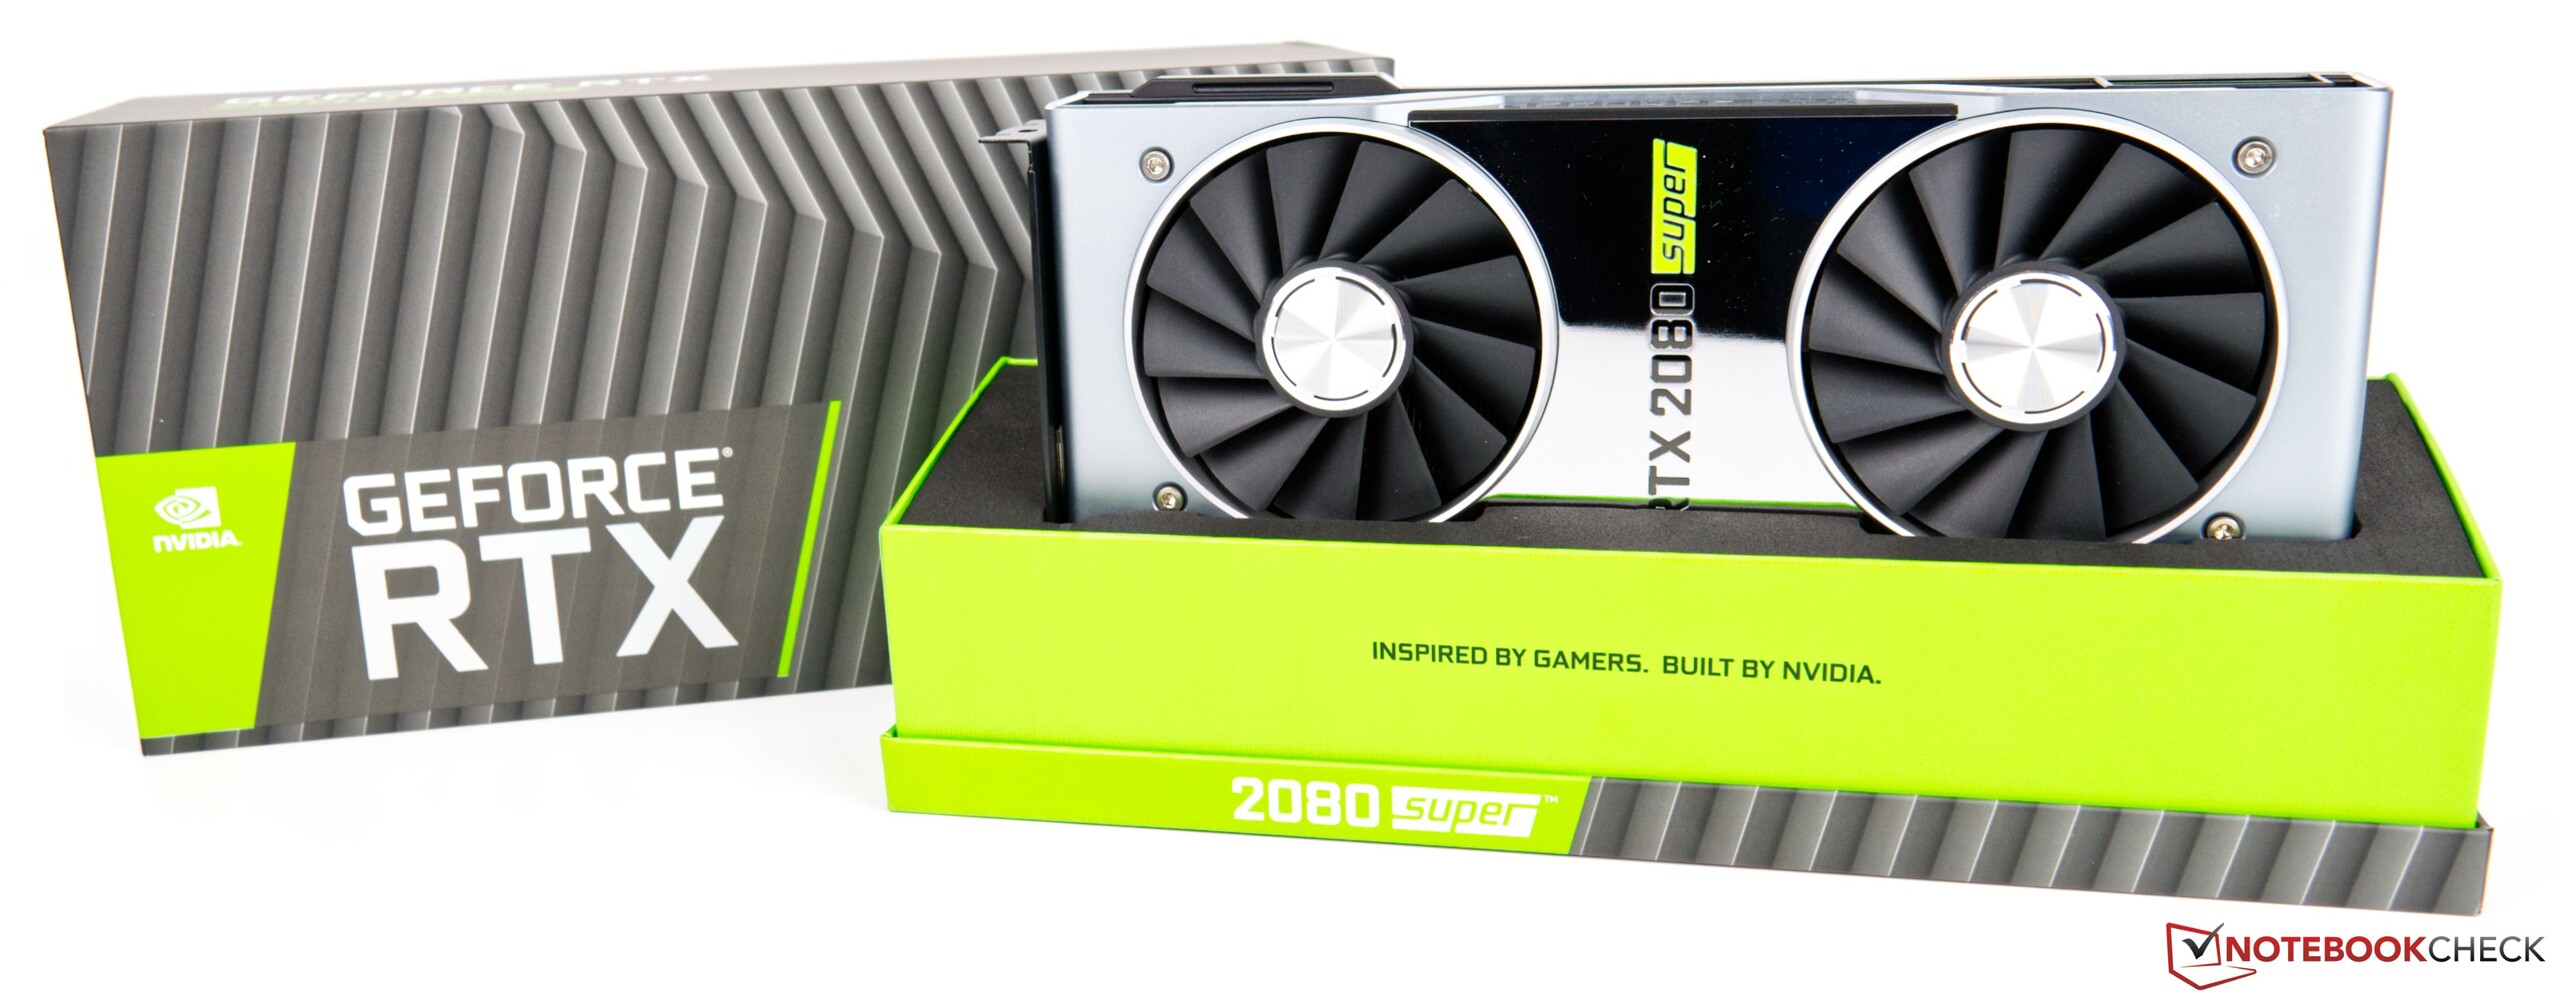
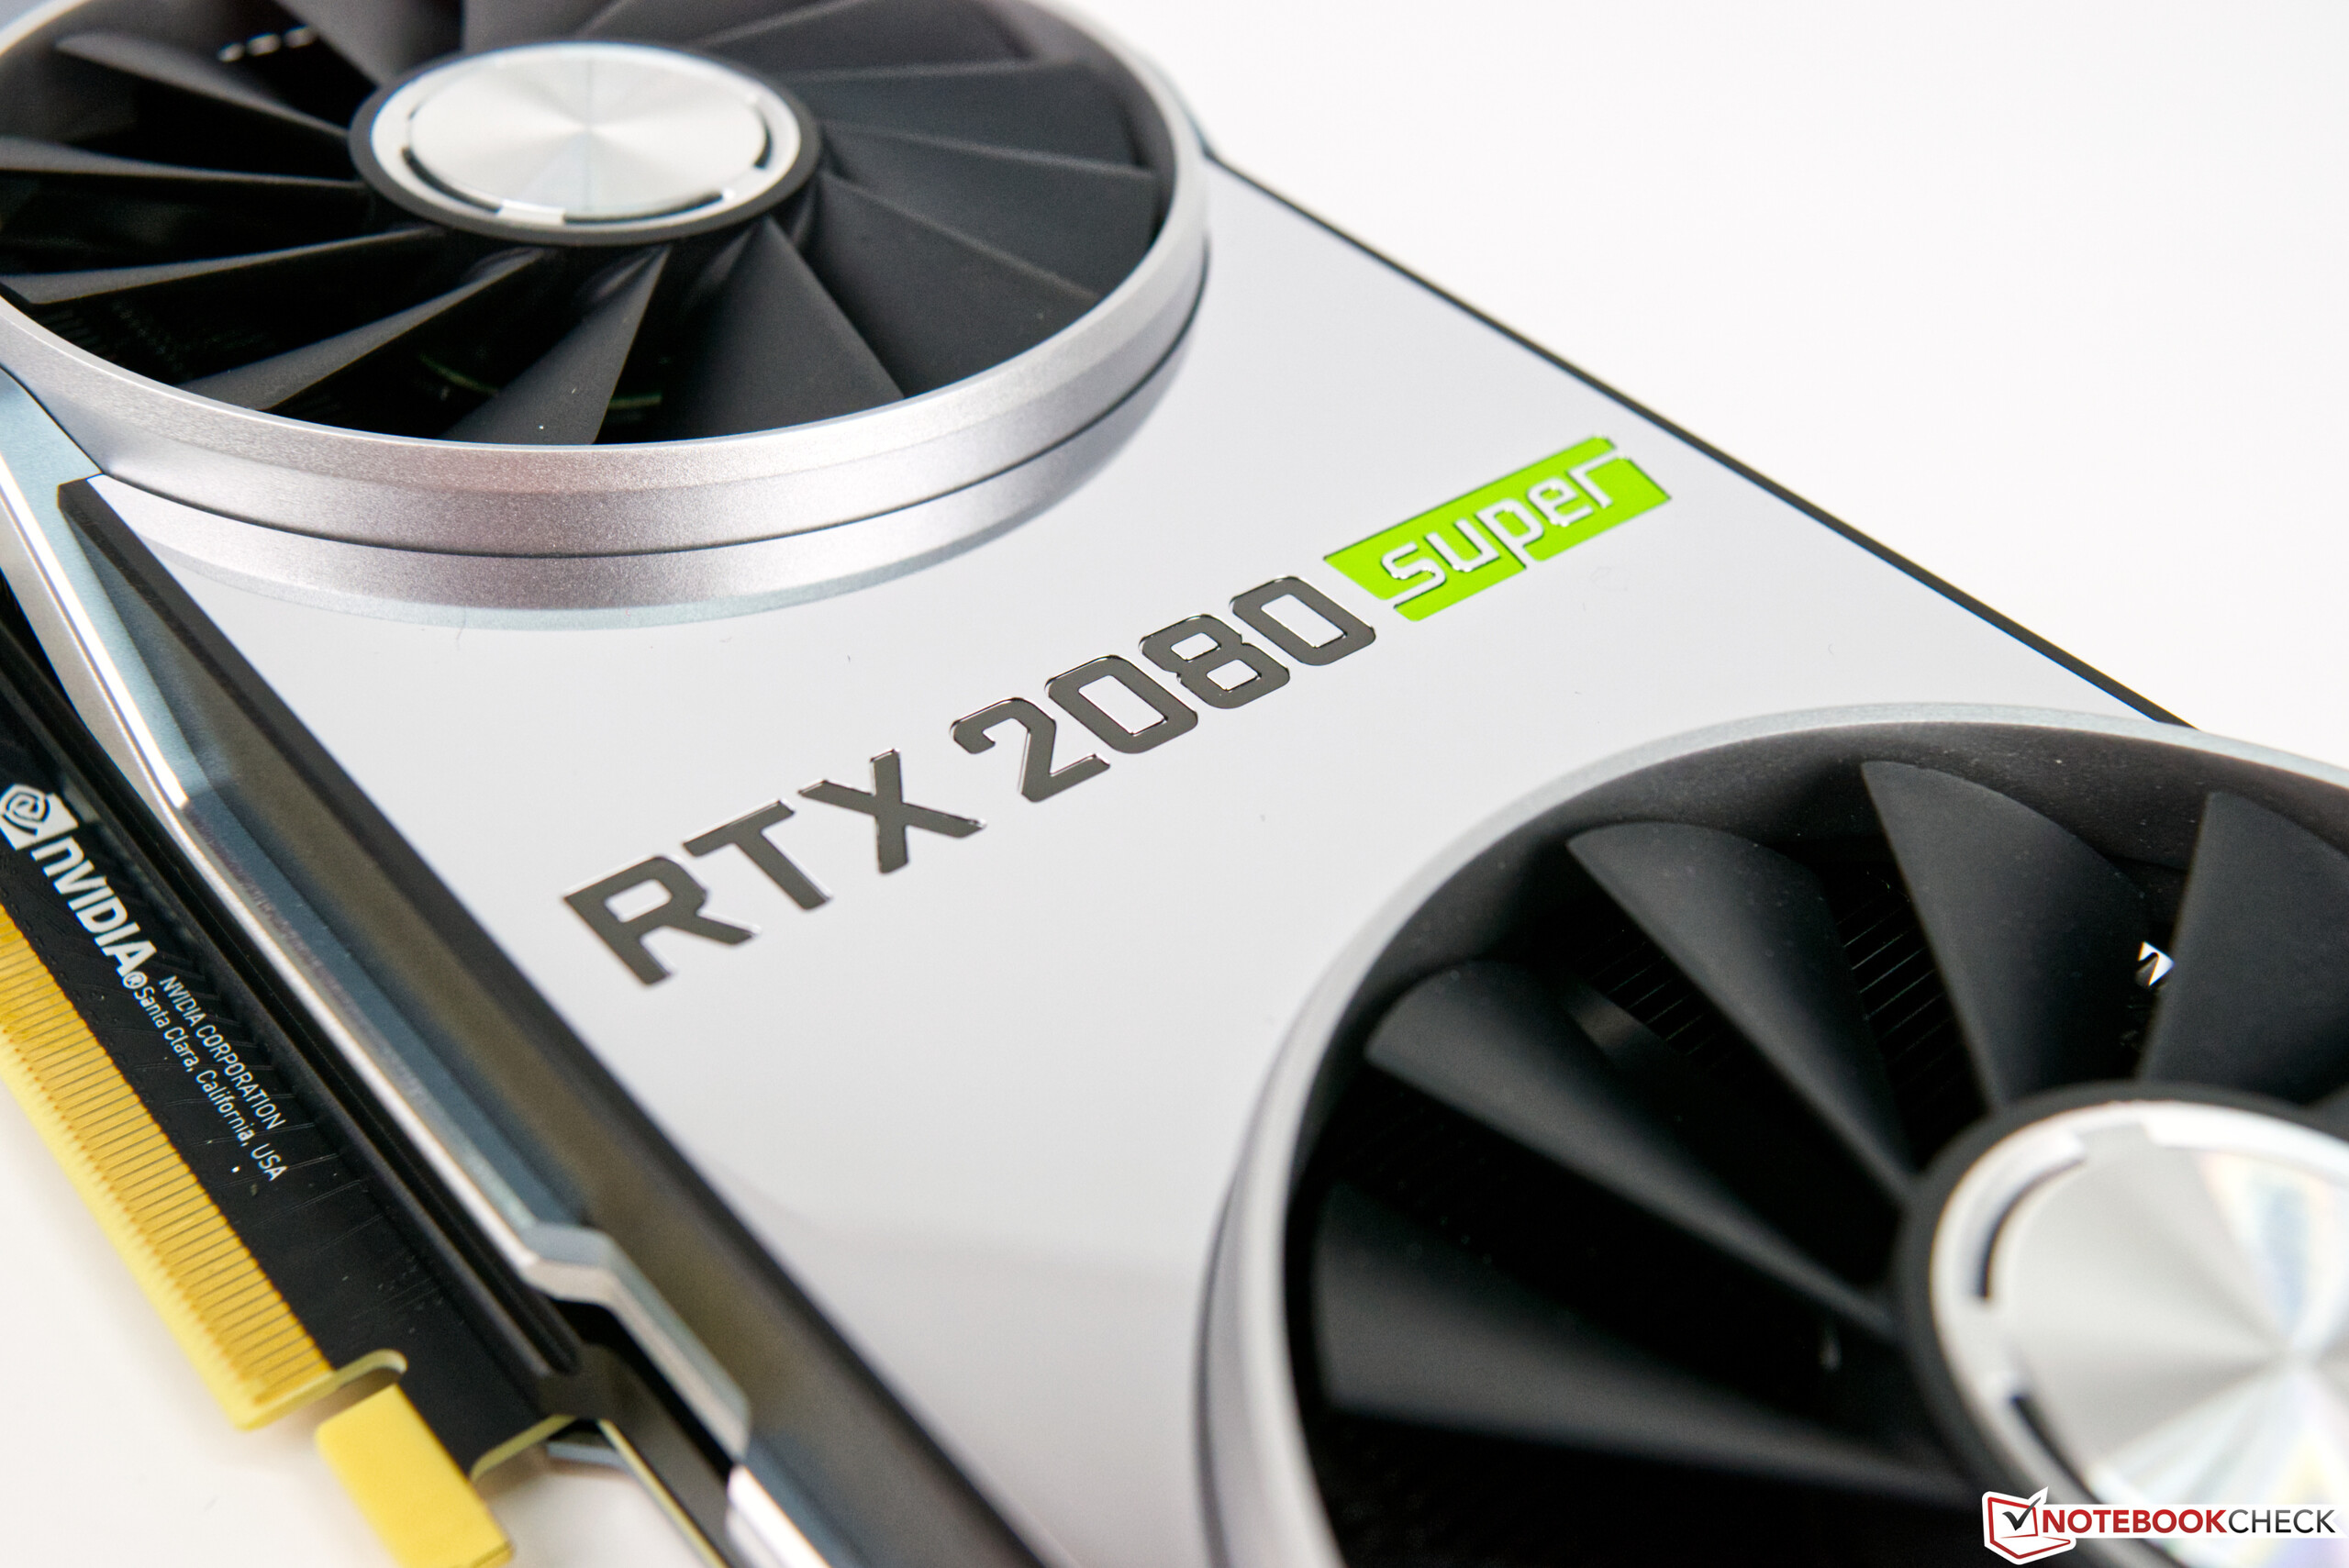
Recensione della GPU Desktop NVIDIA RTX 2080 SUPER: Una GPU Desktop high-end

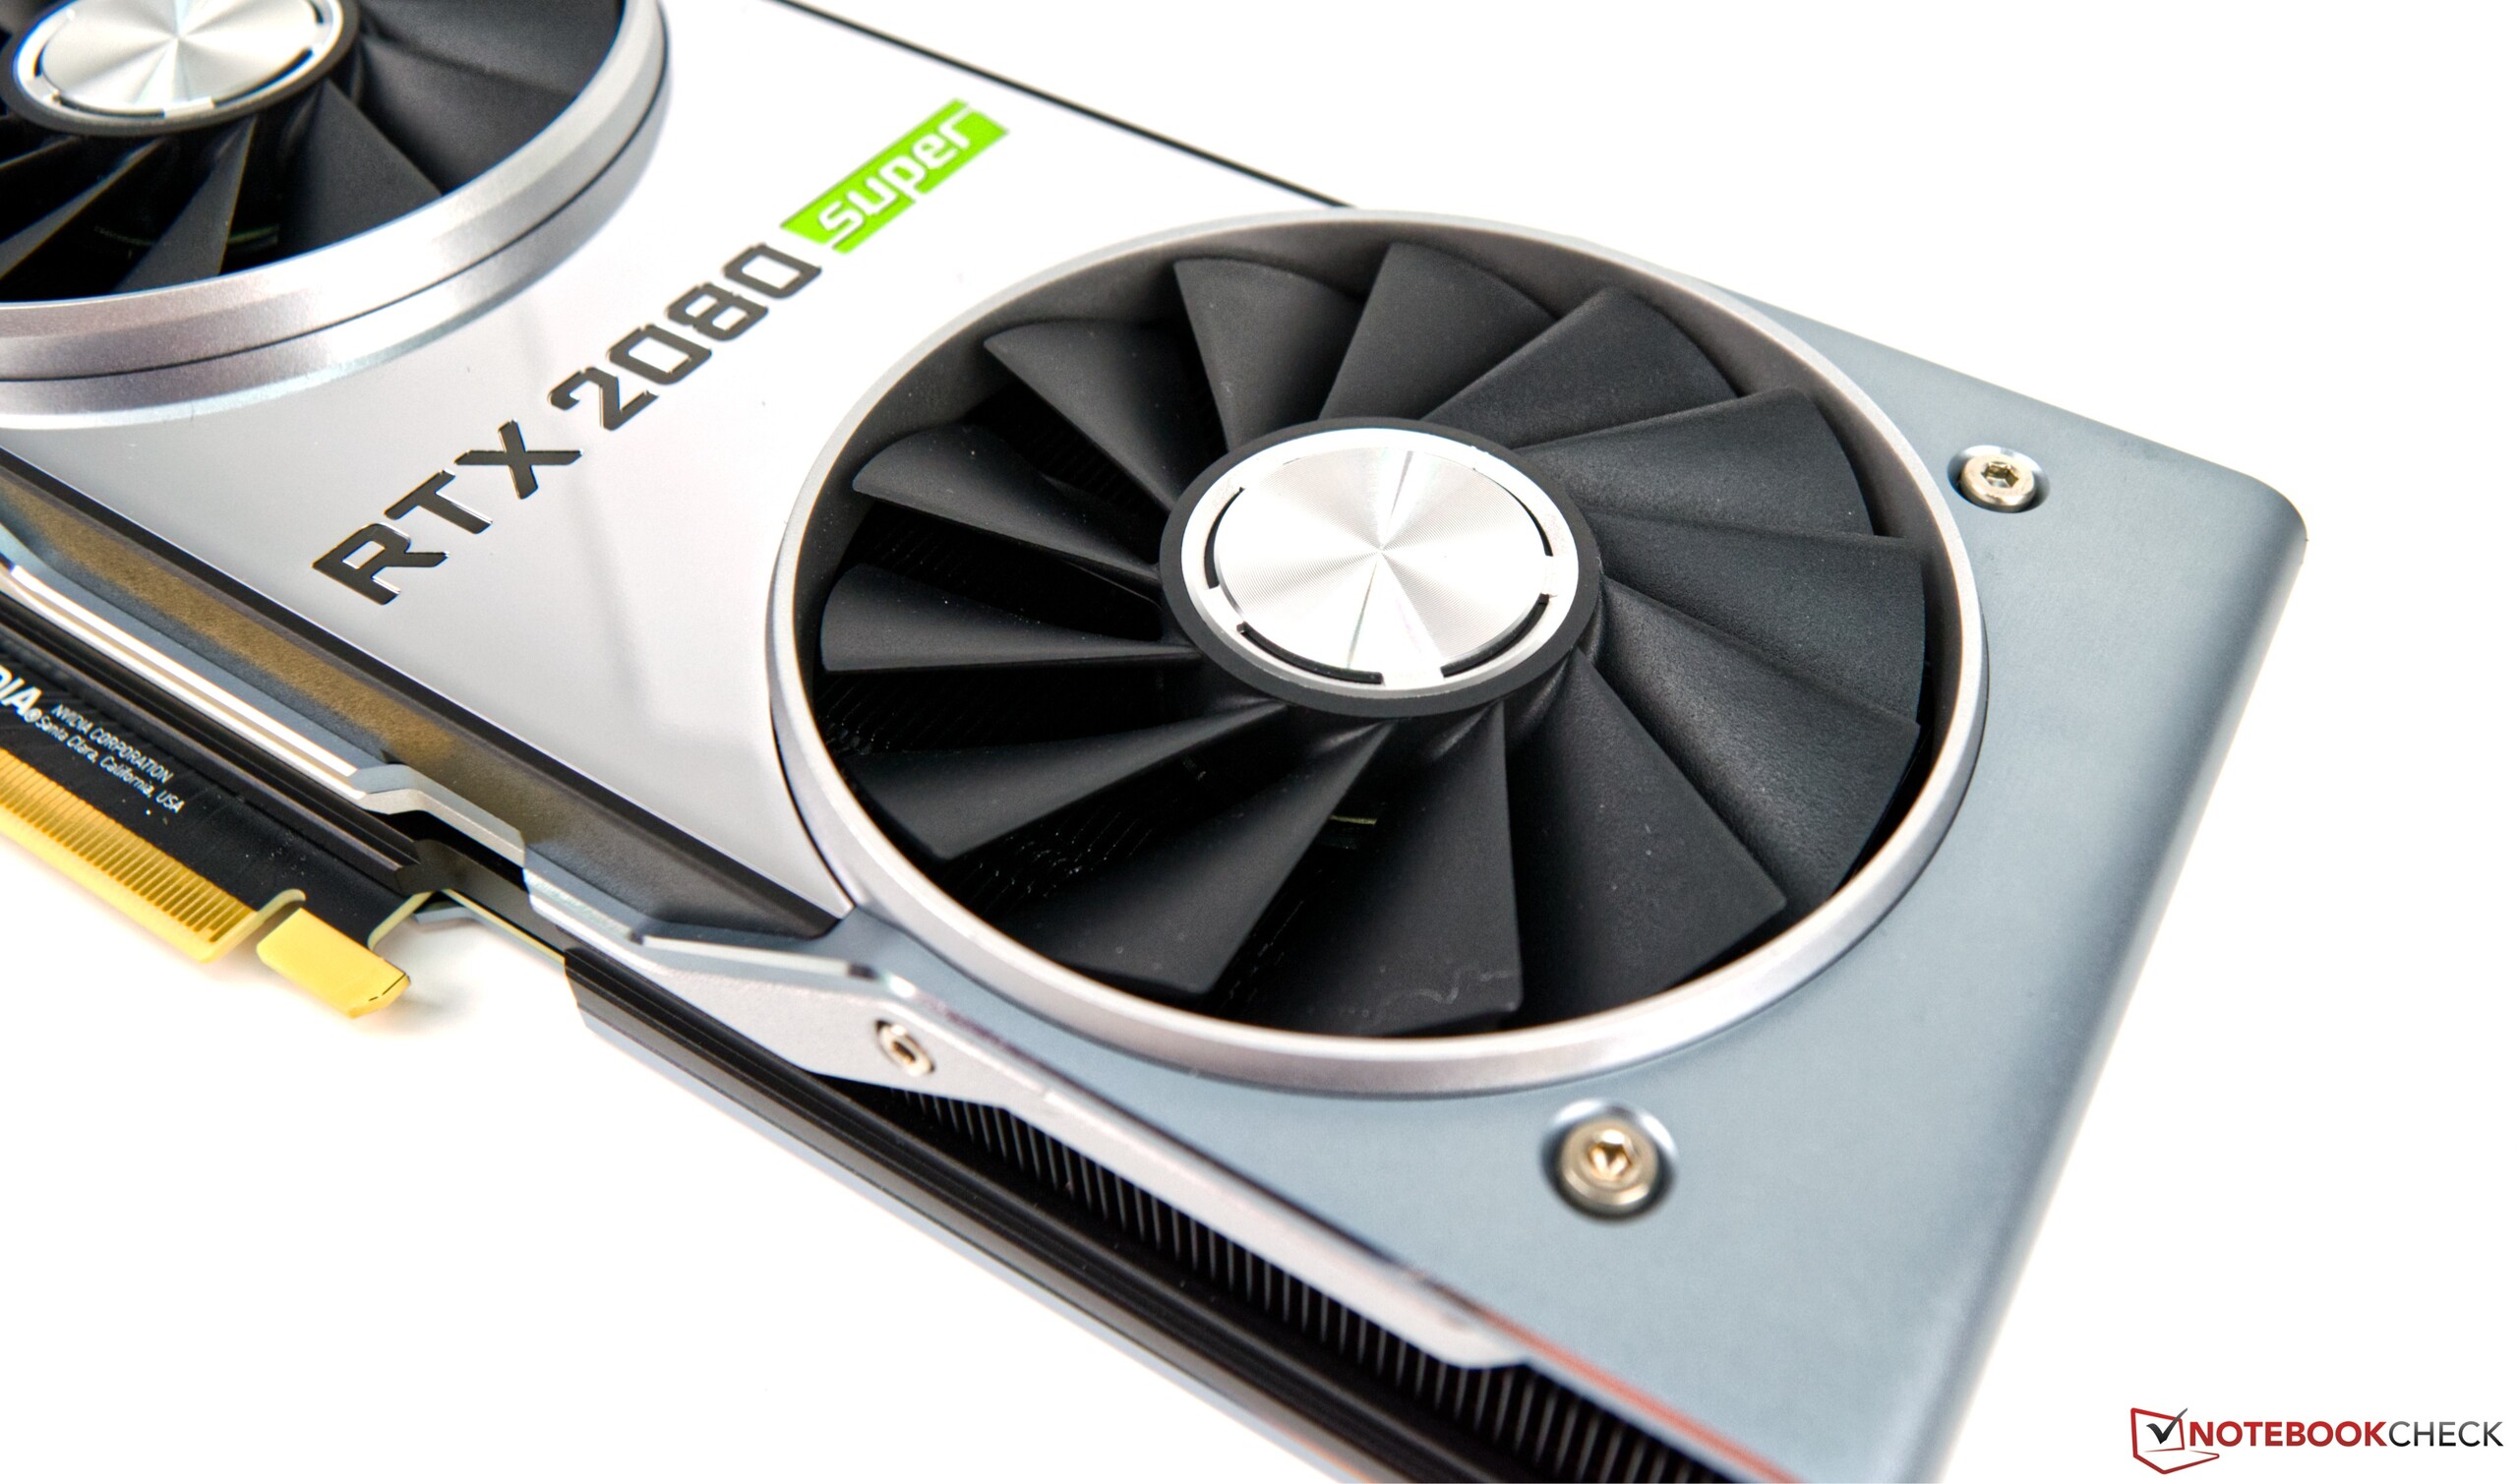
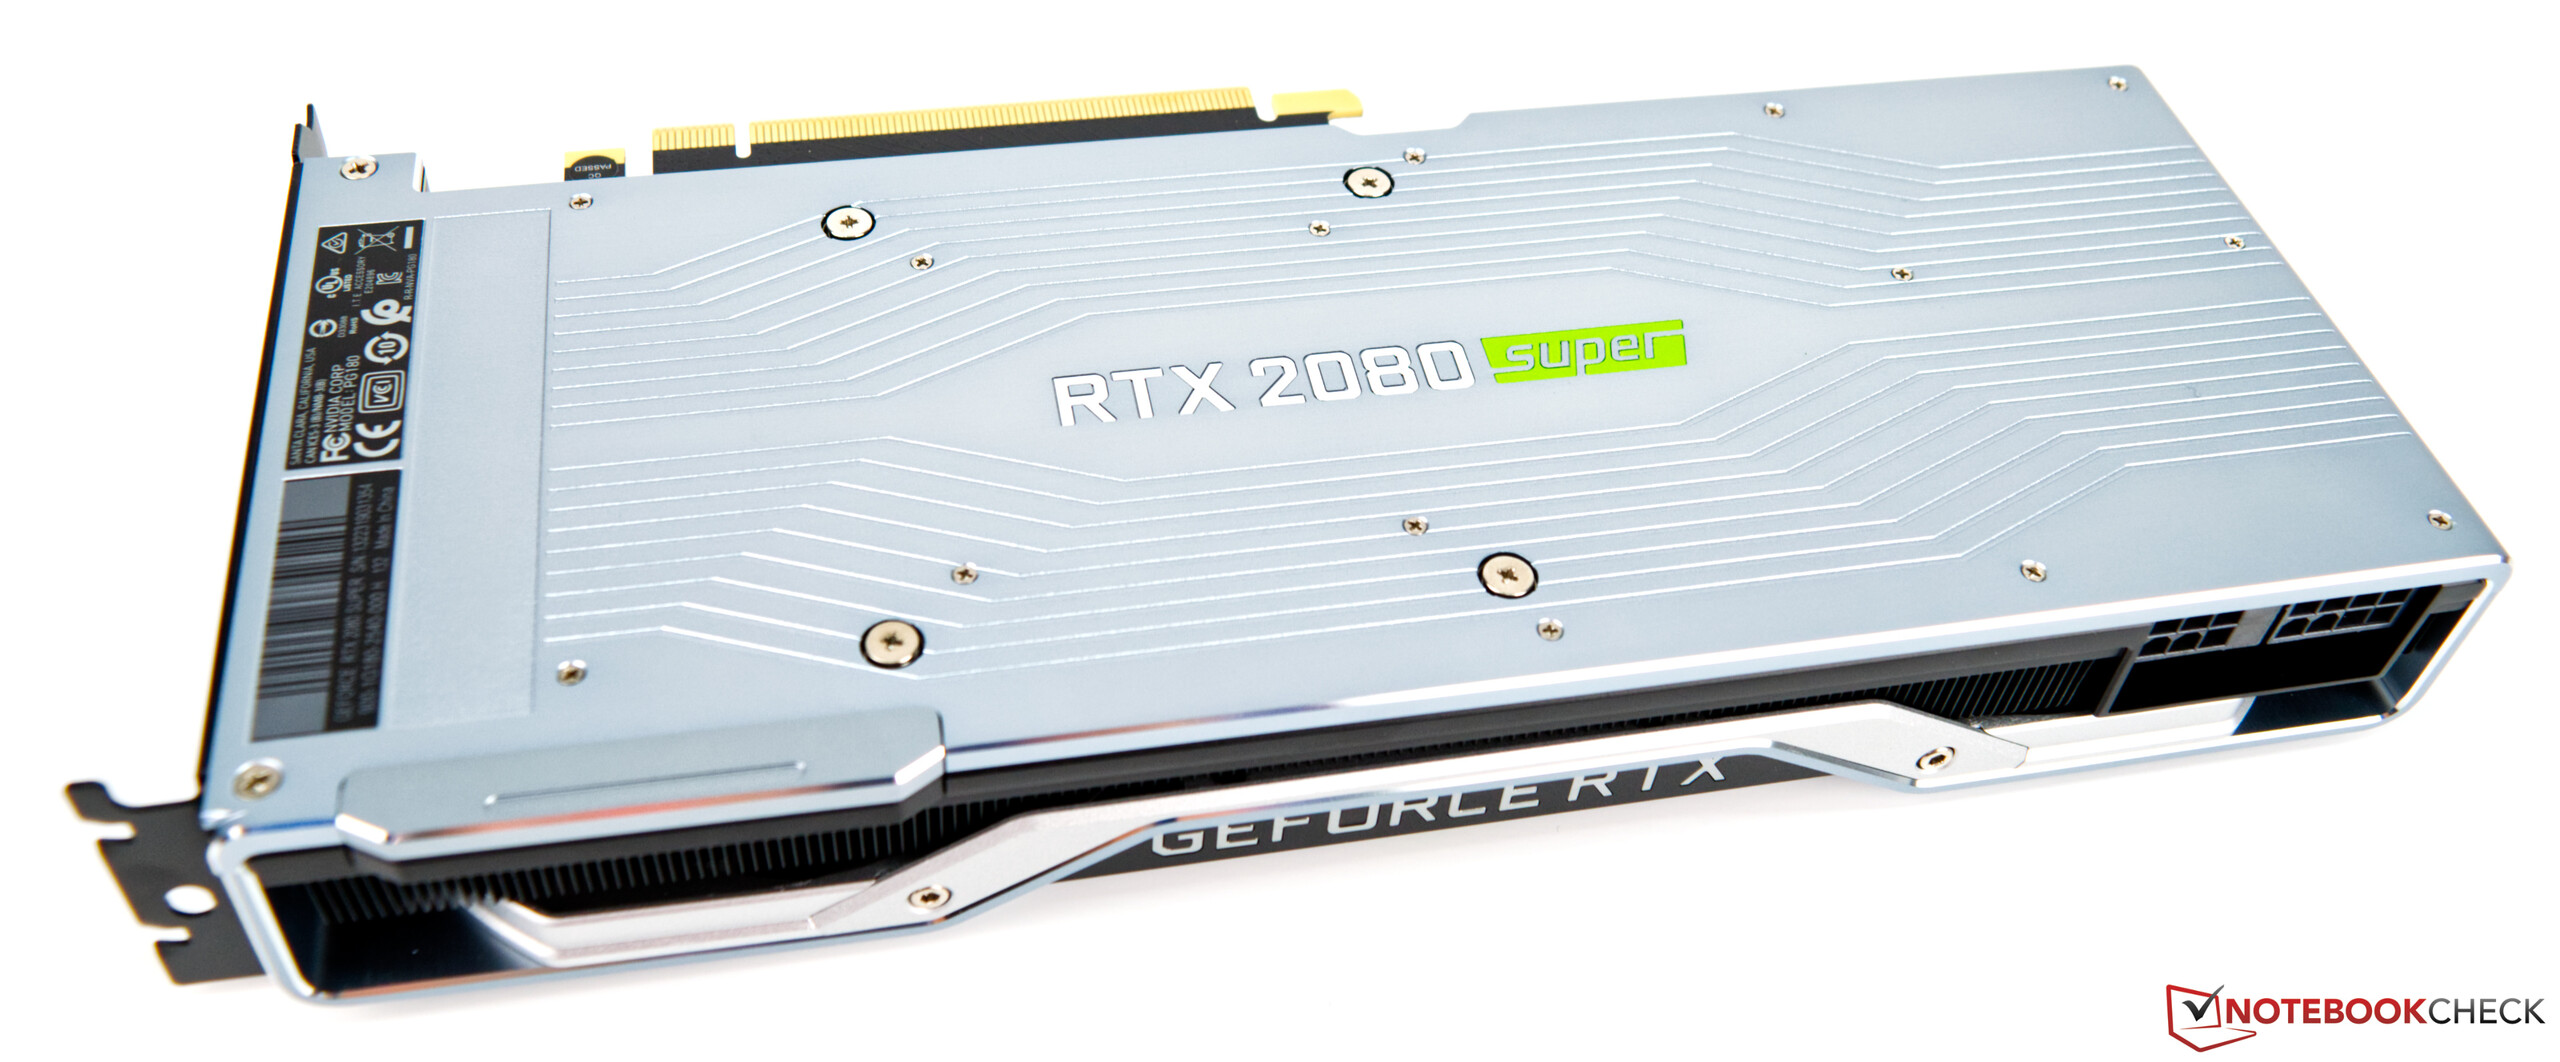
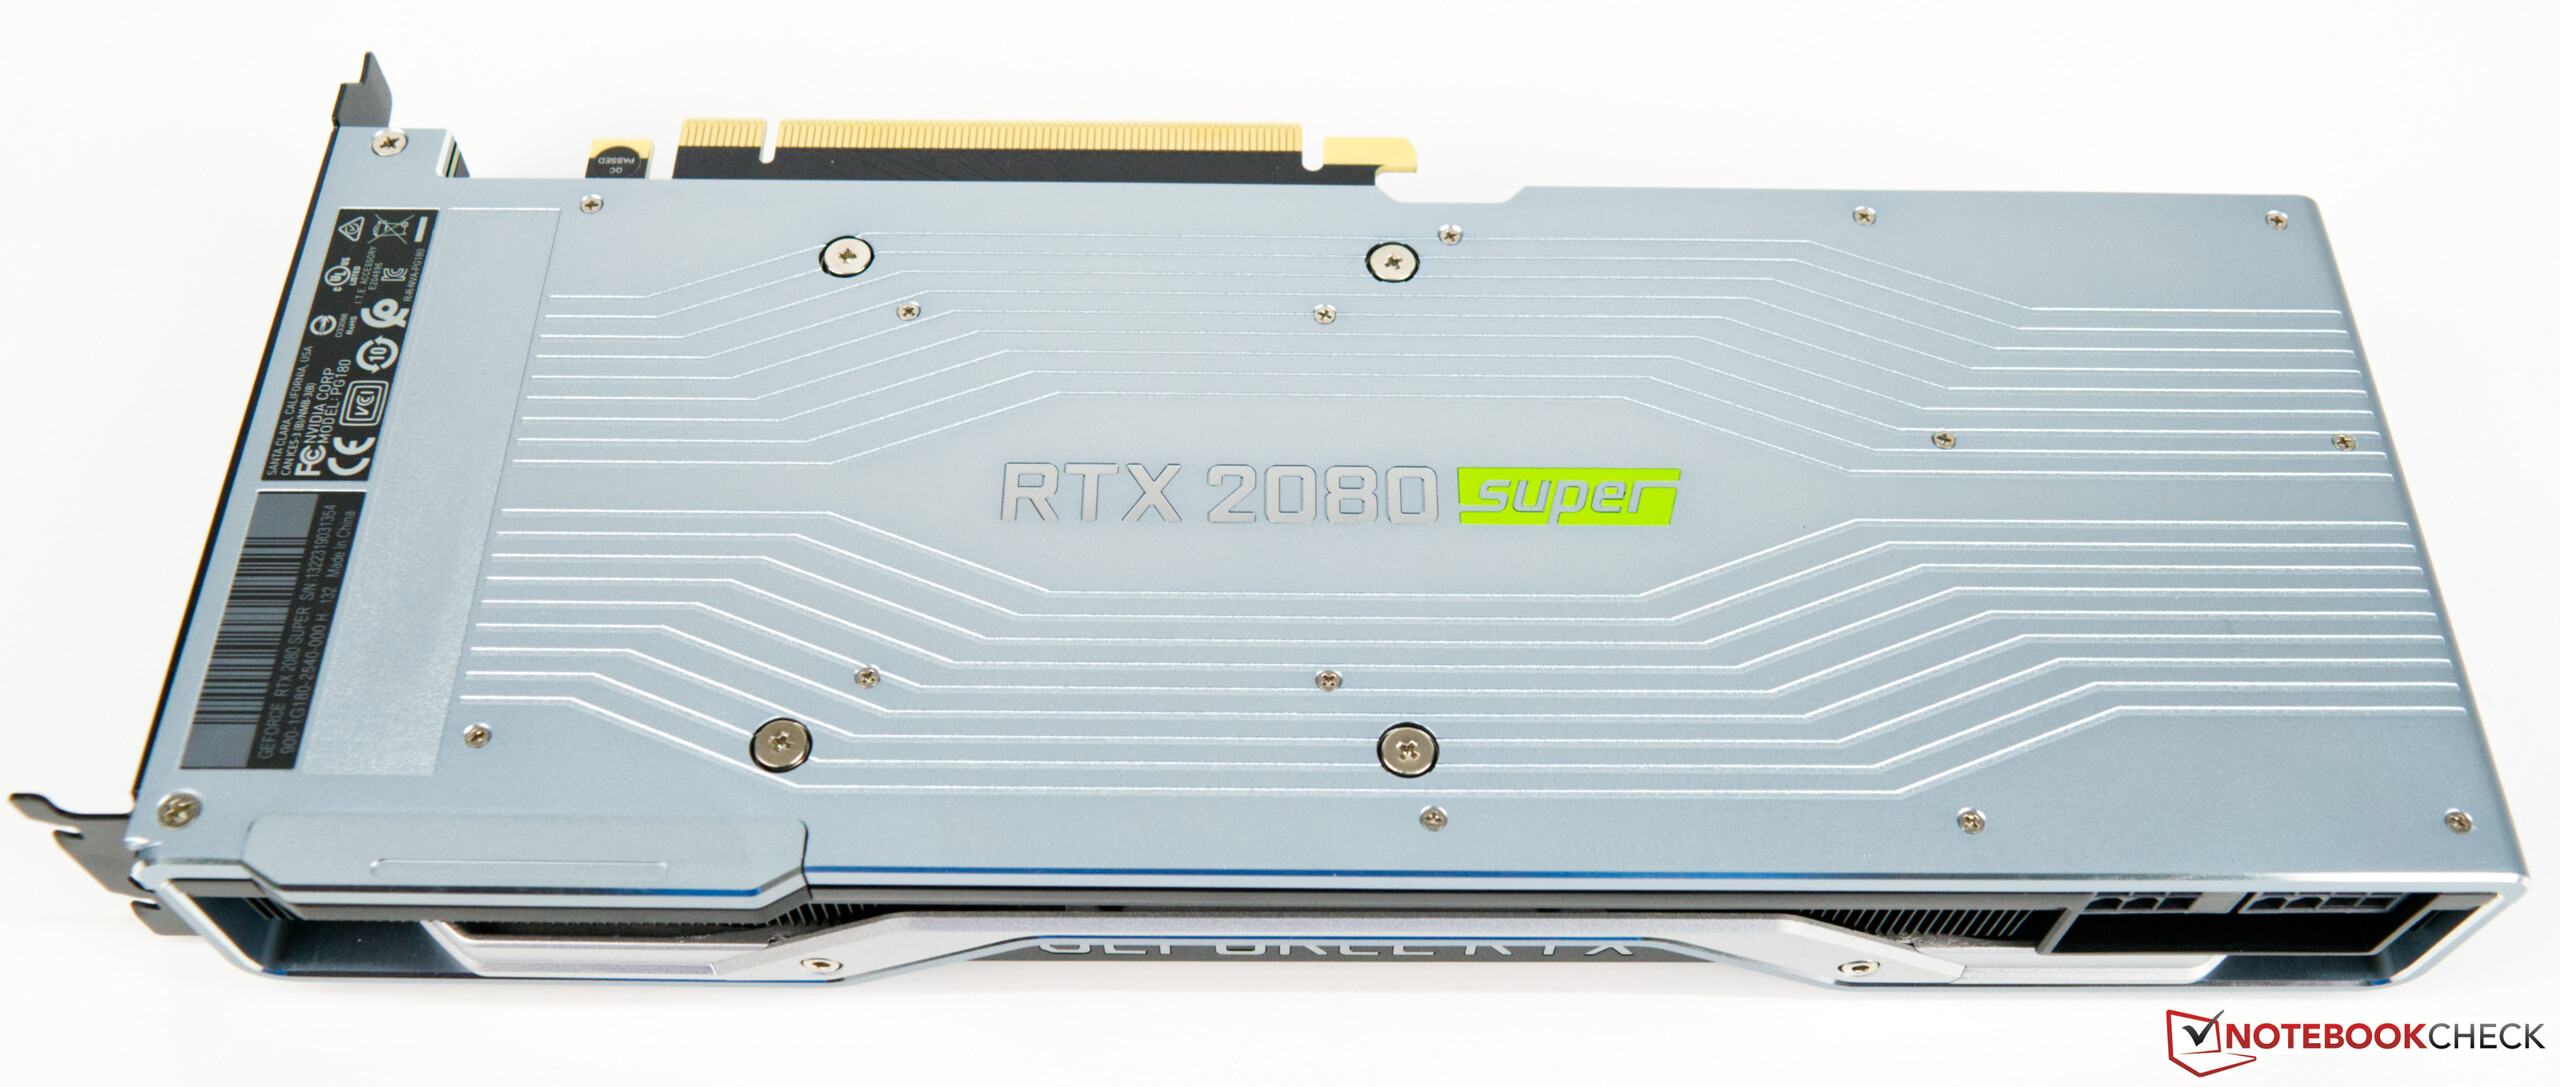
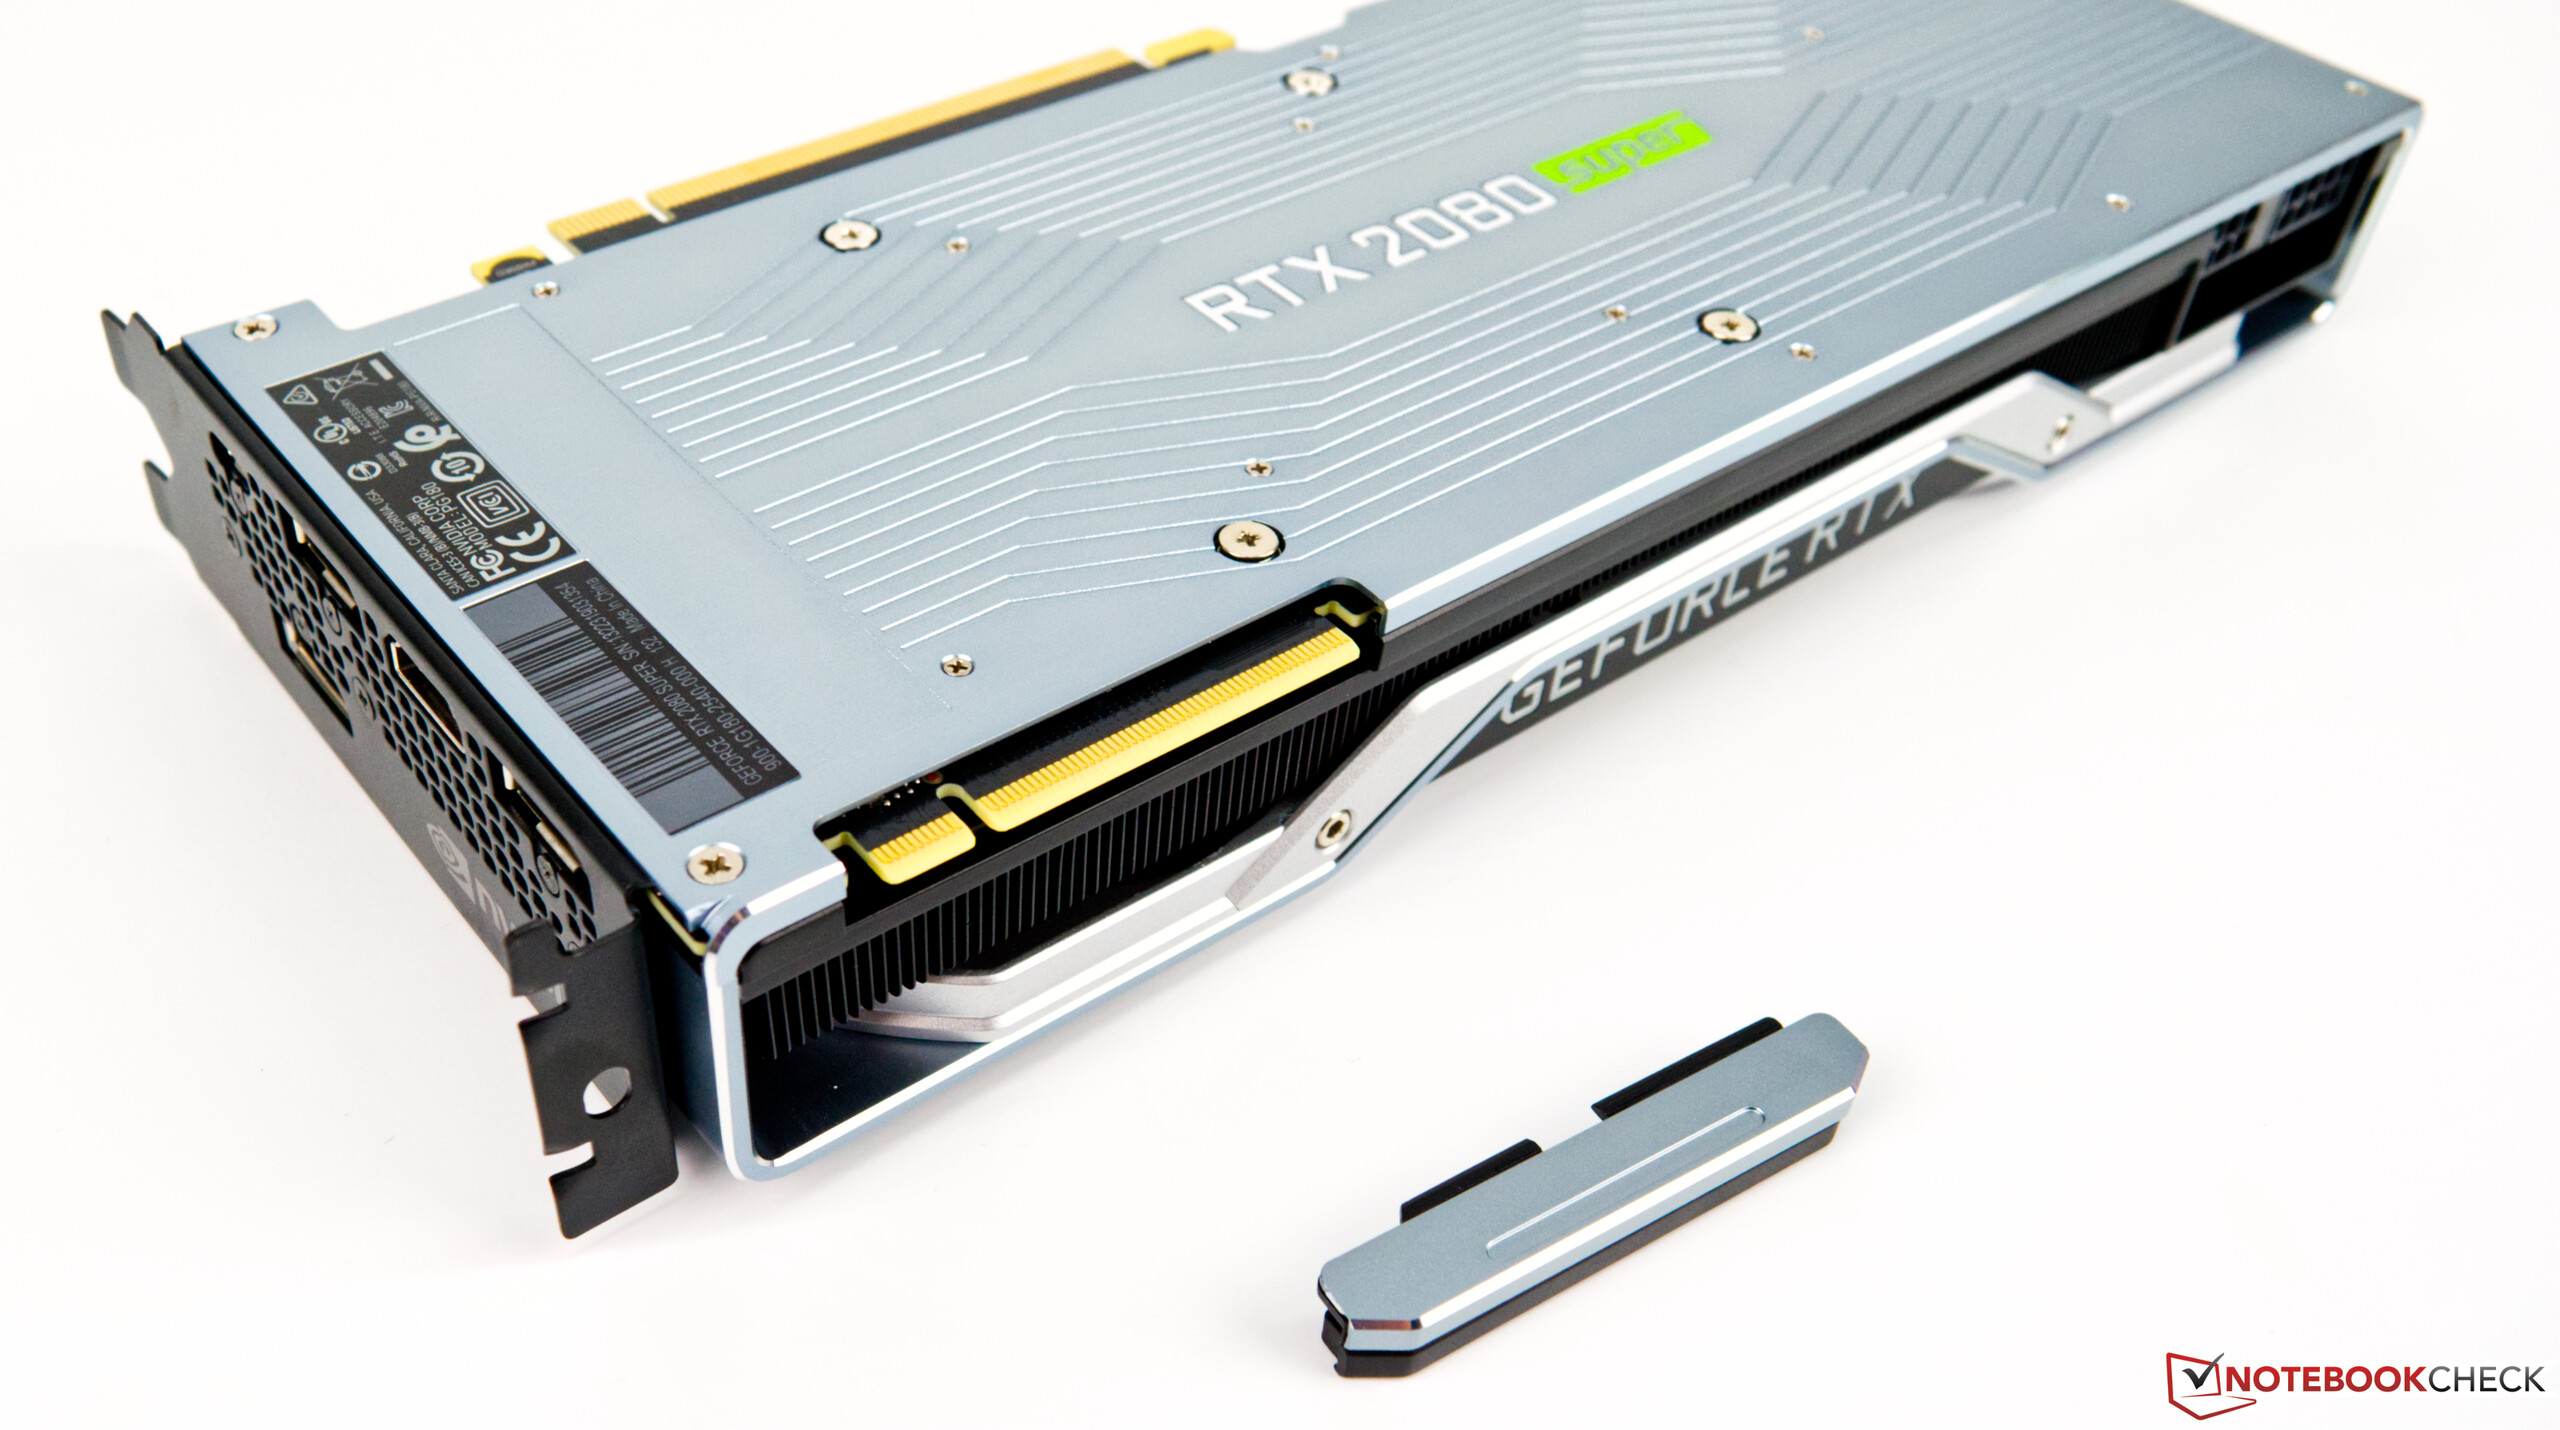
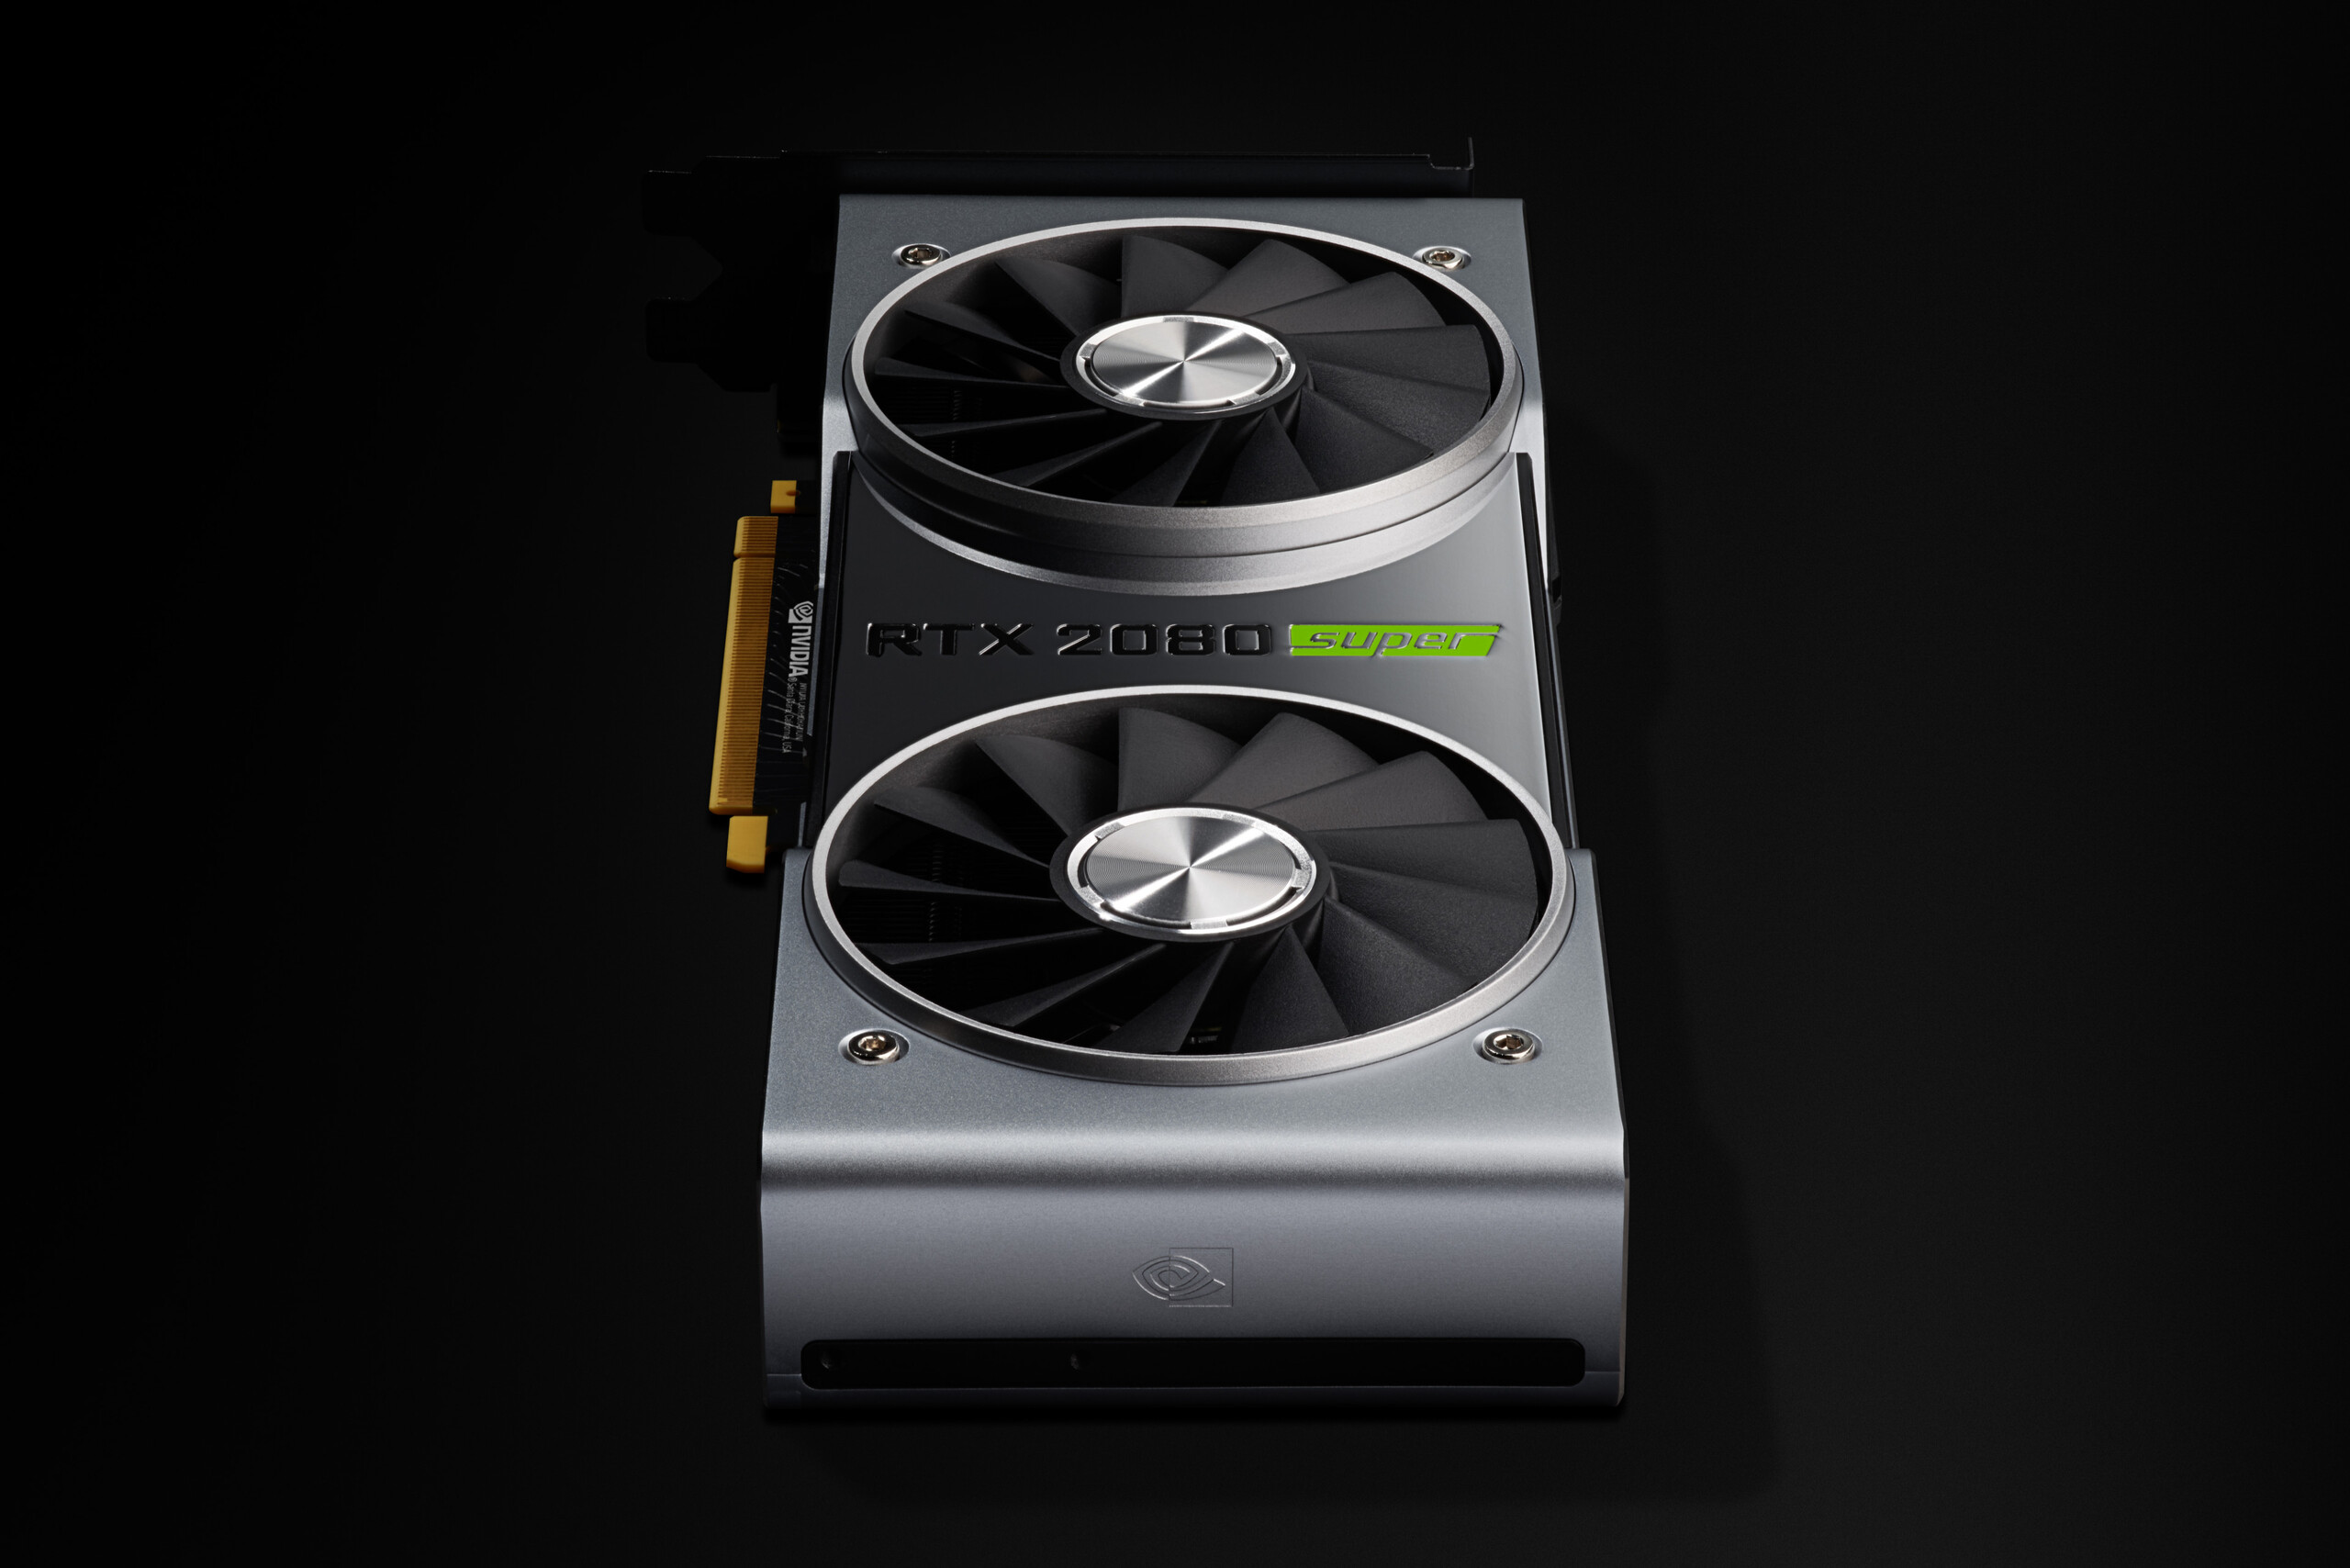
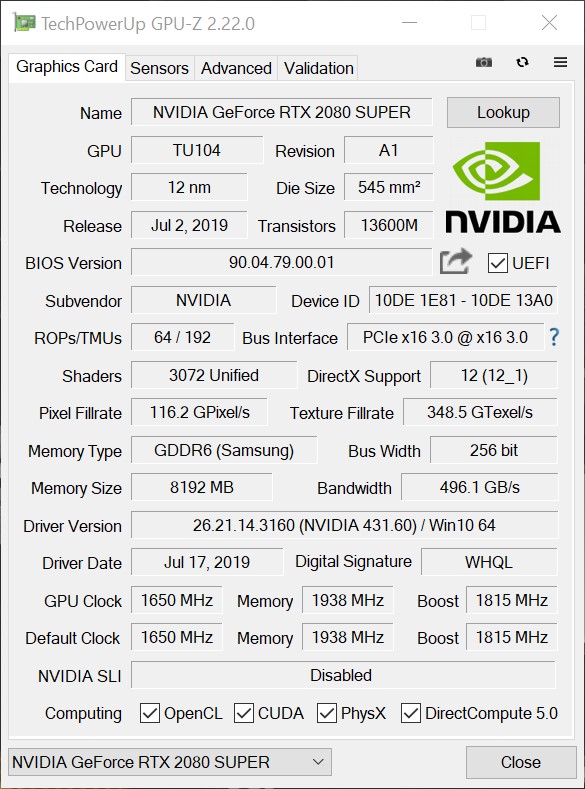
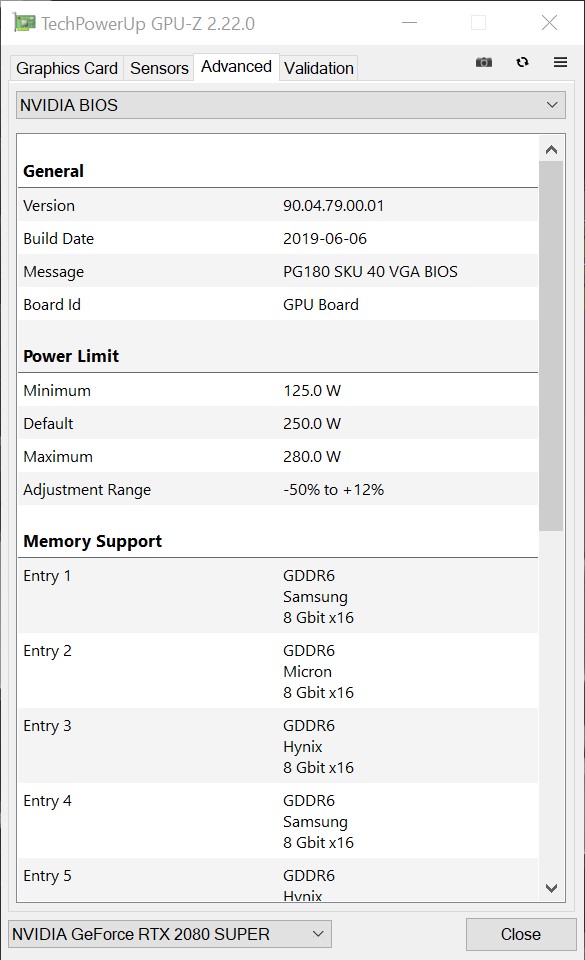
NVIDIA ha annunciato la GeForce RTX 2080 SUPER insieme alle RTX 2060 SUPER e RTX 2070 SUPER. Abbiamo già recensito la Founders Edition degli ultimi due, e ora è la volta della RTX 2080 SUPER, con NVIDIA che ne ha ritardato il lancio fino al 23 luglio. Visivamente, solo una cifra sulla parte anteriore e le informazioni sulla piastra posteriore distinguono le tre schede RTX 20 SUPER FE l'una dall'altra. Internamente, l'RTX 2080 SUPER è diversa dall'RTX 2060 SUPER, con NVIDIA che basa quest'ultima sul suo chip TU106. Al contrario, l'RTX 2080 SUPER e l'RTX 2070 SUPER sono entrambi basati sul TU104, che di fatto è una RTX 2080 Lite. NVIDIA ha migliorato l'RTX 2080 SUPER FE in tutti i settori rispetto al suo predecessore, a parte il volume di VRAM e il suo bus di memoria. Anche la sua larghezza di banda VRAM è aumentata a 15,5 GHz, il che rappresenta una bella spinta rispetto all'equivalente dell'RTX 2080 originale.
L'aumento del numero di unità shader, unità di texture, tensor cores, RT core e maggiori velocità di clock hanno però aumentato il consumo energetico. NVIDIA valuta l'RTX 2080 SUPER FE a 250 W, 35 W in più dell'RTX 2080 originale e alla pari con l'RTX 2080 Ti. Tuttavia, quest'ultimo offre più VRAM con un bus di memoria più alto insieme a più unità shader, unità di texture, tensor cores e RT cores. Forse rendere l'RTX 2080 SUPER FE e l'RTX 2080 Ti paragonabili a questo proposito non è stata una mossa così saggia.


Panoramica delle GPU Turing
| Specifiche | RTX 2060 | RTX 2060 SUPER | RTX 2070 | RTX 2070 SUPER | RTX 2080 | RTX 2080 SUPER | RTX 2080 Ti | TITAN RTX |
| Chip Grafico | TU106 | TU106 | TU106 | TU104 | TU104 | TU104 | TU102 | TU102 |
| FinFET process | 12 nm | 12 nm | 12 nm | 12 nm | 12 nm | 12 nm | 12 nm | 12 nm |
| Unita' Shader | 1,920 | 2,176 | 2,304 | 2,560 | 2,944 | 3,072 | 4,352 | 4,608 |
| Unita' Texture | 120 | 136 | 144 | 160 | 184 | 192 | 272 | 288 |
| Tensor Cores | 240 | 272 | 288 | 320 | 368 | 384 | 544 | 572 |
| RT Cores | 30 | 34 | 36 | 40 | 46 | 48 | 68 | 72 |
| GPU Base Clock | 1,365 MHz | 1,470 MHz | 1,410 MHz | 1,605 MHz | 1,515 MHz | 1,650 MHz | 1,350 MHz | 1,350 MHz |
| GPU Boost Clock | 1,680 MHz | 1,650 MHz | 1,620 MHz | 1,770 MHz | 1,710 MHz | 1,815 MHz | 1,545 MHz | 1,770 MHz |
| Memory Bus | 192 Bit | 256 Bit | 256 Bit | 256 Bit | 256 Bit | 256 Bit | 352 Bit | 384 Bit |
| Memory Bandwidth | 336 GB/s | 448 GB/s | 448 GB/s | 448 GB/s | 448 GB/s | 496,1 GB/s | 616 GB/s | 672 GB/s |
| VRAM | 6 GB GDDR6 | 8 GB GDDR6 | 8 GB GDDR6 | 8 GB GDDR6 | 8 GB GDDR6 | 8 GB GDDR6 | 11 GB GDDR6 | 24 GB GDDR6 |
| TDP | 160 W | 175 W | 175 W | 215 W | 215 W | 250 W | 250 W | 280 W |
Sistema di test
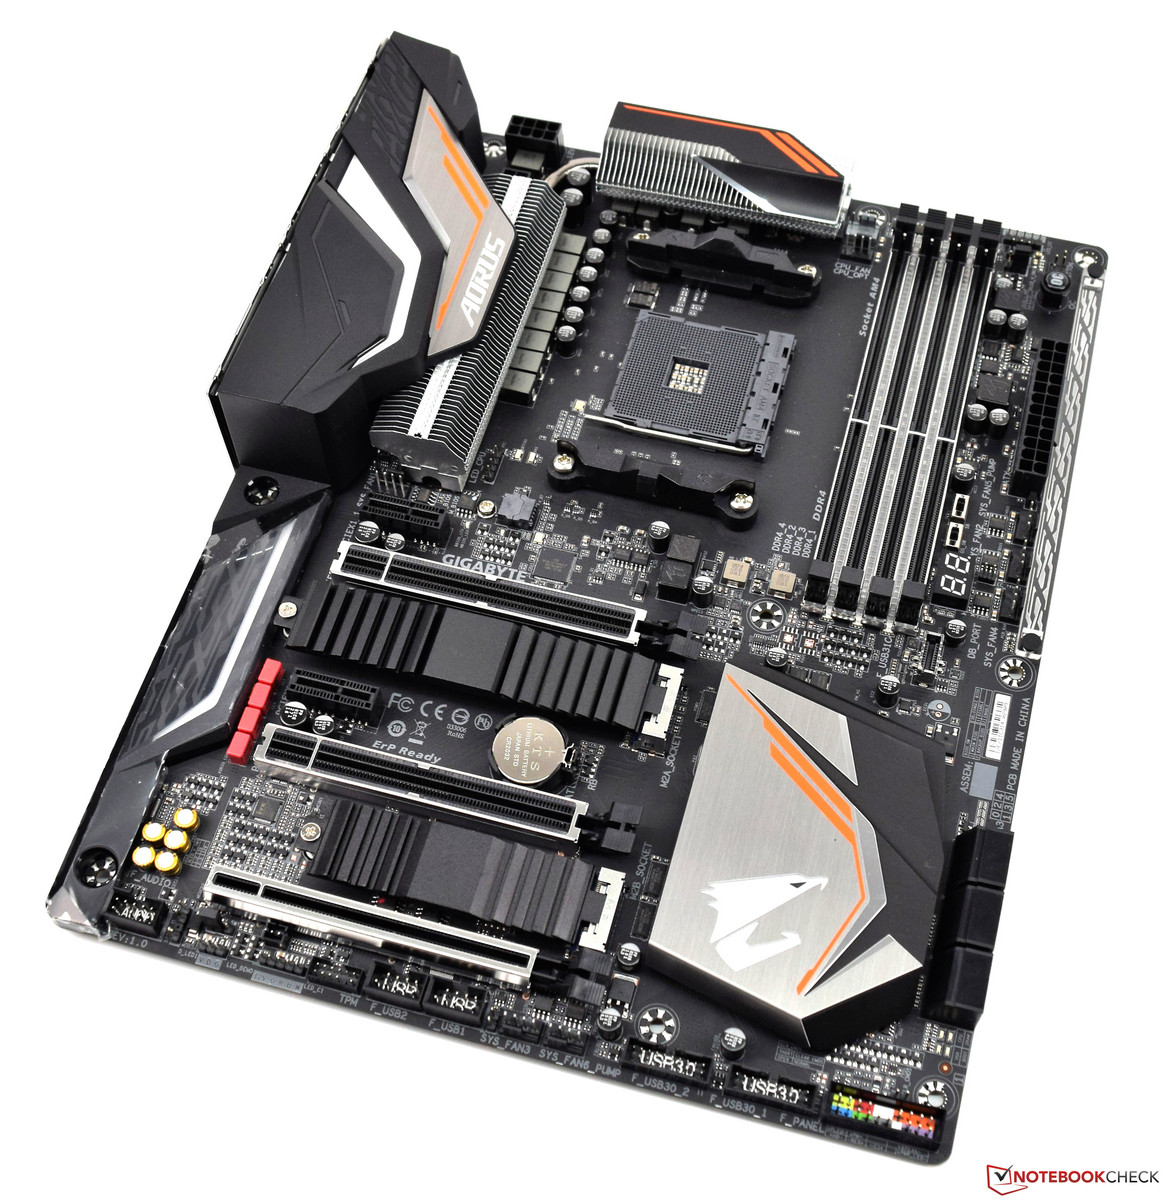
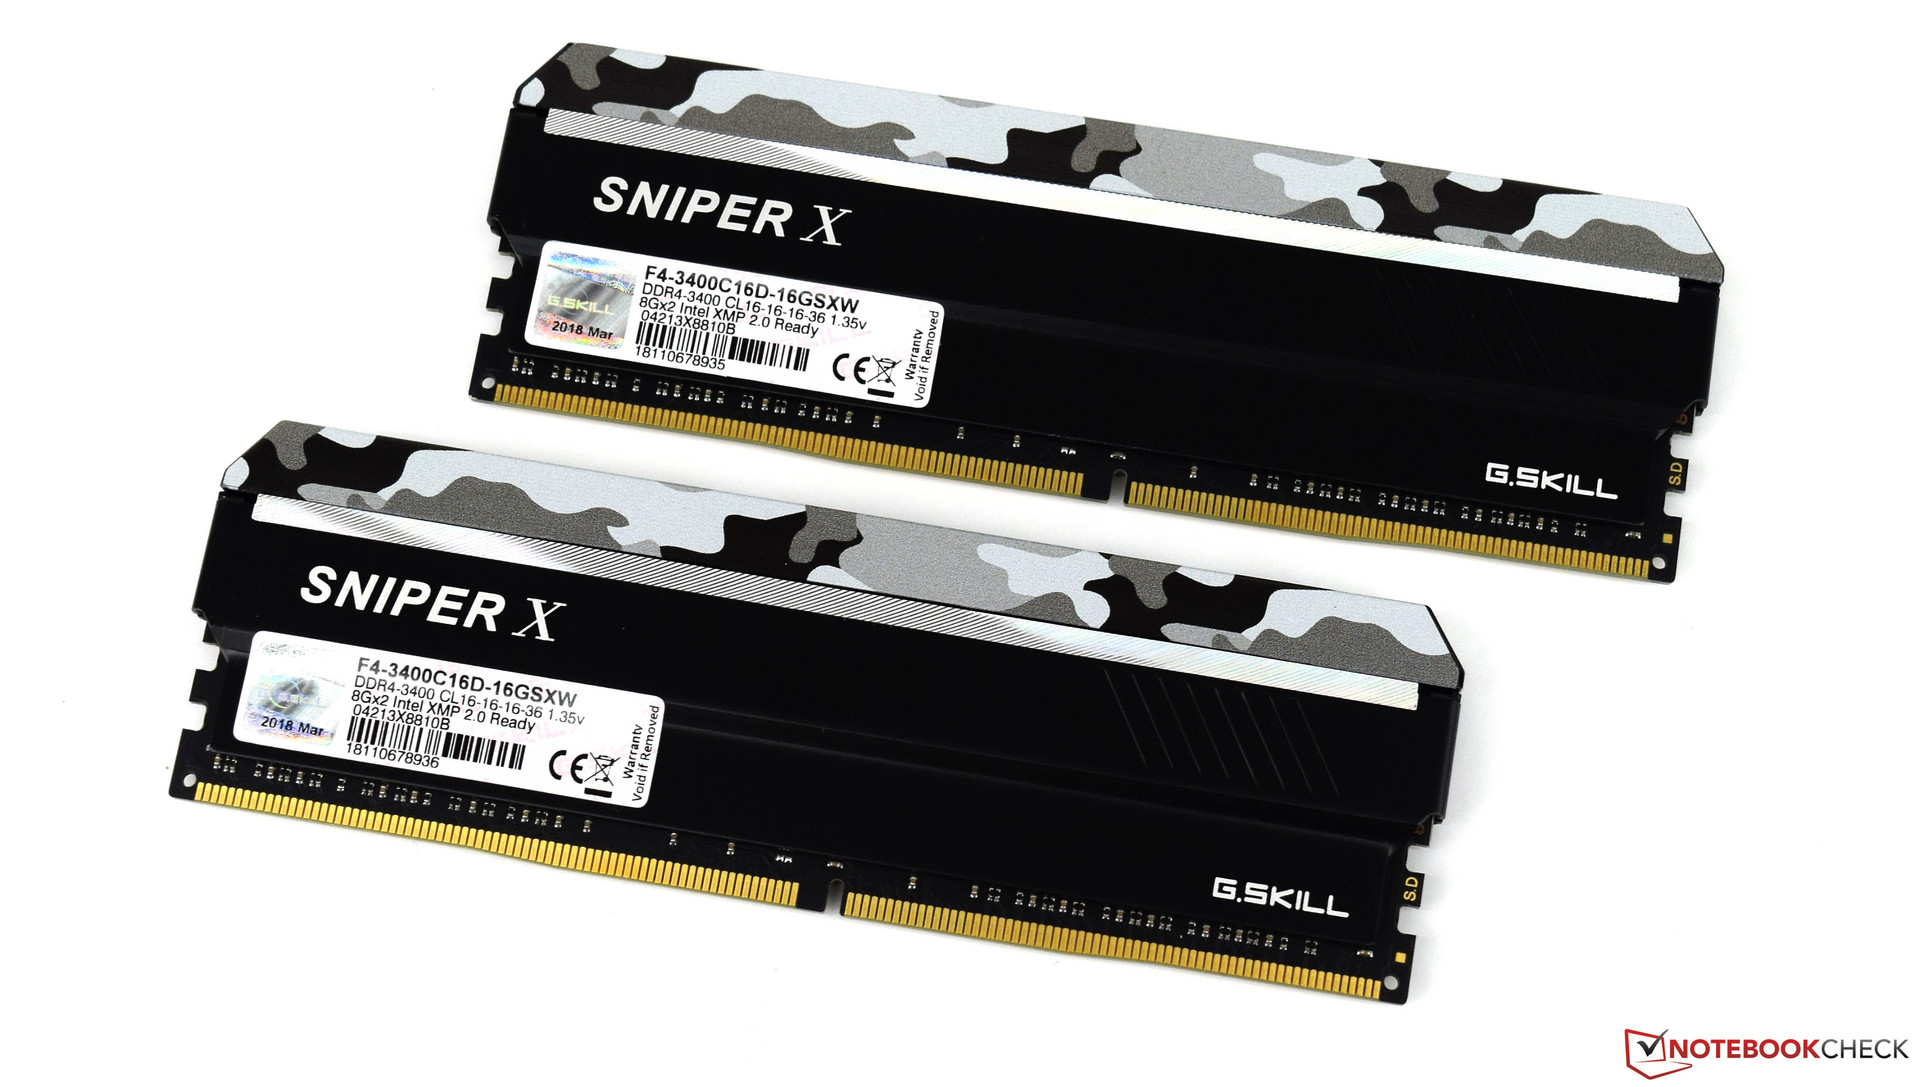
Il nostro sistema di test è basato sulla scheda madre Wi-Fi Gigabyte X470 Aorus Gaming 7 Wi-Fi. Abbiamo accoppiato la scheda con la AMD Ryzen 7 2700X, che offre prestazioni eccellenti con un budget limitato, e un Be Quiet Silent Loop 280 mm AIO. Abbiamo anche equipaggiato il sistema con 16 GB di RAM di G-Skill RAM che si trova a 3.400 MHz, il tutto alloggiato in un case Corsair Carbide Air 540 ATX Cube. Inoltre, abbiamo eseguito tutti i nostri test sull'Acer Predator XB321HK, un monitor 4K che ci permette anche di condurre dei benchmark di gioco UHD.
Un ringraziamento ad AMD per averci gentilmente fornito questa piattaforma di test per testare l'RTX 2080 SUPER FE.
| Case | Corsair Carbide Air 540 ATX Cube |
| CPU | AMD Ryzen 7 2700X |
| CPU cooler | Be Quiet Silent Loop 280 mm |
| RAM | G-Skill Sniper X 16 GB DDR4 3,400 MHz |
| Scheda madre | Gigabyte X470 Aorus Gaming 7 WiFi |
| Monitor | Acer Predator XB321HK 4K |
| SSD | ADATA SP900 M.2 256 GB |
| SDD | Western Digital SN720 512 GB - for games |
| SSD | Crucial MX500 2 TB – for games |
| OS | Microsoft Windows 10 Professional 64-Bit (Version 1903) |
| Drivers | NVIDIA 431.16 – last updated on 07.10.2019 |
Velcità Clock
NVIDIA ha notevolmente aumentato la velocità di base e di turbo clock della RTX 2080 SUPER FE rispetto al suo predecessore. L'RTX 2080 SUPER FE ha un core clock di 1.650 MHz, 135 MHz più alto di quello dell'RTX 2080, e un boost clock di 1.815 MHz, un miglioramento di 105 MHz rispetto al suo predecessore. NVIDIA ha rivoluzionato anche la VRAM, portandolo a 15,5 GHz, il che produce una larghezza di banda di memoria di 496 GB/s. Il suo bus di memoria rimane comunque a 256-Bit.
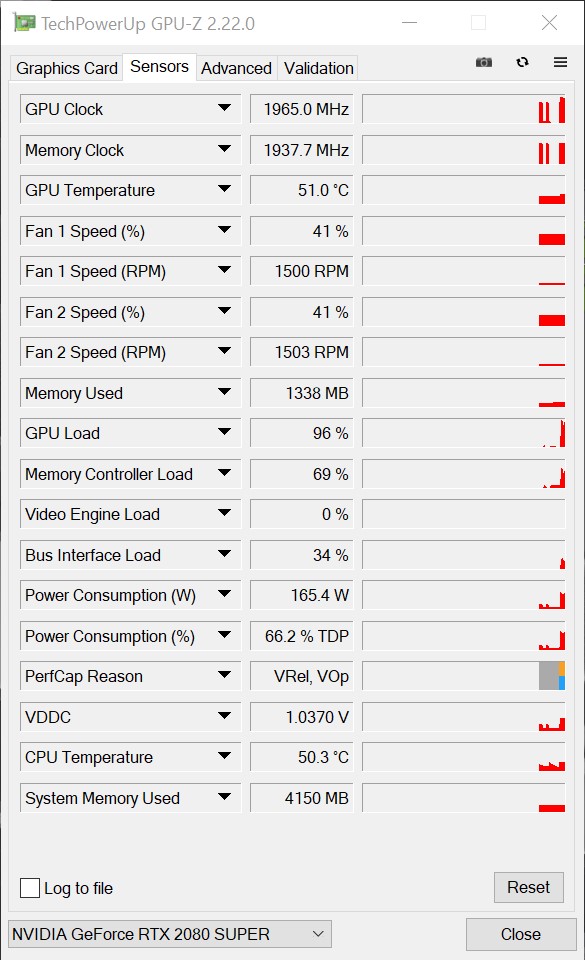
Tuttavia, l'RTX 2080 SUPER FE può raggiungere velocità di clock ancora più elevate, con NVIDIA che fornisce il suo boost clock solo come linea guida. La nostra unità di prova ha avuto una media di 1.900 MHz nei benchmarks e nei giochi, ma ha superato i 2.000 MHz quando abbiamo aumentato il power target (PT).
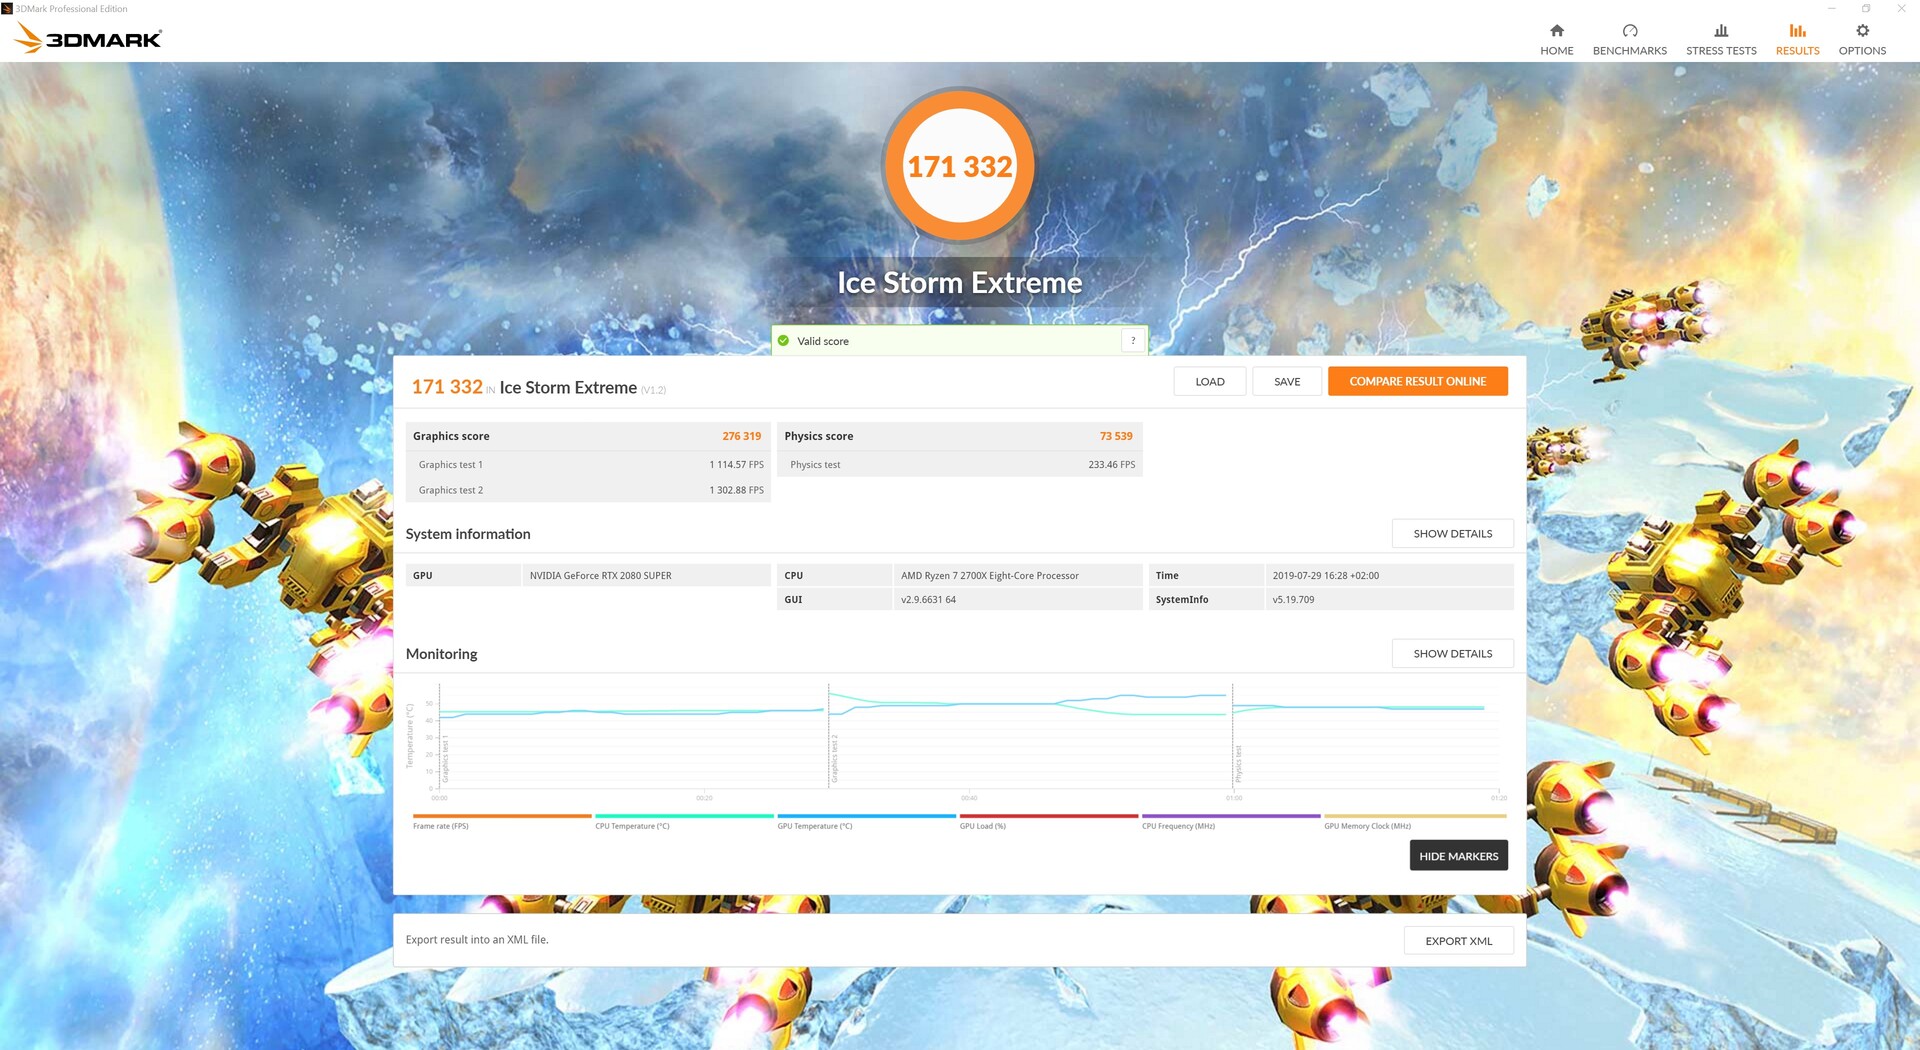
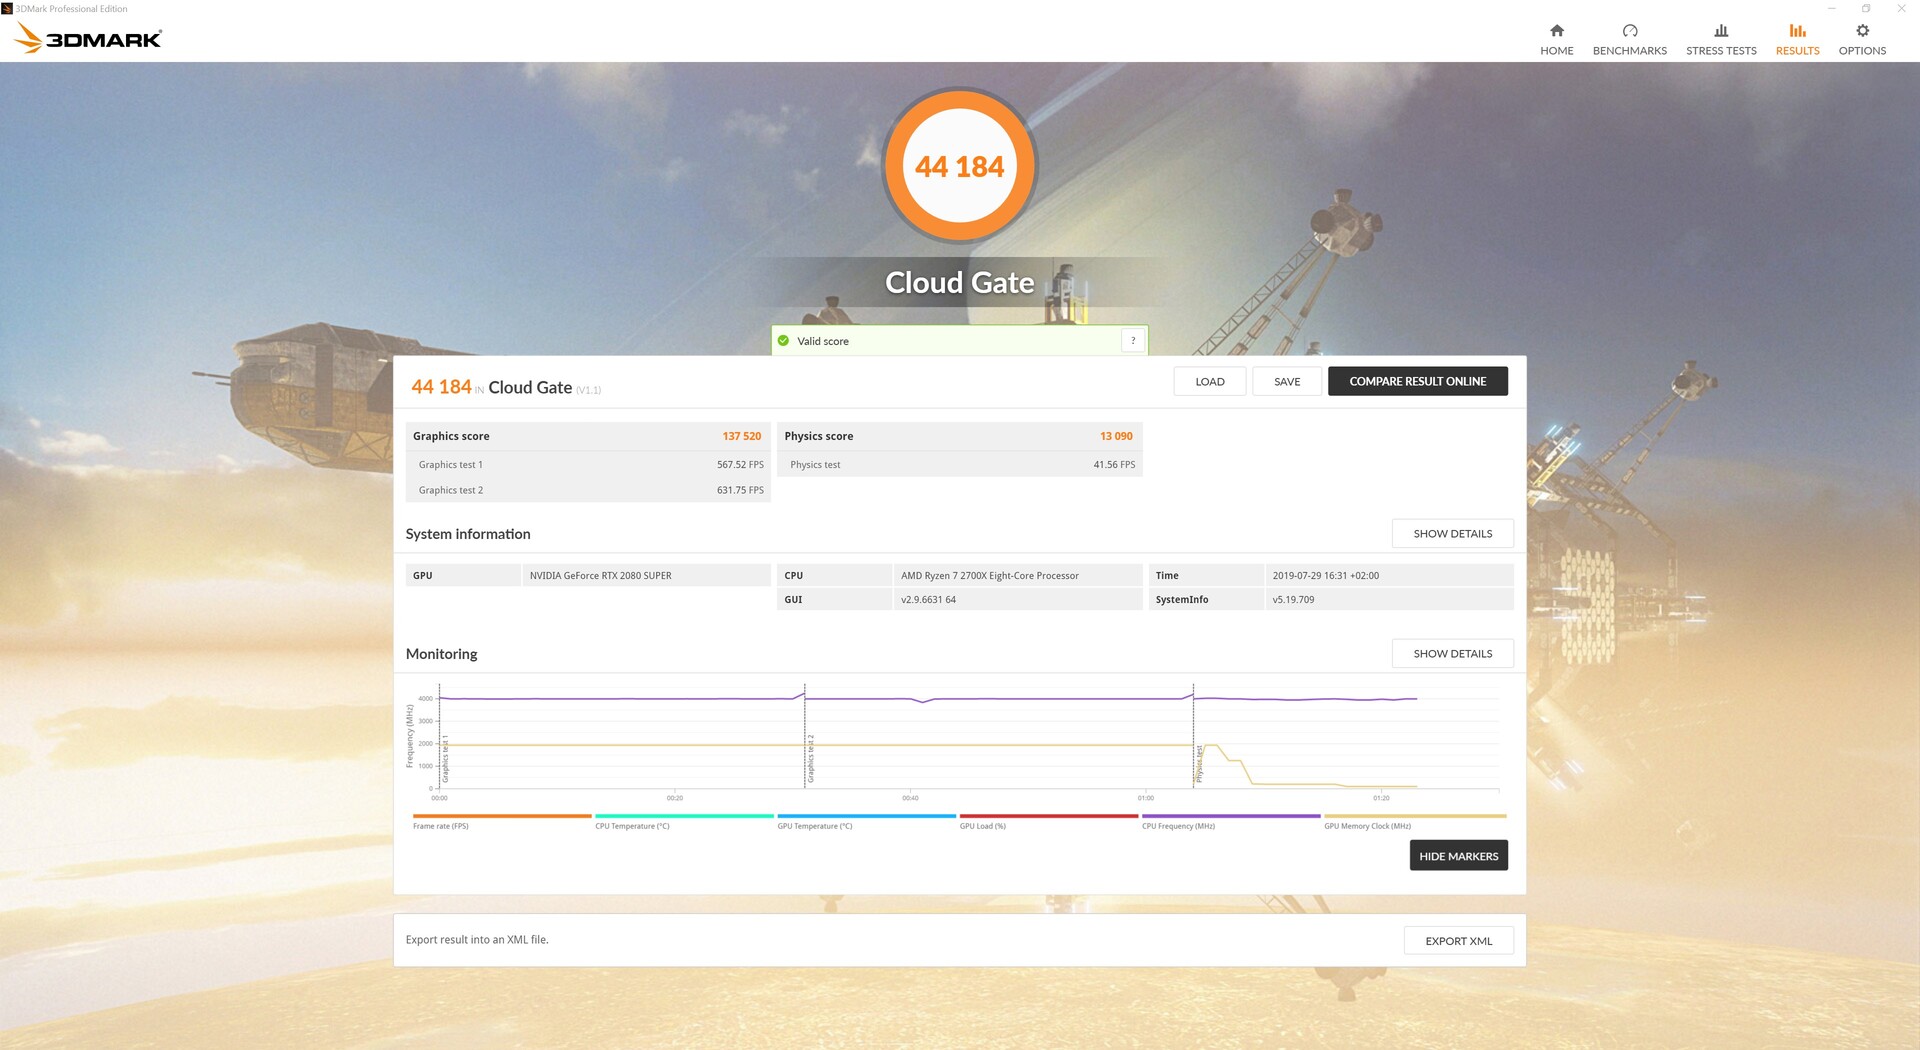
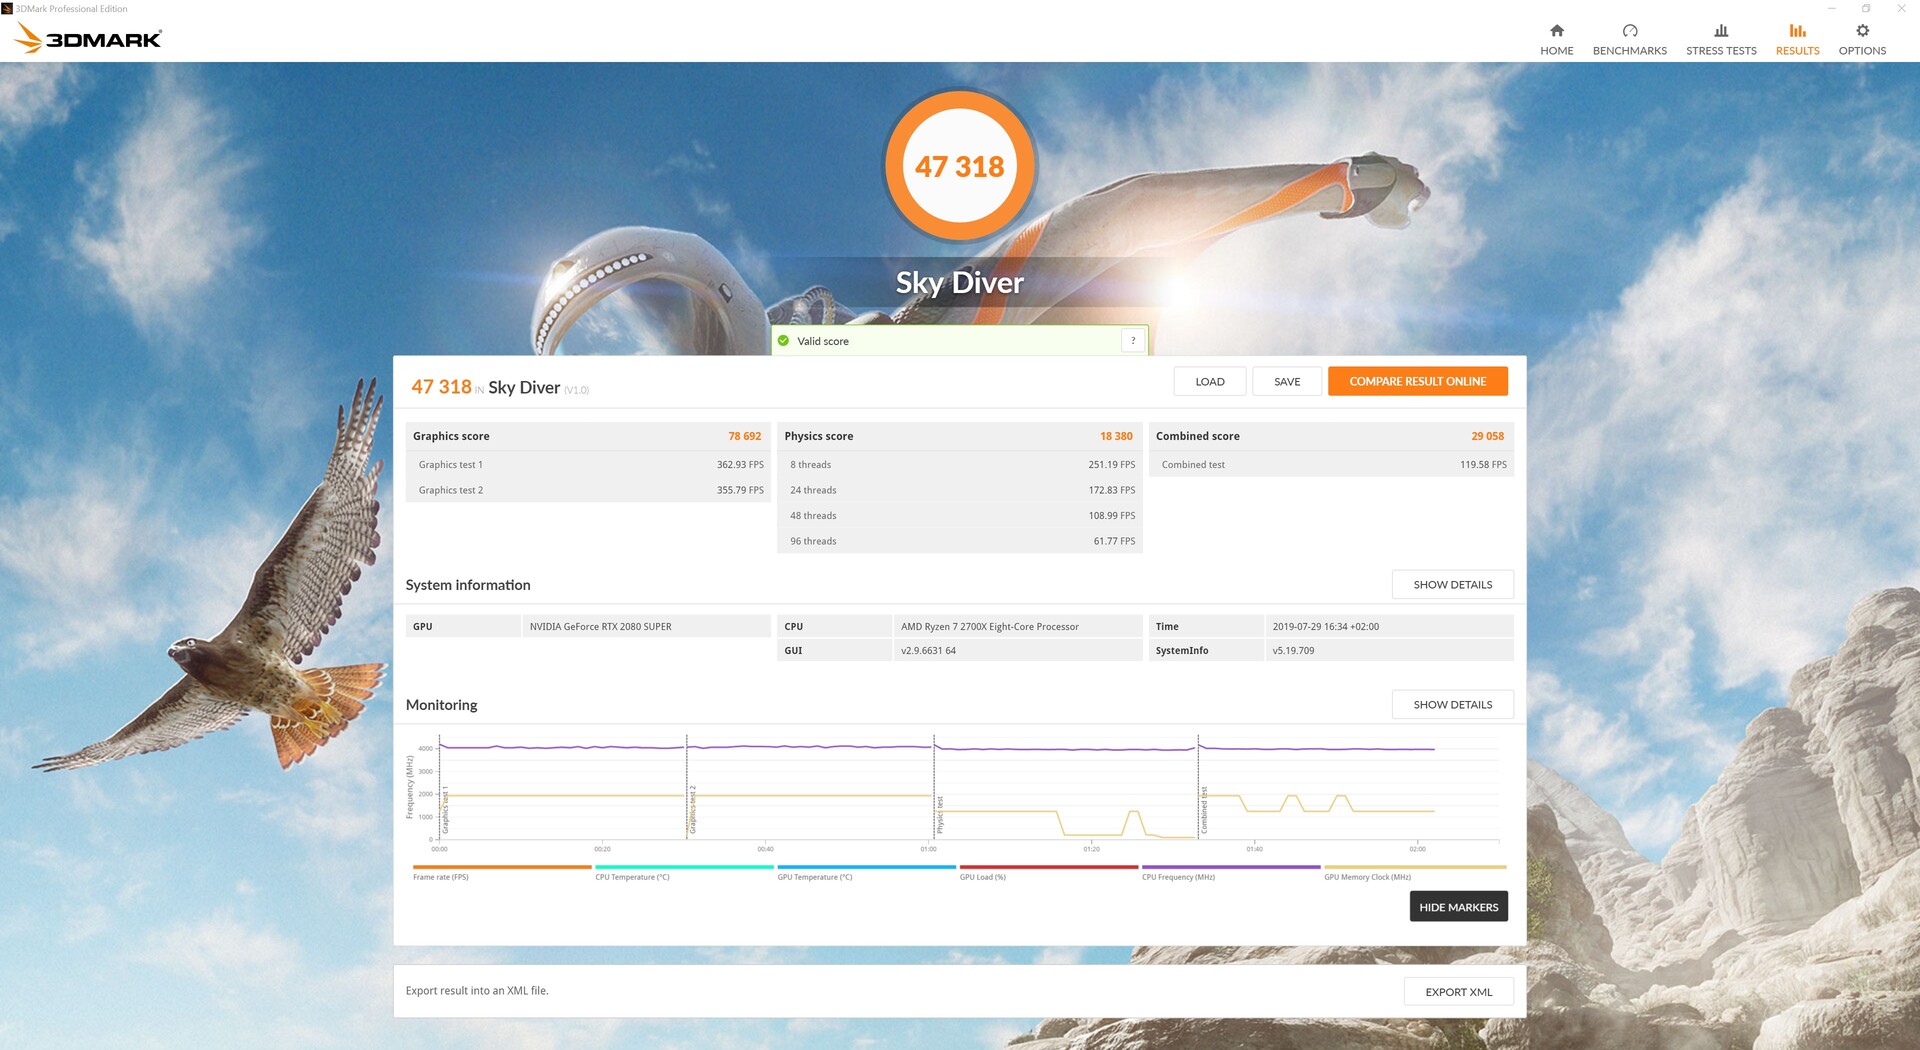
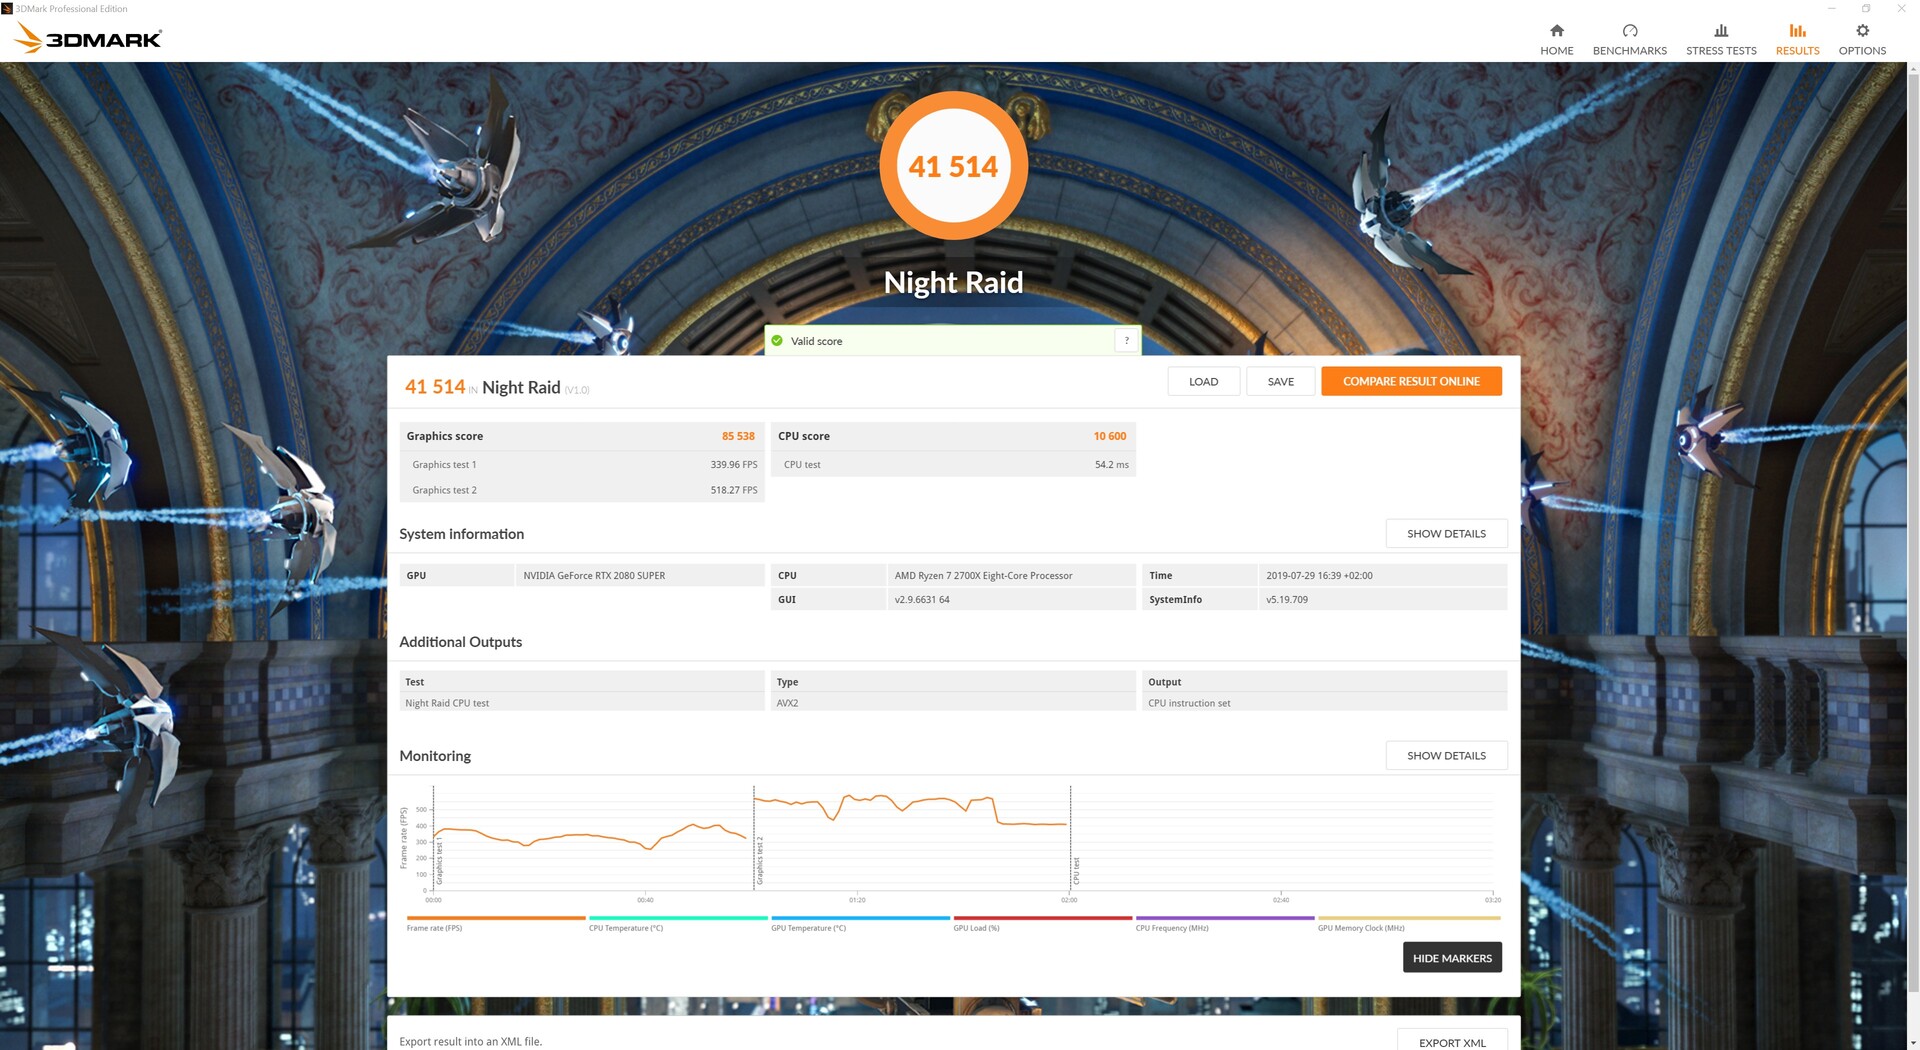
Benchmarks Sintetici
In breve, l'RTX 2080 SUPER FE non può superare l'RTX 2080 Gaming X Trio in termini di benchmarks sintetici. Hanno raggiunto sostanzialmente gli stessi risultati nei benchmarks che abbiamo eseguito, anche se il secondo è a volte un po' più veloce del primo in alcuni benchmarks. E' un po' ingiusto confrontare l'RTX 2080 SUPER FE con una scheda overcloccata, specialmente una con un TDP da 260 Watt. L'RTX 2080 SUPER FE dovrebbe però superare il suo predecessore, come fa con l'RTX 2070 SUPER FE, ma non abbiamo avuto a disposizione uns RTX 2080 FE durante questi test per verificarlo.


| 3DMark 11 - 1280x720 Performance GPU | |
| Nvidia Titan RTX | |
| MSI RTX 2080 Gaming X Trio | |
| Nvidia GeForce RTX 2080 Super | |
| AMD Radeon VII | |
| AMD Radeon RX 5700 XT | |
| Nvidia GeForce RTX 2070 Super | |
| AMD Radeon RX 5700 | |
| MSI RTX 2070 Gaming Z 8G | |
| Nvidia GeForce RTX 2060 Super | |
| AMD Radeon RX Vega 64 | |
| MSI RTX 2060 Gaming Z 6G | |
| Unigine Heaven 4.0 | |
| Extreme Preset OpenGL | |
| Nvidia Titan RTX | |
| Nvidia GeForce RTX 2080 Super | |
| MSI RTX 2080 Gaming X Trio | |
| Nvidia GeForce RTX 2070 Super | |
| MSI RTX 2070 Gaming Z 8G | |
| Nvidia GeForce RTX 2060 Super | |
| MSI RTX 2060 Gaming Z 6G | |
| AMD Radeon RX 5700 XT | |
| AMD Radeon VII | |
| AMD Radeon RX 5700 | |
| Extreme Preset DX11 | |
| Nvidia Titan RTX | |
| MSI RTX 2080 Gaming X Trio | |
| Nvidia GeForce RTX 2080 Super | |
| Nvidia GeForce RTX 2070 Super | |
| MSI RTX 2070 Gaming Z 8G | |
| Nvidia GeForce RTX 2060 Super | |
| AMD Radeon VII | |
| AMD Radeon RX 5700 XT | |
| MSI RTX 2060 Gaming Z 6G | |
| AMD Radeon RX 5700 | |
| Unigine Valley 1.0 | |
| 1920x1080 Extreme HD DirectX AA:x8 | |
| Nvidia Titan RTX | |
| Nvidia GeForce RTX 2080 Super | |
| MSI RTX 2080 Gaming X Trio | |
| Nvidia GeForce RTX 2070 Super | |
| MSI RTX 2070 Gaming Z 8G | |
| AMD Radeon VII | |
| Nvidia GeForce RTX 2060 Super | |
| AMD Radeon RX 5700 XT | |
| AMD Radeon RX 5700 | |
| MSI RTX 2060 Gaming Z 6G | |
| 1920x1080 Extreme HD Preset OpenGL AA:x8 | |
| Nvidia Titan RTX | |
| Nvidia GeForce RTX 2080 Super | |
| MSI RTX 2080 Gaming X Trio | |
| Nvidia GeForce RTX 2070 Super | |
| MSI RTX 2070 Gaming Z 8G | |
| Nvidia GeForce RTX 2060 Super | |
| AMD Radeon RX 5700 XT | |
| MSI RTX 2060 Gaming Z 6G | |
| AMD Radeon RX 5700 | |
| AMD Radeon VII | |
| 3DMark 05 Standard | 43011 punti | |
| 3DMark 06 Standard Score | 34358 punti | |
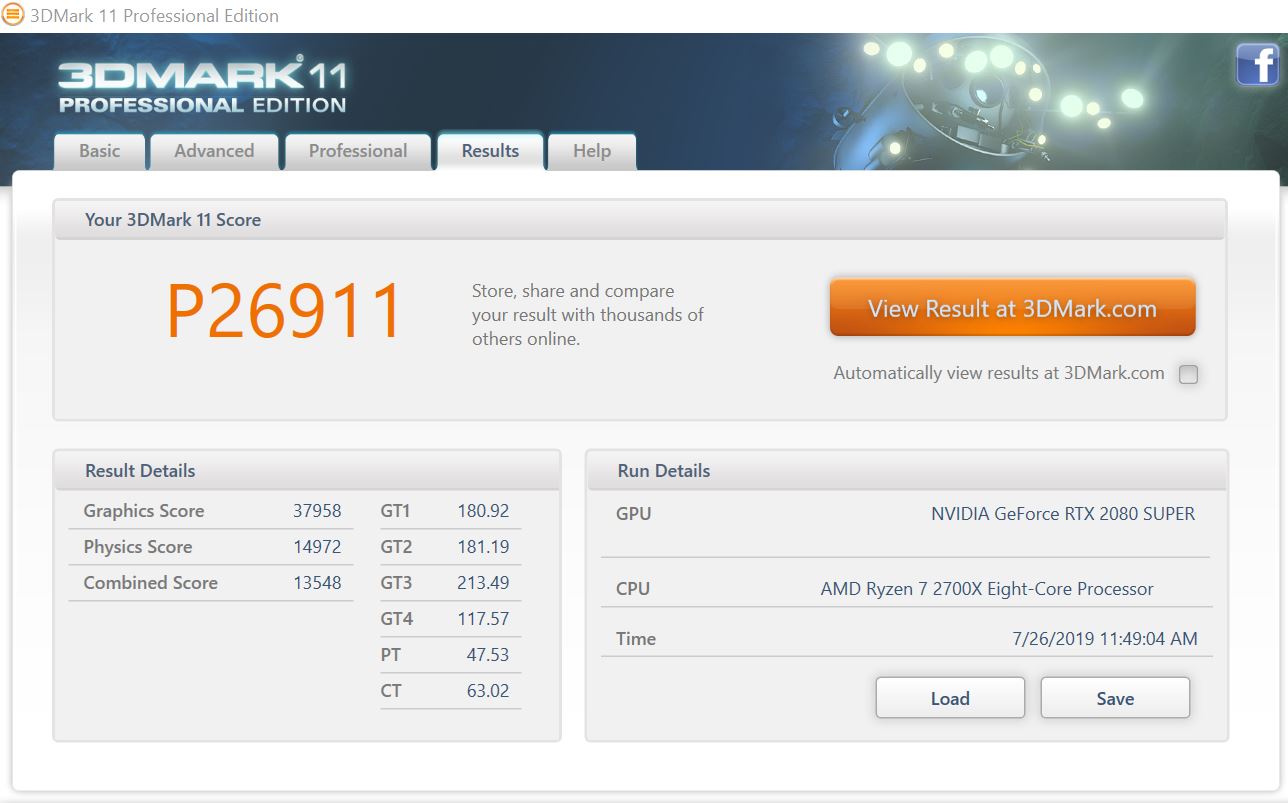
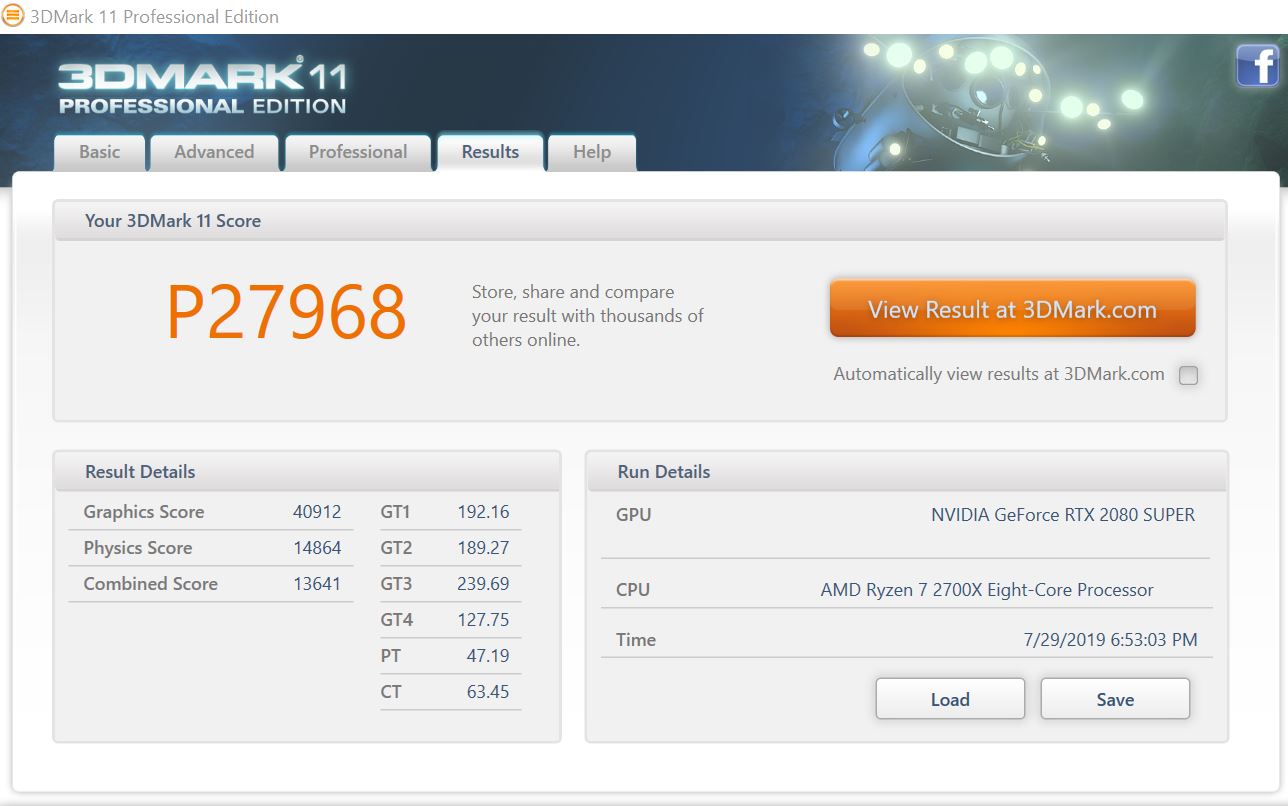
| 3DMark 11 Performance | 26911 punti | |
| 3DMark Ice Storm Standard Score | 174249 punti | |
| 3DMark Cloud Gate Standard Score | 44184 punti | |
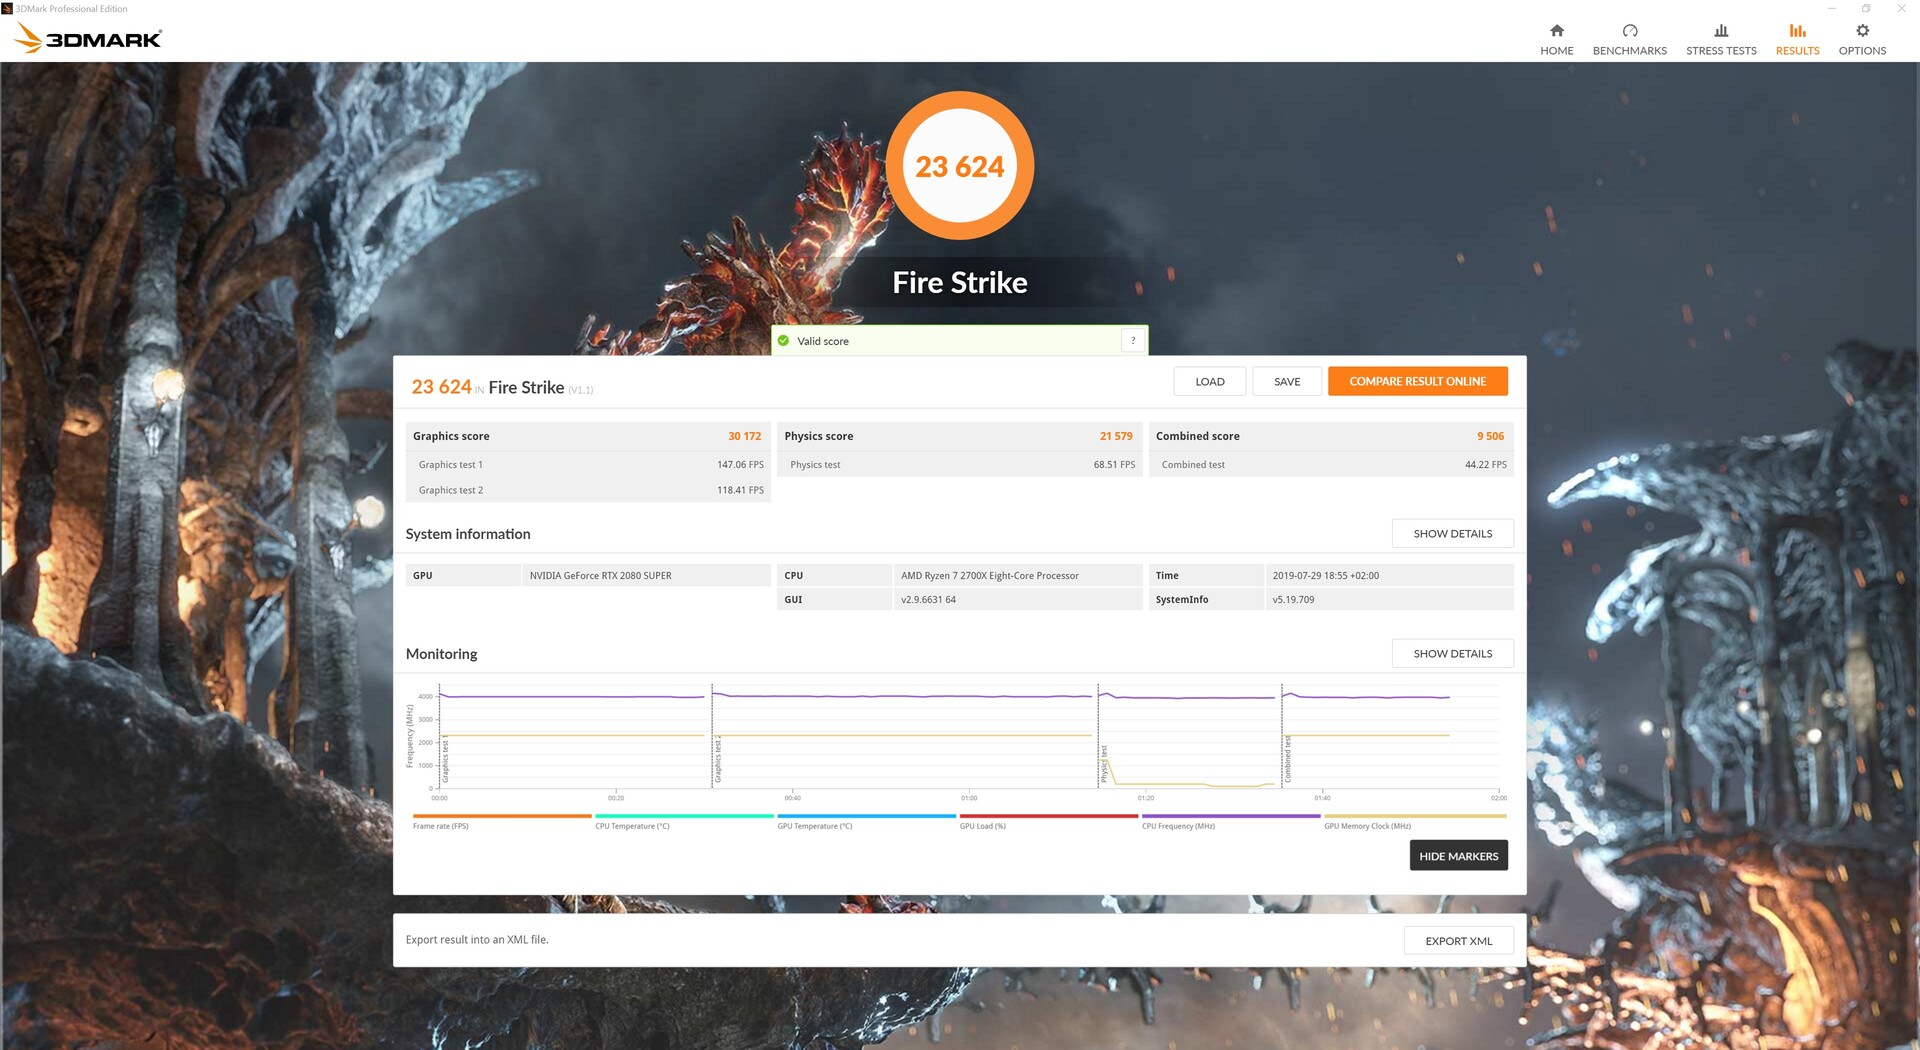
| 3DMark Fire Strike Score | 22441 punti | |
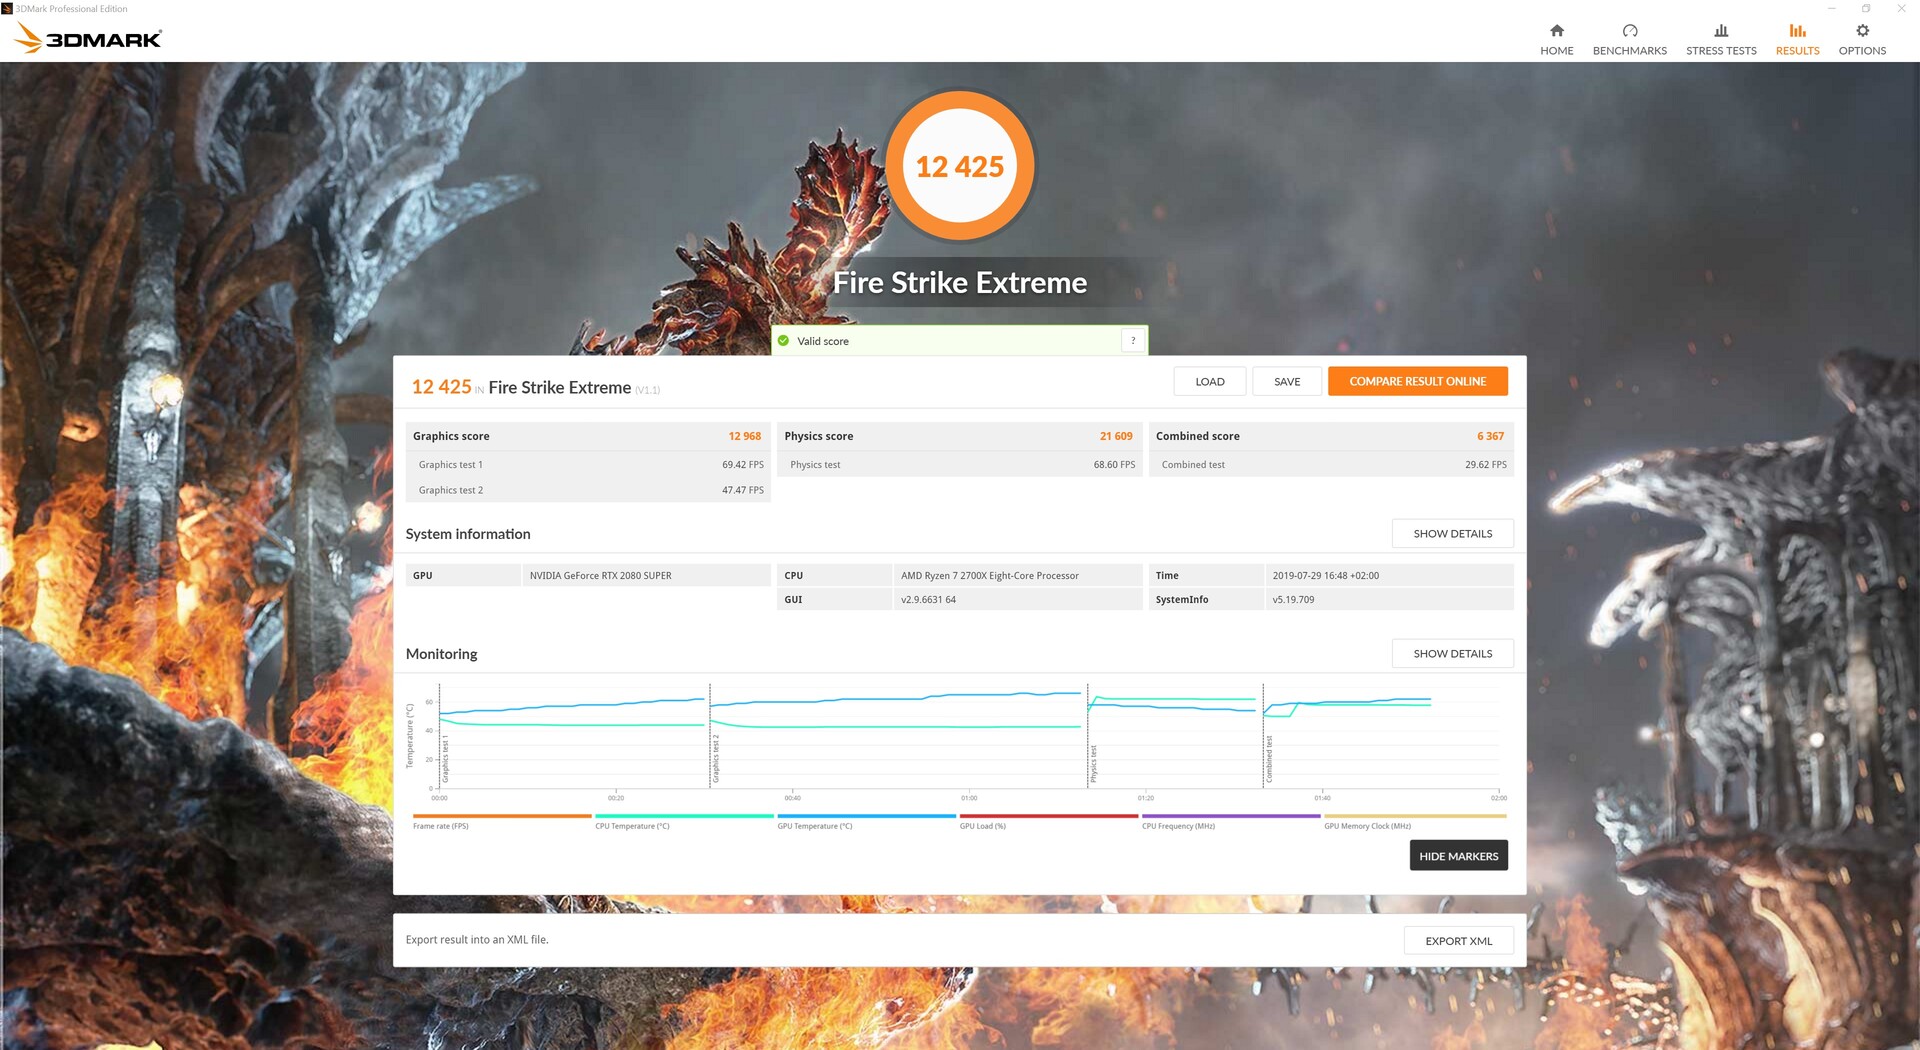
| 3DMark Fire Strike Extreme Score | 12425 punti | |
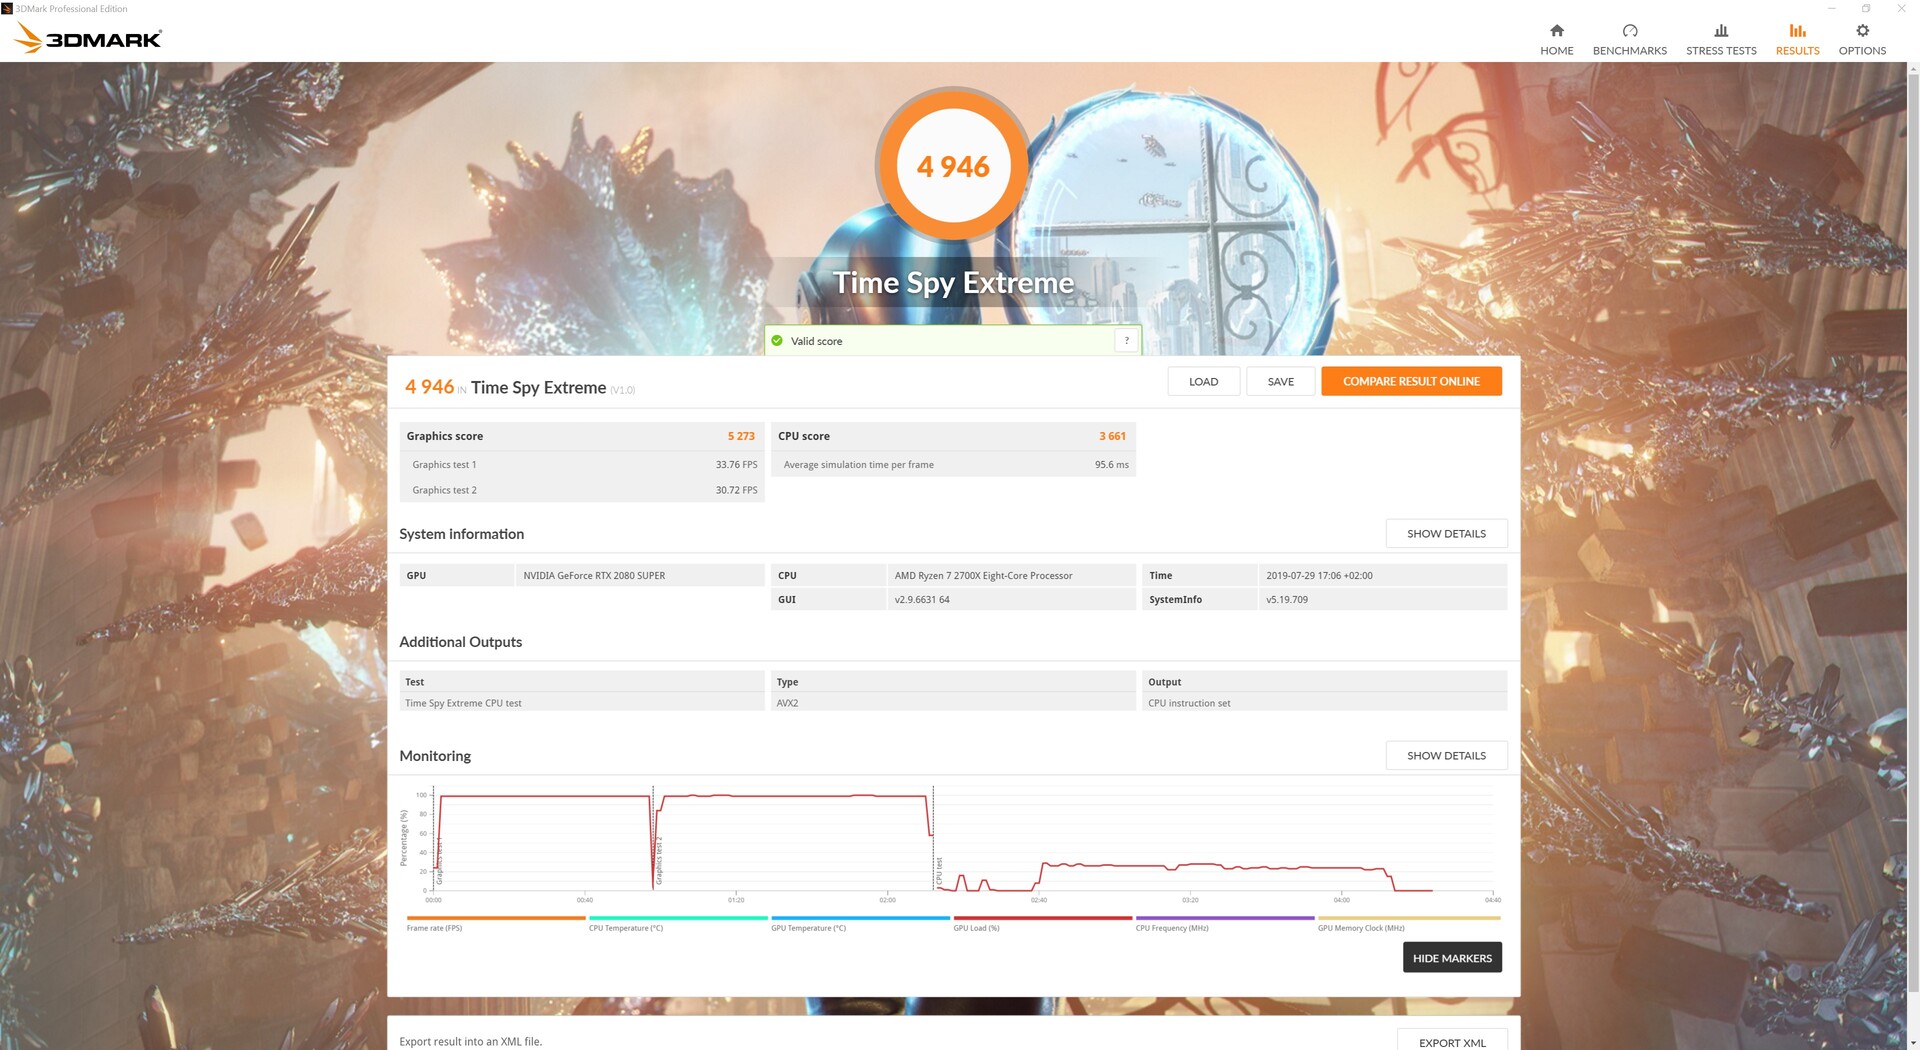
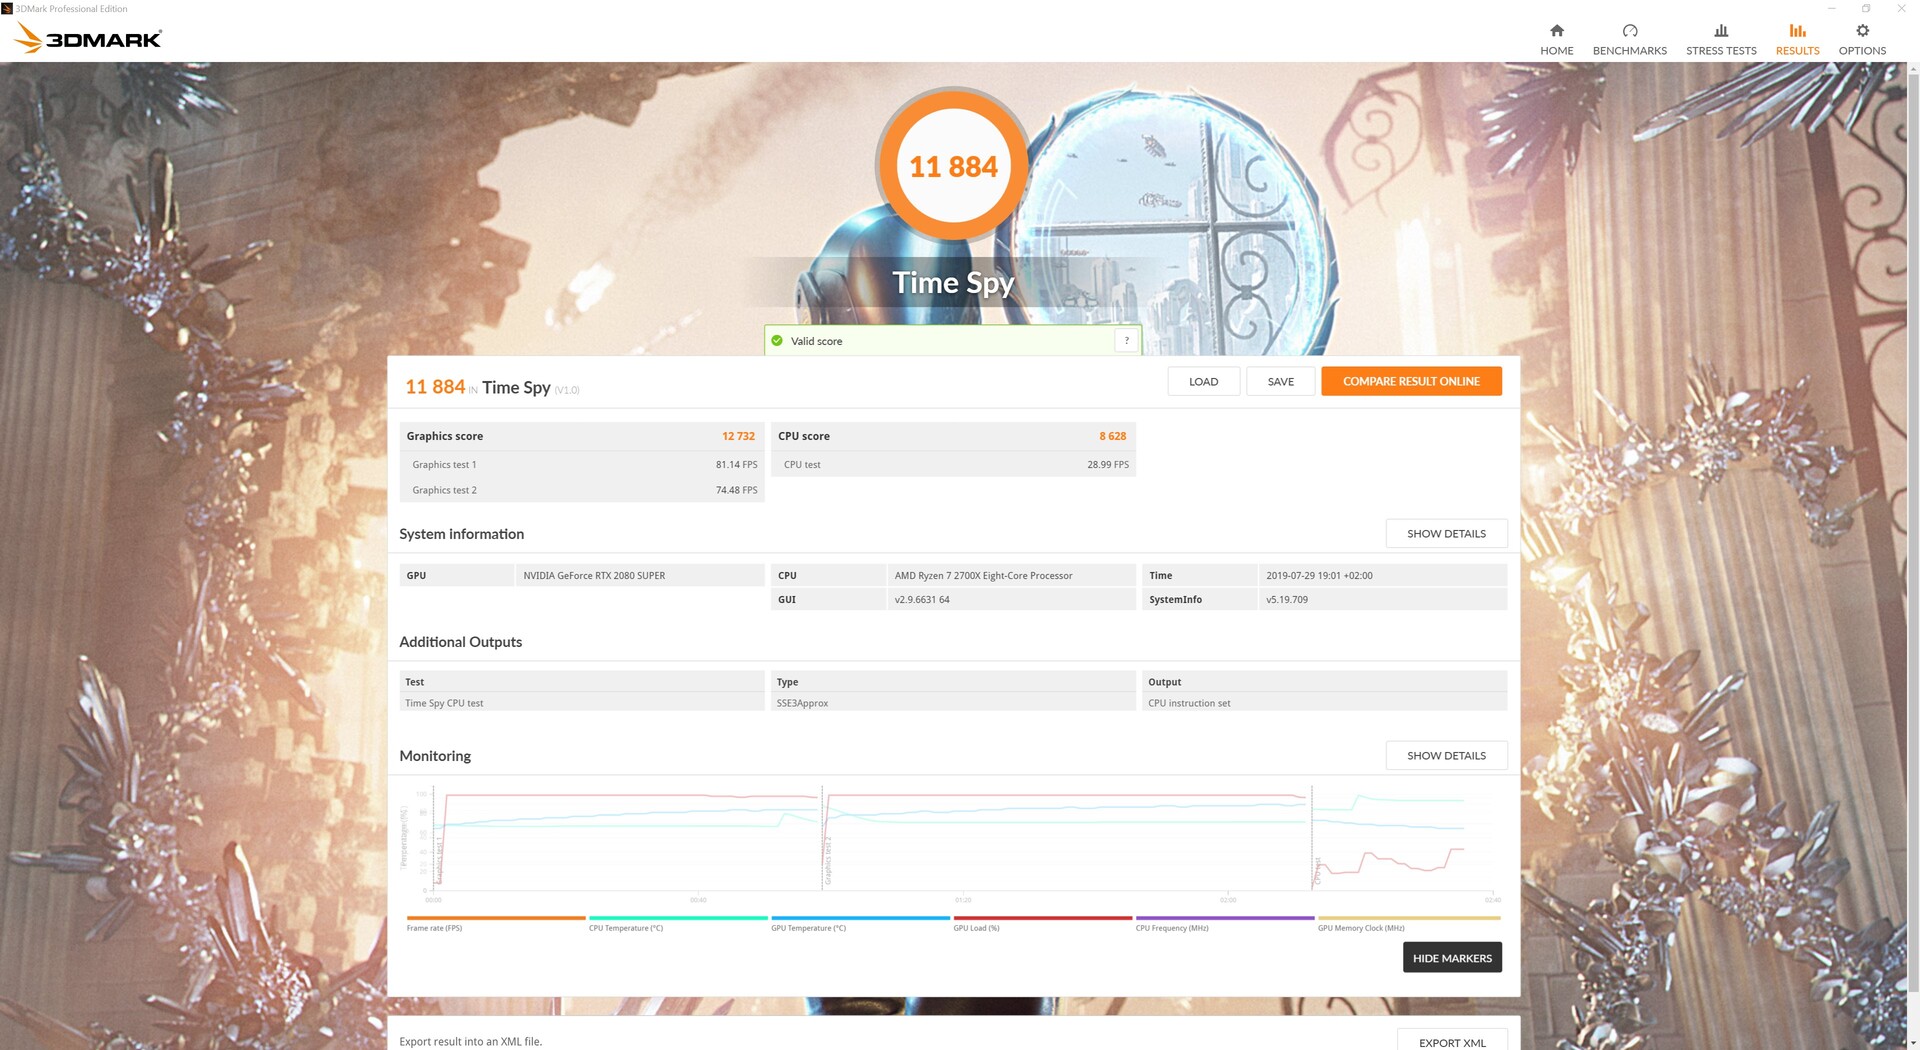
| 3DMark Time Spy Score | 10931 punti | |
Aiuto | ||
Gaming Benchmarks
I benchmarks gaming dipingono un quadro simile, con l'RTX 2080 SUPER FE e l'RTX 2080 Gaming X Trio a distanza di pochi fotogrammi l'uno dall'altro al massimo della grafica, a parte qualche eccezione. Le due schede non reggono il confronto con la TITAN RTX.
L'RTX 2080 SUPER FE può riprodurre tutti gli attuali giochi tripla A a 1440p e ultra-grafica. Tuttavia, gli originali RTX 2080 e RTX 2070 SUPER FE possono farlo, mentre l'RTX 2080 SUPER FE non può sempre arrivare fino a 4K per distinguersi dai suoi fratelli TU104. Lo stesso vale quando DLSS e Raytracing sono abilitati. L'RTX 2080 SUPER ha più cores RT e Tensor rispetto all'RTX 2080 e all'RTX 2070 SUPER FE, ma non è un miracolo.
L'RTX 2080 SUPER FE supera ancora tutte le attuali GPU AMD, anche se la Radeon VII è occasionalmente su alcuni fotogrammi dietro la nostra unità di prova. La Radeon RX 5700 XT è generalmente scambiata con l'RTX 2070 SUPER FE.
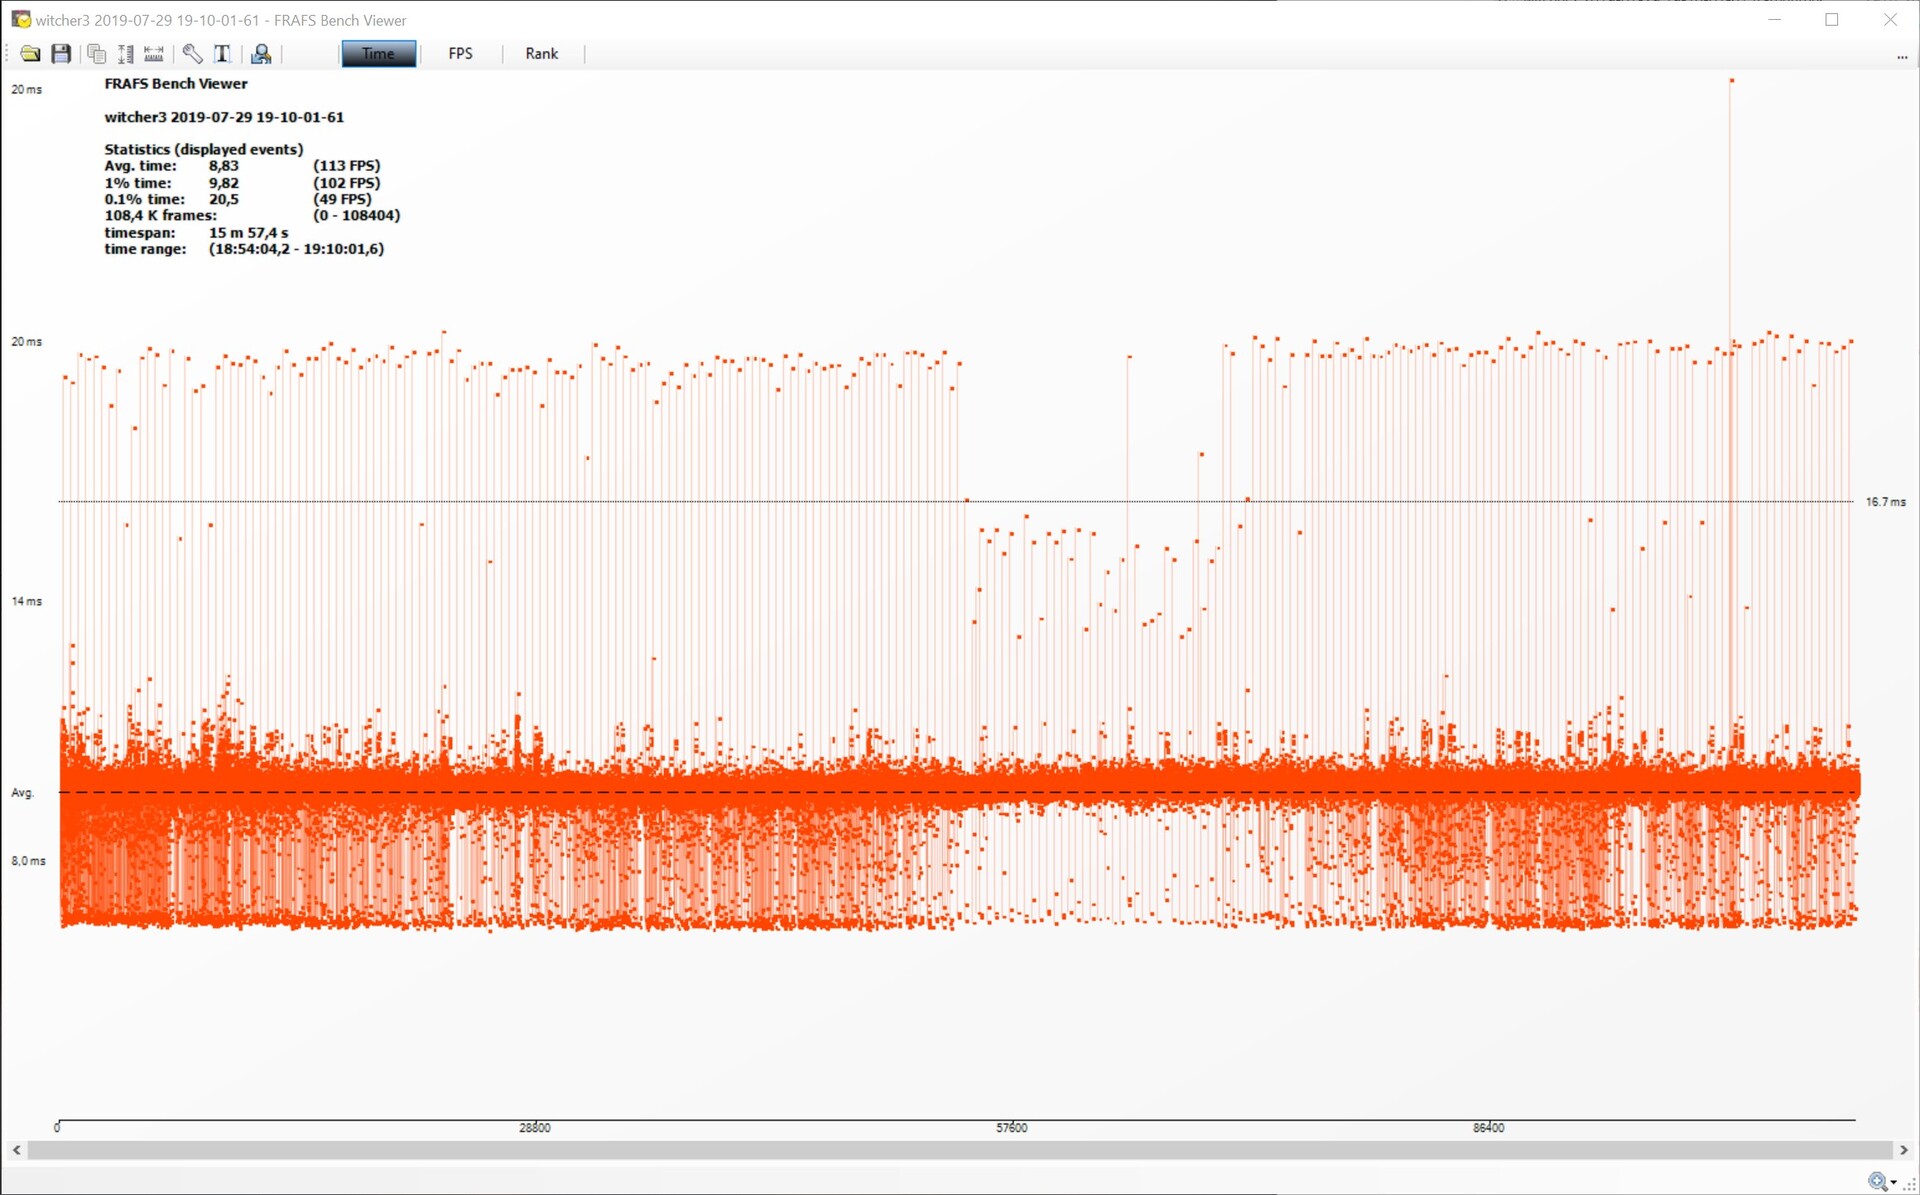
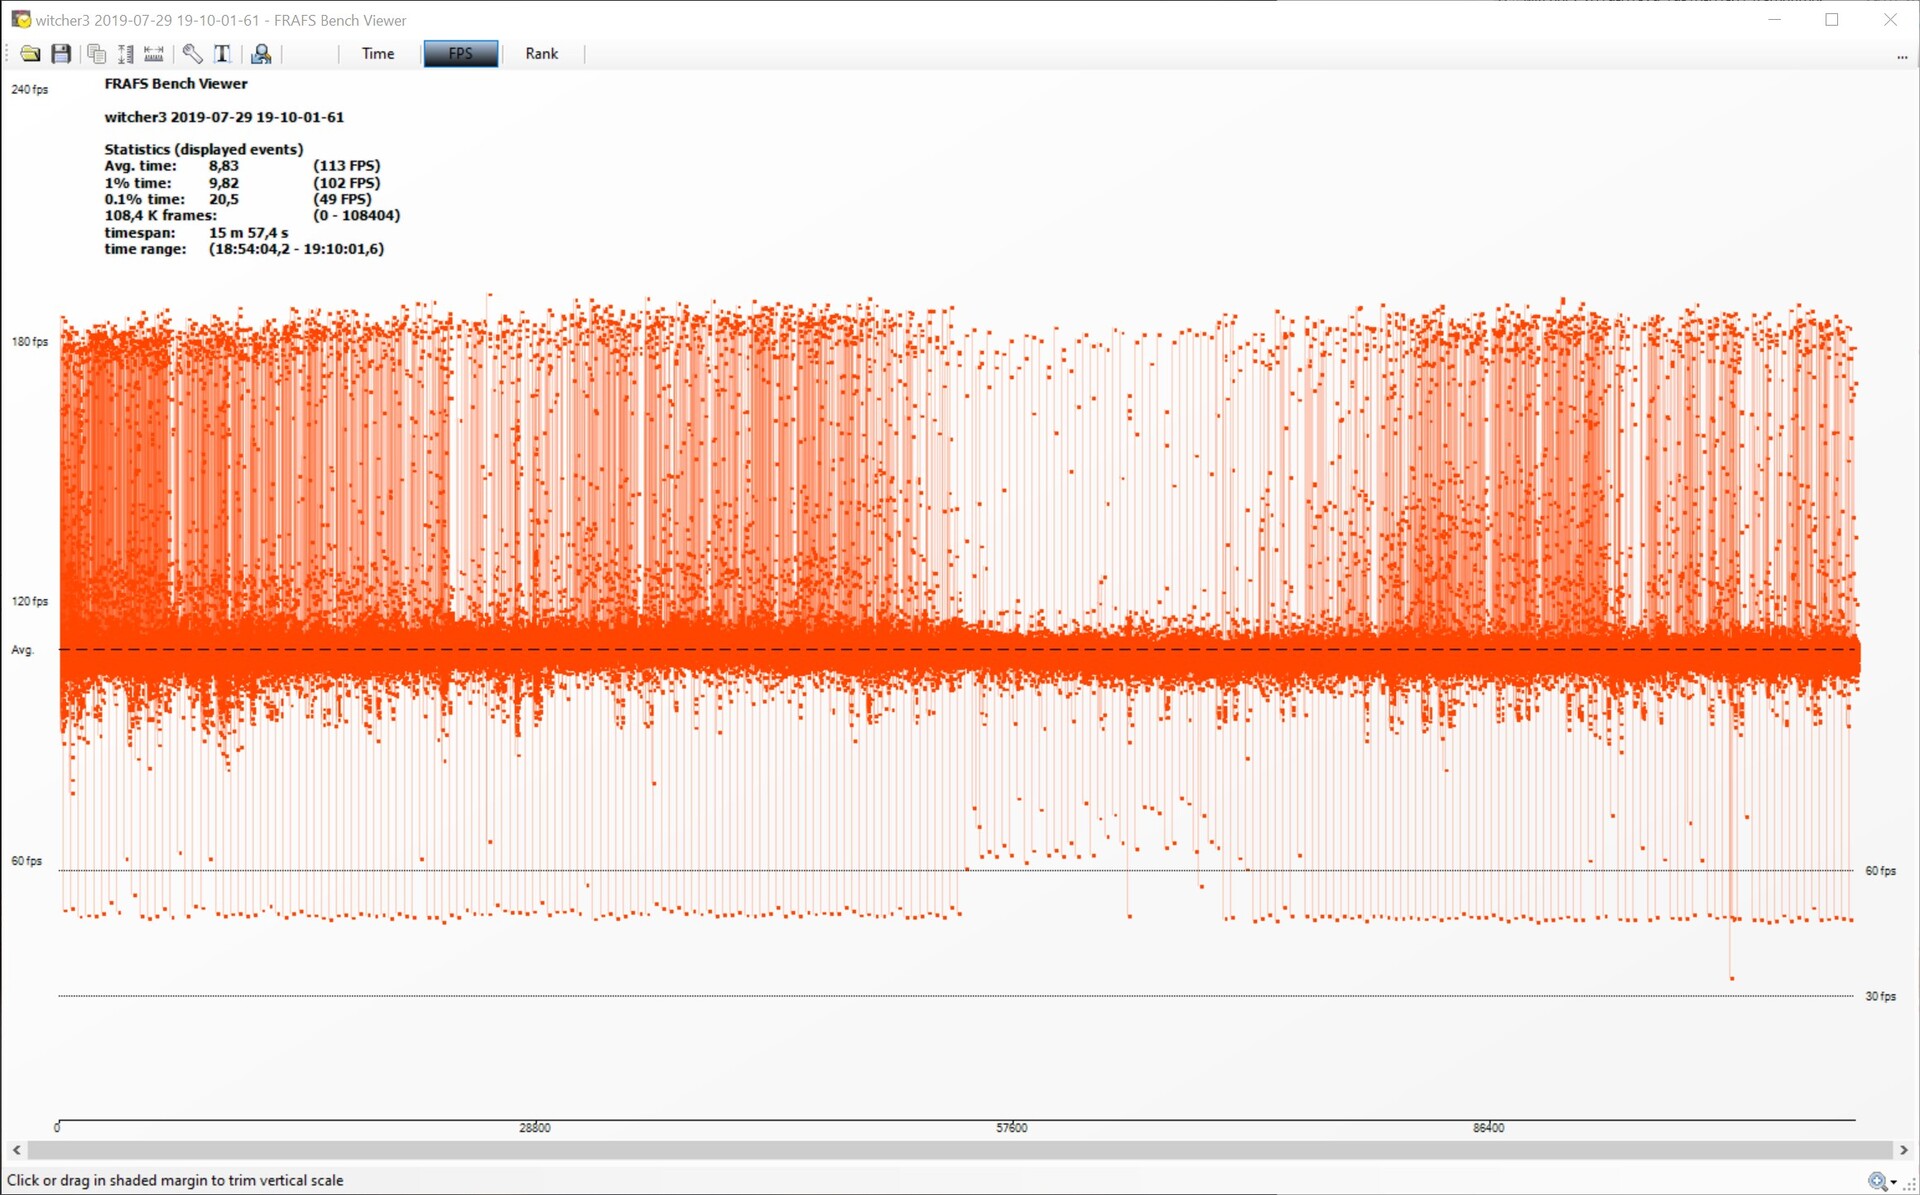
Abbiamo anche esaminato come l'RTX 2080 SUPER FE ha gestito le sue prestazioni in condizioni di carico sostenuto, con i nostri test precedenti che sono stati brevi punti di riferimento che abbiamo eseguito un paio di volte. Abbiamo lasciato "The Witcher 3" in funzione per un'ora a 1080p e sull'ultra preset, durante il quale abbiamo misurato le variazioni di frametime e framerate. Stranamente, l'RTX 2080 SUPER FE ha subito più cali della Radeon RX 5700 XT, ma ha comunque registrato una media di 113 FPS. Anche l'RTX 2060 SUPER FE e l'RTX 2070 SUPER FE hanno perso meno frames rispetto ai loro fratelli più potenti. Le prestazioni sono calate di circa 5 FPS alla fine del test, che non è particolarmente grave.
The Witcher 3: Framerates – ultra preset
| Call of Duty Black Ops 4 | |
| 1920x1080 Very High / On | |
| Nvidia Titan RTX | |
| MSI RTX 2080 Gaming X Trio | |
| Nvidia GeForce RTX 2080 Super | |
| AMD Radeon RX Vega 64 | |
| Nvidia GeForce RTX 2070 Super | |
| MSI RTX 2070 Gaming Z 8G | |
| AMD Radeon VII | |
| Nvidia GeForce RTX 2060 Super | |
| AMD Radeon RX 5700 XT | |
| MSI RTX 2060 Gaming Z 6G | |
| AMD Radeon RX 5700 | |
| 3840x2160 Very High / On | |
| Nvidia Titan RTX | |
| MSI RTX 2080 Gaming X Trio | |
| Nvidia GeForce RTX 2080 Super | |
| AMD Radeon RX Vega 64 | |
| AMD Radeon VII | |
| AMD Radeon RX 5700 XT | |
| Nvidia GeForce RTX 2070 Super | |
| AMD Radeon RX 5700 | |
| Nvidia GeForce RTX 2060 Super | |
| MSI RTX 2070 Gaming Z 8G | |
| MSI RTX 2060 Gaming Z 6G | |
| 2560x1440 Very High / On | |
| Nvidia GeForce RTX 2080 Super | |
| AMD Radeon RX 5700 XT | |
| MSI RTX 2080 Gaming X Trio | |
| Nvidia GeForce RTX 2070 Super | |
| MSI RTX 2070 Gaming Z 8G | |
| AMD Radeon RX 5700 | |
| Nvidia GeForce RTX 2060 Super | |
| Assassin´s Creed Odyssey | |
| 1920x1080 Ultra High Preset | |
| Nvidia Titan RTX | |
| MSI RTX 2080 Gaming X Trio | |
| Nvidia GeForce RTX 2080 Super | |
| MSI RTX 2070 Gaming Z 8G | |
| Nvidia GeForce RTX 2070 Super | |
| AMD Radeon VII | |
| AMD Radeon RX 5700 XT | |
| Nvidia GeForce RTX 2060 Super | |
| AMD Radeon RX 5700 | |
| MSI RTX 2060 Gaming Z 6G | |
| AMD Radeon RX Vega 64 | |
| 3840x2160 Ultra High Preset | |
| Nvidia Titan RTX | |
| AMD Radeon VII | |
| MSI RTX 2080 Gaming X Trio | |
| Nvidia GeForce RTX 2080 Super | |
| Nvidia GeForce RTX 2070 Super | |
| MSI RTX 2070 Gaming Z 8G | |
| AMD Radeon RX 5700 XT | |
| Nvidia GeForce RTX 2060 Super | |
| AMD Radeon RX 5700 | |
| AMD Radeon RX Vega 64 | |
| MSI RTX 2060 Gaming Z 6G | |
| 2560x1440 Ultra High Preset | |
| MSI RTX 2080 Gaming X Trio | |
| Nvidia GeForce RTX 2080 Super | |
| Nvidia GeForce RTX 2070 Super | |
| MSI RTX 2070 Gaming Z 8G | |
| AMD Radeon RX 5700 XT | |
| Nvidia GeForce RTX 2060 Super | |
| AMD Radeon RX 5700 | |
| FIFA 19 | |
| 1920x1080 Ultra Preset AA:4x MS | |
| AMD Radeon RX Vega 64 | |
| AMD Radeon RX 5700 XT | |
| AMD Radeon RX 5700 | |
| Nvidia GeForce RTX 2070 Super | |
| Nvidia GeForce RTX 2080 Super | |
| Nvidia Titan RTX | |
| MSI RTX 2080 Gaming X Trio | |
| AMD Radeon VII | |
| MSI RTX 2070 Gaming Z 8G | |
| Nvidia GeForce RTX 2060 Super | |
| MSI RTX 2060 Gaming Z 6G | |
| 3840x2160 Ultra Preset AA:4x MS | |
| Nvidia Titan RTX | |
| AMD Radeon VII | |
| MSI RTX 2080 Gaming X Trio | |
| Nvidia GeForce RTX 2080 Super | |
| AMD Radeon RX 5700 XT | |
| Nvidia GeForce RTX 2060 Super | |
| MSI RTX 2070 Gaming Z 8G | |
| Nvidia GeForce RTX 2070 Super | |
| AMD Radeon RX 5700 | |
| AMD Radeon RX Vega 64 | |
| MSI RTX 2060 Gaming Z 6G | |
| 2560x1440 Ultra Preset AA:4x MS | |
| AMD Radeon RX 5700 XT | |
| AMD Radeon RX 5700 | |
| Nvidia GeForce RTX 2070 Super | |
| Nvidia GeForce RTX 2080 Super | |
| MSI RTX 2080 Gaming X Trio | |
| Nvidia GeForce RTX 2060 Super | |
| MSI RTX 2070 Gaming Z 8G | |
| Forza Horizon 4 | |
| 1920x1080 Ultra Preset AA:2xMS | |
| MSI RTX 2080 Gaming X Trio | |
| AMD Radeon RX 5700 XT | |
| Nvidia GeForce RTX 2080 Super | |
| Nvidia Titan RTX | |
| AMD Radeon VII | |
| Nvidia GeForce RTX 2070 Super | |
| AMD Radeon RX Vega 64 | |
| AMD Radeon RX 5700 | |
| MSI RTX 2070 Gaming Z 8G | |
| Nvidia GeForce RTX 2060 Super | |
| MSI RTX 2060 Gaming Z 6G | |
| 3840x2160 Ultra Preset AA:2xMS | |
| Nvidia Titan RTX | |
| MSI RTX 2080 Gaming X Trio | |
| Nvidia GeForce RTX 2080 Super | |
| AMD Radeon RX 5700 XT | |
| AMD Radeon VII | |
| Nvidia GeForce RTX 2070 Super | |
| AMD Radeon RX 5700 | |
| MSI RTX 2070 Gaming Z 8G | |
| AMD Radeon RX Vega 64 | |
| Nvidia GeForce RTX 2060 Super | |
| MSI RTX 2060 Gaming Z 6G | |
| 2560x1440 Ultra Preset AA:2xMS | |
| AMD Radeon RX 5700 XT | |
| MSI RTX 2080 Gaming X Trio | |
| Nvidia GeForce RTX 2080 Super | |
| Nvidia GeForce RTX 2070 Super | |
| AMD Radeon RX 5700 | |
| MSI RTX 2070 Gaming Z 8G | |
| Nvidia GeForce RTX 2060 Super | |
| F1 2018 | |
| 1920x1080 Ultra High Preset AA:T AF:16x | |
| Nvidia Titan RTX | |
| MSI RTX 2080 Gaming X Trio | |
| AMD Radeon VII | |
| Nvidia GeForce RTX 2070 Super | |
| Nvidia GeForce RTX 2080 Super | |
| MSI RTX 2070 Gaming Z 8G | |
| Nvidia GeForce RTX 2060 Super | |
| MSI RTX 2060 Gaming Z 6G | |
| AMD Radeon RX Vega 64 | |
| 3840x2160 Ultra High Preset AA:T AF:16x | |
| Nvidia Titan RTX | |
| MSI RTX 2080 Gaming X Trio | |
| Nvidia GeForce RTX 2080 Super | |
| AMD Radeon VII | |
| Nvidia GeForce RTX 2070 Super | |
| MSI RTX 2070 Gaming Z 8G | |
| Nvidia GeForce RTX 2060 Super | |
| MSI RTX 2060 Gaming Z 6G | |
| AMD Radeon RX Vega 64 | |
| 2560x1440 Ultra High Preset AA:T AF:16x | |
| MSI RTX 2080 Gaming X Trio | |
| Nvidia GeForce RTX 2080 Super | |
| Nvidia GeForce RTX 2070 Super | |
| MSI RTX 2070 Gaming Z 8G | |
| Nvidia GeForce RTX 2060 Super | |
| Monster Hunter World | |
| 1920x1080 Highest Preset (Image Quality High) | |
| Nvidia Titan RTX | |
| MSI RTX 2080 Gaming X Trio | |
| Nvidia GeForce RTX 2080 Super | |
| Nvidia GeForce RTX 2070 Super | |
| MSI RTX 2070 Gaming Z 8G | |
| AMD Radeon VII | |
| Nvidia GeForce RTX 2060 Super | |
| AMD Radeon RX 5700 XT | |
| MSI RTX 2060 Gaming Z 6G | |
| AMD Radeon RX Vega 64 | |
| AMD Radeon RX 5700 | |
| 3840x2160 Highest Preset (Image Quality High) | |
| Nvidia Titan RTX | |
| MSI RTX 2080 Gaming X Trio | |
| Nvidia GeForce RTX 2080 Super | |
| Nvidia GeForce RTX 2070 Super | |
| AMD Radeon VII | |
| MSI RTX 2070 Gaming Z 8G | |
| AMD Radeon RX 5700 XT | |
| AMD Radeon RX Vega 64 | |
| Nvidia GeForce RTX 2060 Super | |
| AMD Radeon RX 5700 | |
| MSI RTX 2060 Gaming Z 6G | |
| 2560x1440 Highest Preset (Image Quality High) | |
| MSI RTX 2080 Gaming X Trio | |
| Nvidia GeForce RTX 2080 Super | |
| Nvidia GeForce RTX 2070 Super | |
| MSI RTX 2070 Gaming Z 8G | |
| AMD Radeon RX 5700 XT | |
| Nvidia GeForce RTX 2060 Super | |
| AMD Radeon RX 5700 | |
| Assassin´s Creed Origins | |
| 1920x1080 Ultra High Preset | |
| Nvidia Titan RTX | |
| MSI RTX 2080 Gaming X Trio | |
| MSI RTX 2070 Gaming Z 8G | |
| Nvidia GeForce RTX 2080 Super | |
| Nvidia GeForce RTX 2070 Super | |
| Nvidia GeForce RTX 2060 Super | |
| MSI RTX 2060 Gaming Z 6G | |
| AMD Radeon RX Vega 64 | |
| AMD Radeon VII | |
| AMD Radeon RX 5700 | |
| AMD Radeon RX 5700 XT | |
| 3840x2160 Ultra High Preset | |
| Nvidia Titan RTX | |
| Nvidia GeForce RTX 2080 Super | |
| MSI RTX 2080 Gaming X Trio | |
| AMD Radeon VII | |
| Nvidia GeForce RTX 2070 Super | |
| MSI RTX 2070 Gaming Z 8G | |
| Nvidia GeForce RTX 2060 Super | |
| MSI RTX 2060 Gaming Z 6G | |
| AMD Radeon RX 5700 XT | |
| AMD Radeon RX 5700 | |
| AMD Radeon RX Vega 64 | |
| 2560x1440 Ultra High Preset | |
| MSI RTX 2080 Gaming X Trio | |
| Nvidia GeForce RTX 2080 Super | |
| Nvidia GeForce RTX 2070 Super | |
| MSI RTX 2070 Gaming Z 8G | |
| Nvidia GeForce RTX 2060 Super | |
| AMD Radeon RX 5700 XT | |
| AMD Radeon RX 5700 | |
| Kingdom Come: Deliverance | |
| 1920x1080 Ultra High Preset | |
| Nvidia Titan RTX | |
| Nvidia GeForce RTX 2080 Super | |
| MSI RTX 2080 Gaming X Trio | |
| Nvidia GeForce RTX 2070 Super | |
| MSI RTX 2070 Gaming Z 8G | |
| Nvidia GeForce RTX 2060 Super | |
| AMD Radeon RX 5700 XT | |
| AMD Radeon RX Vega 64 | |
| AMD Radeon VII | |
| MSI RTX 2060 Gaming Z 6G | |
| AMD Radeon RX 5700 | |
| 3840x2160 Ultra High Preset | |
| Nvidia Titan RTX | |
| Nvidia GeForce RTX 2080 Super | |
| MSI RTX 2080 Gaming X Trio | |
| AMD Radeon RX Vega 64 | |
| Nvidia GeForce RTX 2070 Super | |
| AMD Radeon VII | |
| MSI RTX 2070 Gaming Z 8G | |
| Nvidia GeForce RTX 2060 Super | |
| AMD Radeon RX 5700 XT | |
| AMD Radeon RX 5700 | |
| MSI RTX 2060 Gaming Z 6G | |
| 2560x1440 Ultra High Preset | |
| MSI RTX 2080 Gaming X Trio | |
| Nvidia GeForce RTX 2080 Super | |
| Nvidia GeForce RTX 2070 Super | |
| AMD Radeon RX 5700 XT | |
| Nvidia GeForce RTX 2060 Super | |
| MSI RTX 2070 Gaming Z 8G | |
| AMD Radeon RX 5700 | |
| Destiny 2 | |
| 1920x1080 Highest Preset AA:SM AF:16x | |
| Nvidia Titan RTX | |
| MSI RTX 2070 Gaming Z 8G | |
| Nvidia GeForce RTX 2080 Super | |
| MSI RTX 2080 Gaming X Trio | |
| Nvidia GeForce RTX 2060 Super | |
| Nvidia GeForce RTX 2070 Super | |
| AMD Radeon RX 5700 XT | |
| AMD Radeon RX 5700 | |
| AMD Radeon VII | |
| MSI RTX 2060 Gaming Z 6G | |
| 3840x2160 Highest Preset AA:SM AF:16x | |
| Nvidia Titan RTX | |
| Nvidia GeForce RTX 2080 Super | |
| MSI RTX 2080 Gaming X Trio | |
| Nvidia GeForce RTX 2070 Super | |
| MSI RTX 2070 Gaming Z 8G | |
| AMD Radeon RX 5700 XT | |
| Nvidia GeForce RTX 2060 Super | |
| AMD Radeon VII | |
| MSI RTX 2060 Gaming Z 6G | |
| AMD Radeon RX 5700 | |
| 2560x1440 Highest Preset AA:SM AF:16x | |
| Nvidia GeForce RTX 2080 Super | |
| MSI RTX 2080 Gaming X Trio | |
| Nvidia GeForce RTX 2070 Super | |
| MSI RTX 2070 Gaming Z 8G | |
| AMD Radeon RX 5700 XT | |
| Nvidia GeForce RTX 2060 Super | |
| AMD Radeon RX 5700 | |
| Far Cry Primal | |
| 1920x1080 Ultra Preset AA:SM | |
| AMD Radeon RX Vega 64 | |
| MSI RTX 2070 Gaming Z 8G | |
| AMD Radeon VII | |
| MSI RTX 2060 Gaming Z 6G | |
| AMD Radeon RX 5700 | |
| MSI RTX 2080 Gaming X Trio | |
| Nvidia GeForce RTX 2060 Super | |
| Nvidia GeForce RTX 2070 Super | |
| Nvidia GeForce RTX 2080 Super | |
| AMD Radeon RX 5700 XT | |
| Nvidia Titan RTX | |
| 3840x2160 High Preset AA:SM | |
| Nvidia Titan RTX | |
| Nvidia GeForce RTX 2080 Super | |
| MSI RTX 2080 Gaming X Trio | |
| AMD Radeon VII | |
| Nvidia GeForce RTX 2070 Super | |
| MSI RTX 2070 Gaming Z 8G | |
| AMD Radeon RX 5700 XT | |
| Nvidia GeForce RTX 2060 Super | |
| AMD Radeon RX 5700 | |
| MSI RTX 2060 Gaming Z 6G | |
| AMD Radeon RX Vega 64 | |
| The Witcher 3 | |
| 1920x1080 Ultra Graphics & Postprocessing (HBAO+) | |
| Nvidia Titan RTX | |
| MSI RTX 2080 Gaming X Trio | |
| Nvidia GeForce RTX 2080 Super | |
| Nvidia GeForce RTX 2070 Super | |
| AMD Radeon RX 5700 XT | |
| MSI RTX 2070 Gaming Z 8G | |
| AMD Radeon RX 5700 | |
| Nvidia GeForce RTX 2060 Super | |
| AMD Radeon RX Vega 64 | |
| AMD Radeon VII | |
| MSI RTX 2060 Gaming Z 6G | |
| 3840x2160 High Graphics & Postprocessing (Nvidia HairWorks Off) | |
| Nvidia Titan RTX | |
| Nvidia GeForce RTX 2080 Super | |
| MSI RTX 2080 Gaming X Trio | |
| Nvidia GeForce RTX 2070 Super | |
| MSI RTX 2070 Gaming Z 8G | |
| Nvidia GeForce RTX 2060 Super | |
| AMD Radeon VII | |
| AMD Radeon RX 5700 XT | |
| MSI RTX 2060 Gaming Z 6G | |
| AMD Radeon RX Vega 64 | |
| AMD Radeon RX 5700 | |
| Watch Dogs 2 | |
| 1920x1080 Ultra Preset | |
| Nvidia Titan RTX | |
| Nvidia GeForce RTX 2080 Super | |
| MSI RTX 2080 Gaming X Trio | |
| Nvidia GeForce RTX 2070 Super | |
| MSI RTX 2070 Gaming Z 8G | |
| Nvidia GeForce RTX 2060 Super | |
| AMD Radeon RX Vega 64 | |
| MSI RTX 2060 Gaming Z 6G | |
| AMD Radeon VII | |
| 3840x2160 High Preset | |
| Nvidia Titan RTX | |
| Nvidia GeForce RTX 2080 Super | |
| MSI RTX 2080 Gaming X Trio | |
| Nvidia GeForce RTX 2070 Super | |
| MSI RTX 2070 Gaming Z 8G | |
| Nvidia GeForce RTX 2060 Super | |
| AMD Radeon VII | |
| MSI RTX 2060 Gaming Z 6G | |
| AMD Radeon RX Vega 64 | |
| Battlefield 1 | |
| 1920x1080 Ultra Preset AA:T | |
| Nvidia Titan RTX | |
| Nvidia GeForce RTX 2070 Super | |
| Nvidia GeForce RTX 2080 Super | |
| MSI RTX 2080 Gaming X Trio | |
| AMD Radeon RX Vega 64 | |
| Nvidia GeForce RTX 2060 Super | |
| MSI RTX 2070 Gaming Z 8G | |
| AMD Radeon VII | |
| MSI RTX 2060 Gaming Z 6G | |
| 3840x2160 High Preset AA:T | |
| Nvidia Titan RTX | |
| Nvidia GeForce RTX 2080 Super | |
| MSI RTX 2080 Gaming X Trio | |
| AMD Radeon VII | |
| Nvidia GeForce RTX 2070 Super | |
| MSI RTX 2070 Gaming Z 8G | |
| Nvidia GeForce RTX 2060 Super | |
| AMD Radeon RX Vega 64 | |
| MSI RTX 2060 Gaming Z 6G | |
| The Division | |
| 1920x1080 Ultra Preset AF:16x | |
| Nvidia Titan RTX | |
| Nvidia GeForce RTX 2080 Super | |
| MSI RTX 2080 Gaming X Trio | |
| AMD Radeon RX 5700 XT | |
| AMD Radeon RX 5700 | |
| Nvidia GeForce RTX 2070 Super | |
| MSI RTX 2070 Gaming Z 8G | |
| Nvidia GeForce RTX 2060 Super | |
| AMD Radeon RX Vega 64 | |
| MSI RTX 2060 Gaming Z 6G | |
| AMD Radeon VII | |
| 3840x2160 High Preset AF:8x | |
| Nvidia Titan RTX | |
| MSI RTX 2080 Gaming X Trio | |
| Nvidia GeForce RTX 2080 Super | |
| AMD Radeon RX 5700 XT | |
| Nvidia GeForce RTX 2070 Super | |
| AMD Radeon VII | |
| MSI RTX 2070 Gaming Z 8G | |
| AMD Radeon RX 5700 | |
| Nvidia GeForce RTX 2060 Super | |
| AMD Radeon RX Vega 64 | |
| MSI RTX 2060 Gaming Z 6G | |
| For Honor | |
| 1920x1080 Extreme Preset AA:T AF:16x | |
| Nvidia Titan RTX | |
| Nvidia GeForce RTX 2080 Super | |
| MSI RTX 2080 Gaming X Trio | |
| AMD Radeon RX 5700 XT | |
| Nvidia GeForce RTX 2070 Super | |
| AMD Radeon RX 5700 | |
| MSI RTX 2070 Gaming Z 8G | |
| Nvidia GeForce RTX 2060 Super | |
| AMD Radeon RX Vega 64 | |
| MSI RTX 2060 Gaming Z 6G | |
| AMD Radeon VII | |
| 3840x2160 High Preset AA:T AF:8x | |
| Nvidia Titan RTX | |
| Nvidia GeForce RTX 2080 Super | |
| MSI RTX 2080 Gaming X Trio | |
| Nvidia GeForce RTX 2070 Super | |
| AMD Radeon VII | |
| AMD Radeon RX 5700 XT | |
| MSI RTX 2070 Gaming Z 8G | |
| Nvidia GeForce RTX 2060 Super | |
| AMD Radeon RX 5700 | |
| MSI RTX 2060 Gaming Z 6G | |
| AMD Radeon RX Vega 64 | |
| Ghost Recon Wildlands | |
| 1920x1080 Ultra Preset AA:T AF:16x | |
| Nvidia Titan RTX | |
| Nvidia GeForce RTX 2080 Super | |
| MSI RTX 2080 Gaming X Trio | |
| Nvidia GeForce RTX 2070 Super | |
| AMD Radeon RX 5700 XT | |
| MSI RTX 2070 Gaming Z 8G | |
| Nvidia GeForce RTX 2060 Super | |
| AMD Radeon RX 5700 | |
| MSI RTX 2060 Gaming Z 6G | |
| AMD Radeon RX Vega 64 | |
| AMD Radeon VII | |
| 3840x2160 Ultra Preset AA:T AF:16x | |
| Nvidia Titan RTX | |
| Nvidia GeForce RTX 2080 Super | |
| MSI RTX 2080 Gaming X Trio | |
| Nvidia GeForce RTX 2070 Super | |
| AMD Radeon RX 5700 XT | |
| MSI RTX 2070 Gaming Z 8G | |
| AMD Radeon RX 5700 | |
| Nvidia GeForce RTX 2060 Super | |
| Doom | |
| 1920x1080 Ultra Preset AA:SM | |
| Nvidia Titan RTX | |
| Nvidia GeForce RTX 2060 Super | |
| MSI RTX 2080 Gaming X Trio | |
| MSI RTX 2070 Gaming Z 8G | |
| MSI RTX 2060 Gaming Z 6G | |
| Nvidia GeForce RTX 2070 Super | |
| Nvidia GeForce RTX 2080 Super | |
| 3840x2160 High Preset AA:FX | |
| Nvidia Titan RTX | |
| MSI RTX 2080 Gaming X Trio | |
| Nvidia GeForce RTX 2080 Super | |
| Nvidia GeForce RTX 2070 Super | |
| MSI RTX 2070 Gaming Z 8G | |
| Nvidia GeForce RTX 2060 Super | |
| MSI RTX 2060 Gaming Z 6G | |
| GTA V | |
| 1920x1080 Highest AA:4xMSAA + FX AF:16x | |
| Nvidia Titan RTX | |
| MSI RTX 2080 Gaming X Trio | |
| AMD Radeon VII | |
| MSI RTX 2070 Gaming Z 8G | |
| MSI RTX 2060 Gaming Z 6G | |
| Nvidia GeForce RTX 2060 Super | |
| Nvidia GeForce RTX 2070 Super | |
| Nvidia GeForce RTX 2080 Super | |
| AMD Radeon RX 5700 | |
| AMD Radeon RX 5700 XT | |
| 3840x2160 High/On (Advanced Graphics Off) AA:FX AF:8x | |
| Nvidia Titan RTX | |
| Nvidia GeForce RTX 2080 Super | |
| Nvidia GeForce RTX 2070 Super | |
| AMD Radeon RX 5700 XT | |
| MSI RTX 2080 Gaming X Trio | |
| Nvidia GeForce RTX 2060 Super | |
| AMD Radeon RX 5700 | |
| AMD Radeon VII | |
| MSI RTX 2070 Gaming Z 8G | |
| MSI RTX 2060 Gaming Z 6G | |
| Battlefield 4 - 3840x2160 High Preset | |
| Nvidia Titan RTX | |
| Nvidia GeForce RTX 2080 Super | |
| MSI RTX 2080 Gaming X Trio | |
| Nvidia GeForce RTX 2070 Super | |
| MSI RTX 2070 Gaming Z 8G | |
| AMD Radeon RX Vega 64 | |
| AMD Radeon VII | |
| Nvidia GeForce RTX 2060 Super | |
| MSI RTX 2060 Gaming Z 6G | |
| Farming Simulator 19 | |
| 1920x1080 Very High Preset | |
| Nvidia Titan RTX | |
| MSI RTX 2080 Gaming X Trio | |
| MSI RTX 2060 Gaming Z 6G | |
| Nvidia GeForce RTX 2070 Super | |
| MSI RTX 2070 Gaming Z 8G | |
| Nvidia GeForce RTX 2060 Super | |
| Nvidia GeForce RTX 2080 Super | |
| AMD Radeon RX 5700 XT | |
| AMD Radeon VII | |
| AMD Radeon RX Vega 64 | |
| AMD Radeon RX 5700 | |
| 3840x2160 Very High Preset | |
| Nvidia Titan RTX | |
| Nvidia GeForce RTX 2080 Super | |
| MSI RTX 2080 Gaming X Trio | |
| Nvidia GeForce RTX 2070 Super | |
| MSI RTX 2070 Gaming Z 8G | |
| Nvidia GeForce RTX 2060 Super | |
| MSI RTX 2060 Gaming Z 6G | |
| AMD Radeon RX 5700 XT | |
| AMD Radeon VII | |
| AMD Radeon RX 5700 | |
| AMD Radeon RX Vega 64 | |
| 2560x1440 Very High Preset | |
| MSI RTX 2080 Gaming X Trio | |
| Nvidia GeForce RTX 2080 Super | |
| MSI RTX 2070 Gaming Z 8G | |
| Nvidia GeForce RTX 2070 Super | |
| Nvidia GeForce RTX 2060 Super | |
| AMD Radeon RX 5700 XT | |
| AMD Radeon RX 5700 | |
| Just Cause 4 | |
| 1920x1080 Very High / On AA:SM AF:16x | |
| Nvidia Titan RTX | |
| Nvidia GeForce RTX 2080 Super | |
| MSI RTX 2080 Gaming X Trio | |
| Nvidia GeForce RTX 2070 Super | |
| AMD Radeon RX 5700 XT | |
| MSI RTX 2070 Gaming Z 8G | |
| Nvidia GeForce RTX 2060 Super | |
| AMD Radeon VII | |
| MSI RTX 2060 Gaming Z 6G | |
| AMD Radeon RX Vega 64 | |
| AMD Radeon RX 5700 | |
| 3840x2160 Very High / On AA:SM AF:16x | |
| Nvidia Titan RTX | |
| Nvidia GeForce RTX 2080 Super | |
| MSI RTX 2080 Gaming X Trio | |
| Nvidia GeForce RTX 2070 Super | |
| AMD Radeon VII | |
| AMD Radeon RX 5700 XT | |
| MSI RTX 2070 Gaming Z 8G | |
| Nvidia GeForce RTX 2060 Super | |
| AMD Radeon RX 5700 | |
| MSI RTX 2060 Gaming Z 6G | |
| AMD Radeon RX Vega 64 | |
| 2560x1440 Very High / On AA:SM AF:16x | |
| Nvidia GeForce RTX 2080 Super | |
| MSI RTX 2080 Gaming X Trio | |
| Nvidia GeForce RTX 2070 Super | |
| AMD Radeon RX 5700 XT | |
| MSI RTX 2070 Gaming Z 8G | |
| Nvidia GeForce RTX 2060 Super | |
| AMD Radeon RX 5700 | |
| F1 2019 | |
| 3840x2160 Ultra High Preset AA:T AF:16x | |
| Nvidia GeForce RTX 2080 Super | |
| Nvidia GeForce RTX 2070 Super | |
| AMD Radeon RX 5700 XT | |
| AMD Radeon RX 5700 | |
| Nvidia GeForce RTX 2060 Super | |
| AMD Radeon RX Vega 64 | |
| 1920x1080 Ultra High Preset AA:T AF:16x | |
| Nvidia GeForce RTX 2080 Super | |
| AMD Radeon RX 5700 XT | |
| Nvidia GeForce RTX 2070 Super | |
| AMD Radeon RX Vega 64 | |
| AMD Radeon RX 5700 | |
| Nvidia GeForce RTX 2060 Super | |
| 2560x1440 Ultra High Preset AA:T AF:16x | |
| Nvidia GeForce RTX 2080 Super | |
| Nvidia GeForce RTX 2070 Super | |
| AMD Radeon RX 5700 XT | |
| AMD Radeon RX 5700 | |
| Nvidia GeForce RTX 2060 Super | |
| AMD Radeon RX Vega 64 | |
| basso | medio | alto | ultra | QHD | 4K | |
|---|---|---|---|---|---|---|
| BioShock Infinite (2013) | 305 | 270 | 252 | 196 | ||
| Battlefield 4 (2013) | 200 | 200 | 200 | 191 | 126 | |
| GTA V (2015) | 169 | 162 | 141 | 84 | 115 | |
| The Witcher 3 (2015) | 295 | 259 | 195 | 109 | 79 | |
| Dota 2 Reborn (2015) | 135.2 | 124.6 | 123.4 | 111.8 | 107.9 | |
| Rainbow Six Siege (2015) | 296.8 | 255.6 | 245.1 | 236.1 | 150 | |
| Rise of the Tomb Raider (2016) | 252 | 183 | 176 | 165 | 79 | |
| Far Cry Primal (2016) | 119 | 106 | 97 | 90 | 74 | |
| The Division (2016) | 189 | 174.5 | 149.1 | 132.1 | 69.7 | |
| Doom (2016) | 178 | 144 | 141 | 134 | 114 | |
| Overwatch (2016) | 300 | 300 | 300 | 267 | 152 | |
| Deus Ex Mankind Divided (2016) | 146.5 | 138.7 | 120.5 | 82 | 53.4 | |
| Battlefield 1 (2016) | 193 | 178 | 165 | 152 | 93 | |
| Dishonored 2 (2016) | 119 | 118 | 116 | 112 | 85 | |
| Watch Dogs 2 (2016) | 121 | 111 | 105 | 87 | 56.6 | |
| For Honor (2017) | 292.2 | 222.8 | 214.8 | 169.8 | 78.8 | |
| Ghost Recon Wildlands (2017) | 151.9 | 122 | 118.7 | 74.8 | 54.9 | |
| Rocket League (2017) | 249 | 247 | 248 | 171 | ||
| Dirt 4 (2017) | 289 | 226 | 197 | 161 | 102 | |
| Playerunknown's Battlegrounds (PUBG) (2017) | 202 | 173 | 168 | 159 | 68 | |
| Destiny 2 (2017) | 151 | 150 | 149 | 148 | 133 | 74 |
| Assassin´s Creed Origins (2017) | 108 | 97 | 94 | 82 | 76 | 53 |
| Call of Duty WWII (2017) | 235 | 234 | 173 | 154 | 137 | 88 |
| Fortnite (2018) | 297 | 253 | 185 | 180 | 127 | 64 |
| Final Fantasy XV Benchmark (2018) | 159 | 130 | 97 | 46.4 | ||
| Kingdom Come: Deliverance (2018) | 160 | 141 | 112 | 79 | 70 | 39.5 |
| X-Plane 11.11 (2018) | 101 | 91 | 76 | 66 | ||
| Far Cry 5 (2018) | 120 | 109 | 105 | 98 | 94 | 61 |
| The Crew 2 (2018) | 60 | 60 | 60 | 60 | 60 | 60 |
| Monster Hunter World (2018) | 141 | 135 | 134 | 114 | 76 | 37.6 |
| F1 2018 (2018) | 219 | 198 | 151 | 133 | 120 | 74 |
| Shadow of the Tomb Raider (2018) | 125 | 116 | 115 | 110 | 91 | 49 |
| FIFA 19 (2018) | 271 | 266 | 258 | 253 | 249 | 197 |
| Forza Horizon 4 (2018) | 168 | 143 | 142 | 133 | 117 | 81 |
| Assassin´s Creed Odyssey (2018) | 108 | 99 | 87 | 68 | 58 | 41 |
| Call of Duty Black Ops 4 (2018) | 228 | 194 | 191 | 173 | 134 | 62 |
| Hitman 2 (2018) | 92 | 90 | 81 | 79 | 79 | 68 |
| Battlefield V (2018) | 146 | 122 | 110 | 101 | 85 | 55.7 |
| Farming Simulator 19 (2018) | 191 | 151 | 122 | 117 | 122 | 85 |
| Darksiders III (2018) | 210 | 136 | 131 | 124 | 104 | 55.3 |
| Just Cause 4 (2018) | 194 | 170 | 132 | 124 | 93 | 53.4 |
| Apex Legends (2019) | 144 | 144 | 144 | 144 | 143 | 89 |
| Far Cry New Dawn (2019) | 111 | 98 | 95 | 86 | 83 | 64 |
| Metro Exodus (2019) | 125 | 109 | 90 | 76 | 61 | 40 |
| Anthem (2019) | 105 | 103 | 100 | 95 | 87 | 55.5 |
| Dirt Rally 2.0 (2019) | 235 | 186 | 179 | 129 | 100 | 63 |
| The Division 2 (2019) | 182 | 150 | 129 | 106 | 79 | 45 |
| Anno 1800 (2019) | 90 | 88 | 70 | 38.6 | 38 | 35.1 |
| Rage 2 (2019) | 229 | 157 | 136 | 133 | 90 | 46.4 |
| F1 2019 (2019) | 207 | 191 | 157 | 145 | 124 | 79 |
Prestazioni di calcolo
Il duello tra l'RTX 2080 SUPER FE e l'RTX 2080 Gaming X Trio è proseguito nei nostri benchmarks di calcolo, con la seconda a ridosso della prima in tutti gli SPECviewperf 12 e SiSoft Sandra 2016, ad eccezione di SPECviewperf 12 e SiSoft Sandra 2016. La TITAN RTX segna generalmente circa il 30% in più della RTX 2080 SUPER FE e offre prestazioni dalla Quadro-esque nonostante la mancanza di supporto del driver.
Anche i modelli Radeon VII ed RX 5700 XT occasionalmente offrono prestazioni relativamente buone. Tuttavia, l'RTX 2080 SUPER FE spesso si trova in leggero vantaggio.
| LuxMark v2.0 64Bit | |
| Room GPUs-only | |
| Nvidia Titan RTX | |
| AMD Radeon VII | |
| MSI RTX 2080 Gaming X Trio | |
| Nvidia GeForce RTX 2080 Super | |
| Nvidia GeForce RTX 2070 Super | |
| MSI RTX 2070 Gaming Z 8G | |
| Nvidia GeForce RTX 2060 Super | |
| MSI RTX 2060 Gaming Z 6G | |
| AMD Radeon RX 5700 XT | |
| AMD Radeon RX 5700 | |
| Sala GPUs-only | |
| Nvidia Titan RTX | |
| MSI RTX 2080 Gaming X Trio | |
| Nvidia GeForce RTX 2080 Super | |
| Nvidia GeForce RTX 2070 Super | |
| MSI RTX 2070 Gaming Z 8G | |
| Nvidia GeForce RTX 2060 Super | |
| AMD Radeon VII | |
| AMD Radeon RX 5700 XT | |
| MSI RTX 2060 Gaming Z 6G | |
| AMD Radeon RX 5700 | |
| SiSoft Sandra 2016 | |
| Image Processing | |
| AMD Radeon VII | |
| Nvidia GeForce RTX 2080 Super | |
| MSI RTX 2080 Gaming X Trio | |
| Nvidia GeForce RTX 2070 Super | |
| MSI RTX 2070 Gaming Z 8G | |
| Nvidia GeForce RTX 2060 Super | |
| AMD Radeon RX 5700 XT | |
| MSI RTX 2060 Gaming Z 6G | |
| AMD Radeon RX 5700 | |
| GP Cryptography (Higher Security AES256+SHA2-512) | |
| MSI RTX 2080 Gaming X Trio | |
| AMD Radeon VII | |
| Nvidia GeForce RTX 2080 Super | |
| Nvidia GeForce RTX 2070 Super | |
| MSI RTX 2070 Gaming Z 8G | |
| Nvidia GeForce RTX 2060 Super | |
| MSI RTX 2060 Gaming Z 6G | |
| GP Financial Analysis (FP High/Double Precision) | |
| AMD Radeon VII | |
| MSI RTX 2080 Gaming X Trio | |
| Nvidia GeForce RTX 2080 Super | |
| Nvidia GeForce RTX 2070 Super | |
| MSI RTX 2070 Gaming Z 8G | |
| Nvidia GeForce RTX 2060 Super | |
| MSI RTX 2060 Gaming Z 6G | |
| AMD Radeon RX 5700 XT | |
| AMD Radeon RX 5700 | |
Emissioni
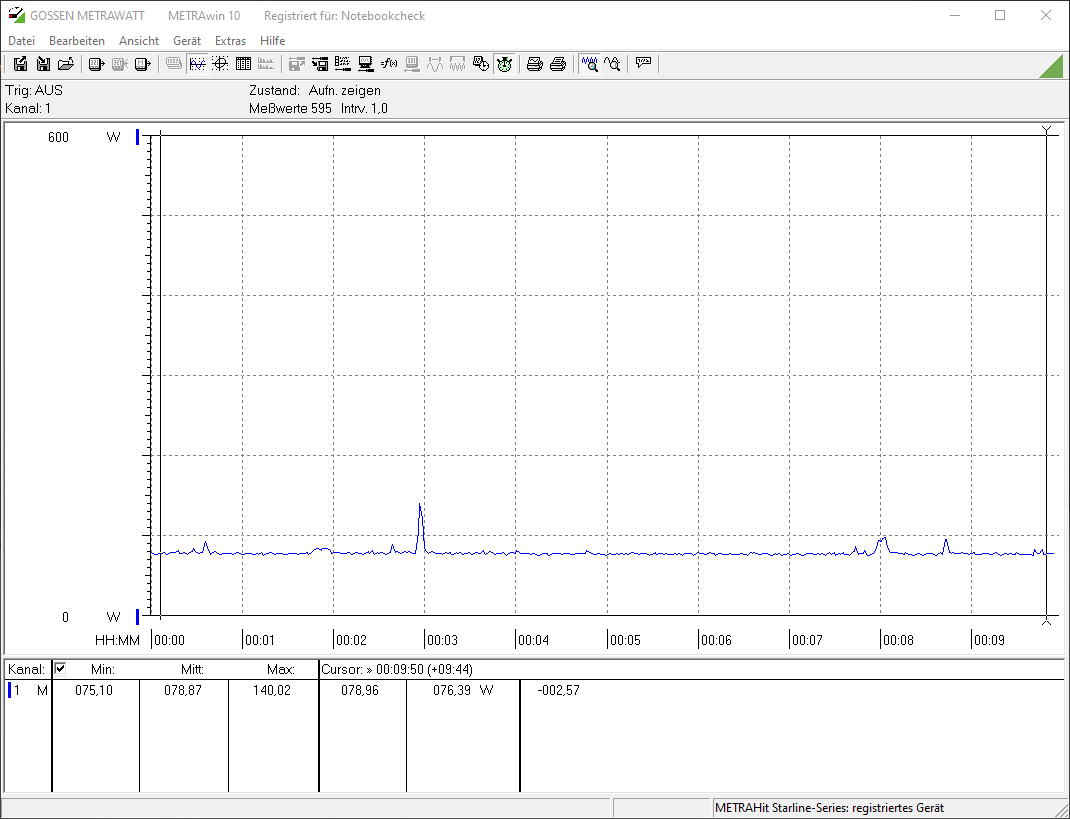
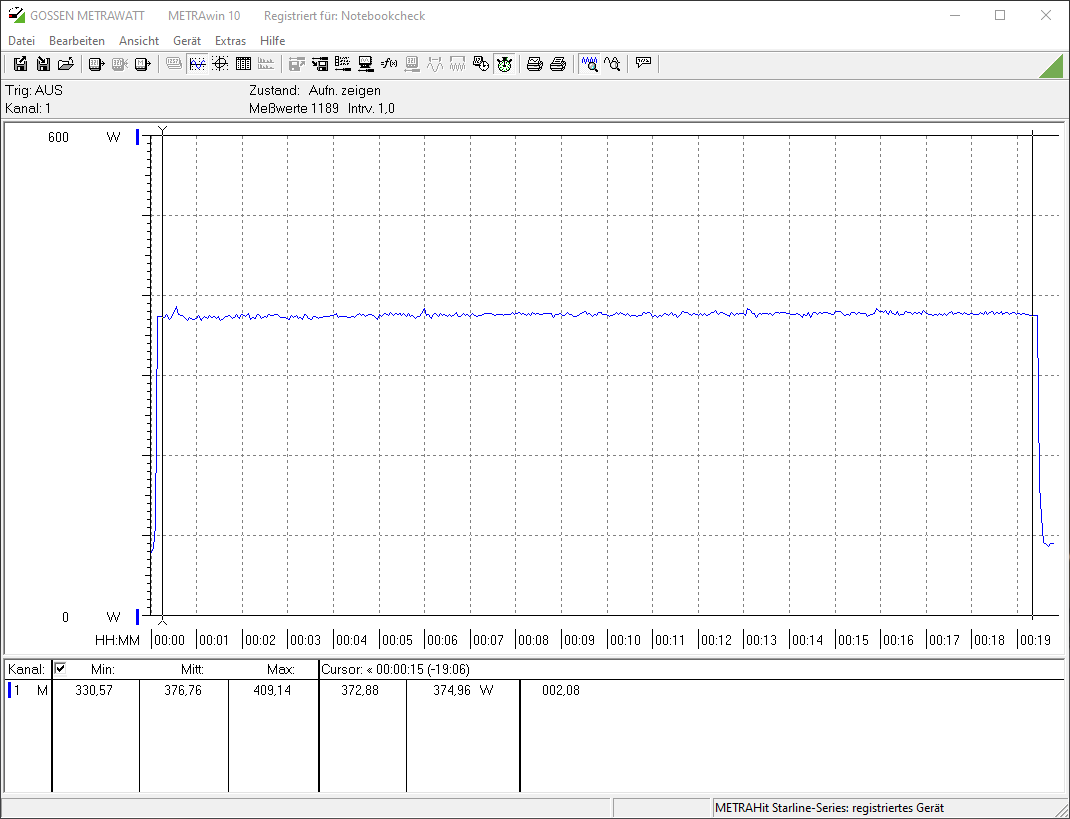
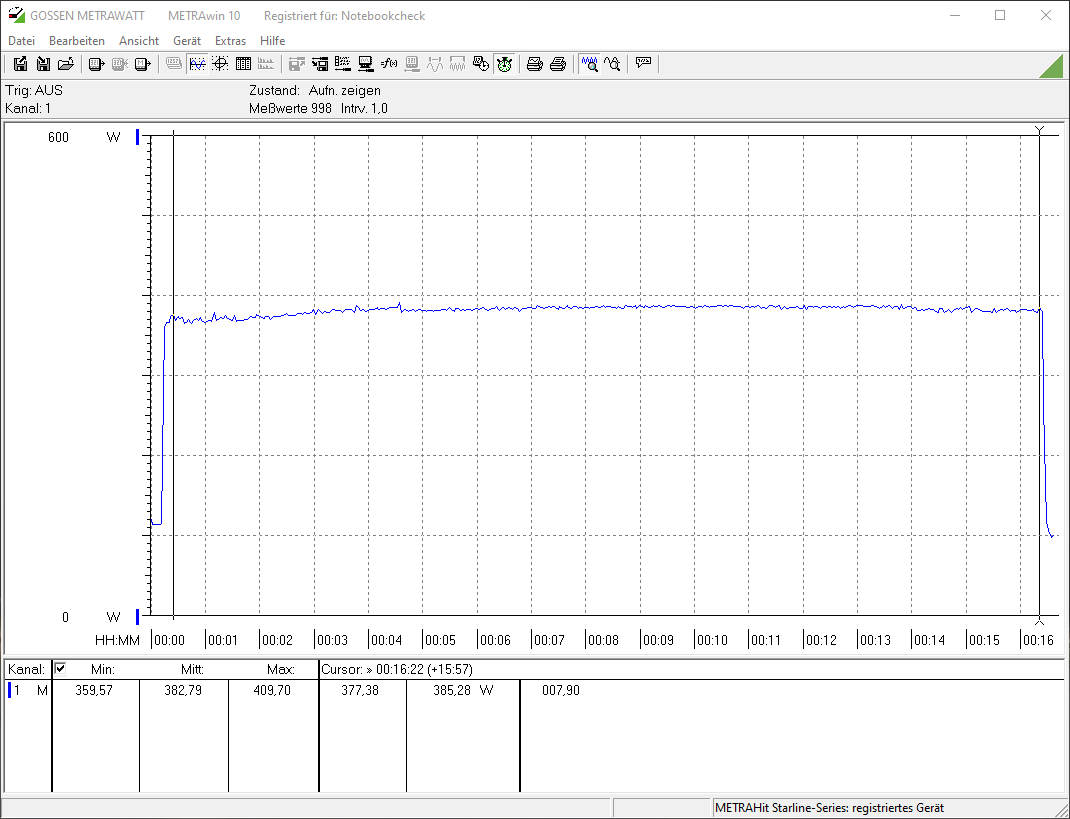
L'RTX 2080 SUPER FE e il nostro sistema di test ha avuto una media di 79 W al minimo, anche se dovete tenere presente che questo valore non include quanto consumato dal nostro monitor di test. Al contrario, il nostro sistema di test Radeon RX 5700 XT e Radeon RX 5700 sono state entrambe sotto i 70 W. Inoltro il nostro sistema di test alimentato da RTX 2080 SUPER FE ha avuto una media di circa 377 W durante il benchmark FurMark, ponendolo 50 W davanti all'RX 5700 XT e 33 W dell'RTX 2070 Gaming Z 8G. Al contrario, l'RTX 2080 Gaming X Trio aveva bisogno di un'enorme potenza da 402 W.
Vale la pena notare che alcuni giochi sono pesanti per CPU e GPU, con "The Witcher 3" che spinge il nostro sistema fino a 383 W a 1080p e massima grafica. È interessante notare che il sistema RTX 2080 Gaming X Trio alimentato dalla RTX 2080 Gaming X Trio è aumentato di soli 2 W, mentre la nostra unità di prova ha consumato altri 6 W. Solo la Radeon RX Vega 64 e la TITAN RTX consumano più della RTX 2080 SUPER FE qui, anche se entrambi hanno TDP notevolmente più alti rispetto alla più potente scheda RTX 20 SUPER.
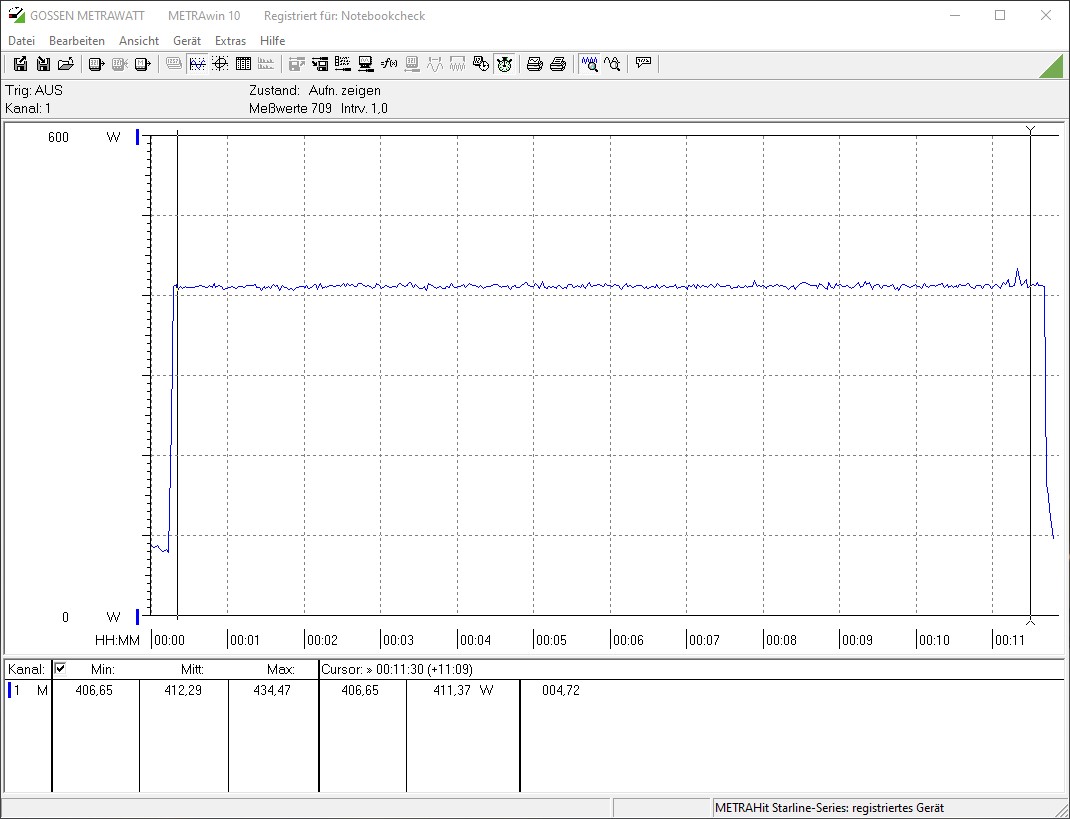
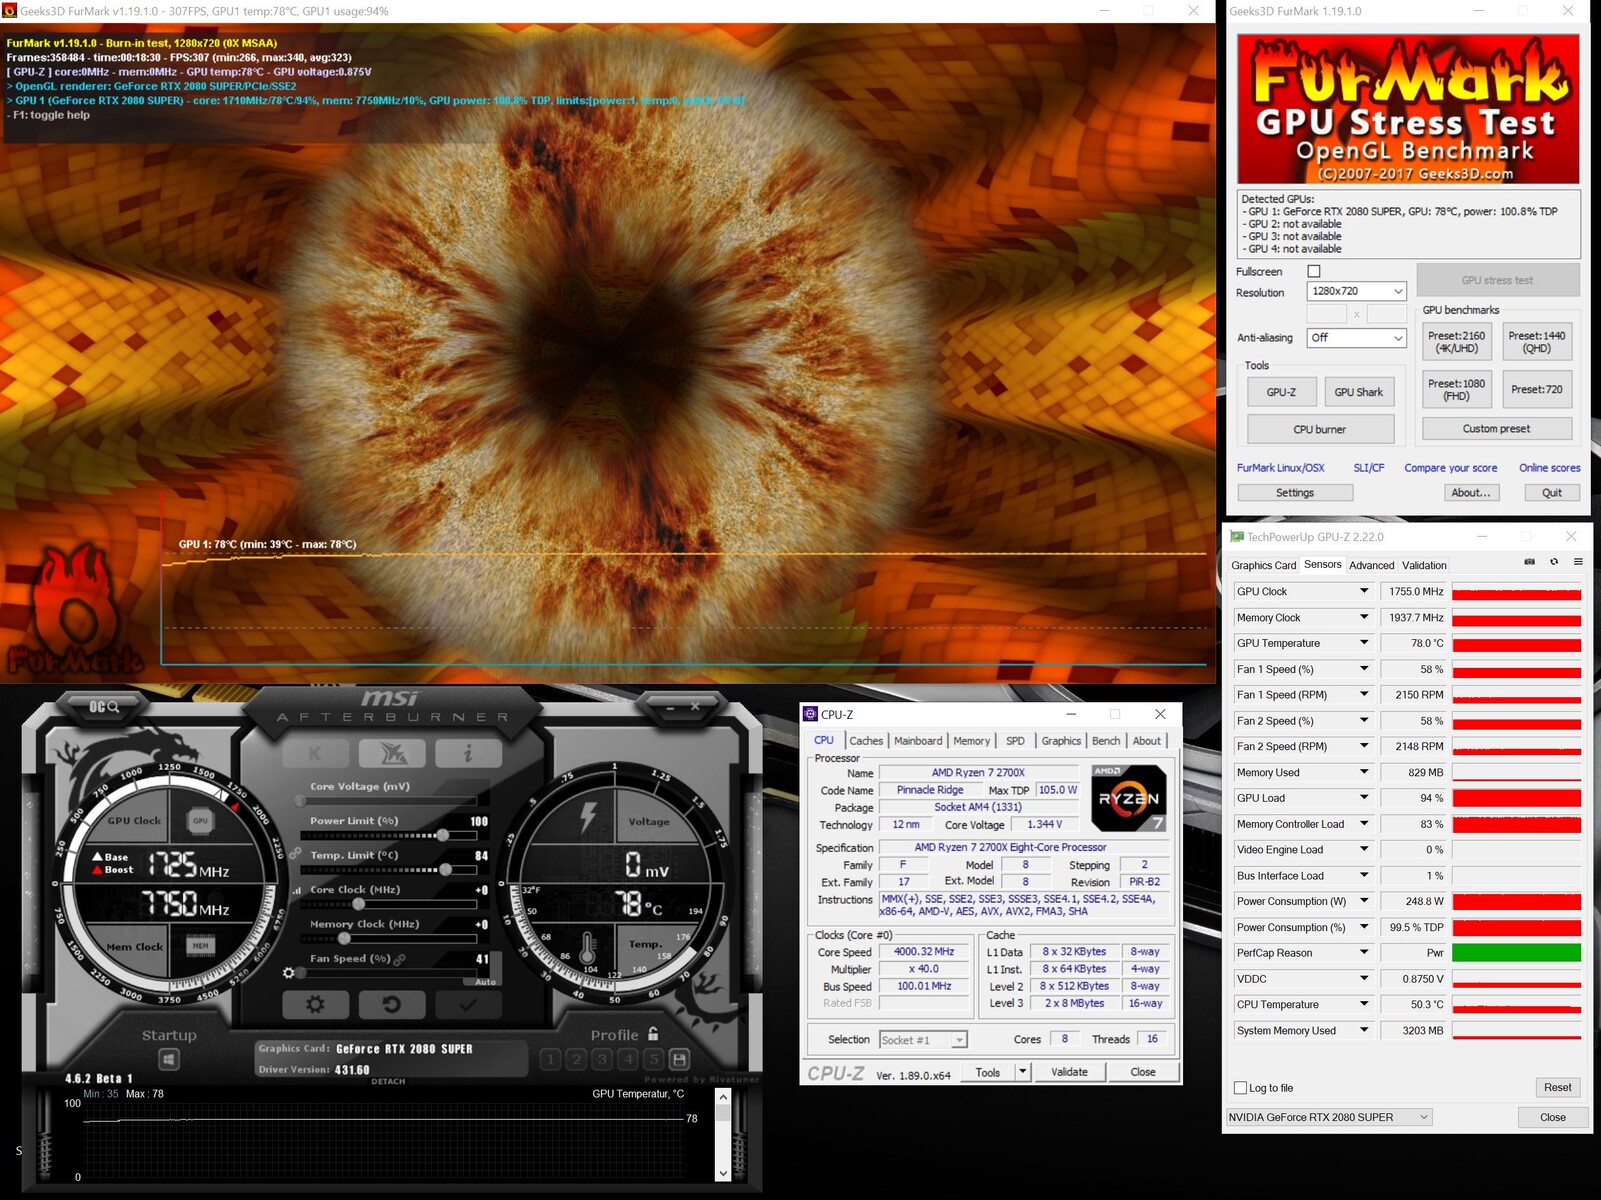
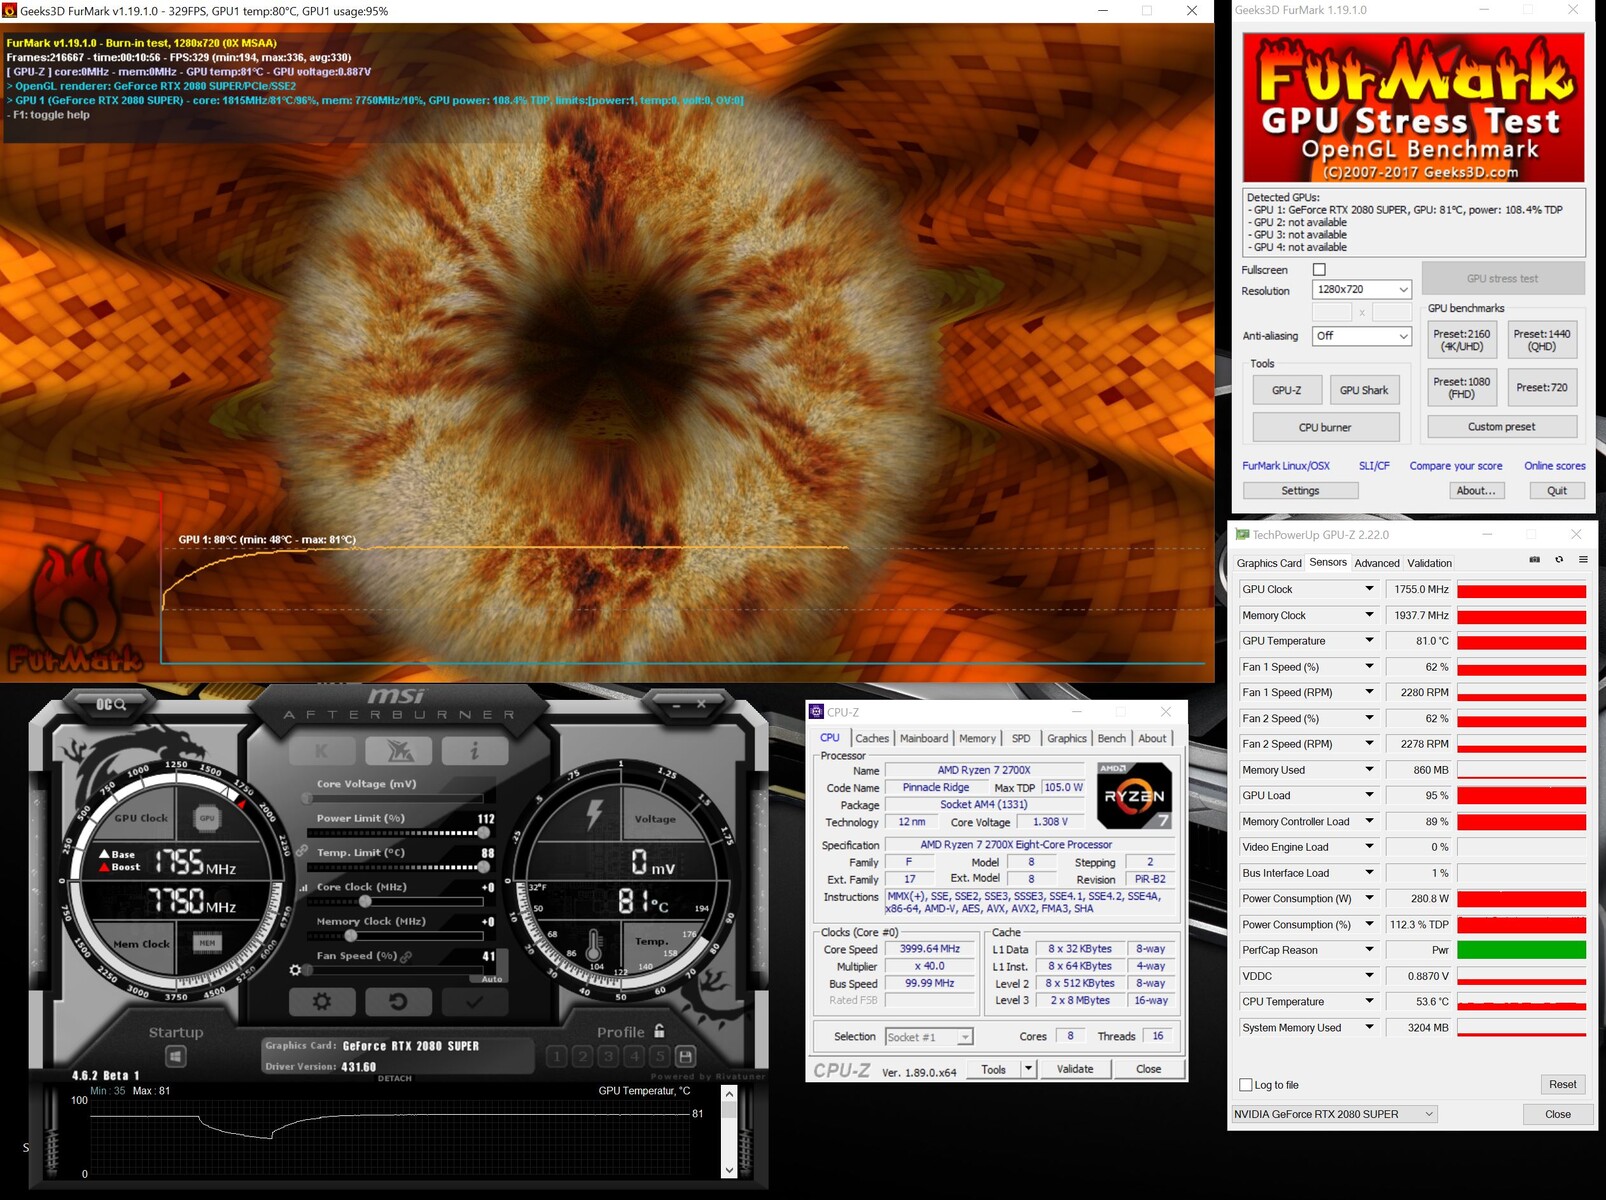
NVIDIA permette un aumento del 12% nel PT per la RTX 2080 SUPER, quindi abbiamo deciso di ripetere i nostri stress test e i nostri benchmarks di gioco per vedere quale differenza il 12% in più di potenza ha apportato ai nostri risultati. Questo cambiamento ha portato il TDP a 280 W, mettendo l'RTX 2080 SUPER FE alla pari con il TITAN RTX. Di conseguenza, il sistema ha avuto una media di 412 W in condizioni di carico sostenuto, con un aumento di circa 36 W.
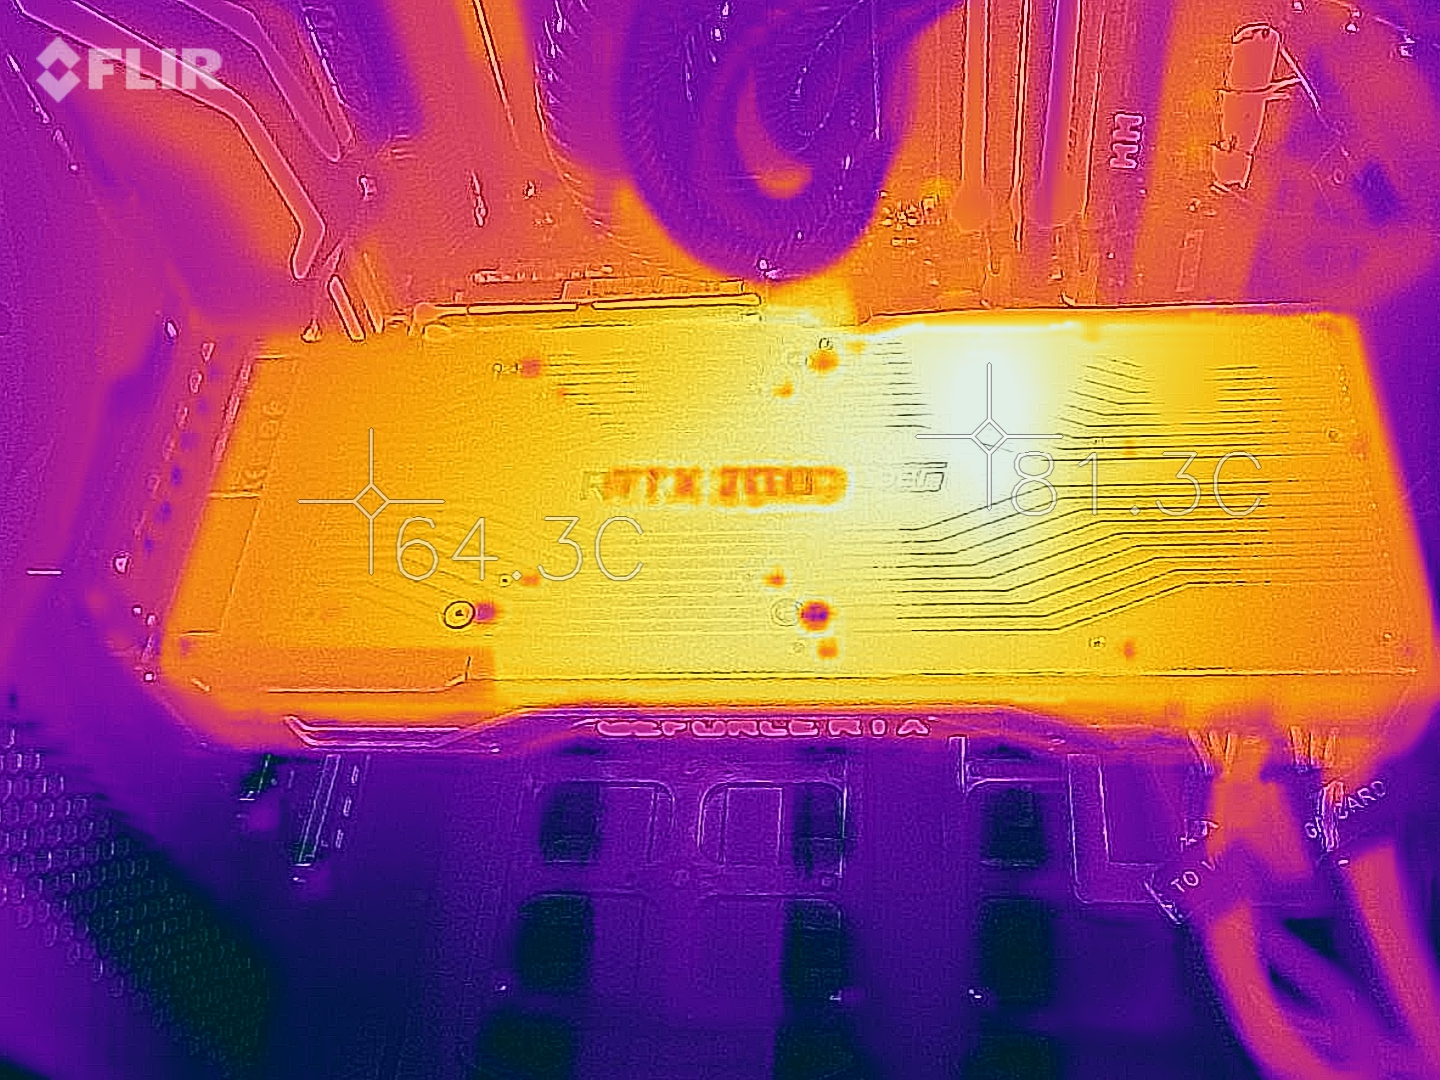
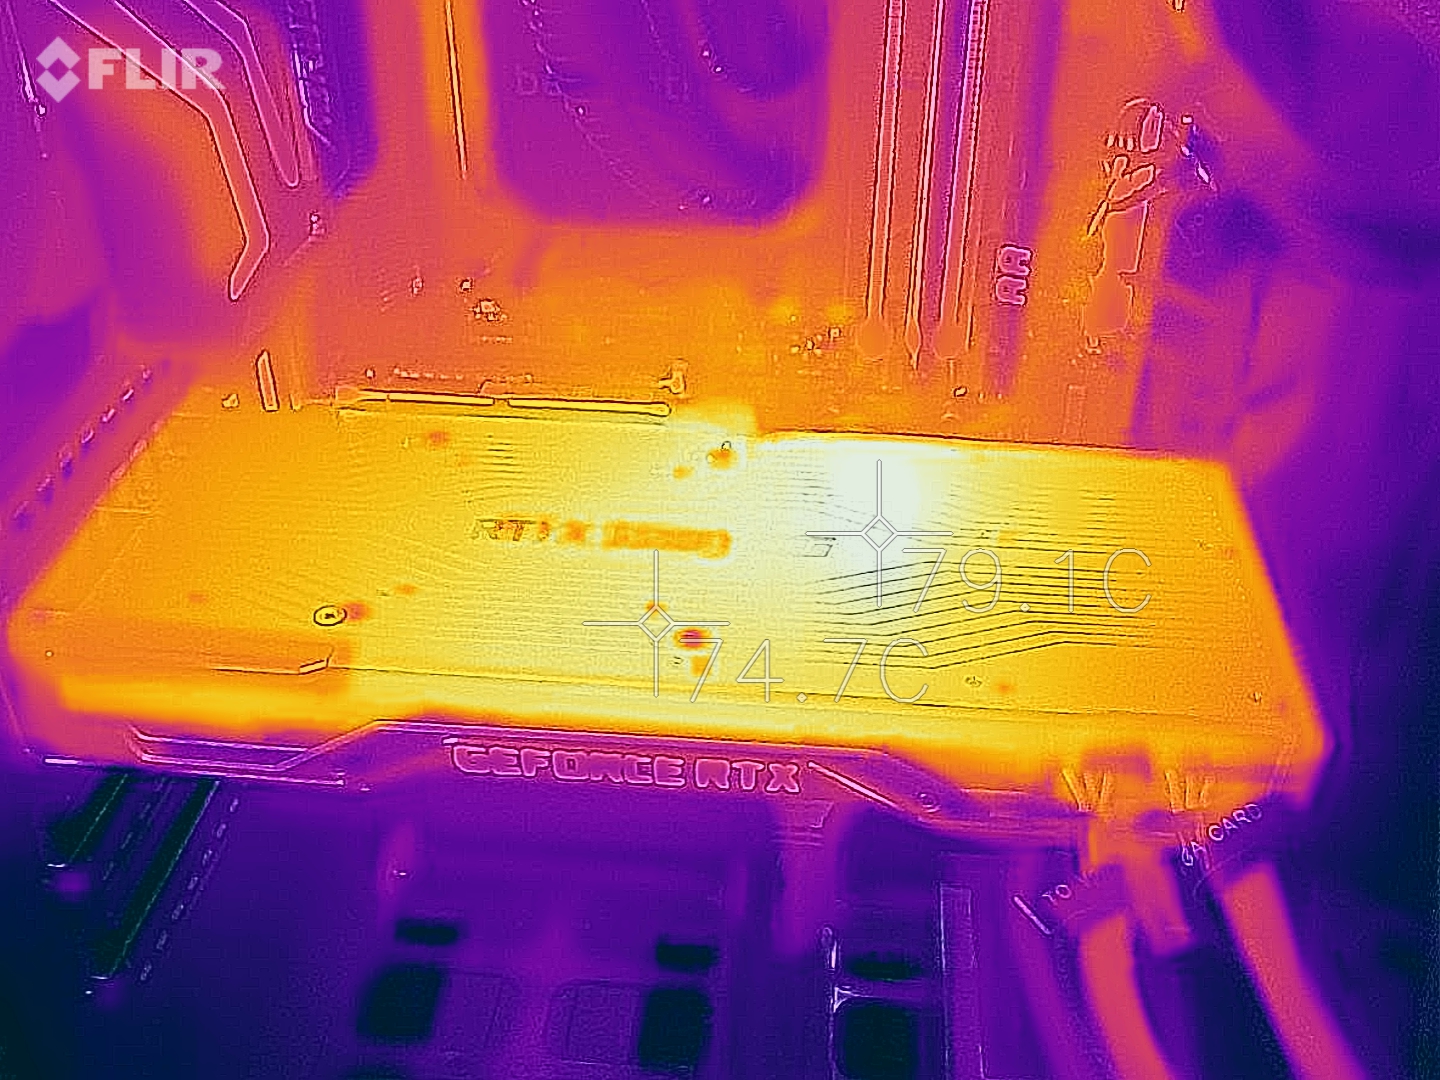
Tuttavia, l'aumento del PT non ha avuto un grande effetto sulle temperature del core della GPU. La nostra unità di prova ha raggiunto 78 °C (~172 °F) con i settaggi base, che è aumentato di 3 °C (~7 °F) al 112% di PT. NVIDIA sostiene che la GPU può funzionare in modo sicuro fino a 84 °C (~183 °F), che non ha mai superato durante i nostri test nemmeno a 112% PT. Abbiamo condotto tutti i nostri test con l'RTX 2080 SUPER FE anche in un case chiuso, per riferimento.
Mentre le ventole raffreddano in modo affidabile l'RTX 2080 SUPER FE, attualmente non c'è modo di disabilitarli. Le ventole della nostra unità di prova sono udibili anche al minimo, proprio come quelle della RTX 2070 SUPER FE. In definitiva, se volete una RTX 2080 SUPER, allora dovete scendere a compromessi tra lo stile della scheda Fondatori Edition e il silenzio delle schede partner.
| Power Consumption | |
| 1920x1080 The Witcher 3 ultra (external Monitor) | |
| Nvidia Titan RTX | |
| AMD Radeon RX Vega 64 (Idle: 74.3 W) | |
| MSI RTX 2080 Gaming X Trio (Idle: 87.78 W) | |
| Nvidia GeForce RTX 2080 Super (Idle: 78.87 W) | |
| AMD Radeon RX 5700 XT (Idle: 69.8 W) | |
| Nvidia GeForce RTX 2070 Super (96.8 fps, Idle: 80.5 W) | |
| MSI RTX 2070 Gaming Z 8G (Idle: 73.3 W) | |
| AMD Radeon VII (Idle: 81.39 W) | |
| Nvidia GeForce RTX 2060 Super (82.7 fps, Idle: 77.12 W) | |
| AMD Radeon RX 5700 (84.2 fps, Idle: 64.5 W) | |
| MSI RTX 2060 Gaming Z 6G (Idle: 74.66 W) | |
| 1280x720 FurMark 1.19 GPU Stress Test (external Monitor) | |
| AMD Radeon VII (Idle: 81.39 W) | |
| MSI RTX 2080 Gaming X Trio | |
| Nvidia GeForce RTX 2080 Super (Idle: 78.87 W) | |
| MSI RTX 2070 Gaming Z 8G (Idle: 73.3 W) | |
| AMD Radeon RX 5700 XT (239 fps, Idle: 69.8 W) | |
| Nvidia GeForce RTX 2070 Super (283 fps, Idle: 80.5 W) | |
| MSI RTX 2060 Gaming Z 6G (Idle: 74.66 W) | |
| Nvidia GeForce RTX 2060 Super (237 fps, Idle: 77.12 W) | |
| AMD Radeon RX 5700 (207 fps, Idle: 64.5 W) | |
* ... Meglio usare valori piccoli
Overclocking
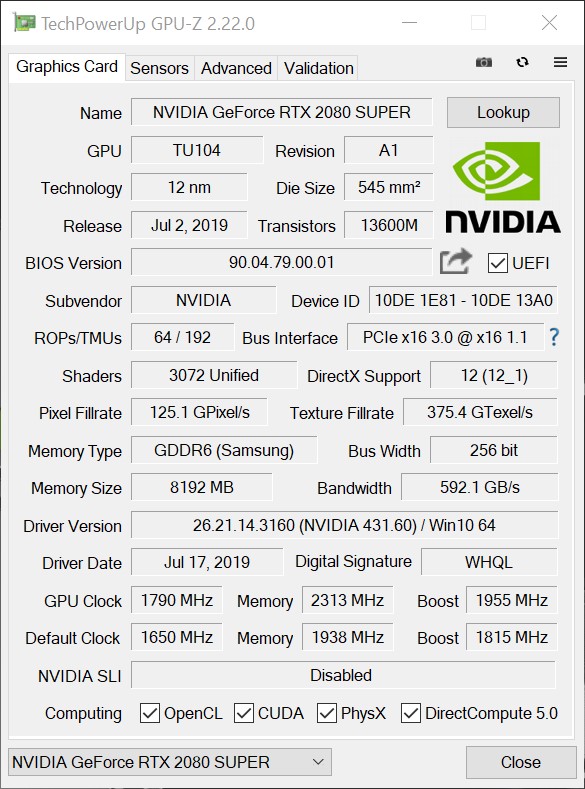
Abbiamo anche provato l'overclocking della RTX 2080 SUPER FE, come facciamo con tutte le GPU desktop che testiamo. Non ci aspettavamo di avere molto spazio per l'overclocking dopo le nostre esperienze con la RTX 2070 SUPER FE, ma la VRAM nella nostra unità di prova ci ha piacevolmente sorpreso. Abbiamo ottenuto un overclock VRAM da 1.500 MHz nell'MSI Afterburner, che ha aumentato la larghezza di banda di memoria da 496,1 GB/s a ben 592 GB/s. Abbiamo anche gestito un core clock migliorato da 140 MHz, con il boost clock che è salito a 1.955 MHz. La GPU ha gestito comodamente 2.000 MHz quando abbiamo aumentato anche il PT.
In breve, questo offre il primo assaggio del vero potenziale di TU104 e RTX 2080 SUPER. Ci aspettiamo che i partner delle schede aggiuntive (AIB) di NVIDIA spingano la GPU ai suoi limiti.
In combinazione con il 112% PT, i nostri sforzi di overclocking hanno portato a framerate di circa il 10% in più. Tuttavia, raccomandiamo di utilizzare un sistema di raffreddamento alternativo a quello di serie, come ad esempio un sistema di raffreddamento ad acqua, che ha faticato a dissipare la quantità di calore in eccesso prodotta dal nostro overclock. Abbiamo misurato un assorbimento di potenza superiore di 30 W una volta overclockato, il che pone la RTX 2080 SUPER ai livelli della TITAN RTX.
Pro
Contro
Giudizio Complessivo
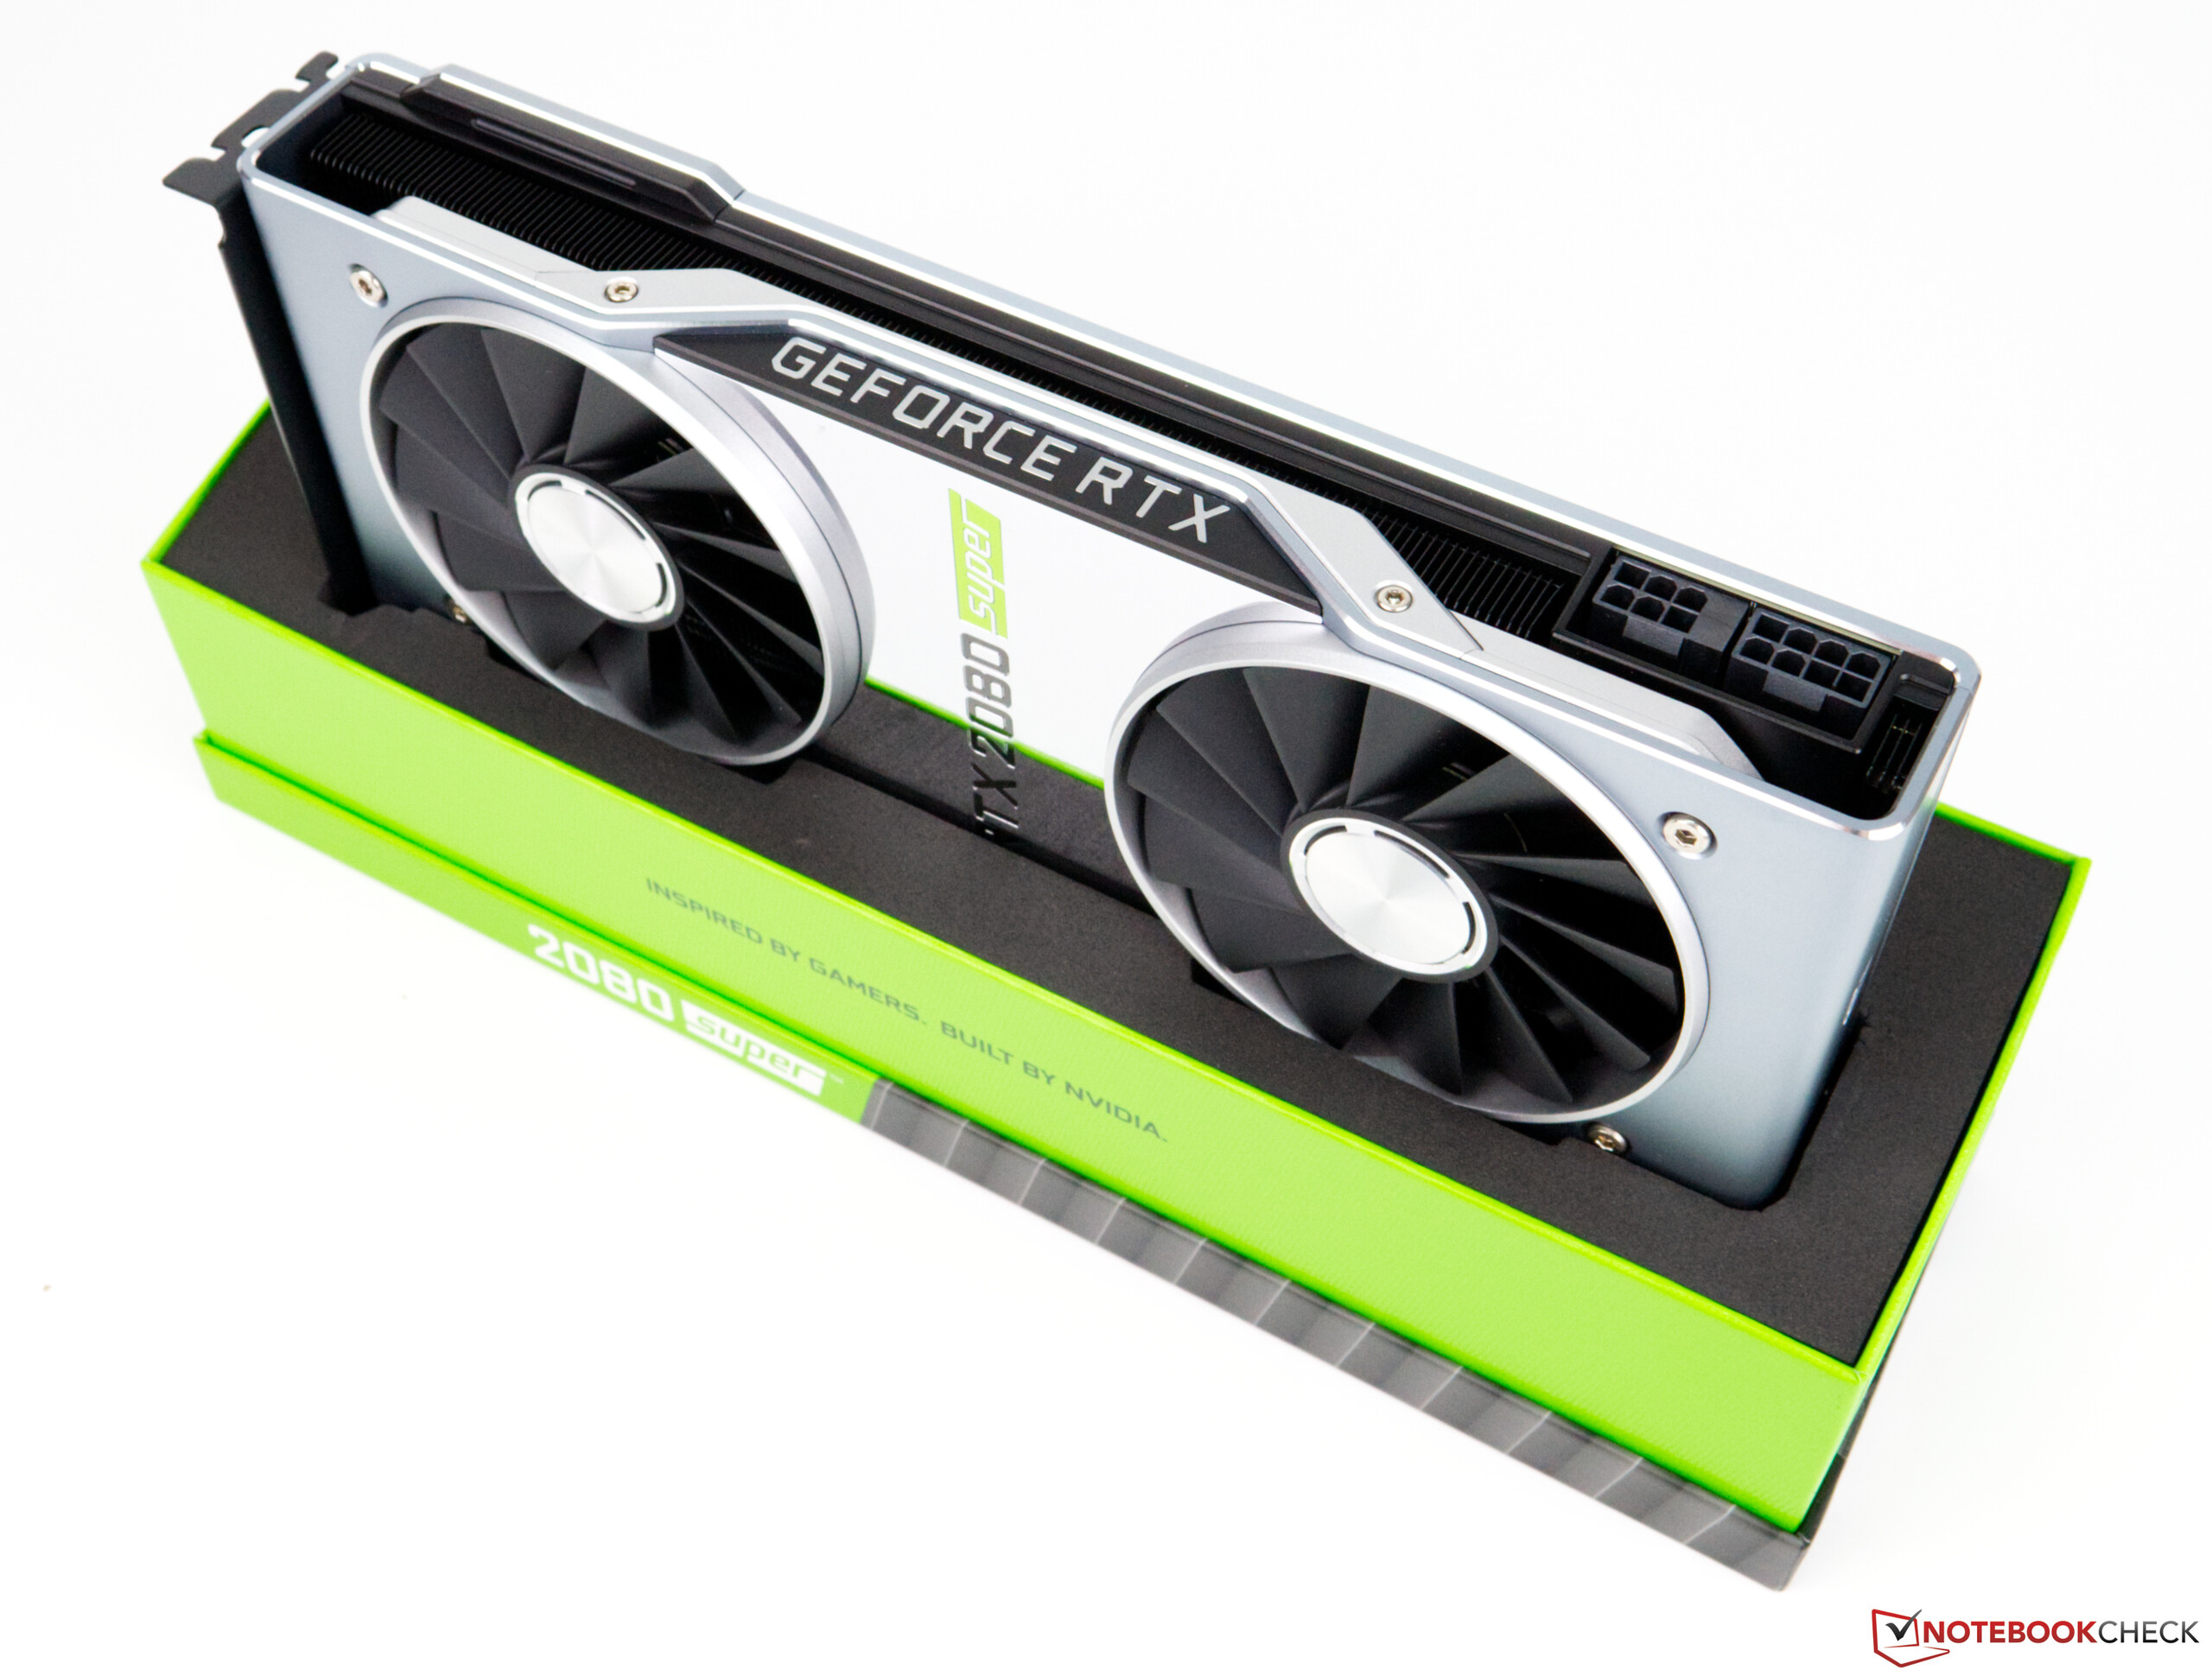
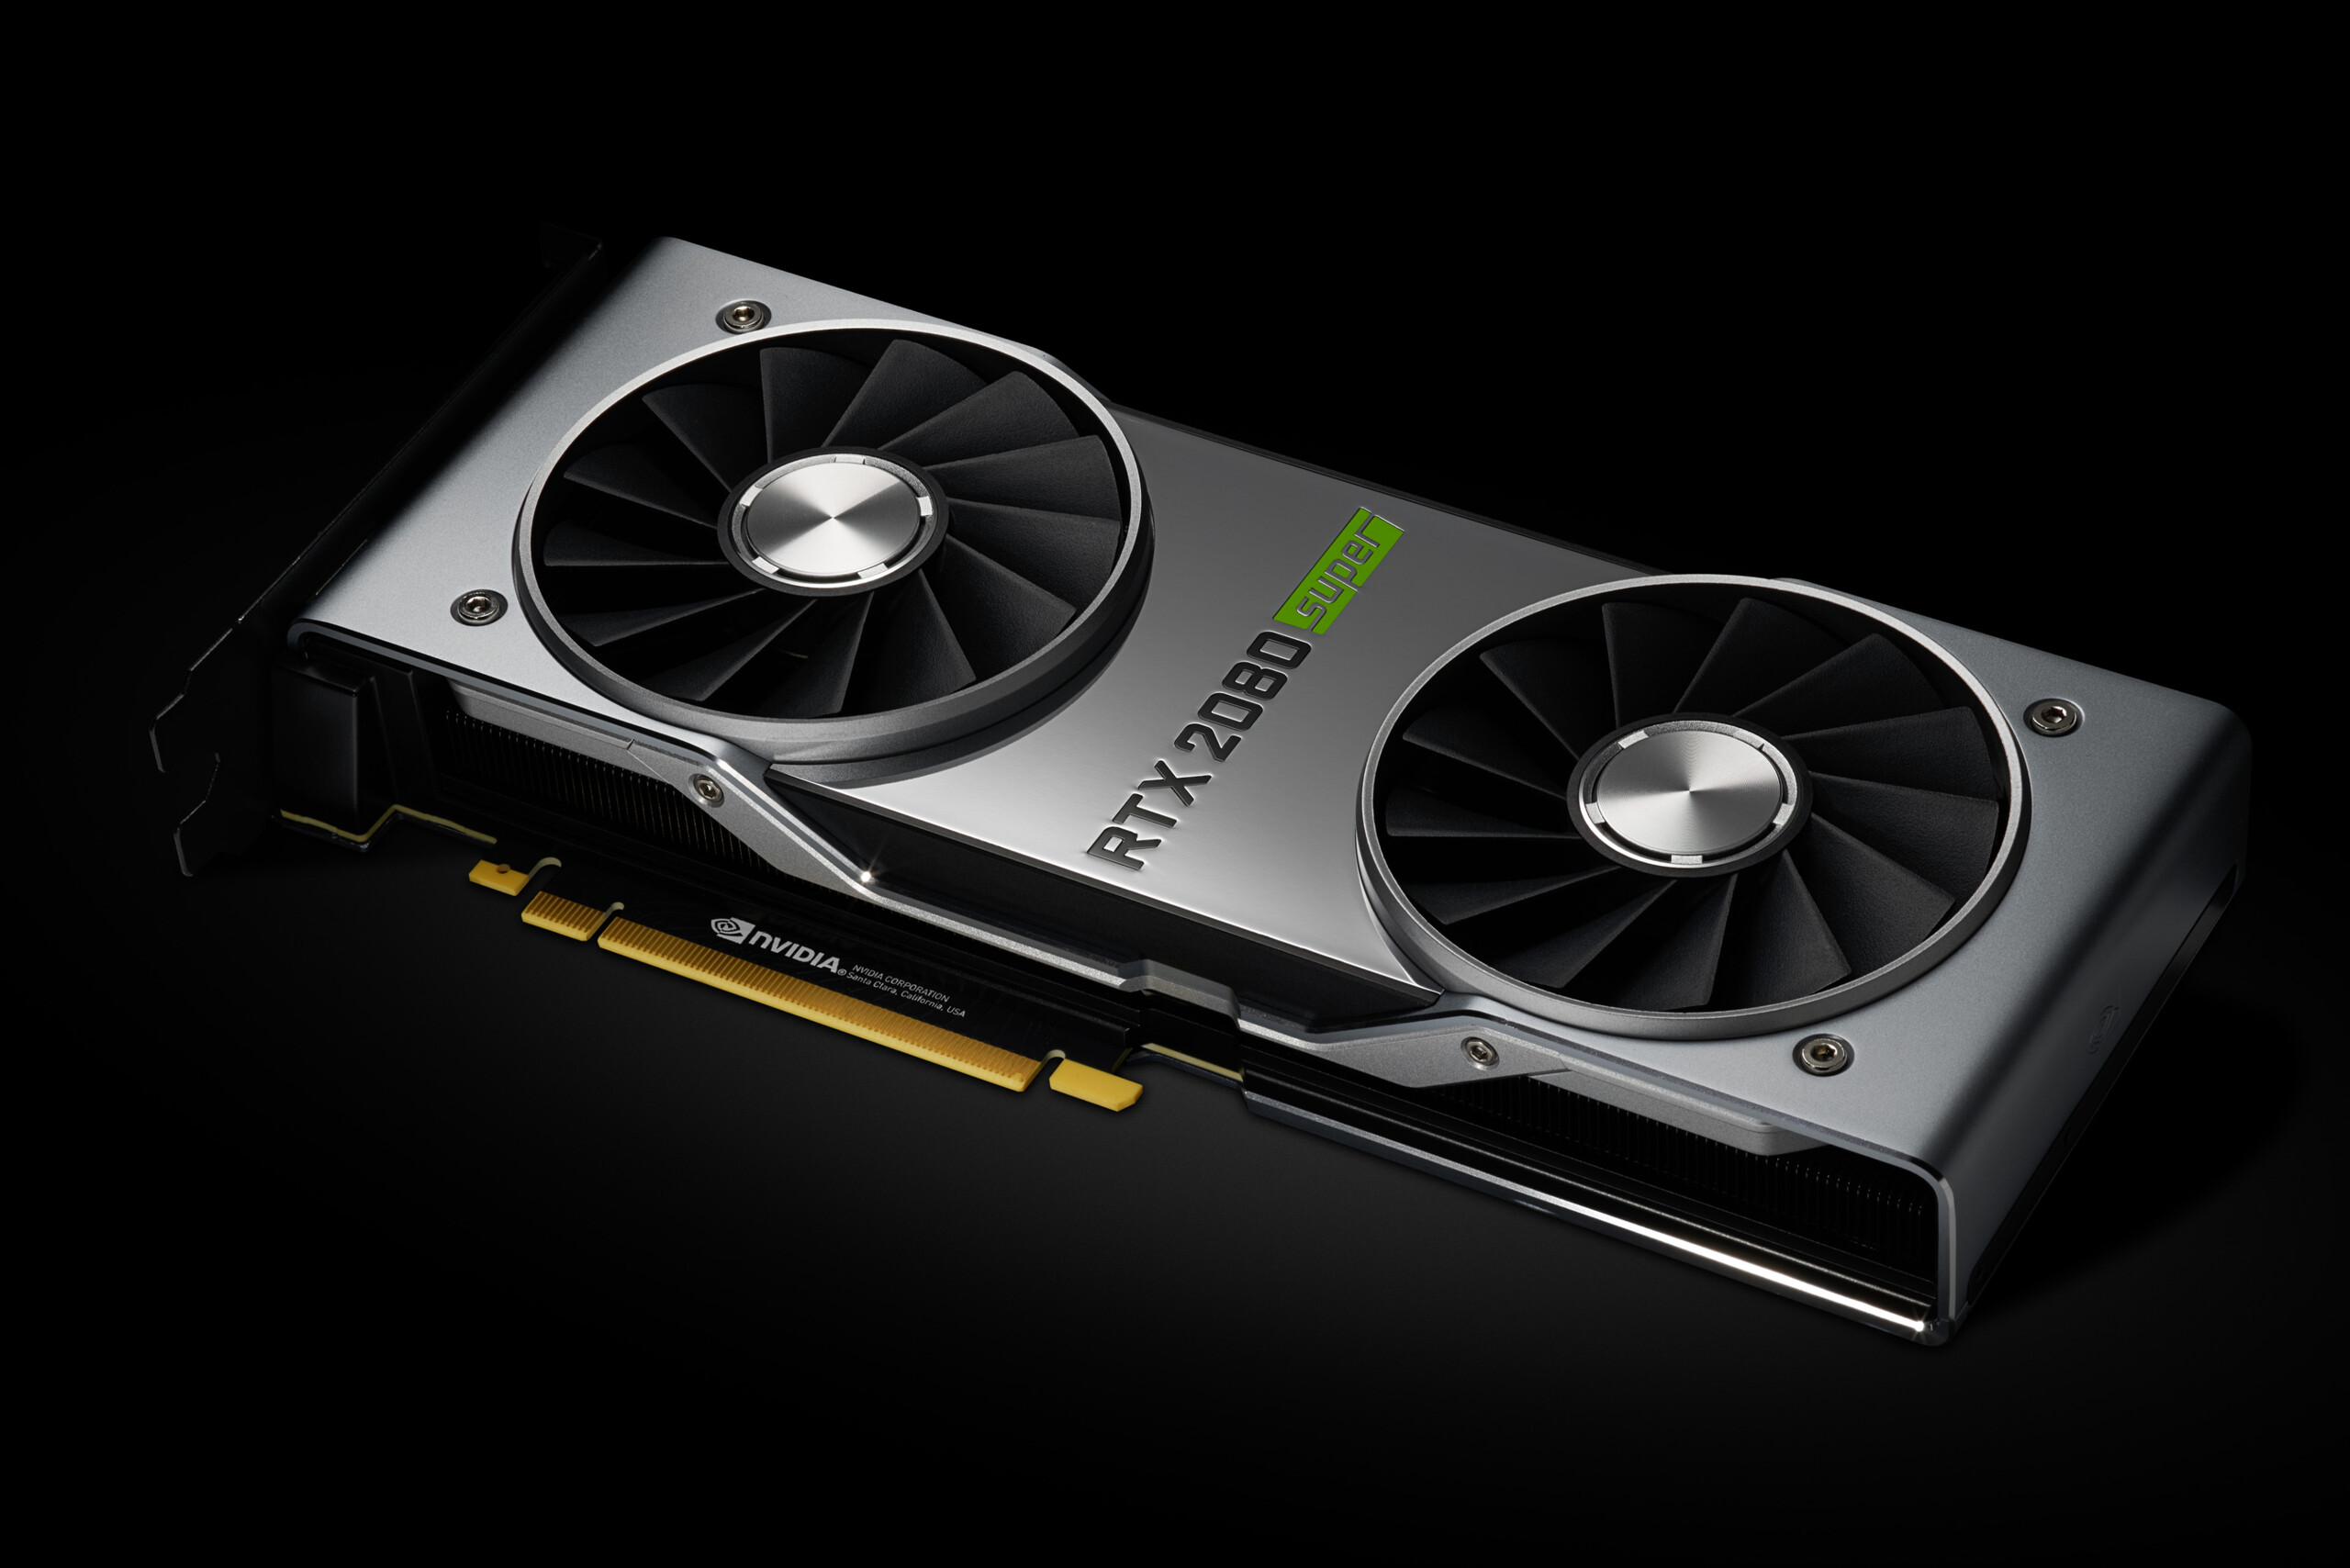
La GeForce RTX 2080 SUPER è l'ultimo aggiornamento che arriva sugli scaffali. L'RTX 2080 SUPER migliora rispetto all'RTX 2080, ma attualmente non c'è motivo sufficiente per la sua esistenza. NVIDIA basa l'RTX 2080 SUPER sul suo chip TU104, lo stesso di quello dell'RTX 2070 SUPER e dell'RTX 2080. Tuttavia, l'RTX 2080 SUPER è la prima GPU ad utilizzare il TU104 al massimo del suo potenziale. La nostra unità di prova è ben costruita e fa la sua figura, con poco impatto estetico per distinguere la serie RTX 20 SUPER. Mentre tutte e tre le GPU TU104 sono dotate di 8 GB di GDDR6 VRAM, NVIDIA ha optato per una variante Samsung più veloce per l'RTX 2080 SUPER, che ha un potenziale di overclocking maggiore rispetto alle VRAM nelle versioni RTX 2070 SUPER e RTX 2080.
Nonostante i miglioramenti nelle prestazioni dell'RTX 2080 FE, l'RTX 2080 SUPER FE non ha potuto superare le prestazioni dell'MSI RTX 2080 Gaming X Trio. Anche l'RTX 2080 SUPER FE è molto potente, con NVIDIA che valuta il suo TDP a 250 W, il che lo pone a 35 W in più rispetto all'RTX 2080 e alla pari con l'RTX 2080 Ti.
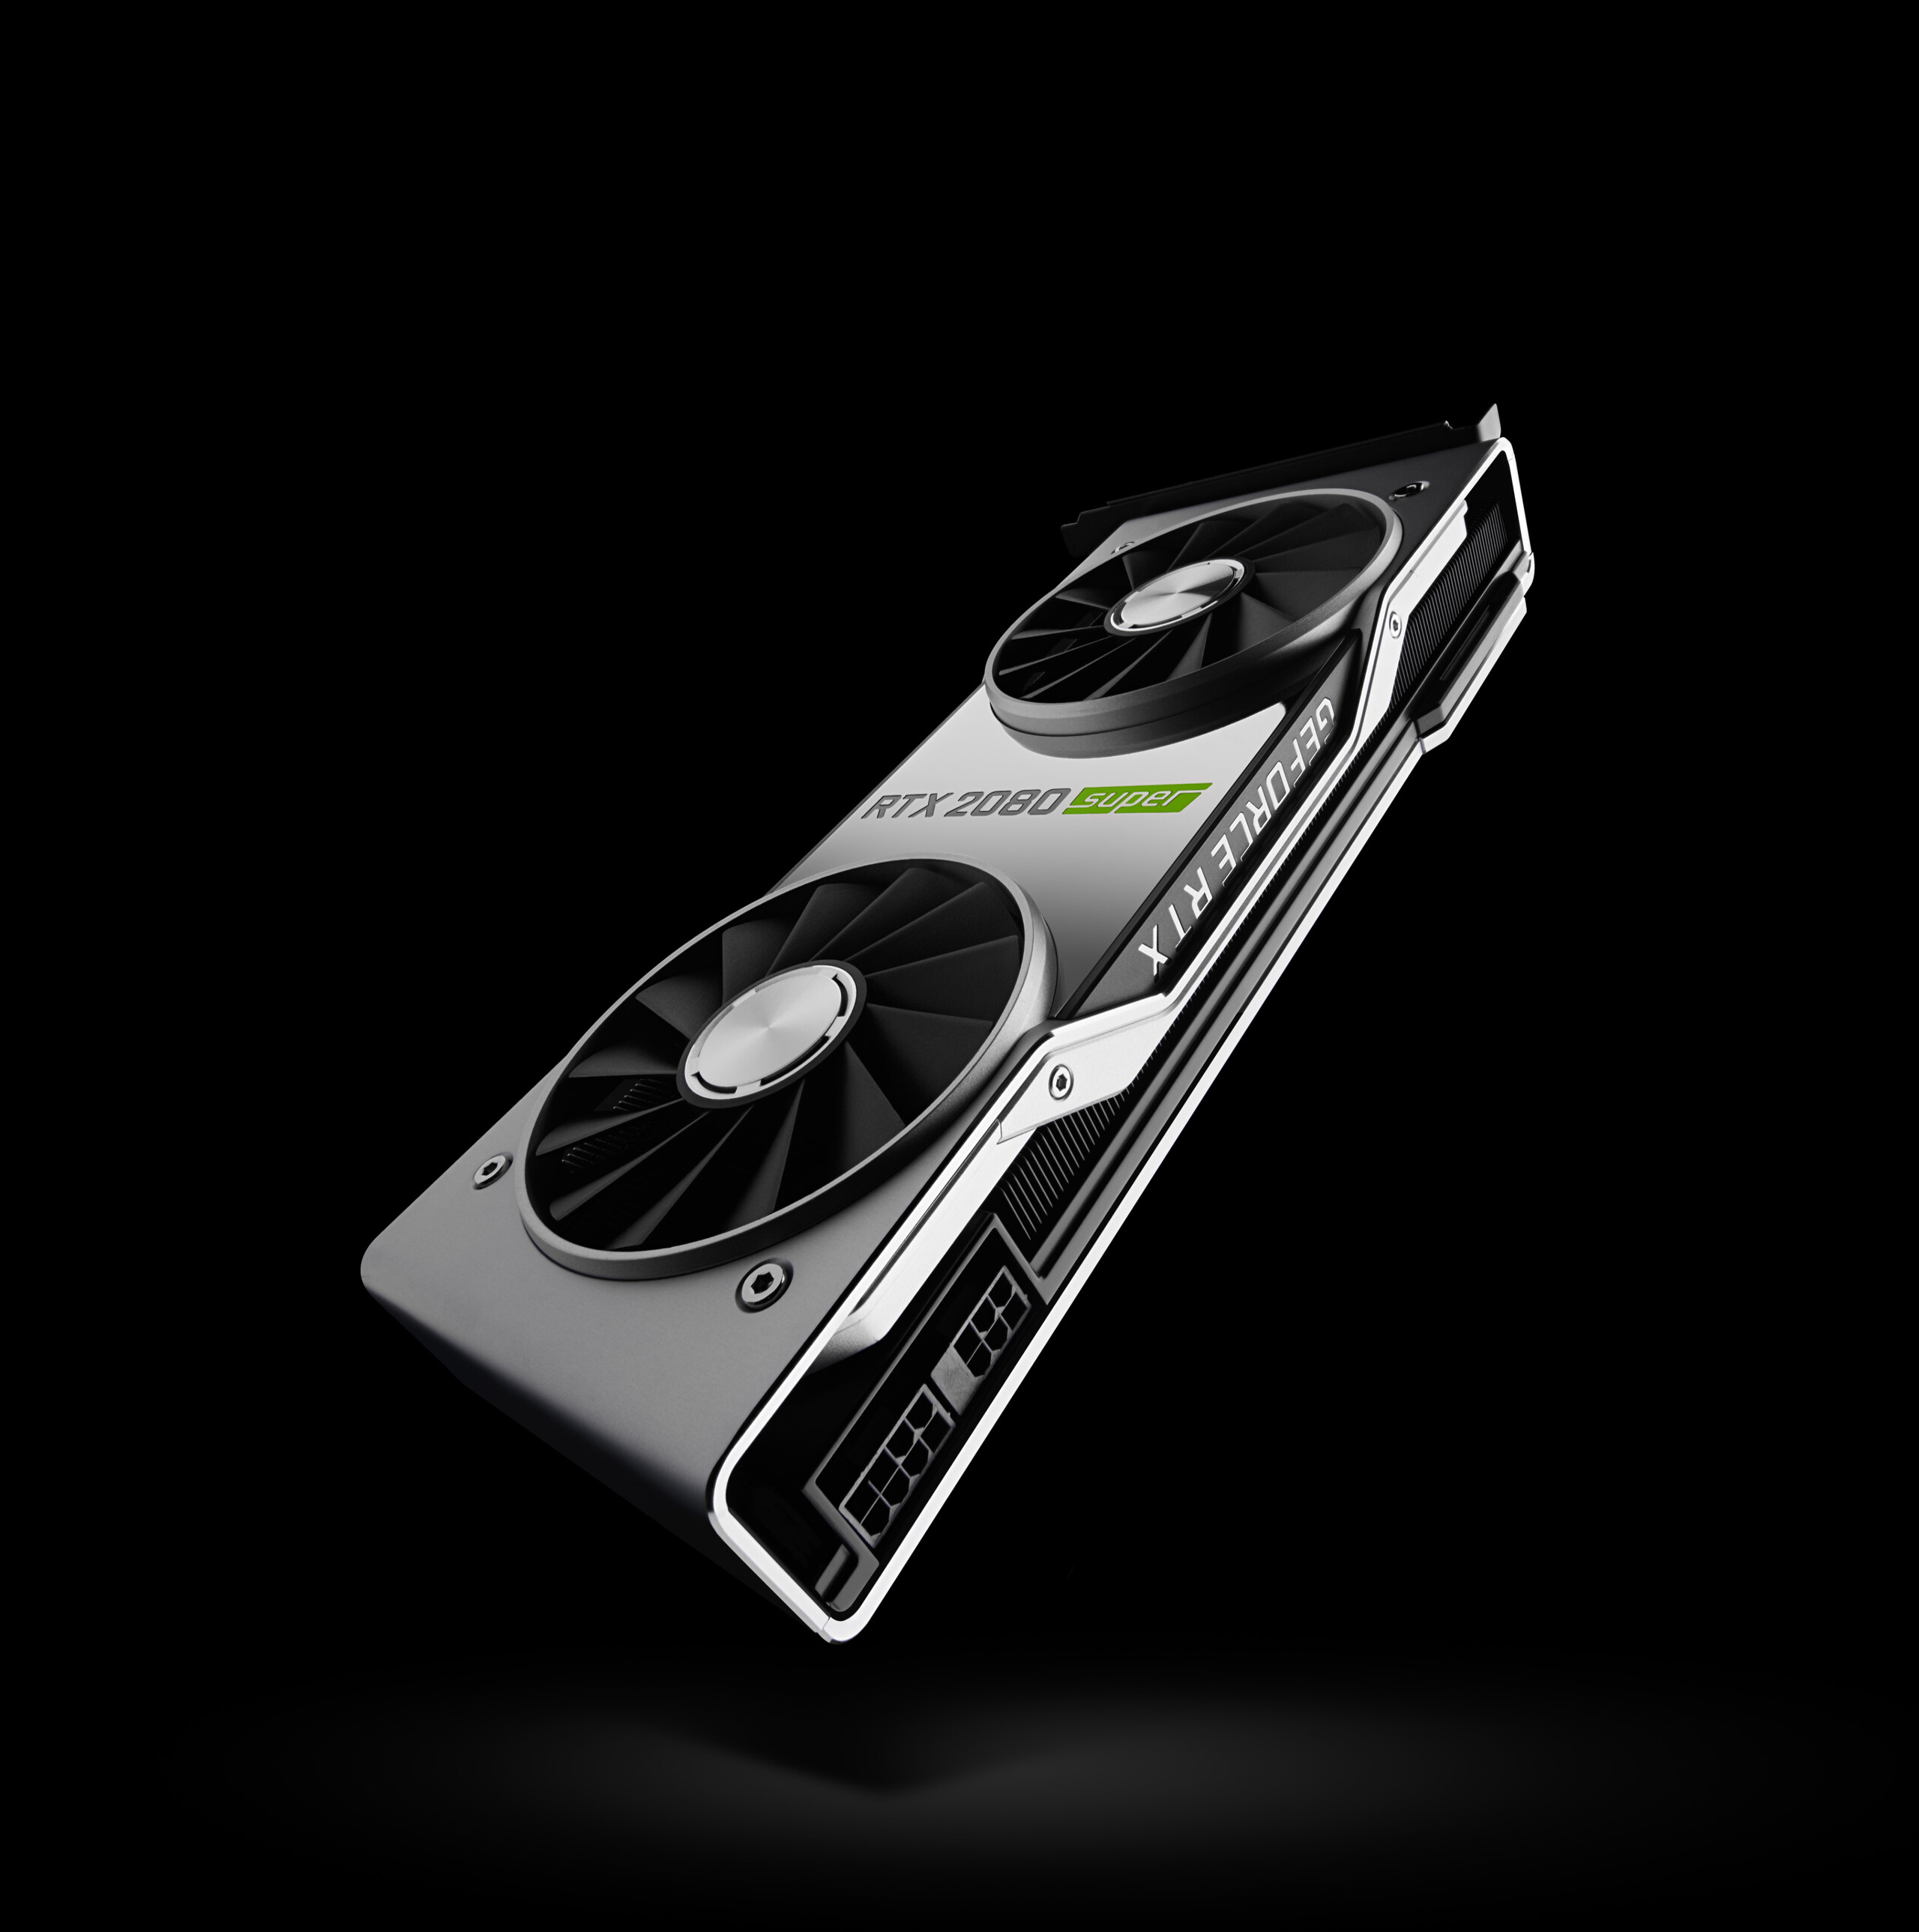
La NVIDIA RTX 2080 SUPER dovrebbe essere la GPU per i giochi desktop di fascia alta a meno di 1.000 dollari. Anche la Founders Edition sembra squisita, ma non offre abbastanza per distinguersi dall'originale RTX 2080 o dall'RTX 2070 SUPER.
L'RTX 2080 SUPER FE è attualmente venduta al dettaglio per 699 dollari ed è un looker per gli standard delle GPU Desktop. Tuttavia, non riusciamo a capire perché NVIDIA mantiene le sue ventole in funzione anche al minimo. Inspiegabilmente, non c'è modo di superare manualmente questa limitazione, che è inaccettabile per una scheda da quasi 700 dollari. Speriamo che gli AIBs di NVIDIA correggano questa situazione con le loro schede personalizzate RTX 2080 SUPER. Anche la RTX 2080 SUPER non è una delle GPU Desktop più silenziose, anche se le schede AMD sono ancora molto più rumorose della RTX 2080 SUPER sotto carico.
Non è immediatamente chiaro a chi è destinato l'RTX 2080 SUPER. La GPU non è in grado di riprodurre tutti i titoli a tripla A in 4K al massimo della grafica, il che non lo rende diverso dall'RTX 2070 SUPER o dall'RTX 2080 in questo senso. Il gioco a 1440p non è un problema anche per nessuna delle schede TU104. Inoltre, ci si aspetta che il prezzo di RTX 2080 SUPER rimanga intorno ai 700 dollari fino a quando AMD sfida l'egemonia di NVIDIA nel mercato di punta delle GPU.
In definitiva, la RTX 2080 SUPER rappresenta la migliore GPU desktop che si possa acquistare senza spendere 1.000 dollari. Tuttavia, è stato possibile ottenere praticamente la stessa esperienza con la RTX 2070 SUPER risparmiando 200 dollari. Allo stesso modo, probabilmente risparmierete un importo comparabile se acquistate un RTX 2080 originale fuori produzione. In breve, la RTX 2080 SUPER è una GPU Desktop eccellente e superflua.
Benchmark
specvp12 sw-03 +
Cinebench R15 OpenGL 64 Bit +
* Numeri più piccoli rappresentano prestazioni supeiori
Benchmarks per i giochi
I seguenti benchmarks deirivano dai benchmarks dei portatili recensiti. Le prestazioni dipendono dalla scheda grafica utilizzata, dal clock rate, dal processore, dai settaggi di sistema, dai drivers, e dai sistemi operativi. Quindi i risultati non sono rappresentativi per i portatili con questa GPU. Per informazioni dettagliate sui risultati del benchmark, cliccate sul numero di fps.

F1 25
2025Monster Hunter Wilds
2025
Marvel Rivals
2024
Black Myth: Wukong
2024
Cyberpunk 2077
2023
Baldur's Gate 3
2023
Company of Heroes 3
2023
Returnal
2023
Hogwarts Legacy
2023

F1 22
2022
Ghostwire Tokyo
2022
Cyberpunk 2077 1.6
2022
GRID Legends
2022
Elden Ring
2022
Dying Light 2
2022
God of War
2022
Halo Infinite
2021
Forza Horizon 5
2021
Riders Republic
2021
Far Cry 6
2021
FIFA 22
2021
F1 2021
2021
Hitman 3
2021
Cyberpunk 2077 1.0
2020
Yakuza Like a Dragon
2020


Dirt 5
2020
Watch Dogs Legion
2020
FIFA 21
2020
Star Wars Squadrons
2020

Serious Sam 4
2020
Crysis Remastered
2020

Horizon Zero Dawn
2020
Death Stranding
2020
F1 2020
2020
Valorant
2020
Gears Tactics
2020
Doom Eternal
2020
Hunt Showdown
2020
Escape from Tarkov
2020


Need for Speed Heat
2019

GRID 2019
2019

FIFA 20
2019
Borderlands 3
2019
Control
2019
F1 2019
2019

Rage 2
2019
Anno 1800
2019
The Division 2
2019
Dirt Rally 2.0
2019
Anthem
2019
Far Cry New Dawn
2019
Metro Exodus
2019
Apex Legends
2019
Just Cause 4
2018
Darksiders III
2018
Battlefield V
2018
Farming Simulator 19
2018
Hitman 2
2018


Forza Horizon 4
2018
FIFA 19
2018

Strange Brigade
2018
F1 2018
2018
Monster Hunter World
2018
The Crew 2
2018
Far Cry 5
2018
World of Tanks enCore
2018
X-Plane 11.11
2018


Fortnite
2018
Call of Duty WWII
2017

Destiny 2
2017

Dirt 4
2017Rocket League
2017For Honor
2017Watch Dogs 2
2016
Dishonored 2
2016
Battlefield 1
2016
Overwatch
2016
Doom
2016
The Division
2016
Far Cry Primal
2016

Rainbow Six Siege
2015Dota 2 Reborn
2015
The Witcher 3
2015
GTA V
2015
Battlefield 4
2013BioShock Infinite
2013| basso | medio | alto | ultra | QHD | 4K | |
|---|---|---|---|---|---|---|
| F1 25 | 206 | 196 | 162.8 | |||
| Monster Hunter Wilds | 53.9 | 40.8 | 31.2 | |||
| Marvel Rivals | 102 | 81 | 73 | 50 | 34 | |
| Black Myth: Wukong | 62 | 47 | 26 | 20 | ||
| Cyberpunk 2077 | 135.1 | 111.3 | 96.9 | 86 | 55 | 24.3 |
| Baldur's Gate 3 | 102.3 | 69.5 | 36.2 | |||
| Company of Heroes 3 | 131 | 101 | 59 | |||
| Returnal | 78 | 57 | 32 | |||
| Hogwarts Legacy | 58.6 | 46.5 | 27.6 | |||
| Call of Duty Modern Warfare 2 2022 | 95 | 89 | 66 | 40 | ||
| F1 22 | 243 | 249 | 117.5 | 65.6 | 43.1 | 21.3 |
| Ghostwire Tokyo | 157.7 | 97 | 52.6 | |||
| Cyberpunk 2077 1.6 | 88.8 | 57.1 | 30.7 | |||
| GRID Legends | 116 | 97.5 | 66.4 | |||
| Elden Ring | 60 | 48.8 | ||||
| Dying Light 2 | 79.3 | 56.2 | 28.9 | |||
| God of War | 68.9 | 60.5 | 40.6 | |||
| Halo Infinite | 108 | 81.2 | 47.2 | |||
| Forza Horizon 5 | 81 | 70 | 49 | |||
| Riders Republic | 117 | 80 | 49 | |||
| Far Cry 6 | 105 | 98.6 | 92 | 87 | 82.3 | 51.5 |
| FIFA 22 | 208 | |||||
| F1 2021 | 231 | 212 | 183 | 114 | 92.3 | 53.5 |
| Hitman 3 | 272 | 197 | 179 | 166 | 115 | 64 |
| Cyberpunk 2077 1.0 | 126 | 95 | 82.6 | 72.1 | 49.1 | 24.1 |
| Yakuza Like a Dragon | 114 | 113 | 116 | 108 | 79.2 | 42.5 |
| Call of Duty Black Ops Cold War | 185 | 134 | 105 | 83 | 64 | 41 |
| Assassin´s Creed Valhalla | 128 | 94 | 79 | 70 | 57 | 36 |
| Dirt 5 | 217 | 139 | 115 | 96.3 | 82.5 | 54.1 |
| Watch Dogs Legion | 117 | 114 | 99.3 | 75.4 | 57.3 | 34.4 |
| FIFA 21 | 228 | 227 | 211 | 210 | 211 | 205 |
| Star Wars Squadrons | 448 | 351 | 307 | 286 | 201 | 119 |
| Mafia Definitive Edition | 152.5 | 130.2 | 118.1 | 88.8 | 48.5 | |
| Serious Sam 4 | 134.4 | 113.6 | 107.7 | 104.6 | 94.2 | 67.7 |
| Crysis Remastered | 248 | 191 | 99.4 | 78.9 | 48.8 | 30.6 |
| Flight Simulator 2020 | 87.3 | 76.2 | 63.1 | 47.2 | 40.2 | 24.9 |
| Horizon Zero Dawn | 158 | 125 | 113 | 95 | 75 | 44 |
| Death Stranding | 189 | 161 | 148 | 146 | 105 | 60.3 |
| F1 2020 | 297 | 254 | 225 | 162 | 127 | 77.2 |
| Valorant | 341 | 301 | 283 | 273 | 262 | |
| Gears Tactics | 323.2 | 228.5 | 151 | 118.5 | 81.6 | 48.7 |
| Doom Eternal | 242 | 223 | 219 | 217 | 163 | 86.8 |
| Hunt Showdown | 254 | 170 | 142 | 96.6 | 46.8 | |
| Escape from Tarkov | 120 | 118 | 117 | 111 | 90.2 | 53.7 |
| Red Dead Redemption 2 | 144 | 126 | 93 | 61 | 50.6 | 33 |
| Star Wars Jedi Fallen Order | 122 | 120 | 118 | 107 | 59.5 | |
| Need for Speed Heat | 114 | 108 | 100 | 92 | 90 | 56.5 |
| Call of Duty Modern Warfare 2019 | 203 | 191 | 163 | 144 | 110 | 65 |
| GRID 2019 | 169 | 148 | 141 | 118 | 99 | 64 |
| Ghost Recon Breakpoint | 158 | 127 | 120 | 90 | 65 | 39 |
| FIFA 20 | 269 | 267 | 254 | 253 | 252 | 242 |
| Borderlands 3 | 150.3 | 131.9 | 108.2 | 91 | 65.5 | 35.9 |
| Control | 240 | 124 | 95 | 62 | 30.4 | |
| F1 2019 | 207 | 191 | 157 | 157 | 131 | 82 |
| Total War: Three Kingdoms | 234.4 | 149.2 | 118.5 | 91 | 63 | 32 |
| Rage 2 | 229 | 157 | 136 | 135 | 91 | 47 |
| Anno 1800 | 90 | 88 | 70 | 42 | 39 | 35 |
| The Division 2 | 182 | 150 | 129 | 106 | 79 | 44 |
| Dirt Rally 2.0 | 235 | 186 | 179 | 129 | 100 | 61 |
| Anthem | 105 | 103 | 100 | 95 | 87 | 55.5 |
| Far Cry New Dawn | 111 | 98 | 95 | 93 | 90 | 63 |
| Metro Exodus | 125 | 109 | 90 | 79 | 63 | 40 |
| Apex Legends | 144 | 144 | 144 | 144 | 143 | 89 |
| Just Cause 4 | 194 | 170 | 132 | 124 | 93 | 53.4 |
| Darksiders III | 210 | 136 | 131 | 124 | 104 | 55.3 |
| Battlefield V | 146 | 122 | 110 | 131 | 108 | 68 |
| Farming Simulator 19 | 191 | 151 | 122 | 117 | 122 | 85 |
| Hitman 2 | 92 | 90 | 81 | 79 | 79 | 68 |
| Call of Duty Black Ops 4 | 228 | 194 | 191 | 173 | 134 | 62 |
| Assassin´s Creed Odyssey | 108 | 99 | 87 | 68 | 58 | 41 |
| Forza Horizon 4 | 168 | 143 | 142 | 133 | 117 | 81 |
| FIFA 19 | 271 | 266 | 258 | 253 | 249 | 197 |
| Shadow of the Tomb Raider | 125 | 116 | 115 | 114 | 92 | 49 |
| Strange Brigade | 445 | 277 | 225 | 189 | 141 | 82 |
| F1 2018 | 219 | 198 | 151 | 133 | 120 | 74 |
| Monster Hunter World | 141 | 135 | 134 | 114 | 76 | 37.6 |
| The Crew 2 | 60 | 60 | 60 | 60 | 60 | 60 |
| Far Cry 5 | 120 | 109 | 105 | 106 | 100 | 61 |
| World of Tanks enCore | 222 | 160 | 78 | |||
| X-Plane 11.11 | 126 | 114 | 94 | 70 | ||
| Kingdom Come: Deliverance | 160 | 141 | 112 | 79 | 70 | 39.5 |
| Final Fantasy XV Benchmark | 159 | 130 | 101 | 47 | ||
| Fortnite | 297 | 253 | 185 | 180 | 127 | 64 |
| Call of Duty WWII | 235 | 234 | 173 | 154 | 137 | 88 |
| Assassin´s Creed Origins | 108 | 97 | 94 | 82 | 76 | 53 |
| Destiny 2 | 151 | 150 | 149 | 148 | 133 | 74 |
| Middle-earth: Shadow of War | 131 | 60 | ||||
| Playerunknown's Battlegrounds (PUBG) | 202 | 173 | 168 | 159 | 68 | |
| Dirt 4 | 289 | 226 | 197 | 161 | 102 | |
| Rocket League | 249 | 247 | 248 | 171 | ||
| Ghost Recon Wildlands | 151.9 | 122 | 118.7 | 74.8 | 54.9 | |
| For Honor | 292.2 | 222.8 | 214.8 | 169.8 | 78.8 | |
| Watch Dogs 2 | 121 | 111 | 105 | 87 | 56.6 | |
| Dishonored 2 | 119 | 118 | 116 | 112 | 85 | |
| Battlefield 1 | 193 | 178 | 165 | 152 | 93 | |
| Deus Ex Mankind Divided | 146.5 | 138.7 | 120.5 | 86 | 55 | |
| Overwatch | 300 | 300 | 300 | 267 | 152 | |
| Doom | 178 | 144 | 141 | 134 | 114 | |
| The Division | 189 | 174.5 | 149.1 | 132.1 | 69.7 | |
| Far Cry Primal | 119 | 106 | 97 | 90 | 74 | |
| Rise of the Tomb Raider | 252 | 183 | 176 | 165 | 79 | |
| Rainbow Six Siege | 296.8 | 255.6 | 245.1 | 236.1 | 150 | |
| Dota 2 Reborn | 156 | 142 | 138 | 129 | 116 | |
| The Witcher 3 | 295 | 259 | 195 | 109 | 79 | |
| GTA V | 169 | 162 | 141 | 84 | 115 | |
| Battlefield 4 | 200 | 200 | 200 | 191 | 126 | |
| BioShock Infinite | 305 | 270 | 252 | 196 | ||
| basso | medio | alto | ultra | QHD | 4K | < 30 fps < 60 fps < 120 fps ≥ 120 fps | 15 72 | 1 26 63 | 1 41 49 | 1 5 51 39 | 1 16 48 17 | 6 47 40 9 |
Per conoscere altri giochi che potrebbero essere utilizzabili e per una lista completa di tutti i giochi e delle schede grafiche visitate la nostra Gaming List
