Notebookcheck Logo

NVIDIA GeForce GTX 980 Ti

NVIDIA GeForce GTX 980 Ti

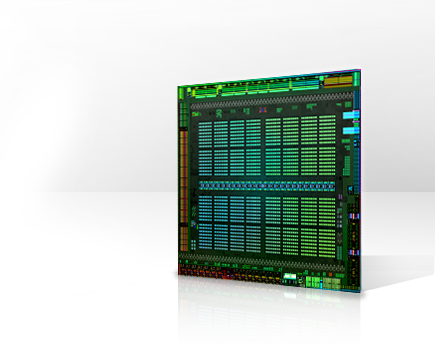
La Nvidia GeForce GTX 980 Ti è una scheda grafica High-End desktop basata sull'architettura Maxwell. Utilizza il grande chip GM200 con 2,816 CUDA cores (versus 2048 della GTX 980) ed è realizzato in 28 nm. Insieme alla NVidia Titan X (che utilizza lo stesso chip con più memoria grafica), la 980Ti era la scheda grafica single chip più veloce per desktops nel 2015. Nel 2016 le nuove Pascal based GeForce GTX 1070 e 1080 tuttavia sono state più veloci ed utilizzano meno energia grazie alla nuova architettura ed al processo in 16 nm.

GeForce GTX 900 Serie

GeForce GTX 980 SLI (Laptop) 4096 @ 1.13 - 1.23 GHz256 Bit @ 3500 MHz
GeForce GTX 980 Ti 2816 @ 1 - 1.2 GHz256 Bit @ 7000 MHz
GeForce GTX 980 2048 @ 1.13 - 1.22 GHz256 Bit @ 3500 MHz
GeForce GTX 980 (Laptop) 2048 @ 1.13 - 1.23 GHz256 Bit @ 3500 MHz
GeForce GTX 970 1664 @ 1.05 - 1.18 GHz224 + 32 Bit @ 3500 MHz
GeForce GTX 960 1024 @ 1.13 - 1.18 GHz128 Bit @ 3500 MHz
GeForce GTX 950 768 @ 1.02 - 1.19 GHz128 Bit @ 3300 MHz
Nome in codiceGM200
ArchitetturaMaxwell
Pipelines2816 - unified
Velocità del core1000 - 1200 (Boost) MHz
Velocità della memoria7000 MHz
Larghezza del bus di memoria256 Bit
Tipo di memoriaGDDR5
Max. quantità di memoria6 GB
Memoria condivisano
APIDirectX 12_1, OpenGL 4.5
Consumo di corrente250 Watt
Transistor Count8 Billion
tecnologia28 nm
CaratteristicheCUDA, 3D Vision, PhysX, GeForce Experience, Surround, GameStream, GPU Boost 2.0, Adaptive Vertical Sync, G-SYNC, SLI
Data dell'annuncio02.06.2015
Link alla pagina del produttorewww.nvidia.de

Benchmark

3DMark - 3DMark Time Spy Score
5026 Points (14%)
3DMark - 3DMark Time Spy Graphics
5058 Points (13%)
3DMark - 3DMark Ice Storm Unlimited Graphics
443119 Points (50%)
3DMark 11 - 3DM11 Performance Score
18303 Points (25%)
3DMark Vantage
3DM Vant. Perf. total +
3DM Vant. Perf. GPU no PhysX +
3DMark Vantage - 3DM Vant. Perf. GPU no PhysX
58633 Points (33%)
3DMark 06 3DMark 06 - Standard 1280x1024 +
3DMark 06
37454 Points (49%)
SPECviewperf 12
specvp12 sw-03 +
specvp12 snx-02 +
specvp12 showcase-01 +
specvp12 mediacal-01 +
specvp12 maya-04 +
SPECviewperf 12 - specvp12 maya-04
138.6 fps (38%)
specvp12 energy-01 +
SPECviewperf 12 - specvp12 energy-01
3.8 fps (3%)
specvp12 creo-01 +
SPECviewperf 12 - specvp12 creo-01
44.5 fps (18%)
specvp12 catia-04 +
SPECviewperf 12 - specvp12 catia-04
72.1 fps (12%)
GFXBench - GFXBench Car Chase Offscreen
279 fps (31%)
GFXBench 3.1 - GFXBench Manhattan ES 3.1 Offscreen
254 fps (5%)
GFXBench 3.0 - GFXBench 3.0 Manhattan Offscreen
481 fps (28%)
GFXBench (DX / GLBenchmark) 2.7
GFXBench T-Rex HD Offscreen C24Z16 +
GFXBench (DX / GLBenchmark) 2.7 - GFXBench T-Rex HD Offscreen C24Z16
1131 fps (9%)
LuxMark v2.0 64Bit - LuxMark v2.0 Room GPU
2490 Samples/s (11%)
LuxMark v2.0 64Bit - LuxMark v2.0 Sala GPU
3919 Samples/s (7%)
ComputeMark v2.1 - ComputeMark v2.1 Result
12373 punti (13%)
- Valori di benchmark per questa scheda grafica
- Valori medi di benchmark per questa scheda grafica
* Numeri più piccoli rappresentano prestazioni supeiori

Benchmarks per i giochi

I seguenti benchmarks deirivano dai benchmarks dei portatili recensiti. Le prestazioni dipendono dalla scheda grafica utilizzata, dal clock rate, dal processore, dai settaggi di sistema, dai drivers, e dai sistemi operativi. Quindi i risultati non sono rappresentativi per i portatili con questa GPU. Per informazioni dettagliate sui risultati del benchmark, cliccate sul numero di fps.

ultra 1920x1080
76  fps    + Confronta
QHD 2560x1440
54.2  fps    + Confronta
4K 3840x2160
31.5  fps    + Confronta
» Giocabile con tutti i portatili testati con dettagli ultra.
ultra 1920x1080
53.3  fps    + Confronta
QHD 2560x1440
37.5  fps    + Confronta
4K 3840x2160
20.2  fps    + Confronta
» Giocabile con tutti i portatili testati con dettagli ultra.
Control

Control

2019
alto 1920x1080
52.1  fps    + Confronta
QHD 2560x1440
33.6  fps    + Confronta
4K 3840x2160
16.4  fps    + Confronta
» Giocabile con tutti i portatili testati con dettagli alto.
ultra 1920x1080
67  fps    + Confronta
QHD 2560x1440
50.3  fps    + Confronta
4K 3840x2160
31.3  fps    + Confronta
» Giocabile con tutti i portatili testati con dettagli ultra.
ultra 1920x1080
97  fps    + Confronta
QHD 2560x1440
66  fps    + Confronta
4K 3840x2160
34.6  fps    + Confronta
» Giocabile con tutti i portatili testati con dettagli ultra.
ultra 1920x1080
72  fps    + Confronta
4K 3840x2160
28.9  fps    + Confronta
» Giocabile con tutti i portatili testati con dettagli ultra.
ultra 1920x1080
98  fps    + Confronta
4K 3840x2160
33.1  fps    + Confronta
» Giocabile con tutti i portatili testati con dettagli ultra.
ultra 1920x1080
94  fps    + Confronta
4K 3840x2160
40.2  fps    + Confronta
» Giocabile con tutti i portatili testati con dettagli ultra.
ultra 1920x1080
133  fps    + Confronta
4K 3840x2160
52.2  fps    + Confronta
» Giocabile con tutti i portatili testati con dettagli ultra.
4K 3840x2160
41.2  fps    + Confronta
Hitman 2

Hitman 2

2018
ultra 1920x1080
73  fps    + Confronta
4K 3840x2160
29.7  fps    + Confronta
» Giocabile con tutti i portatili testati con dettagli ultra.
ultra 1920x1080
93  fps    + Confronta
4K 3840x2160
30.4  fps    + Confronta
» Giocabile con tutti i portatili testati con dettagli ultra.
ultra 1920x1080
46  fps    + Confronta
4K 3840x2160
18  fps    + Confronta
» Giocabile con tutti i portatili testati con dettagli ultra.
ultra 1920x1080
72  fps    + Confronta
4K 3840x2160
42  fps    + Confronta
» Giocabile con tutti i portatili testati con dettagli ultra.
ultra 1920x1080
65  fps    + Confronta
4K 3840x2160
23  fps    + Confronta
» Giocabile con tutti i portatili testati con dettagli ultra.
F1 2018

F1 2018

2018
ultra 1920x1080
82  fps    + Confronta
4K 3840x2160
42  fps    + Confronta
» Giocabile con tutti i portatili testati con dettagli ultra.
Far Cry 5

Far Cry 5

2018
ultra 1920x1080
77  fps    + Confronta
4K 3840x2160
30  fps    + Confronta
» Giocabile con tutti i portatili testati con dettagli ultra.
basso 1280x720
136  fps    + Confronta
medio 1920x1080
78  fps    + Confronta
alto 1920x1080
55.1 58.4 ~ 57 fps    + Confronta
4K 3840x2160
24.8 26.1 ~ 25 fps    + Confronta
» Giocabile con tutti i portatili testati con dettagli alto.
Fortnite

Fortnite

2018
ultra 1920x1080
88  fps    + Confronta
4K 3840x2160
32  fps    + Confronta
» Giocabile con tutti i portatili testati con dettagli ultra.
ultra 1920x1080
60  fps    + Confronta
4K 3840x2160
28  fps    + Confronta
» Giocabile con tutti i portatili testati con dettagli ultra.
ultra 1920x1080
68  fps    + Confronta
4K 3840x2160
29  fps    + Confronta
» Giocabile con tutti i portatili testati con dettagli ultra.
ultra 1920x1080
71.5  fps    + Confronta
4K 3840x2160
26.1  fps    + Confronta
» Giocabile con tutti i portatili testati con dettagli ultra.
4K 3820x2160
151  fps    + Confronta
alto 1920x1080
76  fps    + Confronta
ultra 1920x1080
70.3  fps    + Confronta
4K 3840x2160
32.5  fps    + Confronta
» Giocabile con tutti i portatili testati con dettagli ultra.
basso 1280x720
156  fps    + Confronta
medio 1920x1080
88  fps    + Confronta
alto 1920x1080
82  fps    + Confronta
ultra 1920x1080
48.6  fps    + Confronta
4K 3840x2160
32.8  fps    + Confronta
» Giocabile con tutti i portatili testati con dettagli ultra.
For Honor

For Honor

2017
basso 1280x720
293  fps    + Confronta
medio 1920x1080
158  fps    + Confronta
alto 1920x1080
148  fps    + Confronta
ultra 1920x1080
108  fps    + Confronta
4K 3840x2160
47.7  fps    + Confronta
» Giocabile con tutti i portatili testati con dettagli ultra.
Additional Benchmarks
Medium Preset 4xAF TAA 1366x768
241
Extreme Preset 16xAF TAA 3840x2160
33.2
4K 3840x2160
46.7  fps    + Confronta
ultra 1920x1080
55.5  fps    + Confronta
4K 3840x2160
33.9  fps    + Confronta
» Giocabile con tutti i portatili testati con dettagli ultra.
ultra 1920x1080
72  fps    + Confronta
4K 3840x2160
36.9  fps    + Confronta
» Giocabile con tutti i portatili testati con dettagli ultra.
ultra 1920x1080
104  fps    + Confronta
4K 3840x2160
59.6  fps    + Confronta
» Giocabile con tutti i portatili testati con dettagli ultra.
Additional Benchmarks
Ultra / On T2X SMAA 3840x2160
51.6
ultra 1920x1080
116  fps    + Confronta
4K 3840x2160
62  fps    + Confronta
» Giocabile con tutti i portatili testati con dettagli ultra.
4K 3840x2160
117  fps    + Confronta
ultra 1920x1080
115  fps    + Confronta
4K 3840x2160
55.1  fps    + Confronta
» Giocabile con tutti i portatili testati con dettagli ultra.
ultra 1920x1080
87  fps    + Confronta
4K 3840x2160
78  fps    + Confronta
» Giocabile con tutti i portatili testati con dettagli ultra.
Mafia 3

Mafia 3

2016
alto 1920x1080
47.1  fps    + Confronta
4K 3840x2160
21.2  fps    + Confronta
» Giocabile con tutti i portatili testati con dettagli alto.
FIFA 17

FIFA 17

2016
ultra 1920x1080
345  fps    + Confronta
4K 3840x2160
158  fps    + Confronta
» Giocabile con tutti i portatili testati con dettagli ultra.
alto 1920x1080
72  fps    + Confronta
ultra 1920x1080
41.2  fps    + Confronta
4K 3840x2160
24.8  fps    + Confronta
» Giocabile con tutti i portatili testati con dettagli ultra.
alto 1920x1080
102  fps    + Confronta
ultra 1920x1080
49.3  fps    + Confronta
4K 3840x2160
46.7  fps    + Confronta
» Giocabile con tutti i portatili testati con dettagli ultra.
alto 1920x1080
105  fps    + Confronta
ultra 1920x1080
95  fps    + Confronta
4K 3840x2160
38.3  fps    + Confronta
» Giocabile con tutti i portatili testati con dettagli ultra.
Overwatch

Overwatch

2016
alto 1920x1080
256  fps    + Confronta
ultra 1920x1080
154  fps    + Confronta
4K 3840x2160
87  fps    + Confronta
» Giocabile con tutti i portatili testati con dettagli ultra.
Doom

Doom

2016
basso 1280x720
173  fps    + Confronta
medio 1366x768
176  fps    + Confronta
alto 1920x1080
134  fps    + Confronta
ultra 1920x1080
127  fps    + Confronta
4K 3840x2160
46  fps    + Confronta
» Giocabile con tutti i portatili testati con dettagli ultra.
Additional Benchmarks
Medium Preset 1920x1080
147
medio 1920x1080
76  fps    + Confronta
alto 1920x1080
74  fps    + Confronta
4K 3840x2160
31.2  fps    + Confronta
» Giocabile con tutti i portatili testati con dettagli alto.
Additional Benchmarks
extreme 3840x2160
38.5
ultra 1920x1080
90  fps    + Confronta
4K 3840x2160
48  fps    + Confronta
» Giocabile con tutti i portatili testati con dettagli ultra.
alto 1920x1080
77  fps    + Confronta
ultra 1920x1080
70  fps    + Confronta
4K 3840x2160
32.6  fps    + Confronta
» Giocabile con tutti i portatili testati con dettagli ultra.
basso 1280x720
240  fps    + Confronta
medio 1366x768
173  fps    + Confronta
alto 1920x1080
96  fps    + Confronta
ultra 1920x1080
76  fps    + Confronta
4K 3840x2160
39.8  fps    + Confronta
» Giocabile con tutti i portatili testati con dettagli ultra.
basso 1280x720
154  fps    + Confronta
medio 1920x1080
126  fps    + Confronta
alto 1920x1080
112  fps    + Confronta
ultra 1920x1080
83  fps    + Confronta
4K 3840x2160
40  fps    + Confronta
» Giocabile con tutti i portatili testati con dettagli ultra.
XCOM 2

XCOM 2

2016
medio 1920x1080
103  fps    + Confronta
alto 1920x1080
85  fps    + Confronta
ultra 1920x1080
41.2  fps    + Confronta
4K 3840x2160
25  fps    + Confronta
» Giocabile con tutti i portatili testati con dettagli ultra.
basso 1024x768
224  fps    + Confronta
medio 1366x768
163  fps    + Confronta
alto 1920x1080
103  fps    + Confronta
ultra 1920x1080
88  fps    + Confronta
4K 3840x2160
40.6  fps    + Confronta
» Giocabile con tutti i portatili testati con dettagli ultra.
basso 1024x768
321  fps    + Confronta
medio 1366x768
275  fps    + Confronta
alto 1920x1080
192  fps    + Confronta
ultra 1920x1080
164  fps    + Confronta
4K 3840x2160
67  fps    + Confronta
» Giocabile con tutti i portatili testati con dettagli ultra.
basso 1024x768
166  fps    + Confronta
medio 1366x768
153  fps    + Confronta
alto 1920x1080
116  fps    + Confronta
ultra 1920x1080
103  fps    + Confronta
4K 3840x2160
48  fps    + Confronta
» Giocabile con tutti i portatili testati con dettagli ultra.
ultra 1920x1080
134  fps    + Confronta
4K 3840x2160
53  fps    + Confronta
» Giocabile con tutti i portatili testati con dettagli ultra.
ultra 1920x1080
46.3  fps    + Confronta
4K 3840x2160
37.4  fps    + Confronta
» Giocabile con tutti i portatili testati con dettagli ultra.
Fallout 4

Fallout 4

2015
ultra 1920x1080
106  fps    + Confronta
4K 3840x2160
46  fps    + Confronta
» Giocabile con tutti i portatili testati con dettagli ultra.
ultra 1920x1080
117  fps    + Confronta
4K 3840x2160
47.5  fps    + Confronta
» Giocabile con tutti i portatili testati con dettagli ultra.
Anno 2205

Anno 2205

2015
ultra 1920x1080
43.9  fps    + Confronta
4K 3840x2160
52.2  fps    + Confronta
» Giocabile con tutti i portatili testati con dettagli ultra.
FIFA 16

FIFA 16

2015
4K 3840x2160
162  fps    + Confronta
ultra 1920x1080
162  fps    + Confronta
4K 3840 x 2160
87  fps    + Confronta
» Giocabile con tutti i portatili testati con dettagli ultra.
Mad Max

Mad Max

2015
medio 1366x768
306  fps    + Confronta
alto 1920x1080
197  fps    + Confronta
ultra 1920x1080
180  fps    + Confronta
4K 3840x2160
65  fps    + Confronta
» Giocabile con tutti i portatili testati con dettagli ultra.
4K 3840x2160
132  fps    + Confronta
ultra 1920x1080
59.3  fps    + Confronta
4K 3840x2160
44  fps    + Confronta
» Giocabile con tutti i portatili testati con dettagli ultra.
alto 1920x1080
155  fps    + Confronta
ultra 1920x1080
137  fps    + Confronta
4K 3840x2160
109  fps    + Confronta
» Giocabile con tutti i portatili testati con dettagli ultra.
GTA V

GTA V

2015
ultra 1920x1080
68  fps    + Confronta
4K 3840x2160
79  fps    + Confronta
» Giocabile con tutti i portatili testati con dettagli ultra.
ultra 1920x1080
116  fps    + Confronta
» Giocabile con tutti i portatili testati con dettagli ultra.
ultra 1920x1080
100  fps    + Confronta
» Giocabile con tutti i portatili testati con dettagli ultra.
ultra 1920x1080
136  fps    + Confronta
4K 3840x2160
70  fps    + Confronta
» Giocabile con tutti i portatili testati con dettagli ultra.
basso 1024x768
169  fps    + Confronta
medio 1366x768
165  fps    + Confronta
alto 1366x768
160  fps    + Confronta
ultra 1920x1080
119  fps    + Confronta
» Giocabile con tutti i portatili testati con dettagli ultra.
ultra 1920x1080
160  fps    + Confronta
» Giocabile con tutti i portatili testati con dettagli ultra.
ultra 1920x1080
219  fps    + Confronta
» Giocabile con tutti i portatili testati con dettagli ultra.
Crysis 3

Crysis 3

2013
ultra 1920x1080
81  fps    + Confronta
» Giocabile con tutti i portatili testati con dettagli ultra.
bassomedioaltoultraQHD4K
Call of Duty Modern Warfare 20197654.231.5
Borderlands 353.337.520.2
Control52.133.616.4
Dirt Rally 2.06750.331.3
Apex Legends976634.6
Just Cause 47228.9
Darksiders III9833.1
Battlefield V9440.2
Farming Simulator 1913352.2
Fallout 7641.2
Hitman 27329.7
Call of Duty Black Ops 49330.4
Assassin´s Creed Odyssey4618
Forza Horizon 47242
Shadow of the Tomb Raider6523
F1 20188242
Far Cry 57730
Final Fantasy XV Benchmark136785725
Fortnite8832
Assassin´s Creed Origins6028
Middle-earth: Shadow of War6829
Playerunknown's Battlegrounds (PUBG)71.526.1
Team Fortress 2151
Mass Effect Andromeda7670.332.5
Ghost Recon Wildlands156888248.632.8
For Honor29315814810847.7
Resident Evil 746.7
Watch Dogs 255.533.9
Dishonored 27236.9
Call of Duty Infinite Warfare10459.6
Titanfall 211662
Farming Simulator 17117
Battlefield 111555.1
Civilization VI8778
Mafia 347.121.2
FIFA 17345158
Deus Ex Mankind Divided7241.224.8
No Man's Sky10249.346.7
Mirror's Edge Catalyst1059538.3
Overwatch25615487
Doom17317613412746
Ashes of the Singularity767431.2
Need for Speed 20169048
Hitman 2016777032.6
The Division240173967639.8
Far Cry Primal1541261128340
XCOM 21038541.225
Rise of the Tomb Raider2241631038840.6
Rainbow Six Siege32127519216467
Just Cause 316615311610348
Star Wars Battlefront13453
Assassin's Creed Syndicate46.337.4
Fallout 410646
Call of Duty: Black Ops 311747.5
Anno 220543.952.2
FIFA 16162
World of Warships16287
Mad Max30619718065
Dota 2 Reborn132
The Witcher 359.344
Dirt Rally155137109
GTA V6879
Battlefield Hardline116
Dragon Age: Inquisition100
Battlefield 413670
Metro: Last Light169165160119
BioShock Infinite160
Tomb Raider219
Crysis 381
< 30 fps
< 60 fps
< 120 fps
≥ 120 fps


10


4
9

3
12
7

10
37
12

4
1
13
36
10
4

Per conoscere altri giochi che potrebbero essere utilizzabili e per una lista completa di tutti i giochi e delle schede grafiche visitate la nostra Gaming List

v1.26
log 16. 16:09:29

#0 no ids found in url (should be separated by "_") +0s ... 0s

#1 not redirecting to Ajax server +0s ... 0s

#2 did not recreate cache, as it is less than 5 days old! Created at Sat, 16 Mar 2024 05:38:32 +0100 +0.001s ... 0.001s

#3 no comparison url found in template nbc.compare_page_1 needed +0.034s ... 0.035s

#4 no comparison url found in template nbc.compare_page_1 needed +0s ... 0.035s

#5 no comparison url found in template nbc.compare_page_1 needed +0s ... 0.035s

#6 no comparison url found in template nbc.compare_page_1 needed +0s ... 0.036s

#7 no comparison url found in template nbc.compare_page_1 needed +0s ... 0.036s

#8 no comparison url found in template nbc.compare_page_1 needed +0s ... 0.036s

#9 composed specs +0s ... 0.036s

#10 did output specs +0s ... 0.036s

#11 start showIntegratedCPUs +0s ... 0.036s

#12 getting avg benchmarks for device 7325 +0.012s ... 0.049s

#13 got single benchmarks 7325 +0.007s ... 0.056s

#14 got avg benchmarks for devices +0s ... 0.056s

#15 min, max, avg, median took s +0.41s ... 0.466s

#16 before gaming benchmark output +0s ... 0.466s

#17 Got 174 rows for game benchmarks. +0.005s ... 0.47s

#18 composed SQL query for gamebenchmarks +0s ... 0.47s

#19 got data and put it in $dataArray +0.044s ... 0.515s

#20 benchmarks composed for output. +1.263s ... 1.777s

#21 no comparison url found in template nbc.compare_page_1 needed +0.004s ... 1.781s

#22 return log +0s ... 1.781s

Nessuna recensione trovato per questa scheda grafica

Please share our article, every link counts!

Classe 0

Arc A380

Classe 1

NVIDIA RTX A6000 Desktop
Radeon Pro W6800 Desktop
Radeon RX 6800 Desktop
NVIDIA Titan RTX Desktop
Radeon RX 6750 XT Desktop
Radeon RX 6700 XT Desktop
Radeon RX 6650 XT Desktop
Arc A580 Desktop

Classe 2

NVIDIA GeForce RTX 3060 Desktop
Titan X Pascal Desktop
Radeon VII Desktop
Radeon RX 5700 XT (Desktop) Desktop
Radeon RX 5700 (Desktop) Desktop
RX Vega 56 Desktop
Radeon RX 5600 XT (Desktop) Desktop
Pro Vega 56 Desktop
GeForce GTX 1650 Super (Desktop) Desktop
Radeon RX 580 Desktop
GeForce GTX 1060 (Desktop) Desktop
Radeon RX 570 Desktop
Radeon RX 480 Desktop

Classe 3

UHD Graphics 32EUs
UHD Graphics 750
FirePro W4100 Desktop
FirePro W2100 Desktop

Classe 4

UHD Graphics 730

Posizione approssimativa dell'adattatore grafico

> Recensioni e prove di notebook, tablets e smartphones > Info Techniche / Tips > Confronto delle schede video > NVIDIA > NVIDIA GeForce GTX 980 Ti
Klaus Hinum, 2016-09-26 (Update: 2016-09-26)