Recensione del PC desktop Acer Predator Orion 3000 con Core i7-12700F e RTX 3070
")
La serie Predator di Acer esiste da molti anni e si rivolge principalmente ai giocatori. Esistono vari modelli con questa denominazione sia per i portatili che per i PC desktop. Con l'attuale Predator Orion 3000, il produttore non solo aggiorna il prodotto ma utilizza anche un nuovo case rispetto alla vecchia generazione.
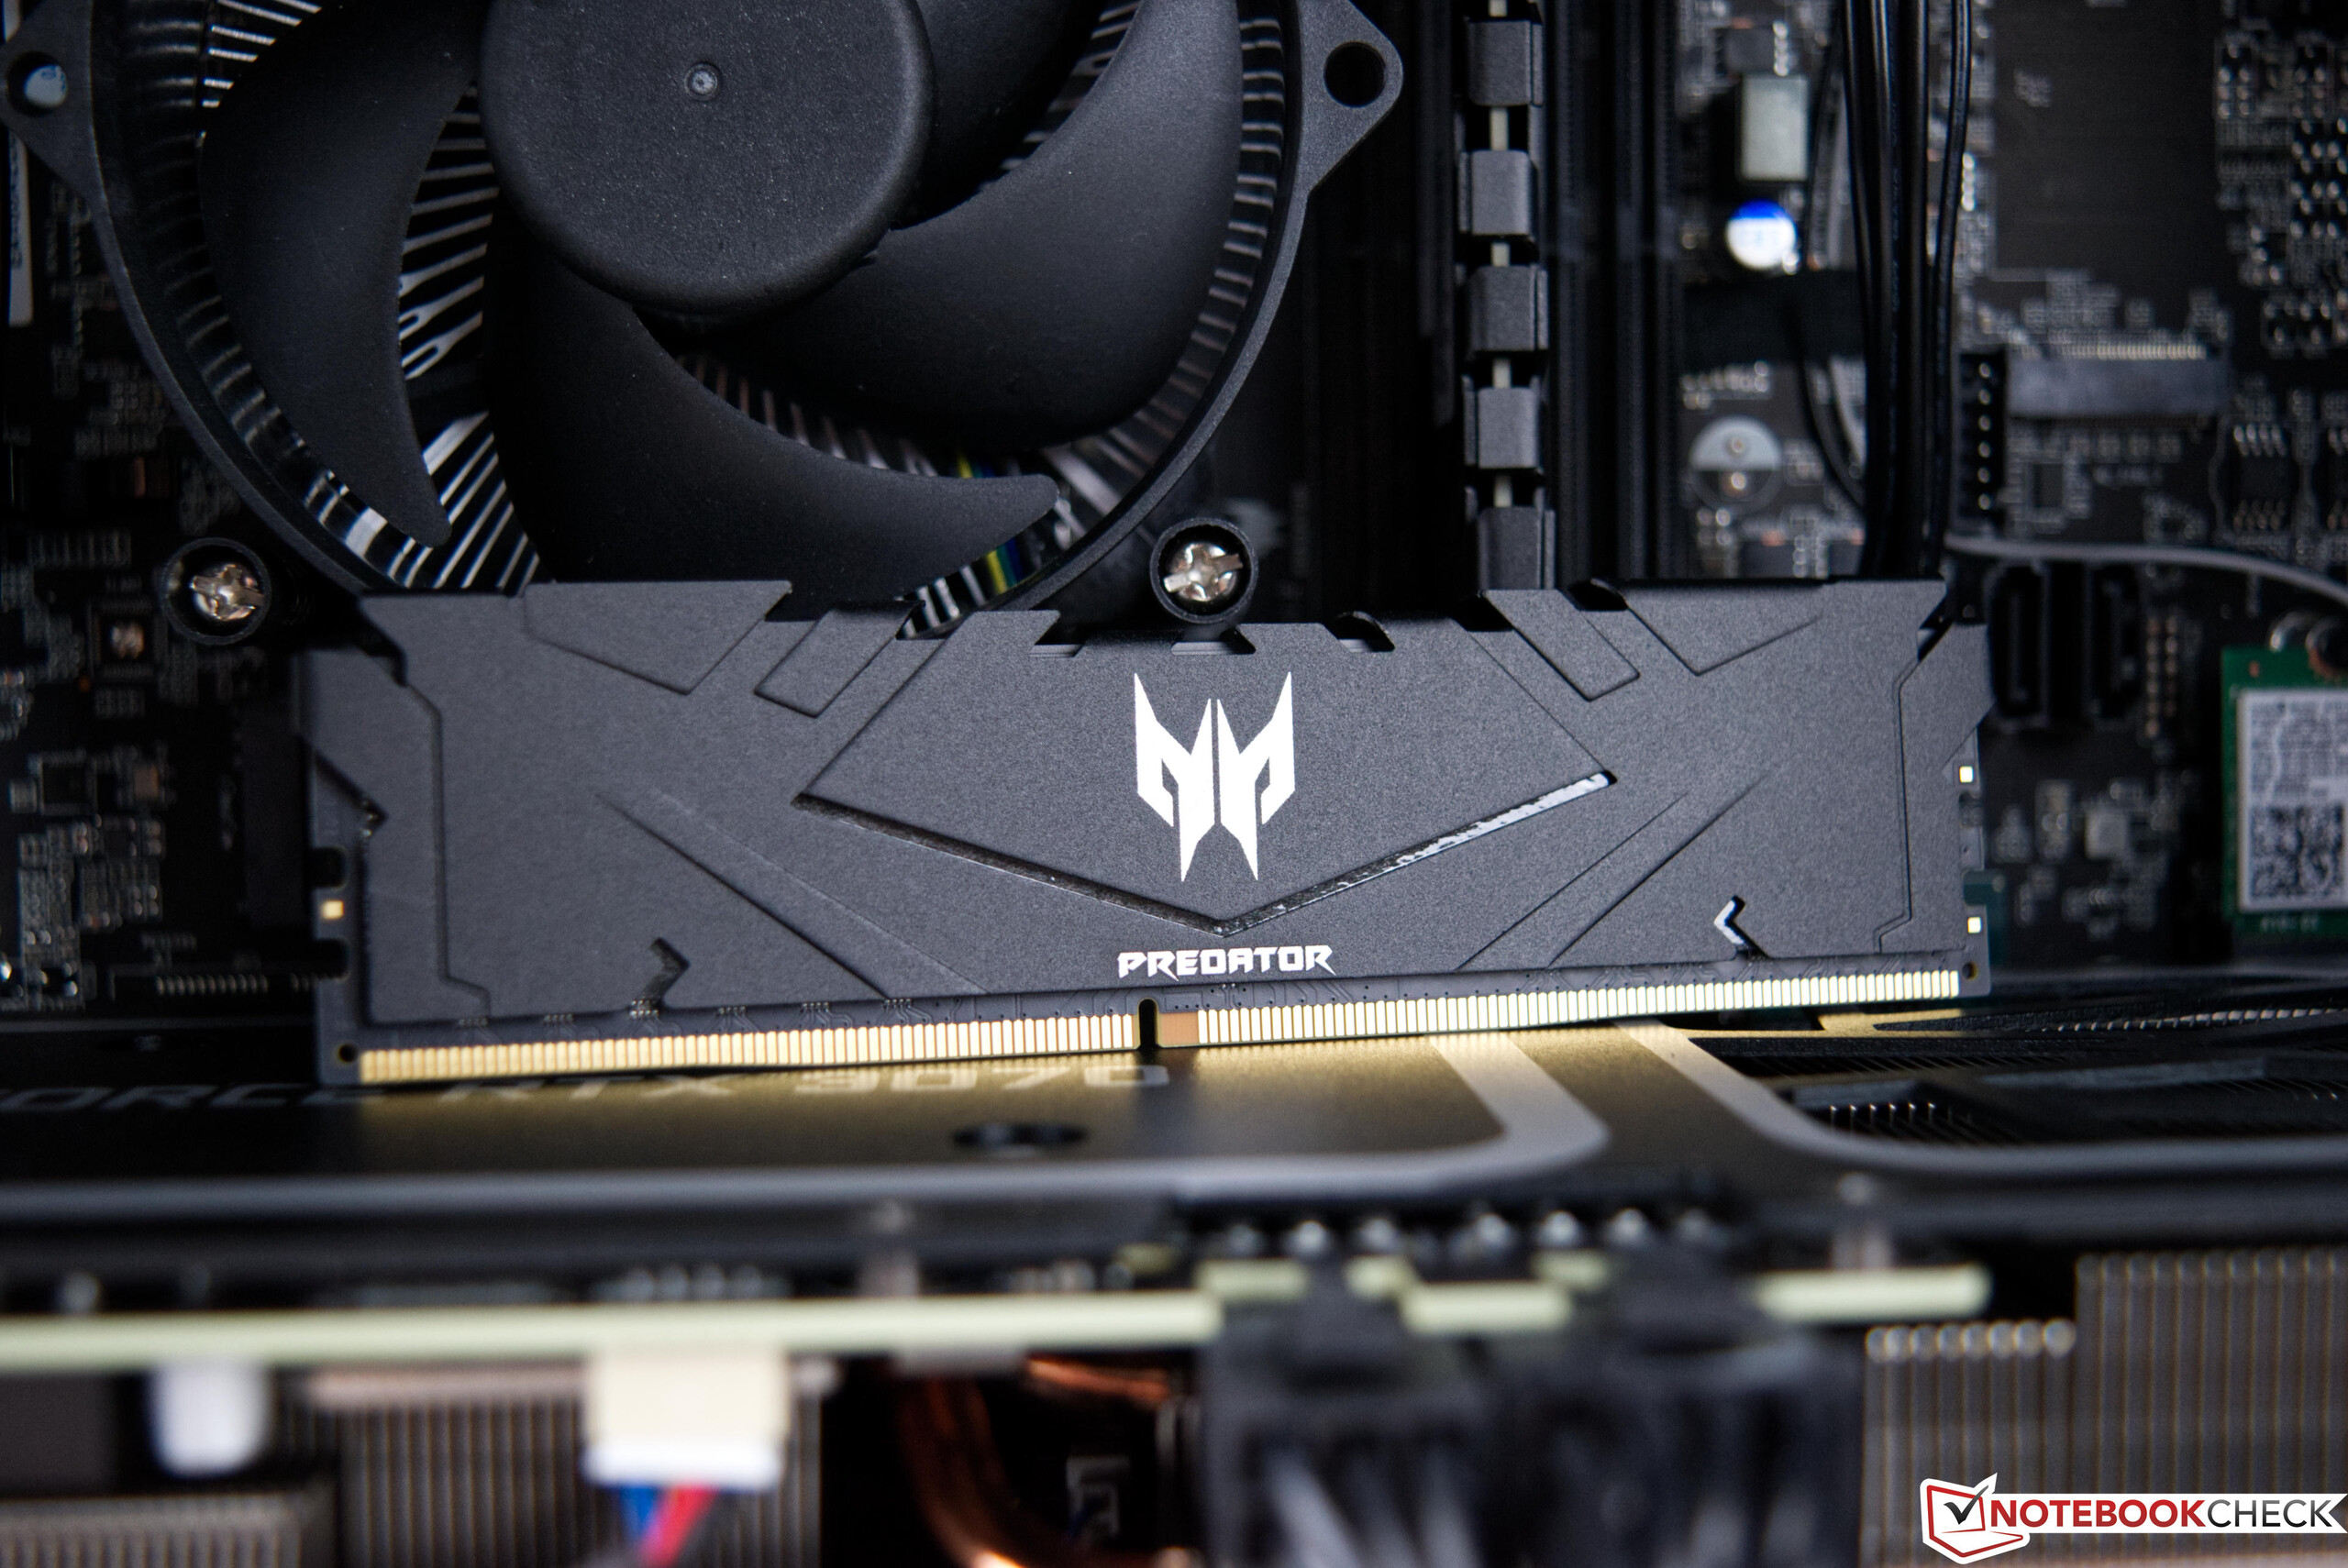
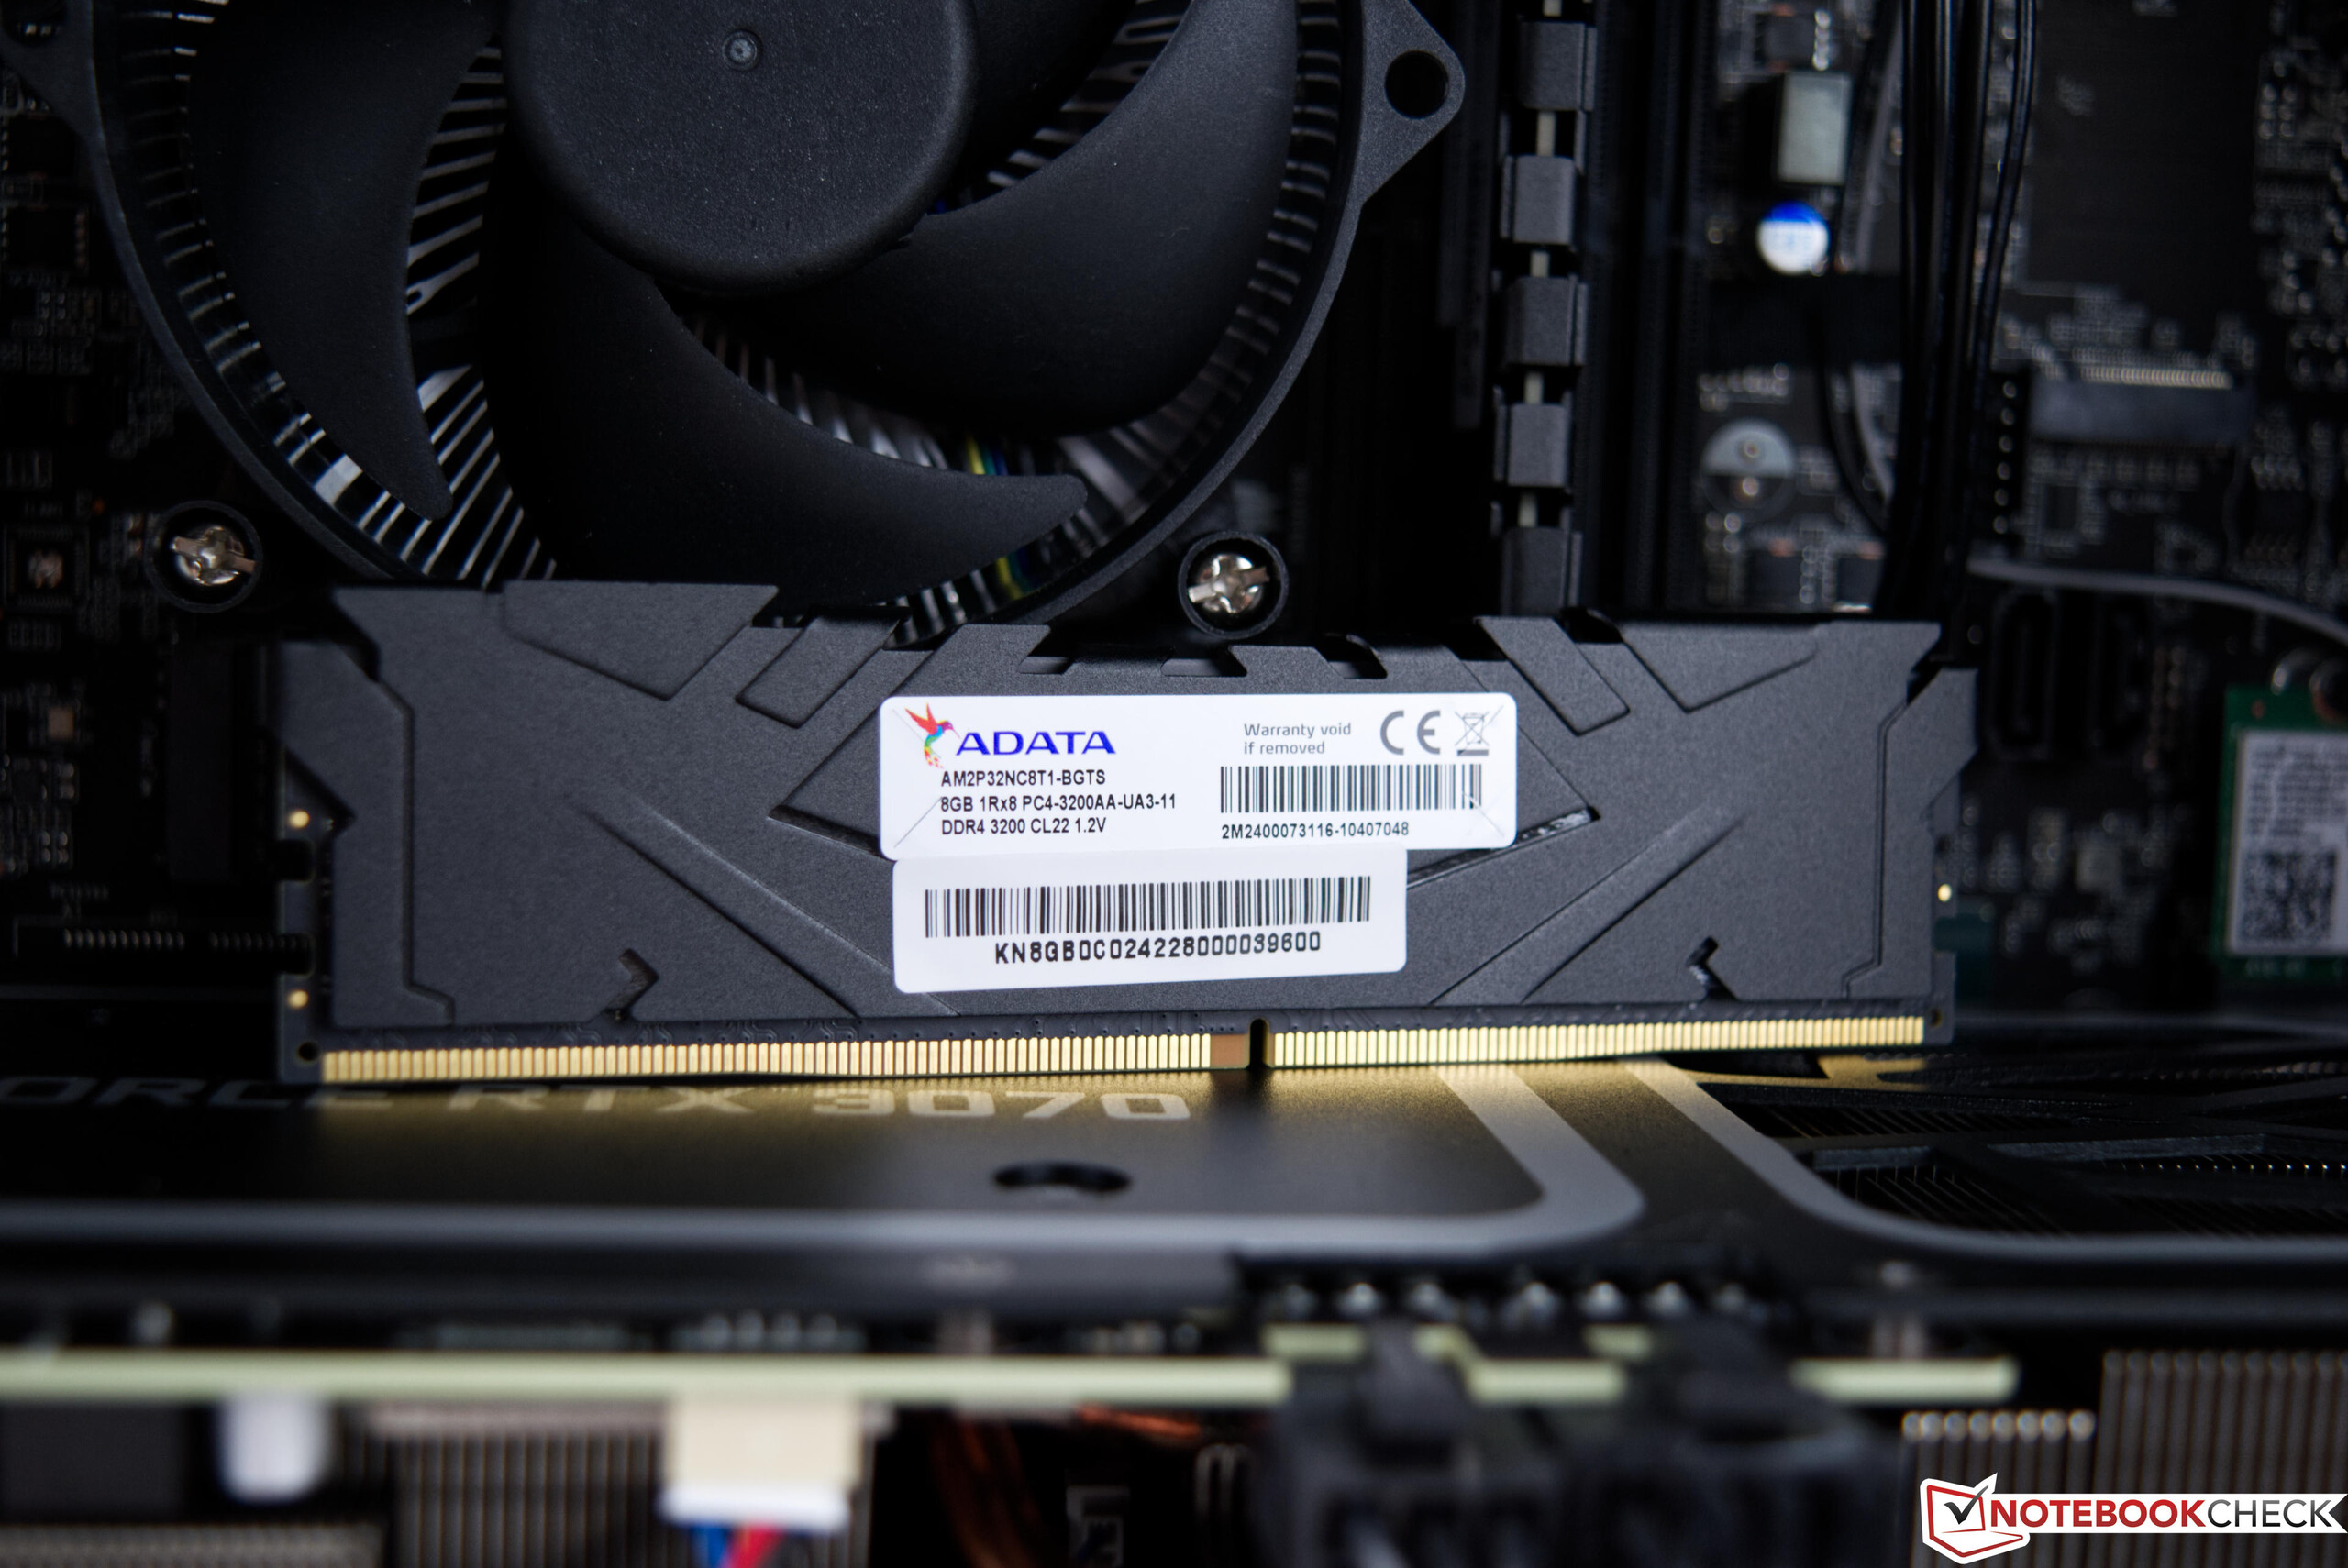
Come base viene sempre utilizzato un Intel Core i7-12700 o un Intel Core i7-12700F (Intel Core i7-12700F nel nostro campione). Tuttavia, esistono diversi modelli in termini di configurazione della GPU, anche se il modelloGeForce RTX 3070è il modello di punta di questa serie. Per quanto riguarda la memoria di lavoro, viene sempre utilizzata una RAM DDR4. Tuttavia, è possibile scegliere tra 16 GB o 32 GB a seconda del proprio budget. Lo stesso vale per lo storage, che nel nostro sistema è il minimo con 1 TB che Acer offre nell'attuale Predator Orion 3000.
Potenziali concorrenti a confronto
Punteggio | Data | Modello | Peso | Altezza | Prezzo |
|---|---|---|---|---|---|
v7 (old) | 09/2022 | Acer Predator Orion 3000 PO3-640 i7-12700F, GeForce RTX 3070 | 7.4 kg | 377 mm | |
v (old) | 12/2021 | Intel Beast Canyon NUC i9-11900KB, GeForce RTX 3060 | 189 mm | ||
v (old) | 06/2021 | Zotac Magnus One (ECM73070C) i7-10700, GeForce RTX 3070 | |||
v (old) | 05/2022 | Zotac ZBOX Magnus EN173070C i7-11800H, GeForce RTX 3070 Laptop GPU | 1.8 kg | 62.2 mm | |
v (old) | 04/2022 | Intel Dragon Canyon NUC - RTX 3060 i9-12900, GeForce RTX 3060 | 189 mm | ||
v (old) | 06/2020 | Zotac MEK Mini (RTX 2070 Super) i7-9700, GeForce RTX 2070 Super (Desktop) |
Acer Predator Orion 3000 PO3-640 in dettaglio

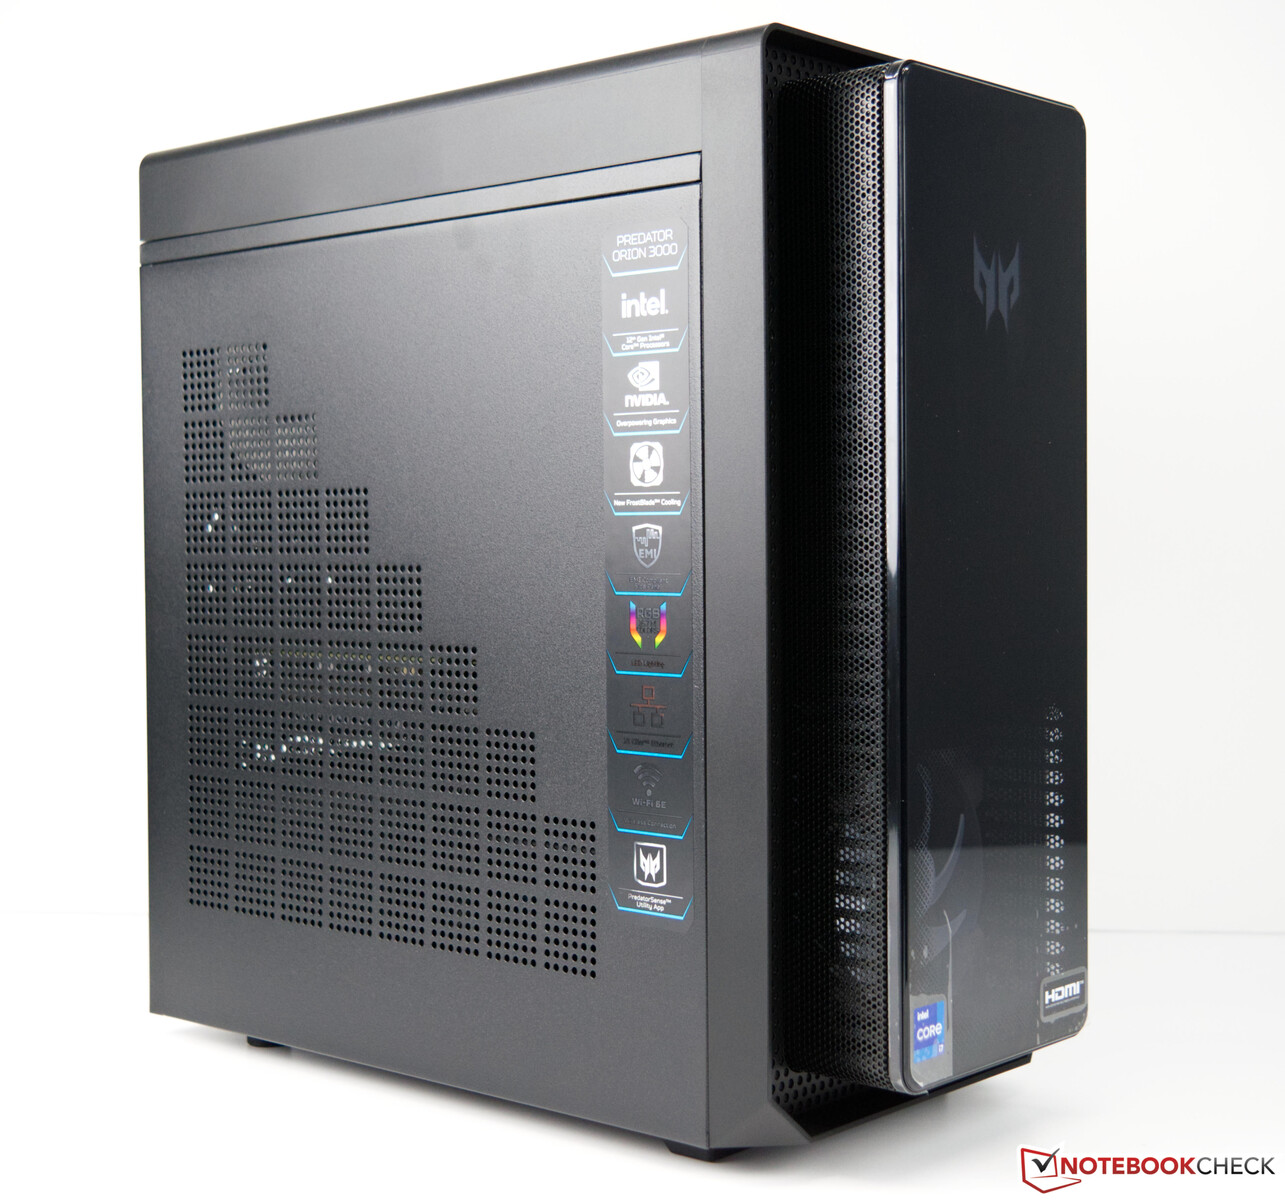
Caso
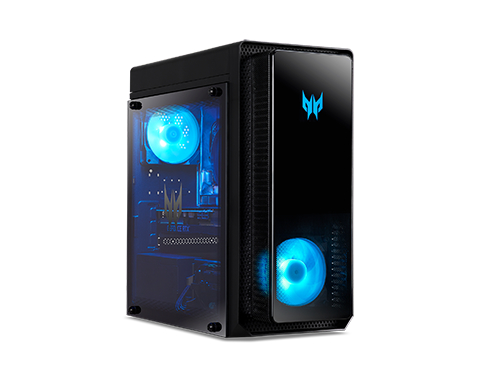
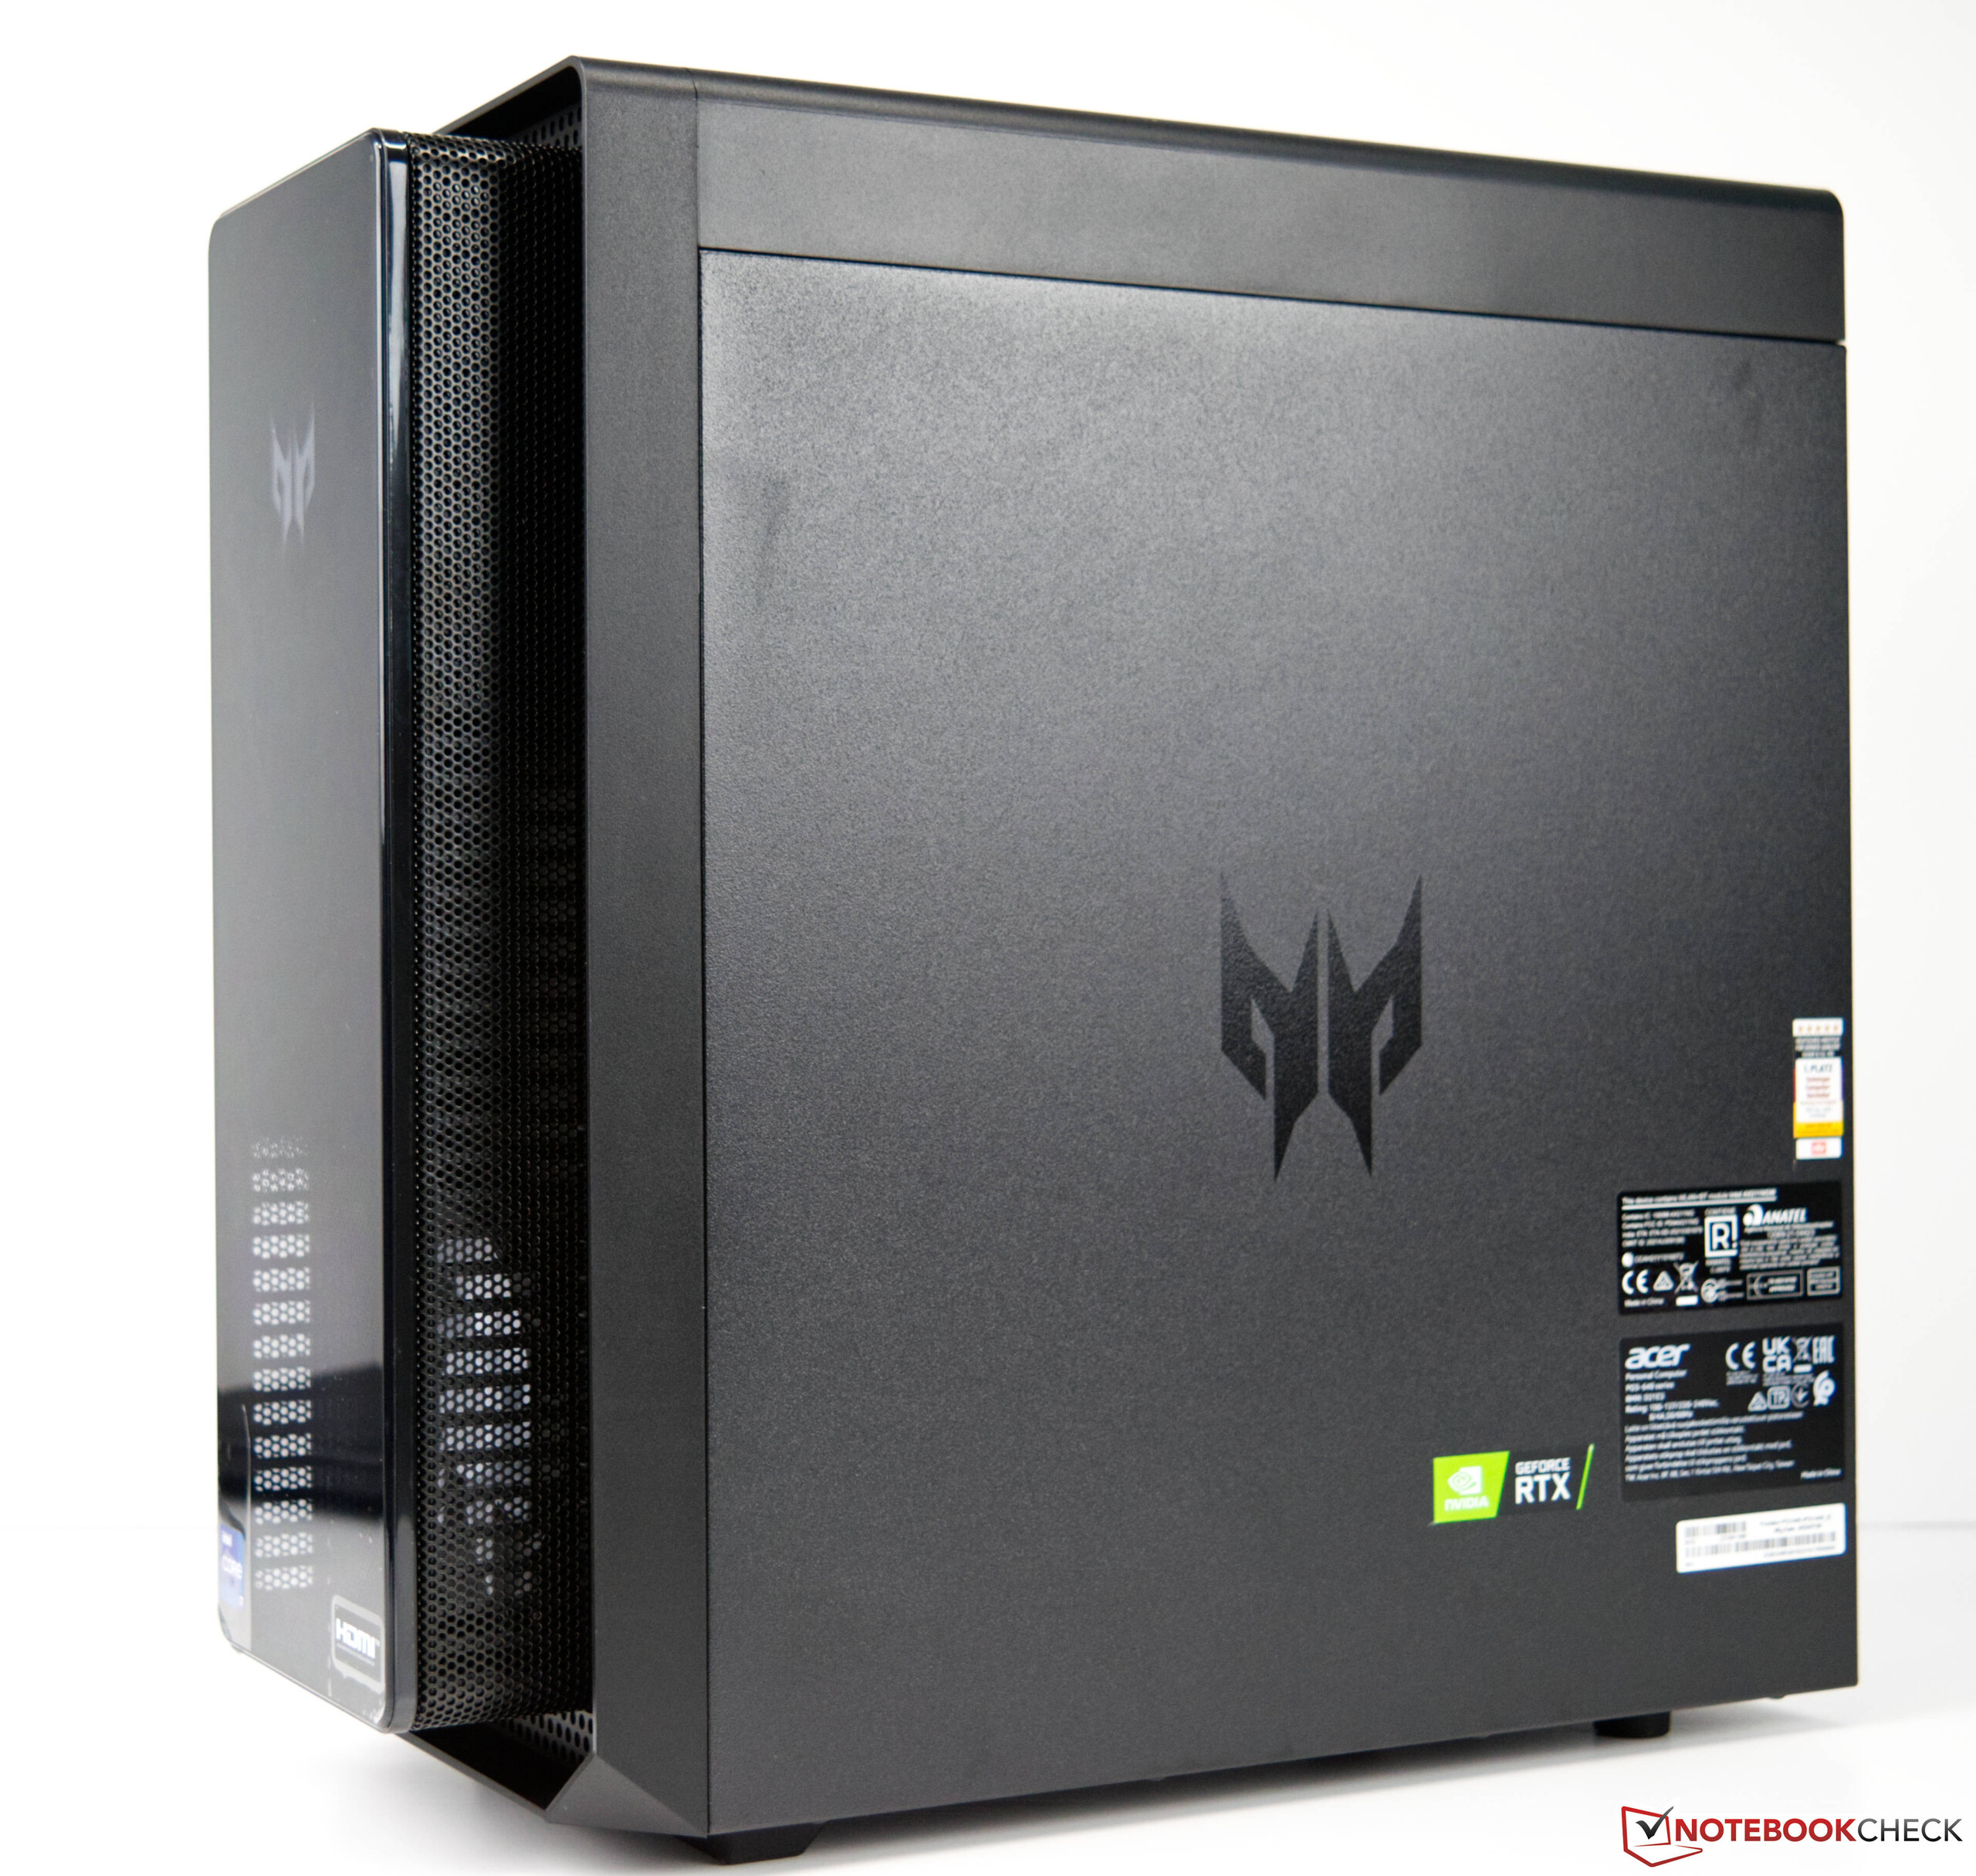
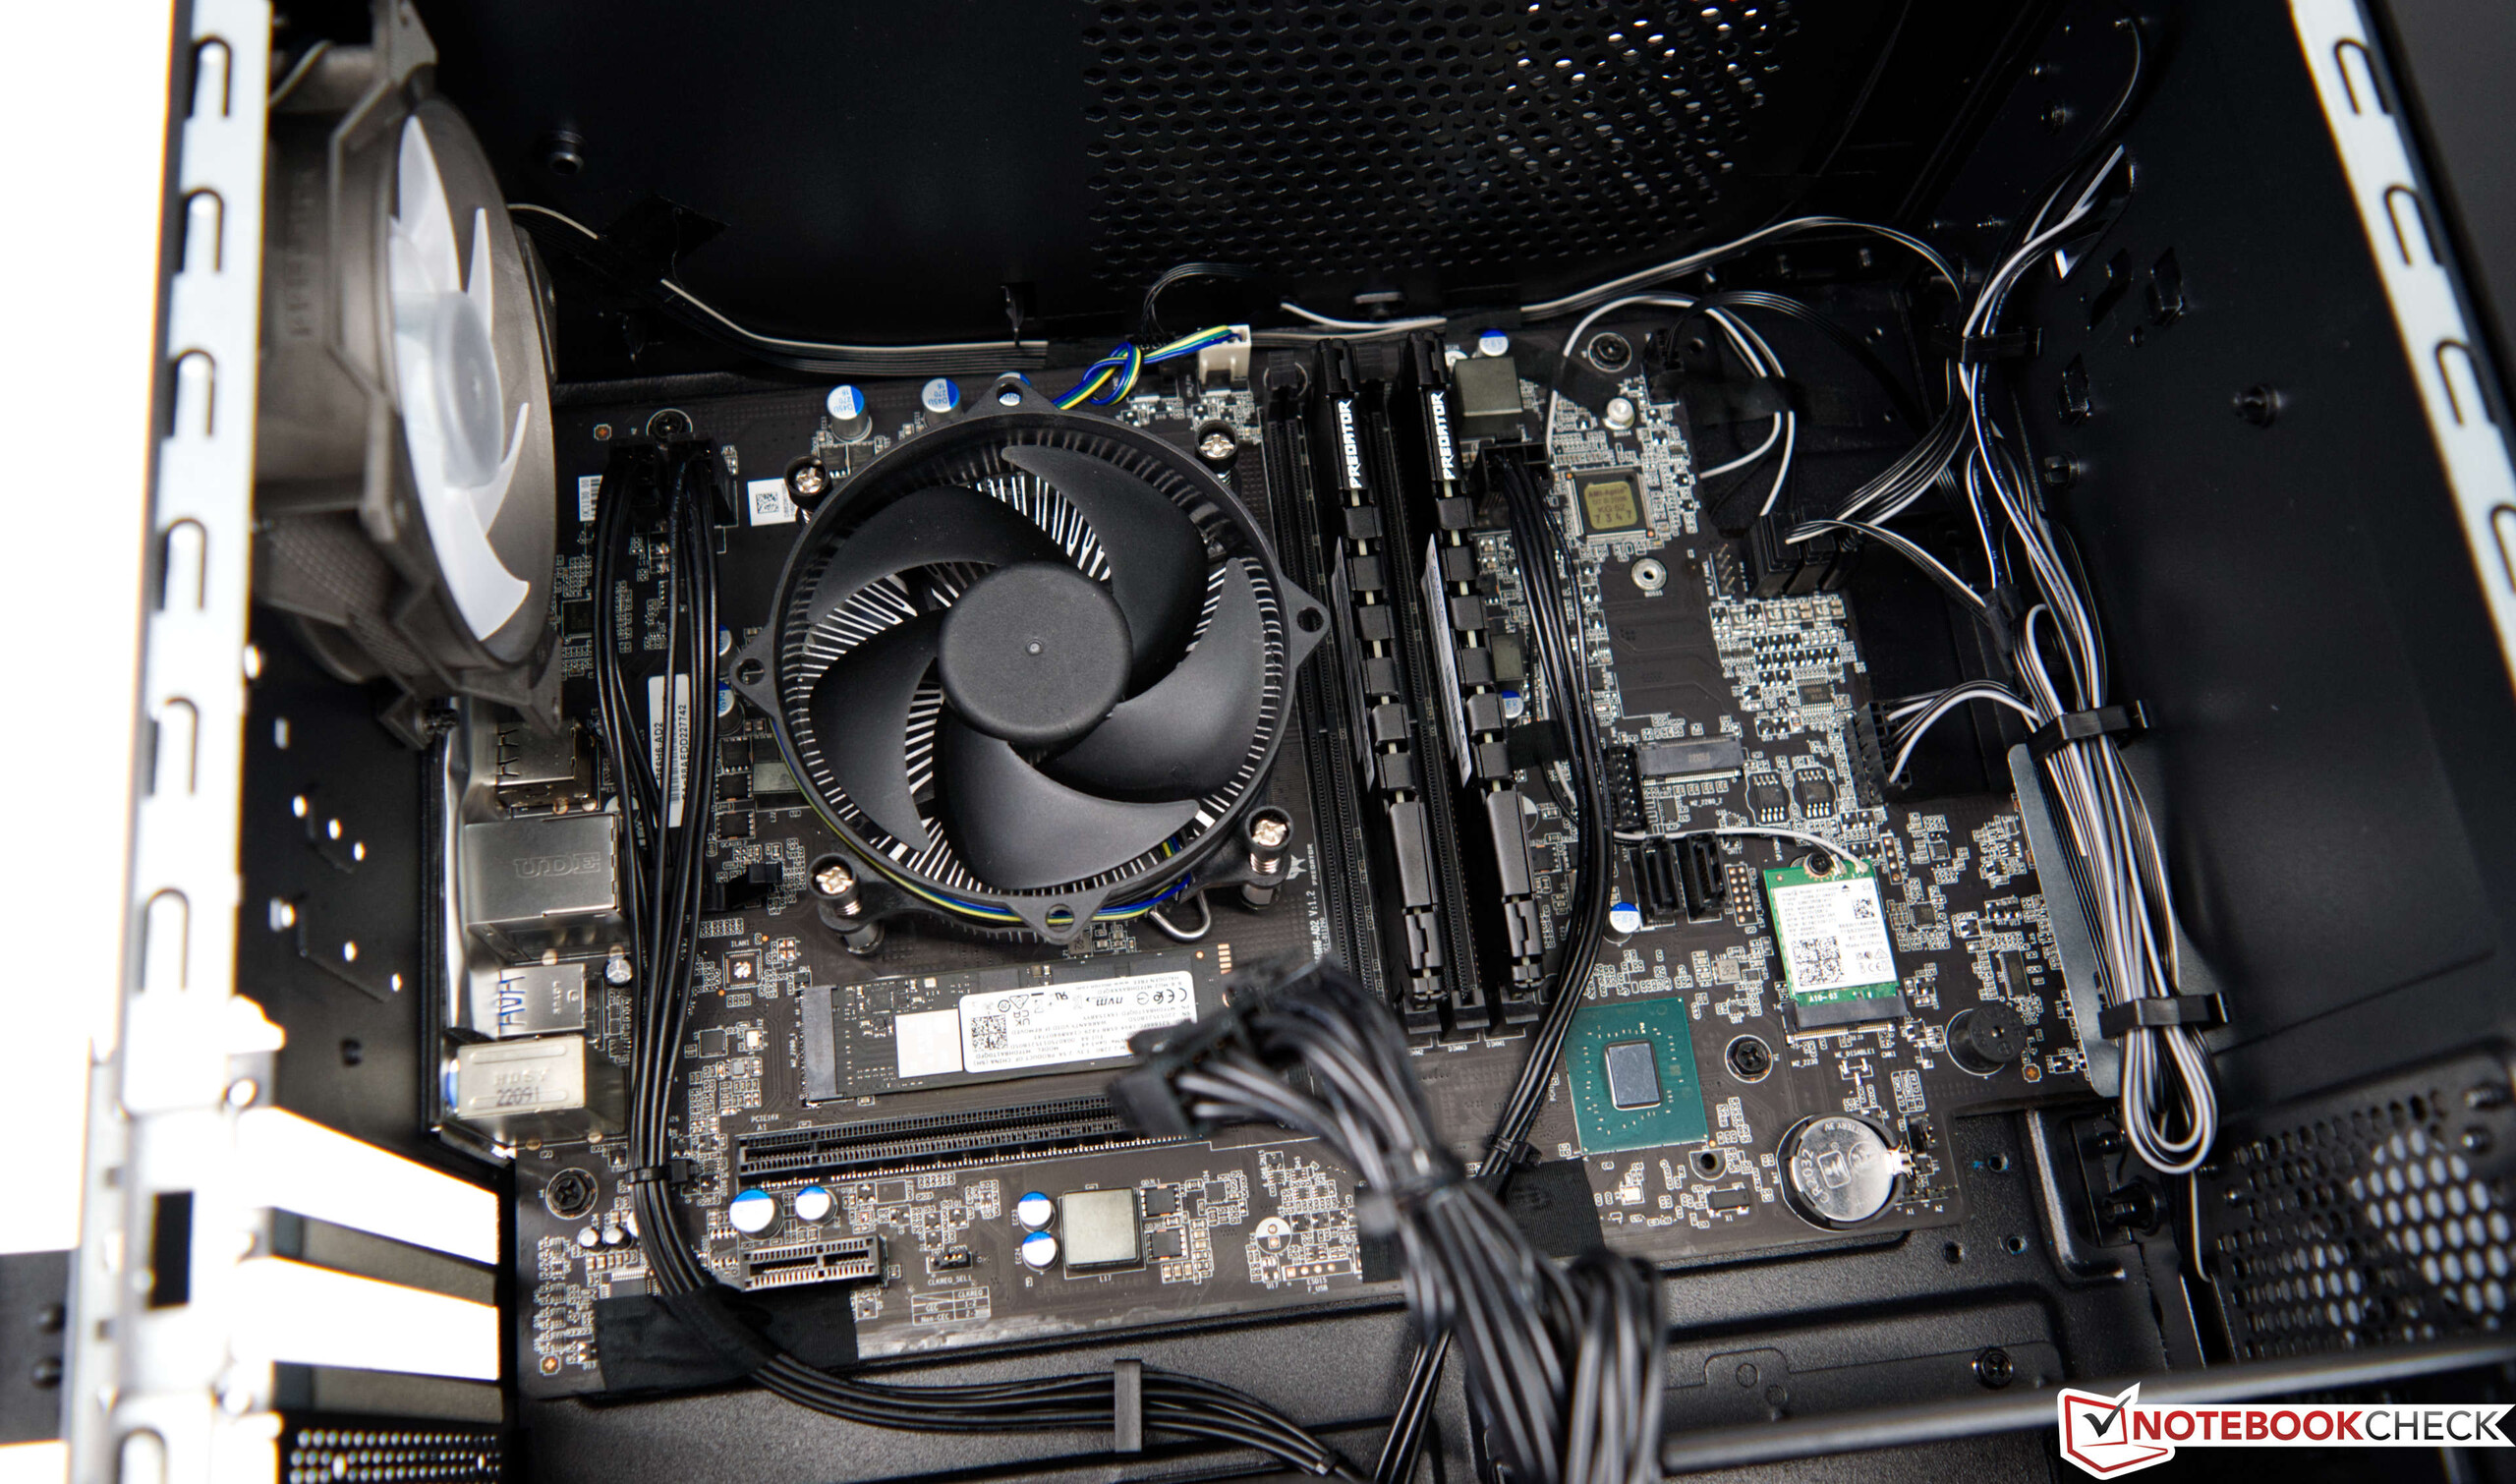
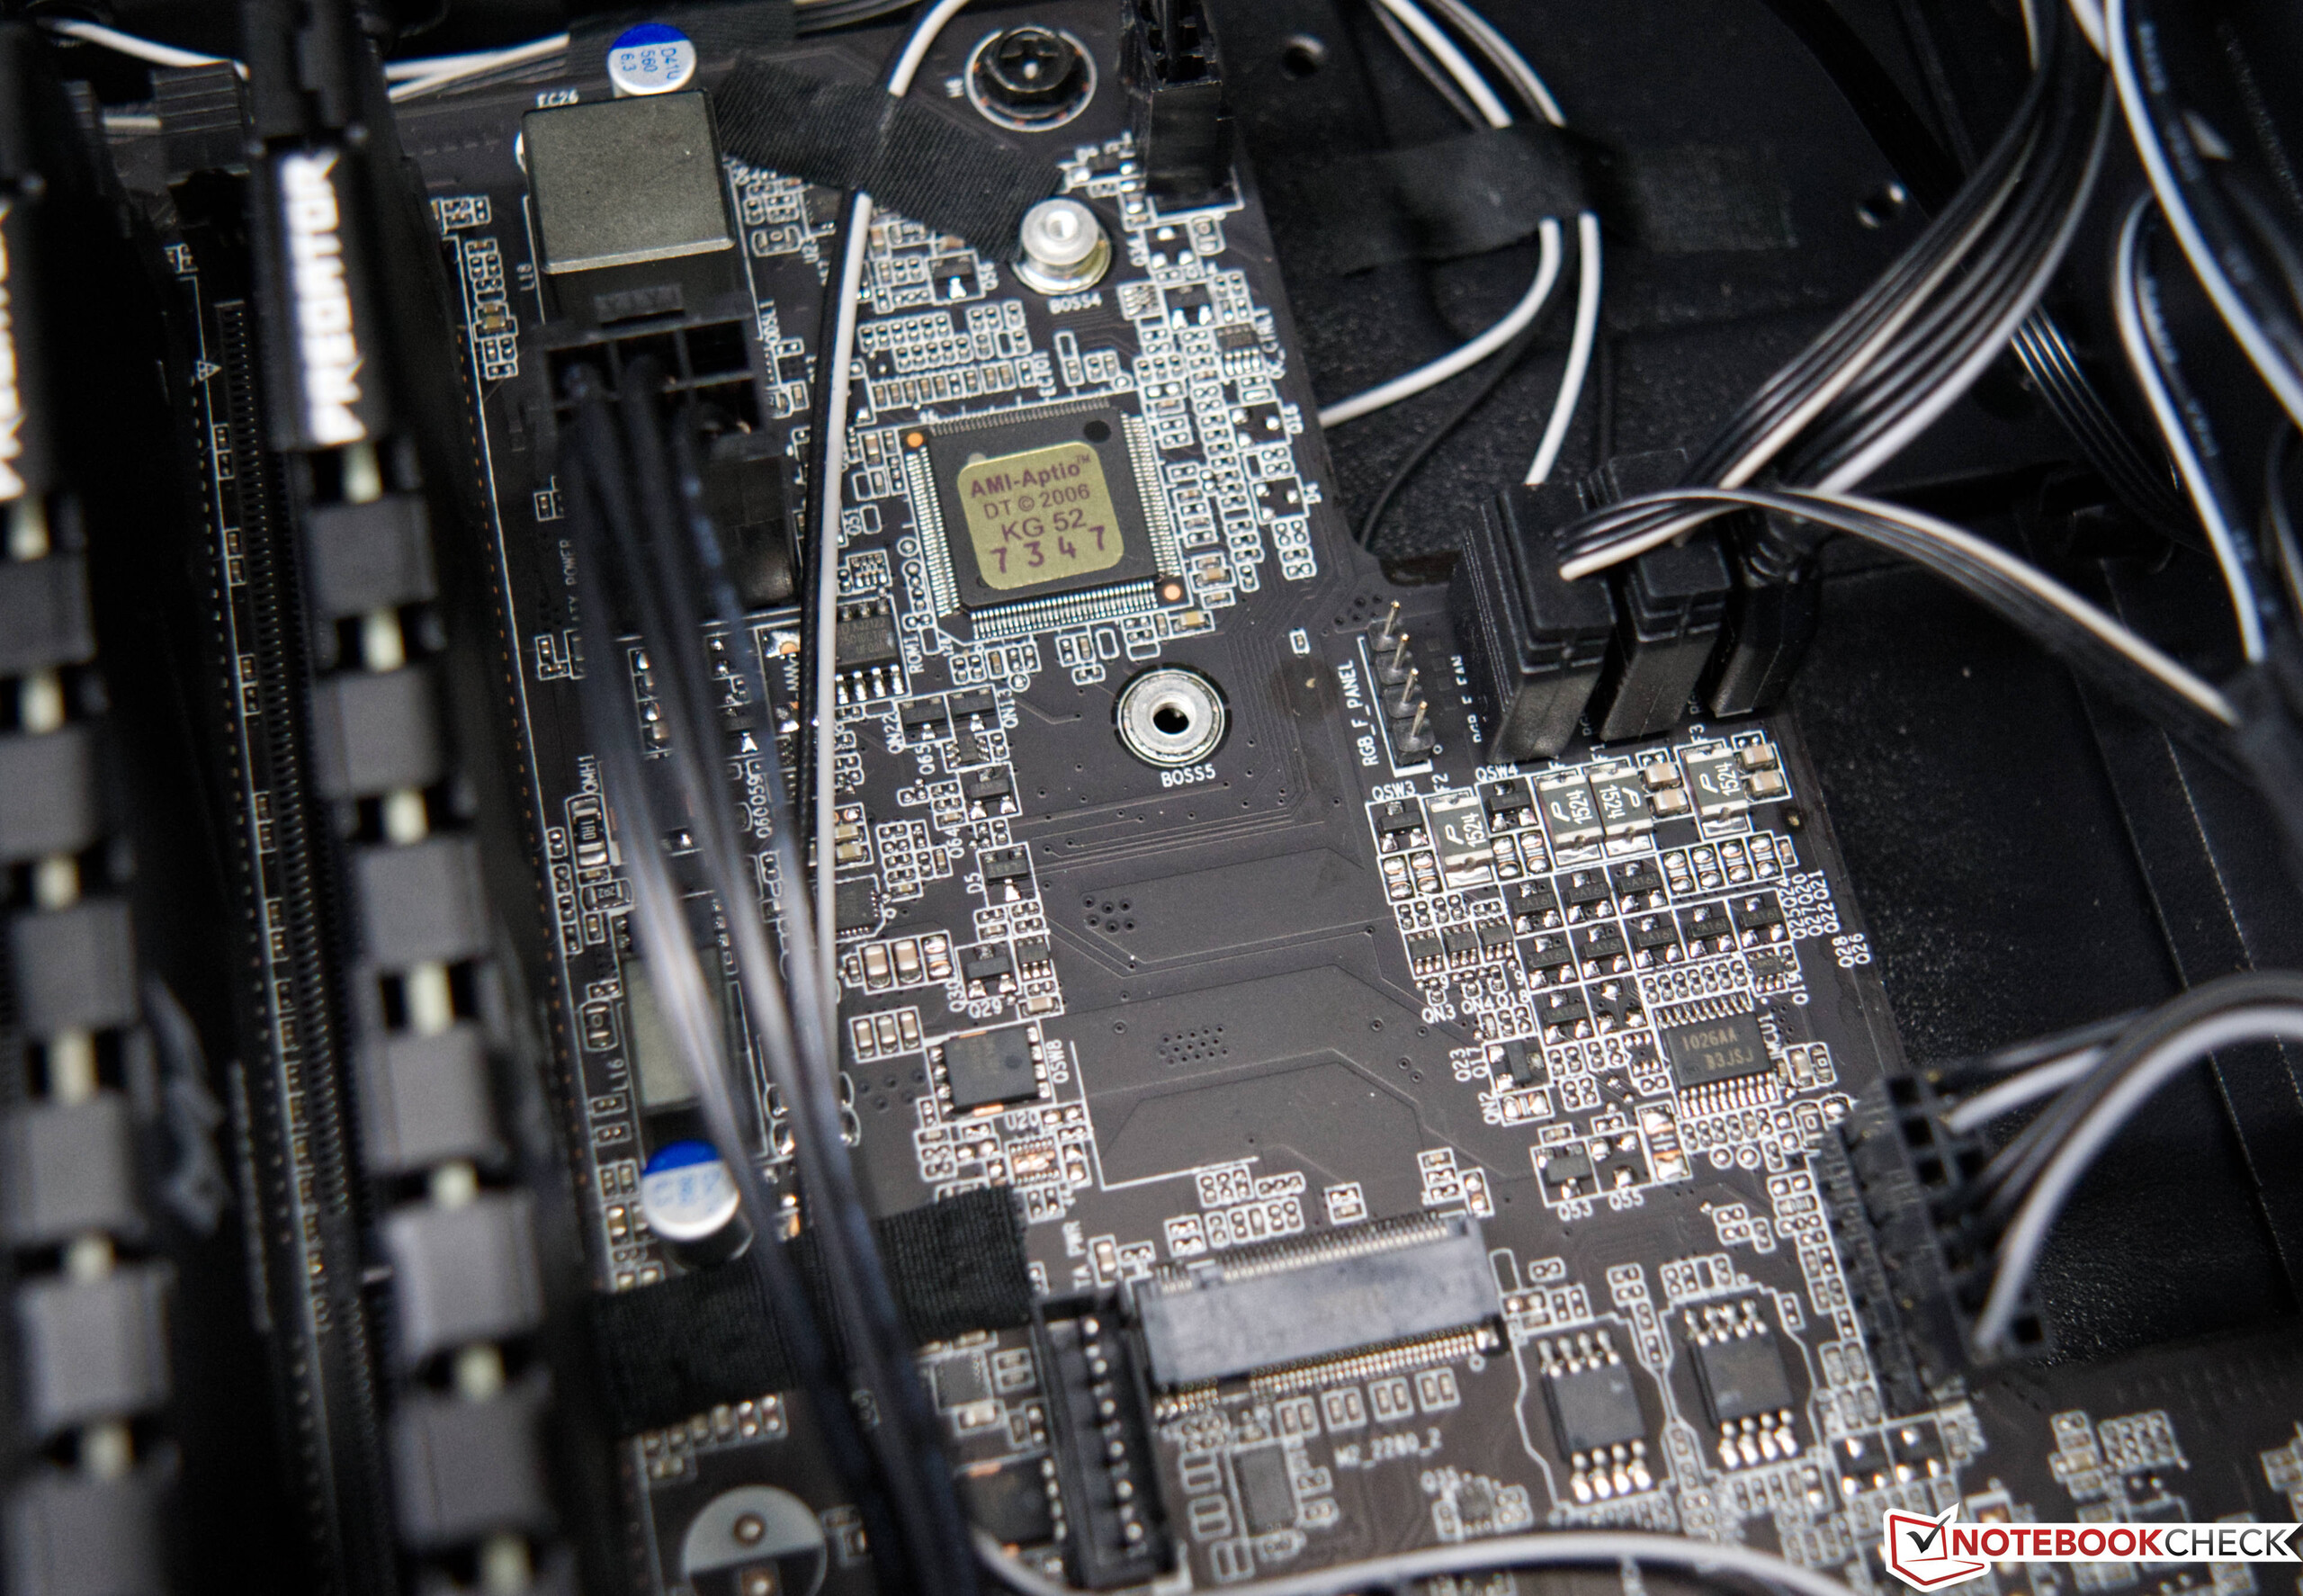
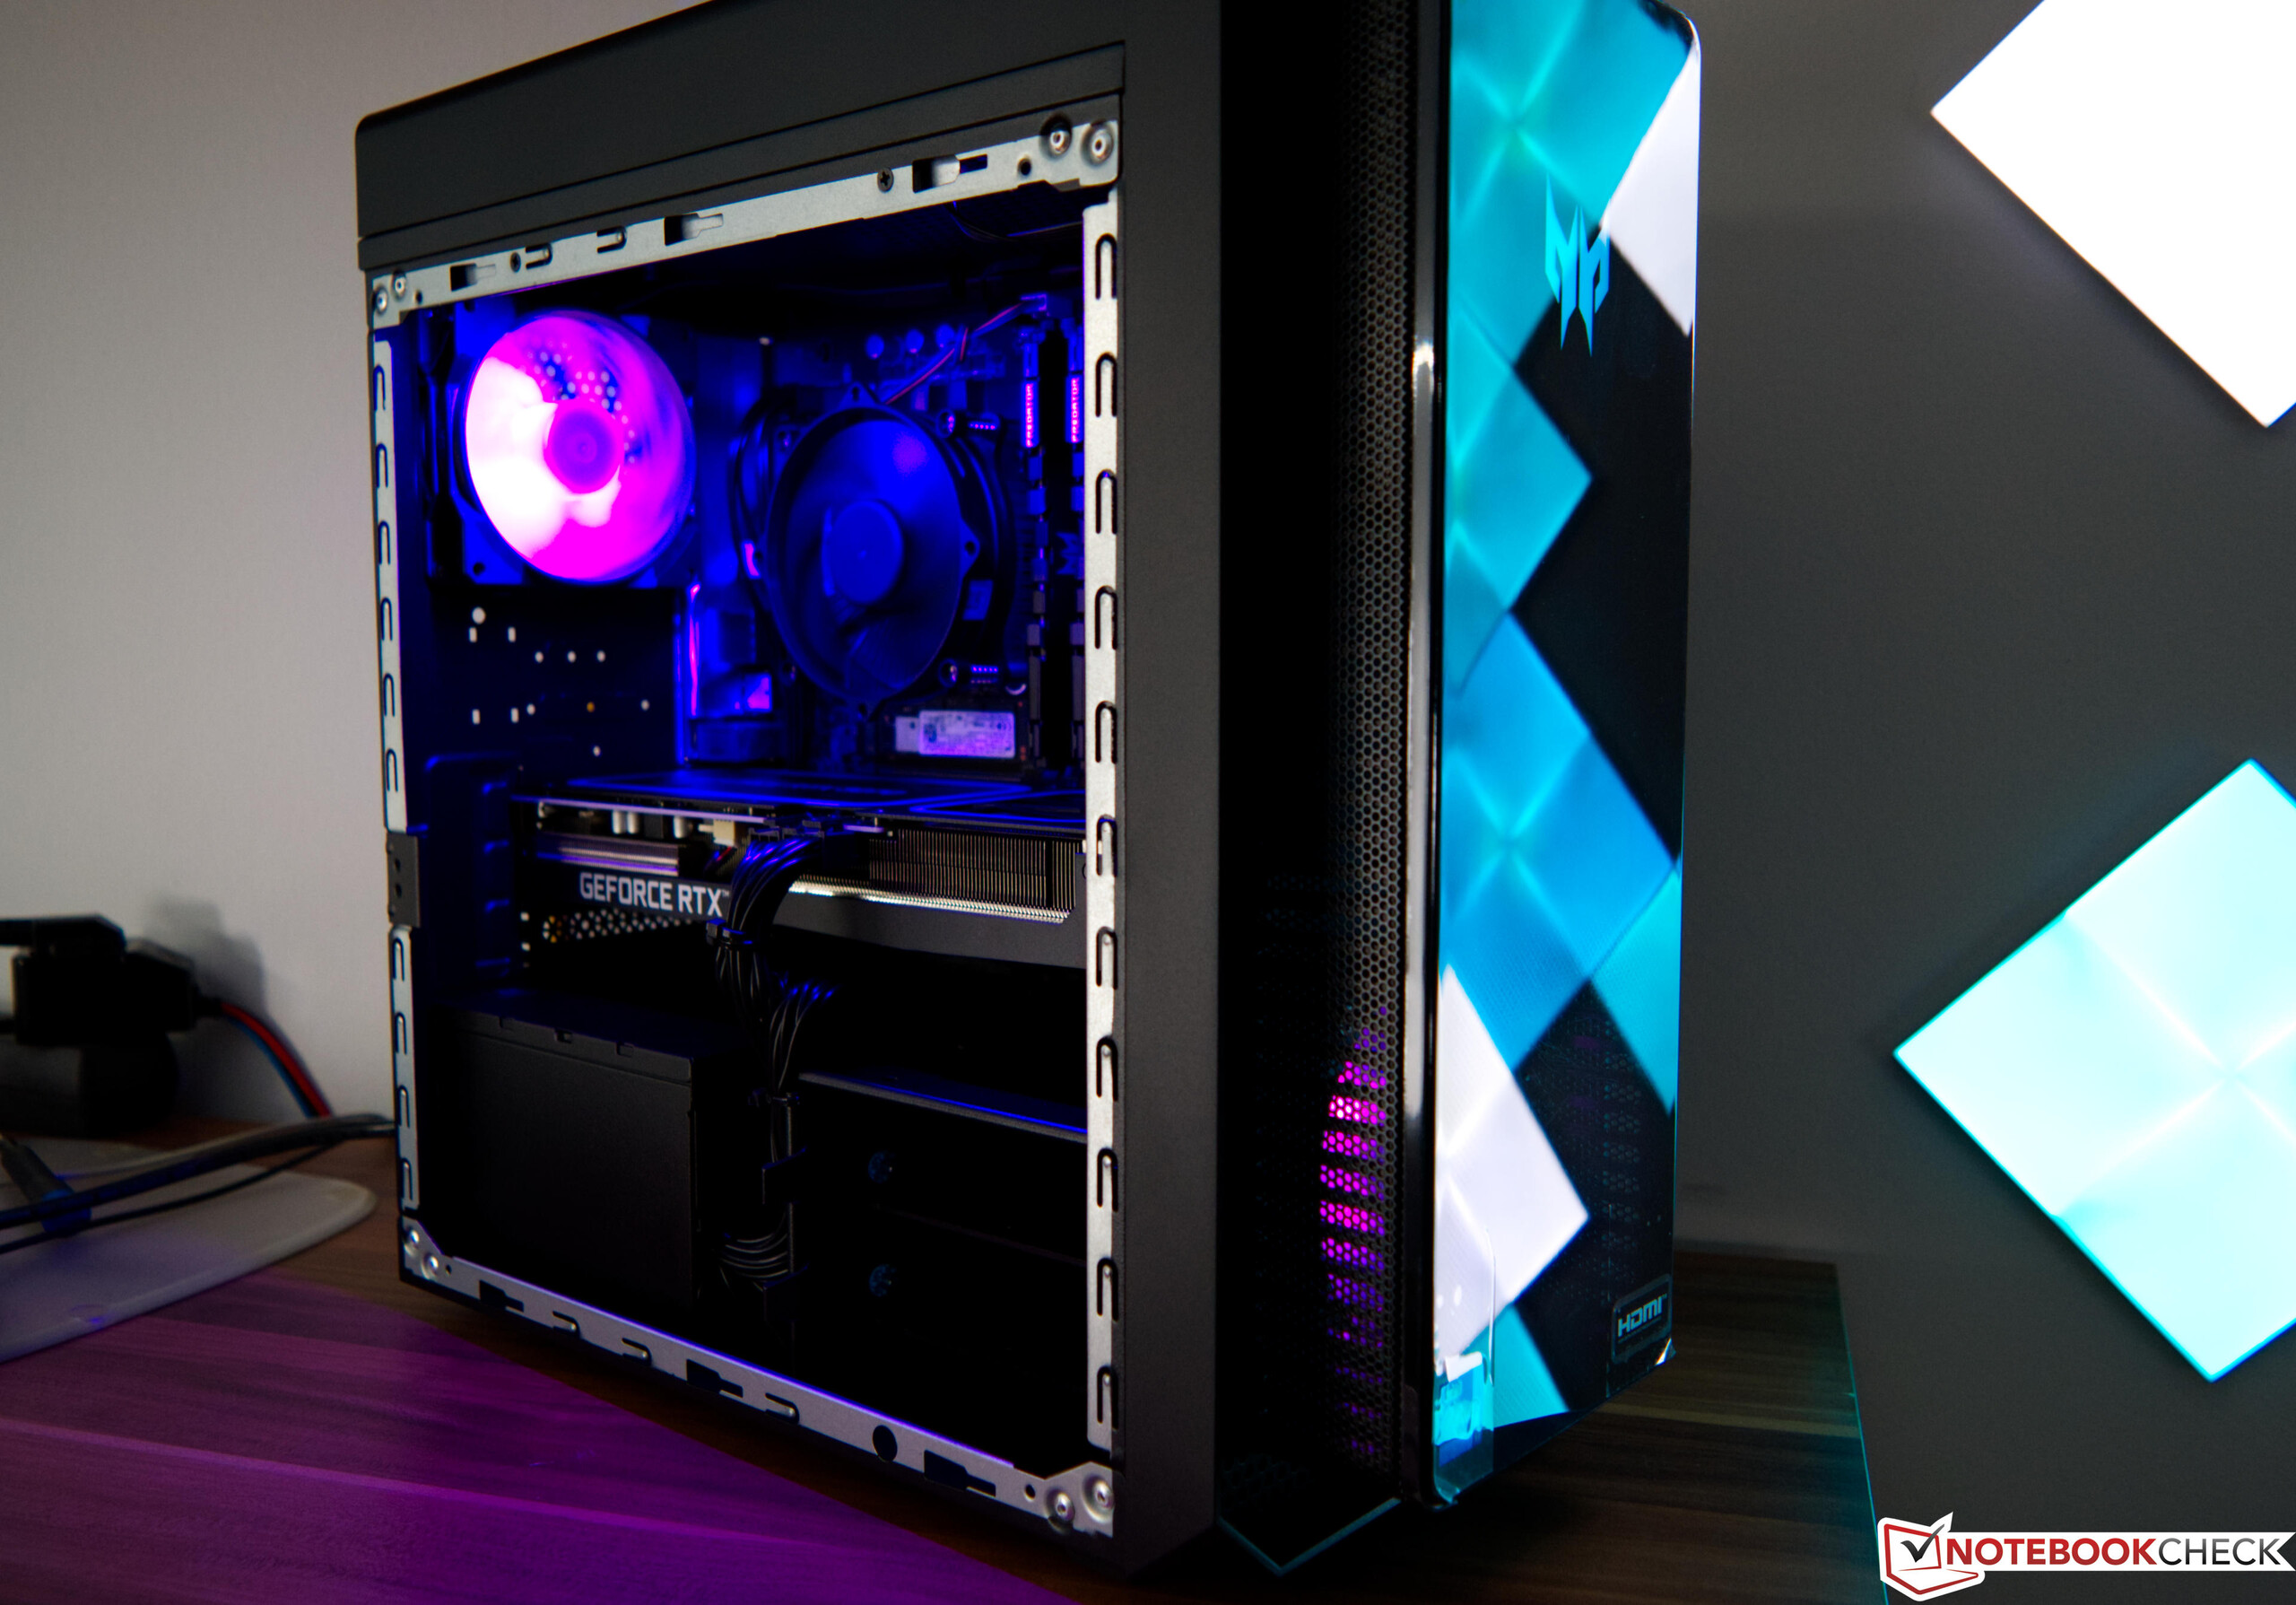
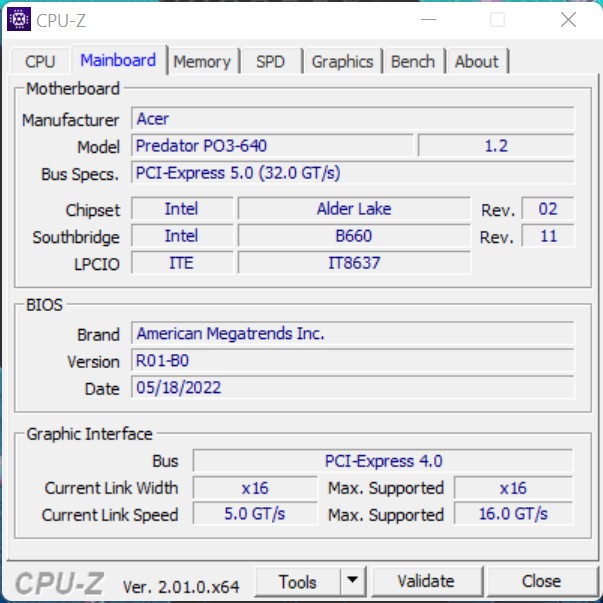
Il case dell'Acer Predator Orion 3000 PO3-640 sembra a prima vista un case ATX standard. Tuttavia, il produttore si discosta dallo standard perché i connettori anteriori si trovano direttamente sulla scheda madre e non sono collegati alla scheda madre tramite cavo. Con una struttura di questo tipo, la sostituzione della scheda madre è quasi impossibile. Tuttavia, altri produttori seguono una strada simile e installano schede madri proprietarie in case proprietari. Il case è ben realizzato, anche se l'aspetto è davvero una questione di gusti. La dotazione comprende anche un pannello laterale con una finestra di visualizzazione per mostrare meglio i componenti installati. Tuttavia, a causa del flusso d'aria già molto limitato, ci siamo astenuti dall'utilizzare il pannello laterale otticamente chic durante il test. Almeno il coperchio metallico offre alcuni fori per aspirare l'aria fresca.
Attrezzatura
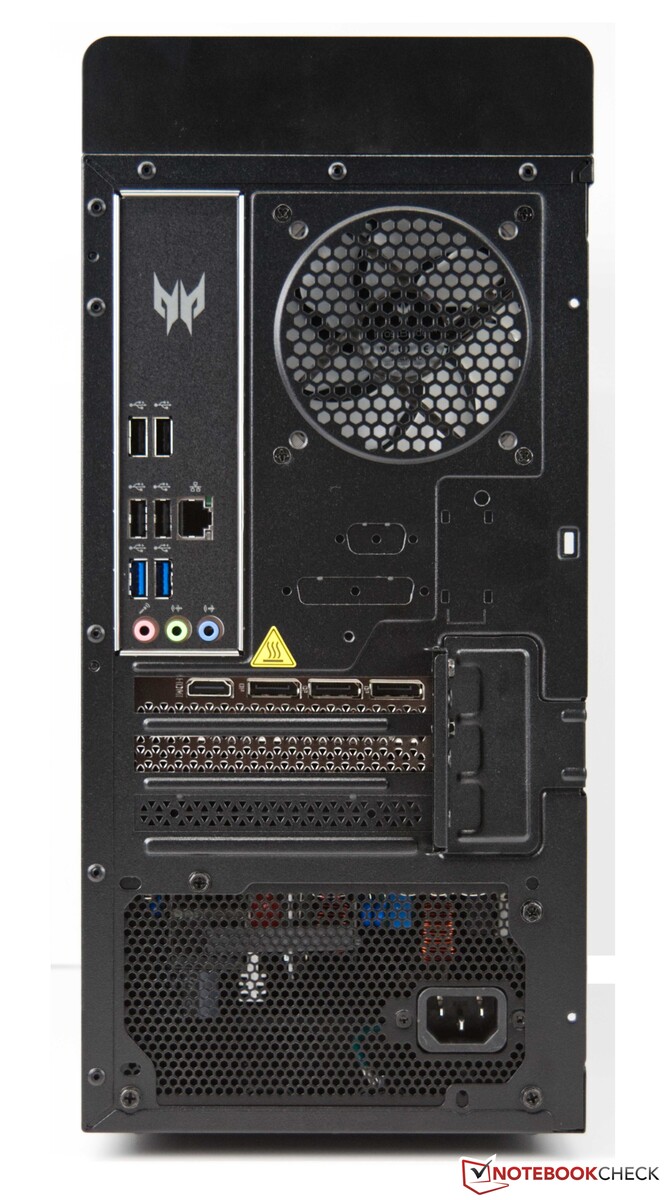
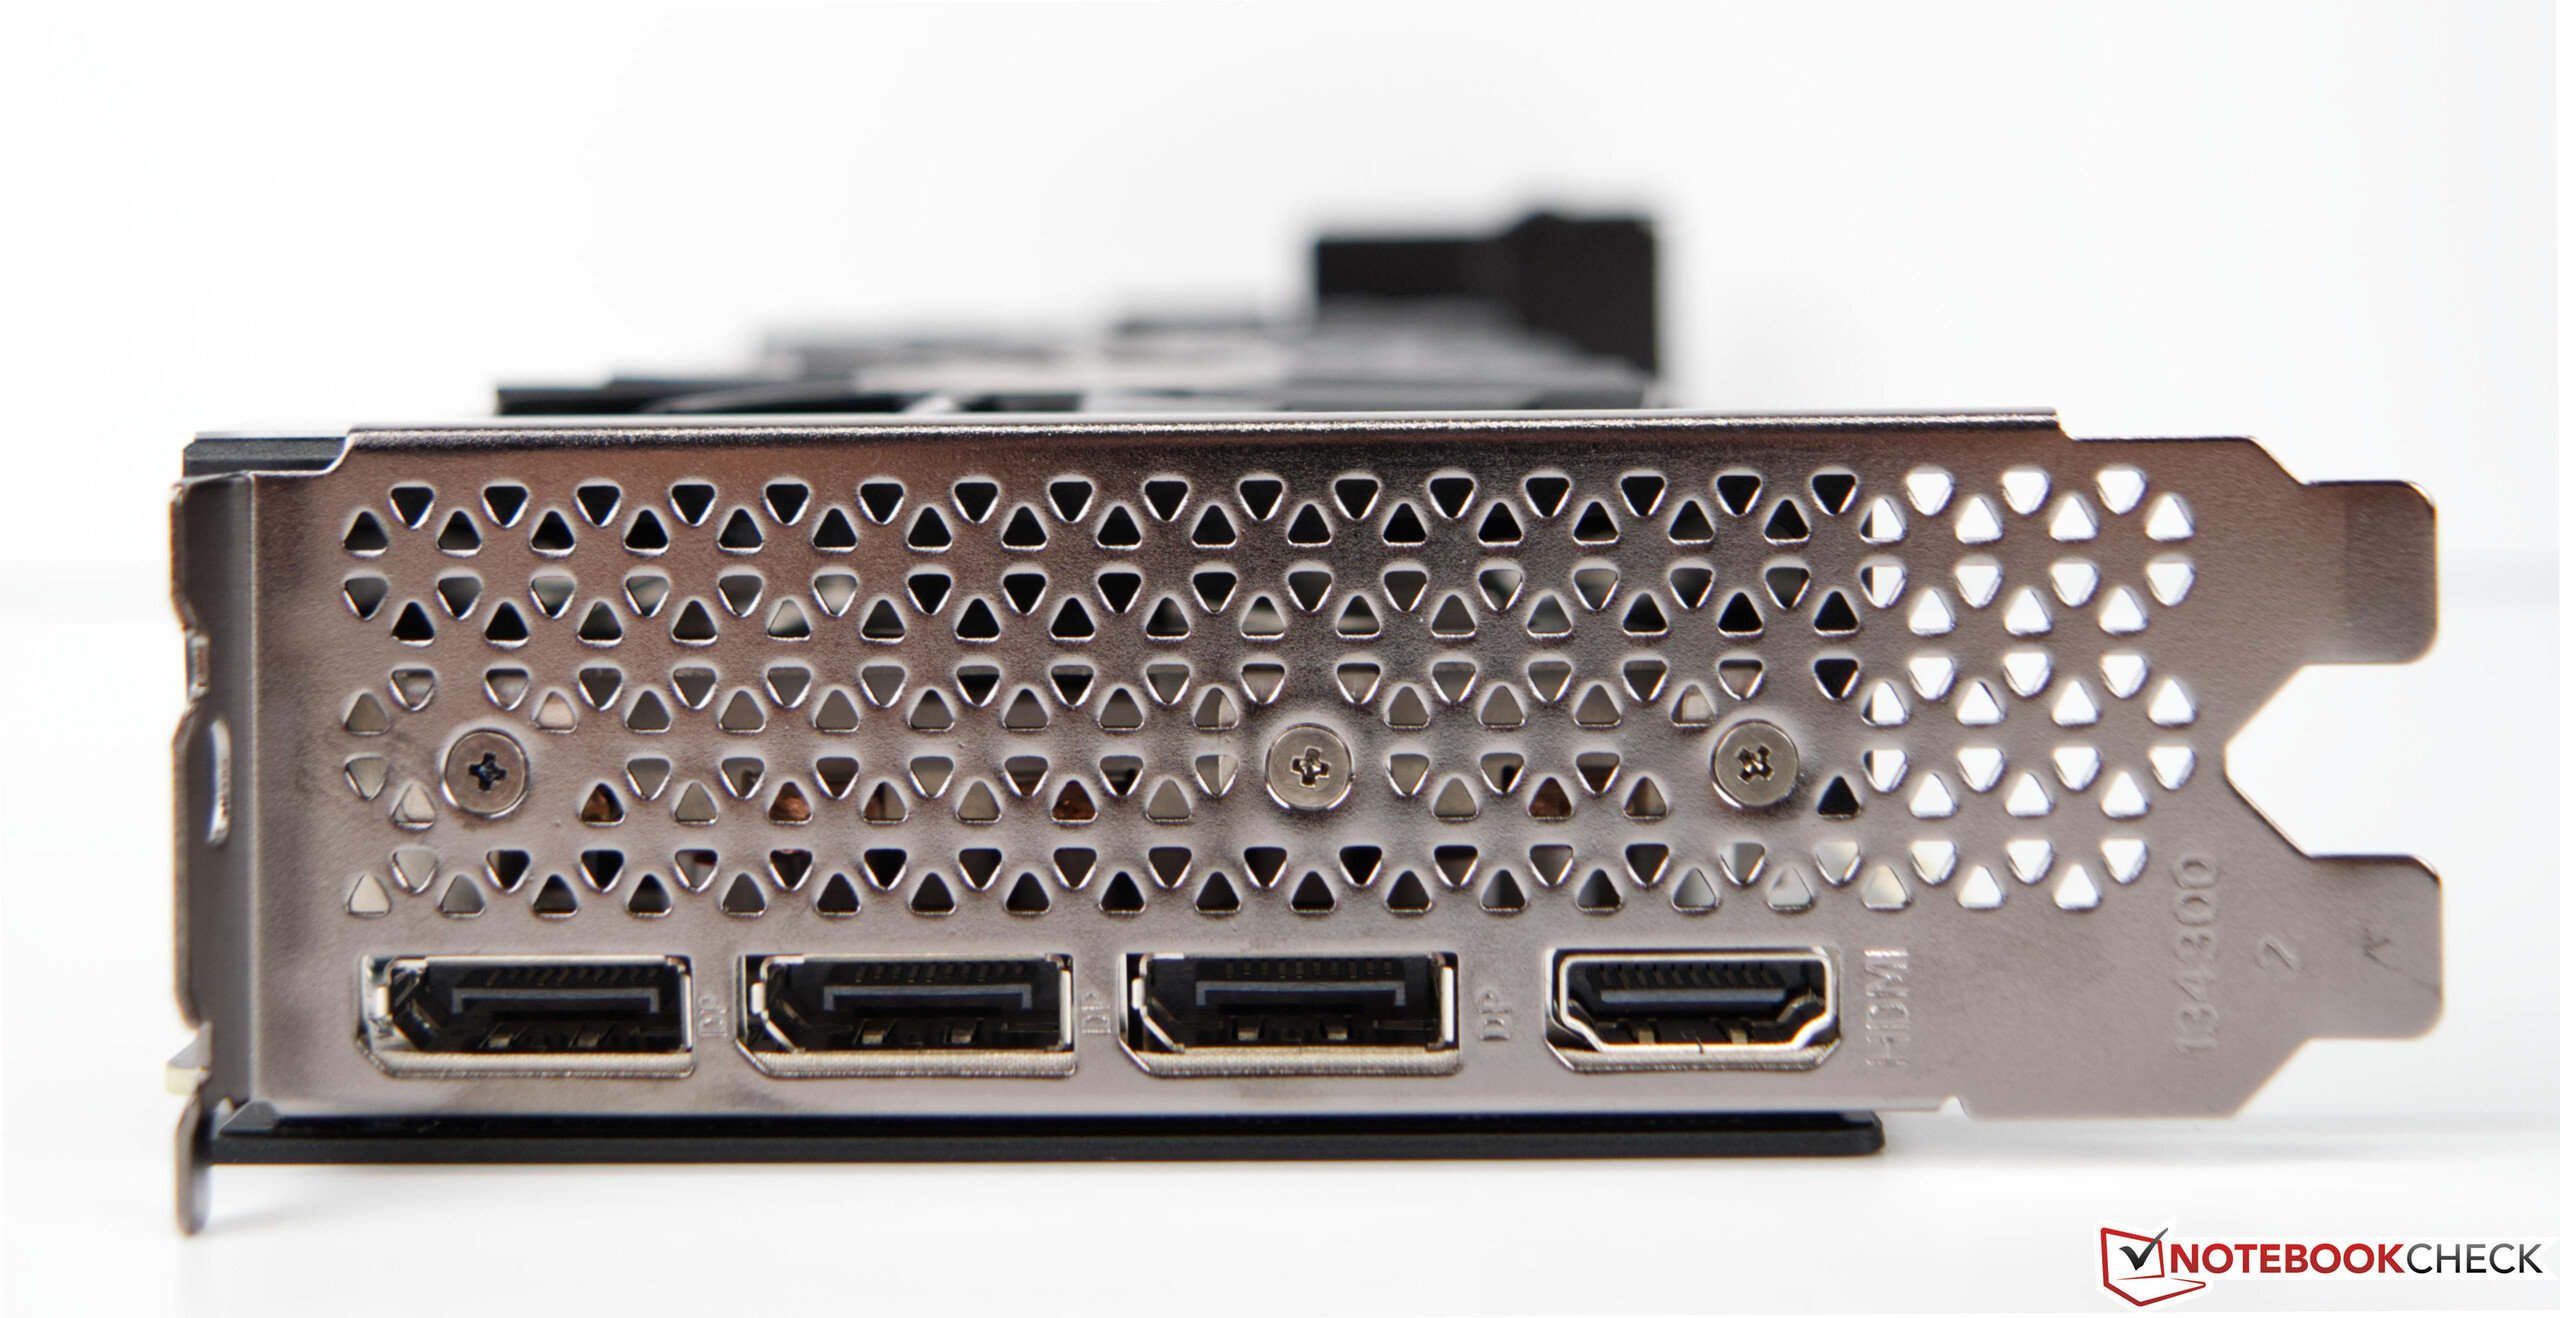
Non c'è molto da criticare nella selezione delle interfacce. Ci sono un totale di 8 porte USB, suddivise in 7 TypeA e 1 Type-C. La GPU offre 3x DisplayPort e HDMI come standard. Tuttavia, l'interfaccia di rete è solo Gigabit LAN. Avremmo preferito una porta LAN 2,5G o 5G più veloce. Inoltre, si deve fare a meno di un lettore di schede SD. La distribuzione delle porte è tipica di un dispositivo di classe. Non sorprende quindi che la maggior parte delle interfacce si trovi sul retro. Tuttavia, le porte USB sulla parte anteriore sono un po' difficili da raggiungere a causa della struttura del case.
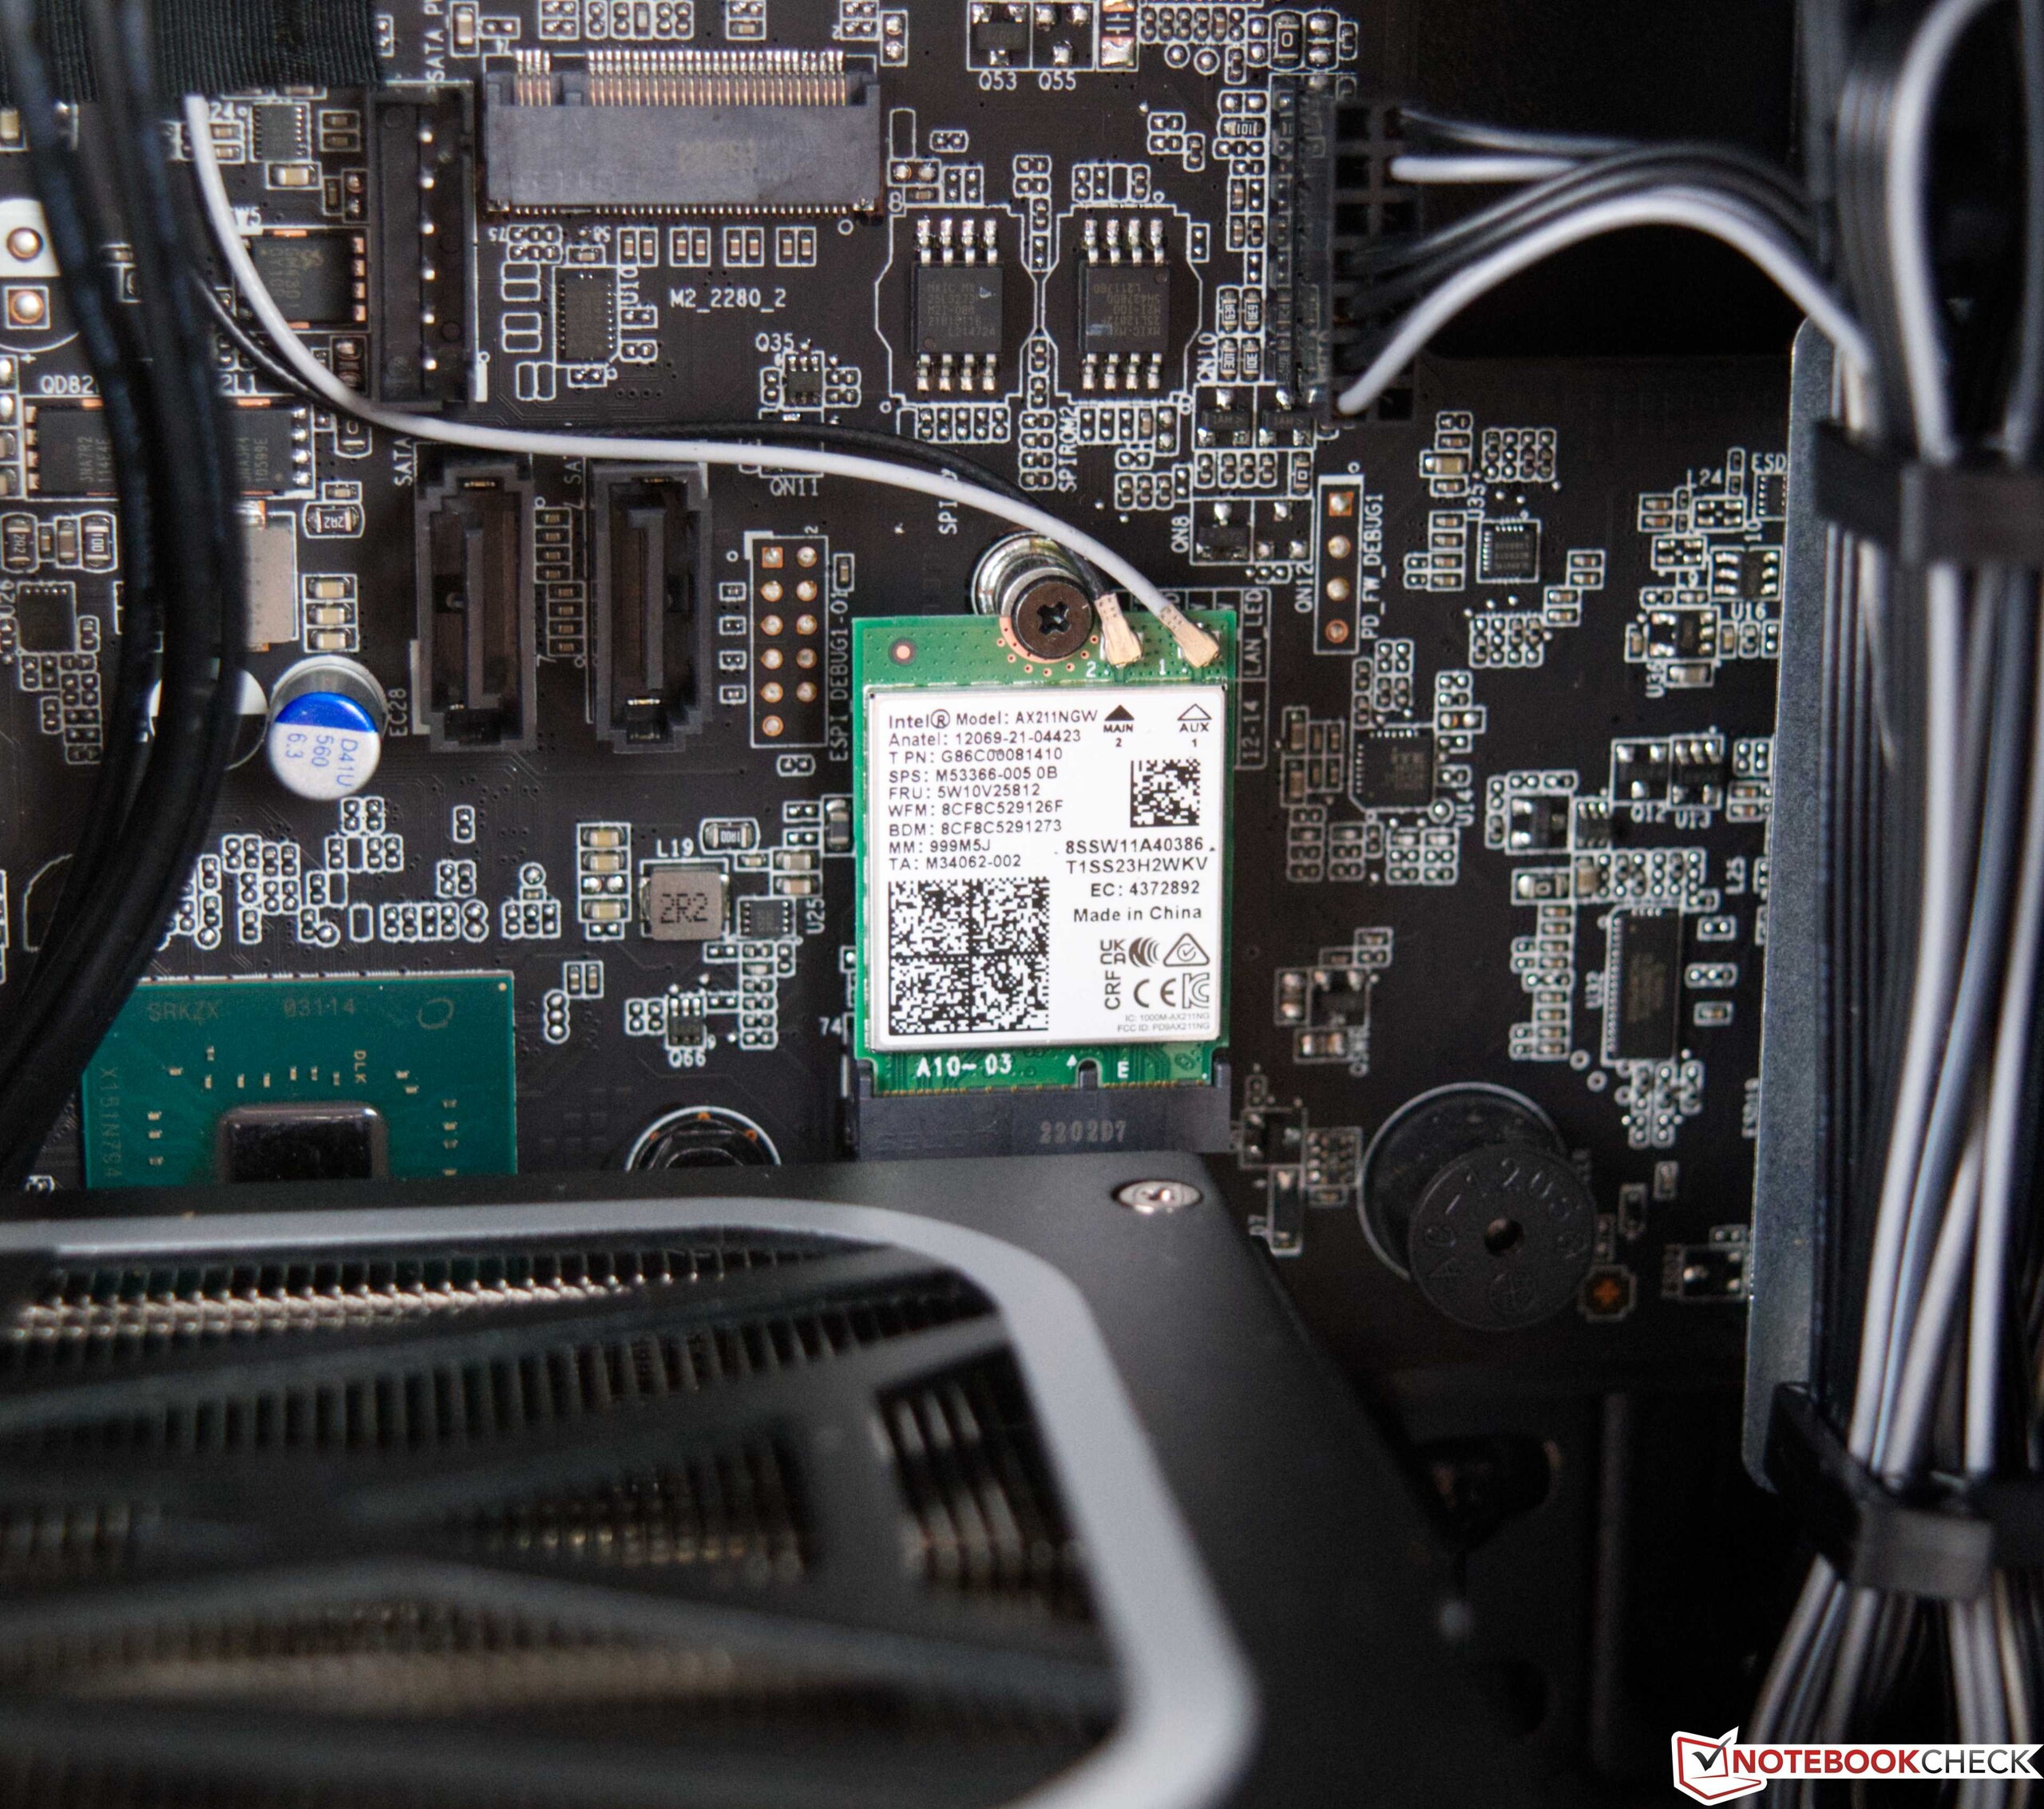
Comunicazione
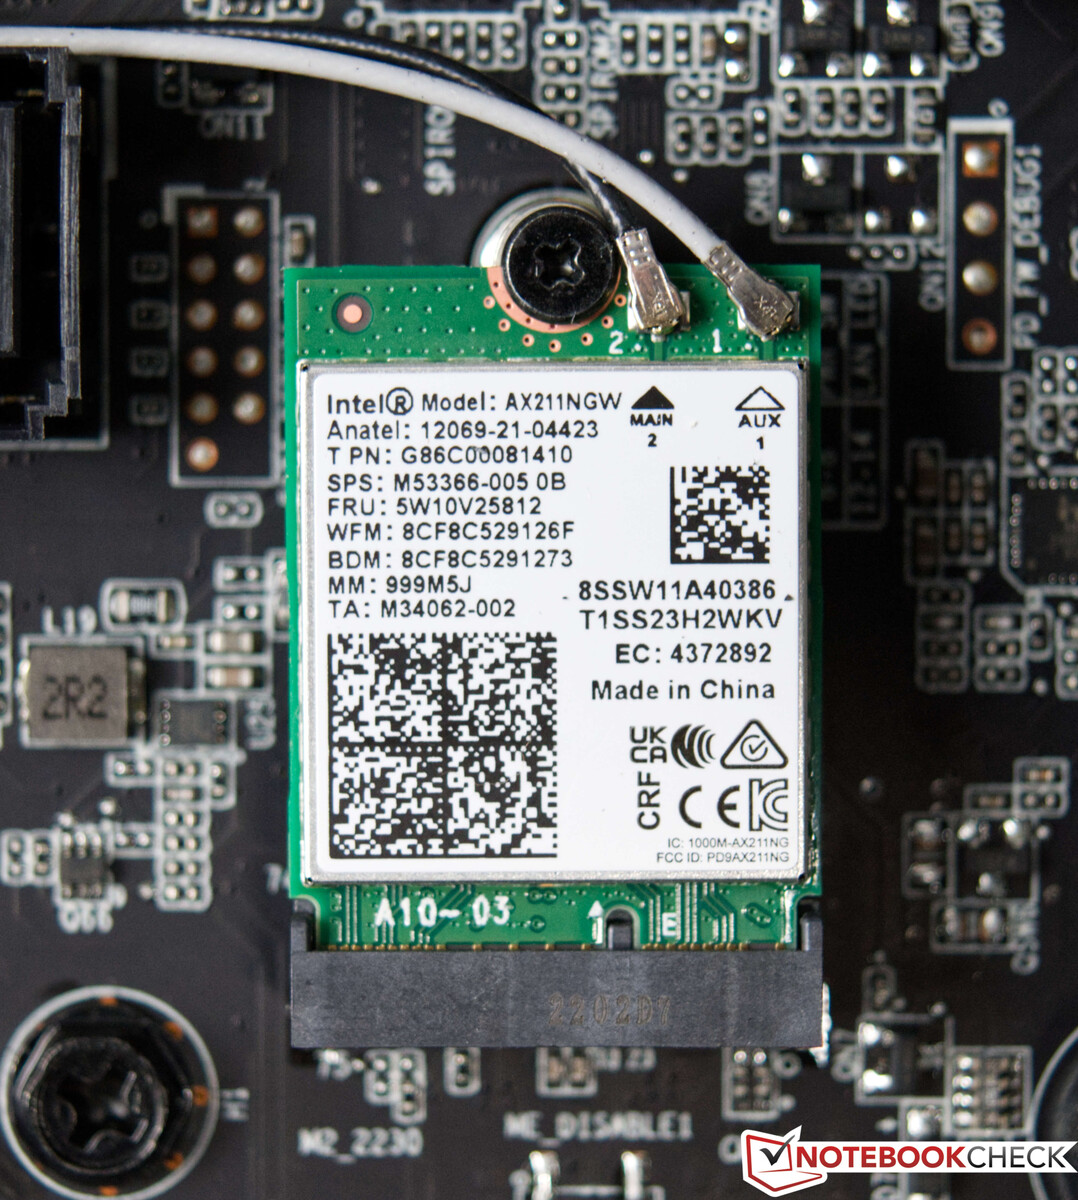
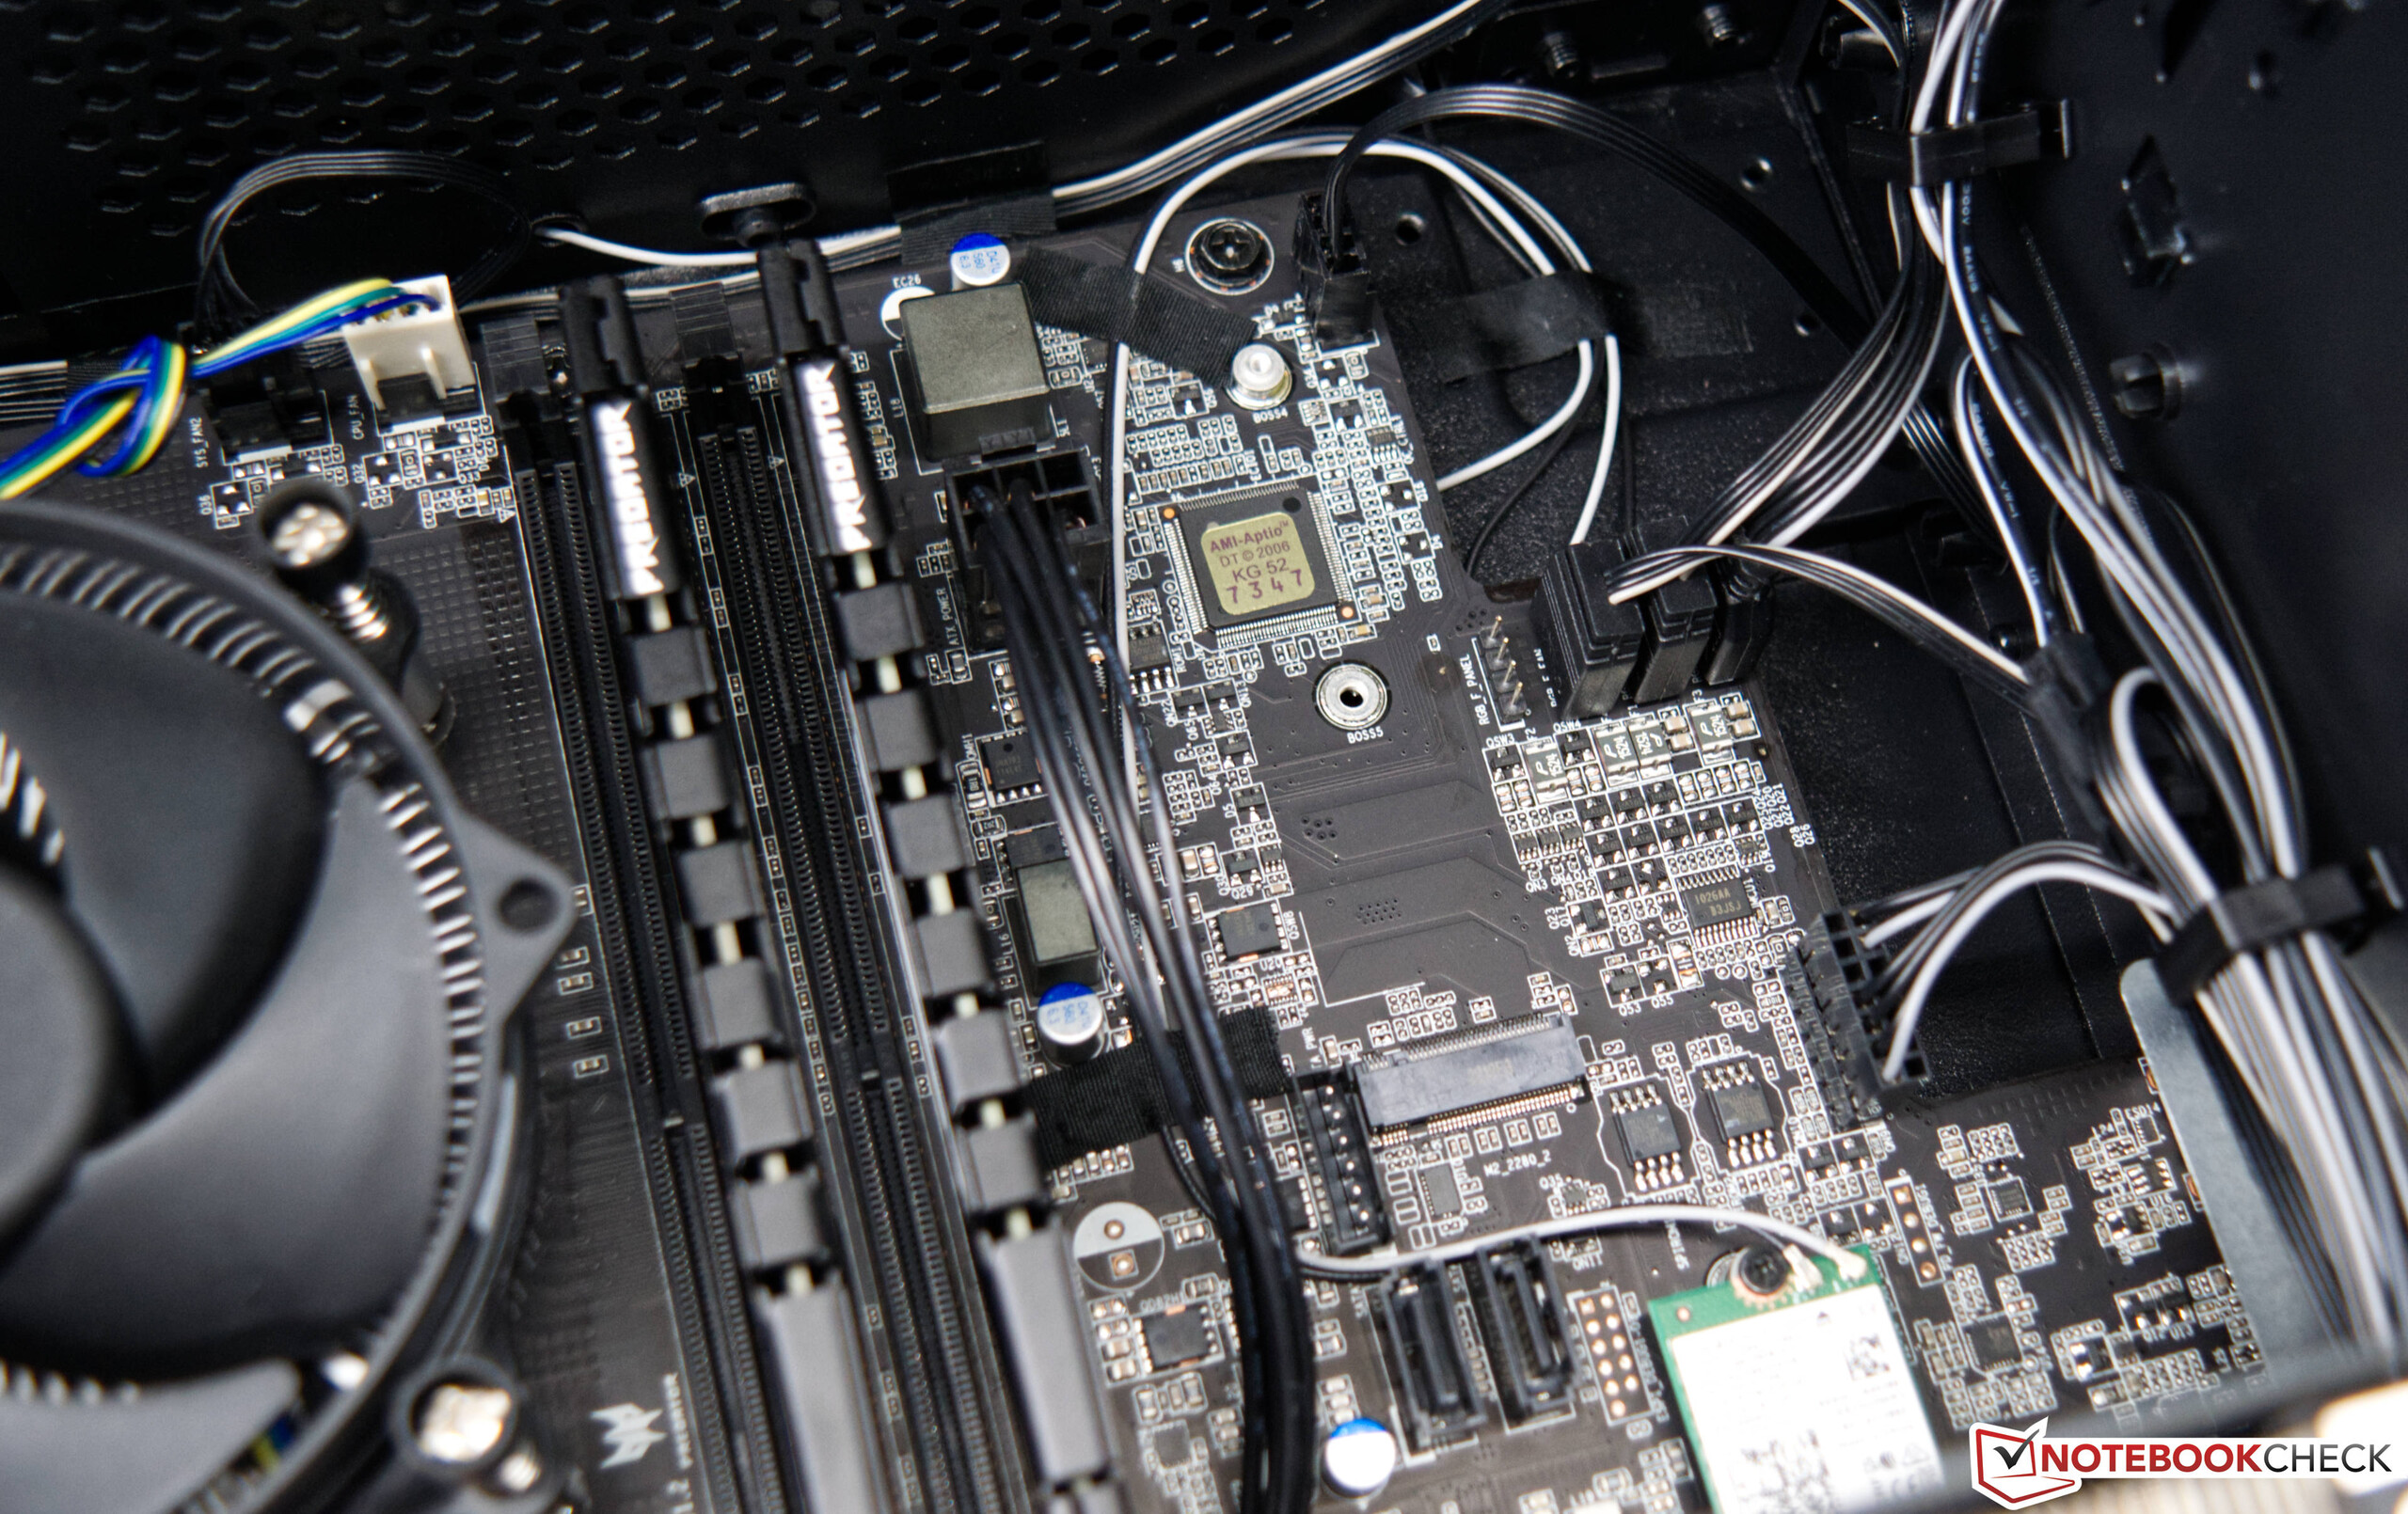
Acer equipaggia il Predator con un modulo Intel Wi-Fi 6E AX211. Si trova come scheda plug-in M.2 direttamente sulla scheda madre e offre velocità di trasferimento relativamente buone. Tuttavia, le prestazioni dell'Intel Wi-Fi 6E AX211 nella ricezione dei dati non riescono a tenere il passo con le buone velocità di trasmissione. I dispositivi di confronto offrono in parte velocità migliori. Tuttavia, il test di tutti i giorni ha dimostrato che è possibile gestire bene anche il modulo WLAN installato. Non abbiamo riscontrato alcun problema nell'utilizzo della connessione wireless. In alternativa, l'utente può utilizzare una porta RJ45 che si basa su un chip killer E2600. Sfortunatamente, questa offre solo un massimo di 1 GBit/s.
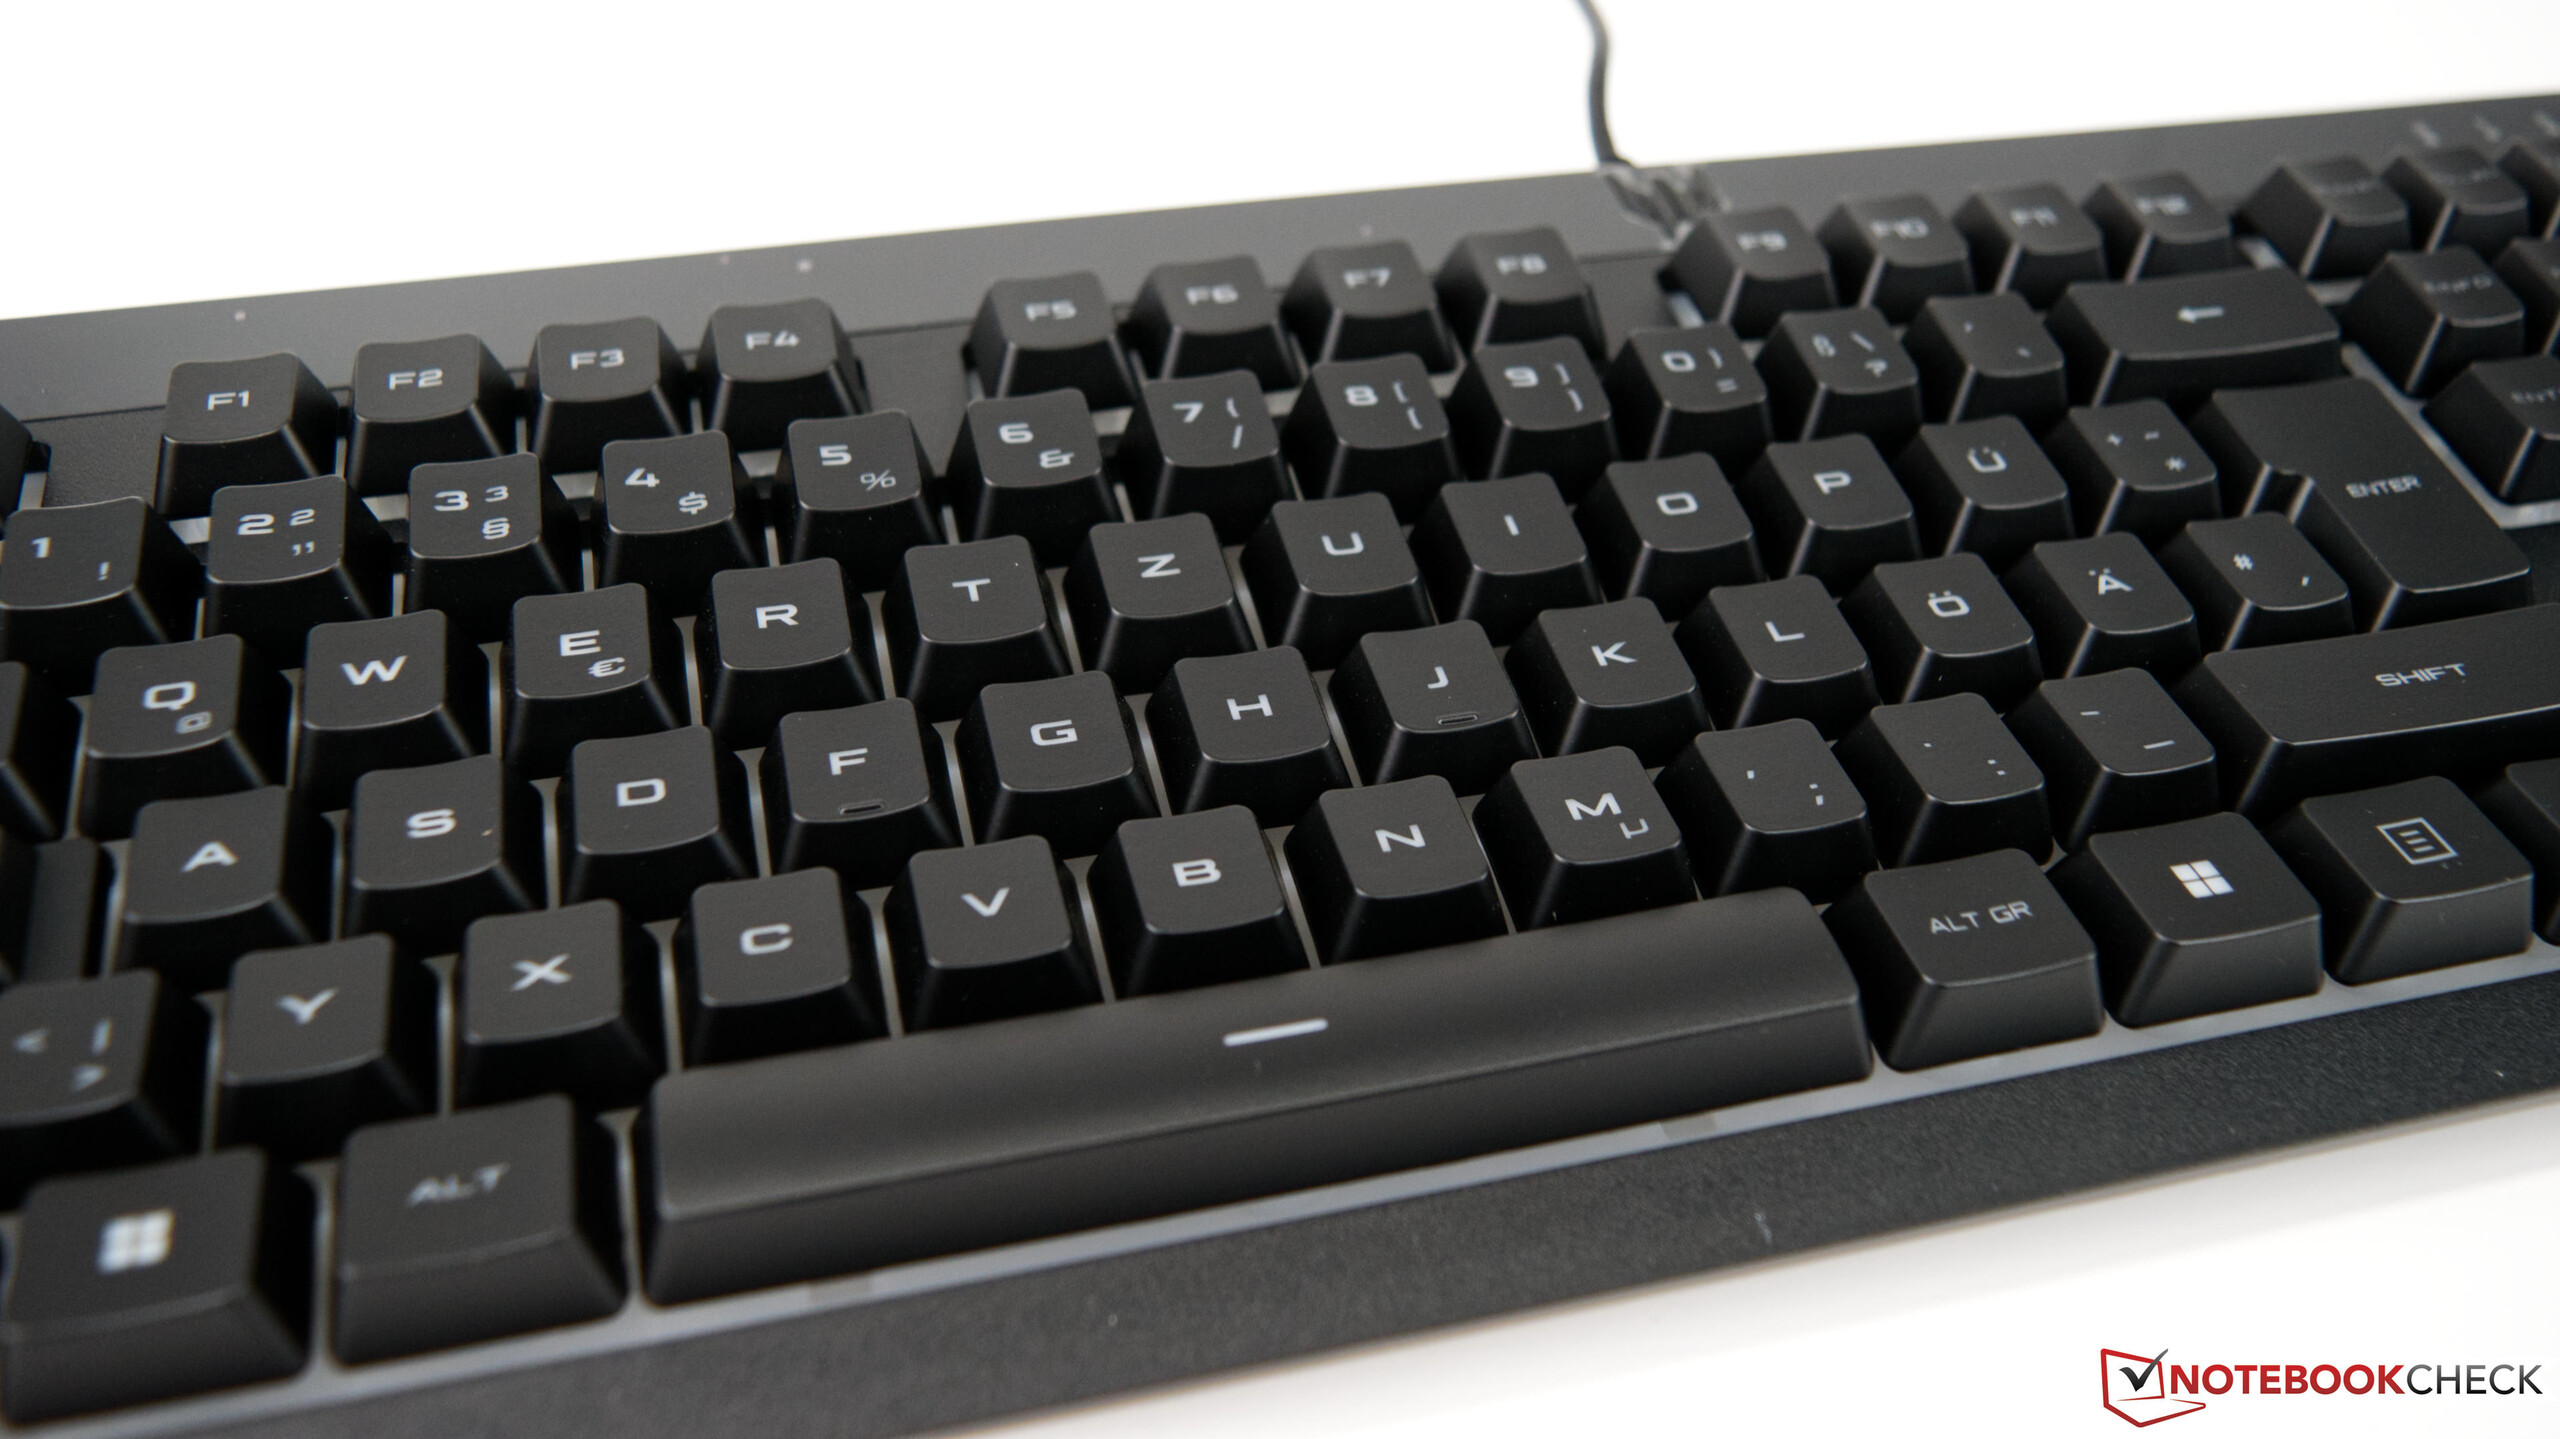
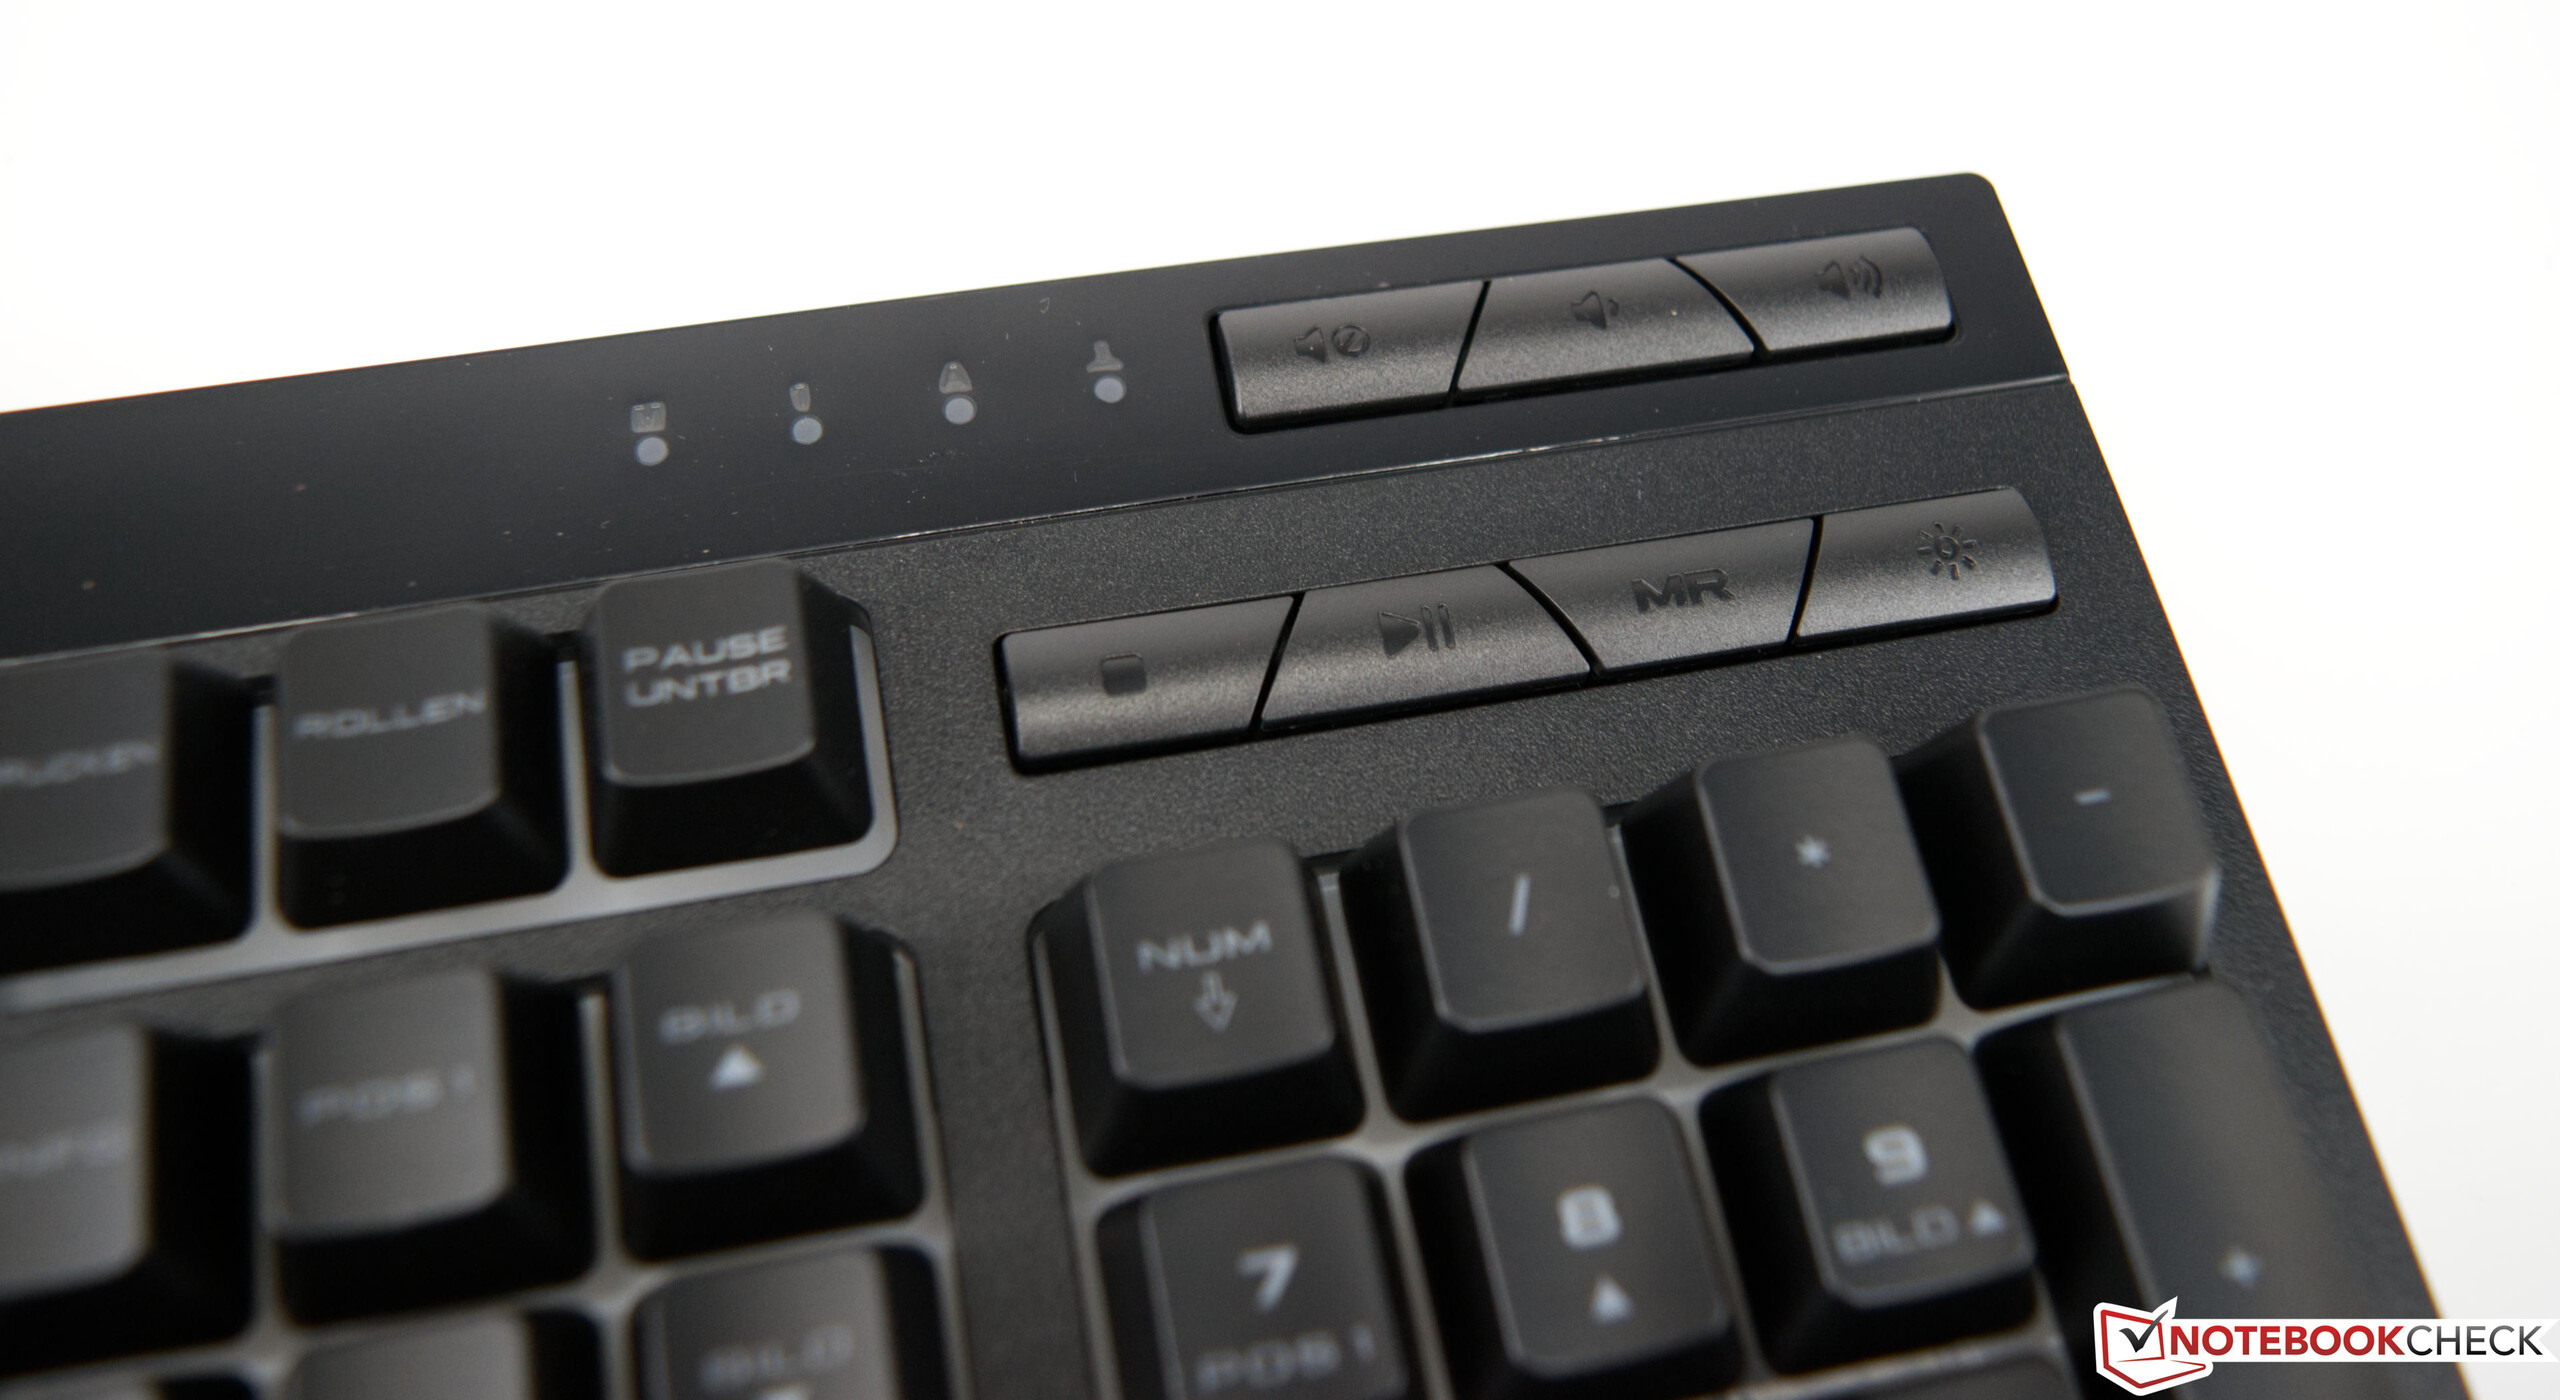
Accessori
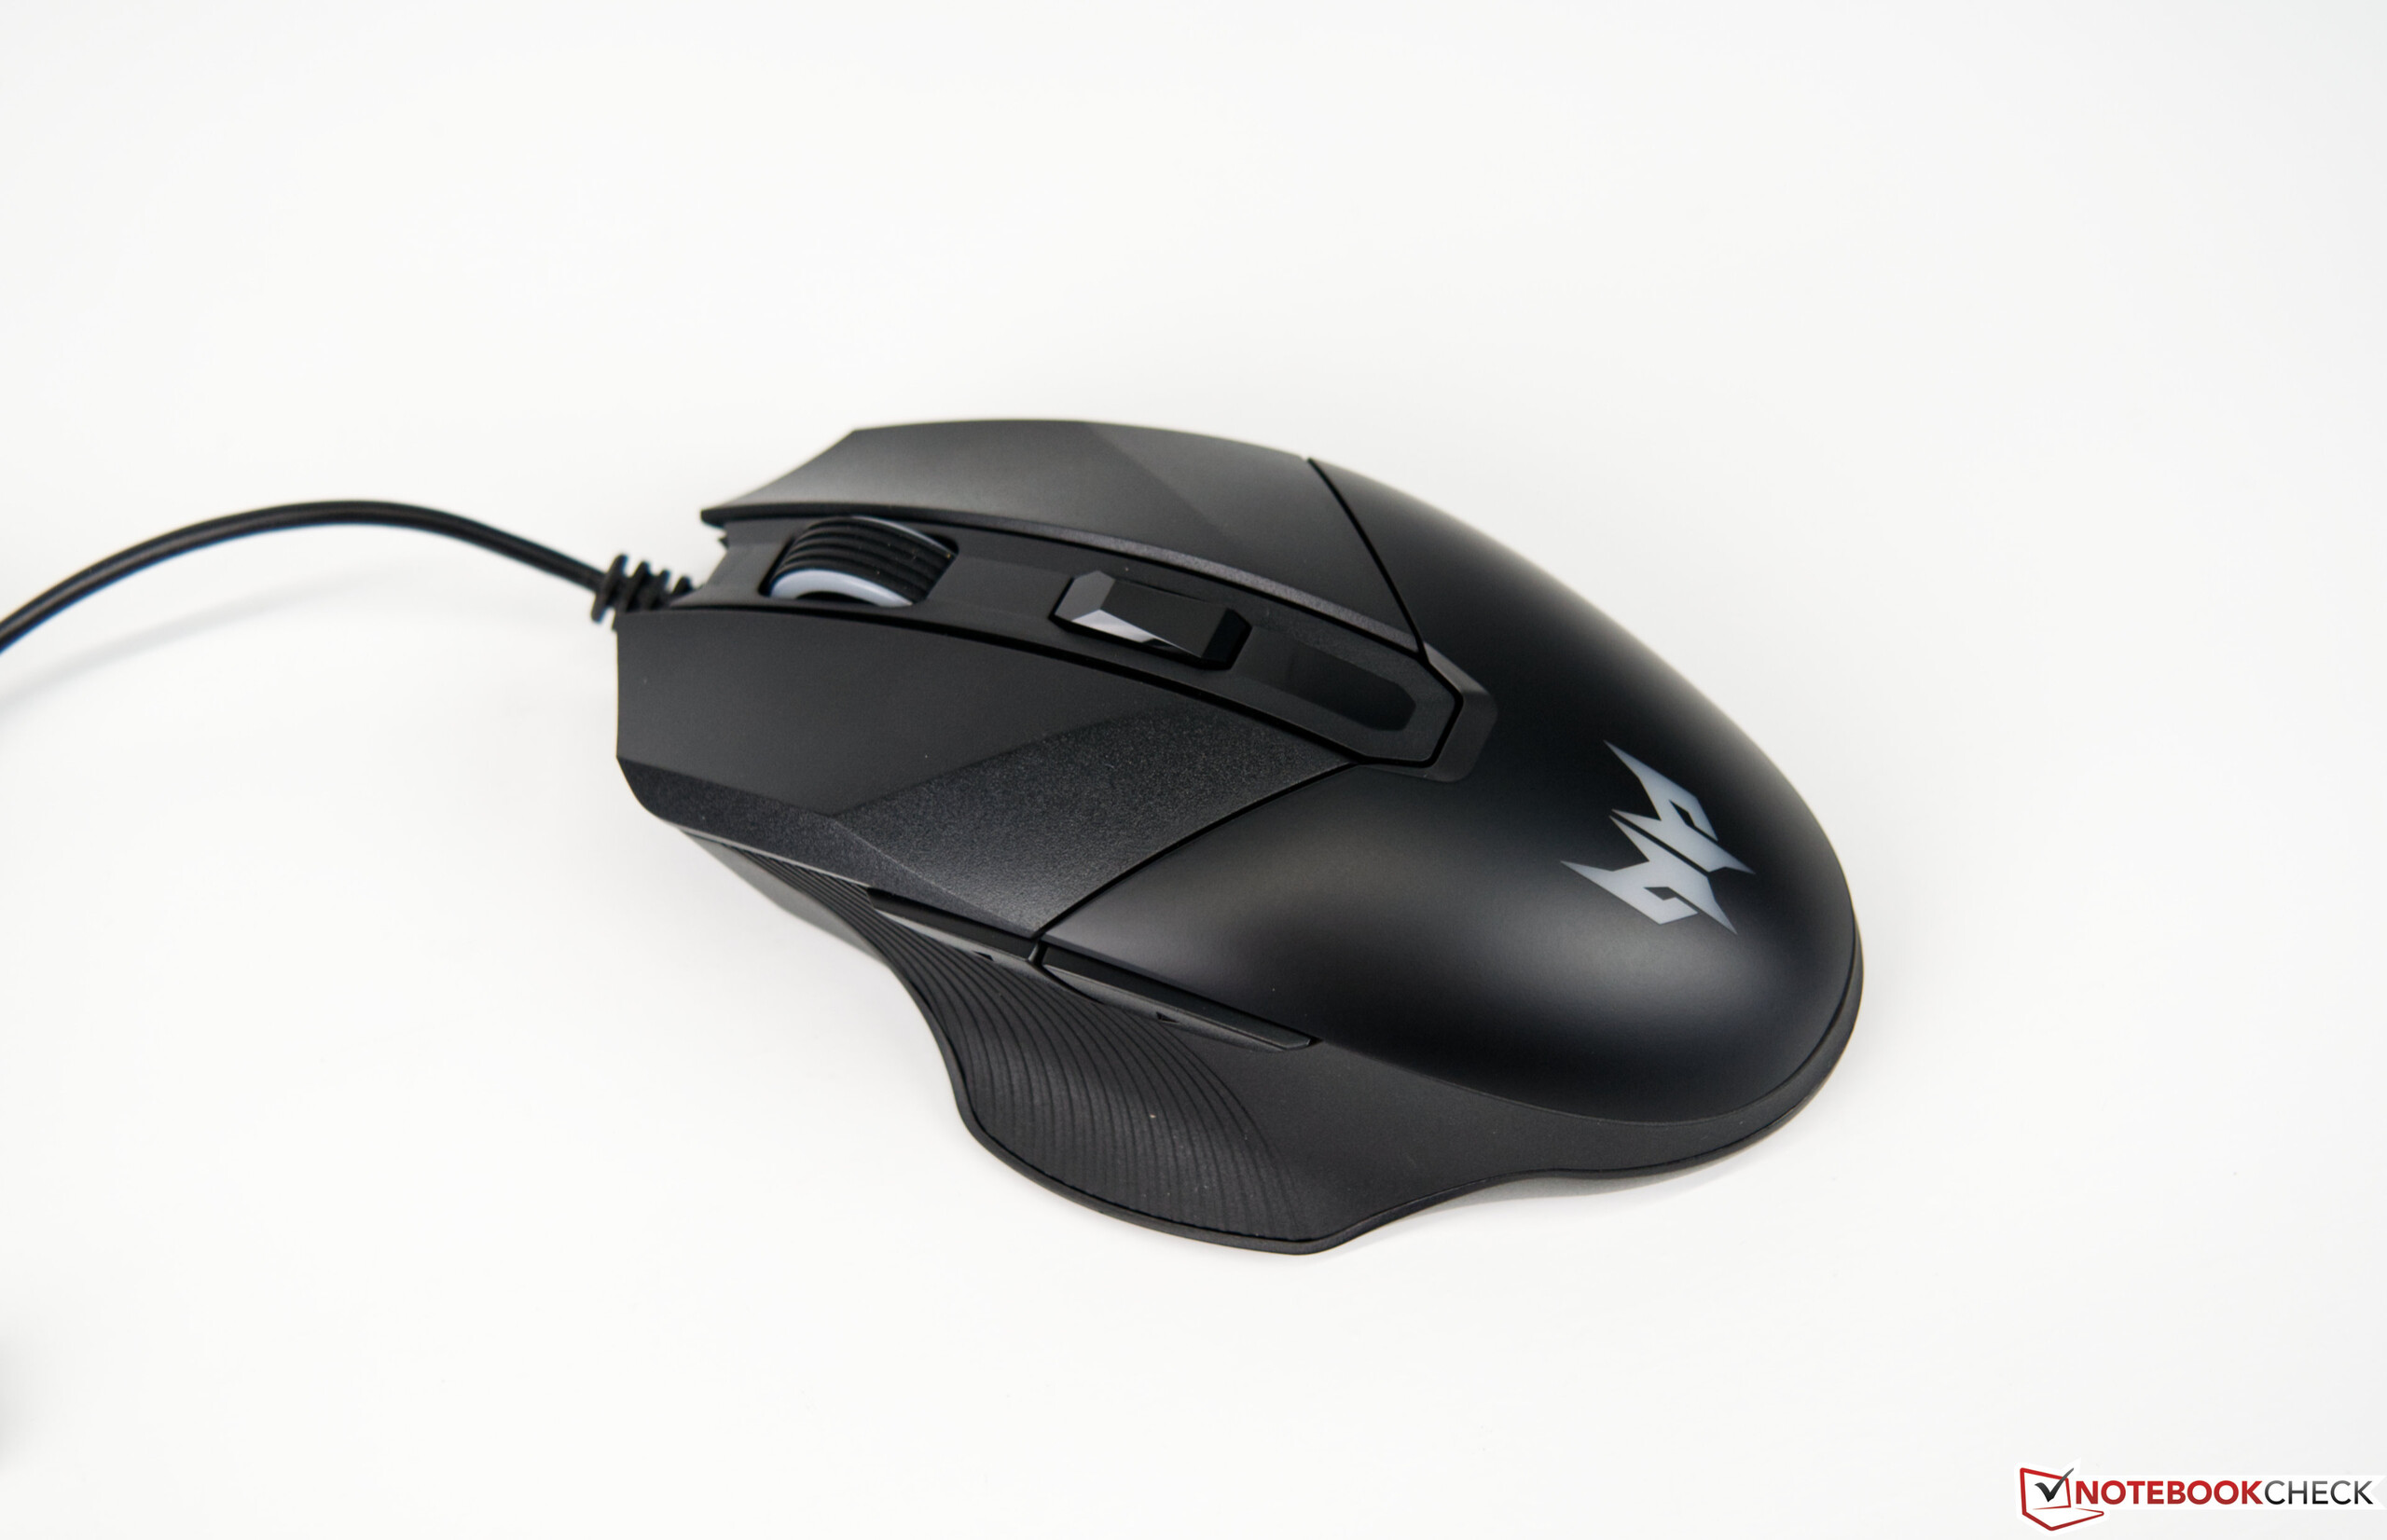
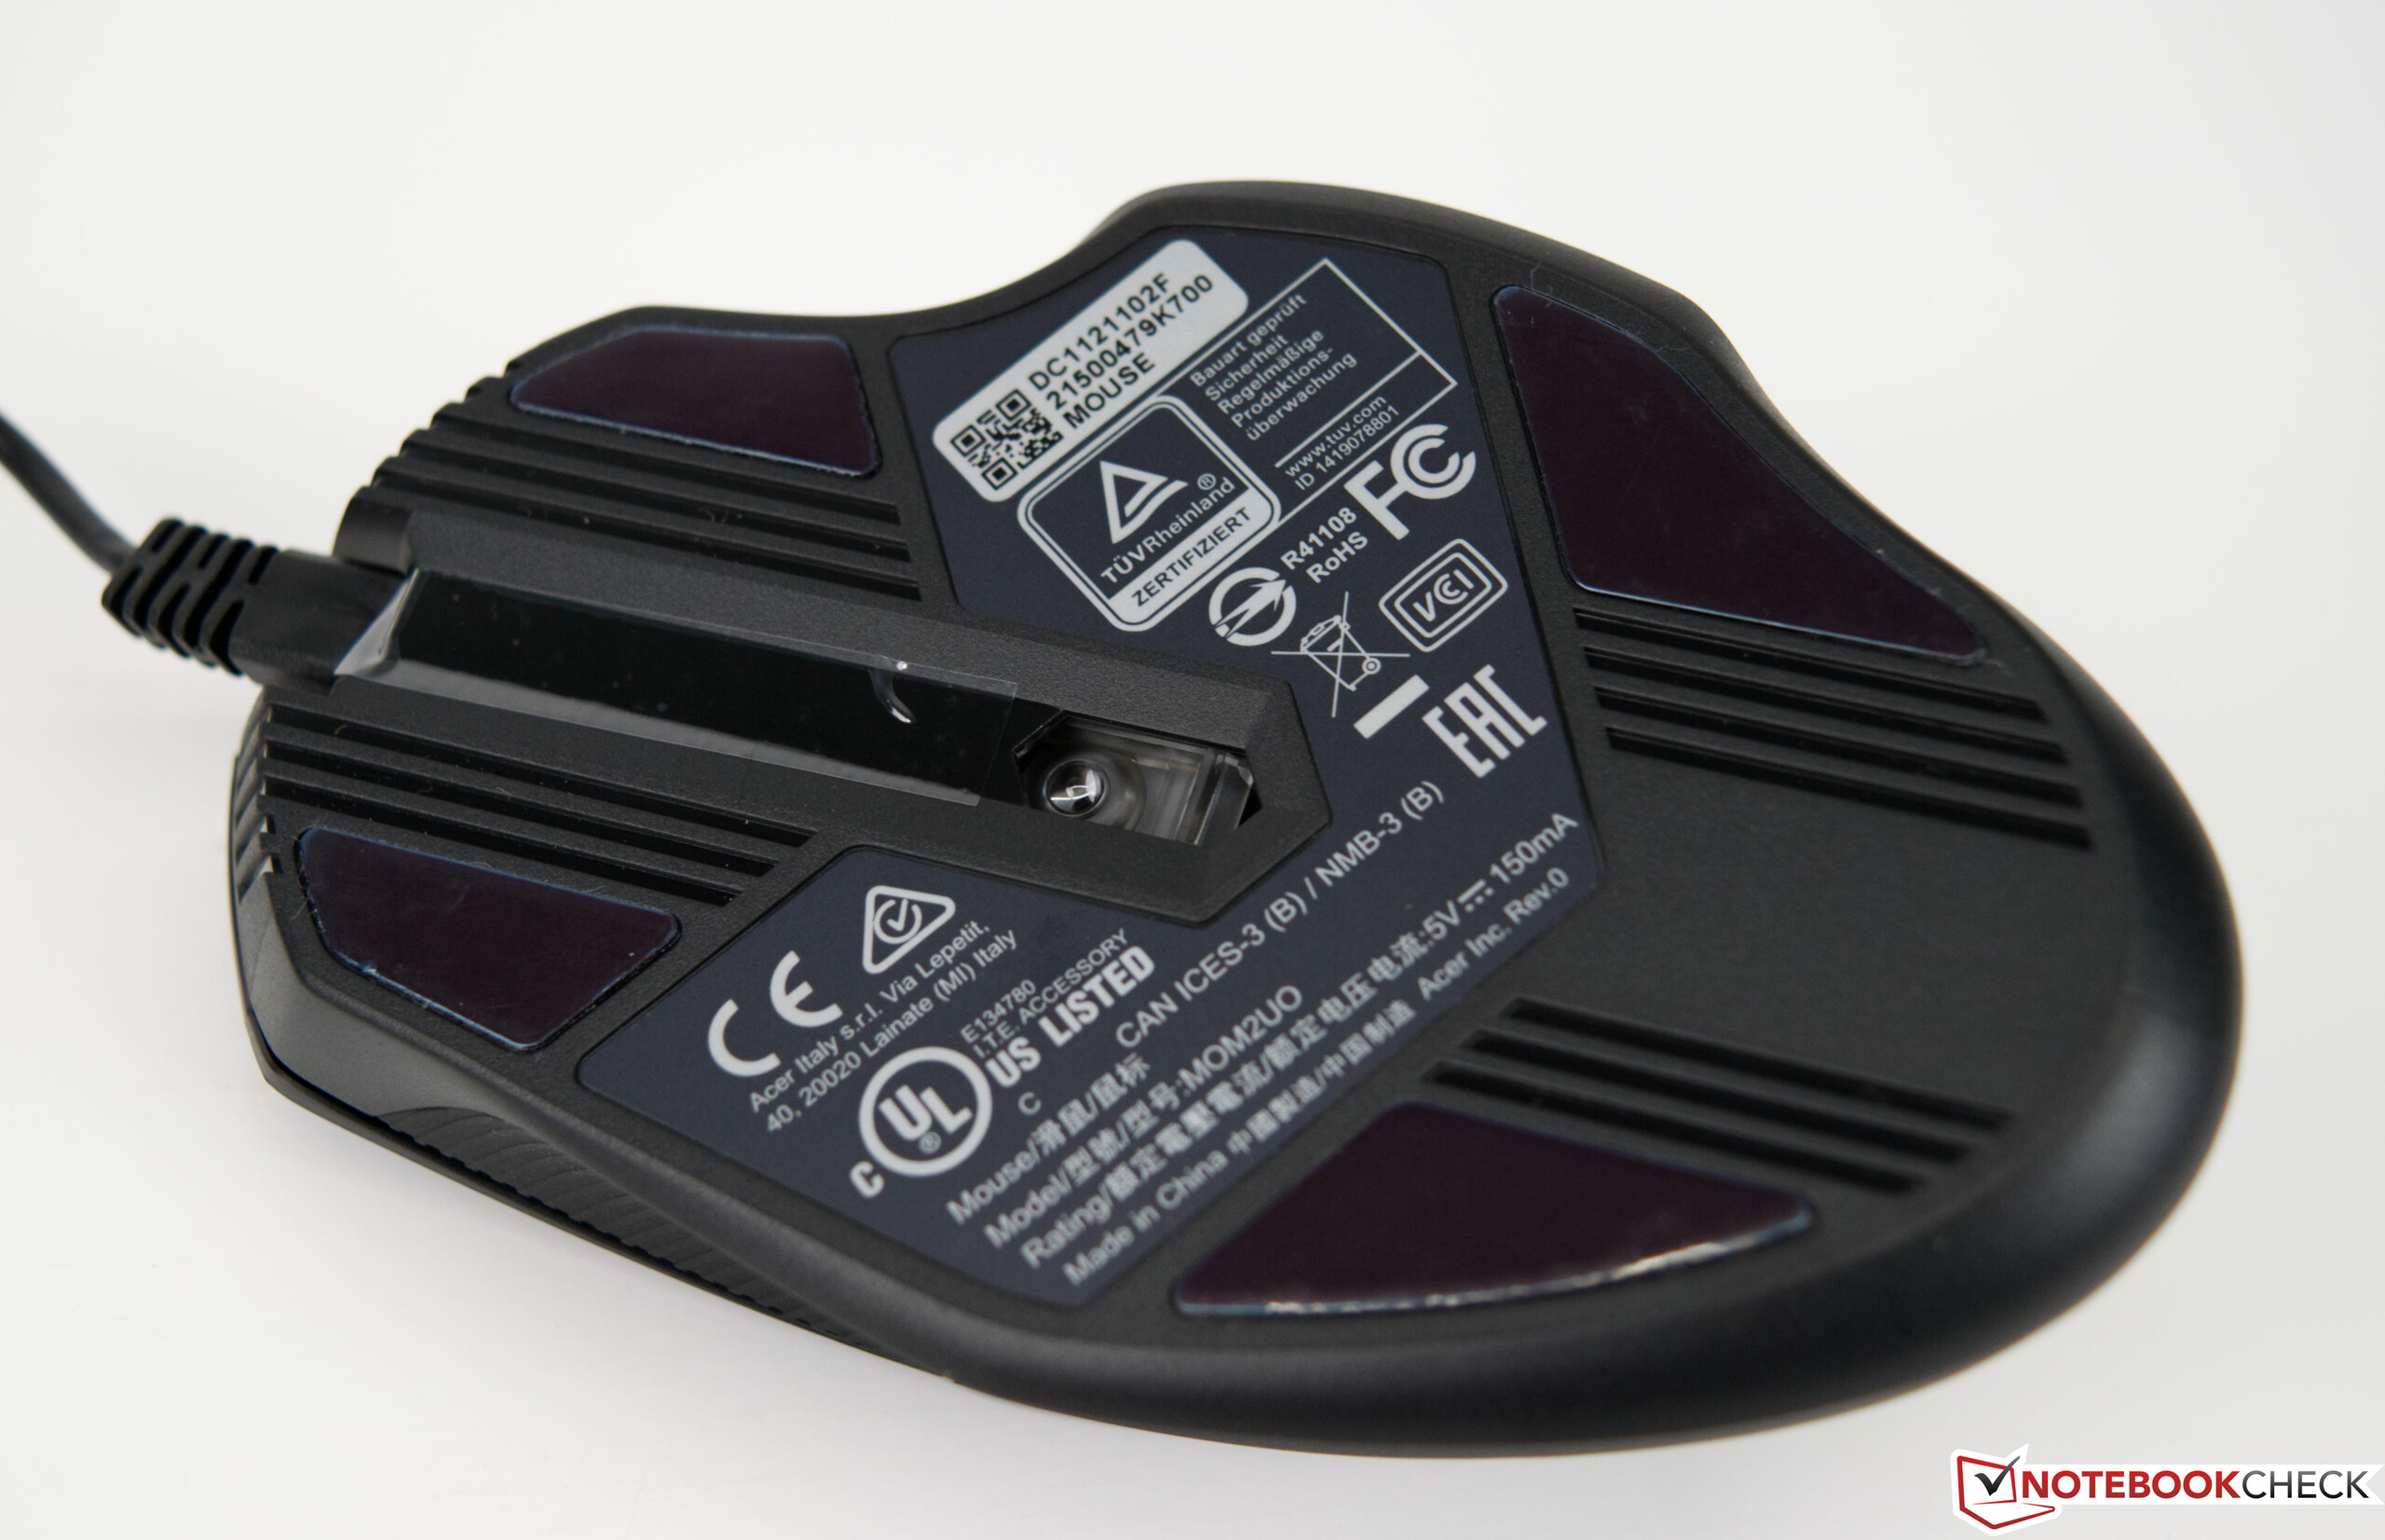
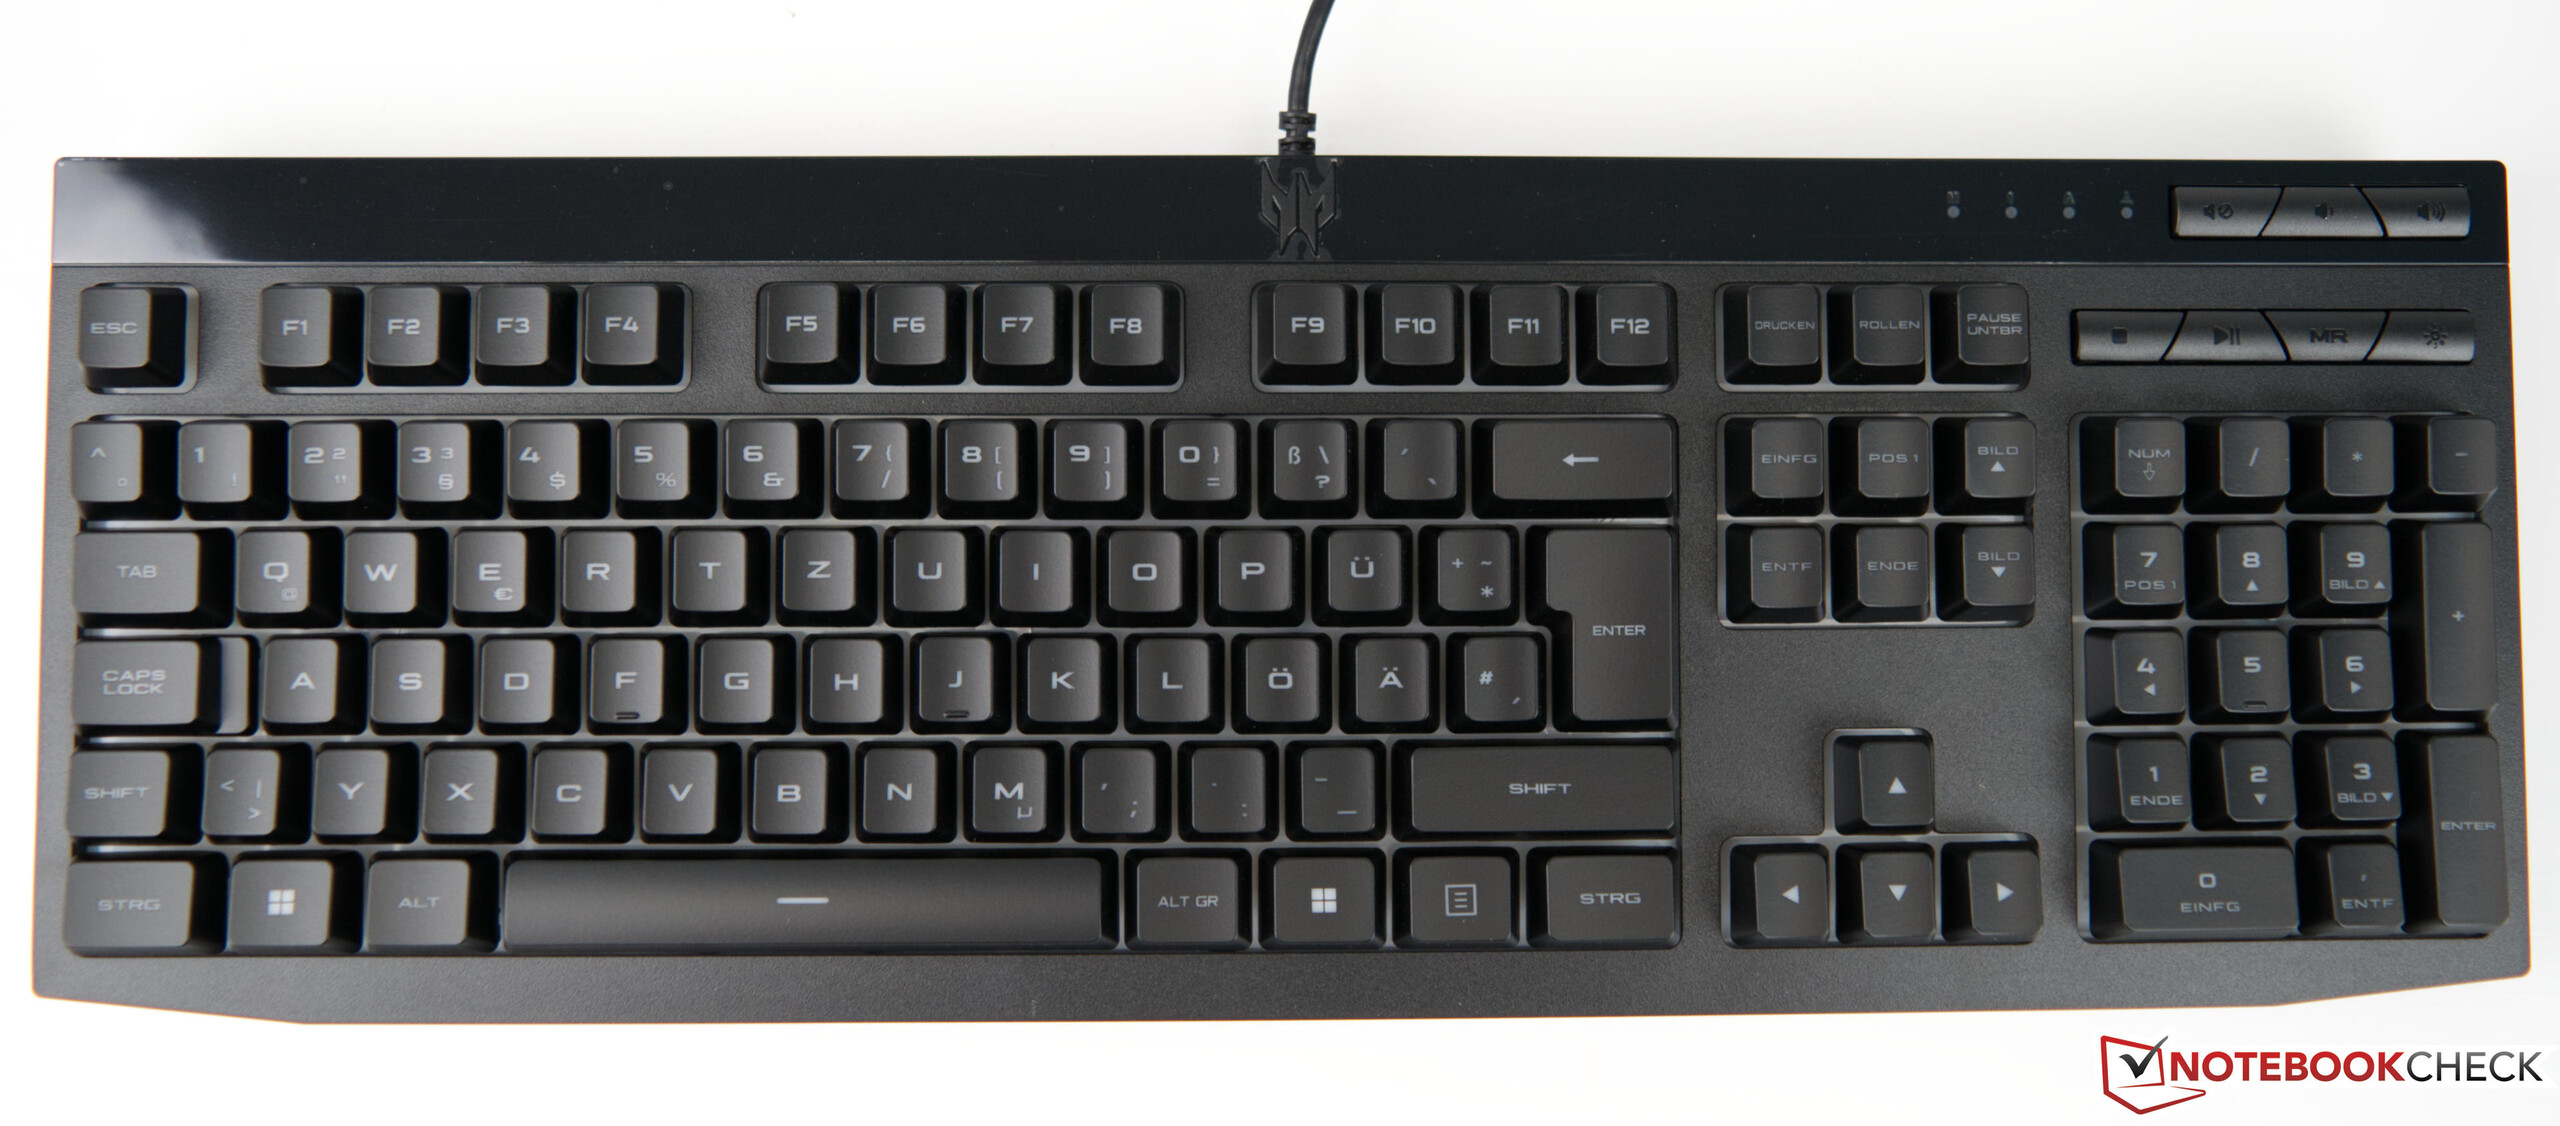
Se acquistate un Acer Predator Orion 3000, riceverete anche una tastiera otticamente coordinata e un mouse da gioco, anch'esso in stile Predator. In questo modo, si è ben preparati per l'inizio e l'hardware fornisce un'impressione generale coerente. Il tower può essere aggiornato con un pannello laterale opzionale che include una finestra di visualizzazione. In questo modo è possibile sfruttare al meglio l'illuminazione RGB integrata.
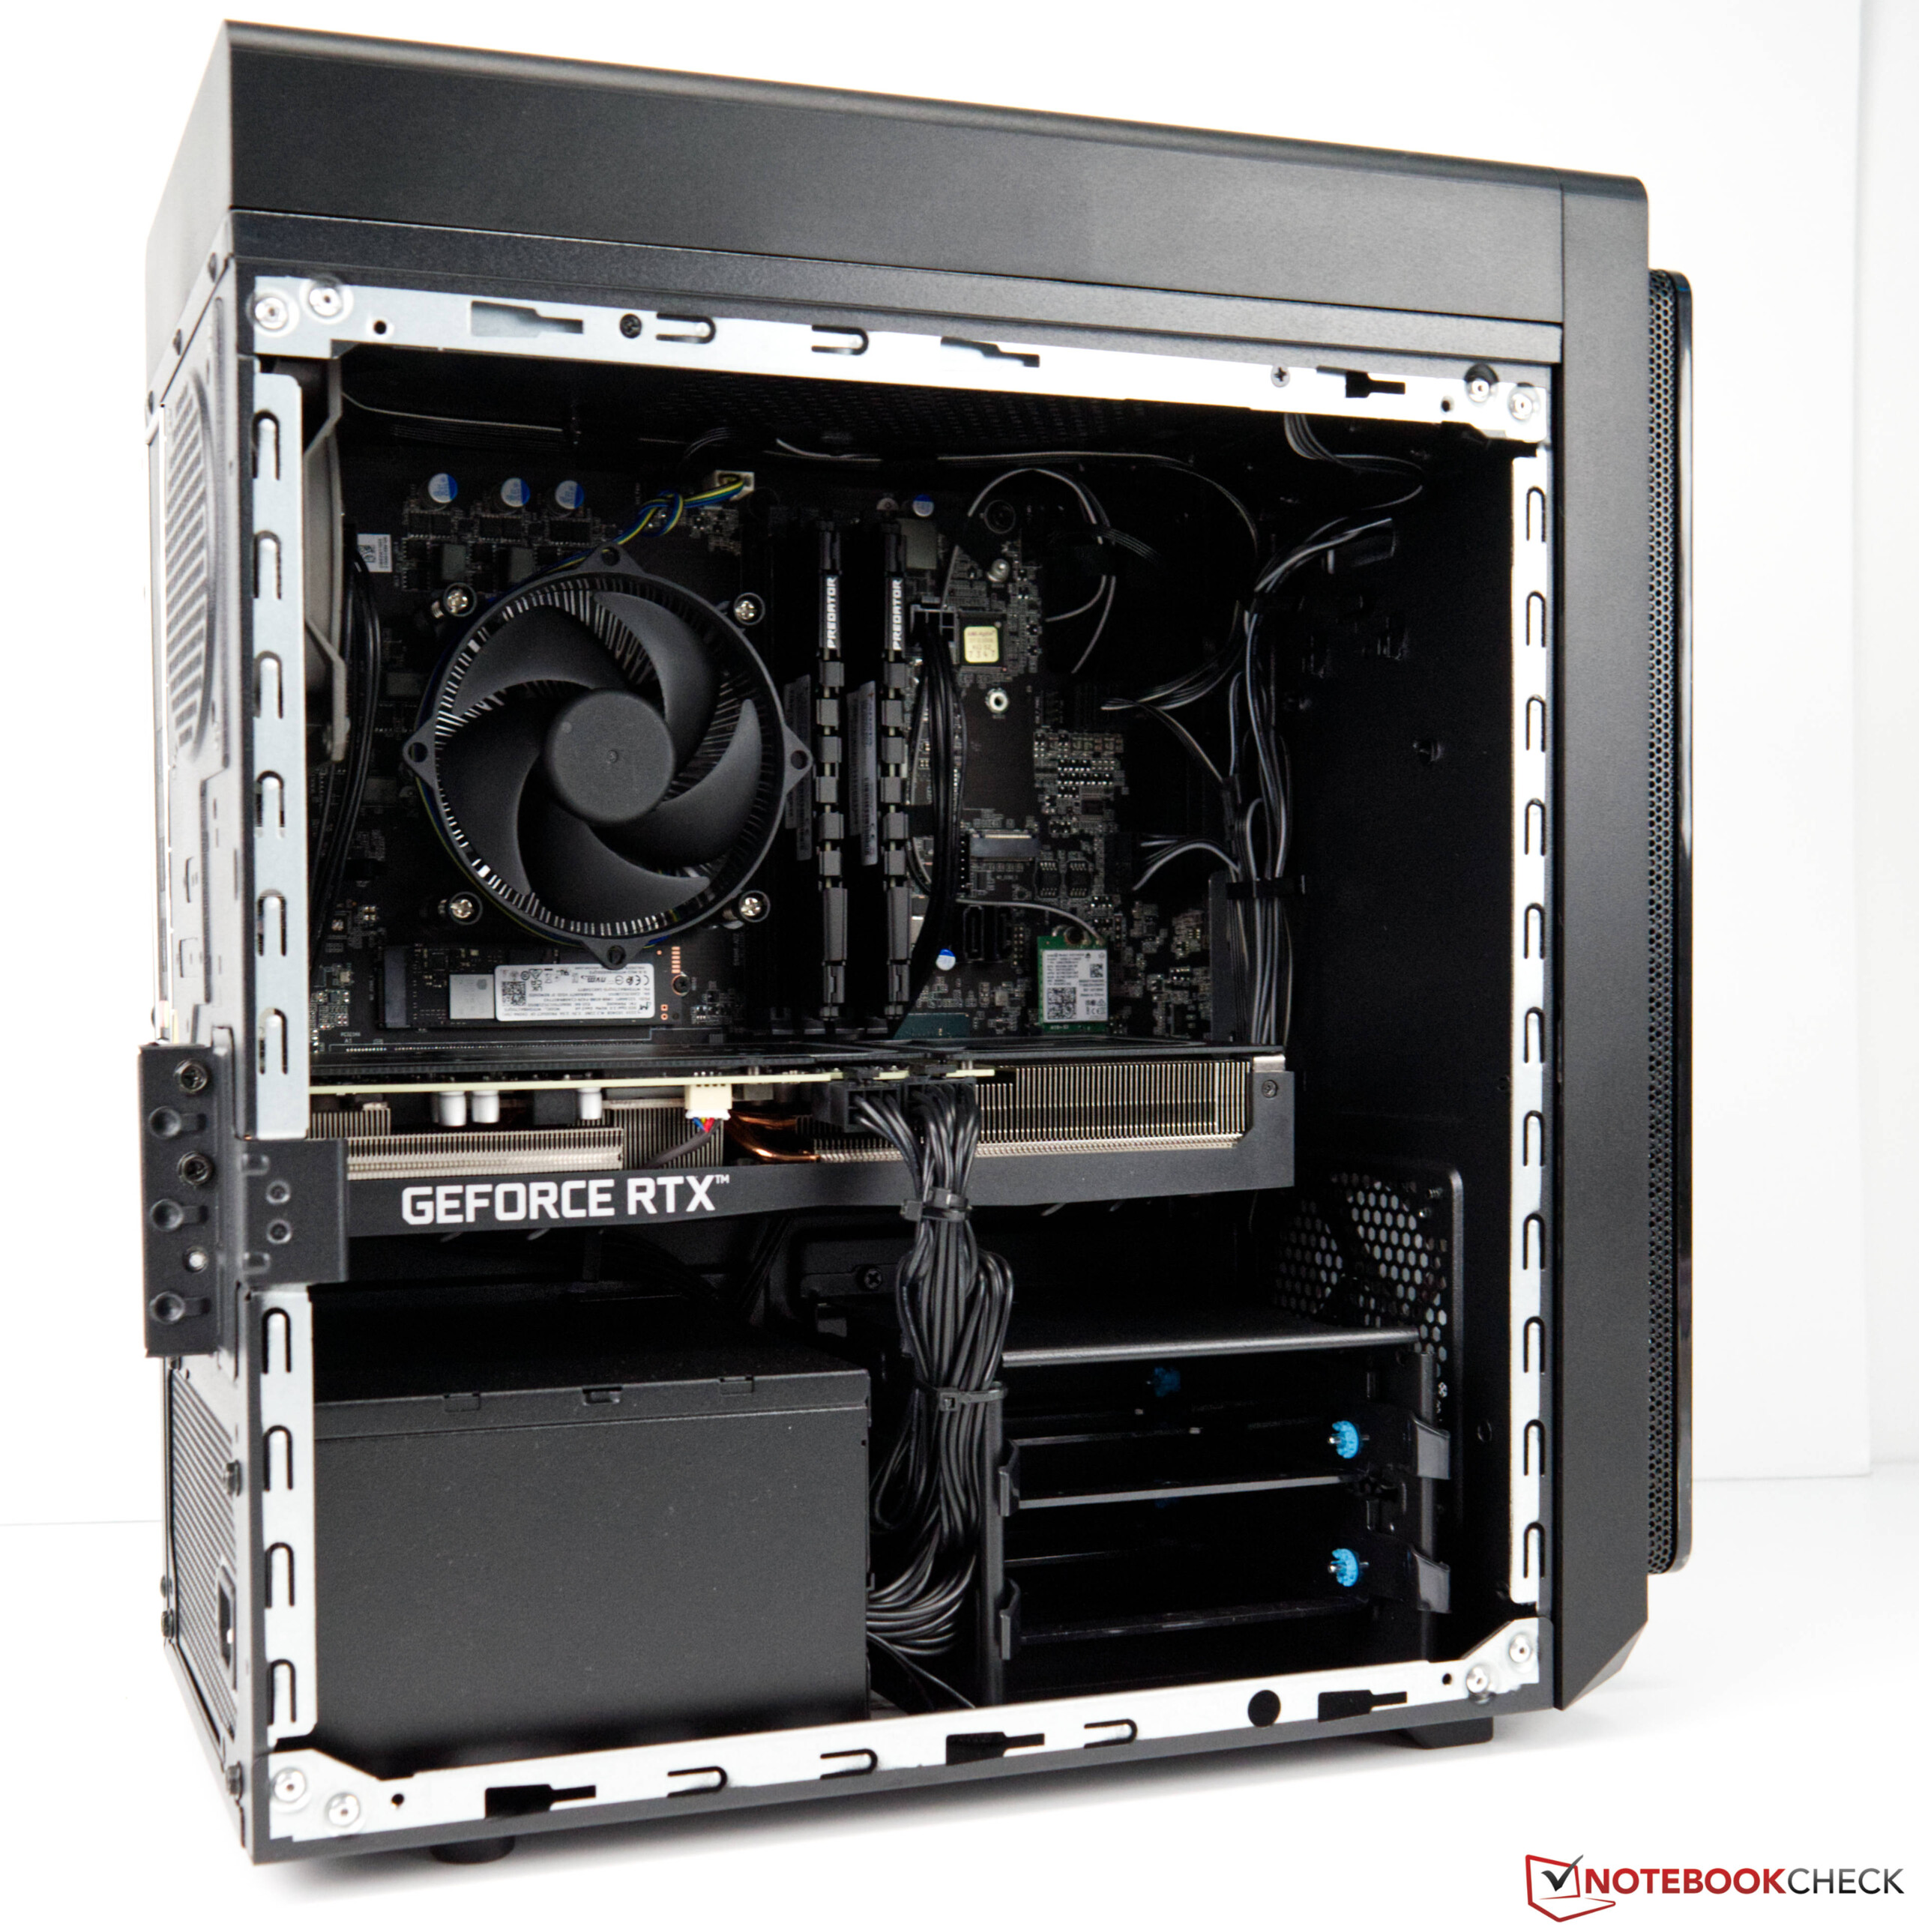
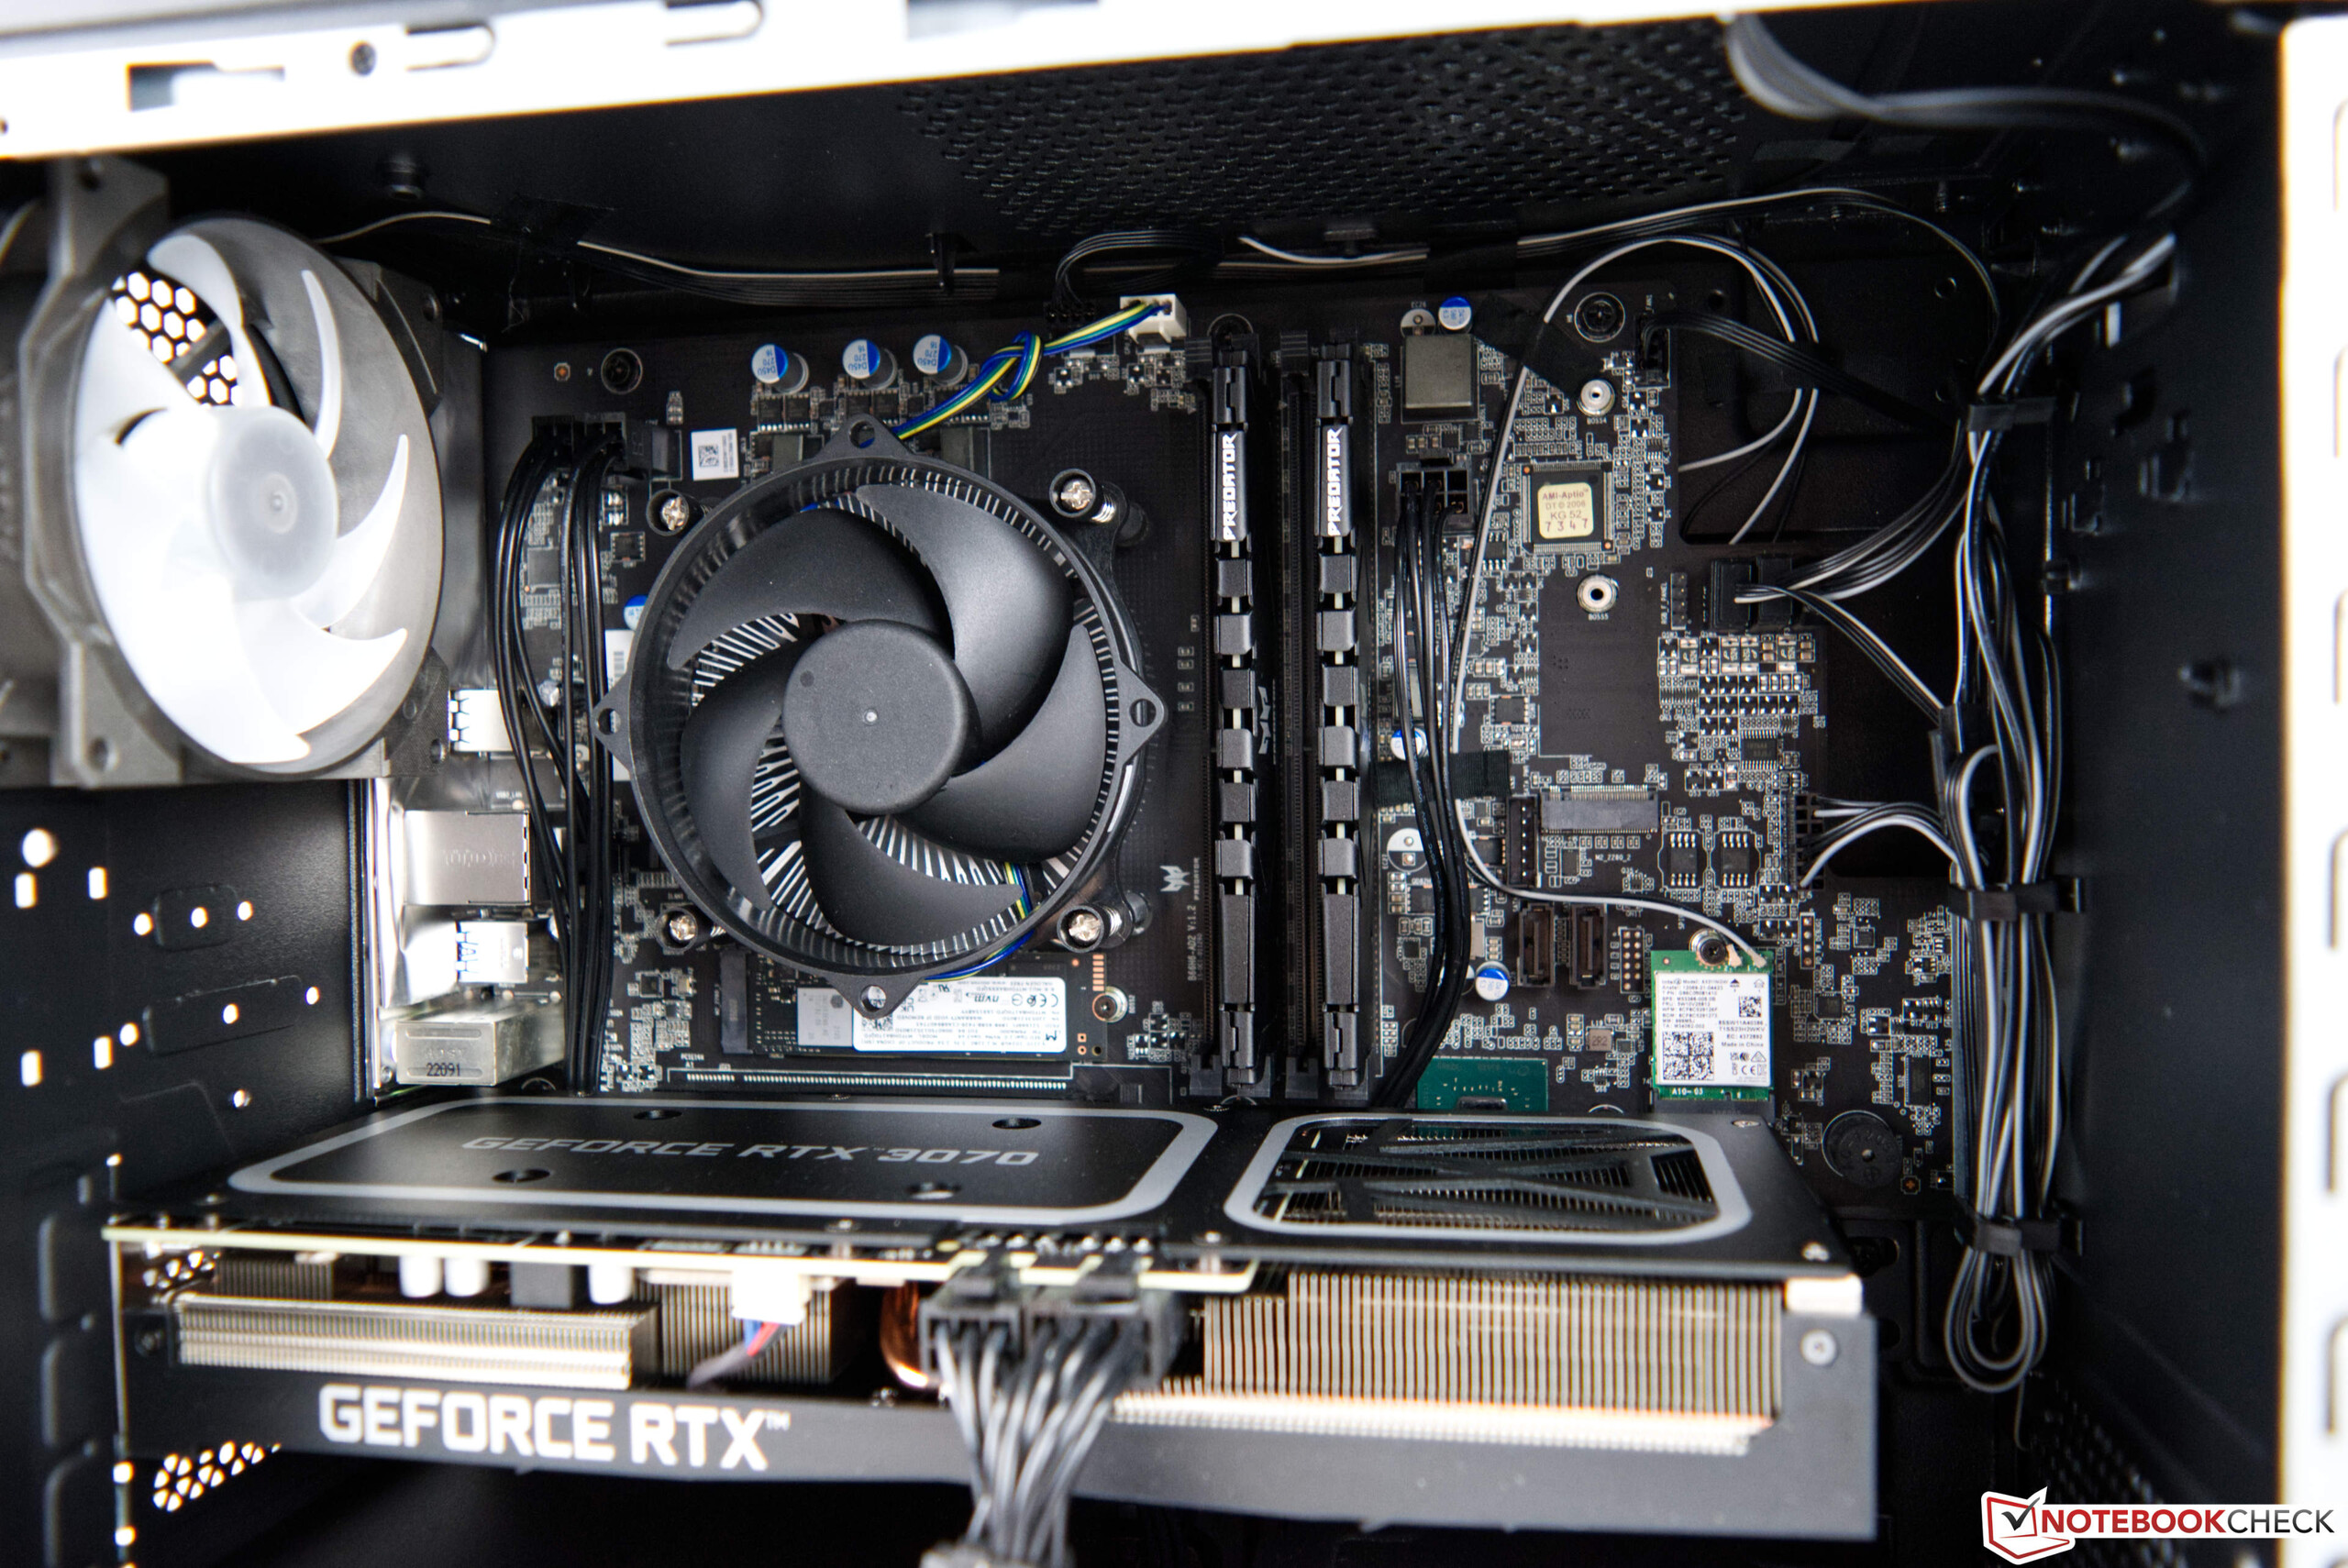
Manutenzione
La manutenzione non è un grosso problema per l'Acer Predator Orion 3000. Il pannello laterale è fissato con due viti e può essere rimosso facilmente. I componenti interni sono facilmente accessibili. Ad esempio, la memoria di massa può essere espansa con un secondo modulo M.2. In alternativa, è possibile alloggiare fino a due dischi rigidi convenzionali da 3,5 pollici.
Prestazioni - Core i7-12700F frenato
La versione attuale del Predator Orion 3000 di Acer è sempre dotata di una CPU frugale da 65 watt. Pertanto, il modello più robusto è equipaggiato con il processore Intel Core i7-12700F. Questo offre ottime prestazioni e può sempre fornire la migliore velocità per la rispettiva applicazione grazie all'architettura ibrida con core E e P. In una configurazione più economica, è possibile ottenere anche il Predator Orion 3000 con un Intel Core i5-12400. Anche questo offre buone prestazioni di gioco, ma deve fare a meno degli E-cores. Per quanto riguarda la scheda grafica, è disponibile almeno una GeForce RTX 3060che è progettata per i giochi a 1080p. Maggiori prestazioni sono disponibili con la GeForce RTX 3070che consente anche di giocare a 1440p.
Condizioni di prova
Abbiamo eseguito tutti i test con il profilo energetico al massimo delle prestazioni
. Inoltre, non abbiamo utilizzato il pannello laterale trasparente del case. Le velocità delle ventole possono essere configurate anche tramite lo strumento Predator Sense
. Abbiamo mantenuto l'impostazione automatica per ottenere un buon compromesso tra rumore e prestazioni.
Processore
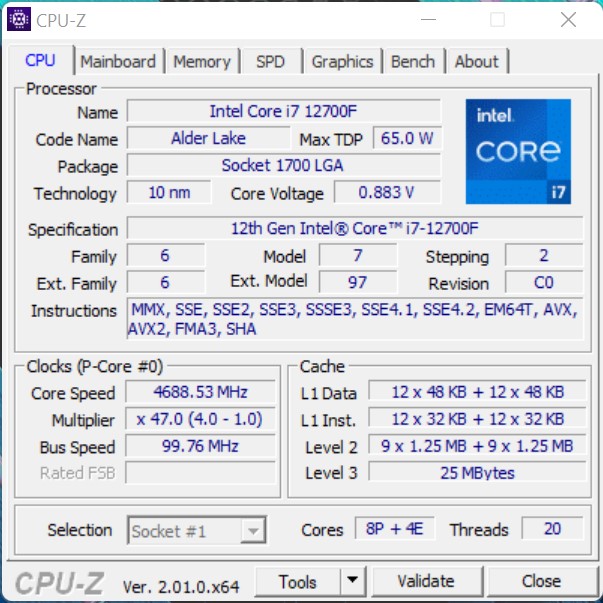
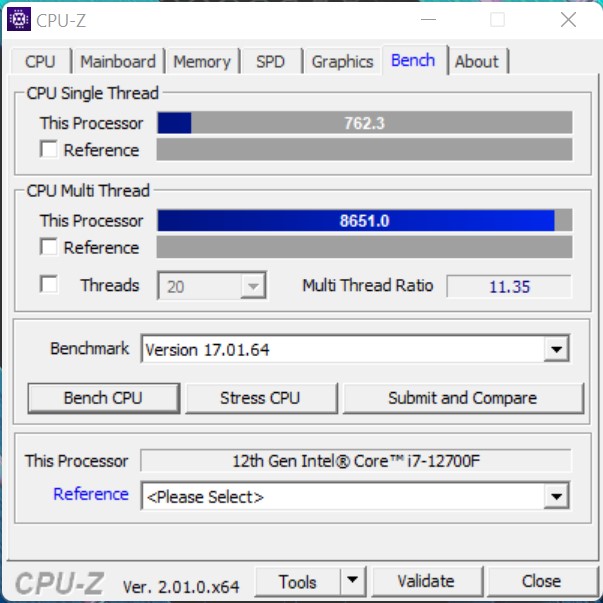
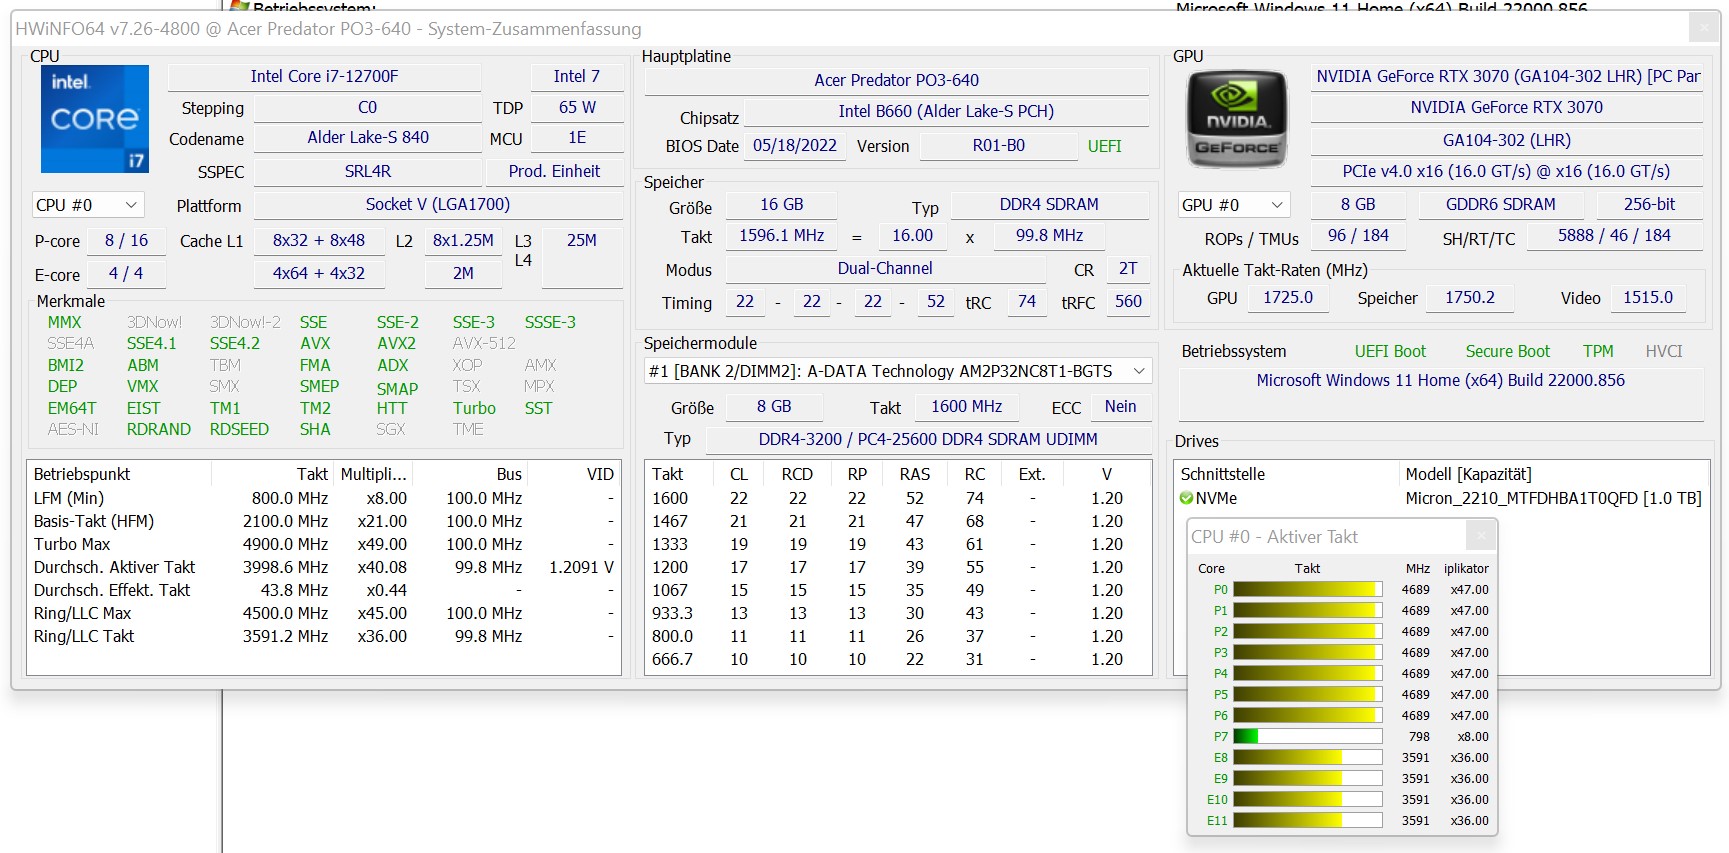
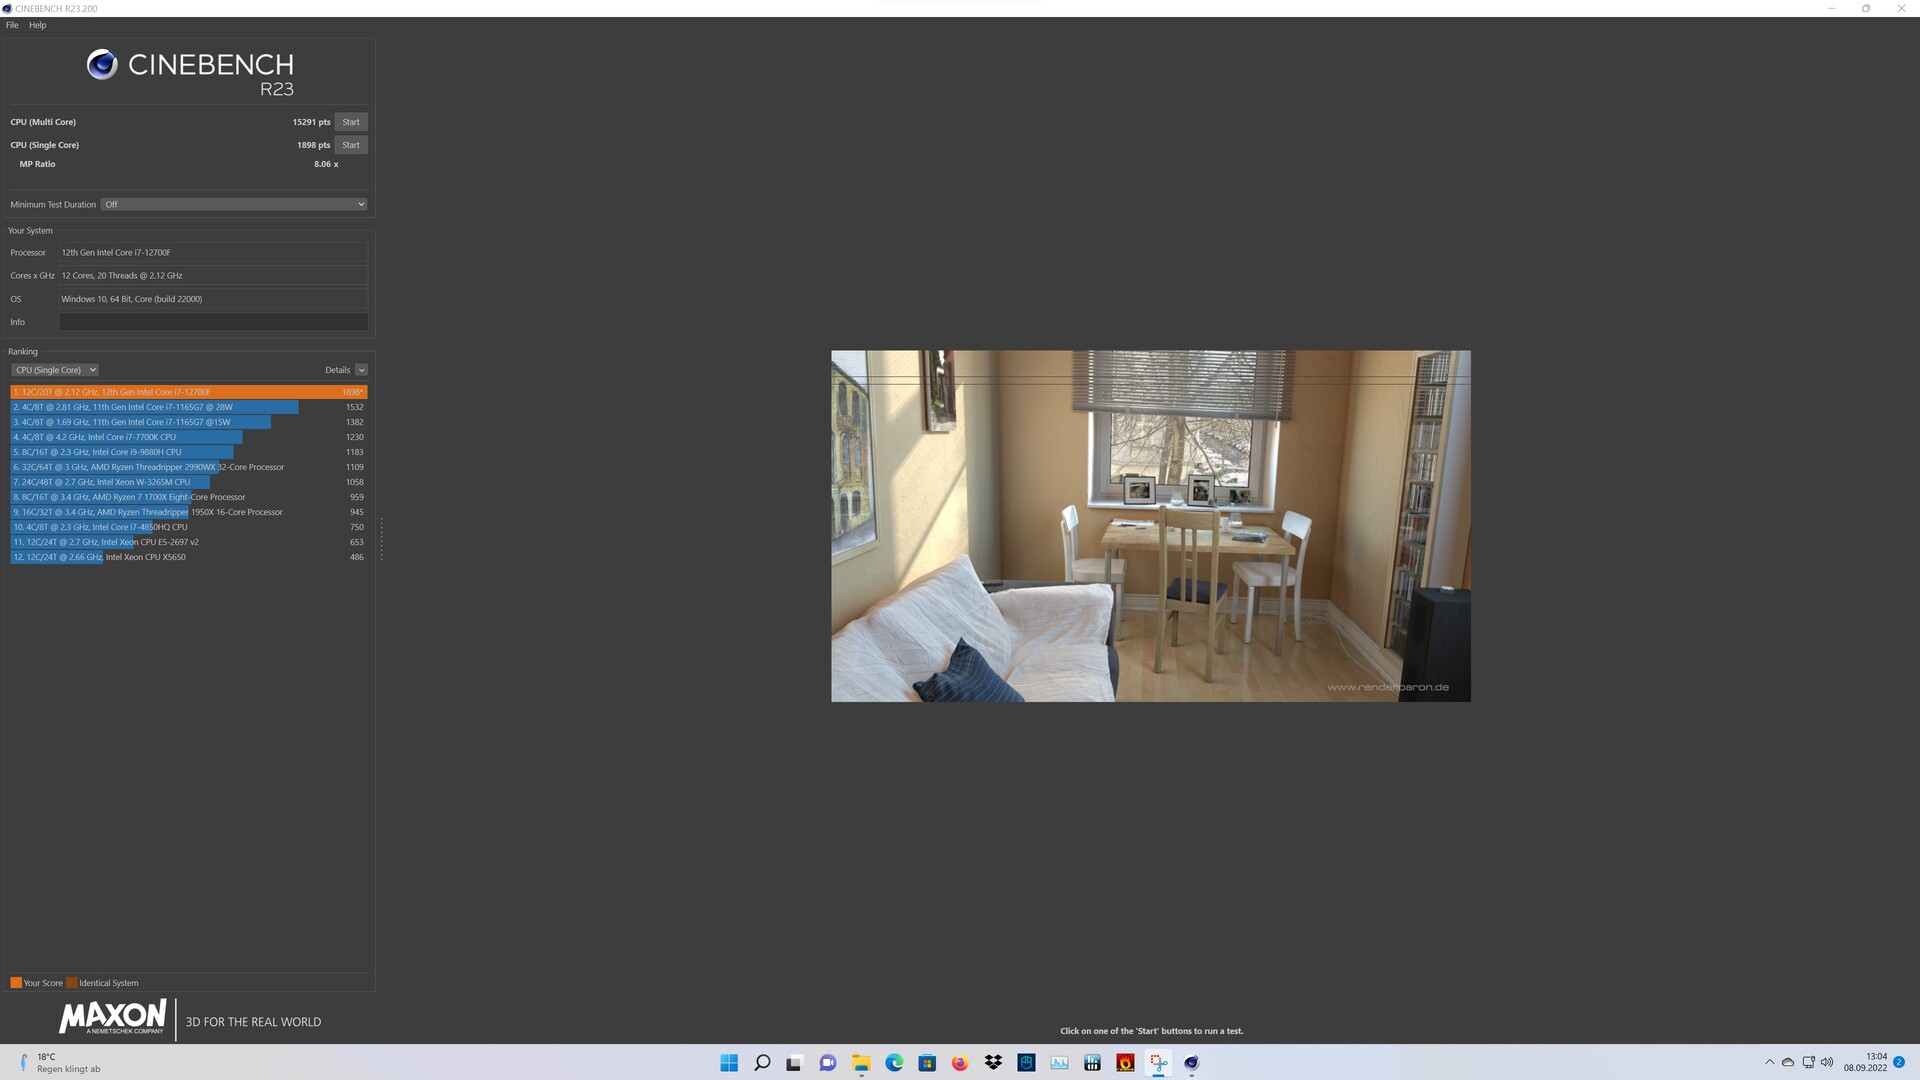
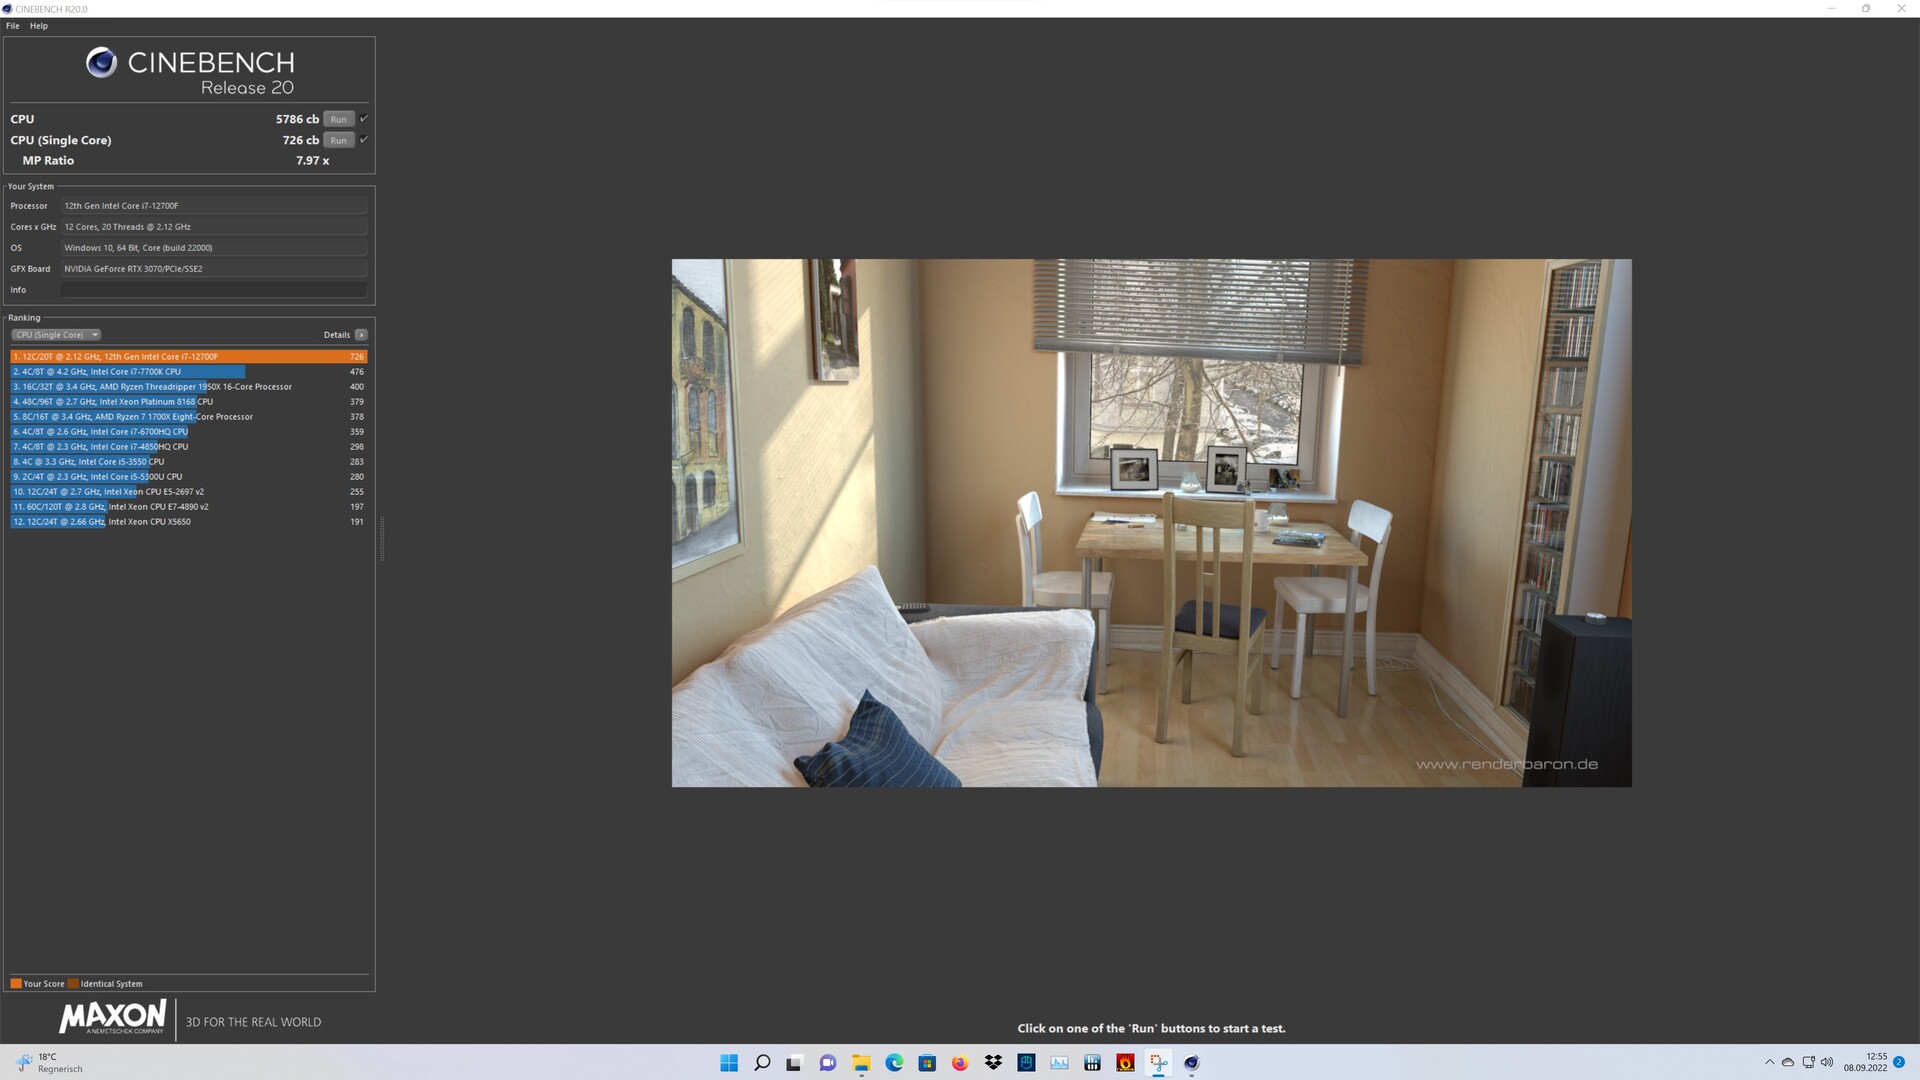
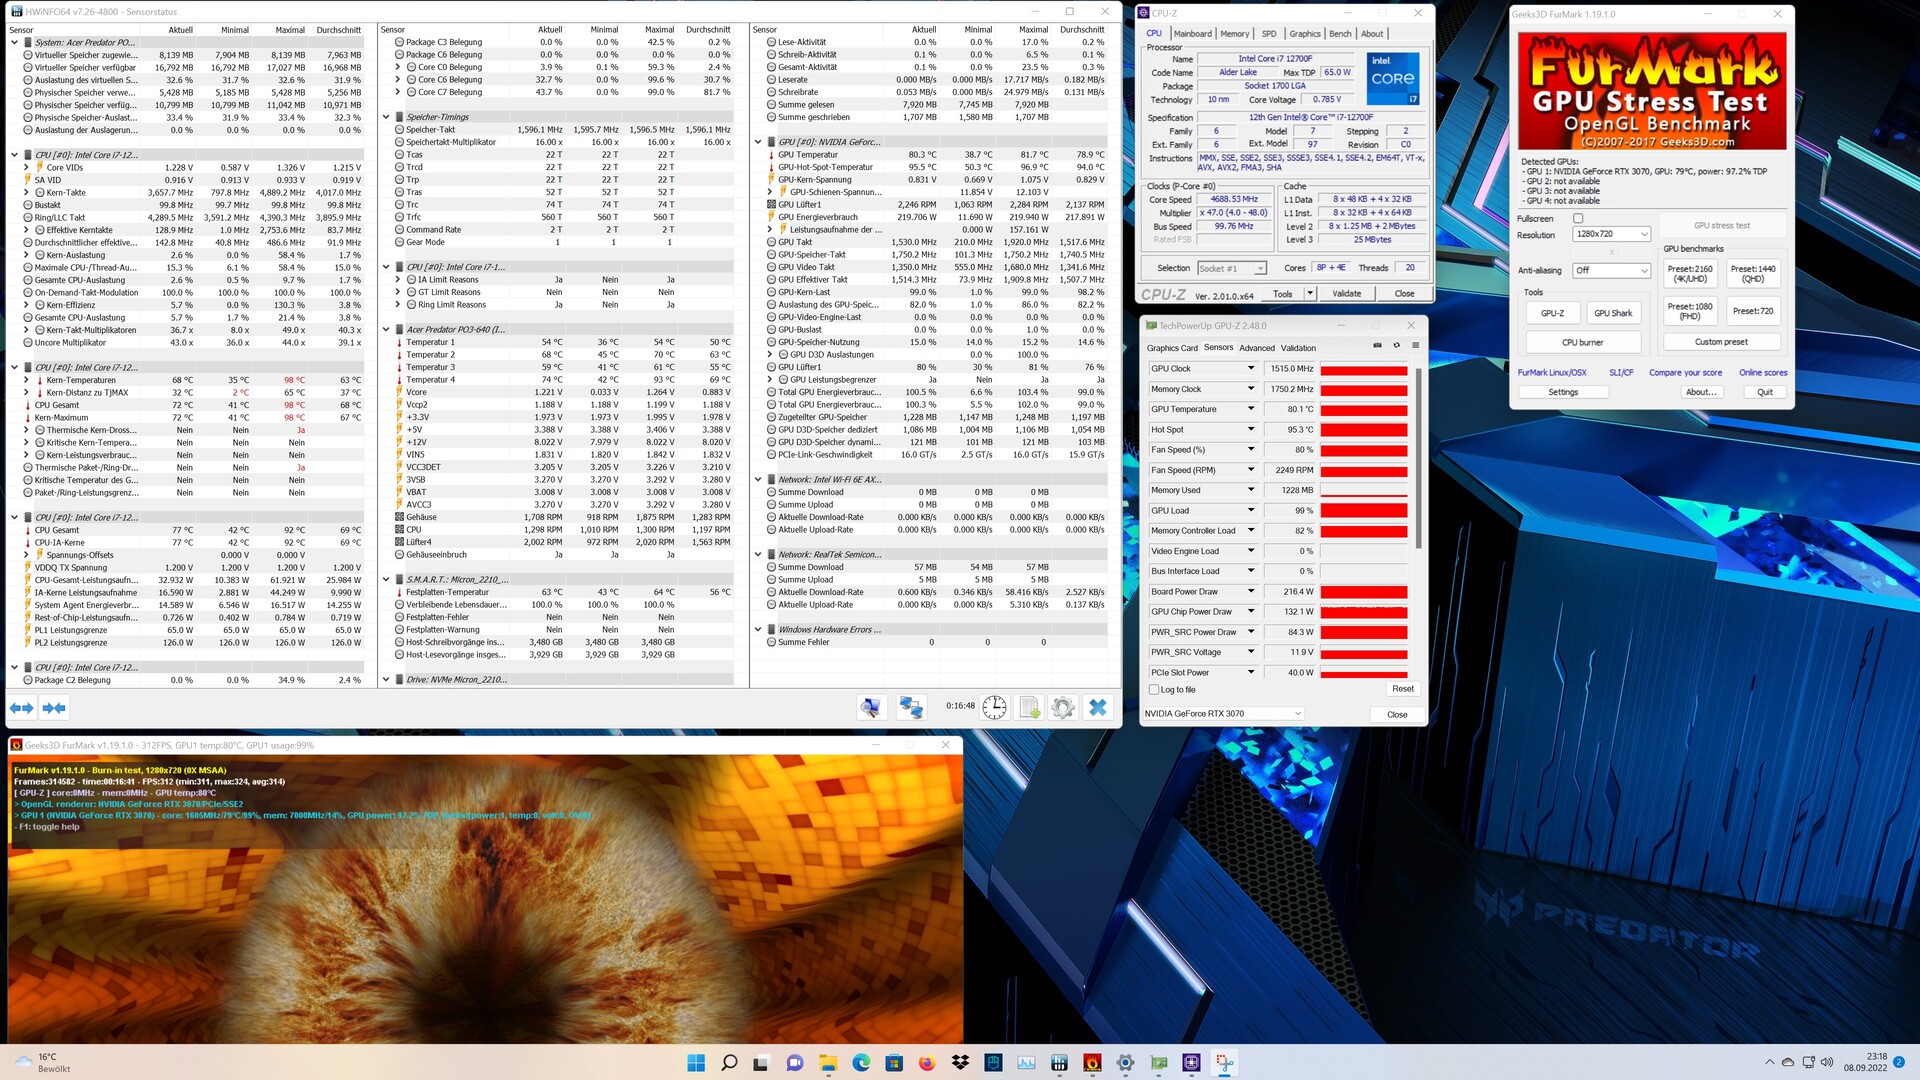
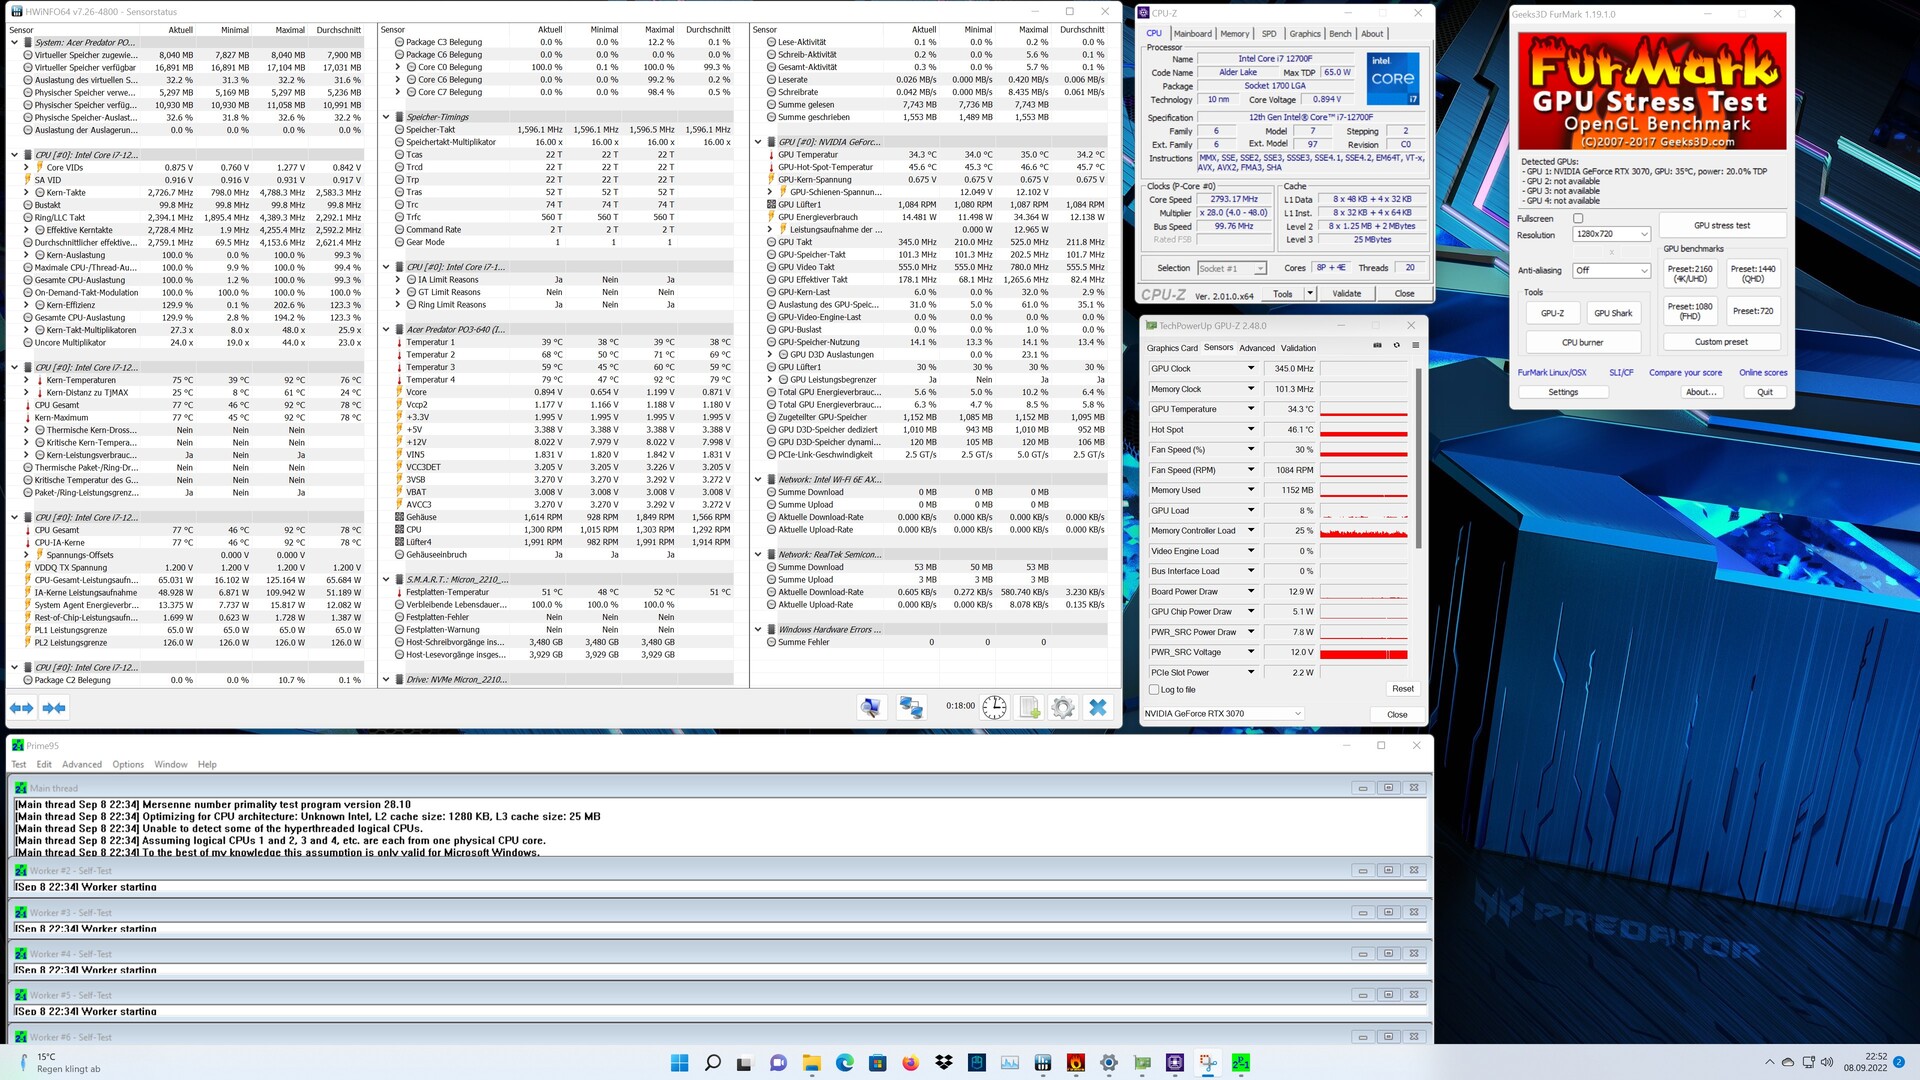
Con il Intel Core i7-12700Fil Predator Orion 3000 oggetto di questa recensione è dotato del modello più veloce che Acer offre per questo PC. Il SoC da 65 watt offre 8 core P e 4 core E, che insieme possono elaborare fino a 20 thread contemporaneamente. Tuttavia, Acer limita un po' l'Intel Core i7-12700F quando si tratta di potenza massima, poiché il PL2 è normalmente di 180 watt per questo modello. Acer, invece, limita il consumo massimo di energia a 126 watt per un massimo di 28 secondi. Rispetto agli altri dispositivi di confronto, l'Acer Predator Orion 3000 può comunque ottenere un buon risultato. Tuttavia, il produttore rinuncia alle prestazioni per ottenere un risultato complessivo migliore.
Per ulteriori confronti e benchmark, facciamo riferimento al nostroTabella di confronto delle CPU.
* ... Meglio usare valori piccoli
AIDA64: FP32 Ray-Trace | FPU Julia | CPU SHA3 | CPU Queen | FPU SinJulia | FPU Mandel | CPU AES | CPU ZLib | FP64 Ray-Trace | CPU PhotoWorxx
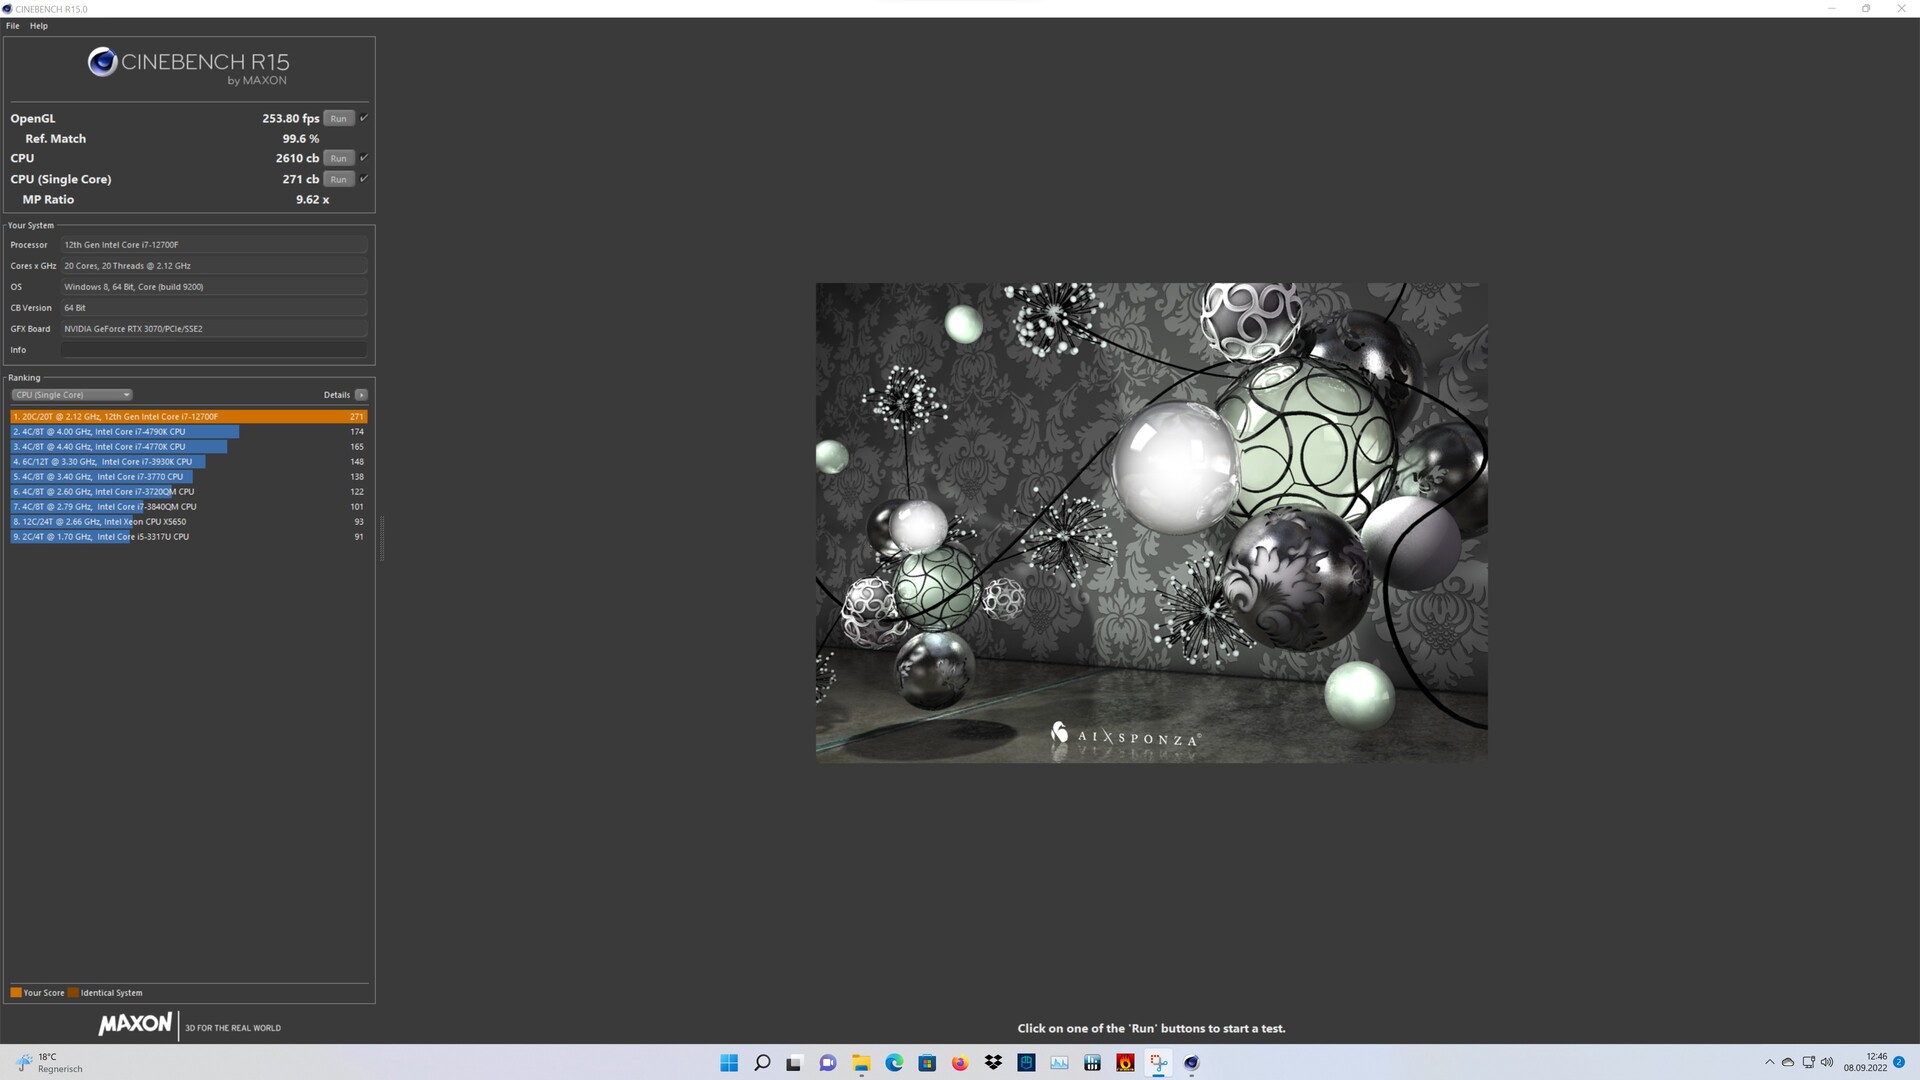
Acer Predator Orion 3000 nel multi-loop di Cinebench R15
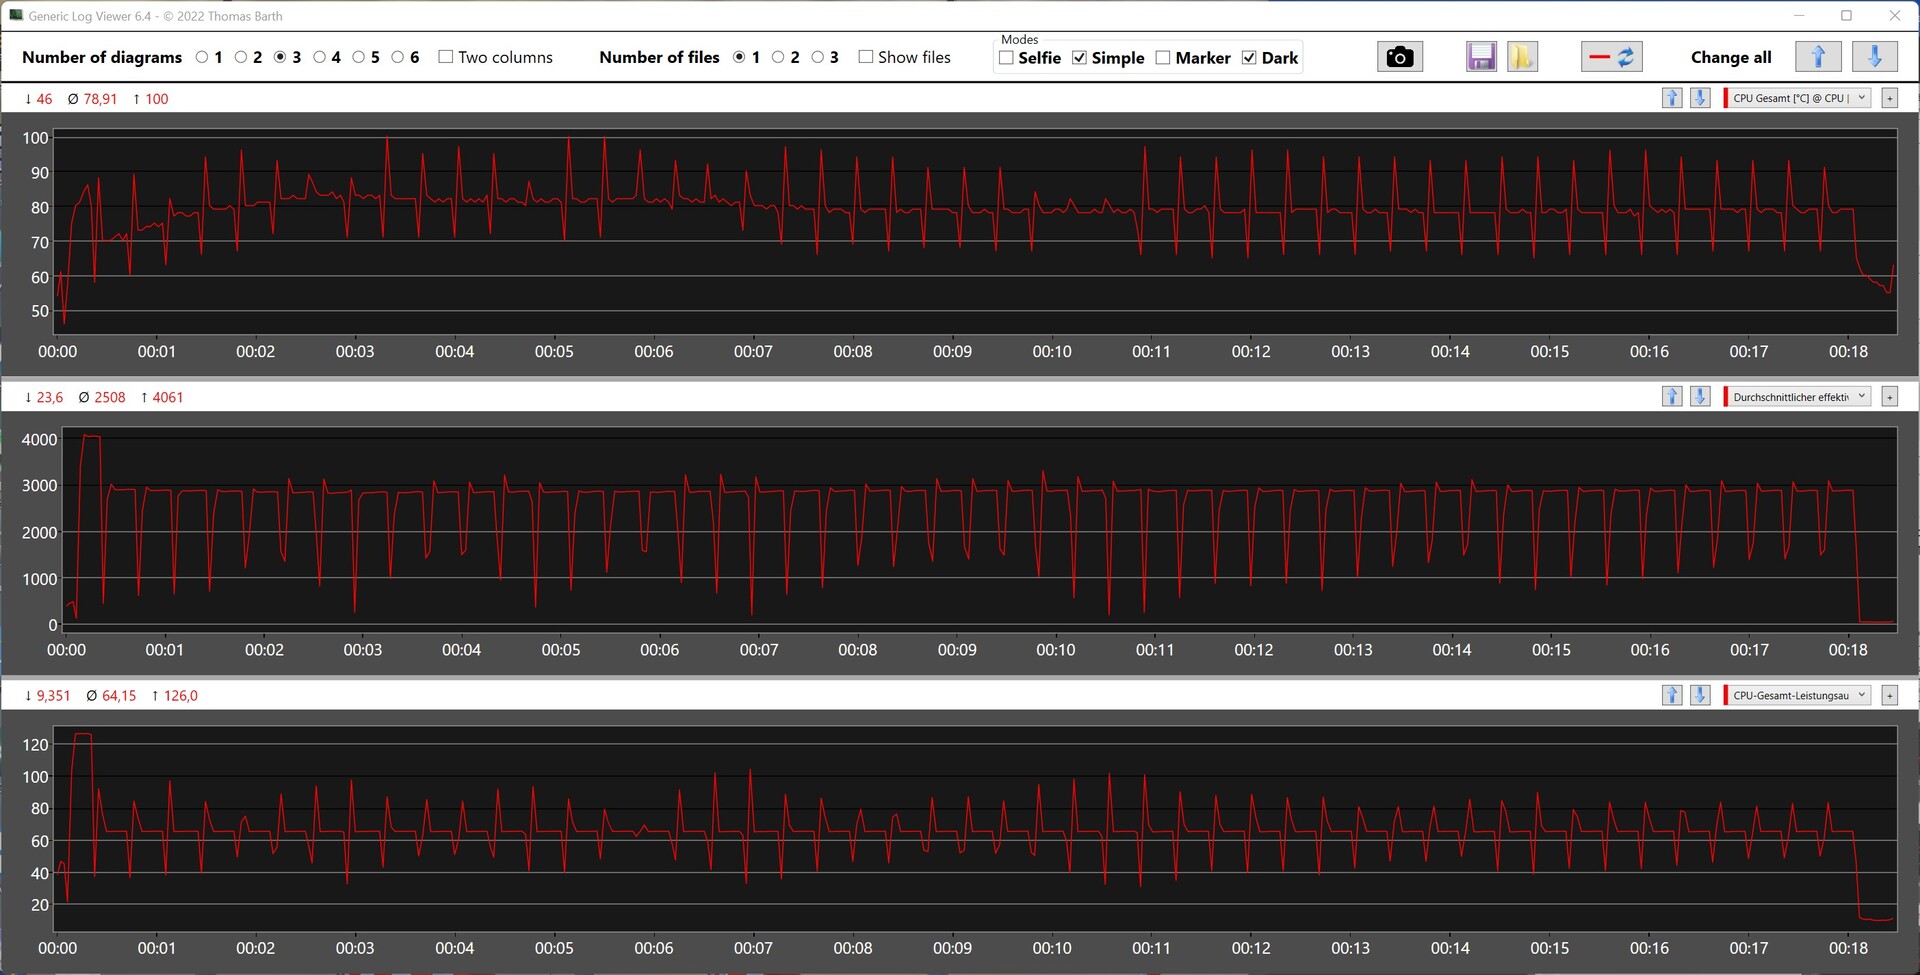
Durante il ciclo continuo di Cinebench R15 abbiamo una prima idea dell'efficienza in combinazione con il raffreddamento integrato. Dopo il primo ciclo, le prestazioni calano drasticamente perché l'aumento del PL2 può essere mantenuto solo più a lungo durante il primo ciclo rispetto ai cicli successivi. Le metriche della CPU registrate durante il test lo dimostrano molto bene.
Prestazioni del sistema
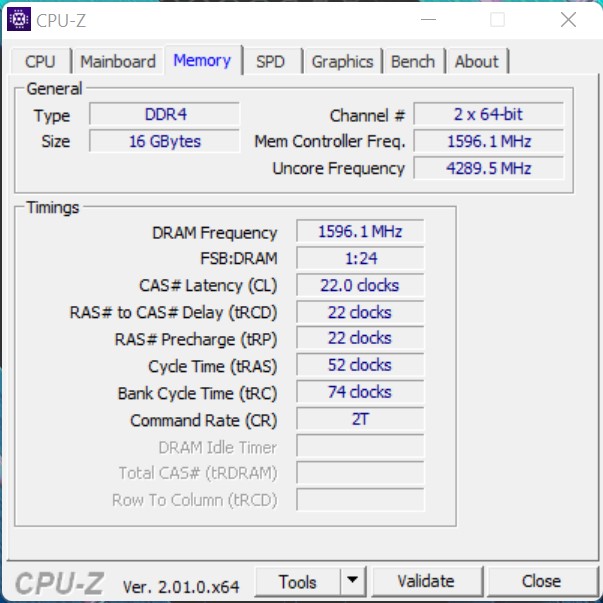
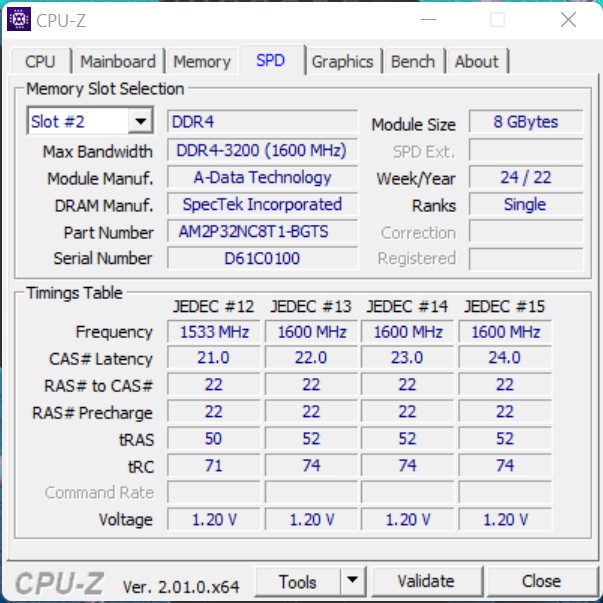
Il fatto che i benchmark delle prestazioni del sistema non richiamino in modo permanente tutte le prestazioni si addice chiaramente all'Acer Predator Orion 3000. I risultati sono buoni e solo di pochi punti percentuali peggiori rispetto a quelli dell'Intel Dragon Canyon NUC Intel Dragon Canyon NUC con Intel Core i9-12900. La memoria di lavoro si comporta abbastanza bene rispetto ai dispositivi di confronto presenti nel test, anche se si potrebbe ottenere qualche prestazione in più con una RAM più veloce e latenze più basse.
| AIDA64 / Memory Copy | |
| Media della classe Desktop (54743 - 98416, n=21, ultimi 2 anni) | |
| Acer Predator Orion 3000 PO3-640 | |
| Media Intel Core i7-12700F (n=1) | |
| Intel Beast Canyon NUC | |
| Intel Dragon Canyon NUC - RTX 3060 | |
| Zotac ZBOX Magnus EN173070C | |
| Zotac MEK Mini (RTX 2070 Super) | |
| AIDA64 / Memory Read | |
| Media della classe Desktop (58375 - 110448, n=21, ultimi 2 anni) | |
| Zotac ZBOX Magnus EN173070C | |
| Acer Predator Orion 3000 PO3-640 | |
| Media Intel Core i7-12700F (n=1) | |
| Intel Beast Canyon NUC | |
| Intel Dragon Canyon NUC - RTX 3060 | |
| Zotac MEK Mini (RTX 2070 Super) | |
| AIDA64 / Memory Write | |
| Media della classe Desktop (60635 - 93889, n=21, ultimi 2 anni) | |
| Zotac ZBOX Magnus EN173070C | |
| Intel Beast Canyon NUC | |
| Intel Dragon Canyon NUC - RTX 3060 | |
| Acer Predator Orion 3000 PO3-640 | |
| Media Intel Core i7-12700F (n=1) | |
| Zotac MEK Mini (RTX 2070 Super) | |
| AIDA64 / Memory Latency | |
| Media della classe Desktop (68.5 - 168, n=21, ultimi 2 anni) | |
| Intel Beast Canyon NUC | |
| Intel Dragon Canyon NUC - RTX 3060 | |
| Zotac ZBOX Magnus EN173070C | |
| Acer Predator Orion 3000 PO3-640 | |
| Media Intel Core i7-12700F (n=1) | |
| Zotac MEK Mini (RTX 2070 Super) | |
* ... Meglio usare valori piccoli
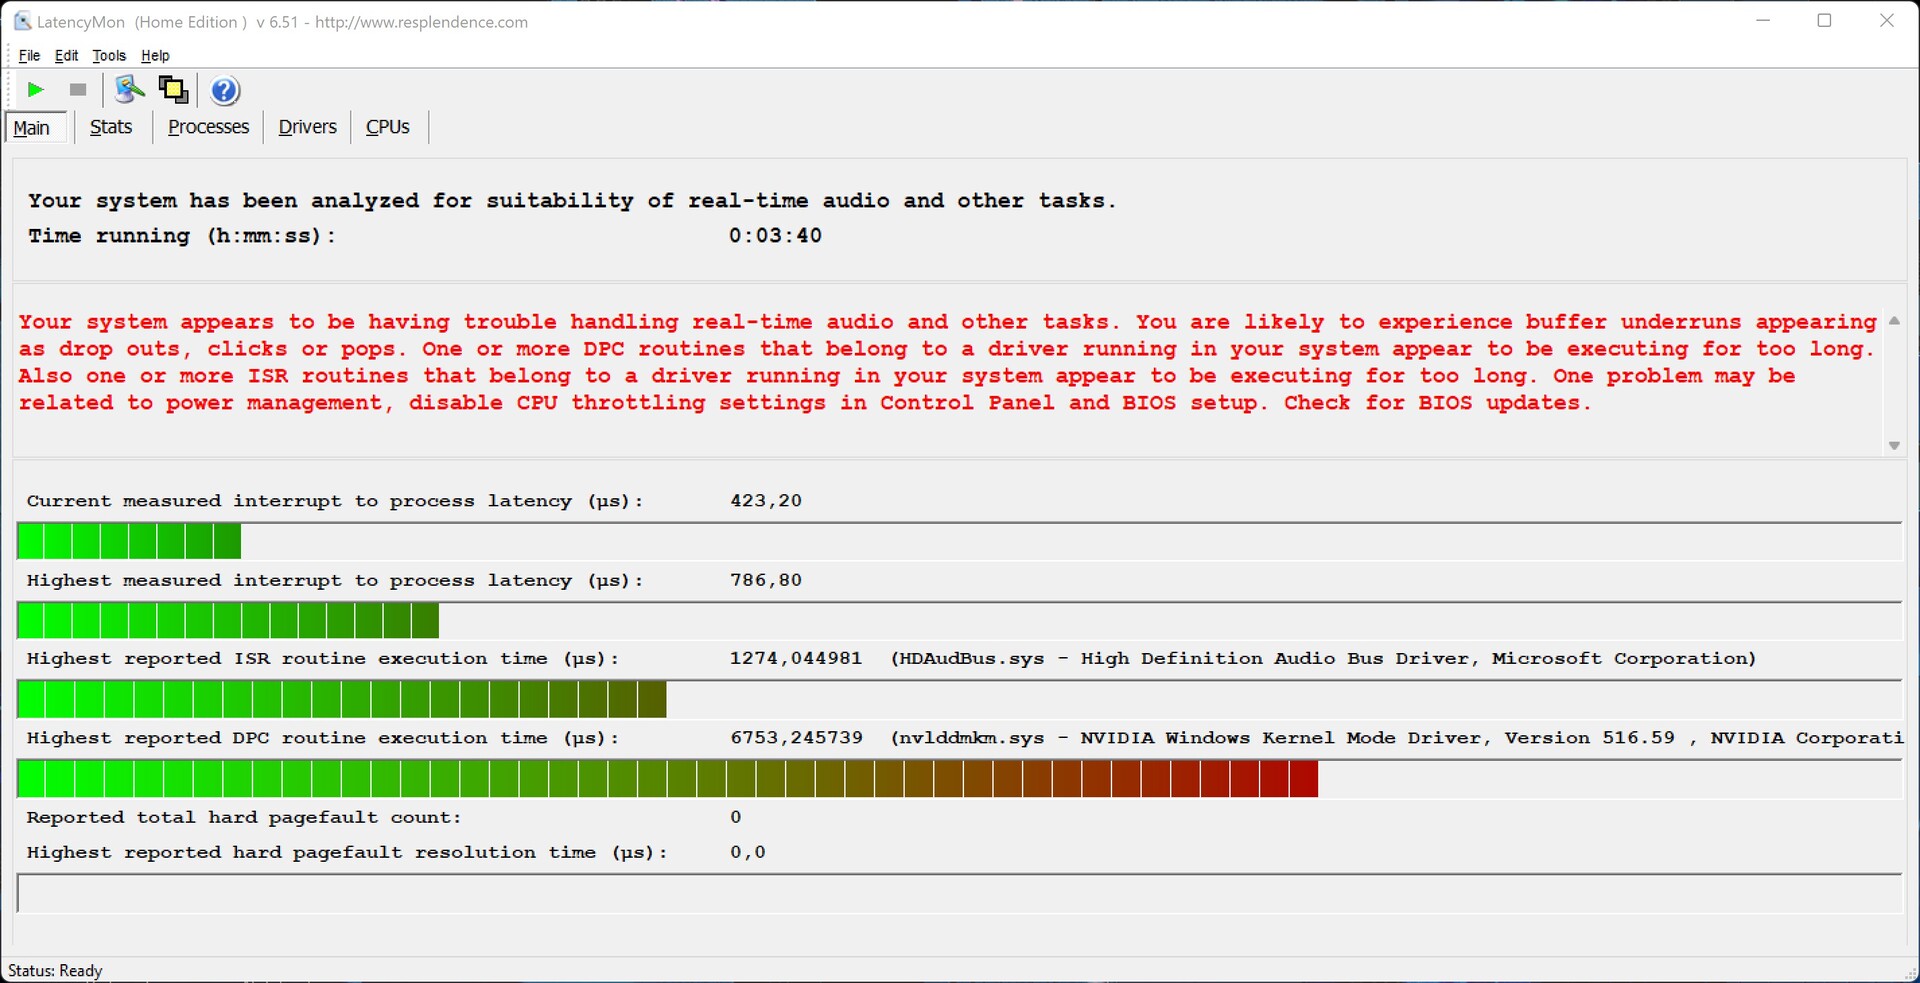
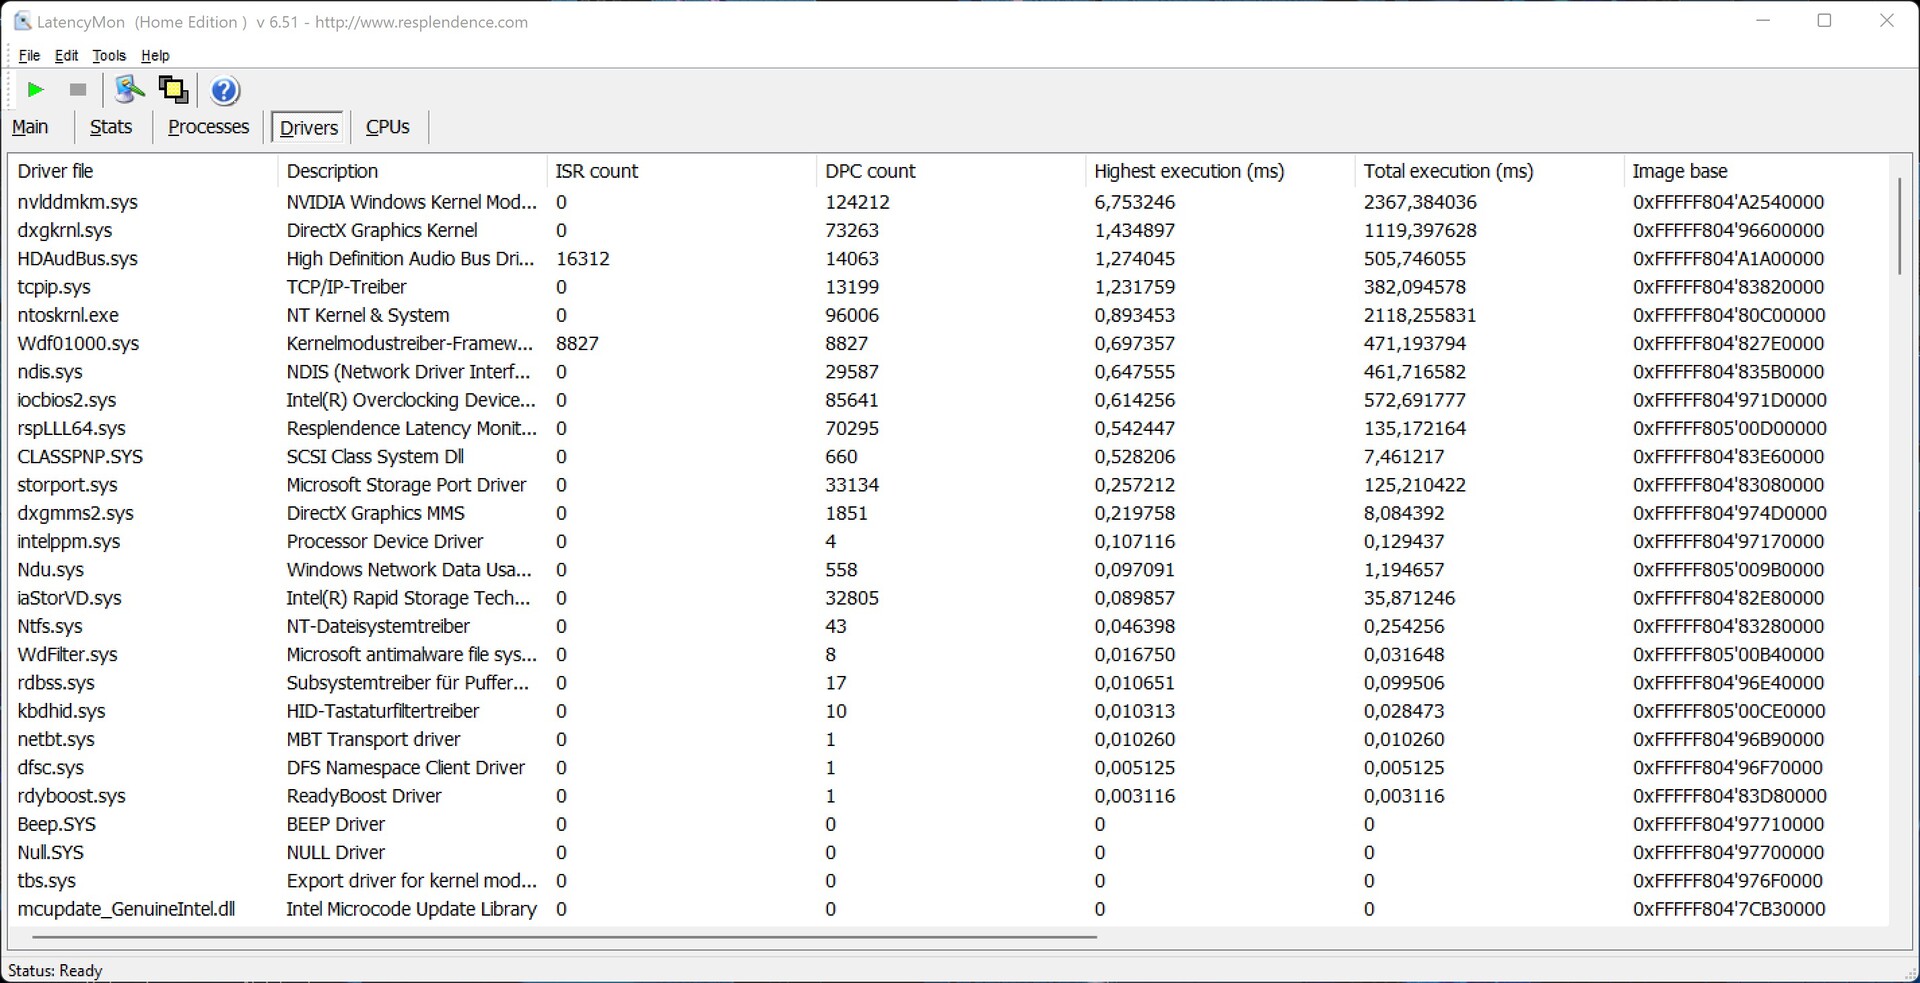
Latenze DPC
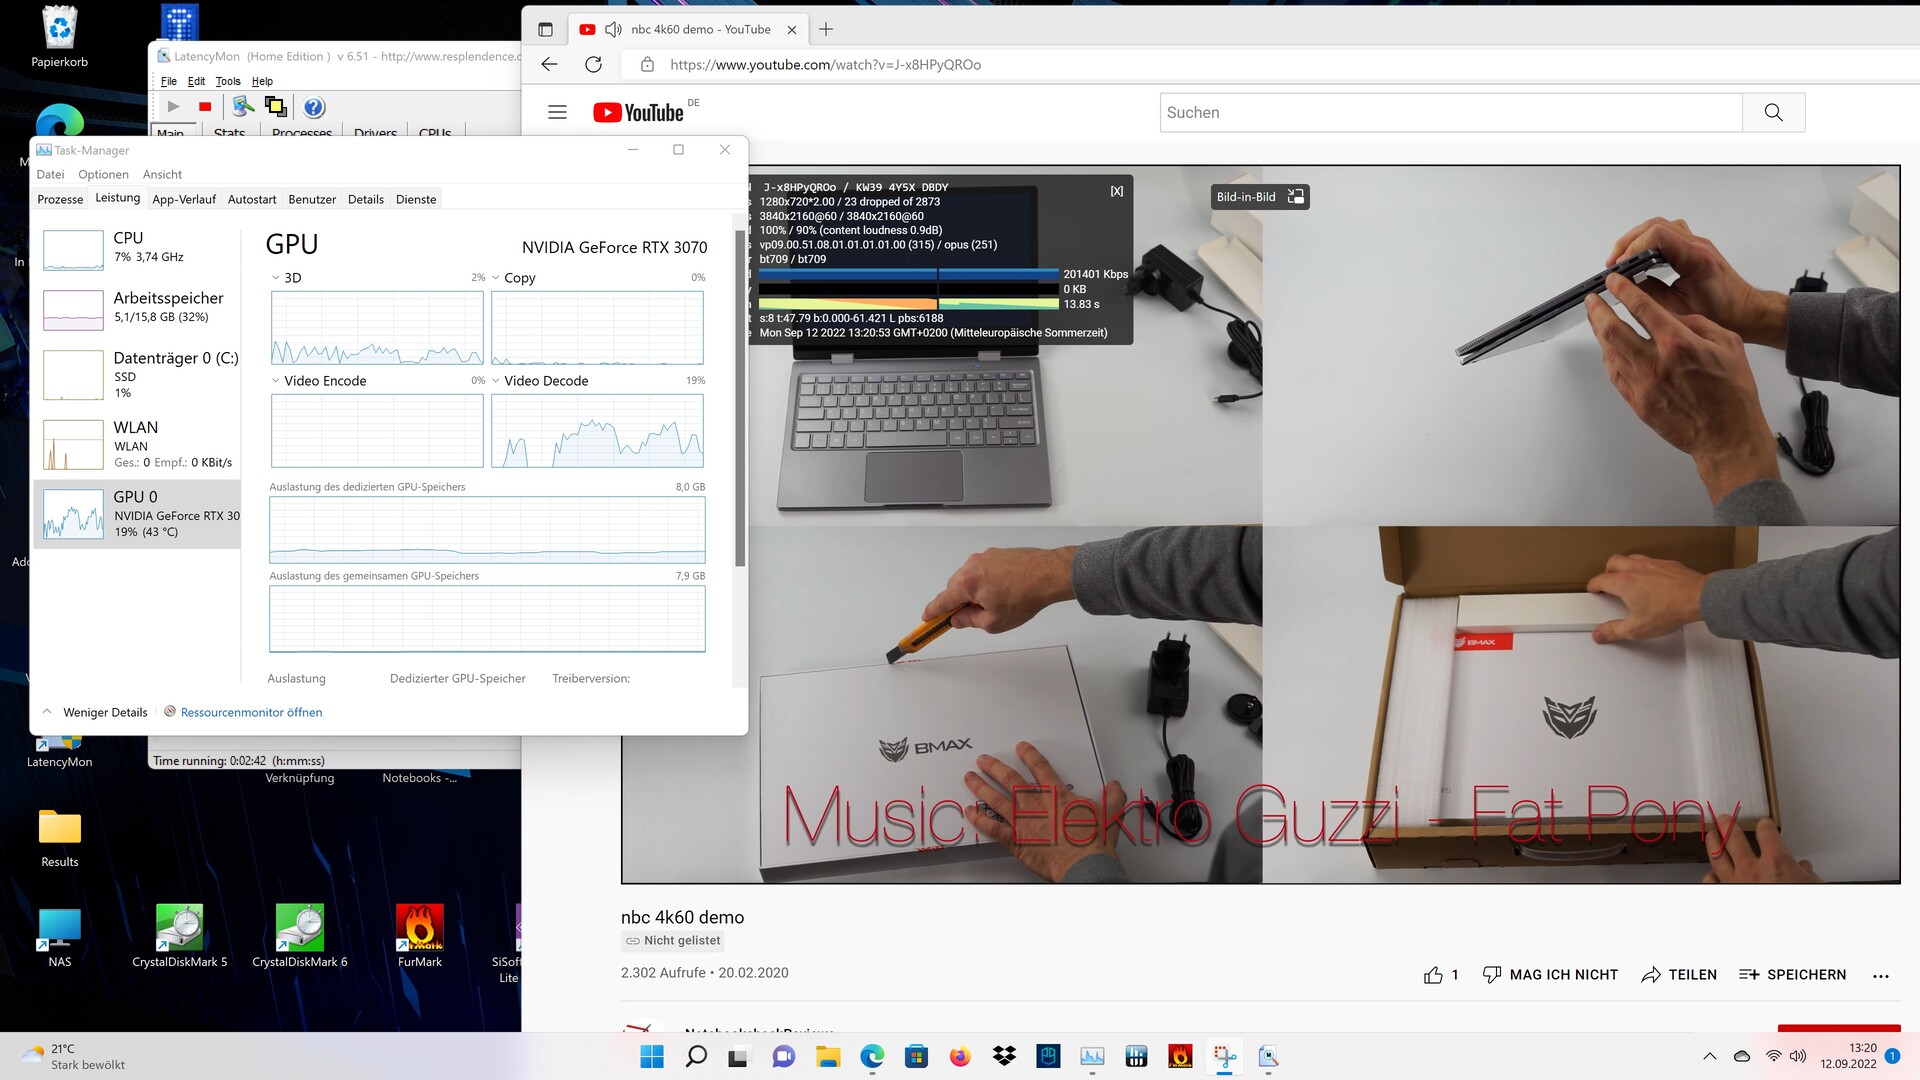
LatencyMon segnala già problemi di latenza quando si aprono più schede in Edge. I driver non sembrano ancora ottimizzati.
| DPC Latencies / LatencyMon - interrupt to process latency (max), Web, Youtube, Prime95 | |
| Acer Predator Orion 3000 PO3-640, Intel Core i7-12700F | |
| Minisforum EliteMini B550, AMD Ryzen 7 5700G | |
| Asus ExpertCenter D9 SFF, Intel Core i7-11700 | |
| Zotac ZBOX Magnus EN173070C, Intel Core i7-11800H | |
| Minisforum EliteMini HX90, AMD Ryzen 9 5900HX | |
* ... Meglio usare valori piccoli
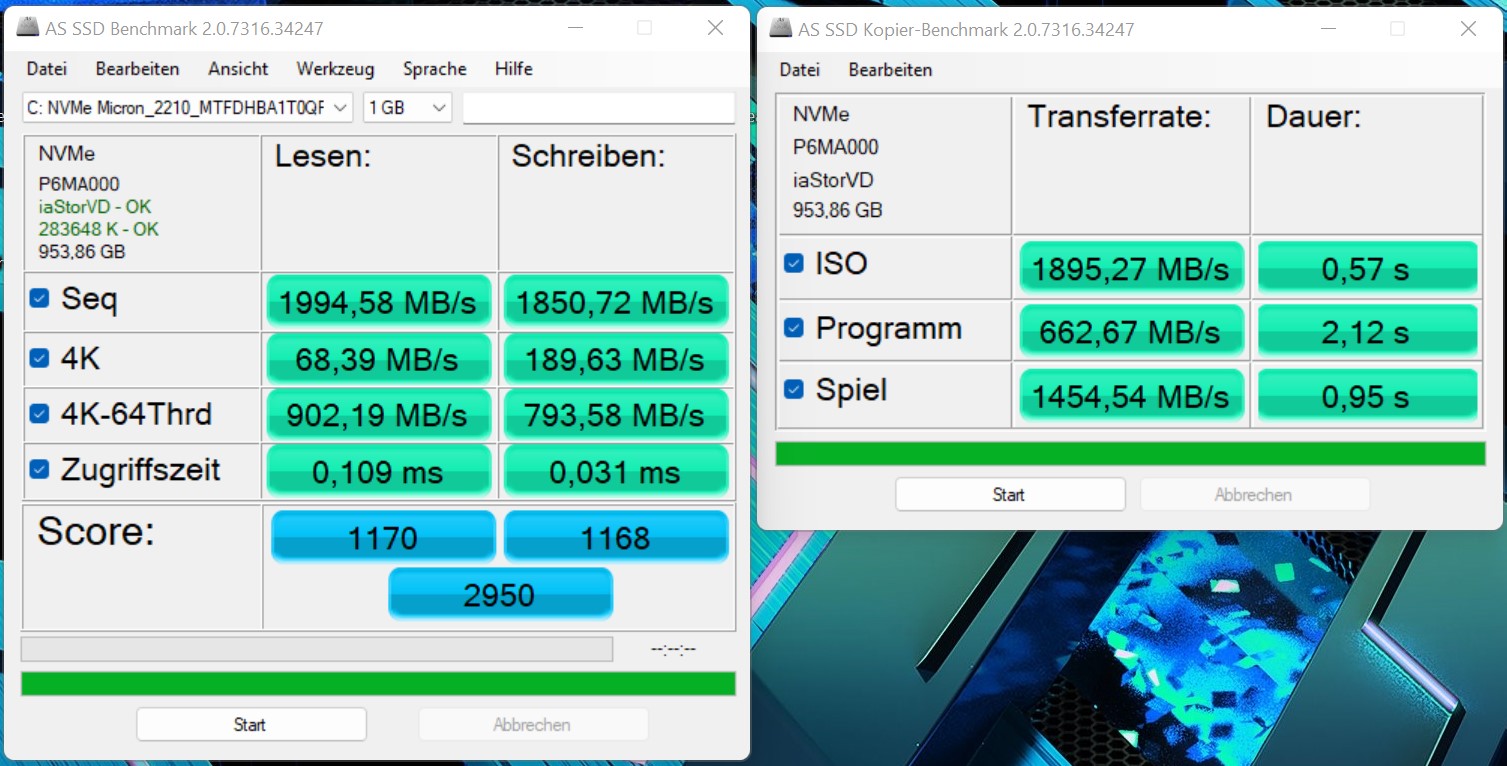
Memoria di massa
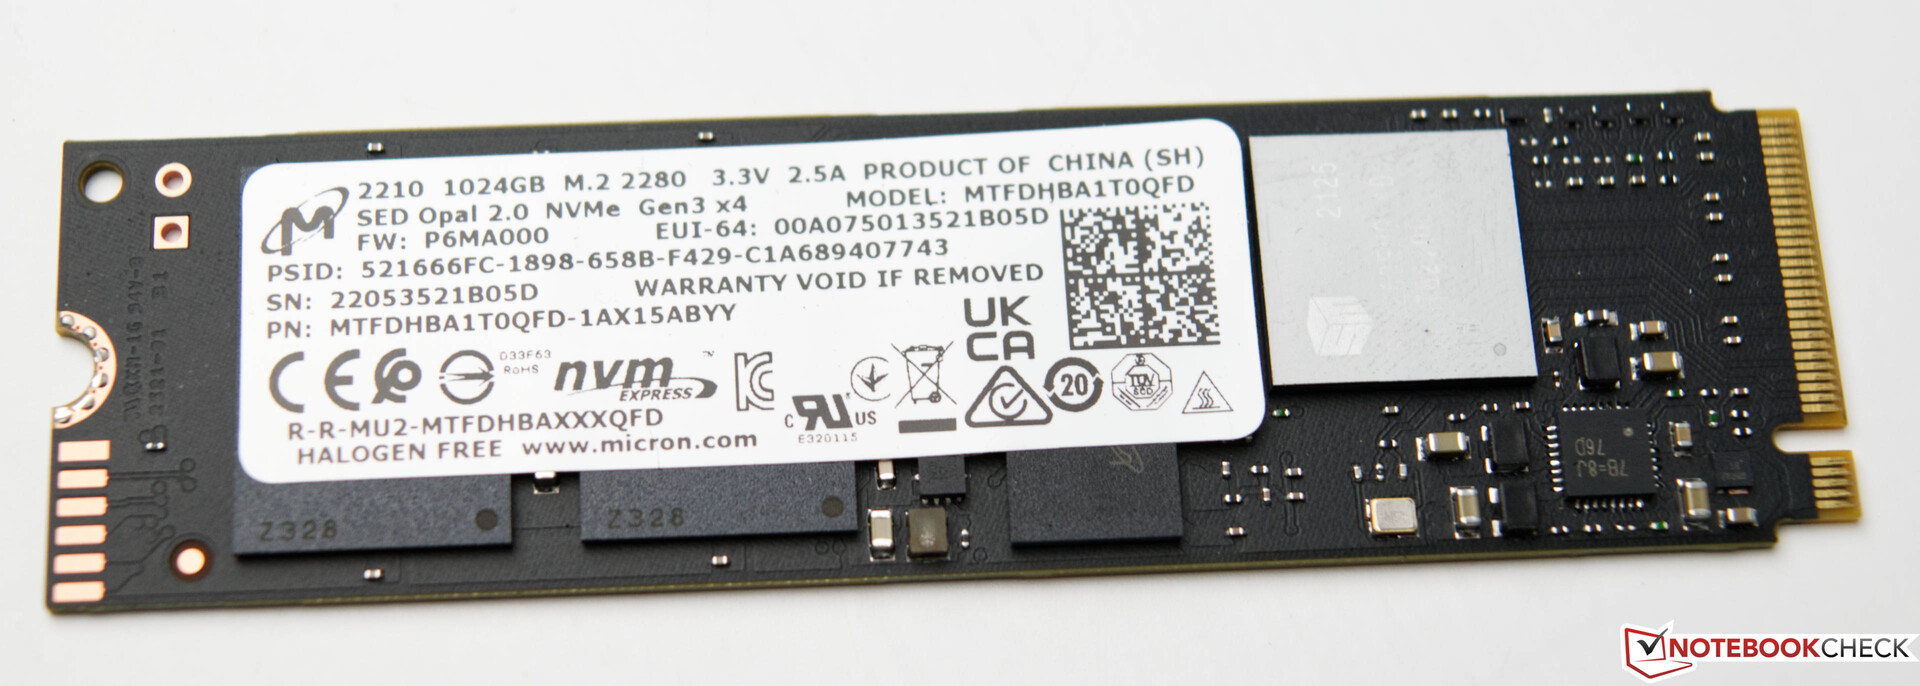
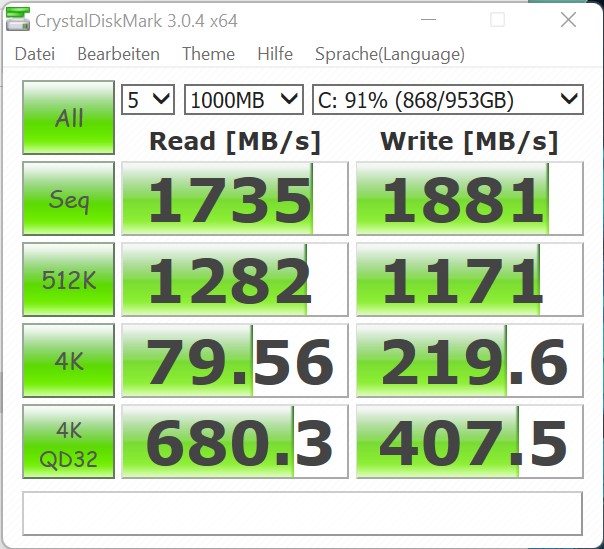
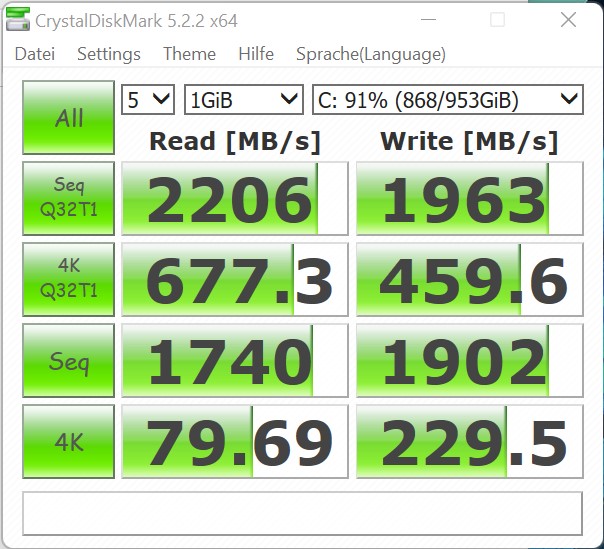
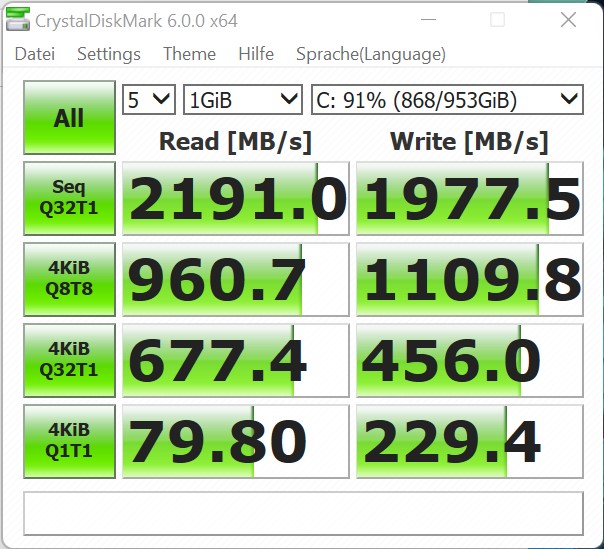
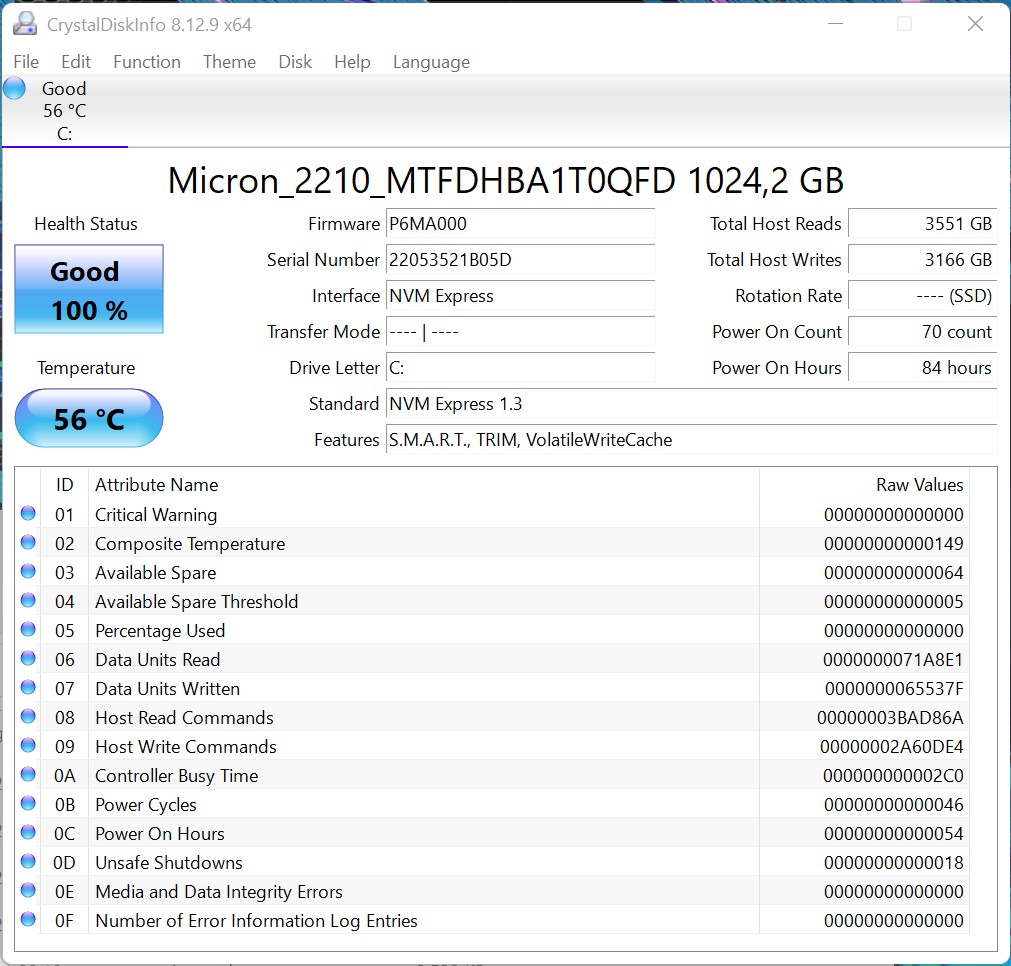
Il nostro campione di prova è dotato di un'unità SSD da 1 TB di Micron. Il modulo M.2 offre buone velocità di trasferimento, anche se i valori massimi non sono all'altezza dei dispositivi di confronto. Tuttavia, nell'uso quotidiano non si nota quasi nulla. La velocità di lettura 4K, ad esempio, ha un impatto molto maggiore, che si rivela molto buono nell'Acer Predator Orion 3000. La capacità di archiviazione di 1 TB è sufficiente e, a nostro avviso, non dovrebbe essere inferiore per un dispositivo di gioco. La memoria di massa dell'Acer Predator Orion 3000 può essere espansa con relativa facilità. È possibile installare un secondo modulo M.2 sulla scheda madre. Inoltre, nel case c'è spazio anche per due dischi rigidi da 3,5 pollici. Tutti i cavi di collegamento necessari sono inclusi nel dispositivo
Per ulteriori confronti e benchmark, consultare la nostraTabella di confronto.

* ... Meglio usare valori piccoli
Disk Throttling: DiskSpd Read Loop, Queue Depth 8
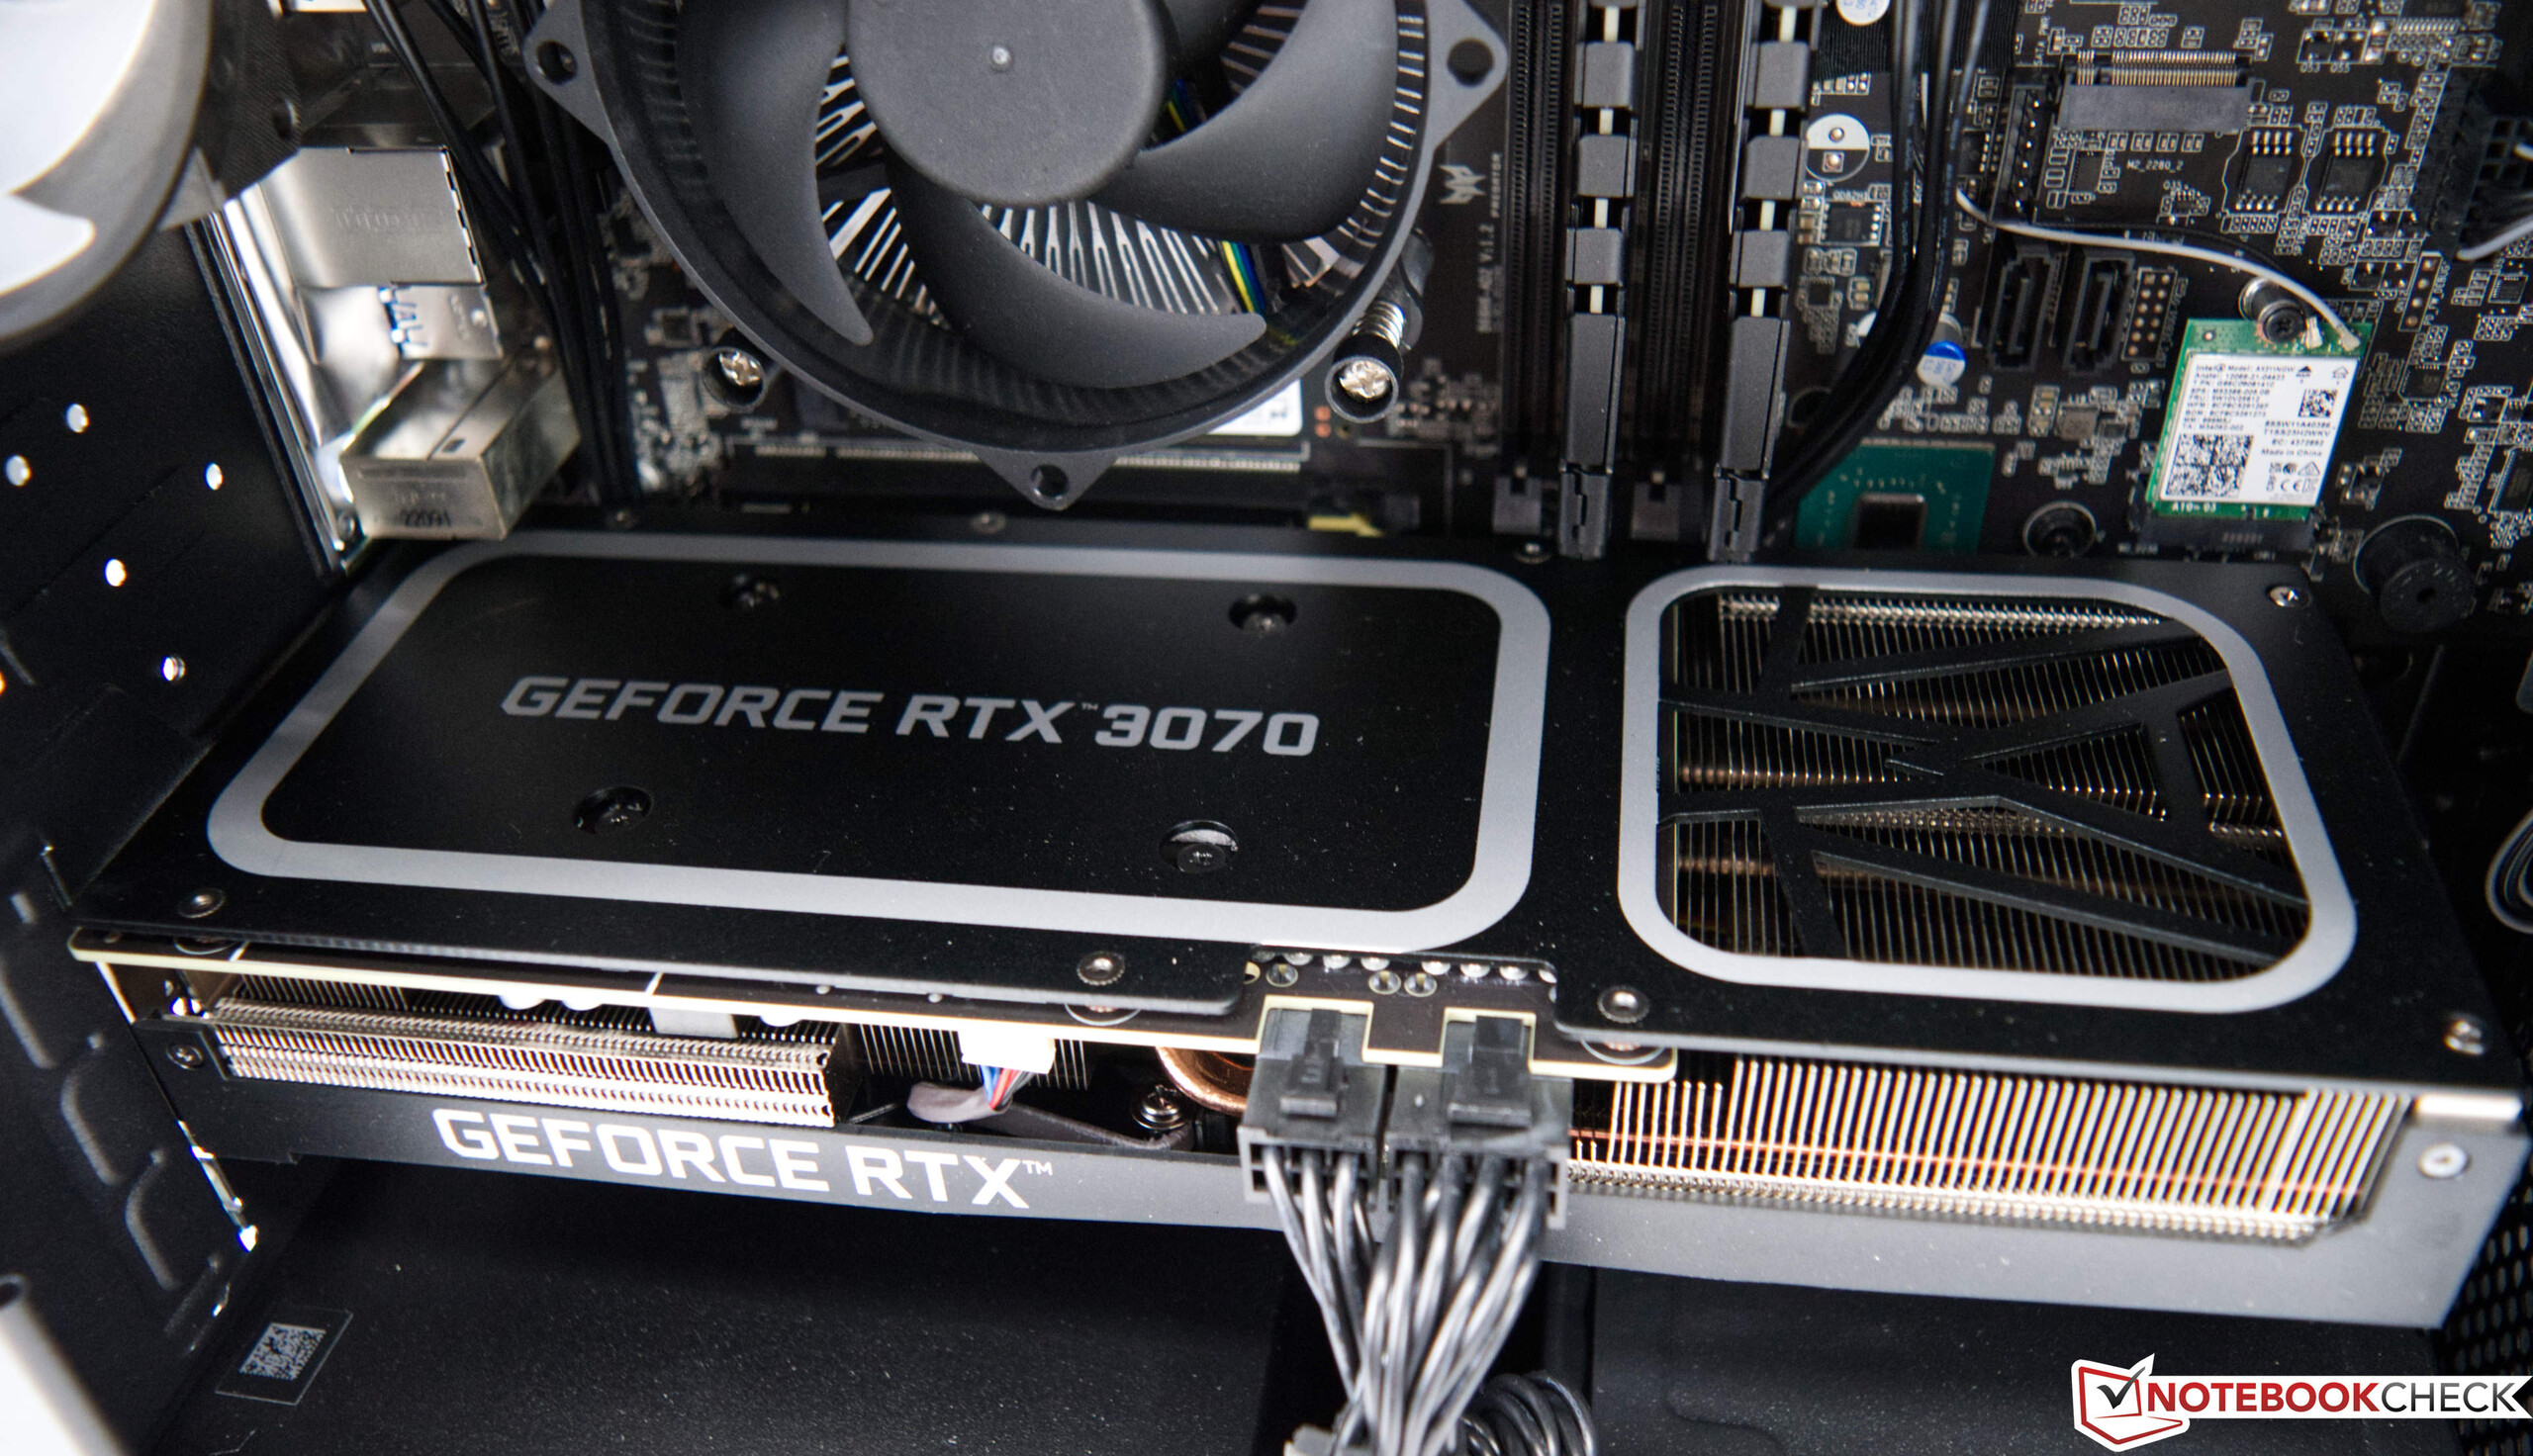
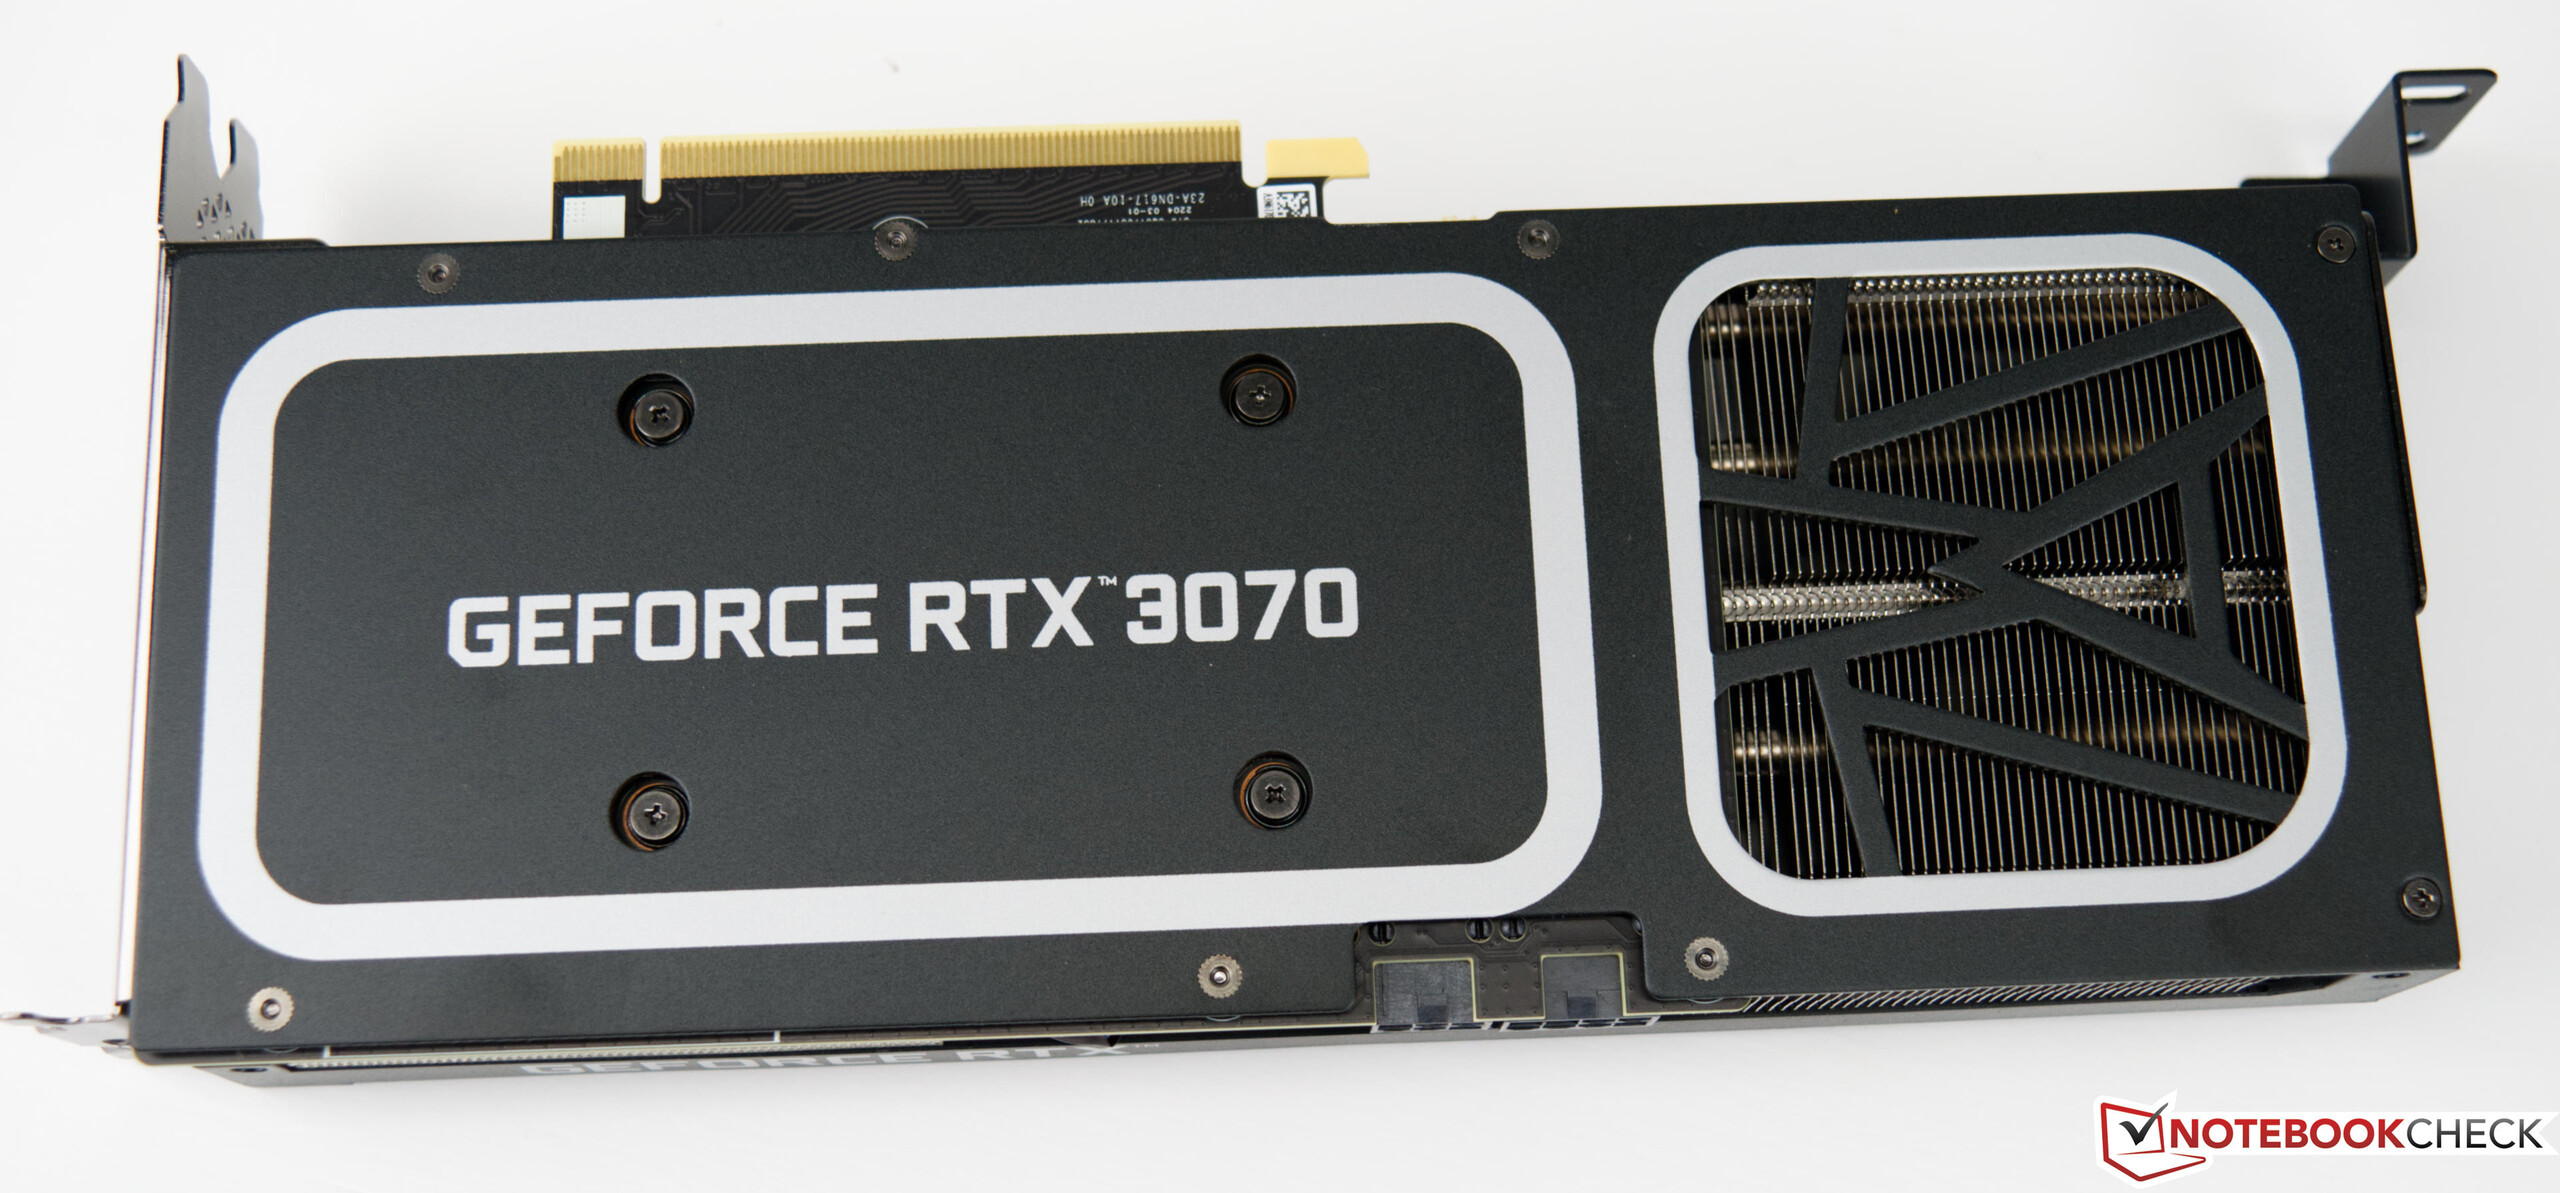
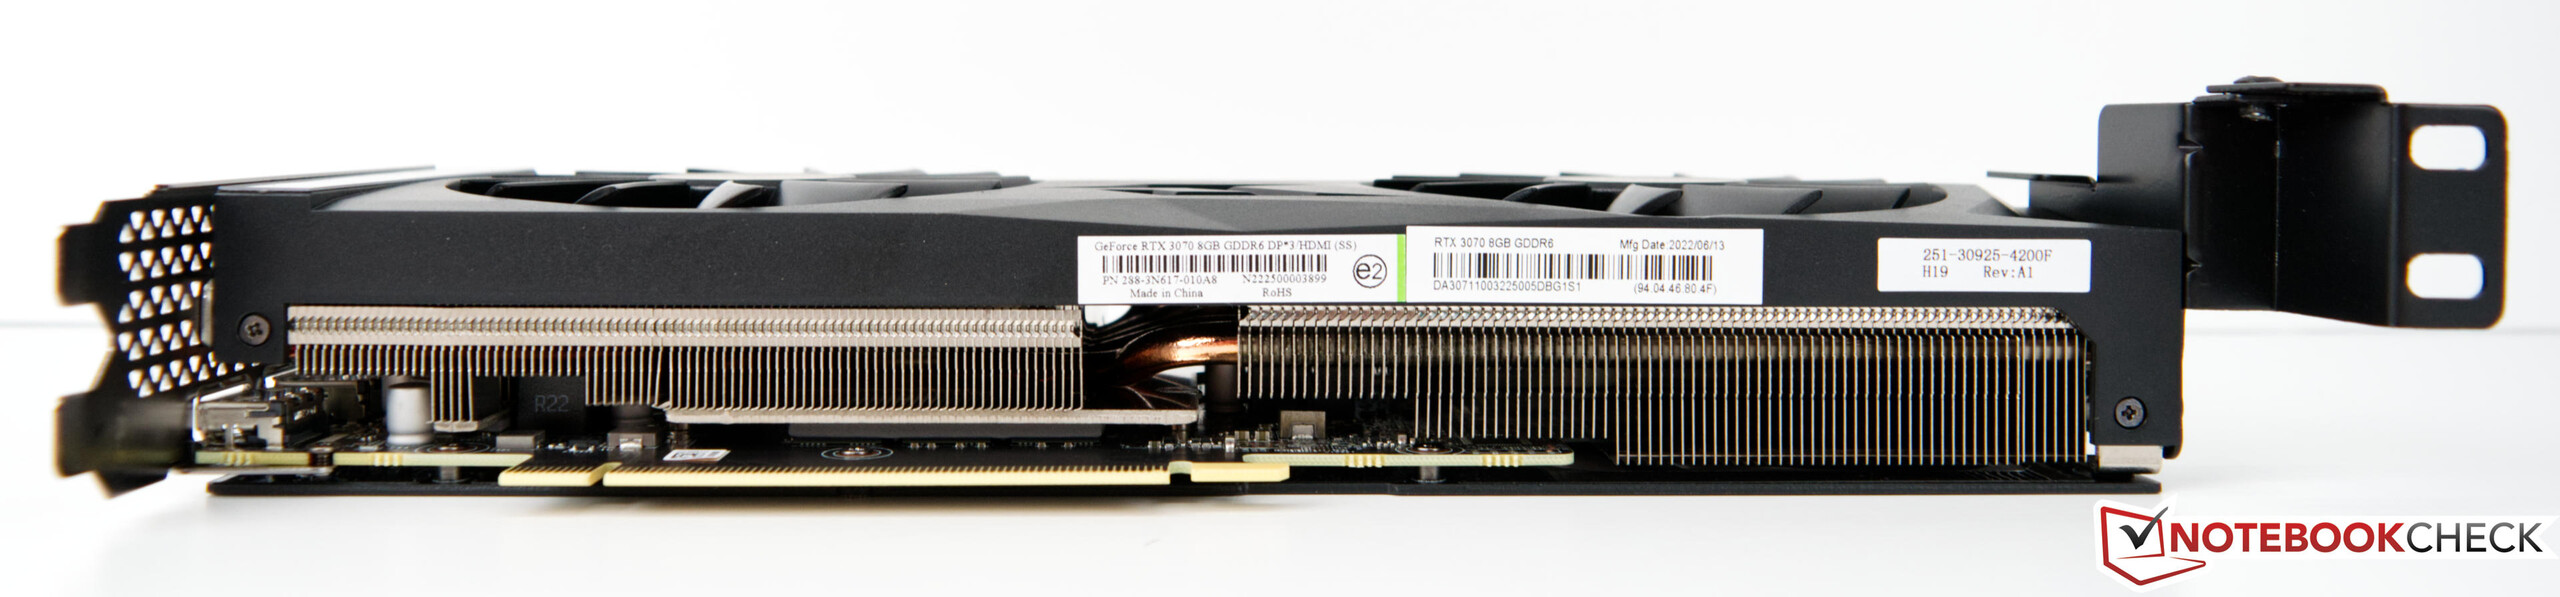
Scheda grafica
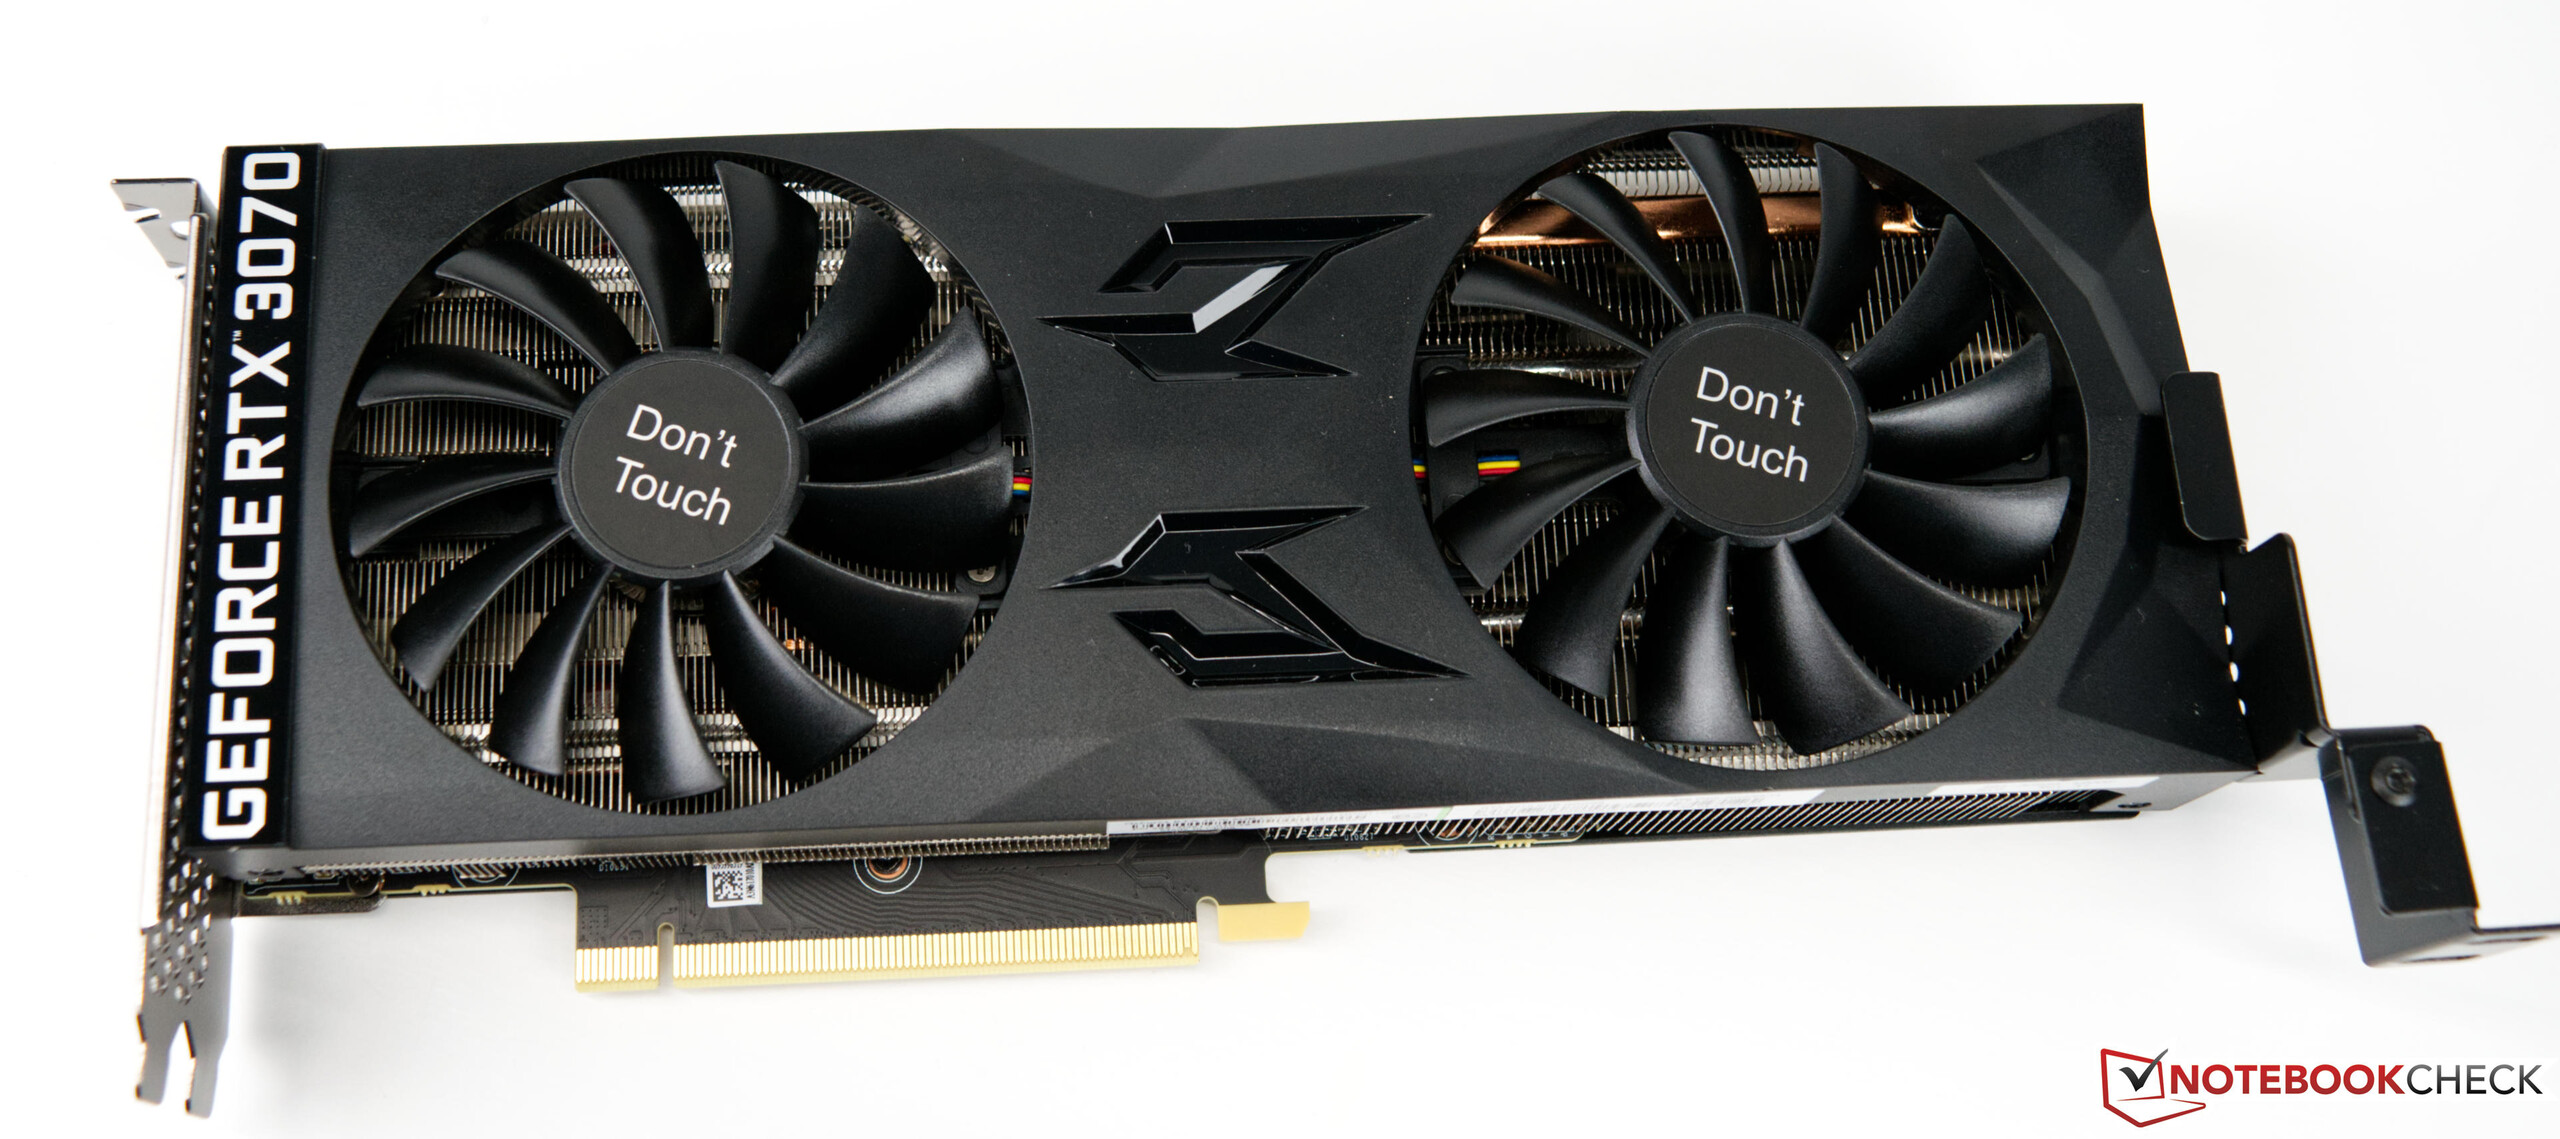
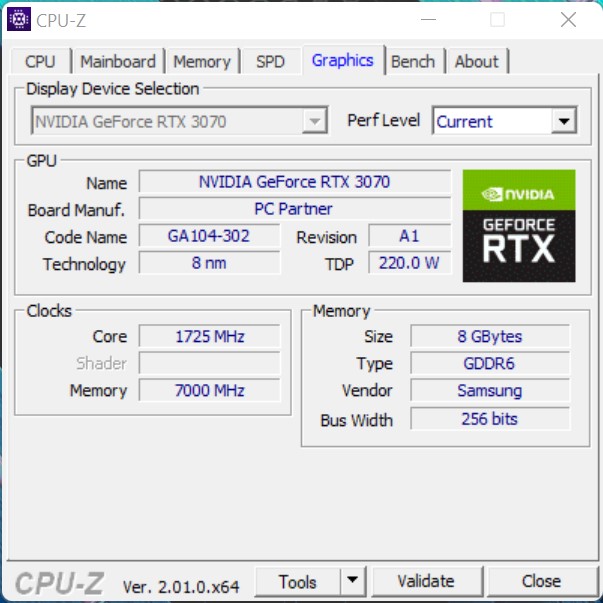
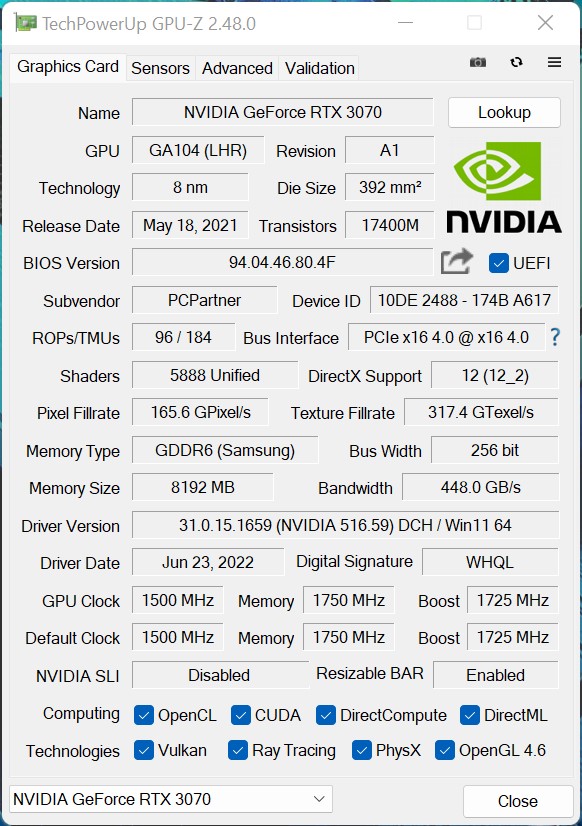
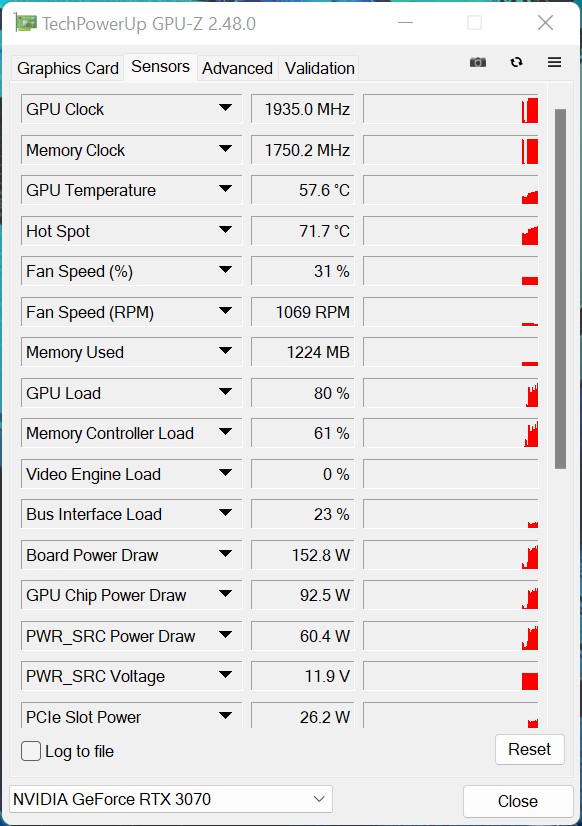
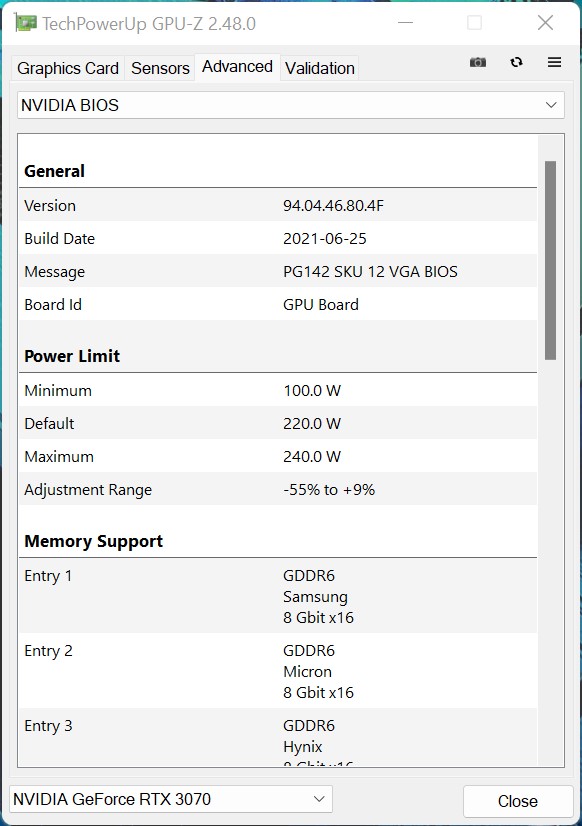
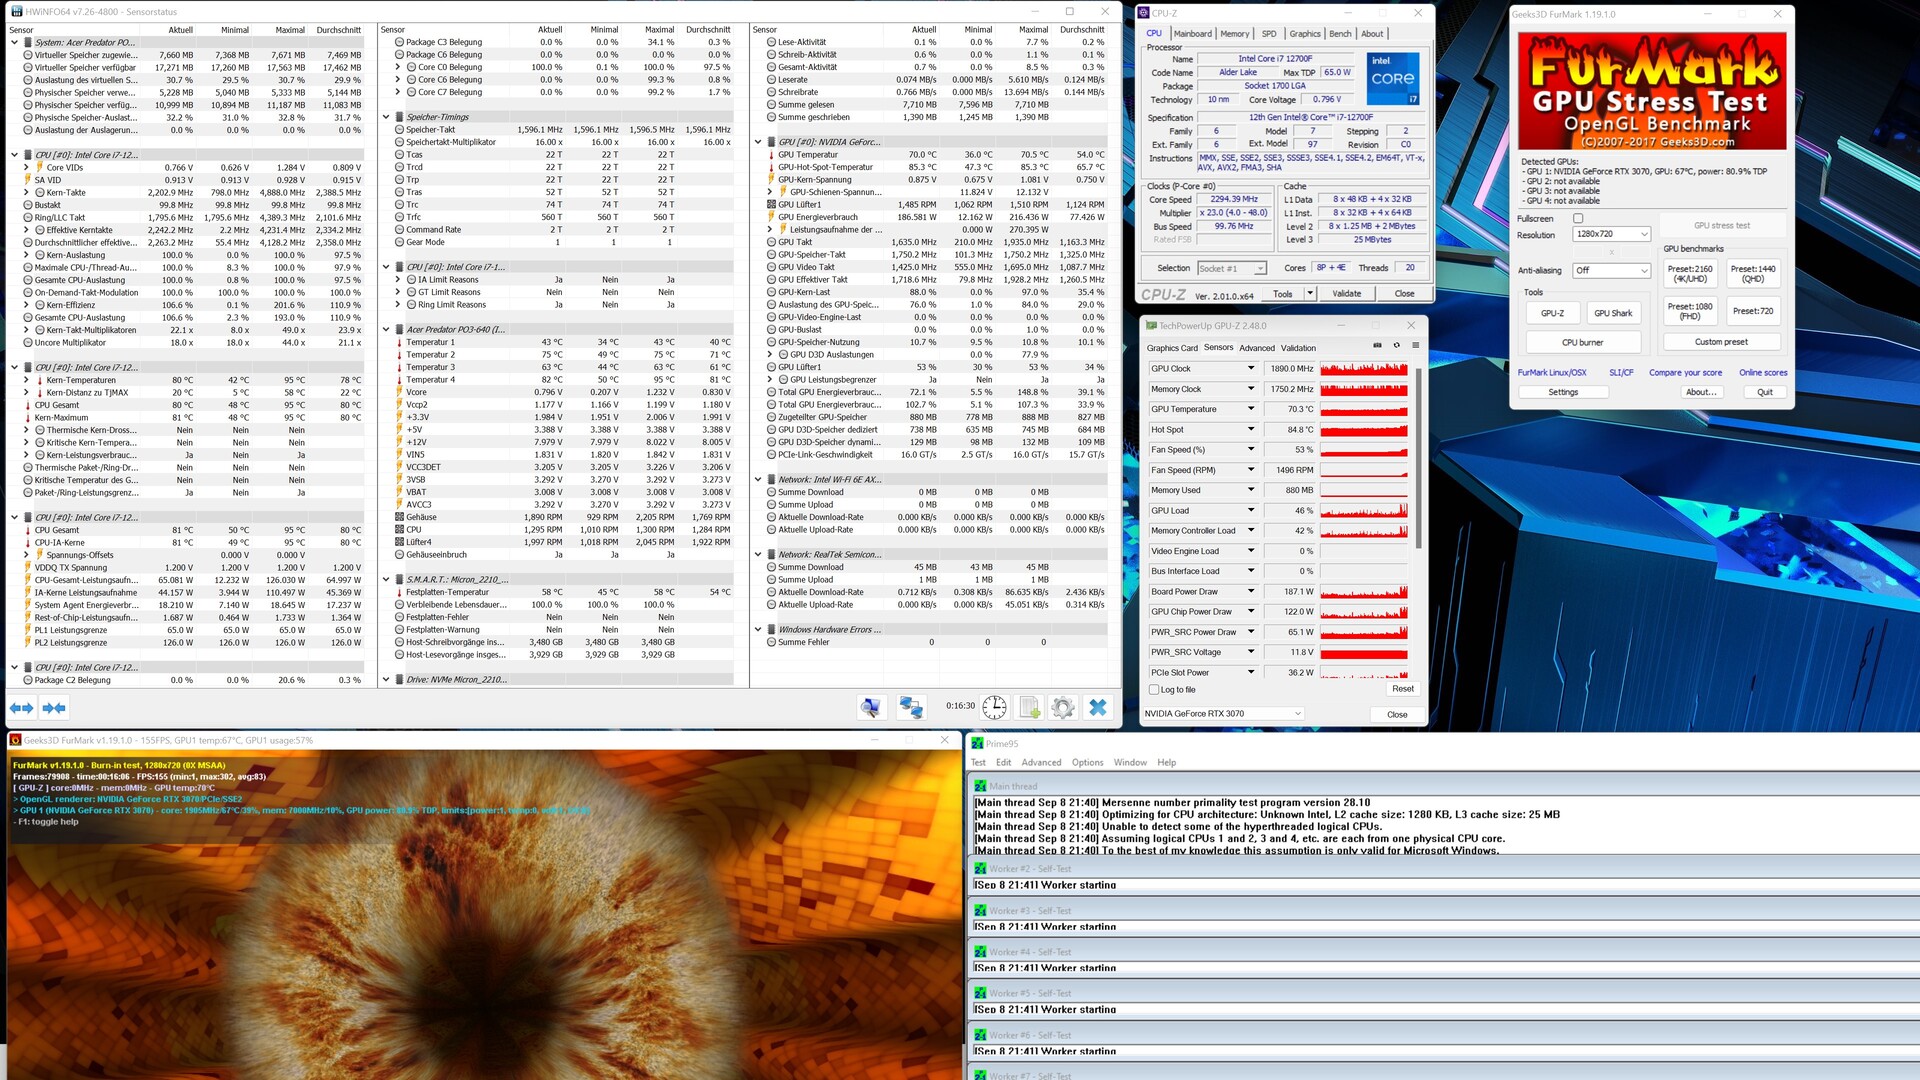
Con la Nvidia GeForce RTX 3070abbiamo l'Acer Predator Orion 3000 nella configurazione più potente del test. Considerando le prestazioni della CPU un po' strozzate, le prestazioni 3D nei test sintetici risultano molto buone. Il modello sconosciuto di GeForce RTX 3070 funziona esattamente secondo le specifiche fornite da Nvidia. Ciò significa un clock della GPU di 1.500 MHz, che viene specificato con 1.750 MHz in Boost. Per quanto riguarda la VRAM, la RTX 3070 ha tipicamente 8 GB di GDDR6 e il consumo totale del modello installato è di 220 watt. Rispetto al modello Zotac Magnus One l'Acer Predator Orion 3000 può prevalere grazie alla migliore CPU.
Altri benchmark della Nvidia GeForce RTX 3070 possono essere trovatiqui
| Performance rating - Percent | |
| Acer Predator Orion 3000 PO3-640 | |
| Zotac Magnus One (ECM73070C) | |
| Zotac ZBOX Magnus EN173070C | |
| Intel Dragon Canyon NUC - RTX 3060 | |
| Intel Beast Canyon NUC | |
| Unigine Valley 1.0 | |
| 1920x1080 Extreme HD DirectX AA:x8 | |
| Acer Predator Orion 3000 PO3-640 | |
| Zotac Magnus One (ECM73070C) | |
| Zotac ZBOX Magnus EN173070C | |
| Intel Dragon Canyon NUC - RTX 3060 | |
| Intel Beast Canyon NUC | |
| 1920x1080 Extreme HD Preset OpenGL AA:x8 | |
| Acer Predator Orion 3000 PO3-640 | |
| Zotac Magnus One (ECM73070C) | |
| Zotac ZBOX Magnus EN173070C | |
| Intel Dragon Canyon NUC - RTX 3060 | |
| Intel Beast Canyon NUC | |
| 3DMark 05 Standard | 58568 punti | |
| 3DMark 06 Standard Score | 59134 punti | |
| 3DMark Vantage P Result | 91011 punti | |
| 3DMark 11 Performance | 36421 punti | |
| 3DMark Ice Storm Standard Score | 237580 punti | |
| 3DMark Cloud Gate Standard Score | 59231 punti | |
| 3DMark Fire Strike Score | 25739 punti | |
| 3DMark Fire Strike Extreme Score | 15841 punti | |
| 3DMark Time Spy Score | 12665 punti | |
Aiuto | ||
Prestazioni di gioco
L'Acer Predator Orion 3000 beneficia molto bene del processore Alder Lake nei test di gioco. Questo processore offre prestazioni per clock molto elevate (IPC, Instructions per Cycle), che portano a un discreto incremento durante i giochi. Il Predator Orion 3000 è in grado di implementare questo aspetto molto bene nonostante le limitazioni del TDP, poiché i giochi spesso non richiedono la piena potenza della CPU. Insieme allaNvidia GeForce RTX 3070anche i giochi più recenti possono essere giocati senza problemi. Dovreste limitarvi a una risoluzione massima di 1440p, anche se la GeForce RTX 3070 è in grado di gestire molti giochi anche a 2160p. Per una panoramica delle prestazioni di tutti i giochi testati rispetto ad altri modelli, facciamo riferimento al nostro Elenco dei giochi per GPU.
| GTA V | |
| 1920x1080 Highest AA:4xMSAA + FX AF:16x | |
| KFA2 GeForce RTX 3080 SG | |
| Acer Predator Orion 3000 PO3-640 | |
| Media NVIDIA GeForce RTX 3070 (91.1 - 122.4, n=5) | |
| Zotac ZBOX Magnus EN173070C | |
| Intel Beast Canyon NUC | |
| Intel Dragon Canyon NUC - RTX 3060 | |
| Zotac Magnus One (ECM73070C) | |
| 1920x1080 High/On (Advanced Graphics Off) AA:2xMSAA + FX AF:8x | |
| KFA2 GeForce RTX 3080 SG | |
| Acer Predator Orion 3000 PO3-640 | |
| Intel Beast Canyon NUC | |
| Intel Dragon Canyon NUC - RTX 3060 | |
| Media NVIDIA GeForce RTX 3070 (157 - 177.7, n=5) | |
| Zotac ZBOX Magnus EN173070C | |
| Zotac Magnus One (ECM73070C) | |
| The Witcher 3 | |
| 1920x1080 High Graphics & Postprocessing (Nvidia HairWorks Off) | |
| KFA2 GeForce RTX 3080 SG | |
| Acer Predator Orion 3000 PO3-640 | |
| Zotac Magnus One (ECM73070C) | |
| Media NVIDIA GeForce RTX 3070 (100 - 264, n=8) | |
| Zotac ZBOX Magnus EN173070C | |
| Intel Dragon Canyon NUC - RTX 3060 | |
| Zotac MEK Mini (RTX 2070 Super) | |
| 1920x1080 Ultra Graphics & Postprocessing (HBAO+) | |
| KFA2 GeForce RTX 3080 SG | |
| Acer Predator Orion 3000 PO3-640 | |
| Zotac Magnus One (ECM73070C) | |
| Media NVIDIA GeForce RTX 3070 (52.8 - 132.2, n=7) | |
| Zotac ZBOX Magnus EN173070C | |
| Zotac MEK Mini (RTX 2070 Super) | |
| Intel Dragon Canyon NUC - RTX 3060 | |
| F1 2020 | |
| 2560x1440 Ultra High Preset AA:T AF:16x | |
| KFA2 GeForce RTX 3080 SG | |
| Acer Predator Orion 3000 PO3-640 | |
| Media NVIDIA GeForce RTX 3070 (143 - 162.2, n=3) | |
| Zotac ZBOX Magnus EN173070C | |
| Intel Beast Canyon NUC | |
| Intel Dragon Canyon NUC - RTX 3060 | |
| 1920x1080 Ultra High Preset AA:T AF:16x | |
| KFA2 GeForce RTX 3080 SG | |
| Acer Predator Orion 3000 PO3-640 | |
| Media NVIDIA GeForce RTX 3070 (179 - 215, n=3) | |
| Zotac ZBOX Magnus EN173070C | |
| Intel Beast Canyon NUC | |
| Intel Dragon Canyon NUC - RTX 3060 | |
| basso | medio | alto | ultra | QHD | 4K | |
|---|---|---|---|---|---|---|
| GTA V (2015) | 184.7 | 181.6 | 177.7 | 122.4 | 113.1 | 125.9 |
| The Witcher 3 (2015) | 507 | 408 | 264 | 132.2 | 93.9 | |
| Dota 2 Reborn (2015) | 146.5 | 133.9 | 129.3 | 121.4 | 122.7 | |
| Rise of the Tomb Raider (2016) | 376 | 266 | 182.9 | 153.7 | 76.7 | |
| Final Fantasy XV Benchmark (2018) | 195.8 | 172.3 | 129.7 | 99.3 | 58.2 | |
| X-Plane 11.11 (2018) | 150.6 | 137.4 | 111.3 | 98.4 | ||
| Far Cry 5 (2018) | 179 | 159 | 151 | 141 | 125 | 72 |
| Strange Brigade (2018) | 466 | 328 | 268 | 233 | 173.2 | 98.7 |
| Shadow of the Tomb Raider (2018) | 194.8 | 173.8 | 166.8 | 157.1 | 114.8 | 62.6 |
| Far Cry New Dawn (2019) | 162 | 140 | 135 | 121 | 113 | 74 |
| Metro Exodus (2019) | 224 | 156.8 | 121.9 | 97.7 | 78.3 | 49.7 |
| Anno 1800 (2019) | 167.5 | 164.1 | 130.8 | 74.7 | 69.3 | 41.8 |
| Control (2019) | 240 | 167.7 | 124.9 | 81.3 | 40.6 | |
| Borderlands 3 (2019) | 171.5 | 144.7 | 127.9 | 108.9 | 82.9 | 46.3 |
| F1 2020 (2020) | 351 | 302 | 288 | 215 | 162.2 | 92.7 |
| Watch Dogs Legion (2020) | 125 | 123 | 109 | 89 | 67 | 37 |
| Dirt 5 (2020) | 248.1 | 191.8 | 157 | 122.1 | 99 | 65.3 |
| F1 2021 (2021) | 407 | 361 | 304 | 158 | 118 | 67.3 |
| New World (2021) | 166.9 | 139.5 | 128.3 | 117.5 | 95 | 48.9 |
| Far Cry 6 (2021) | 154.9 | 138.3 | 121.1 | 114.2 | 95.9 | 26.4 |
| Forza Horizon 5 (2021) | 247 | 171 | 160 | 115 | 100 | 73 |
| God of War (2022) | 142.3 | 140.5 | 117.8 | 83.5 | 69.3 | 49.8 |
| GRID Legends (2022) | 249 | 224 | 198 | 151 | 127 | 84 |
| Cyberpunk 2077 1.6 (2022) | 146.7 | 145.1 | 136 | 90.3 | 60.6 | 29 |
| Tiny Tina's Wonderlands (2022) | 248 | 204 | 145.8 | 113.9 | 80.7 | 44.4 |
| F1 22 (2022) | 258 | 249 | 228 | 81 | 52 | 25 |
Emissioni - Sistema di raffreddamento debole
Emissioni acustiche
Il sistema di raffreddamento dell'Acer Predator Orion 3000 consiste in una ventola nella parte anteriore, che aspira l'aria fresca, e in una ventola nella parte posteriore, che dovrebbe trasportare l'aria calda fuori dal case. In teoria, questo sembra abbastanza buono, ma in pratica si scopre che non è ottimale. Non per niente Acer limita il consumo massimo di energia del processore del Predator Orion 3000. Tuttavia, il PC non si distingue negativamente nel test con soli 31,6 dB(A) in idle, nonostante il radiatore della CPU molto piccolo. Il sistema è relativamente silenzioso anche sotto carico e raggiunge circa 38 dB(A) nello stress test. Tuttavia, se lasciamo girare le ventole alla massima velocità (tramite la modalità di gioco Predator Sense), il nostro dispositivo di misurazione mostra 54 dB(A).
Rumorosità
| Idle |
| 31.5 / 31.6 / 31.6 dB(A) |
| Sotto carico |
| 32.7 / 38.1 dB(A) |
 | ||
30 dB silenzioso 40 dB(A) udibile 50 dB(A) rumoroso |
||
min: | ||
| Acer Predator Orion 3000 PO3-640 i7-12700F, GeForce RTX 3070 | Zotac Magnus One (ECM73070C) i7-10700, GeForce RTX 3070 | Zotac ZBOX Magnus EN173070C i7-11800H, GeForce RTX 3070 Laptop GPU | Intel Dragon Canyon NUC - RTX 3060 i9-12900, GeForce RTX 3060 | |
|---|---|---|---|---|
| Noise | -18% | -10% | -2% | |
| off /ambiente * (dB) | 29.8 | 30 -1% | 30.7 -3% | 30.2 -1% |
| Idle Minimum * (dB) | 31.5 | 33.58 -7% | 32.7 -4% | 30.2 4% |
| Idle Average * (dB) | 31.6 | 32.8 -4% | 30.4 4% | |
| Idle Maximum * (dB) | 31.6 | 32.8 -4% | 30.8 3% | |
| Load Average * (dB) | 32.7 | 44.25 -35% | 41.7 -28% | |
| Load Maximum * (dB) | 38.1 | 48.72 -28% | 45.4 -19% | 45.1 -18% |
* ... Meglio usare valori piccoli
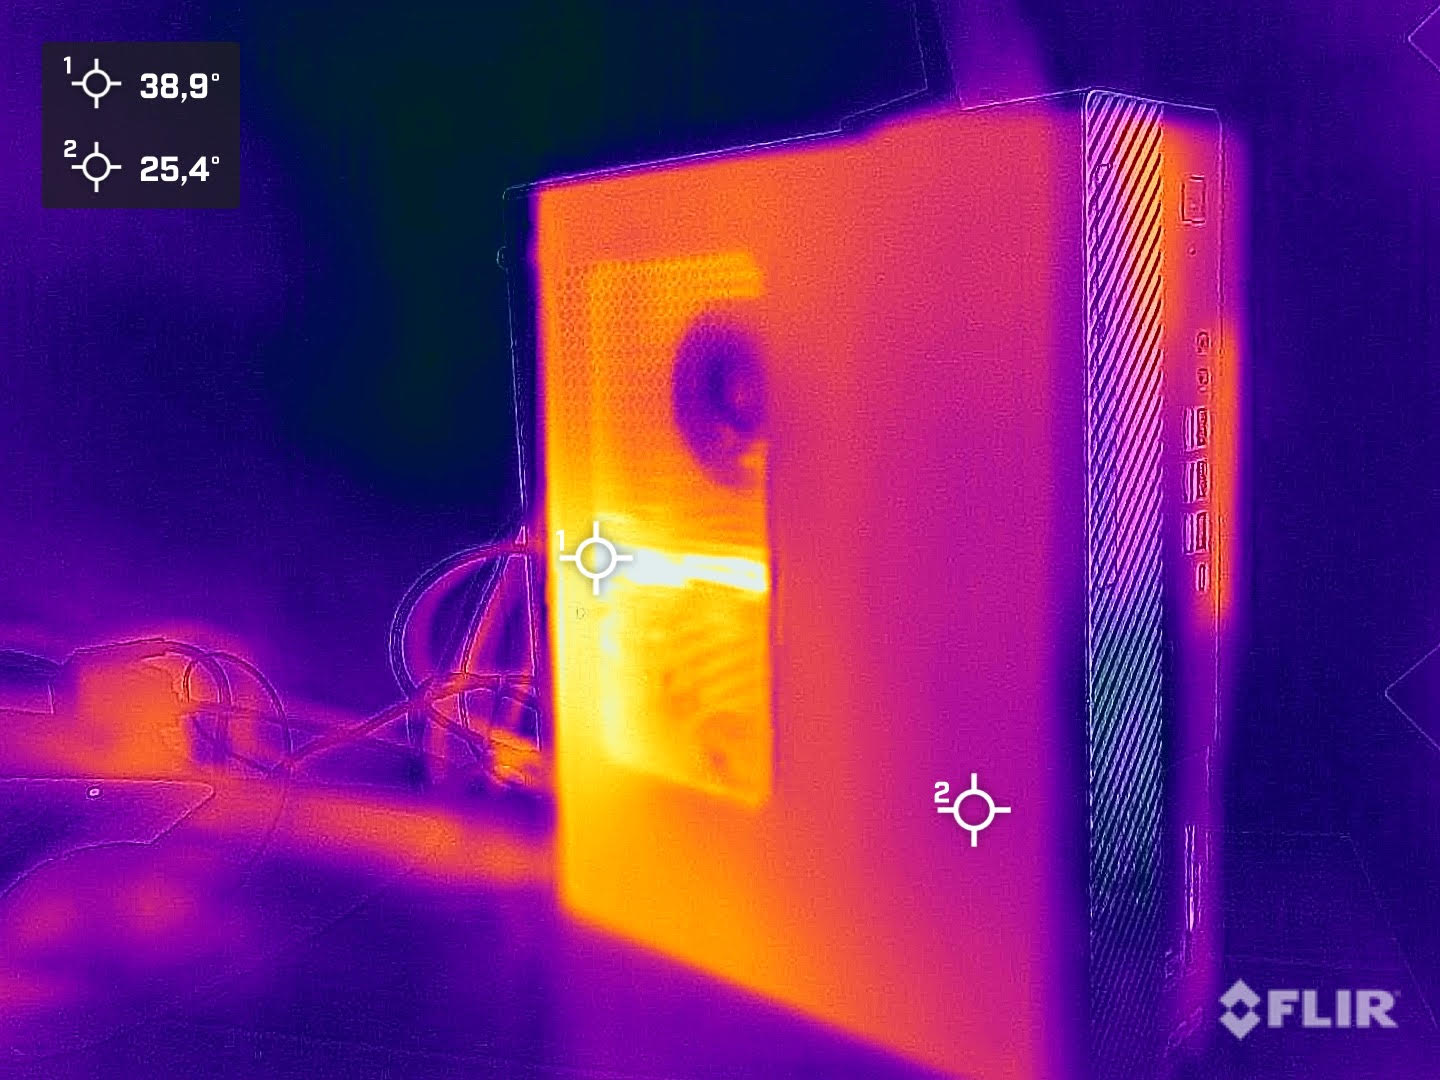
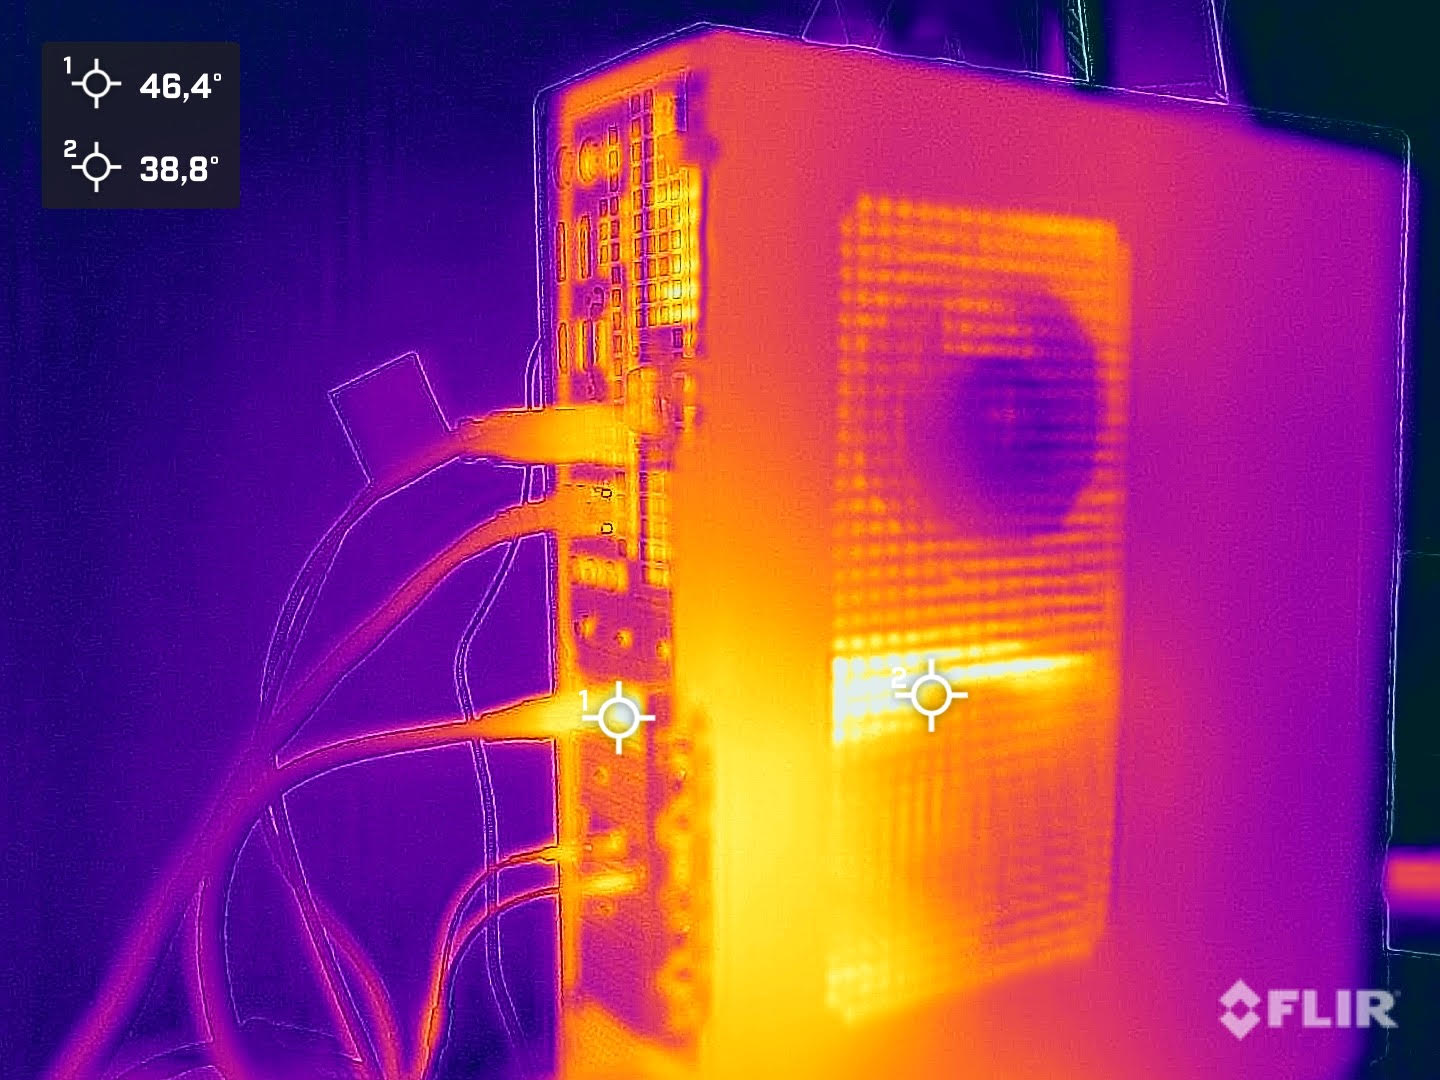
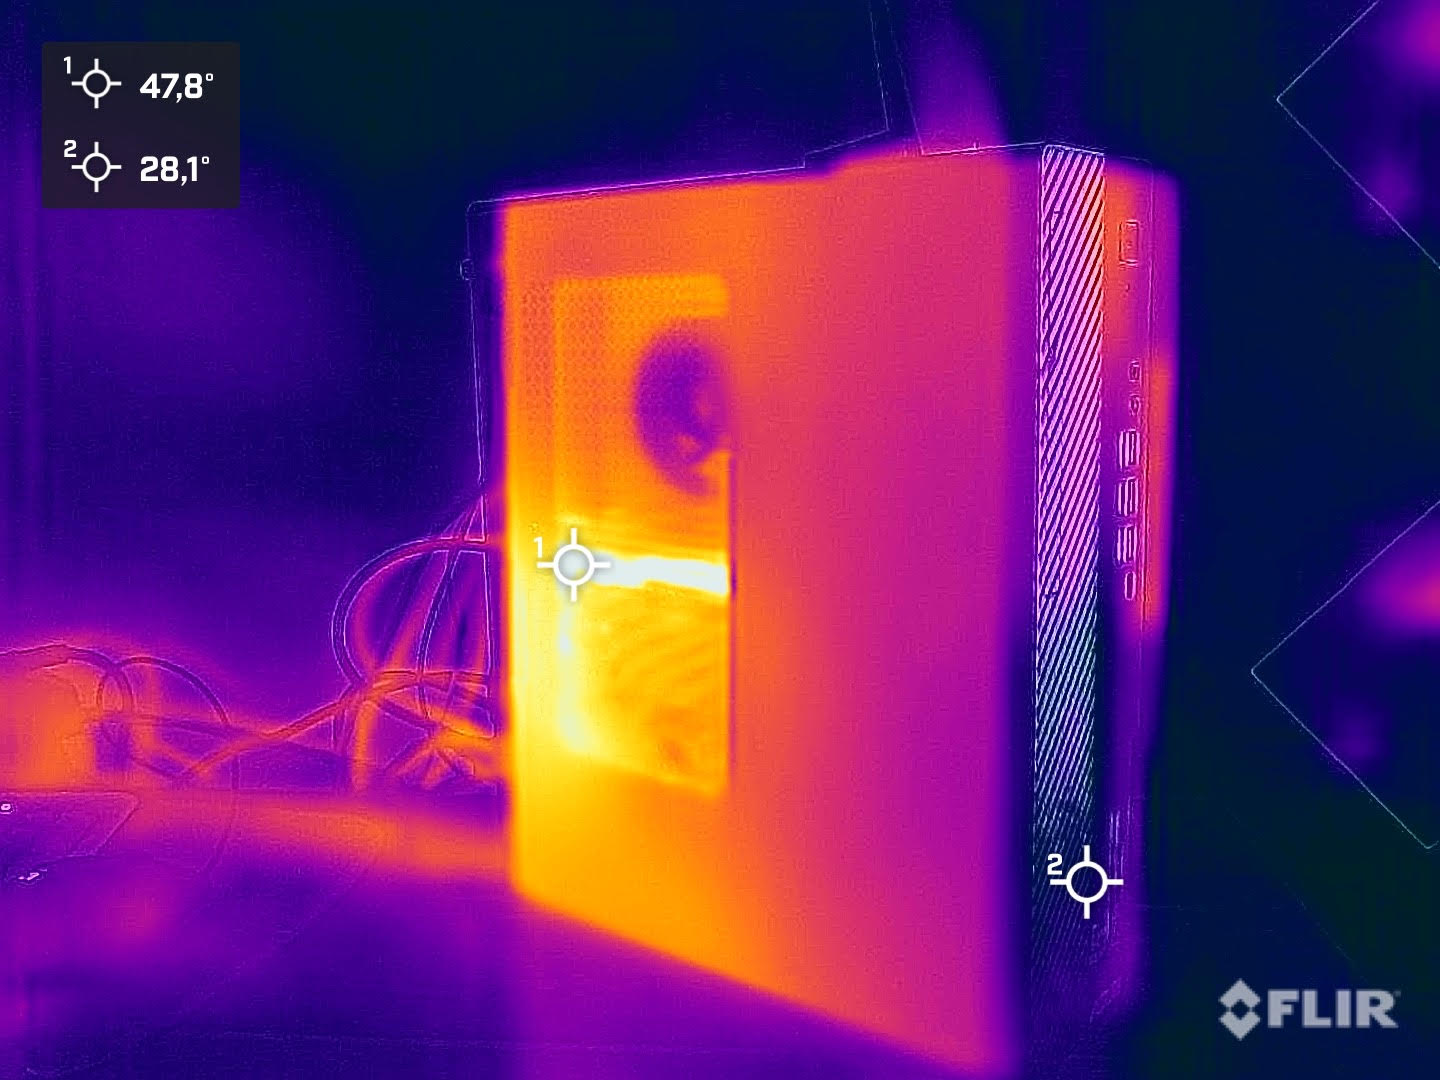
Temperatura
Il case dell'Acer Predator Orion 3000 si riscalda un po' sotto carico, ma non è un problema. La singola ventola sul retro, invece, spinge l'aria molto calda fuori dal case. Una dissipazione aggiuntiva del calore verso la parte superiore sarebbe ancora più efficace. Notiamo il valore massimo del processore di 98 °C sotto carico. Questo dimostra che Acer è già al limite con il raffreddamento installato, anche se il processore Intel Core i7-12700F avrebbe ancora delle riserve. Ciononostante, il Predator Orion 3000 è riuscito a fornire buone prestazioni nel test. La temperatura massima della GPU è notevolmente inferiore, 70,5 °C
Consumo di energia
L'Acer Predator Orion 3000 è sorprendentemente parsimonioso quando è al minimo e a basso carico. Il nostro misuratore mostra solo poco meno di 30 watt. Nel test di stress raggiunge i 361 watt per un breve periodo, anche se in media sono disponibili solo 186 watt. Ciò è dovuto al PL2, che è consentito solo per un massimo di 28 secondi. Il consumo energetico del sistema è in media di 338 watt durante il gioco. Abbiamo documentato picchi a breve termine fino a 364 watt. È installato un alimentatore ATX da 500 watt, in grado di soddisfare i requisiti hardware.
| Off / Standby | |
| Idle | |
| Sotto carico |
|
Leggenda:
min: | |
| Acer Predator Orion 3000 PO3-640 i7-12700F, GeForce RTX 3070 | Zotac ZBOX Magnus EN173070C i7-11800H, GeForce RTX 3070 Laptop GPU | Media NVIDIA GeForce RTX 3070 | Media della classe Desktop | |
|---|---|---|---|---|
| Power Consumption | -27% | -93% | -4% | |
| Idle Minimum * (Watt) | 24.6 | 31.3 -27% | 56 ? -128% | 17.9 ? 27% |
| Idle Average * (Watt) | 24.6 | 35.1 -43% | 58.5 ? -138% | 37.2 ? -51% |
| Idle Maximum * (Watt) | 29.6 | 41.6 -41% | 70.5 ? -138% | 41.3 ? -40% |
| Load Average * (Watt) | 124.6 | 214 -72% | 122.1 ? 2% | 96.7 ? 22% |
| Witcher 3 ultra * (Watt) | 338.1 | 193.5 43% | ||
| Load Maximum * (Watt) | 186.1 | 231 -24% | 305 ? -64% | 141.6 ? 24% |
* ... Meglio usare valori piccoli
Power Consumption with external Monitor
Pro
Contro
Conclusione - PC da gioco veloce con un raffreddamento insufficiente
L'Acer Predator Orion 3000 è un PC da gioco compatto basato sull'attuale generazione di CPU Intel. Il Intel Core i7-12700F offre ottime prestazioni ed è abbastanza veloce da soddisfare le esigenze dei giochi attuali, nonostante la limitazione PL2. Si sarebbe potuto ottenere di più con un raffreddamento migliore. Con la Nvidia GeForce RTX 3070si ottiene un modello convenzionale che corrisponde alle specifiche di Nvidia. Tuttavia, il modello si comporta bene e raggiunge frame rate fluidi con risoluzione 1440p nei giochi attuali. Il resto della configurazione è piuttosto standard con un'unità SSD da 1 TB e 16 GB di RAM DDR4. L'uso di una RAM DDR5 più veloce sarebbe stato a prova di futuro.
Per migliorare l'aspetto dell'Acer Predator Orion 3000, il pannello laterale sinistro può essere sostituito da un pannello laterale con una finestra di visualizzazione. Questo fa parte della dotazione. Sono presenti anche una tastiera e un mouse, che riprendono il look di Acer Predator e forniscono quindi un quadro generale coerente
Grazie all'Intel Core i7-12700F e alla Nvidia GeForce RTX 3070, l'Acer Predator Orion 3000 offre una buona base come PC da gioco. Purtroppo, il sistema di raffreddamento deve accettare alcuni compromessi.
Il punto più critico è il raffreddamento troppo ridotto del processore. Tuttavia, è sorprendente che l'Acer Predator Orion 3000 non sia insopportabilmente rumoroso. Probabilmente il produttore ha rinunciato a velocità più elevate in modalità automatica a scapito di temperature più elevate. La curva della ventola autoregolata può garantire temperature leggermente migliori sotto carico. Tuttavia, anche le basse emissioni acustiche sotto carico sono un ricordo del passato.
Prezzi e disponibilità
L'Acer Predator Orion 3000 è disponibile direttamente sul sito Acer e costa 2.200 euro nella nostra configurazione di prova. Attualmente, è possibile ottenere il dispositivo anche presso Computer Universe per soli 1.900 euro.
Acer Predator Orion 3000 PO3-640
- 09/13/2022 v7 (old)
Sebastian Bade
Price comparison
