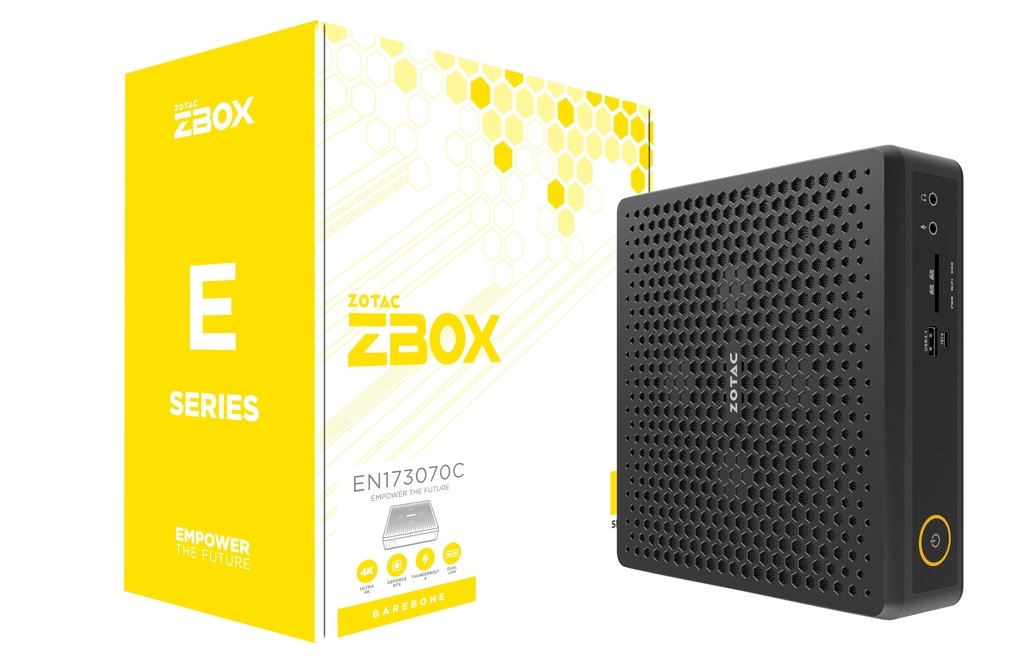
Recensione dello Zotac ZBOX Magnus: GeForce RTX 3070 Mobile e SoC Tiger Lake in un case da 2,65 litri
Con il marchio Zotac ZBOX, il produttore offre una serie di PC compatti destinati a diversi scenari di utilizzo individuali. In combinazione con l'aggiunta del marchio Magnus, la direzione è quella di un PC da gioco, che si riflette anche nei componenti integrati. La versione attuale del Magnus EN173070C contiene un processore Intel Core i7-11800Hche dovrebbe garantire un'operatività di gioco veloce in combinazione con la scheda Nvidia RTX 30 Nvidia GeForce RTX 3070 Laptopgrafica. Questa combinazione non è nuova per noi che ci occupiamo di recensioni di computer portatili e possiamo già dare una stima approssimativa delle prestazioni da aspettarci
Nella nostra configurazione, il Magnus EN173070C costa quasi 1650 euro (~1743 dollari). Tuttavia, poiché si tratta sempre di un sistema barebone, bisogna calcolare anche l'SSD, la RAM e la licenza di Windows. A seconda dei componenti scelti, il conto totale può facilmente superare i 2000 Euro (~$2113). Coloro per i quali le prestazioni della Nvidia GeForce RTX 3070 Laptopnvidia RTX 3070 non sono sufficienti, possono anche acquistare la versione EN173080C del Magnus, che contiene una GPU più veloce con la Nvidia GeForce RTX 3080 Laptopgrafica. La CPU rimane la stessa con il Intel Core i7-11800H. È possibile acquistare anche il modello Magnus EN153060C, che offre prestazioni leggermente inferiori e include il processore Intel Core i5-11400H.Intel Core i5-11400Hintel Core i5-11400H e Nvidia GeForce RTX 3060 LaptopgPU.
Zotac ZBOX Magnus IT173070C in dettaglio
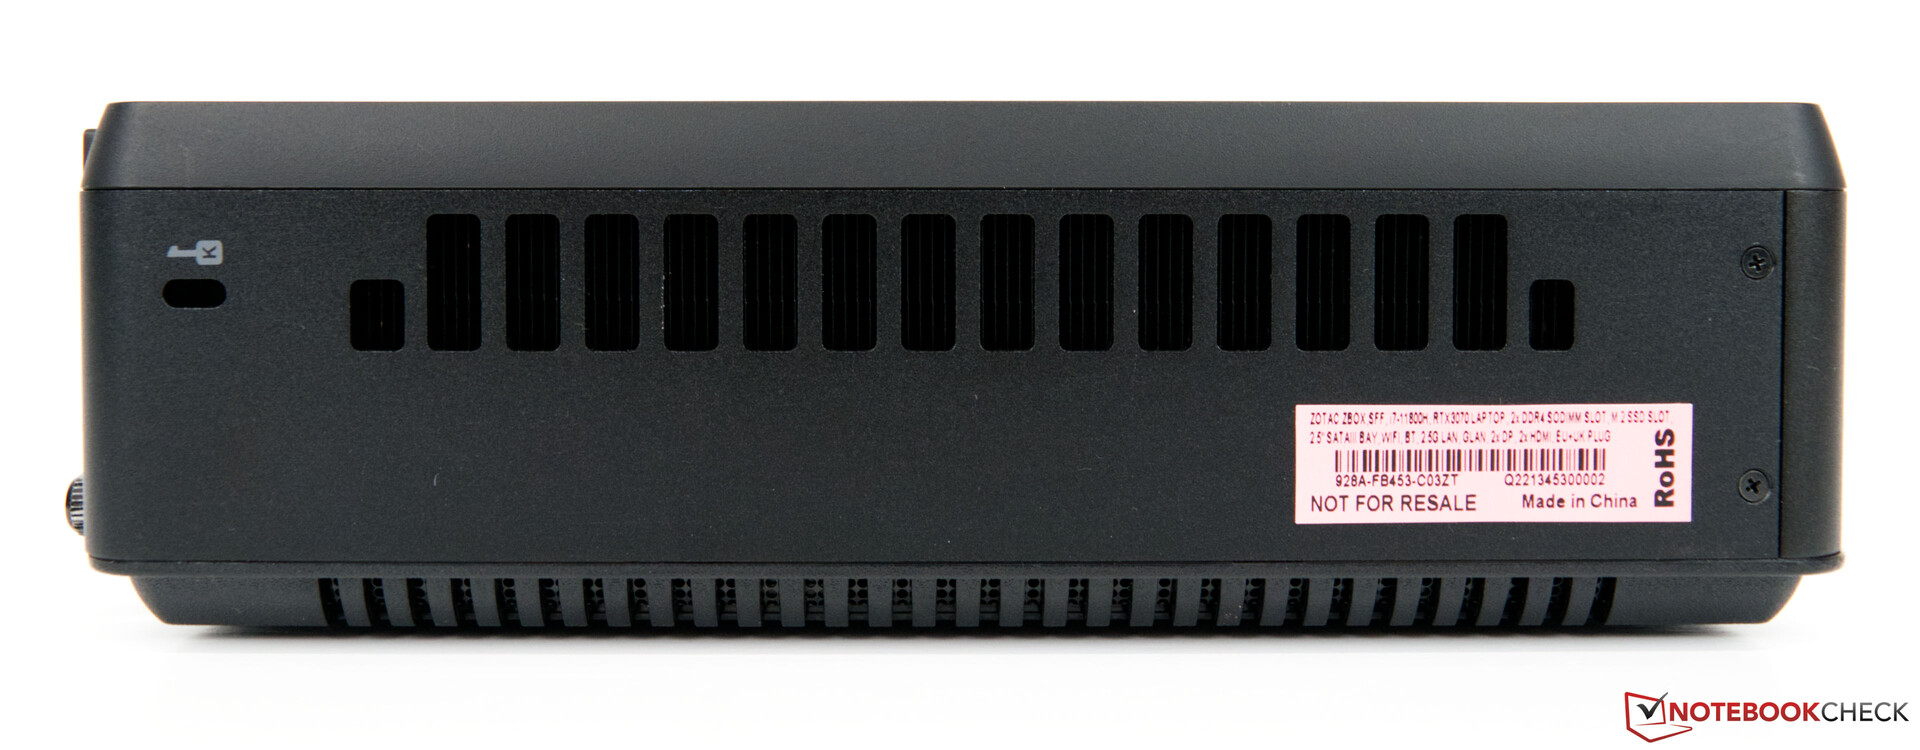
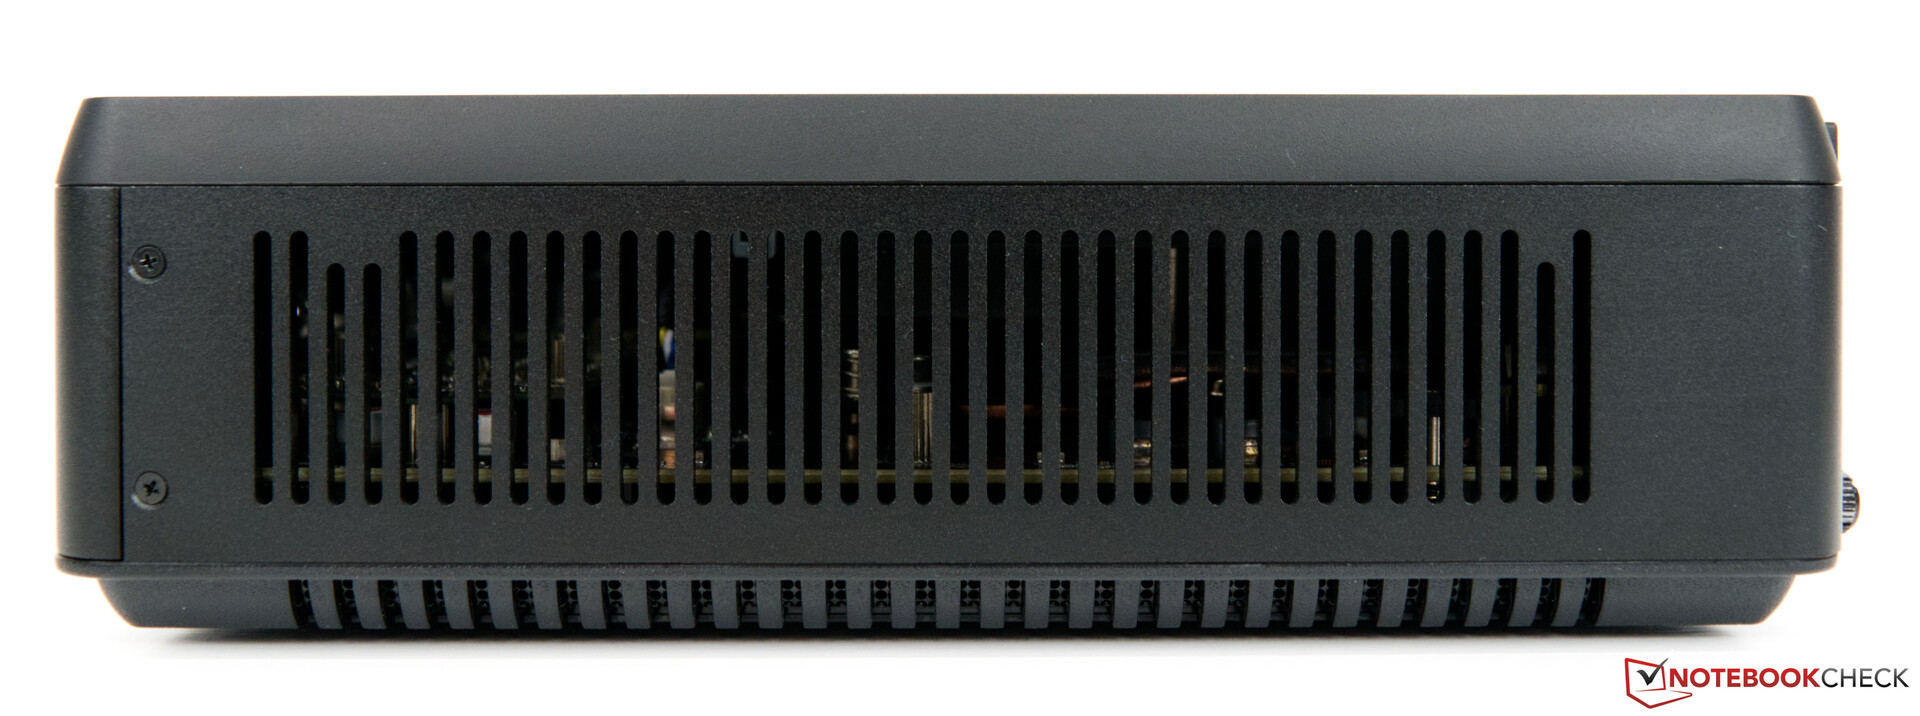
Caso
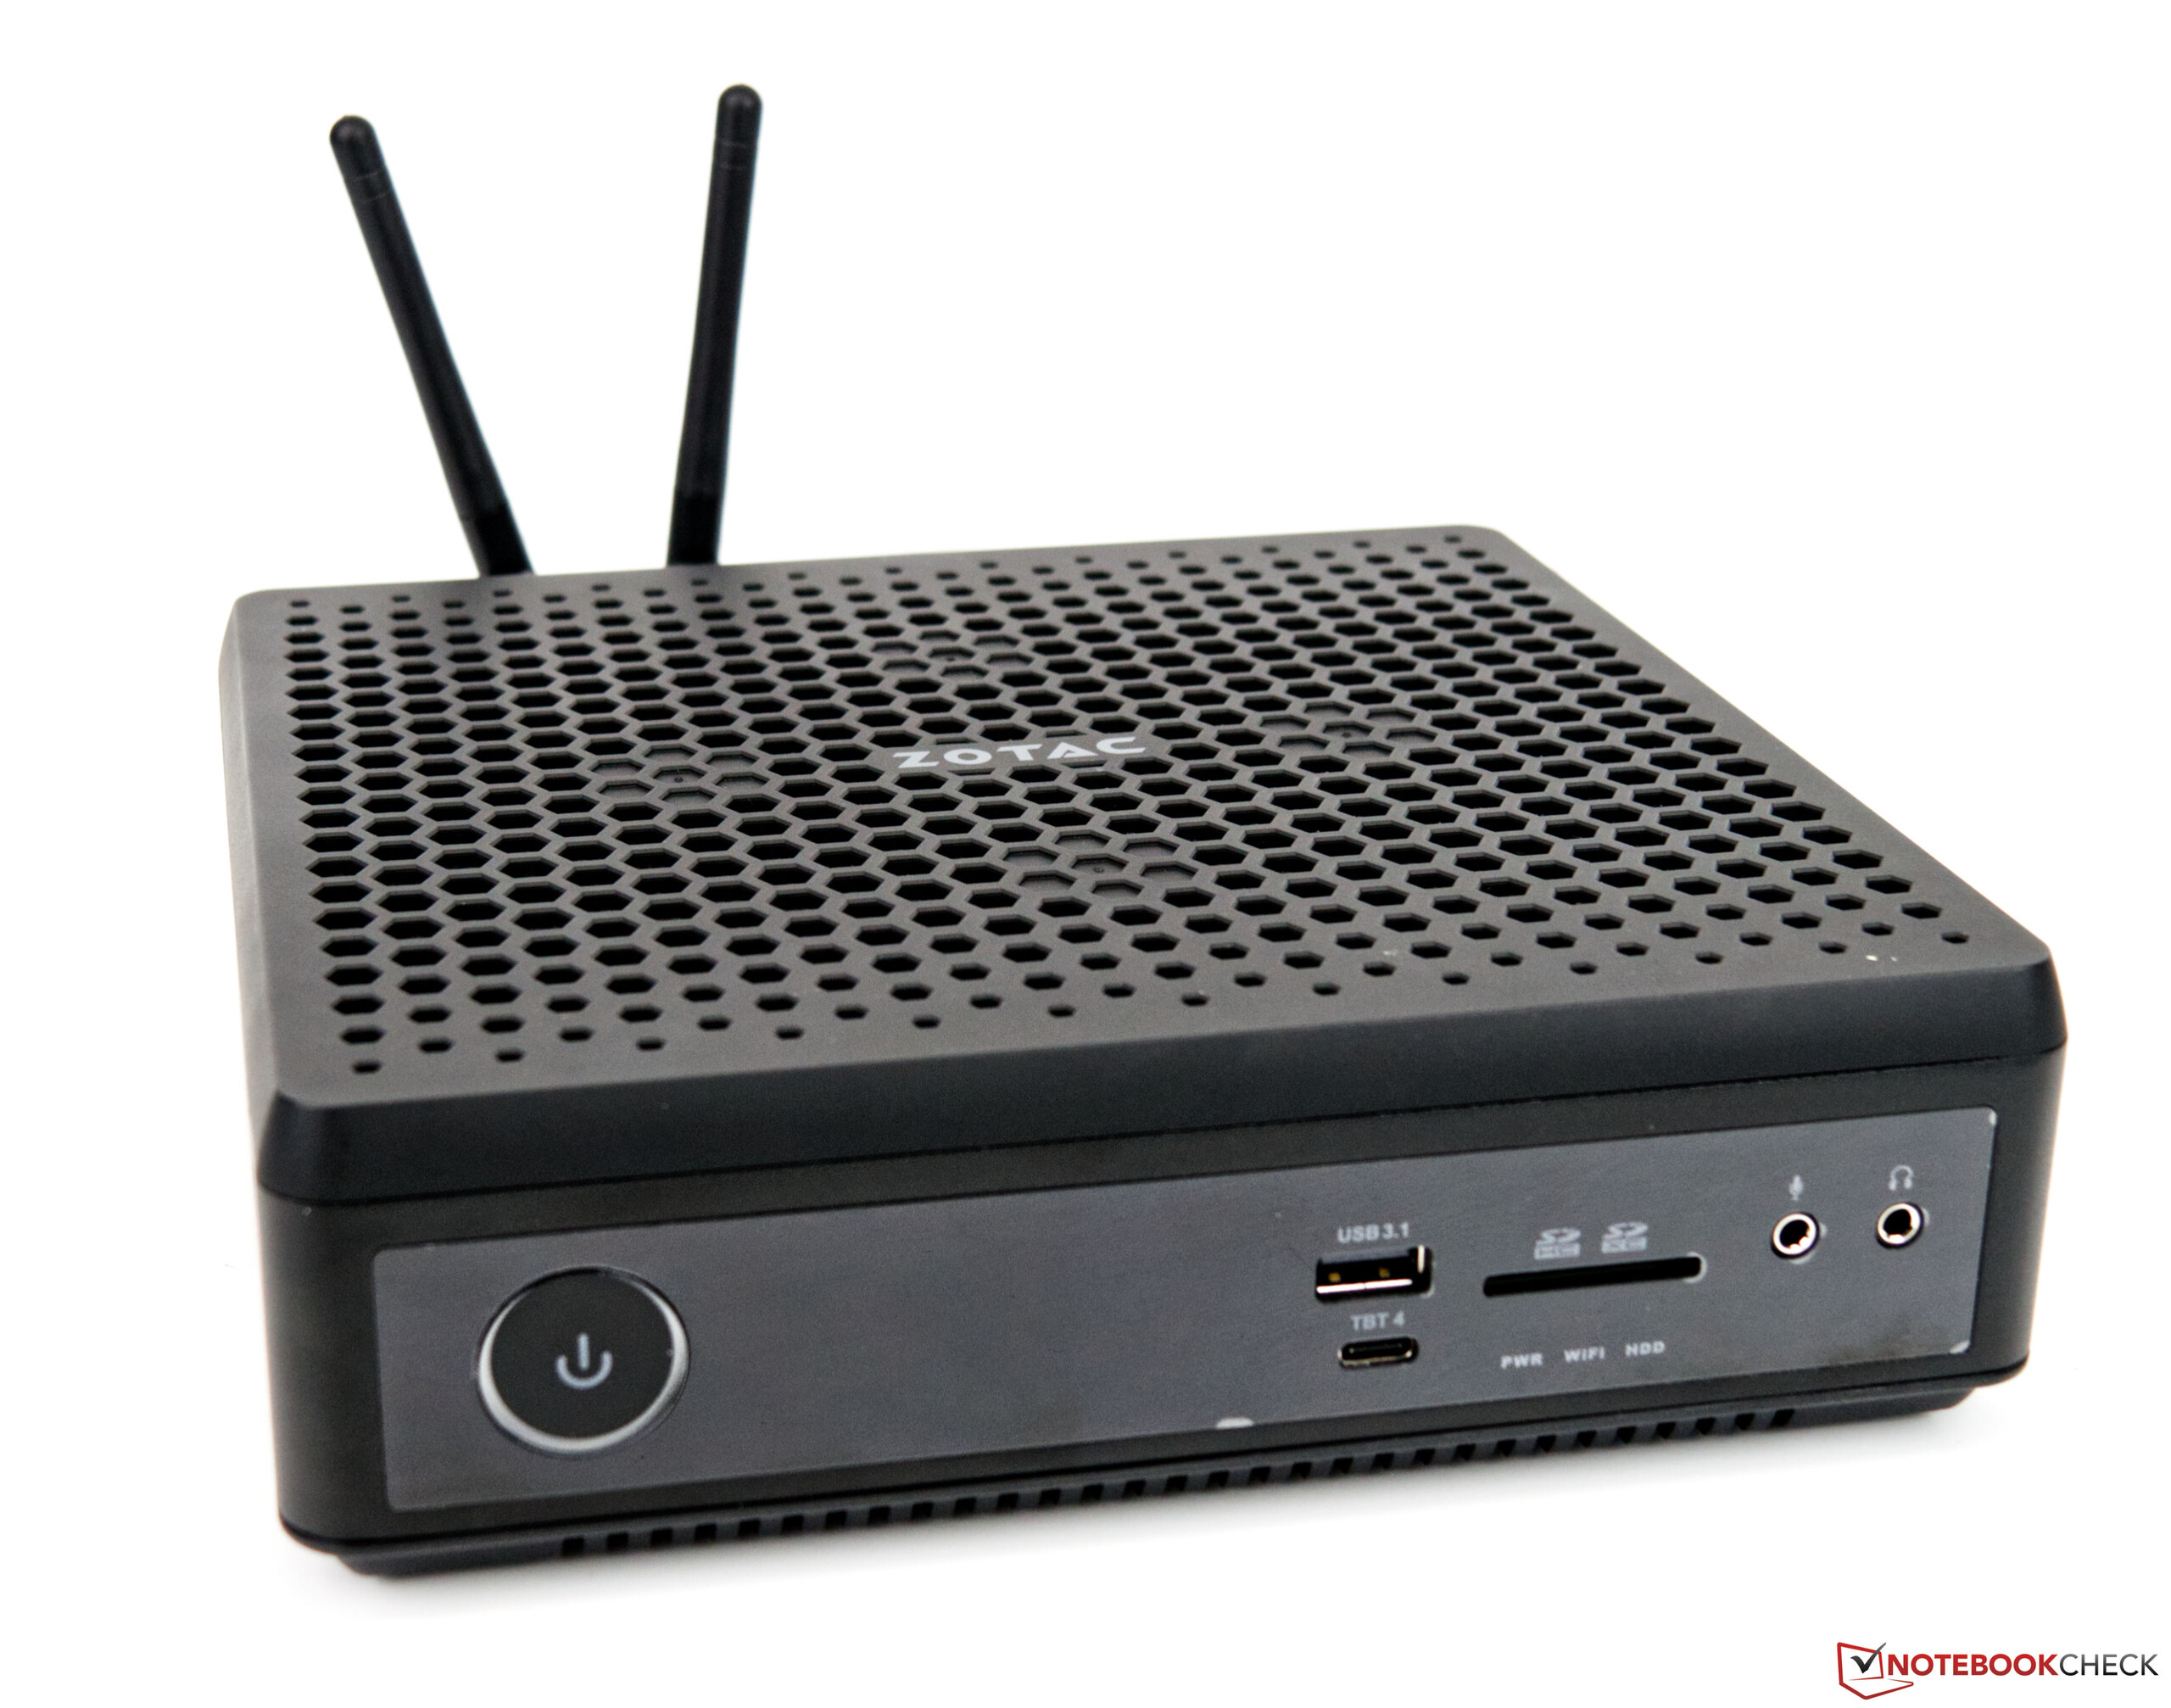
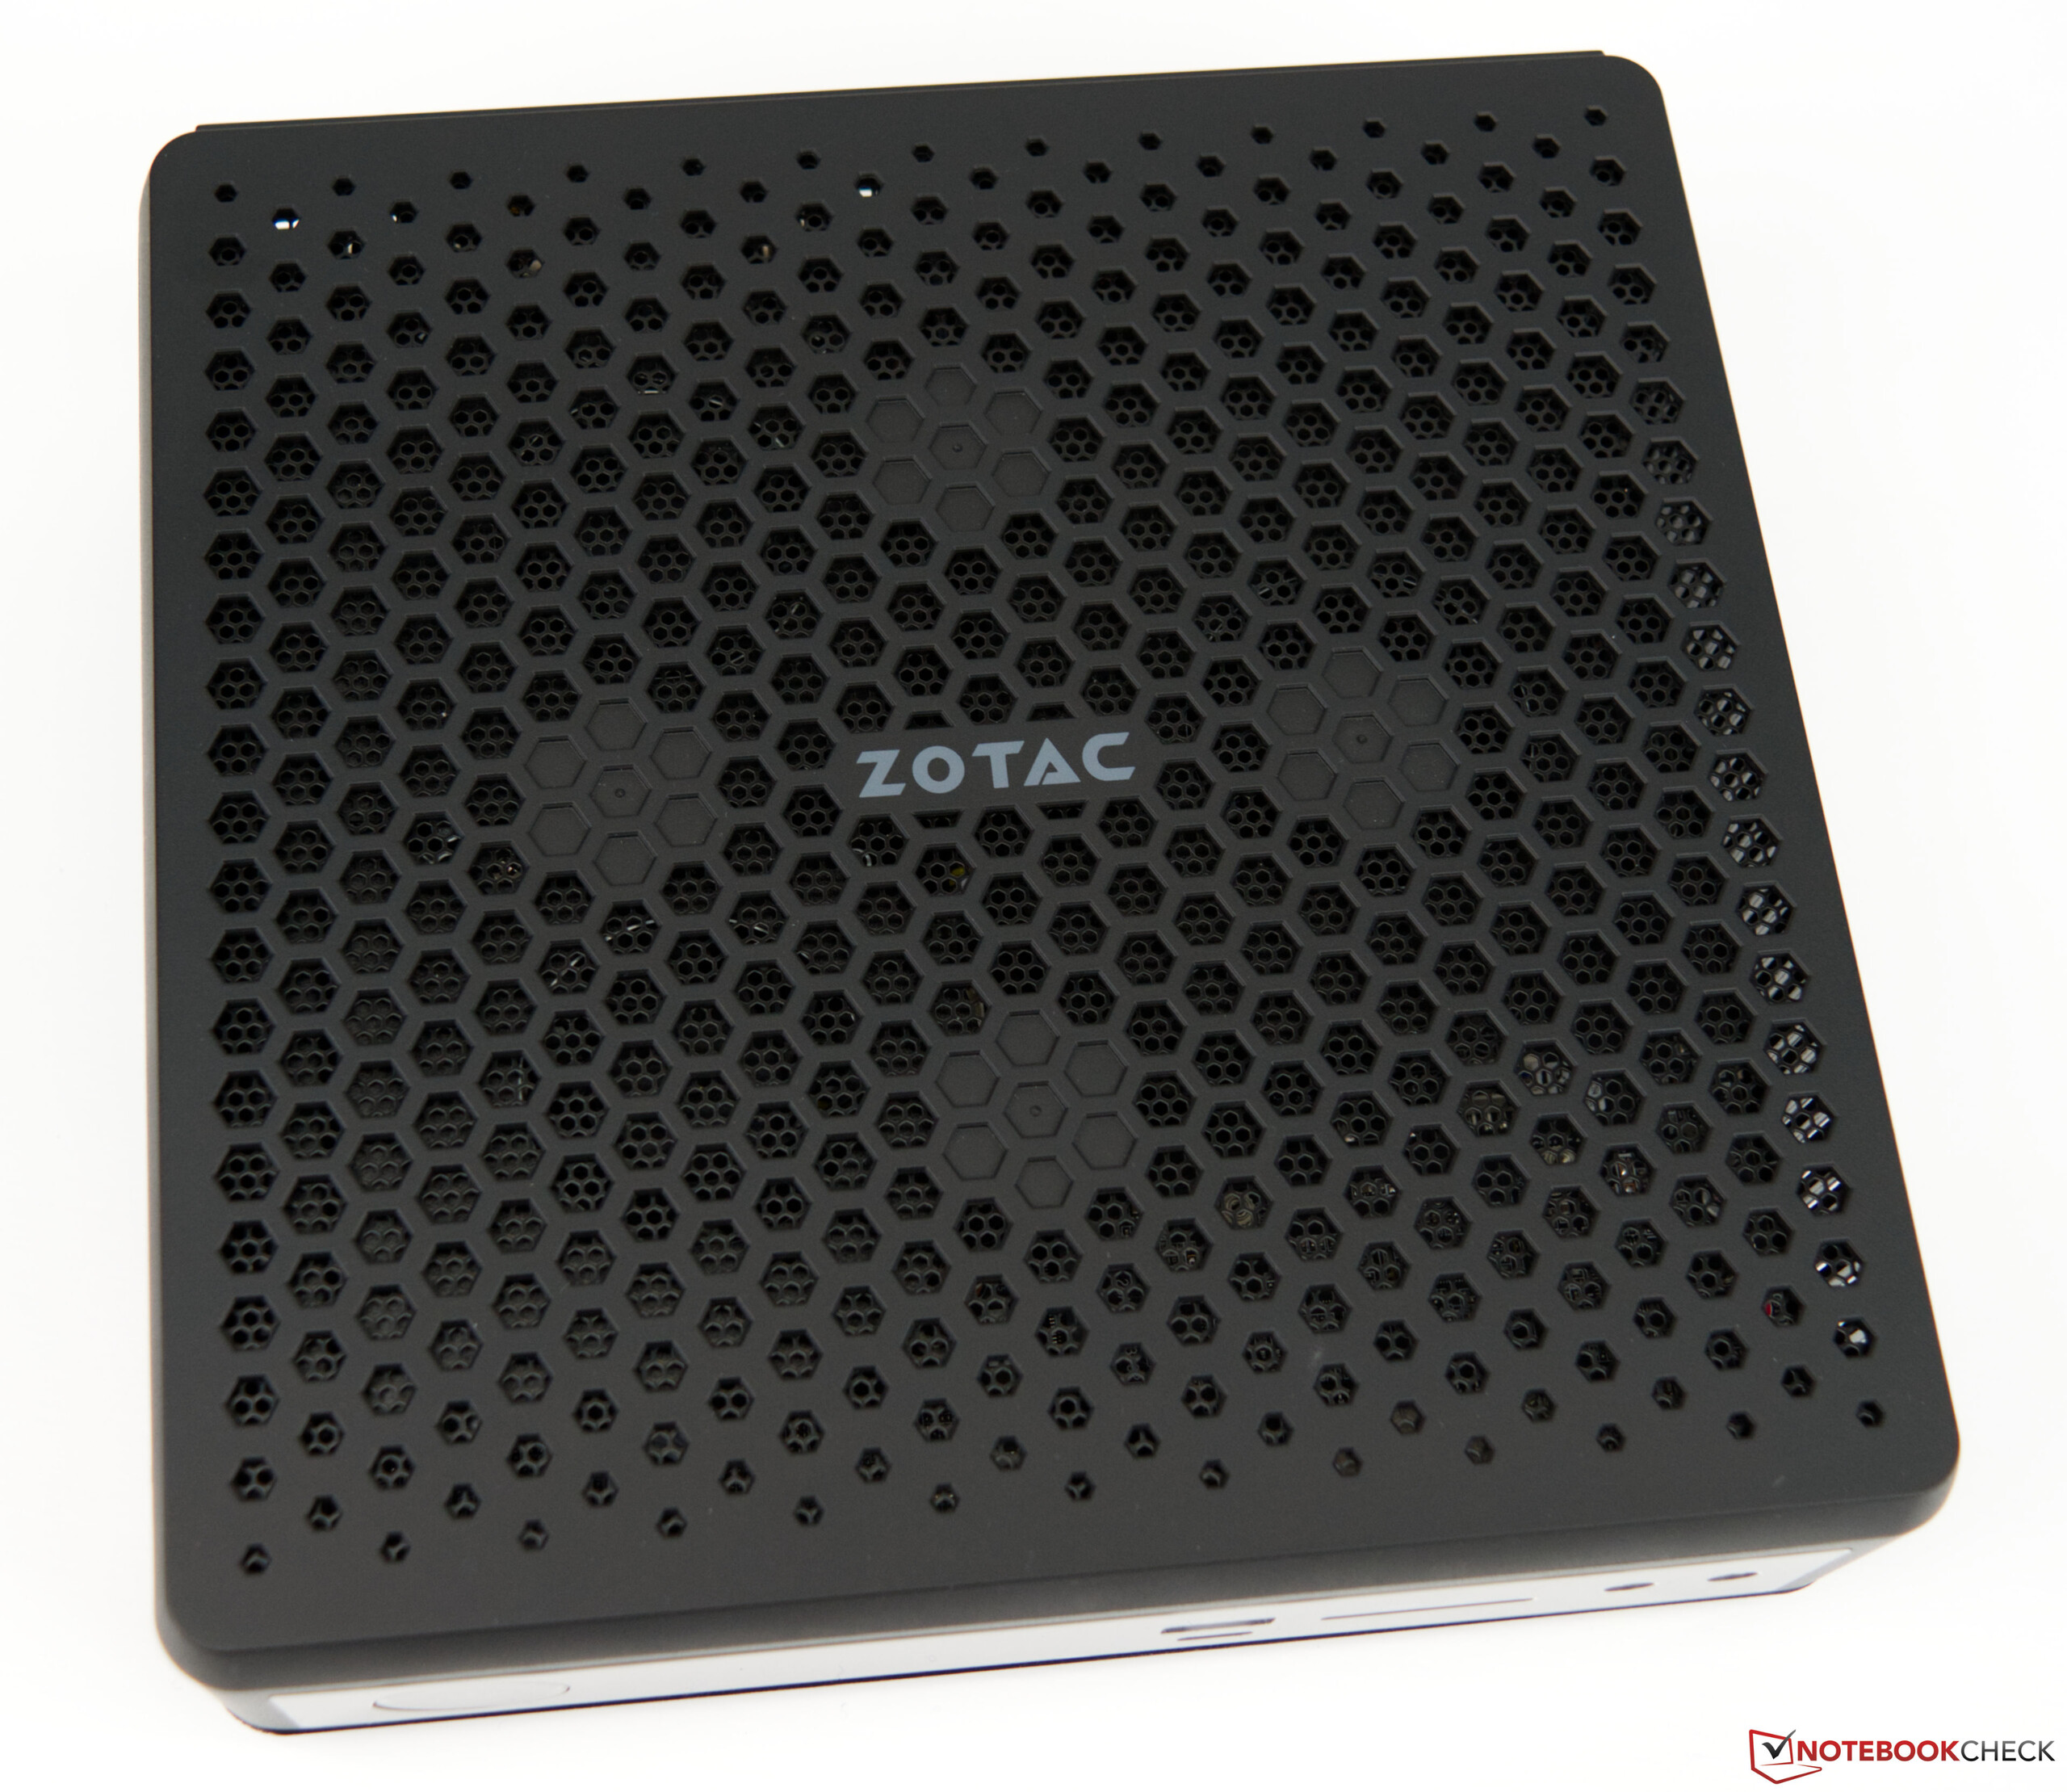
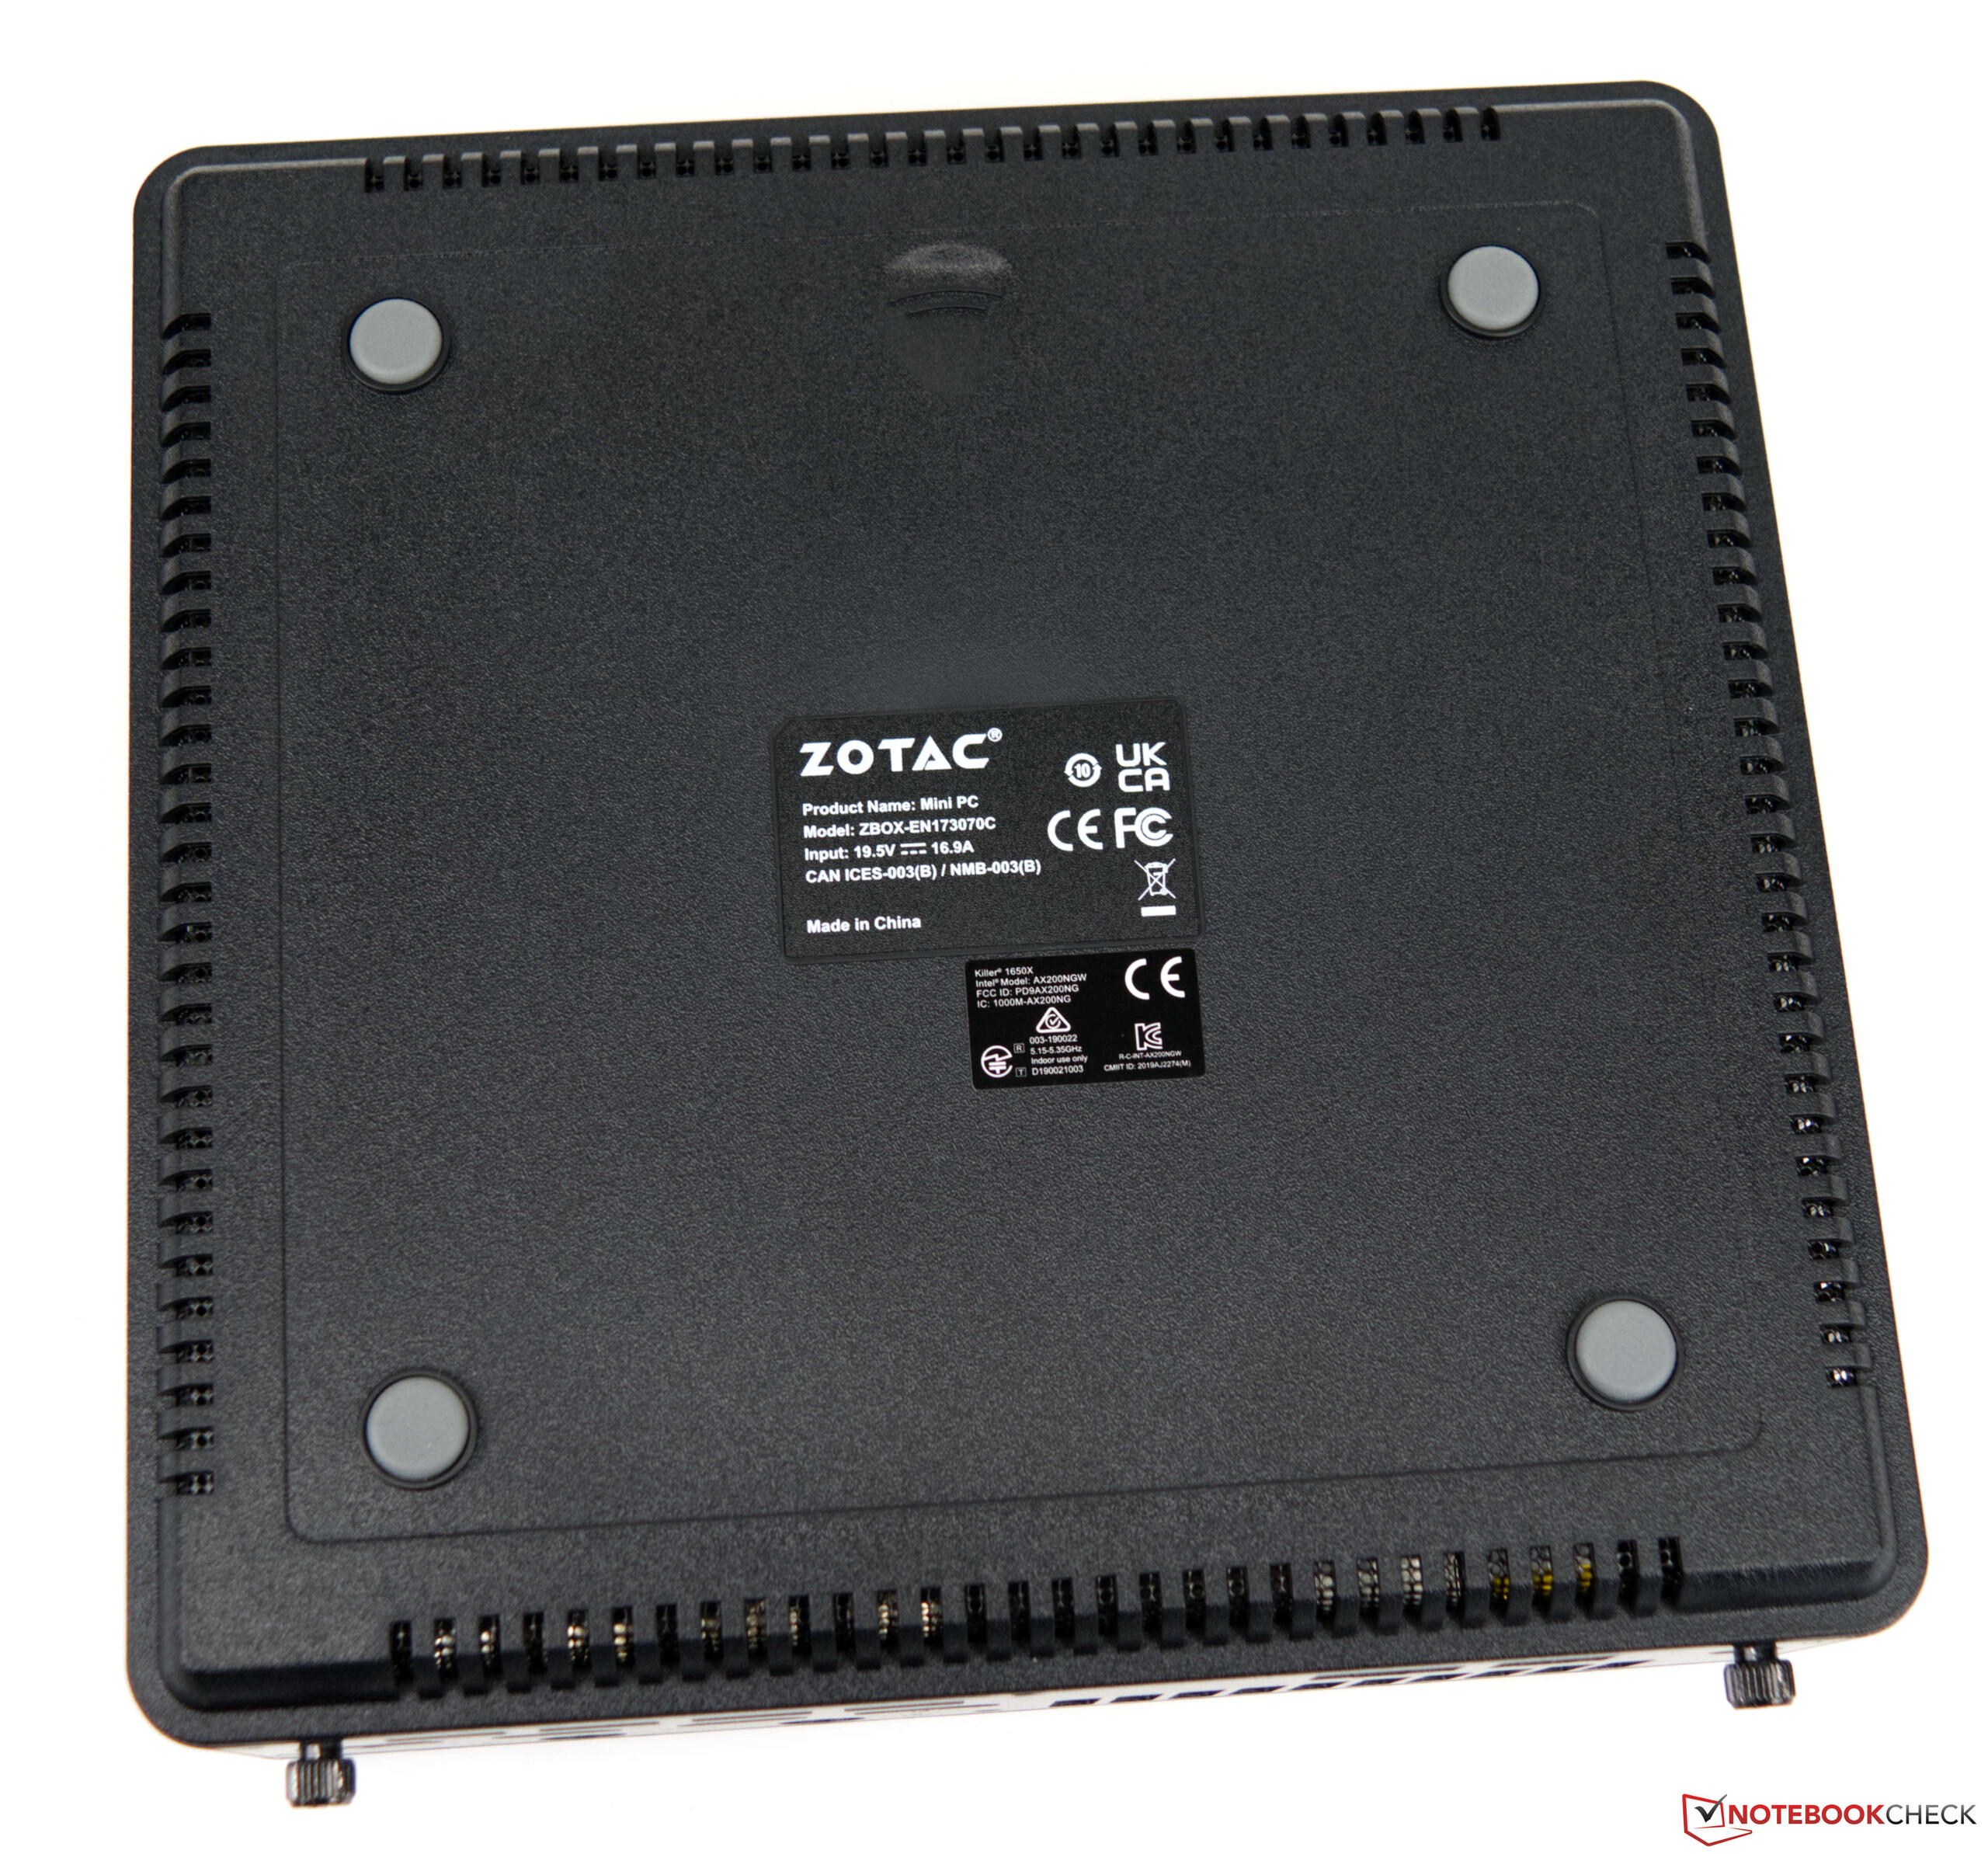
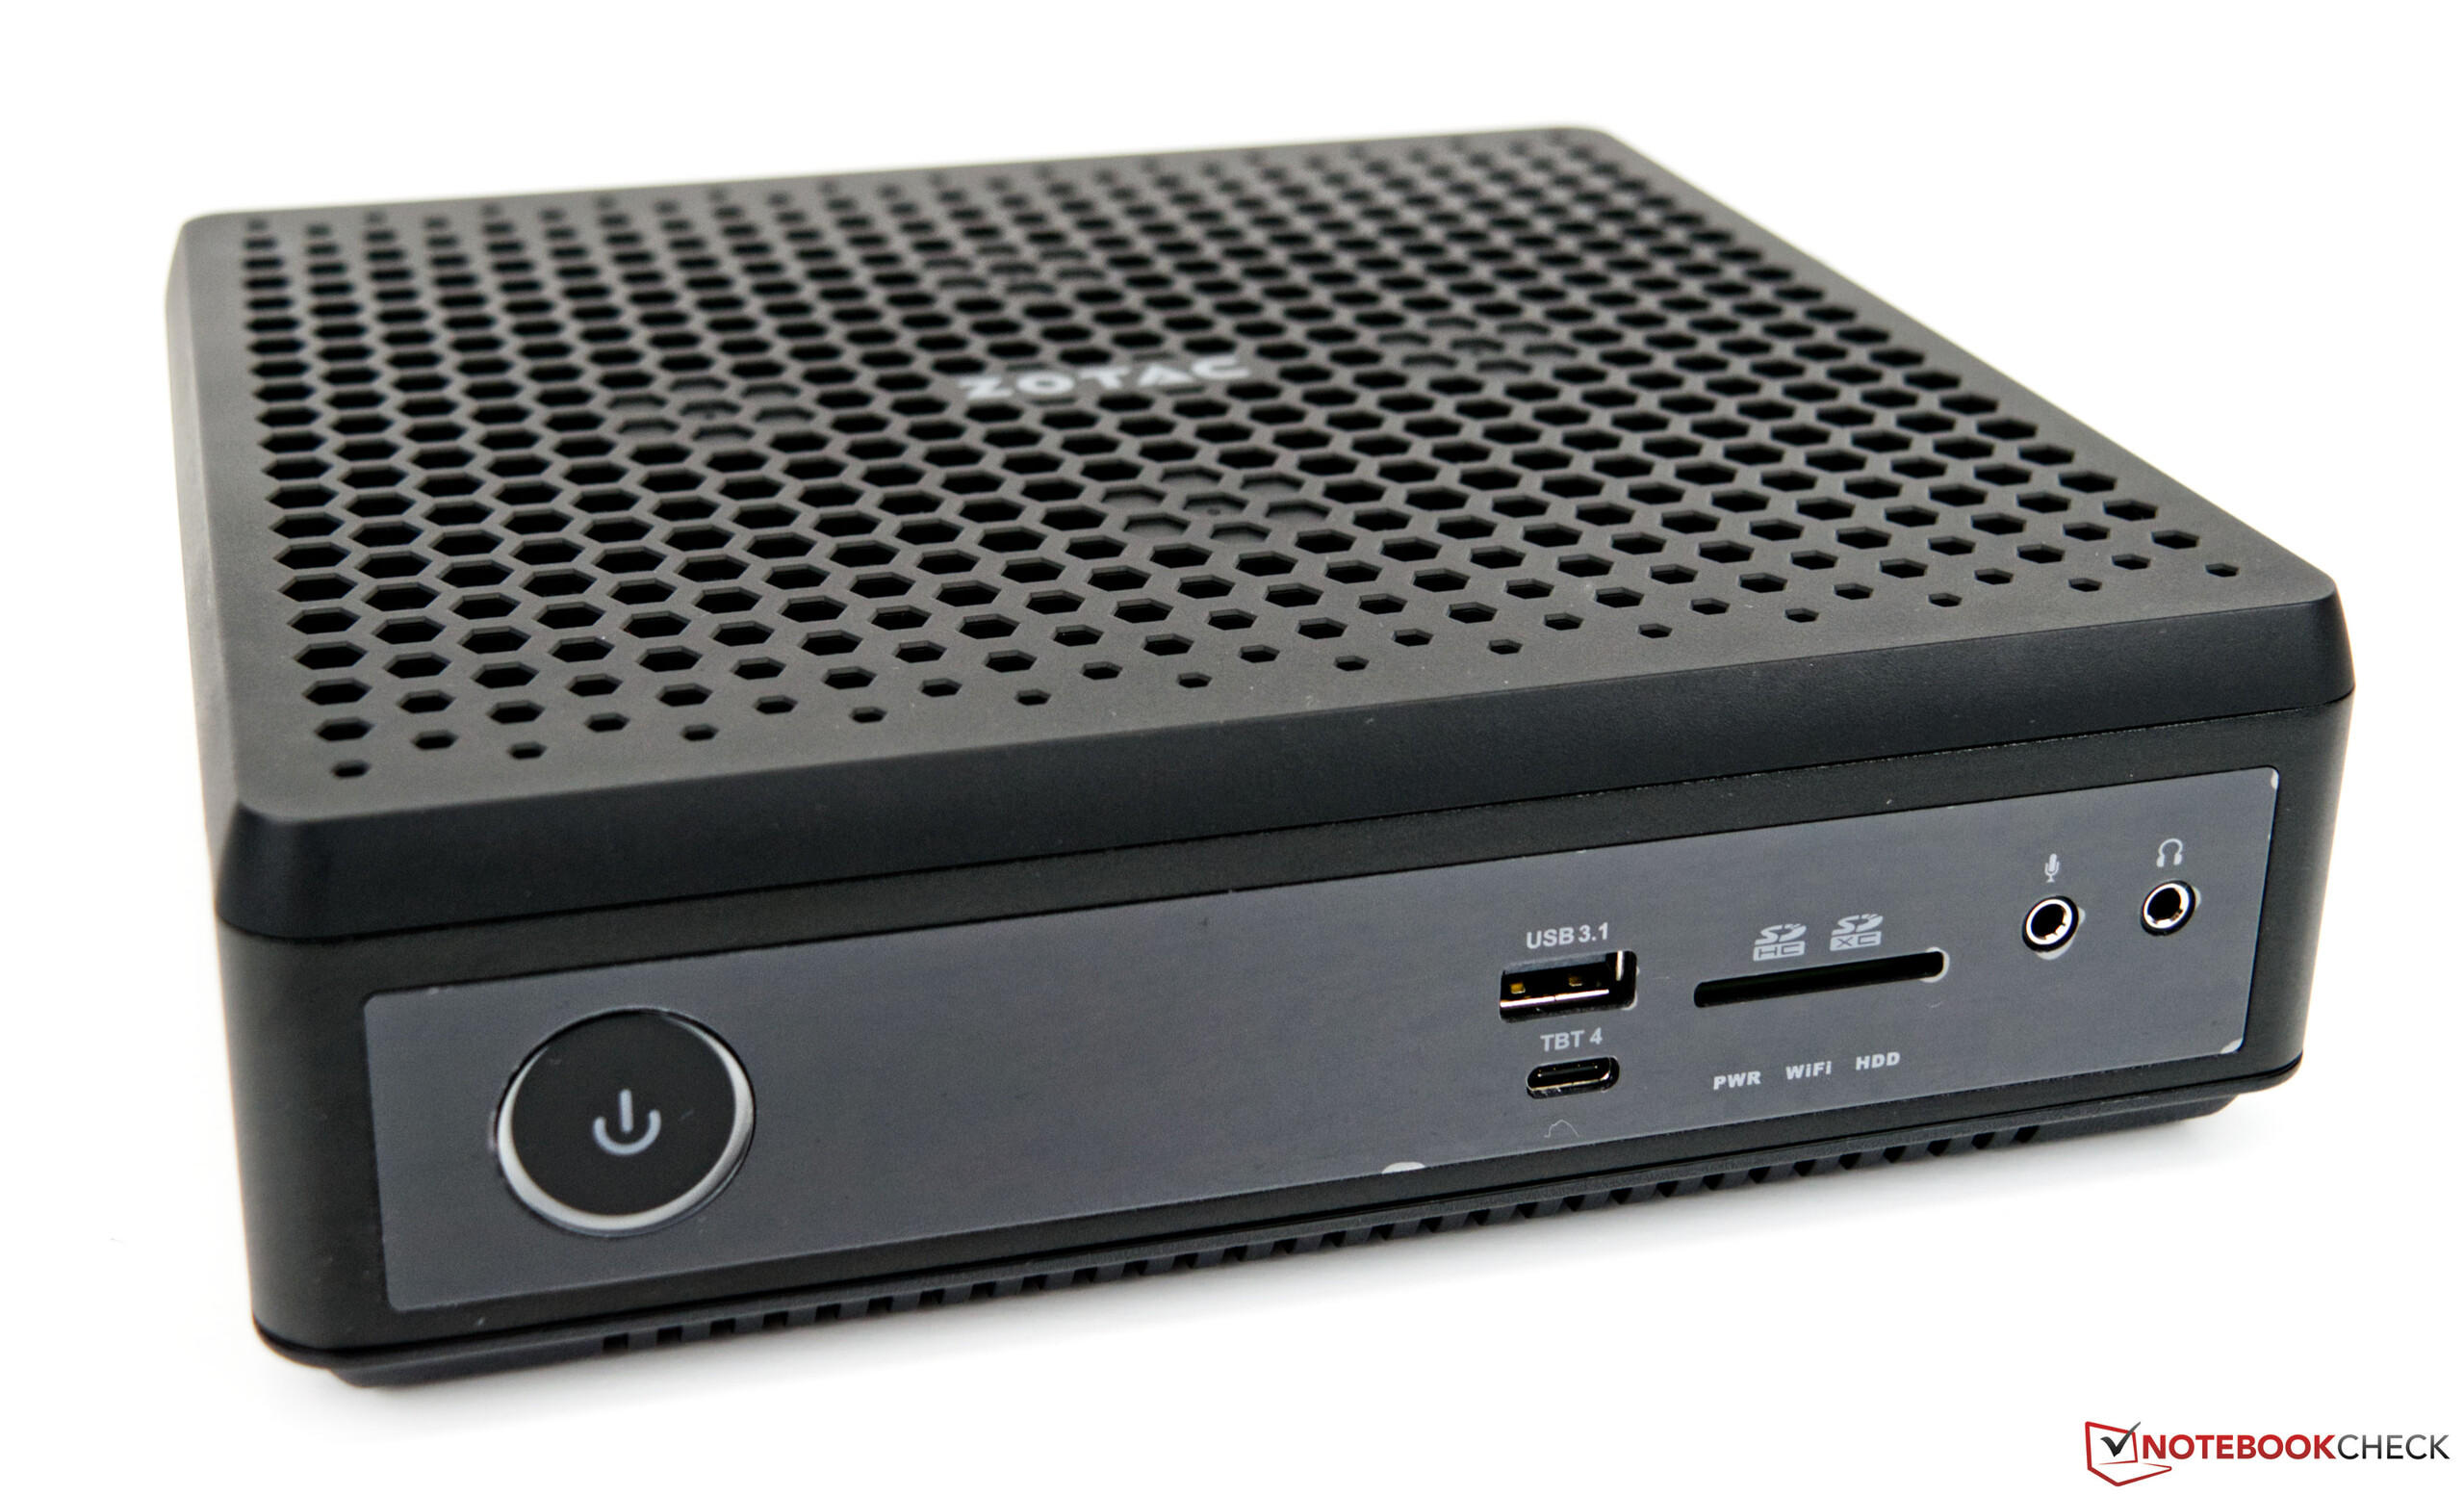
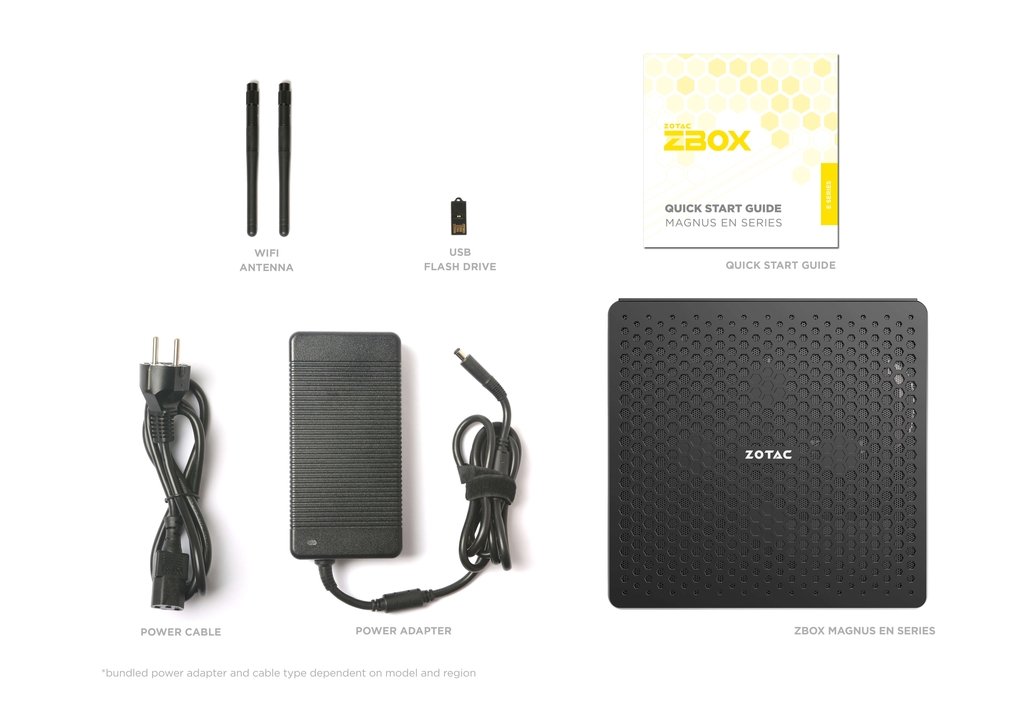
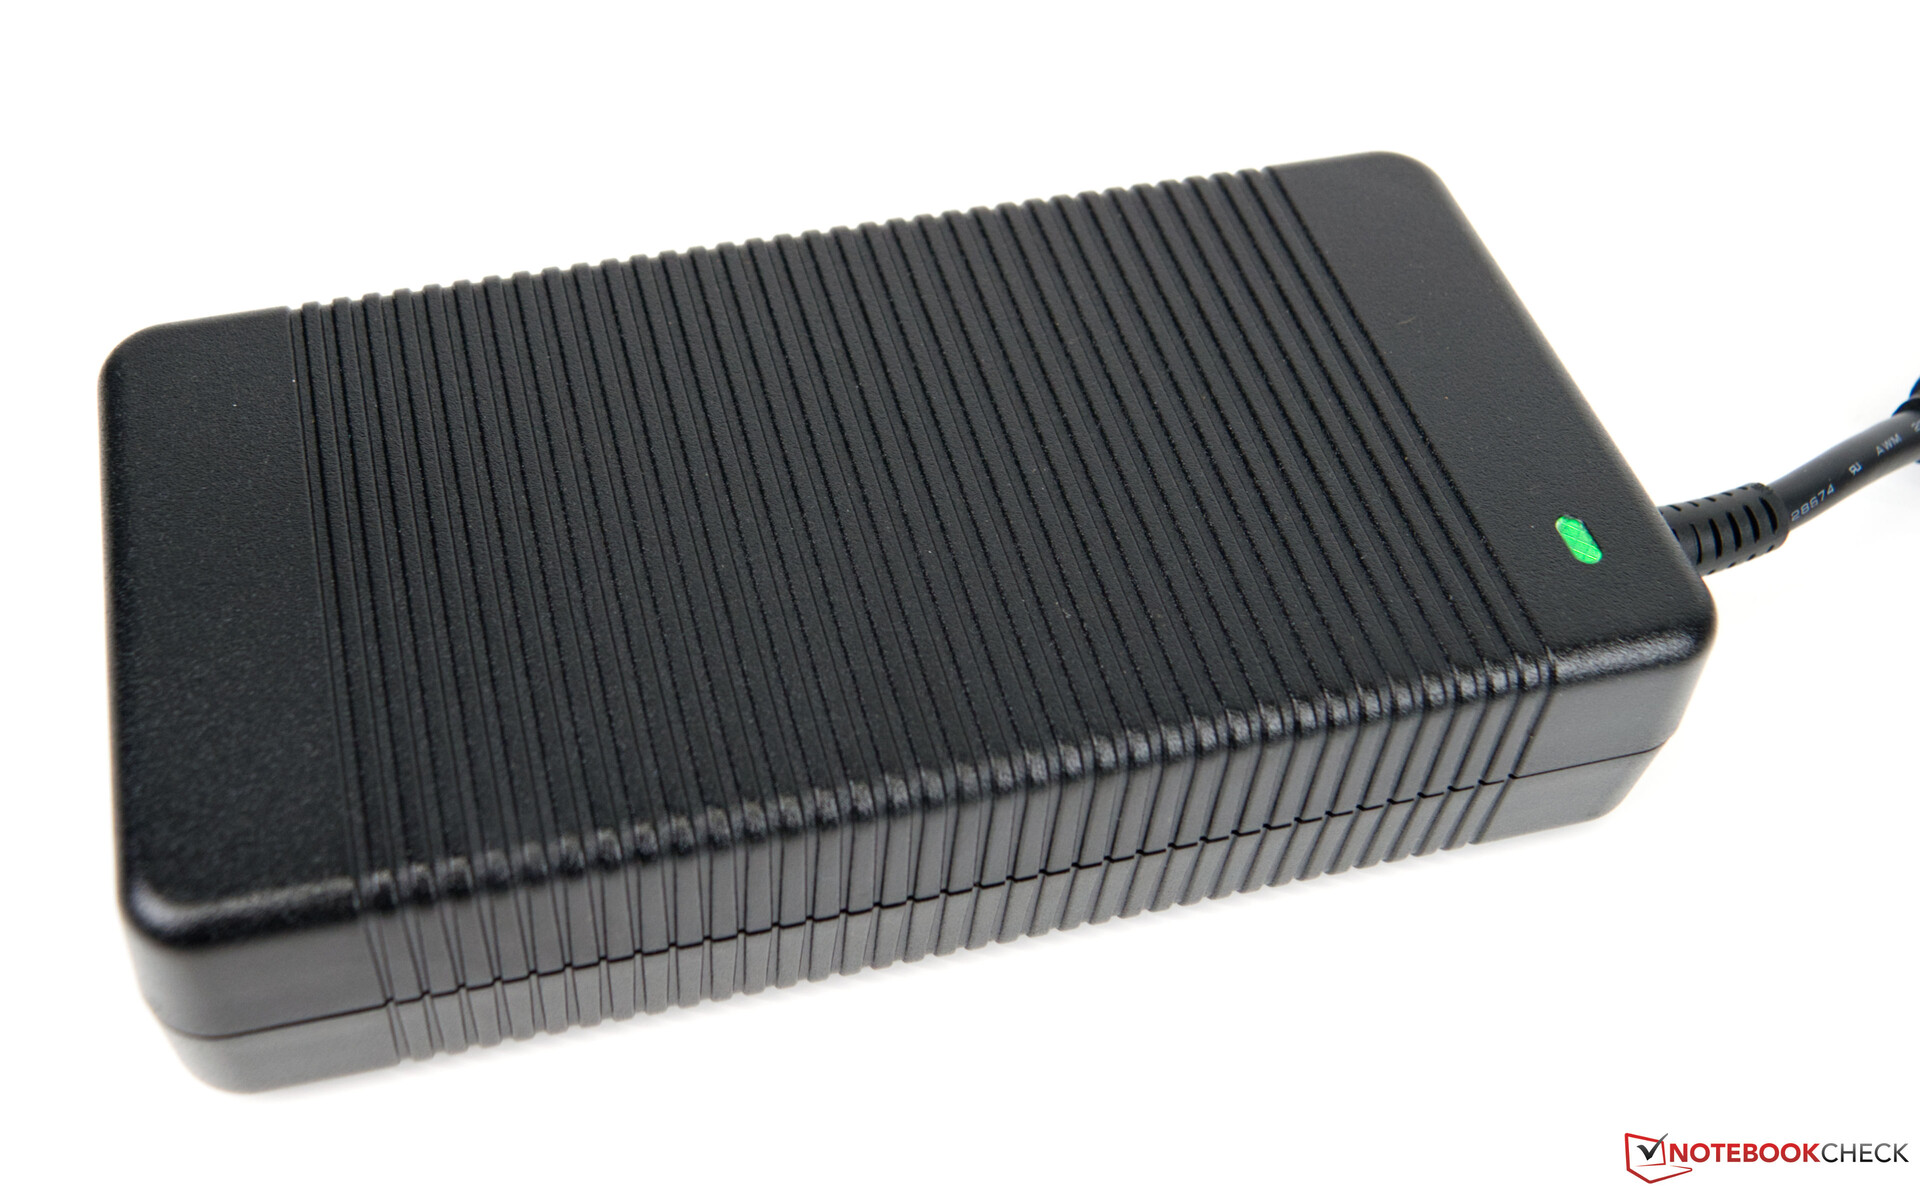
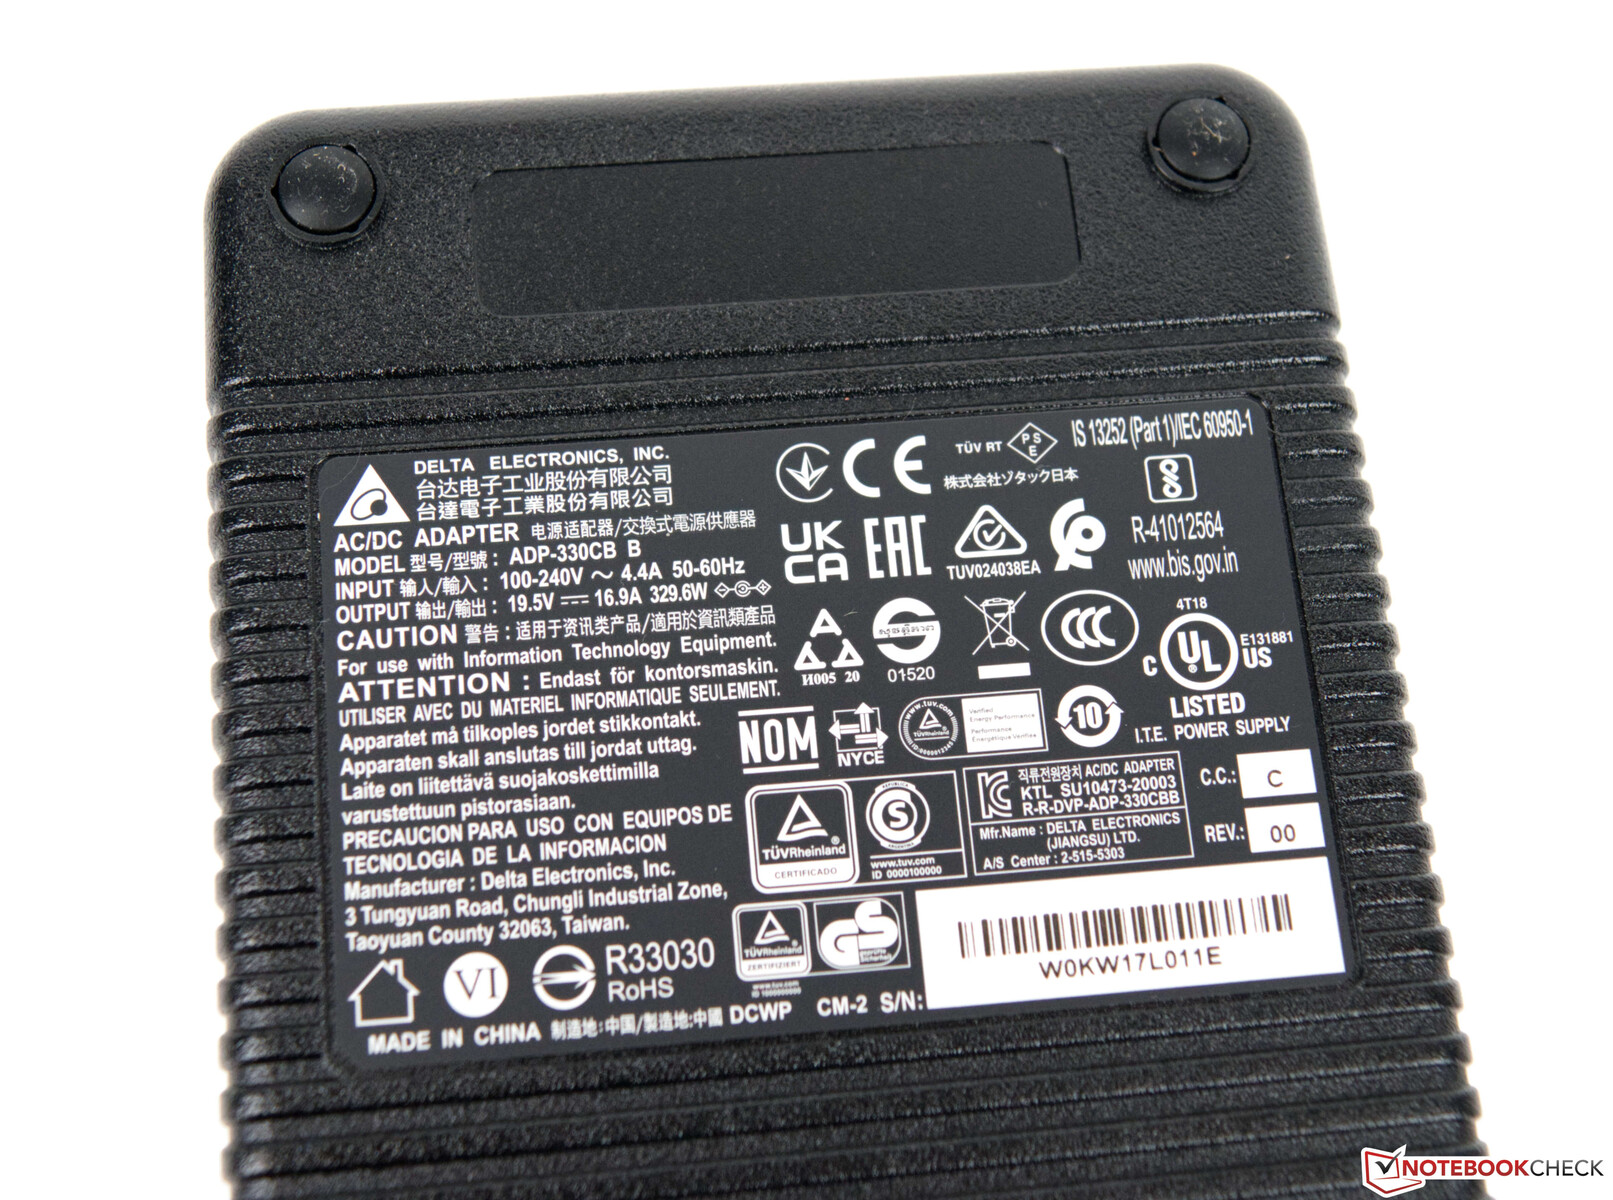
Visivamente, lo Zotac ZBOX Magnus EN173070C si distingue chiaramente. Lo Zotac ZBOX Magnus EN72080V era già basato sul case compatto, che è cambiato solo in minima parte nella parte anteriore. Si può anche fare a meno dell'RGB, come dimostra Zotac. Chi ama un design semplice e compatto sarà soddisfatto. Il case è realizzato in plastica e ci ha lasciato un'ottima impressione aptica. Insieme alla RAM aggiunta e ai due SSD M.2, il sistema pesa poco meno di 1,8 chilogrammi (~4 lb). A ciò si aggiunge il pesante alimentatore da 330 Watt, che pesa 1,3 chilogrammi (~2,9 lb). In termini di dimensioni, l'alimentatore è grande circa la metà del Magnus EN173070C stesso, che non ha bisogno di molto spazio con un ingombro di 21 x 20,3 cm (~8,3 x 8 in). Con un'altezza di soli 6,22 cm, il dispositivo è anche relativamente sottile.
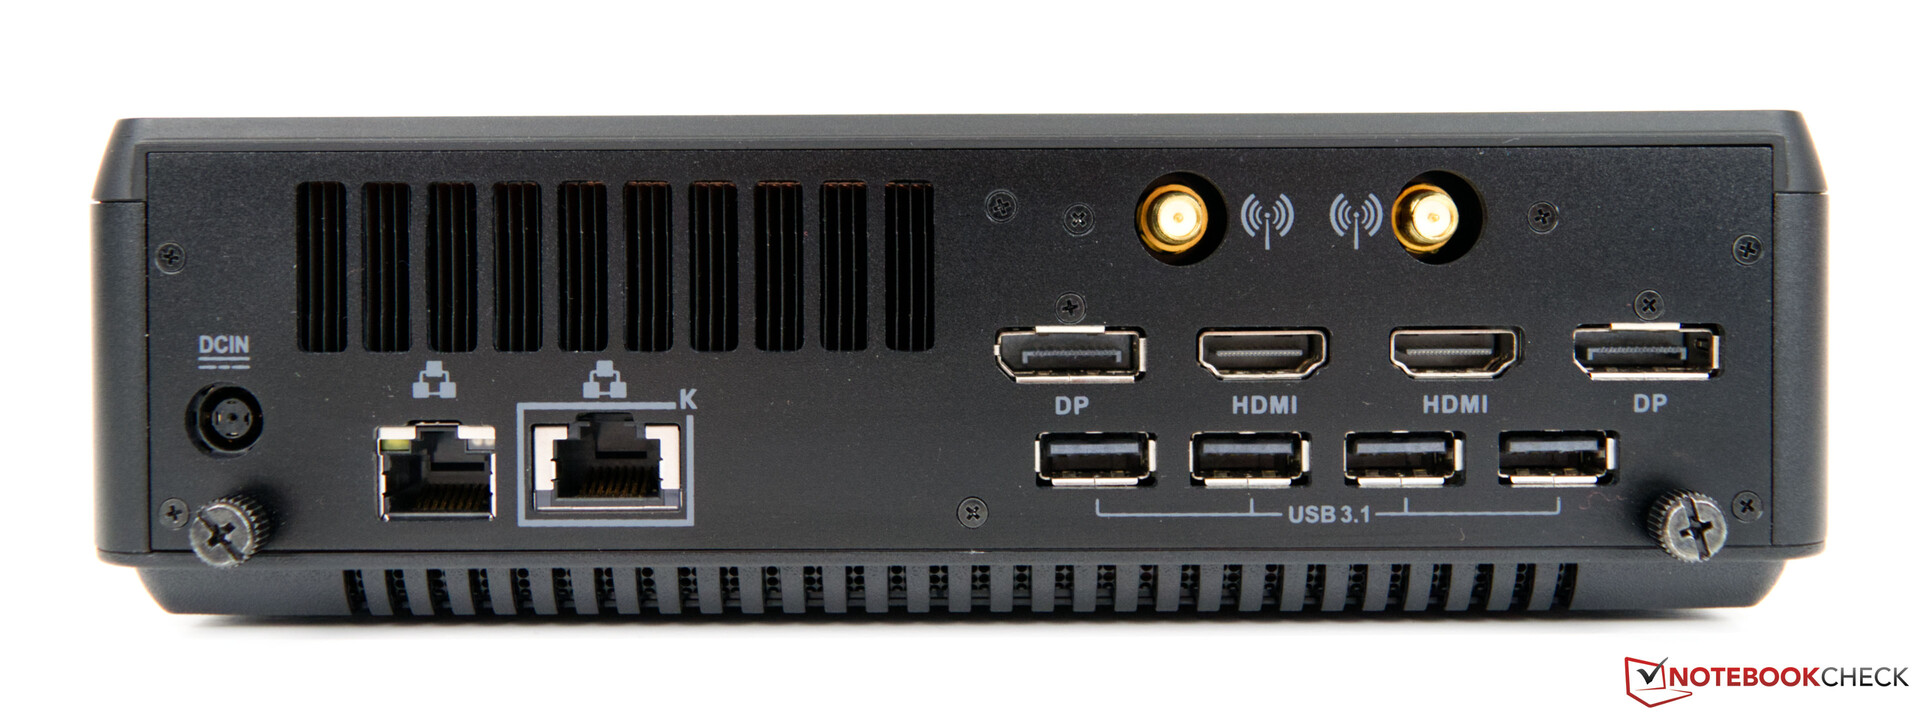
Apparecchiature di connessione
Lo Zotac ZBOX Magnus EN173070C offre un'ampia varietà di connessioni esterne, ma questo dovrebbe essere previsto anche da un PC desktop. Ci sono in totale cinque porte USB Type-A e una singola connessione Type-C, che supporta Thunderbolt 4. Quest'ultima, tuttavia, ha il limite di essere destinata solo ai dati. Tuttavia, quest'ultima ha una limitazione: è destinata solo ai dati. Inoltre, è possibile gestire fino a quattro display esterni contemporaneamente. Per collegarli, sono disponibili due porte DisplayPort e due HDMI. Inoltre, gli utenti non dovranno più fare a meno di un lettore di schede SD.
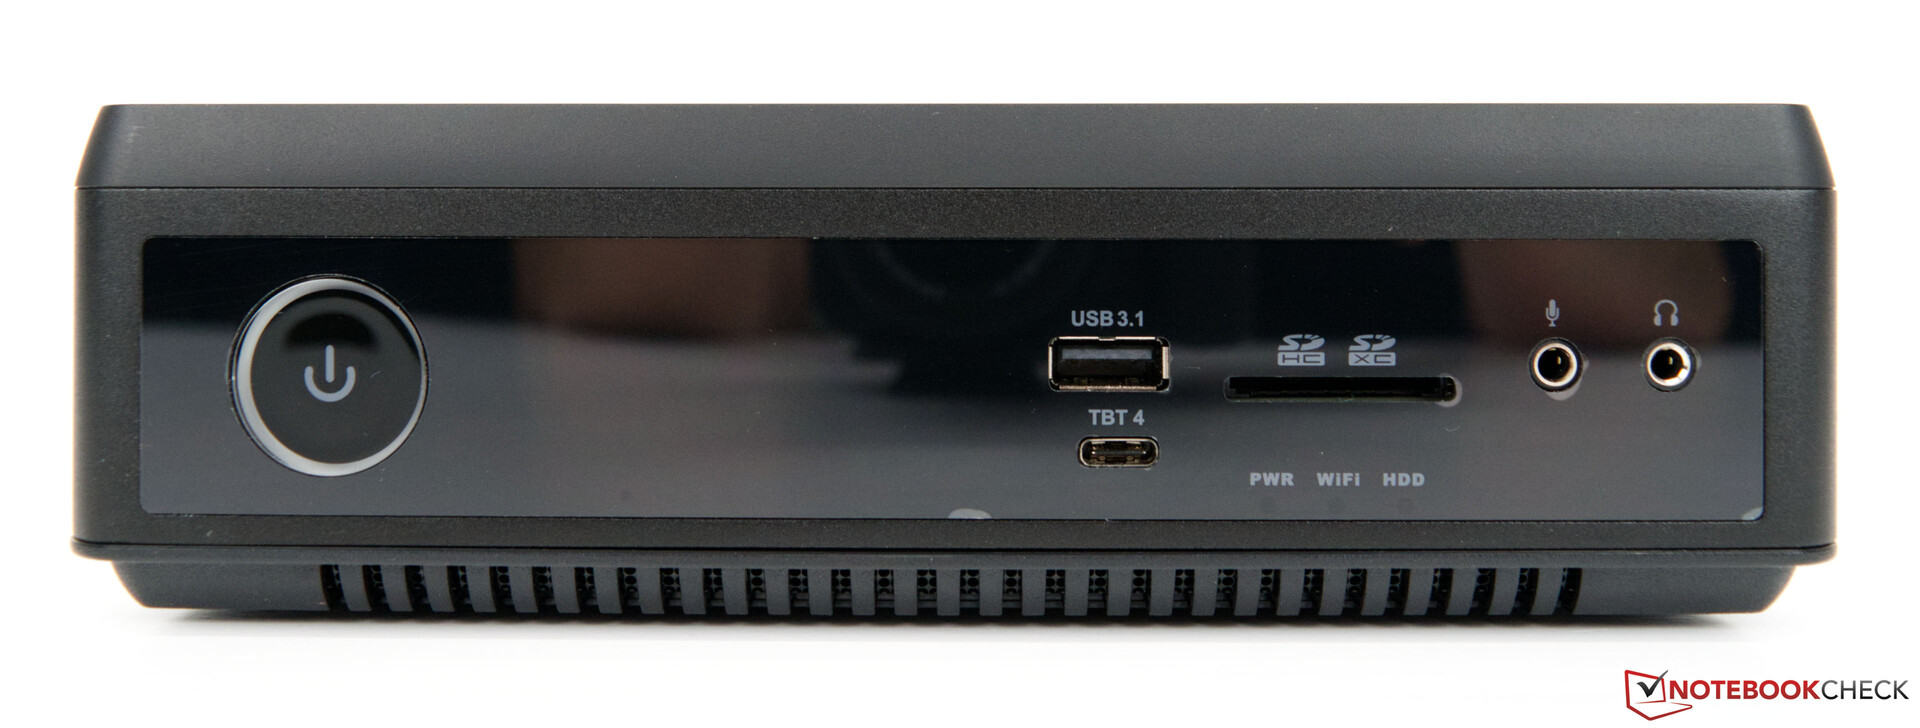
Lettore di schede SD
Il lettore di schede SD all'interno offre velocità USB-3 e non è in grado di sfruttare appieno le prestazioni della nostra scheda di prova (AV Pro SD microSD 128 GB V60). Al contrario, il Intel Dragon Canyon NUCmostra cosa è possibile fare con il supporto UHS II.
| SD Card Reader | |
| average JPG Copy Test (av. of 3 runs) | |
| Intel Dragon Canyon NUC | |
| Zotac ZBOX Magnus EN173070C (AV Pro SD microSD 128 GB V60) | |
| maximum AS SSD Seq Read Test (1GB) | |
| Intel Dragon Canyon NUC | |
| Zotac ZBOX Magnus EN173070C (AV Pro SD microSD 128 GB V60) | |
Comunicazione
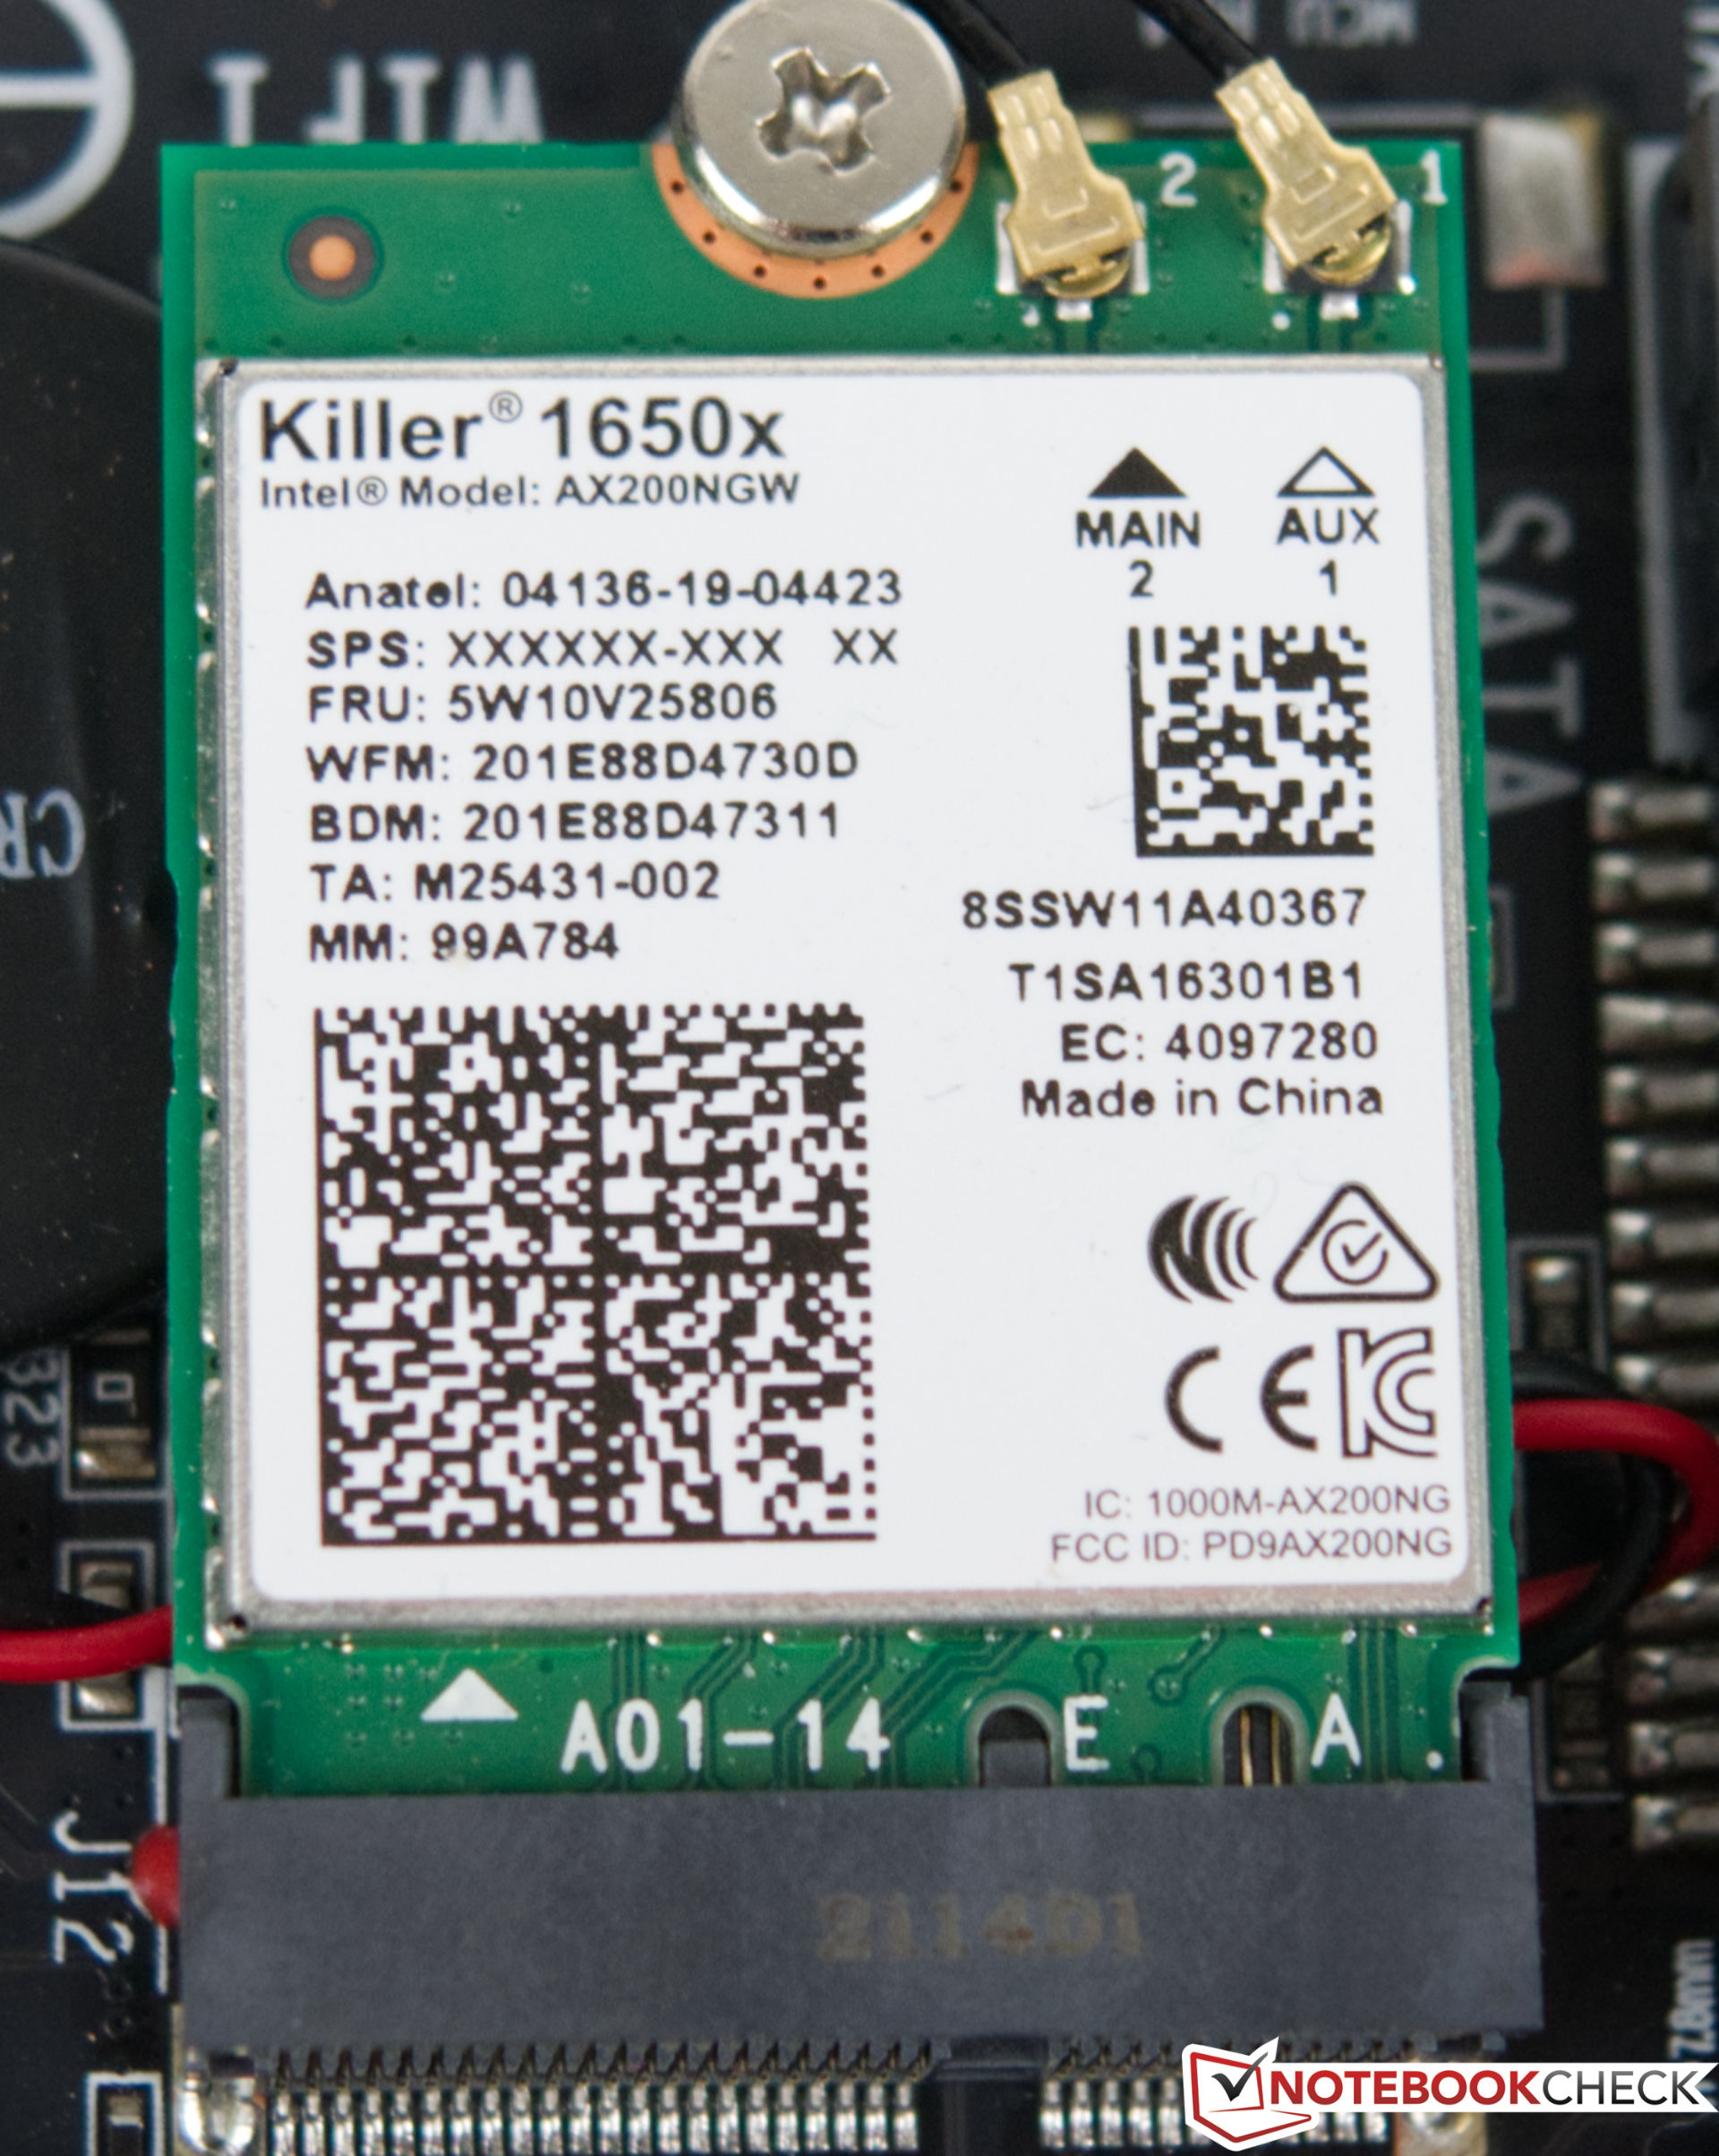
Zotac utilizza un modulo WLAN di Killer nel Magnus EN173070C. L'AX1650x offre Wi-Fi 6 e fa un ottimo lavoro nel nostro test. Le prestazioni rimangono stabili anche per un periodo di tempo più lungo e non ci sono variazioni significative. Tuttavia, nel confronto diretto, il Intel Dragon Canyon NUCcon l'Intel Wi-Fi 6E AX211 è in grado di fornire valori migliori. Abbiamo eseguito il test in condizioni ottimali utilizzando il router gaming WLAN Asus GT-AXE1000WiFi-6E.
Prestazioni
Processore
Zotac ZBOX Magnus EN173070C utilizza un processoreIntel Core i7-11800HcPU. Questo processore è pensato per i computer portatili e offre 8 core e 16 thread a una velocità di clock massima di 4,6 GHz. Il SoC, che appartiene alla serie Tiger Lake, fa un buon lavoro in un sistema compatto. Zotac definisce il valore PL1 a 55 watt e il sistema è in grado di consumare fino a 69 watt per un breve periodo di tempo. Anche se le prestazioni non si riflettono realmente nei risultati, il SoC della nostra unità di test funziona al livello di un Intel Core i9-10900Kdurante il carico a singolo core, e a volte è persino in grado di superarlo. D'altra parte, l'Intel Core i7-11800H è superato dall'AMD Ryzen 9 5900HX.AMD Ryzen 9 5900HXin molti test. Ci aspettiamo un salto di prestazioni notevole solo con i SoC Alder Lake P di Intel. Forse Zotac sta già pianificando un piccolo aggiornamento nel prossimo futuro, che dovrebbe migliorare le prestazioni in tutte le aree.
* ... Meglio usare valori piccoli
AIDA64: FP32 Ray-Trace | FPU Julia | CPU SHA3 | CPU Queen | FPU SinJulia | FPU Mandel | CPU AES | CPU ZLib | FP64 Ray-Trace | CPU PhotoWorxx
| Performance rating | |
| Media della classe Desktop | |
| Minisforum EliteMini HX90 | |
| AMD Ryzen 7 5800X | |
| Zotac ZBOX Magnus EN173070C | |
| Media Intel Core i7-11800H | |
| Intel Core i5-12600K | |
| Intel Ghost Canyon NUC (RTX 2070) -1! | |
| AIDA64 / FP32 Ray-Trace | |
| Media della classe Desktop (12248 - 84577, n=21, ultimi 2 anni) | |
| AMD Ryzen 7 5800X | |
| Minisforum EliteMini HX90 | |
| Media Intel Core i7-11800H (8772 - 15961, n=20) | |
| Zotac ZBOX Magnus EN173070C | |
| Intel Ghost Canyon NUC (RTX 2070) | |
| Intel Core i5-12600K | |
| AIDA64 / FPU Julia | |
| Media della classe Desktop (65152 - 246125, n=21, ultimi 2 anni) | |
| Minisforum EliteMini HX90 | |
| AMD Ryzen 7 5800X | |
| Media Intel Core i7-11800H (39404 - 65636, n=20) | |
| Zotac ZBOX Magnus EN173070C | |
| Intel Ghost Canyon NUC (RTX 2070) | |
| Intel Core i5-12600K | |
| AIDA64 / CPU SHA3 | |
| Media della classe Desktop (2982 - 10804, n=21, ultimi 2 anni) | |
| Media Intel Core i7-11800H (2599 - 4439, n=20) | |
| Zotac ZBOX Magnus EN173070C | |
| Minisforum EliteMini HX90 | |
| Intel Core i5-12600K | |
| Intel Ghost Canyon NUC (RTX 2070) | |
| AMD Ryzen 7 5800X | |
| AIDA64 / CPU Queen | |
| Media della classe Desktop (76512 - 187912, n=18, ultimi 2 anni) | |
| AMD Ryzen 7 5800X | |
| Minisforum EliteMini HX90 | |
| Media Intel Core i7-11800H (85233 - 91941, n=20) | |
| Zotac ZBOX Magnus EN173070C | |
| Intel Core i5-12600K | |
| AIDA64 / FPU SinJulia | |
| Media della classe Desktop (6443 - 35251, n=21, ultimi 2 anni) | |
| AMD Ryzen 7 5800X | |
| Minisforum EliteMini HX90 | |
| Intel Core i5-12600K | |
| Zotac ZBOX Magnus EN173070C | |
| Intel Ghost Canyon NUC (RTX 2070) | |
| Media Intel Core i7-11800H (6420 - 9792, n=20) | |
| AIDA64 / FPU Mandel | |
| Media della classe Desktop (31697 - 129745, n=21, ultimi 2 anni) | |
| Minisforum EliteMini HX90 | |
| AMD Ryzen 7 5800X | |
| Media Intel Core i7-11800H (23365 - 39464, n=20) | |
| Zotac ZBOX Magnus EN173070C | |
| Intel Ghost Canyon NUC (RTX 2070) | |
| Intel Core i5-12600K | |
| AIDA64 / CPU AES | |
| Media della classe Desktop (57777 - 513073, n=21, ultimi 2 anni) | |
| Minisforum EliteMini HX90 | |
| Zotac ZBOX Magnus EN173070C | |
| Media Intel Core i7-11800H (74617 - 149388, n=20) | |
| AMD Ryzen 7 5800X | |
| Intel Core i5-12600K | |
| Intel Ghost Canyon NUC (RTX 2070) | |
| AIDA64 / CPU ZLib | |
| Media della classe Desktop (887 - 2674, n=21, ultimi 2 anni) | |
| Intel Core i5-12600K | |
| AMD Ryzen 7 5800X | |
| Minisforum EliteMini HX90 | |
| Zotac ZBOX Magnus EN173070C | |
| Intel Ghost Canyon NUC (RTX 2070) | |
| Media Intel Core i7-11800H (461 - 830, n=43) | |
| AIDA64 / FP64 Ray-Trace | |
| Media della classe Desktop (6471 - 44013, n=21, ultimi 2 anni) | |
| AMD Ryzen 7 5800X | |
| Minisforum EliteMini HX90 | |
| Media Intel Core i7-11800H (4545 - 8717, n=21) | |
| Zotac ZBOX Magnus EN173070C | |
| Intel Ghost Canyon NUC (RTX 2070) | |
| Intel Core i5-12600K | |
| AIDA64 / CPU PhotoWorxx | |
| Intel Core i5-12600K | |
| Media della classe Desktop (38071 - 63949, n=21, ultimi 2 anni) | |
| AMD Ryzen 7 5800X | |
| Zotac ZBOX Magnus EN173070C | |
| Intel Ghost Canyon NUC (RTX 2070) | |
| Media Intel Core i7-11800H (11898 - 26757, n=21) | |
| Minisforum EliteMini HX90 | |
Zotac ZBOX Magnus durante il Multi Loop di Cinebench R15
La struttura compatta richiede un sistema di raffreddamento ben progettato ed efficace. Zotac offre esattamente questo, dal momento che non abbiamo riscontrato una forte perdita di prestazioni a carico costante durante il ciclo di carico ripetuto di Cinebench R15.
Soluzione per lo storage e le prestazioni delle applicazioni
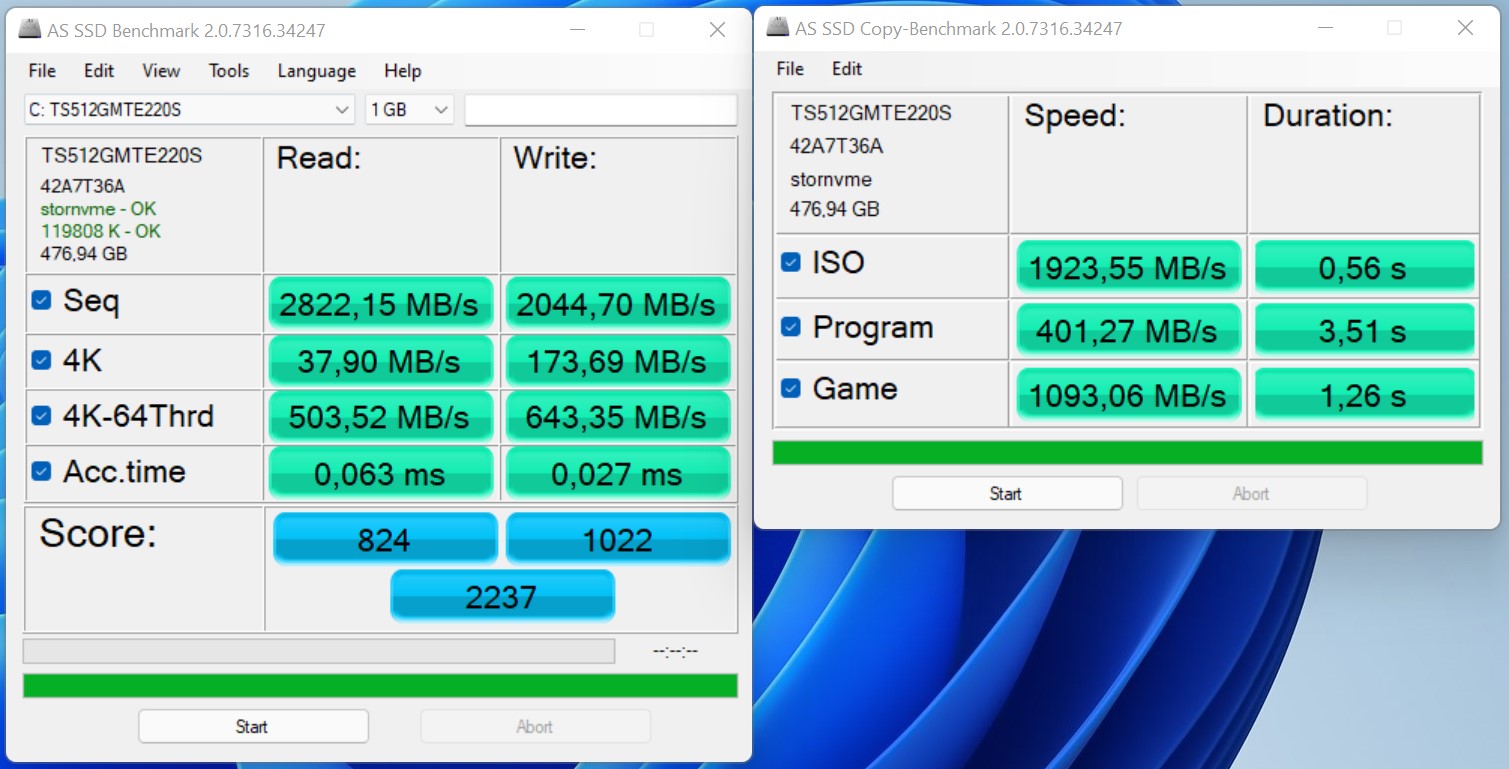
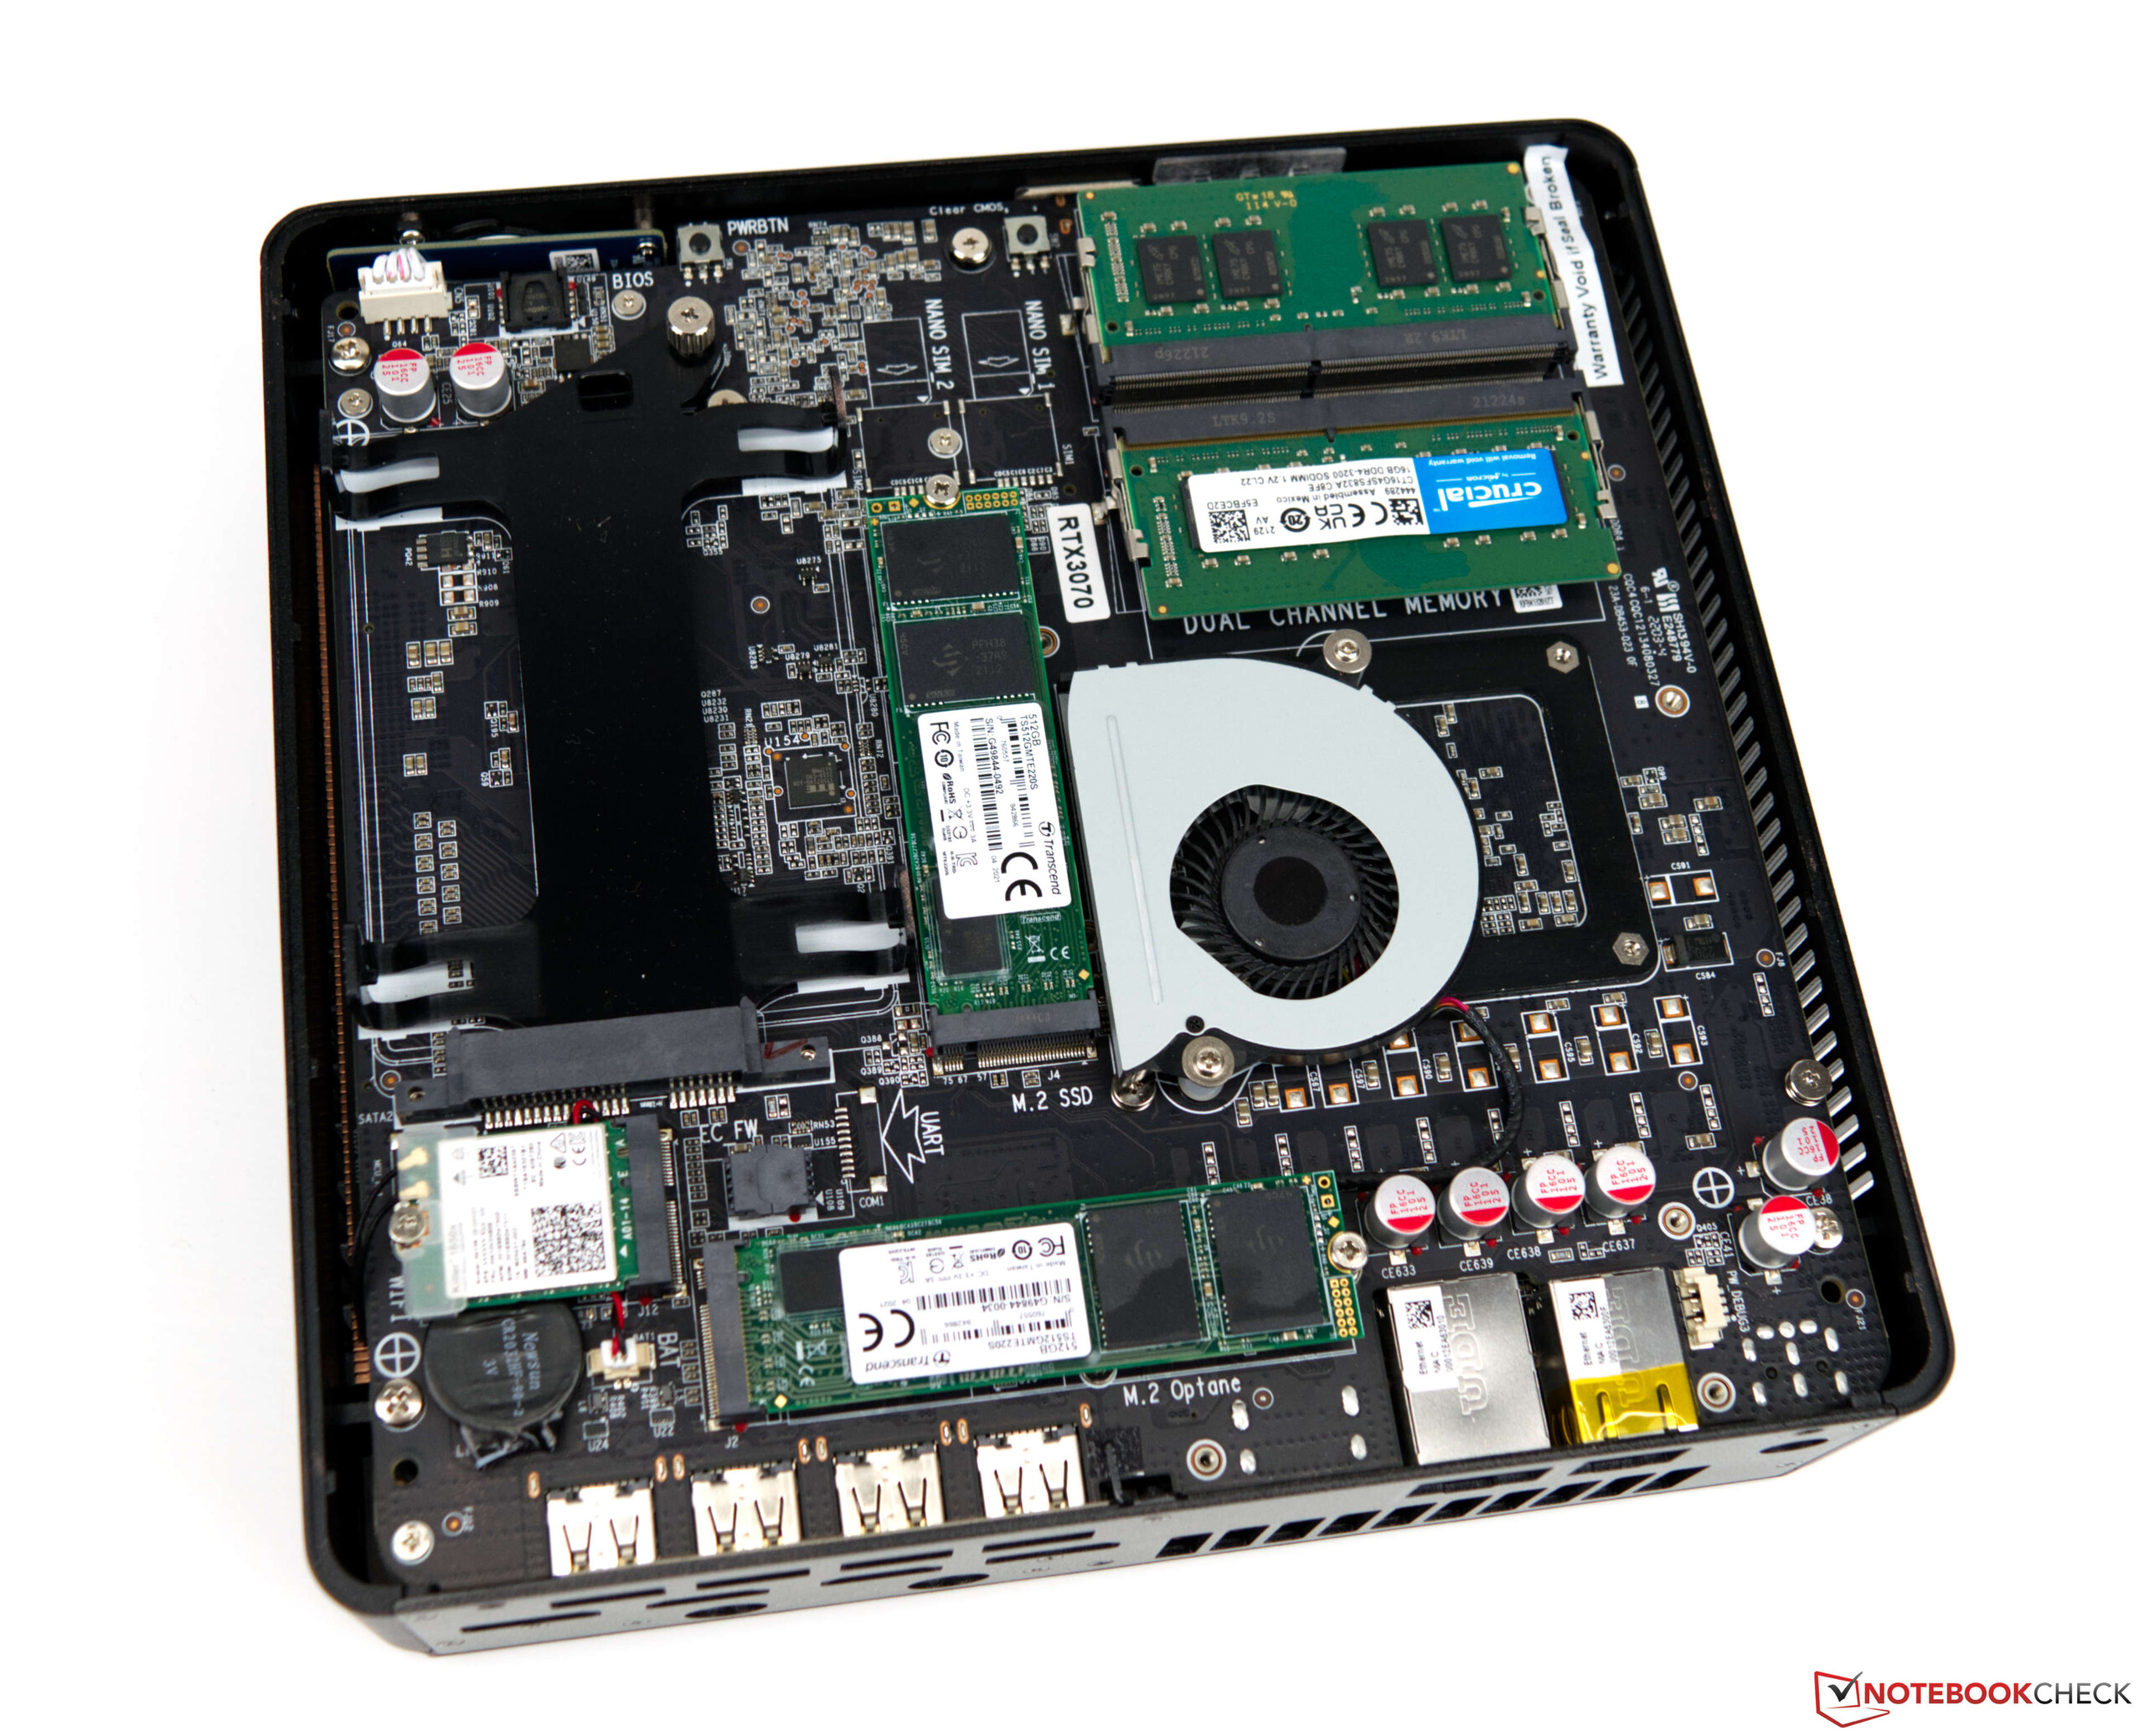
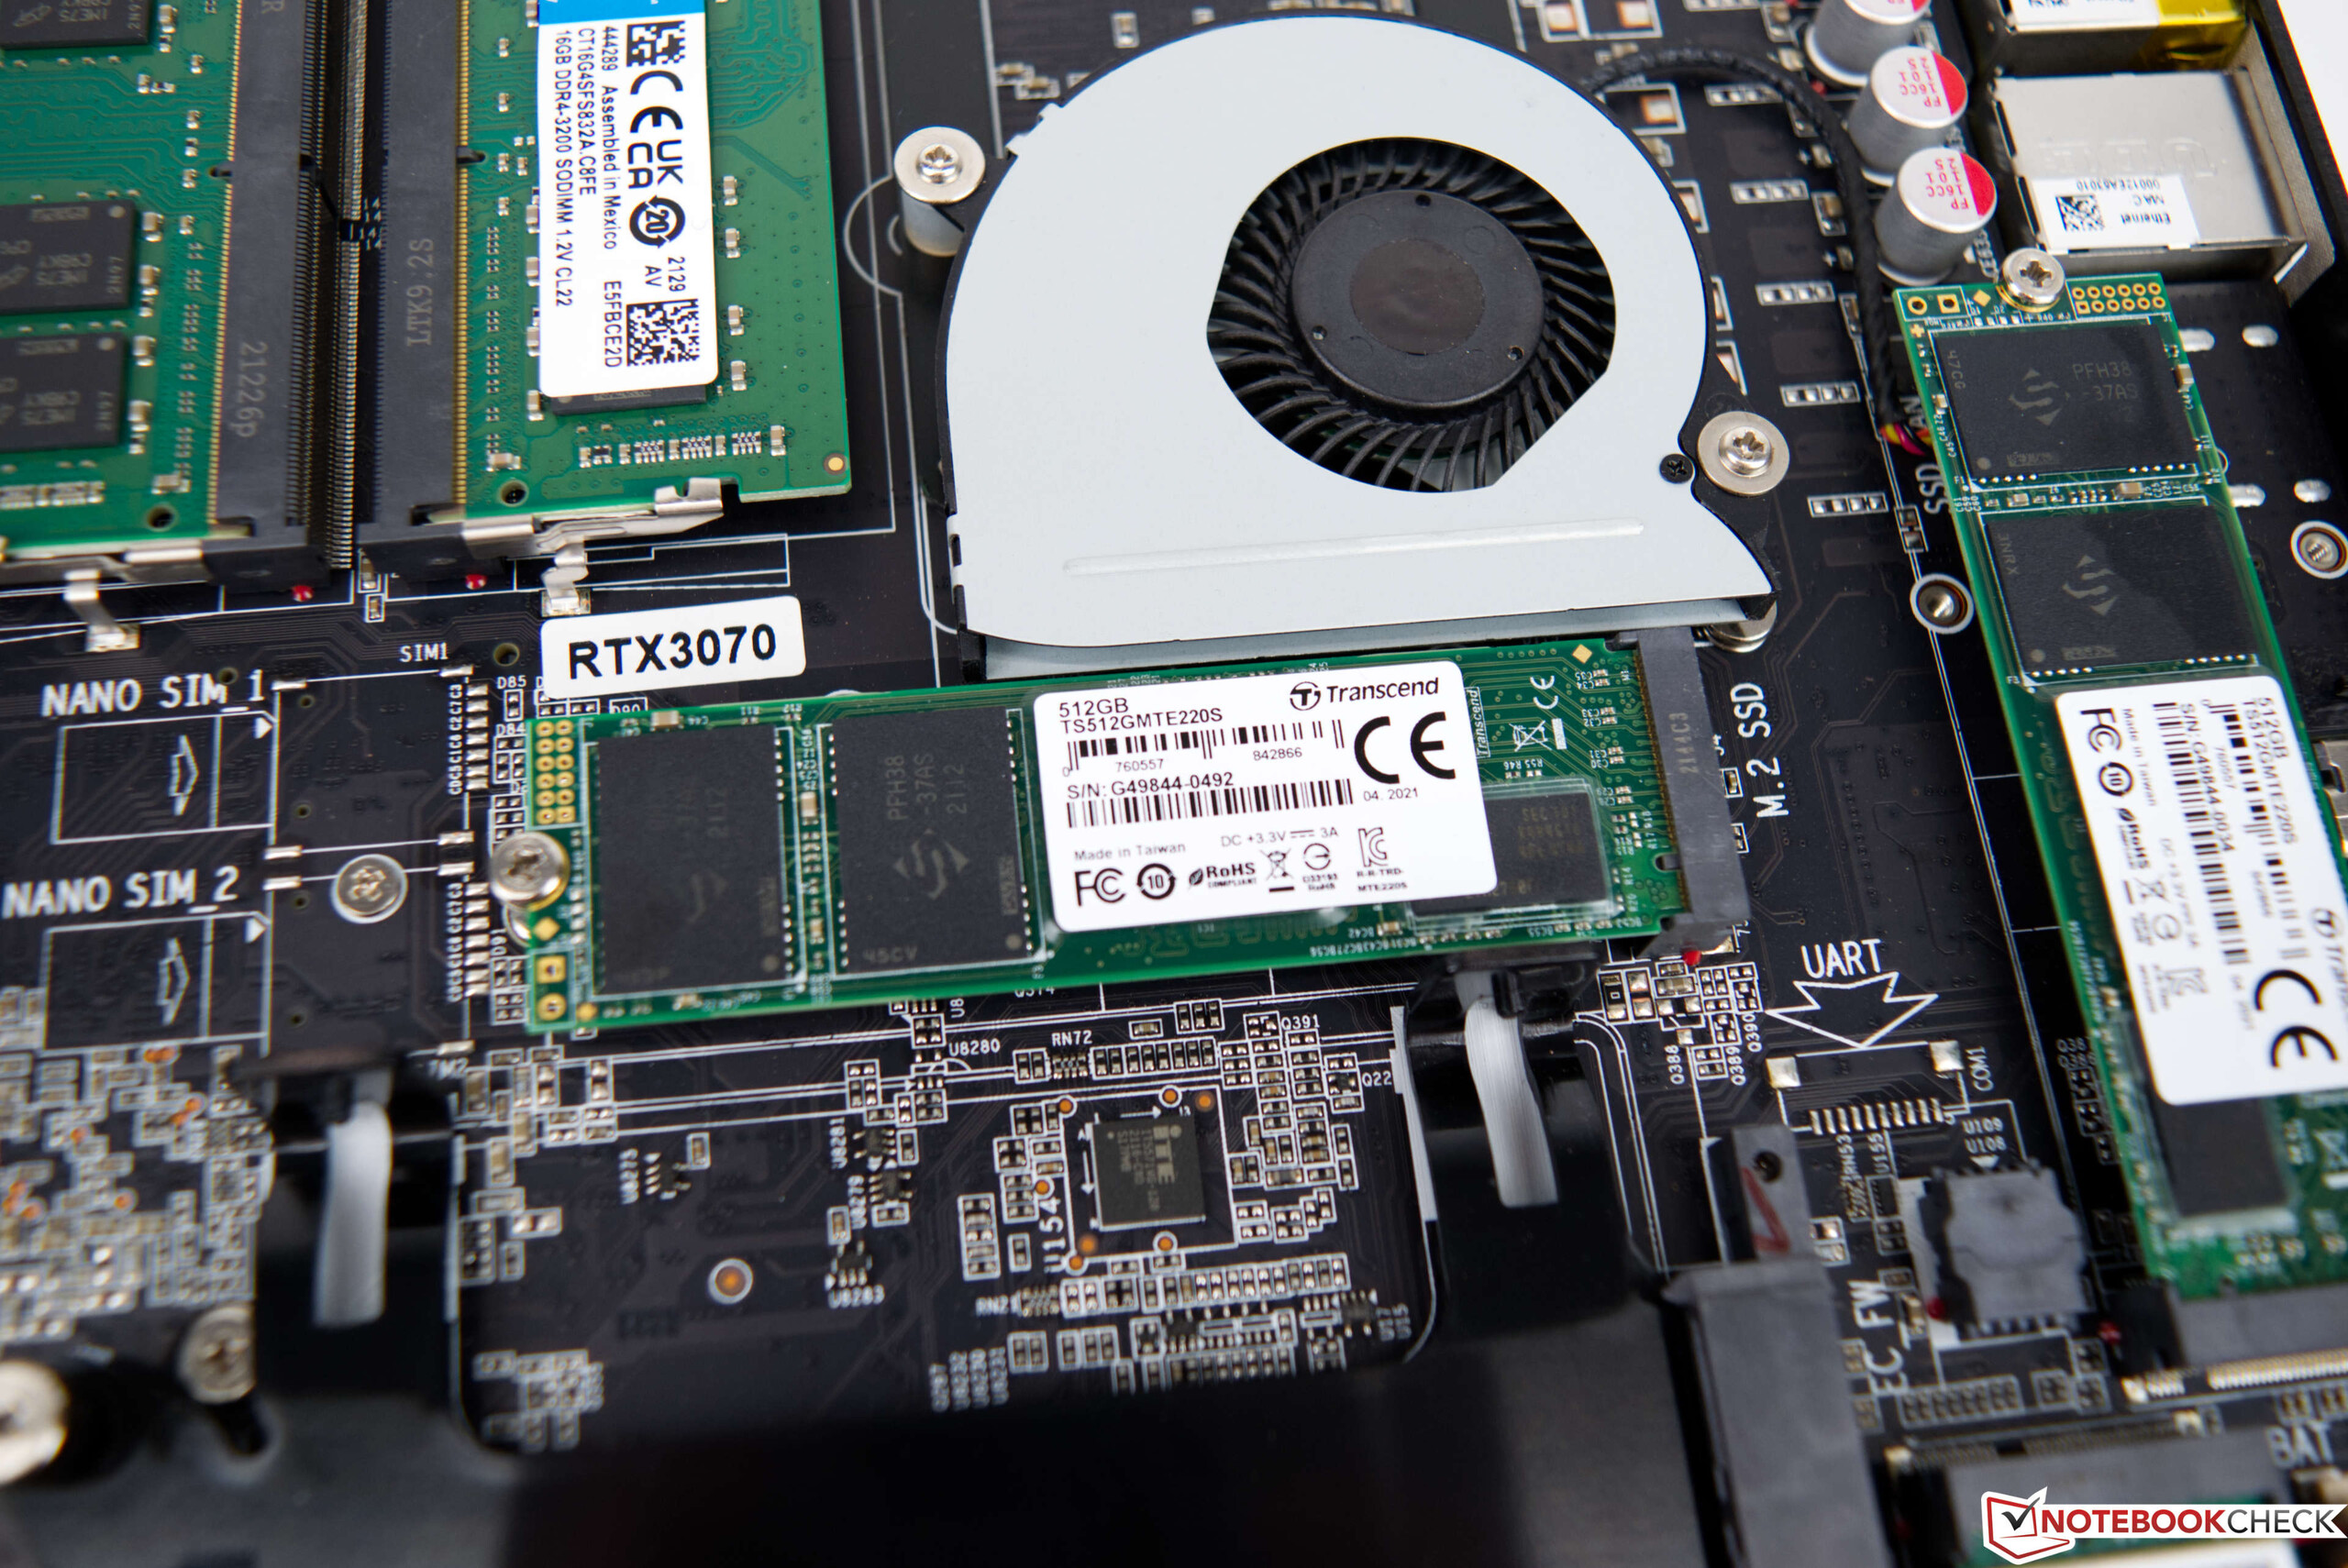
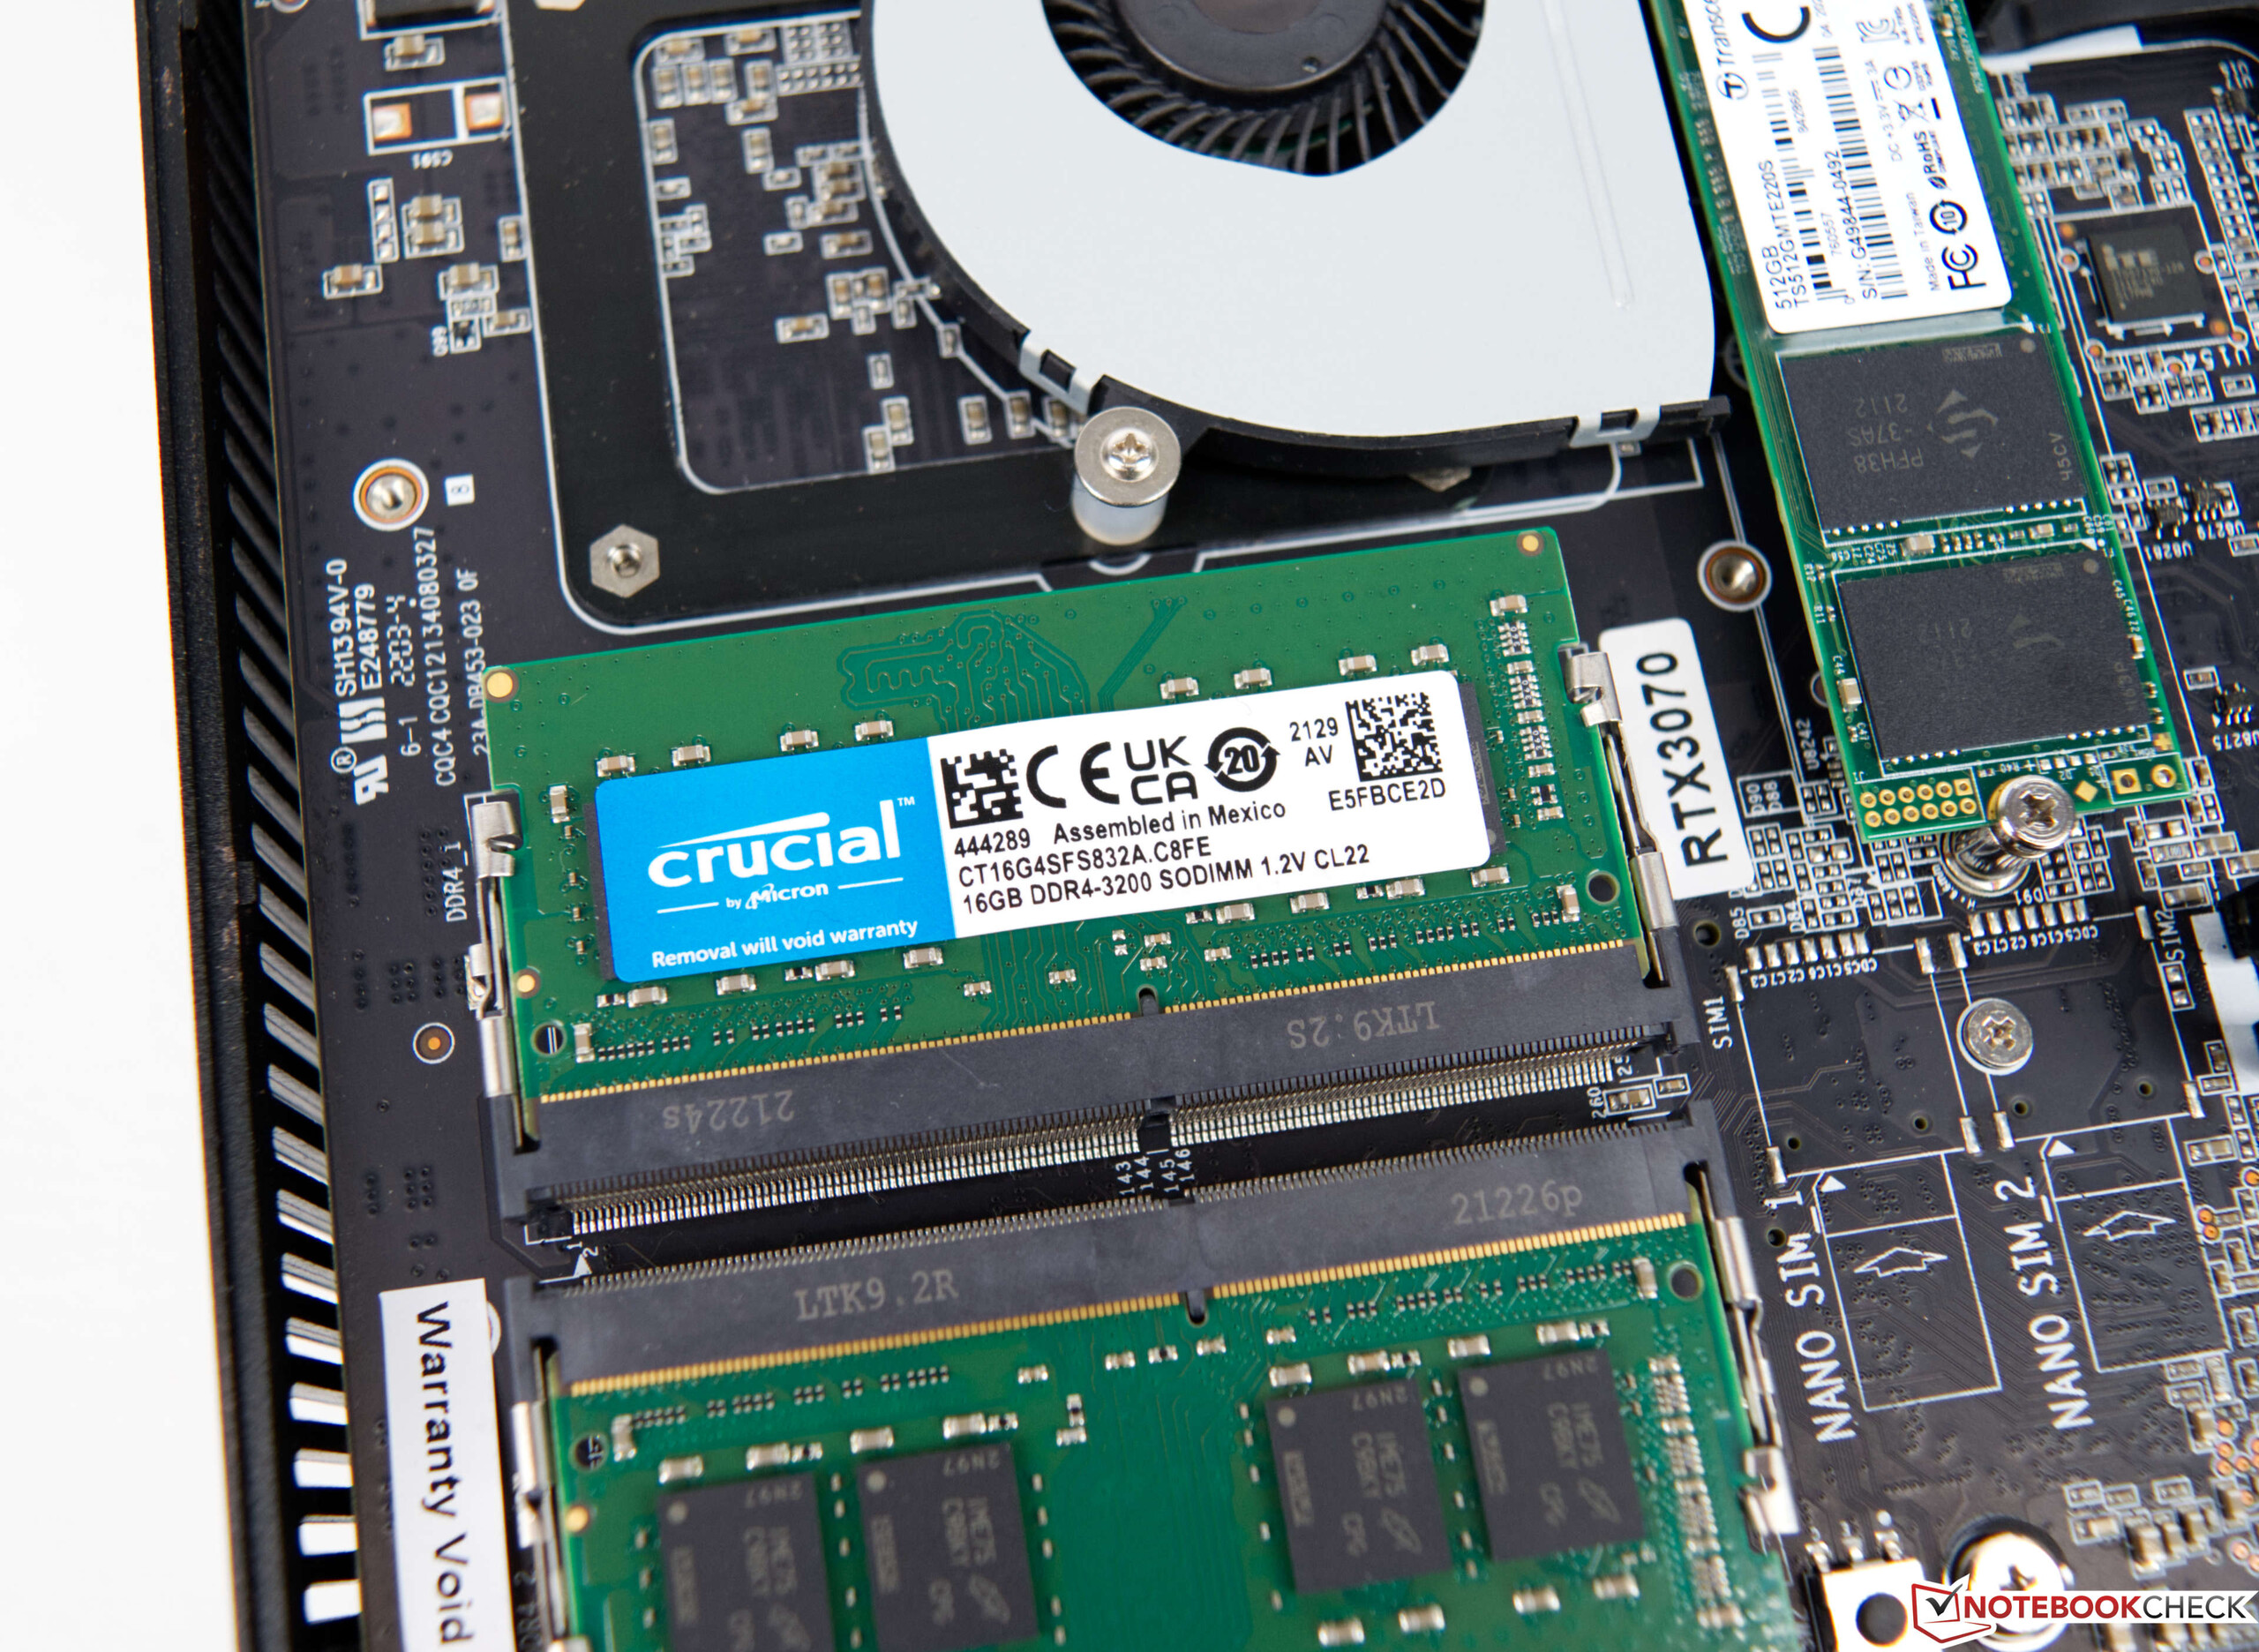
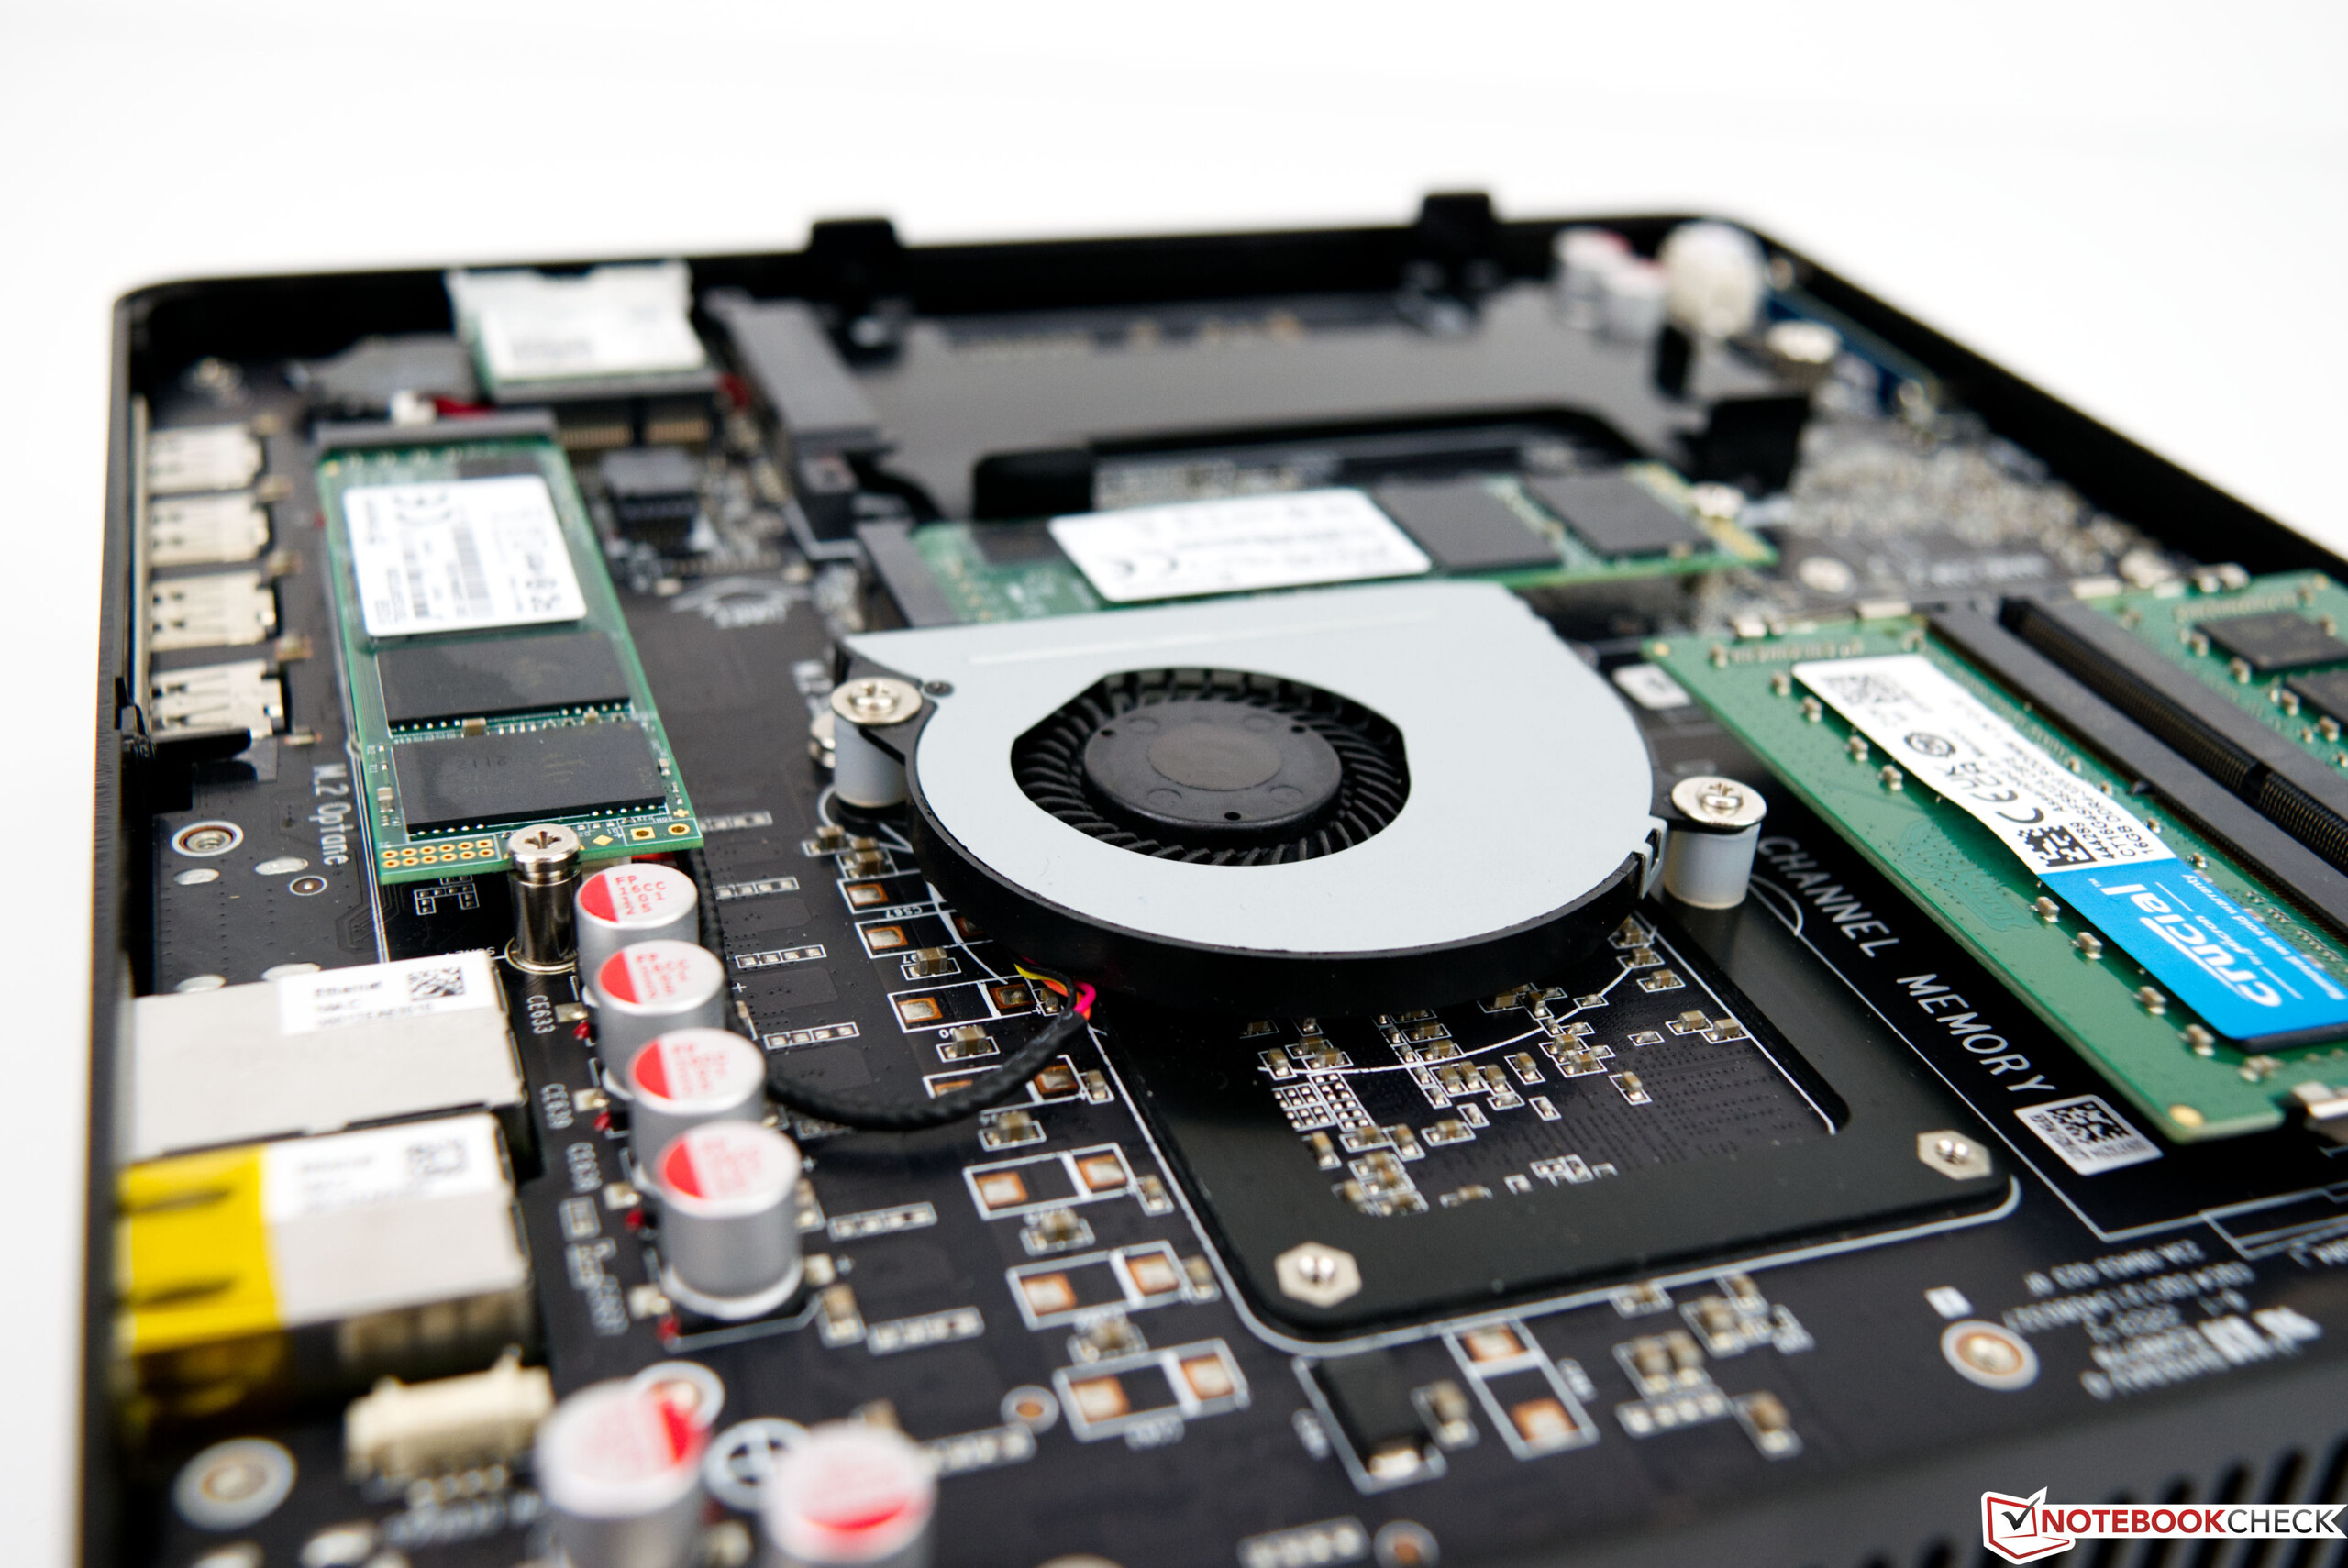
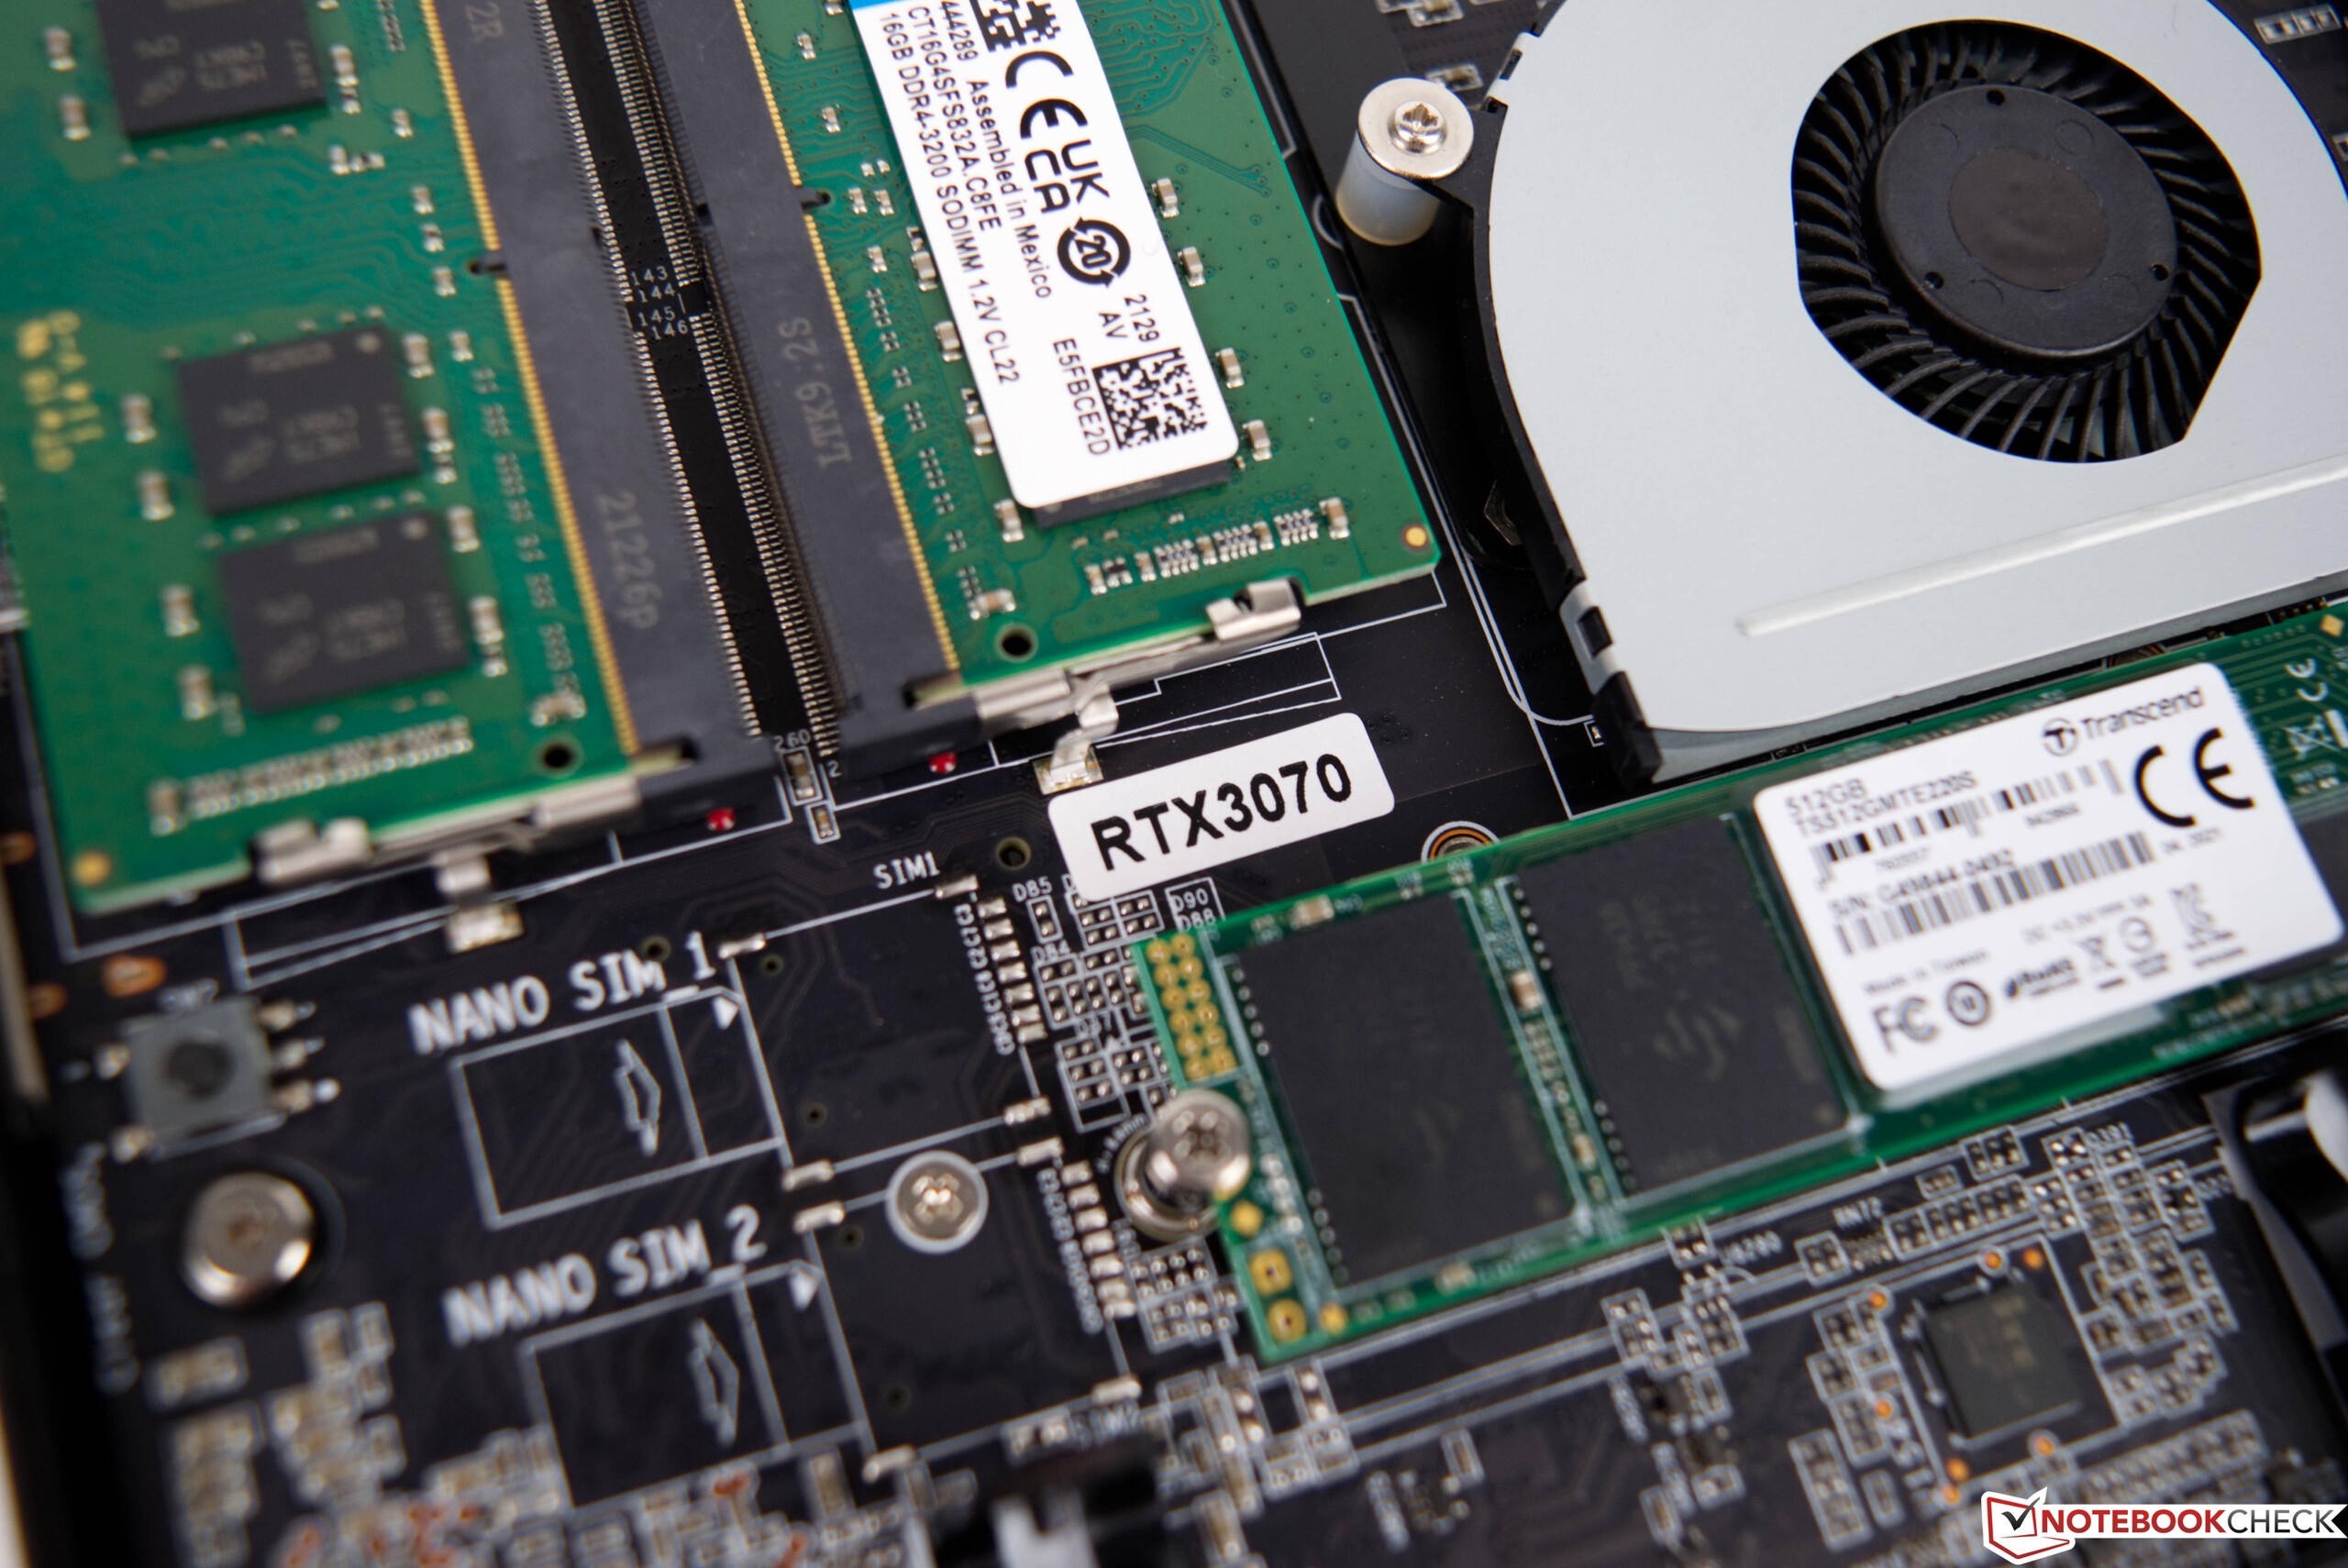
Nei benchmark applicativi, notiamo un chiaro aumento delle prestazioni rispetto al modello Zotac ZBOX Magus EN2080V Zotac ZBOX Magus EN72080V. Insieme, il SoC più recente e la scheda grafica significativamente più veloce garantiscono il buon risultato. Nel complesso, lo Zotac ZBOX Magnus EN173070C è persino leggermente più veloce dell'Intel Dragon Canyon NUC con la sua GPU desktop a grandezza naturale e la CPU Alder Lake più recente. Nei test di rendering, la GeForce RTX 3070 Mobile è in grado di guadagnare i punti decisivi rispetto alla GeForce RTX 3060. Da un punto di vista soggettivo, le velocità nel funzionamento quotidiano sono molto buone. Sia che si navighi in Internet, si guardino video o si giochi, Zotac ZBOX Magnus EN173070C è in grado di svolgere tutti questi compiti senza problemi. Per questa recensione, abbiamo equipaggiato il mini PC con 32 GB di RAM DDR4 e due SSD da 512 GB. I modelli di Transcend offrono prestazioni solide. Tuttavia, è possibile ottenere qualche punto percentuale in più in termini di prestazioni utilizzando SSD ancora più veloci. Il case può ospitare fino a tre soluzioni di archiviazione. Oltre alle due connessioni M.2, che non sono limitate alla lunghezza di 80 mm, è possibile installare anche un'unità da 2,5 pollici.
| DPC Latencies / LatencyMon - interrupt to process latency (max), Web, Youtube, Prime95 | |
| Zotac ZBOX Magnus EN173070C, Intel Core i7-11800H | |
| Minisforum EliteMini HX90, AMD Ryzen 9 5900HX | |
* ... Meglio usare valori piccoli
prestazioni 3D e di gioco
Per un PC da gioco, una scheda grafica veloce è indispensabile per ottenere frame rate fluidi. Nel nostro caso, c'è una scheda grafica veloce con 8 GB di VRAM con il modello Nvidia GeForce RTX 3070 Mobile. Allo stesso tempo, non è possibile fare un confronto con le versioni desktop della stessa nomenclatura. Invece, la versione mobile della GeForce RTX 3070raggiunge prestazioni simili a quelle di una Nvidia GeForce RTX 3060. Il confronto diretto con il NUC Intel Beast Canyon lo illustra molto bene.
Nella classificazione del TDP, Zotac va avanti a tutta velocità, consentendo fino a 125 watt sotto carico. In questo modo, le prestazioni della scheda grafica dedicata non vengono limitate artificialmente, come spesso accade nei portatili compatti. Questo porta anche a risultati a volte buoni rispetto alle prestazioni medie dell'adattatore grafico. I giochi che abbiamo testato possono essere riprodotti senza problemi ai massimi livelli di dettaglio con risoluzione FHD e QHD. Tuttavia, quando la risoluzione si sposta verso il 4K, le cose possono diventare difficili. Ma ci sono ancora molti giochi che possono essere riprodotti senza problemi anche ad alta risoluzione
Ulteriori confronti e benchmark sono disponibili nel nostro GPU.
| basso | medio | alto | ultra | QHD | 4K | |
|---|---|---|---|---|---|---|
| GTA V (2015) | 182.7 | 177.1 | 167.5 | 104.9 | 94.4 | 100.8 |
| The Witcher 3 (2015) | 435 | 331 | 190.1 | 105.5 | 70.7 | |
| Dota 2 Reborn (2015) | 164.4 | 148.3 | 142.9 | 133.9 | 127.7 | |
| Rise of the Tomb Raider (2016) | 302 | 216 | 141.9 | 116.2 | 55.4 | |
| Final Fantasy XV Benchmark (2018) | 190.1 | 139 | 101 | 75.3 | 43.5 | |
| X-Plane 11.11 (2018) | 136.6 | 121.2 | 95.7 | 82.3 | ||
| Far Cry 5 (2018) | 159 | 136 | 129 | 120 | 101 | 55 |
| Strange Brigade (2018) | 437 | 267 | 216 | 186.7 | 137.3 | 78.1 |
| Shadow of the Tomb Raider (2018) | 169.6 | 146.4 | 142.5 | 133.7 | 95.1 | 50.8 |
| Far Cry New Dawn (2019) | 134 | 116 | 112 | 100 | 91 | 57 |
| Metro Exodus (2019) | 177.1 | 123 | 94 | 74.6 | 58.7 | 36.6 |
| Control (2019) | 240 | 128 | 93.7 | 60.9 | 30.3 | |
| Borderlands 3 (2019) | 135.5 | 117.3 | 101 | 84.6 | 62.2 | 34.2 |
| F1 2020 (2020) | 315 | 267 | 238 | 165.8 | 123.6 | 68.3 |
| Dirt 5 (2020) | 227 | 153 | 123 | 96 | 75 | 49 |
| F1 2021 (2021) | 367 | 309 | 246 | 122.7 | 88.3 | 49.8 |
| Alan Wake Remastered (2021) | 119.2 | 118.2 | 118.2 | 113.1 | ||
| Far Cry 6 (2021) | 127.5 | 109.5 | 99 | 99.8 | 79.2 | 41 |
| Guardians of the Galaxy (2021) | 123 | 124 | 122 | 120 | 102 | 55 |
| Riders Republic (2021) | 174 | 144 | 118 | 107 | 77 | 40 |
| Forza Horizon 5 (2021) | 213 | 141 | 129 | 82 | 70 | 48 |
| Farming Simulator 22 (2021) | 205 | 161.1 | 138.8 | 132.8 | 124.8 | 79.2 |
| God of War (2022) | 122.2 | 109.4 | 88.1 | 61.7 | 50.7 | 33.8 |
| Rainbow Six Extraction (2022) | 241 | 182 | 181 | 149 | 97 | 49 |
| GRID Legends (2022) | 194 | 189 | 158 | 123 | 95 | 62 |
| Cyberpunk 2077 1.6 (2022) | 139 | 116 | 92 | 76 | 47 | 22 |
| Elex 2 (2022) | 98.4 | 95.1 | 87.3 | 79.5 | 61.8 | 34.5 |
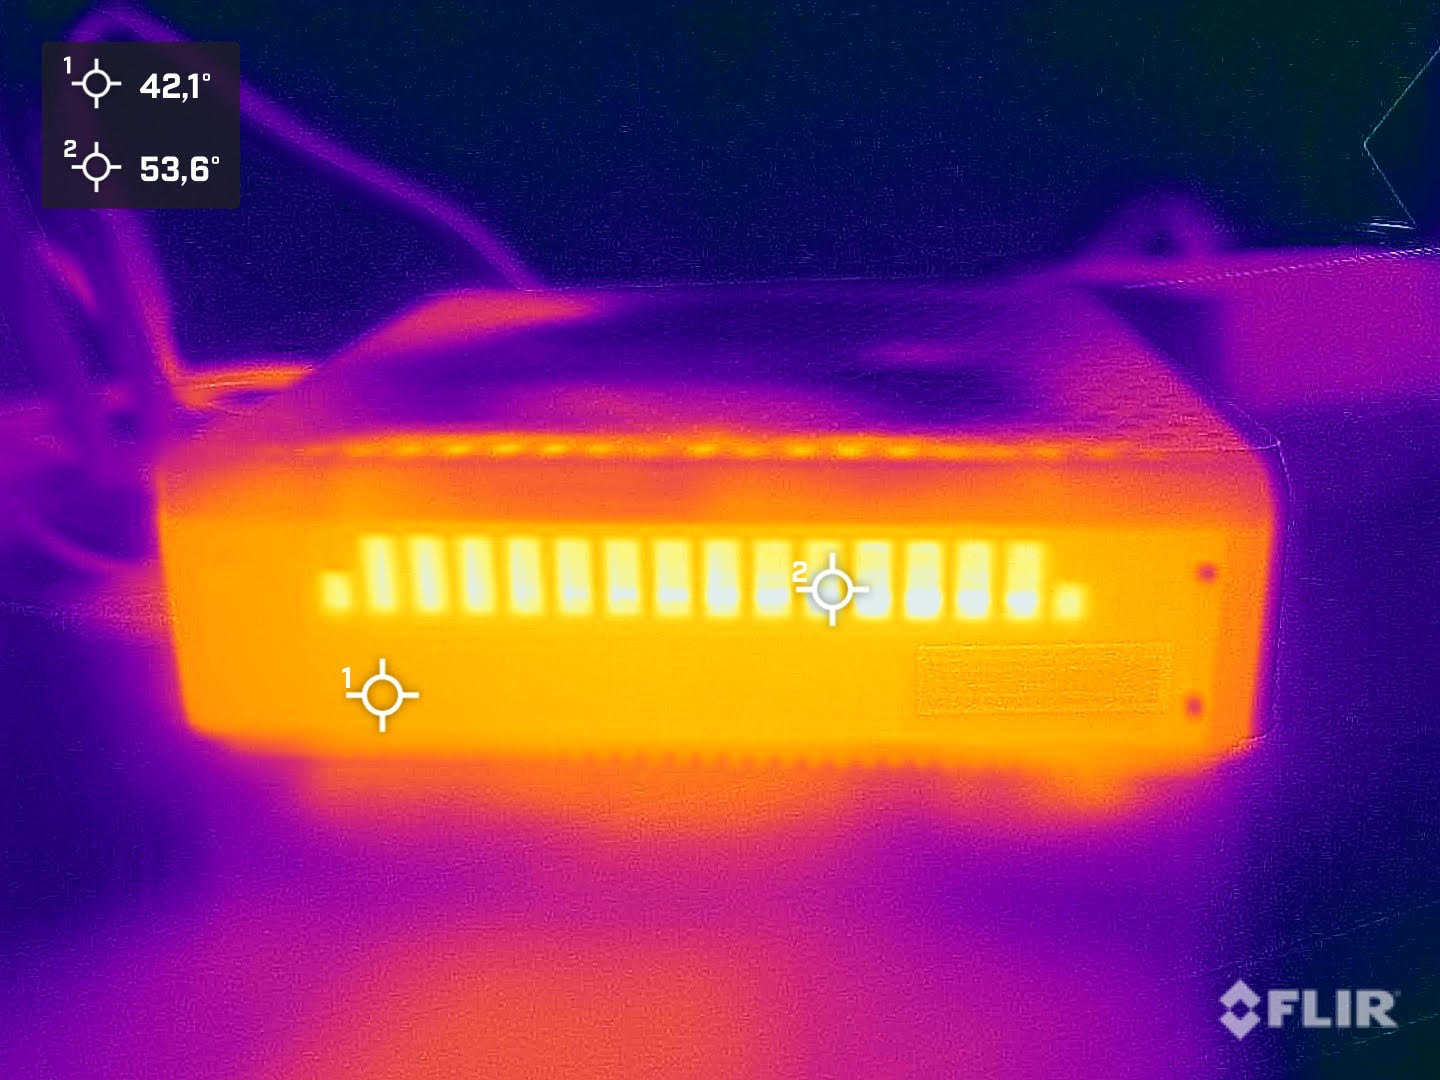
Emissioni
Emissioni sonore
Quando si acquista un portatile da gioco, di solito si è consapevoli dell'aumento del livello di rumore che questo comporta. Tuttavia, le cose sono spesso diverse per un PC desktop, poiché i sistemi di raffreddamento più grandi sono in grado di dissipare il calore in modo più efficace e silenzioso. Ma poiché Zotac utilizza un case molto compatto, le ventole integrate devono lavorare molto sotto carico. I livelli di rumore sotto carico ricordano quelli di un portatile da gioco medio. A 45 dB(A), il dispositivo è chiaramente udibile. A basso carico, misuriamo ancora 41 dB(A). Nel funzionamento in 2D, le ventole turbinano silenziosamente e sono appena percettibili.
Rumorosità
| Idle |
| 32.7 / 32.8 / 32.8 dB(A) |
| Sotto carico |
| 41.7 / 45.4 dB(A) |
 | ||
30 dB silenzioso 40 dB(A) udibile 50 dB(A) rumoroso |
||
min: | ||
| Zotac ZBOX Magnus EN173070C GeForce RTX 3070 Laptop GPU, i7-11800H, Transcend M.2 SSD 2200S TS512GMTE220S | Zotac Magnus One (ECM73070C) GeForce RTX 3070, i7-10700, Phison 512GB PA6620060U | Minisforum EliteMini HX90 Vega 8, R9 5900HX, Kingston OM8PCP3512F-AB | |
|---|---|---|---|
| Noise | -4% | 10% | |
| off /ambiente * (dB) | 30.7 | 30 2% | 30.8 -0% |
| Idle Minimum * (dB) | 32.7 | 33.58 -3% | |
| Idle Average * (dB) | 32.8 | 31.6 4% | |
| Idle Maximum * (dB) | 32.8 | ||
| Load Average * (dB) | 41.7 | 44.25 -6% | |
| Load Maximum * (dB) | 45.4 | 48.72 -7% | 33.4 26% |
* ... Meglio usare valori piccoli
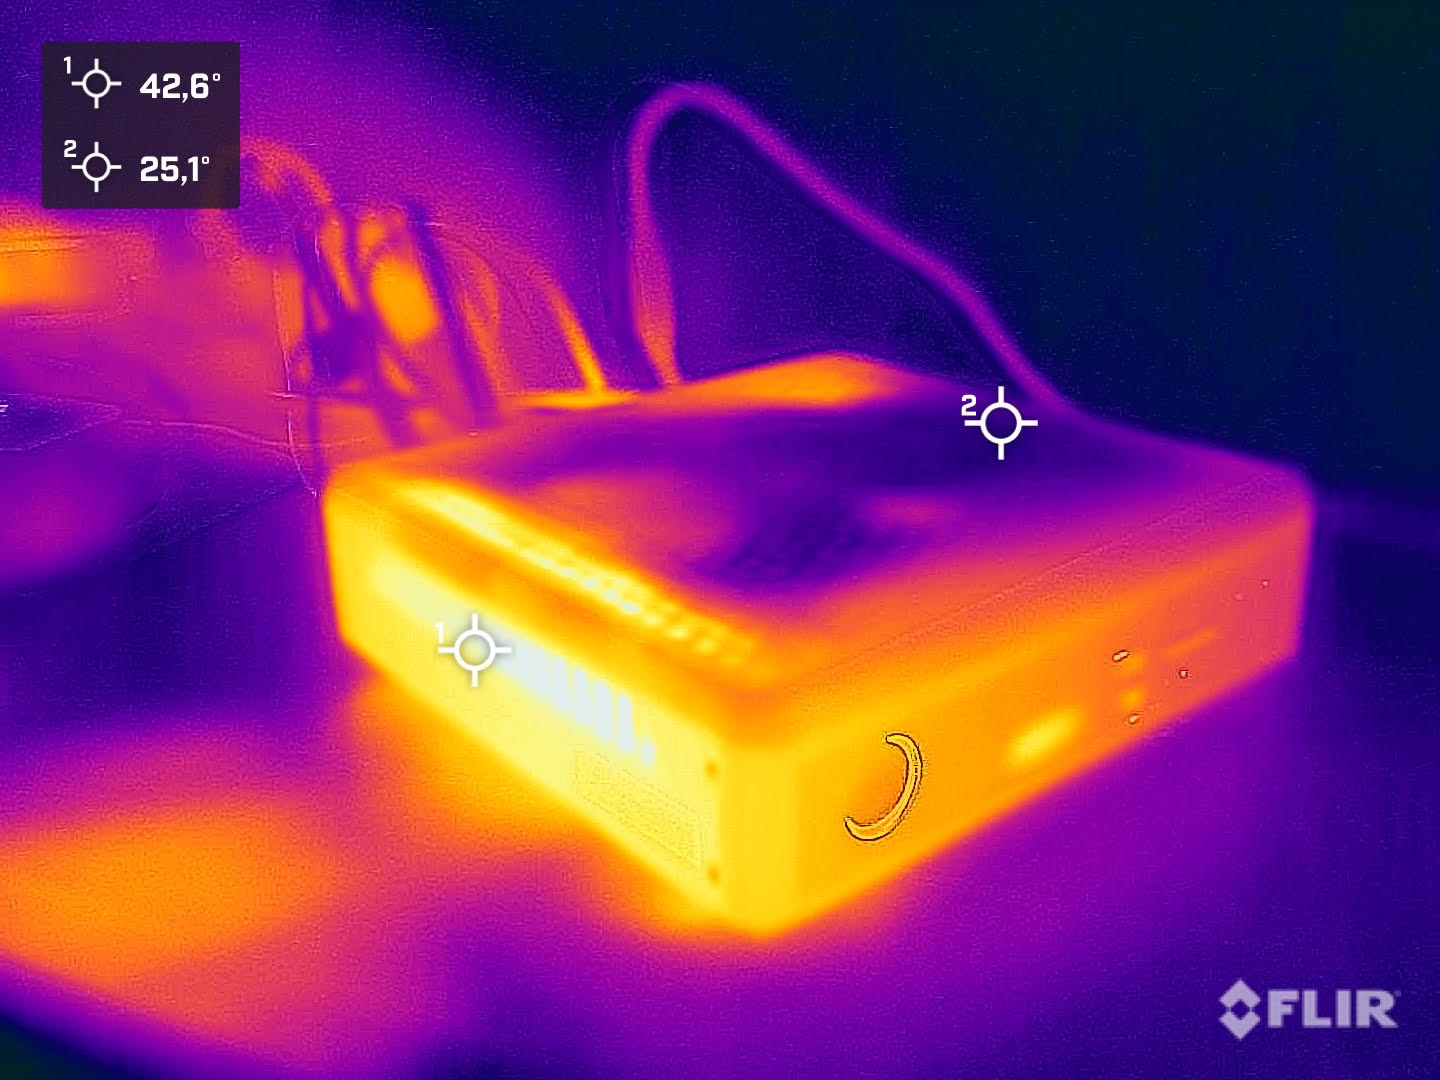
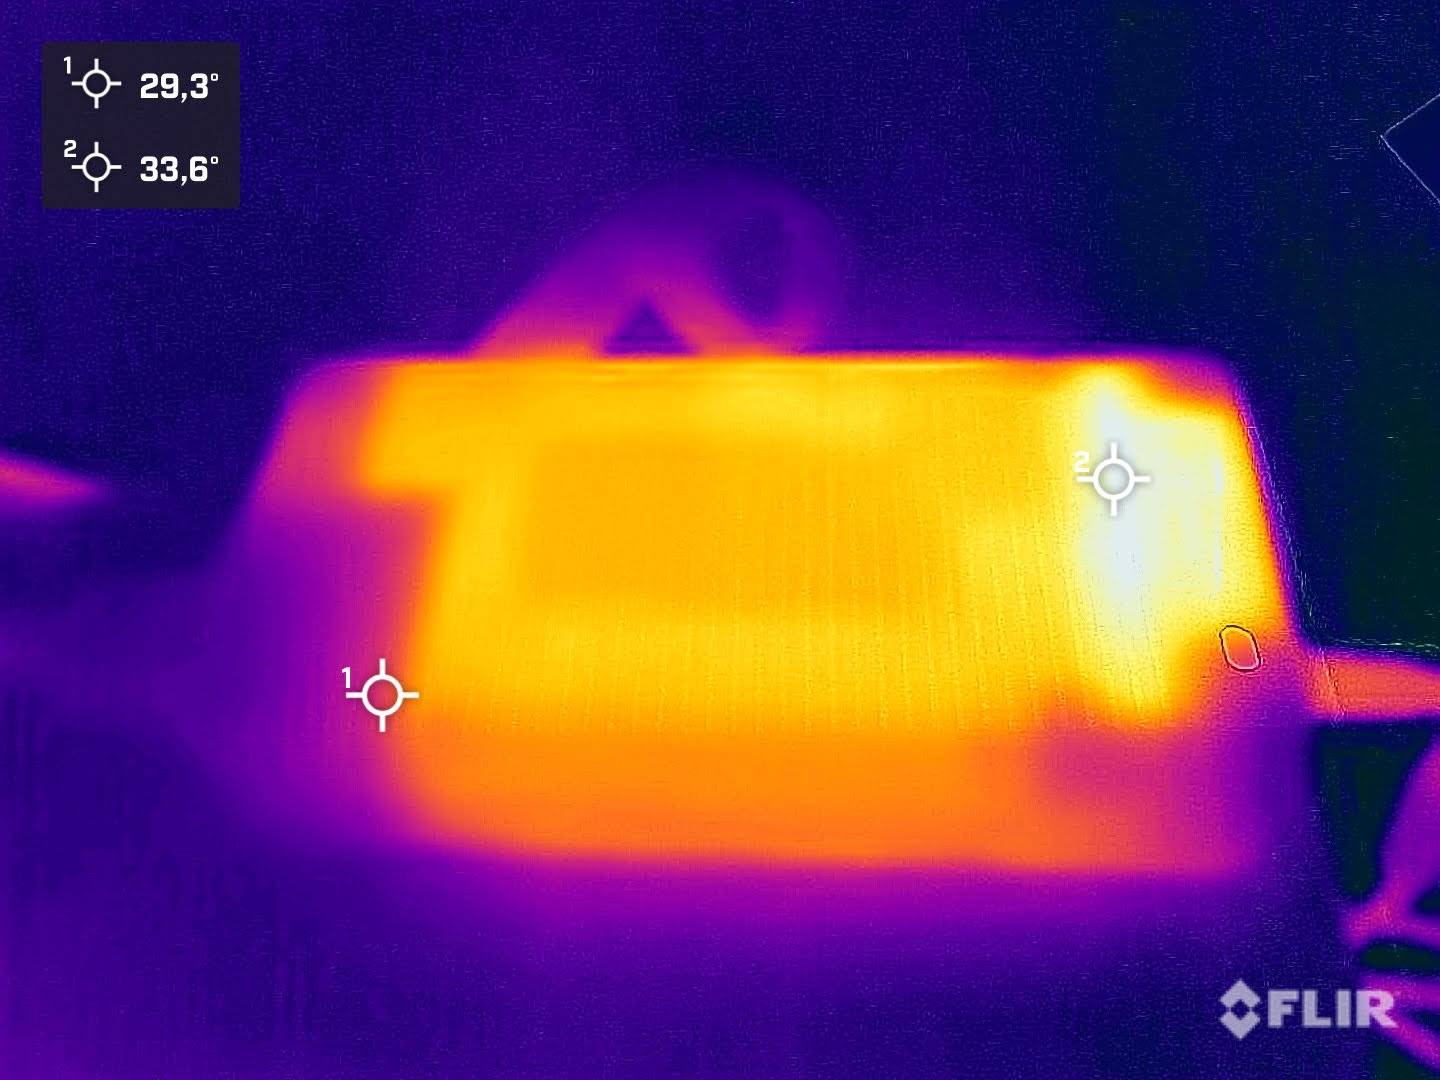
Temperature
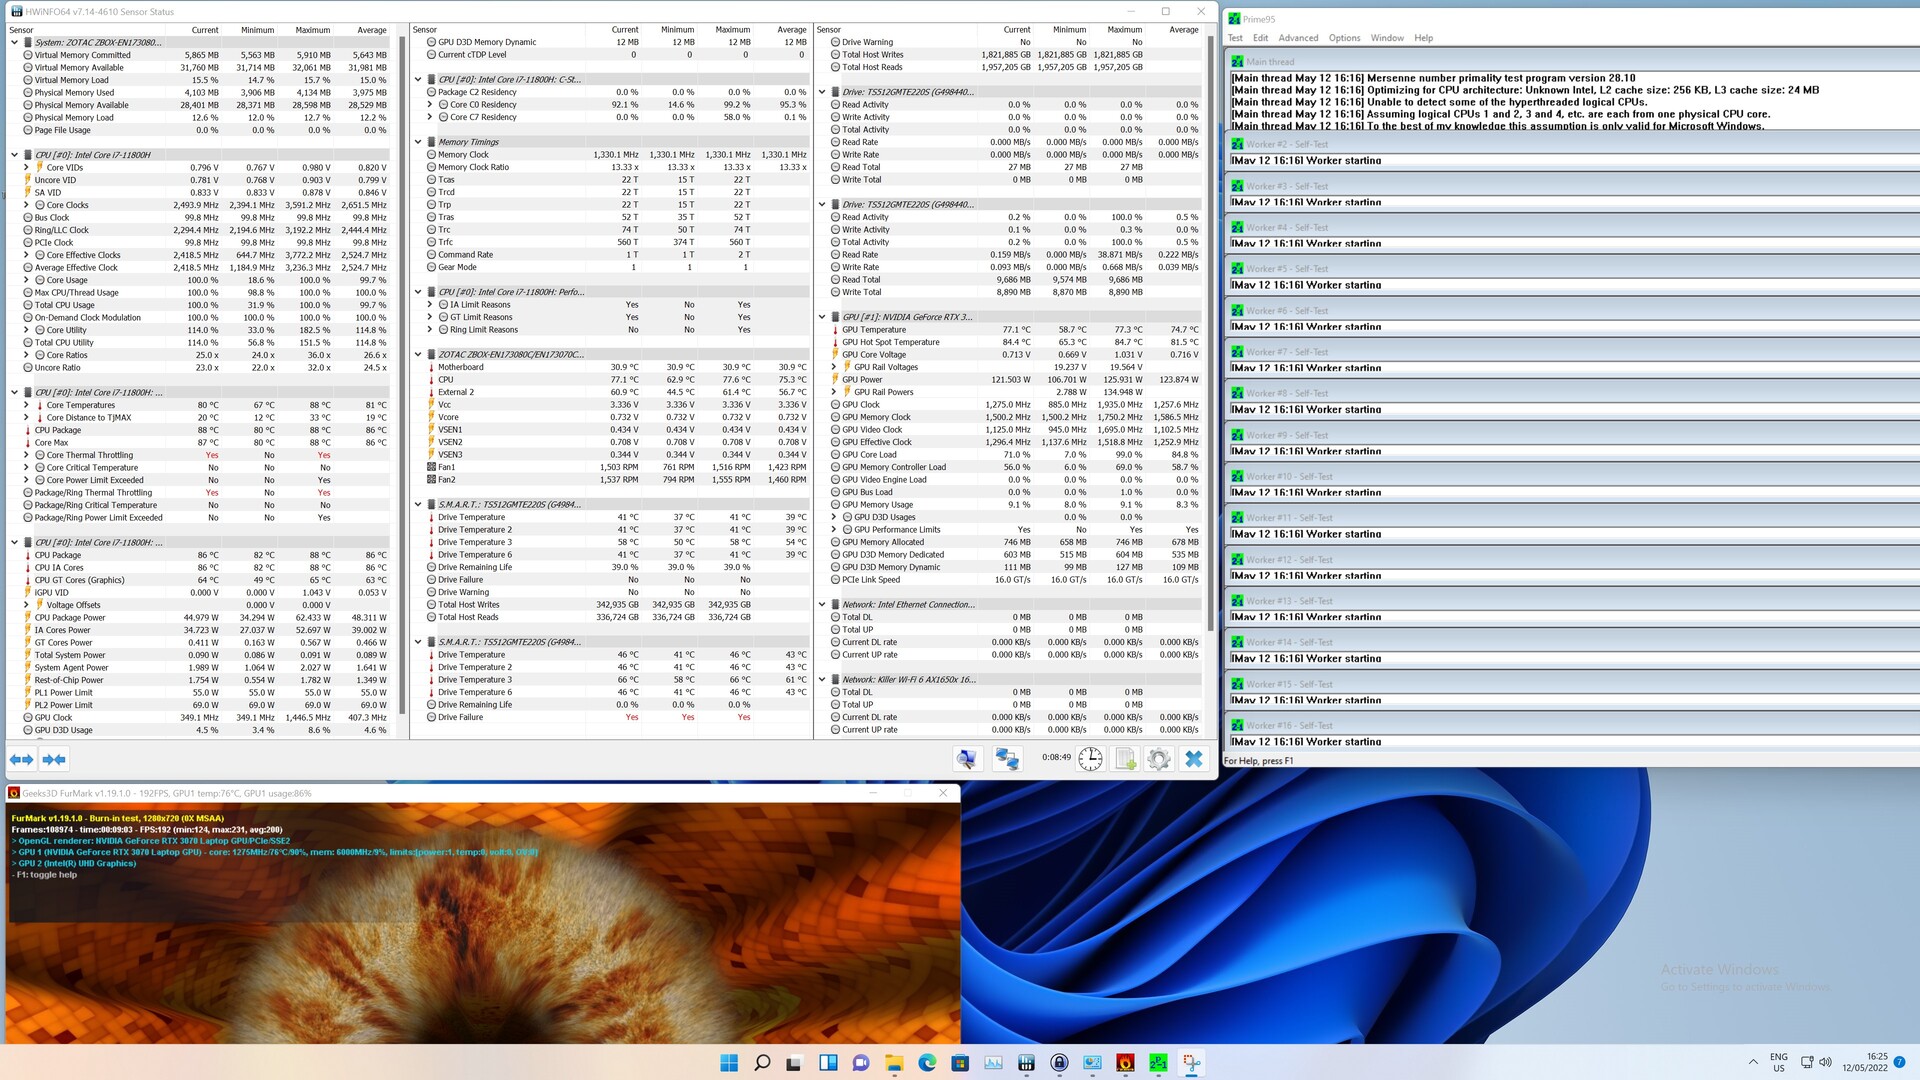
Durante lo stress test, abbiamo sottoposto il sistema ai massimi livelli di carico con Prime95 e FurMark. In questo scenario peggiore, l'Intel Core i7-11800H Intel Core i7-11800Hraggiunge una temperatura massima di 88 °C (190 °F). Nella scheda grafica si misura un valore leggermente inferiore, pari a 77 °C (171 °F). La velocità di clock della CPU è di 2,6 GHz, superiore alla velocità di clock di base di 2,3 GHz. Il carico costante su tutti i componenti non ha un effetto negativo, e un benchmark 3D subito dopo produce un risultato identico rispetto all'avvio a freddo.
Consumo di energia
Durante il funzionamento inattivo, il consumo energetico dello Zotac ZBOX Magnus EN173070C è compreso tra 31 e 41 watt. Per un sistema desktop, questi sono valori molto buoni. D'altra parte, se confrontati con quelli di computer portatili di pari potenza, questi valori sono decisamente troppo elevati. Sotto carico, abbiamo misurato 214 watt in media. Allo stesso tempo, il robusto alimentatore è in grado di gestire facilmente il consumo di picco di soli 231 watt che abbiamo misurato.
| Idle | |
| Sotto carico |
|
Leggenda:
min: | |
Power Consumption With External Monitor
Pro
Contro
Verdetto - Un PC da gioco ultracompatto

Con lo ZBOX Magnus EN173070C, Zotac offre un buon aggiornamento del prodotto. Il veloceIntel Core i7-11800Hoffre un'ottima velocità di funzionamento e la Nvidia GeForce RTX 3070 Mobileè altrettanto in grado di produrre buone prestazioni senza essere strozzata artificialmente. Qui sono disponibili tutti i 125 watt, il che significa che anche la Nvidia GeForce RTX 3080 Mobile è spesso superata. Tuttavia, dobbiamo ancora considerare che i livelli di prestazioni sono nella gamma di unaNvidia GeForce RTX 3060 DesktopnVIDIA RTX 3060 DESKTOP. Ma considerando la compattezza del case da soli 2,65 litri, è sorprendente ciò che Zotac può offrire con i suoi ZBOX.
Tutto questo, ovviamente, ha anche un prezzo. Rispetto ai portatili da gioco economici come l' Acer Nitro5 AN515il prezzo è simile. A volte si deve addirittura pagare di più, dato che l'SSD e la RAM non sono inclusi nella dotazione di base. A 1650 euro (~1743 dollari), Zotac chiede un prezzo elevato. D'altra parte, si ottiene anche un PC da gioco ultracompatto che si può riporre o portare con sé con la stessa facilità di un portatile.
Le prestazioni di gioco ci hanno convinto e anche la varietà di connessioni è sufficiente. Allo stesso tempo, bisogna anche tenere presente che è possibile trasferire dati solo tramite Thunderbolt 4, ma non è possibile utilizzarla per far funzionare una scheda grafica esterna. Questo è un peccato a nostro avviso, perché altrimenti permetterebbe di aumentare le prestazioni 3D senza dover acquistare un dispositivo completamente nuovo.
Lo Zotac ZBOX Magnus EN173070C è un PC da gioco molto veloce basato su componenti mobili. Tuttavia, prima di acquistarlo, è necessario conoscere le caratteristiche di un sistema barebone.
In termini di rumorosità, lo Zotac ZBOX Magnus EN173070C perde rispetto ai PC desktop tradizionali. Sotto carico, le ventole devono aumentare considerevolmente, ma il rumore della ventola è ancora relativamente confortevole e non troppo acuto. Un'alternativa è offerta da Intel con il Dragon Canyon NUCche è un altro sistema barebone, proprio come lo ZBOX Magnus EN173070C. Sebbene il dispositivo non sia altrettanto compatto, può essere equipaggiato con schede grafiche desktop convenzionali. Come sempre, il cliente ha la possibilità di scegliere e deve decidere quali parametri sono più importanti per l'acquisto.
Prezzo e disponibilità
Mentre lo Zotac ZBOX Magnus EN173070C è elencato nel sito di Zotac USe in molti altri siti specifici del paese, sembra essere difficile da trovare per l'acquisto negli Stati Uniti. Il modello più diffuso negli Stati Uniti sembra essere ilMini PC ZOTAC Magnus ONE ECM7307LH, che utilizza un case diverso e include già RAM, SSD e HDD per $2130 su Amazon.

