Notebookcheck Logo

Recensione dell'Intel NUC 9 Extreme con Core i9 ed RTX 2070

Il diavolo è nei dettagli! I sistemi NUC di Intel sono in circolazione da molti anni e sono noti per la loro struttura compatta. Il nuovo Intel NUC 9 Extreme offre persino spazio sufficiente per una GPU desktop completa. Anche se questo aumenta notevolmente le dimensioni del dispositivo, esso rimane comunque abbastanza compatto. Scoprite nella nostra recensione che prestazioni potete aspettarvi.

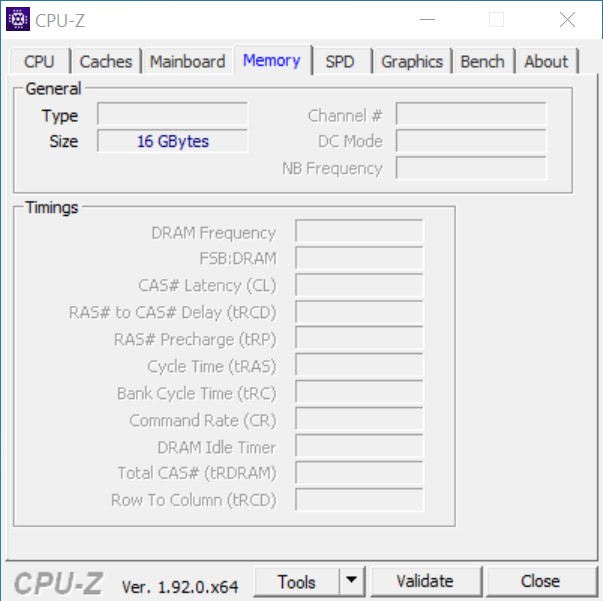
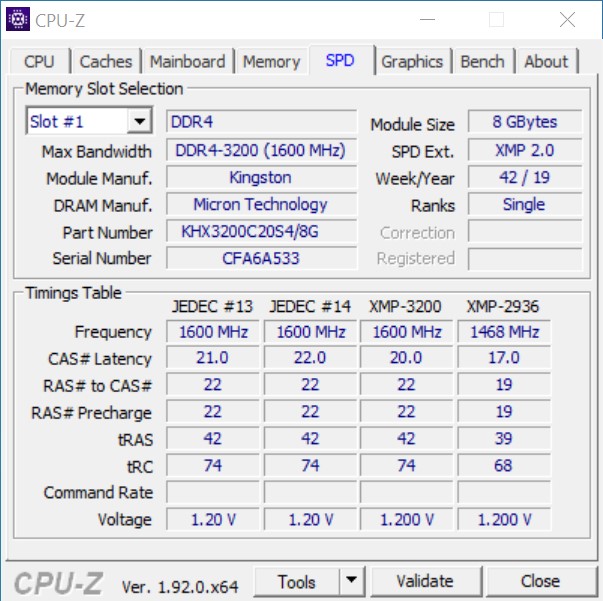
I computer Intel NUC sono in circolazione da un bel po' di tempo, e la maggior parte delle volte questi PC in miniatura sono utilizzati come piccoli computer da ufficio. Un esempio degno di nota è stato l'Intel NUC Hades Canyon, creato in collaborazione con AMD e rivolto ai giocatori alla ricerca di una macchina compatta. Questo è esattamente il punto in cui il nuovo Ghost Canyon entra nell'arena, in quanto offre un case più piccolo di 5 litri senza sacrificare le prestazioni. Il modello da noi recensito è dotato di un Intel Core i9-9980HK, 16 GB di RAM e due SSD con una capacità di archiviazione combinata di 1,38 TB. L'accelerazione 3D è fornita da una Nvidia GeForce RTX 2070. Questa combinazione dovrebbe essere più che potente per far funzionare anche i giochi attuali senza problemi.

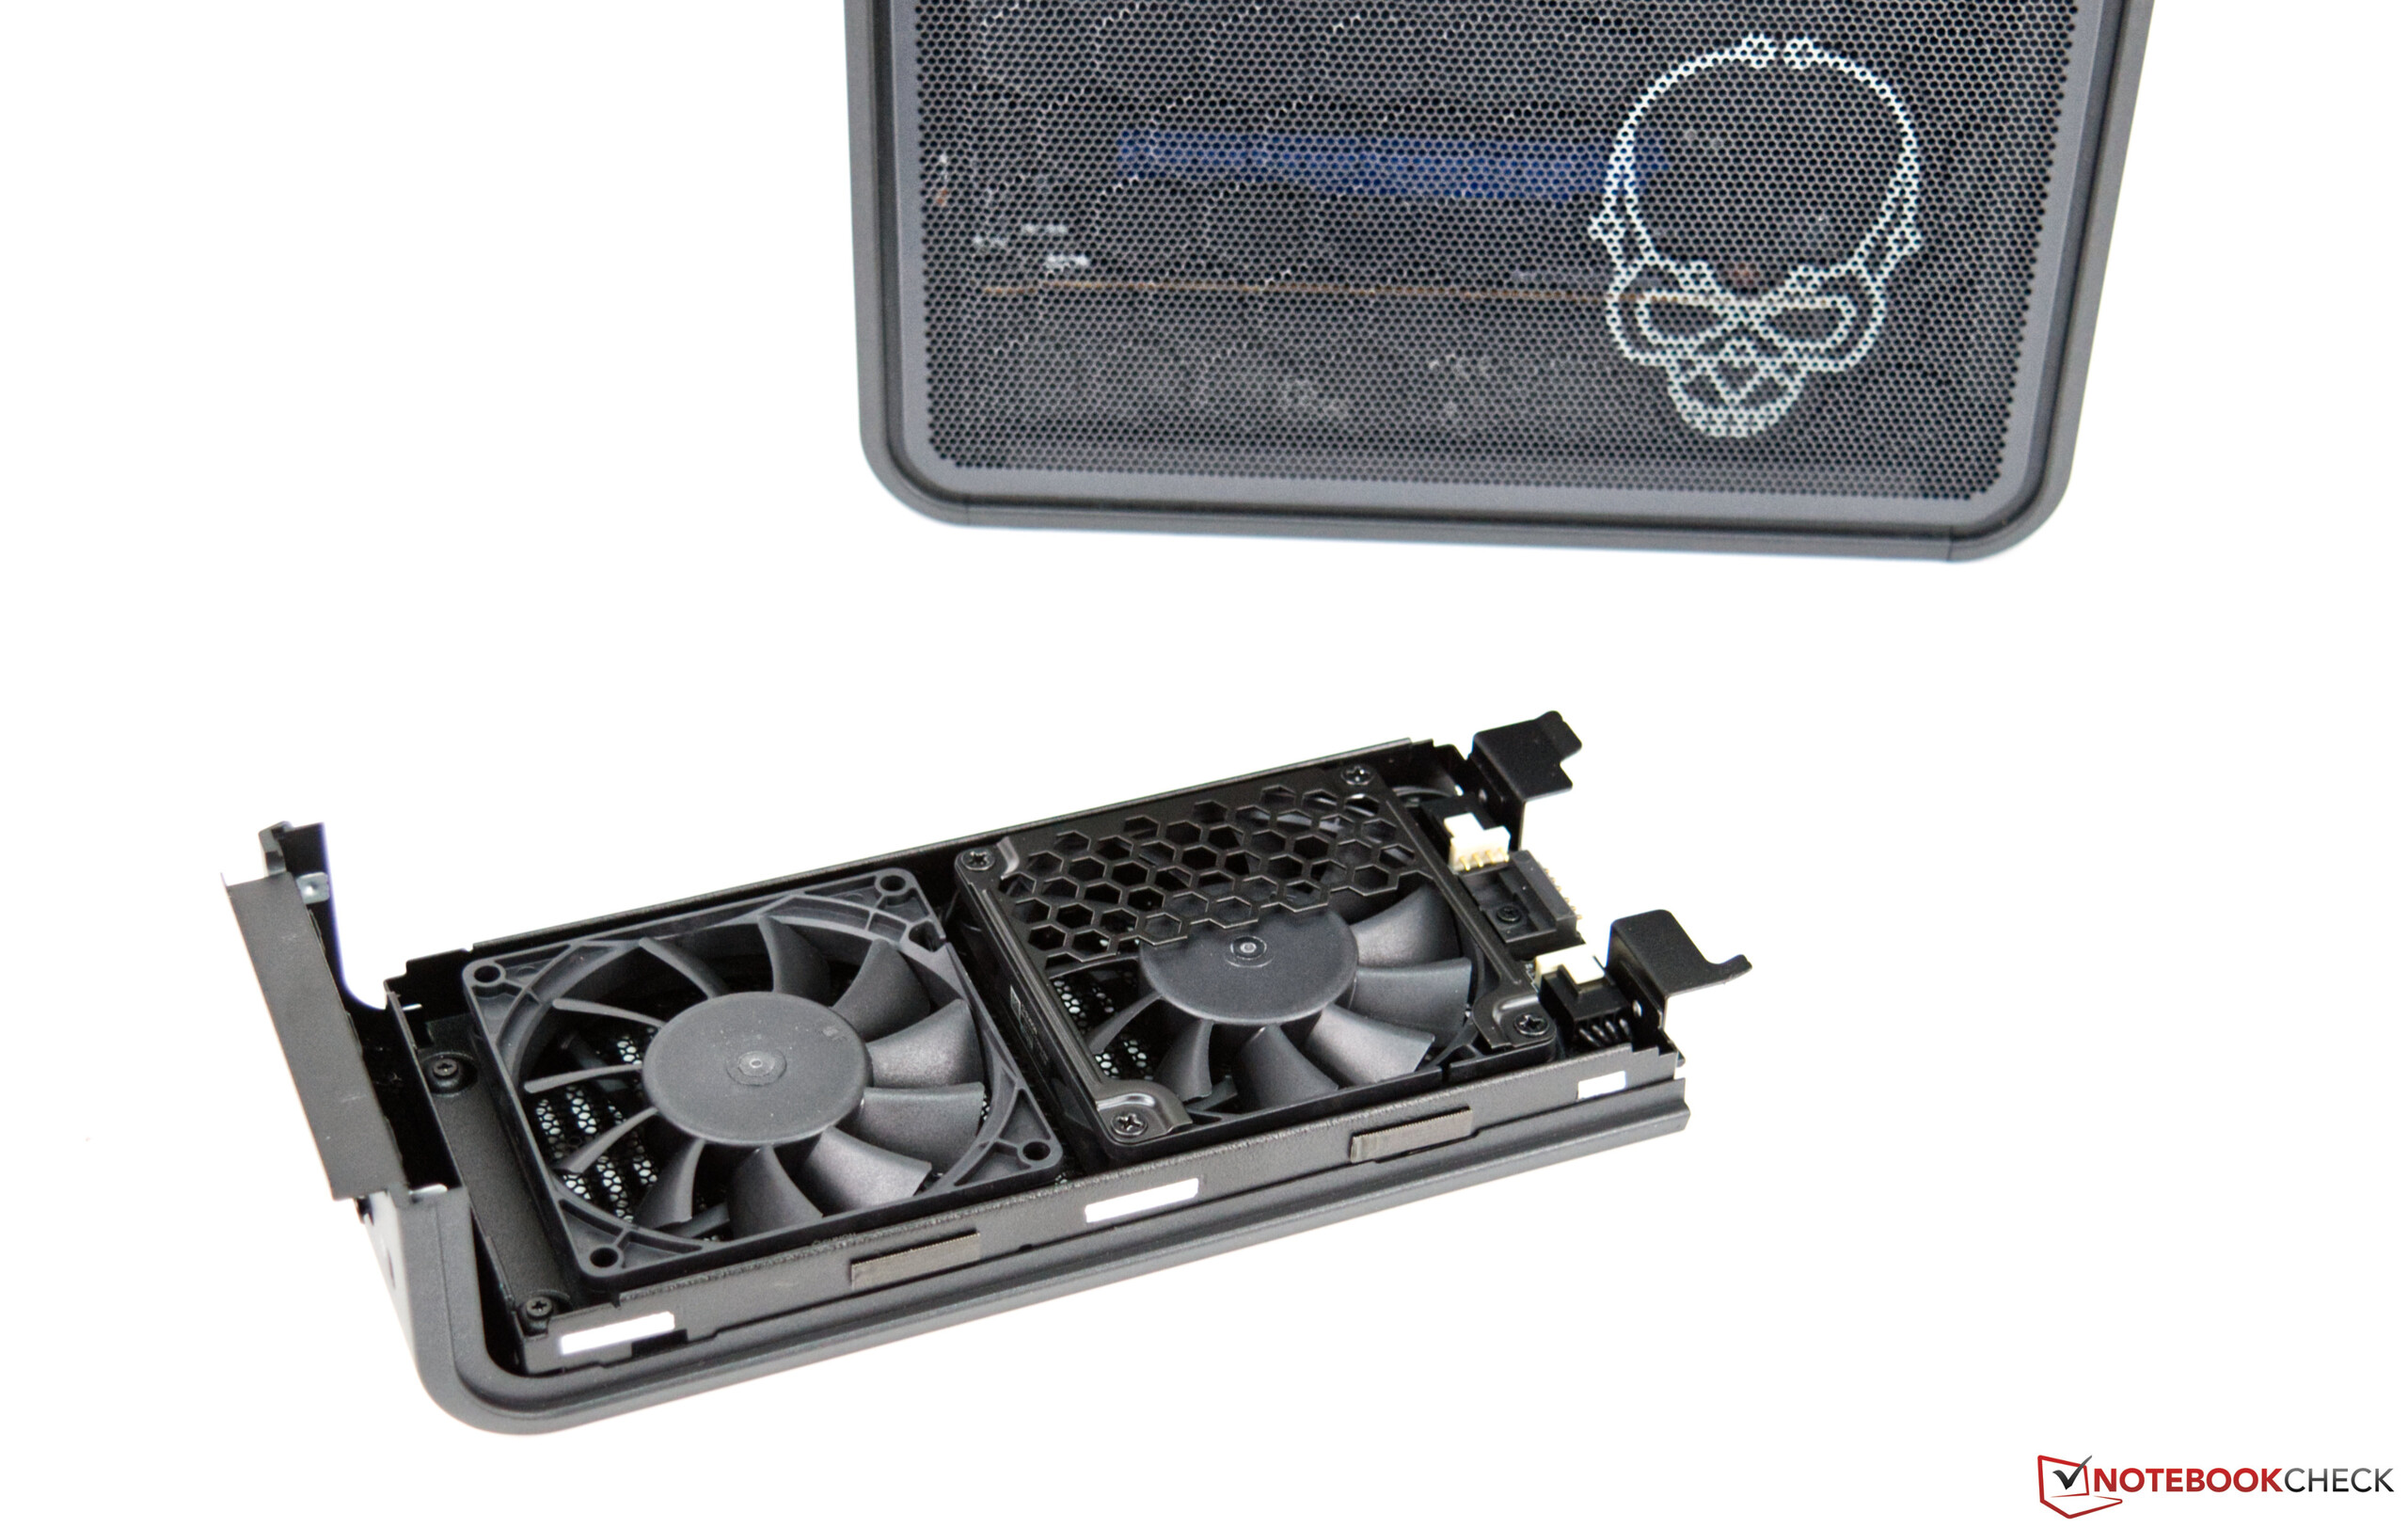
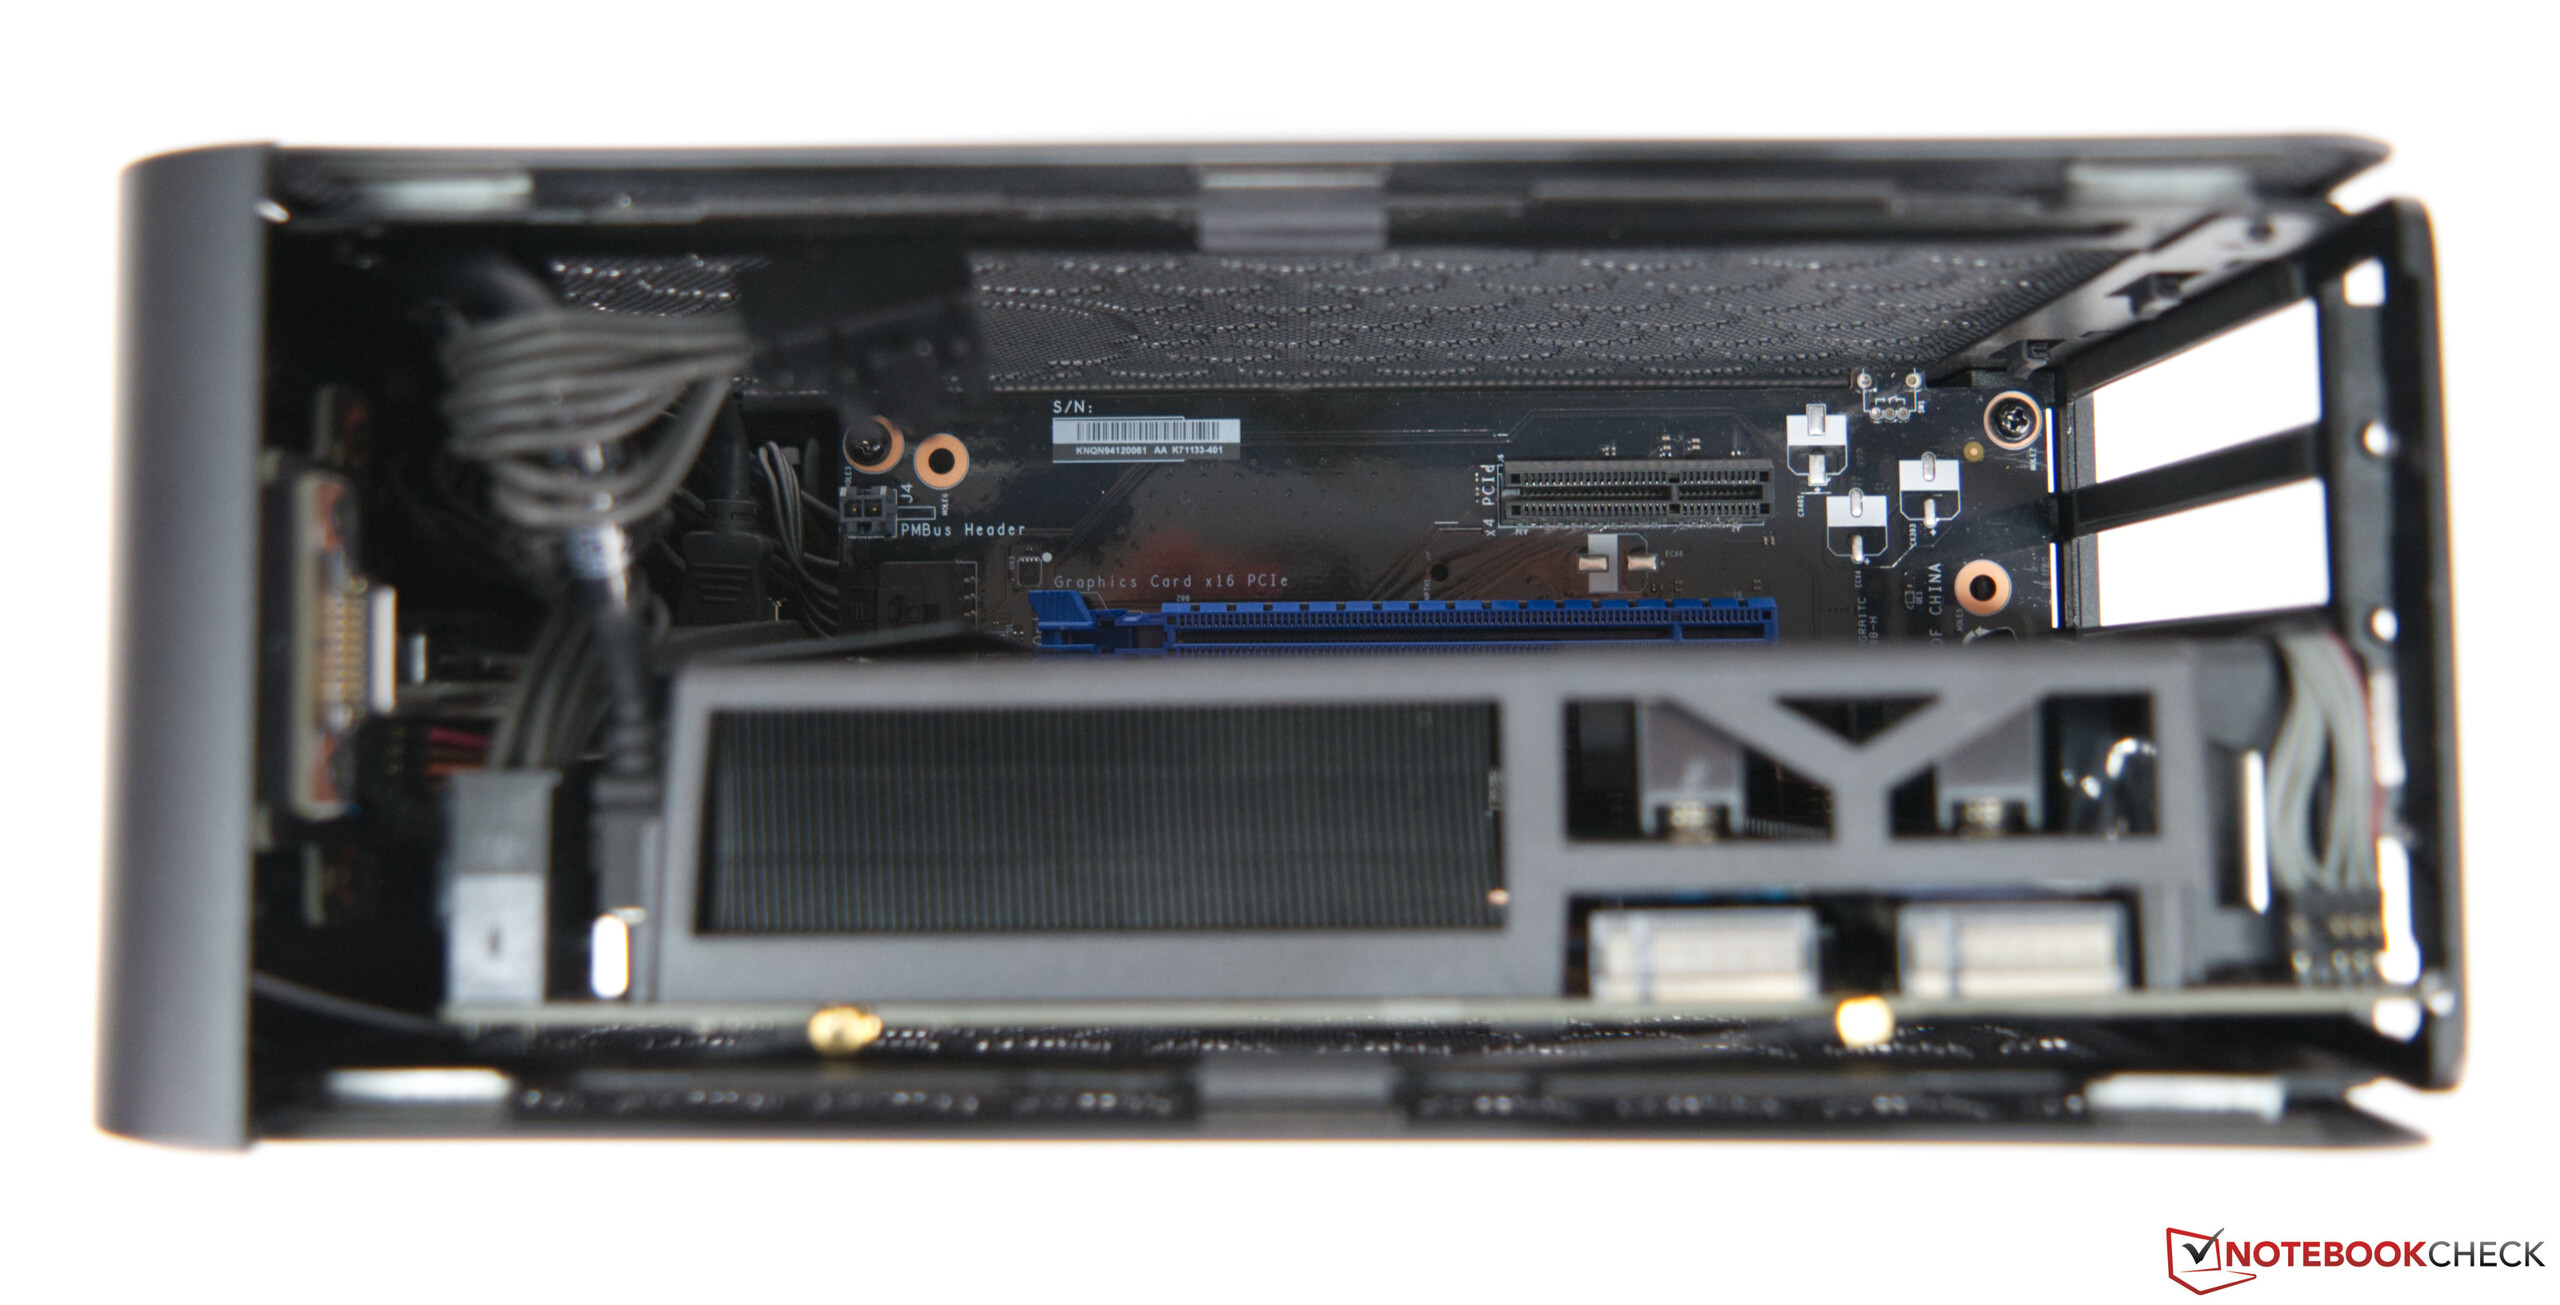
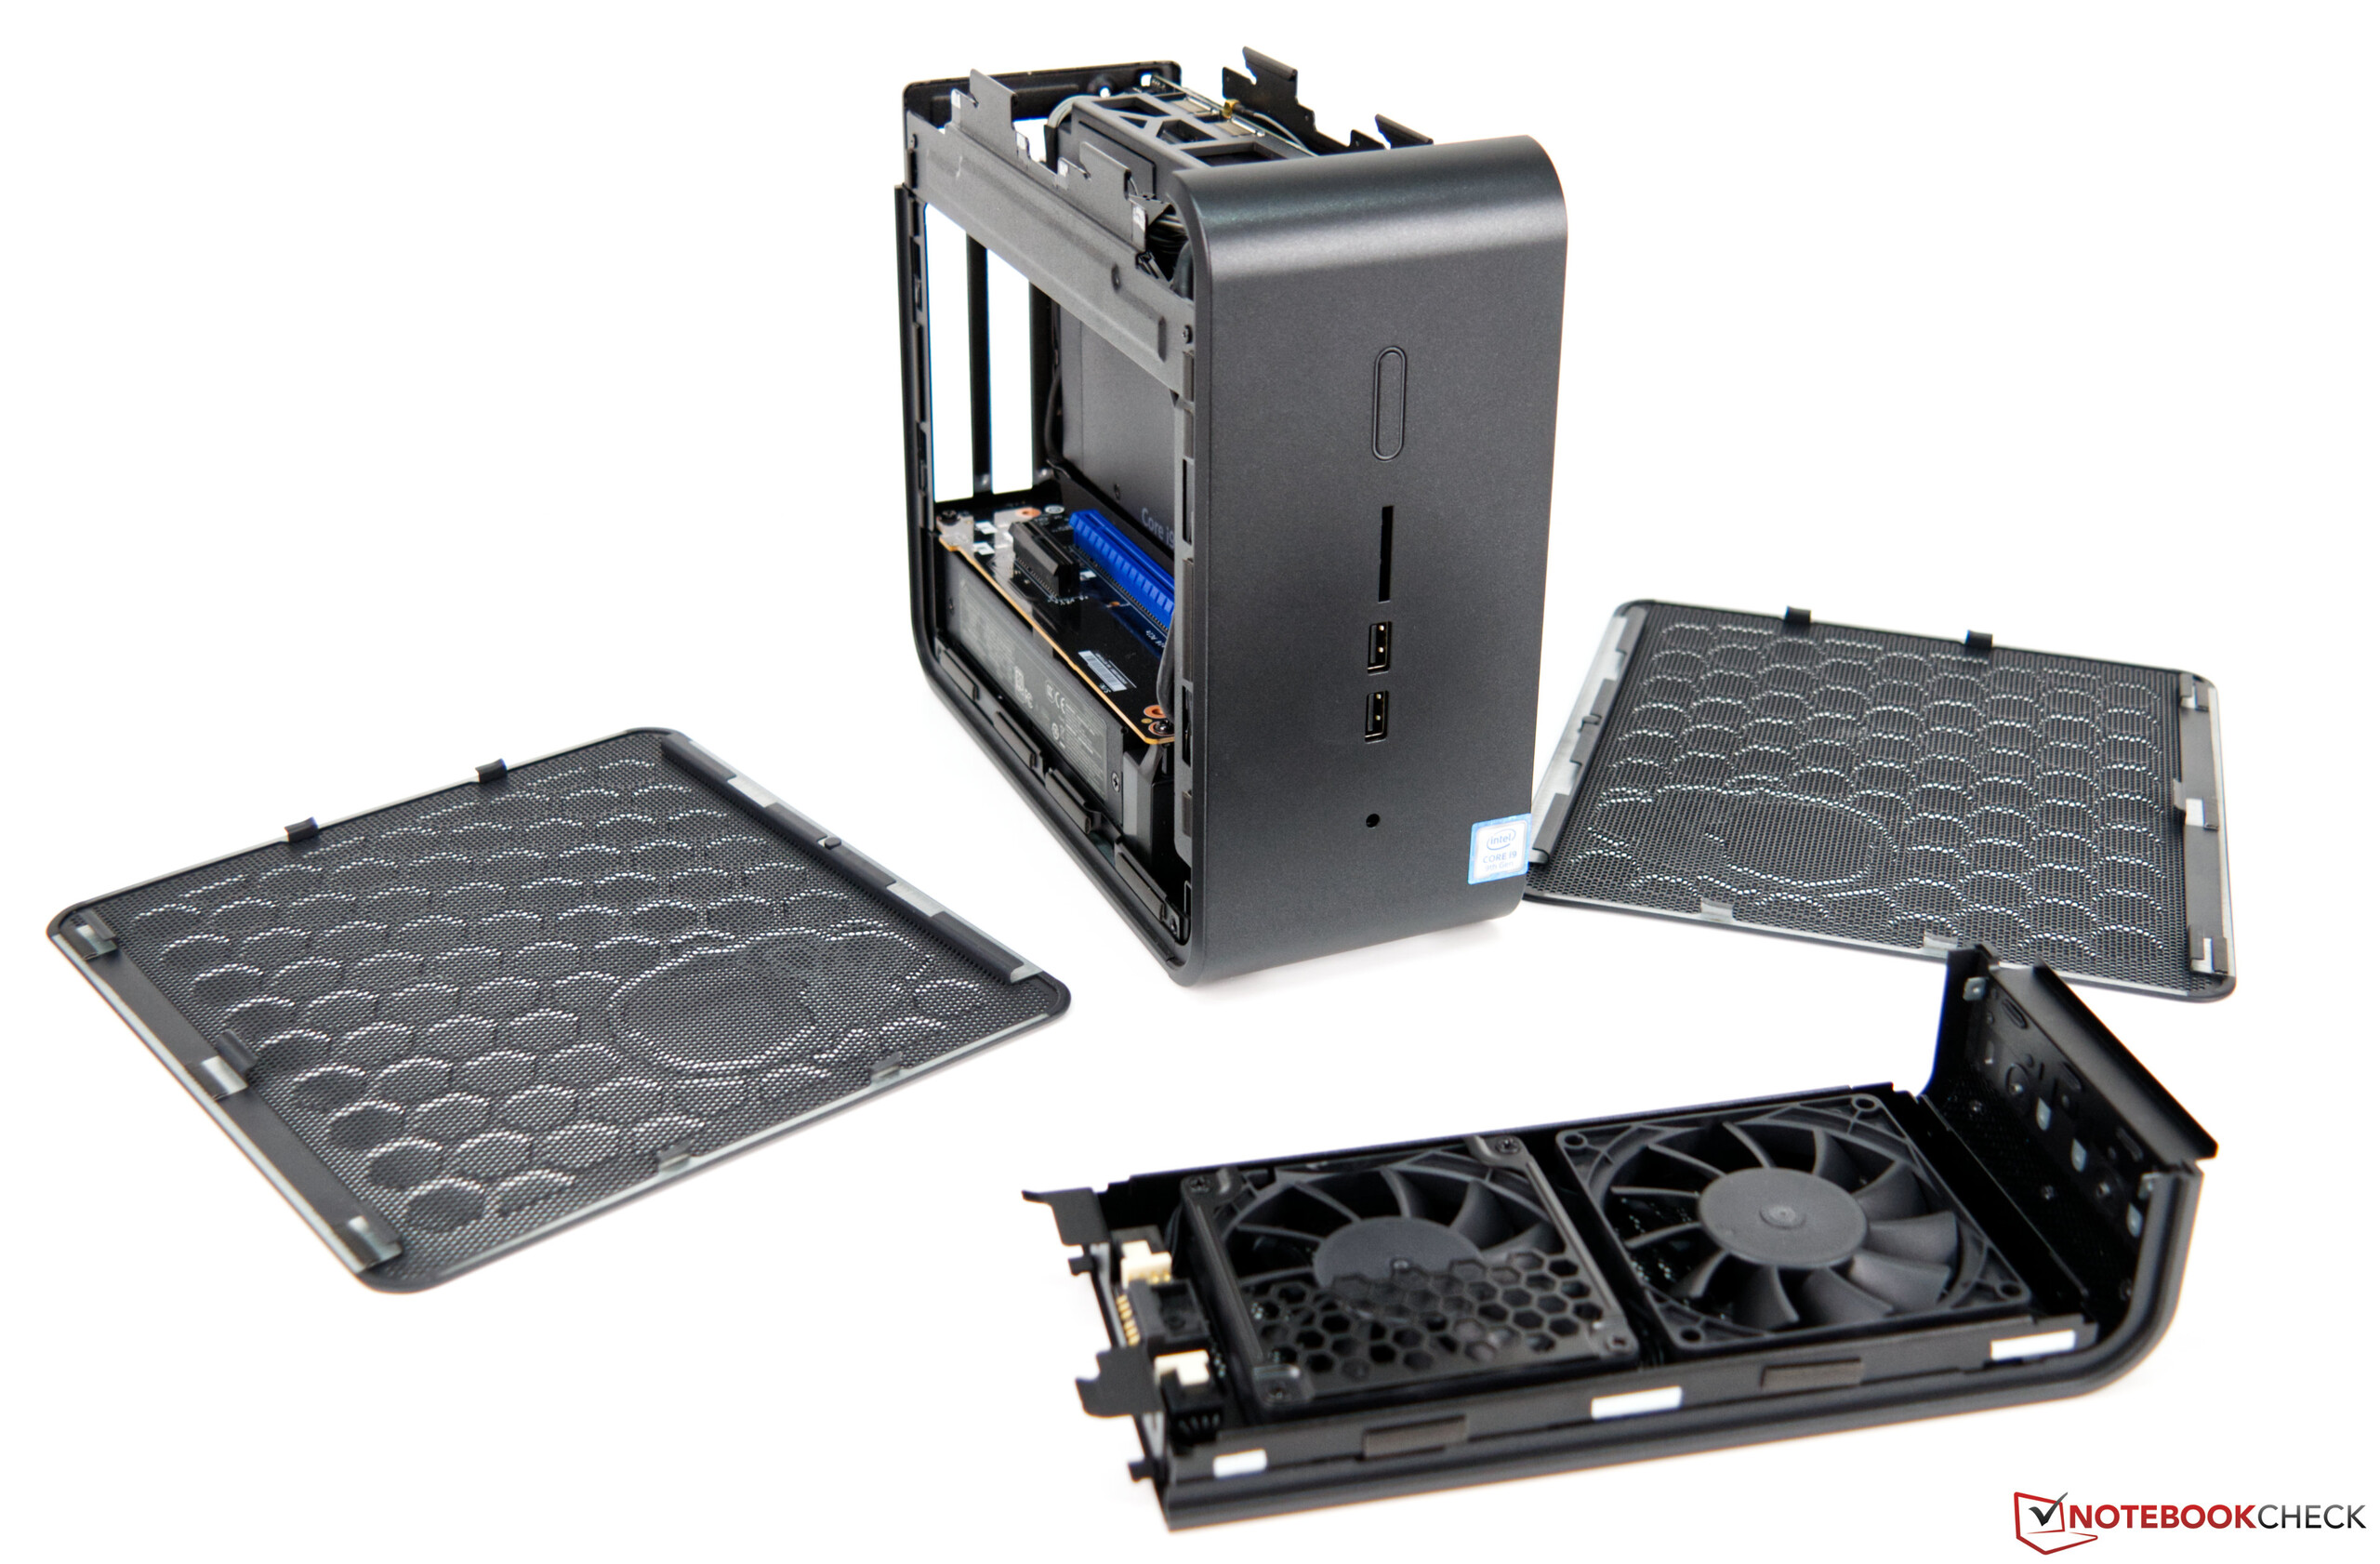
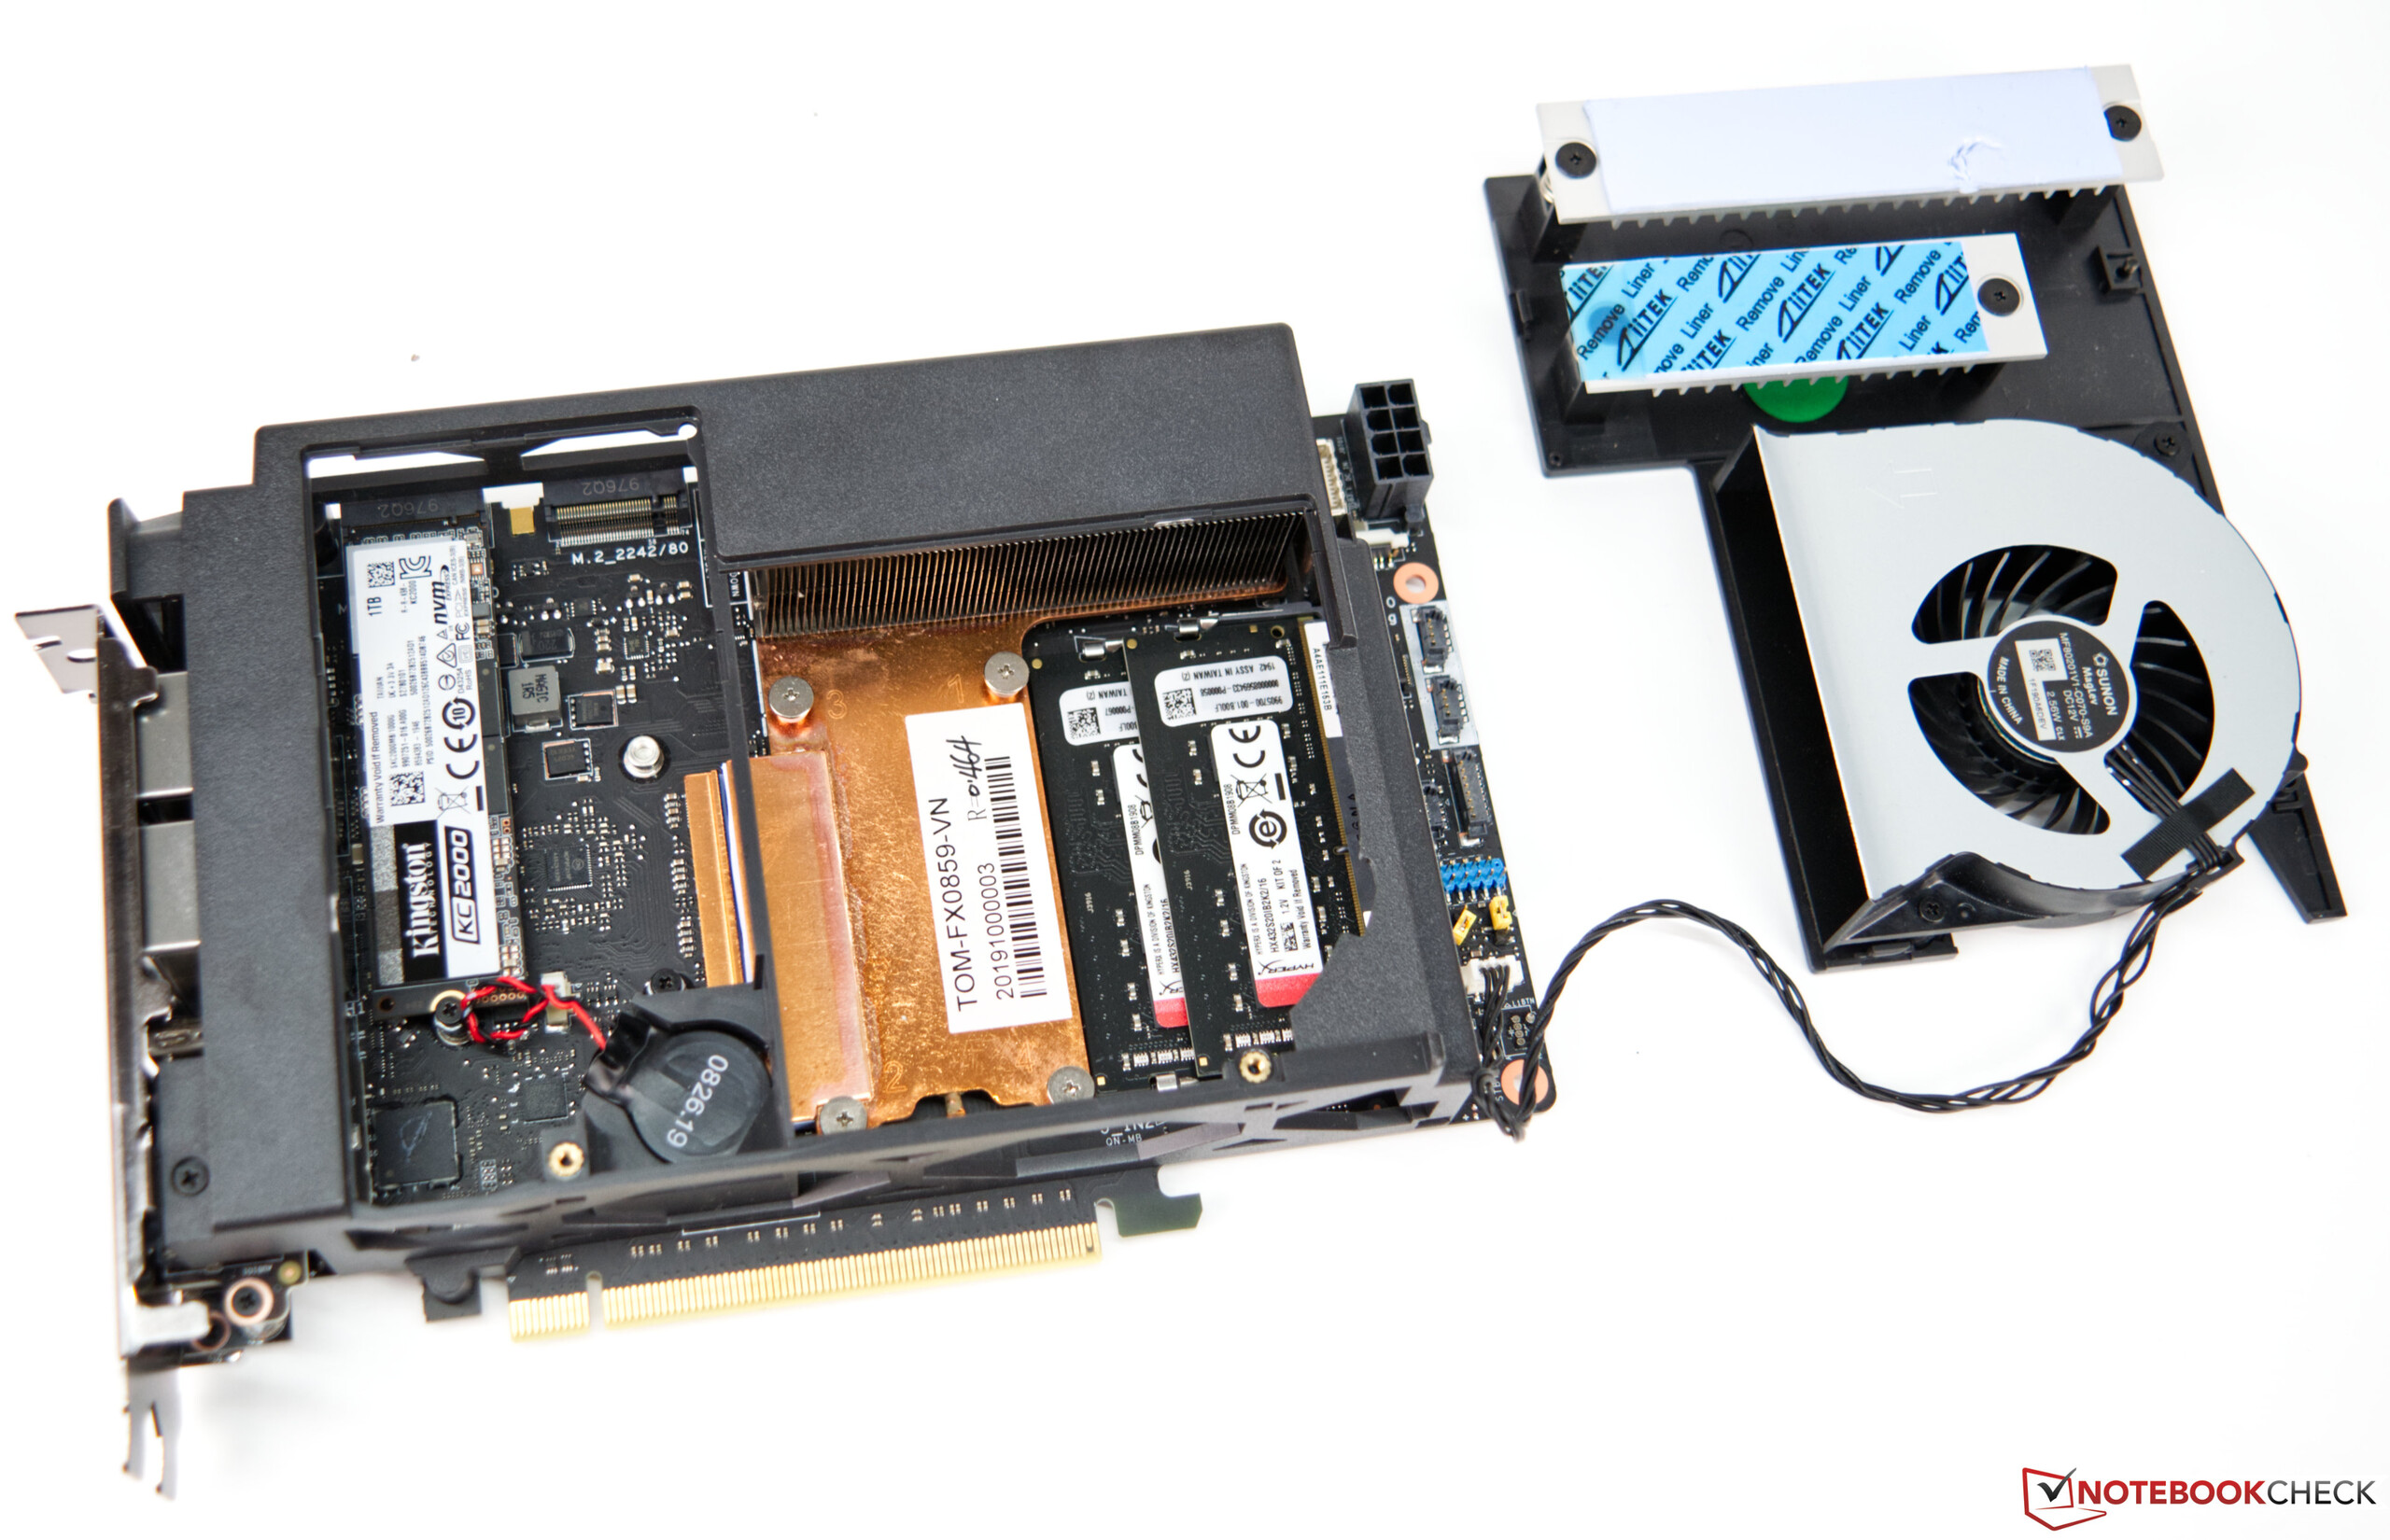
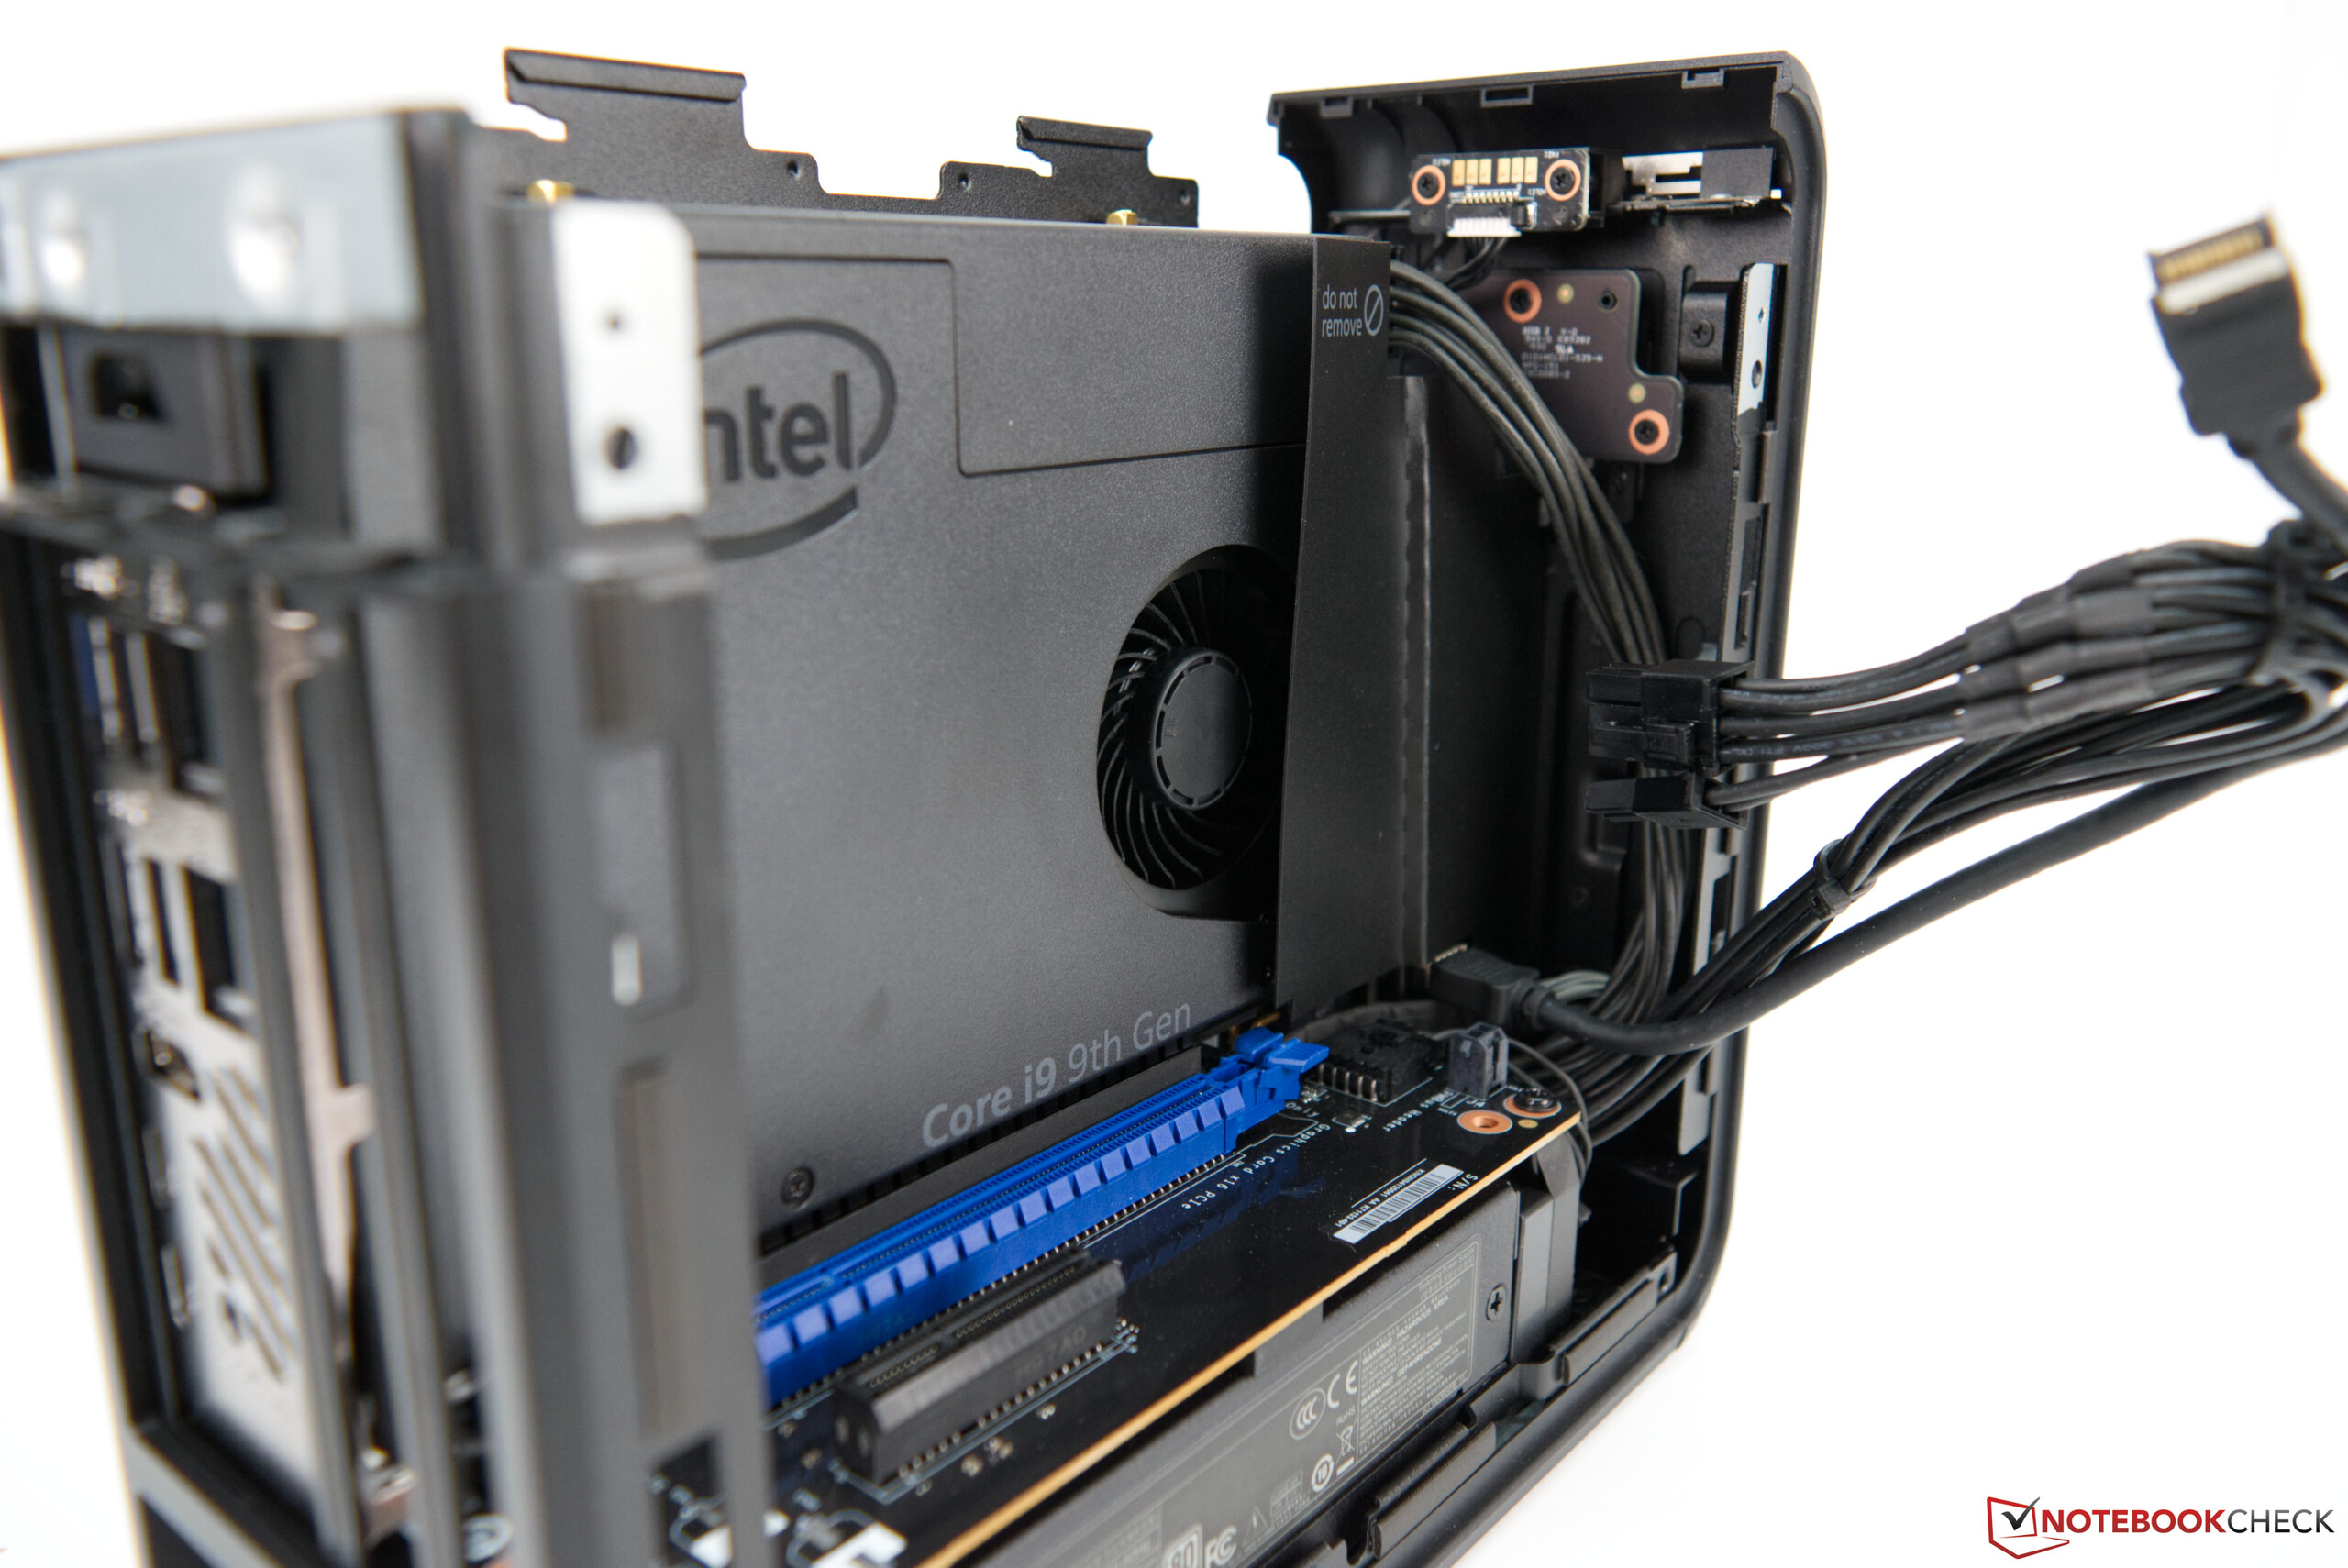
Se state pensando di acquistare questo dispositivo tenete presente che la RAM, lo storage e la scheda grafica dedicata sono opzionali e non sono inclusi nel NUC. Indipendentemente da ciò, la SKU dotata di Core i9-9980HK vi costerà quasi 1.700 dollari. In alternativa, il Ghost Canyon NUC può anche essere equipaggiato con un Intel Intel Core i5-9300H per circa $1.000, o un Intel Core i7-9750H per circa $1.300. In ogni caso sarà necessario aggiungere RAM e almeno un dispositivo di memorizzazione. Il computer in sé non è troppo complicato da smontare.

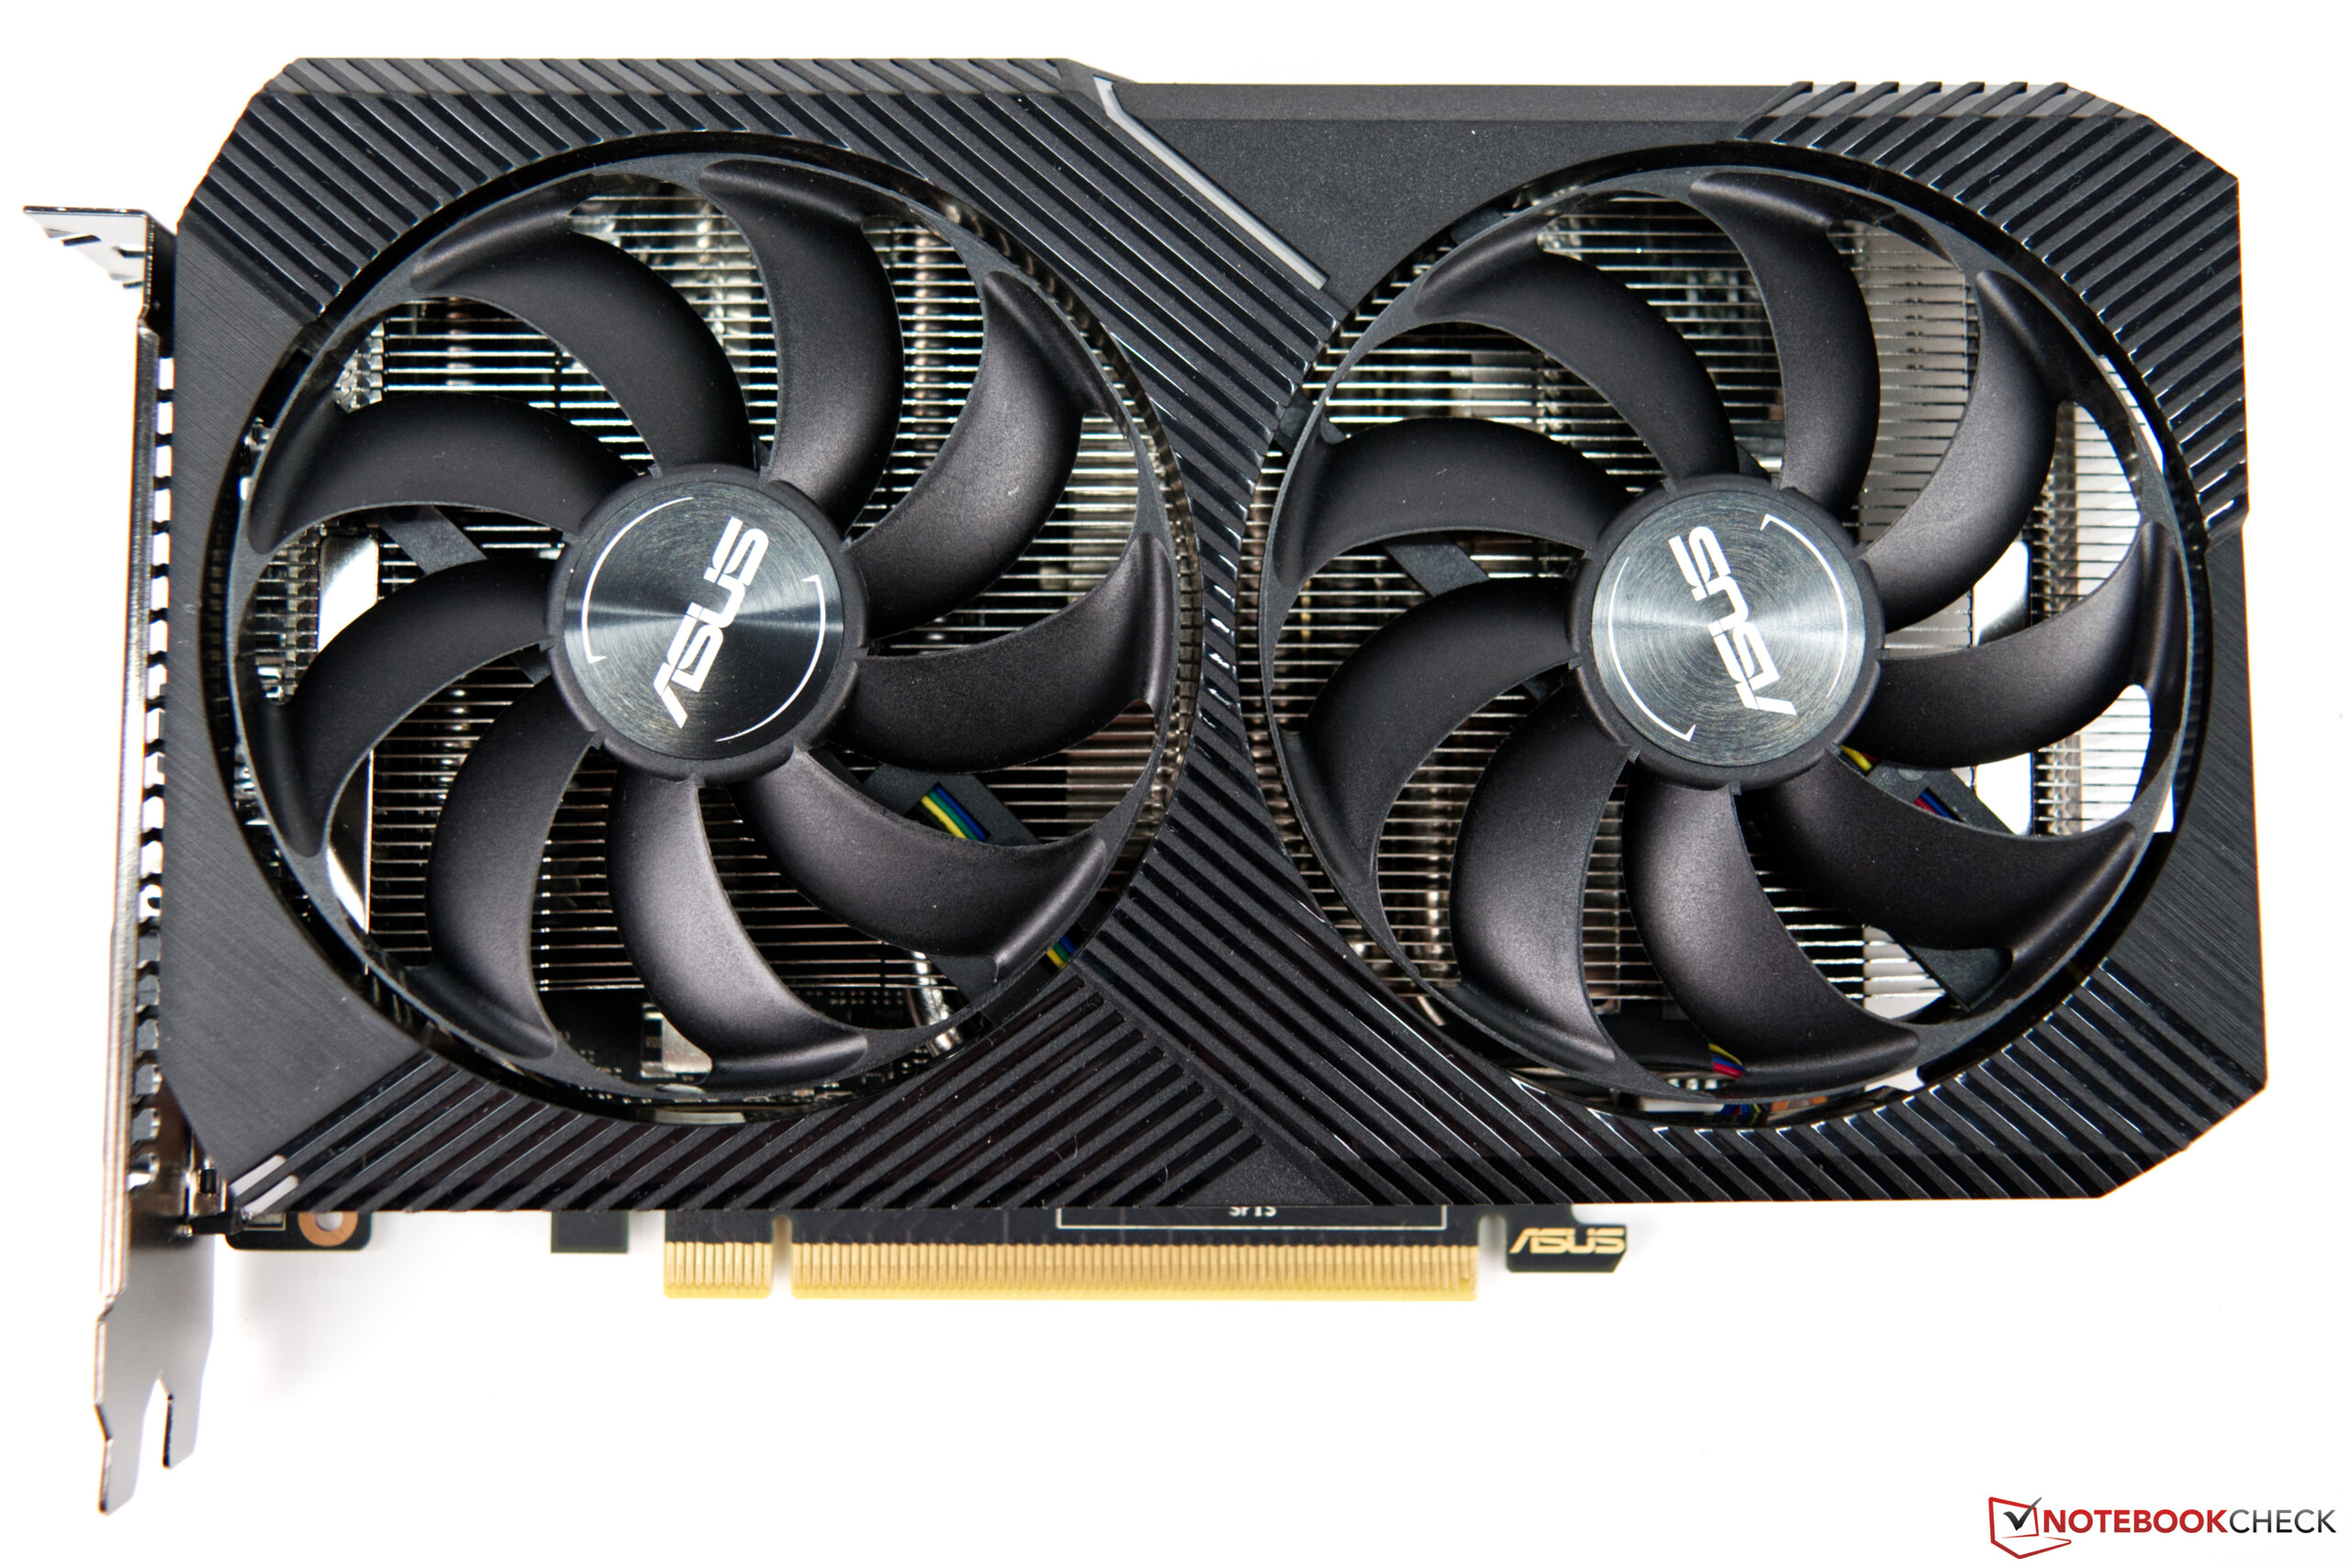
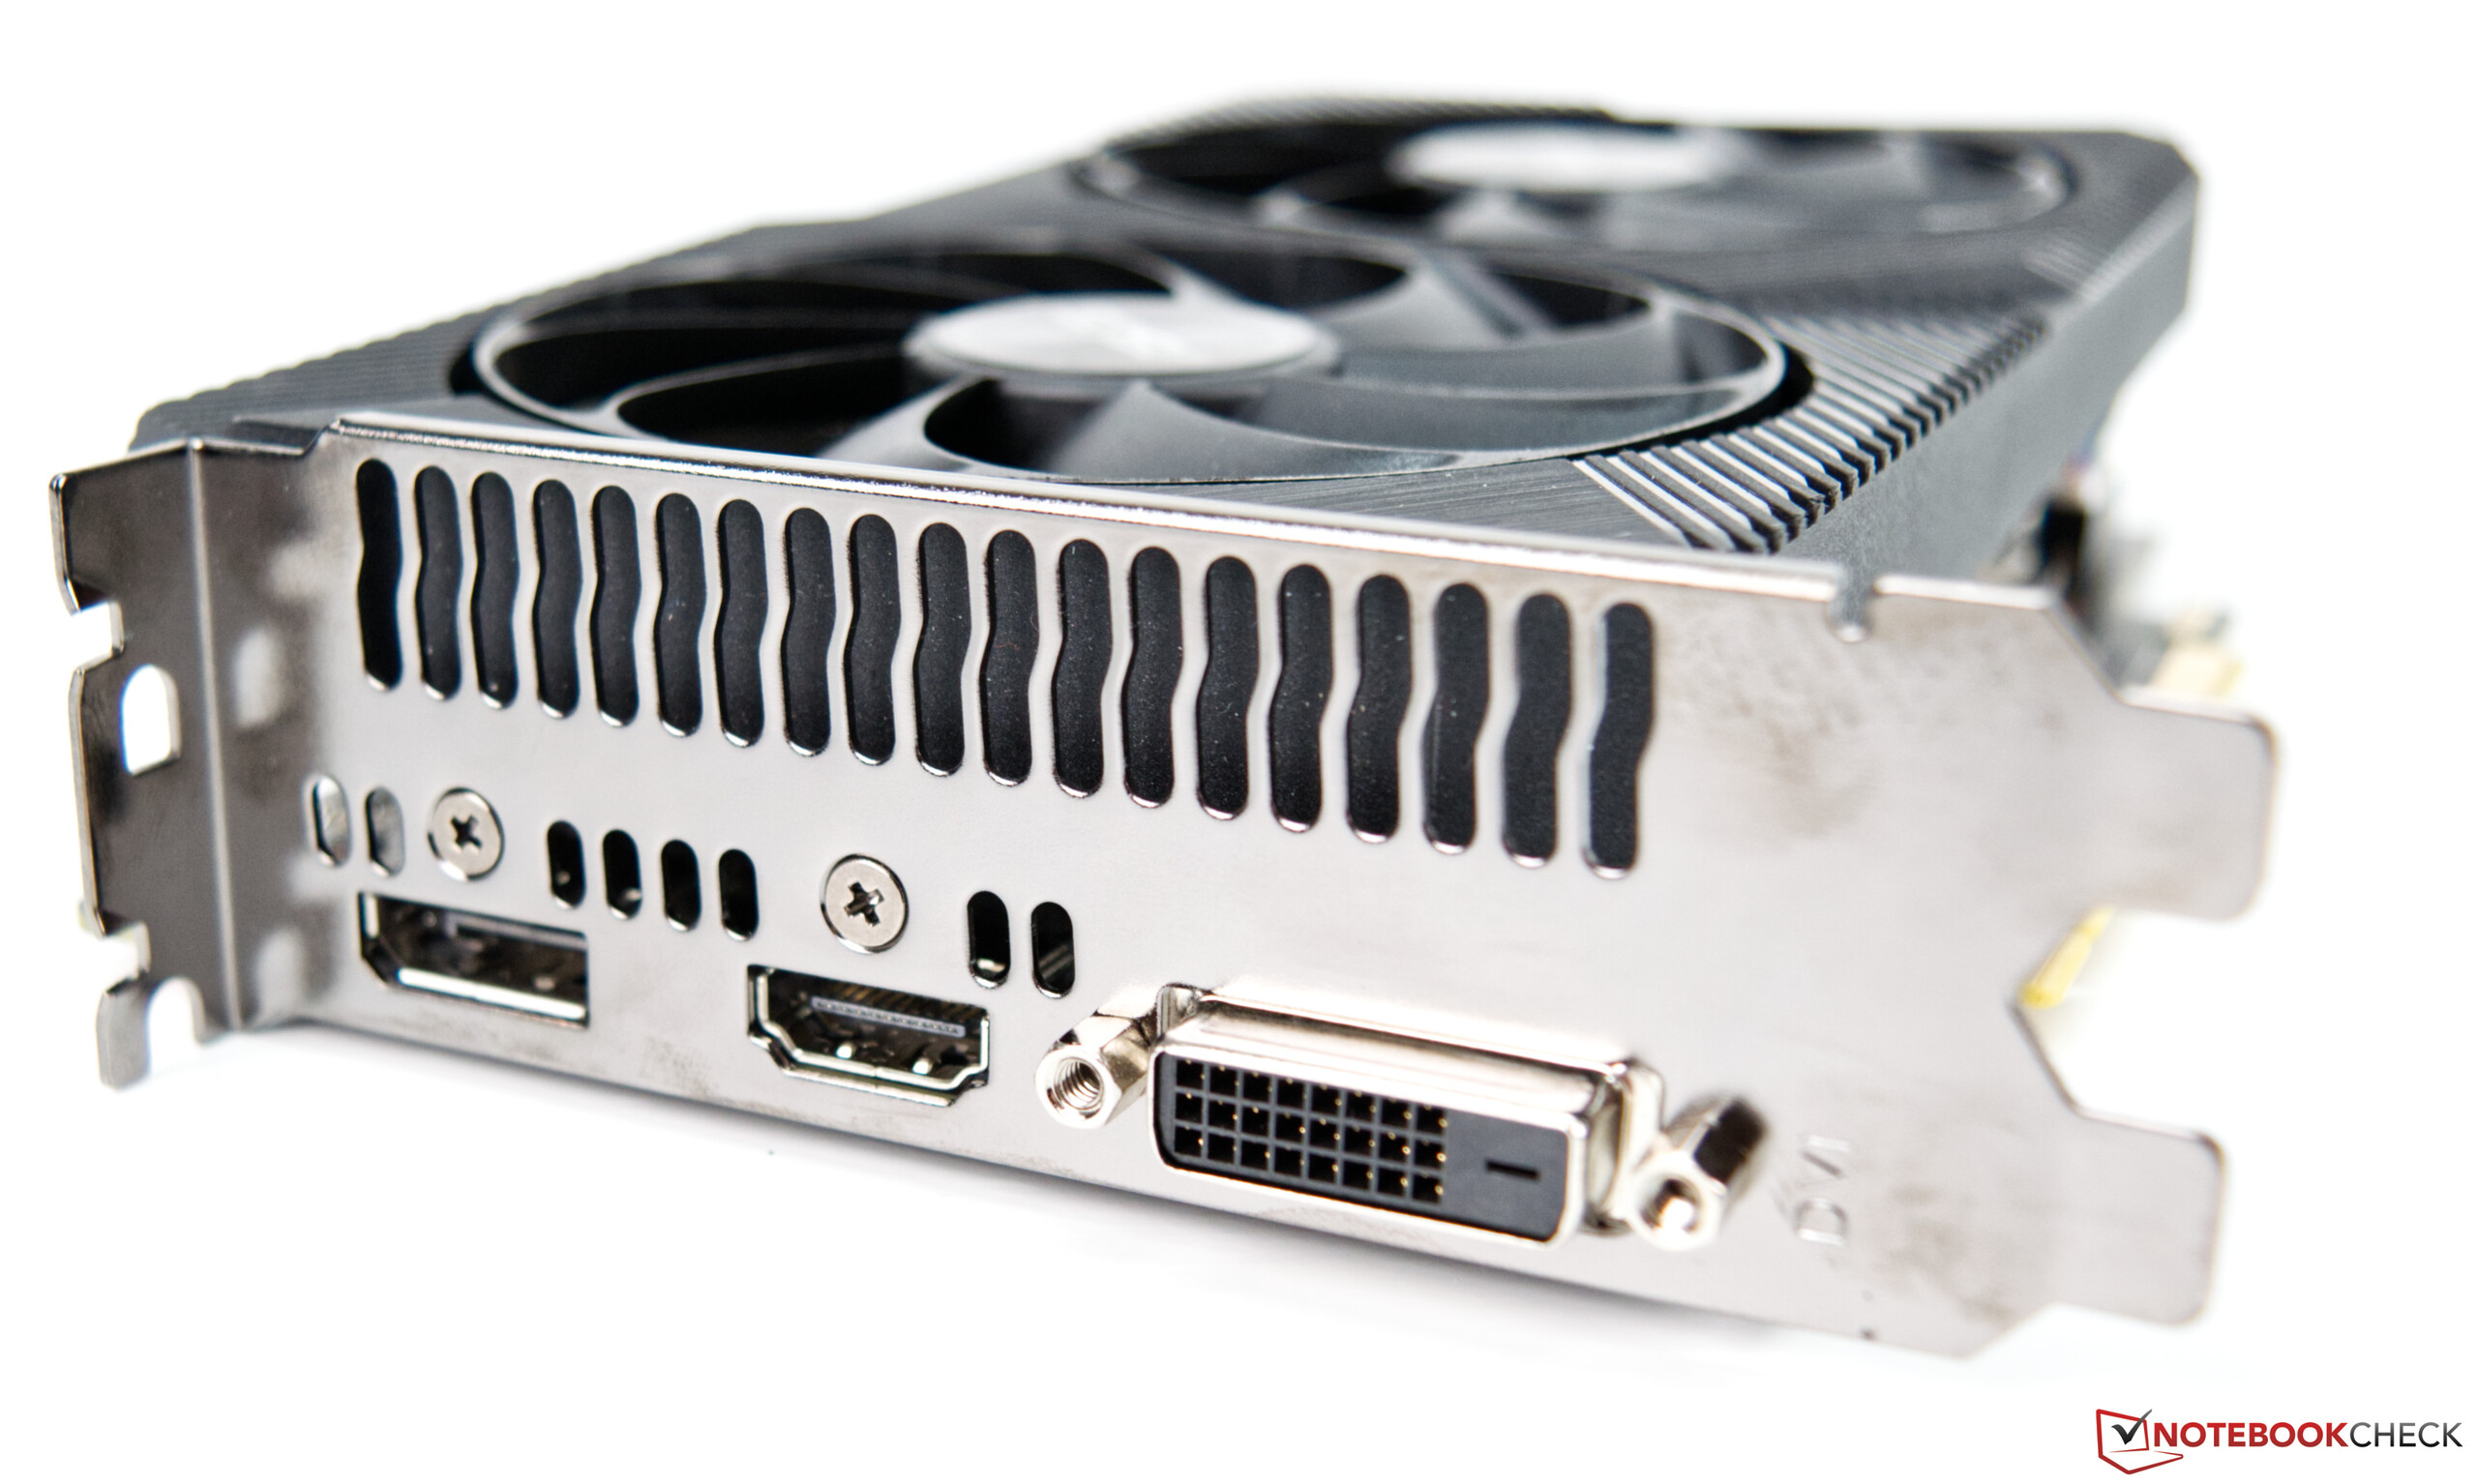
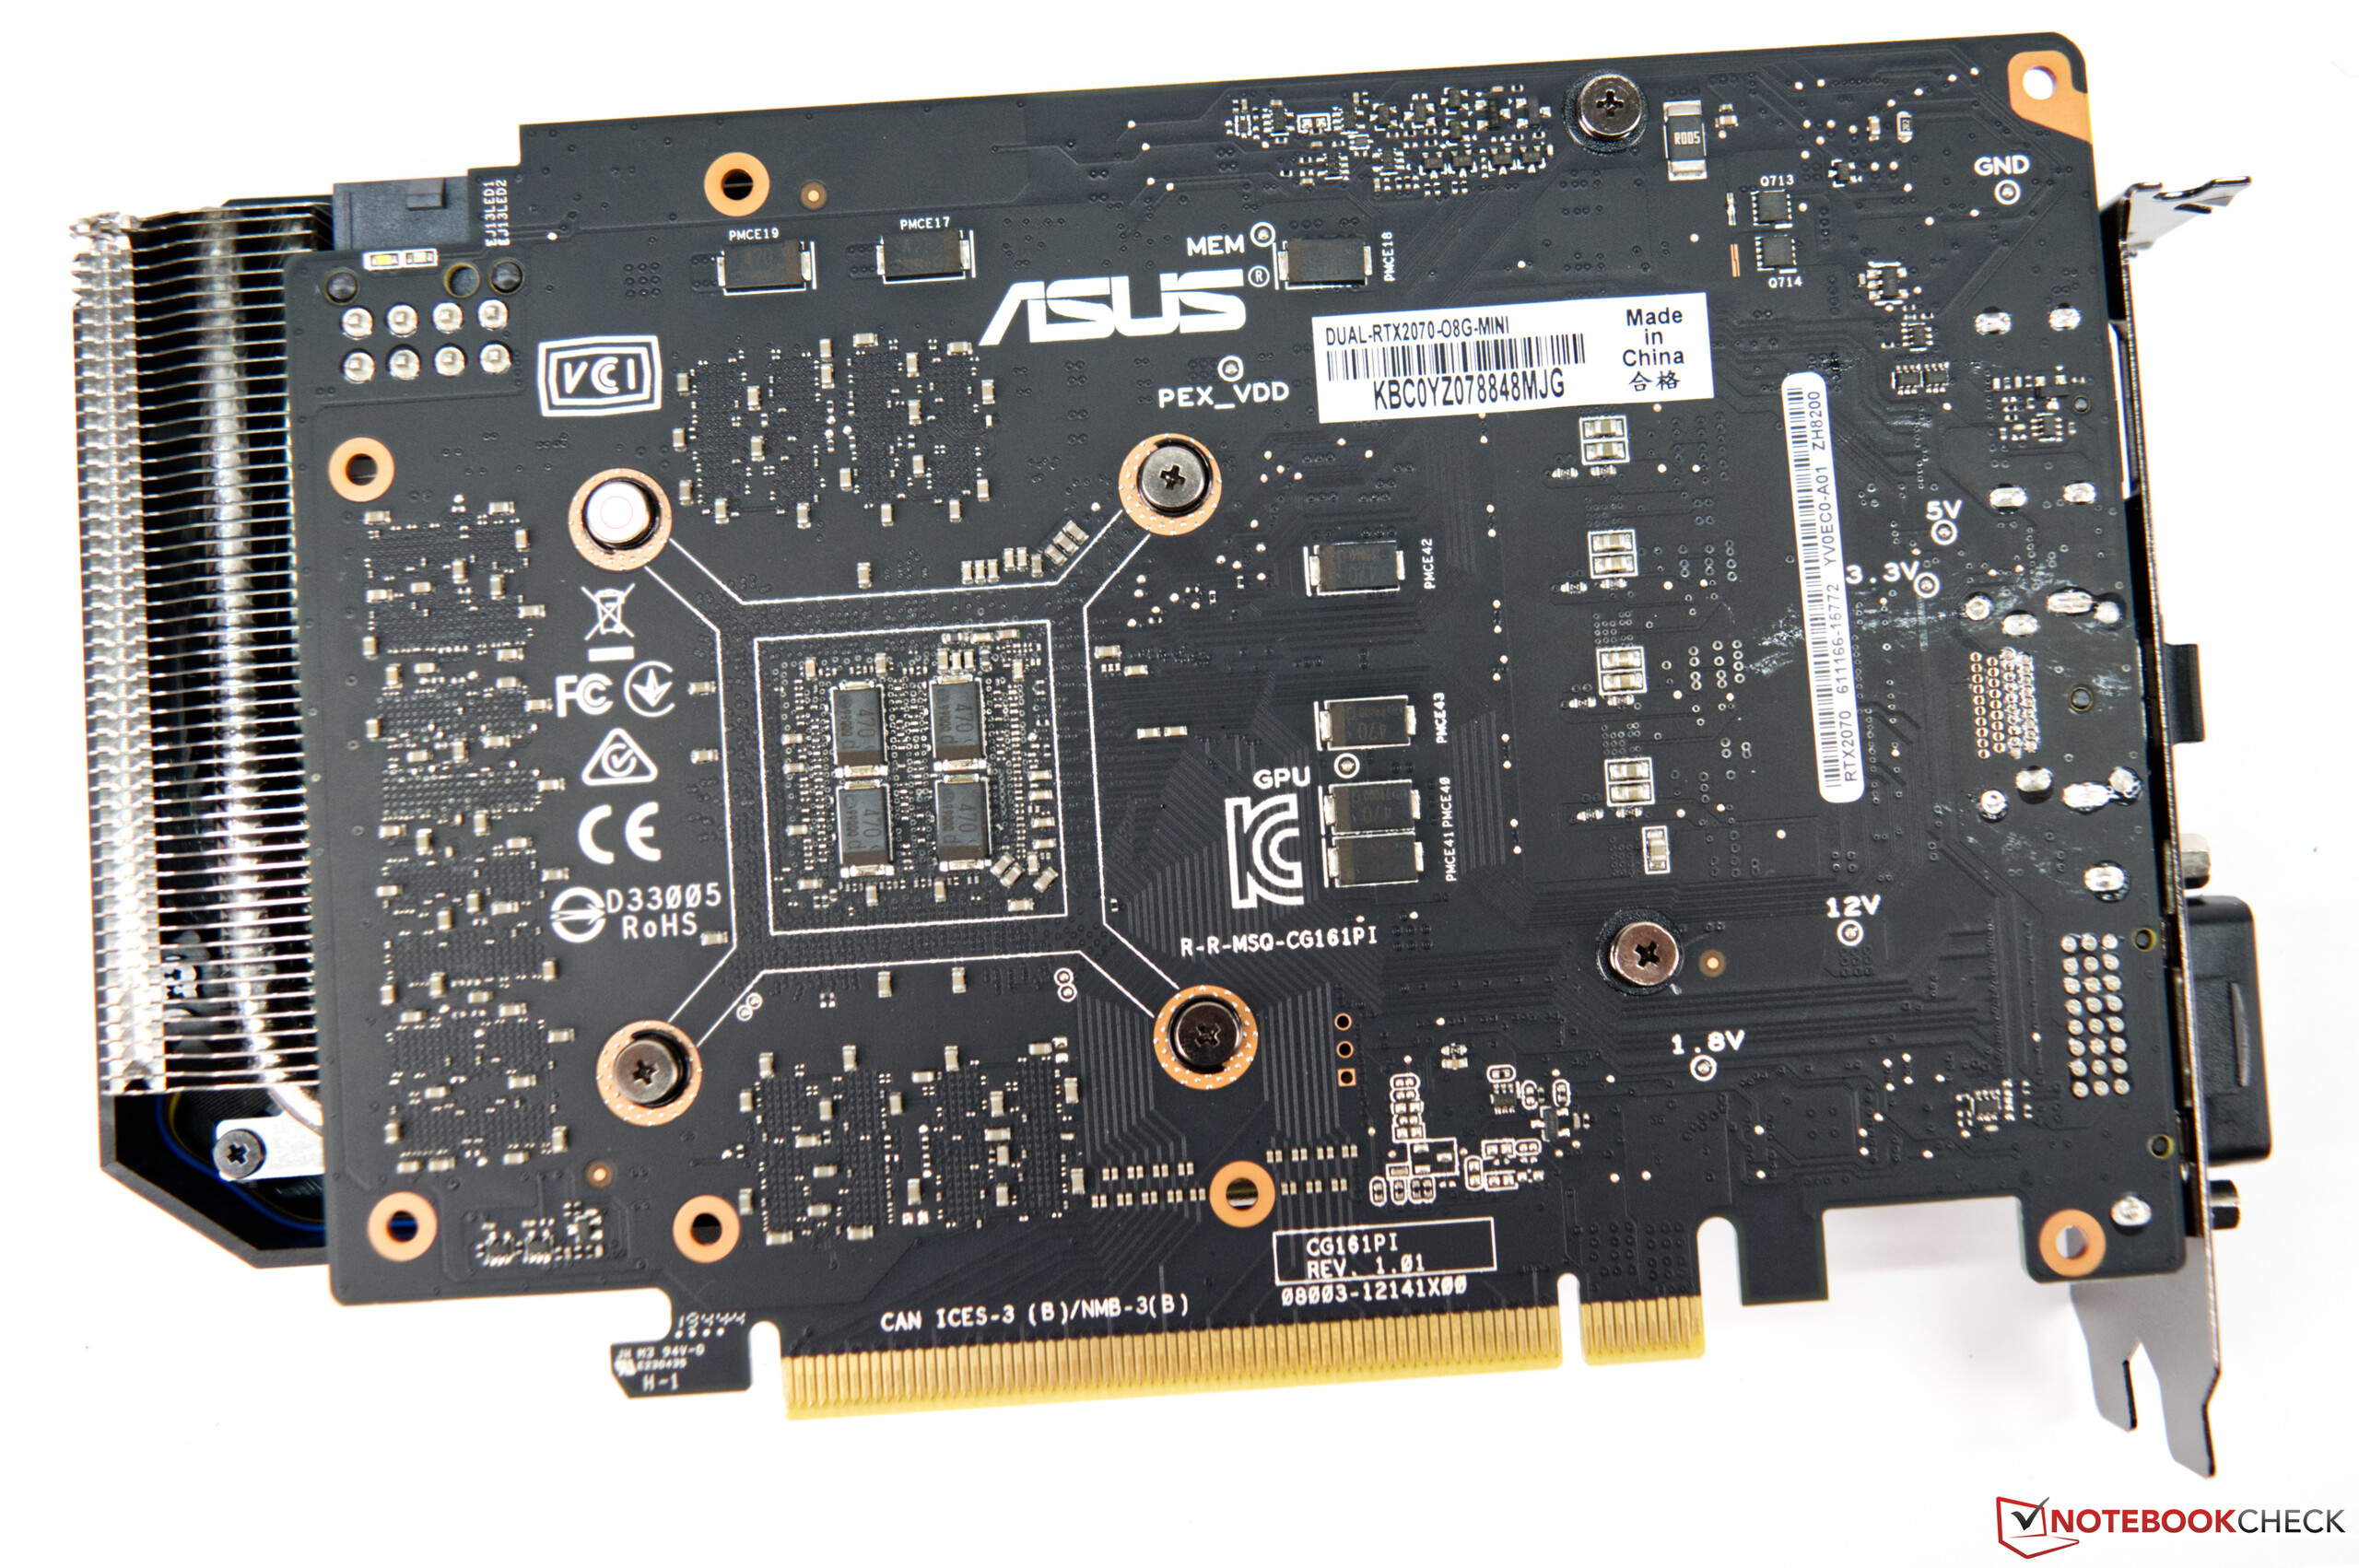
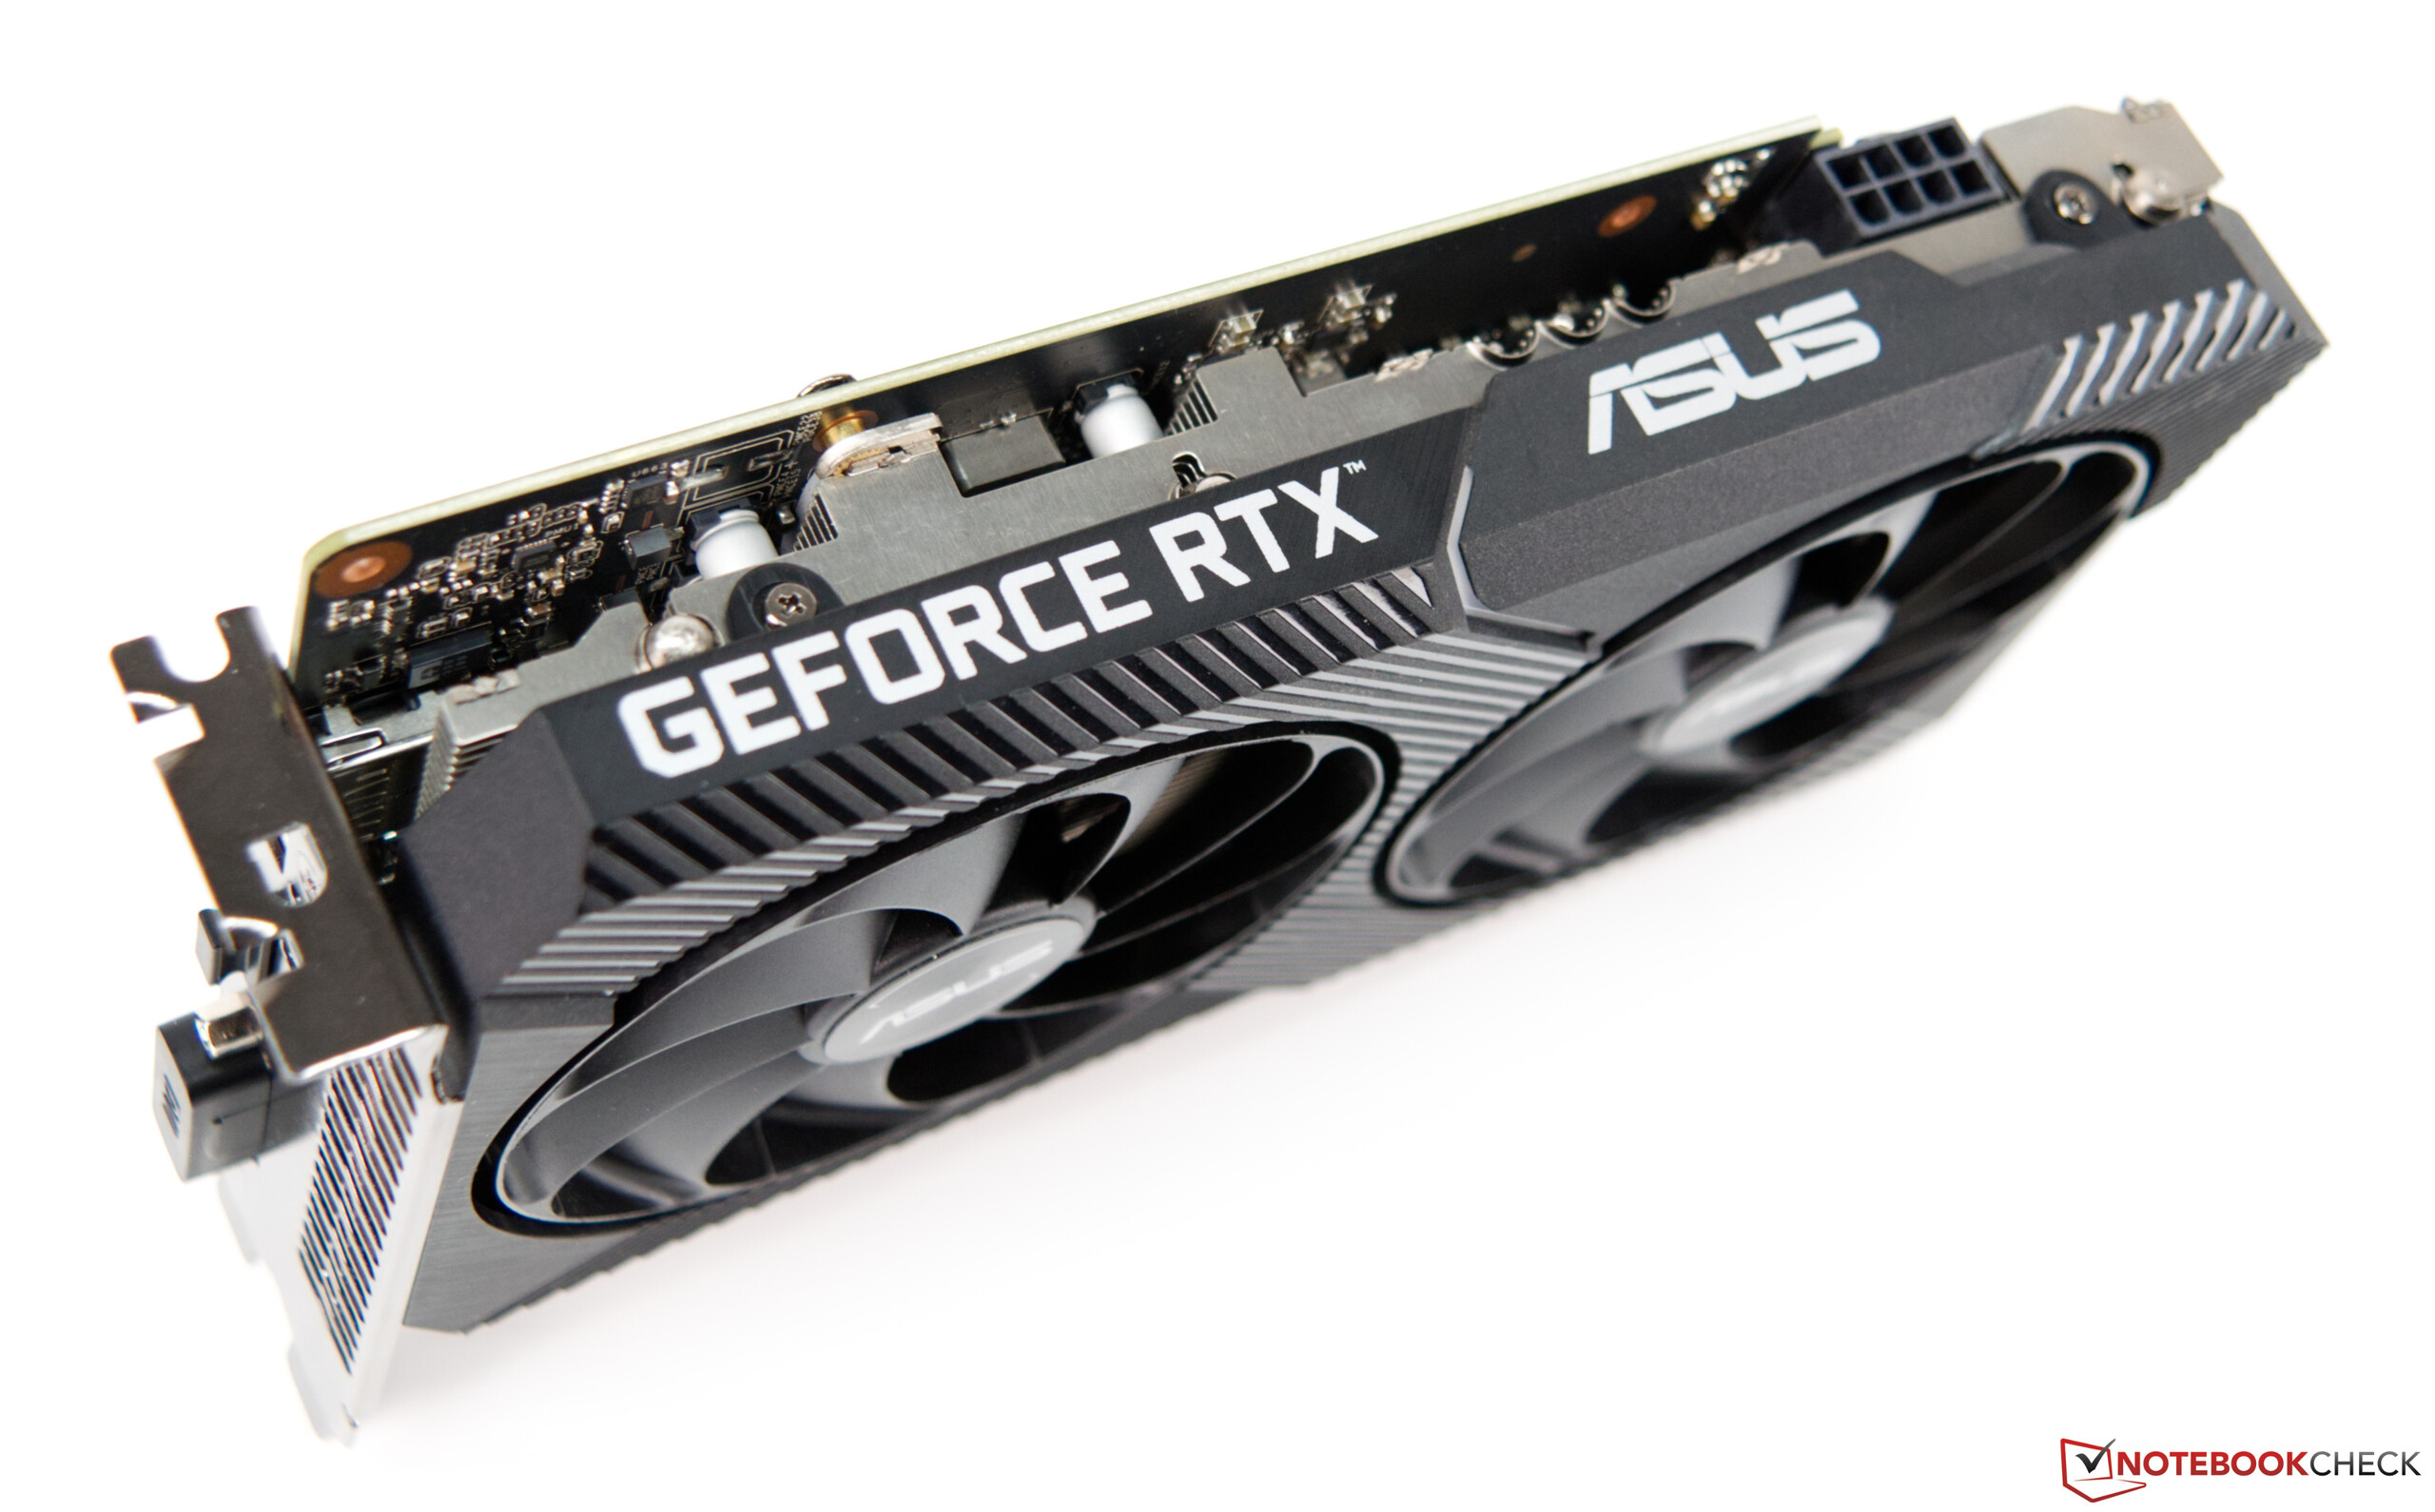
Se si vuole aggiungere anche una scheda grafica dedicata è necessario prestare particolare attenzione alle dimensioni. La nostra unità di test è stata equipaggiata con una GeForce RTX 2070 in miniatura di Asus. Intel ha una lista di compatibilità con Ghost Canyon NUC.

Intel NUC 9 Extreme Kit
Intel NUC 9 Extreme Kit mit GeForce RTX 2070
Intel NUC 9 Extreme Kit
Intel NUC 9 Extreme Kit Compute Elementi
Intel NUC 9 Extreme Kit Compute Element
Intel NUC 9 Extreme Kit Compute Elementi
Intel NUC 9 Extreme Kit Modulo WLAN
Intel NUC 9 Extreme Kit Compute Elementi (dissipatore)
Intel NUC 9 Extreme Kit
Asus GeForce RTX 2070 Mini
Intel NUC 9 Extreme Kit

Intel NUC 9 Extreme in dettaglio

Intel NUC 9 Extreme Kit Compute Elementi

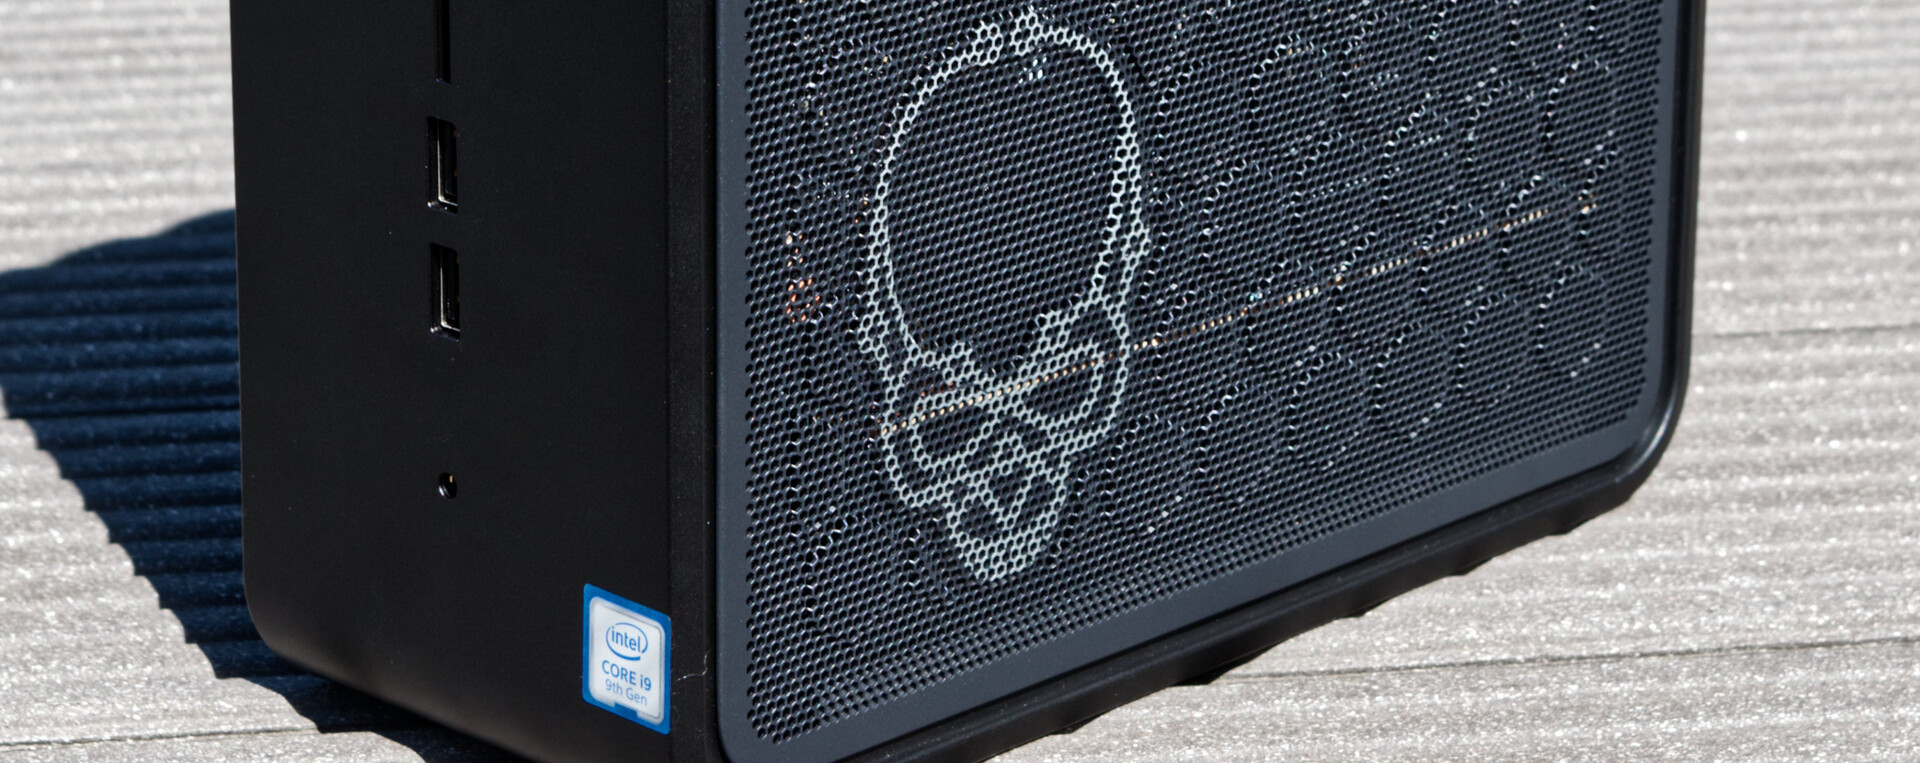
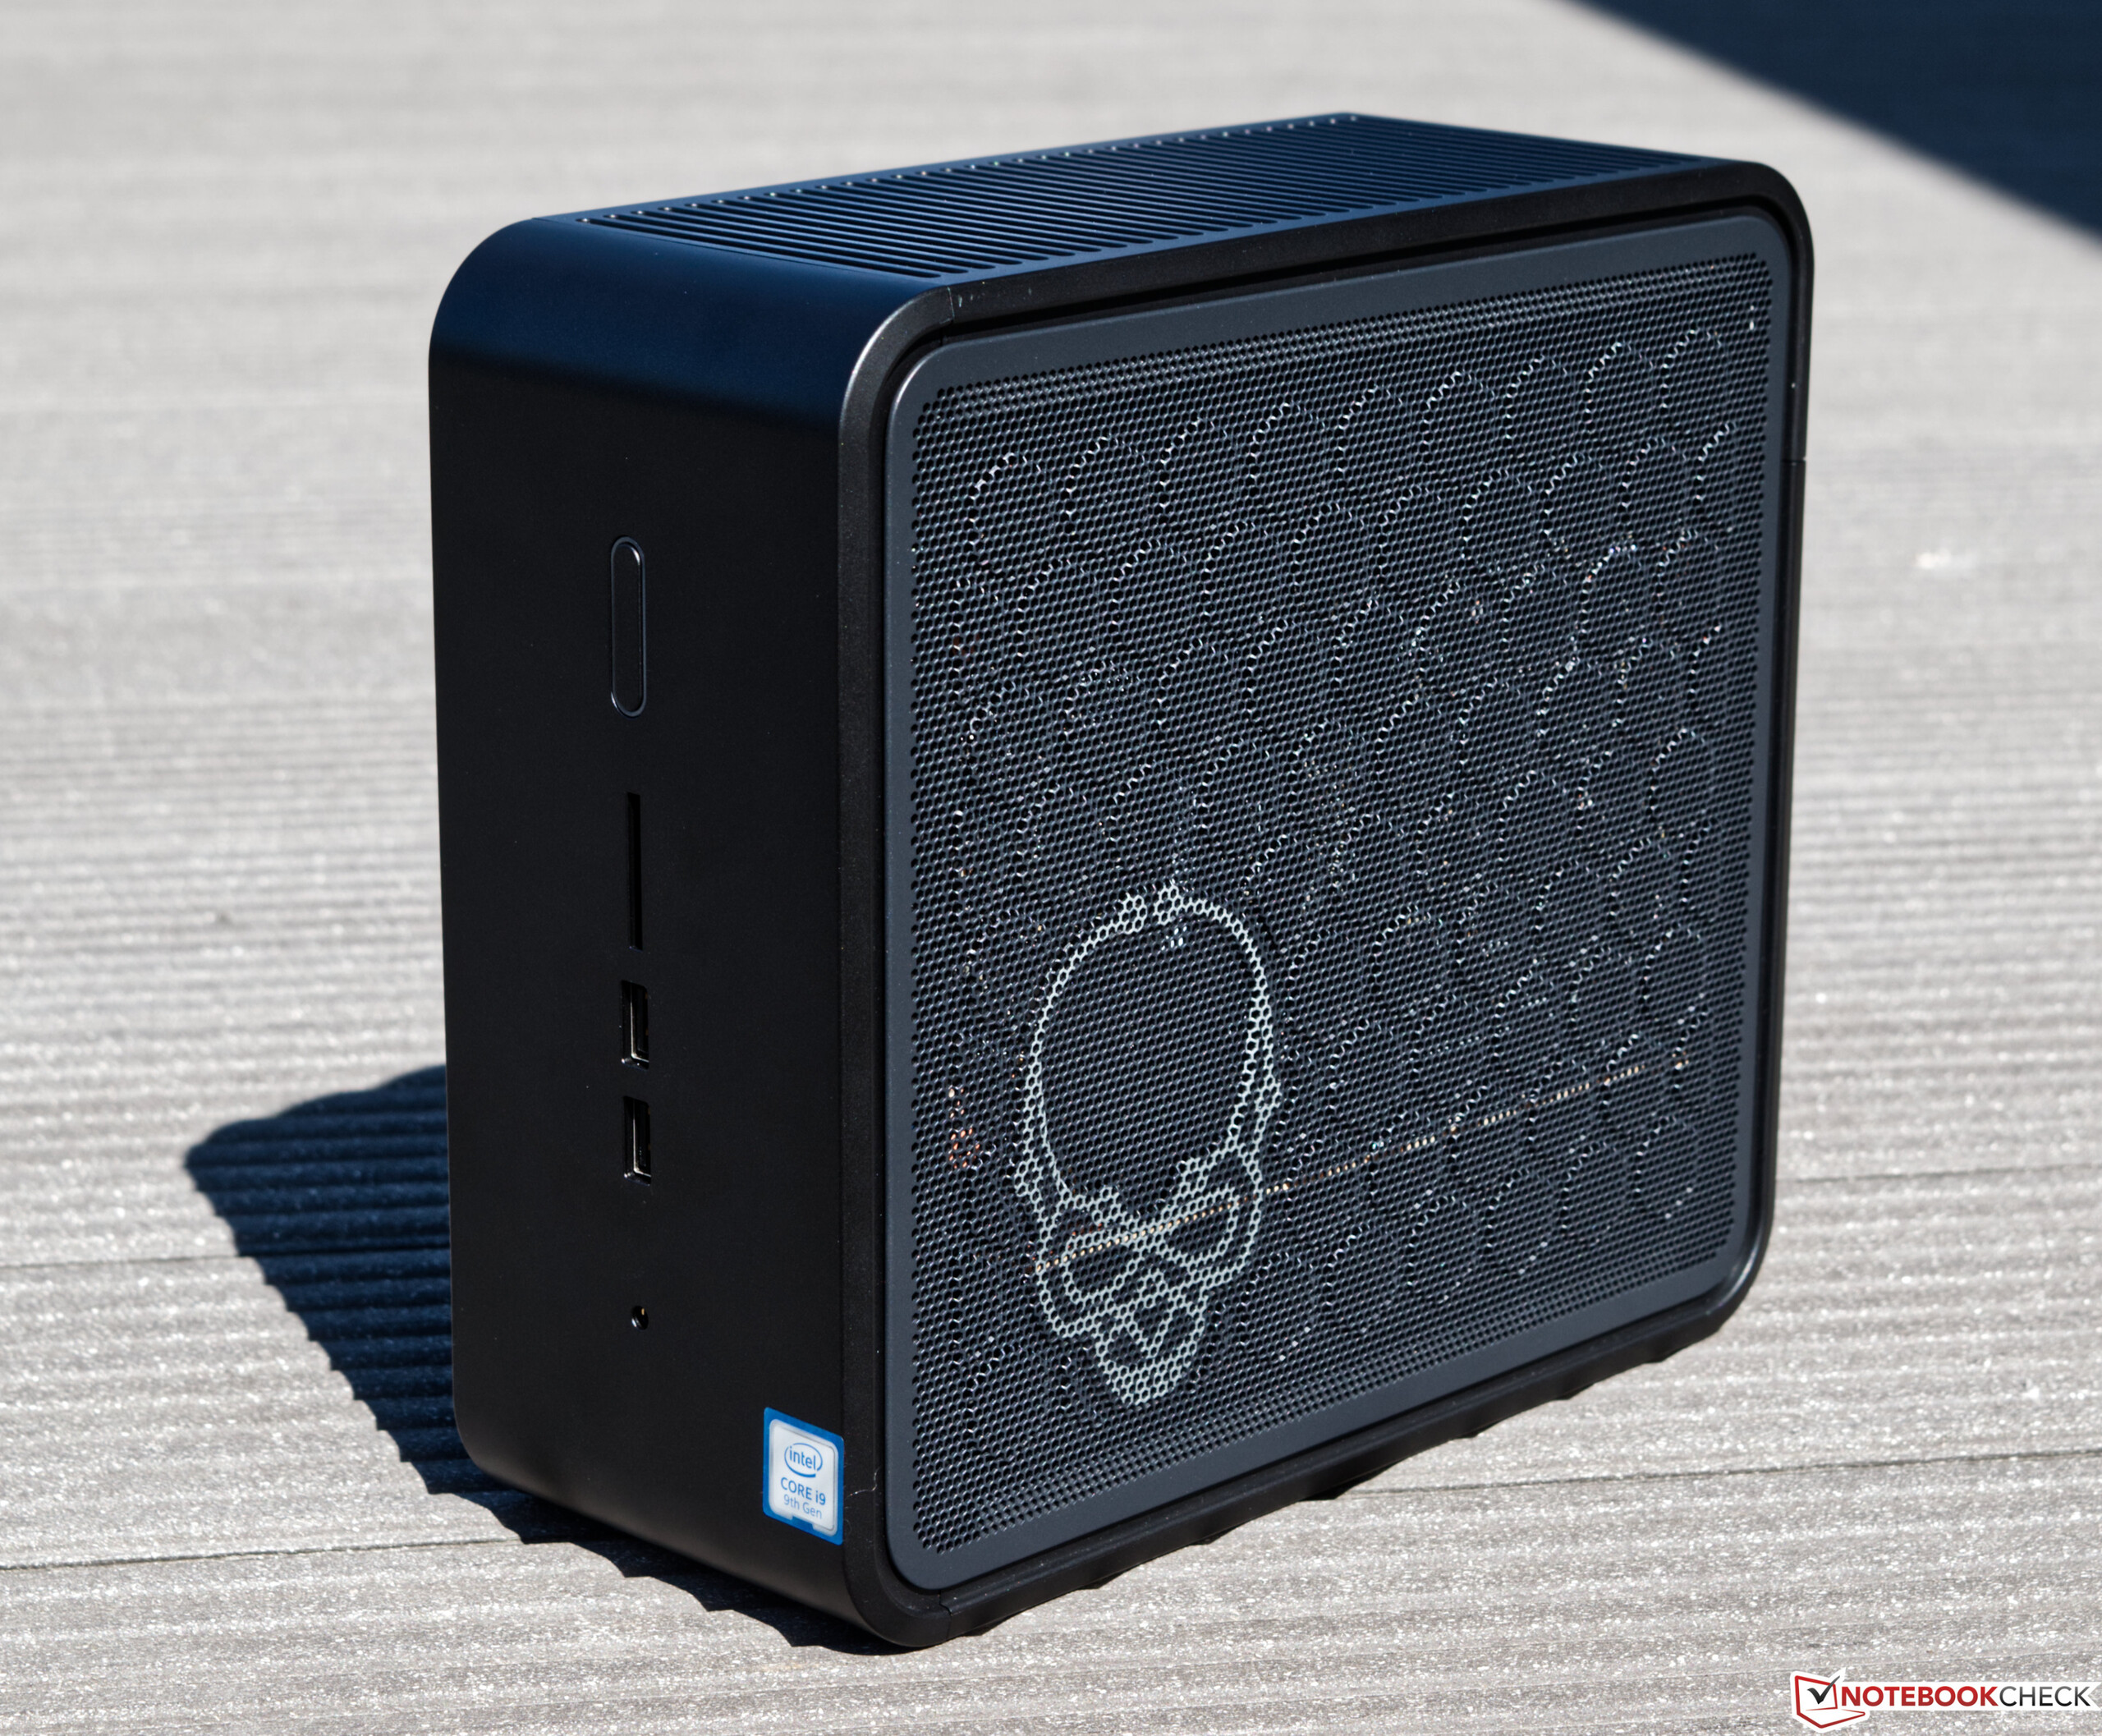
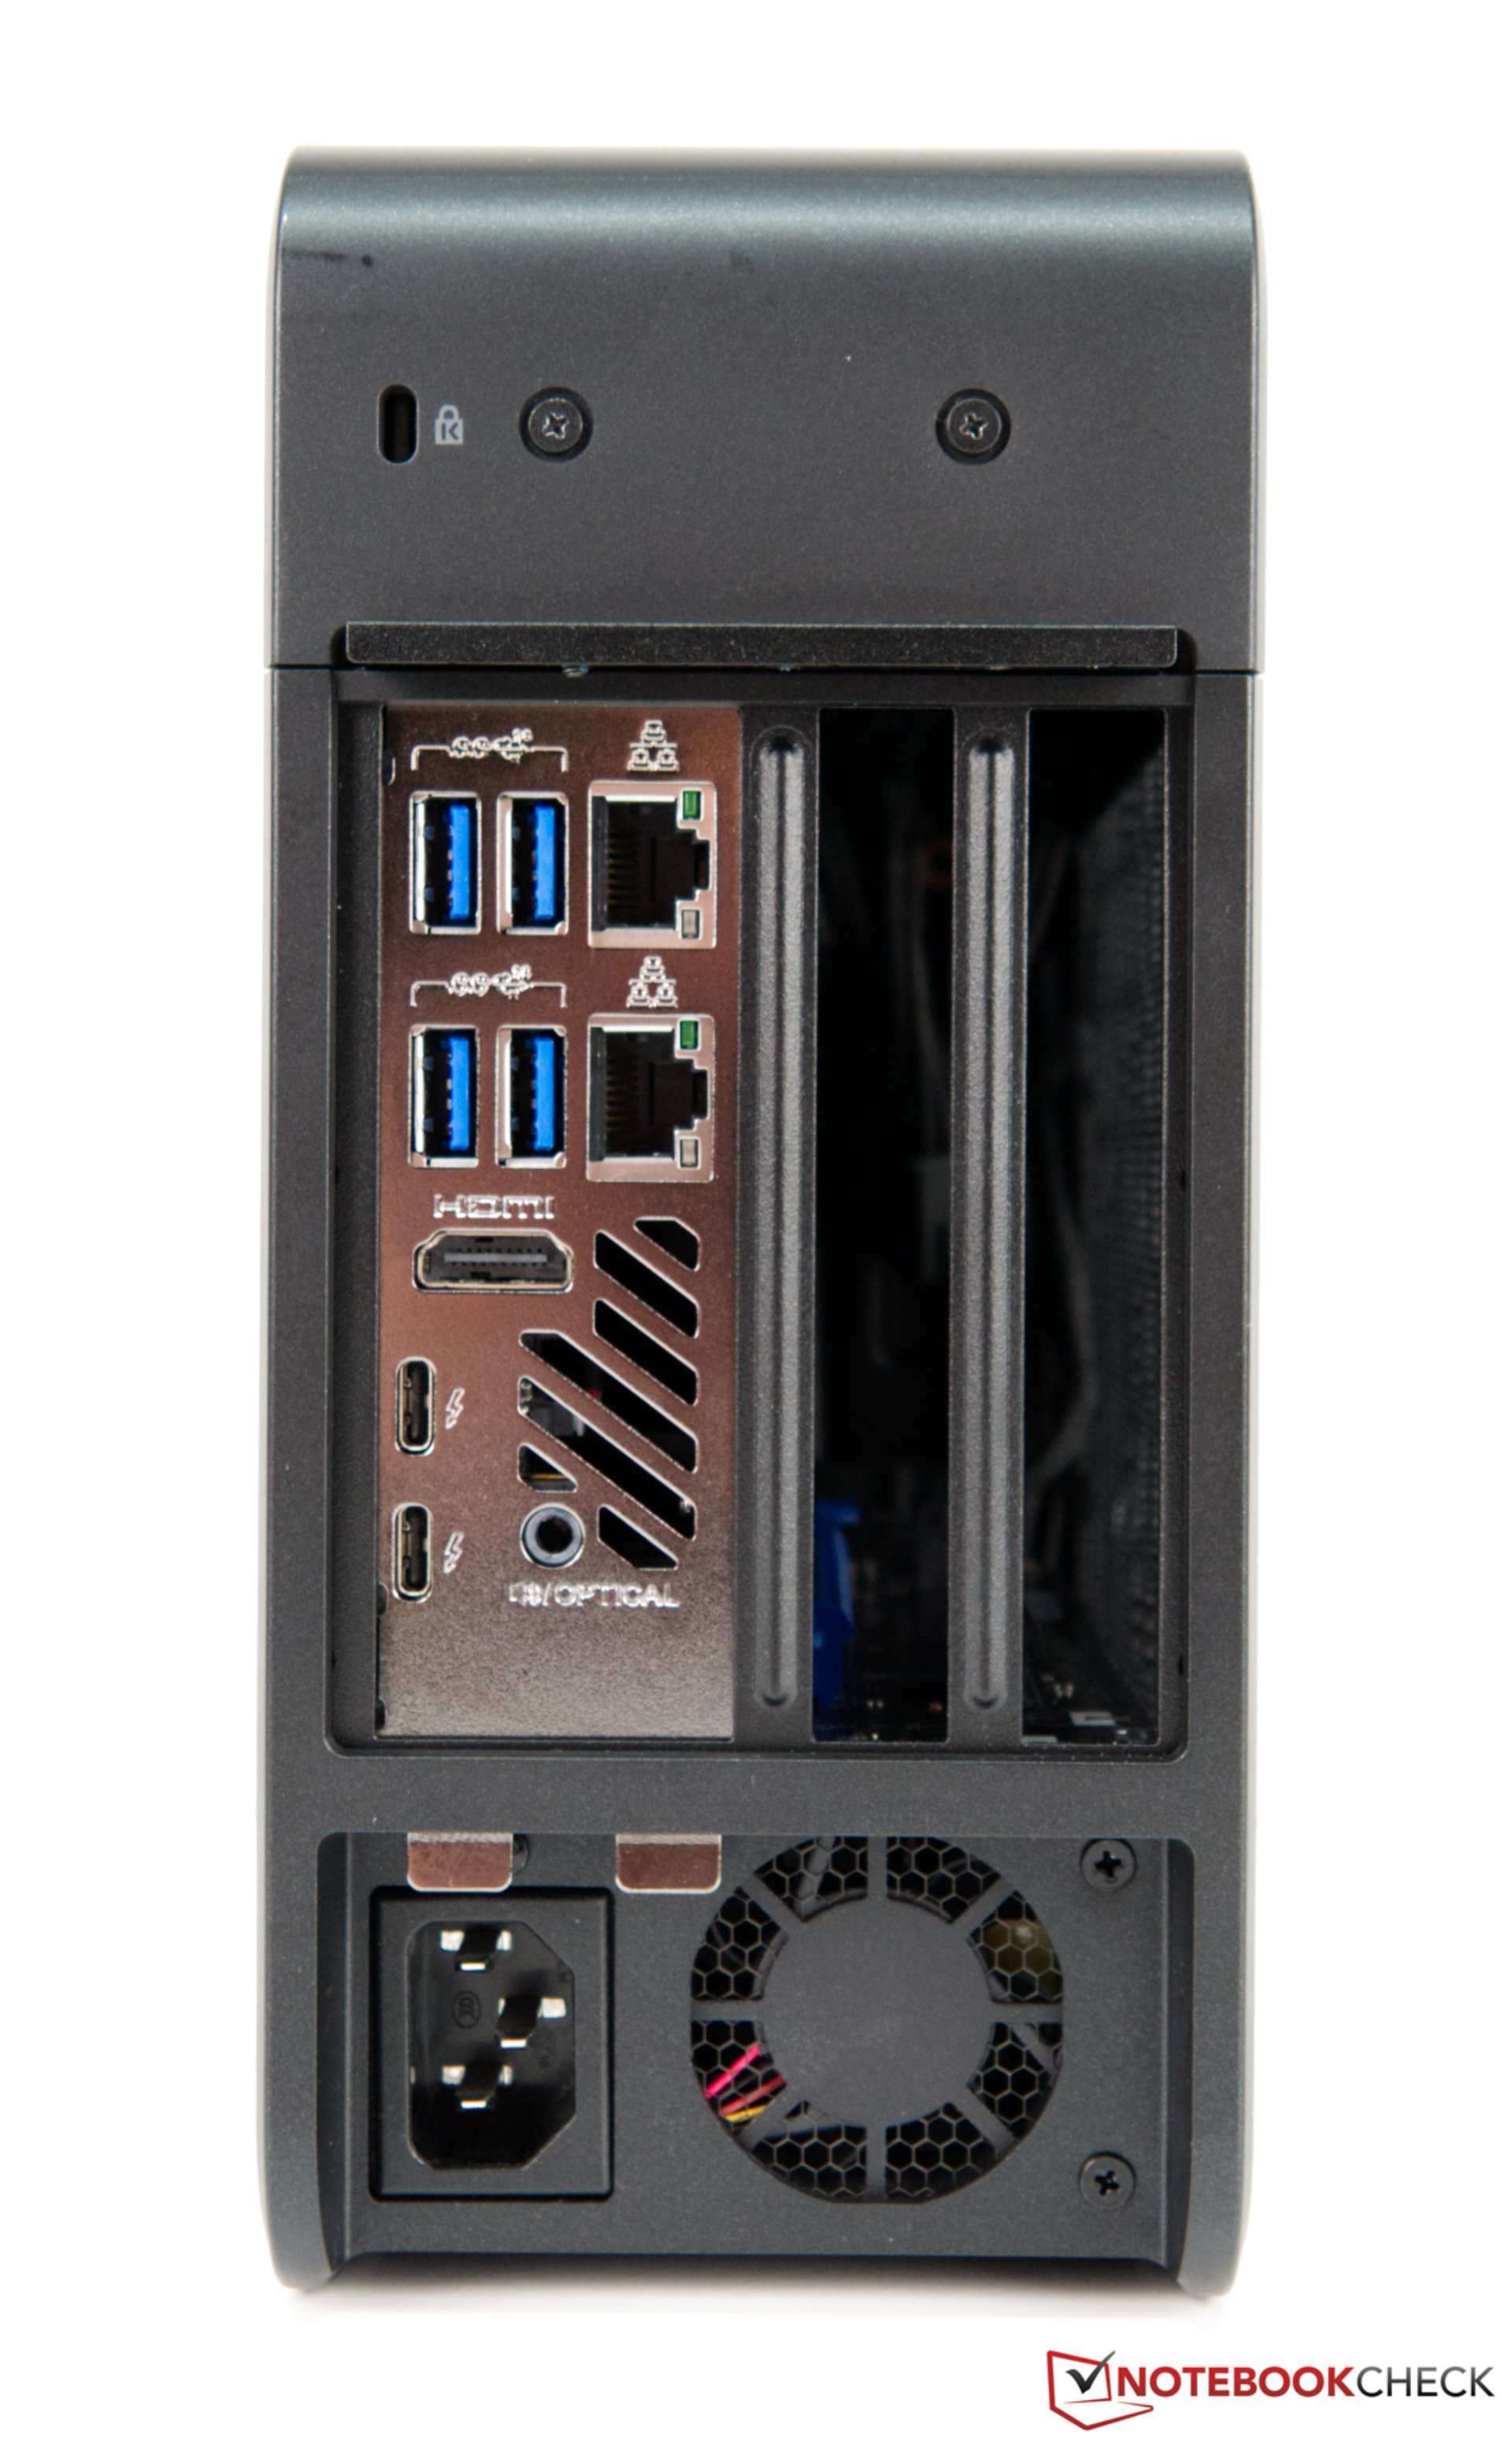
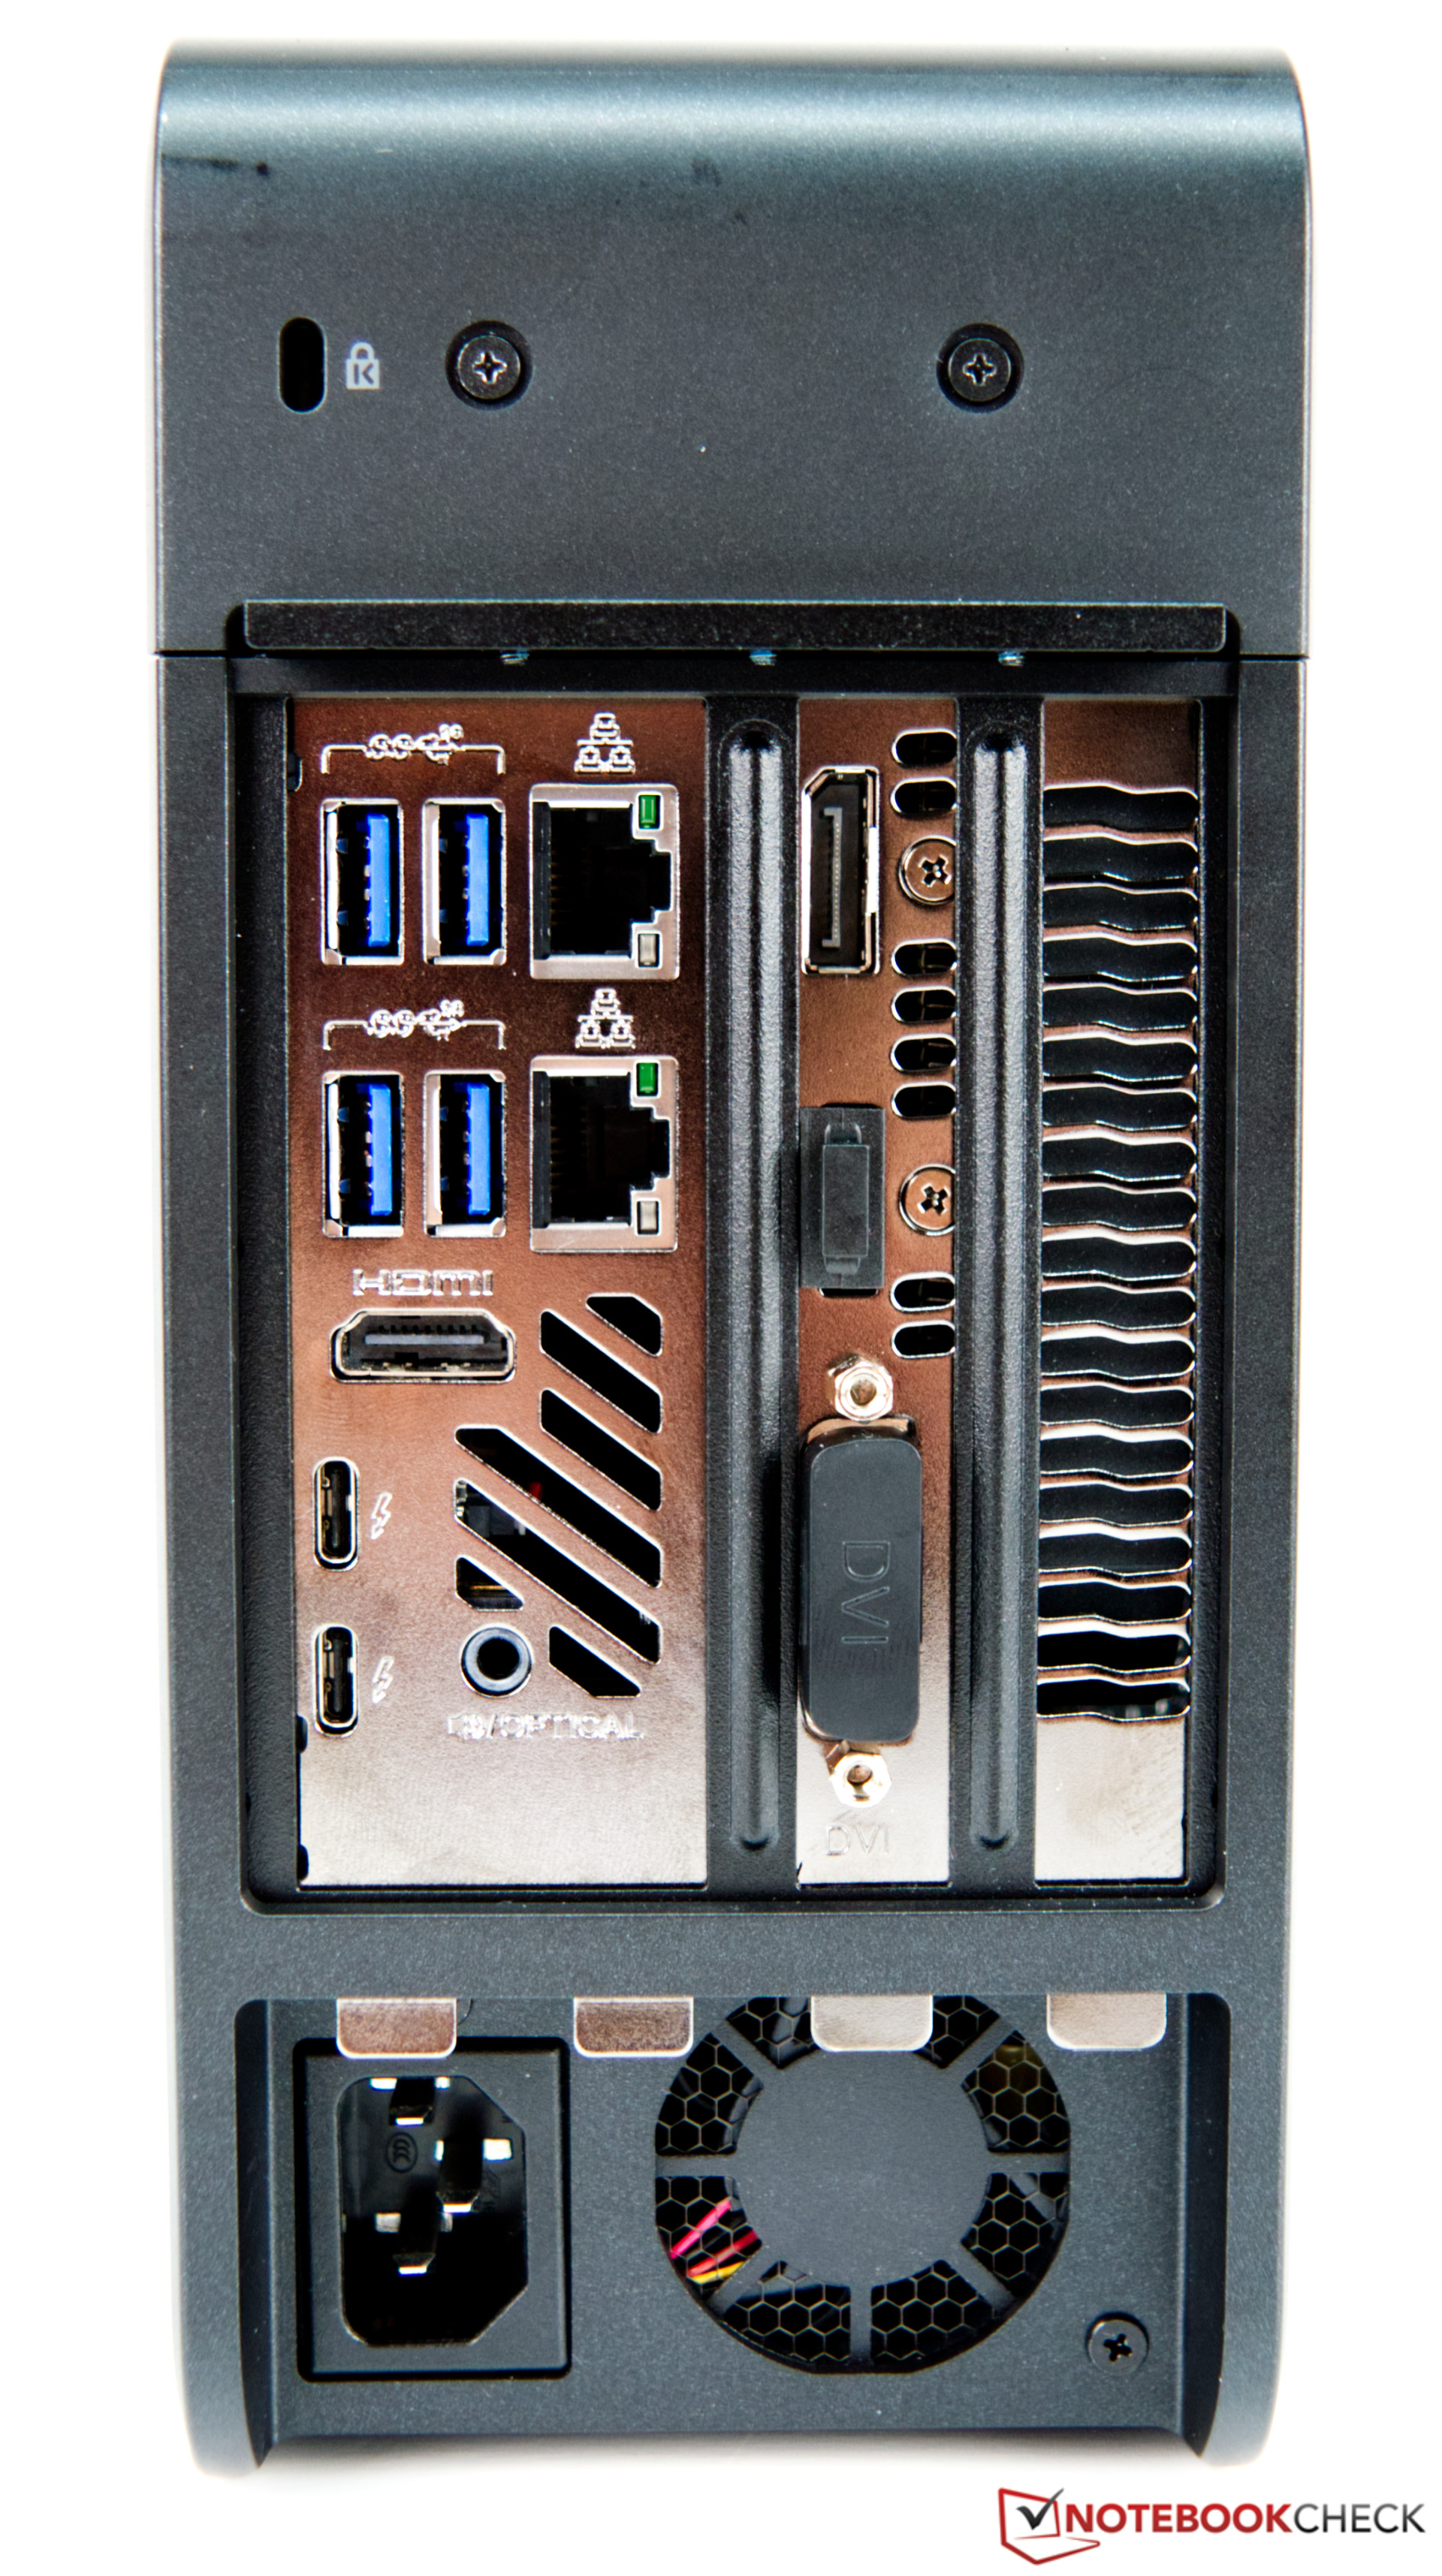
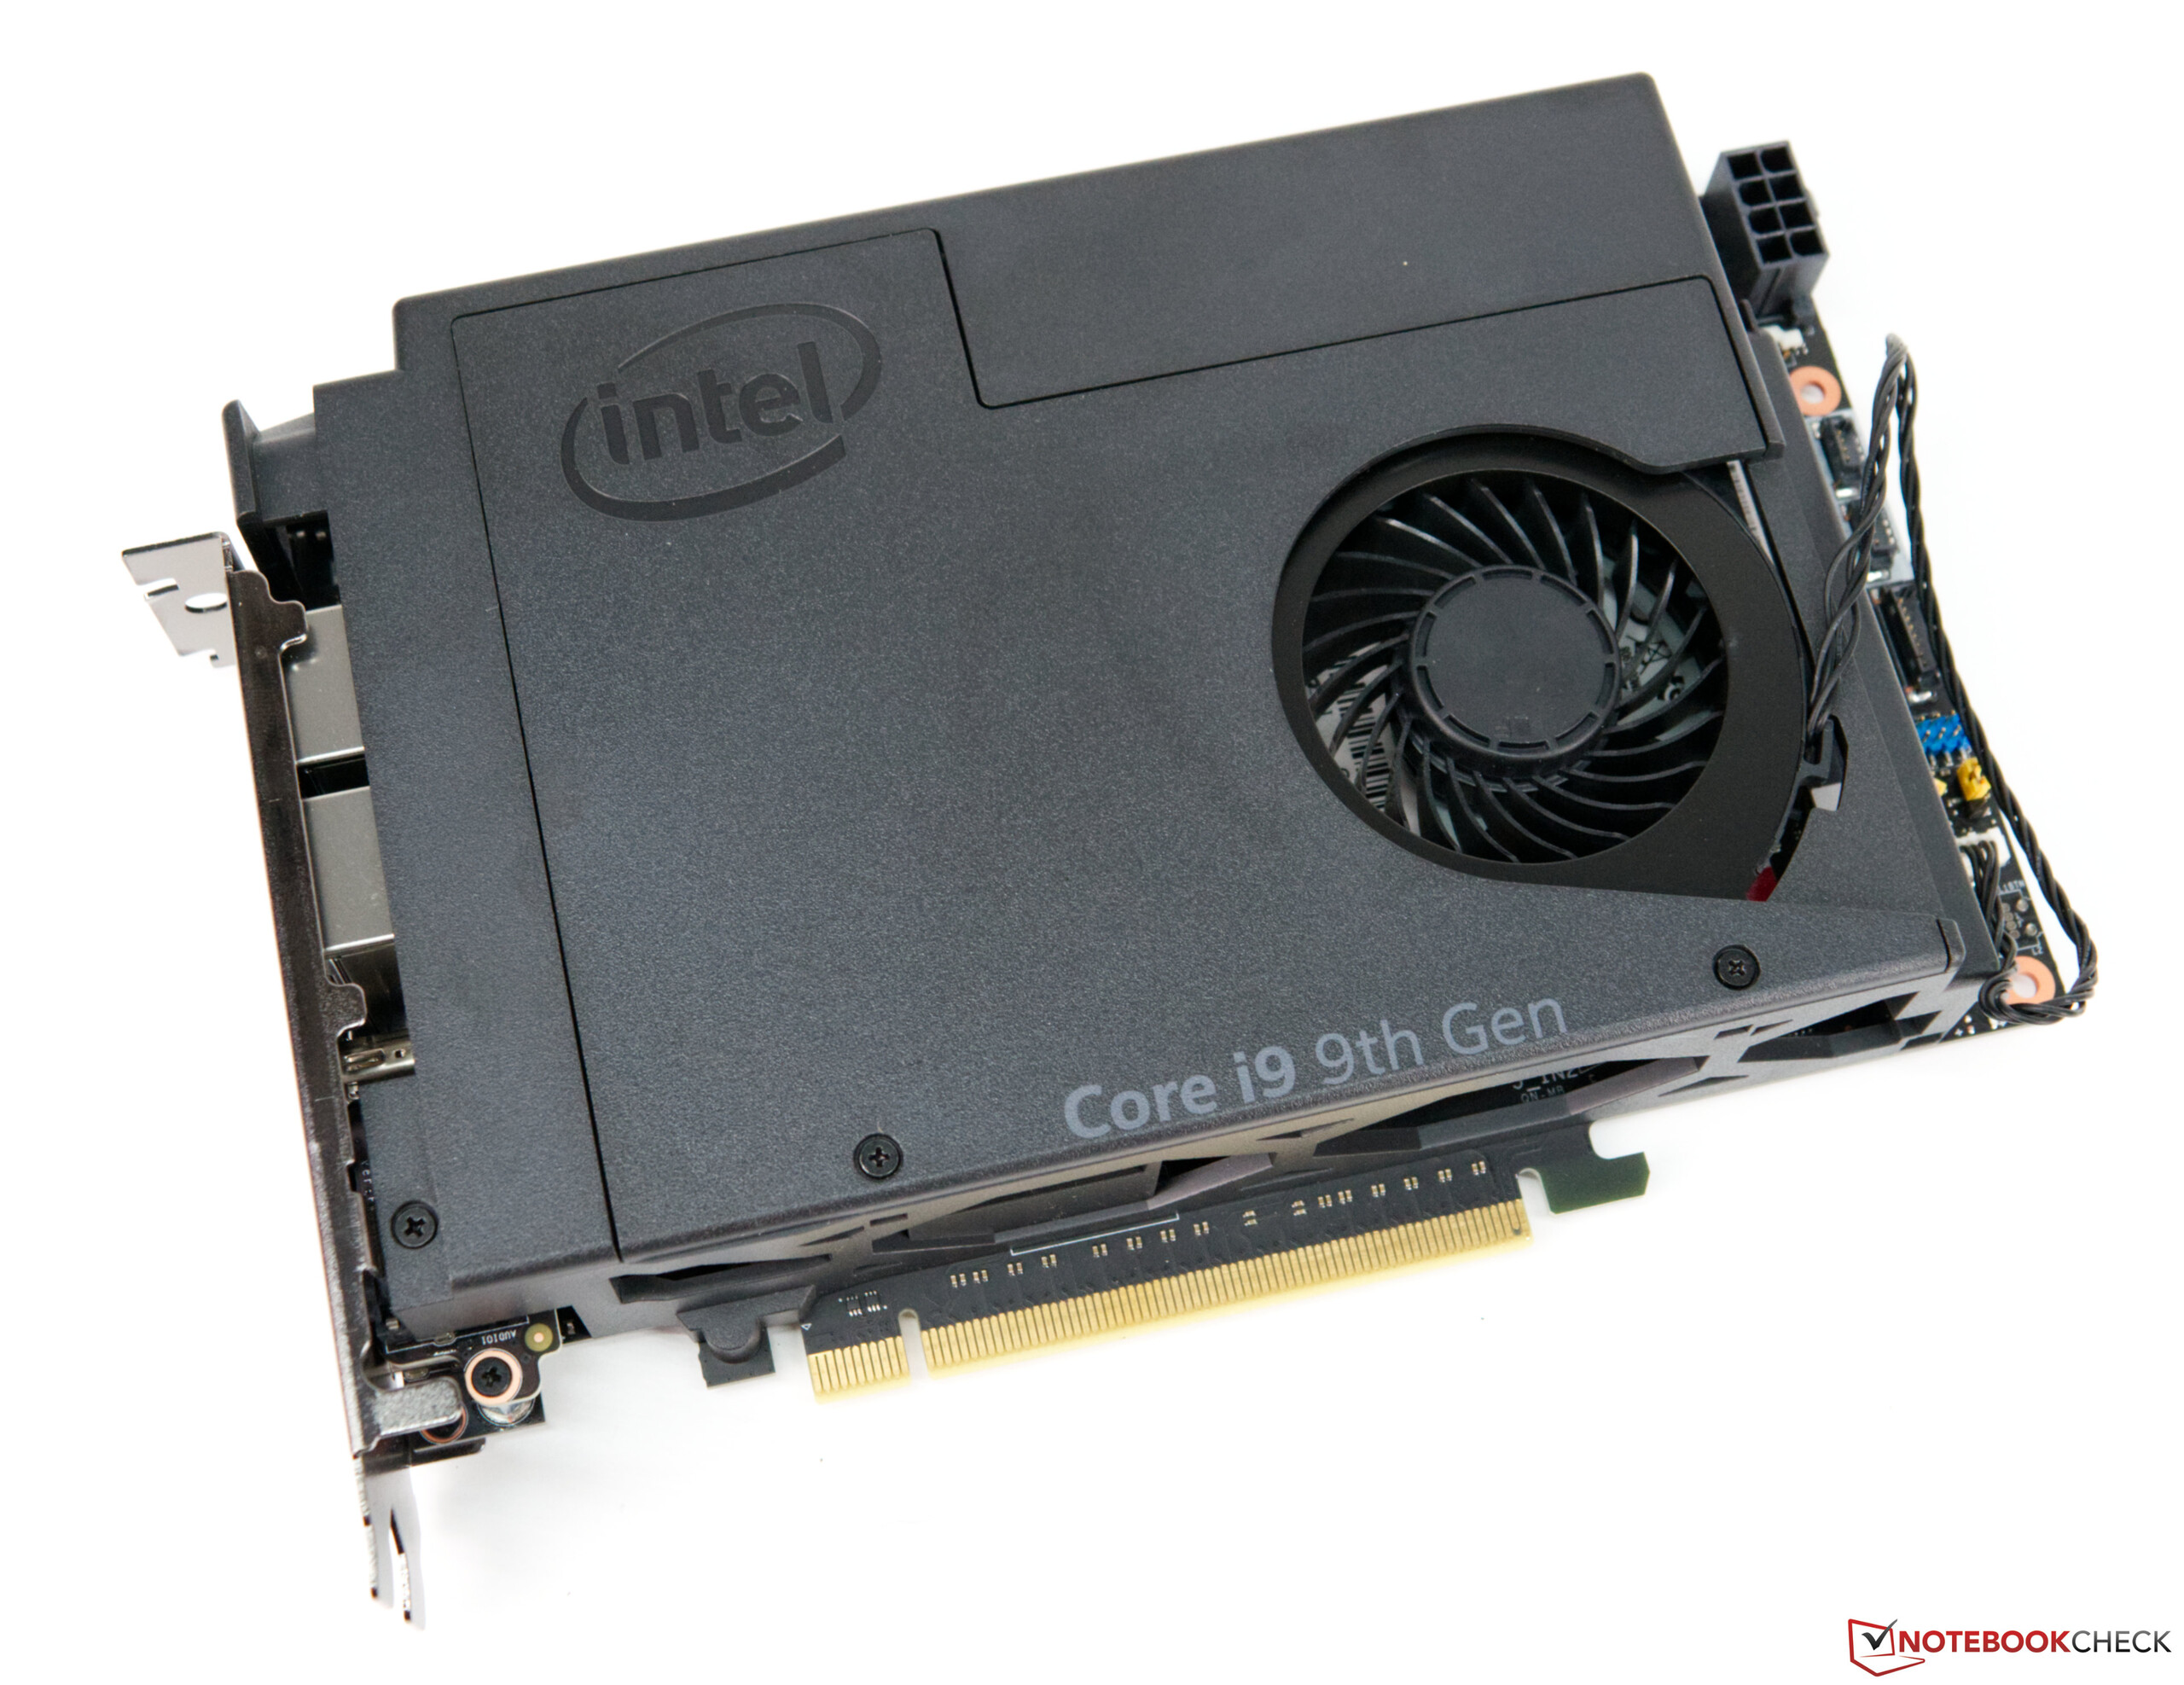
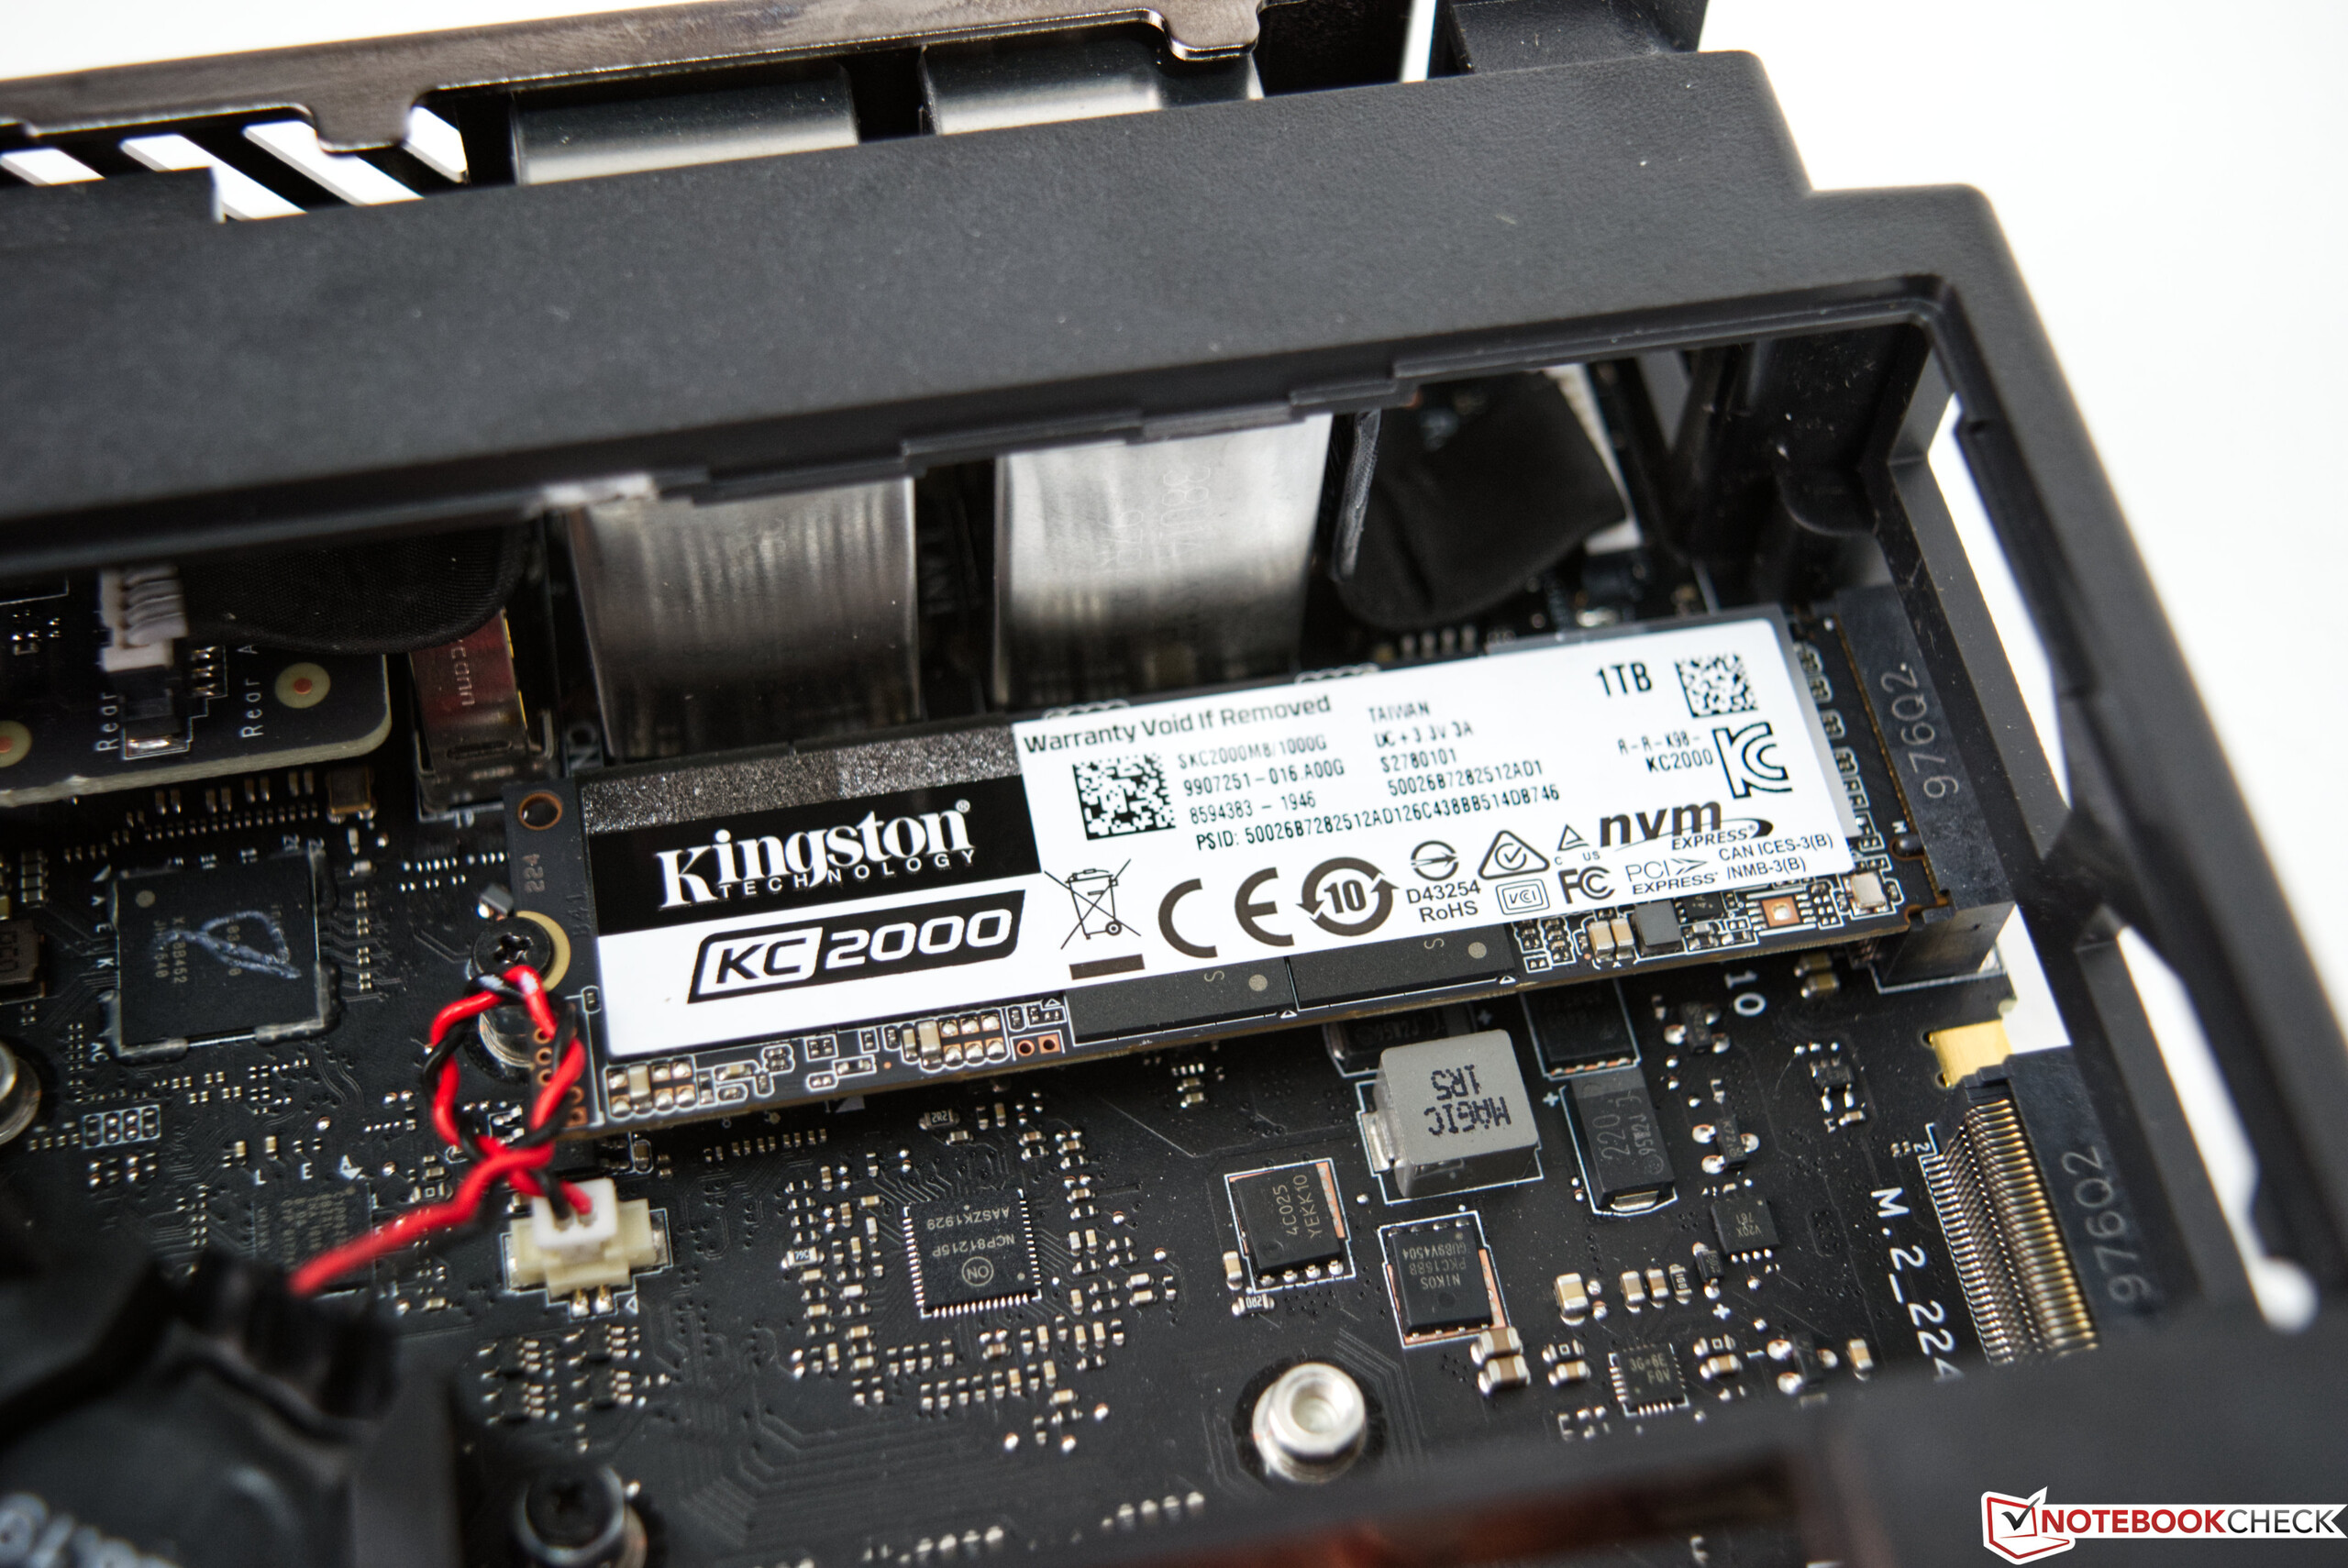
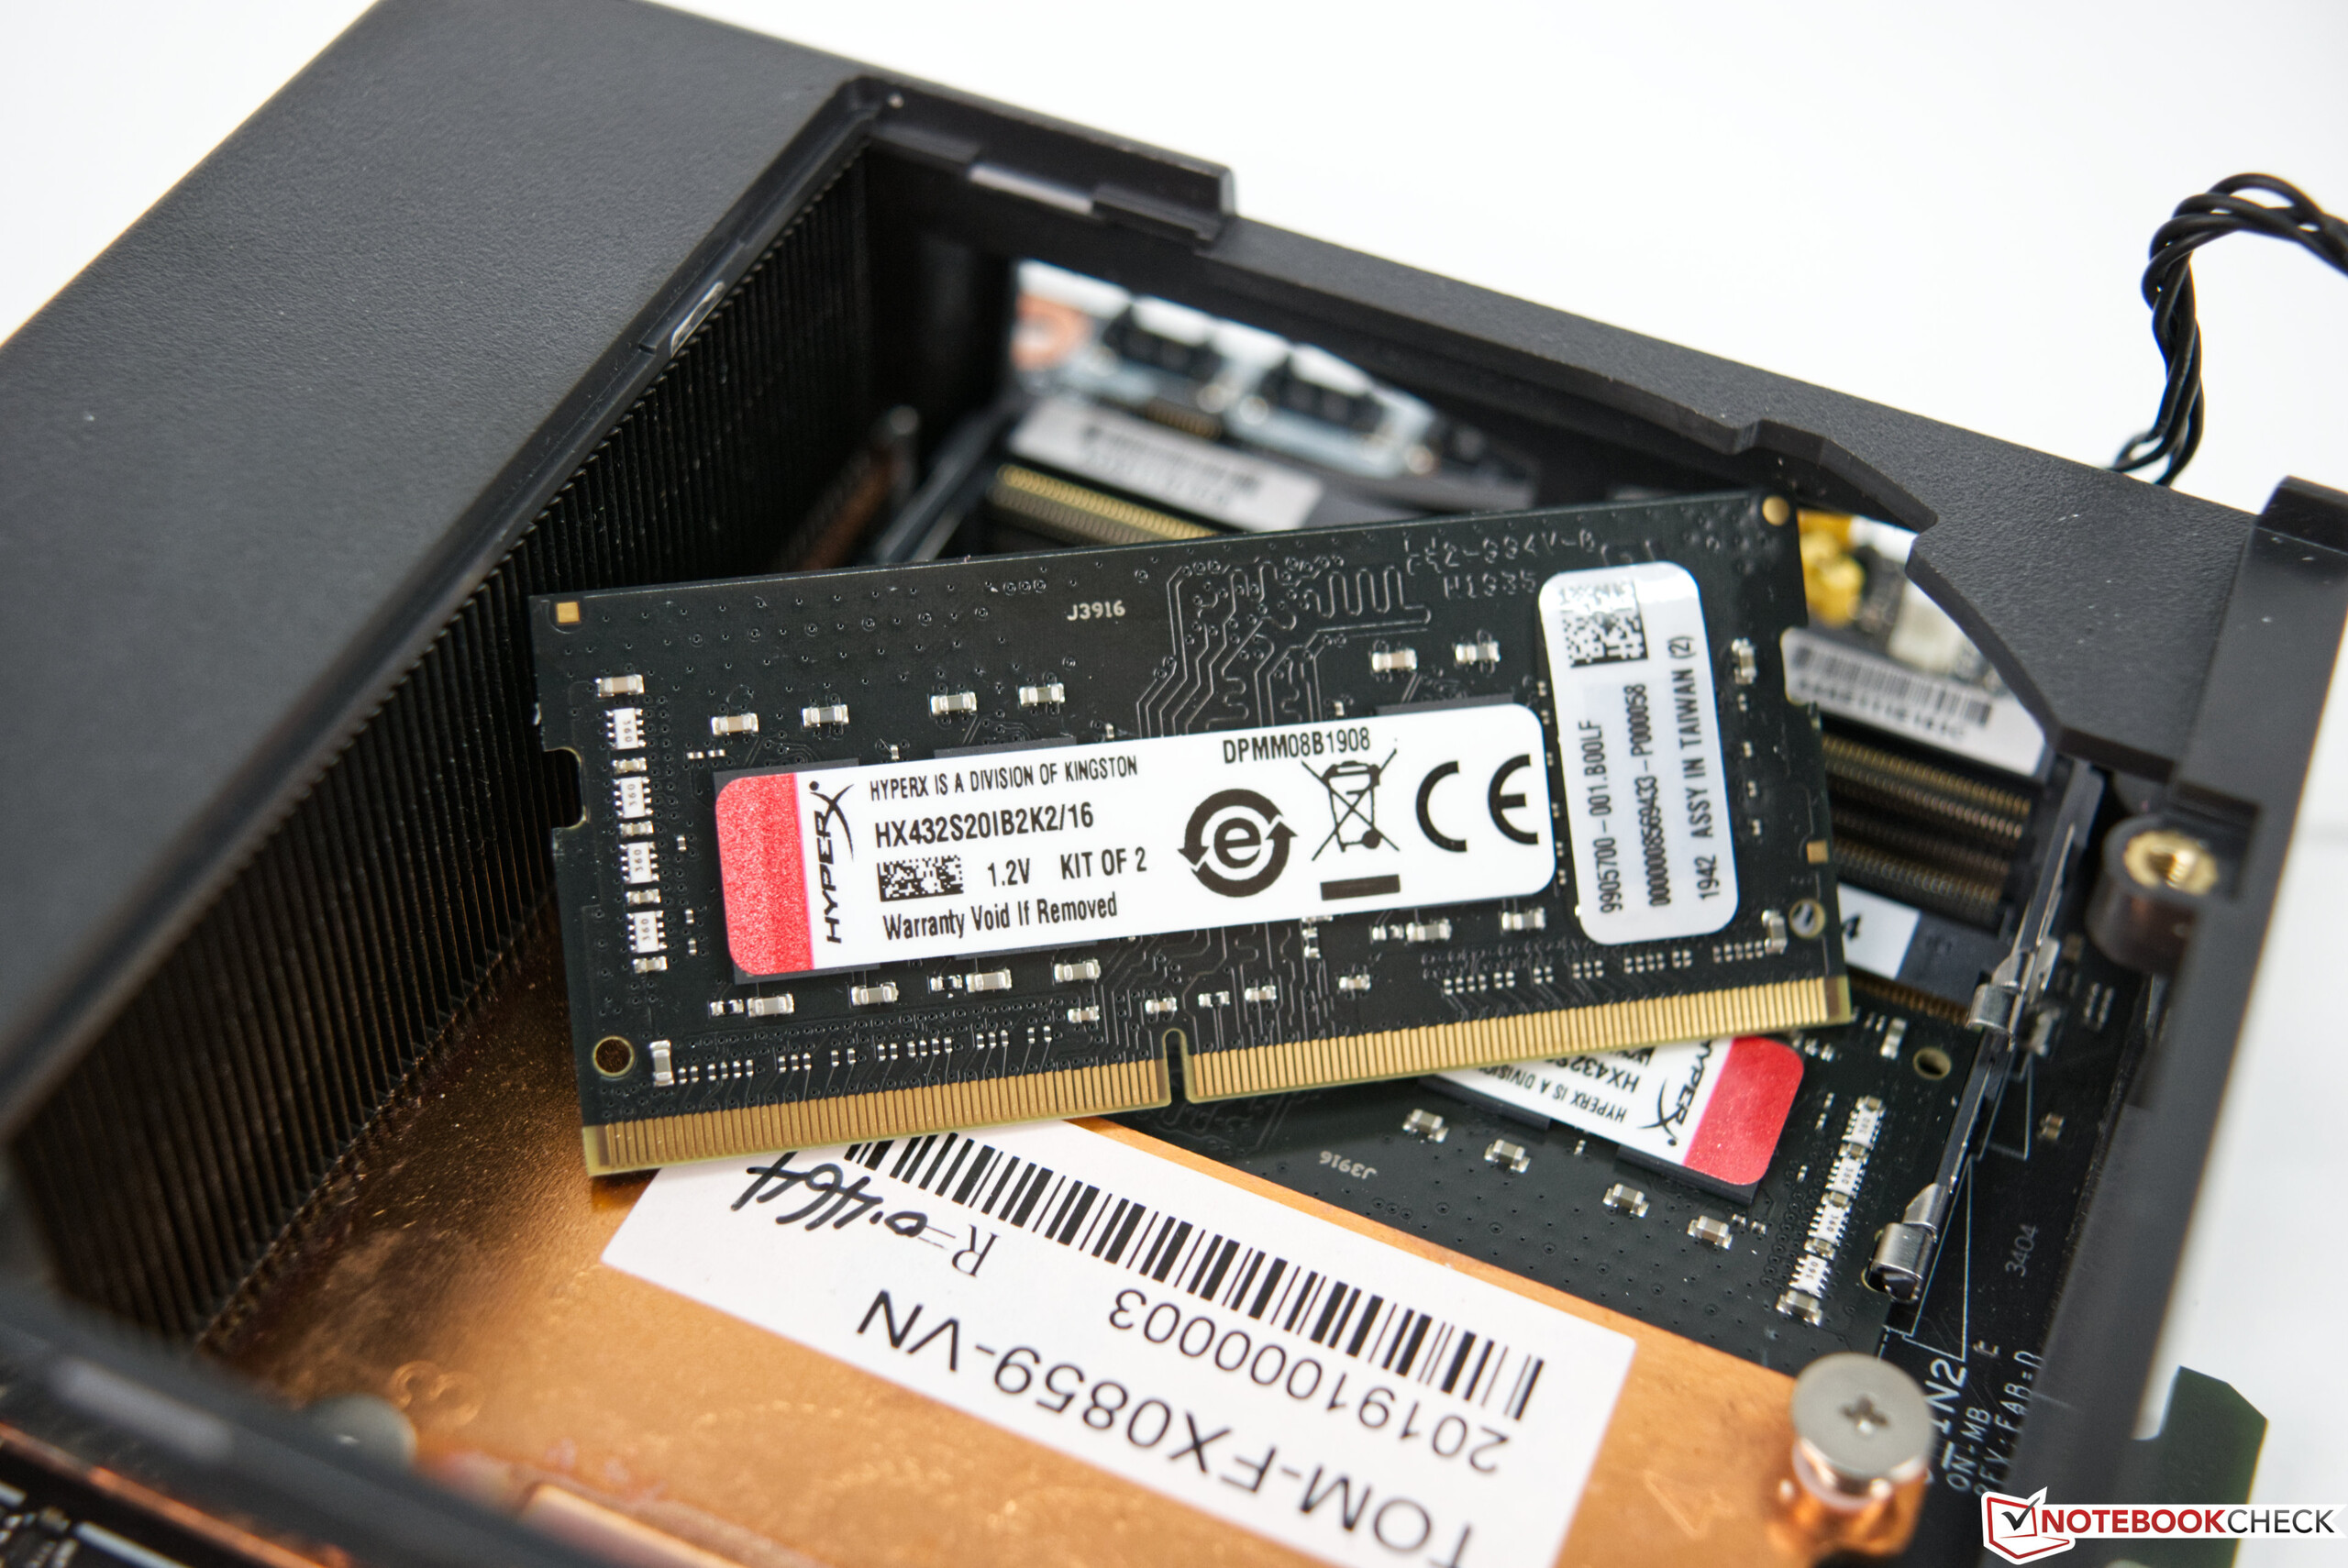
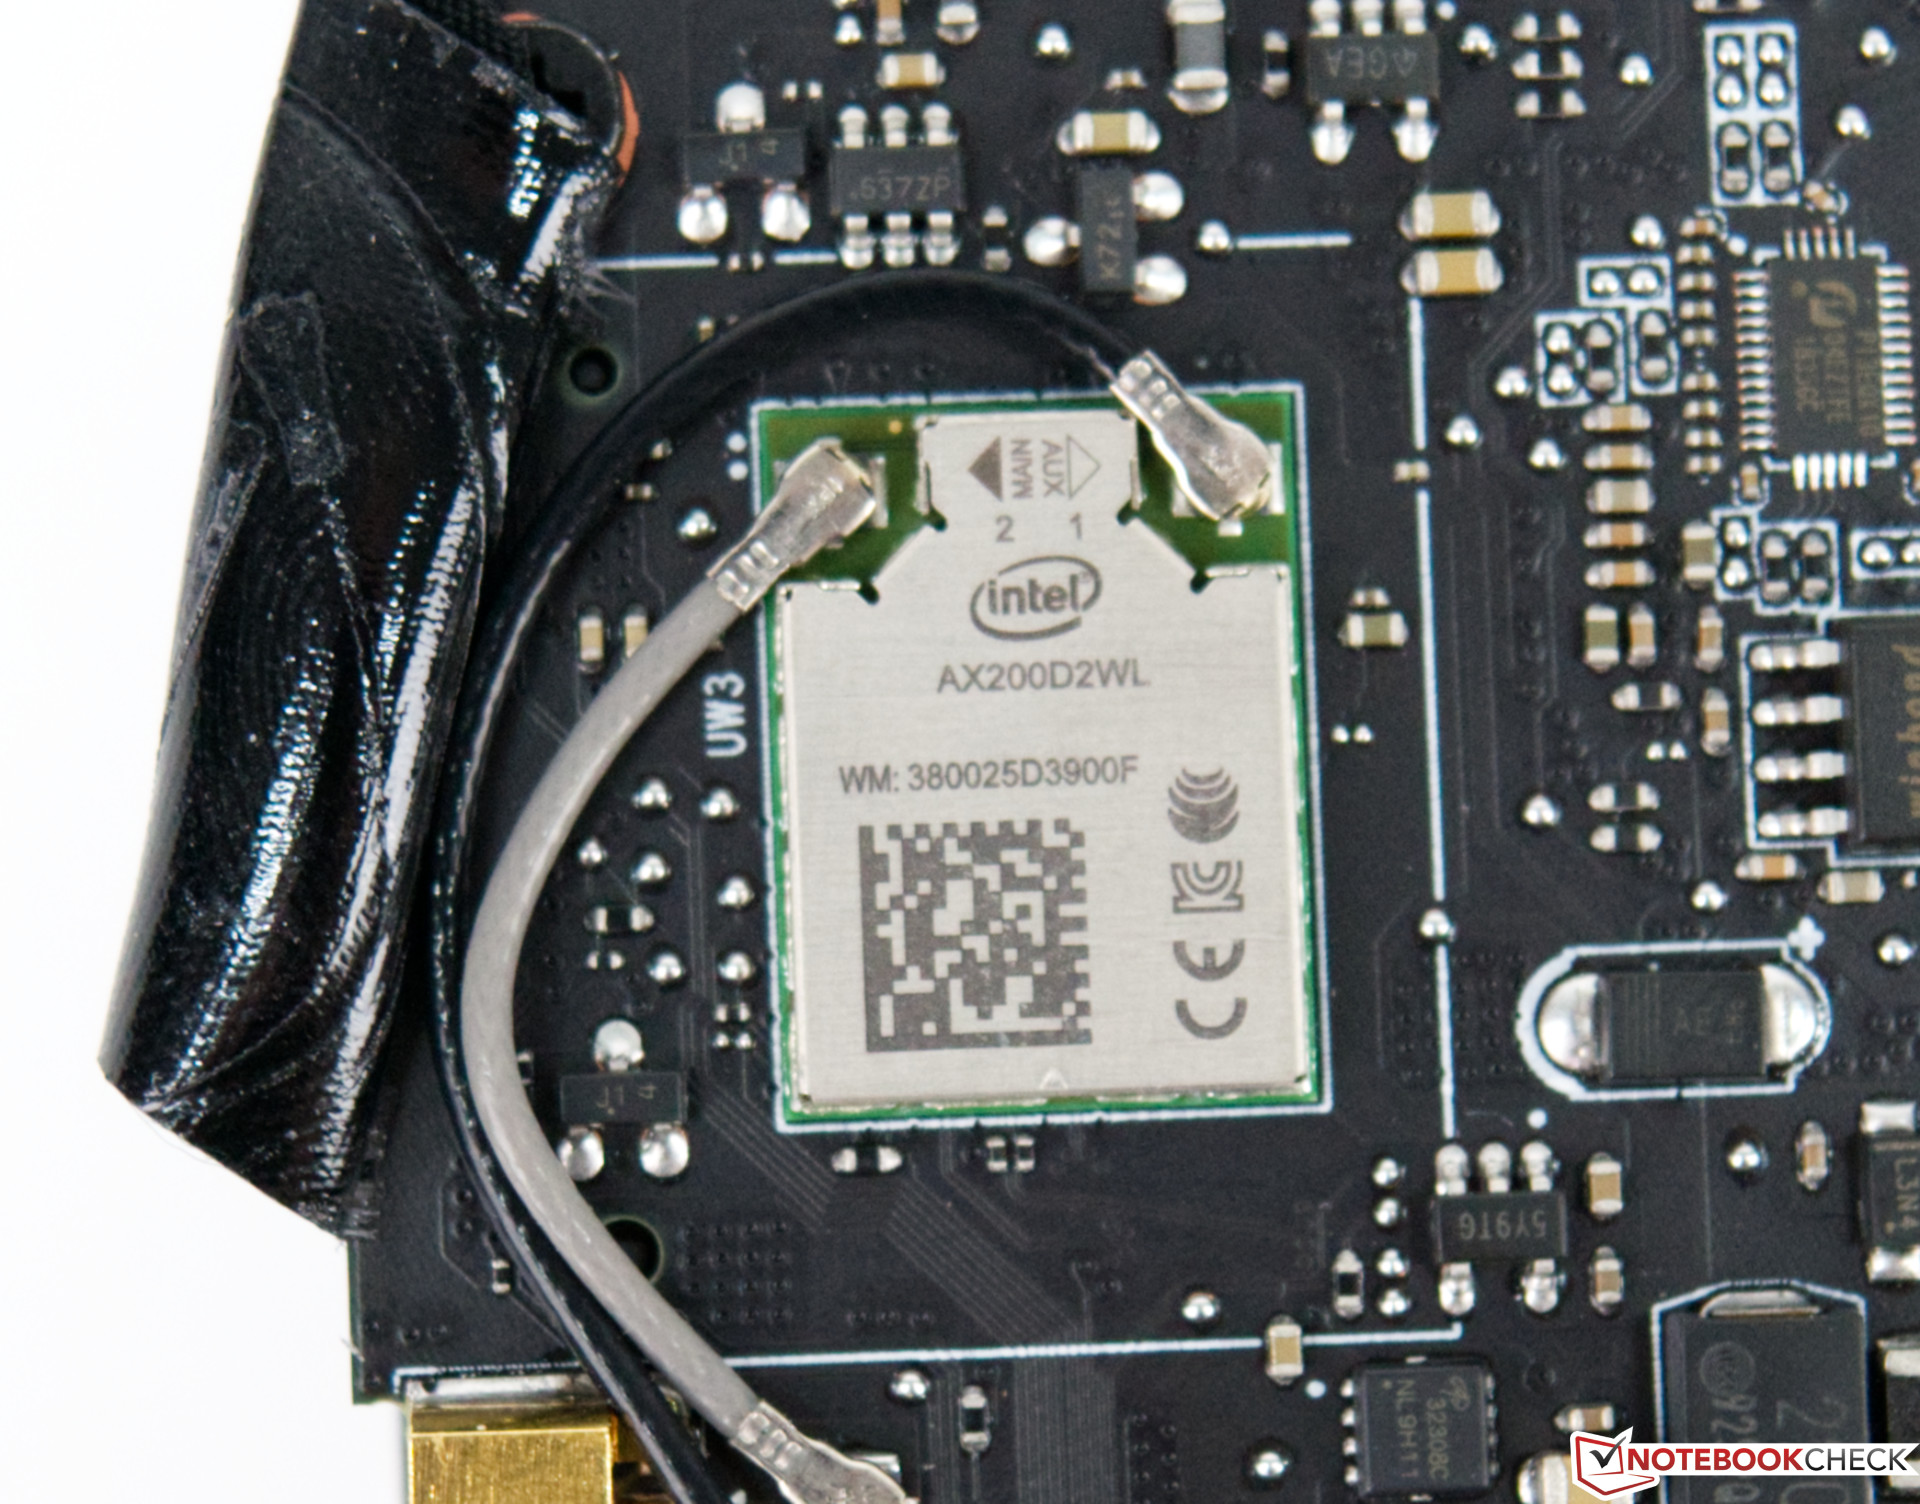
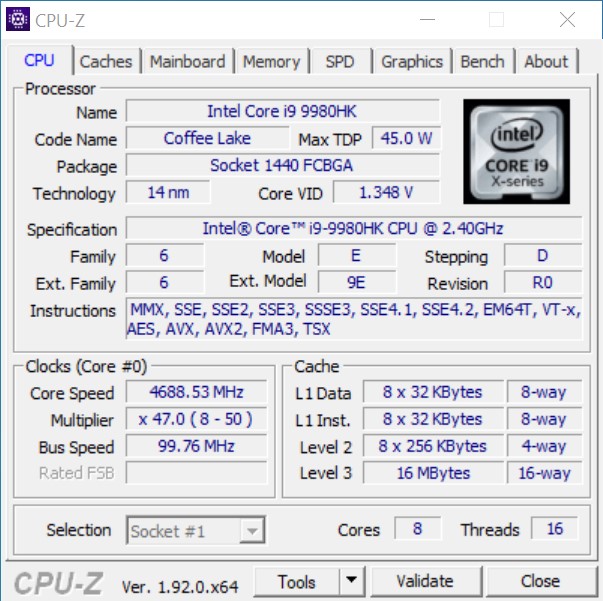
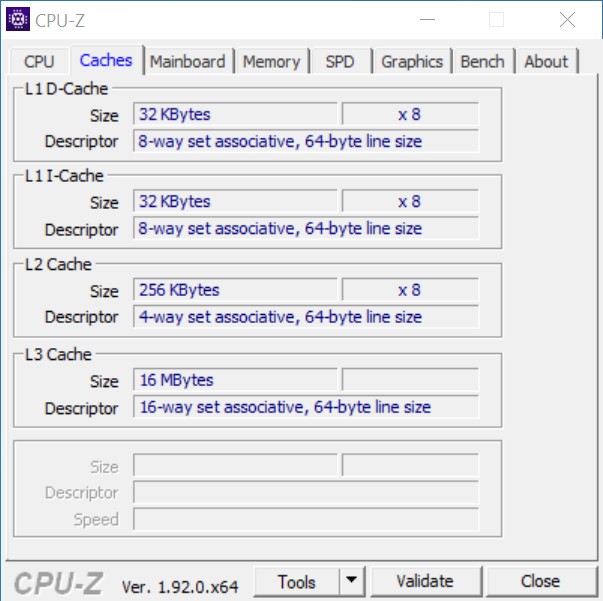
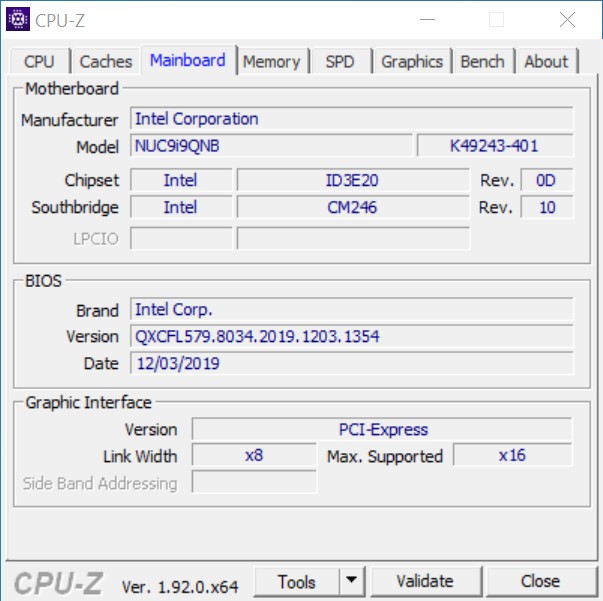
Il NUC 9 Extreme offre un processore Intel Core i9-9980HK a 8-cores/16-threads. La CPU mobile è saldata sulla scheda madre dell'elemento di calcolo, che include anche tutte le porte esterne come USB, LAN e HDMI. In combinazione con le due porte USB nella parte anteriore, il NUC dispone di un totale di otto porte USB, due delle quali sono porte USB-C con supporto per Thunderbolt che trasportano anche un segnale DisplayPort. In questo modo, è possibile collegare un totale di tre displays all'iGPU del SoC, due via USB-C e uno via HDMI 2.0b. Inoltre, sono disponibili due slots SO-DIMM e due slots M.2. La connettività di rete può essere ottenuta sia attraverso una delle due porte Ethernet che attraverso il modulo Wi-Fi 6. Una di queste porte ethernet supporta anche velocità fino a 2,5 Gbps.

Benchmarks Processore

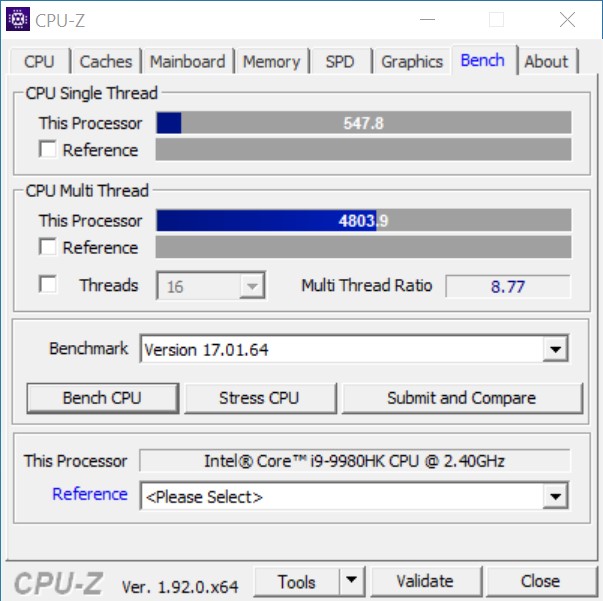
Tutto sommato l'Intel Core i9-9980HK si è comportato in modo ammirevole, anche se non necessariamente più veloce del notebook medio dotato dello stesso processore. Per rendere le cose più piccanti e fornire un quadro più ampio abbiamo anche aggiunto tre CPU desktop nel mix: una Intel Core i5-10600K, una Intel Core i9-10900K e una AMD Ryzen 9 3950X. Rispetto a queste, la Core i9-9980HK ha funzionato in modo simile alla Core i5-10600K, e non è stata in grado di tenere il passo con CPU a 10 o anche 16 cores. Le prestazioni a singolo core, invece, erano il punto di forza del Core i9-9980HK, e si attestava solo pochi punti percentuali al di sotto del Core i9-10900K. Nei benchmarks multi-thread la CPU non è riuscita a compensare i core mancanti rispetto alle CPU desktop. Dato che il Ghost Canyon NUC può anche essere equipaggiato con un Intel Core i5-9300H e un Intel Core i7-9750H abbiamo aggiunto anche questi due al nostro gruppo di confronto. In questo modo si ottiene un quadro più ampio e completo di cosa aspettarsi da questi due SoCs.

CPU-Z
CPU-Z
CPU-Z
CPU-Z
CPU-Z
CPU-Z
CPU-Z
Cinebench R15
CPU Single 64Bit
Intel Core i9-10900K, NVIDIA Titan RTX
i9-10900K, 3700 MHz
224 Points +4%
Intel Core i9-9980HK, NVIDIA GeForce RTX 2070 (Desktop)
i9-9980HK, 2400 MHz
215 Points
AMD Ryzen 9 3950X, NVIDIA Titan RTX
R9 3950X, 3500 MHz
209 Points -3%
Intel Core i5-10600K, NVIDIA Titan RTX
i5-10600K, 4100 MHz
205 Points -5%
Media Intel Core i9-9980HK
  (181 - 215, n=13)
198.8 Points -8%
Media Intel Core i7-9750H
  (170 - 194, n=82)
183.7 Points -15%
Media Intel Core i5-9300H
  (169 - 176, n=11)
172.6 Points -20%
CPU Multi 64Bit
AMD Ryzen 9 3950X, NVIDIA Titan RTX
R9 3950X, 3500 MHz
4002 Points +149%
Intel Core i9-10900K, NVIDIA Titan RTX
i9-10900K, 3700 MHz
2620 Points +63%
Media Intel Core i9-9980HK
  (1327 - 1930, n=14)
1656 Points +3%
Intel Core i9-9980HK, NVIDIA GeForce RTX 2070 (Desktop)
i9-9980HK, 2400 MHz
1607 Points
Intel Core i5-10600K, NVIDIA Titan RTX
i5-10600K, 4100 MHz
1452 Points -10%
Media Intel Core i7-9750H
  (952 - 1306, n=85)
1182 Points -26%
Media Intel Core i5-9300H
  (717 - 850, n=11)
784 Points -51%
Cinebench R20
CPU (Single Core)
Intel Core i9-10900K, NVIDIA Titan RTX
i9-10900K, 3700 MHz
532 Points +6%
AMD Ryzen 9 3950X, NVIDIA Titan RTX
R9 3950X, 3500 MHz
520 Points +3%
Intel Core i9-9980HK, NVIDIA GeForce RTX 2070 (Desktop)
i9-9980HK, 2400 MHz
504 Points
Media Intel Core i9-9980HK
  (431 - 505, n=10)
471 Points -7%
Intel Core i5-10600K, NVIDIA Titan RTX
i5-10600K, 4100 MHz
464 Points -8%
Media Intel Core i7-9750H
  (416 - 486, n=55)
443 Points -12%
Media Intel Core i5-9300H
  (398 - 427, n=9)
415 Points -18%
CPU (Multi Core)
AMD Ryzen 9 3950X, NVIDIA Titan RTX
R9 3950X, 3500 MHz
9075 Points +170%
Intel Core i9-10900K, NVIDIA Titan RTX
i9-10900K, 3700 MHz
6381 Points +90%
Media Intel Core i9-9980HK
  (2974 - 4150, n=10)
3530 Points +5%
Intel Core i5-10600K, NVIDIA Titan RTX
i5-10600K, 4100 MHz
3443 Points +3%
Intel Core i9-9980HK, NVIDIA GeForce RTX 2070 (Desktop)
i9-9980HK, 2400 MHz
3357 Points
Media Intel Core i7-9750H
  (2017 - 3133, n=55)
2564 Points -24%
Media Intel Core i5-9300H
  (1530 - 1877, n=9)
1727 Points -49%
Cinebench R11.5
CPU Single 64Bit
Intel Core i9-10900K, NVIDIA Titan RTX
i9-10900K, 3700 MHz
2.56 Points +7%
Intel Core i9-9980HK, NVIDIA GeForce RTX 2070 (Desktop)
i9-9980HK, 2400 MHz
2.4 Points
AMD Ryzen 9 3950X, NVIDIA Titan RTX
R9 3950X, 3500 MHz
2.37 Points -1%
Media Intel Core i9-9980HK
  (2.25 - 2.4, n=3)
2.31 Points -4%
Intel Core i5-10600K, NVIDIA Titan RTX
i5-10600K, 4100 MHz
2.19 Points -9%
Media Intel Core i7-9750H
  (1.96 - 2.19, n=10)
2.1 Points -12%
CPU Multi 64Bit
AMD Ryzen 9 3950X, NVIDIA Titan RTX
R9 3950X, 3500 MHz
43.68 Points +142%
Intel Core i9-10900K, NVIDIA Titan RTX
i9-10900K, 3700 MHz
29.03 Points +61%
Intel Core i9-9980HK, NVIDIA GeForce RTX 2070 (Desktop)
i9-9980HK, 2400 MHz
18.04 Points
Media Intel Core i9-9980HK
  (14.8 - 18, n=3)
16.7 Points -7%
Intel Core i5-10600K, NVIDIA Titan RTX
i5-10600K, 4100 MHz
15.76 Points -13%
Media Intel Core i7-9750H
  (11.3 - 14.1, n=10)
13 Points -28%
Cinebench R10
Rendering Single CPUs 64Bit
Intel Core i9-10900K, NVIDIA Titan RTX
i9-10900K, 3700 MHz
10625 Points +3%
AMD Ryzen 9 3950X, NVIDIA Titan RTX
R9 3950X, 3500 MHz
10580 Points +2%
Intel Core i9-9980HK, NVIDIA GeForce RTX 2070 (Desktop)
i9-9980HK, 2400 MHz
10359 Points
Media Intel Core i9-9980HK
  ()
10359 Points 0%
Intel Core i5-10600K, NVIDIA Titan RTX
i5-10600K, 4100 MHz
9594 Points -7%
Media Intel Core i7-9750H
  (9069 - 9346, n=3)
9165 Points -12%
Rendering Multiple CPUs 64Bit
AMD Ryzen 9 3950X, NVIDIA Titan RTX
R9 3950X, 3500 MHz
86232 Points +55%
Intel Core i9-10900K, NVIDIA Titan RTX
i9-10900K, 3700 MHz
80495 Points +44%
Intel Core i9-9980HK, NVIDIA GeForce RTX 2070 (Desktop)
i9-9980HK, 2400 MHz
55742 Points
Media Intel Core i9-9980HK
  ()
55742 Points 0%
Intel Core i5-10600K, NVIDIA Titan RTX
i5-10600K, 4100 MHz
51816 Points -7%
Media Intel Core i7-9750H
  (37188 - 44238, n=3)
40129 Points -28%
Blender - v2.79 BMW27 CPU
Media Intel Core i5-9300H
  (588 - 643, n=3)
611 Seconds * -93%
Media Intel Core i7-9750H
  (342 - 495, n=21)
433 Seconds * -36%
Media Intel Core i9-9980HK
  (317 - 527, n=3)
398 Seconds * -25%
Intel Core i9-9980HK, NVIDIA GeForce RTX 2070 (Desktop)
i9-9980HK, 2400 MHz
317.4 Seconds *
Intel Core i5-10600K, NVIDIA Titan RTX
i5-10600K, 4100 MHz
302.4 Seconds * +5%
Intel Core i9-10900K, NVIDIA Titan RTX
i9-10900K, 3700 MHz
167.3 Seconds * +47%
AMD Ryzen 9 3950X, NVIDIA Titan RTX
R9 3950X, 3500 MHz
125.8 Seconds * +60%
wPrime 2.10
32m
Media Intel Core i7-9750H
  ()
4.93 s * -30%
Intel Core i5-10600K, NVIDIA Titan RTX
i5-10600K, 4100 MHz
4.648 s * -23%
Media Intel Core i9-9980HK
  (3.79 - 4.94, n=2)
4.36 s * -15%
AMD Ryzen 9 3950X, NVIDIA Titan RTX
R9 3950X, 3500 MHz
4.112 s * -9%
Intel Core i9-9980HK, NVIDIA GeForce RTX 2070 (Desktop)
i9-9980HK, 2400 MHz
3.788 s *
Intel Core i9-10900K, NVIDIA Titan RTX
i9-10900K, 3700 MHz
3.582 s * +5%
1024m
Media Intel Core i7-9750H
  ()
154.4 s * -28%
Intel Core i9-9980HK, NVIDIA GeForce RTX 2070 (Desktop)
i9-9980HK, 2400 MHz
120.2 s *
Media Intel Core i9-9980HK
  (110.4 - 120.2, n=2)
115.3 s * +4%
Intel Core i5-10600K, NVIDIA Titan RTX
i5-10600K, 4100 MHz
113.2 s * +6%
Intel Core i9-10900K, NVIDIA Titan RTX
i9-10900K, 3700 MHz
66.3 s * +45%
AMD Ryzen 9 3950X, NVIDIA Titan RTX
R9 3950X, 3500 MHz
44.86 s * +63%
X264 HD Benchmark 4.0
Pass 1
Intel Core i9-10900K, NVIDIA Titan RTX
i9-10900K, 3700 MHz
289.5 (289min - 291max) fps +22%
AMD Ryzen 9 3950X, NVIDIA Titan RTX
R9 3950X, 3500 MHz
265 (265min - 266max) fps +12%
Intel Core i5-10600K, NVIDIA Titan RTX
i5-10600K, 4100 MHz
251.5 (250min - 253max) fps +6%
Media Intel Core i9-9980HK
  (238 - 239, n=2)
238 fps 0%
Intel Core i9-9980HK, NVIDIA GeForce RTX 2070 (Desktop)
i9-9980HK, 2400 MHz
237.5 (236min - 239max) fps
Media Intel Core i7-9750H
  (211 - 219, n=2)
215 fps -9%
Media Intel Core i5-9300H
  ()
193.7 fps -18%
Pass 2
AMD Ryzen 9 3950X, NVIDIA Titan RTX
R9 3950X, 3500 MHz
168 (168min - 169max) fps +81%
Intel Core i9-10900K, NVIDIA Titan RTX
i9-10900K, 3700 MHz
149 (149min - 149max) fps +61%
Media Intel Core i9-9980HK
  (92.8 - 94.8, n=2)
93.8 fps +1%
Intel Core i9-9980HK, NVIDIA GeForce RTX 2070 (Desktop)
i9-9980HK, 2400 MHz
92.8 (89.1min - 100max) fps
Intel Core i5-10600K, NVIDIA Titan RTX
i5-10600K, 4100 MHz
88.2 (88min - 88.2max) fps -5%
Media Intel Core i7-9750H
  (69.6 - 70.9, n=2)
70.3 fps -24%
Media Intel Core i5-9300H
  ()
49.4 fps -47%
WinRAR - Result
Intel Core i9-10900K, NVIDIA Titan RTX
i9-10900K, 3700 MHz
9739 KB/s +34%
AMD Ryzen 9 3950X, NVIDIA Titan RTX
R9 3950X, 3500 MHz
7409 KB/s +2%
Media Intel Core i9-9980HK
  (7266 - 7436, n=2)
7351 KB/s +1%
Intel Core i9-9980HK, NVIDIA GeForce RTX 2070 (Desktop)
i9-9980HK, 2400 MHz
7266 KB/s
Intel Core i5-10600K, NVIDIA Titan RTX
i5-10600K, 4100 MHz
6536 KB/s -10%
Media Intel Core i7-9750H
  (6160 - 6631, n=2)
6396 KB/s -12%
Media Intel Core i5-9300H
  ()
5663 KB/s -22%
TrueCrypt
AES Mean 100MB
Intel Core i9-10900K, NVIDIA Titan RTX
i9-10900K, 3700 MHz
14.6 GB/s +45%
AMD Ryzen 9 3950X, NVIDIA Titan RTX
R9 3950X, 3500 MHz
10.8 GB/s +7%
Media Intel Core i9-9980HK
  (10.1 - 10.3, n=2)
10.2 GB/s +1%
Intel Core i9-9980HK, NVIDIA GeForce RTX 2070 (Desktop)
i9-9980HK, 2400 MHz
10.1 GB/s
Intel Core i5-10600K, NVIDIA Titan RTX
i5-10600K, 4100 MHz
8 GB/s -21%
Media Intel Core i7-9750H
  (7.3 - 7.4, n=2)
7.35 GB/s -27%
Media Intel Core i5-9300H
  ()
4.7 GB/s -53%
Twofish Mean 100MB
AMD Ryzen 9 3950X, NVIDIA Titan RTX
R9 3950X, 3500 MHz
3.6 GB/s +112%
Intel Core i9-10900K, NVIDIA Titan RTX
i9-10900K, 3700 MHz
2.6 GB/s +53%
Intel Core i9-9980HK, NVIDIA GeForce RTX 2070 (Desktop)
i9-9980HK, 2400 MHz
1.7 GB/s
Media Intel Core i9-9980HK
  (1.7 - 1.7, n=2)
1.7 GB/s 0%
Intel Core i5-10600K, NVIDIA Titan RTX
i5-10600K, 4100 MHz
1.4 GB/s -18%
Media Intel Core i7-9750H
  (1.2 - 1.3, n=2)
1.25 GB/s -26%
Media Intel Core i5-9300H
  ()
0.84 GB/s -51%
Serpent Mean 100MB
AMD Ryzen 9 3950X, NVIDIA Titan RTX
R9 3950X, 3500 MHz
2.3 GB/s +130%
Intel Core i9-10900K, NVIDIA Titan RTX
i9-10900K, 3700 MHz
1.5 GB/s +50%
Intel Core i9-9980HK, NVIDIA GeForce RTX 2070 (Desktop)
i9-9980HK, 2400 MHz
1 GB/s
Media Intel Core i9-9980HK
  (1 - 1, n=2)
1 GB/s 0%
Intel Core i5-10600K, NVIDIA Titan RTX
i5-10600K, 4100 MHz
0.82 GB/s -18%
Media Intel Core i7-9750H
  (0.7 - 0.75, n=2)
0.725 GB/s -27%
Media Intel Core i5-9300H
  ()
0.5 GB/s -50%
Geekbench 5.5
Multi-Core
AMD Ryzen 9 3950X, NVIDIA Titan RTX
R9 3950X, 3500 MHz
12363 Points +63%
Intel Core i9-10900K, NVIDIA Titan RTX
i9-10900K, 3700 MHz
11414 Points +51%
Intel Core i9-9980HK, NVIDIA GeForce RTX 2070 (Desktop)
i9-9980HK, 2400 MHz
7568 Points
Media Intel Core i9-9980HK
  (6945 - 7703, n=3)
7405 Points -2%
Intel Core i5-10600K, NVIDIA Titan RTX
i5-10600K, 4100 MHz
7248 Points -4%
Media Intel Core i7-9750H
  (4859 - 6262, n=13)
5597 Points -26%
Single-Core
Intel Core i9-10900K, NVIDIA Titan RTX
i9-10900K, 3700 MHz
1449 Points +5%
Intel Core i9-9980HK, NVIDIA GeForce RTX 2070 (Desktop)
i9-9980HK, 2400 MHz
1378 Points
Media Intel Core i9-9980HK
  (1314 - 1378, n=2)
1346 Points -2%
AMD Ryzen 9 3950X, NVIDIA Titan RTX
R9 3950X, 3500 MHz
1306 Points -5%
Intel Core i5-10600K, NVIDIA Titan RTX
i5-10600K, 4100 MHz
1286 Points -7%
Media Intel Core i7-9750H
  (1117 - 1251, n=13)
1190 Points -14%
Geekbench 5.0
5.0 Multi-Core
AMD Ryzen 9 3950X, NVIDIA Titan RTX
R9 3950X, 3500 MHz
12976 Points +72%
Intel Core i9-10900K, NVIDIA Titan RTX
i9-10900K, 3700 MHz
11407 Points +51%
Intel Core i9-9980HK, NVIDIA GeForce RTX 2070 (Desktop)
i9-9980HK, 2400 MHz
7540 Points
Media Intel Core i9-9980HK
  (7072 - 7805, n=4)
7421 Points -2%
Intel Core i5-10600K, NVIDIA Titan RTX
i5-10600K, 4100 MHz
7237 Points -4%
Media Intel Core i7-9750H
  (4812 - 6230, n=15)
5575 Points -26%
Media Intel Core i5-9300H
  (3697 - 4200, n=3)
4014 Points -47%
5.0 Single-Core
Intel Core i9-10900K, NVIDIA Titan RTX
i9-10900K, 3700 MHz
1440 Points +6%
Intel Core i9-9980HK, NVIDIA GeForce RTX 2070 (Desktop)
i9-9980HK, 2400 MHz
1355 Points
AMD Ryzen 9 3950X, NVIDIA Titan RTX
R9 3950X, 3500 MHz
1315 Points -3%
Intel Core i5-10600K, NVIDIA Titan RTX
i5-10600K, 4100 MHz
1281 Points -5%
Media Intel Core i9-9980HK
  (1171 - 1355, n=4)
1273 Points -6%
Media Intel Core i7-9750H
  (1105 - 1248, n=15)
1179 Points -13%
Media Intel Core i5-9300H
  (1095 - 1137, n=3)
1118 Points -17%
Geekbench 4.4
64 Bit Single-Core Score
Intel Core i9-10900K, NVIDIA Titan RTX
i9-10900K, 3700 MHz
6348 Points +6%
Intel Core i9-9980HK, NVIDIA GeForce RTX 2070 (Desktop)
i9-9980HK, 2400 MHz
5969 Points
Media Intel Core i9-9980HK
  (5617 - 5972, n=3)
5853 Points -2%
Intel Core i5-10600K, NVIDIA Titan RTX
i5-10600K, 4100 MHz
5821 Points -2%
AMD Ryzen 9 3950X, NVIDIA Titan RTX
R9 3950X, 3500 MHz
5749 Points -4%
Media Intel Core i7-9750H
  (4440 - 5511, n=27)
5238 Points -12%
Media Intel Core i5-9300H
  (4704 - 5089, n=7)
4898 Points -18%
64 Bit Multi-Core Score
AMD Ryzen 9 3950X, NVIDIA Titan RTX
R9 3950X, 3500 MHz
48962 Points +67%
Intel Core i9-10900K, NVIDIA Titan RTX
i9-10900K, 3700 MHz
43058 Points +47%
Media Intel Core i9-9980HK
  (28625 - 30849, n=3)
29620 Points +1%
Intel Core i9-9980HK, NVIDIA GeForce RTX 2070 (Desktop)
i9-9980HK, 2400 MHz
29385 Points
Intel Core i5-10600K, NVIDIA Titan RTX
i5-10600K, 4100 MHz
28391 Points -3%
Media Intel Core i7-9750H
  (17054 - 25043, n=27)
22076 Points -25%
Media Intel Core i5-9300H
  (14853 - 17684, n=7)
16246 Points -45%
3DMark 11 - 1280x720 Performance Physics
Intel Core i9-10900K, NVIDIA Titan RTX
i9-10900K, 3700 MHz
22140 Points +35%
AMD Ryzen 9 3950X, NVIDIA Titan RTX
R9 3950X, 3500 MHz
21016 Points +28%
Intel Core i9-9980HK, NVIDIA GeForce RTX 2070 (Desktop)
i9-9980HK, 2400 MHz
16422 Points
Intel Core i5-10600K, NVIDIA Titan RTX
i5-10600K, 4100 MHz
15961 Points -3%
Media Intel Core i9-9980HK
  (9056 - 18260, n=12)
15688 Points -4%
Media Intel Core i7-9750H
  (9704 - 14337, n=80)
12766 Points -22%
Intel Core i9-9980HK, Intel UHD Graphics 630
i9-9980HK, 2400 MHz
9056 Points -45%
Media Intel Core i5-9300H
  (7499 - 10557, n=12)
8987 Points -45%
7-Zip 18.03
7z b 4
AMD Ryzen 9 3950X, NVIDIA Titan RTX
R9 3950X, 3500 MHz
99467 MIPS +126%
Intel Core i9-10900K, NVIDIA Titan RTX
i9-10900K, 3700 MHz
70968 MIPS +61%
Intel Core i9-9980HK, NVIDIA GeForce RTX 2070 (Desktop)
i9-9980HK, 2400 MHz
44081 MIPS
Media Intel Core i9-9980HK
  (39566 - 44081, n=4)
41756 MIPS -5%
Intel Core i5-10600K, NVIDIA Titan RTX
i5-10600K, 4100 MHz
40379 MIPS -8%
Media Intel Core i7-9750H
  (28512 - 35174, n=21)
32357 MIPS -27%
Media Intel Core i5-9300H
  (20736 - 23155, n=3)
22008 MIPS -50%
7z b 4 -mmt1
Intel Core i9-10900K, NVIDIA Titan RTX
i9-10900K, 3700 MHz
5954 MIPS +6%
Intel Core i9-9980HK, NVIDIA GeForce RTX 2070 (Desktop)
i9-9980HK, 2400 MHz
5642 MIPS
Media Intel Core i9-9980HK
  (5283 - 5642, n=4)
5426 MIPS -4%
AMD Ryzen 9 3950X, NVIDIA Titan RTX
R9 3950X, 3500 MHz
5340 MIPS -5%
Intel Core i5-10600K, NVIDIA Titan RTX
i5-10600K, 4100 MHz
5289 MIPS -6%
Media Intel Core i7-9750H
  (4580 - 5090, n=21)
4846 MIPS -14%
Media Intel Core i5-9300H
  (4542 - 4626, n=3)
4592 MIPS -19%
HWBOT x265 Benchmark v2.2 - 4k Preset
Intel Core i9-10900K, NVIDIA Titan RTX
i9-10900K, 3700 MHz
21 fps +84%
AMD Ryzen 9 3950X, NVIDIA Titan RTX
R9 3950X, 3500 MHz
15.8 fps +39%
Intel Core i5-10600K, NVIDIA Titan RTX
i5-10600K, 4100 MHz
12.2 fps +7%
Media Intel Core i9-9980HK
  (10.8 - 12.4, n=3)
11.5 fps +1%
Intel Core i9-9980HK, NVIDIA GeForce RTX 2070 (Desktop)
i9-9980HK, 2400 MHz
11.4 fps
Media Intel Core i7-9750H
  (7.1 - 10.7, n=21)
8.72 fps -24%
Media Intel Core i5-9300H
  (5.7 - 6.5, n=3)
6.07 fps -47%
R Benchmark 2.5 - Overall mean
Media Intel Core i7-9750H
  (0.608 - 0.695, n=14)
0.643 sec * -19%
Intel Core i5-10600K, NVIDIA Titan RTX
i5-10600K, 4100 MHz
0.593 sec * -10%
Intel Core i9-9980HK, NVIDIA GeForce RTX 2070 (Desktop)
i9-9980HK, 2400 MHz
0.541 sec *
Media Intel Core i9-9980HK
  ()
0.541 sec * -0%
Intel Core i9-10900K, NVIDIA Titan RTX
i9-10900K, 3700 MHz
0.528 sec * +2%
AMD Ryzen 9 3950X, NVIDIA Titan RTX
R9 3950X, 3500 MHz
0.524 sec * +3%
LibreOffice - 20 Documents To PDF
Intel Core i9-10900K, NVIDIA Titan RTX
i9-10900K, 3700 MHz
76 s * -68%
Media Intel Core i7-9750H
  (54.5 - 64.7, n=9)
59 s * -30%
AMD Ryzen 9 3950X, NVIDIA Titan RTX
R9 3950X, 3500 MHz
53.6 s * -19%
Media Intel Core i9-9980HK
  (45.2 - 57.5, n=2)
51.4 s * -14%
Intel Core i5-10600K, NVIDIA Titan RTX
i5-10600K, 4100 MHz
46.06 s * -2%
Intel Core i9-9980HK, NVIDIA GeForce RTX 2070 (Desktop)
i9-9980HK, 2400 MHz
45.23 s *
WebXPRT 3 - Overall
Intel Core i9-10900K, NVIDIA Titan RTX
i9-10900K, 3700 MHz
255 Points +9%
AMD Ryzen 9 3950X, NVIDIA Titan RTX
R9 3950X, 3500 MHz
239 Points +3%
Intel Core i5-10600K, NVIDIA Titan RTX
i5-10600K, 4100 MHz
239 Points +3%
Intel Core i9-9980HK, NVIDIA GeForce RTX 2070 (Desktop)
i9-9980HK, 2400 MHz
233 Points
Media Intel Core i9-9980HK
  ()
233 Points 0%
Media Intel Core i5-9300H
  ()
222 Points -5%
Media Intel Core i7-9750H
  (199 - 231, n=10)
211 Points -9%
Mozilla Kraken 1.1 - Total
Media Intel Core i5-9300H
  (1079 - 1349, n=8)
1138 ms * -51%
Media Intel Core i7-9750H
  (845 - 1713, n=54)
1048 ms * -39%
Media Intel Core i9-9980HK
  (705 - 999, n=9)
878 ms * -16%
Intel Core i5-10600K, NVIDIA Titan RTX
i5-10600K, 4100 MHz
760 ms * -1%
Intel Core i9-9980HK, NVIDIA GeForce RTX 2070 (Desktop)
i9-9980HK, 2400 MHz
754 ms *
Intel Core i9-10900K, NVIDIA Titan RTX
i9-10900K, 3700 MHz
709 ms * +6%
AMD Ryzen 9 3950X, NVIDIA Titan RTX
R9 3950X, 3500 MHz
706 ms * +6%
3DMark
3840x2160 Fire Strike Ultra Physics
AMD Ryzen 9 3950X, NVIDIA Titan RTX
R9 3950X, 3500 MHz
31881 Points +46%
Intel Core i9-10900K, NVIDIA Titan RTX
i9-10900K, 3700 MHz
29374 Points +34%
Intel Core i9-9980HK, NVIDIA GeForce RTX 2070 (Desktop)
i9-9980HK, 2400 MHz
21864 Points
Media Intel Core i9-9980HK
  (19832 - 22568, n=8)
21323 Points -2%
Intel Core i5-10600K, NVIDIA Titan RTX
i5-10600K, 4100 MHz
19942 Points -9%
Intel Core i9-9980HK, Intel UHD Graphics 630
i9-9980HK, 2400 MHz
19832 Points -9%
Media Intel Core i7-9750H
  (12628 - 17820, n=51)
16437 Points -25%
Media Intel Core i5-9300H
  (9749 - 12343, n=6)
11357 Points -48%
1920x1080 Fire Strike Physics
AMD Ryzen 9 3950X, NVIDIA Titan RTX
R9 3950X, 3500 MHz
32004 Points +47%
Intel Core i9-10900K, NVIDIA Titan RTX
i9-10900K, 3700 MHz
29805 Points +37%
Intel Core i9-9980HK, NVIDIA GeForce RTX 2070 (Desktop)
i9-9980HK, 2400 MHz
21706 Points
Intel Core i9-9980HK, Intel UHD Graphics 630
i9-9980HK, 2400 MHz
20357 Points -6%
Intel Core i5-10600K, NVIDIA Titan RTX
i5-10600K, 4100 MHz
20040 Points -8%
Media Intel Core i9-9980HK
  (11758 - 22463, n=11)
19893 Points -8%
Media Intel Core i7-9750H
  (12438 - 17788, n=76)
16332 Points -25%
Media Intel Core i5-9300H
  (9387 - 12349, n=12)
11376 Points -48%
2560x1440 Time Spy CPU
Intel Core i9-10900K, NVIDIA Titan RTX
i9-10900K, 3700 MHz
14326 Points +52%
AMD Ryzen 9 3950X, NVIDIA Titan RTX
R9 3950X, 3500 MHz
12404 Points +32%
Intel Core i9-9980HK, NVIDIA GeForce RTX 2070 (Desktop)
i9-9980HK, 2400 MHz
9417 Points
Media Intel Core i9-9980HK
  (5540 - 10162, n=12)
8487 Points -10%
Intel Core i5-10600K, NVIDIA Titan RTX
i5-10600K, 4100 MHz
8290 Points -12%
Intel Core i9-9980HK, Intel UHD Graphics 630
i9-9980HK, 2400 MHz
7243 Points -23%
Media Intel Core i7-9750H
  (4620 - 7171, n=70)
6334 Points -33%
Media Intel Core i5-9300H
  (3165 - 4861, n=10)
4074 Points -57%

* ... Meglio usare valori piccoli

Intel NUC 9 Extreme Kit nel ciclo Cinebench R15

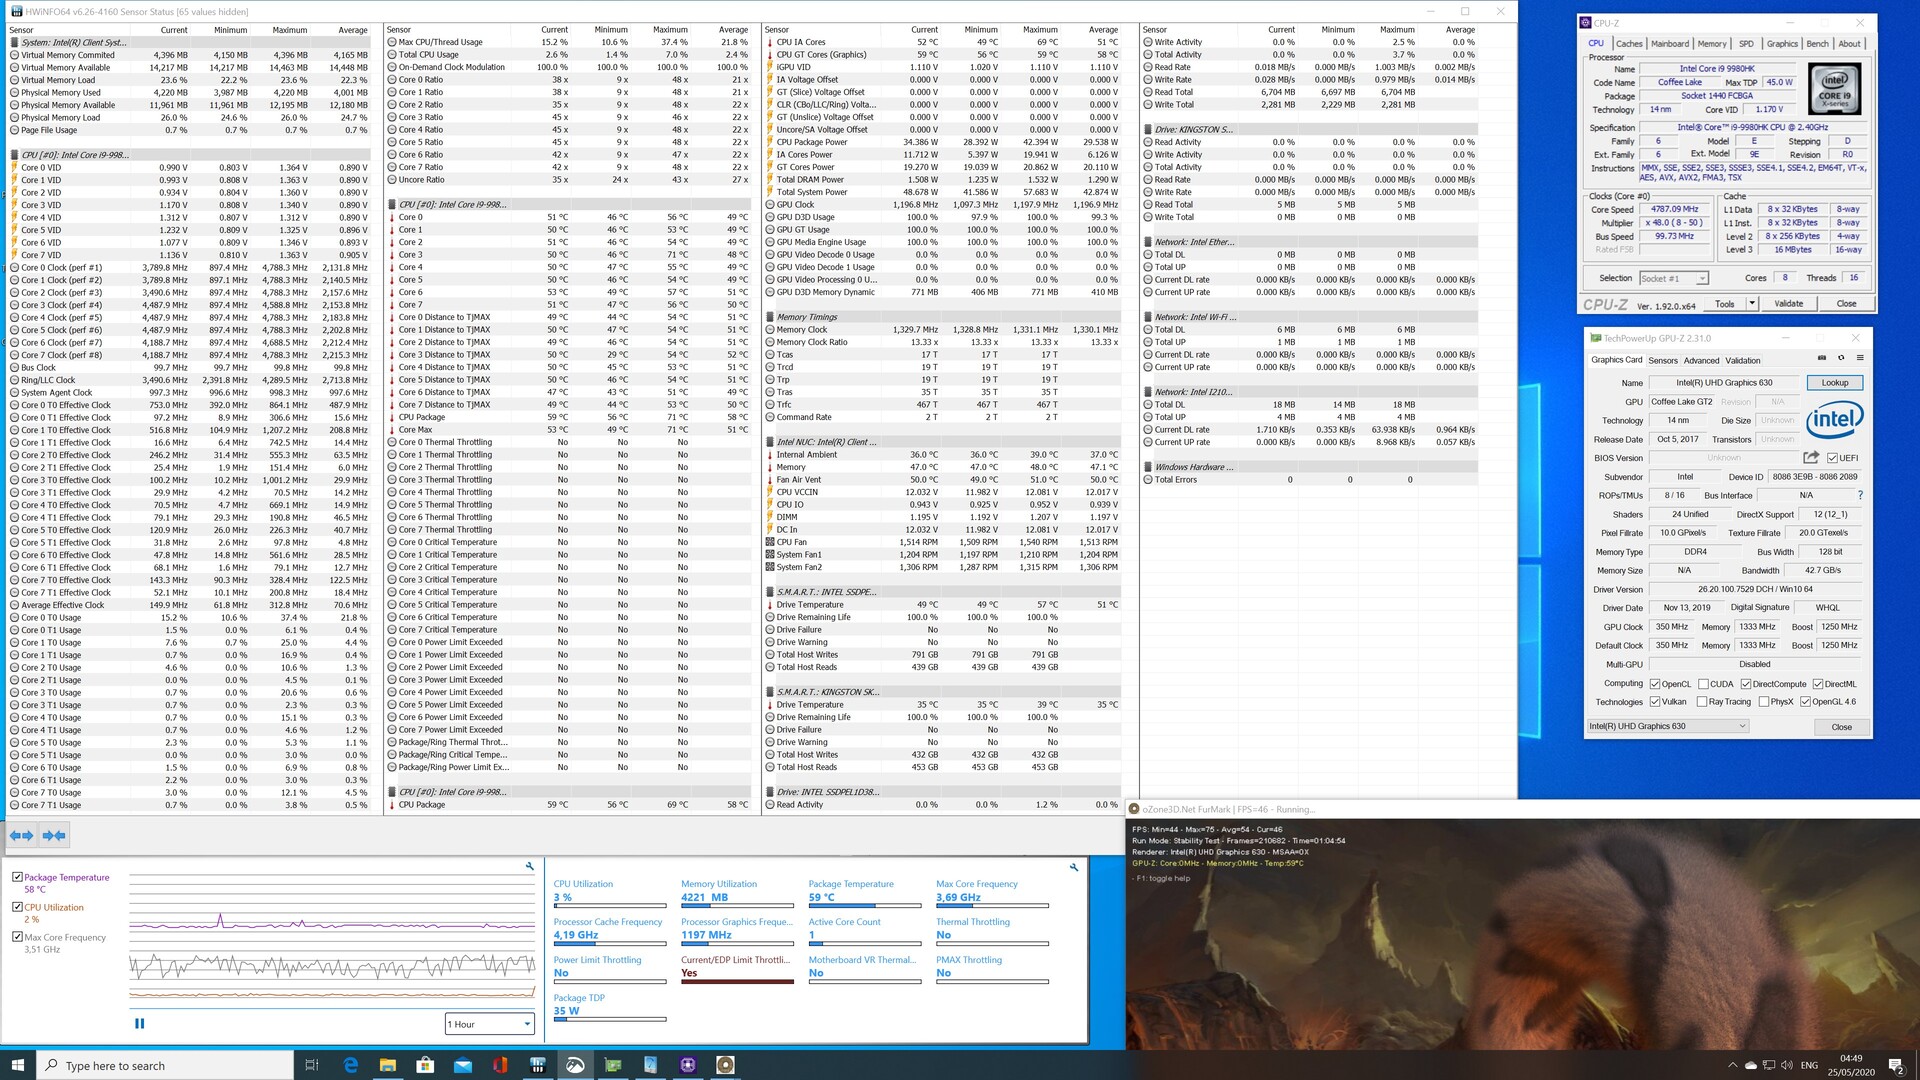
Nonostante la sua struttura compatta, la soluzione di raffreddamento ha funzionato molto bene ed è riuscita a raffreddare la CPU in modo adeguato per garantire punteggi elevati e costanti nel nostro loop multithread Cinebench R15. I punteggi sono scesi di circa 150 punti dopo l'esecuzione iniziale, durante la quale il Core i9-9980HK è stato in grado di sfruttare appieno le elevate capacità di turbo boost ed è rimasto stabile in seguito. In media, il nostro modello di prova ha ottenuto 1.463 punti. Abbiamo eseguito lo stesso test con la GeForce RTX 2070 rimossa per determinare se ha bloccato o meno il flusso d'aria e siamo lieti di riferire che non è stato così. Deviazioni minori a parte i risultati erano identici.

1410.81460.81510.81560.8Tooltip
Intel Ghost Canyon NUC (RTX 2070) Intel Core i9-9980HK, Intel Core i9-9980HK: Ø1463 (1410.79-1593.44)

Prestazioni con le applicazioni

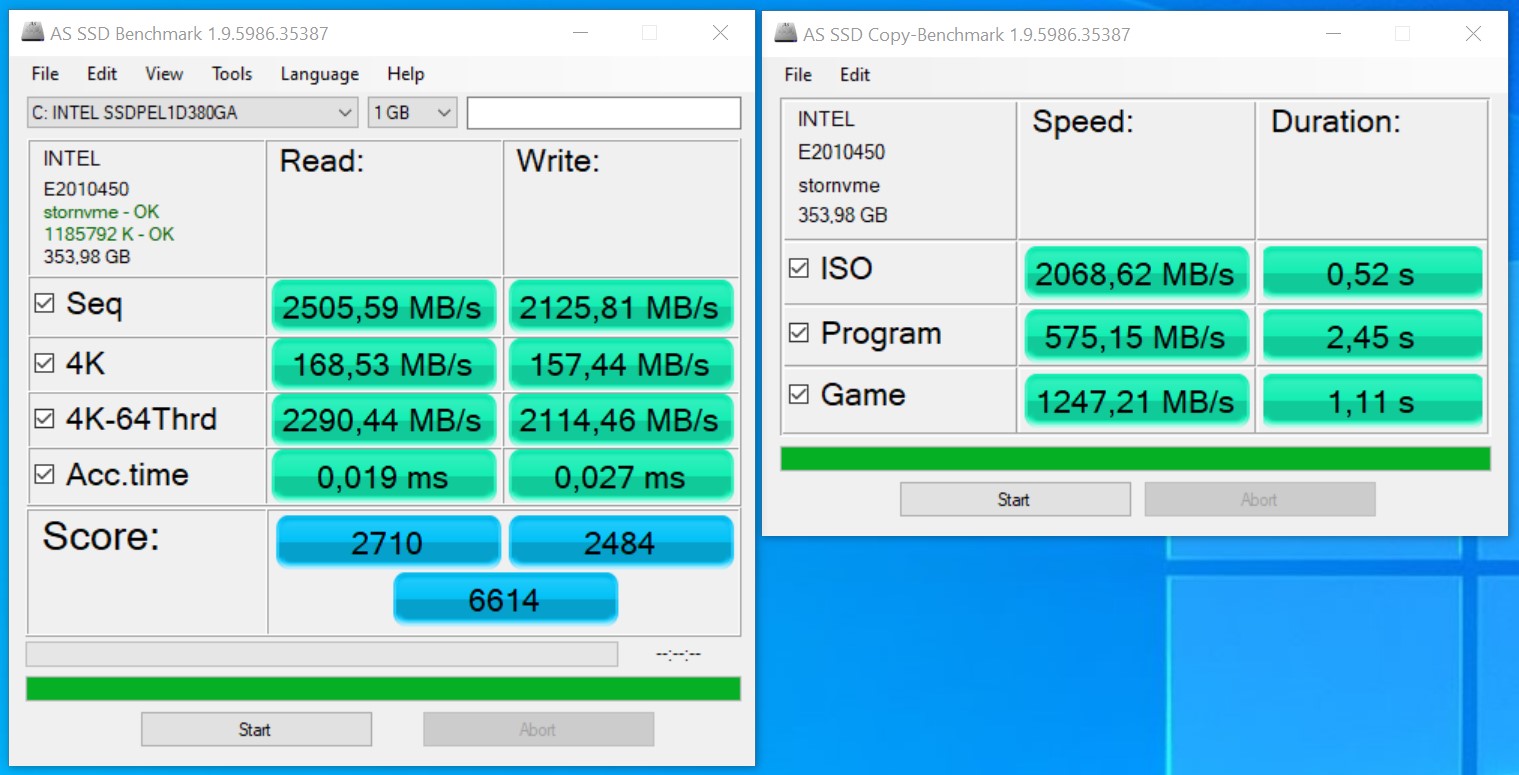
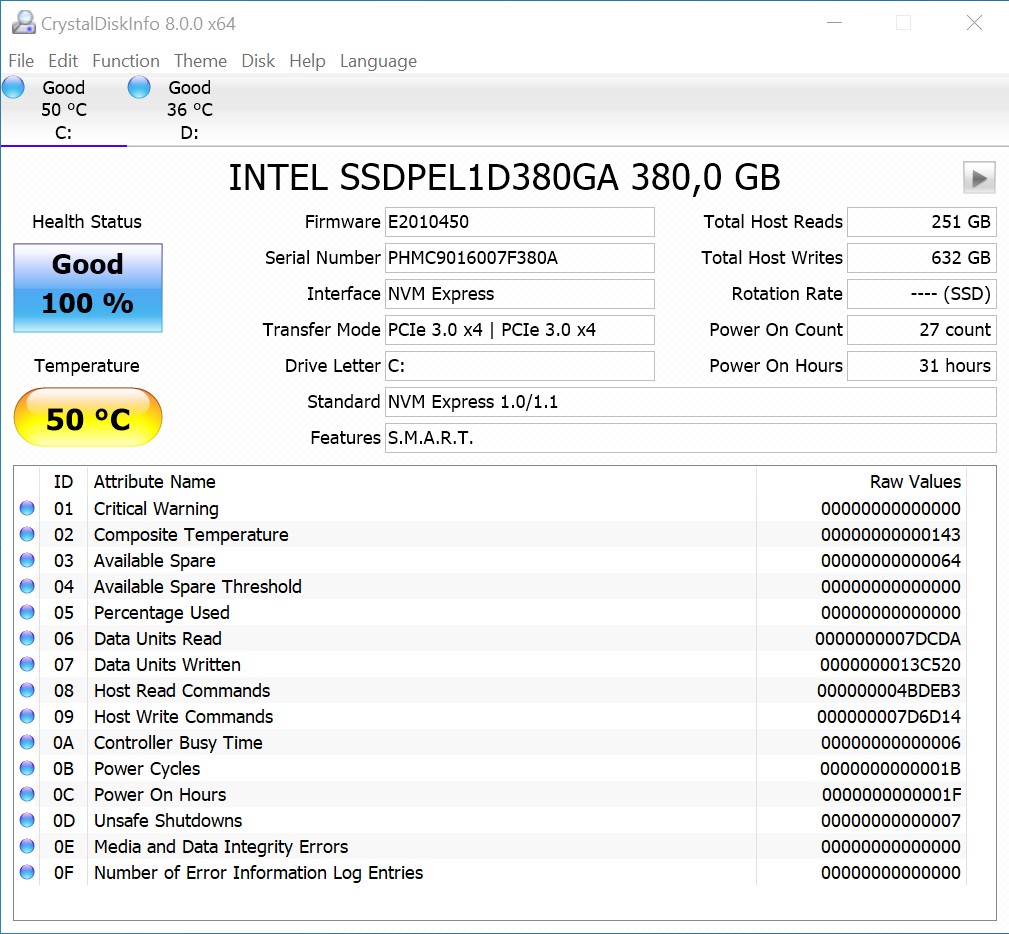
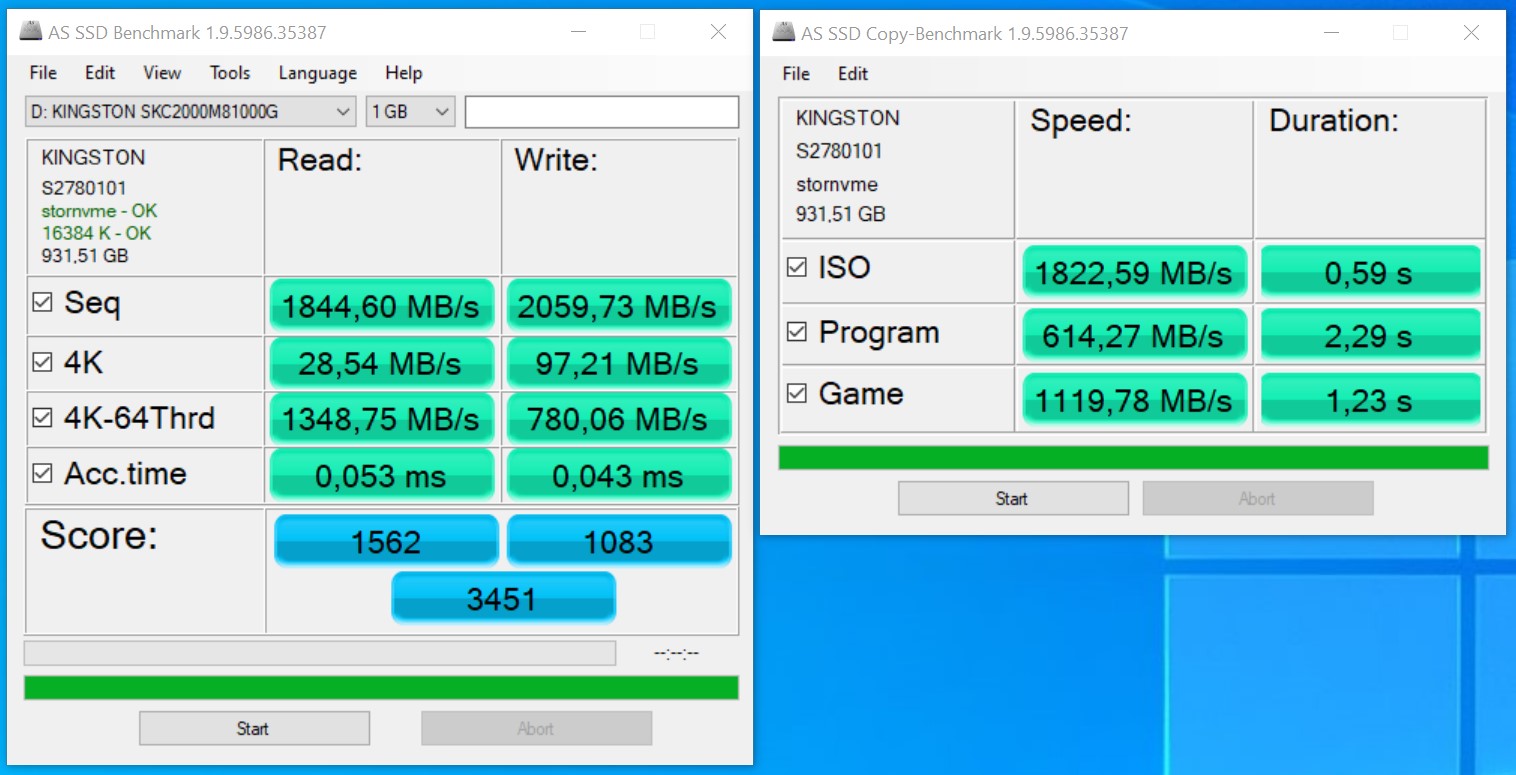
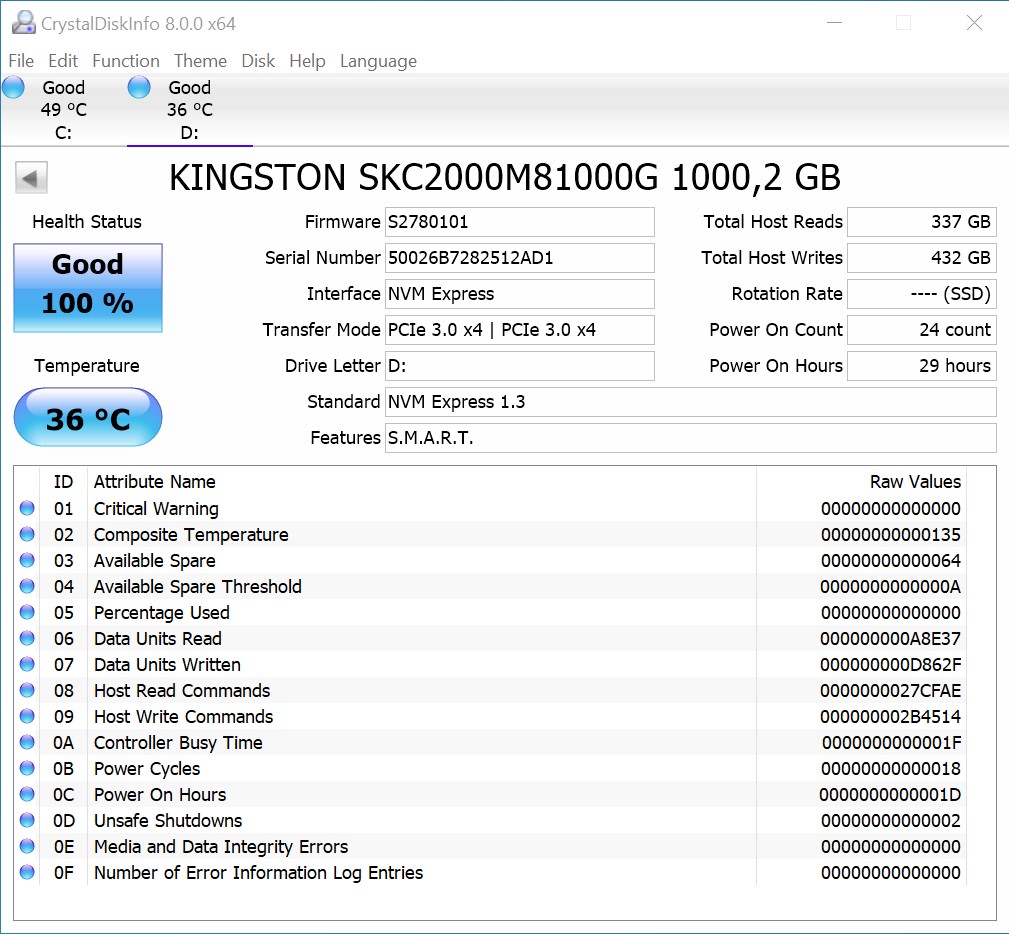
Il nostro modello di test è stato appena sotto ai tre processori desktop, nei nostri benchmarks delle prestazioni con le applicazioni. Ancora una volta, abbiamo eseguito gli stessi test con la GPU dedicata rimossa, e i risultati sono stati identici per i test grafici. Nessuno si è stupito del fatto che la RTX2070 si sia rivelata molto più potente della 630. Di conseguenza, l'Intel NUC 9 è un ottimo dispositivo per il lavoro quotidiano. Gli SSD installati hanno funzionato molto bene, il che ha ridotto al minimo i tempi di attesa. Anche i test di gioco non sono stati una grande sfida per il dispositivo. Complimenti a Intel per aver creato un NUC scattante.

Intel Optane SSD 905P (380 GB)
Kingston KC2000 NVMe SSD (1.024 GB)
PCMark 10 - Score
AMD Ryzen 9 3950X, AMD Ryzen 9 3950X
NVIDIA Titan RTX
7869 Points +13%
Intel Core i9-10900K, Intel Core i9-10900K
NVIDIA Titan RTX
7641 Points +10%
Corsair One i160, Intel Core i9-9900K
NVIDIA GeForce RTX 2080 Ti (Desktop)
7329 Points +6%
Intel Core i5-10600K, Intel Core i5-10600K
NVIDIA Titan RTX
7279 Points +5%
Intel Ghost Canyon NUC (RTX 2070), Intel Core i9-9980HK
NVIDIA GeForce RTX 2070 (Desktop)
6939 Points
Intel Ghost Canyon NUC, Intel Core i9-9980HK
Intel UHD Graphics 630
4806 Points -31%
PCMark 8
Work Score Accelerated v2
AMD Ryzen 9 3950X, AMD Ryzen 9 3950X
NVIDIA Titan RTX
5388 Points +6%
Corsair One i160, Intel Core i9-9900K
NVIDIA GeForce RTX 2080 Ti (Desktop)
5296 Points +5%
Intel Core i5-10600K, Intel Core i5-10600K
NVIDIA Titan RTX
5148 Points +2%
Intel Core i9-10900K, Intel Core i9-10900K
NVIDIA Titan RTX
5115 Points +1%
Intel Ghost Canyon NUC (RTX 2070), Intel Core i9-9980HK
NVIDIA GeForce RTX 2070 (Desktop)
5066 Points
Intel Ghost Canyon NUC, Intel Core i9-9980HK
Intel UHD Graphics 630
4814 Points -5%
Creative Score Accelerated v2
Corsair One i160, Intel Core i9-9900K
NVIDIA GeForce RTX 2080 Ti (Desktop)
10550 Points +18%
AMD Ryzen 9 3950X, AMD Ryzen 9 3950X
NVIDIA Titan RTX
10402 Points +16%
Intel Core i5-10600K, Intel Core i5-10600K
NVIDIA Titan RTX
10349 Points +15%
Intel Core i9-10900K, Intel Core i9-10900K
NVIDIA Titan RTX
10245 Points +14%
Intel Ghost Canyon NUC (RTX 2070), Intel Core i9-9980HK
NVIDIA GeForce RTX 2070 (Desktop)
8969 Points
Intel Ghost Canyon NUC, Intel Core i9-9980HK
Intel UHD Graphics 630
5572 Points -38%
Home Score Accelerated v2
Corsair One i160, Intel Core i9-9900K
NVIDIA GeForce RTX 2080 Ti (Desktop)
5418 Points +3%
AMD Ryzen 9 3950X, AMD Ryzen 9 3950X
NVIDIA Titan RTX
5404 Points +3%
Intel Ghost Canyon NUC (RTX 2070), Intel Core i9-9980HK
NVIDIA GeForce RTX 2070 (Desktop)
5247 Points
Intel Core i5-10600K, Intel Core i5-10600K
NVIDIA Titan RTX
5212 Points -1%
Intel Core i9-10900K, Intel Core i9-10900K
NVIDIA Titan RTX
5185 Points -1%
Intel Ghost Canyon NUC, Intel Core i9-9980HK
Intel UHD Graphics 630
4075 Points -22%
SPECviewperf 12
1900x1060 Solidworks (sw-03)
Intel Core i9-10900K, Intel Core i9-10900K
NVIDIA Titan RTX
172.2 fps +191%
Intel Core i5-10600K, Intel Core i5-10600K
NVIDIA Titan RTX
158.2 fps +167%
AMD Ryzen 9 3950X, AMD Ryzen 9 3950X
NVIDIA Titan RTX
157.6 fps +166%
Corsair One i160, Intel Core i9-9900K
NVIDIA GeForce RTX 2080 Ti (Desktop)
83.7 fps +41%
Intel Ghost Canyon NUC (RTX 2070), Intel Core i9-9980HK
NVIDIA GeForce RTX 2070 (Desktop)
59.2 fps
Intel Ghost Canyon NUC, Intel Core i9-9980HK
Intel UHD Graphics 630
29.03 fps -51%
1900x1060 Siemens NX (snx-02)
Intel Core i9-10900K, Intel Core i9-10900K
NVIDIA Titan RTX
263.3 fps +2800%
Intel Core i5-10600K, Intel Core i5-10600K
NVIDIA Titan RTX
259.1 fps +2754%
AMD Ryzen 9 3950X, AMD Ryzen 9 3950X
NVIDIA Titan RTX
254.8 fps +2706%
Corsair One i160, Intel Core i9-9900K
NVIDIA GeForce RTX 2080 Ti (Desktop)
12.72 fps +40%
Intel Ghost Canyon NUC (RTX 2070), Intel Core i9-9980HK
NVIDIA GeForce RTX 2070 (Desktop)
9.08 fps
Intel Ghost Canyon NUC, Intel Core i9-9980HK
Intel UHD Graphics 630
3.37 fps -63%
1900x1060 Showcase (showcase-01)
Intel Core i5-10600K, Intel Core i5-10600K
NVIDIA Titan RTX
196.1 fps +65%
Intel Core i9-10900K, Intel Core i9-10900K
NVIDIA Titan RTX
192.4 fps +62%
AMD Ryzen 9 3950X, AMD Ryzen 9 3950X
NVIDIA Titan RTX
188.3 fps +59%
Corsair One i160, Intel Core i9-9900K
NVIDIA GeForce RTX 2080 Ti (Desktop)
182.3 fps +54%
Intel Ghost Canyon NUC (RTX 2070), Intel Core i9-9980HK
NVIDIA GeForce RTX 2070 (Desktop)
118.5 fps
Intel Ghost Canyon NUC, Intel Core i9-9980HK
Intel UHD Graphics 630
8.38 fps -93%
1900x1060 Medical (medical-01)
Intel Core i5-10600K, Intel Core i5-10600K
NVIDIA Titan RTX
94.6 fps +136%
Intel Core i9-10900K, Intel Core i9-10900K
NVIDIA Titan RTX
94.5 fps +135%
AMD Ryzen 9 3950X, AMD Ryzen 9 3950X
NVIDIA Titan RTX
88.1 fps +119%
Corsair One i160, Intel Core i9-9900K
NVIDIA GeForce RTX 2080 Ti (Desktop)
56.6 fps +41%
Intel Ghost Canyon NUC (RTX 2070), Intel Core i9-9980HK
NVIDIA GeForce RTX 2070 (Desktop)
40.14 fps
Intel Ghost Canyon NUC, Intel Core i9-9980HK
Intel UHD Graphics 630
2.96 fps -93%
1900x1060 Maya (maya-04)
Corsair One i160, Intel Core i9-9900K
NVIDIA GeForce RTX 2080 Ti (Desktop)
190.9 fps +12%
Intel Core i9-10900K, Intel Core i9-10900K
NVIDIA Titan RTX
188.7 fps +10%
AMD Ryzen 9 3950X, AMD Ryzen 9 3950X
NVIDIA Titan RTX
172.2 fps +1%
Intel Ghost Canyon NUC (RTX 2070), Intel Core i9-9980HK
NVIDIA GeForce RTX 2070 (Desktop)
171 fps
Intel Core i5-10600K, Intel Core i5-10600K
NVIDIA Titan RTX
169.4 fps -1%
Intel Ghost Canyon NUC, Intel Core i9-9980HK
Intel UHD Graphics 630
15.67 fps -91%
1900x1060 Energy (energy-01)
Intel Core i5-10600K, Intel Core i5-10600K
NVIDIA Titan RTX
28.77 fps +150%
Intel Core i9-10900K, Intel Core i9-10900K
NVIDIA Titan RTX
28.72 fps +150%
AMD Ryzen 9 3950X, AMD Ryzen 9 3950X
NVIDIA Titan RTX
28.18 fps +145%
Corsair One i160, Intel Core i9-9900K
NVIDIA GeForce RTX 2080 Ti (Desktop)
16.72 fps +46%
Intel Ghost Canyon NUC (RTX 2070), Intel Core i9-9980HK
NVIDIA GeForce RTX 2070 (Desktop)
11.49 fps
Intel Ghost Canyon NUC, Intel Core i9-9980HK
Intel UHD Graphics 630
0.29 fps -97%
1900x1060 Creo (creo-01)
Intel Core i9-10900K, Intel Core i9-10900K
NVIDIA Titan RTX
157.2 fps +201%
Intel Core i5-10600K, Intel Core i5-10600K
NVIDIA Titan RTX
142.7 fps +173%
AMD Ryzen 9 3950X, AMD Ryzen 9 3950X
NVIDIA Titan RTX
134.8 fps +158%
Corsair One i160, Intel Core i9-9900K
NVIDIA GeForce RTX 2080 Ti (Desktop)
72.2 fps +38%
Intel Ghost Canyon NUC (RTX 2070), Intel Core i9-9980HK
NVIDIA GeForce RTX 2070 (Desktop)
52.2 fps
Intel Ghost Canyon NUC, Intel Core i9-9980HK
Intel UHD Graphics 630
14.51 fps -72%
1900x1060 Catia (catia-04)
Intel Core i9-10900K, Intel Core i9-10900K
NVIDIA Titan RTX
225.2 fps +188%
AMD Ryzen 9 3950X, AMD Ryzen 9 3950X
NVIDIA Titan RTX
218.4 fps +179%
Intel Core i5-10600K, Intel Core i5-10600K
NVIDIA Titan RTX
215.5 fps +175%
Corsair One i160, Intel Core i9-9900K
NVIDIA GeForce RTX 2080 Ti (Desktop)
120.8 fps +54%
Intel Ghost Canyon NUC (RTX 2070), Intel Core i9-9980HK
NVIDIA GeForce RTX 2070 (Desktop)
78.3 fps
Intel Ghost Canyon NUC, Intel Core i9-9980HK
Intel UHD Graphics 630
16.61 fps -79%
1900x1060 3ds Max (3dsmax-05)
Intel Core i9-10900K, Intel Core i9-10900K
NVIDIA Titan RTX
297.4 fps +64%
Intel Core i5-10600K, Intel Core i5-10600K
NVIDIA Titan RTX
296.9 fps +64%
AMD Ryzen 9 3950X, AMD Ryzen 9 3950X
NVIDIA Titan RTX
274.5 fps +52%
Corsair One i160, Intel Core i9-9900K
NVIDIA GeForce RTX 2080 Ti (Desktop)
271.8 fps +50%
Intel Ghost Canyon NUC (RTX 2070), Intel Core i9-9980HK
NVIDIA GeForce RTX 2070 (Desktop)
180.8 fps
Intel Ghost Canyon NUC, Intel Core i9-9980HK
Intel UHD Graphics 630
11.27 fps -94%
SPECviewperf 13
Solidworks (sw-04)
Intel Core i9-10900K, Intel Core i9-10900K
NVIDIA Titan RTX
166.2 fps +95%
Intel Core i5-10600K, Intel Core i5-10600K
NVIDIA Titan RTX
153.9 fps +80%
AMD Ryzen 9 3950X, AMD Ryzen 9 3950X
NVIDIA Titan RTX
153.2 fps +79%
Corsair One i160, Intel Core i9-9900K
NVIDIA GeForce RTX 2080 Ti (Desktop)
116.3 fps +36%
Intel Ghost Canyon NUC (RTX 2070), Intel Core i9-9980HK
NVIDIA GeForce RTX 2070 (Desktop)
85.4 fps
Intel Ghost Canyon NUC, Intel Core i9-9980HK
Intel UHD Graphics 630
37.96 fps -56%
Siemens NX (snx-03)
Intel Core i9-10900K, Intel Core i9-10900K
NVIDIA Titan RTX
472.9 fps +2796%
Intel Core i5-10600K, Intel Core i5-10600K
NVIDIA Titan RTX
469.1 fps +2773%
AMD Ryzen 9 3950X, AMD Ryzen 9 3950X
NVIDIA Titan RTX
460 fps +2717%
Corsair One i160, Intel Core i9-9900K
NVIDIA GeForce RTX 2080 Ti (Desktop)
23.03 fps +41%
Intel Ghost Canyon NUC (RTX 2070), Intel Core i9-9980HK
NVIDIA GeForce RTX 2070 (Desktop)
16.33 fps
Intel Ghost Canyon NUC, Intel Core i9-9980HK
Intel UHD Graphics 630
6.07 fps -63%
Showcase (showcase-02)
Intel Core i5-10600K, Intel Core i5-10600K
NVIDIA Titan RTX
195.1 fps +65%
Intel Core i9-10900K, Intel Core i9-10900K
NVIDIA Titan RTX
194.1 fps +64%
AMD Ryzen 9 3950X, AMD Ryzen 9 3950X
NVIDIA Titan RTX
186.8 fps +58%
Corsair One i160, Intel Core i9-9900K
NVIDIA GeForce RTX 2080 Ti (Desktop)
182.6 fps +54%
Intel Ghost Canyon NUC (RTX 2070), Intel Core i9-9980HK
NVIDIA GeForce RTX 2070 (Desktop)
118.5 fps
Intel Ghost Canyon NUC, Intel Core i9-9980HK
Intel UHD Graphics 630
8.34 fps -93%
Medical (medical-02)
AMD Ryzen 9 3950X, AMD Ryzen 9 3950X
NVIDIA Titan RTX
90.3 fps +60%
Intel Core i5-10600K, Intel Core i5-10600K
NVIDIA Titan RTX
89.7 fps +59%
Intel Core i9-10900K, Intel Core i9-10900K
NVIDIA Titan RTX
88.7 fps +57%
Corsair One i160, Intel Core i9-9900K
NVIDIA GeForce RTX 2080 Ti (Desktop)
85 fps +51%
Intel Ghost Canyon NUC (RTX 2070), Intel Core i9-9980HK
NVIDIA GeForce RTX 2070 (Desktop)
56.4 fps
Intel Ghost Canyon NUC, Intel Core i9-9980HK
Intel UHD Graphics 630
2.28 fps -96%
Maya (maya-05)
Intel Core i9-10900K, Intel Core i9-10900K
NVIDIA Titan RTX
405.9 fps +44%
Corsair One i160, Intel Core i9-9900K
NVIDIA GeForce RTX 2080 Ti (Desktop)
402 fps +43%
AMD Ryzen 9 3950X, AMD Ryzen 9 3950X
NVIDIA Titan RTX
394.9 fps +41%
Intel Core i5-10600K, Intel Core i5-10600K
NVIDIA Titan RTX
387.5 fps +38%
Intel Ghost Canyon NUC (RTX 2070), Intel Core i9-9980HK
NVIDIA GeForce RTX 2070 (Desktop)
281 fps
Intel Ghost Canyon NUC, Intel Core i9-9980HK
Intel UHD Graphics 630
23.03 fps -92%
Energy (energy-02)
Intel Core i5-10600K, Intel Core i5-10600K
NVIDIA Titan RTX
53.3 fps +144%
Intel Core i9-10900K, Intel Core i9-10900K
NVIDIA Titan RTX
53.2 fps +144%
AMD Ryzen 9 3950X, AMD Ryzen 9 3950X
NVIDIA Titan RTX
52.4 fps +140%
Corsair One i160, Intel Core i9-9900K
NVIDIA GeForce RTX 2080 Ti (Desktop)
31.93 fps +46%
Intel Ghost Canyon NUC (RTX 2070), Intel Core i9-9980HK
NVIDIA GeForce RTX 2070 (Desktop)
21.83 fps
Intel Ghost Canyon NUC, Intel Core i9-9980HK
Intel UHD Graphics 630
0.77 fps -96%
Creo (creo-02)
Intel Core i9-10900K, Intel Core i9-10900K
NVIDIA Titan RTX
336.3 fps +83%
Intel Core i5-10600K, Intel Core i5-10600K
NVIDIA Titan RTX
331.7 fps +80%
AMD Ryzen 9 3950X, AMD Ryzen 9 3950X
NVIDIA Titan RTX
328.8 fps +79%
Corsair One i160, Intel Core i9-9900K
NVIDIA GeForce RTX 2080 Ti (Desktop)
286.1 fps +56%
Intel Ghost Canyon NUC (RTX 2070), Intel Core i9-9980HK
NVIDIA GeForce RTX 2070 (Desktop)
183.8 fps
Intel Ghost Canyon NUC, Intel Core i9-9980HK
Intel UHD Graphics 630
18.83 fps -90%
Catia (catia-05)
Intel Core i9-10900K, Intel Core i9-10900K
NVIDIA Titan RTX
362.1 fps +218%
AMD Ryzen 9 3950X, AMD Ryzen 9 3950X
NVIDIA Titan RTX
355.2 fps +212%
Intel Core i5-10600K, Intel Core i5-10600K
NVIDIA Titan RTX
341.7 fps +201%
Corsair One i160, Intel Core i9-9900K
NVIDIA GeForce RTX 2080 Ti (Desktop)
177.3 fps +56%
Intel Ghost Canyon NUC (RTX 2070), Intel Core i9-9980HK
NVIDIA GeForce RTX 2070 (Desktop)
113.7 fps
Intel Ghost Canyon NUC, Intel Core i9-9980HK
Intel UHD Graphics 630
23.36 fps -79%
3ds Max (3dsmax-06)
Intel Core i5-10600K, Intel Core i5-10600K
NVIDIA Titan RTX
294.4 fps +65%
Intel Core i9-10900K, Intel Core i9-10900K
NVIDIA Titan RTX
292.5 fps +64%
AMD Ryzen 9 3950X, AMD Ryzen 9 3950X
NVIDIA Titan RTX
274.5 fps +54%
Corsair One i160, Intel Core i9-9900K
NVIDIA GeForce RTX 2080 Ti (Desktop)
265.9 fps +49%
Intel Ghost Canyon NUC (RTX 2070), Intel Core i9-9980HK
NVIDIA GeForce RTX 2070 (Desktop)
178.6 fps
Intel Ghost Canyon NUC, Intel Core i9-9980HK
Intel UHD Graphics 630
14.98 fps -92%

Prestazioni 3D e Gaming

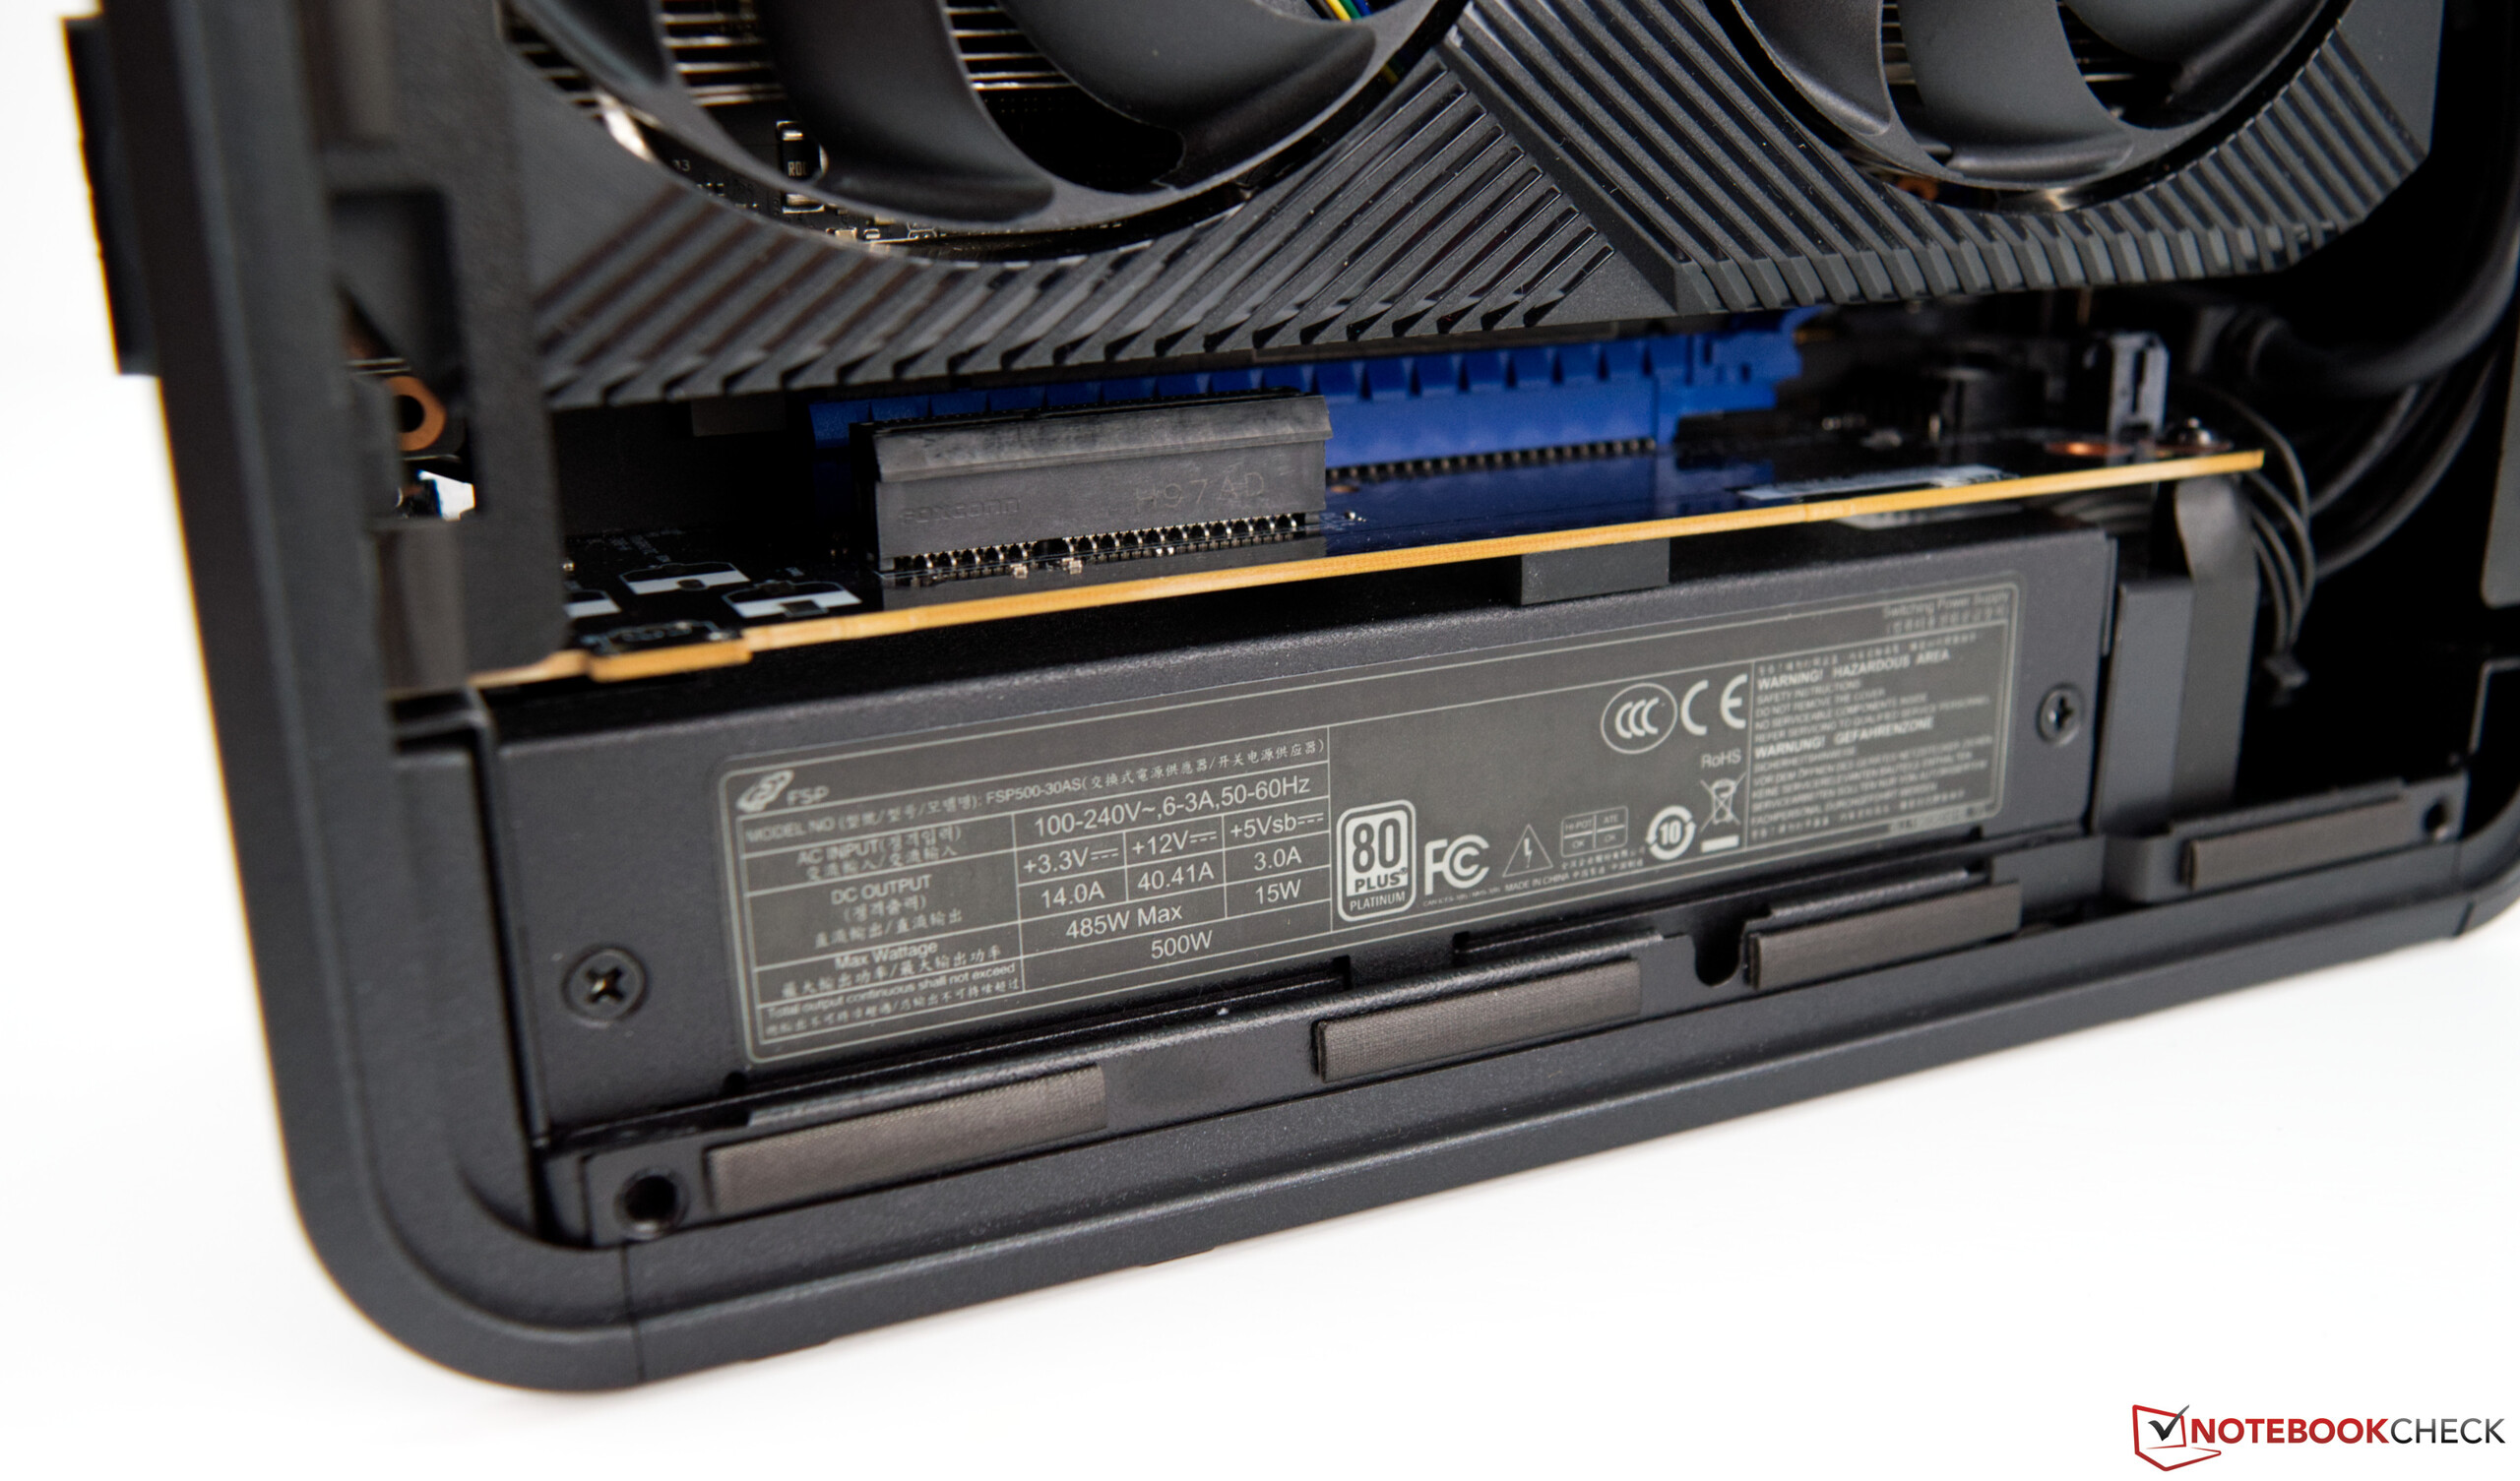
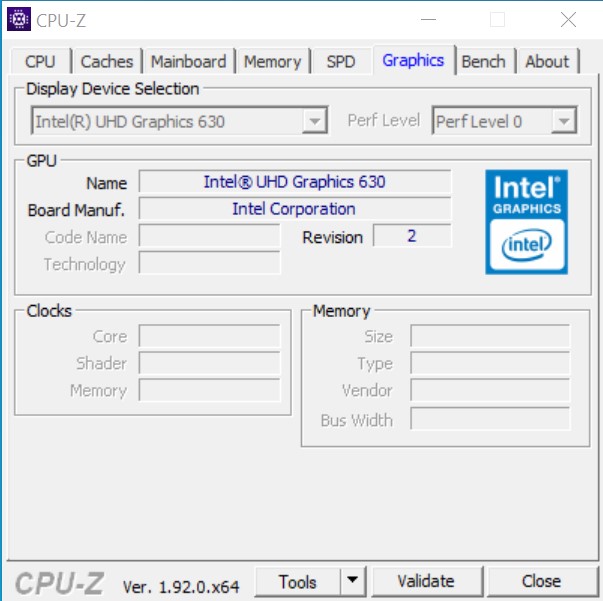
Le prestazioni 3D dipendono dalla GPU di cui il sistema è dotato. Dato che il NUC viene fornito senza una GPU dedicata di default abbiamo ripetuto tutti i benchmarks con la GPU integrata del Core i9-9980HK. La nostra unità di prova ha ottenuto prestazioni molto migliori rispetto alla media di Intel UHD Graphics 630. Tuttavia, è rimasta troppo lenta per i giochi impegnativi. Quelli a loro volta hanno funzionato perfettamente bene in QHD usando la Asus GeForce RTX 2070 Mini. Tenete presente che le GPU più potenti potrebbero essere troppo potenti per l'alimentatore da 500 W del NUC.

Borderlands 3
1280x720 Very Low Overall Quality (DX11)
Intel Ghost Canyon NUC (RTX 2070)
GeForce RTX 2070 (Desktop), i9-9980HK, Kingston KC2500 1 TB SKC2500M81000G
152 fps
Media NVIDIA GeForce RTX 2070 (Desktop)
  (138 - 152, n=2)
145 fps -5%
Media NVIDIA GeForce RTX 2070 Mobile
  (94 - 125, n=2)
109.5 fps -28%
Media Intel UHD Graphics 630
  ()
17.8 fps -88%
1920x1080 Badass Overall Quality (DX11)
Media NVIDIA GeForce RTX 2070 (Desktop)
  (70.9 - 74.4, n=2)
72.7 fps +3%
Intel Ghost Canyon NUC (RTX 2070)
GeForce RTX 2070 (Desktop), i9-9980HK, Kingston KC2500 1 TB SKC2500M81000G
70.9 fps
Media NVIDIA GeForce RTX 2070 Mobile
  (61 - 64.5, n=3)
62.9 fps -11%
Metro Exodus
1280x720 Low Quality AF:4x
Intel Ghost Canyon NUC (RTX 2070)
GeForce RTX 2070 (Desktop), i9-9980HK, Kingston KC2500 1 TB SKC2500M81000G
181 (100.48min - 268.67max) fps
Media NVIDIA GeForce RTX 2070 (Desktop)
  (82.7 - 181, n=4)
131.1 fps -28%
Media NVIDIA GeForce RTX 2070 Mobile
  (91.1 - 98, n=2)
94.6 fps -48%
Media Intel UHD Graphics 630
  ()
15.4 fps -91%
1920x1080 Ultra Quality AF:16x
Intel Ghost Canyon NUC (RTX 2070)
GeForce RTX 2070 (Desktop), i9-9980HK, Kingston KC2500 1 TB SKC2500M81000G
60.9 (33.61min - 92.62max) fps
Media NVIDIA GeForce RTX 2070 (Desktop)
  (33.4 - 62.8, n=4)
54.4 fps -11%
Media NVIDIA GeForce RTX 2070 Mobile
  (53.3 - 54.6, n=5)
53.9 fps -11%
Far Cry New Dawn
1280x720 Low Preset
Intel Ghost Canyon NUC (RTX 2070)
GeForce RTX 2070 (Desktop), i9-9980HK, Kingston KC2500 1 TB SKC2500M81000G
128 (92min - 190max) fps
Media NVIDIA GeForce RTX 2070 (Desktop)
  (117 - 128, n=3)
121.7 fps -5%
Media Intel UHD Graphics 630
  ()
17 fps -87%
1920x1080 Ultra Preset
Media NVIDIA GeForce RTX 2070 (Desktop)
  (79 - 94, n=3)
87.7 fps +11%
Media NVIDIA GeForce RTX 2070 Mobile
  (82 - 83, n=2)
82.5 fps +4%
Intel Ghost Canyon NUC (RTX 2070)
GeForce RTX 2070 (Desktop), i9-9980HK, Kingston KC2500 1 TB SKC2500M81000G
79 (61min - 99max) fps
Forza Horizon 4
1280x720 Very Low Preset
Intel Ghost Canyon NUC (RTX 2070)
GeForce RTX 2070 (Desktop), i9-9980HK, Kingston KC2500 1 TB SKC2500M81000G
198 fps
Media NVIDIA GeForce RTX 2070 (Desktop)
  (169 - 198, n=4)
183.3 fps -7%
Media NVIDIA GeForce RTX 2070 Mobile
  ()
137 fps -31%
1920x1080 Ultra Preset AA:2xMS
Media NVIDIA GeForce RTX 2070 (Desktop)
  (106 - 118, n=4)
111 fps +5%
Intel Ghost Canyon NUC (RTX 2070)
GeForce RTX 2070 (Desktop), i9-9980HK, Kingston KC2500 1 TB SKC2500M81000G
106 fps
Media NVIDIA GeForce RTX 2070 Mobile
  ()
94 fps -11%
Far Cry 5
1280x720 Low Preset AA:T
Intel Ghost Canyon NUC (RTX 2070)
GeForce RTX 2070 (Desktop), i9-9980HK, Kingston KC2500 1 TB SKC2500M81000G
147 (119min - 193max) fps
Media NVIDIA GeForce RTX 2070 Mobile
  ()
147 fps 0%
Media NVIDIA GeForce RTX 2070 (Desktop)
  (126 - 147, n=4)
132.5 fps -10%
Media Intel UHD Graphics 630
  (13 - 15, n=3)
14 fps -90%
1920x1080 Ultra Preset AA:T
Media NVIDIA GeForce RTX 2070 Mobile
  (103 - 109, n=2)
106 fps +23%
Media NVIDIA GeForce RTX 2070 (Desktop)
  (86 - 105, n=4)
99.8 fps +16%
Intel Ghost Canyon NUC (RTX 2070)
GeForce RTX 2070 (Desktop), i9-9980HK, Kingston KC2500 1 TB SKC2500M81000G
86 (68min - 111max) fps
X-Plane 11.11
1280x720 low (fps_test=1)
Intel Ghost Canyon NUC (RTX 2070)
GeForce RTX 2070 (Desktop), i9-9980HK, Kingston KC2500 1 TB SKC2500M81000G
127 fps
Media NVIDIA GeForce RTX 2070 (Desktop)
  ()
127 fps 0%
Media NVIDIA GeForce RTX 2070 Mobile
  (96.1 - 128.4, n=8)
107.9 fps -15%
Media Intel UHD Graphics 630
  (11.6 - 31.3, n=10)
21 fps -83%
1920x1080 high (fps_test=3)
Intel Ghost Canyon NUC (RTX 2070)
GeForce RTX 2070 (Desktop), i9-9980HK, Kingston KC2500 1 TB SKC2500M81000G
92.7 fps
Media NVIDIA GeForce RTX 2070 (Desktop)
  ()
92.7 fps 0%
Media NVIDIA GeForce RTX 2070 Mobile
  (71.9 - 92.5, n=8)
79.9 fps -14%
Media Intel UHD Graphics 630
  (10.3 - 18.3, n=10)
13.8 fps -85%
Final Fantasy XV Benchmark
1280x720 Lite Quality
Intel Ghost Canyon NUC (RTX 2070)
GeForce RTX 2070 (Desktop), i9-9980HK, Kingston KC2500 1 TB SKC2500M81000G
193 (94min - 237max) fps
Media NVIDIA GeForce RTX 2070 Mobile
  (151 - 158, n=2)
154.5 fps -20%
Media NVIDIA GeForce RTX 2070 (Desktop)
  (106.5 - 193, n=5)
154.4 fps -20%
Media Intel UHD Graphics 630
  (9.5 - 14, n=3)
11.6 fps -94%
1920x1080 High Quality
Intel Ghost Canyon NUC (RTX 2070)
GeForce RTX 2070 (Desktop), i9-9980HK, Kingston KC2500 1 TB SKC2500M81000G
90.6 (56min - 138max) fps
Media NVIDIA GeForce RTX 2070 (Desktop)
  (60.8 - 90.6, n=5)
81.9 fps -10%
Media NVIDIA GeForce RTX 2070 Mobile
  (77 - 80.6, n=3)
78.6 fps -13%
Dota 2 Reborn
1280x720 min (0/3) fastest
Intel Ghost Canyon NUC (RTX 2070)
GeForce RTX 2070 (Desktop), i9-9980HK, Kingston KC2500 1 TB SKC2500M81000G
155.6 (135.2min) fps
Media NVIDIA GeForce RTX 2070 (Desktop)
  ()
155.6 fps 0%
Media NVIDIA GeForce RTX 2070 Mobile
  (129.7 - 153, n=9)
144.4 fps -7%
Media Intel UHD Graphics 630
  (70.4 - 99.1, n=11)
80.6 fps -48%
1920x1080 ultra (3/3) best looking
Intel Ghost Canyon NUC (RTX 2070)
GeForce RTX 2070 (Desktop), i9-9980HK, Kingston KC2500 1 TB SKC2500M81000G
130.3 (114.9min) fps
Media NVIDIA GeForce RTX 2070 (Desktop)
  ()
130.3 fps 0%
Media NVIDIA GeForce RTX 2070 Mobile
  (98.4 - 124, n=9)
115.9 fps -11%
Media Intel UHD Graphics 630
  (6.8 - 21, n=11)
17.8 fps -86%
The Witcher 3
1024x768 Low Graphics & Postprocessing
Media NVIDIA GeForce RTX 2070 Mobile
  (193.9 - 357, n=12)
290 fps +1%
Intel Ghost Canyon NUC (RTX 2070)
GeForce RTX 2070 (Desktop), i9-9980HK, Kingston KC2500 1 TB SKC2500M81000G
286 (243min - 334max) fps
Media NVIDIA GeForce RTX 2070 (Desktop)
  (151.4 - 315, n=5)
271 fps -5%
Media Intel UHD Graphics 630
  (15.2 - 17.3, n=3)
16.2 fps -94%
1920x1080 Ultra Graphics & Postprocessing (HBAO+)
Intel Ghost Canyon NUC (RTX 2070)
GeForce RTX 2070 (Desktop), i9-9980HK, Kingston KC2500 1 TB SKC2500M81000G
83.1 (72min - 93max) fps
Media NVIDIA GeForce RTX 2070 (Desktop)
  (40.9 - 95, n=5)
79.2 fps -5%
Media NVIDIA GeForce RTX 2070 Mobile
  (64 - 82.1, n=21)
74.3 fps -11%
3DMark
Fire Strike Extreme Graphics
Media NVIDIA GeForce RTX 2070 (Desktop)
  (9979 - 11423, n=5)
10987 Points +10%
Intel Ghost Canyon NUC (RTX 2070)
GeForce RTX 2070 (Desktop), i9-9980HK, Kingston KC2500 1 TB SKC2500M81000G
9979 Points
Media NVIDIA GeForce RTX 2070 Mobile
  (9042 - 9335, n=3)
9179 Points -8%
Intel Ghost Canyon NUC
UHD Graphics 630, i9-9980HK, Kingston KC2500 1 TB SKC2500M81000G
657 Points -93%
Media Intel UHD Graphics 630
  (600 - 657, n=2)
629 Points -94%
1920x1080 Fire Strike Graphics
Media NVIDIA GeForce RTX 2070 (Desktop)
  (16770 - 24242, n=6)
21999 Points +6%
Intel Ghost Canyon NUC (RTX 2070)
GeForce RTX 2070 (Desktop), i9-9980HK, Kingston KC2500 1 TB SKC2500M81000G
20775 Points
Media NVIDIA GeForce RTX 2070 Mobile
  (18169 - 21138, n=19)
20123 Points -3%
Intel Ghost Canyon NUC
UHD Graphics 630, i9-9980HK, Kingston KC2500 1 TB SKC2500M81000G
1472 Points -93%
Media Intel UHD Graphics 630
  (722 - 1472, n=11)
1228 Points -94%
2560x1440 Time Spy Graphics
Media NVIDIA GeForce RTX 2070 (Desktop)
  (7445 - 9656, n=6)
8952 Points +4%
Intel Ghost Canyon NUC (RTX 2070)
GeForce RTX 2070 (Desktop), i9-9980HK, Kingston KC2500 1 TB SKC2500M81000G
8631 Points
Media NVIDIA GeForce RTX 2070 Mobile
  (7006 - 8028, n=18)
7651 Points -11%
Intel Ghost Canyon NUC
UHD Graphics 630, i9-9980HK, Kingston KC2500 1 TB SKC2500M81000G
459 Points -95%
Media Intel UHD Graphics 630
  (367 - 459, n=10)
410 Points -95%
3DMark 11
1280x720 Performance GPU
Media NVIDIA GeForce RTX 2070 (Desktop)
  (22174 - 32373, n=7)
29866 Points +4%
Intel Ghost Canyon NUC (RTX 2070)
GeForce RTX 2070 (Desktop), i9-9980HK, Kingston KC2500 1 TB SKC2500M81000G
28828 Points
Media NVIDIA GeForce RTX 2070 Mobile
  (23335 - 27298, n=21)
25775 Points -11%
Intel Ghost Canyon NUC
UHD Graphics 630, i9-9980HK, Kingston KC2500 1 TB SKC2500M81000G
2025 Points -93%
Media Intel UHD Graphics 630
  (642 - 2025, n=12)
1742 Points -94%
1280x720 Performance
Intel Ghost Canyon NUC (RTX 2070)
GeForce RTX 2070 (Desktop), i9-9980HK, Kingston KC2500 1 TB SKC2500M81000G
24131 Points
Media NVIDIA GeForce RTX 2070 (Desktop)
  (15341 - 27206, n=7)
23703 Points -2%
Media NVIDIA GeForce RTX 2070 Mobile
  (17817 - 23447, n=21)
20620 Points -15%
Intel Ghost Canyon NUC
UHD Graphics 630, i9-9980HK, Kingston KC2500 1 TB SKC2500M81000G
2259 Points -91%
Media Intel UHD Graphics 630
  (790 - 2326, n=12)
1990 Points -92%
basso medio alto ultraQHD4K
The Witcher 3 (2015) 286 216 142 83.1 55.9
Dota 2 Reborn (2015) 155.6 141.8 137.6 130.3 116.1
Final Fantasy XV Benchmark (2018) 193 122 90.6 37.1
X-Plane 11.11 (2018) 127 115 92.7 82.2
Far Cry 5 (2018) 147 106 82 86 71 46
Forza Horizon 4 (2018) 198 141 132 106 88 61
Far Cry New Dawn (2019) 128 92 87 79 63 49
Metro Exodus (2019) 181 104 77 60.9 48.4 30.5
Borderlands 3 (2019) 152 126 91.7 70.9 49.8 26.7

Consumo Energetico del NUC 9 Extreme ed emissioni di calore

Intel NUC 9 Extreme Kit durante lo stress test

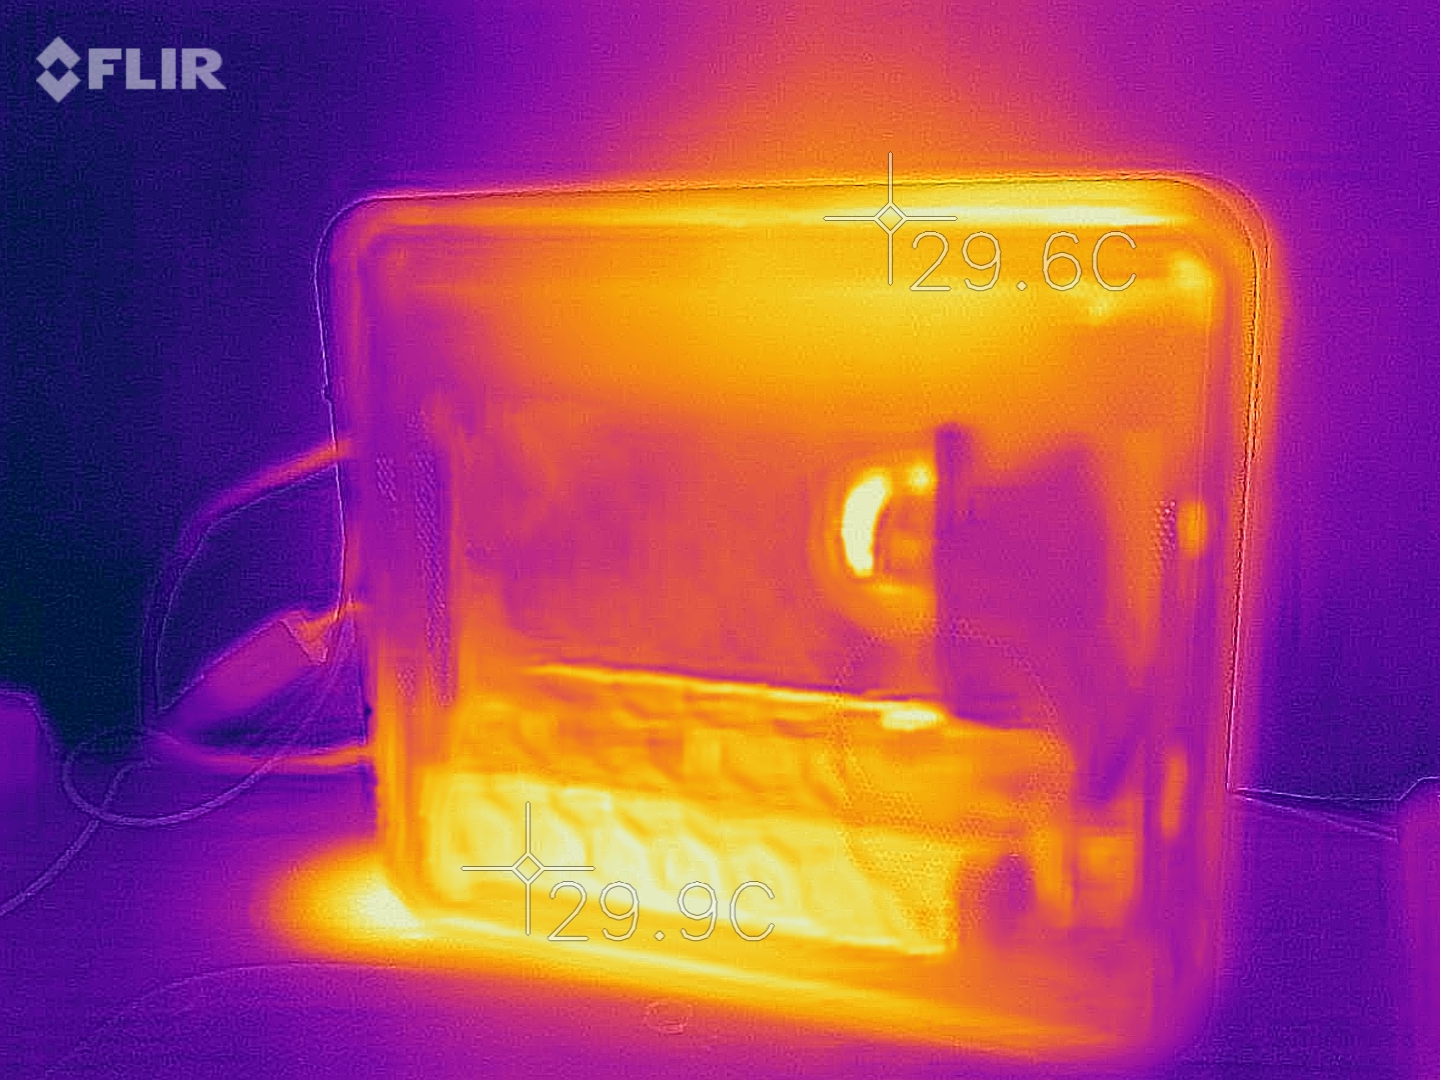
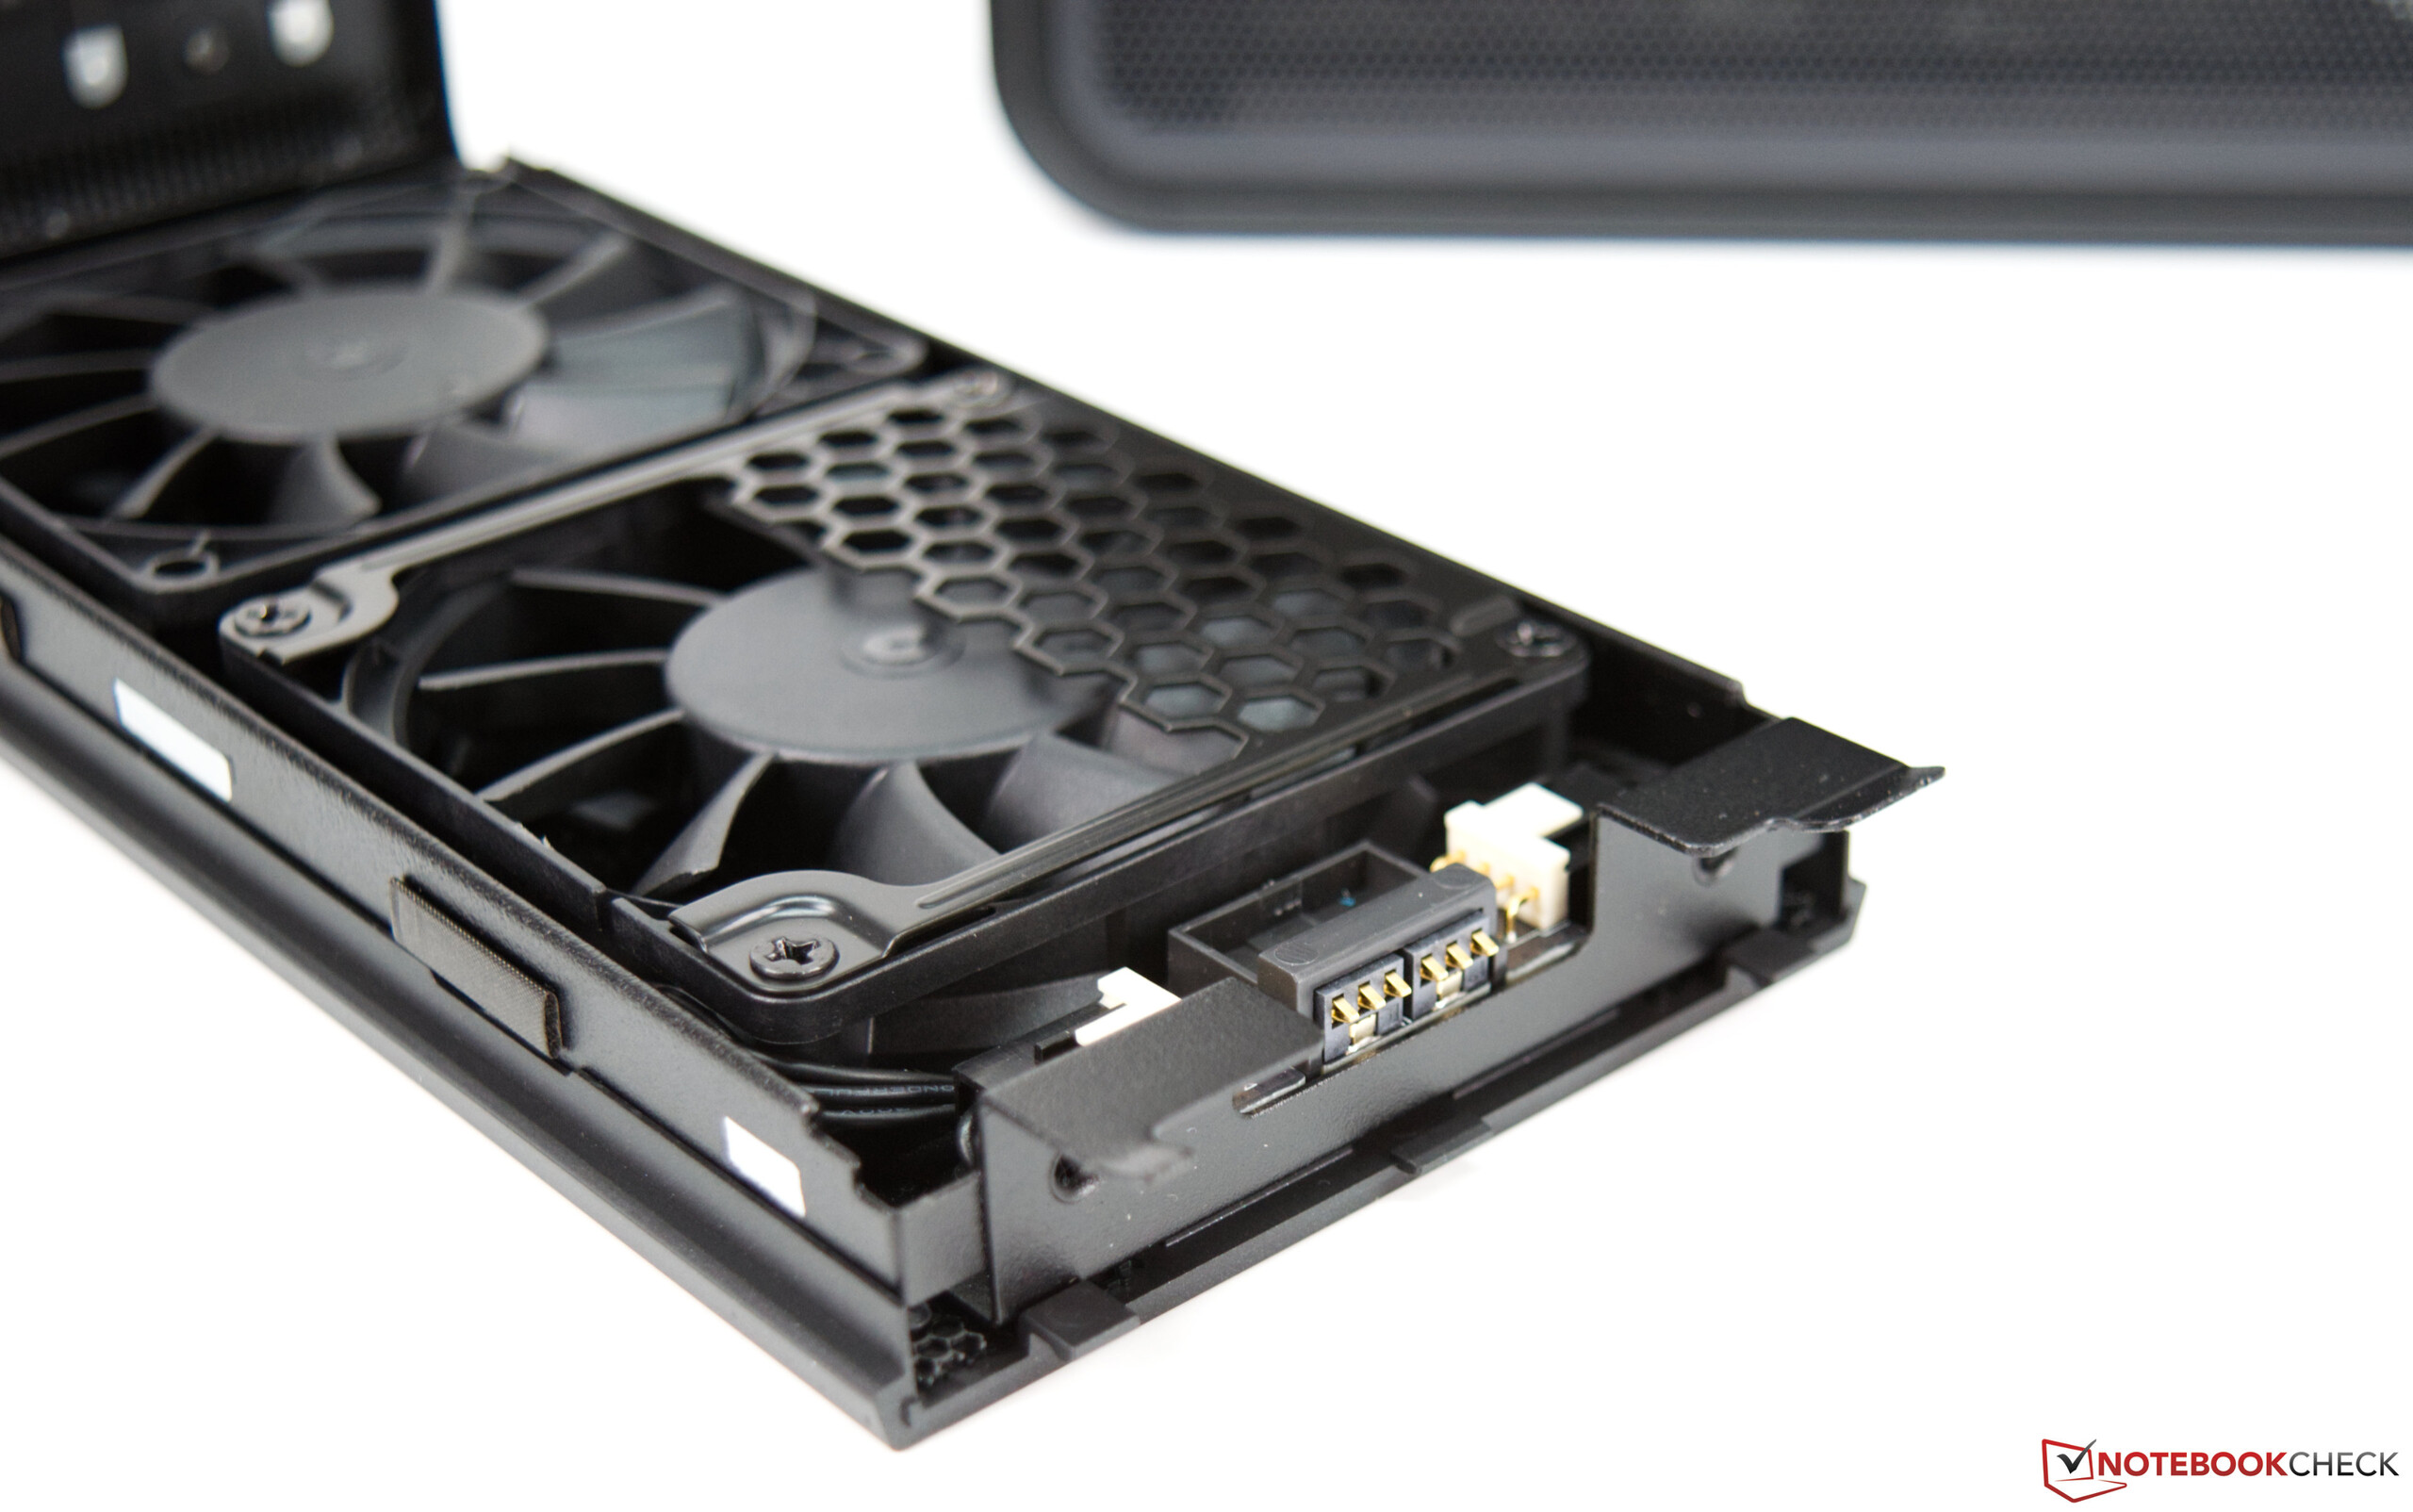
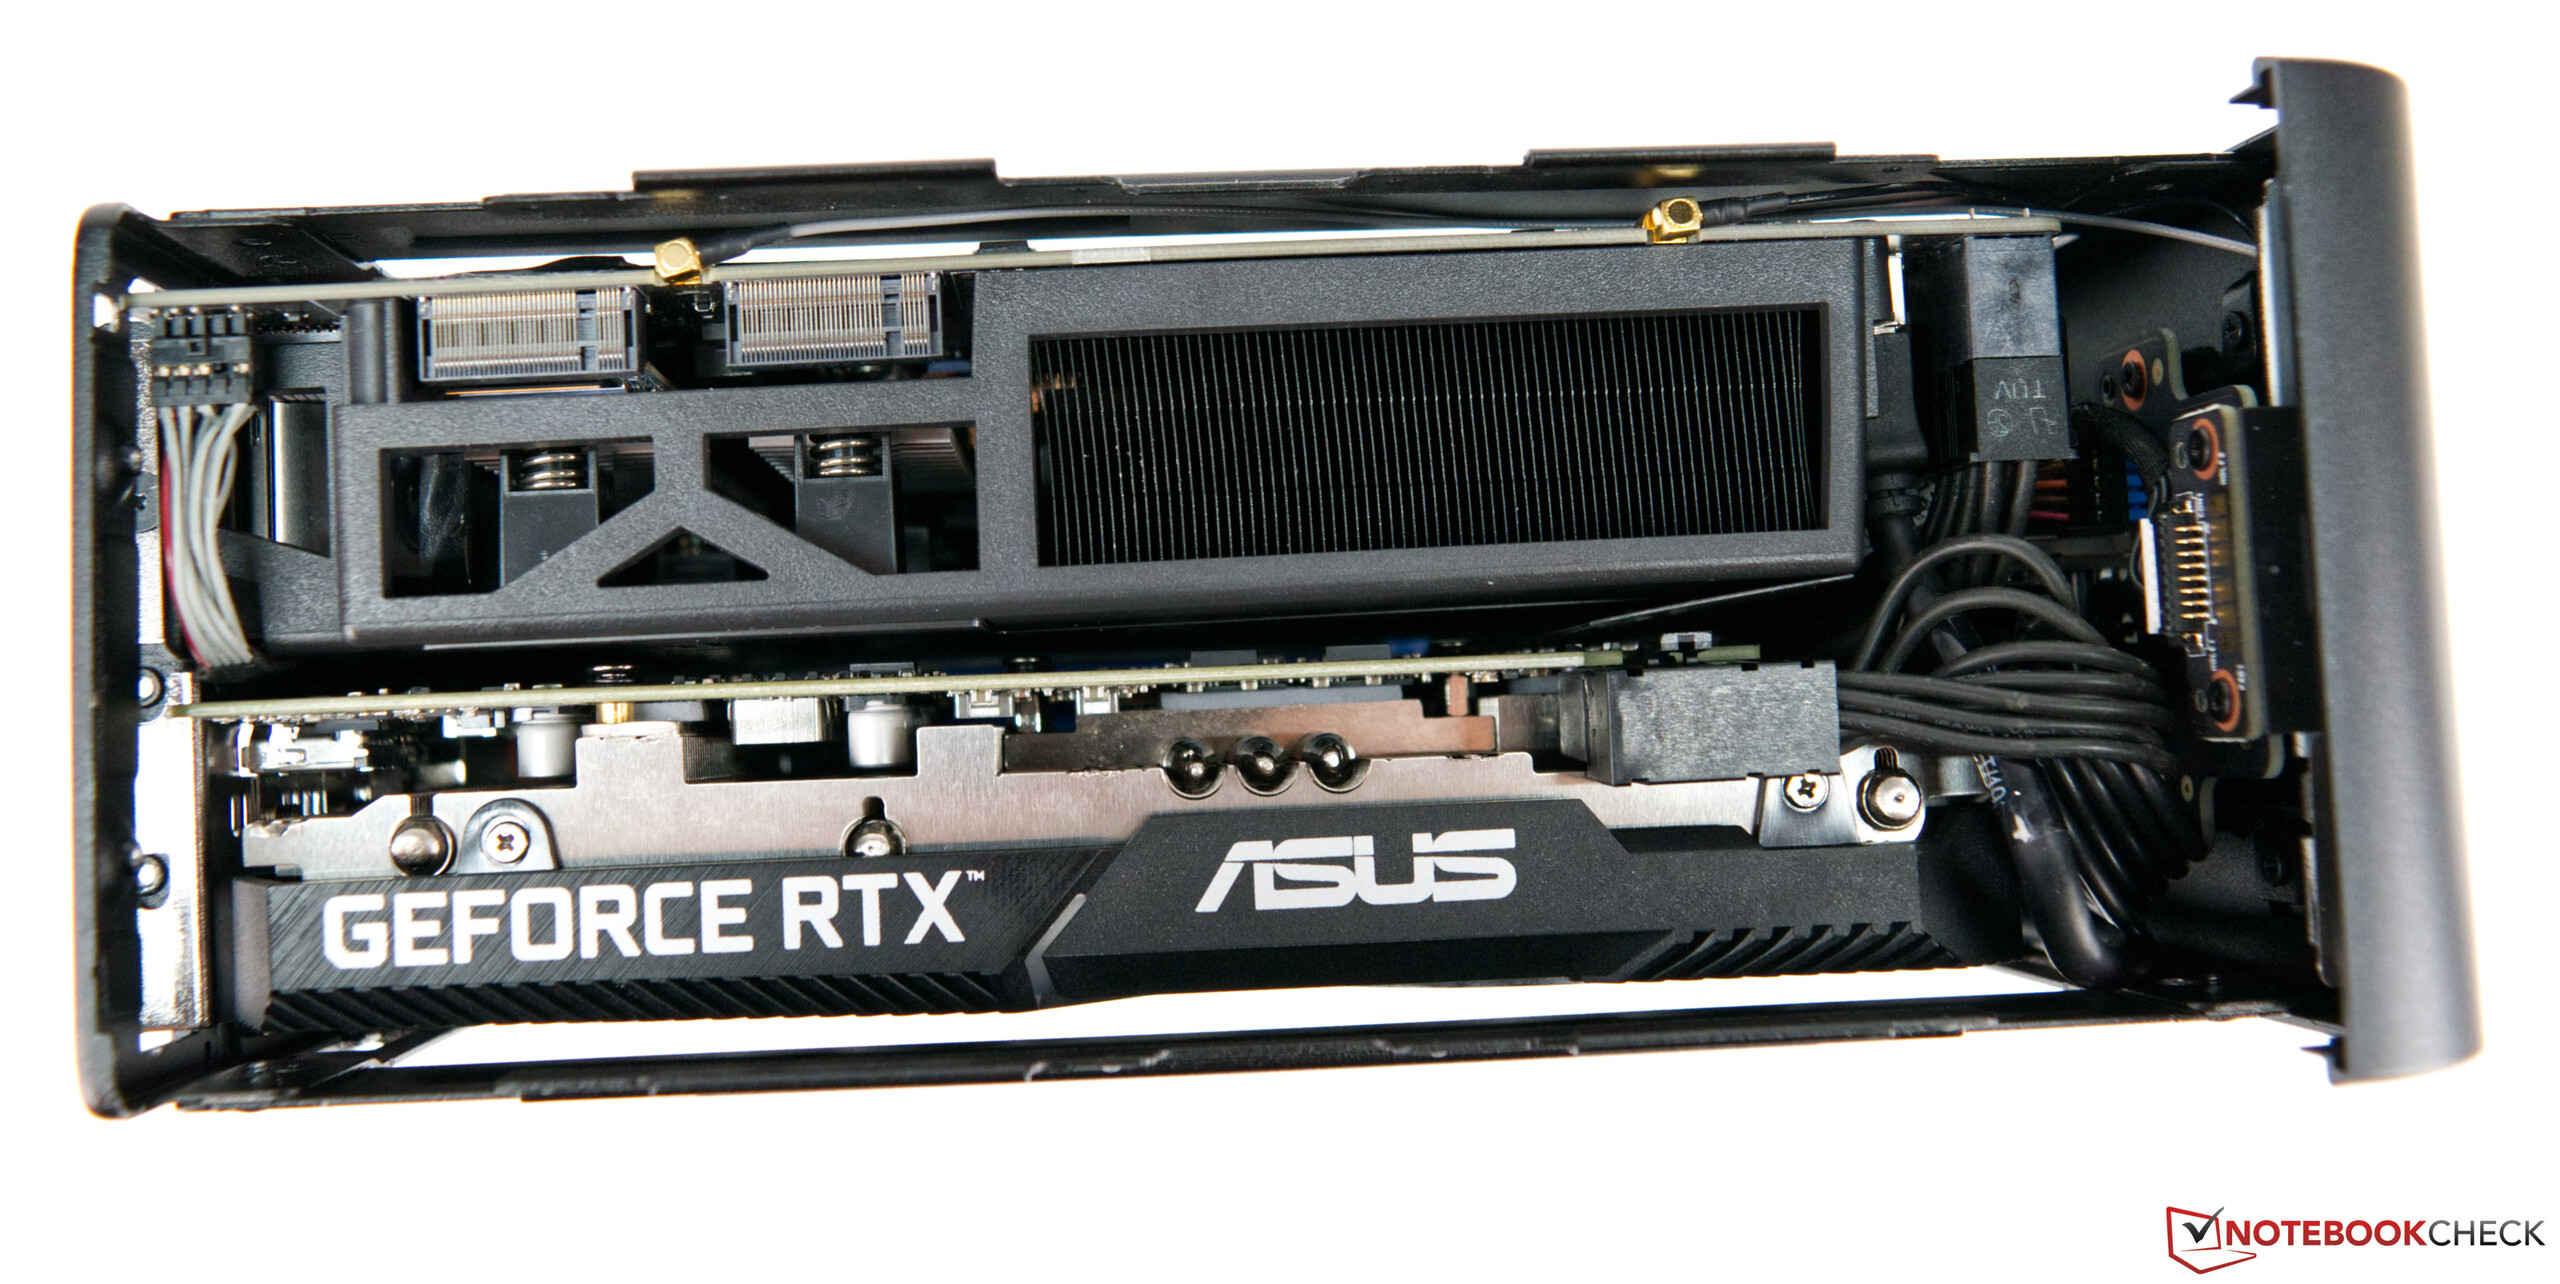
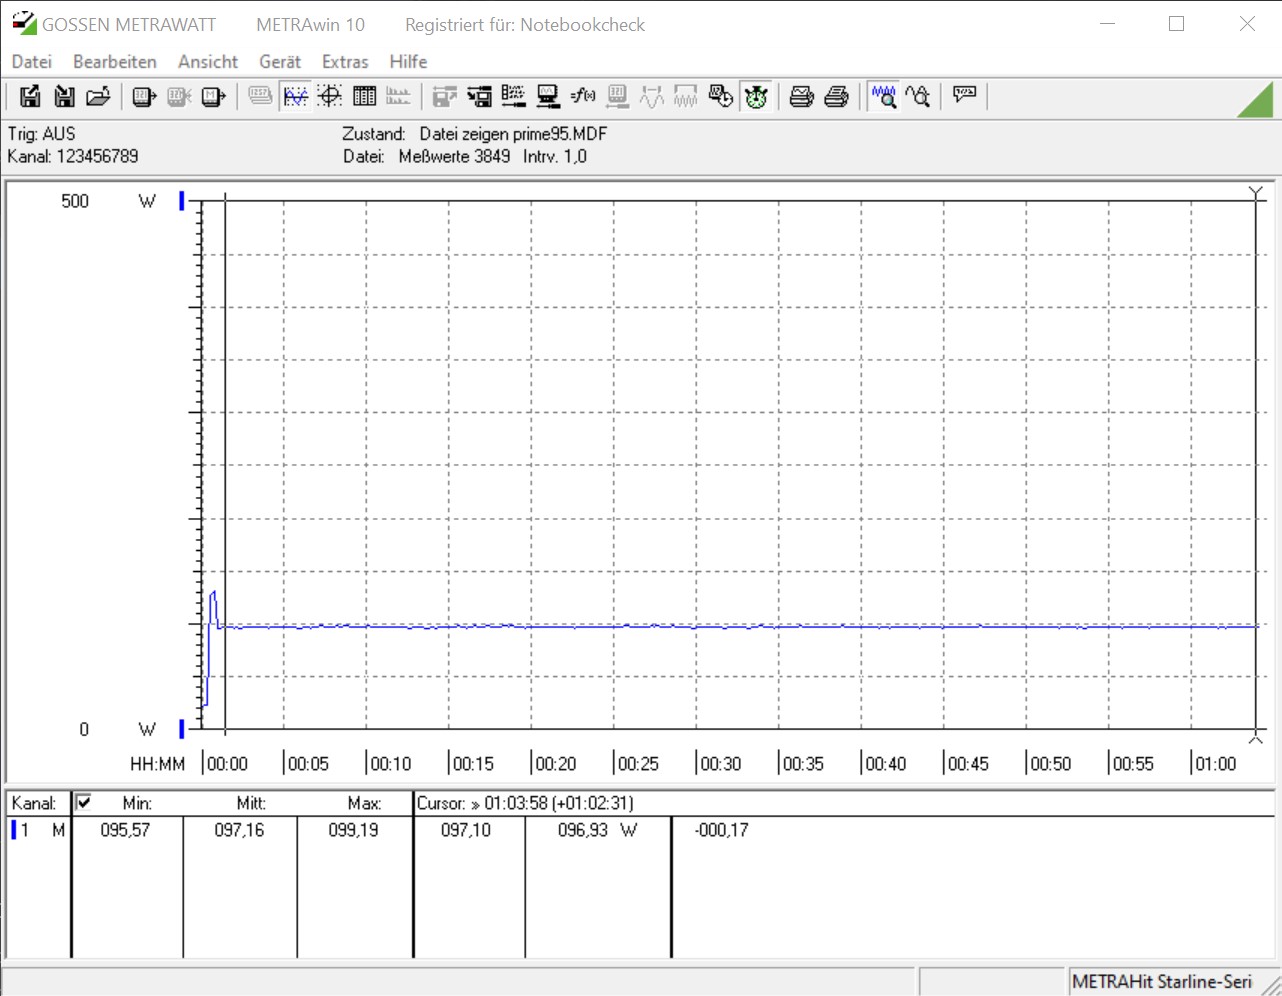
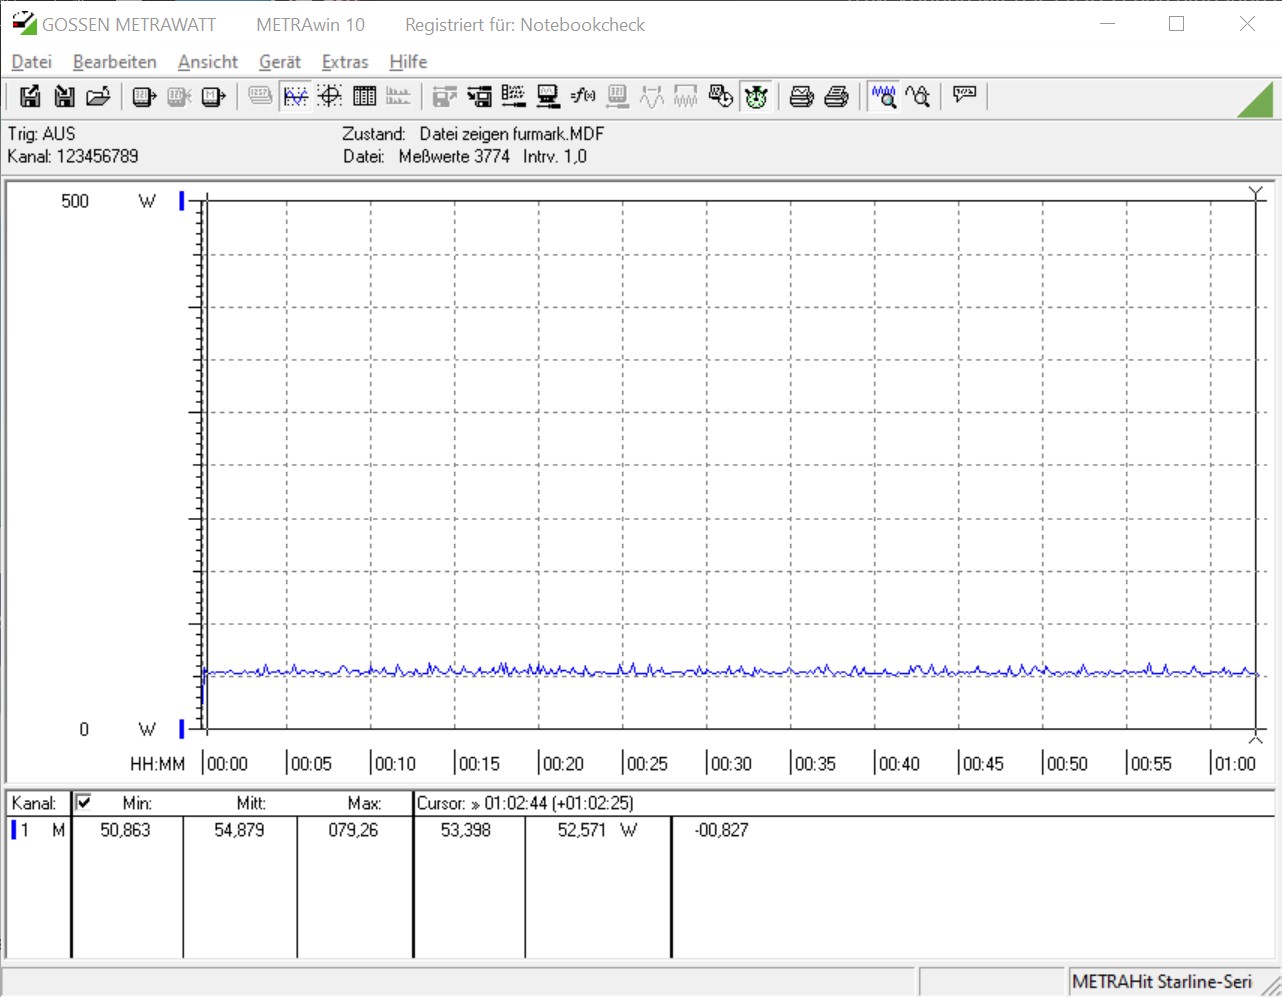
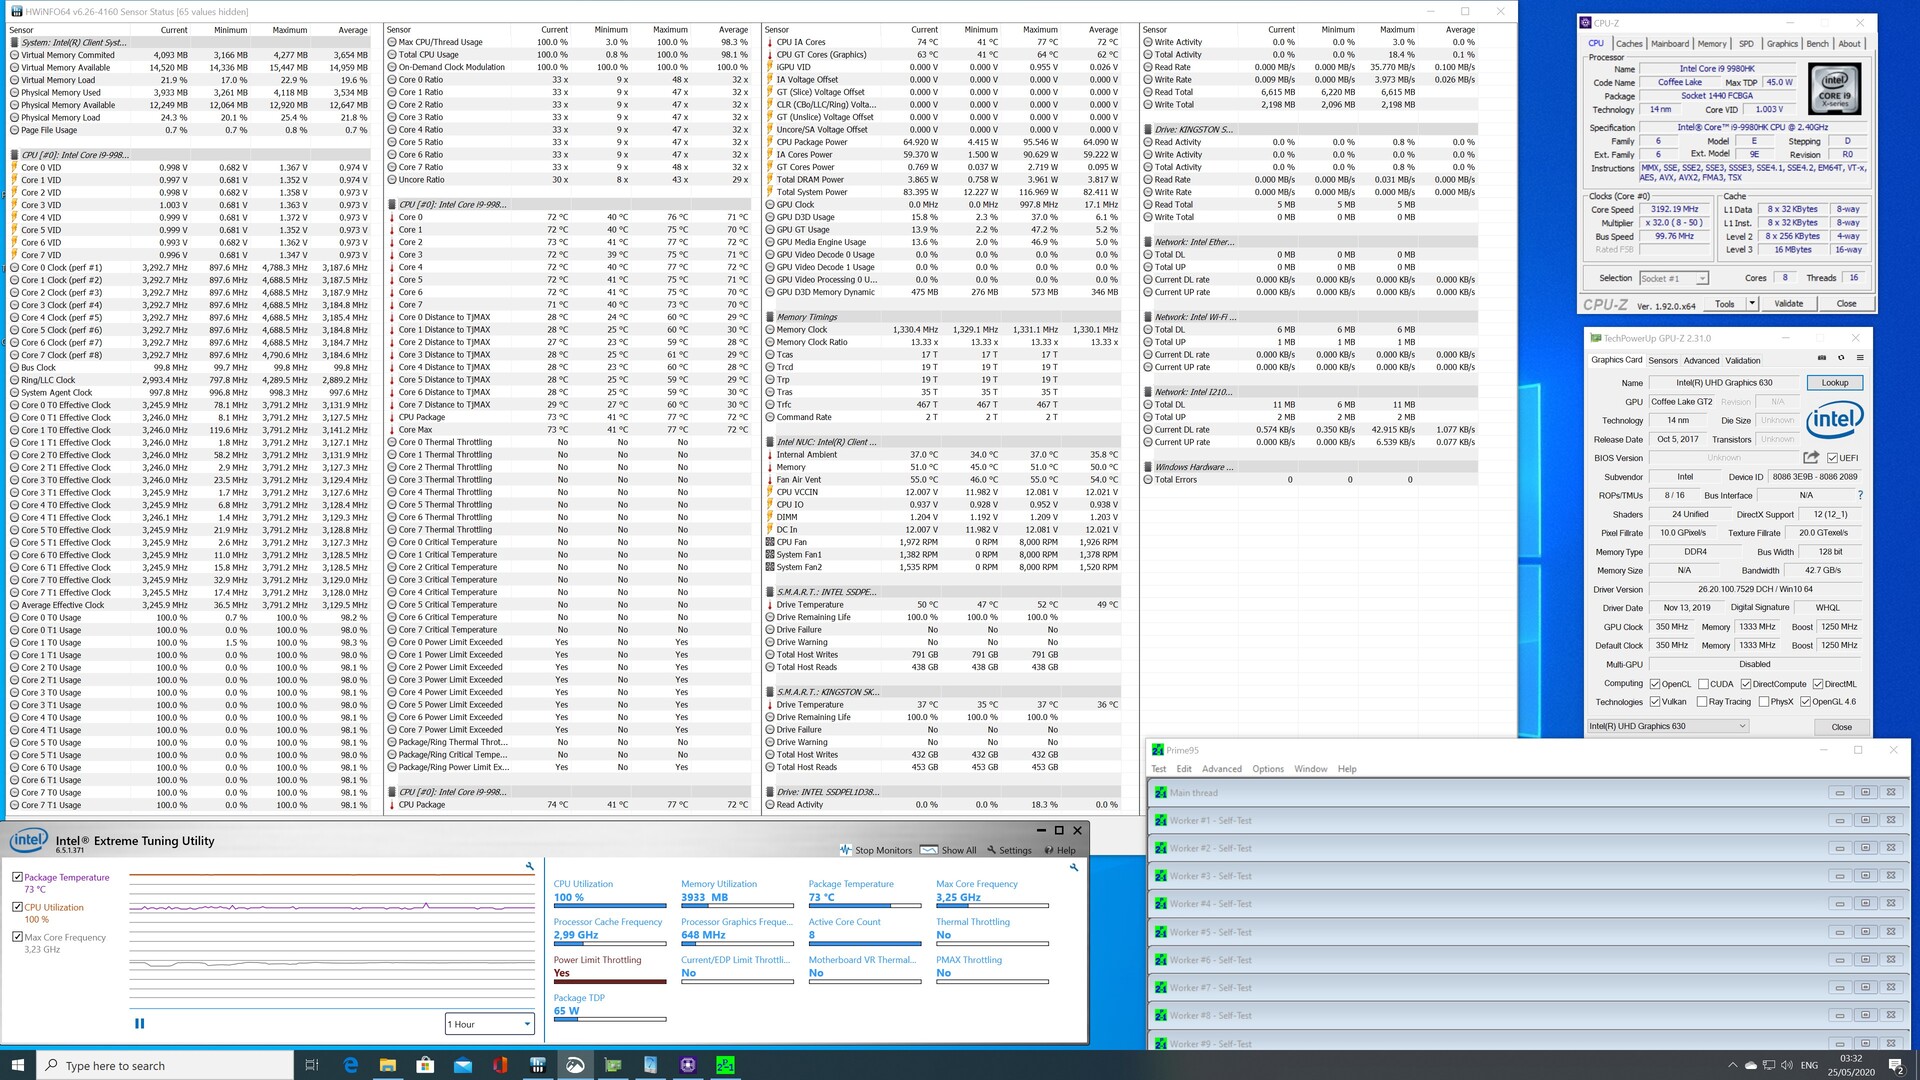
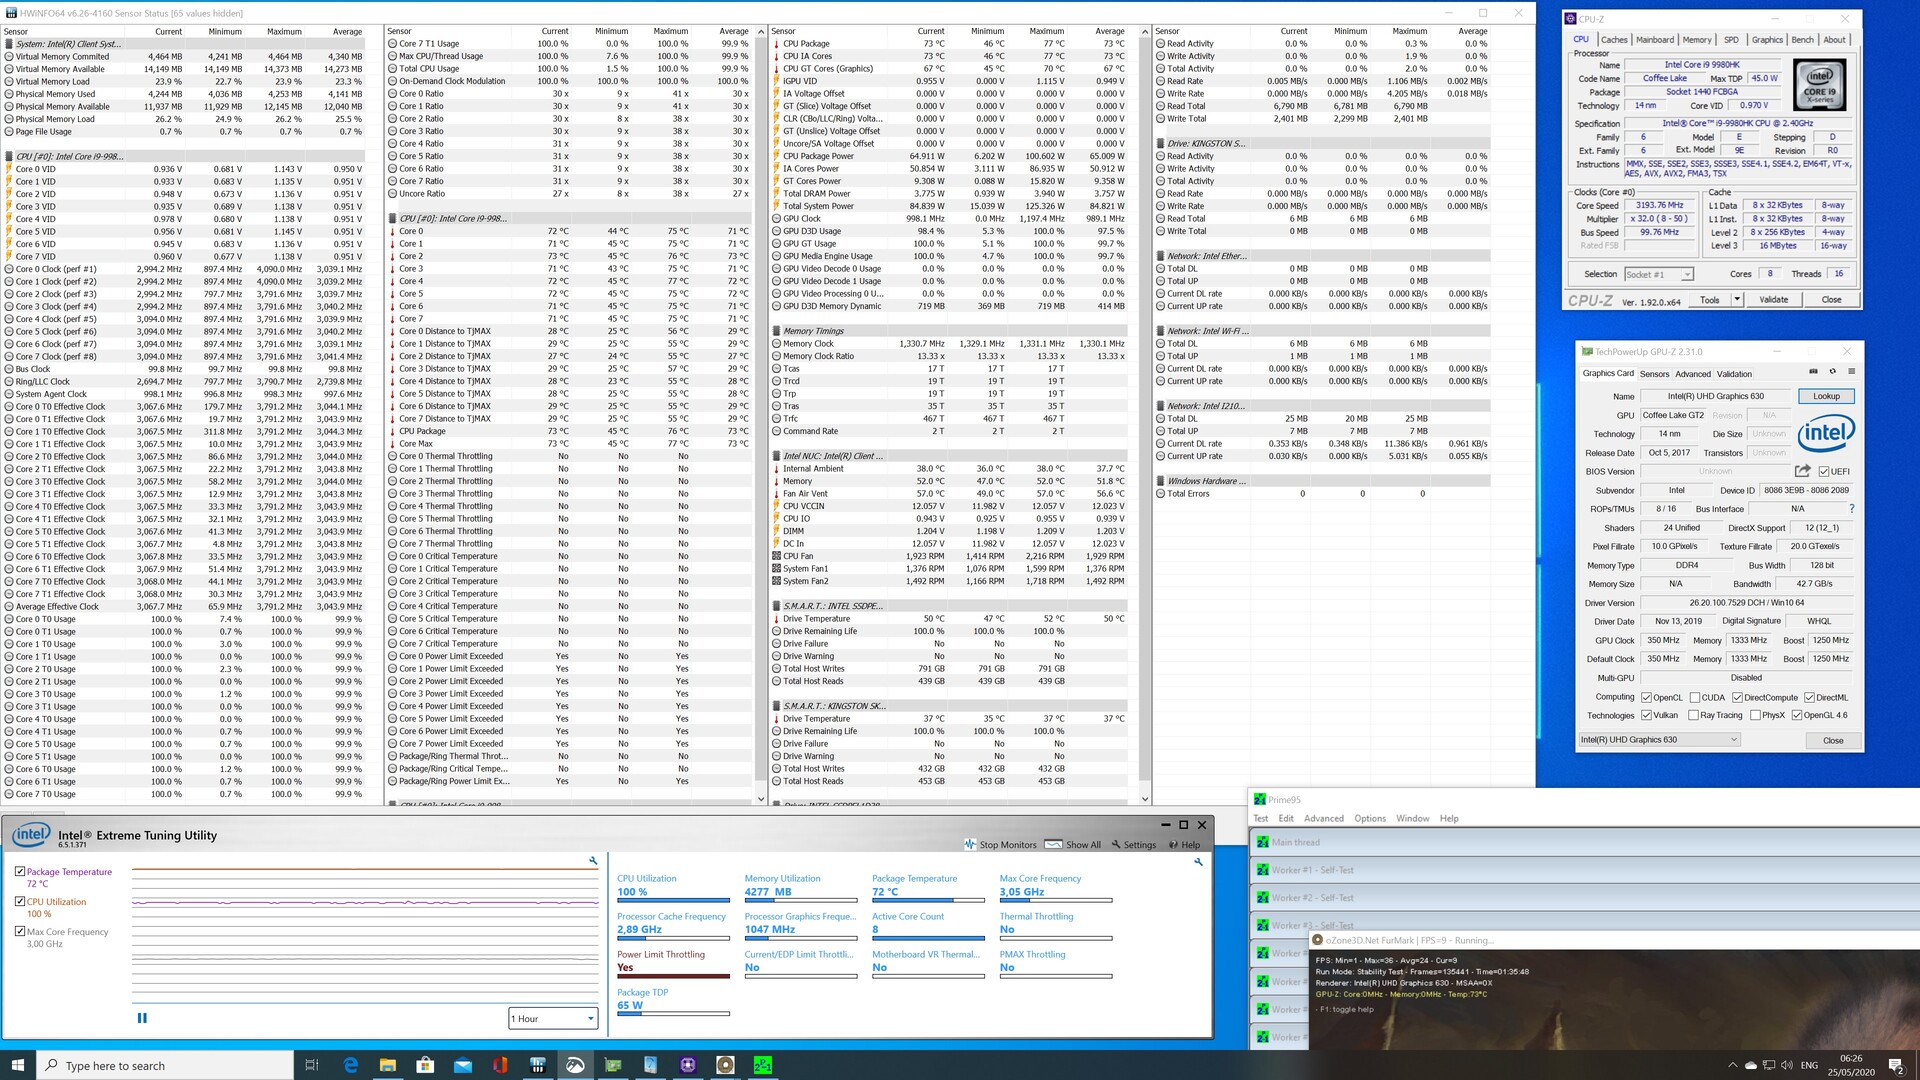
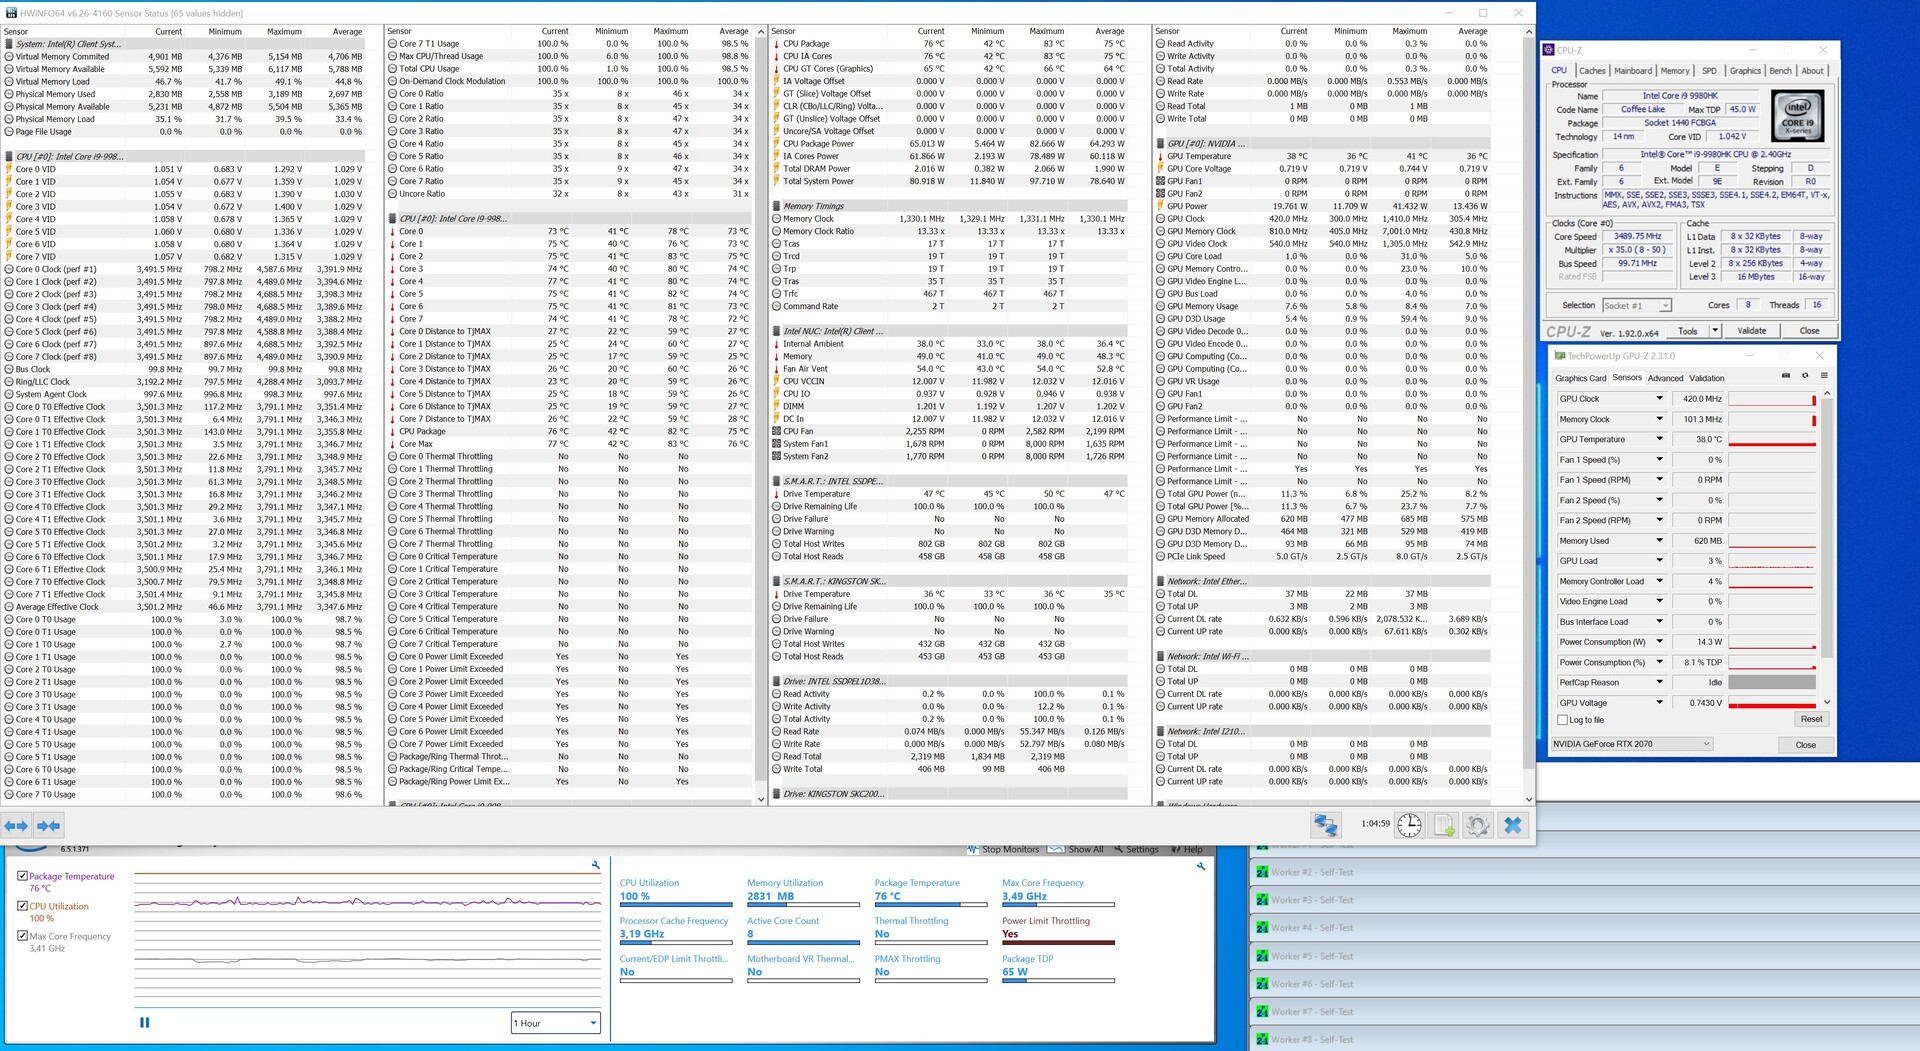
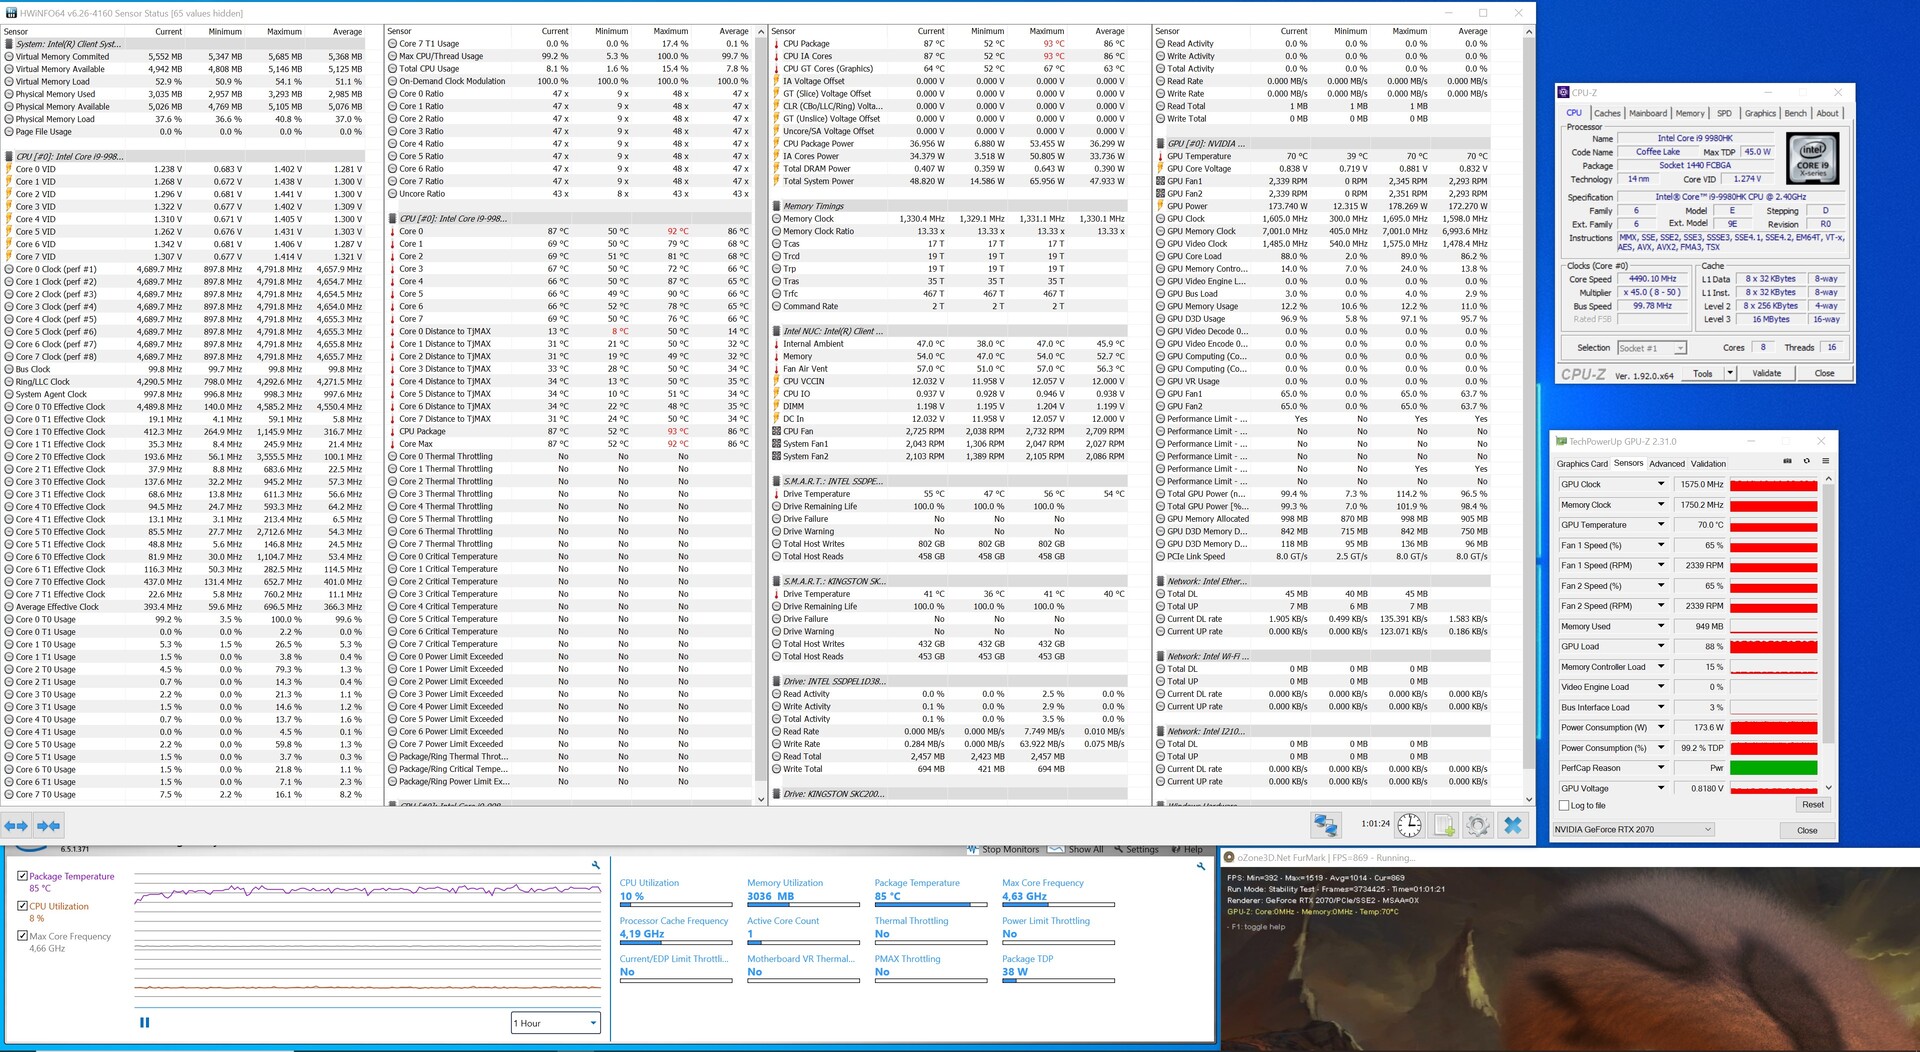
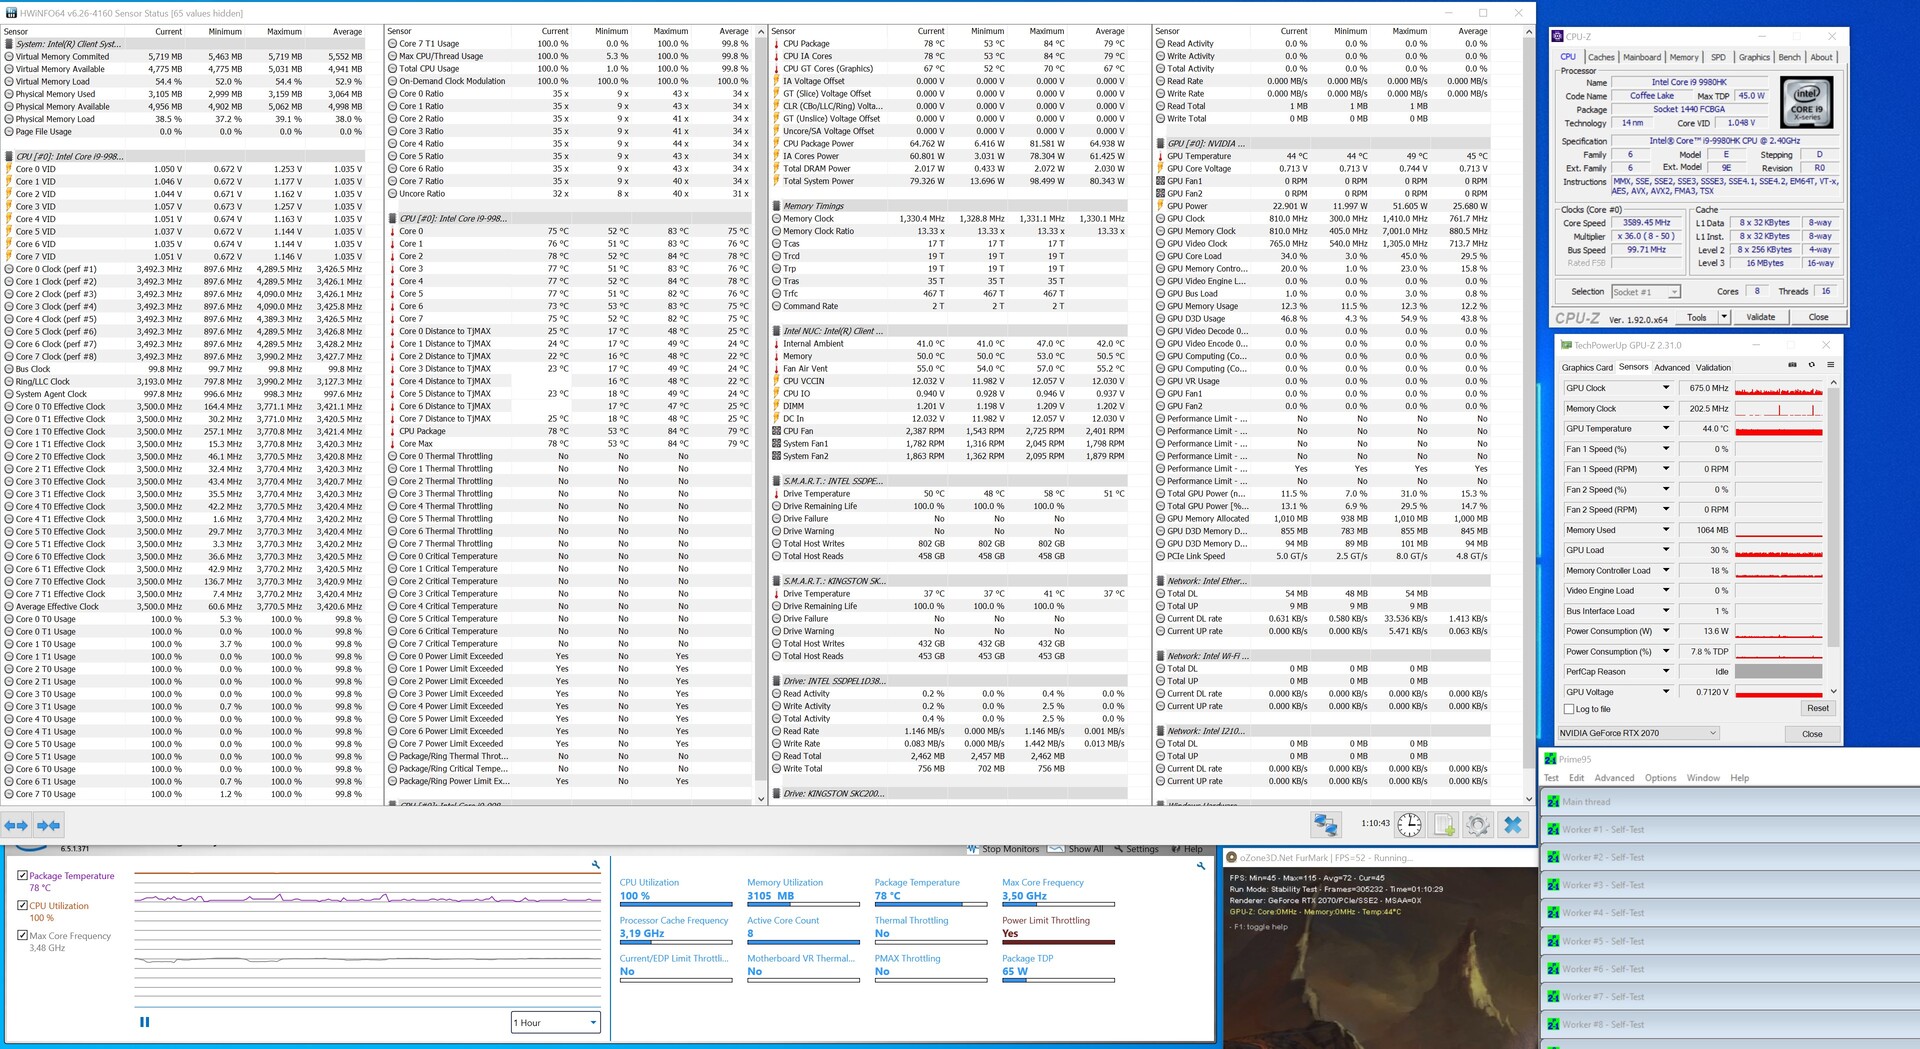
Intel si affida fortemente all'effetto camino per mantenere le temperature sotto controllo. Ciò significa che l'aria fredda viene aspirata sui lati e viaggia verso l'alto attraverso il case e verso l'esterno. Tutto questo funziona straordinariamente bene finché non c'è una GPU che blocca il flusso d'aria. Durante il nostro stress test siamo stati in grado di determinare che le prestazioni non risentono degli effetti di raffreddamento ridotti, tuttavia le emissioni di rumore sono aumentate in modo significativo con una GPU installata. Nel Prime95 sono aumentate da 38,8 dB(A) a 39,8 dB(A). Il motivo per cui Intel non ha semplicemente spostato la ventola dall'altra parte rimane un mistero per noi. Le coperture in rete avrebbero garantito una corretta ventilazione. L'esecuzione dello stress test della GPU (FurMark) ha portato a 48,5 dB(A), che è stato almeno in parte dovuto alle ventole di RTX 2070. La GPU ha raggiunto una temperatura di circa 70 °C, ed entrambe le sue ventole giravano a circa il 58% della loro velocità massima. Abbiamo anche notato un rumore elettrico molto chiaramente udibile che non suonava come il tipico coil whine per cui le GPU sono note, ma per lo più si faceva notare quando si accedeva ai dispositivi di memorizzazione e occasionalmente nel mezzo.

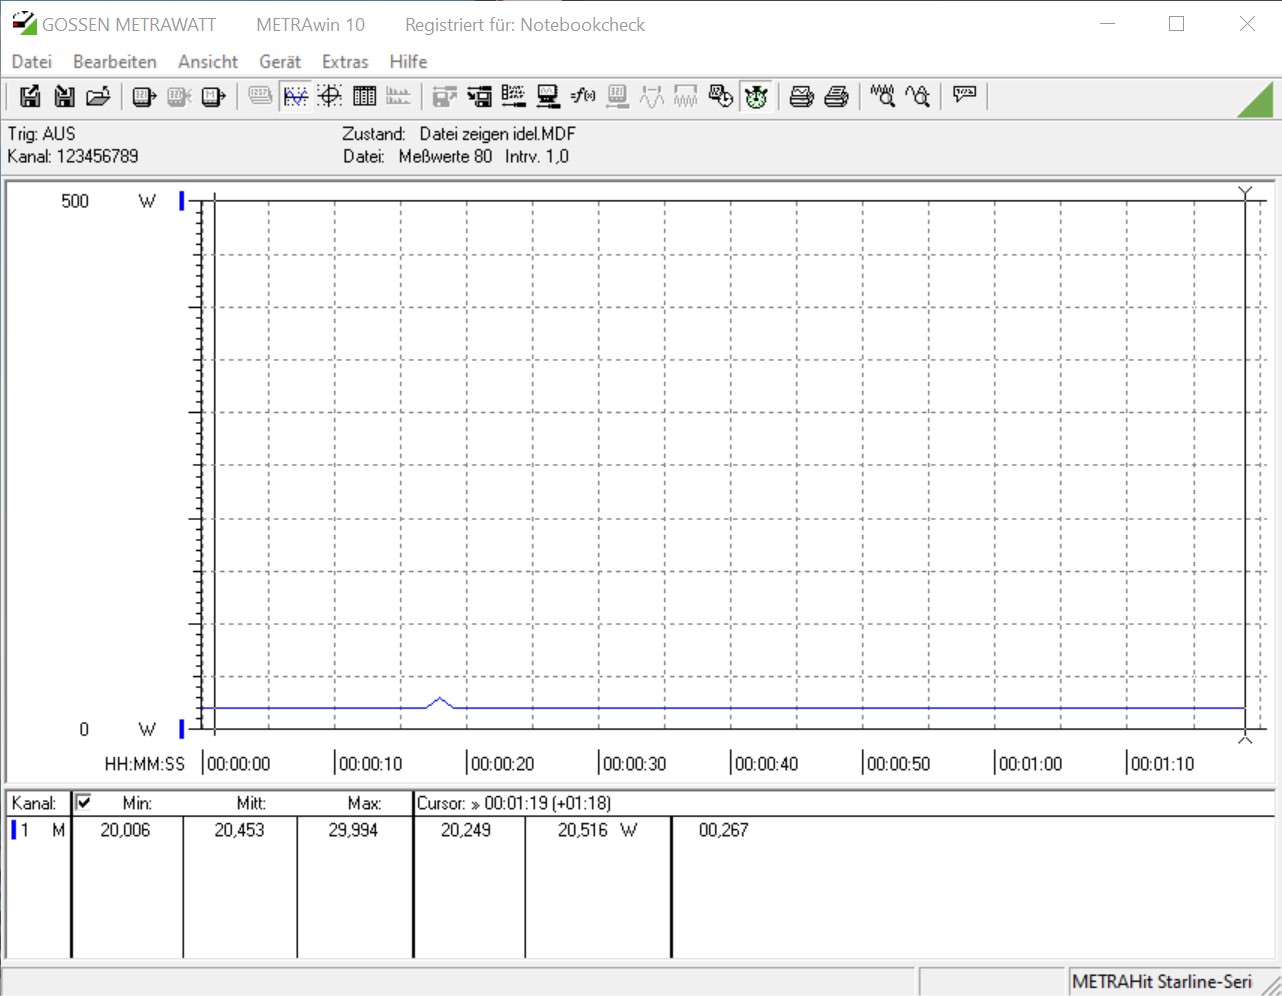
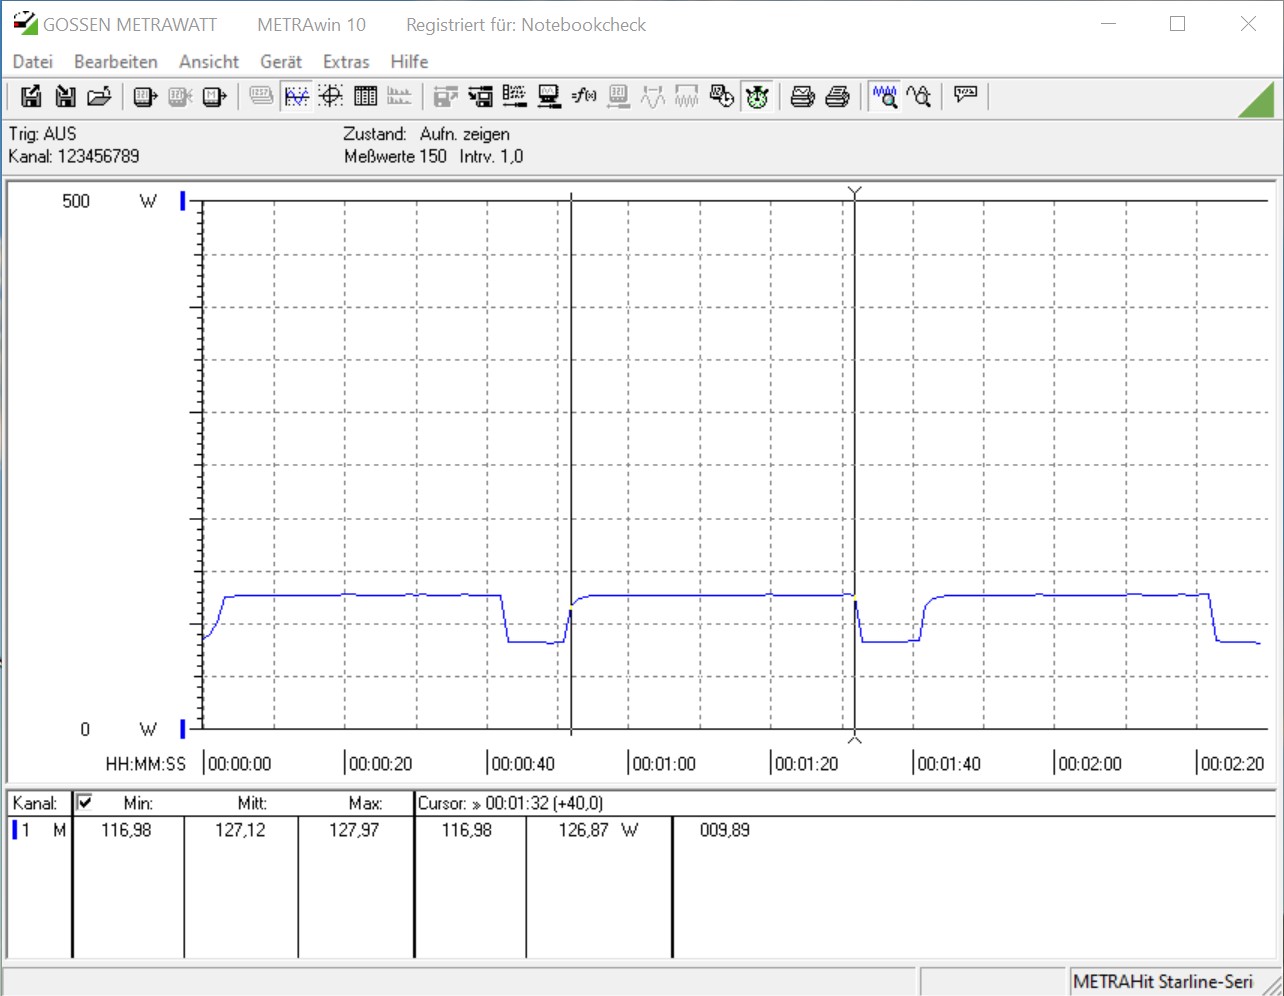
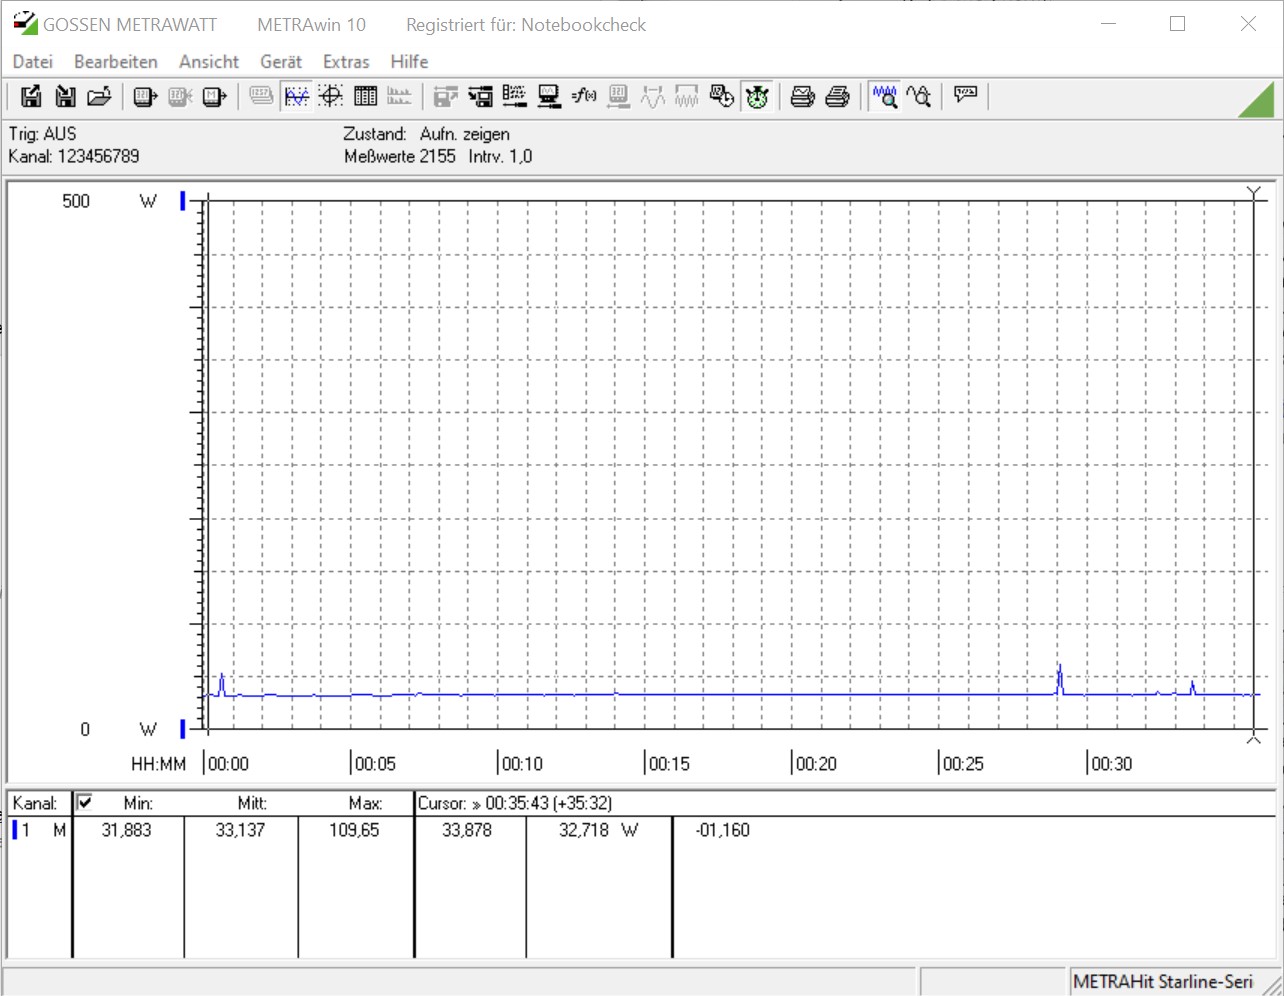
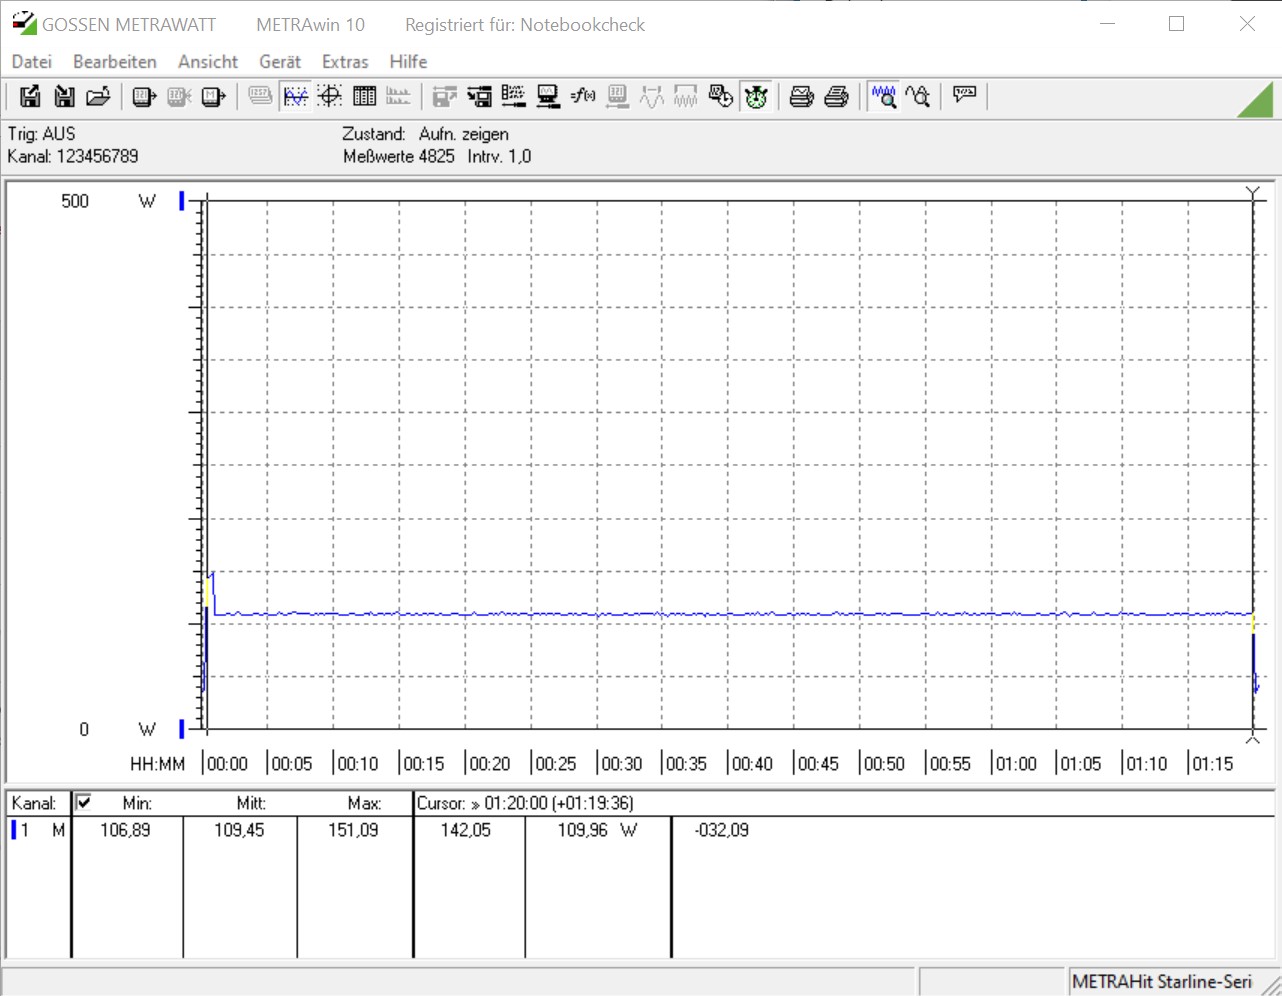
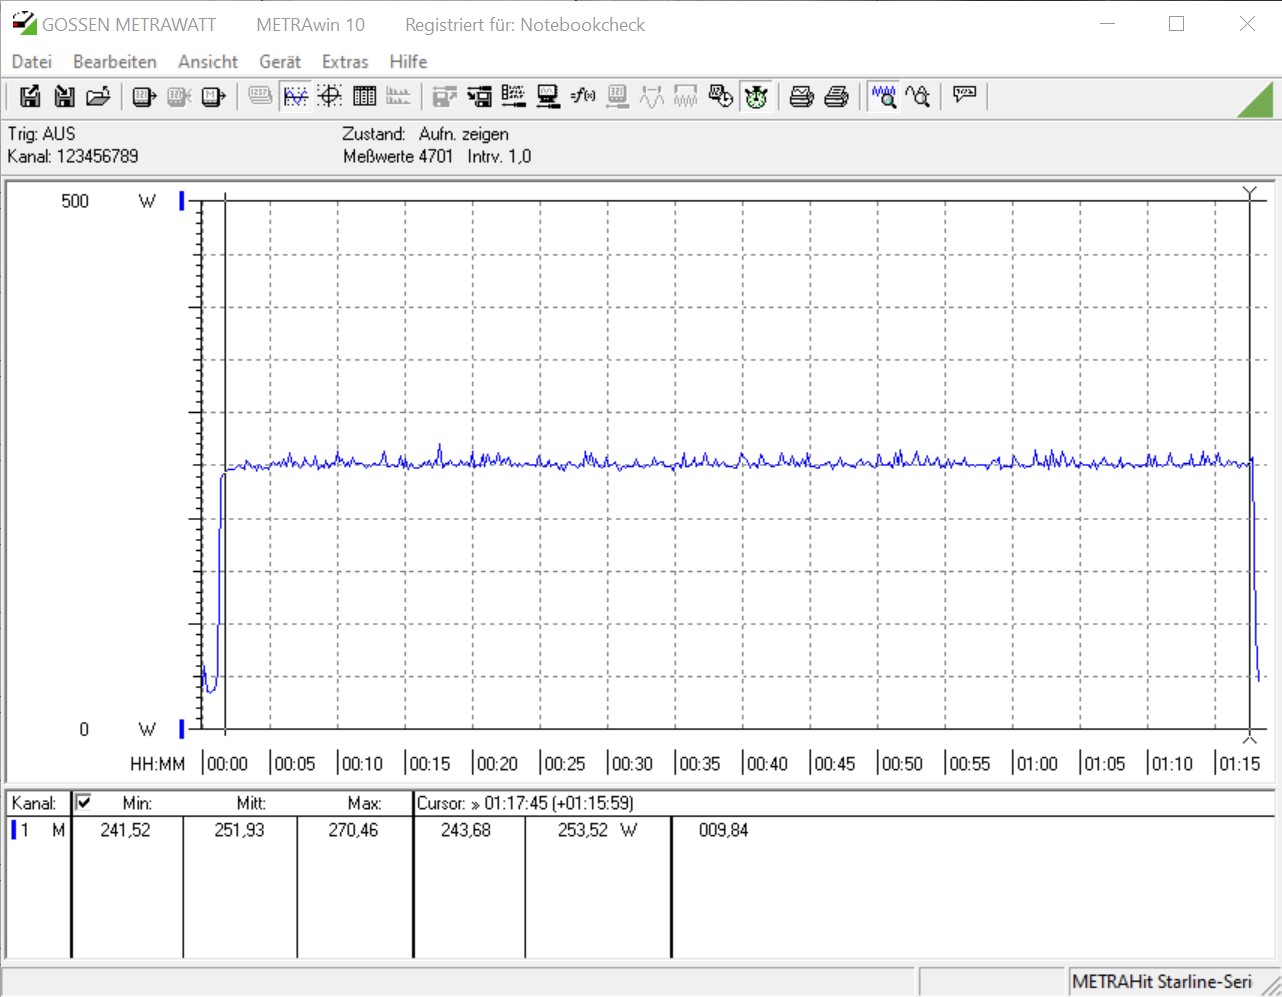
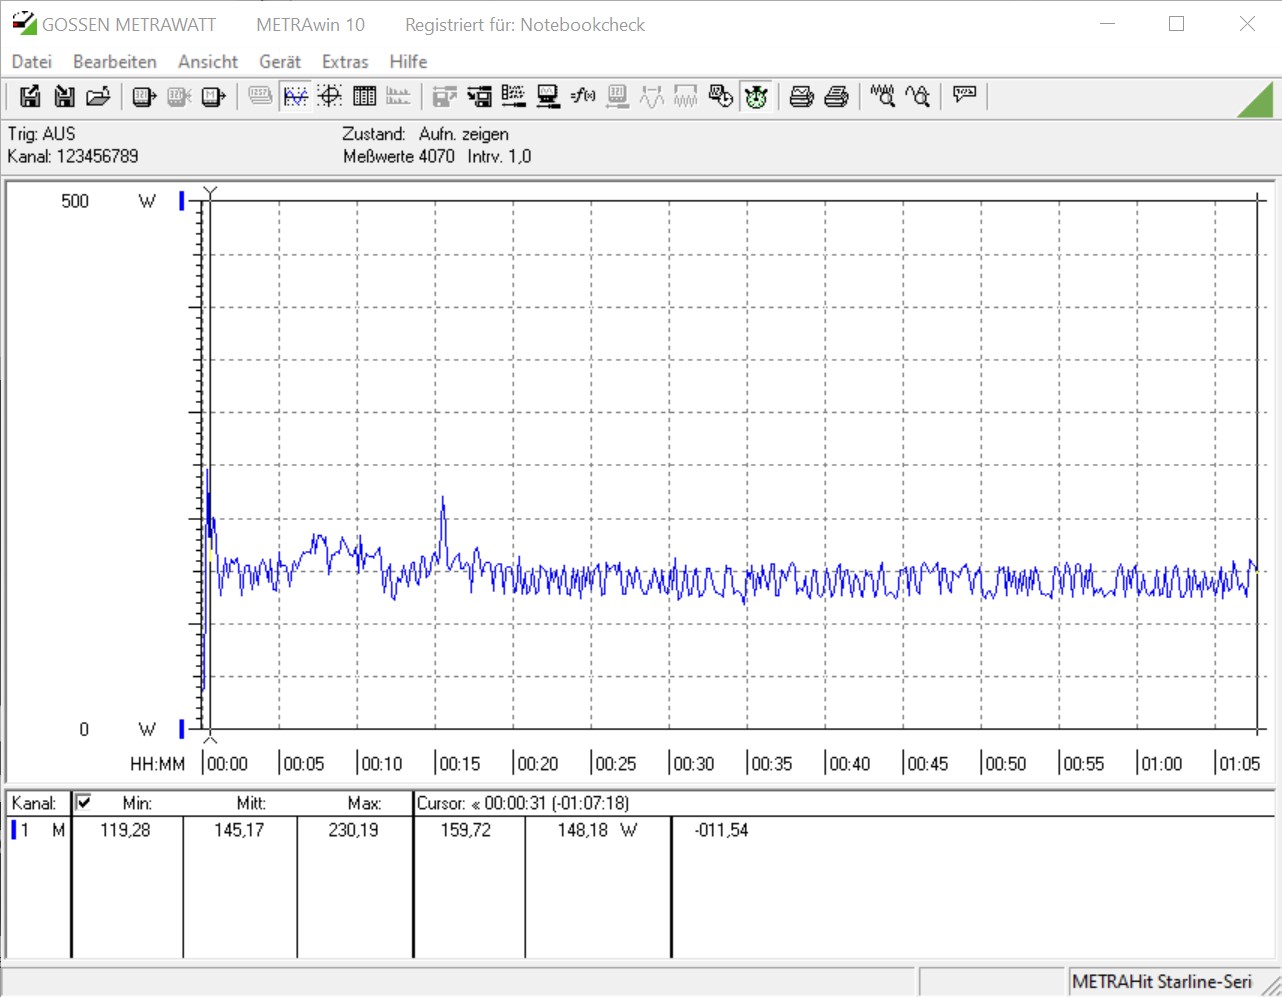
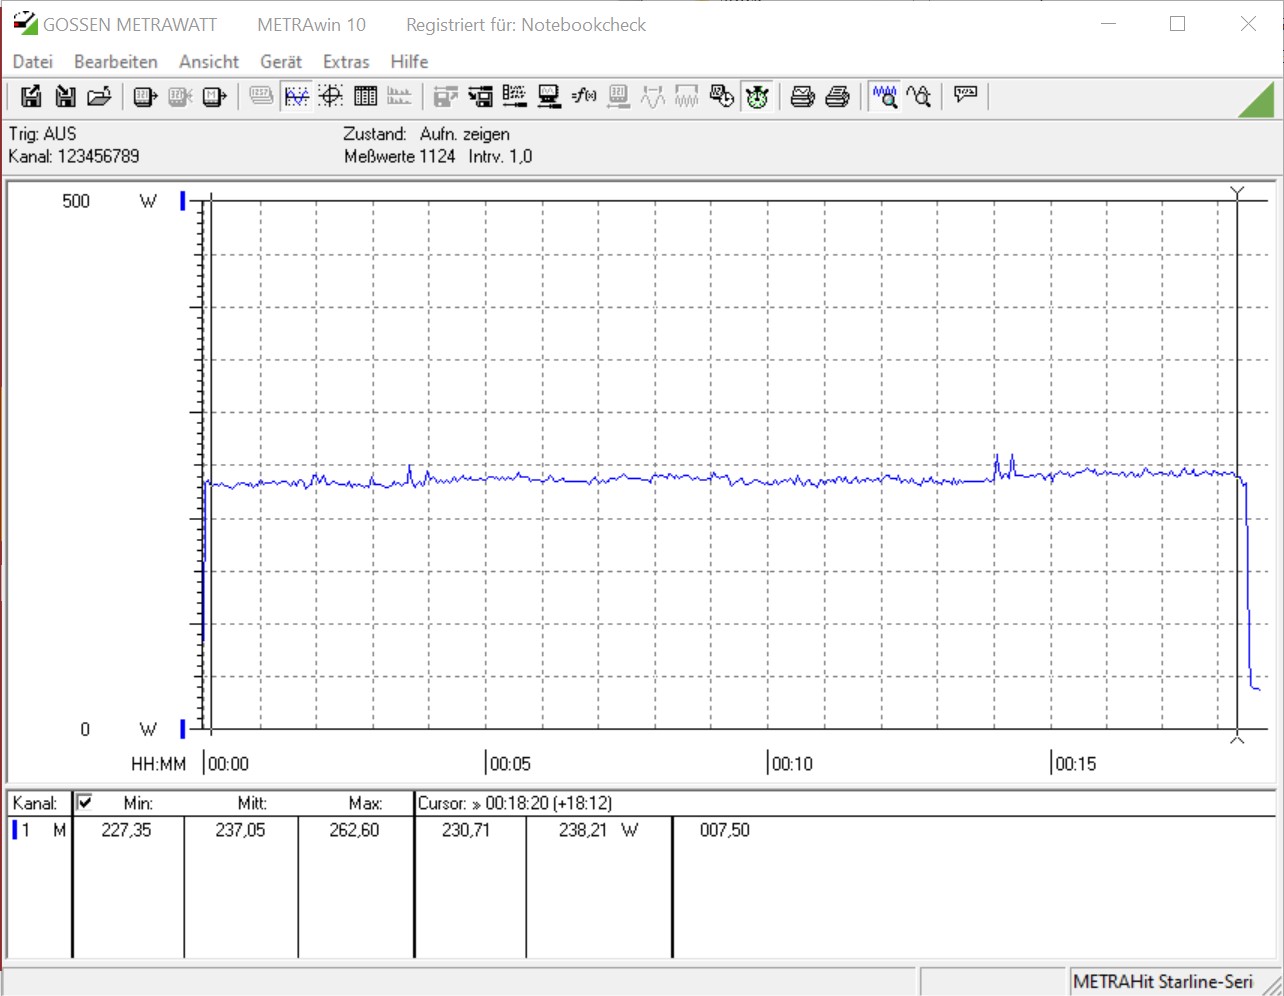
Il consumo di energia è stato nel complesso piuttosto basso. Quando era inattivo, il dispositivo consumava appena 20 W. Il più alto consumo di energia registrato senza GPU dedicata si è verificato durante il nostro loop multithread Cinebench R15 a 127 W. L'installazione della GeForce RTX 2070 ha aumentato il consumo di energia inattivo a 33 W, e fino a 251 W durante il nostro stress test FurMark. Un consumo energetico accettabile considerando che un NUC equipaggiato come tale è fondamentalmente un vero e proprio PC gaming. Il massimo che l'alimentatore da 500 W ha dovuto fornire per un breve periodo di tempo è stato di 270 W. Mentre il consumo di potenza di gioco è stato significativamente più basso e si è assestato intorno ai 237 W in media.

Power Consumption
1920x1080 The Witcher 3 ultra (external Monitor)
AMD Ryzen 9 3950X
NVIDIA Titan RTX, R9 3950X, Intel Optane 905P 480GB 2.5 (Idle: 95 W)
423.6 (400min - 442max) Watt * -79%
Intel Core i9-10900K
NVIDIA Titan RTX, i9-10900K, WDC PC SN720 SDAQNTW-512G (Idle: 52.3 W)
396.2 (380min - 475max) Watt * -67%
Intel Core i5-10600K
NVIDIA Titan RTX, i5-10600K (Idle: 52.2 W)
386.9 (380min - 404max) Watt * -63%
Intel Ghost Canyon NUC (RTX 2070)
GeForce RTX 2070 (Desktop), i9-9980HK, Kingston KC2500 1 TB SKC2500M81000G (Idle: 33.1 W)
237.1 (227min - 263max) Watt *
Prime95 V2810 Stress (external Monitor)
Intel Core i9-10900K
NVIDIA Titan RTX, i9-10900K, WDC PC SN720 SDAQNTW-512G (Idle: 52.3 W)
275.7 (254min - 385max) Watt * -152%
Intel Core i5-10600K
NVIDIA Titan RTX, i5-10600K (Idle: 52.2 W)
204.4 (191min - 261max) Watt * -87%
AMD Ryzen 9 3950X
NVIDIA Titan RTX, R9 3950X, Intel Optane 905P 480GB 2.5 (Idle: 95 W)
198.8 (185min - 240max) Watt * -82%
Intel Ghost Canyon NUC (RTX 2070)
GeForce RTX 2070 (Desktop), i9-9980HK, Kingston KC2500 1 TB SKC2500M81000G (Idle: 33.1 W)
109.4 (107min - 151max) Watt *
Intel Ghost Canyon NUC
UHD Graphics 630, i9-9980HK, Kingston KC2500 1 TB SKC2500M81000G (Idle: 20.45 W)
97.2 (96min - 99max) Watt * +11%
Cinebench R15 Multi (external Monitor)
Intel Core i9-10900K
NVIDIA Titan RTX, i9-10900K, WDC PC SN720 SDAQNTW-512G (Idle: 52.3 W)
268.5 (265min - 270max) Watt *
AMD Ryzen 9 3950X
NVIDIA Titan RTX, R9 3950X, Intel Optane 905P 480GB 2.5 (Idle: 95 W)
219.5 (218min - 225max) Watt *
Intel Core i5-10600K
NVIDIA Titan RTX, i5-10600K (Idle: 52.2 W)
172.5 (170min - 176max) Watt *
Intel Ghost Canyon NUC
UHD Graphics 630, i9-9980HK, Kingston KC2500 1 TB SKC2500M81000G (Idle: 20.45 W)
127.1 (117min - 128max) Watt *
Temperatures - CPU Temperature Prime95
Intel Core i9-10900K
NVIDIA Titan RTX, i9-10900K, WDC PC SN720 SDAQNTW-512G
88 °C
AMD Ryzen 9 3950X
NVIDIA Titan RTX, R9 3950X, Intel Optane 905P 480GB 2.5
83.8 °C
Intel Ghost Canyon NUC
UHD Graphics 630, i9-9980HK, Kingston KC2500 1 TB SKC2500M81000G
77 °C
Intel Core i5-10600K
NVIDIA Titan RTX, i5-10600K
70 °C

* ... Meglio usare valori piccoli

Intel NUC 9 Extreme Kit senza RTX 2070

Intel NUC 9 Extreme Kit - consumo energetico in idle
Intel NUC 9 Extreme Kit - consumo energetico Prime95
Intel NUC 9 Extreme Kit - consumo energetico FurMark
Intel NUC 9 Extreme Kit - consumo energetico Prime95 e FurMark
Intel NUC 9 Extreme Kit - consumo energetico Cinebench-R15-Multi
Intel NUC 9 Extreme Kit - stress test Prime95 solo
Intel NUC 9 Extreme Kit - stress test FurMark solo
Intel NUC 9 Extreme Kit - stress test Prime95 e FurMark


Intel NUC 9 Extreme Kit con RTX 2070

Intel NUC 9 Extreme Kit - consumo energetico idle
Intel NUC 9 Extreme Kit - consumo energetico Prime95
Intel NUC 9 Extreme Kit - consumo energetico FurMark
Intel NUC 9 Extreme Kit - consumo energetico Prime95 e FurMark
Intel NUC 9 Extreme Kit - consumo energetico The Witcher 3 (Ultra)
Intel NUC 9 Extreme Kit - stress test Prime95 solo
Intel NUC 9 Extreme Kit - stress test FurMark solo
Intel NUC 9 Extreme Kit - stress test Prime95 and FurMark


Pro

+ molto piccolo
+ ben costruito
+ Core i9 8 cores
+ elevate prestazioni del sistema
+ Connettività generosa
+ Thunderbolt 3
+ Wi-Fi 6
+ tre slots M.2
+ Alimentazione 500 W

Contro

- prezzo elevato
- non pronto all'uso OOB
- sistema di raffreddamento non ottimale
- compatibilità limitata della scheda
- molto rumoroso sotto carico

Giudizio – Piccola centrale elettrica con prezzo alto

Recensione dell'Intel NUC 9 Extreme Kit. Dispositivo di test fornito da Intel Germany

Il kit Intel NUC 9 Extreme è un sistema piccolo ma molto potente. Al suo prezzo attuale di 1.700 dollari è tutt'altro che un ottimo affare, ed è necessario tenere presente che sarà necessario fornire RAM, spazio di archiviazione e, se lo si desidera, una GPU dedicata separatamente. In cambio, si ottiene un dispositivo molto ben equipaggiato e moderno. Dotato di una GPU ad alte prestazioni, il mini PC in miniatura si trasforma in un vero e proprio PC gaming in grado di far funzionare senza problemi anche i giochi più recenti e famosi.

Se non avete bisogno delle prestazioni a 8 cores del Core i9-9980HK di Intel potete anche acquistare la SKU con processori più lenti i7-9750H o i5-9300H. Entrambi si trovano spesso nei laptops gaming e si sono dimostrati in passato molto solidi e con prestazioni adeguate. Tuttavia, il Core i9-9980HK rimane il perno di questo NUC.

Nonostante le sue grandi prestazioni, questa piccola centrale elettrica avrà difficoltà ad entrare nei carrelli della spesa dei gamers a causa del suo prezzo elevato.

Ci sono anche alcuni difetti con il Ghost Canyon NUC di Intel, in particolare per quanto riguarda la rumorosità con la scheda grafica dedicata installata. Grazie alla sua struttura compatta, la ventola è quasi completamente coperta in questo caso, e l'aria soffiata sul tubo di calore del SoC è calda a causa della vicinanza della ventola alla scheda grafica. Il che, a sua volta, aumenta drasticamente le emissioni di rumore. Un design leggermente diverso con la ventola sul lato esterno del case sarebbe stata molto probabilmente un'alternativa migliore.

Tutto sommato, il NUC 9 Extreme di Intel è il più piccolo PC sotto 1,3 galloni che può contenere una GeForce RTX 2070. È dotato di componenti di alta qualità e di una grande qualità costruttiva. Corsair ha adottato un approccio molto simile con il suo prezzo simile (paragonabile ad un Intel Ghost Canyon NUC 9 Extreme completamente equipaggiato) Una serie che abbiamo già testato (vedi One i160). Il MEK Mini di Zotac è l'ennesimo PC in miniatura che può essere equipaggiato con una RTX 2070.

Please share our article, every link counts!
> Recensioni e prove di notebook, tablets e smartphones > Recensioni e prove > Recensioni e prove > Recensione dell'Intel NUC 9 Extreme con Core i9 ed RTX 2070
Sebastian Bade, 2020-06-13 (Update: 2020-06-13)