Notebookcheck Logo

Recensione del Mini PC Zotac ZBOX Magnus con GeForce RTX 2080

Piccola centrale elettrica! Come sistema barebone, Zotac sta seguendo con lo ZBOX lo stesso percorso che Intel ha fatto con il suo Ghost Canyon NUC. Abbiamo dato un'occhiata più da vicino allo ZBOX Magnus con la GPU GeForce RTX 2080 e siamo rimasti positivamente sorpresi. Potete scoprire di cosa è capace il mini PC nella nostra recensione dettagliata.

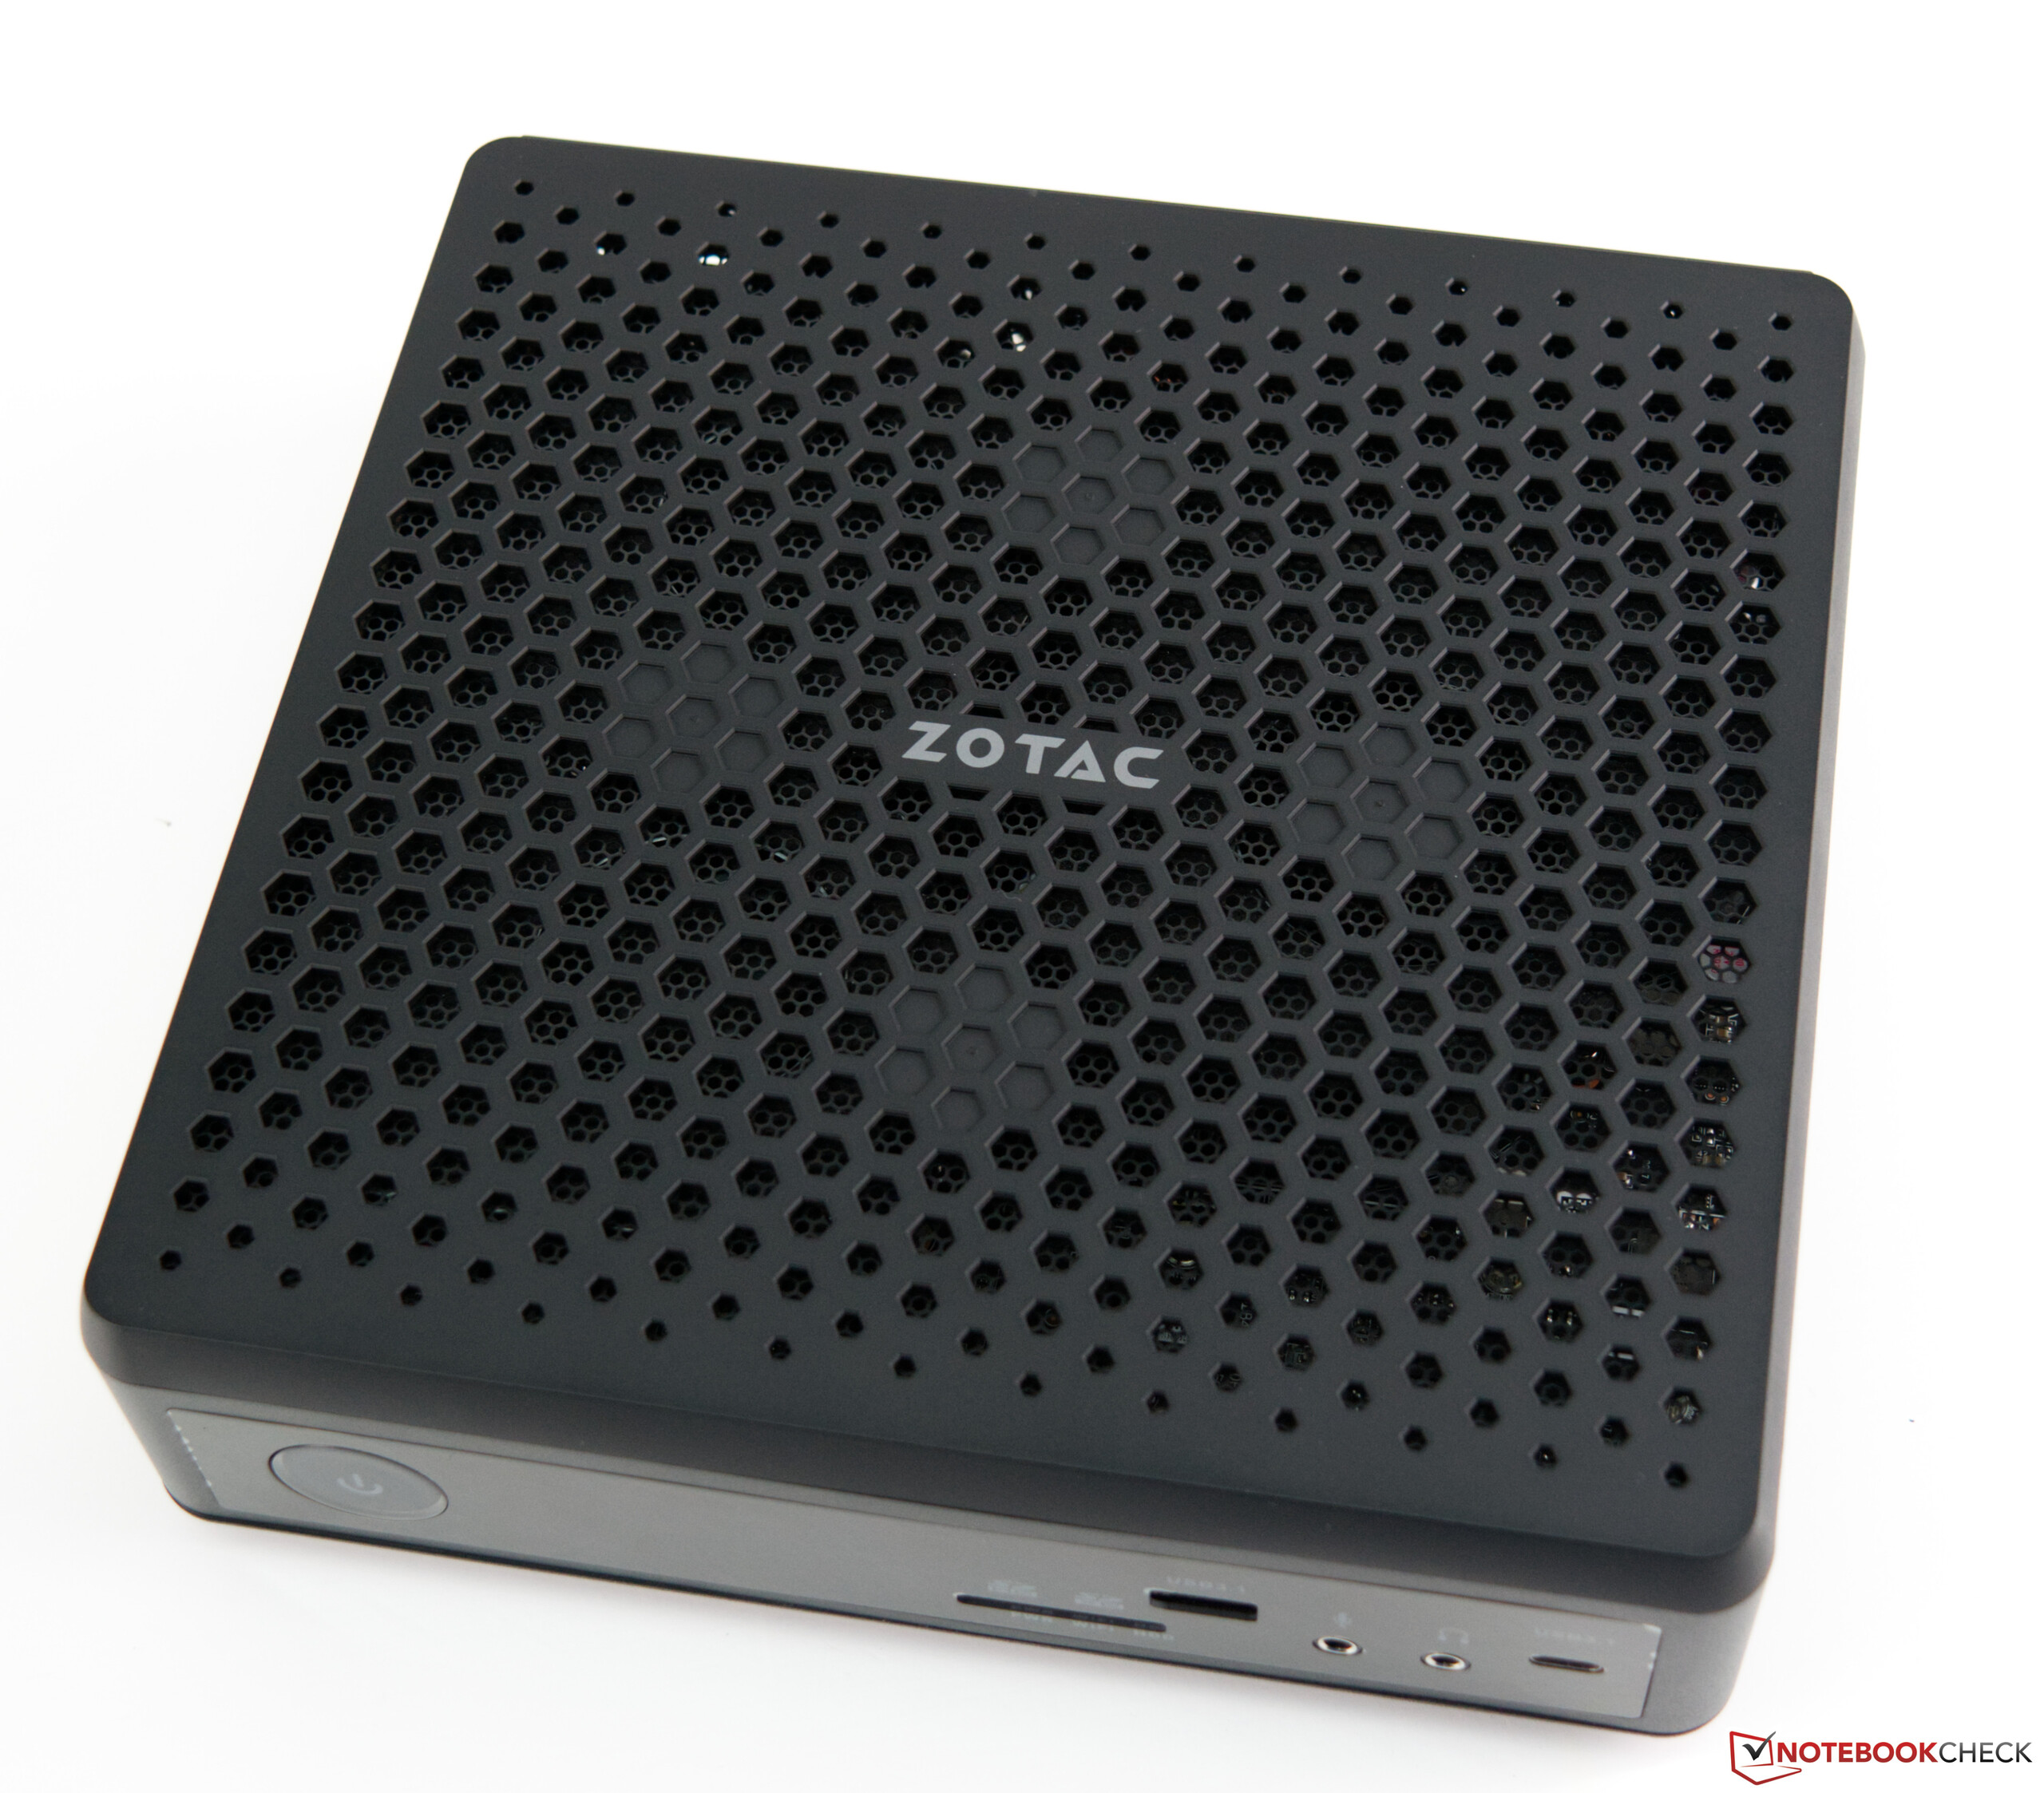
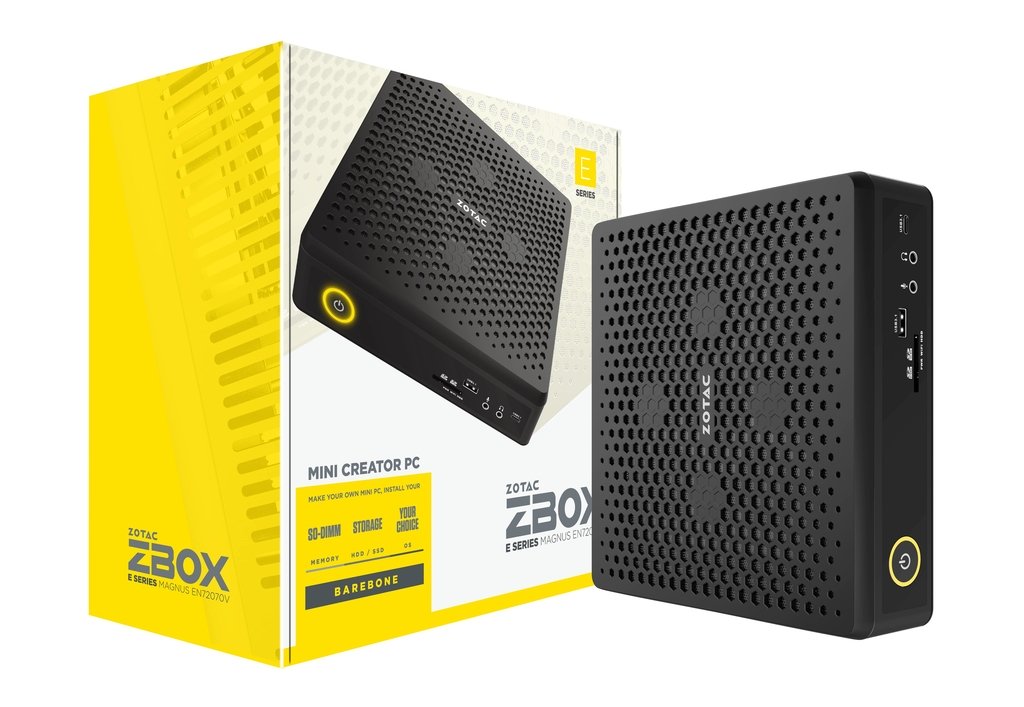
Lo ZBOX di Zotac esiste da molto tempo e il concetto di base non è nuovo. Con l'ultima versione, il produttore accoppia la nona generazione di processori Core di Intel con l'architettura Turing delle schede grafiche Nvidia. Questa configurazione si basa su componenti che normalmente si trovano solo nei computer portatili per tenere sotto controllo il consumo di energia e il conseguente sviluppo di calore. Dopotutto, tutto deve adattarsi al mini sistema, che ha un ingombro di soli 21 x 20,3 centimetri. Anche l'altezza è abbastanza bassa a 6,22 centimetri.

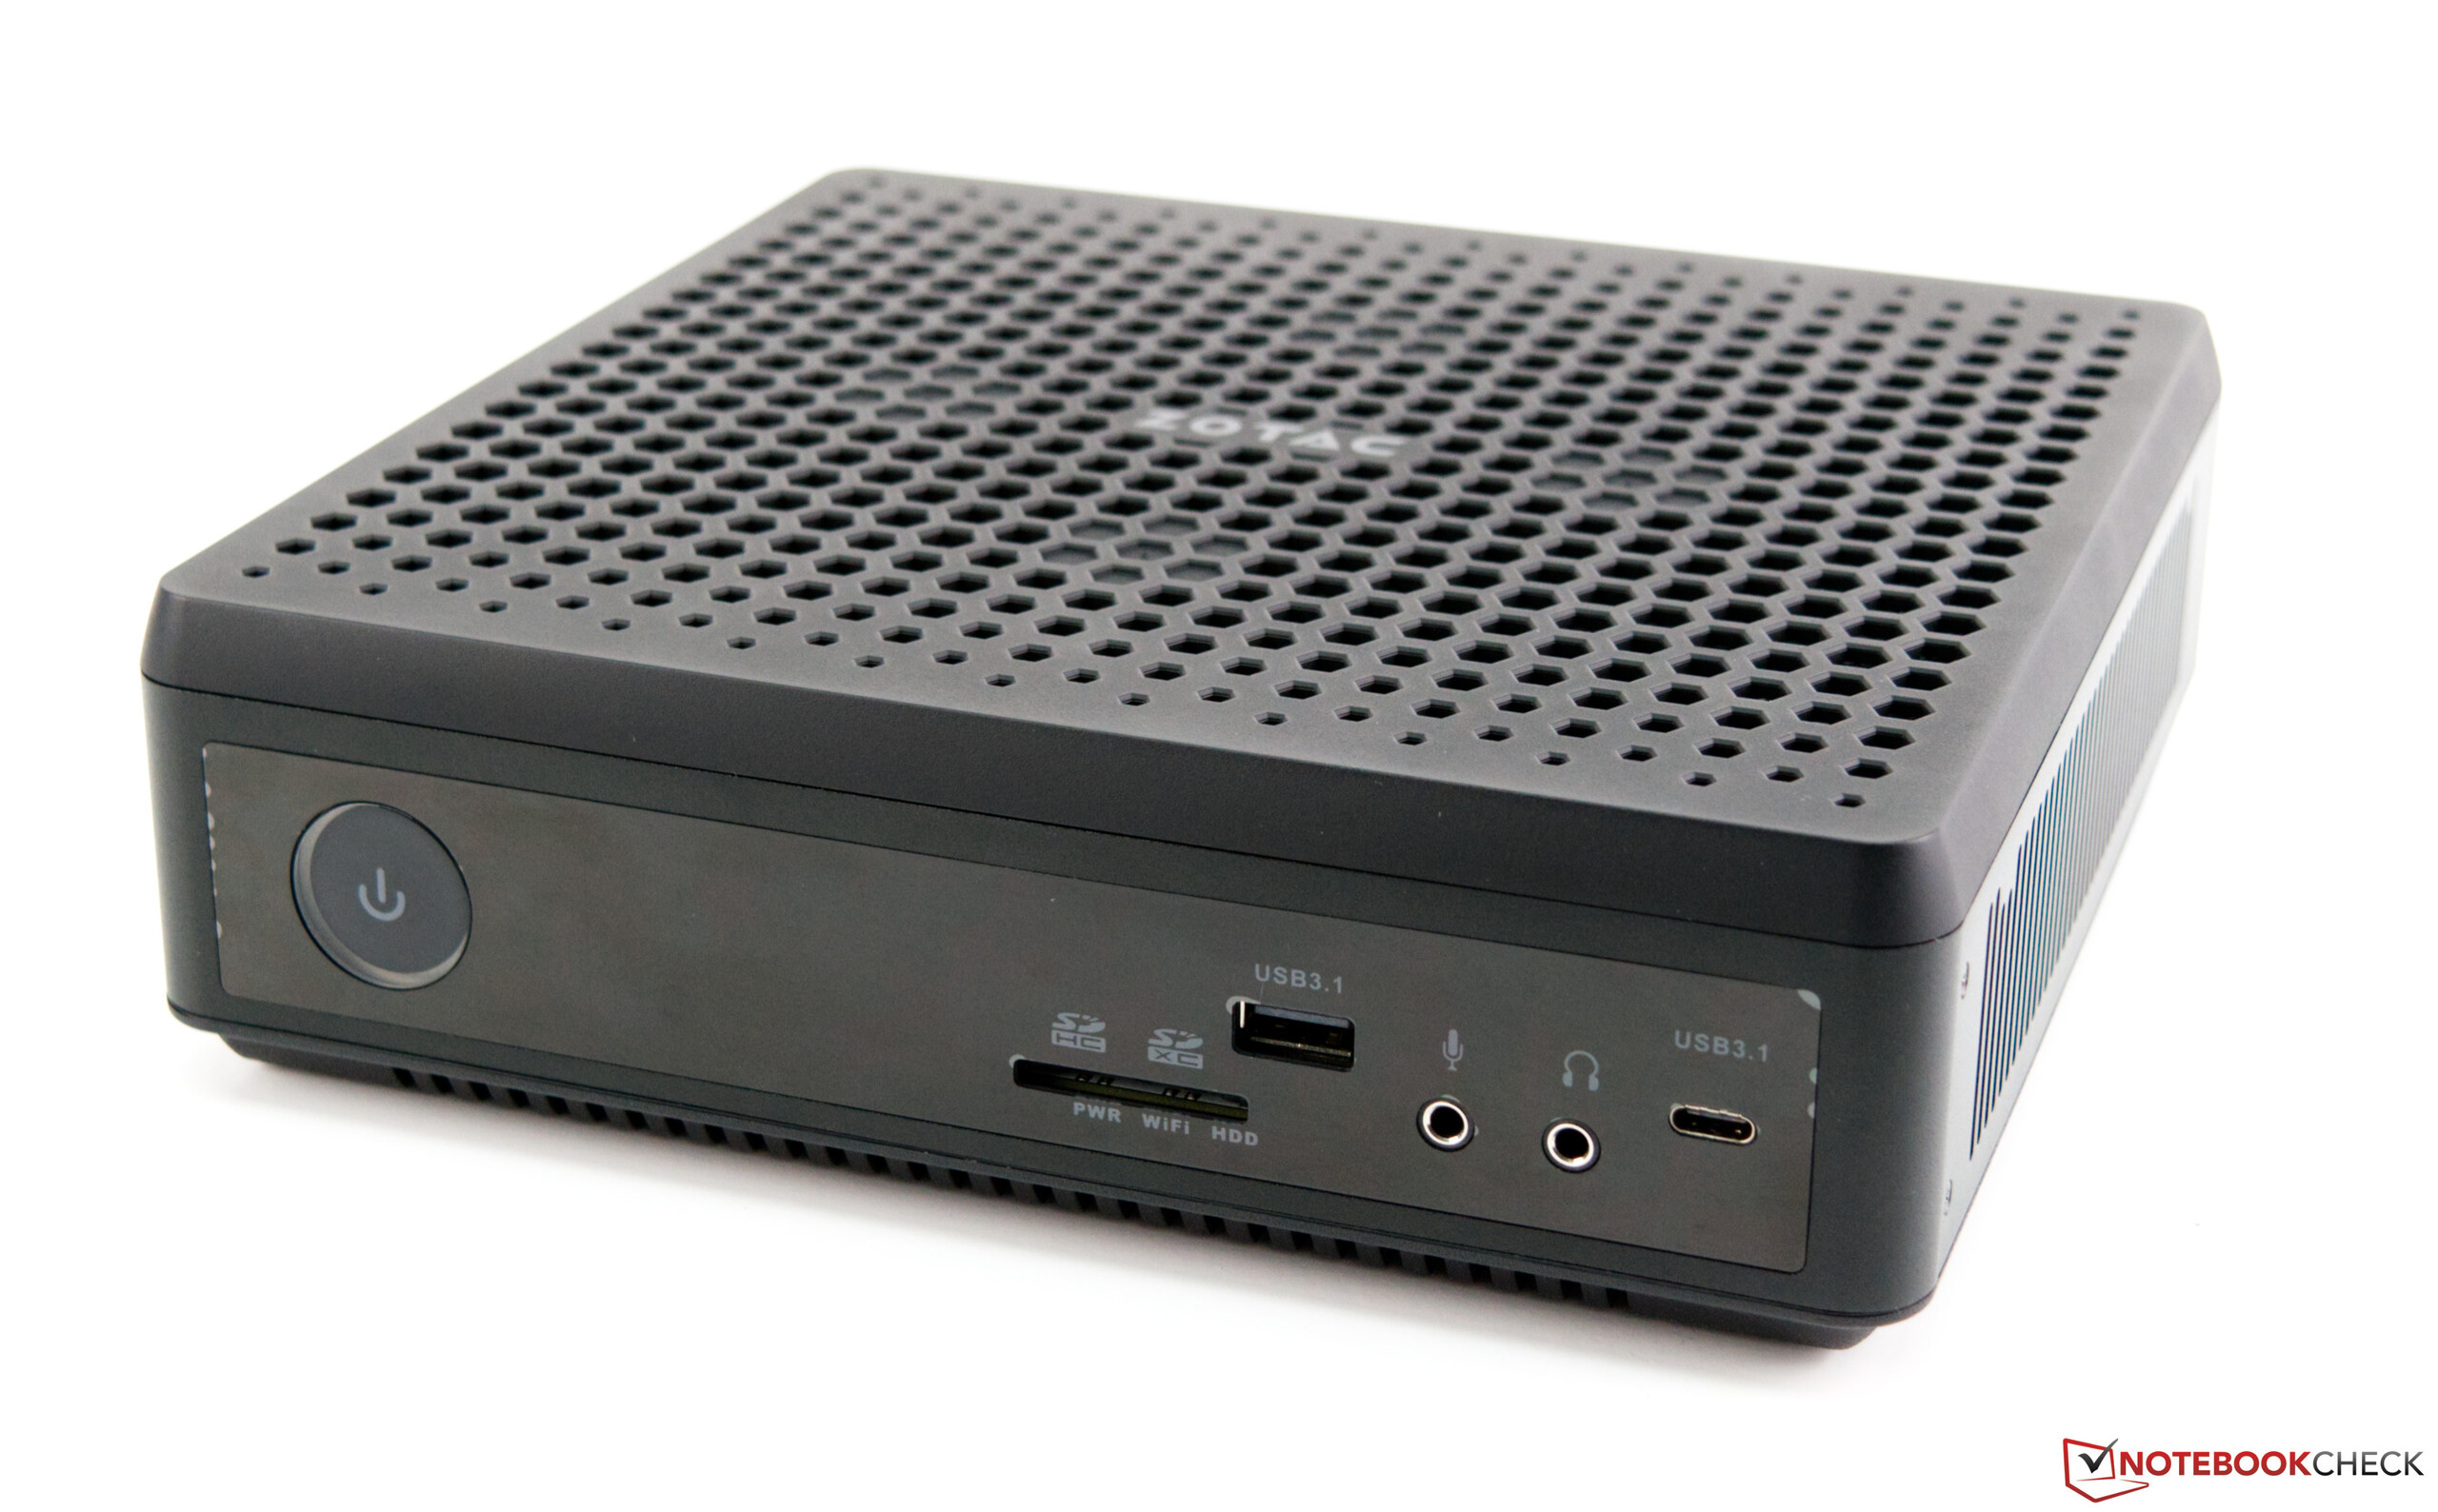
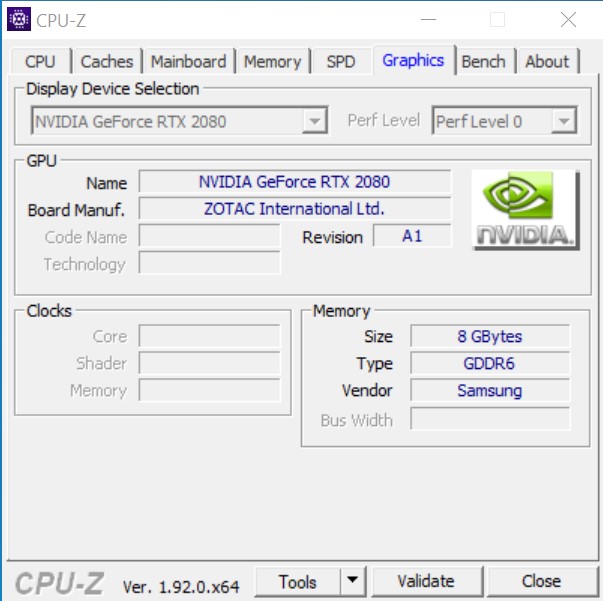
Il case compatto sembra di alta qualità e stabile, ed è completamente nero. Gli elementi di illuminazione sono stati deliberatamente esclusi dal PC barebone. Chi ama i giochi di luce può dare un'occhiata alla recensione dello Zotac MEK MINI. Lo ZBOX Magnus è dotato di un Intel Core i7-9750H, che offre una solida performance nei giochi moderni. Insieme alla GeForce RTX 2080 (mobile) integrata, sul sistema si possono giocare anche giochi molto impegnativi. Maggiori informazioni in merito si trovano nella rispettiva sezione più in basso in questa recensione.

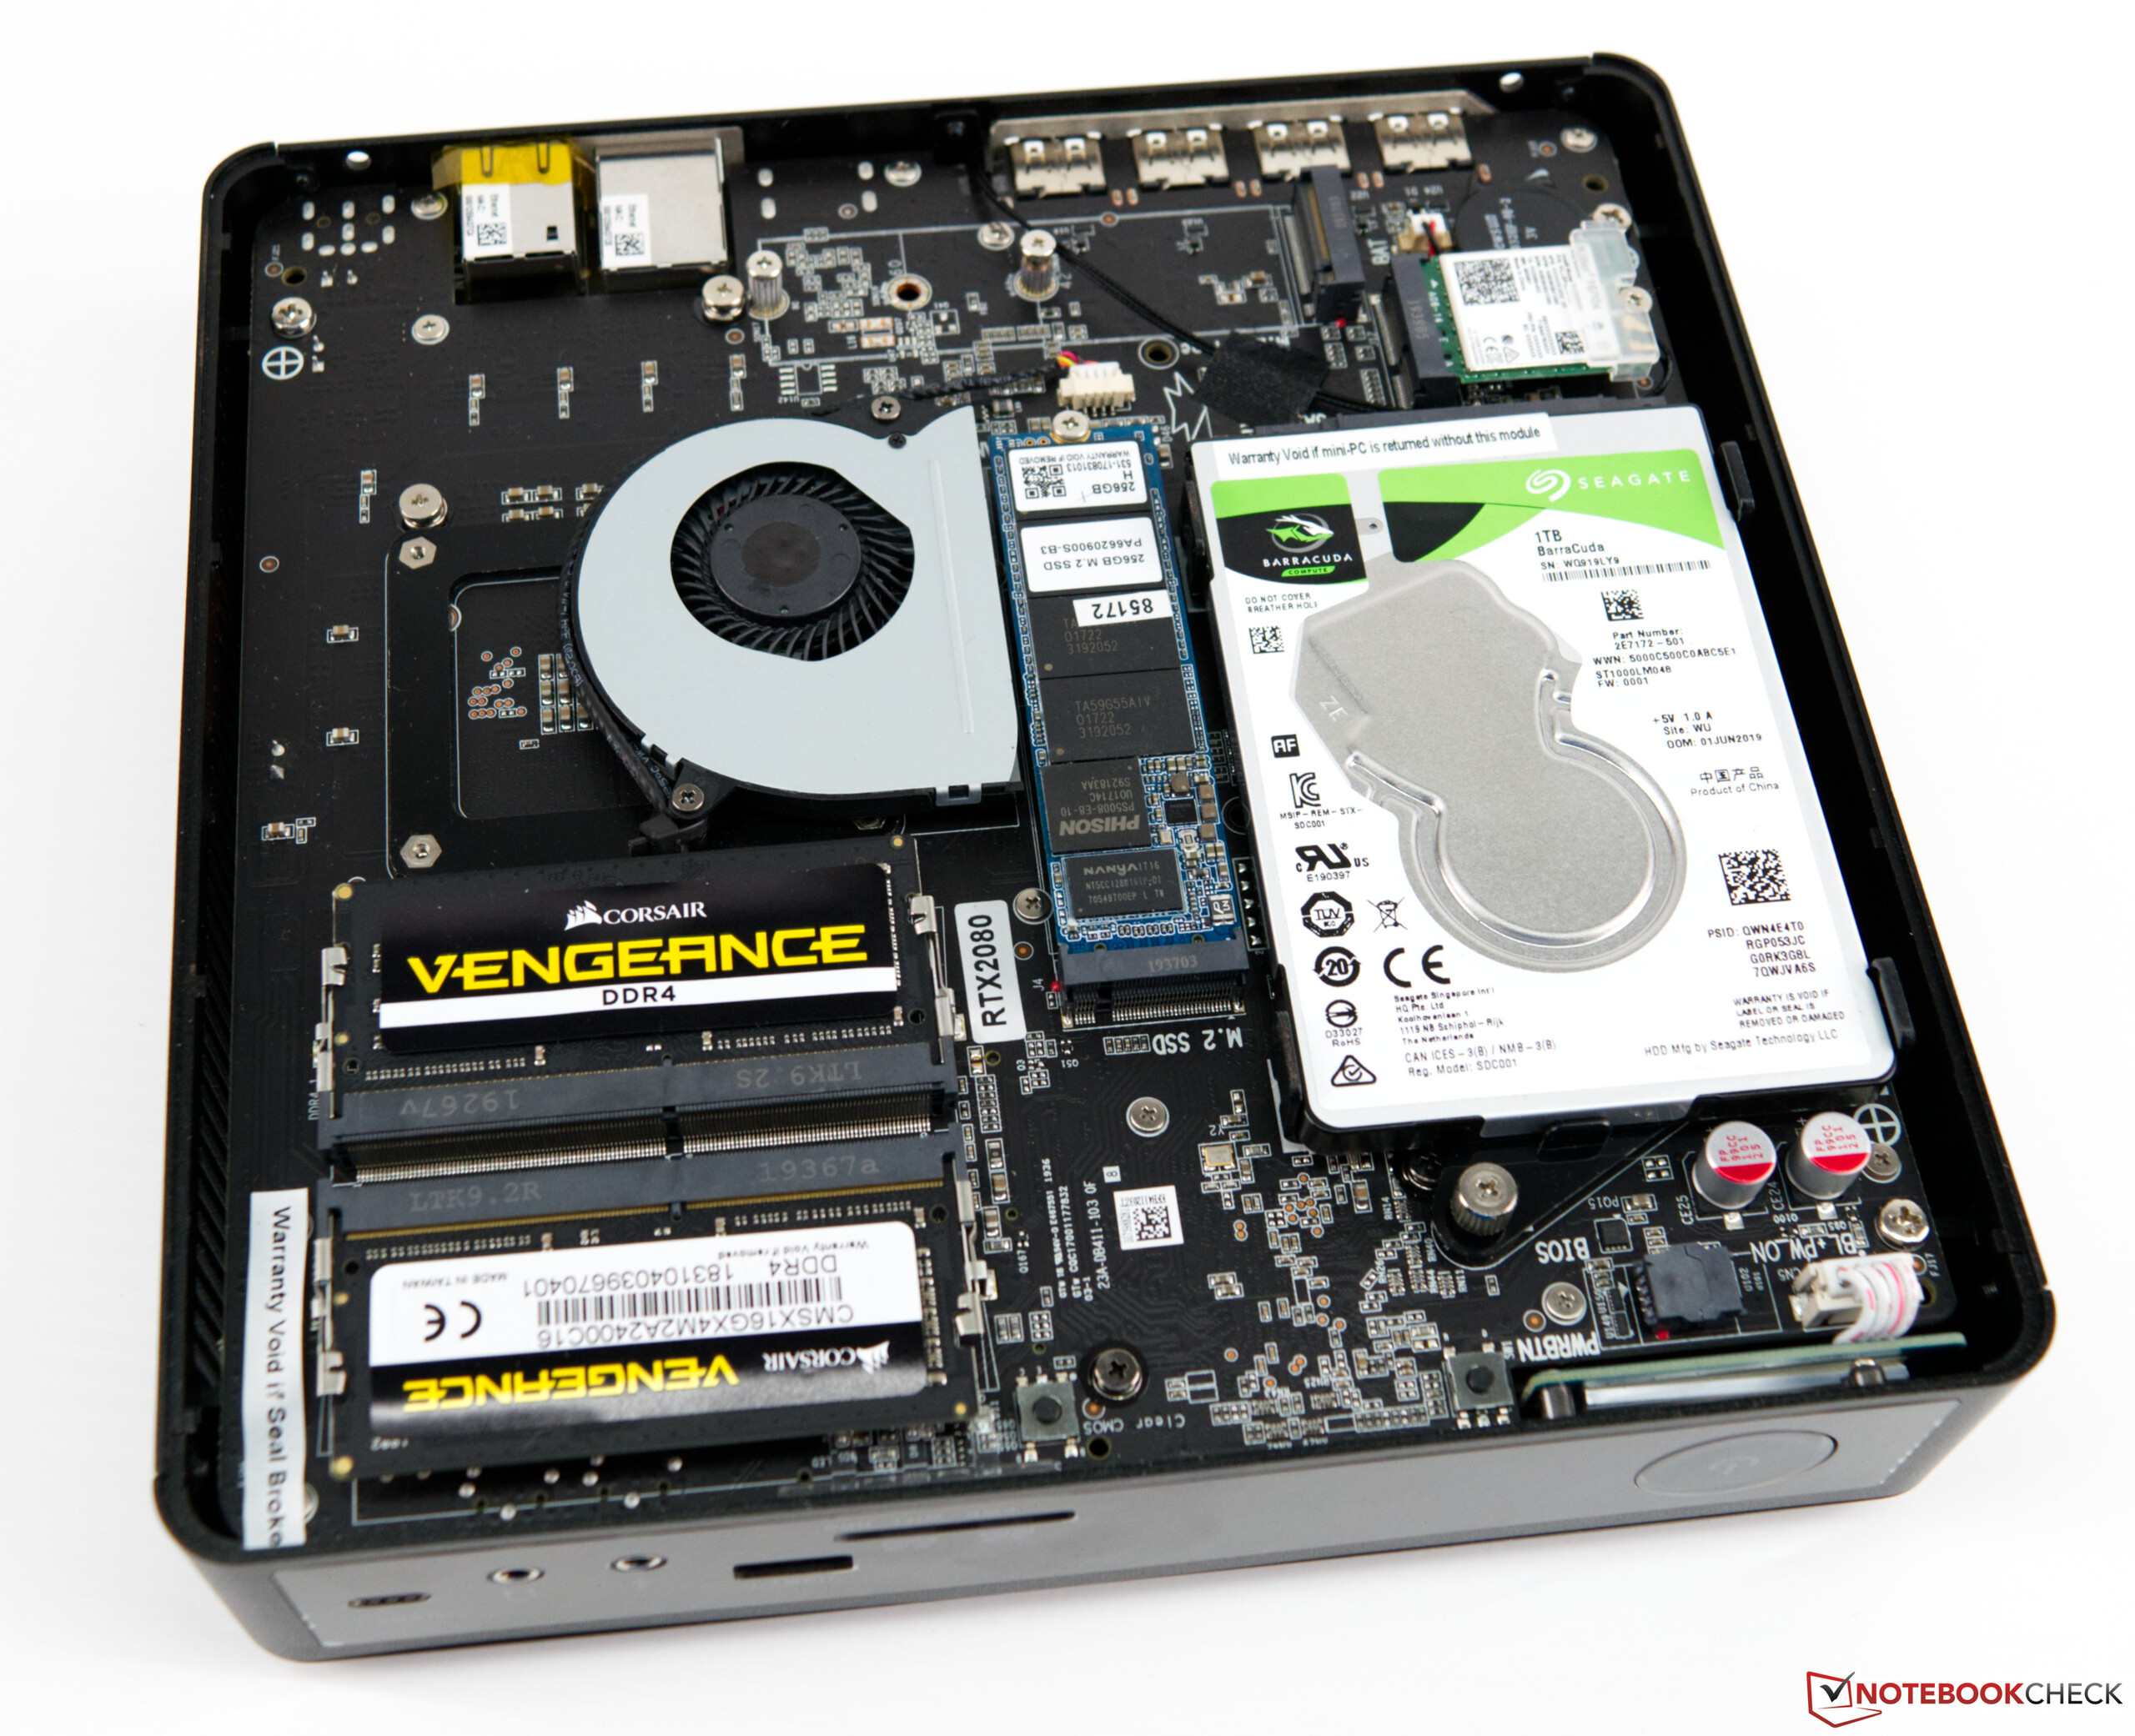
Trattandosi di un sistema barebone, come già detto, lo ZBOX viene fornito senza RAM e senza unità di memorizzazione. Qui l'acquirente può decidere cosa installare e non dipende quindi da un sistema preconfigurato.

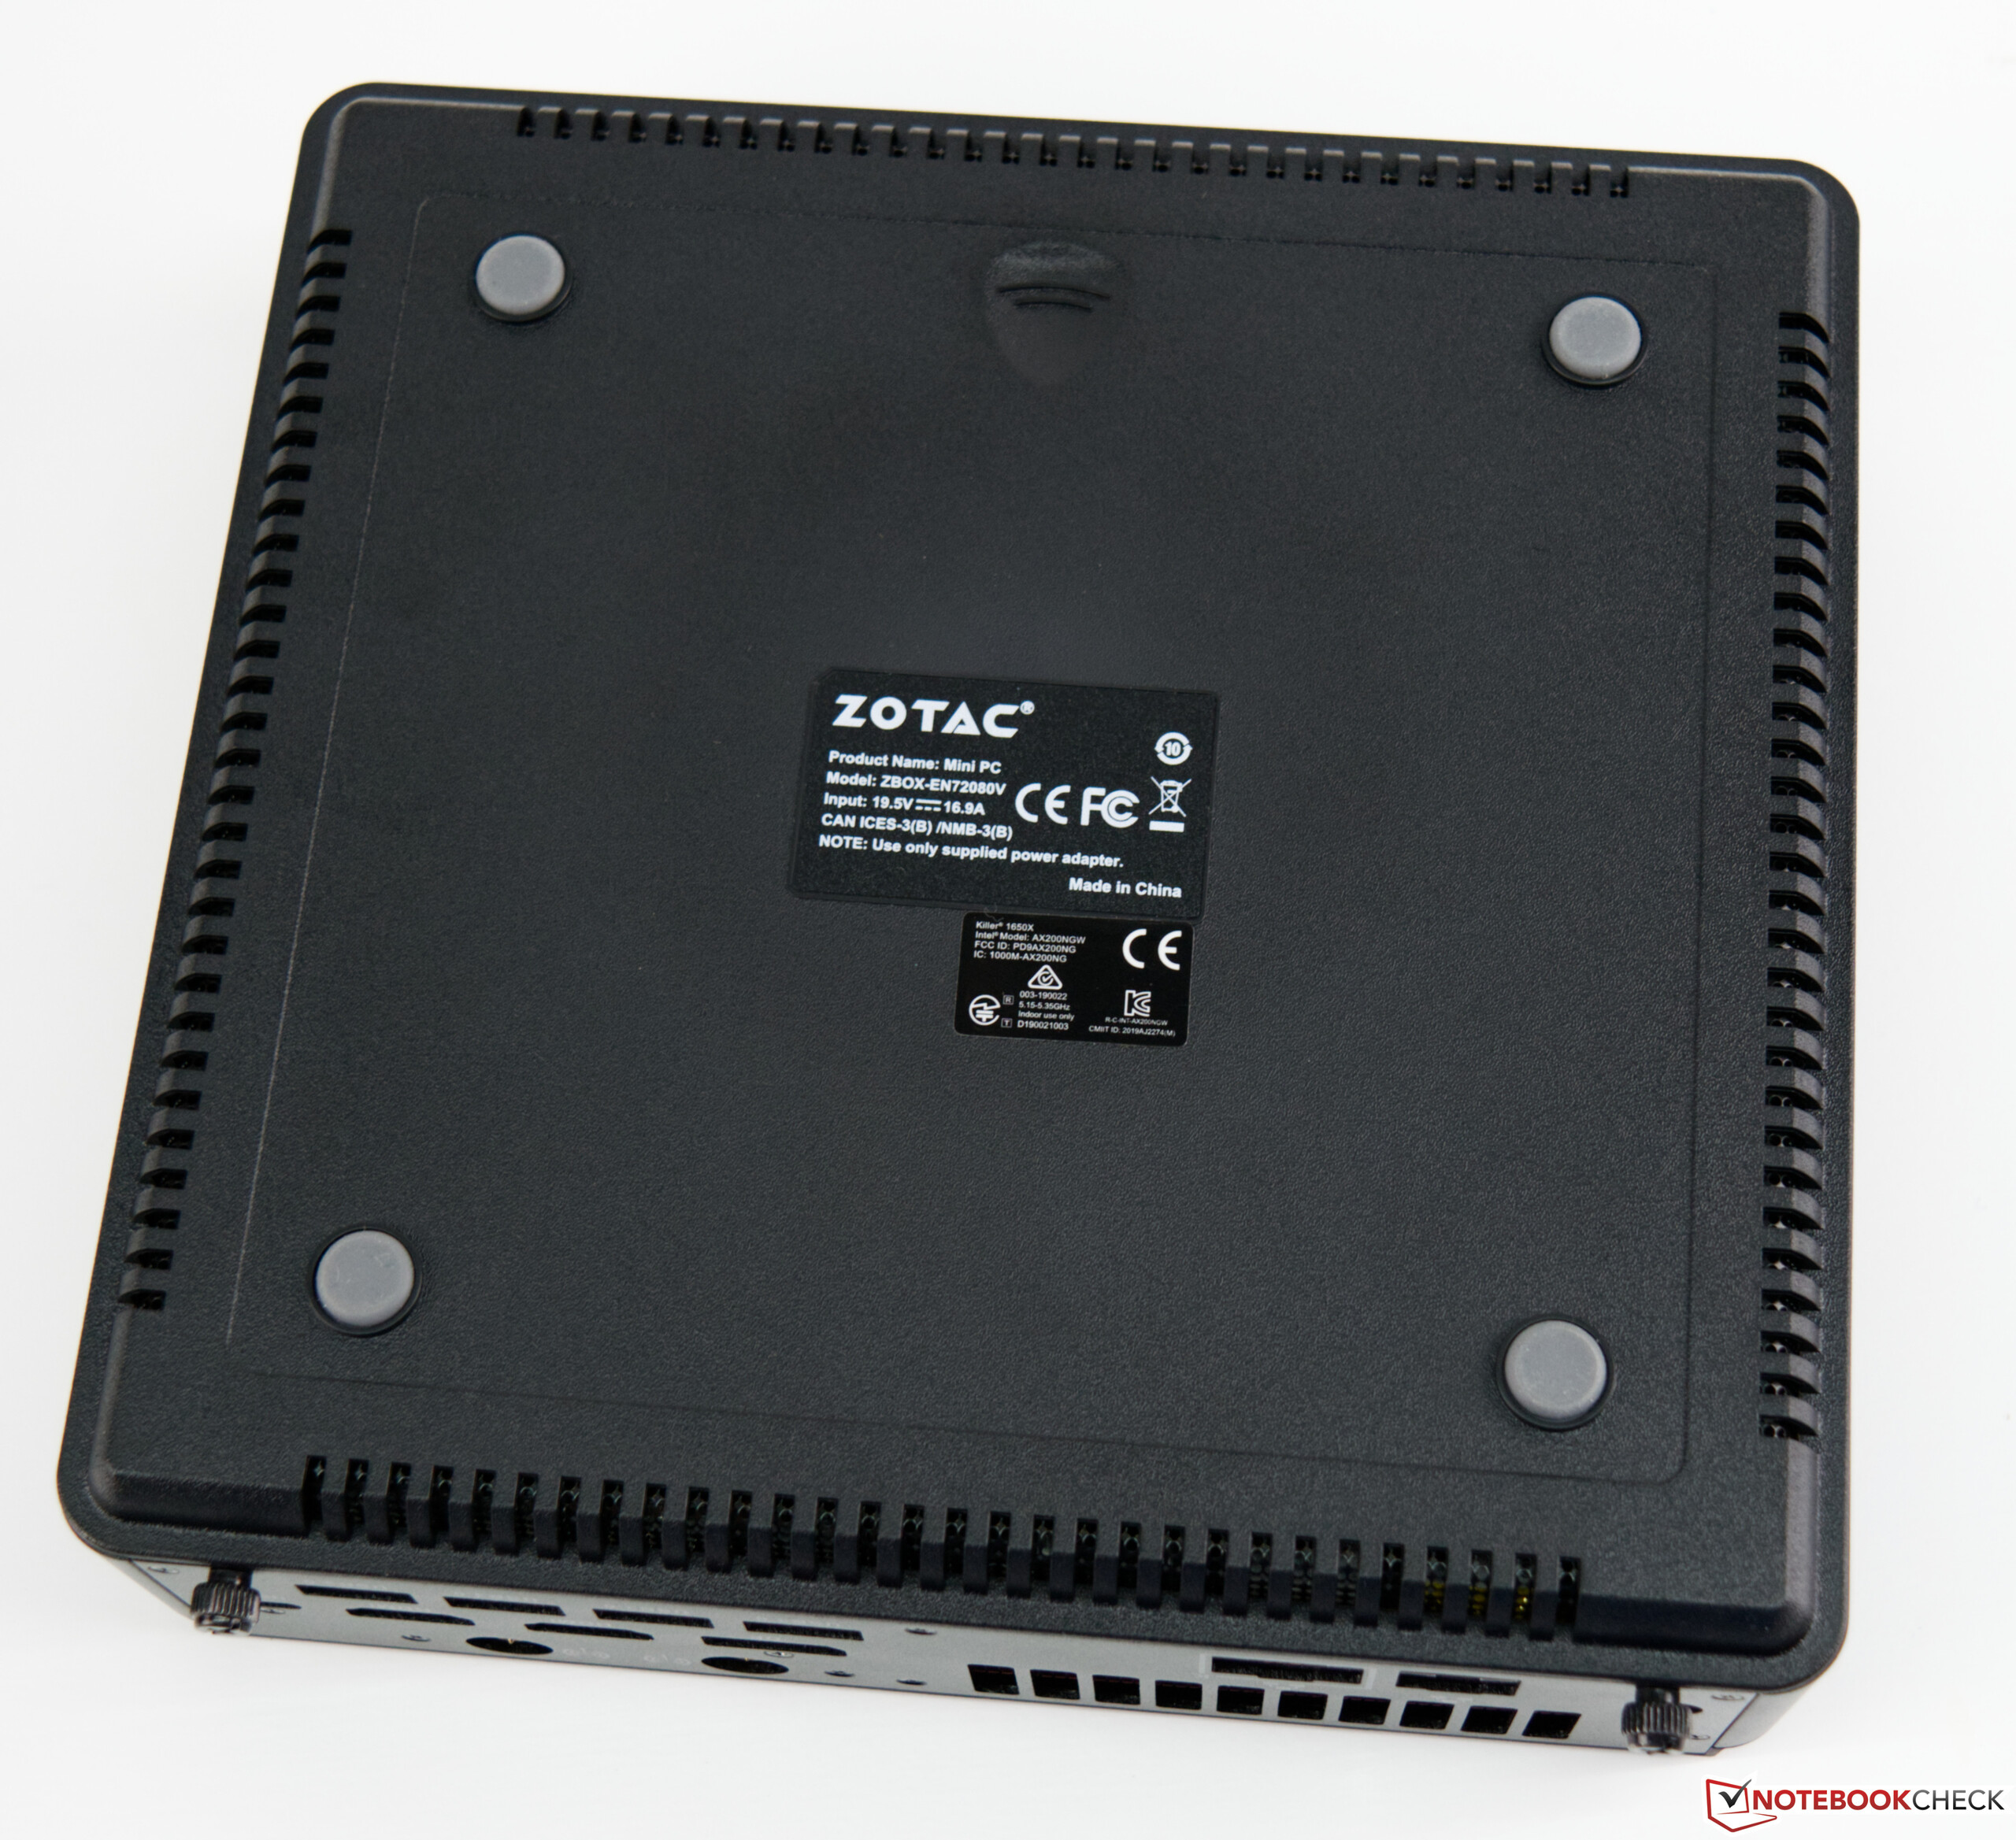
Al momento del test, lo Zotac ZBOX Magnus EN72080V costa poco meno di 1.700 Euro (~$2.004).

Zotac ZBOX Magnus
Zotac ZBOX Magnus
Zotac ZBOX Magnus
Zotac ZBOX Magnus
Zotac ZBOX Magnus
Zotac ZBOX Magnus

Zotac ZBOX Magnus in dettaglio

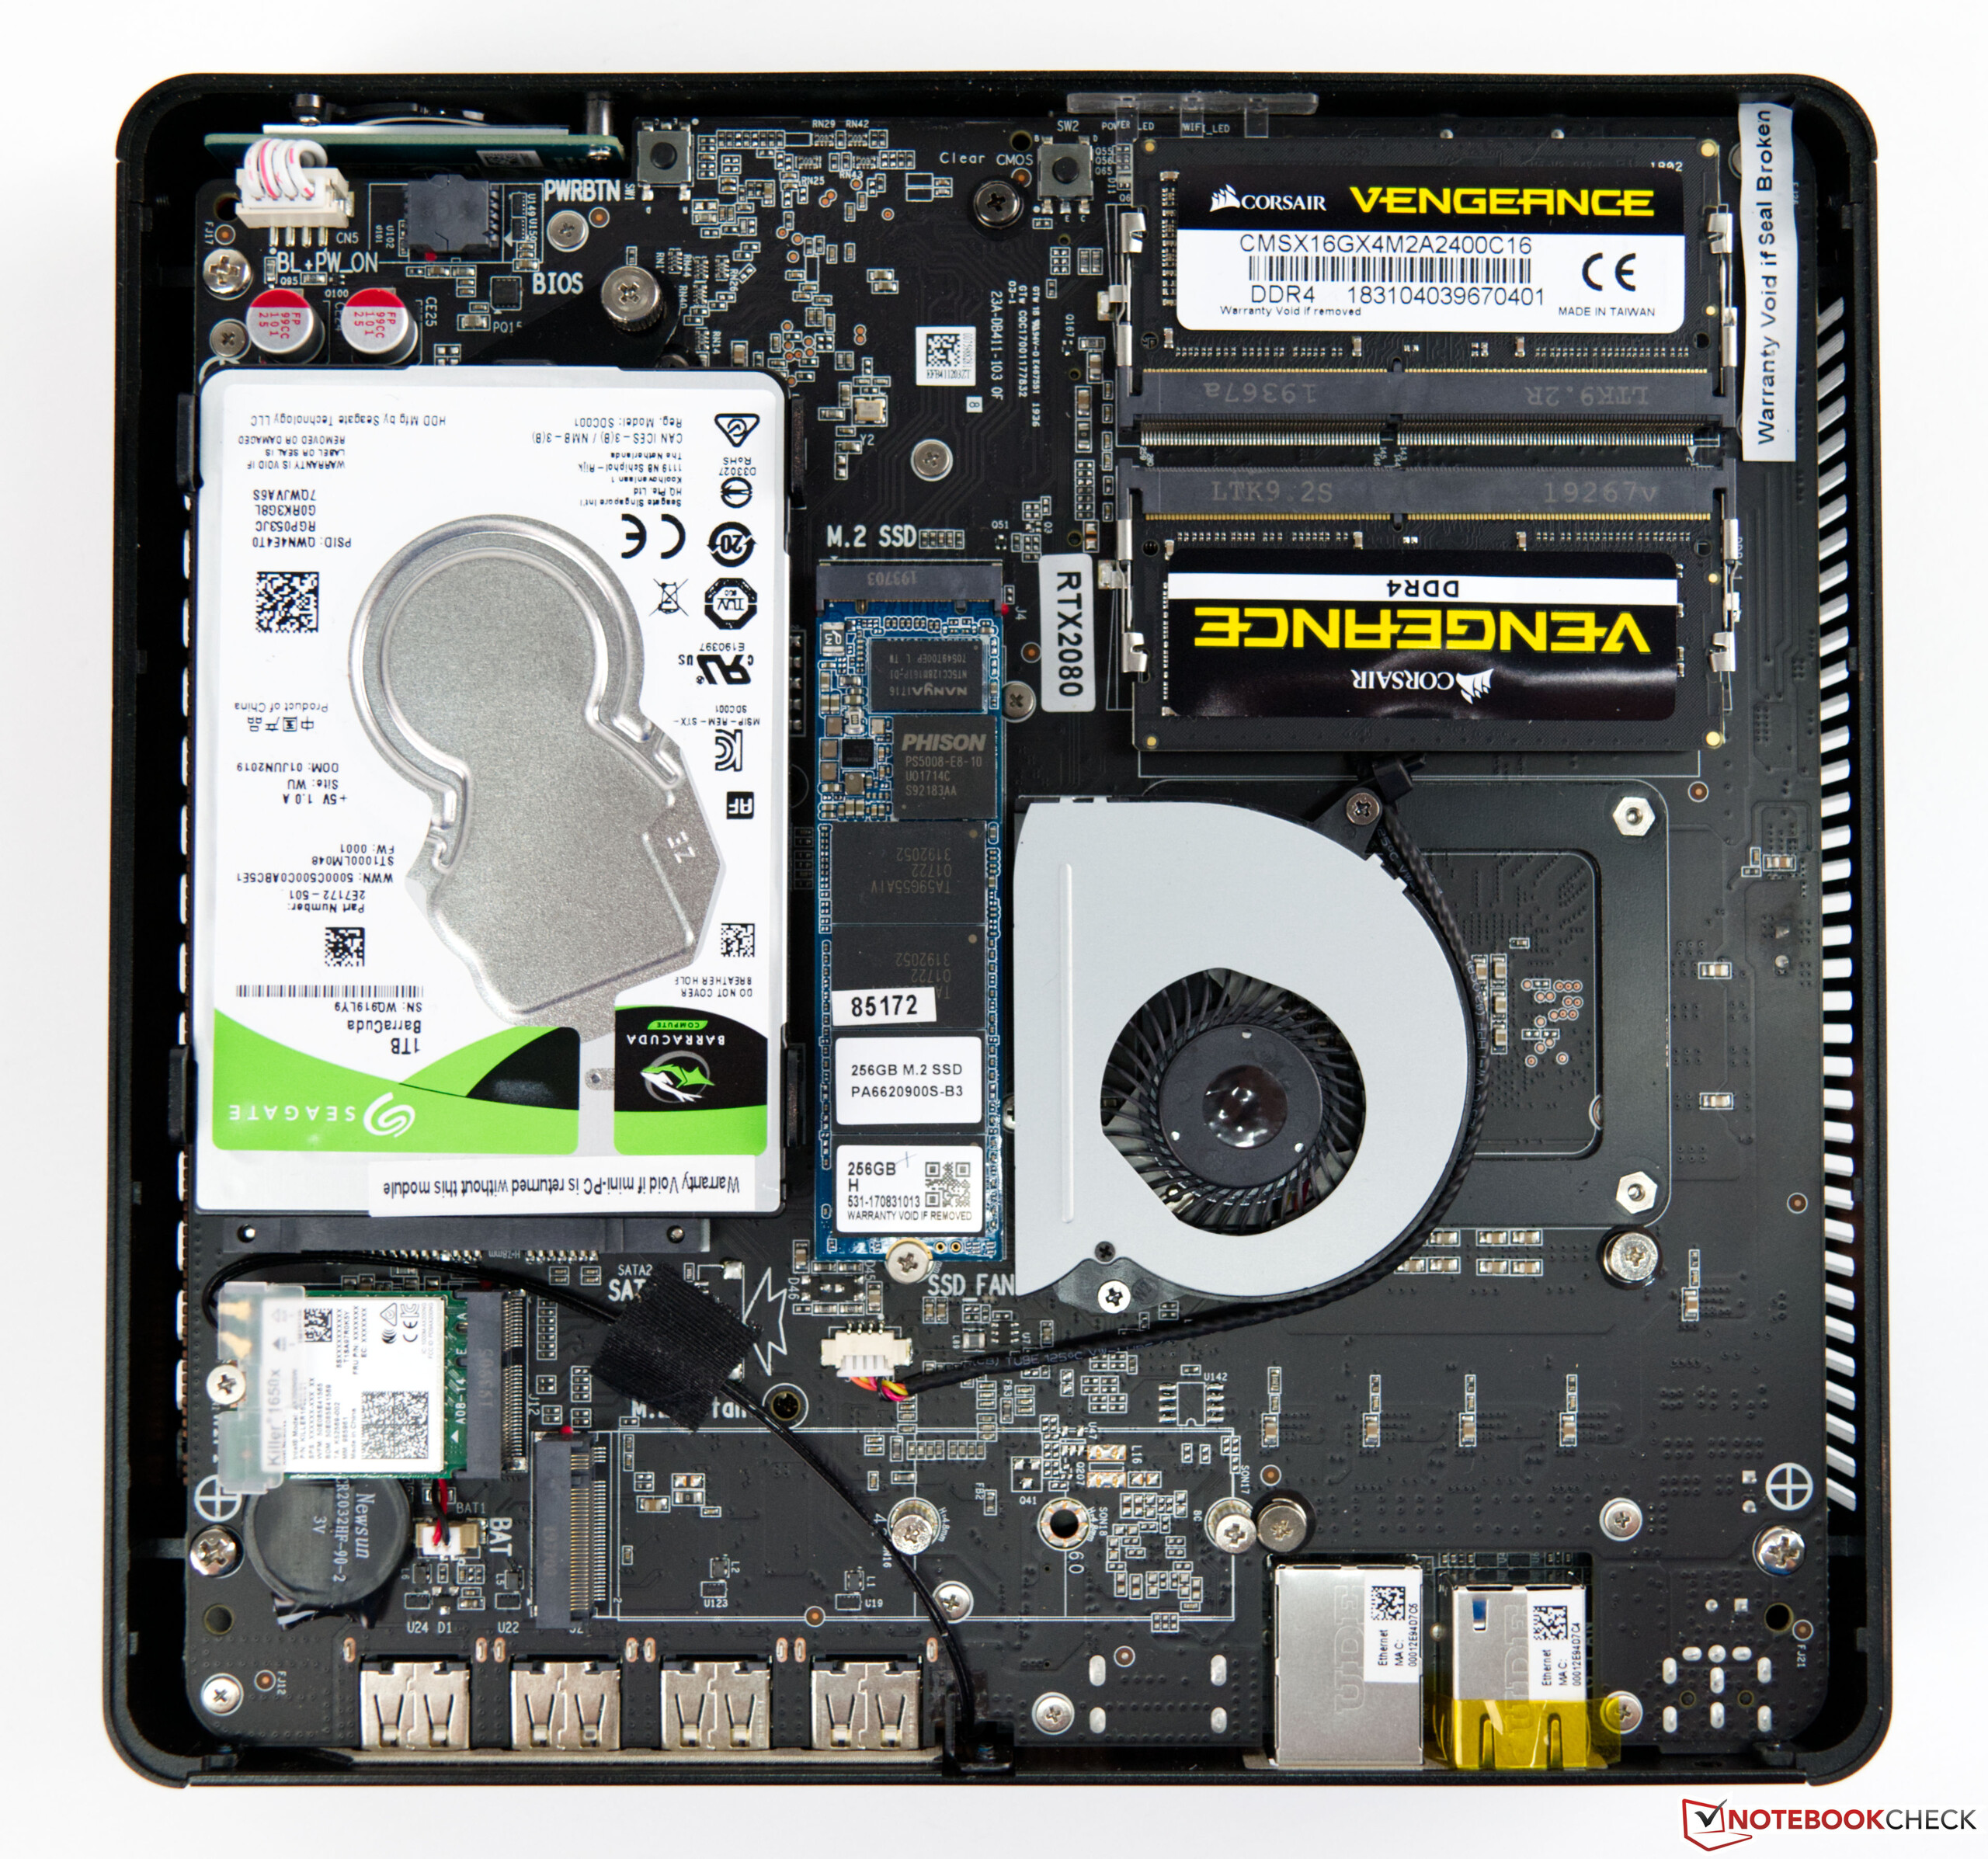
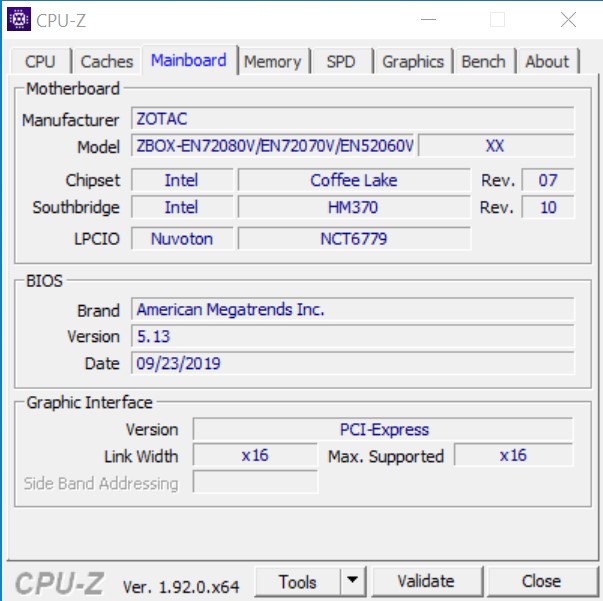
Come accennato all'inizio, lo Zotac ZBOX Magnus è un sistema barebone. Ciò significa che spetta all'utente decidere quale dispositivo di archiviazione e quale memoria installare. Il PC viene già fornito con tutto il resto. Nella nostra versione, l'Intel Core i7-9750H è installato insieme alla GeForce RTX 2080. Inoltre, molte porte IO si trovano sul retro e anche sul fronte. Inoltre, la veloce WLAN (Wi-Fi 6) e una porta dual-LAN forniscono le necessarie connessioni di rete.

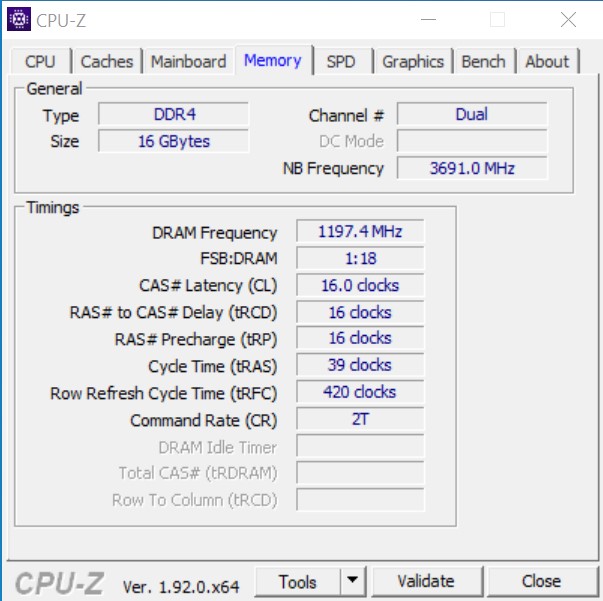
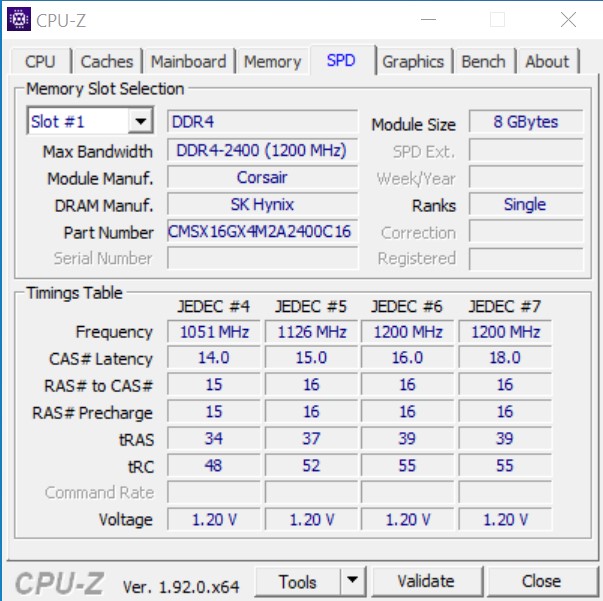
Per la nostra recensione, Zotac ha già dotato il dispositivo di un SSD M.2 e di un disco rigido. Lo stesso vale per la RAM. Questa può essere ampliata, se necessario, fino a 32 GB. 

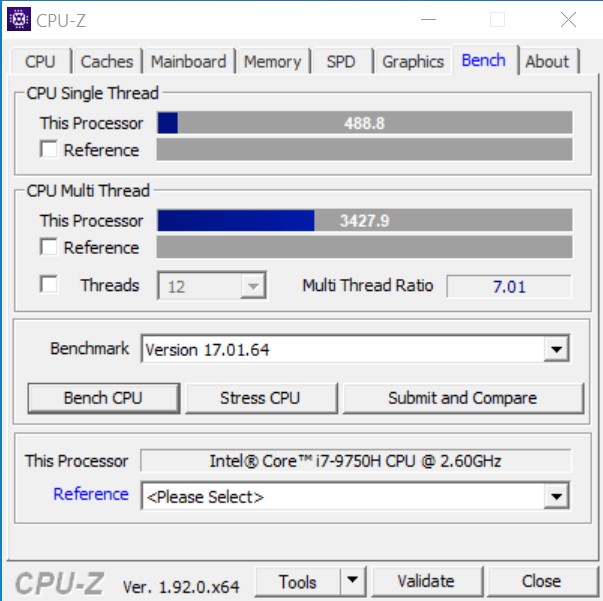
Benchmarks Porcessore

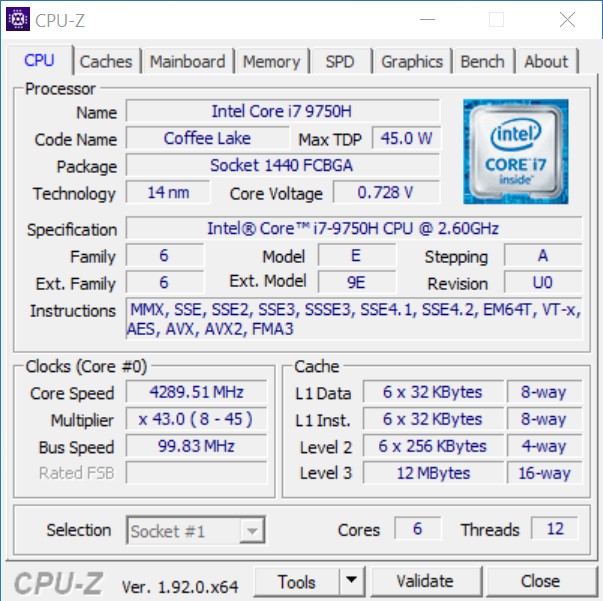
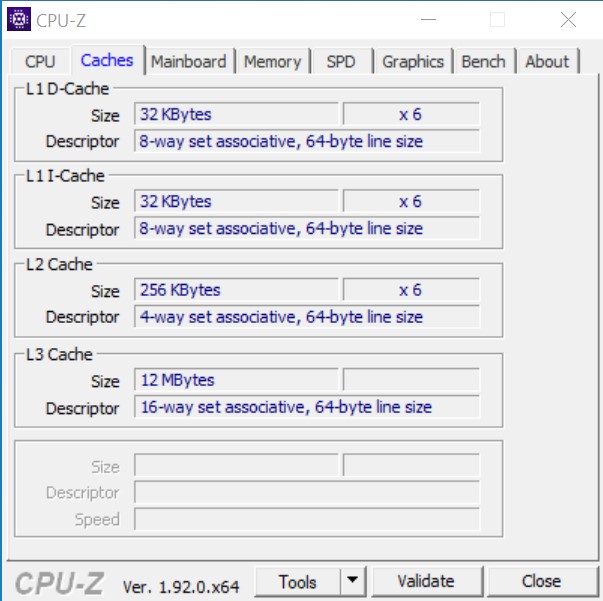
L'Intel Core i7-9750H è un processore veloce hexa-core che viene utilizzato principalmente nei computer portatili. Il produttore ha scelto questo processore per la sua compattezza e il basso consumo energetico. Lo ZBOX Magnus potrebbe fornire un buon risultato nel test con il suo Core i7-9750H. La buona unità di raffreddamento assicura che le prestazioni del SoC siano superiori alla media degli altri processori Core i7-9750H che abbiamo già testato. Tuttavia, lo ZBOX non è in grado di battere il Ghost Canyon NUC di Intel, il che è dovuto ai due cores mancanti, dato che il NUC di Intel è equipaggiato con un Core i9-9980HK.

CPU-Z
CPU-Z
CPU-Z
CPU-Z
CPU-Z
CPU-Z
CPU-Z
XTU
XTU (benchmark)
Cinebench R15
CPU Single 64Bit
Intel Core i9-10900K, NVIDIA Titan RTX
i9-10900K, 3700 MHz
224 Points +16%
Intel Core i9-9980HK, NVIDIA GeForce RTX 2070 (Desktop)
i9-9980HK, 2400 MHz
215 Points +11%
Intel Core i5-10600K, NVIDIA Titan RTX
i5-10600K, 4100 MHz
205 Points +6%
Media Intel Core i9-9980HK
  (181 - 215, n=13)
198.8 Points +3%
Intel Core i7-9750H, NVIDIA GeForce RTX 2080 Mobile
i7-9750H, 2600 MHz
193 Points
Media Intel Core i7-9750H
  (170 - 194, n=82)
183.7 Points -5%
Intel Core i5-9400F, NVIDIA Titan RTX
i5-9400F, 2900 MHz
173 Points -10%
Media Intel Core i5-9300H
  (169 - 176, n=11)
172.6 Points -11%
CPU Multi 64Bit
Intel Core i9-10900K, NVIDIA Titan RTX
i9-10900K, 3700 MHz
2620 Points +122%
Media Intel Core i9-9980HK
  (1327 - 1930, n=14)
1656 Points +40%
Intel Core i9-9980HK, NVIDIA GeForce RTX 2070 (Desktop)
i9-9980HK, 2400 MHz
1607 Points +36%
Intel Core i5-10600K, NVIDIA Titan RTX
i5-10600K, 4100 MHz
1452 Points +23%
Media Intel Core i7-9750H
  (952 - 1306, n=85)
1182 Points 0%
Intel Core i7-9750H, NVIDIA GeForce RTX 2080 Mobile
i7-9750H, 2600 MHz
1180 Points
Intel Core i5-9400F, NVIDIA Titan RTX
i5-9400F, 2900 MHz
984 Points -17%
Media Intel Core i5-9300H
  (717 - 850, n=11)
784 Points -34%
Cinebench R20
CPU (Single Core)
Intel Core i9-10900K, NVIDIA Titan RTX
i9-10900K, 3700 MHz
532 Points +9%
Intel Core i9-9980HK, NVIDIA GeForce RTX 2070 (Desktop)
i9-9980HK, 2400 MHz
504 Points +4%
Intel Core i7-9750H, NVIDIA GeForce RTX 2080 Mobile
i7-9750H, 2600 MHz
486 Points
Media Intel Core i9-9980HK
  (431 - 505, n=10)
471 Points -3%
Intel Core i5-10600K, NVIDIA Titan RTX
i5-10600K, 4100 MHz
464 Points -5%
Media Intel Core i7-9750H
  (416 - 486, n=55)
443 Points -9%
Intel Core i5-9400F, NVIDIA Titan RTX
i5-9400F, 2900 MHz
416 Points -14%
Media Intel Core i5-9300H
  (398 - 427, n=9)
415 Points -15%
CPU (Multi Core)
Intel Core i9-10900K, NVIDIA Titan RTX
i9-10900K, 3700 MHz
6381 Points +138%
Media Intel Core i9-9980HK
  (2974 - 4150, n=10)
3530 Points +32%
Intel Core i5-10600K, NVIDIA Titan RTX
i5-10600K, 4100 MHz
3443 Points +29%
Intel Core i9-9980HK, NVIDIA GeForce RTX 2070 (Desktop)
i9-9980HK, 2400 MHz
3357 Points +25%
Intel Core i7-9750H, NVIDIA GeForce RTX 2080 Mobile
i7-9750H, 2600 MHz
2679 Points
Media Intel Core i7-9750H
  (2017 - 3133, n=55)
2564 Points -4%
Intel Core i5-9400F, NVIDIA Titan RTX
i5-9400F, 2900 MHz
2378 Points -11%
Media Intel Core i5-9300H
  (1530 - 1877, n=9)
1727 Points -36%
Cinebench R11.5
CPU Single 64Bit
Intel Core i9-10900K, NVIDIA Titan RTX
i9-10900K, 3700 MHz
2.56 Points +17%
Intel Core i9-9980HK, NVIDIA GeForce RTX 2070 (Desktop)
i9-9980HK, 2400 MHz
2.4 Points +10%
Media Intel Core i9-9980HK
  (2.25 - 2.4, n=3)
2.31 Points +5%
Intel Core i5-10600K, NVIDIA Titan RTX
i5-10600K, 4100 MHz
2.19 Points 0%
Intel Core i7-9750H, NVIDIA GeForce RTX 2080 Mobile
i7-9750H, 2600 MHz
2.19 Points
Media Intel Core i7-9750H
  (1.96 - 2.19, n=10)
2.1 Points -4%
Intel Core i5-9400F, NVIDIA Titan RTX
i5-9400F, 2900 MHz
1.95 Points -11%
CPU Multi 64Bit
Intel Core i9-10900K, NVIDIA Titan RTX
i9-10900K, 3700 MHz
29.03 Points +124%
Intel Core i9-9980HK, NVIDIA GeForce RTX 2070 (Desktop)
i9-9980HK, 2400 MHz
18.04 Points +39%
Media Intel Core i9-9980HK
  (14.8 - 18, n=3)
16.7 Points +29%
Intel Core i5-10600K, NVIDIA Titan RTX
i5-10600K, 4100 MHz
15.76 Points +22%
Media Intel Core i7-9750H
  (11.3 - 14.1, n=10)
13 Points 0%
Intel Core i7-9750H, NVIDIA GeForce RTX 2080 Mobile
i7-9750H, 2600 MHz
12.96 Points
Intel Core i5-9400F, NVIDIA Titan RTX
i5-9400F, 2900 MHz
11.27 Points -13%
Cinebench R10
Rendering Single CPUs 64Bit
Intel Core i9-10900K, NVIDIA Titan RTX
i9-10900K, 3700 MHz
10625 Points +14%
Intel Core i9-9980HK, NVIDIA GeForce RTX 2070 (Desktop)
i9-9980HK, 2400 MHz
10359 Points +11%
Media Intel Core i9-9980HK
  ()
10359 Points +11%
Intel Core i5-10600K, NVIDIA Titan RTX
i5-10600K, 4100 MHz
9594 Points +3%
Intel Core i7-9750H, NVIDIA GeForce RTX 2080 Mobile
i7-9750H, 2600 MHz
9346 Points
Media Intel Core i7-9750H
  (9069 - 9346, n=3)
9165 Points -2%
Intel Core i5-9400F, NVIDIA Titan RTX
i5-9400F, 2900 MHz
8182 Points -12%
Rendering Multiple CPUs 64Bit
Intel Core i9-10900K, NVIDIA Titan RTX
i9-10900K, 3700 MHz
80495 Points +82%
Intel Core i9-9980HK, NVIDIA GeForce RTX 2070 (Desktop)
i9-9980HK, 2400 MHz
55742 Points +26%
Media Intel Core i9-9980HK
  ()
55742 Points +26%
Intel Core i5-10600K, NVIDIA Titan RTX
i5-10600K, 4100 MHz
51816 Points +17%
Intel Core i7-9750H, NVIDIA GeForce RTX 2080 Mobile
i7-9750H, 2600 MHz
44238 Points
Media Intel Core i7-9750H
  (37188 - 44238, n=3)
40129 Points -9%
Intel Core i5-9400F, NVIDIA Titan RTX
i5-9400F, 2900 MHz
40065 Points -9%
Blender - v2.79 BMW27 CPU
Media Intel Core i5-9300H
  (588 - 643, n=3)
611 Seconds * -49%
Intel Core i5-9400F, NVIDIA Titan RTX
i5-9400F, 2900 MHz
468.5 Seconds * -14%
Media Intel Core i7-9750H
  (342 - 495, n=21)
433 Seconds * -6%
Intel Core i7-9750H, NVIDIA GeForce RTX 2080 Mobile
i7-9750H, 2600 MHz
409.6 Seconds *
Media Intel Core i9-9980HK
  (317 - 527, n=3)
398 Seconds * +3%
Intel Core i9-9980HK, NVIDIA GeForce RTX 2070 (Desktop)
i9-9980HK, 2400 MHz
317.4 Seconds * +23%
Intel Core i5-10600K, NVIDIA Titan RTX
i5-10600K, 4100 MHz
302.4 Seconds * +26%
Intel Core i9-10900K, NVIDIA Titan RTX
i9-10900K, 3700 MHz
167.3 Seconds * +59%
wPrime 2.10
32m
Intel Core i5-9400F, NVIDIA Titan RTX
i5-9400F, 2900 MHz
6.757 s * -37%
Intel Core i7-9750H, NVIDIA GeForce RTX 2080 Mobile
i7-9750H, 2600 MHz
4.932 s *
Media Intel Core i7-9750H
  ()
4.93 s * -0%
Intel Core i5-10600K, NVIDIA Titan RTX
i5-10600K, 4100 MHz
4.648 s * +6%
Media Intel Core i9-9980HK
  (3.79 - 4.94, n=2)
4.36 s * +12%
Intel Core i9-9980HK, NVIDIA GeForce RTX 2070 (Desktop)
i9-9980HK, 2400 MHz
3.788 s * +23%
Intel Core i9-10900K, NVIDIA Titan RTX
i9-10900K, 3700 MHz
3.582 s * +27%
1024m
Intel Core i5-9400F, NVIDIA Titan RTX
i5-9400F, 2900 MHz
198.7 s * -29%
Intel Core i7-9750H, NVIDIA GeForce RTX 2080 Mobile
i7-9750H, 2600 MHz
154.4 s *
Media Intel Core i7-9750H
  ()
154.4 s * -0%
Intel Core i9-9980HK, NVIDIA GeForce RTX 2070 (Desktop)
i9-9980HK, 2400 MHz
120.2 s * +22%
Media Intel Core i9-9980HK
  (110.4 - 120.2, n=2)
115.3 s * +25%
Intel Core i5-10600K, NVIDIA Titan RTX
i5-10600K, 4100 MHz
113.2 s * +27%
Intel Core i9-10900K, NVIDIA Titan RTX
i9-10900K, 3700 MHz
66.3 s * +57%
X264 HD Benchmark 4.0
Pass 1
Intel Core i9-10900K, NVIDIA Titan RTX
i9-10900K, 3700 MHz
289.5 (289min - 291max) fps +37%
Intel Core i5-10600K, NVIDIA Titan RTX
i5-10600K, 4100 MHz
251.5 (250min - 253max) fps +19%
Media Intel Core i9-9980HK
  (238 - 239, n=2)
238 fps +13%
Intel Core i9-9980HK, NVIDIA GeForce RTX 2070 (Desktop)
i9-9980HK, 2400 MHz
237.5 (236min - 239max) fps +13%
Intel Core i5-9400F, NVIDIA Titan RTX
i5-9400F, 2900 MHz
234 (233min - 234max) fps +11%
Media Intel Core i7-9750H
  (211 - 219, n=2)
215 fps +2%
Intel Core i7-9750H, NVIDIA GeForce RTX 2080 Mobile
i7-9750H, 2600 MHz
211 (208min - 214max) fps
Media Intel Core i5-9300H
  ()
193.7 fps -8%
Pass 2
Intel Core i9-10900K, NVIDIA Titan RTX
i9-10900K, 3700 MHz
149 (149min - 149max) fps +110%
Media Intel Core i9-9980HK
  (92.8 - 94.8, n=2)
93.8 fps +32%
Intel Core i9-9980HK, NVIDIA GeForce RTX 2070 (Desktop)
i9-9980HK, 2400 MHz
92.8 (89.1min - 100max) fps +31%
Intel Core i5-10600K, NVIDIA Titan RTX
i5-10600K, 4100 MHz
88.2 (88min - 88.2max) fps +24%
Intel Core i7-9750H, NVIDIA GeForce RTX 2080 Mobile
i7-9750H, 2600 MHz
70.9 (70min - 71.6max) fps
Media Intel Core i7-9750H
  (69.6 - 70.9, n=2)
70.3 fps -1%
Intel Core i5-9400F, NVIDIA Titan RTX
i5-9400F, 2900 MHz
64 (63.9min - 64.1max) fps -10%
Media Intel Core i5-9300H
  ()
49.4 fps -30%
WinRAR - Result
Intel Core i9-10900K, NVIDIA Titan RTX
i9-10900K, 3700 MHz
9739 KB/s +58%
Media Intel Core i9-9980HK
  (7266 - 7436, n=2)
7351 KB/s +19%
Intel Core i9-9980HK, NVIDIA GeForce RTX 2070 (Desktop)
i9-9980HK, 2400 MHz
7266 KB/s +18%
Intel Core i5-10600K, NVIDIA Titan RTX
i5-10600K, 4100 MHz
6536 KB/s +6%
Media Intel Core i7-9750H
  (6160 - 6631, n=2)
6396 KB/s +4%
Intel Core i7-9750H, NVIDIA GeForce RTX 2080 Mobile
i7-9750H, 2600 MHz
6160 KB/s
Intel Core i5-9400F, NVIDIA Titan RTX
i5-9400F, 2900 MHz
5794 KB/s -6%
Media Intel Core i5-9300H
  ()
5663 KB/s -8%
TrueCrypt
AES Mean 100MB
Intel Core i9-10900K, NVIDIA Titan RTX
i9-10900K, 3700 MHz
14.6 GB/s +97%
Media Intel Core i9-9980HK
  (10.1 - 10.3, n=2)
10.2 GB/s +38%
Intel Core i9-9980HK, NVIDIA GeForce RTX 2070 (Desktop)
i9-9980HK, 2400 MHz
10.1 GB/s +36%
Intel Core i5-10600K, NVIDIA Titan RTX
i5-10600K, 4100 MHz
8 GB/s +8%
Intel Core i7-9750H, NVIDIA GeForce RTX 2080 Mobile
i7-9750H, 2600 MHz
7.4 GB/s
Media Intel Core i7-9750H
  (7.3 - 7.4, n=2)
7.35 GB/s -1%
Intel Core i5-9400F, NVIDIA Titan RTX
i5-9400F, 2900 MHz
5.2 GB/s -30%
Media Intel Core i5-9300H
  ()
4.7 GB/s -36%
Twofish Mean 100MB
Intel Core i9-10900K, NVIDIA Titan RTX
i9-10900K, 3700 MHz
2.6 GB/s +117%
Intel Core i9-9980HK, NVIDIA GeForce RTX 2070 (Desktop)
i9-9980HK, 2400 MHz
1.7 GB/s +42%
Media Intel Core i9-9980HK
  (1.7 - 1.7, n=2)
1.7 GB/s +42%
Intel Core i5-10600K, NVIDIA Titan RTX
i5-10600K, 4100 MHz
1.4 GB/s +17%
Media Intel Core i7-9750H
  (1.2 - 1.3, n=2)
1.25 GB/s +4%
Intel Core i7-9750H, NVIDIA GeForce RTX 2080 Mobile
i7-9750H, 2600 MHz
1.2 GB/s
Intel Core i5-9400F, NVIDIA Titan RTX
i5-9400F, 2900 MHz
0.86 GB/s -28%
Media Intel Core i5-9300H
  ()
0.84 GB/s -30%
Serpent Mean 100MB
Intel Core i9-10900K, NVIDIA Titan RTX
i9-10900K, 3700 MHz
1.5 GB/s +114%
Intel Core i9-9980HK, NVIDIA GeForce RTX 2070 (Desktop)
i9-9980HK, 2400 MHz
1 GB/s +43%
Media Intel Core i9-9980HK
  (1 - 1, n=2)
1 GB/s +43%
Intel Core i5-10600K, NVIDIA Titan RTX
i5-10600K, 4100 MHz
0.82 GB/s +17%
Media Intel Core i7-9750H
  (0.7 - 0.75, n=2)
0.725 GB/s +4%
Intel Core i7-9750H, NVIDIA GeForce RTX 2080 Mobile
i7-9750H, 2600 MHz
0.7 GB/s
Intel Core i5-9400F, NVIDIA Titan RTX
i5-9400F, 2900 MHz
0.51 GB/s -27%
Media Intel Core i5-9300H
  ()
0.5 GB/s -29%
Geekbench 5.5
Multi-Core
Intel Core i9-10900K, NVIDIA Titan RTX
i9-10900K, 3700 MHz
11414 Points +94%
Intel Core i9-9980HK, NVIDIA GeForce RTX 2070 (Desktop)
i9-9980HK, 2400 MHz
7568 Points +28%
Media Intel Core i9-9980HK
  (6945 - 7703, n=3)
7405 Points +26%
Intel Core i5-10600K, NVIDIA Titan RTX
i5-10600K, 4100 MHz
7248 Points +23%
Intel Core i7-9750H, NVIDIA GeForce RTX 2080 Mobile
i7-9750H, 2600 MHz
5894 Points
Intel Core i5-9400F, NVIDIA Titan RTX
i5-9400F, 2900 MHz
5715 Points -3%
Media Intel Core i7-9750H
  (4859 - 6262, n=13)
5597 Points -5%
Single-Core
Intel Core i9-10900K, NVIDIA Titan RTX
i9-10900K, 3700 MHz
1449 Points +18%
Intel Core i9-9980HK, NVIDIA GeForce RTX 2070 (Desktop)
i9-9980HK, 2400 MHz
1378 Points +12%
Media Intel Core i9-9980HK
  (1314 - 1378, n=2)
1346 Points +10%
Intel Core i5-10600K, NVIDIA Titan RTX
i5-10600K, 4100 MHz
1286 Points +5%
Intel Core i7-9750H, NVIDIA GeForce RTX 2080 Mobile
i7-9750H, 2600 MHz
1225 Points
Media Intel Core i7-9750H
  (1117 - 1251, n=13)
1190 Points -3%
Intel Core i5-9400F, NVIDIA Titan RTX
i5-9400F, 2900 MHz
1139 Points -7%
Geekbench 5.0
5.0 Multi-Core
Intel Core i9-10900K, NVIDIA Titan RTX
i9-10900K, 3700 MHz
11407 Points +94%
Intel Core i9-9980HK, NVIDIA GeForce RTX 2070 (Desktop)
i9-9980HK, 2400 MHz
7540 Points +28%
Media Intel Core i9-9980HK
  (7072 - 7805, n=4)
7421 Points +26%
Intel Core i5-10600K, NVIDIA Titan RTX
i5-10600K, 4100 MHz
7237 Points +23%
Intel Core i7-9750H, NVIDIA GeForce RTX 2080 Mobile
i7-9750H, 2600 MHz
5885 Points
Intel Core i5-9400F, NVIDIA Titan RTX
i5-9400F, 2900 MHz
5698 Points -3%
Media Intel Core i7-9750H
  (4812 - 6230, n=15)
5575 Points -5%
Media Intel Core i5-9300H
  (3697 - 4200, n=3)
4014 Points -32%
5.0 Single-Core
Intel Core i9-10900K, NVIDIA Titan RTX
i9-10900K, 3700 MHz
1440 Points +18%
Intel Core i9-9980HK, NVIDIA GeForce RTX 2070 (Desktop)
i9-9980HK, 2400 MHz
1355 Points +11%
Intel Core i5-10600K, NVIDIA Titan RTX
i5-10600K, 4100 MHz
1281 Points +5%
Media Intel Core i9-9980HK
  (1171 - 1355, n=4)
1273 Points +4%
Intel Core i7-9750H, NVIDIA GeForce RTX 2080 Mobile
i7-9750H, 2600 MHz
1219 Points
Media Intel Core i7-9750H
  (1105 - 1248, n=15)
1179 Points -3%
Intel Core i5-9400F, NVIDIA Titan RTX
i5-9400F, 2900 MHz
1132 Points -7%
Media Intel Core i5-9300H
  (1095 - 1137, n=3)
1118 Points -8%
Geekbench 4.4
64 Bit Single-Core Score
Intel Core i9-10900K, NVIDIA Titan RTX
i9-10900K, 3700 MHz
6348 Points +18%
Intel Core i9-9980HK, NVIDIA GeForce RTX 2070 (Desktop)
i9-9980HK, 2400 MHz
5969 Points +11%
Media Intel Core i9-9980HK
  (5617 - 5972, n=3)
5853 Points +8%
Intel Core i5-10600K, NVIDIA Titan RTX
i5-10600K, 4100 MHz
5821 Points +8%
Intel Core i7-9750H, NVIDIA GeForce RTX 2080 Mobile
i7-9750H, 2600 MHz
5401 Points
Intel Core i5-9400F, NVIDIA Titan RTX
i5-9400F, 2900 MHz
5347 Points -1%
Media Intel Core i7-9750H
  (4440 - 5511, n=27)
5238 Points -3%
Media Intel Core i5-9300H
  (4704 - 5089, n=7)
4898 Points -9%
64 Bit Multi-Core Score
Intel Core i9-10900K, NVIDIA Titan RTX
i9-10900K, 3700 MHz
43058 Points +87%
Media Intel Core i9-9980HK
  (28625 - 30849, n=3)
29620 Points +29%
Intel Core i9-9980HK, NVIDIA GeForce RTX 2070 (Desktop)
i9-9980HK, 2400 MHz
29385 Points +28%
Intel Core i5-10600K, NVIDIA Titan RTX
i5-10600K, 4100 MHz
28391 Points +23%
Intel Core i7-9750H, NVIDIA GeForce RTX 2080 Mobile
i7-9750H, 2600 MHz
23000 Points
Media Intel Core i7-9750H
  (17054 - 25043, n=27)
22076 Points -4%
Intel Core i5-9400F, NVIDIA Titan RTX
i5-9400F, 2900 MHz
21830 Points -5%
Media Intel Core i5-9300H
  (14853 - 17684, n=7)
16246 Points -29%
3DMark 11 - 1280x720 Performance Physics
Intel Core i9-10900K, NVIDIA Titan RTX
i9-10900K, 3700 MHz
22140 Points +71%
Intel Core i9-9980HK, NVIDIA GeForce RTX 2070 (Desktop)
i9-9980HK, 2400 MHz
16422 Points +27%
Intel Core i5-10600K, NVIDIA Titan RTX
i5-10600K, 4100 MHz
15961 Points +23%
Media Intel Core i9-9980HK
  (9056 - 18260, n=12)
15688 Points +21%
Intel Core i7-9750H, NVIDIA GeForce RTX 2080 Mobile
i7-9750H, 2600 MHz
12967 Points
Media Intel Core i7-9750H
  (9704 - 14337, n=80)
12766 Points -2%
Intel Core i5-9400F, NVIDIA Titan RTX
i5-9400F, 2900 MHz
11185 Points -14%
Media Intel Core i5-9300H
  (7499 - 10557, n=12)
8987 Points -31%
7-Zip 18.03
7z b 4
Intel Core i9-10900K, NVIDIA Titan RTX
i9-10900K, 3700 MHz
70968 MIPS +111%
Intel Core i9-9980HK, NVIDIA GeForce RTX 2070 (Desktop)
i9-9980HK, 2400 MHz
44081 MIPS +31%
Media Intel Core i9-9980HK
  (39566 - 44081, n=4)
41756 MIPS +24%
Intel Core i5-10600K, NVIDIA Titan RTX
i5-10600K, 4100 MHz
40379 MIPS +20%
Intel Core i7-9750H, NVIDIA GeForce RTX 2080 Mobile
i7-9750H, 2600 MHz
33556 MIPS
Media Intel Core i7-9750H
  (28512 - 35174, n=21)
32357 MIPS -4%
Intel Core i5-9400F, NVIDIA Titan RTX
i5-9400F, 2900 MHz
25639 MIPS -24%
Media Intel Core i5-9300H
  (20736 - 23155, n=3)
22008 MIPS -34%
7z b 4 -mmt1
Intel Core i9-10900K, NVIDIA Titan RTX
i9-10900K, 3700 MHz
5954 MIPS +17%
Intel Core i9-9980HK, NVIDIA GeForce RTX 2070 (Desktop)
i9-9980HK, 2400 MHz
5642 MIPS +11%
Media Intel Core i9-9980HK
  (5283 - 5642, n=4)
5426 MIPS +7%
Intel Core i5-10600K, NVIDIA Titan RTX
i5-10600K, 4100 MHz
5289 MIPS +4%
Intel Core i7-9750H, NVIDIA GeForce RTX 2080 Mobile
i7-9750H, 2600 MHz
5090 MIPS
Media Intel Core i7-9750H
  (4580 - 5090, n=21)
4846 MIPS -5%
Intel Core i5-9400F, NVIDIA Titan RTX
i5-9400F, 2900 MHz
4678 MIPS -8%
Media Intel Core i5-9300H
  (4542 - 4626, n=3)
4592 MIPS -10%
HWBOT x265 Benchmark v2.2 - 4k Preset
Intel Core i9-10900K, NVIDIA Titan RTX
i9-10900K, 3700 MHz
21 fps +134%
Intel Core i5-10600K, NVIDIA Titan RTX
i5-10600K, 4100 MHz
12.2 fps +36%
Media Intel Core i9-9980HK
  (10.8 - 12.4, n=3)
11.5 fps +28%
Intel Core i9-9980HK, NVIDIA GeForce RTX 2070 (Desktop)
i9-9980HK, 2400 MHz
11.4 fps +27%
Intel Core i5-9400F, NVIDIA Titan RTX
i5-9400F, 2900 MHz
9.07 fps +1%
Intel Core i7-9750H, NVIDIA GeForce RTX 2080 Mobile
i7-9750H, 2600 MHz
8.99 fps
Media Intel Core i7-9750H
  (7.1 - 10.7, n=21)
8.72 fps -3%
Media Intel Core i5-9300H
  (5.7 - 6.5, n=3)
6.07 fps -32%
R Benchmark 2.5 - Overall mean
Intel Core i5-9400F, NVIDIA Titan RTX
i5-9400F, 2900 MHz
0.667 sec * -10%
Media Intel Core i7-9750H
  (0.608 - 0.695, n=14)
0.643 sec * -6%
Intel Core i7-9750H, NVIDIA GeForce RTX 2080 Mobile
i7-9750H, 2600 MHz
0.608 sec *
Intel Core i5-10600K, NVIDIA Titan RTX
i5-10600K, 4100 MHz
0.593 sec * +2%
Intel Core i9-9980HK, NVIDIA GeForce RTX 2070 (Desktop)
i9-9980HK, 2400 MHz
0.541 sec * +11%
Media Intel Core i9-9980HK
  ()
0.541 sec * +11%
Intel Core i9-10900K, NVIDIA Titan RTX
i9-10900K, 3700 MHz
0.528 sec * +13%
LibreOffice - 20 Documents To PDF
Intel Core i9-10900K, NVIDIA Titan RTX
i9-10900K, 3700 MHz
76 s * -31%
Media Intel Core i7-9750H
  (54.5 - 64.7, n=9)
59 s * -2%
Intel Core i5-9400F, NVIDIA Titan RTX
i5-9400F, 2900 MHz
58.9 s * -2%
Intel Core i7-9750H, NVIDIA GeForce RTX 2080 Mobile
i7-9750H, 2600 MHz
57.8 s *
Media Intel Core i9-9980HK
  (45.2 - 57.5, n=2)
51.4 s * +11%
Intel Core i5-10600K, NVIDIA Titan RTX
i5-10600K, 4100 MHz
46.06 s * +20%
Intel Core i9-9980HK, NVIDIA GeForce RTX 2070 (Desktop)
i9-9980HK, 2400 MHz
45.23 s * +22%
WebXPRT 3 - Overall
Intel Core i9-10900K, NVIDIA Titan RTX
i9-10900K, 3700 MHz
255 Points +20%
Intel Core i5-10600K, NVIDIA Titan RTX
i5-10600K, 4100 MHz
239 Points +12%
Intel Core i9-9980HK, NVIDIA GeForce RTX 2070 (Desktop)
i9-9980HK, 2400 MHz
233 Points +9%
Media Intel Core i9-9980HK
  ()
233 Points +9%
Media Intel Core i5-9300H
  ()
222 Points +4%
Intel Core i7-9750H, NVIDIA GeForce RTX 2080 Mobile
i7-9750H, 2600 MHz
213 Points
Intel Core i5-9400F, NVIDIA Titan RTX
i5-9400F, 2900 MHz
211 Points -1%
Media Intel Core i7-9750H
  (199 - 231, n=10)
211 Points -1%
Mozilla Kraken 1.1 - Total
Media Intel Core i5-9300H
  (1079 - 1349, n=8)
1138 ms * -35%
Media Intel Core i7-9750H
  (845 - 1713, n=54)
1048 ms * -24%
Media Intel Core i9-9980HK
  (705 - 999, n=9)
878 ms * -4%
Intel Core i5-9400F, NVIDIA Titan RTX
i5-9400F, 2900 MHz
867 ms * -3%
Intel Core i7-9750H, NVIDIA GeForce RTX 2080 Mobile
i7-9750H, 2600 MHz
845 ms *
Intel Core i5-10600K, NVIDIA Titan RTX
i5-10600K, 4100 MHz
760 ms * +10%
Intel Core i9-9980HK, NVIDIA GeForce RTX 2070 (Desktop)
i9-9980HK, 2400 MHz
754 ms * +11%
Intel Core i9-10900K, NVIDIA Titan RTX
i9-10900K, 3700 MHz
709 ms * +16%
3DMark
3840x2160 Fire Strike Ultra Physics
Intel Core i9-10900K, NVIDIA Titan RTX
i9-10900K, 3700 MHz
29374 Points +67%
Intel Core i9-9980HK, NVIDIA GeForce RTX 2070 (Desktop)
i9-9980HK, 2400 MHz
21864 Points +24%
Media Intel Core i9-9980HK
  (19832 - 22568, n=8)
21323 Points +21%
Intel Core i5-10600K, NVIDIA Titan RTX
i5-10600K, 4100 MHz
19942 Points +13%
Intel Core i7-9750H, NVIDIA GeForce RTX 2080 Mobile
i7-9750H, 2600 MHz
17597 Points
Media Intel Core i7-9750H
  (12628 - 17820, n=51)
16437 Points -7%
Intel Core i5-9400F, NVIDIA Titan RTX
i5-9400F, 2900 MHz
12651 Points -28%
Media Intel Core i5-9300H
  (9749 - 12343, n=6)
11357 Points -35%
1920x1080 Fire Strike Physics
Intel Core i9-10900K, NVIDIA Titan RTX
i9-10900K, 3700 MHz
29805 Points +71%
Intel Core i9-9980HK, NVIDIA GeForce RTX 2070 (Desktop)
i9-9980HK, 2400 MHz
21706 Points +25%
Intel Core i5-10600K, NVIDIA Titan RTX
i5-10600K, 4100 MHz
20040 Points +15%
Media Intel Core i9-9980HK
  (11758 - 22463, n=11)
19893 Points +14%
Intel Core i7-9750H, NVIDIA GeForce RTX 2080 Mobile
i7-9750H, 2600 MHz
17416 Points
Media Intel Core i7-9750H
  (12438 - 17788, n=76)
16332 Points -6%
Intel Core i5-9400F, NVIDIA Titan RTX
i5-9400F, 2900 MHz
12616 Points -28%
Media Intel Core i5-9300H
  (9387 - 12349, n=12)
11376 Points -35%
2560x1440 Time Spy CPU
Intel Core i9-10900K, NVIDIA Titan RTX
i9-10900K, 3700 MHz
14326 Points +132%
Intel Core i9-9980HK, NVIDIA GeForce RTX 2070 (Desktop)
i9-9980HK, 2400 MHz
9417 Points +53%
Media Intel Core i9-9980HK
  (5540 - 10162, n=12)
8487 Points +38%
Intel Core i5-10600K, NVIDIA Titan RTX
i5-10600K, 4100 MHz
8290 Points +34%
Media Intel Core i7-9750H
  (4620 - 7171, n=70)
6334 Points +3%
Intel Core i7-9750H, NVIDIA GeForce RTX 2080 Mobile
i7-9750H, 2600 MHz
6167 Points
Intel Core i5-9400F, NVIDIA Titan RTX
i5-9400F, 2900 MHz
5777 Points -6%
Media Intel Core i5-9300H
  (3165 - 4861, n=10)
4074 Points -34%

* ... Meglio usare valori piccoli

Lo Zotac ZBOX Magnus nel Cinebench R15 multi-loop

Il design compatto richiede un sistema di raffreddamento intelligente ed efficace. Questo è esattamente ciò che offre lo ZBOX Magnus di Zotac, perché il loop continuo Cinebench R15 non mostra alcuna grave perdita di prestazioni anche sotto carico sostenuto.

10801130118012301280133013801430148015301580Tooltip
Zotac ZBOX Magnus EN72070V Intel Core i7-9750H, Intel Core i7-9750H: Ø1107 (1097.27-1166.52)
Intel Ghost Canyon NUC (RTX 2070) Intel Core i9-9980HK, Intel Core i9-9980HK: Ø1463 (1410.79-1593.44)
Media Intel Core i7-9750H  : Ø1095 (1080-1184)

Prestazioni con le applicazioni

Lo Zotac ZBOX Magnus supera i benchmarks delle applicazioni senza problemi e fornisce un buon risultato. Rispetto ai tradizionali PC desktop, tuttavia, il mini PC ottiene la pagliuzza più corta. Tuttavia, la differenza di prestazioni nel lavoro quotidiano non è degna di nota. La GeForce RTX 2080 Mobile è rimasta un po' indietro nei test grafici. Ma anche la versione desktop della GeForce RTX 2070 non è riuscita a fornire risultati significativamente migliori nel Ghost Canyon NUC.

PCMark 10 - Score
AMD Ryzen 9 3950X, AMD Ryzen 9 3950X
NVIDIA Titan RTX
7869 Points +28%
Intel Core i9-10900K, Intel Core i9-10900K
NVIDIA Titan RTX
7641 Points +24%
Corsair One i160, Intel Core i9-9900K
NVIDIA GeForce RTX 2080 Ti (Desktop)
7329 Points +19%
Intel Core i5-10600K, Intel Core i5-10600K
NVIDIA Titan RTX
7279 Points +18%
Intel Ghost Canyon NUC (RTX 2070), Intel Core i9-9980HK
NVIDIA GeForce RTX 2070 (Desktop)
6939 Points +13%
Zotac ZBOX Magnus EN72070V, Intel Core i7-9750H
NVIDIA GeForce RTX 2080 Mobile
6159 Points
Media Intel Core i7-9750H
  (4395 - 6453, n=72)
5533 Points -10%
PCMark 8
Work Score Accelerated v2
Media Intel Core i7-9750H
  (4241 - 6593, n=57)
5461 Points +11%
AMD Ryzen 9 3950X, AMD Ryzen 9 3950X
NVIDIA Titan RTX
5388 Points +9%
Corsair One i160, Intel Core i9-9900K
NVIDIA GeForce RTX 2080 Ti (Desktop)
5296 Points +7%
Intel Core i5-10600K, Intel Core i5-10600K
NVIDIA Titan RTX
5148 Points +4%
Intel Core i9-10900K, Intel Core i9-10900K
NVIDIA Titan RTX
5115 Points +4%
Intel Ghost Canyon NUC (RTX 2070), Intel Core i9-9980HK
NVIDIA GeForce RTX 2070 (Desktop)
5066 Points +3%
Zotac ZBOX Magnus EN72070V, Intel Core i7-9750H
NVIDIA GeForce RTX 2080 Mobile
4927 Points
Creative Score Accelerated v2
Corsair One i160, Intel Core i9-9900K
NVIDIA GeForce RTX 2080 Ti (Desktop)
10550 Points +21%
AMD Ryzen 9 3950X, AMD Ryzen 9 3950X
NVIDIA Titan RTX
10402 Points +19%
Intel Core i5-10600K, Intel Core i5-10600K
NVIDIA Titan RTX
10349 Points +19%
Intel Core i9-10900K, Intel Core i9-10900K
NVIDIA Titan RTX
10245 Points +17%
Intel Ghost Canyon NUC (RTX 2070), Intel Core i9-9980HK
NVIDIA GeForce RTX 2070 (Desktop)
8969 Points +3%
Zotac ZBOX Magnus EN72070V, Intel Core i7-9750H
NVIDIA GeForce RTX 2080 Mobile
8733 Points
Media Intel Core i7-9750H
  (3753 - 8733, n=22)
6192 Points -29%
Home Score Accelerated v2
Corsair One i160, Intel Core i9-9900K
NVIDIA GeForce RTX 2080 Ti (Desktop)
5418 Points +8%
AMD Ryzen 9 3950X, AMD Ryzen 9 3950X
NVIDIA Titan RTX
5404 Points +8%
Intel Ghost Canyon NUC (RTX 2070), Intel Core i9-9980HK
NVIDIA GeForce RTX 2070 (Desktop)
5247 Points +5%
Intel Core i5-10600K, Intel Core i5-10600K
NVIDIA Titan RTX
5212 Points +4%
Intel Core i9-10900K, Intel Core i9-10900K
NVIDIA Titan RTX
5185 Points +4%
Zotac ZBOX Magnus EN72070V, Intel Core i7-9750H
NVIDIA GeForce RTX 2080 Mobile
5009 Points
Media Intel Core i7-9750H
  (3417 - 5661, n=56)
4424 Points -12%
SPECviewperf 12
1900x1060 Solidworks (sw-03)
Intel Core i9-10900K, Intel Core i9-10900K
NVIDIA Titan RTX
172.2 fps +163%
Intel Core i5-10600K, Intel Core i5-10600K
NVIDIA Titan RTX
158.2 fps +142%
AMD Ryzen 9 3950X, AMD Ryzen 9 3950X
NVIDIA Titan RTX
157.6 fps +141%
Media Intel Core i7-9750H
  (44.7 - 149.1, n=15)
95.8 fps +46%
Corsair One i160, Intel Core i9-9900K
NVIDIA GeForce RTX 2080 Ti (Desktop)
83.7 fps +28%
Zotac ZBOX Magnus EN72070V, Intel Core i7-9750H
NVIDIA GeForce RTX 2080 Mobile
65.5 fps
Intel Ghost Canyon NUC (RTX 2070), Intel Core i9-9980HK
NVIDIA GeForce RTX 2070 (Desktop)
59.2 fps -10%
1900x1060 Siemens NX (snx-02)
Intel Core i9-10900K, Intel Core i9-10900K
NVIDIA Titan RTX
263.3 fps +2137%
Intel Core i5-10600K, Intel Core i5-10600K
NVIDIA Titan RTX
259.1 fps +2101%
AMD Ryzen 9 3950X, AMD Ryzen 9 3950X
NVIDIA Titan RTX
254.8 fps +2065%
Media Intel Core i7-9750H
  (7.7 - 186, n=15)
87.5 fps +643%
Corsair One i160, Intel Core i9-9900K
NVIDIA GeForce RTX 2080 Ti (Desktop)
12.72 fps +8%
Zotac ZBOX Magnus EN72070V, Intel Core i7-9750H
NVIDIA GeForce RTX 2080 Mobile
11.77 fps
Intel Ghost Canyon NUC (RTX 2070), Intel Core i9-9980HK
NVIDIA GeForce RTX 2070 (Desktop)
9.08 fps -23%
1900x1060 Showcase (showcase-01)
Intel Core i5-10600K, Intel Core i5-10600K
NVIDIA Titan RTX
196.1 fps +60%
Intel Core i9-10900K, Intel Core i9-10900K
NVIDIA Titan RTX
192.4 fps +57%
AMD Ryzen 9 3950X, AMD Ryzen 9 3950X
NVIDIA Titan RTX
188.3 fps +54%
Corsair One i160, Intel Core i9-9900K
NVIDIA GeForce RTX 2080 Ti (Desktop)
182.3 fps +49%
Zotac ZBOX Magnus EN72070V, Intel Core i7-9750H
NVIDIA GeForce RTX 2080 Mobile
122.4 fps
Intel Ghost Canyon NUC (RTX 2070), Intel Core i9-9980HK
NVIDIA GeForce RTX 2070 (Desktop)
118.5 fps -3%
Media Intel Core i7-9750H
  (25.2 - 122.4, n=15)
79.3 fps -35%
1900x1060 Medical (medical-01)
Intel Core i5-10600K, Intel Core i5-10600K
NVIDIA Titan RTX
94.6 fps +151%
Intel Core i9-10900K, Intel Core i9-10900K
NVIDIA Titan RTX
94.5 fps +151%
AMD Ryzen 9 3950X, AMD Ryzen 9 3950X
NVIDIA Titan RTX
88.1 fps +134%
Corsair One i160, Intel Core i9-9900K
NVIDIA GeForce RTX 2080 Ti (Desktop)
56.6 fps +50%
Media Intel Core i7-9750H
  (14.7 - 65, n=12)
44.9 fps +19%
Intel Ghost Canyon NUC (RTX 2070), Intel Core i9-9980HK
NVIDIA GeForce RTX 2070 (Desktop)
40.14 fps +6%
Zotac ZBOX Magnus EN72070V, Intel Core i7-9750H
NVIDIA GeForce RTX 2080 Mobile
37.71 fps
1900x1060 Maya (maya-04)
Corsair One i160, Intel Core i9-9900K
NVIDIA GeForce RTX 2080 Ti (Desktop)
190.9 fps +19%
Intel Core i9-10900K, Intel Core i9-10900K
NVIDIA Titan RTX
188.7 fps +17%
AMD Ryzen 9 3950X, AMD Ryzen 9 3950X
NVIDIA Titan RTX
172.2 fps +7%
Intel Ghost Canyon NUC (RTX 2070), Intel Core i9-9980HK
NVIDIA GeForce RTX 2070 (Desktop)
171 fps +6%
Intel Core i5-10600K, Intel Core i5-10600K
NVIDIA Titan RTX
169.4 fps +5%
Zotac ZBOX Magnus EN72070V, Intel Core i7-9750H
NVIDIA GeForce RTX 2080 Mobile
160.6 fps
Media Intel Core i7-9750H
  (40.7 - 160.6, n=15)
88.7 fps -45%
1900x1060 Energy (energy-01)
Intel Core i5-10600K, Intel Core i5-10600K
NVIDIA Titan RTX
28.77 fps +148%
Intel Core i9-10900K, Intel Core i9-10900K
NVIDIA Titan RTX
28.72 fps +147%
AMD Ryzen 9 3950X, AMD Ryzen 9 3950X
NVIDIA Titan RTX
28.18 fps +143%
Corsair One i160, Intel Core i9-9900K
NVIDIA GeForce RTX 2080 Ti (Desktop)
16.72 fps +44%
Zotac ZBOX Magnus EN72070V, Intel Core i7-9750H
NVIDIA GeForce RTX 2080 Mobile
11.61 fps
Intel Ghost Canyon NUC (RTX 2070), Intel Core i9-9980HK
NVIDIA GeForce RTX 2070 (Desktop)
11.49 fps -1%
Media Intel Core i7-9750H
  (3.93 - 16.1, n=12)
10.9 fps -6%
1900x1060 Creo (creo-01)
Intel Core i9-10900K, Intel Core i9-10900K
NVIDIA Titan RTX
157.2 fps +173%
Intel Core i5-10600K, Intel Core i5-10600K
NVIDIA Titan RTX
142.7 fps +148%
AMD Ryzen 9 3950X, AMD Ryzen 9 3950X
NVIDIA Titan RTX
134.8 fps +134%
Media Intel Core i7-9750H
  (38.4 - 140.7, n=15)
90.2 fps +57%
Corsair One i160, Intel Core i9-9900K
NVIDIA GeForce RTX 2080 Ti (Desktop)
72.2 fps +26%
Zotac ZBOX Magnus EN72070V, Intel Core i7-9750H
NVIDIA GeForce RTX 2080 Mobile
57.5 fps
Intel Ghost Canyon NUC (RTX 2070), Intel Core i9-9980HK
NVIDIA GeForce RTX 2070 (Desktop)
52.2 fps -9%
1900x1060 Catia (catia-04)
Intel Core i9-10900K, Intel Core i9-10900K
NVIDIA Titan RTX
225.2 fps +126%
AMD Ryzen 9 3950X, AMD Ryzen 9 3950X
NVIDIA Titan RTX
218.4 fps +119%
Intel Core i5-10600K, Intel Core i5-10600K
NVIDIA Titan RTX
215.5 fps +116%
Corsair One i160, Intel Core i9-9900K
NVIDIA GeForce RTX 2080 Ti (Desktop)
120.8 fps +21%
Media Intel Core i7-9750H
  (54.2 - 161.9, n=15)
100.6 fps +1%
Zotac ZBOX Magnus EN72070V, Intel Core i7-9750H
NVIDIA GeForce RTX 2080 Mobile
99.8 fps
Intel Ghost Canyon NUC (RTX 2070), Intel Core i9-9980HK
NVIDIA GeForce RTX 2070 (Desktop)
78.3 fps -22%
1900x1060 3ds Max (3dsmax-05)
Intel Core i9-10900K, Intel Core i9-10900K
NVIDIA Titan RTX
297.4 fps +44%
Intel Core i5-10600K, Intel Core i5-10600K
NVIDIA Titan RTX
296.9 fps +43%
AMD Ryzen 9 3950X, AMD Ryzen 9 3950X
NVIDIA Titan RTX
274.5 fps +32%
Corsair One i160, Intel Core i9-9900K
NVIDIA GeForce RTX 2080 Ti (Desktop)
271.8 fps +31%
Zotac ZBOX Magnus EN72070V, Intel Core i7-9750H
NVIDIA GeForce RTX 2080 Mobile
207.2 fps
Intel Ghost Canyon NUC (RTX 2070), Intel Core i9-9980HK
NVIDIA GeForce RTX 2070 (Desktop)
180.8 fps -13%
Media Intel Core i7-9750H
  (57.5 - 207, n=11)
156 fps -25%
SPECviewperf 13
Solidworks (sw-04)
Intel Core i9-10900K, Intel Core i9-10900K
NVIDIA Titan RTX
166.2 fps +77%
Intel Core i5-10600K, Intel Core i5-10600K
NVIDIA Titan RTX
153.9 fps +64%
AMD Ryzen 9 3950X, AMD Ryzen 9 3950X
NVIDIA Titan RTX
153.2 fps +63%
Corsair One i160, Intel Core i9-9900K
NVIDIA GeForce RTX 2080 Ti (Desktop)
116.3 fps +24%
Media Intel Core i7-9750H
  (64.8 - 125.4, n=15)
101.2 fps +8%
Zotac ZBOX Magnus EN72070V, Intel Core i7-9750H
NVIDIA GeForce RTX 2080 Mobile
93.9 fps
Intel Ghost Canyon NUC (RTX 2070), Intel Core i9-9980HK
NVIDIA GeForce RTX 2070 (Desktop)
85.4 fps -9%
Siemens NX (snx-03)
Intel Core i9-10900K, Intel Core i9-10900K
NVIDIA Titan RTX
472.9 fps +2135%
Intel Core i5-10600K, Intel Core i5-10600K
NVIDIA Titan RTX
469.1 fps +2117%
AMD Ryzen 9 3950X, AMD Ryzen 9 3950X
NVIDIA Titan RTX
460 fps +2074%
Media Intel Core i7-9750H
  (13.9 - 306, n=15)
158.8 fps +650%
Corsair One i160, Intel Core i9-9900K
NVIDIA GeForce RTX 2080 Ti (Desktop)
23.03 fps +9%
Zotac ZBOX Magnus EN72070V, Intel Core i7-9750H
NVIDIA GeForce RTX 2080 Mobile
21.16 fps
Intel Ghost Canyon NUC (RTX 2070), Intel Core i9-9980HK
NVIDIA GeForce RTX 2070 (Desktop)
16.33 fps -23%
Showcase (showcase-02)
Intel Core i5-10600K, Intel Core i5-10600K
NVIDIA Titan RTX
195.1 fps +60%
Intel Core i9-10900K, Intel Core i9-10900K
NVIDIA Titan RTX
194.1 fps +60%
AMD Ryzen 9 3950X, AMD Ryzen 9 3950X
NVIDIA Titan RTX
186.8 fps +54%
Corsair One i160, Intel Core i9-9900K
NVIDIA GeForce RTX 2080 Ti (Desktop)
182.6 fps +50%
Zotac ZBOX Magnus EN72070V, Intel Core i7-9750H
NVIDIA GeForce RTX 2080 Mobile
121.6 fps
Intel Ghost Canyon NUC (RTX 2070), Intel Core i9-9980HK
NVIDIA GeForce RTX 2070 (Desktop)
118.5 fps -3%
Media Intel Core i7-9750H
  (25.2 - 121.6, n=15)
77.4 fps -36%
Medical (medical-02)
AMD Ryzen 9 3950X, AMD Ryzen 9 3950X
NVIDIA Titan RTX
90.3 fps +46%
Intel Core i5-10600K, Intel Core i5-10600K
NVIDIA Titan RTX
89.7 fps +45%
Intel Core i9-10900K, Intel Core i9-10900K
NVIDIA Titan RTX
88.7 fps +44%
Corsair One i160, Intel Core i9-9900K
NVIDIA GeForce RTX 2080 Ti (Desktop)
85 fps +38%
Zotac ZBOX Magnus EN72070V, Intel Core i7-9750H
NVIDIA GeForce RTX 2080 Mobile
61.8 fps
Media Intel Core i7-9750H
  (13.1 - 88.9, n=12)
58.5 fps -5%
Intel Ghost Canyon NUC (RTX 2070), Intel Core i9-9980HK
NVIDIA GeForce RTX 2070 (Desktop)
56.4 fps -9%
Maya (maya-05)
Intel Core i9-10900K, Intel Core i9-10900K
NVIDIA Titan RTX
405.9 fps +38%
Corsair One i160, Intel Core i9-9900K
NVIDIA GeForce RTX 2080 Ti (Desktop)
402 fps +36%
AMD Ryzen 9 3950X, AMD Ryzen 9 3950X
NVIDIA Titan RTX
394.9 fps +34%
Intel Core i5-10600K, Intel Core i5-10600K
NVIDIA Titan RTX
387.5 fps +31%
Zotac ZBOX Magnus EN72070V, Intel Core i7-9750H
NVIDIA GeForce RTX 2080 Mobile
294.9 fps
Intel Ghost Canyon NUC (RTX 2070), Intel Core i9-9980HK
NVIDIA GeForce RTX 2070 (Desktop)
281 fps -5%
Media Intel Core i7-9750H
  (68.8 - 295, n=15)
173.8 fps -41%
Energy (energy-02)
Intel Core i5-10600K, Intel Core i5-10600K
NVIDIA Titan RTX
53.3 fps +146%
Intel Core i9-10900K, Intel Core i9-10900K
NVIDIA Titan RTX
53.2 fps +145%
AMD Ryzen 9 3950X, AMD Ryzen 9 3950X
NVIDIA Titan RTX
52.4 fps +141%
Corsair One i160, Intel Core i9-9900K
NVIDIA GeForce RTX 2080 Ti (Desktop)
31.93 fps +47%
Media Intel Core i7-9750H
  (7.29 - 38, n=12)
24.1 fps +11%
Intel Ghost Canyon NUC (RTX 2070), Intel Core i9-9980HK
NVIDIA GeForce RTX 2070 (Desktop)
21.83 fps +1%
Zotac ZBOX Magnus EN72070V, Intel Core i7-9750H
NVIDIA GeForce RTX 2080 Mobile
21.71 fps
Creo (creo-02)
Intel Core i9-10900K, Intel Core i9-10900K
NVIDIA Titan RTX
336.3 fps +65%
Intel Core i5-10600K, Intel Core i5-10600K
NVIDIA Titan RTX
331.7 fps +62%
AMD Ryzen 9 3950X, AMD Ryzen 9 3950X
NVIDIA Titan RTX
328.8 fps +61%
Corsair One i160, Intel Core i9-9900K
NVIDIA GeForce RTX 2080 Ti (Desktop)
286.1 fps +40%
Zotac ZBOX Magnus EN72070V, Intel Core i7-9750H
NVIDIA GeForce RTX 2080 Mobile
204.3 fps
Intel Ghost Canyon NUC (RTX 2070), Intel Core i9-9980HK
NVIDIA GeForce RTX 2070 (Desktop)
183.8 fps -10%
Media Intel Core i7-9750H
  (67.7 - 218, n=15)
160.3 fps -22%
Catia (catia-05)
Intel Core i9-10900K, Intel Core i9-10900K
NVIDIA Titan RTX
362.1 fps +148%
AMD Ryzen 9 3950X, AMD Ryzen 9 3950X
NVIDIA Titan RTX
355.2 fps +143%
Intel Core i5-10600K, Intel Core i5-10600K
NVIDIA Titan RTX
341.7 fps +134%
Corsair One i160, Intel Core i9-9900K
NVIDIA GeForce RTX 2080 Ti (Desktop)
177.3 fps +21%
Media Intel Core i7-9750H
  (77.1 - 215, n=15)
154.8 fps +6%
Zotac ZBOX Magnus EN72070V, Intel Core i7-9750H
NVIDIA GeForce RTX 2080 Mobile
146.1 fps
Intel Ghost Canyon NUC (RTX 2070), Intel Core i9-9980HK
NVIDIA GeForce RTX 2070 (Desktop)
113.7 fps -22%
3ds Max (3dsmax-06)
Intel Core i5-10600K, Intel Core i5-10600K
NVIDIA Titan RTX
294.4 fps +45%
Intel Core i9-10900K, Intel Core i9-10900K
NVIDIA Titan RTX
292.5 fps +44%
AMD Ryzen 9 3950X, AMD Ryzen 9 3950X
NVIDIA Titan RTX
274.5 fps +35%
Corsair One i160, Intel Core i9-9900K
NVIDIA GeForce RTX 2080 Ti (Desktop)
265.9 fps +31%
Zotac ZBOX Magnus EN72070V, Intel Core i7-9750H
NVIDIA GeForce RTX 2080 Mobile
203 fps
Intel Ghost Canyon NUC (RTX 2070), Intel Core i9-9980HK
NVIDIA GeForce RTX 2070 (Desktop)
178.6 fps -12%
Media Intel Core i7-9750H
  (56.7 - 203, n=15)
145.1 fps -29%

3D and gaming performance

La scheda grafica integrata è di importanza decisiva per le prestazioni 3D. Nel nostro caso, lo ZBOX Magnus offre un'ottima scelta con la GeForce RTX 2080, che offre anche una certa sicurezza per il futuro. La versione mobile della RTX 2080 perde nel confronto diretto con la versione desktop della GeForce RTX 2070. Tuttavia, tutti i giochi possono essere riprodotti senza problemi in 1080p con il massimo dei dettagli. Lo Zotac ZBOX Magnus può gestire anche una risoluzione più alta di 1440p. Solo a partire da 2160p la GeForce RTX 2080 Mobile non riesce più a generare frame rates fluidi in ogni gioco. La stessa sorte tocca alla Nvidia GeForce RTX 2070 nell'Intel Ghost Canyon NUC.

Borderlands 3
1280x720 Very Low Overall Quality (DX11)
Intel Ghost Canyon NUC (RTX 2070)
GeForce RTX 2070 (Desktop), i9-9980HK, Kingston KC2500 1 TB SKC2500M81000G
152 fps +19%
Media NVIDIA GeForce RTX 2080 Mobile
  (128 - 150, n=2)
139 fps +9%
Zotac ZBOX Magnus EN72070V
GeForce RTX 2080 Mobile, i7-9750H
128 fps
1920x1080 Badass Overall Quality (DX11)
Zotac ZBOX Magnus EN72070V
GeForce RTX 2080 Mobile, i7-9750H
84.3 fps
Media NVIDIA GeForce RTX 2080 Mobile
  (79.4 - 89.4, n=4)
83.8 fps -1%
Intel Ghost Canyon NUC (RTX 2070)
GeForce RTX 2070 (Desktop), i9-9980HK, Kingston KC2500 1 TB SKC2500M81000G
70.9 fps -16%
Metro Exodus
1280x720 Low Quality AF:4x
Intel Ghost Canyon NUC (RTX 2070)
GeForce RTX 2070 (Desktop), i9-9980HK, Kingston KC2500 1 TB SKC2500M81000G
181 (100.48min - 268.67max) fps +21%
Media NVIDIA GeForce RTX 2080 Mobile
  (149 - 165, n=2)
157 fps +5%
Zotac ZBOX Magnus EN72070V
GeForce RTX 2080 Mobile, i7-9750H
149 (77.18min - 225.38max) fps
1920x1080 Ultra Quality AF:16x
Media NVIDIA GeForce RTX 2080 Mobile
  (67.7 - 77.4, n=5)
71.8 fps +3%
Zotac ZBOX Magnus EN72070V
GeForce RTX 2080 Mobile, i7-9750H
69.5 (33.32min - 121.08max) fps
Intel Ghost Canyon NUC (RTX 2070)
GeForce RTX 2070 (Desktop), i9-9980HK, Kingston KC2500 1 TB SKC2500M81000G
60.9 (33.61min - 92.62max) fps -12%
Far Cry New Dawn
1280x720 Low Preset
Intel Ghost Canyon NUC (RTX 2070)
GeForce RTX 2070 (Desktop), i9-9980HK, Kingston KC2500 1 TB SKC2500M81000G
128 (92min - 190max) fps +9%
Zotac ZBOX Magnus EN72070V
GeForce RTX 2080 Mobile, i7-9750H
117 (83min - 171max) fps
Media NVIDIA GeForce RTX 2080 Mobile
  (109 - 117, n=2)
113 fps -3%
1920x1080 Ultra Preset
Media NVIDIA GeForce RTX 2080 Mobile
  (82 - 108, n=5)
93 fps +6%
Zotac ZBOX Magnus EN72070V
GeForce RTX 2080 Mobile, i7-9750H
88 (63min - 134max) fps
Intel Ghost Canyon NUC (RTX 2070)
GeForce RTX 2070 (Desktop), i9-9980HK, Kingston KC2500 1 TB SKC2500M81000G
79 (61min - 99max) fps -10%
Forza Horizon 4
1280x720 Very Low Preset
Intel Ghost Canyon NUC (RTX 2070)
GeForce RTX 2070 (Desktop), i9-9980HK, Kingston KC2500 1 TB SKC2500M81000G
198 fps +17%
Zotac ZBOX Magnus EN72070V
GeForce RTX 2080 Mobile, i7-9750H
169 fps
Media NVIDIA GeForce RTX 2080 Mobile
  ()
169 fps 0%
1920x1080 Ultra Preset AA:2xMS
Zotac ZBOX Magnus EN72070V
GeForce RTX 2080 Mobile, i7-9750H
139 fps
Media NVIDIA GeForce RTX 2080 Mobile
  ()
139 fps 0%
Intel Ghost Canyon NUC (RTX 2070)
GeForce RTX 2070 (Desktop), i9-9980HK, Kingston KC2500 1 TB SKC2500M81000G
106 fps -24%
Far Cry 5
1280x720 Low Preset AA:T
Intel Ghost Canyon NUC (RTX 2070)
GeForce RTX 2070 (Desktop), i9-9980HK, Kingston KC2500 1 TB SKC2500M81000G
147 (119min - 193max) fps +20%
Zotac ZBOX Magnus EN72070V
GeForce RTX 2080 Mobile, i7-9750H
123 (94min - 156max) fps
Media NVIDIA GeForce RTX 2080 Mobile
  (123 - 123, n=2)
123 fps 0%
1920x1080 Ultra Preset AA:T
Media NVIDIA GeForce RTX 2080 Mobile
  (73 - 115, n=3)
94.7 fps +30%
Intel Ghost Canyon NUC (RTX 2070)
GeForce RTX 2070 (Desktop), i9-9980HK, Kingston KC2500 1 TB SKC2500M81000G
86 (68min - 111max) fps +18%
Zotac ZBOX Magnus EN72070V
GeForce RTX 2080 Mobile, i7-9750H
73 (59min - 94max) fps
X-Plane 11.11
1280x720 low (fps_test=1)
Intel Ghost Canyon NUC (RTX 2070)
GeForce RTX 2070 (Desktop), i9-9980HK, Kingston KC2500 1 TB SKC2500M81000G
127 fps +11%
Zotac ZBOX Magnus EN72070V
GeForce RTX 2080 Mobile, i7-9750H
114 fps
Media NVIDIA GeForce RTX 2080 Mobile
  (98.2 - 114, n=3)
104.7 fps -8%
1920x1080 high (fps_test=3)
Intel Ghost Canyon NUC (RTX 2070)
GeForce RTX 2070 (Desktop), i9-9980HK, Kingston KC2500 1 TB SKC2500M81000G
92.7 fps +9%
Zotac ZBOX Magnus EN72070V
GeForce RTX 2080 Mobile, i7-9750H
84.7 fps
Media NVIDIA GeForce RTX 2080 Mobile
  (73.1 - 84.7, n=3)
77.6 fps -8%
Final Fantasy XV Benchmark
1280x720 Lite Quality
Intel Ghost Canyon NUC (RTX 2070)
GeForce RTX 2070 (Desktop), i9-9980HK, Kingston KC2500 1 TB SKC2500M81000G
193 (94min - 237max) fps +29%
Zotac ZBOX Magnus EN72070V
GeForce RTX 2080 Mobile, i7-9750H
150 fps
Media NVIDIA GeForce RTX 2080 Mobile
  ()
150 fps 0%
1920x1080 High Quality
Media NVIDIA GeForce RTX 2080 Mobile
  (90.6 - 108, n=3)
99.2 fps +9%
Intel Ghost Canyon NUC (RTX 2070)
GeForce RTX 2070 (Desktop), i9-9980HK, Kingston KC2500 1 TB SKC2500M81000G
90.6 (56min - 138max) fps 0%
Zotac ZBOX Magnus EN72070V
GeForce RTX 2080 Mobile, i7-9750H
90.6 fps
Dota 2 Reborn
1280x720 min (0/3) fastest
Intel Ghost Canyon NUC (RTX 2070)
GeForce RTX 2070 (Desktop), i9-9980HK, Kingston KC2500 1 TB SKC2500M81000G
155.6 (135.2min) fps +7%
Zotac ZBOX Magnus EN72070V
GeForce RTX 2080 Mobile, i7-9750H
145.2 (127.2min) fps
Media NVIDIA GeForce RTX 2080 Mobile
  (134.8 - 152.8, n=3)
144.3 fps -1%
1920x1080 ultra (3/3) best looking
Intel Ghost Canyon NUC (RTX 2070)
GeForce RTX 2070 (Desktop), i9-9980HK, Kingston KC2500 1 TB SKC2500M81000G
130.3 (114.9min) fps +5%
Zotac ZBOX Magnus EN72070V
GeForce RTX 2080 Mobile, i7-9750H
124.6 (108.1min) fps
Media NVIDIA GeForce RTX 2080 Mobile
  (103.9 - 133.8, n=3)
120.8 fps -3%
The Witcher 3
1024x768 Low Graphics & Postprocessing
Zotac ZBOX Magnus EN72070V
GeForce RTX 2080 Mobile, i7-9750H
338 (303min - 379max) fps
Media NVIDIA GeForce RTX 2080 Mobile
  (195.8 - 414, n=9)
322 fps -5%
Intel Ghost Canyon NUC (RTX 2070)
GeForce RTX 2070 (Desktop), i9-9980HK, Kingston KC2500 1 TB SKC2500M81000G
286 (243min - 334max) fps -15%
1920x1080 Ultra Graphics & Postprocessing (HBAO+)
Zotac ZBOX Magnus EN72070V
GeForce RTX 2080 Mobile, i7-9750H
95.9 (87min - 106max) fps
Media NVIDIA GeForce RTX 2080 Mobile
  (82.2 - 105, n=16)
95.6 fps 0%
Intel Ghost Canyon NUC (RTX 2070)
GeForce RTX 2070 (Desktop), i9-9980HK, Kingston KC2500 1 TB SKC2500M81000G
83.1 (72min - 93max) fps -13%
3DMark
Fire Strike Extreme Graphics
Media NVIDIA GeForce RTX 2080 Mobile
  (11133 - 12514, n=2)
11824 Points +6%
Zotac ZBOX Magnus EN72070V
GeForce RTX 2080 Mobile, i7-9750H
11133 Points
Intel Ghost Canyon NUC (RTX 2070)
GeForce RTX 2070 (Desktop), i9-9980HK, Kingston KC2500 1 TB SKC2500M81000G
9979 Points -10%
1920x1080 Fire Strike Graphics
Media NVIDIA GeForce RTX 2080 Mobile
  (22504 - 27319, n=16)
25211 Points +12%
Zotac ZBOX Magnus EN72070V
GeForce RTX 2080 Mobile, i7-9750H
22504 Points
Intel Ghost Canyon NUC (RTX 2070)
GeForce RTX 2070 (Desktop), i9-9980HK, Kingston KC2500 1 TB SKC2500M81000G
20775 Points -8%
2560x1440 Time Spy Graphics
Media NVIDIA GeForce RTX 2080 Mobile
  (9411 - 10992, n=15)
10046 Points +7%
Zotac ZBOX Magnus EN72070V
GeForce RTX 2080 Mobile, i7-9750H
9411 Points
Intel Ghost Canyon NUC (RTX 2070)
GeForce RTX 2070 (Desktop), i9-9980HK, Kingston KC2500 1 TB SKC2500M81000G
8631 Points -8%
3DMark 11
1280x720 Performance GPU
Media NVIDIA GeForce RTX 2080 Mobile
  (31826 - 38809, n=17)
35286 Points +11%
Zotac ZBOX Magnus EN72070V
GeForce RTX 2080 Mobile, i7-9750H
31877 Points
Intel Ghost Canyon NUC (RTX 2070)
GeForce RTX 2070 (Desktop), i9-9980HK, Kingston KC2500 1 TB SKC2500M81000G
28828 Points -10%
1280x720 Performance
Media NVIDIA GeForce RTX 2080 Mobile
  (20224 - 29759, n=19)
26032 Points +12%
Intel Ghost Canyon NUC (RTX 2070)
GeForce RTX 2070 (Desktop), i9-9980HK, Kingston KC2500 1 TB SKC2500M81000G
24131 Points +4%
Zotac ZBOX Magnus EN72070V
GeForce RTX 2080 Mobile, i7-9750H
23165 Points
basso medio alto ultraQHD4K
The Witcher 3 (2015) 338 279 175 95.9 63.9
Dota 2 Reborn (2015) 145.2 135.5 130.5 124.6 119
Final Fantasy XV Benchmark (2018) 150 117 90.6 67.7 39.5
X-Plane 11.11 (2018) 114 102 84.7 73
Far Cry 5 (2018) 123 72 84 73 67 52
Forza Horizon 4 (2018) 169 147 145 139 122 82
Far Cry New Dawn (2019) 117 102 97 88 82 54
Metro Exodus (2019) 149 112 88.1 69.5 54.8 35.1
Borderlands 3 (2019) 128 117 93.4 84.3 61.4 33.2

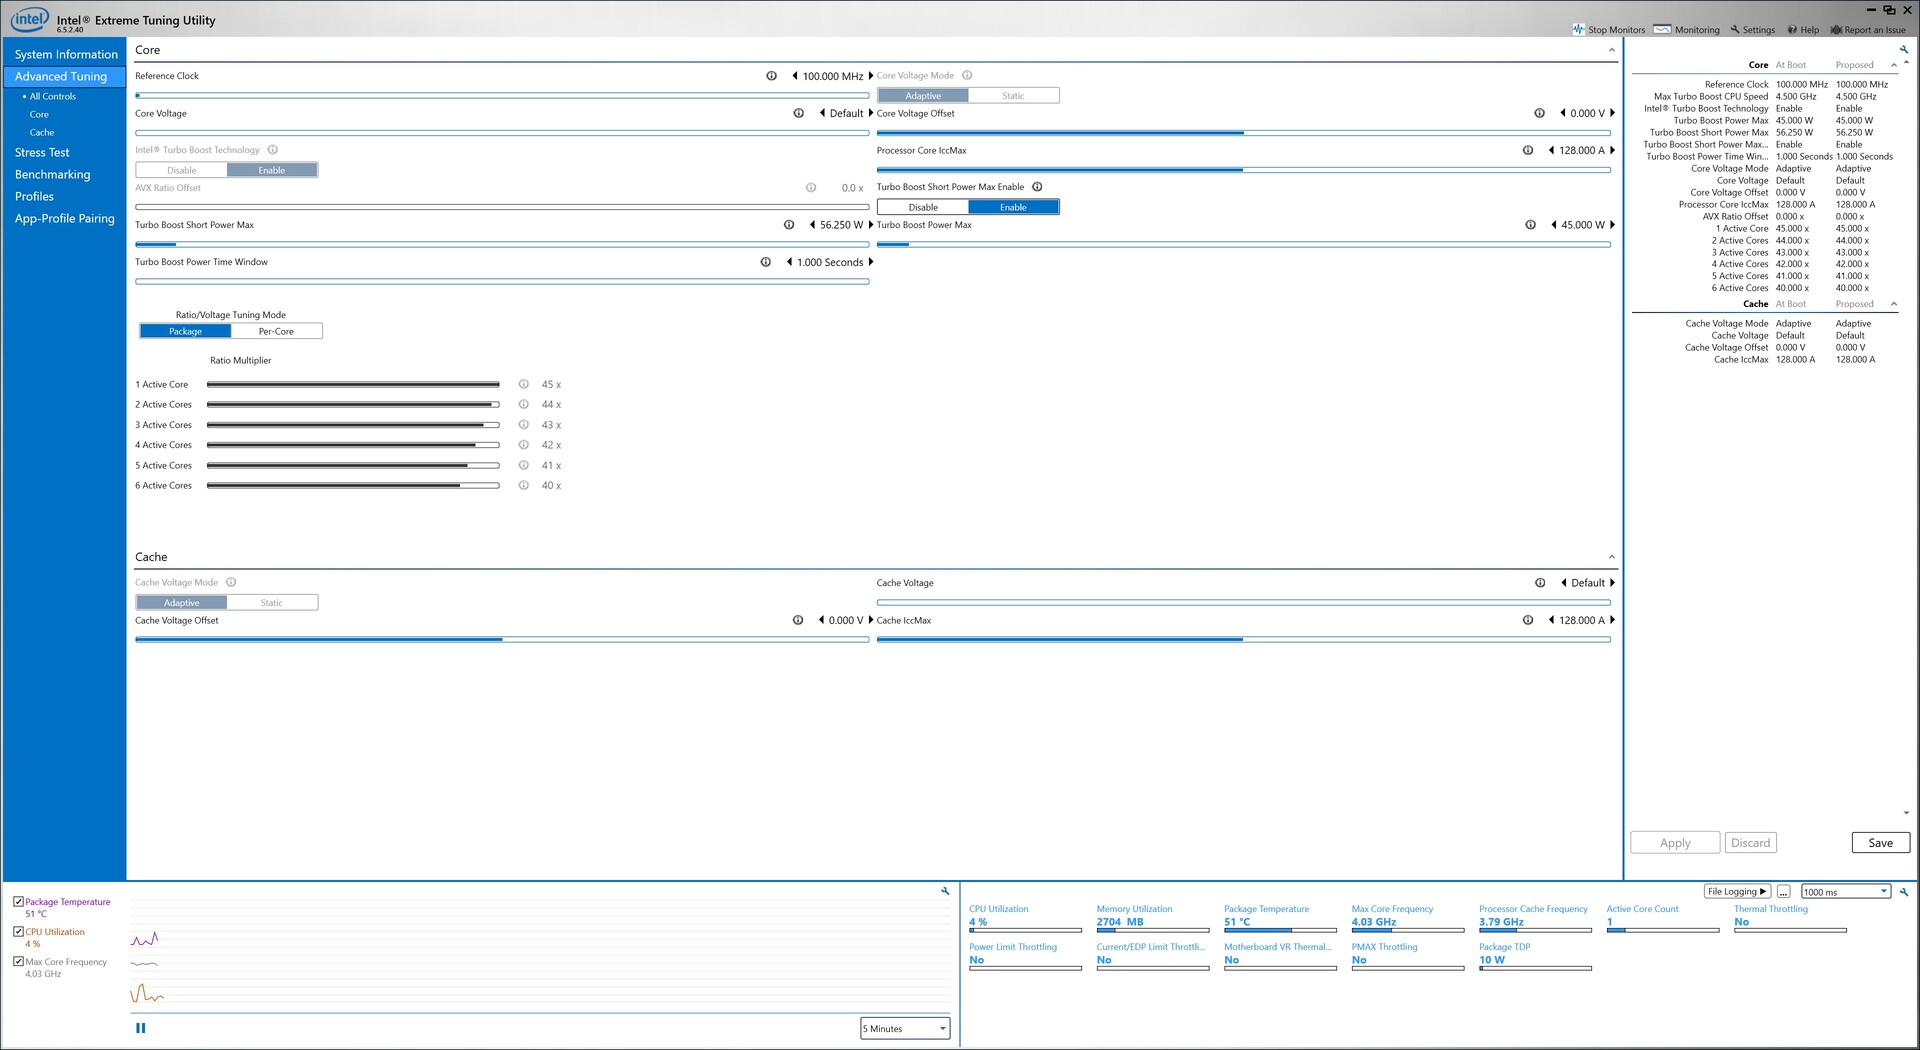
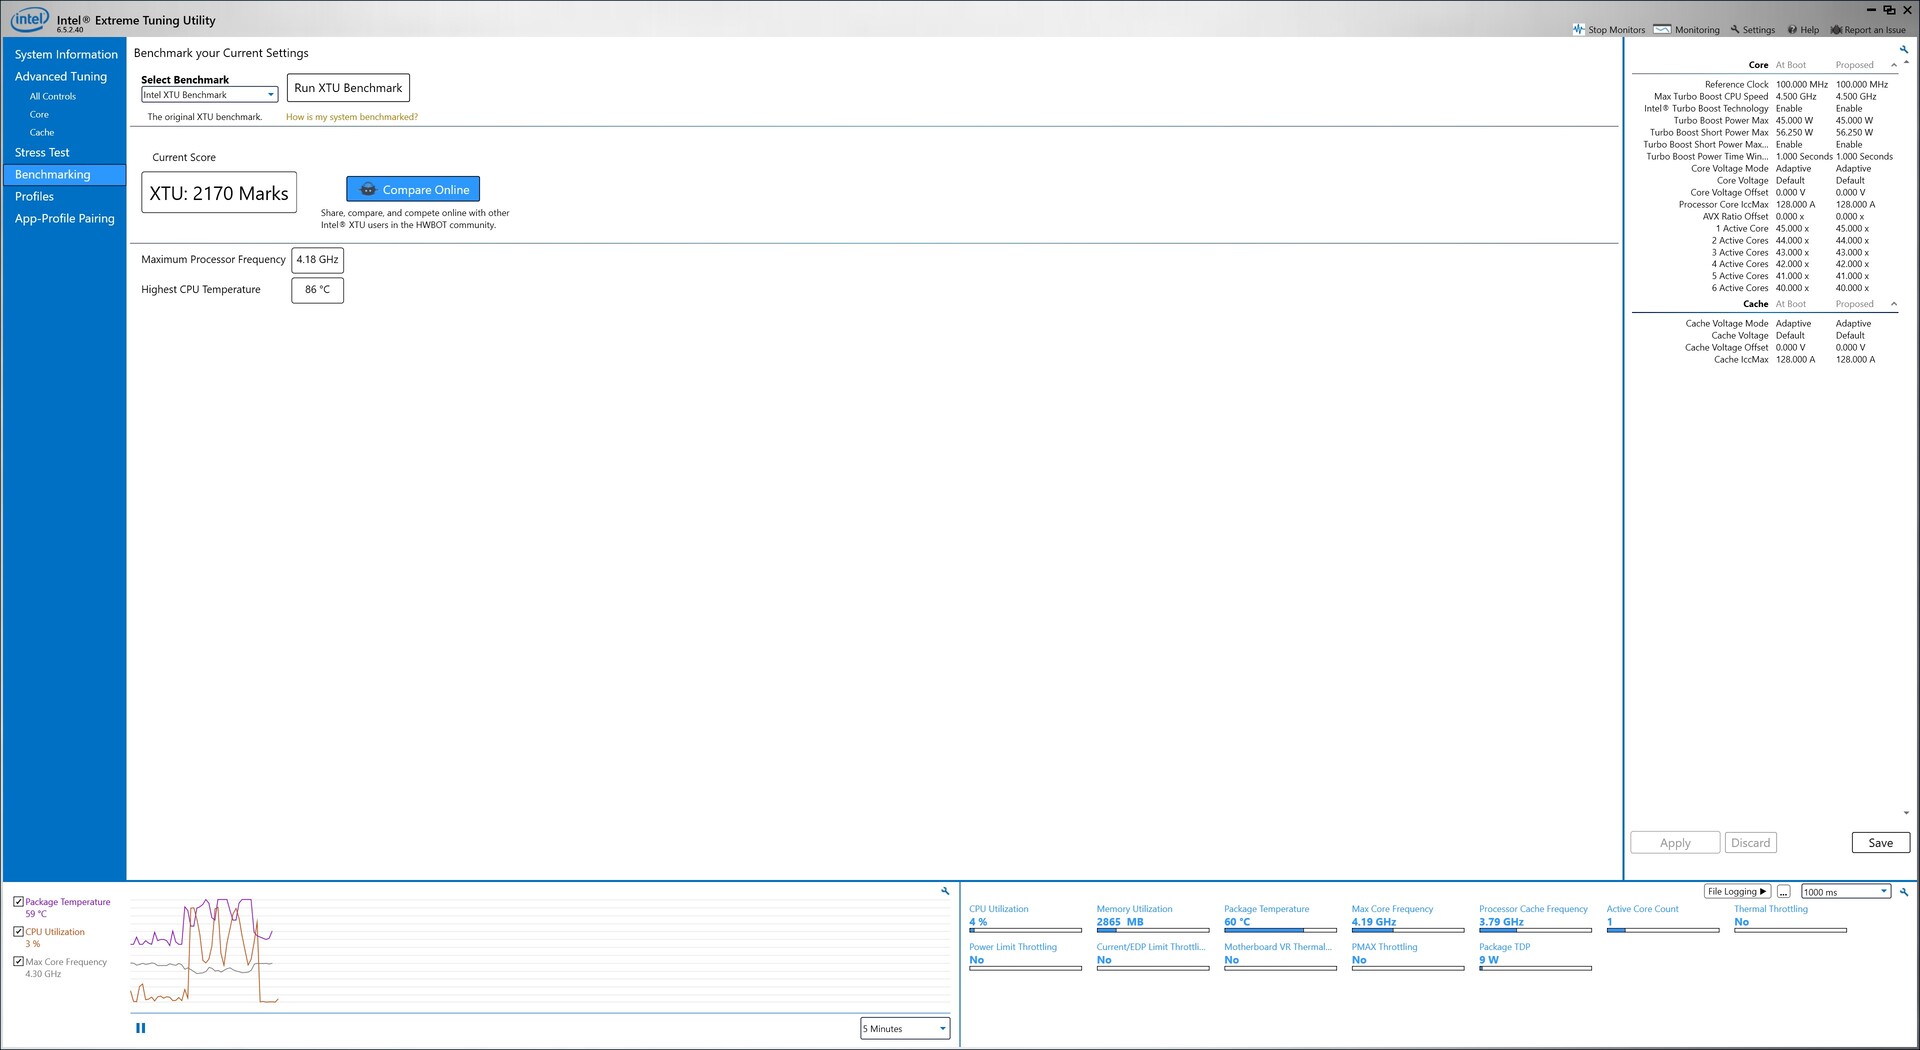
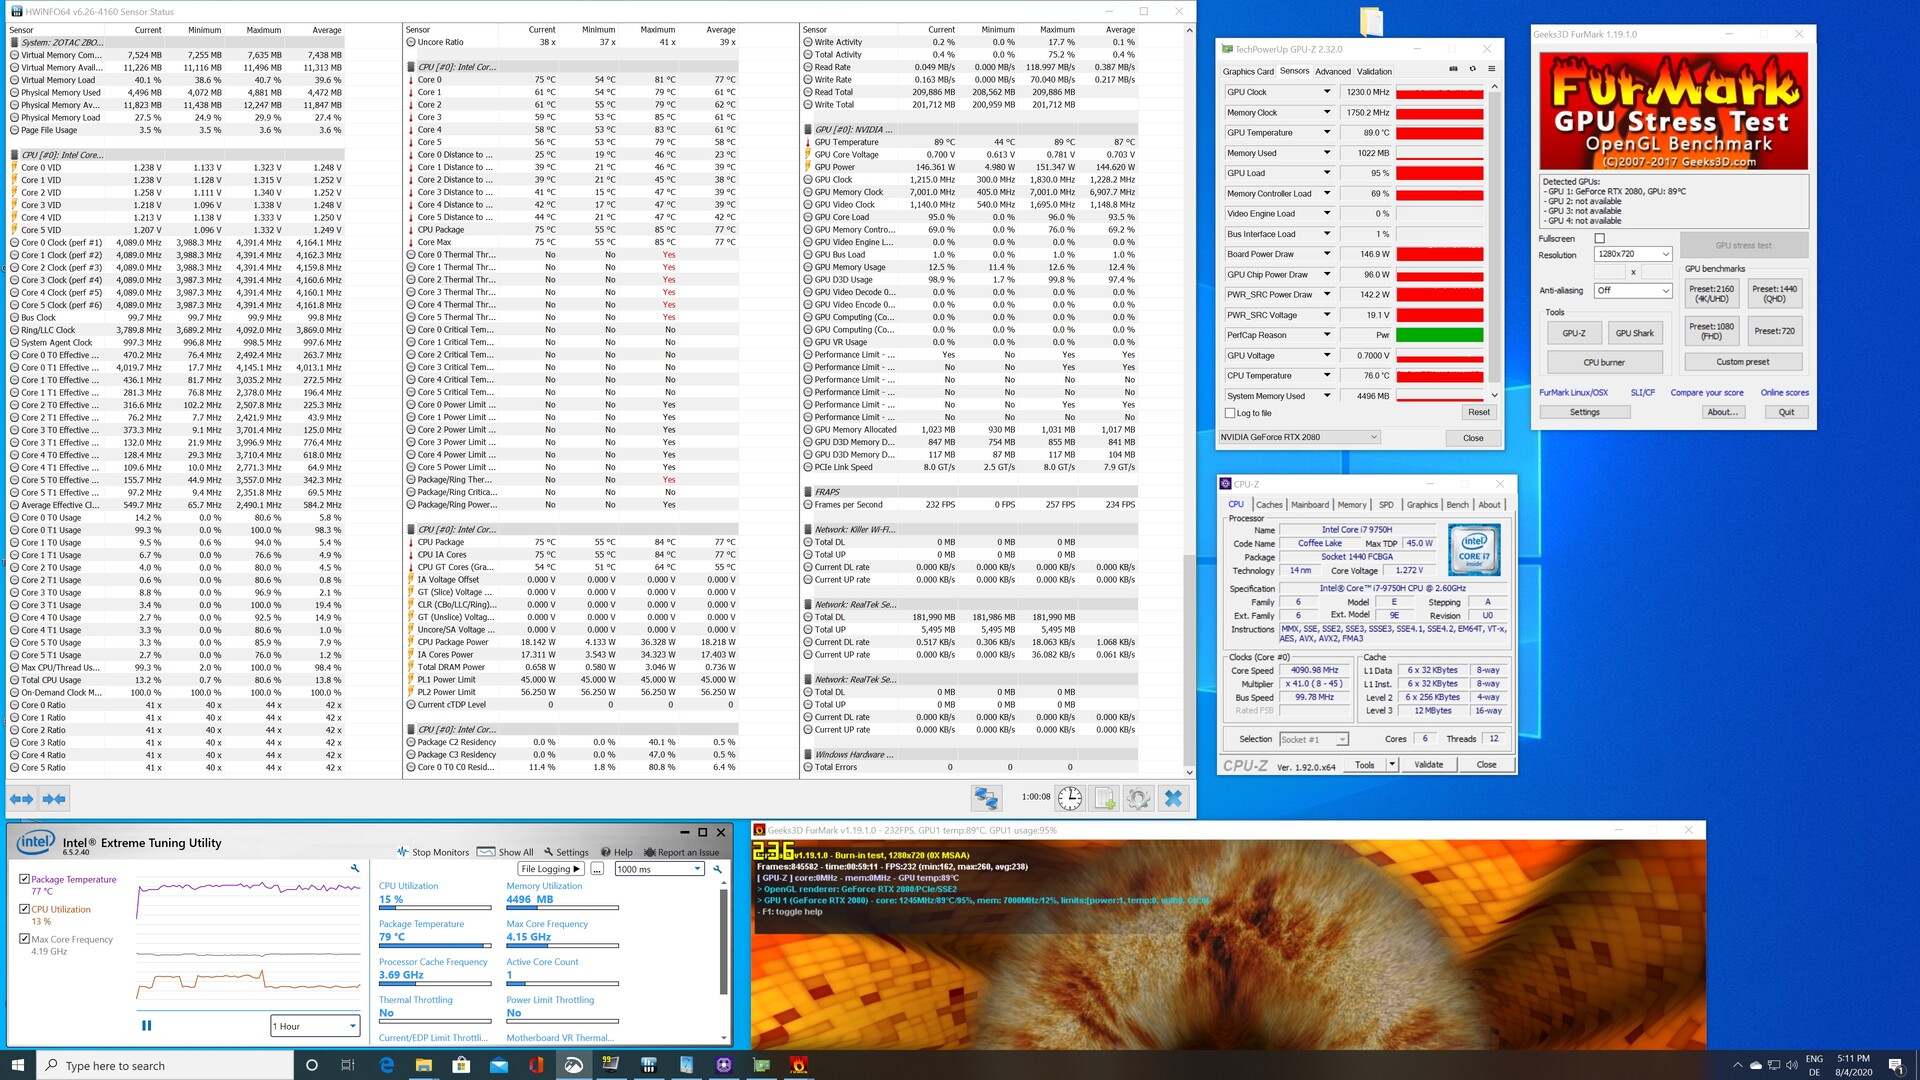
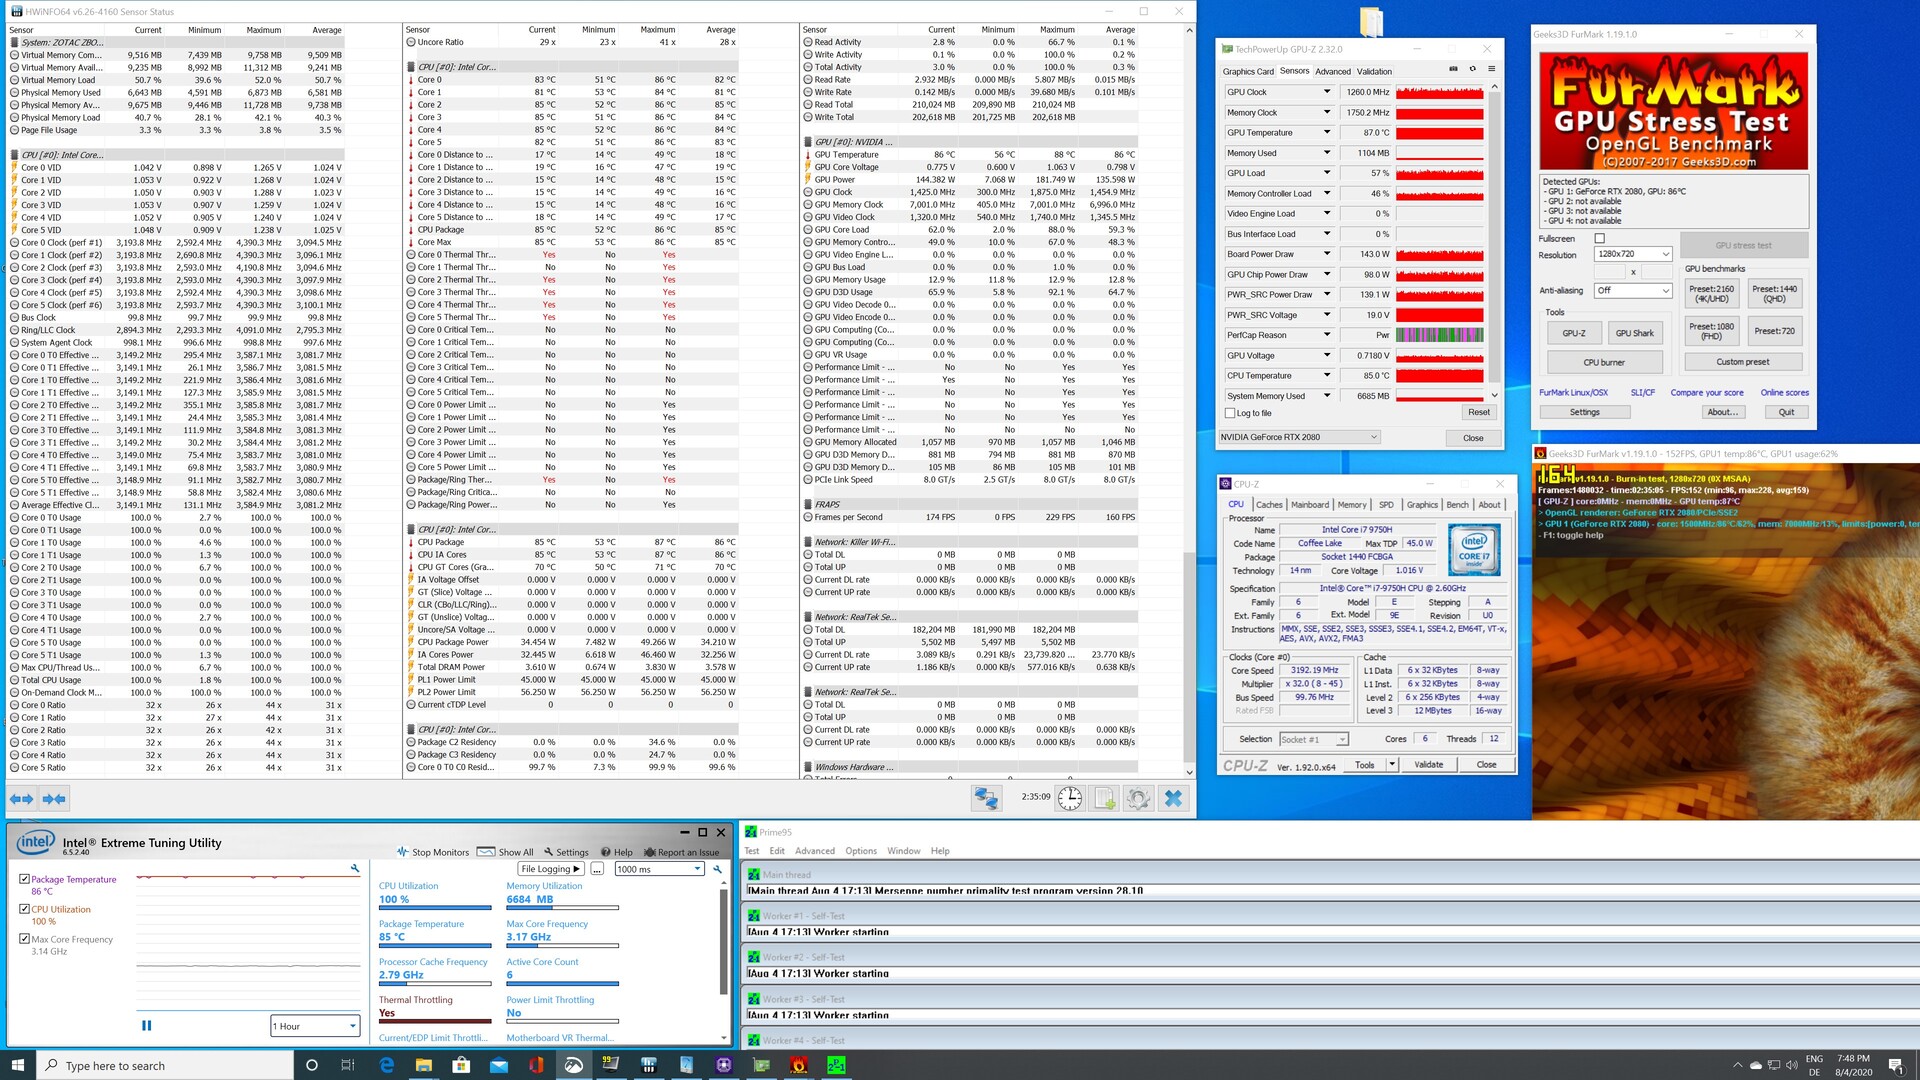
Consumo energetico e temperature dello ZBOX Magnus

Zotac ZBOX Magnus durante lo stress test

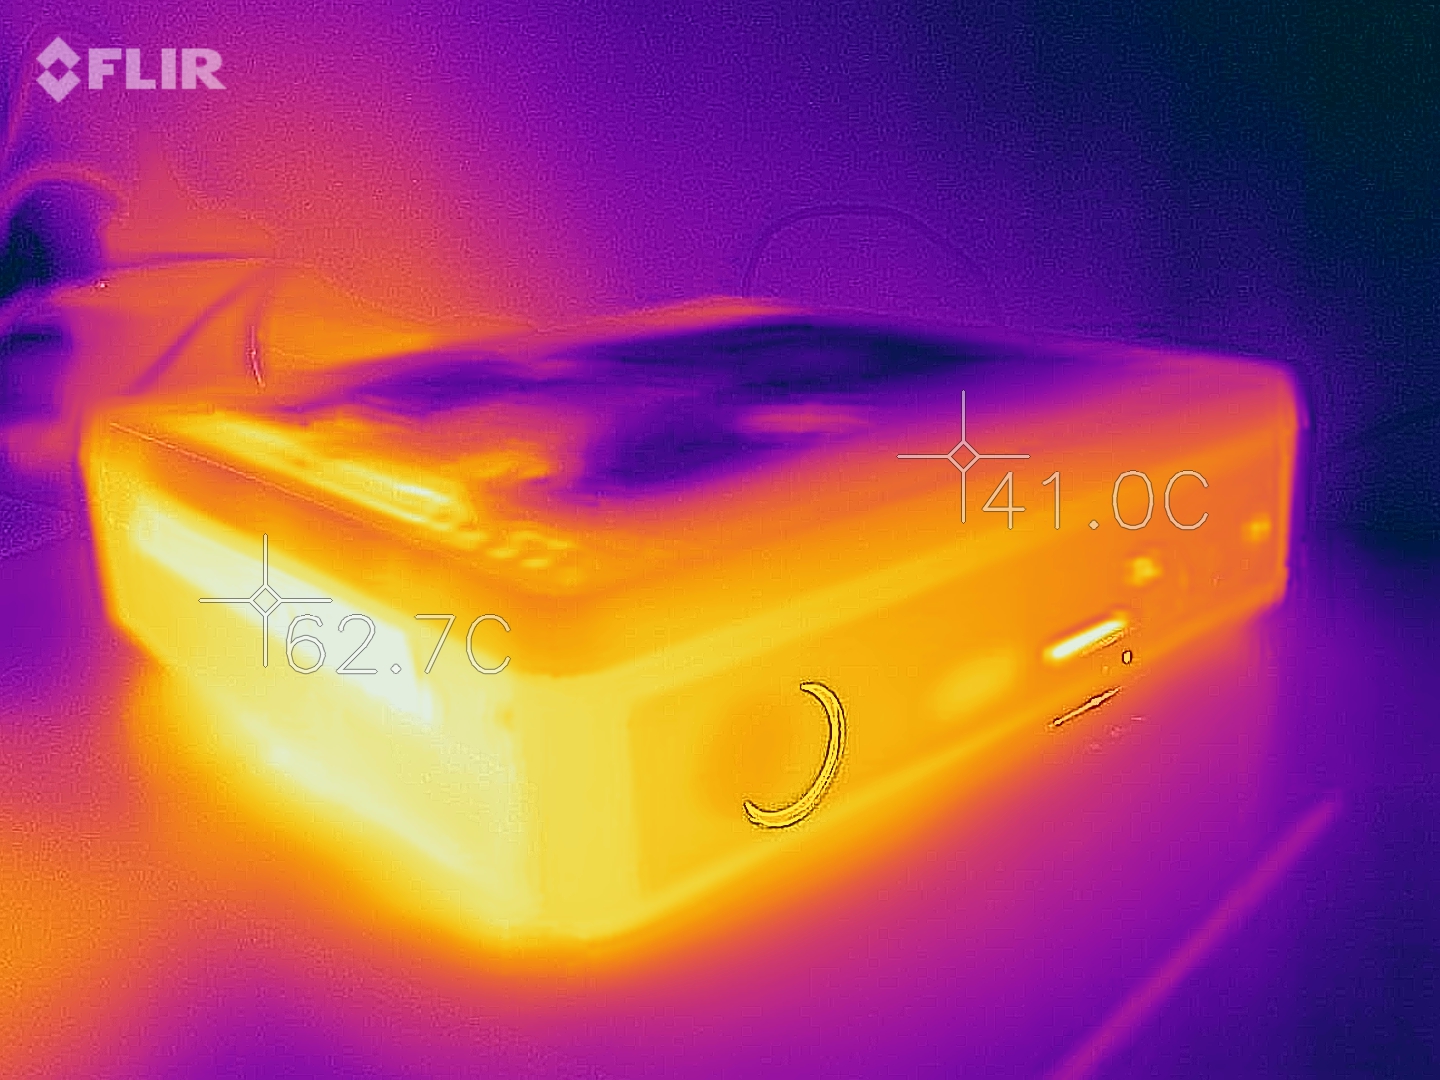
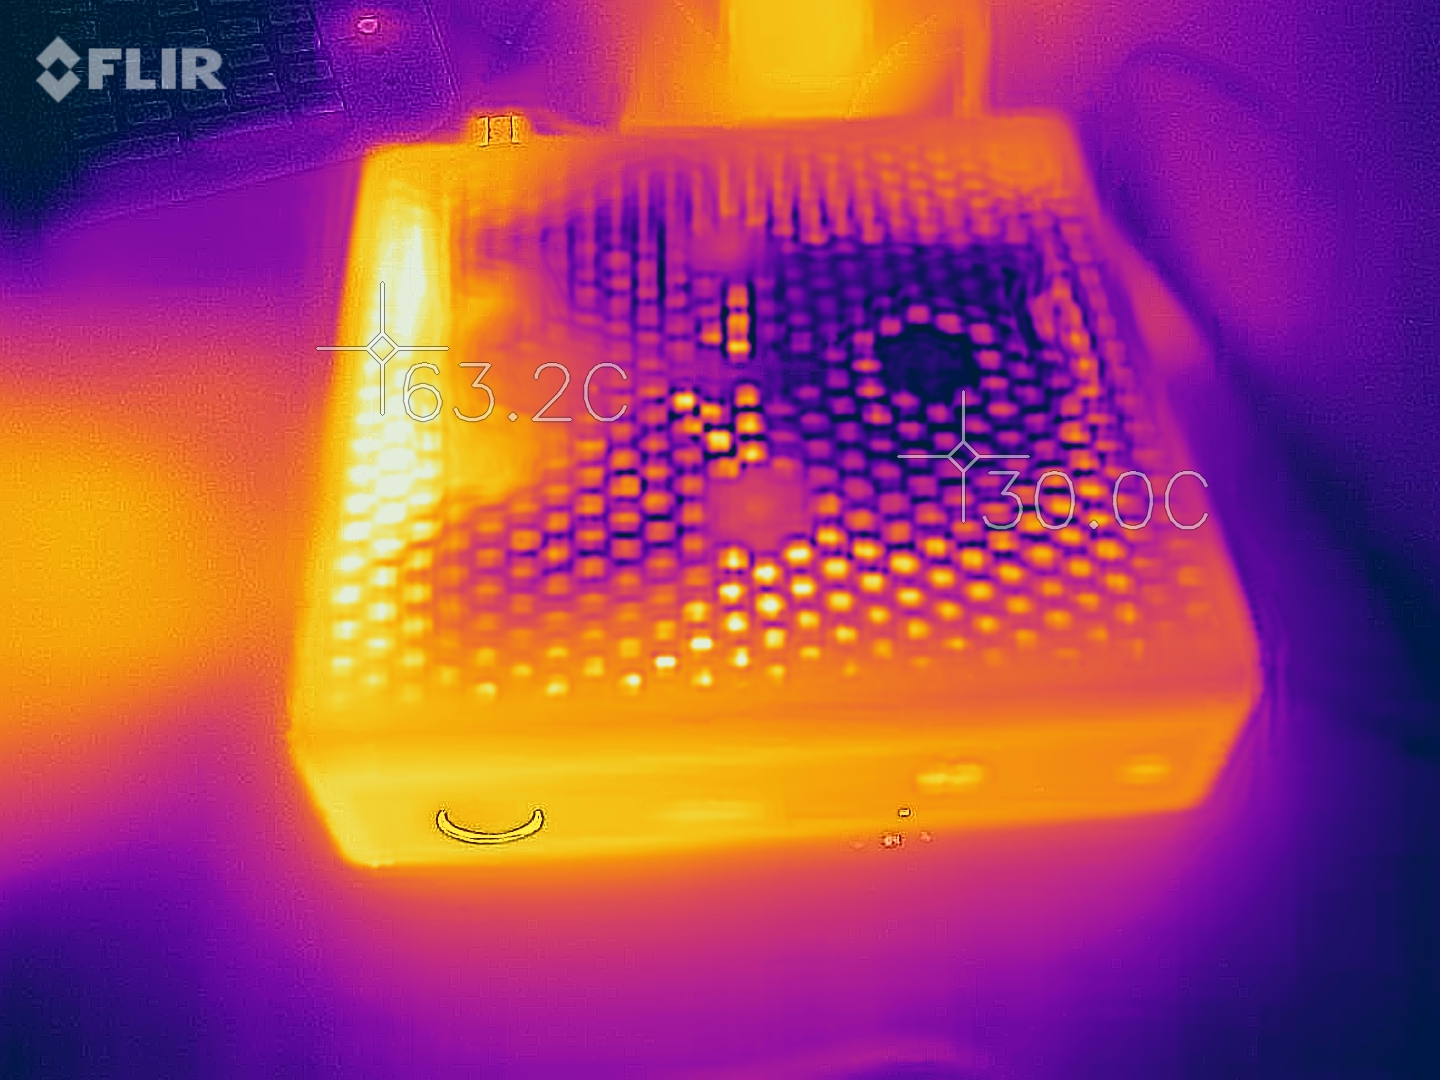
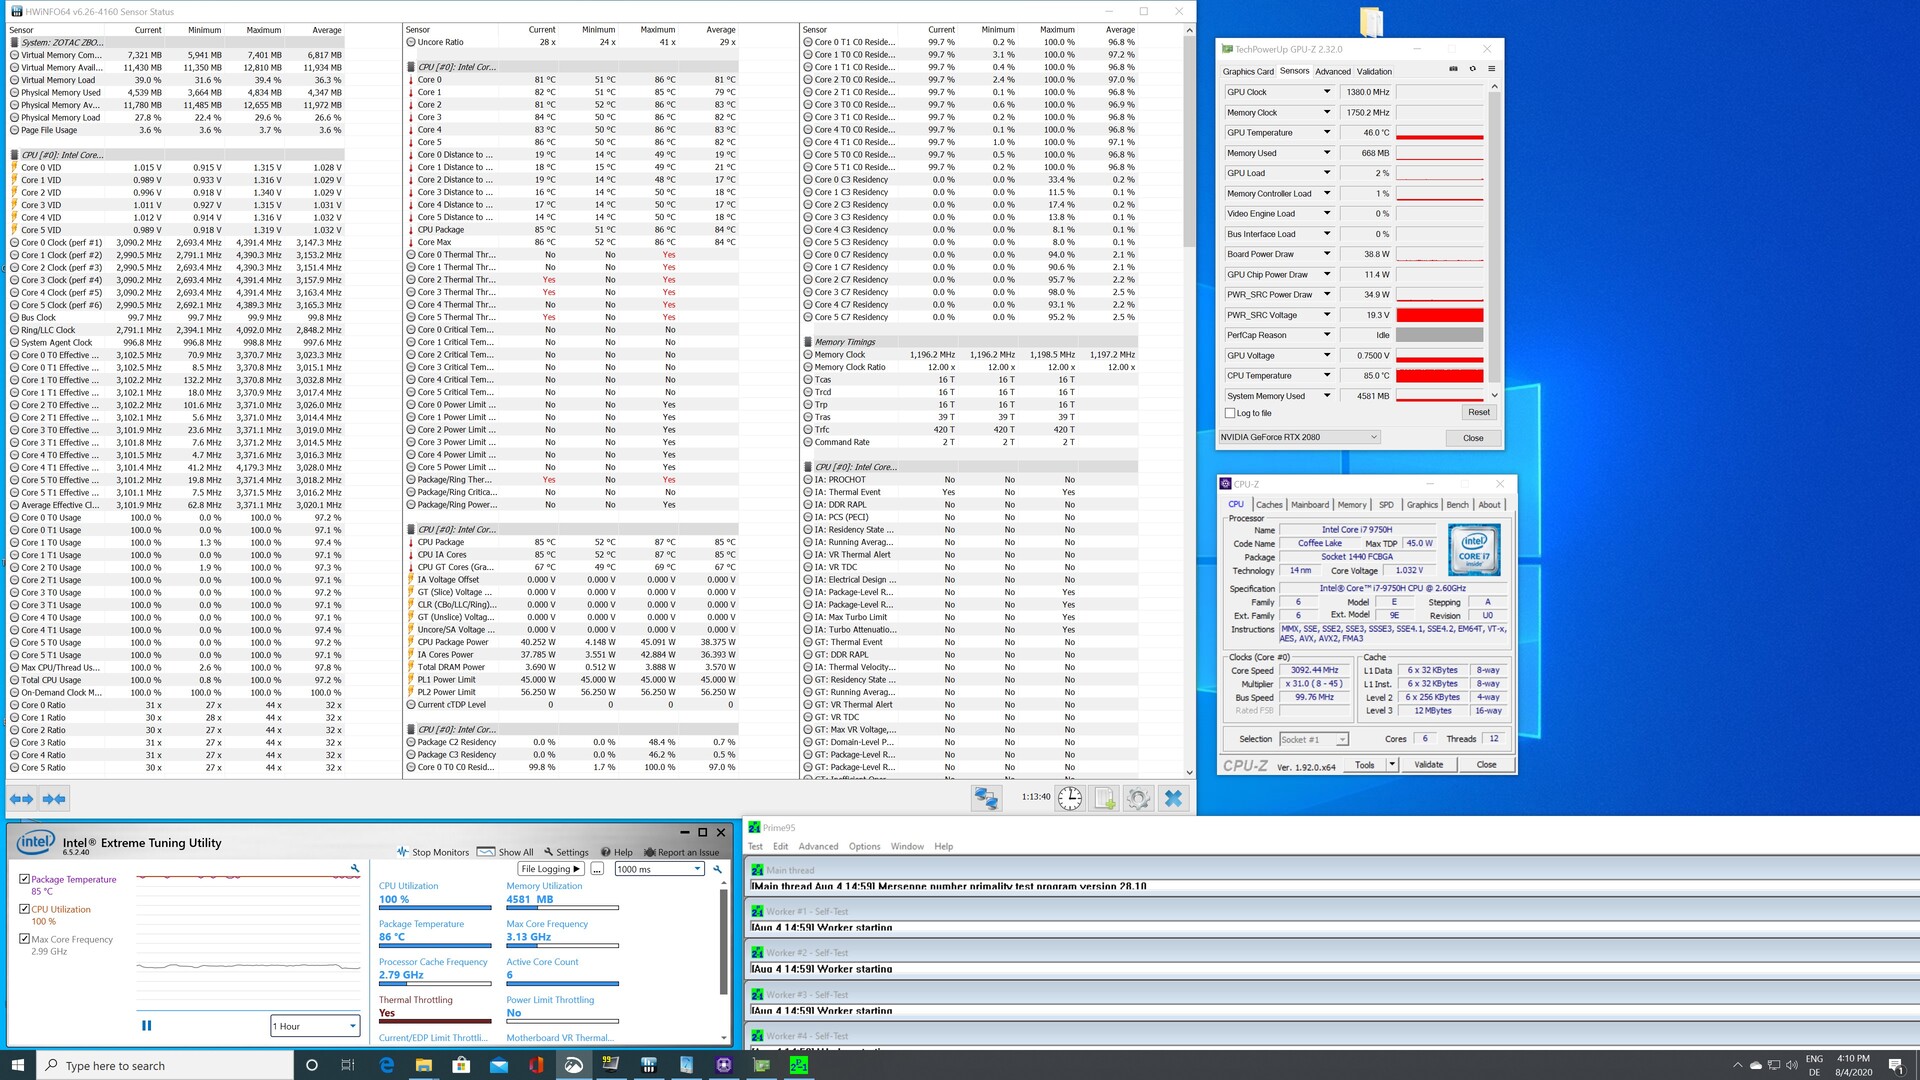
Lo ZBOX Magnus di Zotac è dotato di un sistema di raffreddamento intelligente che raffredda i componenti in modo efficace e affidabile. La maggior parte del calore viene condotto fuori dall'involucro attraverso i lati e il retro. Ci è piaciuto molto il livello di rumore sotto carico, perché il mini PC era udibile ma non disturbante a 38,6 dB(A). Grazie al fatto che il rumore della ventola non è ad alta frequenza, il mini PC non genera nemmeno un fastidioso rumore di funzionamento a pieno carico. Durante i giochi, il rumore di fondo era anche un po' più basso attestandosi a 37,2 dB(A). Nonostante il buon raffreddamento, il processore e la scheda grafica si riscaldano fino a quasi 90 °C (~194 °F) nel nostro stress test. Questo è ancora entro le specifiche previste.

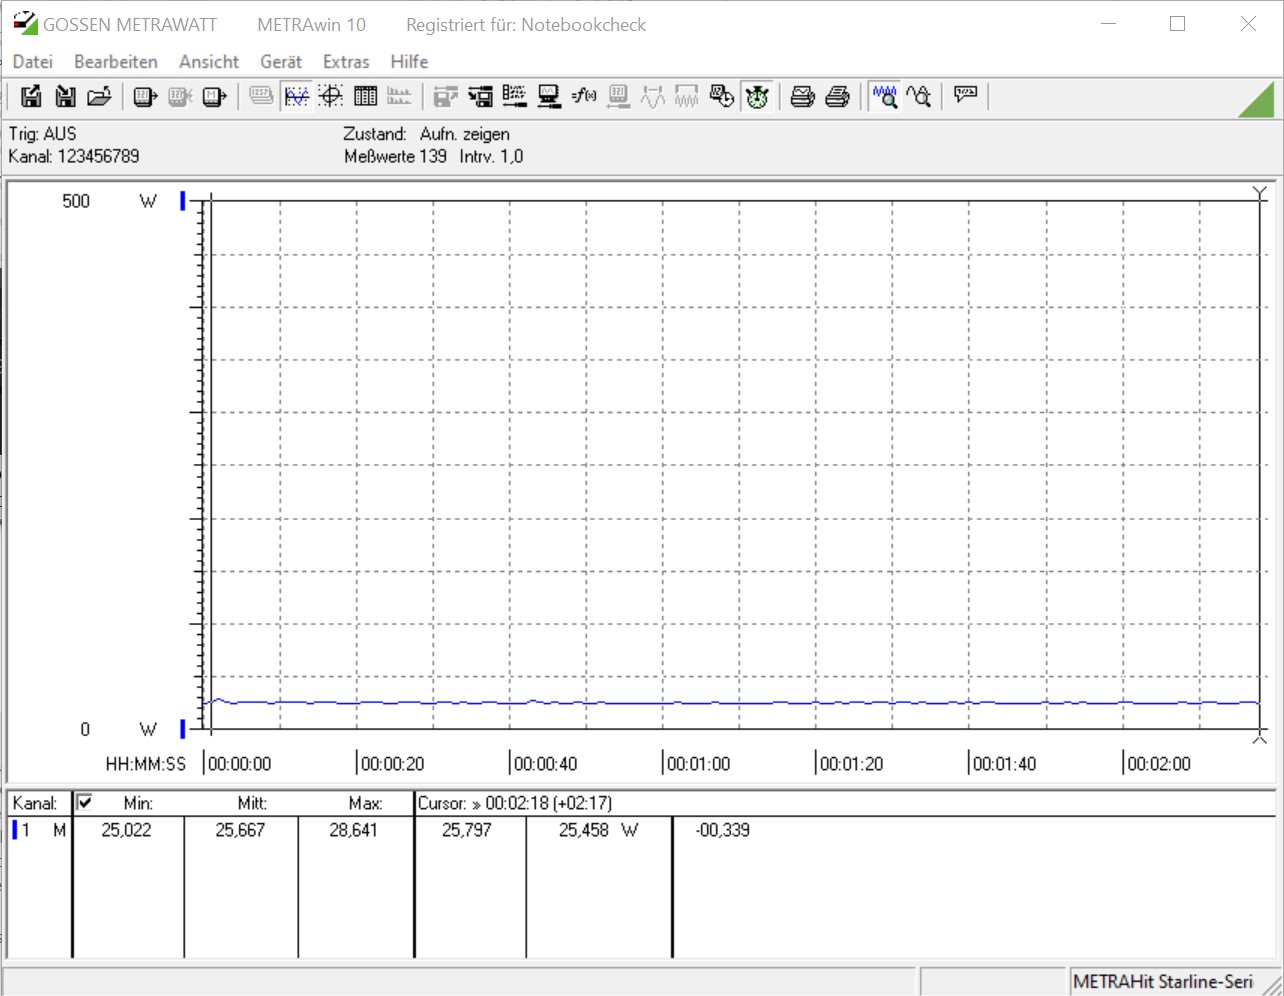
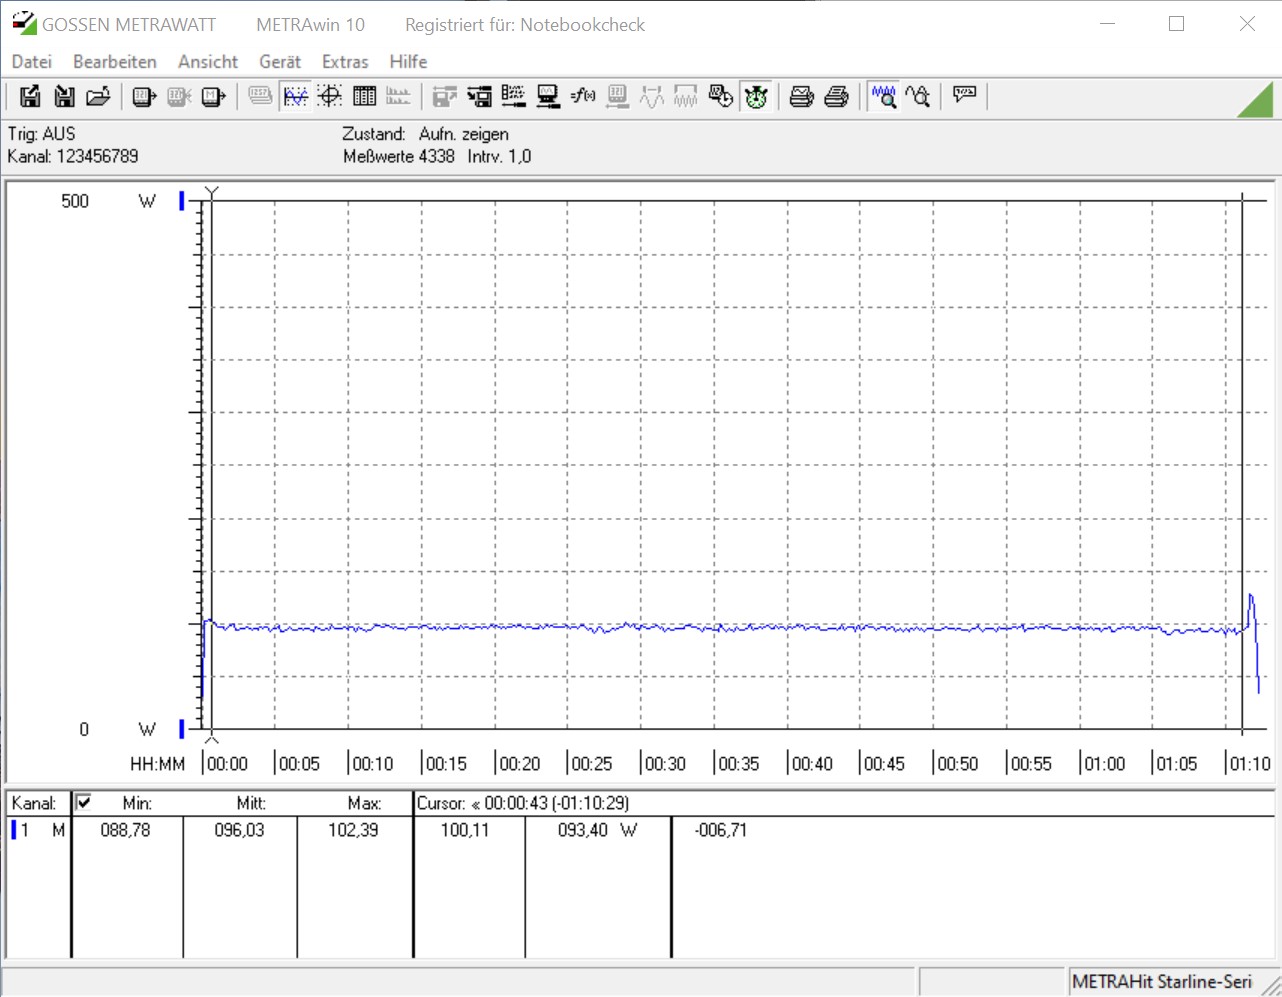
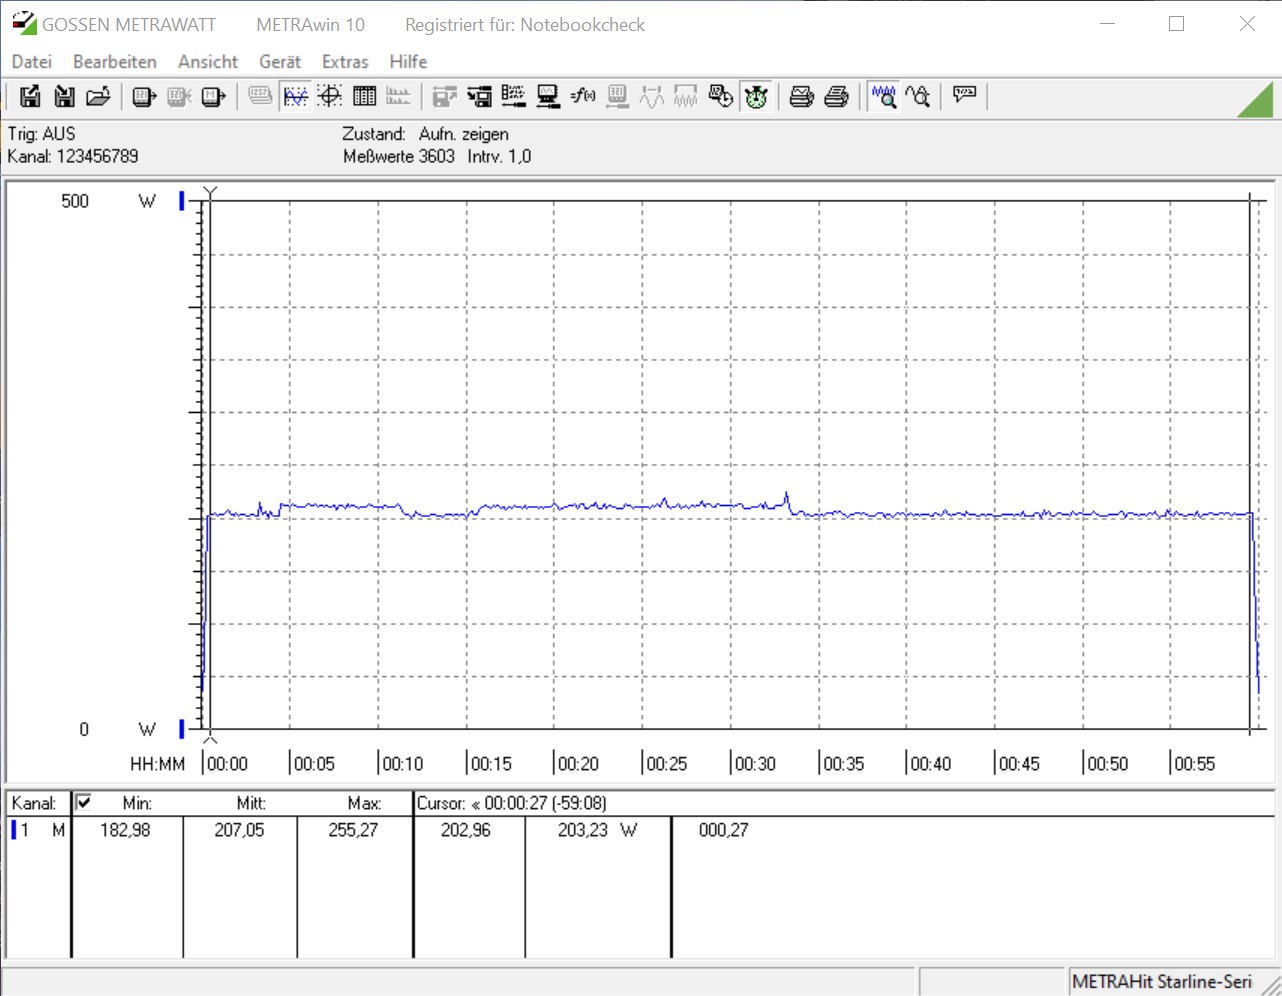
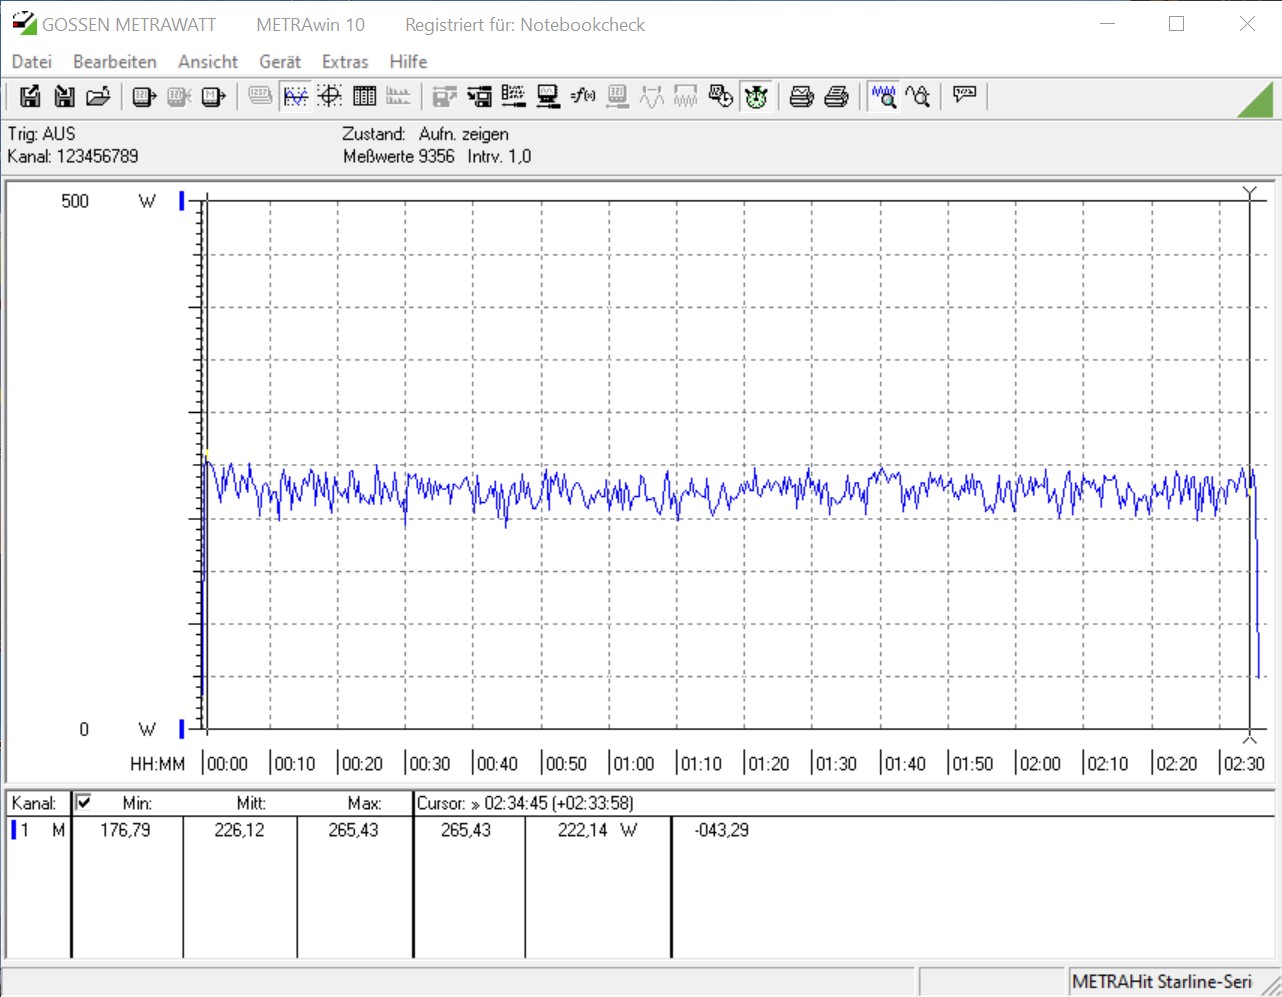
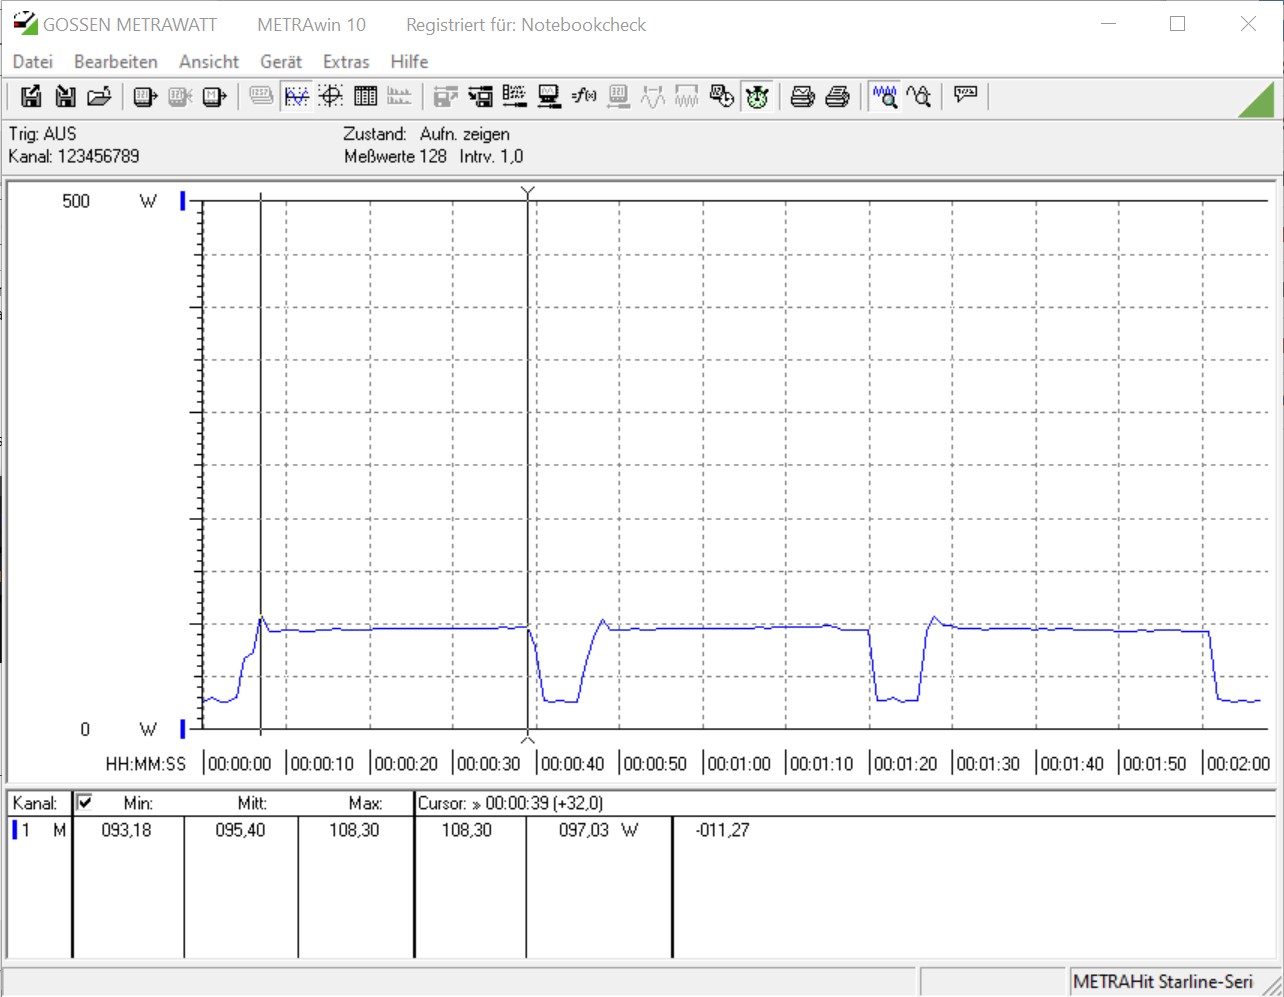
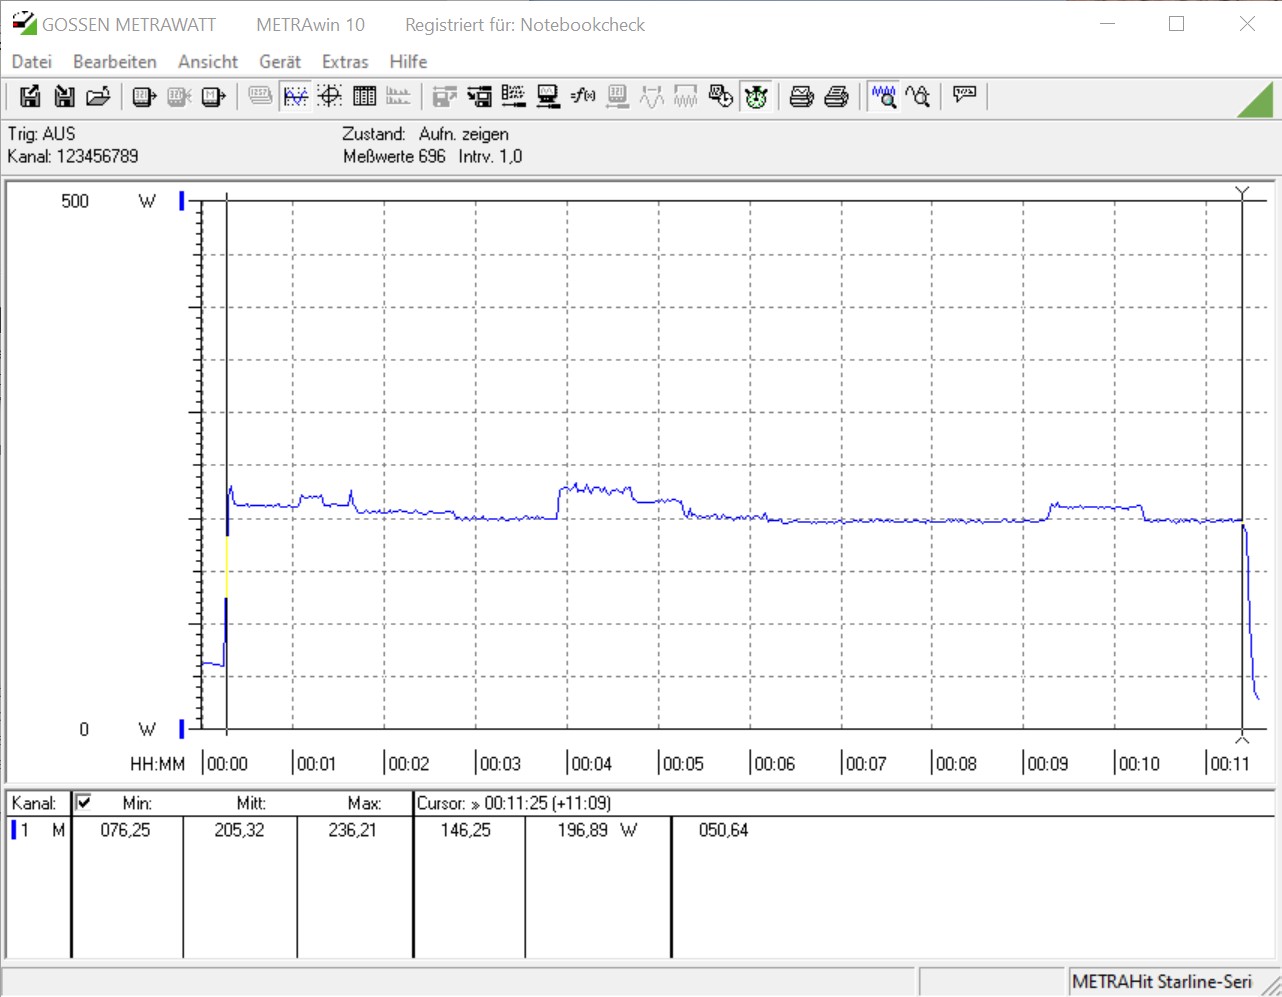
Il vero punto di forza dello ZBOX sta nella sua efficienza energetica, perché il nostro campione di prova è molto parsimonioso rispetto ad un PC desktop convenzionale. Lo ZBOX Magnus è stato anche in grado di tenere testa al Ghost Canyon NUC con un consumo energetico inferiore. Abbiamo misurato un massimo di 236 watt durante i giochi, dato che la CPU e la GPU sono qui sotto carico estremo. L'alimentatore da 330 watt non ha problemi con questo valore.

Power Consumption
1920x1080 The Witcher 3 ultra (external Monitor)
AMD Ryzen 9 3950X
NVIDIA Titan RTX, R9 3950X, Intel Optane 905P 480GB 2.5 (Idle: 95 W)
423.6 (400min - 442max) Watt * -106%
Intel Core i9-10900K
NVIDIA Titan RTX, i9-10900K, WDC PC SN720 SDAQNTW-512G (Idle: 52.3 W)
396.2 (380min - 475max) Watt * -93%
Intel Core i5-10600K
NVIDIA Titan RTX, i5-10600K (Idle: 52.2 W)
386.9 (380min - 404max) Watt * -88%
Intel Core i5 9400F
NVIDIA Titan RTX, i5-9400F (Idle: 57 W)
379.5 (292min - 402max) Watt * -85%
Intel Ghost Canyon NUC (RTX 2070)
GeForce RTX 2070 (Desktop), i9-9980HK, Kingston KC2500 1 TB SKC2500M81000G (Idle: 33.1 W)
237.1 (227min - 263max) Watt * -15%
Zotac ZBOX Magnus EN72070V
GeForce RTX 2080 Mobile, i7-9750H (Idle: 25.7 W)
205.3 (76min - 236max) Watt *
Prime95 V2810 Stress (external Monitor)
Intel Core i9-10900K
NVIDIA Titan RTX, i9-10900K, WDC PC SN720 SDAQNTW-512G (Idle: 52.3 W)
275.7 (254min - 385max) Watt * -187%
Intel Core i5-10600K
NVIDIA Titan RTX, i5-10600K (Idle: 52.2 W)
204.4 (191min - 261max) Watt * -113%
AMD Ryzen 9 3950X
NVIDIA Titan RTX, R9 3950X, Intel Optane 905P 480GB 2.5 (Idle: 95 W)
198.8 (185min - 240max) Watt * -107%
Intel Core i5 9400F
NVIDIA Titan RTX, i5-9400F (Idle: 57 W)
131.6 (122min - 187max) Watt * -37%
Intel Ghost Canyon NUC (RTX 2070)
GeForce RTX 2070 (Desktop), i9-9980HK, Kingston KC2500 1 TB SKC2500M81000G (Idle: 33.1 W)
109.4 (107min - 151max) Watt * -14%
Zotac ZBOX Magnus EN72070V
GeForce RTX 2080 Mobile, i7-9750H (Idle: 25.7 W)
96 (89min - 102max) Watt *
Cinebench R15 Multi (external Monitor)
Intel Core i9-10900K
NVIDIA Titan RTX, i9-10900K, WDC PC SN720 SDAQNTW-512G (Idle: 52.3 W)
268.5 (265min - 270max) Watt * -181%
AMD Ryzen 9 3950X
NVIDIA Titan RTX, R9 3950X, Intel Optane 905P 480GB 2.5 (Idle: 95 W)
219.5 (218min - 225max) Watt * -130%
Intel Core i5-10600K
NVIDIA Titan RTX, i5-10600K (Idle: 52.2 W)
172.5 (170min - 176max) Watt * -81%
Intel Core i5 9400F
NVIDIA Titan RTX, i5-9400F (Idle: 57 W)
122.5 (121min - 125max) Watt * -28%
Zotac ZBOX Magnus EN72070V
GeForce RTX 2080 Mobile, i7-9750H (Idle: 25.7 W)
95.4 (93min - 108max) Watt *
Temperatures - CPU Temperature Prime95
Intel Core i9-10900K
NVIDIA Titan RTX, i9-10900K, WDC PC SN720 SDAQNTW-512G
88 °C +2%
Zotac ZBOX Magnus EN72070V
GeForce RTX 2080 Mobile, i7-9750H
86 °C
AMD Ryzen 9 3950X
NVIDIA Titan RTX, R9 3950X, Intel Optane 905P 480GB 2.5
83.8 °C -3%
Intel Core i5-10600K
NVIDIA Titan RTX, i5-10600K
70 °C -19%
Intel Core i5 9400F
NVIDIA Titan RTX, i5-9400F
61 °C -29%

* ... Meglio usare valori piccoli

Zotac ZBOX Magnus - consumo energetico a riposo
Zotac ZBOX Magnus - consumo energetico Prime95
Zotac ZBOX Magnus - consumo energetico FurMark
Zotac ZBOX Magnus - consumo energetico Prime95 e FurMark
Zotac ZBOX Magnus - consumo energetico Cinebench R15 Multi
Zotac ZBOX Magnus - consumo energetico The Witcher 3 (Ultra preset)
Zotac ZBOX Magnus - Stress test solo Prime95
Zotac ZBOX Magnus - Stress test solo FurMark
Zotac ZBOX Magnus - Stress test Prime95 e FurMark


Pro

+ molto compatto
+ prodotto con alta qualità
+ adatto per il gaming
+ relativamente silenzioso sotto carico
+ molti collegamenti
+ buone prestazioni del sistema
+ 3 dispositivi di memorizzazione possono essere installati (2x M.2 2280, 1x 2,5")
+ Wi-Fi 6

Contro

- prezzo elevato
- non pronto per il funzionamento immediato (barebone)
- poche opzioni di aggiornamento (CPU e GPU sono installate saldamente)

Giudizio Complessivo - ZBOX Magnus potente e silenzioso

Zotac ZBOX Magnus. Fornito da Zotac Germany

Lo Zotac ZBOX Magnus non è un PC qualsiasi, ma come sistema barebone, offre all'utente la possibilità di completare il dispositivo secondo le proprie esigenze. È possibile scegliere liberamente i dispositivi di archiviazione e il tipo di memoria. Purtroppo gli utenti sono limitati per quanto riguarda il processore e la scheda grafica, perché non è possibile aggiornare questi componenti in un secondo momento.

Abbiamo testato lo ZBOX Magnus con l'Intel Core i7-9750H in combinazione con la Nvidia GeForce RTX 2080 Mobile. In termini di prestazioni pure, è possibile eseguire tutti i giochi moderni senza problemi con il piccolo PC senza dover sacrificare i dettagli. Tuttavia, è richiesta la risoluzione WQHD. Lo ZBOX domina anche molti titoli in UHD, anche se spesso è necessario ridurre i dettagli. Al contrario, la GeForce RTX 2080 Mobile offre circa le stesse prestazioni della GeForce RTX 2070 Desktop.

Lo Zotac ZBOX Magnus è un potente PC gaming nel formato mini. Tuttavia, prima di acquistarlo, è necessario familiarizzare con le peculiarità di un sistema barebone.

Il sistema offre un grande vantaggio in termini di volume. I dispositivi molto compatti sono spesso molto rumorosi e soffrono di un forte sviluppo di calore. Nel complesso, Zotac ha un'ottima presa sul problema del calore, e anche il livello di rumore sotto carico va bene arrivando a poco meno di 39 dB(A).

Chi vuole investire 1.700 Euro (~$2.004) nel sistema barebone ora conosce i vantaggi e gli svantaggi che lo ZBOX Magnus offre. In termini di prezzo, sia Intel con il Ghost Canyon NUC che Zotac con lo ZBOX Magnus non si arrendono facilmente. Tuttavia, bisogna considerare che il Ghost Canyon NUC non include una scheda grafica dedicata nel prezzo d'acquisto. Di conseguenza, questo punto va chiaramente a favore dello Zotac.

Please share our article, every link counts!
> Recensioni e prove di notebook, tablets e smartphones > Recensioni e prove > Recensioni e prove > Recensione del Mini PC Zotac ZBOX Magnus con GeForce RTX 2080
Sebastian Bade, 2020-08-10 (Update: 2021-03-12)