Notebookcheck Logo

Recensione dell'Intel NUC 11 Beast Canyon con Core i9 e RTX 3060

Centrale elettrica compatta! Intel ancora una volta alza il livello delle prestazioni con l'Intel NUC 11 Extreme Compute Element. Il nuovo Compute Element è usato nel Beast Canyon e, insieme a una GPU Nvidia dedicata, rende un sistema di gioco potente e compatto. Potete scoprire come il sistema si comporta rispetto a sistemi desktop comparabili in questa recensione.

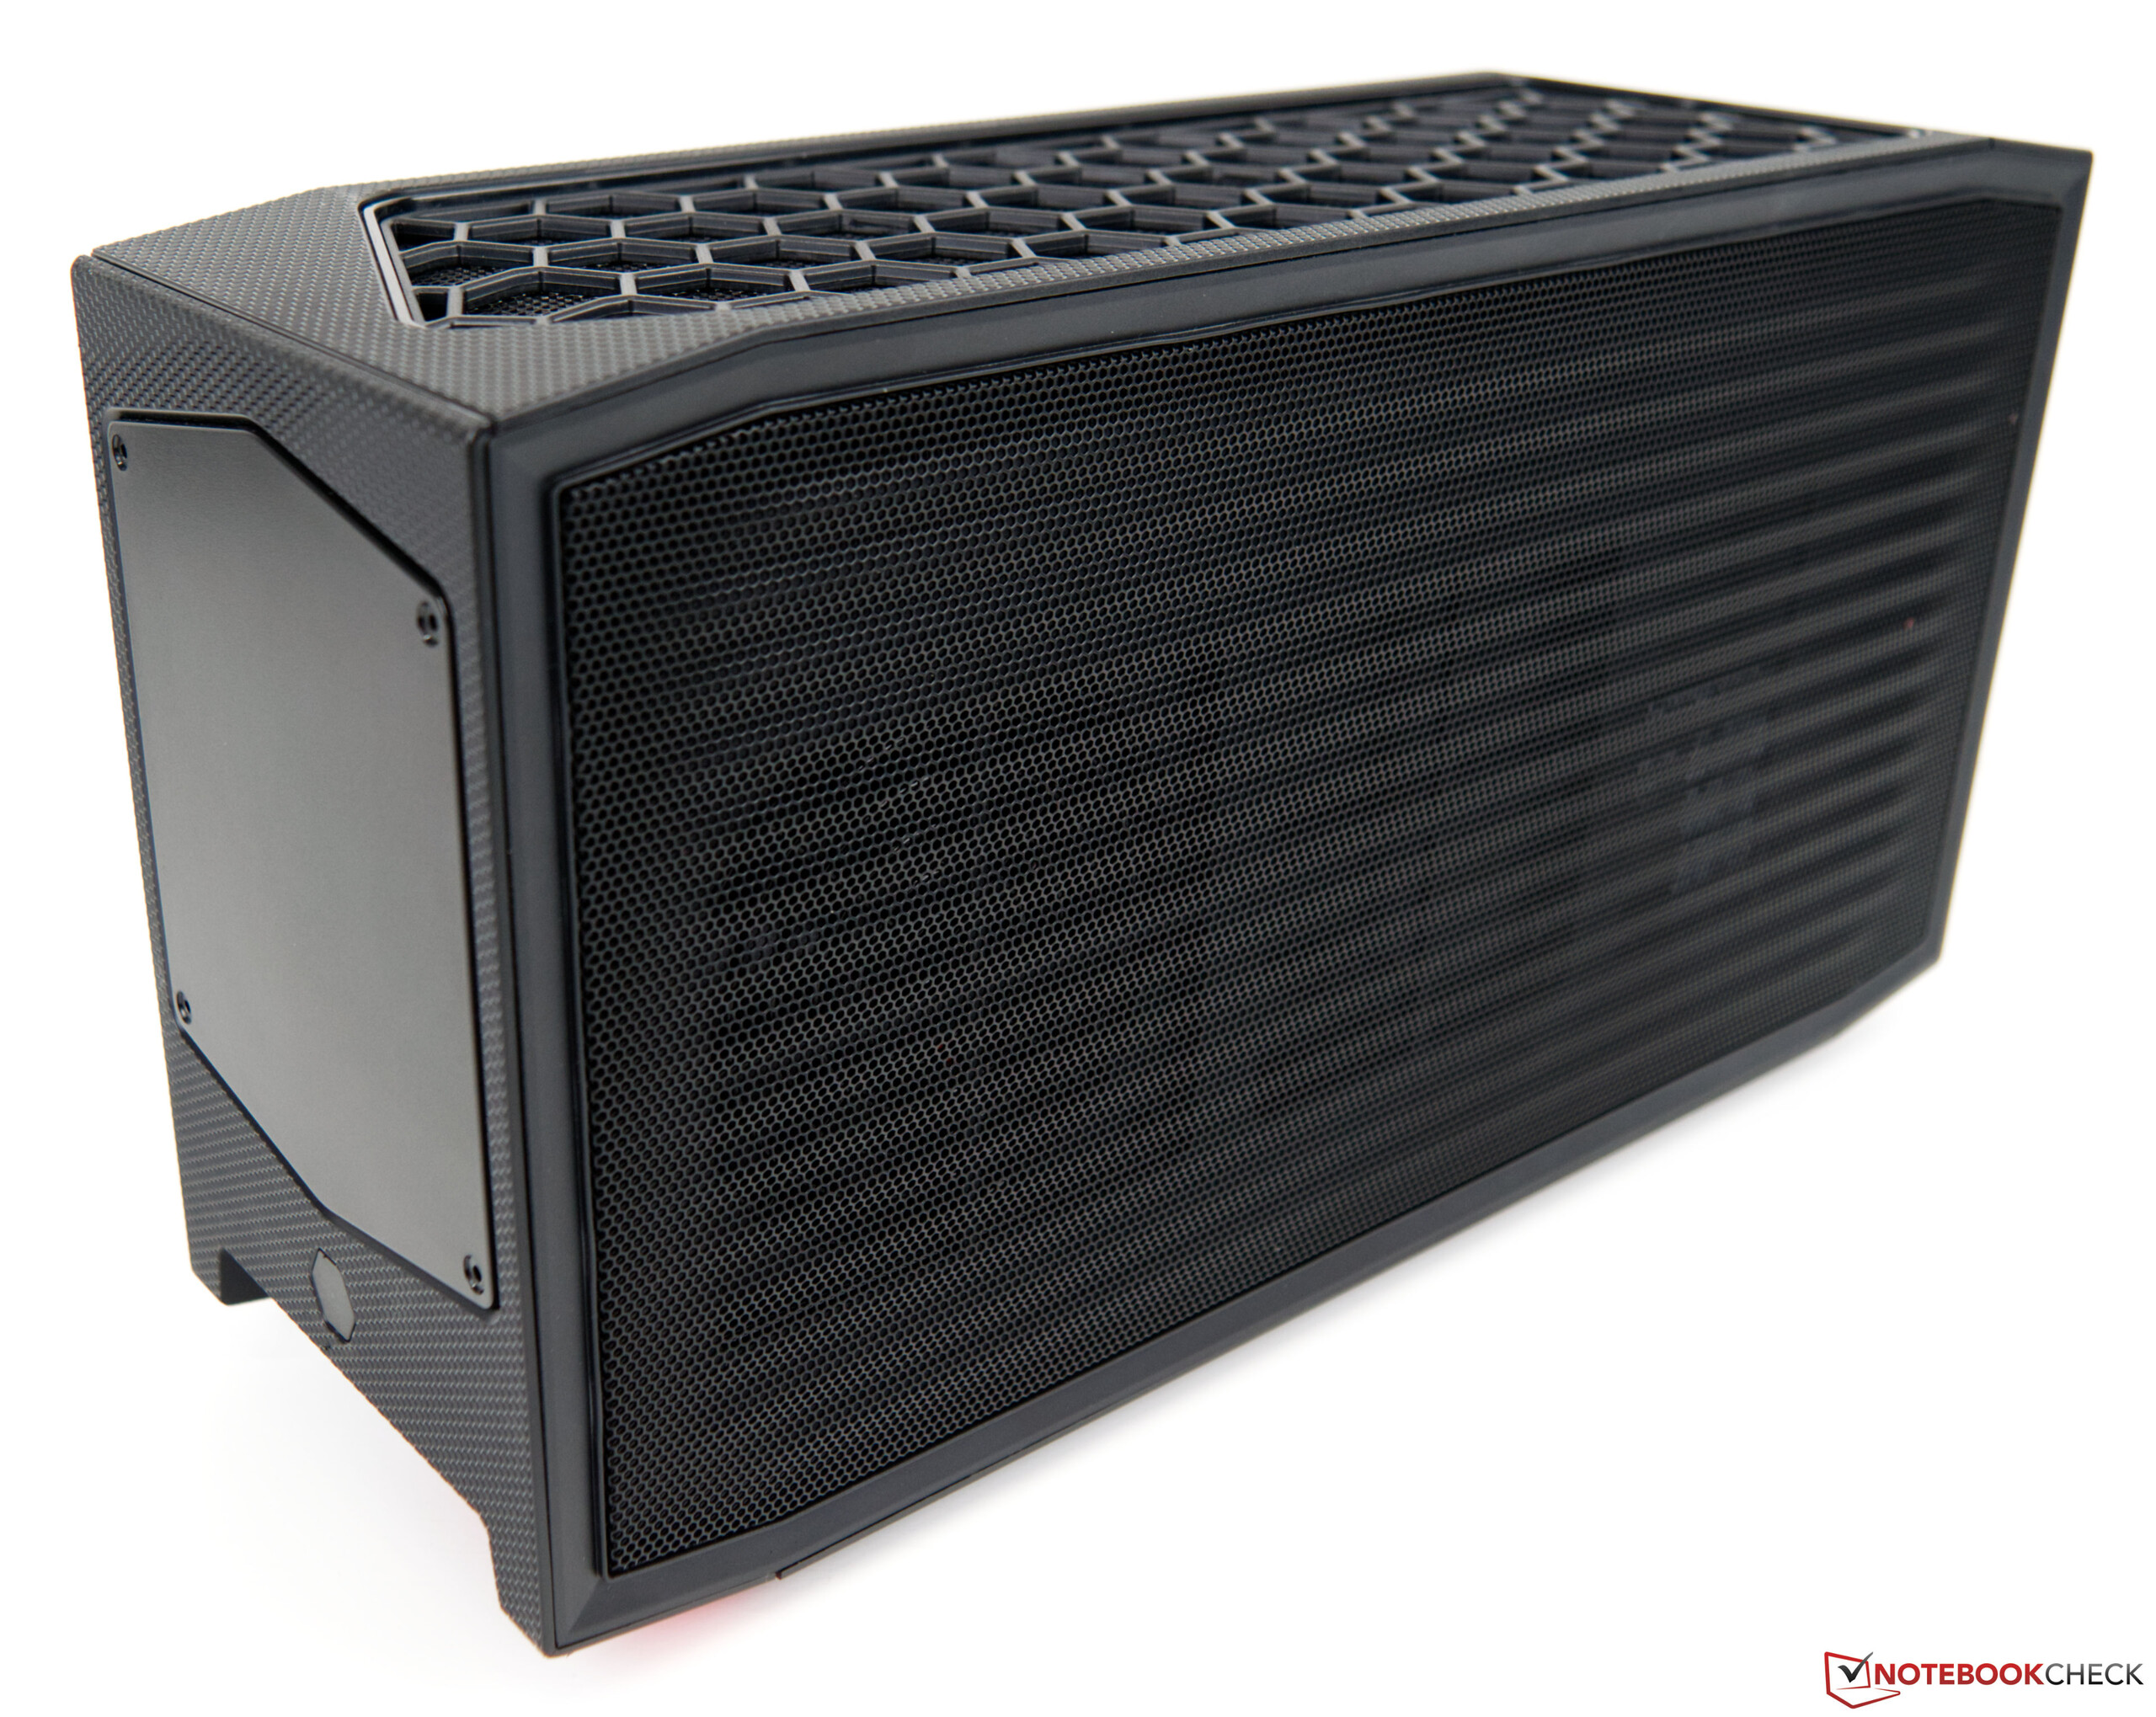
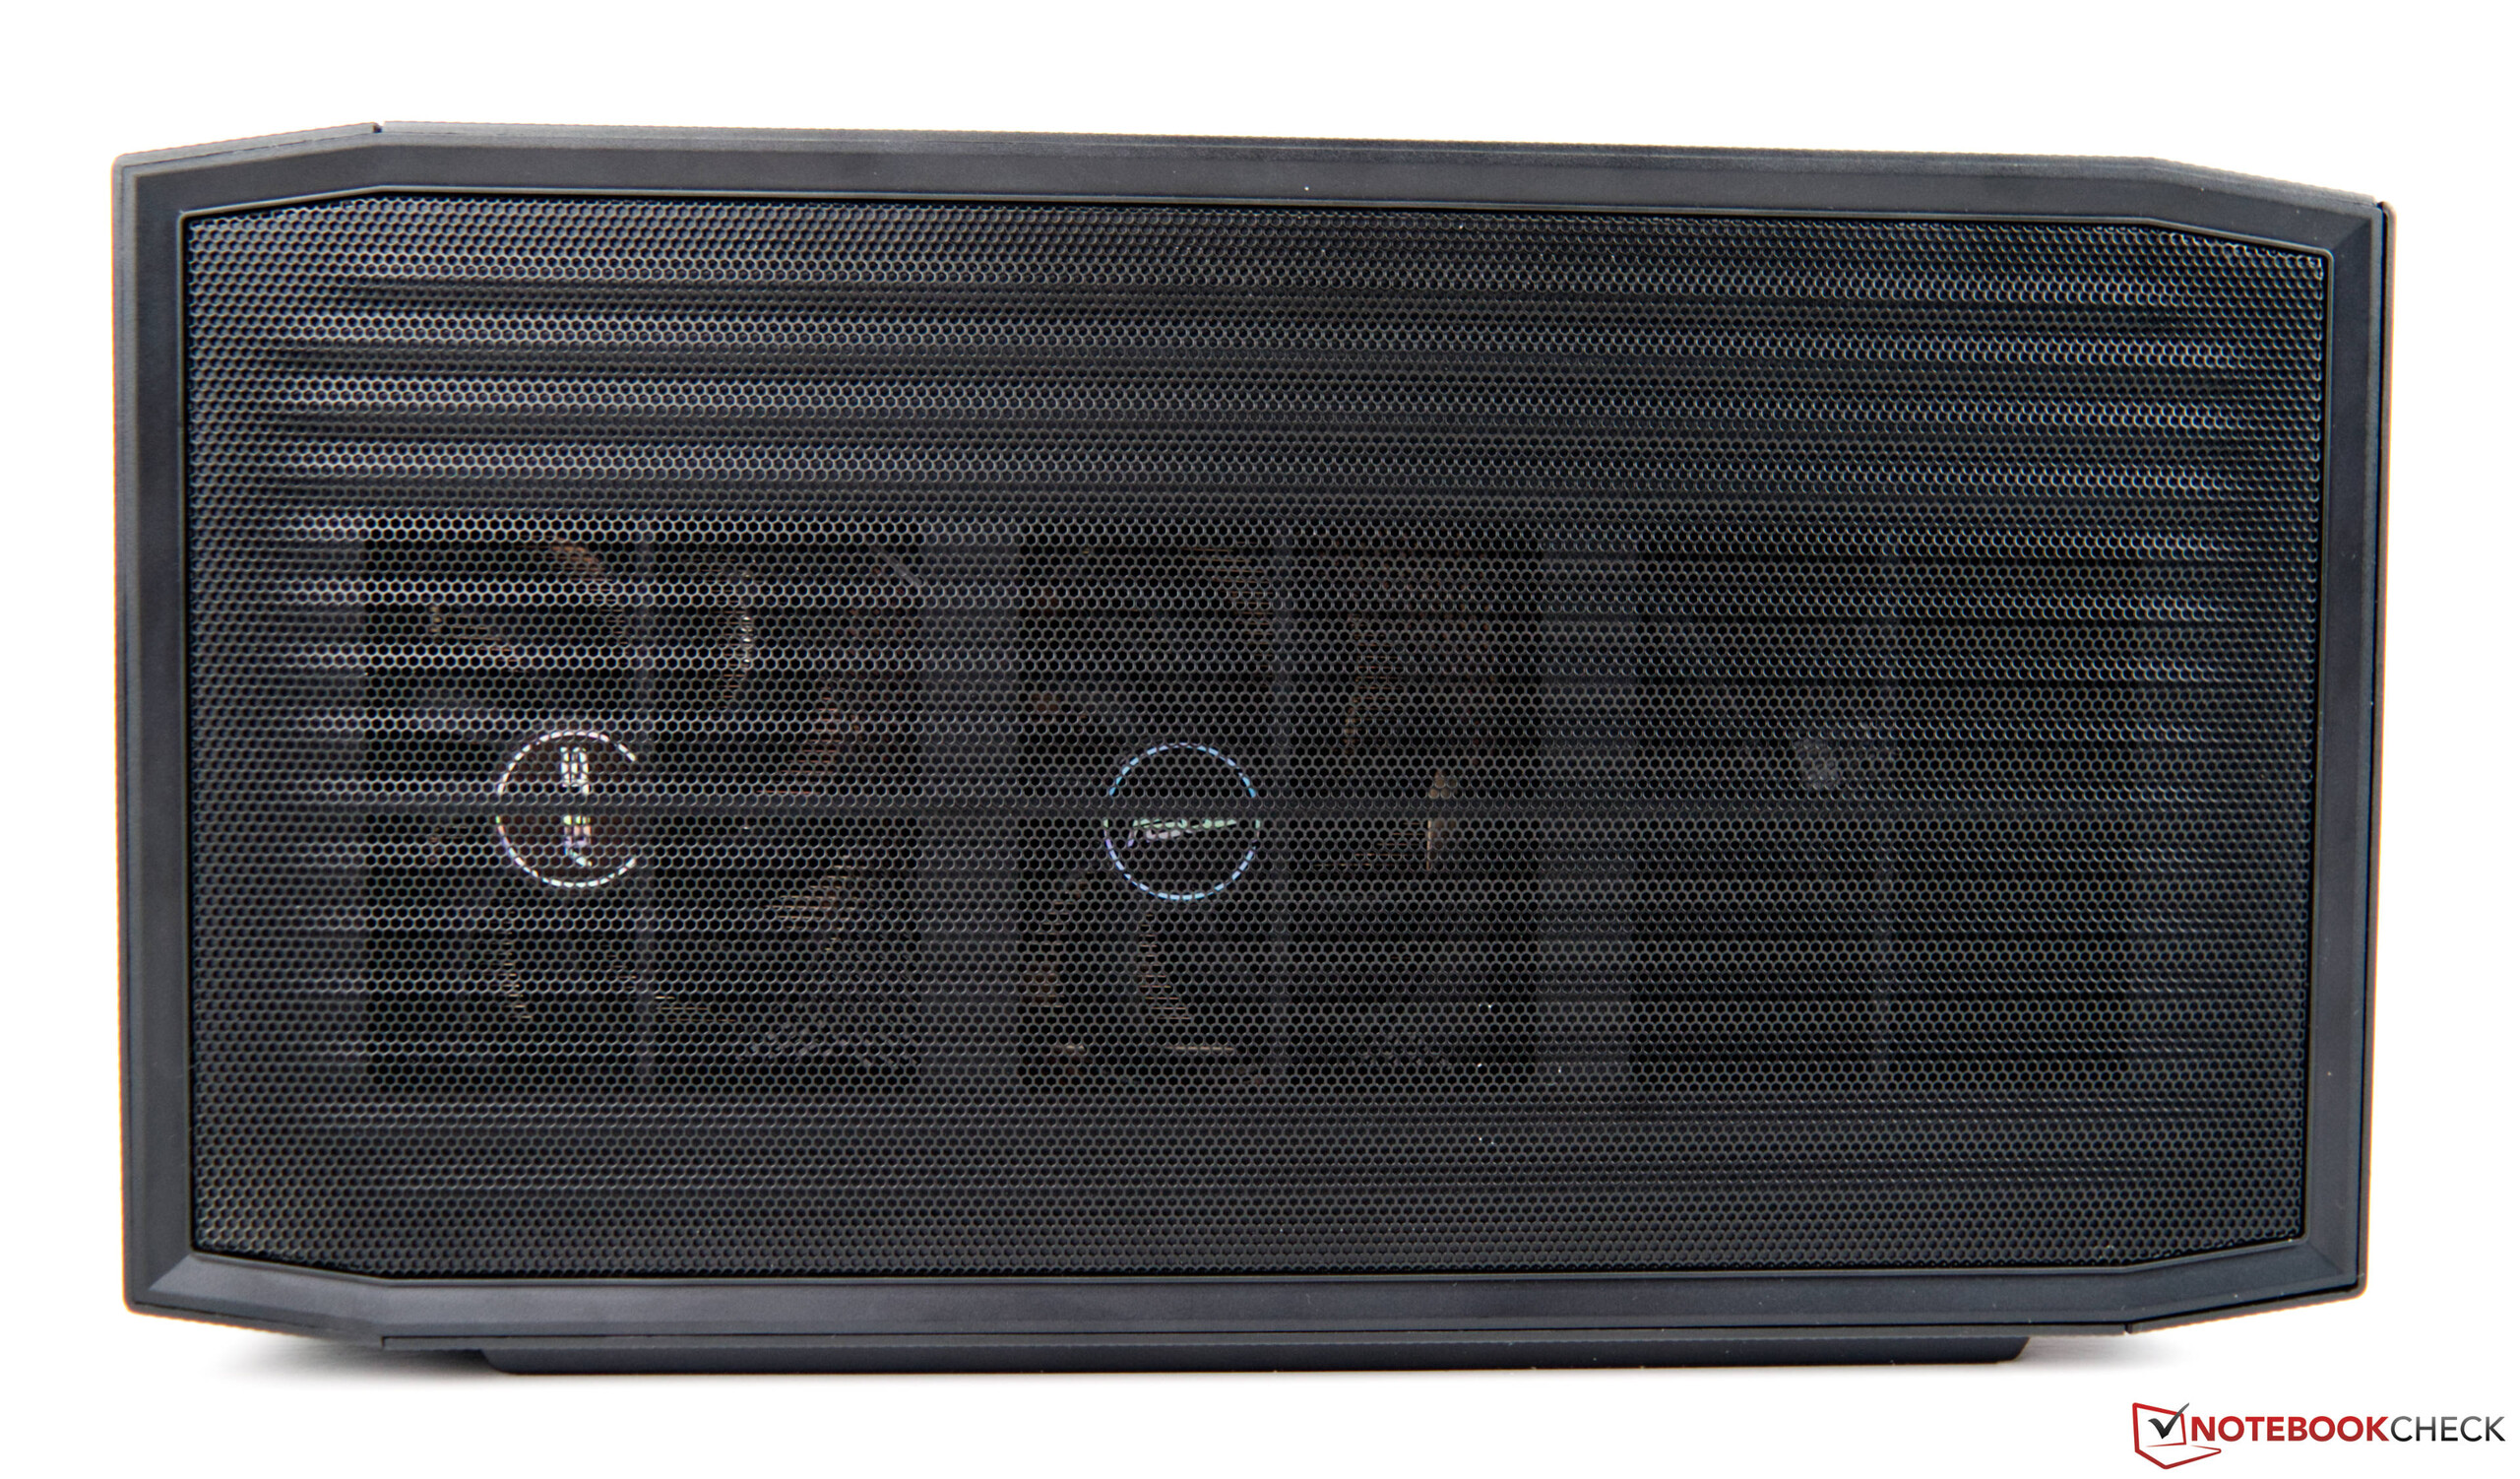
Intel offre principalmente sistemi compatti da ufficio con il marchio NUC. Tuttavia, ci sono sistemi di gioco di Intel che portano anche NUC nel loro nome. L'anno scorso, per esempio, siamo rimasti impressionati dalle prestazioni del Intel Ghost Canyon NUC. Quest'anno, Intel ha introdotto un altro sistema di gioco basato sull'elemento di calcolo appositamente sviluppato, il Beast Canyon NUC, adottando un approccio leggermente diverso

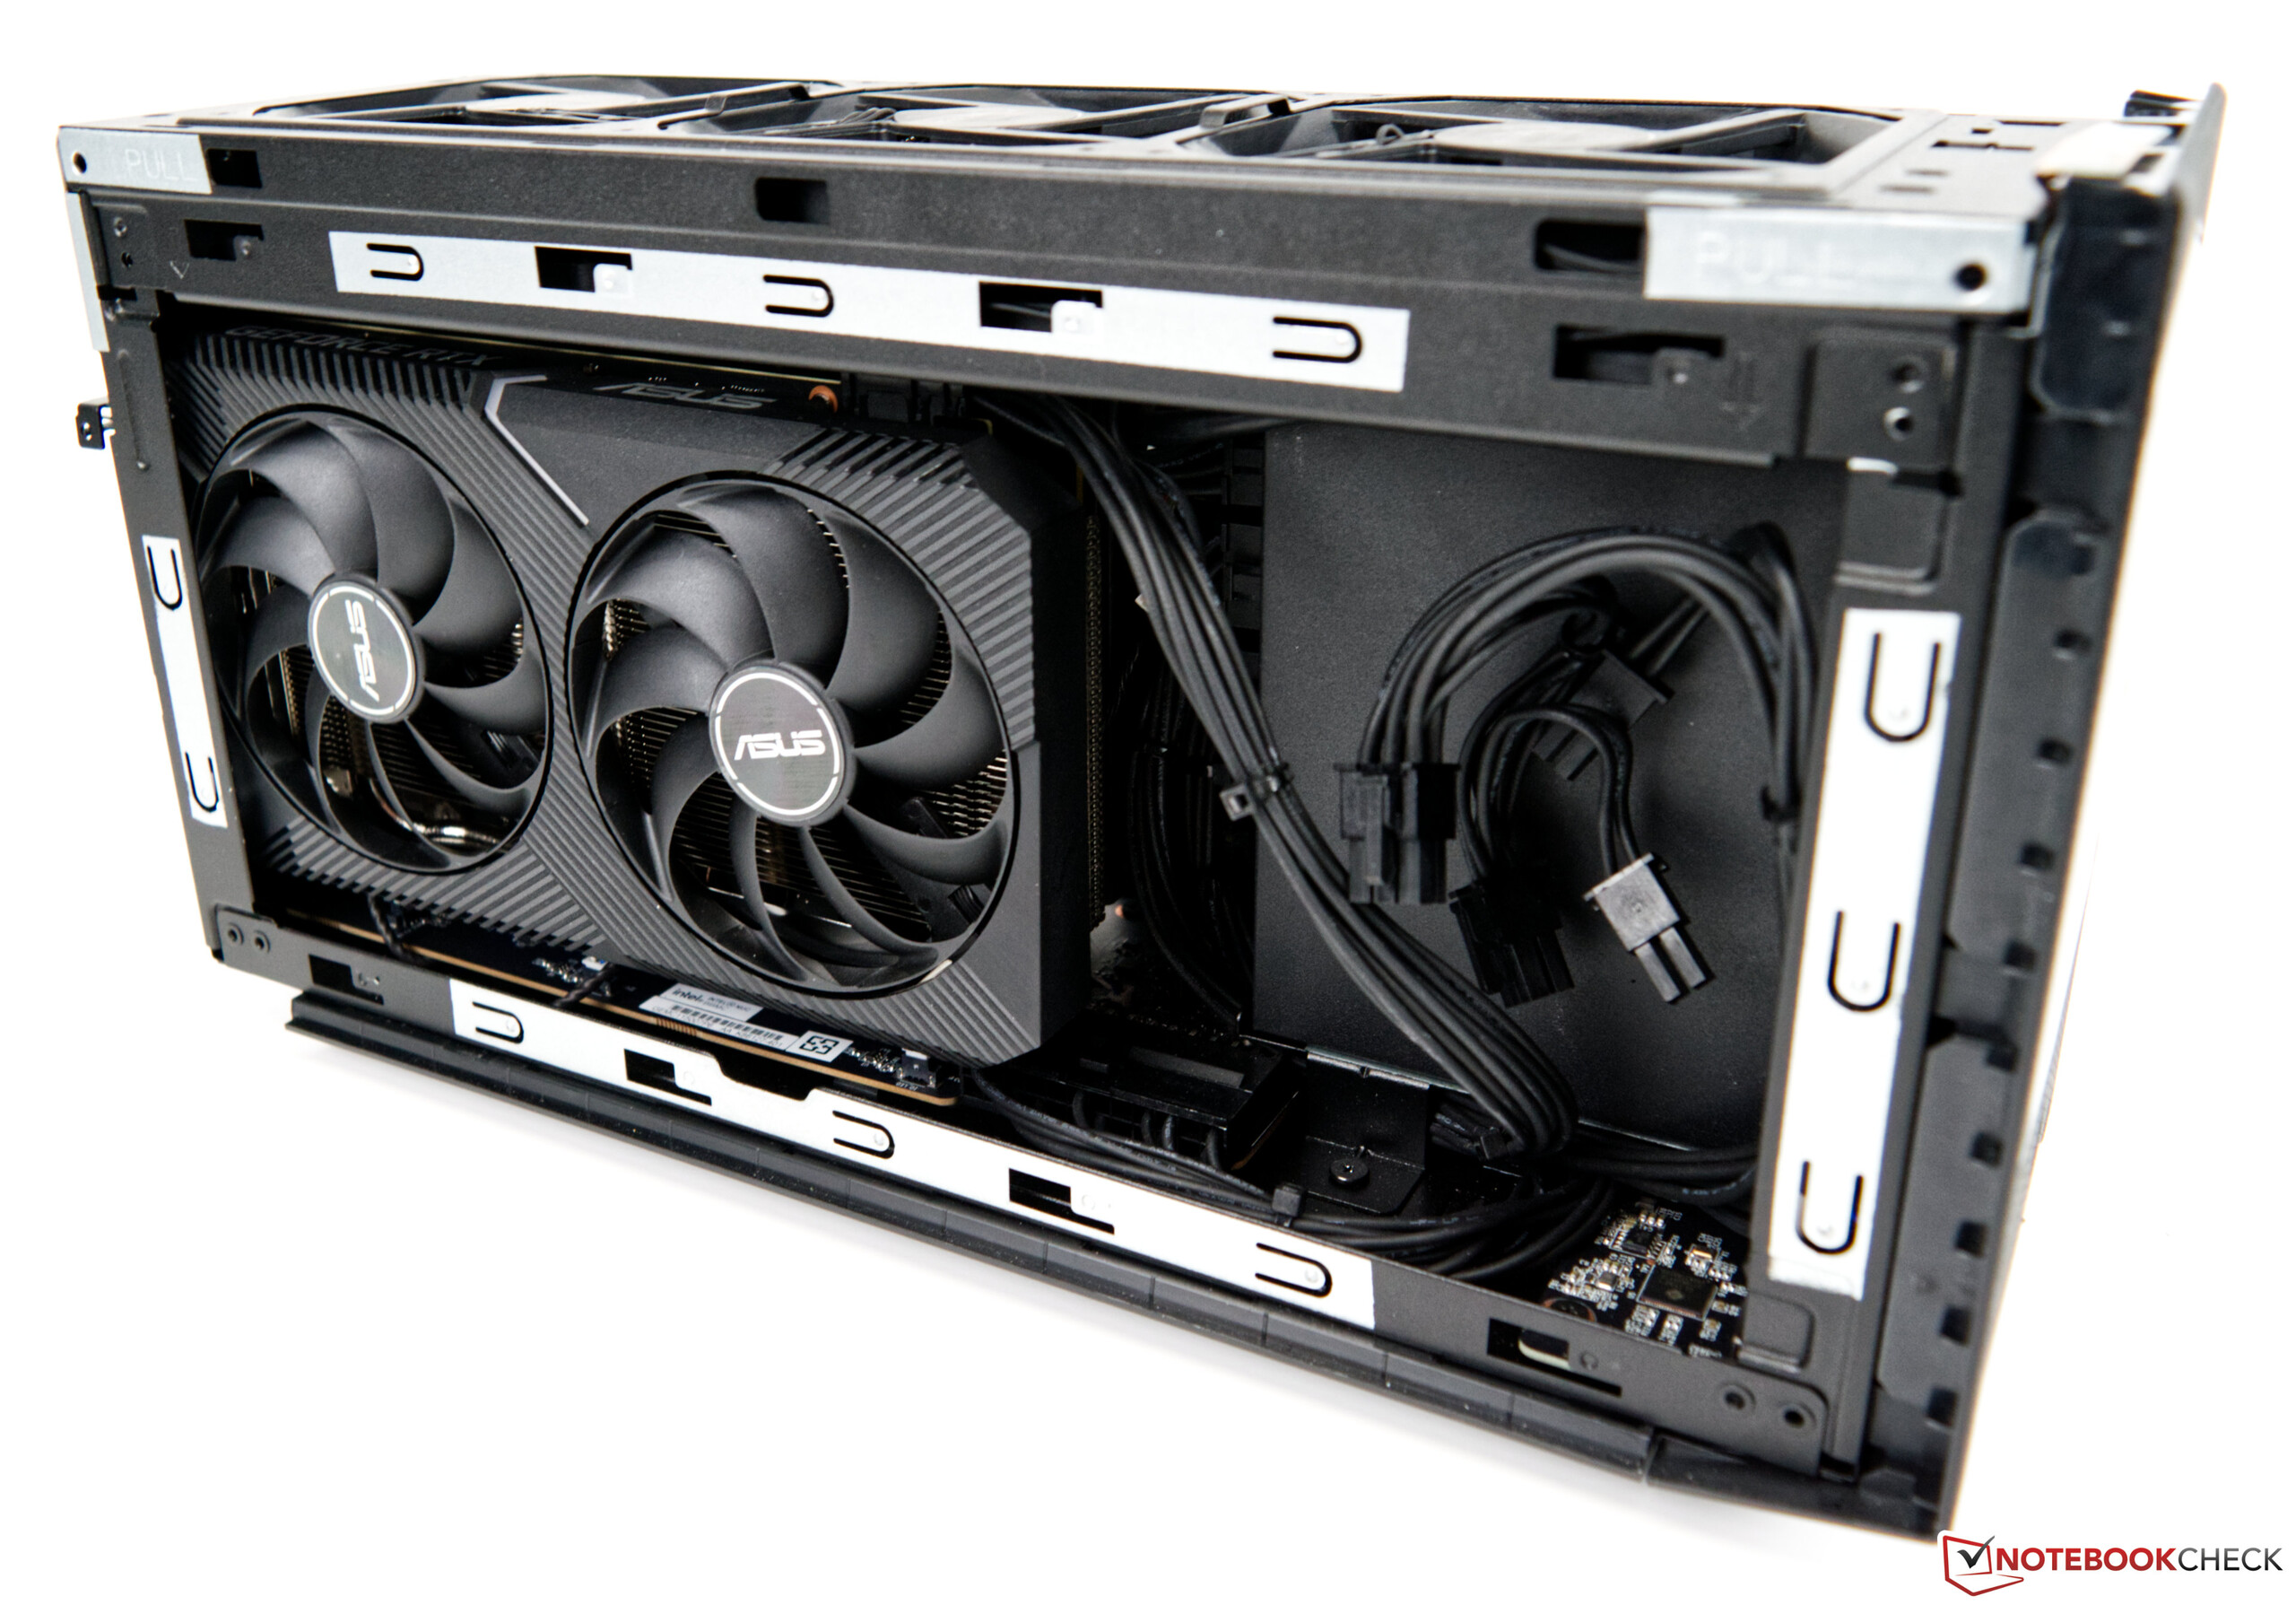
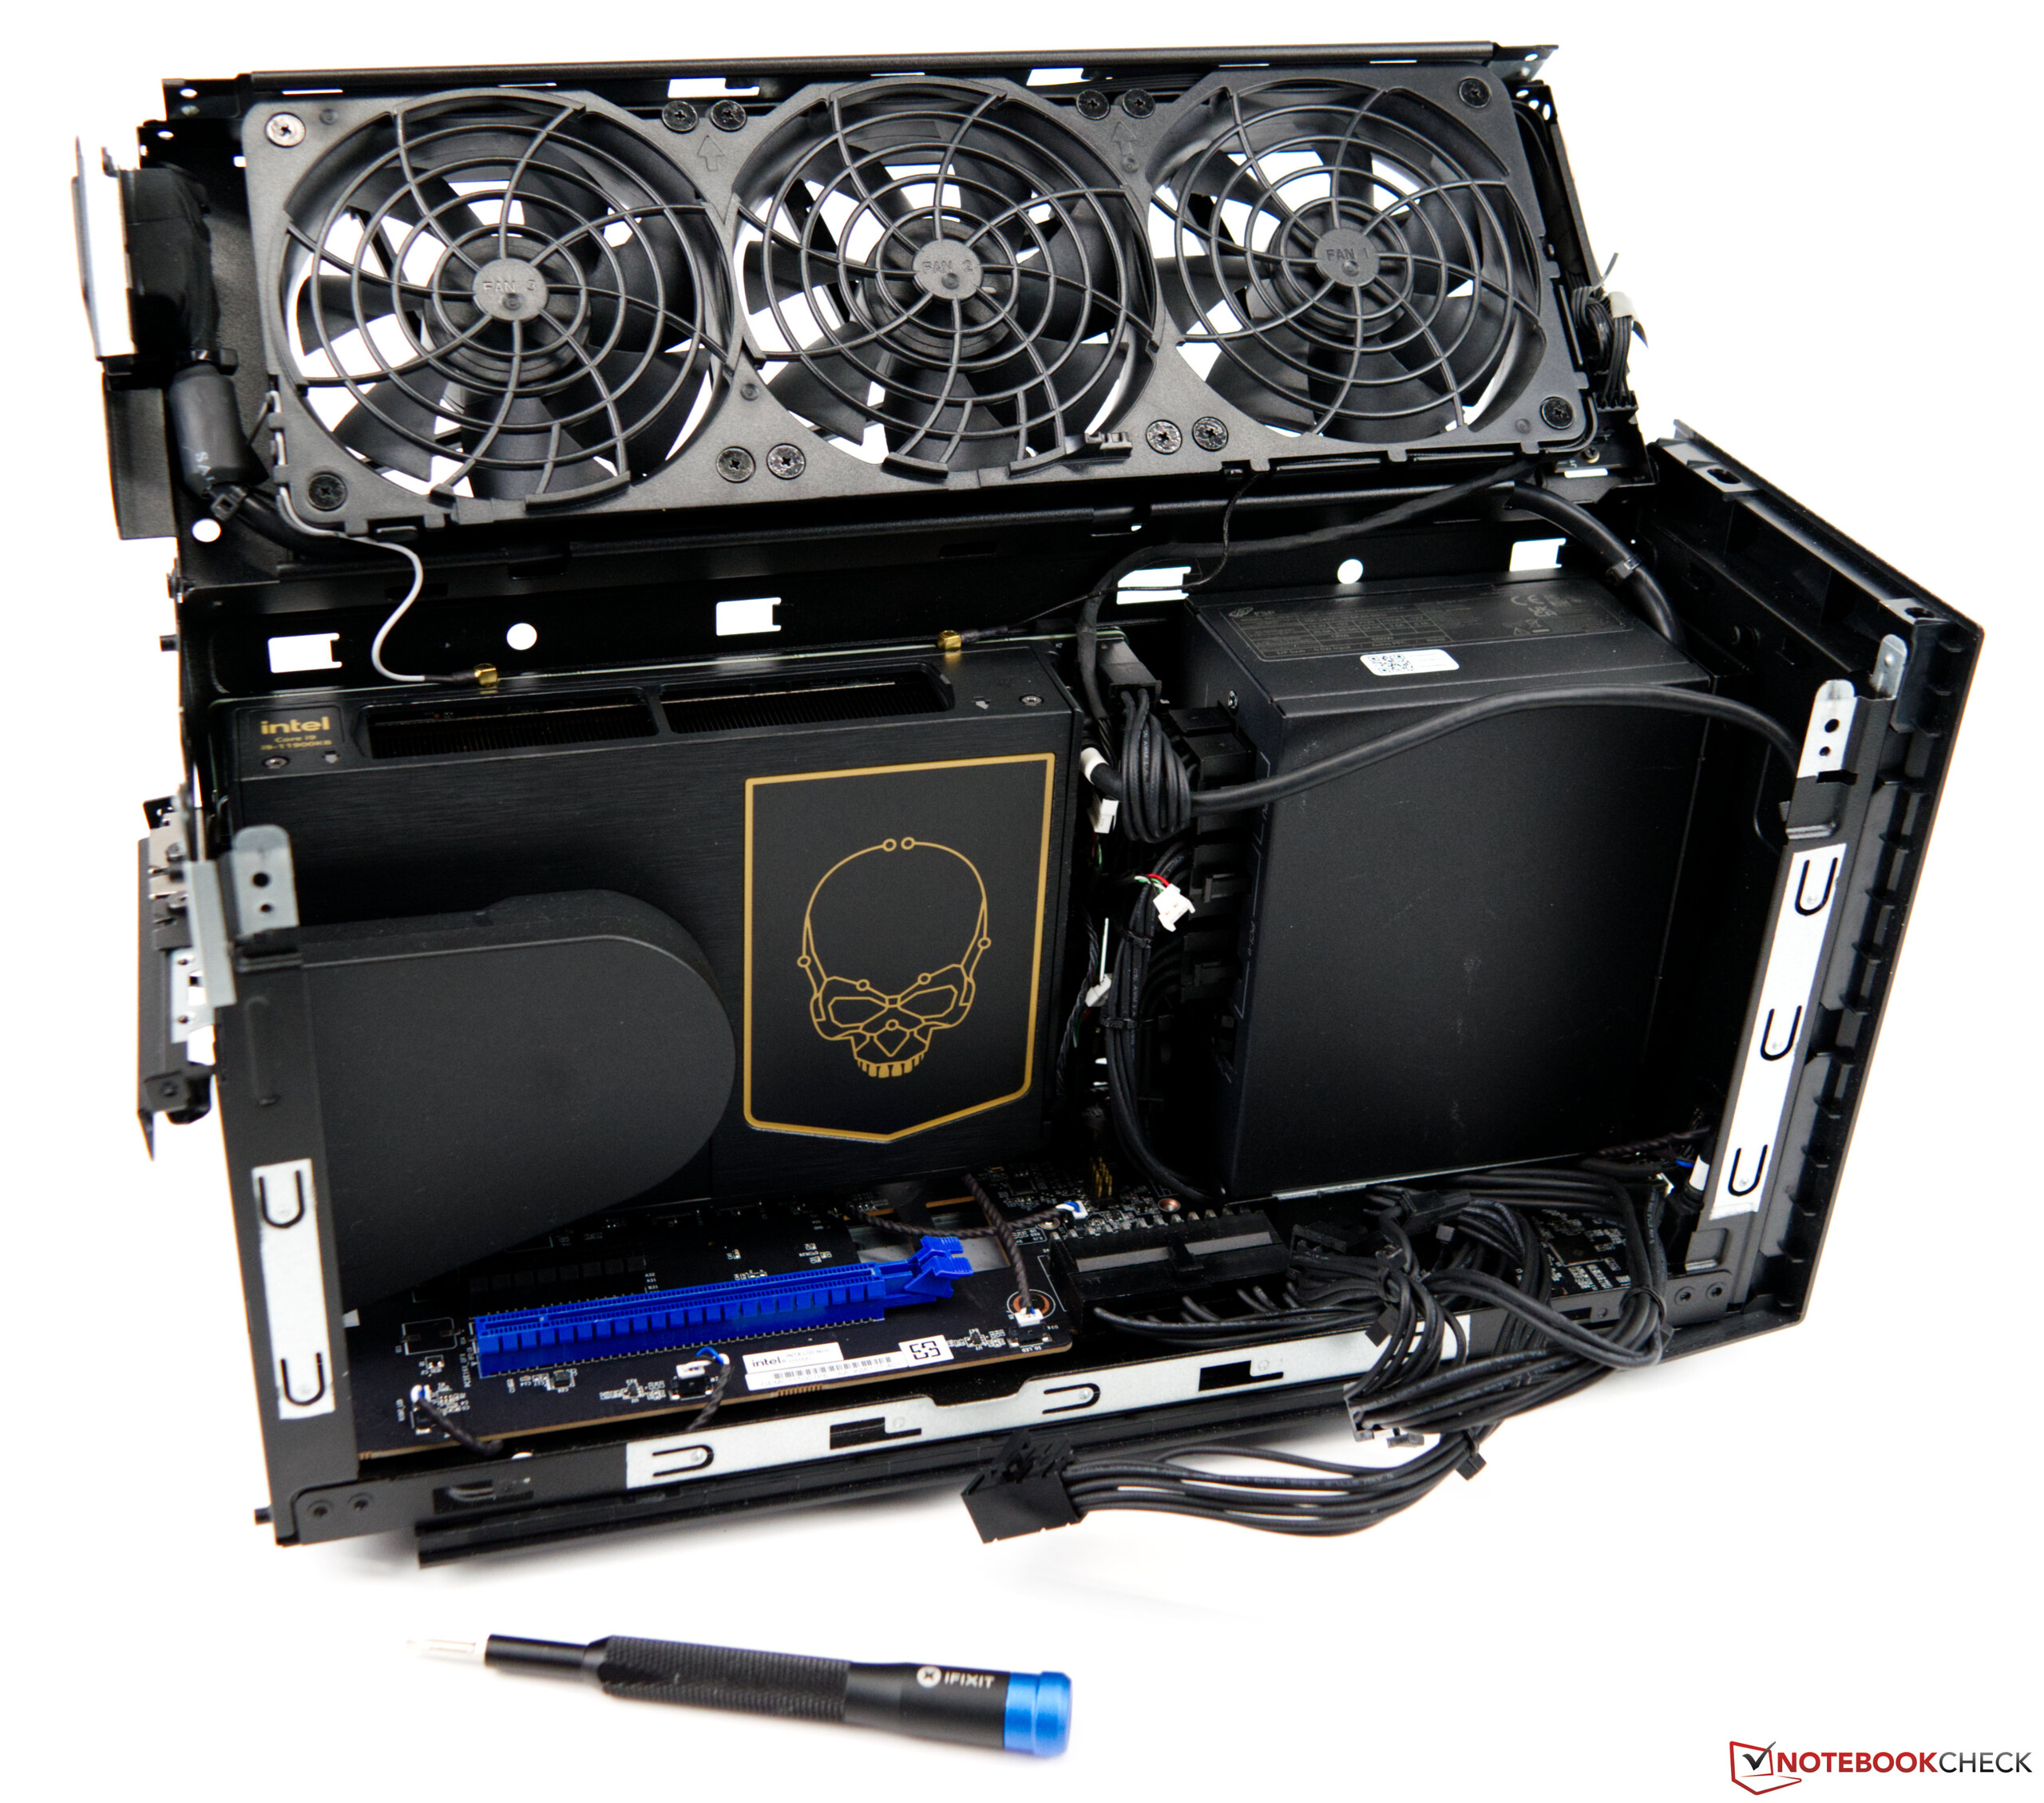
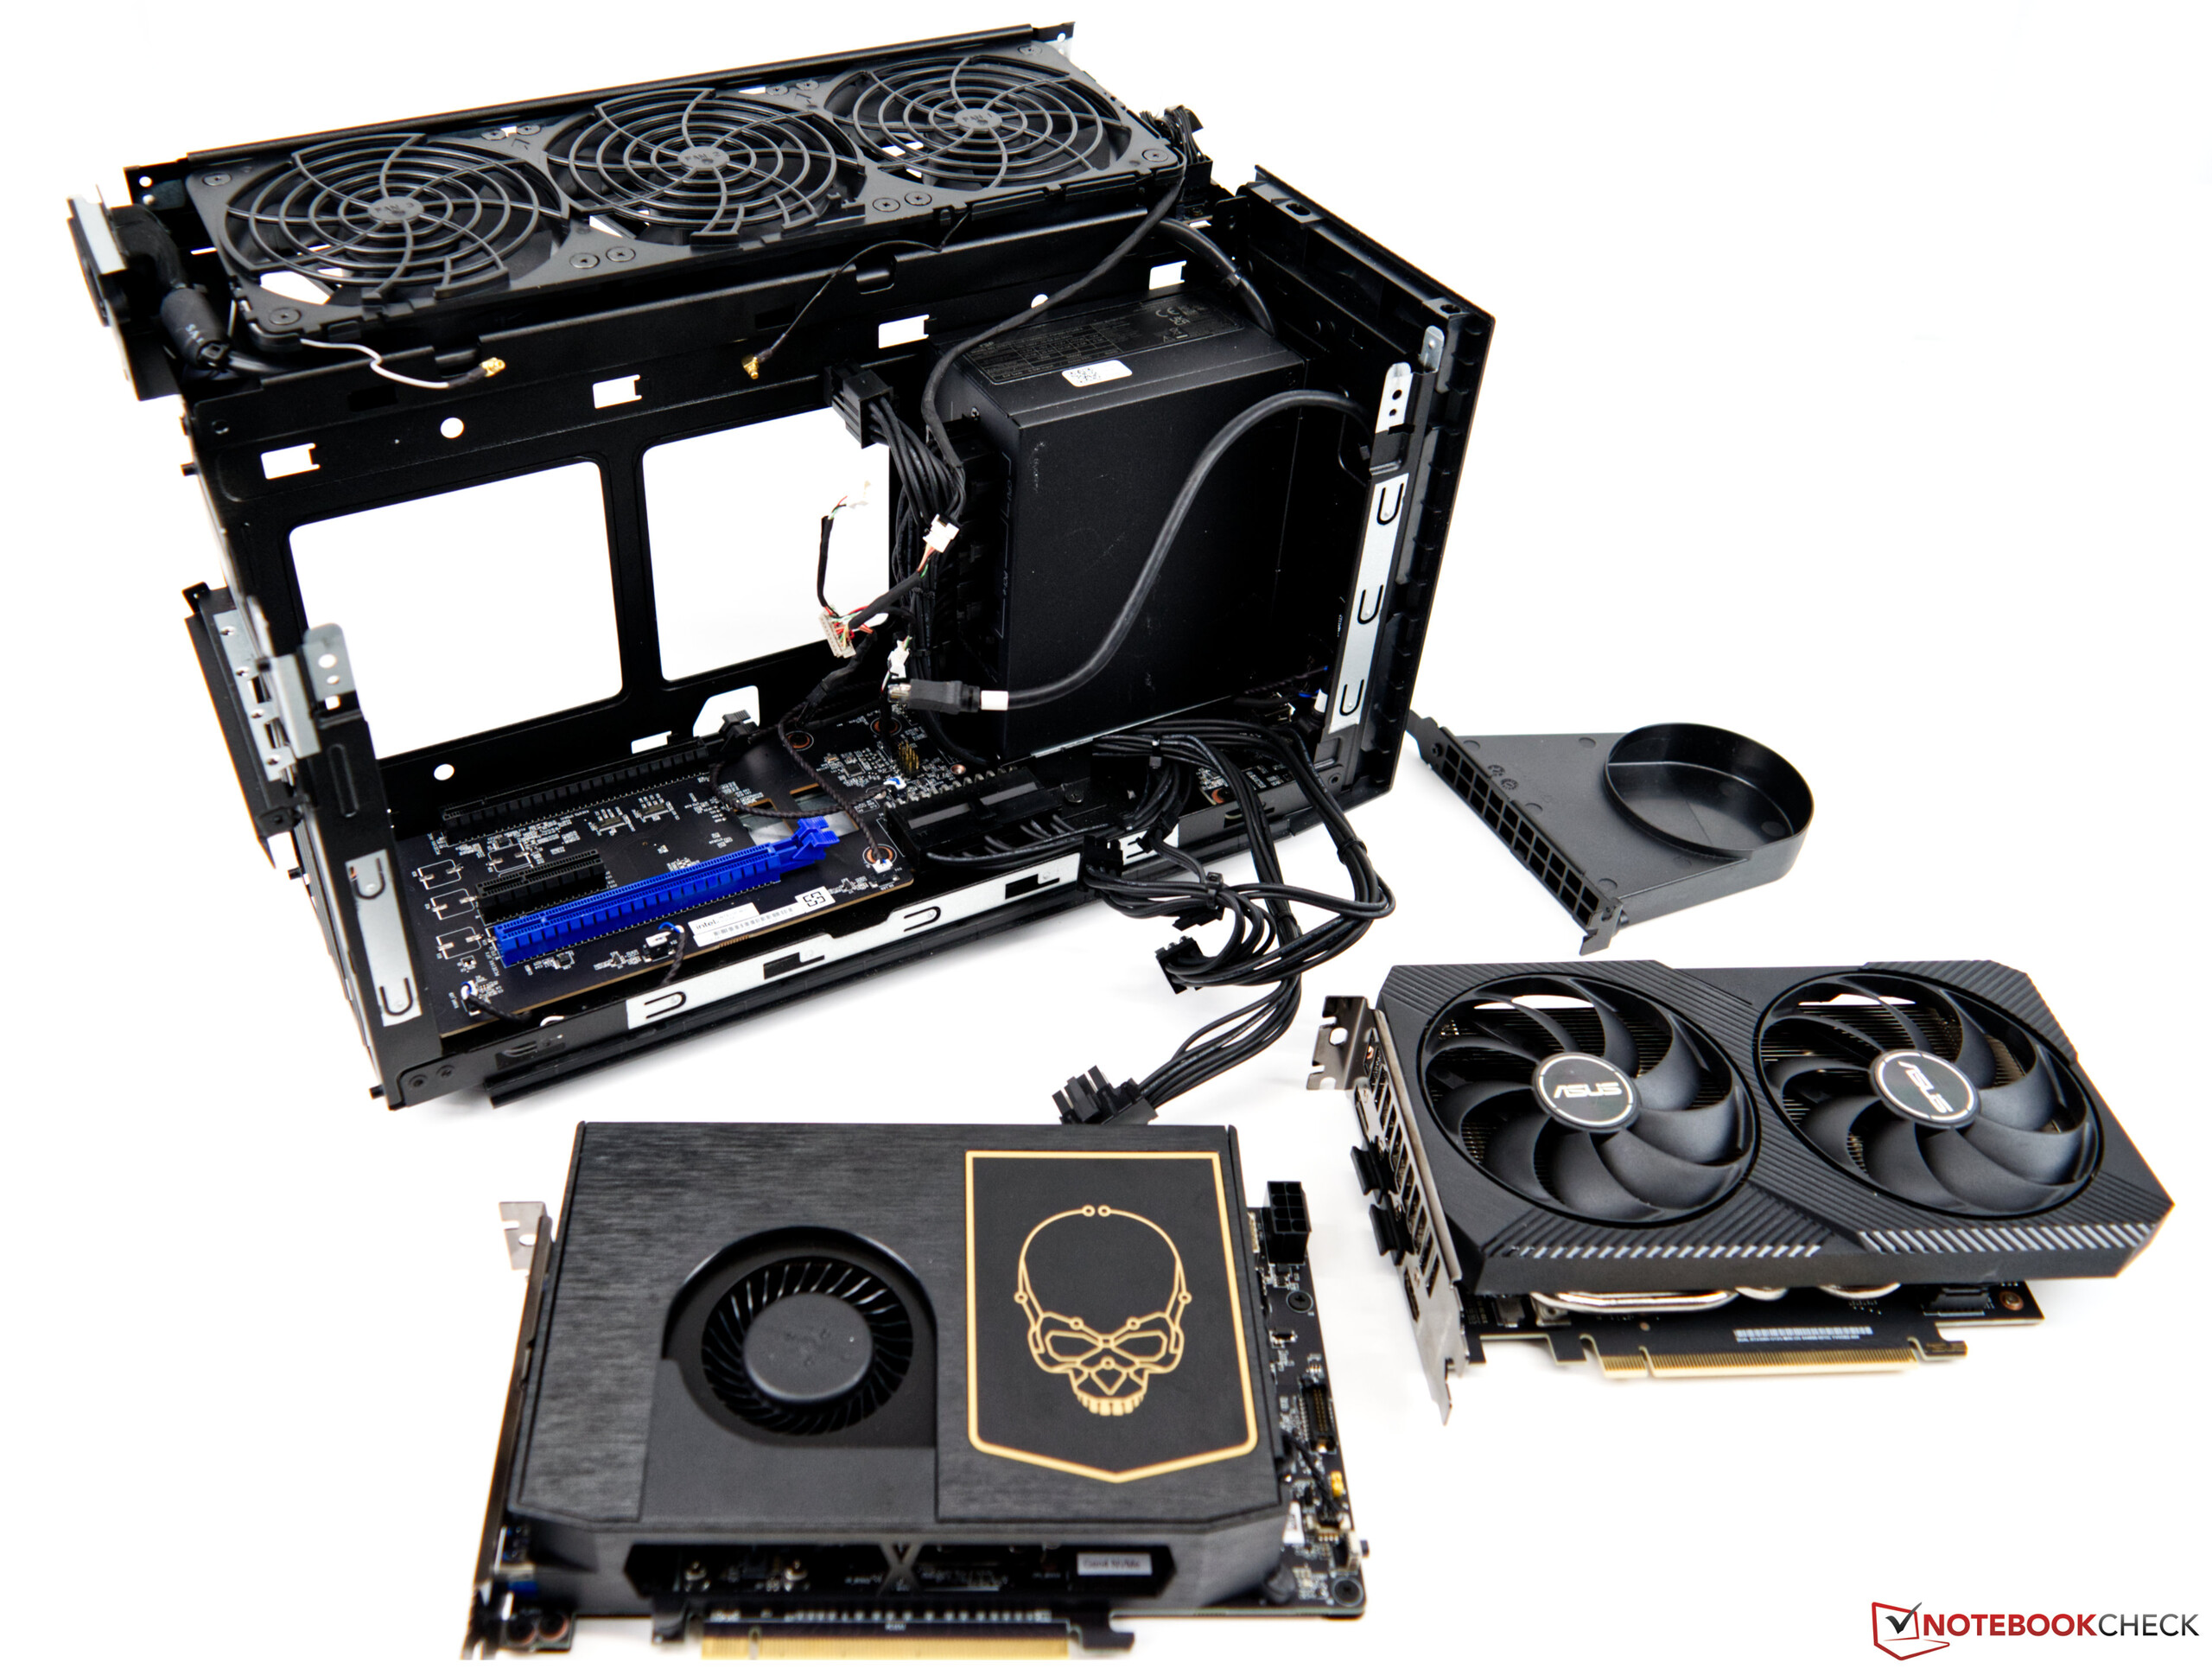
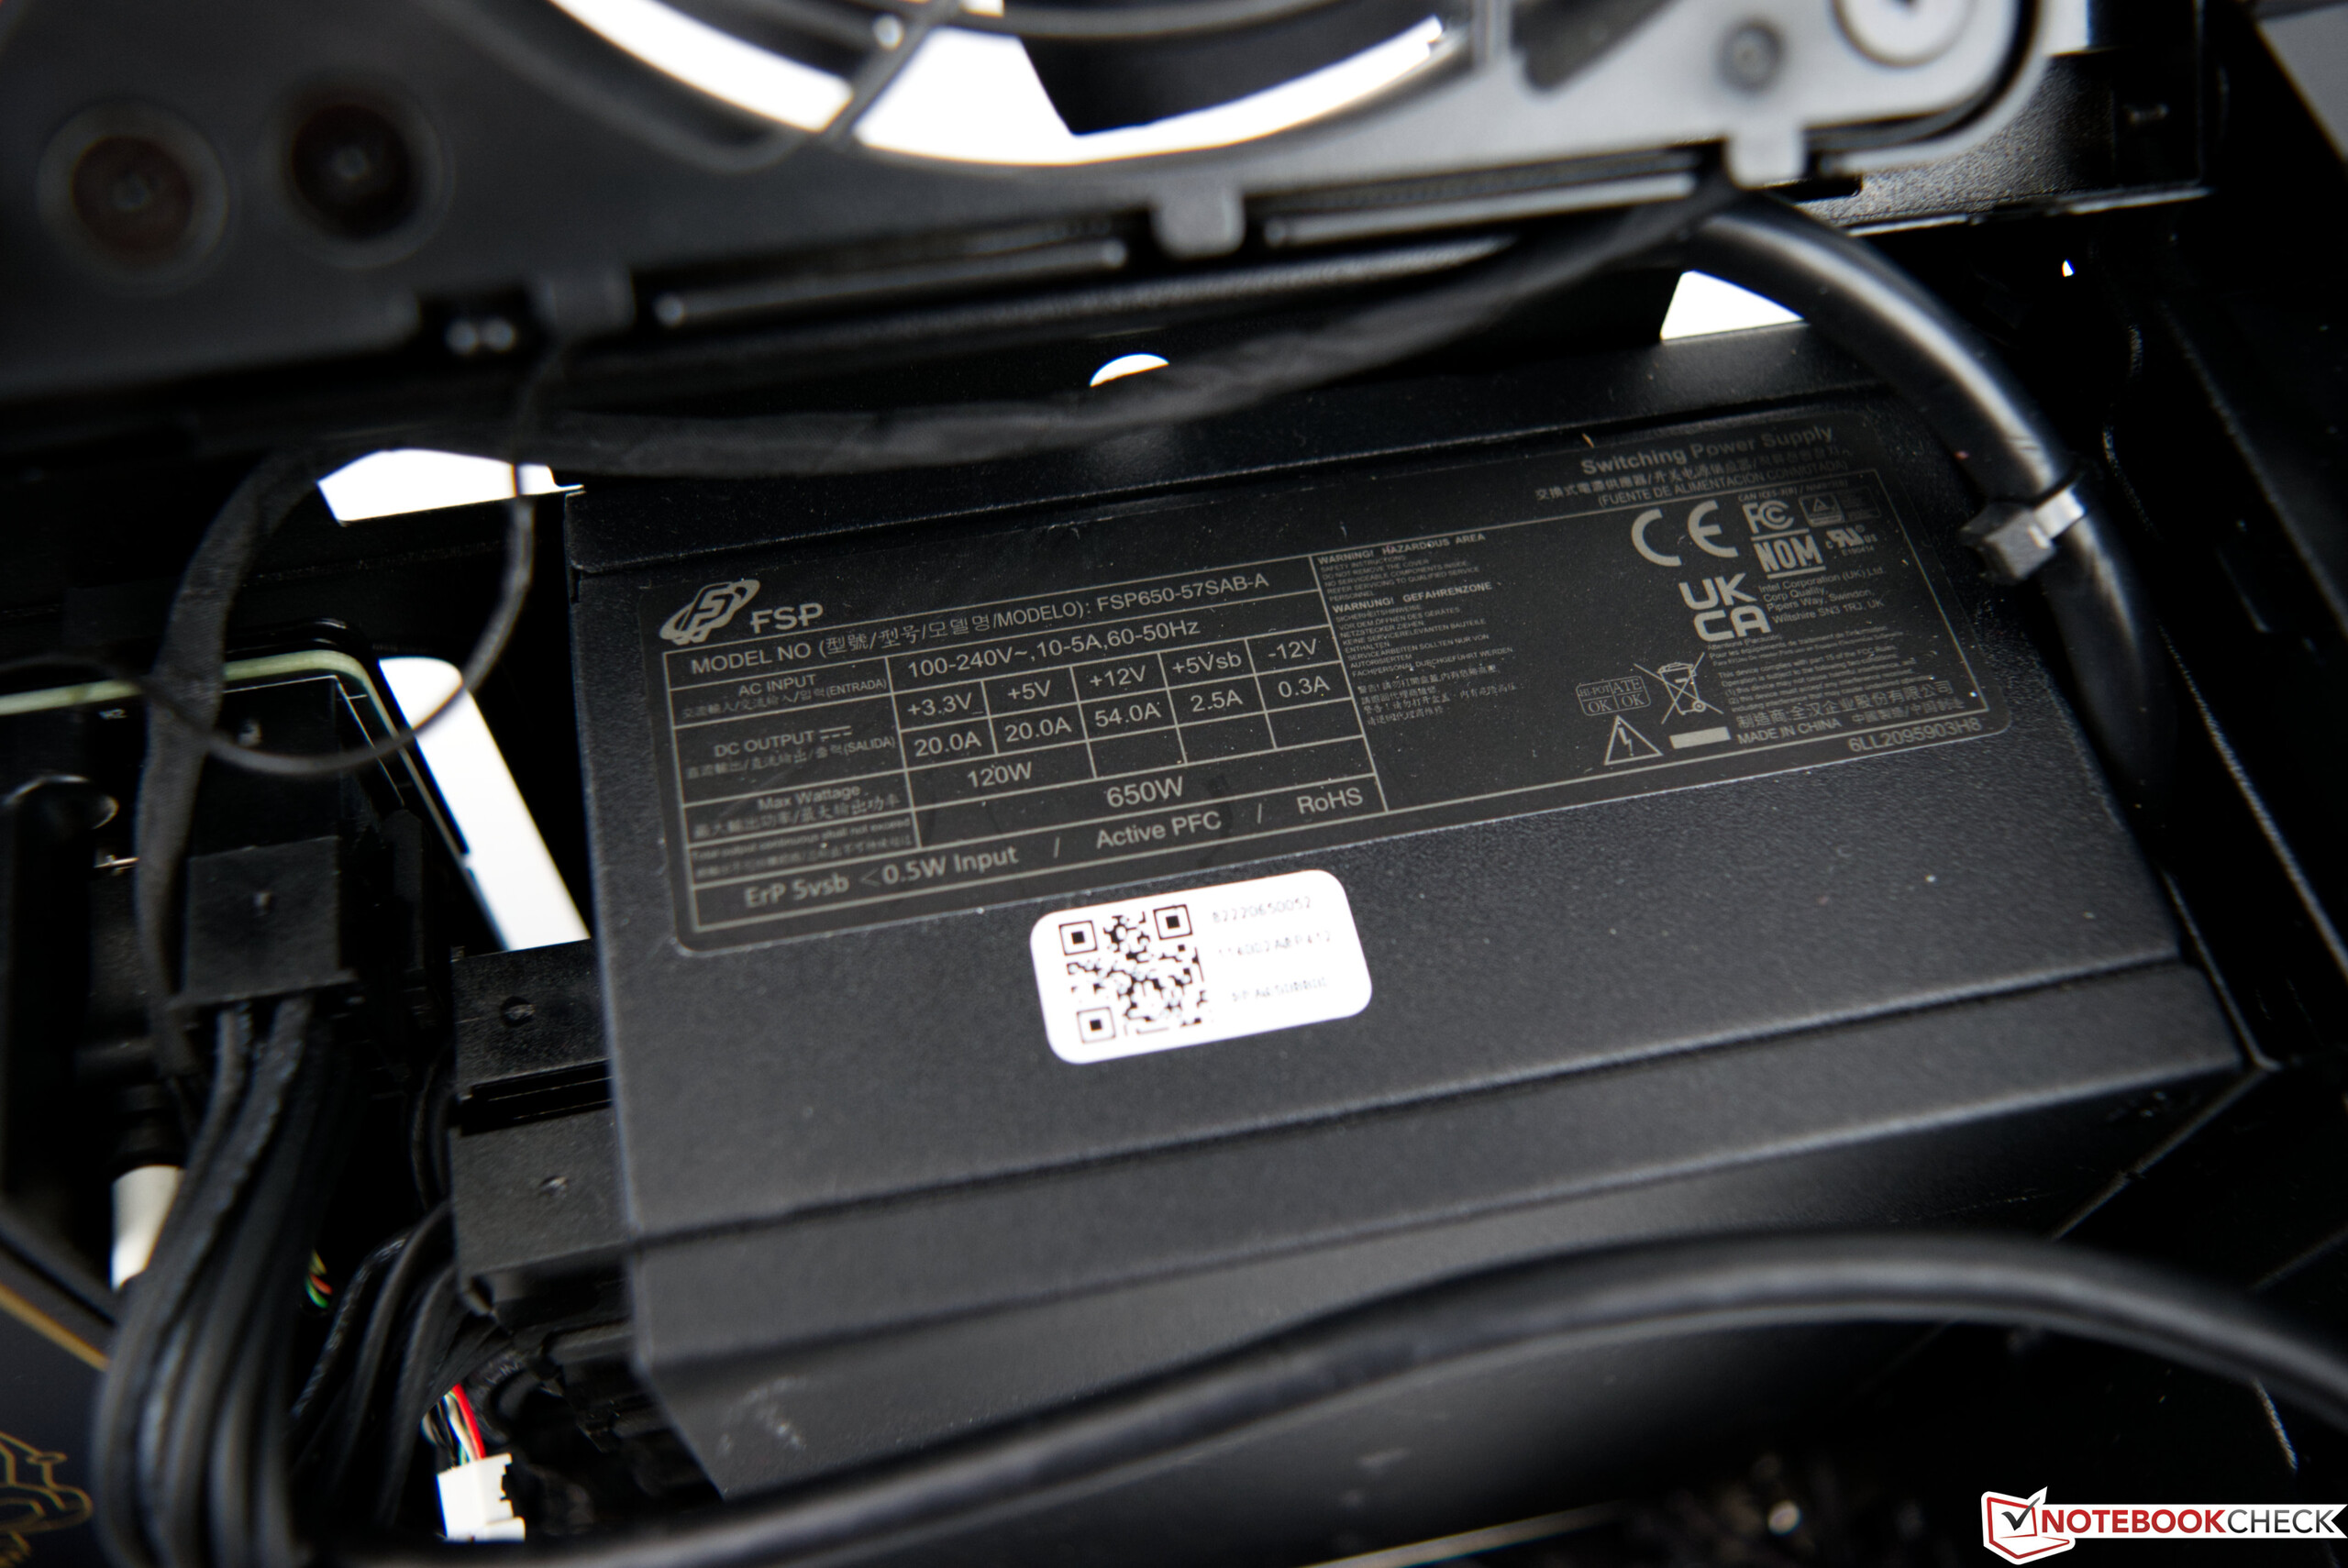
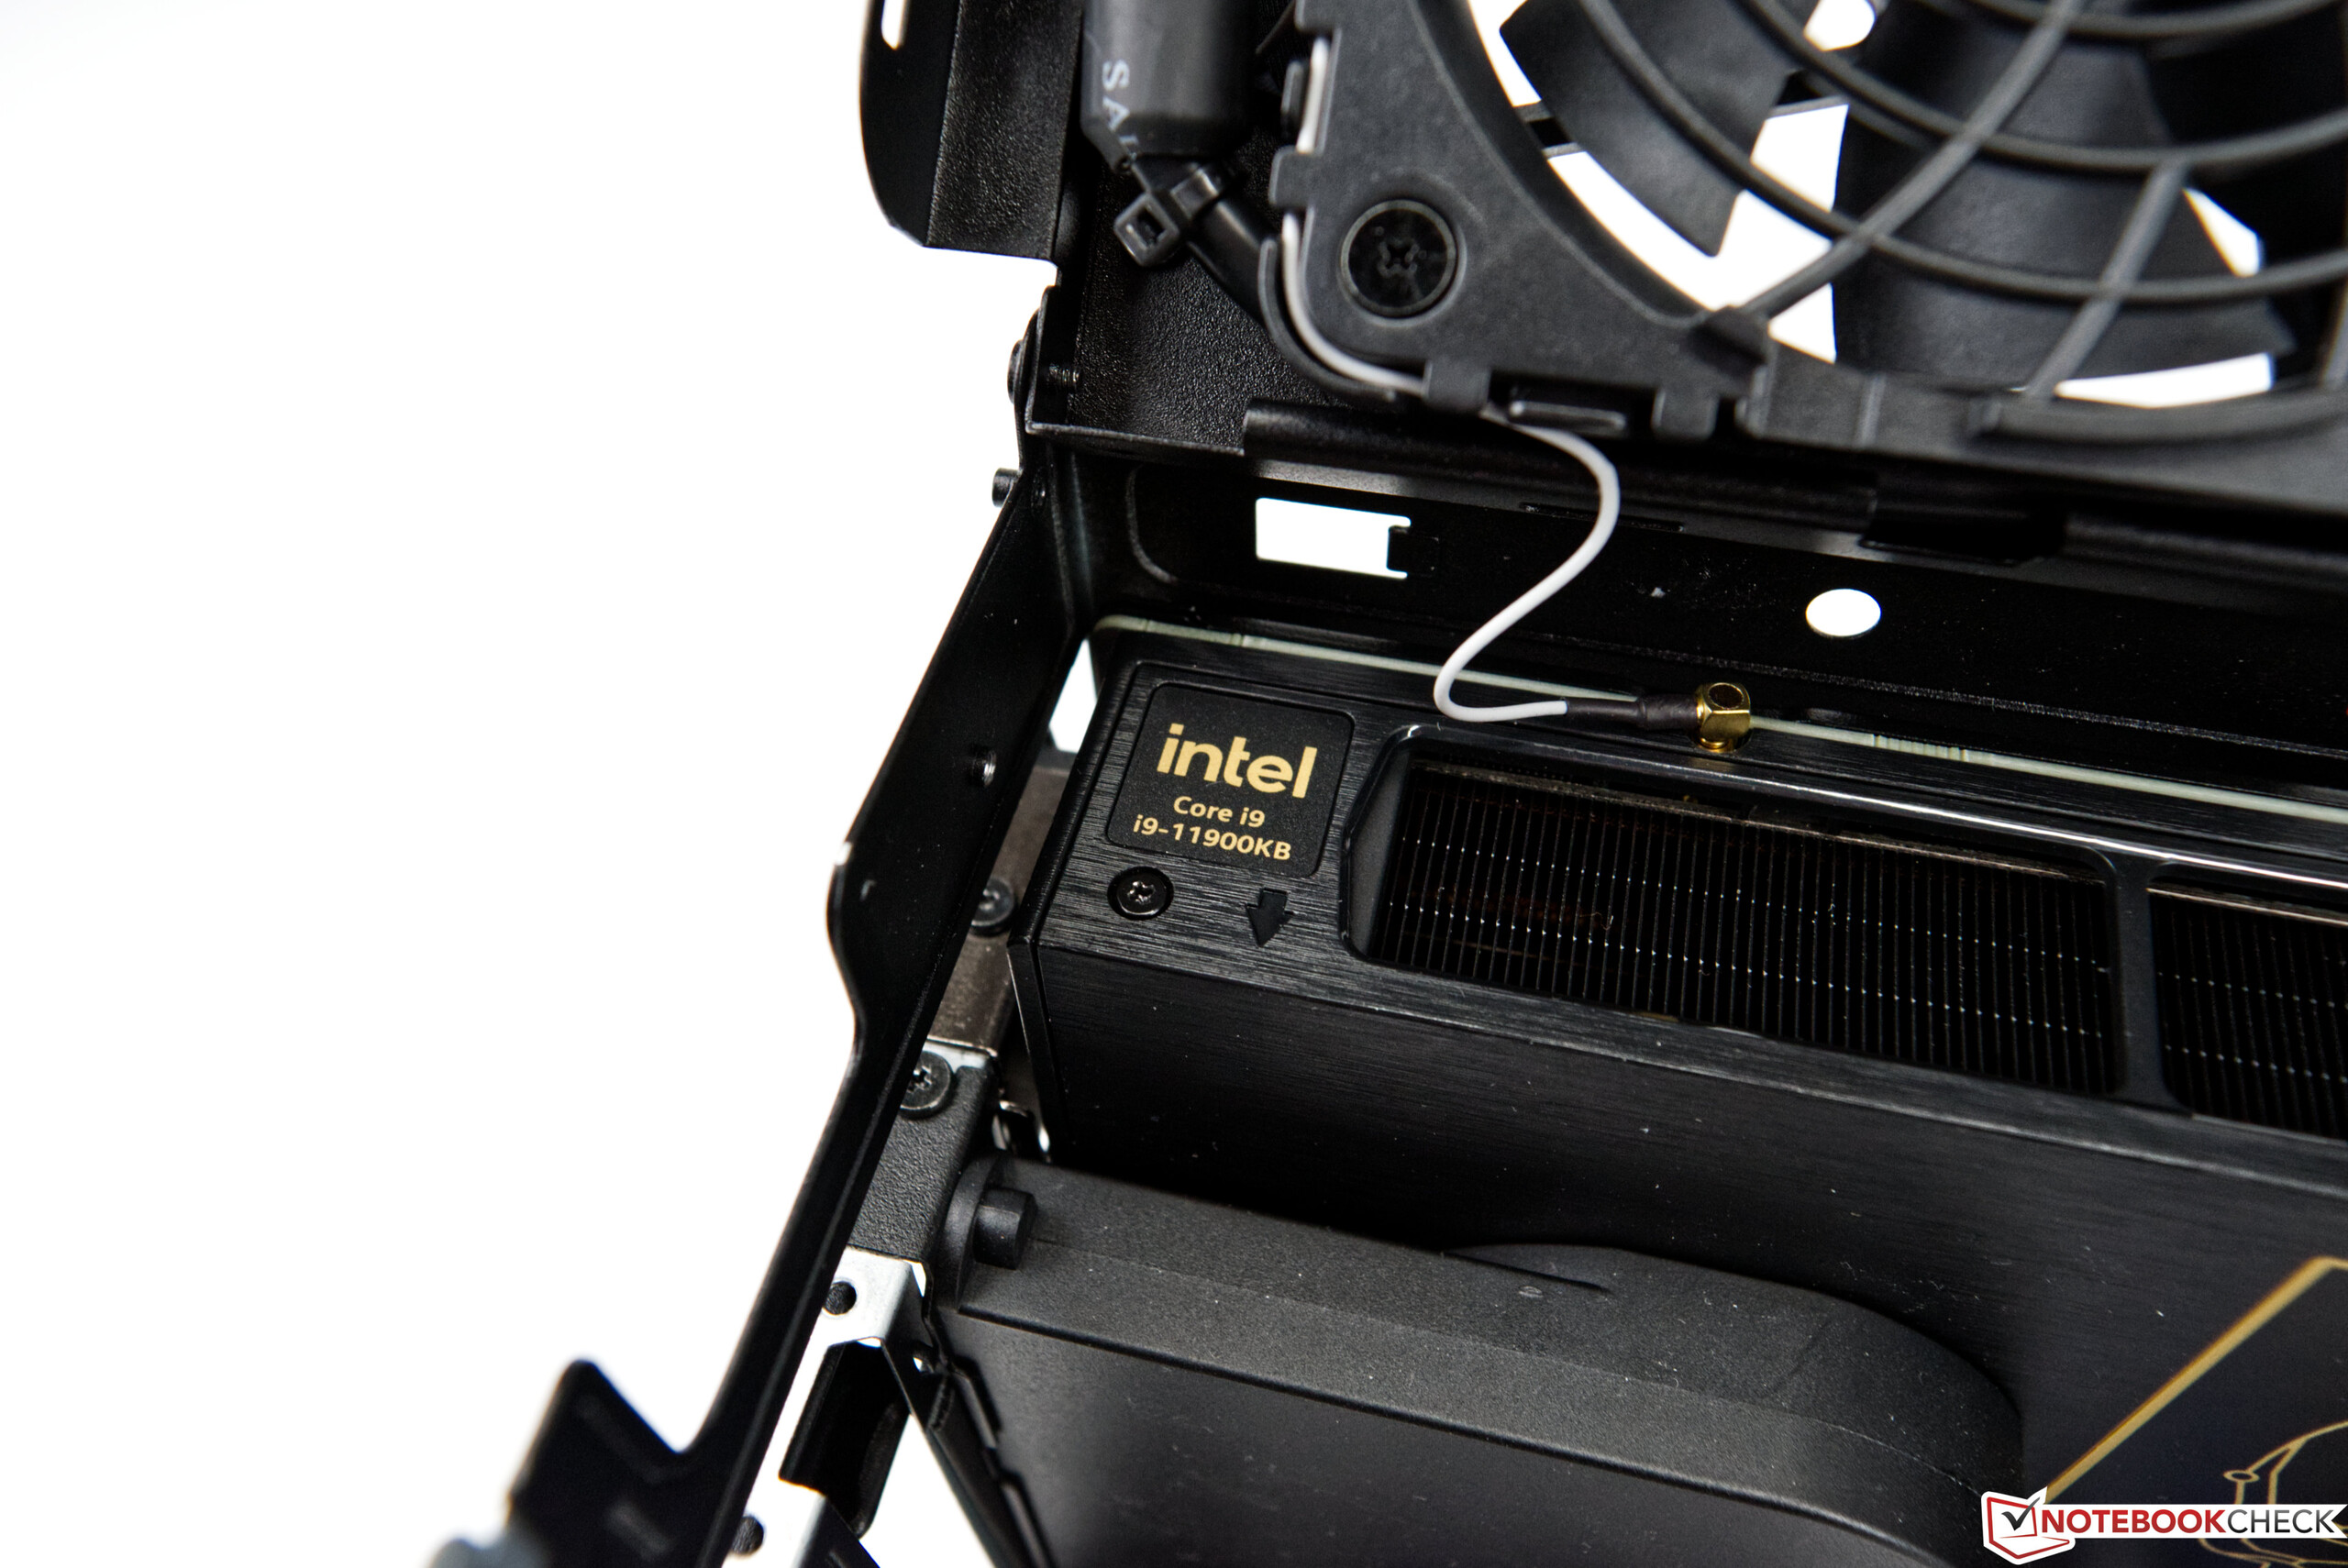
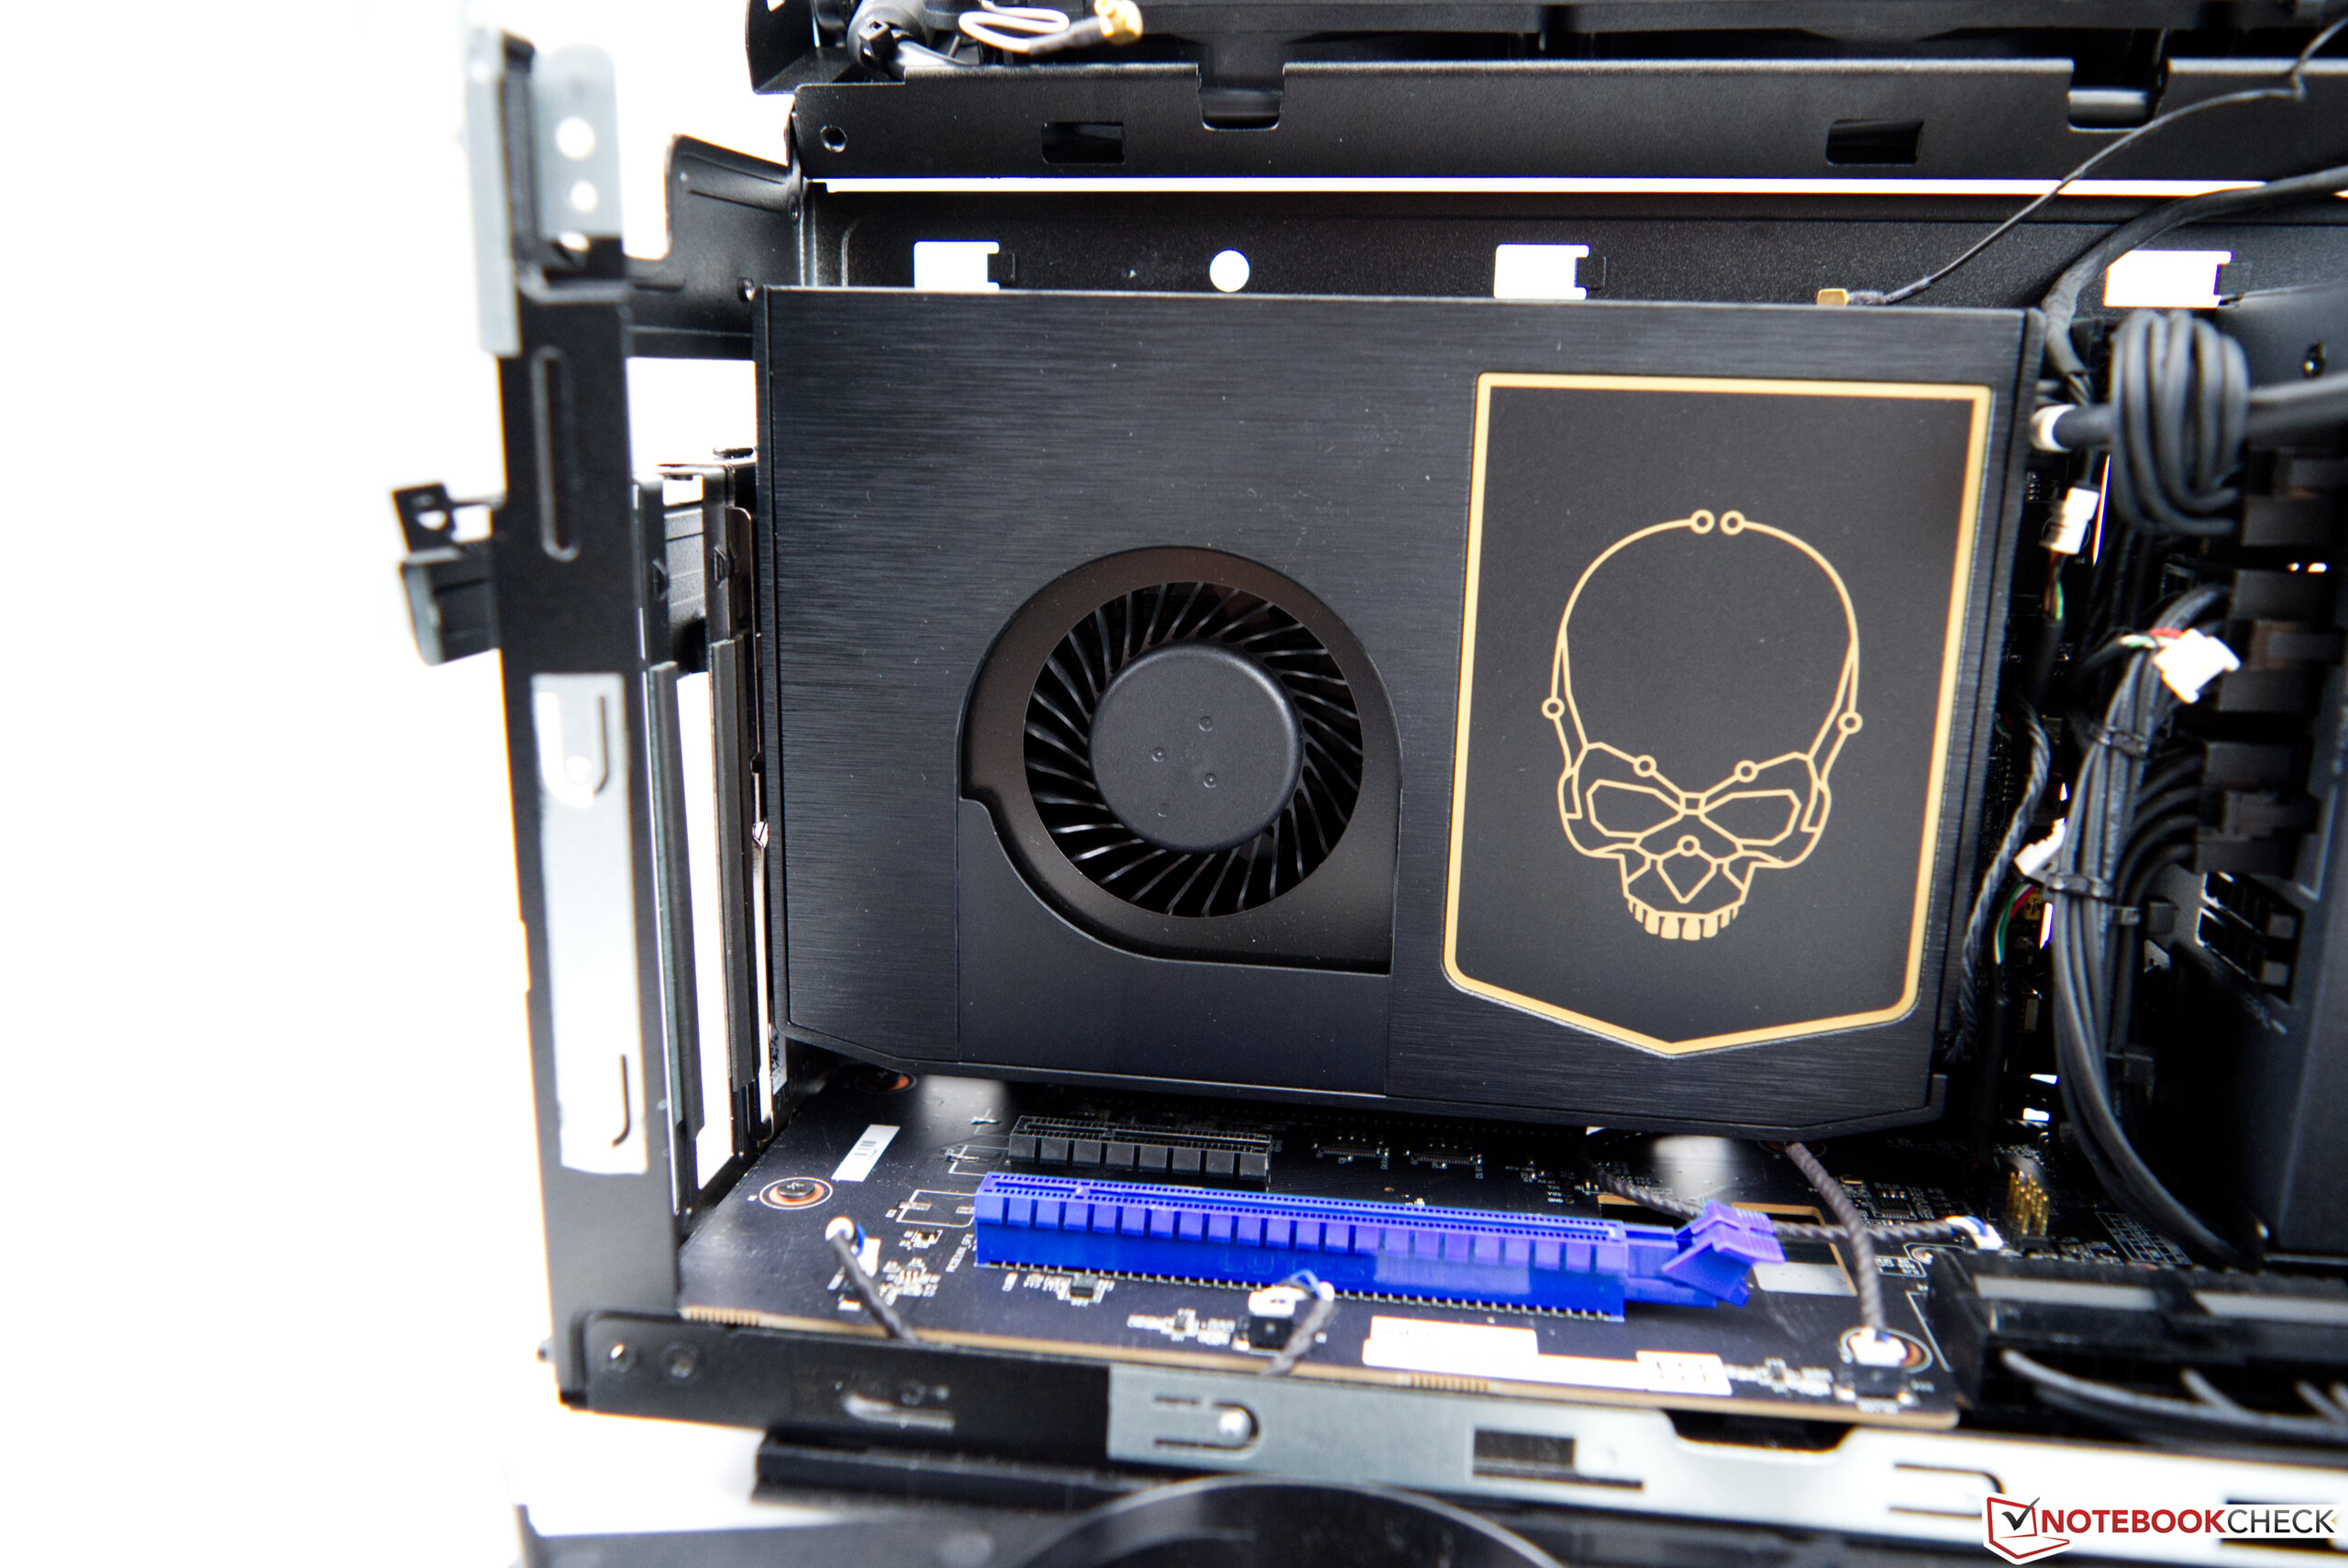
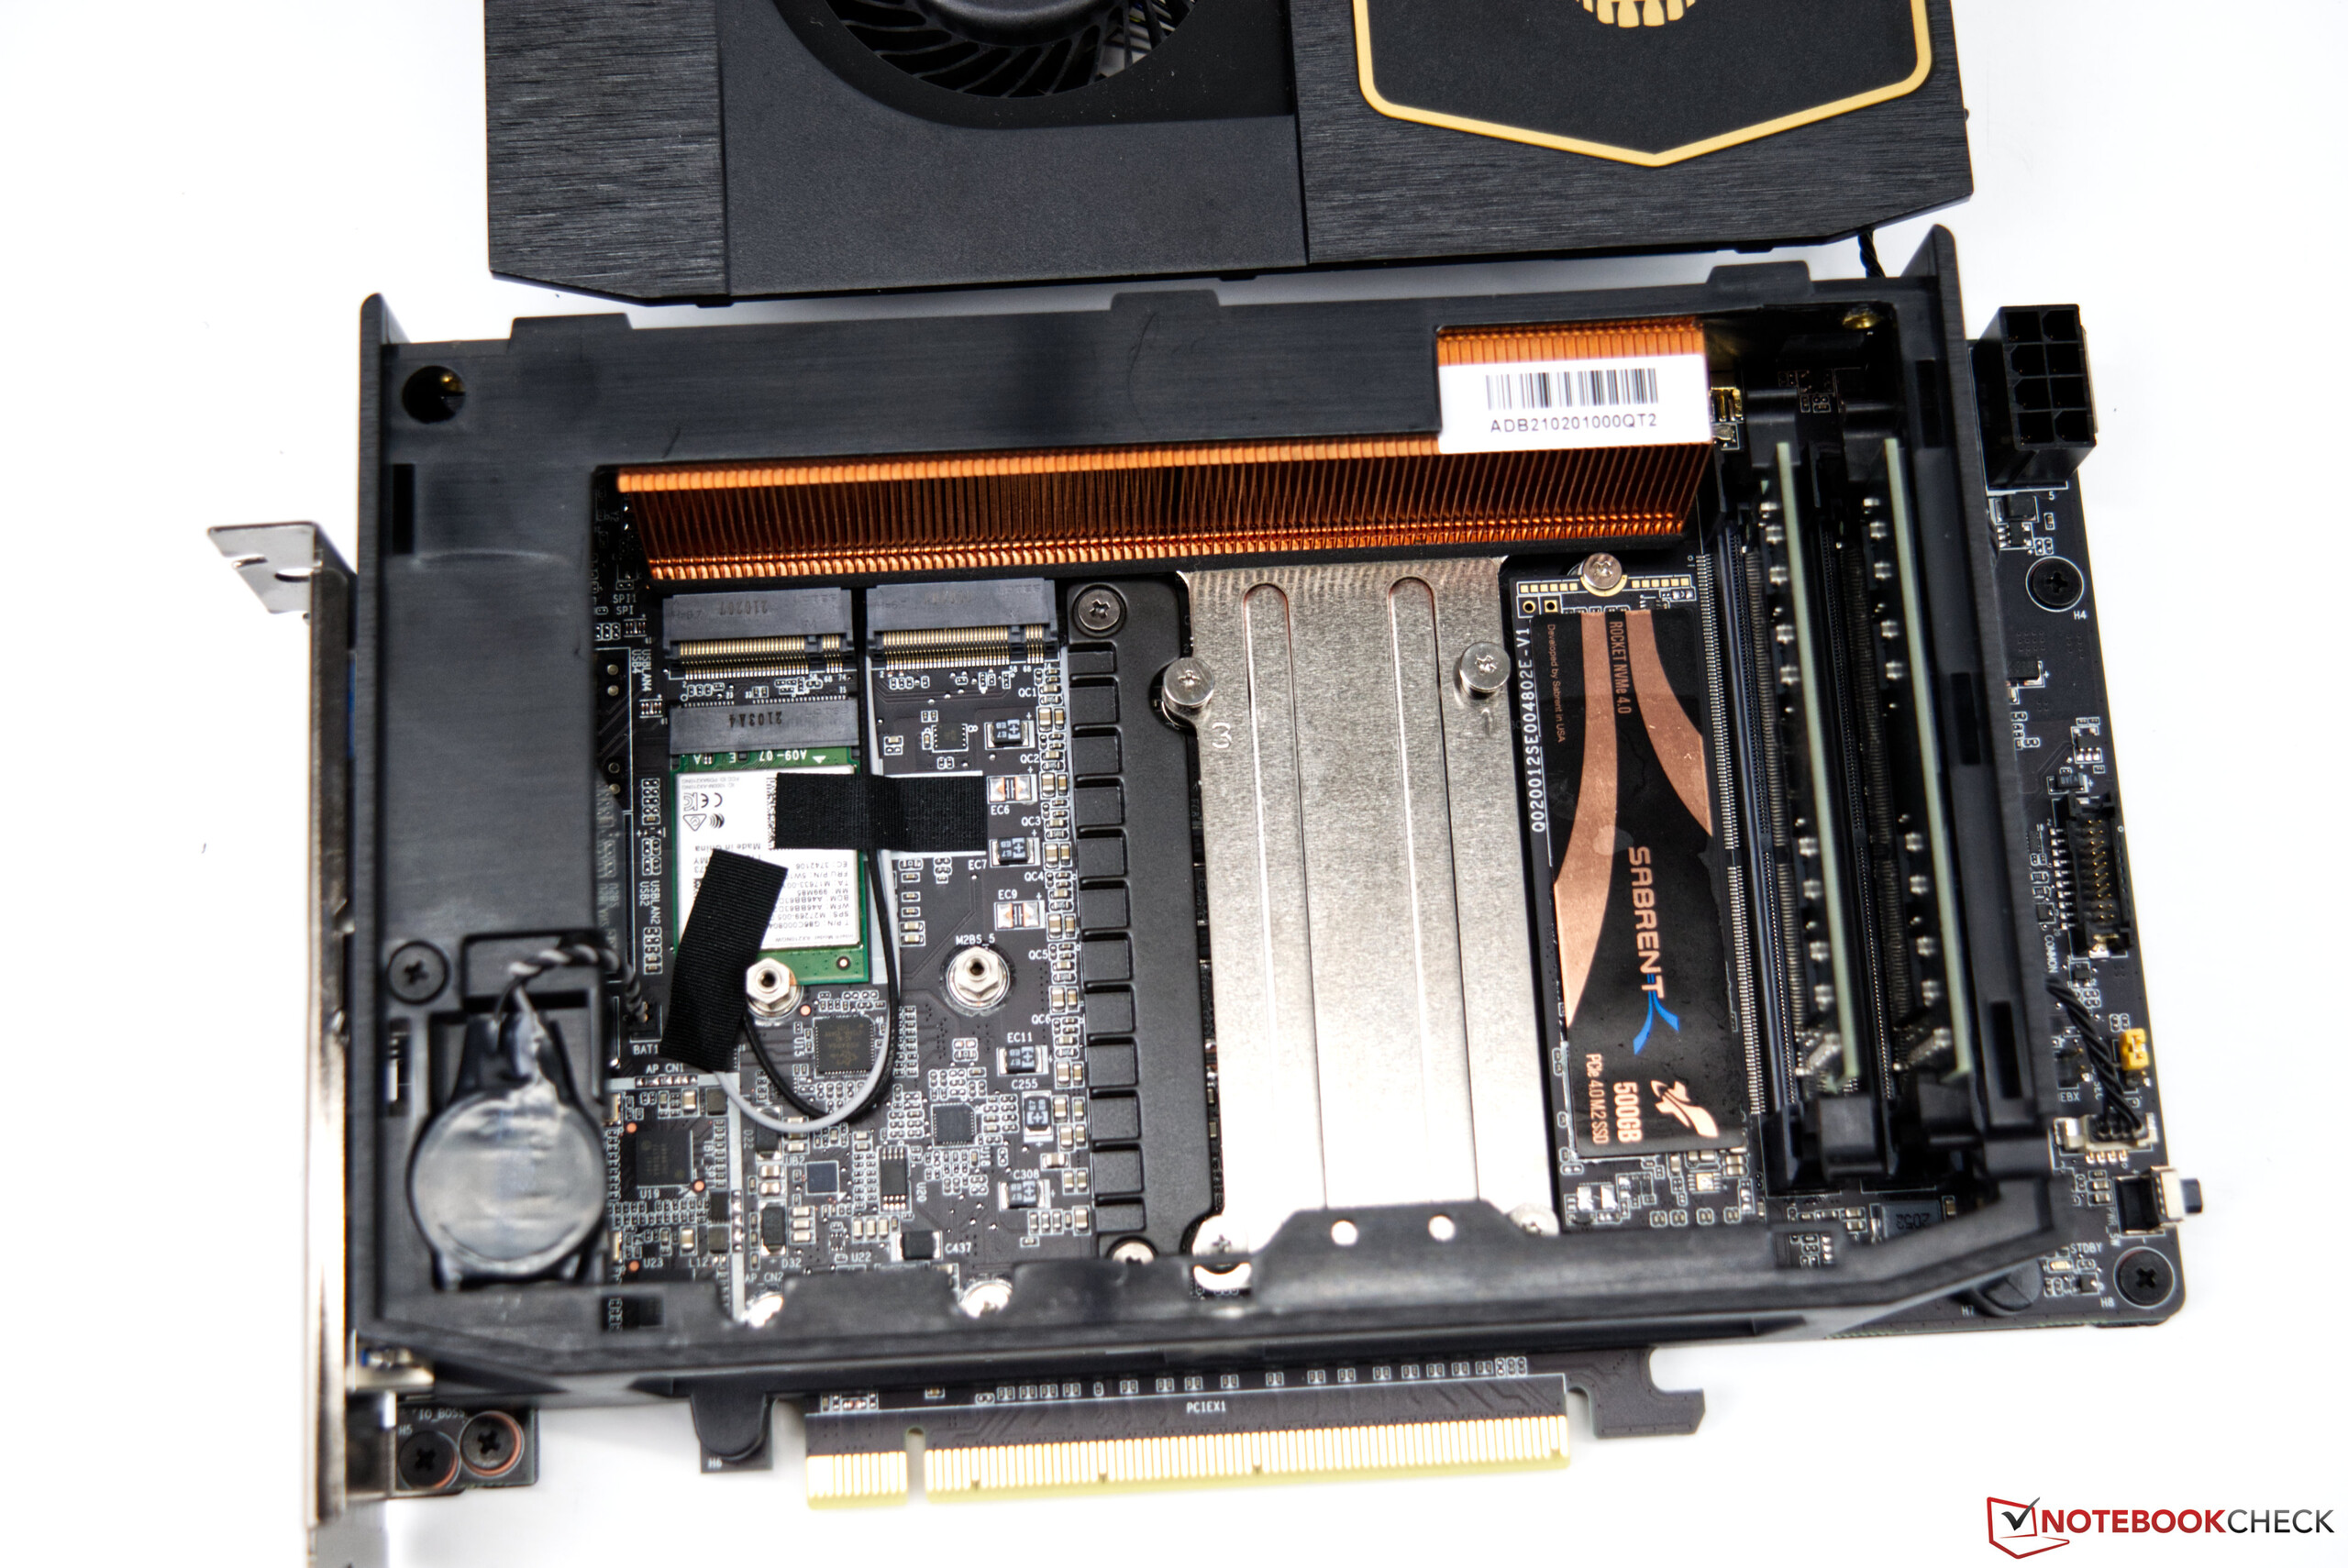
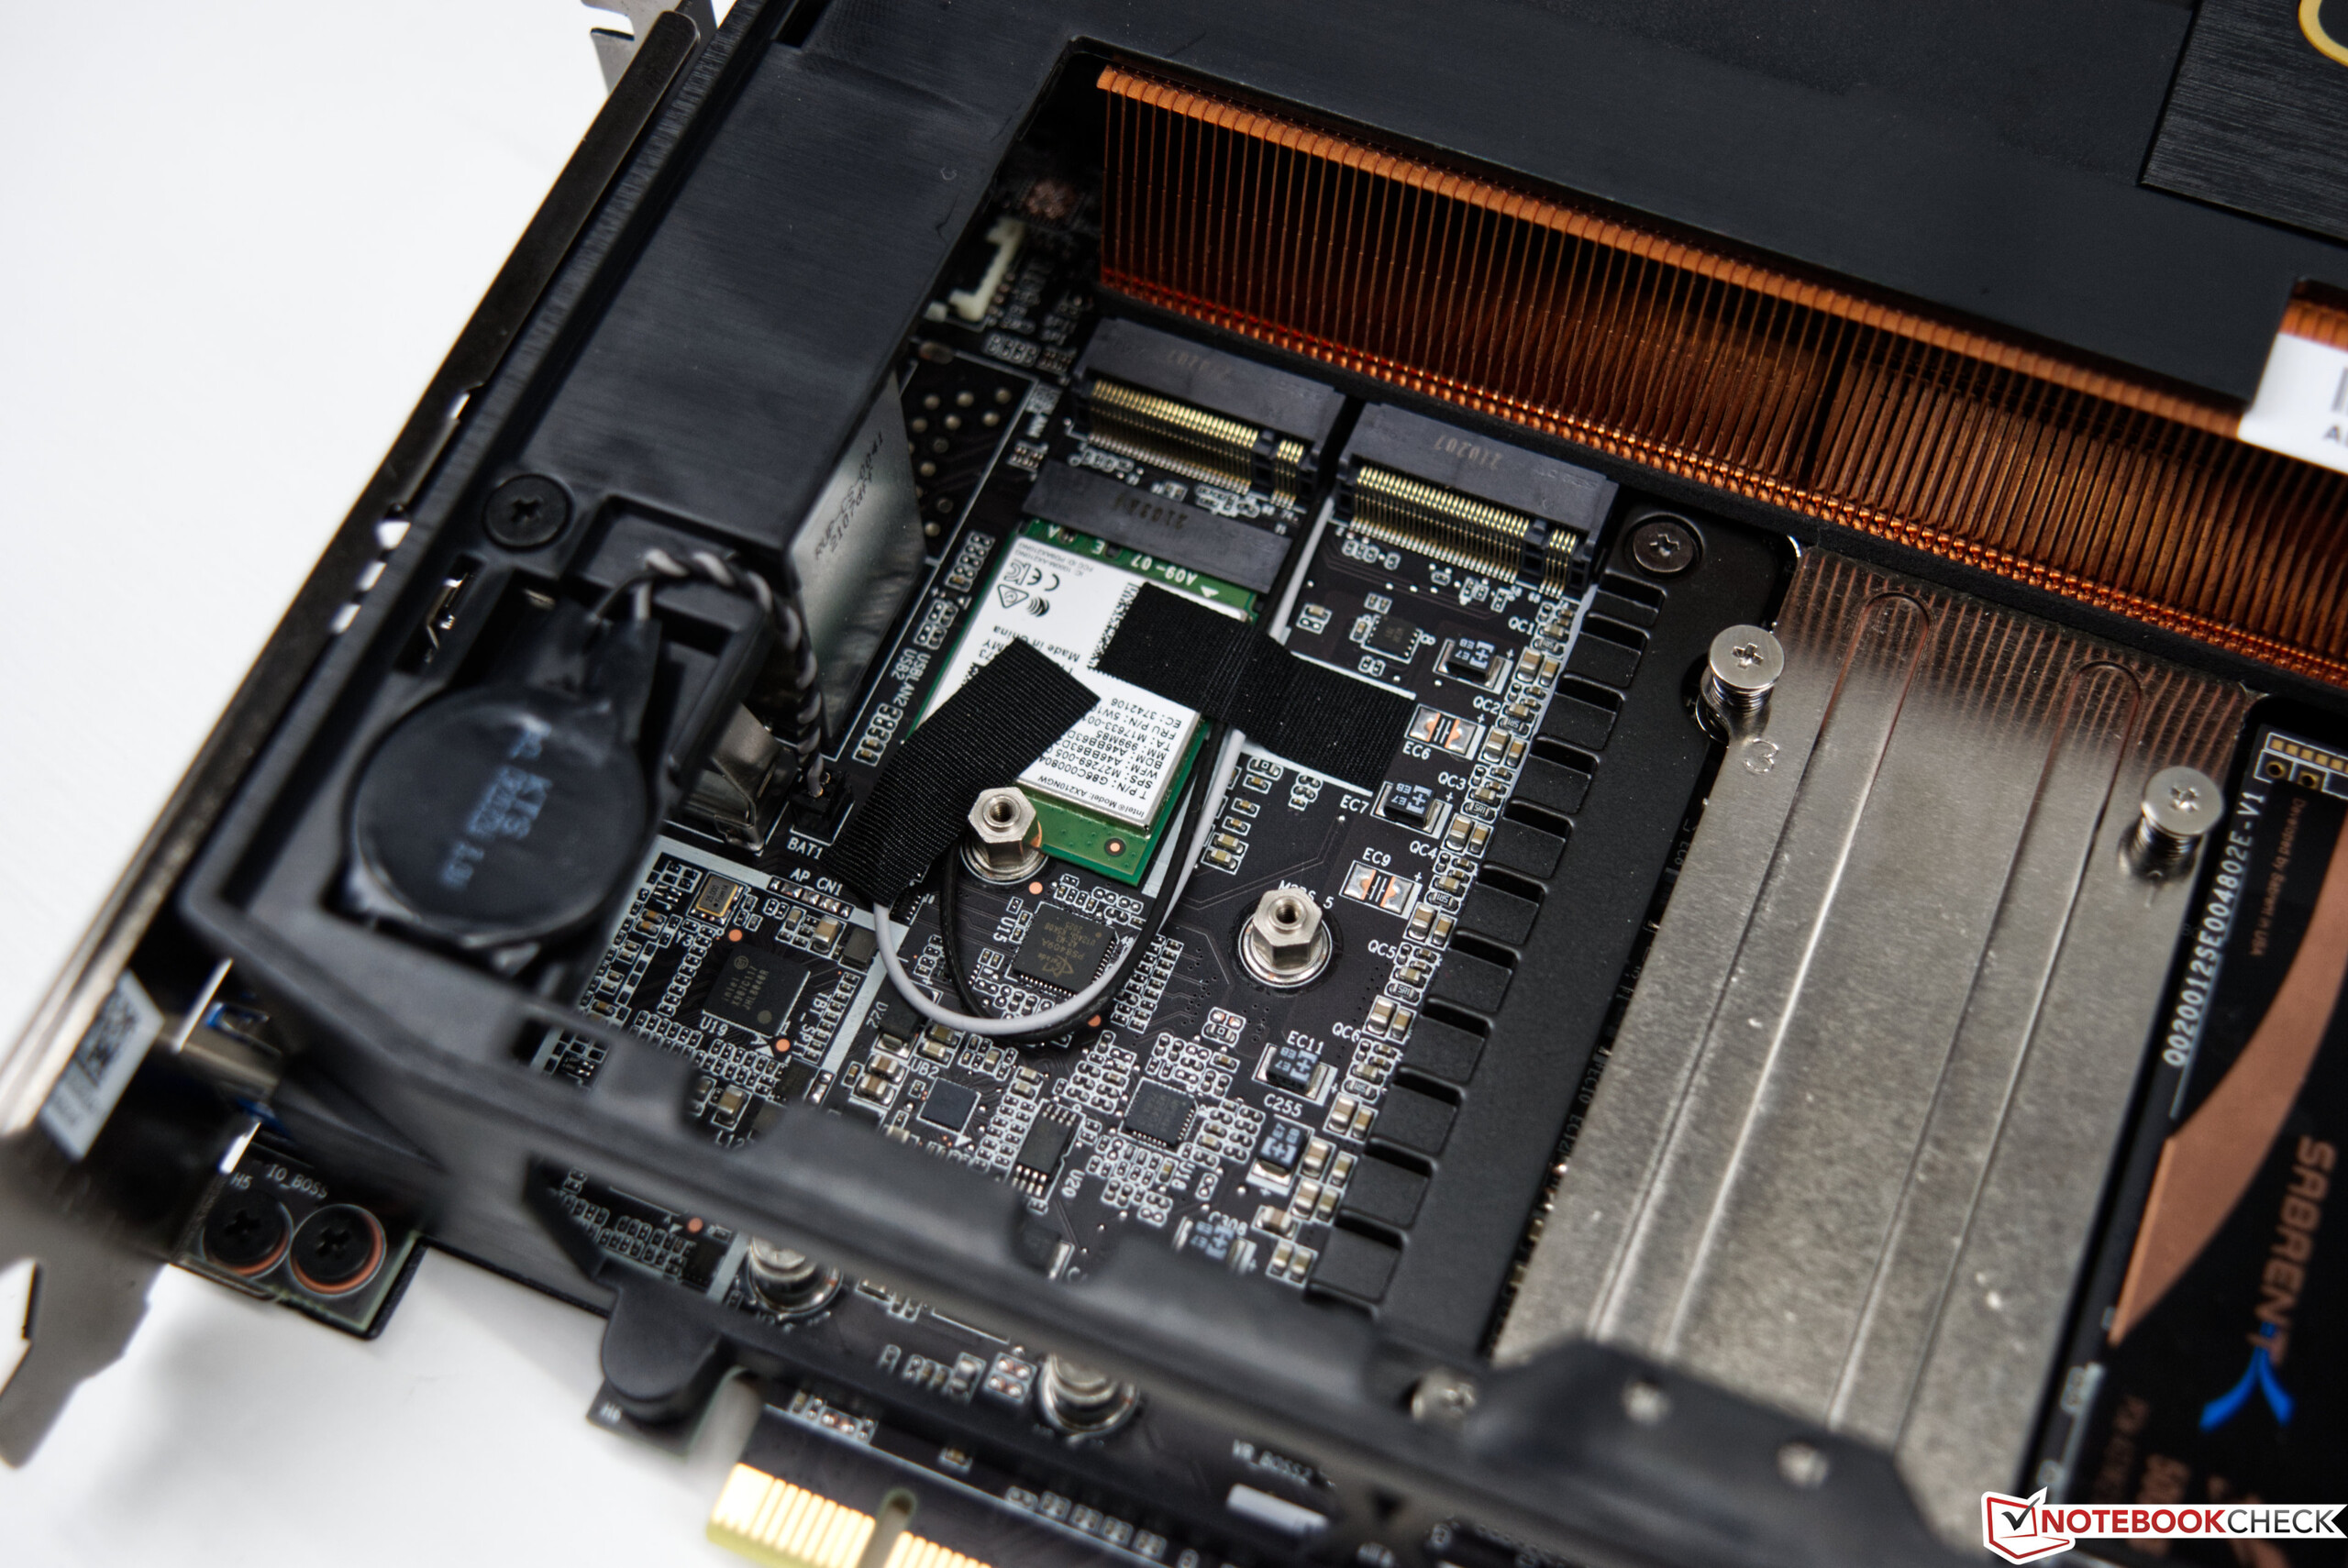
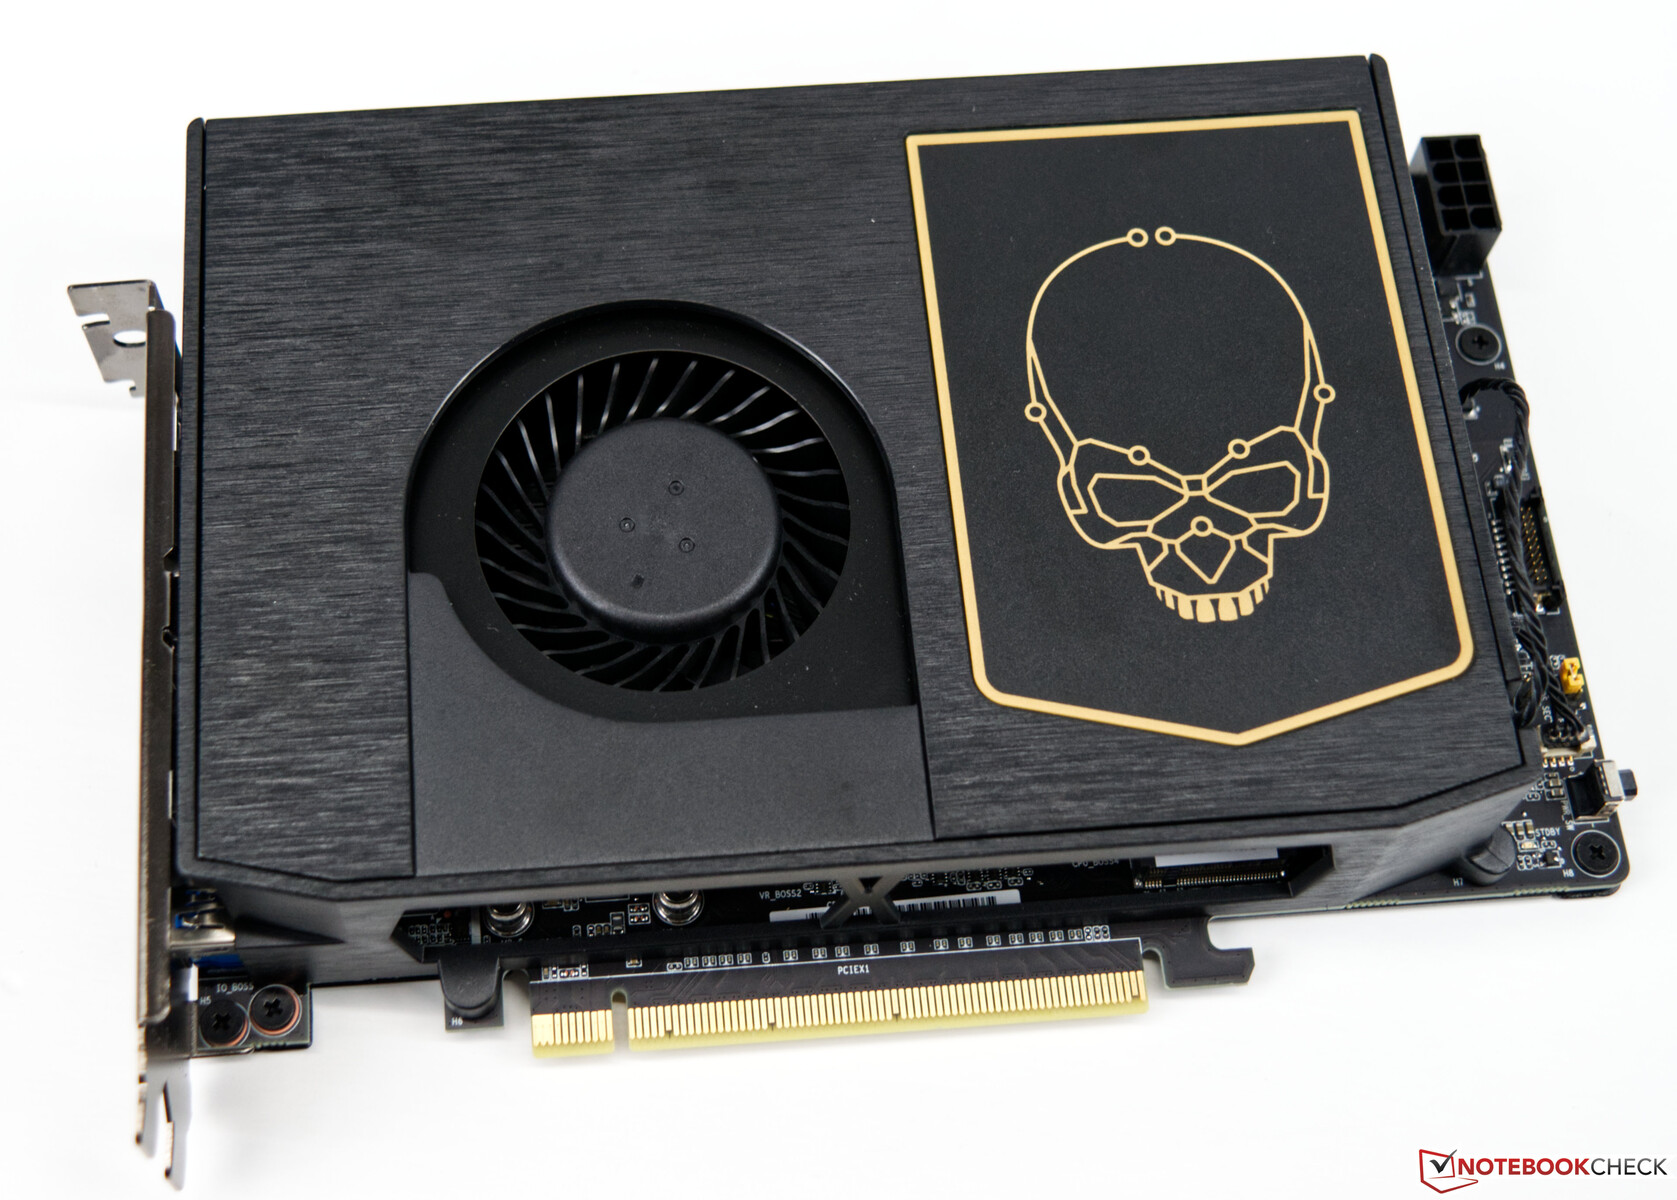
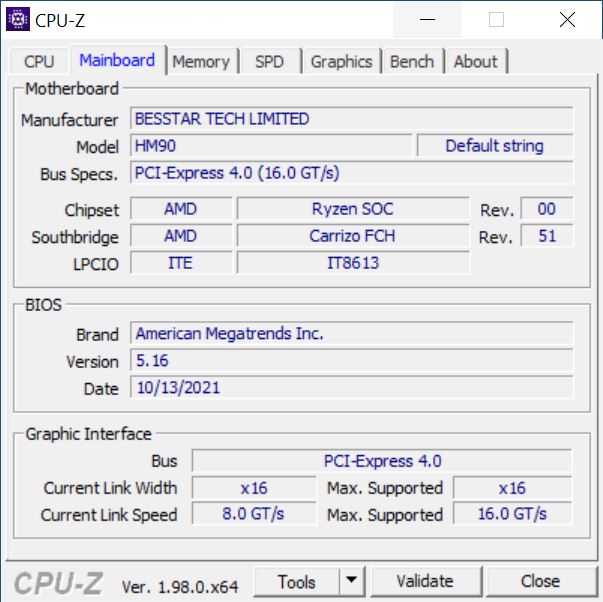
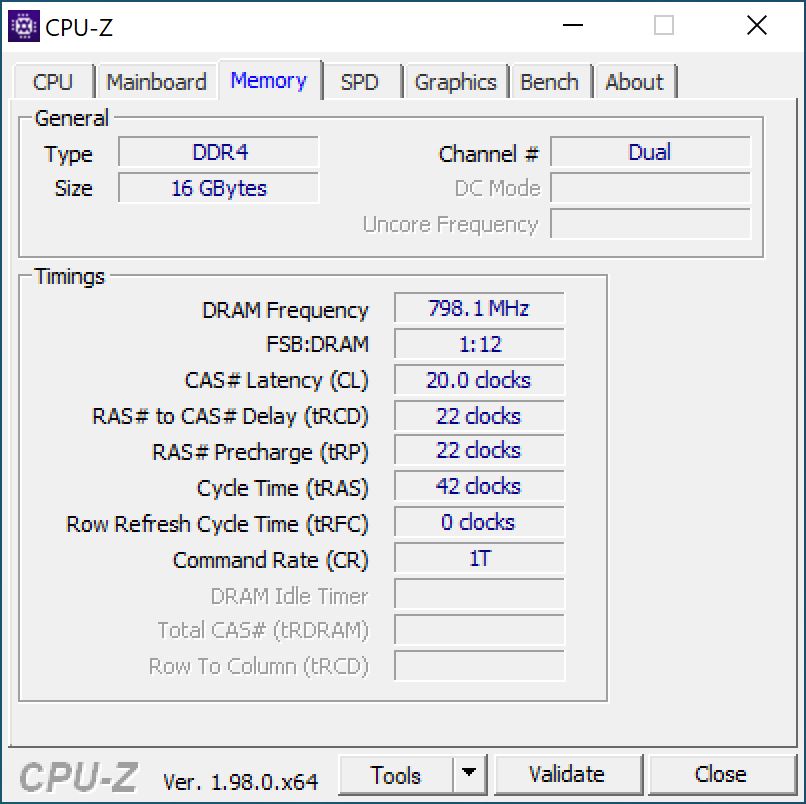
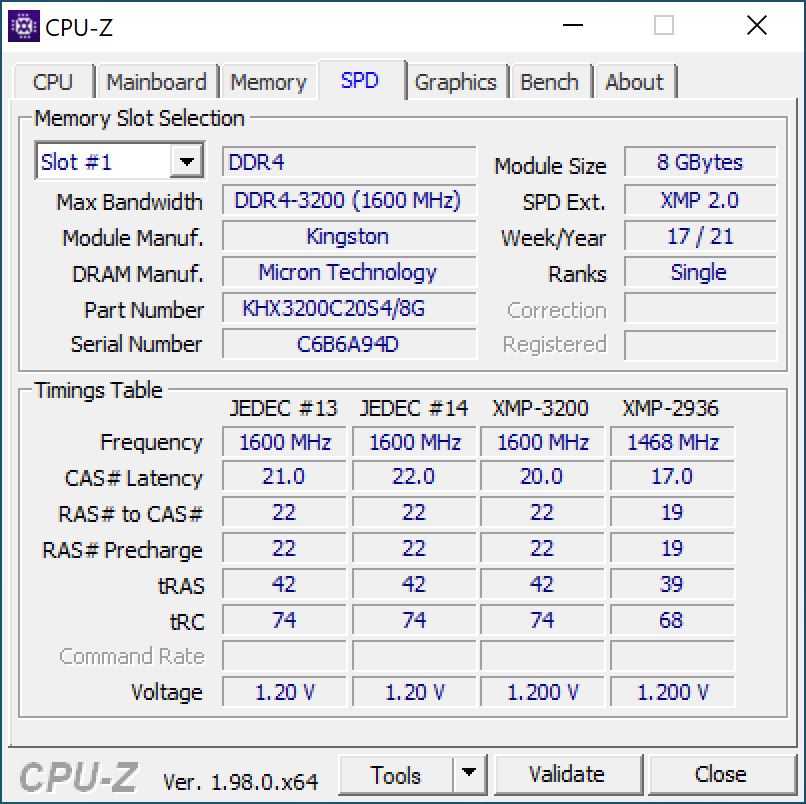
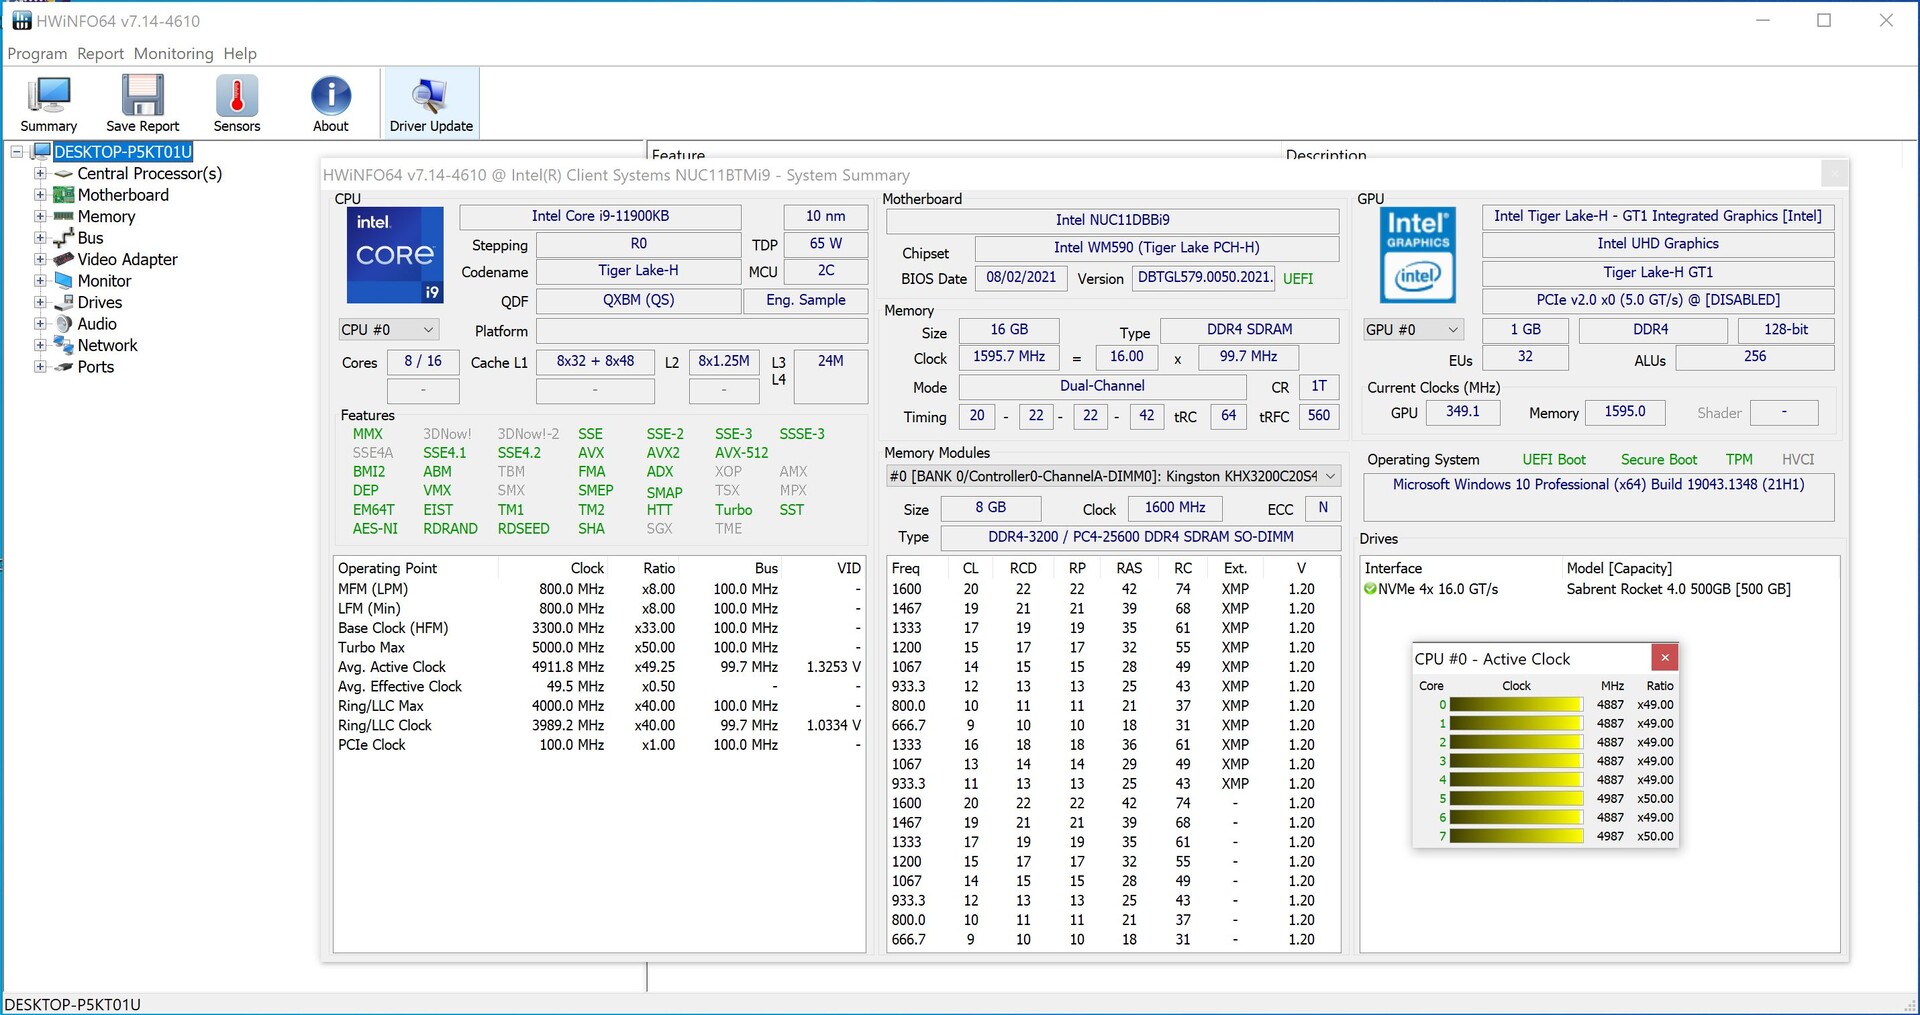
Visivamente, i due sistemi differiscono molto anche se il layout interno approssimativo varia solo nella disposizione dei componenti. L'alimentatore è ancora nascosto nel case e questa volta utilizza il fattore di forma SFX, che rende più facile la sostituzione in caso di difetto. Il nuovo elemento di calcolo è ancora riposto come una scheda plug-in in uno slot PCI Express e contiene il Intel Core i9-11900KB- un SoC molto veloce con 8 core e 16 thread. Inoltre, l'elemento di calcolo NUC 11 Extreme offre spazio per due moduli SO-DIMM e ospita fino a tre M.2 SSD2 oltre al modulo WLAN.

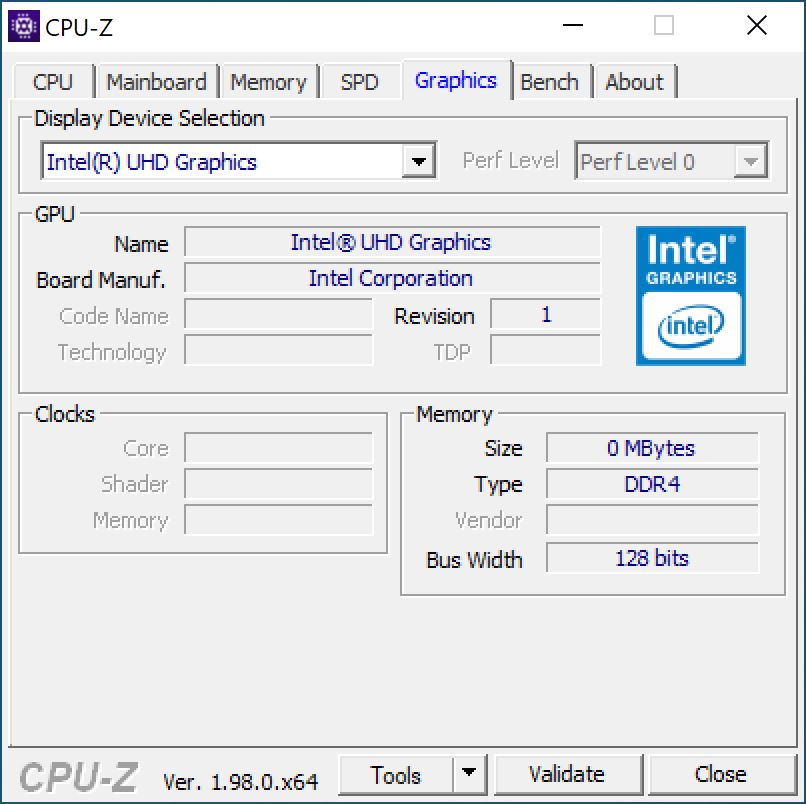
Il SoC ha una propria iGPU, che è adatta al gioco solo in misura limitata. Invece, la Nvidia GeForce RTX 3060installata nel Beast Canyon fornisce una prestazione di gioco decente in combinazione con il veloce SoC.

Il prezzo del Beast Canyon non è molto chiaro. Intel stessa cita un MSRP di poco meno di 1.200 dollari per il modello Core i9, che abbiamo in recensione qui. Il modello Core i7 (Intel Core i9-11700B) ha un prezzo di circa 1.000 dollari. Va notato che questi sono i prezzi del sistema barebone, il che significa costi aggiuntivi per RAM, SSD e GPU. Una stima approssimativa usando il nostro sistema di test come base indica che i costi sono ben oltre i 2.000 dollari. La situazione attuale per le schede grafiche è il fattore più grande per i costi aggiuntivi. L'installata GeForce RTX 3060 di Asus costa attualmente ~US$1,000. I costi possono essere ridotti un po' se si sceglie un'alternativa più economica o si seleziona un modello adatto per conto proprio.

Tuttavia, coloro che vogliono usare l'Intel NUC 11 Extreme Kit con una scheda grafica dedicata dovrebbero prestare attenzione alle dimensioni della scheda. L'unità di raffreddamento non dovrebbe occupare più di due slot PCIe. La lunghezza della scheda grafica è limitata a un massimo di 12 pollici.

Intel NUC 11 Extreme Kit – Beast Canyon
Processore
Intel Core i9-11900KB 8 x 3.3 - 5.3 GHz, 90 W PL2 / Short Burst, 65 W PL1 / Sustained, Tiger Lake-H
Scheda grafica
NVIDIA GeForce RTX 3060 - 12 GB VRAM, Core: 1837 MHz, Memoria: 15000 MHz, 170 W TDP, Nvidia 471.41
Memoria
16 GB 
Scheda madre
Intel WM590 (Tiger Lake PCH-H)
Harddisk
Sabrent Rocket 4.0 500GB, 500 GB 
, M.2 2280 NVMe
Porte di connessione
12 USB 3.1 Gen 2, 2 USB 4.0 40 Gbps, 2 Thunderbolt, 1 HDMI, 1 Kensington Lock, Connessioni Audio: 7.1 digital, Lettore schede: SDXC with UHS-II support
Rete
Intel I225-LM Ethernet Controller (10/100/1000/2500MBit/s), Intel Wi-Fi 6E AX210 (a/b/g/h/n = Wi-Fi 4/ac = Wi-Fi 5/ax = Wi-Fi 6/), Bluetooth 5.2
Dimensioni
altezza x larghezza x profondità (in mm): 189 x 120 x 357
Altre caratteristiche
36 Mesi Garanzia
Nota: il produttore potrebbe usare componenti di fornitori diversi pannelli dei diplay, drive o banchi di memoria con specifiche simili.


Intel NUC 11 Beast Canyon
Intel NUC 11 Beast Canyon - Elemento di calcolo
Intel NUC 11 Beast Canyon
Intel NUC 11 Beast Canyon - RAM
Intel NUC 11 Beast Canyon
Intel NUC 11 Beast Canyon - GeForce RTX 3060

Elemento di calcolo Intel NUC 11 Extreme in dettaglio

Elemento di calcolo Intel NUC 11 Extreme Kit

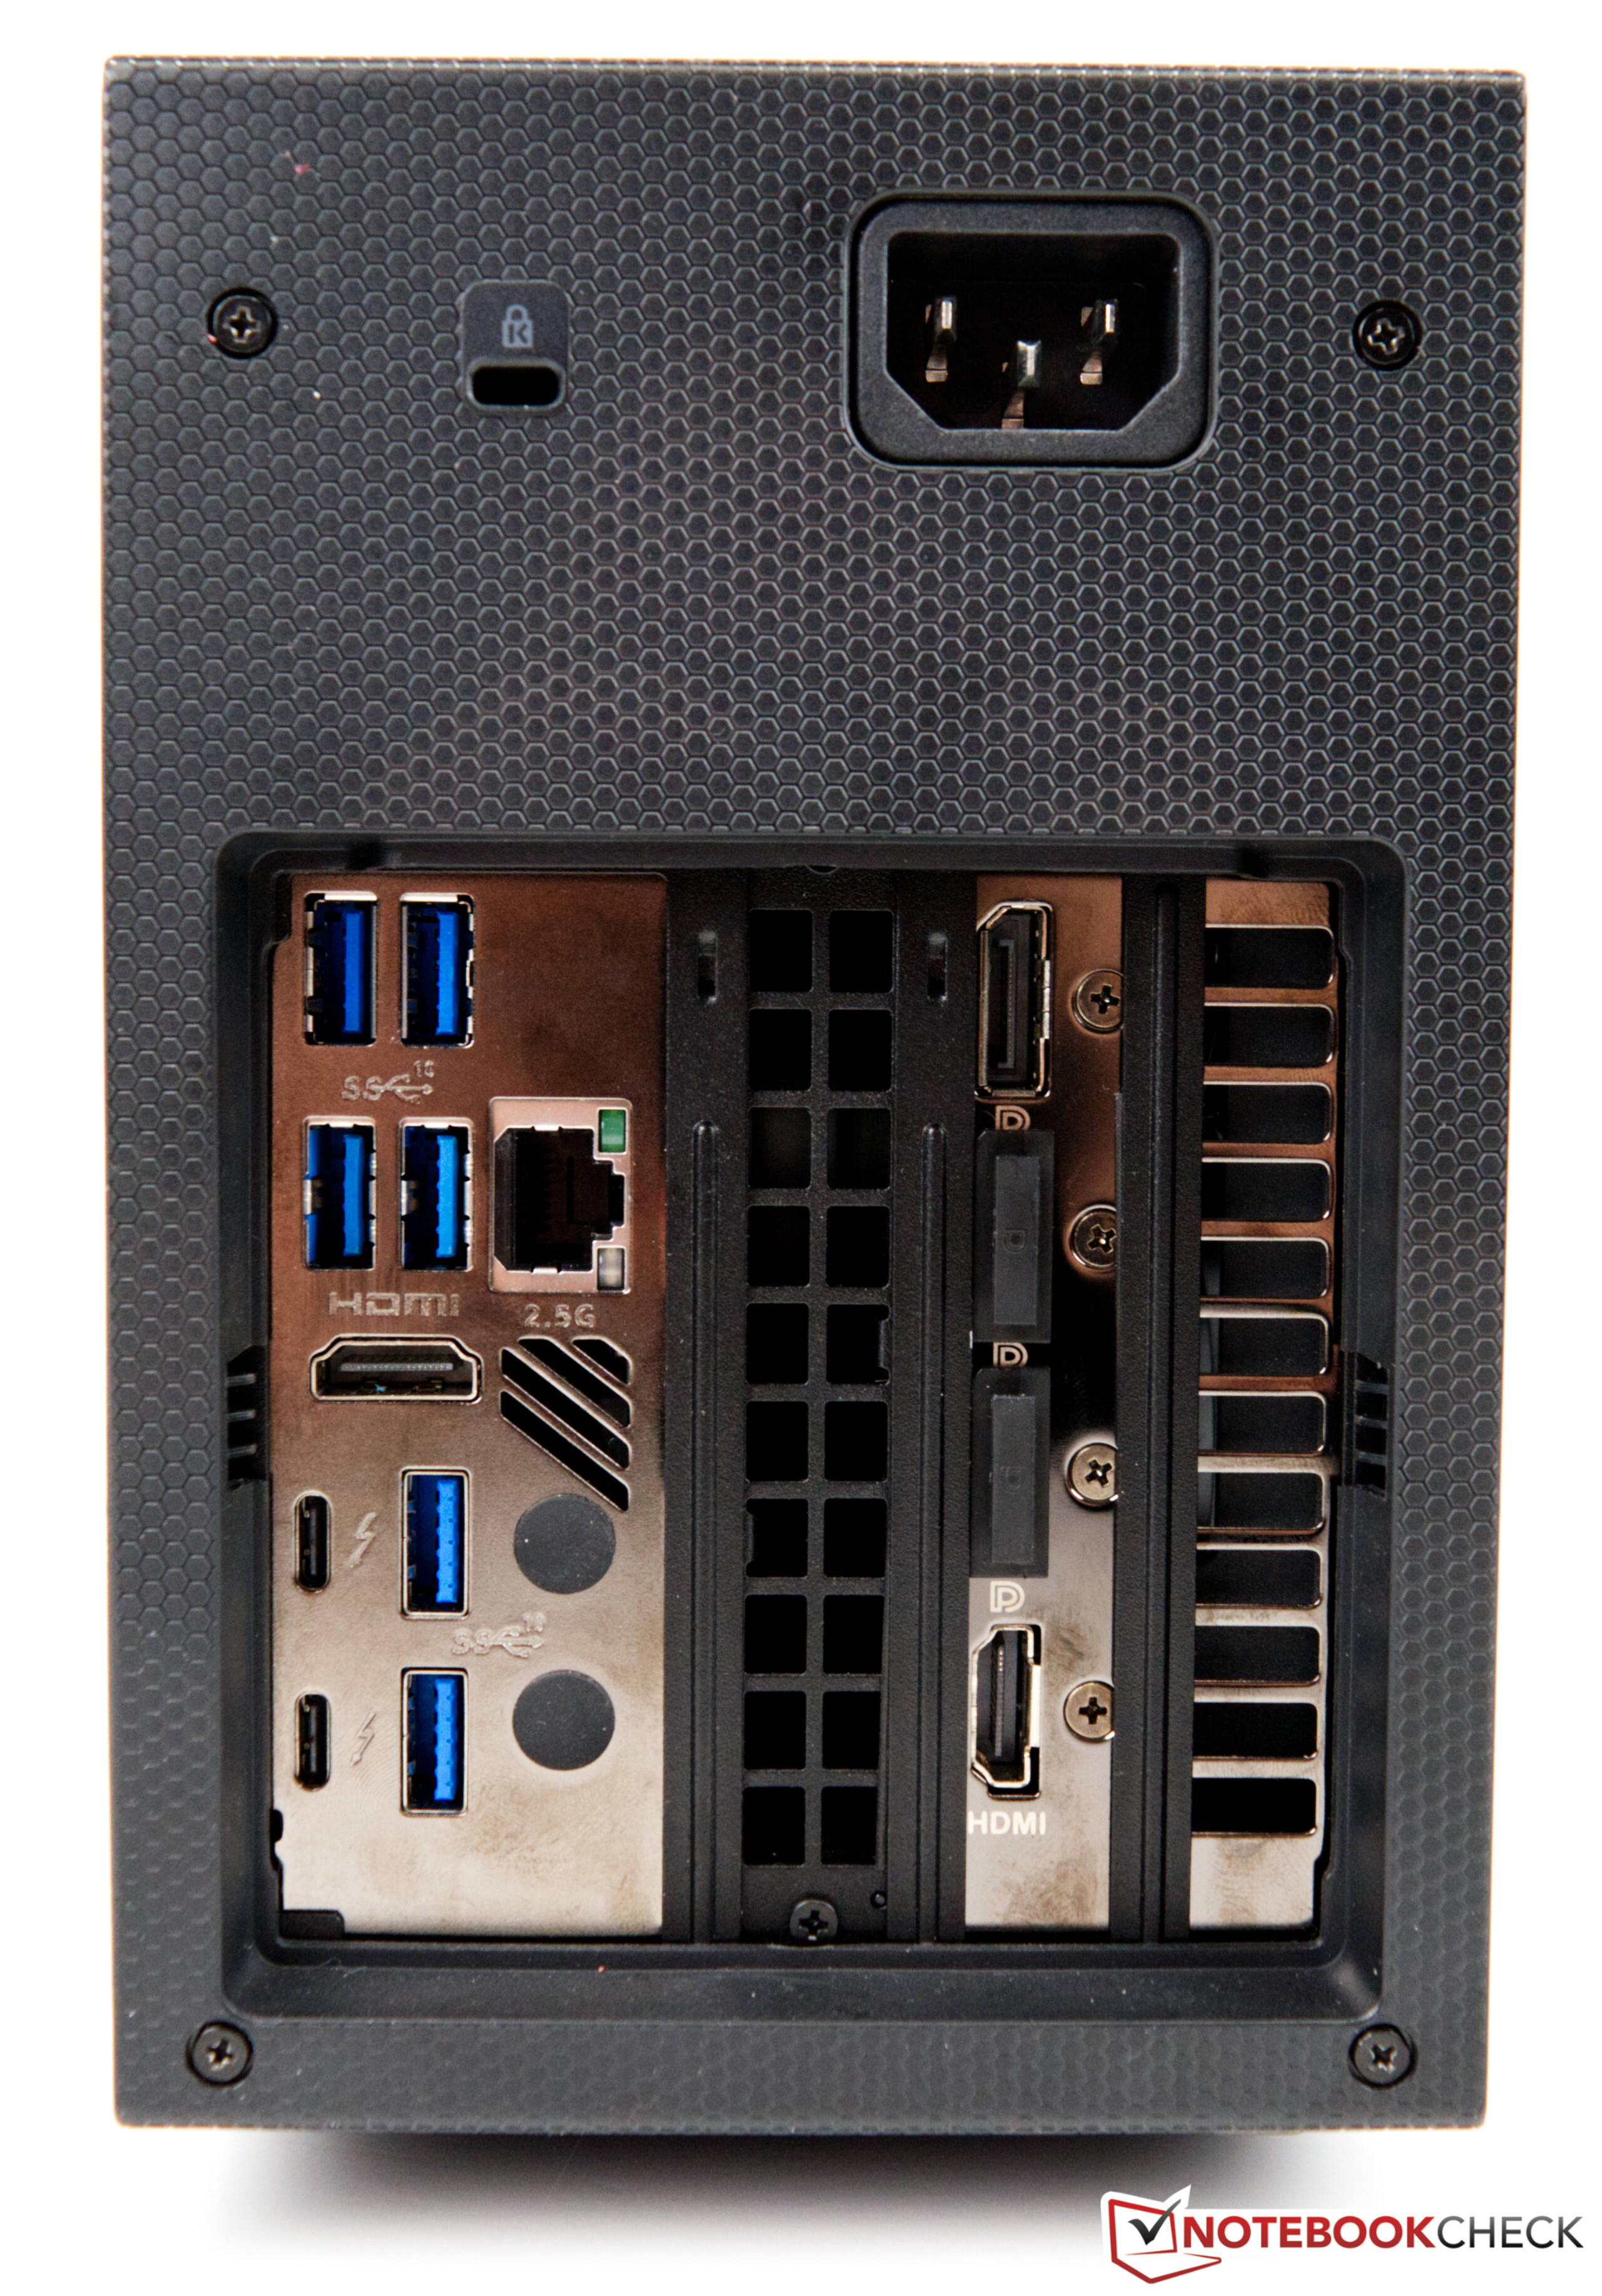
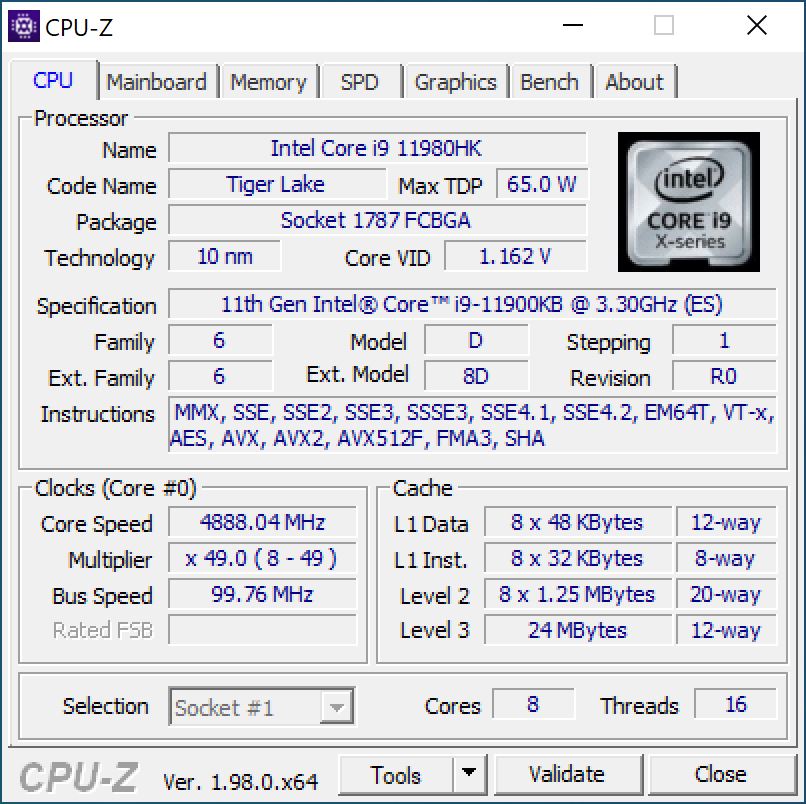
L'Intel NUC 11 Extreme offre con il Intel Core i9-11900KB un SoC a 8 core con 16 thread basato sulla serie Tiger Lake. Il SoC ha le sue radici nei fattori di forma mobile ed è una buona opzione per sistemi piccoli e compatti grazie al basso consumo energetico. Inoltre, tutte le interfacce esterne sono sul Compute Element, che è sotto forma di una scheda PCI Express plug-in nel sistema. Tutto ciò che è importante è a bordo e non si deve fare a meno di nulla.

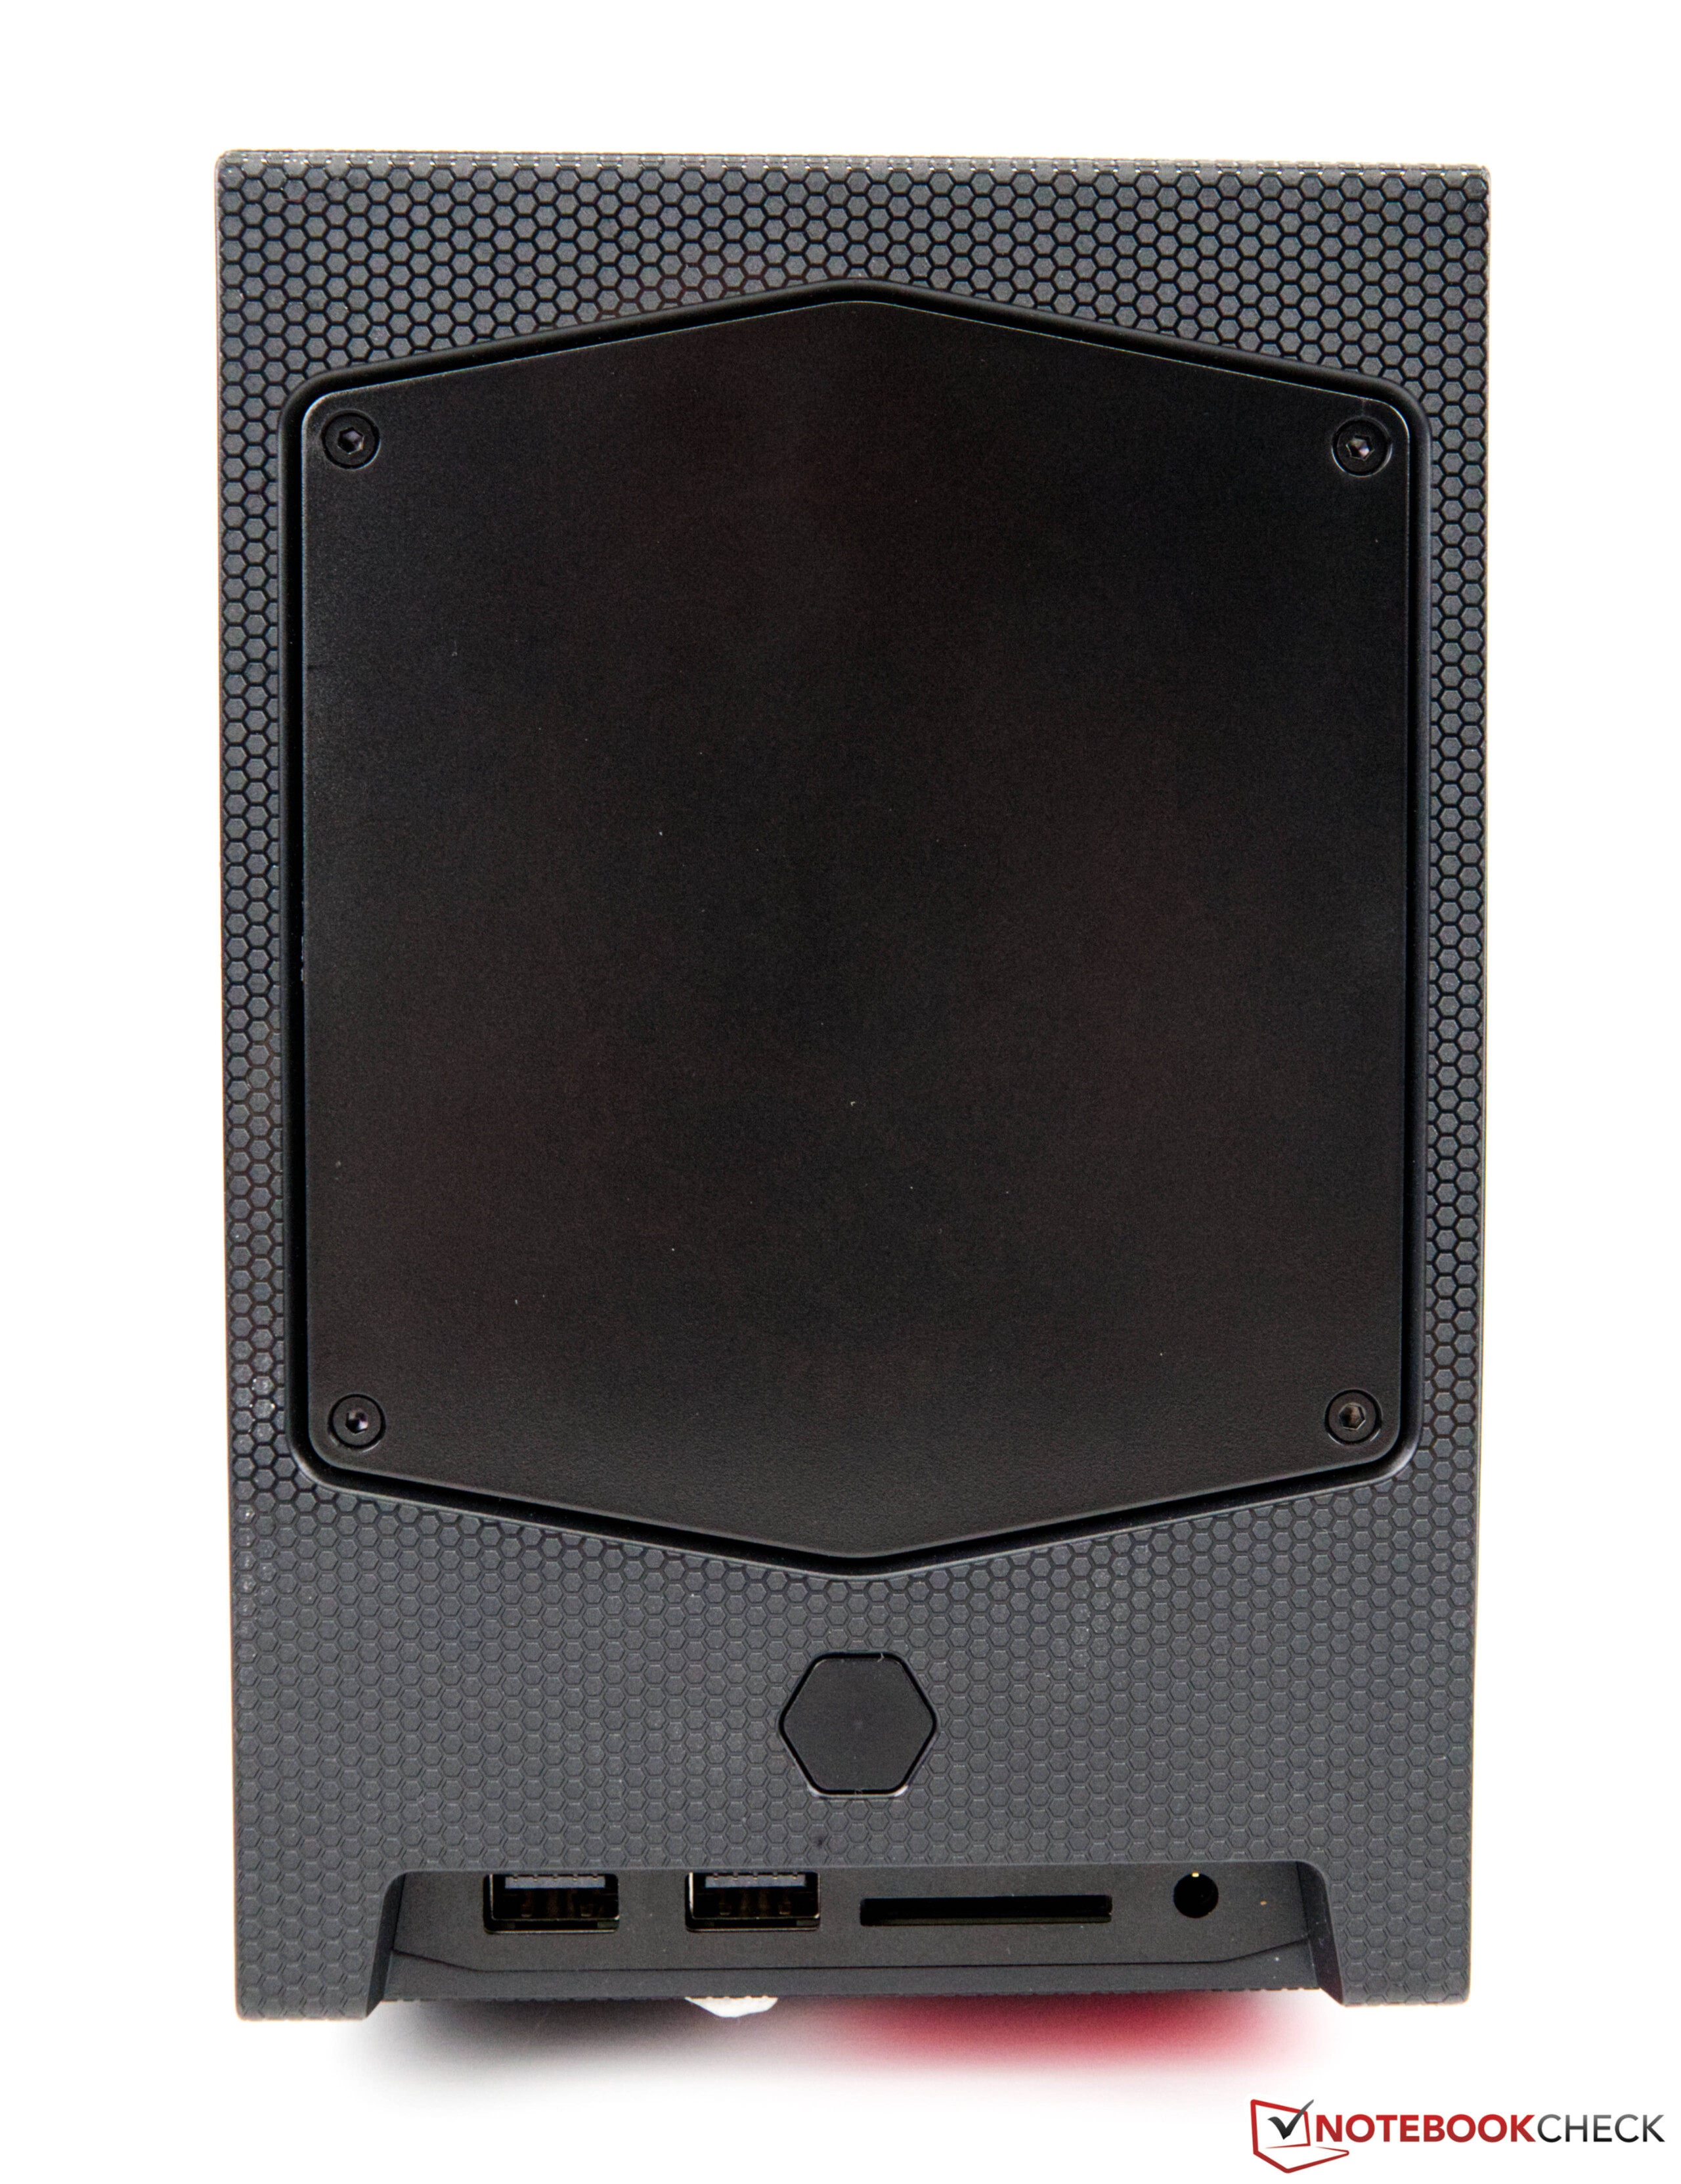
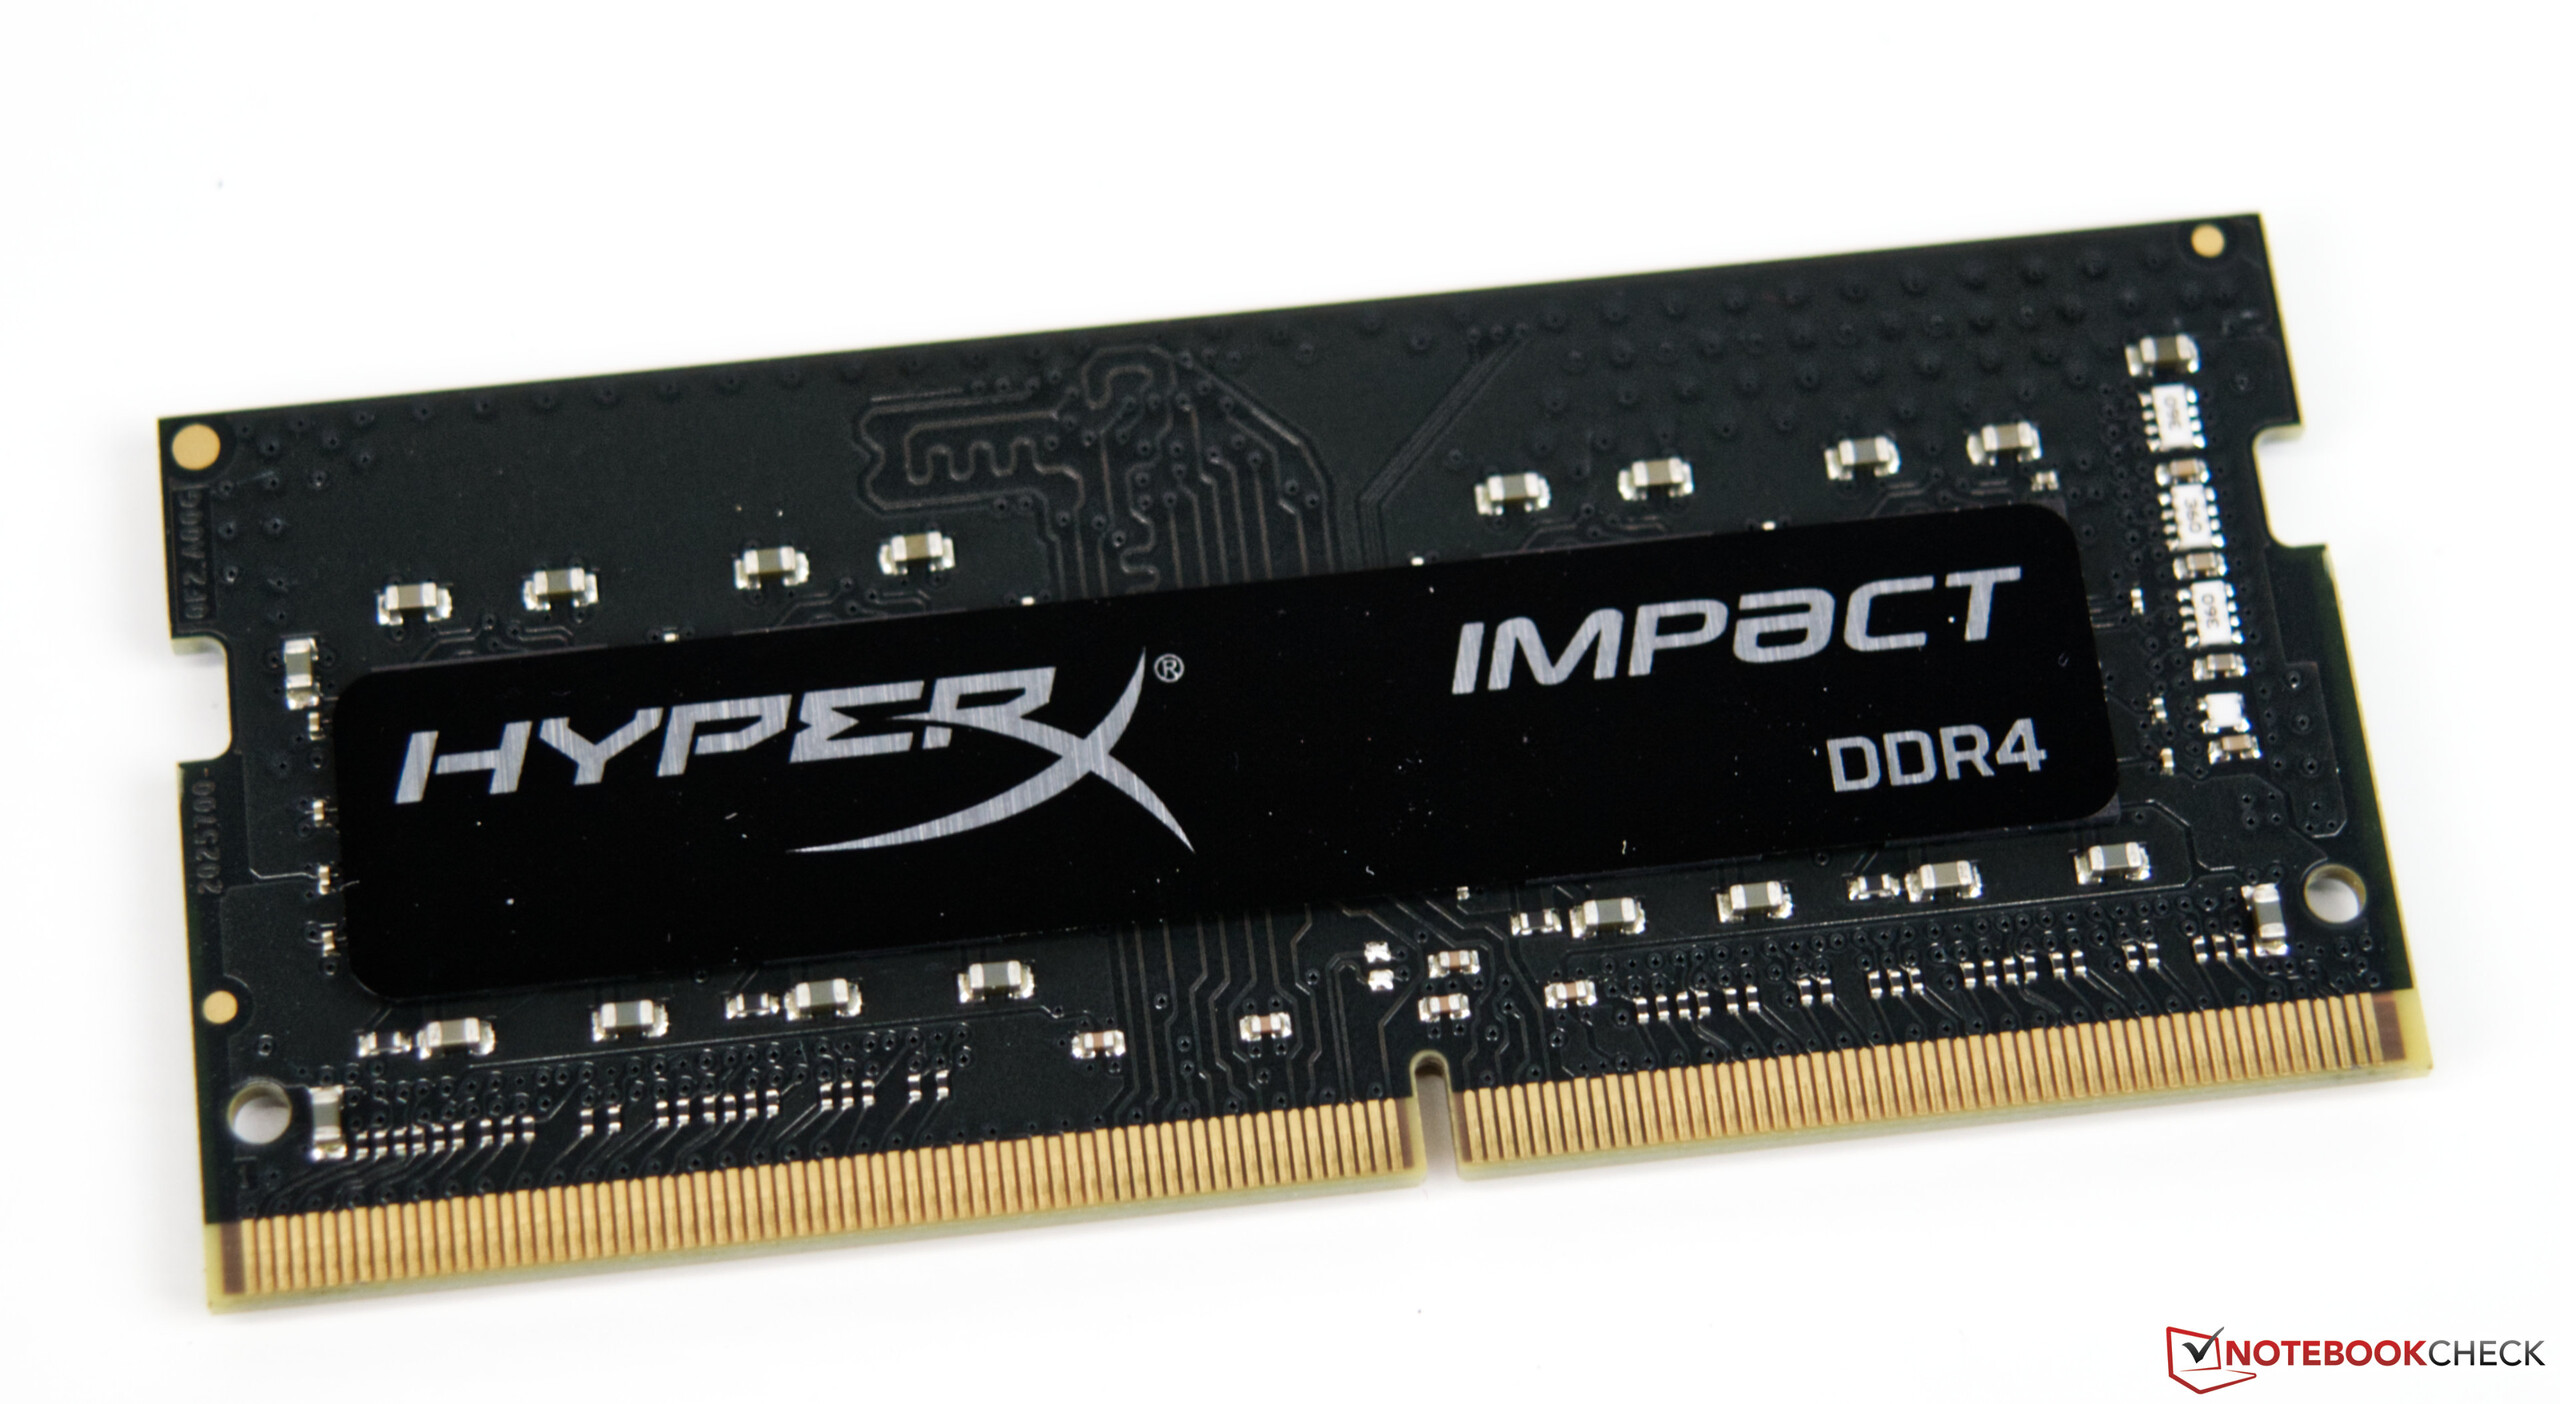
Sul retro, ci sono 6x USB 3.1 Gen2 Type-A e due porte USB-C tra cui Thunderbolt 4. Fino a tre display possono essere gestiti contemporaneamente tramite HDMI o USB-C, e ci sono due modi diversi per collegare il sistema alla rete - WiFi 6E o 2,5 Gbit LAN. Due moduli SO-DIMM RAM con un massimo di 32 GB ciascuno possono essere installati nell'elemento di calcolo stesso. Inoltre, c'è spazio per tre SSD M.2.

Parametri di riferimento del processore

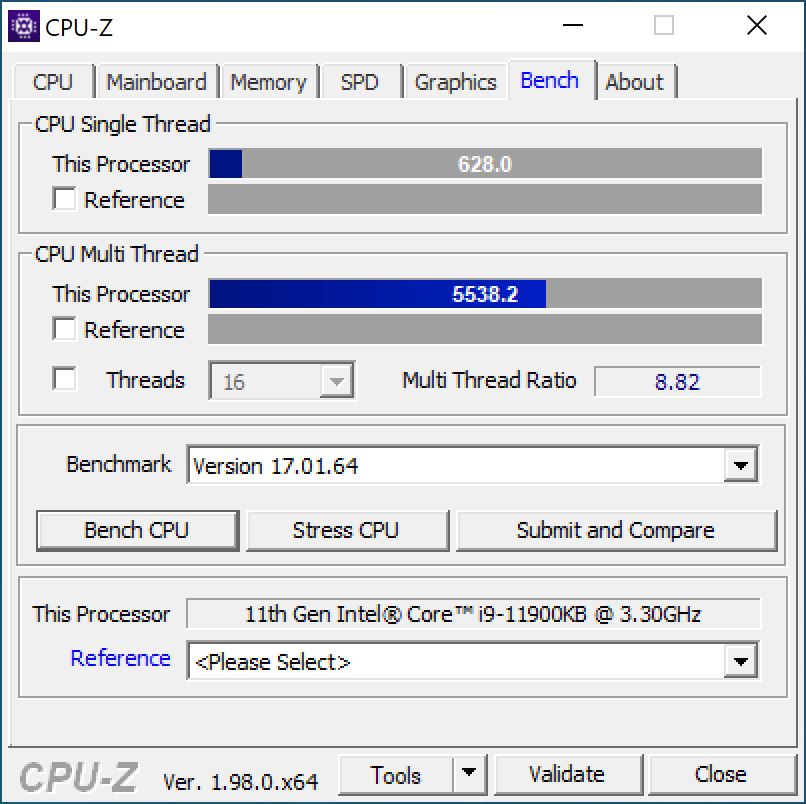
Il Intel Core i9-11900KB è un SoC che ha trovato la sua strada dal laptop al desktop. Intel installa il SoC nel Compute Element e beneficia del basso consumo di 65 W. Tuttavia, la potenza massima del pacchetto CPU è limitata a 90 W per un breve periodo

Nel test, il SoC mostra prestazioni solide e si comporta in modo simile all'Intel Core i5-11600K. L'Intel Core i9-11900KB è superiore al Core i5-11600K nelle applicazioni multi-thread grazie alle due unità di calcolo aggiuntive. Se confrontiamo due CPU a 8 core, il nostro campione di prova deve ammettere la sconfitta in confronto all Intel Core i9-11900K. Tuttavia, il divario è gestibile quando si guarda al consumo energetico di queste CPU

Per ulteriori confronti e benchmark, vi rimandiamo alla nostraTabella di confronto delle CPU.

CPU-Z
CPU-Z
CPU-Z
CPU-Z
CPU-Z
CPU-Z
CPU-Z
HWiNFO
Performance Rating - Percent
AMD Ryzen 7 5800X, NVIDIA Titan RTX
R7 5800X, 3800 MHz
54.2 pt
Intel Core i9-11900K, NVIDIA Titan RTX
i9-11900K, 3500 MHz
52.4 pt
AMD Ryzen 9 3950X, NVIDIA Titan RTX
R9 3950X, 3500 MHz
51.4 pt
Intel Core i9-10900K, NVIDIA Titan RTX
i9-10900K, 3700 MHz
50.9 pt
Intel Core i9-11900KB, NVIDIA GeForce RTX 3060
i9-11900KB, 3300 MHz
48.1 pt
Intel Core i5-11600K, NVIDIA Titan RTX
i5-11600K, 3900 MHz
47.7 pt
AMD Ryzen 7 3800XT, NVIDIA Titan RTX
R7 3800XT, 3900 MHz
46.9 pt
Intel Core i9-9980HK, NVIDIA GeForce RTX 2070 (Desktop)
i9-9980HK, 2400 MHz
43.7 pt
Intel Core i5-10600K, NVIDIA Titan RTX
i5-10600K, 4100 MHz
42.2 pt
Cinebench R15
CPU Single 64Bit
AMD Ryzen 7 5800X, NVIDIA Titan RTX
R7 5800X, 3800 MHz
266 Points +8%
Intel Core i9-11900K, NVIDIA Titan RTX
i9-11900K, 3500 MHz
262 Points +6%
Intel Core i9-11900KB, NVIDIA GeForce RTX 3060
i9-11900KB, 3300 MHz
247 Points
Intel Core i5-11600K, NVIDIA Titan RTX
i5-11600K, 3900 MHz
242 Points -2%
Intel Core i9-10900K, NVIDIA Titan RTX
i9-10900K, 3700 MHz
224 Points -9%
AMD Ryzen 7 3800XT, NVIDIA Titan RTX
R7 3800XT, 3900 MHz
219 Points -11%
Intel Core i9-9980HK, NVIDIA GeForce RTX 2070 (Desktop)
i9-9980HK, 2400 MHz
215 Points -13%
AMD Ryzen 9 3950X, NVIDIA Titan RTX
R9 3950X, 3500 MHz
209 Points -15%
Intel Core i5-10600K, NVIDIA Titan RTX
i5-10600K, 4100 MHz
205 Points -17%
CPU Multi 64Bit
AMD Ryzen 9 3950X, NVIDIA Titan RTX
R9 3950X, 3500 MHz
4002 Points +97%
Intel Core i9-10900K, NVIDIA Titan RTX
i9-10900K, 3700 MHz
2620 Points +29%
AMD Ryzen 7 5800X, NVIDIA Titan RTX
R7 5800X, 3800 MHz
2616 Points +29%
Intel Core i9-11900K, NVIDIA Titan RTX
i9-11900K, 3500 MHz
2436 Points +20%
AMD Ryzen 7 3800XT, NVIDIA Titan RTX
R7 3800XT, 3900 MHz
2230 Points +10%
Intel Core i9-11900KB, NVIDIA GeForce RTX 3060
i9-11900KB, 3300 MHz
2027 Points
Intel Core i5-11600K, NVIDIA Titan RTX
i5-11600K, 3900 MHz
1738 Points -14%
Intel Core i9-9980HK, NVIDIA GeForce RTX 2070 (Desktop)
i9-9980HK, 2400 MHz
1607 Points -21%
Intel Core i5-10600K, NVIDIA Titan RTX
i5-10600K, 4100 MHz
1452 Points -28%
Cinebench R20
CPU (Single Core)
Intel Core i9-11900K, NVIDIA Titan RTX
i9-11900K, 3500 MHz
647 Points +3%
Intel Core i9-11900KB, NVIDIA GeForce RTX 3060
i9-11900KB, 3300 MHz
629 Points
AMD Ryzen 7 5800X, NVIDIA Titan RTX
R7 5800X, 3800 MHz
625 Points -1%
Intel Core i5-11600K, NVIDIA Titan RTX
i5-11600K, 3900 MHz
595 Points -5%
AMD Ryzen 7 3800XT, NVIDIA Titan RTX
R7 3800XT, 3900 MHz
544 Points -14%
Intel Core i9-10900K, NVIDIA Titan RTX
i9-10900K, 3700 MHz
532 Points -15%
AMD Ryzen 9 3950X, NVIDIA Titan RTX
R9 3950X, 3500 MHz
520 Points -17%
Intel Core i9-9980HK, NVIDIA GeForce RTX 2070 (Desktop)
i9-9980HK, 2400 MHz
504 Points -20%
Intel Core i5-10600K, NVIDIA Titan RTX
i5-10600K, 4100 MHz
464 Points -26%
CPU (Multi Core)
AMD Ryzen 9 3950X, NVIDIA Titan RTX
R9 3950X, 3500 MHz
9075 Points +95%
Intel Core i9-10900K, NVIDIA Titan RTX
i9-10900K, 3700 MHz
6381 Points +37%
AMD Ryzen 7 5800X, NVIDIA Titan RTX
R7 5800X, 3800 MHz
6068 Points +31%
Intel Core i9-11900K, NVIDIA Titan RTX
i9-11900K, 3500 MHz
5997 Points +29%
AMD Ryzen 7 3800XT, NVIDIA Titan RTX
R7 3800XT, 3900 MHz
5120 Points +10%
Intel Core i9-11900KB, NVIDIA GeForce RTX 3060
i9-11900KB, 3300 MHz
4644 Points
Intel Core i5-11600K, NVIDIA Titan RTX
i5-11600K, 3900 MHz
4349 Points -6%
Intel Core i5-10600K, NVIDIA Titan RTX
i5-10600K, 4100 MHz
3443 Points -26%
Intel Core i9-9980HK, NVIDIA GeForce RTX 2070 (Desktop)
i9-9980HK, 2400 MHz
3357 Points -28%
Cinebench R11.5
CPU Single 64Bit
Intel Core i9-11900K, NVIDIA Titan RTX
i9-11900K, 3500 MHz
3.1 Points +9%
AMD Ryzen 7 5800X, NVIDIA Titan RTX
R7 5800X, 3800 MHz
3.09 Points +9%
Intel Core i5-11600K, NVIDIA Titan RTX
i5-11600K, 3900 MHz
2.87 Points +1%
Intel Core i9-11900KB, NVIDIA GeForce RTX 3060
i9-11900KB, 3300 MHz
2.84 Points
Intel Core i9-10900K, NVIDIA Titan RTX
i9-10900K, 3700 MHz
2.56 Points -10%
Intel Core i9-9980HK, NVIDIA GeForce RTX 2070 (Desktop)
i9-9980HK, 2400 MHz
2.4 Points -15%
AMD Ryzen 9 3950X, NVIDIA Titan RTX
R9 3950X, 3500 MHz
2.37 Points -17%
AMD Ryzen 7 3800XT, NVIDIA Titan RTX
R7 3800XT, 3900 MHz
2.36 Points -17%
Intel Core i5-10600K, NVIDIA Titan RTX
i5-10600K, 4100 MHz
2.19 Points -23%
CPU Multi 64Bit
AMD Ryzen 9 3950X, NVIDIA Titan RTX
R9 3950X, 3500 MHz
43.68 Points +98%
AMD Ryzen 7 5800X, NVIDIA Titan RTX
R7 5800X, 3800 MHz
29.31 Points +33%
Intel Core i9-10900K, NVIDIA Titan RTX
i9-10900K, 3700 MHz
29.03 Points +32%
Intel Core i9-11900K, NVIDIA Titan RTX
i9-11900K, 3500 MHz
26.76 Points +21%
AMD Ryzen 7 3800XT, NVIDIA Titan RTX
R7 3800XT, 3900 MHz
24.18 Points +10%
Intel Core i9-11900KB, NVIDIA GeForce RTX 3060
i9-11900KB, 3300 MHz
22.07 Points
Intel Core i5-11600K, NVIDIA Titan RTX
i5-11600K, 3900 MHz
19.32 Points -12%
Intel Core i9-9980HK, NVIDIA GeForce RTX 2070 (Desktop)
i9-9980HK, 2400 MHz
18.04 Points -18%
Intel Core i5-10600K, NVIDIA Titan RTX
i5-10600K, 4100 MHz
15.76 Points -29%
Cinebench R10
Rendering Single CPUs 64Bit
Intel Core i9-11900K, NVIDIA Titan RTX
i9-11900K, 3500 MHz
14149 Points +13%
AMD Ryzen 7 5800X, NVIDIA Titan RTX
R7 5800X, 3800 MHz
13039 Points +4%
Intel Core i5-11600K, NVIDIA Titan RTX
i5-11600K, 3900 MHz
12957 Points +4%
Intel Core i9-11900KB, NVIDIA GeForce RTX 3060
i9-11900KB, 3300 MHz
12508 Points
Intel Core i9-10900K, NVIDIA Titan RTX
i9-10900K, 3700 MHz
10625 Points -15%
AMD Ryzen 9 3950X, NVIDIA Titan RTX
R9 3950X, 3500 MHz
10580 Points -15%
AMD Ryzen 7 3800XT, NVIDIA Titan RTX
R7 3800XT, 3900 MHz
10497 Points -16%
Intel Core i9-9980HK, NVIDIA GeForce RTX 2070 (Desktop)
i9-9980HK, 2400 MHz
10359 Points -17%
Intel Core i5-10600K, NVIDIA Titan RTX
i5-10600K, 4100 MHz
9594 Points -23%
Rendering Multiple CPUs 64Bit
AMD Ryzen 9 3950X, NVIDIA Titan RTX
R9 3950X, 3500 MHz
86232 Points +28%
AMD Ryzen 7 5800X, NVIDIA Titan RTX
R7 5800X, 3800 MHz
83426 Points +24%
Intel Core i9-11900K, NVIDIA Titan RTX
i9-11900K, 3500 MHz
80613 Points +20%
Intel Core i9-10900K, NVIDIA Titan RTX
i9-10900K, 3700 MHz
80495 Points +20%
AMD Ryzen 7 3800XT, NVIDIA Titan RTX
R7 3800XT, 3900 MHz
68388 Points +2%
Intel Core i9-11900KB, NVIDIA GeForce RTX 3060
i9-11900KB, 3300 MHz
67183 Points
Intel Core i5-11600K, NVIDIA Titan RTX
i5-11600K, 3900 MHz
64663 Points -4%
Intel Core i9-9980HK, NVIDIA GeForce RTX 2070 (Desktop)
i9-9980HK, 2400 MHz
55742 Points -17%
Intel Core i5-10600K, NVIDIA Titan RTX
i5-10600K, 4100 MHz
51816 Points -23%
Blender - v2.79 BMW27 CPU
Intel Core i9-9980HK, NVIDIA GeForce RTX 2070 (Desktop)
i9-9980HK, 2400 MHz
317.4 Seconds * -21%
Intel Core i5-10600K, NVIDIA Titan RTX
i5-10600K, 4100 MHz
302.4 Seconds * -15%
Intel Core i5-11600K, NVIDIA Titan RTX
i5-11600K, 3900 MHz
264.5 Seconds * -1%
Intel Core i9-11900KB, NVIDIA GeForce RTX 3060
i9-11900KB, 3300 MHz
262.7 Seconds *
AMD Ryzen 7 3800XT, NVIDIA Titan RTX
R7 3800XT, 3900 MHz
222.7 Seconds * +15%
AMD Ryzen 7 5800X, NVIDIA Titan RTX
R7 5800X, 3800 MHz
196.8 Seconds * +25%
Intel Core i9-11900K, NVIDIA Titan RTX
i9-11900K, 3500 MHz
190.3 Seconds * +28%
Intel Core i9-10900K, NVIDIA Titan RTX
i9-10900K, 3700 MHz
167.3 Seconds * +36%
AMD Ryzen 9 3950X, NVIDIA Titan RTX
R9 3950X, 3500 MHz
125.8 Seconds * +52%
wPrime 2.10
32m
Intel Core i5-11600K, NVIDIA Titan RTX
i5-11600K, 3900 MHz
4.919 s * -44%
Intel Core i5-10600K, NVIDIA Titan RTX
i5-10600K, 4100 MHz
4.648 s * -36%
AMD Ryzen 9 3950X, NVIDIA Titan RTX
R9 3950X, 3500 MHz
4.112 s * -20%
Intel Core i9-11900K, NVIDIA Titan RTX
i9-11900K, 3500 MHz
3.982 s * -17%
Intel Core i9-9980HK, NVIDIA GeForce RTX 2070 (Desktop)
i9-9980HK, 2400 MHz
3.788 s * -11%
AMD Ryzen 7 3800XT, NVIDIA Titan RTX
R7 3800XT, 3900 MHz
3.74 s * -9%
Intel Core i9-10900K, NVIDIA Titan RTX
i9-10900K, 3700 MHz
3.582 s * -5%
Intel Core i9-11900KB, NVIDIA GeForce RTX 3060
i9-11900KB, 3300 MHz
3.416 s *
AMD Ryzen 7 5800X, NVIDIA Titan RTX
R7 5800X, 3800 MHz
3.037 s * +11%
1024m
Intel Core i9-9980HK, NVIDIA GeForce RTX 2070 (Desktop)
i9-9980HK, 2400 MHz
120.2 s * -18%
Intel Core i5-10600K, NVIDIA Titan RTX
i5-10600K, 4100 MHz
113.2 s * -11%
Intel Core i5-11600K, NVIDIA Titan RTX
i5-11600K, 3900 MHz
107.6 s * -5%
Intel Core i9-11900KB, NVIDIA GeForce RTX 3060
i9-11900KB, 3300 MHz
102.2 s *
AMD Ryzen 7 5800X, NVIDIA Titan RTX
R7 5800X, 3800 MHz
86.1 s * +16%
AMD Ryzen 7 3800XT, NVIDIA Titan RTX
R7 3800XT, 3900 MHz
81.4 s * +20%
Intel Core i9-11900K, NVIDIA Titan RTX
i9-11900K, 3500 MHz
77.9 s * +24%
Intel Core i9-10900K, NVIDIA Titan RTX
i9-10900K, 3700 MHz
66.3 s * +35%
AMD Ryzen 9 3950X, NVIDIA Titan RTX
R9 3950X, 3500 MHz
44.86 s * +56%
X264 HD Benchmark 4.0
Pass 1
AMD Ryzen 7 5800X, NVIDIA Titan RTX
R7 5800X, 3800 MHz
339 (338min - 341max) fps +24%
Intel Core i9-11900K, NVIDIA Titan RTX
i9-11900K, 3500 MHz
309.5 (308min - 311max) fps +14%
Intel Core i5-11600K, NVIDIA Titan RTX
i5-11600K, 3900 MHz
299 (294min - 299max) fps +10%
Intel Core i9-10900K, NVIDIA Titan RTX
i9-10900K, 3700 MHz
289.5 (289min - 291max) fps +6%
Intel Core i9-11900KB, NVIDIA GeForce RTX 3060
i9-11900KB, 3300 MHz
272.5 (271min - 279max) fps
AMD Ryzen 7 3800XT, NVIDIA Titan RTX
R7 3800XT, 3900 MHz
271 (270min - 273max) fps -1%
AMD Ryzen 9 3950X, NVIDIA Titan RTX
R9 3950X, 3500 MHz
265 (265min - 266max) fps -3%
Intel Core i5-10600K, NVIDIA Titan RTX
i5-10600K, 4100 MHz
251.5 (250min - 253max) fps -8%
Intel Core i9-9980HK, NVIDIA GeForce RTX 2070 (Desktop)
i9-9980HK, 2400 MHz
237.5 (236min - 239max) fps -13%
Pass 2
AMD Ryzen 9 3950X, NVIDIA Titan RTX
R9 3950X, 3500 MHz
168 (168min - 169max) fps +58%
AMD Ryzen 7 5800X, NVIDIA Titan RTX
R7 5800X, 3800 MHz
152 (151min - 152max) fps +43%
Intel Core i9-10900K, NVIDIA Titan RTX
i9-10900K, 3700 MHz
149 (149min - 149max) fps +41%
Intel Core i9-11900K, NVIDIA Titan RTX
i9-11900K, 3500 MHz
137 (137min - 137max) fps +29%
AMD Ryzen 7 3800XT, NVIDIA Titan RTX
R7 3800XT, 3900 MHz
119 (118min - 119max) fps +12%
Intel Core i9-11900KB, NVIDIA GeForce RTX 3060
i9-11900KB, 3300 MHz
106 (101min - 108max) fps
Intel Core i5-11600K, NVIDIA Titan RTX
i5-11600K, 3900 MHz
101 (101min - 101max) fps -5%
Intel Core i9-9980HK, NVIDIA GeForce RTX 2070 (Desktop)
i9-9980HK, 2400 MHz
92.8 (89.1min - 100max) fps -12%
Intel Core i5-10600K, NVIDIA Titan RTX
i5-10600K, 4100 MHz
88.2 (88min - 88.2max) fps -17%
WinRAR - Result
AMD Ryzen 7 5800X, NVIDIA Titan RTX
R7 5800X, 3800 MHz
15604 KB/s +63%
Intel Core i9-10900K, NVIDIA Titan RTX
i9-10900K, 3700 MHz
9739 KB/s +2%
Intel Core i9-11900KB, NVIDIA GeForce RTX 3060
i9-11900KB, 3300 MHz
9584 KB/s
Intel Core i9-11900K, NVIDIA Titan RTX
i9-11900K, 3500 MHz
9030 KB/s -6%
Intel Core i5-11600K, NVIDIA Titan RTX
i5-11600K, 3900 MHz
7850 KB/s -18%
AMD Ryzen 7 3800XT, NVIDIA Titan RTX
R7 3800XT, 3900 MHz
7467 KB/s -22%
AMD Ryzen 9 3950X, NVIDIA Titan RTX
R9 3950X, 3500 MHz
7409 KB/s -23%
Intel Core i9-9980HK, NVIDIA GeForce RTX 2070 (Desktop)
i9-9980HK, 2400 MHz
7266 KB/s -24%
Intel Core i5-10600K, NVIDIA Titan RTX
i5-10600K, 4100 MHz
6536 KB/s -32%
TrueCrypt
AES Mean 100MB
AMD Ryzen 7 5800X, NVIDIA Titan RTX
R7 5800X, 3800 MHz
15 GB/s +29%
Intel Core i9-10900K, NVIDIA Titan RTX
i9-10900K, 3700 MHz
14.6 GB/s +26%
Intel Core i9-11900K, NVIDIA Titan RTX
i9-11900K, 3500 MHz
13 GB/s +12%
Intel Core i9-11900KB, NVIDIA GeForce RTX 3060
i9-11900KB, 3300 MHz
11.6 GB/s
AMD Ryzen 7 3800XT, NVIDIA Titan RTX
R7 3800XT, 3900 MHz
11.4 GB/s -2%
AMD Ryzen 9 3950X, NVIDIA Titan RTX
R9 3950X, 3500 MHz
10.8 GB/s -7%
Intel Core i9-9980HK, NVIDIA GeForce RTX 2070 (Desktop)
i9-9980HK, 2400 MHz
10.1 GB/s -13%
Intel Core i5-11600K, NVIDIA Titan RTX
i5-11600K, 3900 MHz
9.7 GB/s -16%
Intel Core i5-10600K, NVIDIA Titan RTX
i5-10600K, 4100 MHz
8 GB/s -31%
Twofish Mean 100MB
AMD Ryzen 9 3950X, NVIDIA Titan RTX
R9 3950X, 3500 MHz
3.6 GB/s +112%
Intel Core i9-10900K, NVIDIA Titan RTX
i9-10900K, 3700 MHz
2.6 GB/s +53%
AMD Ryzen 7 3800XT, NVIDIA Titan RTX
R7 3800XT, 3900 MHz
2 GB/s +18%
AMD Ryzen 7 5800X, NVIDIA Titan RTX
R7 5800X, 3800 MHz
2 GB/s +18%
Intel Core i9-11900K, NVIDIA Titan RTX
i9-11900K, 3500 MHz
1.9 GB/s +12%
Intel Core i9-9980HK, NVIDIA GeForce RTX 2070 (Desktop)
i9-9980HK, 2400 MHz
1.7 GB/s 0%
Intel Core i9-11900KB, NVIDIA GeForce RTX 3060
i9-11900KB, 3300 MHz
1.7 GB/s
Intel Core i5-11600K, NVIDIA Titan RTX
i5-11600K, 3900 MHz
1.5 GB/s -12%
Intel Core i5-10600K, NVIDIA Titan RTX
i5-10600K, 4100 MHz
1.4 GB/s -18%
Serpent Mean 100MB
AMD Ryzen 9 3950X, NVIDIA Titan RTX
R9 3950X, 3500 MHz
2.3 GB/s +109%
Intel Core i9-10900K, NVIDIA Titan RTX
i9-10900K, 3700 MHz
1.5 GB/s +36%
AMD Ryzen 7 5800X, NVIDIA Titan RTX
R7 5800X, 3800 MHz
1.3 GB/s +18%
AMD Ryzen 7 3800XT, NVIDIA Titan RTX
R7 3800XT, 3900 MHz
1.2 GB/s +9%
Intel Core i9-11900K, NVIDIA Titan RTX
i9-11900K, 3500 MHz
1.2 GB/s +9%
Intel Core i9-11900KB, NVIDIA GeForce RTX 3060
i9-11900KB, 3300 MHz
1.1 GB/s
Intel Core i9-9980HK, NVIDIA GeForce RTX 2070 (Desktop)
i9-9980HK, 2400 MHz
1 GB/s -9%
Intel Core i5-11600K, NVIDIA Titan RTX
i5-11600K, 3900 MHz
0.9 GB/s -18%
Intel Core i5-10600K, NVIDIA Titan RTX
i5-10600K, 4100 MHz
0.82 GB/s -25%
Geekbench 5.5
Multi-Core
AMD Ryzen 9 3950X, NVIDIA Titan RTX
R9 3950X, 3500 MHz
12363 Points +39%
Intel Core i9-10900K, NVIDIA Titan RTX
i9-10900K, 3700 MHz
11414 Points +28%
AMD Ryzen 7 5800X, NVIDIA Titan RTX
R7 5800X, 3800 MHz
11354 Points +27%
Intel Core i9-11900K, NVIDIA Titan RTX
i9-11900K, 3500 MHz
11035 Points +24%
AMD Ryzen 7 3800XT, NVIDIA Titan RTX
R7 3800XT, 3900 MHz
8948 Points 0%
Intel Core i9-11900KB, NVIDIA GeForce RTX 3060
i9-11900KB, 3300 MHz
8924 Points
Intel Core i5-11600K, NVIDIA Titan RTX
i5-11600K, 3900 MHz
8523 Points -4%
Intel Core i9-9980HK, NVIDIA GeForce RTX 2070 (Desktop)
i9-9980HK, 2400 MHz
7568 Points -15%
Intel Core i5-10600K, NVIDIA Titan RTX
i5-10600K, 4100 MHz
7248 Points -19%
Single-Core
Intel Core i9-11900K, NVIDIA Titan RTX
i9-11900K, 3500 MHz
1885 Points +14%
Intel Core i5-11600K, NVIDIA Titan RTX
i5-11600K, 3900 MHz
1752 Points +6%
AMD Ryzen 7 5800X, NVIDIA Titan RTX
R7 5800X, 3800 MHz
1665 Points +1%
Intel Core i9-11900KB, NVIDIA GeForce RTX 3060
i9-11900KB, 3300 MHz
1656 Points
Intel Core i9-10900K, NVIDIA Titan RTX
i9-10900K, 3700 MHz
1449 Points -12%
Intel Core i9-9980HK, NVIDIA GeForce RTX 2070 (Desktop)
i9-9980HK, 2400 MHz
1378 Points -17%
AMD Ryzen 7 3800XT, NVIDIA Titan RTX
R7 3800XT, 3900 MHz
1353 Points -18%
AMD Ryzen 9 3950X, NVIDIA Titan RTX
R9 3950X, 3500 MHz
1306 Points -21%
Intel Core i5-10600K, NVIDIA Titan RTX
i5-10600K, 4100 MHz
1286 Points -22%
Geekbench 5.0
5.0 Multi-Core
AMD Ryzen 9 3950X, NVIDIA Titan RTX
R9 3950X, 3500 MHz
12976 Points +47%
Intel Core i9-10900K, NVIDIA Titan RTX
i9-10900K, 3700 MHz
11407 Points +29%
AMD Ryzen 7 5800X, NVIDIA Titan RTX
R7 5800X, 3800 MHz
11246 Points +27%
Intel Core i9-11900K, NVIDIA Titan RTX
i9-11900K, 3500 MHz
11008 Points +24%
AMD Ryzen 7 3800XT, NVIDIA Titan RTX
R7 3800XT, 3900 MHz
9163 Points +4%
Intel Core i9-11900KB, NVIDIA GeForce RTX 3060
i9-11900KB, 3300 MHz
8845 Points
Intel Core i5-11600K, NVIDIA Titan RTX
i5-11600K, 3900 MHz
8542 Points -3%
Intel Core i9-9980HK, NVIDIA GeForce RTX 2070 (Desktop)
i9-9980HK, 2400 MHz
7540 Points -15%
Intel Core i5-10600K, NVIDIA Titan RTX
i5-10600K, 4100 MHz
7237 Points -18%
5.0 Single-Core
Intel Core i9-11900K, NVIDIA Titan RTX
i9-11900K, 3500 MHz
1863 Points +14%
Intel Core i5-11600K, NVIDIA Titan RTX
i5-11600K, 3900 MHz
1731 Points +6%
AMD Ryzen 7 5800X, NVIDIA Titan RTX
R7 5800X, 3800 MHz
1673 Points +2%
Intel Core i9-11900KB, NVIDIA GeForce RTX 3060
i9-11900KB, 3300 MHz
1638 Points
Intel Core i9-10900K, NVIDIA Titan RTX
i9-10900K, 3700 MHz
1440 Points -12%
AMD Ryzen 7 3800XT, NVIDIA Titan RTX
R7 3800XT, 3900 MHz
1360 Points -17%
Intel Core i9-9980HK, NVIDIA GeForce RTX 2070 (Desktop)
i9-9980HK, 2400 MHz
1355 Points -17%
AMD Ryzen 9 3950X, NVIDIA Titan RTX
R9 3950X, 3500 MHz
1315 Points -20%
Intel Core i5-10600K, NVIDIA Titan RTX
i5-10600K, 4100 MHz
1281 Points -22%
Geekbench 4.4
64 Bit Single-Core Score
Intel Core i9-11900K, NVIDIA Titan RTX
i9-11900K, 3500 MHz
7976 Points +14%
Intel Core i5-11600K, NVIDIA Titan RTX
i5-11600K, 3900 MHz
7438 Points +6%
AMD Ryzen 7 5800X, NVIDIA Titan RTX
R7 5800X, 3800 MHz
7333 Points +5%
Intel Core i9-11900KB, NVIDIA GeForce RTX 3060
i9-11900KB, 3300 MHz
6991 Points
Intel Core i9-10900K, NVIDIA Titan RTX
i9-10900K, 3700 MHz
6348 Points -9%
Intel Core i9-9980HK, NVIDIA GeForce RTX 2070 (Desktop)
i9-9980HK, 2400 MHz
5969 Points -15%
AMD Ryzen 7 3800XT, NVIDIA Titan RTX
R7 3800XT, 3900 MHz
5830 Points -17%
Intel Core i5-10600K, NVIDIA Titan RTX
i5-10600K, 4100 MHz
5821 Points -17%
AMD Ryzen 9 3950X, NVIDIA Titan RTX
R9 3950X, 3500 MHz
5749 Points -18%
64 Bit Multi-Core Score
AMD Ryzen 9 3950X, NVIDIA Titan RTX
R9 3950X, 3500 MHz
48962 Points +35%
AMD Ryzen 7 5800X, NVIDIA Titan RTX
R7 5800X, 3800 MHz
44131 Points +22%
Intel Core i9-10900K, NVIDIA Titan RTX
i9-10900K, 3700 MHz
43058 Points +19%
Intel Core i9-11900K, NVIDIA Titan RTX
i9-11900K, 3500 MHz
42329 Points +17%
Intel Core i9-11900KB, NVIDIA GeForce RTX 3060
i9-11900KB, 3300 MHz
36310 Points
AMD Ryzen 7 3800XT, NVIDIA Titan RTX
R7 3800XT, 3900 MHz
35526 Points -2%
Intel Core i5-11600K, NVIDIA Titan RTX
i5-11600K, 3900 MHz
33266 Points -8%
Intel Core i9-9980HK, NVIDIA GeForce RTX 2070 (Desktop)
i9-9980HK, 2400 MHz
29385 Points -19%
Intel Core i5-10600K, NVIDIA Titan RTX
i5-10600K, 4100 MHz
28391 Points -22%
3DMark 11 - 1280x720 Performance Physics
AMD Ryzen 7 5800X, NVIDIA Titan RTX
R7 5800X, 3800 MHz
23381 Points +31%
Intel Core i9-10900K, NVIDIA Titan RTX
i9-10900K, 3700 MHz
22140 Points +24%
Intel Core i9-11900K, NVIDIA Titan RTX
i9-11900K, 3500 MHz
21175 Points +19%
AMD Ryzen 9 3950X, NVIDIA Titan RTX
R9 3950X, 3500 MHz
21016 Points +18%
AMD Ryzen 7 3800XT, NVIDIA Titan RTX
R7 3800XT, 3900 MHz
18905 Points +6%
Intel Core i9-11900KB, NVIDIA GeForce RTX 3060
i9-11900KB, 3300 MHz
17803 Points
Intel Core i5-11600K, NVIDIA Titan RTX
i5-11600K, 3900 MHz
17381 Points -2%
Intel Core i9-9980HK, NVIDIA GeForce RTX 2070 (Desktop)
i9-9980HK, 2400 MHz
16422 Points -8%
Intel Core i5-10600K, NVIDIA Titan RTX
i5-10600K, 4100 MHz
15961 Points -10%
7-Zip 18.03
7z b 4
AMD Ryzen 9 3950X, NVIDIA Titan RTX
R9 3950X, 3500 MHz
99467 MIPS +98%
AMD Ryzen 7 5800X, NVIDIA Titan RTX
R7 5800X, 3800 MHz
74306 MIPS +48%
Intel Core i9-10900K, NVIDIA Titan RTX
i9-10900K, 3700 MHz
70968 MIPS +42%
Intel Core i9-11900K, NVIDIA Titan RTX
i9-11900K, 3500 MHz
62746 MIPS +25%
AMD Ryzen 7 3800XT, NVIDIA Titan RTX
R7 3800XT, 3900 MHz
59247 MIPS +18%
Intel Core i9-11900KB, NVIDIA GeForce RTX 3060
i9-11900KB, 3300 MHz
50152 MIPS
Intel Core i5-11600K, NVIDIA Titan RTX
i5-11600K, 3900 MHz
45322 MIPS -10%
Intel Core i9-9980HK, NVIDIA GeForce RTX 2070 (Desktop)
i9-9980HK, 2400 MHz
44081 MIPS -12%
Intel Core i5-10600K, NVIDIA Titan RTX
i5-10600K, 4100 MHz
40379 MIPS -19%
7z b 4 -mmt1
AMD Ryzen 7 5800X, NVIDIA Titan RTX
R7 5800X, 3800 MHz
6970 MIPS +17%
Intel Core i9-11900K, NVIDIA Titan RTX
i9-11900K, 3500 MHz
6652 MIPS +11%
Intel Core i5-11600K, NVIDIA Titan RTX
i5-11600K, 3900 MHz
6136 MIPS +3%
Intel Core i9-11900KB, NVIDIA GeForce RTX 3060
i9-11900KB, 3300 MHz
5979 MIPS
Intel Core i9-10900K, NVIDIA Titan RTX
i9-10900K, 3700 MHz
5954 MIPS 0%
Intel Core i9-9980HK, NVIDIA GeForce RTX 2070 (Desktop)
i9-9980HK, 2400 MHz
5642 MIPS -6%
AMD Ryzen 7 3800XT, NVIDIA Titan RTX
R7 3800XT, 3900 MHz
5516 MIPS -8%
AMD Ryzen 9 3950X, NVIDIA Titan RTX
R9 3950X, 3500 MHz
5340 MIPS -11%
Intel Core i5-10600K, NVIDIA Titan RTX
i5-10600K, 4100 MHz
5289 MIPS -12%
HWBOT x265 Benchmark v2.2 - 4k Preset
Intel Core i9-10900K, NVIDIA Titan RTX
i9-10900K, 3700 MHz
21 fps +46%
AMD Ryzen 7 5800X, NVIDIA Titan RTX
R7 5800X, 3800 MHz
20.8 fps +44%
Intel Core i9-11900K, NVIDIA Titan RTX
i9-11900K, 3500 MHz
19.8 fps +38%
AMD Ryzen 7 3800XT, NVIDIA Titan RTX
R7 3800XT, 3900 MHz
16.1 fps +12%
AMD Ryzen 9 3950X, NVIDIA Titan RTX
R9 3950X, 3500 MHz
15.8 fps +10%
Intel Core i5-11600K, NVIDIA Titan RTX
i5-11600K, 3900 MHz
14.7 fps +2%
Intel Core i9-11900KB, NVIDIA GeForce RTX 3060
i9-11900KB, 3300 MHz
14.4 fps
Intel Core i5-10600K, NVIDIA Titan RTX
i5-10600K, 4100 MHz
12.2 fps -15%
Intel Core i9-9980HK, NVIDIA GeForce RTX 2070 (Desktop)
i9-9980HK, 2400 MHz
11.4 fps -21%
R Benchmark 2.5 - Overall mean
Intel Core i5-10600K, NVIDIA Titan RTX
i5-10600K, 4100 MHz
0.593 sec * -11%
Intel Core i9-9980HK, NVIDIA GeForce RTX 2070 (Desktop)
i9-9980HK, 2400 MHz
0.541 sec * -1%
Intel Core i9-11900KB, NVIDIA GeForce RTX 3060
i9-11900KB, 3300 MHz
0.535 sec *
Intel Core i9-10900K, NVIDIA Titan RTX
i9-10900K, 3700 MHz
0.528 sec * +1%
AMD Ryzen 9 3950X, NVIDIA Titan RTX
R9 3950X, 3500 MHz
0.524 sec * +2%
AMD Ryzen 7 3800XT, NVIDIA Titan RTX
R7 3800XT, 3900 MHz
0.512 sec * +4%
Intel Core i5-11600K, NVIDIA Titan RTX
i5-11600K, 3900 MHz
0.506 sec * +5%
Intel Core i9-11900K, NVIDIA Titan RTX
i9-11900K, 3500 MHz
0.4733 sec * +12%
AMD Ryzen 7 5800X, NVIDIA Titan RTX
R7 5800X, 3800 MHz
0.4509 sec * +16%
LibreOffice - 20 Documents To PDF
Intel Core i9-10900K, NVIDIA Titan RTX
i9-10900K, 3700 MHz
76 s * -69%
Intel Core i9-11900K, NVIDIA Titan RTX
i9-11900K, 3500 MHz
72.5 s * -61%
AMD Ryzen 9 3950X, NVIDIA Titan RTX
R9 3950X, 3500 MHz
53.6 s * -19%
Intel Core i5-10600K, NVIDIA Titan RTX
i5-10600K, 4100 MHz
46.06 s * -3%
Intel Core i9-9980HK, NVIDIA GeForce RTX 2070 (Desktop)
i9-9980HK, 2400 MHz
45.23 s * -1%
Intel Core i9-11900KB, NVIDIA GeForce RTX 3060
i9-11900KB, 3300 MHz
44.9 s *
AMD Ryzen 7 3800XT, NVIDIA Titan RTX
R7 3800XT, 3900 MHz
44.78 s * -0%
AMD Ryzen 7 5800X, NVIDIA Titan RTX
R7 5800X, 3800 MHz
43.31 s * +4%
Intel Core i5-11600K, NVIDIA Titan RTX
i5-11600K, 3900 MHz
39.7 s * +12%
WebXPRT 3 - Overall
AMD Ryzen 7 5800X, NVIDIA Titan RTX
R7 5800X, 3800 MHz
296 Points +10%
Intel Core i5-11600K, NVIDIA Titan RTX
i5-11600K, 3900 MHz
280 Points +4%
Intel Core i9-11900KB, NVIDIA GeForce RTX 3060
i9-11900KB, 3300 MHz
269 Points
Intel Core i9-10900K, NVIDIA Titan RTX
i9-10900K, 3700 MHz
255 Points -5%
AMD Ryzen 7 3800XT, NVIDIA Titan RTX
R7 3800XT, 3900 MHz
249 Points -7%
AMD Ryzen 9 3950X, NVIDIA Titan RTX
R9 3950X, 3500 MHz
239 Points -11%
Intel Core i5-10600K, NVIDIA Titan RTX
i5-10600K, 4100 MHz
239 Points -11%
Intel Core i9-9980HK, NVIDIA GeForce RTX 2070 (Desktop)
i9-9980HK, 2400 MHz
233 Points -13%
Intel Core i9-11900K, NVIDIA Titan RTX
i9-11900K, 3500 MHz
217 Points -19%
Mozilla Kraken 1.1 - Total
Intel Core i5-10600K, NVIDIA Titan RTX
i5-10600K, 4100 MHz
760 ms * -26%
Intel Core i9-9980HK, NVIDIA GeForce RTX 2070 (Desktop)
i9-9980HK, 2400 MHz
754 ms * -25%
Intel Core i9-10900K, NVIDIA Titan RTX
i9-10900K, 3700 MHz
709 ms * -18%
AMD Ryzen 9 3950X, NVIDIA Titan RTX
R9 3950X, 3500 MHz
706 ms * -17%
AMD Ryzen 7 3800XT, NVIDIA Titan RTX
R7 3800XT, 3900 MHz
683 ms * -13%
Intel Core i9-11900KB, NVIDIA GeForce RTX 3060
i9-11900KB, 3300 MHz
602 ms *
Intel Core i5-11600K, NVIDIA Titan RTX
i5-11600K, 3900 MHz
587 ms * +2%
AMD Ryzen 7 5800X, NVIDIA Titan RTX
R7 5800X, 3800 MHz
558 ms * +7%
Intel Core i9-11900K, NVIDIA Titan RTX
i9-11900K, 3500 MHz
544 ms * +10%
3DMark
3840x2160 Fire Strike Ultra Physics
AMD Ryzen 9 3950X, NVIDIA Titan RTX
R9 3950X, 3500 MHz
31881 Points +33%
AMD Ryzen 7 5800X, NVIDIA Titan RTX
R7 5800X, 3800 MHz
31095 Points +30%
Intel Core i9-10900K, NVIDIA Titan RTX
i9-10900K, 3700 MHz
29374 Points +23%
Intel Core i9-11900K, NVIDIA Titan RTX
i9-11900K, 3500 MHz
27685 Points +16%
AMD Ryzen 7 3800XT, NVIDIA Titan RTX
R7 3800XT, 3900 MHz
25286 Points +6%
Intel Core i9-11900KB, NVIDIA GeForce RTX 3060
i9-11900KB, 3300 MHz
23921 Points
Intel Core i5-11600K, NVIDIA Titan RTX
i5-11600K, 3900 MHz
23190 Points -3%
Intel Core i9-9980HK, NVIDIA GeForce RTX 2070 (Desktop)
i9-9980HK, 2400 MHz
21864 Points -9%
Intel Core i5-10600K, NVIDIA Titan RTX
i5-10600K, 4100 MHz
19942 Points -17%
1920x1080 Fire Strike Physics
AMD Ryzen 9 3950X, NVIDIA Titan RTX
R9 3950X, 3500 MHz
32004 Points +32%
AMD Ryzen 7 5800X, NVIDIA Titan RTX
R7 5800X, 3800 MHz
30938 Points +27%
Intel Core i9-10900K, NVIDIA Titan RTX
i9-10900K, 3700 MHz
29805 Points +23%
Intel Core i9-11900K, NVIDIA Titan RTX
i9-11900K, 3500 MHz
28927 Points +19%
AMD Ryzen 7 3800XT, NVIDIA Titan RTX
R7 3800XT, 3900 MHz
25132 Points +3%
Intel Core i9-11900KB, NVIDIA GeForce RTX 3060
i9-11900KB, 3300 MHz
24327 Points
Intel Core i5-11600K, NVIDIA Titan RTX
i5-11600K, 3900 MHz
22631 Points -7%
Intel Core i9-9980HK, NVIDIA GeForce RTX 2070 (Desktop)
i9-9980HK, 2400 MHz
21706 Points -11%
Intel Core i5-10600K, NVIDIA Titan RTX
i5-10600K, 4100 MHz
20040 Points -18%
2560x1440 Time Spy CPU
Intel Core i9-10900K, NVIDIA Titan RTX
i9-10900K, 3700 MHz
14326 Points +43%
Intel Core i9-11900K, NVIDIA Titan RTX
i9-11900K, 3500 MHz
13433 Points +34%
AMD Ryzen 9 3950X, NVIDIA Titan RTX
R9 3950X, 3500 MHz
12404 Points +24%
AMD Ryzen 7 5800X, NVIDIA Titan RTX
R7 5800X, 3800 MHz
11599 Points +16%
AMD Ryzen 7 3800XT, NVIDIA Titan RTX
R7 3800XT, 3900 MHz
10302 Points +3%
Intel Core i9-11900KB, NVIDIA GeForce RTX 3060
i9-11900KB, 3300 MHz
10035 Points
Intel Core i5-11600K, NVIDIA Titan RTX
i5-11600K, 3900 MHz
9482 Points -6%
Intel Core i9-9980HK, NVIDIA GeForce RTX 2070 (Desktop)
i9-9980HK, 2400 MHz
9417 Points -6%
Intel Core i5-10600K, NVIDIA Titan RTX
i5-10600K, 4100 MHz
8290 Points -17%

* ... Meglio usare valori piccoli

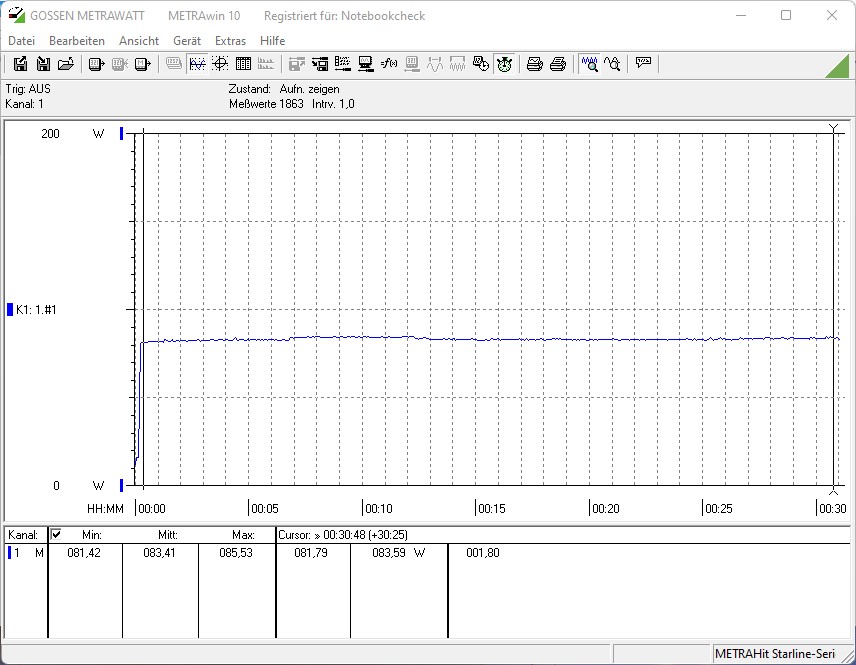
Intel NUC 11 Extreme Kit nel Cinebench R15 multi-loop

Il primo test di carico con il Cinebench R15 multi-loop mostra prestazioni stabili. Con 1.800 punti, l'Intel Core i9-11900KB offre una prestazione costantemente elevata senza cali di prestazioni. Tuttavia, un leggero calo di prestazioni può essere notato dopo le prime due esecuzioni.

1410.81460.81510.81560.81610.81660.81710.81760.81810.8Tooltip
Intel Beast Canyon NUC Intel Core i9-11900KB, Intel Core i9-11900KB: Ø1800 (1776.75-1859.25)
Intel Ghost Canyon NUC (RTX 2070) Intel Core i9-9980HK, Intel Core i9-9980HK: Ø1463 (1410.79-1593.44)

Prestazioni dell'applicazione

Nei benchmark delle applicazioni, il nostro campione di prova è solo leggermente più avanti del NUC Ghost Canyon. Nel complesso, l'hardware più recente non può fornire un guadagno di prestazioni decente. Soggettivamente, tuttavia, possiamo dire che sia il Ghost Canyon NUC che il Beast Canyon NUC sono abbastanza veloci nell'uso quotidiano. Lunghi tempi di attesa sono stati sperimentati solo durante il download di giochi di grandi dimensioni, ma questo è dovuto alle restrizioni di banda del provider internet. Il nostro campione di prova si comporta abbastanza bene anche contro i sistemi di test attuali, come si può vedere nei risultati di PCMark 10 qui sotto.

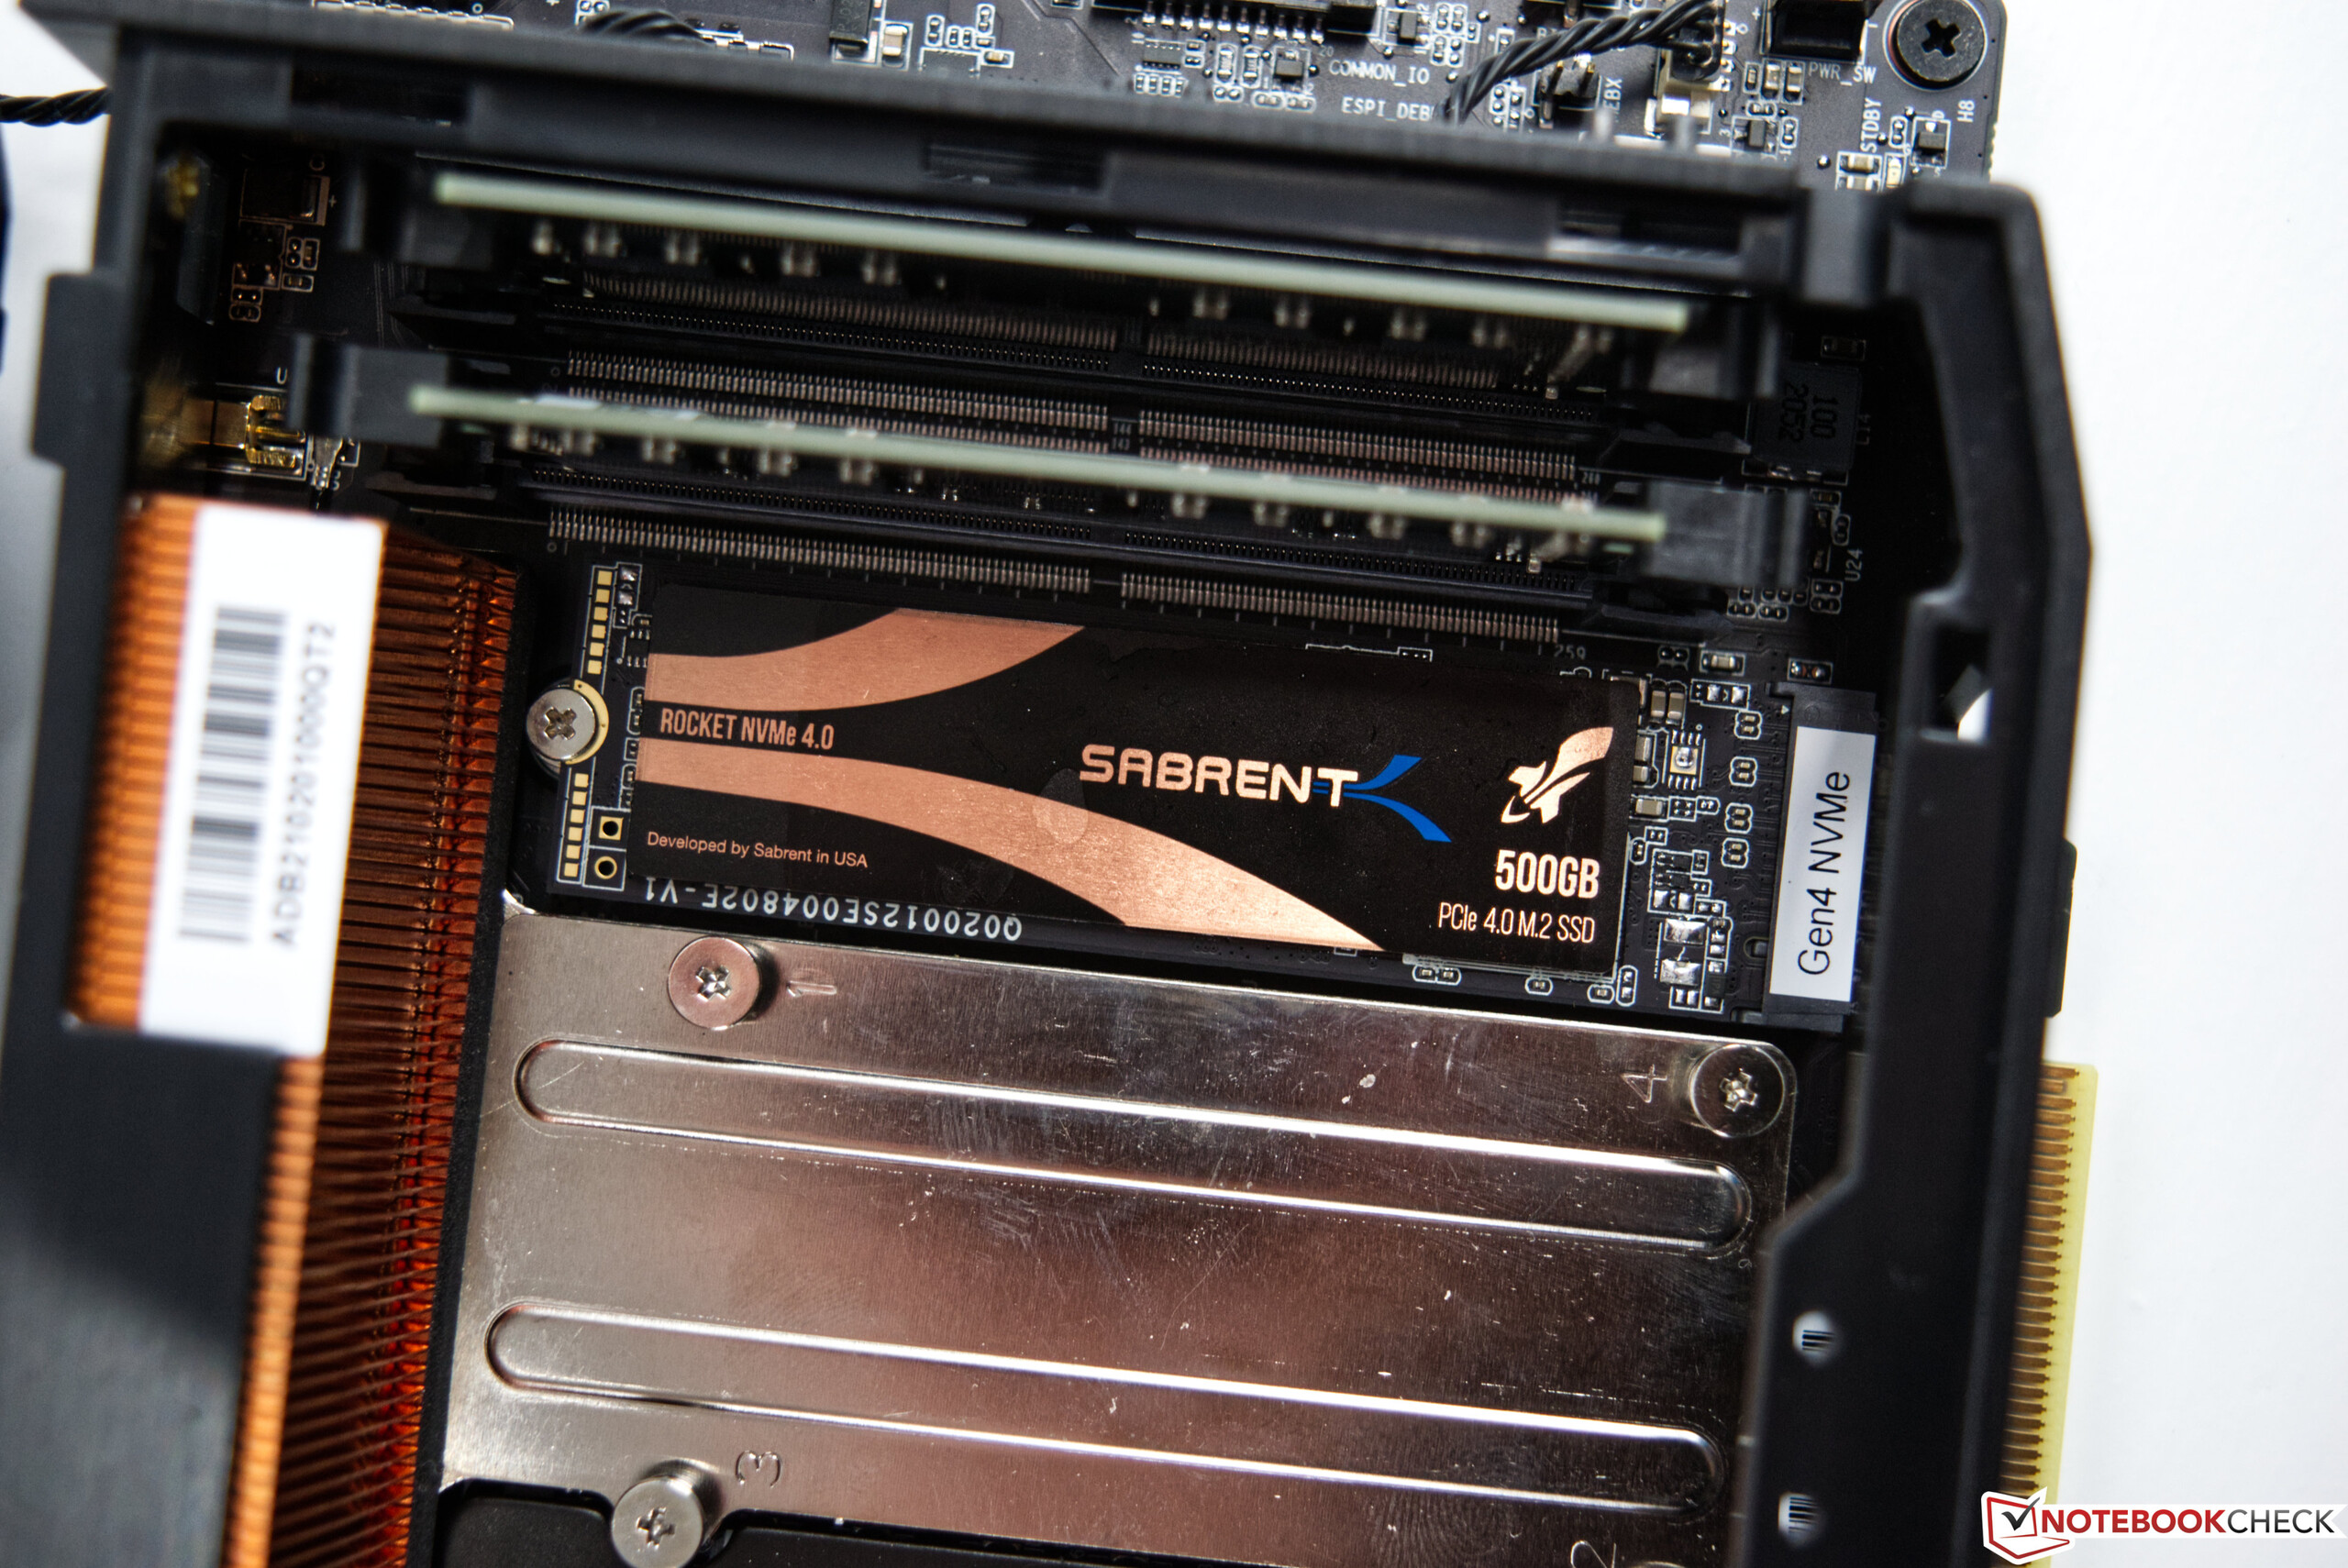
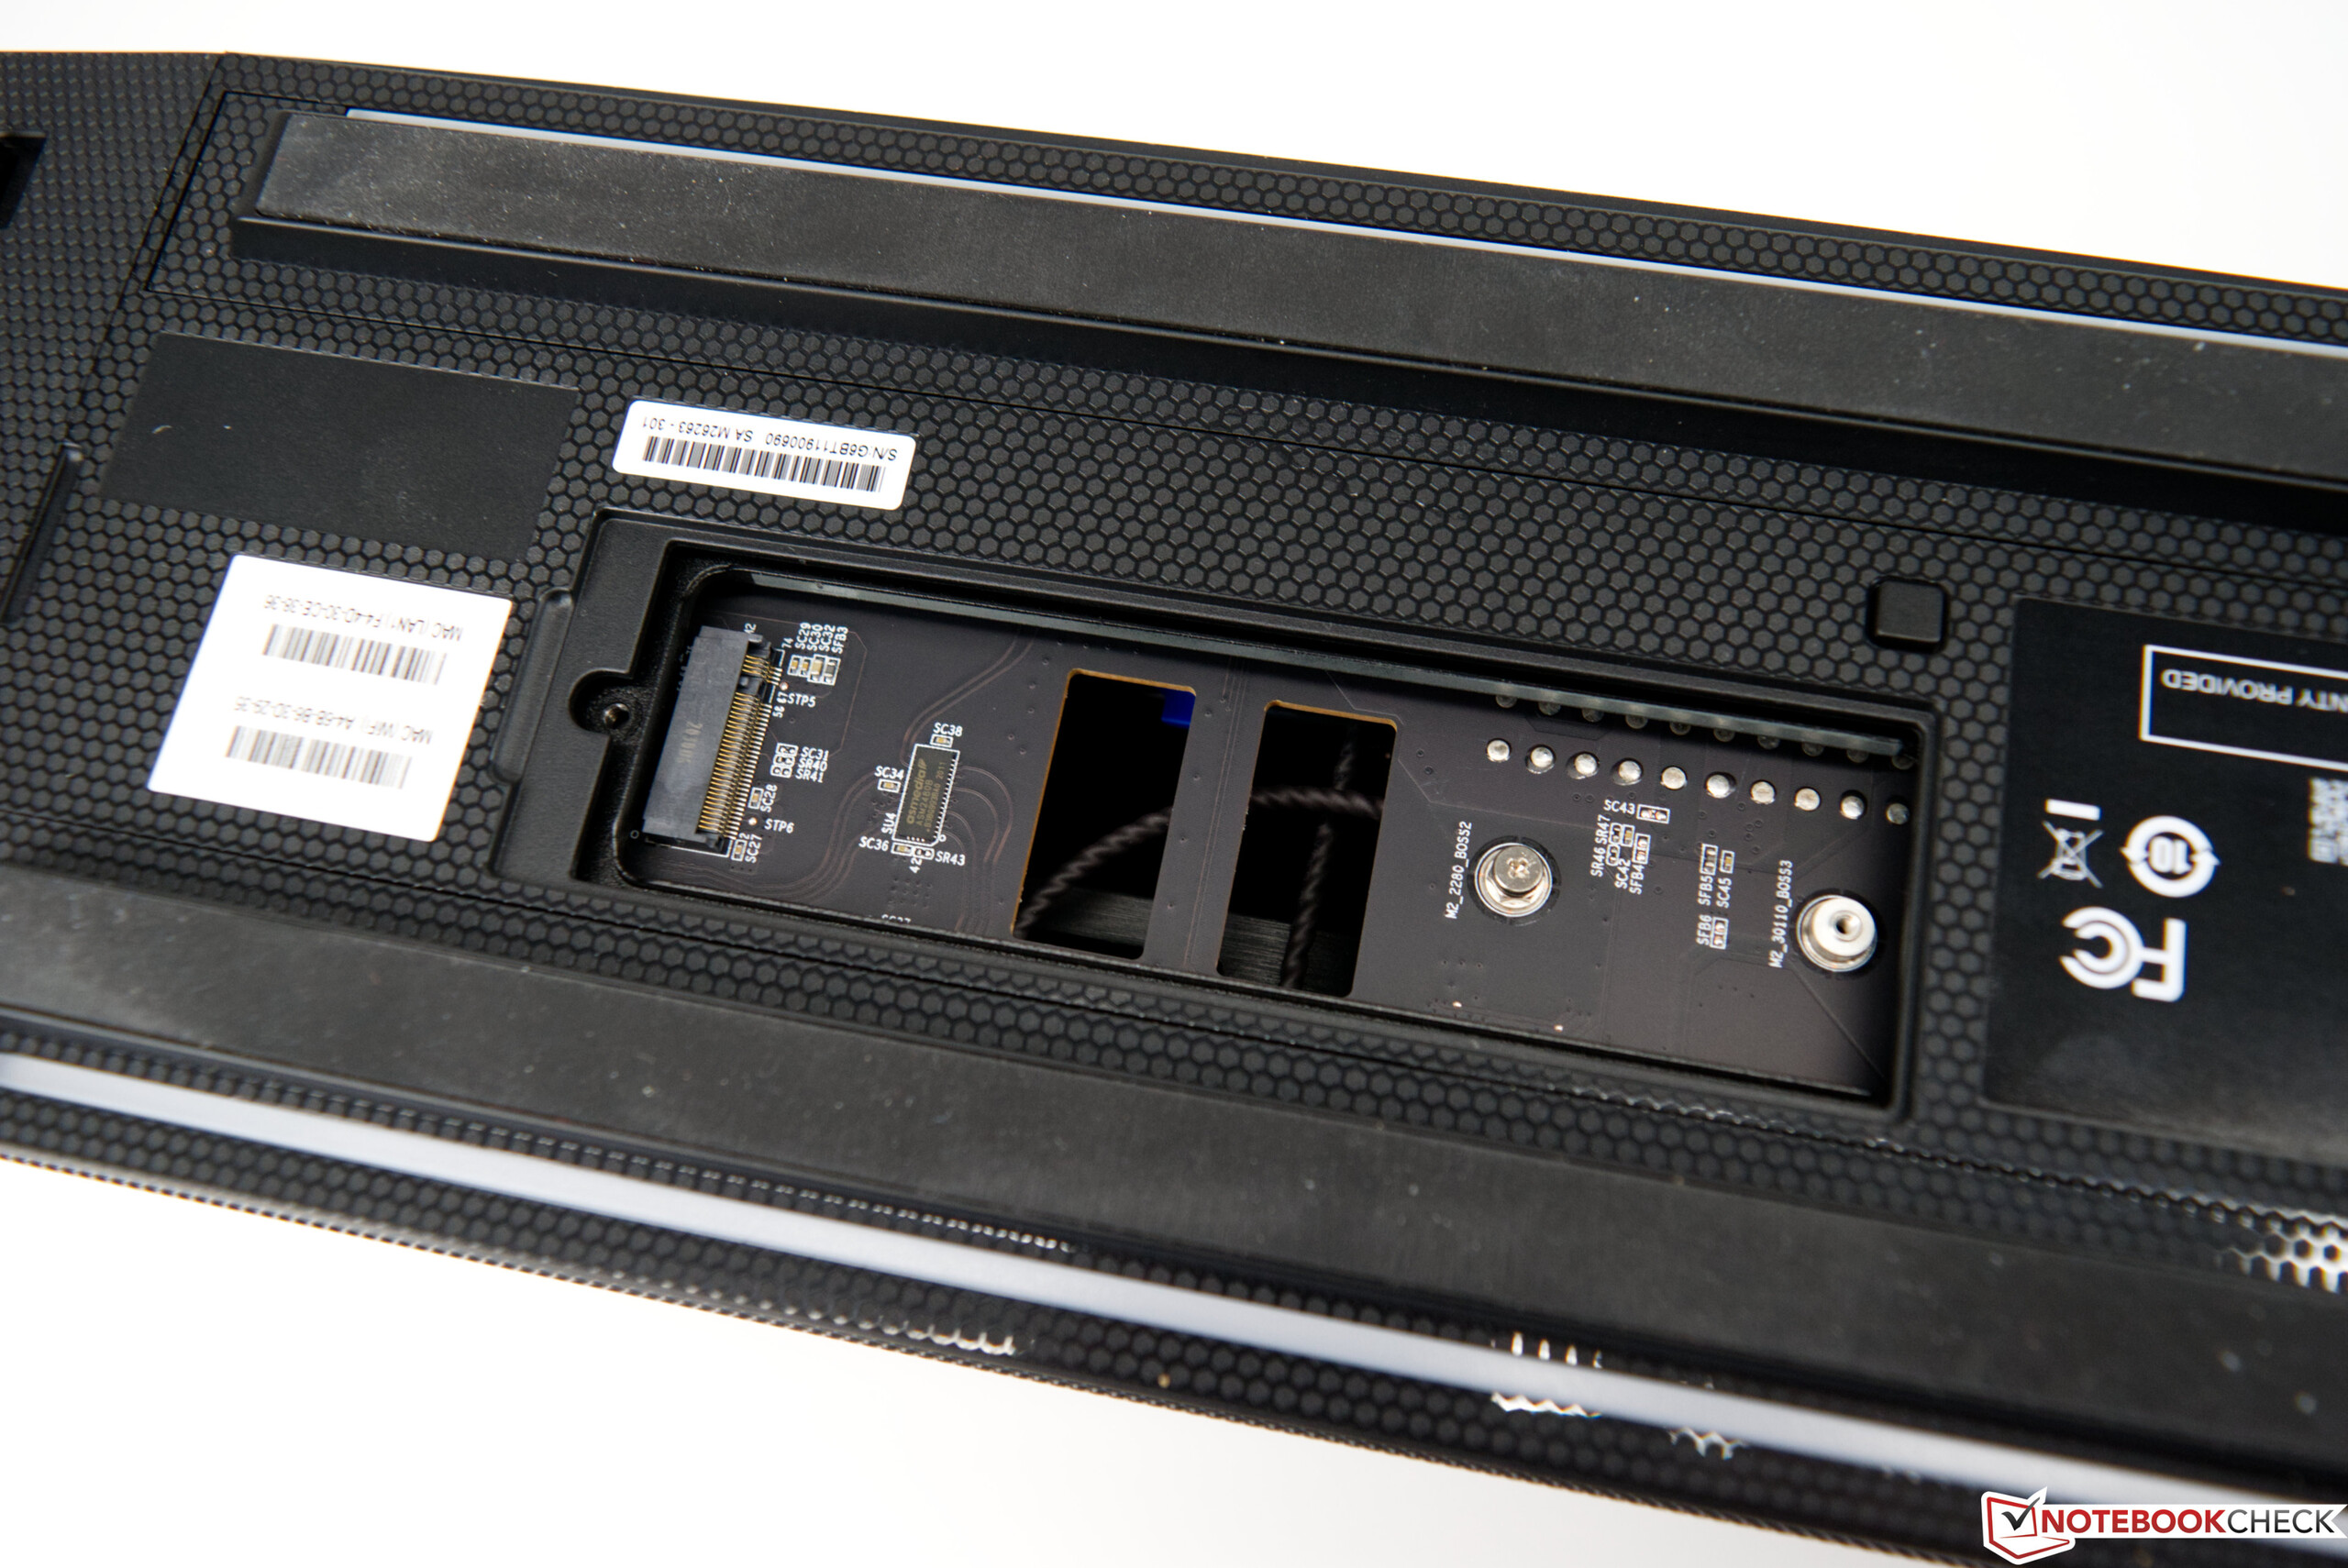
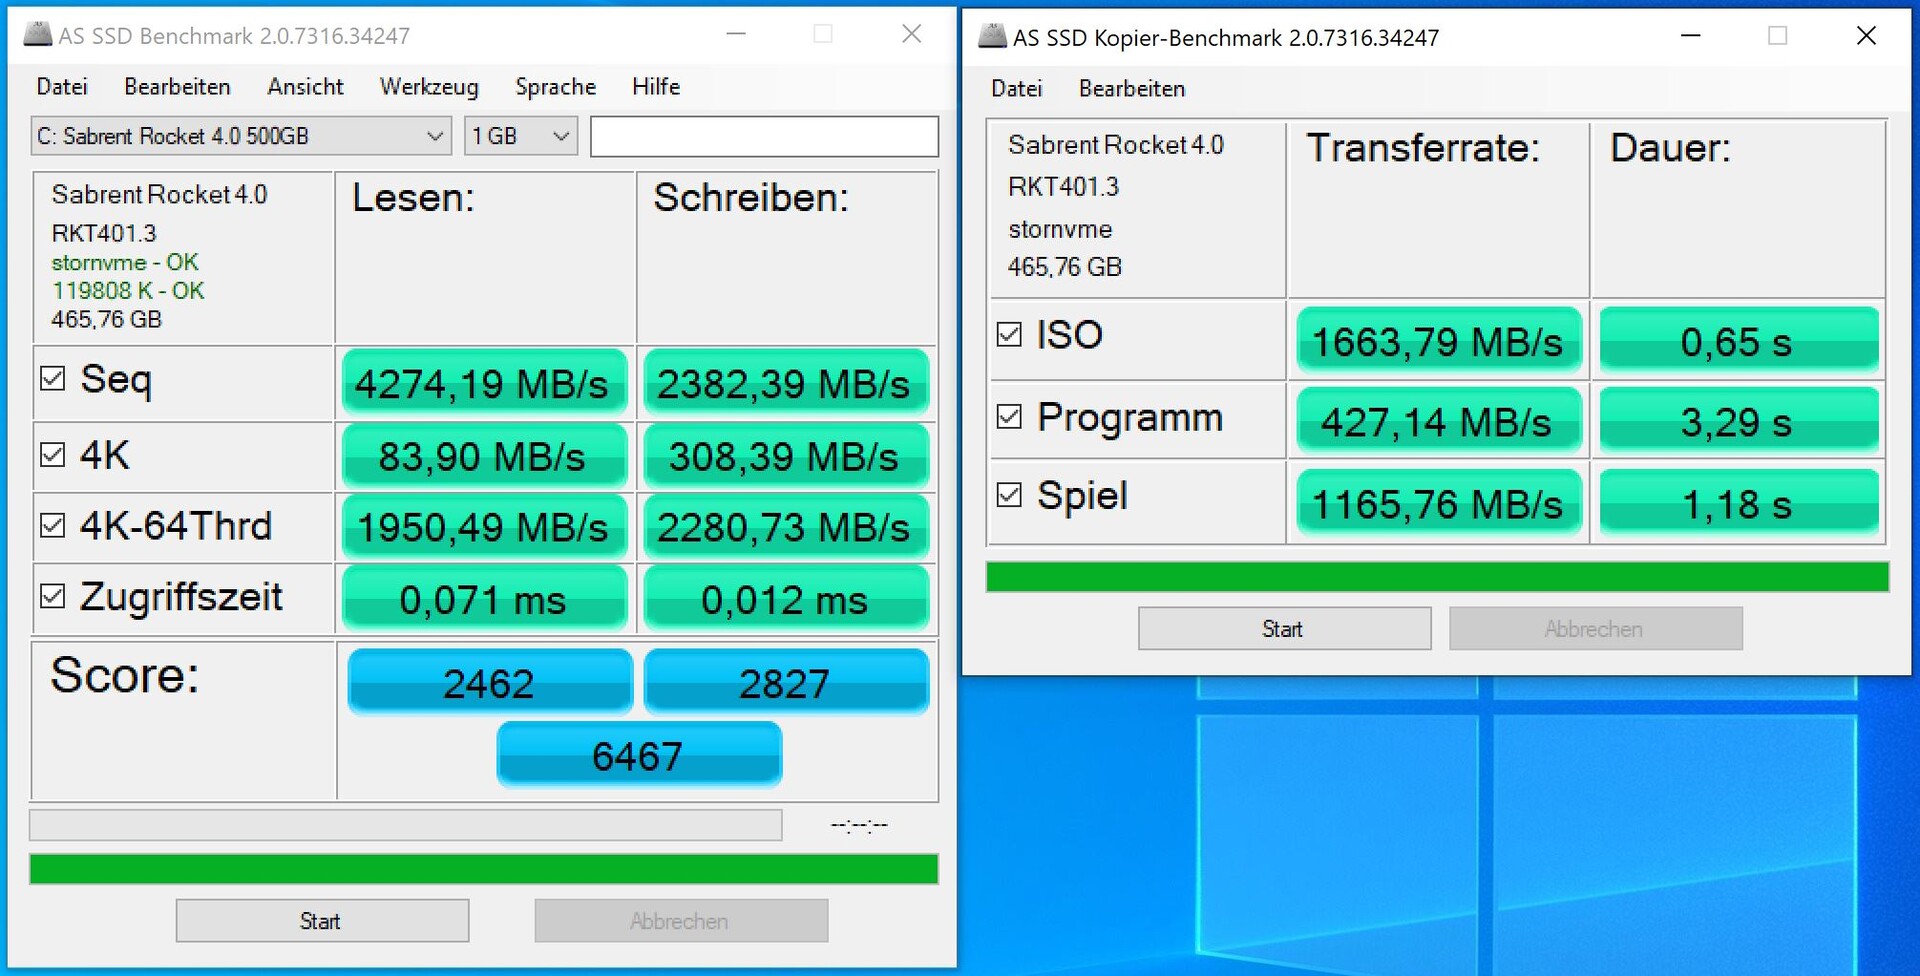
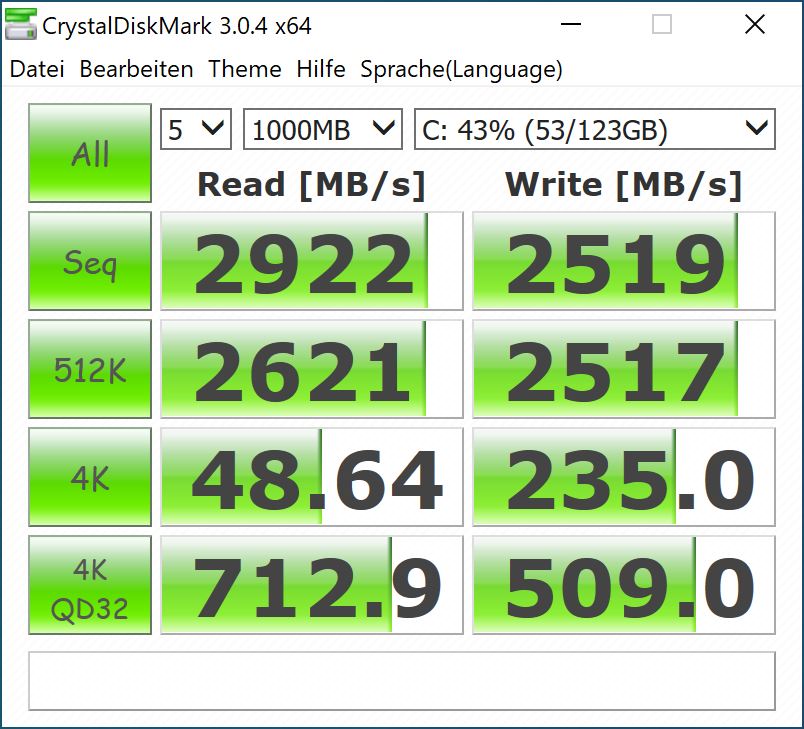
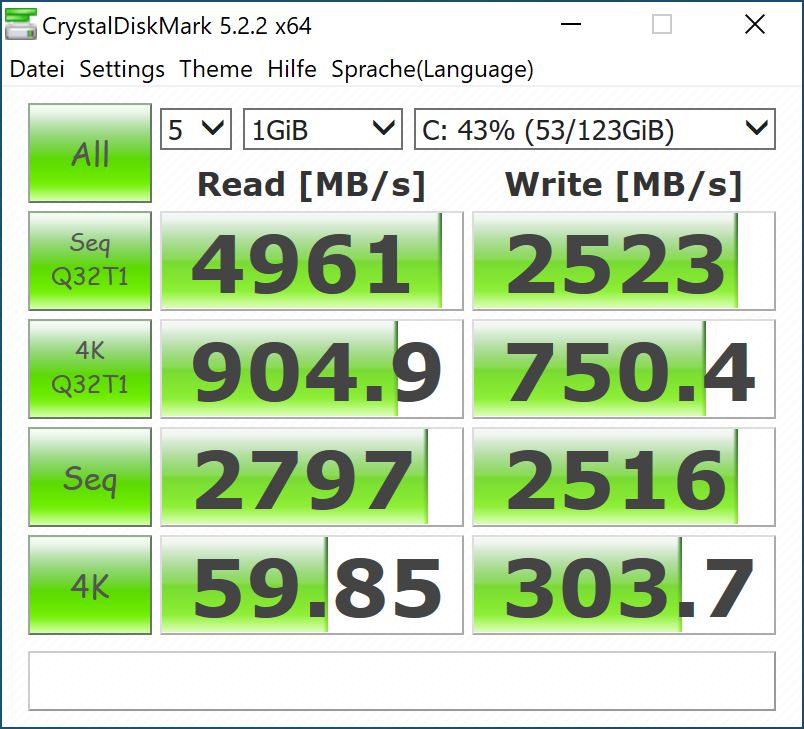
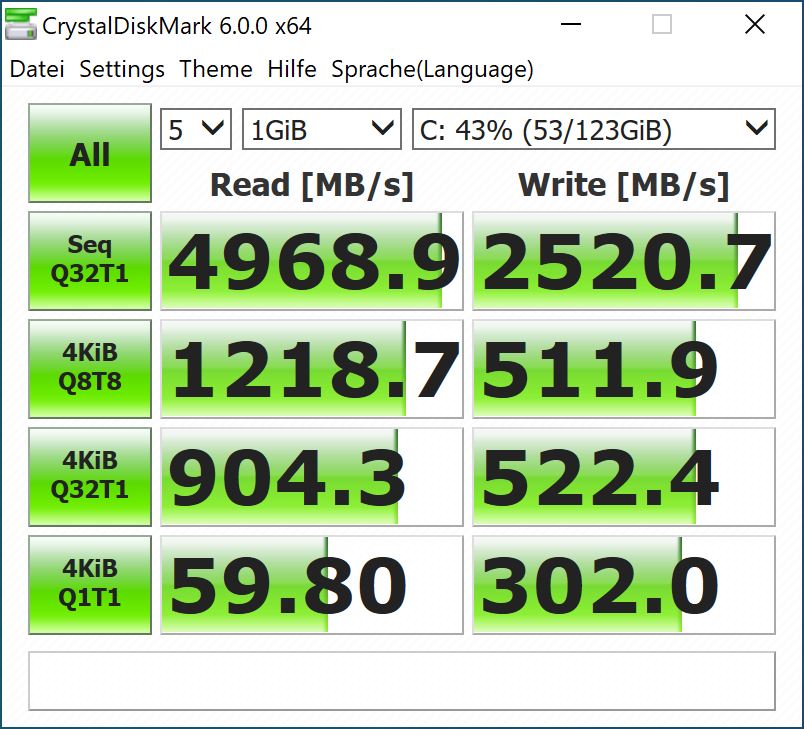
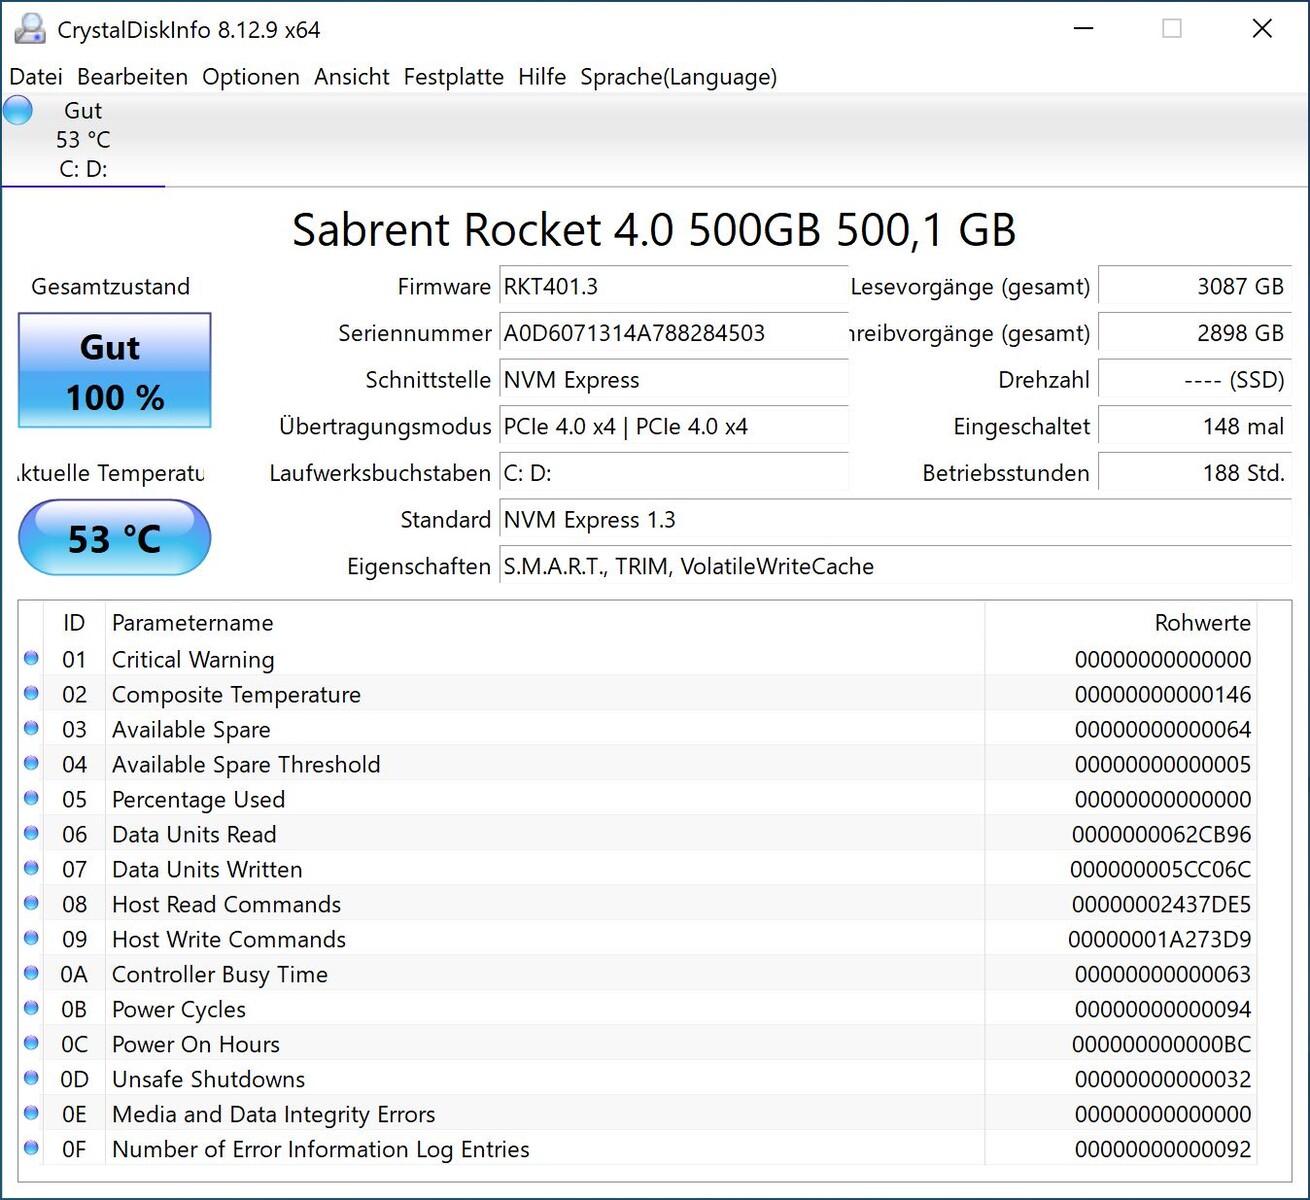
Intel ha equipaggiato il campione di prova con un SSD da 500 GB, che si è comportato molto bene nel test. A causa della costruzione, è possibile installare solo SSD nel Beast Canyon NUC. Il Compute Element ha tre slot M.2-2280 e un altro modulo può essere installato nel case sul lato inferiore

AS SSD
AS SSD
CDM 3
CDM 3
CDM 5
CDM 5
CDM 6
CDM 6
CDI
CDI
Performance Rating - Percent
Intel Core i9-11900K, Intel Core i9-11900K
NVIDIA Titan RTX
98.5 pt
Intel Core i5-11600K, Intel Core i5-11600K
NVIDIA Titan RTX
96.7 pt
Intel Core i9-10900K, Intel Core i9-10900K
NVIDIA Titan RTX
95.1 pt
Intel Core i5-10600K, Intel Core i5-10600K
NVIDIA Titan RTX
92.5 pt
AMD Ryzen 9 3950X, AMD Ryzen 9 3950X
NVIDIA Titan RTX
91.1 pt
Corsair One i160, Intel Core i9-9900K
NVIDIA GeForce RTX 2080 Ti (Desktop)
65.2 pt
Intel Beast Canyon NUC, Intel Core i9-11900KB
NVIDIA GeForce RTX 3060
46.8 pt
Intel Ghost Canyon NUC (RTX 2070), Intel Core i9-9980HK
NVIDIA GeForce RTX 2070 (Desktop)
46.5 pt
PCMark 10 - Score
AMD Ryzen 9 3950X, AMD Ryzen 9 3950X
NVIDIA Titan RTX
7869 Points +8%
Intel Core i9-11900K, Intel Core i9-11900K
NVIDIA Titan RTX
7745 Points +6%
Intel Core i5-11600K, Intel Core i5-11600K
NVIDIA Titan RTX
7740 Points +6%
Intel Core i9-10900K, Intel Core i9-10900K
NVIDIA Titan RTX
7641 Points +5%
Corsair One i160, Intel Core i9-9900K
NVIDIA GeForce RTX 2080 Ti (Desktop)
7329 Points +1%
Intel Beast Canyon NUC, Intel Core i9-11900KB
NVIDIA GeForce RTX 3060
7281 Points
Intel Core i5-10600K, Intel Core i5-10600K
NVIDIA Titan RTX
7279 Points 0%
Intel Ghost Canyon NUC (RTX 2070), Intel Core i9-9980HK
NVIDIA GeForce RTX 2070 (Desktop)
6939 Points -5%
SPECviewperf 12
1900x1060 Solidworks (sw-03)
Intel Core i9-11900K, Intel Core i9-11900K
NVIDIA Titan RTX
182 fps +154%
Intel Core i9-10900K, Intel Core i9-10900K
NVIDIA Titan RTX
172.2 fps +141%
Intel Core i5-11600K, Intel Core i5-11600K
NVIDIA Titan RTX
171 fps +139%
Intel Core i5-10600K, Intel Core i5-10600K
NVIDIA Titan RTX
158.2 fps +121%
AMD Ryzen 9 3950X, AMD Ryzen 9 3950X
NVIDIA Titan RTX
157.6 fps +120%
Corsair One i160, Intel Core i9-9900K
NVIDIA GeForce RTX 2080 Ti (Desktop)
83.7 fps +17%
Intel Beast Canyon NUC, Intel Core i9-11900KB
NVIDIA GeForce RTX 3060
71.6 fps
Intel Ghost Canyon NUC (RTX 2070), Intel Core i9-9980HK
NVIDIA GeForce RTX 2070 (Desktop)
59.2 fps -17%
1900x1060 Siemens NX (snx-02)
Intel Core i9-10900K, Intel Core i9-10900K
NVIDIA Titan RTX
263.3 fps +2909%
Intel Core i5-10600K, Intel Core i5-10600K
NVIDIA Titan RTX
259.1 fps +2861%
AMD Ryzen 9 3950X, AMD Ryzen 9 3950X
NVIDIA Titan RTX
254.8 fps +2812%
Intel Core i5-11600K, Intel Core i5-11600K
NVIDIA Titan RTX
251 fps +2769%
Intel Core i9-11900K, Intel Core i9-11900K
NVIDIA Titan RTX
245 fps +2700%
Corsair One i160, Intel Core i9-9900K
NVIDIA GeForce RTX 2080 Ti (Desktop)
12.72 fps +45%
Intel Ghost Canyon NUC (RTX 2070), Intel Core i9-9980HK
NVIDIA GeForce RTX 2070 (Desktop)
9.08 fps +4%
Intel Beast Canyon NUC, Intel Core i9-11900KB
NVIDIA GeForce RTX 3060
8.75 fps
1900x1060 Showcase (showcase-01)
Intel Core i9-11900K, Intel Core i9-11900K
NVIDIA Titan RTX
203 fps +80%
Intel Core i5-11600K, Intel Core i5-11600K
NVIDIA Titan RTX
202 fps +79%
Intel Core i5-10600K, Intel Core i5-10600K
NVIDIA Titan RTX
196.1 fps +74%
Intel Core i9-10900K, Intel Core i9-10900K
NVIDIA Titan RTX
192.4 fps +70%
AMD Ryzen 9 3950X, AMD Ryzen 9 3950X
NVIDIA Titan RTX
188.3 fps +67%
Corsair One i160, Intel Core i9-9900K
NVIDIA GeForce RTX 2080 Ti (Desktop)
182.3 fps +61%
Intel Ghost Canyon NUC (RTX 2070), Intel Core i9-9980HK
NVIDIA GeForce RTX 2070 (Desktop)
118.5 fps +5%
Intel Beast Canyon NUC, Intel Core i9-11900KB
NVIDIA GeForce RTX 3060
113 fps
1900x1060 Medical (medical-01)
Intel Core i5-10600K, Intel Core i5-10600K
NVIDIA Titan RTX
94.6 fps +131%
Intel Core i9-10900K, Intel Core i9-10900K
NVIDIA Titan RTX
94.5 fps +131%
Intel Core i5-11600K, Intel Core i5-11600K
NVIDIA Titan RTX
88.7 fps +117%
AMD Ryzen 9 3950X, AMD Ryzen 9 3950X
NVIDIA Titan RTX
88.1 fps +115%
Intel Core i9-11900K, Intel Core i9-11900K
NVIDIA Titan RTX
87.8 fps +115%
Corsair One i160, Intel Core i9-9900K
NVIDIA GeForce RTX 2080 Ti (Desktop)
56.6 fps +38%
Intel Beast Canyon NUC, Intel Core i9-11900KB
NVIDIA GeForce RTX 3060
40.9 fps
Intel Ghost Canyon NUC (RTX 2070), Intel Core i9-9980HK
NVIDIA GeForce RTX 2070 (Desktop)
40.14 fps -2%
1900x1060 Maya (maya-04)
Intel Core i9-11900K, Intel Core i9-11900K
NVIDIA Titan RTX
199 fps +4%
Intel Beast Canyon NUC, Intel Core i9-11900KB
NVIDIA GeForce RTX 3060
191 fps
Corsair One i160, Intel Core i9-9900K
NVIDIA GeForce RTX 2080 Ti (Desktop)
190.9 fps 0%
Intel Core i9-10900K, Intel Core i9-10900K
NVIDIA Titan RTX
188.7 fps -1%
Intel Core i5-11600K, Intel Core i5-11600K
NVIDIA Titan RTX
186 fps -3%
AMD Ryzen 9 3950X, AMD Ryzen 9 3950X
NVIDIA Titan RTX
172.2 fps -10%
Intel Ghost Canyon NUC (RTX 2070), Intel Core i9-9980HK
NVIDIA GeForce RTX 2070 (Desktop)
171 fps -10%
Intel Core i5-10600K, Intel Core i5-10600K
NVIDIA Titan RTX
169.4 fps -11%
1900x1060 Energy (energy-01)
Intel Core i5-10600K, Intel Core i5-10600K
NVIDIA Titan RTX
28.77 fps +188%
Intel Core i9-10900K, Intel Core i9-10900K
NVIDIA Titan RTX
28.72 fps +187%
Intel Core i5-11600K, Intel Core i5-11600K
NVIDIA Titan RTX
28.3 fps +183%
Intel Core i9-11900K, Intel Core i9-11900K
NVIDIA Titan RTX
28.2 fps +182%
AMD Ryzen 9 3950X, AMD Ryzen 9 3950X
NVIDIA Titan RTX
28.18 fps +182%
Corsair One i160, Intel Core i9-9900K
NVIDIA GeForce RTX 2080 Ti (Desktop)
16.72 fps +67%
Intel Ghost Canyon NUC (RTX 2070), Intel Core i9-9980HK
NVIDIA GeForce RTX 2070 (Desktop)
11.49 fps +15%
Intel Beast Canyon NUC, Intel Core i9-11900KB
NVIDIA GeForce RTX 3060
10 fps
1900x1060 Creo (creo-01)
Intel Core i9-11900K, Intel Core i9-11900K
NVIDIA Titan RTX
173 fps +250%
Intel Core i5-11600K, Intel Core i5-11600K
NVIDIA Titan RTX
164 fps +232%
Intel Core i9-10900K, Intel Core i9-10900K
NVIDIA Titan RTX
157.2 fps +218%
Intel Core i5-10600K, Intel Core i5-10600K
NVIDIA Titan RTX
142.7 fps +189%
AMD Ryzen 9 3950X, AMD Ryzen 9 3950X
NVIDIA Titan RTX
134.8 fps +173%
Corsair One i160, Intel Core i9-9900K
NVIDIA GeForce RTX 2080 Ti (Desktop)
72.2 fps +46%
Intel Ghost Canyon NUC (RTX 2070), Intel Core i9-9980HK
NVIDIA GeForce RTX 2070 (Desktop)
52.2 fps +6%
Intel Beast Canyon NUC, Intel Core i9-11900KB
NVIDIA GeForce RTX 3060
49.4 fps
1900x1060 Catia (catia-04)
Intel Core i9-11900K, Intel Core i9-11900K
NVIDIA Titan RTX
269 fps +249%
Intel Core i5-11600K, Intel Core i5-11600K
NVIDIA Titan RTX
251 fps +226%
Intel Core i9-10900K, Intel Core i9-10900K
NVIDIA Titan RTX
225.2 fps +192%
AMD Ryzen 9 3950X, AMD Ryzen 9 3950X
NVIDIA Titan RTX
218.4 fps +184%
Intel Core i5-10600K, Intel Core i5-10600K
NVIDIA Titan RTX
215.5 fps +180%
Corsair One i160, Intel Core i9-9900K
NVIDIA GeForce RTX 2080 Ti (Desktop)
120.8 fps +57%
Intel Ghost Canyon NUC (RTX 2070), Intel Core i9-9980HK
NVIDIA GeForce RTX 2070 (Desktop)
78.3 fps +2%
Intel Beast Canyon NUC, Intel Core i9-11900KB
NVIDIA GeForce RTX 3060
77 fps
1900x1060 3ds Max (3dsmax-05)
Intel Core i9-10900K, Intel Core i9-10900K
NVIDIA Titan RTX
297.4 fps +48%
Intel Core i5-10600K, Intel Core i5-10600K
NVIDIA Titan RTX
296.9 fps +48%
Intel Core i9-11900K, Intel Core i9-11900K
NVIDIA Titan RTX
289 fps +44%
Intel Core i5-11600K, Intel Core i5-11600K
NVIDIA Titan RTX
288 fps +43%
AMD Ryzen 9 3950X, AMD Ryzen 9 3950X
NVIDIA Titan RTX
274.5 fps +37%
Corsair One i160, Intel Core i9-9900K
NVIDIA GeForce RTX 2080 Ti (Desktop)
271.8 fps +35%
Intel Beast Canyon NUC, Intel Core i9-11900KB
NVIDIA GeForce RTX 3060
201 fps
Intel Ghost Canyon NUC (RTX 2070), Intel Core i9-9980HK
NVIDIA GeForce RTX 2070 (Desktop)
180.8 fps -10%
SPECviewperf 13
Solidworks (sw-04)
Intel Core i9-11900K, Intel Core i9-11900K
NVIDIA Titan RTX
198 fps +90%
Intel Core i5-11600K, Intel Core i5-11600K
NVIDIA Titan RTX
185 fps +78%
Intel Core i9-10900K, Intel Core i9-10900K
NVIDIA Titan RTX
166.2 fps +60%
Intel Core i5-10600K, Intel Core i5-10600K
NVIDIA Titan RTX
153.9 fps +48%
AMD Ryzen 9 3950X, AMD Ryzen 9 3950X
NVIDIA Titan RTX
153.2 fps +47%
Corsair One i160, Intel Core i9-9900K
NVIDIA GeForce RTX 2080 Ti (Desktop)
116.3 fps +12%
Intel Beast Canyon NUC, Intel Core i9-11900KB
NVIDIA GeForce RTX 3060
104 fps
Intel Ghost Canyon NUC (RTX 2070), Intel Core i9-9980HK
NVIDIA GeForce RTX 2070 (Desktop)
85.4 fps -18%
Siemens NX (snx-03)
Intel Core i9-10900K, Intel Core i9-10900K
NVIDIA Titan RTX
472.9 fps +2893%
Intel Core i5-10600K, Intel Core i5-10600K
NVIDIA Titan RTX
469.1 fps +2869%
AMD Ryzen 9 3950X, AMD Ryzen 9 3950X
NVIDIA Titan RTX
460 fps +2811%
Intel Core i5-11600K, Intel Core i5-11600K
NVIDIA Titan RTX
453 fps +2767%
Intel Core i9-11900K, Intel Core i9-11900K
NVIDIA Titan RTX
450 fps +2748%
Corsair One i160, Intel Core i9-9900K
NVIDIA GeForce RTX 2080 Ti (Desktop)
23.03 fps +46%
Intel Ghost Canyon NUC (RTX 2070), Intel Core i9-9980HK
NVIDIA GeForce RTX 2070 (Desktop)
16.33 fps +3%
Intel Beast Canyon NUC, Intel Core i9-11900KB
NVIDIA GeForce RTX 3060
15.8 fps
Showcase (showcase-02)
Intel Core i5-10600K, Intel Core i5-10600K
NVIDIA Titan RTX
195.1 fps +73%
Intel Core i9-10900K, Intel Core i9-10900K
NVIDIA Titan RTX
194.1 fps +72%
Intel Core i9-11900K, Intel Core i9-11900K
NVIDIA Titan RTX
194 fps +72%
Intel Core i5-11600K, Intel Core i5-11600K
NVIDIA Titan RTX
193 fps +71%
AMD Ryzen 9 3950X, AMD Ryzen 9 3950X
NVIDIA Titan RTX
186.8 fps +65%
Corsair One i160, Intel Core i9-9900K
NVIDIA GeForce RTX 2080 Ti (Desktop)
182.6 fps +62%
Intel Ghost Canyon NUC (RTX 2070), Intel Core i9-9980HK
NVIDIA GeForce RTX 2070 (Desktop)
118.5 fps +5%
Intel Beast Canyon NUC, Intel Core i9-11900KB
NVIDIA GeForce RTX 3060
113 fps
Medical (medical-02)
AMD Ryzen 9 3950X, AMD Ryzen 9 3950X
NVIDIA Titan RTX
90.3 fps +66%
Intel Core i9-11900K, Intel Core i9-11900K
NVIDIA Titan RTX
90 fps +65%
Intel Core i5-11600K, Intel Core i5-11600K
NVIDIA Titan RTX
90 fps +65%
Intel Core i5-10600K, Intel Core i5-10600K
NVIDIA Titan RTX
89.7 fps +65%
Intel Core i9-10900K, Intel Core i9-10900K
NVIDIA Titan RTX
88.7 fps +63%
Corsair One i160, Intel Core i9-9900K
NVIDIA GeForce RTX 2080 Ti (Desktop)
85 fps +56%
Intel Ghost Canyon NUC (RTX 2070), Intel Core i9-9980HK
NVIDIA GeForce RTX 2070 (Desktop)
56.4 fps +4%
Intel Beast Canyon NUC, Intel Core i9-11900KB
NVIDIA GeForce RTX 3060
54.4 fps
Maya (maya-05)
Intel Core i9-11900K, Intel Core i9-11900K
NVIDIA Titan RTX
454 fps +73%
Intel Core i5-11600K, Intel Core i5-11600K
NVIDIA Titan RTX
449 fps +71%
Intel Core i9-10900K, Intel Core i9-10900K
NVIDIA Titan RTX
405.9 fps +55%
Corsair One i160, Intel Core i9-9900K
NVIDIA GeForce RTX 2080 Ti (Desktop)
402 fps +53%
AMD Ryzen 9 3950X, AMD Ryzen 9 3950X
NVIDIA Titan RTX
394.9 fps +51%
Intel Core i5-10600K, Intel Core i5-10600K
NVIDIA Titan RTX
387.5 fps +48%
Intel Ghost Canyon NUC (RTX 2070), Intel Core i9-9980HK
NVIDIA GeForce RTX 2070 (Desktop)
281 fps +7%
Intel Beast Canyon NUC, Intel Core i9-11900KB
NVIDIA GeForce RTX 3060
262 fps
Energy (energy-02)
Intel Core i5-11600K, Intel Core i5-11600K
NVIDIA Titan RTX
53.9 fps +293%
Intel Core i9-11900K, Intel Core i9-11900K
NVIDIA Titan RTX
53.7 fps +292%
Intel Core i5-10600K, Intel Core i5-10600K
NVIDIA Titan RTX
53.3 fps +289%
Intel Core i9-10900K, Intel Core i9-10900K
NVIDIA Titan RTX
53.2 fps +288%
AMD Ryzen 9 3950X, AMD Ryzen 9 3950X
NVIDIA Titan RTX
52.4 fps +282%
Corsair One i160, Intel Core i9-9900K
NVIDIA GeForce RTX 2080 Ti (Desktop)
31.93 fps +133%
Intel Ghost Canyon NUC (RTX 2070), Intel Core i9-9980HK
NVIDIA GeForce RTX 2070 (Desktop)
21.83 fps +59%
Intel Beast Canyon NUC, Intel Core i9-11900KB
NVIDIA GeForce RTX 3060
13.7 fps
Creo (creo-02)
Intel Core i9-11900K, Intel Core i9-11900K
NVIDIA Titan RTX
355 fps +106%
Intel Core i5-11600K, Intel Core i5-11600K
NVIDIA Titan RTX
354 fps +106%
Intel Core i9-10900K, Intel Core i9-10900K
NVIDIA Titan RTX
336.3 fps +96%
Intel Core i5-10600K, Intel Core i5-10600K
NVIDIA Titan RTX
331.7 fps +93%
AMD Ryzen 9 3950X, AMD Ryzen 9 3950X
NVIDIA Titan RTX
328.8 fps +91%
Corsair One i160, Intel Core i9-9900K
NVIDIA GeForce RTX 2080 Ti (Desktop)
286.1 fps +66%
Intel Ghost Canyon NUC (RTX 2070), Intel Core i9-9980HK
NVIDIA GeForce RTX 2070 (Desktop)
183.8 fps +7%
Intel Beast Canyon NUC, Intel Core i9-11900KB
NVIDIA GeForce RTX 3060
172 fps
Catia (catia-05)
Intel Core i9-11900K, Intel Core i9-11900K
NVIDIA Titan RTX
415 fps +299%
Intel Core i5-11600K, Intel Core i5-11600K
NVIDIA Titan RTX
397 fps +282%
Intel Core i9-10900K, Intel Core i9-10900K
NVIDIA Titan RTX
362.1 fps +248%
AMD Ryzen 9 3950X, AMD Ryzen 9 3950X
NVIDIA Titan RTX
355.2 fps +242%
Intel Core i5-10600K, Intel Core i5-10600K
NVIDIA Titan RTX
341.7 fps +229%
Corsair One i160, Intel Core i9-9900K
NVIDIA GeForce RTX 2080 Ti (Desktop)
177.3 fps +70%
Intel Ghost Canyon NUC (RTX 2070), Intel Core i9-9980HK
NVIDIA GeForce RTX 2070 (Desktop)
113.7 fps +9%
Intel Beast Canyon NUC, Intel Core i9-11900KB
NVIDIA GeForce RTX 3060
104 fps
3ds Max (3dsmax-06)
Intel Core i5-10600K, Intel Core i5-10600K
NVIDIA Titan RTX
294.4 fps +46%
Intel Core i9-10900K, Intel Core i9-10900K
NVIDIA Titan RTX
292.5 fps +45%
Intel Core i5-11600K, Intel Core i5-11600K
NVIDIA Titan RTX
288 fps +43%
Intel Core i9-11900K, Intel Core i9-11900K
NVIDIA Titan RTX
287 fps +42%
AMD Ryzen 9 3950X, AMD Ryzen 9 3950X
NVIDIA Titan RTX
274.5 fps +36%
Corsair One i160, Intel Core i9-9900K
NVIDIA GeForce RTX 2080 Ti (Desktop)
265.9 fps +32%
Intel Beast Canyon NUC, Intel Core i9-11900KB
NVIDIA GeForce RTX 3060
202 fps
Intel Ghost Canyon NUC (RTX 2070), Intel Core i9-9980HK
NVIDIA GeForce RTX 2070 (Desktop)
178.6 fps -12%

Prestazioni 3D e di gioco

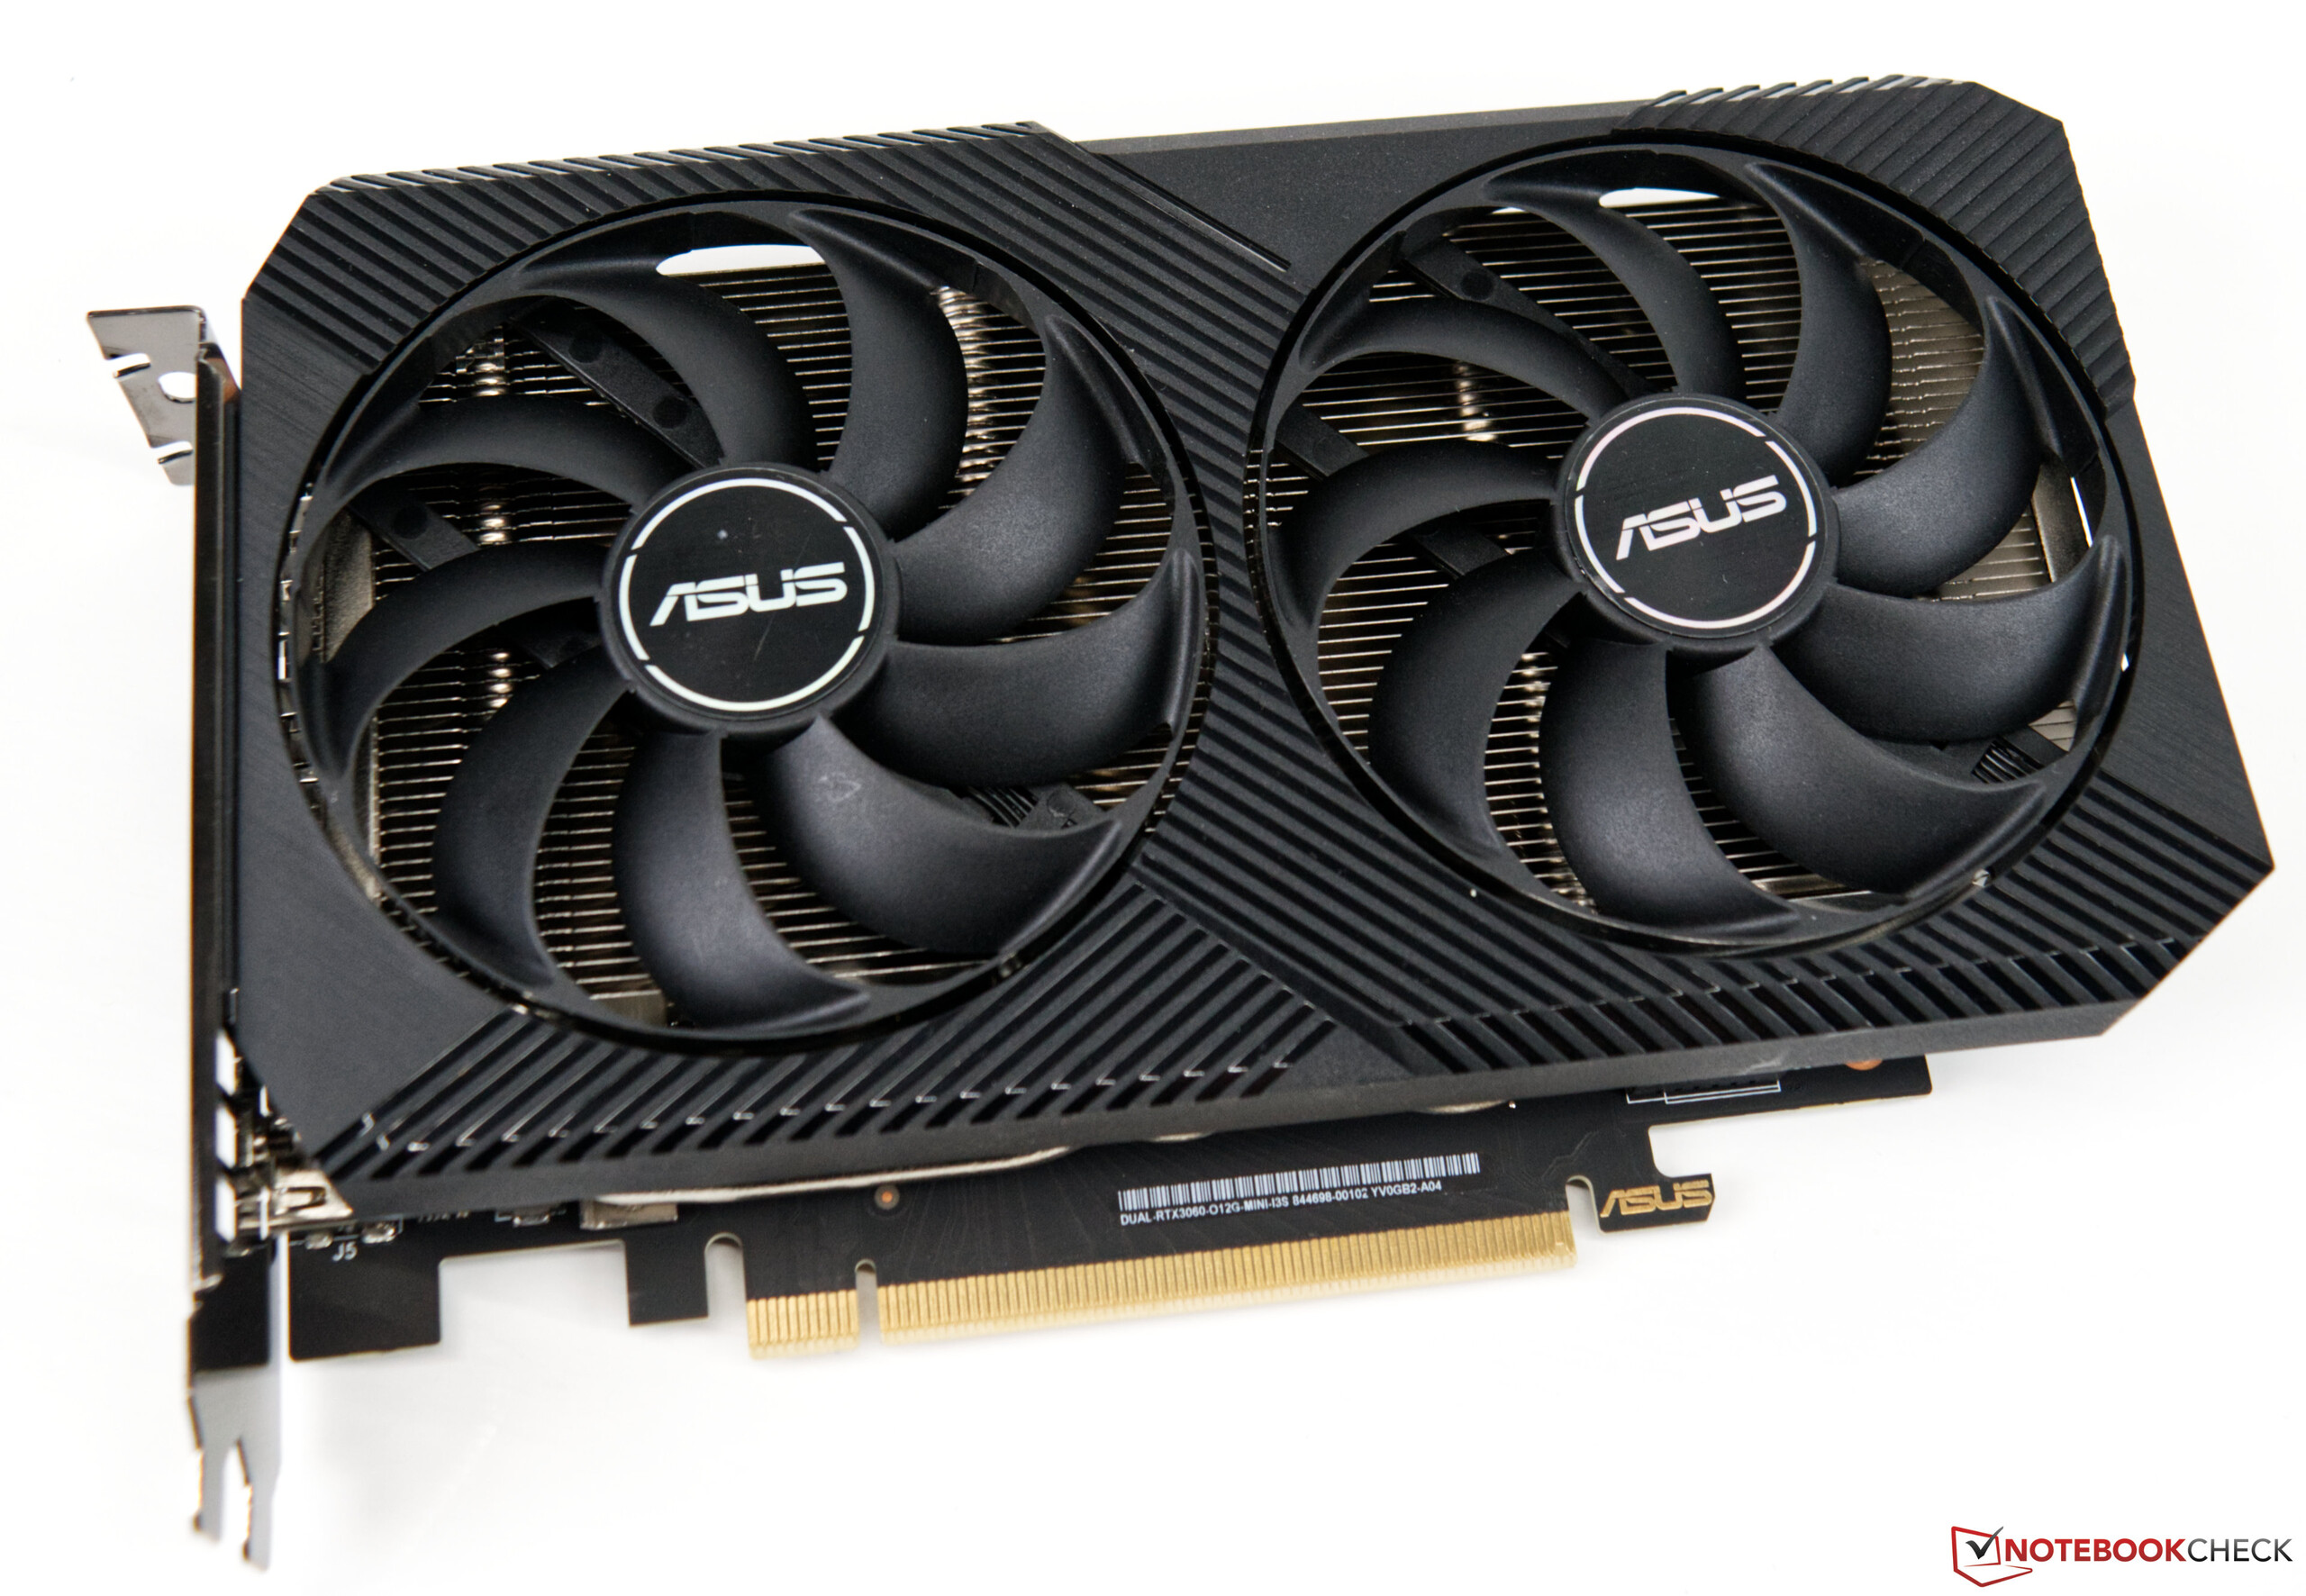
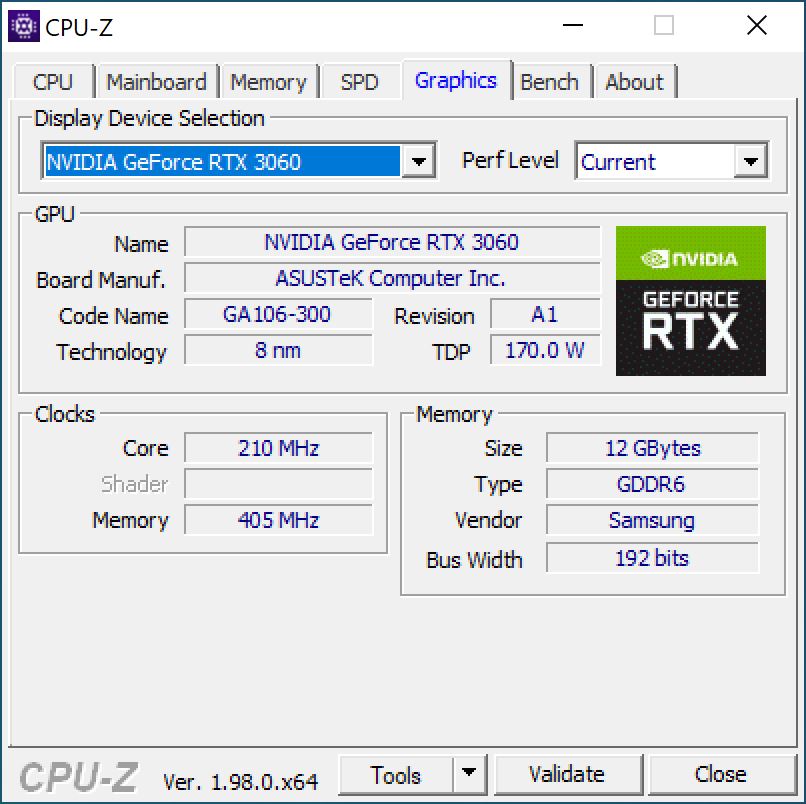
Per una buona performance di gioco, il nostro sistema di test è equipaggiato con un Nvidia GeForce RTX 3060 di Asus. Poiché il Beast Canyon NUC è venduto senza una scheda grafica dedicata, gli utenti possono decidere da soli cosa vogliono installare. La GPU integrata del Intel Core i9-11900KB non è raccomandata per il gioco. La GeForce RTX 3060 installata qui offre prestazioni solide che sono per lo più sufficienti per il gioco a 1080p e 1440p. Tuttavia, non è del tutto sufficiente per un gioco 4K costantemente fluido. Ciononostante, i titoli più vecchi possono essere resi senza problemi ad alte risoluzioni

Per ulteriori confronti e benchmark, fate riferimento al nostroGPU tabella di confronto

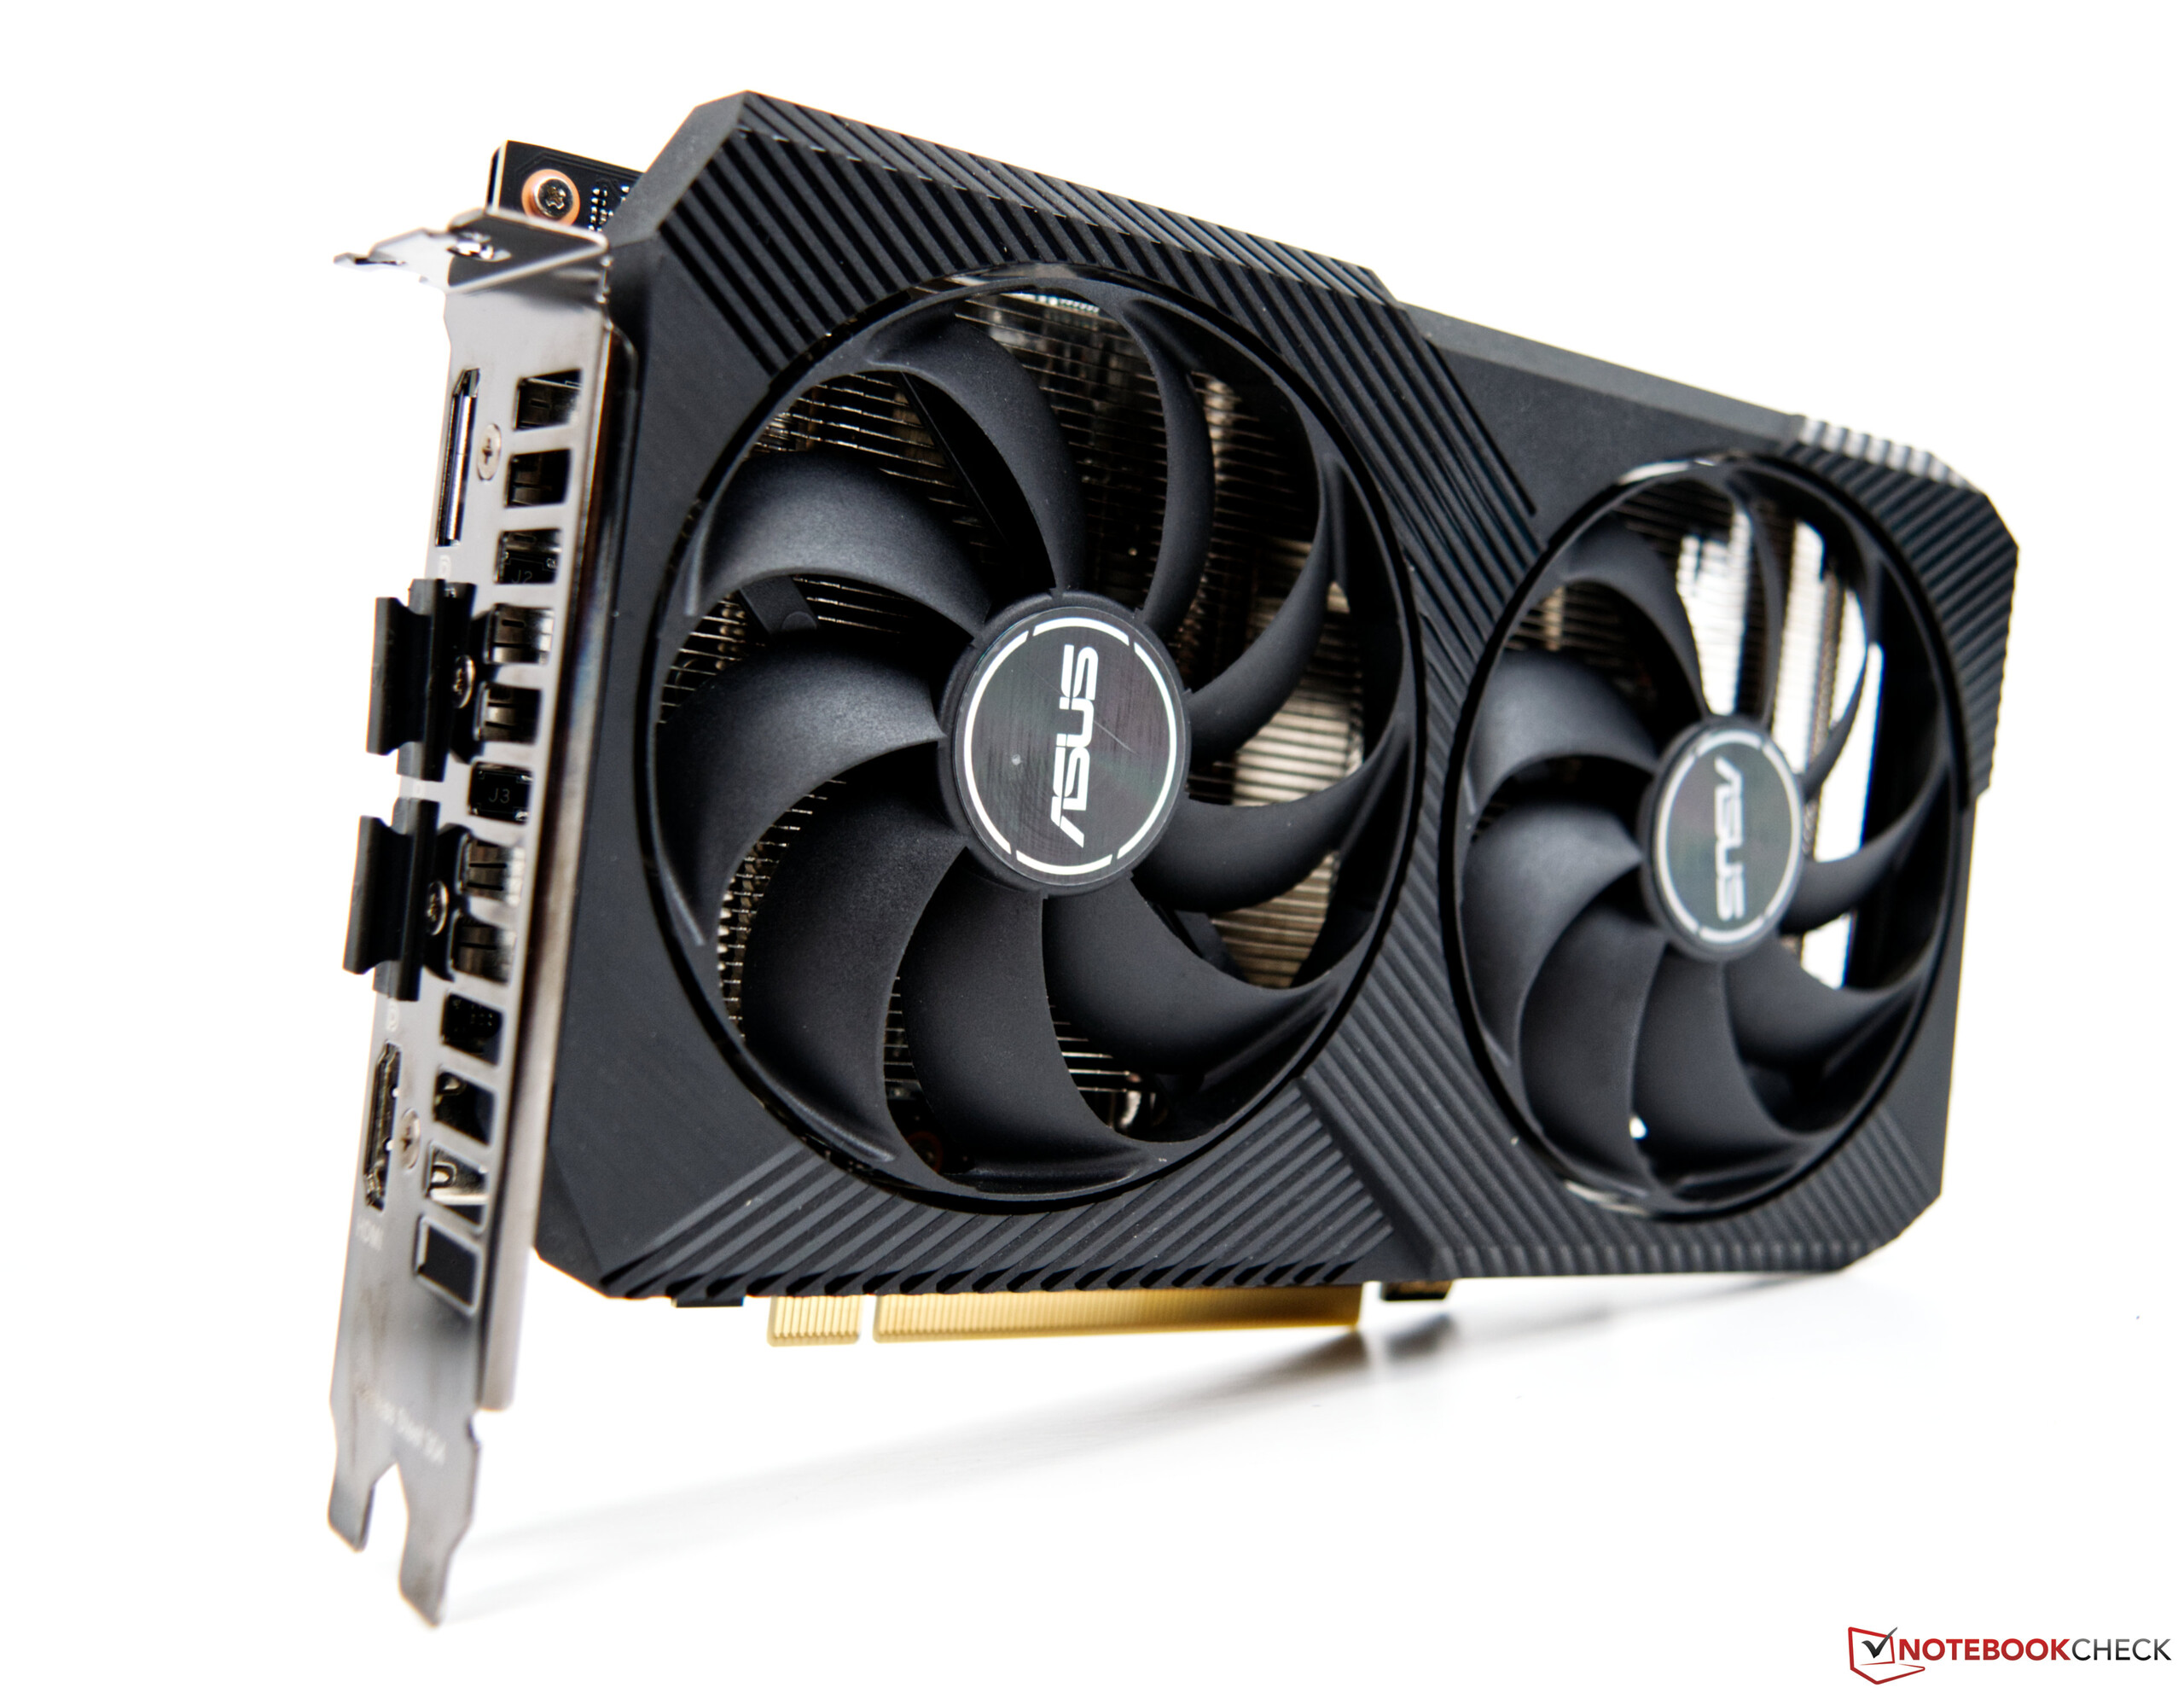
Se vuoi installare una scheda grafica diversa nel Beast Canyon NUC, dovresti conoscere in anticipo le dimensioni della GPU. La scheda grafica non deve avere più di un design di raffreddamento a due slot e dovrebbe avere una lunghezza massima di 12 pollici.

Performance Rating - Percent
Zotac Magnus One (ECM73070C)
NVIDIA GeForce RTX 3070, i7-10700, Phison 512GB PA6620060U
89.5 pt
Inno3D GeForce RTX 3060 Twin X2
NVIDIA GeForce RTX 3060, R9 5900X, Corsair MP600
87.5 pt
Intel Beast Canyon NUC -2!
NVIDIA GeForce RTX 3060, i9-11900KB, Sabrent Rocket 4.0 500GB
84.9 pt
Intel Ghost Canyon NUC (RTX 2070)
GeForce RTX 2070 (Desktop), i9-9980HK, Kingston KC2500 1 TB SKC2500M81000G
75.5 pt
Borderlands 3
1280x720 Very Low Overall Quality (DX11)
Inno3D GeForce RTX 3060 Twin X2
NVIDIA GeForce RTX 3060, R9 5900X, Corsair MP600
172 fps +10%
Intel Beast Canyon NUC
NVIDIA GeForce RTX 3060, i9-11900KB, Sabrent Rocket 4.0 500GB
156 fps
Intel Ghost Canyon NUC (RTX 2070)
GeForce RTX 2070 (Desktop), i9-9980HK, Kingston KC2500 1 TB SKC2500M81000G
152 fps -3%
Zotac Magnus One (ECM73070C)
NVIDIA GeForce RTX 3070, i7-10700, Phison 512GB PA6620060U
149 fps -4%
1920x1080 Badass Overall Quality (DX11)
Intel Beast Canyon NUC
NVIDIA GeForce RTX 3060, i9-11900KB, Sabrent Rocket 4.0 500GB
100 fps
Zotac Magnus One (ECM73070C)
NVIDIA GeForce RTX 3070, i7-10700, Phison 512GB PA6620060U
98.8 fps -1%
Inno3D GeForce RTX 3060 Twin X2
NVIDIA GeForce RTX 3060, R9 5900X, Corsair MP600
78.5 fps -21%
Intel Ghost Canyon NUC (RTX 2070)
GeForce RTX 2070 (Desktop), i9-9980HK, Kingston KC2500 1 TB SKC2500M81000G
70.9 fps -29%
Metro Exodus
1280x720 Low Quality AF:4x
Inno3D GeForce RTX 3060 Twin X2
NVIDIA GeForce RTX 3060, R9 5900X, Corsair MP600
202 (94.16min - 331.35max) fps +2%
Intel Beast Canyon NUC
NVIDIA GeForce RTX 3060, i9-11900KB, Sabrent Rocket 4.0 500GB
198 (96.07min - 323.73max) fps
Intel Ghost Canyon NUC (RTX 2070)
GeForce RTX 2070 (Desktop), i9-9980HK, Kingston KC2500 1 TB SKC2500M81000G
181 (100.48min - 268.67max) fps -9%
Zotac Magnus One (ECM73070C)
NVIDIA GeForce RTX 3070, i7-10700, Phison 512GB PA6620060U
166 (92.98min - 251.64max) fps -16%
1920x1080 Ultra Quality AF:16x
Zotac Magnus One (ECM73070C)
NVIDIA GeForce RTX 3070, i7-10700, Phison 512GB PA6620060U
93.1 (45.73min - 151.06max) fps +56%
Intel Ghost Canyon NUC (RTX 2070)
GeForce RTX 2070 (Desktop), i9-9980HK, Kingston KC2500 1 TB SKC2500M81000G
60.9 (33.61min - 92.62max) fps +2%
Intel Beast Canyon NUC
NVIDIA GeForce RTX 3060, i9-11900KB, Sabrent Rocket 4.0 500GB
59.8 (30.99min - 119.9max) fps
Inno3D GeForce RTX 3060 Twin X2
NVIDIA GeForce RTX 3060, R9 5900X, Corsair MP600
55.1 (32.45min - 87.42max) fps -8%
Far Cry New Dawn
1280x720 Low Preset
Inno3D GeForce RTX 3060 Twin X2
NVIDIA GeForce RTX 3060, R9 5900X, Corsair MP600
163 (117min - 259max) fps +13%
Intel Beast Canyon NUC
NVIDIA GeForce RTX 3060, i9-11900KB, Sabrent Rocket 4.0 500GB
144 (82min - 218max) fps
Intel Ghost Canyon NUC (RTX 2070)
GeForce RTX 2070 (Desktop), i9-9980HK, Kingston KC2500 1 TB SKC2500M81000G
128 (92min - 190max) fps -11%
Zotac Magnus One (ECM73070C)
NVIDIA GeForce RTX 3070, i7-10700, Phison 512GB PA6620060U
126 (96min - 186max) fps -12%
1920x1080 Ultra Preset
Inno3D GeForce RTX 3060 Twin X2
NVIDIA GeForce RTX 3060, R9 5900X, Corsair MP600
112 (83min - 146max) fps +10%
Intel Beast Canyon NUC
NVIDIA GeForce RTX 3060, i9-11900KB, Sabrent Rocket 4.0 500GB
102 (72min - 145max) fps
Zotac Magnus One (ECM73070C)
NVIDIA GeForce RTX 3070, i7-10700, Phison 512GB PA6620060U
95 (66min - 149max) fps -7%
Intel Ghost Canyon NUC (RTX 2070)
GeForce RTX 2070 (Desktop), i9-9980HK, Kingston KC2500 1 TB SKC2500M81000G
79 (61min - 99max) fps -23%
Far Cry 5
1280x720 Low Preset AA:T
Inno3D GeForce RTX 3060 Twin X2
NVIDIA GeForce RTX 3060, R9 5900X, Corsair MP600
196 (146min - 267max) fps +15%
Intel Beast Canyon NUC
NVIDIA GeForce RTX 3060, i9-11900KB, Sabrent Rocket 4.0 500GB
170 (105min - 231max) fps
Zotac Magnus One (ECM73070C)
NVIDIA GeForce RTX 3070, i7-10700, Phison 512GB PA6620060U
150 (118min - 203max) fps -12%
Intel Ghost Canyon NUC (RTX 2070)
GeForce RTX 2070 (Desktop), i9-9980HK, Kingston KC2500 1 TB SKC2500M81000G
147 (119min - 193max) fps -14%
1920x1080 Ultra Preset AA:T
Inno3D GeForce RTX 3060 Twin X2
NVIDIA GeForce RTX 3060, R9 5900X, Corsair MP600
132 (109min - 150max) fps +8%
Intel Beast Canyon NUC
NVIDIA GeForce RTX 3060, i9-11900KB, Sabrent Rocket 4.0 500GB
122 (93min - 151max) fps
Zotac Magnus One (ECM73070C)
NVIDIA GeForce RTX 3070, i7-10700, Phison 512GB PA6620060U
117 (89min - 155max) fps -4%
Intel Ghost Canyon NUC (RTX 2070)
GeForce RTX 2070 (Desktop), i9-9980HK, Kingston KC2500 1 TB SKC2500M81000G
86 (68min - 111max) fps -30%
X-Plane 11.11
1280x720 low (fps_test=1)
Inno3D GeForce RTX 3060 Twin X2
NVIDIA GeForce RTX 3060, R9 5900X, Corsair MP600
160 fps +6%
Intel Beast Canyon NUC
NVIDIA GeForce RTX 3060, i9-11900KB, Sabrent Rocket 4.0 500GB
151 fps
Intel Ghost Canyon NUC (RTX 2070)
GeForce RTX 2070 (Desktop), i9-9980HK, Kingston KC2500 1 TB SKC2500M81000G
127 fps -16%
Zotac Magnus One (ECM73070C)
NVIDIA GeForce RTX 3070, i7-10700, Phison 512GB PA6620060U
124 fps -18%
1920x1080 high (fps_test=3)
Inno3D GeForce RTX 3060 Twin X2
NVIDIA GeForce RTX 3060, R9 5900X, Corsair MP600
112 fps +7%
Intel Beast Canyon NUC
NVIDIA GeForce RTX 3060, i9-11900KB, Sabrent Rocket 4.0 500GB
105 fps
Intel Ghost Canyon NUC (RTX 2070)
GeForce RTX 2070 (Desktop), i9-9980HK, Kingston KC2500 1 TB SKC2500M81000G
92.7 fps -12%
Zotac Magnus One (ECM73070C)
NVIDIA GeForce RTX 3070, i7-10700, Phison 512GB PA6620060U
91 fps -13%
Final Fantasy XV Benchmark
1280x720 Lite Quality
Inno3D GeForce RTX 3060 Twin X2
NVIDIA GeForce RTX 3060, R9 5900X, Corsair MP600
210 fps +7%
Intel Beast Canyon NUC
NVIDIA GeForce RTX 3060, i9-11900KB, Sabrent Rocket 4.0 500GB
196 fps
Intel Ghost Canyon NUC (RTX 2070)
GeForce RTX 2070 (Desktop), i9-9980HK, Kingston KC2500 1 TB SKC2500M81000G
193 (94min - 237max) fps -2%
Zotac Magnus One (ECM73070C)
NVIDIA GeForce RTX 3070, i7-10700, Phison 512GB PA6620060U
167 fps -15%
1920x1080 High Quality
Zotac Magnus One (ECM73070C)
NVIDIA GeForce RTX 3070, i7-10700, Phison 512GB PA6620060U
112 fps +26%
Intel Ghost Canyon NUC (RTX 2070)
GeForce RTX 2070 (Desktop), i9-9980HK, Kingston KC2500 1 TB SKC2500M81000G
90.6 (56min - 138max) fps +2%
Inno3D GeForce RTX 3060 Twin X2
NVIDIA GeForce RTX 3060, R9 5900X, Corsair MP600
88.6 fps 0%
Intel Beast Canyon NUC
NVIDIA GeForce RTX 3060, i9-11900KB, Sabrent Rocket 4.0 500GB
88.6 fps
Dota 2 Reborn
1280x720 min (0/3) fastest
Inno3D GeForce RTX 3060 Twin X2
NVIDIA GeForce RTX 3060, R9 5900X, Corsair MP600
202.1 (165min) fps +13%
Intel Beast Canyon NUC
NVIDIA GeForce RTX 3060, i9-11900KB, Sabrent Rocket 4.0 500GB
178.3 (153.2min) fps
Zotac Magnus One (ECM73070C)
NVIDIA GeForce RTX 3070, i7-10700, Phison 512GB PA6620060U
164.2 (143.5min) fps -8%
Intel Ghost Canyon NUC (RTX 2070)
GeForce RTX 2070 (Desktop), i9-9980HK, Kingston KC2500 1 TB SKC2500M81000G
155.6 (135.2min) fps -13%
1920x1080 ultra (3/3) best looking
Inno3D GeForce RTX 3060 Twin X2
NVIDIA GeForce RTX 3060, R9 5900X, Corsair MP600
159.7 (126.4min) fps +9%
Intel Beast Canyon NUC
NVIDIA GeForce RTX 3060, i9-11900KB, Sabrent Rocket 4.0 500GB
147.1 (126min) fps
Intel Ghost Canyon NUC (RTX 2070)
GeForce RTX 2070 (Desktop), i9-9980HK, Kingston KC2500 1 TB SKC2500M81000G
130.3 (114.9min) fps -11%
Zotac Magnus One (ECM73070C)
NVIDIA GeForce RTX 3070, i7-10700, Phison 512GB PA6620060U
129.7 (113.4min) fps -12%
The Witcher 3
1024x768 Low Graphics & Postprocessing
Inno3D GeForce RTX 3060 Twin X2
NVIDIA GeForce RTX 3060, R9 5900X, Corsair MP600
433 (59.9min, 150P0.1, 297P1 - 888max) fps
Zotac Magnus One (ECM73070C)
NVIDIA GeForce RTX 3070, i7-10700, Phison 512GB PA6620060U
367 fps
Intel Ghost Canyon NUC (RTX 2070)
GeForce RTX 2070 (Desktop), i9-9980HK, Kingston KC2500 1 TB SKC2500M81000G
286 (243min - 334max) fps
1920x1080 Ultra Graphics & Postprocessing (HBAO+)
Zotac Magnus One (ECM73070C)
NVIDIA GeForce RTX 3070, i7-10700, Phison 512GB PA6620060U
121 fps
Intel Ghost Canyon NUC (RTX 2070)
GeForce RTX 2070 (Desktop), i9-9980HK, Kingston KC2500 1 TB SKC2500M81000G
83.1 (72min - 93max) fps
Inno3D GeForce RTX 3060 Twin X2
NVIDIA GeForce RTX 3060, R9 5900X, Corsair MP600
63.3 (22.3min, 40.7P0.1, 51.3P1 - 358max) fps
3DMark
Fire Strike Extreme Graphics
Zotac Magnus One (ECM73070C)
NVIDIA GeForce RTX 3070, i7-10700, Phison 512GB PA6620060U
15597 Points +53%
Inno3D GeForce RTX 3060 Twin X2
NVIDIA GeForce RTX 3060, R9 5900X, Corsair MP600
10330 Points +1%
Intel Beast Canyon NUC
NVIDIA GeForce RTX 3060, i9-11900KB, Sabrent Rocket 4.0 500GB
10181 Points
Intel Ghost Canyon NUC (RTX 2070)
GeForce RTX 2070 (Desktop), i9-9980HK, Kingston KC2500 1 TB SKC2500M81000G
9979 Points -2%
1920x1080 Fire Strike Graphics
Zotac Magnus One (ECM73070C)
NVIDIA GeForce RTX 3070, i7-10700, Phison 512GB PA6620060U
30090 Points +41%
Inno3D GeForce RTX 3060 Twin X2
NVIDIA GeForce RTX 3060, R9 5900X, Corsair MP600
21847 Points +2%
Intel Beast Canyon NUC
NVIDIA GeForce RTX 3060, i9-11900KB, Sabrent Rocket 4.0 500GB
21379 Points
Intel Ghost Canyon NUC (RTX 2070)
GeForce RTX 2070 (Desktop), i9-9980HK, Kingston KC2500 1 TB SKC2500M81000G
20775 Points -3%
2560x1440 Time Spy Graphics
Zotac Magnus One (ECM73070C)
NVIDIA GeForce RTX 3070, i7-10700, Phison 512GB PA6620060U
12668 Points +49%
Intel Ghost Canyon NUC (RTX 2070)
GeForce RTX 2070 (Desktop), i9-9980HK, Kingston KC2500 1 TB SKC2500M81000G
8631 Points +1%
Inno3D GeForce RTX 3060 Twin X2
NVIDIA GeForce RTX 3060, R9 5900X, Corsair MP600
8559 Points 0%
Intel Beast Canyon NUC
NVIDIA GeForce RTX 3060, i9-11900KB, Sabrent Rocket 4.0 500GB
8525 Points
3DMark 11
1280x720 Performance GPU
Zotac Magnus One (ECM73070C)
NVIDIA GeForce RTX 3070, i7-10700, Phison 512GB PA6620060U
40950 Points +42%
Intel Beast Canyon NUC
NVIDIA GeForce RTX 3060, i9-11900KB, Sabrent Rocket 4.0 500GB
28939 Points
Intel Ghost Canyon NUC (RTX 2070)
GeForce RTX 2070 (Desktop), i9-9980HK, Kingston KC2500 1 TB SKC2500M81000G
28828 Points 0%
Inno3D GeForce RTX 3060 Twin X2
NVIDIA GeForce RTX 3060, R9 5900X, Corsair MP600
28072 Points -3%
1280x720 Performance
Zotac Magnus One (ECM73070C)
NVIDIA GeForce RTX 3070, i7-10700, Phison 512GB PA6620060U
29057 Points +16%
Inno3D GeForce RTX 3060 Twin X2
NVIDIA GeForce RTX 3060, R9 5900X, Corsair MP600
26986 Points +7%
Intel Beast Canyon NUC
NVIDIA GeForce RTX 3060, i9-11900KB, Sabrent Rocket 4.0 500GB
25149 Points
Intel Ghost Canyon NUC (RTX 2070)
GeForce RTX 2070 (Desktop), i9-9980HK, Kingston KC2500 1 TB SKC2500M81000G
24131 Points -4%
basso medio alto ultraQHD4K
GTA V (2015) 186 181 177 104 81.4 82.3
Dota 2 Reborn (2015) 178.3 161.7 155.6 147.1 116.1
Final Fantasy XV Benchmark (2018) 196 123 88.6 64.8 38
X-Plane 11.11 (2018) 151 133 105 88.5
Far Cry 5 (2018) 170 140 131 122 94 49
Strange Brigade (2018) 491 230 180 154 116 66.8
Far Cry New Dawn (2019) 144 120 115 102 88 50
Metro Exodus (2019) 198 105 77.4 59.8 48.6 31.3
Borderlands 3 (2019) 156 152 133 100 70.2 36.8
F1 2020 (2020) 355 259 208 142 106 60.2
F1 2021 (2021) 419 261 206 96.9 72 40.9
Far Cry 6 (2021) 136 116 103 90.8 68.8 38.8

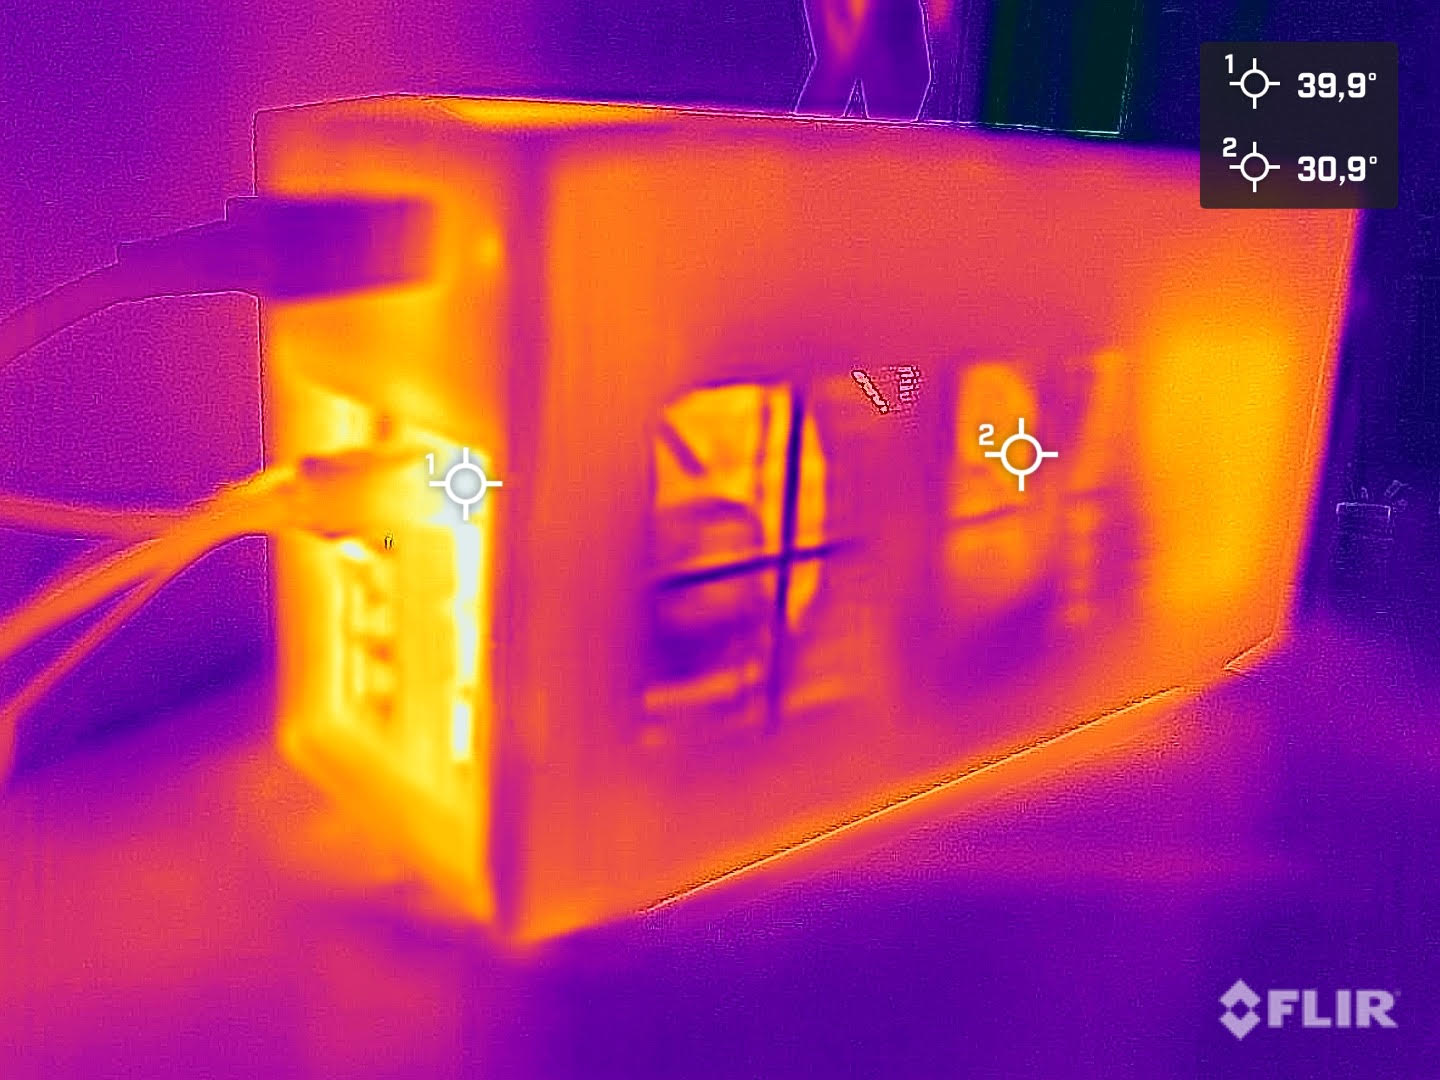
Consumo energetico e sviluppo del calore dell'Intel NUC 11 Beast Canyon

Intel NUC 11 Beast Canyon durante lo stress test

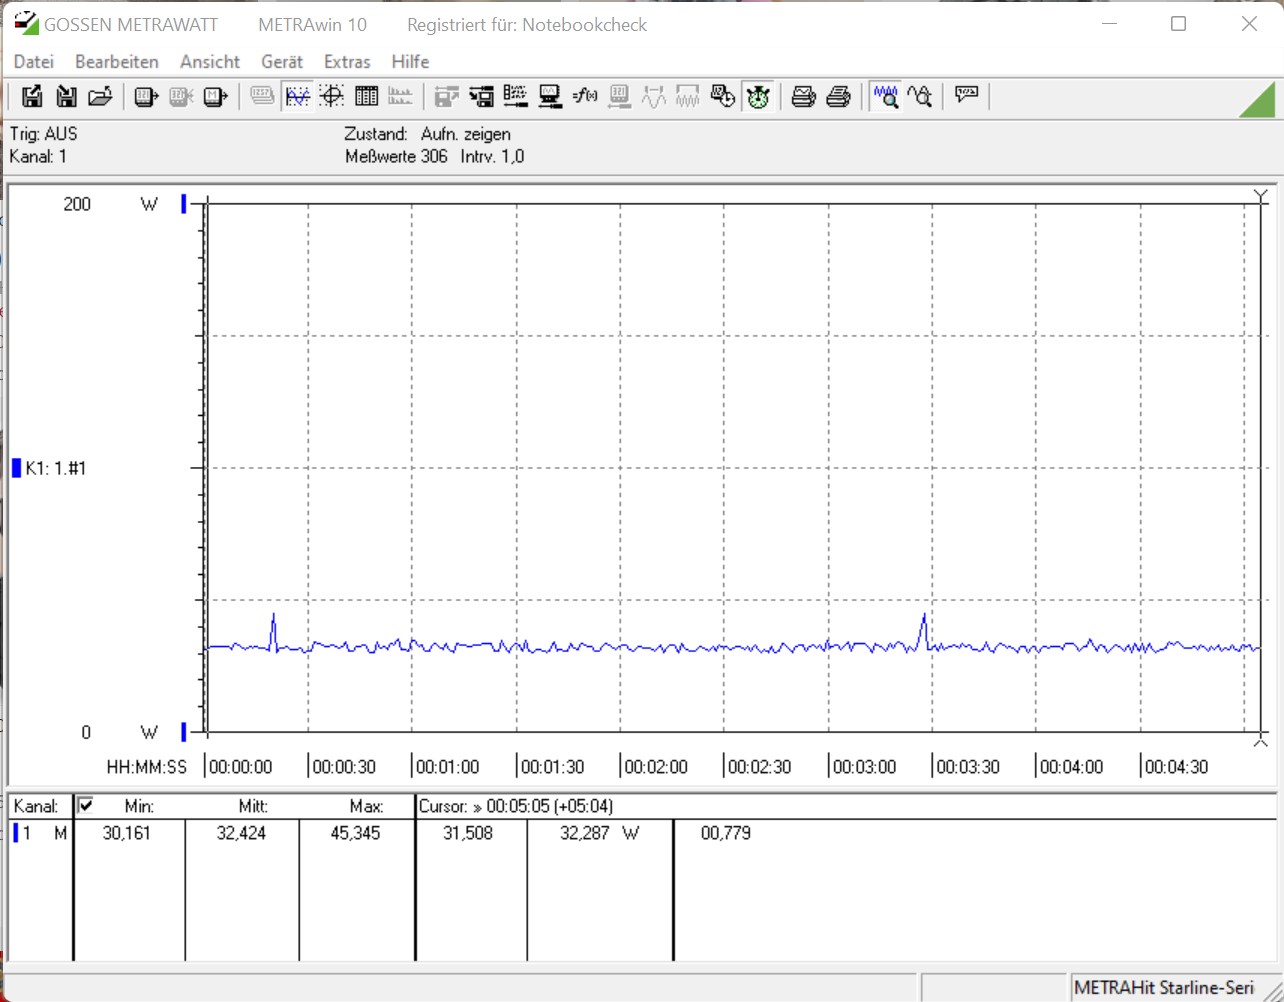
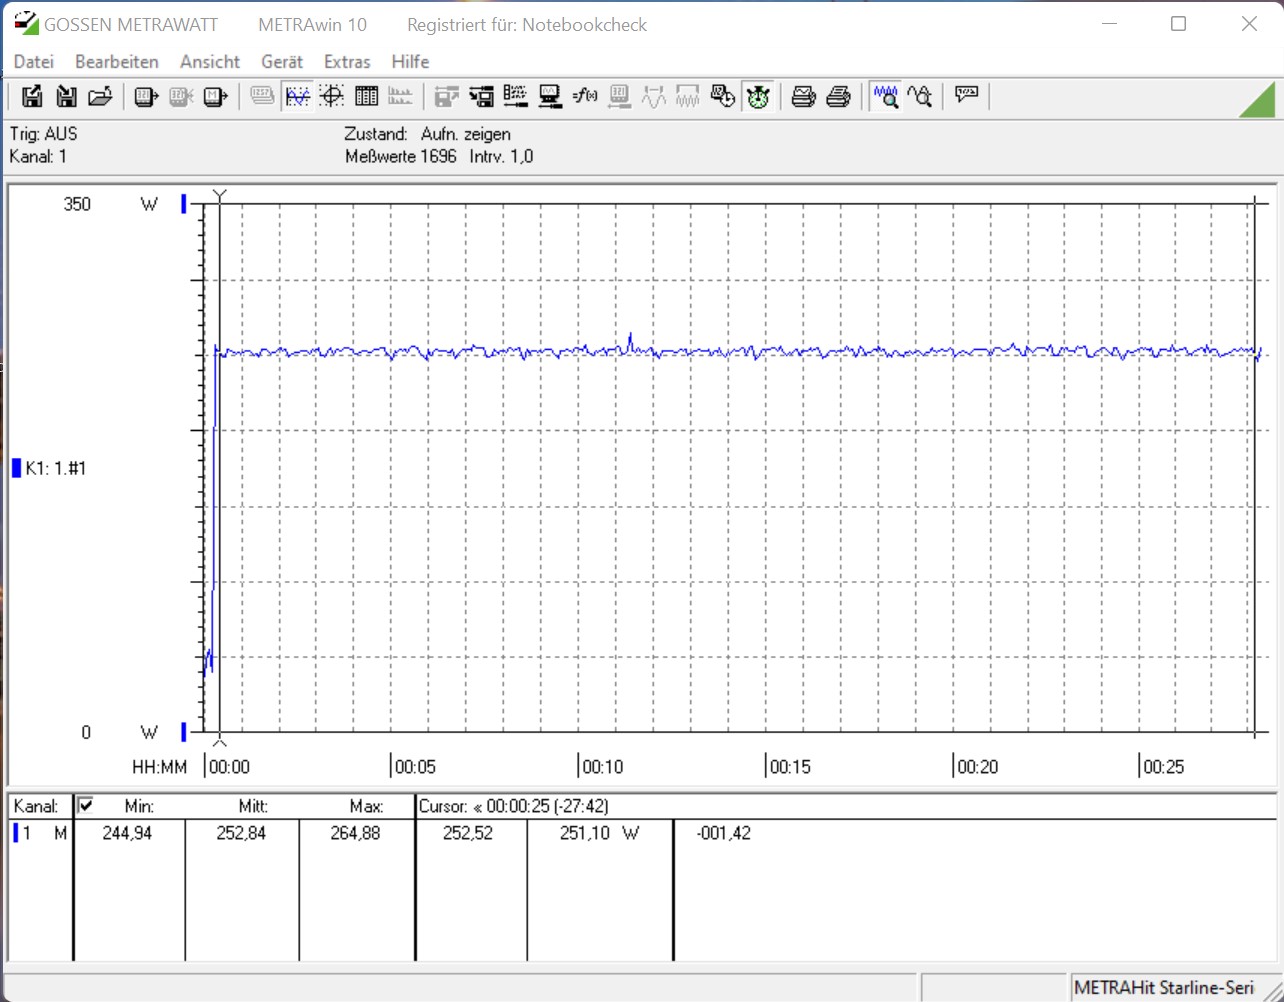
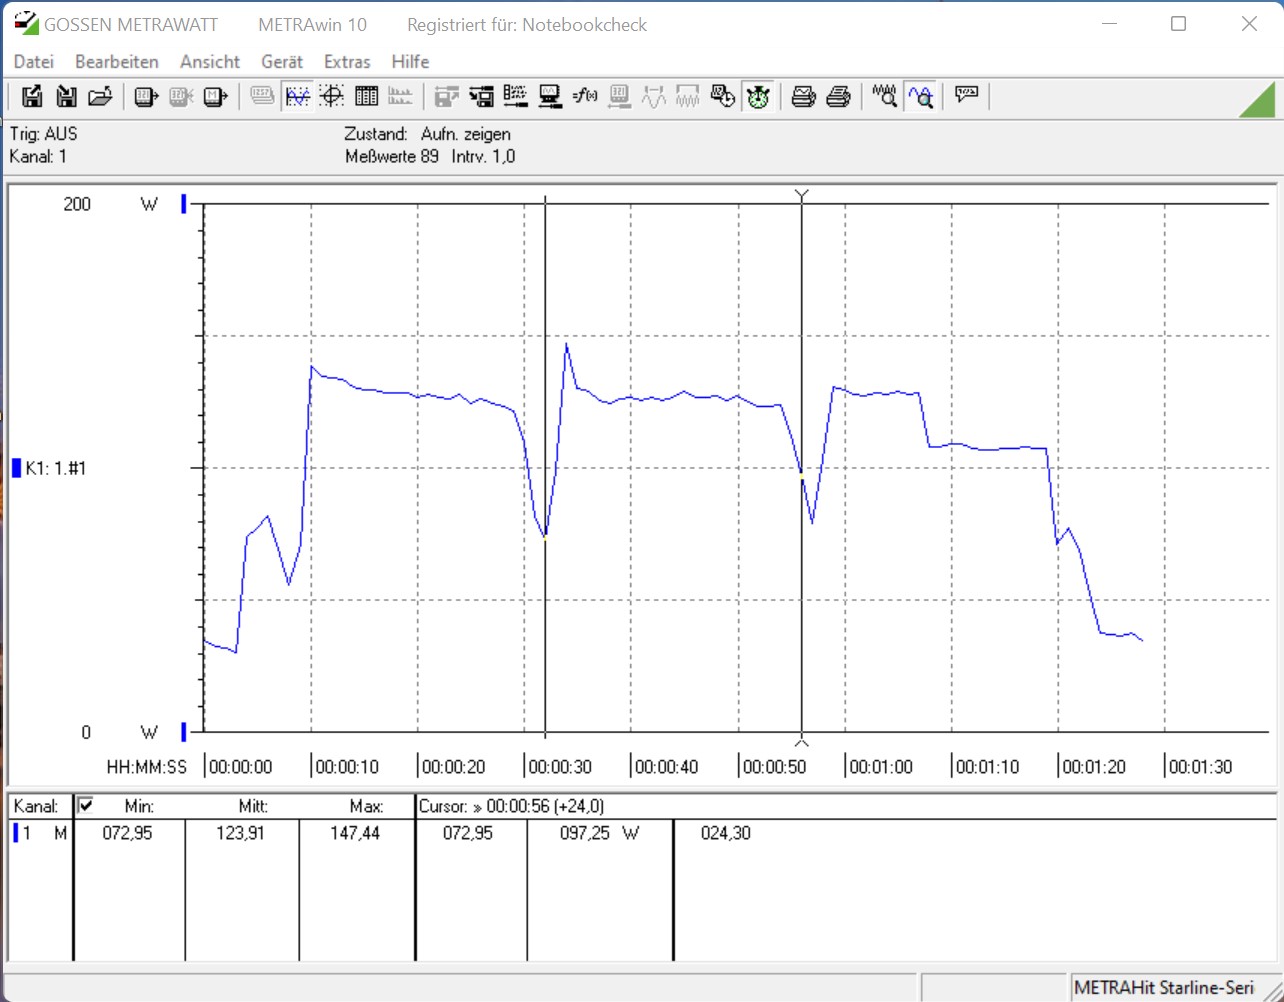
Il basso consumo energetico dell'Intel NUC 11 Extreme è una fonte di gioia. A causa del frugale SoC, notiamo solo 124 W per il sistema sotto carico nel test Cinebench R15 Multi. Un sistema desktop basato su un Intel Core i5-10600K ha bisogno di una media di 172,5 W. Anche il sistema di test con l'Intel Core i9-10900K consuma ~100 W

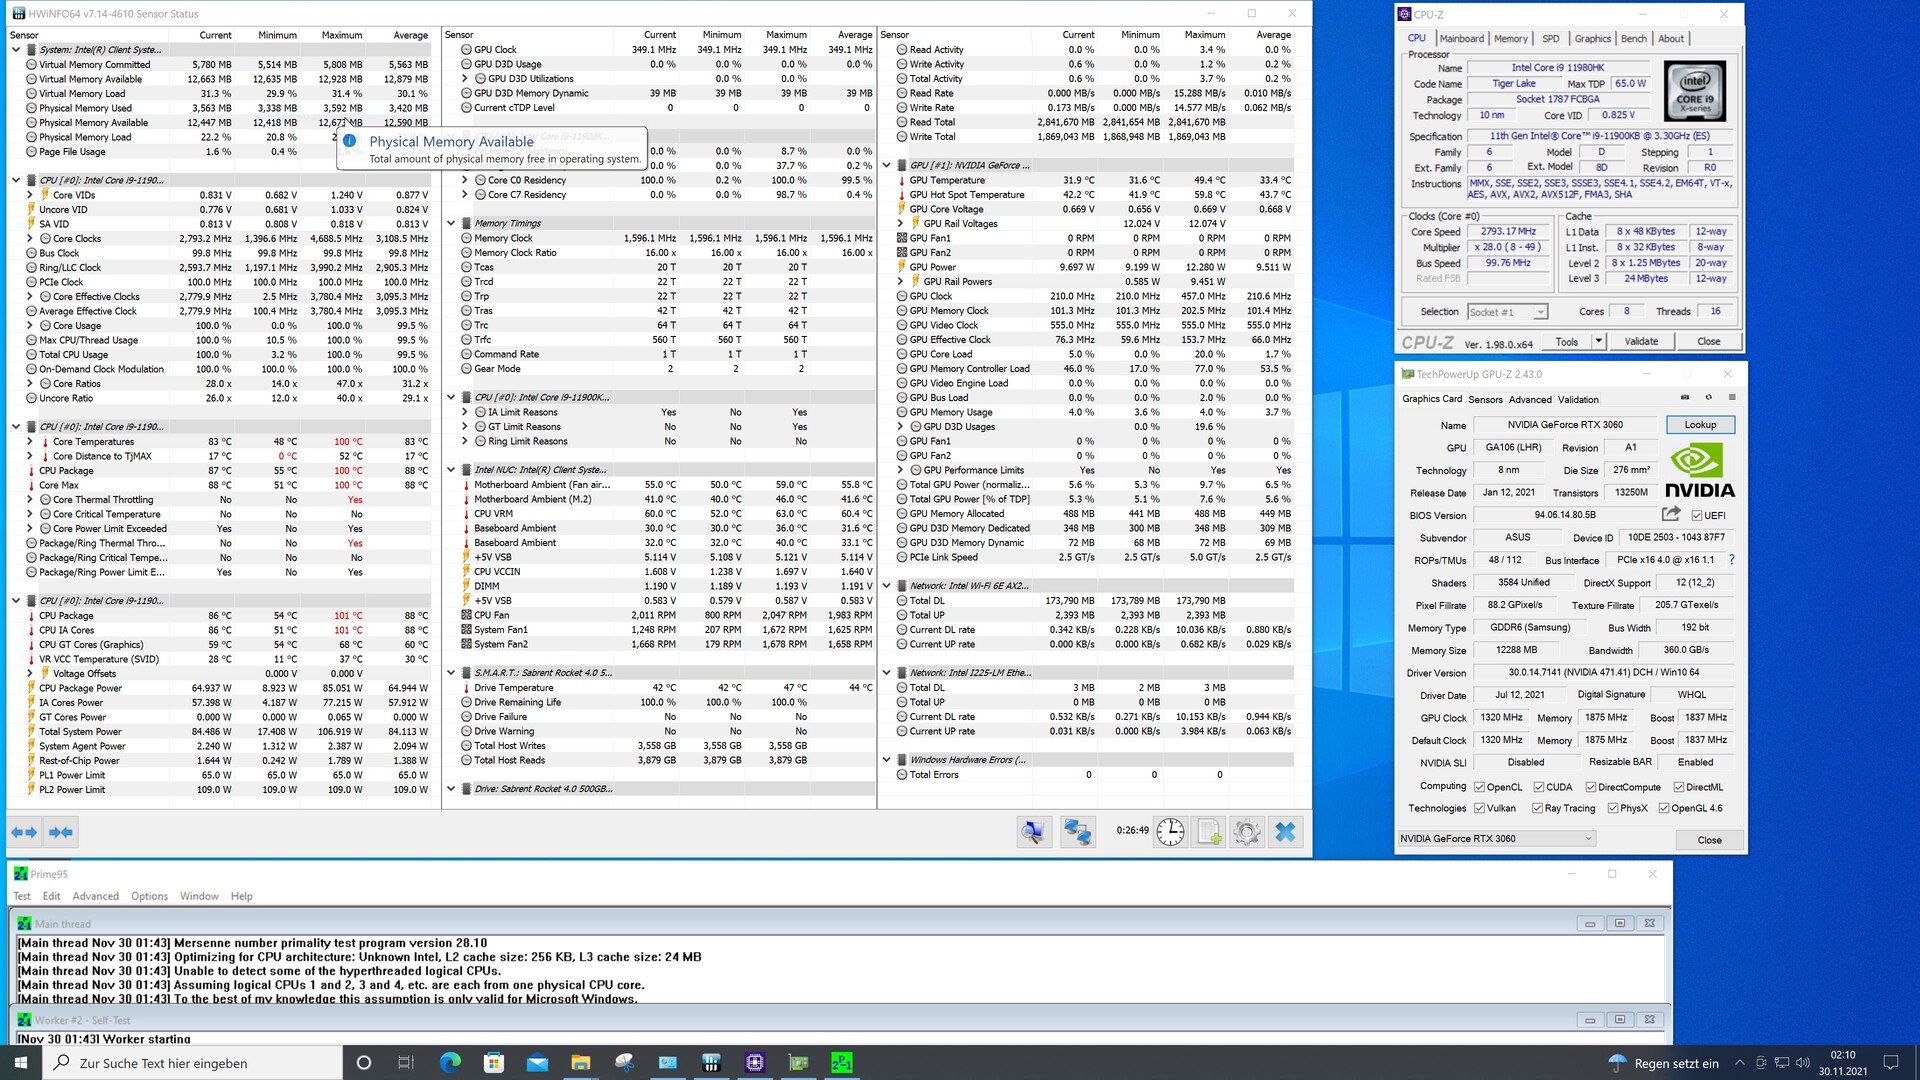
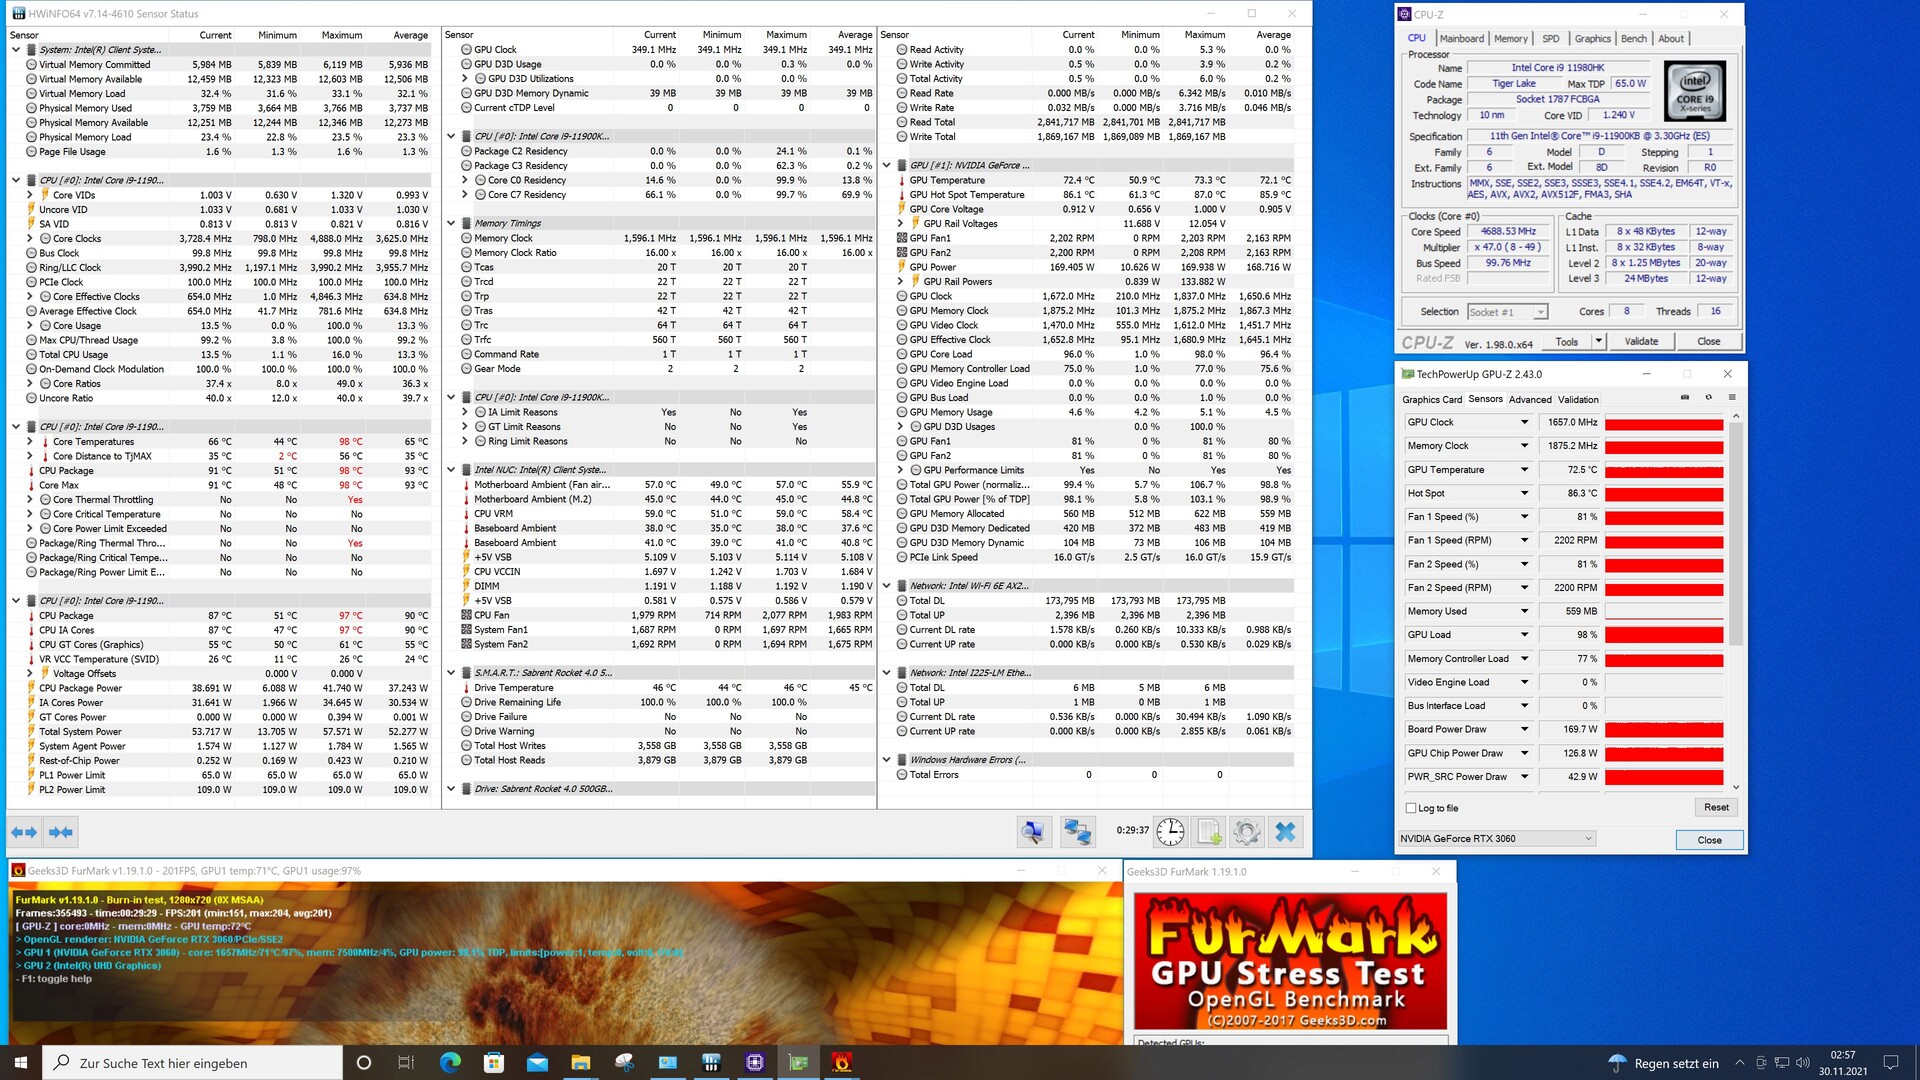
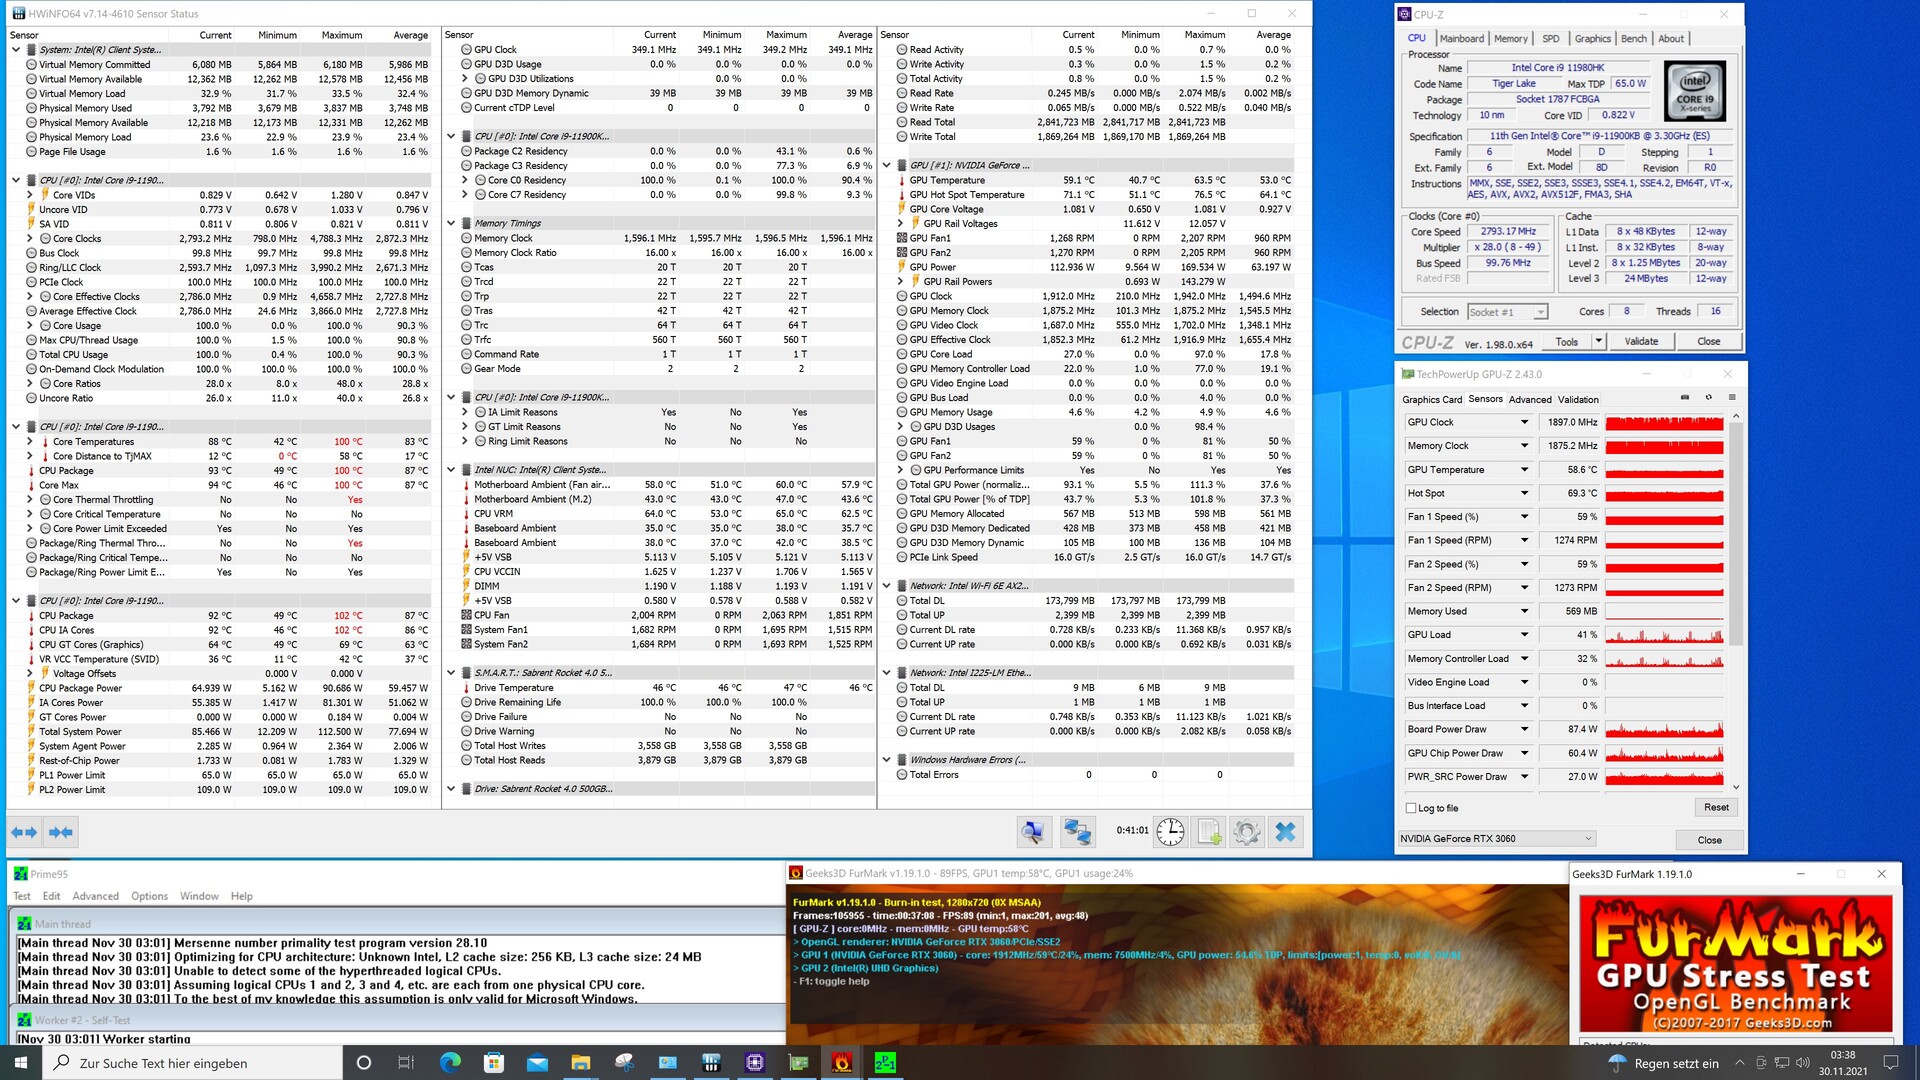
Nello stress test, l'Intel Core i9-11900KB è un po' più affamato quando si tratta di consumo energetico rispetto all Intel Core i9-9980HK. Tuttavia, la richiesta aggiuntiva di solo il tre per cento è gestibile e anche abbastanza buona con 113 W sulla linea di fondo.

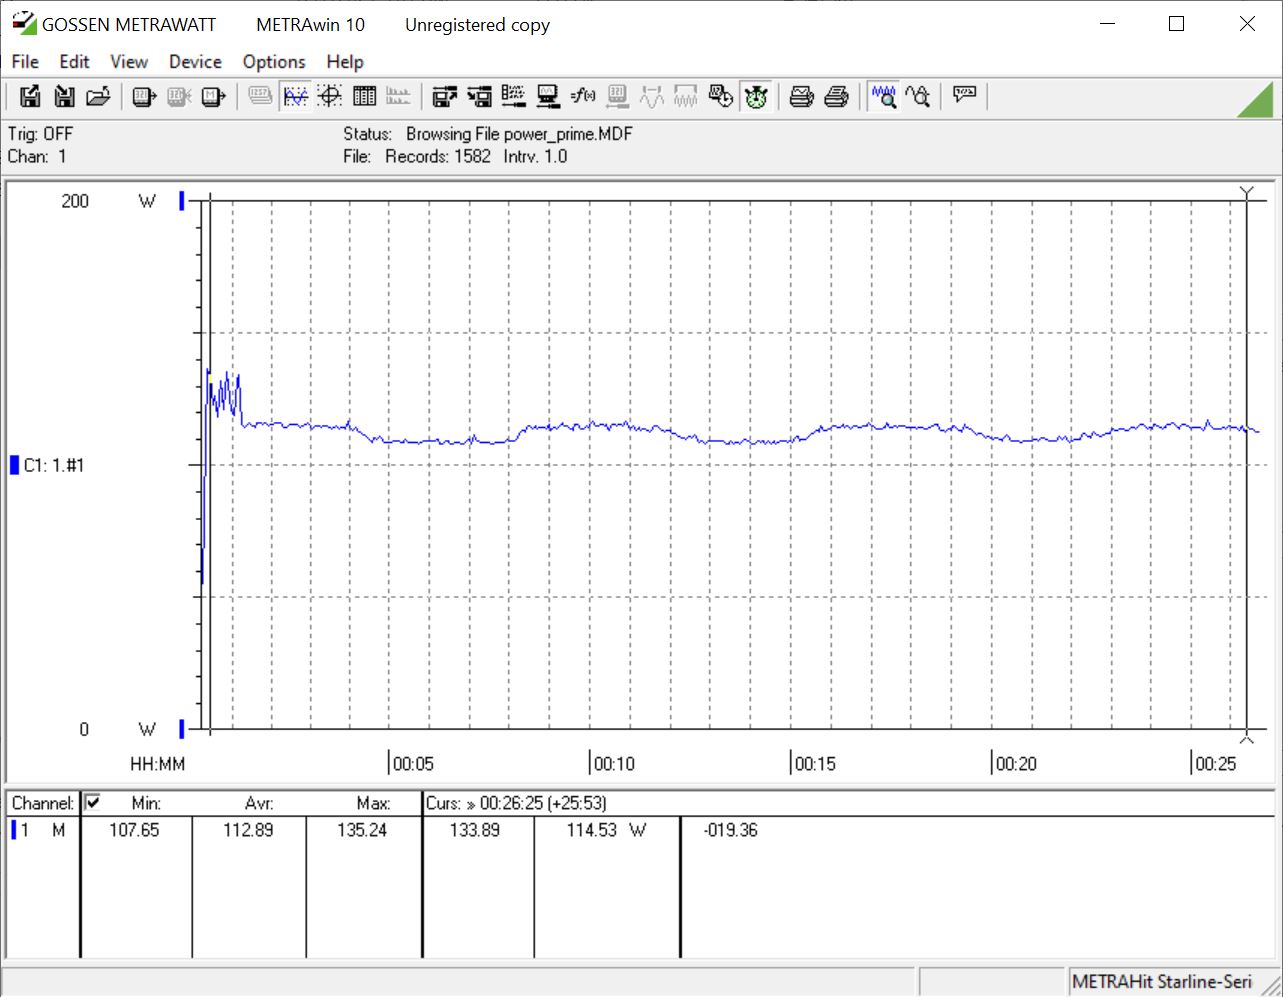
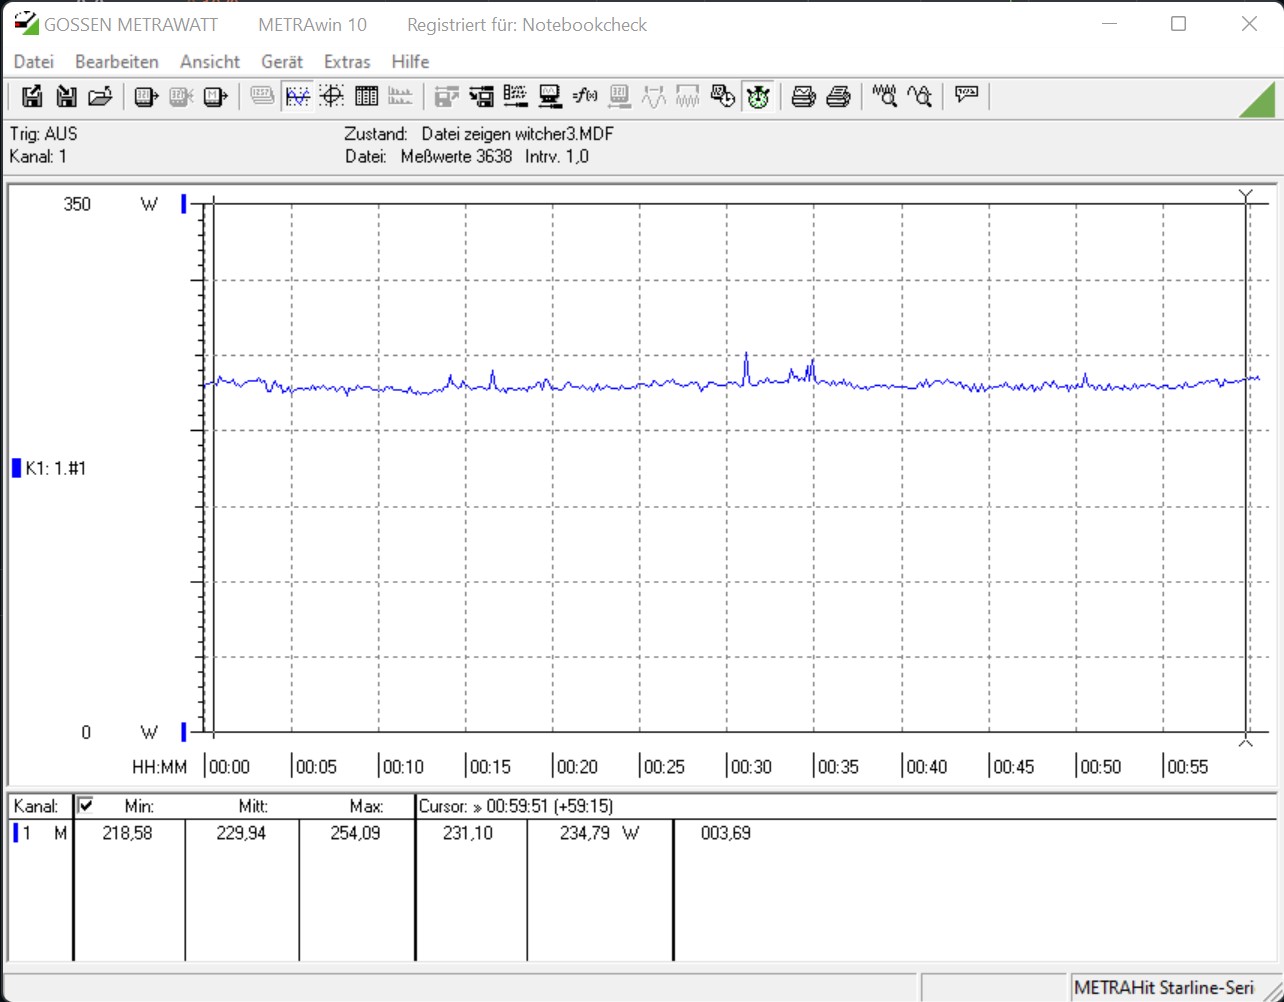
Quando si gioca, la scheda grafica installata determina i requisiti energetici del sistema in larga misura. Il Beast Canyon NUC vince il confronto con il Ghost Canyon NUC con un margine ridotto, anche se il TDP della GeForce RTX 3060 con 170 W è notevolmente inferiore a quello della GeForce RTX 2070 Super (215 W).

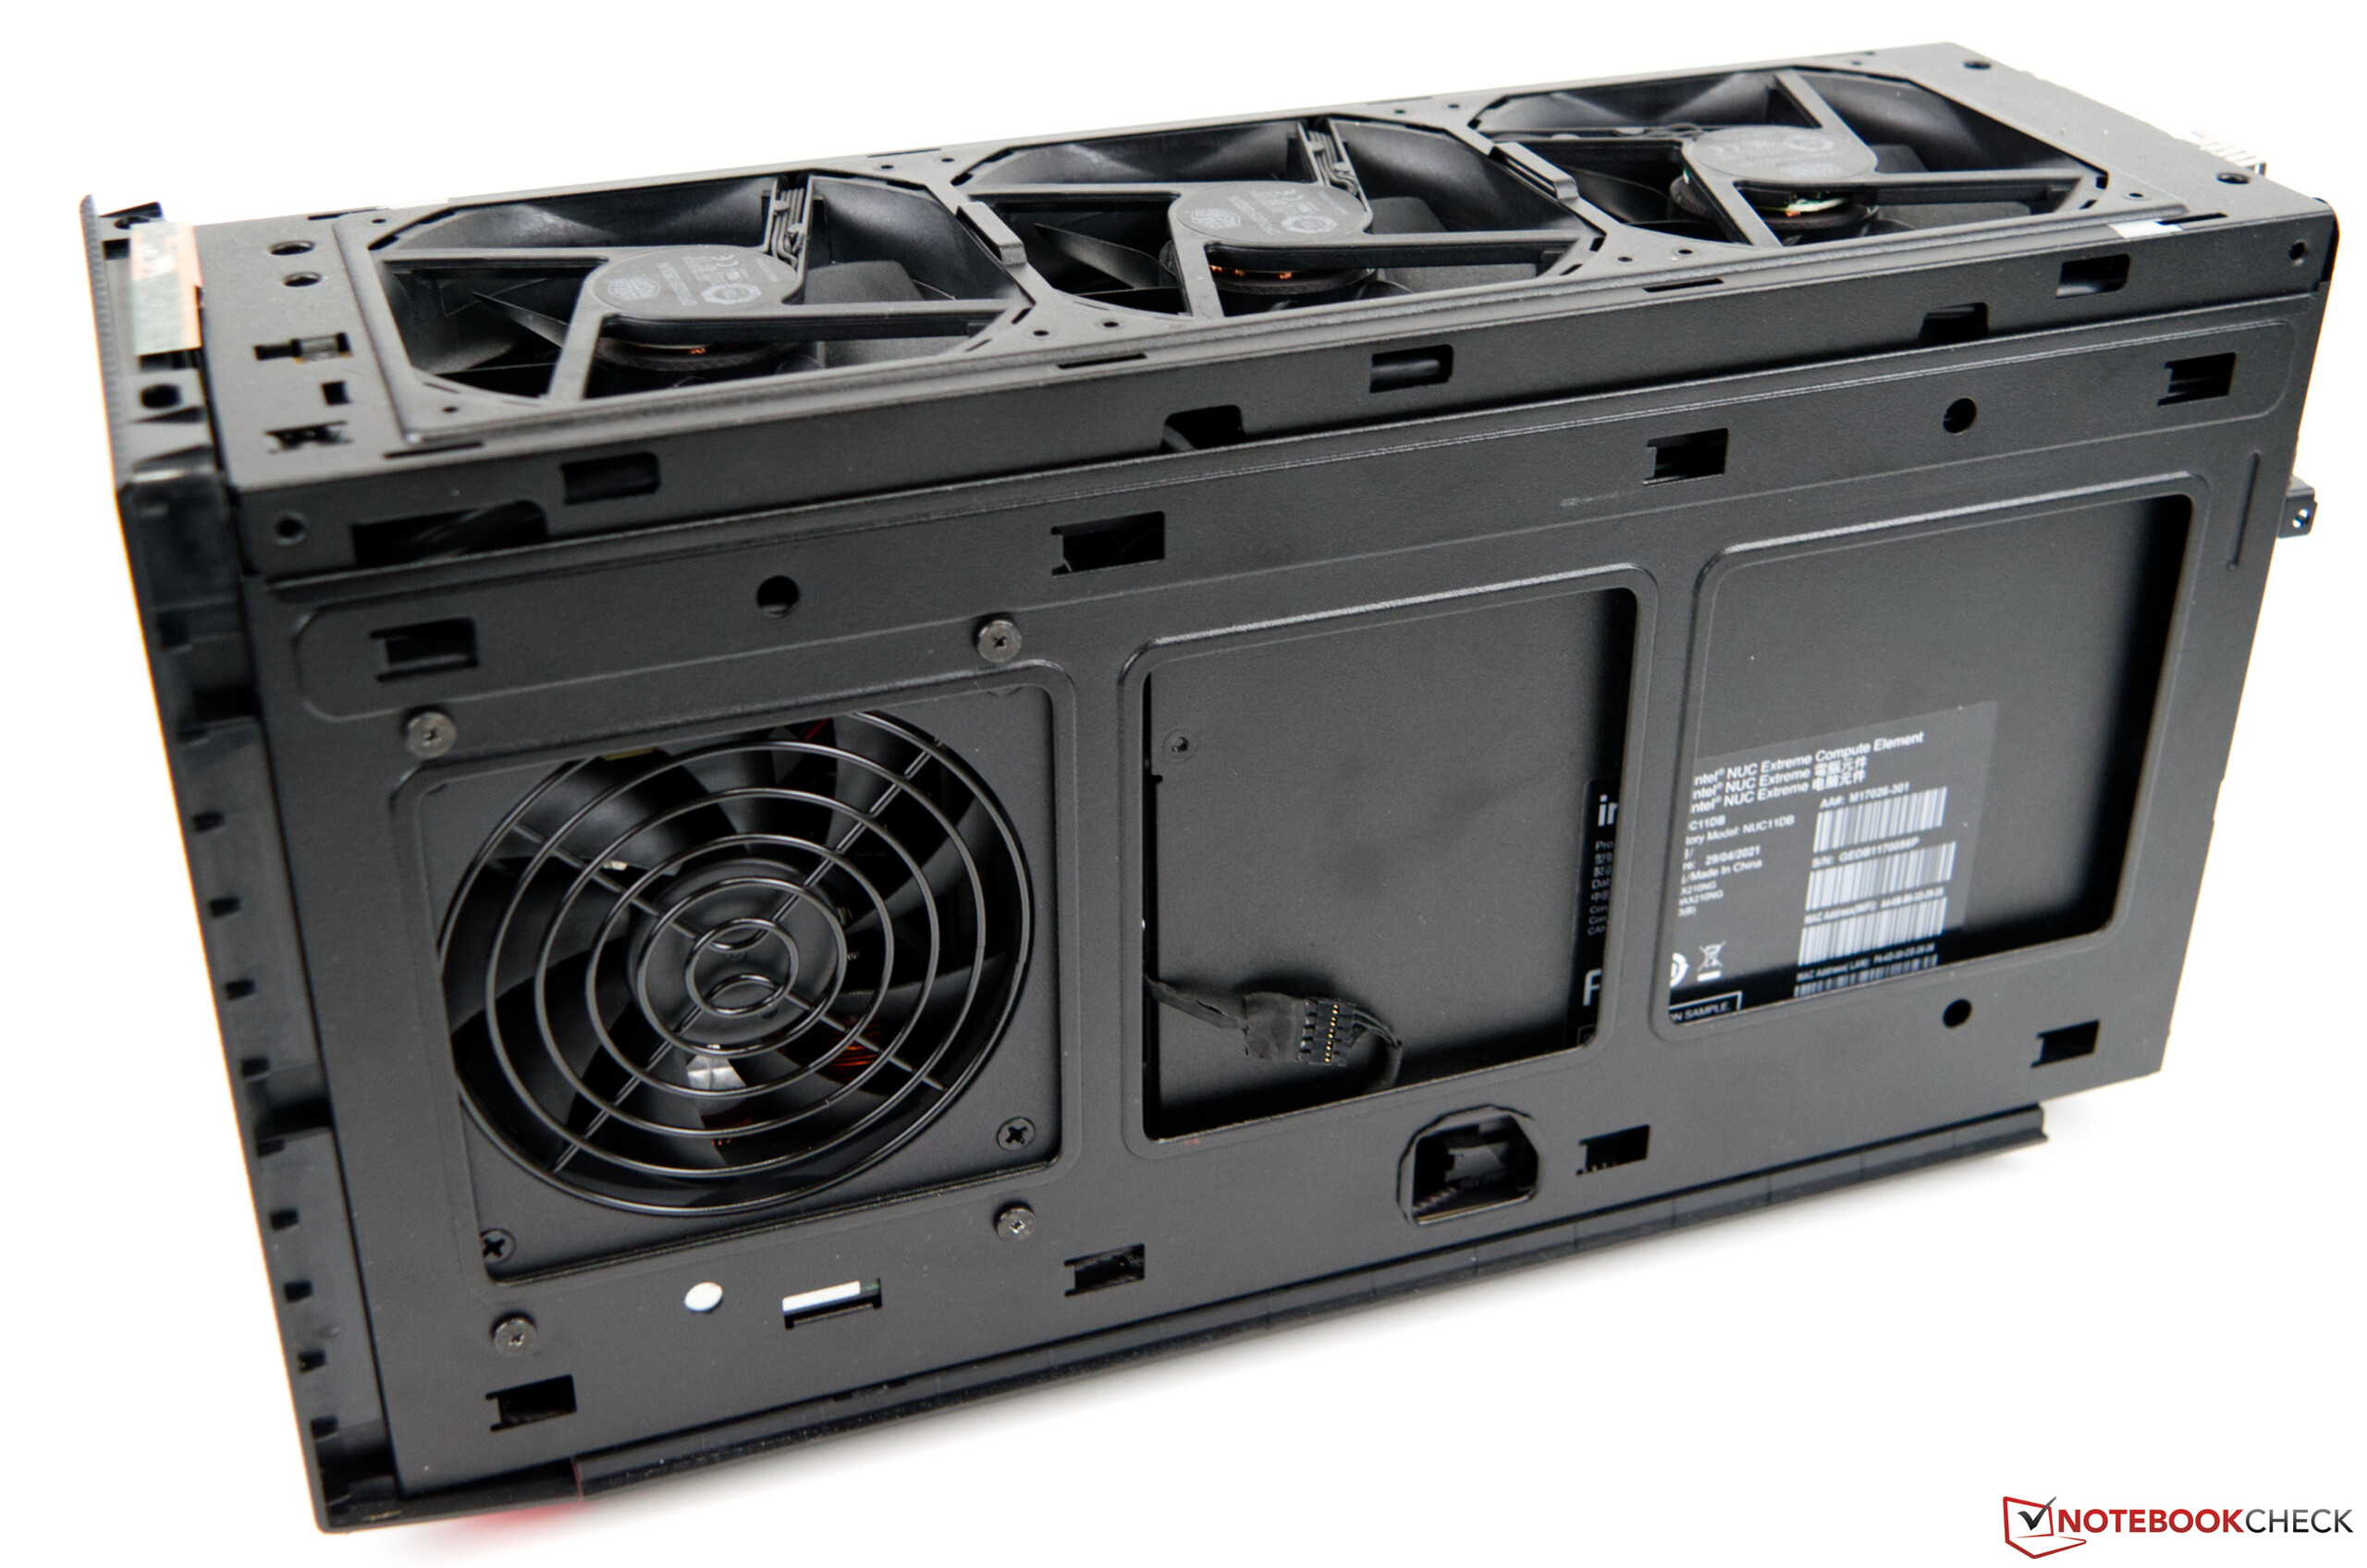
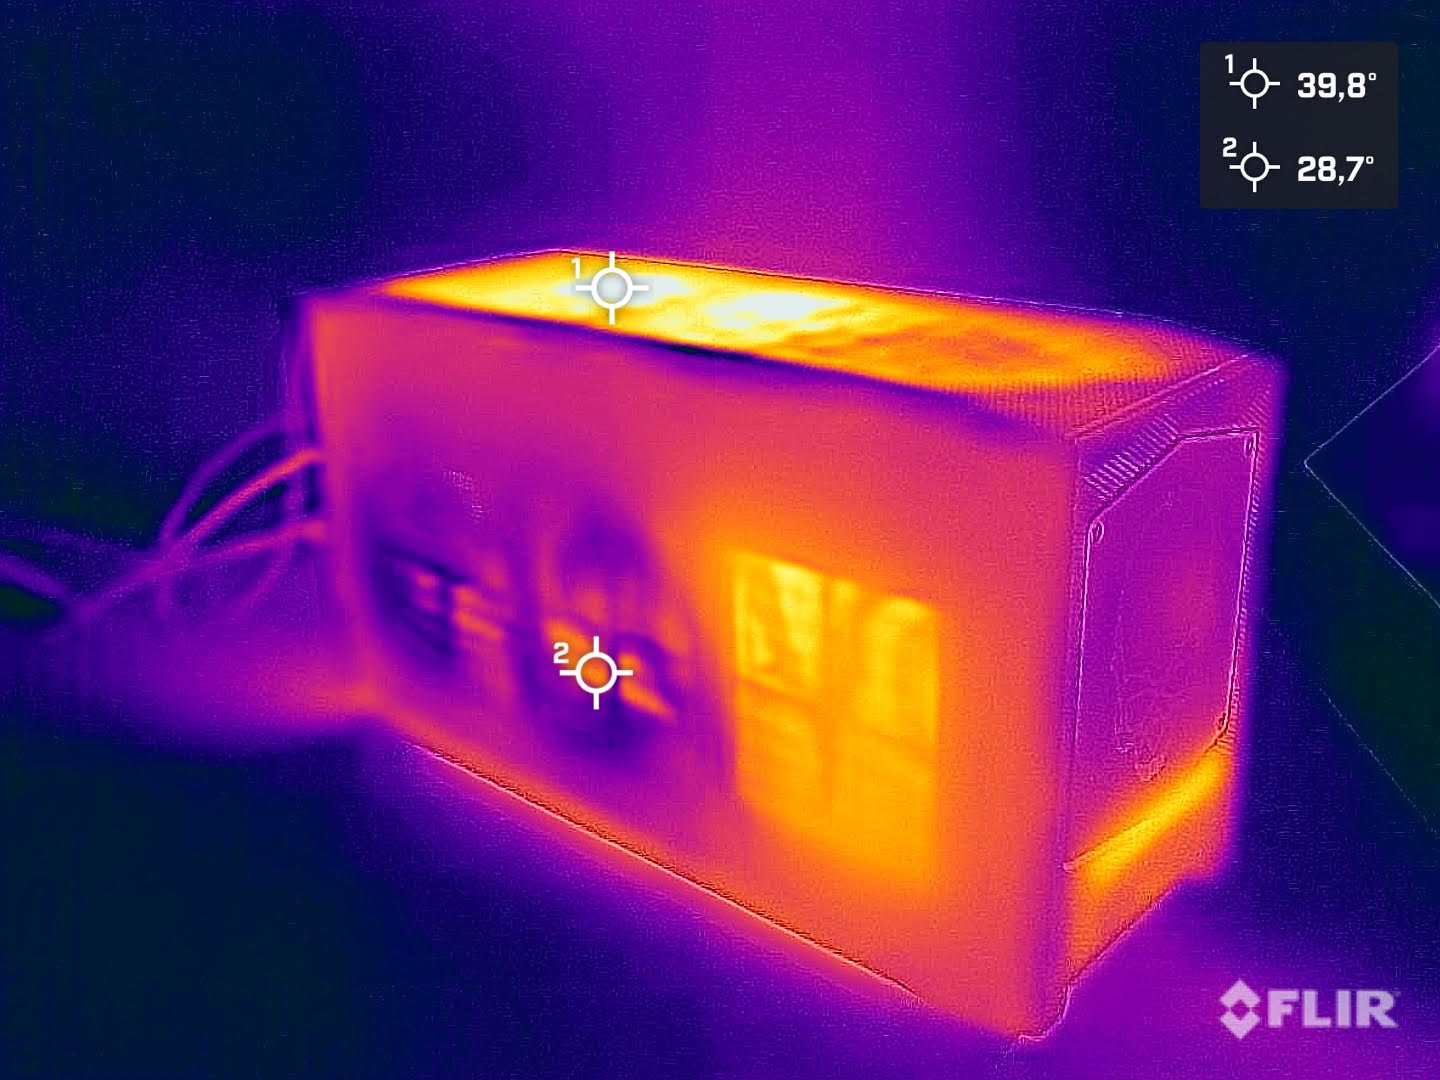
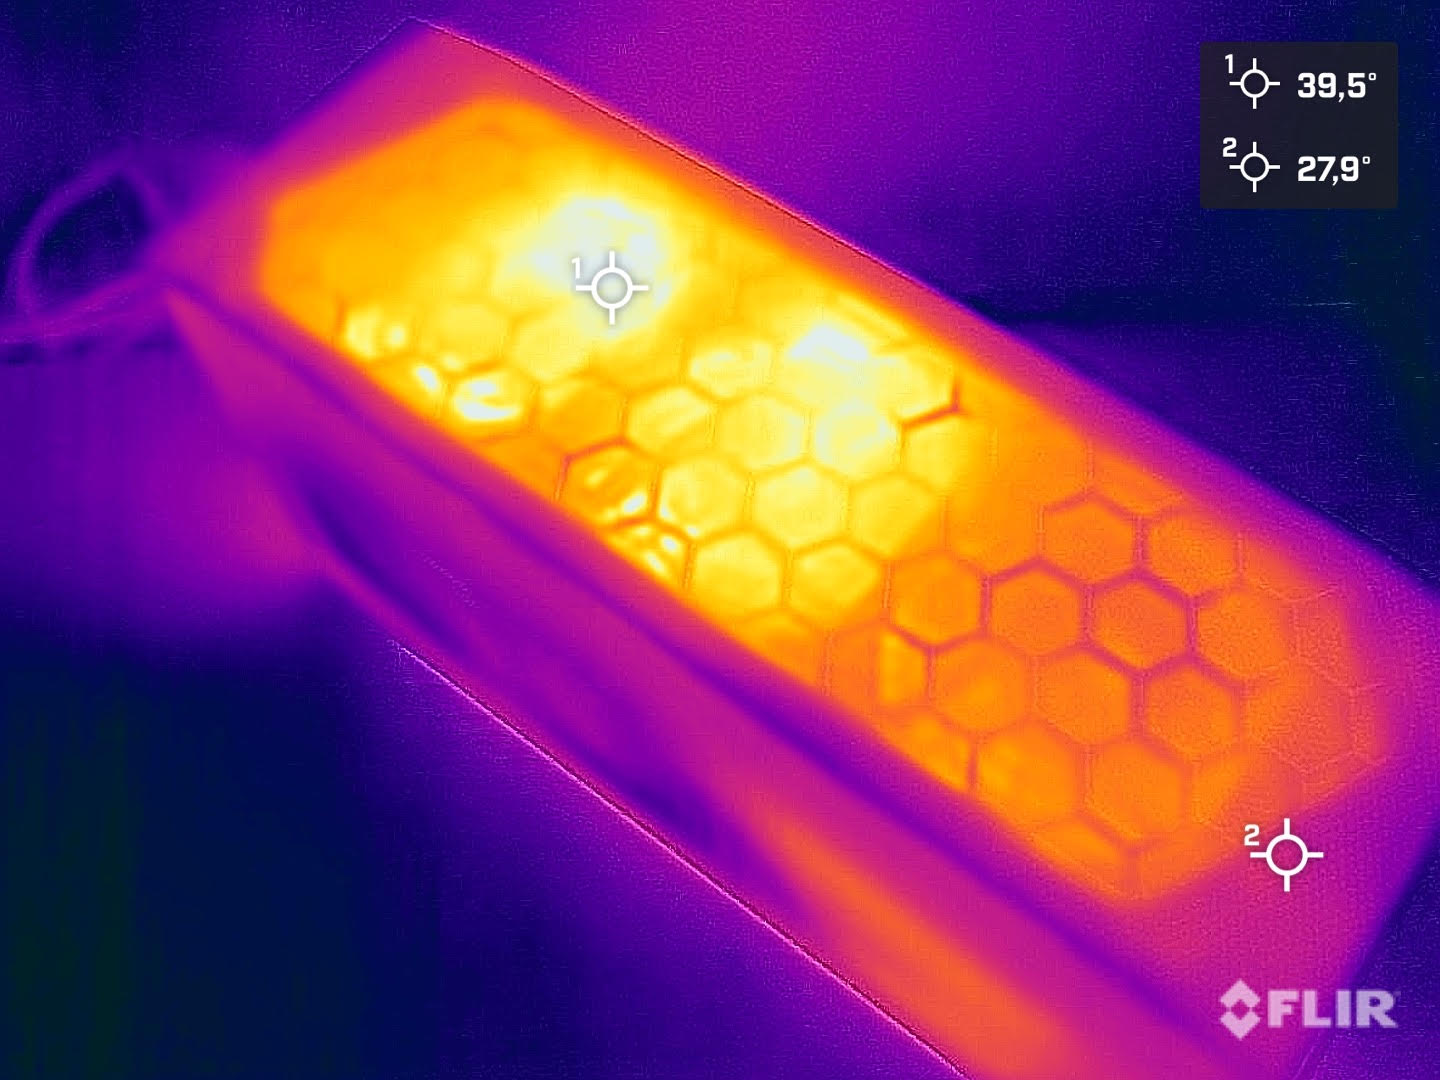
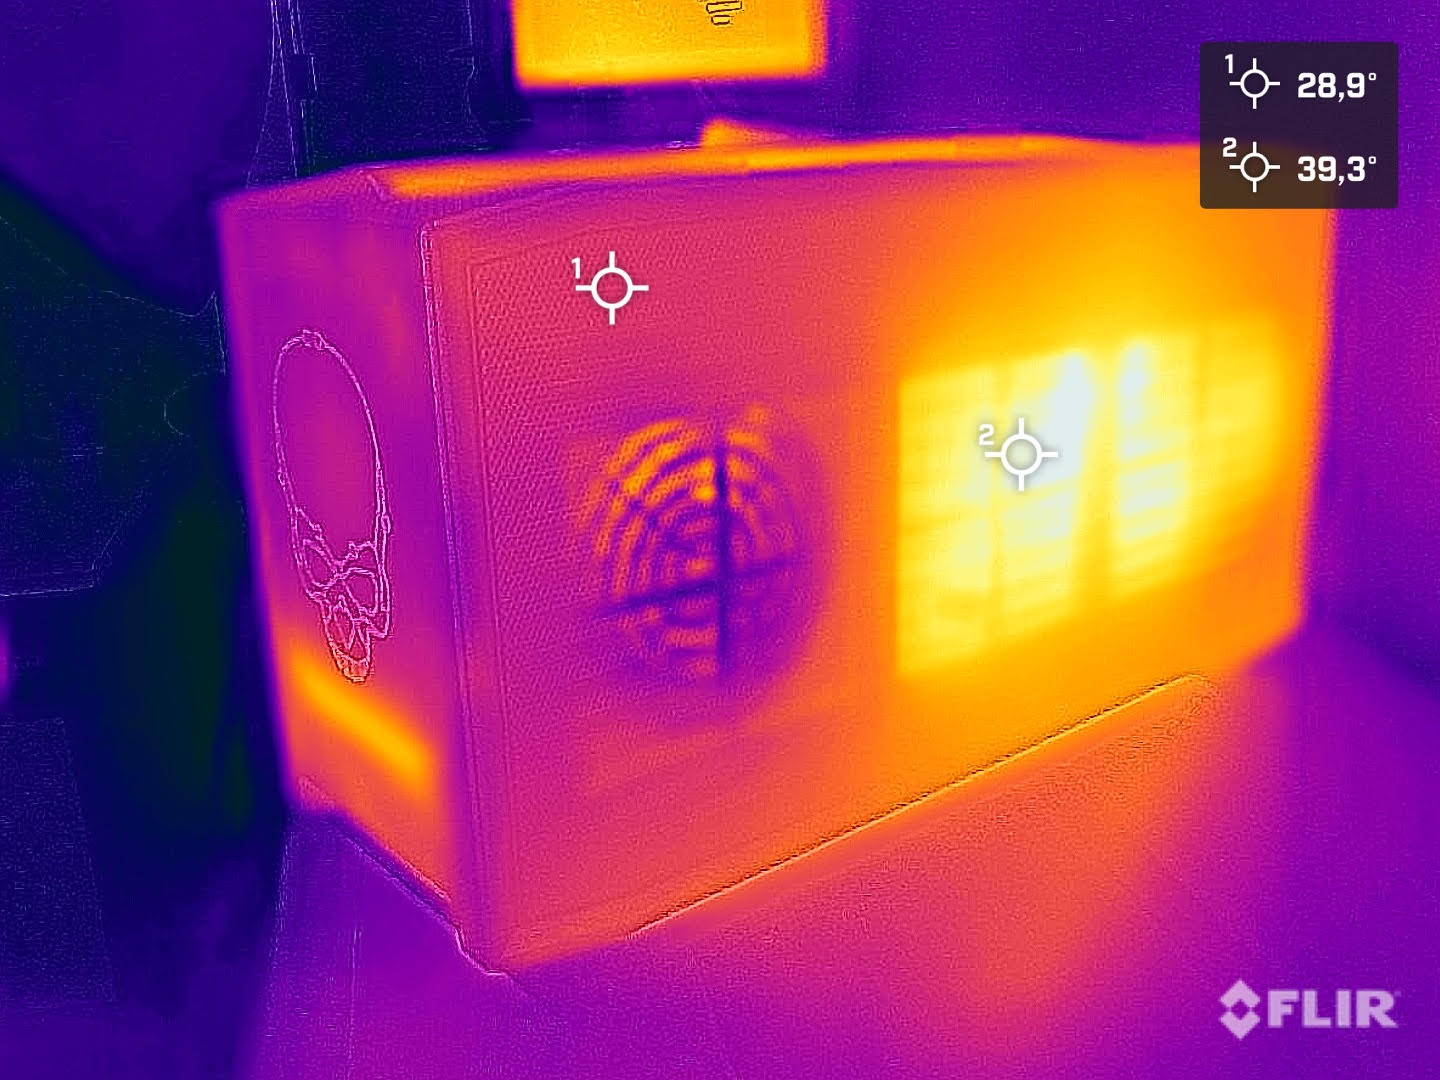
Che Intel non regola eccessivamente le prestazioni dell'Intel Core i9-11900KB può essere visto nelle letture della temperatura non appena le prestazioni sono richieste. La soglia dei 100 °C può essere raggiunta senza troppi problemi. Tuttavia, questo non potrebbe essere associato ad una prestazione chiaramente decrescente nel test delle prestazioni. Il raffreddamento del Compute Element è assicurato da una piccola ventola, che è supportata da tre ventole aggiuntive nella zona superiore del case. Il design compatto ha naturalmente la sua parte nelle temperature dei componenti. Di conseguenza, dipende anche dalla scheda grafica dedicata nel sistema. Se volete usare solo la iGPU e fare a meno di un adattatore grafico dedicato, potete aspettarvi una prestazione leggermente superiore del SoC. Tuttavia, non ci si dovrebbe aspettare un drastico guadagno di prestazioni.

Il design compatto ha ancora un grande svantaggio però, ed è il livello di rumore. L'Intel NUC 11 Extreme Kit - Beast Canyon è chiaramente udibile e con 36 dB(A), il sistema non è veramente silenzioso anche quando è al minimo. Quindi, non è sorprendente che abbiamo potuto misurare 50,5 dB(A) durante il gioco. Abbiamo determinato i livelli di rumore ad una distanza di 15 cm (~6 pollici) dal dispositivo. Dovreste notare un po' meno rumore di fondo se non posizionate l'Intel NUC 11 Extreme Kit - Beast Canyon direttamente accanto a voi.

Power Consumption
1920x1080 The Witcher 3 ultra (external Monitor)
AMD Ryzen 9 3950X
NVIDIA Titan RTX, R9 3950X, Intel Optane 905P 480GB 2.5 (Idle: 95 W)
423.6 (400min - 442max) Watt * -84%
Intel Core i9-10900K
NVIDIA Titan RTX, i9-10900K, WDC PC SN720 SDAQNTW-512G (Idle: 52.3 W)
396.2 (380min - 475max) Watt * -72%
Intel Core i5-10600K
NVIDIA Titan RTX, i5-10600K (Idle: 52.2 W)
386.9 (380min - 404max) Watt * -68%
Corsair One i160
GeForce RTX 2080 Ti (Desktop), i9-9900K, Samsung PM961 NVMe MZVLW512HMJP (Idle: 51.5 W)
359 (348min - 374max) Watt * -56%
Intel Ghost Canyon NUC (RTX 2070)
GeForce RTX 2070 (Desktop), i9-9980HK, Kingston KC2500 1 TB SKC2500M81000G (Idle: 33.1 W)
237.1 (227min - 263max) Watt * -3%
Intel Beast Canyon NUC
NVIDIA GeForce RTX 3060, i9-11900KB, Sabrent Rocket 4.0 500GB (Idle: 32 W)
229.9 (219min - 254max) Watt *
Prime95 V2810 Stress (external Monitor)
Intel Core i9-10900K
NVIDIA Titan RTX, i9-10900K, WDC PC SN720 SDAQNTW-512G (Idle: 52.3 W)
275.7 (254min - 385max) Watt * -144%
Intel Core i5-10600K
NVIDIA Titan RTX, i5-10600K (Idle: 52.2 W)
204.4 (191min - 261max) Watt * -81%
AMD Ryzen 9 3950X
NVIDIA Titan RTX, R9 3950X, Intel Optane 905P 480GB 2.5 (Idle: 95 W)
198.8 (185min - 240max) Watt * -76%
Intel Beast Canyon NUC
NVIDIA GeForce RTX 3060, i9-11900KB, Sabrent Rocket 4.0 500GB (Idle: 34 W)
112.9 (108min - 135max) Watt *
Intel Ghost Canyon NUC (RTX 2070)
GeForce RTX 2070 (Desktop), i9-9980HK, Kingston KC2500 1 TB SKC2500M81000G (Idle: 33.1 W)
109.4 (107min - 151max) Watt * +3%
Cinebench R15 Multi (external Monitor)
Intel Core i9-10900K
NVIDIA Titan RTX, i9-10900K, WDC PC SN720 SDAQNTW-512G (Idle: 52.3 W)
268.5 (265min - 270max) Watt * -117%
AMD Ryzen 9 3950X
NVIDIA Titan RTX, R9 3950X, Intel Optane 905P 480GB 2.5 (Idle: 95 W)
219.5 (218min - 225max) Watt * -77%
Intel Core i5-10600K
NVIDIA Titan RTX, i5-10600K (Idle: 52.2 W)
172.5 (170min - 176max) Watt * -39%
Intel Beast Canyon NUC
NVIDIA GeForce RTX 3060, i9-11900KB, Sabrent Rocket 4.0 500GB (Idle: 32 W)
123.9 (73min - 147max) Watt *
Temperatures - CPU Temperature Prime95
Intel Core i9-10900K
NVIDIA Titan RTX, i9-10900K, WDC PC SN720 SDAQNTW-512G
88 °C
AMD Ryzen 9 3950X
NVIDIA Titan RTX, R9 3950X, Intel Optane 905P 480GB 2.5
83.8 °C
Intel Core i5-10600K
NVIDIA Titan RTX, i5-10600K
70 °C

* ... Meglio usare valori piccoli

Intel NUC 11 Extreme Kit - Beast Canyon - Consumo energetico al minimo
Intel NUC 11 Extreme Kit - Beast Canyon - consumo energetico Prime95
Intel NUC 11 Extreme Kit - Beast Canyon - consumo energetico FurMark
Intel NUC 11 Extreme Kit - Beast Canyon - consumo energetico Prime95 e FurMark
Intel NUC 11 Extreme Kit - Beast Canyon - consumo energetico Cinebench R15 nT
Kit Intel NUC 11 Extreme - Beast Canyon - Consumo energetico Il Witcher 3 (Ultra-Preset)
Intel NUC 11 Extreme Kit - Beast Canyon - stress test Prime95 solo
Intel NUC 11 Extreme Kit - Beast Canyon - stress test FurMark solo
Intel NUC 11 Extreme Kit - Beast Canyon - stress test Prime95 e FurMark

Pro

+ case stabile e compatto
+ Core i9 con 8 core e 16 thread
+ alte prestazioni del sistema
+ Alimentatore con fattore di forma SFX con 650 watt
+ molte opzioni di connettività
+ 2x Thunderbolt 4
+ Lettore di schede SD UHS-II
+ quattro slot M.2
+ Wi-Fi 6

Contro

- chiaramente udibile sotto carico
- compatibilità limitata con le schede di espansione

Verdetto - Compatto, moderno e veloce

L'Intel NUC 11 Extreme Kit - Beast Canyon offre ottime prestazioni in un piccolo chassis. Con il nuovo Compute Element basato sull'Intel Core i9-11900KB, c'è un SoC economico che viene dal segmento dei laptop. Gli 8 core e i 16 thread forniscono ottime prestazioni nei giochi e nella produttività grazie all'elevato IPC. Tuttavia, il prezzo minimo di 1200 dollari non è un buon affare. Una scheda grafica dedicata, la memoria di lavoro, la memoria di massa e il sistema operativo devono essere aggiunti a questo, quindi si finisce rapidamente a nord dei 2.000 dollari. I sistemi desktop comparabili sono attualmente altrettanto costosi, quindi puoi sicuramente considerare l'acquisto dell'Intel NUC 11 Extreme Kit - Beast Canyon

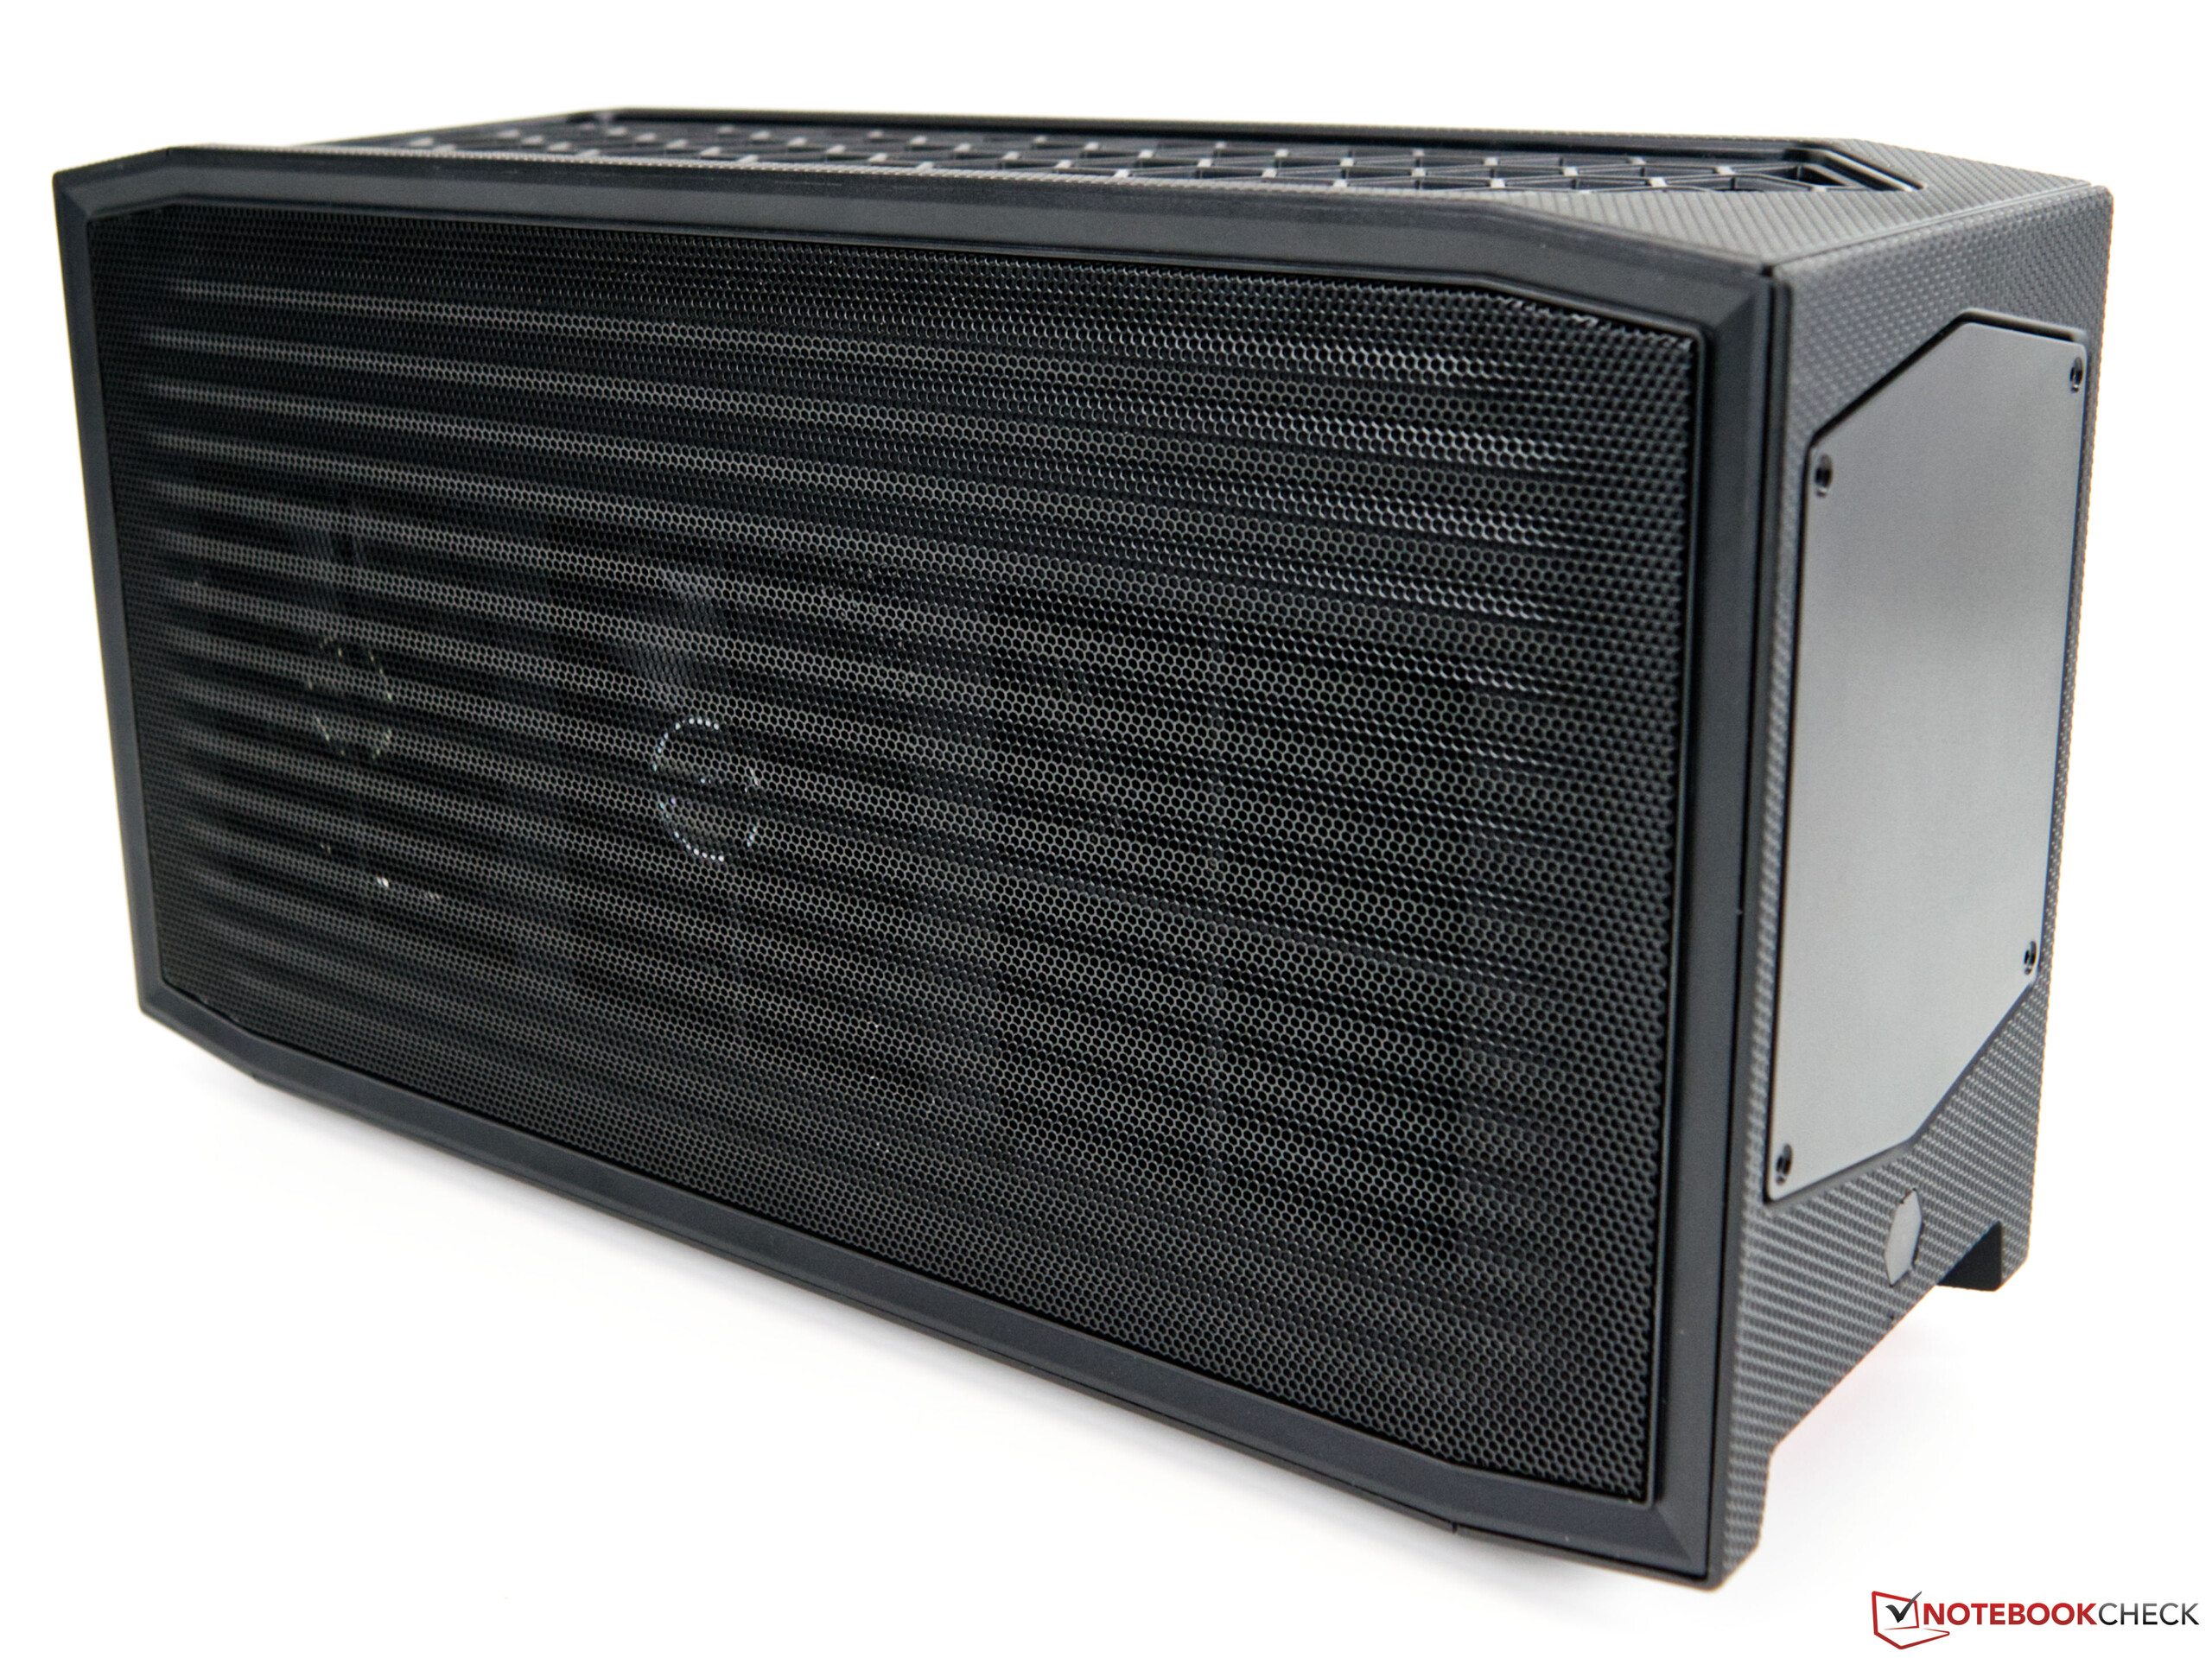
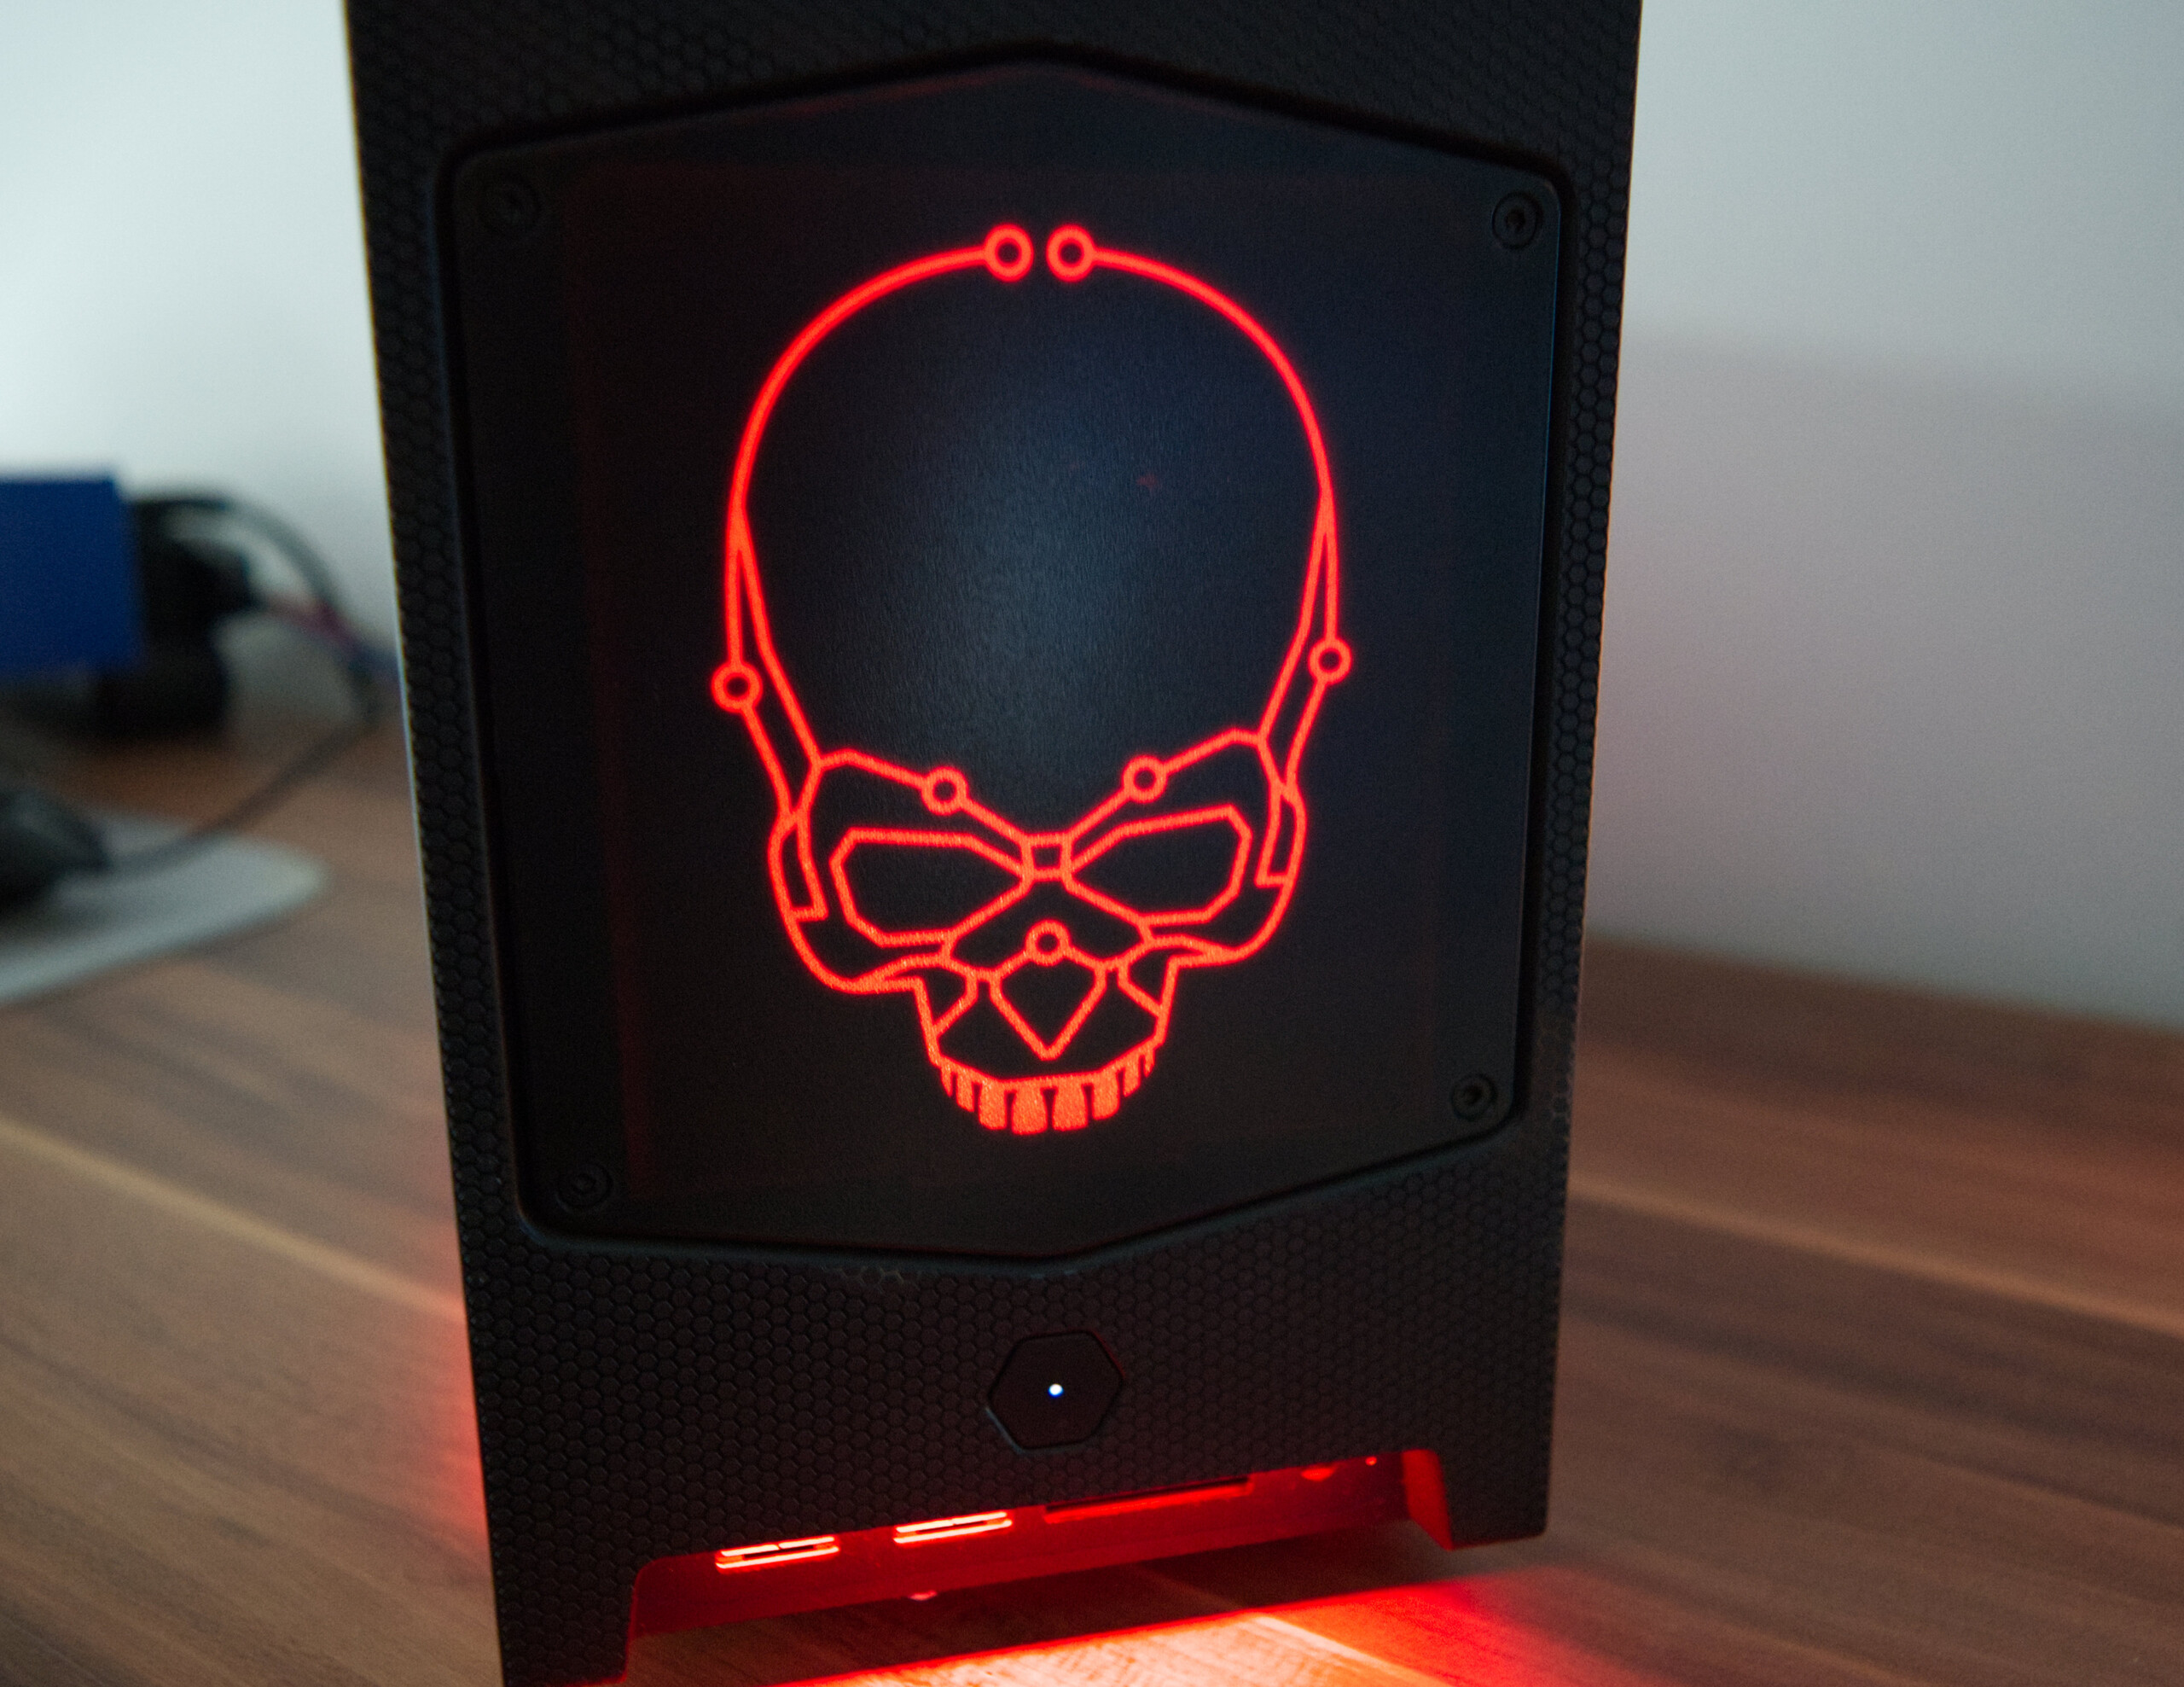
Il più grande svantaggio è probabilmente l'alto livello di rumore, che è chiaramente udibile sotto carico. Se puoi vivere con gli svantaggi del sistema e non vuoi installare la scheda grafica più grande, otterrai un sistema compatto con valore di rarità con l'Intel NUC 11 Extreme Kit - Beast Canyon. Il case non è disponibile separatamente ed è un eye-catcher con accenti ottici.

Intel spinge le prestazioni dei suoi dispositivi compatti ancora di più con l'Intel NUC 11 Extreme Kit - Beast Canyon

La selezione e il numero di interfacce sono molto buoni. Con due porte Thunderbolt 4, ha anche il più veloce e moderno standard a prova di futuro. Ci sono anche molte porte USB per collegare le periferiche e persino un veloce lettore di schede SD con lo standard UHS-II è disponibile. Solo la mancanza di una seconda porta Ethernet potrebbe essere criticata, anche se sarebbe una lamentela di alto livello.

L'alternativa all'Intel NUC 11 Extreme Kit - Beast Canyon sarebbe quella di assemblare un sistema da soli, che probabilmente costerebbe lo stesso. Il Zotac Magnus Oneè anche una buona opzione quando si tratta di PC da gioco molto compatto.

Please share our article, every link counts!
> Recensioni e prove di notebook, tablets e smartphones > Recensioni e prove > Recensioni e prove > Recensione dell'Intel NUC 11 Beast Canyon con Core i9 e RTX 3060
Sebastian Bade, 2021-12-15 (Update: 2021-12-20)