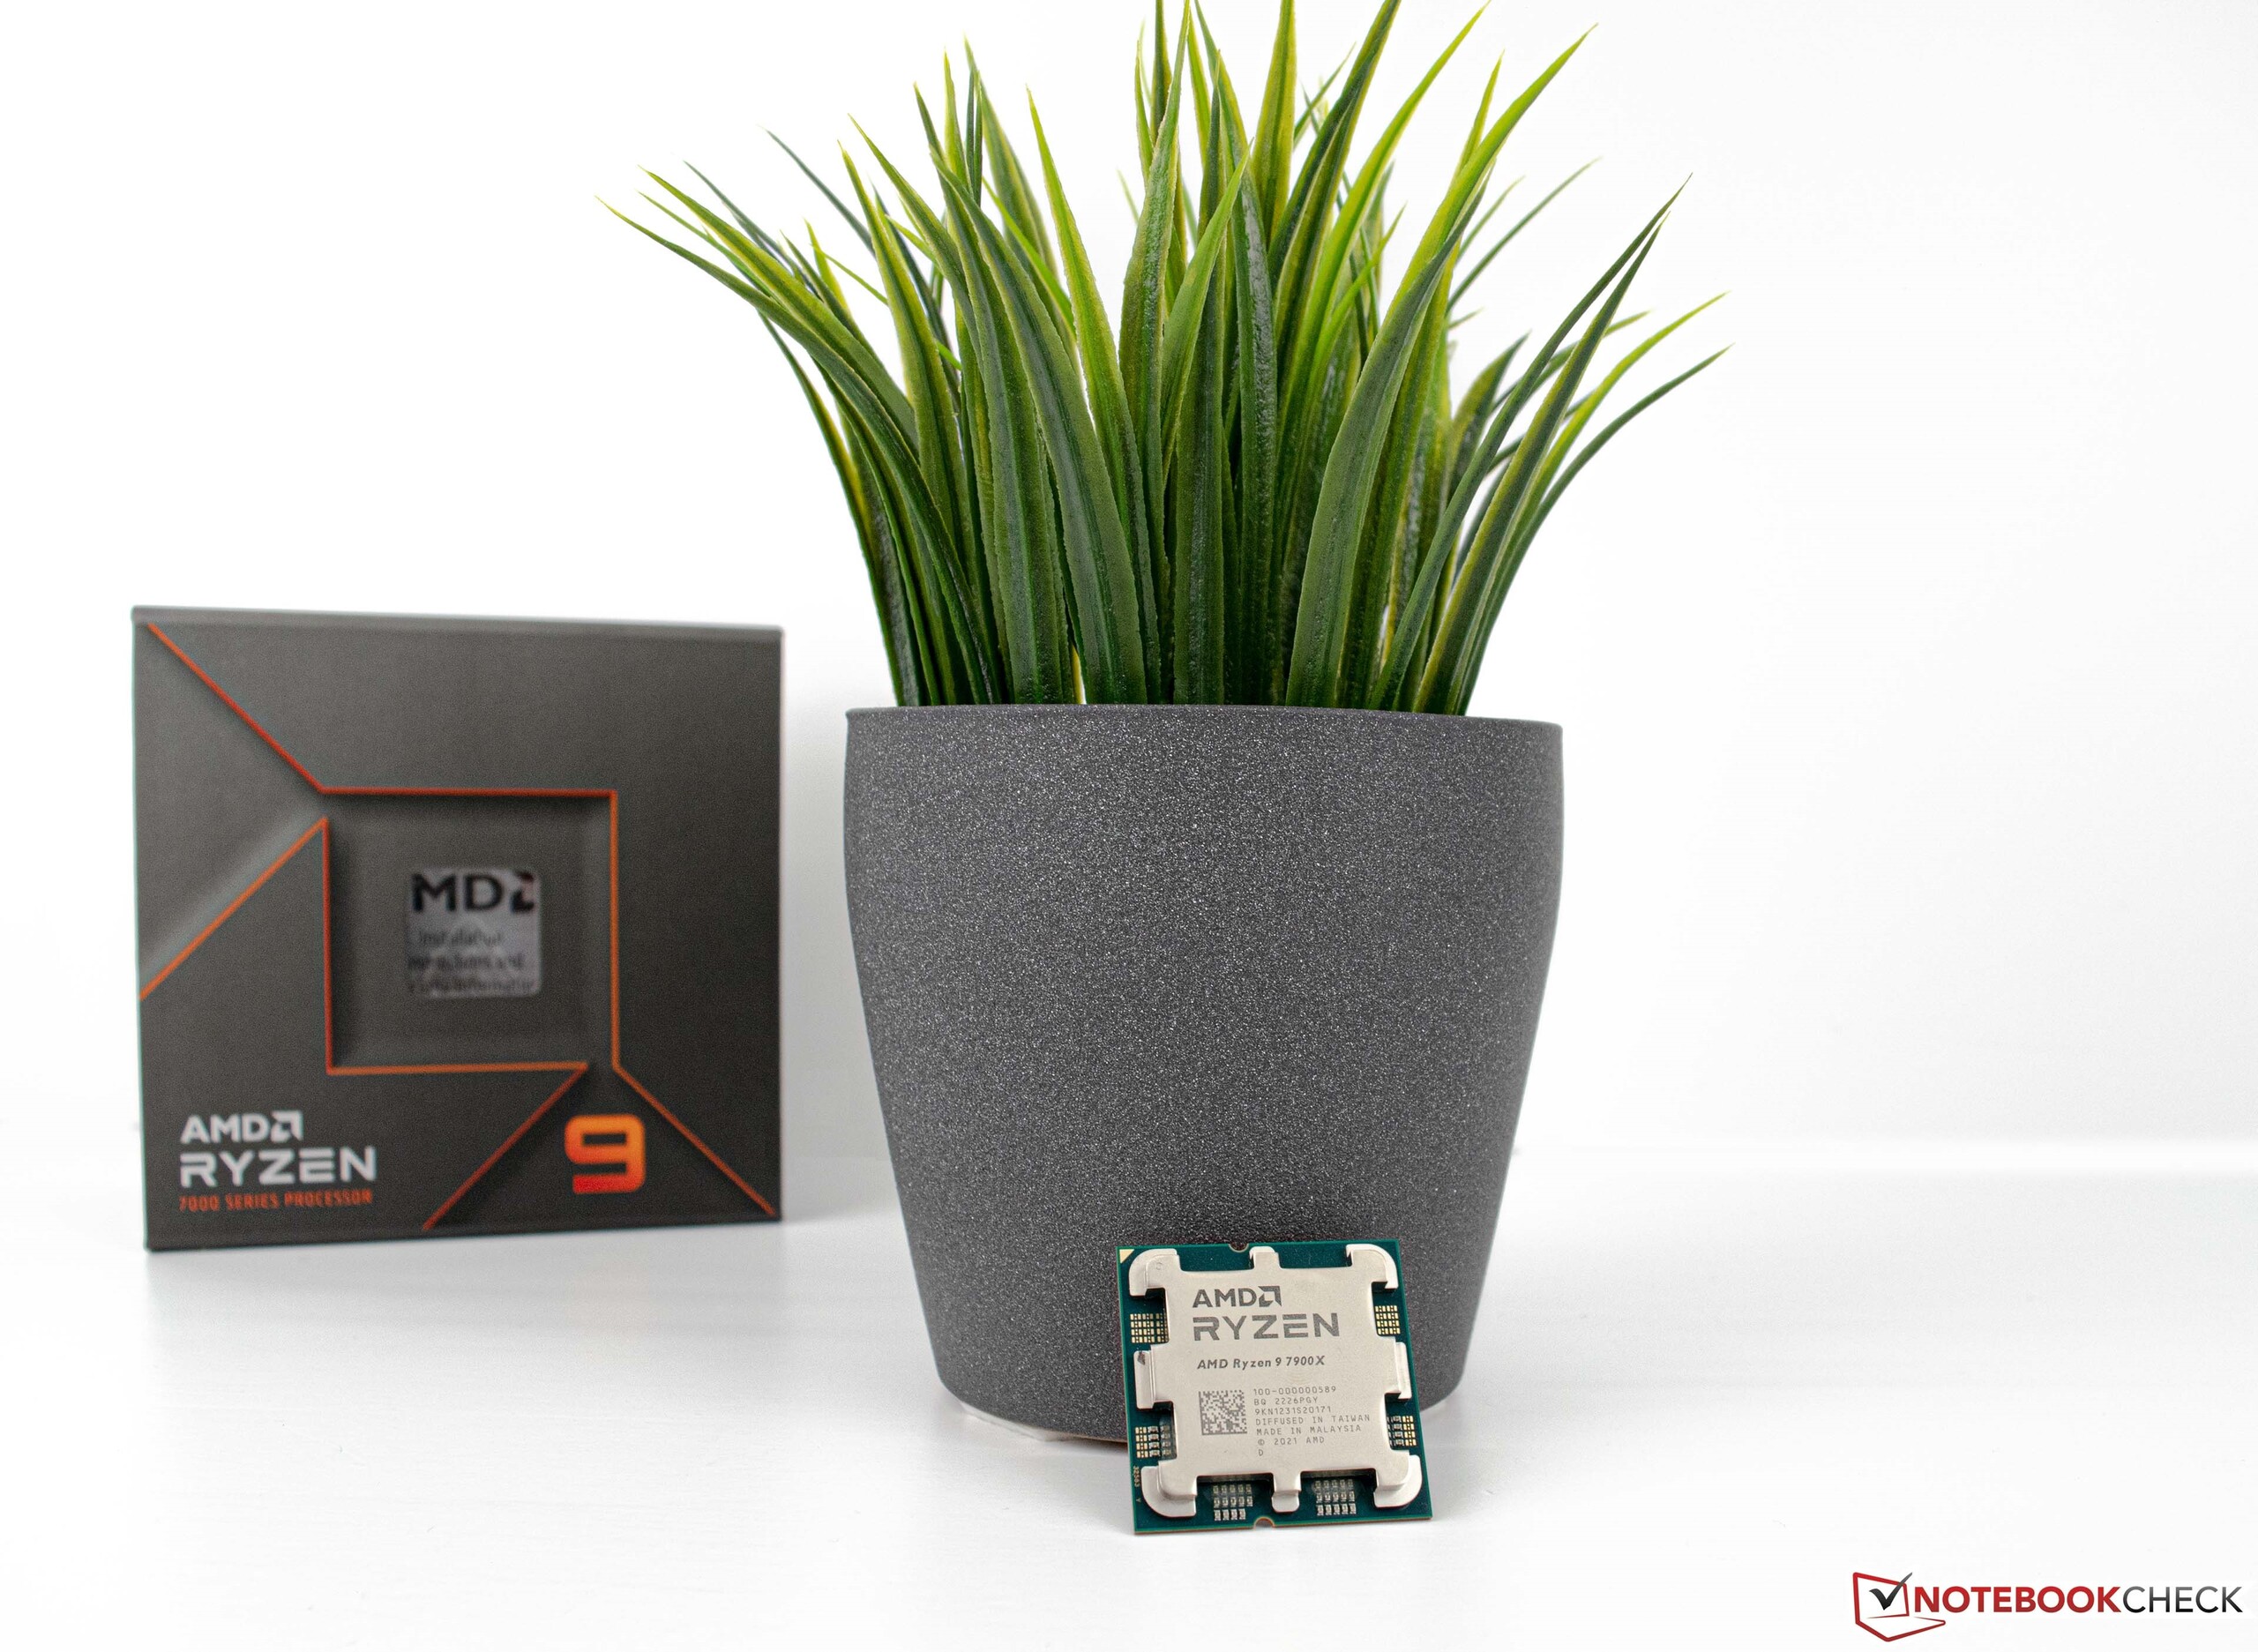
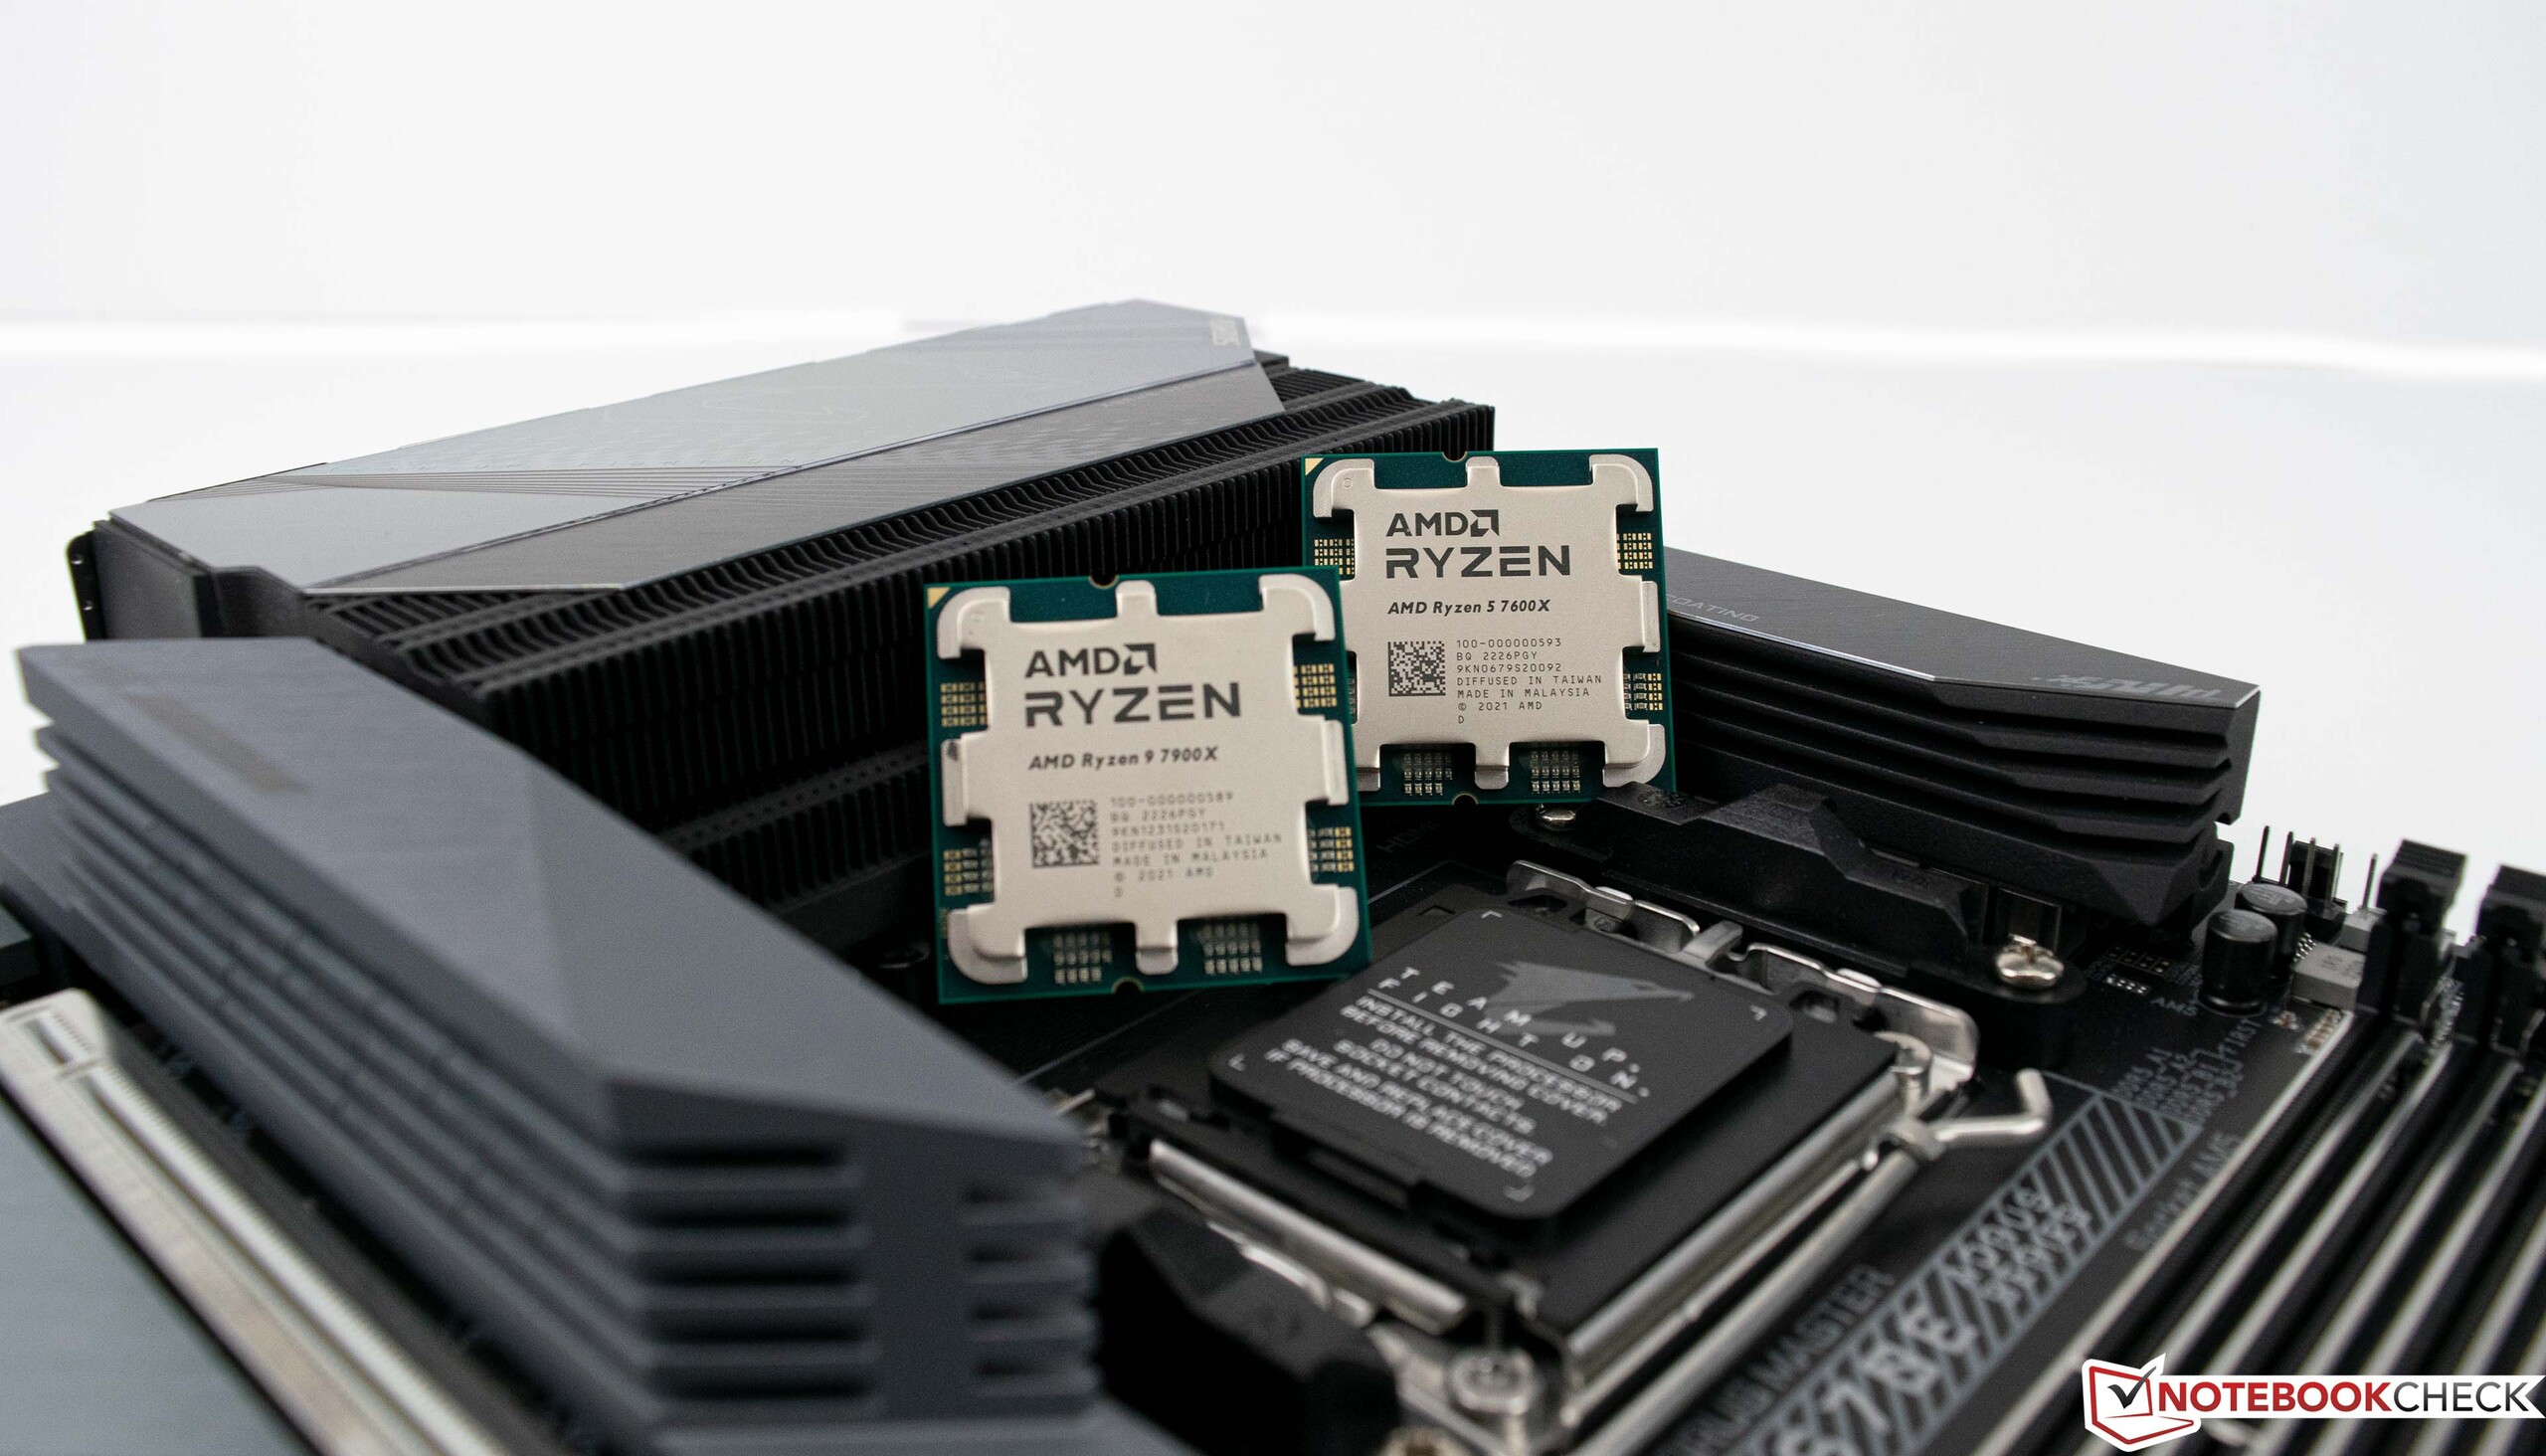
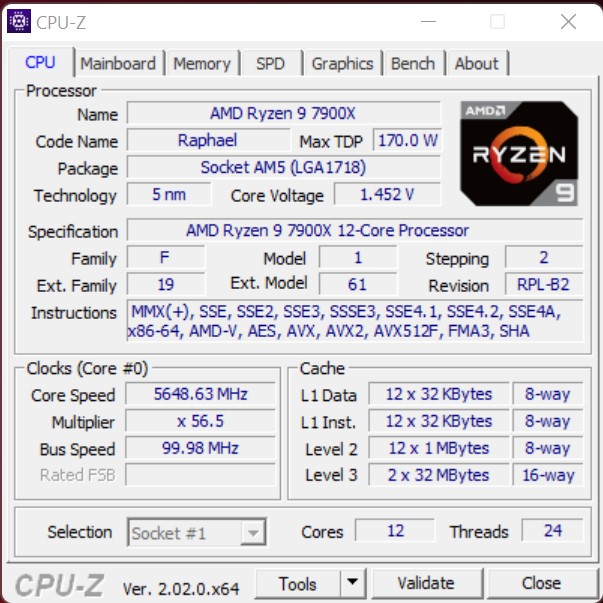
Recensione delle AMD Ryzen 9 7900X e AMD Ryzen 5 7600X: Torniamo alla corona di CPU gaming più veloce con Raphael!
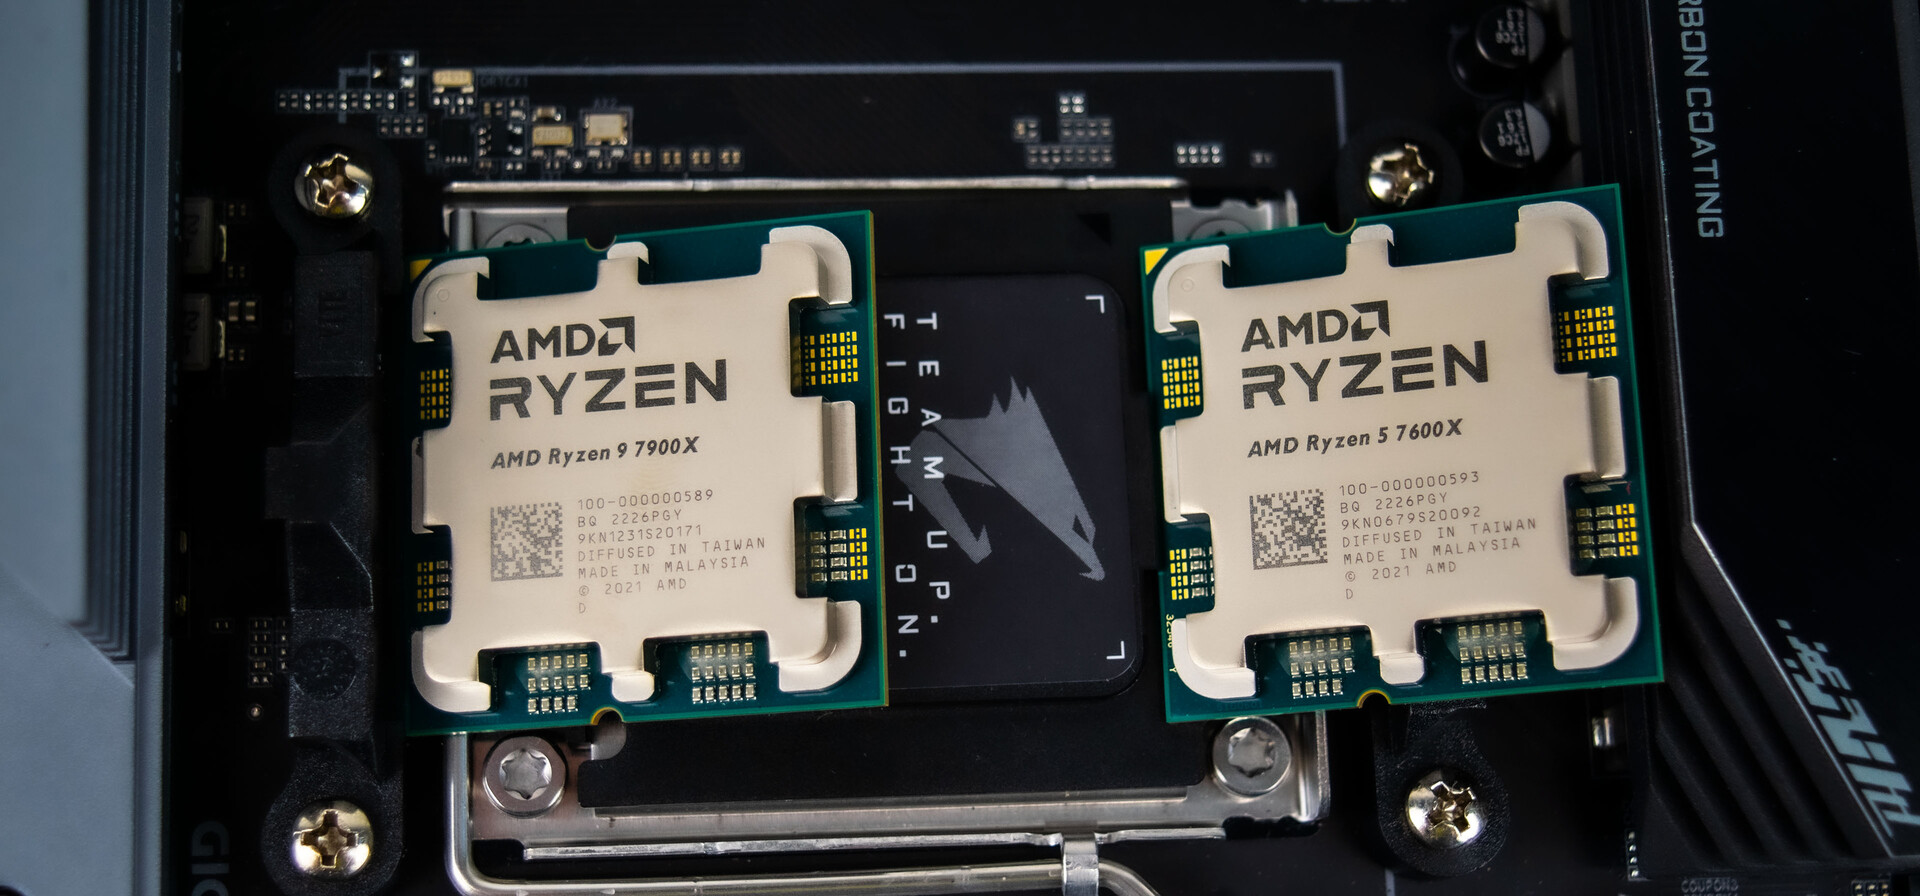
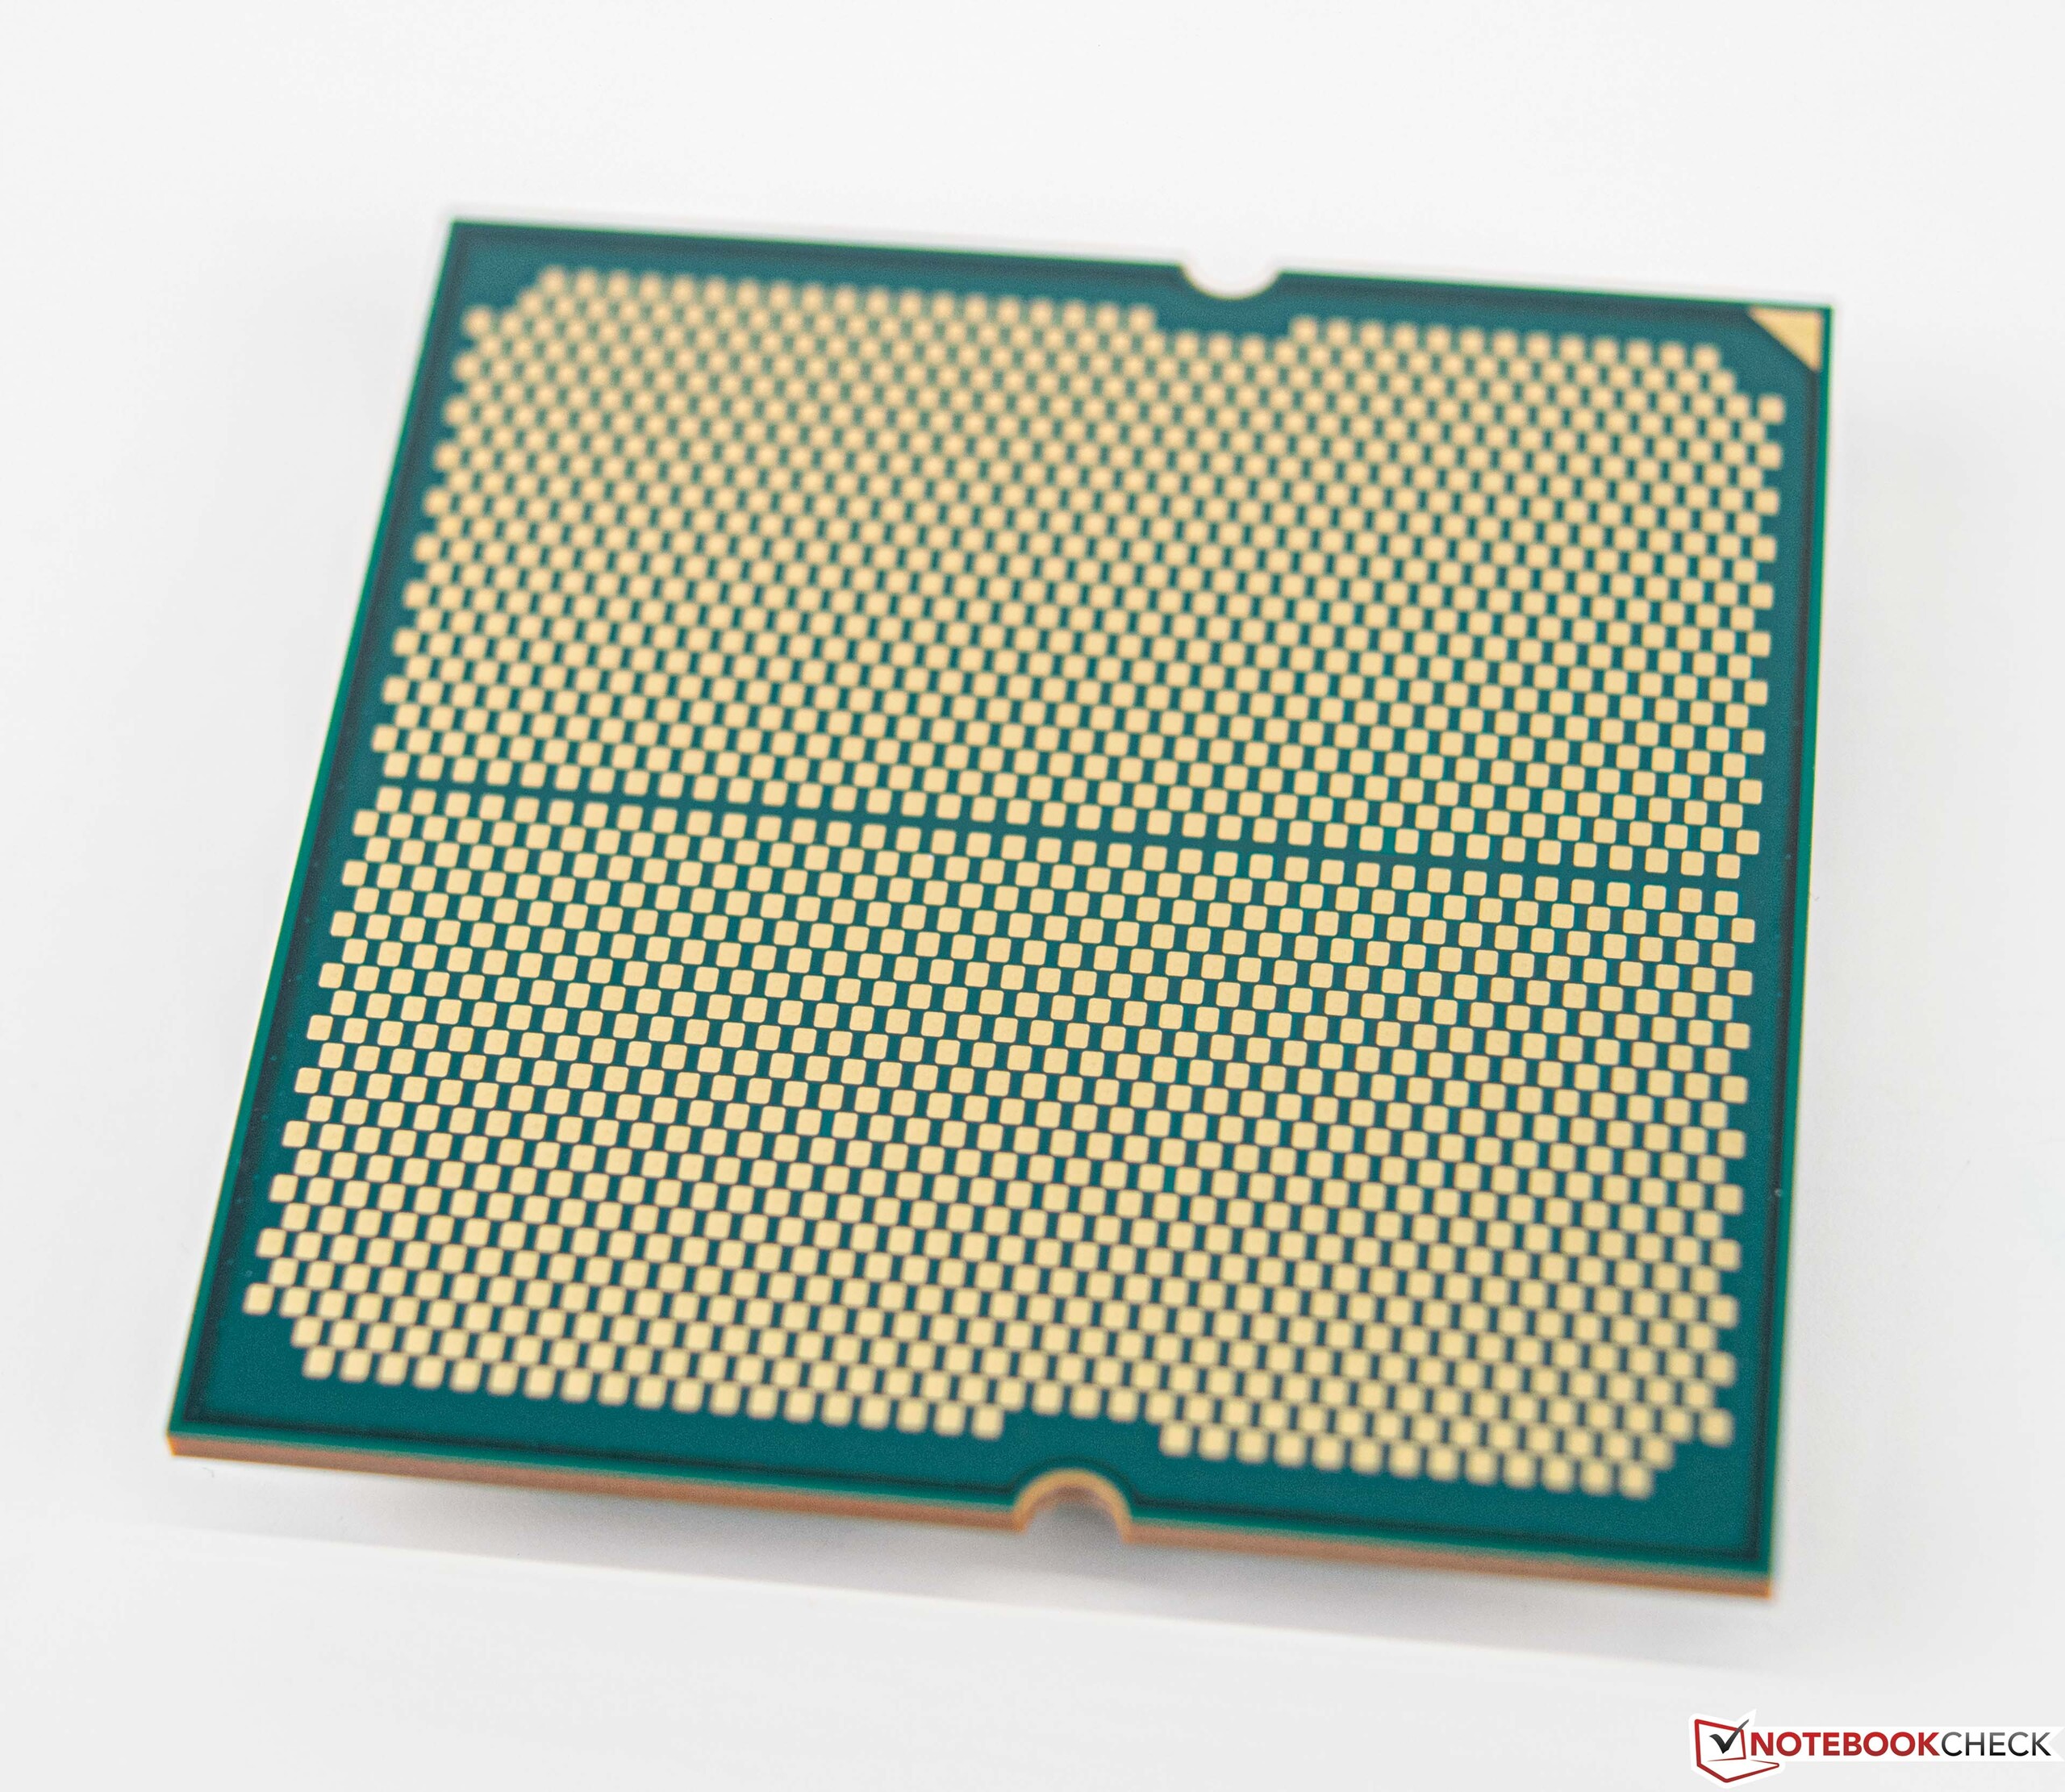
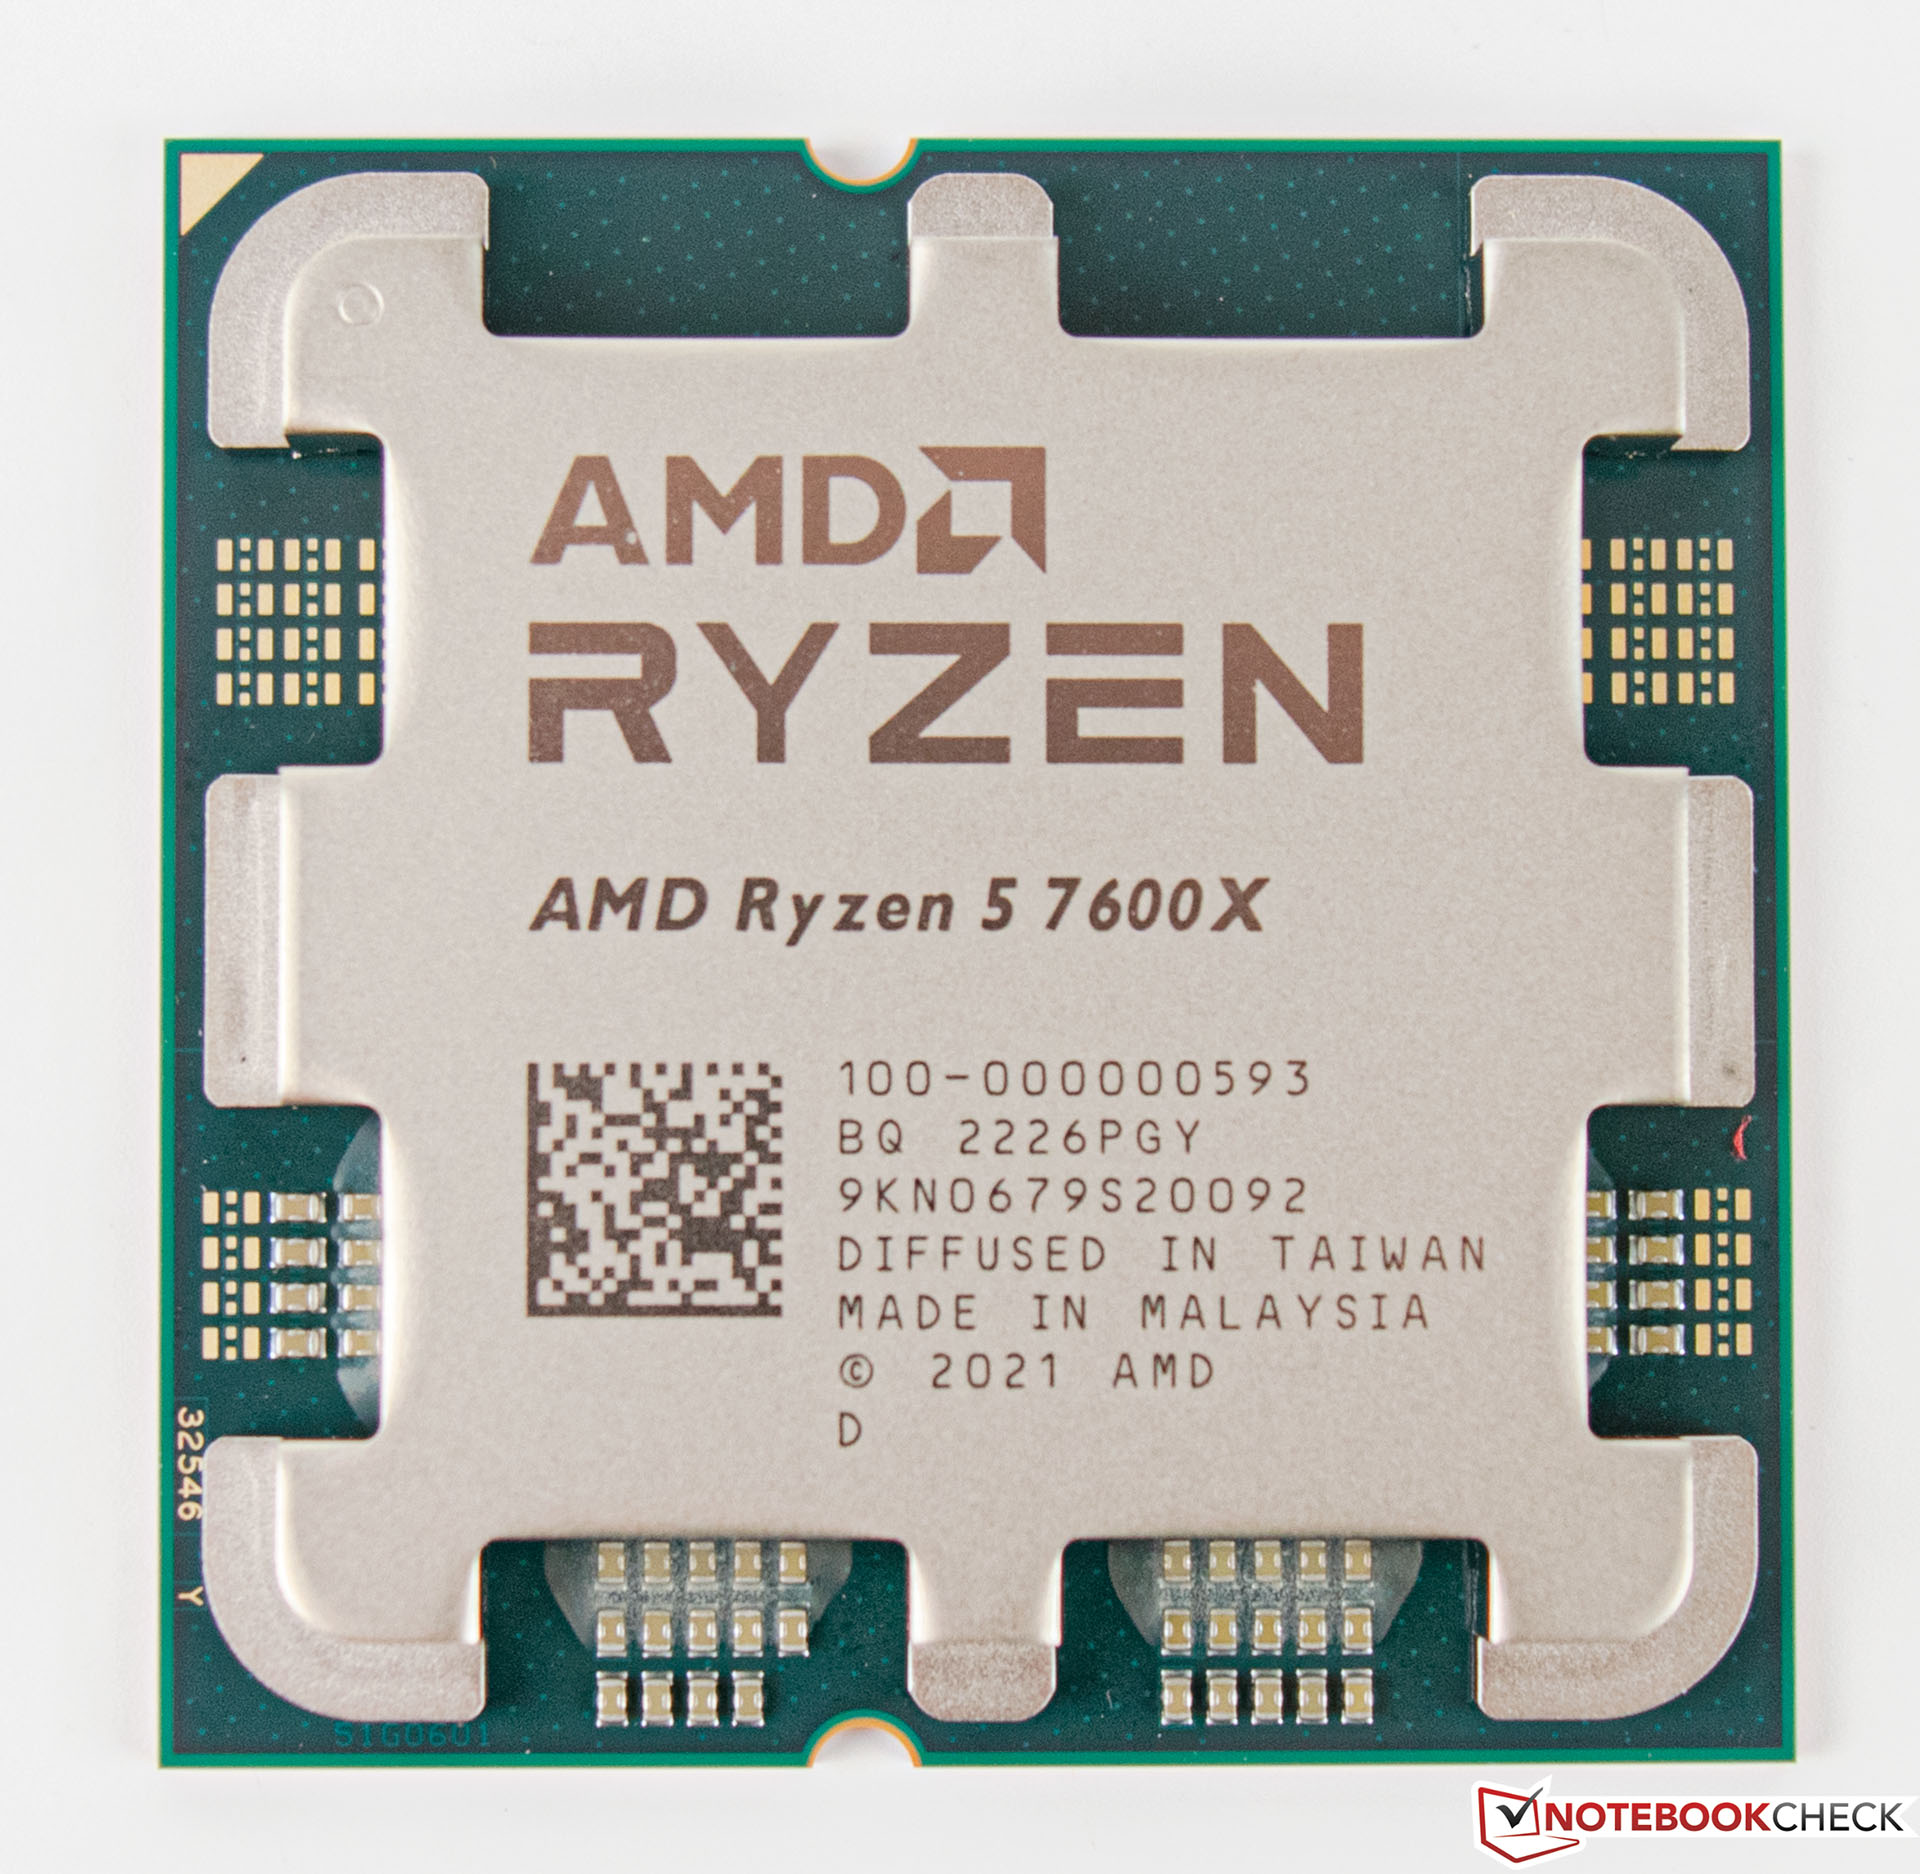
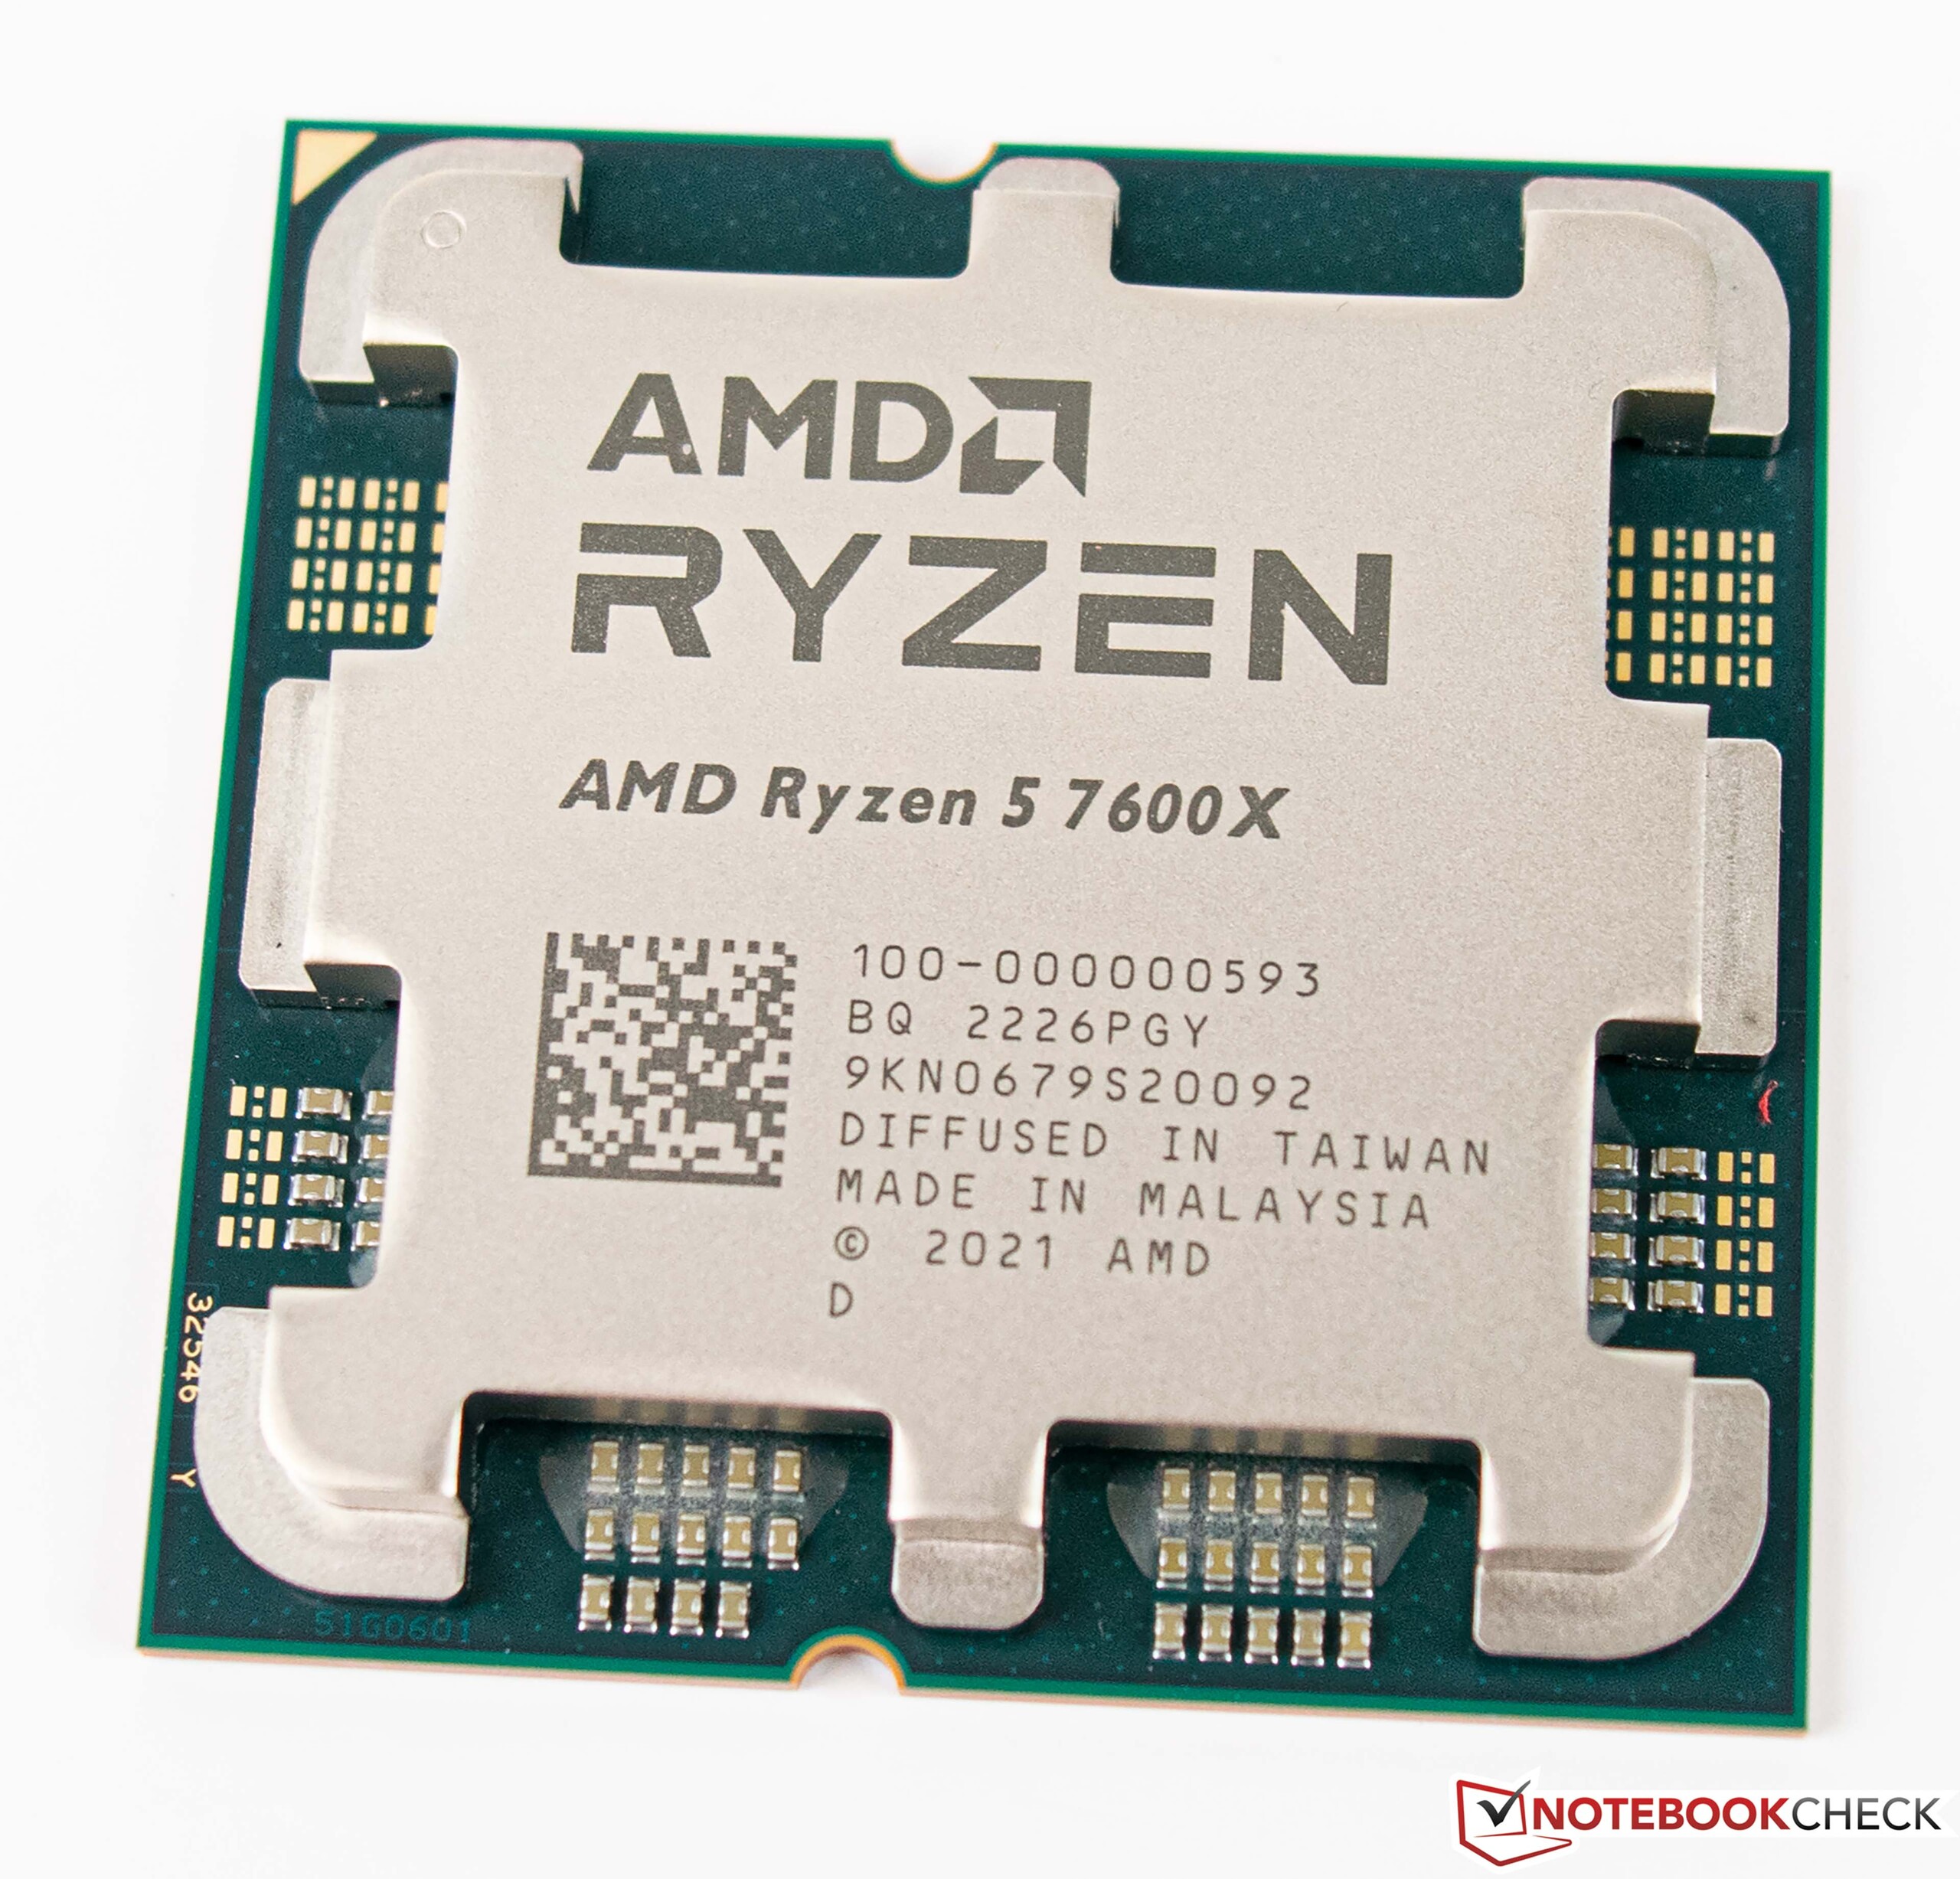
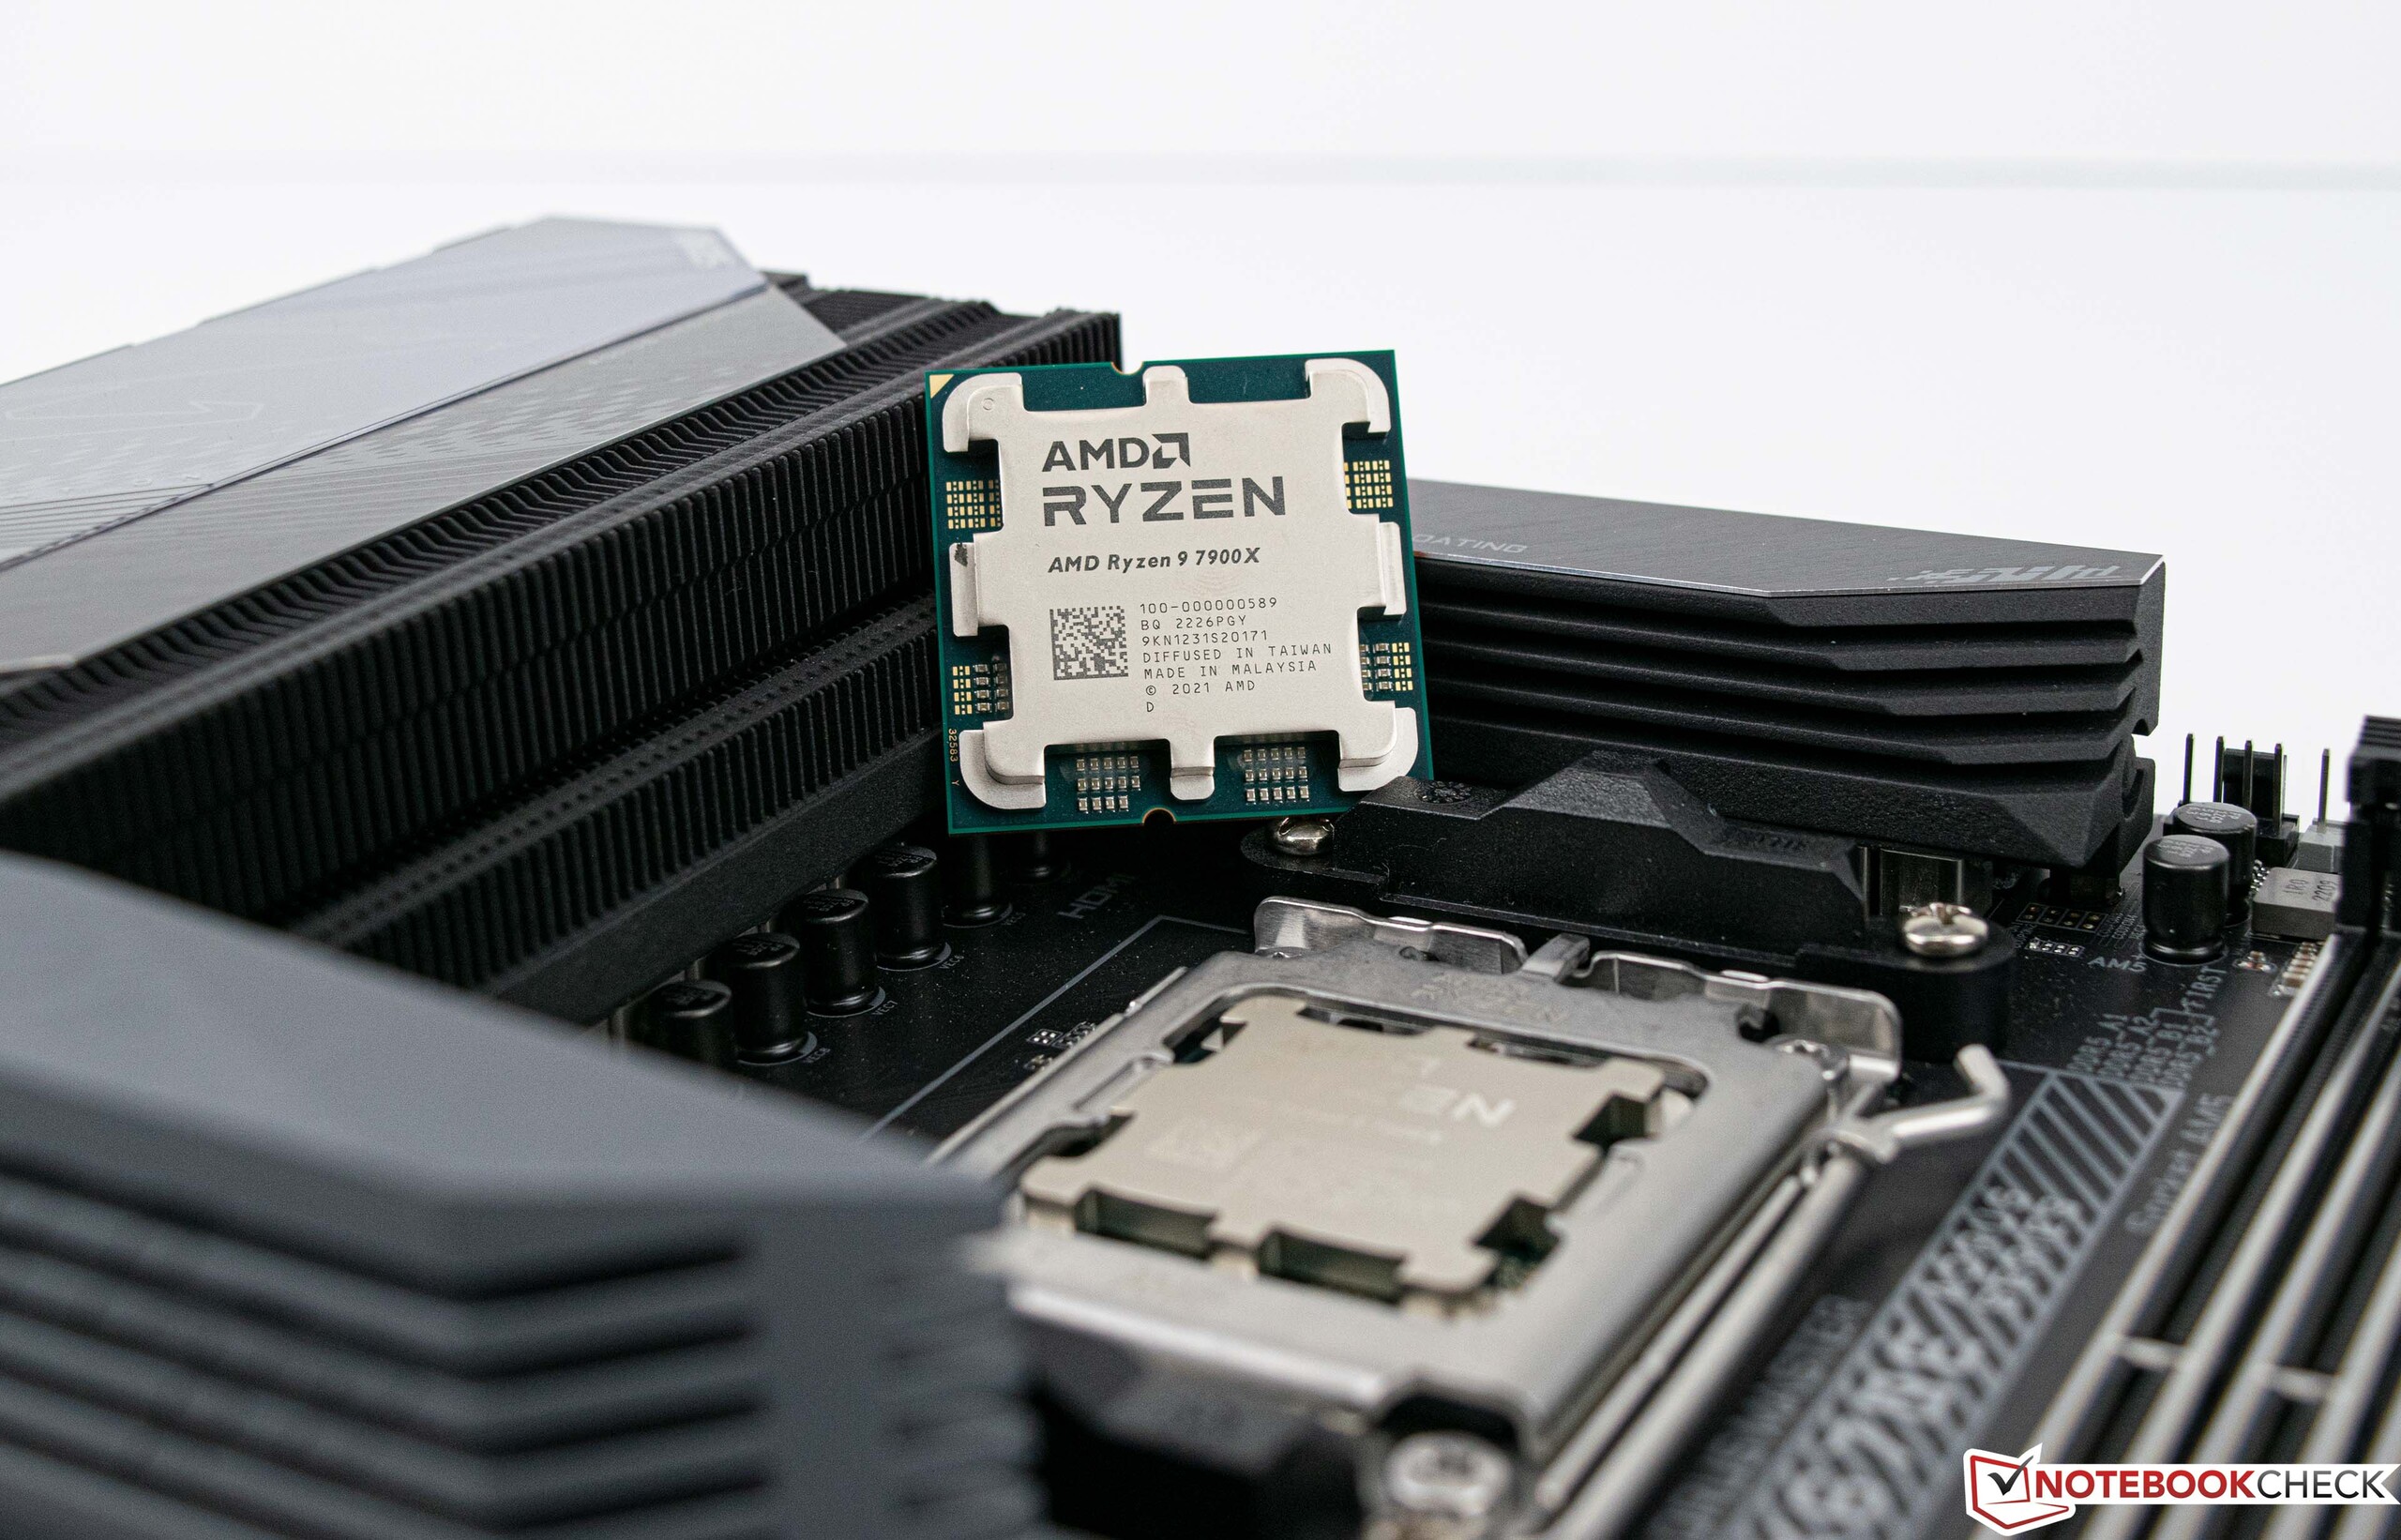
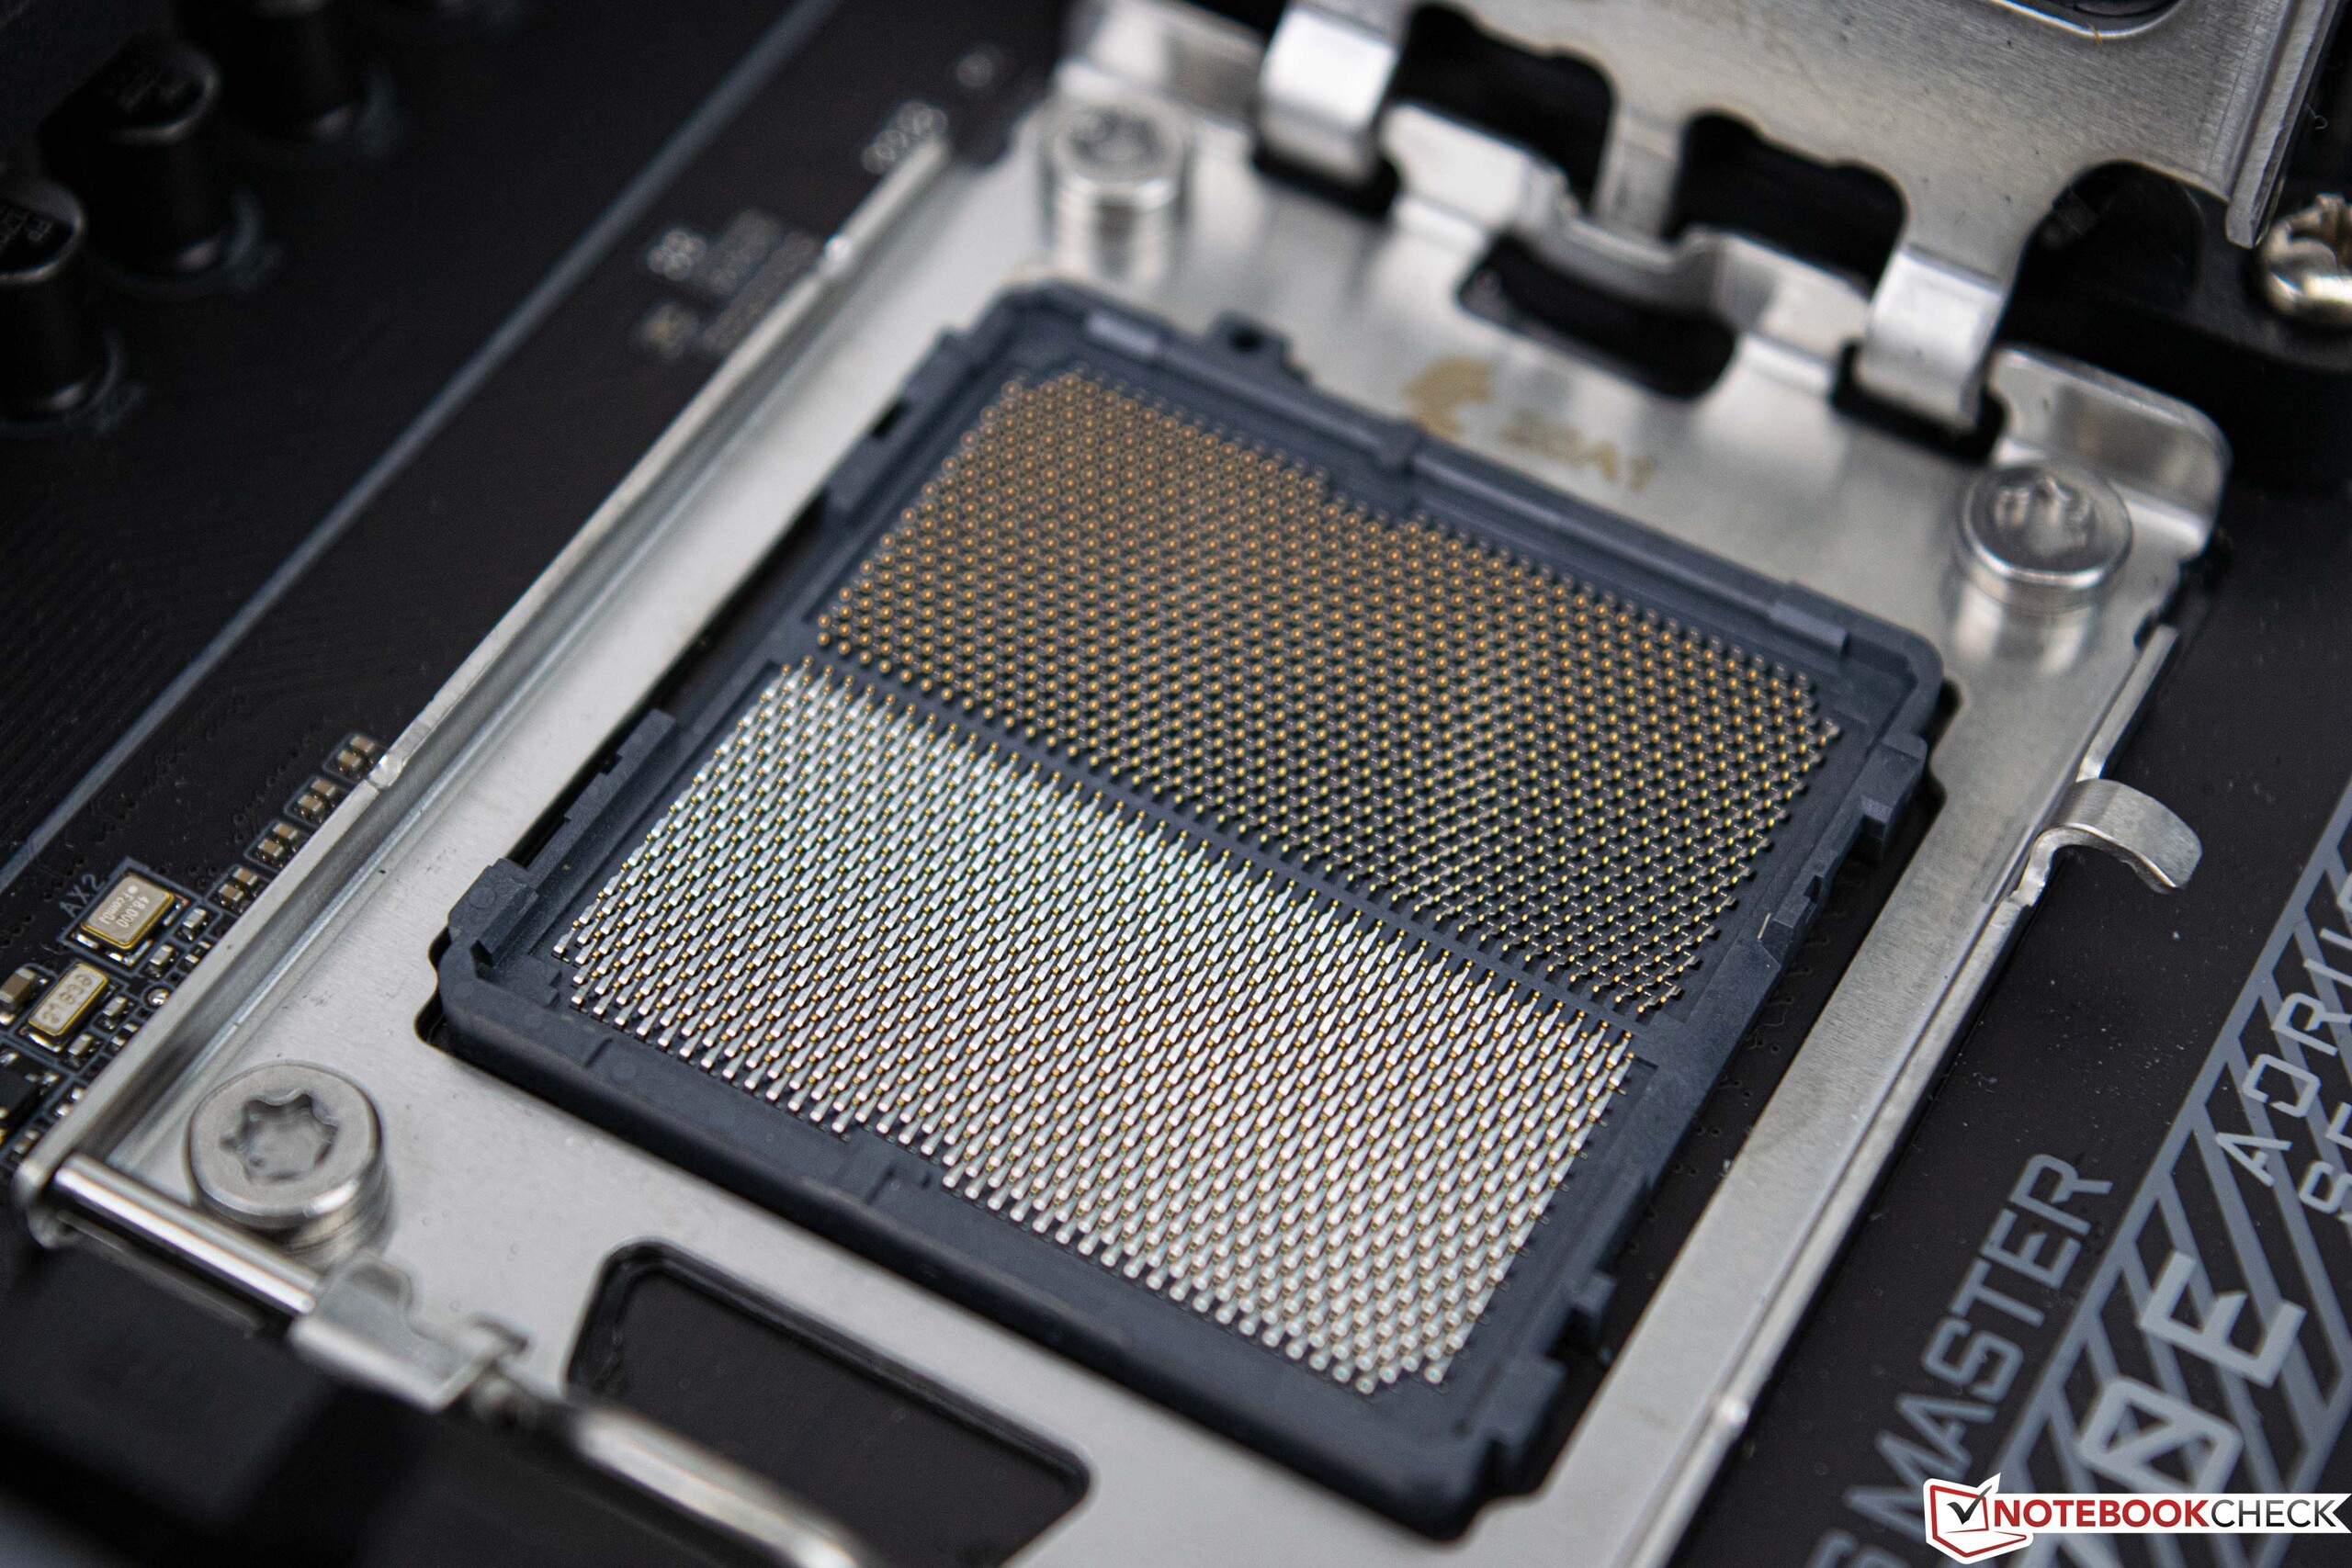
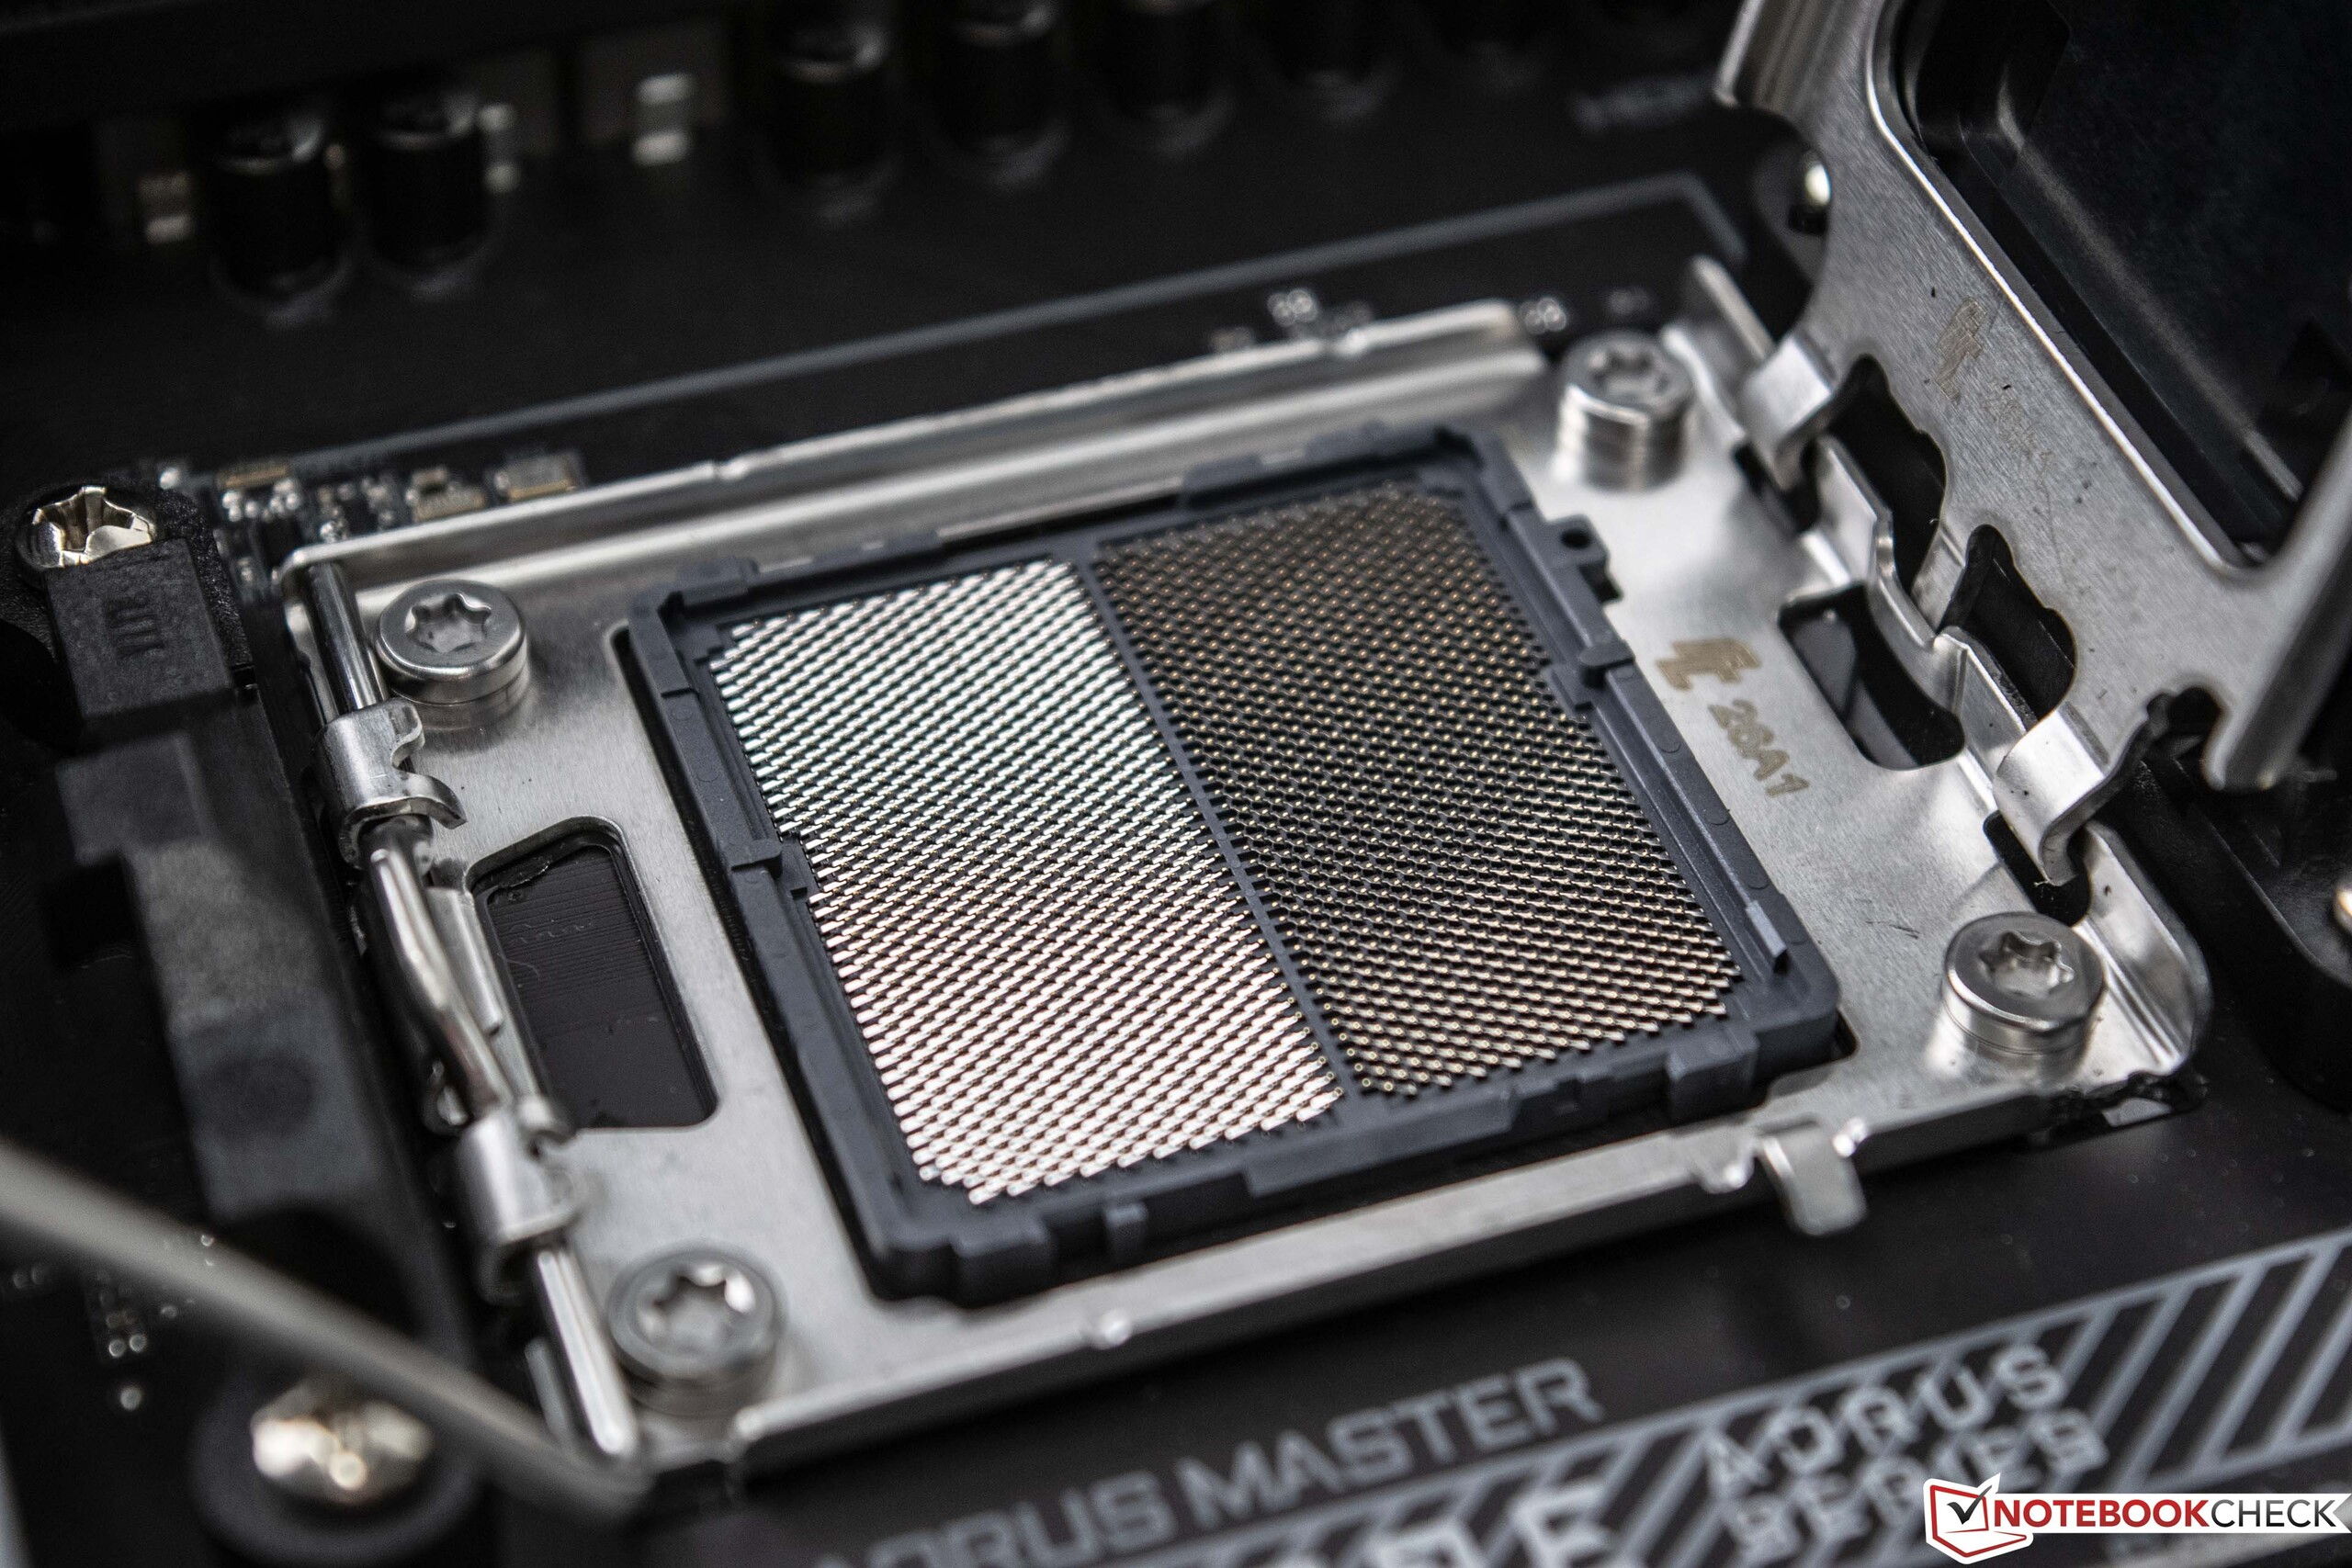
L'08.10.2020, AMD ha effettuato l'ultimo grande lancio di processori desktop. Oggi, quasi due anni dopo, AMD rilascia i nuovissimi modelli AMD Ryzen 7000. Oltre ai nuovi processori, ci sono molte altre novità che riguardano la scheda madre e la RAM. Il socket AM4 viene sostituito dal nuovo socket AM5 basato su un layout PGA. Ciò significa che Ryzen 7000 non ha pin, ma solo superfici di contatto sul lato inferiore - 1.718 per l'esattezza. A differenza di Intel, tuttavia, l'uso di DDR5 è diventato obbligatorio con Ryzen 7000. Non c'è retrocompatibilità, il che va assolutamente considerato quando si calcolano i costi di un aggiornamento.
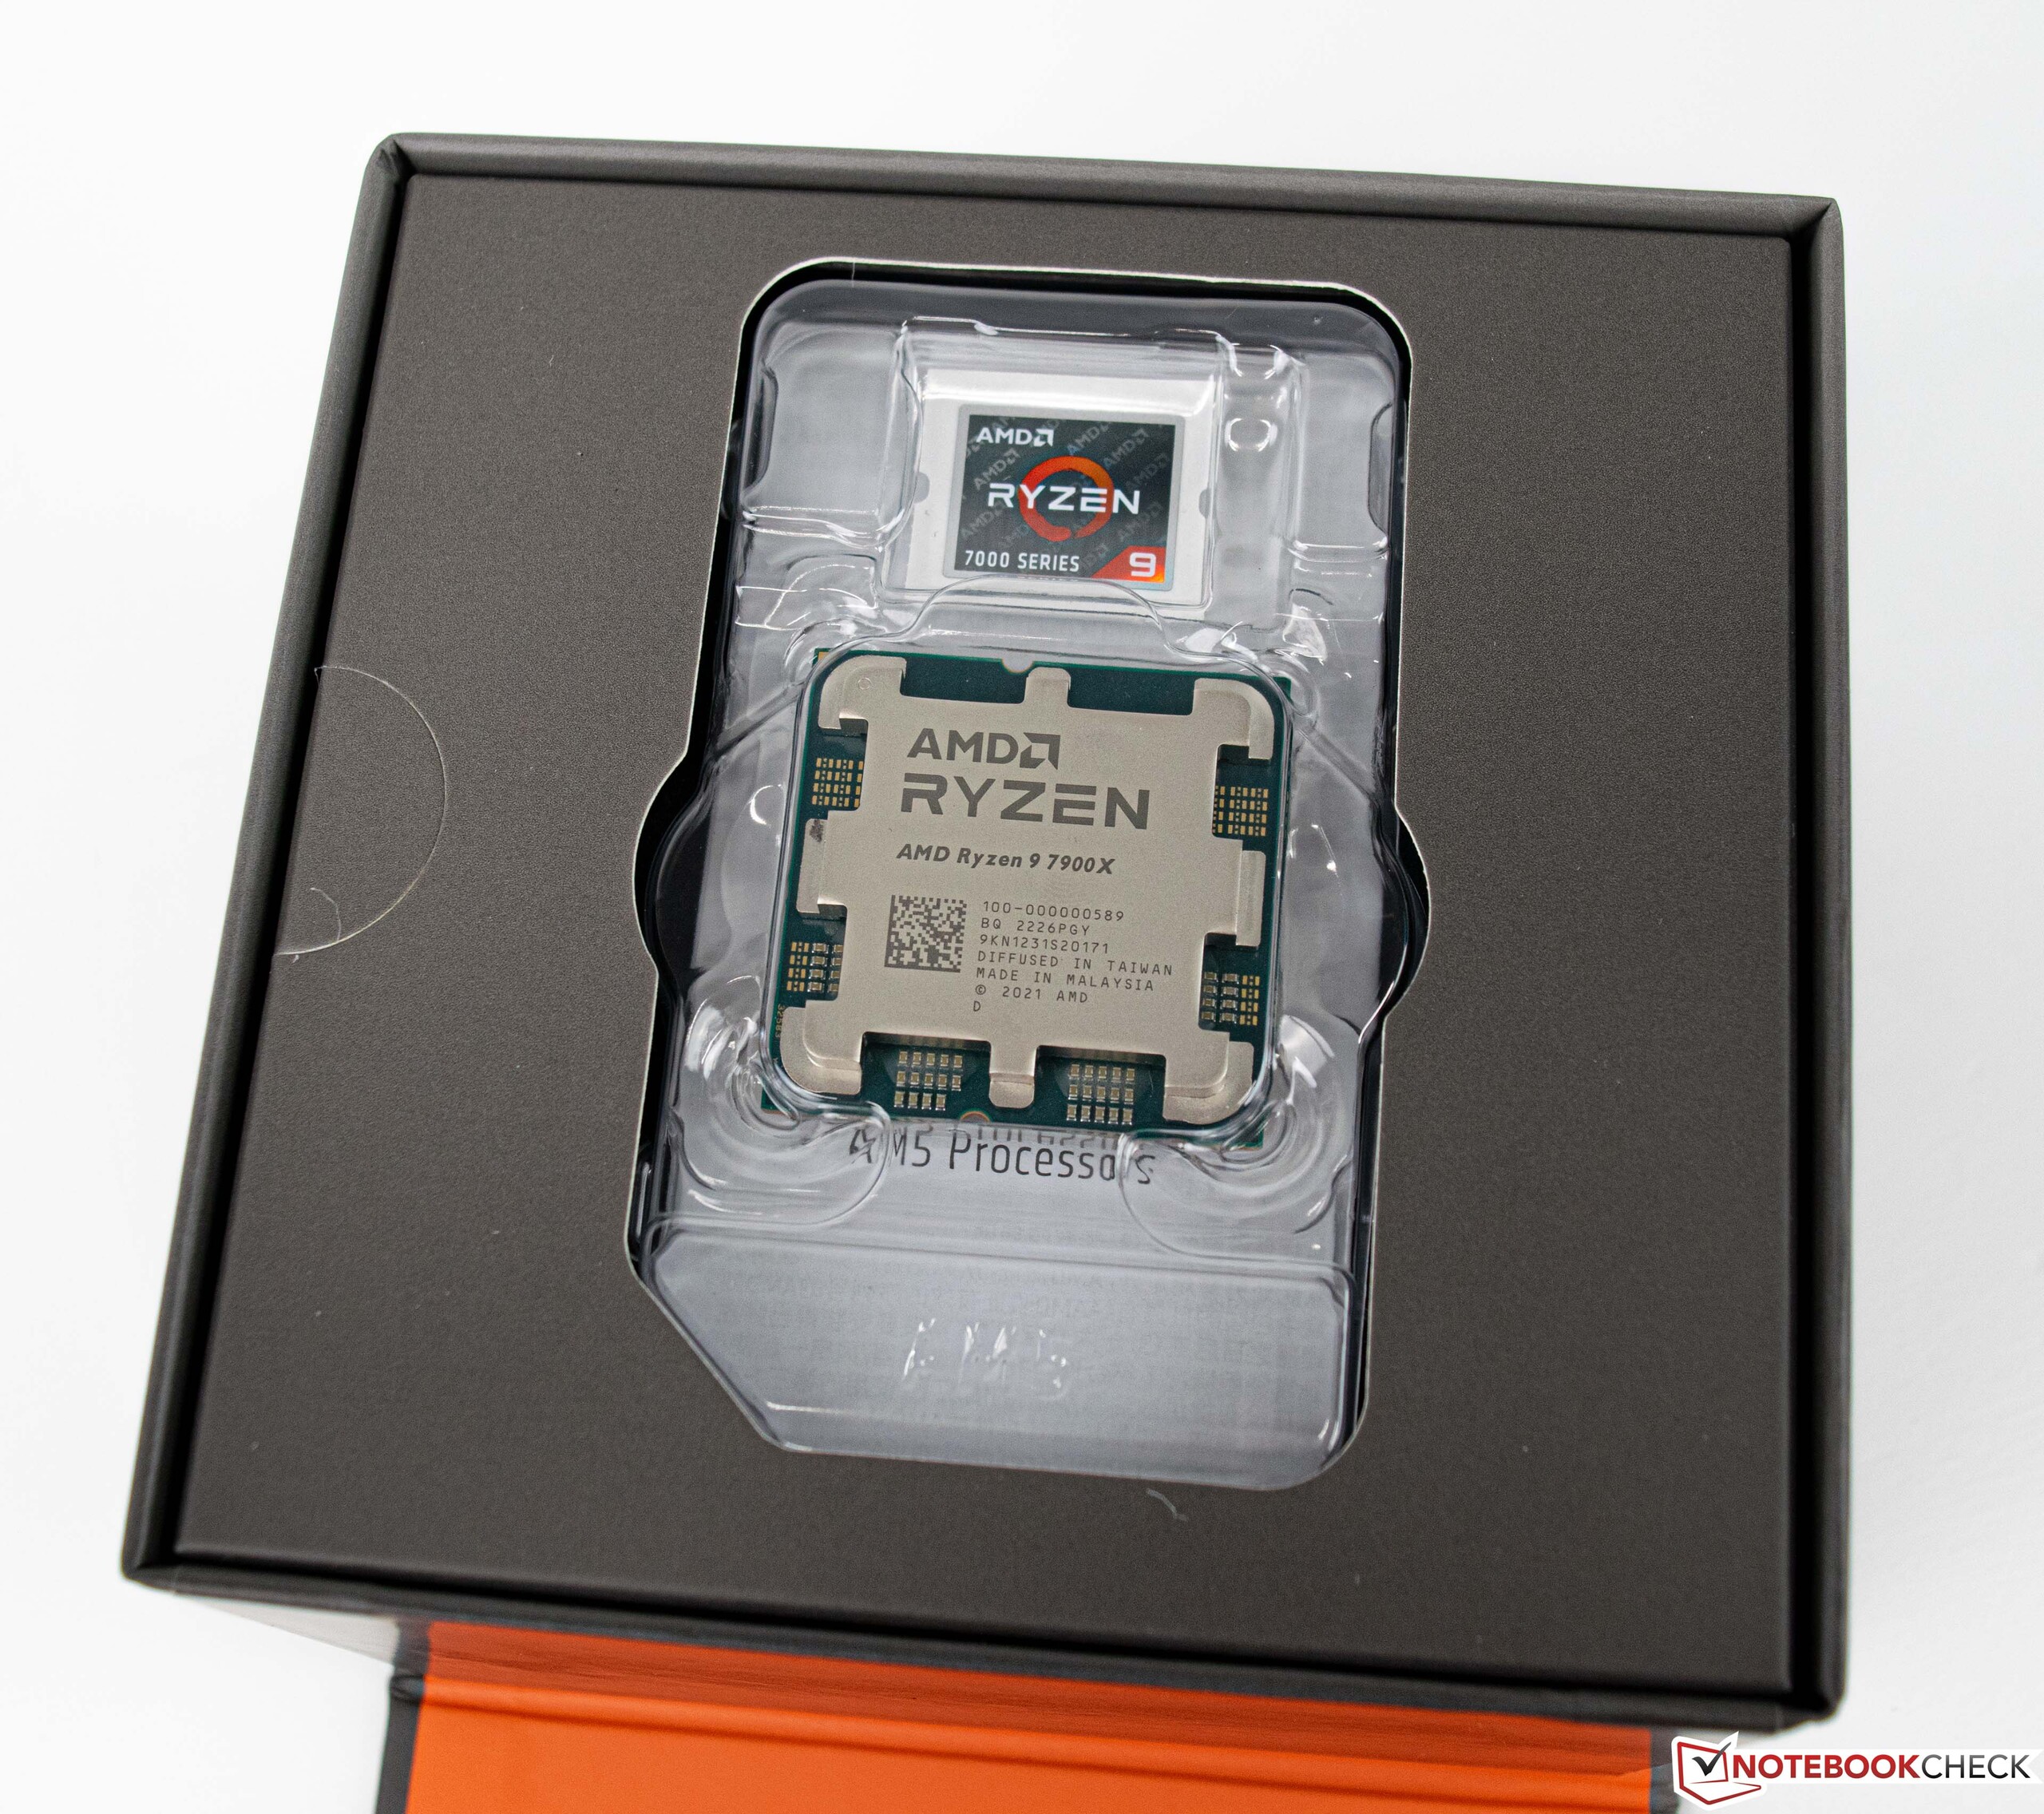
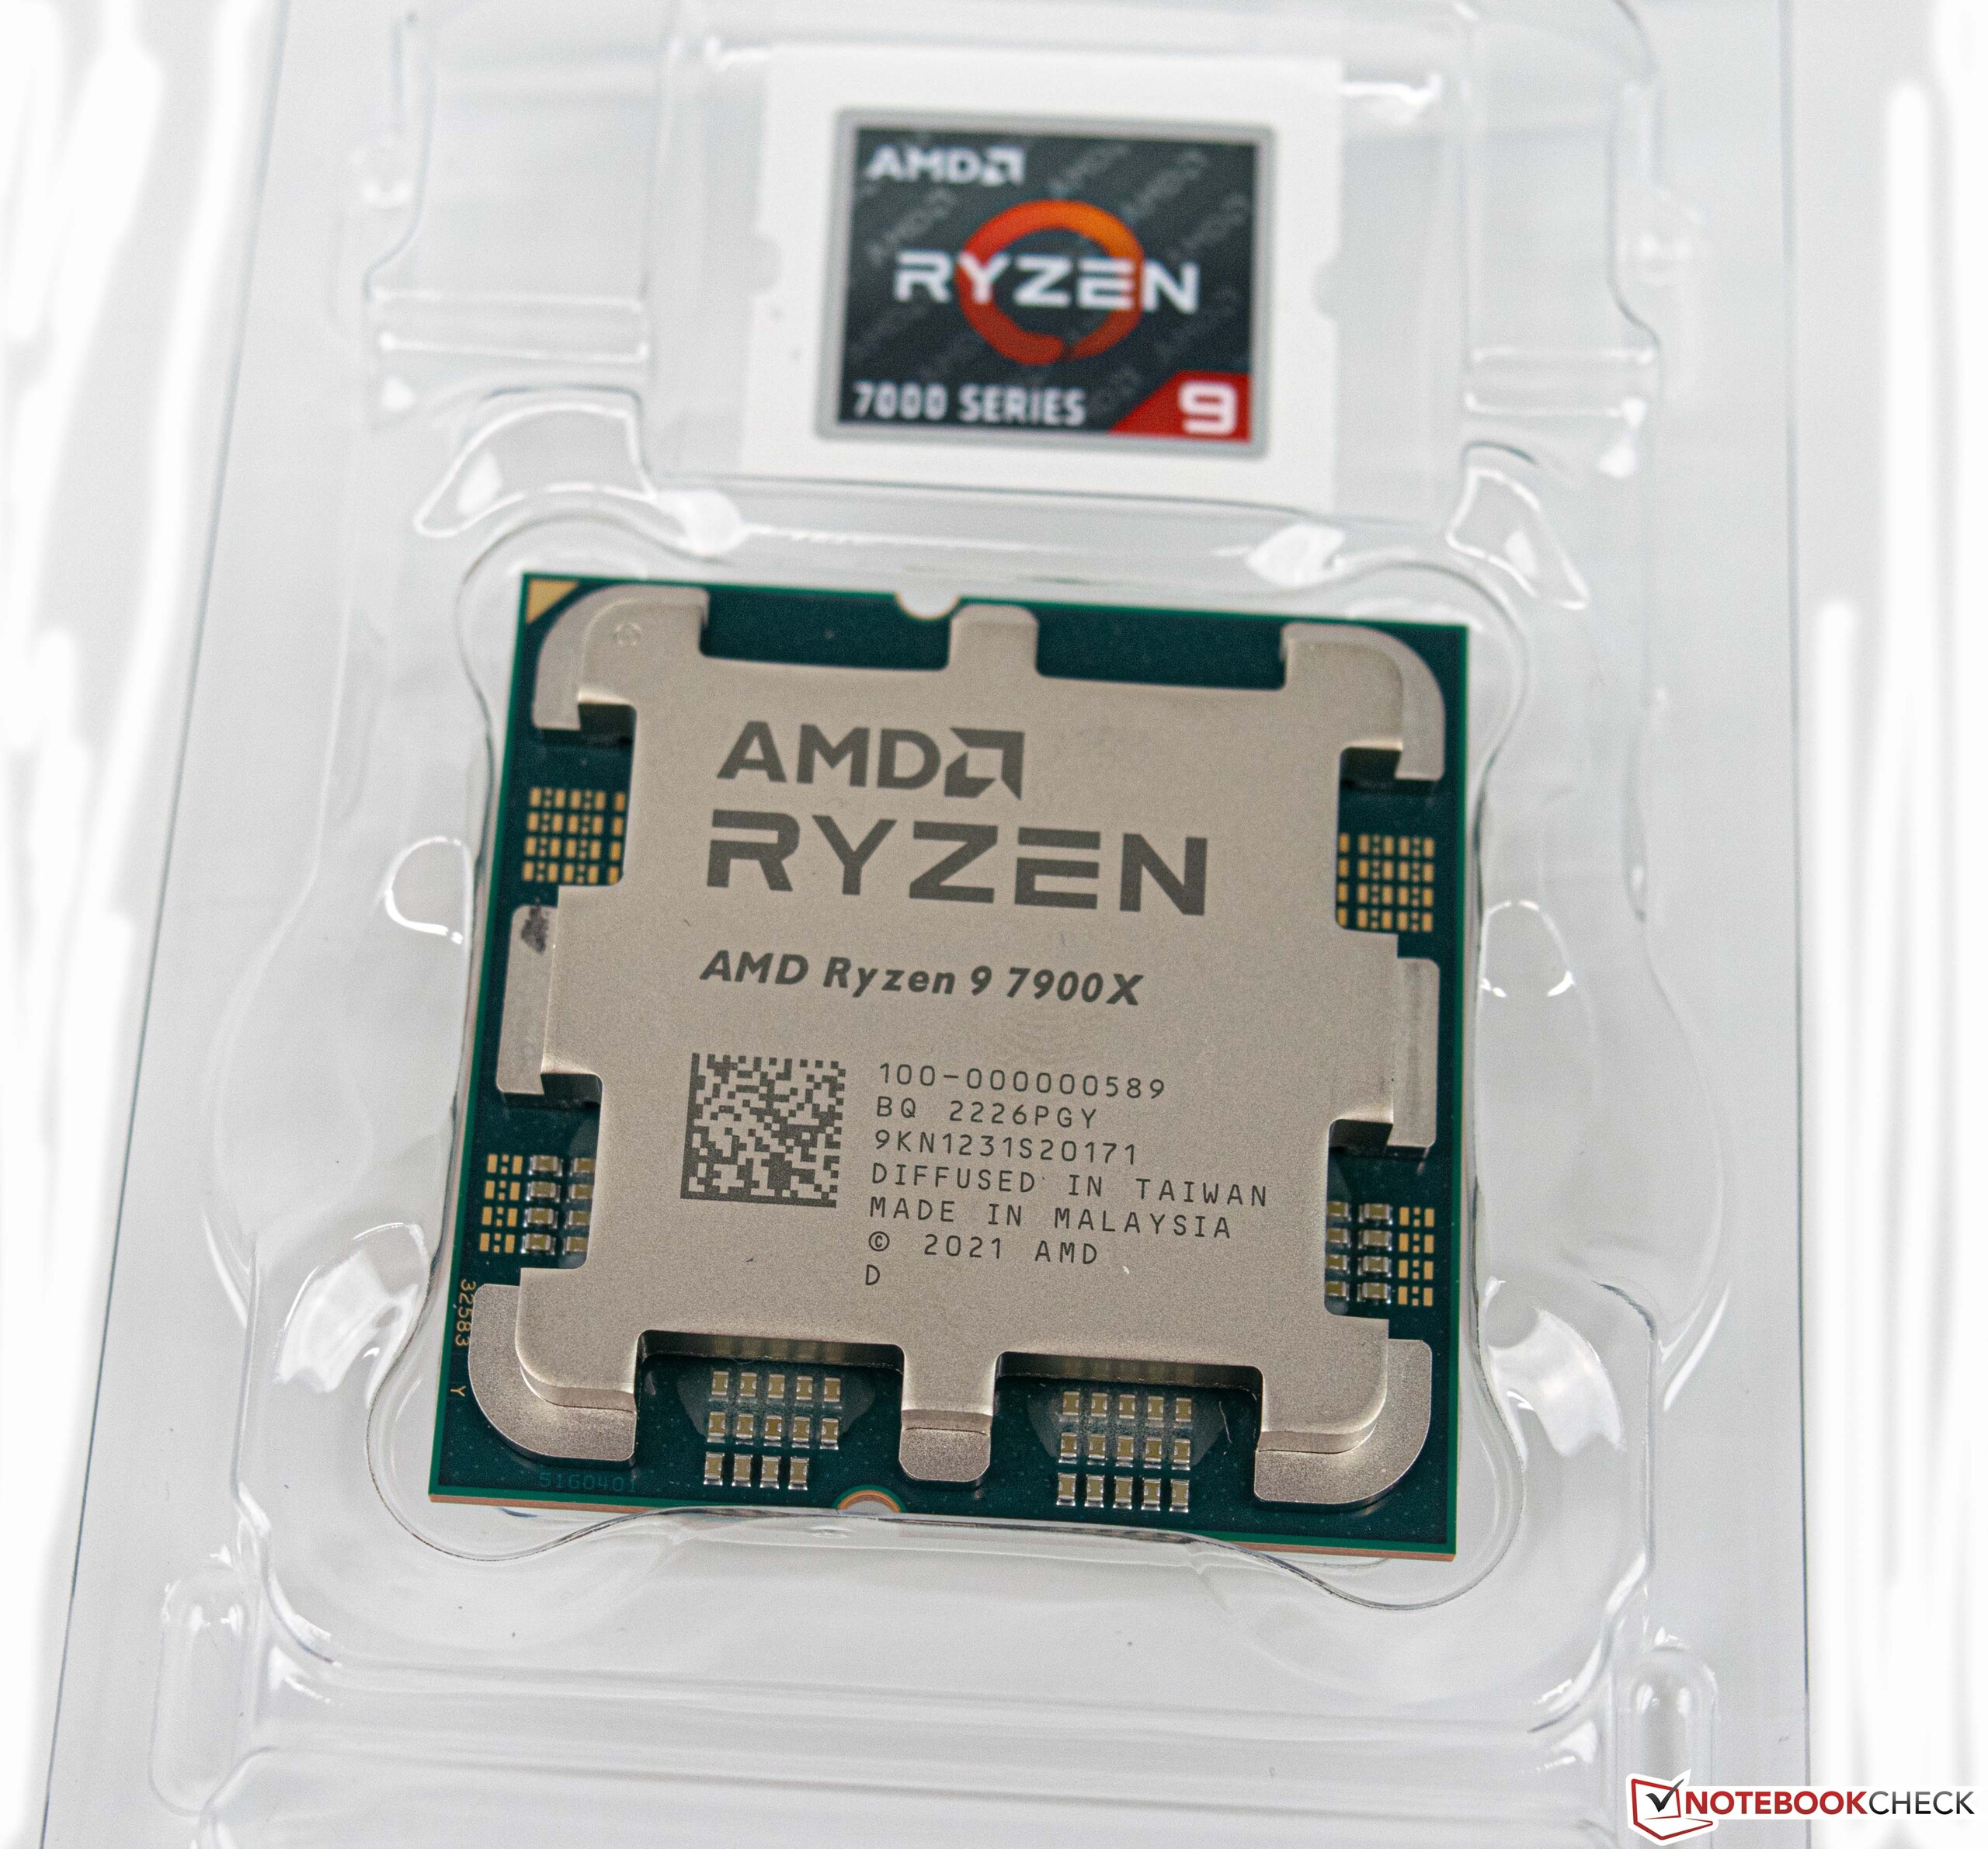
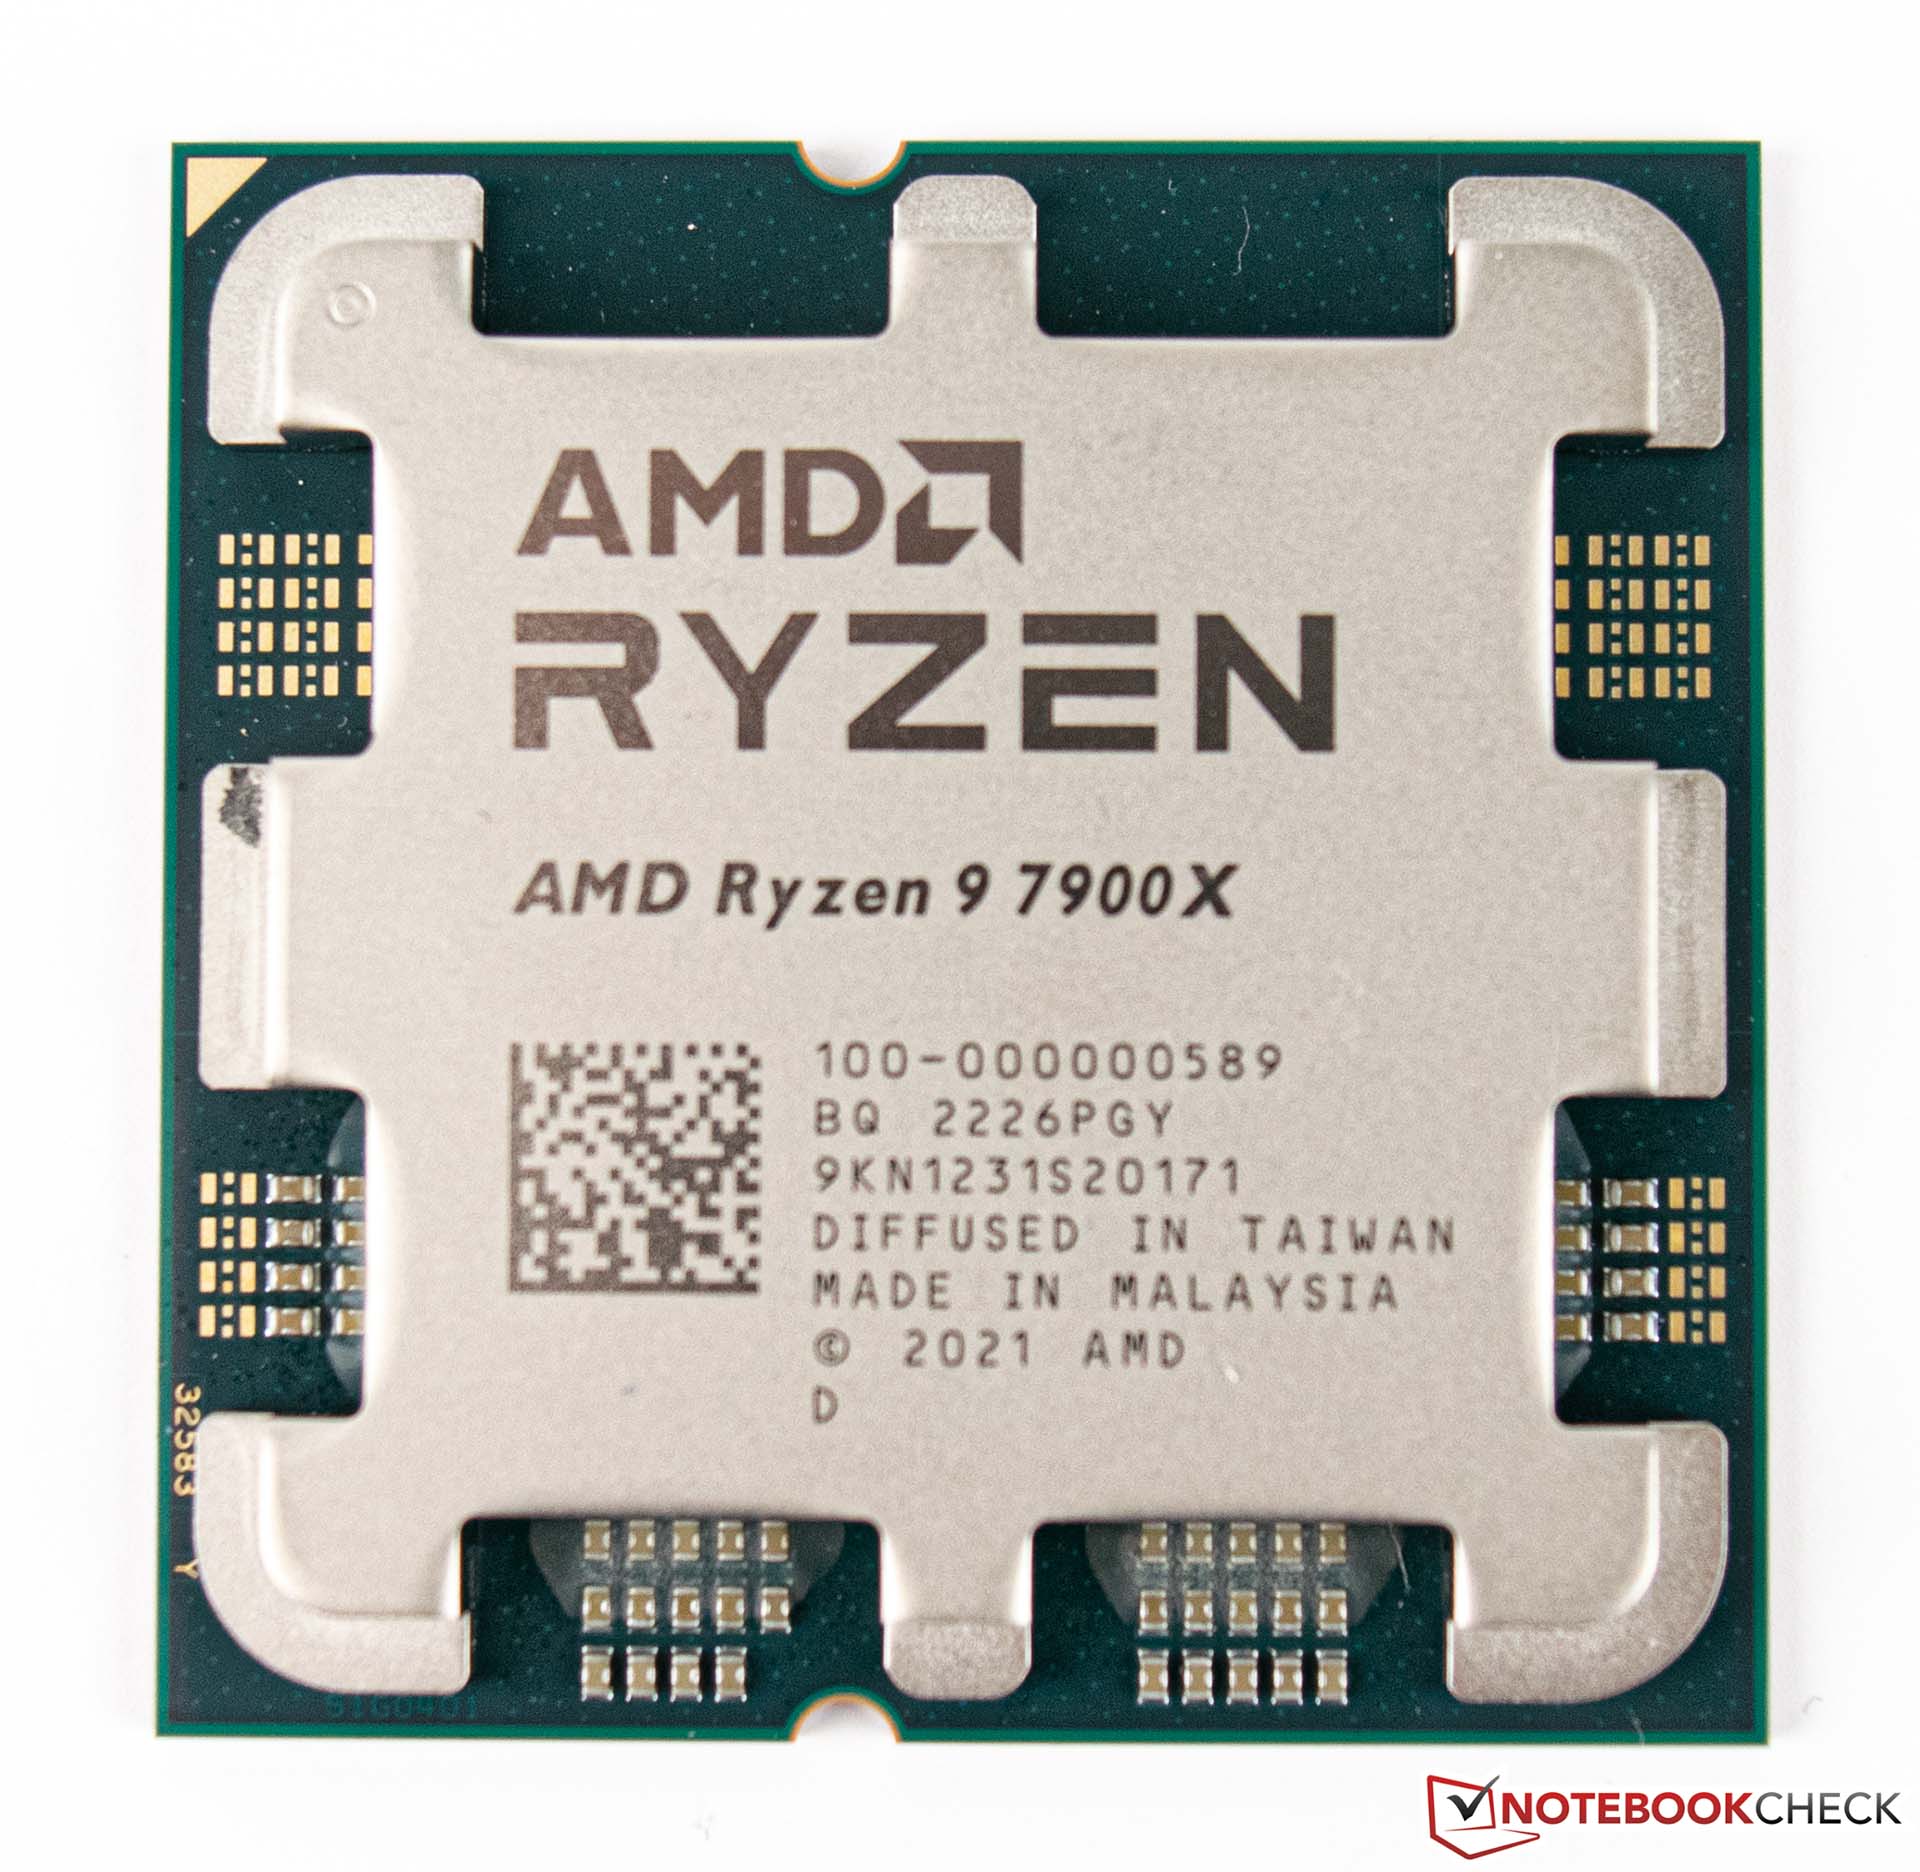
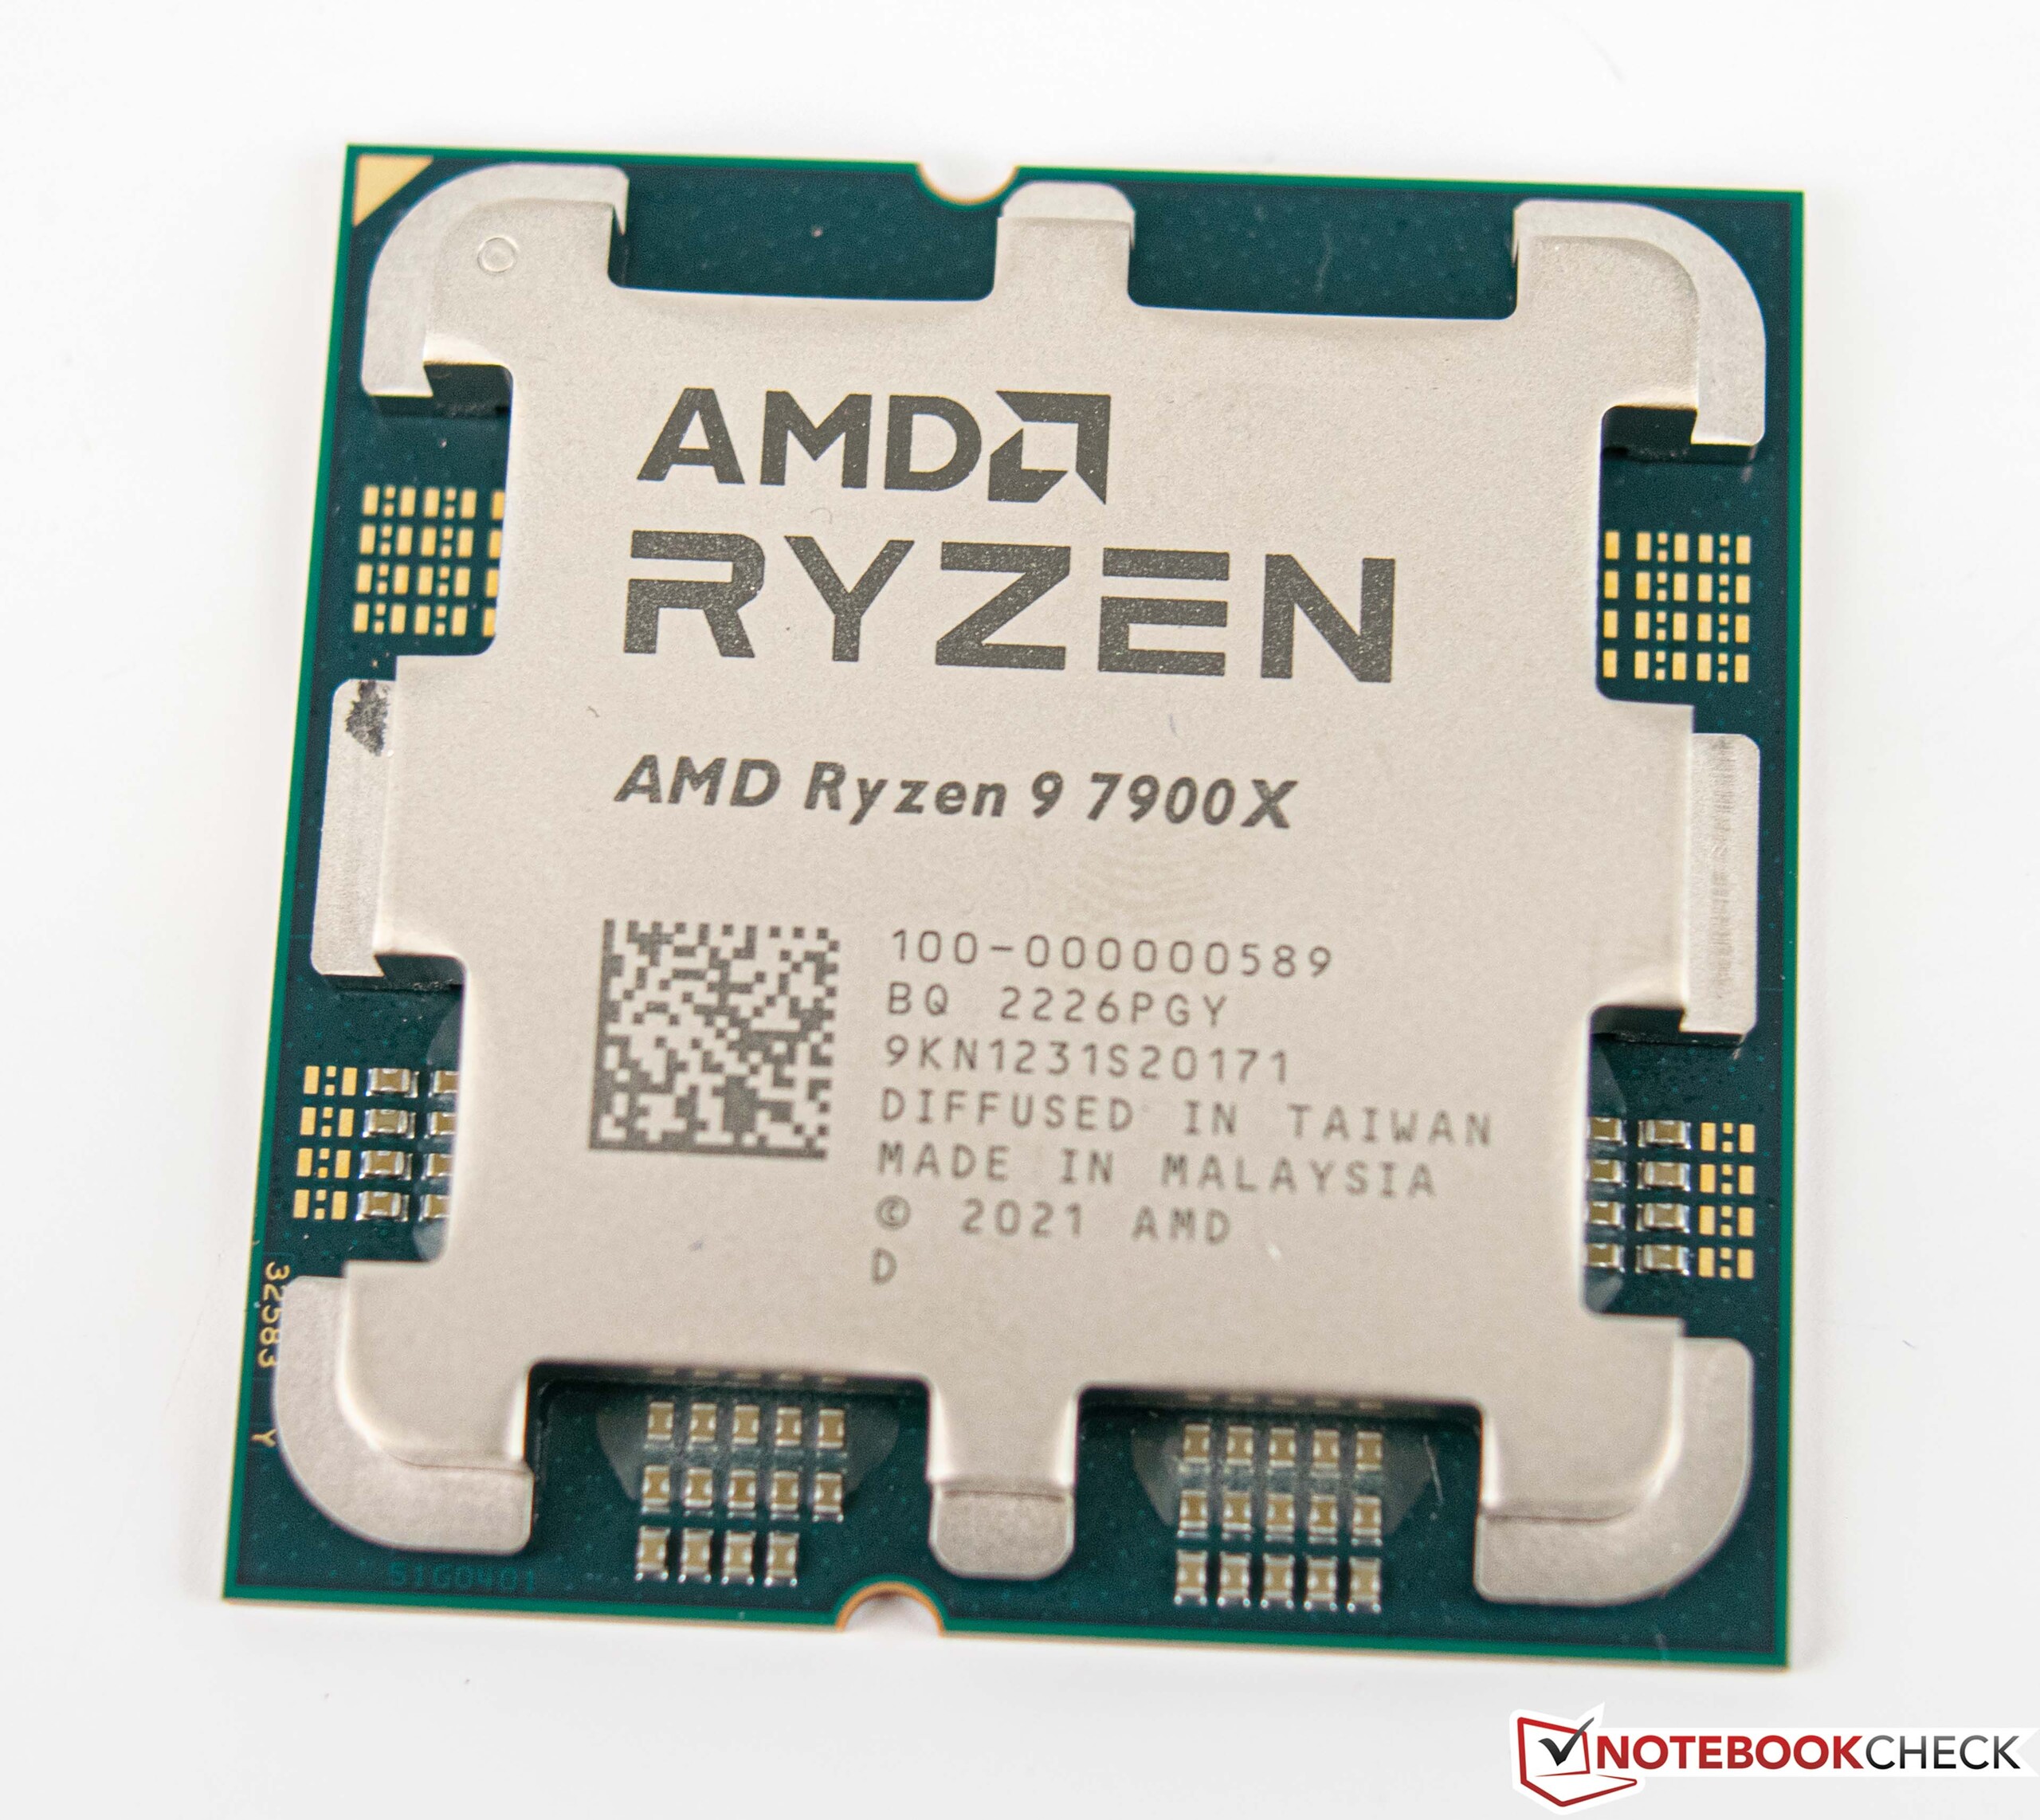
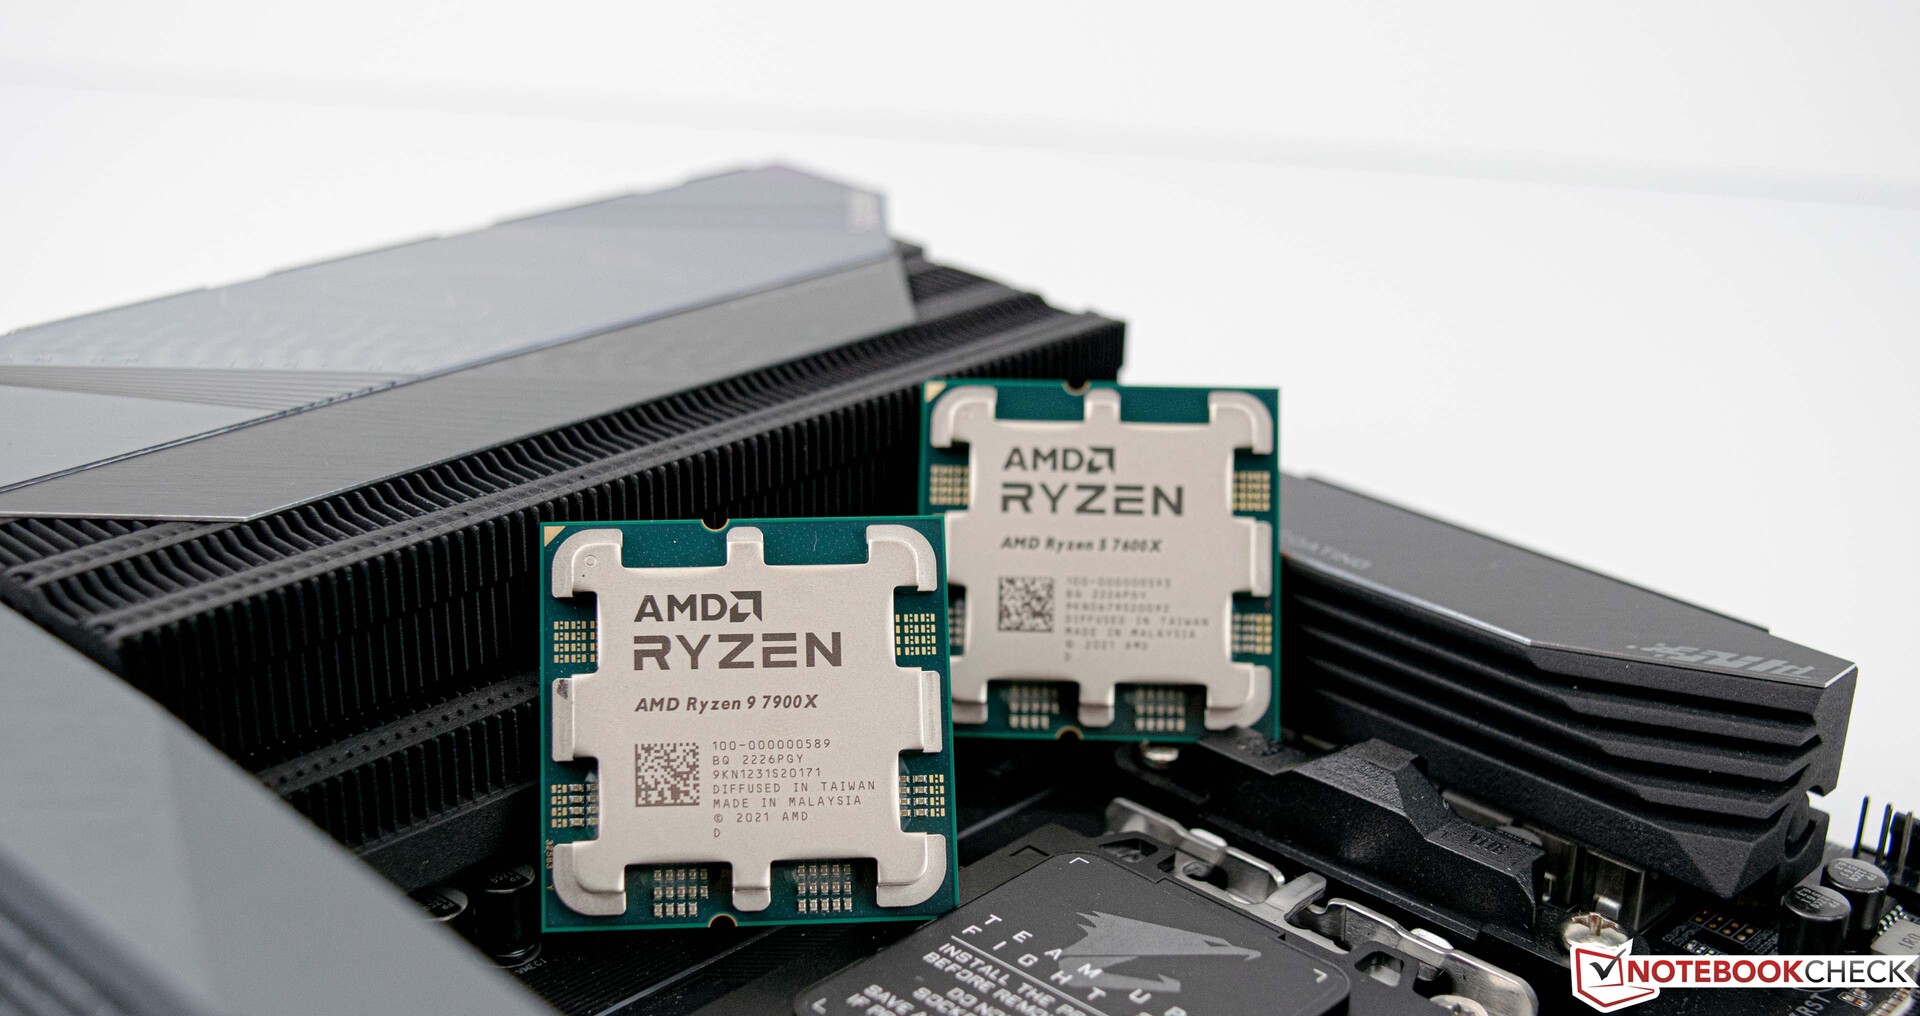
Rispetto ai modelli precedenti, il processore presenta ulteriori differenze visive in termini di diffusore di calore. Internamente, tuttavia, AMD si affida ancora al cosiddetto design chiplet, che consiste in due CCD con otto core ciascuno e un die I/O nell'AMD Ryzen 9 7950X. Come è noto, i due CCD comunicano attraverso l'Infinity Fabric con il die di I/O, che ora include sempre una iGPU oltre al nuovo controller di memoria DDR5.
I nuovi processori sono prodotti presso TSMC e AMD fa un passo avanti con il processo a 5 nm. In questo modo è possibile raggiungere velocità di clock più elevate, che AMD sfrutta molto bene. Il Ryzen 9 7950X può raggiungere i 5,7 GHz in modalità Turbo. Il Ryzen 9 7900X ha ancora 5,6 GHz nella sua scheda tecnica. A questo punto, possiamo già dire che queste frequenze di clock sono state raggiunte anche nei nostri test. Insieme all'IPC più elevato e alle frequenze di clock significativamente aumentate, gli utenti possono aspettarsi un discreto aumento delle prestazioni.
Tuttavia, l'aumento delle prestazioni ha uno svantaggio, perché il TDP dei nuovi modelli Ryzen 9 è aumentato fino a 170 W. AMD specifica addirittura fino a 230 W per l'intero pacchetto (PPT - Package Power Tracking). Tuttavia, questo valore è ancora inferiore a quello consentito da Intel per i suoi processori attuali, che arriva a 241 W sotto carico.
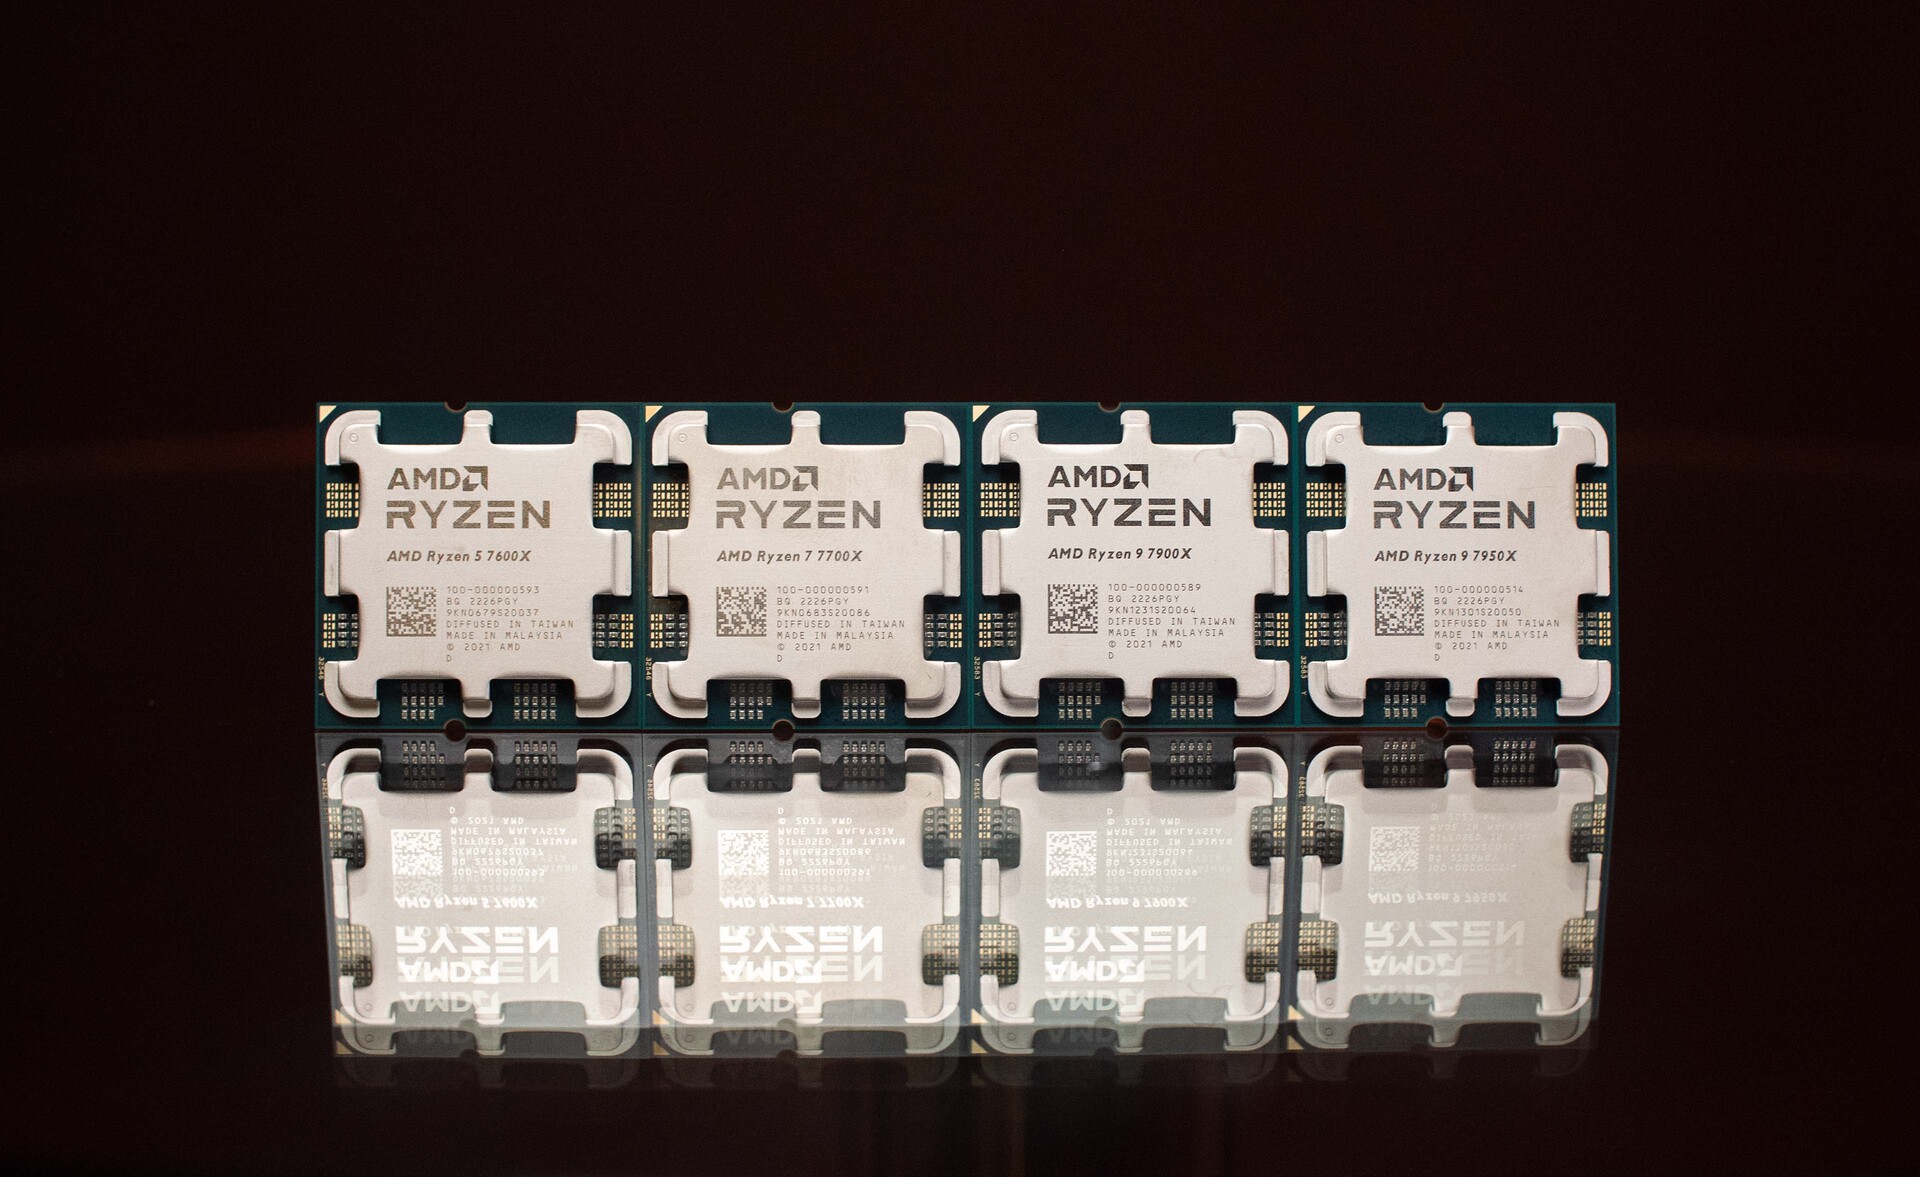
La famiglia AMD Ryzen 7000 in sintesi
| Modello | Cores/Threads | Orologio base | Turbo clock | Cache L2 | Cache L3 | TDP | PPT | Prezzo di lancio |
|---|---|---|---|---|---|---|---|---|
| Ryzen 9 7950X | 16/32 | 4,5 GHz | 5,7 GHz | 16x 1 MB | 64 MB | 170 W | 230 W | 699 USD / 849 EUR |
| Ryzen 9 7900X | 12/24 | 4,7 GHz | 5,6 GHz | 12x 1 MB | 64 MB | 170 W | 230 W | 549 USD / 669 EUR |
| Ryzen 7 7700X | 8/16 | 4,5 GHz | 5,4 GHz | 8x 1 MB | 32 MB | 105 W | 142 W | 399 USD / 479 EUR |
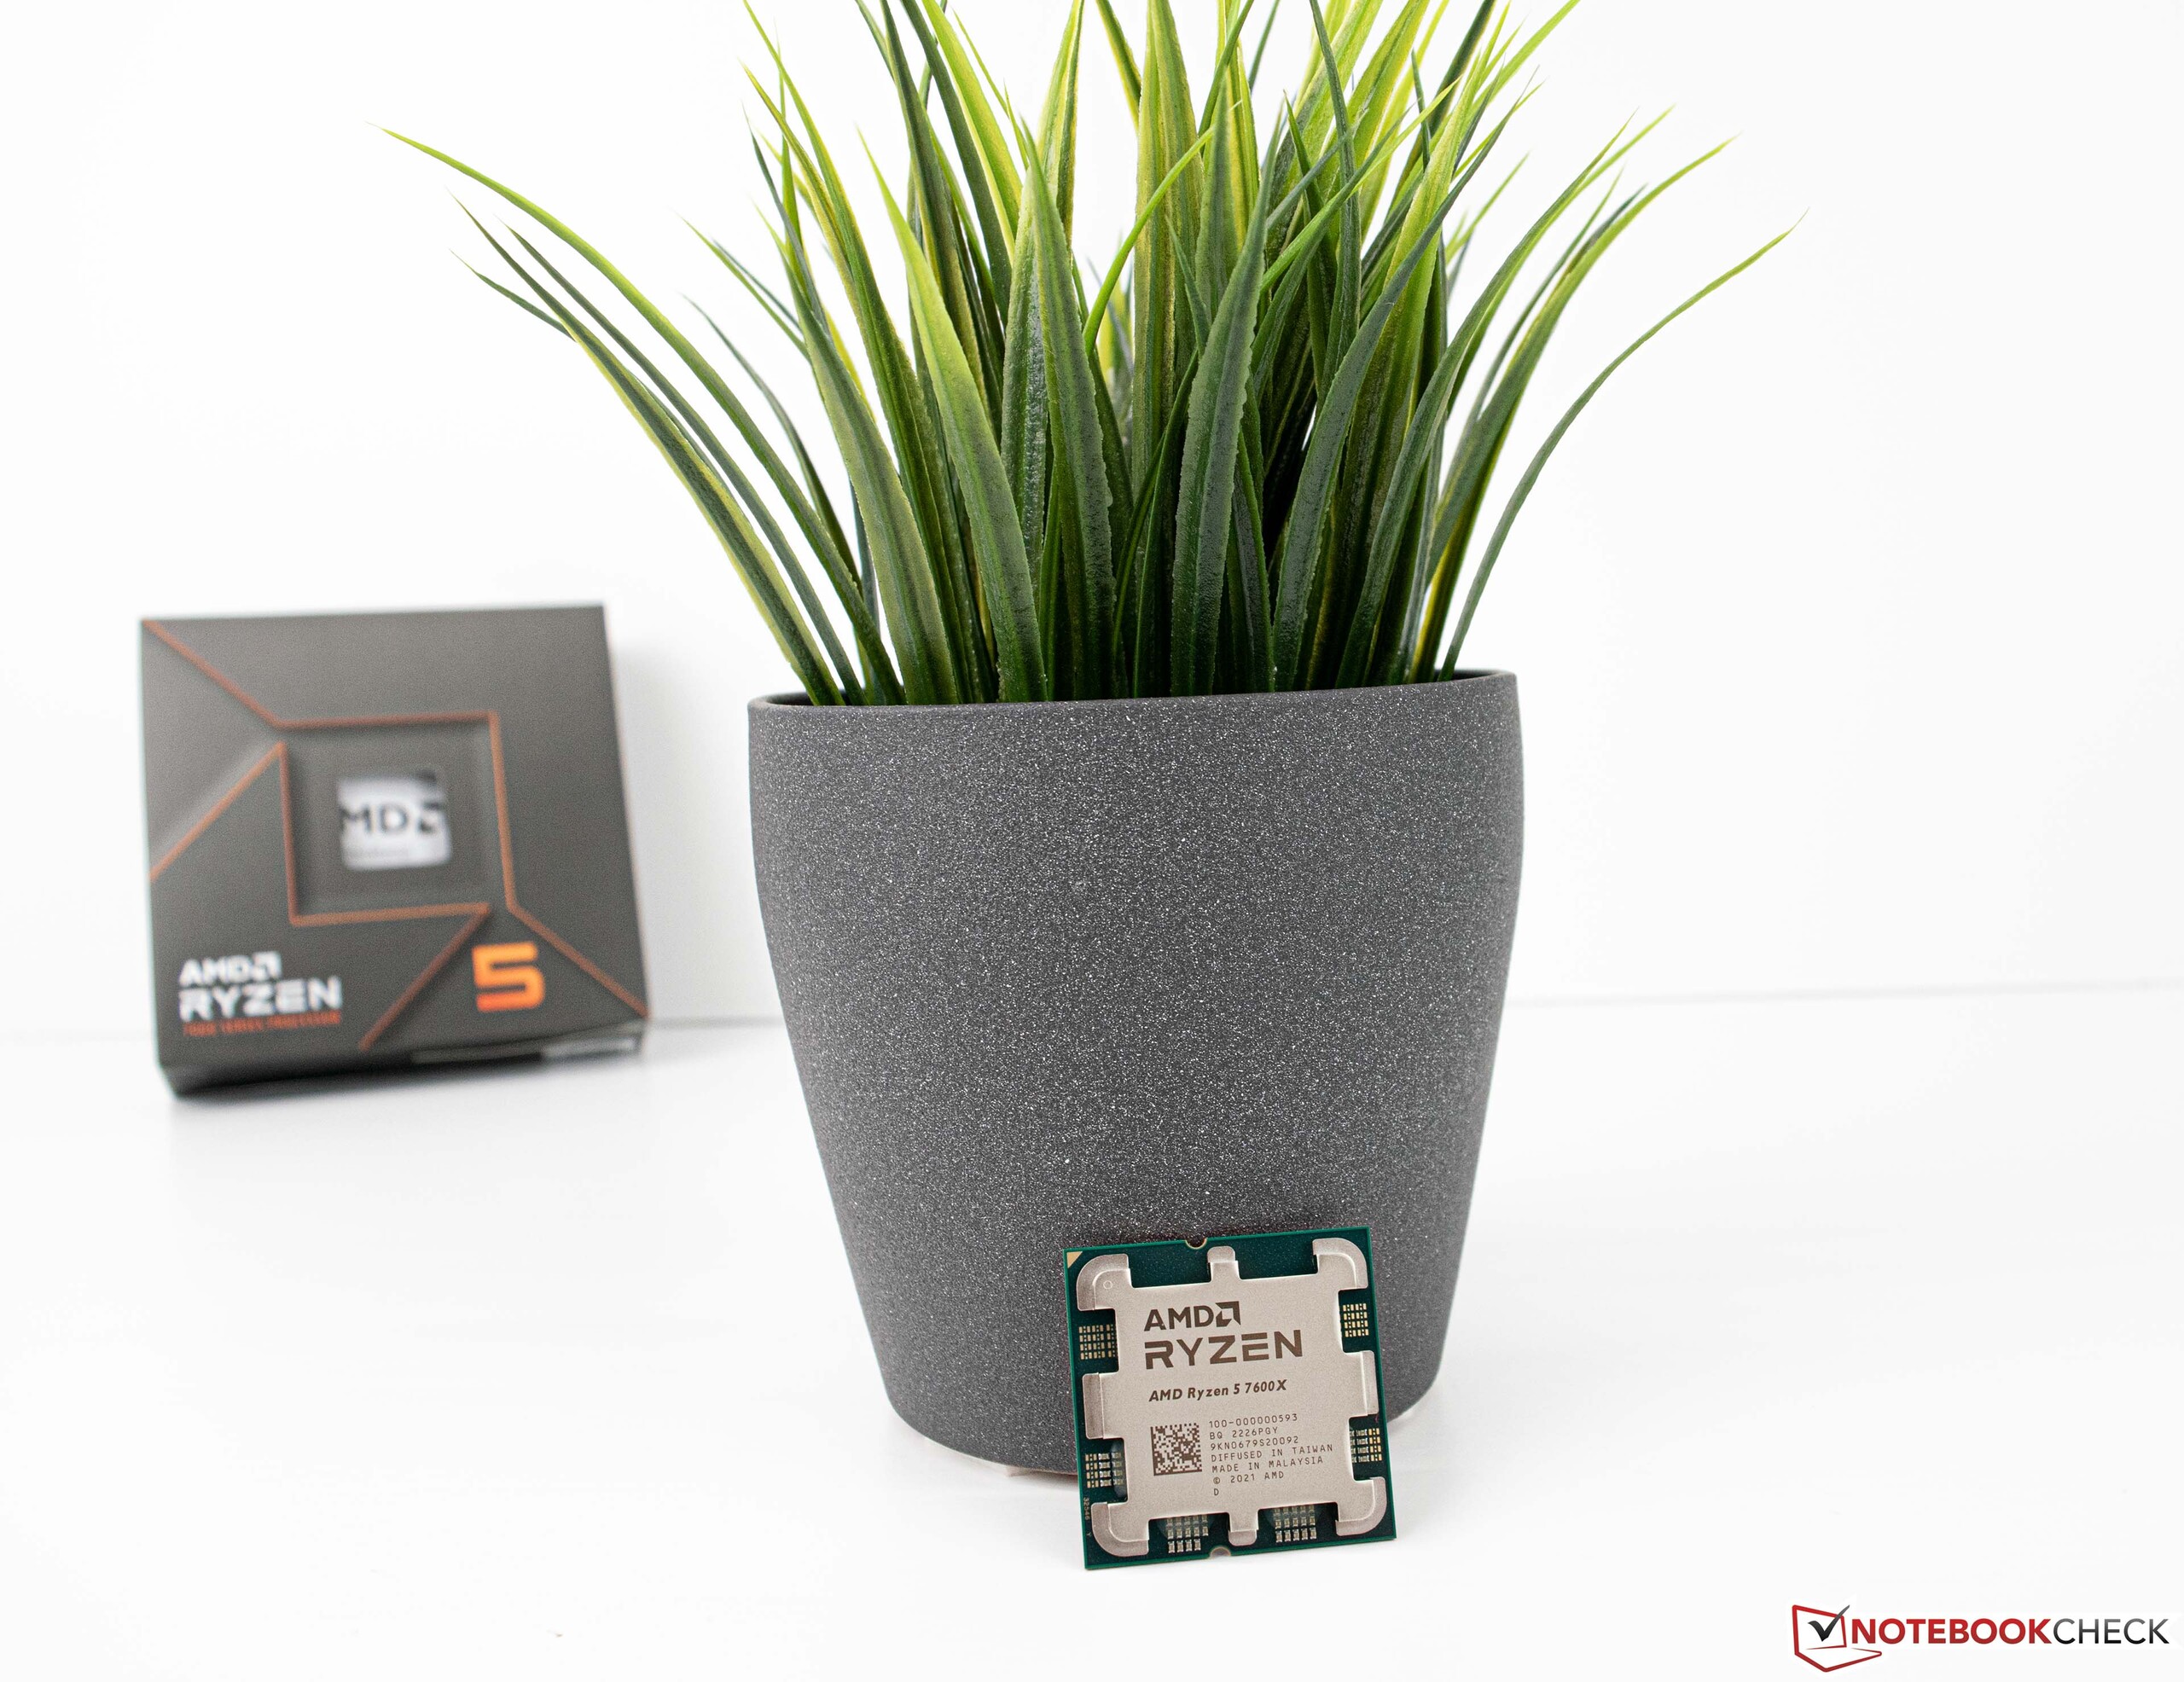
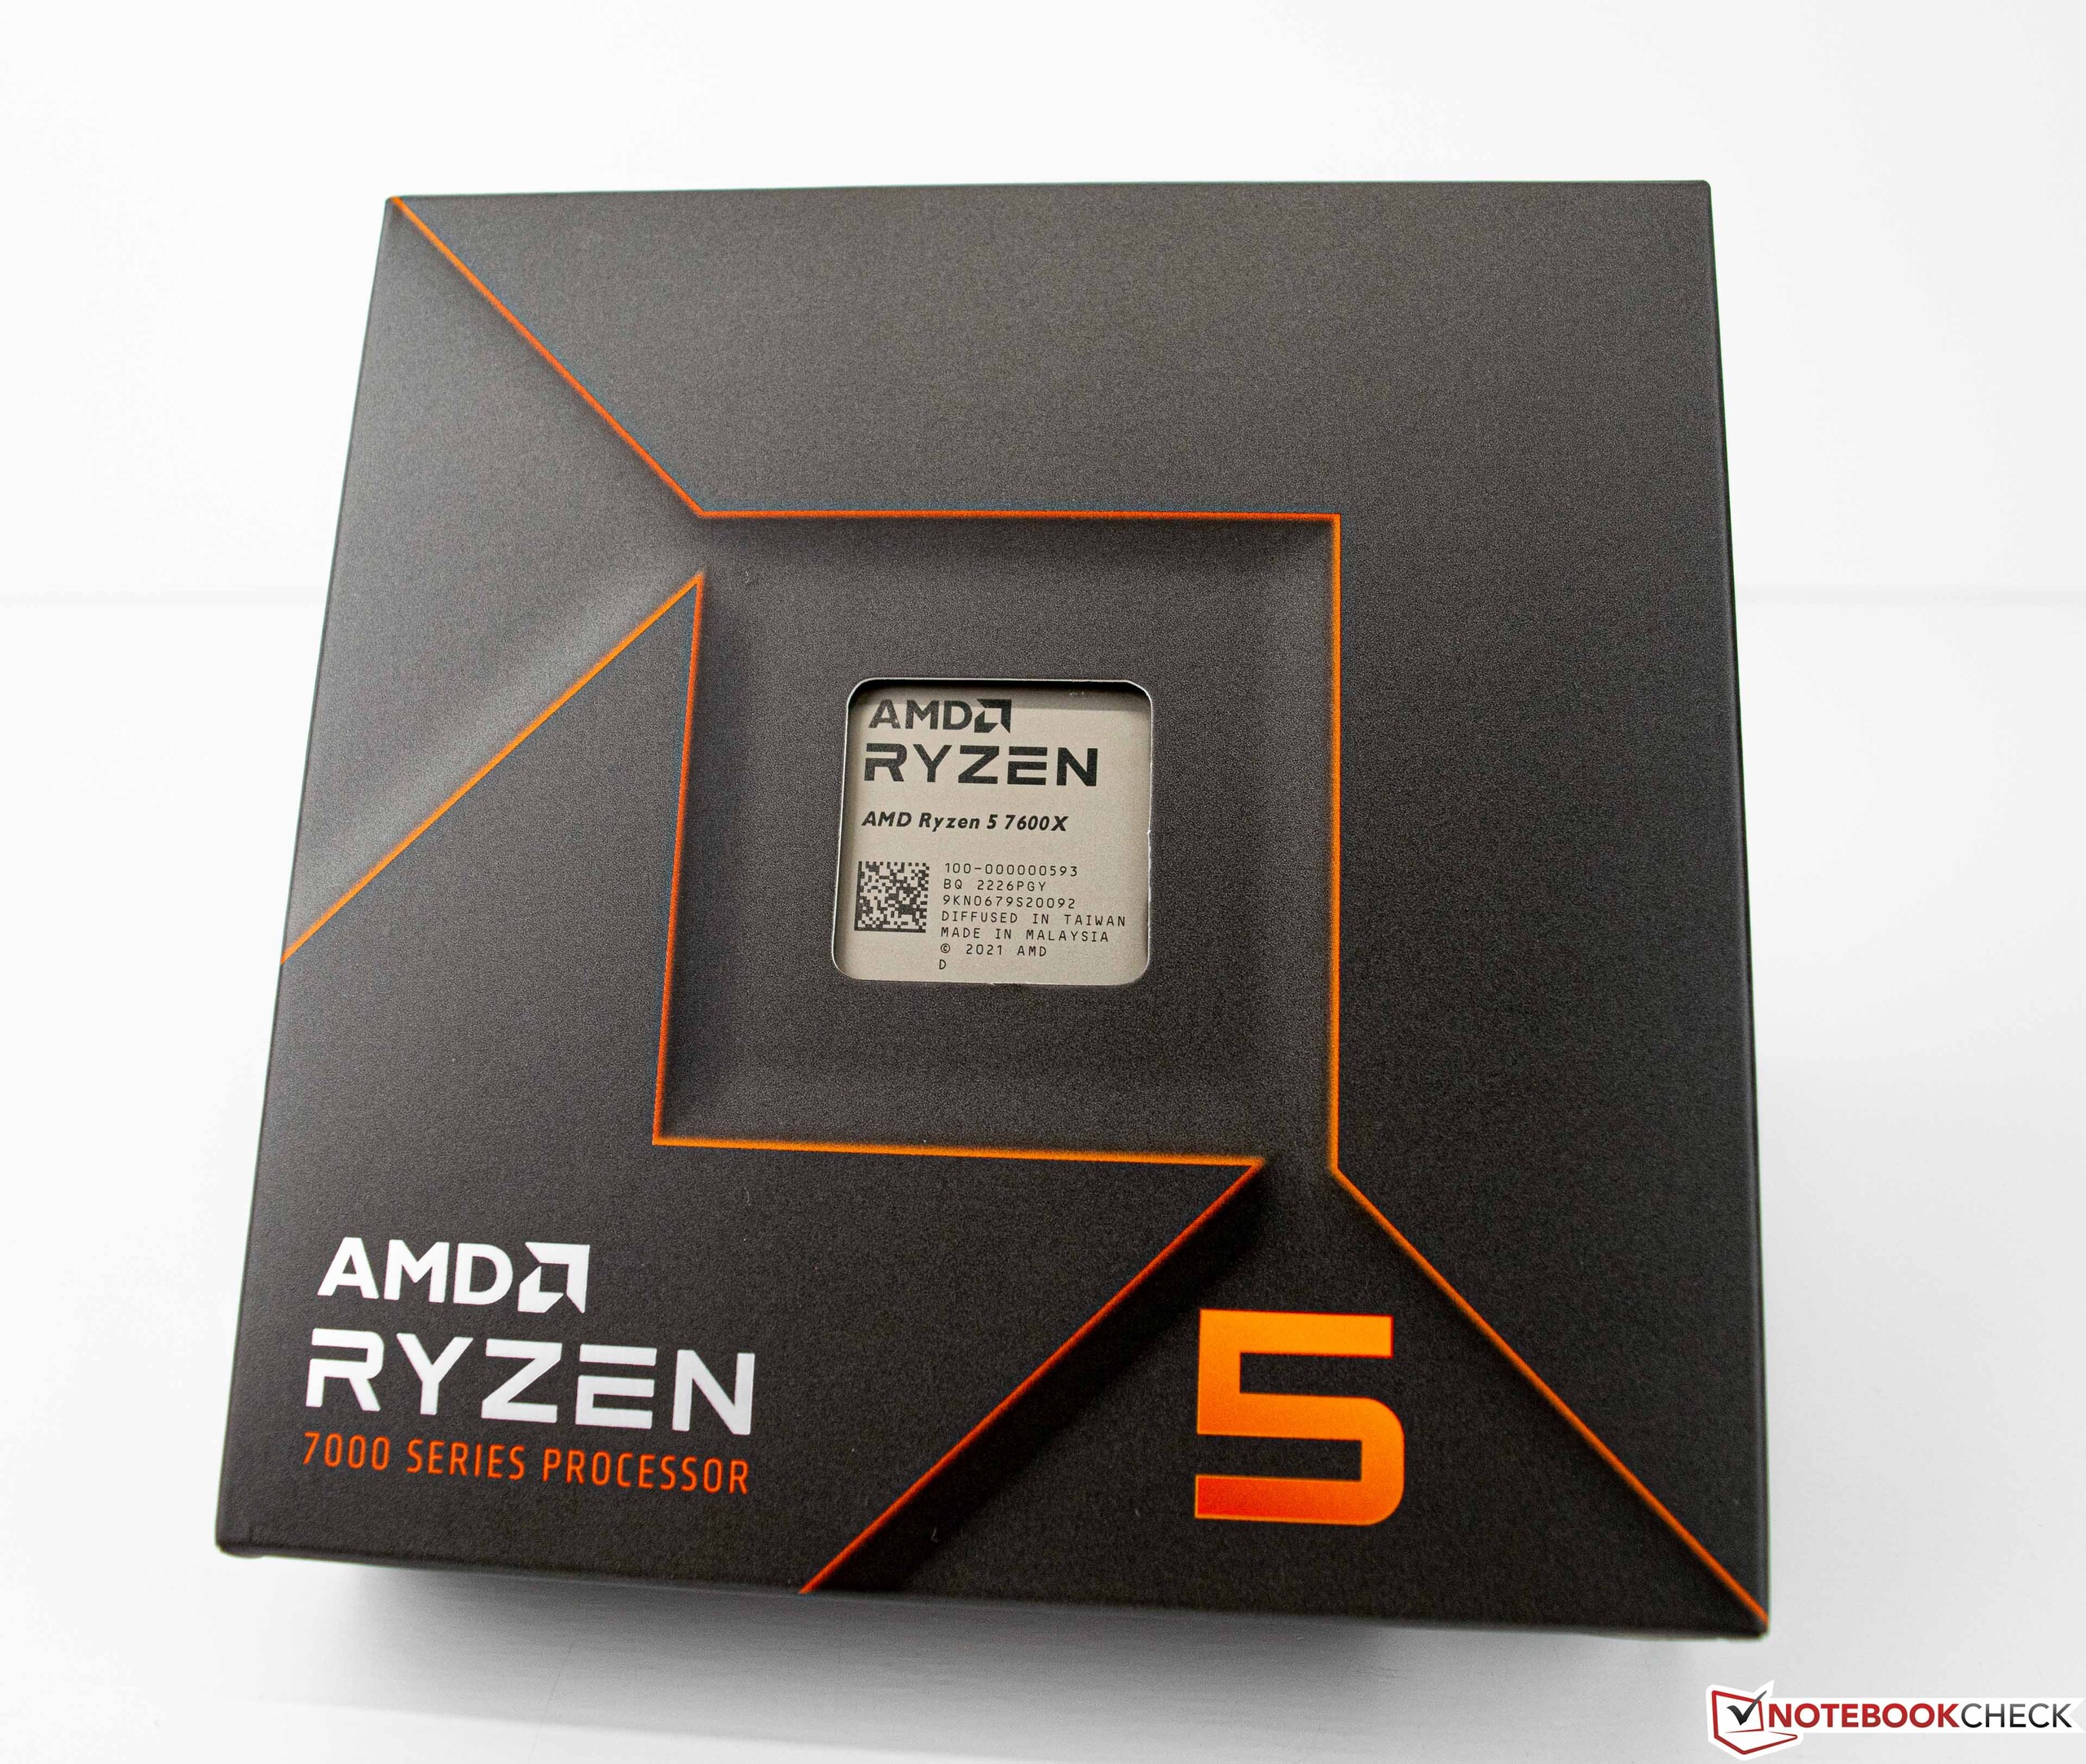
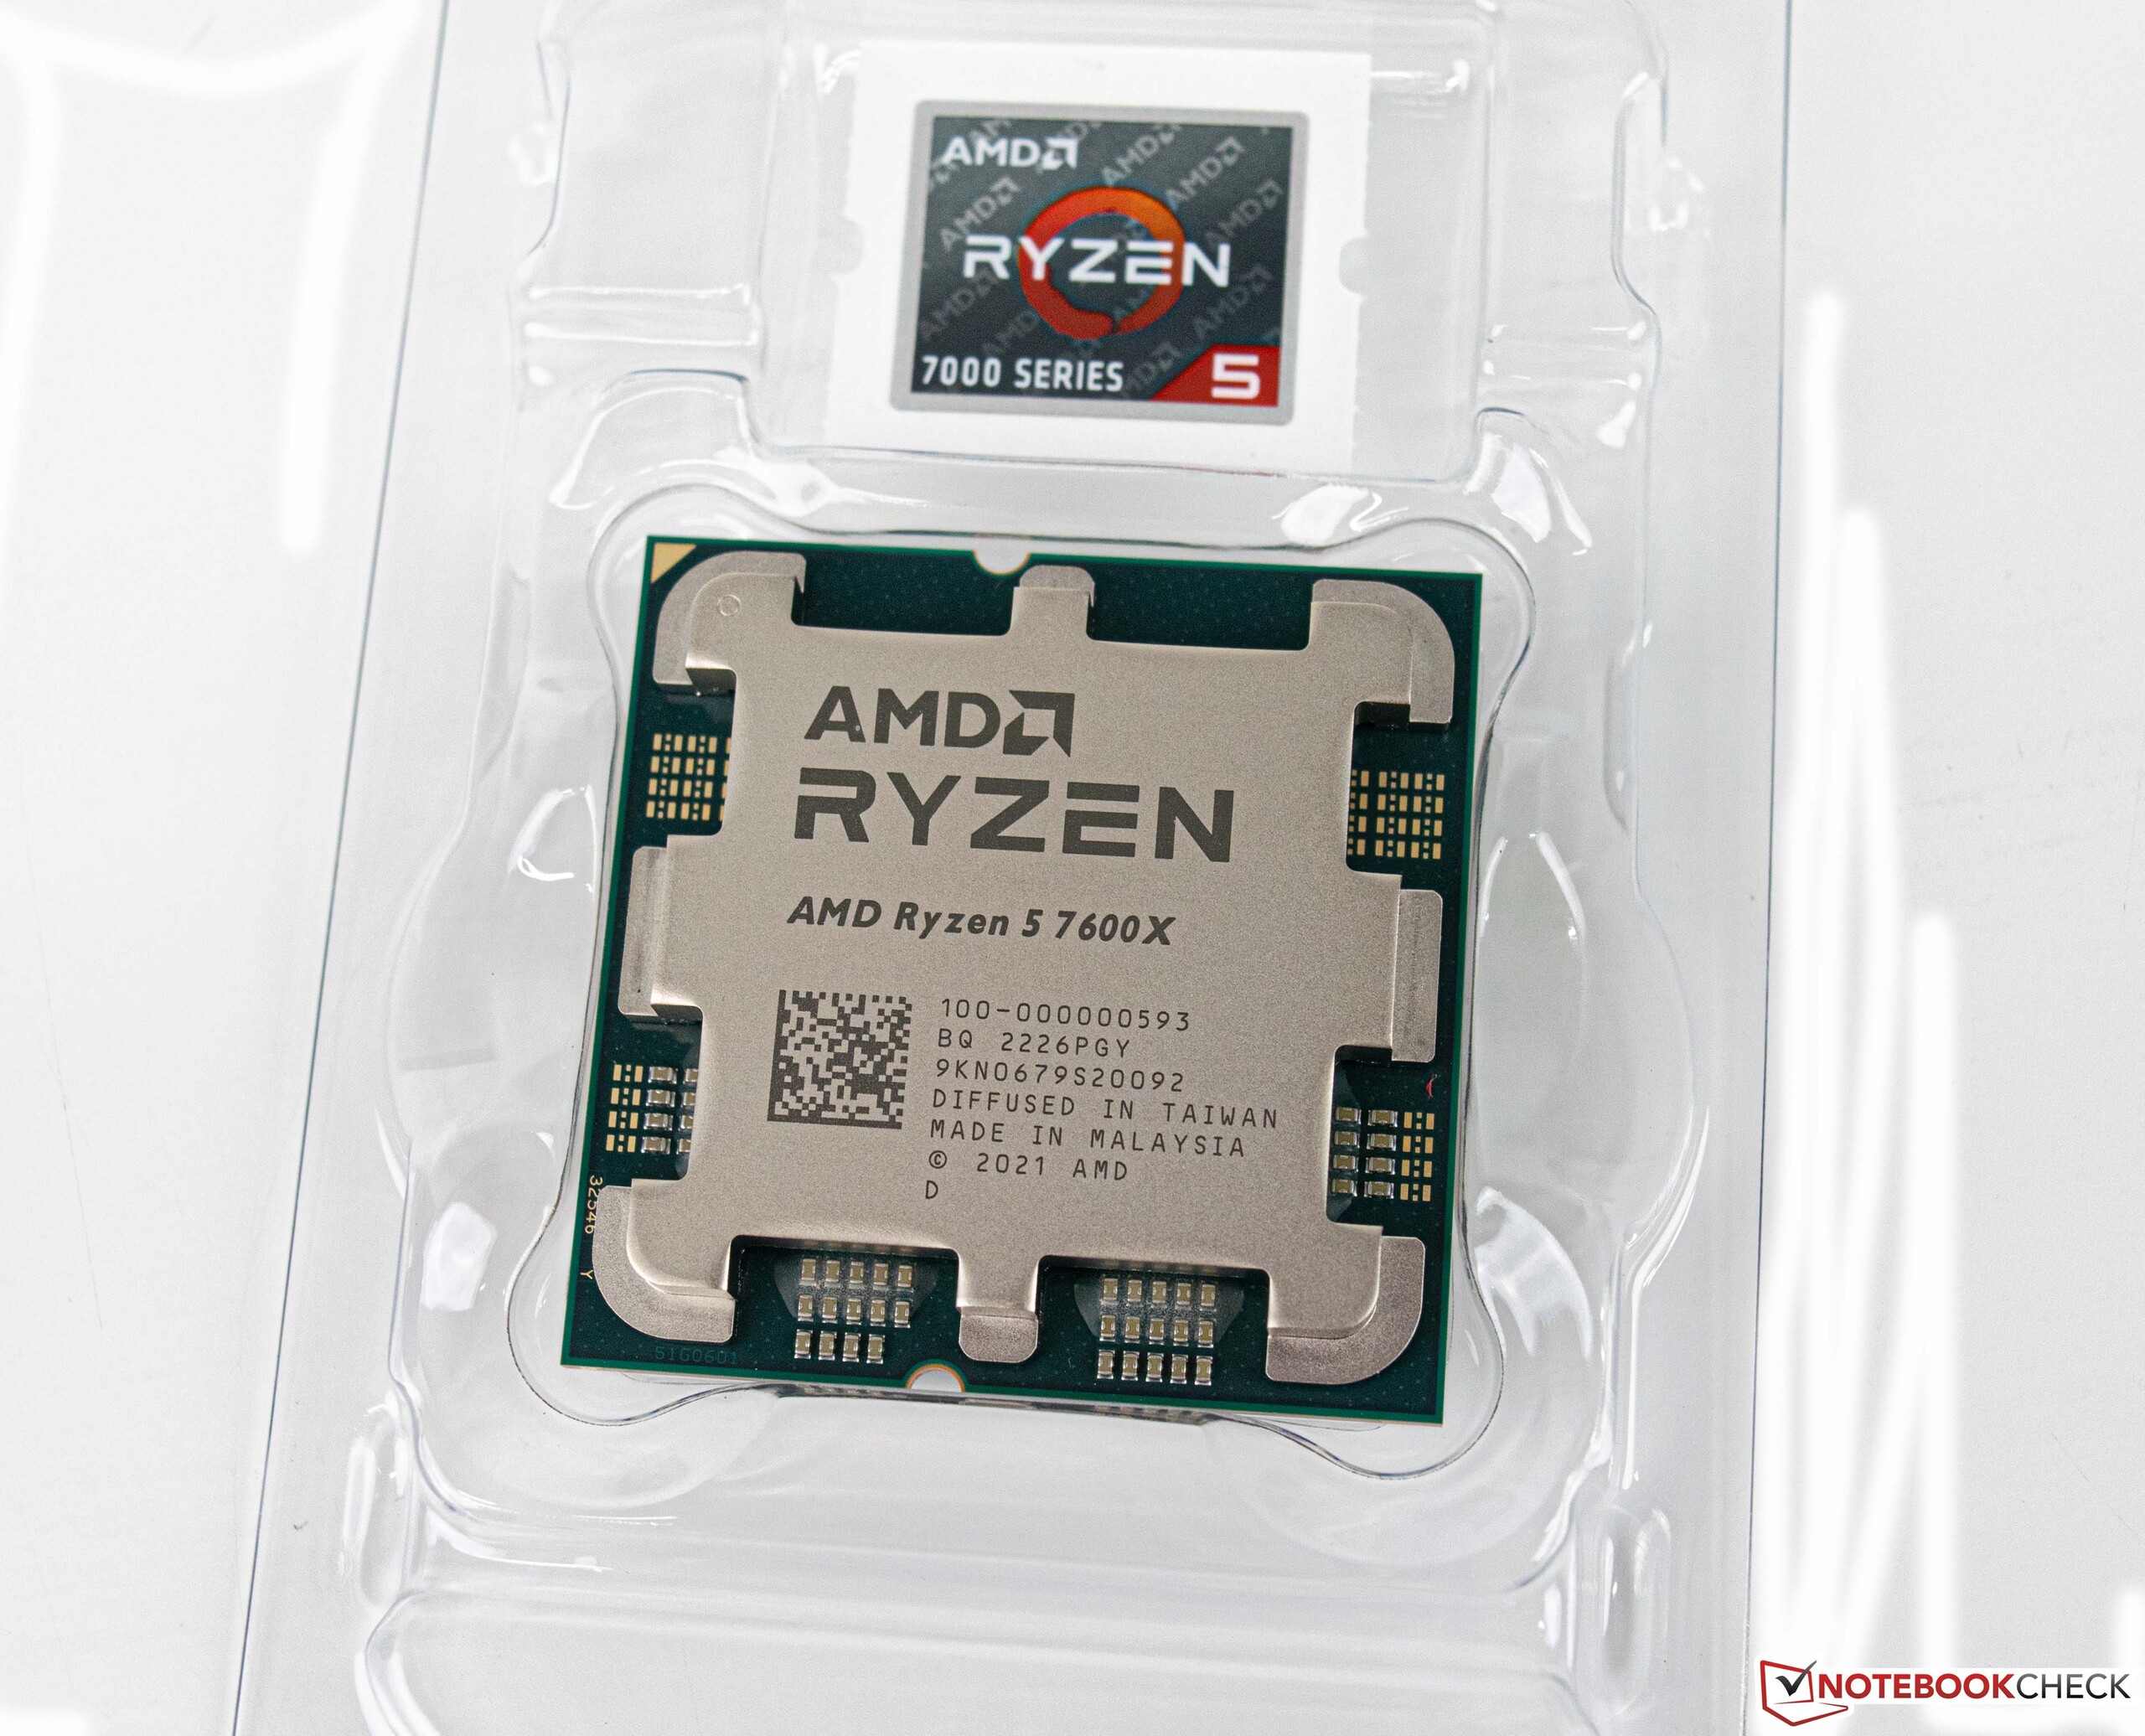
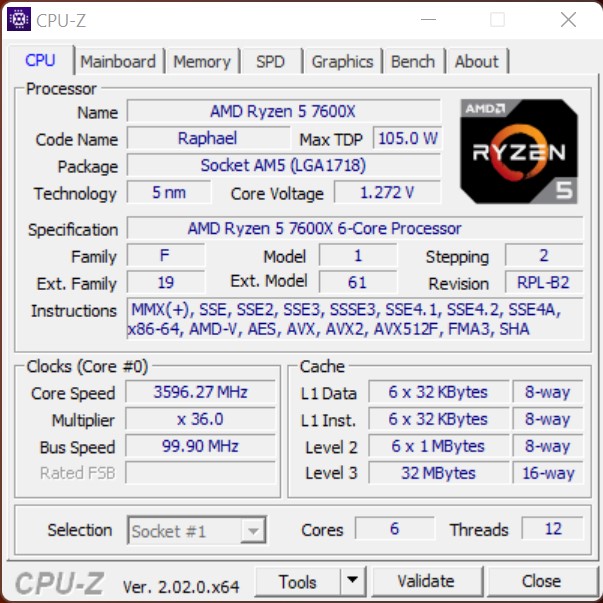
| Ryzen 5 7600X | 6/12 | 4,7 GHz | 5,3 GHz | 6x 1 MB | 32 MB | 105 W | 142 W | 299 USD / 359 EUR |
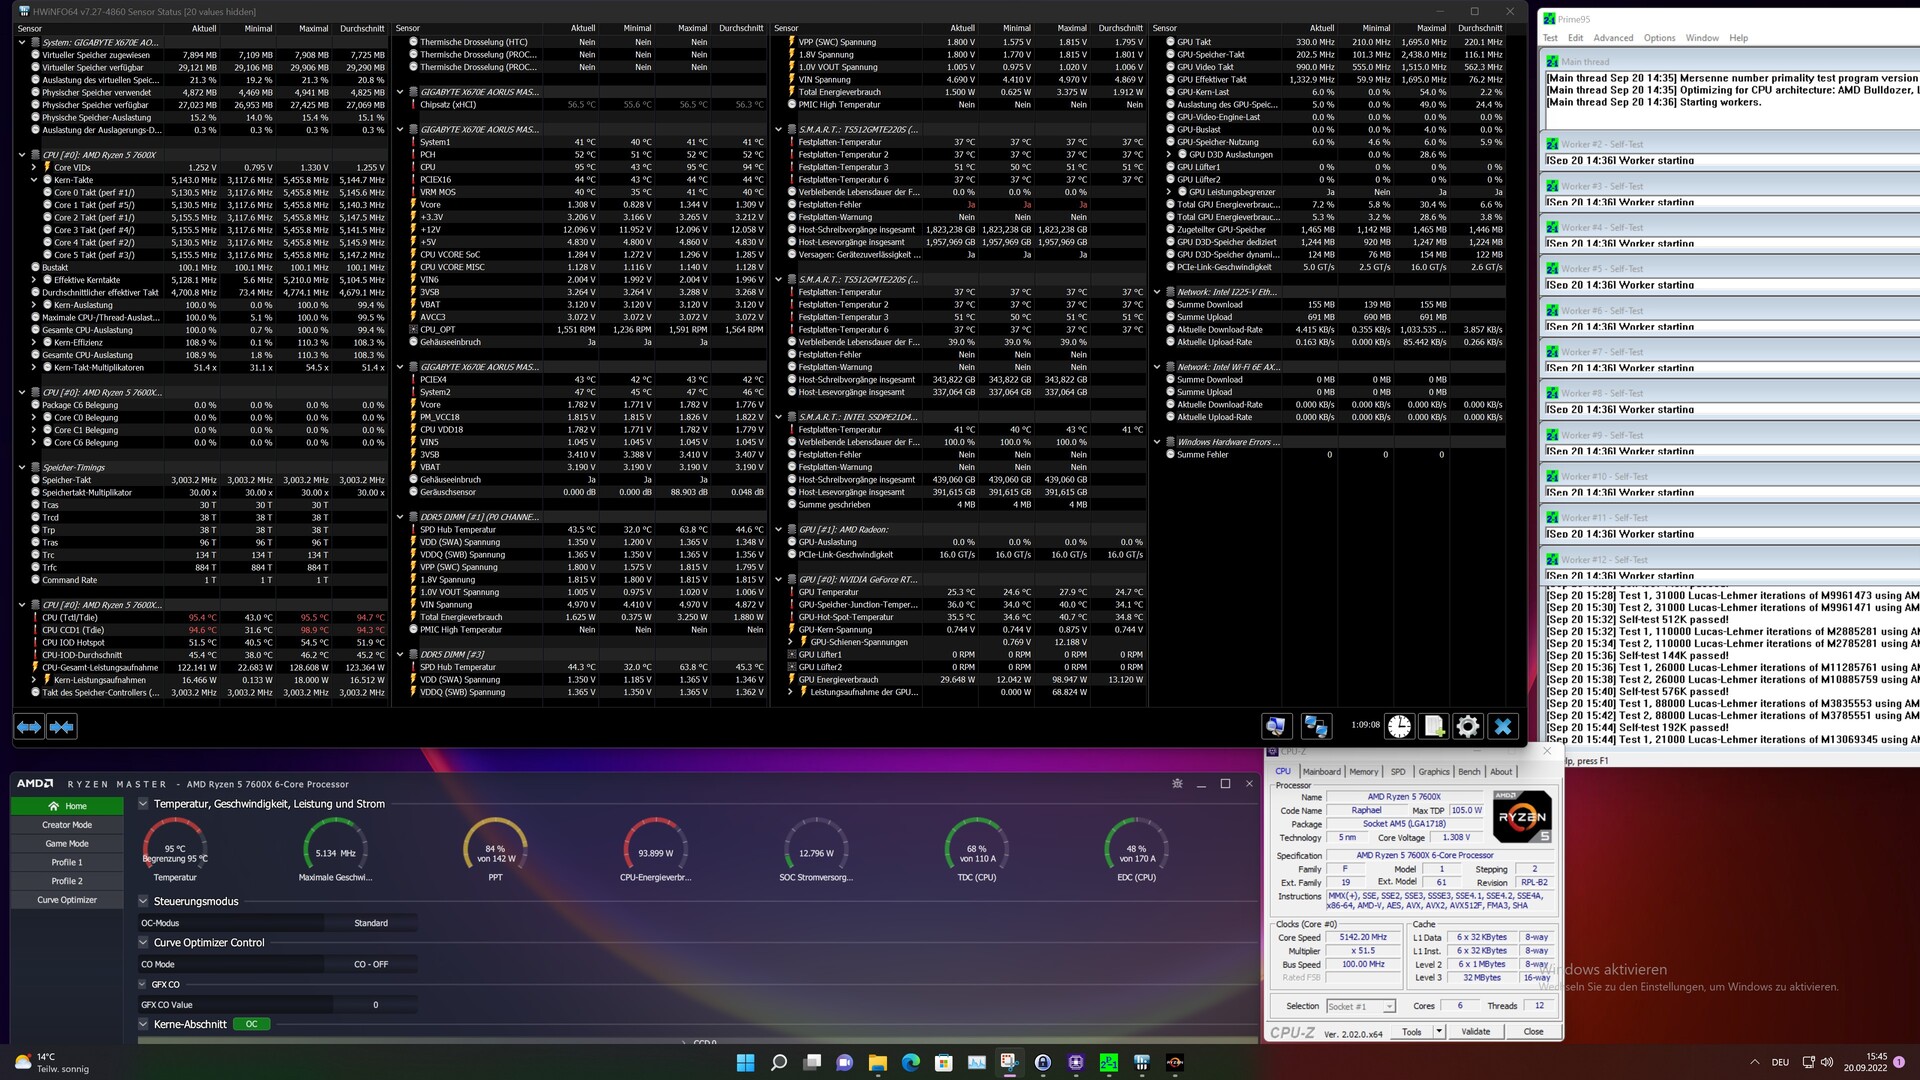
Il sistema di test
Utilizziamo il seguente sistema per i seguenti benchmark e test
- Banco di prova Raijintek Pean
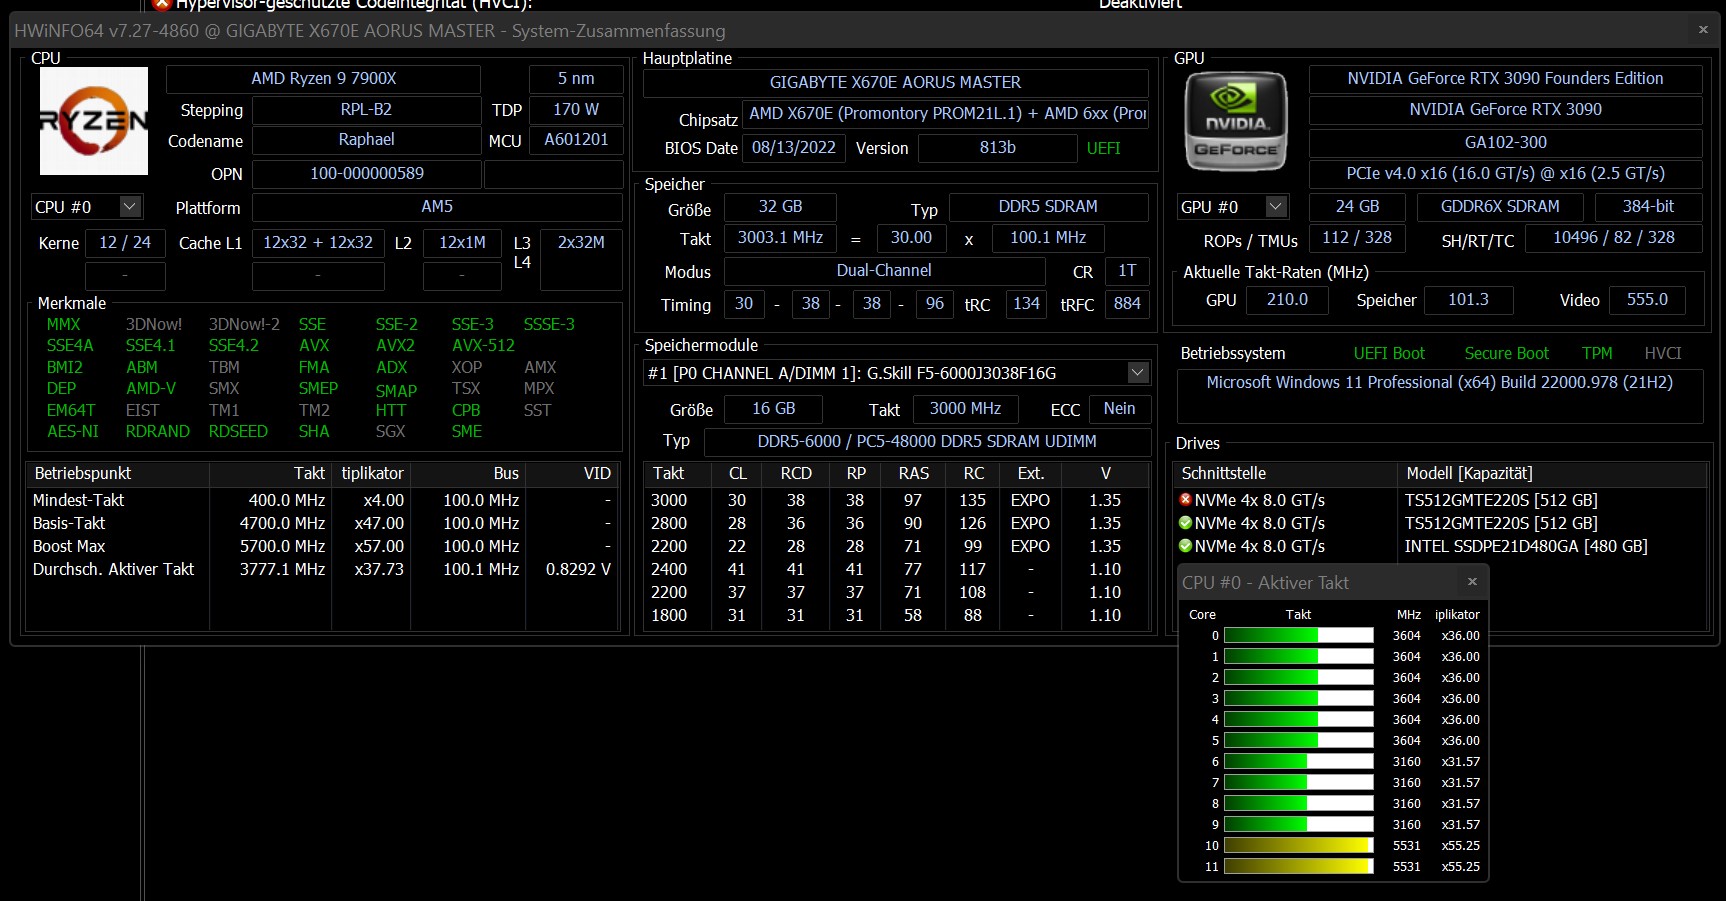
- AMD Ryzen 9 7900X, AMD Ryzen 5 7600X
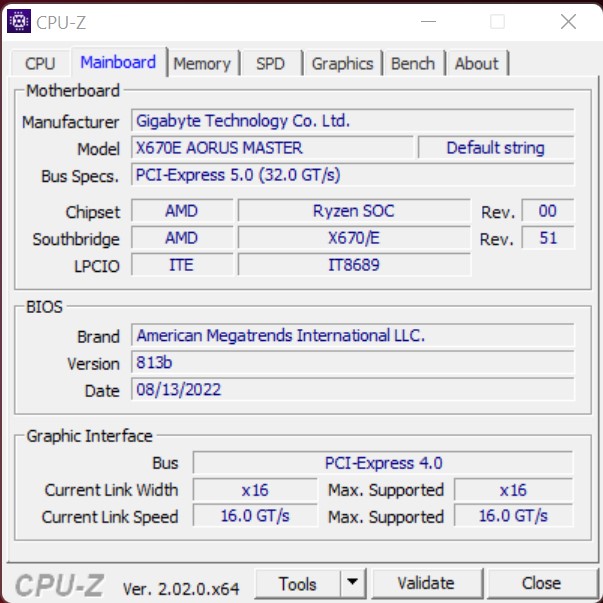
- Gigabyte X670E Aorus Master, BIOS: 813b
- Alphacool Eisbear 280 AiO
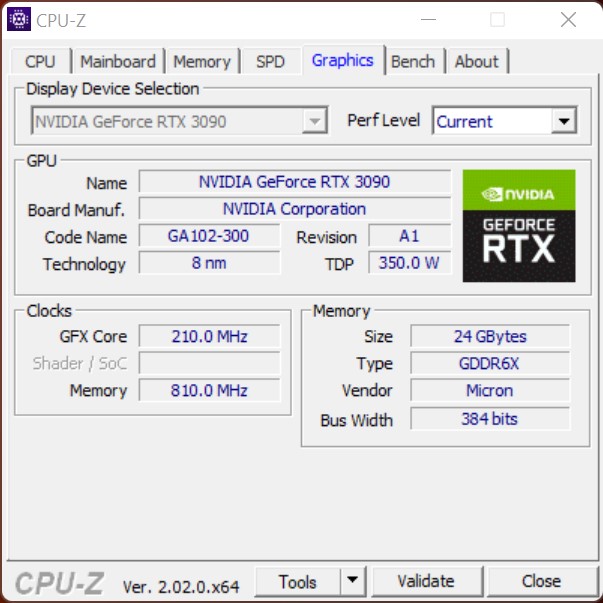
- Nvidia GeForce RTX 3090 Founders Edition
- Alimentatore Corsair HX 1200i
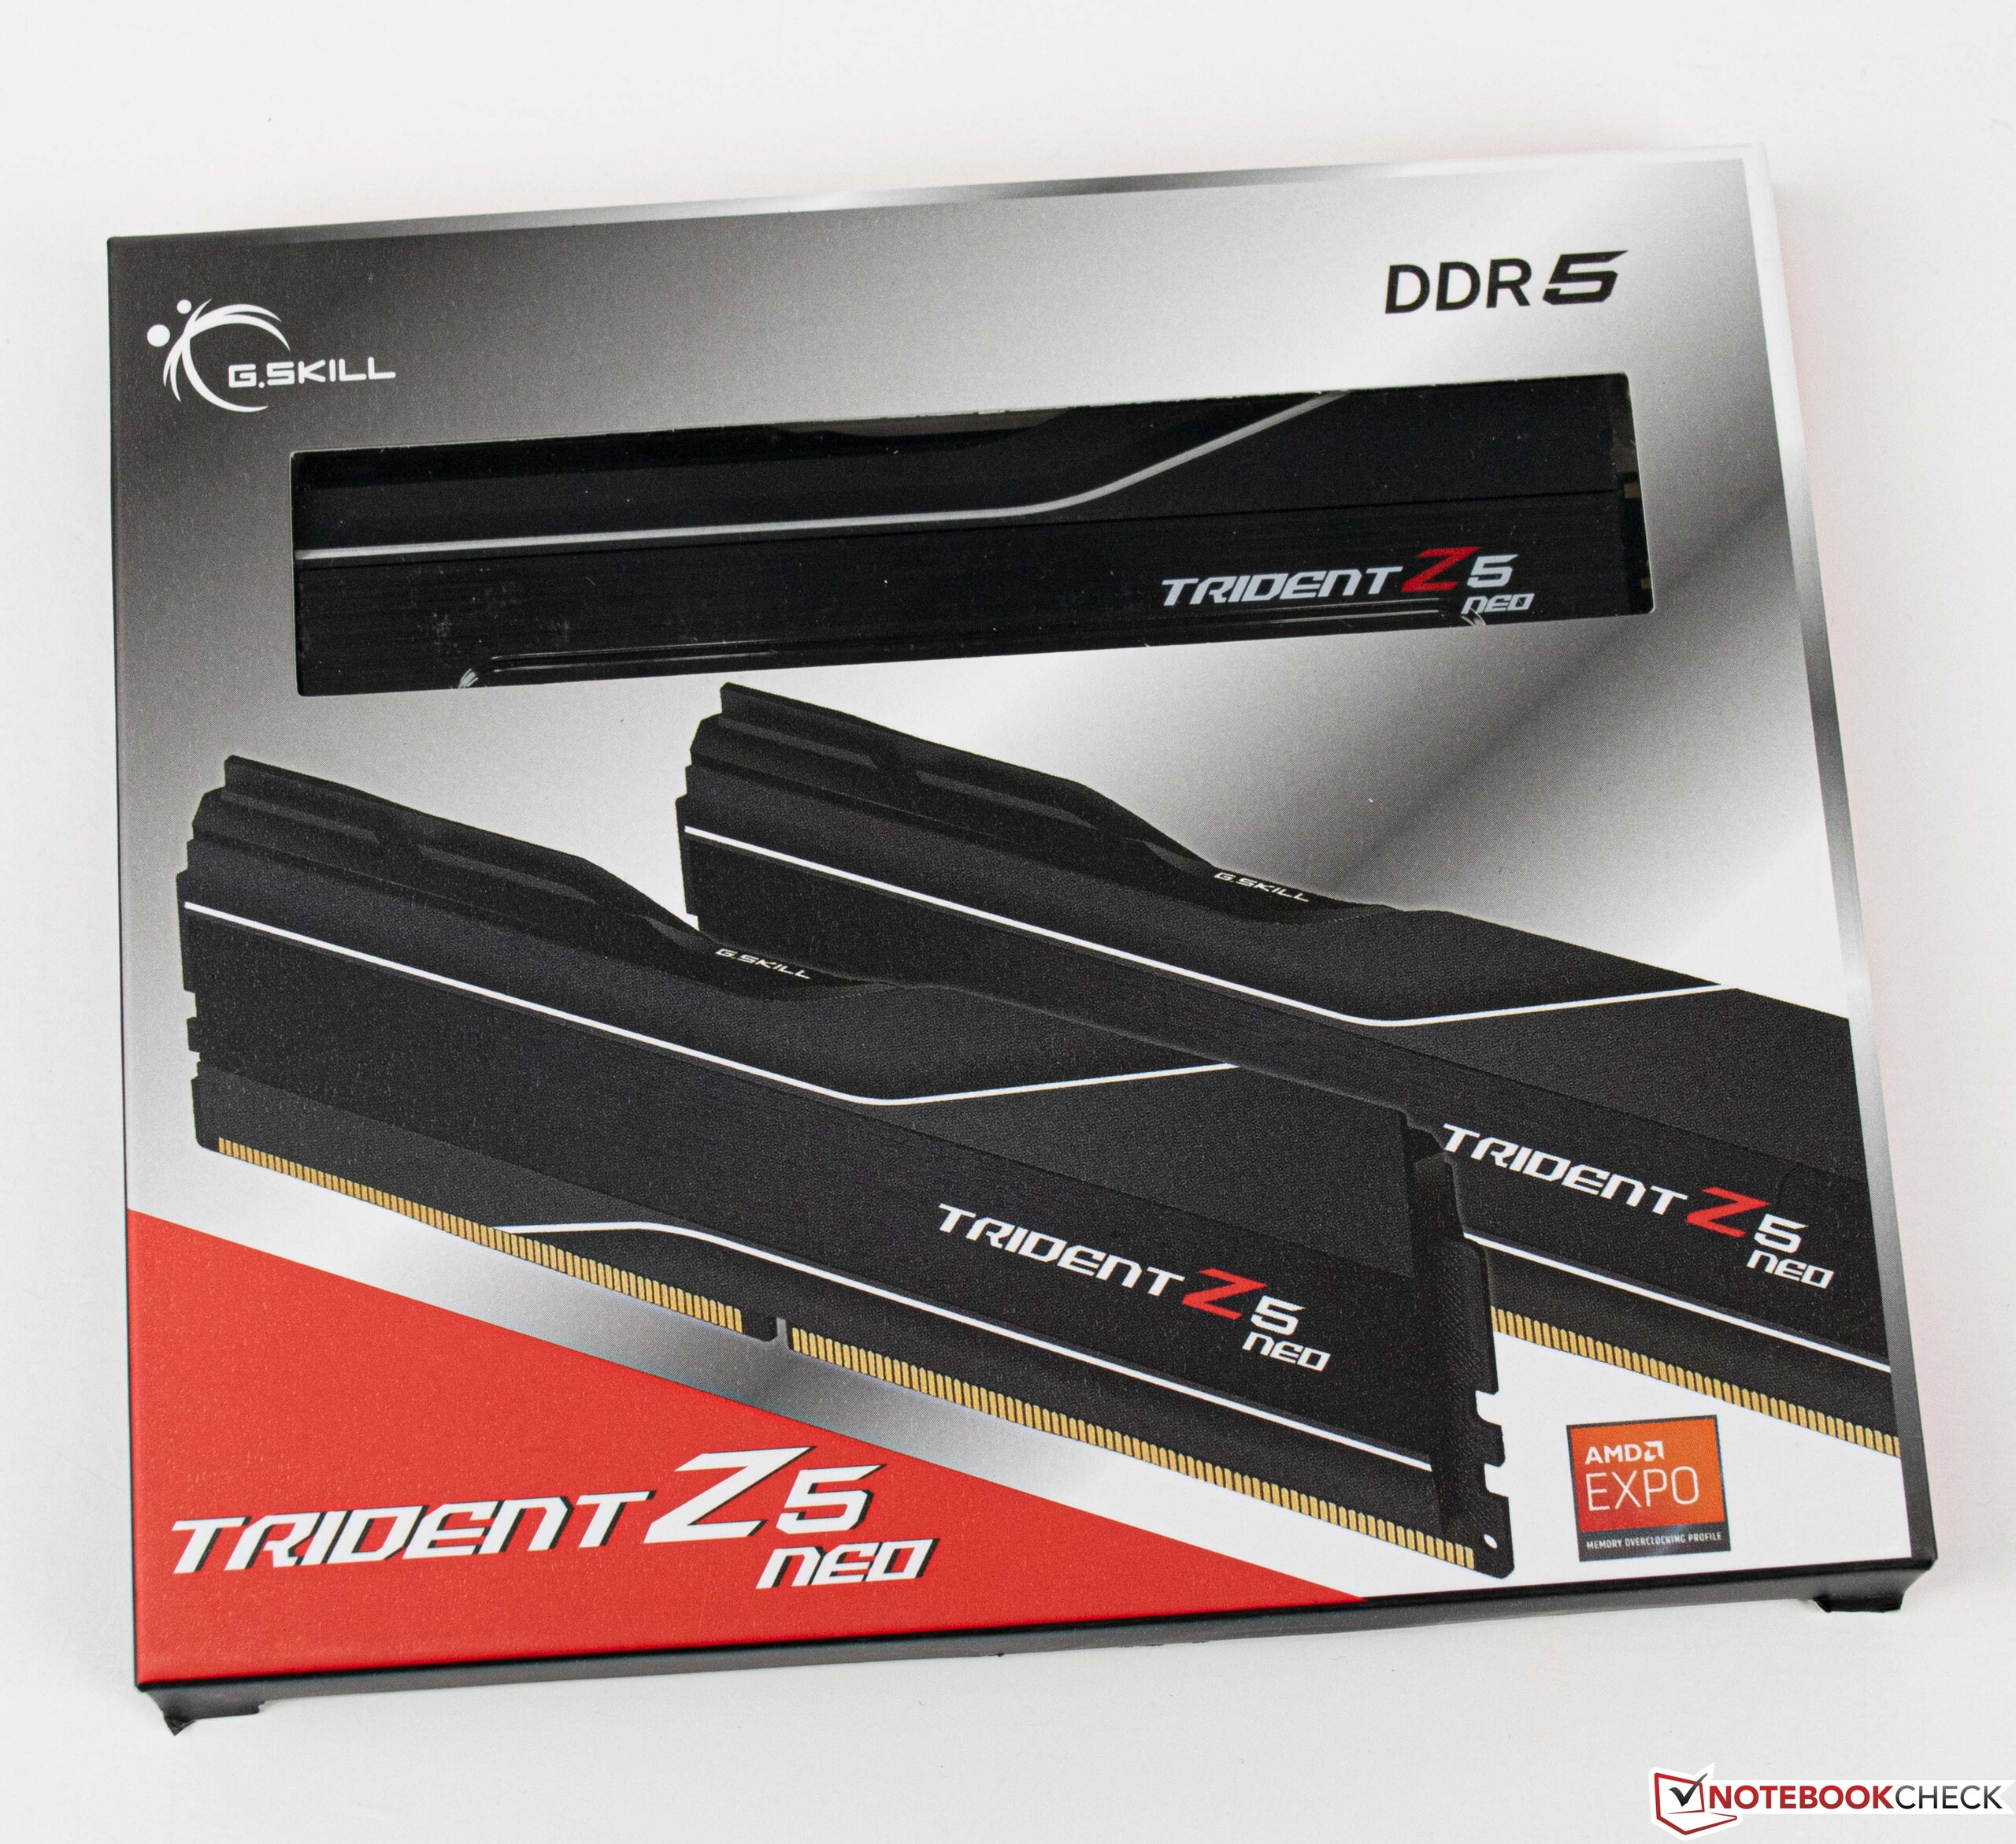
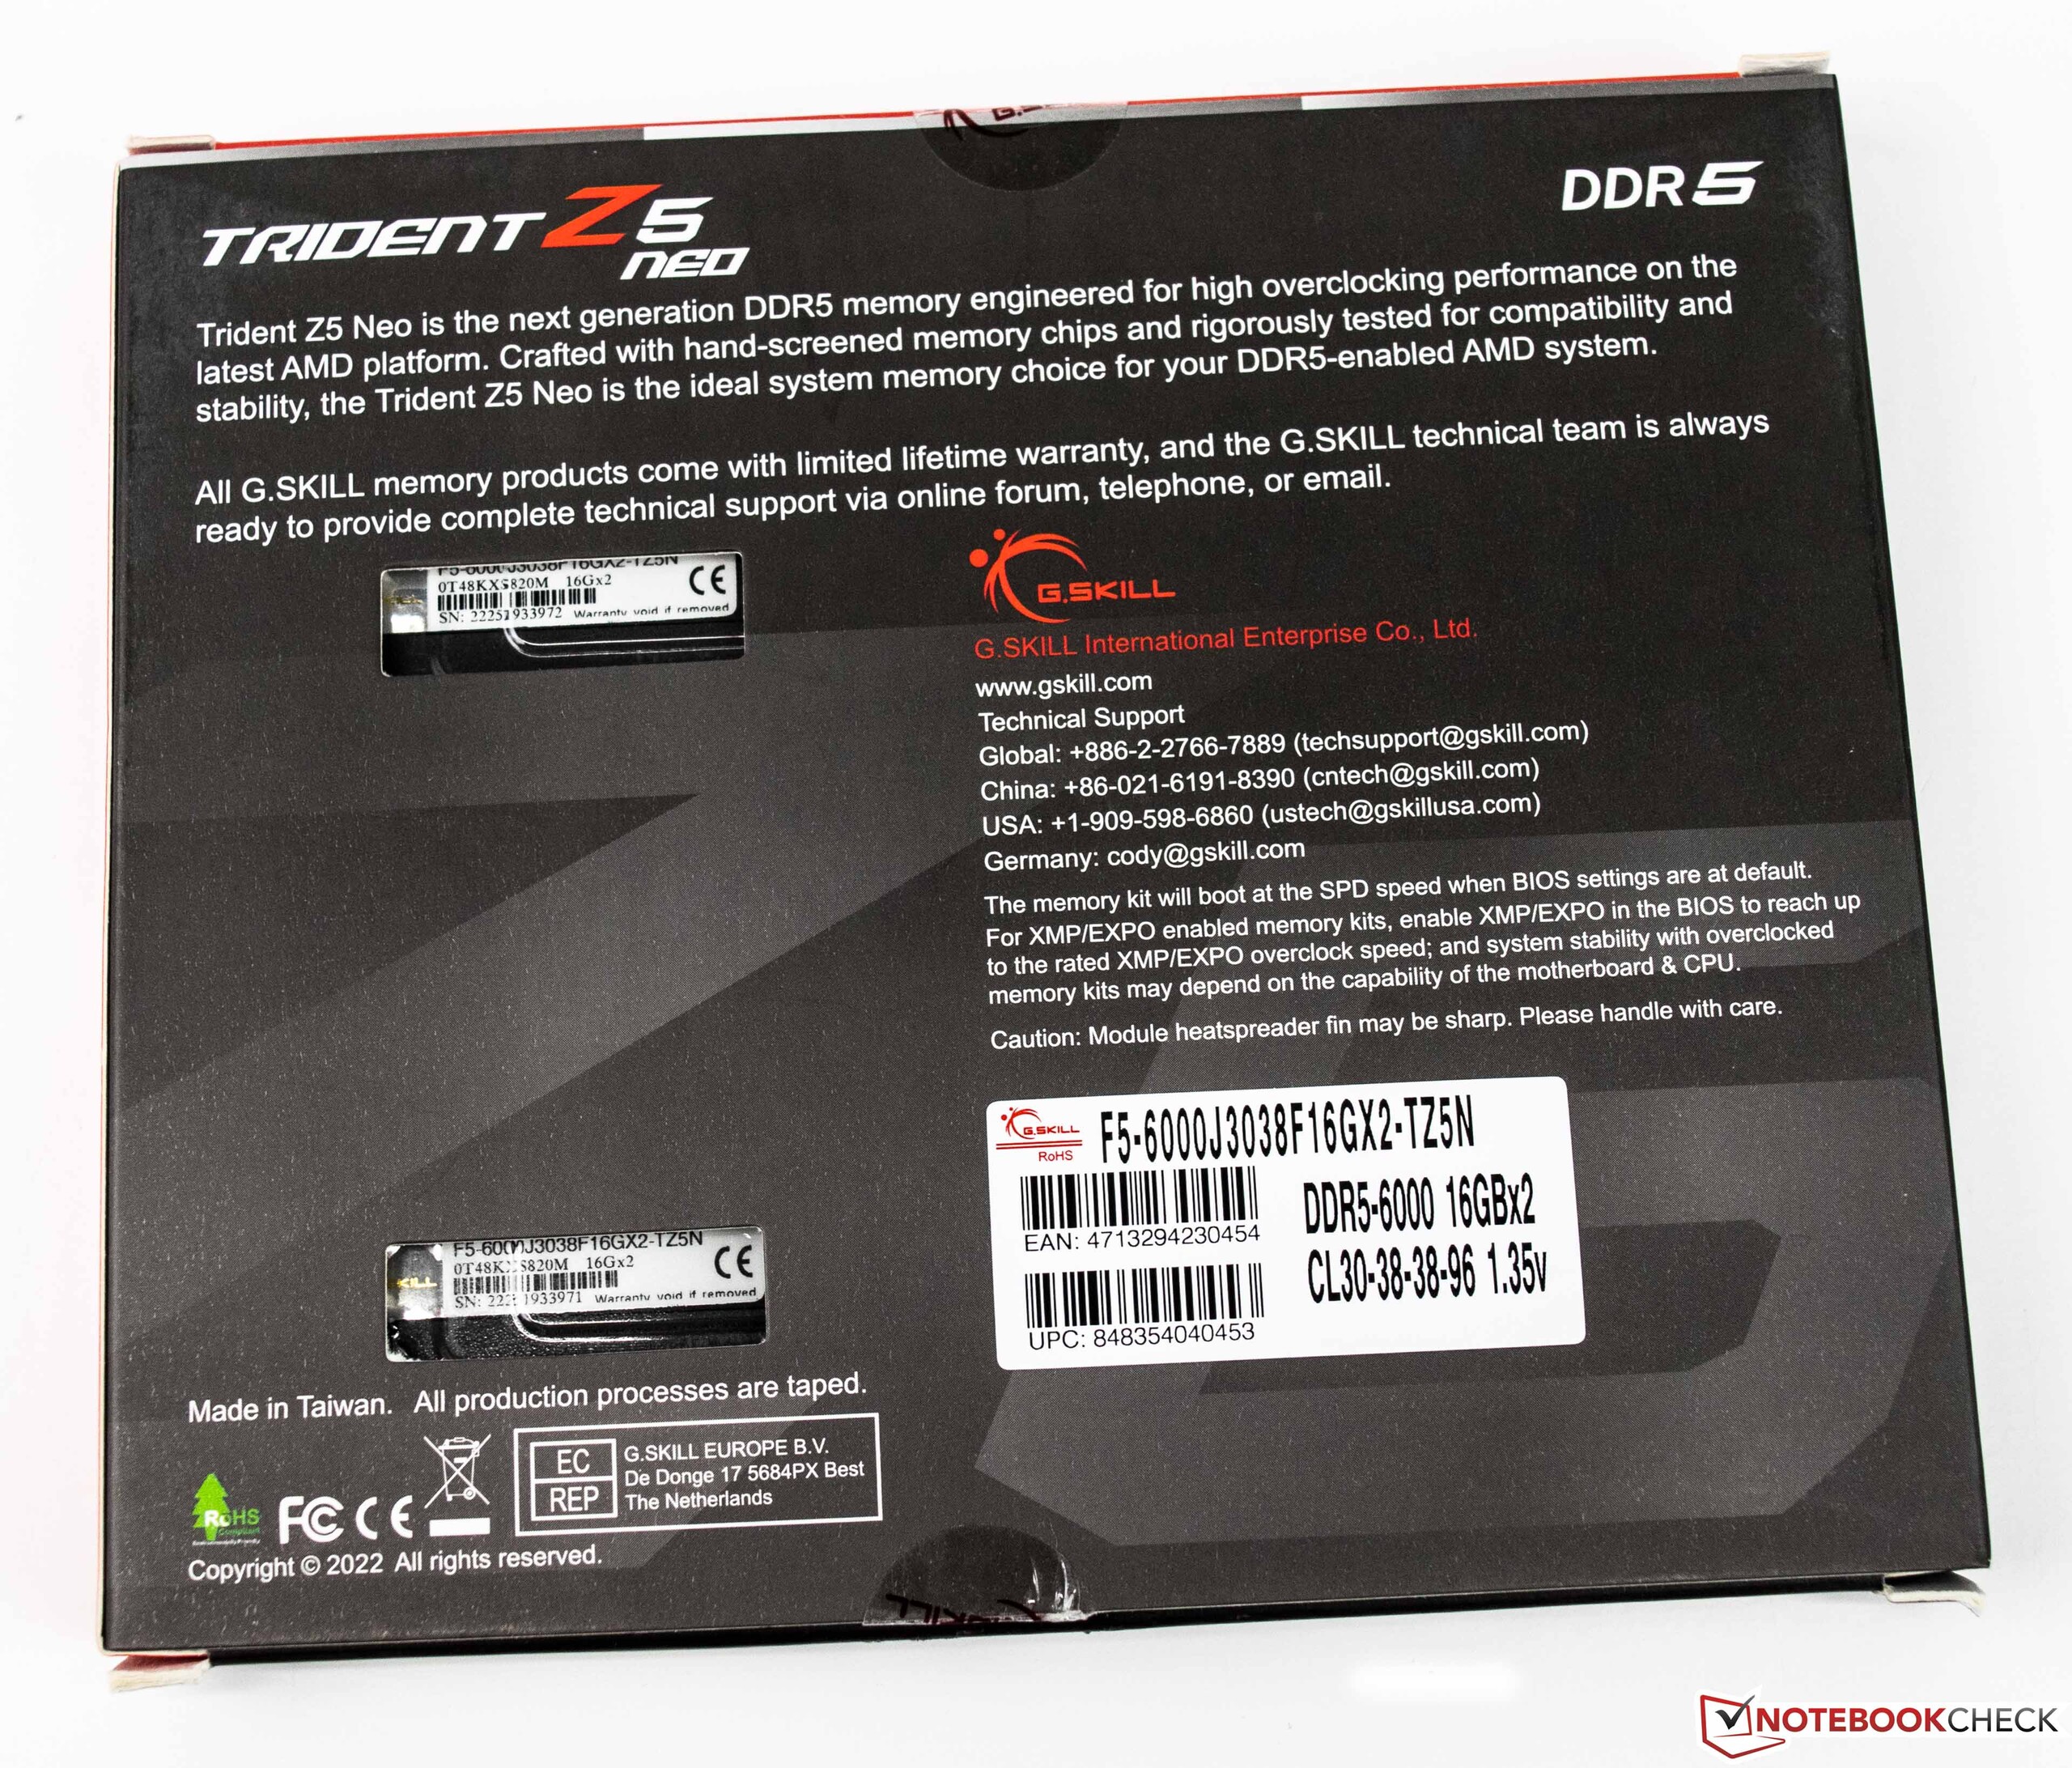
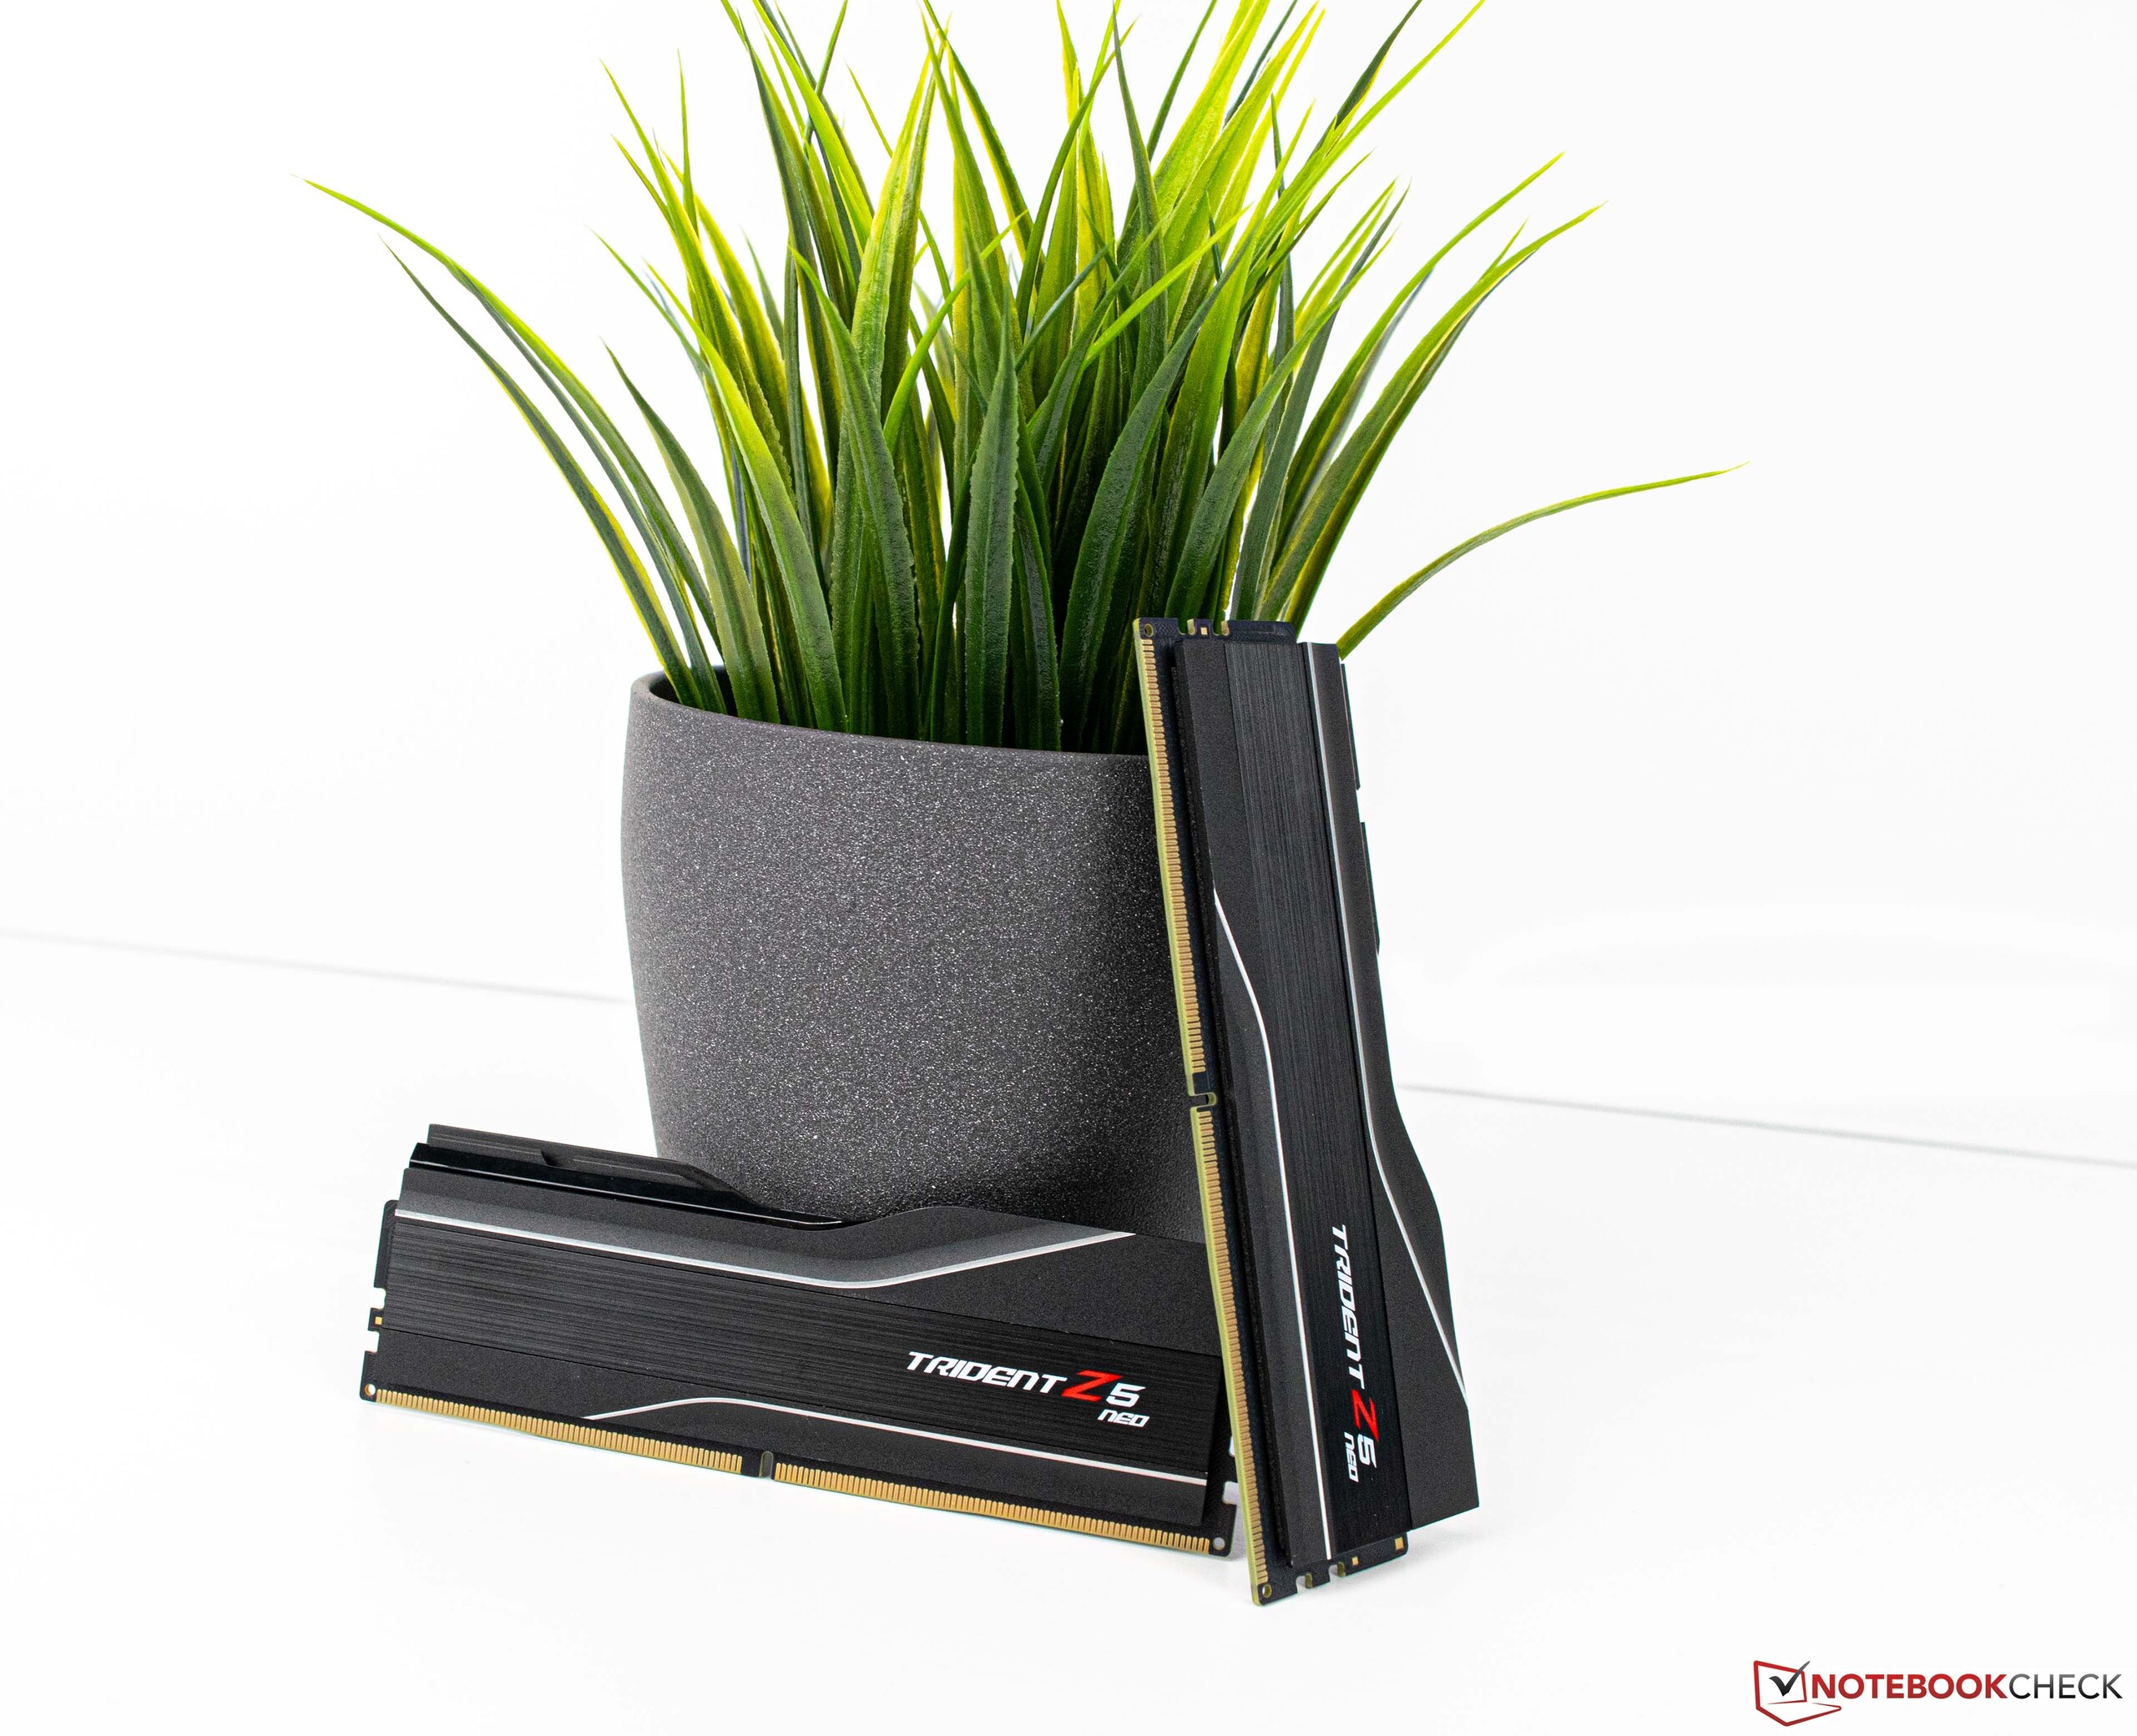
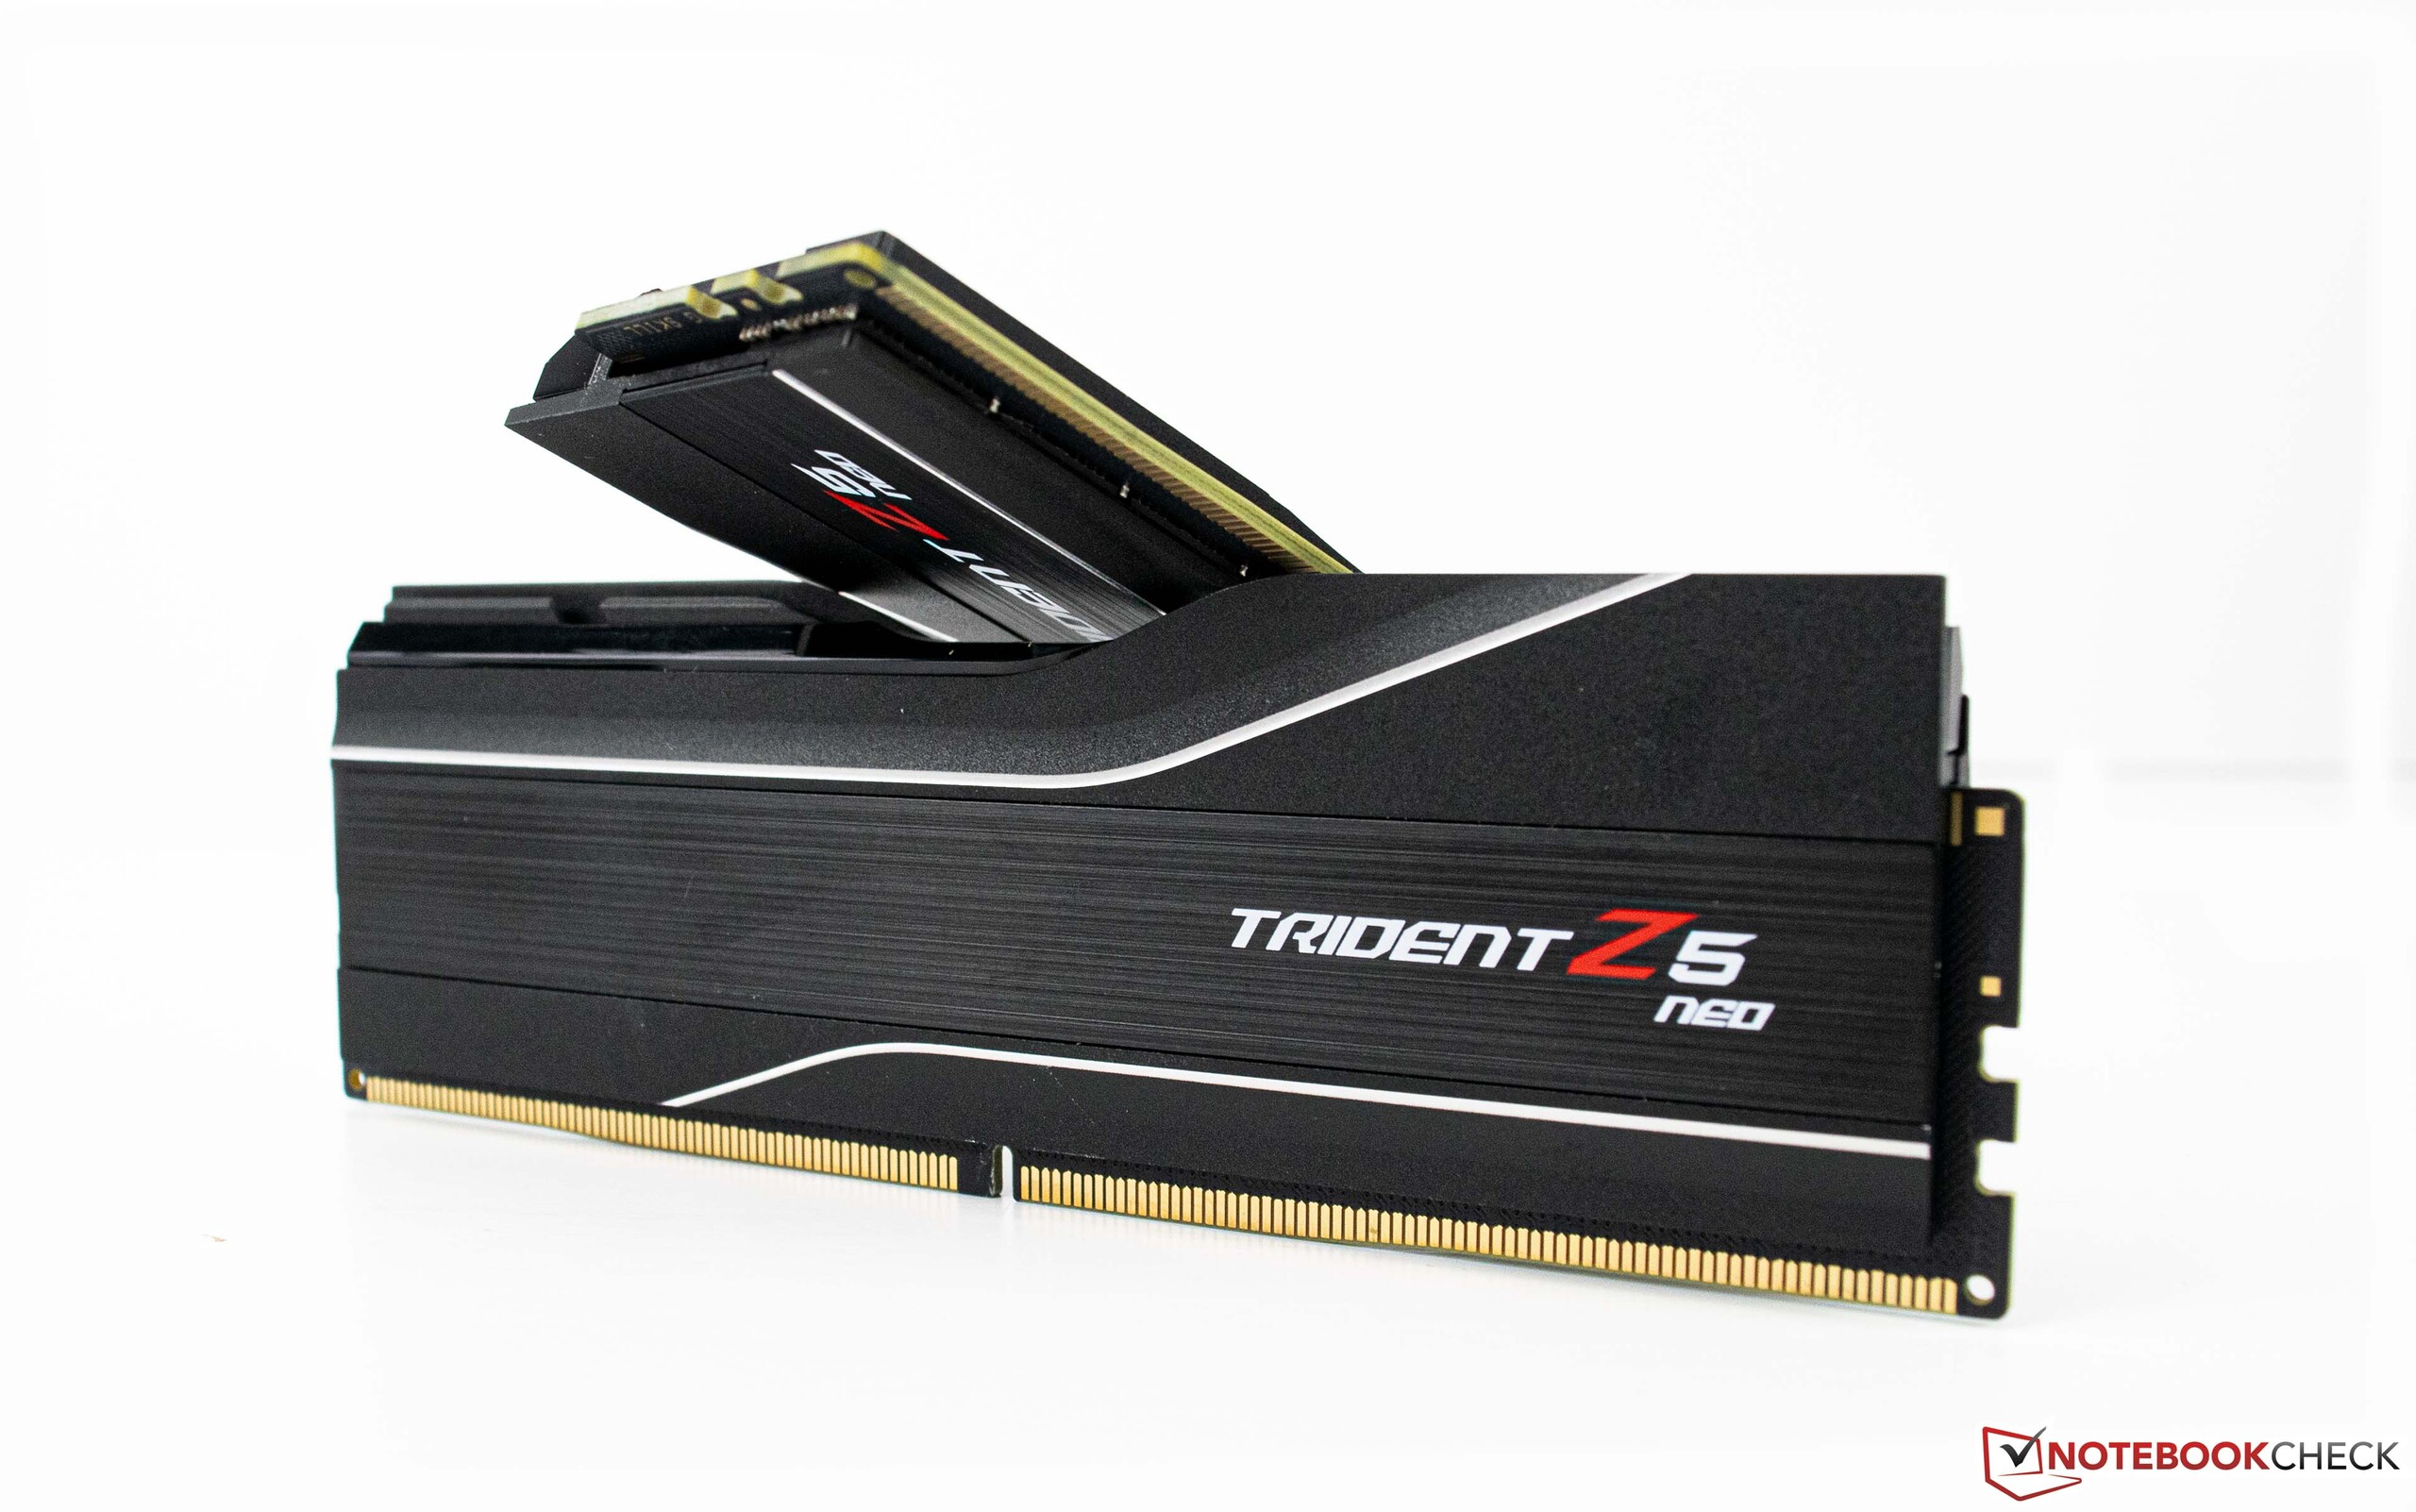
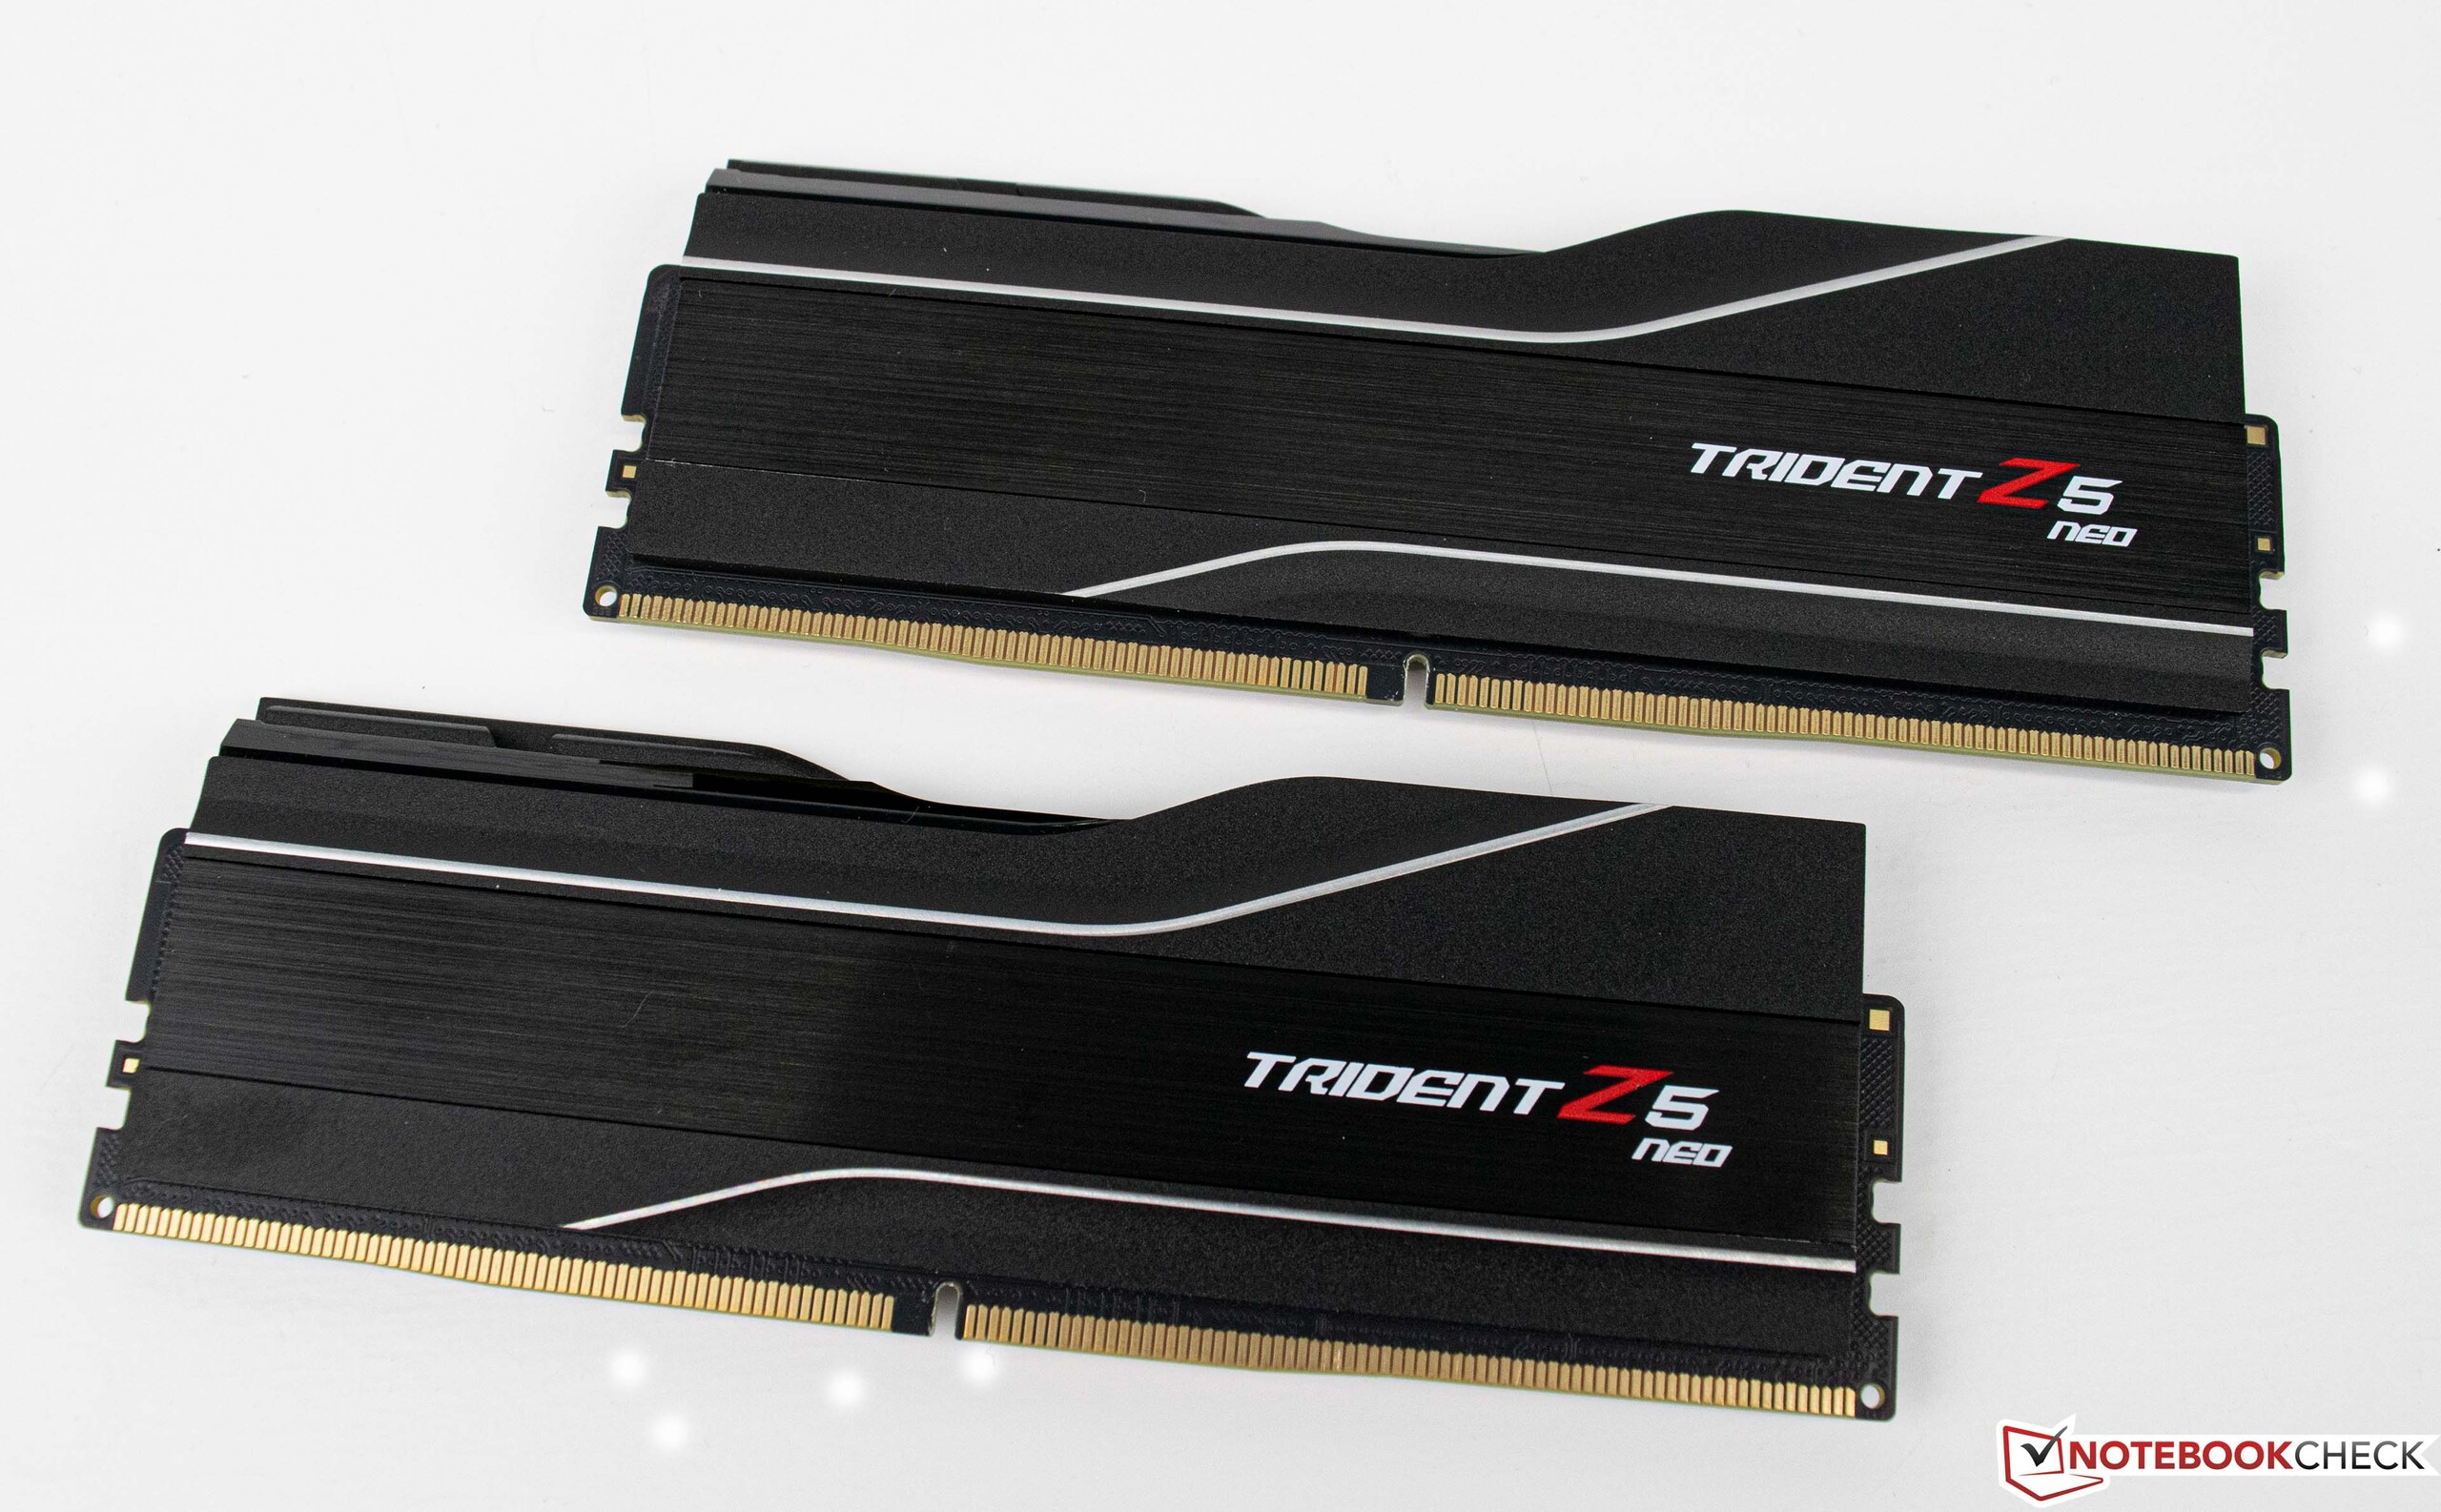
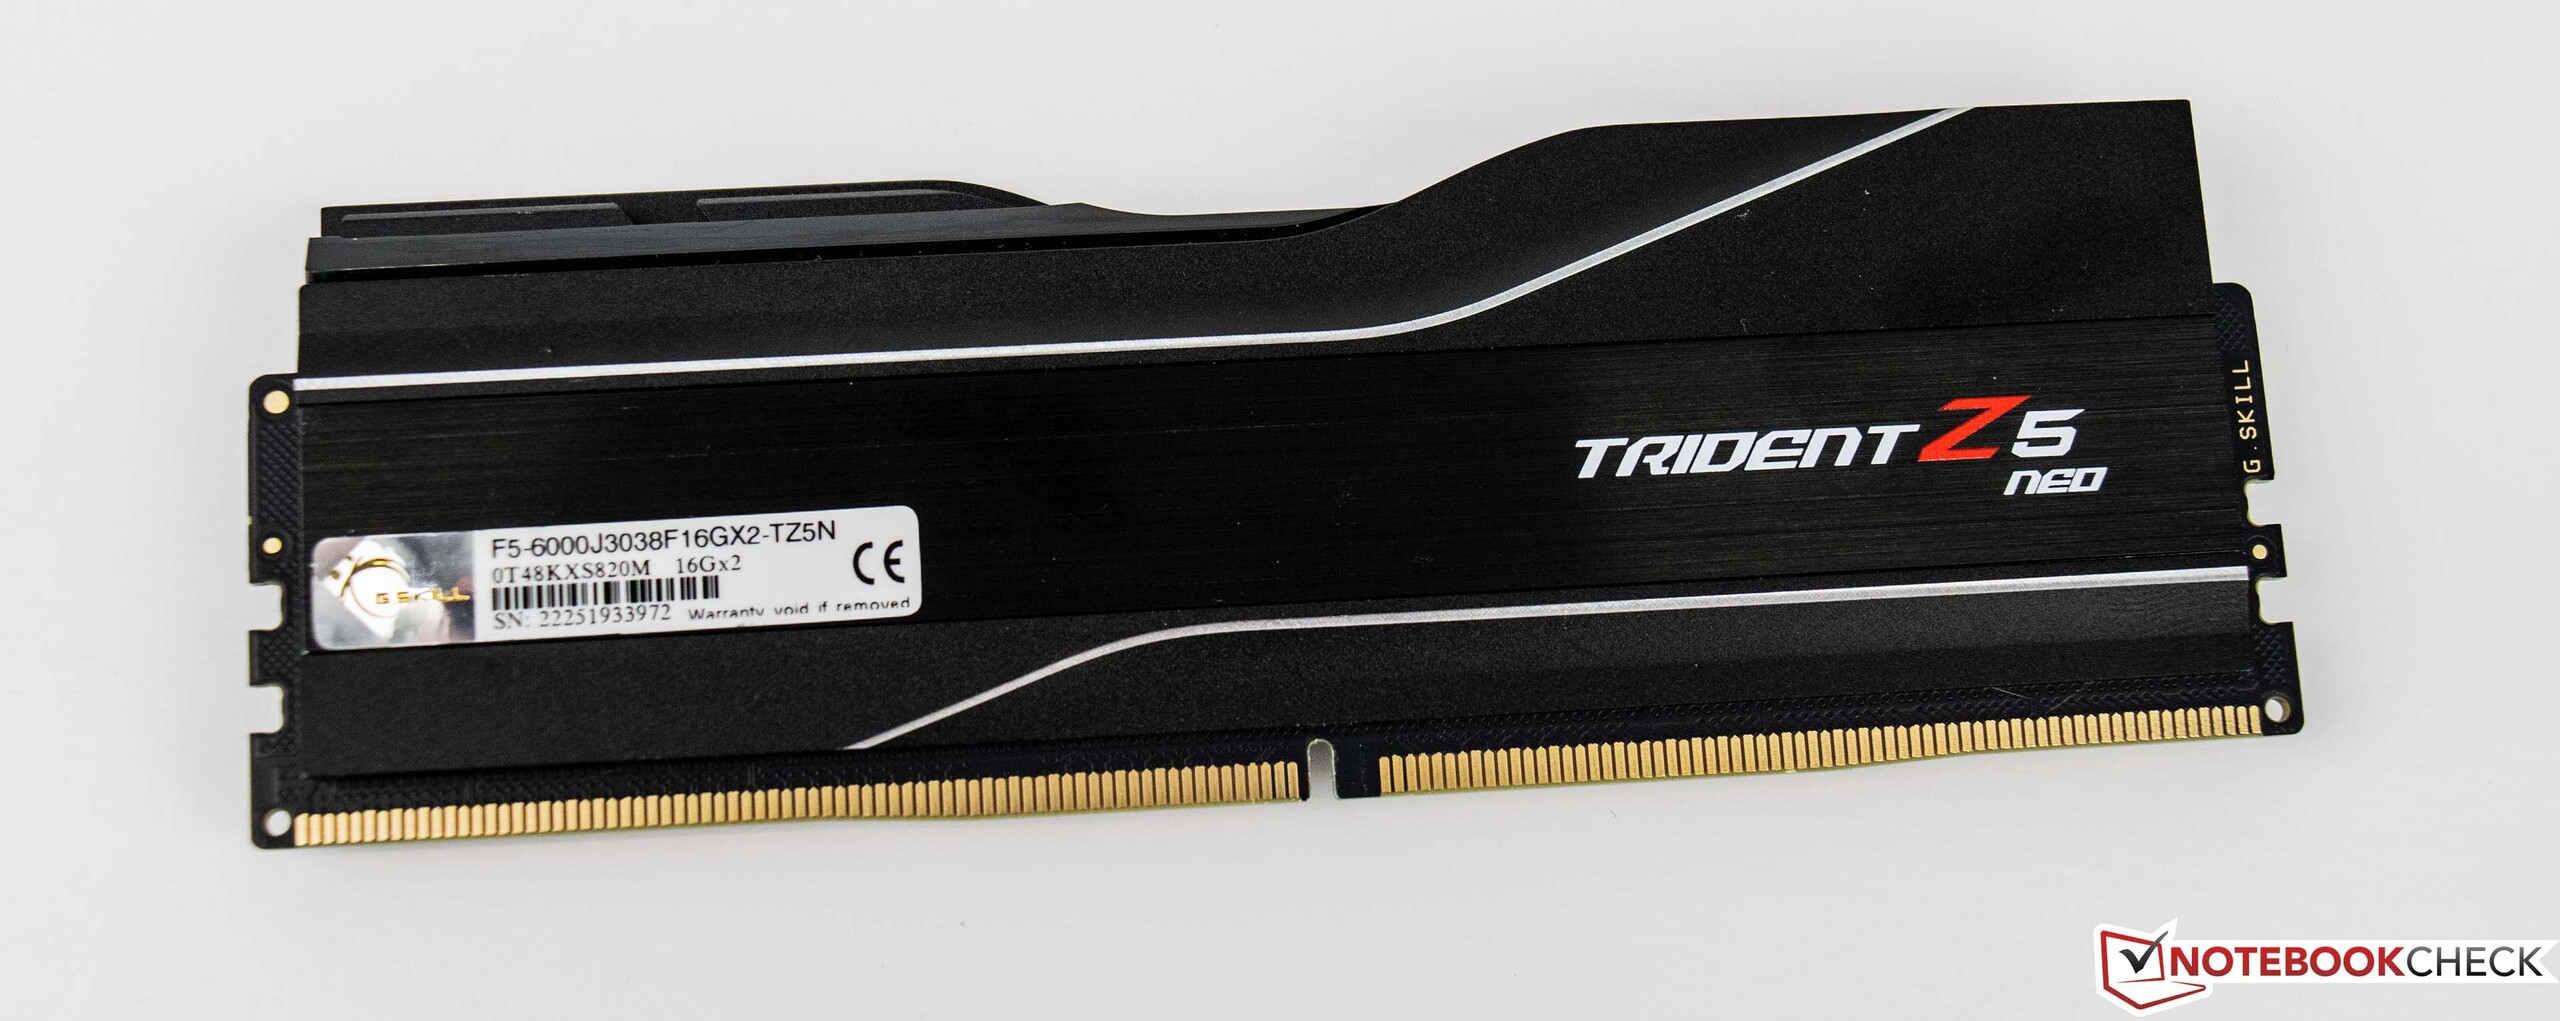
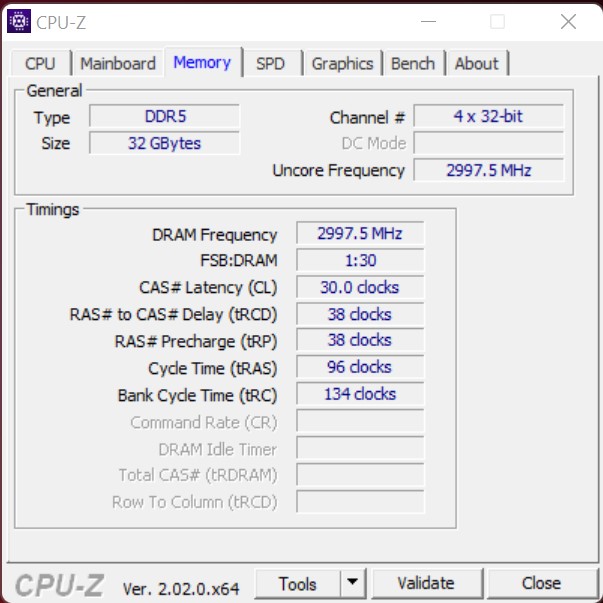
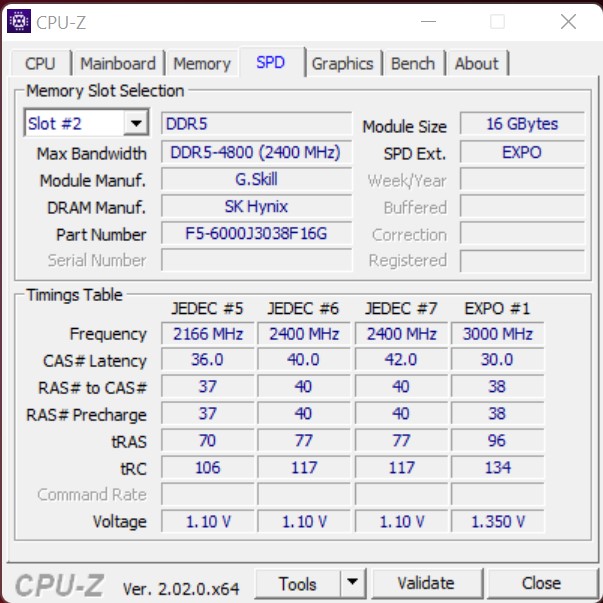
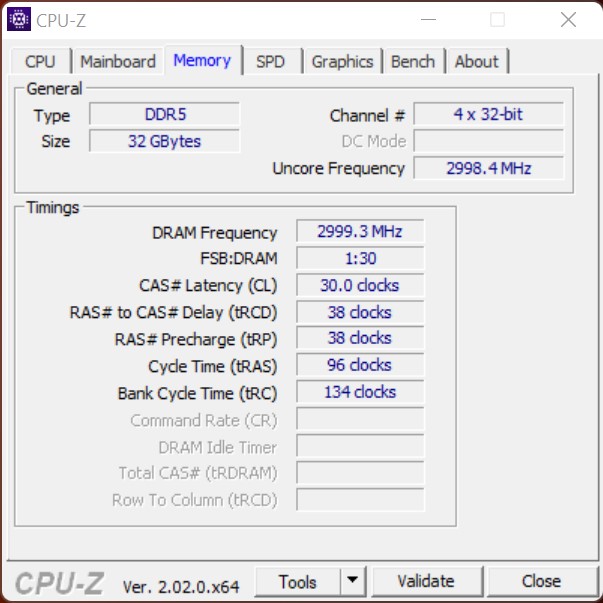
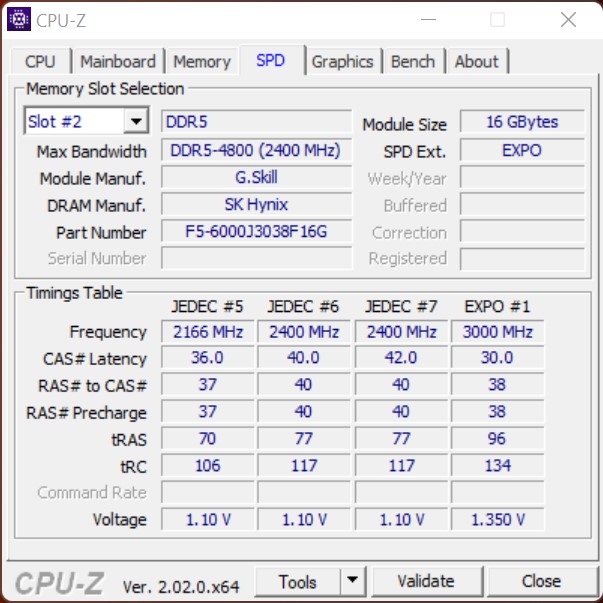
- G.Skill Trident Z5 Neo DDR5-6000 2x 16 GB, EXPO (DDR5-6000 CL30-38-38-96)
- SSD Intel Optane 905P 480 GB PCIe
- 2x Transcend NVMe SSD 512 GB
- Microsoft Windows 11 Professional 64-bit (versione 21H2)
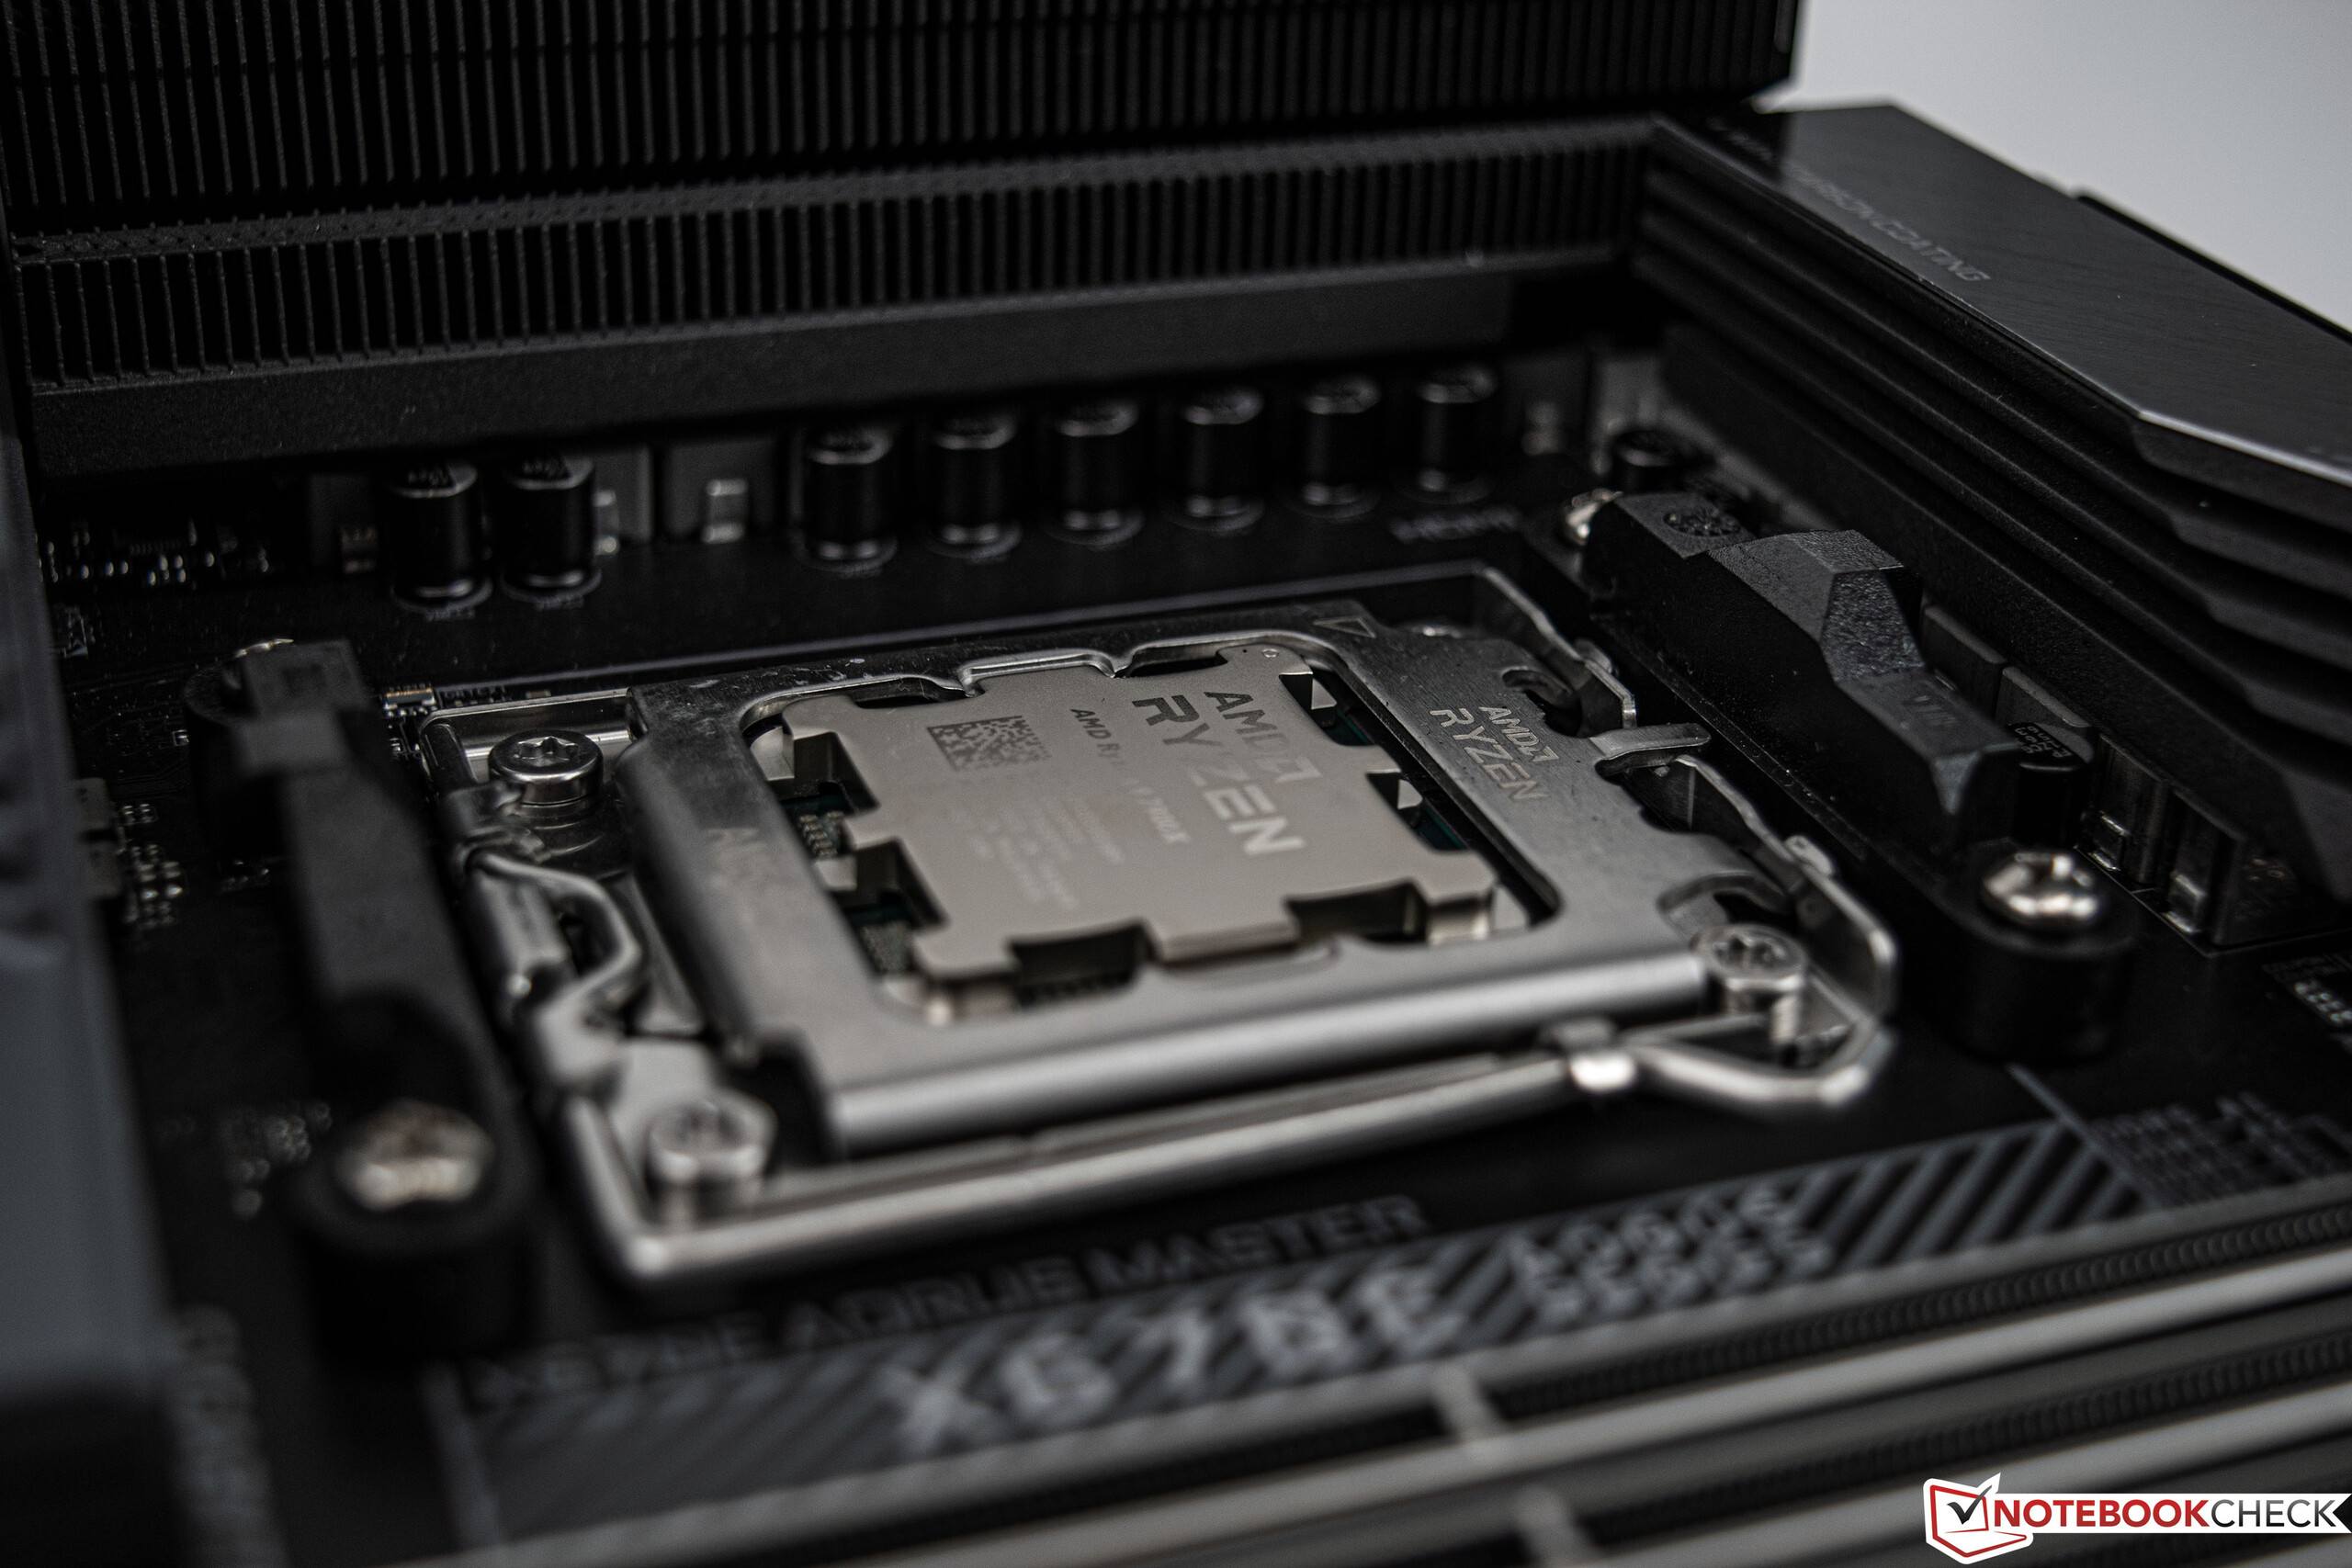

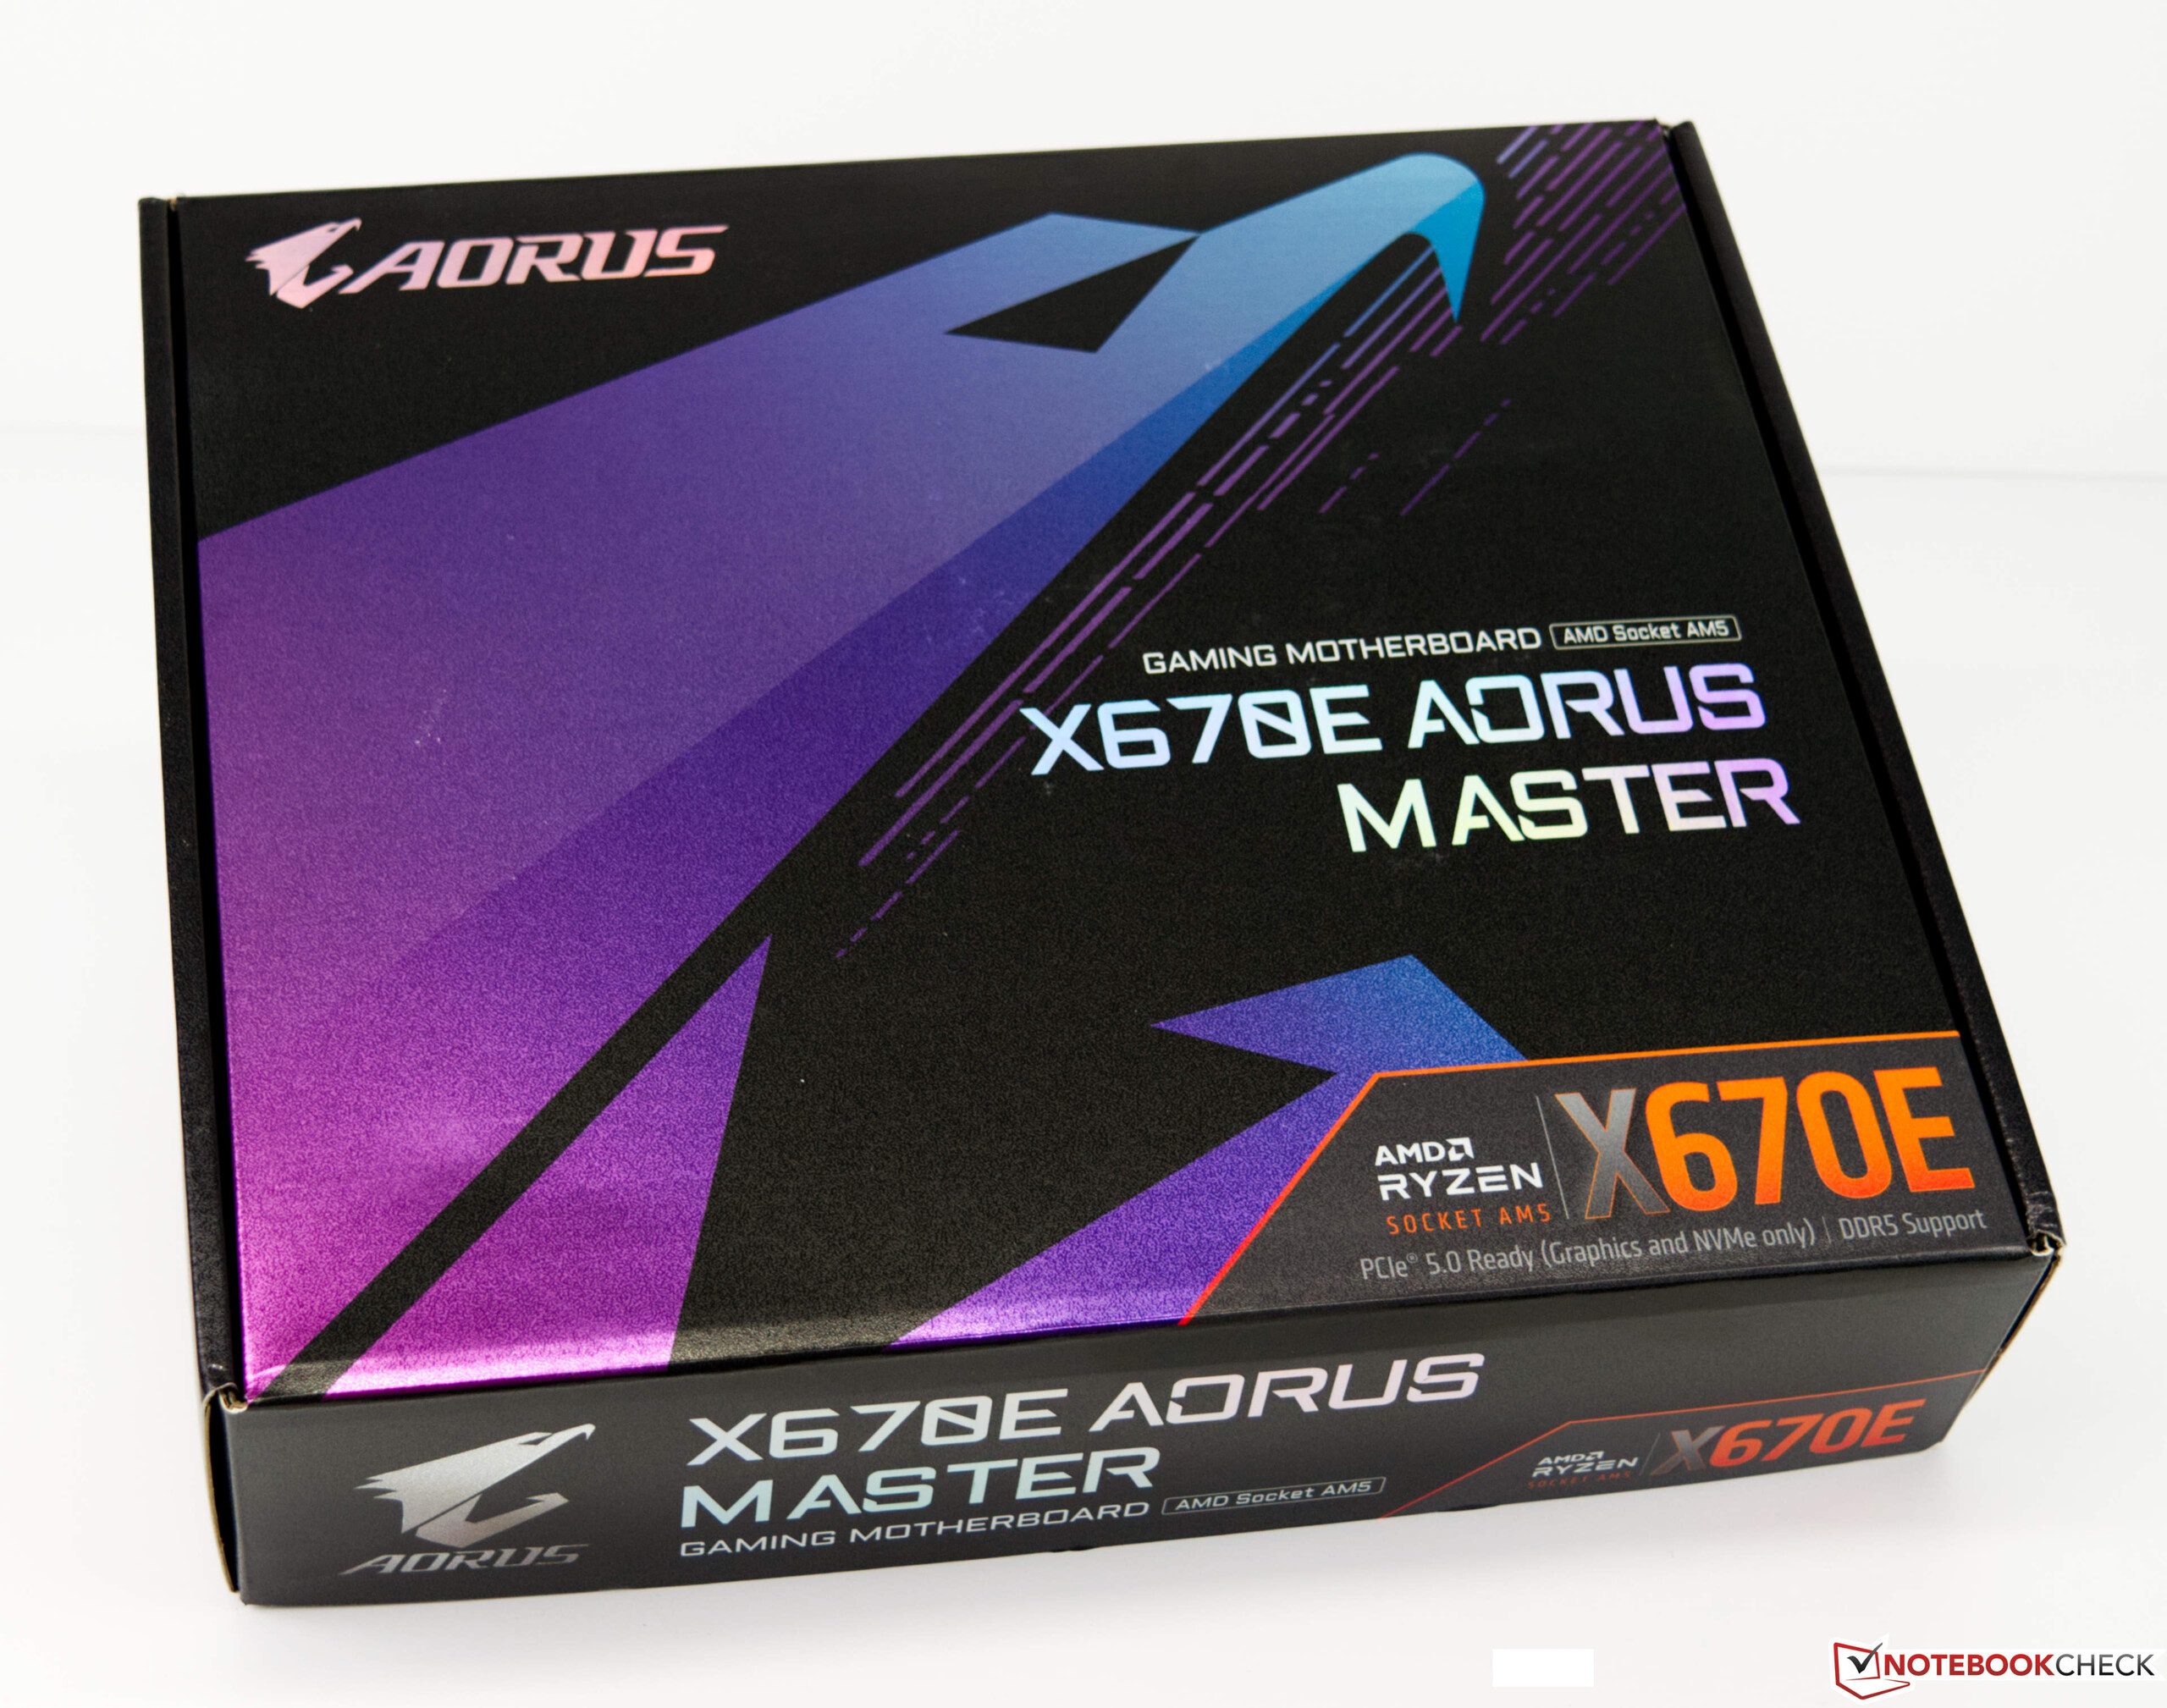
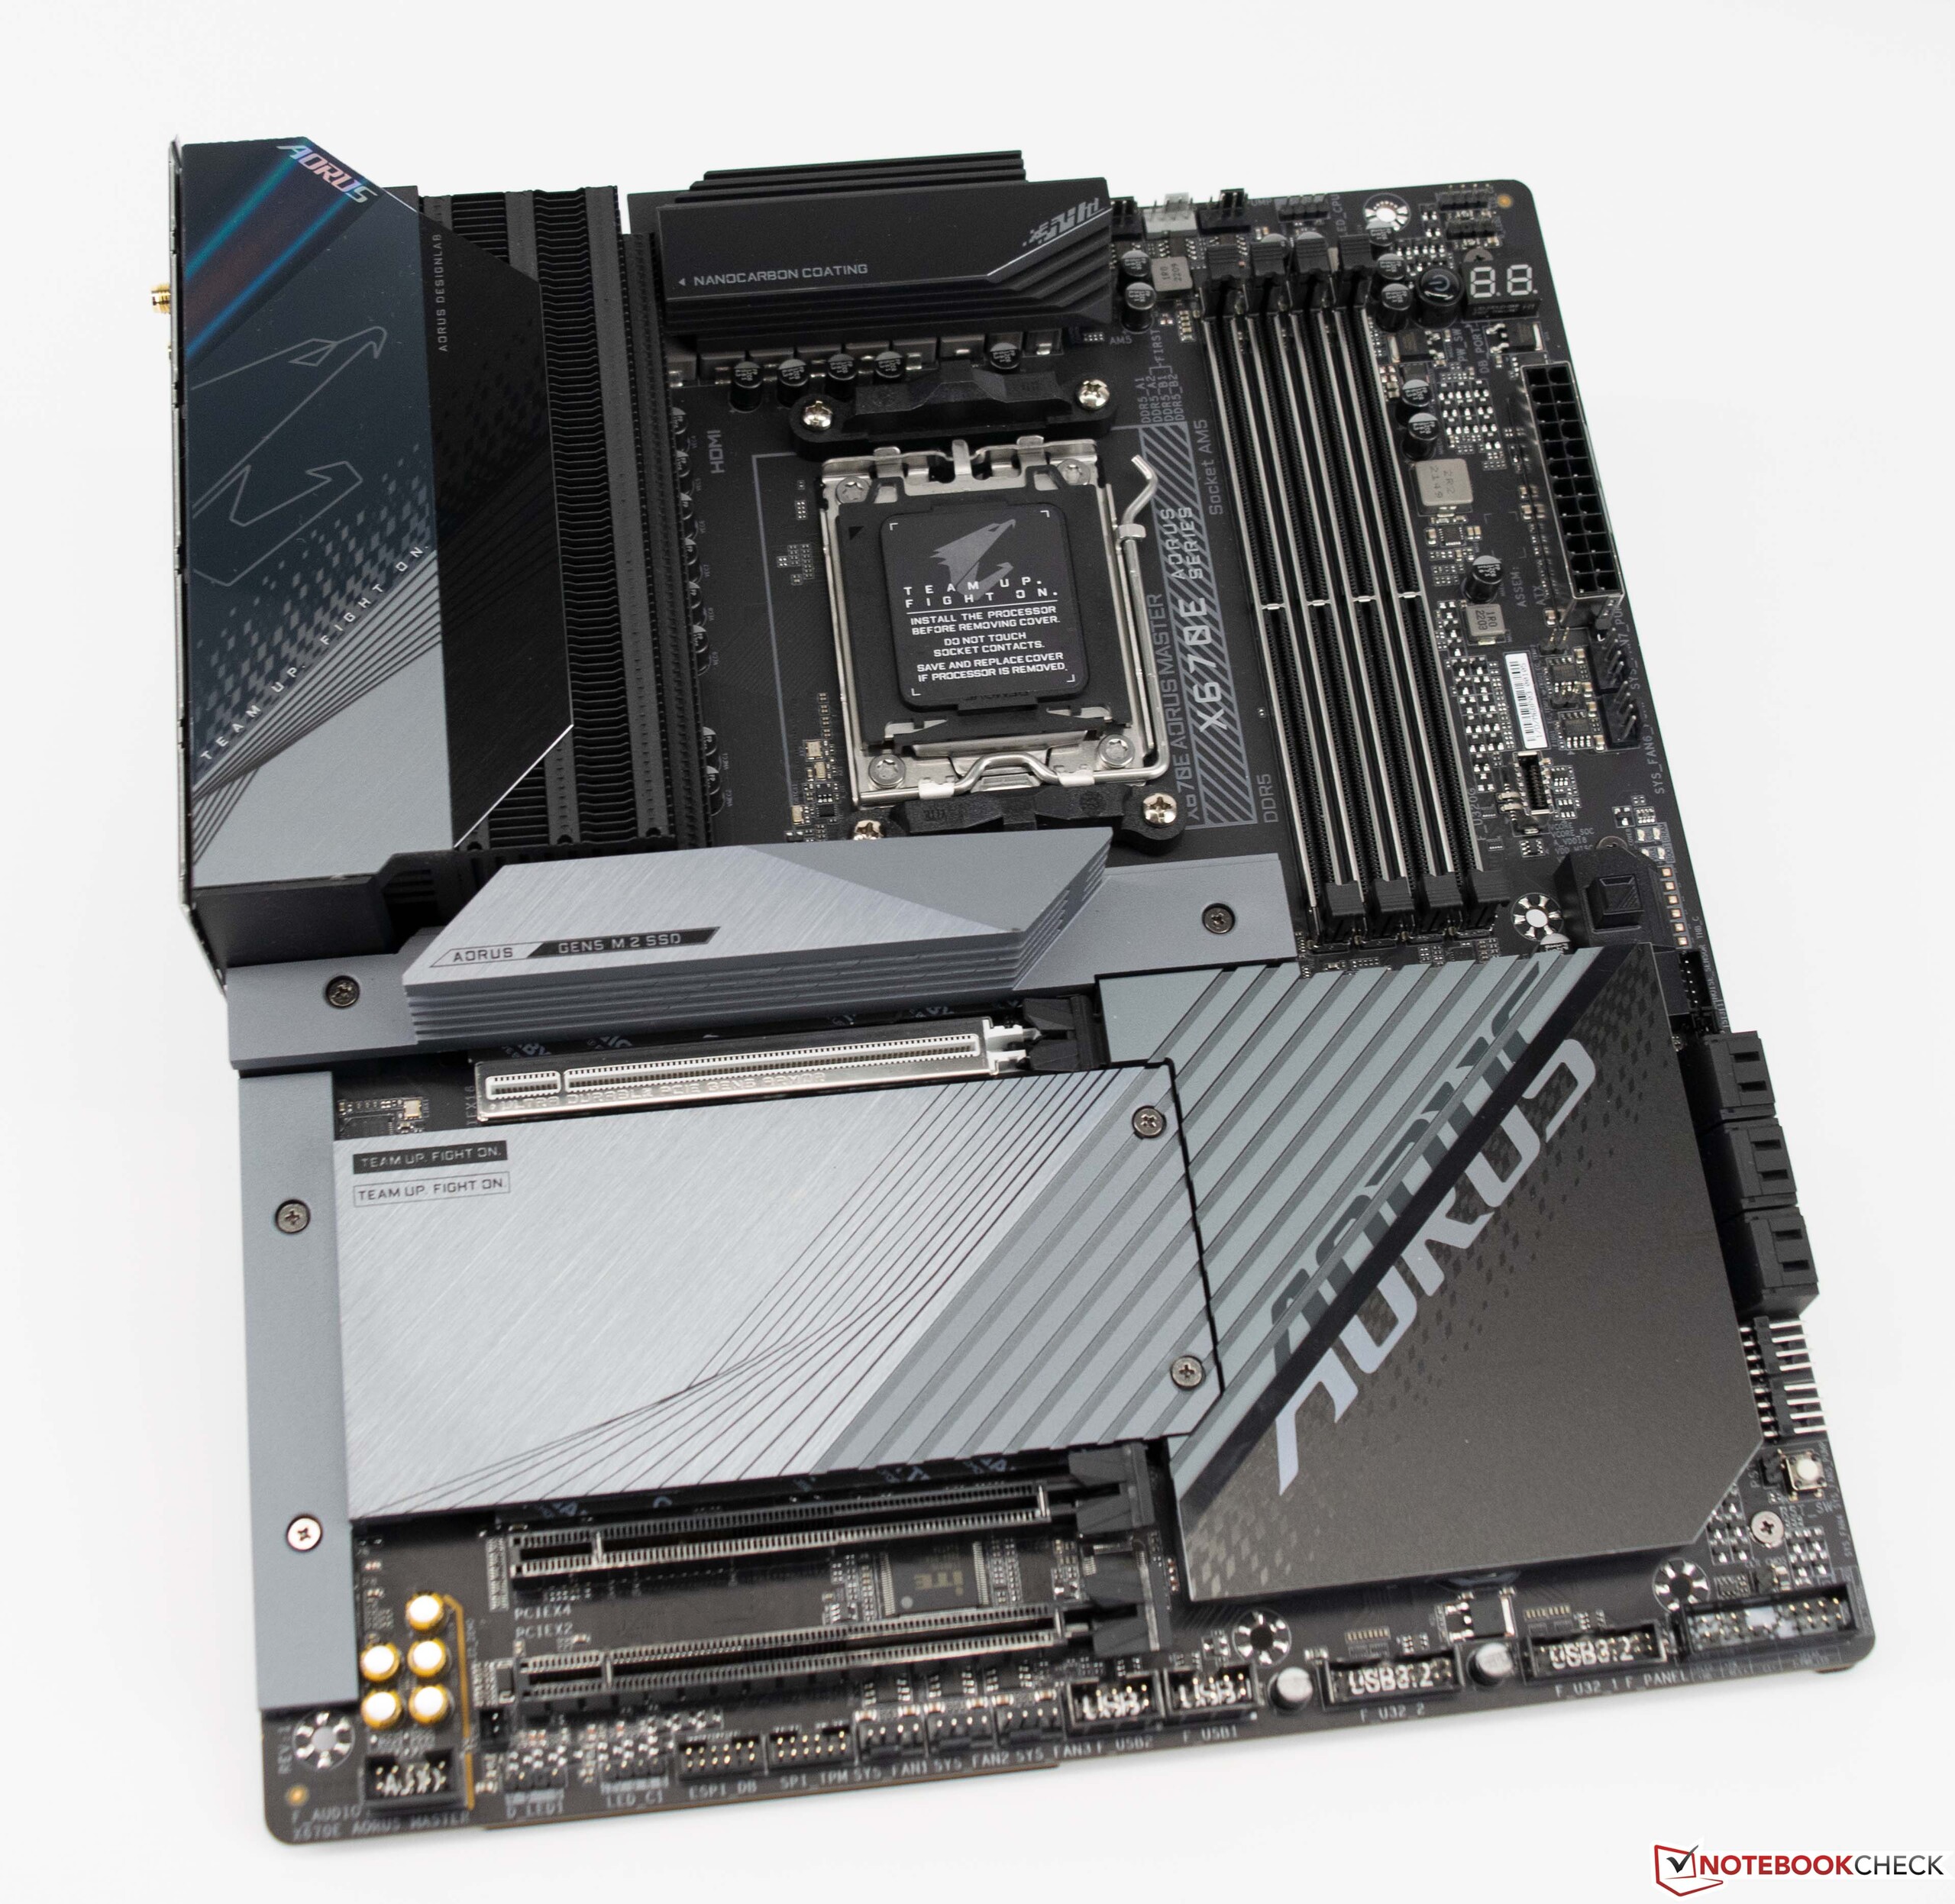
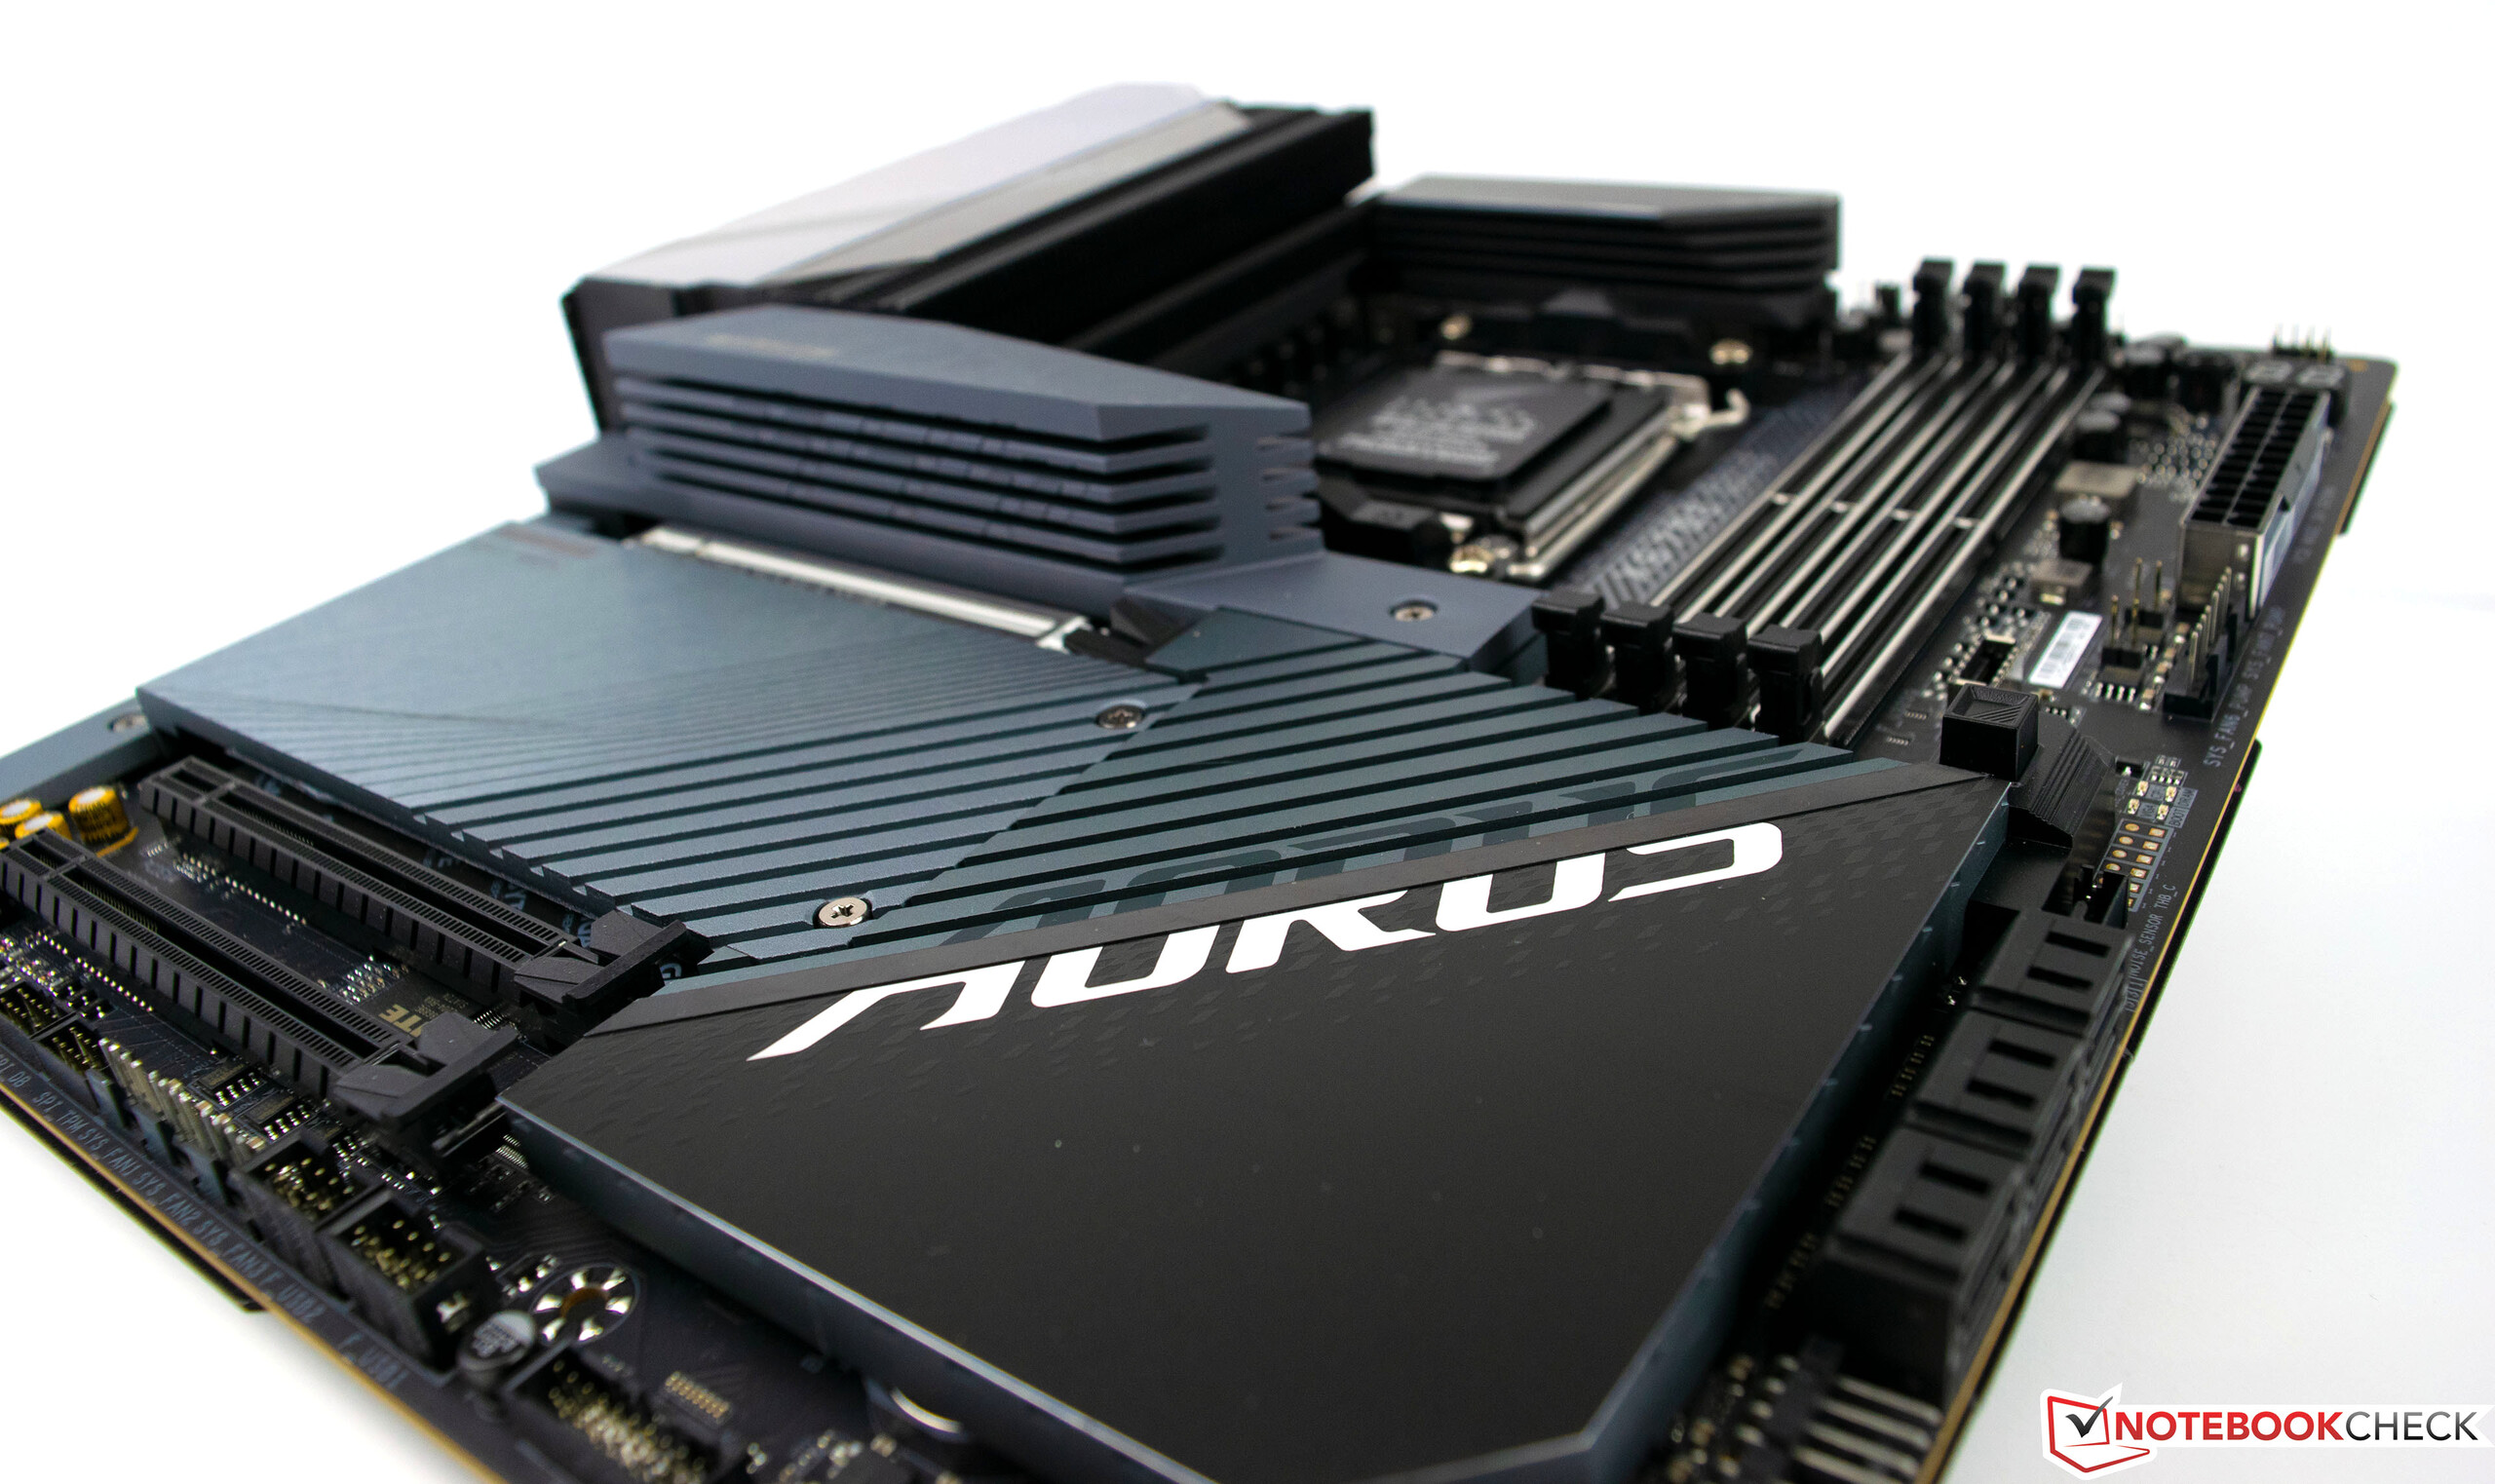
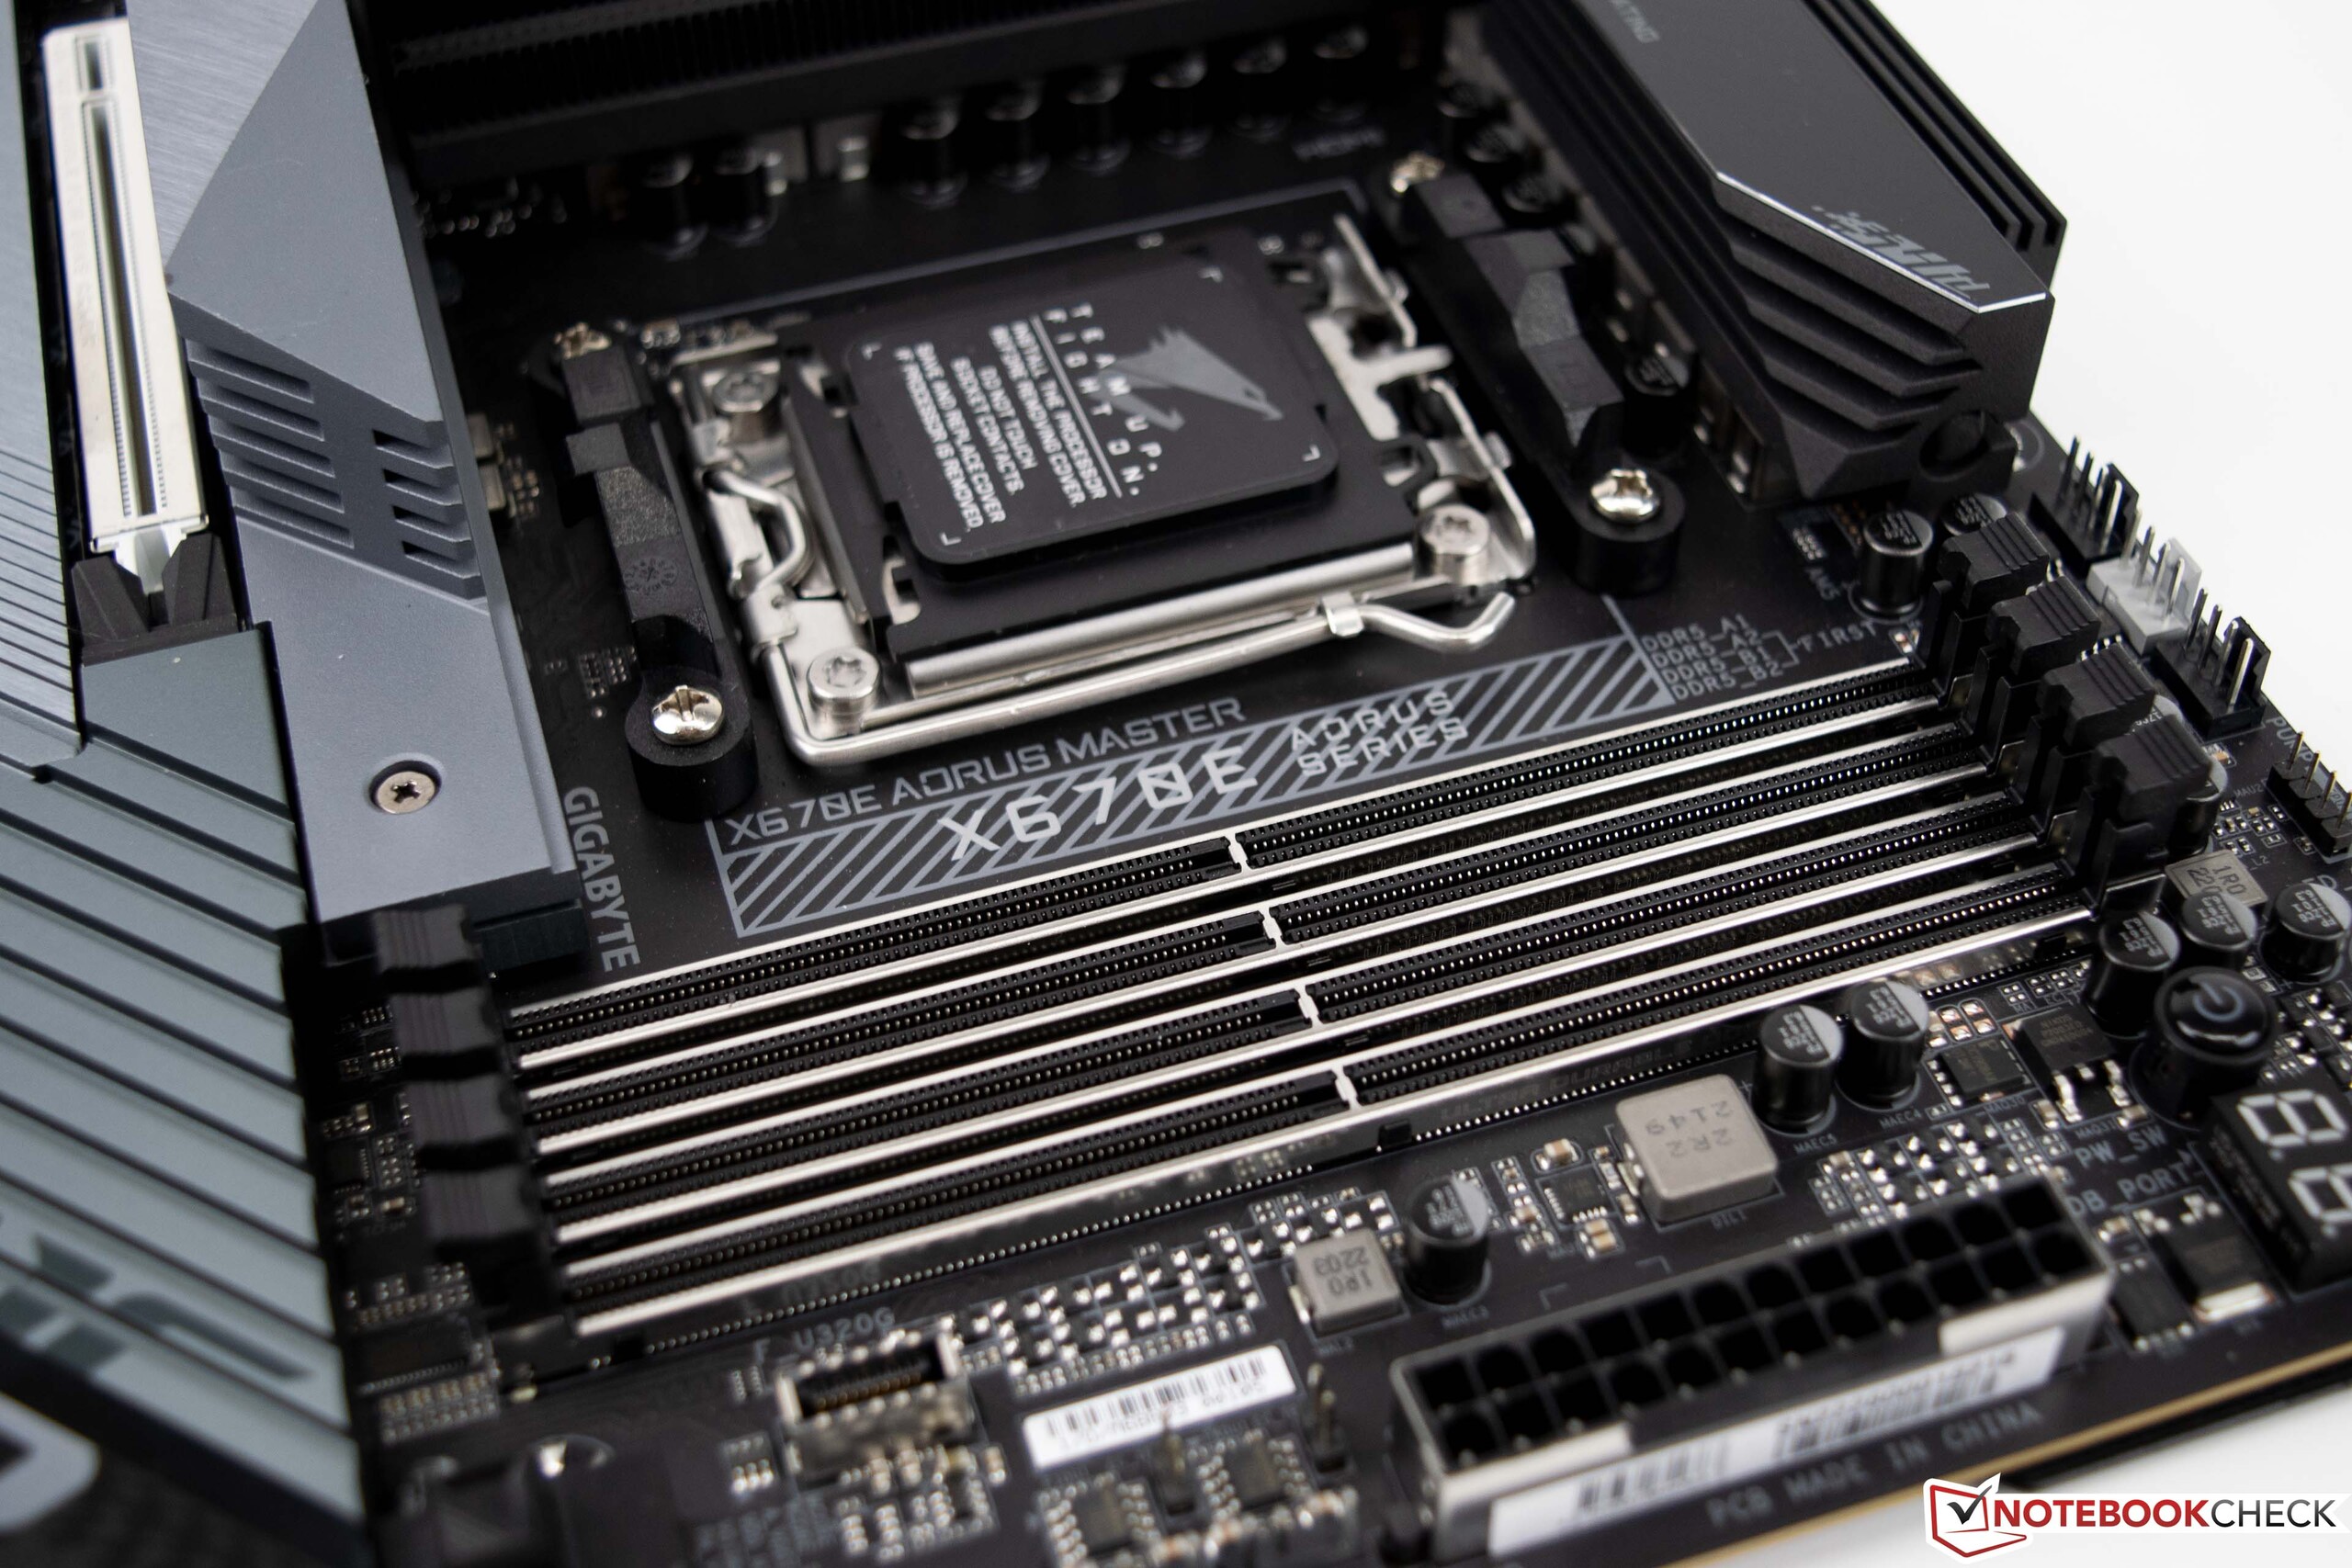
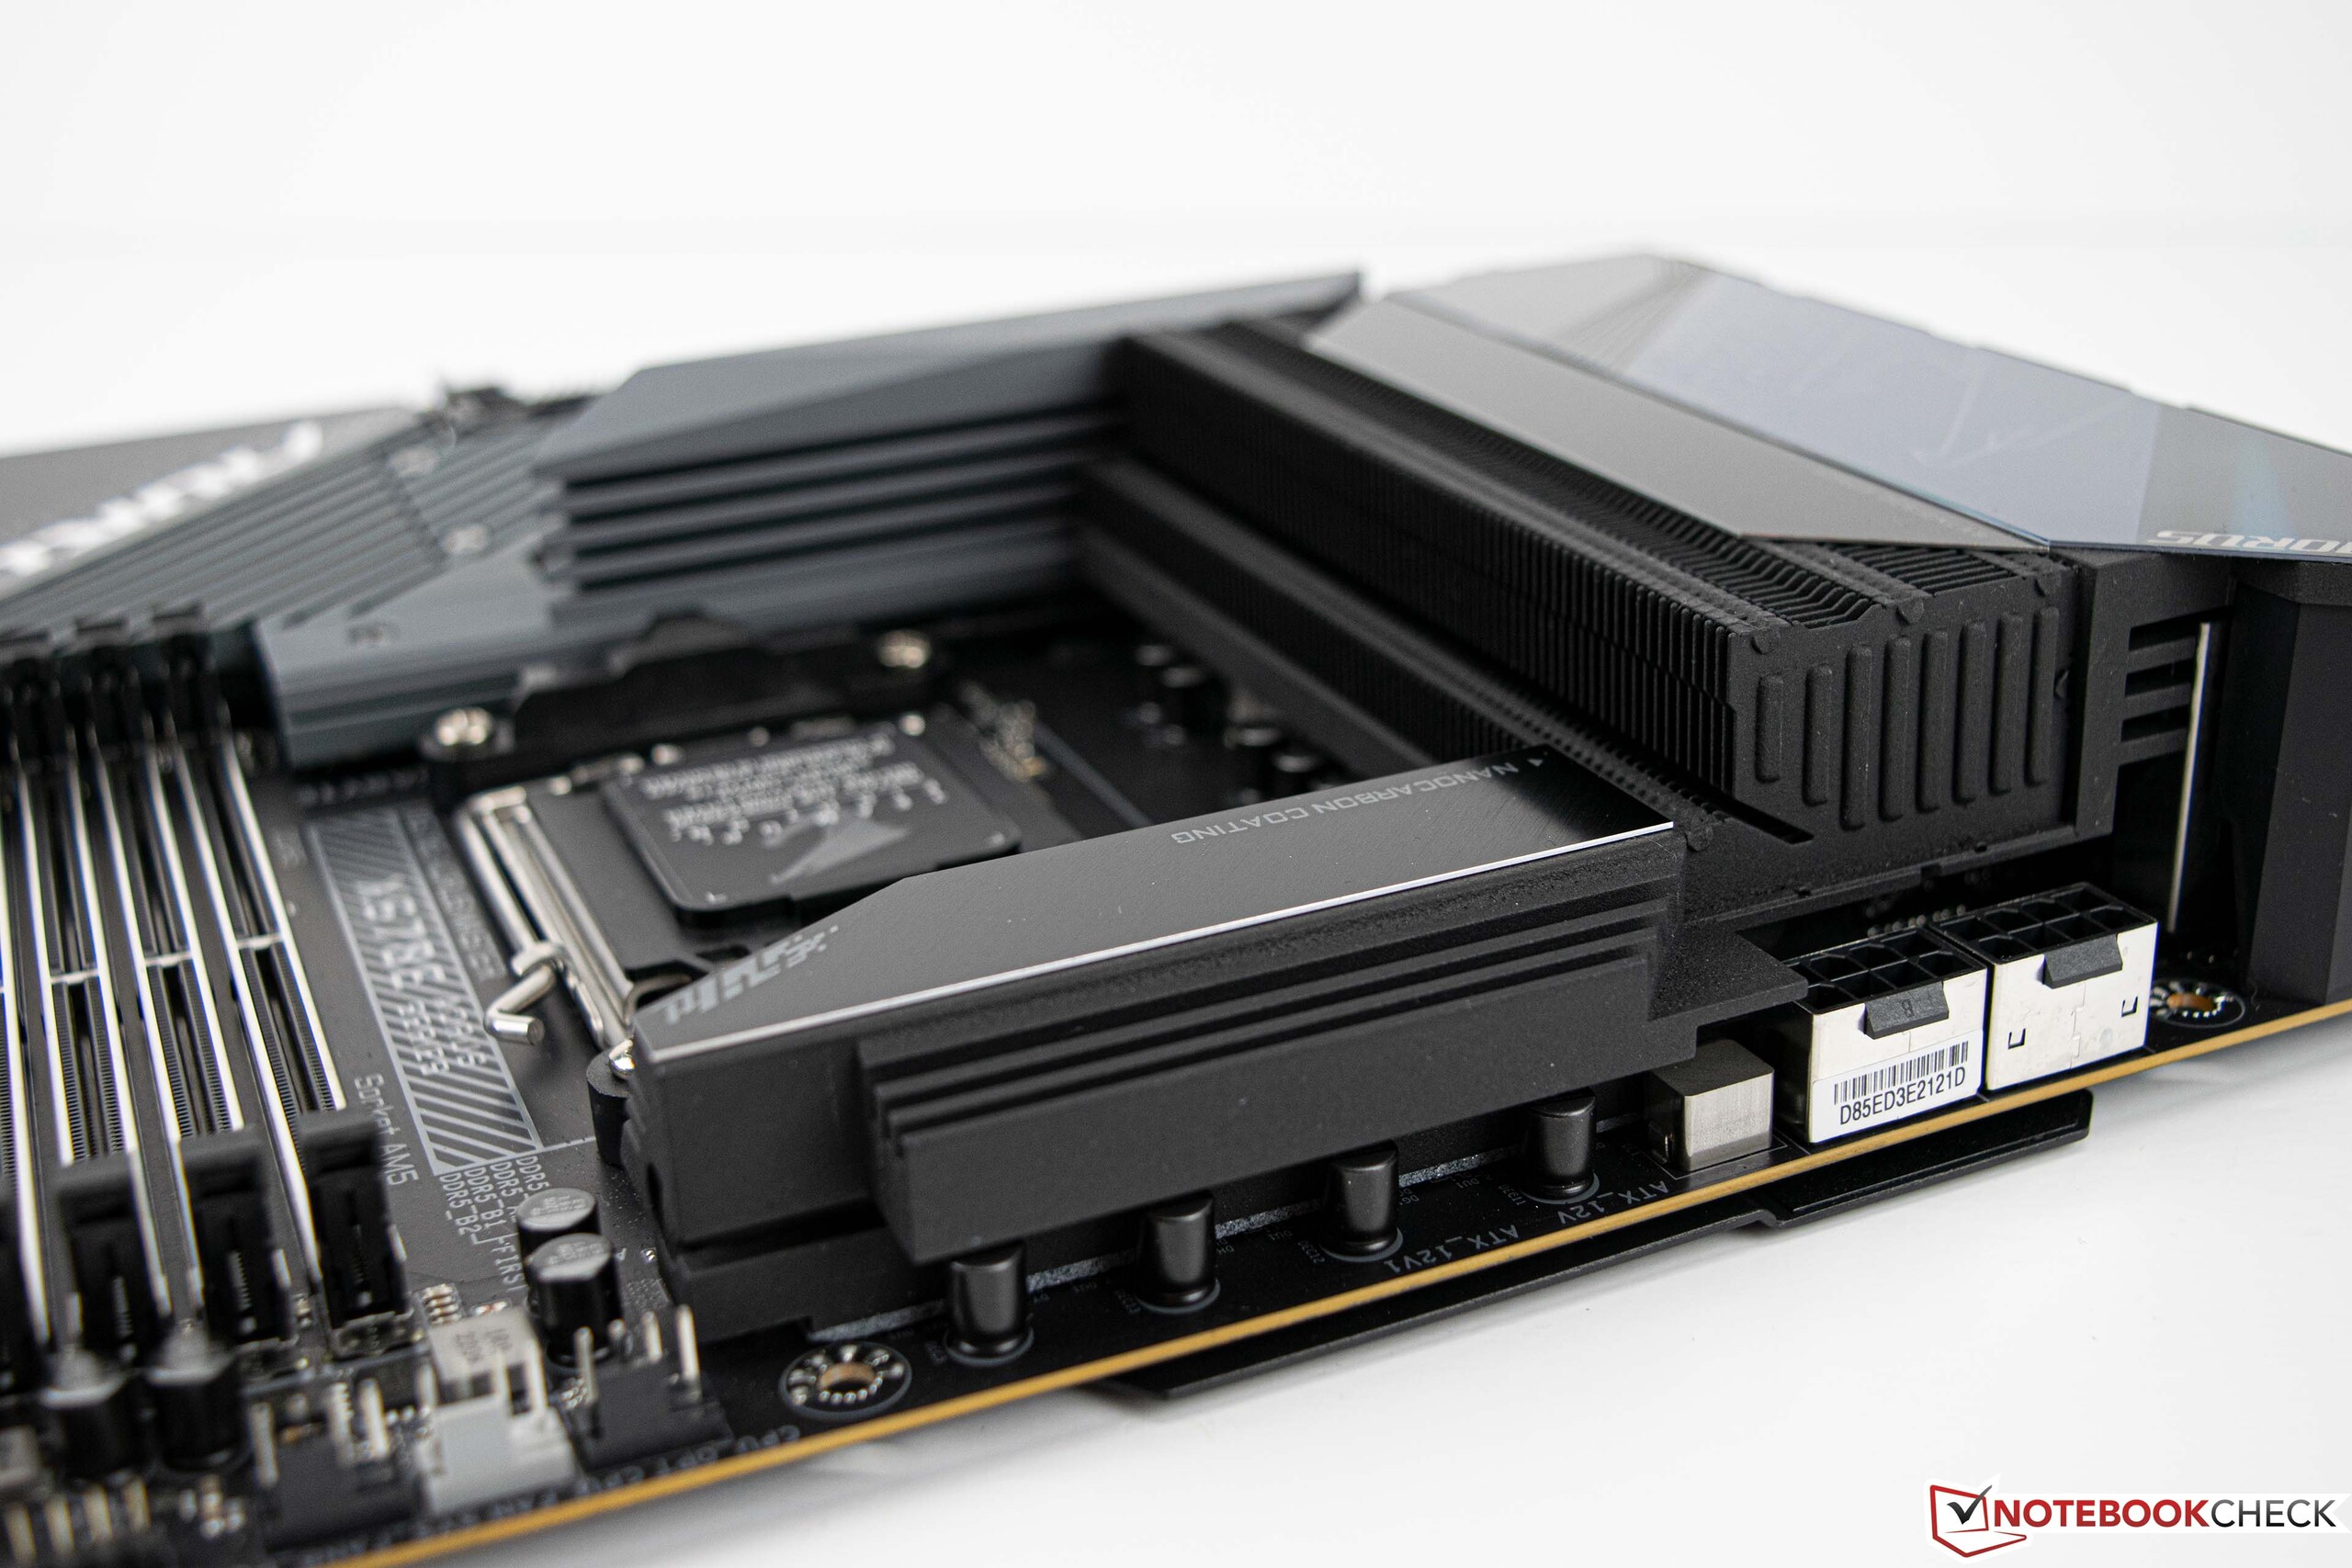
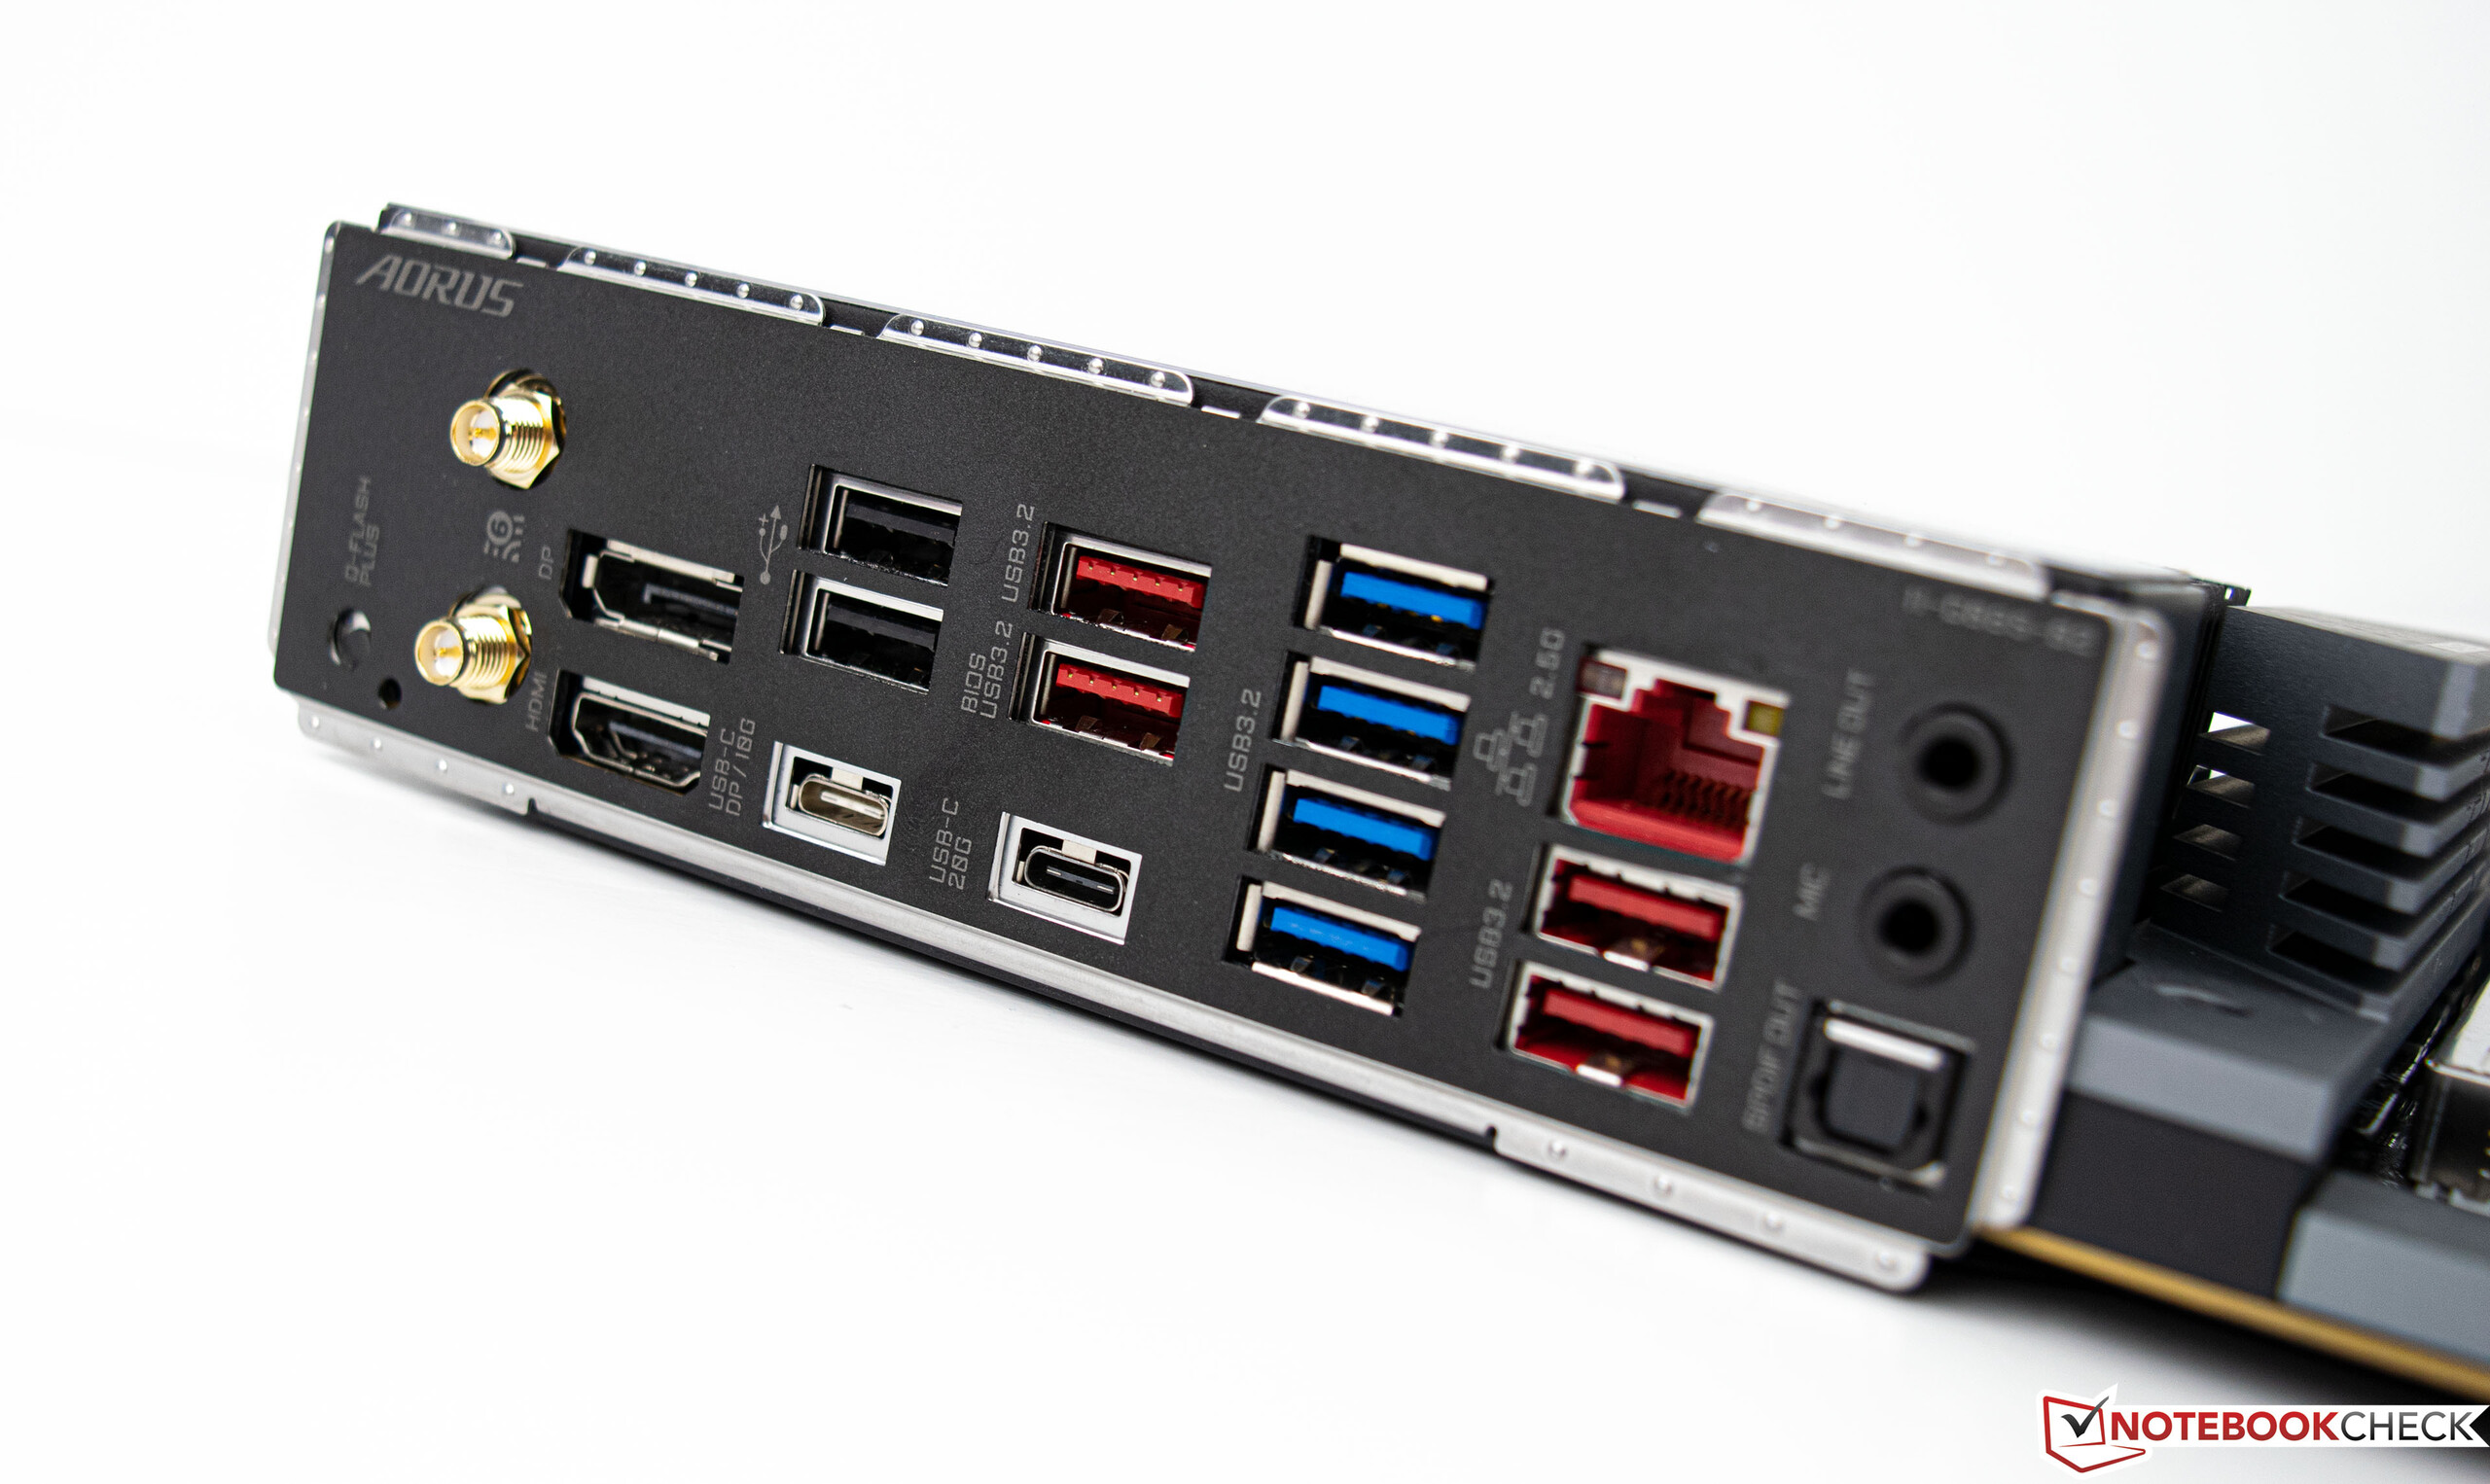
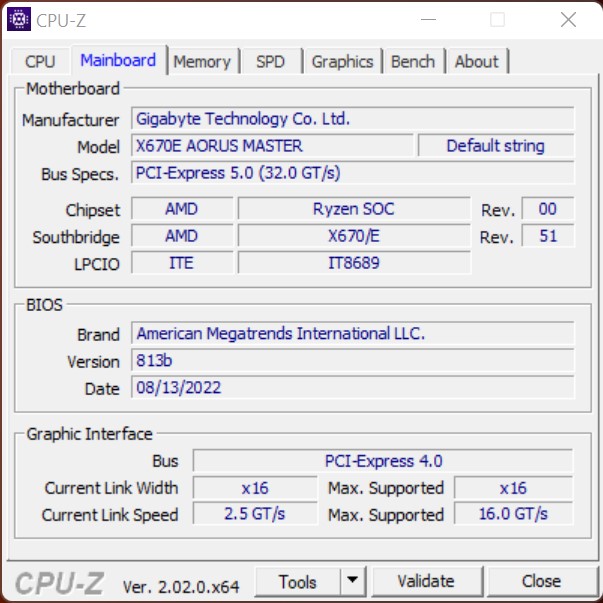
Il Gigabyte X670E Aorus Master in dettaglio
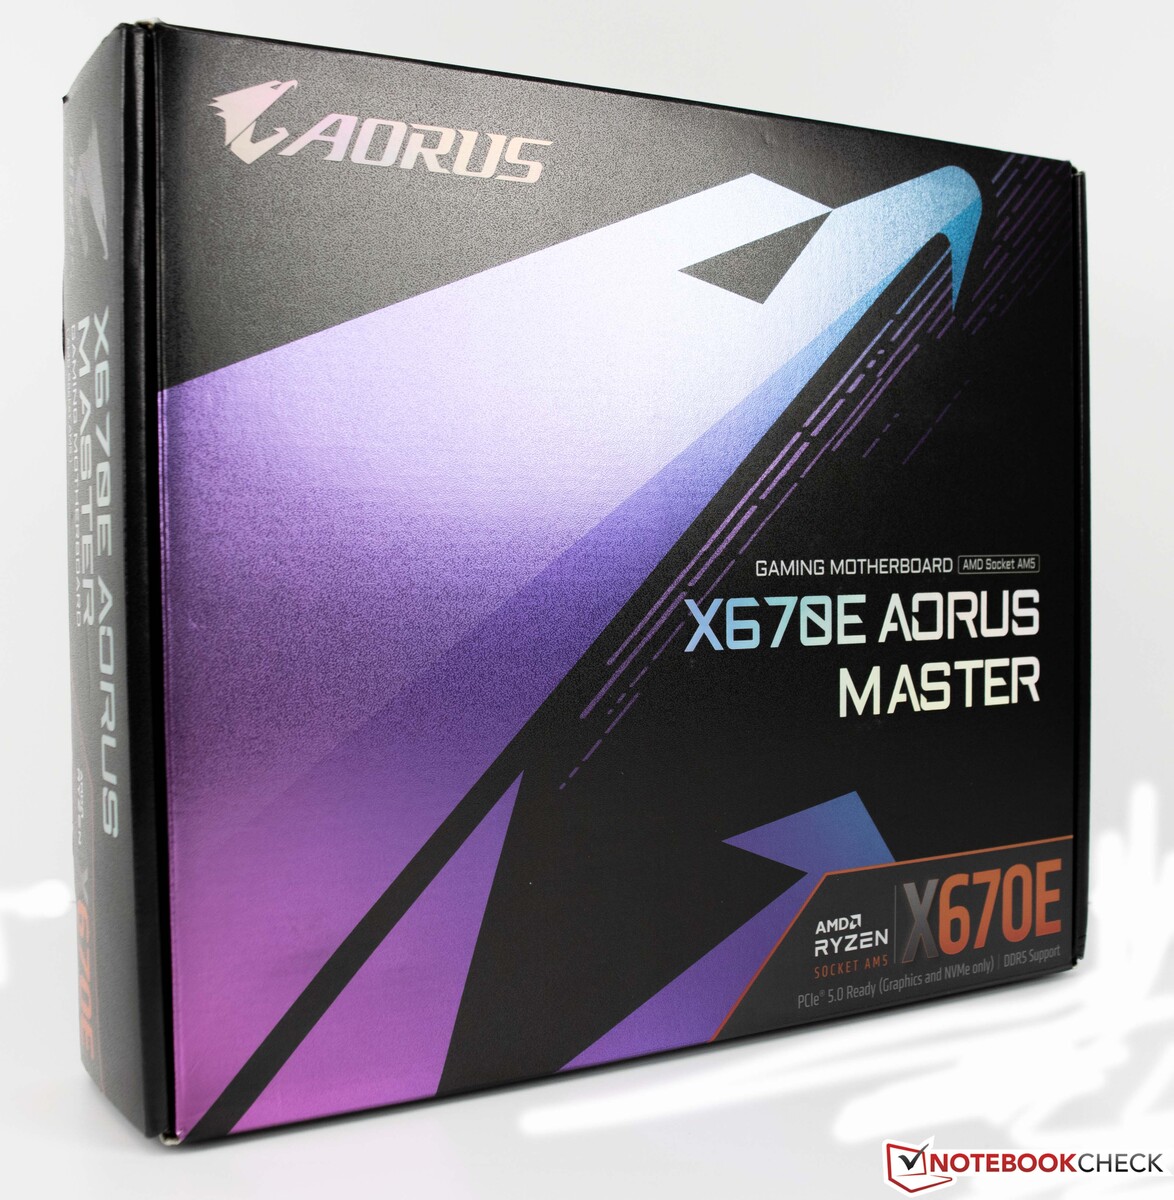
Utilizziamo la Gigabyte X670E Aorus Master come base per il nostro test. La scheda madre offre tutte le nuove caratteristiche dei nuovi processori AMD Ryzen. Tra queste c'è il supporto PCIe 5.0, che sarà utilizzato dalle future unità SSD ma anche dalle schede grafiche.
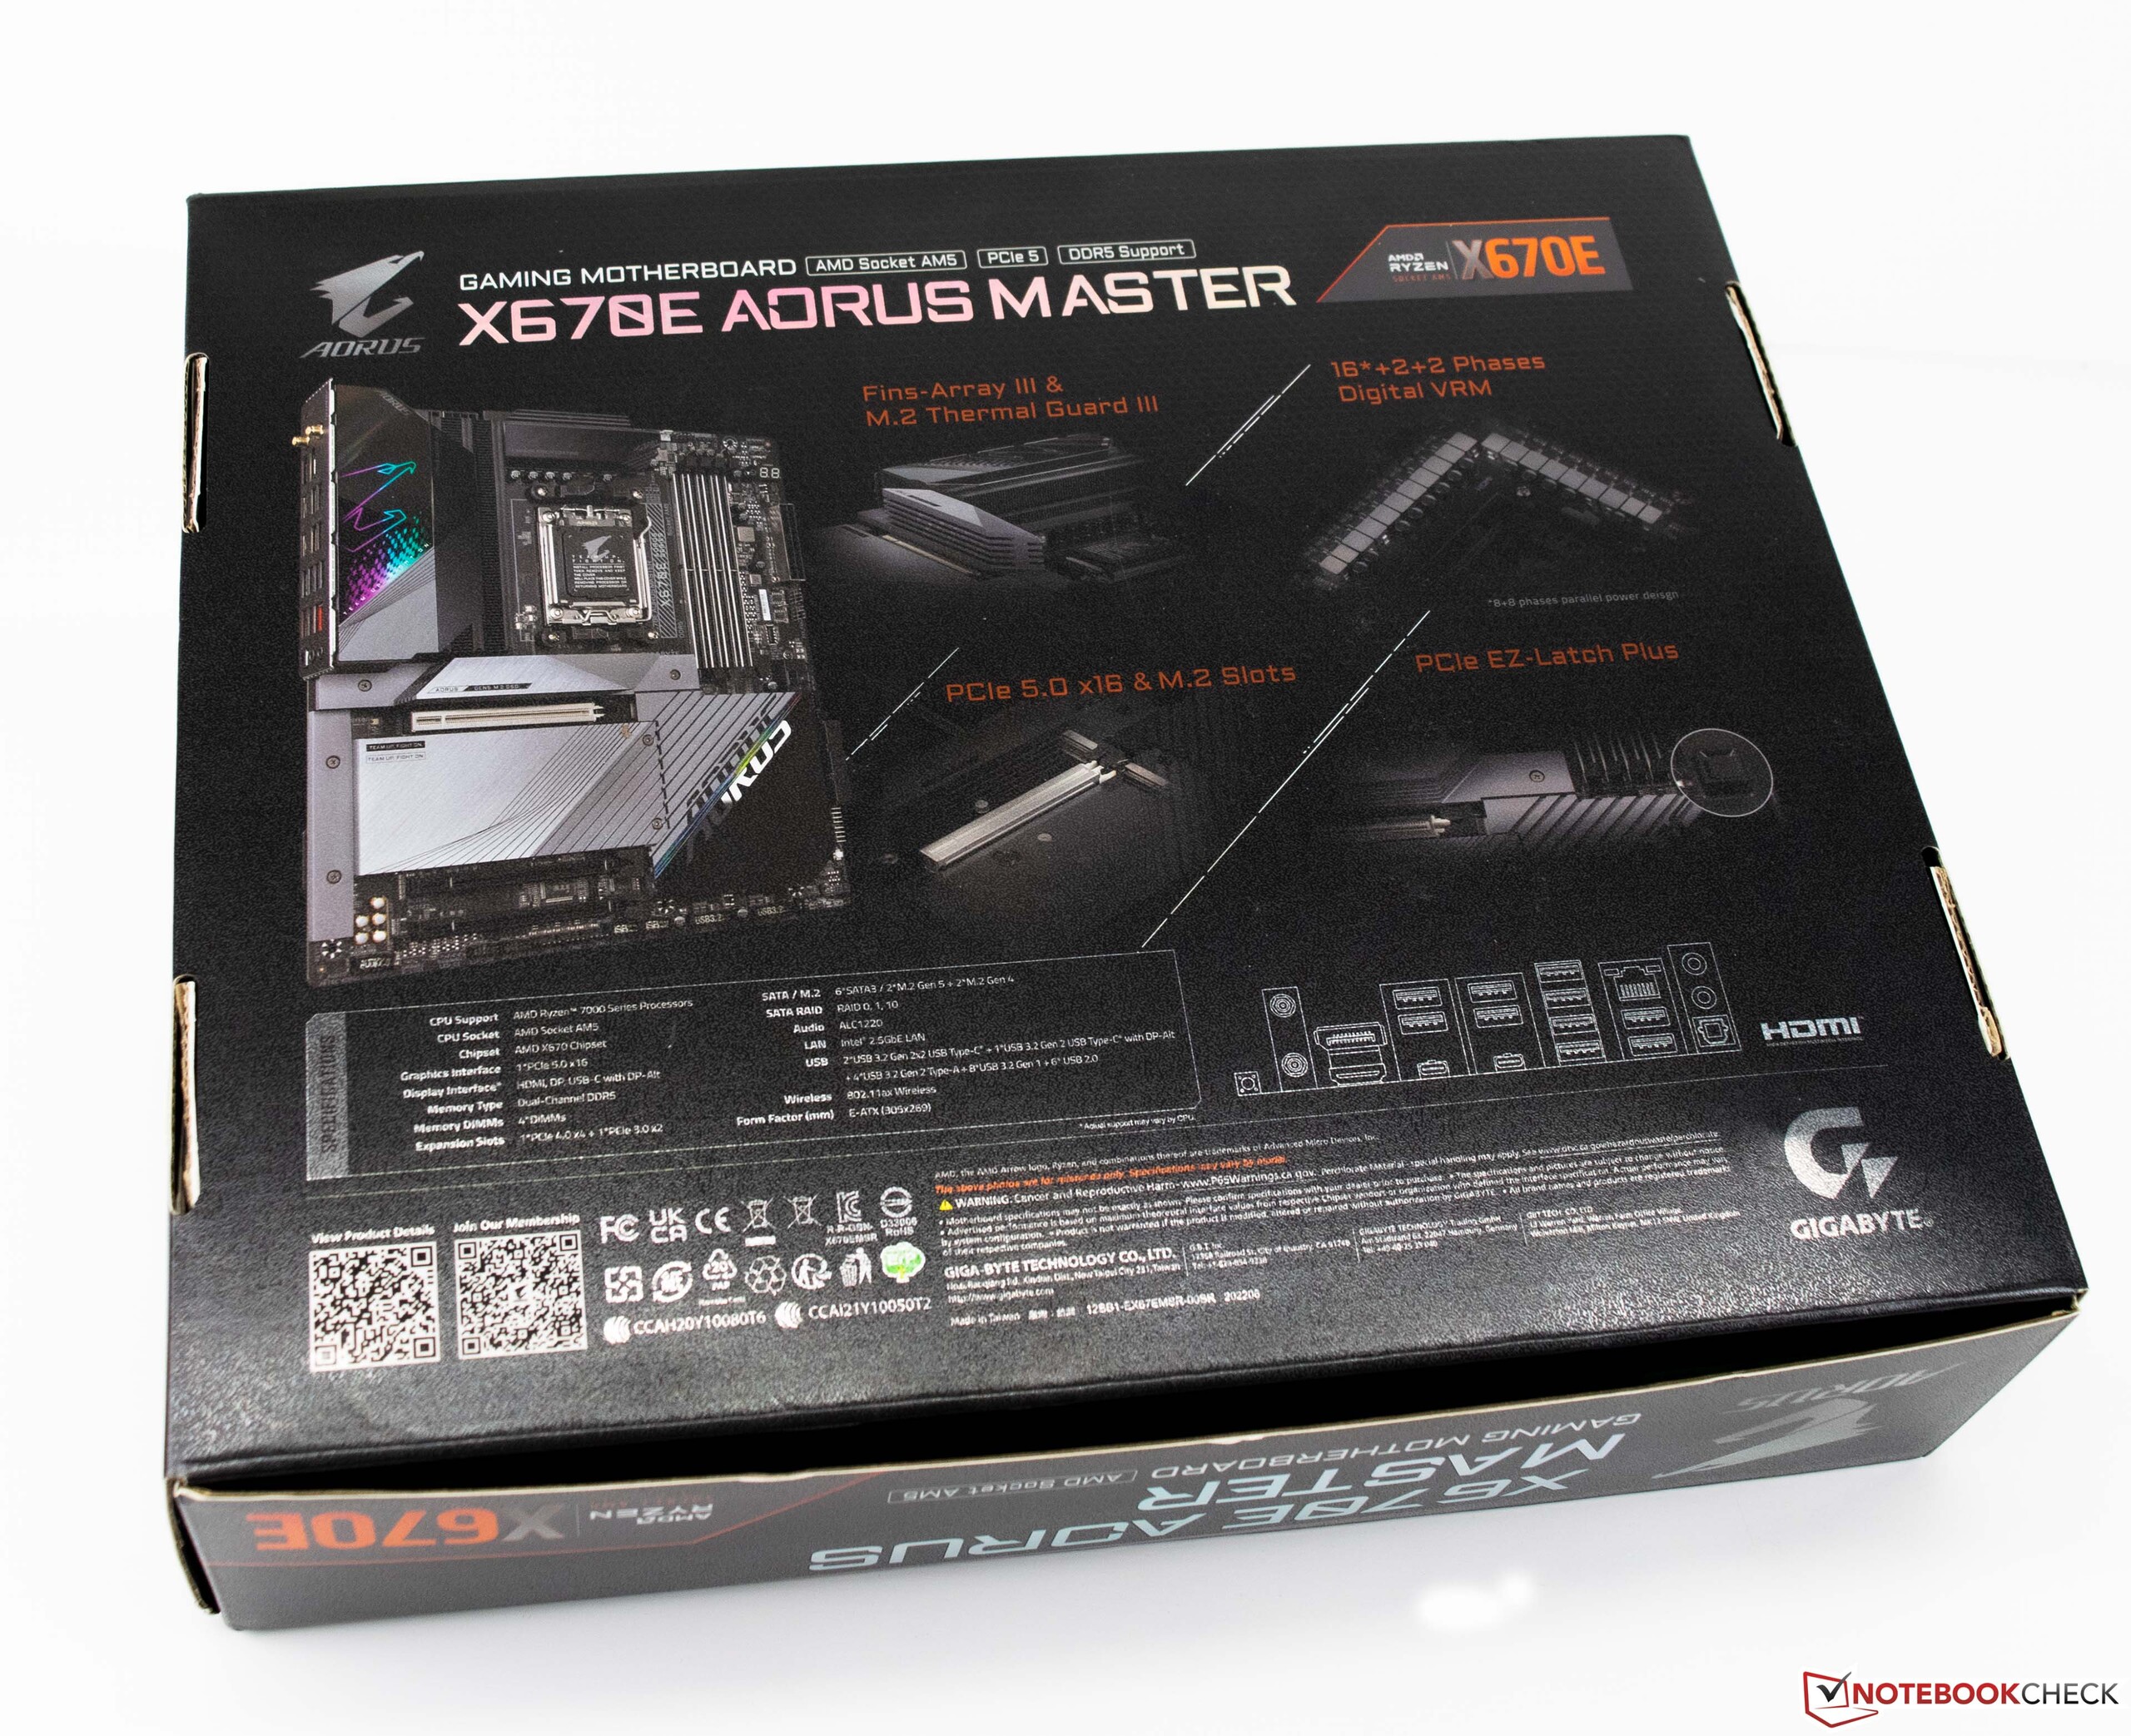
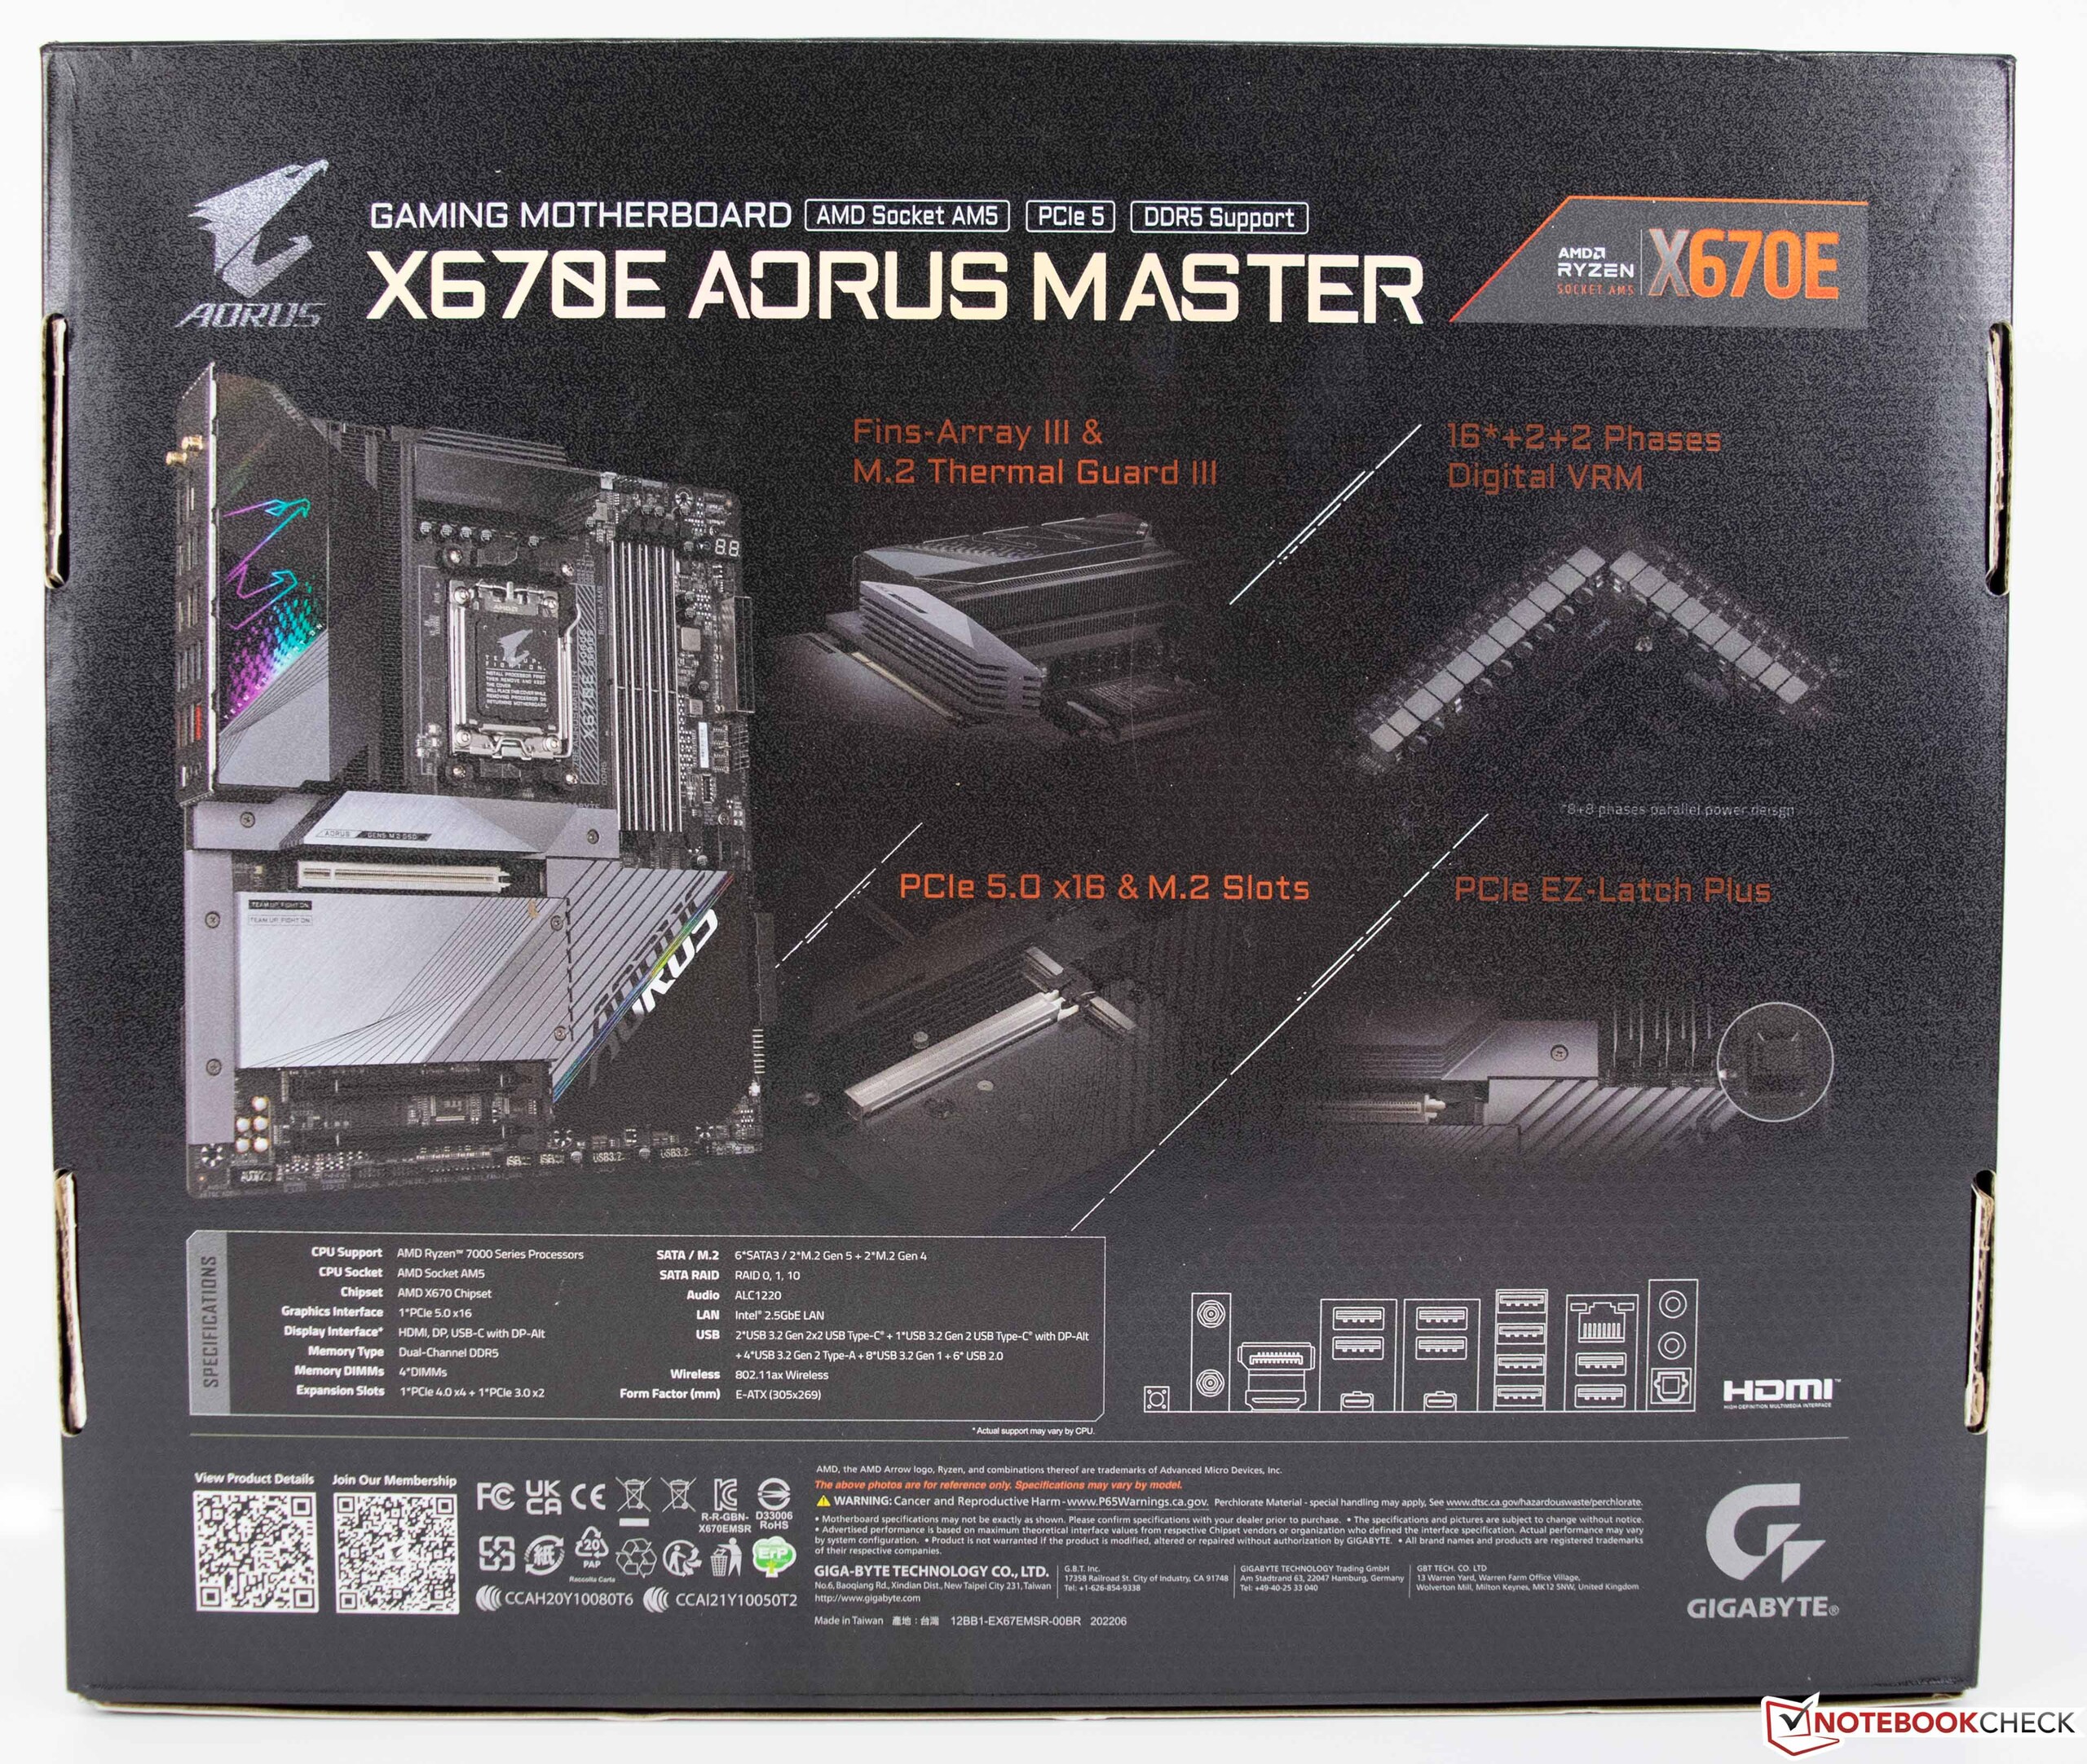
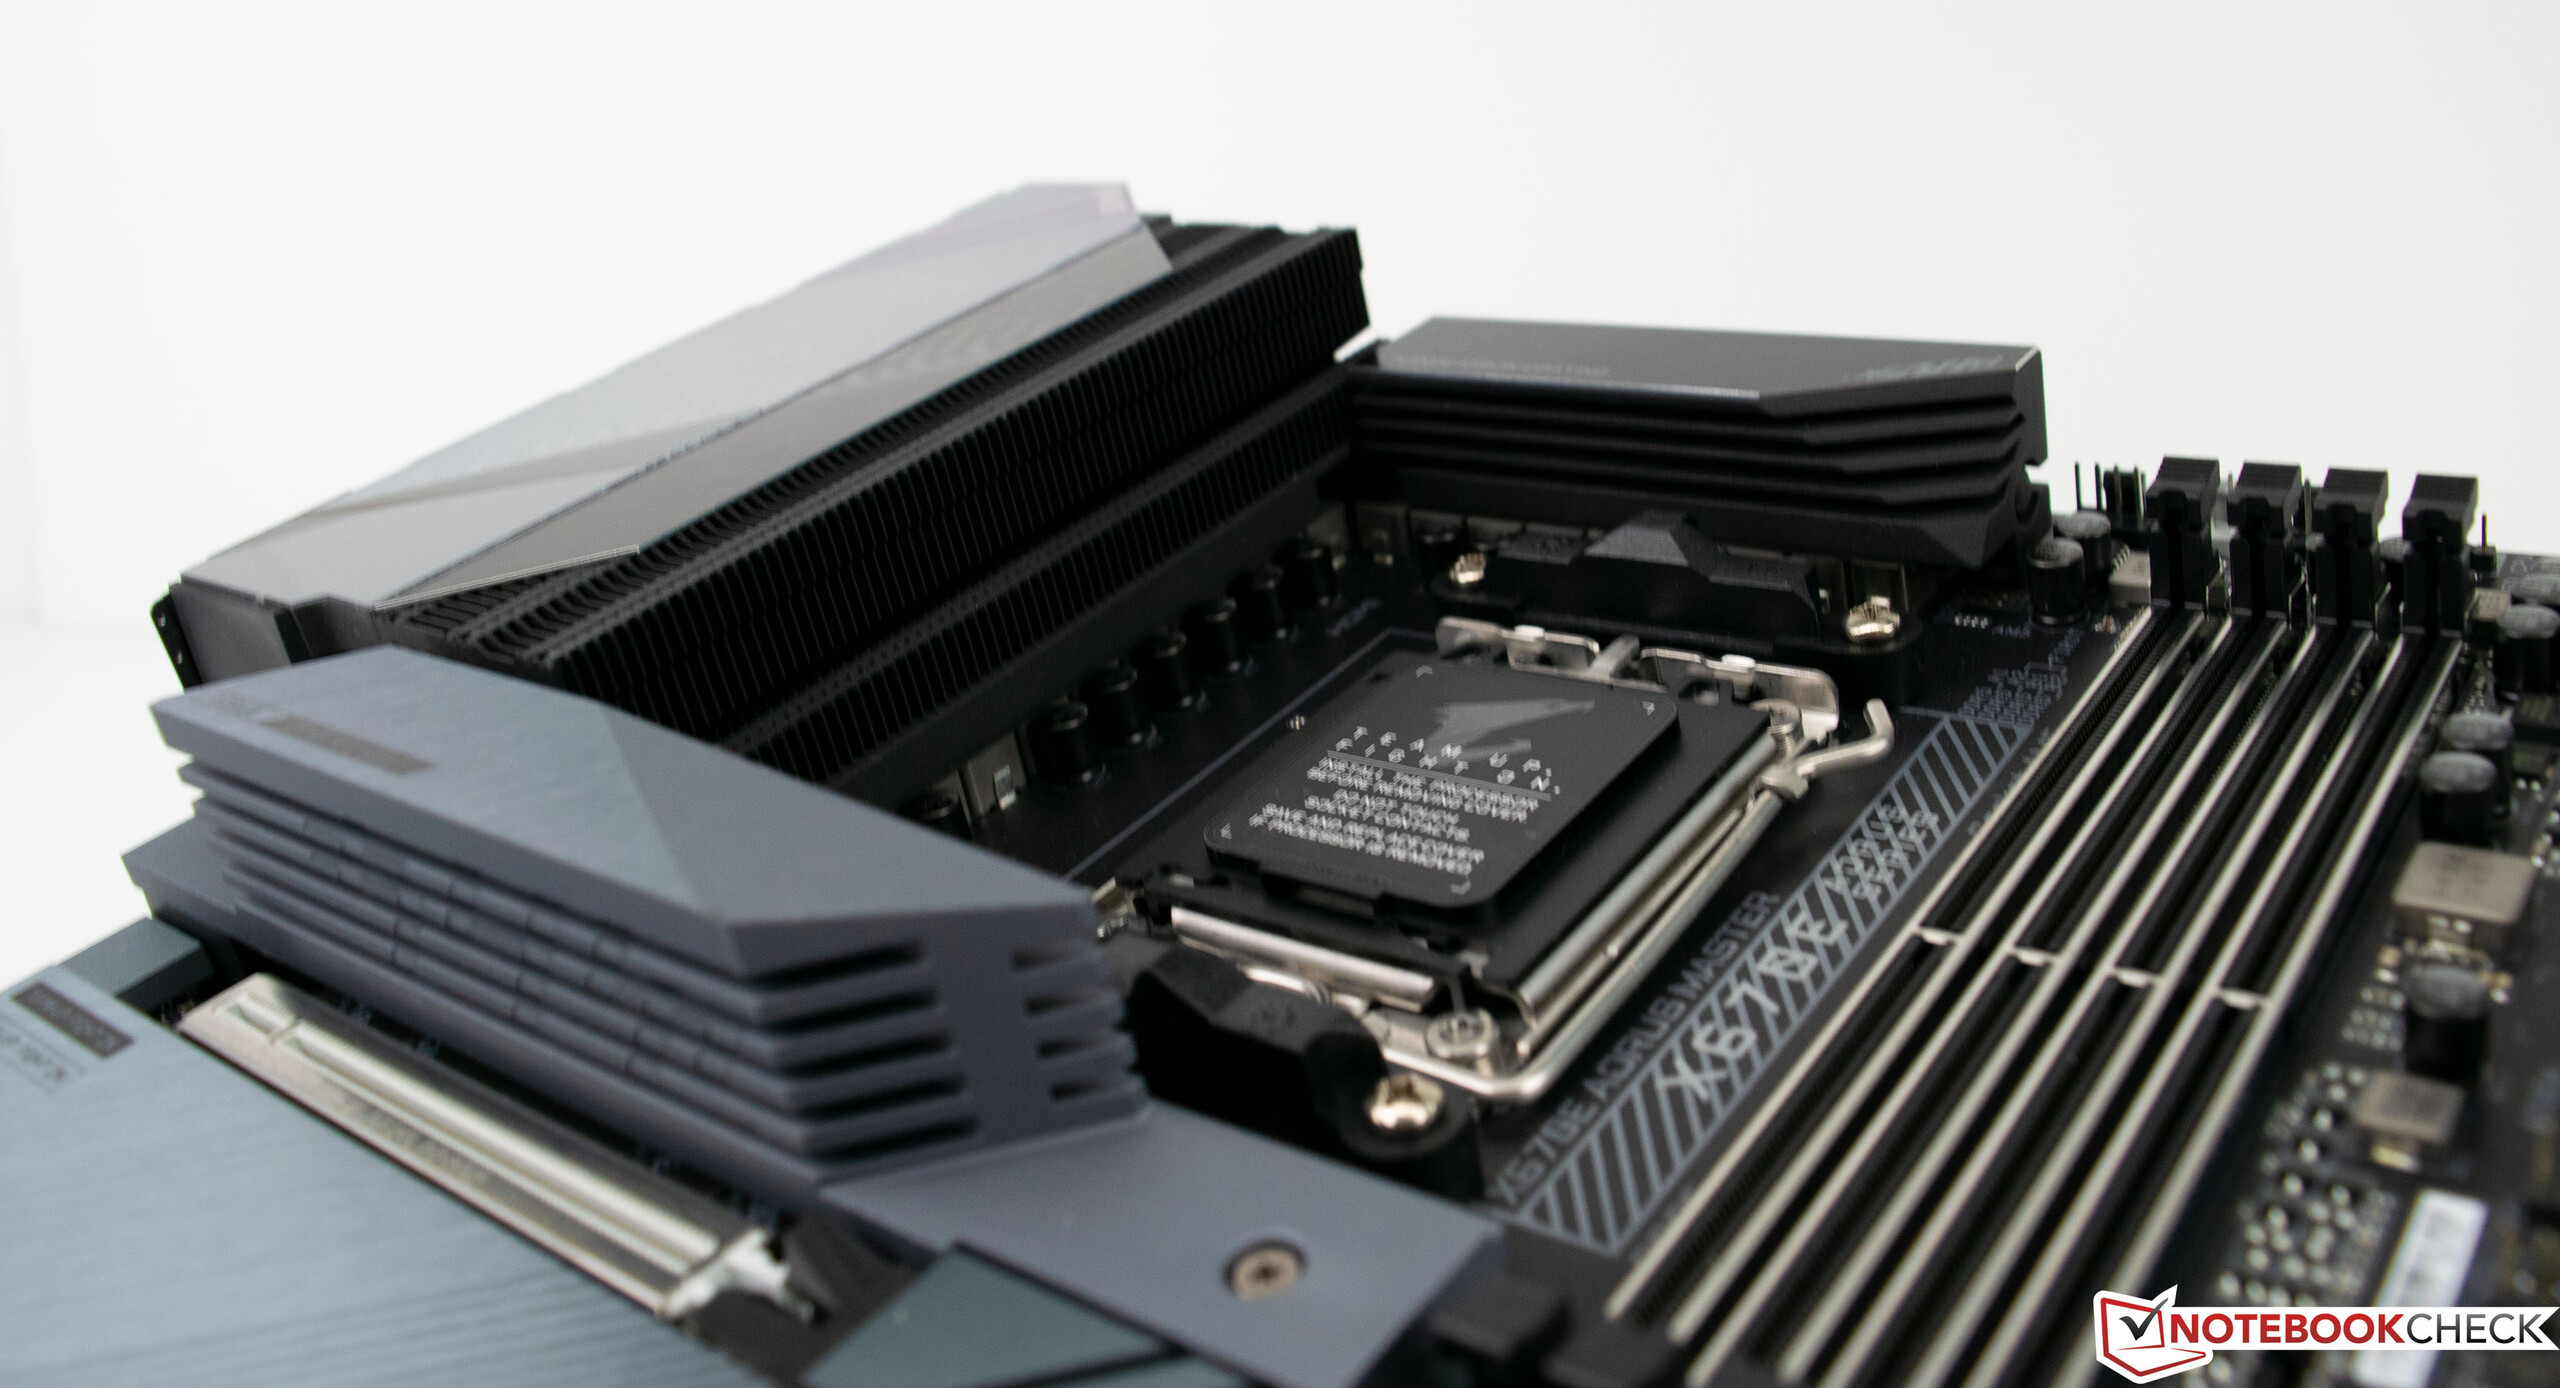
In totale, ci saranno quattro diversi chipset per il socket AM5, tra cui X670E, X670, B650E e B650. Tuttavia, le schede più economiche saranno disponibili solo nelle prossime settimane. L'ammiraglia di Gigabyte offre 16+2+2 fasi con il chipset X670 Extreme per garantire una buona alimentazione del processore anche in caso di overclock estremo. I convertitori di tensione si trovano sotto un massiccio dissipatore di calore, il che significa che non abbiamo avuto problemi di temperatura anche sotto carico.
In totale, è possibile memorizzare fino a quattro unità SSD M.2 direttamente sulla scheda madre. Tuttavia, solo il primo slot M.2 offre il nuovo supporto PCIe 5.0. Il raffreddamento attivo del chipset, che era presente nelle schede X570, non è disponibile nella Gigabyte X670E Aorus Master. Il nuovo socket LGA, noto come AM5, offre 1.718 aree di contatto ed è compatibile con i vecchi dissipatori AM4. AMD ha anche parlato della durata del nuovo socket AM5 durante il lancio del prodotto. Si suppone che possa servire come base almeno fino al 2025.
Parametri di riferimento del processore
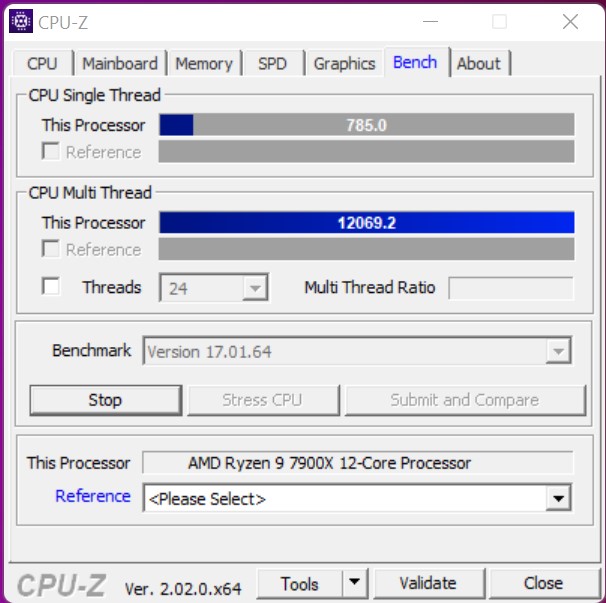
Le specifiche tecniche dei nuovi processori AMD Ryzen 7000 promettono già molto, e i nuovi processori possono effettivamente dimostrarlo in azione. Rispetto alla generazione Ryzen 5000, registriamo un aumento delle prestazioni del 26% per l'AMD Ryzen 9 7900X. L'AMD Ryzen 5 7600X può guadagnare quasi il 20% nella valutazione delle prestazioni rispetto all'AMD Ryzen 5 5600X.
Per quanto riguarda l'AMD Ryzen 9 7900X, è ancora più veloce dell'AMD Ryzen 9 5950X AMD Ryzen 9 5950X. Ma il nuovo 12-core può anche prevalere sul 16-core nei singoli benchmark. Pertanto, possiamo ipotizzare che l'AMD Ryzen 9 7950X sia in grado di fornire prestazioni multi-thread nettamente superiori. Nei prossimi giorni cercheremo di sottoporre questo campione al nostro test per poter mostrare le prestazioni del modello di punta rispetto alla concorrenza. A proposito della concorrenza, il Intel Core i9-12900K non riesce a tenere il passo con l'AMD Ryzen 9 7900X e si posiziona al 9% dietro il nostro campione di prova.
Il più piccolo AMD Ryzen 5 7600X si comporta in modo simile e può superare l'AMD Ryzen 5 5600X AMD Ryzen 5 5600X chiaramente. Il vantaggio rispetto al Intel Core i5-12600K è leggermente inferiore rispetto al 12-core, circa il 6%, ma è comunque presente.
Resta da vedere cosa proporrà Intel con i nuovi processori Raptor Lake. Questi dovrebbero arrivare a breve e noi siamo già in attesa di un'altra battaglia.
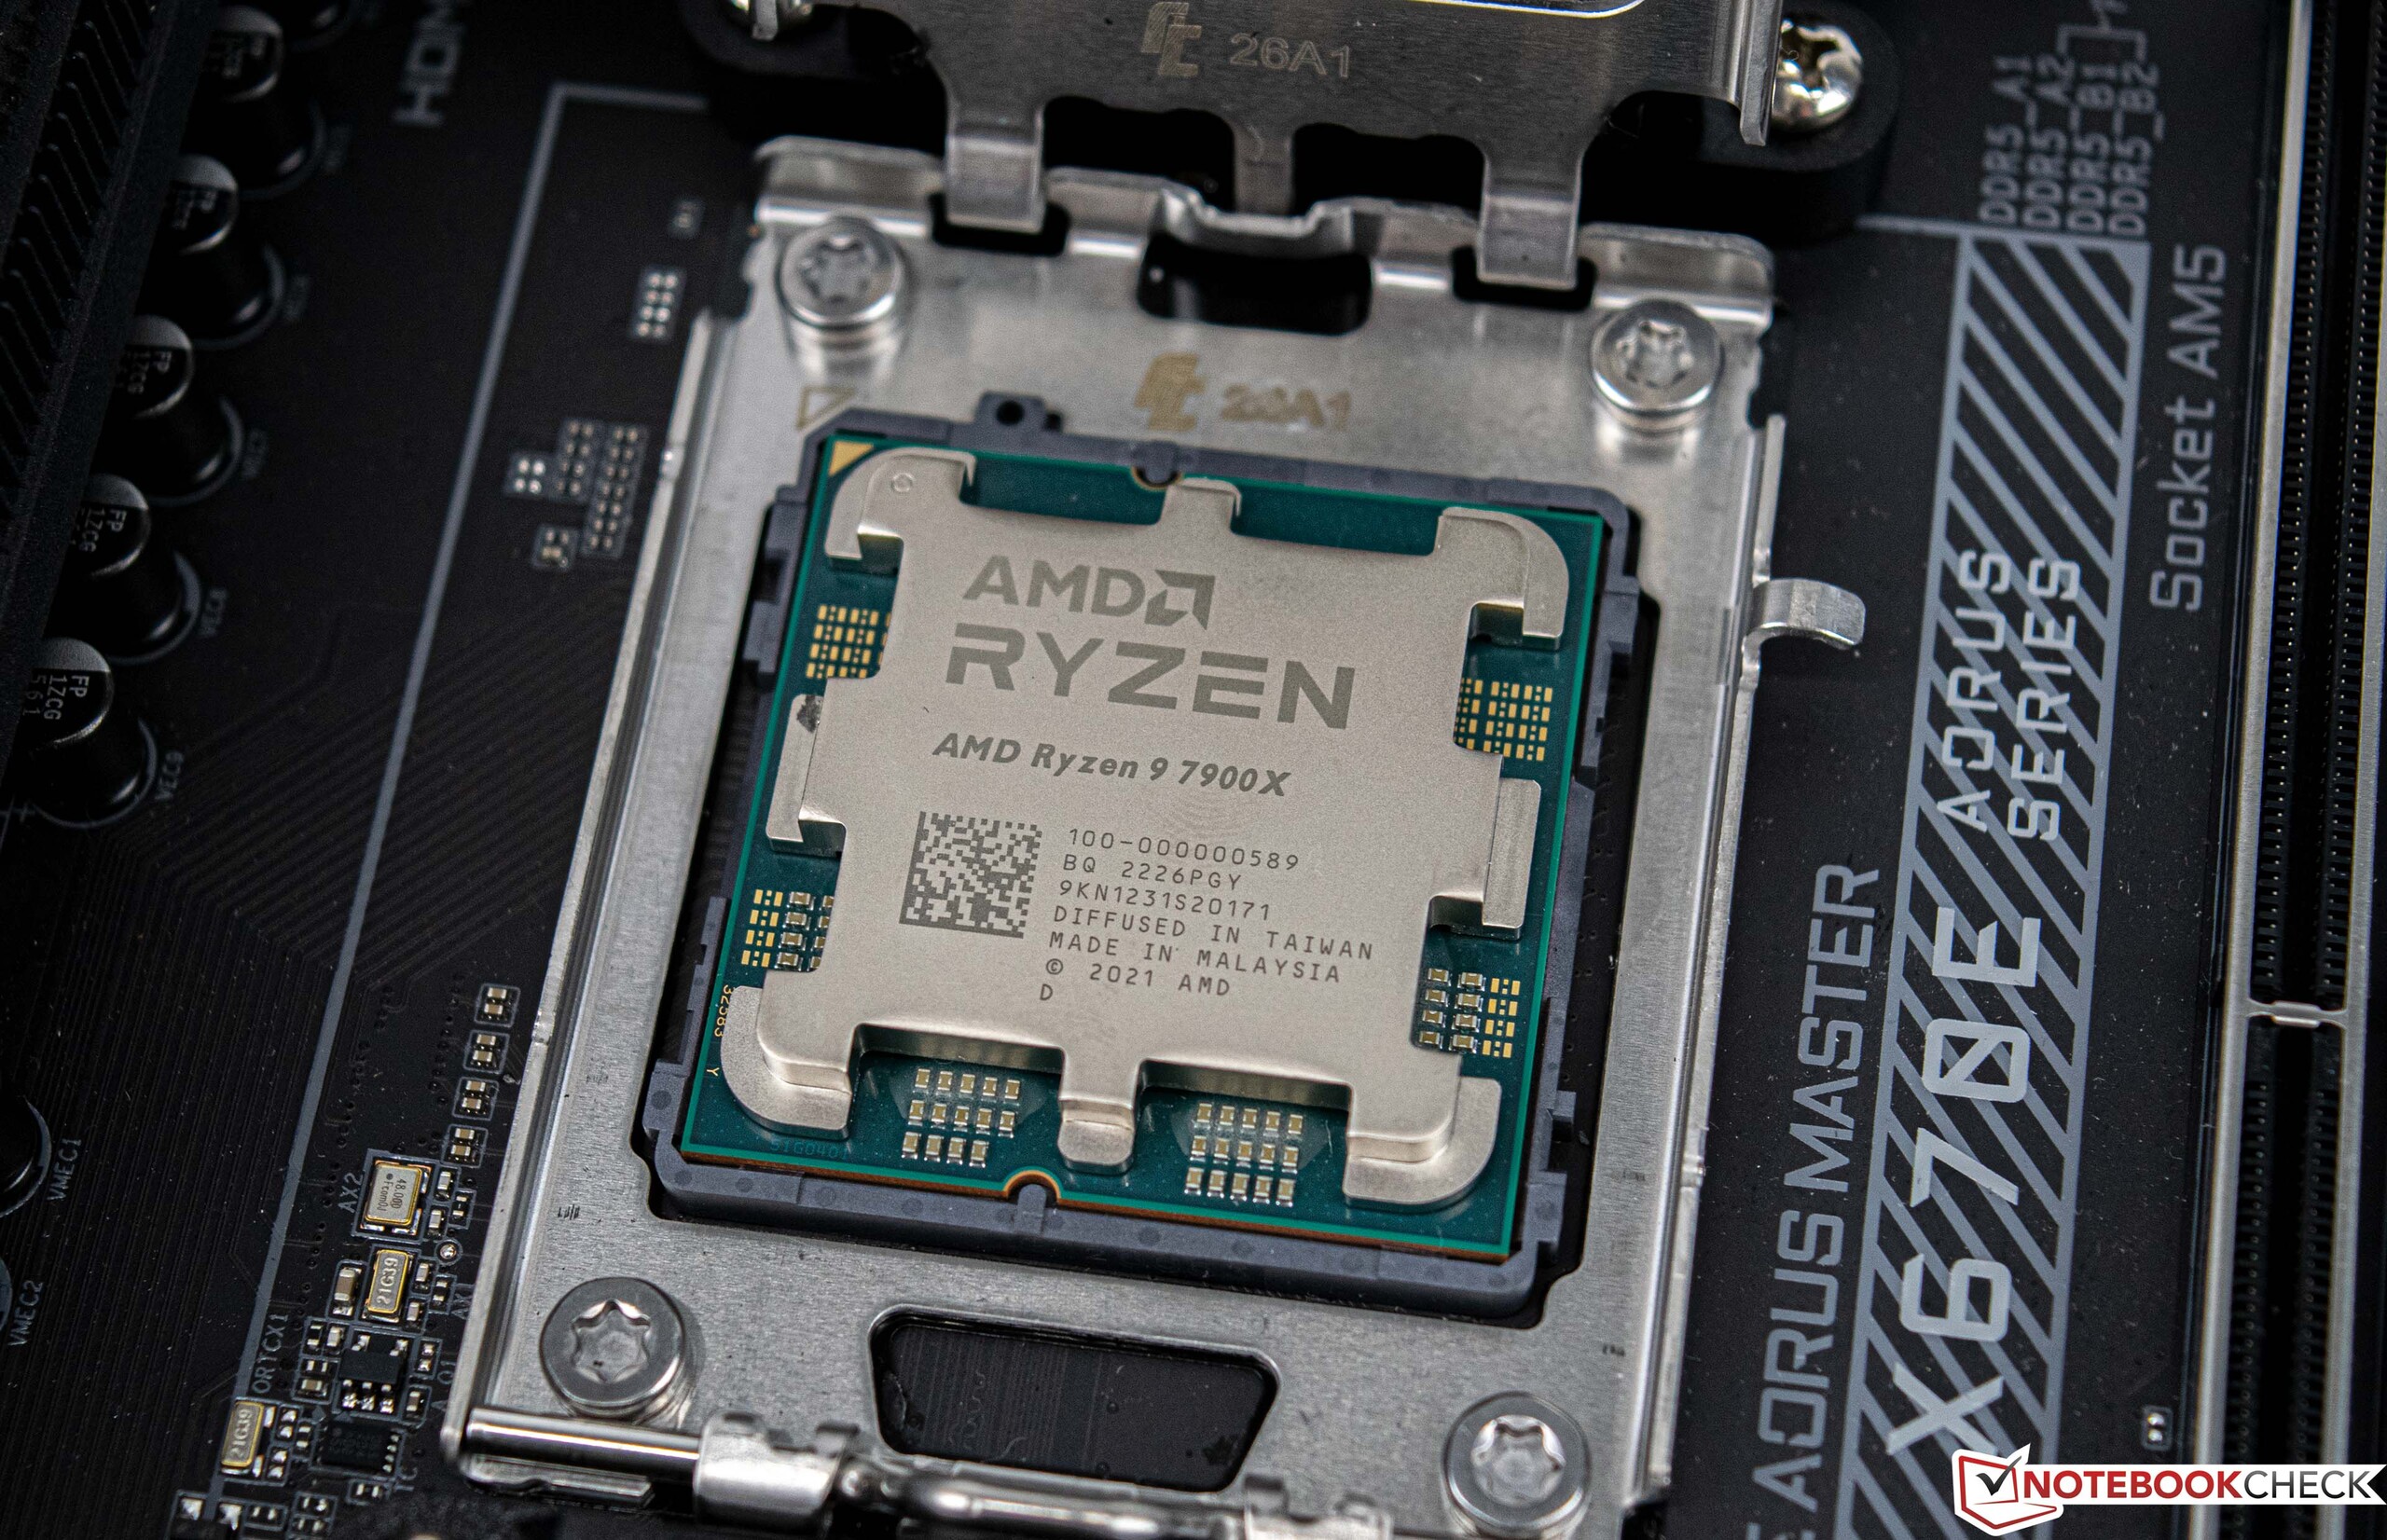
AMD Ryzen 9 7900X

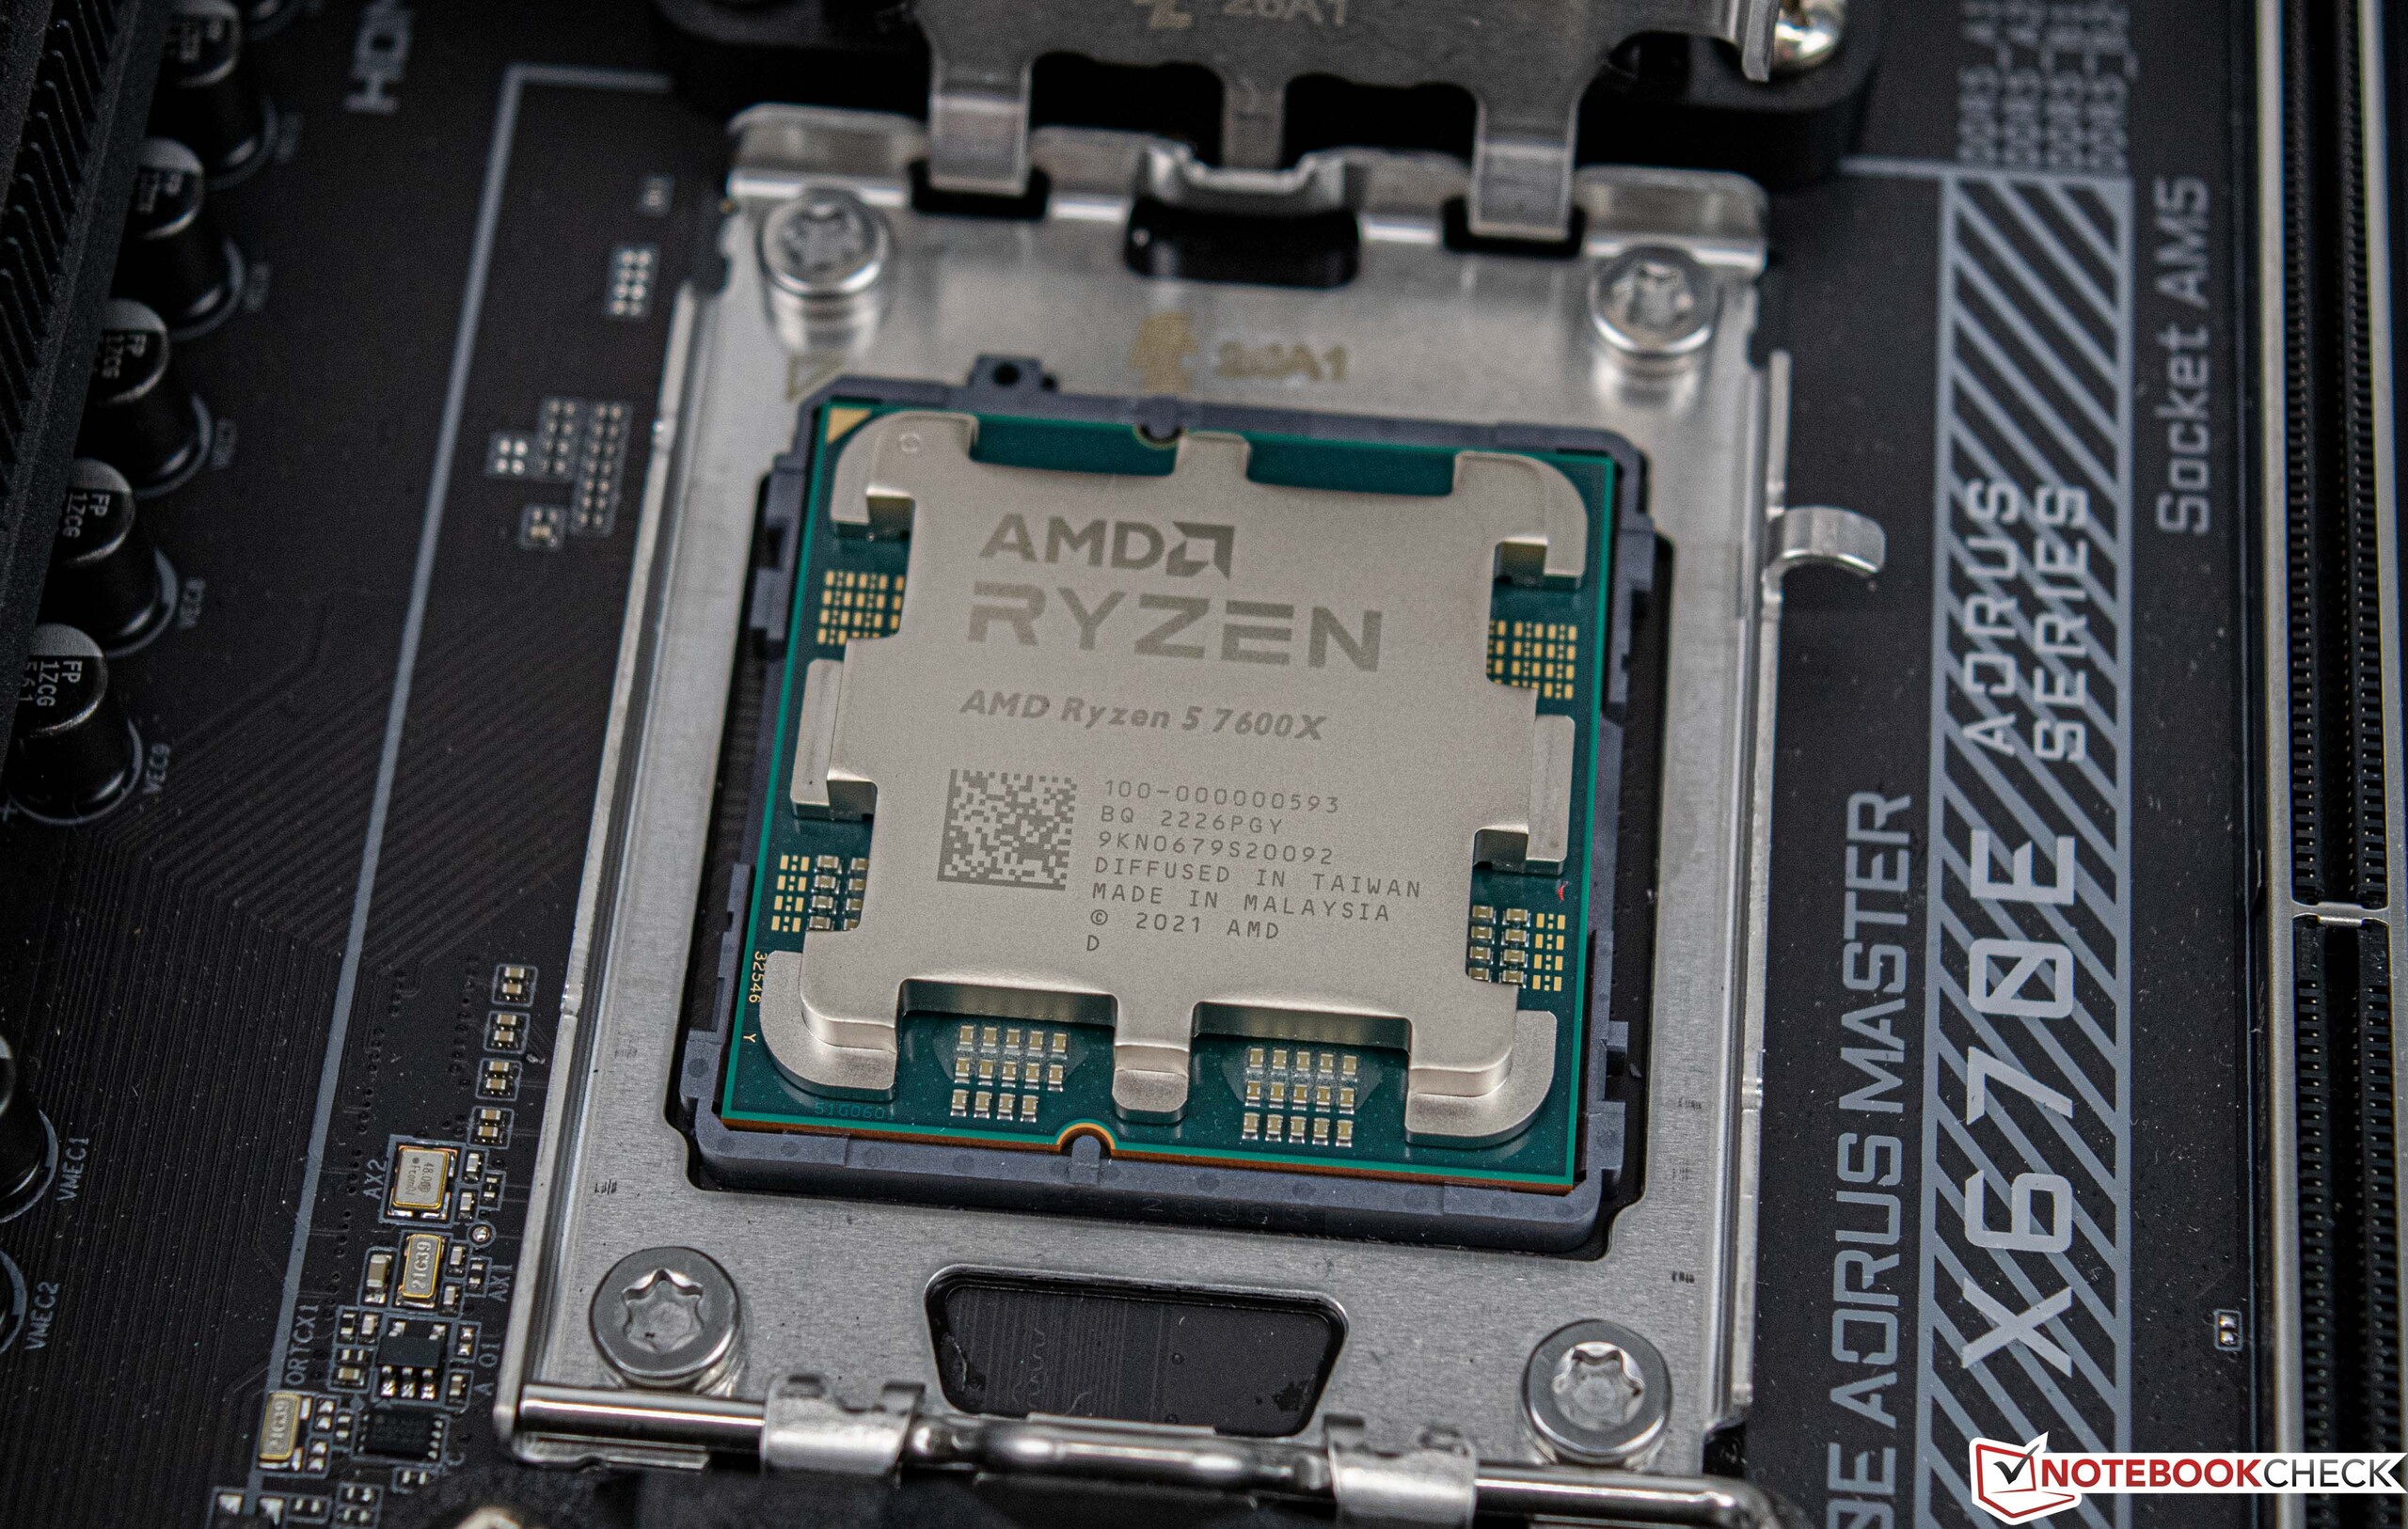
AMD Ryzen 5 7600X
| Performance rating - Percent | |
| AMD Ryzen 9 7900X | |
| Intel Core i9-12900K | |
| AMD Ryzen 9 5950X | |
| AMD Ryzen 5 7600X | |
| Intel Core i5-12600K | |
| AMD Ryzen 9 5900X -2! | |
| AMD Ryzen 5 5600X | |
| Cinebench R10 | |
| Rendering Single CPUs 64Bit | |
| AMD Ryzen 9 7900X | |
| Intel Core i9-12900K | |
| AMD Ryzen 5 7600X | |
| Intel Core i5-12600K | |
| AMD Ryzen 9 5950X | |
| AMD Ryzen 9 5900X | |
| AMD Ryzen 5 5600X | |
| Rendering Multiple CPUs 64Bit | |
| AMD Ryzen 9 7900X | |
| Intel Core i9-12900K | |
| AMD Ryzen 9 5950X | |
| AMD Ryzen 9 5900X | |
| AMD Ryzen 5 7600X | |
| Intel Core i5-12600K | |
| AMD Ryzen 5 5600X | |
| Blender - v2.79 BMW27 CPU | |
| AMD Ryzen 5 5600X | |
| AMD Ryzen 5 7600X | |
| Intel Core i5-12600K | |
| AMD Ryzen 9 5900X | |
| Intel Core i9-12900K | |
| AMD Ryzen 9 5950X | |
| AMD Ryzen 9 7900X | |
| WinRAR - Result | |
| AMD Ryzen 9 7900X | |
| AMD Ryzen 5 7600X | |
| AMD Ryzen 9 5900X | |
| AMD Ryzen 5 5600X | |
| AMD Ryzen 9 5950X | |
| Intel Core i9-12900K | |
| Intel Core i5-12600K | |
| 3DMark 11 - 1280x720 Performance Physics | |
| AMD Ryzen 9 7900X | |
| Intel Core i9-12900K | |
| AMD Ryzen 5 7600X | |
| AMD Ryzen 9 5950X | |
| Intel Core i5-12600K | |
| AMD Ryzen 9 5900X | |
| AMD Ryzen 5 5600X | |
| HWBOT x265 Benchmark v2.2 - 4k Preset | |
| AMD Ryzen 9 7900X | |
| AMD Ryzen 9 5950X | |
| Intel Core i5-12600K | |
| Intel Core i9-12900K | |
| AMD Ryzen 9 5900X | |
| AMD Ryzen 5 7600X | |
| AMD Ryzen 5 5600X | |
| R Benchmark 2.5 - Overall mean | |
| AMD Ryzen 5 5600X | |
| AMD Ryzen 9 5950X | |
| AMD Ryzen 9 5900X | |
| Intel Core i5-12600K | |
| Intel Core i9-12900K | |
| AMD Ryzen 5 7600X | |
| AMD Ryzen 9 7900X | |
| LibreOffice - 20 Documents To PDF | |
| Intel Core i5-12600K | |
| AMD Ryzen 9 5900X | |
| AMD Ryzen 9 5950X | |
| AMD Ryzen 5 5600X | |
| Intel Core i9-12900K | |
| AMD Ryzen 5 7600X | |
| AMD Ryzen 9 7900X | |
| WebXPRT 3 - Overall | |
| AMD Ryzen 9 7900X | |
| AMD Ryzen 5 7600X | |
| Intel Core i9-12900K | |
| Intel Core i5-12600K | |
| AMD Ryzen 9 5950X | |
| AMD Ryzen 5 5600X | |
| AMD Ryzen 9 5900X | |
| Mozilla Kraken 1.1 - Total | |
| AMD Ryzen 5 5600X | |
| AMD Ryzen 9 5900X | |
| AMD Ryzen 9 5950X | |
| Intel Core i5-12600K | |
| Intel Core i9-12900K | |
| AMD Ryzen 5 7600X | |
| AMD Ryzen 9 7900X | |
* ... Meglio usare valori piccoli
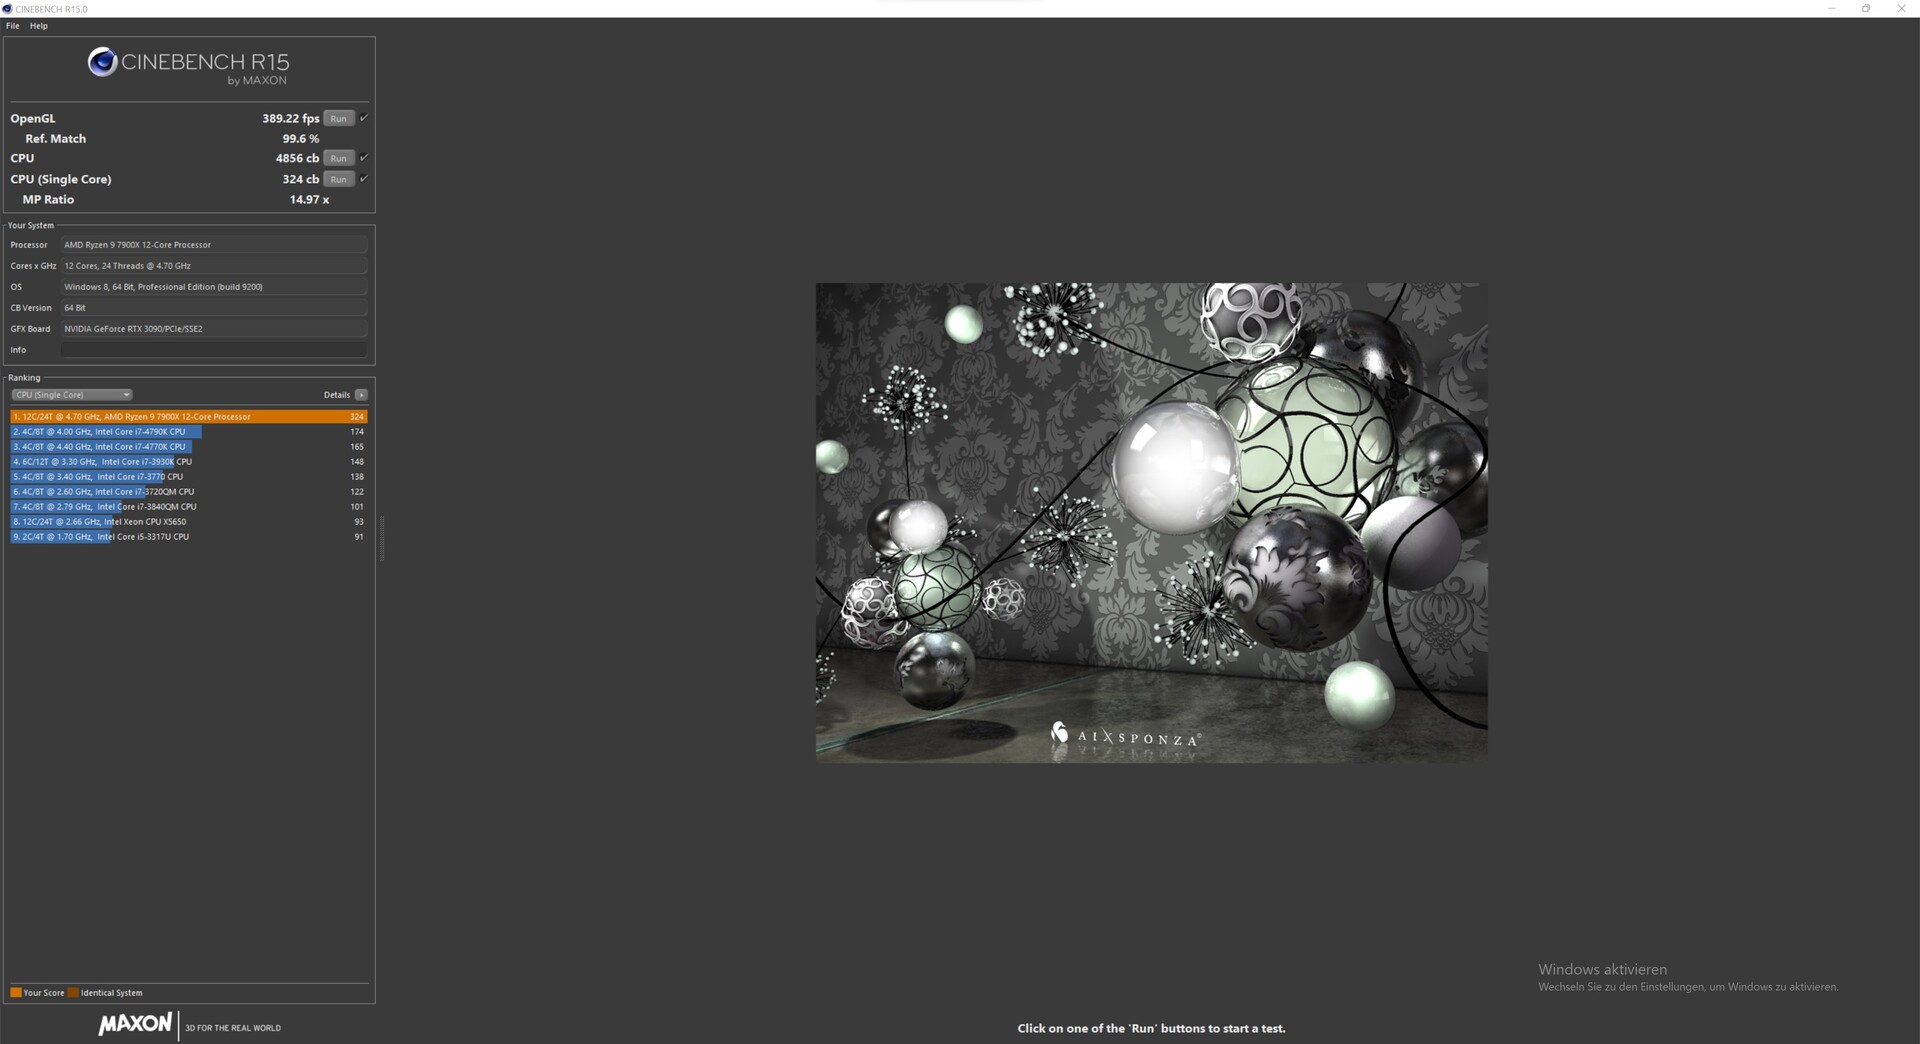
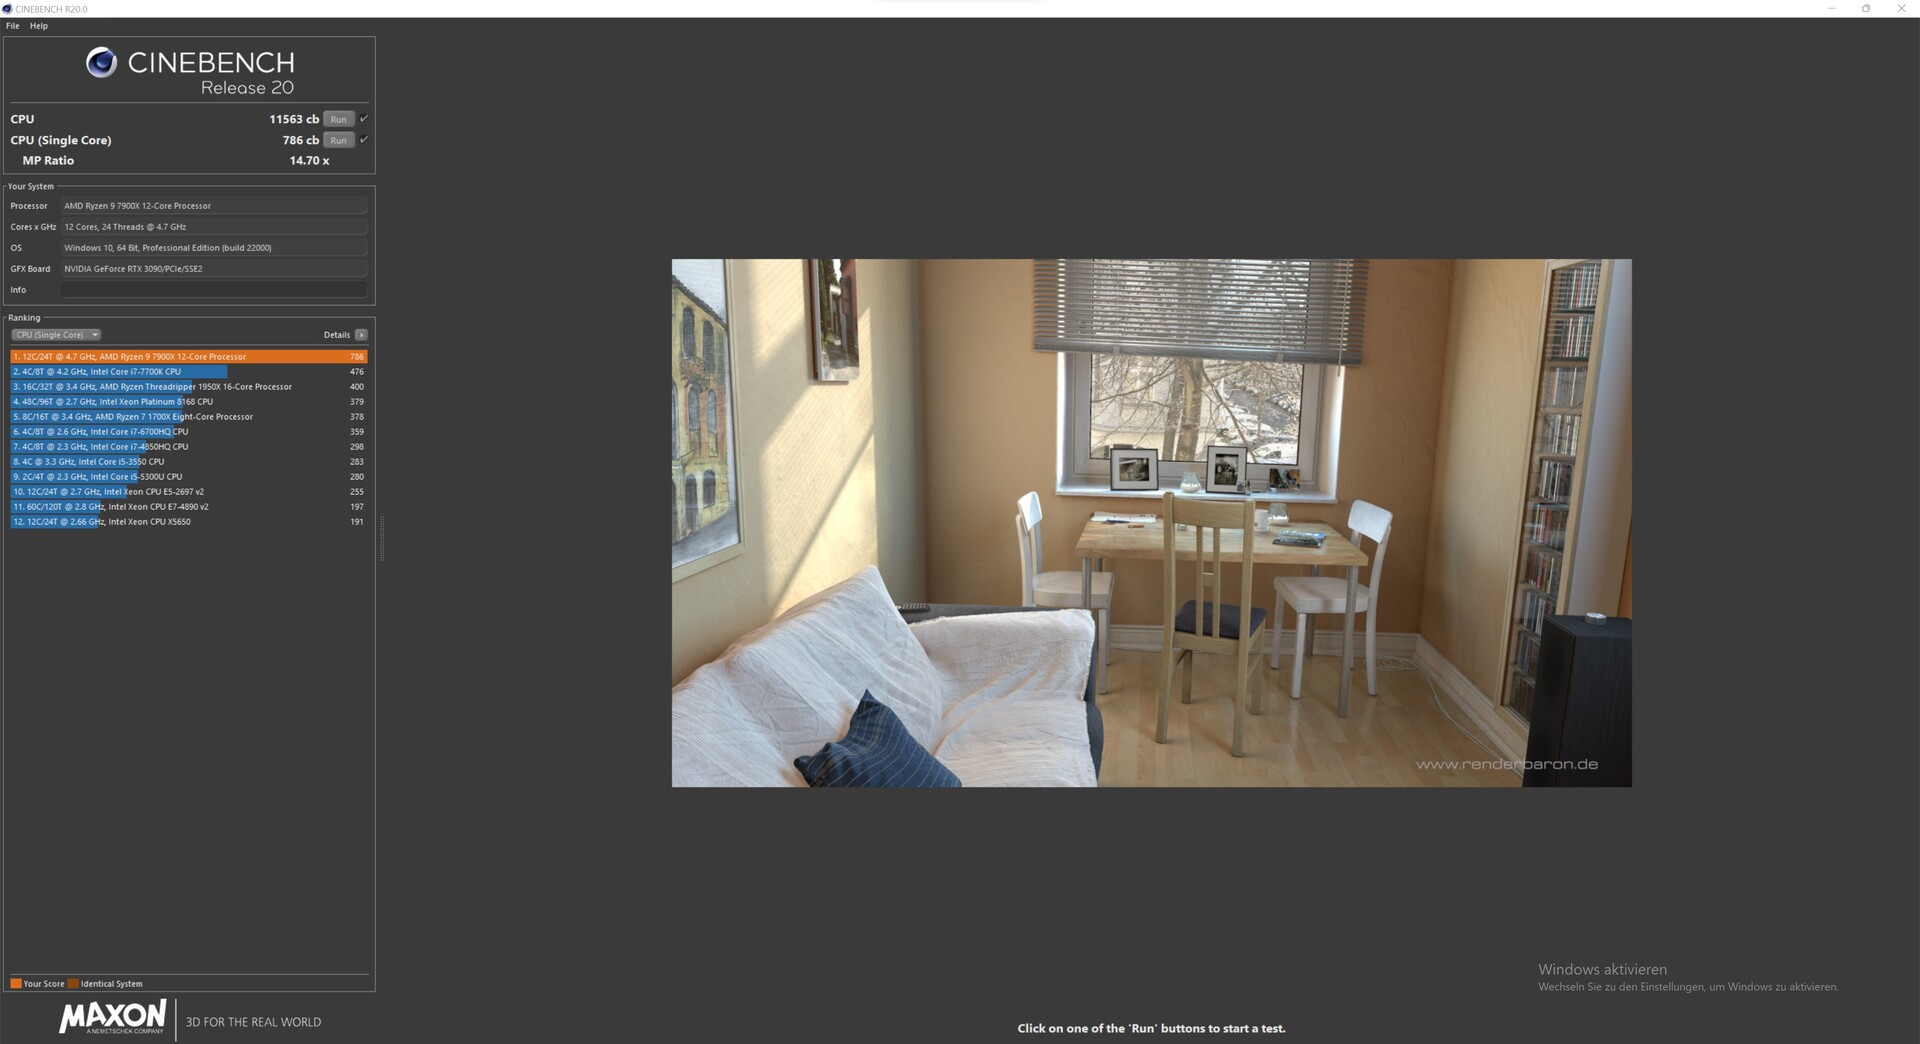
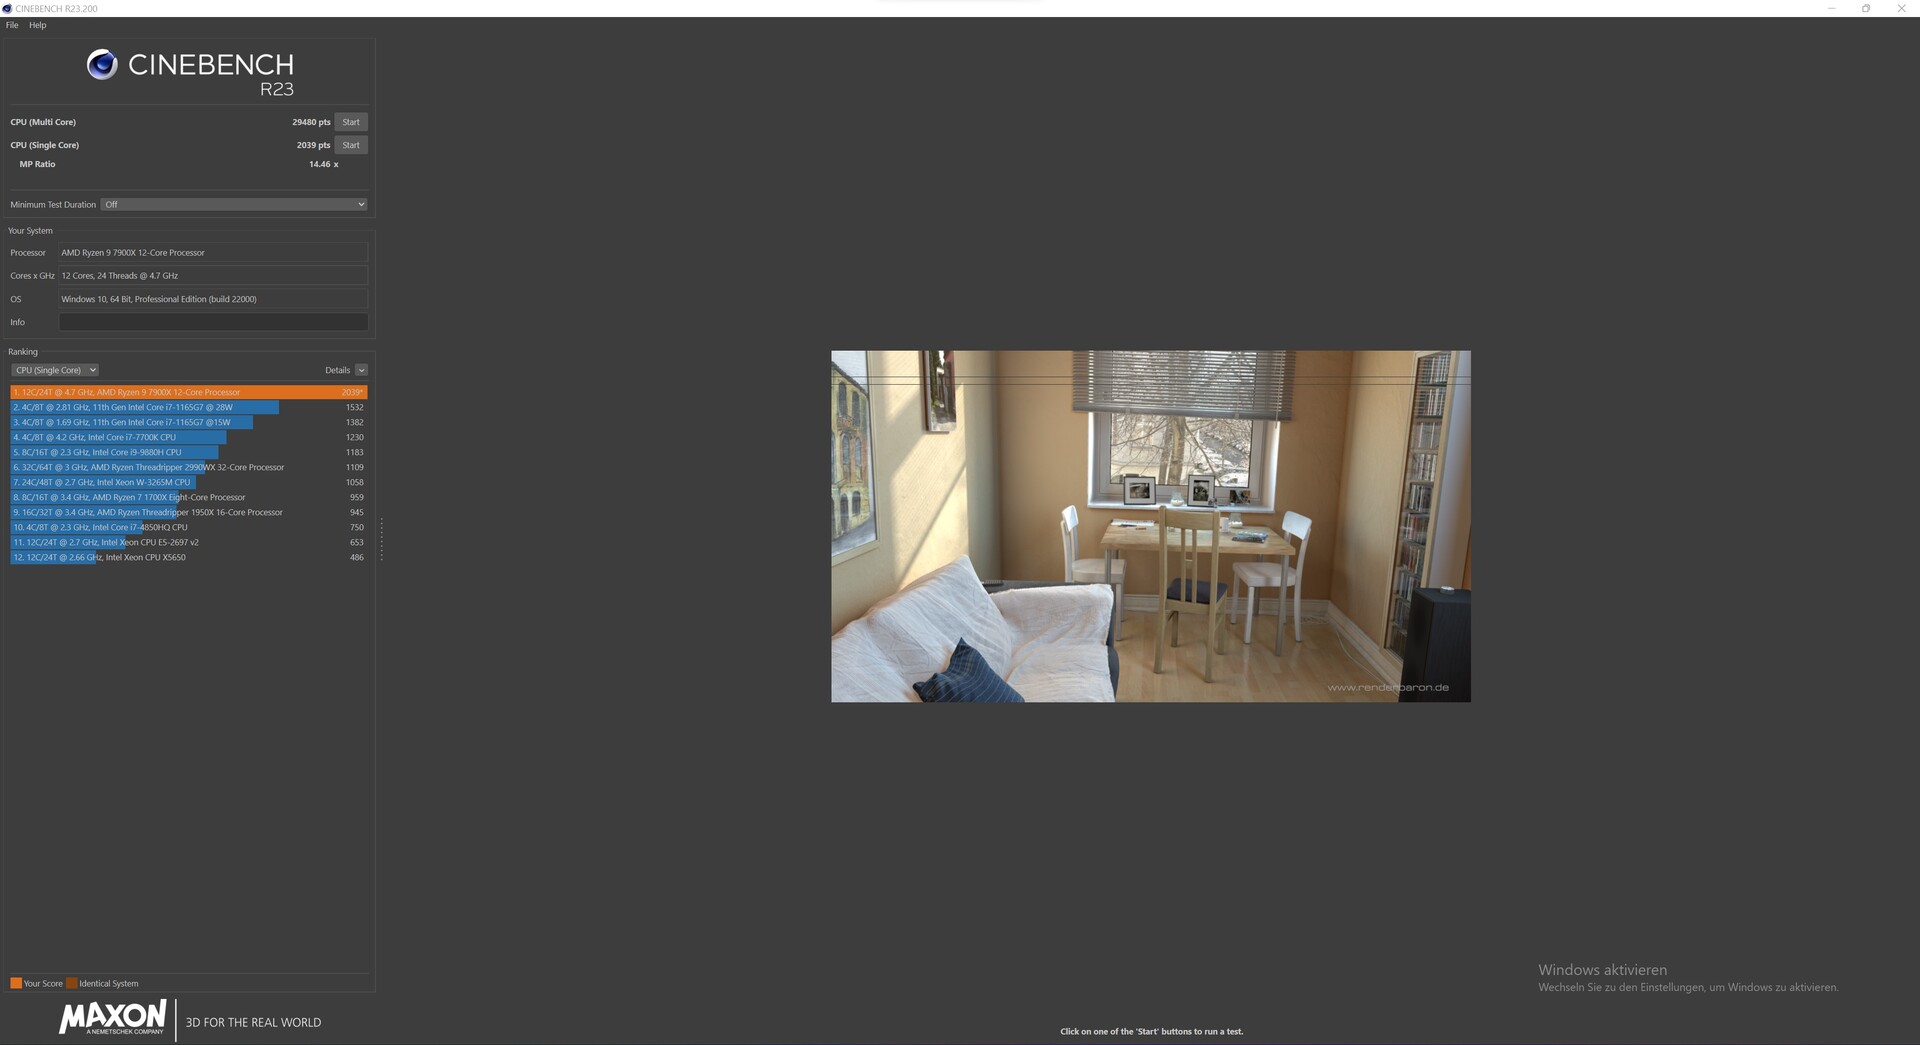
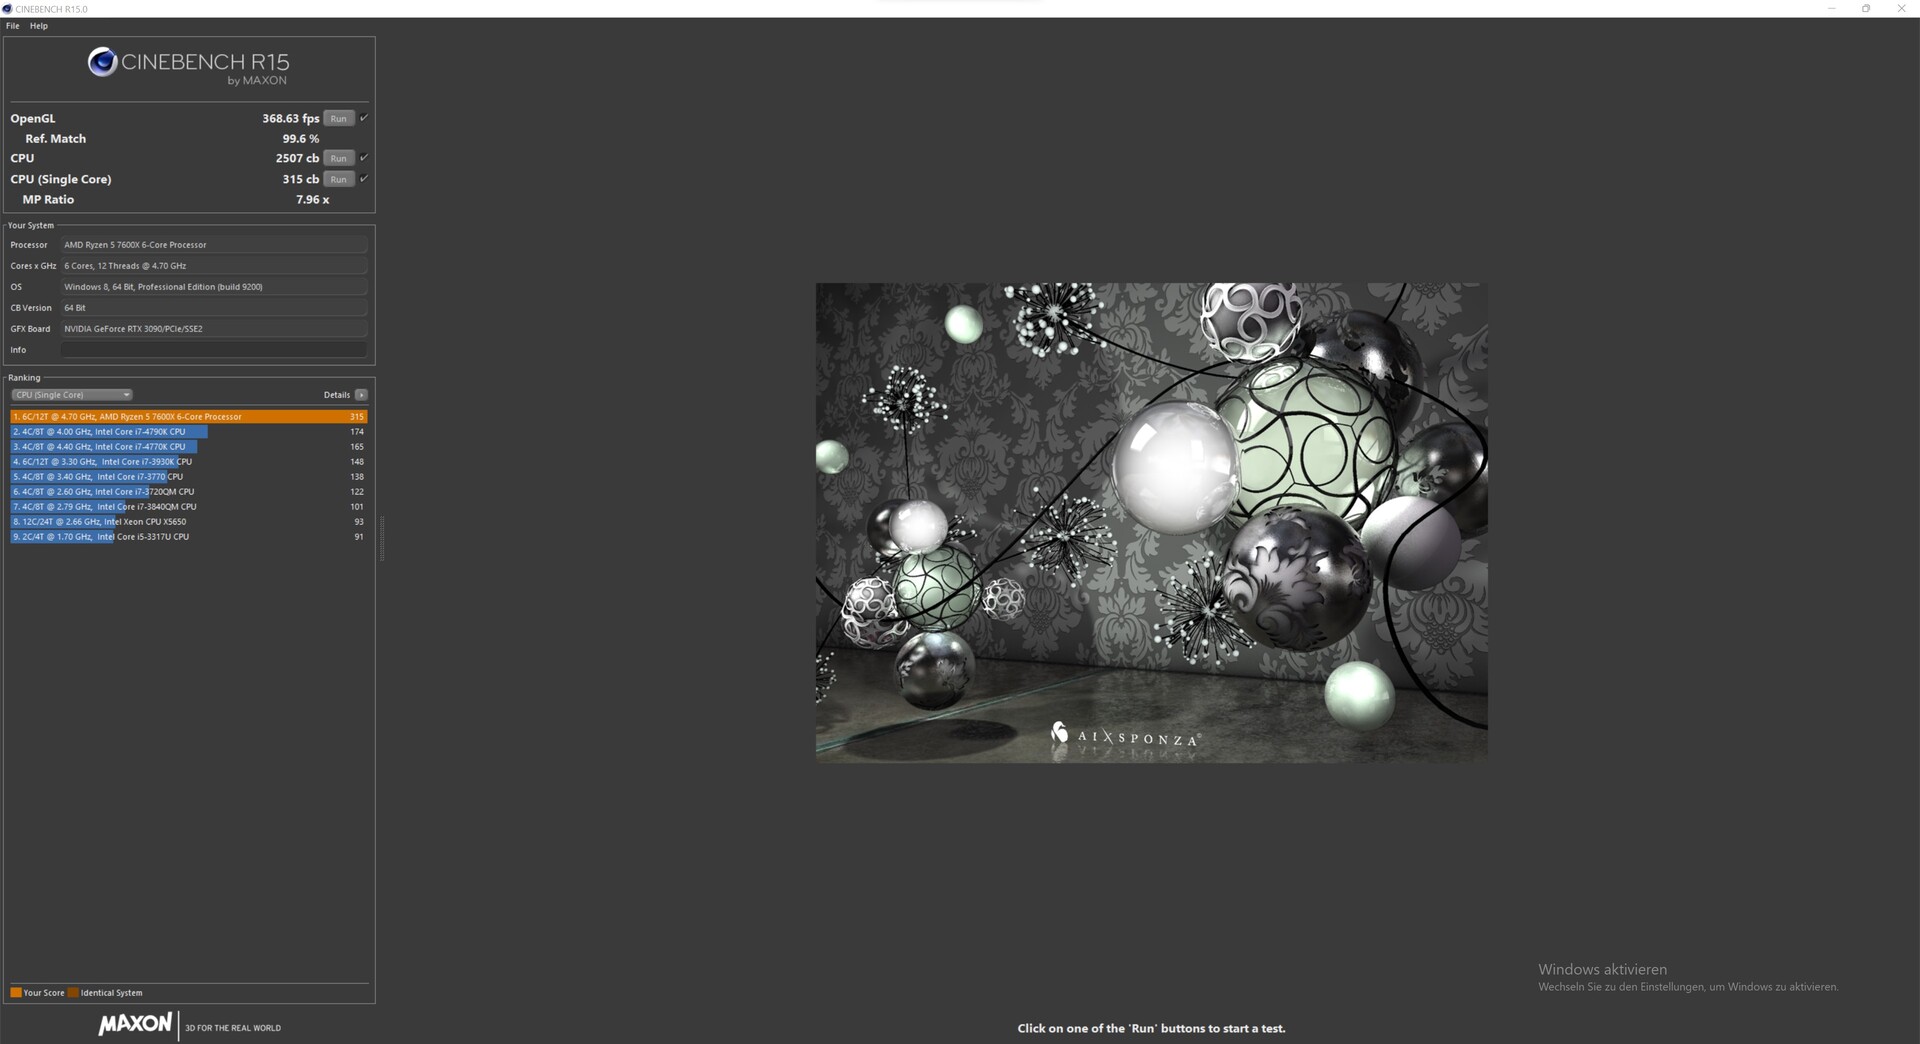


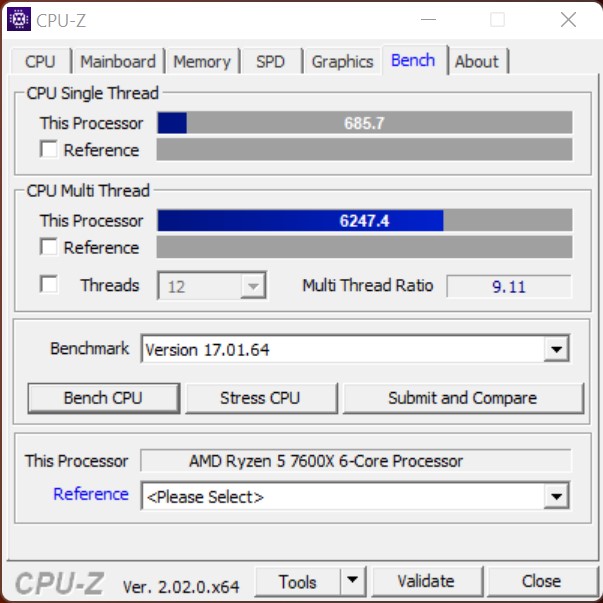
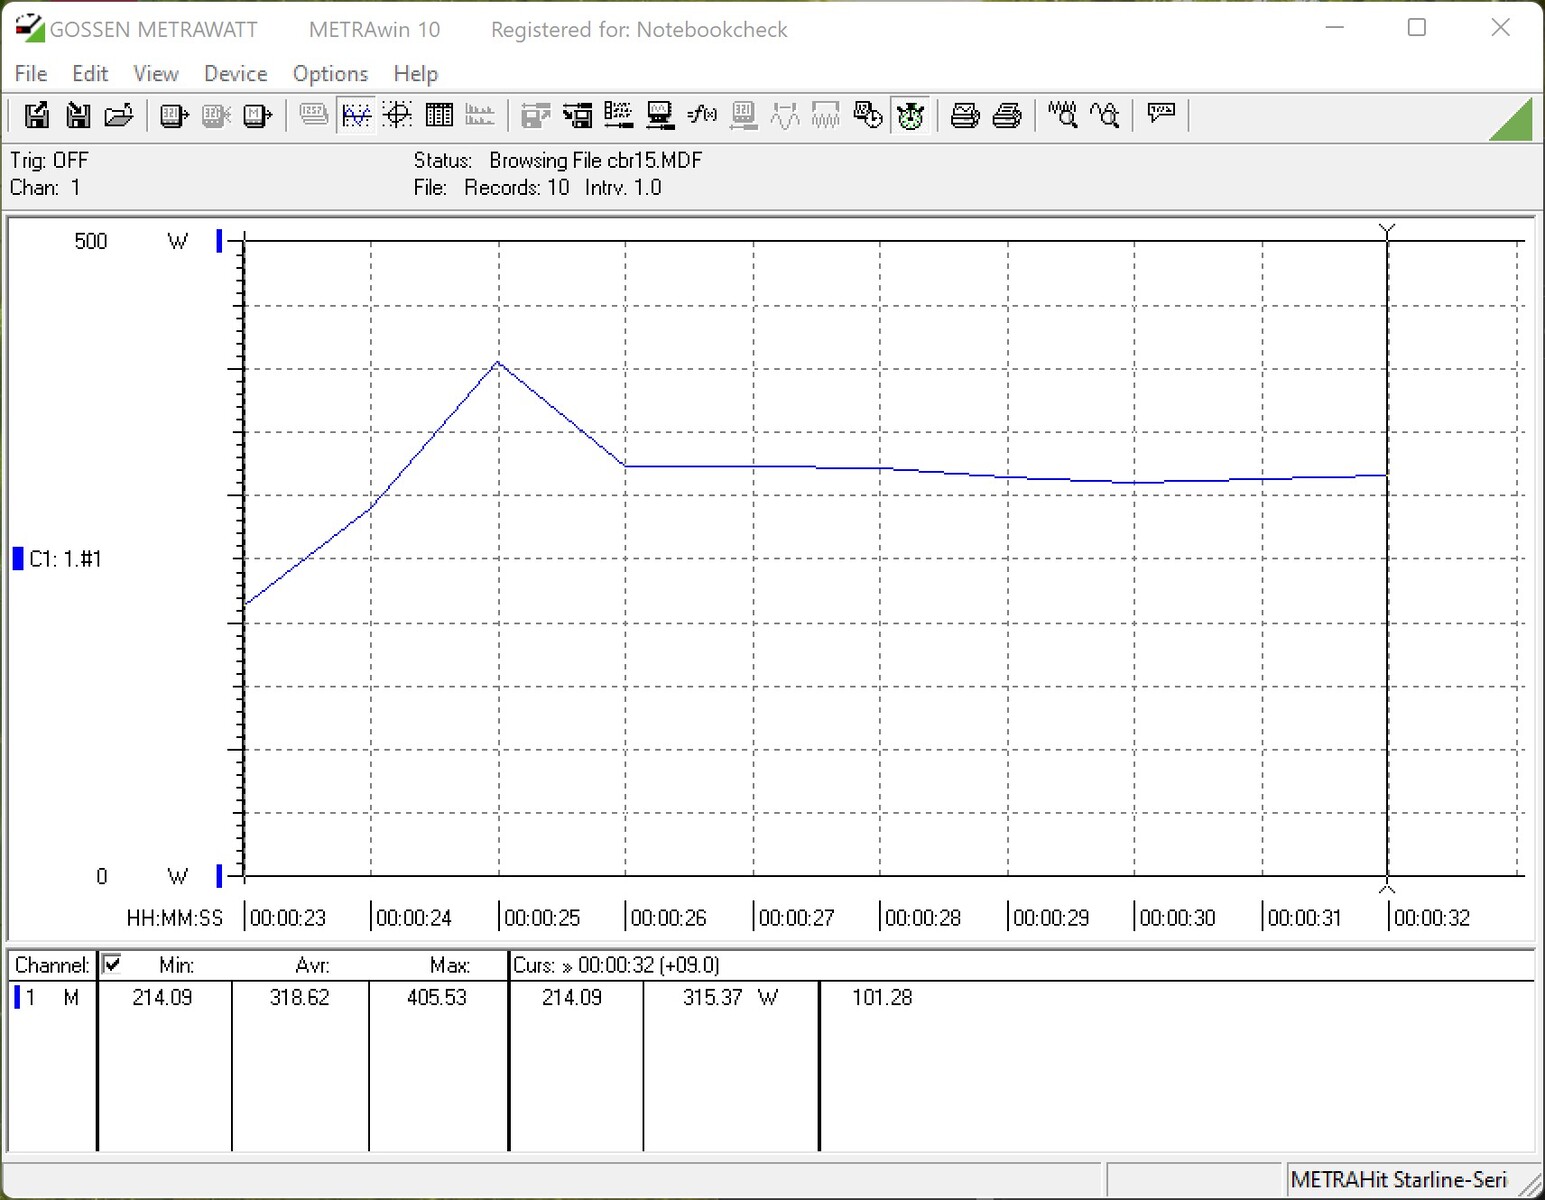
AMD Ryzen 5 7600X + AMD Ryzen 9 7900X contro Cinebench R15 multi-loop
Le elevate prestazioni multi-thread possono essere mantenute in modo permanente anche nella nostra configurazione di test, come possiamo vedere nei risultati del Cinebench R15 multi-loop. Con una media di 4.785 punti, l'AMD Ryzen 9 7900X conclude questo test meglio dell'AMD Ryzen 9 5950X AMD Ryzen 9 5950X (4.467 punti)
L'AMD Ryzen 5 7600X non riesce a mantenere il vantaggio dell'Intel Core i5 12600K Intel Core i5 12600K anche se il divario è estremamente ridotto, con soli 100 punti nelle 50 prove. Il Intel Core i9-12900K non gioca un ruolo importante e non riesce nemmeno a mettere sotto pressione l'AMD Ryzen 9 7900X.
Benchmark sintetici e prestazioni delle applicazioni
I due nuovi processori AMD si sono imposti chiaramente nei benchmark sintetici. L'AMD Ryzen 9 7900X può posizionarsi davanti alla concorrenza con un netto vantaggio. AMD deve solo posizionarsi dietro Intel nei benchmark della memoria. Tuttavia, il divario è solo a una cifra percentuale.
| PCMark 10 - Score | |
| AMD Ryzen 9 7900X | |
| AMD Ryzen 5 7600X | |
| AMD Ryzen 9 5950X | |
| Intel Core i9-12900K | |
| AMD Ryzen 5 5600X | |
| Intel Core i5-12600K | |
| AMD Ryzen 9 5900X | |
| 3DMark 11 - 1280x720 Performance Physics | |
| AMD Ryzen 9 7900X | |
| Intel Core i9-12900K | |
| AMD Ryzen 5 7600X | |
| AMD Ryzen 9 5950X | |
| Intel Core i5-12600K | |
| Intel Core i9-12900K | |
| AMD Ryzen 9 5900X | |
| AMD Ryzen 5 5600X | |
| CrossMark - Overall | |
| AMD Ryzen 9 7900X | |
| AMD Ryzen 5 7600X | |
| Intel Core i5-12600K | |
| AMD Ryzen 9 5900X | |
| AMD Ryzen 9 5950X | |
| AMD Ryzen 5 5600X | |
| AIDA64 / Memory Copy | |
| Intel Core i5-12600K | |
| AMD Ryzen 9 7900X | |
| AMD Ryzen 9 5900X | |
| AMD Ryzen 5 7600X | |
| AMD Ryzen 9 5950X | |
| Desktop-PC | |
| AMD Ryzen 5 5600X | |
| Media della classe (4514 - 234662, n=2206) | |
| AIDA64 / Memory Read | |
| Intel Core i5-12600K | |
| AMD Ryzen 9 7900X | |
| AMD Ryzen 9 5900X | |
| AMD Ryzen 9 5950X | |
| AMD Ryzen 5 5600X | |
| AMD Ryzen 5 7600X | |
| Media della classe (4031 - 271066, n=2168) | |
| Desktop-PC | |
| AIDA64 / Memory Write | |
| AMD Ryzen 5 7600X | |
| AMD Ryzen 9 7900X | |
| Intel Core i5-12600K | |
| Media della classe (3506 - 242868, n=2173) | |
| AMD Ryzen 9 5900X | |
| Desktop-PC | |
| AMD Ryzen 9 5950X | |
| AMD Ryzen 5 5600X | |
| AIDA64 / Memory Latency | |
| Media della classe (6.1 - 536, n=2235) | |
| Intel Core i5-12600K | |
| AMD Ryzen 9 5950X | |
| AMD Ryzen 5 5600X | |
| AMD Ryzen 5 7600X | |
| AMD Ryzen 9 7900X | |
| Desktop-PC | |
| AMD Ryzen 9 5900X | |
* ... Meglio usare valori piccoli
Parametri di gioco
Passiamo ora ai benchmark di gioco. Grazie alle elevate prestazioni single-thread dei processori Intel, quest'ultima ha avuto un ruolo di primo piano per molto tempo ed è stata gradualmente messa sotto pressione da AMD con le CPU Ryzen 5000. Solo con il Intel Core i9-12900Kintel ha potuto riconquistare la corona sotto questo aspetto. Ma ora c'è un altro cambiamento al vertice, perché l'Intel Core i9-12900K è ora battuto dai nuovi processori AMD Ryzen della generazione 7000. Il Core i9-12900K deve addirittura sottomettersi all'AMD Ryzen 5 7600X, che è davvero impressionante.
Tuttavia, bisogna considerare che la differenza di prestazioni si riduce con l'aumentare delle risoluzioni, poiché dipende maggiormente dalle prestazioni della scheda grafica. Tuttavia, possiamo in parte fare a meno di un drastico aumento delle prestazioni a favore dei nuovi processori AMD Ryzen a 1080p con dettagli massimi.
Gaming performance in direct comparison with Intel
| Performance rating - Percent | |
| AMD Ryzen 9 7900X | |
| AMD Ryzen 5 7600X | |
| Intel Core i9-12900K | |
| Intel Core i5-12600K -2! | |
| F1 22 | |
| 1920x1080 Low Preset AA:T AF:16x | |
| AMD Ryzen 9 7900X | |
| AMD Ryzen 5 7600X | |
| Intel Core i9-12900K | |
| Intel Core i5-12600K | |
| 1920x1080 Ultra High Preset AA:T AF:16x | |
| Intel Core i9-12900K | |
| Intel Core i5-12600K | |
| AMD Ryzen 5 7600X | |
| AMD Ryzen 9 7900X | |
| Cyberpunk 2077 1.6 | |
| 1920x1080 Ultra Preset | |
| AMD Ryzen 9 7900X | |
| Intel Core i5-12600K | |
| AMD Ryzen 5 7600X | |
| Intel Core i9-12900K | |
| 1920x1080 Low Preset | |
| Intel Core i9-12900K | |
| AMD Ryzen 9 7900X | |
| AMD Ryzen 5 7600X | |
| Intel Core i5-12600K | |
| Far Cry 5 | |
| 1920x1080 Ultra Preset AA:T | |
| Intel Core i9-12900K | |
| AMD Ryzen 9 7900X | |
| AMD Ryzen 5 7600X | |
| Intel Core i5-12600K | |
| 1280x720 Low Preset AA:T | |
| AMD Ryzen 9 7900X | |
| AMD Ryzen 5 7600X | |
| Intel Core i9-12900K | |
| Intel Core i5-12600K | |
| X-Plane 11.11 | |
| 1920x1080 high (fps_test=3) | |
| AMD Ryzen 9 7900X | |
| AMD Ryzen 5 7600X | |
| Intel Core i9-12900K | |
| Intel Core i5-12600K | |
| 1280x720 low (fps_test=1) | |
| AMD Ryzen 5 7600X | |
| AMD Ryzen 9 7900X | |
| Intel Core i9-12900K | |
| Intel Core i5-12600K | |
| Final Fantasy XV Benchmark | |
| 1920x1080 High Quality | |
| AMD Ryzen 9 7900X | |
| AMD Ryzen 5 7600X | |
| Intel Core i9-12900K | |
| Intel Core i5-12600K | |
| 1280x720 Lite Quality | |
| AMD Ryzen 9 7900X | |
| Intel Core i9-12900K | |
| AMD Ryzen 5 7600X | |
| Intel Core i5-12600K | |
| Dota 2 Reborn | |
| 1920x1080 ultra (3/3) best looking | |
| AMD Ryzen 9 7900X | |
| AMD Ryzen 5 7600X | |
| Intel Core i9-12900K | |
| Intel Core i5-12600K | |
| 1280x720 min (0/3) fastest | |
| AMD Ryzen 5 7600X | |
| AMD Ryzen 9 7900X | |
| Intel Core i9-12900K | |
| Intel Core i5-12600K | |
| The Witcher 3 | |
| 1920x1080 Ultra Graphics & Postprocessing (HBAO+) | |
| AMD Ryzen 9 7900X | |
| AMD Ryzen 5 7600X | |
| Intel Core i9-12900K | |
| 1024x768 Low Graphics & Postprocessing | |
| AMD Ryzen 9 7900X | |
| AMD Ryzen 5 7600X | |
| Intel Core i9-12900K | |
| GTA V | |
| 1920x1080 Highest AA:4xMSAA + FX AF:16x | |
| AMD Ryzen 9 7900X | |
| AMD Ryzen 5 7600X | |
| Intel Core i9-12900K | |
| Intel Core i5-12600K | |
| 1024x768 Lowest Settings possible | |
| AMD Ryzen 9 7900X | |
| AMD Ryzen 5 7600X | |
| Intel Core i9-12900K | |
| Intel Core i5-12600K | |
Ryzen 9 7900X with Nvidia GeForce RTX 3090
| basso | medio | alto | ultra | QHD | 4K | |
|---|---|---|---|---|---|---|
| GTA V (2015) | 187.5 | 187.5 | 187.1 | 161.4 | 151.8 | 182.2 |
| The Witcher 3 (2015) | 773 | 586 | 384 | 188.1 | 156.9 | |
| Dota 2 Reborn (2015) | 293.1 | 257 | 250.4 | 231.65 | 216.7 | |
| Final Fantasy XV Benchmark (2018) | 236 | 231 | 190.8 | 146.6 | 88.8 | |
| X-Plane 11.11 (2018) | 225 | 199.2 | 160.9 | 133.5 | ||
| Far Cry 5 (2018) | 244 | 211 | 203 | 186 | 176 | 110 |
| Strange Brigade (2018) | 741 | 479 | 380 | 329 | 249 | 153.1 |
| Shadow of the Tomb Raider (2018) | 314 | 261 | 251 | 234 | 172.2 | 99.6 |
| Far Cry New Dawn (2019) | 200 | 176 | 169 | 151 | 143 | 109 |
| Metro Exodus (2019) | 311 | 223 | 175.2 | 140.1 | 115.8 | 76.6 |
| Borderlands 3 (2019) | 244 | 213 | 190.8 | 164.1 | 131.6 | 75.3 |
| F1 2020 (2020) | 487 | 403 | 374 | 270 | 218 | 138.8 |
| F1 2021 (2021) | 648 | 548 | 441 | 224 | 175.4 | 105.3 |
| Cyberpunk 2077 1.6 (2022) | 214 | 213 | 174 | 173 | 88 | 46 |
| Tiny Tina's Wonderlands (2022) | 364 | 294 | 212 | 168.5 | 124 | 70.8 |
| F1 22 (2022) | 344 | 361 | 321 | 125.1 | 83.8 | 42.4 |
| The Quarry (2022) | 282 | 216 | 177.7 | 144.4 | 103.6 | 58.9 |
Ryzen 5 7600X with Nvidia GeForce RTX 3090
| basso | medio | alto | ultra | QHD | 4K | |
|---|---|---|---|---|---|---|
| GTA V (2015) | 187.5 | 187.5 | 186.7 | 155.2 | 148 | 181.9 |
| The Witcher 3 (2015) | 710 | 566 | 265 | 186.4 | 158.1 | |
| Dota 2 Reborn (2015) | 301.3 | 260 | 244.9 | 228.5 | 214.5 | |
| Final Fantasy XV Benchmark (2018) | 233 | 227 | 188.4 | 147.1 | 90.6 | |
| X-Plane 11.11 (2018) | 227 | 193.6 | 151.8 | 127.6 | ||
| Far Cry 5 (2018) | 238 | 208 | 196 | 183 | 171 | 111 |
| Strange Brigade (2018) | 819 | 510 | 402 | 354 | 270 | 161.4 |
| Shadow of the Tomb Raider (2018) | 299 | 251 | 241 | 228 | 172 | 99.7 |
| Far Cry New Dawn (2019) | 191 | 168 | 161 | 144 | 138 | 109 |
| Metro Exodus (2019) | 321 | 221 | 173.1 | 138.5 | 115.4 | 76.3 |
| Borderlands 3 (2019) | 232 | 205 | 185 | 161.2 | 130.7 | 75 |
| F1 2020 (2020) | 587 | 460 | 418 | 302 | 238 | 145.4 |
| F1 2021 (2021) | 699 | 562 | 453 | 227 | 175.8 | 105.6 |
| Cyberpunk 2077 1.6 (2022) | 199 | 198 | 174 | 125 | 88 | 46 |
| Tiny Tina's Wonderlands (2022) | 367 | 294 | 211 | 168.3 | 124 | 70.4 |
| F1 22 (2022) | 333 | 352 | 312 | 126.4 | 84.4 | 42.6 |
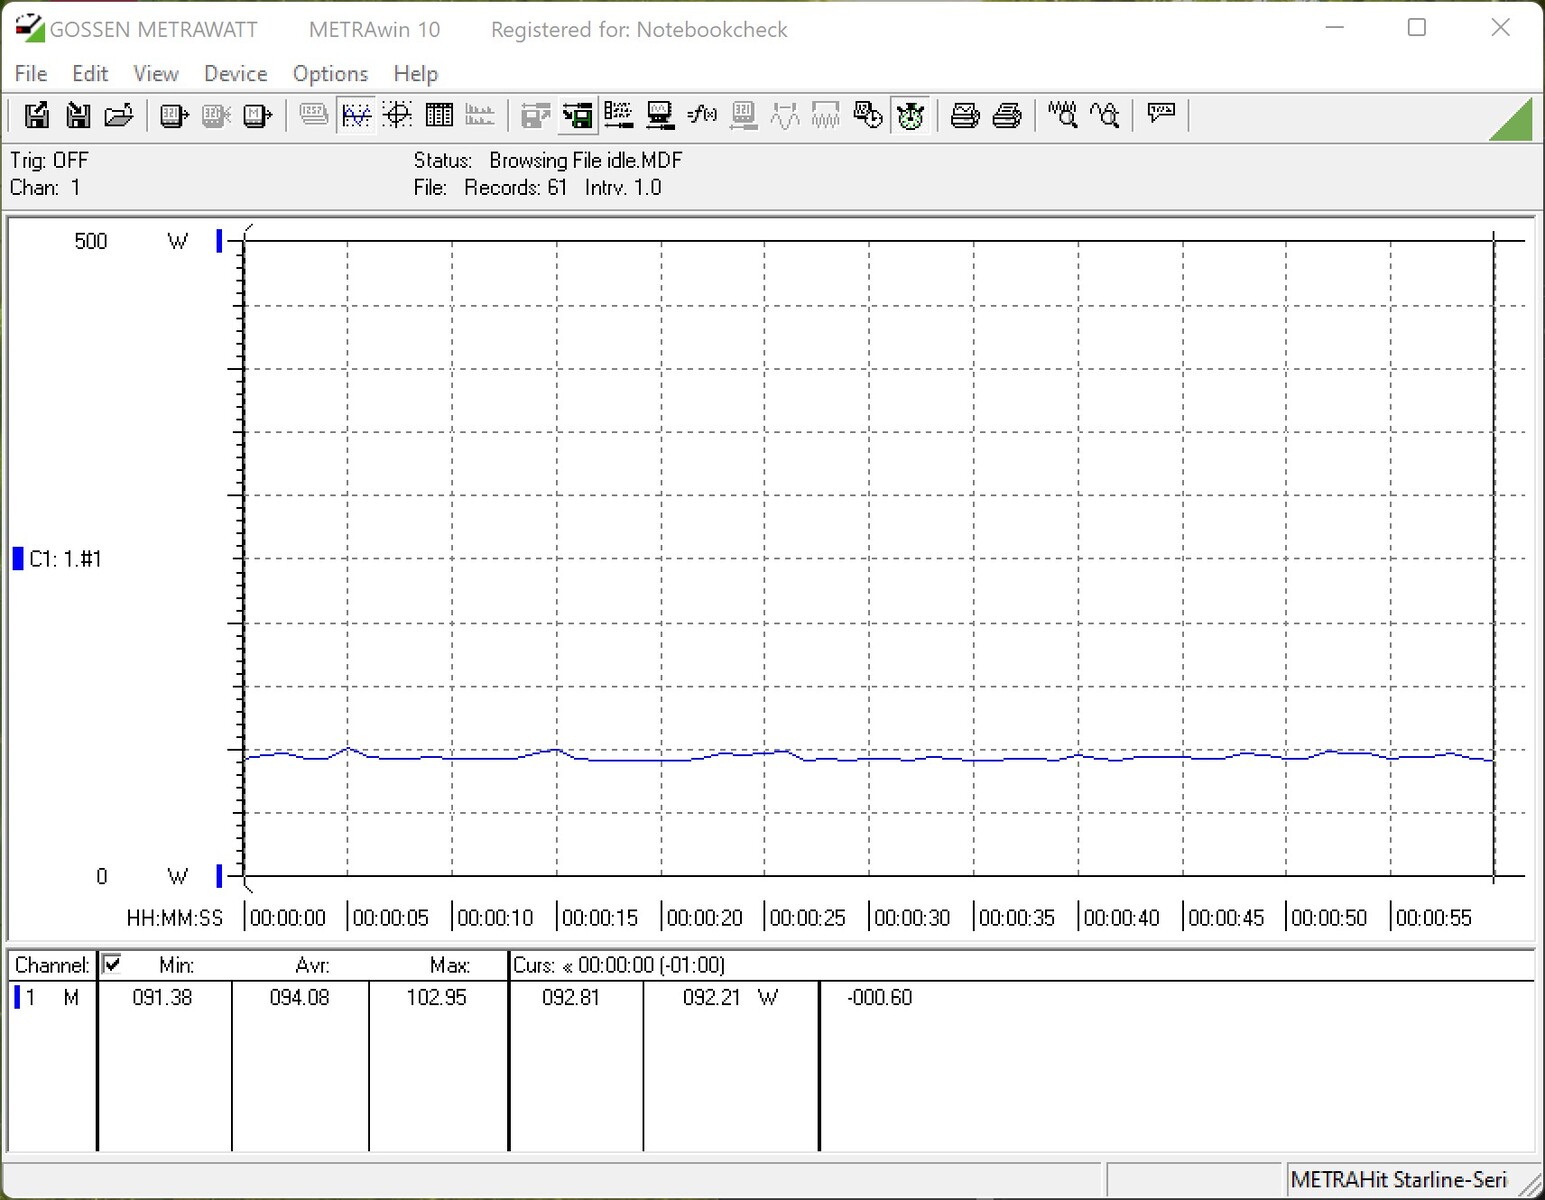
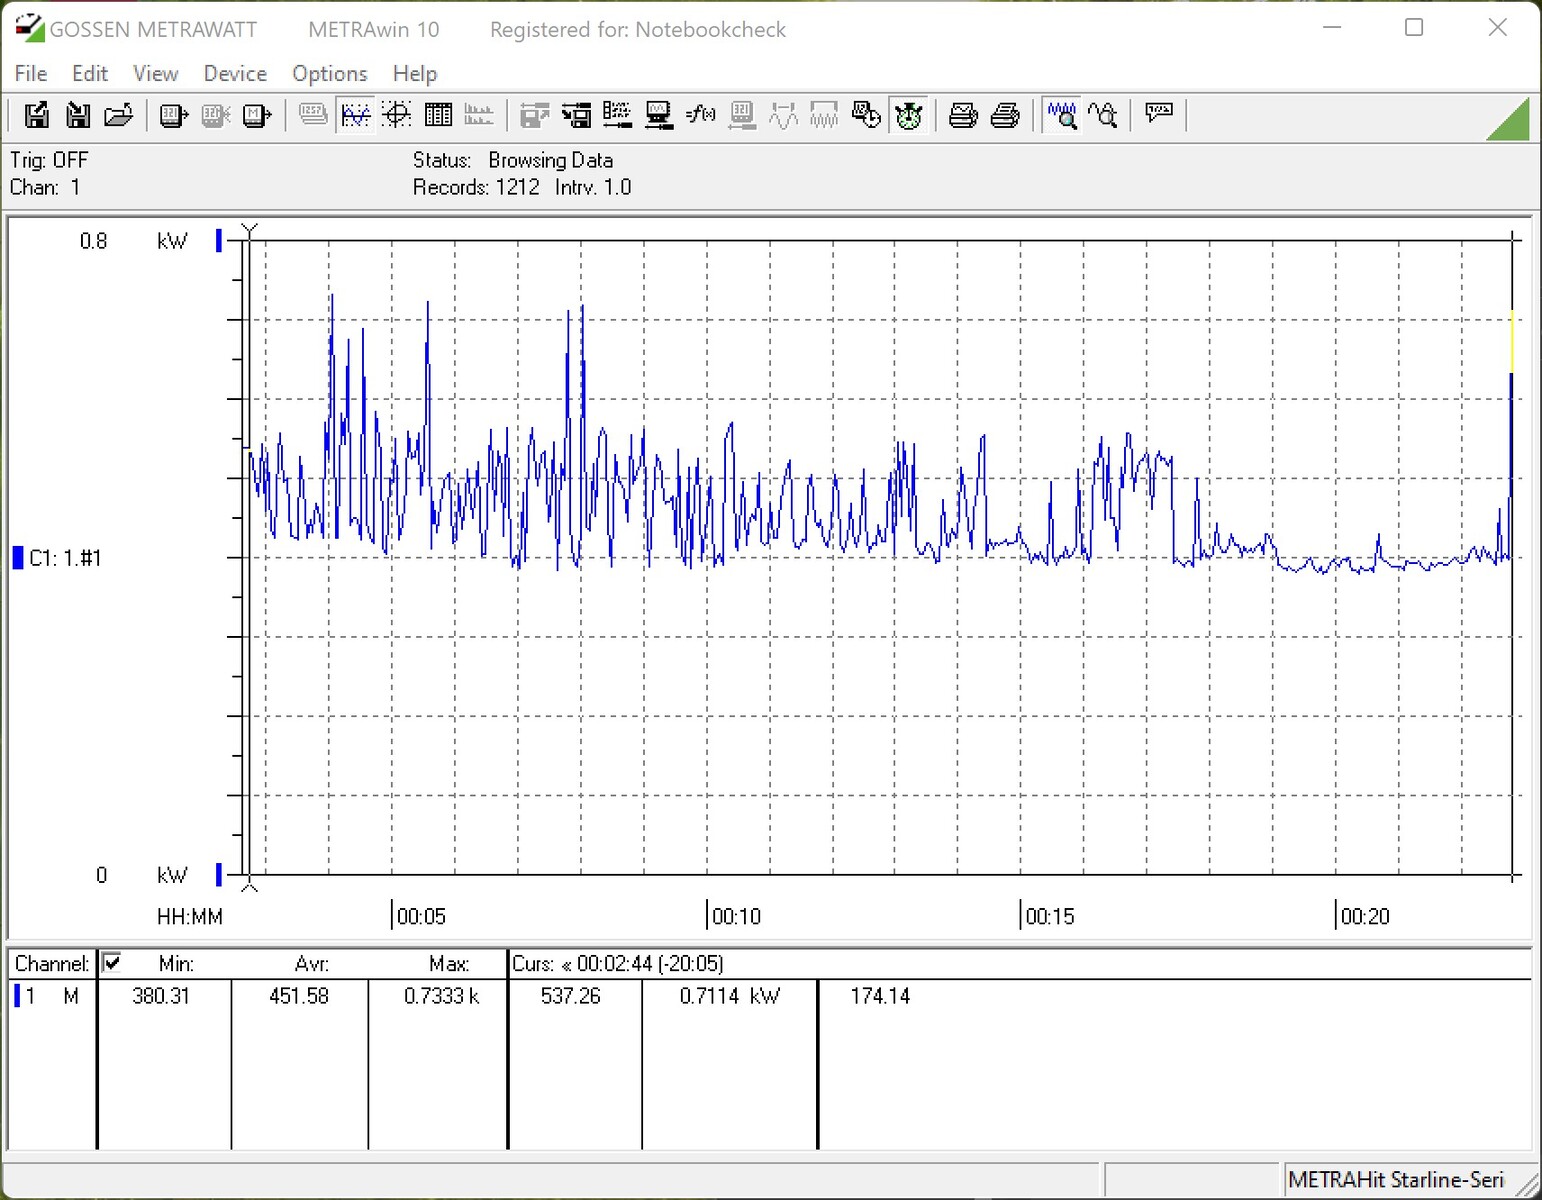
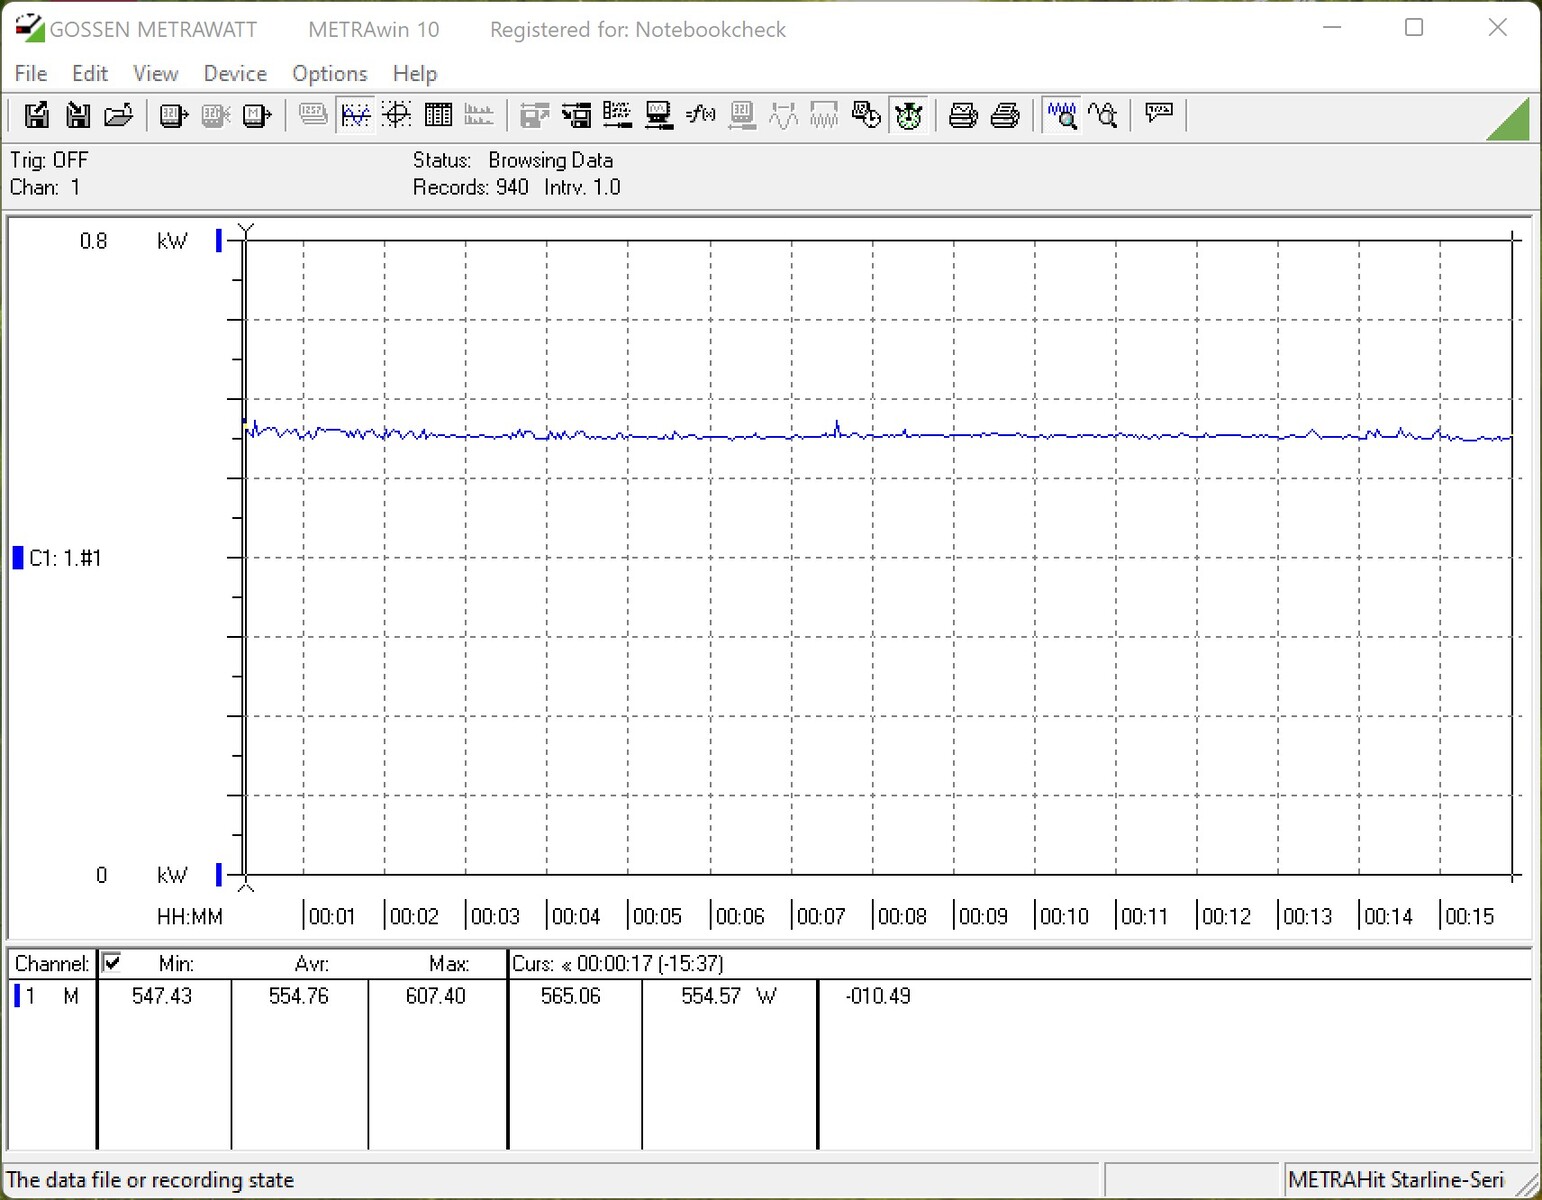
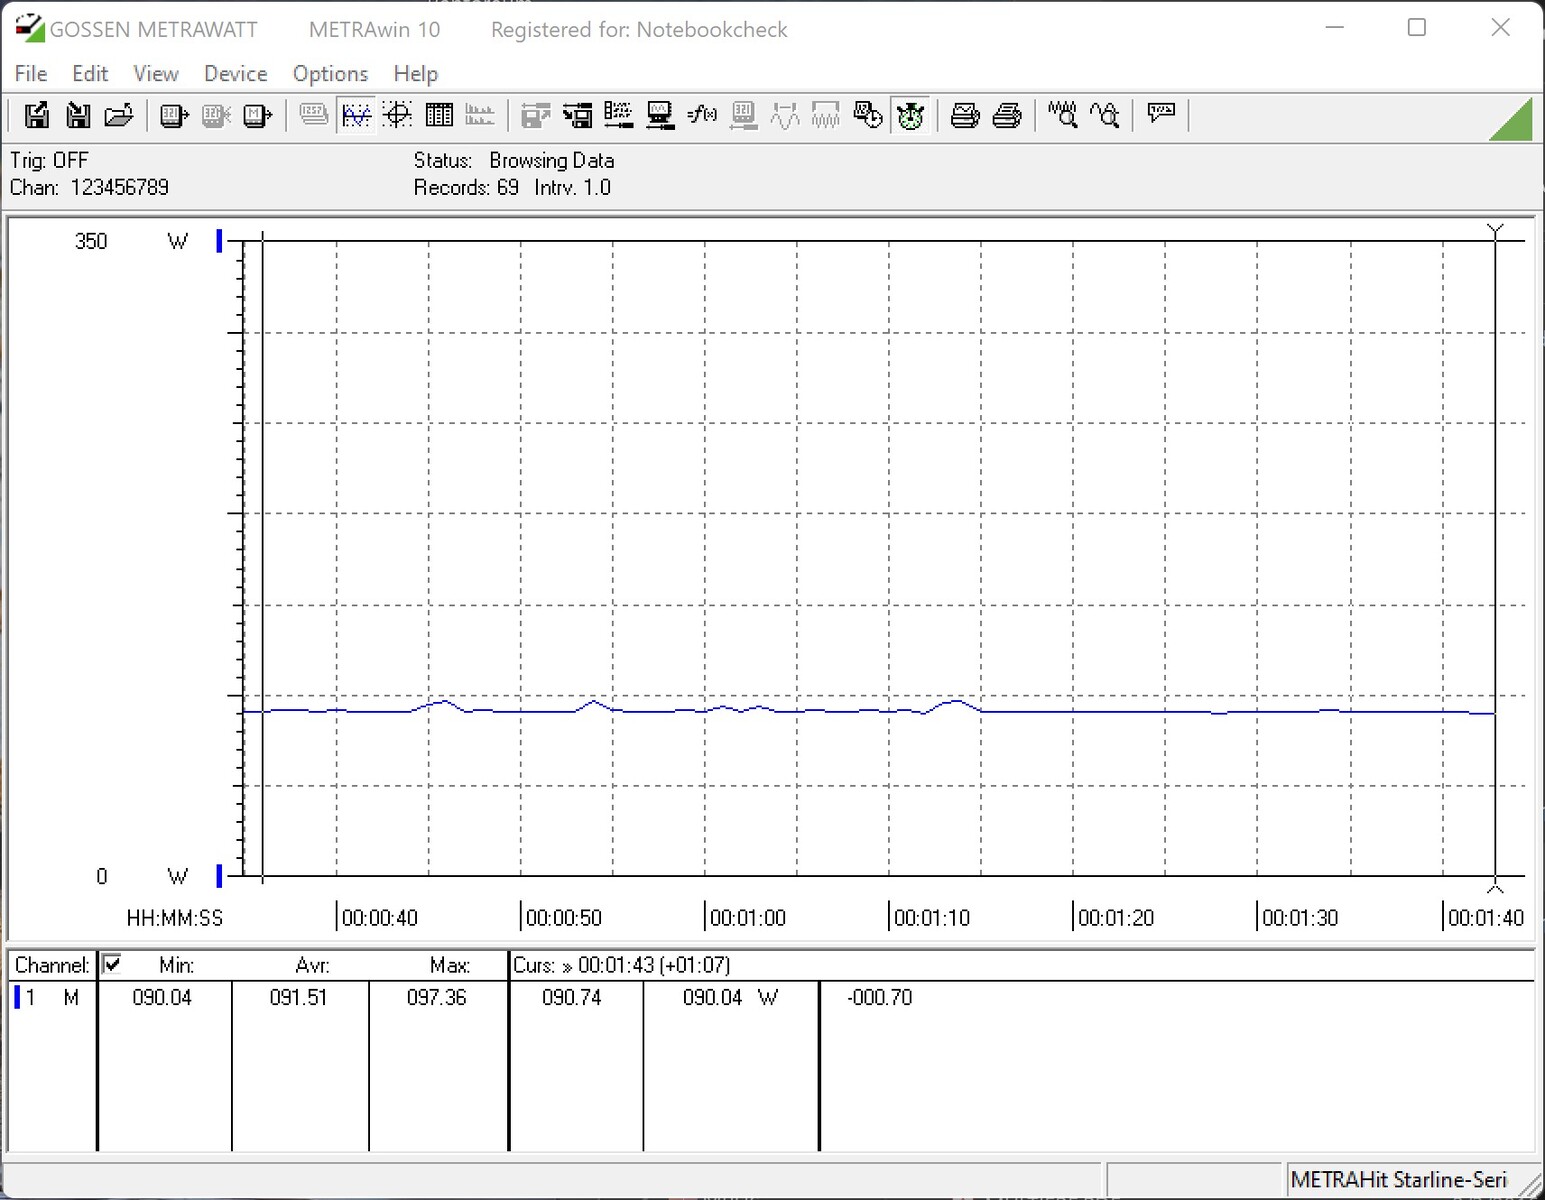
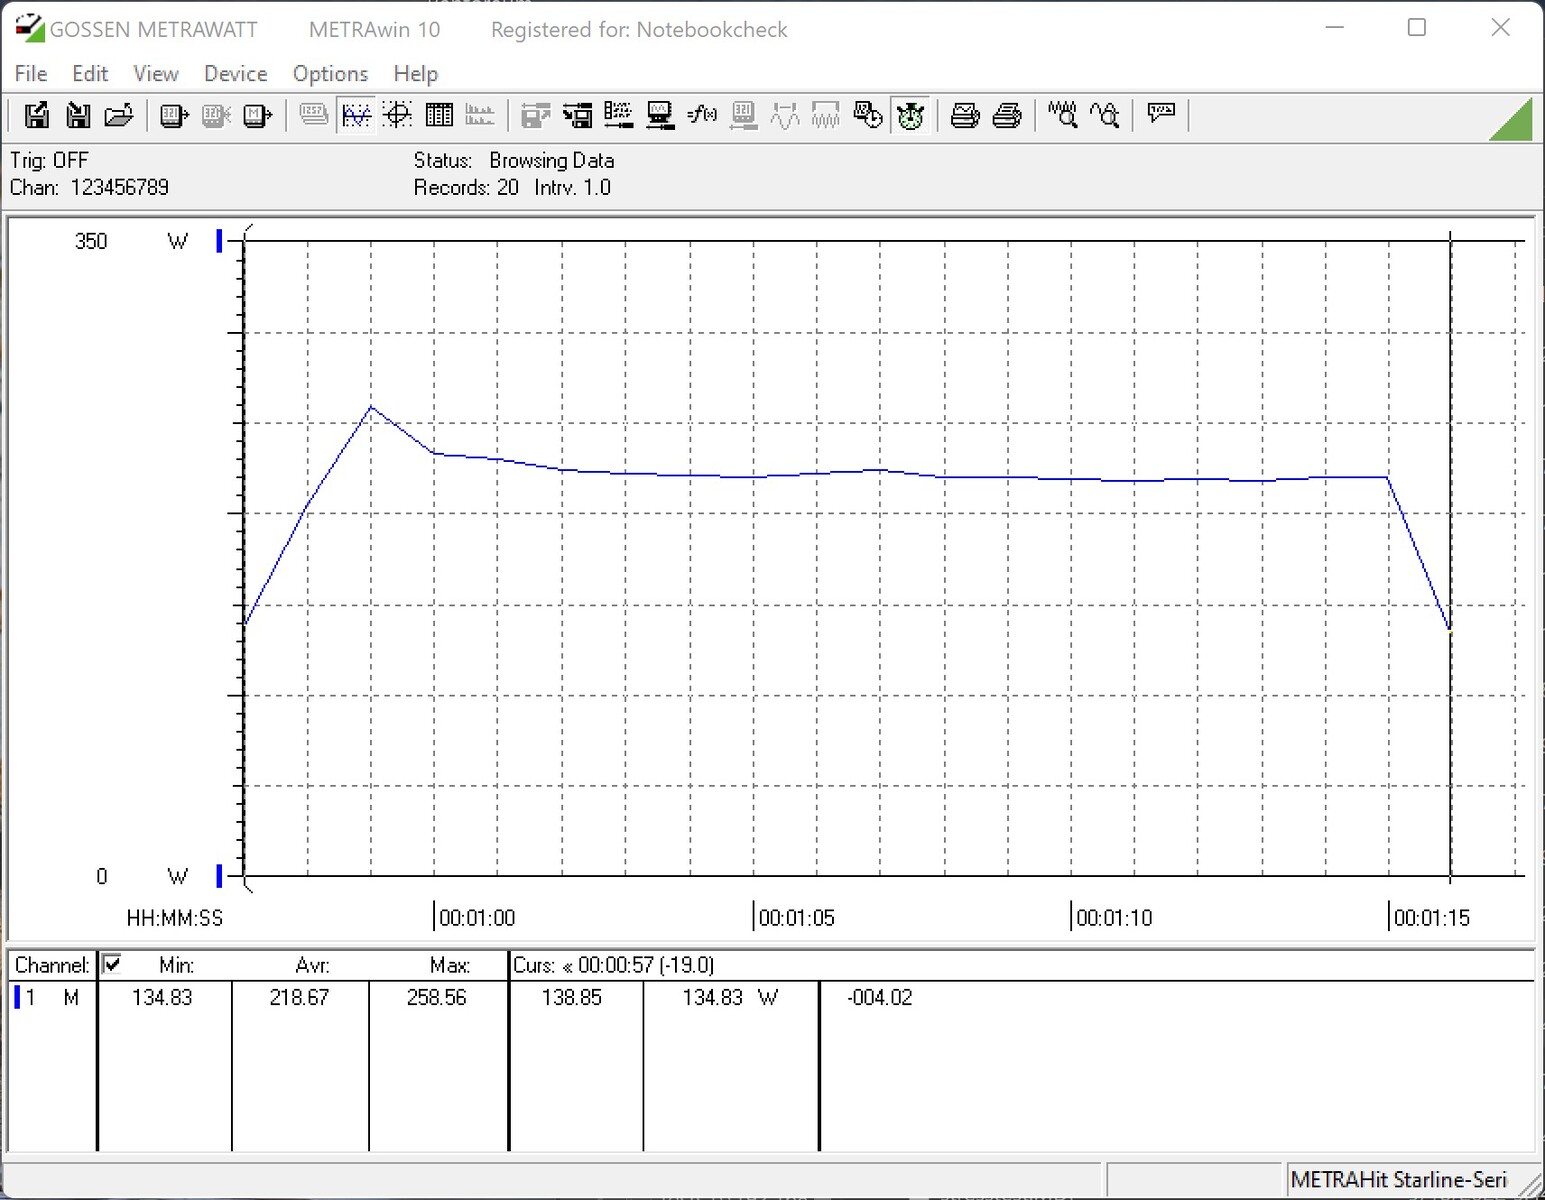
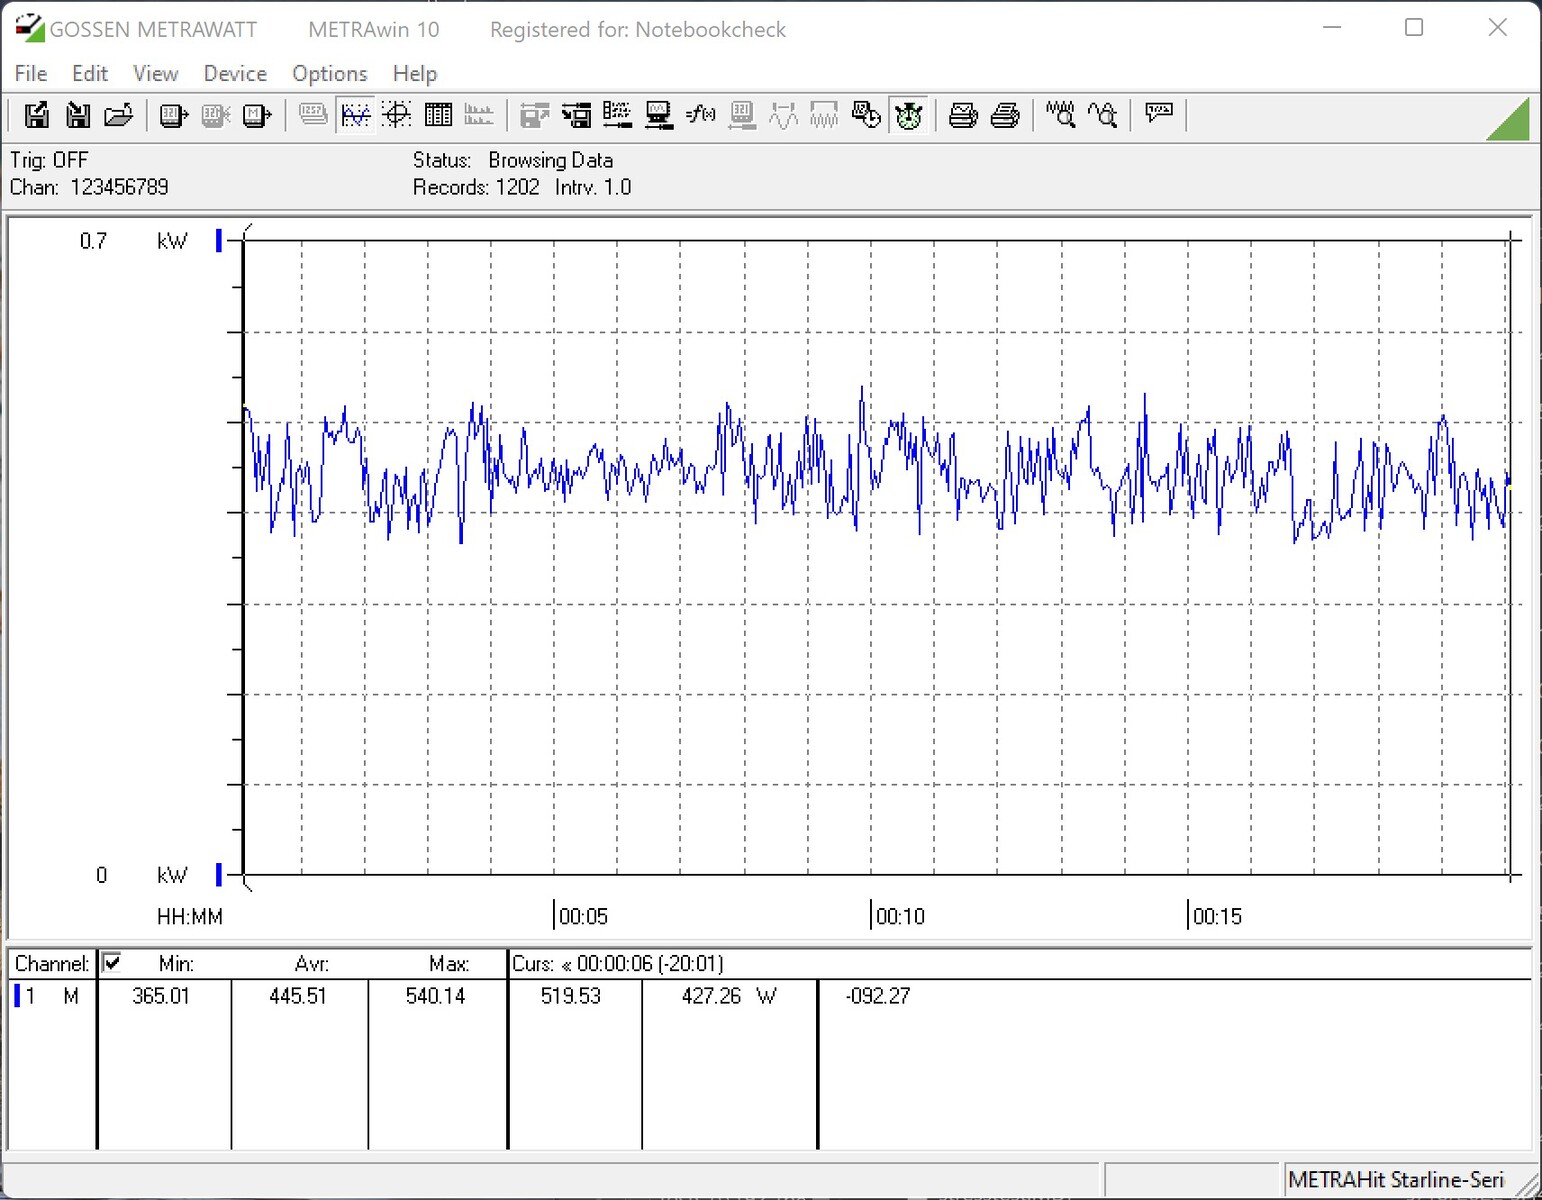
Consumo di energia
Le elevate prestazioni dei nuovi processori AMD Ryzen 7000 sono accompagnate da un consumo energetico notevolmente superiore. Se l'AMD Ryzen 9 5900X aveva ancora un consumo di 105 W (TDP - Thermal Design Power), gli attuali modelli Ryzen 9 possono consumare 170 W. Il PPT (Package Power Tracking) passa da 142 W a 230 W
Se diamo un'occhiata al confronto sotto carico con Cinebech R15-Multi, l'AMD Ryzen 9 7900X è solo leggermente dietro all'Intel Core i9-12900K Intel Core i9-12900K nella classifica. Tuttavia, notiamo una prestazione inferiore rispetto all' AMD Ryzen 9 5900Xindicato da un consumo energetico superiore del 33%. Per l'AMD Ryzen 5 7600X, notiamo solo un aumento del 26% rispetto all'AMD Ryzen 5 5600X AMD Ryzen 5 5600X. Abbiamo osservato un aumento delle prestazioni simile anche nello stress test con Prime95. Con più di 500 W, il consumo energetico durante il gioco è ancora una volta significativamente più alto a causa della scheda grafica. Dobbiamo calcolare circa 350 W per la sola Nvidia GeForce RTX 3090.
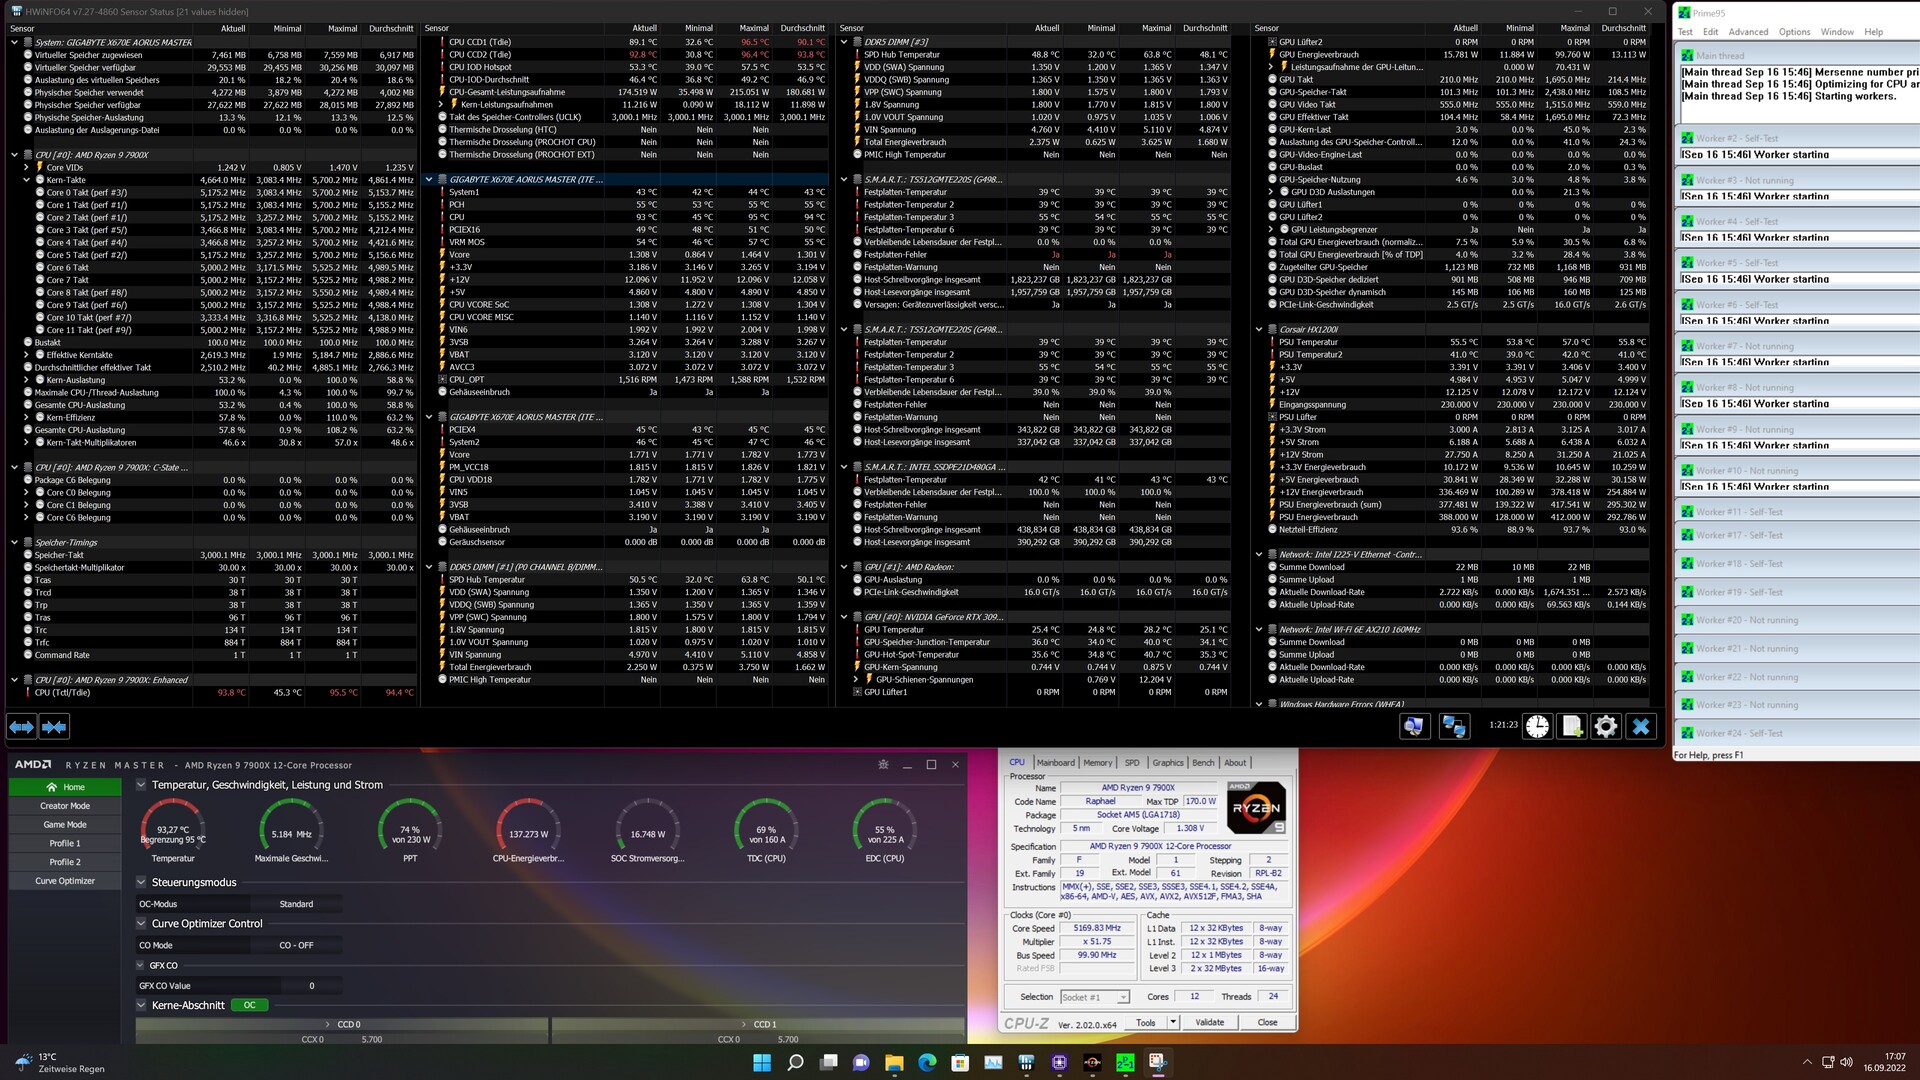
AMD raccomanda di utilizzare una soluzione di raffreddamento adeguata per i suoi processori. Pertanto, si dovrebbe almeno utilizzare una soluzione AiO da 240 o 280 quando si utilizza un AMD Ryzen 9, anche se un buon raffreddatore a torre è sufficiente per l'AMD Ryzen 7 e per l'AMD Ryzen 5. Tuttavia, il nostro test di carico mostra che la nostra soluzione AiO da 280 aveva già i suoi problemi nella configurazione aperta. La temperatura massima di 95 °C specificata da AMD per tutti i nuovi processori è stata comunque raggiunta. Il nostro consiglio è di utilizzare una soluzione 360 AiO, indipendentemente dal fatto che venga installato Ryzen 9, Ryzen 7 o Ryzen 5 della serie 7000. Come suggerimento, AMD fornisce anche un valore di riferimento per le temperature, che è compreso tra 70 e 90 °C.
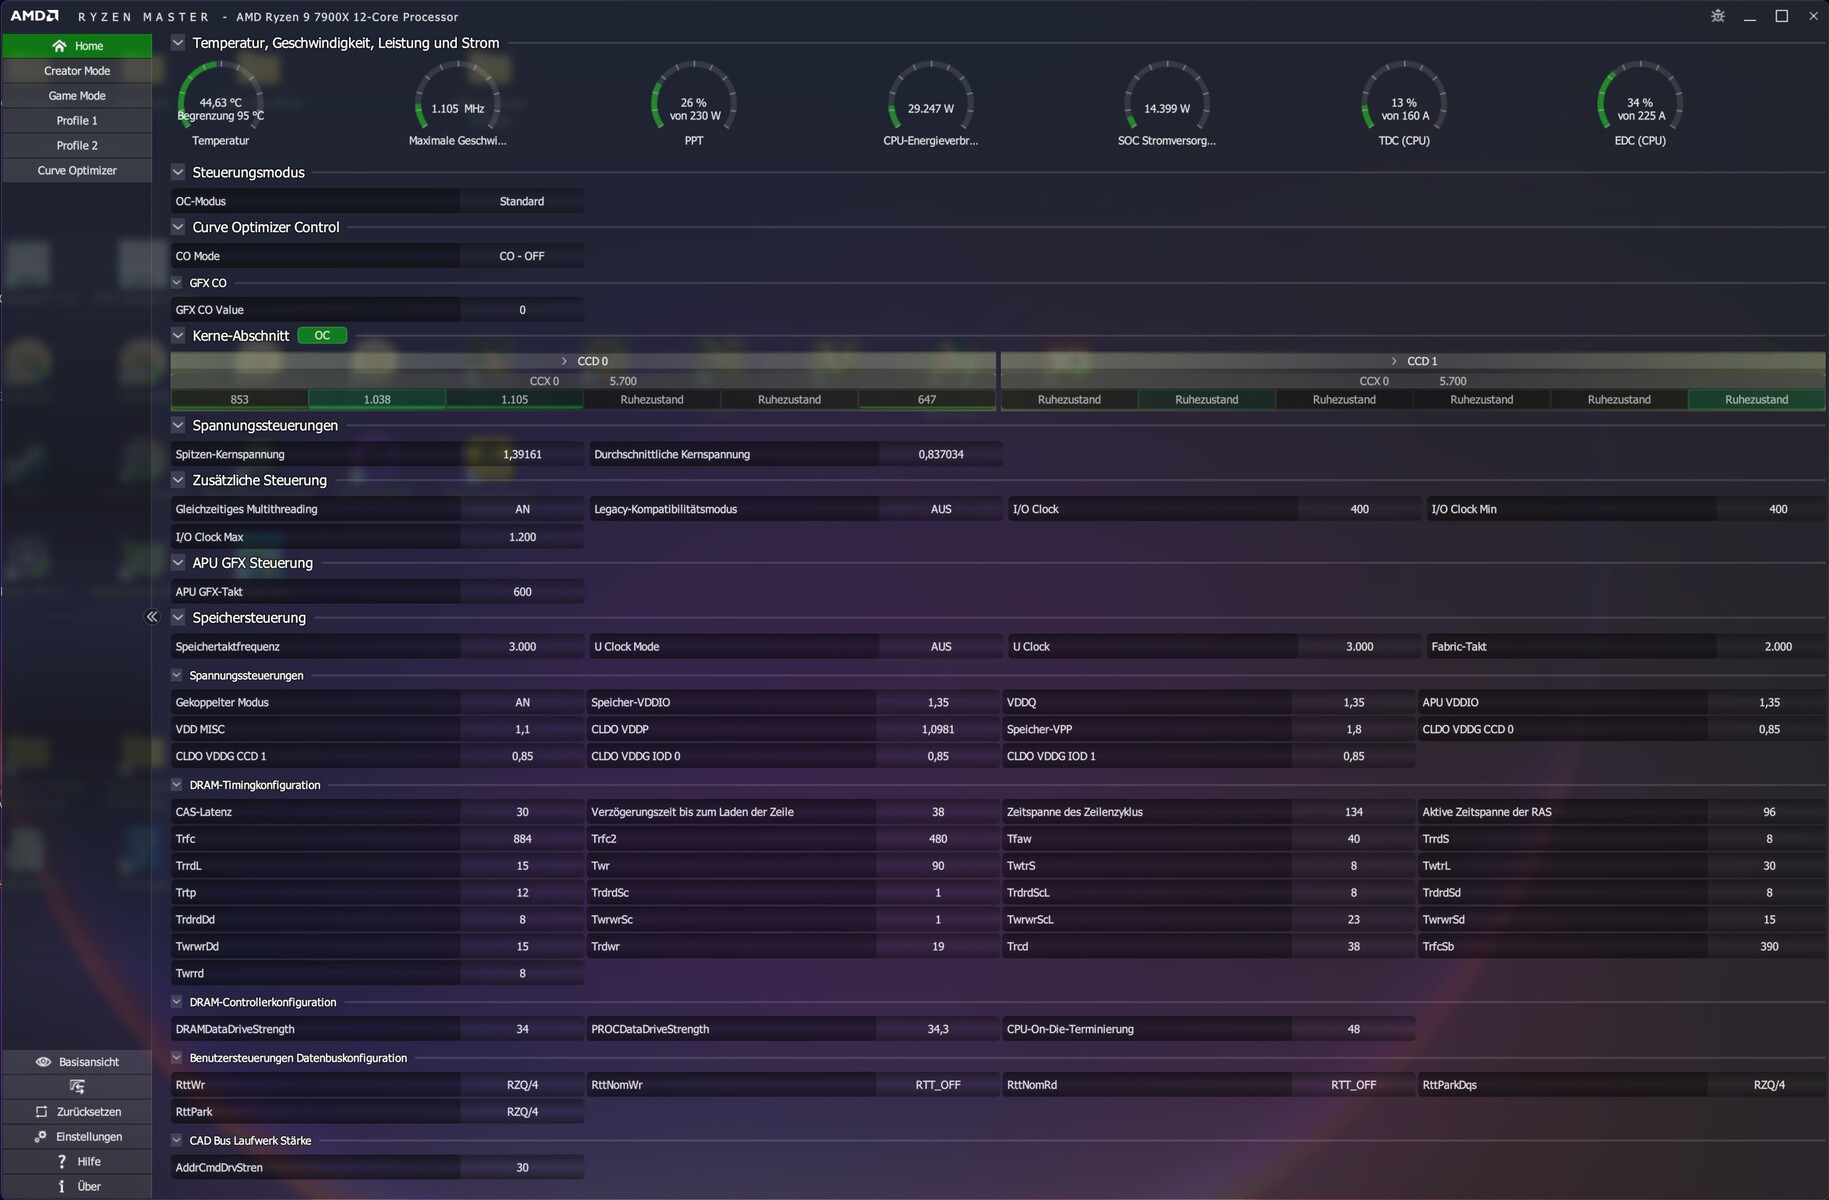
Modalità Eco:
AMD utilizza questa modalità per ridurre il TDP, che può essere paragonato ai limiti PL1 e PL2 di Intel. I processori possono quindi funzionare a 65 W, 105 W o a 170 W non strozzati.
AMD Ryzen 9 7900X
AMD Ryzen 5 7600X
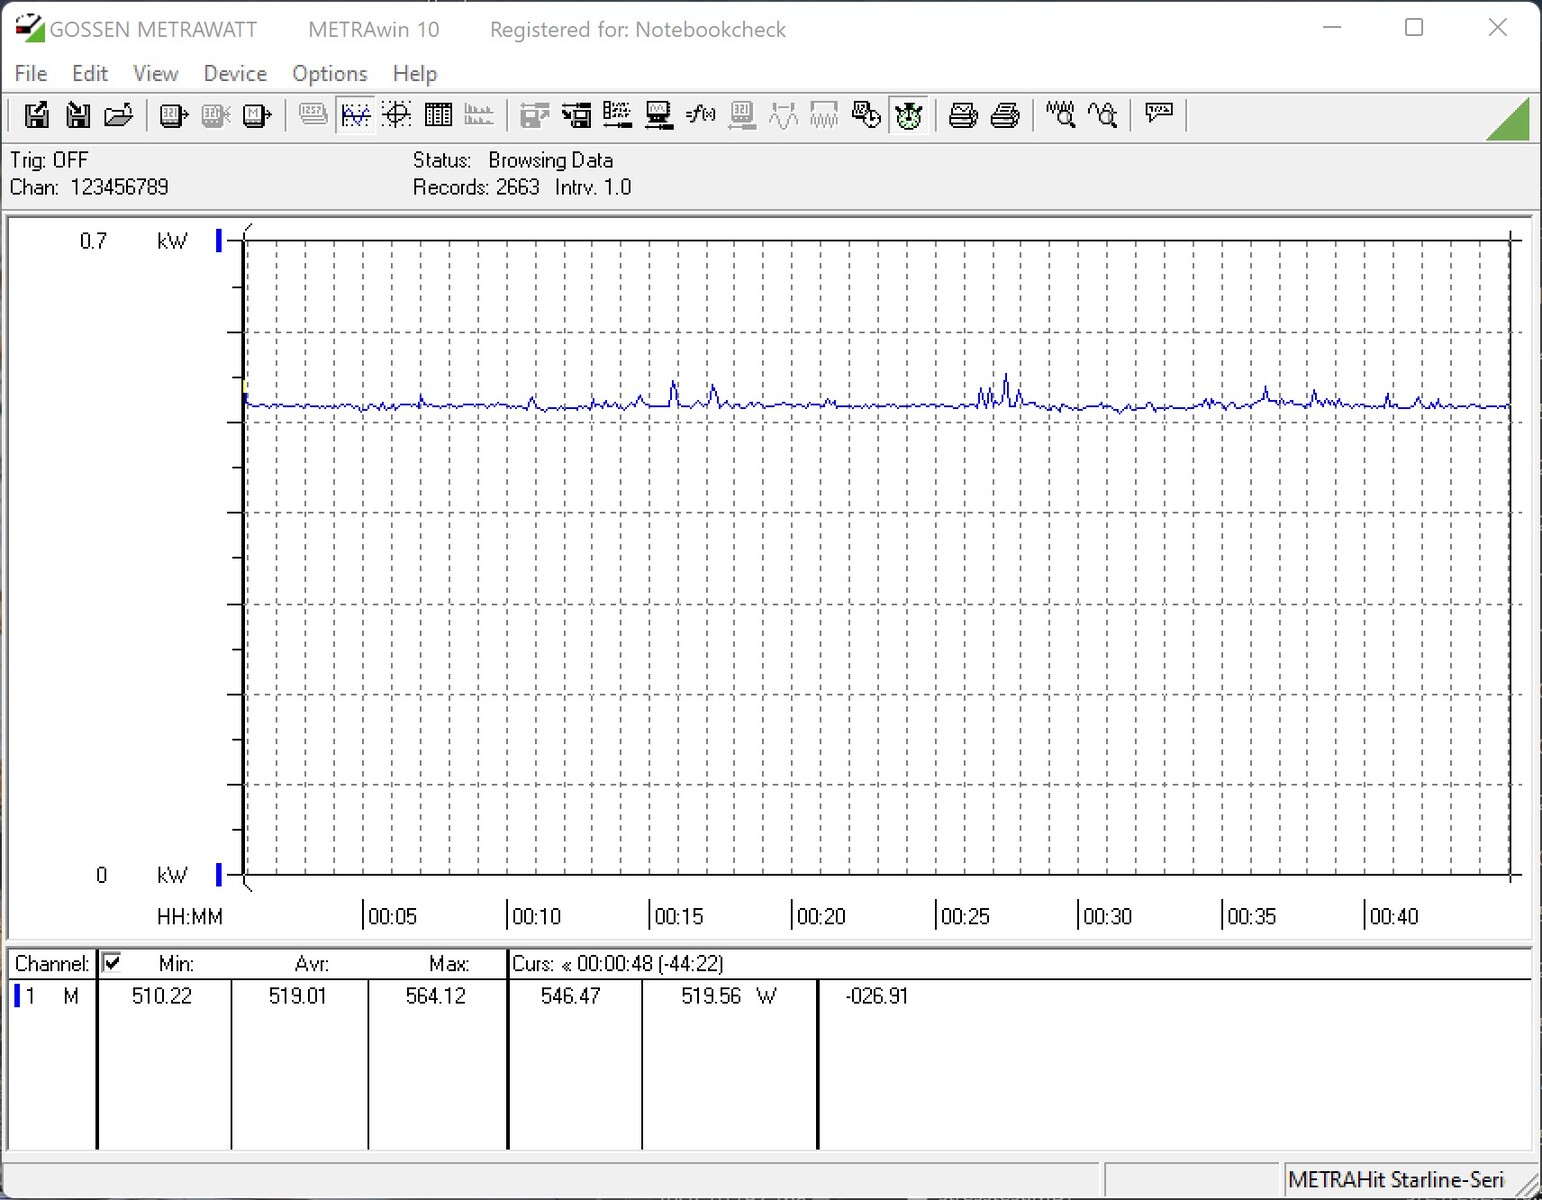
| Power Consumption / Cinebench R15 Multi (external Monitor) | |
| Intel Core i9-12900K (Idle: 70.5 W) | |
| AMD Ryzen 9 7900X | |
| AMD Ryzen 9 5900X (Idle: 78.1 W) | |
| AMD Ryzen 9 5950X (Idle: 78 W) | |
| AMD Ryzen 5 7600X | |
| Intel Core i5-12600K (Idle: 70.45 W) | |
| AMD Ryzen 5 5600X (Idle: 79.23 W) | |
| Power Consumption / Prime95 V2810 Stress (external Monitor) | |
| AMD Ryzen 9 7900X | |
| Intel Core i9-12900K (Idle: 70.5 W) | |
| Intel Core i5-12600K (Idle: 70.45 W) | |
| AMD Ryzen 9 5950X (Idle: 78 W) | |
| AMD Ryzen 9 5900X (Idle: 78.1 W) | |
| AMD Ryzen 5 7600X | |
| AMD Ryzen 5 5600X (Idle: 79.23 W) | |
| Power Consumption / The Witcher 3 ultra (external Monitor) | |
| AMD Ryzen 9 7900X | |
| AMD Ryzen 5 7600X | |
| Nvidia GeForce RTX 3090 Founders Edition (Idle: 91.1 W) | |
| Intel Core i9-12900K (Idle: 70.5 W) | |
| AMD Ryzen 9 5950X (Idle: 78 W) | |
| AMD Ryzen 9 5900X (Idle: 78.1 W) | |
| AMD Ryzen 5 5600X (Idle: 79.23 W) | |
| Intel Core i5-12600K (Idle: 70.45 W) | |
* ... Meglio usare valori piccoli
Power Consumption With External Monitor
Pro
Contro
Conclusione: Estremamente veloce ma anche affamato di prestazioni
Dopo oltre cinque anni in cui il socket AM4 è stato la base dei processori Ryzen, AMD presenta ora il nuovo socket AM5 insieme ai nuovi processori AMD Ryzen 7000. Ci piace il passaggio da PGA a LGA e il problema della rottura dei pin delle CPU quando si rimuove il dissipatore appartiene finalmente al passato. Questo significa anche che lo standard DDR4 è finito, perché Ryzen 7000 è compatibile solo con AM5 e DDR5. Questo è un passo che Intel ha già fatto con la serie Alder Lake, anche se supporta ancora DDR4 e DDR5.
In termini di prestazioni, AMD ha ancora una volta aumentato in modo significativo le prestazioni per clock (IPC). Insieme alle frequenze di clock significativamente più elevate che sono ora possibili con la produzione a 5 nm, registriamo un aumento delle prestazioni fino al 30%. Rispetto al Ryzen 5000, non ci sono grandi cambiamenti sotto il dissipatore di calore. Ci sono ancora due CCD e un die di I/O sul PCB. Il die I/O è prodotto in 6 nm e offre una iGPU, che non può essere utilizzata per applicazioni 3D con solo 2 CU.
Tuttavia, possiamo attualmente affermare che AMD offre prestazioni di gioco migliori rispetto al Core i9-12900K di Intel con il Ryzen 9 7900X e il Ryzen 5 7600X. Il Core i9-12900K di Intel, che ha già un anno di vita, sarà sostituito nel prossimo futuro, il che potrebbe cambiare completamente il rapporto di forza. Tuttavia, per ora si tratta solo di sogni del futuro e noi stiamo valutando il presente. Inoltre, in questa recensione non abbiamo ancora esaminato il modello di punta di AMD, l'AMD Ryzen 9 7950X. C'è ancora più potenziale per mettere Intel ancora più sotto pressione.
Il Ryzen 9 7900X e il Ryzen 5 7600X di AMD offrono prestazioni favolose sotto tutti gli aspetti. Inoltre, c'è un degno successore nel Socket AM5 che elimina i problemi noti
Come spesso accade, il cliente ha l'imbarazzo della scelta e deve decidere quale CPU preferire. Se volete solo giocare, sarete serviti molto bene con un AMD Ryzen 5 7600X. La CPU a 6 core è veloce e offre tutti i vantaggi della nuova generazione Zen 4. La differenza di prestazioni rispetto all'AMD Ryzen 9 7900X è estremamente ridotta nei giochi testati. Se siete alla ricerca di una piattaforma per il lavoro produttivo o siete creatori di contenuti, sarete sicuramente soddisfatti dell'AMD Ryzen 9 7900X, perché le elevate prestazioni multi-thread sono migliori di quelle dell'AMD Ryzen 9 5950X.
Prezzi e disponibilità
Direttamente nel negozio AMD https://www.amd.com/de/direct-buy/de ma i processori attuali possono essere acquistati anche presso molti noti negozi online. AMD indica un MSRP di 669 euro per l'AMD Ryzen 9 7900X. Secondo AMD, il modello base, l'AMD Ryzen 5 7600X, costa 359 euro.
