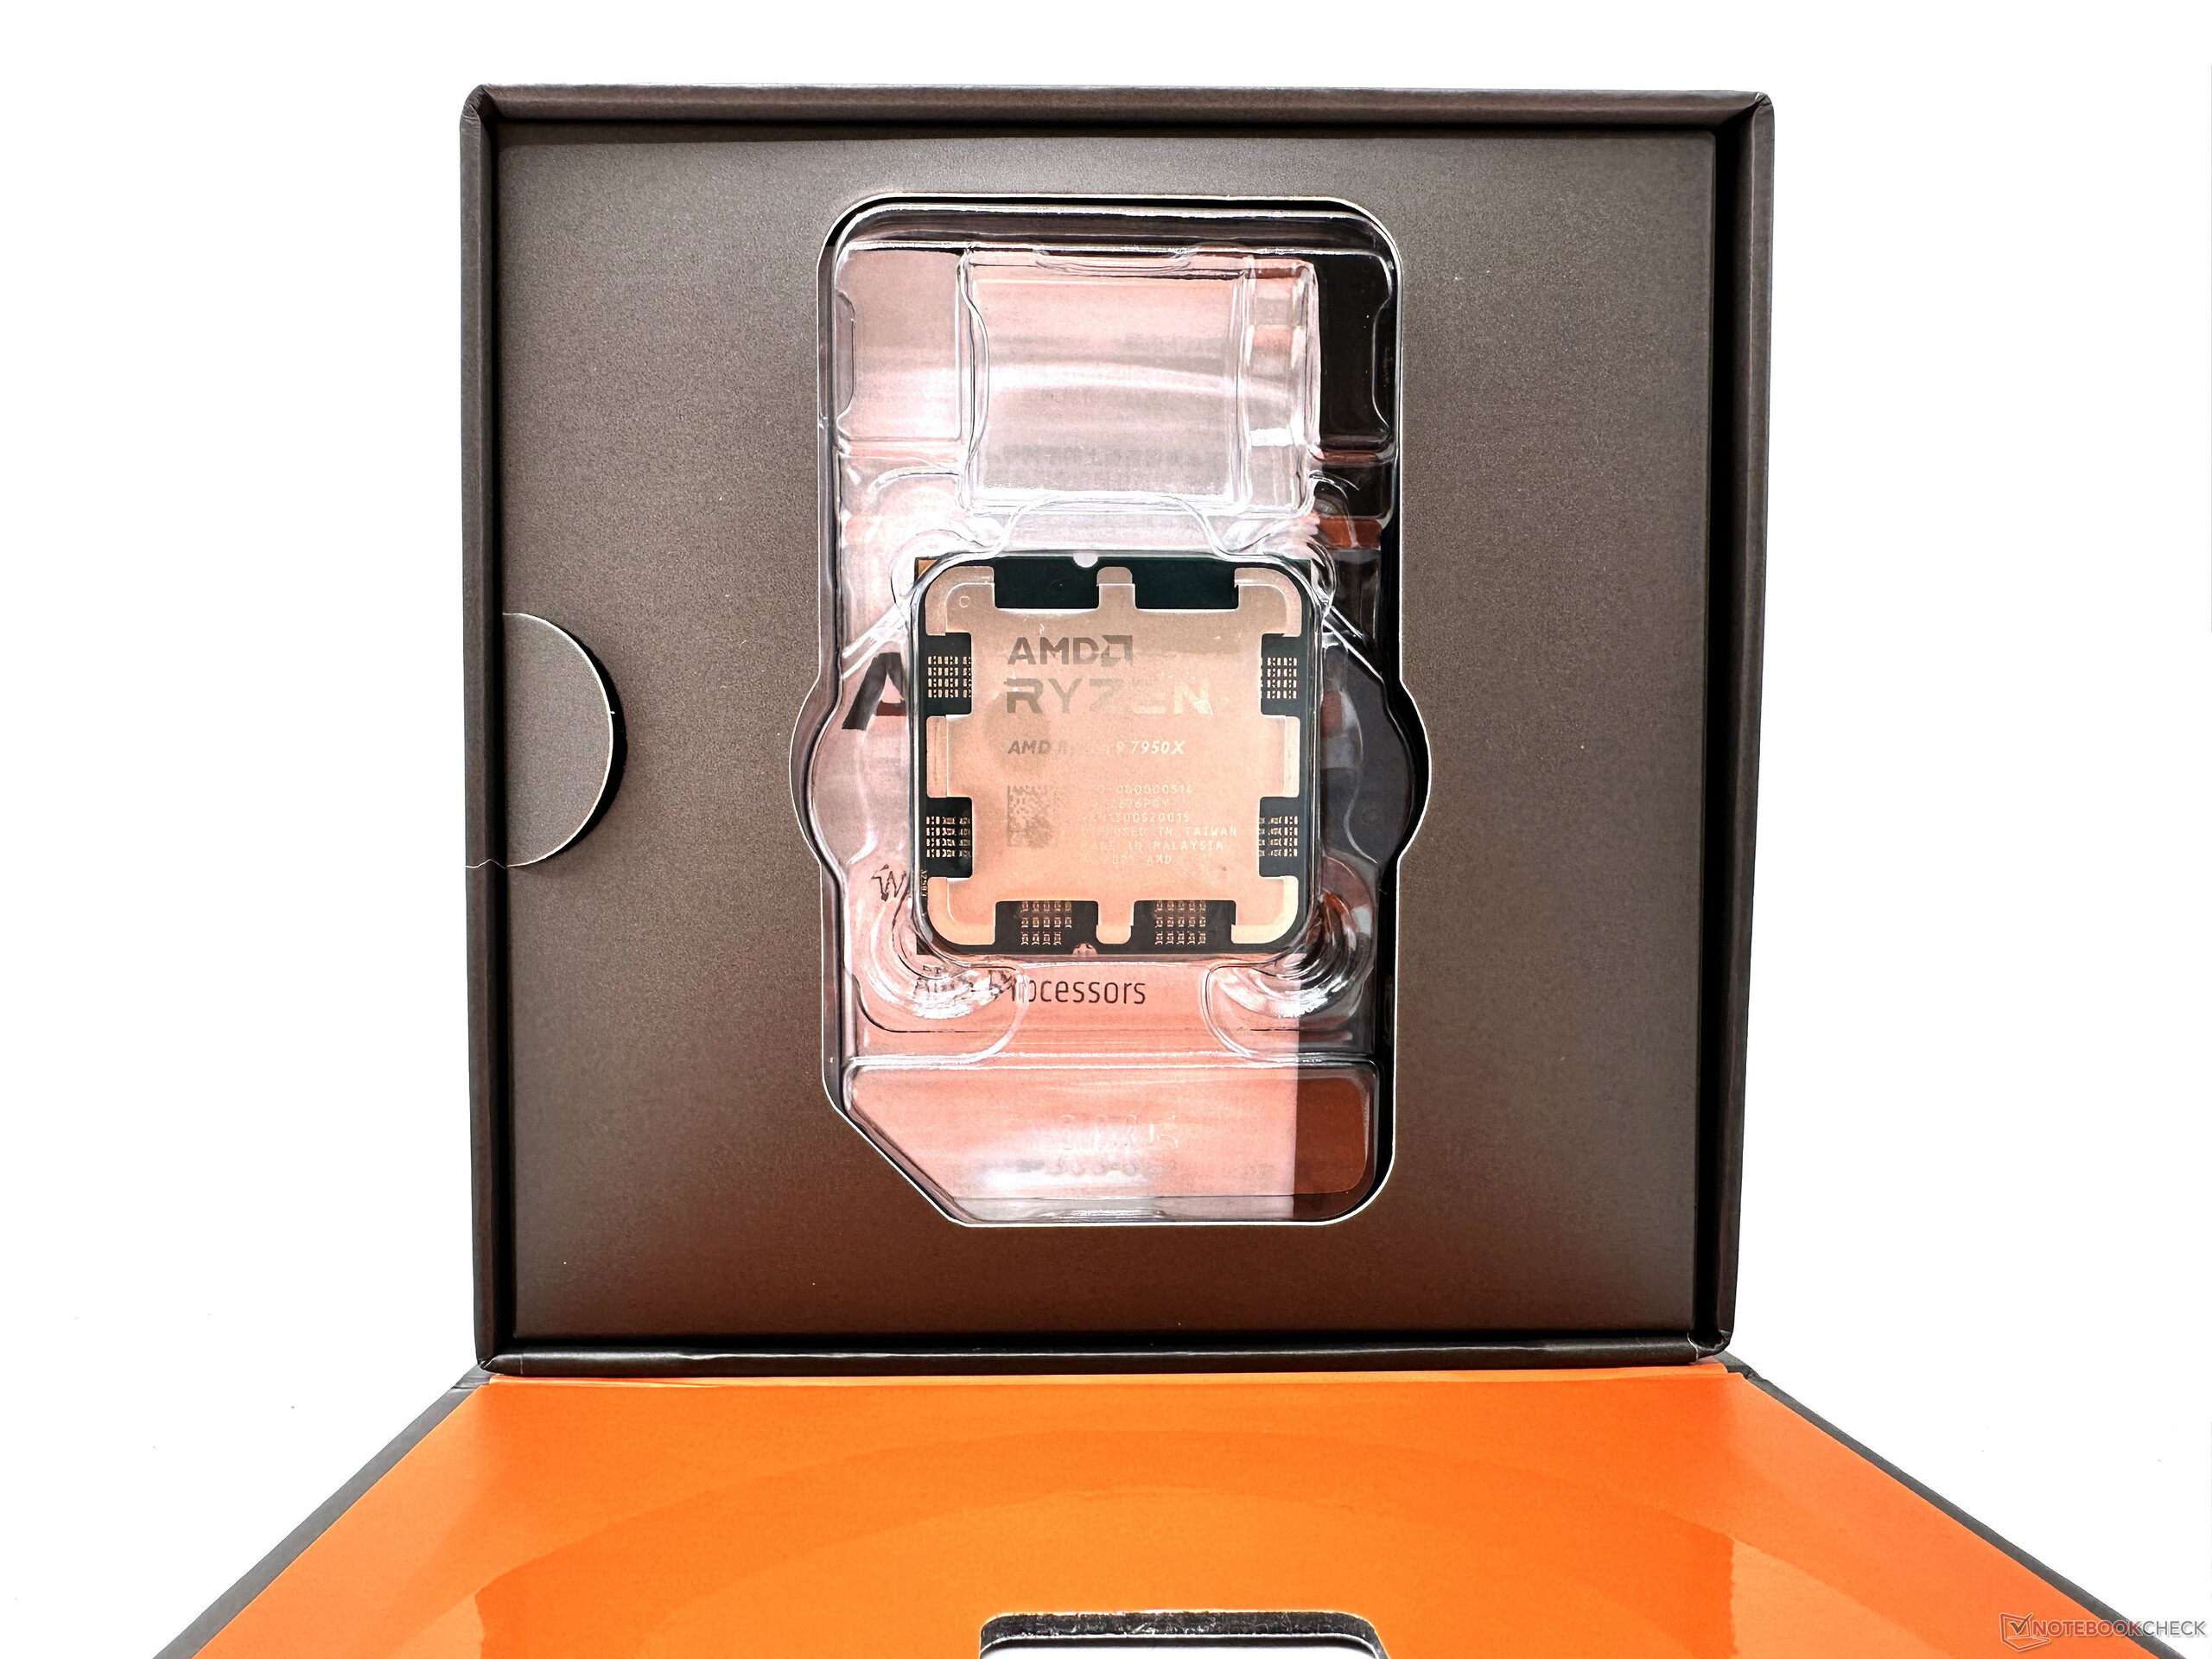
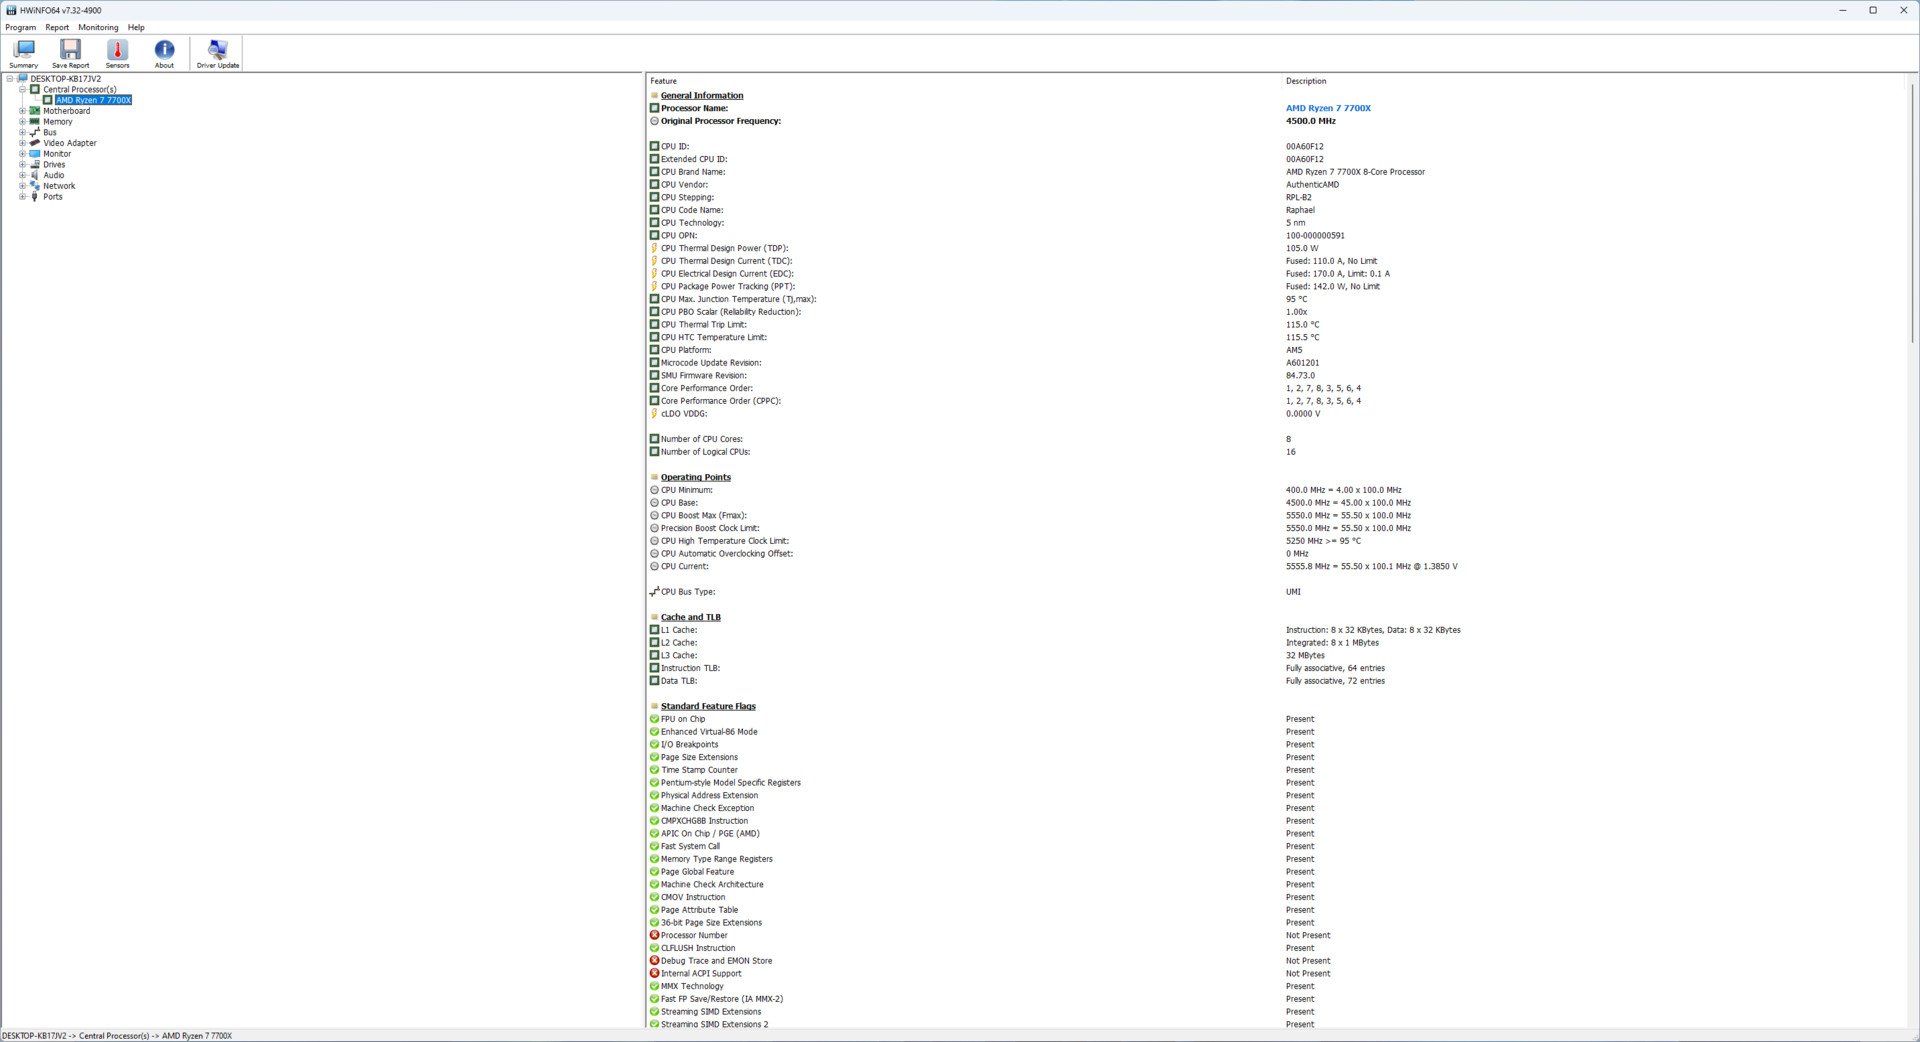
Recensione di AMD Ryzen 9 7950X e AMD Ryzen 7 7700X: Prestazioni superlative e guadagni di efficienza che danno filo da torcere a Raptor Lake
Dopo aver mantenuto la piattaforma AM4 per oltre mezzo decennio, Zen 4 segna il primo passaggio generazionale di AMD verso una nuova era del PC computing. La linea Raphael Zen 4, che per ora conta quattro SKU, porta con sé il supporto nativo per le tecnologie DDR5 e PCIe Gen 5. Oltre a queste, i processori Zen 4 sono dotati di istruzioni AVX-512. Oltre a queste, i processori Zen 4 sono dotati di supporto per le istruzioni AVX-512, di una iGPU RDNA 2 integrata e della promessa di un aumento dell'IPC e dell'efficienza energetica.
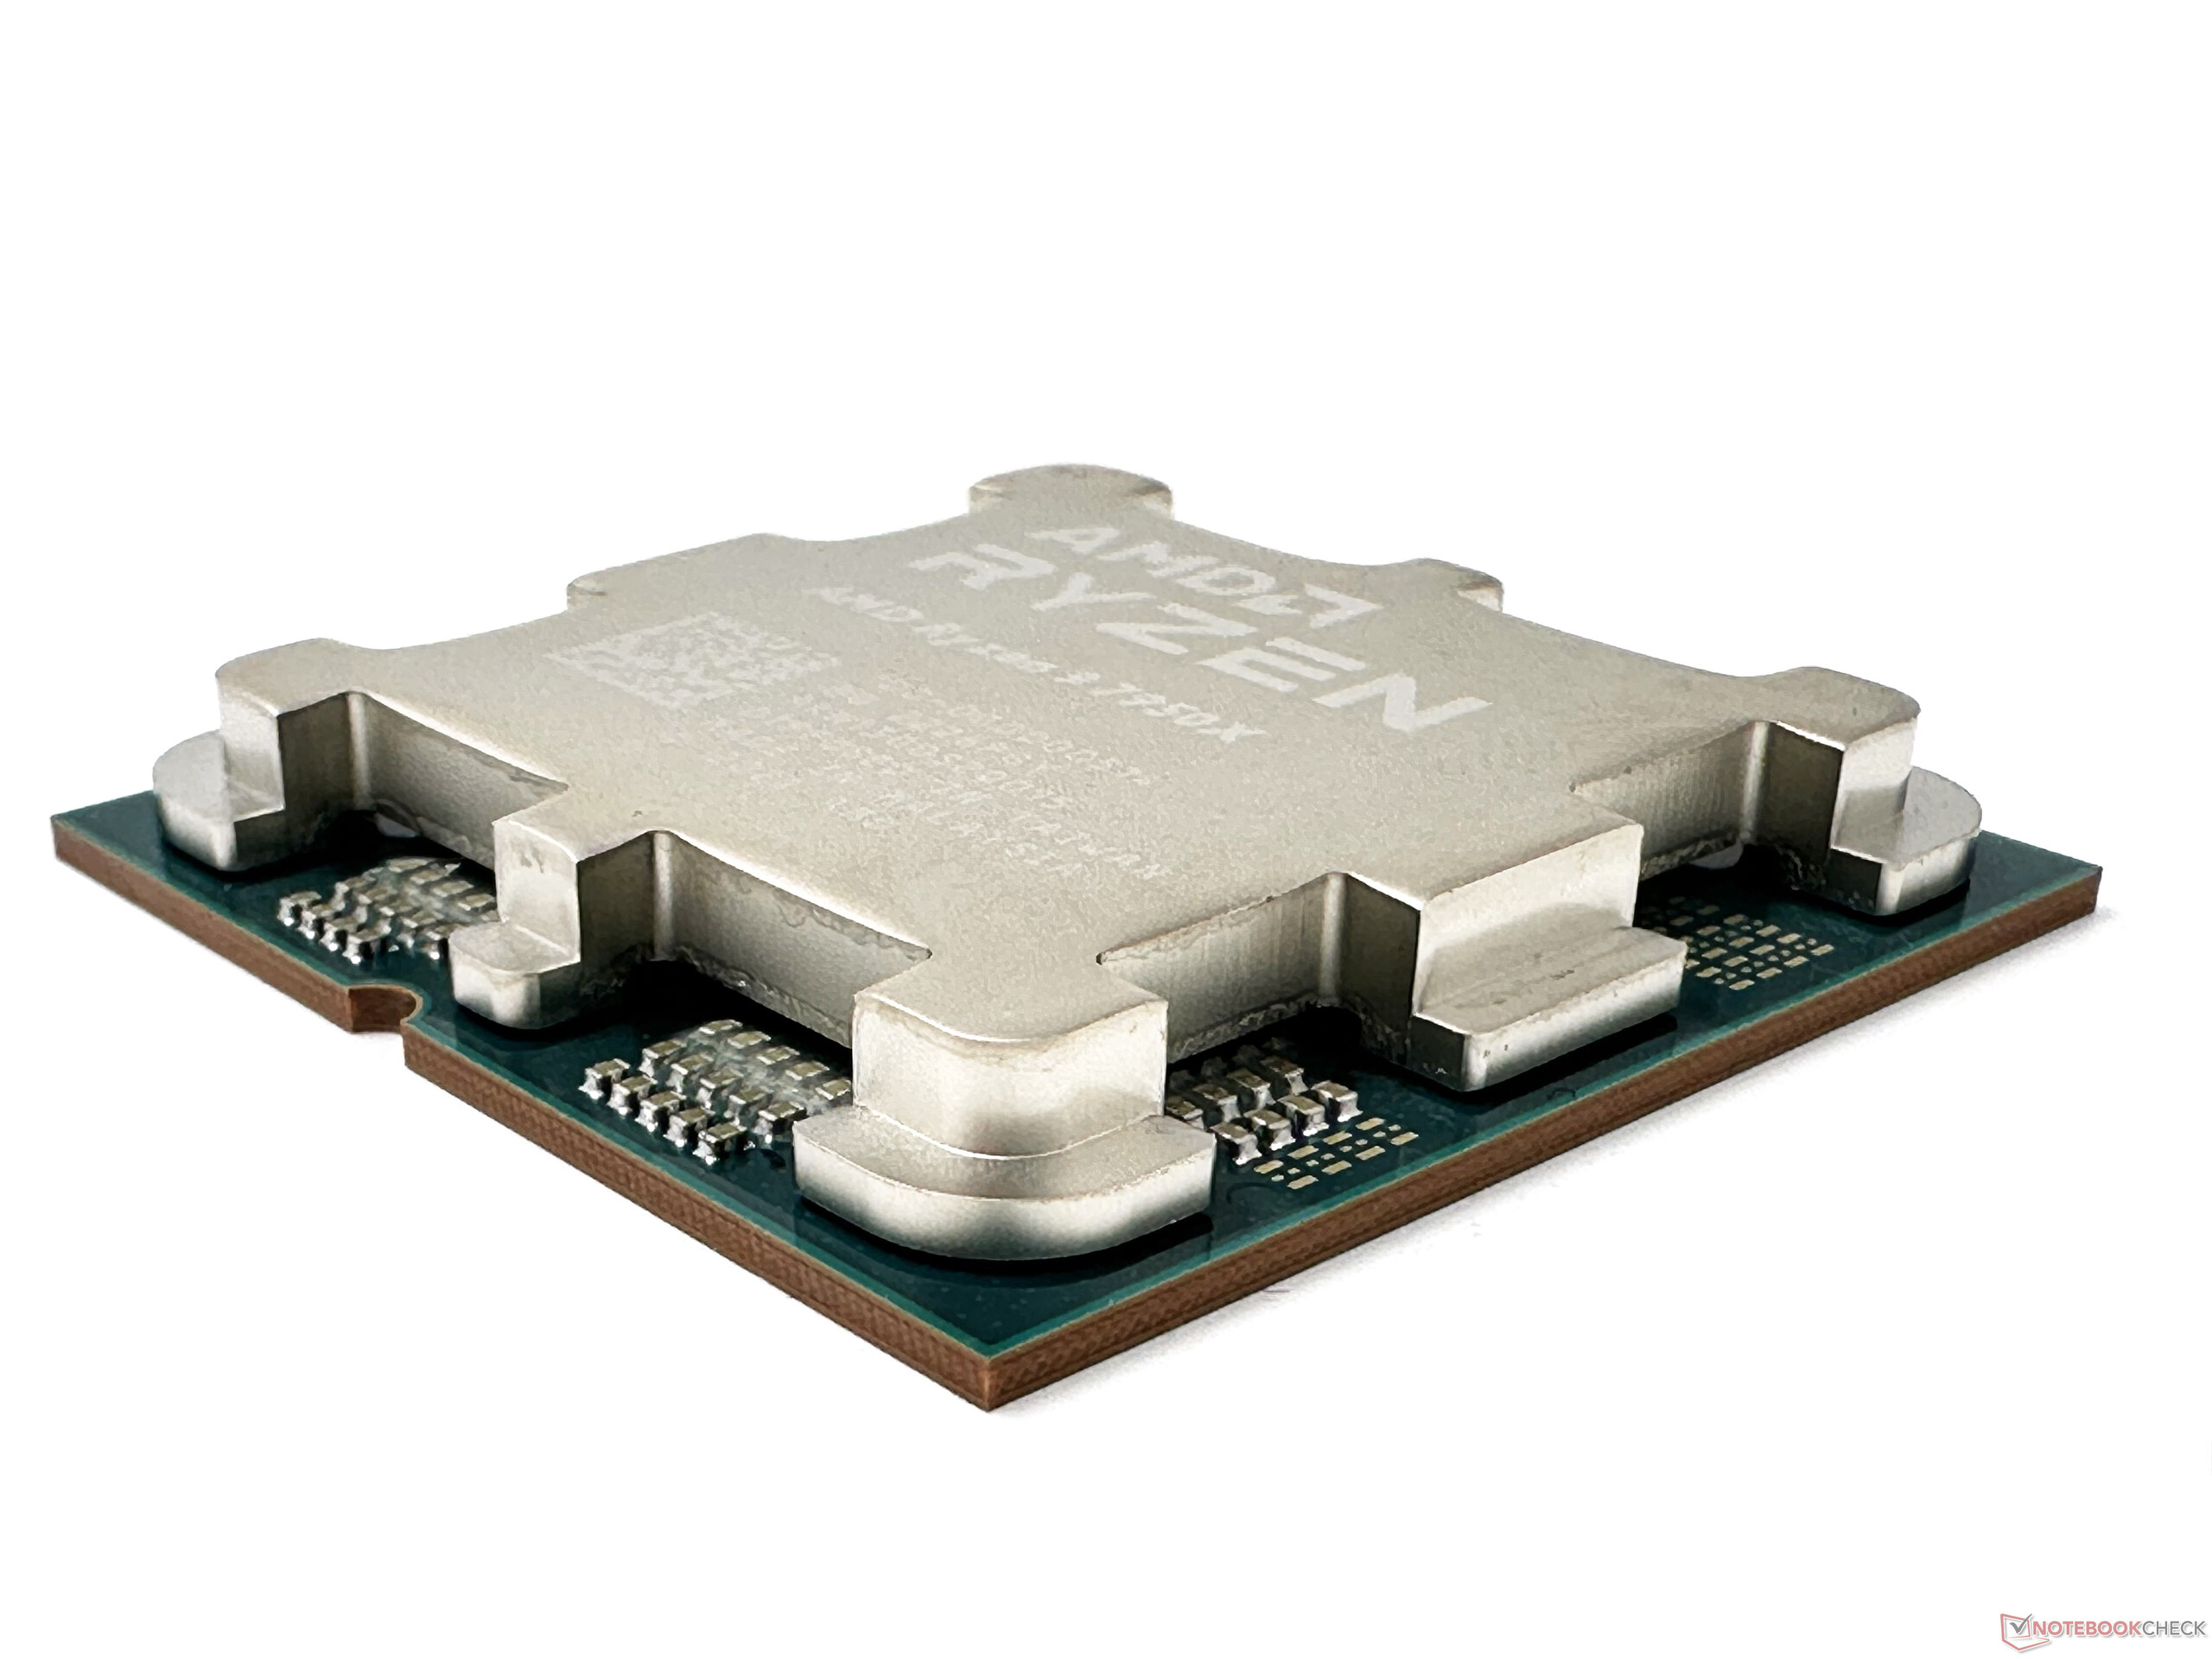
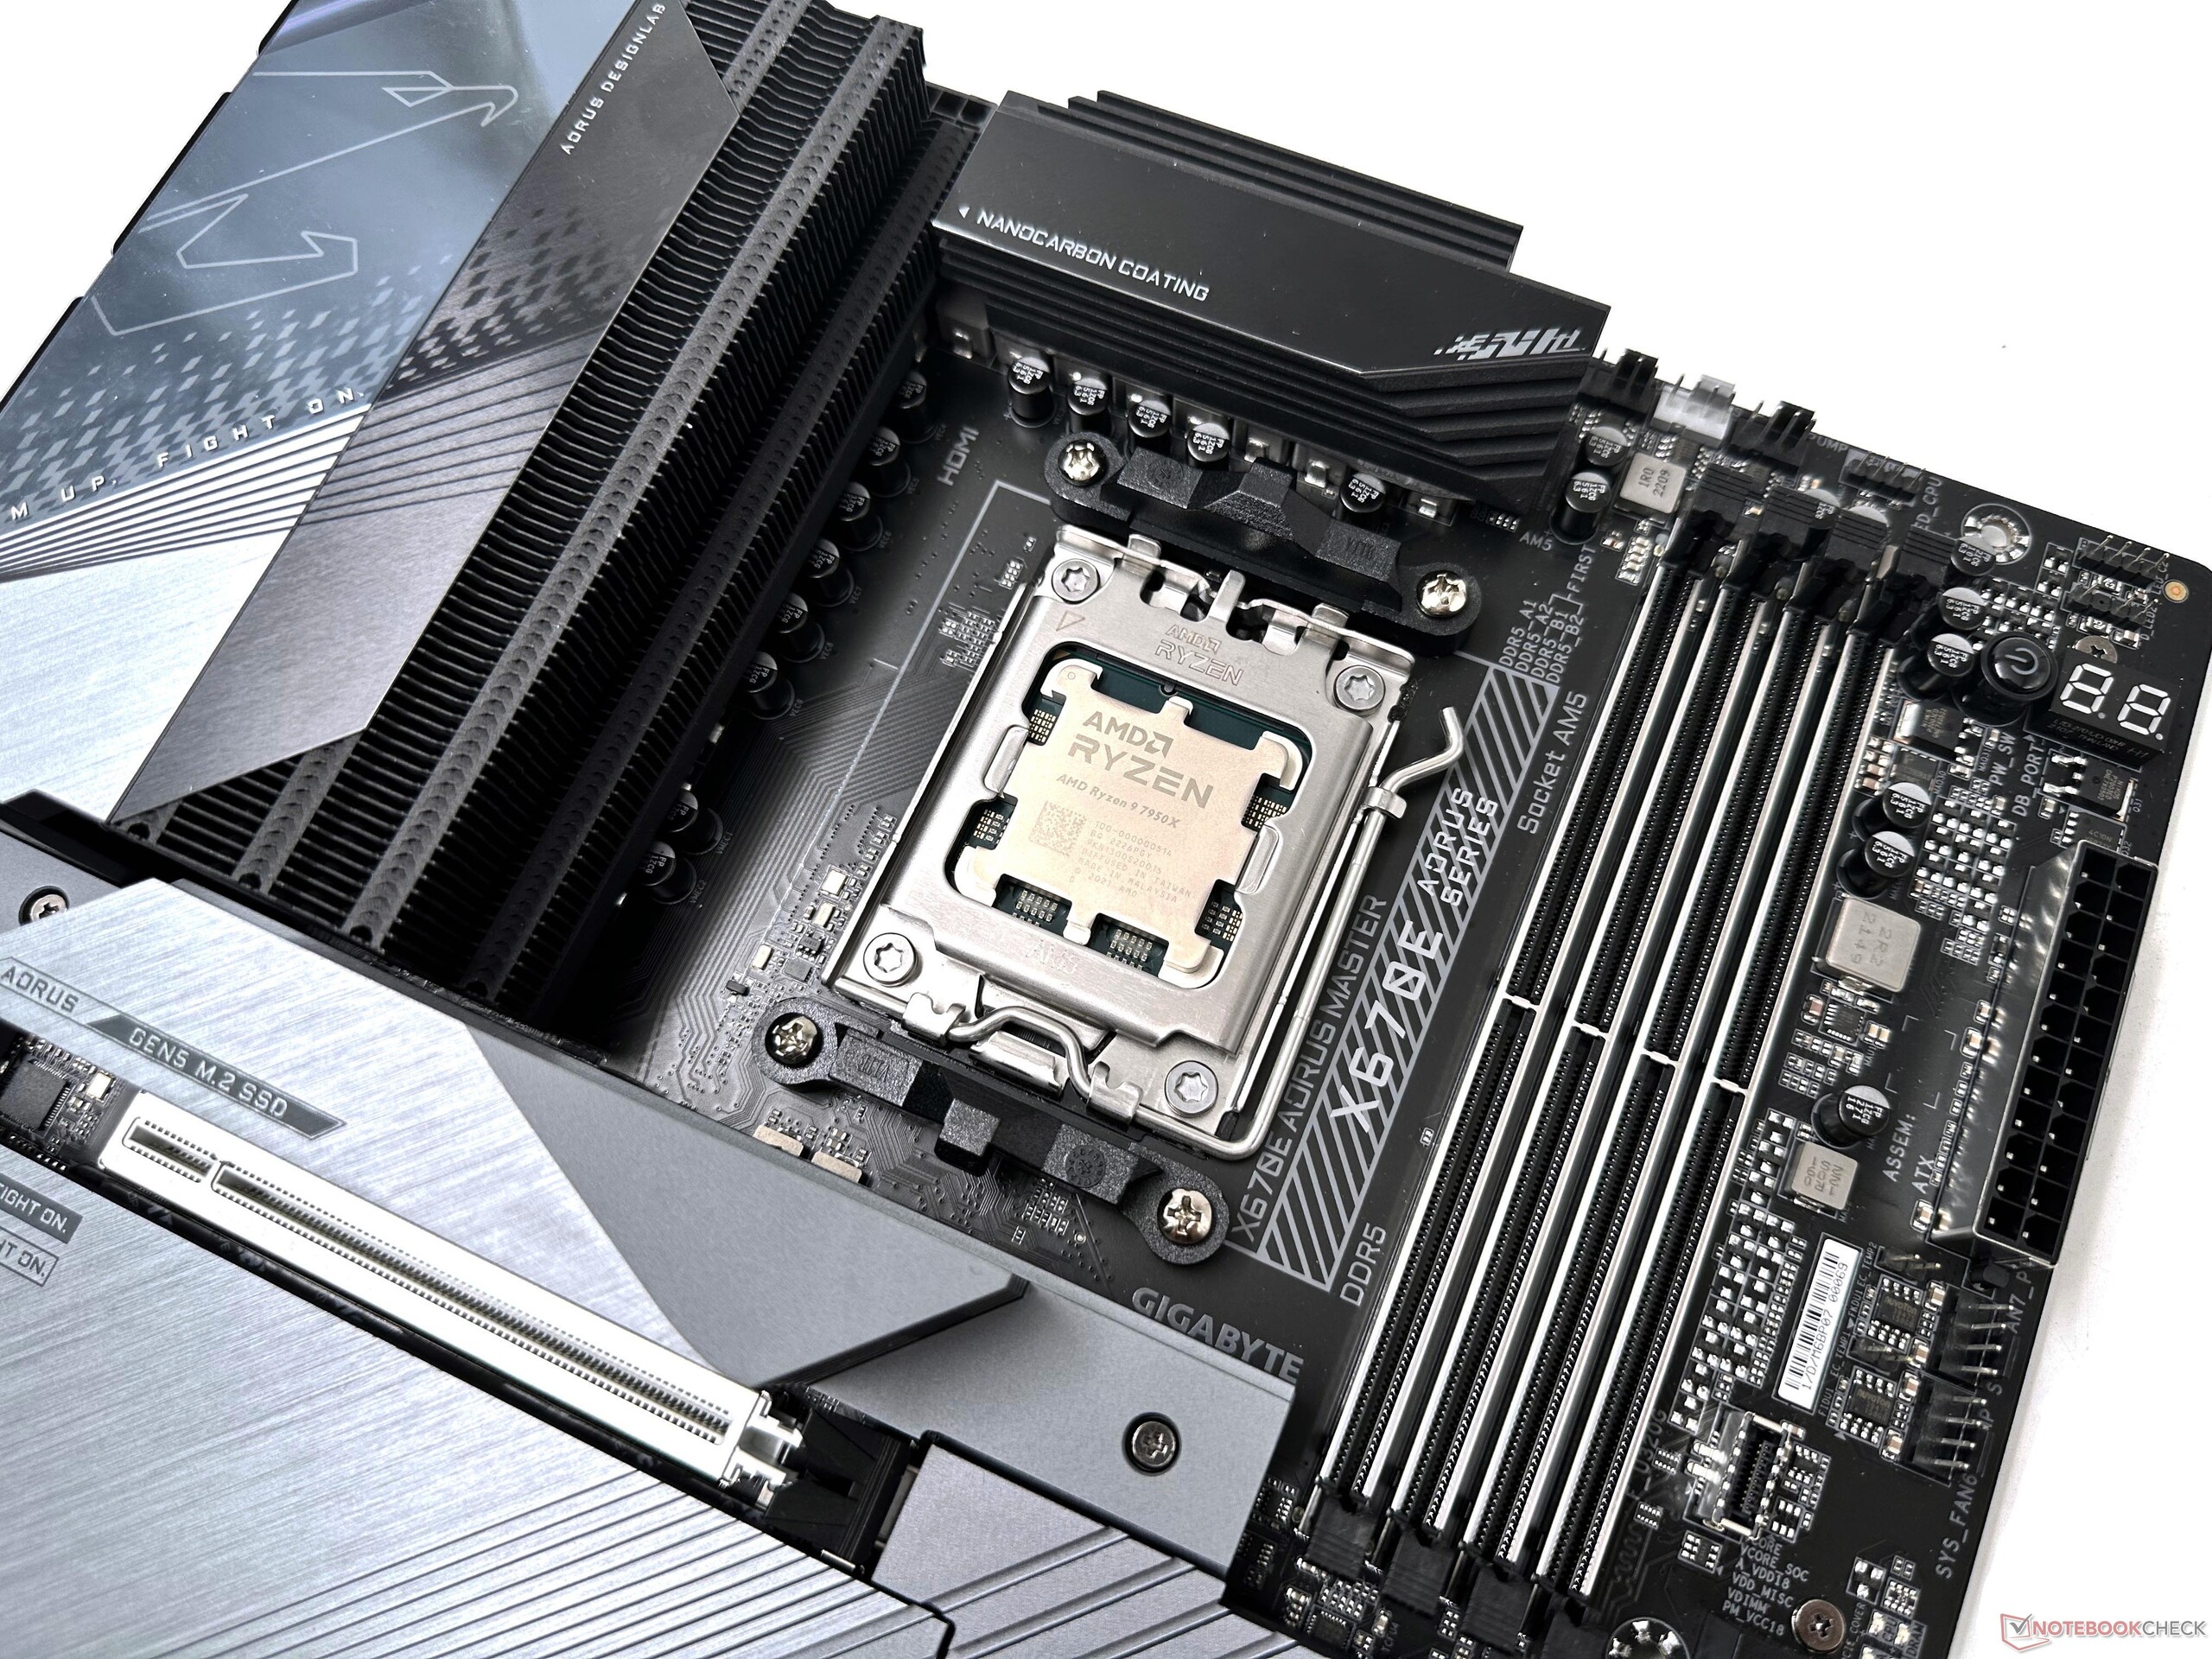
La serie Zen 4 Ryzen 7000 richiede nuove schede madri basate su schede madri basate su socket AM5le schede di punta X670E sono dotate di chipset dual-PROM21 a catena. Il nuovo socket LGA 1718 consente di aumentare i limiti di potenza fino a 230 W PPT, che può ospitare CPU con TDP fino a 170 W.
I core complex dies (CCD) di Zen 4 sono fabbricati sul nodo TSMC a 5 nm, mentre il die I/O, che ospita l'iGPU RDNA 2 a 2 CU, le corsie PCIe Gen 5 e il controller di memoria DDR5, utilizza TSMC a 6 nm. A differenza di Intel Raptor Lakeche supporta sia DDR4 che DDR5, AM5 supporta solo la memoria DDR5
Se da un lato questo porta diversi vantaggi ingegneristici, dall'altro c'è un intoppo a breve termine per i consumatori, dato che i prezzi delle DDR5 rimangono più alti rispetto alle DDR4
Con AM4, gli utenti dovevano configurare il fabric, il controller di memoria e i clock di memoria in modo che funzionassero in un rapporto 1:1:1, il che significava che la RAM DDR4-3600 era il punto di forza per Ryzen 5000. In Ryzen 7000, il clock del fabric può essere impostato su Auto, mentre il controller di memoria e i clock della memoria possono essere eseguiti in un rapporto 1:1
AMD raccomanda la RAM DDR5-6000 come punto di forza per Ryzen 7000. Gli utenti possono scegliere tra i profili EXPO predeterminati, che sono in pratica il modo gratuito di AMD di definire l'OC della memoria con un solo clic, simile per molti versi all'XMP di Intel. La nostra piattaforma di prova ha richiesto un tempo insolitamente lungo per adattarsi ai nuovi profili EXPO, ma i nuovi aggiornamenti del BIOS dovrebbero consentire modifiche più rapide.
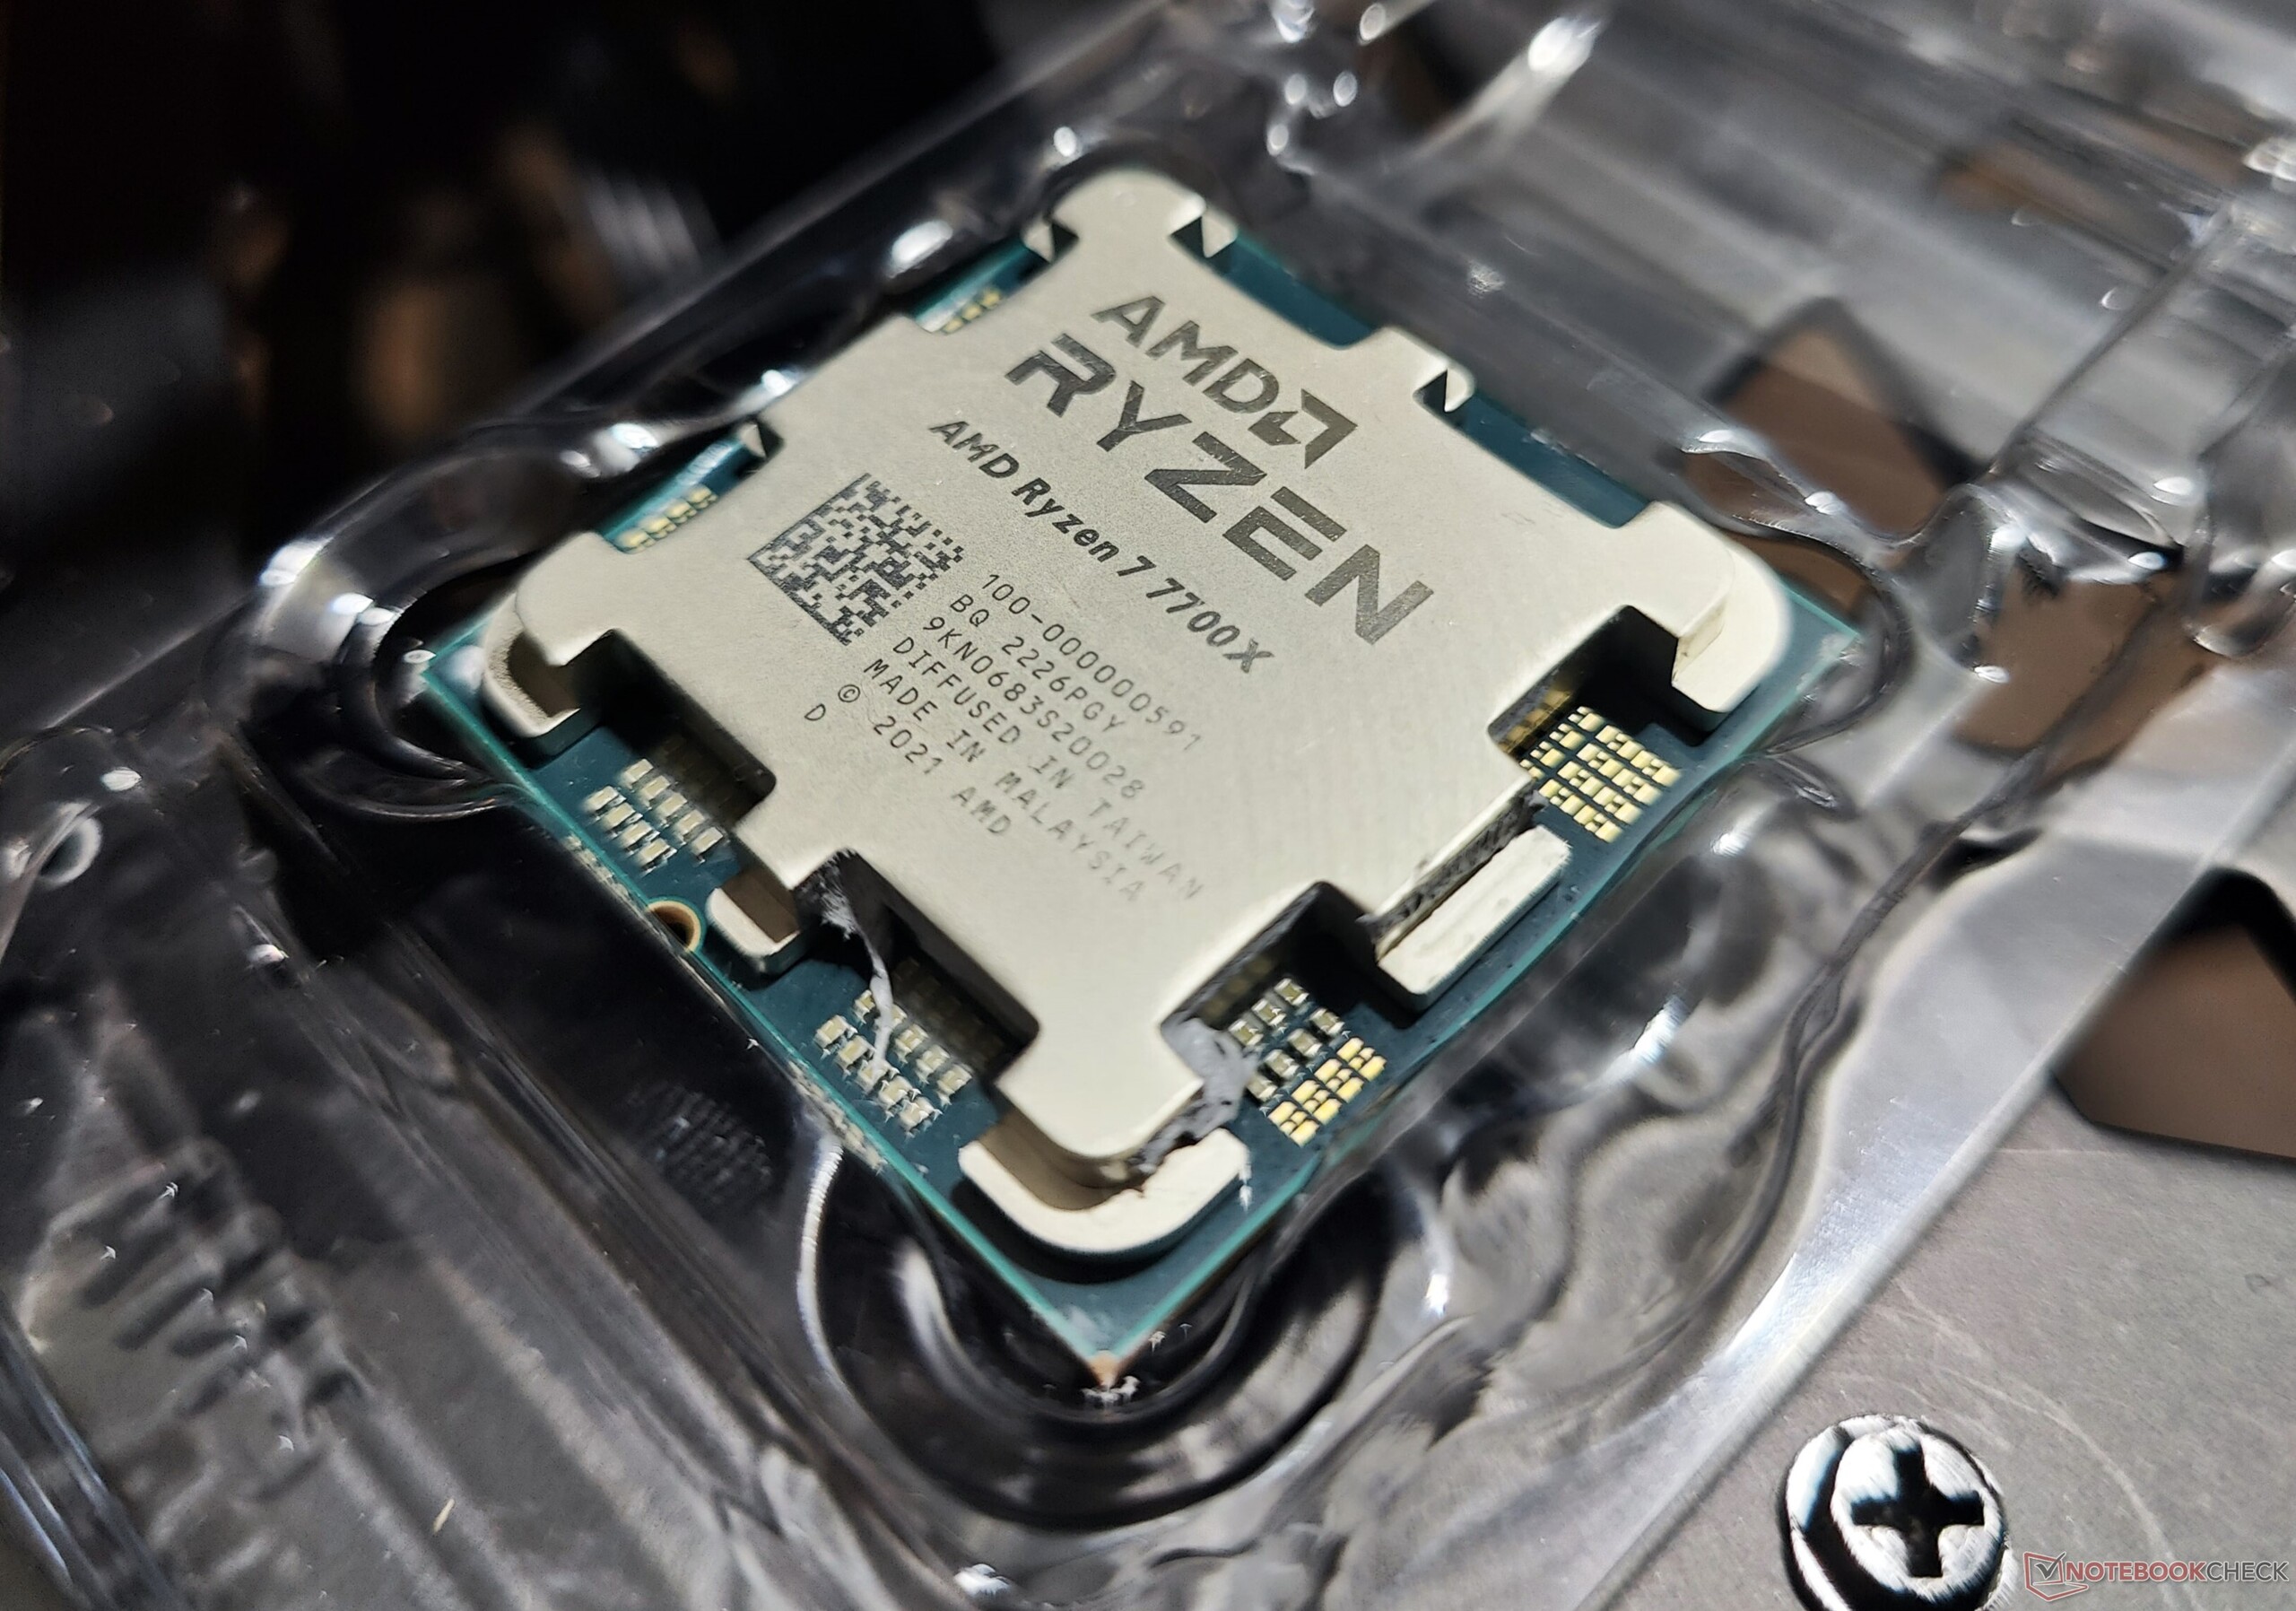
Abbiamo già recensito il AMD Ryzen 9 7900X e Ryzen 5 7600X e siamo rimasti piuttosto colpiti dall'offerta. In questa recensione, completiamo l'attuale serie Zen 4 Ryzen 7000 testando in dettaglio il Ryzen 9 7950X e il Ryzen 7 7700X. Ora che è disponibile anche la linea Raptor Lake di Intel, i confronti diventano ancora più interessanti.

Una panoramica dei processori desktop AMD 'Raphael' Zen 4 Ryzen 7000
| SKU | Cores/Threads | Orologio base | Turbo Clock | Cache L2 | Cache L3 | TDP | PPT | Prezzo di lancio |
|---|---|---|---|---|---|---|---|---|
| Ryzen 9 7950X | 16/32 | 4,5 GHz | 5,7 GHz | 16x 1 MB | 64 MB | 170 W | 230 W | US$699 / €849 |
| Ryzen 9 7900X | 12/24 | 4,7 GHz | 5,6 GHz | 12x 1 MB | 64 MB | 170 W | 230 W | US$549 / €669 |
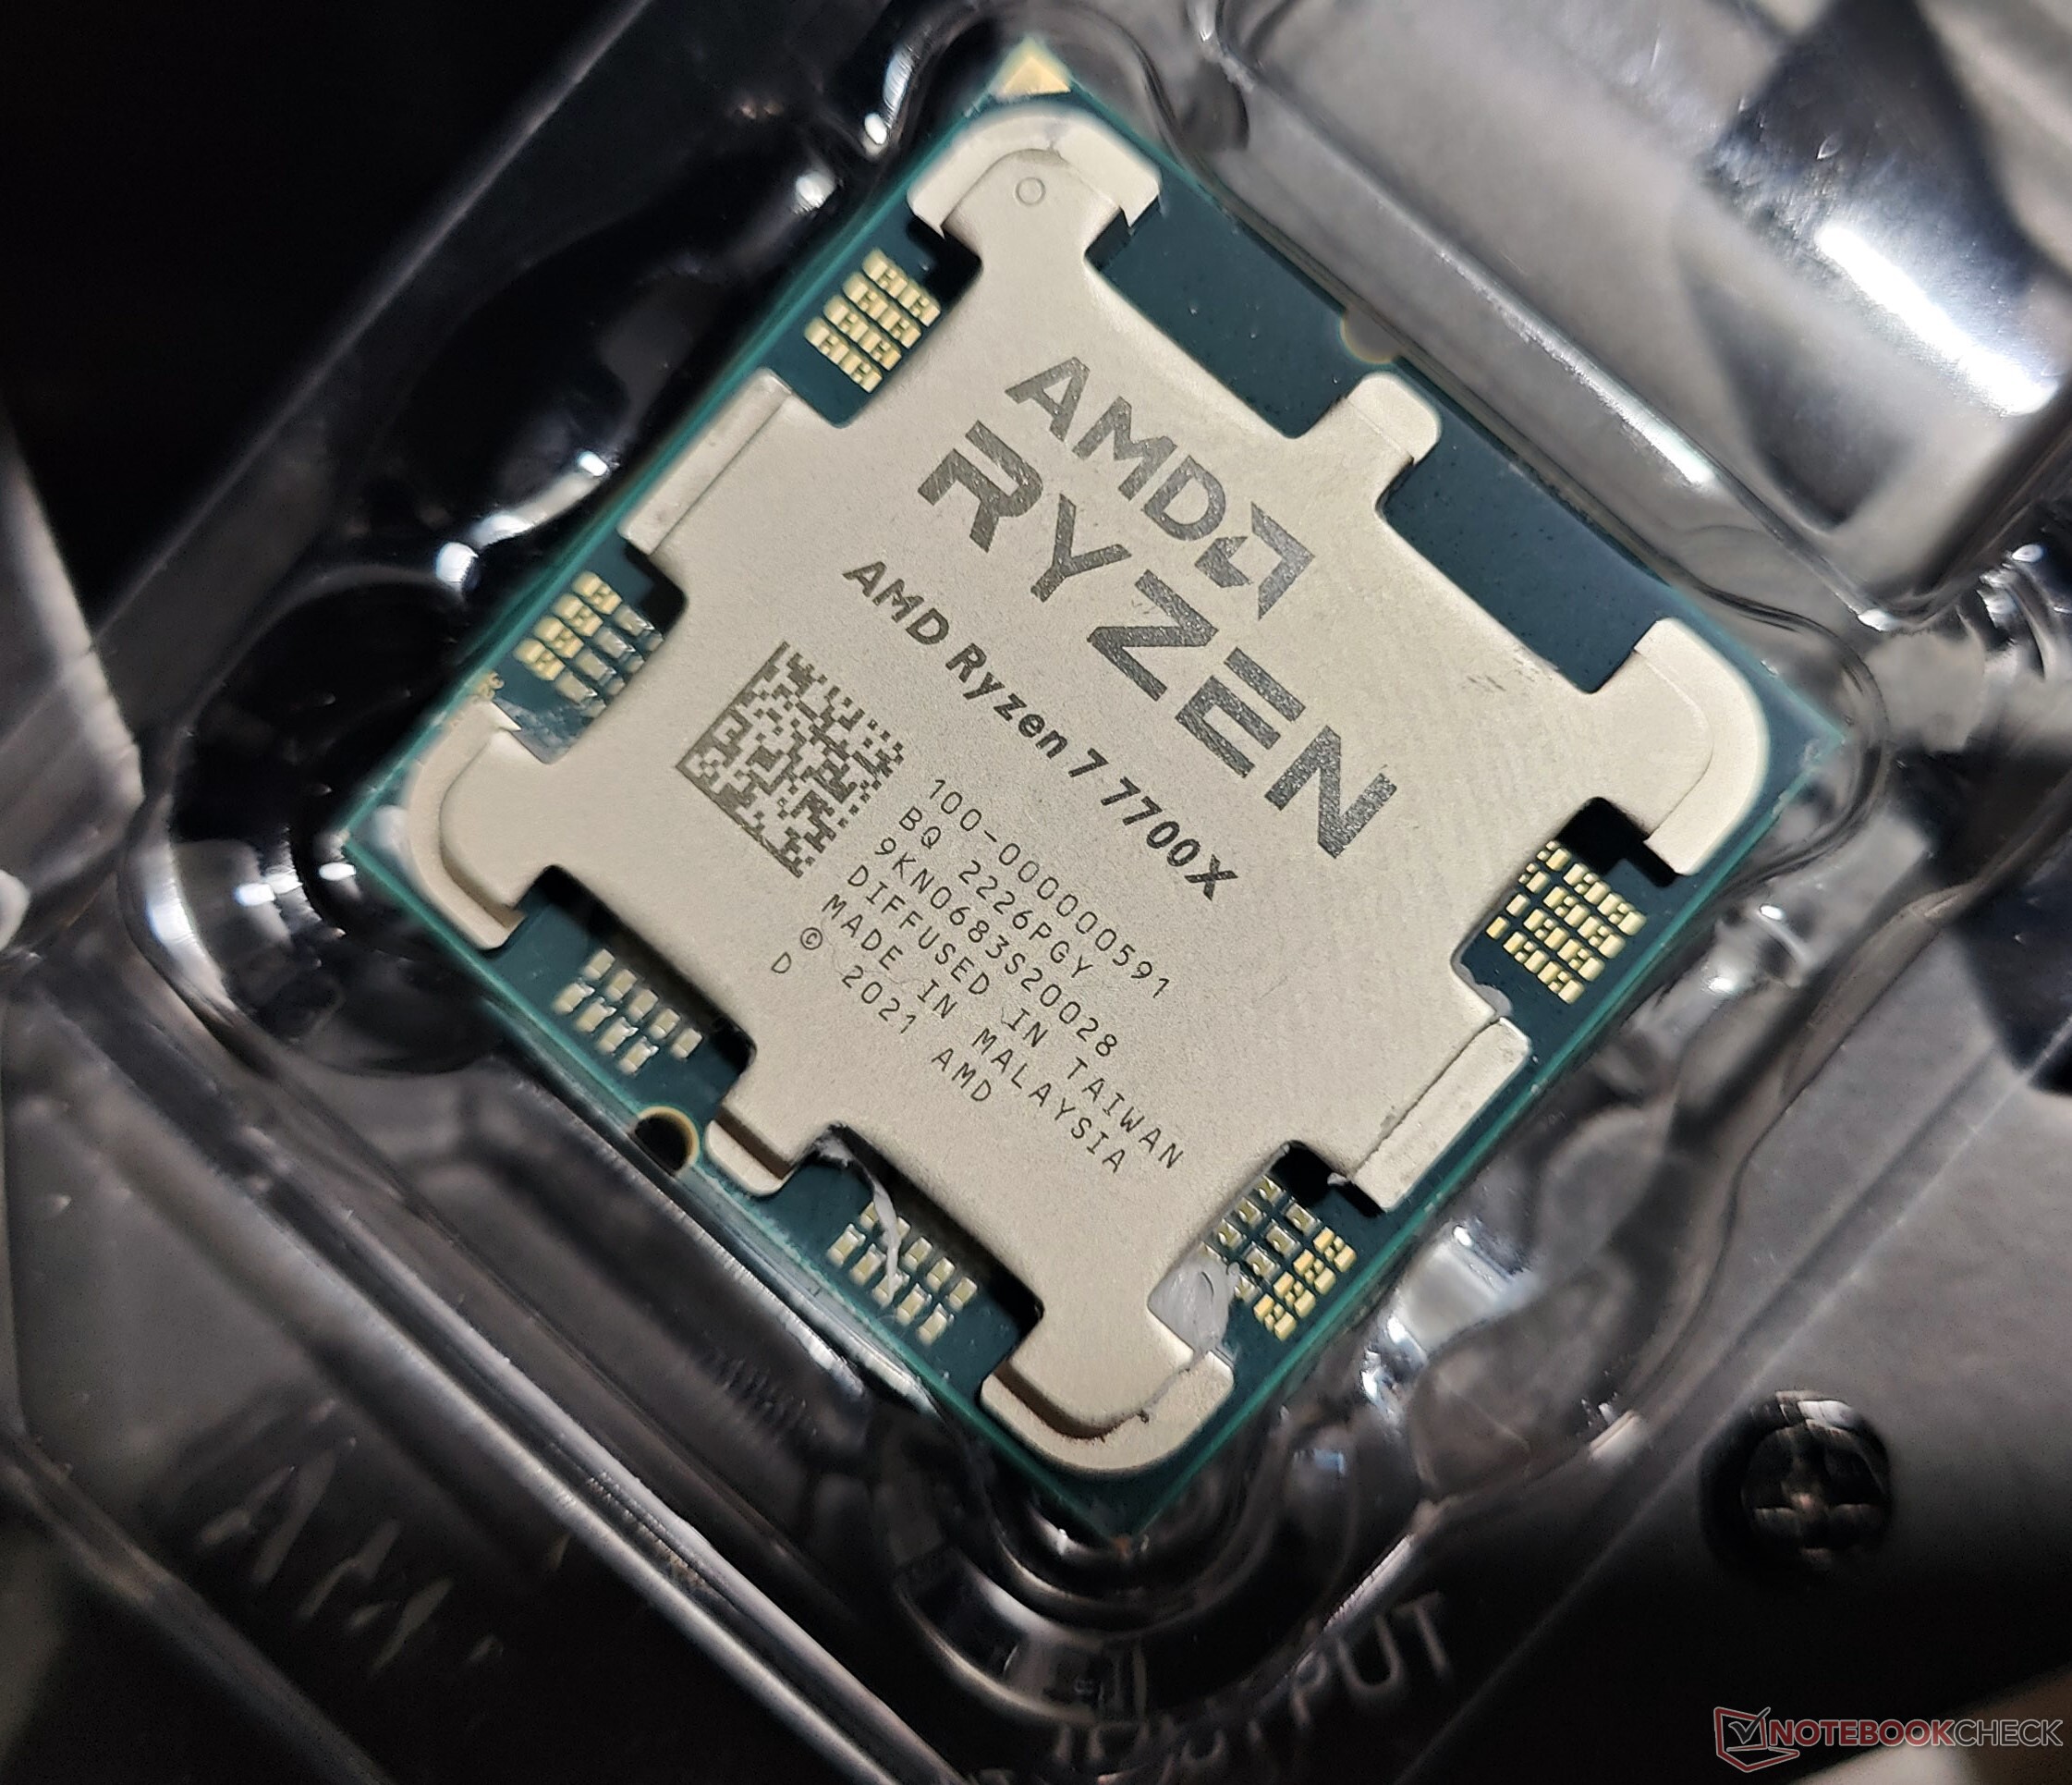
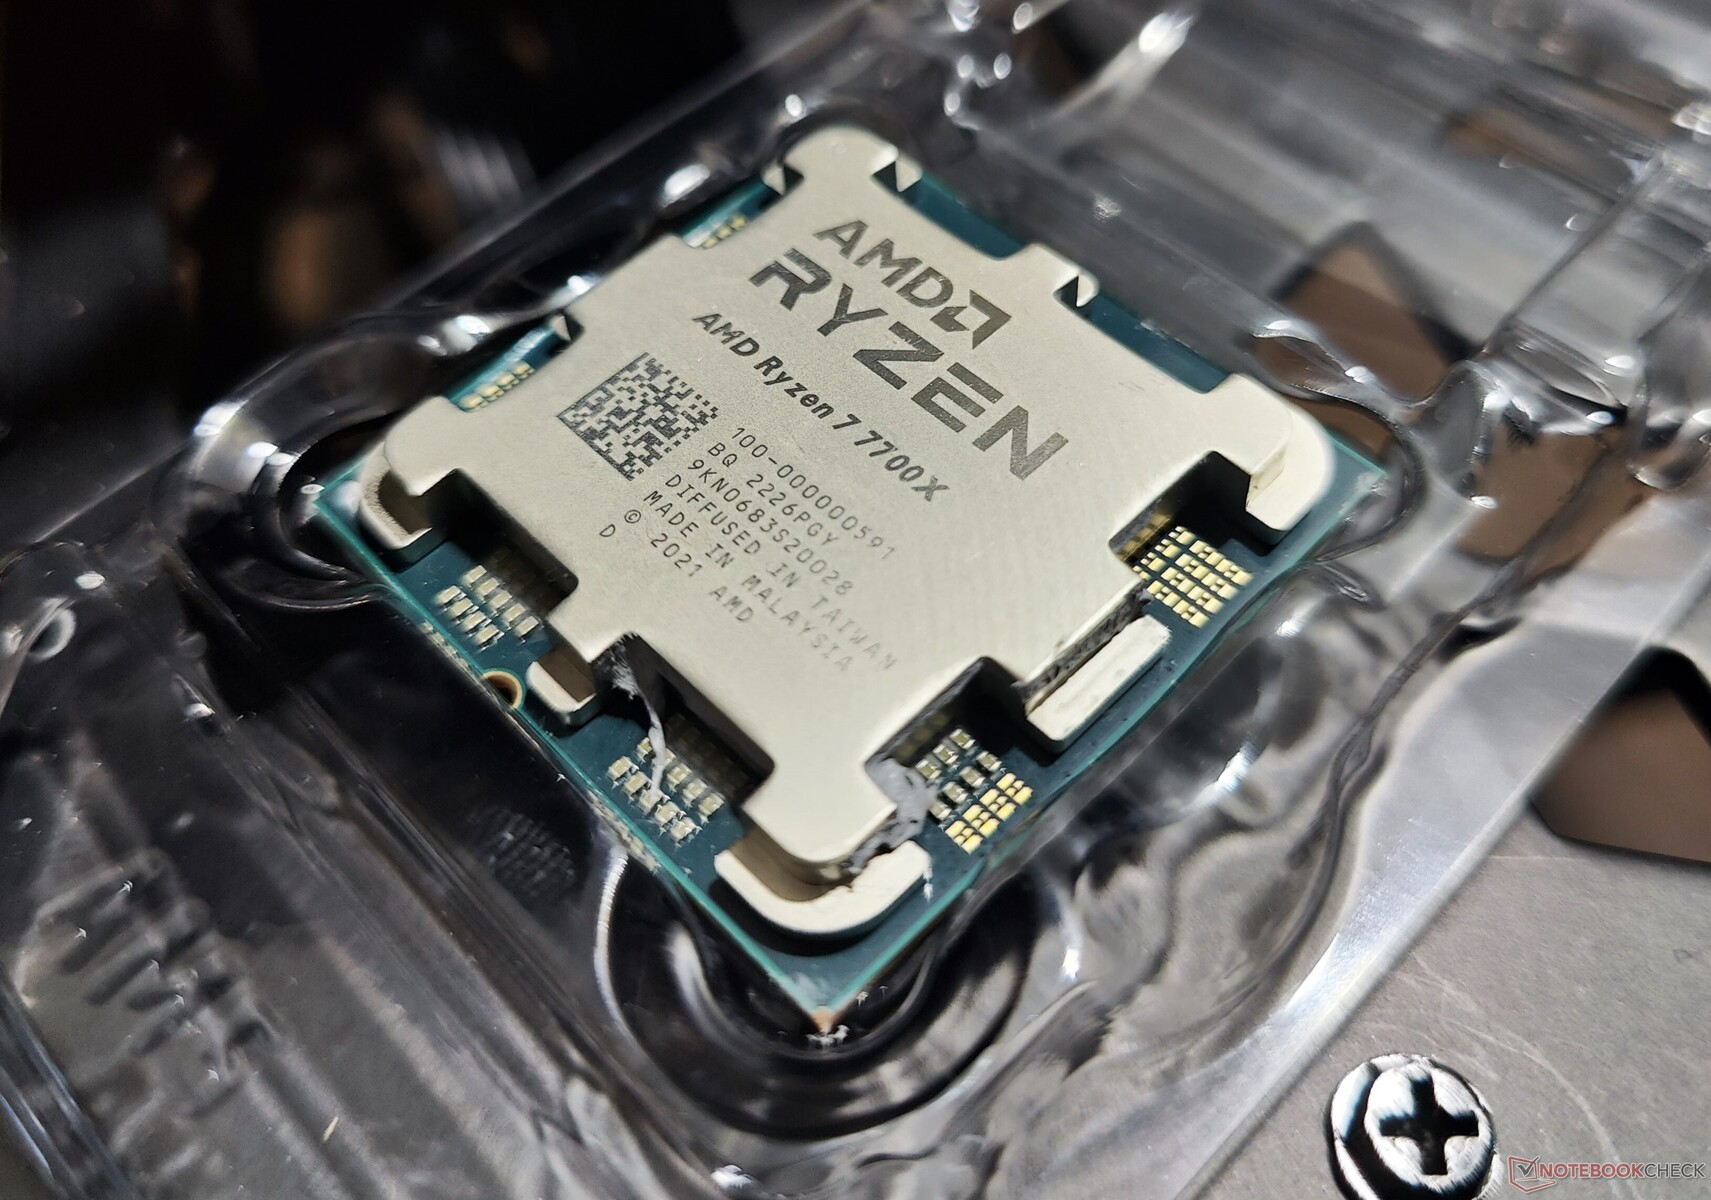
| Ryzen 7 7700X | 8/16 | 4,5 GHz | 5,4 GHz | 8x 1 MB | 32 MB | 105 W | 142 W | US$399 / €479 |
| Ryzen 5 7600X | 6/12 | 4,7 GHz | 5,3 GHz | 6x 1 MB | 32 MB | 105 W | 142 W | US$299 / €359 |
Il banco di prova: Zen 4 viene abbinato alla RTX 3090
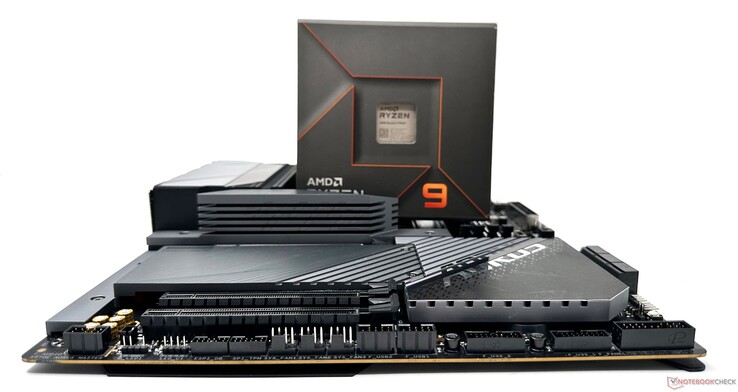
Per il test del Ryzen 7 7700X e del Ryzen 9 7950X abbiamo utilizzato i seguenti componenti
- Banco di prova Cooler Master MasterFrame 700
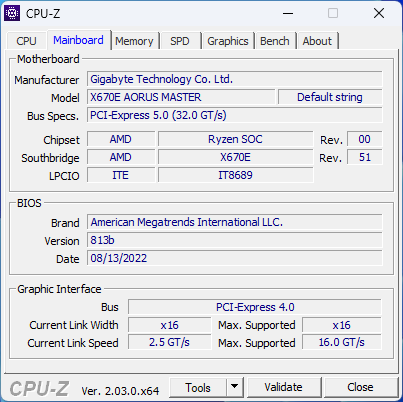
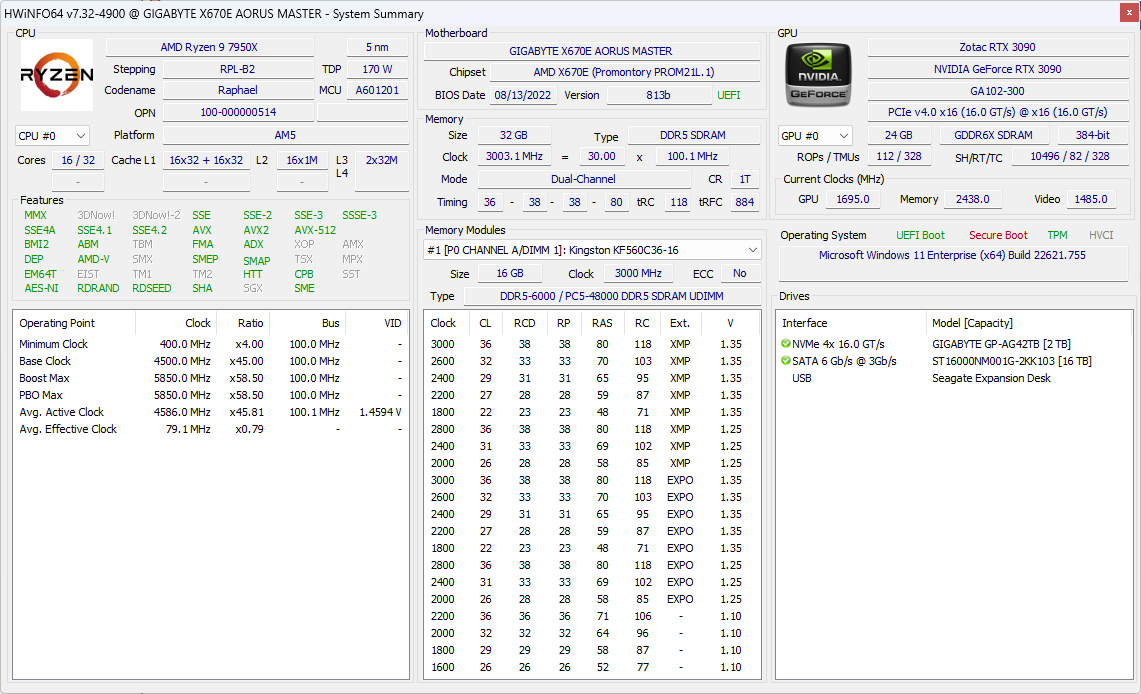
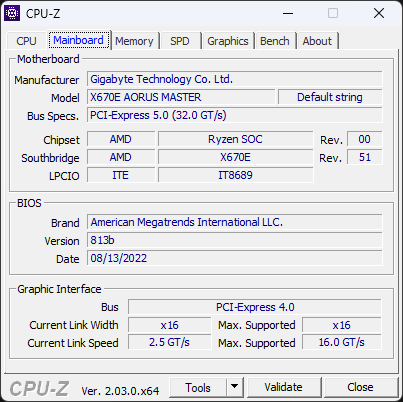
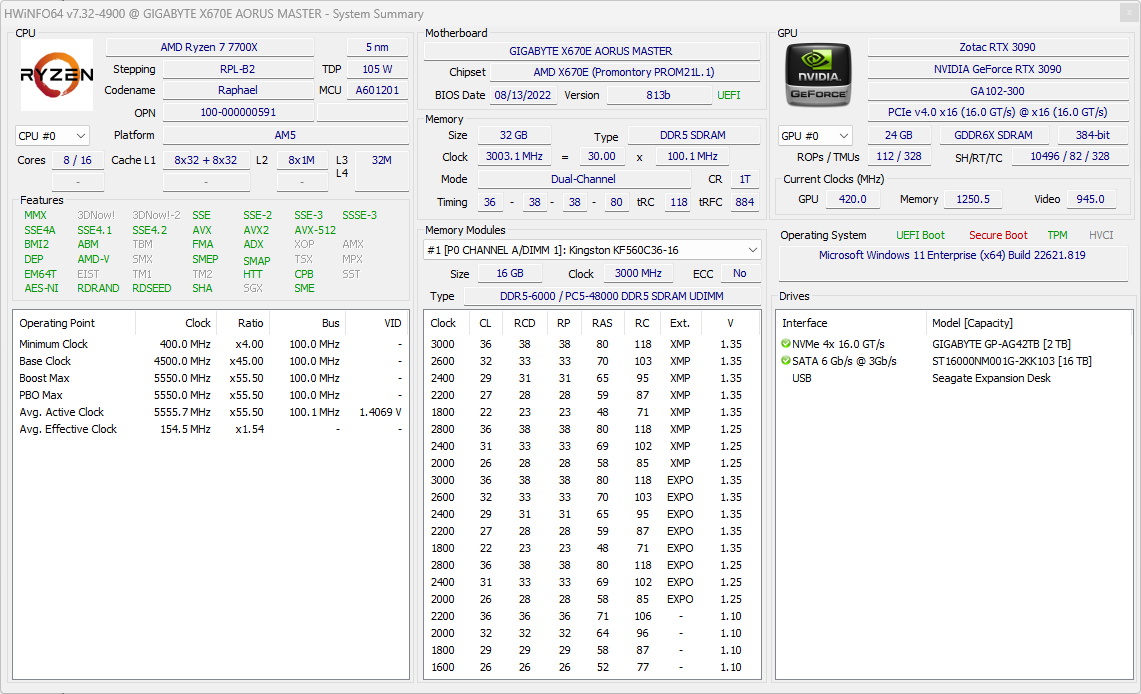
- Scheda madre Gigabyte X670E Aorus Master con BIOS di riferimento versione 813b
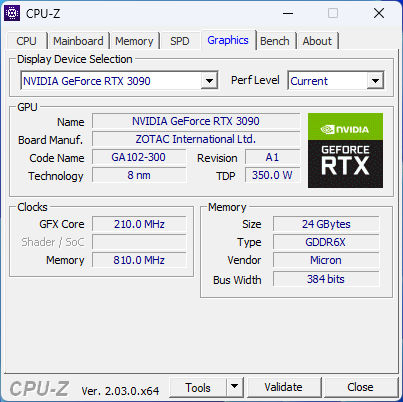
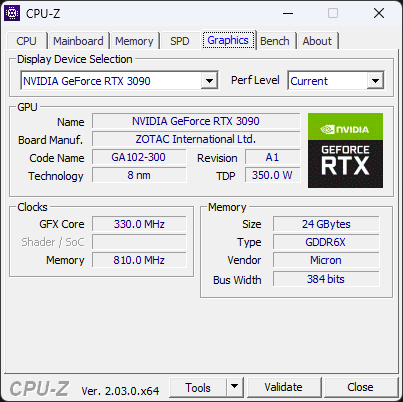
- Zotac Gaming GeForce RTX 3090 GPU Trinity
- SSD Gigabyte Aorus Gen 4 2 TB NVMe per benchmark e giochi
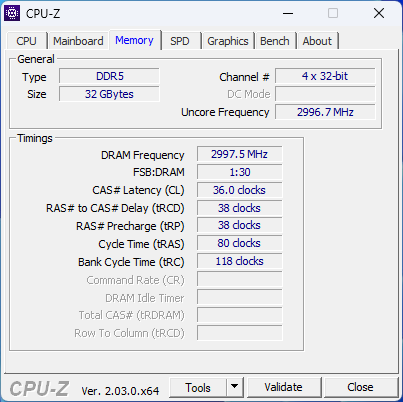
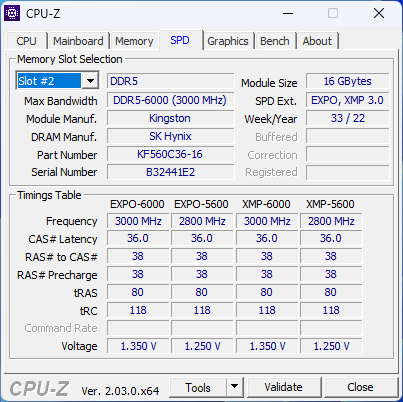
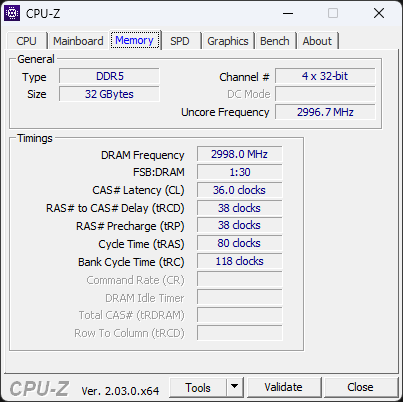
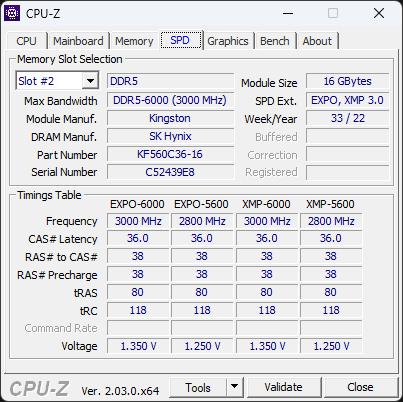
- 2x 16 GB di RAM Kingston Fury Beast DDR5-6000 con timing 36-38-38-80 a 1,35 V
- Monitor Gigabyte M28U 4K 144 Hz
- Raffreddatore AIO Cooler Master MasterLiquid ML360L V2 ARGB
- Cooler Master MVE Gold 1250 V2 alimentatore completamente modulare
Desideriamo ringraziare AMD per averci fornito le CPU Ryzen 7 7700X e Ryzen 9 7950X, la scheda madre X670E Aorus Master e il kit di memoria Kingston DDR5. Vorremmo anche ringraziare Zotac per la GPU RTX 3090 Trinity, Gigabyte per il monitor M28U e l'SSD Aorus NVMe e infine Cooler Master per il banco di prova, il dissipatore AIO e l'alimentatore.
Parametri di riferimento per le CPU: Concorrenza spietata con Raptor Lake
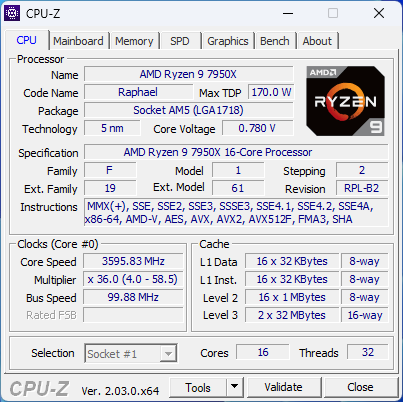
Mentre i punteggi cumulativi vedono le ammiraglie Intel e AMD a pari merito, i singoli benchmark mostrano alcune differenze. Per esempio, il Ryzen 9 7950X è circa l'11% più lento in Cinebench R23 single-core rispetto al Core i9-13900K.
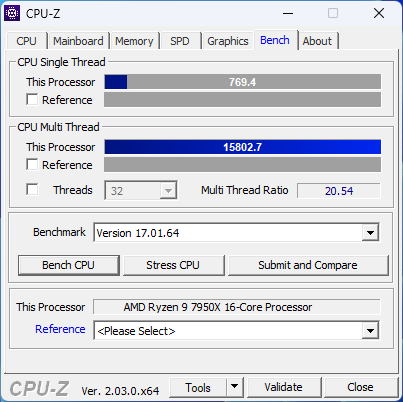
AMD Ryzen 9 7950X
Il divario tra il Ryzen 9 7950X e il Core i9-13900K non è molto significativo nei test Cinebench R20, Cinebench R15 e Geekbench single-core.
Il Ryzen 9 7950X ha un vantaggio del 20% sul Core i9-13900K in TrueCrypt e riesce a battere l'ammiraglia Raptor Lake per un soffio in HWBOT x264 4K e 7-Zip multi. Nella maggior parte degli altri casi, le prestazioni del Ryzen 9 7950X e del Core i9-13900K sono praticamente identiche.
Il Core i9-13900K sembra avere un leggerissimo vantaggio nelle esecuzioni multi-core, ma i risultati complessivi sono in linea con quelle che consideriamo variazioni da esecuzione a esecuzione
AMD Ryzen 7 7700X
È interessante notare che il Ryzen 7 7700X da 8C/16T ha ottenuto un vantaggio rispetto al Core i5-13600K da 14C/20T nei punteggi cumulativi di tutti i test. Mentre il Core i5-13600K e il Ryzen 7 7700X mostrano prestazioni quasi identiche in single-core, il primo è in vantaggio fino al 24% nei test multi-core di Cinebench
I processori Ryzen 7000 in generale sembrano avere prestazioni migliori rispetto alle controparti Intel nel test single-core 7-Zip, con il Ryzen 7 7700X che precede il Core i5-13600K di ben il 23%. Il Ryzen 7 7700X ha anche impiegato il minor tempo tra tutte le CPU a confronto nel nostro benchmark di conversione di LibreOffice in PDF da 20 documenti.

* ... Meglio usare valori piccoli
Nel complesso, sia il Ryzen 9 7950X che il Ryzen 7 7700X hanno ottenuto prestazioni eccellenti nella nostra suite di benchmark per CPU. L'ammiraglia a 16 core AMD Zen 4 pareggia con il Core i9-13900K di Intel Raptor Lake per quanto riguarda le prestazioni complessive della CPU, mentre la differenza tra il Ryzen 7 7700X e il Core i5-13600K rientra nel margine di errore.
Ryzen 9 7950X offre un discreto miglioramento del 29% nelle prestazioni cumulative della CPU rispetto a Ryzen 9 5950X Ryzen 9 5950X. Gli utenti che passano dal modello Alder Lake Core i9-12900K troveranno un sostanziale guadagno del 36% nelle prestazioni complessive, con benefici soprattutto per quanto riguarda i carichi di lavoro multi-thread.
Il Ryzen 7 7700X è in grado di posizionarsi comodamente davanti al Core i9-12900K single-core, il che lo rende una buona proposta per flussi di lavoro fortemente single-thread, come i giochi.
Cinebench R15 Multi Loop
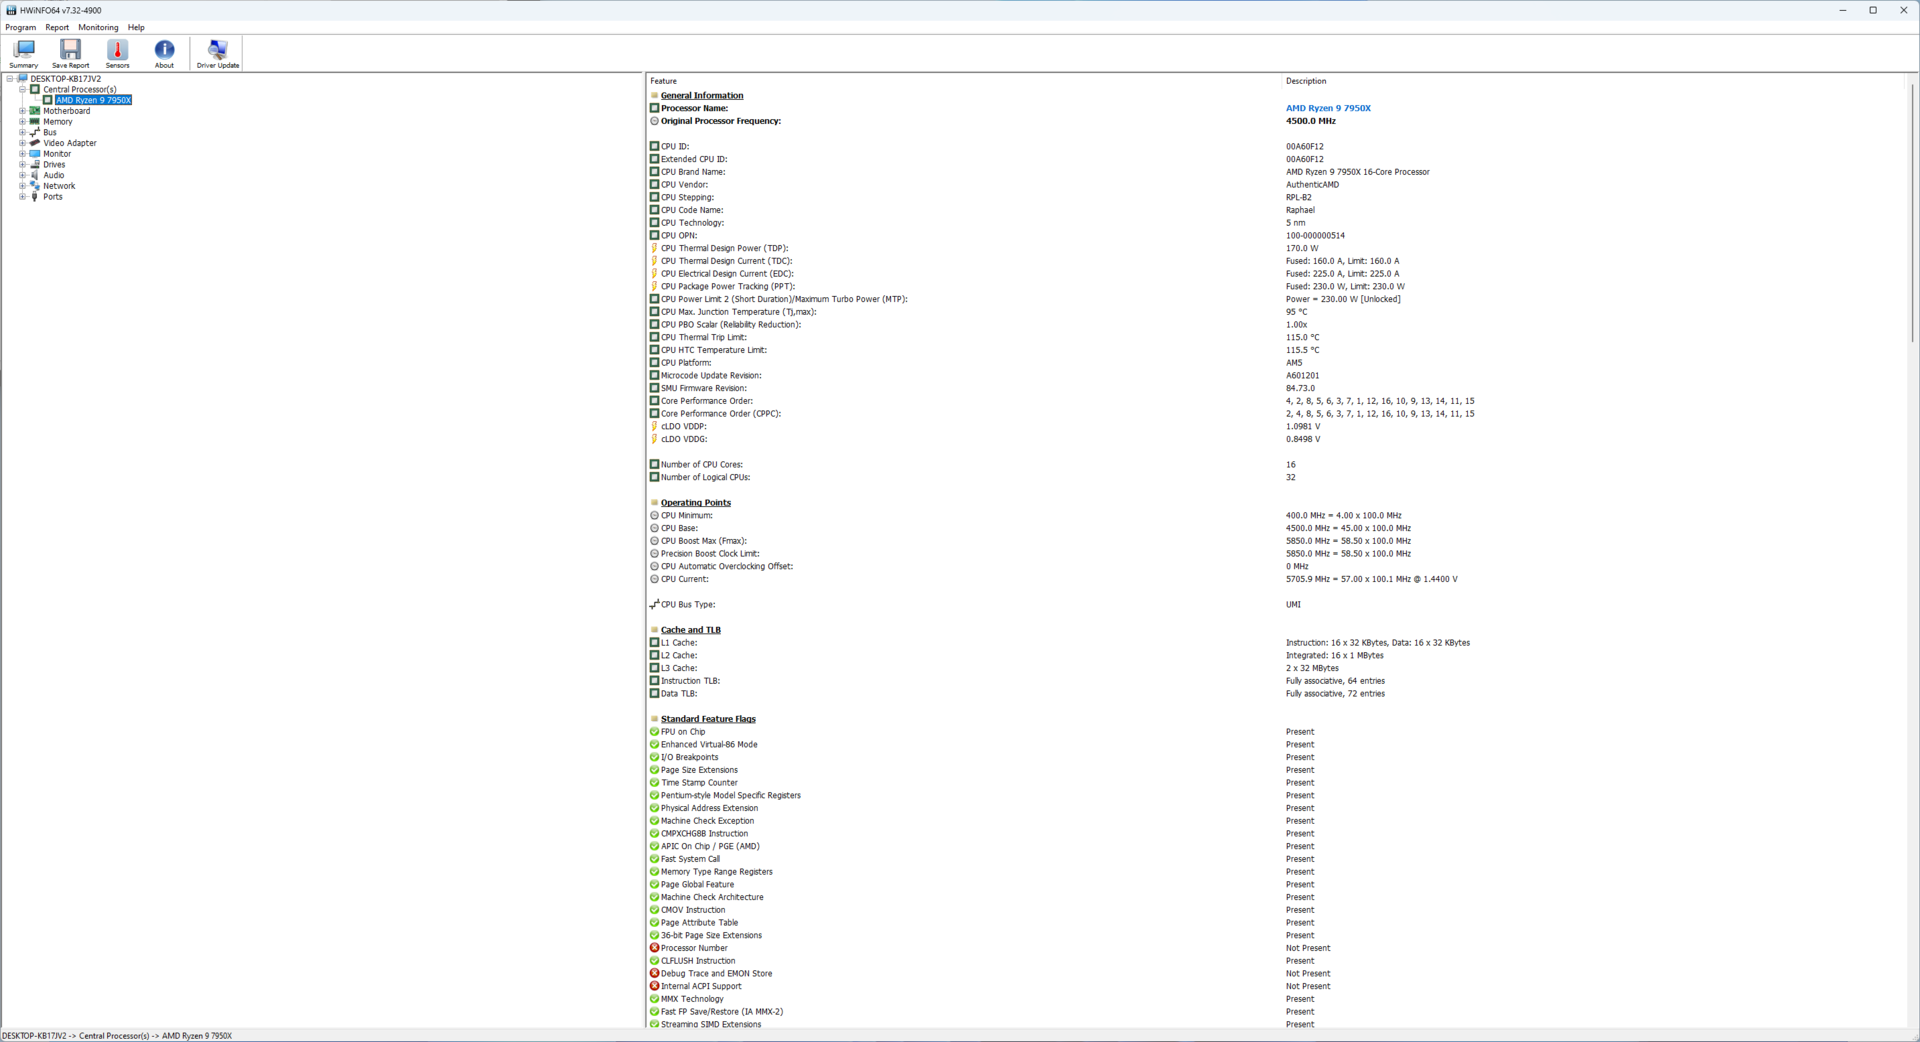
AMD non fornisce un dissipatore nella confezione né per il Ryzen 9 7950X né per il Ryzen 7 7700X, quindi dovrete affidarvi a un'opzione di terze parti. I processori Ryzen 7000 hanno ricevuto alcune critiche per il TjMax di 95 °C, ma AMD assicura che non si tratta di un problema
Secondo l'azienda, i chip della serie Ryzen 7000 sono progettati per funzionare a 95 °C TjMax 24 ore su 24, 7 giorni su 7, senza alcun rischio di danni. Una temperatura operativa massima così elevata permette all'algoritmo di boost Precision Boost Overdrive di spremere il massimo delle prestazioni dal processore. È possibile modificare questo valore per portarlo a valori ancora più elevati (fino a un massimo di 115 °C) o passare alla modalità Eco per un funzionamento più freddo (maggiori informazioni a breve).
Sia il Ryzen 9 7950X che il Ryzen 7 7700X offrono un funzionamento ben sostenuto e privo di strozzature grazie alle eccellenti prestazioni di raffreddamento del Cooler Master MasterLiquid ML360L V2 ARGB AIO.
Prestazioni del sistema: Aumento significativo della produttività rispetto a Zen 3
Il Ryzen 9 7950X e il Ryzen 7 7700X non hanno problemi a eseguire la maggior parte delle applicazioni di produttività. I test AIDA64 vedono costantemente il Ryzen 9 7950X in testa alle classifiche, spesso con un vantaggio significativo rispetto al Core i9-13900K. Una situazione simile si riscontra anche con il Ryzen 7 7700X e il Core i5-13600K. Il test CPU PhotoWorxx, tuttavia, vede un dominio di Intel.
Per qualche motivo, PCMark 10 non è stato eseguito con le impostazioni predefinite del Ryzen 7 7700X, anche se è stato possibile eseguire il benchmark in modalità Eco del processore. Per questo motivo, non includiamo il 7700X nel grafico sottostante.
CrossMark, invece, vede il Ryzen 9 7950X quasi alla pari con il Core i9-13900K, come del resto la coppia Ryzen 7 7700X e Core i5-13600K.
Analogamente a quanto abbiamo visto in precedenza con i benchmark delle CPU, la serie Ryzen 7000 presenta significativi guadagni da una generazione all'altra anche nei test di produttività. Ad esempio, il Ryzen 9 7950X mostra un enorme aumento del 69% nei punteggi complessivi di CrossMark, oltre a mostrare un vantaggio prestazionale schiacciante nella maggior parte dei test CPU AIDA64.
Nei test CPU 3DMark, il Core i9-13900K ha un leggero vantaggio sul Ryzen 9 7950X in Fire Strike Physics, mentre il Ryzen 7 7700X e il Core i5-13600K sono in parità. Time Spy Il test della CPU vede i processori Intel in testa in generale, con il Ryzen 9 7950X in ritardo rispetto al Core i9-13900K del 18%.
| PCMark 10 Score | 10153 punti | |
Aiuto | ||
* ... Meglio usare valori piccoli
Modalità Eco: 65 W Ryzen 9 7950X supera il Core i9-12900K
La modalità Eco è sostanzialmente il linguaggio di AMD per indicare il funzionamento della CPU a un TDP inferiore. Con Zen 4, l'azienda dichiara un sostanziale risparmio energetico con un impatto minimo sulle prestazioni. I valori di TDP offerti dipendono dalla SKU: una CPU da 170 W può essere configurata per funzionare a 105 W o 65 W, mentre un chip da 105 W può essere abbassato a 65 W
La nostra scheda di prova Gigabyte X670E Aorus Master poteva essere utilizzata solo con il BIOS di riferimento 813b di AMD. Ciò significa che la nostra configurazione non offriva un'opzione con un solo clic per attivare la modalità Eco, anche se le unità di vendita al dettaglio dovrebbero essere in grado di aggiornarsi a versioni più recenti che offrono un approccio più diretto. È possibile attivare queste impostazioni anche dall'ultima versione di Ryzen Master.
Tuttavia, abbiamo utilizzato i seguenti valori forniti da AMD nelle impostazioni PBO del firmware per abilitare i TDP corrispondenti
- 65 W TDP = 88.000 PPT; 75.000 TDC; 150.000 EDC
- 105 W TDP = 142.000 PPT; 110.000 TDC; 170.000 EDC
- 170 W TDP = 230.000 PPT; 160.000 TDC; 225.000 EDC
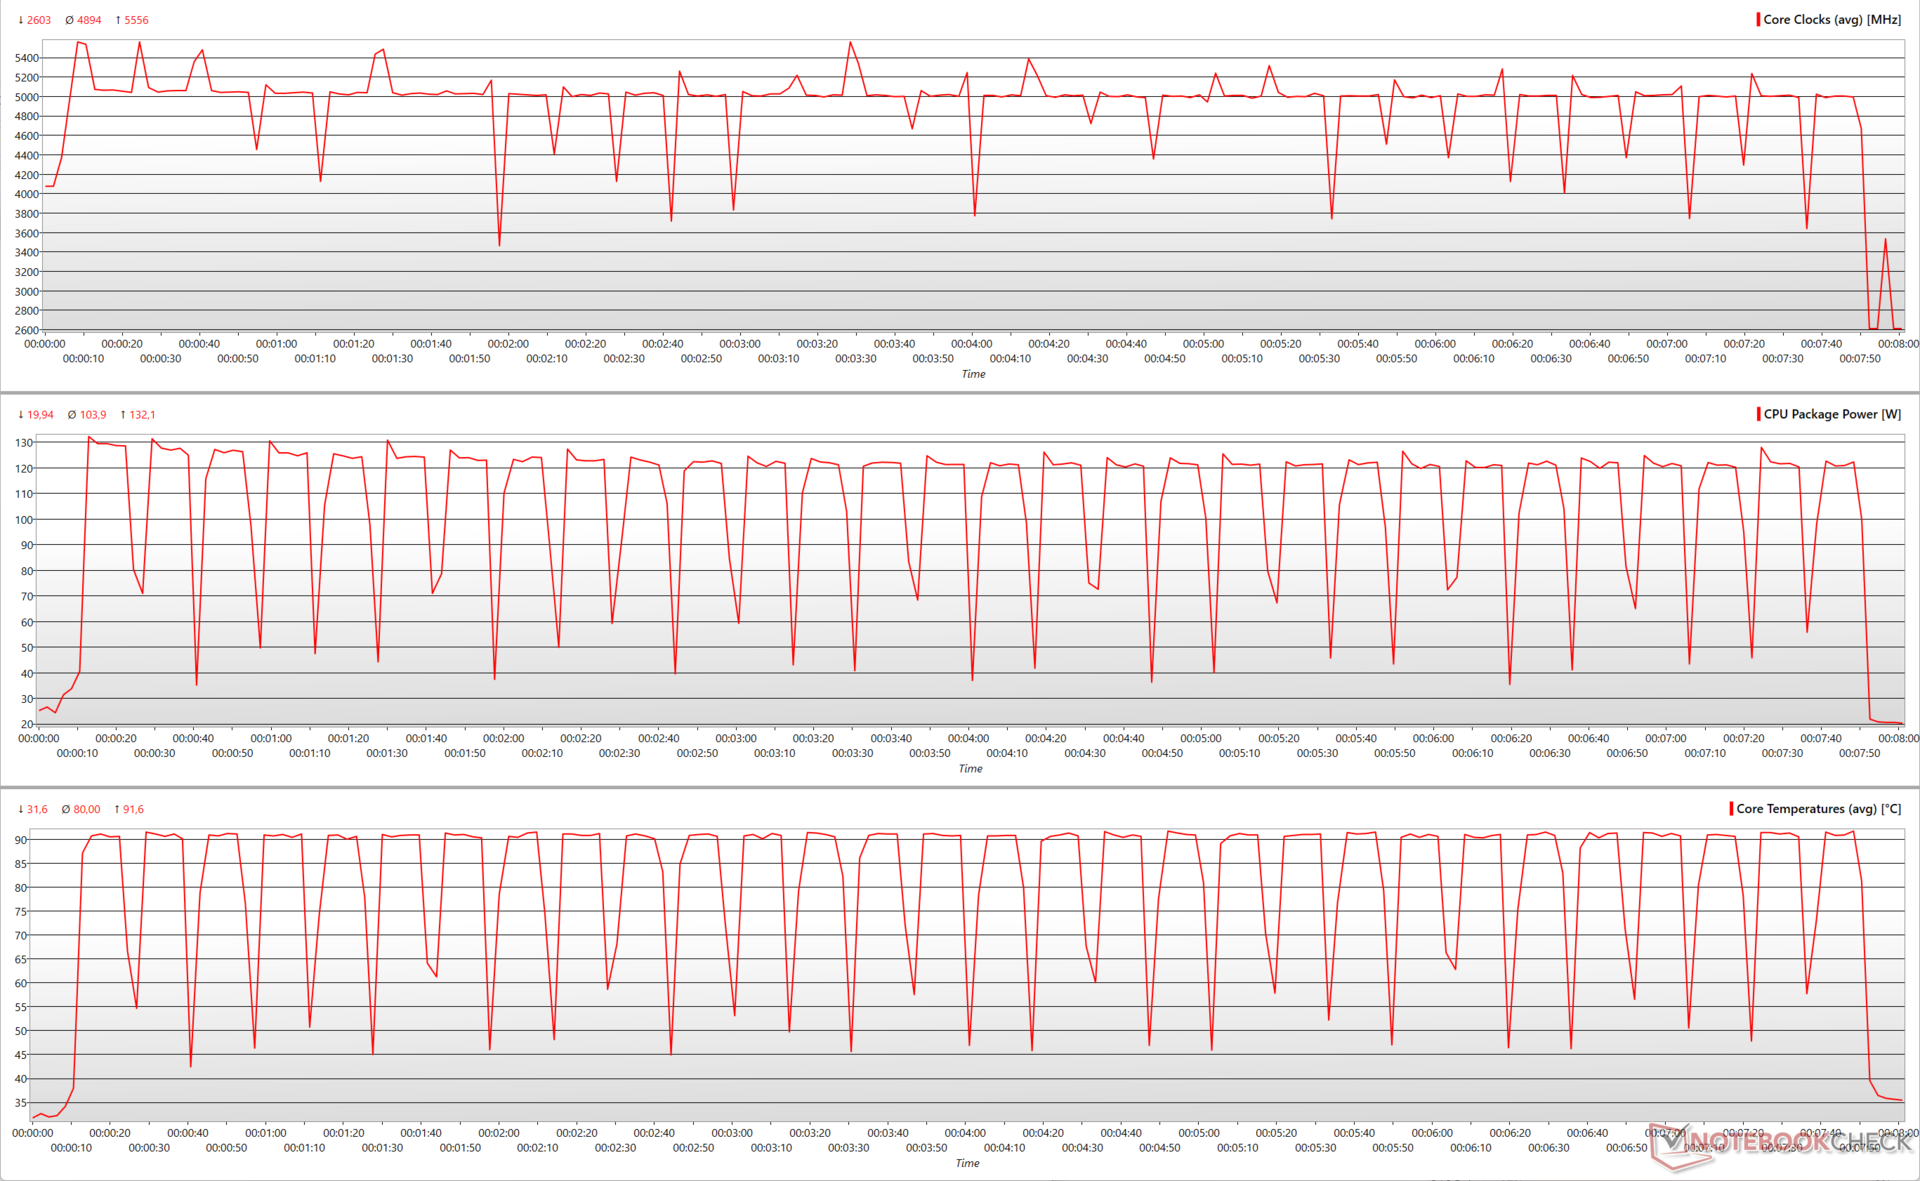
I vantaggi della riduzione del TDP del Ryzen 9 7950X si notano immediatamente nel test Cinebench R15 multi-core a 30 loop. Con un TDP di 105 W, il Ryzen 9 7950X perde solo il 7% delle prestazioni, con un leggero calo del boost massimo da 5,47 GHz a 5,43 GHz. Anche le temperature di picco del core registrano un significativo calo del 22%, passando da 88,5 °C a 68,3 °C.
A 65 W, il Ryzen 9 7950X perde circa il 22,4% delle sue prestazioni nel benchmark, data la marcata riduzione dei core clock. Tuttavia, il processore ora ha una temperatura del core molto più bassa, pari a circa 50 °C, con una potenza massima del pacchetto di appena 90 W.
| Ryzen 9 7950X TDP | CB R15 Punteggio multi-core | Core Clock medio (GHz) | Core Clock max. Clock massimo del core (GHz) | Potenza massima del pacchetto (W) Potenza del pacchetto (W) | Temperatura massima del core (°C) Temperatura massima del core (°C) |
|---|---|---|---|---|---|
| 170 W | 6.236 | 4,77 | 5,47 | 224,6 | 88,5 |
| 105 W | 5.800 (-7%) | 4,54 -(4,82%) | 5,43 (-0,73%) | 145,6 (-35,17%) | 68,3 (-22,82%) |
| 65 W | 4.836 (-22,4%) | 3,98 (-16,56%) | 5,39 (-1,46%) | 90,24 (-59,82%) | 49,7 (-43,84%) |
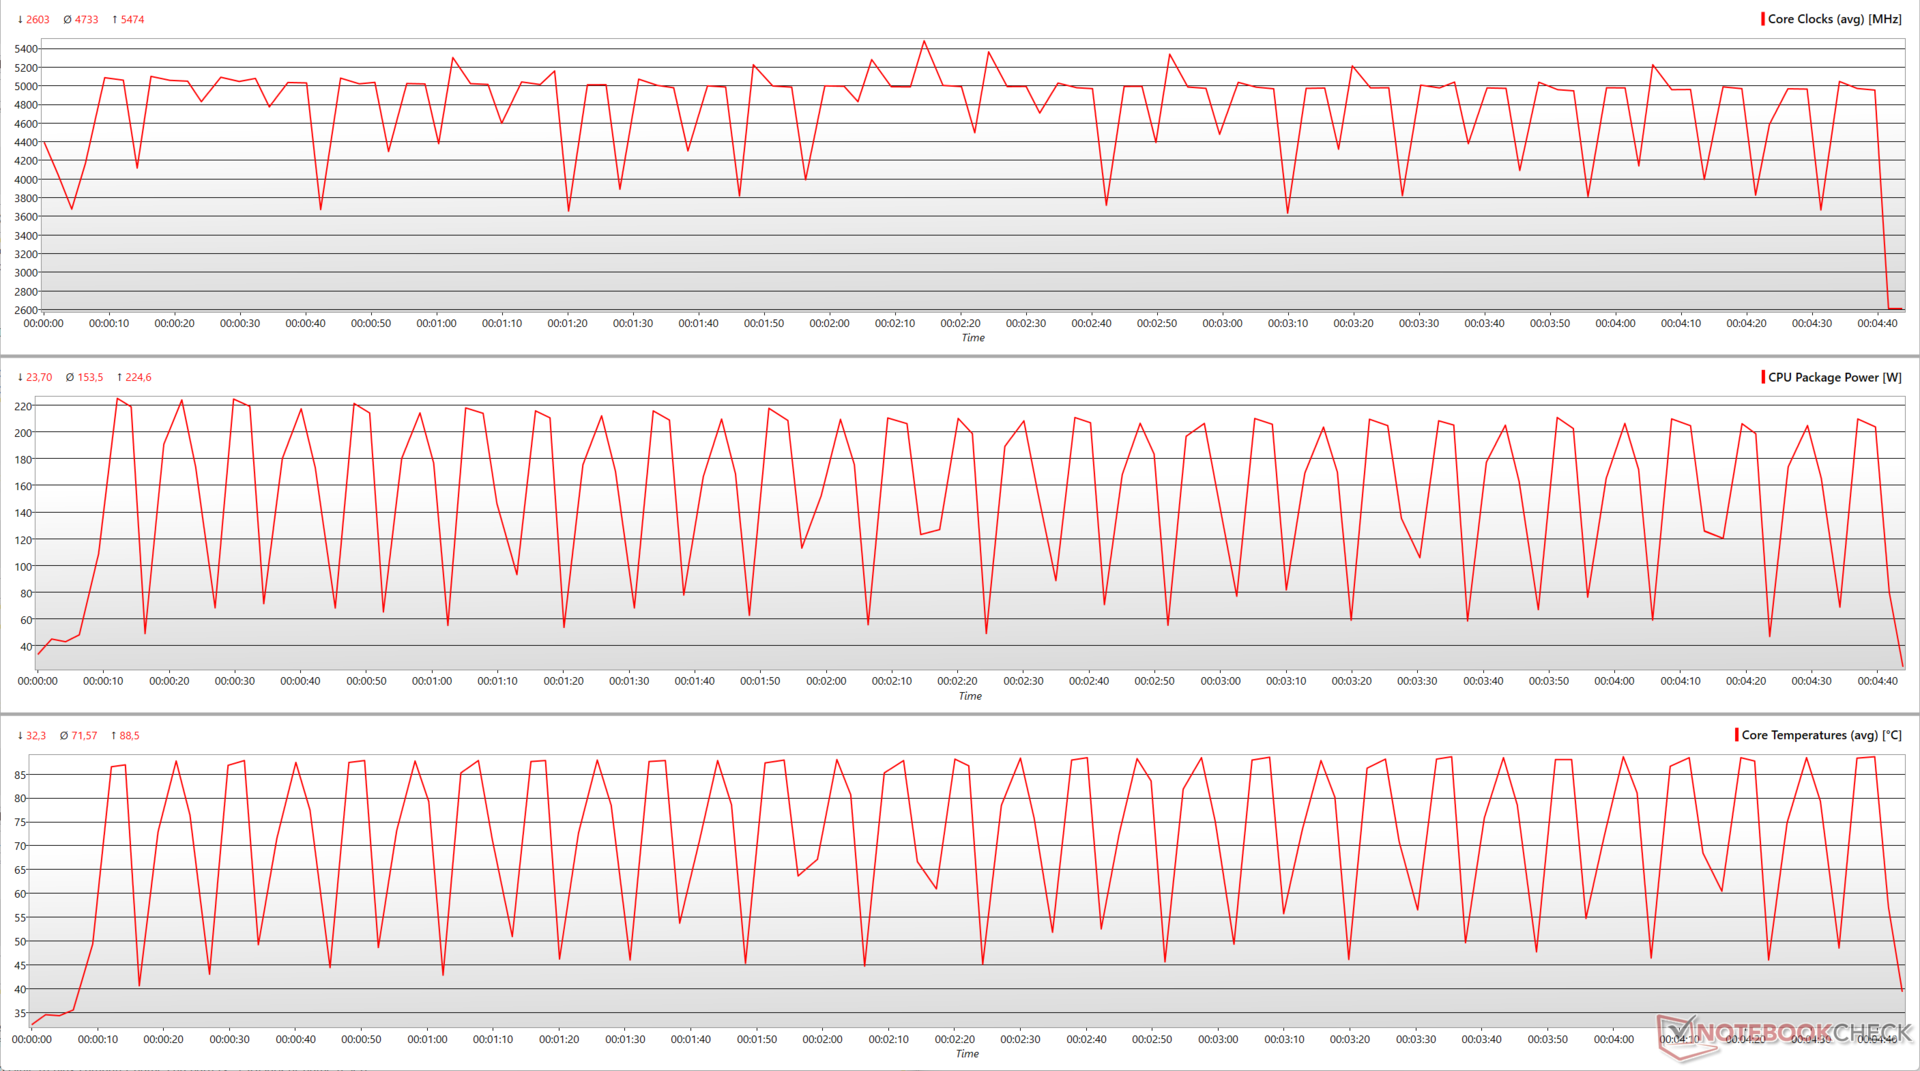
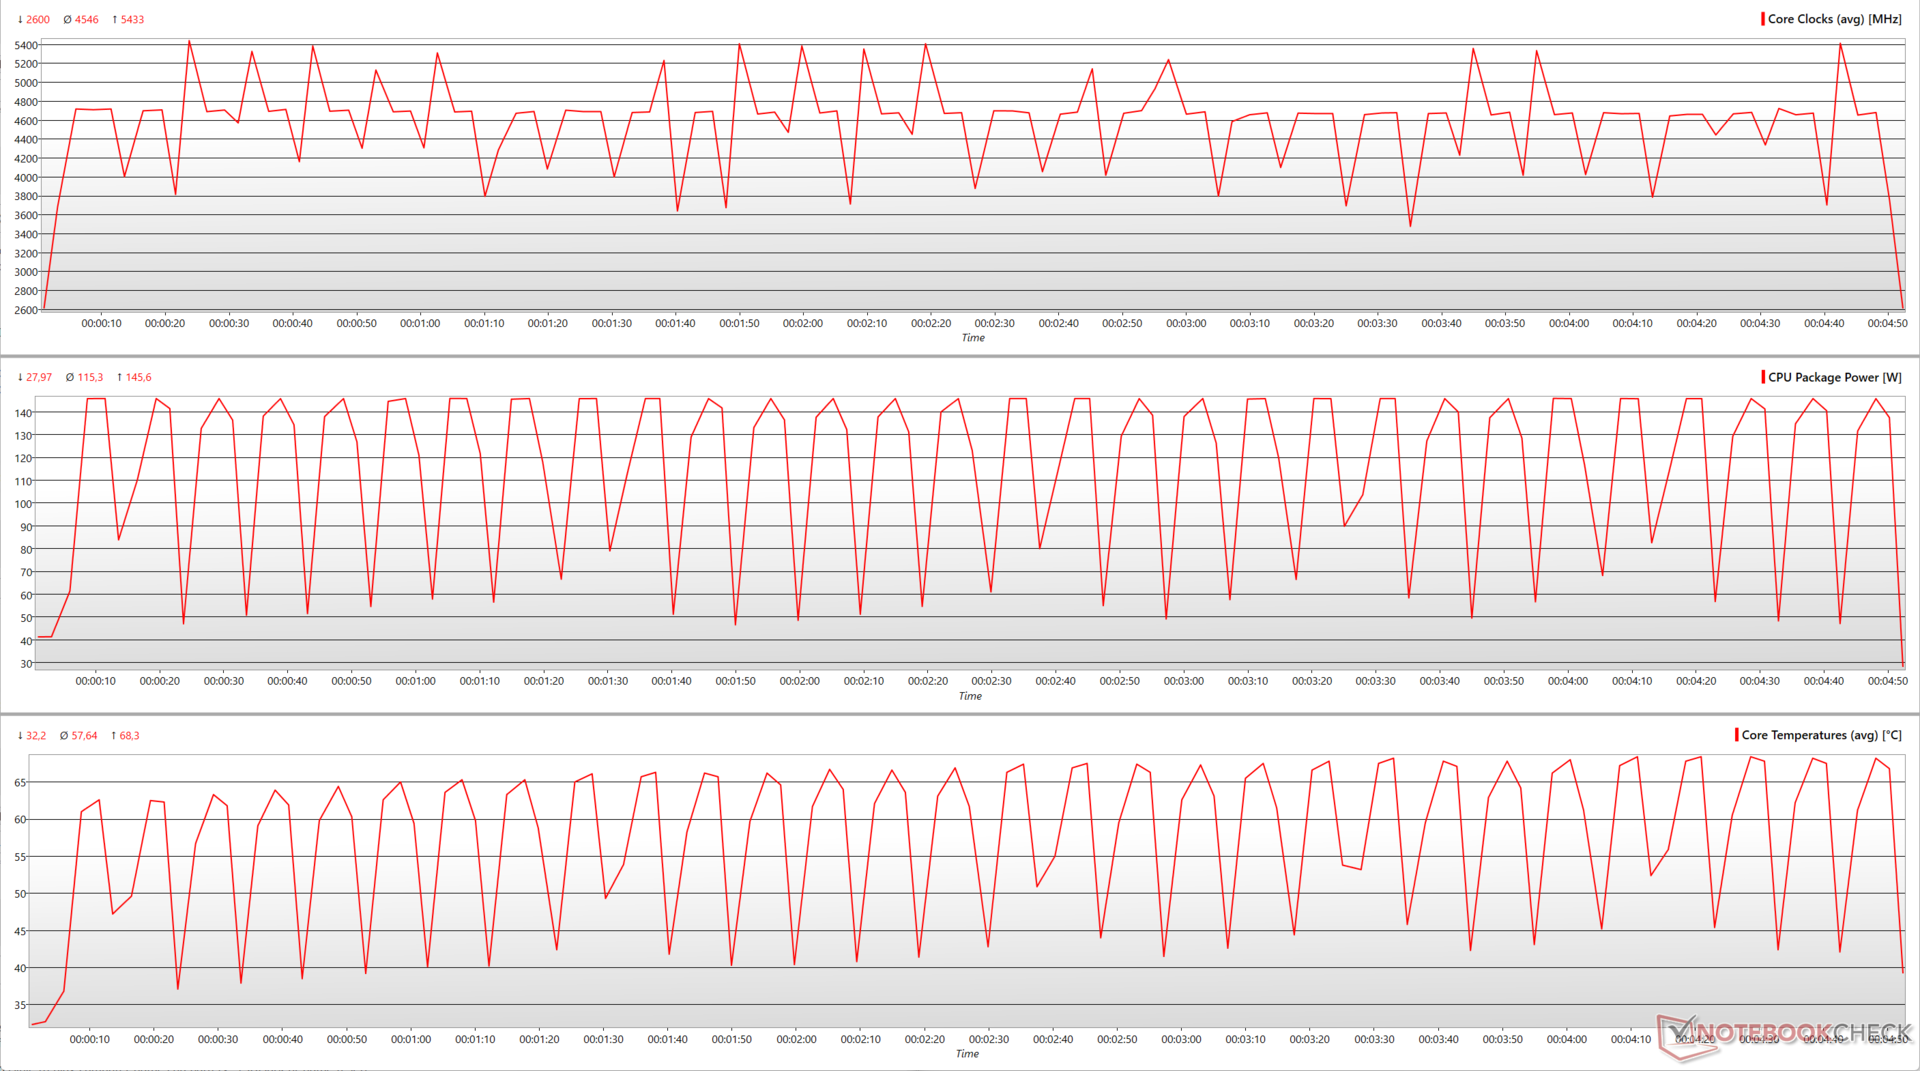
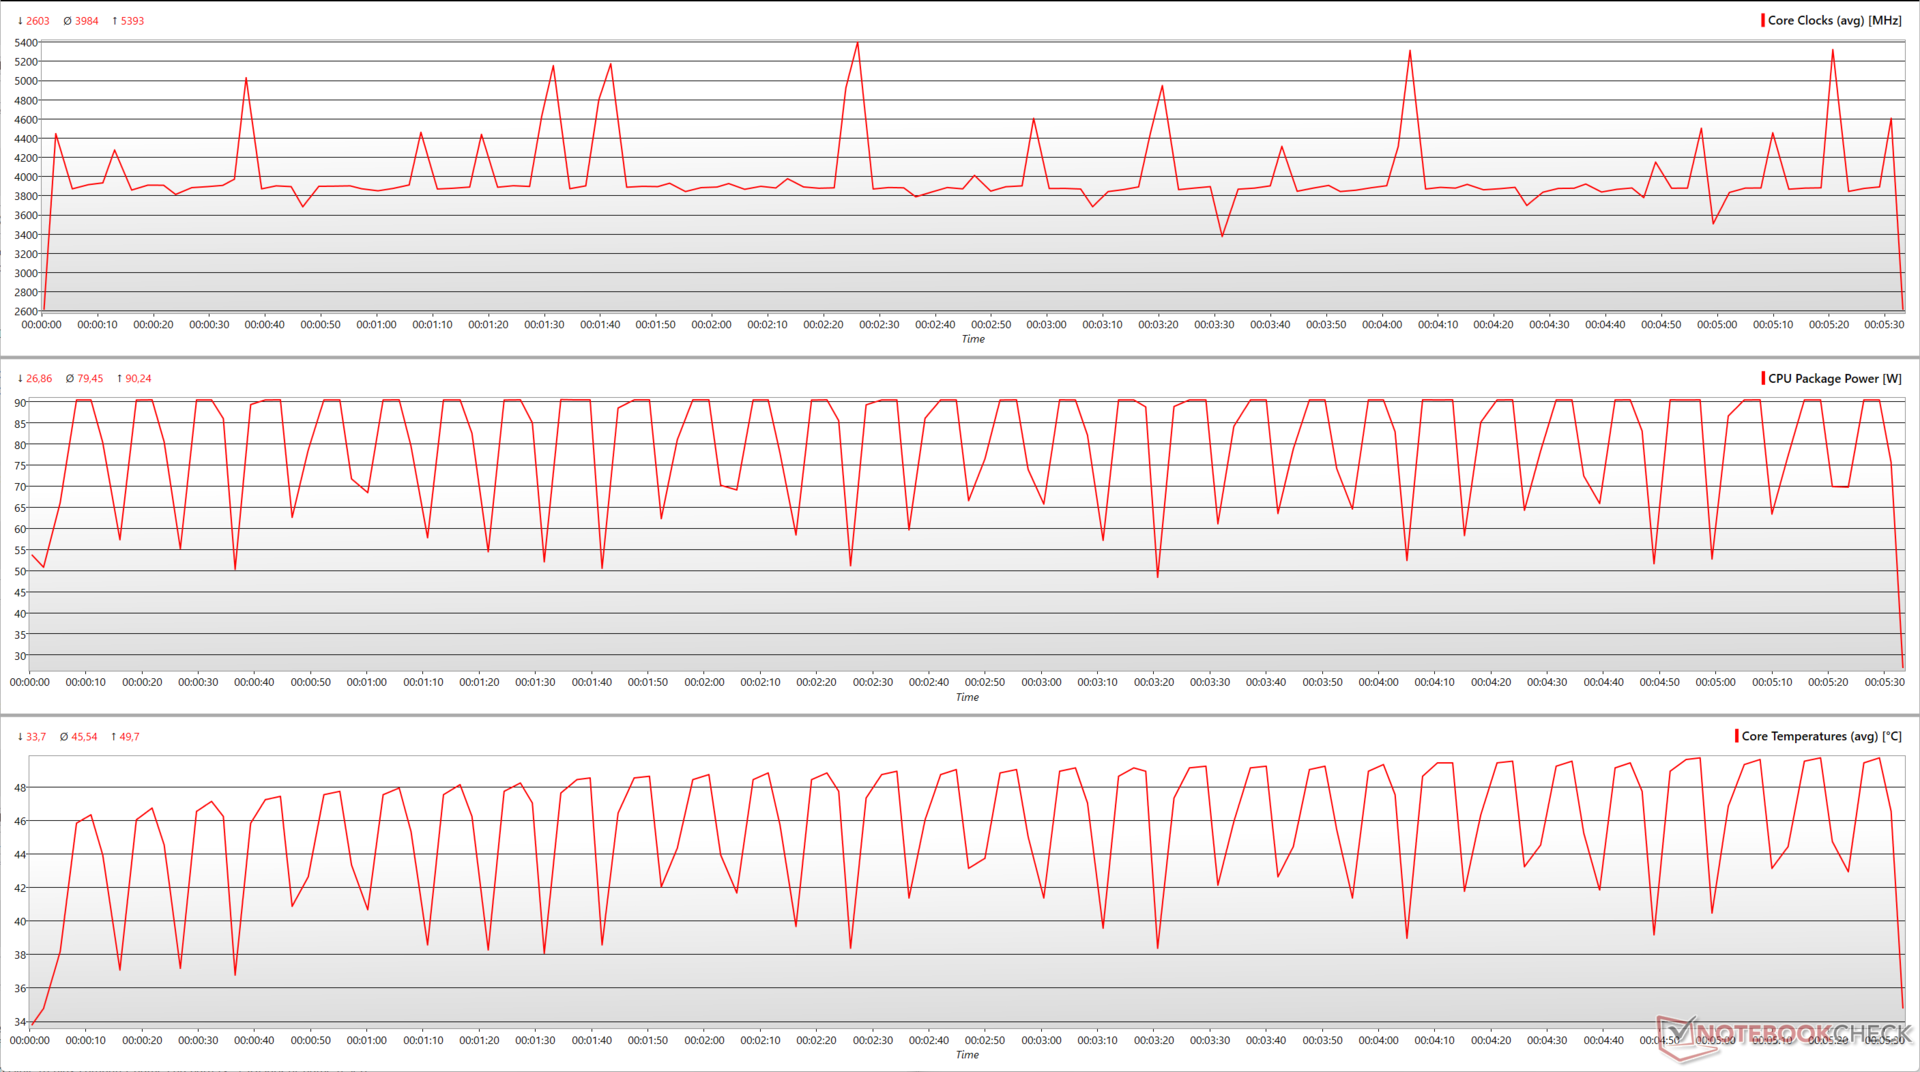
La riduzione delle prestazioni complessive passando da 170 W a 105 W è per lo più trascurabile, anche se i carichi di lavoro multi-core molto intensivi potrebbero subire una riduzione leggermente superiore. La differenza tra 170 W e 65 W è più percepibile, con una riduzione cumulativa del 9% circa nei test.
Frame rate in Witcher 3 a 1080p Ultra non sembra essere influenzato dalla riduzione del TDP. Abbiamo notato fps medi marginalmente più alti con i TDP più bassi, ma i valori massimi di fps erano inferiori rispetto al TDP predefinito.
| Performance rating - Percent | |
| Intel Core i9-13900K | |
| AMD Ryzen 9 7950X | |
| AMD Ryzen 9 7950X ECO 105 W | |
| AMD Ryzen 9 7900X | |
| AMD Ryzen 9 7950X ECO 65 W | |
| Intel Core i9-12900K | |
| Intel Core i5-13600K | |
| AMD Ryzen 7 7700X | |
| AMD Ryzen 7 7700X ECO 65 W | |
| AMD Ryzen 9 5950X | |
| AMD Ryzen 5 7600X | |
| AMD Ryzen 9 5900X | |
| Intel Core i5-12600K | |
| AMD Ryzen 7 5800X | |
| AMD Ryzen 7 5800X3D | |
| AMD Ryzen 5 5600X | |
| Cinebench R23 | |
| Single Core | |
| Intel Core i9-13900K | |
| AMD Ryzen 9 7900X | |
| AMD Ryzen 9 7950X | |
| Intel Core i5-13600K | |
| AMD Ryzen 9 7950X ECO 65 W | |
| AMD Ryzen 9 7950X ECO 105 W | |
| Intel Core i9-12900K | |
| AMD Ryzen 7 7700X ECO 65 W | |
| AMD Ryzen 7 7700X | |
| AMD Ryzen 5 7600X | |
| Intel Core i5-12600K | |
| AMD Ryzen 9 5950X | |
| AMD Ryzen 9 5900X | |
| AMD Ryzen 7 5800X | |
| AMD Ryzen 5 5600X | |
| AMD Ryzen 7 5800X3D | |
| Multi Core | |
| Intel Core i9-13900K | |
| AMD Ryzen 9 7950X | |
| AMD Ryzen 9 7950X ECO 105 W | |
| AMD Ryzen 9 7950X ECO 65 W | |
| AMD Ryzen 9 7900X | |
| AMD Ryzen 9 5950X | |
| Intel Core i9-12900K | |
| Intel Core i5-13600K | |
| AMD Ryzen 9 5900X | |
| AMD Ryzen 7 7700X | |
| AMD Ryzen 7 7700X ECO 65 W | |
| Intel Core i5-12600K | |
| AMD Ryzen 5 7600X | |
| AMD Ryzen 7 5800X | |
| AMD Ryzen 7 5800X3D | |
| AMD Ryzen 5 5600X | |
| Cinebench R20 | |
| CPU (Single Core) | |
| Intel Core i9-13900K | |
| AMD Ryzen 9 7900X | |
| AMD Ryzen 9 7950X | |
| AMD Ryzen 9 7950X ECO 65 W | |
| AMD Ryzen 9 7950X ECO 105 W | |
| Intel Core i5-13600K | |
| AMD Ryzen 7 7700X ECO 65 W | |
| AMD Ryzen 7 7700X | |
| Intel Core i9-12900K | |
| AMD Ryzen 5 7600X | |
| Intel Core i5-12600K | |
| AMD Ryzen 9 5950X | |
| AMD Ryzen 9 5900X | |
| AMD Ryzen 7 5800X | |
| AMD Ryzen 5 5600X | |
| AMD Ryzen 7 5800X3D | |
| CPU (Multi Core) | |
| Intel Core i9-13900K | |
| AMD Ryzen 9 7950X | |
| AMD Ryzen 9 7950X ECO 105 W | |
| AMD Ryzen 9 7950X ECO 65 W | |
| AMD Ryzen 9 7900X | |
| AMD Ryzen 9 5950X | |
| Intel Core i9-12900K | |
| Intel Core i5-13600K | |
| AMD Ryzen 9 5900X | |
| AMD Ryzen 7 7700X | |
| AMD Ryzen 7 7700X ECO 65 W | |
| Intel Core i5-12600K | |
| AMD Ryzen 7 5800X | |
| AMD Ryzen 5 7600X | |
| AMD Ryzen 7 5800X3D | |
| AMD Ryzen 5 5600X | |
| Cinebench R15 | |
| CPU Single 64Bit | |
| Intel Core i9-13900K | |
| AMD Ryzen 9 7900X | |
| AMD Ryzen 9 7950X | |
| AMD Ryzen 9 7950X ECO 105 W | |
| AMD Ryzen 7 7700X ECO 65 W | |
| AMD Ryzen 5 7600X | |
| AMD Ryzen 9 7950X ECO 65 W | |
| AMD Ryzen 7 7700X | |
| Intel Core i5-13600K | |
| Intel Core i9-12900K | |
| Intel Core i5-12600K | |
| AMD Ryzen 9 5950X | |
| AMD Ryzen 9 5900X | |
| AMD Ryzen 7 5800X | |
| AMD Ryzen 5 5600X | |
| AMD Ryzen 7 5800X3D | |
| CPU Multi 64Bit | |
| AMD Ryzen 9 7950X | |
| Intel Core i9-13900K | |
| AMD Ryzen 9 7950X ECO 105 W | |
| AMD Ryzen 9 7900X | |
| AMD Ryzen 9 7950X ECO 65 W | |
| AMD Ryzen 9 5950X | |
| Intel Core i9-12900K | |
| AMD Ryzen 9 5900X | |
| Intel Core i5-13600K | |
| AMD Ryzen 7 7700X | |
| AMD Ryzen 7 7700X ECO 65 W | |
| AMD Ryzen 7 5800X | |
| Intel Core i5-12600K | |
| AMD Ryzen 5 7600X | |
| AMD Ryzen 7 5800X3D | |
| AMD Ryzen 5 5600X | |
| Blender - v2.79 BMW27 CPU | |
| AMD Ryzen 5 5600X | |
| AMD Ryzen 7 5800X3D | |
| AMD Ryzen 5 7600X | |
| AMD Ryzen 7 5800X | |
| Intel Core i5-12600K | |
| AMD Ryzen 7 7700X ECO 65 W | |
| AMD Ryzen 7 7700X | |
| AMD Ryzen 9 5900X | |
| Intel Core i5-13600K | |
| Intel Core i9-12900K | |
| AMD Ryzen 9 5950X | |
| AMD Ryzen 9 7900X | |
| AMD Ryzen 9 7950X ECO 65 W | |
| AMD Ryzen 9 7950X ECO 105 W | |
| AMD Ryzen 9 7950X | |
| Intel Core i9-13900K | |
| Geekbench 5.5 | |
| Single-Core | |
| Intel Core i9-13900K | |
| AMD Ryzen 9 7900X | |
| AMD Ryzen 9 7950X ECO 65 W | |
| AMD Ryzen 9 7950X ECO 105 W | |
| AMD Ryzen 9 7950X | |
| AMD Ryzen 7 7700X | |
| AMD Ryzen 7 7700X ECO 65 W | |
| AMD Ryzen 5 7600X | |
| Intel Core i9-12900K | |
| Intel Core i5-13600K | |
| Intel Core i5-12600K | |
| AMD Ryzen 9 5950X | |
| AMD Ryzen 9 5900X | |
| AMD Ryzen 7 5800X | |
| AMD Ryzen 5 5600X | |
| AMD Ryzen 7 5800X3D | |
| Multi-Core | |
| Intel Core i9-13900K | |
| AMD Ryzen 9 7950X | |
| AMD Ryzen 9 7950X ECO 105 W | |
| AMD Ryzen 9 7950X ECO 65 W | |
| AMD Ryzen 9 7900X | |
| Intel Core i9-12900K | |
| AMD Ryzen 9 5950X | |
| Intel Core i5-13600K | |
| AMD Ryzen 7 7700X | |
| AMD Ryzen 7 7700X ECO 65 W | |
| AMD Ryzen 9 5900X | |
| Intel Core i5-12600K | |
| AMD Ryzen 5 7600X | |
| AMD Ryzen 7 5800X | |
| AMD Ryzen 7 5800X3D | |
| AMD Ryzen 5 5600X | |
| HWBOT x265 Benchmark v2.2 - 4k Preset | |
| AMD Ryzen 9 7950X | |
| Intel Core i9-13900K | |
| AMD Ryzen 9 7950X ECO 105 W | |
| AMD Ryzen 9 7900X | |
| AMD Ryzen 9 7950X ECO 65 W | |
| AMD Ryzen 9 5950X | |
| Intel Core i5-12600K | |
| Intel Core i9-12900K | |
| Intel Core i5-13600K | |
| AMD Ryzen 7 7700X | |
| AMD Ryzen 9 5900X | |
| AMD Ryzen 7 7700X ECO 65 W | |
| AMD Ryzen 5 7600X | |
| AMD Ryzen 7 5800X | |
| AMD Ryzen 7 5800X3D | |
| AMD Ryzen 5 5600X | |
| R Benchmark 2.5 - Overall mean | |
| AMD Ryzen 7 5800X3D | |
| AMD Ryzen 5 5600X | |
| AMD Ryzen 9 5950X | |
| AMD Ryzen 9 5900X | |
| AMD Ryzen 7 5800X | |
| Intel Core i5-12600K | |
| Intel Core i9-12900K | |
| Intel Core i5-13600K | |
| AMD Ryzen 7 7700X ECO 65 W | |
| AMD Ryzen 9 7950X | |
| AMD Ryzen 9 7950X ECO 65 W | |
| AMD Ryzen 9 7950X ECO 105 W | |
| AMD Ryzen 7 7700X | |
| AMD Ryzen 5 7600X | |
| AMD Ryzen 9 7900X | |
| Intel Core i9-13900K | |
| LibreOffice - 20 Documents To PDF | |
| Intel Core i5-12600K | |
| AMD Ryzen 7 5800X3D | |
| AMD Ryzen 9 5900X | |
| AMD Ryzen 9 5950X | |
| AMD Ryzen 5 5600X | |
| AMD Ryzen 7 5800X | |
| Intel Core i9-12900K | |
| AMD Ryzen 5 7600X | |
| Intel Core i9-13900K | |
| AMD Ryzen 9 7950X | |
| Intel Core i5-13600K | |
| AMD Ryzen 9 7900X | |
| AMD Ryzen 7 7700X ECO 65 W | |
| AMD Ryzen 7 7700X | |
| AMD Ryzen 9 7950X ECO 65 W | |
| AMD Ryzen 9 7950X ECO 105 W | |
| The Witcher 3 - 1920x1080 Ultra Graphics & Postprocessing (HBAO+) | |
| AMD Ryzen 7 5800X3D | |
| AMD Ryzen 9 7900X | |
| AMD Ryzen 5 7600X | |
| Intel Core i5-13600K | |
| Intel Core i9-13900K | |
| AMD Ryzen 9 7950X ECO 105 W | |
| AMD Ryzen 9 7950X ECO 65 W | |
| AMD Ryzen 9 7950X | |
| AMD Ryzen 7 7700X | |
| AMD Ryzen 7 7700X ECO 65 W | |
| Intel Core i5-12600K | |
| AMD Ryzen 9 5900X | |
| AMD Ryzen 9 5950X | |
| AMD Ryzen 7 5800X | |
| AMD Ryzen 5 5600X | |
| Intel Core i9-12900K | |
* ... Meglio usare valori piccoli
| Ryzen 7 7700X TDP | CB R15 Punteggio multi-core | Core Clock medio (GHz) | Core Clock max. Clock massimo del core (GHz) | Potenza massima del pacchetto (W) Potenza del pacchetto (W) | Temperatura massima del core (°C) Temperatura massima del core (°C) |
|---|---|---|---|---|---|
| 105 W | 3191 | 4,89 | 5,55 | 132,1 | 91,6 |
| 65 W | 3036 (-4,85%) | 4,78 (-2,24%) | 5,55 | 90 (-31,86%) | 69,7 (-23,9%) |
L'abbassamento a 65 W dai 105 W del Ryzen 7 7700X è meno drastico, con una riduzione di quasi il 5% nei punteggi multi-core di Cinebench R15. Sebbene si noti una leggera riduzione dei clock medi dei core, la velocità di clock massima raggiunge ancora i 5,55 GHz durante l'esecuzione
La temperatura massima del core a 65 W è ora vicina ai 70 °C, con una riduzione del 24% rispetto all'impostazione predefinita che può portare a temperature vicine ai 92 °C.
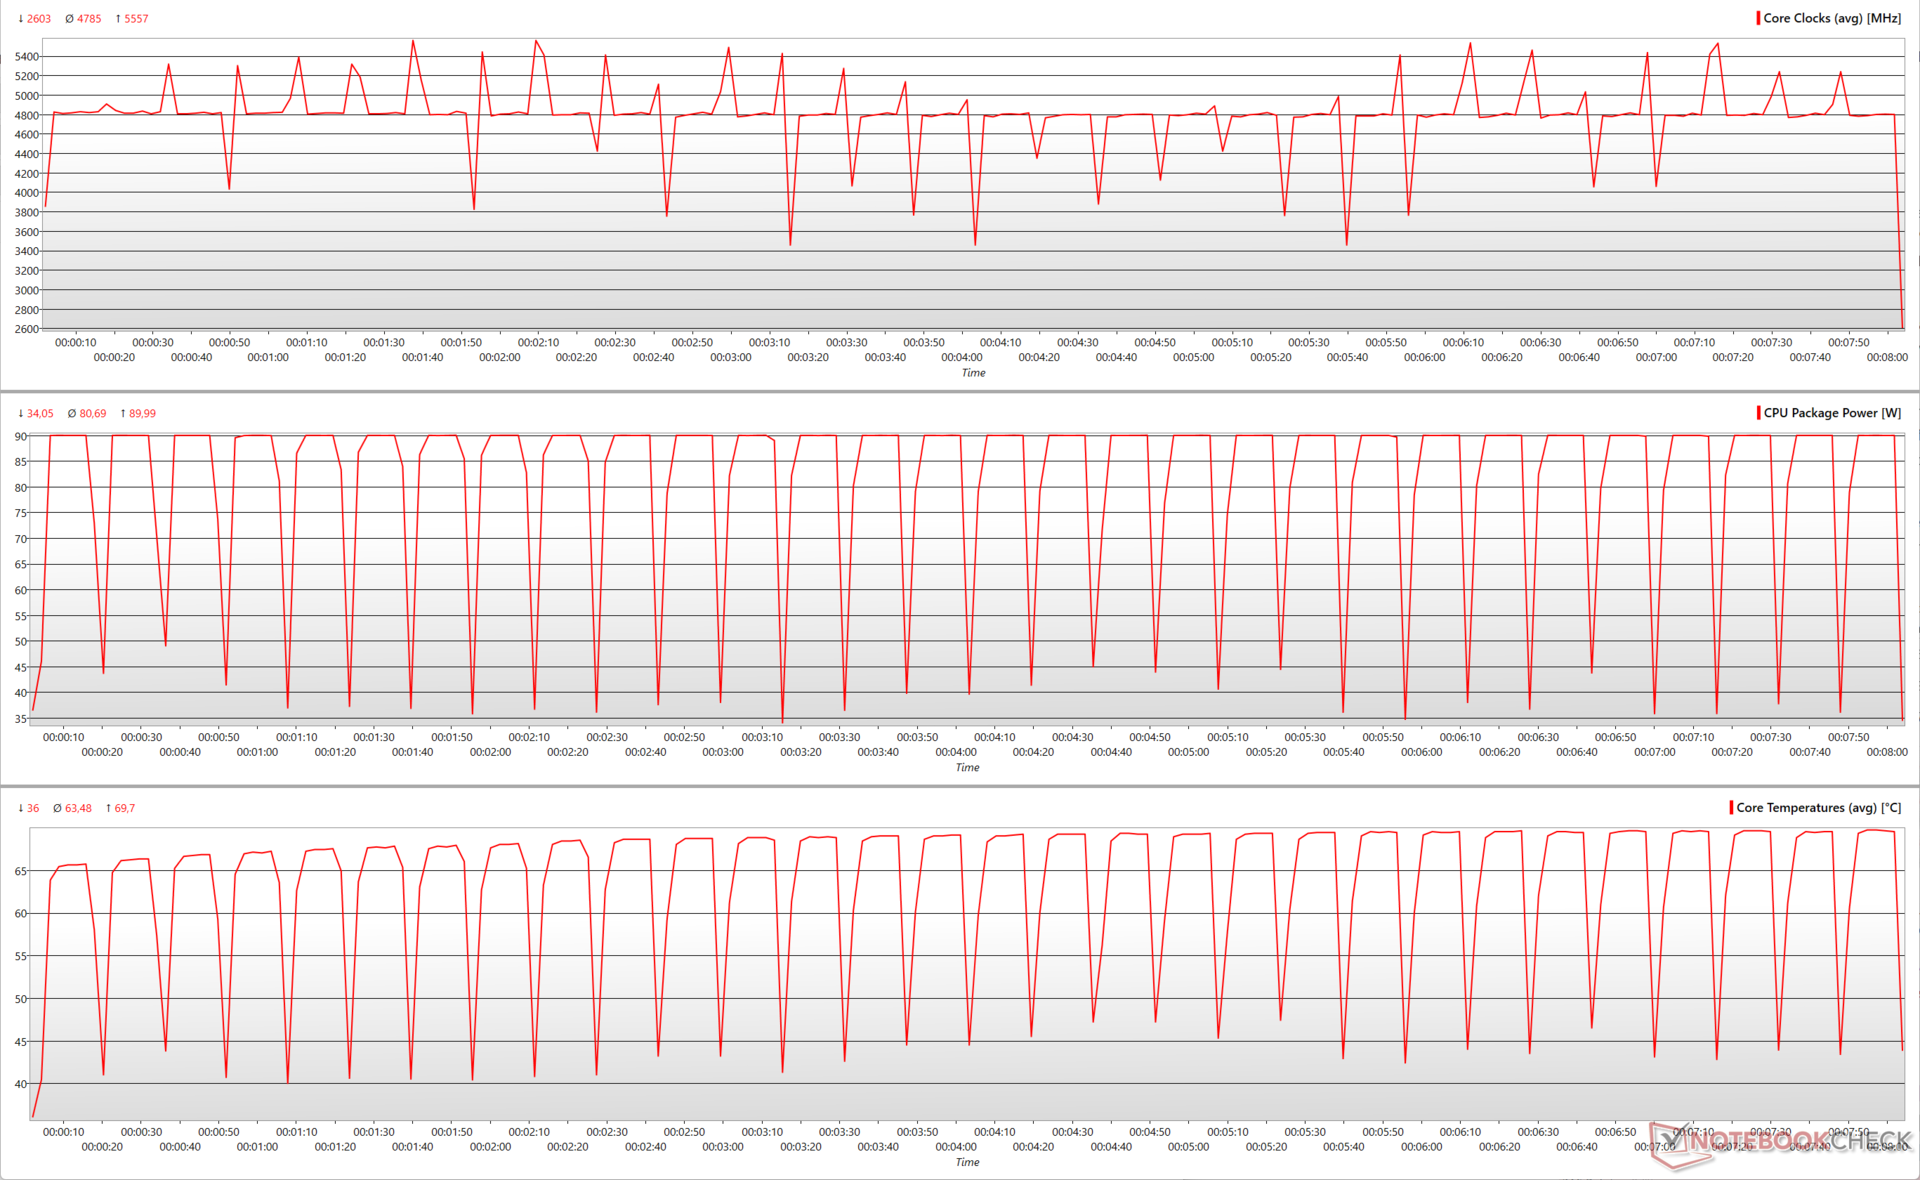
Complessivamente, il Ryzen 7 7700X non perde molto se viene utilizzato con un TDP di 65 W. Il sito Witcher 3 a 1080p Ultra vede ancora una volta fotogrammi marginalmente più alti a 1080p Ultra, ma questo può essere considerato entro il margine di errore.
Nel complesso, il Ryzen 9 7950X a 65 W è ancora più veloce del 14% rispetto a un Core i9-12900K con un PL1=PL2 di 241 W, il che rappresenta un'efficienza eccellente. Rispetto al Core i9-13900K, il Ryzen 9 7950X è in ritardo di appena il 5% con 105 W.
Allo stesso modo, il Ryzen 7 7700X a 65 W è praticamente a pari merito con il Ryzen 9 5950X con il TDP predefinito di 105 W (142 W PL2), mentre è solo del 6% più lento del Core i5-13600K predefinito (125 W PL1, 181 W PL2).
Consigliamo di utilizzare Ryzen 9 7950X e Ryzen 7 7700X in modalità Eco, a meno che non sia necessario sfruttare tutta la potenza grezza di questi processori per flussi di lavoro impegnativi.
prestazioni 3D e di gioco: Una competizione serrata con il migliore di Intel
Il Ryzen 9 7950X e il Ryzen 7 7700X mostrano lievi regressioni nelle prestazioni della GPU 3DMark rispetto al Ryzen 5 7600X e al Ryzen 9 7900X. Tuttavia, le prestazioni sono pari a quelle dei Core i5-13600K e Core i9-13900K.
| Performance rating - Percent | |
| AMD Ryzen 5 7600X | |
| AMD Ryzen 9 7900X | |
| Intel Core i5-13600K | |
| Intel Core i9-13900K | |
| AMD Ryzen 9 7950X | |
| AMD Ryzen 7 7700X | |
| 3DMark | |
| 1920x1080 Fire Strike Graphics | |
| AMD Ryzen 5 7600X | |
| AMD Ryzen 9 7900X | |
| Intel Core i5-13600K | |
| Intel Core i9-13900K | |
| AMD Ryzen 9 7950X | |
| AMD Ryzen 7 7700X | |
| 2560x1440 Time Spy Graphics | |
| AMD Ryzen 9 7900X | |
| AMD Ryzen 5 7600X | |
| Intel Core i9-13900K | |
| Intel Core i5-13600K | |
| AMD Ryzen 7 7700X | |
| AMD Ryzen 9 7950X | |
| 3DMark 11 - 1280x720 Performance GPU | |
| AMD Ryzen 5 7600X | |
| AMD Ryzen 9 7900X | |
| Intel Core i5-13600K | |
| Intel Core i9-13900K | |
| AMD Ryzen 9 7950X | |
| AMD Ryzen 7 7700X | |
| 3DMark 11 Performance | 48825 punti | |
| 3DMark Fire Strike Score | 42285 punti | |
| 3DMark Time Spy Score | 18279 punti | |
Aiuto | ||
Non capita spesso di trovare CPU Intel e AMD in competizione tra loro nel settore dei giochi. Sia il Ryzen 9 7950X che il Ryzen 7 7700X sono eccellenti CPU da gioco, soprattutto se abbinate a GPU veloci come la serie RTX 30 di GeForce o la serie Radeon RX 6000 e superiori. La differenza cumulativa di prestazioni tra le CPU Intel Raptor Lake e le corrispondenti CPU AMD Zen 4 sembra trascurabile.
Detto questo, i singoli giochi possono favorire una piattaforma rispetto all'altra. Per esempio, vediamo che il Ryzen 9 7950X ha ottenuto un vantaggio del 21% rispetto al Core i9-13900K in Final Fantasy XV 1080p High, mentre quest'ultimo supera il 7950X del 13% in Far Cry 5 a 1080p Ultra. Il Ryzen 9 7900Xinvece, precede il Ryzen 9 7950X del 7% in The Witcher 3 a 1080p Ultra
Nel complesso, sia il Ryzen 9 7950X che il Ryzen 7 7700X sono alla pari nei giochi. Se siete principalmente giocatori, potete risparmiare una buona quantità di denaro optando per il Ryzen 7 7700X o addirittura per il Ryzen 5 7600X Ryzen 5 7600X.
| Performance rating - Percent | |
| Intel Core i9-13900K | |
| AMD Ryzen 9 7900X | |
| AMD Ryzen 5 7600X | |
| Media della classe Desktop | |
| AMD Ryzen 9 7950X | |
| AMD Ryzen 7 7700X | |
| Intel Core i5-13600K | |
| The Witcher 3 | |
| 1920x1080 Ultra Graphics & Postprocessing (HBAO+) | |
| Media della classe Desktop (7.8 - 369, n=48, ultimi 2 anni) | |
| AMD Ryzen 9 7900X | |
| AMD Ryzen 5 7600X | |
| Intel Core i5-13600K | |
| Intel Core i9-13900K | |
| AMD Ryzen 9 7950X | |
| AMD Ryzen 7 7700X | |
| 1024x768 Low Graphics & Postprocessing | |
| AMD Ryzen 9 7900X | |
| Intel Core i9-13900K | |
| AMD Ryzen 7 7700X | |
| AMD Ryzen 5 7600X | |
| AMD Ryzen 9 7950X | |
| Media della classe Desktop (39.3 - 841, n=30, ultimi 2 anni) | |
| Intel Core i5-13600K | |
| GTA V | |
| 1920x1080 Highest AA:4xMSAA + FX AF:16x | |
| Intel Core i9-13900K | |
| AMD Ryzen 9 7900X | |
| AMD Ryzen 7 7700X | |
| AMD Ryzen 9 7950X | |
| AMD Ryzen 5 7600X | |
| Intel Core i5-13600K | |
| Media della classe Desktop (9.61 - 172.5, n=13, ultimi 2 anni) | |
| 1920x1080 Lowest Settings possible | |
| AMD Ryzen 9 7950X | |
| AMD Ryzen 7 7700X | |
| Intel Core i9-13900K | |
| Intel Core i5-13600K | |
| AMD Ryzen 9 7900X | |
| AMD Ryzen 5 7600X | |
| Media della classe Desktop (61.3 - 188.2, n=13, ultimi 2 anni) | |
| Cyberpunk 2077 1.6 | |
| 3840x2160 Ultra Preset | |
| AMD Ryzen 9 7950X | |
| AMD Ryzen 7 7700X | |
| AMD Ryzen 9 7900X | |
| AMD Ryzen 5 7600X | |
| 2560x1440 Ultra Preset | |
| AMD Ryzen 9 7950X | |
| AMD Ryzen 7 7700X | |
| AMD Ryzen 9 7900X | |
| AMD Ryzen 5 7600X | |
| 1920x1080 Ultra Preset | |
| AMD Ryzen 9 7900X | |
| AMD Ryzen 7 7700X | |
| AMD Ryzen 9 7950X | |
| AMD Ryzen 5 7600X | |
| F1 22 | |
| 3840x2160 Ultra High Preset AA:T AF:16x | |
| Media della classe Desktop (31.1 - 113.3, n=14, ultimi 2 anni) | |
| AMD Ryzen 5 7600X | |
| AMD Ryzen 9 7900X | |
| Intel Core i5-13600K | |
| AMD Ryzen 9 7950X | |
| AMD Ryzen 7 7700X | |
| Intel Core i9-13900K | |
| 2560x1440 Ultra High Preset AA:T AF:16x | |
| Media della classe Desktop (64.1 - 194.3, n=14, ultimi 2 anni) | |
| AMD Ryzen 5 7600X | |
| Intel Core i5-13600K | |
| AMD Ryzen 7 7700X | |
| AMD Ryzen 9 7900X | |
| AMD Ryzen 9 7950X | |
| Intel Core i9-13900K | |
| 1920x1080 Ultra High Preset AA:T AF:16x | |
| Media della classe Desktop (100.2 - 219, n=14, ultimi 2 anni) | |
| Intel Core i5-13600K | |
| AMD Ryzen 9 7950X | |
| AMD Ryzen 7 7700X | |
| AMD Ryzen 5 7600X | |
| AMD Ryzen 9 7900X | |
| Intel Core i9-13900K | |
| Far Cry 6 | |
| 3840x2160 Ultra Graphics Quality + HD Textures AA:T | |
| Media della classe Desktop (31.7 - 190.9, n=16, ultimi 2 anni) | |
| Intel Core i9-13900K | |
| Intel Core i5-13600K | |
| AMD Ryzen 9 7950X | |
| AMD Ryzen 7 7700X | |
| 2560x1440 Ultra Graphics Quality + HD Textures AA:T | |
| Media della classe Desktop (106.2 - 248, n=16, ultimi 2 anni) | |
| AMD Ryzen 9 7950X | |
| Intel Core i9-13900K | |
| Intel Core i5-13600K | |
| AMD Ryzen 7 7700X | |
| 1920x1080 Ultra Graphics Quality + HD Textures AA:T | |
| Media della classe Desktop (134.7 - 254, n=16, ultimi 2 anni) | |
| Intel Core i9-13900K | |
| Intel Core i5-13600K | |
| AMD Ryzen 9 7950X | |
| AMD Ryzen 7 7700X | |
| Borderlands 3 | |
| 3840x2160 Badass Overall Quality (DX11) | |
| Media della classe Desktop (76.7 - 168, n=13, ultimi 2 anni) | |
| AMD Ryzen 9 7900X | |
| AMD Ryzen 5 7600X | |
| Intel Core i5-13600K | |
| Intel Core i9-13900K | |
| AMD Ryzen 9 7950X | |
| AMD Ryzen 7 7700X | |
| 2560x1440 Badass Overall Quality (DX11) | |
| Media della classe Desktop (129.5 - 223, n=13, ultimi 2 anni) | |
| AMD Ryzen 9 7900X | |
| AMD Ryzen 5 7600X | |
| Intel Core i9-13900K | |
| Intel Core i5-13600K | |
| AMD Ryzen 9 7950X | |
| AMD Ryzen 7 7700X | |
| 1920x1080 Badass Overall Quality (DX11) | |
| Media della classe Desktop (6.4 - 248, n=14, ultimi 2 anni) | |
| AMD Ryzen 9 7900X | |
| Intel Core i9-13900K | |
| AMD Ryzen 5 7600X | |
| Intel Core i5-13600K | |
| AMD Ryzen 9 7950X | |
| AMD Ryzen 7 7700X | |
AMD Ryzen 9 7950X with Nvidia GeForce RTX 3090
| basso | medio | alto | ultra | QHD | 4K | |
|---|---|---|---|---|---|---|
| GTA V (2015) | 187.8 | 187.8 | 187.3 | 155.4 | 150.1 | 181.9 |
| The Witcher 3 (2015) | 703 | 551 | 358 | 175.2 | 150.9 | |
| Dota 2 Reborn (2015) | 293.2 | 259.3 | 248.5 | 222.3 | 208.1 | |
| Final Fantasy XV Benchmark (2018) | 235 | 229 | 229 | 142.4 | 86.8 | |
| X-Plane 11.11 (2018) | 216 | 187.9 | 141 | 122.5 | ||
| Far Cry 5 (2018) | 216 | 196 | 189 | 176 | 169 | 105 |
| Strange Brigade (2018) | 694 | 503 | 404 | 351 | 265 | 158.1 |
| Shadow of the Tomb Raider (2018) | 304 | 255 | 247 | 232 | 169 | 96 |
| Far Cry New Dawn (2019) | 176 | 160 | 156 | 142 | 139 | 105 |
| Metro Exodus (2019) | 281 | 215 | 170.4 | 137 | 112.5 | 73.5 |
| Borderlands 3 (2019) | 219 | 201 | 179.4 | 156.3 | 126.3 | 72.6 |
| F1 2021 (2021) | 619 | 542 | 436 | 225 | 172.8 | 101.8 |
| Far Cry 6 (2021) | 205 | 189 | 169 | 151 | 134 | 84 |
| Forza Horizon 5 (2021) | 337 | 223 | 202 | 129 | 114 | 84 |
| Cyberpunk 2077 1.6 (2022) | 209 | 175.6 | 149.8 | 137.5 | 93.1 | 46.5 |
| Tiny Tina's Wonderlands (2022) | 349 | 289 | 209 | 165.9 | 122 | 69 |
| F1 22 (2022) | 412 | 424 | 355 | 127.9 | 83.3 | 42 |
AMD Ryzen 7 7700X with Nvidia GeForce RTX 3090
| basso | medio | alto | ultra | QHD | 4K | |
|---|---|---|---|---|---|---|
| GTA V (2015) | 187.8 | 187.6 | 186.4 | 155.8 | 148.3 | 180 |
| The Witcher 3 (2015) | 726 | 529 | 344 | 172.4 | 148.3 | |
| Dota 2 Reborn (2015) | 292.3 | 256.4 | 249.8 | 231.1 | 203.5 | |
| Final Fantasy XV Benchmark (2018) | 237 | 237 | 178.3 | 138.4 | 84.3 | |
| X-Plane 11.11 (2018) | 224 | 190.7 | 145.9 | 124 | ||
| Far Cry 5 (2018) | 233 | 201 | 194 | 177 | 168 | 104 |
| Strange Brigade (2018) | 797 | 509 | 404 | 352 | 263 | 157.6 |
| Shadow of the Tomb Raider (2018) | 307 | 252 | 240 | 223 | 168 | 96 |
| Far Cry New Dawn (2019) | 192 | 169 | 162 | 144 | 138 | 104 |
| Metro Exodus (2019) | 317 | 219 | 171.6 | 136.6 | 112.1 | 73.3 |
| Borderlands 3 (2019) | 230 | 197.3 | 174.9 | 153 | 122.6 | 70.3 |
| F1 2021 (2021) | 663 | 543 | 453 | 222 | 169.3 | 101.1 |
| Far Cry 6 (2021) | 196 | 183 | 163 | 149 | 127 | 82 |
| Forza Horizon 5 (2021) | 295 | 205 | 193 | 129 | 114 | 84 |
| Cyberpunk 2077 1.6 (2022) | 205 | 172.1 | 151.3 | 137.7 | 92.8 | 46.2 |
| Tiny Tina's Wonderlands (2022) | 359 | 287 | 204 | 161.8 | 118.8 | 67.5 |
| F1 22 (2022) | 400 | 415 | 352 | 127.2 | 83.9 | 42 |
Consumo di energia: Guadagni sostanziali in termini di efficienza multi-core in modalità Eco
Lo Zen 4 di AMD "Raphael" sembra essere abbastanza efficiente dal punto di vista energetico rispetto alla concorrenza Raptor Lake. Il consumo totale del sistema nel test multi-core Cinebench R15 con il sistema basato su Ryzen 9 7950X è inferiore del 24% rispetto al PC con Core i9-13900K, anche se è superiore del 12% rispetto al Core i9-12900K.
Il sistema basato su Ryzen 7 7700X consuma il 16% in meno in Cinebench R15 multi-core rispetto al Core i5-13600K ed è più o meno simile a un sistema con Ryzen 9 5900X.
La modalità Eco contribuisce ulteriormente a ottenere significativi guadagni in termini di efficienza energetica. Nel caso del Ryzen 9 7950X, le prestazioni da 105 W e 65 W sono rispettivamente più efficienti del 29% e del 47% rispetto al TDP predefinito di 170 W in Cinebench R15 multi-core.
Allo stesso modo, il Ryzen 7700X da 65 W può permettersi un'efficienza superiore del 17% nello stesso benchmark rispetto al TDP operativo predefinito di 105 W della CPU.
Dal momento che le prestazioni single-core sono relativamente inalterate con la modifica del TDP, non sembra esserci alcun vantaggio percepibile in termini di efficienza per i giochi, come si vede nei grafici di efficienza di The Witcher 3 1080p Ultra. Detto questo, il funzionamento di questi chip a TDP inferiori comporta una riduzione del consumo energetico complessivo.
Power Consumption: External Monitor
| Power Consumption / Cinebench R15 Multi Efficiency (external Monitor) | |
| AMD Ryzen 9 7950X ECO 65 W, NVIDIA GeForce RTX 3090 | |
| Media della classe Desktop (13.7 - 41.2, n=14, ultimi 2 anni) | |
| AMD Ryzen 9 7950X ECO 105 W, NVIDIA GeForce RTX 3090 | |
| AMD Ryzen 9 5950X, NVIDIA Titan RTX | |
| AMD Ryzen 9 7950X, NVIDIA GeForce RTX 3090 | |
| Media NVIDIA GeForce RTX 3090 (11.7 - 25.2, n=13) | |
| AMD Ryzen 9 5900X, NVIDIA Titan RTX | |
| AMD Ryzen 9 7900X, NVIDIA GeForce RTX 3090 | |
| AMD Ryzen 7 7700X ECO 65 W, NVIDIA GeForce RTX 3090 | |
| AMD Ryzen 7 7700X, NVIDIA GeForce RTX 3090 | |
| Intel Core i9-13900K, NVIDIA GeForce RTX 3090 | |
| Intel Core i5-13600K, NVIDIA GeForce RTX 3090 | |
| Intel Core i9-12900K, NVIDIA Titan RTX | |
| Intel Core i5-12600K, NVIDIA Titan RTX | |
| AMD Ryzen 7 5800X, NVIDIA Titan RTX | |
| AMD Ryzen 5 7600X, NVIDIA GeForce RTX 3090 | |
| AMD Ryzen 5 5600X, NVIDIA Titan RTX | |
| AMD Ryzen 7 5800X3D, NVIDIA GeForce RTX 3090 Ti | |
| Power Consumption / Witcher 3 ultra Efficiency (external Monitor) | |
| Media della classe Desktop (0.113 - 0.653, n=44, ultimi 2 anni) | |
| Intel Core i5-13600K, NVIDIA GeForce RTX 3090 | |
| AMD Ryzen 5 7600X, NVIDIA GeForce RTX 3090 | |
| Intel Core i5-12600K, NVIDIA Titan RTX | |
| Media NVIDIA GeForce RTX 3090 (0.268 - 0.3954, n=15) | |
| AMD Ryzen 7 5800X3D, NVIDIA GeForce RTX 3090 Ti | |
| AMD Ryzen 5 5600X, NVIDIA Titan RTX | |
| AMD Ryzen 9 7900X, NVIDIA GeForce RTX 3090 | |
| Intel Core i9-13900K, NVIDIA GeForce RTX 3090 | |
| AMD Ryzen 7 7700X, NVIDIA GeForce RTX 3090 | |
| AMD Ryzen 7 5800X, NVIDIA Titan RTX | |
| AMD Ryzen 9 7950X ECO 105 W, NVIDIA GeForce RTX 3090 | |
| AMD Ryzen 9 7950X ECO 65 W, NVIDIA GeForce RTX 3090 | |
| AMD Ryzen 9 7950X, NVIDIA GeForce RTX 3090 | |
| AMD Ryzen 7 7700X ECO 65 W, NVIDIA GeForce RTX 3090 | |
| AMD Ryzen 9 5900X, NVIDIA Titan RTX | |
| AMD Ryzen 9 5950X, NVIDIA Titan RTX | |
| Intel Core i9-12900K, NVIDIA Titan RTX | |
* ... Meglio usare valori piccoli
Pro
Contro
Verdetto: non si può sbagliare con lo Zen 4

il 2022 si è rivelato un anno molto interessante per gli appassionati di PC. Abbiamo visto Nvidia e AMD presentare le loro architetture GPU Ada Lovelace e RDNA 3, mentre Intel e AMD si sono affrontate con le loro lineup Raptor Lake e Zen 4 Raphael.
L'AMD Ryzen 9 7950X rappresenta un'opzione convincente per tutti coloro che sono alla ricerca di una CPU desktop mainstream di punta, in grado di alimentare i loro progetti creativi e di non presentare colli di bottiglia nel gioco. Il Ryzen 9 7950X ha prestazioni pari a quelle del Core i9-13900K nei benchmark complessivi della CPU. Singolarmente, alcuni test favoriscono l'ammiraglia Raptor Lake, ma le differenze non sono così drastiche da essere percepibili nel mondo reale.
In confronto, il Ryzen 7 7700X è in ritardo rispetto al Ryzen 9 7950X del 25%. Tuttavia, questo chip 8C/16T è in grado di offrire prestazioni migliori di un Core i5-13600K o addirittura di un Core i9-12900Ke questo merita un apprezzamento.
Il Ryzen 9 7950X e il Ryzen 7 7700X di AMD rappresentano un sostanziale upgrade rispetto a Zen 3 e garantiscono che le offerte Raptor Lake di Intel non rimangano incontrastate. La possibilità di sfruttare la modalità Eco senza significative penalizzazioni delle prestazioni è una ciliegina sulla torta"
Sia il Ryzen 9 7950X che il Ryzen 7 7700X sono ottimi per la produttività generale. Il Ryzen 9 7950X sembra essere un'opzione migliore rispetto al Core i9-13900K, se il vostro flusso di lavoro include molti calcoli in virgola mobile, come evidenziato dai nostri test AIDA64.
La modalità Eco è forse il miglior punto di forza di questa generazione di CPU AMD. Il fatto che si possa ottenere un guadagno piuttosto significativo con un Ryzen 9 7950X da 65 W rispetto a un Core i9-12900K da 241 W non è affatto da sottovalutare. Gli utenti alla ricerca di una maggiore efficienza energetica per i flussi di lavoro meno impegnativi troveranno che il funzionamento del Ryzen 9 7950X a 65 W può essere fino al 47% più efficiente rispetto alle impostazioni standard.
Il Ryzen 7 7700X è già un chip abbastanza efficiente di per sé, ma l'abbassamento del TDP a 65 W si traduce comunque in un risparmio energetico tangibile. I giocatori non devono preoccuparsi di perdere molte prestazioni con TDP inferiori, poiché le prestazioni single-core rimangono relativamente inalterate.
Il socket AM4 è stato soppiantato dalla nuova piattaforma AM5, che porta con sé il supporto nativo per le DDR5 e il PCIe Gen 5. A differenza di Intel, AMD ha scelto di rendere l'AM5 un'esclusiva DDR5. Al momento le DDR5 hanno un costo elevato e ci vorrà un po' prima che i prezzi diventino più stabili e paragonabili a quelli delle DDR4.
Bisogna anche considerare i costi dell'aggiornamento della scheda madre: le schede madri X670 partono spesso da circa 400 dollari, con le ammiraglie X670E completamente cariche che superano anche i 1.200 dollari per la sola scheda. La buona notizia, tuttavia, è che il sistema di raffreddamento attuale sarà probabilmente adatto e la piattaforma sarà supportata almeno fino al 2025.
Con il Ryzen 9 7950X e il Ryzen 7 7700X, e anche con il Ryzen 9 7900X e Ryzen 5 7600XaMD ha fugato i timori che i chip Zen 4 "Raphael" non siano all'altezza di Raptor Lake di Intel. Zen 4 rappresenta un aggiornamento interessante, nonostante l'investimento iniziale nella piattaforma AM5.
L'imminente arrivo di Ryzen 7000 X3D nei prossimi mesi presenta una prospettiva ancora più allettante, e da qui in poi le cose possono solo migliorare.
Prezzo e disponibilità
Questa volta Intel sembra avere un vantaggio con i prezzi di lancio. Il Core i9-13900K è stato lanciato a 589 dollari di MSRP, ma attualmente viene venduto a 660 dollari. L'AMD Ryzen 9 7950X, invece, è stato lanciato a 699 dollari, ma ora è possibile acquistare il colosso da 16C/32T a 574 dollari su Best Buy e Newegg. I prezzi sul negozio Amazon USsembra tuttavia essere aumentato a 748 dollari
In India, il Ryzen 9 7950X è stato lanciato con un MSRP di ₹67.999, ma ora è disponibile per ₹62.749 su Amazon India e a circa ₹58.000 presso altri rivenditori.
AMD Ryzen 7 7700X è anche disponibile a un prezzo ridotto di 350 dollari su Best Buy e Newegg. In India, la CPU aveva un prezzo di lancio di ₹39.499, ma può essere acquistata a circa ₹34.000 su Amazon India e altri negozi.
Price comparison

