Recensione dell' AMD Ryzen 7 5800X3D: CPU gaming migliore del Core i9-12900K per 120 dollari in meno
AMD è finalmente passata a una nuova piattaforma di socket e chipset con il Ryzen 7000 ma l'azienda sta ancora cercando di sfruttare al massimo il socket AM4. AMD ha annunciato per la prima volta il suo design 3D V-cache basato sulla tecnologia di packaging 3DFabric di TSMC al Computex 2021, mostrando enormi miglioramenti nelle prestazioni di gioco a 1080p
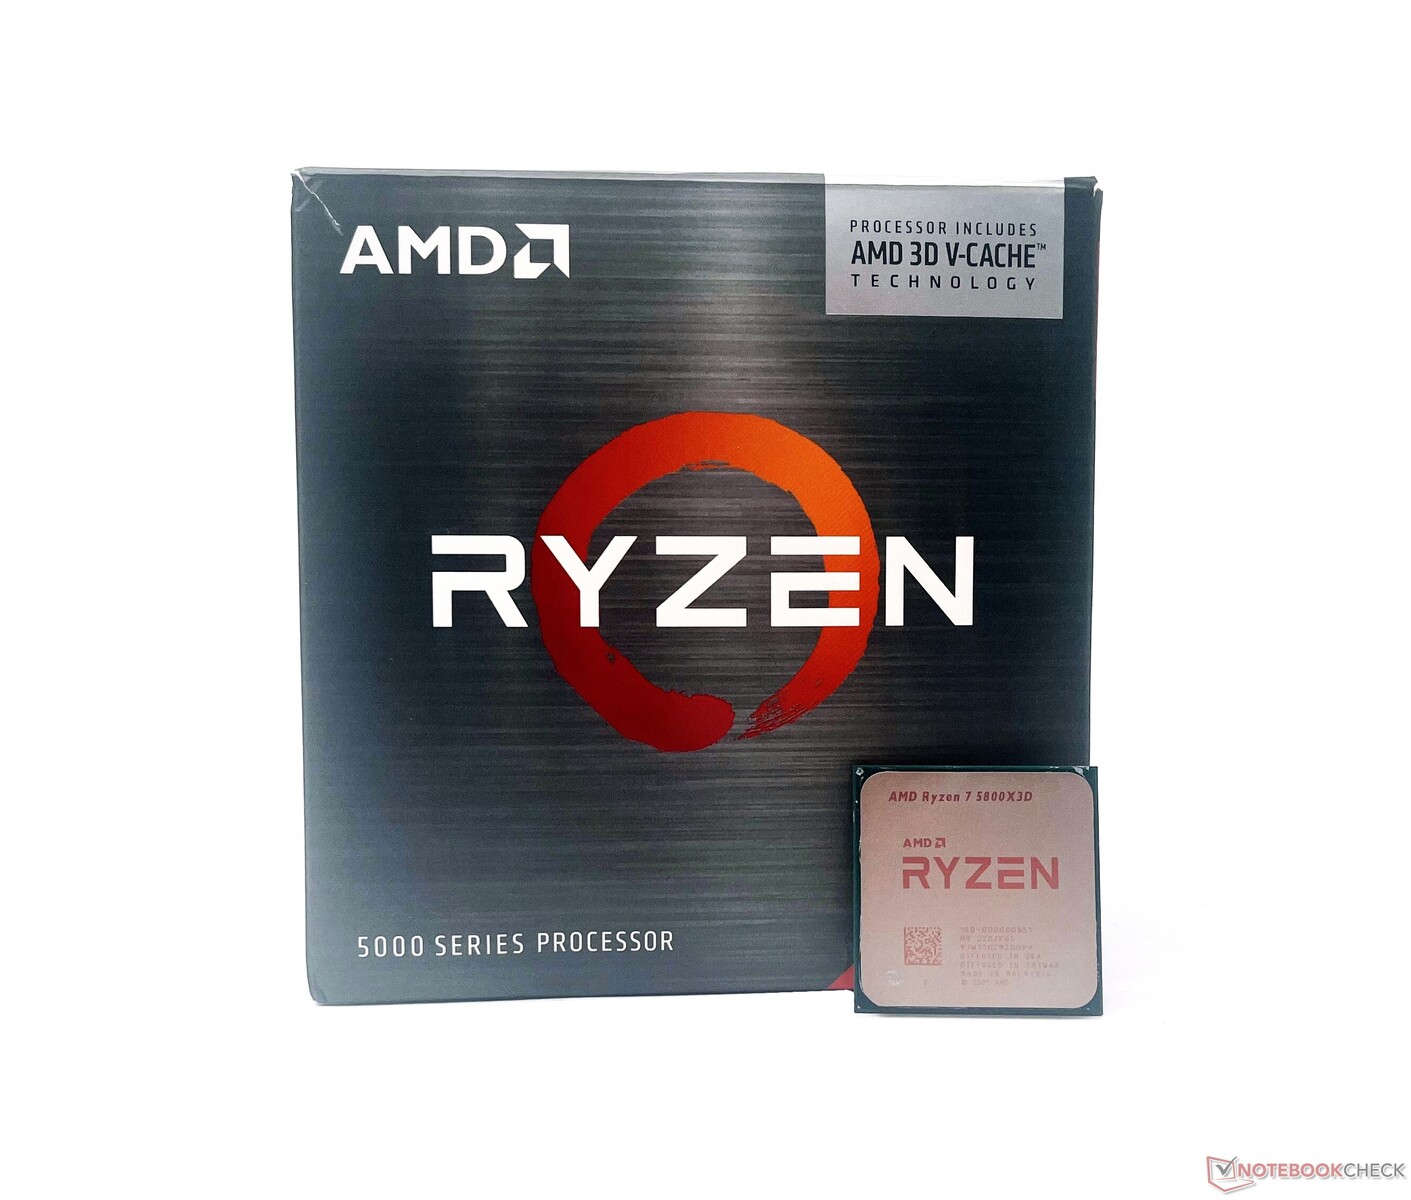
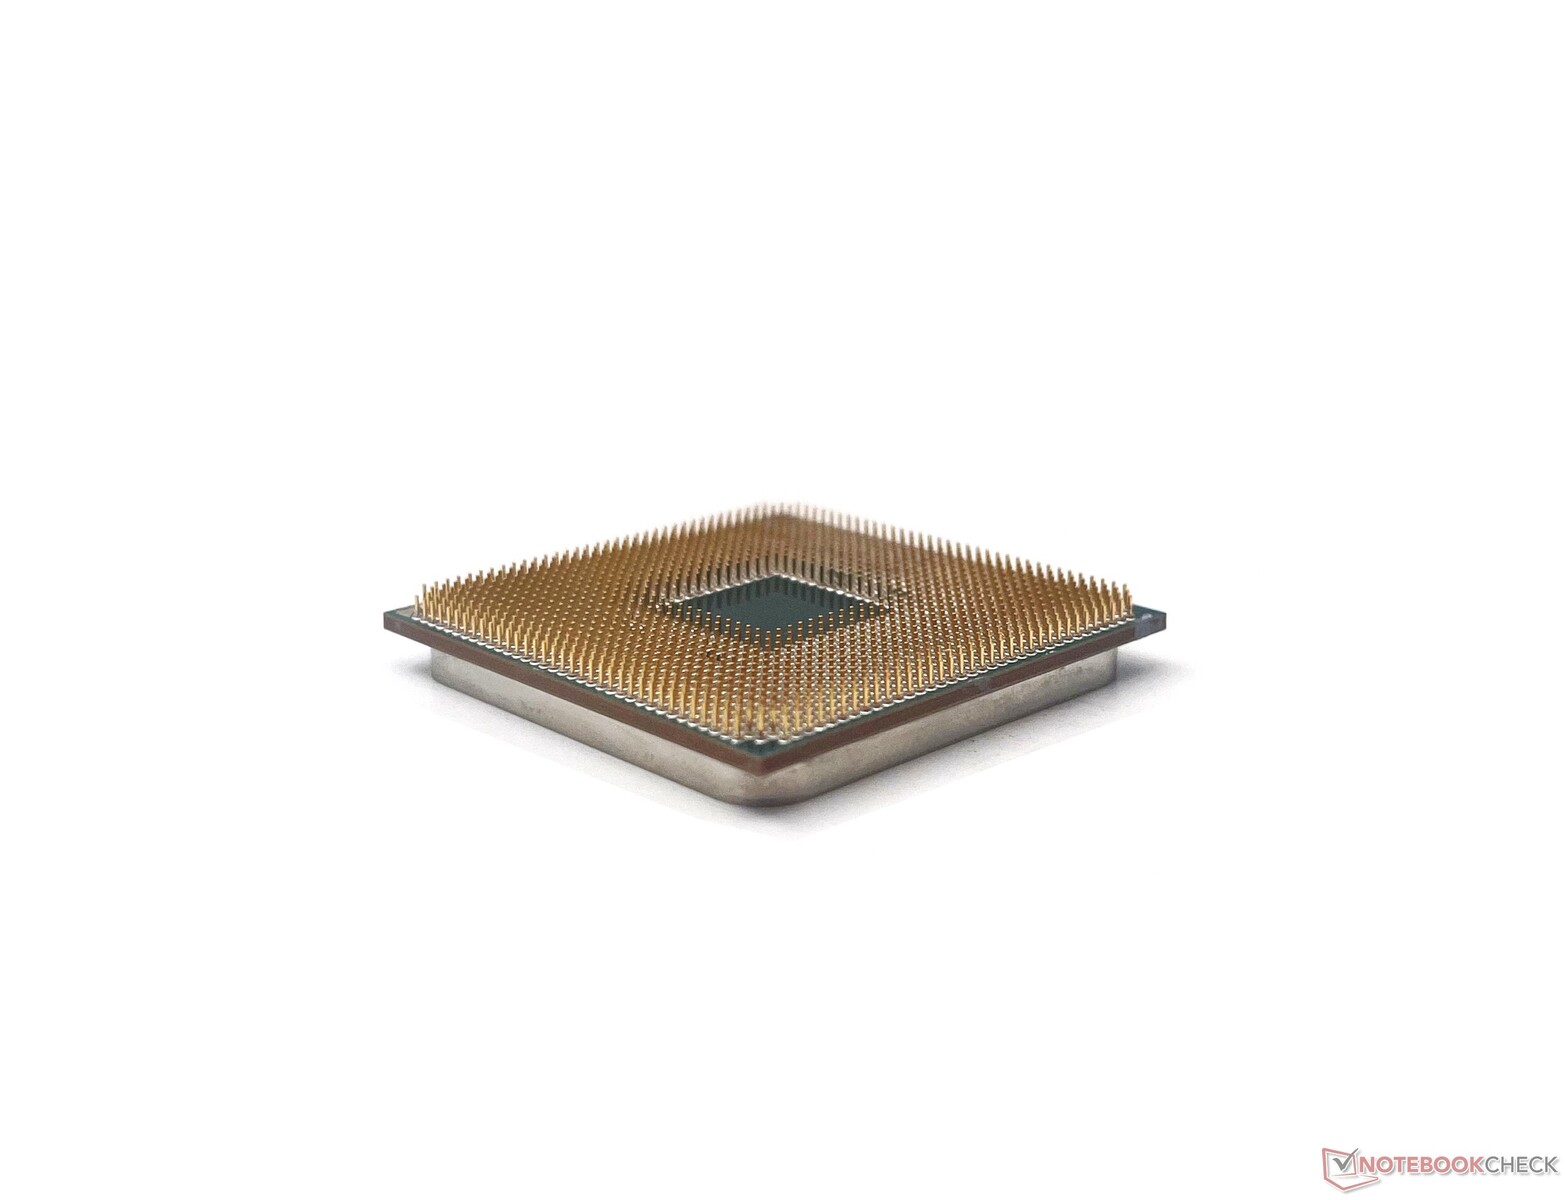
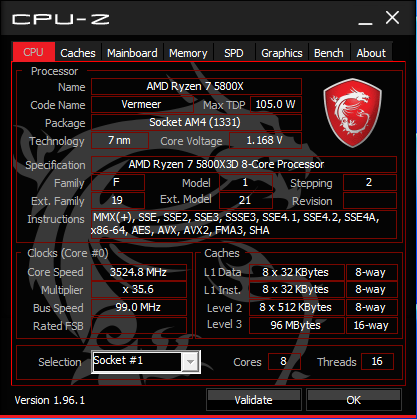
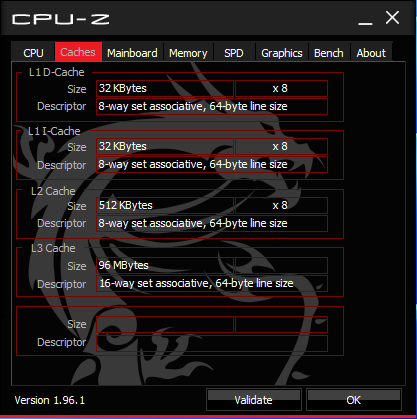
Arriviamo al CES 2022 e AMD ha presentato ryzen 7 5800X3D, un processore a 8 core e 16 thread da 105 W con 64 MB di V-Cache 3D in aggiunta ai 32 MB di cache 2D esistenti.
Mentre AMD ha avuto un buon successo con la linea Zen 3 Vermeer per la maggior parte del tempo, Intel ha rapidamente fatto un passo avanti con l'architettura ibrida Core di Architettura ibrida Core Alder Lake guidata dal Core i9-12900K e successivamente il Core i9-12900KS.
Nonostante la nuova tecnologia di cache, il Ryzen 7 5800X3D è identico agli altri processori Zen 3, anche per quanto riguarda l'altezza della Z. Pertanto, i raffreddatori socket AM4 esistenti funzionano perfettamente con questa CPU.
In questa recensione diamo un'occhiata al Ryzen 7 5800X3D di AMD, vediamo come si posiziona rispetto all'attuale concorrenza Alder Lake di Intel e se si tratta di un investimento da prendere in considerazione nel 2022.
La linea di CPU desktop AMD Ryzen Zen 3 Vermeer
| SKU | Cores/Threads | Clock base (GHz) | Clock turbo (GHz) | L3-Cache (MB) | TDP (W) | MSRP al lancio (US$) |
|---|---|---|---|---|---|---|
| Ryzen 9 5950X | 16/32 | 3,4 | 4,9 | 64 | 105 | 799 |
| Ryzen 9 5900X | 12/24 | 3,7 | 4,8 | 64 | 105 | 549 |
| Ryzen 7 5800X3D | 8/16 | 3,4 | 4,5 | 32+64 | 105 | 449 |
| Ryzen 7 5800X | 8/16 | 3,8 | 4,7 | 32 | 105 | 449 |
| Ryzen 7 5700X | 8/16 | 3,4 | 4,6 | 32 | 65 | 299 |
| Ryzen 5 5600X | 6/12 | 3,7 | 4,6 | 32 | 65 | 299 |
| Ryzen 5 5600 | 6/12 | 3,5 | 4,4 | 32 | 65 | 199 |
Il banco di prova: Ryzen 7 5800X3D incontra la RTX 3090 Ti
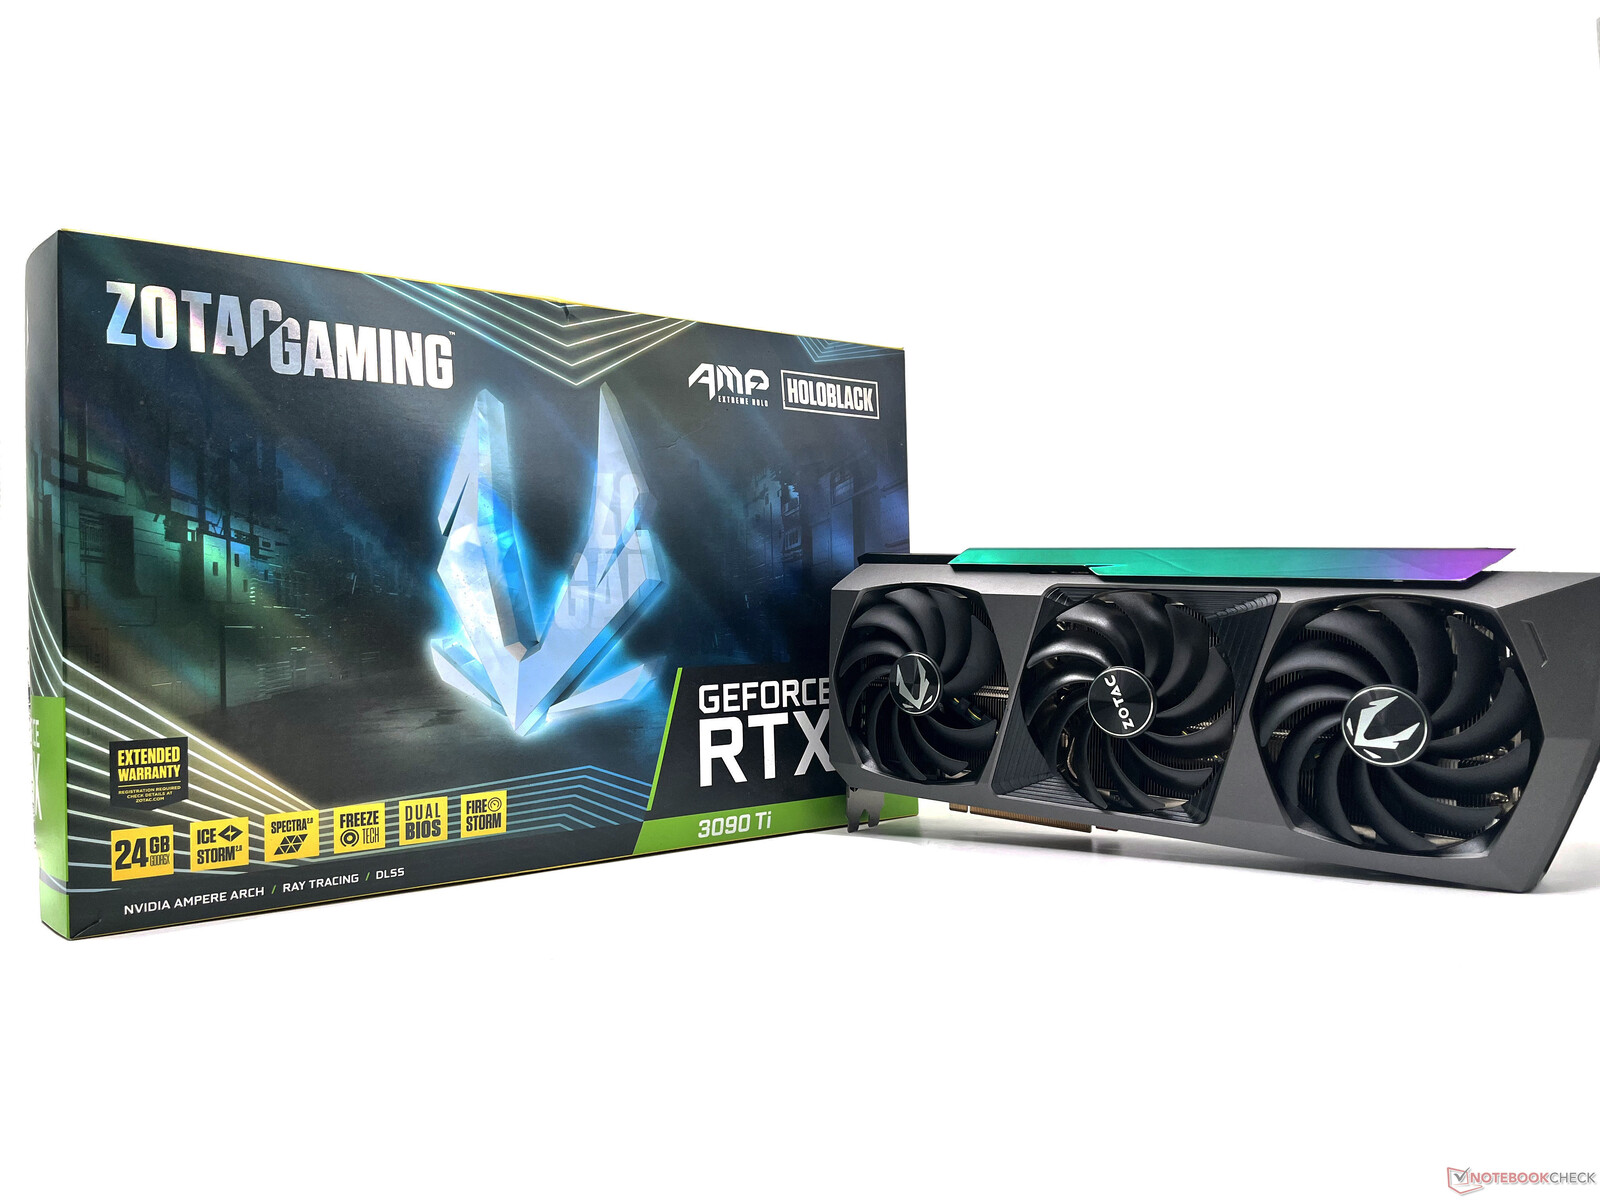
Il nostro banco di prova è basato su quello che avevamo utilizzato in precedenza per la GPU Zotac Gaming GeForce RTX 3090 Ti AMP Extreme Holo per la recensione. Questo include quanto segue:
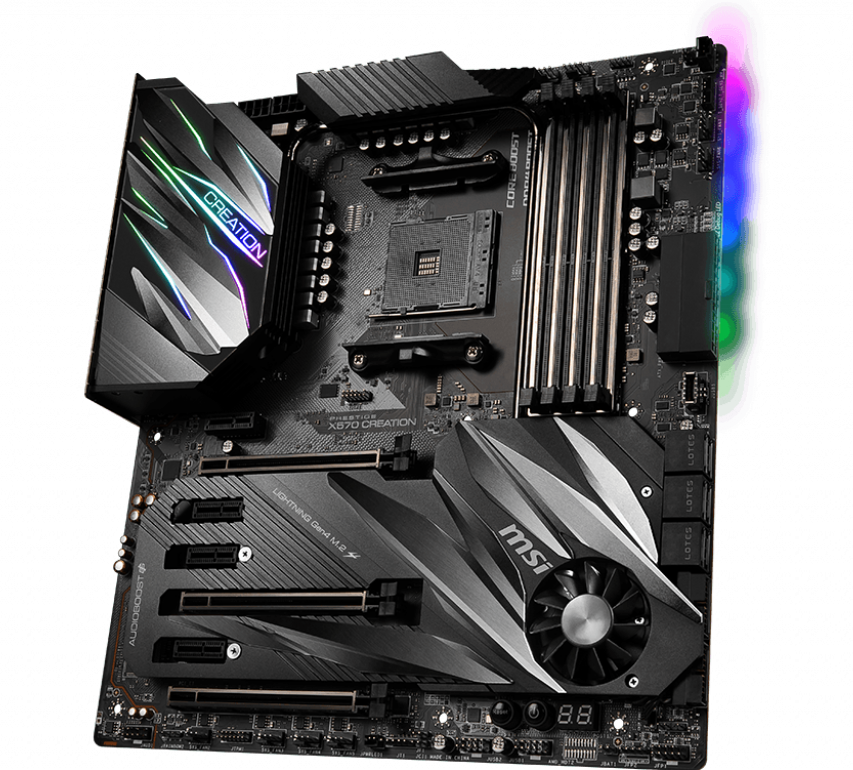
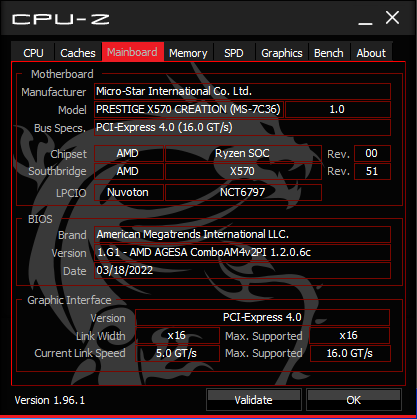
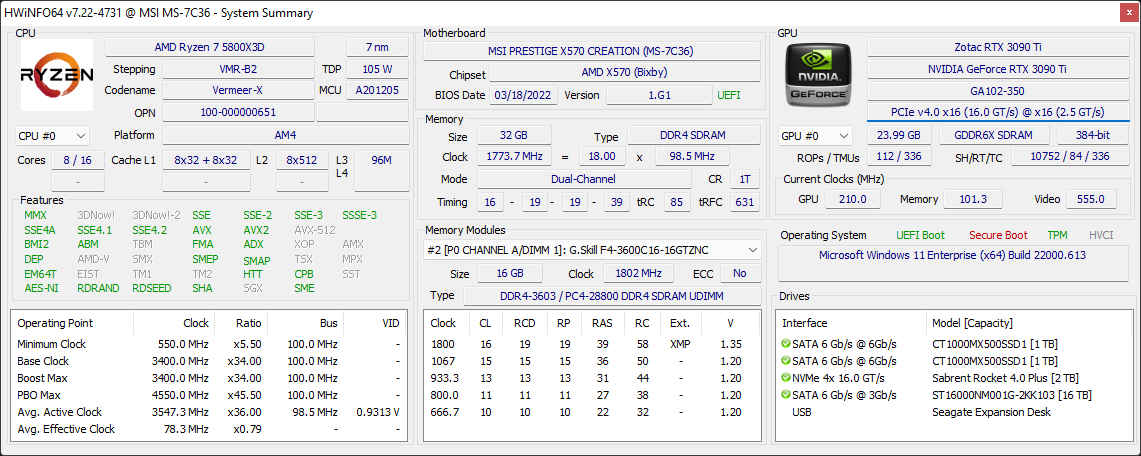
- Scheda madre MSI Prestige X570 Creation con AGESA 1.2.0.6c
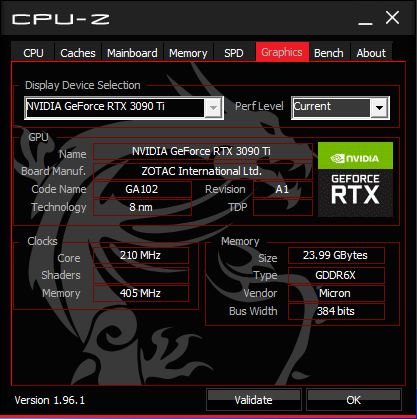
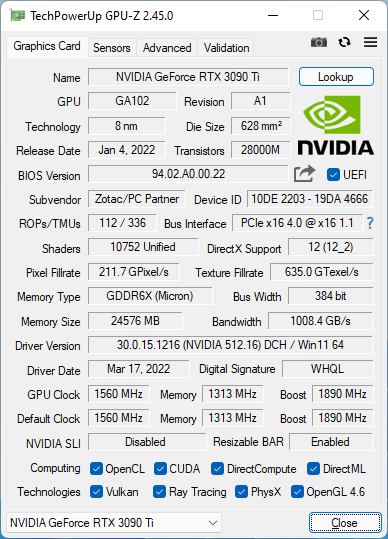
- GPU Zotac Gaming GeForce RTX 3090 Ti AMP Extreme Holo
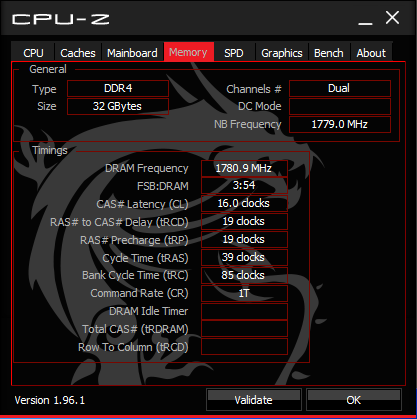
- 2x 16 GB di RAM G.SKILL Trident Z Neo DDR4-3600 con timing 16-19-19-39
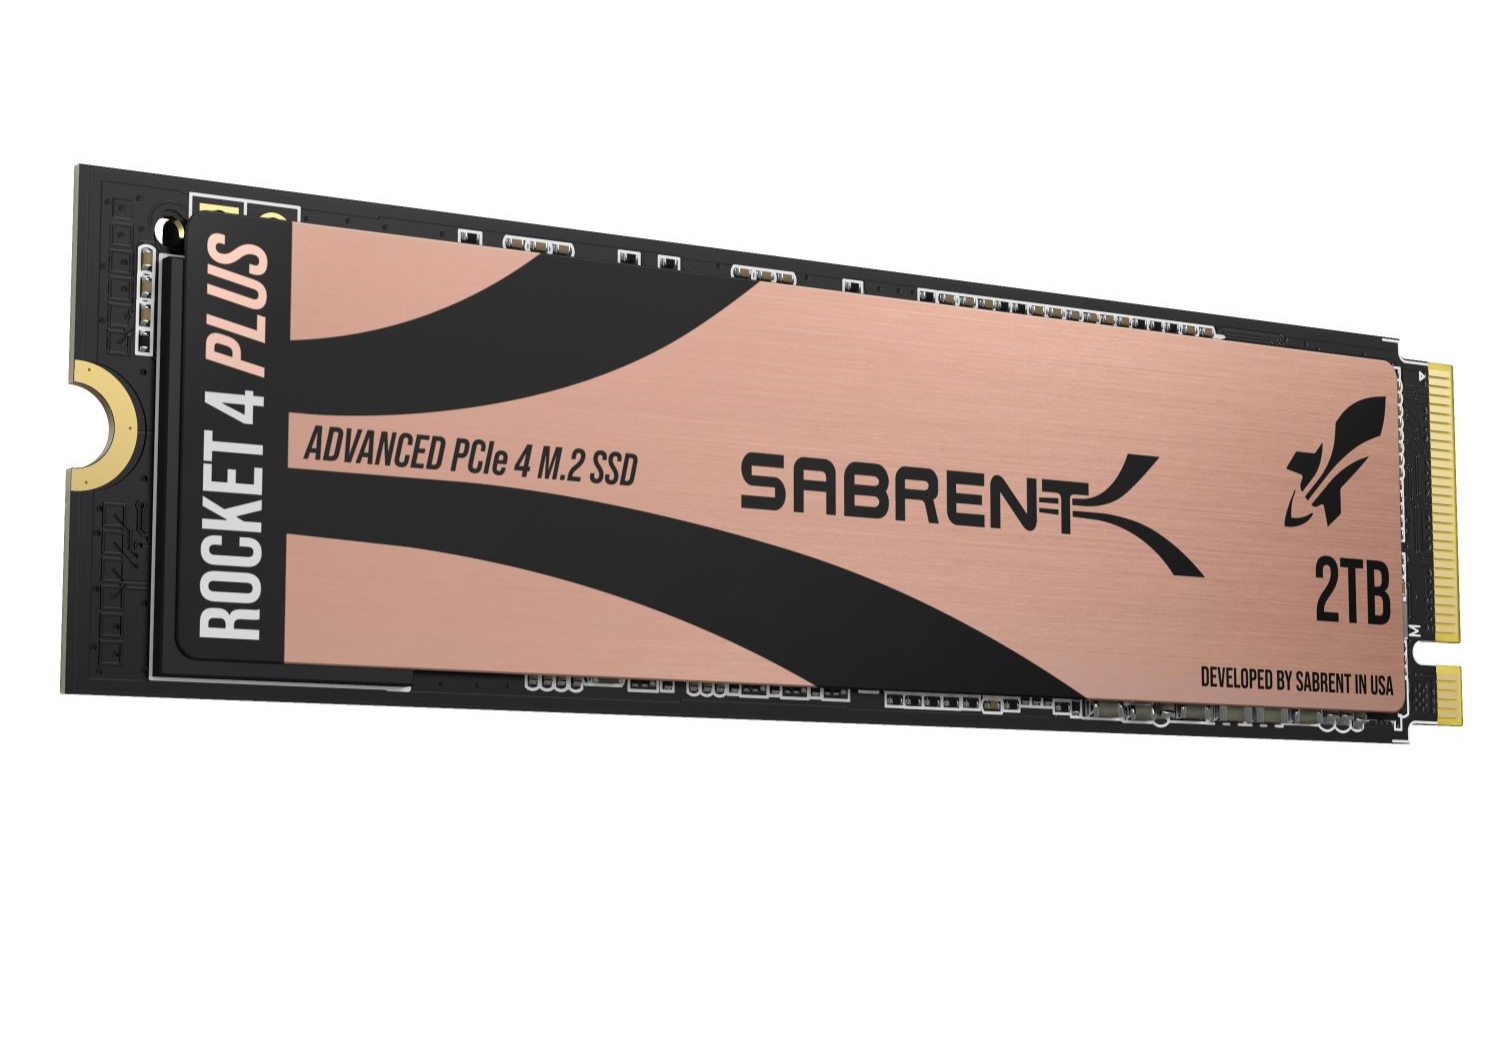
- 2 TB Sabrent Rocket 4 Plus Gen4 NVMe SSD
- 2 SSD Crucial MX500 SATA da 1 TB
- Alimentatore Thermaltake Toughpower 850 W Plus Gold
- Raffreddatore AIO Corsair iCUE H115i Elite Capellix
- Case Corsair iCUE 4000X RGB
- Monitor Gigabyte M28U 4K 144 Hz AMD FreeSync Premium Pro
Desideriamo ringraziare AMD per averci fornito il campione Ryzen 7 5800X3D, Nvidia per la GPU Zotac RTX 3090 Ti, Sabrent per l'unità SSD Rocket 4 Plus Gen4, Corsair per il dissipatore iCUE H115i Elite Capellix e il case 4000X e Gigabyte per il monitor da gioco M28U.
Benchmark sintetici: Ryzen 7 5800X3D passa in secondo piano
Le prestazioni grezze della CPU non sono certo il punto forte del Ryzen 7 5800X3D. Ciò è dovuto principalmente a un paio di ragioni:
- Ryzen 7 5800X3D ha un clock inferiore - 400 MHz di base e 200 MHz di boost - rispetto a Ryzen 7 5800X3D Ryzen 7 5800X
- Sebbene il 5800X3D supporti l'overclock della memoria e dell'Infinity Fabric, l'aggiunta della V-Cache 3D impedisce qualsiasi forma di overclock del core, compreso il Boost Overdrive di Precision
Pertanto, le prestazioni multi-core in Cinebench R15, R20 e R23 sono circa il 6-10% più lente rispetto a un Ryzen 7 5800X. In single-core, anche il Ryzen 5 5600X è più veloce di circa il 6% rispetto al 5800X3D.
Una tendenza simile si riflette anche in altri benchmark sintetici della CPU, dove il Ryzen 7 5800X ottiene un vantaggio confortevole rispetto al Ryzen 7 5800X3D, ad eccezione dei test CPU wPrime, 3DMark 11 Physics e 3DMark Time Spy.
L'Intel Core i9-12900K, grazie alla sua configurazione a 16 core e 24 thread e a un boost clock di 5,1 GHz, mantiene un vantaggio confortevole nei nostri test senza sudare.
| Blender - v2.79 BMW27 CPU | |
| AMD Ryzen 5 5600X | |
| AMD Ryzen 7 5800X3D | |
| AMD Ryzen 7 5800X | |
| Intel Core i5-12600K | |
| AMD Ryzen 9 5900X | |
| Intel Core i9-12900K | |
| AMD Ryzen 9 5950X | |
| WinRAR - Result | |
| AMD Ryzen 7 5800X | |
| AMD Ryzen 7 5800X3D | |
| AMD Ryzen 9 5900X | |
| AMD Ryzen 5 5600X | |
| AMD Ryzen 9 5950X | |
| Intel Core i9-12900K | |
| Intel Core i5-12600K | |
| HWBOT x265 Benchmark v2.2 - 4k Preset | |
| AMD Ryzen 9 5950X | |
| Intel Core i5-12600K | |
| Intel Core i9-12900K | |
| AMD Ryzen 9 5900X | |
| AMD Ryzen 7 5800X | |
| AMD Ryzen 7 5800X3D | |
| AMD Ryzen 5 5600X | |
| R Benchmark 2.5 - Overall mean | |
| AMD Ryzen 7 5800X3D | |
| AMD Ryzen 5 5600X | |
| AMD Ryzen 9 5950X | |
| AMD Ryzen 9 5900X | |
| AMD Ryzen 7 5800X | |
| Intel Core i5-12600K | |
| Intel Core i9-12900K | |
| LibreOffice - 20 Documents To PDF | |
| Intel Core i5-12600K | |
| AMD Ryzen 7 5800X3D | |
| AMD Ryzen 9 5900X | |
| AMD Ryzen 9 5950X | |
| AMD Ryzen 5 5600X | |
| AMD Ryzen 7 5800X | |
| Intel Core i9-12900K | |
| 3DMark 11 - 1280x720 Performance Physics | |
| Intel Core i9-12900K | |
| AMD Ryzen 7 5800X3D | |
| AMD Ryzen 9 5950X | |
| Intel Core i5-12600K | |
| AMD Ryzen 9 5900X | |
| AMD Ryzen 7 5800X | |
| AMD Ryzen 5 5600X | |
* ... Meglio usare valori piccoli
Il dissipatore AIO Corsair H115i Elite Capellix, abbinato al radiatore da 280 mm, riesce a mantenere fresco il Ryzen 7 5800X3D. Non abbiamo notato alcun throttling nel test Cinebench R15 multi-core in loop.
Prestazioni delle applicazioni: Nessun problema nella produttività quotidiana e in alcuni flussi di lavoro creativi
Il Ryzen 7 5800X3D è in grado di gestire abilmente le attività quotidiane di produttività, come dimostrano i risultati di PCMark 10. La sua posizione in fondo alla classifica può essere attribuita ai clock più bassi, ma vediamo solo un deficit di prestazioni dell'8% circa rispetto al Ryzen 7 5800X.
Poiché non avevamo una Titan RTX per questo confronto, abbiamo dovuto accontentarci della RTX 3090 Ti come GPU scelta. Sebbene sulla carta sia una scheda di classe Titan, la RTX 3090 Ti utilizza i driver convenzionali di GeForce che comportano una penalizzazione artificiale delle prestazioni in alcune applicazioni professionali.
Ciononostante, la combinazione Ryzen 7 5800X3D e RTX 3090 Ti consente di ottenere buoni punteggi in alcuni sottoinsiemi dei test SPECviewperf, come 3ds Max, Maya, Showcase e Medical.
| PCMark 10 Score | 7607 punti | |
Aiuto | ||
prestazioni 3D e di gioco: Ryzen 7 5800X3D supera il Core i9-12900K a 1080p
AMD commercializza il Ryzen 7 5800X3D principalmente come processore da gioco. Sebbene il 5800X3D sia chiaramente in difficoltà per quanto riguarda le prestazioni grezze della CPU, le cose cambiano quando si tratta di applicazioni di gioco. Lo vediamo soprattutto a risoluzioni inferiori come 1080p.
La combinazione Ryzen 7 5800X3D+RTX 3090 Ti è chiaramente in testa e riesce persino a battere in modo convincente la configurazione Core i9-12900K+Titan RTX nella maggior parte dei test 3DMark e Unigine con un margine significativo. Si noti che il Ryzen 7 5800X3D perde ancora rispetto alle offerte Intel Alder Lake e alla maggior parte dei suoi cugini Zen 3 negli aspetti relativi alla sola CPU di questi benchmark, come mostrato in precedenza. La RTX 3090 Ti sembra aver dato il suo contributo in questi test, essendo chiaramente una scheda molto più potente della Titan RTX che avevamo utilizzato nelle precedenti recensioni.
Per un'analisi più dettagliata dei risultati dei benchmark 3D sintetici, rimandiamo alla nostra recensione della GPU Zotac GeForce RTX 3090 Ti AMP Extreme Holo.
| 3DMark 11 Performance | 49471 punti | |
| 3DMark Ice Storm Standard Score | 233264 punti | |
| 3DMark Cloud Gate Standard Score | 75753 punti | |
| 3DMark Fire Strike Score | 36563 punti | |
| 3DMark Fire Strike Extreme Score | 24198 punti | |
| 3DMark Time Spy Score | 19241 punti | |
Aiuto | ||
Il Ryzen 7 5800X3D è il chiaro vincitore se siete alla ricerca di una delle CPU da gioco più veloci attualmente disponibili. Purtroppo non siamo riusciti a trovare un campione di Core i9-12900KS, quindi il confronto che segue si limita al Core i9-12900K e al Core i5-12600K della scuderia del Team Blue.
Le risoluzioni a 1080p sono quelle che traggono i maggiori benefici dall'aumento della cache, poiché queste impostazioni sono più limitate per la CPU rispetto a quelle a 2K e oltre. Di conseguenza, il Ryzen 7 5800X3D sembra essere l'abbinamento ideale per la RTX 3090 Ti per spingere il maggior numero possibile di fotogrammi a questa risoluzione. L'aumento rispetto al Core i9-12900K può raggiungere il 40% (Borderlands 3, 1080p Badass Quality) a seconda del gioco e delle impostazioni di qualità scelte.
| F1 2021 | |
| 1920x1080 Medium Preset AA:T AF:16x | |
| AMD Ryzen 7 5800X3D, NVIDIA GeForce RTX 3090 Ti | |
| AMD Ryzen 9 5900X, NVIDIA Titan RTX | |
| Intel Core i9-12900K, NVIDIA Titan RTX | |
| Intel Core i5-12600K, NVIDIA Titan RTX | |
| 1920x1080 High Preset AA:T AF:16x | |
| AMD Ryzen 7 5800X3D, NVIDIA GeForce RTX 3090 Ti | |
| AMD Ryzen 9 5900X, NVIDIA Titan RTX | |
| Intel Core i9-12900K, NVIDIA Titan RTX | |
| Intel Core i5-12600K, NVIDIA Titan RTX | |
| 1920x1080 Ultra High Preset + Raytracing AA:T AF:16x | |
| AMD Ryzen 7 5800X3D, NVIDIA GeForce RTX 3090 Ti | |
| AMD Ryzen 9 5900X, NVIDIA Titan RTX | |
| Intel Core i9-12900K, NVIDIA Titan RTX | |
| Intel Core i5-12600K, NVIDIA Titan RTX | |
| basso | medio | alto | ultra | QHD | 4K | |
|---|---|---|---|---|---|---|
| GTA V (2015) | 185.59 | 160.67 | 155.26 | 182.63 | ||
| The Witcher 3 (2015) | 394 | 193.4 | 172.9 | |||
| Dota 2 Reborn (2015) | 257.7 | 231.2 | 217.1 | 195.8 | 184.2 | |
| Final Fantasy XV Benchmark (2018) | 222 | 226 | 186.1 | 151.6 | 96.3 | |
| X-Plane 11.11 (2018) | 169.1 | 158.1 | 135.9 | 115.7 | ||
| Shadow of the Tomb Raider (2018) | 265 | 257 | 244 | 184 | 106 | |
| Metro Exodus (2019) | 213 | 175.2 | 145.9 | 125.3 | 84.3 | |
| Total War: Three Kingdoms (2019) | 342.6 | 248.9 | 176.6 | 117.9 | 59.9 | |
| Control (2019) | 240 | 209 | 142.5 | 73.9 | ||
| Borderlands 3 (2019) | 204 | 187.6 | 173.3 | 143.1 | 83.8 | |
| Mafia Definitive Edition (2020) | 240 | 231 | 173.9 | 99.2 | ||
| Watch Dogs Legion (2020) | 171.4 | 154.2 | 130.2 | 107.8 | 70.1 | |
| Assassin´s Creed Valhalla (2020) | 160 | 138 | 123 | 108 | 73 | |
| F1 2021 (2021) | 537 | 470 | 242 | 189.3 | 114.9 | |
| Far Cry 6 (2021) | 179 | 161.6 | 142 | 132.9 | 89.9 | |
| Call of Duty Vanguard (2021) | 195.5 | 207 | 191.2 | 149.9 | 93.7 | |
| Forza Horizon 5 (2021) | 231 | 200 | 188 | 127 | 114 | 89 |
| Rainbow Six Extraction (2022) | 411 | 347 | 315 | 290 | 208 | 116 |
| Dying Light 2 (2022) | 202 | 171.4 | 153 | 113.2 | 64.3 | |
| GRID Legends (2022) | 228 | 202 | 173.4 | 156.6 | 153.2 | 120.5 |
| Elden Ring (2022) | 60 | 60 | 60 | 60 | 60 | 60 |
| Cyberpunk 2077 1.6 (2022) | 219 | 201 | 172.8 | 151.8 | 103.9 | 53.3 |
| Ghostwire Tokyo (2022) | 263 | 260 | 261 | 261 | 210 | 113.2 |
| Tiny Tina's Wonderlands (2022) | 324 | 277 | 231 | 190.2 | 142.6 | 81.1 |
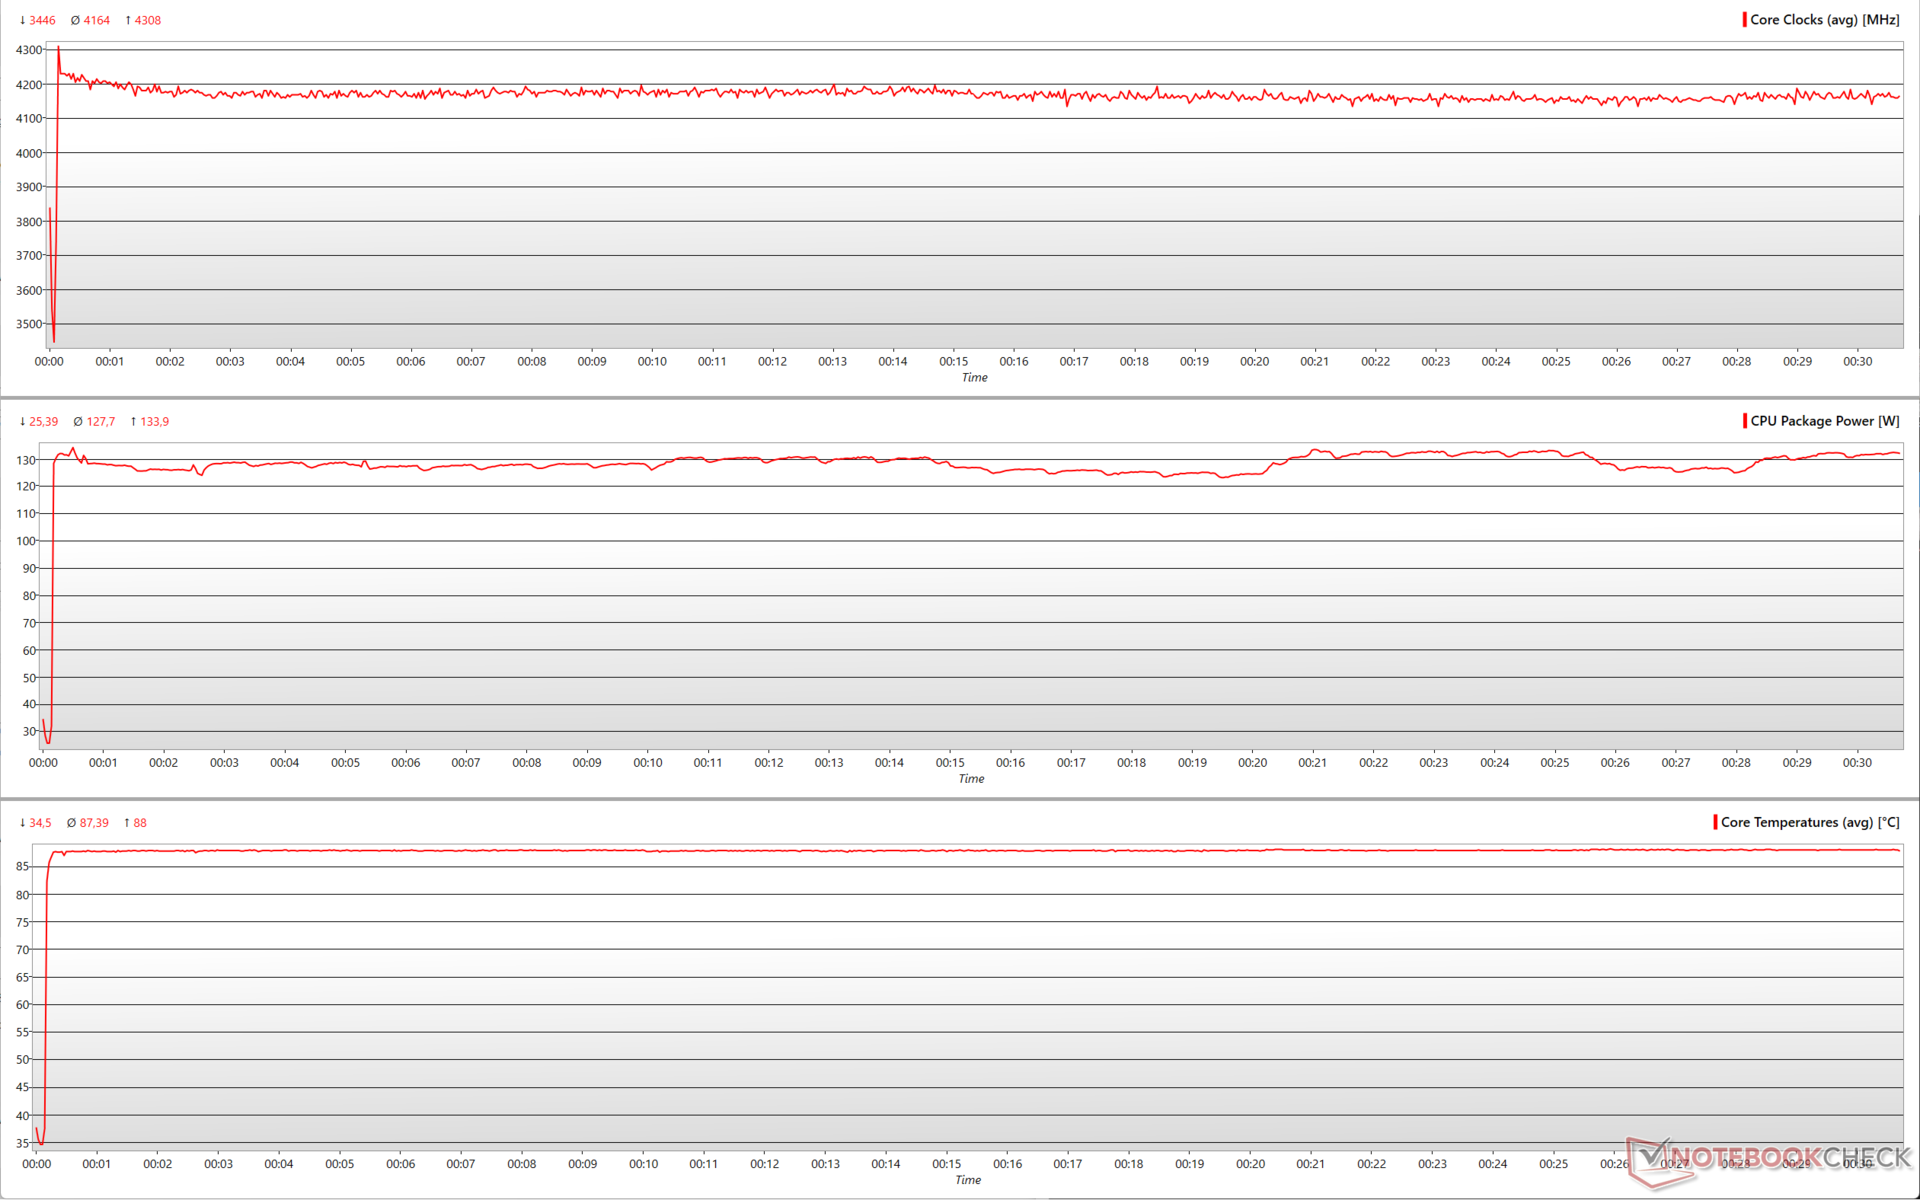
Stress test e temperature: Nessun problema di throttling
Stressando il Ryzen 7 5800X3D con Prime95, la potenza del pacchetto CPU si attesta appena al di sopra dei 130 W e le velocità di clock sono abbastanza costanti vicino ai 4,2 GHz. Le temperature della CPU si aggirano intorno ai 90 °C senza throttling.
Questa costanza di prestazioni è stata riscontrata anche nel test Cinebench R15 multi-core loop di cui sopra. Questo risultato può essere attribuito in parte al Ryzen 7 5800X3D e in parte alle eccellenti prestazioni di raffreddamento del dissipatore AIO Corsair H115i Elite Capellix.
Consumo energetico: Meno economico rispetto al Core i5-12600K nonostante le prestazioni inferiori
Il nostro sistema di prova consuma circa 102 W in idle con un totale di cinque ventole del case (tre Corsair SP da 120 mm e due Corsair ML da 120 mm) e il raffreddatore Elite Capellix con il profilo Balanced. Tutta l'illuminazione RGB era spenta.
Il consumo energetico è più o meno simile a quello del Ryzen 9 5900X e circa il 29% in più rispetto al Ryzen 5 5600X nello stress Prime95 in-place FFT. Il multi-core di Cinebench R15 vede il Ryzen 7 5800X3D leggermente meno economico rispetto al Core i5-12600K anche se il chip di AMD mostra un deficit di prestazioni del 6%. Un profilo simile si riscontra anche con Cinebench R20 multi, questa volta con un divario di prestazioni ancora maggiore del 18% rispetto al Core i5-12600K.
Il Ryzen 7 5800X3D è in ritardo rispetto al Core i9-12900K del 26% in Cinebench R20 single-core, ma sembra consumare leggermente di più. In generale, tuttavia, il consumo totale del sistema con il Ryzen 7 5800X3D è ancora limitato a circa 230 W, mentre il PC con il Core i9-12900K può consumare quasi il 57% in più nei test della CPU multi-core.
Power Consumption: External Monitor
* ... Meglio usare valori piccoli
Pro
Contro
Verdetto: Solo per i giocatori e per gli utenti OG Zen
AMD ha mantenuto a lungo il socket AM4. Anche con il lancio della serie Ryzen 7000 su socket AM5, l'azienda si aspetta che il socket più vecchio abbia buone prestazioni per la maggior parte del tempo. Il Ryzen 7 5800X3D è più che altro un banco di prova per AMD, i cui insegnamenti saranno incorporati nelle iterazioni future. Detto questo, il Ryzen 7 5800X3D sembra essere un'ottima scelta se il vostro caso d'uso principale è il gioco, in particolare a risoluzioni inferiori.
L'uso di una stacked-cache 3D offre ai giochi un margine significativo. Tuttavia, comporta diverse insidie, tra cui l'impossibilità di overcloccare i core stessi e di abbassare i clock di base/boost per garantire che il TDP non vada oltre i 105 W
3D V-cache è un modo ingegnoso per migliorare le prestazioni di gioco senza aumentare il TDP. I giocatori troveranno la 3D V-cache utile per ottenere fotogrammi più alti rispetto al Core i9-12900K per circa 120 dollari in meno. Per tutti gli altri compiti, i clock più bassi e la mancanza di overclocking si rivelano essere delle limitazioni importanti.
Il Ryzen 7 5800X3D soffre quando si tratta di prestazioni grezze della CPU se confrontato con i suoi fratelli della famiglia Zen 3, e perde decisamente rispetto al Core i5-12600K Alder Lake Core i5-12600K e Core i9-12900K core i5-12600K e Core i9-12900K. Il rovescio della medaglia è che questo deficit di prestazioni non è accompagnato da un consumo energetico inferiore
Sebbene il Ryzen 7 5800X3D sia in ritardo per quanto riguarda la componente fisica dei benchmark 3D sintetici, il processore inizia a mostrare il suo valore nelle componenti grafiche di questi test. Il gioco a 1080p o QHD è il miglior caso d'uso per questo processore. Abbinato alla giusta GPU, il Ryzen 7 5800X3D può spingere i fotogrammi molto più di quanto sia possibile con il Core i9-12900K.
Ciò porta a chiedersi se valga la pena aggiornare questa CPU. Vale la pena aggiornare questa CPU?
Il socket AM4 è ora una piattaforma altamente stabile. È ancora presto per il socket AM5 e gli utenti dovrebbero aspettare di vedere come si comporteranno le nuove CPU Ryzen 7000 nei test del mondo reale e scoprire le migliori combinazioni di memoria DDR5 prima di fare il grande passo.
I giocatori che utilizzano ancora processori Zen di vecchia generazione, come un Ryzen 7 2700Xper esempio, troveranno il Ryzen 7 5800X3D un aggiornamento degno di nota e saranno felici di intascare i 120 dollari di risparmio rispetto al Core i9-12900K, oltre a risparmiare sull'aggiornamento della scheda madre (ammesso che la scheda attuale offra ancora un'erogazione di potenza decente). Tuttavia, i creatori di contenuti e coloro che necessitano di prestazioni migliori a tutto tondo potrebbero voler cercare altre opzioni, come il modello Ryzen 7 5800X allo stesso prezzo di listino di 449 dollari.
Il Core i5-12600K è un affare ancora migliore a soli 289 dollari di MSRP, a patto che l'investimento aggiuntivo nell'ecosistema Intel non sia un vincolo.
Prezzo e disponibilità
Price comparison

