Recensione del portatile gaming Lenovo Legion Slim 7 16: Convincente anche con AMD Ryzen

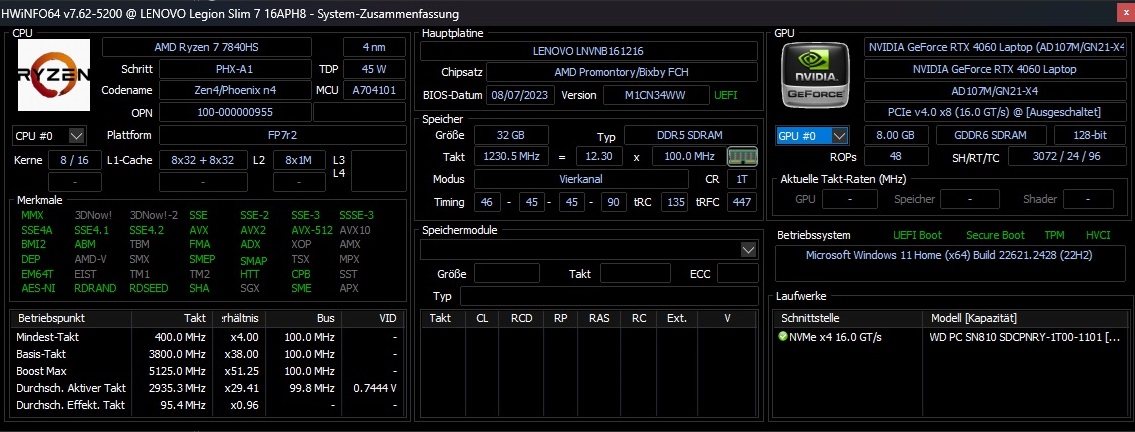
Oltre ai processori Intel, Lenovo offre le CPU AMD per la serie Legion Slim 7. Il modello che abbiamo testato, 16APH8, è dotato di un processore Ryzen 7 7840HS abbinato a un processore GeForce RTX 4060 GPU, 32 GB di DDR5-5600-RAM e una spaziosa unità SSD M.2 da 1 TB. Il laptop vanta un vibrante display WQXGA con risoluzione di 2.560 x 1.600 pixel, un'elevata frequenza di aggiornamento di 240 Hz, calibrazione di fabbrica e supporto HDR; Windows 11 Home completa il prodotto. Nonostante le sue specifiche impressionanti, il 16APH8 ha un prezzo di circa 1750 dollari, il che lo rende relativamente costoso per un laptop dotato di una scheda grafica RTX 4060.
Lo Slim 7 deve affrontare la concorrenza di altri notebook da gioco da 16 pollici con RTX 4060, tra cui modelli come il Asus ROG Flow X16 GV601V, Alienware m16 R1, Acer Predator Helios 16 PH16-71-731Qcosì come il modello di Lenovo Legion Pro 5 16IRX8 e Lenovo LOQ 16IRH8 notebook.
Potenziali concorrenti a confronto
Punteggio | Data | Modello | Peso | Altezza | Dimensione | Risoluzione | Prezzo |
|---|---|---|---|---|---|---|---|
| 90.4 % v7 (old) | 11/2023 | Lenovo Legion Slim 7 16APH8 R7 7840HS, GeForce RTX 4060 Laptop GPU | 2.1 kg | 20 mm | 16.00" | 2560x1600 | |
| 89.7 % v7 (old) | 06/2023 | Asus ROG Flow X16 GV601V i9-13900H, GeForce RTX 4060 Laptop GPU | 2.1 kg | 19.4 mm | 16.00" | 2560x1600 | |
| 88.3 % v7 (old) | 09/2023 | Alienware m16 R1 Intel i7-13700HX, GeForce RTX 4060 Laptop GPU | 3 kg | 25.4 mm | 16.00" | 2560x1600 | |
| 89.5 % v7 (old) | 07/2023 | Acer Predator Helios 16 PH16-71-731Q i7-13700HX, GeForce RTX 4060 Laptop GPU | 2.6 kg | 26.9 mm | 16.00" | 2560x1600 | |
| 87.9 % v7 (old) | 05/2023 | Lenovo Legion Pro 5 16IRX8 i7-13700HX, GeForce RTX 4060 Laptop GPU | 2.5 kg | 26.8 mm | 16.00" | 2560x1600 | |
| 87.3 % v7 (old) | 09/2023 | Lenovo LOQ 16IRH8 i7-13620H, GeForce RTX 4060 Laptop GPU | 2.7 kg | 25.9 mm | 16.00" | 2560x1600 |
Ad eccezione di alcune piccole differenze, il case è lo stesso della versione Intel Versione Intel con il Core i9-13900H e GeForce RTX 4070 che abbiamo già esaminato. Pertanto, in questo articolo ci limiteremo a esaminare brevemente l'involucro, le caratteristiche e i dispositivi di input.
Caso
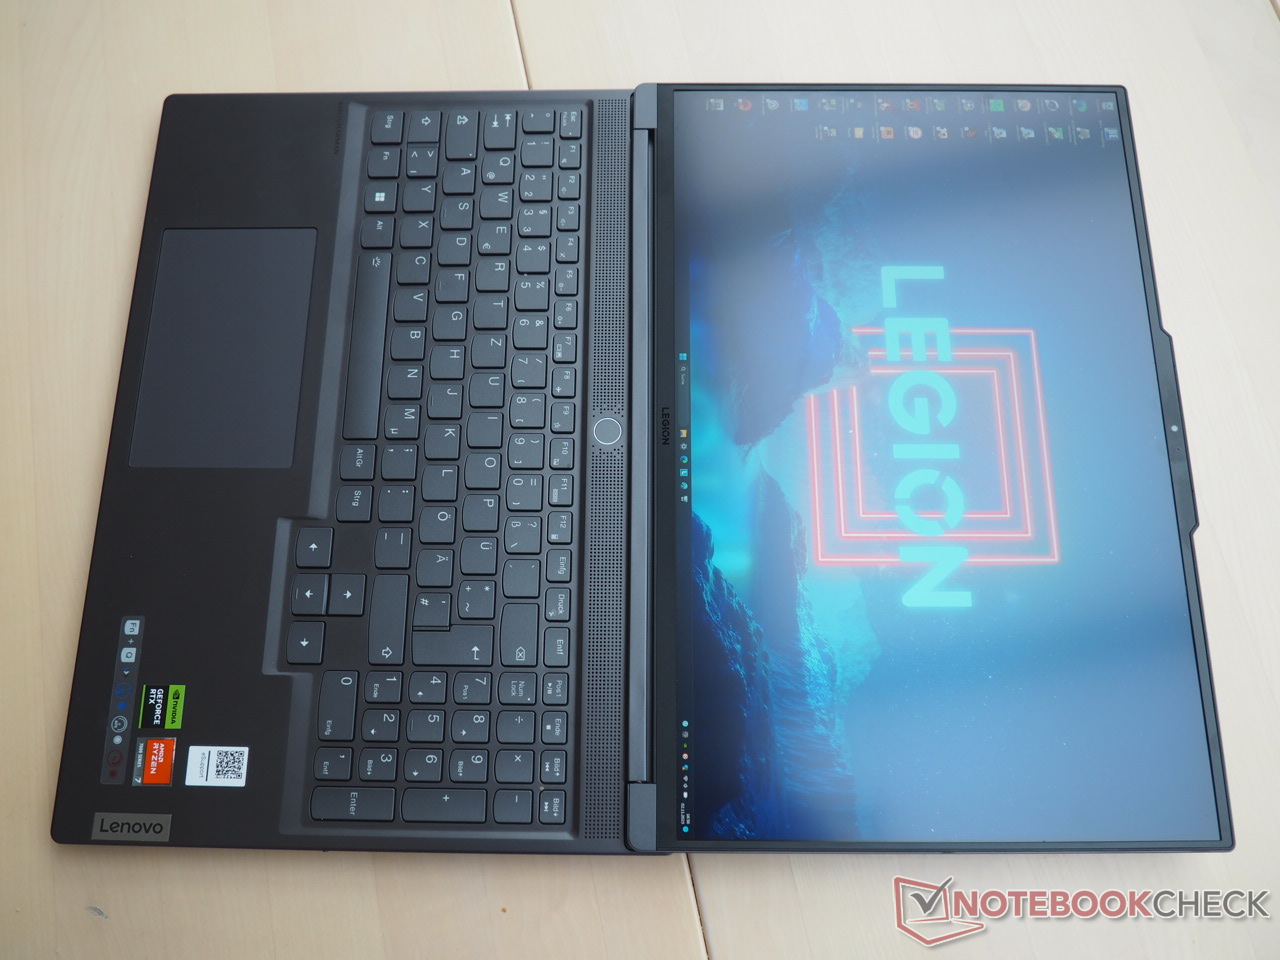
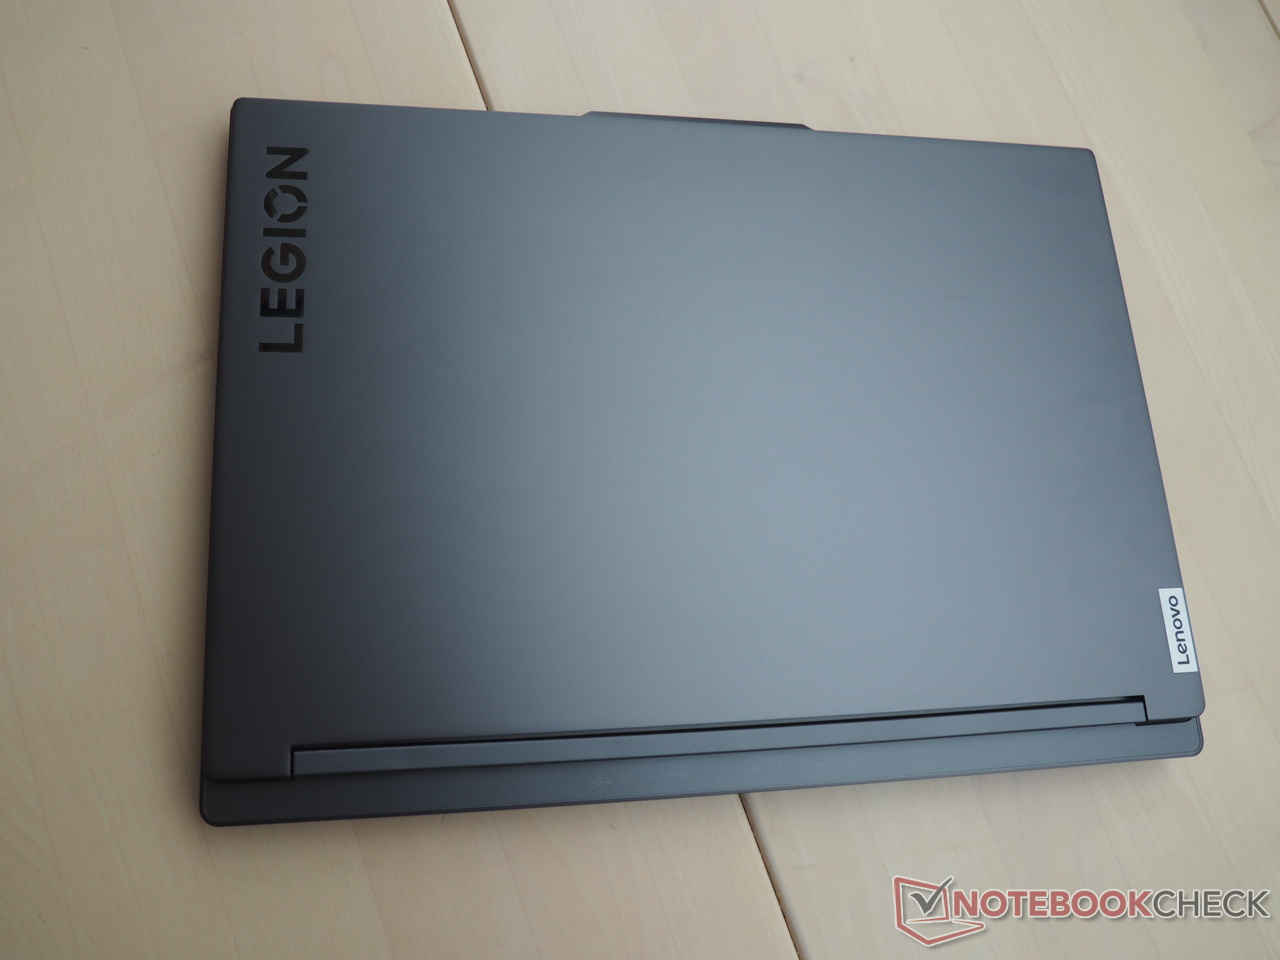
Una delle caratteristiche principali è il corpo elegante. Il dispositivo da 16 pollici presenta un design elegante, materiali pregiati e un'eccellente stabilità. Con un peso di appena 4,6 libbre, si colloca all'estremità più leggera della scala rispetto ai suoi concorrenti.
Connettività
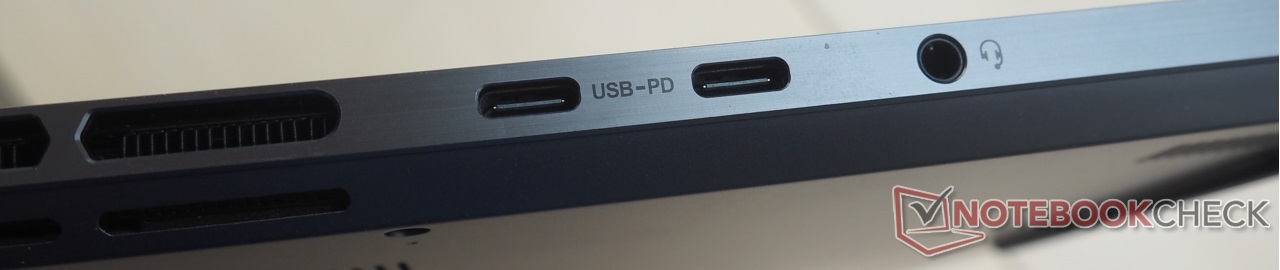
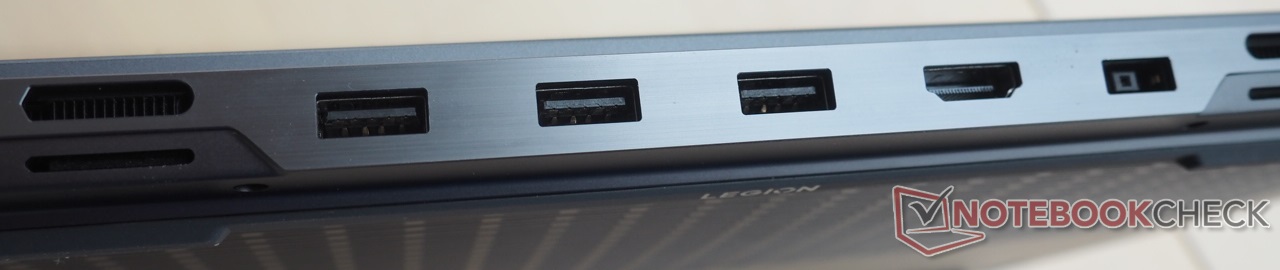
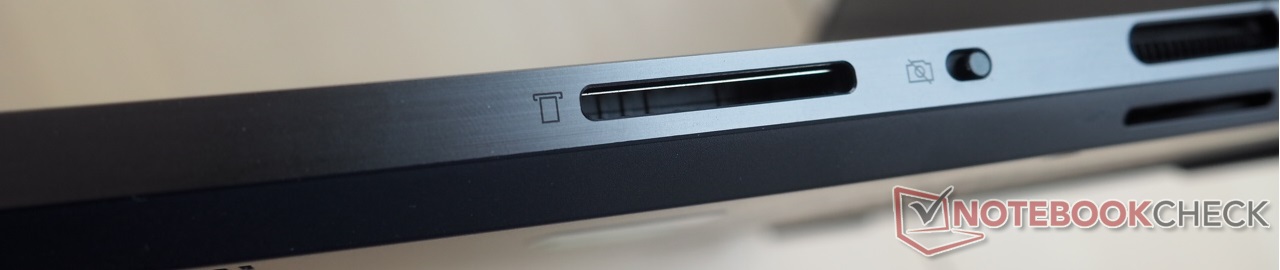
Nonostante l'assenza di una porta RJ45, Slim 7 offre una generosa gamma di connessioni. Sul lato destro, troverà un lettore di schede a media velocità e un otturatore privacy per una webcam decente. Il lato sinistro presenta una presa audio e due porte USB (1x USB 4, 1x USB 3.2 Gen2), entrambe supportano DisplayPort 1.4 e un'erogazione di potenza di 140 watt. Inoltre, è presente una porta HDMI 2.1, che consente di collegare fino a tre monitor esterni. Sul retro, ci sono tre porte USB 3.2 Gen2 e la connessione per l'alimentatore da 230 watt incluso.
Per la connettività wireless, il portatile utilizza un chip Wi-Fi 6E (MediaTek RZ616), che ha prestazioni leggermente inferiori alla media durante la trasmissione, ma superiori alla media durante la ricezione.
Lettore di schede SD
| SD Card Reader | |
| average JPG Copy Test (av. of 3 runs) | |
| Alienware m16 R1 Intel (AV PRO microSD 128 GB V60) | |
| Media della classe Gaming (20.9 - 210, n=54, ultimi 2 anni) | |
| Asus ROG Flow X16 GV601V | |
| Lenovo Legion Slim 7 16APH8 (AV PRO microSD 128 GB V60) | |
| Acer Predator Helios 16 PH16-71-731Q | |
| maximum AS SSD Seq Read Test (1GB) | |
| Asus ROG Flow X16 GV601V | |
| Alienware m16 R1 Intel (AV PRO microSD 128 GB V60) | |
| Media della classe Gaming (25.5 - 261, n=51, ultimi 2 anni) | |
| Acer Predator Helios 16 PH16-71-731Q | |
| Lenovo Legion Slim 7 16APH8 (AV PRO microSD 128 GB V60) | |
Comunicazione
Webcam


Dispositivi di ingresso
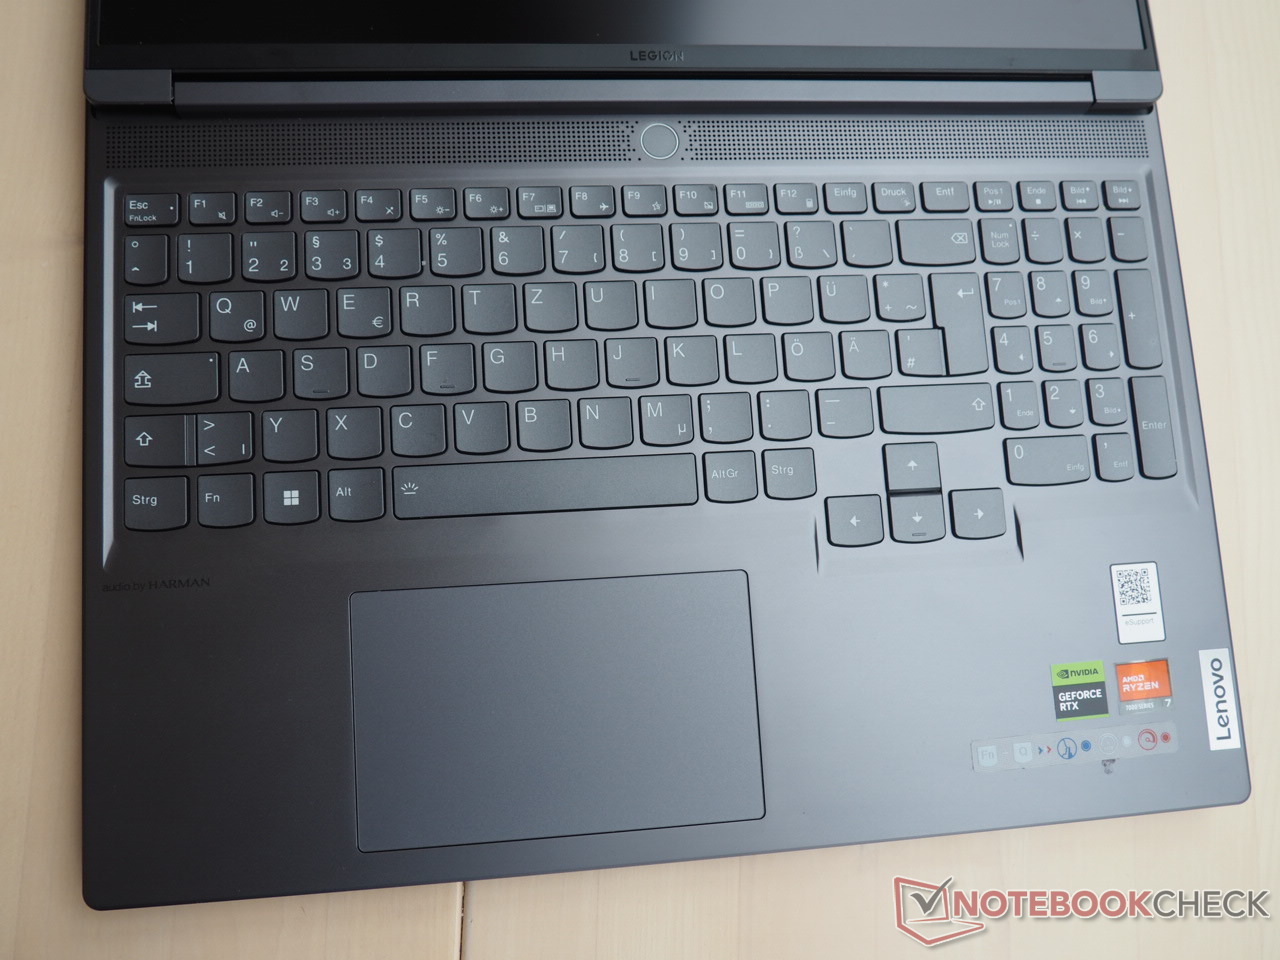
La tastiera non solo offre tasti ben dimensionati, ma anche un bel layout, una forma piacevole dei tasti e un tastierino numerico dedicato. La sensazione di digitazione è solida. Un click pad di circa 4,72 x 2,95 pollici sostituisce il mouse e ha un bell'impatto.
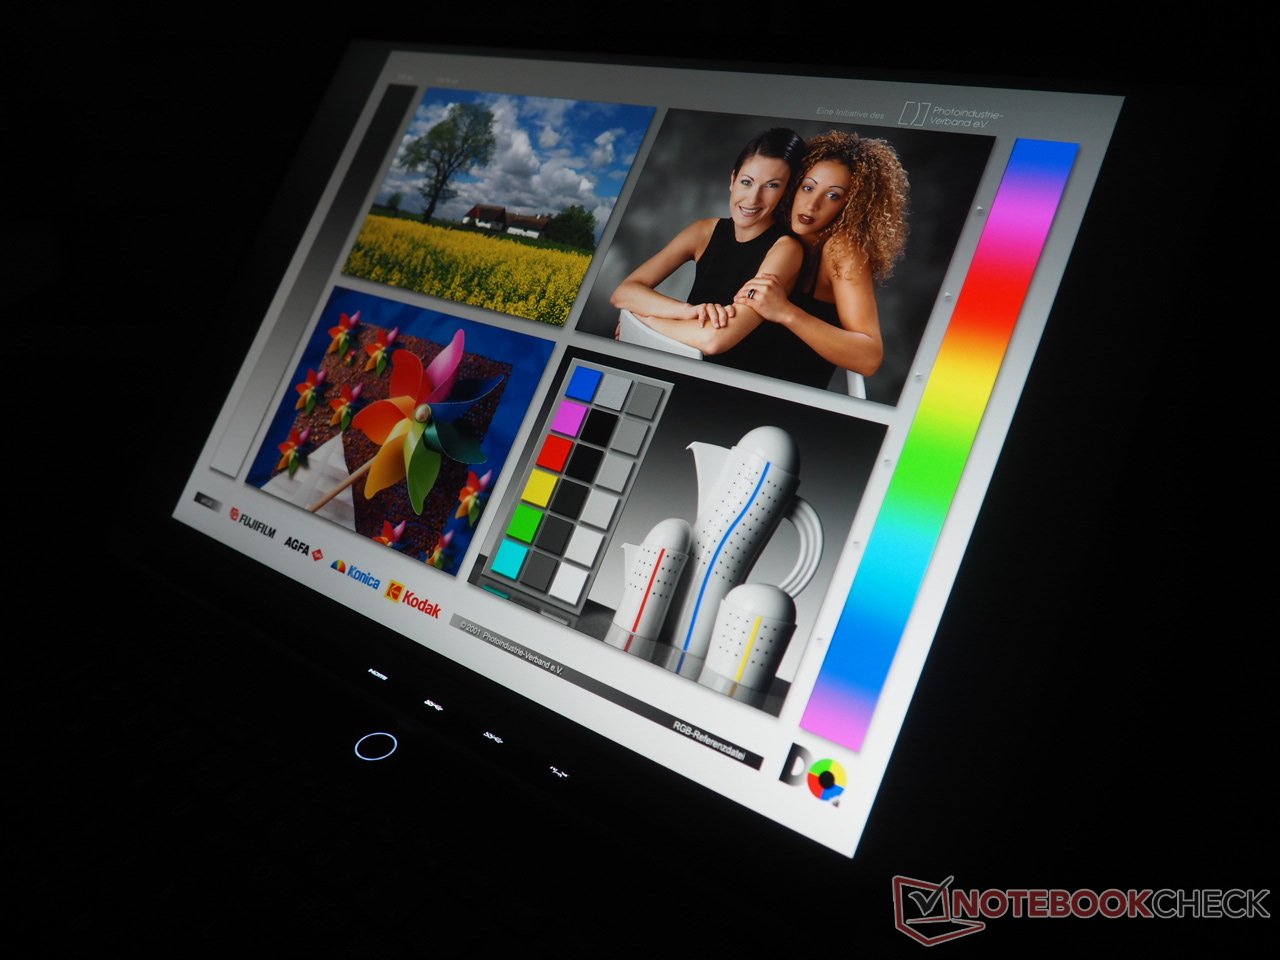
Display
Sebbene il modello Intel e il display del nostro dispositivo di prova abbiano caratteristiche fondamentali simili, non sono uguali. Il nostro modello era dotato di un pannello BOE contrassegnato da NE160QDM-NZ3.
| |||||||||||||||||||||||||
Distribuzione della luminosità: 82 %
Al centro con la batteria: 545 cd/m²
Contrasto: 1135:1 (Nero: 0.48 cd/m²)
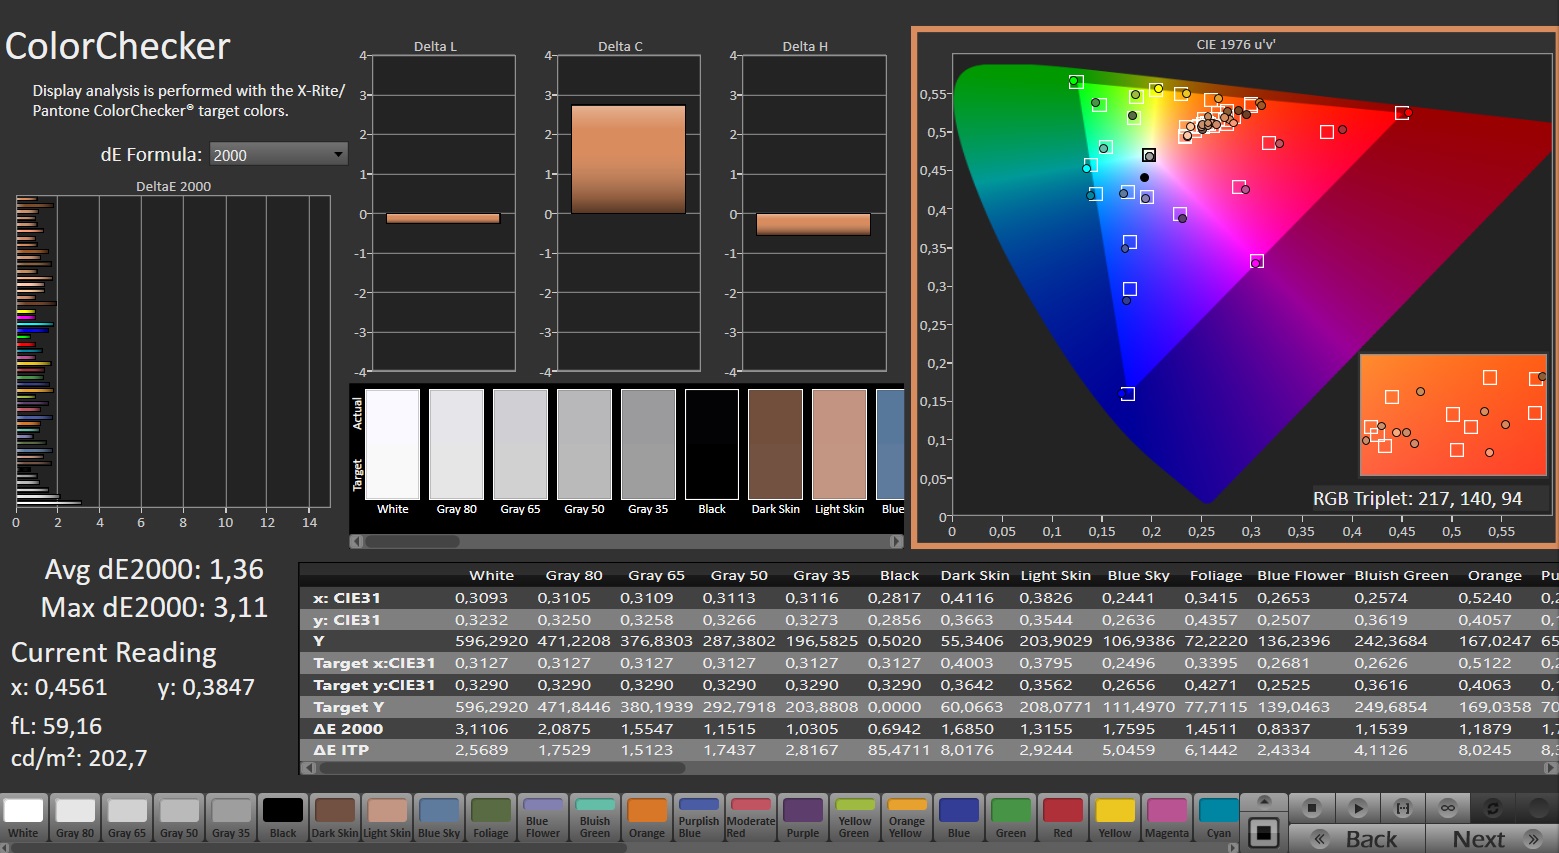
ΔE ColorChecker Calman: 1.36 | ∀{0.5-29.43 Ø4.73}
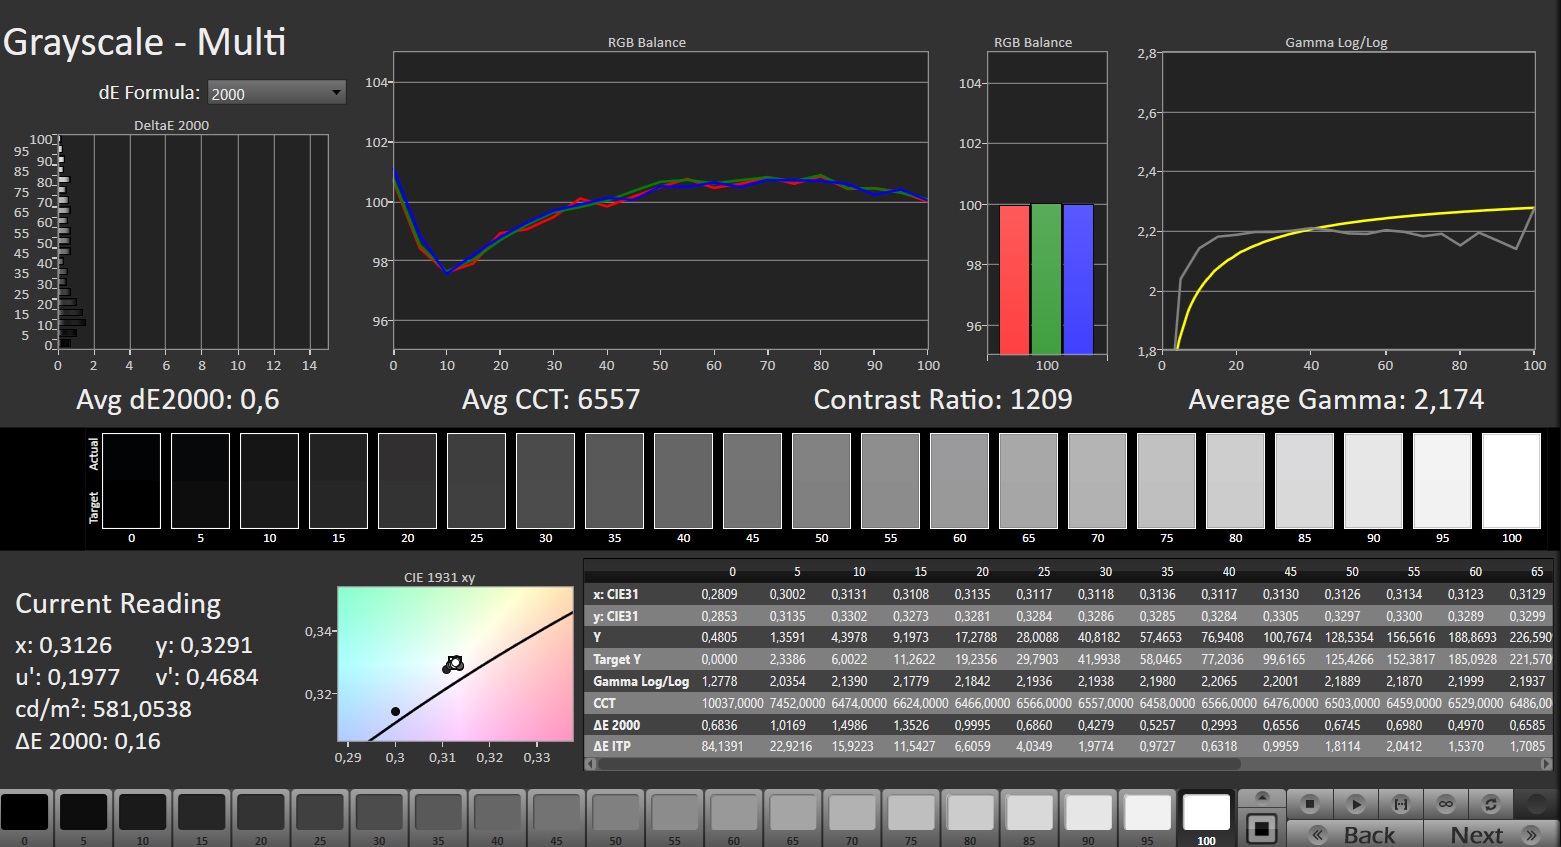
calibrated: 1.04
ΔE Greyscale Calman: 1.4 | ∀{0.09-98 Ø4.97}
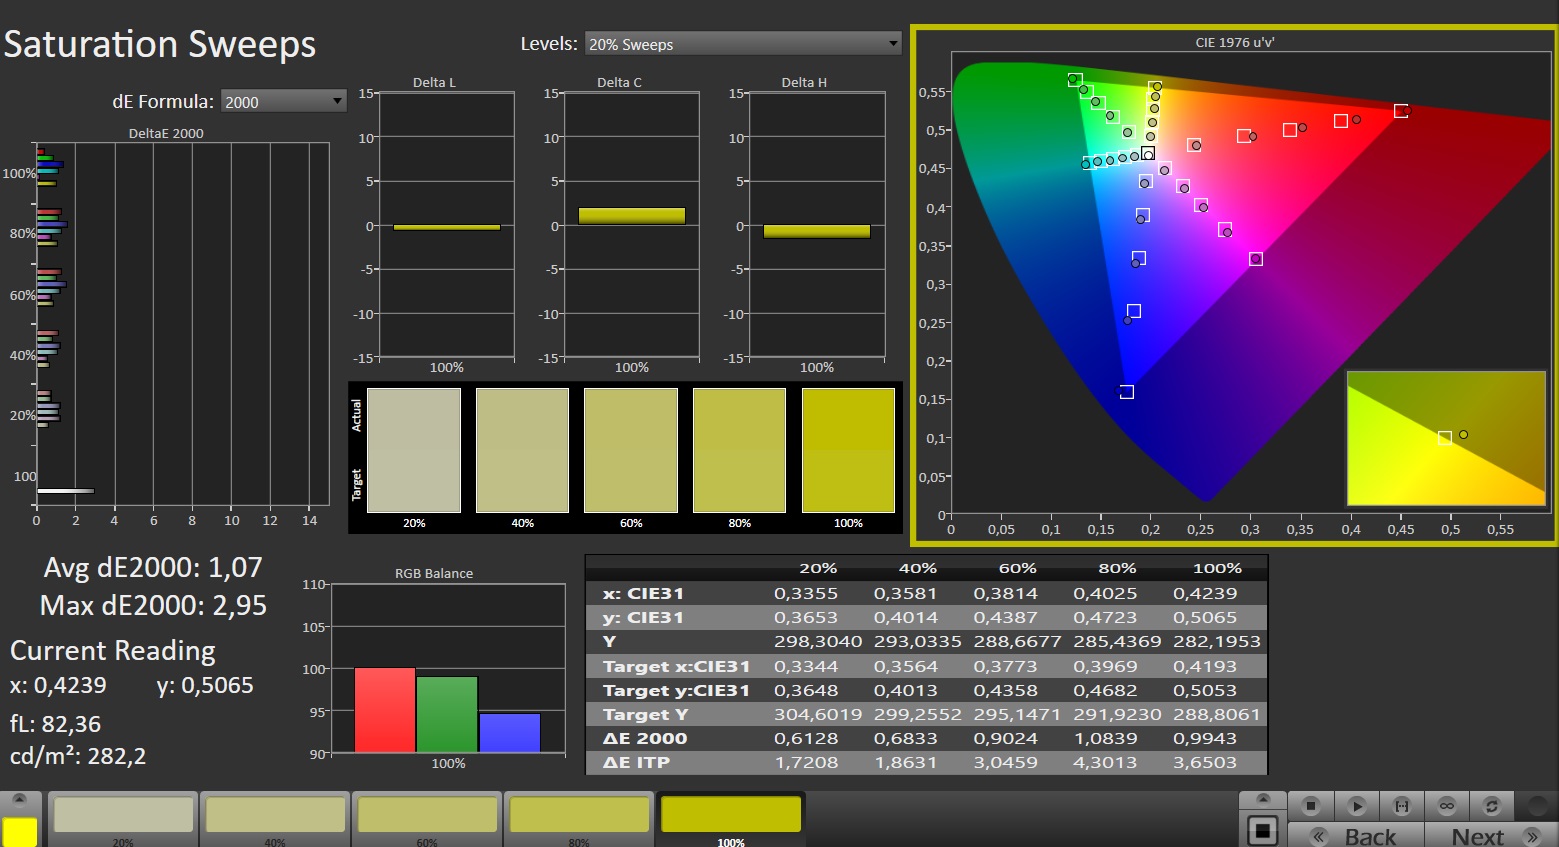
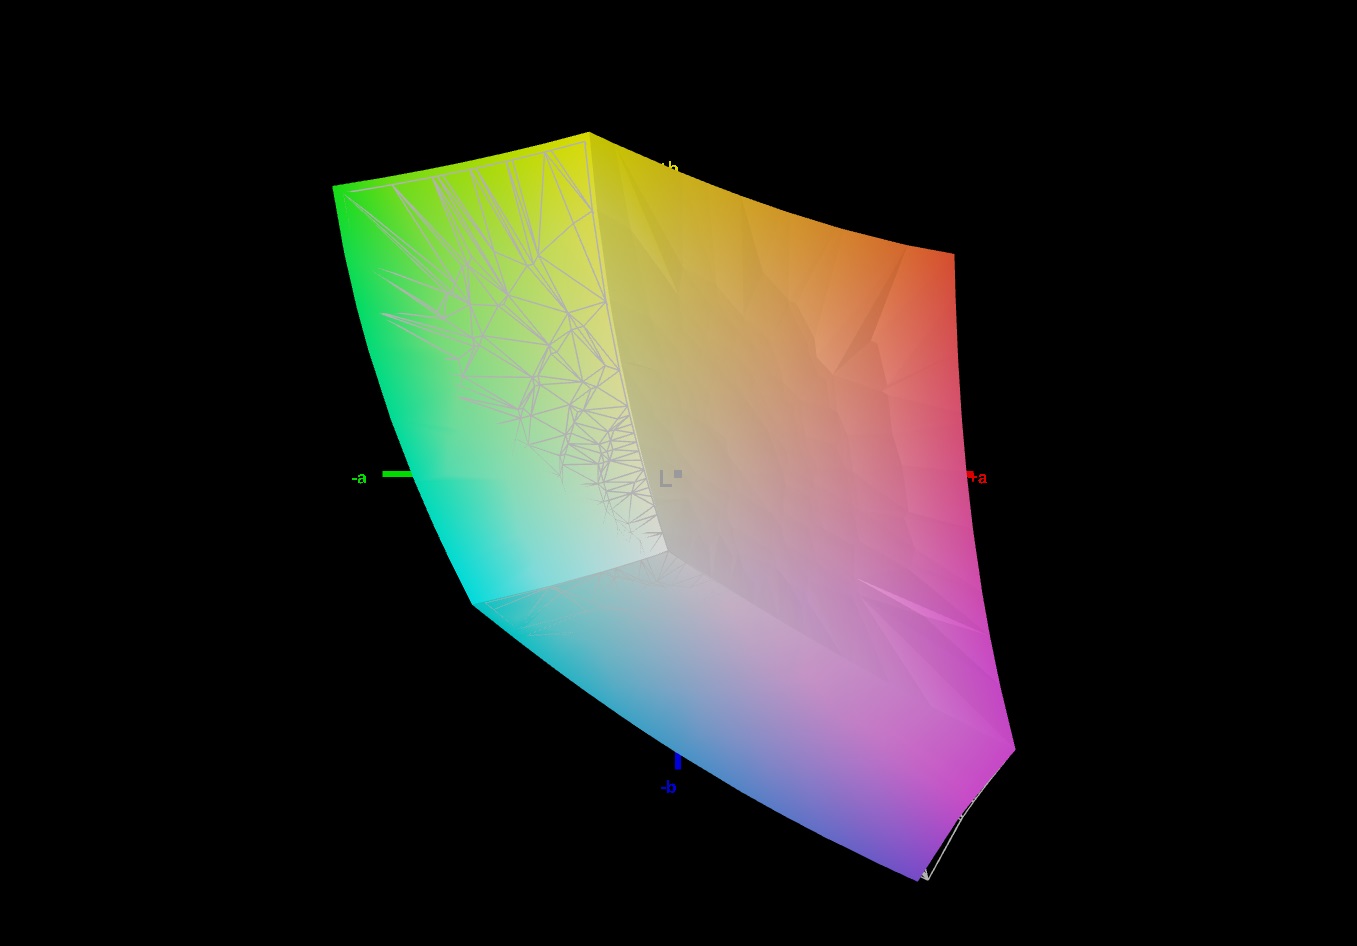
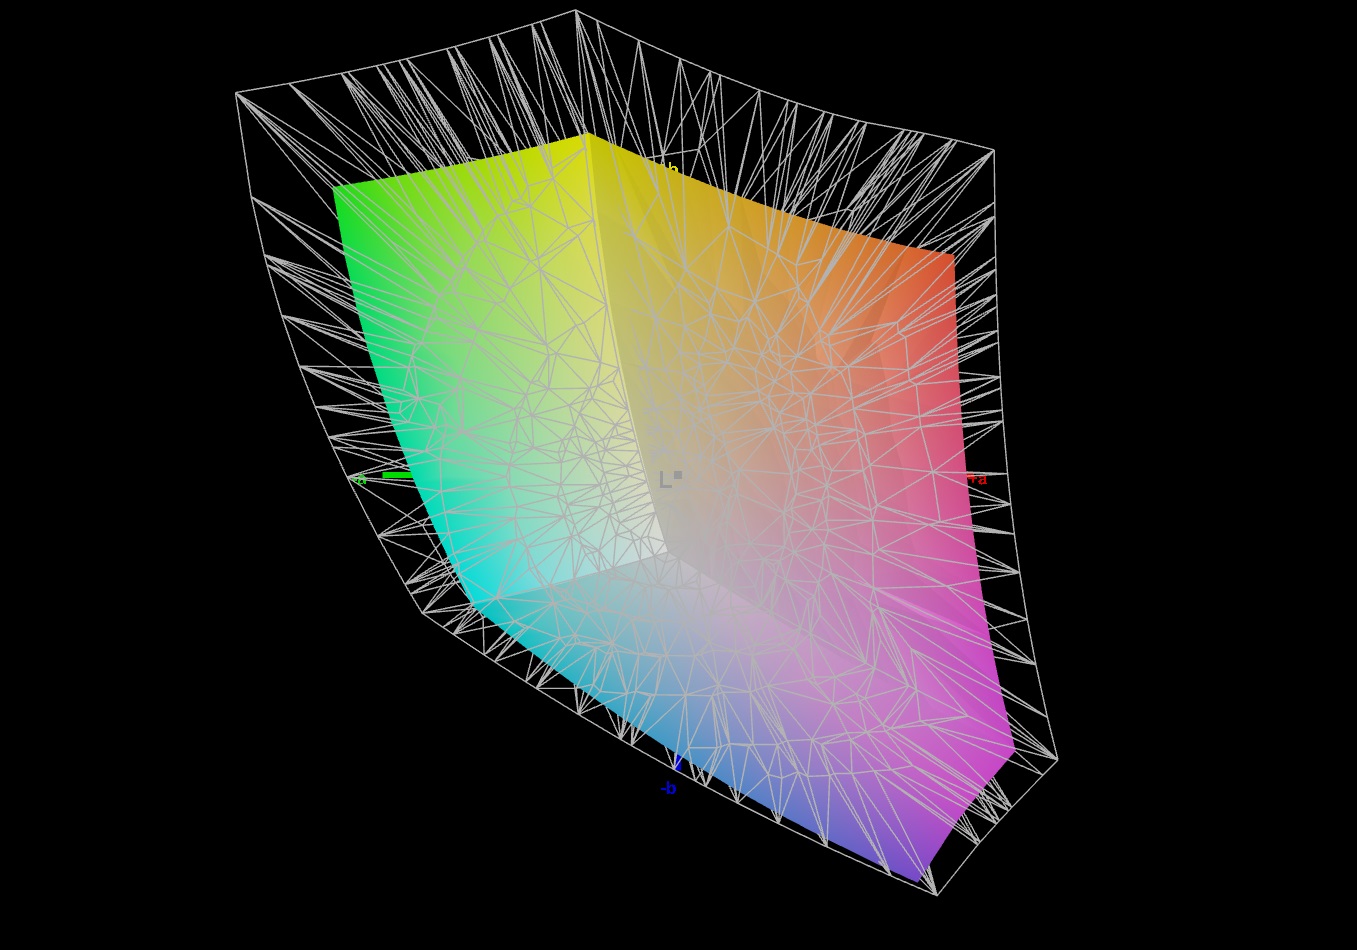
72.4% AdobeRGB 1998 (Argyll 3D)
99.6% sRGB (Argyll 3D)
70.3% Display P3 (Argyll 3D)
Gamma: 2.253
CCT: 6631 K
| Lenovo Legion Slim 7 16APH8 BOE NE160QDM-NZ3, IPS, 2560x1600, 16" | Asus ROG Flow X16 GV601V TMX1603 (TL160ADMP03-0), IPS, 2560x1600, 16" | Alienware m16 R1 Intel BOE NE16NYB, IPS, 2560x1600, 16" | Acer Predator Helios 16 PH16-71-731Q BOE NE160QDM-NZ2, IPS-LED, 2560x1600, 16" | Lenovo Legion Pro 5 16IRX8 AU Optronics B160QAN03.1, IPS, 2560x1600, 16" | Lenovo LOQ 16IRH8 AUOC1A5 (B160QAN03.L), IPS, 2560x1600, 16" | |
|---|---|---|---|---|---|---|
| Display | 18% | -3% | 18% | 0% | -0% | |
| Display P3 Coverage (%) | 70.3 | 96.61 37% | 67.7 -4% | 97.1 38% | 71.2 1% | 70.5 0% |
| sRGB Coverage (%) | 99.6 | 99.92 0% | 97.2 -2% | 100 0% | 98.8 -1% | 98.9 -1% |
| AdobeRGB 1998 Coverage (%) | 72.4 | 84.63 17% | 70 -3% | 84.7 17% | 73.3 1% | 72.6 0% |
| Response Times | 21% | 22% | -8% | -46% | 9% | |
| Response Time Grey 50% / Grey 80% * (ms) | 12.6 ? | 3.8 ? 70% | 4 ? 68% | 13.6 ? -8% | 14.5 ? -15% | 7.2 ? 43% |
| Response Time Black / White * (ms) | 5.9 ? | 7.6 ? -29% | 7.3 ? -24% | 6.4 ? -8% | 10.4 ? -76% | 7.4 ? -25% |
| PWM Frequency (Hz) | ||||||
| Screen | -25% | -32% | -17% | -3% | -7% | |
| Brightness middle (cd/m²) | 545 | 486 -11% | 306 -44% | 511 -6% | 405.7 -26% | 407 -25% |
| Brightness (cd/m²) | 502 | 469 -7% | 302 -40% | 498 -1% | 368 -27% | 369 -26% |
| Brightness Distribution (%) | 82 | 91 11% | 89 9% | 94 15% | 87 6% | 85 4% |
| Black Level * (cd/m²) | 0.48 | 0.39 19% | 0.3 37% | 0.36 25% | 0.38 21% | 0.45 6% |
| Contrast (:1) | 1135 | 1246 10% | 1020 -10% | 1419 25% | 1068 -6% | 904 -20% |
| Colorchecker dE 2000 * | 1.36 | 2.27 -67% | 2.57 -89% | 1.76 -29% | 1.65 -21% | 1.43 -5% |
| Colorchecker dE 2000 max. * | 3.11 | 5.73 -84% | 4.26 -37% | 3.7 -19% | 4.2 -35% | 3.58 -15% |
| Colorchecker dE 2000 calibrated * | 1.04 | 0.6 42% | 0.85 18% | 1.56 -50% | 0.53 49% | 1.07 -3% |
| Greyscale dE 2000 * | 1.4 | 3.36 -140% | 3.3 -136% | 3 -114% | 1.2 14% | 1.13 19% |
| Gamma | 2.253 98% | 2.46 89% | 1.997 110% | 2.33 94% | 2.3 96% | 2.5 88% |
| CCT | 6631 98% | 6625 98% | 6895 94% | 6341 103% | 6453 101% | 6526 100% |
| Media totale (Programma / Settaggio) | 5% /
-9% | -4% /
-18% | -2% /
-8% | -16% /
-8% | 1% /
-3% |
* ... Meglio usare valori piccoli
A parte lo spazio colore, che potrebbe essere leggermente superiore considerando il 70% di copertura DCI-P3 e il 72% di AdobeRGB (rispetto all'Alienware m16 e all'Acer Predator Helios 16), lo schermo WQXGA funziona molto bene in quasi tutti gli aspetti. Grazie alla calibrazione di fabbrica, l'accuratezza del colore è eccezionale fin dall'inizio. Inoltre, i tempi di risposta del pannello a 240 Hz sono decenti, misurando poco meno di 6 ms per le transizioni da nero a bianco e 12 ms per le transizioni da grigio a grigio.
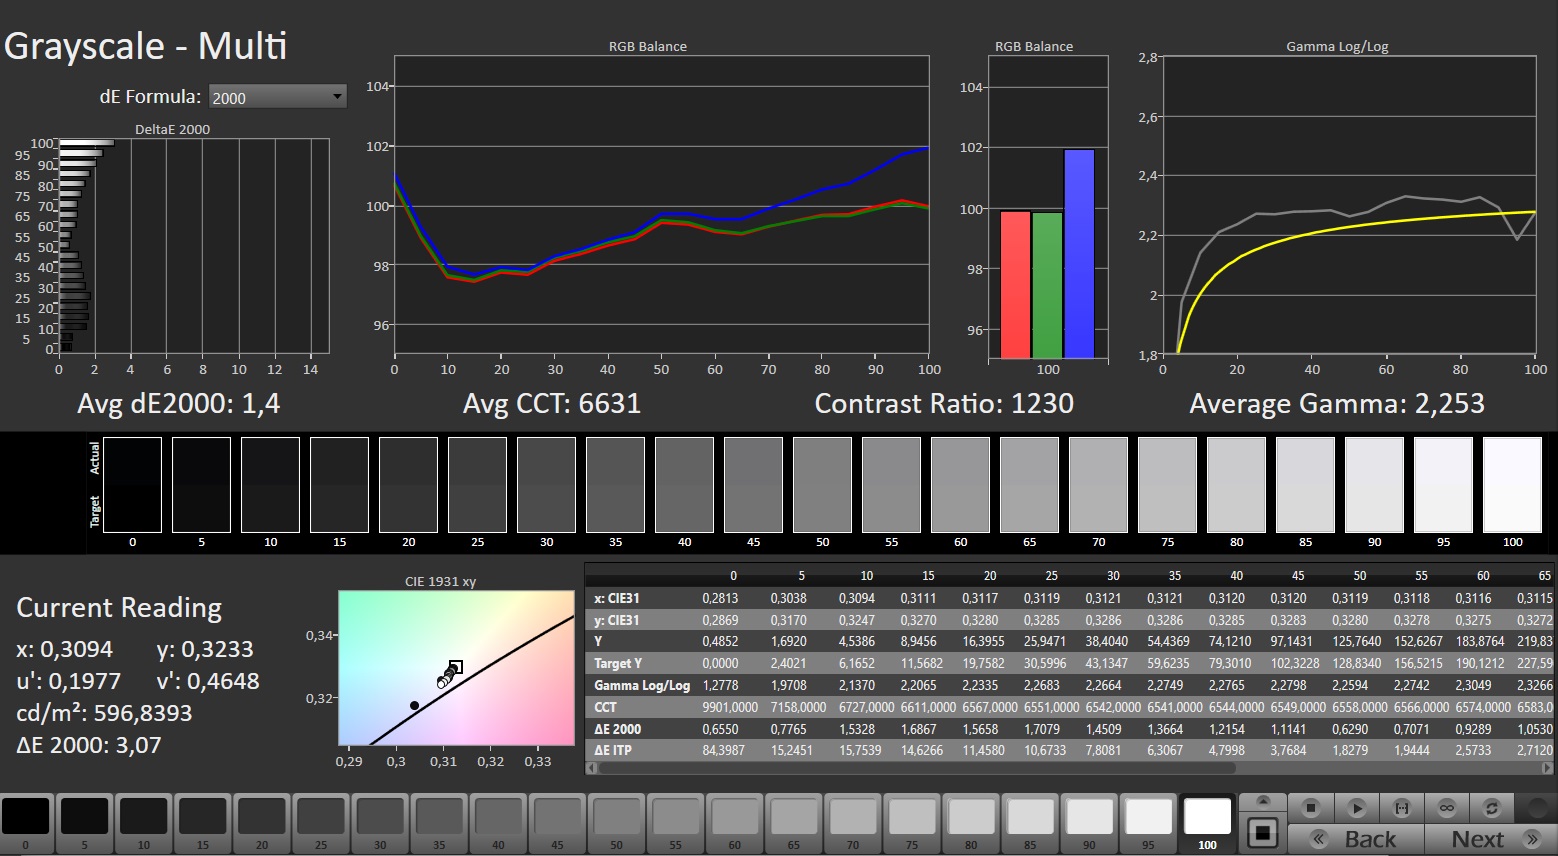

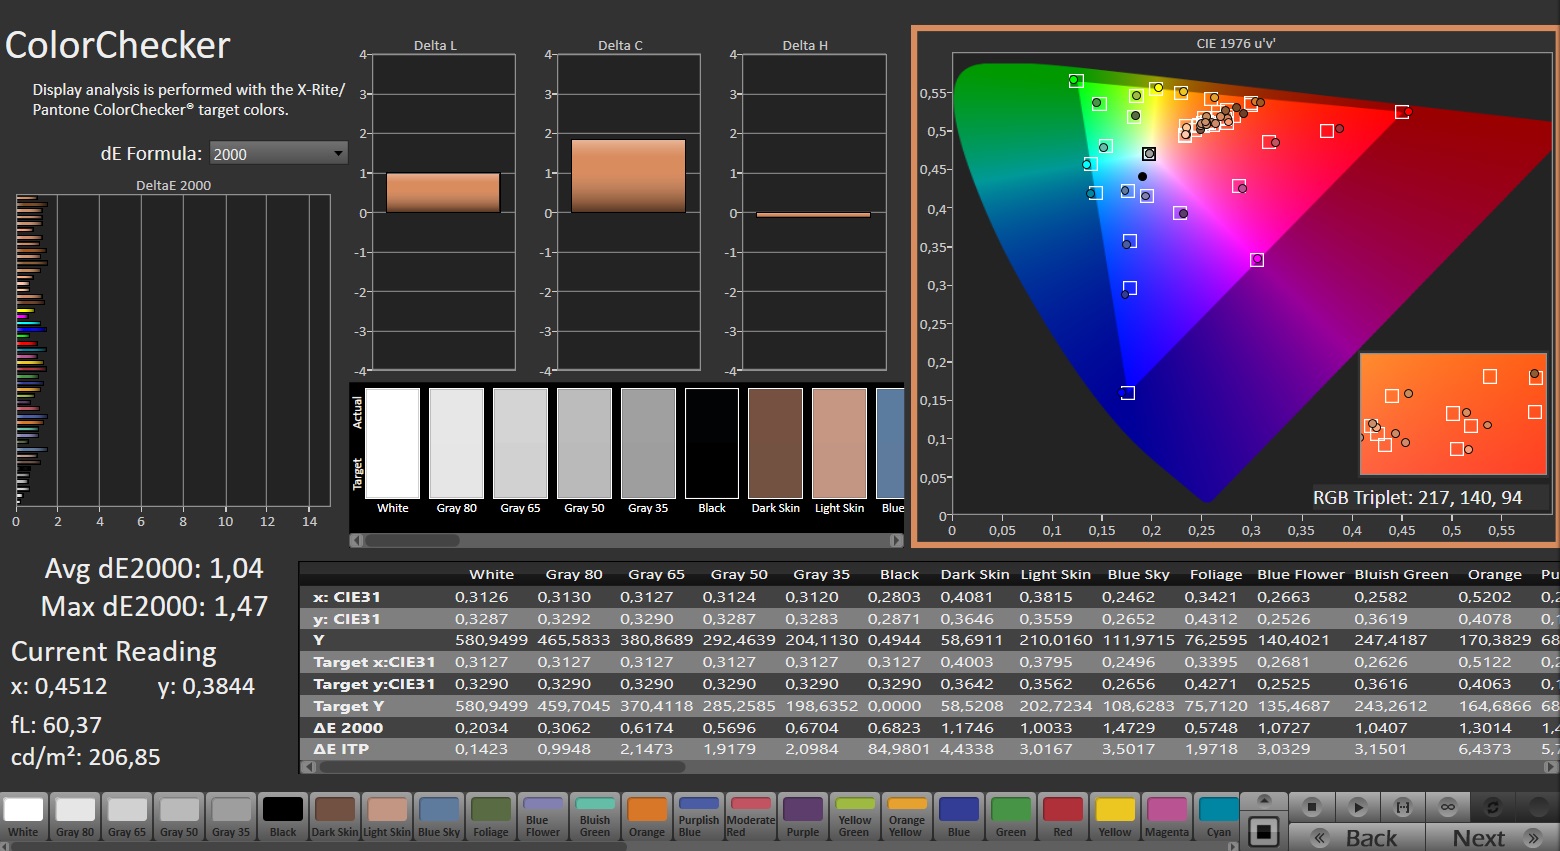
La luminosità è particolarmente degna di nota: un valore medio di 502 cd/m2 è piuttosto elevato per uno schermo IPS e supera persino gli standard dell'azienda per la luminosità degli ambienti SDR (400 cd/m2). I giocatori apprezzeranno il supporto FreeSync e GSync. Nonostante la luminosità massima nel campo di prova, il contrasto non spicca tra i concorrenti. Ciò è dovuto al valore del nero insoddisfacente di 0,48 cd/m².

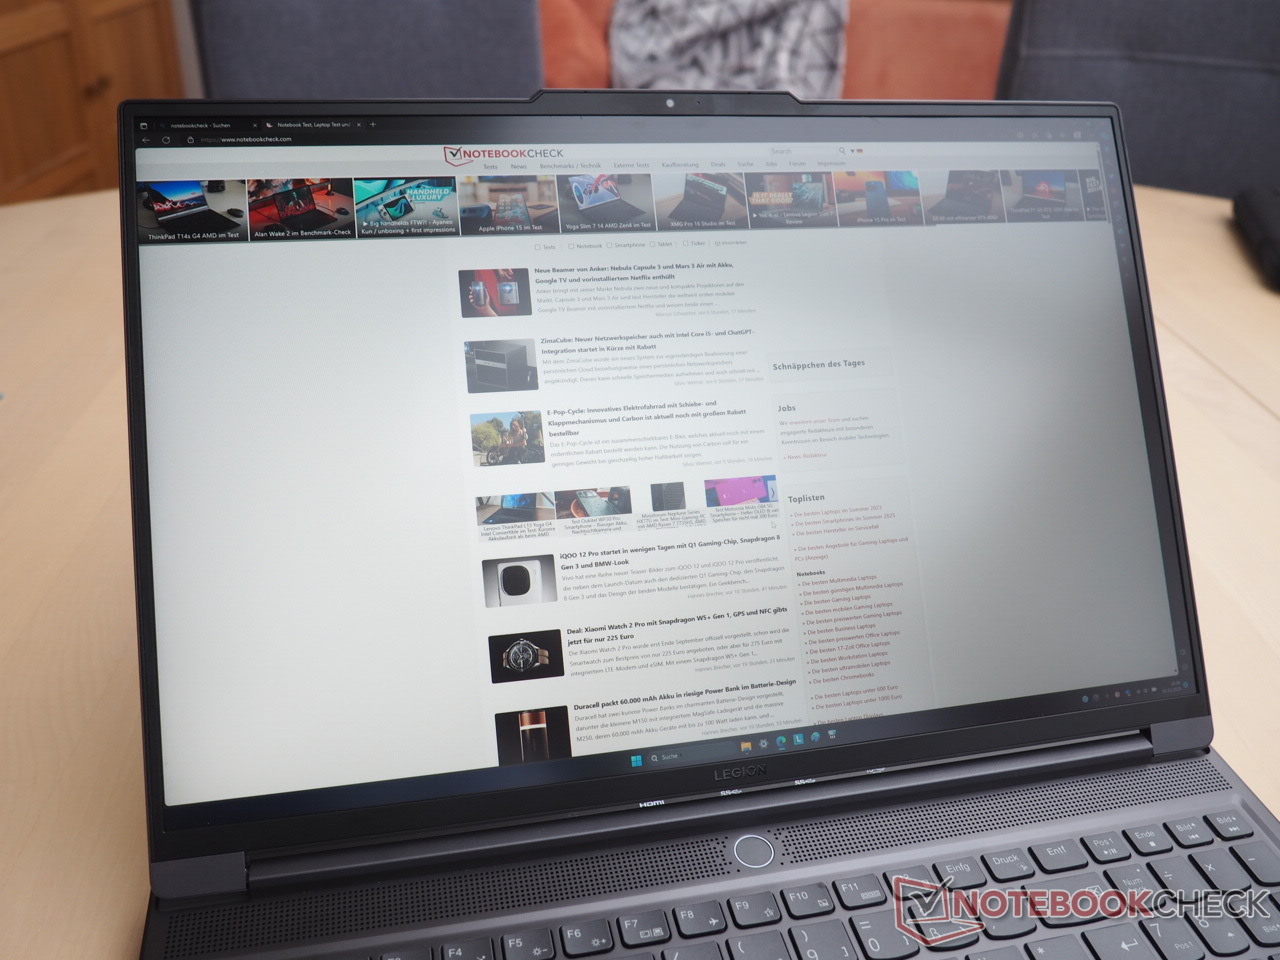
Gli angoli di visione sono conformi al tipico standard IPS, come si evince dalla nostra foto. Non si sono verificati problemi di sfarfallio dello schermo.
Tempi di risposta del Display
| ↔ Tempi di risposta dal Nero al Bianco | ||
|---|---|---|
| 5.9 ms ... aumenta ↗ e diminuisce ↘ combinato | ↗ 1.9 ms Incremento | 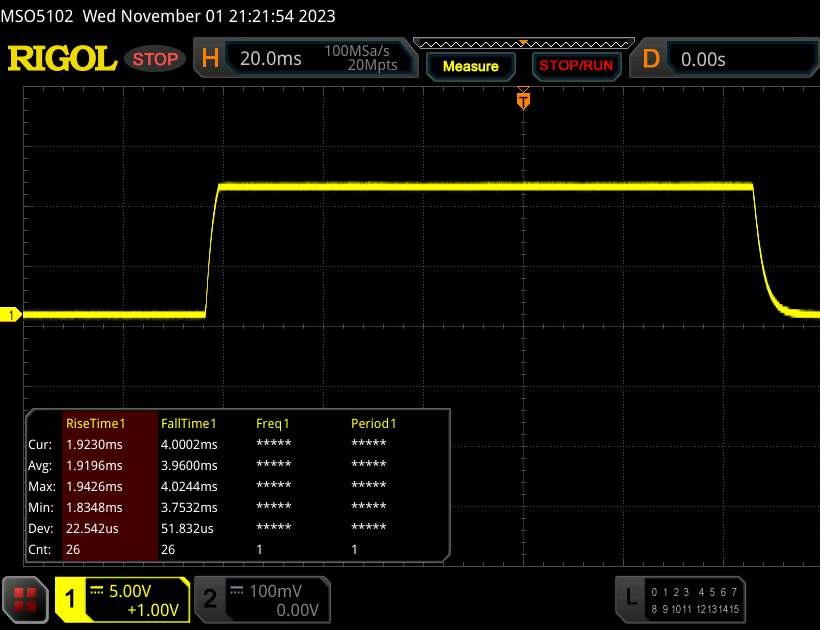 |
| ↘ 4 ms Calo | ||
| Lo schermo ha mostrato valori di risposta molto veloci nei nostri tests ed è molto adatto per i gaming veloce. In confronto, tutti i dispositivi di test variano da 0.1 (minimo) a 240 (massimo) ms. » 18 % di tutti i dispositivi è migliore. Questo significa che i tempi di risposta rilevati sono migliori rispettto alla media di tutti i dispositivi testati (19.9 ms). | ||
| ↔ Tempo di risposta dal 50% Grigio all'80% Grigio | ||
| 12.6 ms ... aumenta ↗ e diminuisce ↘ combinato | ↗ 6.1 ms Incremento | 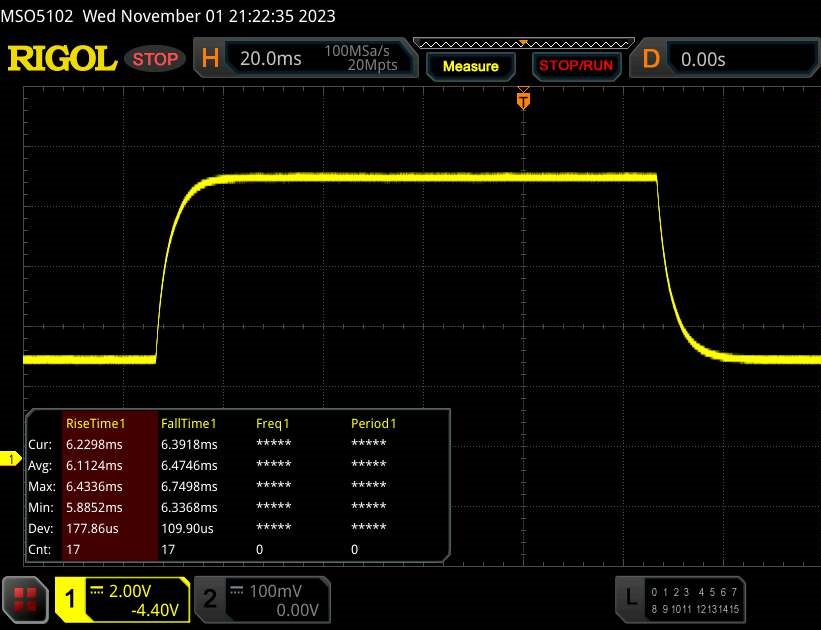 |
| ↘ 6.5 ms Calo | ||
| Lo schermo mostra buoni tempi di risposta durante i nostri tests, ma potrebbe essere troppo lento per i gamers competitivi. In confronto, tutti i dispositivi di test variano da 0.165 (minimo) a 636 (massimo) ms. » 26 % di tutti i dispositivi è migliore. Questo significa che i tempi di risposta rilevati sono migliori rispettto alla media di tutti i dispositivi testati (31.1 ms). | ||
Sfarfallio dello schermo / PWM (Pulse-Width Modulation)
| flickering dello schermo / PWM non rilevato | 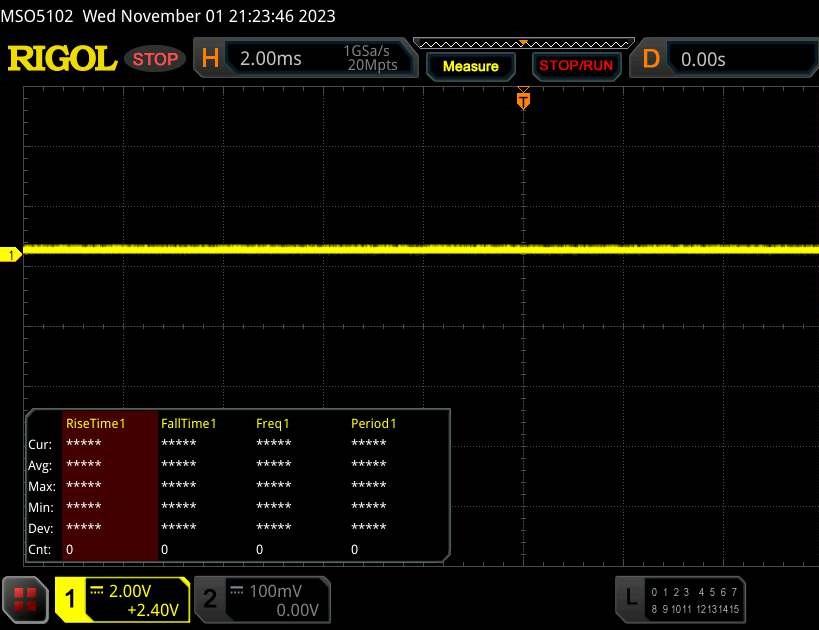 | ||
In confronto: 52 % di tutti i dispositivi testati non utilizza PWM per ridurre la luminosita' del display. Se è rilevato PWM, una media di 7797 (minimo: 5 - massimo: 343500) Hz è stata rilevata. | |||
Prestazioni
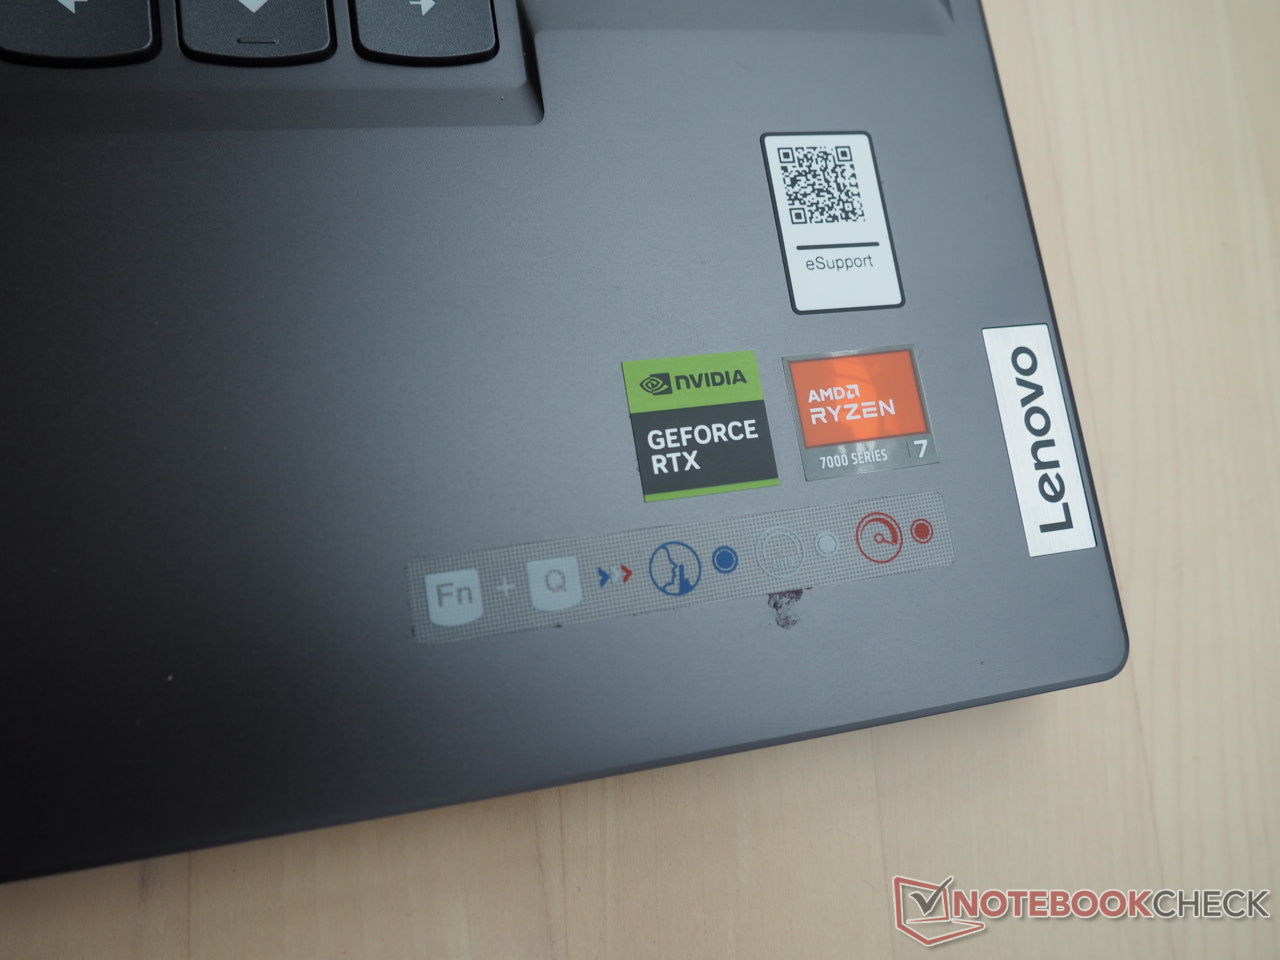
La RTX 4060 di GeForce posiziona Legion nella categoria media dei notebook da gioco. Con 32 GB di RAM e un SSD da 1 TB, dovrebbe essere sufficiente per la maggior parte degli acquirenti per il momento. Chi cerca prestazioni più elevate può optare per la versione RTX 4070. Ma Lenovo non offre attualmente una versione RTX 4080 o RTX 4090 per lo Slim 7.
Condizioni del test
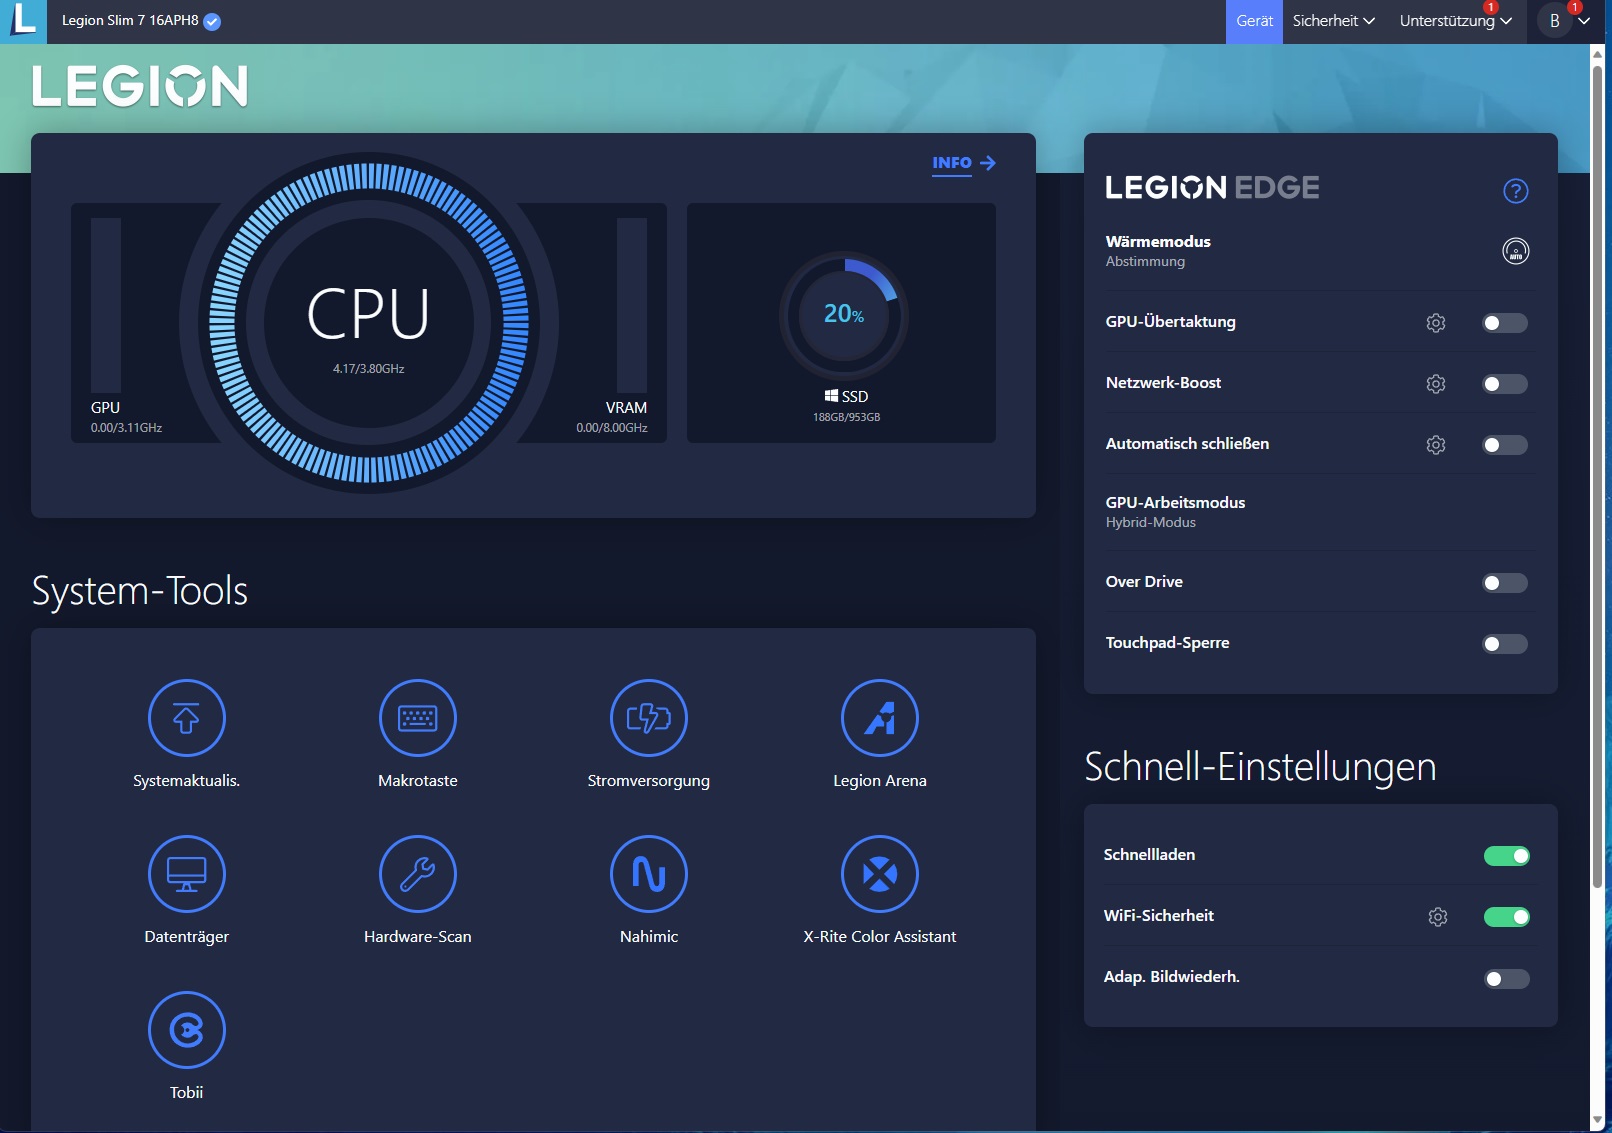
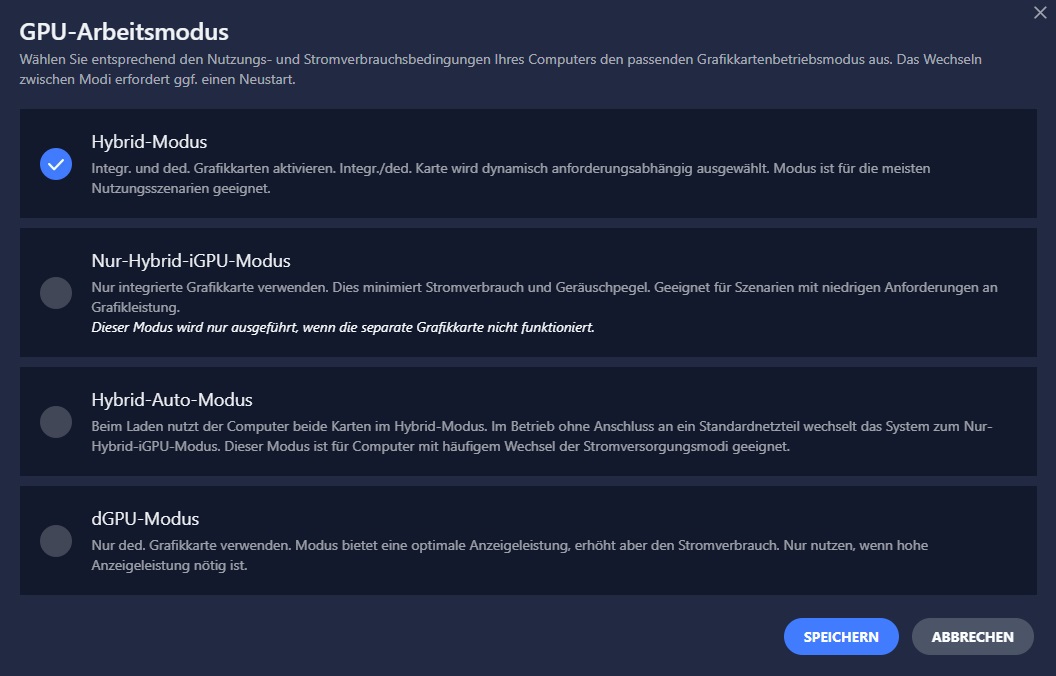
Il software Lenovo Vantage preinstallato si distingue per le sue ampie capacità di personalizzazione. Oltre alla modalità termica, gli utenti possono anche scegliere la modalità di lavoro della GPU. Poiché l'aumento degli FPS nel profilo Prestazioni non è proporzionale al volume più elevato (come mostrato nella tabella), abbiamo condotto tutte le misurazioni nel profilo Bilanciato. La commutazione grafica predefinita (modalità ibrida) era sempre attiva.
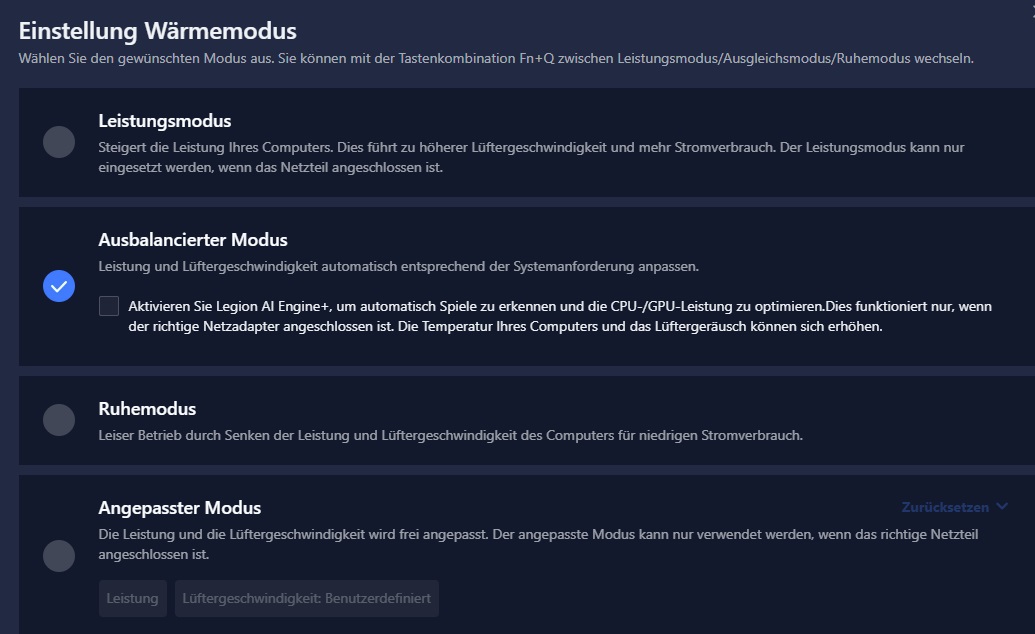
| Silenzioso | Bilanciato | Prestazioni | |
|---|---|---|---|
| Rumore (Witcher 3, FHD/Ultra) | 36 dB(A) | 47 dB(A) | 52 dB(A) |
| Prestazioni (Witcher 3, FHD/Ultra) | ~86 fps | ~98 fps | ~100 fps |
| Limite di potenza 1 (HWInfo) | 50 w | 54 w | 100 w |
| Limite di potenza 2 (HWInfo) | 60 w | 65 w | 125 w |
Processore
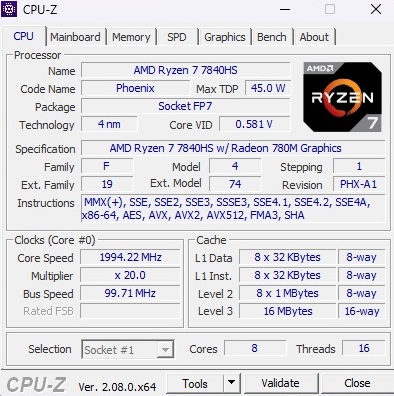
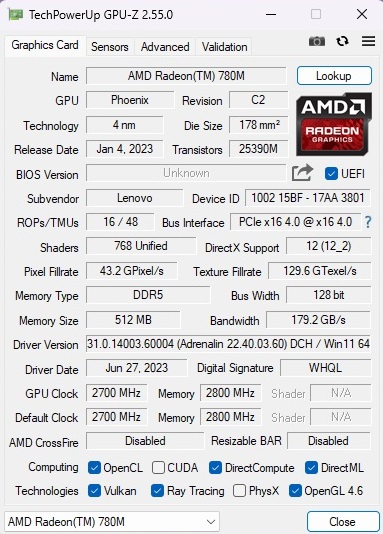
Ryzen 7 7840HS è un processore a otto core dotato di 16 MB di cache L3 e della capacità di gestire fino a 16 thread contemporaneamente, grazie a SMT. Inoltre, il chip da 4 nm è dotato di una GPU integrata relativamente veloce, la Radeon 780Mresponsabile dei calcoli e della visualizzazione delle immagini, per compiti meno impegnativi come il lavoro d'ufficio, lo streaming video e la navigazione web. Durante i test di benchmark, le prestazioni della CPU si posizionano tra il Core i7-13620H e il Core i7-13700HX. Un vantaggio notevole del processore AMD è il miglioramento costante delle prestazioni, una caratteristica non del tutto applicabile o solo parzialmente vera per molte controparti Intel, come evidente in benchmark come il ciclo Cinebench.
Cinebench R15 Multi Loop
* ... Meglio usare valori piccoli
AIDA64: FP32 Ray-Trace | FPU Julia | CPU SHA3 | CPU Queen | FPU SinJulia | FPU Mandel | CPU AES | CPU ZLib | FP64 Ray-Trace | CPU PhotoWorxx
| Performance rating | |
| Media della classe Gaming | |
| Media AMD Ryzen 7 7840HS | |
| Alienware m16 R1 Intel | |
| Lenovo Legion Slim 7 16APH8 | |
| Acer Predator Helios 16 PH16-71-731Q | |
| Lenovo Legion Pro 5 16IRX8 | |
| Asus ROG Flow X16 GV601V | |
| Lenovo LOQ 16IRH8 | |
| AIDA64 / FP32 Ray-Trace | |
| Media della classe Gaming (10227 - 85542, n=109, ultimi 2 anni) | |
| Media AMD Ryzen 7 7840HS (22845 - 28921, n=21) | |
| Lenovo Legion Slim 7 16APH8 | |
| Lenovo Legion Pro 5 16IRX8 | |
| Alienware m16 R1 Intel | |
| Acer Predator Helios 16 PH16-71-731Q | |
| Asus ROG Flow X16 GV601V | |
| Lenovo LOQ 16IRH8 | |
| AIDA64 / FPU Julia | |
| Media della classe Gaming (51376 - 238426, n=109, ultimi 2 anni) | |
| Lenovo Legion Slim 7 16APH8 | |
| Media AMD Ryzen 7 7840HS (97164 - 123167, n=21) | |
| Lenovo Legion Pro 5 16IRX8 | |
| Alienware m16 R1 Intel | |
| Acer Predator Helios 16 PH16-71-731Q | |
| Asus ROG Flow X16 GV601V | |
| Lenovo LOQ 16IRH8 | |
| AIDA64 / CPU SHA3 | |
| Media della classe Gaming (2180 - 9817, n=109, ultimi 2 anni) | |
| Alienware m16 R1 Intel | |
| Media AMD Ryzen 7 7840HS (4293 - 5155, n=21) | |
| Lenovo Legion Slim 7 16APH8 | |
| Lenovo Legion Pro 5 16IRX8 | |
| Acer Predator Helios 16 PH16-71-731Q | |
| Asus ROG Flow X16 GV601V | |
| Lenovo LOQ 16IRH8 | |
| AIDA64 / CPU Queen | |
| Media della classe Gaming (49785 - 173351, n=100, ultimi 2 anni) | |
| Lenovo Legion Slim 7 16APH8 | |
| Media AMD Ryzen 7 7840HS (102271 - 125820, n=21) | |
| Alienware m16 R1 Intel | |
| Acer Predator Helios 16 PH16-71-731Q | |
| Lenovo Legion Pro 5 16IRX8 | |
| Asus ROG Flow X16 GV601V | |
| Lenovo LOQ 16IRH8 | |
| AIDA64 / FPU SinJulia | |
| Lenovo Legion Slim 7 16APH8 | |
| Media AMD Ryzen 7 7840HS (13767 - 15525, n=21) | |
| Media della classe Gaming (4424 - 33636, n=109, ultimi 2 anni) | |
| Alienware m16 R1 Intel | |
| Lenovo Legion Pro 5 16IRX8 | |
| Acer Predator Helios 16 PH16-71-731Q | |
| Asus ROG Flow X16 GV601V | |
| Lenovo LOQ 16IRH8 | |
| AIDA64 / FPU Mandel | |
| Media della classe Gaming (25115 - 128721, n=109, ultimi 2 anni) | |
| Lenovo Legion Slim 7 16APH8 | |
| Media AMD Ryzen 7 7840HS (52084 - 65812, n=21) | |
| Lenovo Legion Pro 5 16IRX8 | |
| Alienware m16 R1 Intel | |
| Acer Predator Helios 16 PH16-71-731Q | |
| Asus ROG Flow X16 GV601V | |
| Lenovo LOQ 16IRH8 | |
| AIDA64 / CPU AES | |
| Alienware m16 R1 Intel | |
| Acer Predator Helios 16 PH16-71-731Q | |
| Media AMD Ryzen 7 7840HS (67389 - 177158, n=21) | |
| Media della classe Gaming (39258 - 247074, n=109, ultimi 2 anni) | |
| Lenovo Legion Pro 5 16IRX8 | |
| Asus ROG Flow X16 GV601V | |
| Lenovo Legion Slim 7 16APH8 | |
| Lenovo LOQ 16IRH8 | |
| AIDA64 / CPU ZLib | |
| Media della classe Gaming (574 - 2531, n=109, ultimi 2 anni) | |
| Acer Predator Helios 16 PH16-71-731Q | |
| Alienware m16 R1 Intel | |
| Lenovo Legion Pro 5 16IRX8 | |
| Asus ROG Flow X16 GV601V | |
| Lenovo Legion Slim 7 16APH8 | |
| Media AMD Ryzen 7 7840HS (944 - 1123, n=21) | |
| Lenovo LOQ 16IRH8 | |
| AIDA64 / FP64 Ray-Trace | |
| Media della classe Gaming (5509 - 45446, n=109, ultimi 2 anni) | |
| Media AMD Ryzen 7 7840HS (12248 - 15599, n=21) | |
| Lenovo Legion Slim 7 16APH8 | |
| Lenovo Legion Pro 5 16IRX8 | |
| Alienware m16 R1 Intel | |
| Acer Predator Helios 16 PH16-71-731Q | |
| Asus ROG Flow X16 GV601V | |
| Lenovo LOQ 16IRH8 | |
| AIDA64 / CPU PhotoWorxx | |
| Media della classe Gaming (12271 - 89891, n=109, ultimi 2 anni) | |
| Lenovo Legion Slim 7 16APH8 | |
| Asus ROG Flow X16 GV601V | |
| Media AMD Ryzen 7 7840HS (17615 - 41516, n=21) | |
| Lenovo Legion Pro 5 16IRX8 | |
| Alienware m16 R1 Intel | |
| Acer Predator Helios 16 PH16-71-731Q | |
| Lenovo LOQ 16IRH8 | |
Prestazioni del sistema
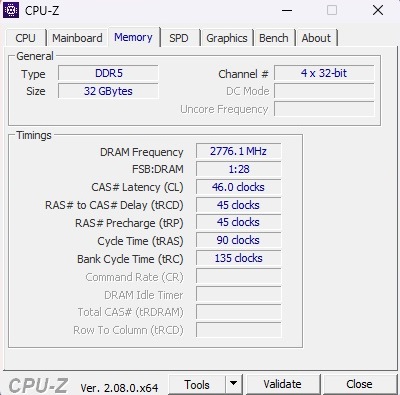
In termini di prestazioni di sistema, lo Slim 7 compete facilmente con i suoi rivali, ottenendo un punteggio di 7.502 punti in PCMark 10. La memoria DDR5, nota per la sua eccezionale velocità, supera la media. Inoltre, il computer mostra una risposta piacevole e rapida negli scenari di utilizzo pratico.
CrossMark: Overall | Productivity | Creativity | Responsiveness
| PCMark 10 / Score | |
| Media della classe Gaming (5828 - 11574, n=95, ultimi 2 anni) | |
| Asus ROG Flow X16 GV601V | |
| Media AMD Ryzen 7 7840HS, NVIDIA GeForce RTX 4060 Laptop GPU (7502 - 7946, n=4) | |
| Acer Predator Helios 16 PH16-71-731Q | |
| Lenovo Legion Pro 5 16IRX8 | |
| Lenovo Legion Slim 7 16APH8 | |
| Alienware m16 R1 Intel | |
| Lenovo LOQ 16IRH8 | |
| PCMark 10 / Essentials | |
| Asus ROG Flow X16 GV601V | |
| Acer Predator Helios 16 PH16-71-731Q | |
| Lenovo Legion Pro 5 16IRX8 | |
| Media AMD Ryzen 7 7840HS, NVIDIA GeForce RTX 4060 Laptop GPU (10441 - 11169, n=4) | |
| Alienware m16 R1 Intel | |
| Media della classe Gaming (8810 - 12600, n=99, ultimi 2 anni) | |
| Lenovo Legion Slim 7 16APH8 | |
| Lenovo LOQ 16IRH8 | |
| PCMark 10 / Productivity | |
| Acer Predator Helios 16 PH16-71-731Q | |
| Media della classe Gaming (6845 - 18766, n=97, ultimi 2 anni) | |
| Asus ROG Flow X16 GV601V | |
| Media AMD Ryzen 7 7840HS, NVIDIA GeForce RTX 4060 Laptop GPU (9575 - 10273, n=4) | |
| Lenovo Legion Slim 7 16APH8 | |
| Alienware m16 R1 Intel | |
| Lenovo Legion Pro 5 16IRX8 | |
| Lenovo LOQ 16IRH8 | |
| PCMark 10 / Digital Content Creation | |
| Media della classe Gaming (7602 - 19657, n=97, ultimi 2 anni) | |
| Lenovo Legion Pro 5 16IRX8 | |
| Media AMD Ryzen 7 7840HS, NVIDIA GeForce RTX 4060 Laptop GPU (11464 - 12418, n=4) | |
| Lenovo Legion Slim 7 16APH8 | |
| Asus ROG Flow X16 GV601V | |
| Acer Predator Helios 16 PH16-71-731Q | |
| Alienware m16 R1 Intel | |
| Lenovo LOQ 16IRH8 | |
| CrossMark / Overall | |
| Acer Predator Helios 16 PH16-71-731Q | |
| Alienware m16 R1 Intel | |
| Media della classe Gaming (1366 - 2409, n=97, ultimi 2 anni) | |
| Asus ROG Flow X16 GV601V | |
| Lenovo LOQ 16IRH8 | |
| Media AMD Ryzen 7 7840HS, NVIDIA GeForce RTX 4060 Laptop GPU (1800 - 1866, n=3) | |
| Lenovo Legion Pro 5 16IRX8 | |
| CrossMark / Productivity | |
| Acer Predator Helios 16 PH16-71-731Q | |
| Alienware m16 R1 Intel | |
| Lenovo LOQ 16IRH8 | |
| Asus ROG Flow X16 GV601V | |
| Media della classe Gaming (1386 - 2254, n=97, ultimi 2 anni) | |
| Media AMD Ryzen 7 7840HS, NVIDIA GeForce RTX 4060 Laptop GPU (1743 - 1821, n=3) | |
| Lenovo Legion Pro 5 16IRX8 | |
| CrossMark / Creativity | |
| Acer Predator Helios 16 PH16-71-731Q | |
| Alienware m16 R1 Intel | |
| Media della classe Gaming (1343 - 2729, n=97, ultimi 2 anni) | |
| Asus ROG Flow X16 GV601V | |
| Lenovo LOQ 16IRH8 | |
| Media AMD Ryzen 7 7840HS, NVIDIA GeForce RTX 4060 Laptop GPU (1908 - 1966, n=3) | |
| Lenovo Legion Pro 5 16IRX8 | |
| CrossMark / Responsiveness | |
| Acer Predator Helios 16 PH16-71-731Q | |
| Alienware m16 R1 Intel | |
| Lenovo LOQ 16IRH8 | |
| Media della classe Gaming (1226 - 2334, n=97, ultimi 2 anni) | |
| Asus ROG Flow X16 GV601V | |
| Lenovo Legion Pro 5 16IRX8 | |
| Media AMD Ryzen 7 7840HS, NVIDIA GeForce RTX 4060 Laptop GPU (1522 - 1776, n=3) | |
| PCMark 10 Score | 7502 punti | |
Aiuto | ||
| AIDA64 / Memory Copy | |
| Lenovo Legion Slim 7 16APH8 | |
| Media della classe Gaming (21750 - 129946, n=109, ultimi 2 anni) | |
| Media AMD Ryzen 7 7840HS (30937 - 72158, n=21) | |
| Asus ROG Flow X16 GV601V | |
| Lenovo Legion Pro 5 16IRX8 | |
| Alienware m16 R1 Intel | |
| Acer Predator Helios 16 PH16-71-731Q | |
| Lenovo LOQ 16IRH8 | |
| AIDA64 / Memory Read | |
| Media della classe Gaming (22956 - 118858, n=109, ultimi 2 anni) | |
| Asus ROG Flow X16 GV601V | |
| Lenovo Legion Pro 5 16IRX8 | |
| Alienware m16 R1 Intel | |
| Acer Predator Helios 16 PH16-71-731Q | |
| Lenovo LOQ 16IRH8 | |
| Lenovo Legion Slim 7 16APH8 | |
| Media AMD Ryzen 7 7840HS (30497 - 62147, n=21) | |
| AIDA64 / Memory Write | |
| Lenovo Legion Slim 7 16APH8 | |
| Acer Predator Helios 16 PH16-71-731Q | |
| Media AMD Ryzen 7 7840HS (34590 - 93323, n=21) | |
| Media della classe Gaming (22297 - 135096, n=109, ultimi 2 anni) | |
| Lenovo Legion Pro 5 16IRX8 | |
| Asus ROG Flow X16 GV601V | |
| Alienware m16 R1 Intel | |
| Lenovo LOQ 16IRH8 | |
| AIDA64 / Memory Latency | |
| Lenovo LOQ 16IRH8 | |
| Media della classe Gaming (75.3 - 259, n=109, ultimi 2 anni) | |
| Media AMD Ryzen 7 7840HS (85.1 - 112, n=21) | |
| Asus ROG Flow X16 GV601V | |
| Lenovo Legion Slim 7 16APH8 | |
| Alienware m16 R1 Intel | |
| Acer Predator Helios 16 PH16-71-731Q | |
| Lenovo Legion Pro 5 16IRX8 | |
* ... Meglio usare valori piccoli
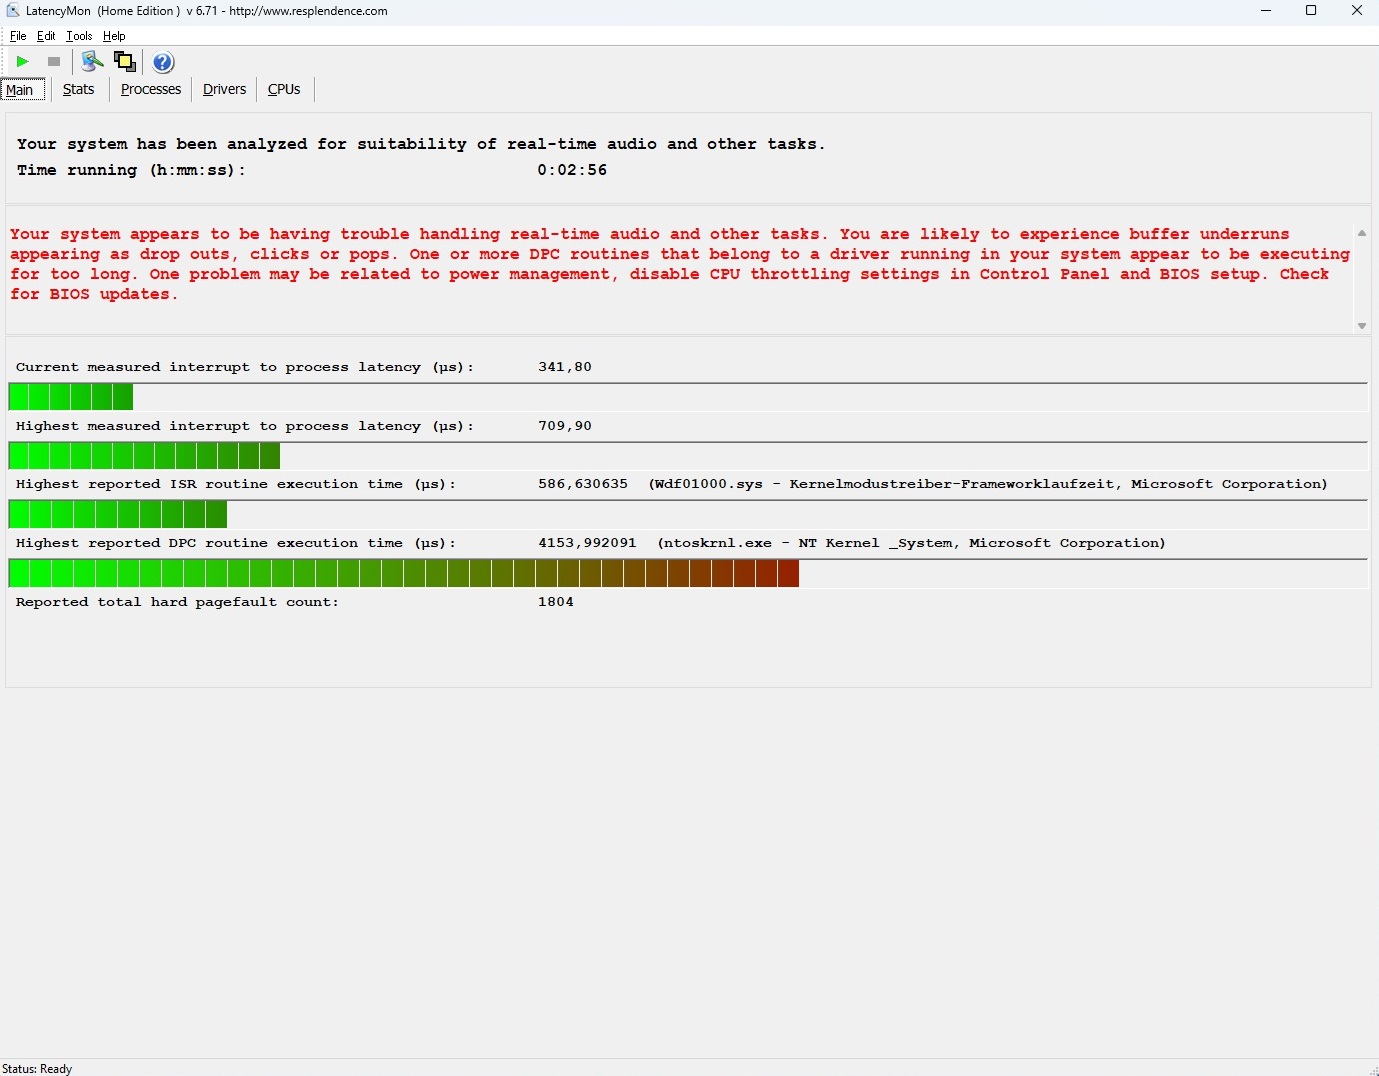
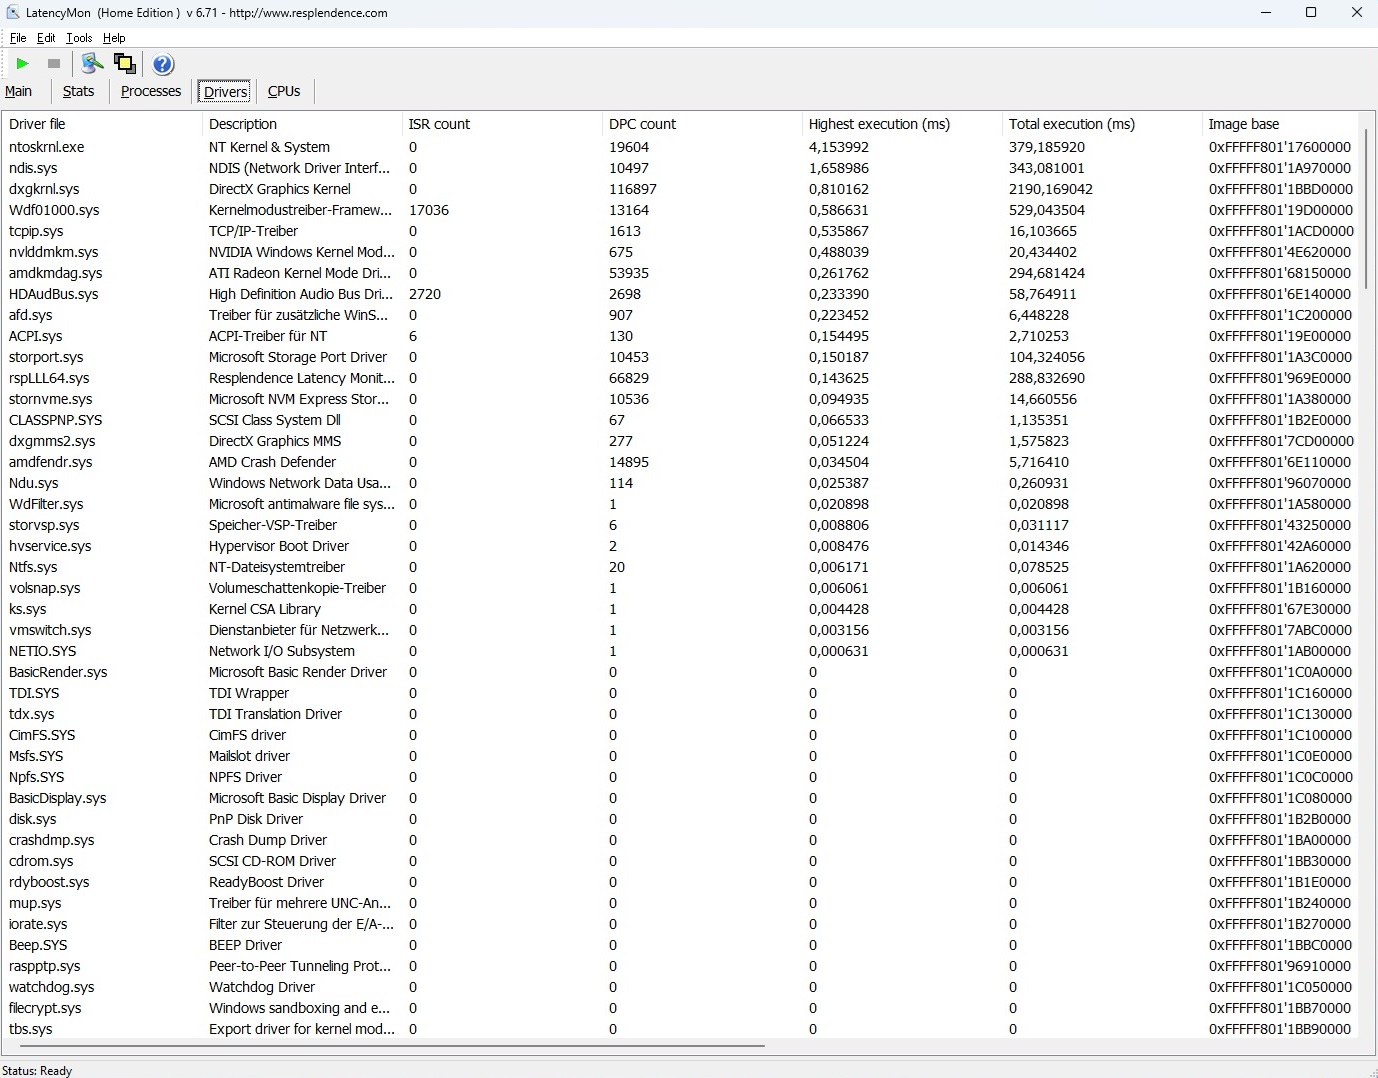
Latenza DPC
Sebbene abbia le latenze più basse tra i dispositivi da 16 pollici del test, lo strumento LatencyMon mostra possibili problemi con l'editing audio e video in tempo reale.
| DPC Latencies / LatencyMon - interrupt to process latency (max), Web, Youtube, Prime95 | |
| Alienware m16 R1 Intel | |
| Acer Predator Helios 16 PH16-71-731Q | |
| Lenovo LOQ 16IRH8 | |
| Asus ROG Flow X16 GV601V | |
| Lenovo Legion Pro 5 16IRX8 | |
| Lenovo Legion Slim 7 16APH8 | |
* ... Meglio usare valori piccoli
Dispositivi di archiviazione
L'SSD integrato da 1 TB di WDC (modello SN810) offre generalmente un'eccellente velocità, ma occasionalmente presenta problemi di throttling sotto carico prolungato. Tuttavia, questi problemi non sono così gravi come quelli osservati nell'Acer Predator Helios 16.

* ... Meglio usare valori piccoli
Continuous power read: DiskSpd Read Loop, Queue Depth 8
Scheda grafica
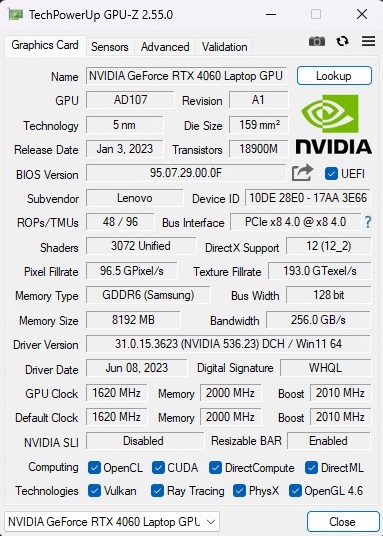
La RTX 4060 di GeForce è una delle GPU per computer portatili più popolari e di successo al momento. Sebbene questo modello di fascia media non sia adatto agli schermi UHD e possa avere una limitata resistenza al futuro a causa della sua architettura GDDR6 VRAM da 8 GB, le sue prestazioni per le risoluzioni Full HD (FHD) o Quad HD (QHD) sono comunque notevoli.
Nei benchmark grafici sintetici, le prestazioni 3D in modalità Bilanciata sono paragonabili alle prestazioni medie di RTX 4060 finora, sebbene siano leggermente inferiori a quelle dei dispositivi di confronto. In particolare, lo Slim 7 non si avvicina nemmeno a raggiungere il TGP massimo di 140 watt, incluso Dynamic Boost.
| 3DMark 11 Performance | 30859 punti | |
| 3DMark Ice Storm Standard Score | 123335 punti | |
| 3DMark Cloud Gate Standard Score | 60481 punti | |
| 3DMark Fire Strike Score | 23735 punti | |
| 3DMark Time Spy Score | 10032 punti | |
Aiuto | ||
* ... Meglio usare valori piccoli
Prestazioni di gioco
I benchmark di gioco mostrano uno schema simile. A parte alcuni giochi molto esigenti come Lords of the Fallen o Alan Wake 2la maggior parte di essi può essere giocata a risoluzione nativa con impostazioni da alte a massime senza problemi, anche se il raggiungimento dei 60 FPS non è sempre garantito.
| The Witcher 3 - 1920x1080 Ultra Graphics & Postprocessing (HBAO+) | |
| Media della classe Gaming (95 - 240, n=8, ultimi 2 anni) | |
| Lenovo Legion Pro 5 16IRX8 | |
| Asus ROG Flow X16 GV601V | |
| Alienware m16 R1 Intel | |
| Lenovo LOQ 16IRH8 | |
| Acer Predator Helios 16 PH16-71-731Q | |
| Media NVIDIA GeForce RTX 4060 Laptop GPU (77 - 159.7, n=42) | |
| Lenovo Legion Slim 7 16APH8 | |
| Alan Wake 2 | |
| 1920x1080 High Preset | |
| Media della classe Gaming (54.6 - 133.2, n=31, ultimi 2 anni) | |
| Media NVIDIA GeForce RTX 4060 Laptop GPU (53.8 - 64.3, n=3) | |
| XMG Pro 15 E23 | |
| Lenovo Legion Slim 7 16APH8 | |
| 2560x1440 High Preset | |
| Media della classe Gaming (31.2 - 93.1, n=33, ultimi 2 anni) | |
| XMG Pro 15 E23 | |
| Media NVIDIA GeForce RTX 4060 Laptop GPU (33 - 36.7, n=3) | |
| Lenovo Legion Slim 7 16APH8 | |
| Lords of the Fallen | |
| 1920x1080 High Preset | |
| XMG Pro 15 E23 | |
| Media NVIDIA GeForce RTX 4060 Laptop GPU (46.7 - 53.9, n=3) | |
| Lenovo Legion Slim 7 16APH8 | |
| 1920x1080 Ultra Preset | |
| XMG Pro 15 E23 | |
| Media NVIDIA GeForce RTX 4060 Laptop GPU (32.8 - 38.1, n=3) | |
| Lenovo Legion Slim 7 16APH8 | |
| 2560x1440 Ultra Preset | |
| XMG Pro 15 E23 | |
| Media NVIDIA GeForce RTX 4060 Laptop GPU (24.2 - 25.7, n=2) | |
| Lenovo Legion Slim 7 16APH8 | |
| Total War Pharaoh | |
| 1920x1080 High Preset | |
| XMG Pro 15 E23 | |
| Media NVIDIA GeForce RTX 4060 Laptop GPU (128 - 149, n=2) | |
| Lenovo Legion Slim 7 16APH8 | |
| Media della classe Gaming (47.4 - 200, n=2, ultimi 2 anni) | |
| 1920x1080 Ultra Preset | |
| XMG Pro 15 E23 | |
| Media NVIDIA GeForce RTX 4060 Laptop GPU (104 - 116, n=2) | |
| Lenovo Legion Slim 7 16APH8 | |
| Media della classe Gaming (42.9 - 161.4, n=2, ultimi 2 anni) | |
| 2560x1440 Ultra Preset | |
| XMG Pro 15 E23 | |
| Media NVIDIA GeForce RTX 4060 Laptop GPU (76 - 81.6, n=2) | |
| Lenovo Legion Slim 7 16APH8 | |
| Media della classe Gaming (24.1 - 127.4, n=2, ultimi 2 anni) | |
| Assassin's Creed Mirage | |
| 1920x1080 High Preset (Adaptive Quality Off) | |
| XMG Pro 15 E23 | |
| Media NVIDIA GeForce RTX 4060 Laptop GPU (76 - 118, n=4) | |
| Lenovo Legion Slim 7 16APH8 | |
| 1920x1080 Ultra High Preset (Adaptive Quality Off) | |
| XMG Pro 15 E23 | |
| Media NVIDIA GeForce RTX 4060 Laptop GPU (65 - 93, n=6) | |
| Lenovo Legion Slim 7 16APH8 | |
| 2560x1440 Ultra High Preset (Adaptive Quality Off) | |
| XMG Pro 15 E23 | |
| Media NVIDIA GeForce RTX 4060 Laptop GPU (64 - 72, n=5) | |
| Lenovo Legion Slim 7 16APH8 | |
| EA Sports FC 24 | |
| 1920x1080 High Preset | |
| Lenovo Legion Slim 7 16APH8 | |
| XMG Pro 15 E23 | |
| Media NVIDIA GeForce RTX 4060 Laptop GPU (142.9 - 155.2, n=3) | |
| 1920x1080 Ultra Preset | |
| XMG Pro 15 E23 | |
| Media NVIDIA GeForce RTX 4060 Laptop GPU (136.9 - 138, n=3) | |
| Lenovo Legion Slim 7 16APH8 | |
| Media della classe Gaming (n=1ultimi 2 anni) | |
| 2560x1440 Ultra Preset | |
| XMG Pro 15 E23 | |
| Media NVIDIA GeForce RTX 4060 Laptop GPU (117.5 - 121, n=2) | |
| Lenovo Legion Slim 7 16APH8 | |
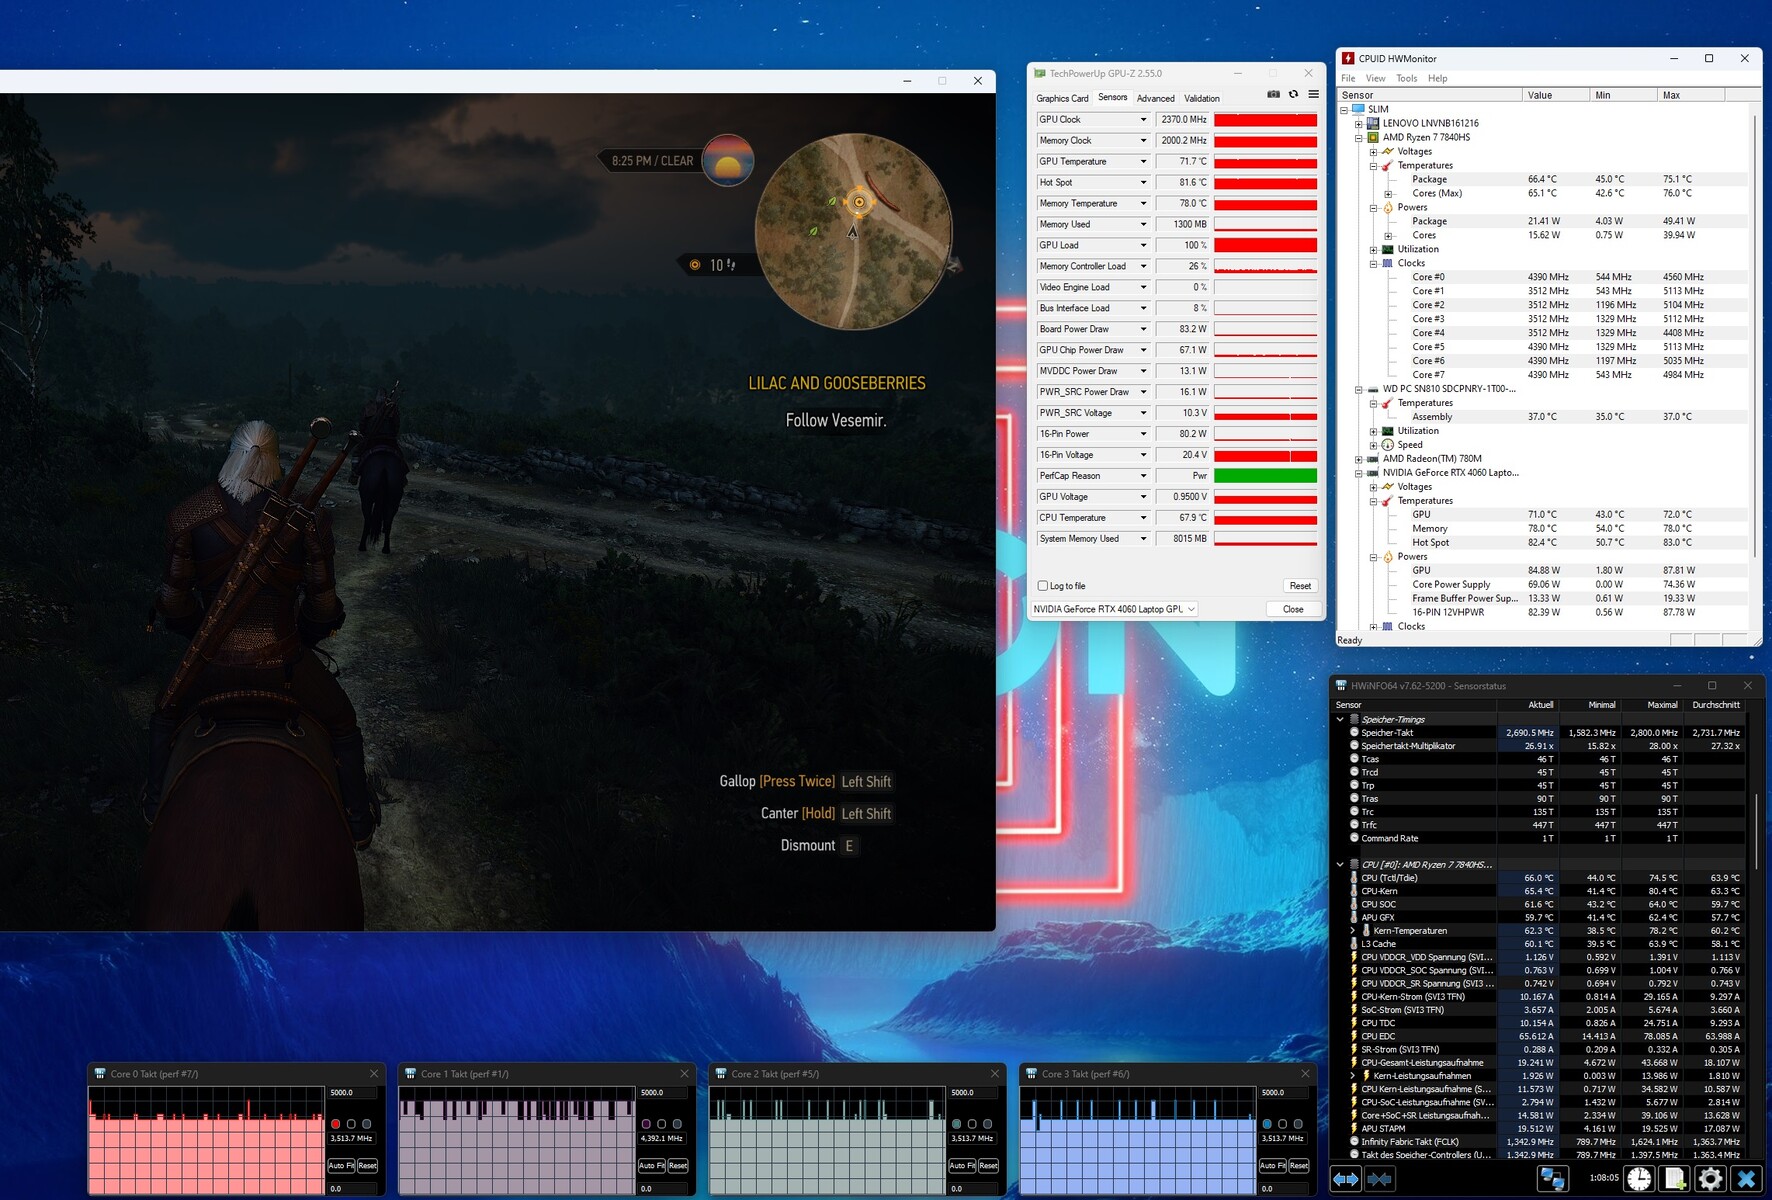
Durante il test di 60 minuti con Il Witcher 3non sono state osservate anomalie. La frequenza dei fotogrammi è rimasta relativamente stabile per tutta la durata.
Witcher 3 FPS chart
| basso | medio | alto | ultra | QHD | |
|---|---|---|---|---|---|
| GTA V (2015) | 172.9 | 166 | 103.2 | ||
| The Witcher 3 (2015) | 98 | ||||
| Dota 2 Reborn (2015) | 161.6 | 159.2 | 140.6 | 134.7 | |
| X-Plane 11.11 (2018) | 116 | 103.5 | 81.6 | ||
| Strange Brigade (2018) | 258 | 208 | 180.8 | ||
| Atomic Heart (2023) | 122.1 | 82.7 | 64.9 | 50.7 | |
| Company of Heroes 3 (2023) | 156 | 122 | 120 | 92 | |
| Sons of the Forest (2023) | 83.8 | 80.2 | 78.8 | 64.2 | |
| Resident Evil 4 Remake (2023) | 98.4 | 92.1 | 64.4 | 55.1 | |
| Armored Core 6 (2023) | 104.5 | 103.1 | 95.6 | 73.2 | |
| Baldur's Gate 3 (2023) | 98.7 | 84.8 | 82.6 | 55.8 | |
| EA Sports FC 24 (2023) | 187.9 | 155.2 | 136.9 | 117.5 | |
| Assassin's Creed Mirage (2023) | 80 | 76 | 65 | 64 | |
| Total War Pharaoh (2023) | 193 | 128 | 104 | 76 | |
| Lords of the Fallen (2023) | 66.4 | 48.2 | 33.2 | 24.2 | |
| Alan Wake 2 (2023) | 58.5 | 53.8 | 33.8 |
Emissioni
Rumore del sistema
Presenta i livelli di rumore più bassi nel campo di prova, con livelli di rumore compresi tra 33 e 49 dB(A) in modalità 3D. Per i giocatori sensibili al rumore, consigliamo di scegliere la modalità silenziosa, che comporta una perdita minima di prestazioni e riduce drasticamente il rumore di lavoro (fare riferimento alla tabella per le condizioni di test specifiche). Le ventole sono talvolta del tutto silenziose quando sono inattive, e anche quando sono attive, il rumore generato è ridotto al minimo. Vale la pena menzionare che la nostra unità di prova non ha mostrato alcun segno di ronzio della bobina.
Rumorosità
| Idle |
| 25 / 28 / 31 dB(A) |
| Sotto carico |
| 33 / 49 dB(A) |
 | ||
30 dB silenzioso 40 dB(A) udibile 50 dB(A) rumoroso |
||
min: | ||
| Lenovo Legion Slim 7 16APH8 R7 7840HS, GeForce RTX 4060 Laptop GPU | Asus ROG Flow X16 GV601V i9-13900H, GeForce RTX 4060 Laptop GPU | Alienware m16 R1 Intel i7-13700HX, GeForce RTX 4060 Laptop GPU | Acer Predator Helios 16 PH16-71-731Q i7-13700HX, GeForce RTX 4060 Laptop GPU | Lenovo Legion Pro 5 16IRX8 i7-13700HX, GeForce RTX 4060 Laptop GPU | Lenovo LOQ 16IRH8 i7-13620H, GeForce RTX 4060 Laptop GPU | |
|---|---|---|---|---|---|---|
| Noise | 3% | -8% | -0% | 4% | -6% | |
| off /ambiente * (dB) | 24 | 24 -0% | 25 -4% | 24 -0% | 23 4% | 23 4% |
| Idle Minimum * (dB) | 25 | 24 4% | 25 -0% | 24 4% | 23.1 8% | 23 8% |
| Idle Average * (dB) | 28 | 24 14% | 26 7% | 24 14% | 23.1 17% | 23 18% |
| Idle Maximum * (dB) | 31 | 24 23% | 27 13% | 32.32 -4% | 26.6 14% | 27.66 11% |
| Load Average * (dB) | 33 | 36.71 -11% | 52 -58% | 36.66 -11% | 34.7 -5% | 53.62 -62% |
| Witcher 3 ultra * (dB) | 47 | 50.92 -8% | 51 -9% | 49.06 -4% | 47.6 -1% | 53.5 -14% |
| Load Maximum * (dB) | 49 | 50.92 -4% | 53 -8% | 49.49 -1% | 54.8 -12% | 53.5 -9% |
* ... Meglio usare valori piccoli
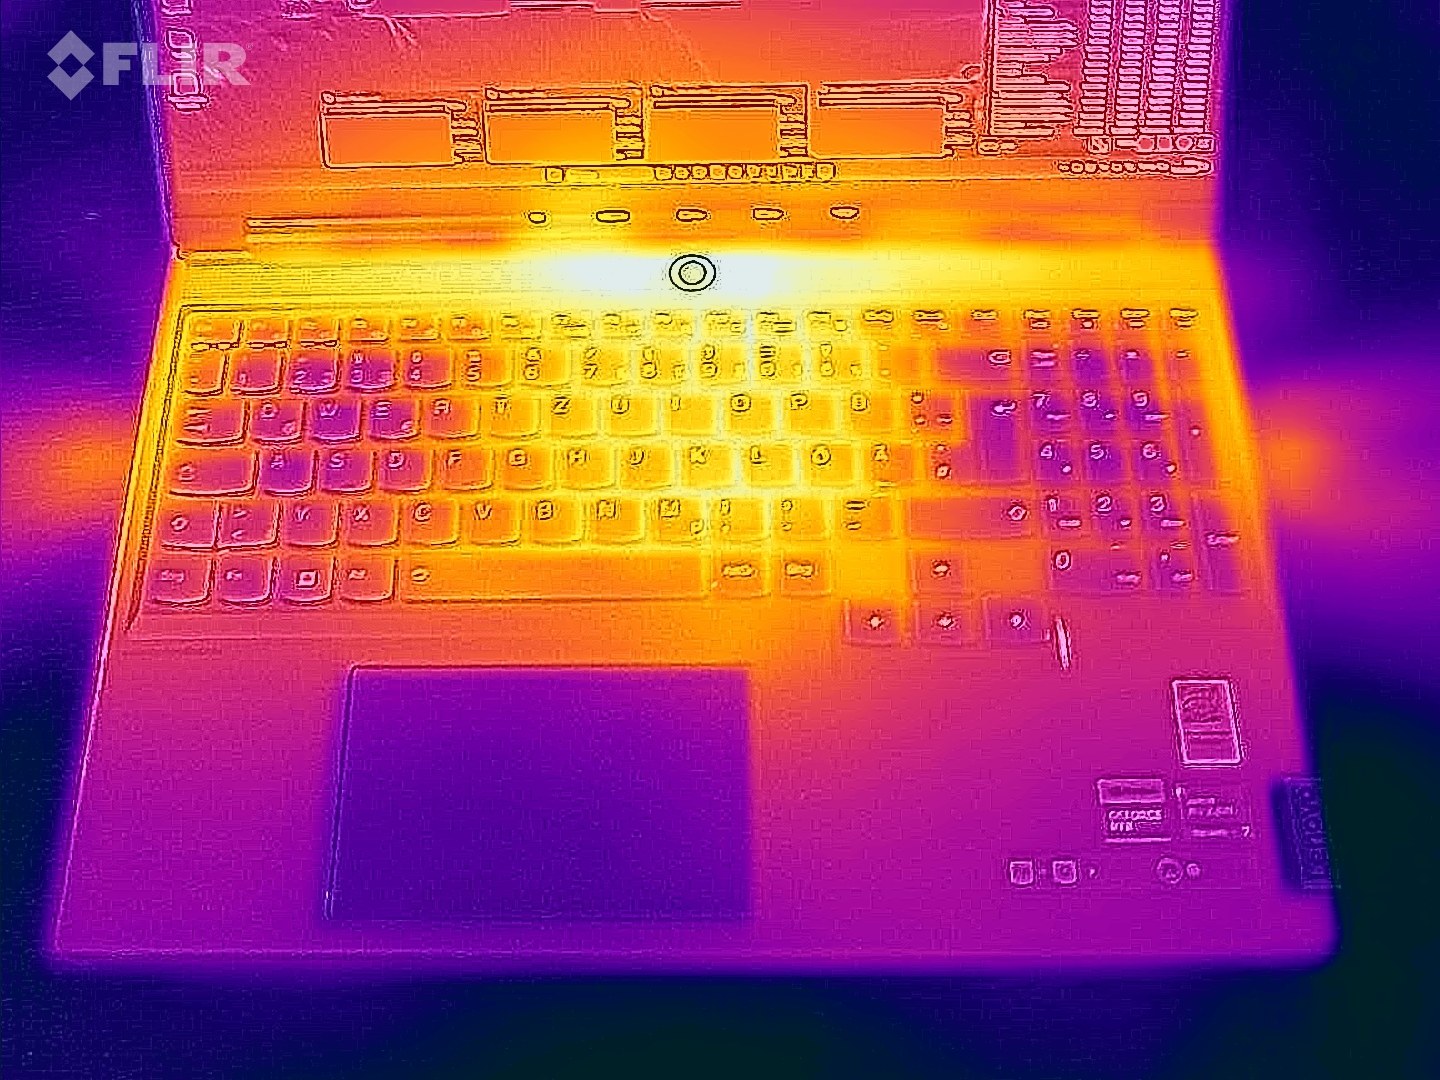
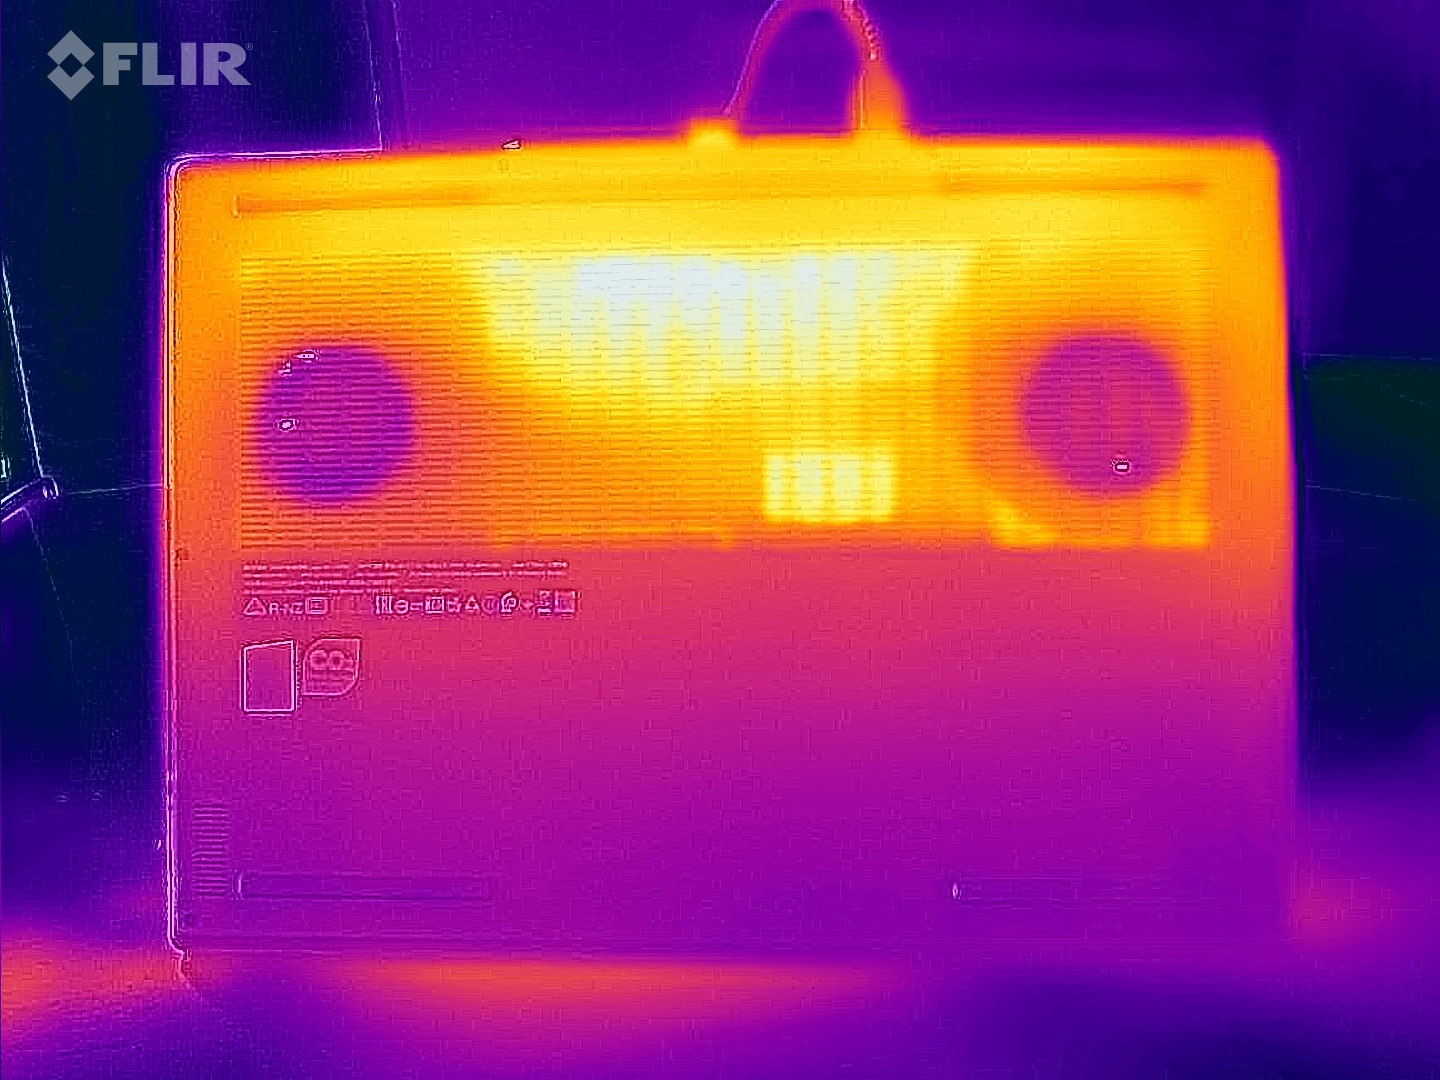
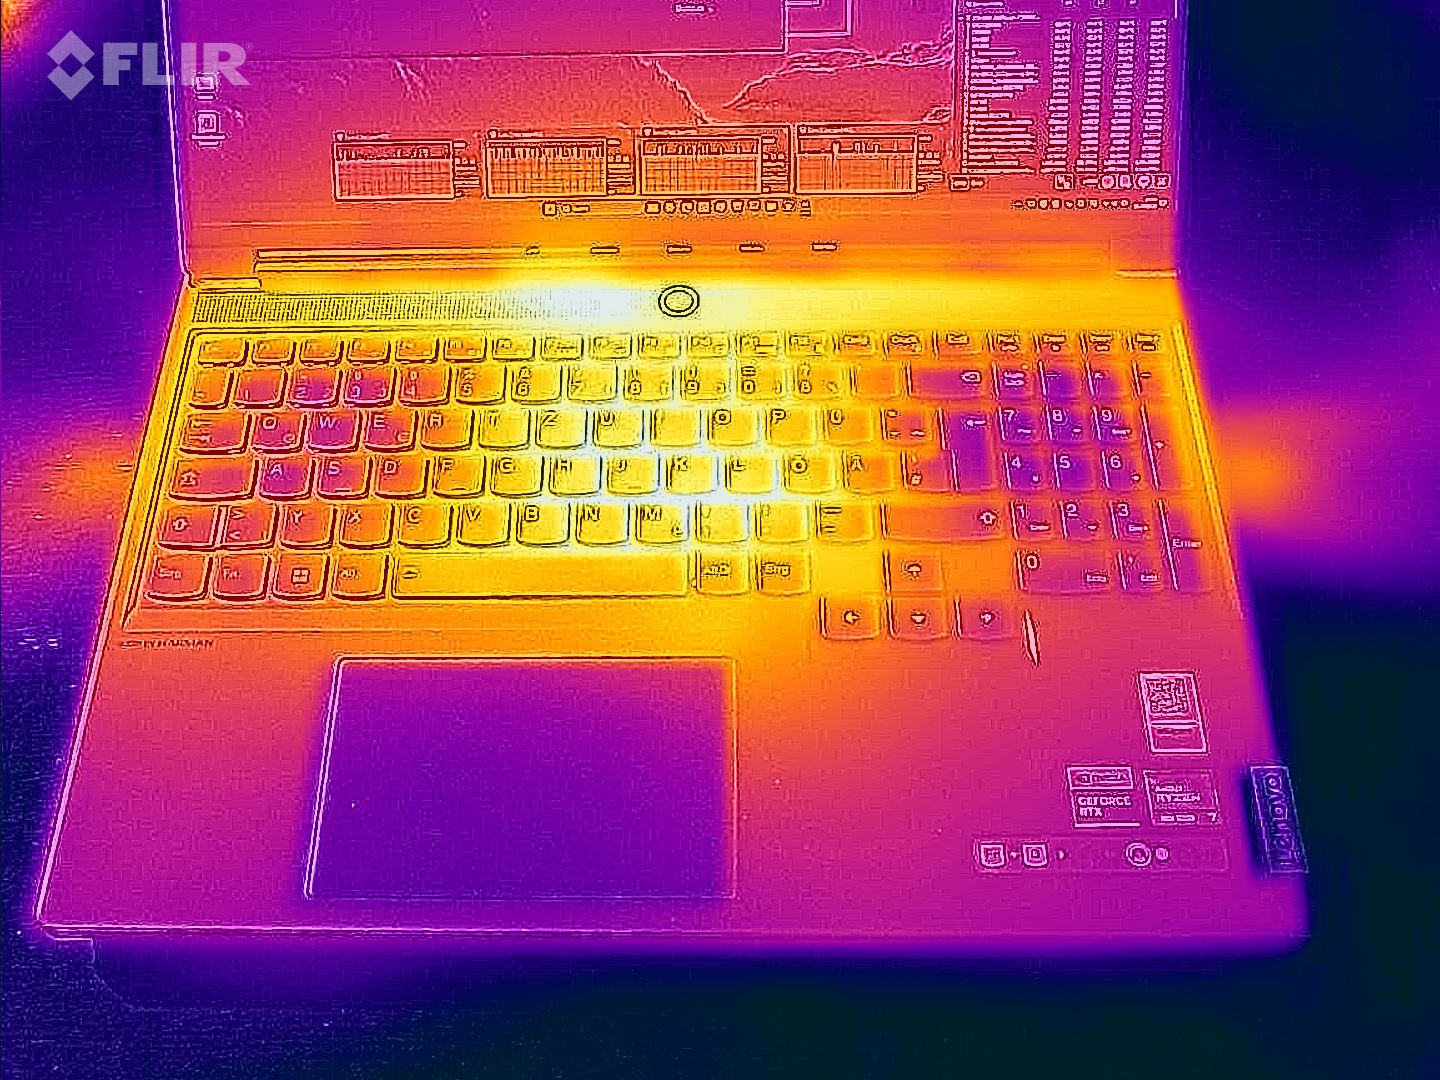
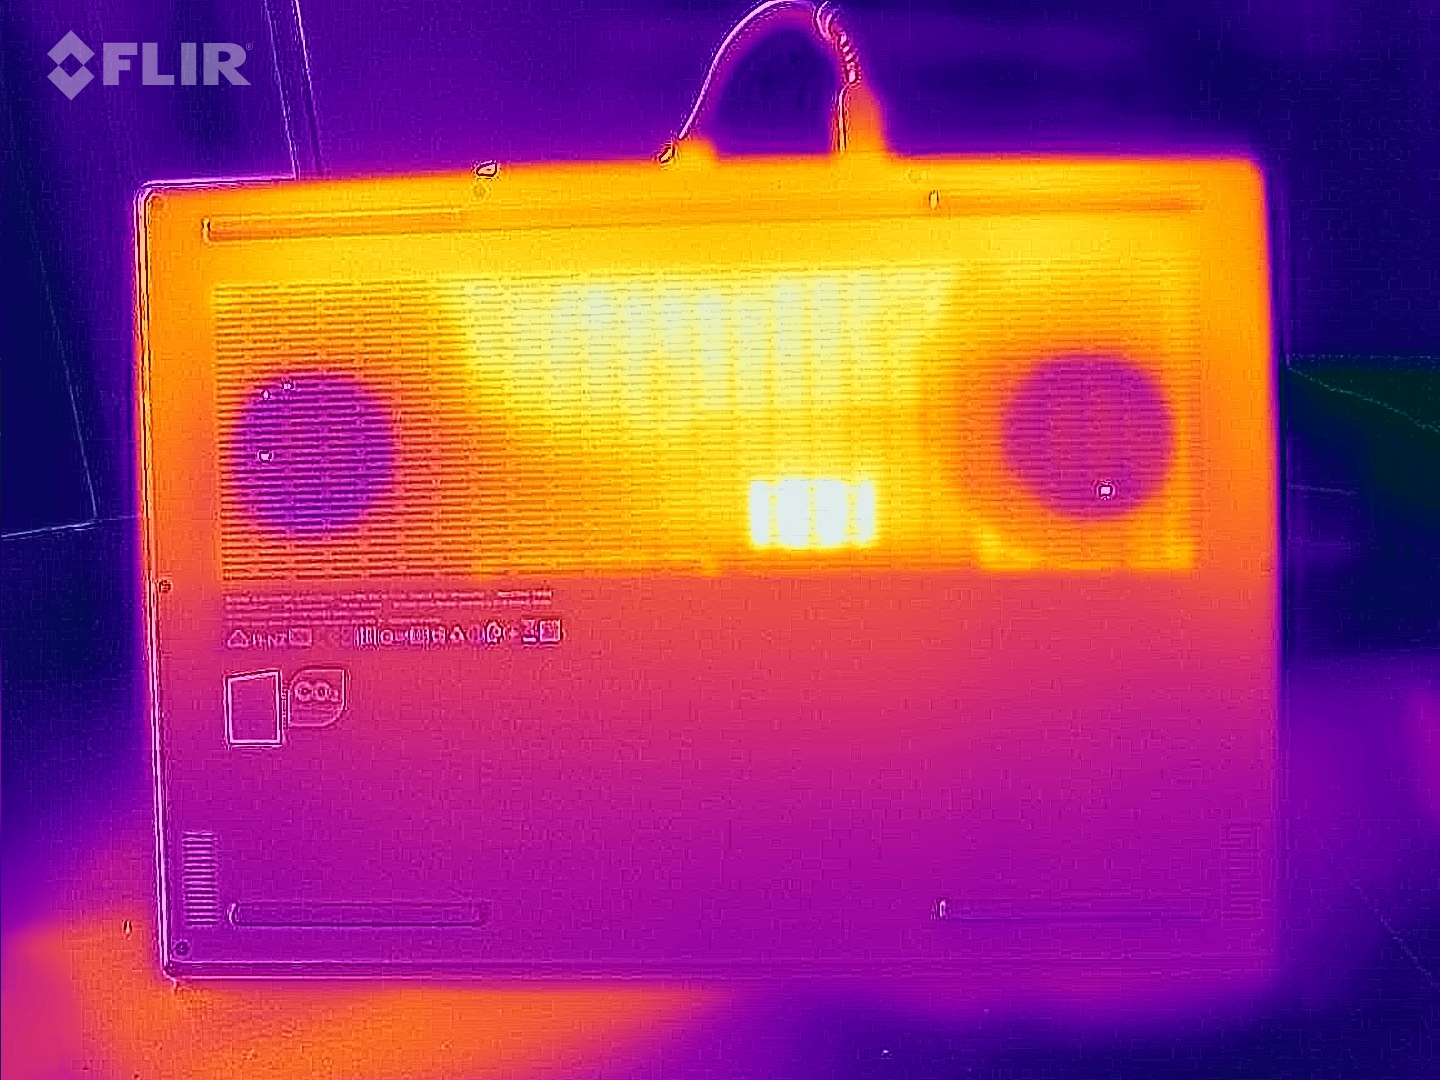
Temperatura
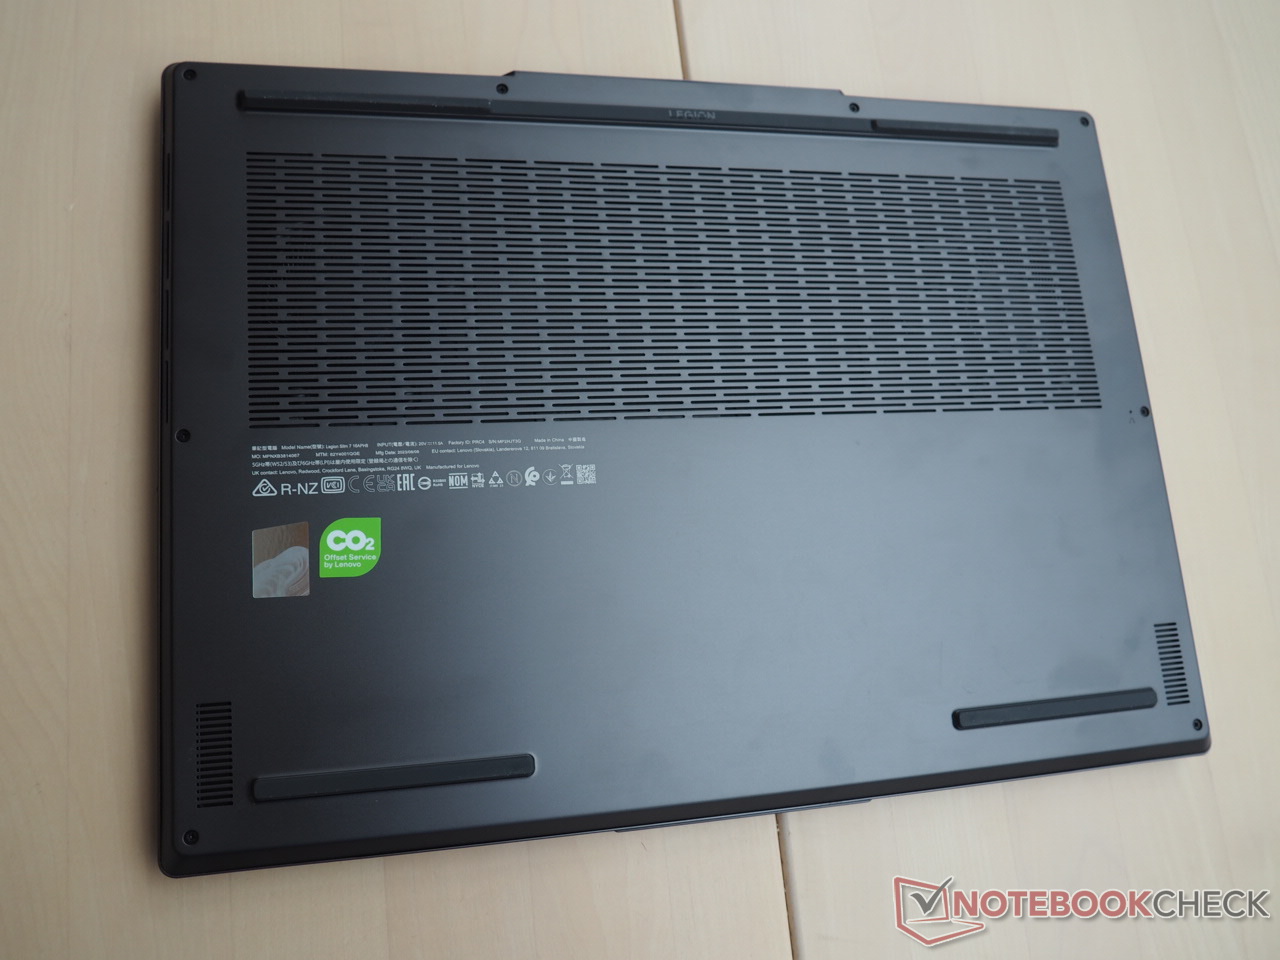
La temperatura all'interno del case rientra nella fascia media e non raggiunge livelli eccezionalmente bassi o alti. Durante gli stress test con gli strumenti Furmark e Prime95, la scheda grafica è andata in tilt, causando le temperature più elevate in modalità gaming. Dopo 60 minuti di funzionamento di The Witcher 3, lo chassis ha raggiunto un massimo di 49°C nella parte superiore e 52°C in quella inferiore, valori tipici per un notebook da gioco. In modalità idle, le temperature superficiali si aggirano intorno a una media di 30°C, indicando un livello di calore moderato.
(-) La temperatura massima sul lato superiore è di 46 °C / 115 F, rispetto alla media di 40.4 °C / 105 F, che varia da 21.2 a 68.8 °C per questa classe Gaming.
(-) Il lato inferiore si riscalda fino ad un massimo di 46 °C / 115 F, rispetto alla media di 43.2 °C / 110 F
(+) In idle, la temperatura media del lato superiore è di 30.3 °C / 87 F, rispetto alla media deld ispositivo di 33.9 °C / 93 F.
(-) Riproducendo The Witcher 3, la temperatura media per il lato superiore e' di 41.6 °C / 107 F, rispetto alla media del dispositivo di 33.9 °C / 93 F.
(+) I poggiapolsi e il touchpad raggiungono la temperatura massima della pelle (35 °C / 95 F) e quindi non sono caldi.
(-) La temperatura media della zona del palmo della mano di dispositivi simili e'stata di 28.8 °C / 83.8 F (-6.2 °C / -11.2 F).
| Lenovo Legion Slim 7 16APH8 R7 7840HS, GeForce RTX 4060 Laptop GPU | Asus ROG Flow X16 GV601V i9-13900H, GeForce RTX 4060 Laptop GPU | Alienware m16 R1 Intel i7-13700HX, GeForce RTX 4060 Laptop GPU | Acer Predator Helios 16 PH16-71-731Q i7-13700HX, GeForce RTX 4060 Laptop GPU | Lenovo Legion Pro 5 16IRX8 i7-13700HX, GeForce RTX 4060 Laptop GPU | Lenovo LOQ 16IRH8 i7-13620H, GeForce RTX 4060 Laptop GPU | |
|---|---|---|---|---|---|---|
| Heat | 1% | -12% | -13% | 2% | 0% | |
| Maximum Upper Side * (°C) | 46 | 46 -0% | 49 -7% | 41 11% | 42.8 7% | 48 -4% |
| Maximum Bottom * (°C) | 46 | 41 11% | 48 -4% | 66 -43% | 50 -9% | 59 -28% |
| Idle Upper Side * (°C) | 33 | 36 -9% | 40 -21% | 36 -9% | 29.6 10% | 28 15% |
| Idle Bottom * (°C) | 34 | 33 3% | 39 -15% | 37 -9% | 34 -0% | 28 18% |
* ... Meglio usare valori piccoli
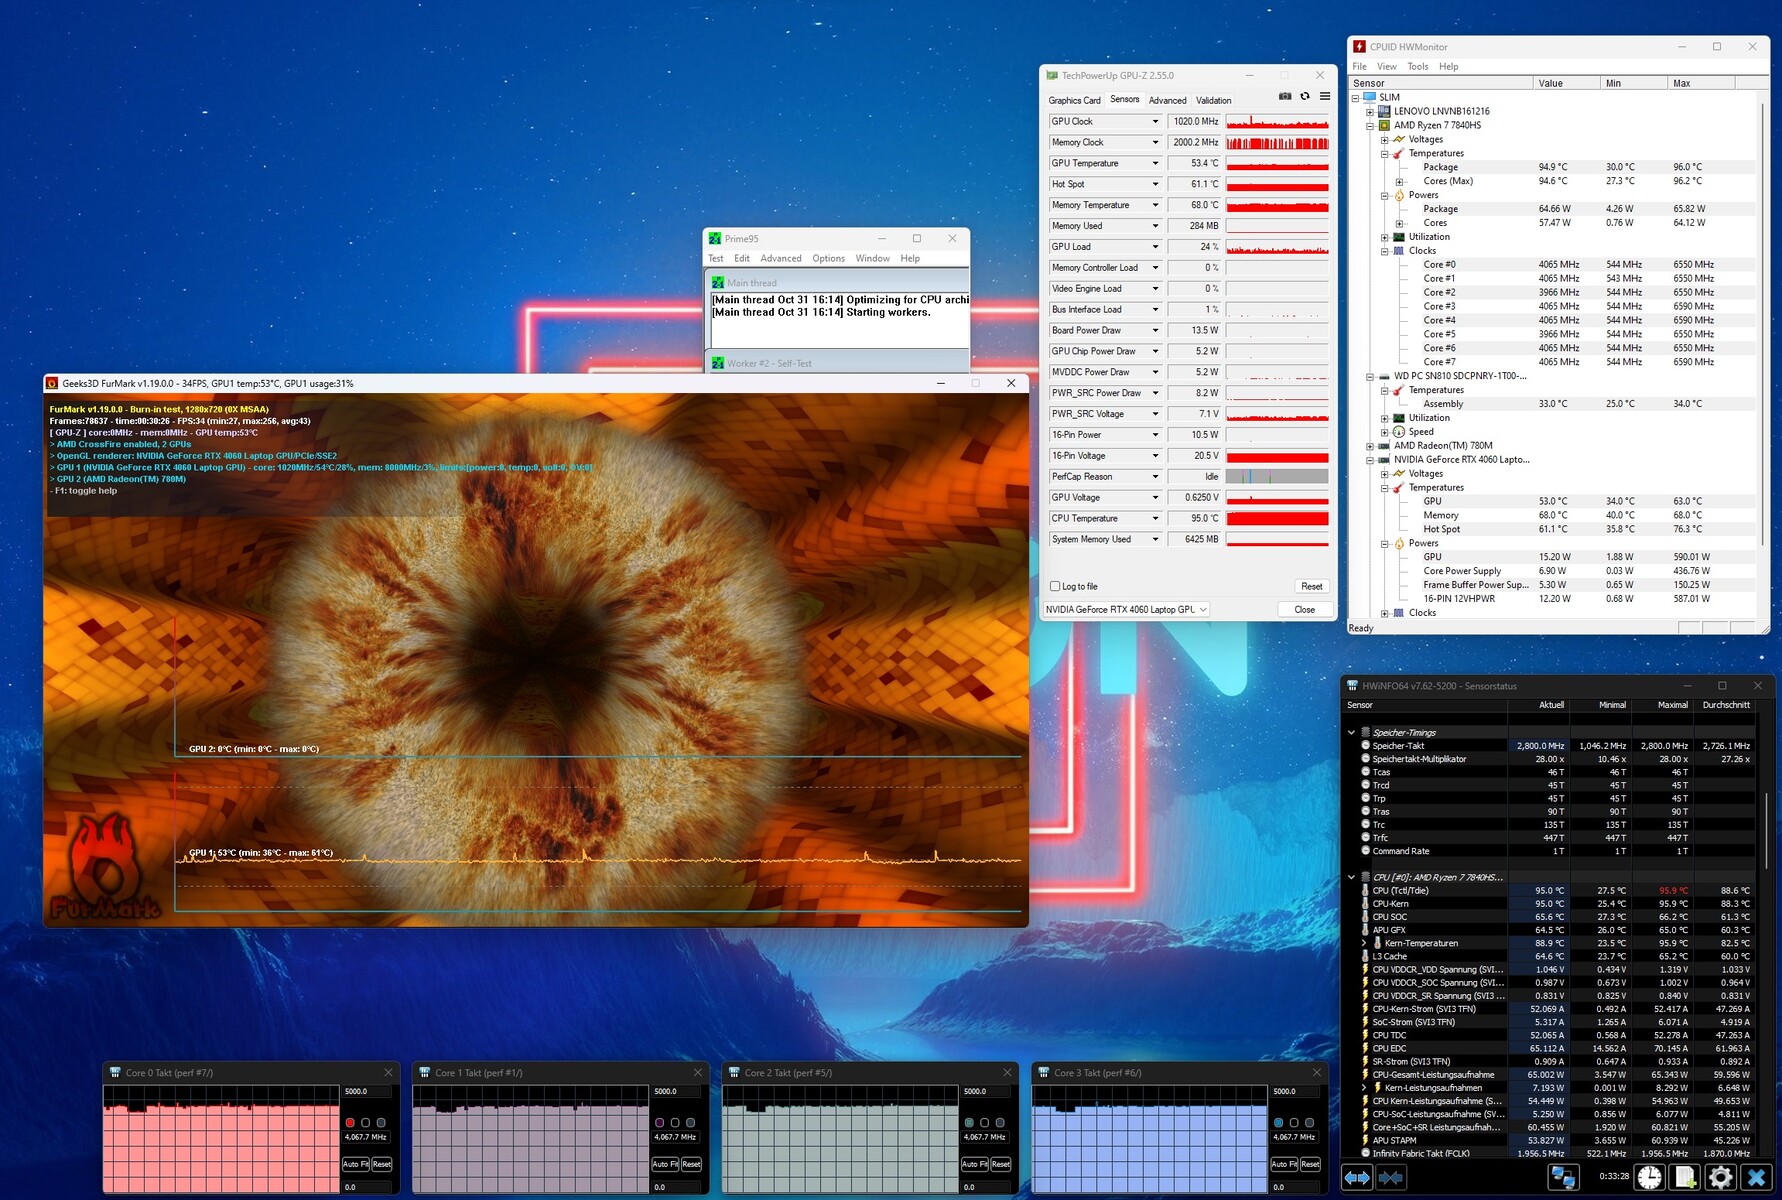
Test da sforzo
La CPU è diventata piuttosto calda durante il nostro test di stress di 60 minuti. Sebbene Ryzen 7 7840HS abbia raggiunto i 95°C, ha mantenuto una frequenza costante di 4,1 GHz. In modalità gaming, la situazione è notevolmente più rilassata. Mentre giocava a The Witcher 3, la temperatura della CPU oscillava a 66°C, mentre la temperatura della scheda grafica rimaneva nella fascia verde, appena sotto i 72°C.
Altoparlanti
La qualità del suono supera quella della maggior parte dei concorrenti. Il sistema 2.0 (Harman) produce un suono robusto che può essere piacevolmente forte, se necessario. Tuttavia, come nella maggior parte dei notebook, i bassi sono un po' carenti.
Lenovo Legion Slim 7 16APH8 analisi audio
(+) | gli altoparlanti sono relativamente potenti (87 dB)
Bassi 100 - 315 Hz
(±) | bassi ridotti - in media 13.8% inferiori alla media
(±) | la linearità dei bassi è media (8.5% delta rispetto alla precedente frequenza)
Medi 400 - 2000 Hz
(+) | medi bilanciati - solo only 1.1% rispetto alla media
(+) | medi lineari (2.5% delta rispetto alla precedente frequenza)
Alti 2 - 16 kHz
(+) | Alti bilanciati - appena 4.1% dalla media
(+) | alti lineari (4.8% delta rispetto alla precedente frequenza)
Nel complesso 100 - 16.000 Hz
(+) | suono nel complesso lineare (9.9% differenza dalla media)
Rispetto alla stessa classe
» 5% di tutti i dispositivi testati in questa classe è stato migliore, 2% simile, 94% peggiore
» Il migliore ha avuto un delta di 6%, medio di 18%, peggiore di 132%
Rispetto a tutti i dispositivi testati
» 4% di tutti i dispositivi testati in questa classe è stato migliore, 1% similare, 95% peggiore
» Il migliore ha avuto un delta di 4%, medio di 24%, peggiore di 134%
Asus ROG Flow X16 GV601V analisi audio
(±) | potenza degli altiparlanti media ma buona (77.38 dB)
Bassi 100 - 315 Hz
(±) | bassi ridotti - in media 9.6% inferiori alla media
(±) | la linearità dei bassi è media (9.2% delta rispetto alla precedente frequenza)
Medi 400 - 2000 Hz
(+) | medi bilanciati - solo only 4.7% rispetto alla media
(±) | linearità dei medi adeguata (7.5% delta rispetto alla precedente frequenza)
Alti 2 - 16 kHz
(+) | Alti bilanciati - appena 2.2% dalla media
(+) | alti lineari (6.1% delta rispetto alla precedente frequenza)
Nel complesso 100 - 16.000 Hz
(+) | suono nel complesso lineare (12% differenza dalla media)
Rispetto alla stessa classe
» 12% di tutti i dispositivi testati in questa classe è stato migliore, 4% simile, 84% peggiore
» Il migliore ha avuto un delta di 6%, medio di 18%, peggiore di 132%
Rispetto a tutti i dispositivi testati
» 9% di tutti i dispositivi testati in questa classe è stato migliore, 2% similare, 88% peggiore
» Il migliore ha avuto un delta di 4%, medio di 24%, peggiore di 134%
Gestione dell'energia
Consumo di energia
Il consumo energetico a volte sembra essere incoerente. Nonostante la commutazione grafica attiva, il consumo in idle di 33-45 watt è superiore alla media. Tuttavia, il consumo di energia di 3DMark 06, pari a circa 59 watt, è molto basso. Inoltre, i risultati ottenuti durante The Witcher 3 (131 watt) e lo stress test (massimo 177 watt) sono inferiori alla concorrenza, dimostrando l'efficienza energetica della CPU Zen 4, almeno sotto carico.
| Off / Standby | |
| Idle | |
| Sotto carico |
|
Leggenda:
min: | |
| Lenovo Legion Slim 7 16APH8 R7 7840HS, GeForce RTX 4060 Laptop GPU | Asus ROG Flow X16 GV601V i9-13900H, GeForce RTX 4060 Laptop GPU | Alienware m16 R1 Intel i7-13700HX, GeForce RTX 4060 Laptop GPU | Acer Predator Helios 16 PH16-71-731Q i7-13700HX, GeForce RTX 4060 Laptop GPU | Lenovo Legion Pro 5 16IRX8 i7-13700HX, GeForce RTX 4060 Laptop GPU | Lenovo LOQ 16IRH8 i7-13620H, GeForce RTX 4060 Laptop GPU | Media della classe Gaming | |
|---|---|---|---|---|---|---|---|
| Power Consumption | 14% | -7% | -4% | -13% | 8% | 5% | |
| Idle Minimum * (Watt) | 33 | 9.6 71% | 10 70% | 15.9 52% | 24.5 26% | 17.2 48% | 13.2 ? 60% |
| Idle Average * (Watt) | 35 | 16 54% | 14 60% | 20.5 41% | 29.2 17% | 19.3 45% | 18.9 ? 46% |
| Idle Maximum * (Watt) | 45 | 16.9 62% | 21 53% | 20.9 54% | 34.3 24% | 21.2 53% | 24.3 ? 46% |
| Load Average * (Watt) | 59 | 104 -76% | 119 -102% | 106 -80% | 98.7 -67% | 90 -53% | 108 ? -83% |
| Witcher 3 ultra * (Watt) | 131 | 142 -8% | 186.7 -43% | 175 -34% | 178.6 -36% | 168 -28% | |
| Load Maximum * (Watt) | 177 | 214 -21% | 323 -82% | 276 -56% | 249.6 -41% | 211 -19% | 254 ? -44% |
* ... Meglio usare valori piccoli
Power consumption Witcher 3 / stress test
Power consumption with external monitor
Durata della batteria
Considerando la grande batteria da 99,9 Wh, l'autonomia non batte alcun record. Circa 7 ore di navigazione in Internet con una luminosità ridotta a 150 cd/m2 è buona, ma considerando le dimensioni della batteria, potrebbe essere significativamente migliore. Tuttavia, si assicura il secondo posto nel campo di prova, subito dopo l'Asus ROG Flow X16.
| Lenovo Legion Slim 7 16APH8 R7 7840HS, GeForce RTX 4060 Laptop GPU, 99.9 Wh | Asus ROG Flow X16 GV601V i9-13900H, GeForce RTX 4060 Laptop GPU, 90 Wh | Alienware m16 R1 Intel i7-13700HX, GeForce RTX 4060 Laptop GPU, 86 Wh | Acer Predator Helios 16 PH16-71-731Q i7-13700HX, GeForce RTX 4060 Laptop GPU, 90 Wh | Lenovo Legion Pro 5 16IRX8 i7-13700HX, GeForce RTX 4060 Laptop GPU, 80 Wh | Lenovo LOQ 16IRH8 i7-13620H, GeForce RTX 4060 Laptop GPU, 80 Wh | Media della classe Gaming | |
|---|---|---|---|---|---|---|---|
| Autonomia della batteria | 11% | -32% | -21% | -52% | -11% | -1% | |
| WiFi v1.3 (h) | 7.1 | 7.9 11% | 4.8 -32% | 5.6 -21% | 3.4 -52% | 6.3 -11% | 7.02 ? -1% |
| H.264 (h) | 8.9 | 5.6 | 4.8 | 6.4 | 8.26 ? | ||
| Load (h) | 1.5 | 1 | 1.5 | 0.7 | 1.5 | 1.47 ? | |
| Reader / Idle (h) | 6.4 | 6.7 | 8.71 ? | ||||
| Witcher 3 ultra (h) | 1.5 |
Pro
Contro
Il verdetto

La versione AMD del portatile, come la sua controparte Intel, è altamente raccomandata.
La sinergia tra Ryzen 7 7840HS e GeForce RTX 4060 permette di ottenere prestazioni fluide, consentendo impostazioni elevate al massimo con una risoluzione di 2.560 x 1.600 pixel.
Il display da 240 Hz si distingue non solo per l'elevata luminosità, ma anche per la visibilità in ambienti esterni. Il case del portatile eccelle in vari aspetti, tra cui connessioni, stabilità, design e qualità dei materiali. Nonostante le dimensioni di 16 pollici, è piuttosto leggero (4,6 libbre). Dispone inoltre di dispositivi di input ben studiati e di un'eccellente qualità del suono.
Anche se ci sono piccoli difetti, come un consumo energetico leggermente maggiore in modalità idle e un occasionale strozzamento dell'SSD nel corso del tempo, queste mancanze non distolgono in modo significativo dall'eccellente esperienza complessiva. Di conseguenza, il portatile riceve una valutazione complessiva molto buona.
Vale la pena ricordare che la concorrenza, come l' Asus ROG Flow X16offre anch'esso prestazioni eccellenti, ma a un prezzo superiore, rendendo il nostro suggerimento ancora più allettante.
Prezzo e disponibilità
Il test di Lenovo Legion Slim 7 16APH8 è disponibile a circa 1750 dollari su Amazon.
Lenovo Legion Slim 7 16APH8
- 11/03/2023 v7 (old)
Florian Glaser
Transparency
La selezione dei dispositivi da recensire viene effettuata dalla nostra redazione. Il campione di prova è stato fornito all'autore come prestito dal produttore o dal rivenditore ai fini di questa recensione. L'istituto di credito non ha avuto alcuna influenza su questa recensione, né il produttore ne ha ricevuto una copia prima della pubblicazione. Non vi era alcun obbligo di pubblicare questa recensione. In quanto società mediatica indipendente, Notebookcheck non è soggetta all'autorità di produttori, rivenditori o editori.
Ecco come Notebookcheck esegue i test
Ogni anno, Notebookcheck esamina in modo indipendente centinaia di laptop e smartphone utilizzando procedure standardizzate per garantire che tutti i risultati siano comparabili. Da circa 20 anni sviluppiamo continuamente i nostri metodi di prova e nel frattempo stabiliamo gli standard di settore. Nei nostri laboratori di prova, tecnici ed editori esperti utilizzano apparecchiature di misurazione di alta qualità. Questi test comportano un processo di validazione in più fasi. Il nostro complesso sistema di valutazione si basa su centinaia di misurazioni e parametri di riferimento ben fondati, che mantengono l'obiettività.Price comparison

