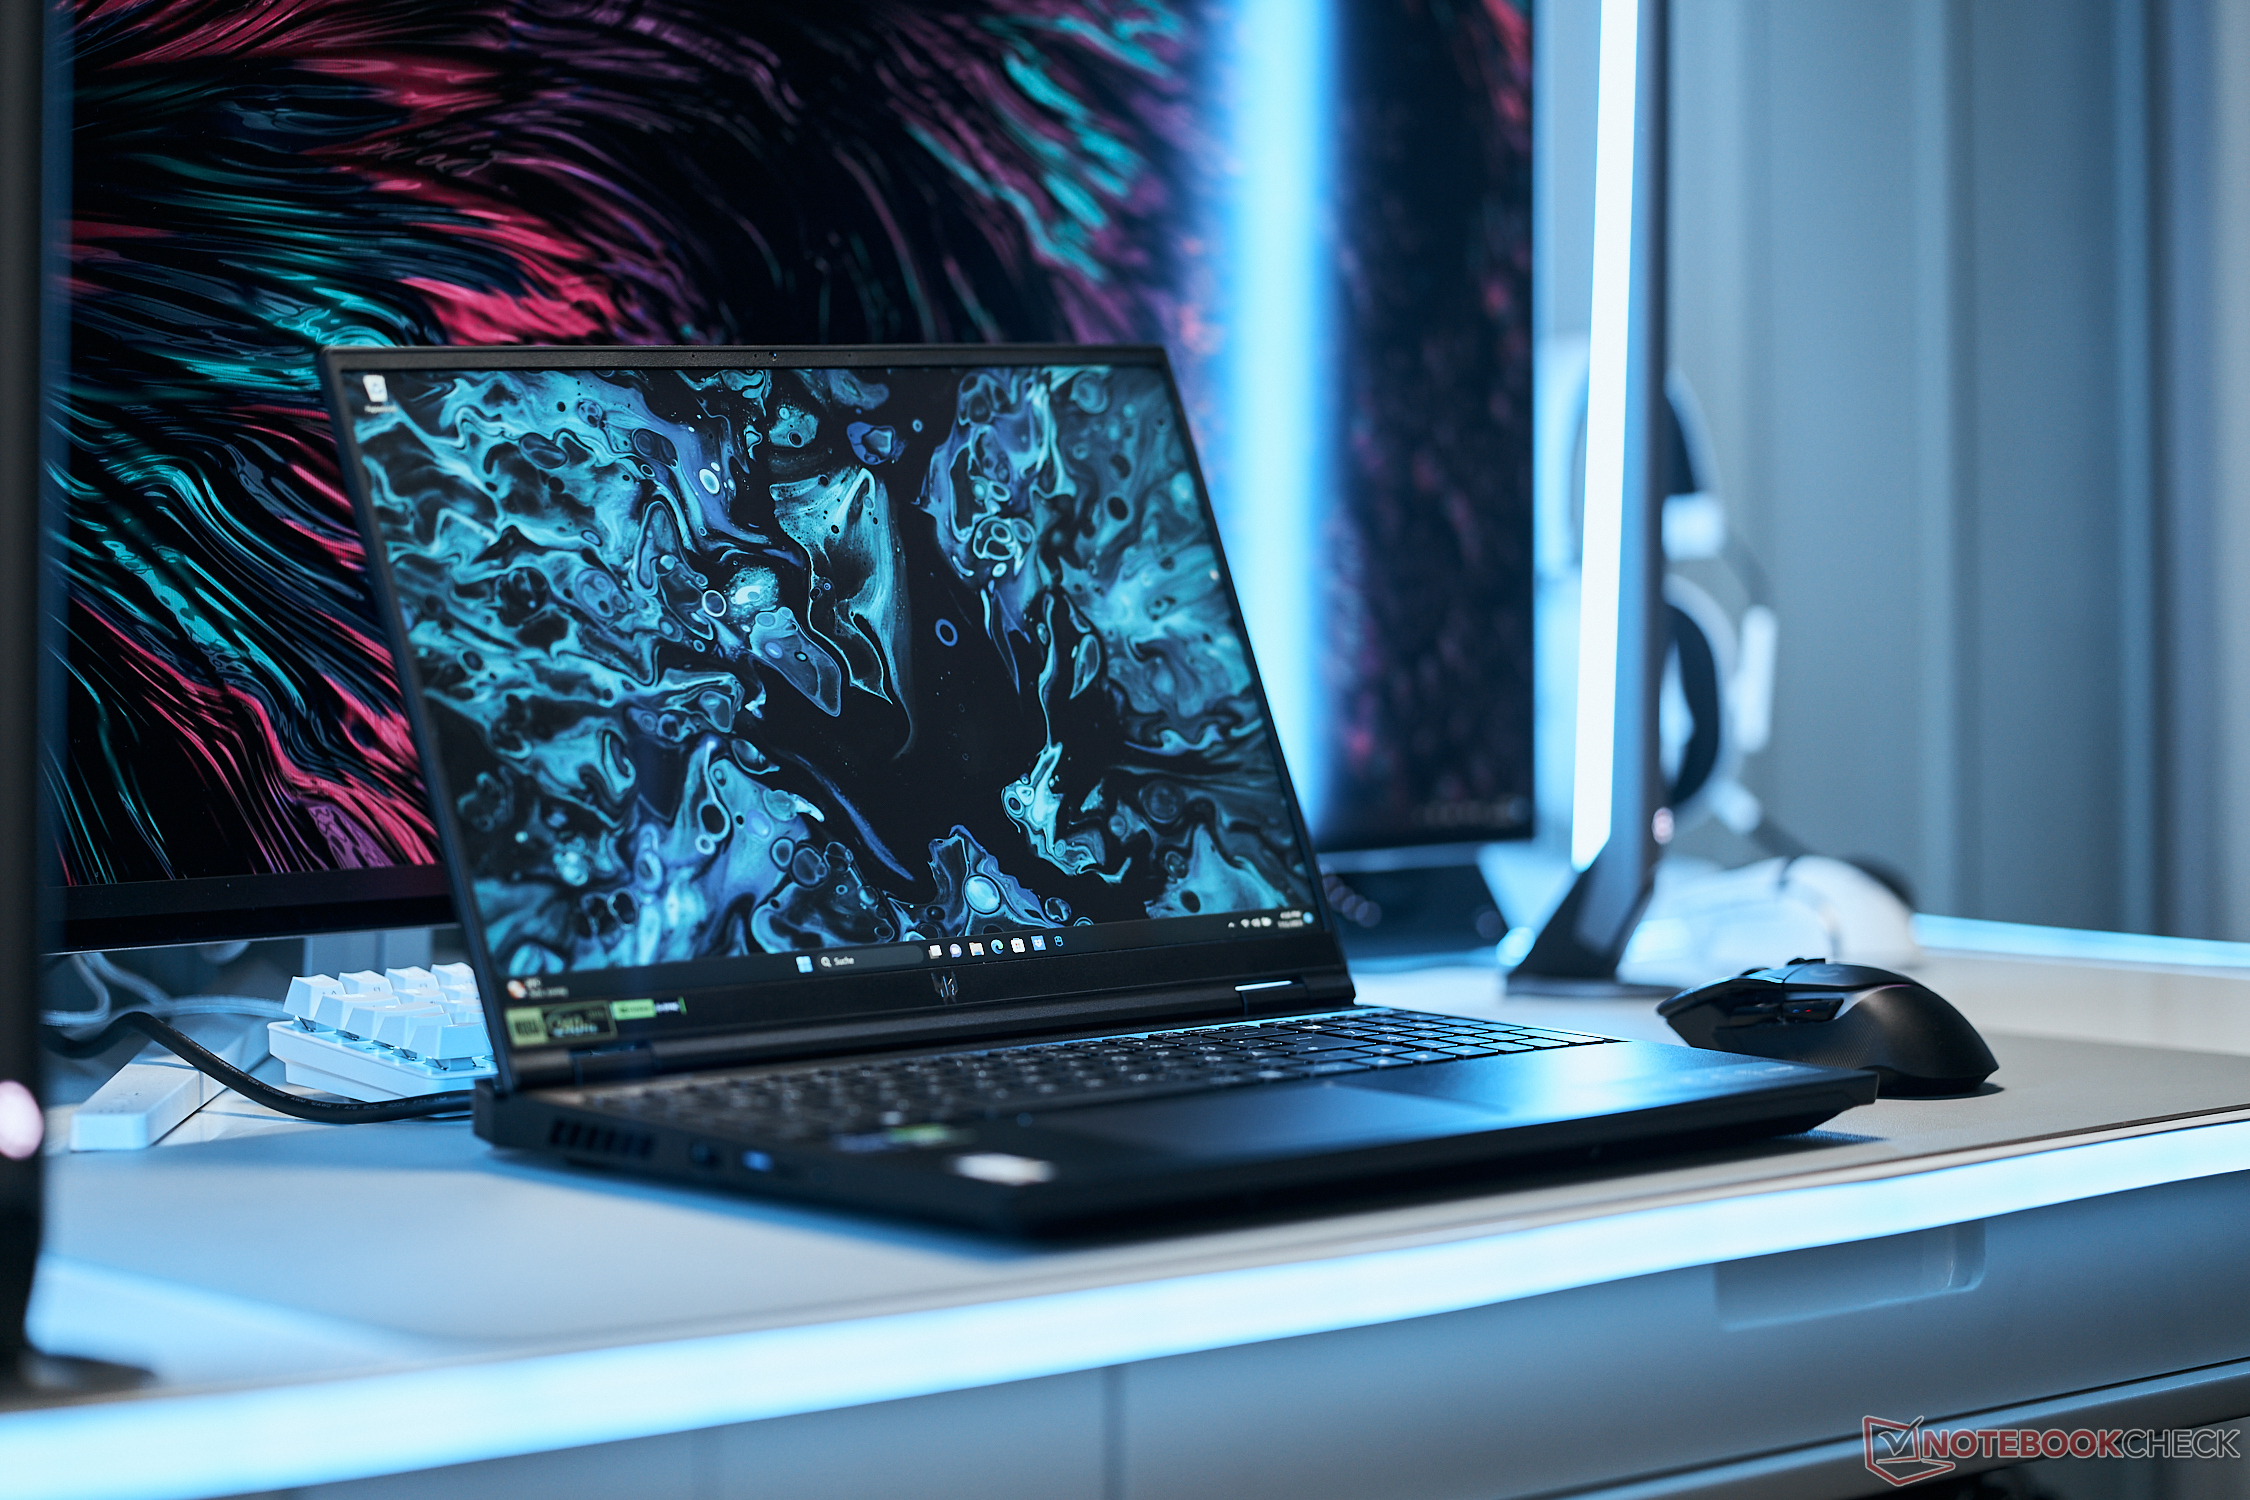
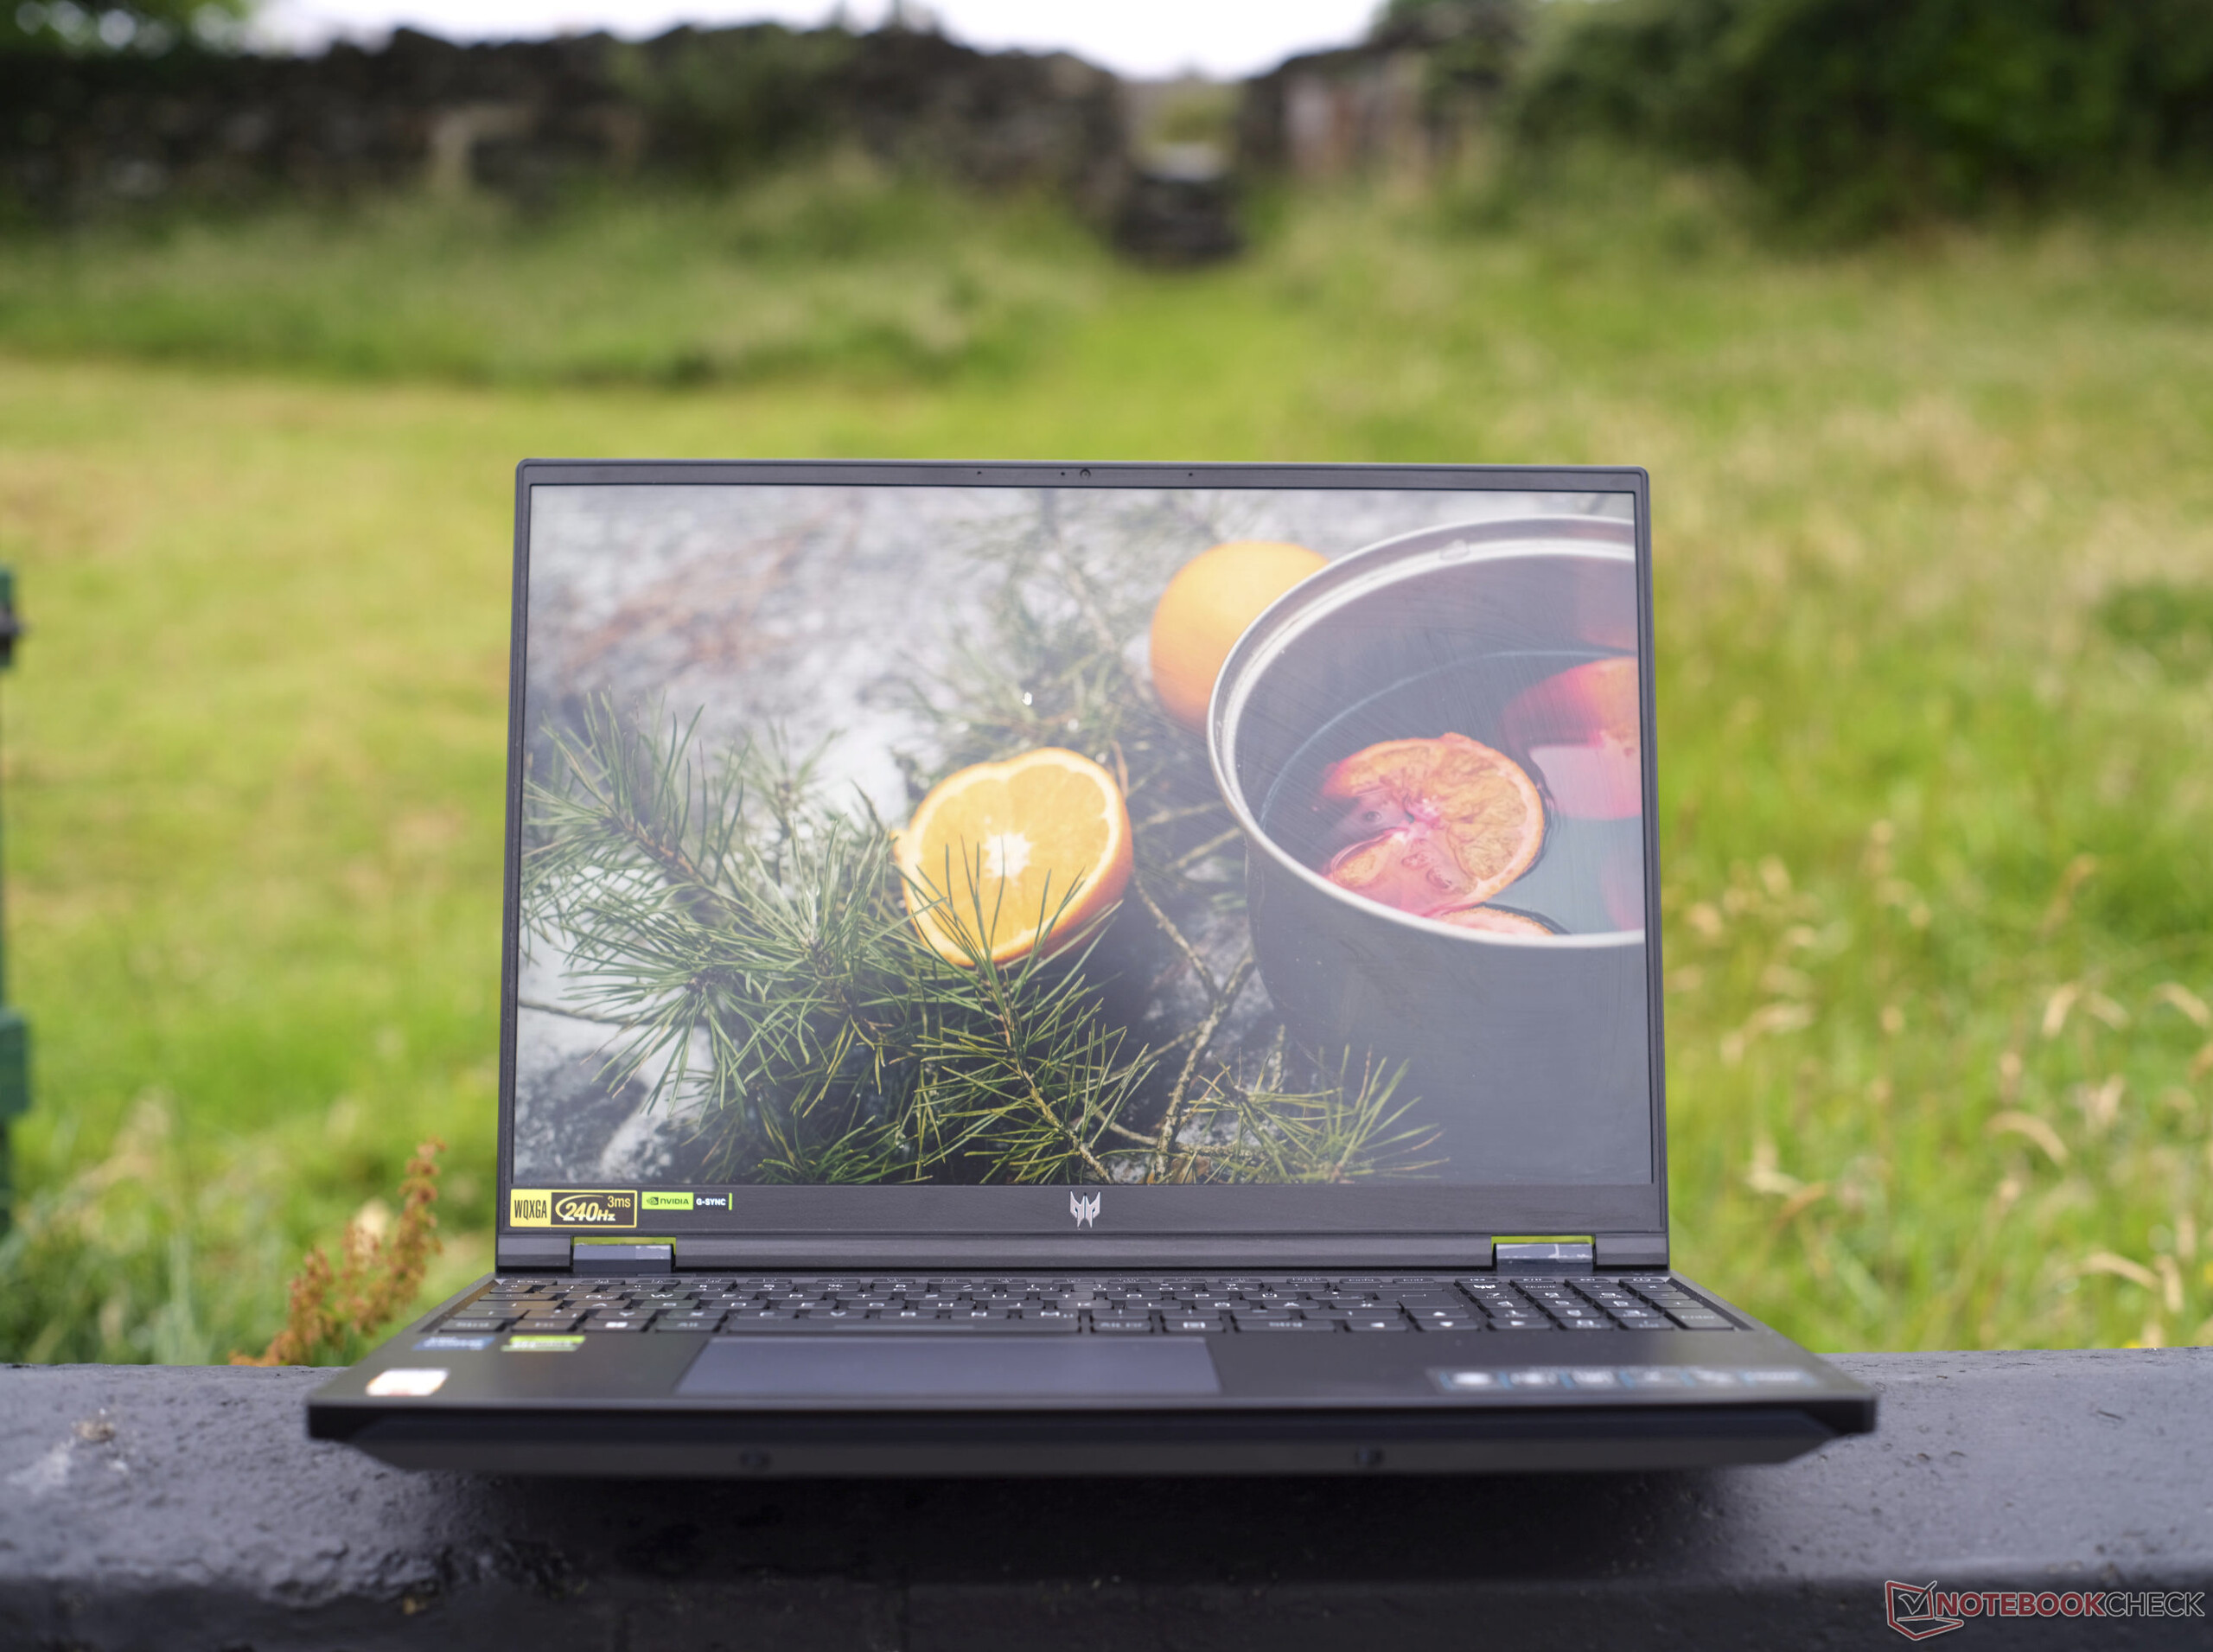
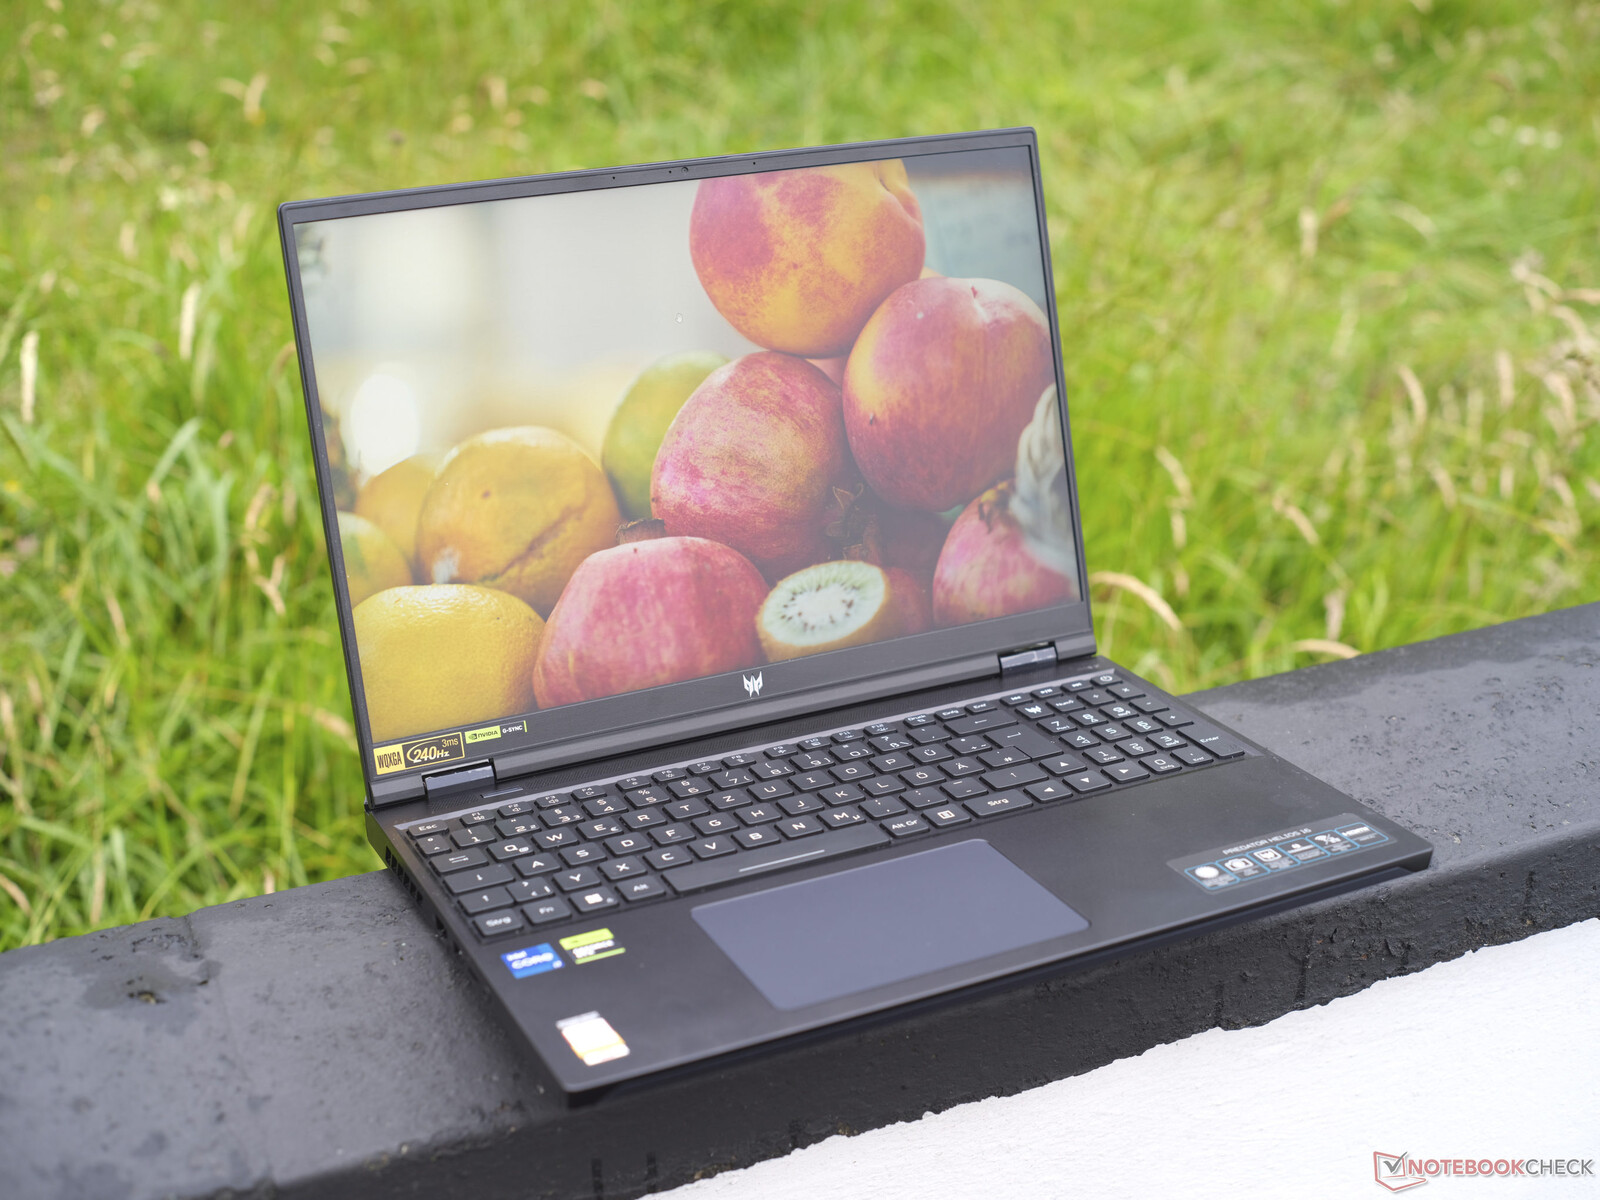
Recensione del portatile Acer Predator Helios 16: Un portatile gaming silenzioso con molti punti di forza
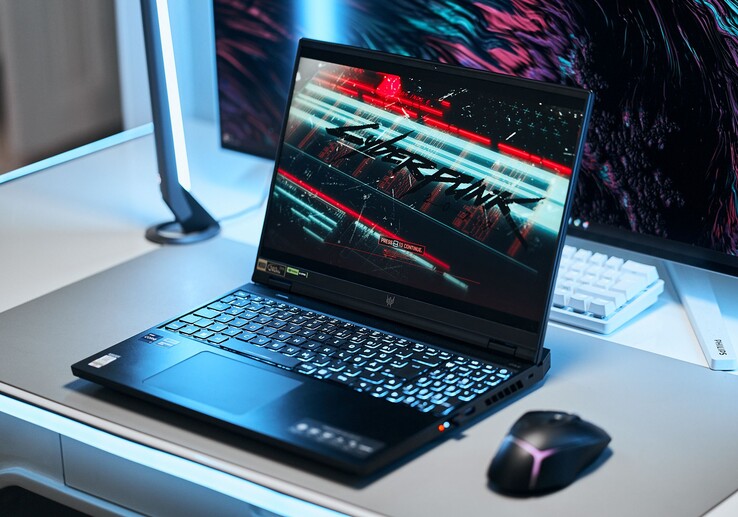
Come successore del Predator Helios 300il Predator Helios 16 è l'ultimo portatile da gioco di fascia alta di Acer con elementi di fascia media. Il nostro modello in prova ha optato per unaRTX 4060, una GPU di livello medio, e costa circa 1.700 dollari, con SKU che arrivano fino a unaRTX 4080disponibili. La fascia media pura di Acer è rappresentata dal modelloHelios Neo 16e dallaSerie Nitroquest'ultima serve a coprire il segmento entry-level. Al contrario, ilTriton 16è il portatile da gioco ultrasottile di Acer.
Inoltre, un processore Intel Core i7-13700HX (TDP di 55 watt), 16 GB di RAM DDR5 (due banchi di RAM) e un SSD da 1 TB (PCIe 4.0). Sebbene sia disponibile anche un display mini-LED, il nostro modello è dotato di un normale pannello IPS retroilluminato a LED che, inaspettatamente, ha optato per un set di funzionalità di fascia alta, come dimostra la nostra recensione.
La concorrenza si presenta principalmente sotto forma di Lenovo Legion Pro 5 ma l'Asus TUF Gaming A16e Gigabyte Aorus 15Xe il modello G15 si contendono il titolo di miglior portatile da gioco di fascia media.
Potenziali concorrenti a confronto
Punteggio | Data | Modello | Peso | Altezza | Dimensione | Risoluzione | Prezzo |
|---|---|---|---|---|---|---|---|
| 89.5 % v7 (old) | 07/2023 | Acer Predator Helios 16 PH16-71-731Q i7-13700HX, GeForce RTX 4060 Laptop GPU | 2.6 kg | 26.9 mm | 16.00" | 2560x1600 | |
| 88.1 % v7 (old) | 06/2023 | Acer Nitro 16 AN16-41 R7 7735HS, GeForce RTX 4070 Laptop GPU | 2.7 kg | 27.9 mm | 16.00" | 2560x1600 | |
| 87.9 % v7 (old) | 05/2023 | Lenovo Legion Pro 5 16IRX8 i7-13700HX, GeForce RTX 4060 Laptop GPU | 2.5 kg | 26.8 mm | 16.00" | 2560x1600 | |
| 86.2 % v7 (old) | 04/2023 | Aorus 15X ASF i7-13700HX, GeForce RTX 4070 Laptop GPU | 2.3 kg | 19.7 mm | 15.60" | 2560x1440 | |
| 86.2 % v7 (old) | 02/2023 | Asus TUF Gaming A16 FA617 R7 7735HS, Radeon RX 7600S | 2.2 kg | 27 mm | 16.00" | 1920x1200 | |
| 84.2 % v7 (old) | 06/2023 | Dell G15 5530 i7-13650HX, GeForce RTX 4060 Laptop GPU | 3 kg | 26.95 mm | 15.60" | 1920x1080 |
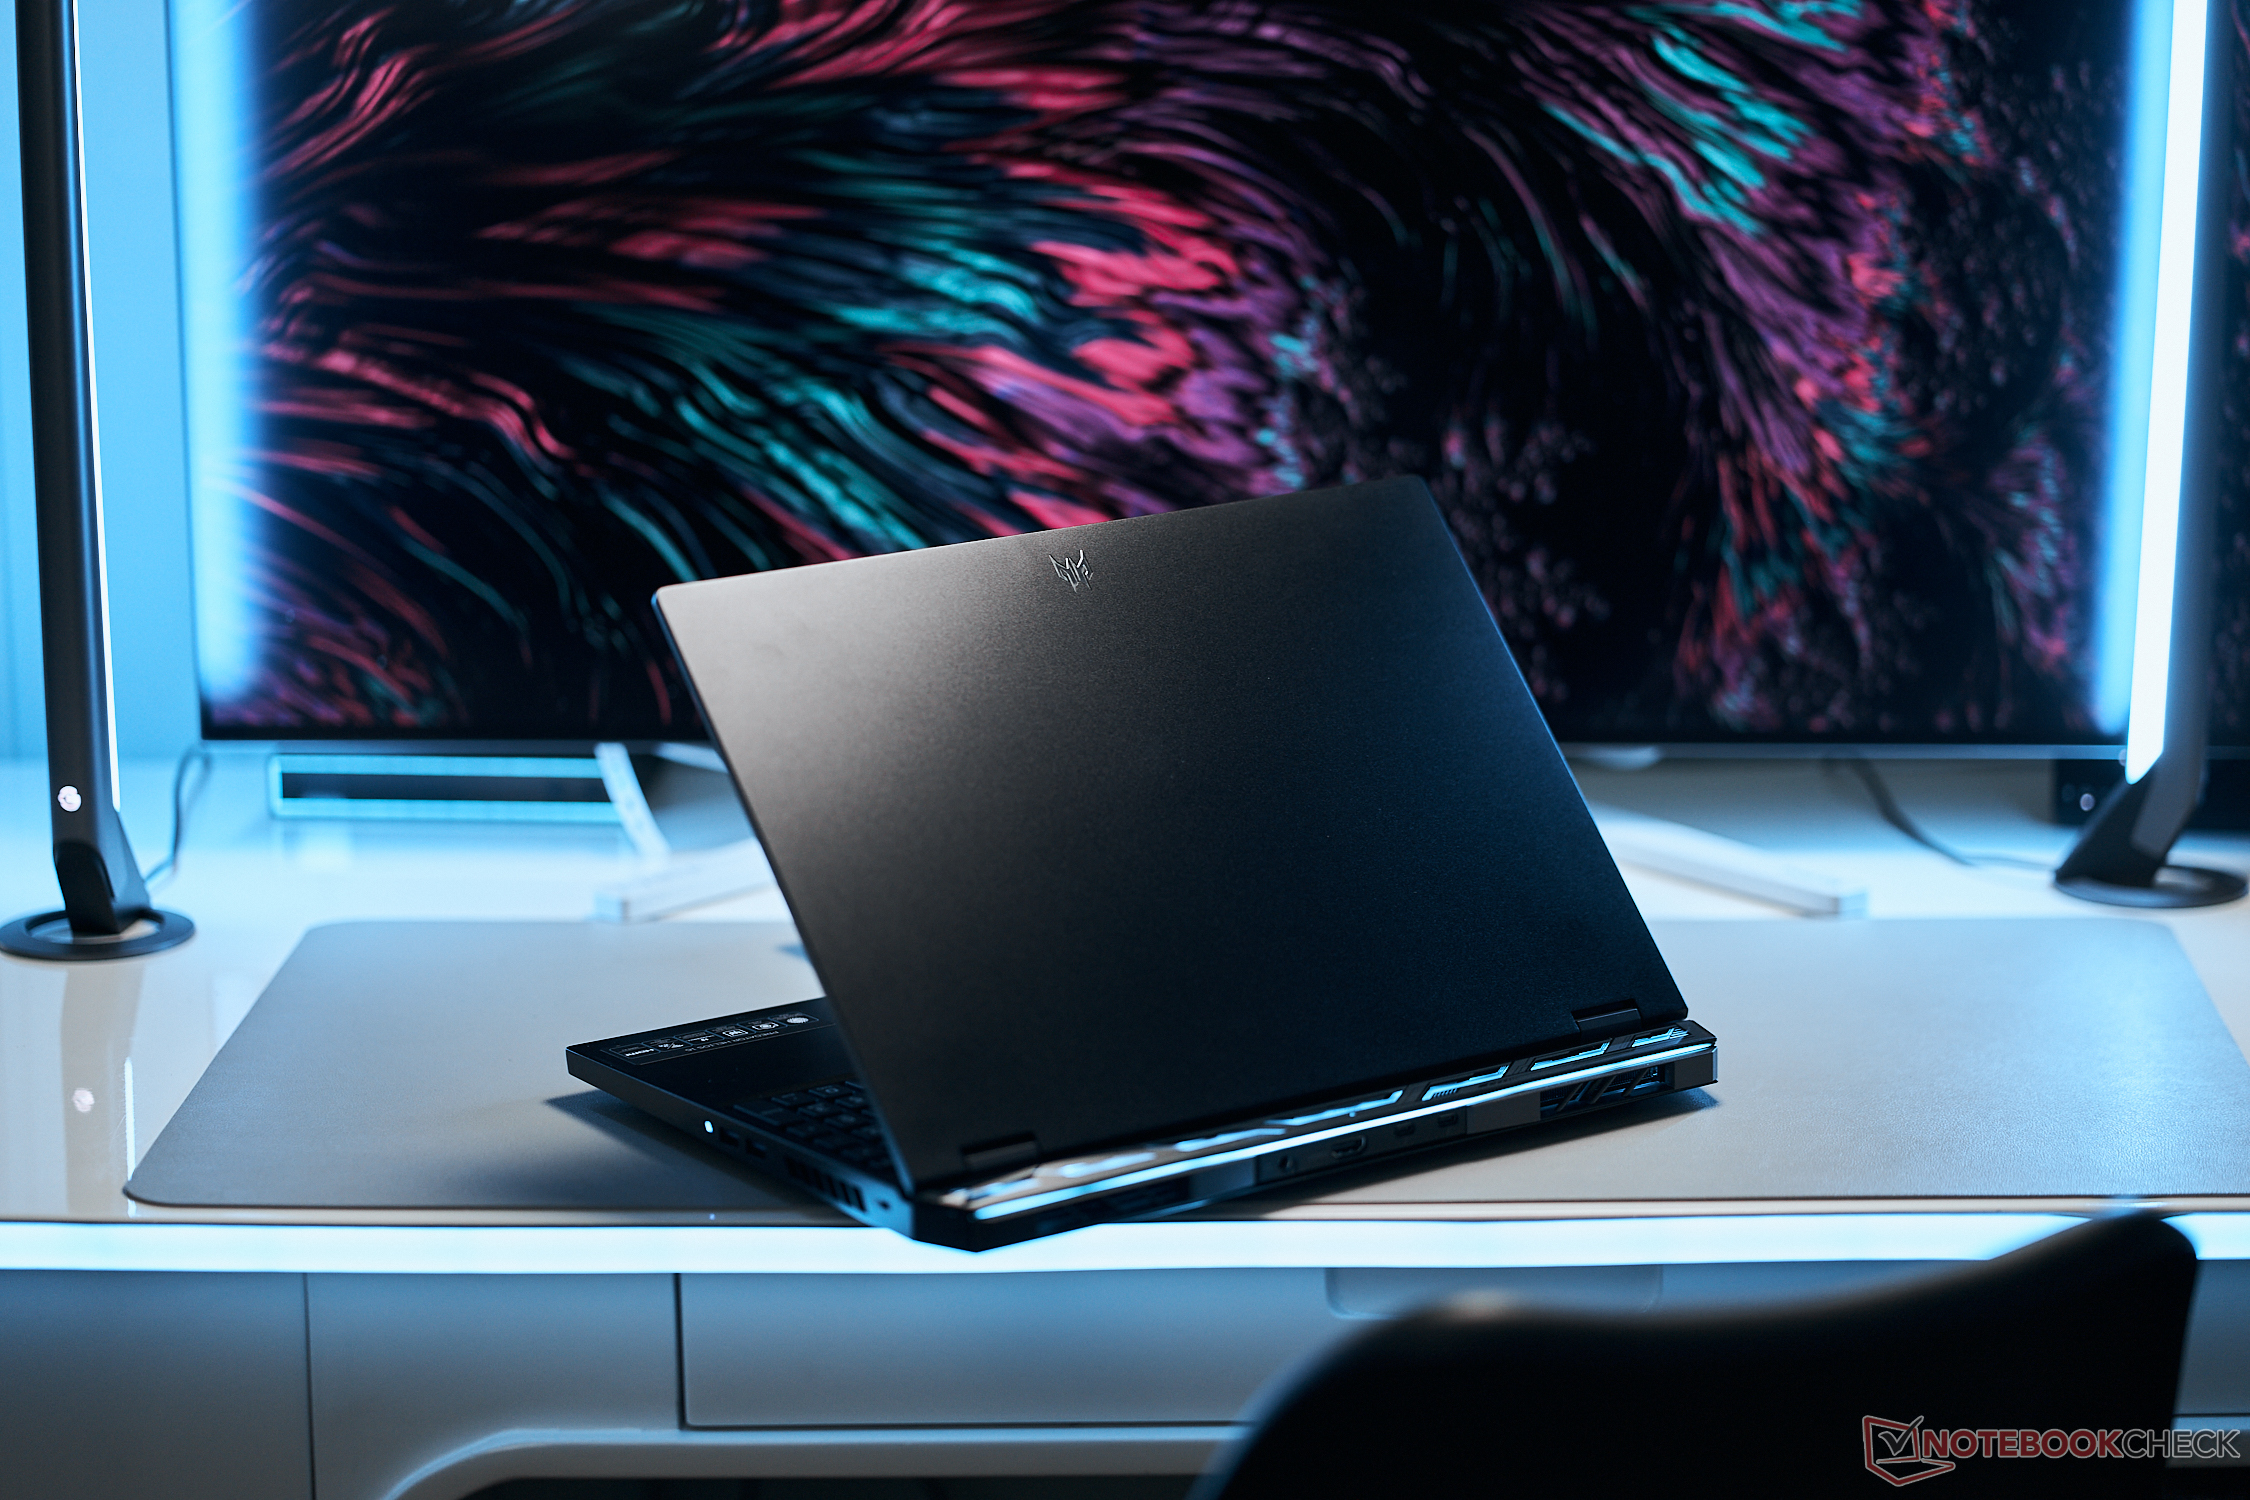
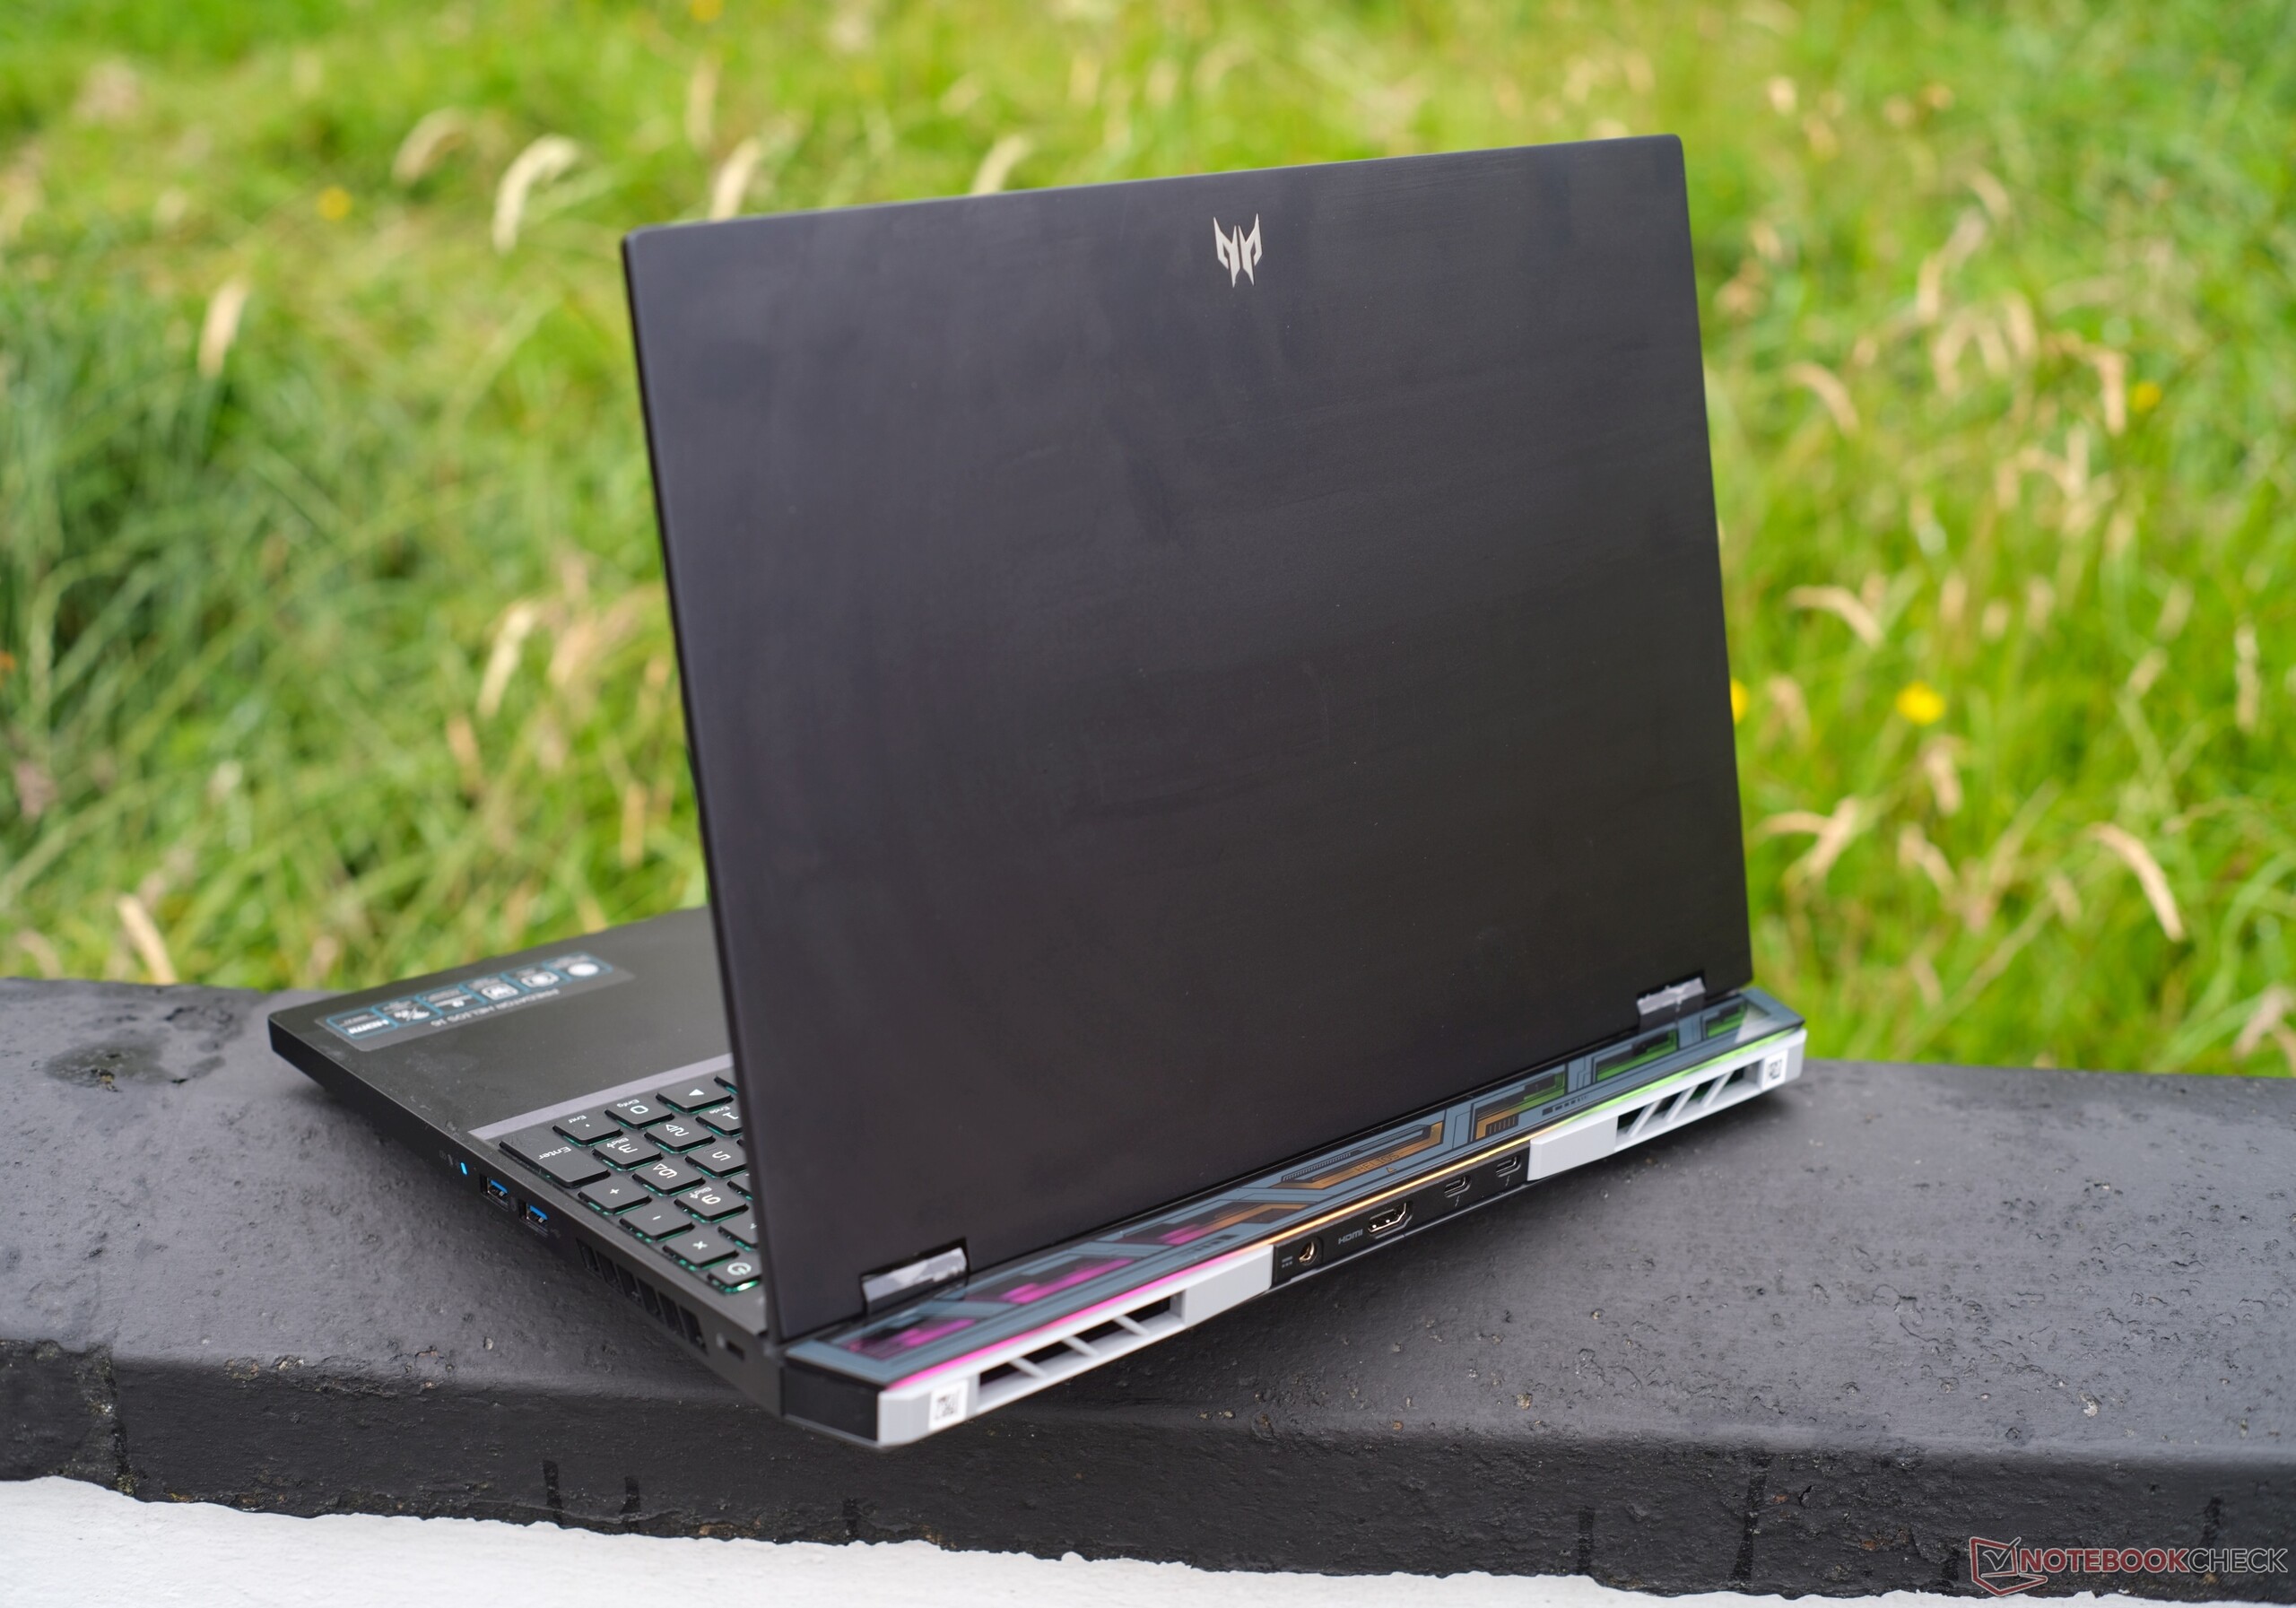
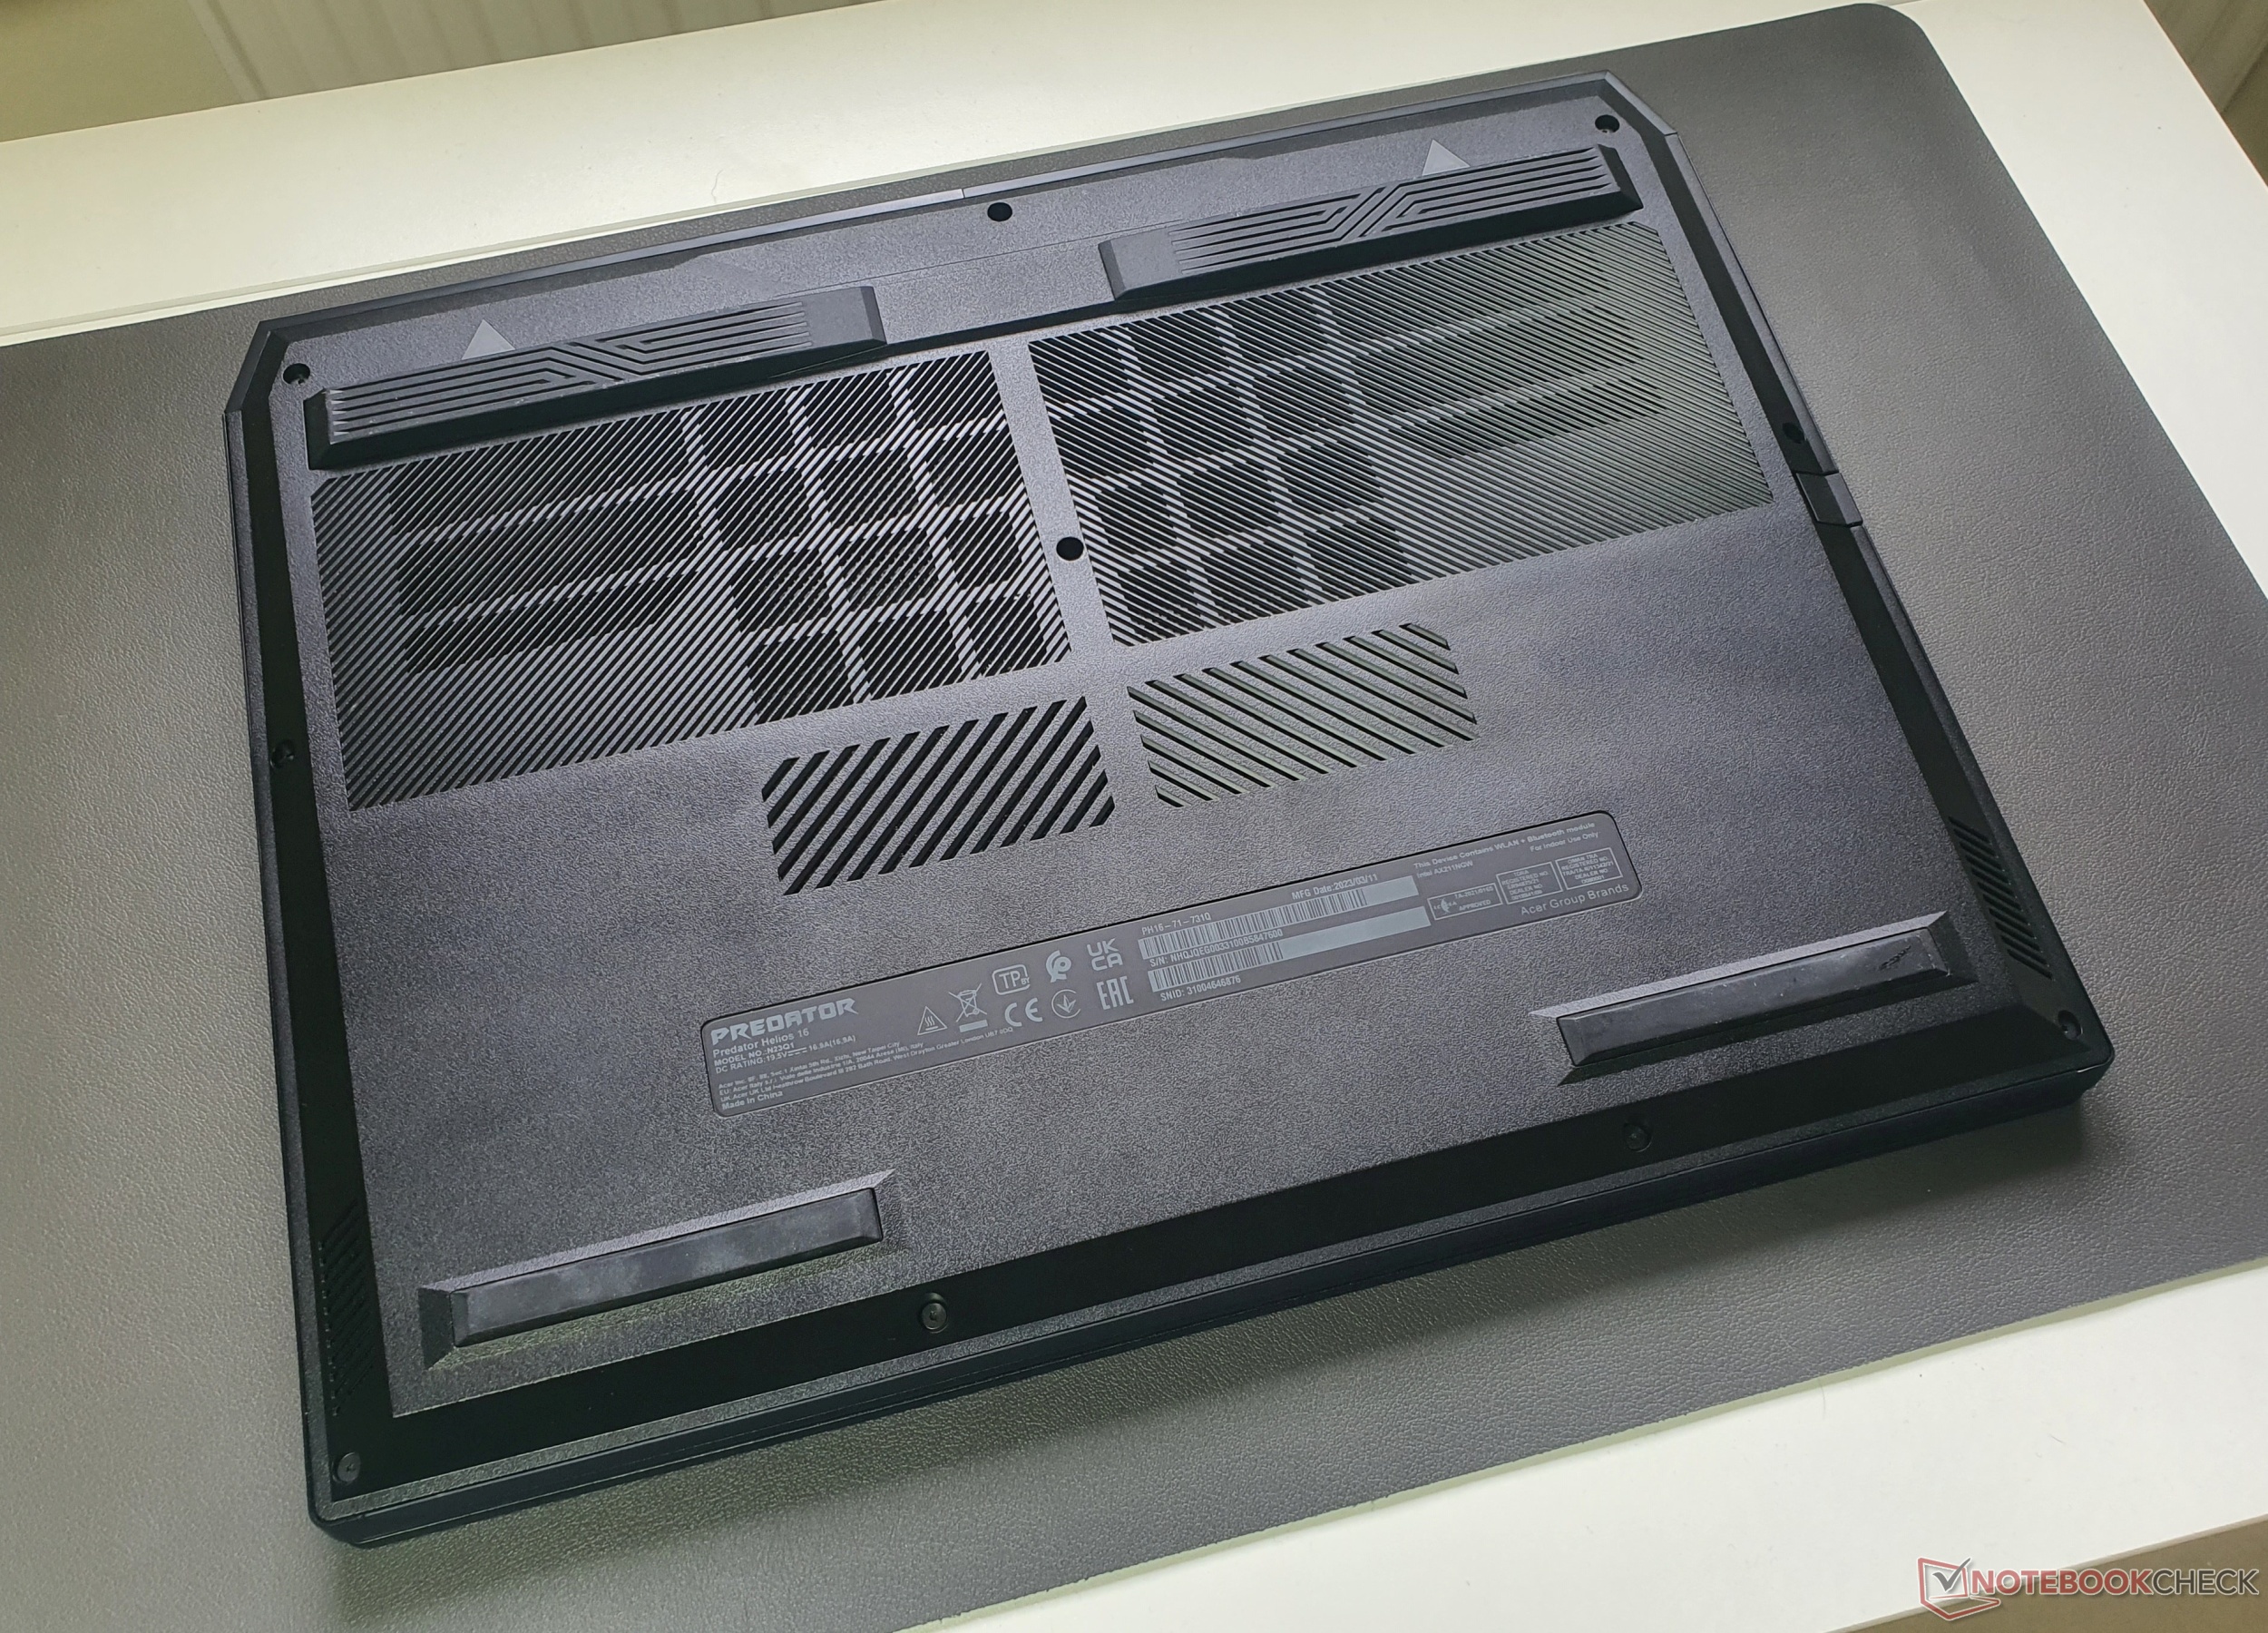
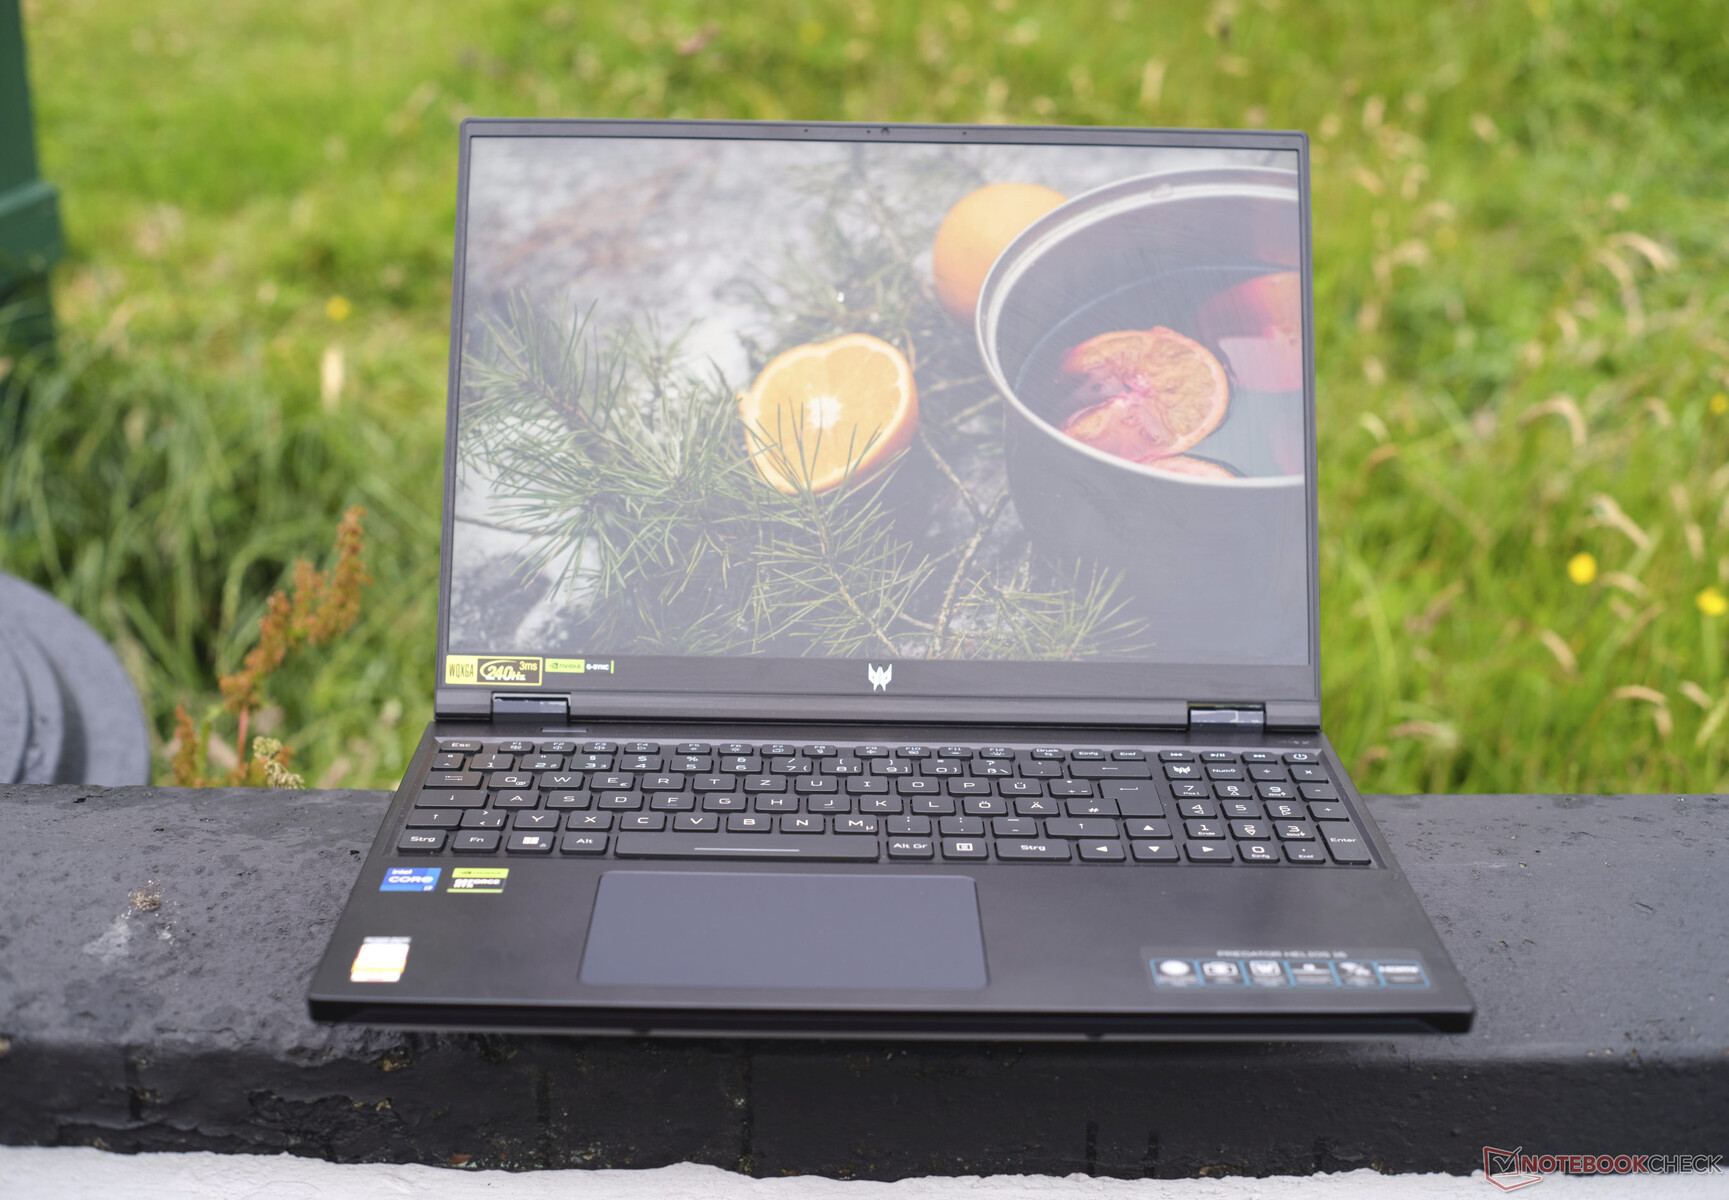
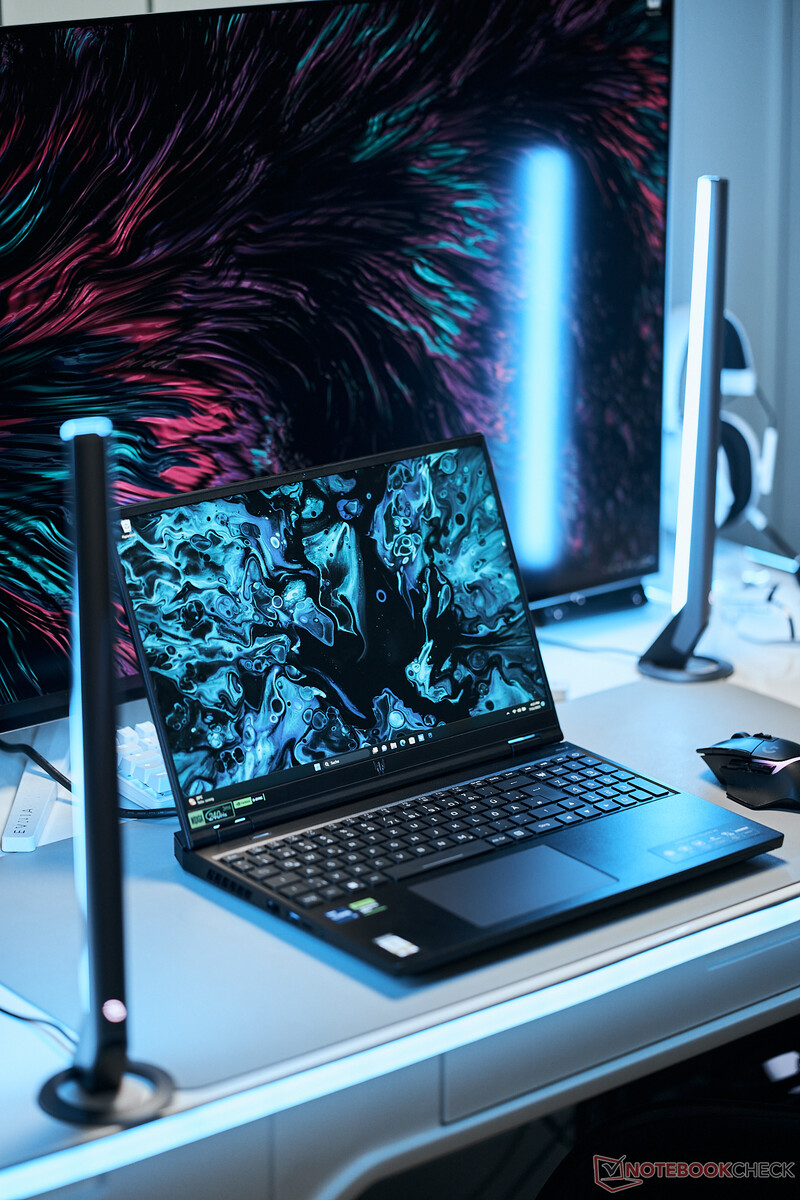
Custodia: Un portatile da gioco Acer robusto e quasi sobrio
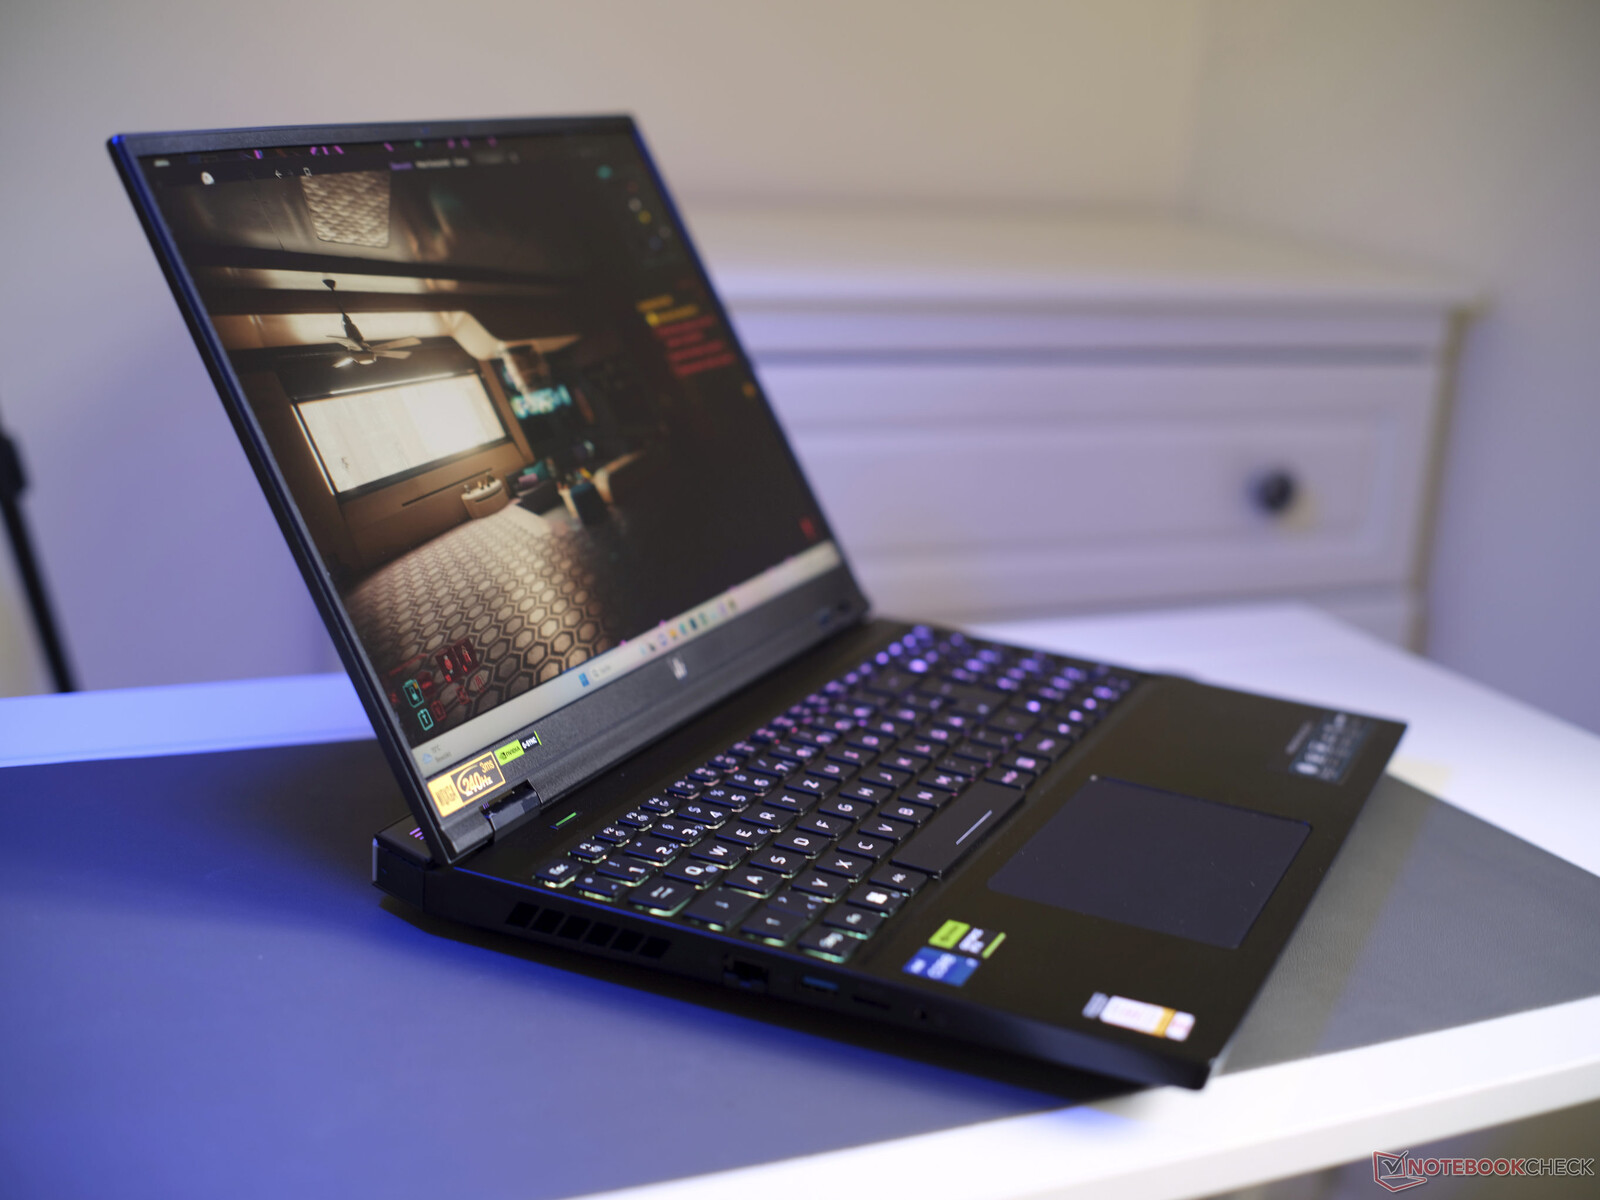
Proprio come il suo predecessorehelios 16 è disponibile in nero opaco ed è realizzato per la maggior parte in lega di alluminio spazzolato, mentre solo l'unità di base e il bordo del display sono in plastica, per evitare gli svantaggi associati ai materiali che conducono il calore.
Gli accenti, su un esterno dall'aspetto altrimenti sobrio, sono rappresentati dall'elegante logo Predator sul coperchio del display e sulla lunetta inferiore, oltre che da un sistema di raffreddamento illuminato a LED e rivolto all'indietro. Le superfici lisce attirano bene le impronte digitali, mentre l'assemblaggio e le finiture sono impeccabili, senza scricchiolii.
L'unità di base è molto stabile, mentre il coperchio può essere leggermente ruotato, ma non siamo riusciti a produrre distorsioni dell'immagine, anche dopo aver esercitato una pressione mirata. Le cerniere sono fissate molto saldamente, il coperchio non oscilla quasi mai e può essere aperto con una sola mano fino a un angolo di 145°. Nel complesso, il Predator Helios fa un'impressione molto solida.
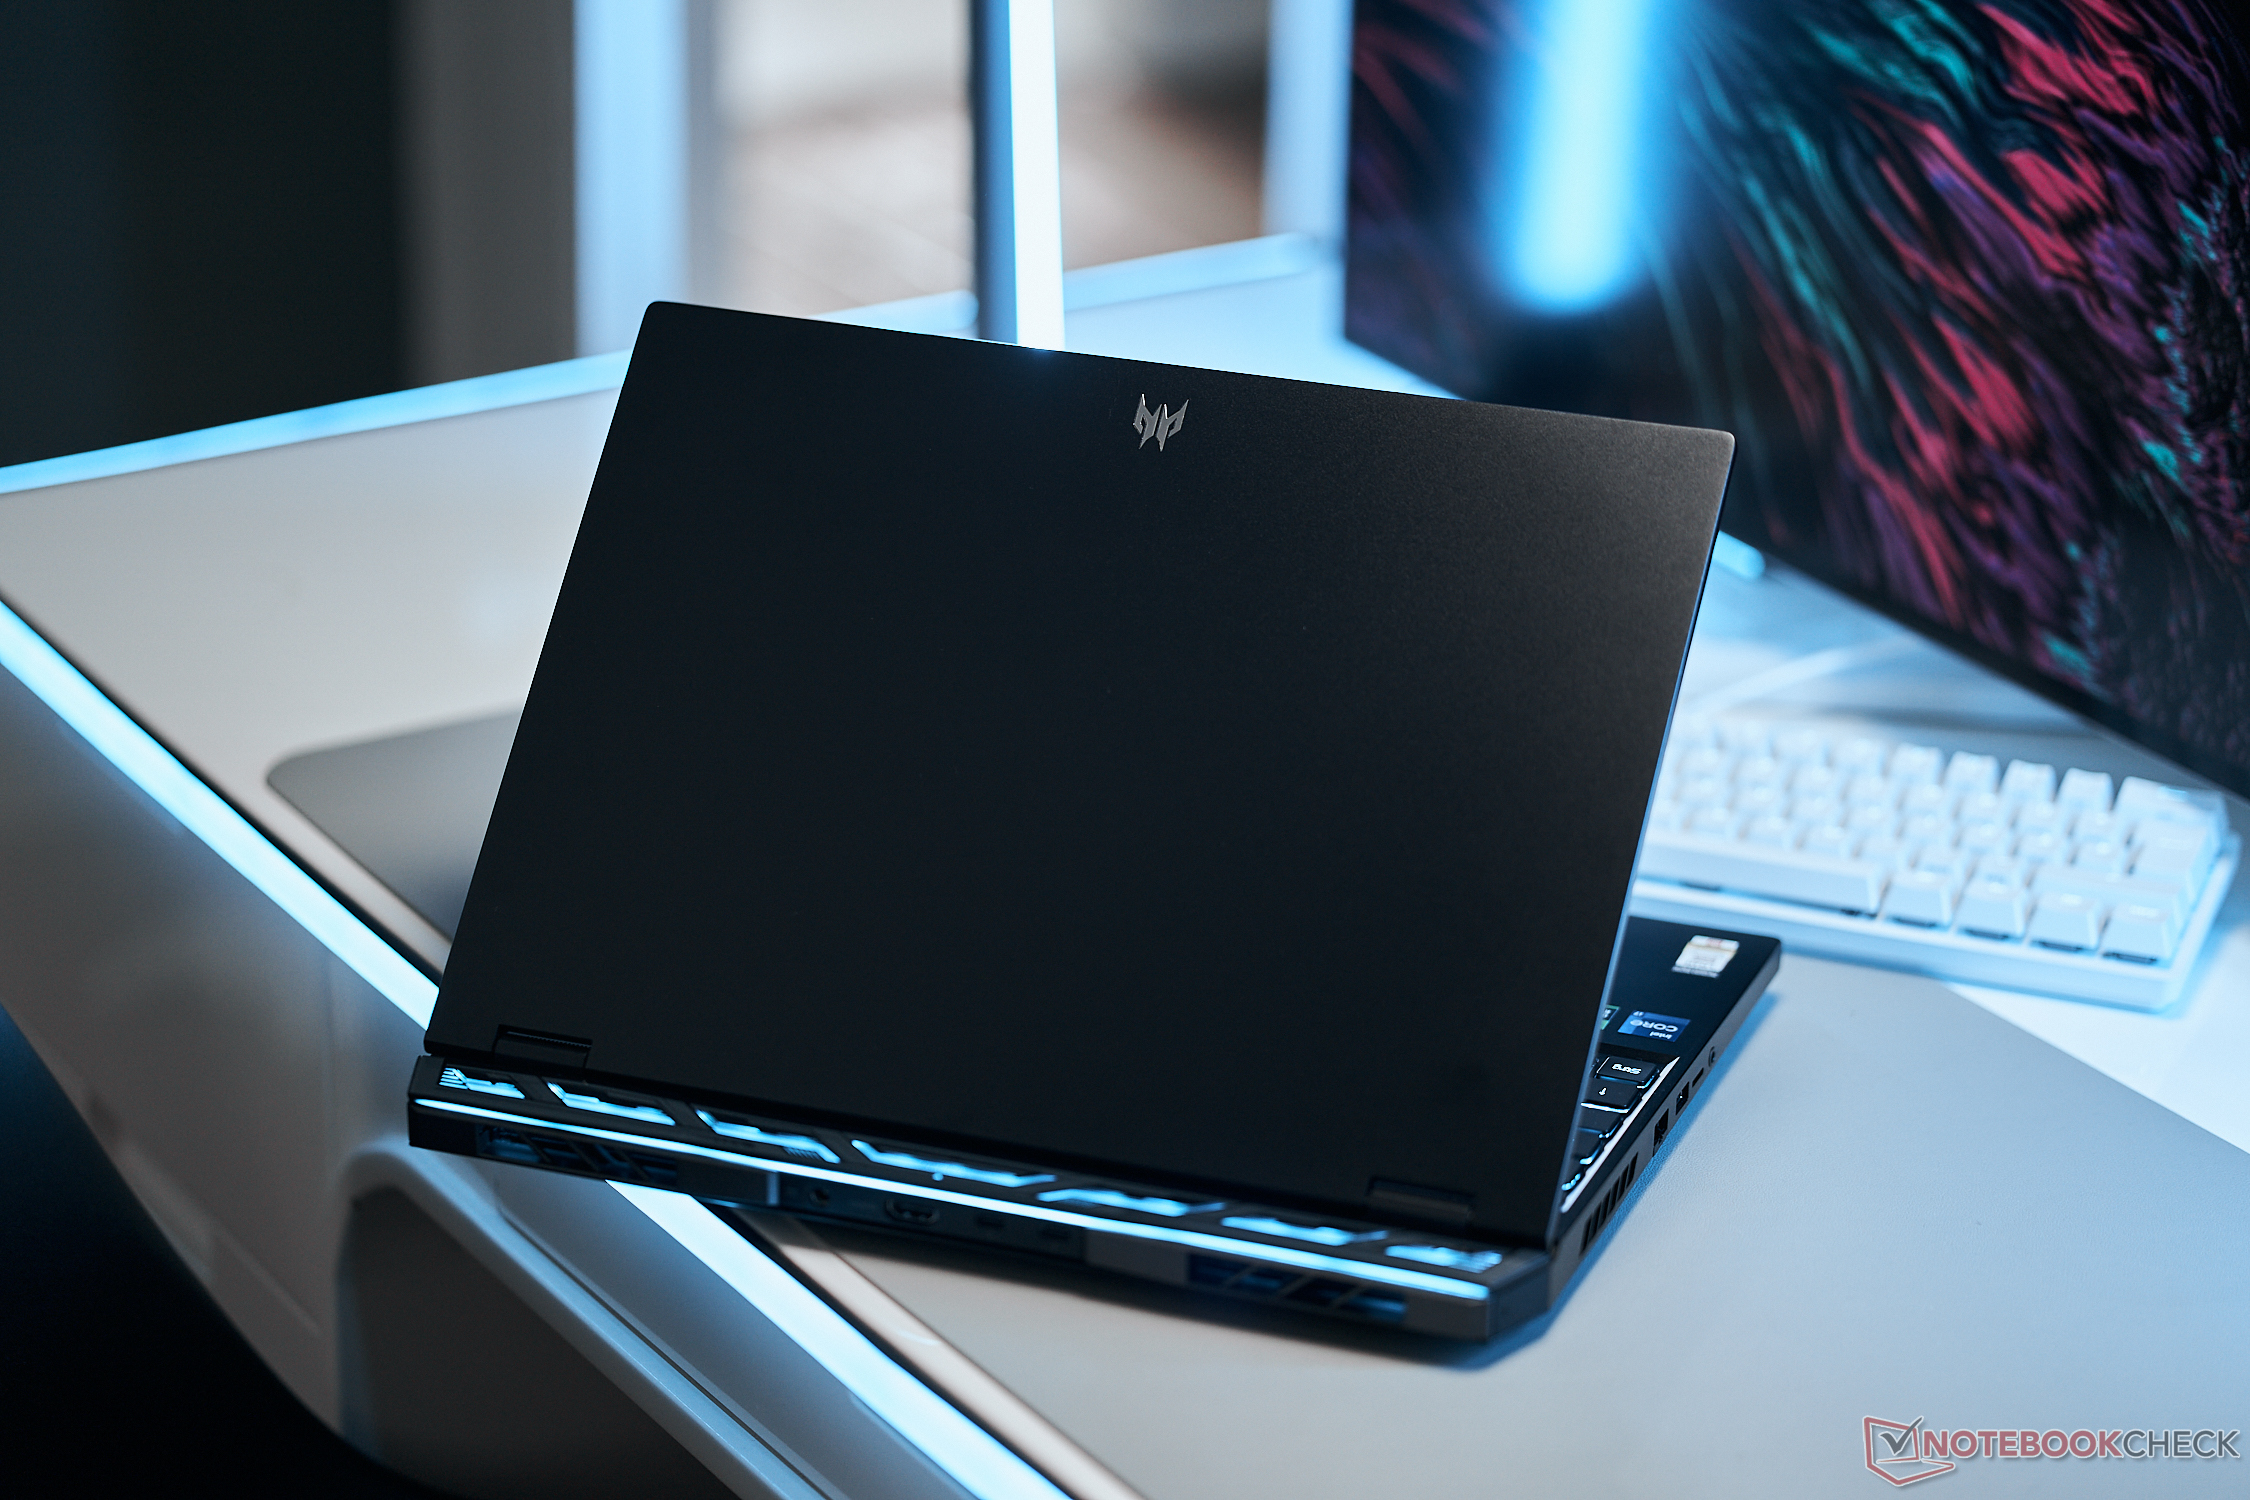


L'Acer Predator Helios è spesso circa 27 mm e pesa poco meno di 2,6 kg. Queste statistiche vitali possono essere considerate nella media per una macchina da gioco con un sistema di raffreddamento così potente. Tuttavia, nonostante la stessa altezza, con un peso di 2,2 kg, l'Asus TUF Gaming A16è significativamente più leggero, mentre lo spessore di 19,7 mm delGigabyte Aorus 15Xè notevolmente più sottile, nonostante abbia lo stesso TGP.
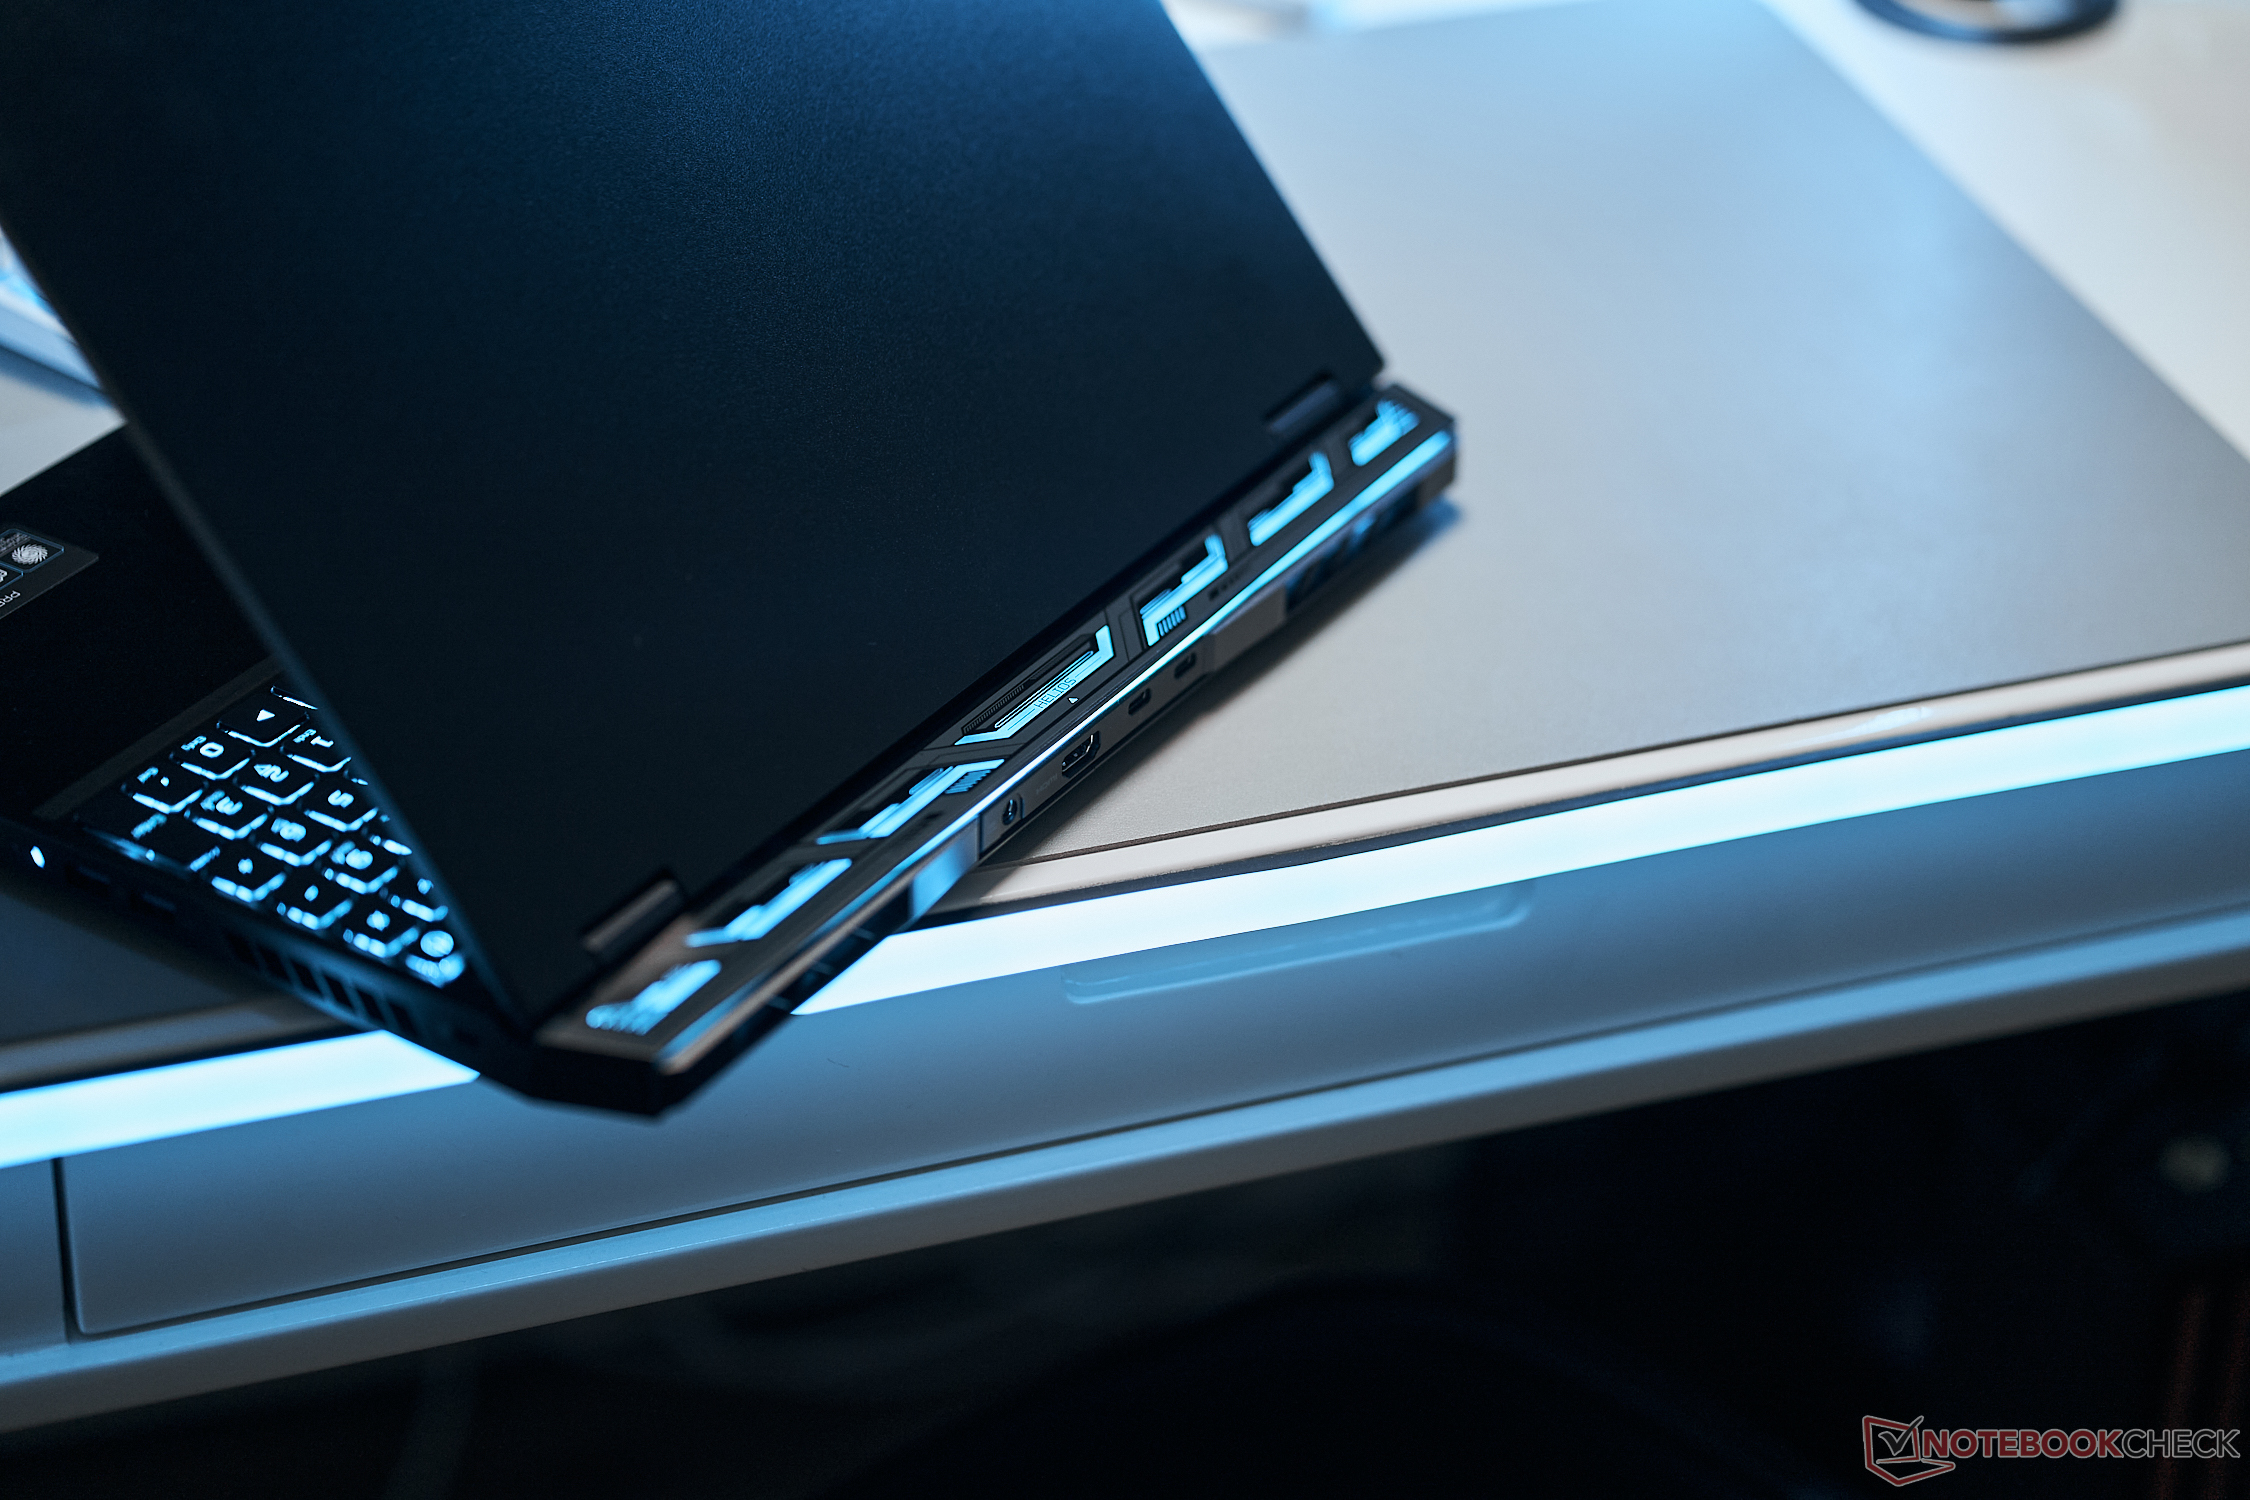
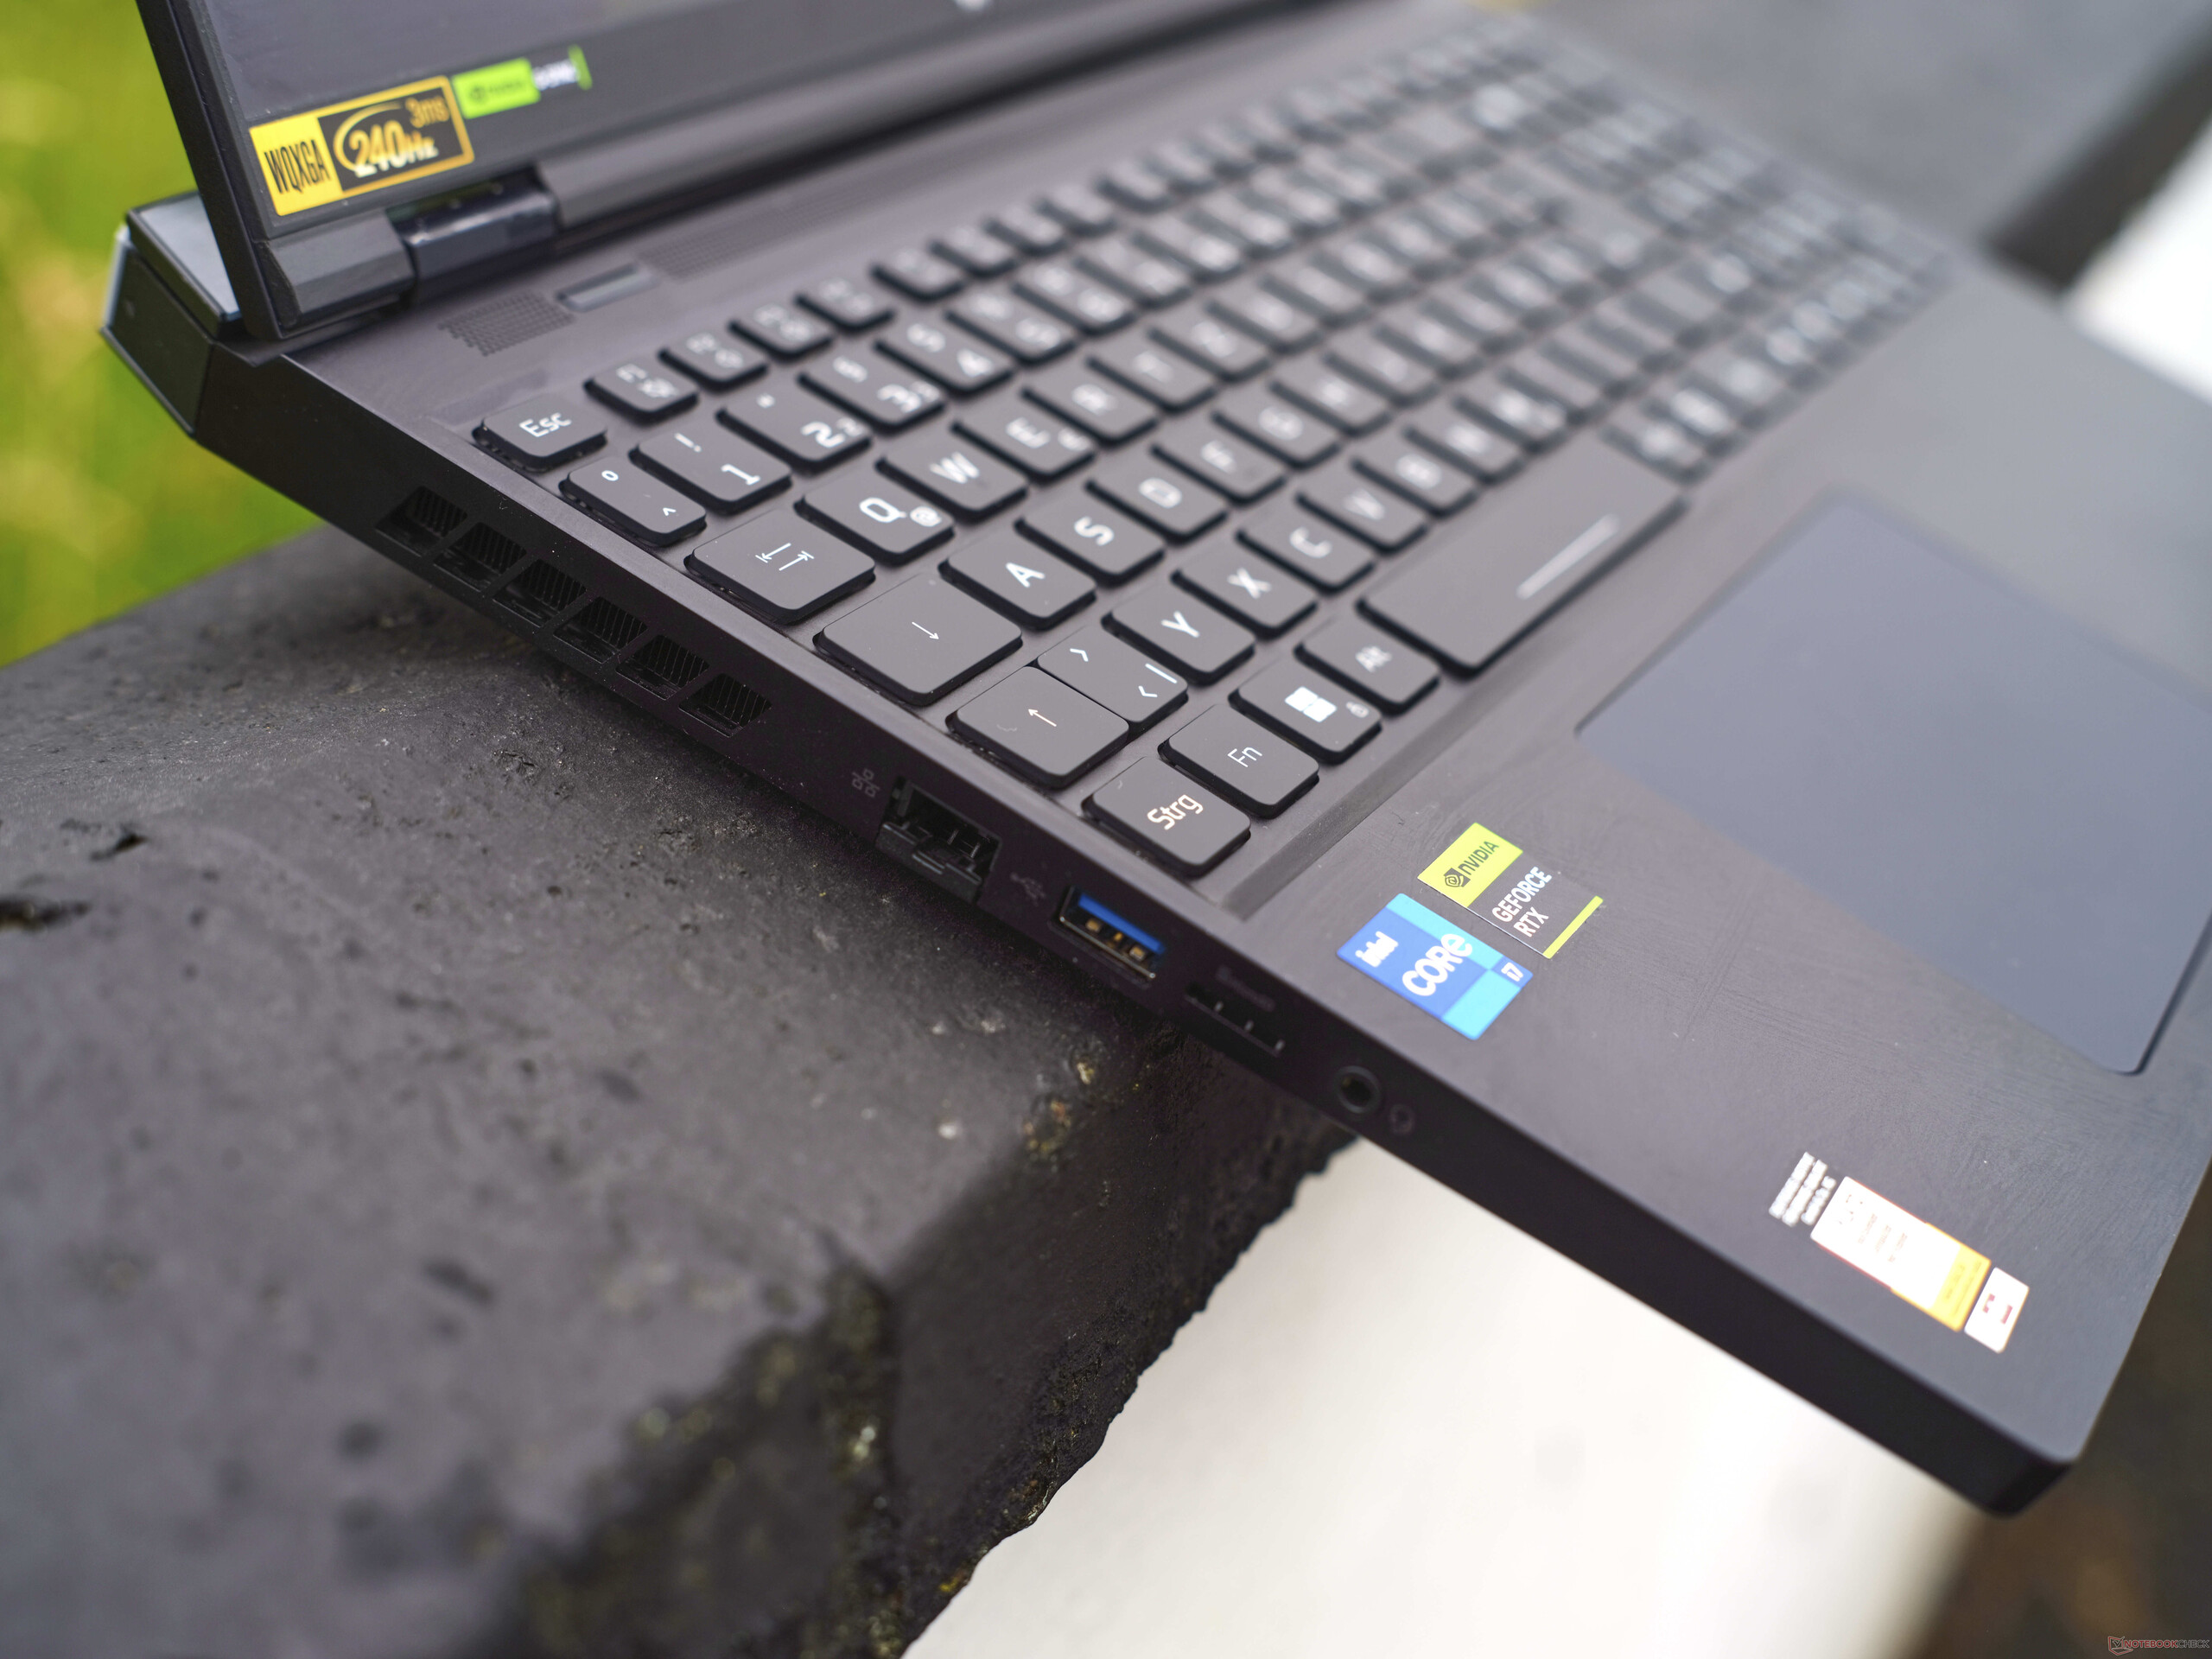
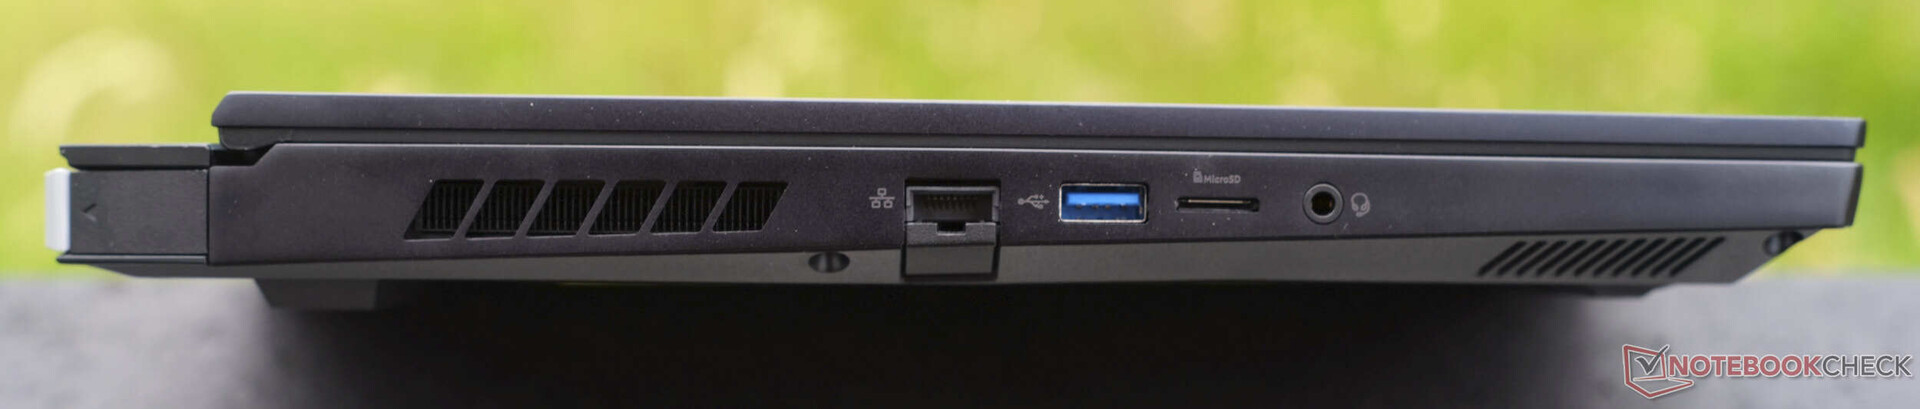
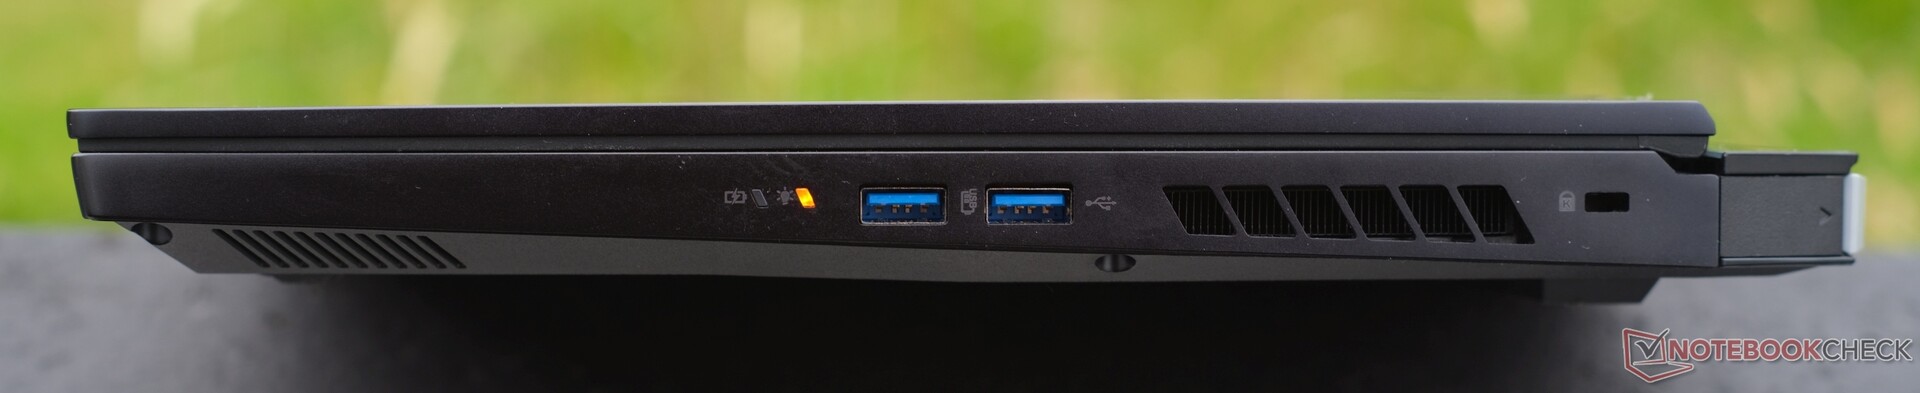
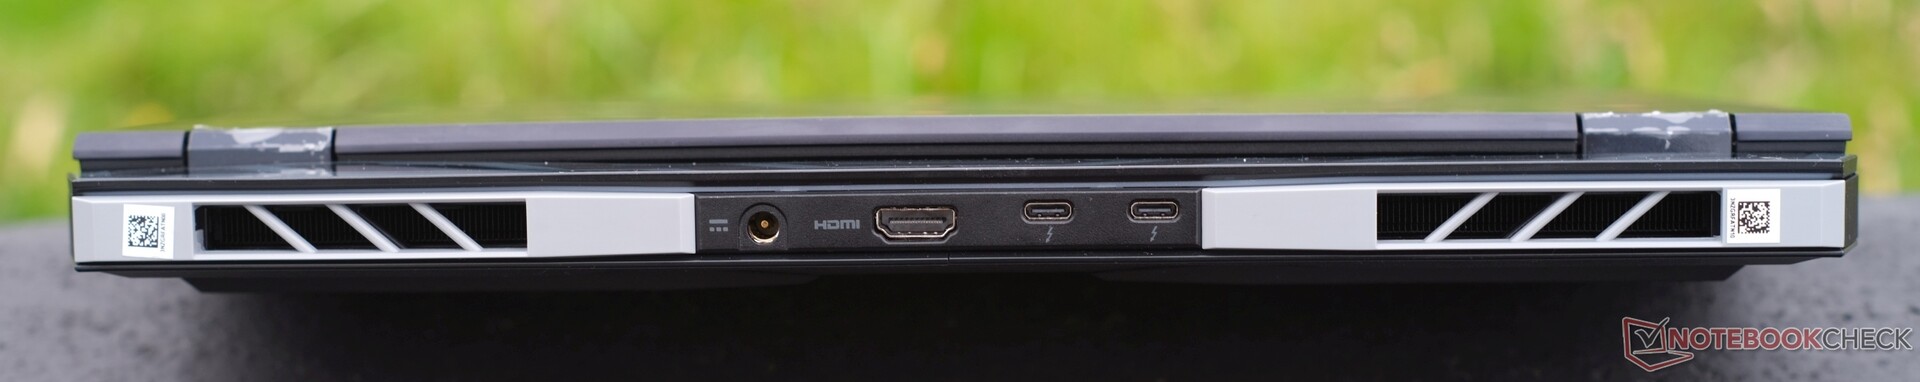
Caratteristiche: Helios 16 offre un'ampia selezione di porte e il veloce Wi-Fi Killer
Il portatile da gioco Acer dispone di numerose porte, tra cui 5x USB. A sinistra c'è 1x USB-A 3.1 (5 GBit/s), a destra 2x USB-A 3.2 (10 GBit/s) e 2x Thunderbolt 4 sul retro che include DisplayPort 1.4 e Power Delivery (100 watt). Il portatile ospita anche Gigabit ethernet, un lettore di schede microSD, un jack audio da 3,5 mm, un lucchetto Kensington, HDMI 2.1 e il connettore di ricarica.
Lettore di schede SD
Abbinato alla nostra scheda di riferimento AV PRO microSD 128 GB V60, il lettore di schede microSD non è necessariamente lento, ma nemmeno molto veloce e questo è un peccato considerando il prezzo dell'Helios 16. Tuttavia, i dispositivi della concorrenza (almeno quelli dotati di lettore di schede) sono altrettanto veloci nella lettura e nella copia dei dati. Tuttavia, i dispositivi della concorrenza (almeno quelli dotati di lettore di schede) leggono e copiano i dati con una velocità simile.
| SD Card Reader | |
| average JPG Copy Test (av. of 3 runs) | |
| Media della classe Gaming (20.9 - 210, n=54, ultimi 2 anni) | |
| Lenovo Legion S7 16ARHA7 (AV PRO microSD 128 GB V60) | |
| Medion Erazer Defender P40 (AV PRO microSD 128 GB V60) | |
| Acer Nitro 16 AN16-41 (AV Pro SD microSD 128 GB V60) | |
| HP Omen 17-ck2097ng (AV PRO microSD 128 GB V60) | |
| Acer Predator Helios 16 PH16-71-731Q | |
| maximum AS SSD Seq Read Test (1GB) | |
| Media della classe Gaming (25.5 - 261, n=51, ultimi 2 anni) | |
| Medion Erazer Defender P40 (AV PRO microSD 128 GB V60) | |
| Lenovo Legion S7 16ARHA7 (AV PRO microSD 128 GB V60) | |
| Acer Predator Helios 16 PH16-71-731Q | |
| Acer Nitro 16 AN16-41 (AV Pro SD microSD 128 GB V60) | |
| HP Omen 17-ck2097ng (AV PRO microSD 128 GB V60) | |
Comunicazione
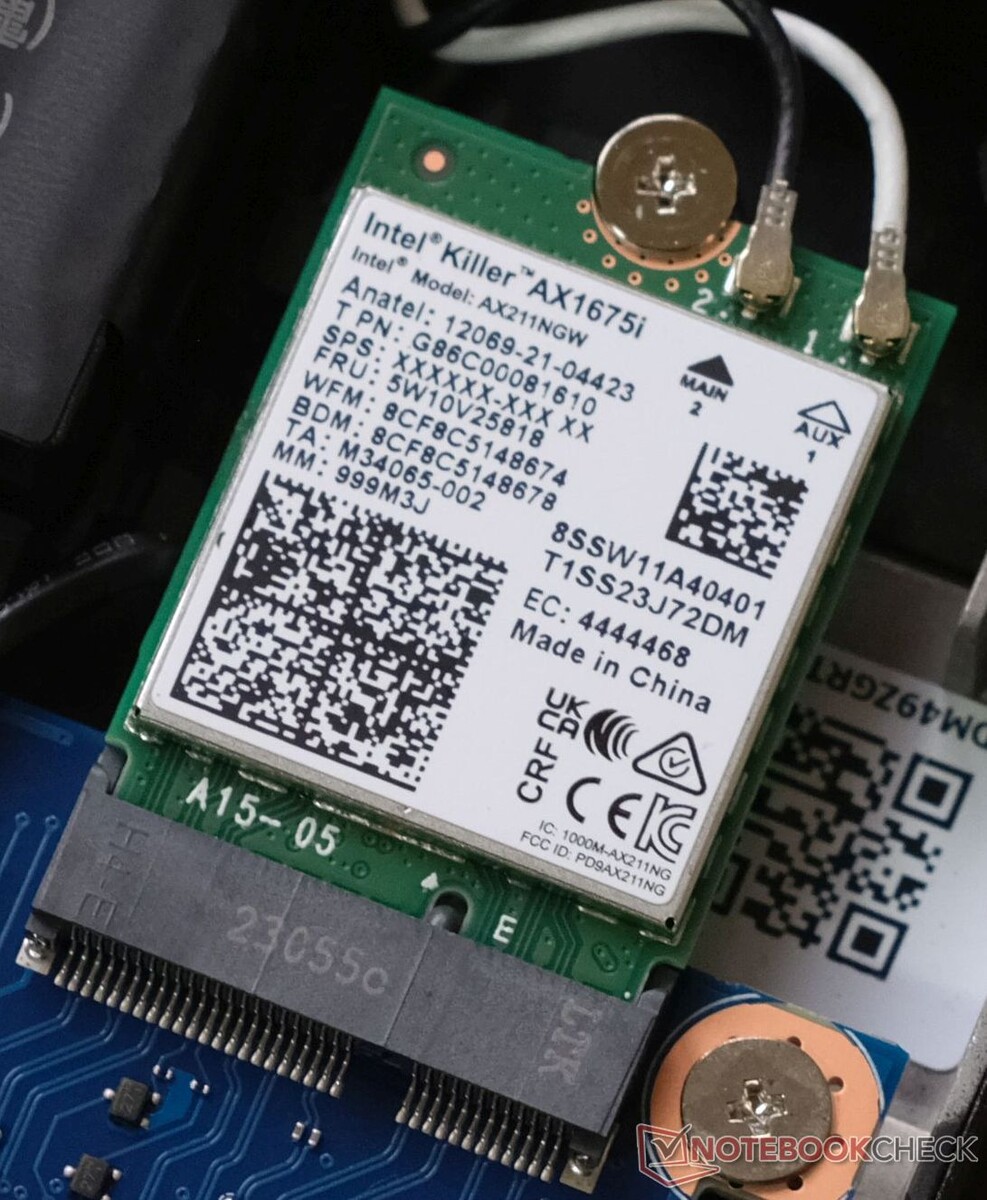
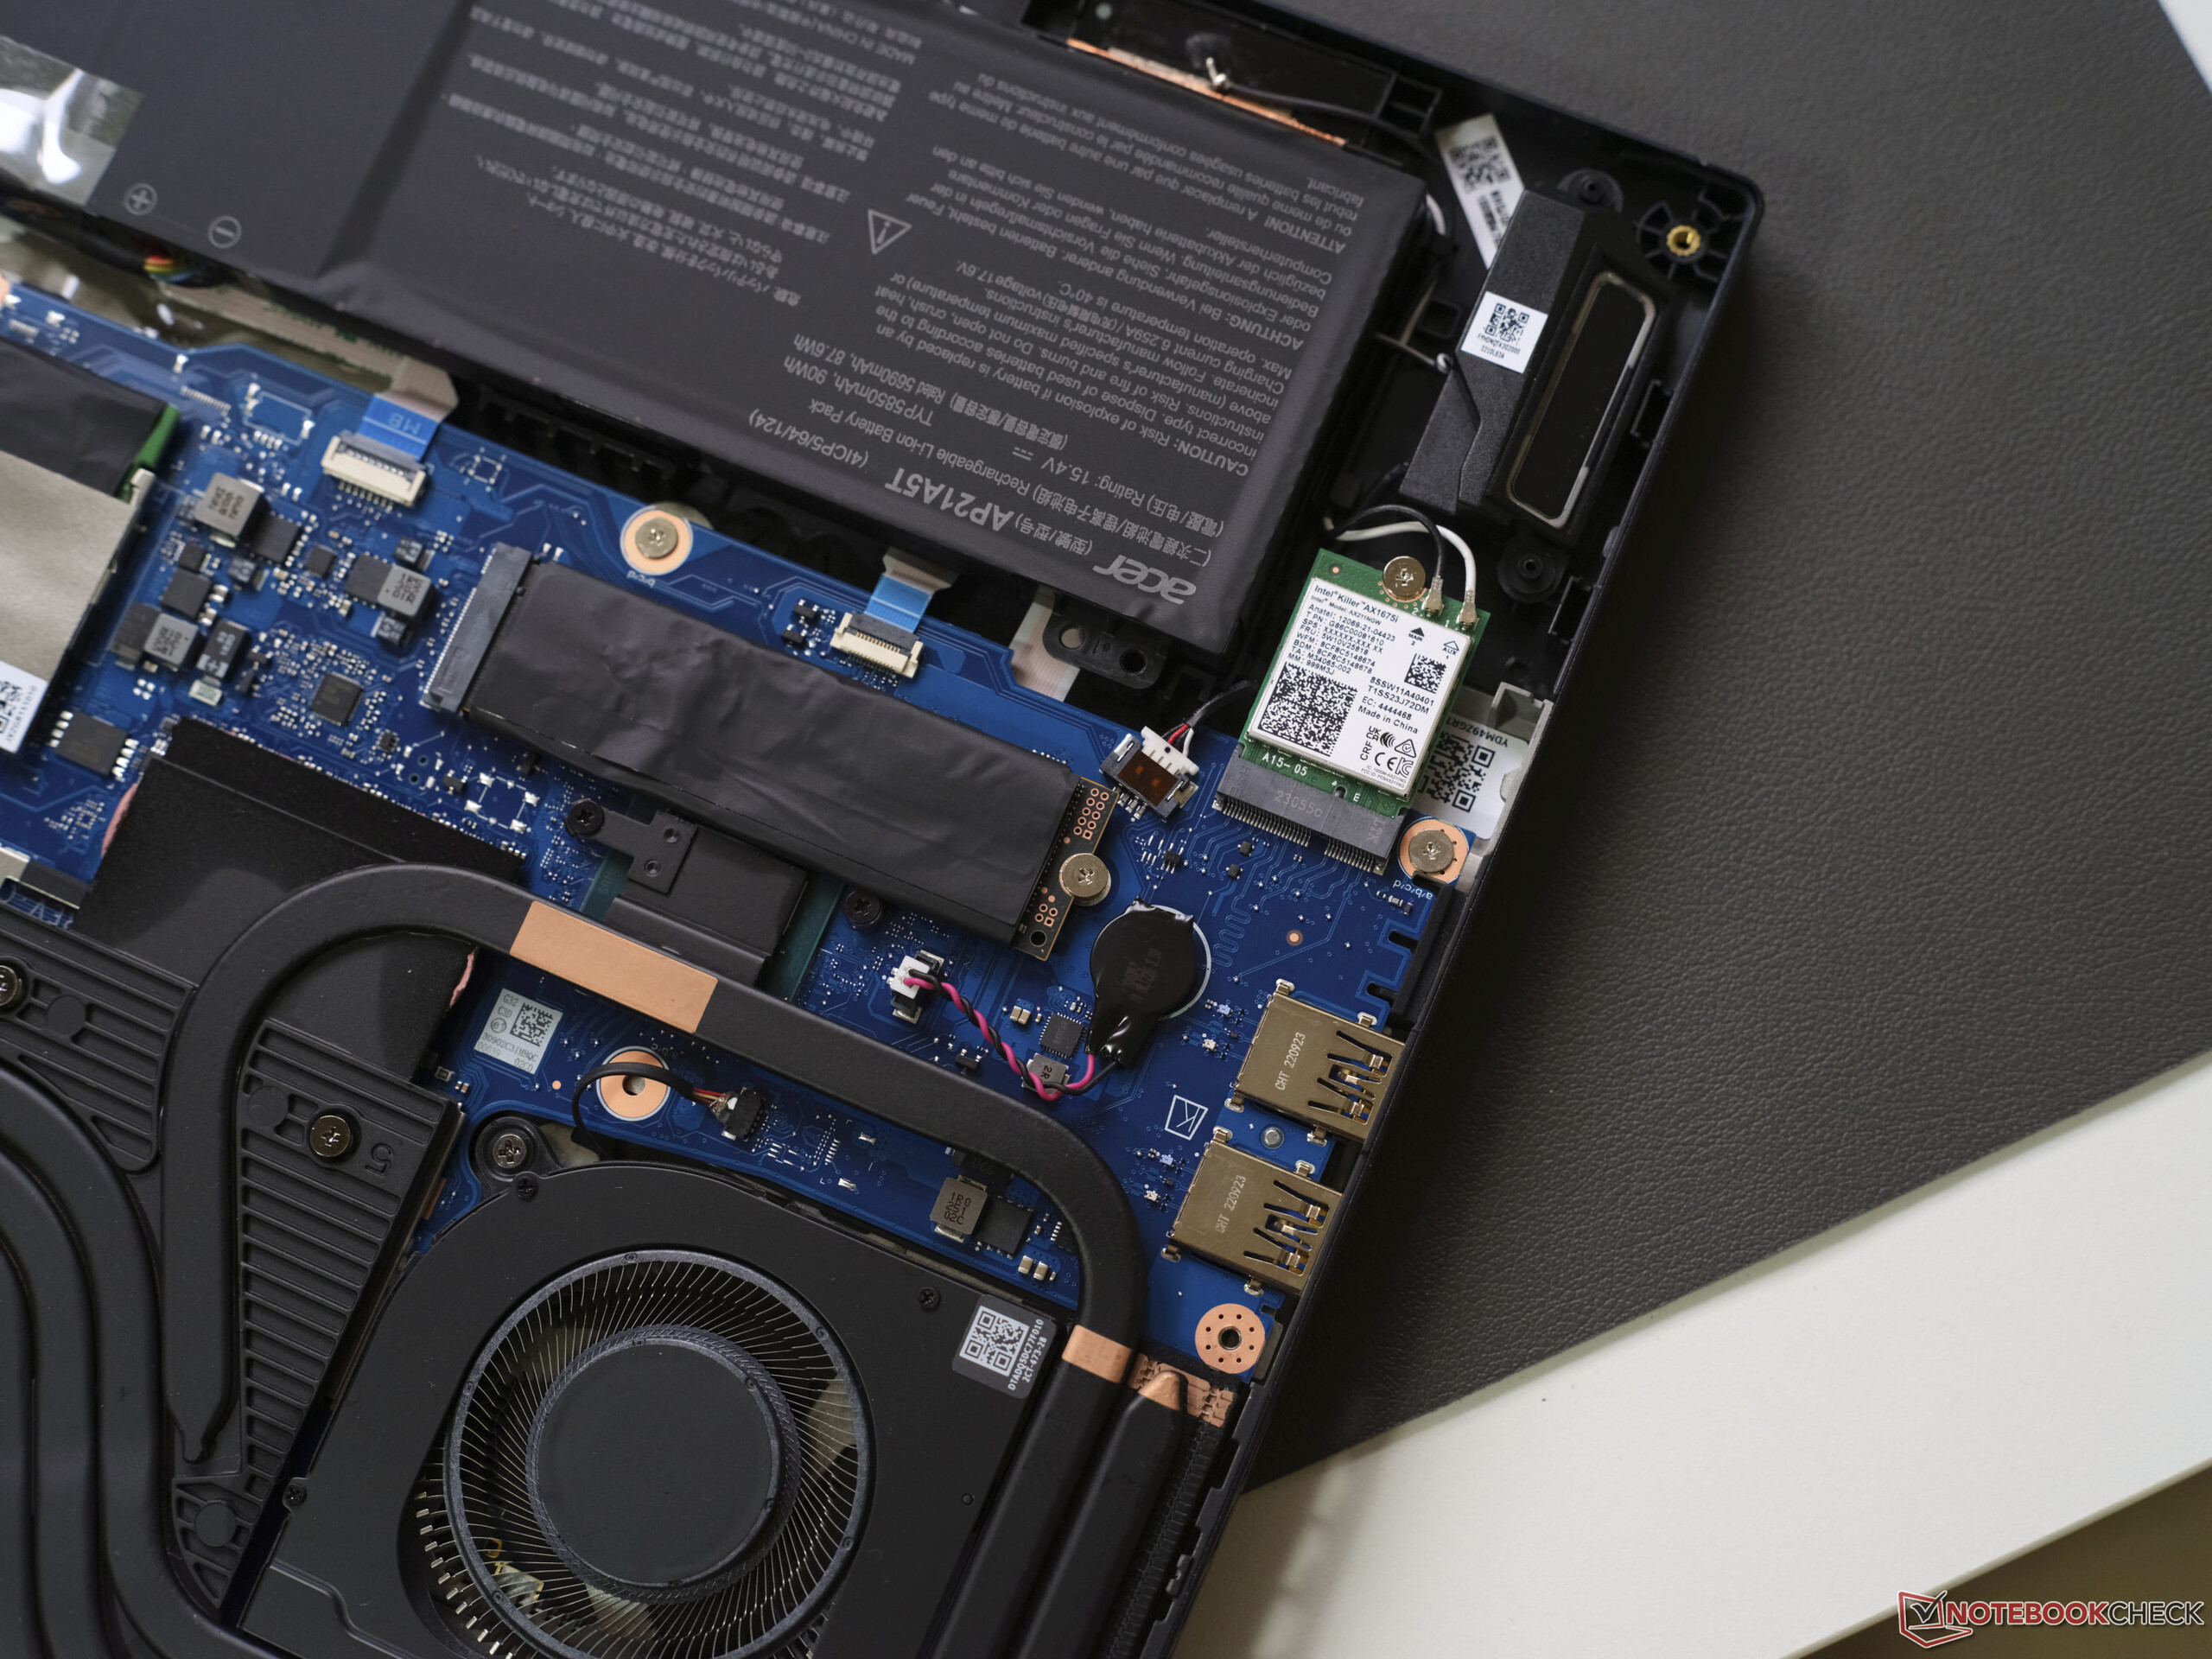
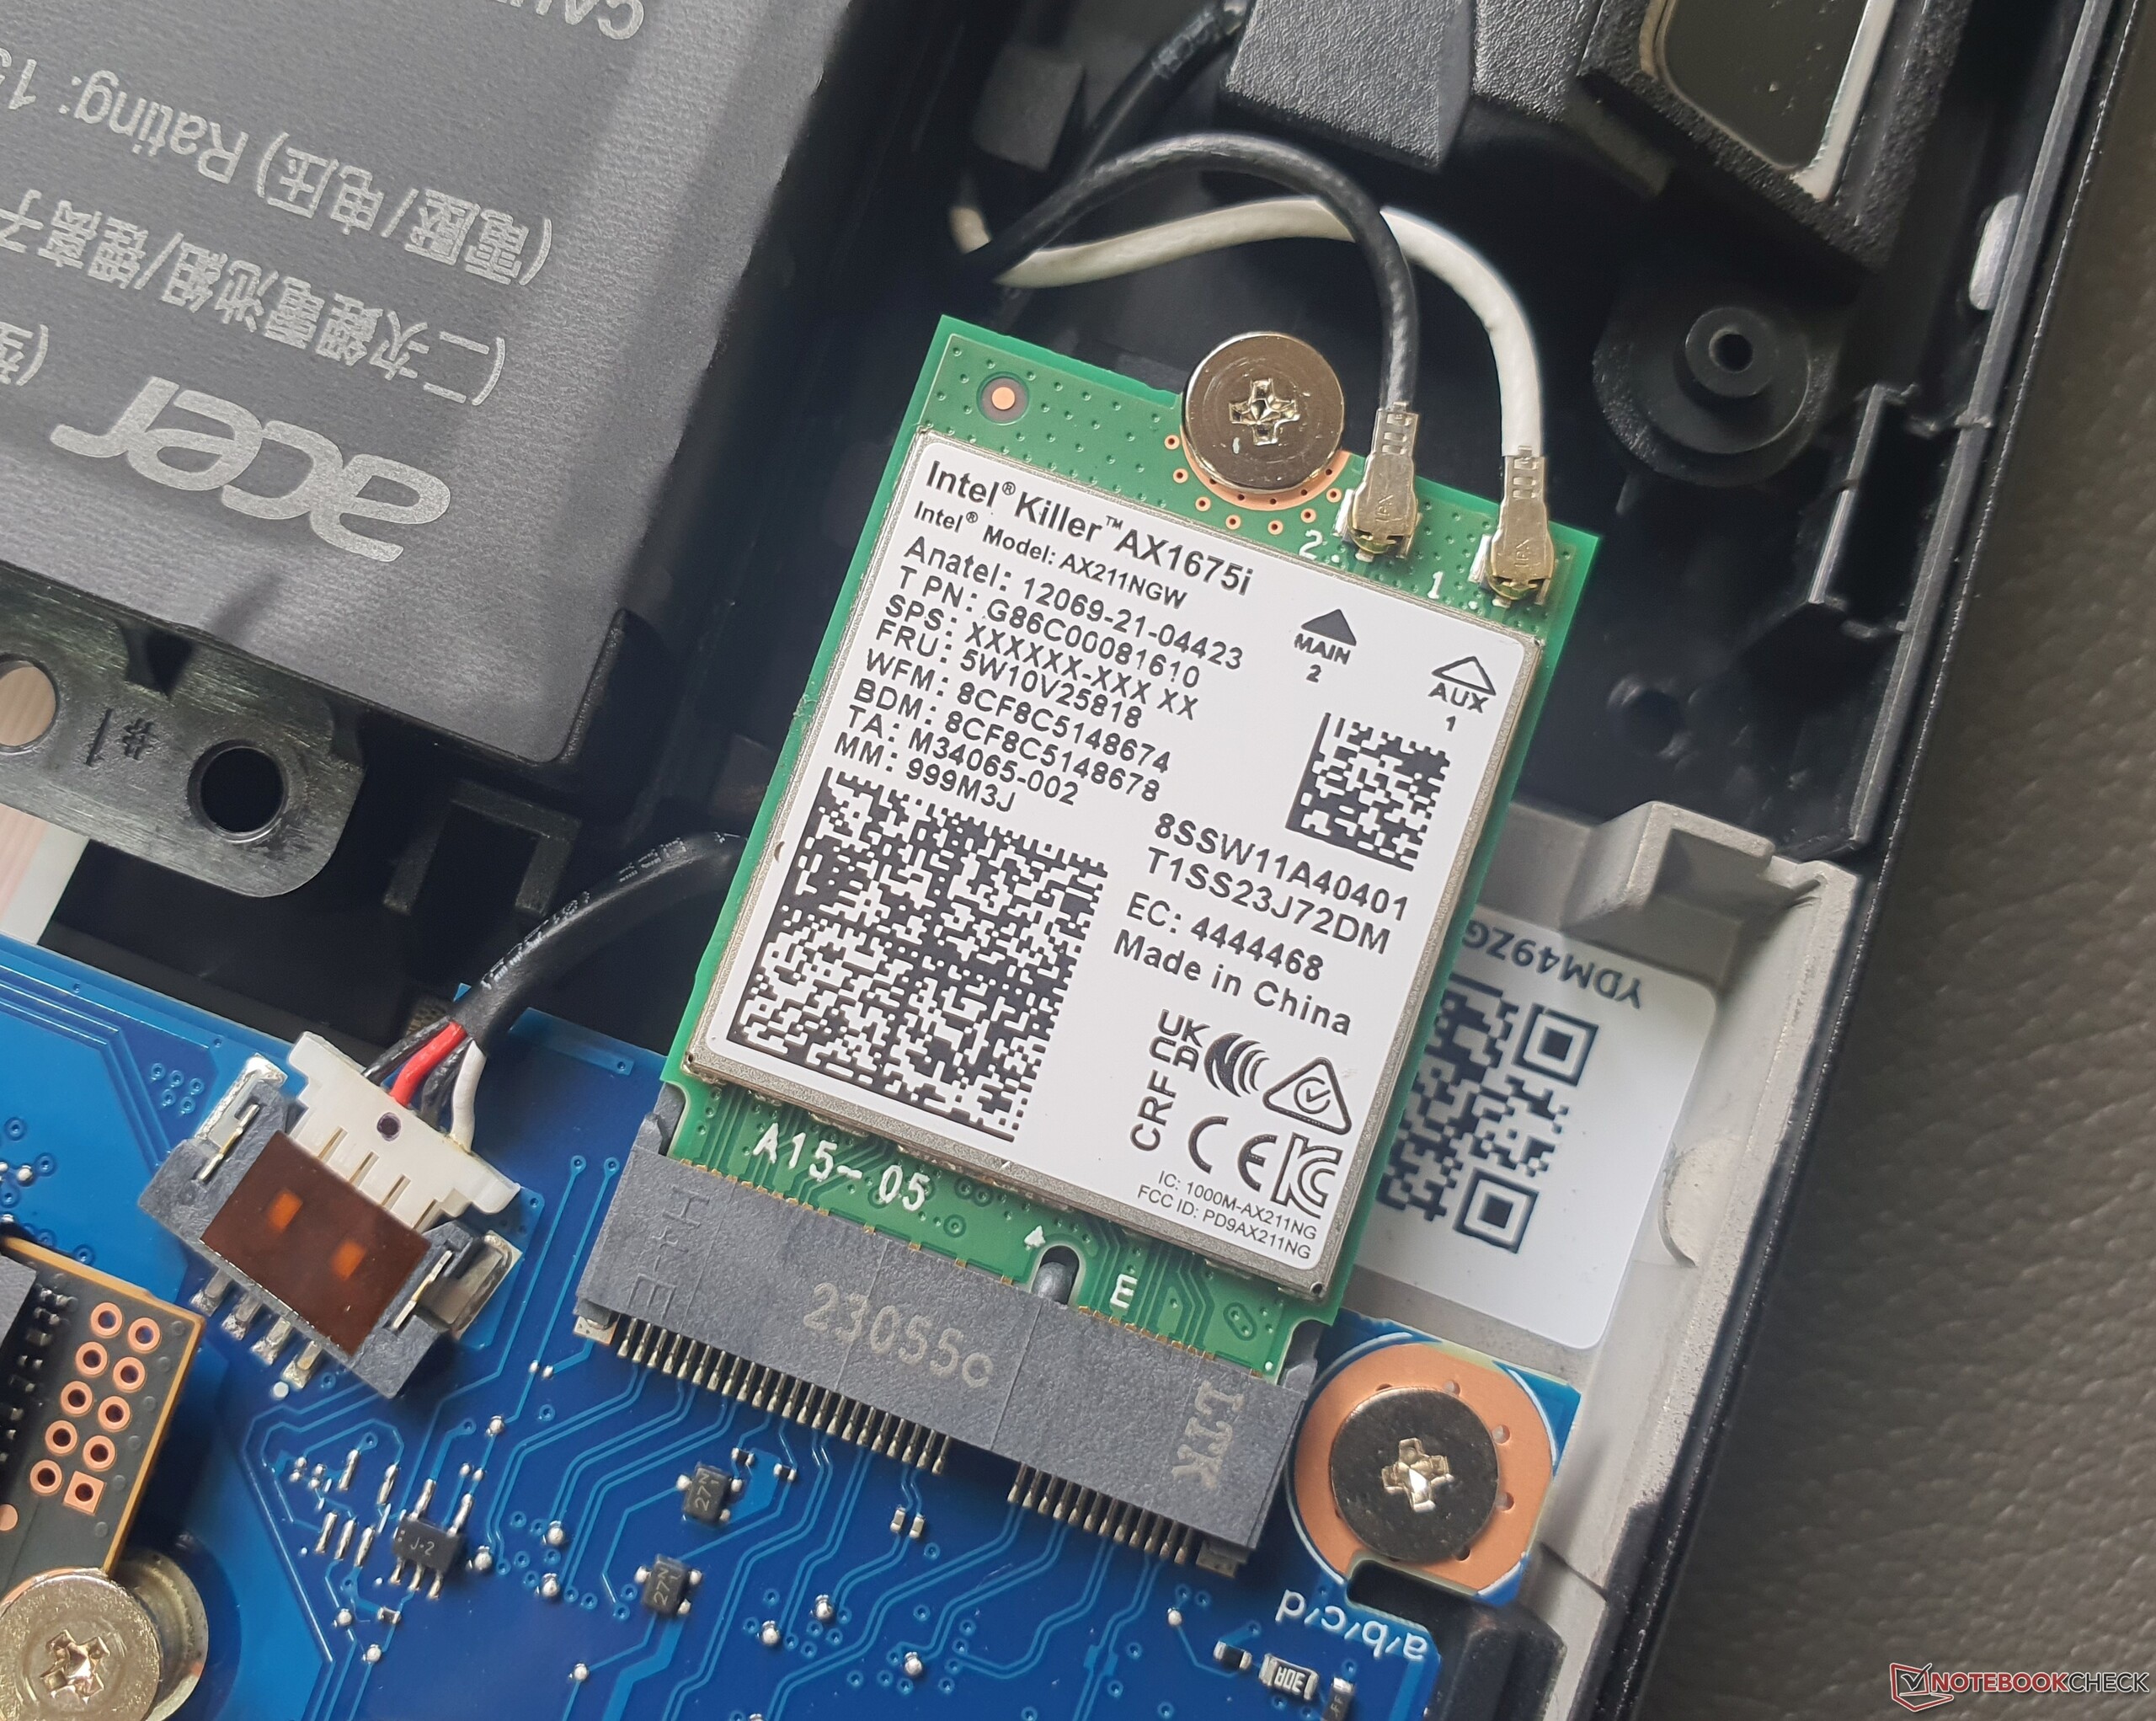
Il chip Intel Killer AX1675i Wi-Fi 6E è responsabile della trasmissione della rete wireless, che opera a una velocità di prim'ordine, fino a 1,6 GBit/s, più veloce di quanto consenta la porta Gigabit RJ45 installata (Killer 2600), che non supporta i 2,5 GBit/s.Legion Pro 5 16e ilTUF Gaming A16sono un po' più indietro rispetto all'Helios 16. È presente il Bluetooth 5.2.
Webcam
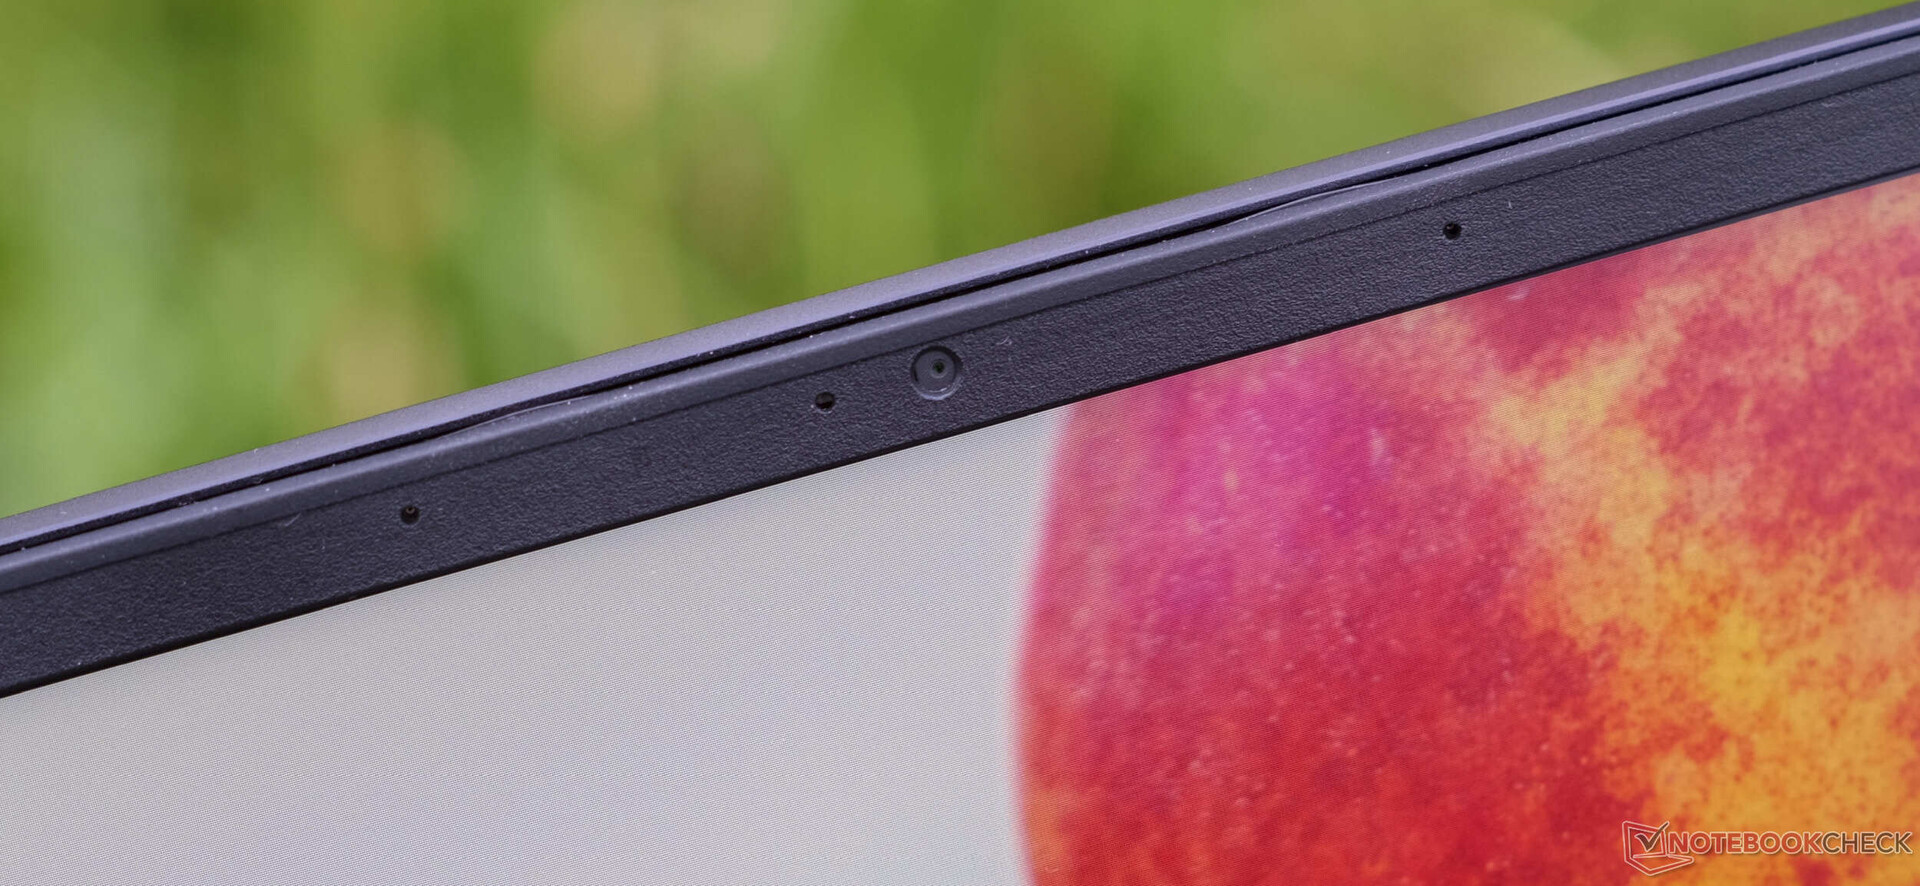
In buone condizioni di illuminazione, la webcam 1080p offre immagini molto buone. In presenza di un controluce (in questo caso proveniente da una finestra laterale senza altre fonti di luce), la qualità si riduce drasticamente. Windows Hello è supportato, ma l'otturatore fisico della fotocamera è assente.


Accessori
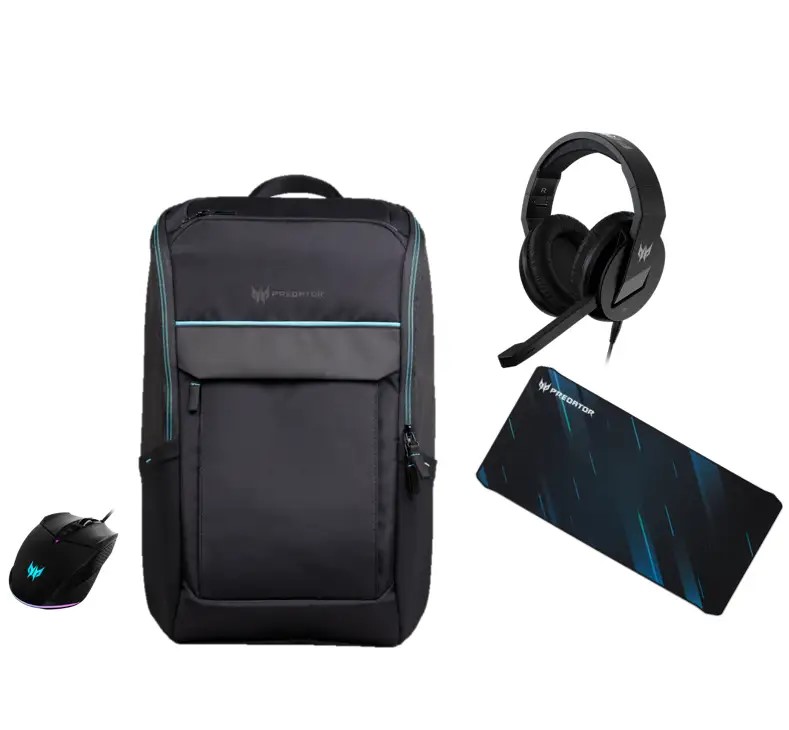
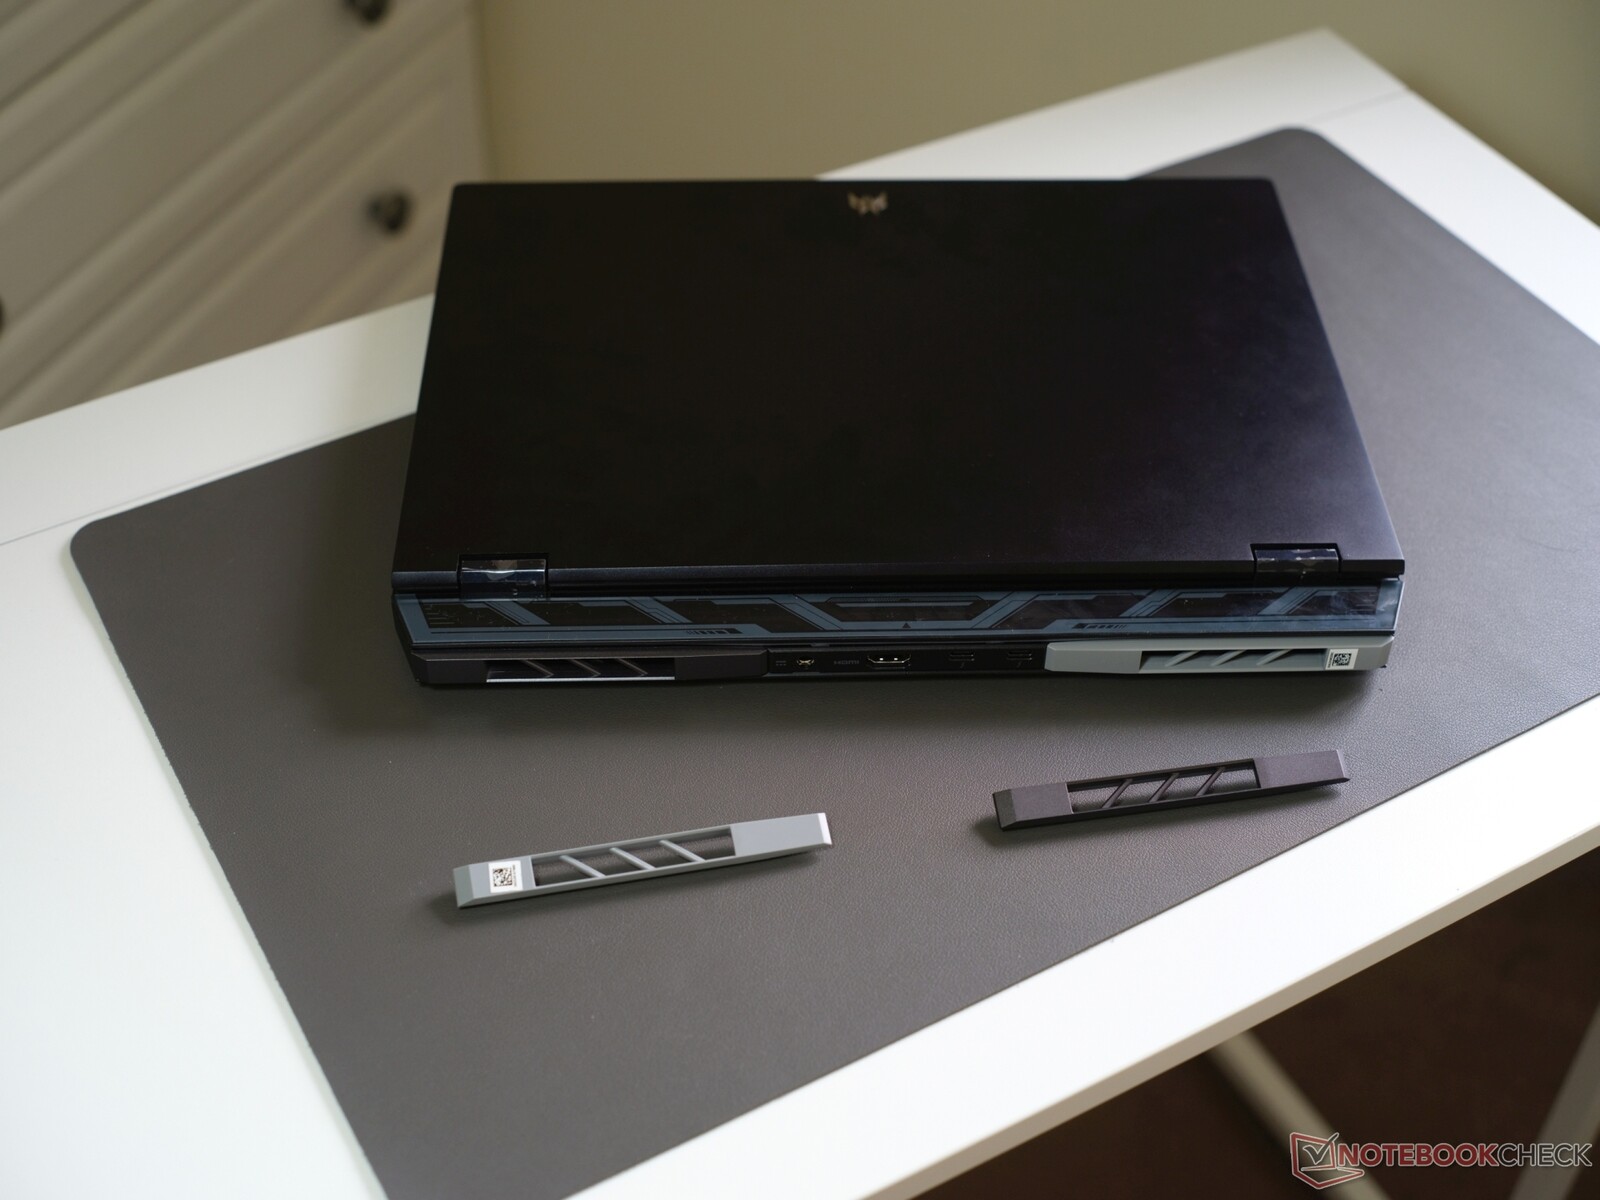
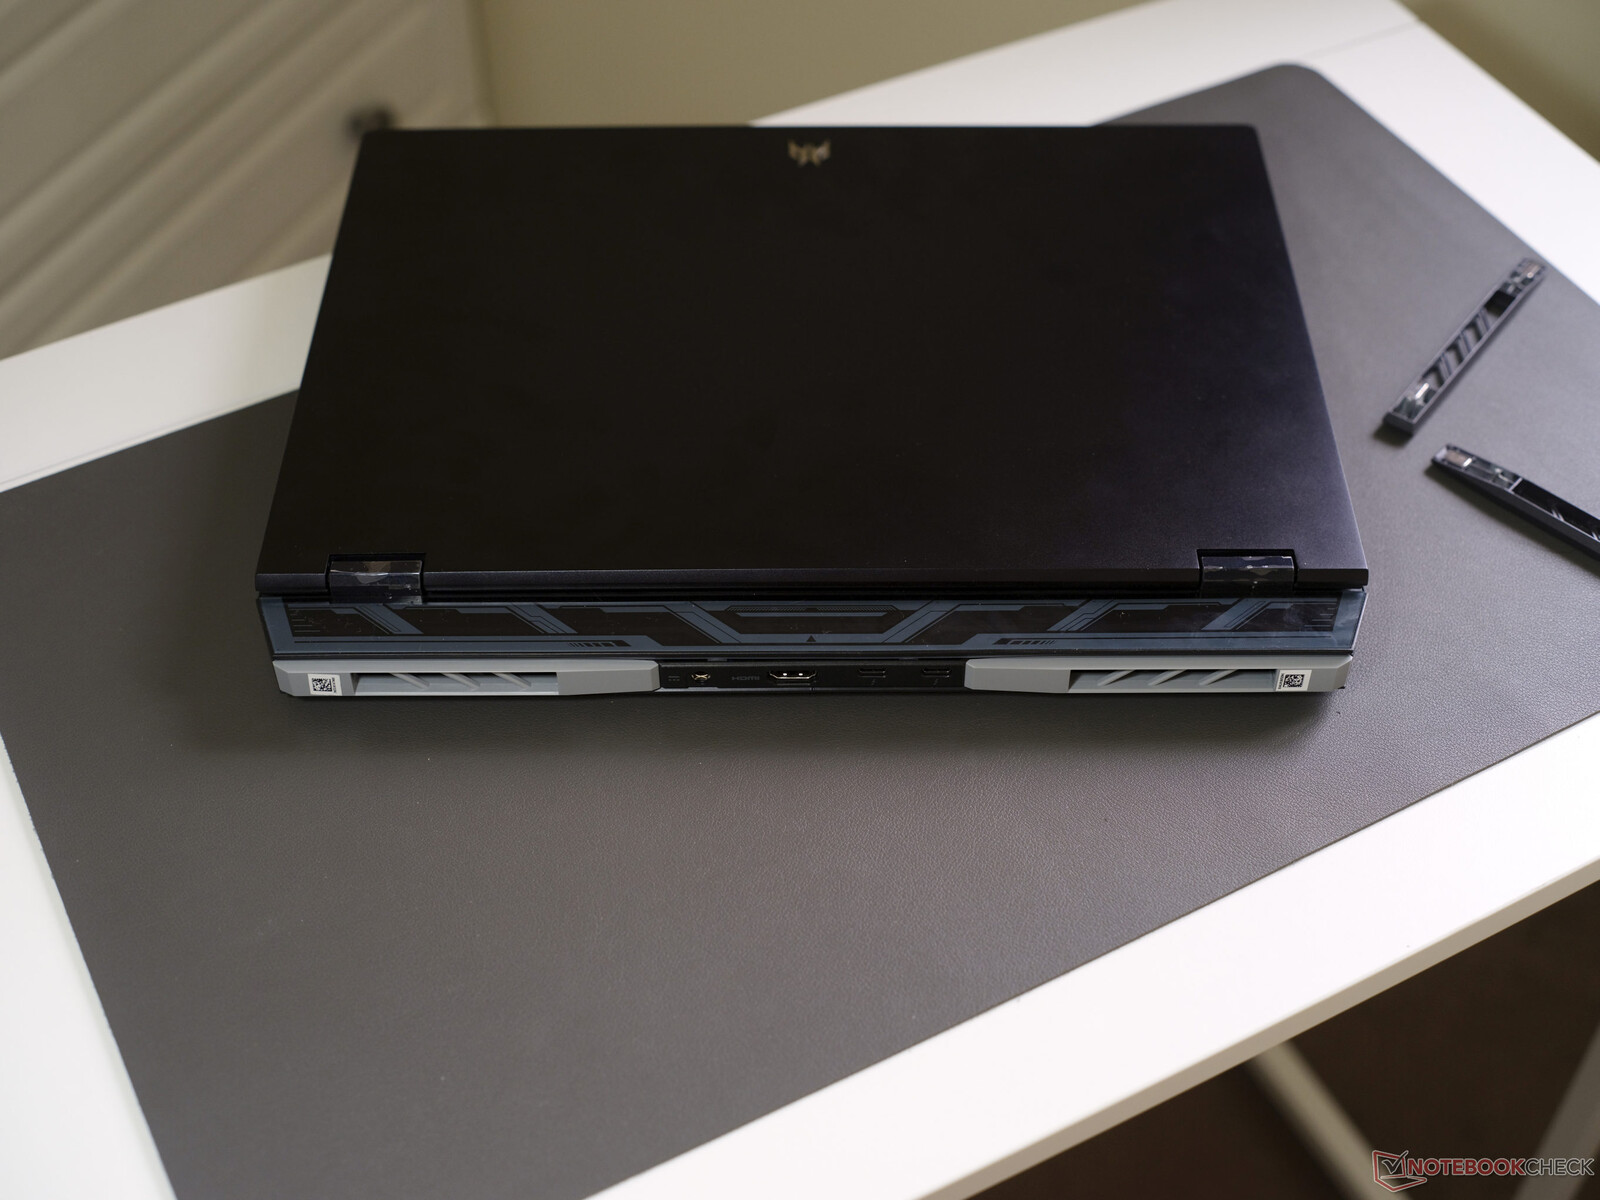
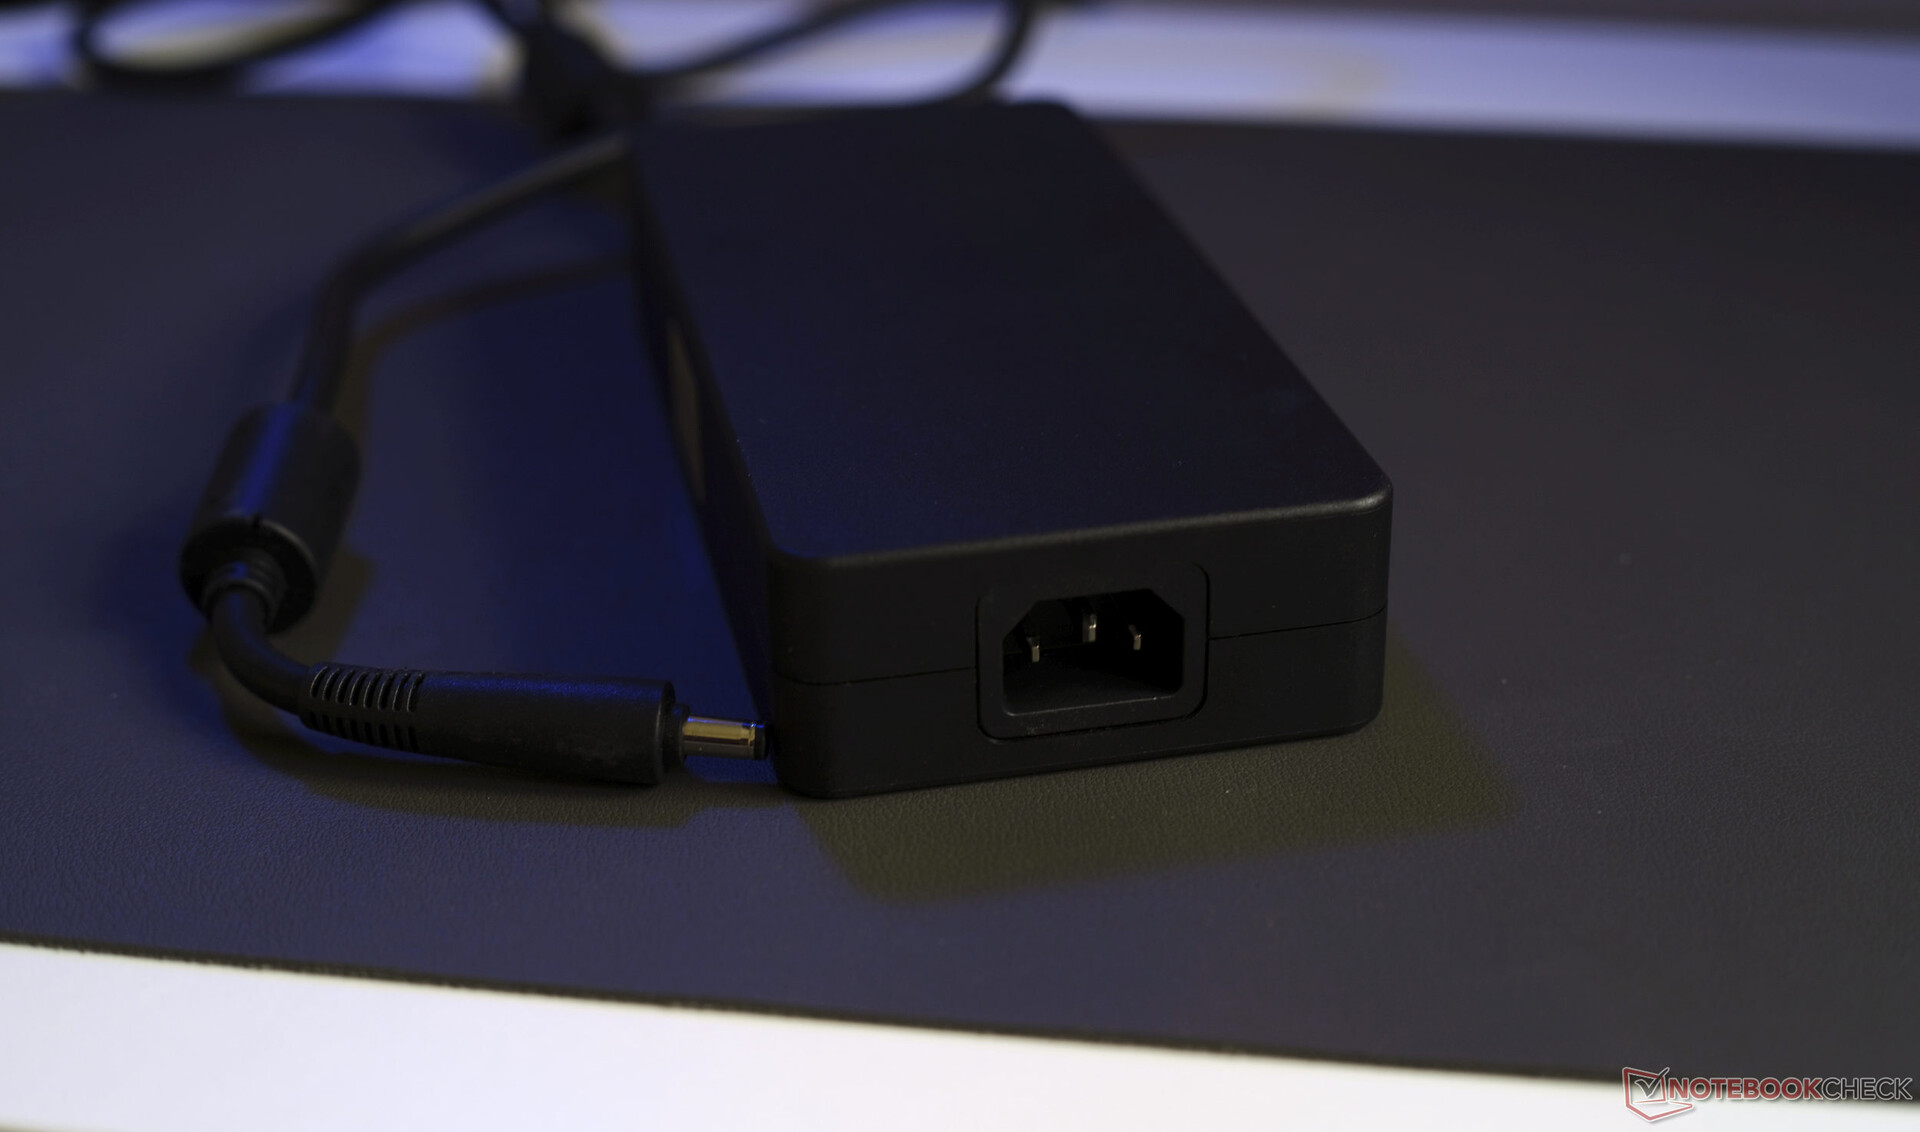
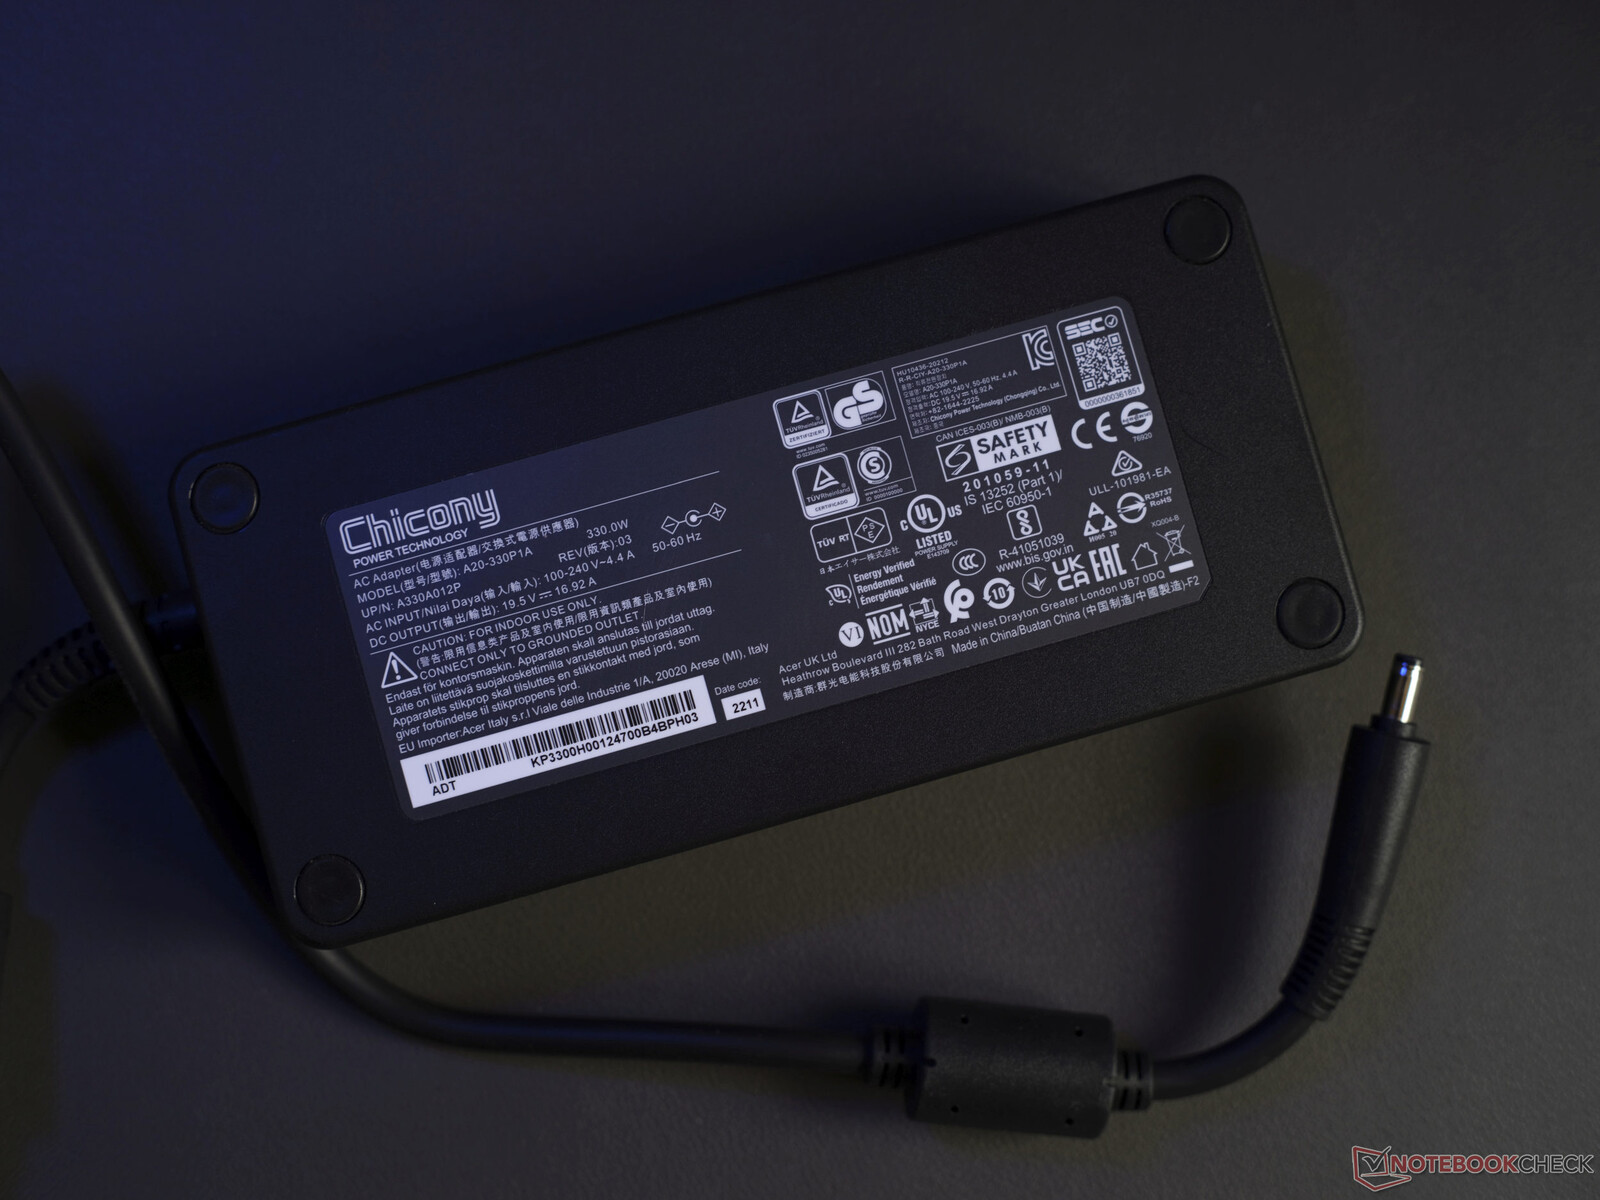
Acer ha incluso due griglie magnetiche aggiuntive per la ventola, di colore grigio chiaro, per sostituire quelle preinstallate di colore grigio scuro. Sarebbe stato divertente avere accenti di colore più avventurosi. A parte questo, c'è solo l'alimentatore da 330 watt. Il produttore non ha scelto un imballaggio ecologico.
Le foto a destra si riferiscono al pacchetto Predator gaming attualmente disponibile sullo store tedesco di Acer.
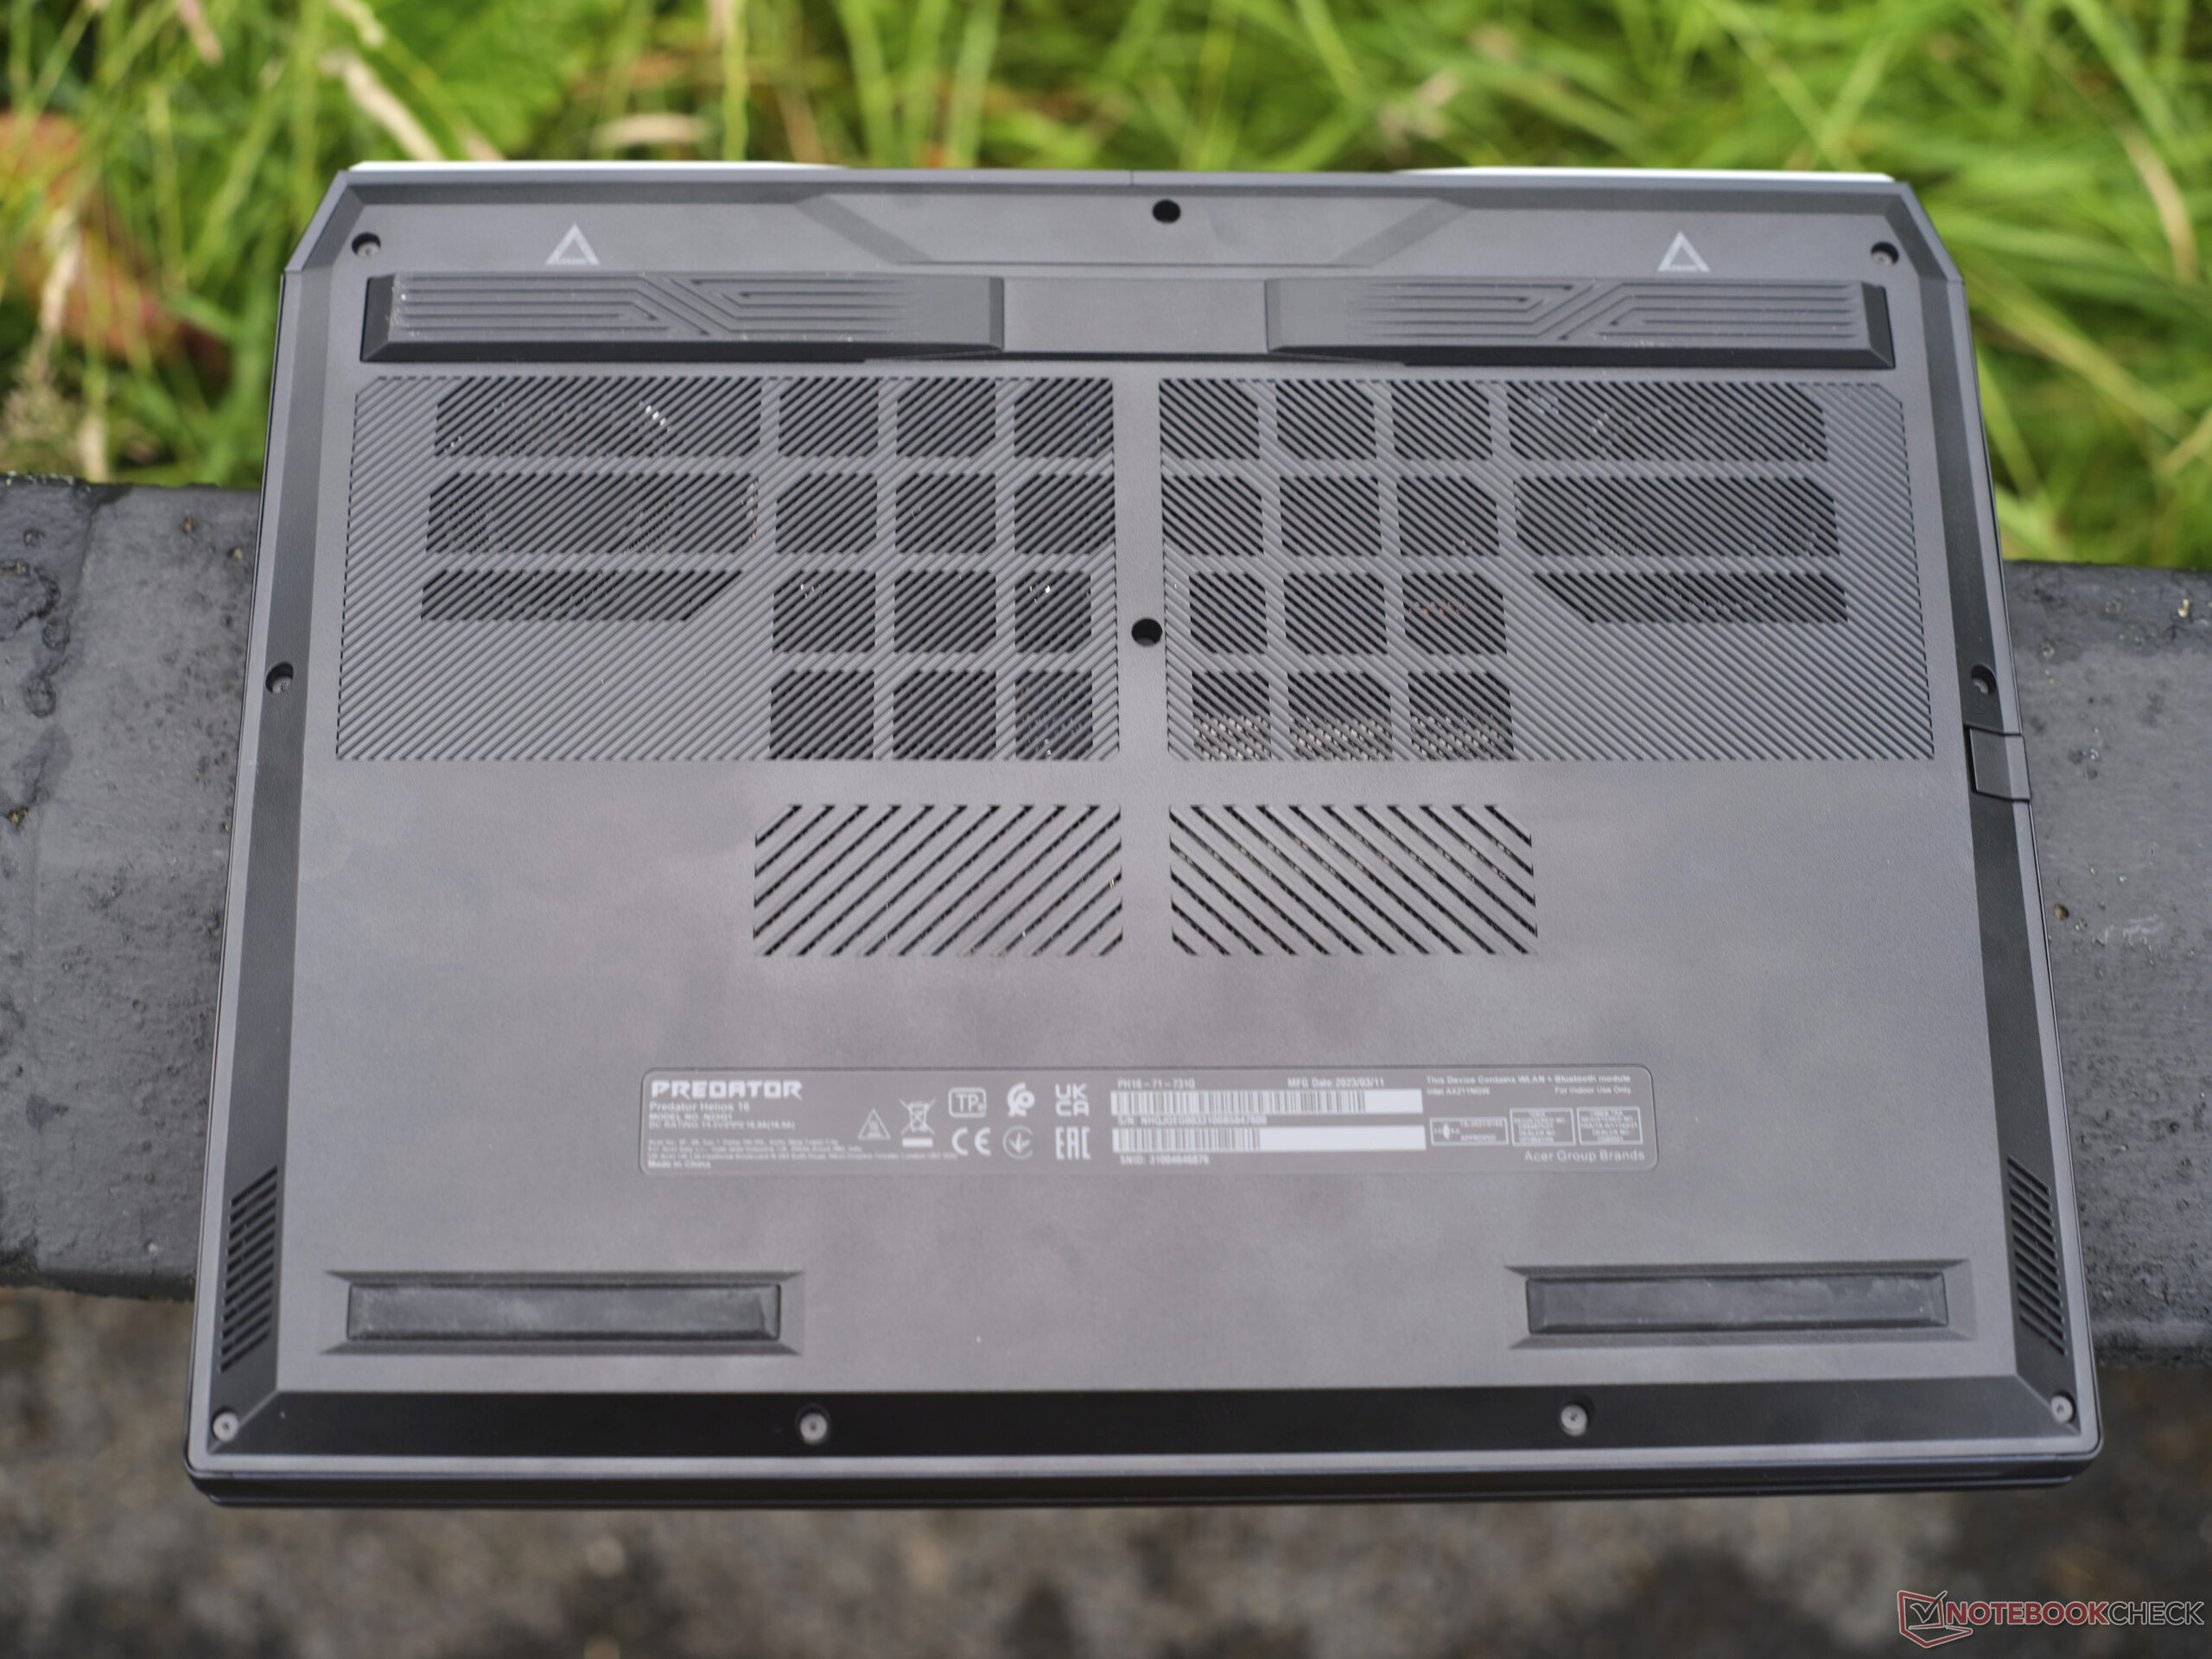
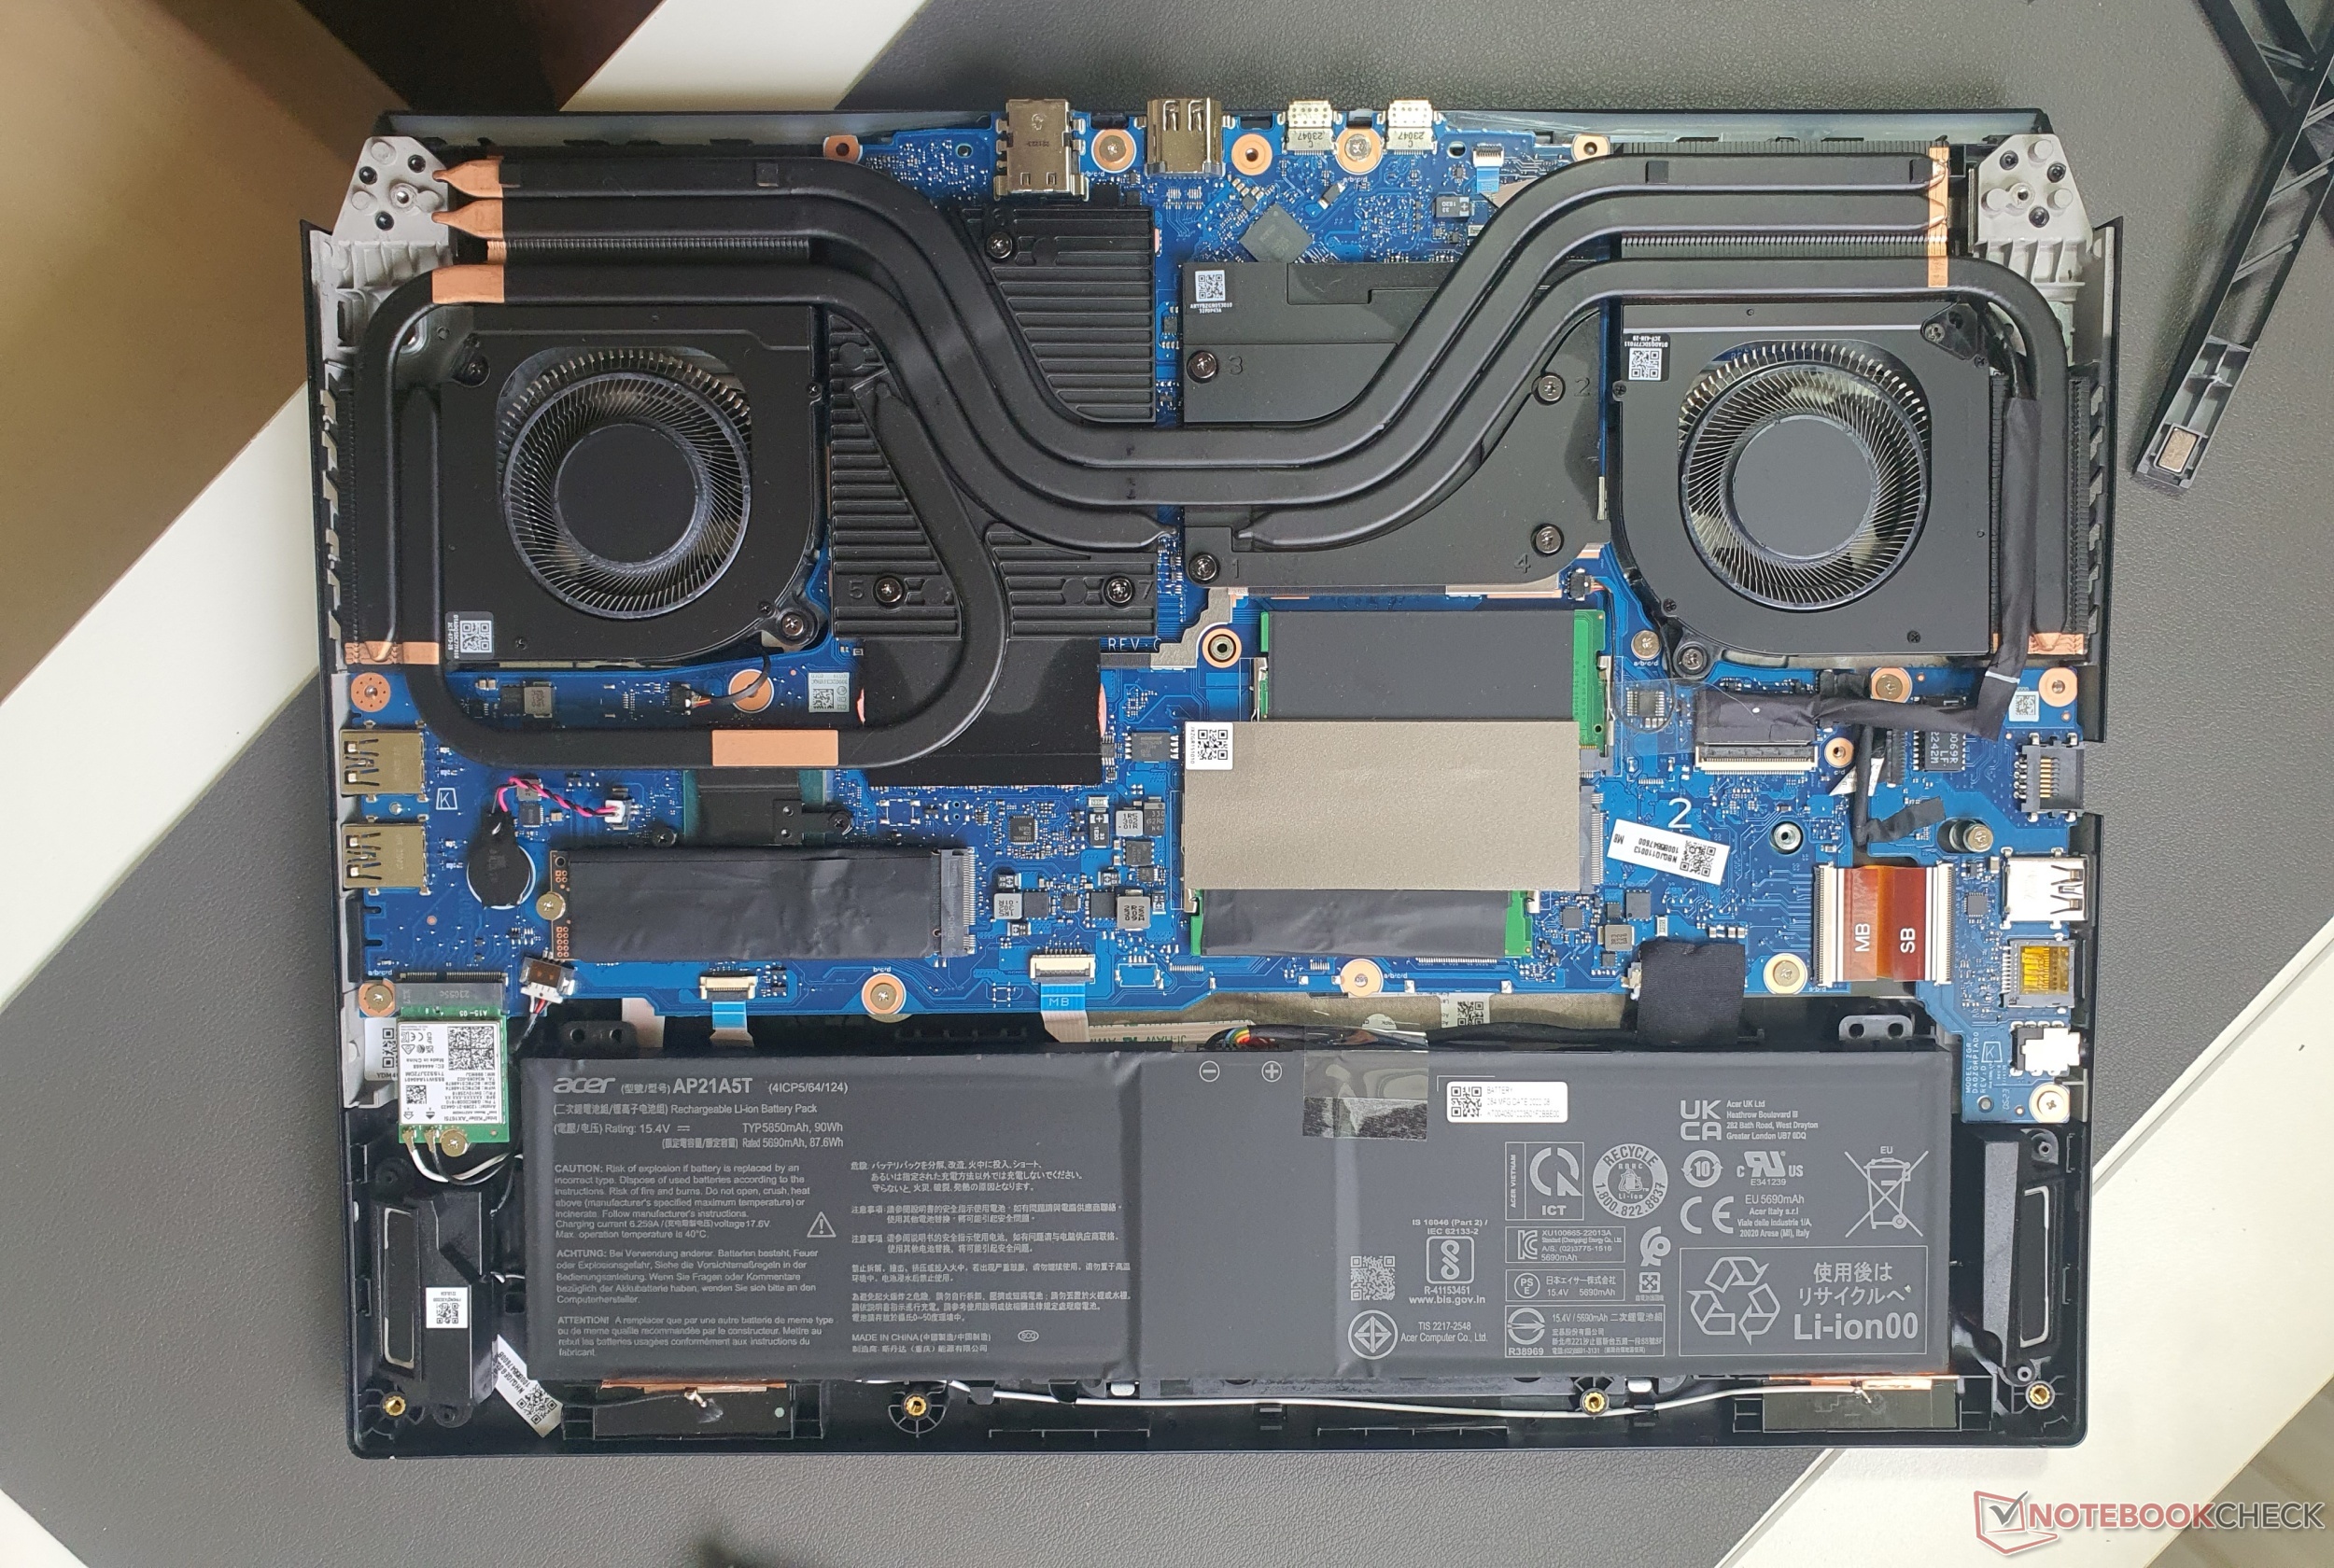
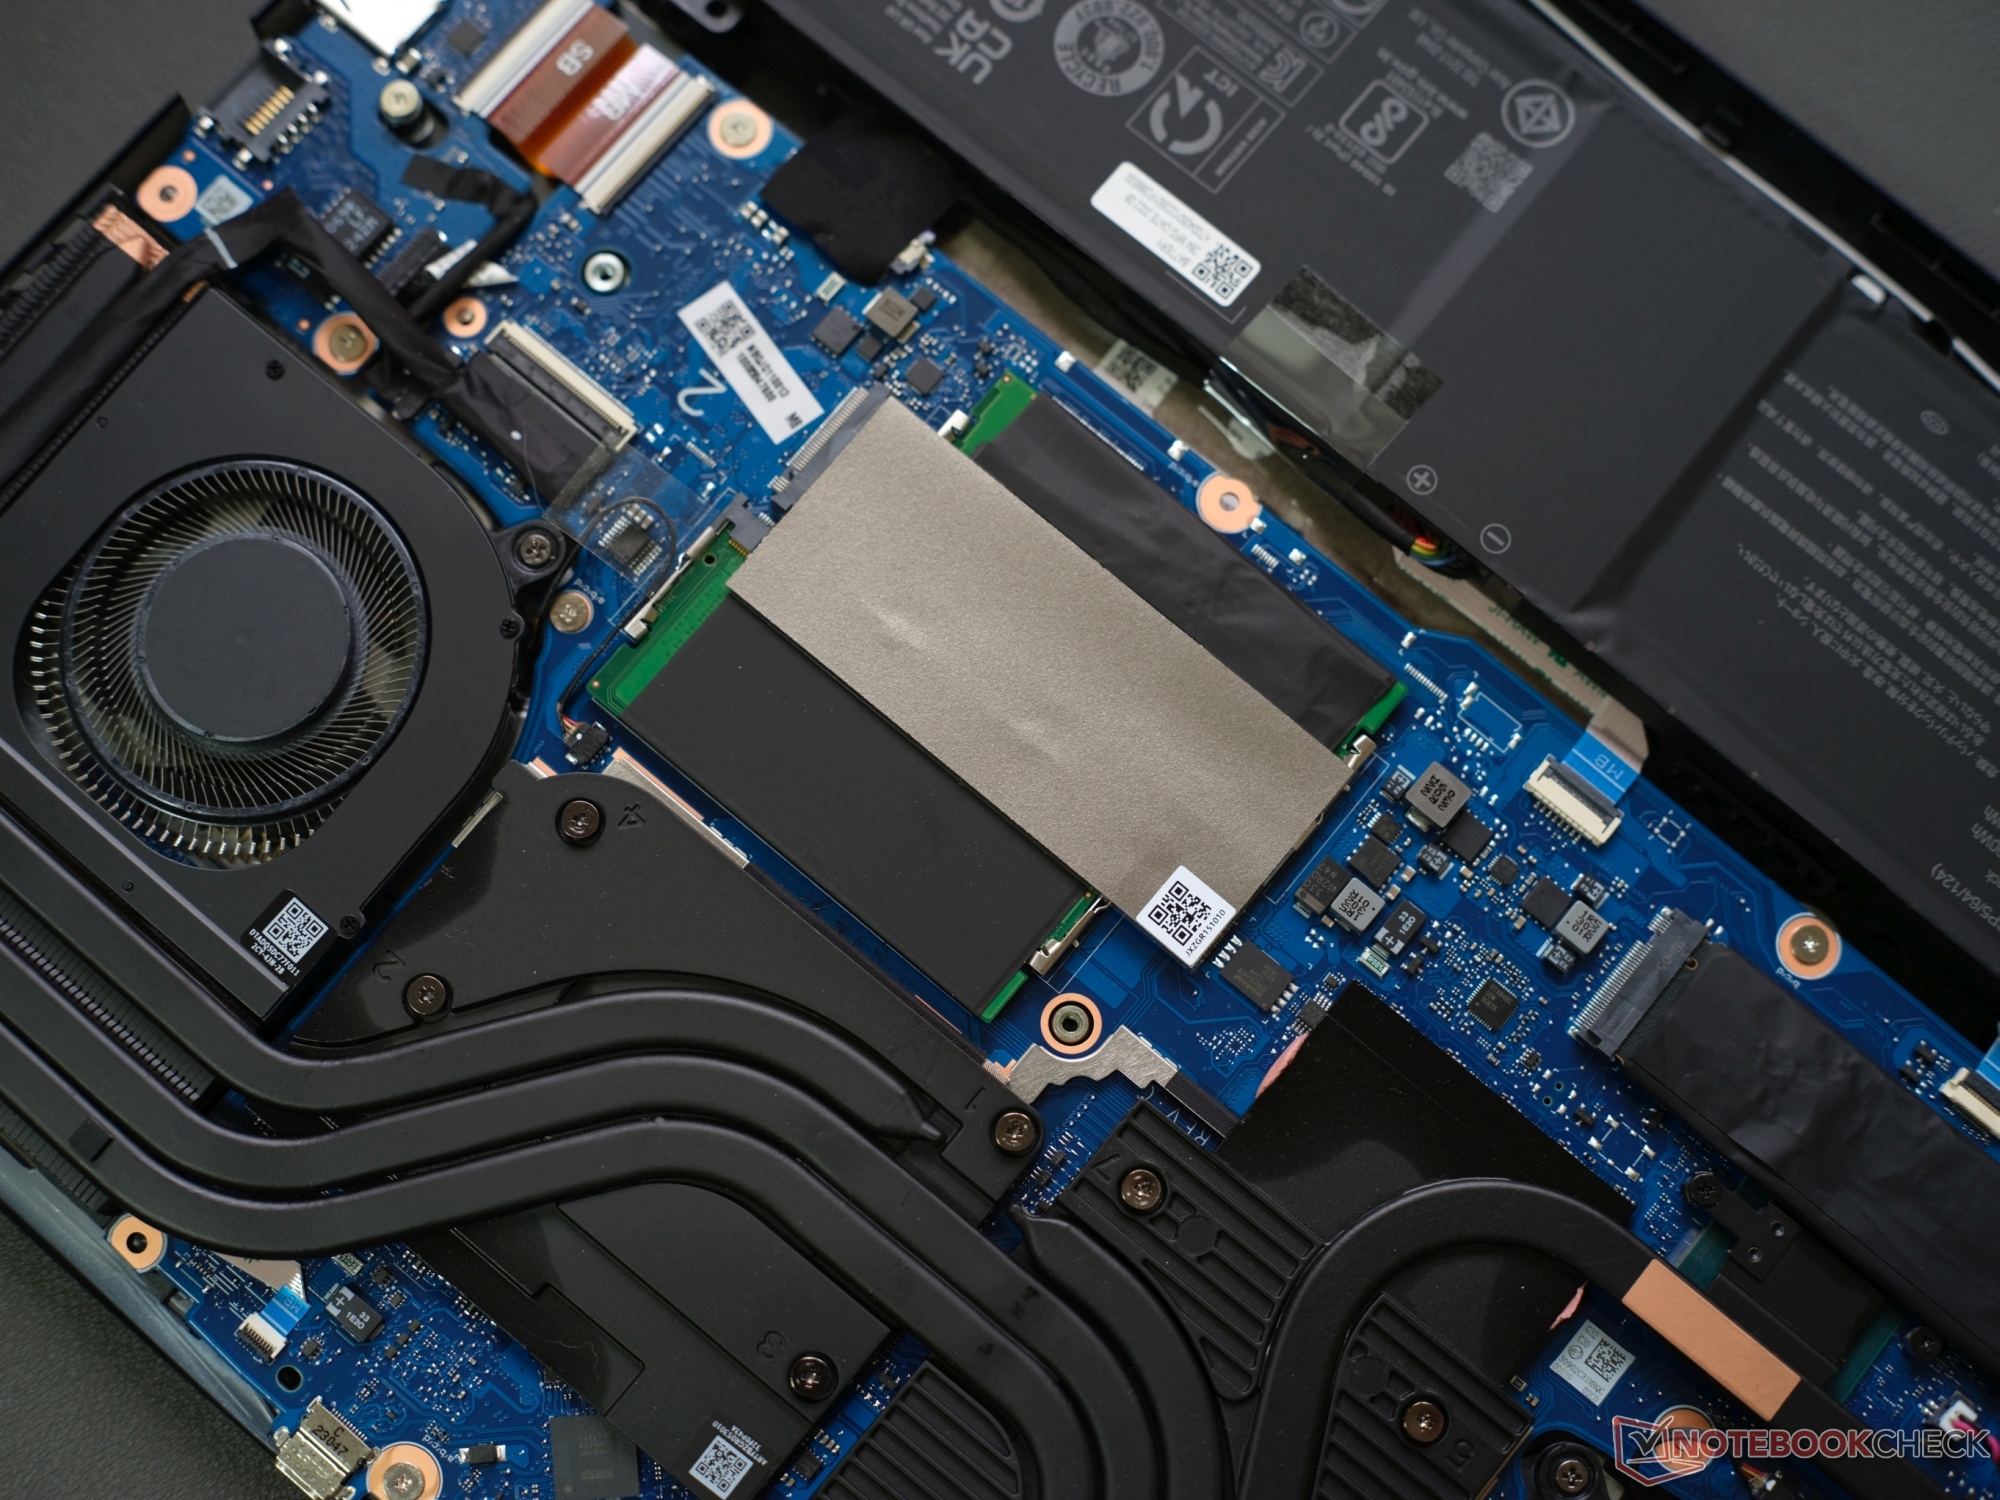
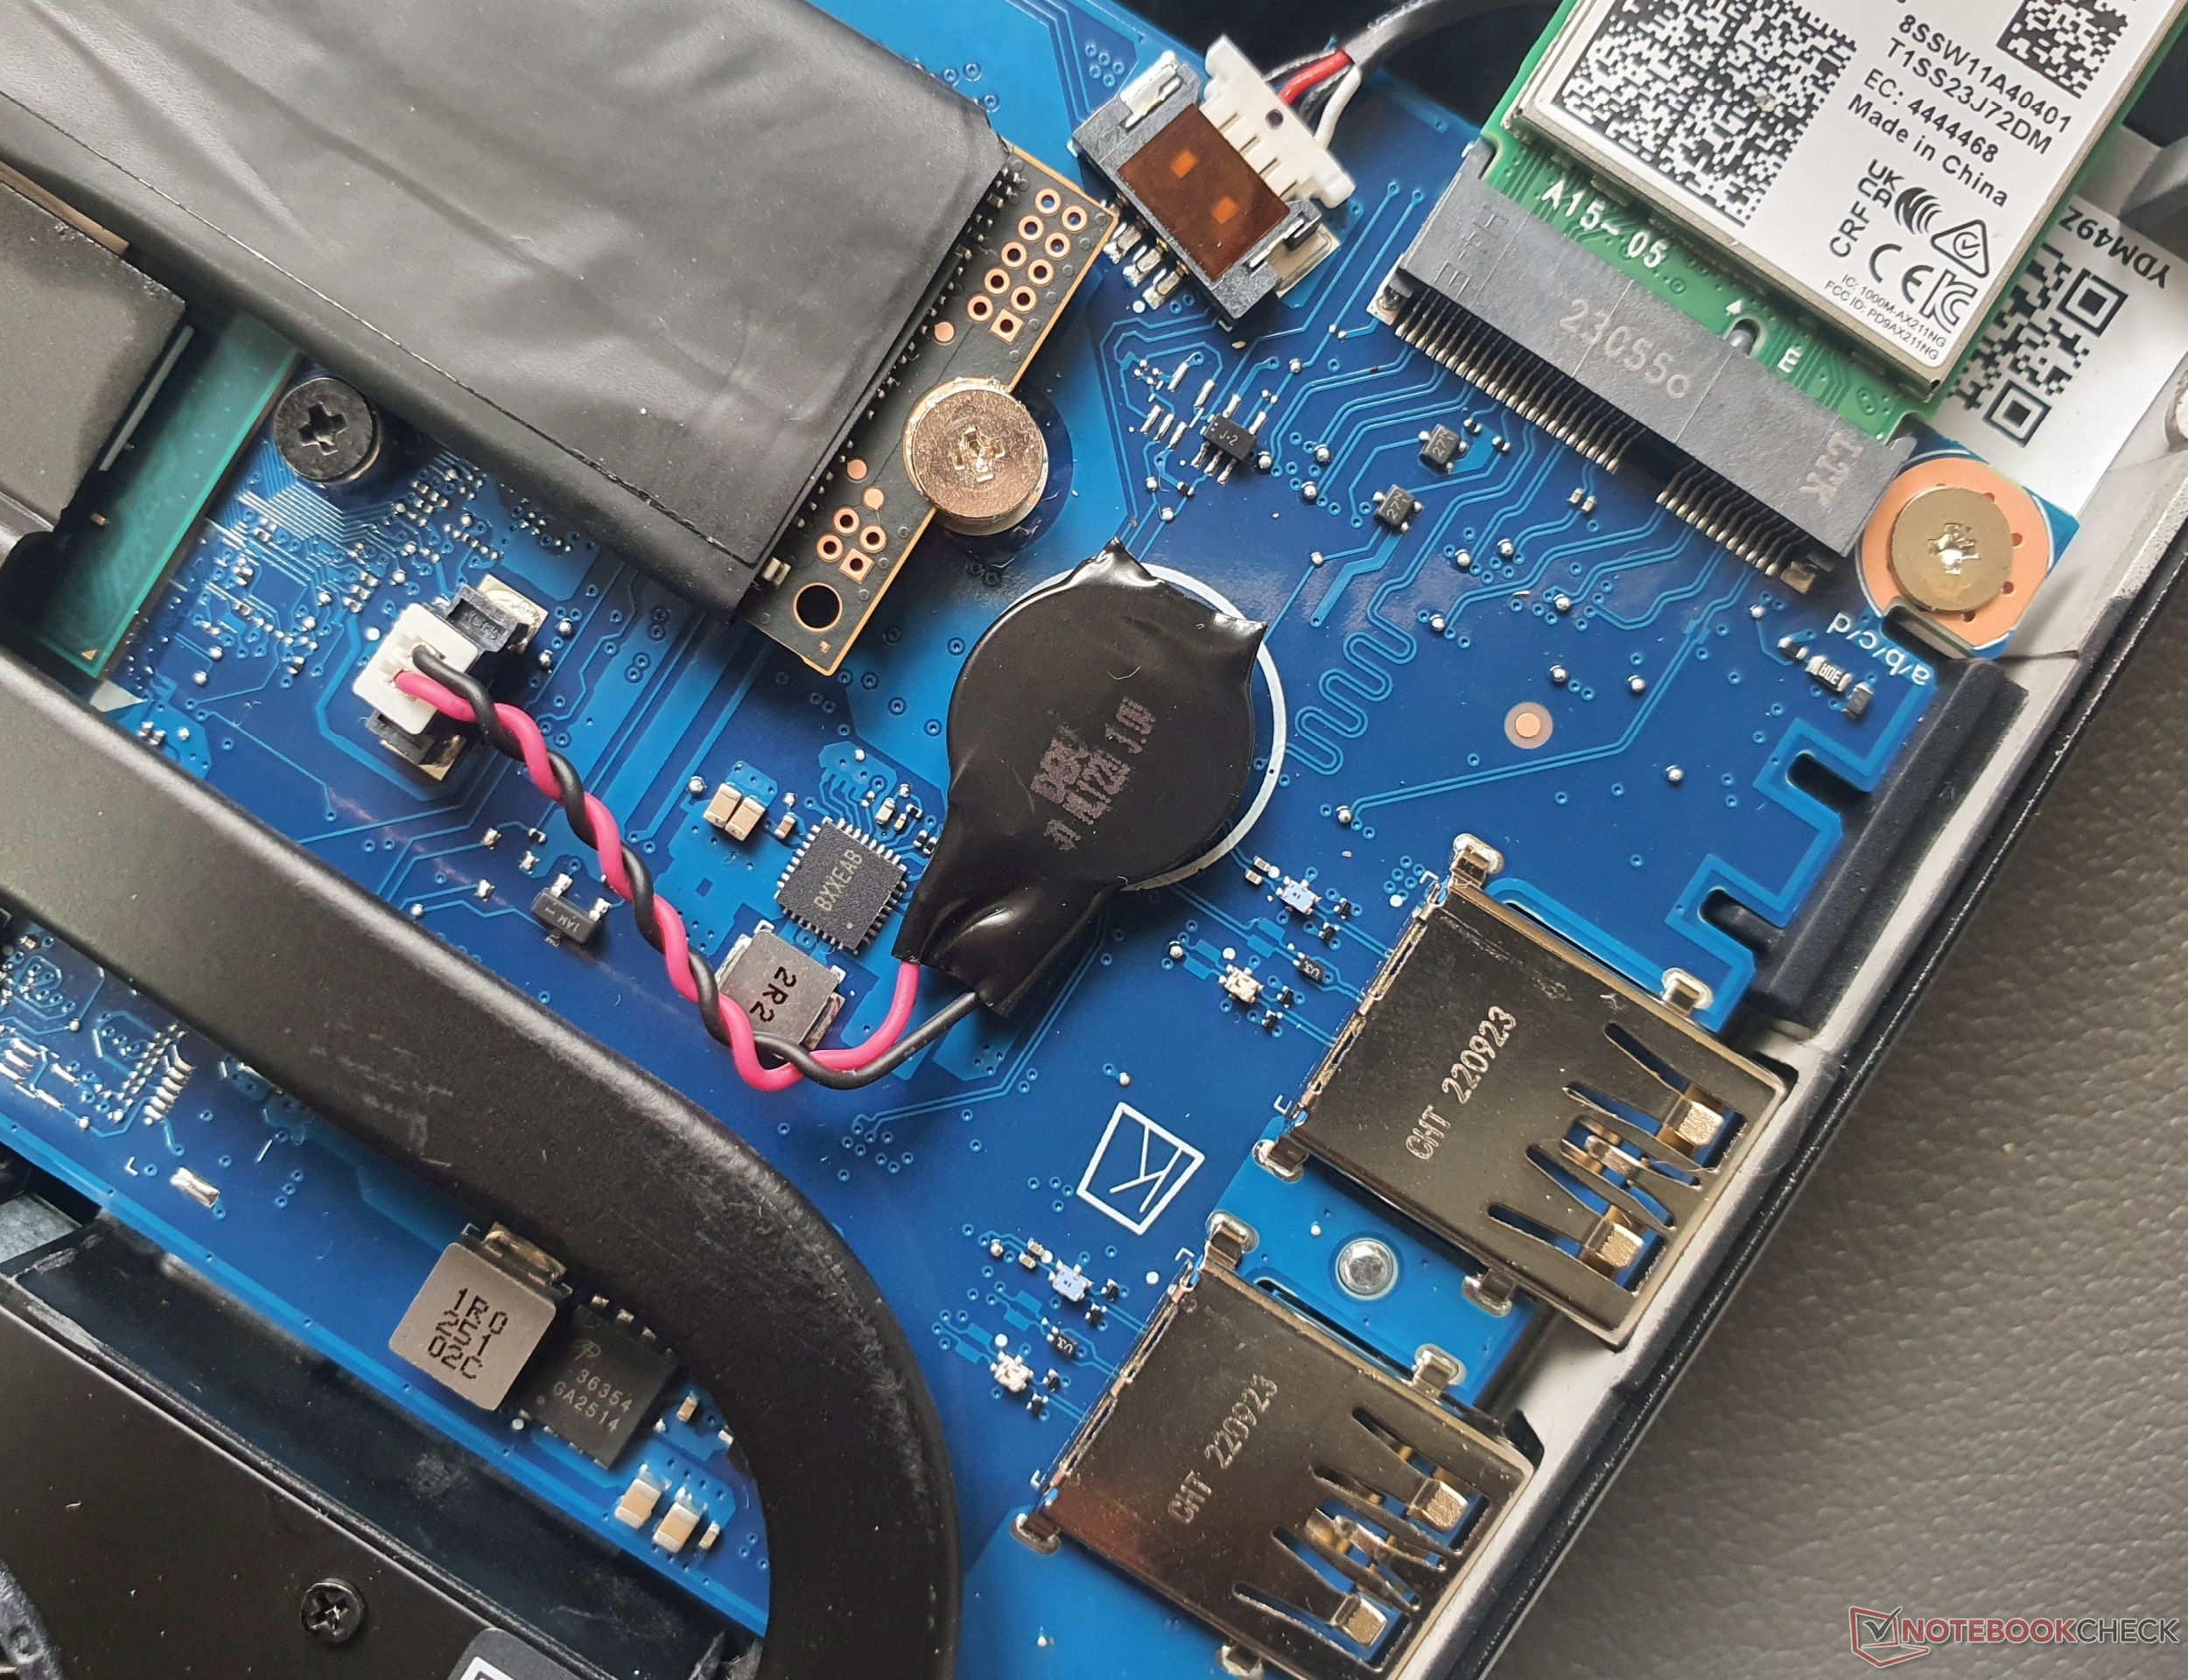
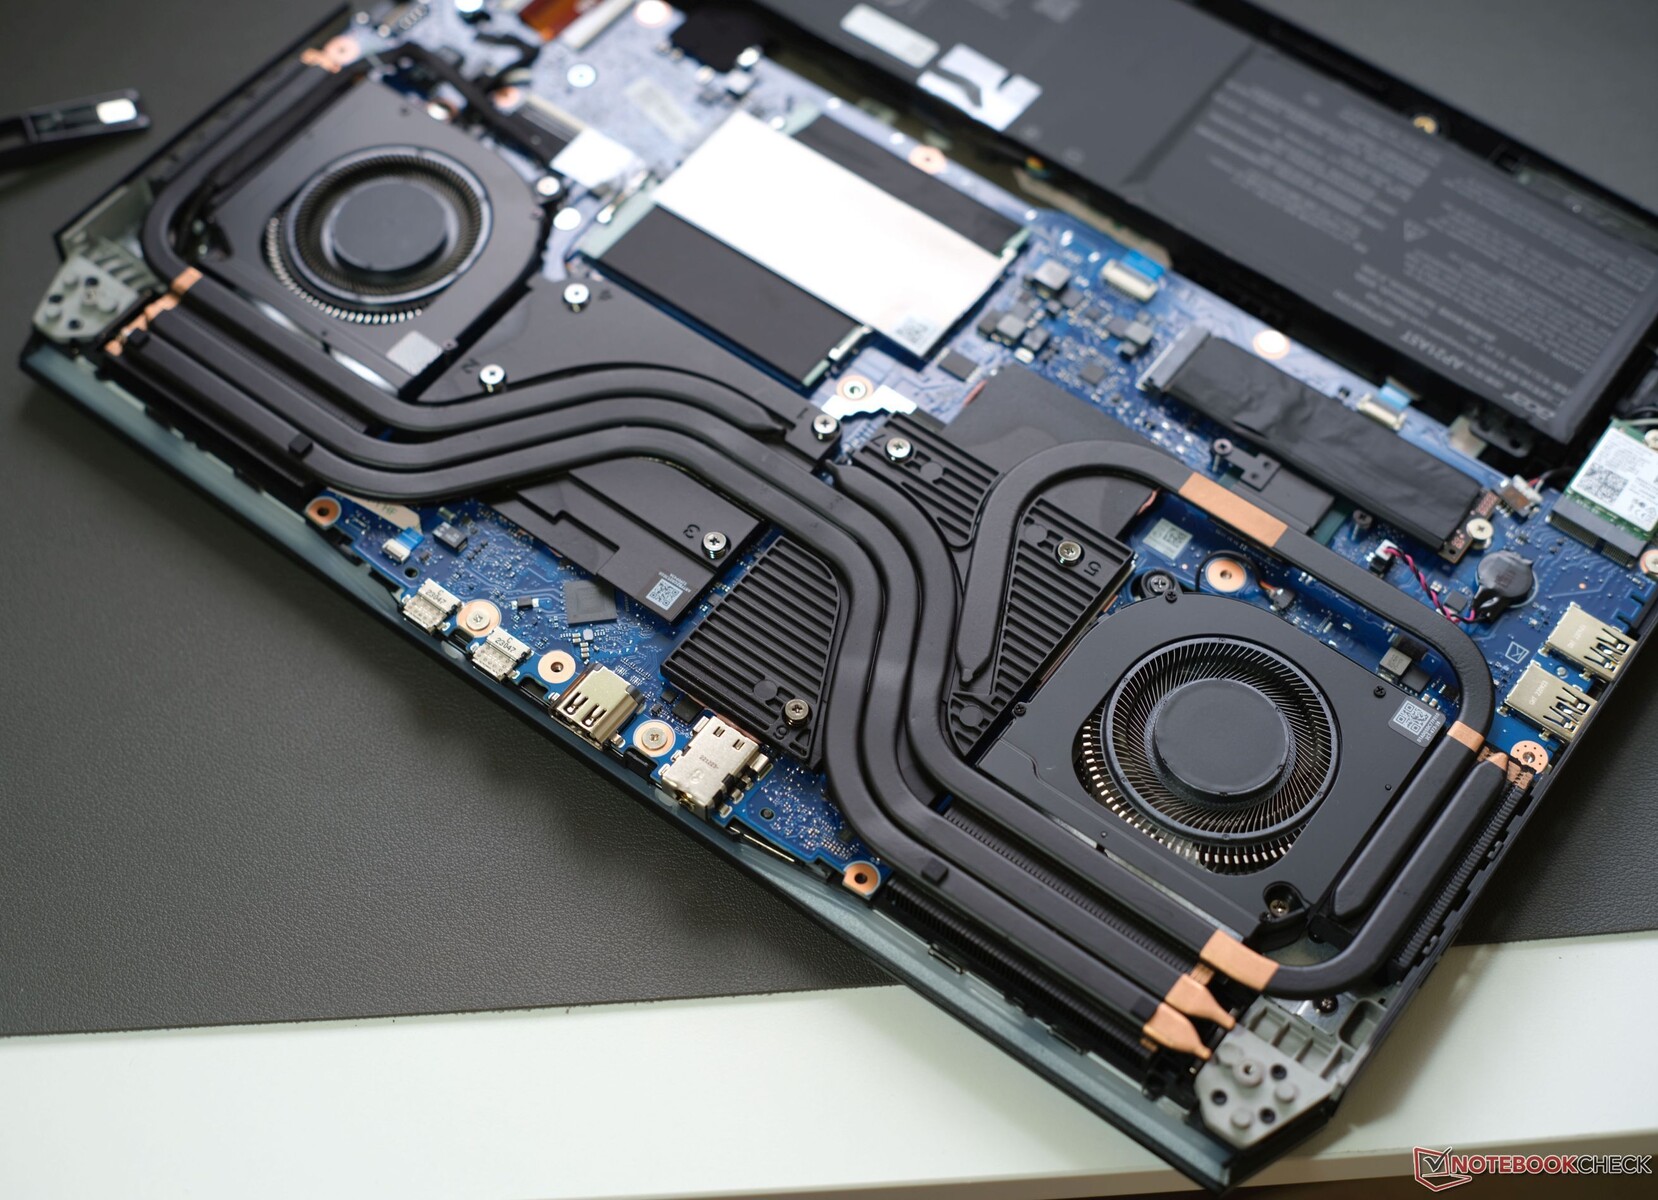
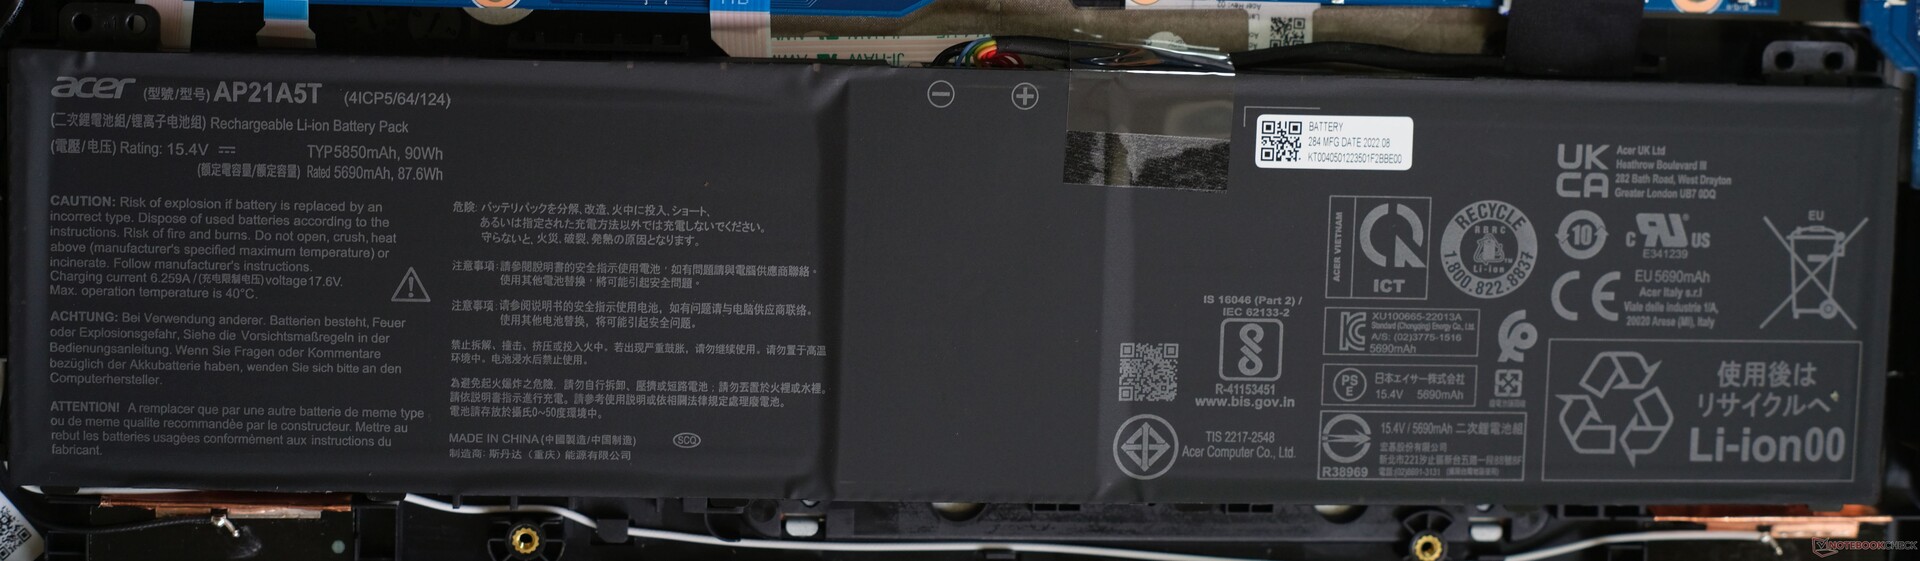
Manutenzione
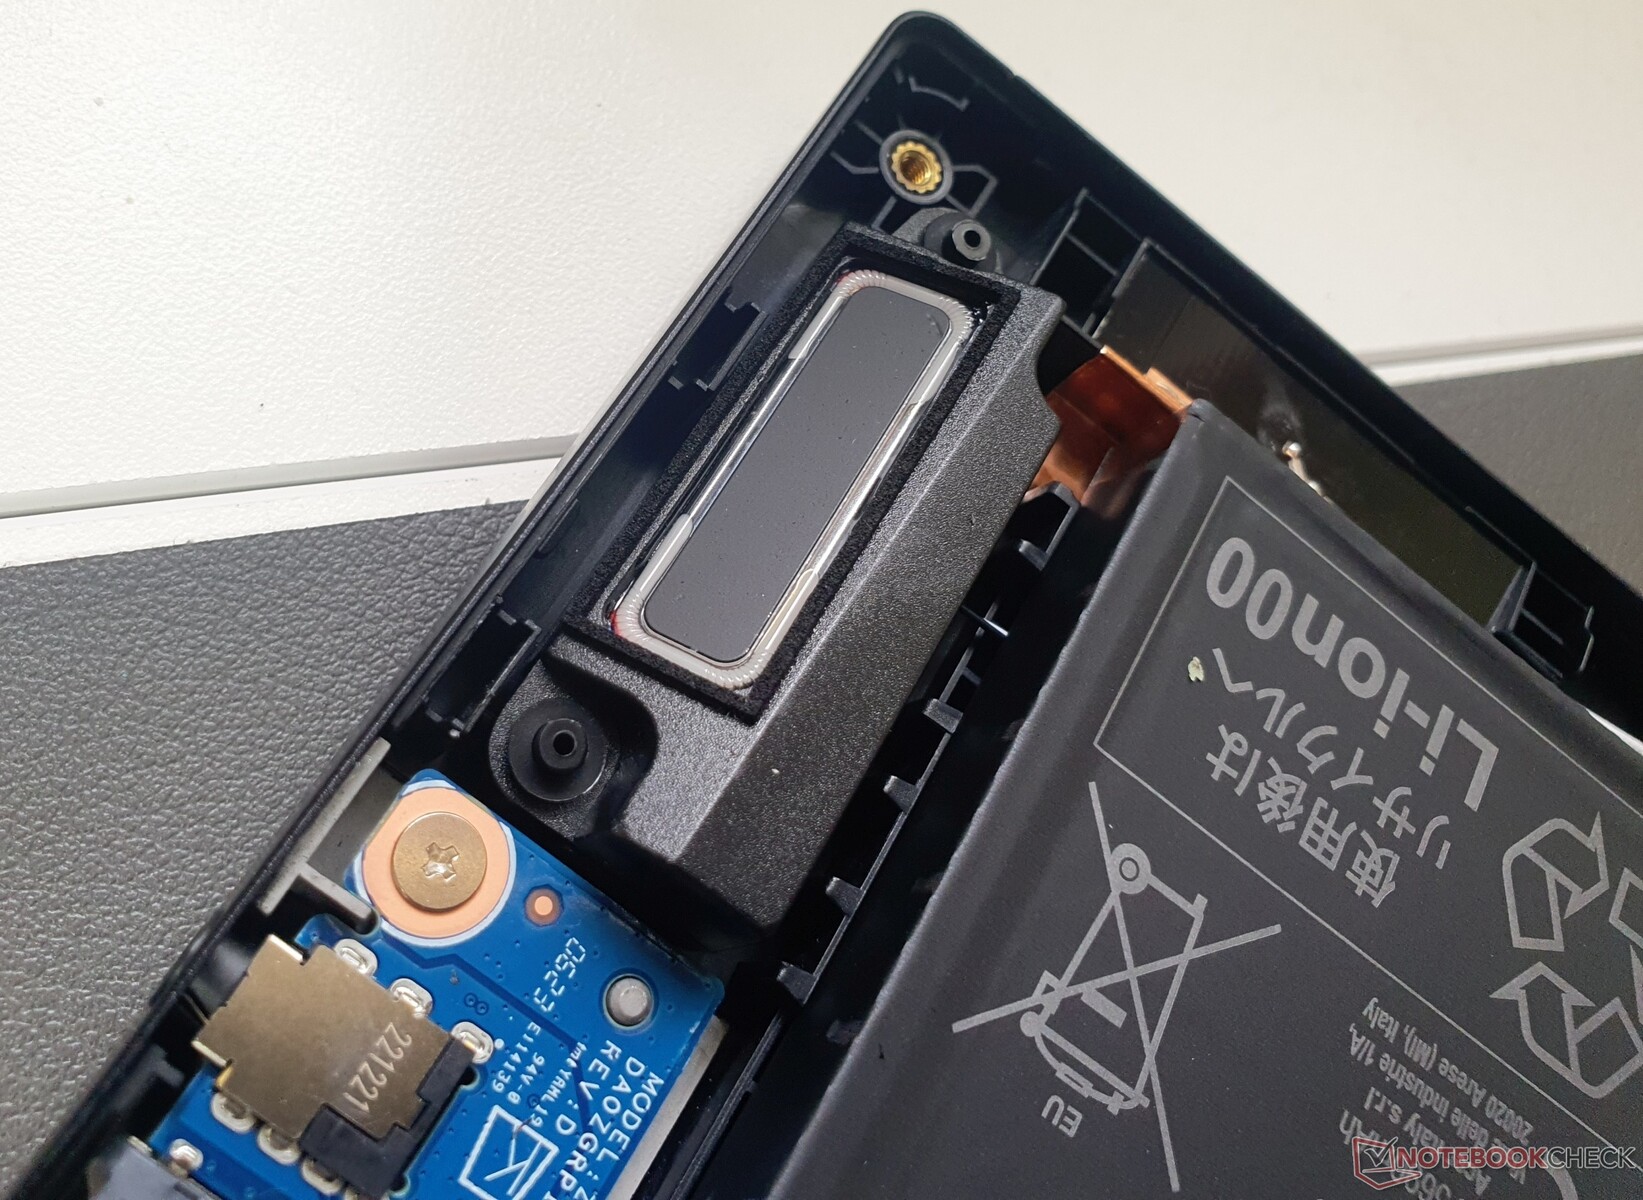
È abbastanza facile accedere ai componenti interni del case dopo aver allentato dieci viti Torx T5. Le parti sostituibili includono la RAM (due banchi), l'unità SSD M.2 2280 e il chip Wi-Fi. Tuttavia, anche la batteria avvitata e la batteria del BIOS possono essere facilmente sostituite.

Garanzia
In Germania, Acer offre una garanzia di 24 mesi. Con Acer Care Plus, la garanzia può essere estesa fino a cinque anni.
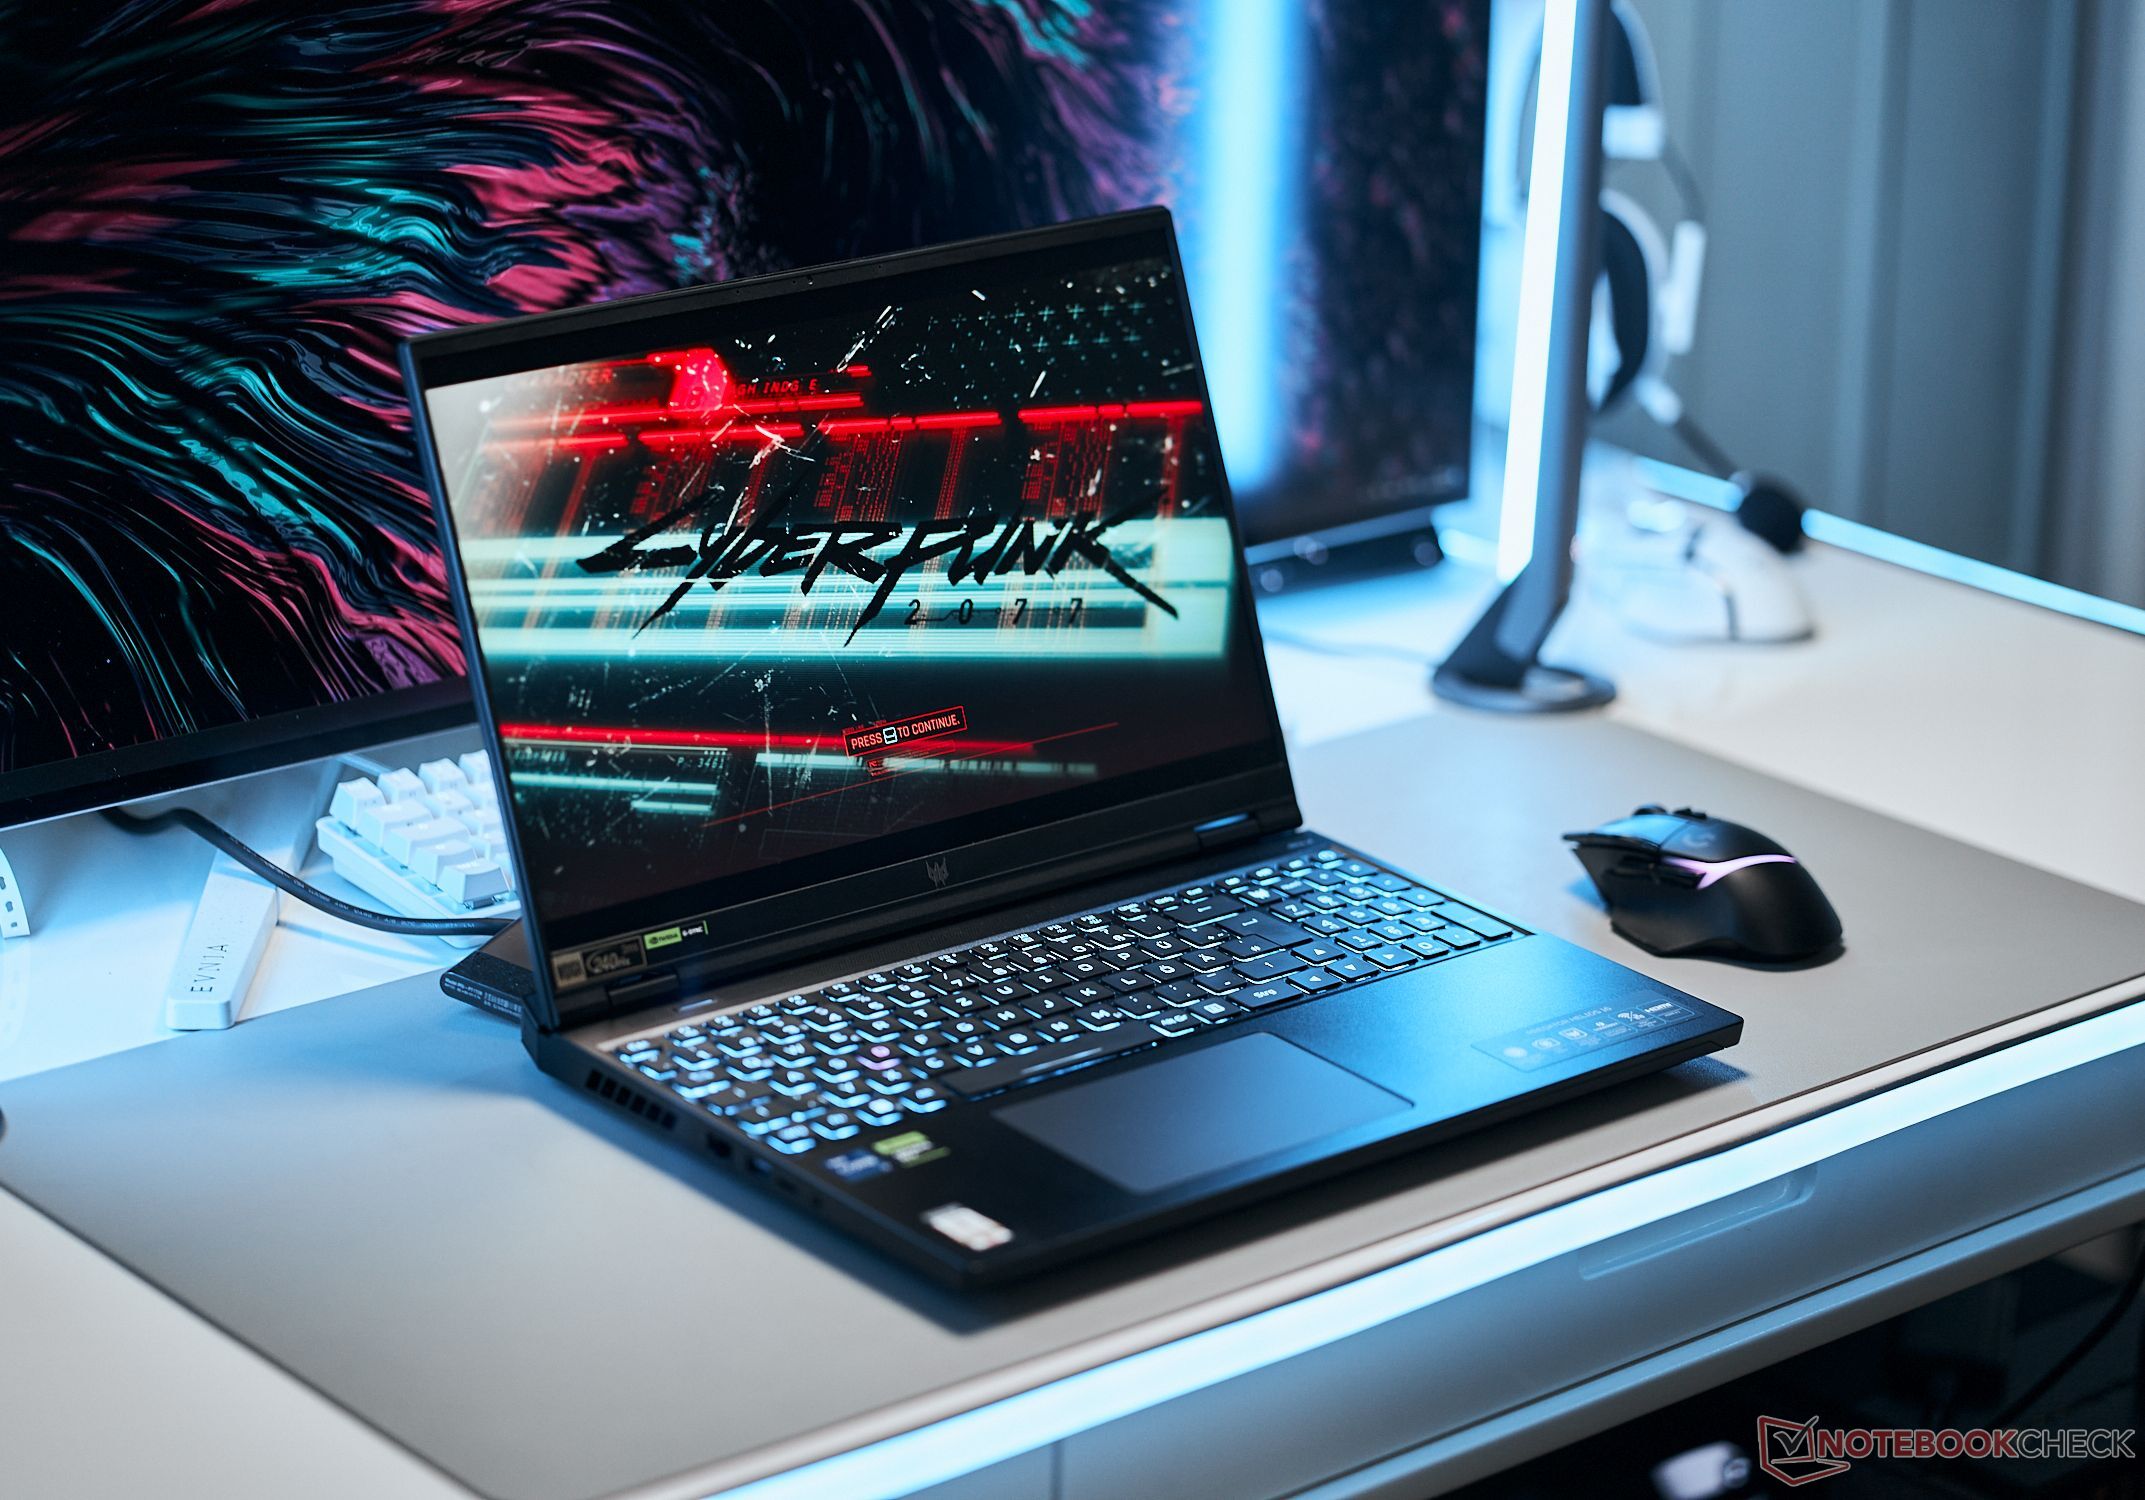
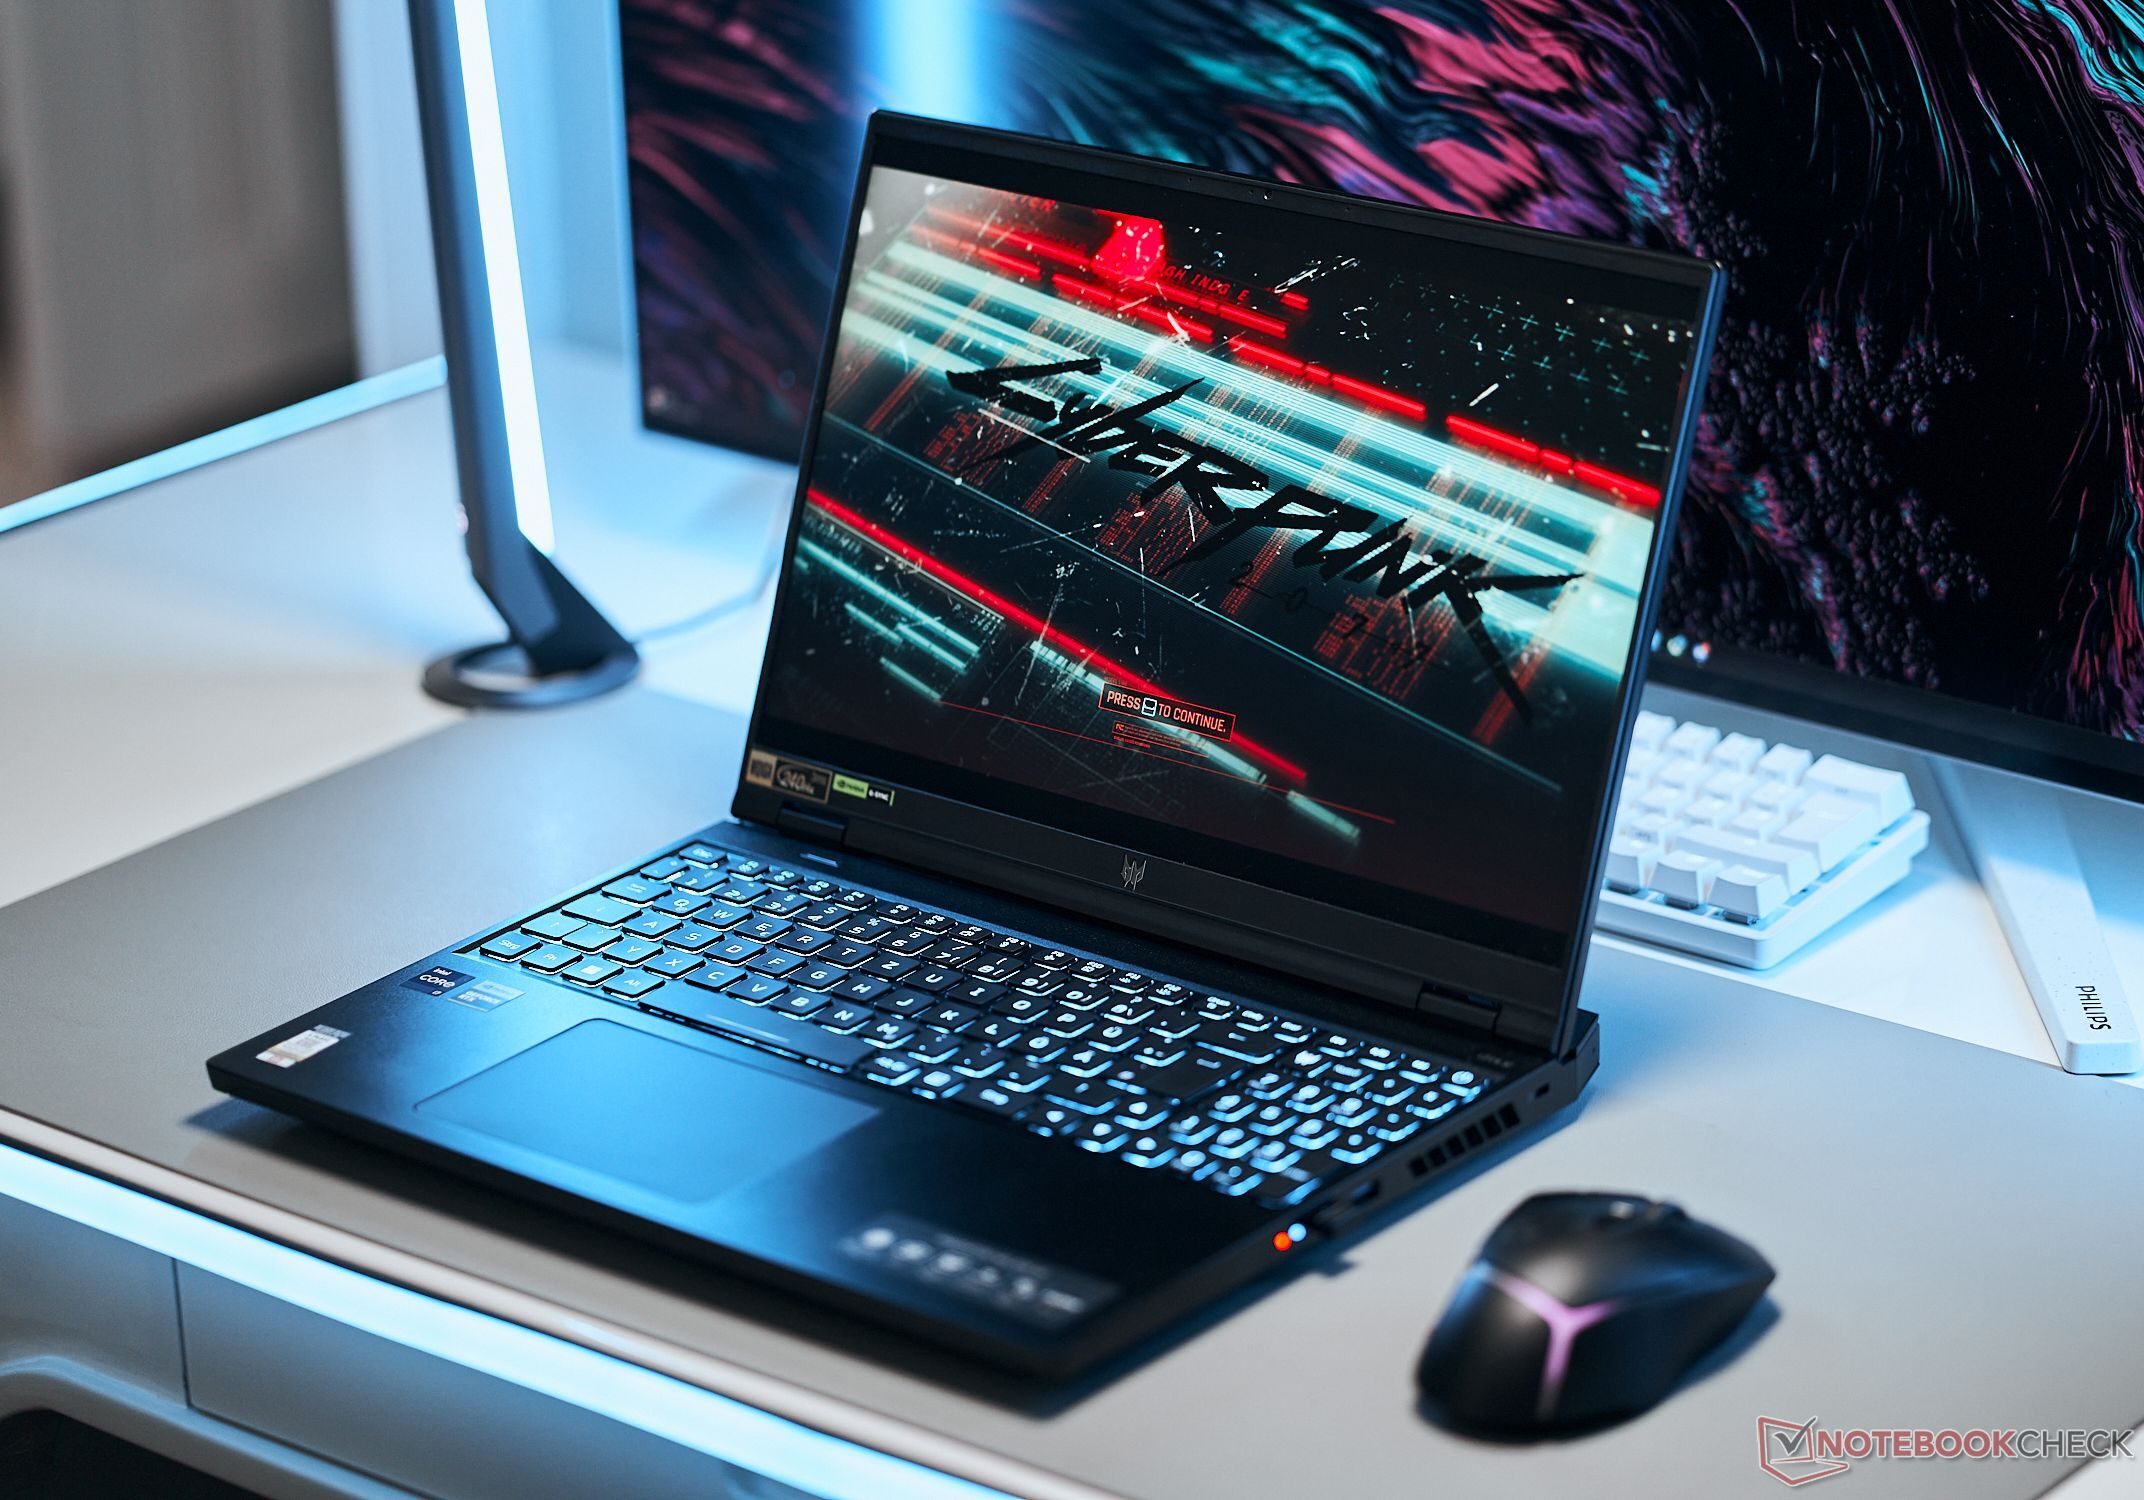
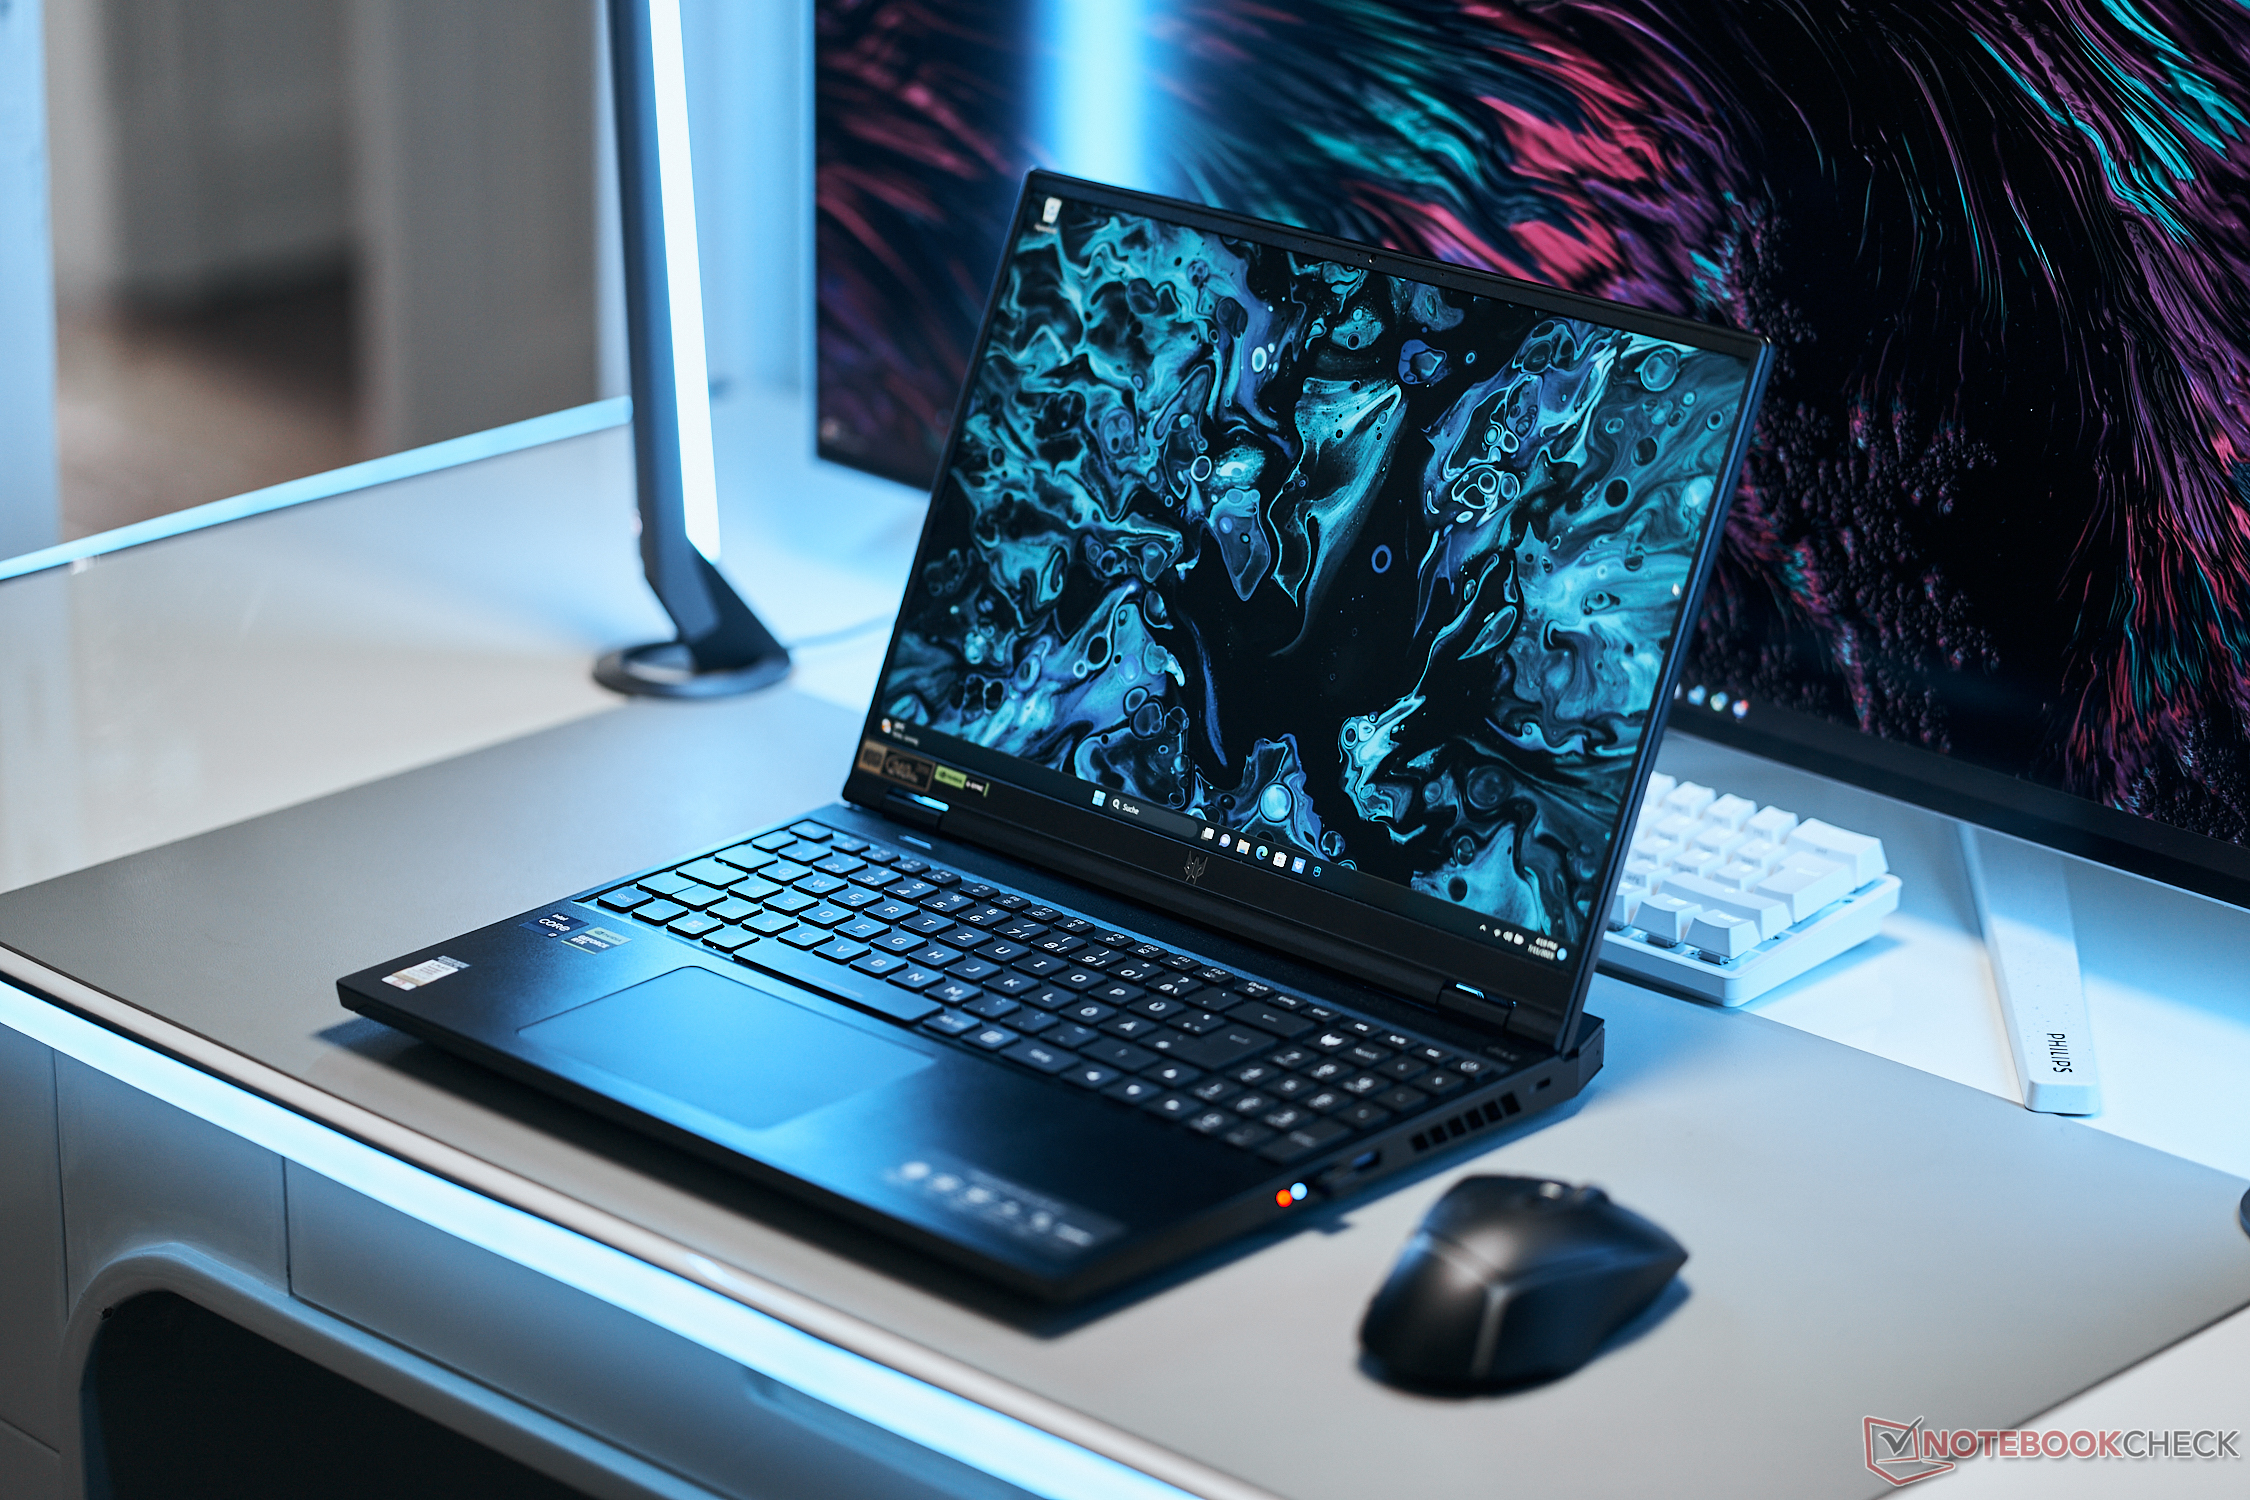
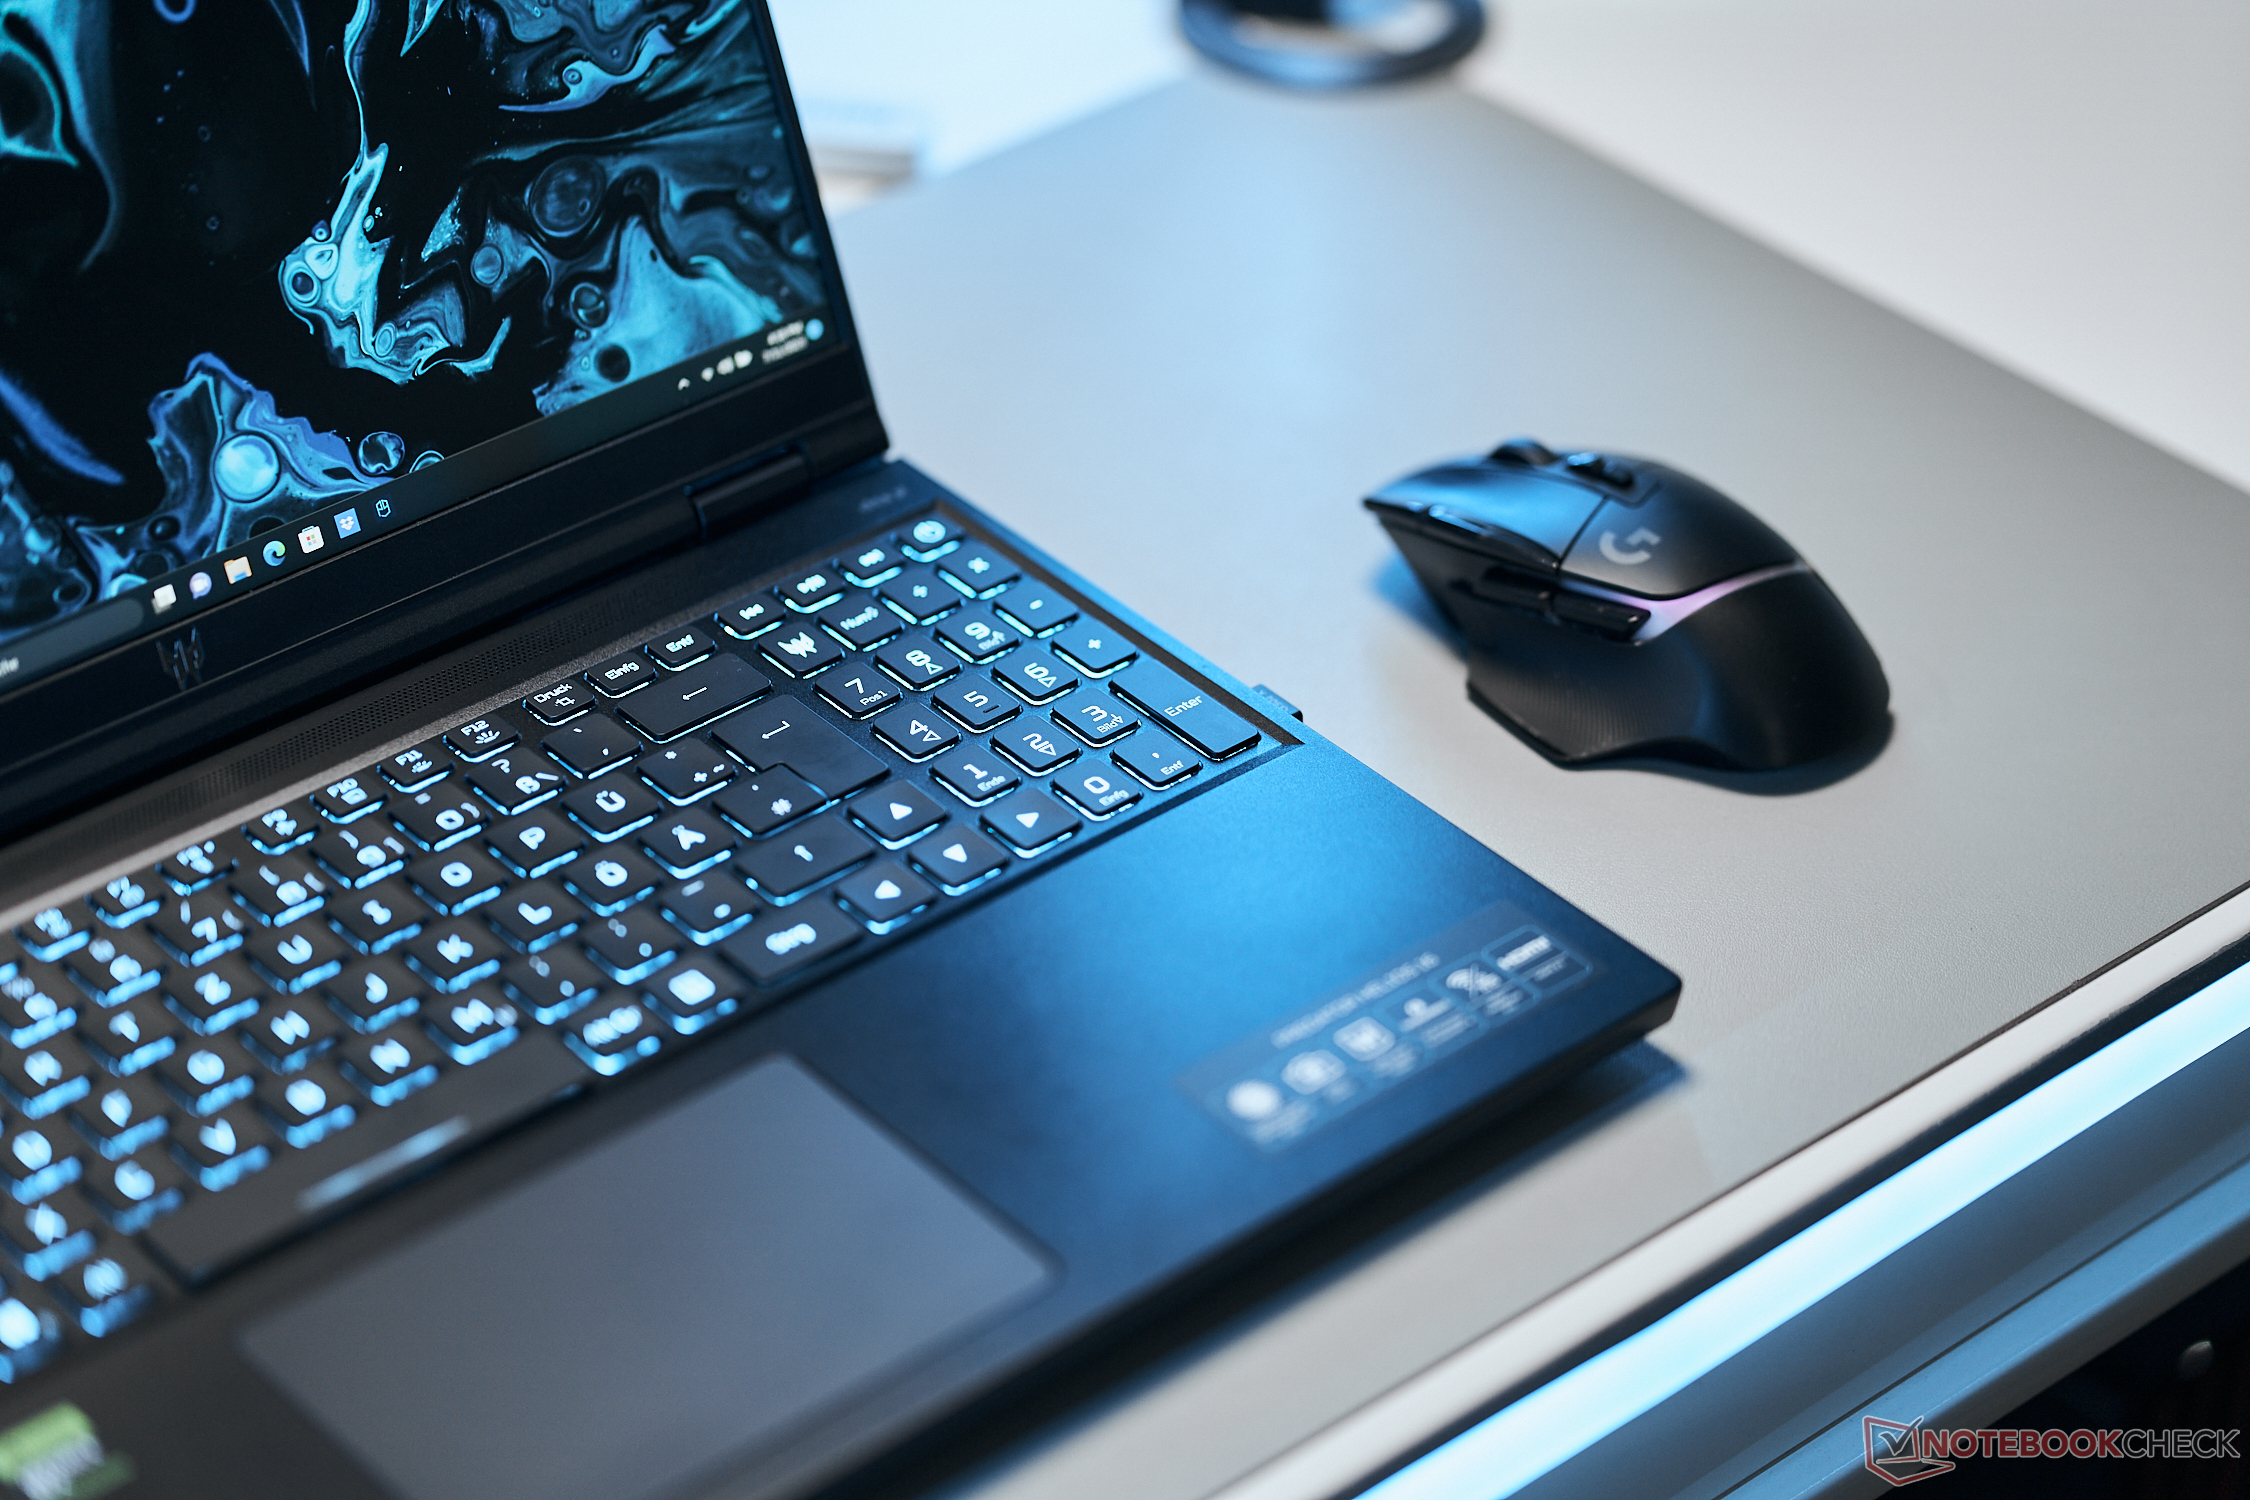
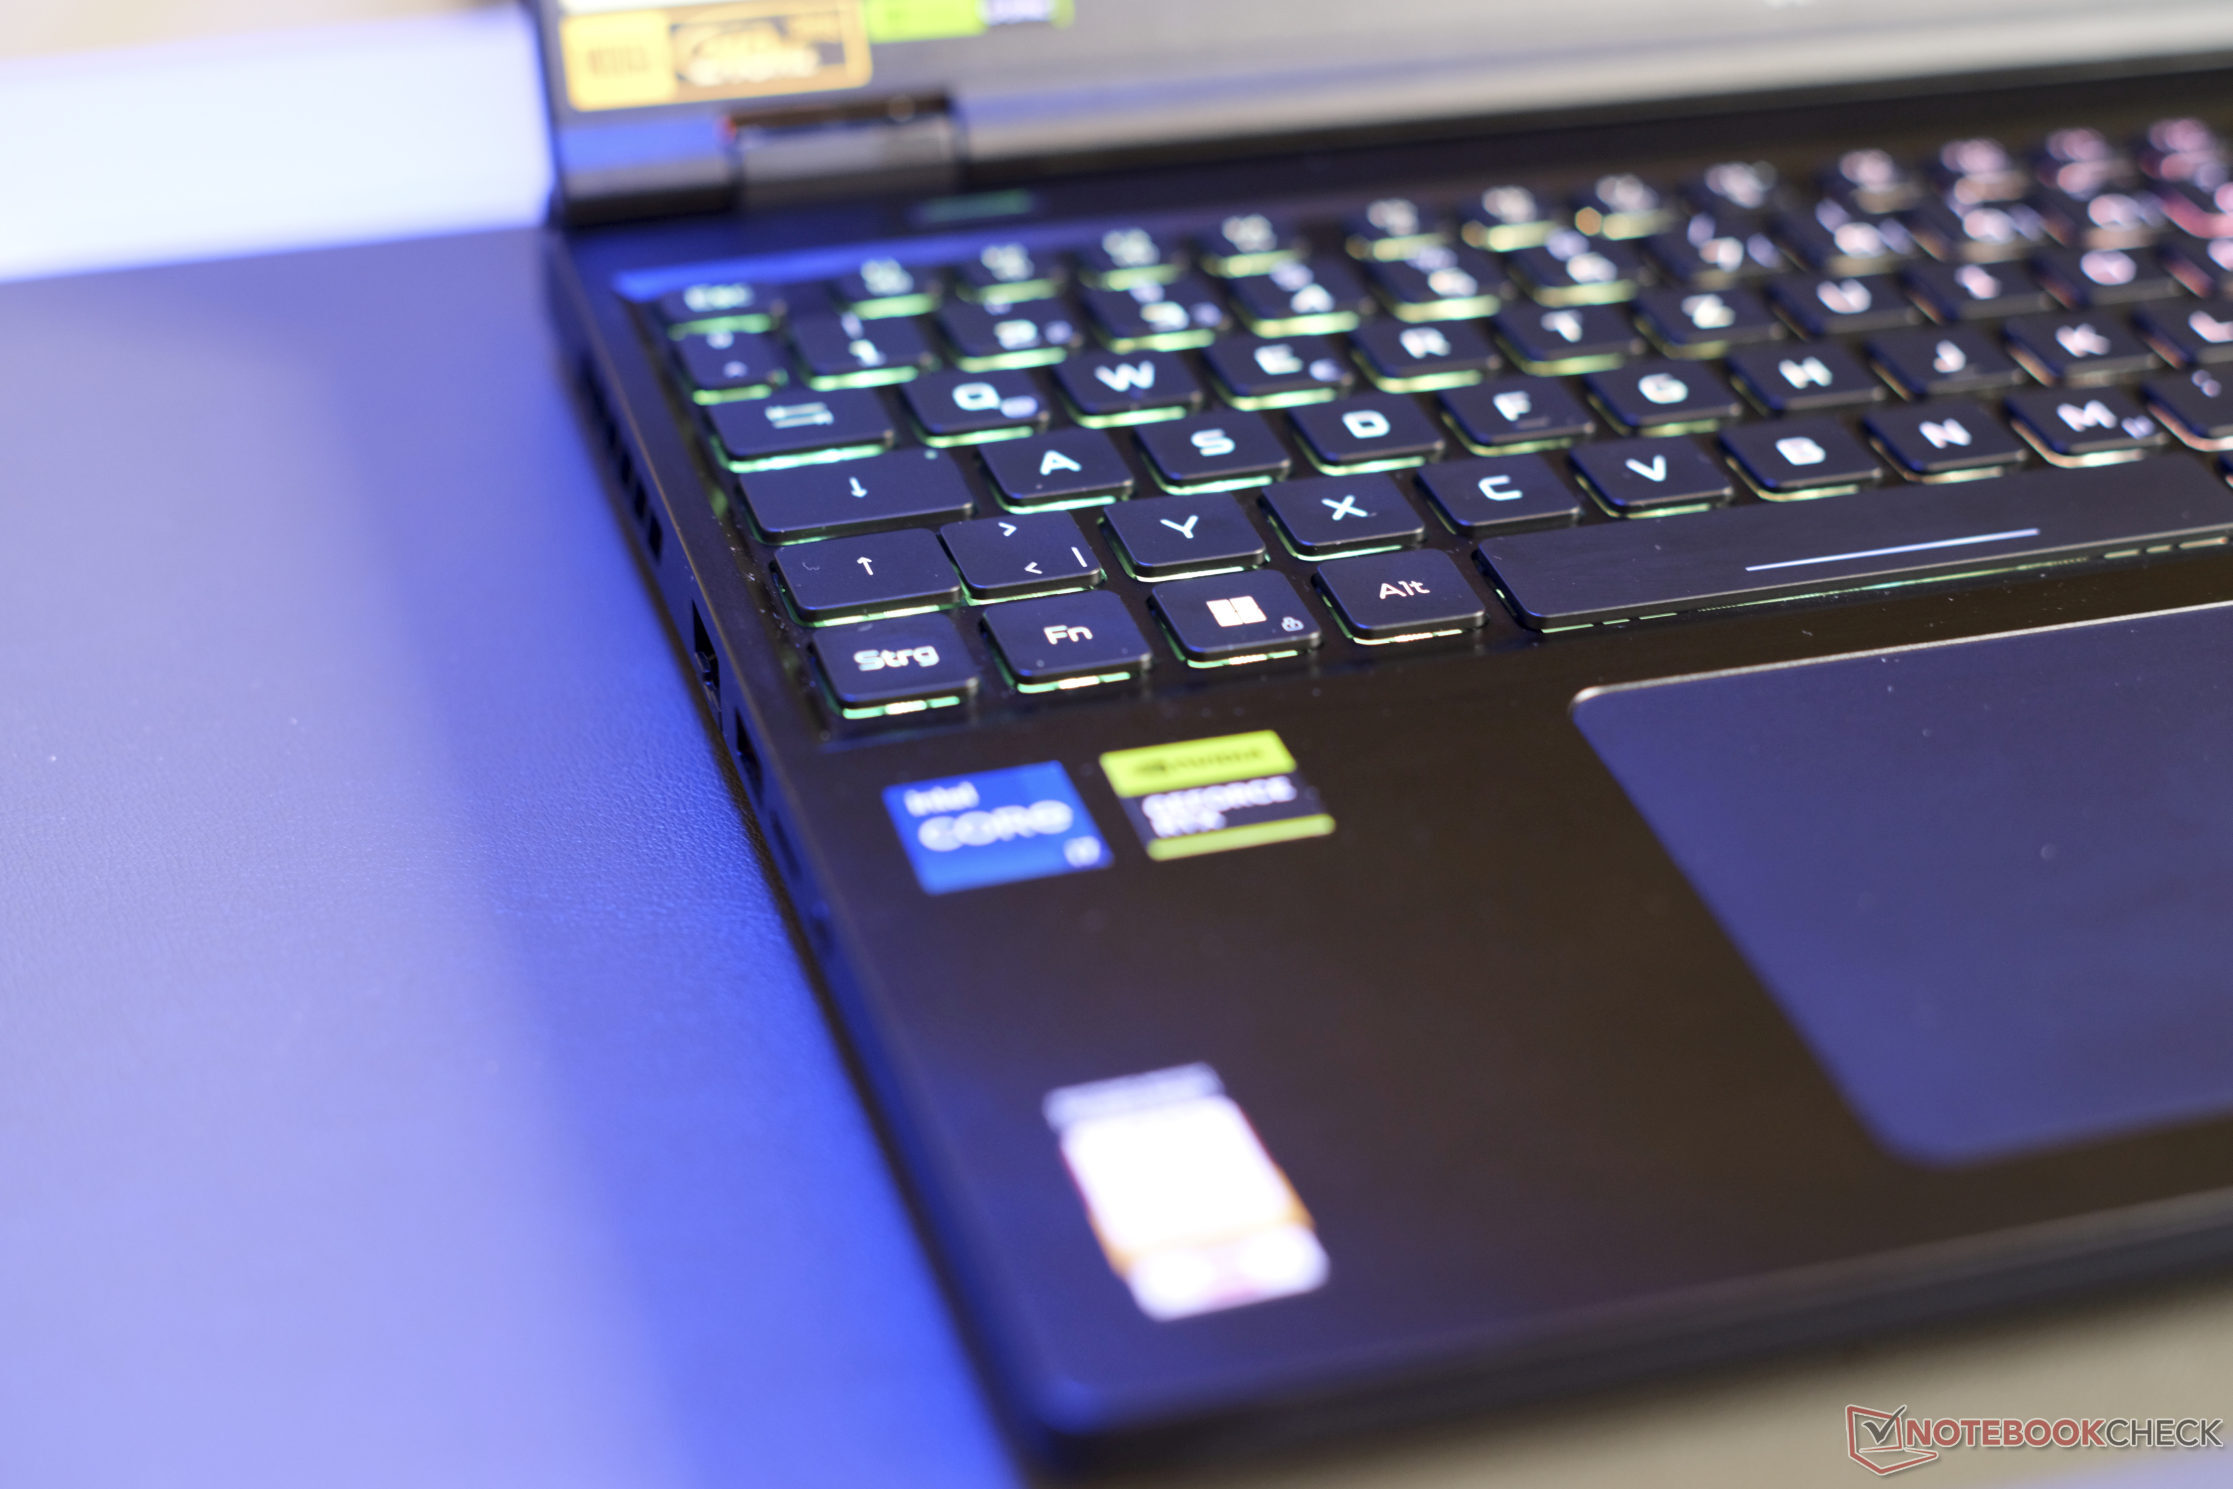
Dispositivi di ingresso: Il Predator Helios è dotato di illuminazione a mini-LED
Tastiera
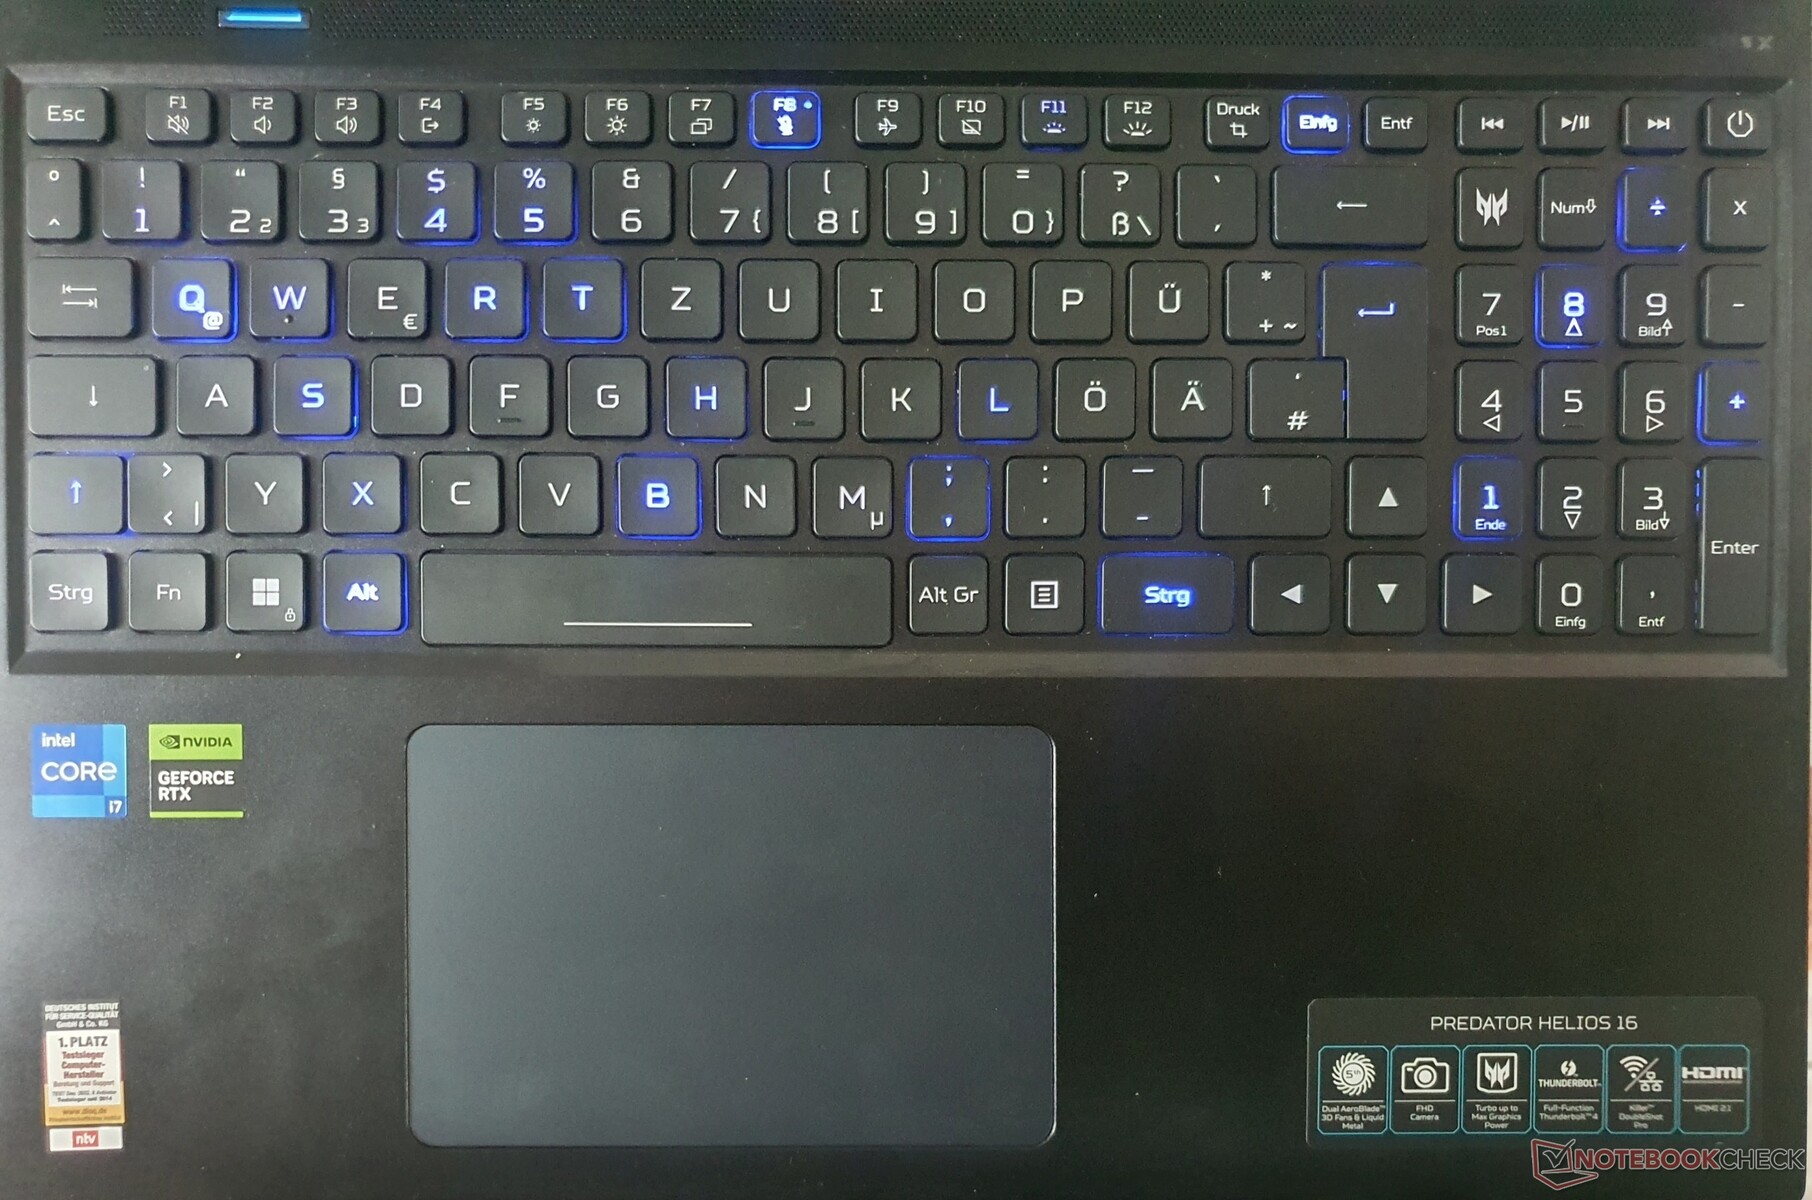
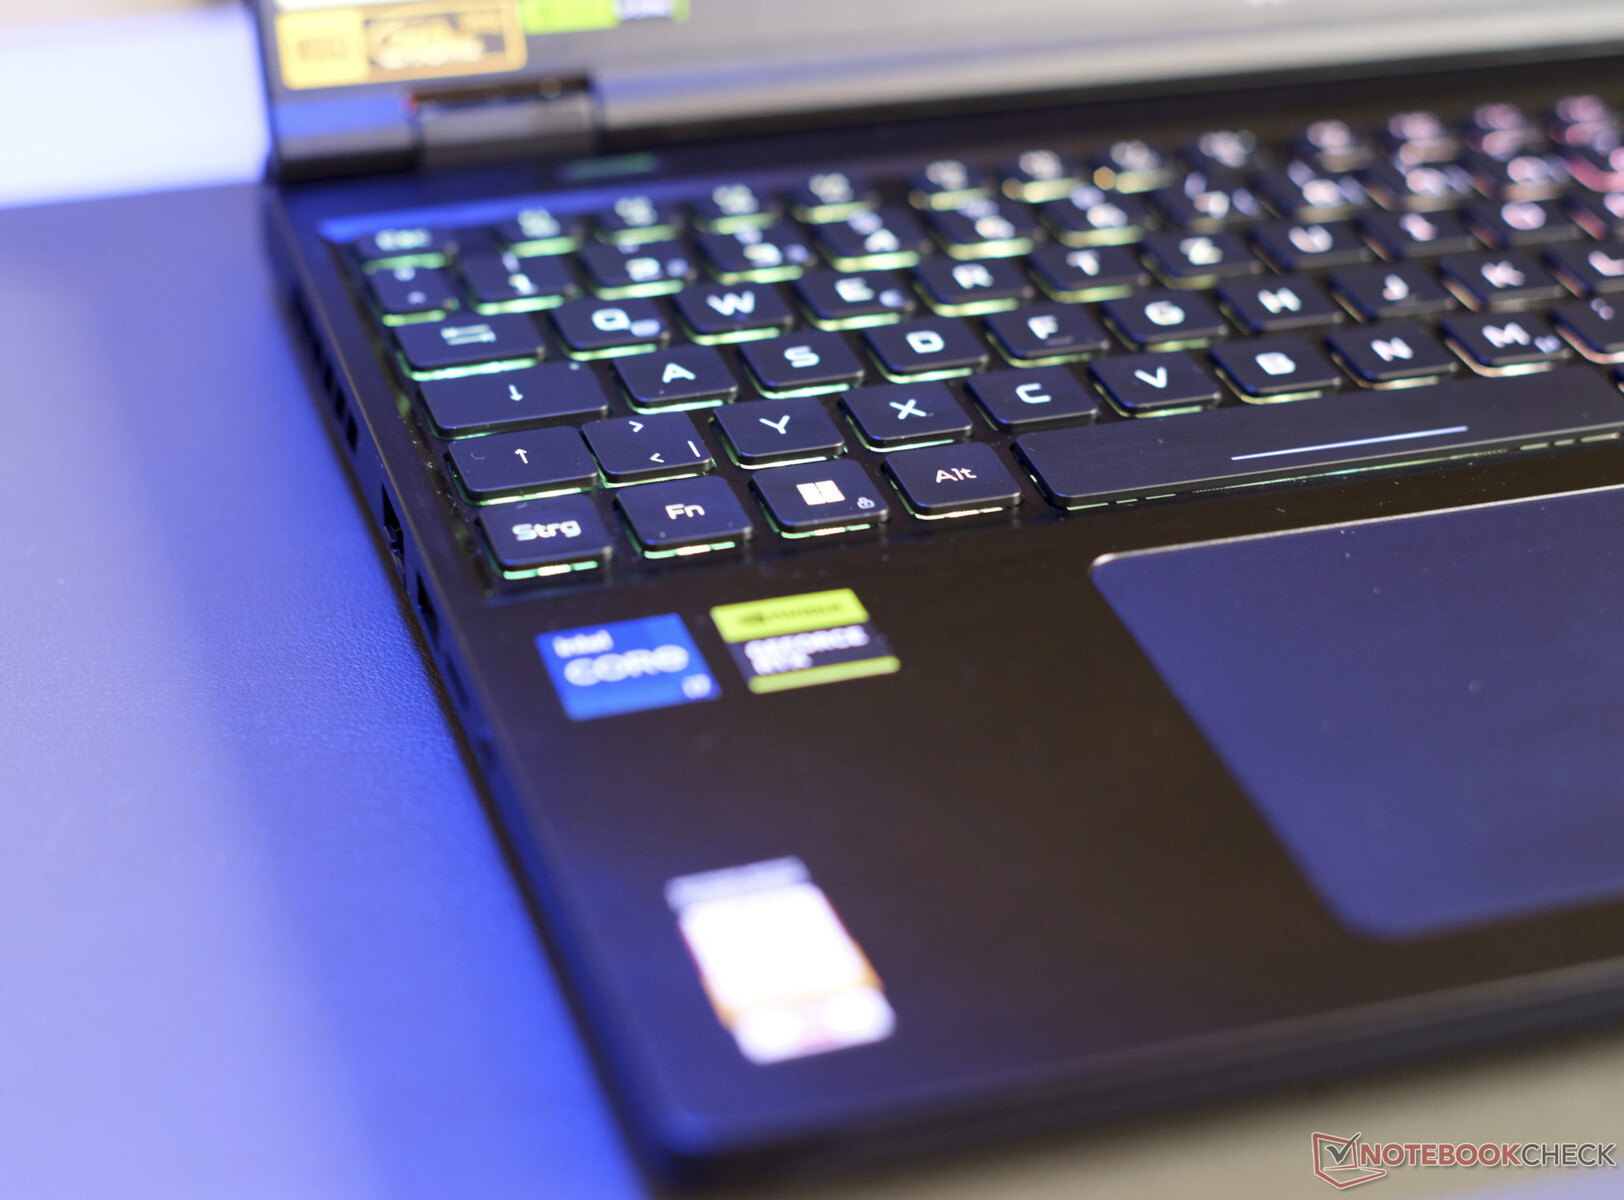
Acer utilizza la stessa tastiera chiclet a 6 file con tasti da 15 x 15 mm dal modello 2020.modello 2020. Nonostante la generosa corsa dei tasti, il feedback non raggiunge il suo potenziale: Il punto di pressione è tangibile e potrebbe essere un po' più definito, ma il rumore di battitura è poco evidente. Al centro e sul lato destro, la tastiera si flette in modo significativo ma non è fastidiosa durante la digitazione, a patto di non martellare i tasti.
La retroilluminazione a mini-LED è nuova e offre diverse impostazioni. Il singolo tasto RGB ha quattro impostazioni disponibili e può diventare molto luminoso. Le transizioni sono particolarmente fluide e pulite, mentre i mini-LED sono anche più efficienti dal punto di vista energetico.
Ci piace il layout e, in particolare, i tasti freccia di dimensioni normali a scapito di uno shift più piccolo. Mentre il pulsante del logo avvia l'applicazione Predator Sense, è possibile passare da una modalità all'altra utilizzando il pulsante sul lato sinistro sopra la tastiera.
Touchpad
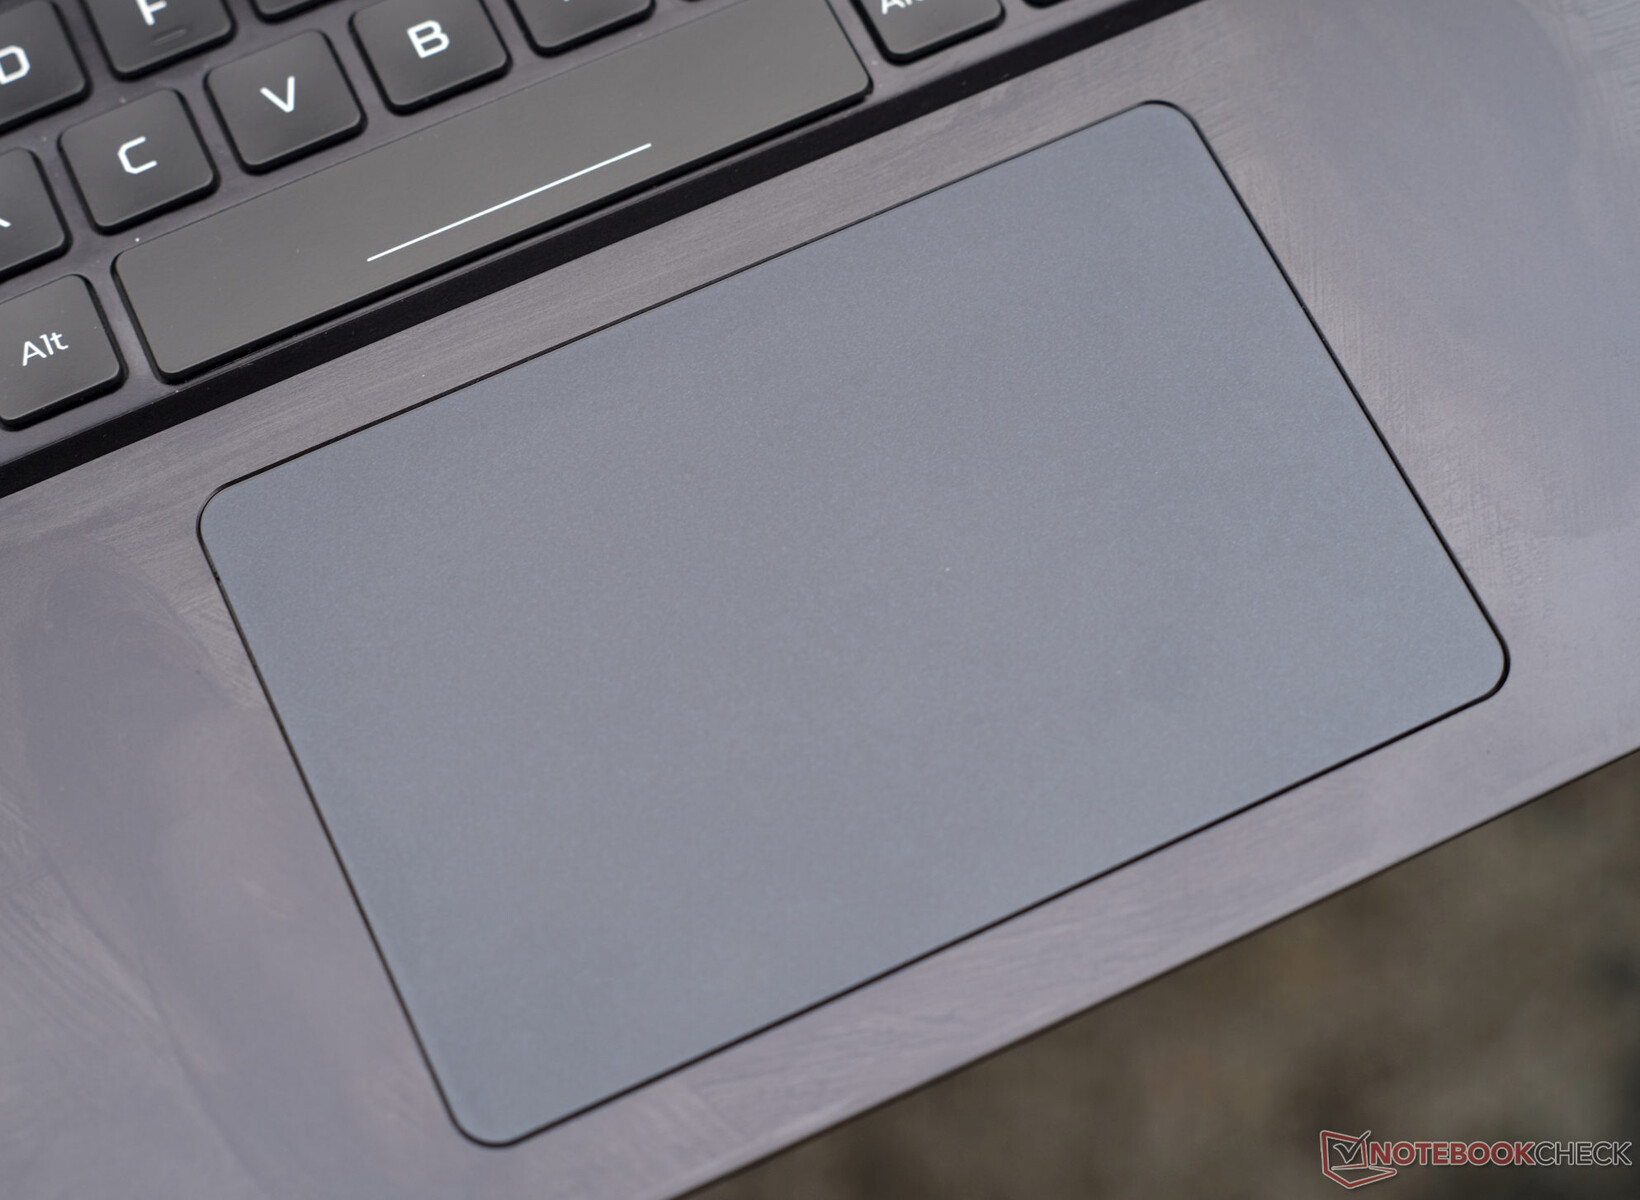
Grazie al rivestimento in Gorilla Glass, il touchpad da 12,6 x 8,3 mm è in grado di far scorrere le dita in modo ottimale e con un feedback molto preciso. Di conseguenza, i gesti multi-touch e lo scorrimento avvengono senza sforzo. I pulsanti integrati hanno una corsa media e un feedback soddisfacente.
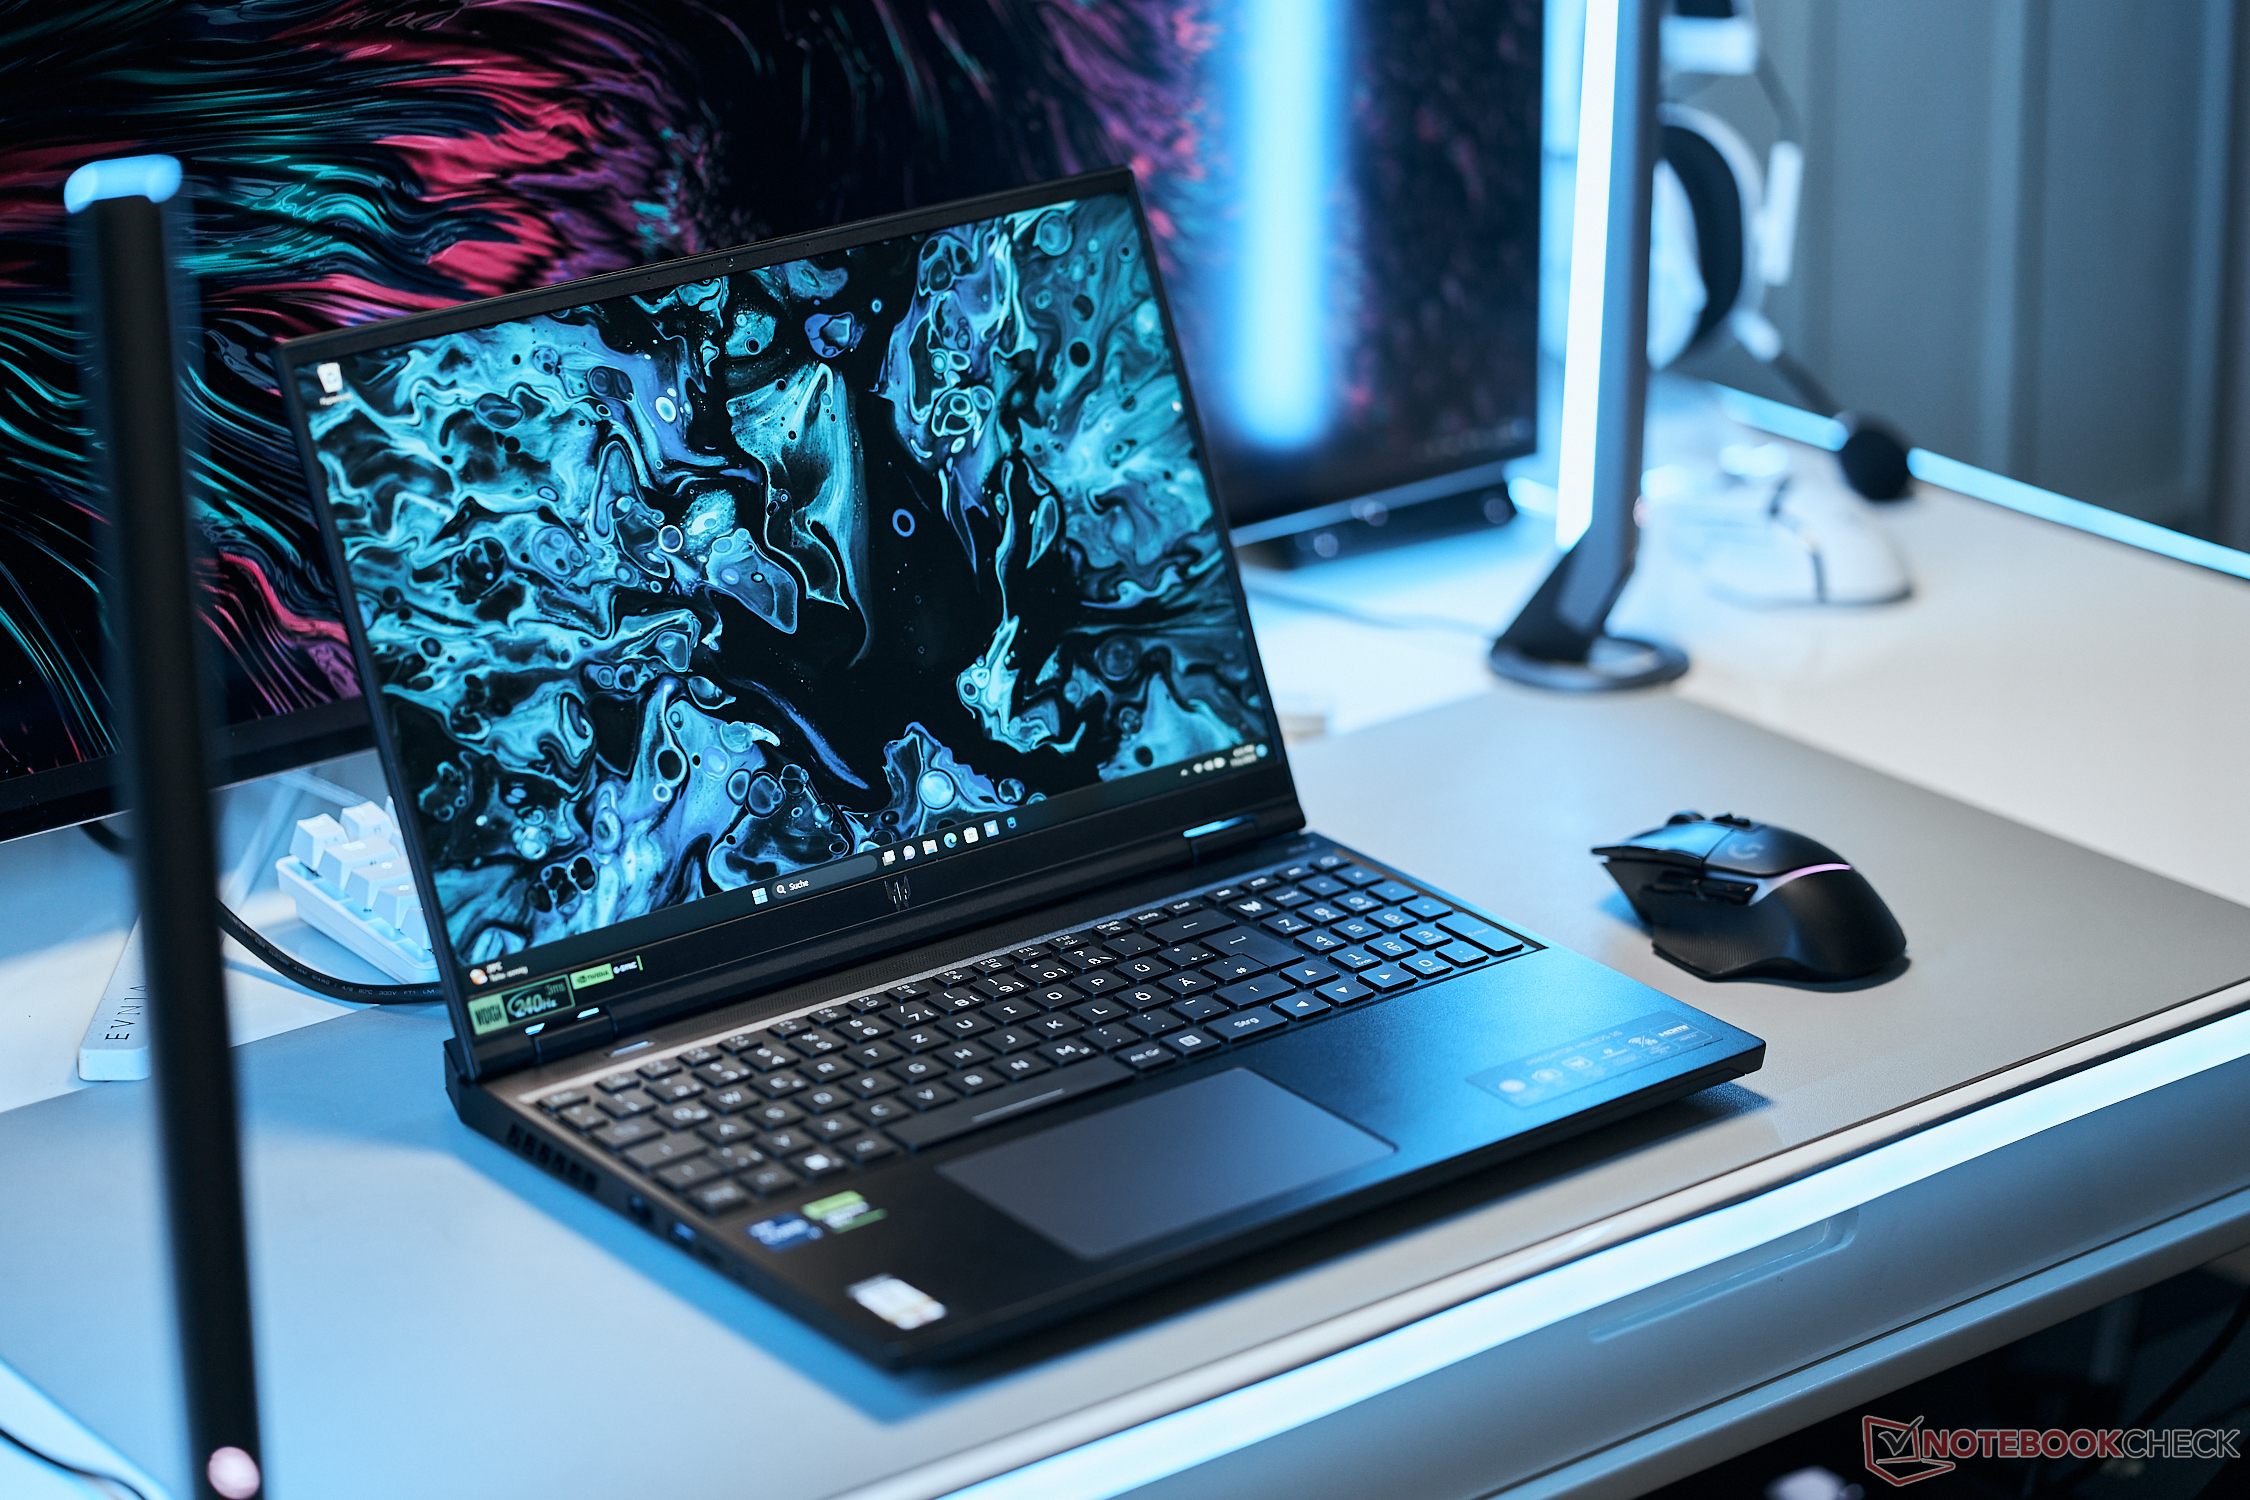
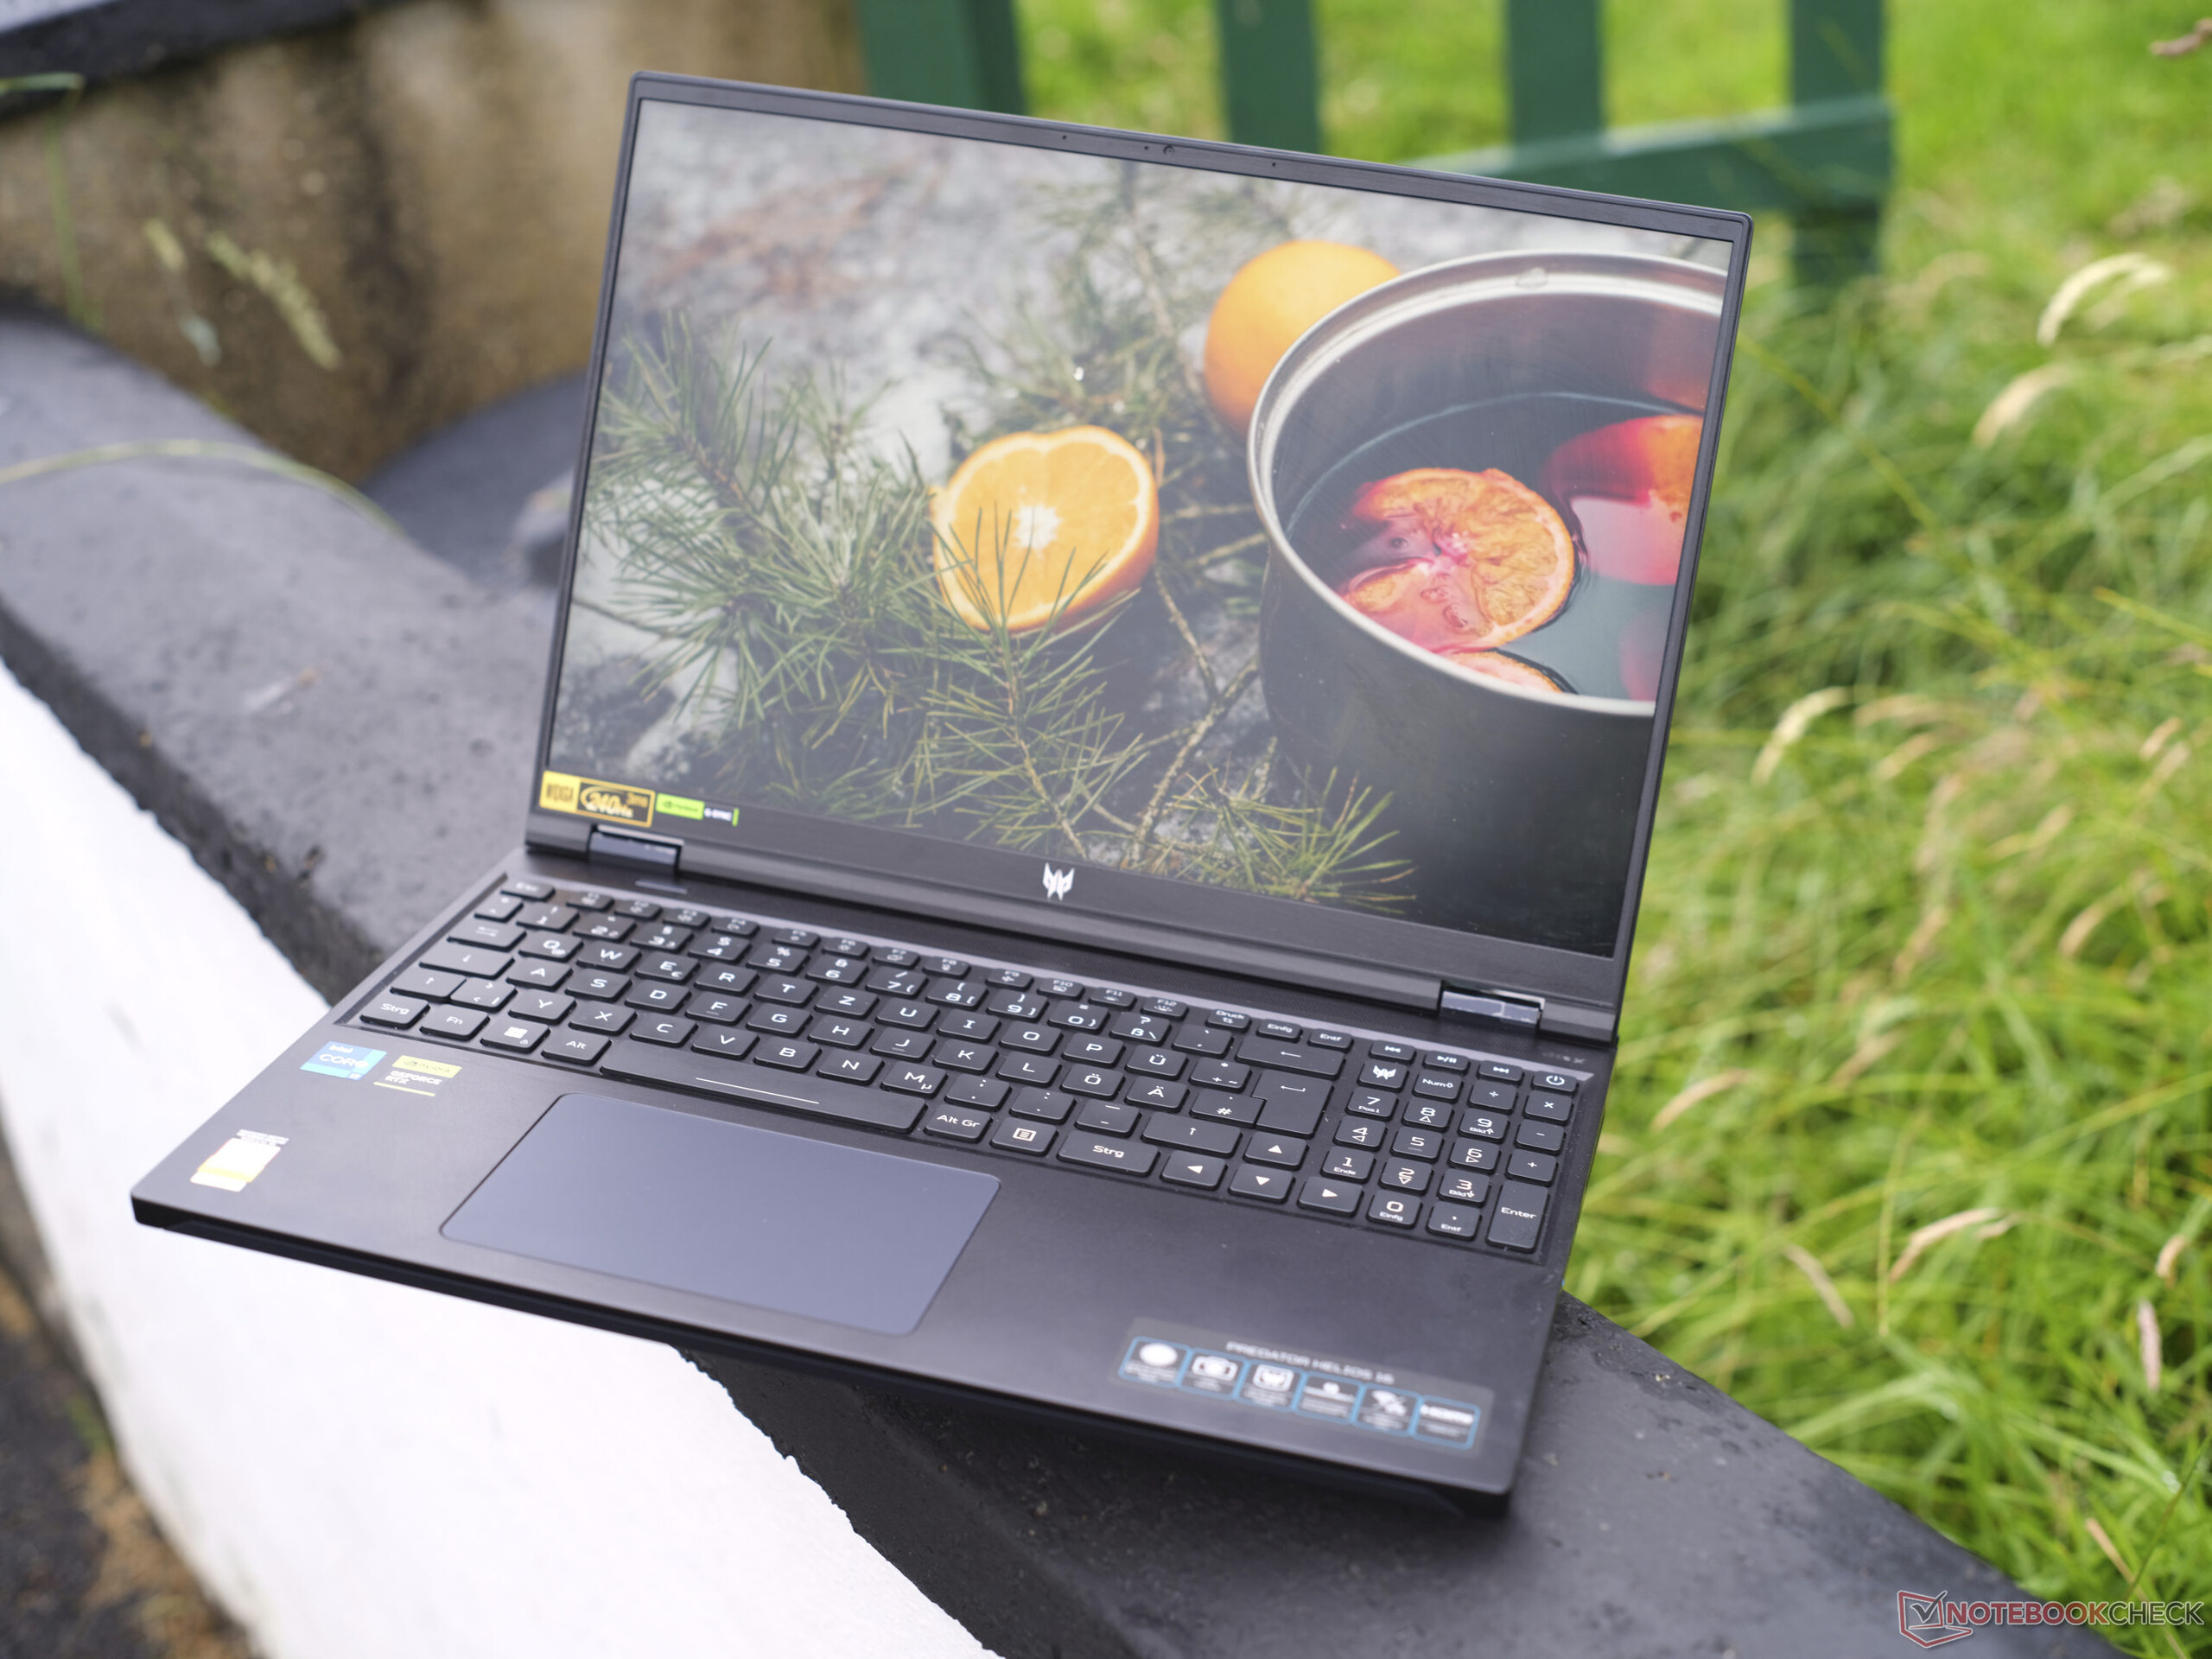
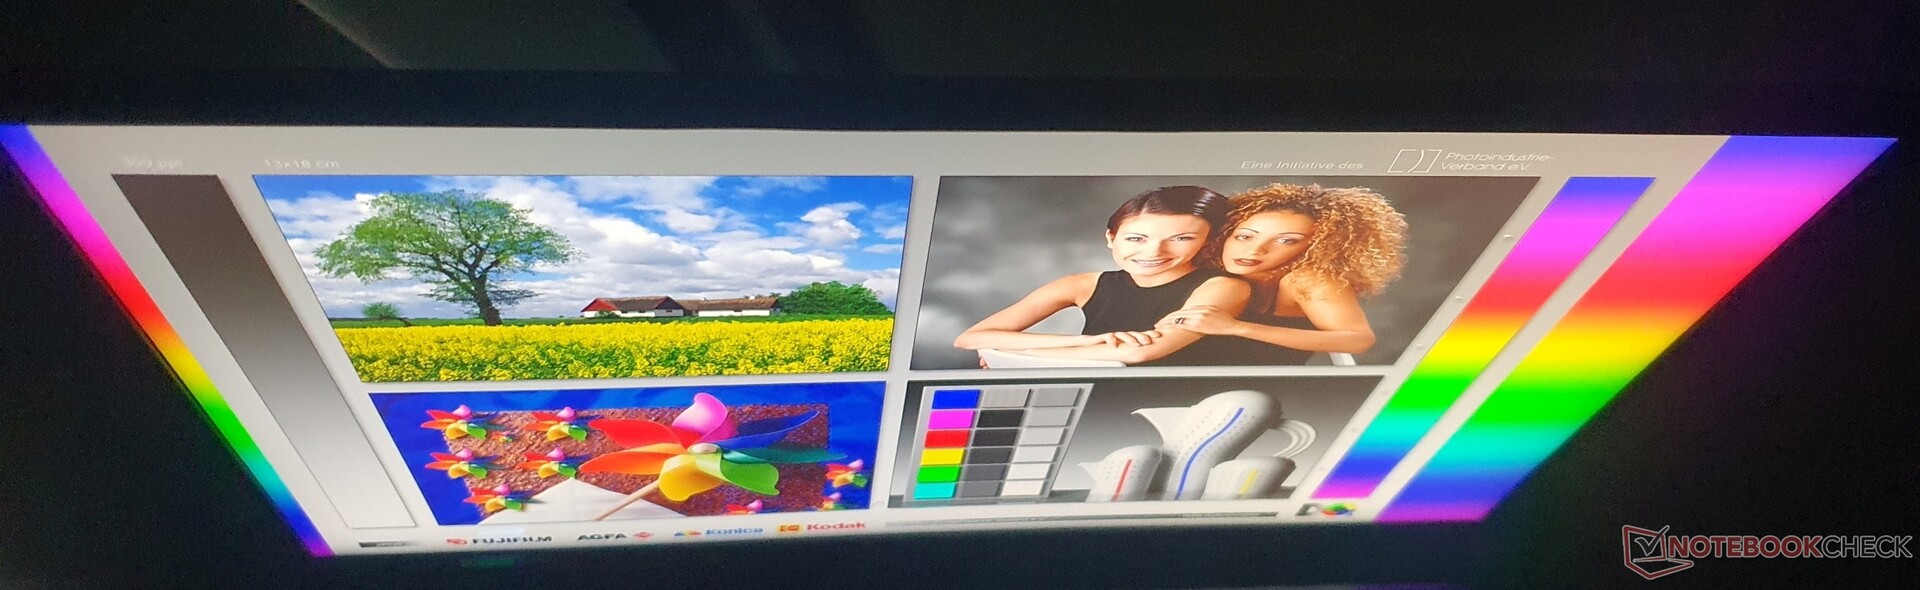
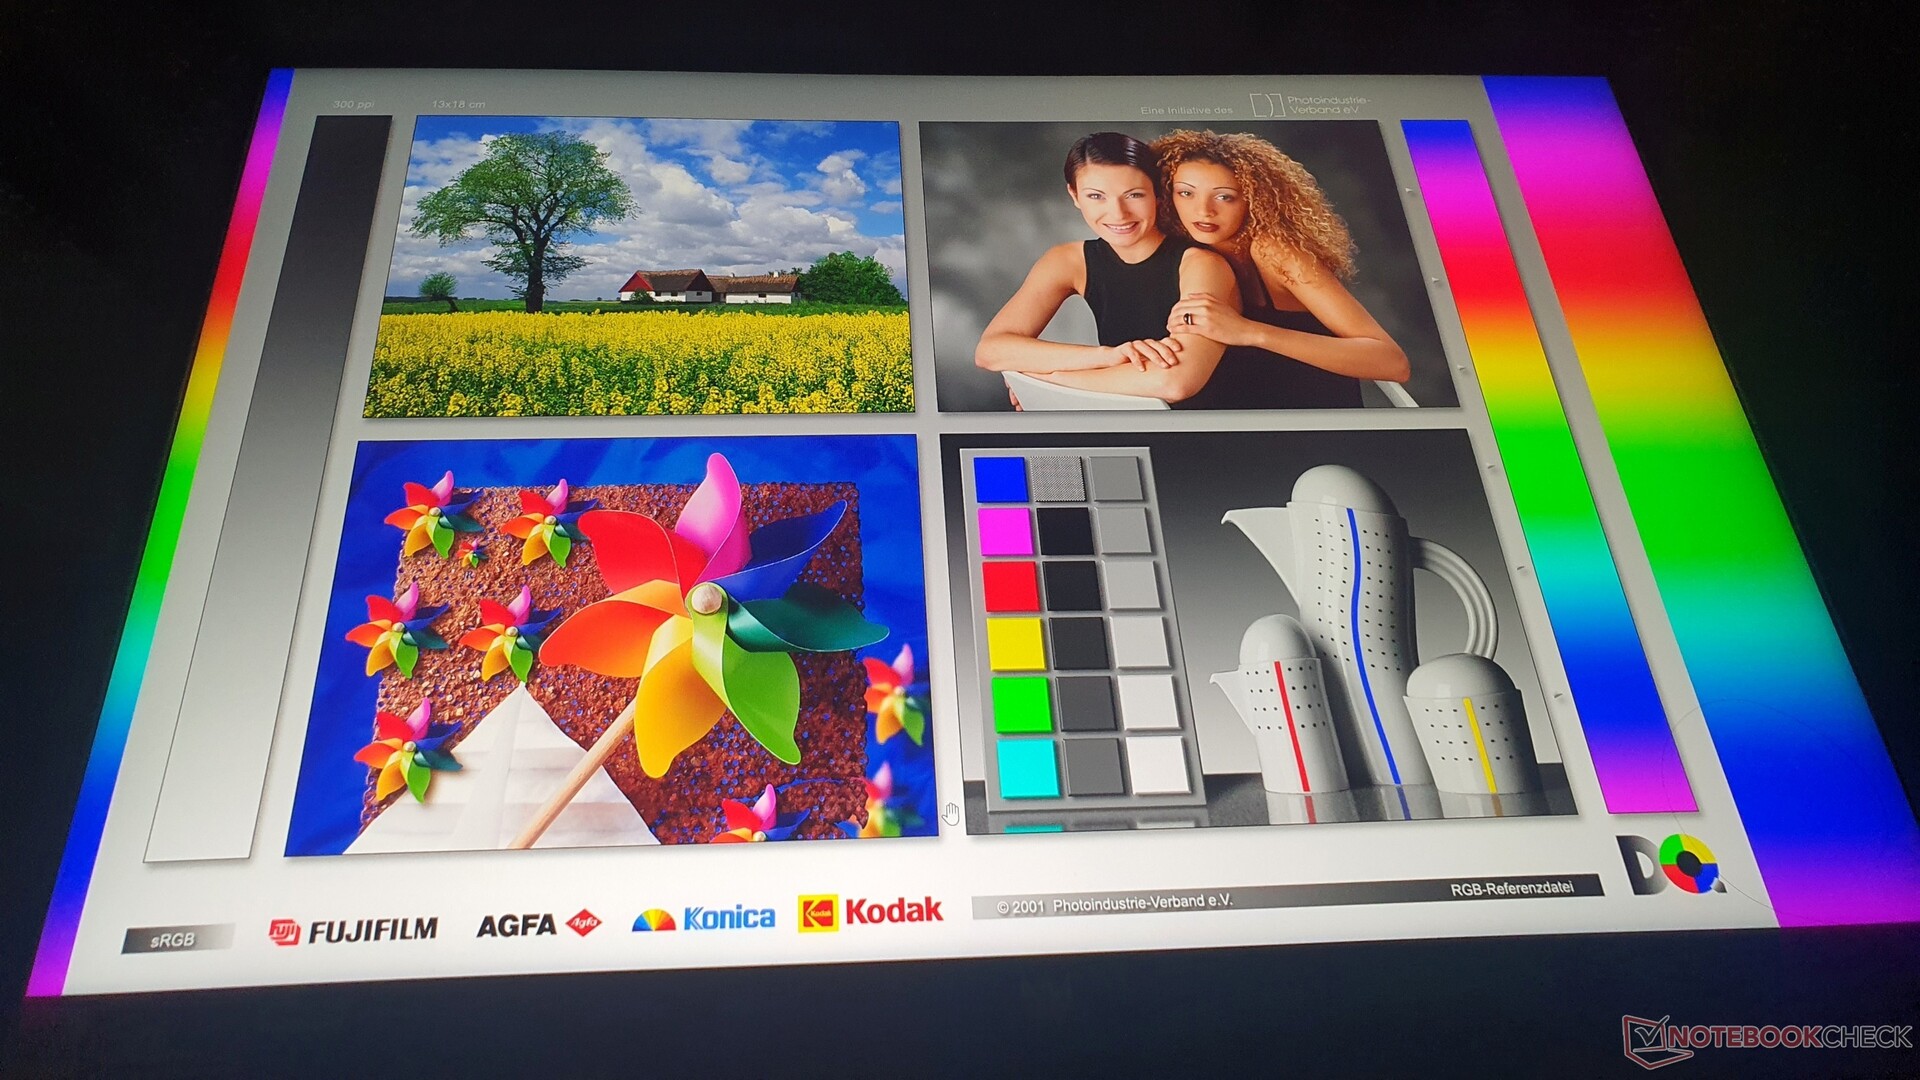
Display: Una macchina da gioco con il 97% di DCI P3, 500 cd/m² e 240 Hz
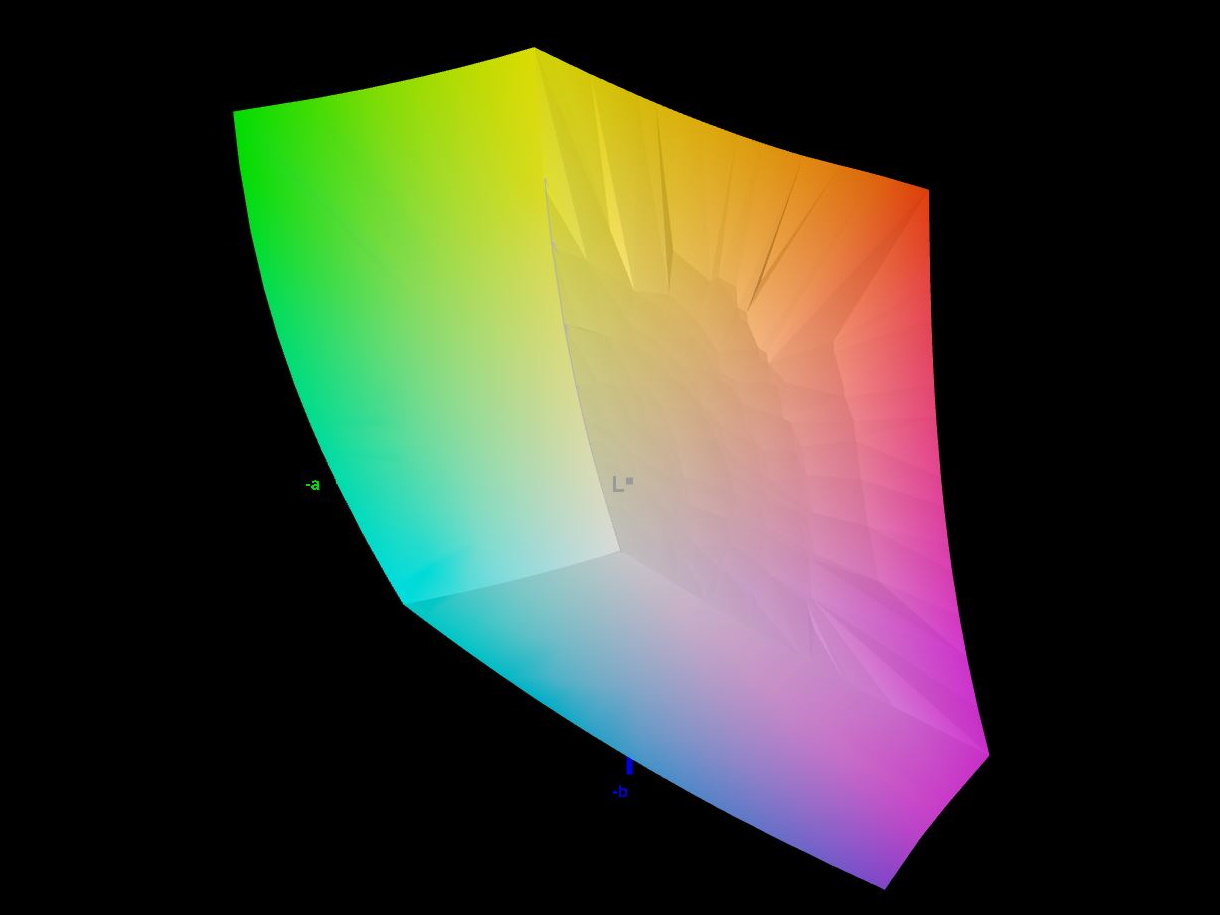
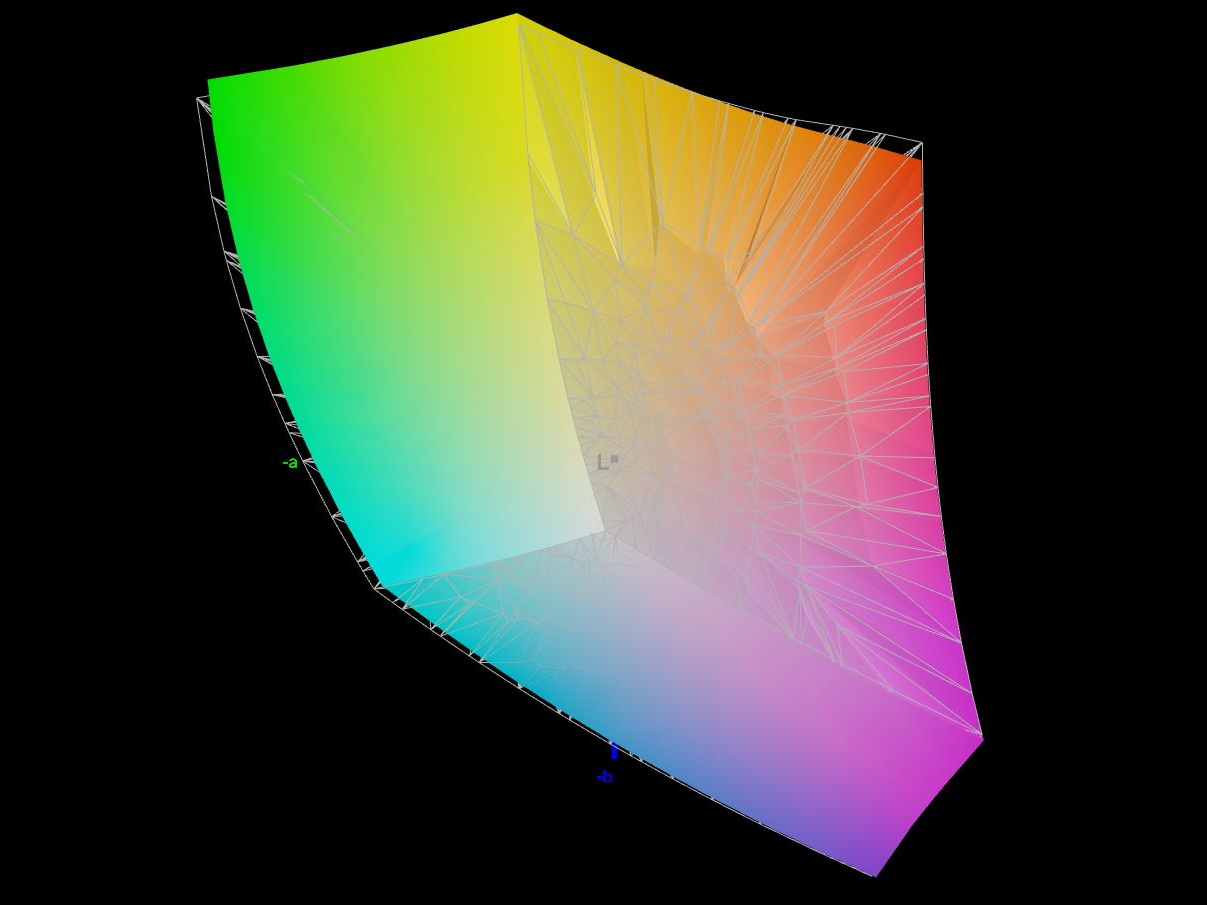
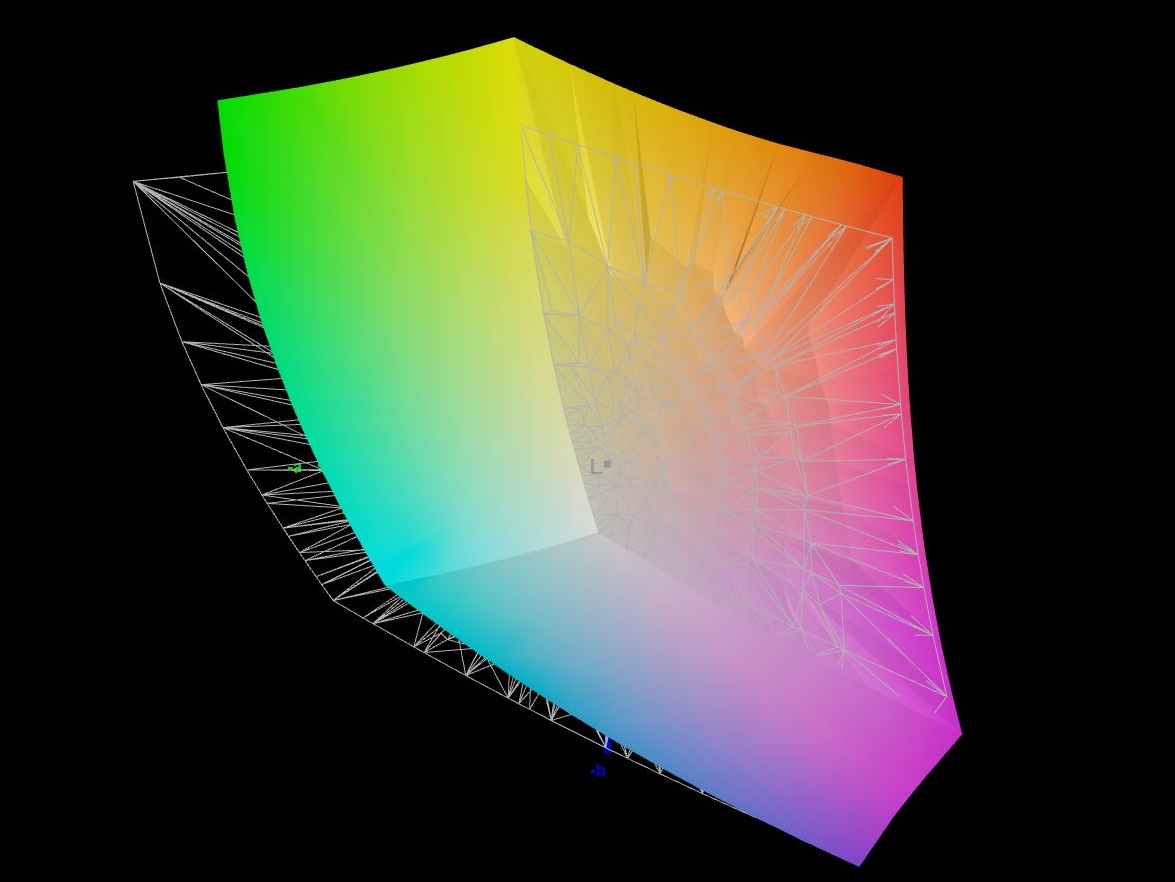
Il dispositivo in prova con il numero di modello PH16-71-731Q non è dotato del display mini-LED disponibile come opzione e delle sue 1.024 zone di regolazione. Ciononostante, siamo rimasti sorpresi dal fatto che il pannello IPS opaco, veloce, da 240 Hz e con una risoluzione di 2.560 x 1.600 pixel (16:10) copra con orgoglio il 97% dello spazio colore DCI P3. Ciò significa che le immagini, anche nei giochi, appaiono ancora più vivide.
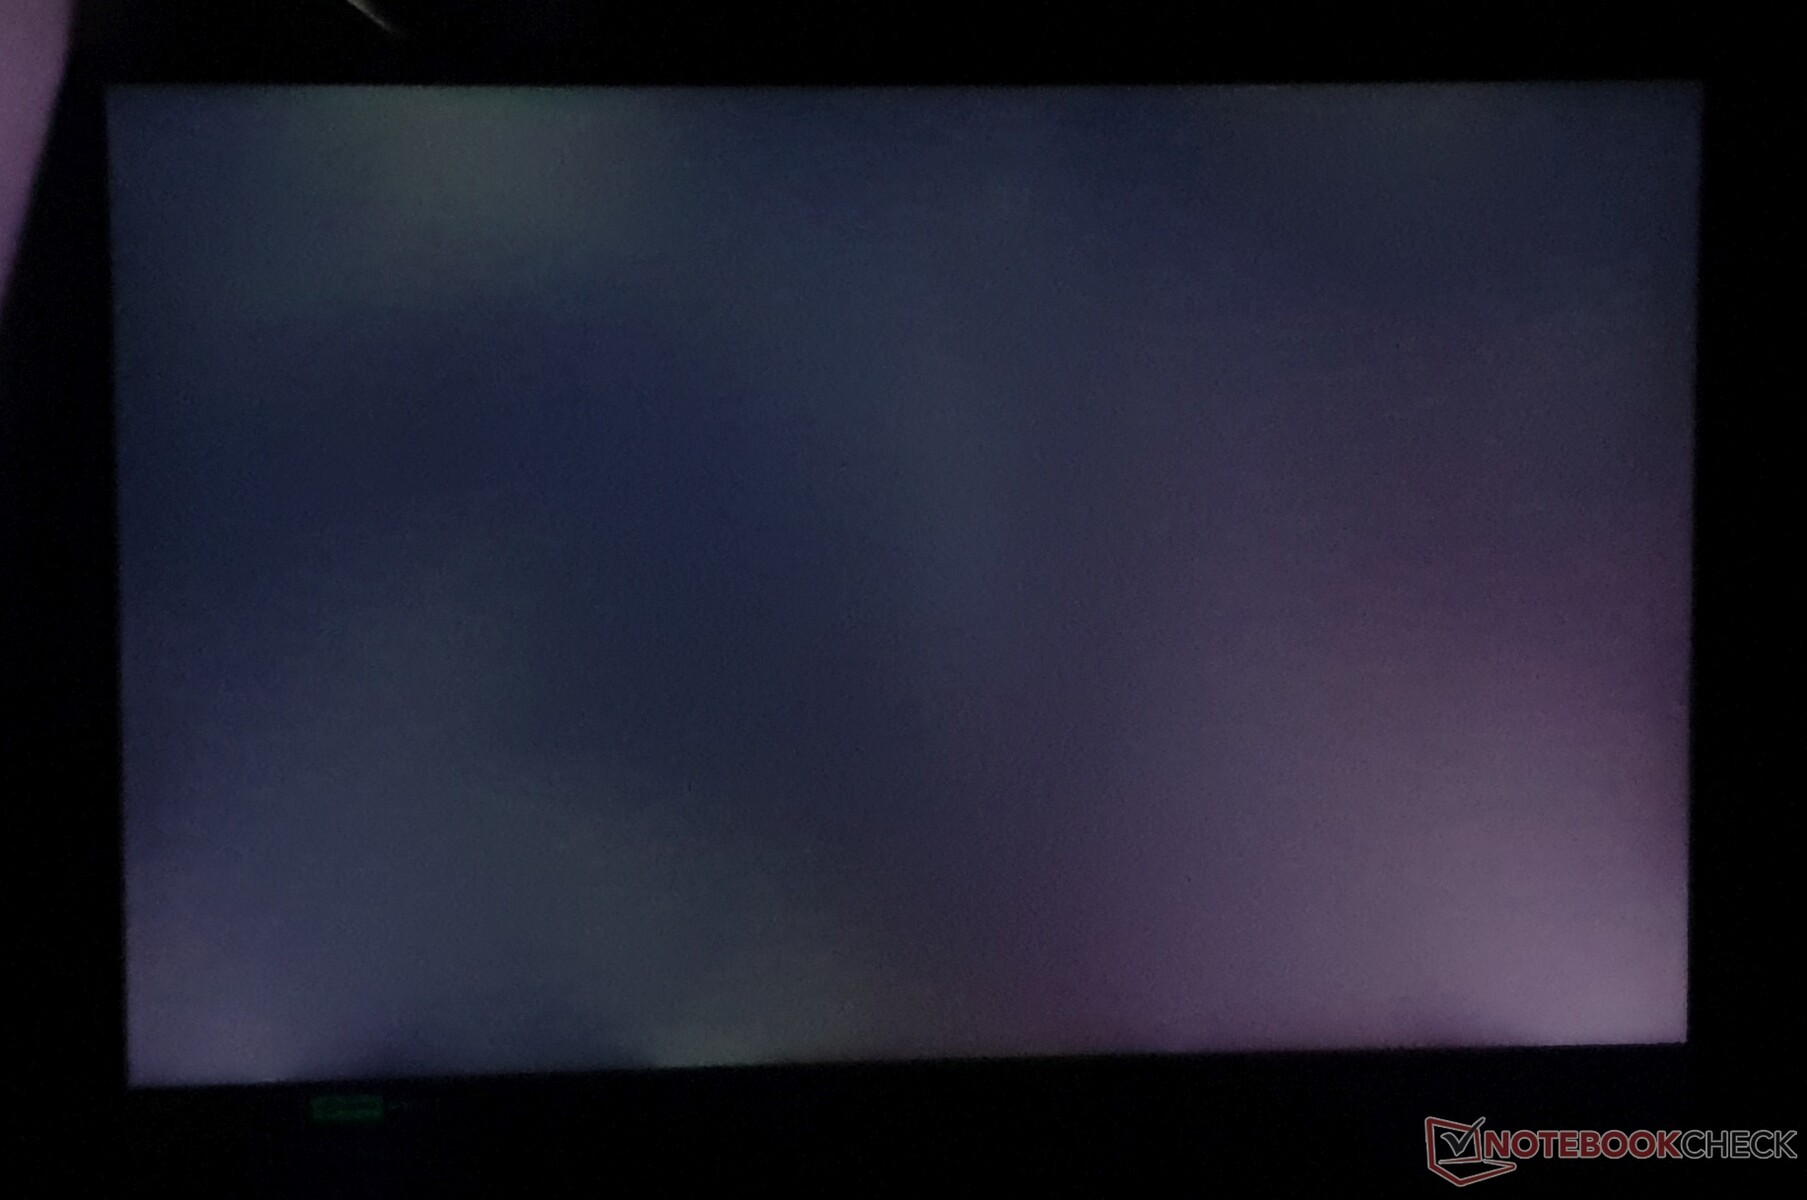
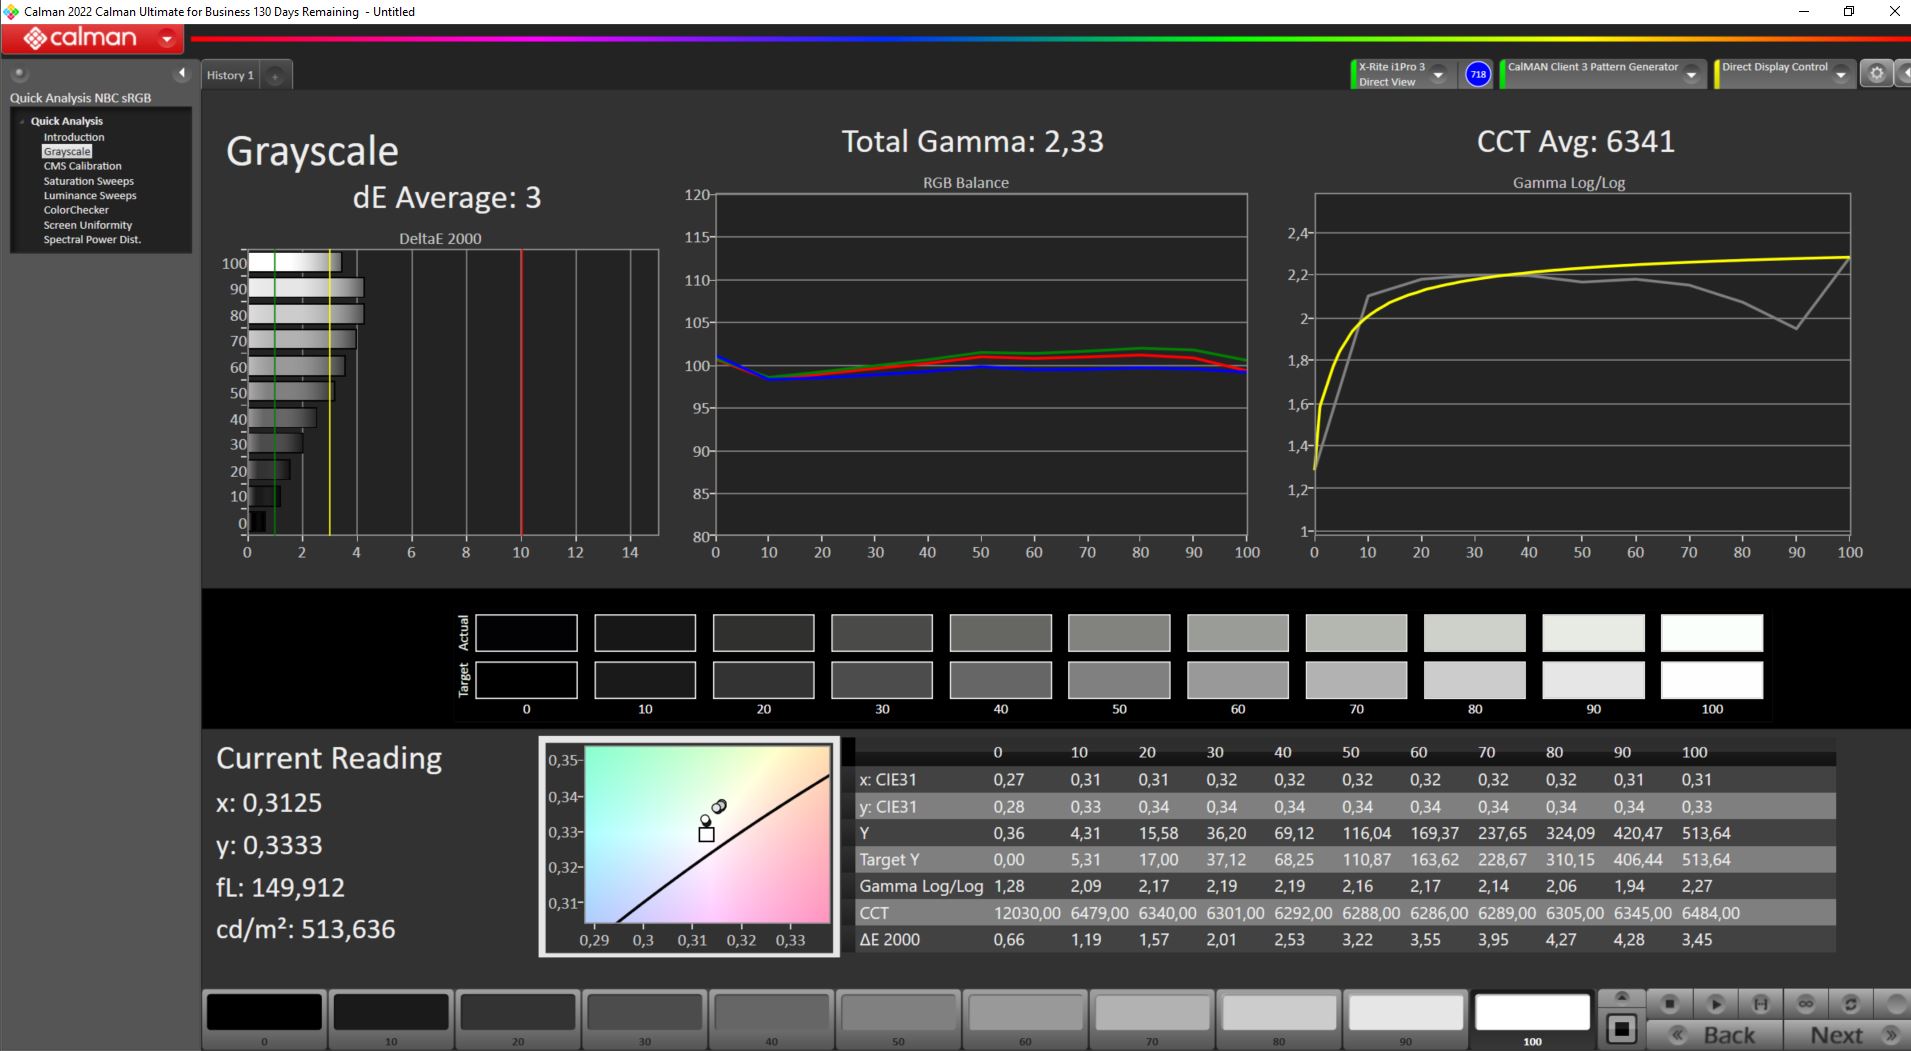
Anche tutti gli altri dati chiave sembrano buoni: Luminosità di poco inferiore a 500 cd/m², contrasto elevato di 1:419:1 e illuminazione uniforme del 94%. Inoltre, non viene utilizzato il PWM, che può portare ad affaticamento degli occhi o mal di testa, Il Acer Nitro 16 è l'unico concorrente nel nostro elenco di dispositivi concorrenti che gestisce una luminosità significativamente superiore a ~300 cd/m².
I buoni tempi di risposta da grigio a grigio, pari a 13,6 ms, e da nero a bianco, pari a 6,4 ms, sono simili a quelli dei suoi colleghi, mentre il Dell G15 5530 ha un tempo di risposta da grigio a grigio di soli 3,4 ms. Inoltre, sono supportati anche Nvidia G-Sync e Dolby Vision.
| |||||||||||||||||||||||||
Distribuzione della luminosità: 94 %
Al centro con la batteria: 511 cd/m²
Contrasto: 1419:1 (Nero: 0.36 cd/m²)
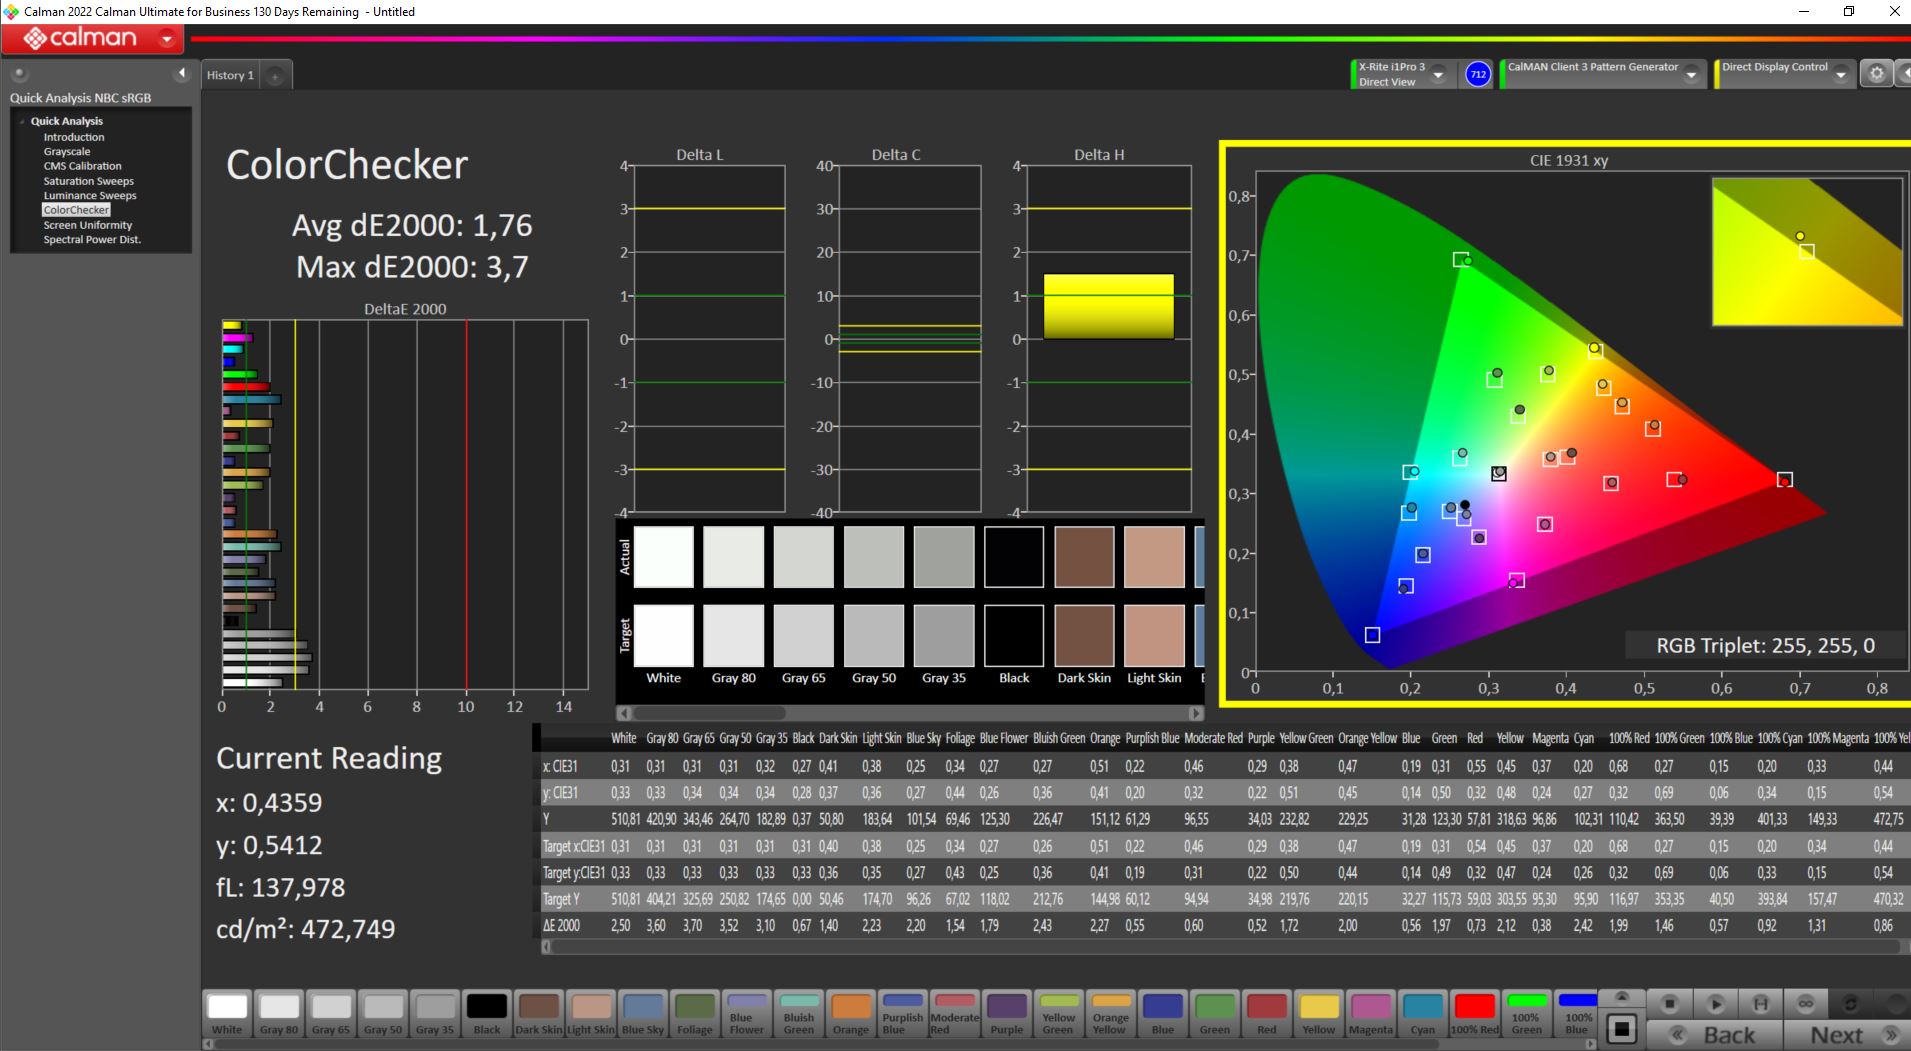
ΔE ColorChecker Calman: 1.76 | ∀{0.5-29.43 Ø4.71}
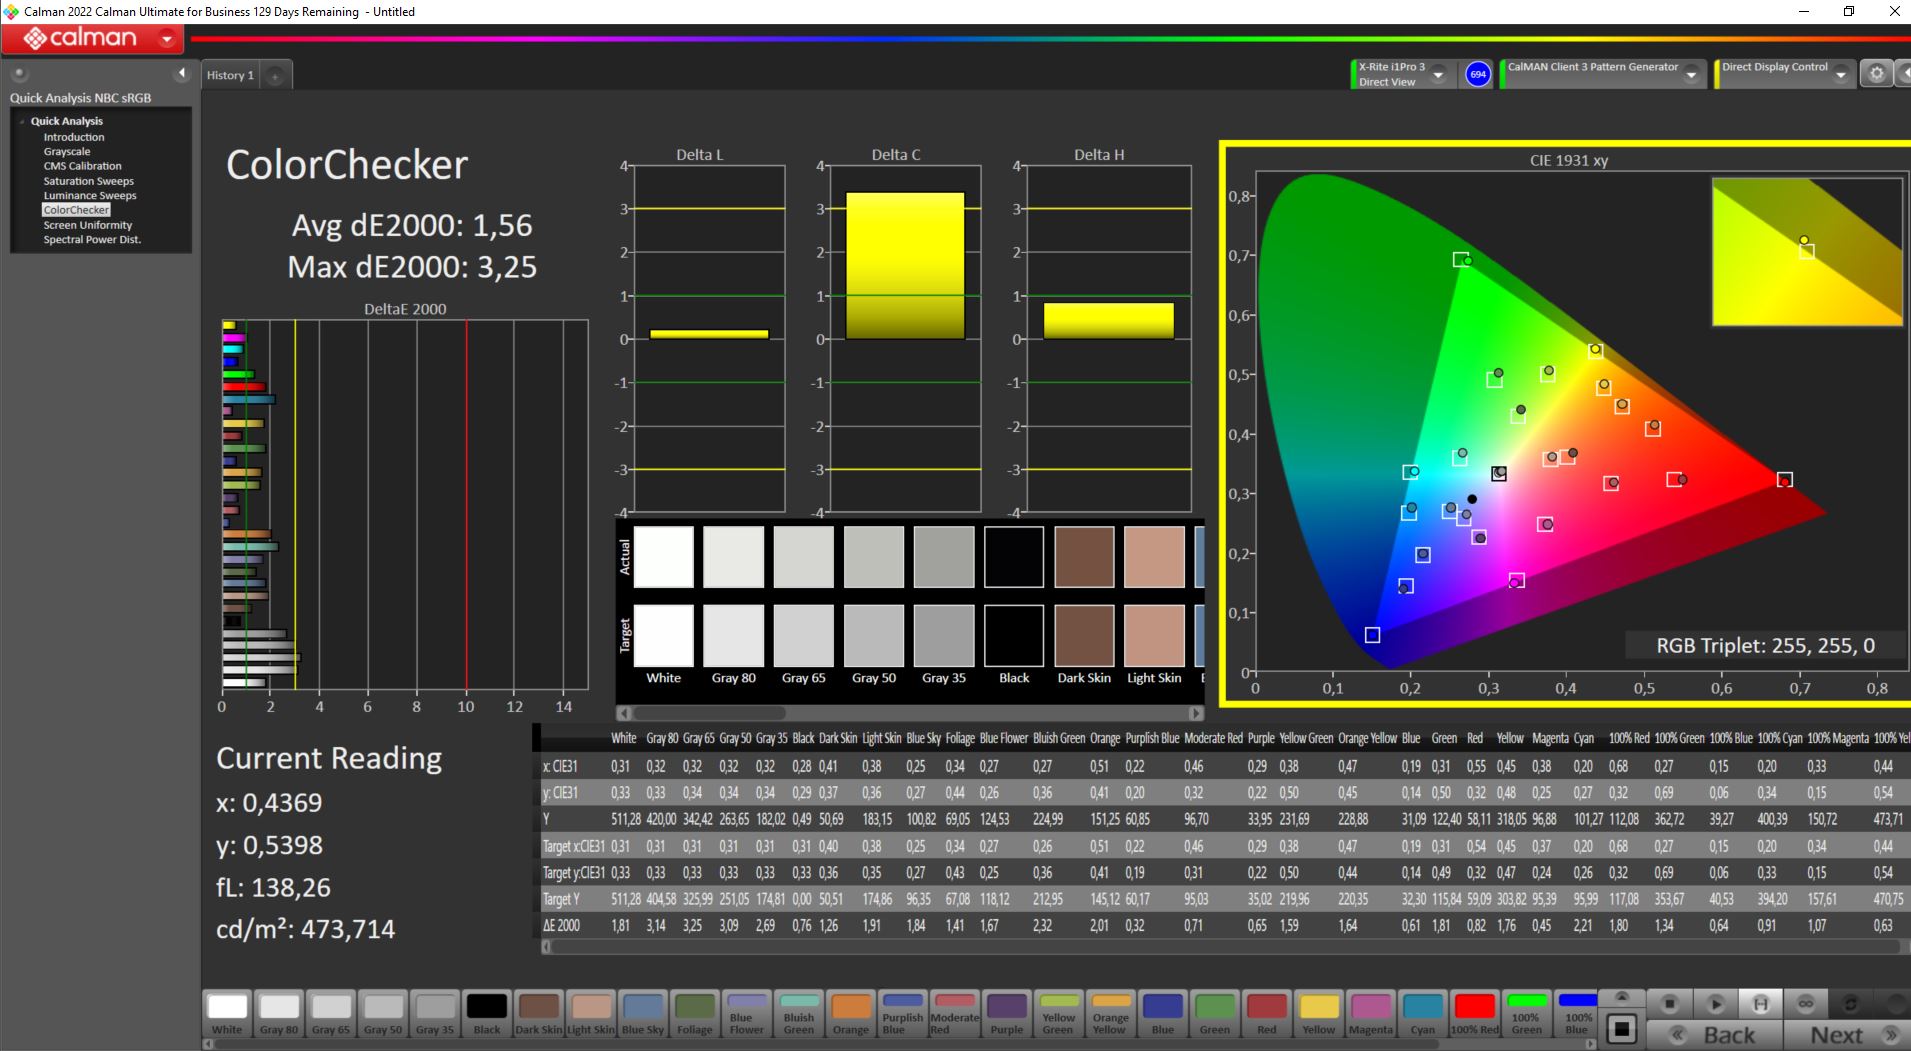
calibrated: 1.56
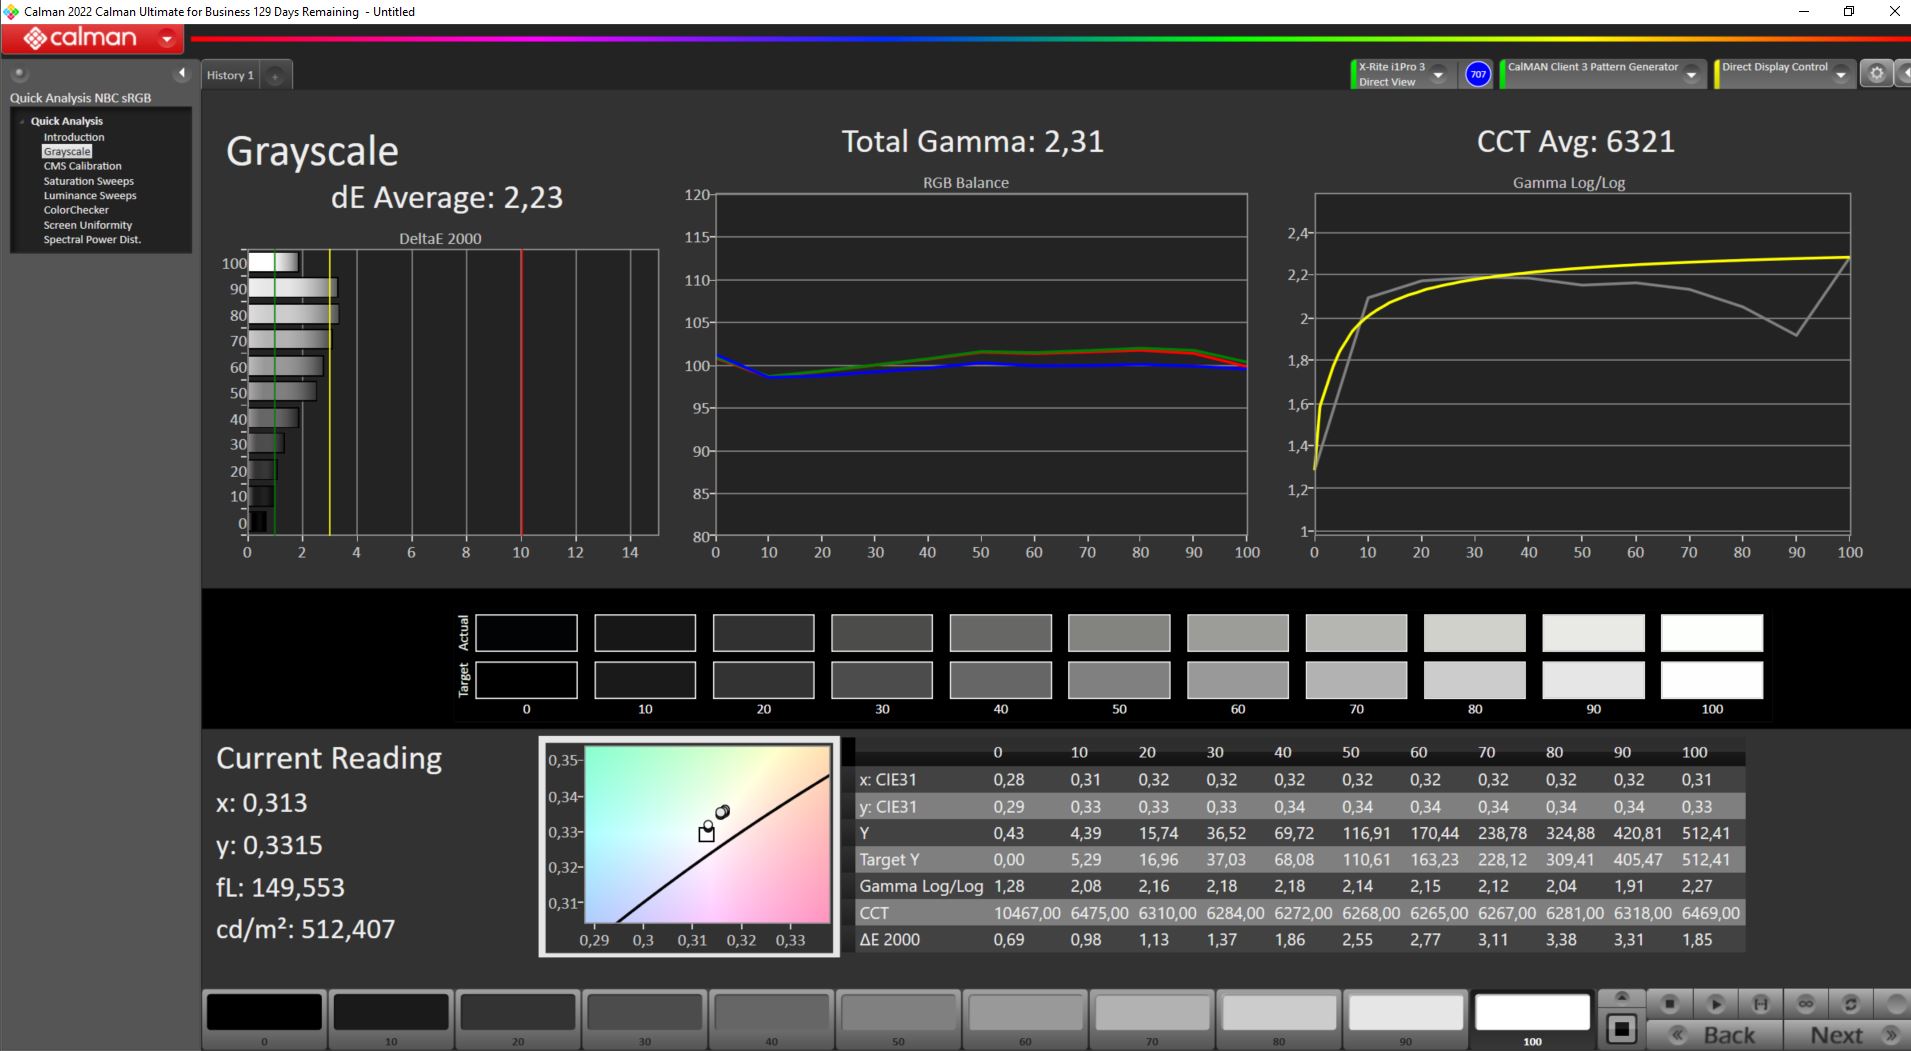
ΔE Greyscale Calman: 3 | ∀{0.09-98 Ø4.96}
84.7% AdobeRGB 1998 (Argyll 3D)
100% sRGB (Argyll 3D)
97.1% Display P3 (Argyll 3D)
Gamma: 2.33
CCT: 6341 K
| Acer Predator Helios 16 PH16-71-731Q BOE NE160QDM-NZ2, IPS-LED, 2560x1600, 16" | Acer Nitro 16 AN16-41 BOE CQ NE16QDM-NY1, IPS, 2560x1600, 16" | Lenovo Legion Pro 5 16IRX8 AU Optronics B160QAN03.1, IPS, 2560x1600, 16" | Aorus 15X ASF BOE CQ NE156QHM-NZ1, IPS, 2560x1440, 15.6" | Asus TUF Gaming A16 FA617 NE160WUM-NX2 (BOE0B33), IPS-Level, 1920x1200, 16" | Dell G15 5530 AUO B156HAN, IPS, 1920x1080, 15.6" | |
|---|---|---|---|---|---|---|
| Display | -16% | -14% | -16% | -16% | -13% | |
| Display P3 Coverage (%) | 97.1 | 67.9 -30% | 71.2 -27% | 69.3 -29% | 69.4 -29% | 73.1 -25% |
| sRGB Coverage (%) | 100 | 99.1 -1% | 98.8 -1% | 98.2 -2% | 97.8 -2% | 98.4 -2% |
| AdobeRGB 1998 Coverage (%) | 84.7 | 69.9 -17% | 73.3 -13% | 70.5 -17% | 70.9 -16% | 74.4 -12% |
| Response Times | 21% | -35% | -19% | -42% | 46% | |
| Response Time Grey 50% / Grey 80% * (ms) | 13.6 ? | 11 ? 19% | 14.5 ? -7% | 12.4 ? 9% | 17 ? -25% | 3.39 ? 75% |
| Response Time Black / White * (ms) | 6.4 ? | 5 ? 22% | 10.4 ? -63% | 9.4 ? -47% | 10.1 ? -58% | 5.35 ? 16% |
| PWM Frequency (Hz) | 21620 ? | |||||
| Screen | -3% | 4% | 5% | 5% | -50% | |
| Brightness middle (cd/m²) | 511 | 520 2% | 405.7 -21% | 316 -38% | 308 -40% | 320 -37% |
| Brightness (cd/m²) | 498 | 494 -1% | 368 -26% | 301 -40% | 293 -41% | 316 -37% |
| Brightness Distribution (%) | 94 | 91 -3% | 87 -7% | 90 -4% | 90 -4% | 94 0% |
| Black Level * (cd/m²) | 0.36 | 0.39 -8% | 0.38 -6% | 0.28 22% | 0.23 36% | 0.21 42% |
| Contrast (:1) | 1419 | 1333 -6% | 1068 -25% | 1129 -20% | 1339 -6% | 1524 7% |
| Colorchecker dE 2000 * | 1.76 | 1.94 -10% | 1.65 6% | 1.54 12% | 1.47 16% | 4.55 -159% |
| Colorchecker dE 2000 max. * | 3.7 | 5.62 -52% | 4.2 -14% | 2.46 34% | 2.98 19% | 9.83 -166% |
| Colorchecker dE 2000 calibrated * | 1.56 | 0.74 53% | 0.53 66% | 1.21 22% | 1.02 35% | 1.51 3% |
| Greyscale dE 2000 * | 3 | 2.94 2% | 1.2 60% | 1.3 57% | 2.2 27% | 6.2 -107% |
| Gamma | 2.33 94% | 2.37 93% | 2.3 96% | 2.307 95% | 2.228 99% | 2.07 106% |
| CCT | 6341 103% | 6443 101% | 6453 101% | 6456 101% | 6228 104% | 6479 100% |
| Media totale (Programma / Settaggio) | 1% /
-2% | -15% /
-6% | -10% /
-3% | -18% /
-6% | -6% /
-29% |
* ... Meglio usare valori piccoli
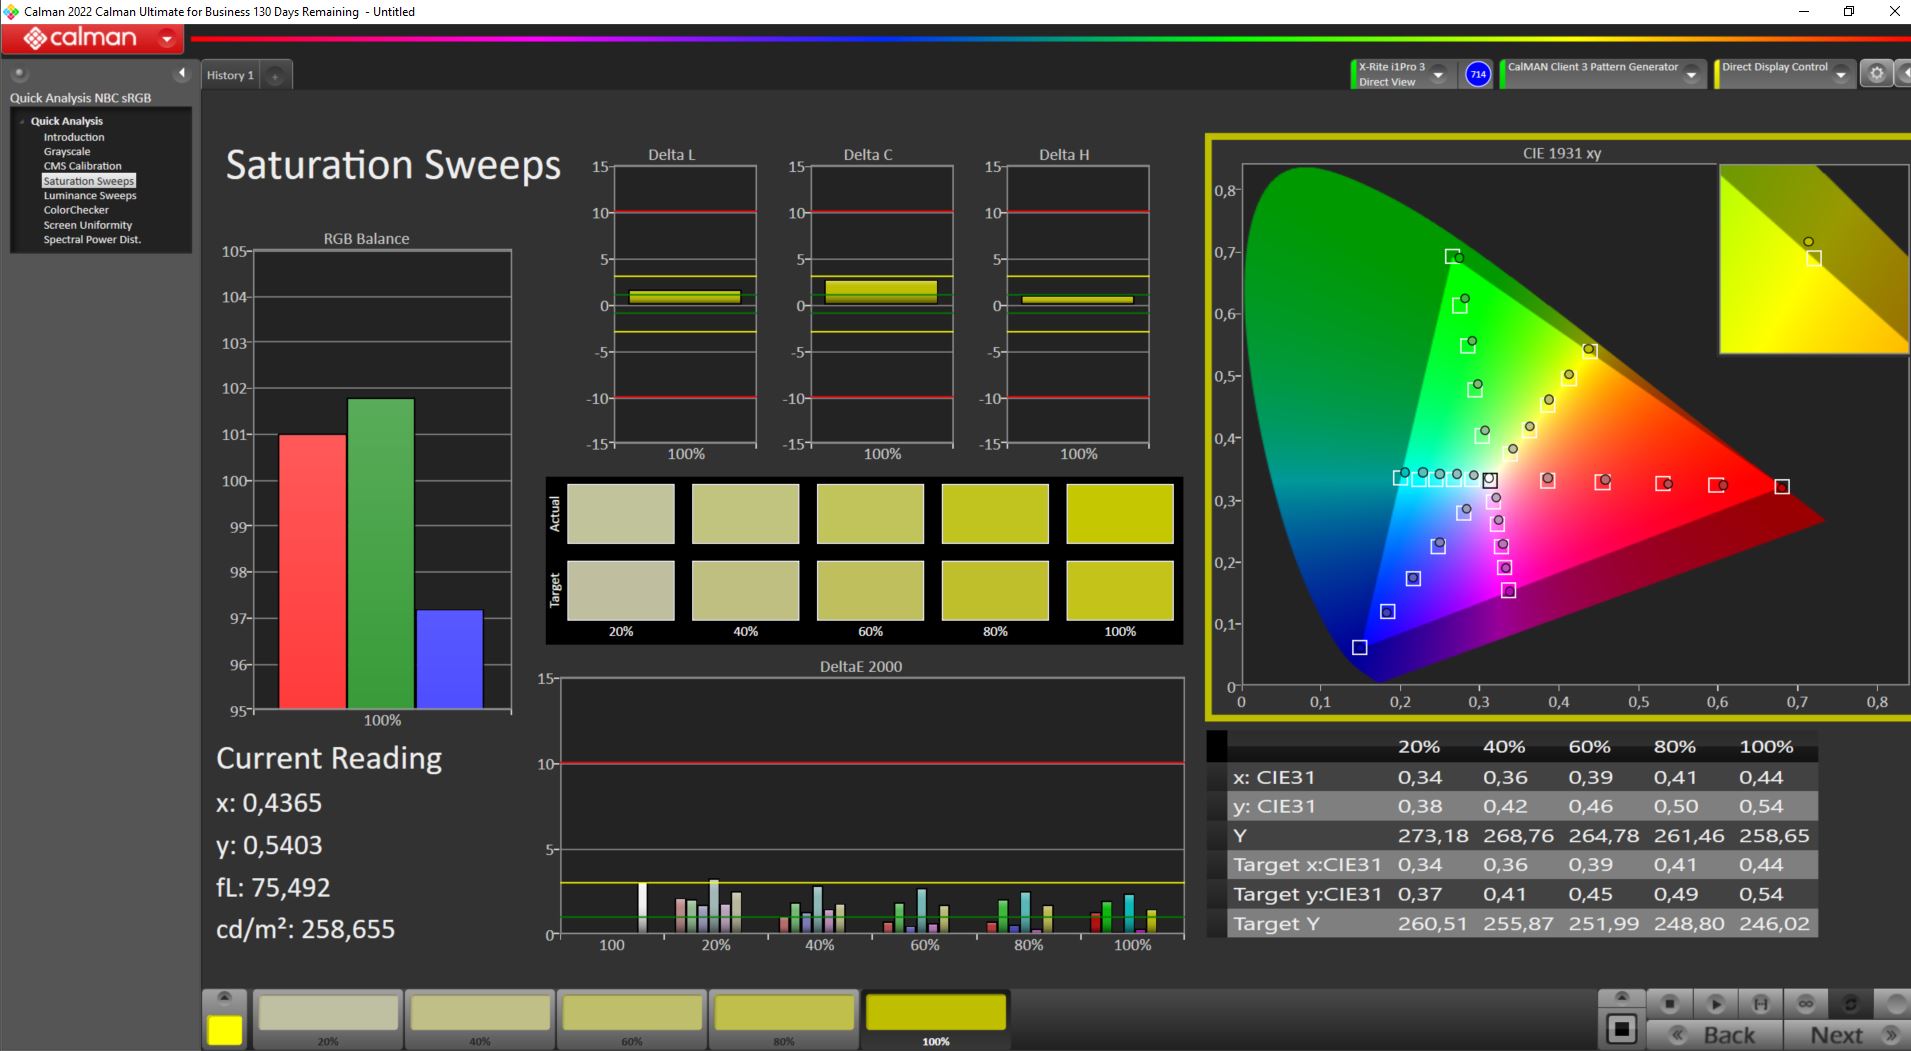
Poiché sono coperti il 100% di sRGB, il 97,1% di DCI P3 e l'84,7% di AdobeRGB, non c'è nulla che possa ostacolare l'editing di foto e video, entrambi basati su colori accurati. Nessun portatile da gioco nel nostro campo di confronto può avvicinarsi a questi numeri, ad eccezione dello spazio colore sRGB.
I colori e le scale di grigio sono già calibrati e quindi non superano il limite DeltaE 3, fino al quale l'occhio umano è in grado di rilevare le deviazioni cromatiche. La nostra calibrazione è riuscita a migliorare ulteriormente questi valori, senza alcuna fusione di colore visibile. Il nostro profilo di colore calibrato può essere scaricato da https://notebookcheck.com/uploads/tx_nbc2/helios16_kal.icm.

Tempi di risposta del Display
| ↔ Tempi di risposta dal Nero al Bianco | ||
|---|---|---|
| 6.4 ms ... aumenta ↗ e diminuisce ↘ combinato | ↗ 2.2 ms Incremento | 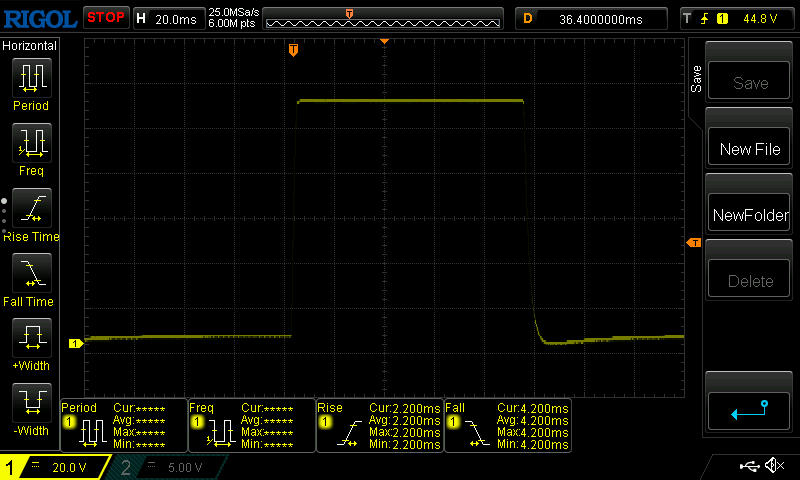 |
| ↘ 4.2 ms Calo | ||
| Lo schermo ha mostrato valori di risposta molto veloci nei nostri tests ed è molto adatto per i gaming veloce. In confronto, tutti i dispositivi di test variano da 0.1 (minimo) a 240 (massimo) ms. » 20 % di tutti i dispositivi è migliore. Questo significa che i tempi di risposta rilevati sono migliori rispettto alla media di tutti i dispositivi testati (19.8 ms). | ||
| ↔ Tempo di risposta dal 50% Grigio all'80% Grigio | ||
| 13.6 ms ... aumenta ↗ e diminuisce ↘ combinato | ↗ 6.2 ms Incremento | 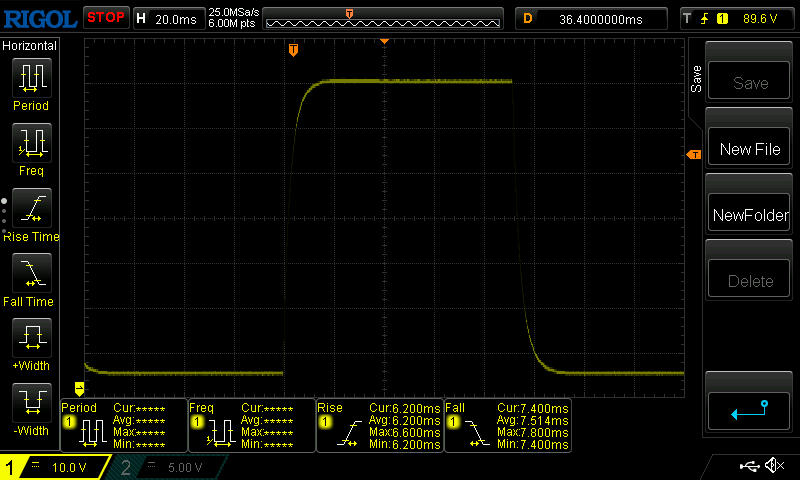 |
| ↘ 7.4 ms Calo | ||
| Lo schermo mostra buoni tempi di risposta durante i nostri tests, ma potrebbe essere troppo lento per i gamers competitivi. In confronto, tutti i dispositivi di test variano da 0.165 (minimo) a 636 (massimo) ms. » 27 % di tutti i dispositivi è migliore. Questo significa che i tempi di risposta rilevati sono migliori rispettto alla media di tutti i dispositivi testati (31 ms). | ||
Sfarfallio dello schermo / PWM (Pulse-Width Modulation)
| flickering dello schermo / PWM non rilevato | 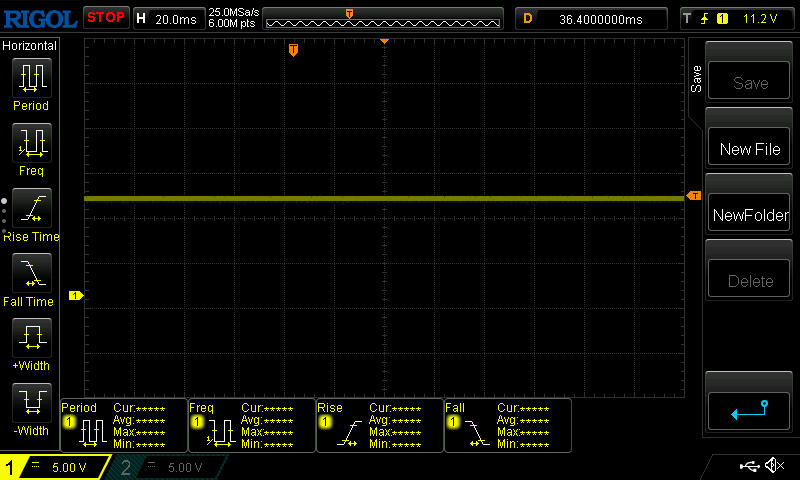 | ||
In confronto: 52 % di tutti i dispositivi testati non utilizza PWM per ridurre la luminosita' del display. Se è rilevato PWM, una media di 7757 (minimo: 5 - massimo: 343500) Hz è stata rilevata. | |||
All'esterno, lo schermo è leggibile sia all'ombra che in penombra. Alla luce diretta del sole, anche il display opaco e i 500 cd/m² non sempre aiutano.

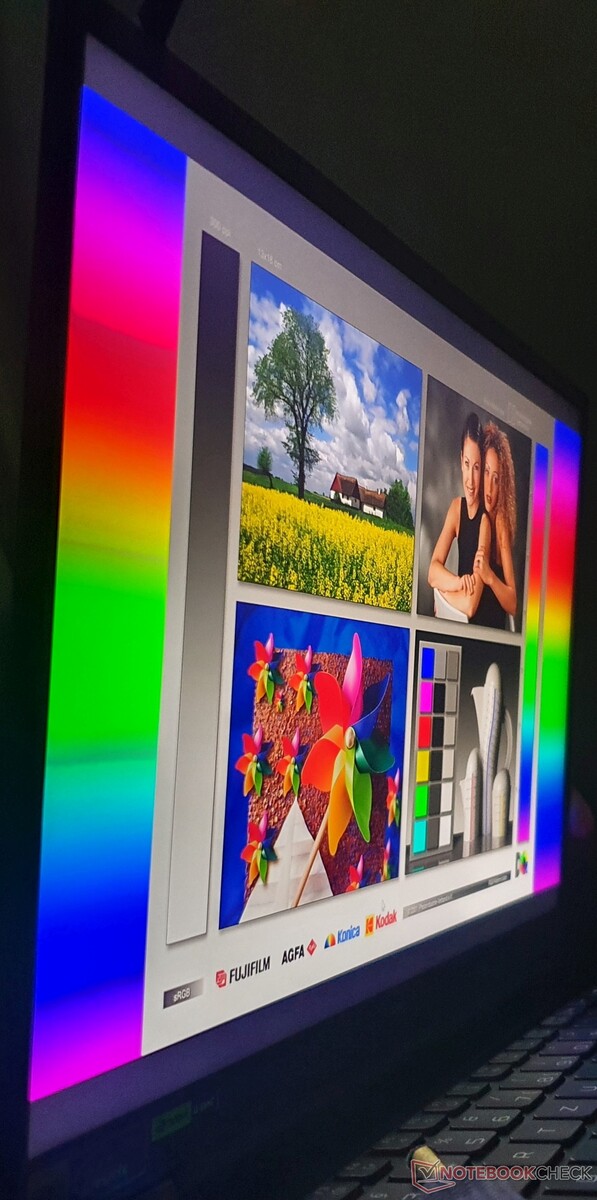
Come tipico per un pannello IPS, gli angoli di visione sono stabili, dall'alto, dal basso e anche lateralmente.
Prestazioni: La RTX 4060 raggiunge la sua velocità di clock massima già a 100 watt
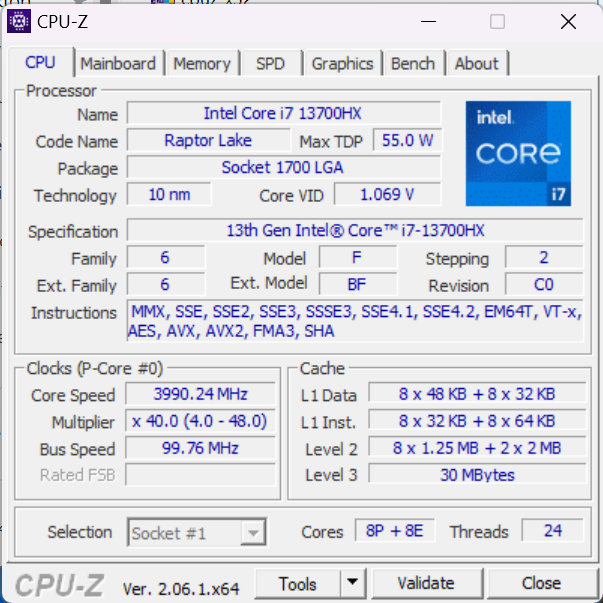
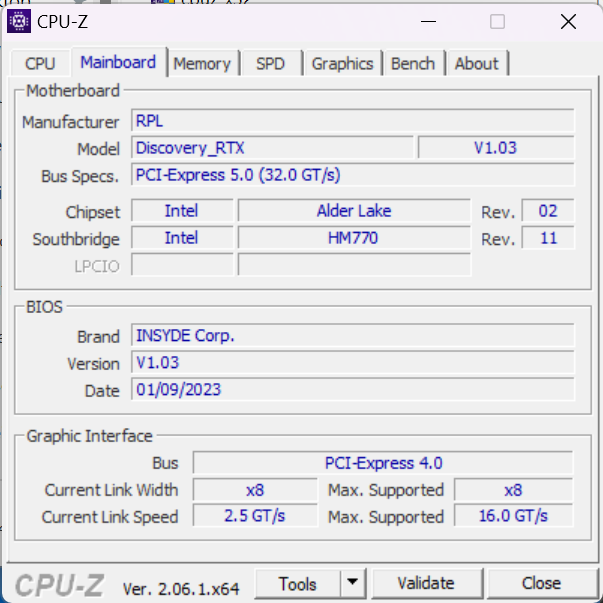
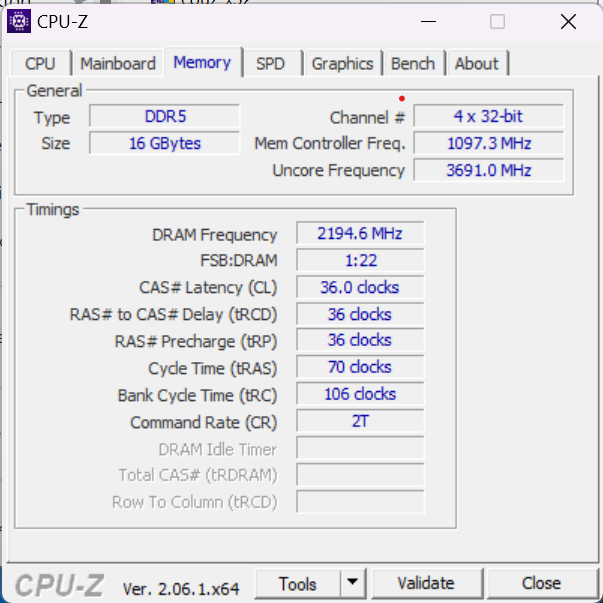
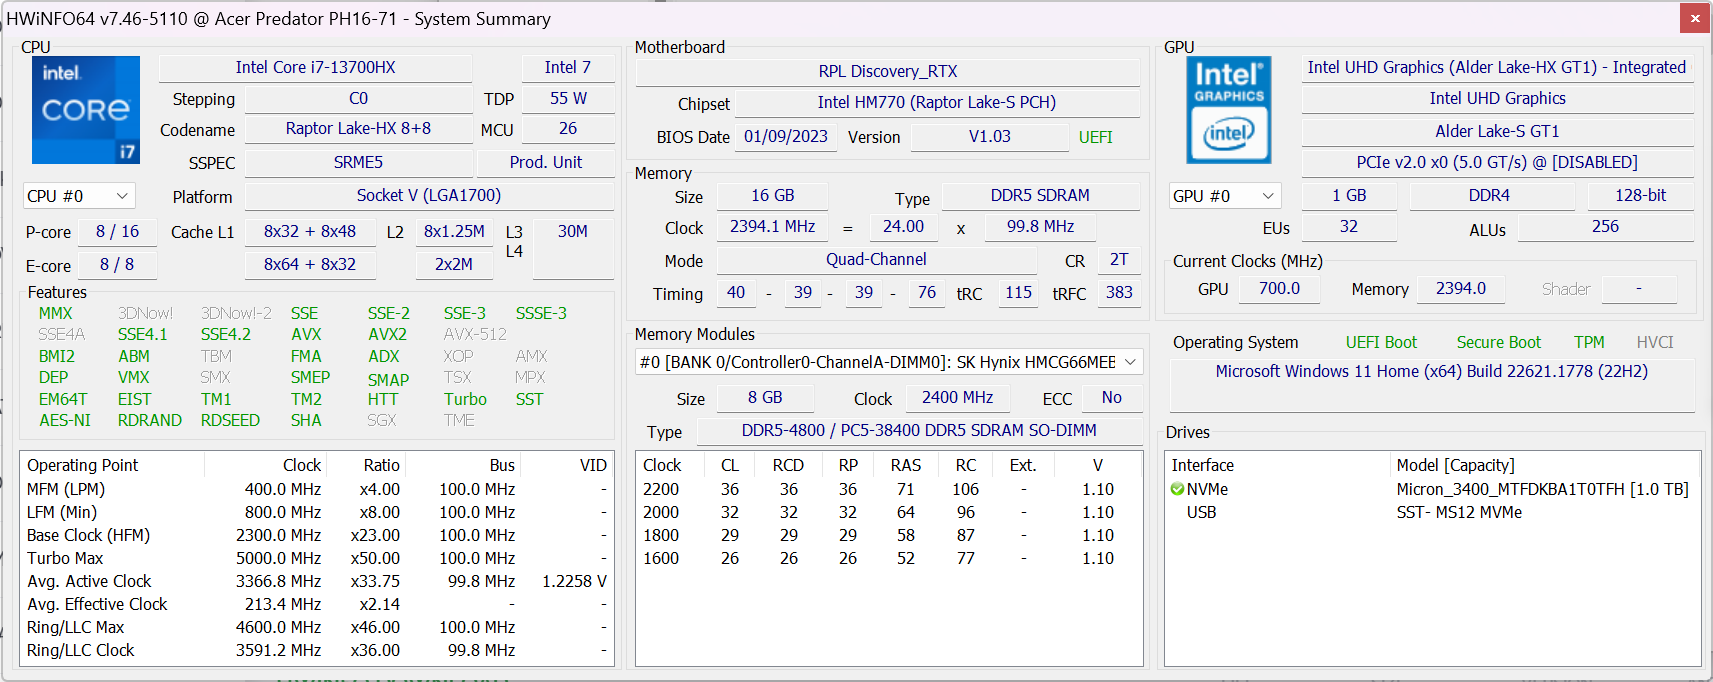
La nostra configurazione di recensione dell'Acer Predator Helios 16 ha un processore Intel Core i7-13700HX(8 core P + 8 core E), 16 GB di RAM DDR5 4800, un disco SSD da 1 TB (PCIe 4.0) e una scheda Nvidia GeForce RTX 4060con TGP massimo (140 watt). Altre SKU sono disponibili con un Core i9-13900HX(8 core P + 16 core E), unRTX 4070 o RTX 4080.
Il mercato di riferimento del modello recensito è quello dei videogiocatori che non hanno bisogno di giocare ai giochi attuali né alla massima frequenza di fotogrammi né alla risoluzione QHD nativa del dispositivo. Altre applicazioni grafiche come l'editing video 4K o il rendering 3D sono facilmente realizzabili con questo modello.
Condizioni di prova
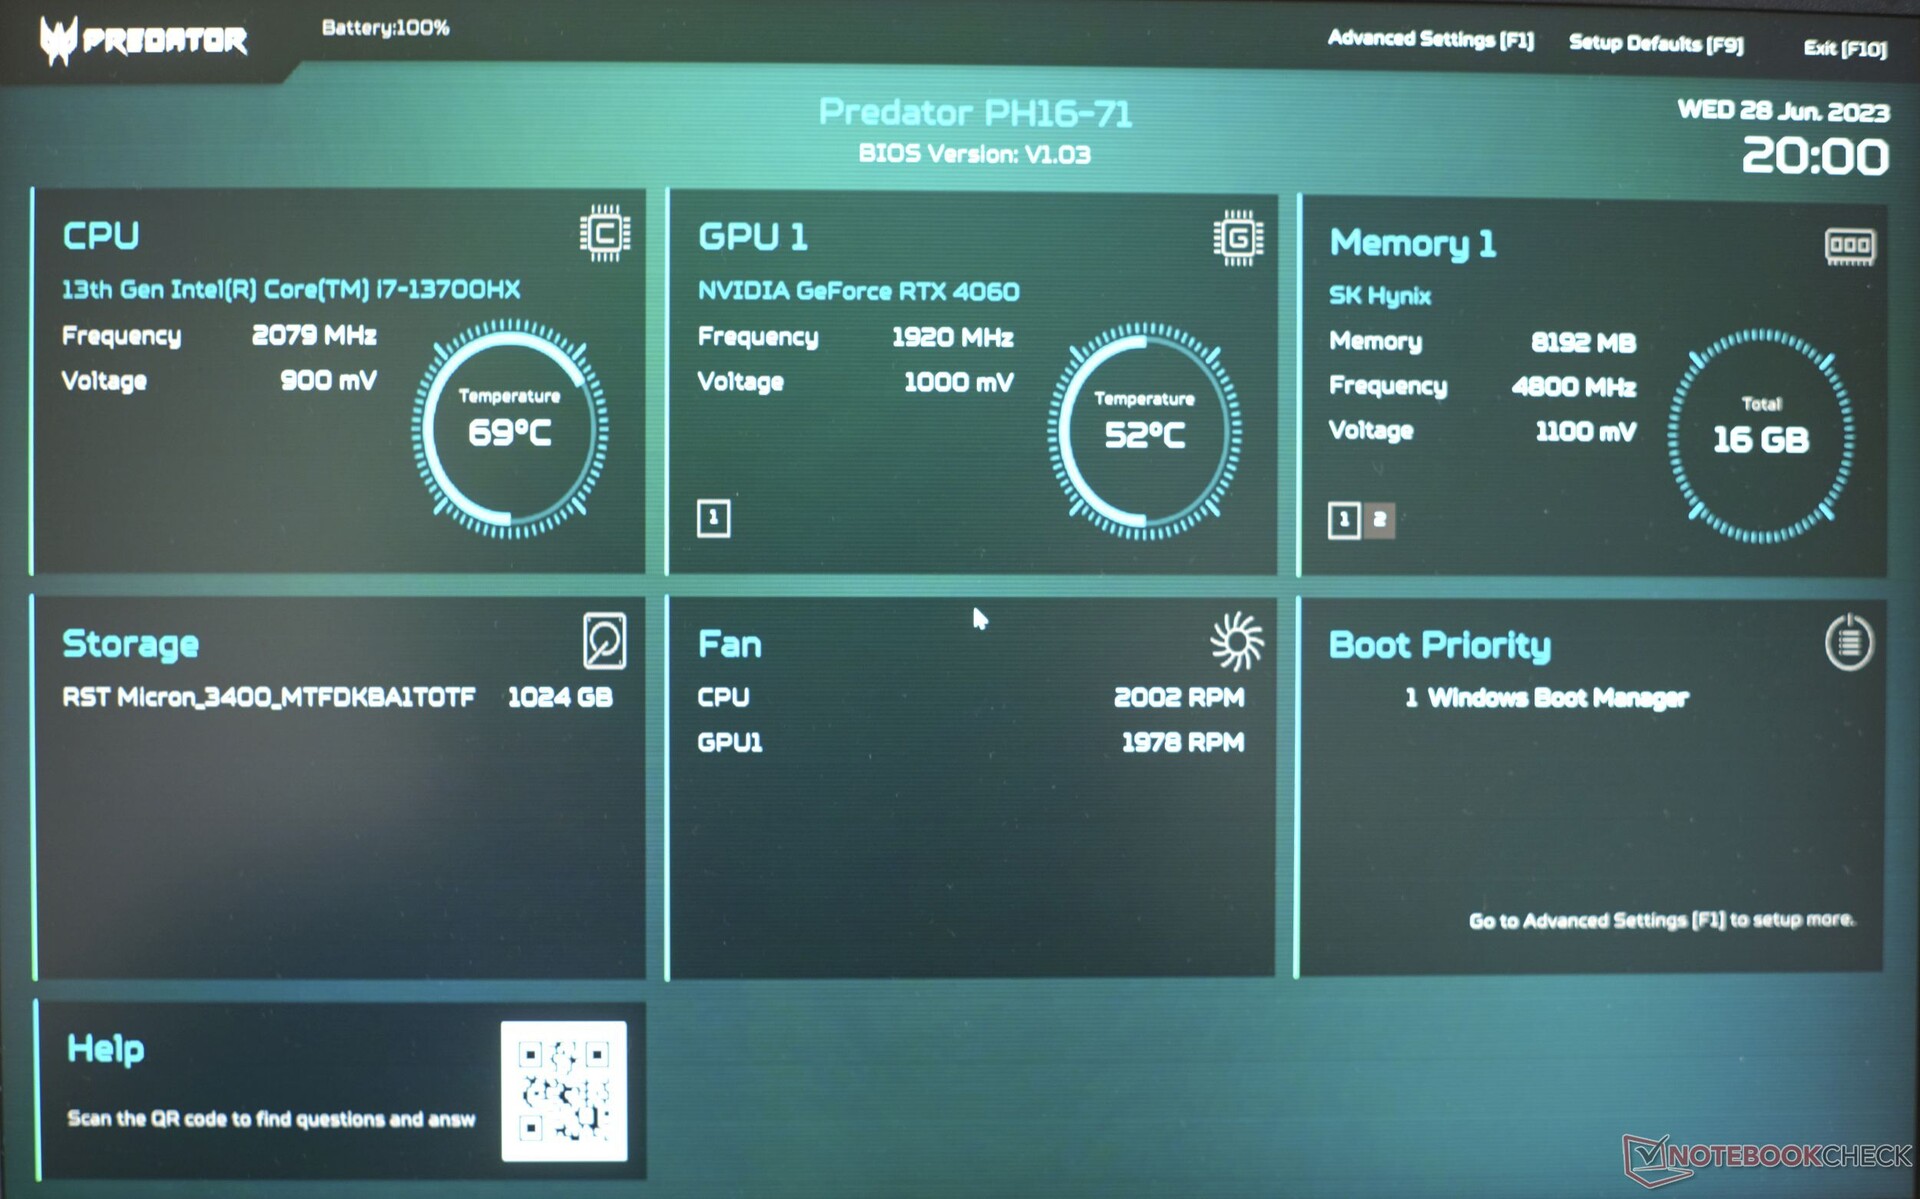
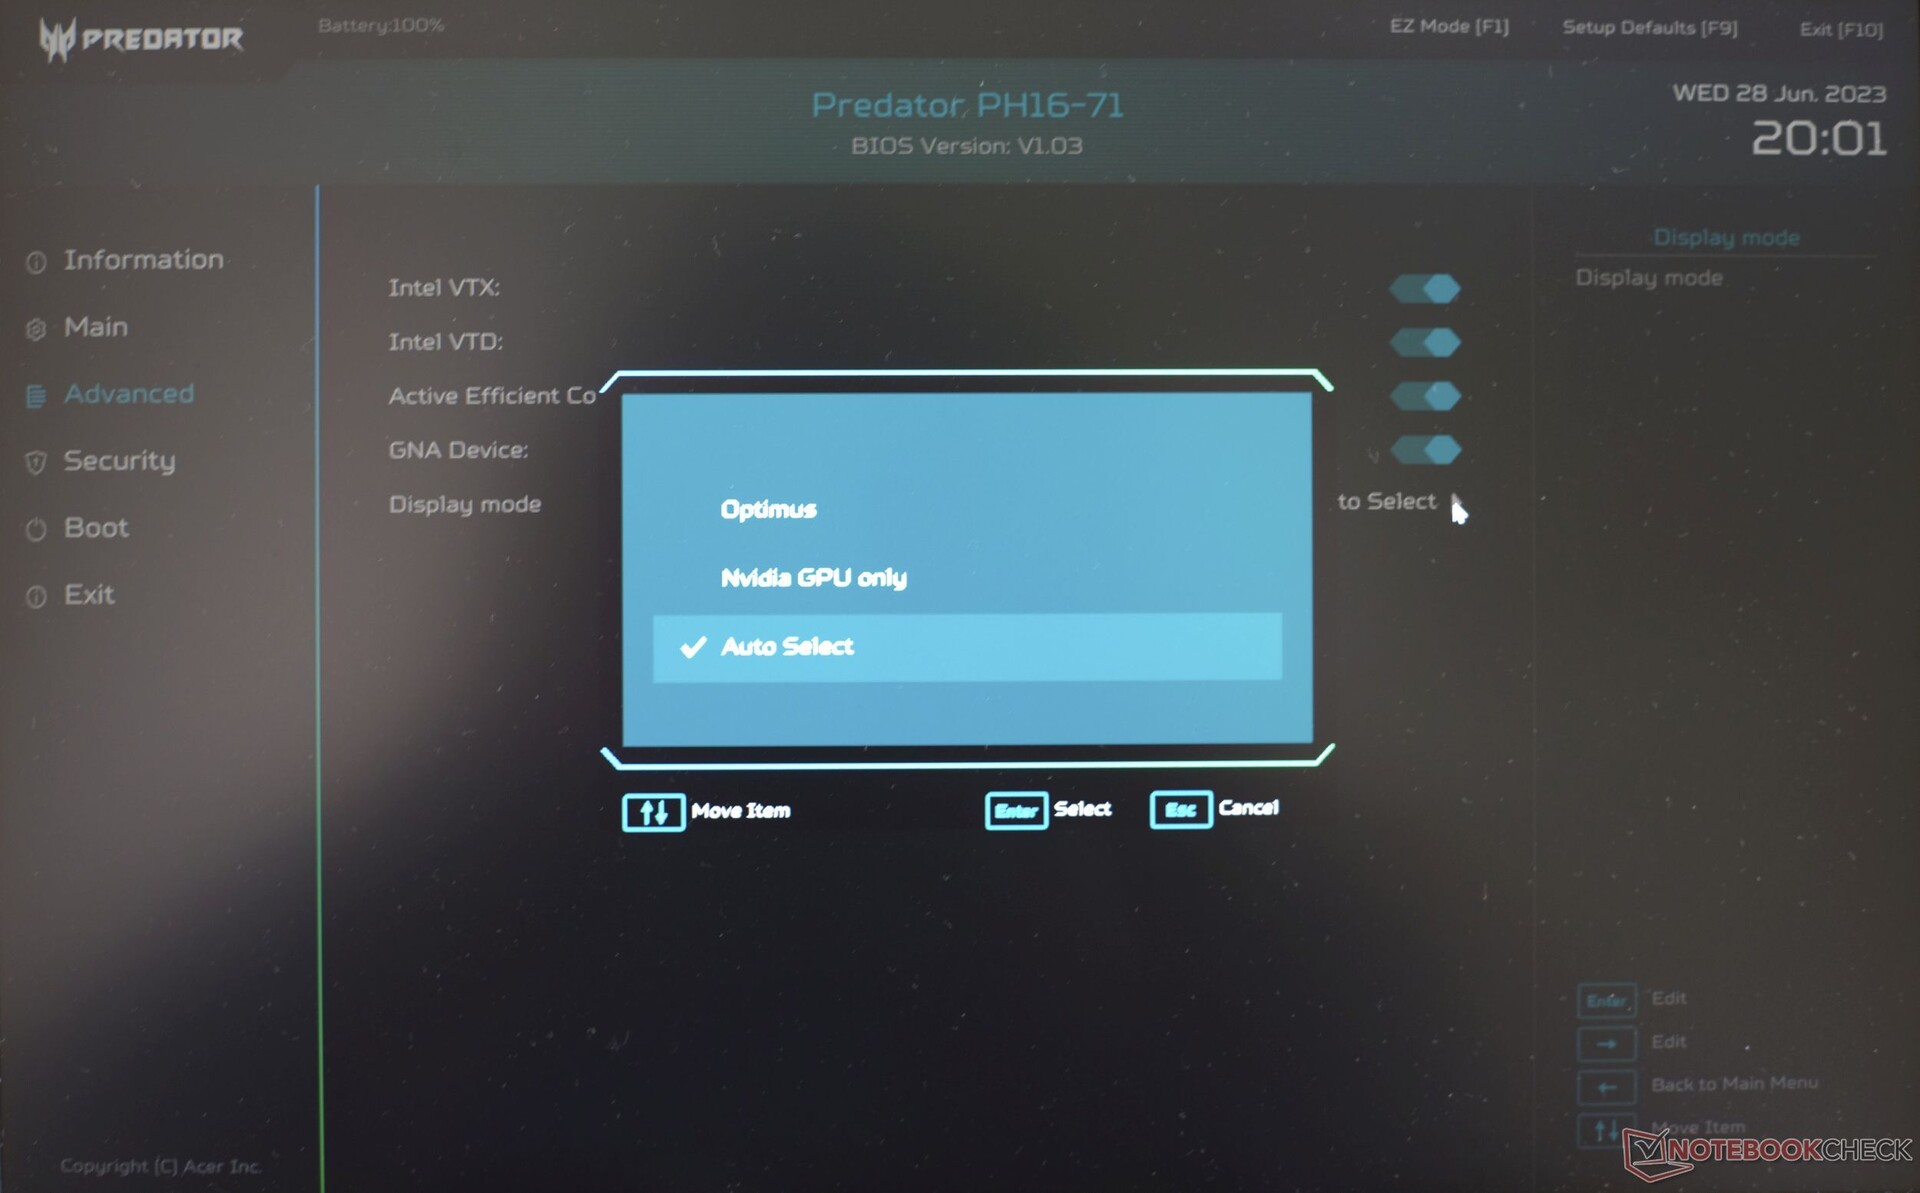
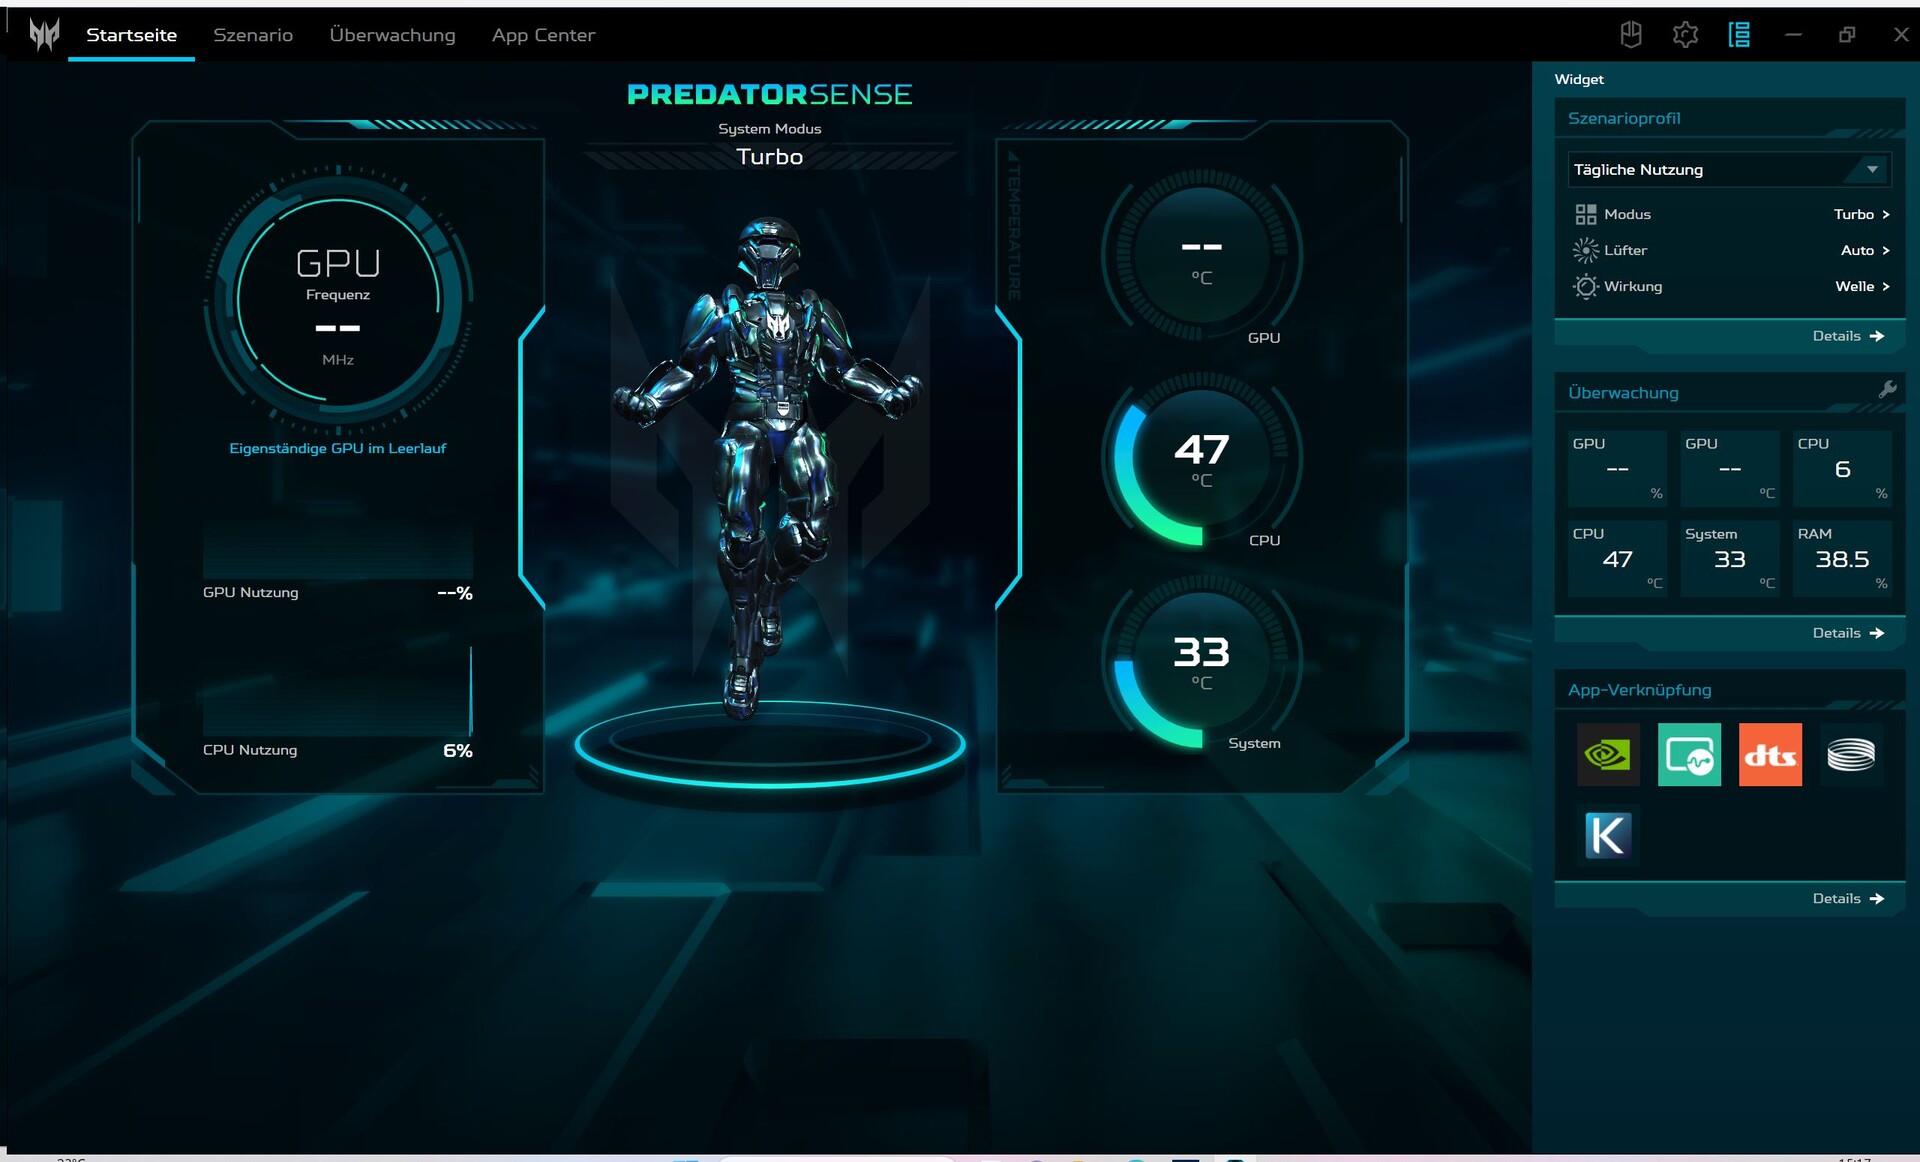
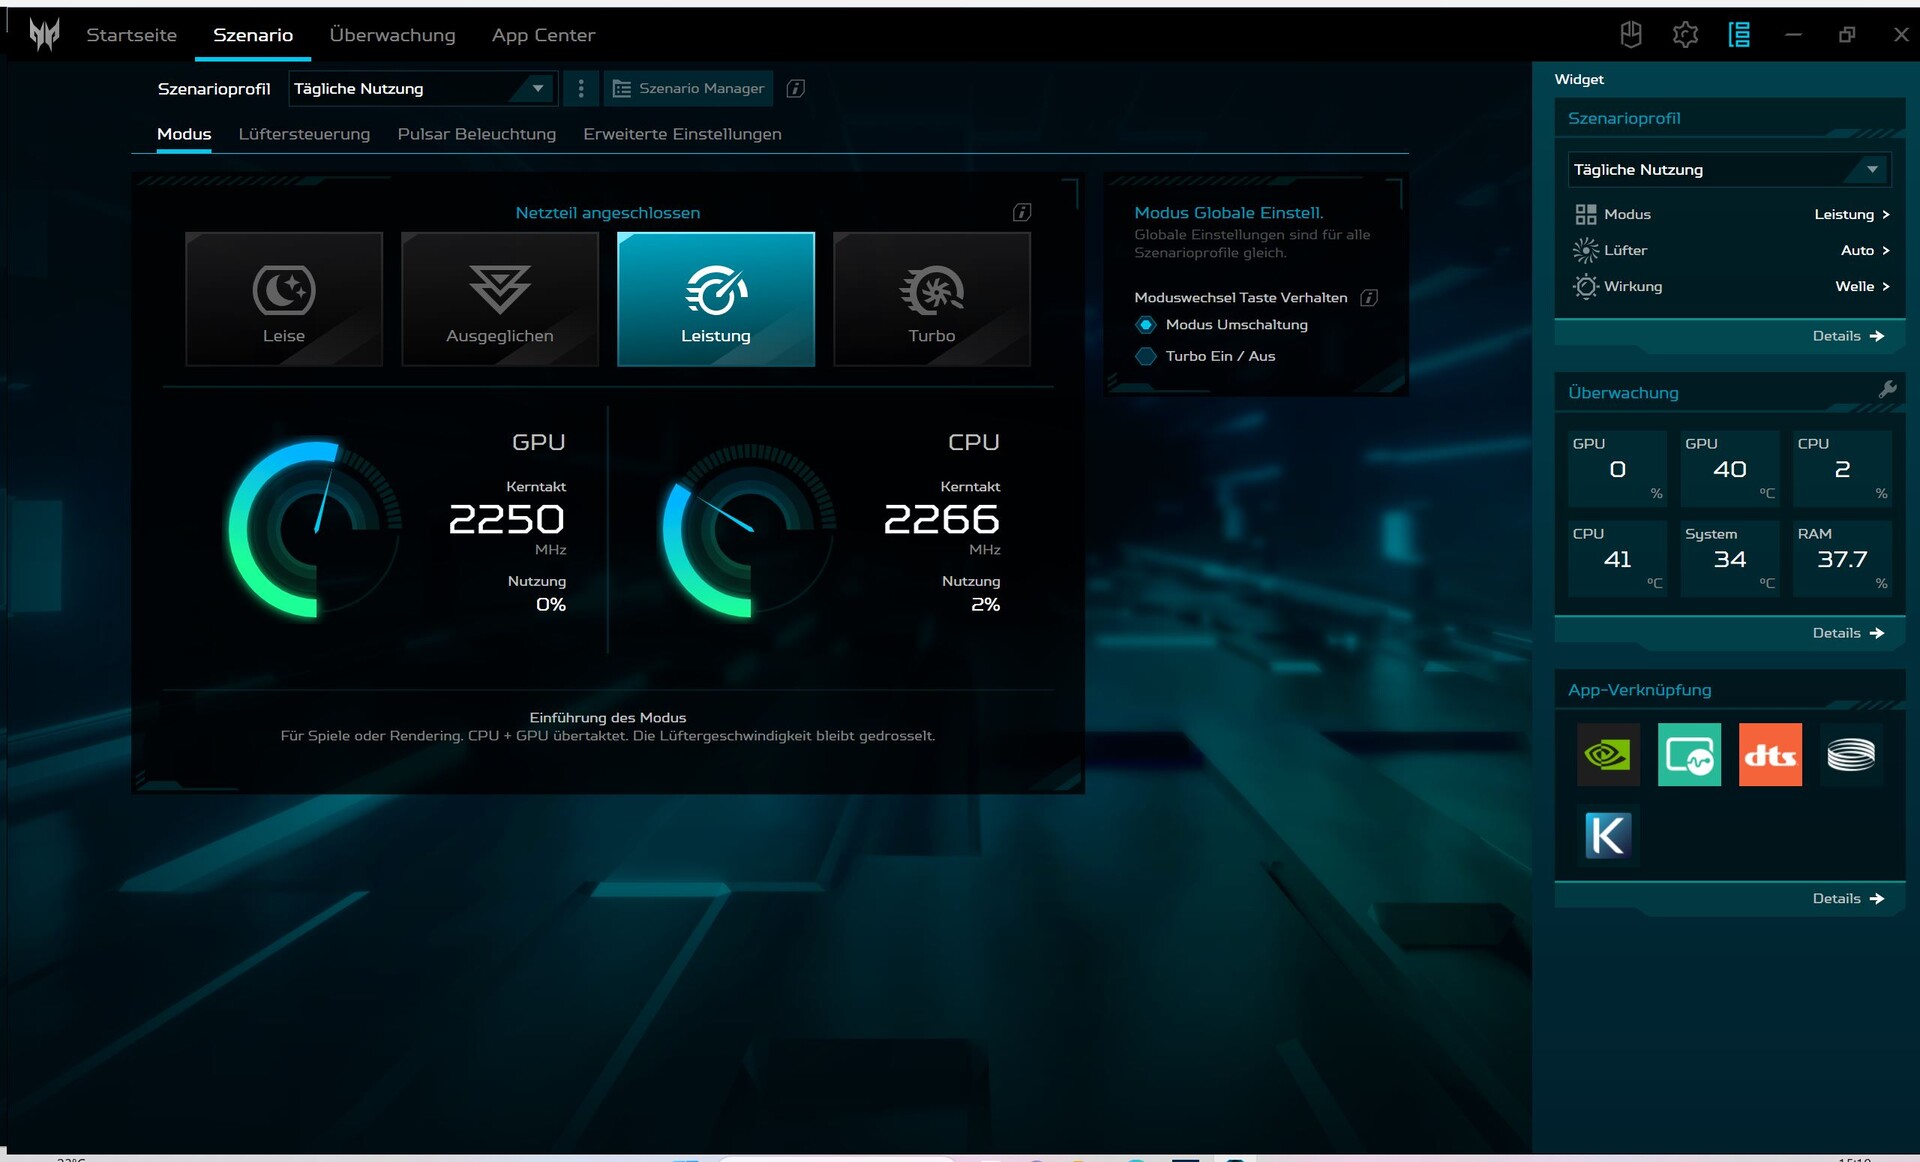
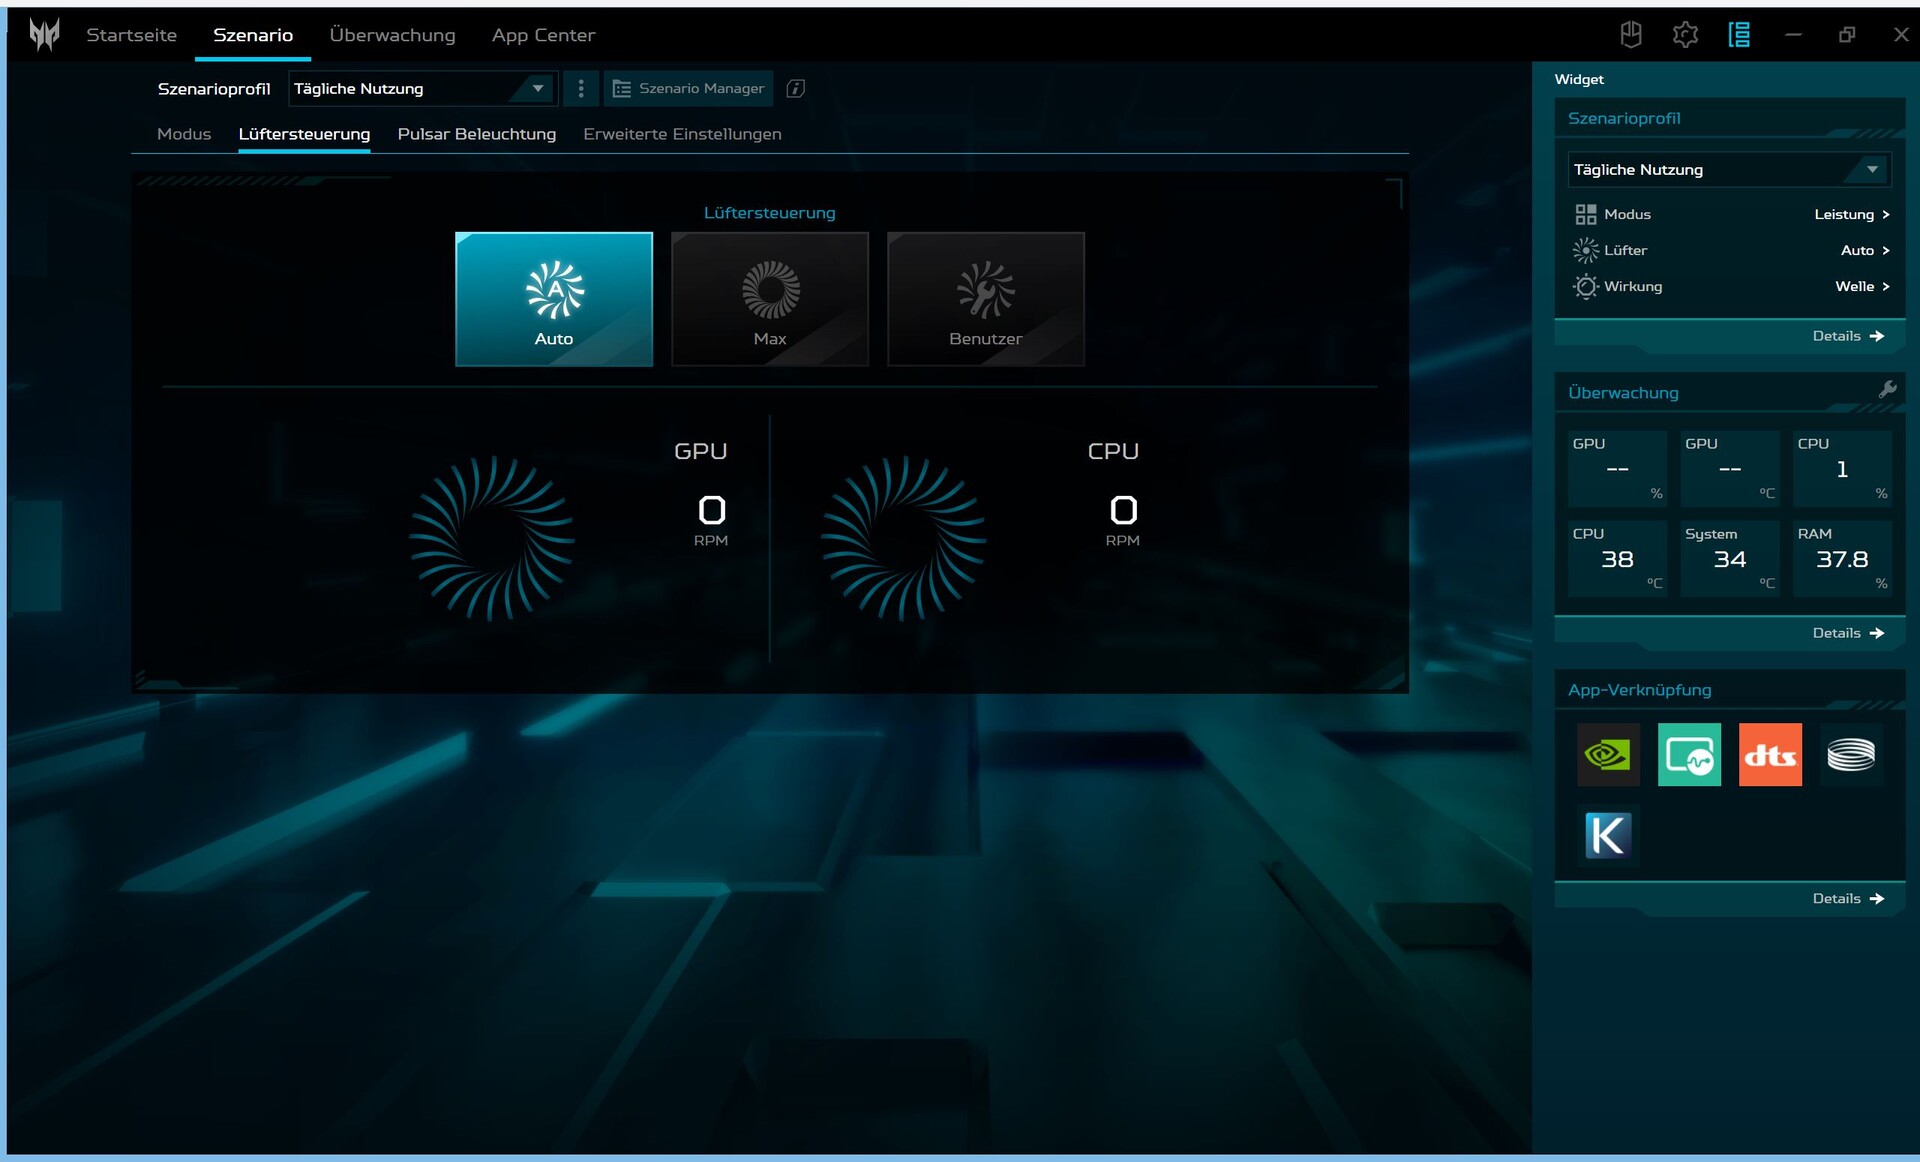
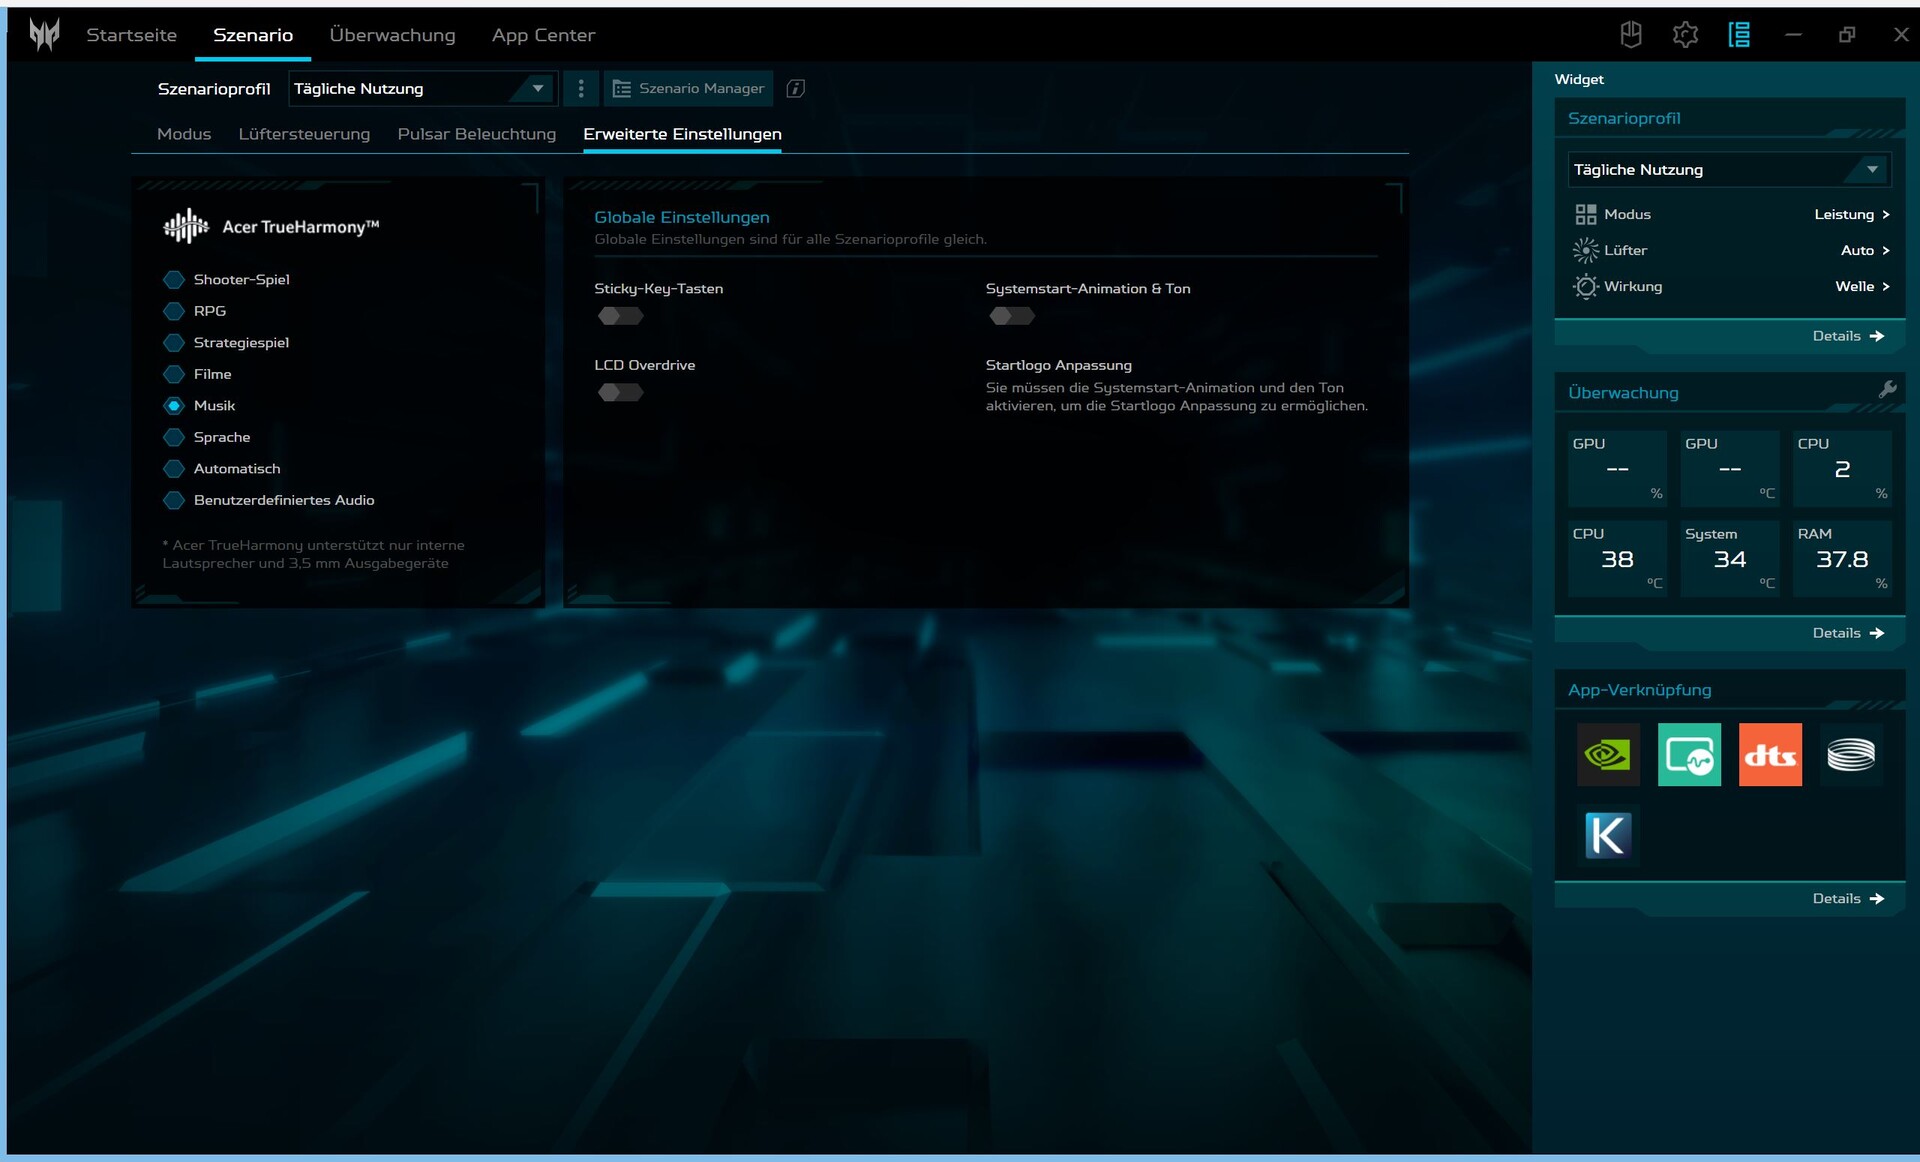
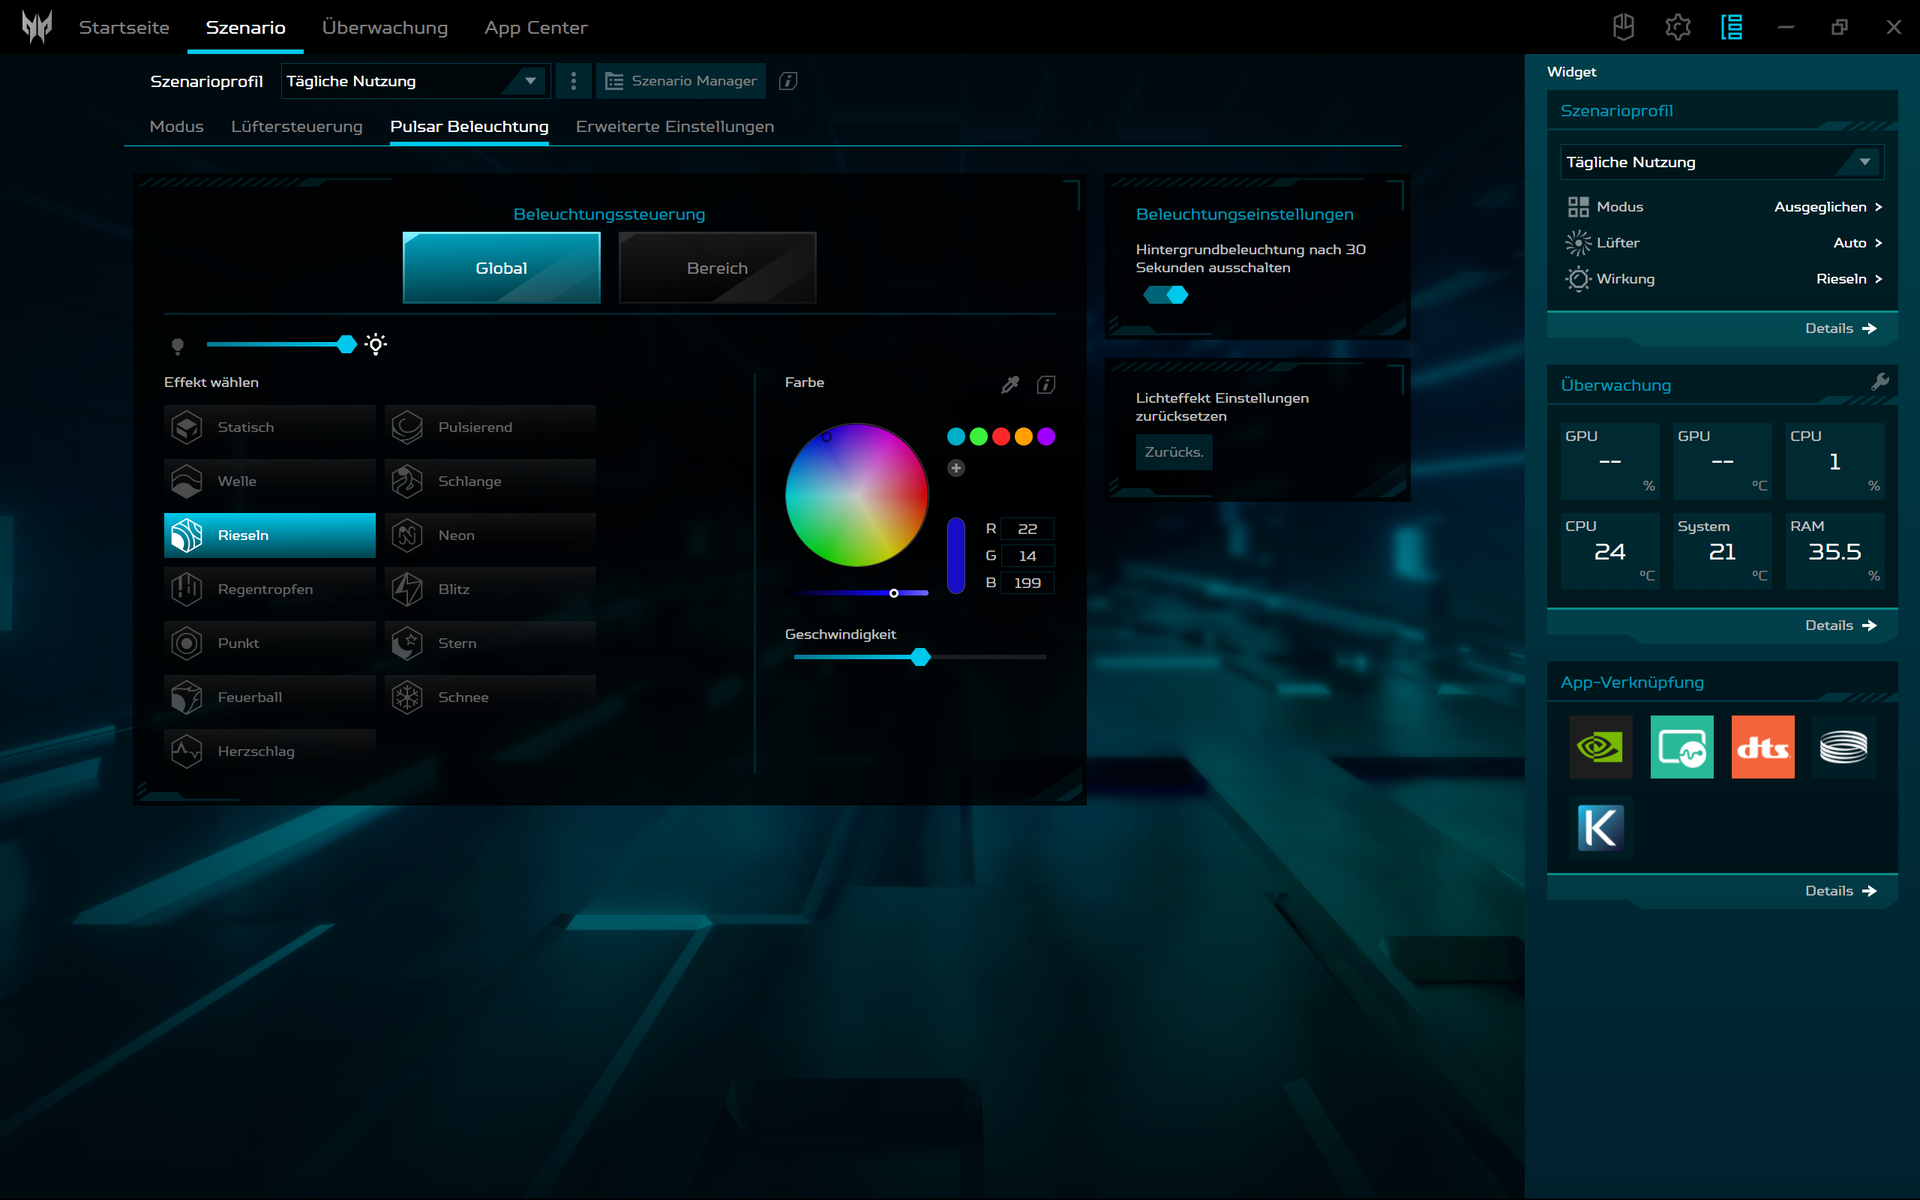
Nel software del Control Center di Acer, "PredatorSense", sono disponibili quattro modalità di prestazioni che possono essere selezionate alternativamente tramite il pulsante sul lato sinistro sopra la tastiera. Abbiamo eseguito i nostri benchmark basati sulle prestazioni utilizzando la modalità "Performance". Una volta scollegato dalla rete elettrica, si è passati automaticamente alla modalità "Balanced". La modalità "Eco", disponibile anche qui, riduce la luminosità dello schermo e tutte le forme di illuminazione a LED vengono disattivate. L'Helios 16 deve essere caricato almeno al 40% per poter controllare le modalità di funzionamento.
La tabella sottostante evidenzia che la perdita di potenza nella modalità "Balanced" è minima e le ventole rimangono notevolmente più silenziose, anzi, quasi piacevolmente silenziose. Al contrario, la modalità "Turbo" è insopportabilmente rumorosa ed è quindi utile solo per lunghi rendering video o simili.
| Scenario | Turbo + ventole Max | Turbo | Prestazioni | Bilanciato | Silenzioso | Batteria |
|---|---|---|---|---|---|---|
| CPU PL2 | 157 W (1:05 min) | 157 W > 150 W (1 min) | 157 W > 140 W (~55 sec) | 157 W > 135 W (~55 sec) | 157 W > 120 W (~40 sec) | 25 W |
| CPU PL1 | 118 W | 115 W | 95 W | 85 W | 55 W | 25 W |
| GPU @Cyberpunk 2077 1.6 | 103 W | 100 W | 100 W | 90 W | 55 W | 37 W |
| GPU @FurMark | 138 W | 137 W | 130 W | 100 W | 60 W | 40 W |
| Prestazioni (Cyperpunk 2077 1.6 @FHD/Ultra) | 96,2fps | 95,5fps | 93,2fps | 87,4fps | 65,8fps | 30fps |
Processore
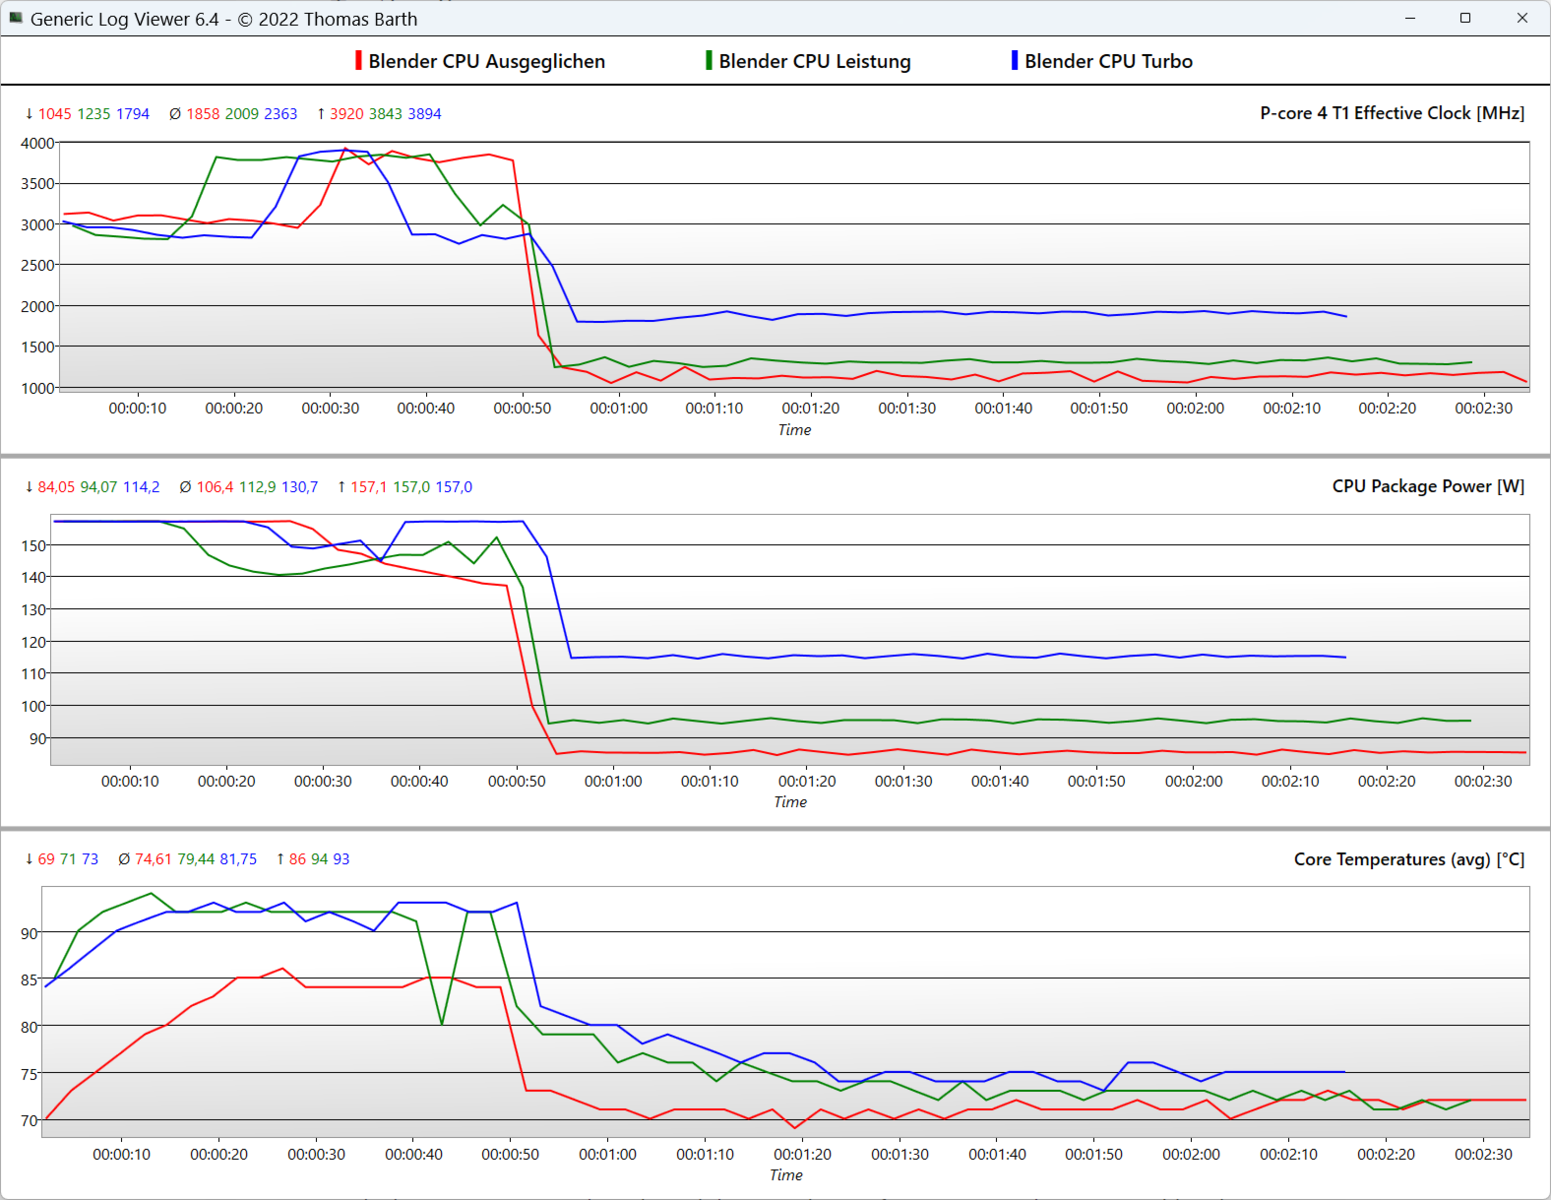
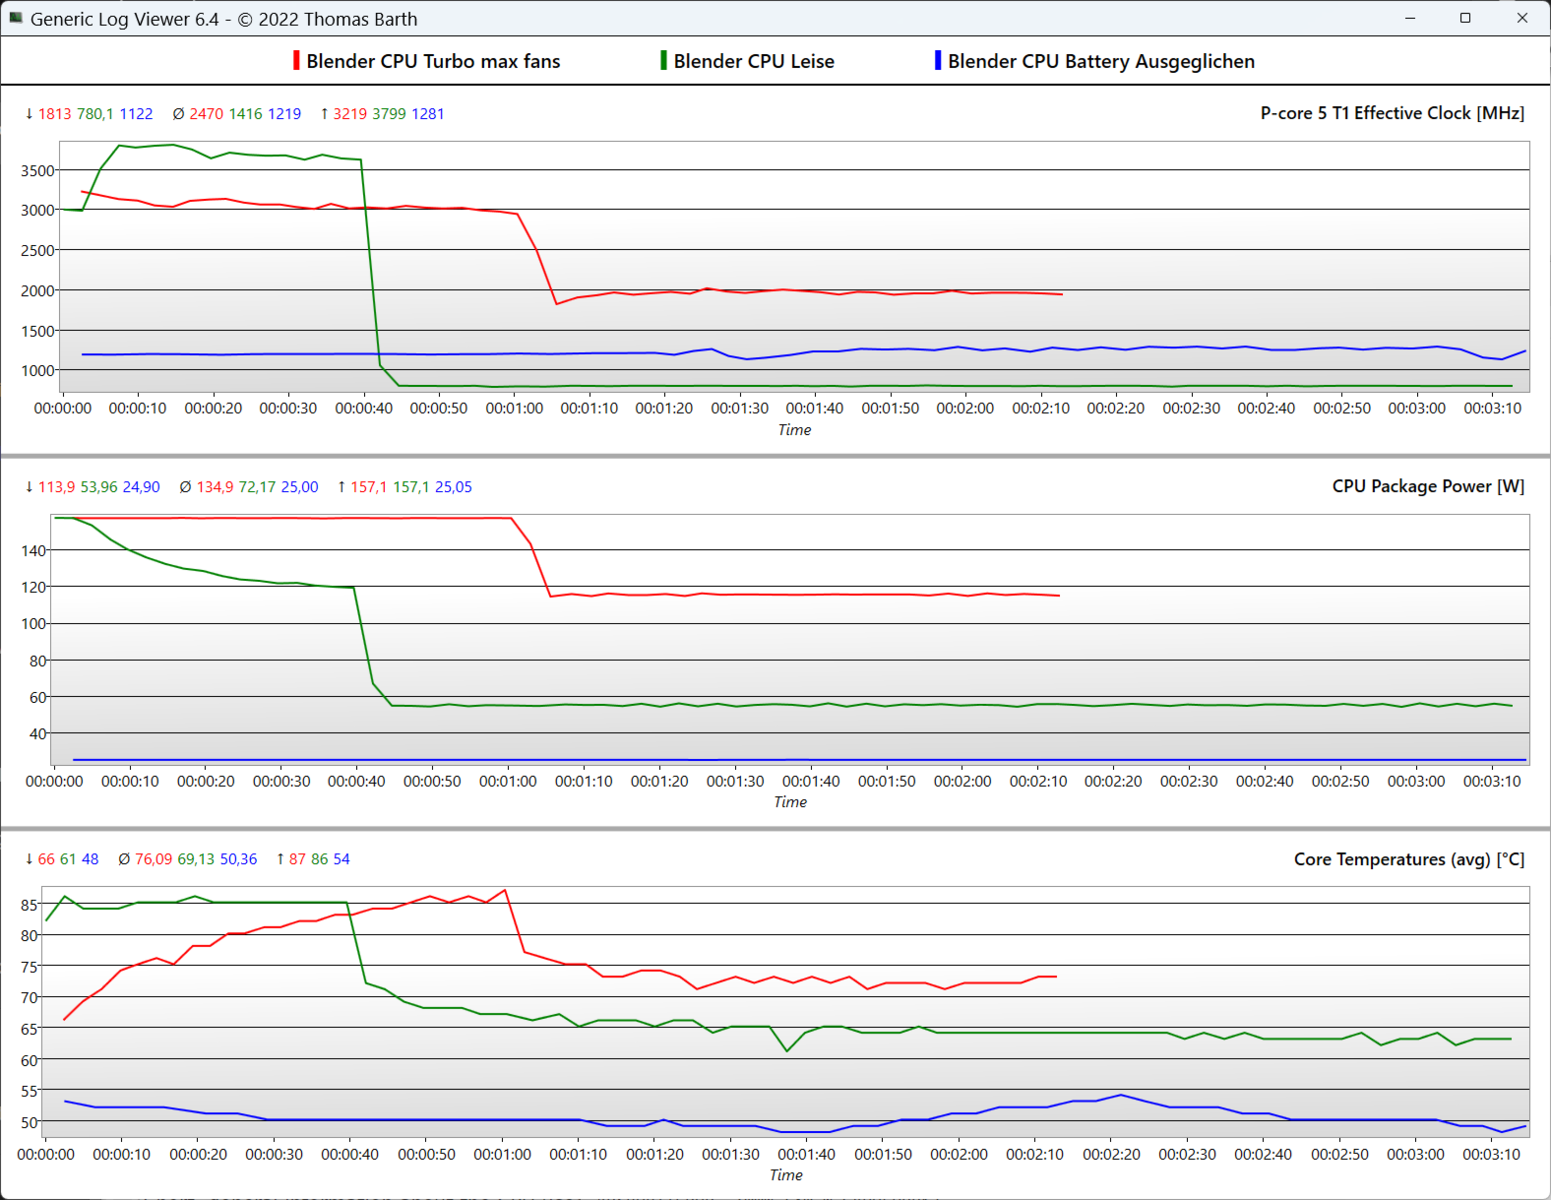
Il processore Intel Core i7-13700HXpossiede 16 core e 24 thread (8 core P + 8 core E) e un TDP di 55 watt. Il turbo di 4,5 GHz non viene sfruttato appieno e, nel primo minuto, i core P si collocano tra 3 GHz e 3,9 GHz per poi scendere rispettivamente a 1,9 GHz (modalità Turbo) e 1,3 GHz (modalità Performance).
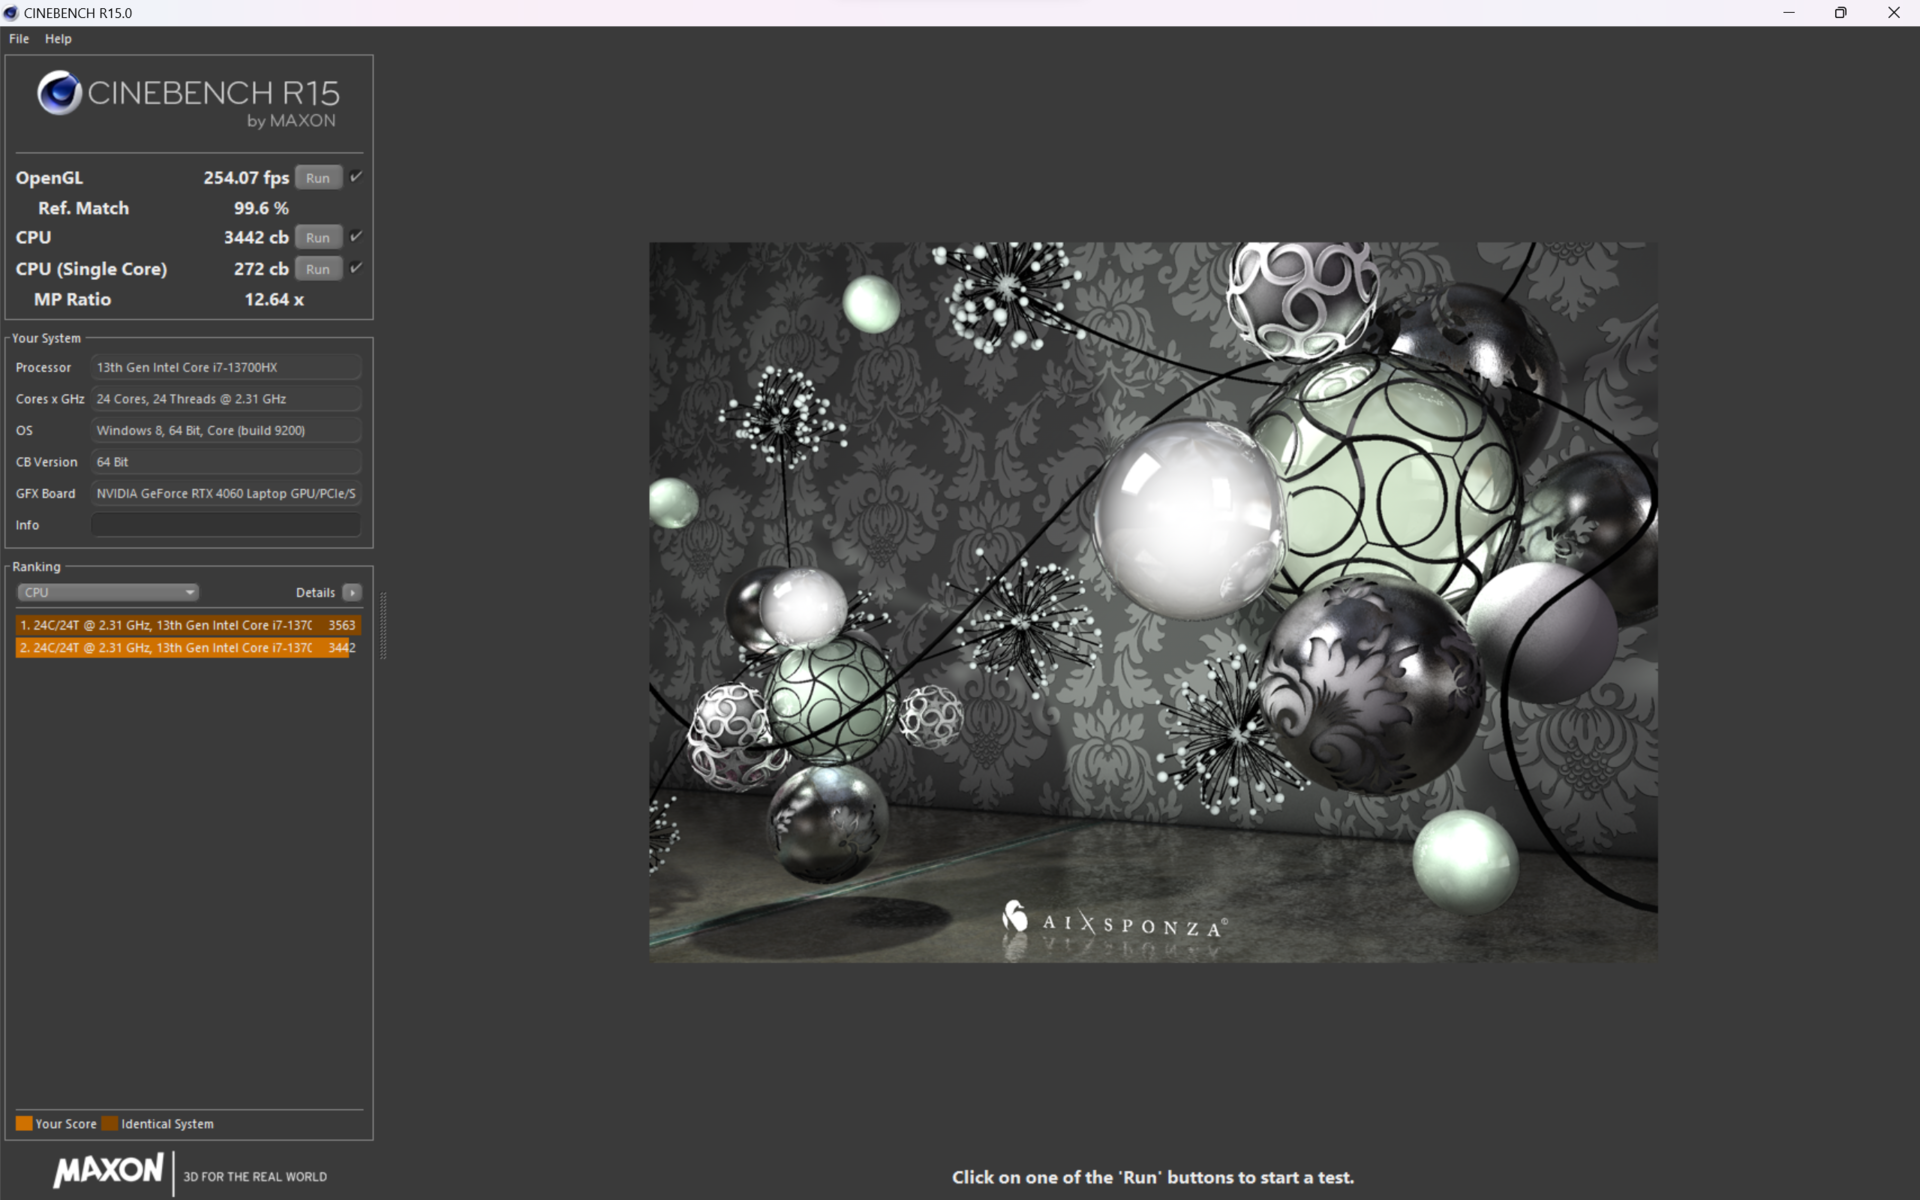
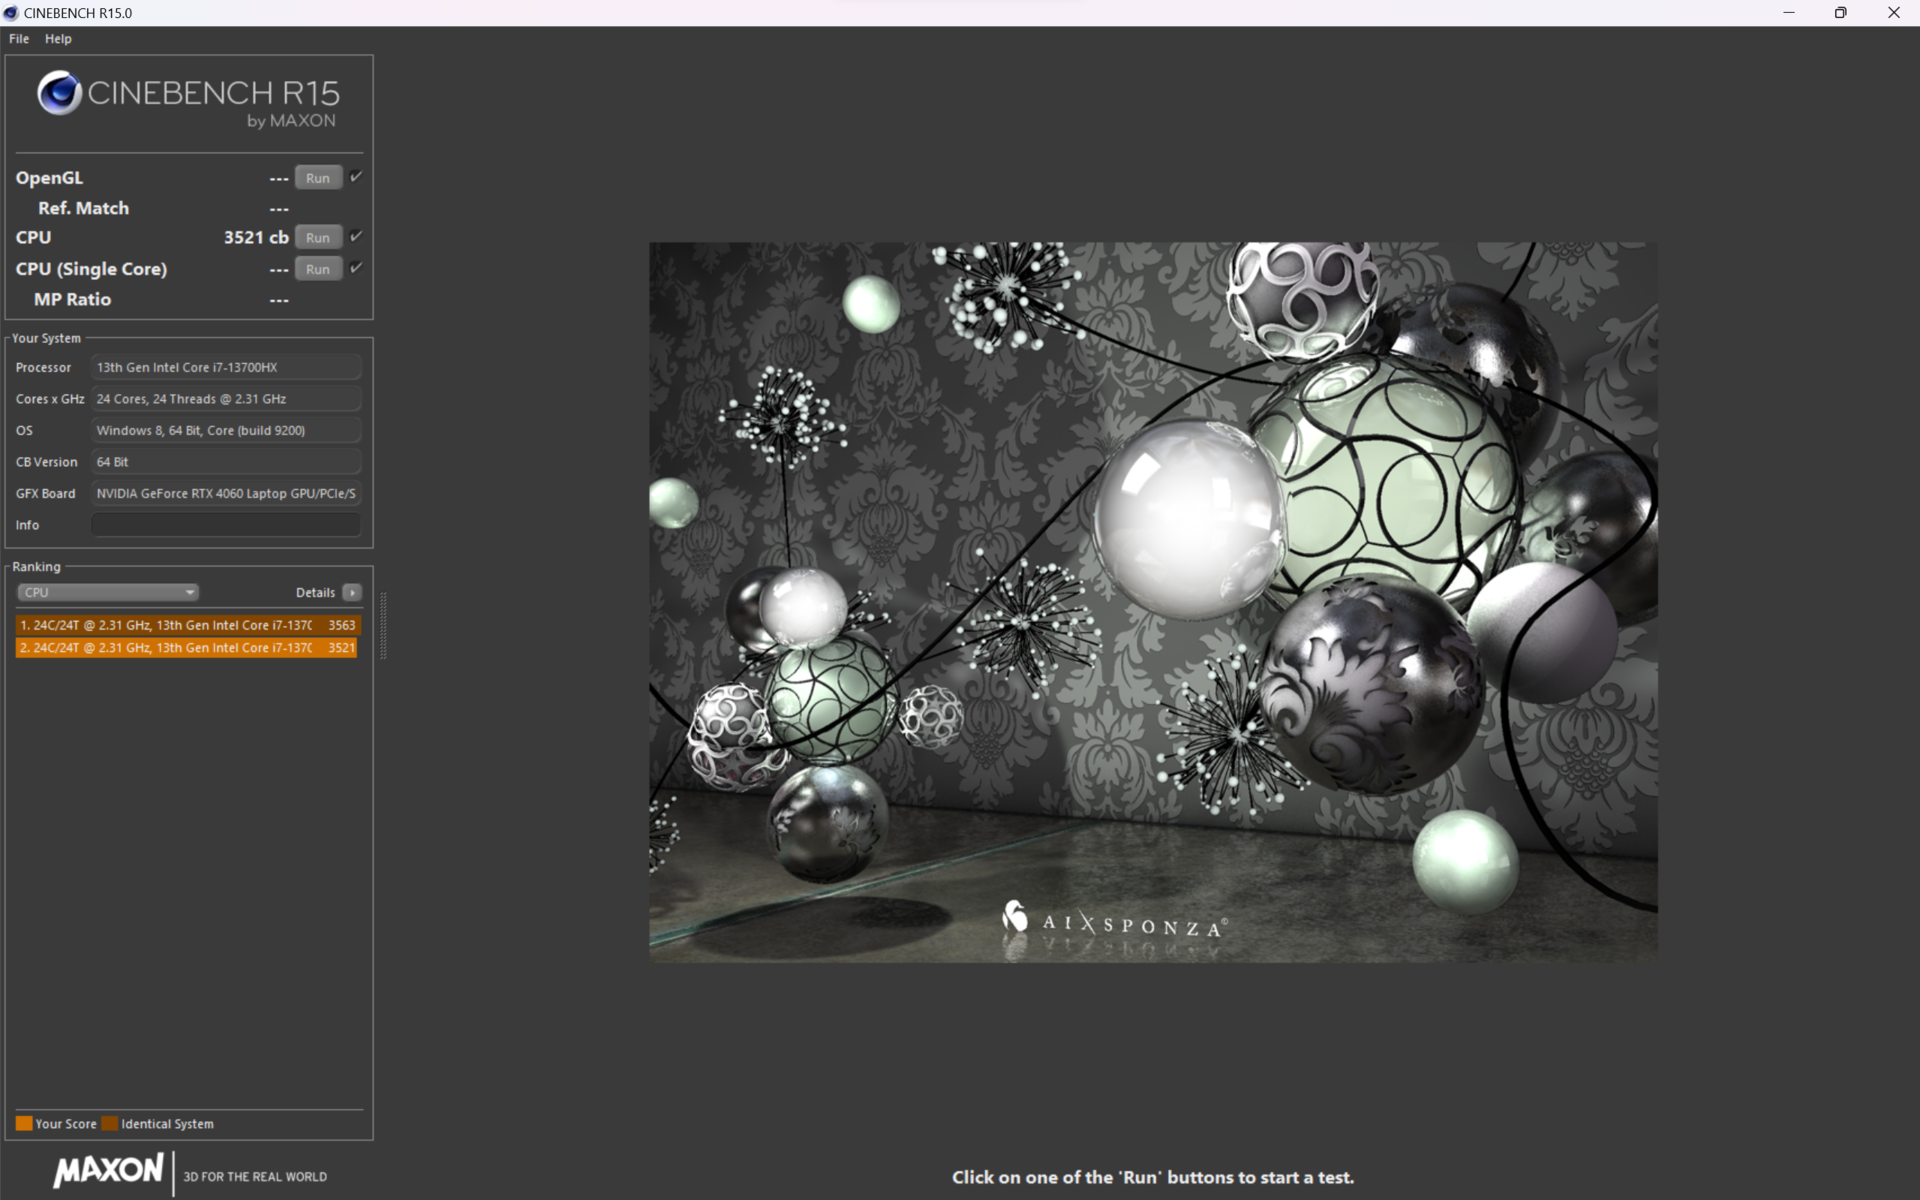
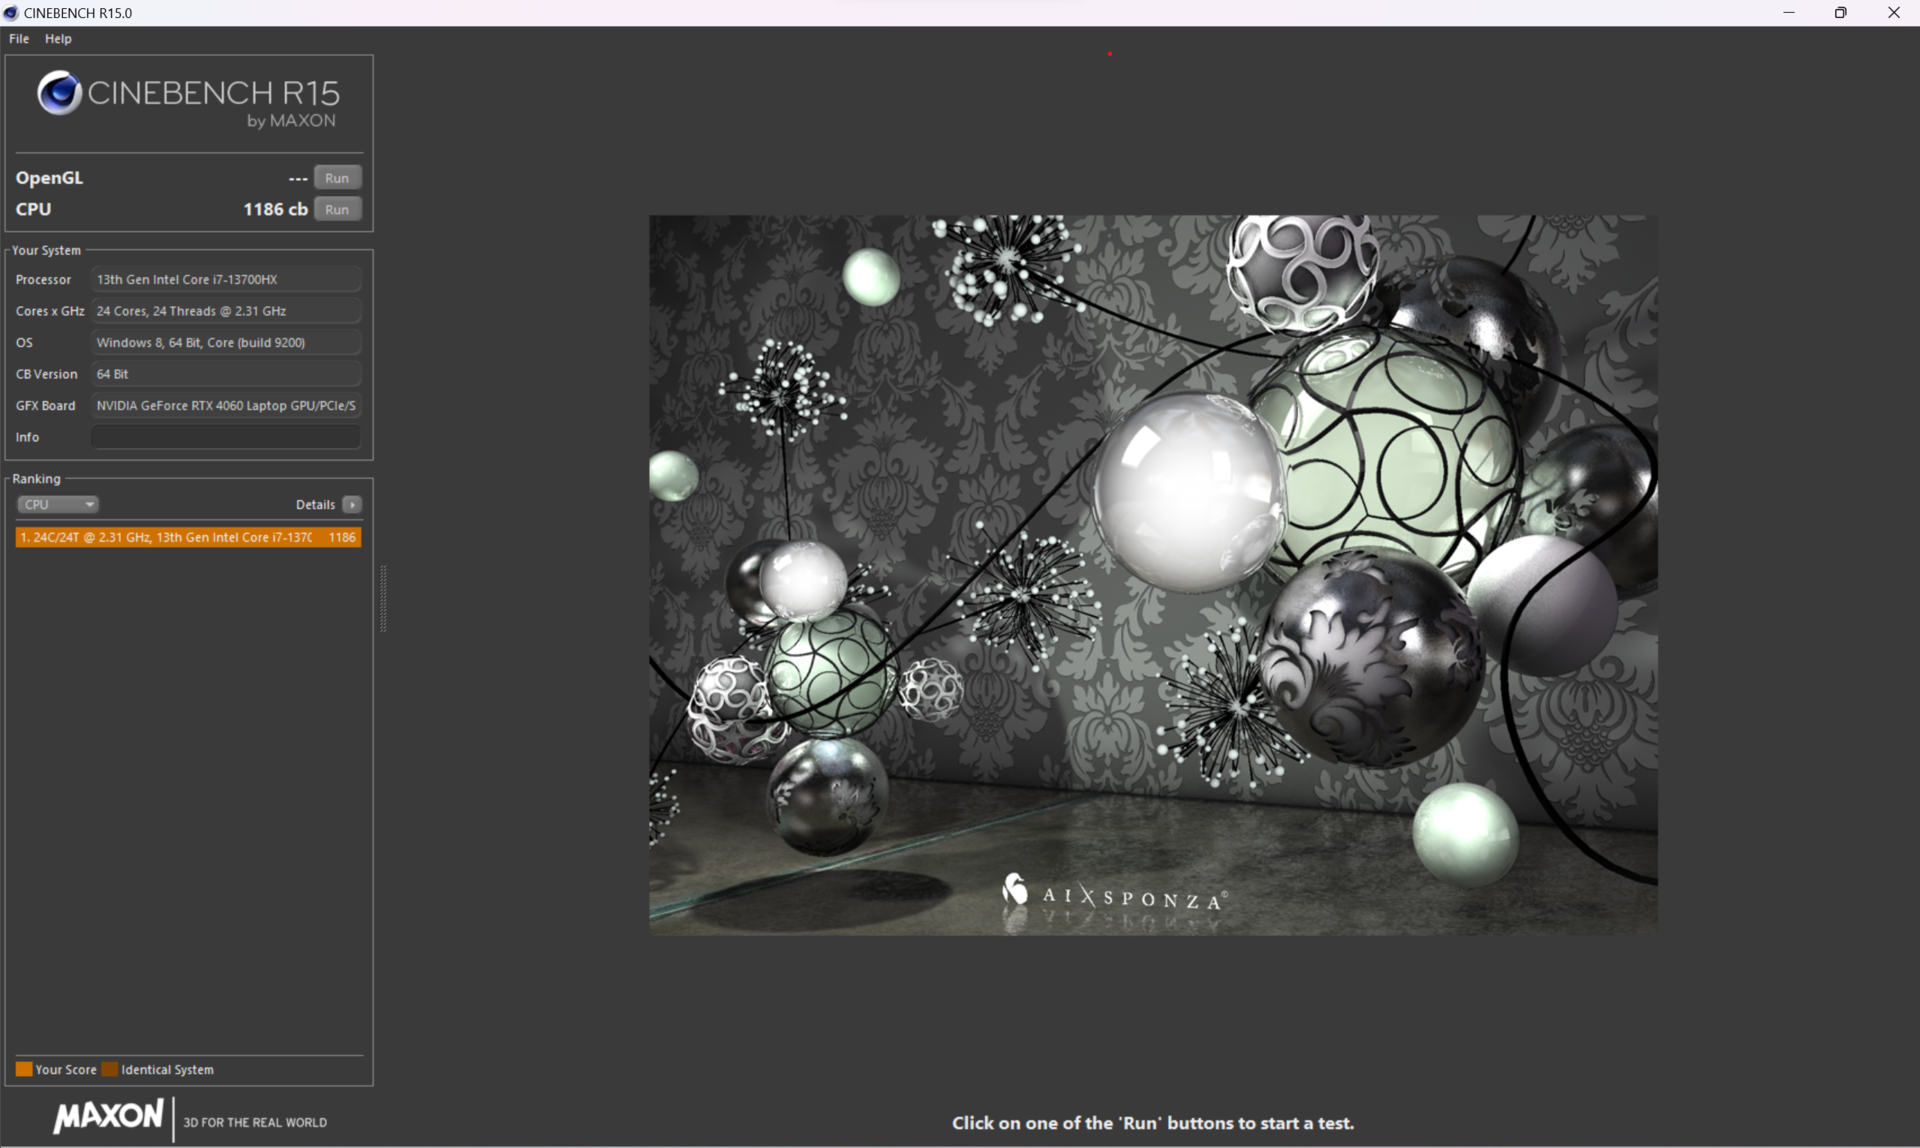
Le prestazioni multi-core corrispondono a quelle dei concorrenti con la stessa CPU. L'8-core AMD Ryzen 7 7735HS presente nell'Acer Nitro 16 e nell'Asus TUF Gaming A16 è chiaramente superato. Alla quinta esecuzione di Cinebench R15, il throttling si attestava a ~15% e poteva essere quasi completamente evitato attivando la rumorosa modalità "Turbo". Il Core i9-13900HX, disponibile come opzione, possiede il doppio del numero di core E ed è tipicamente più veloce del 33% nelle attività multi-core. In modalità batteria, le cose si mettono male, poiché il misero limite di 25 watt di TDP comporta un calo delle prestazioni di quasi il 65%.


Cinebench R15 Multi Continuous Test
Cinebench R23: Multi Core | Single Core
Cinebench R20: CPU (Multi Core) | CPU (Single Core)
Cinebench R15: CPU Multi 64Bit | CPU Single 64Bit
Blender: v2.79 BMW27 CPU
7-Zip 18.03: 7z b 4 | 7z b 4 -mmt1
Geekbench 5.5: Multi-Core | Single-Core
HWBOT x265 Benchmark v2.2: 4k Preset
LibreOffice : 20 Documents To PDF
R Benchmark 2.5: Overall mean
| CPU Performance rating | |
| Media della classe Gaming | |
| Acer Predator Helios 16 PH16-71-731Q | |
| Asus ROG Zephyrus M16 GU604VY-NM042X | |
| Aorus 15X ASF | |
| Dell G15 5530 | |
| Media Intel Core i7-13700HX | |
| Lenovo Legion Pro 5 16IRX8 | |
| Acer Predator Helios 300 (i7-12700H, RTX 3070 Ti) | |
| Acer Nitro 16 AN16-41 | |
| Asus TUF Gaming A16 FA617 | |
| Cinebench R23 / Multi Core | |
| Media della classe Gaming (10488 - 42661, n=107, ultimi 2 anni) | |
| Acer Predator Helios 16 PH16-71-731Q | |
| Dell G15 5530 | |
| Media Intel Core i7-13700HX (15558 - 22598, n=11) | |
| Aorus 15X ASF | |
| Lenovo Legion Pro 5 16IRX8 | |
| Asus ROG Zephyrus M16 GU604VY-NM042X | |
| Acer Predator Helios 300 (i7-12700H, RTX 3070 Ti) | |
| Acer Nitro 16 AN16-41 | |
| Asus TUF Gaming A16 FA617 | |
| Cinebench R23 / Single Core | |
| Media della classe Gaming (1166 - 2415, n=107, ultimi 2 anni) | |
| Asus ROG Zephyrus M16 GU604VY-NM042X | |
| Acer Predator Helios 16 PH16-71-731Q | |
| Aorus 15X ASF | |
| Dell G15 5530 | |
| Media Intel Core i7-13700HX (1666 - 1933, n=11) | |
| Acer Predator Helios 300 (i7-12700H, RTX 3070 Ti) | |
| Lenovo Legion Pro 5 16IRX8 | |
| Asus TUF Gaming A16 FA617 | |
| Acer Nitro 16 AN16-41 | |
| Cinebench R20 / CPU (Multi Core) | |
| Media della classe Gaming (4029 - 16433, n=106, ultimi 2 anni) | |
| Acer Predator Helios 16 PH16-71-731Q | |
| Dell G15 5530 | |
| Aorus 15X ASF | |
| Media Intel Core i7-13700HX (6160 - 8610, n=11) | |
| Asus ROG Zephyrus M16 GU604VY-NM042X | |
| Lenovo Legion Pro 5 16IRX8 | |
| Acer Predator Helios 300 (i7-12700H, RTX 3070 Ti) | |
| Acer Nitro 16 AN16-41 | |
| Asus TUF Gaming A16 FA617 | |
| Cinebench R20 / CPU (Single Core) | |
| Media della classe Gaming (442 - 913, n=106, ultimi 2 anni) | |
| Asus ROG Zephyrus M16 GU604VY-NM042X | |
| Acer Predator Helios 16 PH16-71-731Q | |
| Aorus 15X ASF | |
| Dell G15 5530 | |
| Media Intel Core i7-13700HX (644 - 740, n=11) | |
| Acer Predator Helios 300 (i7-12700H, RTX 3070 Ti) | |
| Lenovo Legion Pro 5 16IRX8 | |
| Asus TUF Gaming A16 FA617 | |
| Acer Nitro 16 AN16-41 | |
| Cinebench R15 / CPU Multi 64Bit | |
| Media della classe Gaming (1578 - 6330, n=105, ultimi 2 anni) | |
| Aorus 15X ASF | |
| Acer Predator Helios 16 PH16-71-731Q | |
| Acer Predator Helios 16 PH16-71-731Q | |
| Lenovo Legion Pro 5 16IRX8 | |
| Media Intel Core i7-13700HX (2548 - 3482, n=12) | |
| Dell G15 5530 | |
| Asus ROG Zephyrus M16 GU604VY-NM042X | |
| Acer Predator Helios 300 (i7-12700H, RTX 3070 Ti) | |
| Acer Nitro 16 AN16-41 | |
| Asus TUF Gaming A16 FA617 | |
| Cinebench R15 / CPU Single 64Bit | |
| Media della classe Gaming (188.8 - 350, n=106, ultimi 2 anni) | |
| Asus ROG Zephyrus M16 GU604VY-NM042X | |
| Aorus 15X ASF | |
| Dell G15 5530 | |
| Acer Predator Helios 16 PH16-71-731Q | |
| Media Intel Core i7-13700HX (243 - 279, n=11) | |
| Lenovo Legion Pro 5 16IRX8 | |
| Acer Predator Helios 300 (i7-12700H, RTX 3070 Ti) | |
| Asus TUF Gaming A16 FA617 | |
| Acer Nitro 16 AN16-41 | |
| Blender / v2.79 BMW27 CPU | |
| Asus TUF Gaming A16 FA617 | |
| Acer Nitro 16 AN16-41 | |
| Acer Predator Helios 300 (i7-12700H, RTX 3070 Ti) | |
| Aorus 15X ASF | |
| Asus ROG Zephyrus M16 GU604VY-NM042X | |
| Media Intel Core i7-13700HX (138 - 207, n=10) | |
| Dell G15 5530 | |
| Acer Predator Helios 16 PH16-71-731Q | |
| Lenovo Legion Pro 5 16IRX8 | |
| Media della classe Gaming (79 - 330, n=104, ultimi 2 anni) | |
| 7-Zip 18.03 / 7z b 4 | |
| Media della classe Gaming (33491 - 148086, n=105, ultimi 2 anni) | |
| Acer Predator Helios 16 PH16-71-731Q | |
| Asus ROG Zephyrus M16 GU604VY-NM042X | |
| Lenovo Legion Pro 5 16IRX8 | |
| Dell G15 5530 | |
| Media Intel Core i7-13700HX (58912 - 89294, n=11) | |
| Aorus 15X ASF | |
| Acer Predator Helios 300 (i7-12700H, RTX 3070 Ti) | |
| Asus TUF Gaming A16 FA617 | |
| Acer Nitro 16 AN16-41 | |
| 7-Zip 18.03 / 7z b 4 -mmt1 | |
| Media della classe Gaming (4199 - 7436, n=105, ultimi 2 anni) | |
| Aorus 15X ASF | |
| Asus ROG Zephyrus M16 GU604VY-NM042X | |
| Acer Predator Helios 16 PH16-71-731Q | |
| Media Intel Core i7-13700HX (5552 - 6409, n=11) | |
| Dell G15 5530 | |
| Asus TUF Gaming A16 FA617 | |
| Acer Predator Helios 300 (i7-12700H, RTX 3070 Ti) | |
| Lenovo Legion Pro 5 16IRX8 | |
| Acer Nitro 16 AN16-41 | |
| Geekbench 5.5 / Multi-Core | |
| Media della classe Gaming (6460 - 28263, n=105, ultimi 2 anni) | |
| Acer Predator Helios 16 PH16-71-731Q | |
| Asus ROG Zephyrus M16 GU604VY-NM042X | |
| Aorus 15X ASF | |
| Lenovo Legion Pro 5 16IRX8 | |
| Dell G15 5530 | |
| Media Intel Core i7-13700HX (10156 - 15850, n=12) | |
| Acer Predator Helios 300 (i7-12700H, RTX 3070 Ti) | |
| Asus TUF Gaming A16 FA617 | |
| Acer Nitro 16 AN16-41 | |
| Geekbench 5.5 / Single-Core | |
| Media della classe Gaming (986 - 2474, n=105, ultimi 2 anni) | |
| Asus ROG Zephyrus M16 GU604VY-NM042X | |
| Acer Predator Helios 16 PH16-71-731Q | |
| Aorus 15X ASF | |
| Dell G15 5530 | |
| Media Intel Core i7-13700HX (1666 - 1899, n=12) | |
| Lenovo Legion Pro 5 16IRX8 | |
| Acer Predator Helios 300 (i7-12700H, RTX 3070 Ti) | |
| Asus TUF Gaming A16 FA617 | |
| Acer Nitro 16 AN16-41 | |
| HWBOT x265 Benchmark v2.2 / 4k Preset | |
| Media della classe Gaming (11.5 - 44.4, n=105, ultimi 2 anni) | |
| Lenovo Legion Pro 5 16IRX8 | |
| Acer Predator Helios 16 PH16-71-731Q | |
| Dell G15 5530 | |
| Media Intel Core i7-13700HX (17.1 - 25.5, n=11) | |
| Asus ROG Zephyrus M16 GU604VY-NM042X | |
| Aorus 15X ASF | |
| Asus TUF Gaming A16 FA617 | |
| Acer Nitro 16 AN16-41 | |
| Acer Predator Helios 300 (i7-12700H, RTX 3070 Ti) | |
| LibreOffice / 20 Documents To PDF | |
| Acer Predator Helios 300 (i7-12700H, RTX 3070 Ti) | |
| Asus TUF Gaming A16 FA617 | |
| Acer Nitro 16 AN16-41 | |
| Asus ROG Zephyrus M16 GU604VY-NM042X | |
| Media della classe Gaming (33.2 - 88.8, n=105, ultimi 2 anni) | |
| Dell G15 5530 | |
| Media Intel Core i7-13700HX (36.5 - 52.9, n=11) | |
| Aorus 15X ASF | |
| Acer Predator Helios 16 PH16-71-731Q | |
| Lenovo Legion Pro 5 16IRX8 | |
| R Benchmark 2.5 / Overall mean | |
| Asus TUF Gaming A16 FA617 | |
| Acer Nitro 16 AN16-41 | |
| Lenovo Legion Pro 5 16IRX8 | |
| Media Intel Core i7-13700HX (0.4274 - 0.513, n=11) | |
| Acer Predator Helios 300 (i7-12700H, RTX 3070 Ti) | |
| Aorus 15X ASF | |
| Media della classe Gaming (0.3439 - 0.759, n=106, ultimi 2 anni) | |
| Acer Predator Helios 16 PH16-71-731Q | |
| Dell G15 5530 | |
| Asus ROG Zephyrus M16 GU604VY-NM042X | |
* ... Meglio usare valori piccoli
AIDA64: FP32 Ray-Trace | FPU Julia | CPU SHA3 | CPU Queen | FPU SinJulia | FPU Mandel | CPU AES | CPU ZLib | FP64 Ray-Trace | CPU PhotoWorxx
| Performance rating | |
| Media della classe Gaming | |
| Acer Predator Helios 16 PH16-71-731Q | |
| Lenovo Legion Pro 5 16IRX8 | |
| Media Intel Core i7-13700HX | |
| Aorus 15X ASF | |
| Dell G15 5530 | |
| Acer Nitro 16 AN16-41 | |
| Asus TUF Gaming A16 FA617 | |
| AIDA64 / FP32 Ray-Trace | |
| Media della classe Gaming (10227 - 85542, n=105, ultimi 2 anni) | |
| Lenovo Legion Pro 5 16IRX8 | |
| Acer Predator Helios 16 PH16-71-731Q | |
| Media Intel Core i7-13700HX (14261 - 21999, n=11) | |
| Dell G15 5530 | |
| Aorus 15X ASF | |
| Acer Nitro 16 AN16-41 | |
| Asus TUF Gaming A16 FA617 | |
| AIDA64 / FPU Julia | |
| Media della classe Gaming (51376 - 238426, n=105, ultimi 2 anni) | |
| Acer Nitro 16 AN16-41 | |
| Lenovo Legion Pro 5 16IRX8 | |
| Asus TUF Gaming A16 FA617 | |
| Acer Predator Helios 16 PH16-71-731Q | |
| Media Intel Core i7-13700HX (74636 - 109364, n=11) | |
| Dell G15 5530 | |
| Aorus 15X ASF | |
| AIDA64 / CPU SHA3 | |
| Media della classe Gaming (2180 - 10115, n=105, ultimi 2 anni) | |
| Lenovo Legion Pro 5 16IRX8 | |
| Acer Predator Helios 16 PH16-71-731Q | |
| Dell G15 5530 | |
| Media Intel Core i7-13700HX (3359 - 5053, n=11) | |
| Aorus 15X ASF | |
| Asus TUF Gaming A16 FA617 | |
| Acer Nitro 16 AN16-41 | |
| AIDA64 / CPU Queen | |
| Media della classe Gaming (49785 - 173351, n=90, ultimi 2 anni) | |
| Acer Predator Helios 16 PH16-71-731Q | |
| Lenovo Legion Pro 5 16IRX8 | |
| Aorus 15X ASF | |
| Media Intel Core i7-13700HX (86532 - 114717, n=11) | |
| Acer Nitro 16 AN16-41 | |
| Dell G15 5530 | |
| Asus TUF Gaming A16 FA617 | |
| AIDA64 / FPU SinJulia | |
| Media della classe Gaming (4424 - 33636, n=105, ultimi 2 anni) | |
| Lenovo Legion Pro 5 16IRX8 | |
| Acer Nitro 16 AN16-41 | |
| Acer Predator Helios 16 PH16-71-731Q | |
| Asus TUF Gaming A16 FA617 | |
| Media Intel Core i7-13700HX (9290 - 13519, n=11) | |
| Aorus 15X ASF | |
| Dell G15 5530 | |
| AIDA64 / FPU Mandel | |
| Media della classe Gaming (25115 - 128721, n=105, ultimi 2 anni) | |
| Acer Nitro 16 AN16-41 | |
| Asus TUF Gaming A16 FA617 | |
| Lenovo Legion Pro 5 16IRX8 | |
| Acer Predator Helios 16 PH16-71-731Q | |
| Media Intel Core i7-13700HX (35751 - 53484, n=11) | |
| Dell G15 5530 | |
| Aorus 15X ASF | |
| AIDA64 / CPU AES | |
| Acer Predator Helios 16 PH16-71-731Q | |
| Aorus 15X ASF | |
| Media Intel Core i7-13700HX (67846 - 182575, n=11) | |
| Media della classe Gaming (39258 - 247074, n=105, ultimi 2 anni) | |
| Lenovo Legion Pro 5 16IRX8 | |
| Dell G15 5530 | |
| Asus TUF Gaming A16 FA617 | |
| Acer Nitro 16 AN16-41 | |
| AIDA64 / CPU ZLib | |
| Media della classe Gaming (574 - 2531, n=105, ultimi 2 anni) | |
| Acer Predator Helios 16 PH16-71-731Q | |
| Lenovo Legion Pro 5 16IRX8 | |
| Dell G15 5530 | |
| Media Intel Core i7-13700HX (981 - 1451, n=11) | |
| Aorus 15X ASF | |
| Acer Nitro 16 AN16-41 | |
| Asus TUF Gaming A16 FA617 | |
| AIDA64 / FP64 Ray-Trace | |
| Media della classe Gaming (5509 - 45446, n=105, ultimi 2 anni) | |
| Lenovo Legion Pro 5 16IRX8 | |
| Acer Predator Helios 16 PH16-71-731Q | |
| Media Intel Core i7-13700HX (7728 - 11837, n=11) | |
| Dell G15 5530 | |
| Aorus 15X ASF | |
| Acer Nitro 16 AN16-41 | |
| Asus TUF Gaming A16 FA617 | |
| AIDA64 / CPU PhotoWorxx | |
| Media della classe Gaming (12271 - 89891, n=105, ultimi 2 anni) | |
| Dell G15 5530 | |
| Lenovo Legion Pro 5 16IRX8 | |
| Acer Predator Helios 16 PH16-71-731Q | |
| Aorus 15X ASF | |
| Media Intel Core i7-13700HX (19678 - 42415, n=11) | |
| Asus TUF Gaming A16 FA617 | |
| Acer Nitro 16 AN16-41 | |
Prestazioni del sistema
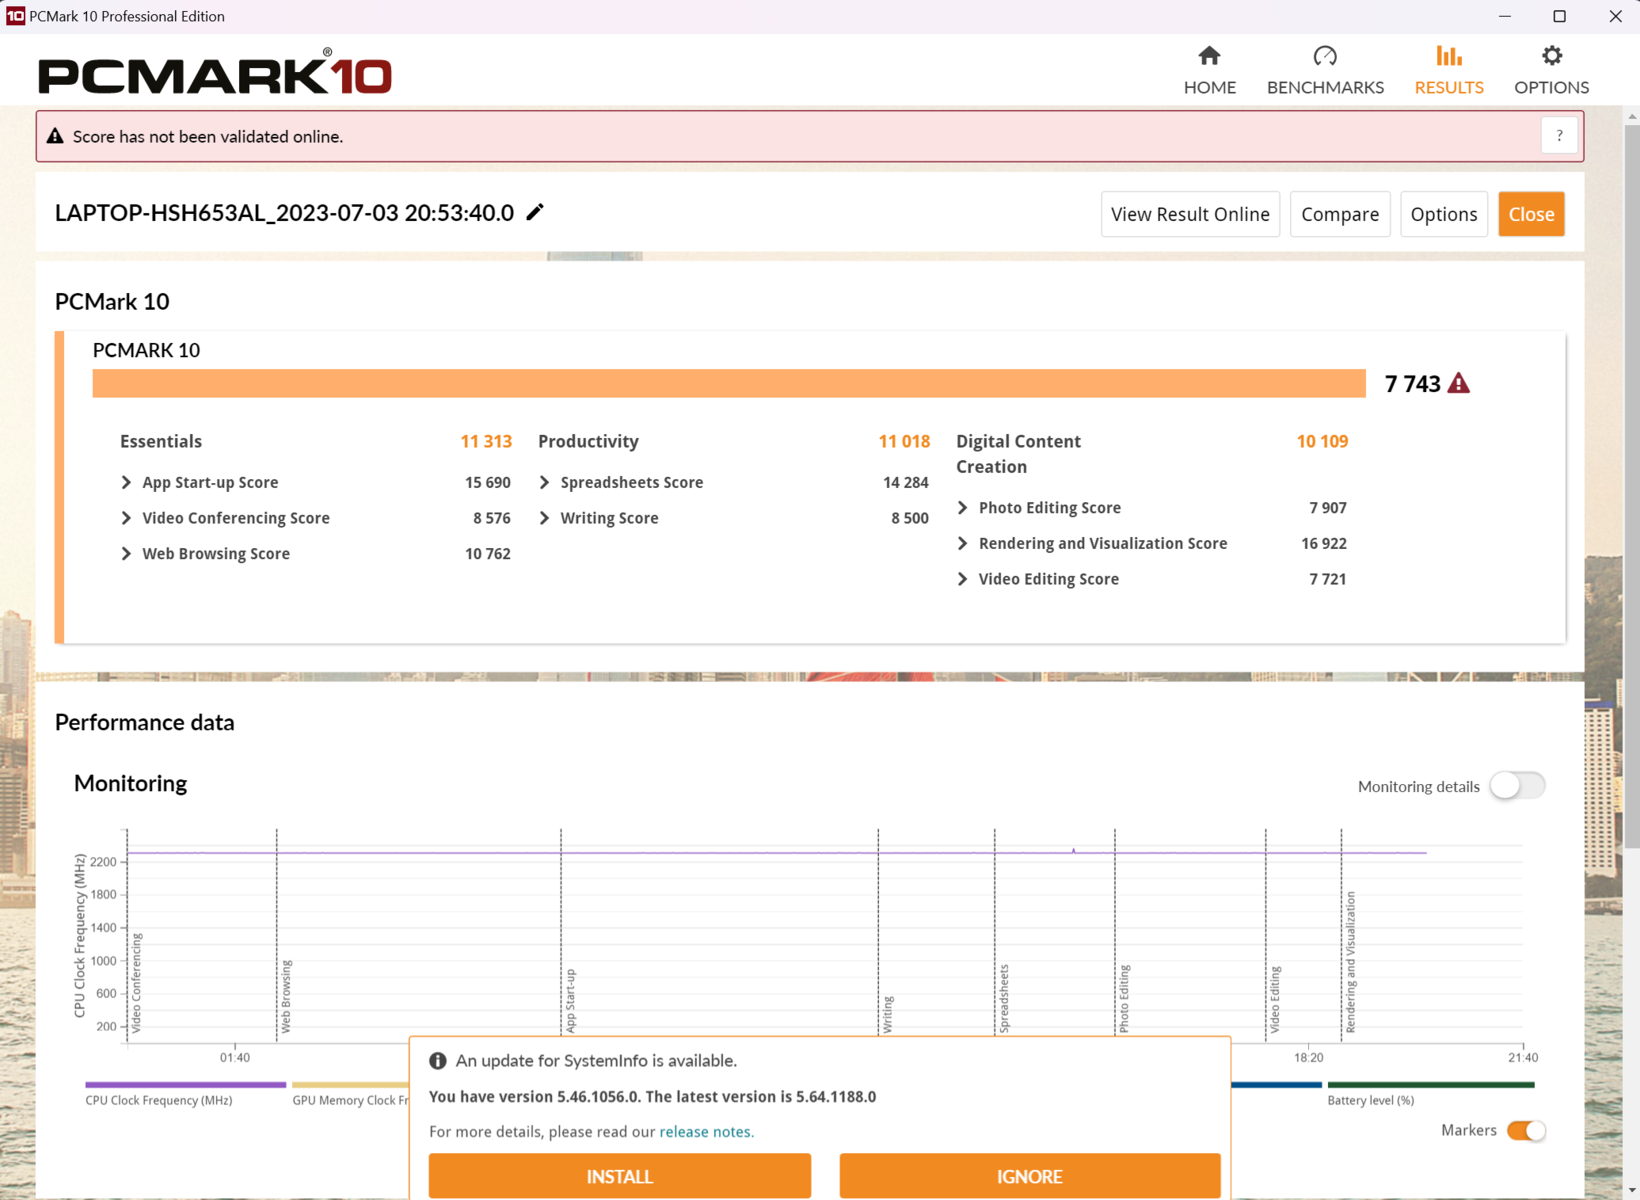
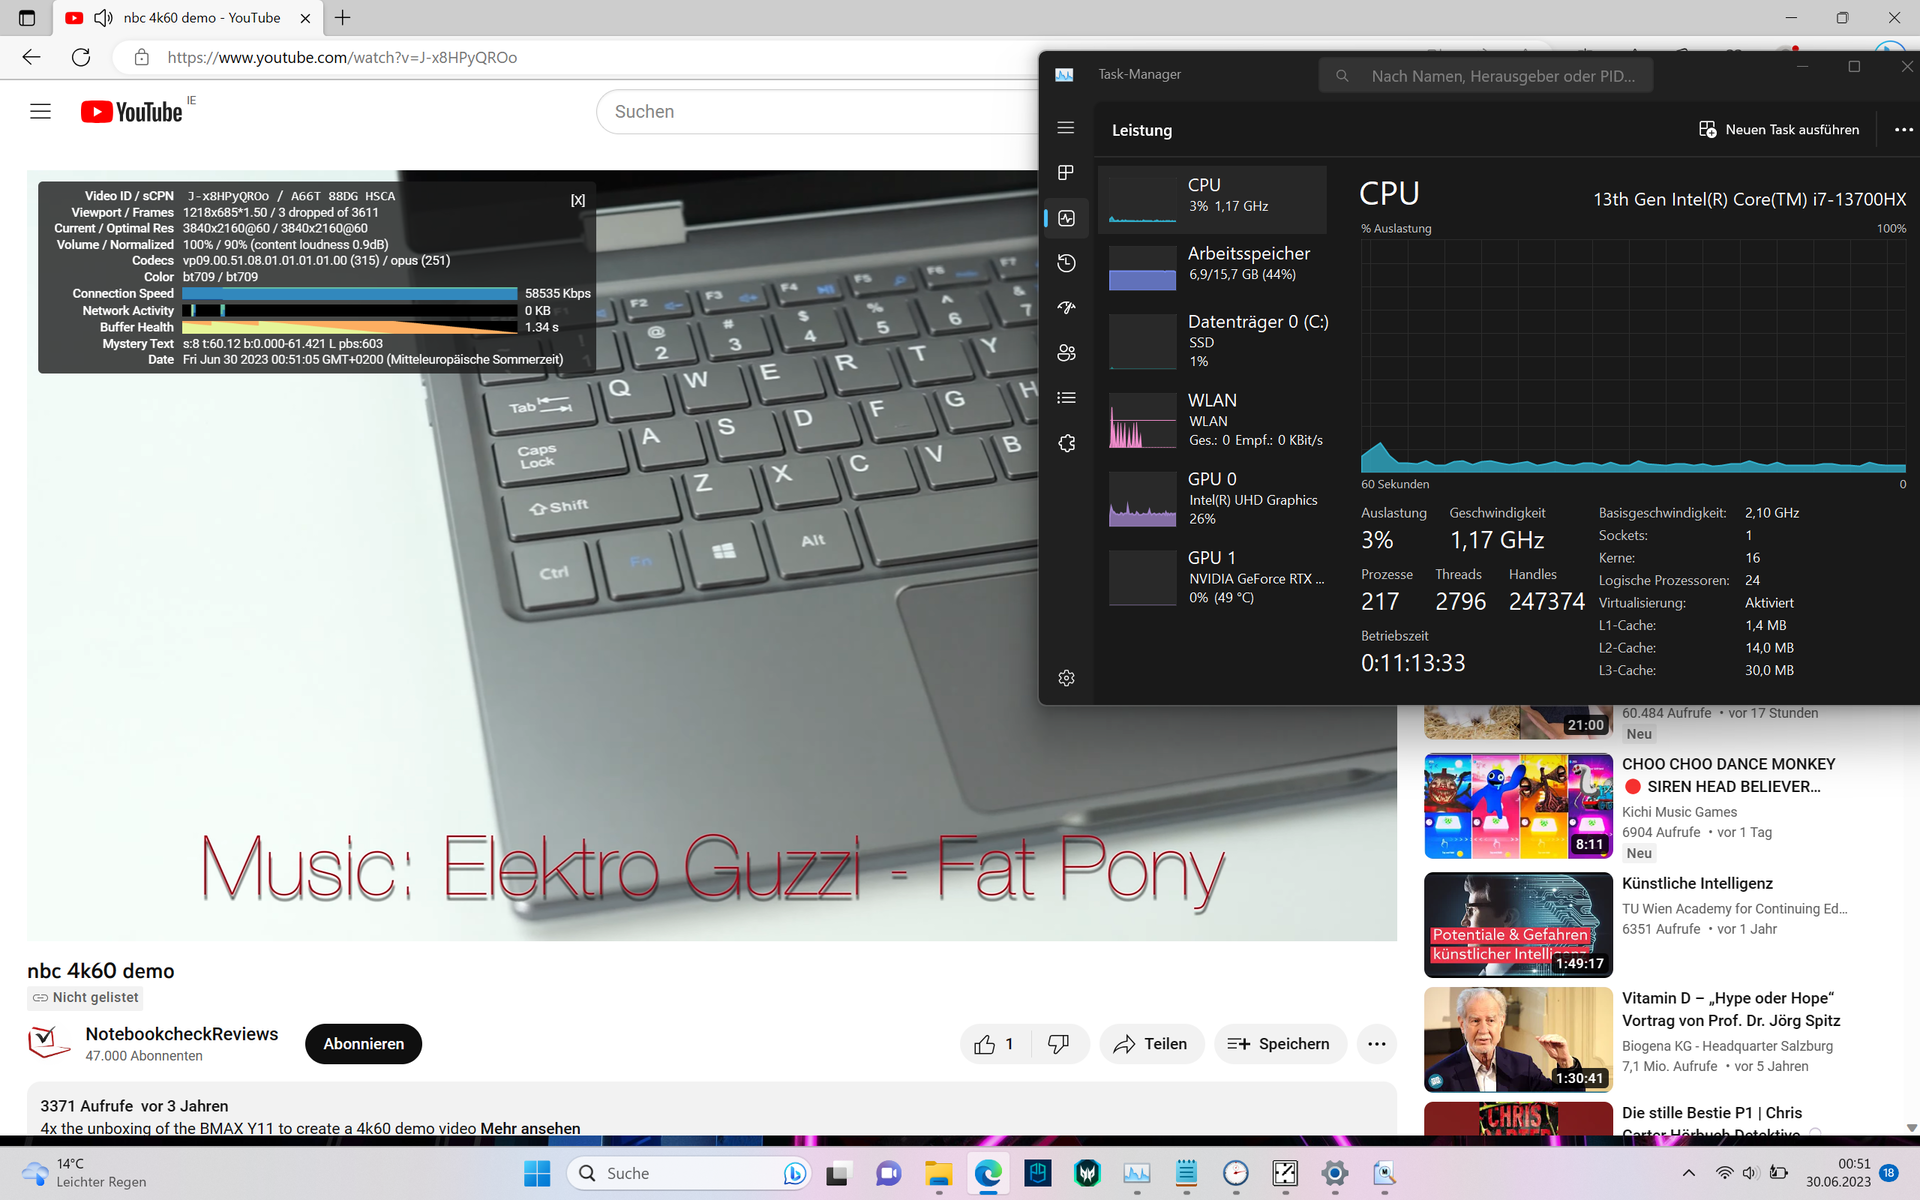
Nelle attività quotidiane, il portatile Acer è eccezionalmente reattivo. Navigare su Internet mentre si riproduce un video 4K su YouTube non fa nemmeno sudare il sistema Intel-HX. Nel benchmark PCMark 10, il Predator Helios si colloca al primo posto, seguito da vicino dal Lenovo Pro 5 1616.Lenovo Legion Pro 5 16.
Allo stesso modo, anche le prestazioni di navigazione web, come illustrato da Mozilla Kraken 1.1 e WebXPRT, si attestano su un livello molto elevato grazie alle forti prestazioni single-core.
CrossMark: Overall | Productivity | Creativity | Responsiveness
Mozilla Kraken 1.1: Total
Speedometer 2.0: Result 2.0
Octane V2: Total Score
Jetstream 2: 2.0 Total
WebXPRT 3: Overall
WebXPRT 4: Overall
| PCMark 10 / Score | |
| Media della classe Gaming (5828 - 12414, n=93, ultimi 2 anni) | |
| Acer Predator Helios 16 PH16-71-731Q | |
| Lenovo Legion Pro 5 16IRX8 | |
| Media Intel Core i7-13700HX, NVIDIA GeForce RTX 4060 Laptop GPU (6909 - 7743, n=5) | |
| Asus TUF Gaming A16 FA617 | |
| Acer Nitro 16 AN16-41 | |
| Aorus 15X ASF | |
| Dell G15 5530 | |
| PCMark 10 / Essentials | |
| Acer Predator Helios 16 PH16-71-731Q | |
| Dell G15 5530 | |
| Lenovo Legion Pro 5 16IRX8 | |
| Aorus 15X ASF | |
| Media della classe Gaming (8810 - 11935, n=97, ultimi 2 anni) | |
| Media Intel Core i7-13700HX, NVIDIA GeForce RTX 4060 Laptop GPU (9760 - 11313, n=5) | |
| Asus TUF Gaming A16 FA617 | |
| Acer Nitro 16 AN16-41 | |
| PCMark 10 / Productivity | |
| Media della classe Gaming (6845 - 25323, n=95, ultimi 2 anni) | |
| Acer Predator Helios 16 PH16-71-731Q | |
| Dell G15 5530 | |
| Media Intel Core i7-13700HX, NVIDIA GeForce RTX 4060 Laptop GPU (9131 - 11018, n=5) | |
| Aorus 15X ASF | |
| Asus TUF Gaming A16 FA617 | |
| Acer Nitro 16 AN16-41 | |
| Lenovo Legion Pro 5 16IRX8 | |
| PCMark 10 / Digital Content Creation | |
| Media della classe Gaming (7602 - 19954, n=95, ultimi 2 anni) | |
| Lenovo Legion Pro 5 16IRX8 | |
| Media Intel Core i7-13700HX, NVIDIA GeForce RTX 4060 Laptop GPU (9393 - 12434, n=5) | |
| Asus TUF Gaming A16 FA617 | |
| Acer Nitro 16 AN16-41 | |
| Acer Predator Helios 16 PH16-71-731Q | |
| Aorus 15X ASF | |
| Dell G15 5530 | |
| CrossMark / Overall | |
| Acer Predator Helios 16 PH16-71-731Q | |
| Aorus 15X ASF | |
| Media della classe Gaming (1366 - 2409, n=94, ultimi 2 anni) | |
| Media Intel Core i7-13700HX, NVIDIA GeForce RTX 4060 Laptop GPU (1663 - 2105, n=5) | |
| Dell G15 5530 | |
| Lenovo Legion Pro 5 16IRX8 | |
| Acer Nitro 16 AN16-41 | |
| CrossMark / Productivity | |
| Acer Predator Helios 16 PH16-71-731Q | |
| Aorus 15X ASF | |
| Media della classe Gaming (1386 - 2254, n=94, ultimi 2 anni) | |
| Media Intel Core i7-13700HX, NVIDIA GeForce RTX 4060 Laptop GPU (1618 - 1989, n=5) | |
| Dell G15 5530 | |
| Lenovo Legion Pro 5 16IRX8 | |
| Acer Nitro 16 AN16-41 | |
| CrossMark / Creativity | |
| Acer Predator Helios 16 PH16-71-731Q | |
| Media della classe Gaming (1343 - 2786, n=94, ultimi 2 anni) | |
| Aorus 15X ASF | |
| Dell G15 5530 | |
| Media Intel Core i7-13700HX, NVIDIA GeForce RTX 4060 Laptop GPU (1710 - 2274, n=5) | |
| Lenovo Legion Pro 5 16IRX8 | |
| Acer Nitro 16 AN16-41 | |
| CrossMark / Responsiveness | |
| Aorus 15X ASF | |
| Acer Predator Helios 16 PH16-71-731Q | |
| Media della classe Gaming (1226 - 2334, n=94, ultimi 2 anni) | |
| Media Intel Core i7-13700HX, NVIDIA GeForce RTX 4060 Laptop GPU (1269 - 1983, n=5) | |
| Lenovo Legion Pro 5 16IRX8 | |
| Dell G15 5530 | |
| Acer Nitro 16 AN16-41 | |
| Mozilla Kraken 1.1 / Total | |
| Asus TUF Gaming A16 FA617 | |
| Asus TUF Gaming A16 FA617 | |
| Acer Nitro 16 AN16-41 | |
| Lenovo Legion Pro 5 16IRX8 | |
| Media Intel Core i7-13700HX, NVIDIA GeForce RTX 4060 Laptop GPU (495 - 538, n=5) | |
| Dell G15 5530 | |
| Acer Predator Helios 16 PH16-71-731Q | |
| Aorus 15X ASF | |
| Media della classe Gaming (391 - 590, n=100, ultimi 2 anni) | |
| Speedometer 2.0 / Result 2.0 | |
| Media della classe Gaming (29 - 736, n=27, ultimi 2 anni) | |
| Acer Predator Helios 16 PH16-71-731Q | |
| Media Intel Core i7-13700HX, NVIDIA GeForce RTX 4060 Laptop GPU (300 - 343, n=3) | |
| Aorus 15X ASF | |
| Acer Nitro 16 AN16-41 | |
| Octane V2 / Total Score | |
| Media della classe Gaming (93292 - 139447, n=27, ultimi 2 anni) | |
| Aorus 15X ASF | |
| Acer Predator Helios 16 PH16-71-731Q | |
| Media Intel Core i7-13700HX, NVIDIA GeForce RTX 4060 Laptop GPU (86875 - 96413, n=3) | |
| Acer Nitro 16 AN16-41 | |
| Jetstream 2 / 2.0 Total | |
| Media della classe Gaming (334 - 516, n=27, ultimi 2 anni) | |
| Lenovo Legion Pro 5 16IRX8 | |
| Acer Predator Helios 16 PH16-71-731Q | |
| Aorus 15X ASF | |
| Media Intel Core i7-13700HX, NVIDIA GeForce RTX 4060 Laptop GPU (263 - 305, n=4) | |
| Acer Nitro 16 AN16-41 | |
| WebXPRT 3 / Overall | |
| Acer Predator Helios 16 PH16-71-731Q | |
| Aorus 15X ASF | |
| Media della classe Gaming (220 - 532, n=98, ultimi 2 anni) | |
| Asus TUF Gaming A16 FA617 | |
| Asus TUF Gaming A16 FA617 | |
| Dell G15 5530 | |
| Media Intel Core i7-13700HX, NVIDIA GeForce RTX 4060 Laptop GPU (238 - 336, n=4) | |
| Acer Nitro 16 AN16-41 | |
| Lenovo Legion Pro 5 16IRX8 | |
| WebXPRT 4 / Overall | |
| Media della classe Gaming (165 - 354, n=98, ultimi 2 anni) | |
| Acer Predator Helios 16 PH16-71-731Q | |
| Dell G15 5530 | |
| Aorus 15X ASF | |
| Media Intel Core i7-13700HX, NVIDIA GeForce RTX 4060 Laptop GPU (247 - 283, n=5) | |
| Lenovo Legion Pro 5 16IRX8 | |
| Asus TUF Gaming A16 FA617 | |
| Asus TUF Gaming A16 FA617 | |
| Acer Nitro 16 AN16-41 | |
* ... Meglio usare valori piccoli
| PCMark 10 Score | 7743 punti | |
Aiuto | ||
| AIDA64 / Memory Copy | |
| Media della classe Gaming (21750 - 129946, n=105, ultimi 2 anni) | |
| Dell G15 5530 | |
| Lenovo Legion Pro 5 16IRX8 | |
| Aorus 15X ASF | |
| Acer Predator Helios 16 PH16-71-731Q | |
| Media Intel Core i7-13700HX (36125 - 63990, n=11) | |
| Asus TUF Gaming A16 FA617 | |
| Acer Nitro 16 AN16-41 | |
| AIDA64 / Memory Read | |
| Media della classe Gaming (22956 - 118858, n=105, ultimi 2 anni) | |
| Dell G15 5530 | |
| Lenovo Legion Pro 5 16IRX8 | |
| Acer Predator Helios 16 PH16-71-731Q | |
| Aorus 15X ASF | |
| Media Intel Core i7-13700HX (36510 - 69729, n=11) | |
| Asus TUF Gaming A16 FA617 | |
| Acer Nitro 16 AN16-41 | |
| AIDA64 / Memory Write | |
| Acer Predator Helios 16 PH16-71-731Q | |
| Media della classe Gaming (22297 - 135096, n=105, ultimi 2 anni) | |
| Lenovo Legion Pro 5 16IRX8 | |
| Dell G15 5530 | |
| Media Intel Core i7-13700HX (33598 - 85675, n=11) | |
| Aorus 15X ASF | |
| Asus TUF Gaming A16 FA617 | |
| Acer Nitro 16 AN16-41 | |
| AIDA64 / Memory Latency | |
| Media della classe Gaming (75.3 - 259, n=105, ultimi 2 anni) | |
| Acer Nitro 16 AN16-41 | |
| Dell G15 5530 | |
| Media Intel Core i7-13700HX (81.5 - 97.9, n=11) | |
| Aorus 15X ASF | |
| Acer Predator Helios 16 PH16-71-731Q | |
| Asus TUF Gaming A16 FA617 | |
| Lenovo Legion Pro 5 16IRX8 | |
* ... Meglio usare valori piccoli
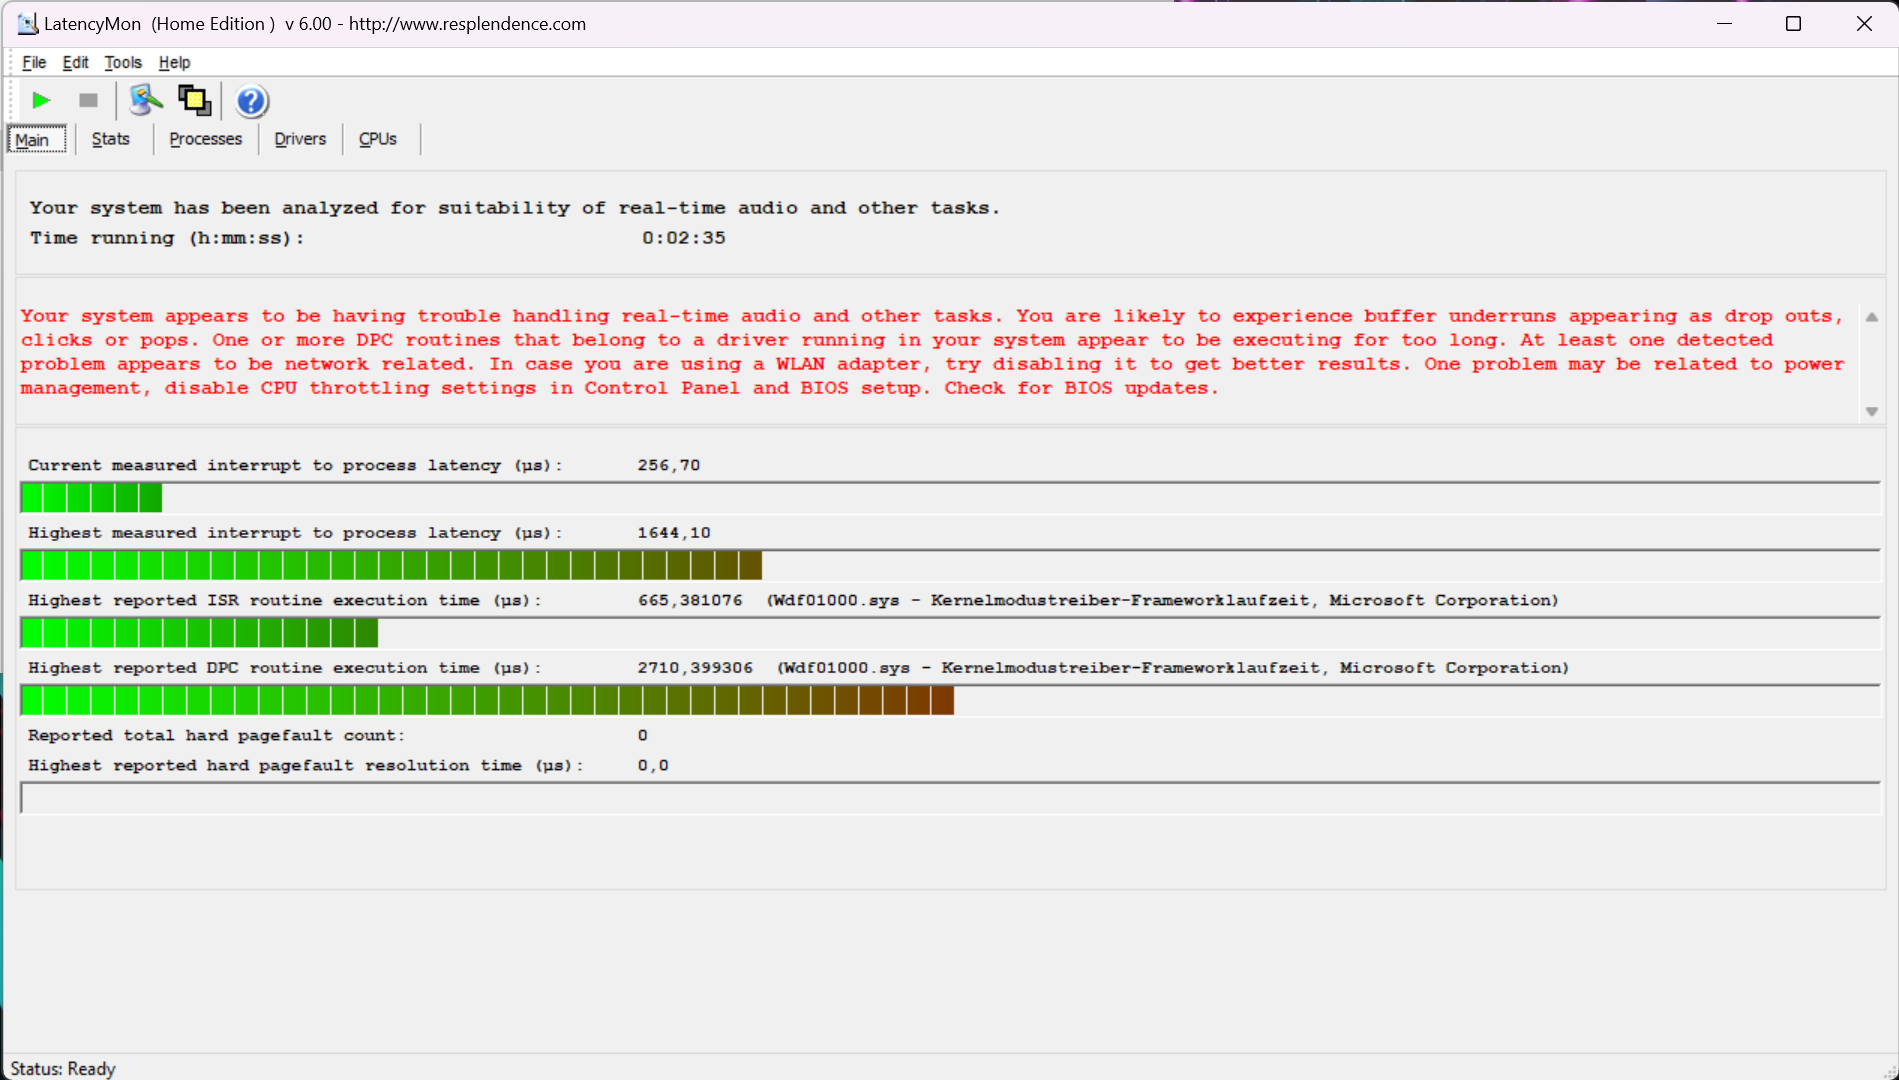
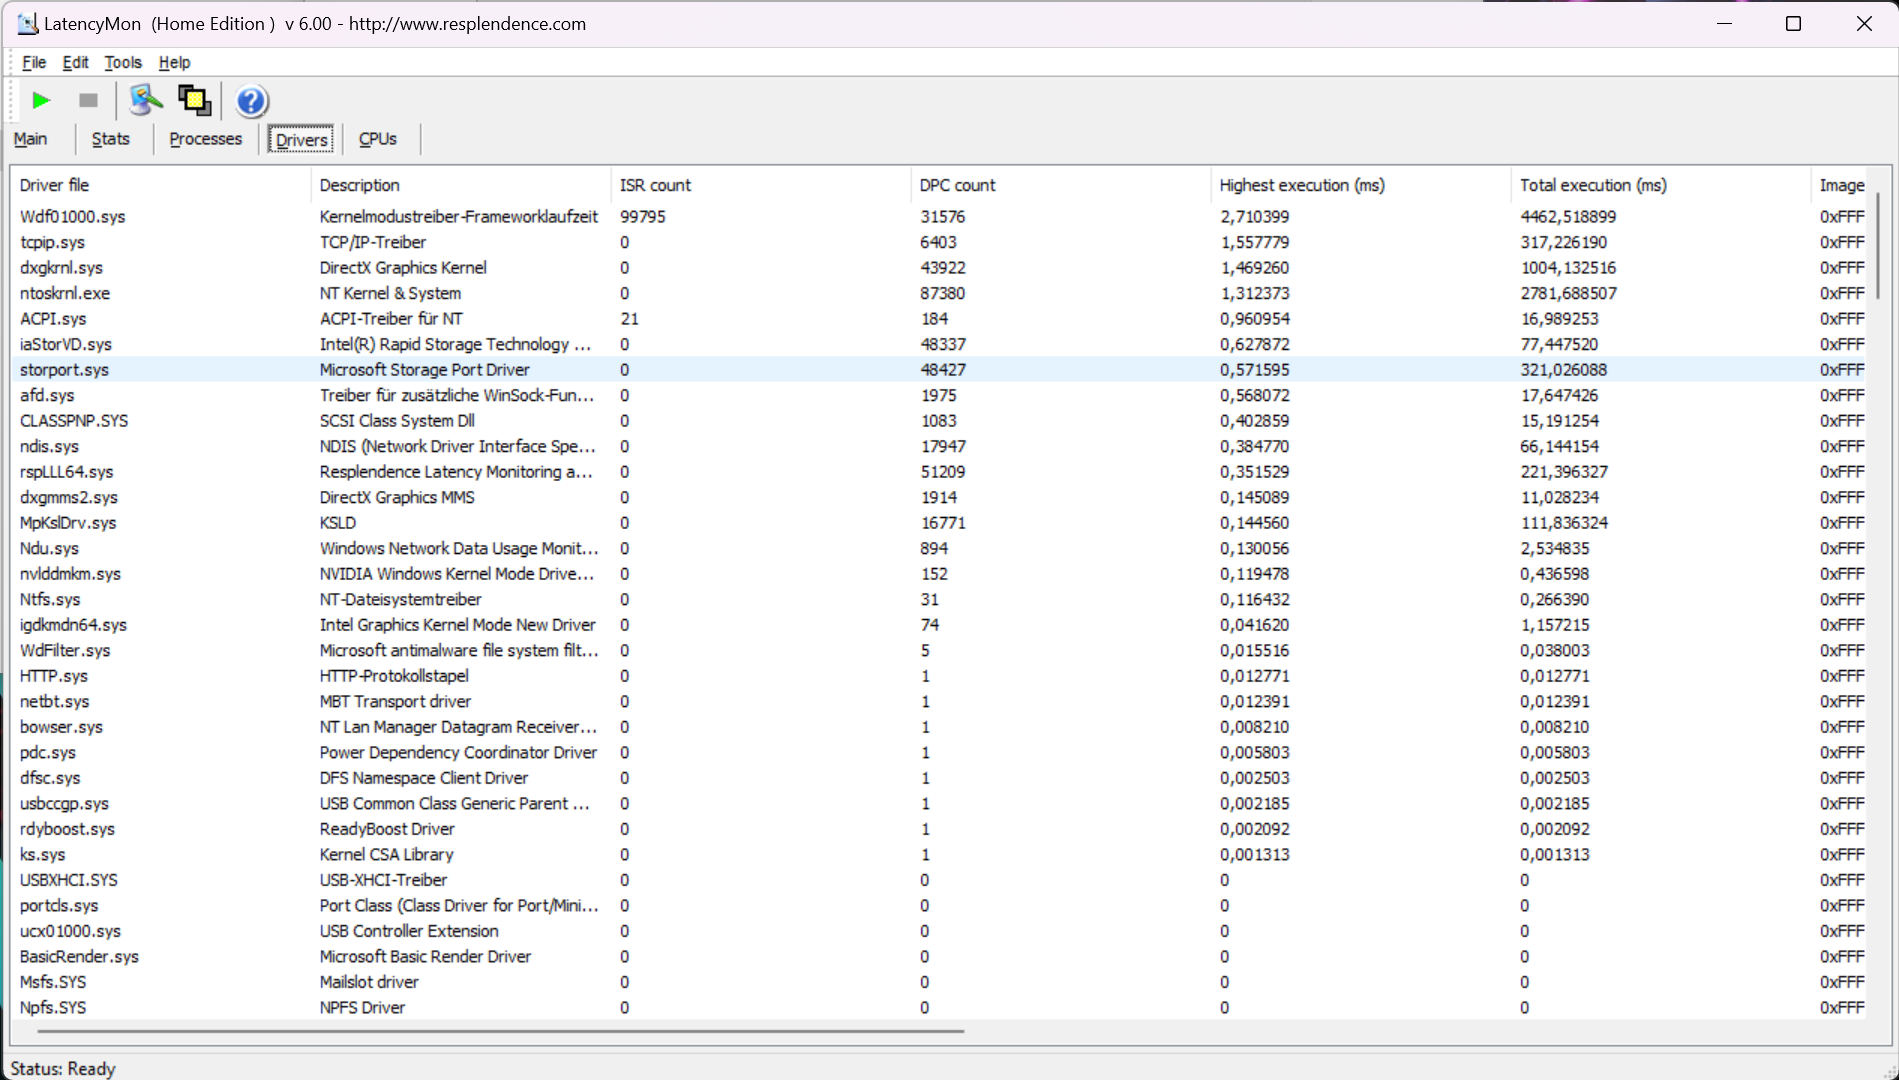
Latenze DPC
| DPC Latencies / LatencyMon - interrupt to process latency (max), Web, Youtube, Prime95 | |
| Dell G15 5530 | |
| Aorus 15X ASF | |
| Acer Predator Helios 16 PH16-71-731Q | |
| Acer Nitro 16 AN16-41 | |
| Lenovo Legion Pro 5 16IRX8 | |
| Asus TUF Gaming A16 FA617 | |
* ... Meglio usare valori piccoli
Memoria di massa
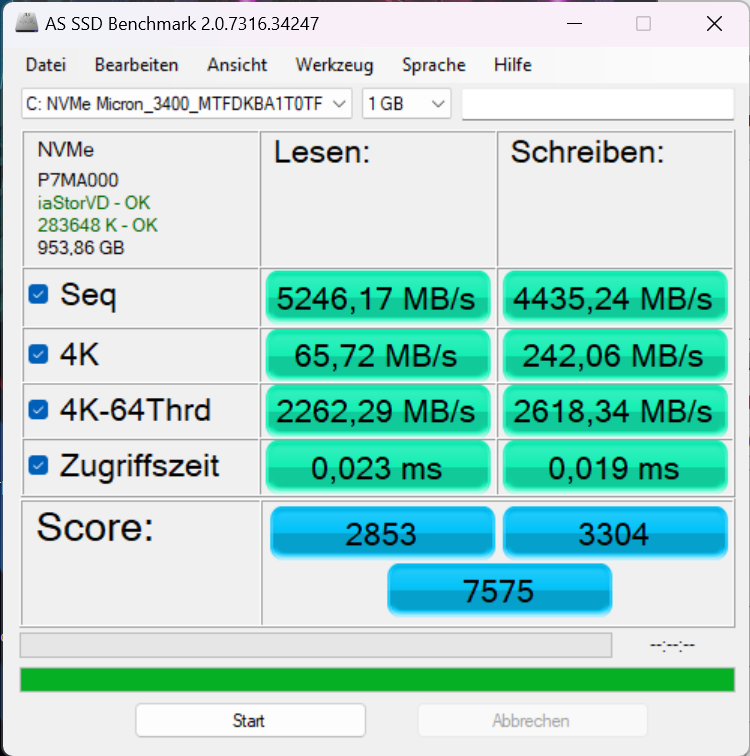
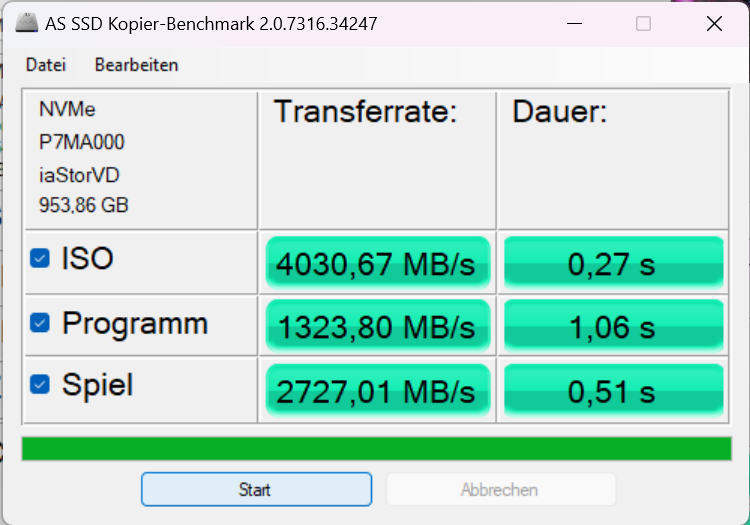
L'unità SSD PCIe 4.0 Micron 3400 installata può contenere 1 TB. Le velocità di trasferimento in lettura sequenziale fino a 6.100 MB/s sono superiori alla media. Tuttavia, dopo poco tempo si verifica un drastico throttling termico che riduce la velocità a un terzo della capacità. Il throttling non è presente nel Micron 3400 presente nell'Asus ROG Flow X16.Asus ROG Flow X16oLenovo Legion 7ma lo stesso problema è stato segnalato sia nell'HP ZBook Fury 16e ZBook Firefly 14.
L'SK Hynix PC801 nel modelloLegion Pro 5 16è in grado di supportare trasferimenti fino a ~6000 MB/s, mentre la piccola unità SSD M.2 2242 presente nel modelloDell G15 5530è chiaramente in fondo al gruppo.
| Acer Predator Helios 16 PH16-71-731Q Micron 3400 1TB MTFDKBA1T0TFH | Acer Nitro 16 AN16-41 Samsung PM9A1 MZVL21T0HCLR | Lenovo Legion Pro 5 16IRX8 SK hynix PC801 HFS512GEJ9X115N | Aorus 15X ASF Gigabyte AG470S1TB-SI B10 | Asus TUF Gaming A16 FA617 Micron 2400 MTFDKBA1T0QFM | Dell G15 5530 SSTC CL4-3D512-Q11 | |
|---|---|---|---|---|---|---|
| AS SSD | -25% | -15% | -15% | -72% | -144% | |
| Seq Read (MB/s) | 5246.2 | 5185.49 -1% | 5856.12 12% | 4649.46 -11% | 3976.53 -24% | 2603.73 -50% |
| Seq Write (MB/s) | 4435.2 | 3900.46 -12% | 4750.28 7% | 3810.26 -14% | 3020.8 -32% | 494.63 -89% |
| 4K Read (MB/s) | 65.7 | 62.76 -4% | 77.12 17% | 100.75 53% | 49.25 -25% | 36.37 -45% |
| 4K Write (MB/s) | 242.1 | 137.9 -43% | 276.66 14% | 308.92 28% | 152.75 -37% | 188.64 -22% |
| 4K-64 Read (MB/s) | 2262.3 | 2593.07 15% | 2572.63 14% | 2964.13 31% | 1901.41 -16% | 932.26 -59% |
| 4K-64 Write (MB/s) | 2618.3 | 3195.33 22% | 3536.78 35% | 3103.89 19% | 1949.13 -26% | 276.64 -89% |
| Access Time Read * (ms) | 0.023 | 0.079 -243% | 0.044 -91% | 0.068 -196% | 0.05 -117% | 0.103 -348% |
| Access Time Write * (ms) | 0.019 | 0.029 -53% | 0.053 -179% | 0.012 37% | 0.105 -453% | 0.182 -858% |
| Score Read (Points) | 2853 | 3174 11% | 3235 13% | 3530 24% | 2348 -18% | 1229 -57% |
| Score Write (Points) | 3304 | 3723 13% | 4288 30% | 3794 15% | 2404 -27% | 515 -84% |
| Score Total (Points) | 7575 | 8452 12% | 9125 20% | 9097 20% | 5903 -22% | 2271 -70% |
| Copy ISO MB/s (MB/s) | 4030.7 | 3037.59 -25% | 566.62 -86% | 1039.04 -74% | 488.98 -88% | |
| Copy Program MB/s (MB/s) | 1323.8 | 968.9 -27% | 1098.38 -17% | 439.84 -67% | 296.26 -78% | |
| Copy Game MB/s (MB/s) | 2727 | 2239.37 -18% | 2670.4 -2% | 721.09 -74% | 452.22 -83% | |
| DiskSpd | -22% | -3% | 9% | -31% | -57% | |
| seq read (MB/s) | 3587 | 3520 -2% | 5346 49% | 3419 -5% | 2460 -31% | 2726 -24% |
| seq write (MB/s) | 4634 | 2220 -52% | 1495 -68% | 3270 -29% | 2991 -35% | 535 -88% |
| seq q8 t1 read (MB/s) | 6521 | 6661 2% | 7127 9% | 7018 8% | 4633 -29% | 2985 -54% |
| seq q8 t1 write (MB/s) | 4962 | 2216 -55% | 4903 -1% | 4398 -11% | 3415 -31% | 539 -89% |
| 4k q1 t1 read (MB/s) | 68.3 | 48.4 -29% | 65.9 -4% | 73.5 8% | 35.5 -48% | 34 -50% |
| 4k q1 t1 write (MB/s) | 249 | 159.6 -36% | 328 32% | 346 39% | 181.3 -27% | 224 -10% |
| 4k q32 t16 read (MB/s) | 2848 | 3311 16% | 2889 1% | 3552 25% | 2025 -29% | 1054 -63% |
| 4k q32 t16 write (MB/s) | 2670 | 2193 -18% | 1457 -45% | 3610 35% | 2291 -14% | 507 -81% |
| Media totale (Programma / Settaggio) | -24% /
-24% | -9% /
-11% | -3% /
-6% | -52% /
-55% | -101% /
-113% |
* ... Meglio usare valori piccoli
* ... Meglio usare valori piccoli
Continuous Performance Read: DiskSpd Read Loop, Queue Depth 8
Scheda grafica
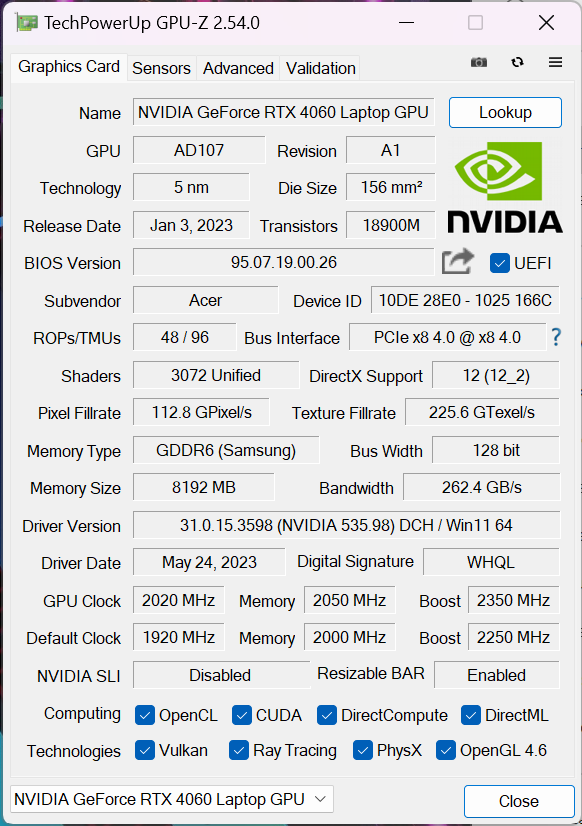
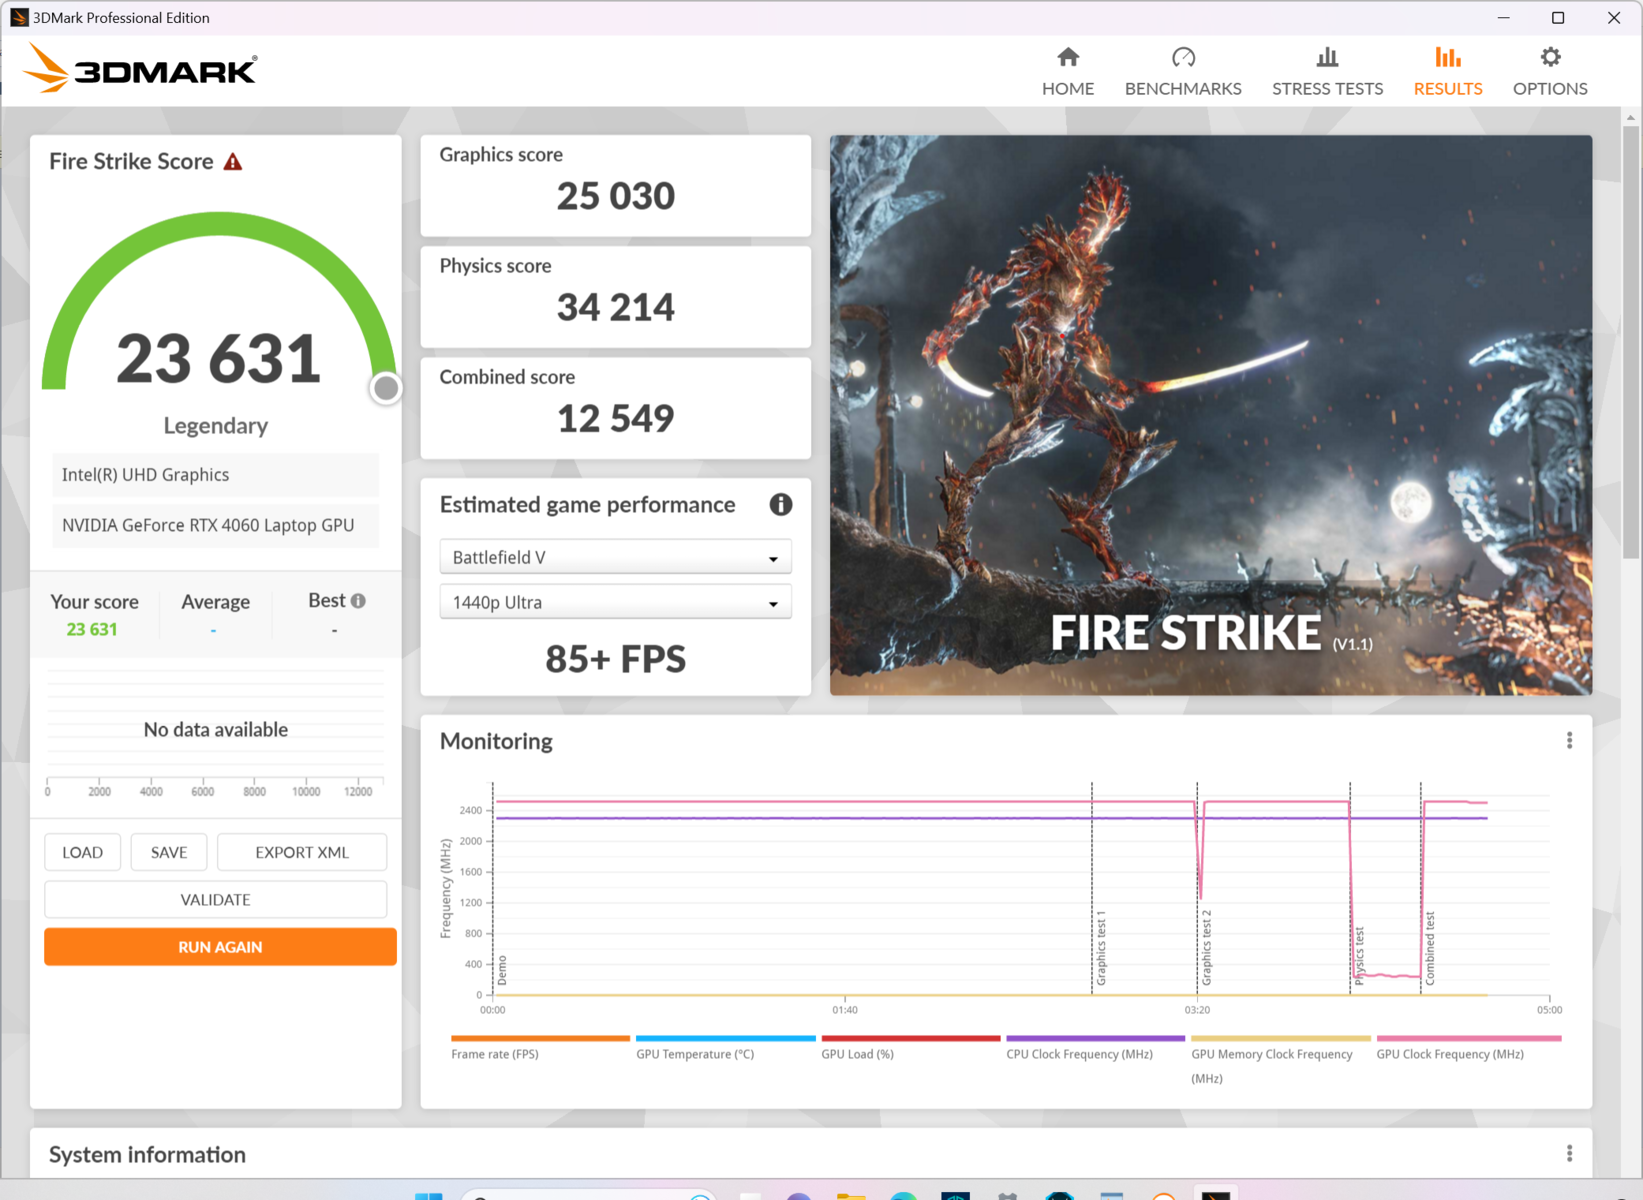
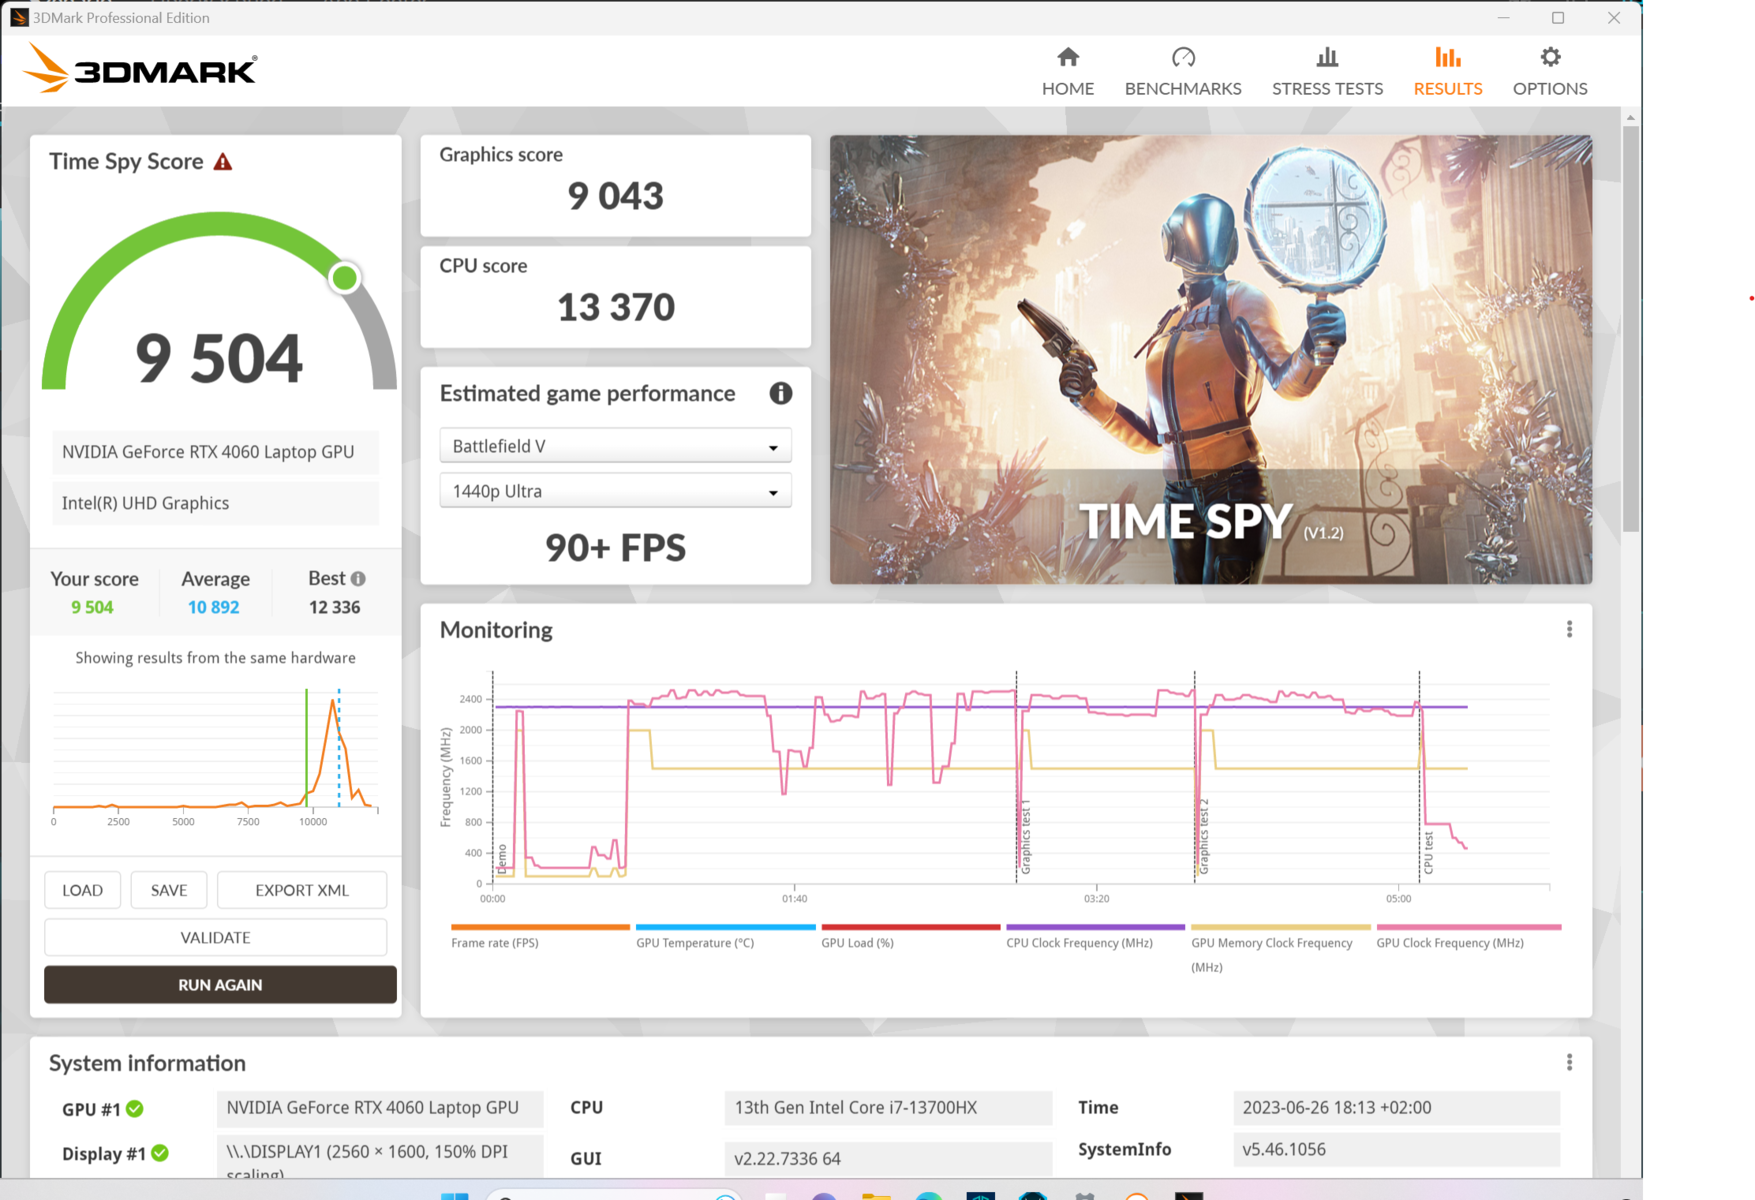
L'Helios 16 è dotato di Nvidia GeForce RTX 4060 è un chip di fascia media con 8 GB di VRAM che ha un TGP massimo di 140 watt (115 watt + 25 watt di Dynamic Boost). Tuttavia, la velocità di clock massima di 2.570 MHz viene raggiunta già a 100 watt. Solo lo stress test FurMark è stato in grado di estrarre ~140 watt dalla GPU. Al contrario, quando si gioca, una GPU RTX 4060 per laptop non assorbe mai più di ~100 W.
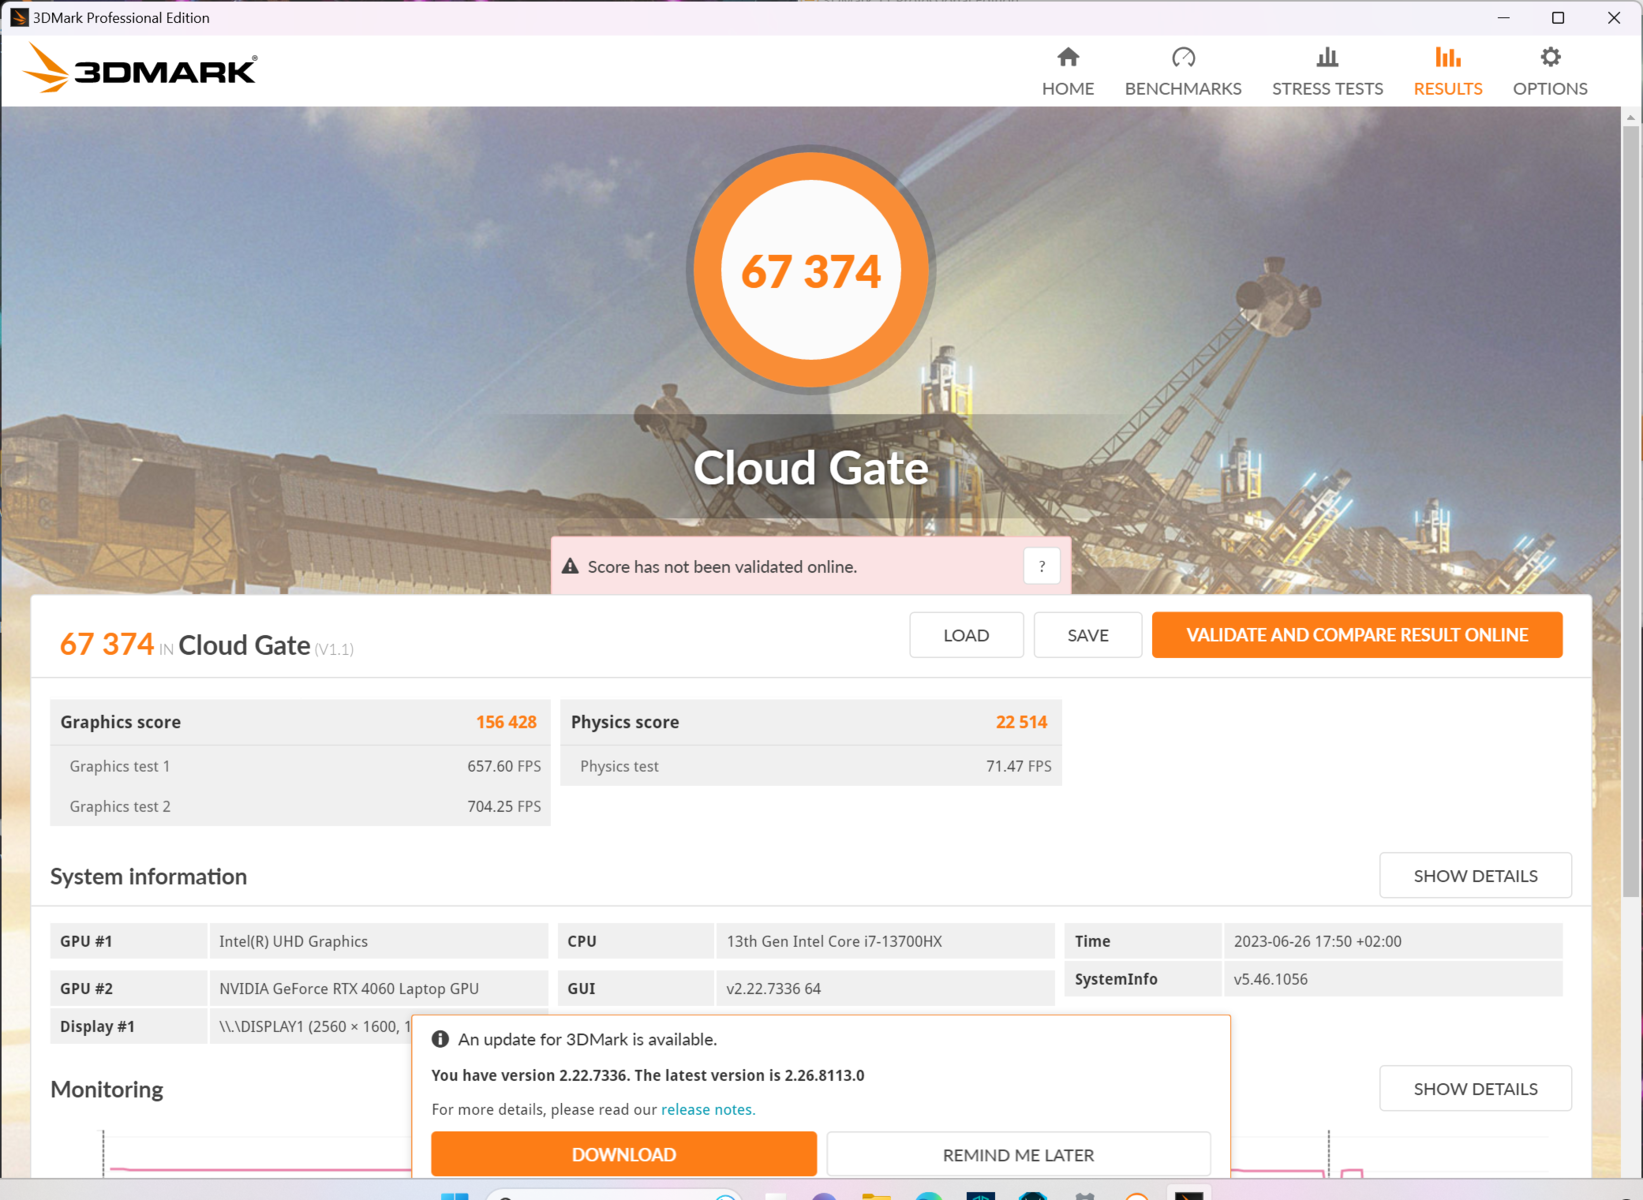
Le prestazioni sono simili a quelle di altri portatili da gioco con RTX 4060 come ilLegion Pro 5 16e il Dell G15 5530. La RTX 4070nel modelloAorus 15X non è molto distante. I risultati dei benchmark sintetici sono dimezzati in modalità batteria.
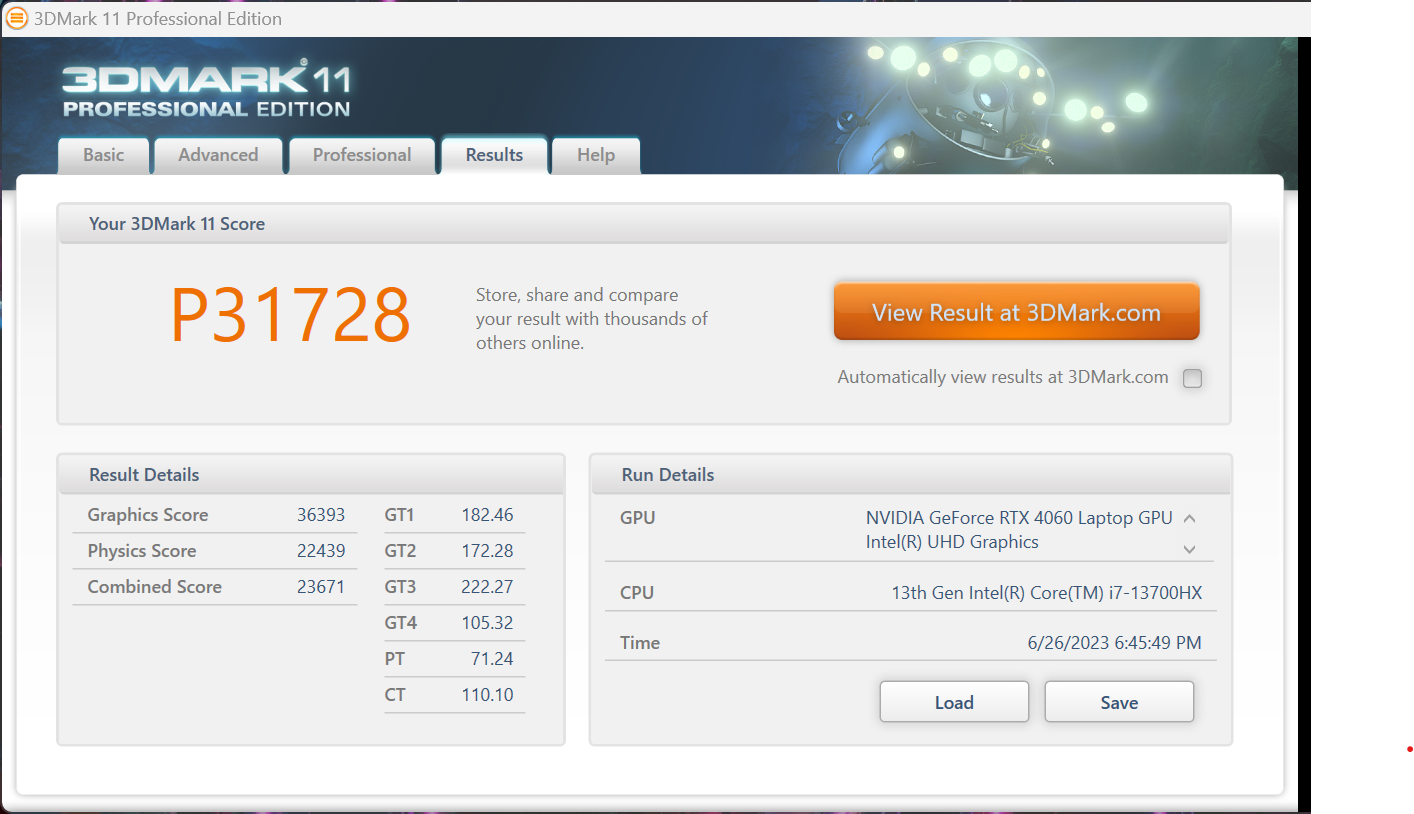
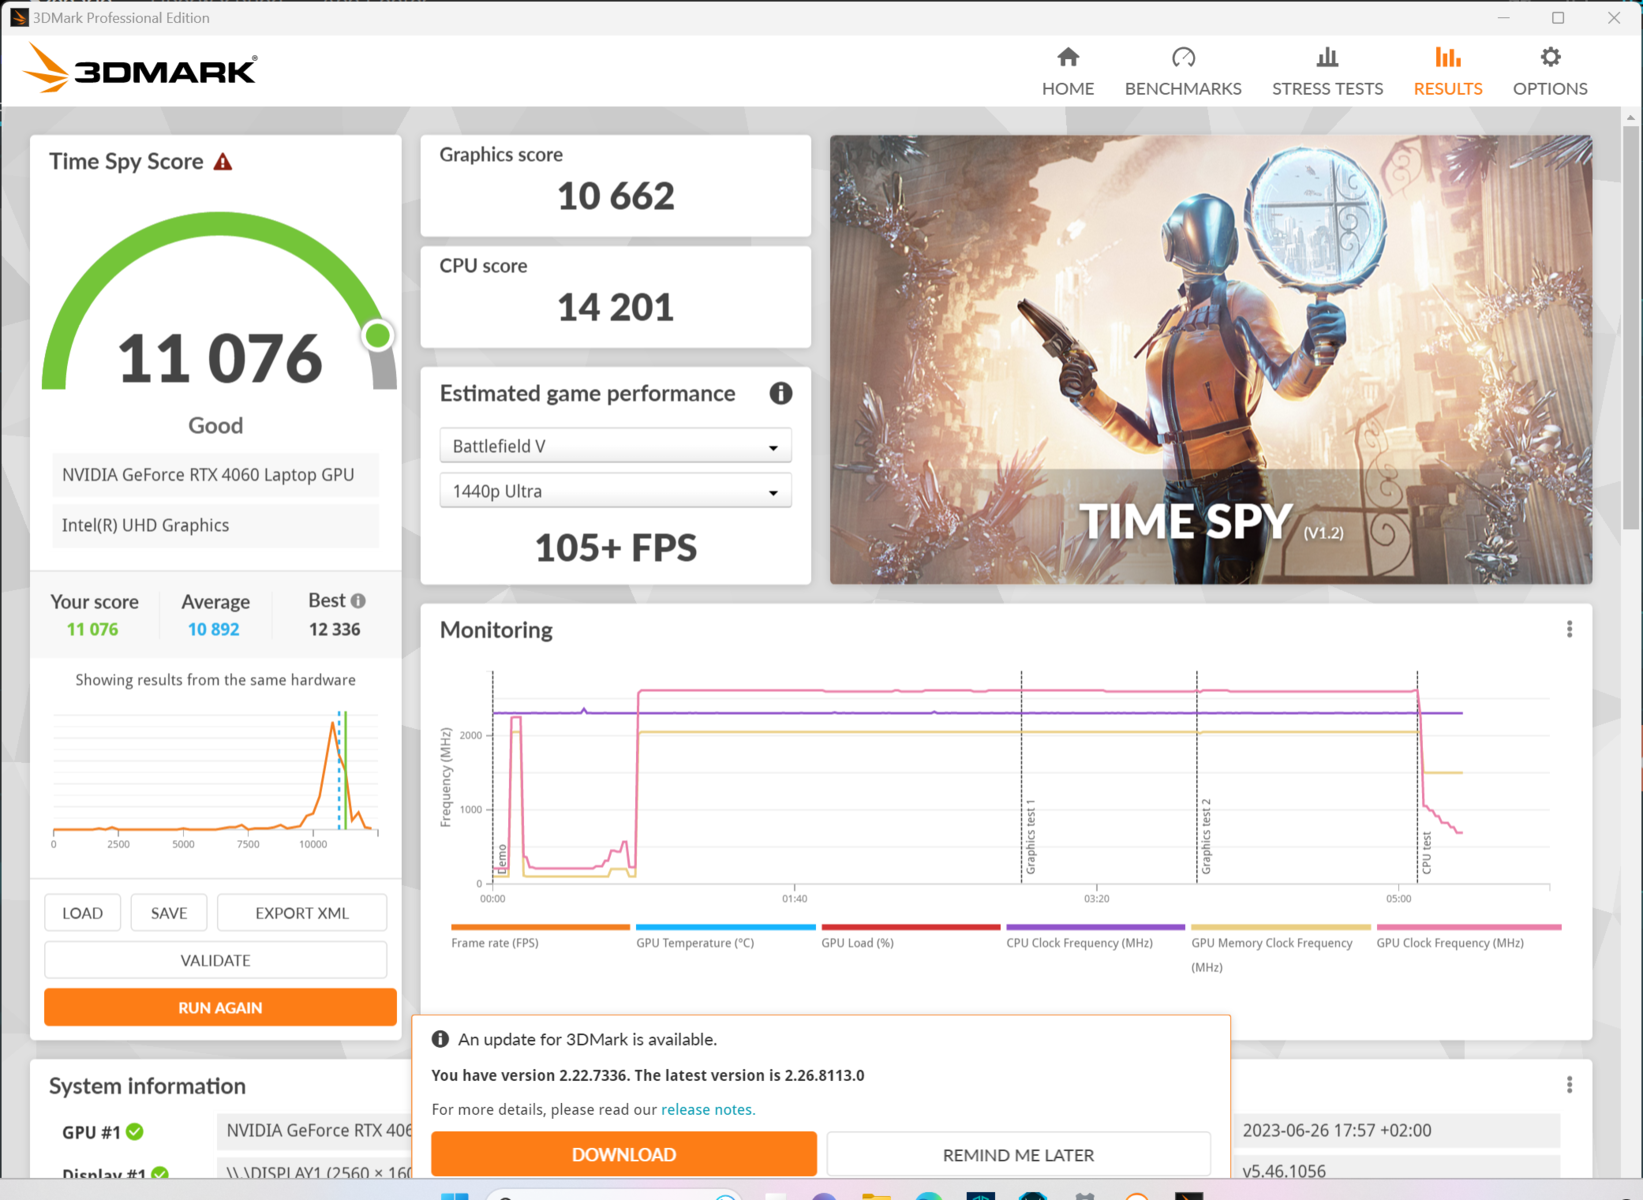
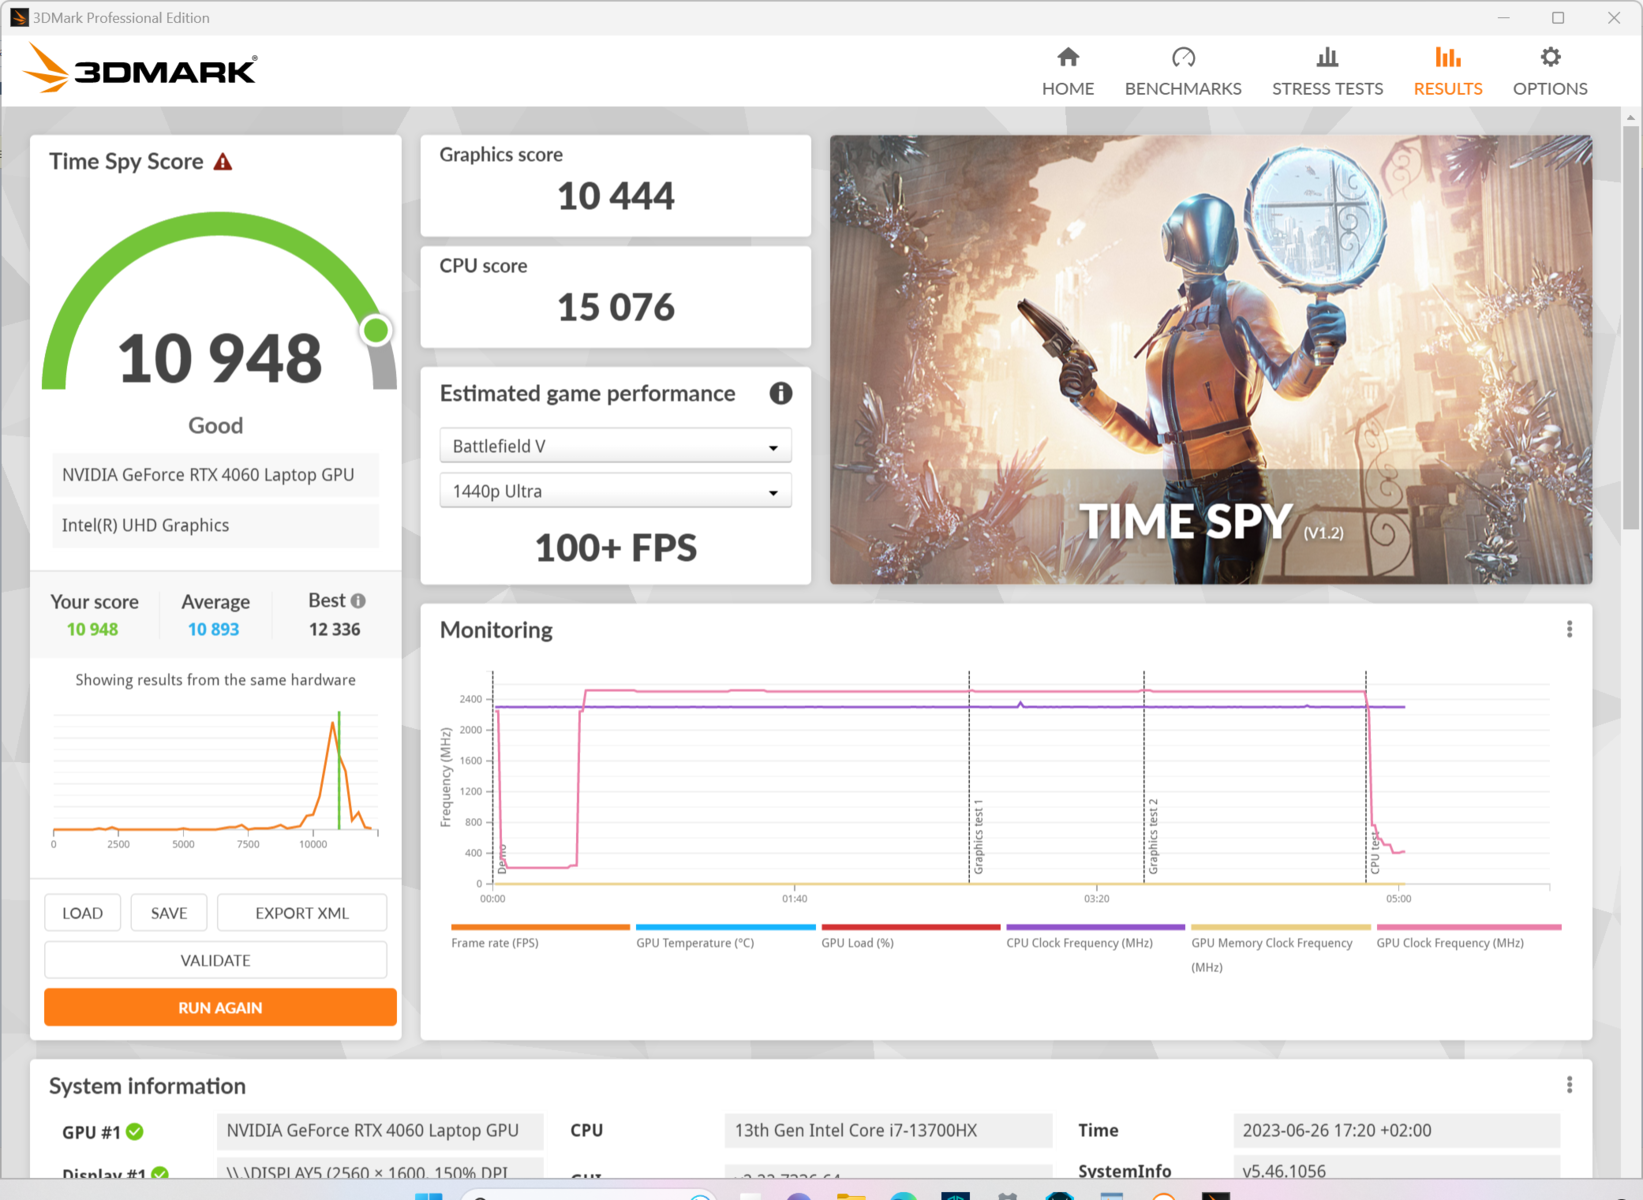

| 3DMark 11 Performance | 31728 punti | |
| 3DMark Cloud Gate Standard Score | 67374 punti | |
| 3DMark Fire Strike Score | 23631 punti | |
| 3DMark Time Spy Score | 10948 punti | |
Aiuto | ||
| Geekbench 6.0 - GPU OpenCL 6.0 | |
| Aorus 15X ASF | |
| Acer Nitro 16 AN16-41 | |
| Acer Predator Helios 16 PH16-71-731Q | |
| Dell G15 5530 | |
* ... Meglio usare valori piccoli
Prestazioni di gioco
In Cyberpunk 2077 @QHD/Ultra, l'Acer Predator Helios 16 è stato in grado di correre in testa al nostro campo di concorrenti, anche leggermente davanti al Legion Pro 5 16'sRTX 4070. Tuttavia, nella nostra valutazione delle prestazioni, i dispositivi concorrenti sono tutti raggruppati con la RadeonRX 7600Spresente nel modello TUF Gaming A16si è leggermente indebolita.
Passando alla modalità solo dGPU si ottiene un misero guadagno di prestazioni del 3%. Se questa viene combinata con la modalità turbo, il guadagno sale al 6%. Con il ray tracing attivato, si ottengono ancora 60 fps in Cyberpunk 2077 1.6 Ultra/FHD invece di 93,2 fps. Con DLSS attivato (bilanciato) - in questo caso senza ray tracing - è di 134,2 fps.
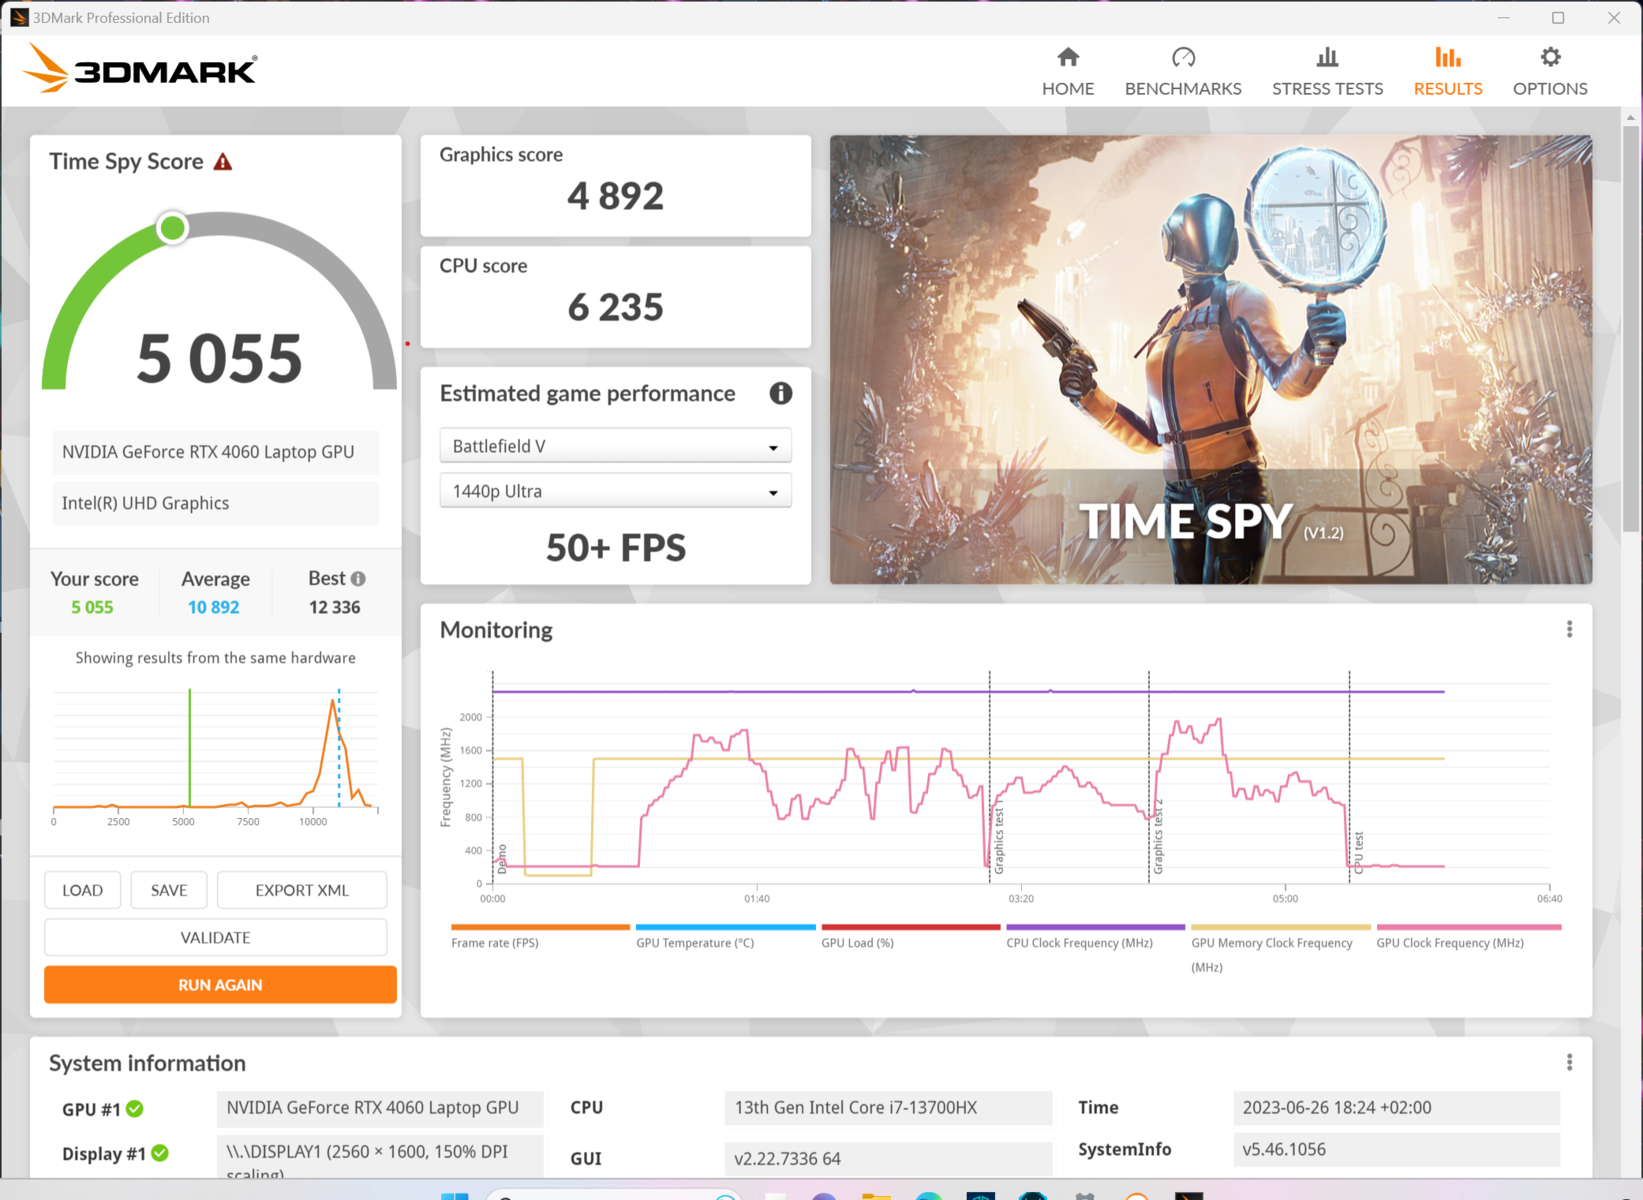
La modalità prestazioni bilanciate fa scendere il frame rate a 87,4, che è più che accettabile considerando le ventole significativamente più silenziose. In modalità batteria, il frame rate scende di quasi il 70% a 30 fps. Con "DLSS Max Performance" è possibile raddoppiare ancora una volta la frequenza dei fotogrammi, in modo che alcuni nuovi giochi vengano riprodotti (e rimangano) relativamente fluidi in modalità batteria.
Witcher 3 FPS diagram
| basso | medio | alto | ultra | QHD | |
|---|---|---|---|---|---|
| GTA V (2015) | 182.8 | 181.3 | 172.5 | 112.8 | 88.3 |
| The Witcher 3 (2015) | 466 | 331 | 181.3 | 102.1 | |
| Dota 2 Reborn (2015) | 189.6 | 171.8 | 159.2 | 153 | |
| Final Fantasy XV Benchmark (2018) | 226 | 150.3 | 100.1 | 72.4 | |
| X-Plane 11.11 (2018) | 136.2 | 123.2 | 95.4 | ||
| Strange Brigade (2018) | 434 | 272 | 215 | 185.2 | 123.5 |
| Shadow of the Tomb Raider (2018) | 141 | 93 | |||
| God of War (2022) | 134.4 | 112.3 | 89.4 | 64.6 | 53.3 |
| Cyberpunk 2077 1.6 (2022) | 132.5 | 126 | 114.9 | 93.2 | 58.6 |
| Tiny Tina's Wonderlands (2022) | 219 | 175.1 | 114.7 | 87.9 | 60 |
| F1 22 (2022) | 256 | 244 | 196.5 | 65.2 | 38 |
| Call of Duty Modern Warfare 2 2022 (2022) | 88 | 60 | |||
| Returnal (2023) | 84.4 | 77.9 | 72.6 | 67 | 59.4 |
Emissioni: L'Acer Predator Helios 16 è dotato di un potente sistema di raffreddamento
Emissioni acustiche
Nell'uso inattivo, quando si naviga in Internet e si svolgono semplici attività d'ufficio, il Predator Helios 16 è quasi sempre piacevolmente silenzioso e, va da sé, in modalità silenziosa o a batteria.
In termini di carico puro della CPU, si sono raggiunti 36,6 dB(A), ma non è stato molto fastidioso. Quando si gioca, la modalità prestazioni diventa molto rumorosa, con 49 dB(A), che è la media per i portatili da gioco. In modalità turbo, il volume diventa insopportabile senza alcun valore aggiunto. Al contrario, la modalità bilanciata consente di ottenere un rumore di fondo quasi gradevole, con una perdita minima di prestazioni. Infine, la modalità silenziosa è facile da ascoltare, con cali di circa il 30% nelle applicazioni 3D.
Tuttavia, caricando il nostro modello in prova, il rumore di fondo era chiaramente udibile.
Rumorosità
| Idle |
| 24 / 24 / 32.32 dB(A) |
| Sotto carico |
| 36.66 / 49.49 dB(A) |
 | ||
30 dB silenzioso 40 dB(A) udibile 50 dB(A) rumoroso |
||
min: | ||
| Acer Predator Helios 16 PH16-71-731Q GeForce RTX 4060 Laptop GPU, i7-13700HX, Micron 3400 1TB MTFDKBA1T0TFH | Acer Nitro 16 AN16-41 GeForce RTX 4070 Laptop GPU, R7 7735HS, Samsung PM9A1 MZVL21T0HCLR | Lenovo Legion Pro 5 16IRX8 GeForce RTX 4060 Laptop GPU, i7-13700HX, SK hynix PC801 HFS512GEJ9X115N | Aorus 15X ASF GeForce RTX 4070 Laptop GPU, i7-13700HX, Gigabyte AG470S1TB-SI B10 | Asus TUF Gaming A16 FA617 Radeon RX 7600S, R7 7735HS, Micron 2400 MTFDKBA1T0QFM | Dell G15 5530 GeForce RTX 4060 Laptop GPU, i7-13650HX, SSTC CL4-3D512-Q11 | |
|---|---|---|---|---|---|---|
| Noise | -3% | 4% | -17% | -1% | 5% | |
| off /ambiente * (dB) | 24 | 25.7 -7% | 23 4% | 25 -4% | 24 -0% | 20.41 15% |
| Idle Minimum * (dB) | 24 | 25.7 -7% | 23.1 4% | 28 -17% | 24 -0% | 26.85 -12% |
| Idle Average * (dB) | 24 | 25.7 -7% | 23.1 4% | 29 -21% | 25 -4% | 26.85 -12% |
| Idle Maximum * (dB) | 32.32 | 26.3 19% | 26.6 18% | 36 -11% | 28 13% | 26.85 17% |
| Load Average * (dB) | 36.66 | 33.9 8% | 34.7 5% | 50 -36% | 42 -15% | 27.65 25% |
| Witcher 3 ultra * (dB) | 49.06 | 47.6 3% | 54 -10% | 50 -2% | 47.9 2% | |
| Load Maximum * (dB) | 49.49 | 62 -25% | 54.8 -11% | 58 -17% | 50 -1% | 47.86 3% |
* ... Meglio usare valori piccoli
Temperatura
Il portatile da gioco di Acer rimane sorprendentemente fresco e, durante le sessioni di gioco, la maggior parte delle superfici non raggiunge neanche i 40 °C. Il calore si concentra solo sul sistema di raffreddamento sporgente sul retro, dove i punti caldi possono raggiungere i 55 °C durante il gioco. Solo nello stress test combinato abbiamo misurato un punto caldo di 66 °C, anche se questo non accade durante l'uso quotidiano. Nella maggior parte dei casi gli utenti non entreranno mai in contatto con la barra posteriore ma, se appoggiato sulle ginocchia, il contatto occasionale con il dispositivo sarà spiacevole durante i giochi.
(±) La temperatura massima sul lato superiore è di 41 °C / 106 F, rispetto alla media di 40.4 °C / 105 F, che varia da 21.2 a 68.8 °C per questa classe Gaming.
(-) Il lato inferiore si riscalda fino ad un massimo di 66 °C / 151 F, rispetto alla media di 43.2 °C / 110 F
(±) In idle, la temperatura media del lato superiore è di 32.4 °C / 90 F, rispetto alla media deld ispositivo di 33.9 °C / 93 F.
(±) Riproducendo The Witcher 3, la temperatura media per il lato superiore e' di 33.1 °C / 92 F, rispetto alla media del dispositivo di 33.9 °C / 93 F.
(+) I poggiapolsi e il touchpad raggiungono la temperatura massima della pelle (32 °C / 89.6 F) e quindi non sono caldi.
(-) La temperatura media della zona del palmo della mano di dispositivi simili e'stata di 28.8 °C / 83.8 F (-3.2 °C / -5.8 F).
| Acer Predator Helios 16 PH16-71-731Q Intel Core i7-13700HX, NVIDIA GeForce RTX 4060 Laptop GPU | Acer Nitro 16 AN16-41 AMD Ryzen 7 7735HS, NVIDIA GeForce RTX 4070 Laptop GPU | Lenovo Legion Pro 5 16IRX8 Intel Core i7-13700HX, NVIDIA GeForce RTX 4060 Laptop GPU | Aorus 15X ASF Intel Core i7-13700HX, NVIDIA GeForce RTX 4070 Laptop GPU | Asus TUF Gaming A16 FA617 AMD Ryzen 7 7735HS, AMD Radeon RX 7600S | Dell G15 5530 Intel Core i7-13650HX, NVIDIA GeForce RTX 4060 Laptop GPU | |
|---|---|---|---|---|---|---|
| Heat | 10% | 12% | 19% | -6% | -2% | |
| Maximum Upper Side * (°C) | 41 | 41.5 -1% | 42.8 -4% | 42 -2% | 54 -32% | 54 -32% |
| Maximum Bottom * (°C) | 66 | 51.8 22% | 50 24% | 51 23% | 47 29% | 62.2 6% |
| Idle Upper Side * (°C) | 36 | 31.6 12% | 29.6 18% | 27 25% | 40 -11% | 33.4 7% |
| Idle Bottom * (°C) | 37 | 34.5 7% | 34 8% | 26 30% | 40 -8% | 33.4 10% |
* ... Meglio usare valori piccoli
Test da sforzo
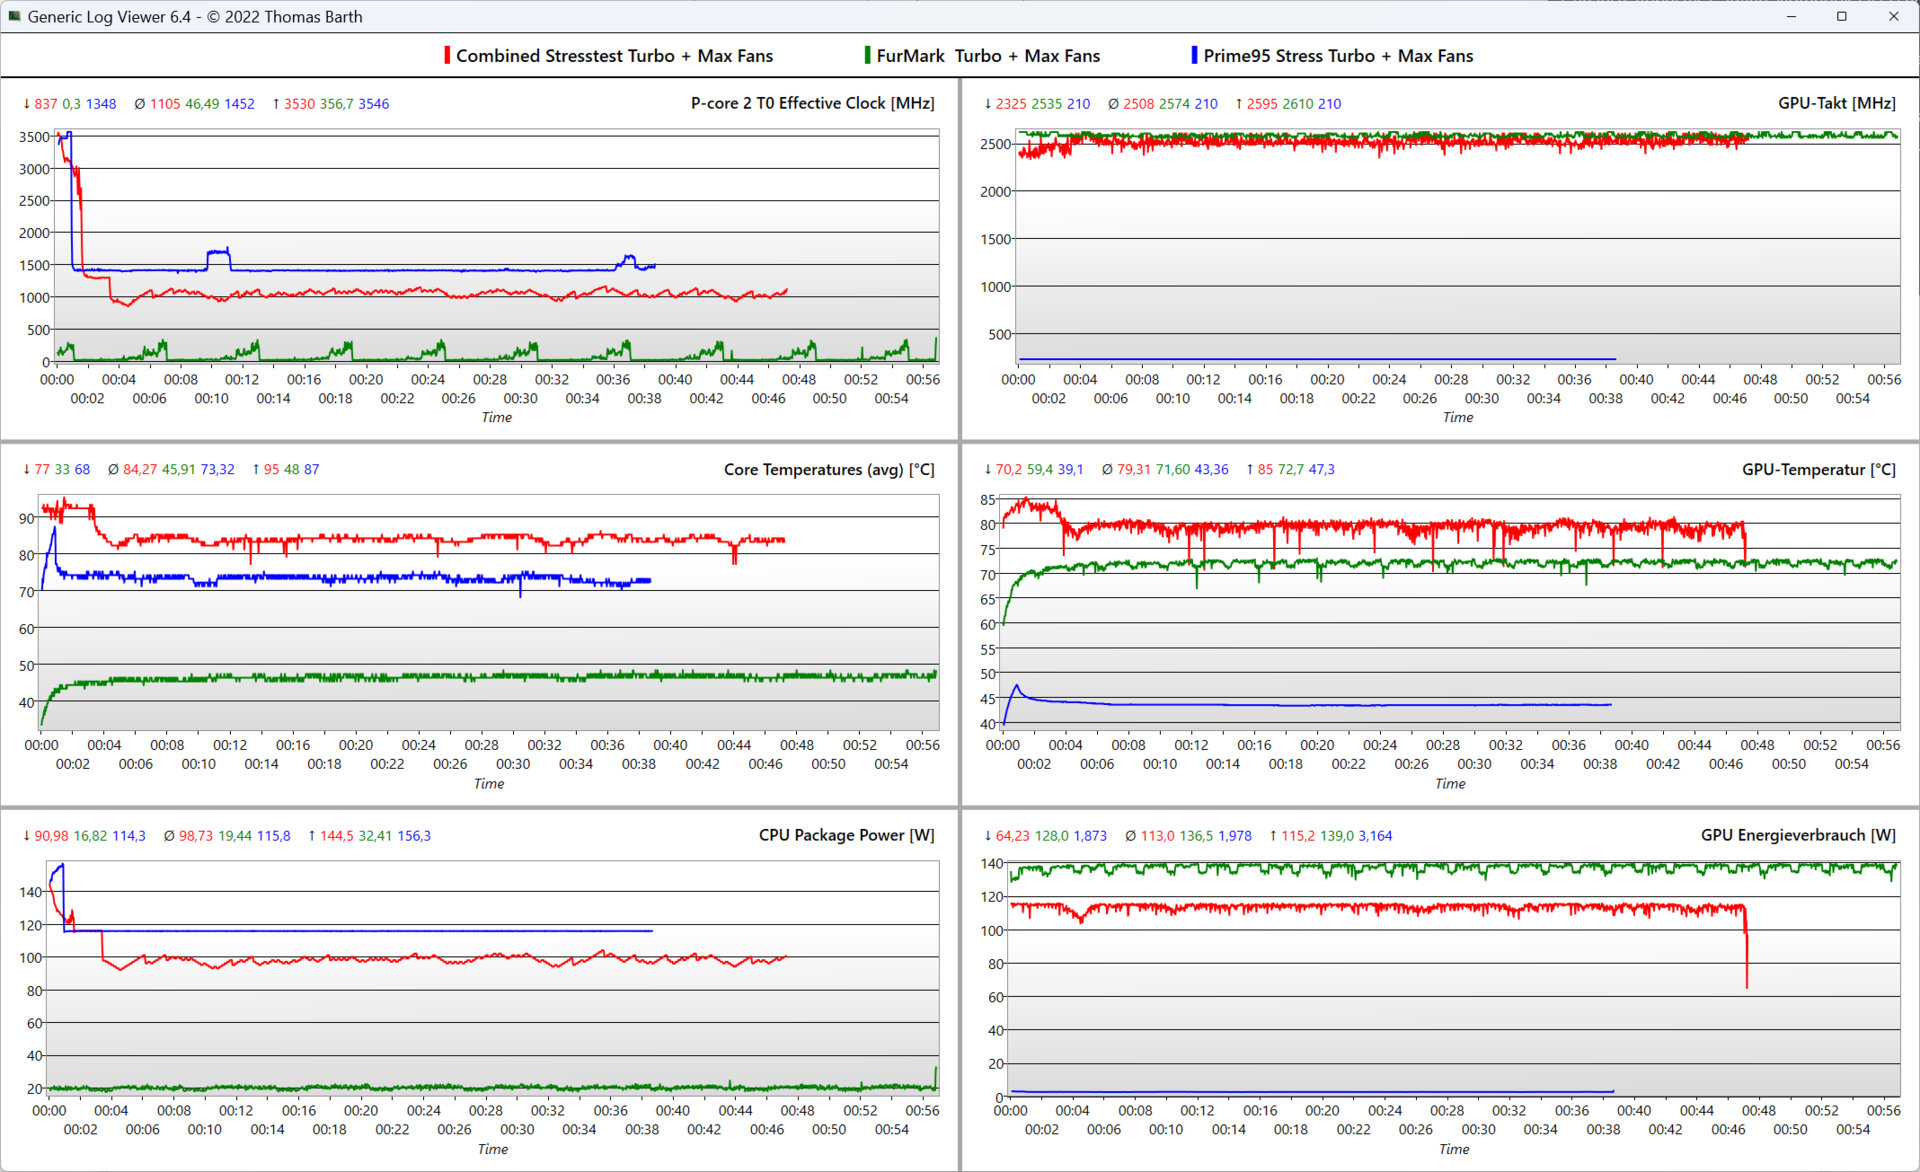
Nel test di stress (FurMark + Prime95), dopo un minuto, il clock rate dei core P è sceso da 3,6 GHz a soli 0,85 GHz, significativamente al di sotto del clock rate di base di 2,1 GHz. Attivando la modalità turbo e le "ventole massime", il clock rate è sceso solo dopo 3 minuti (a ~1,1 GHz). La CPU si riscalda fino a 86 °C (e 83 °C, rispettivamente) e assorbe continuamente 100 watt.
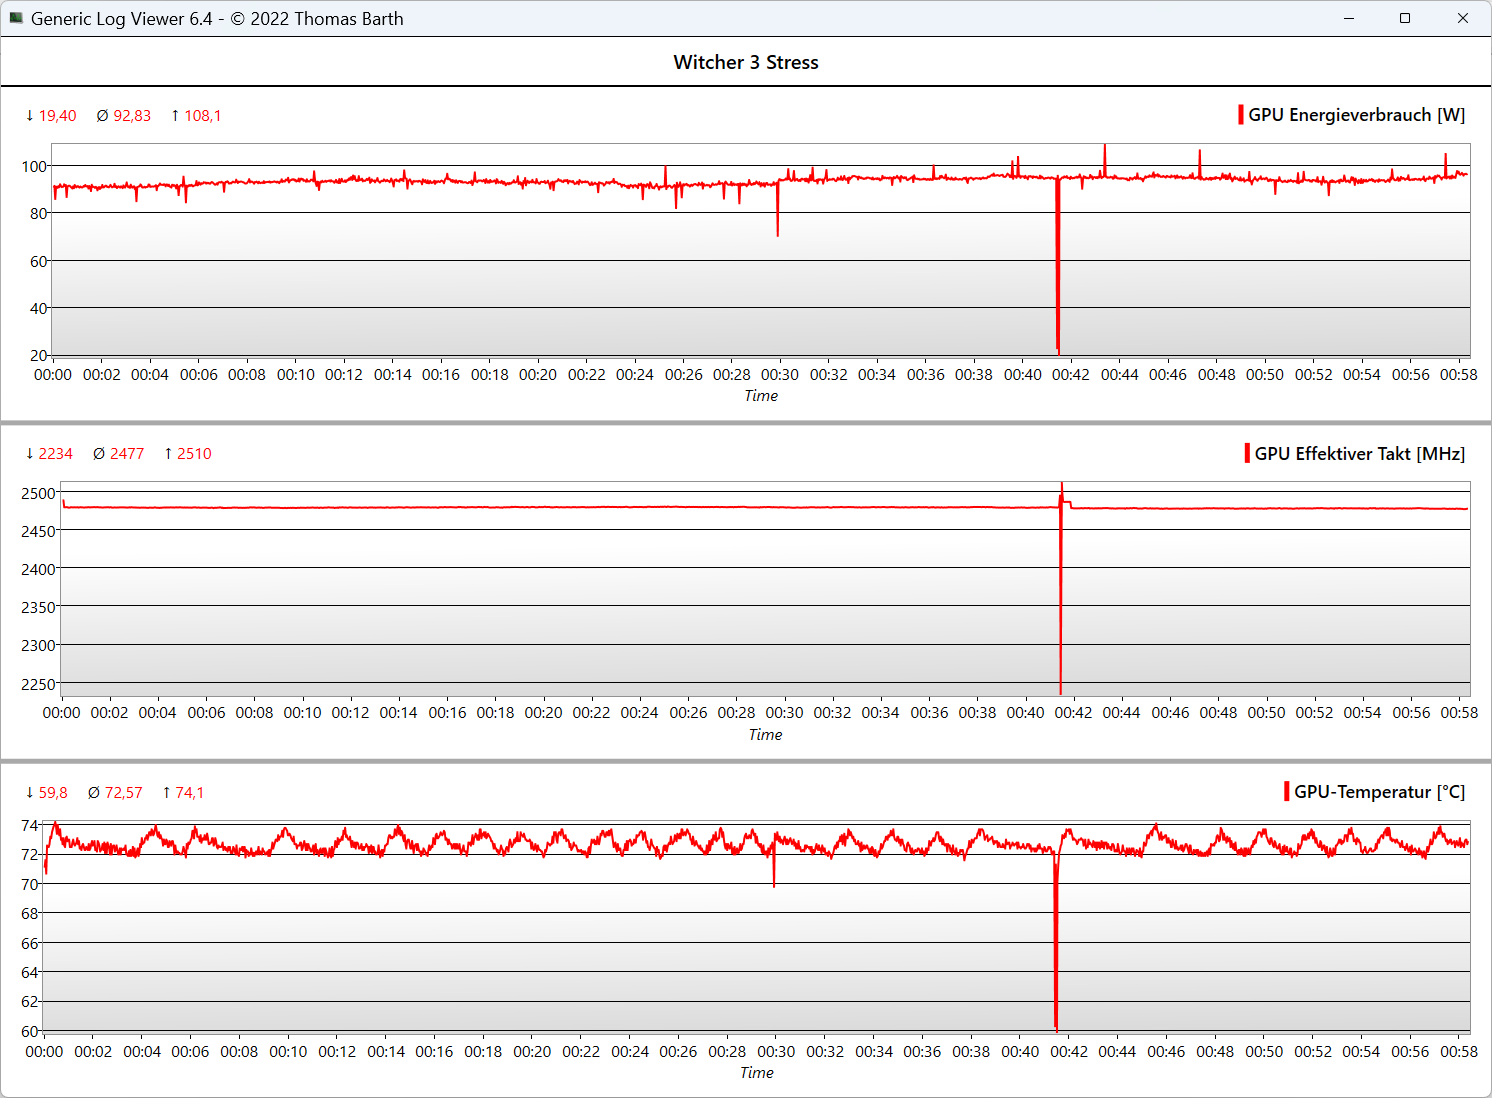
La GPU mantiene più o meno la sua velocità di clock a 2.500-2.600 MHz, non si scalda troppo (81 °C) e assorbe 115 watt. Nello stress test di Witcher 3 e in quasi tutti i giochi, laRTX 4060 richiede solo 100 watt per raggiungere la velocità di clock massima. Tuttavia, nei modelli conRTX 4080la situazione dovrebbe essere diversa.
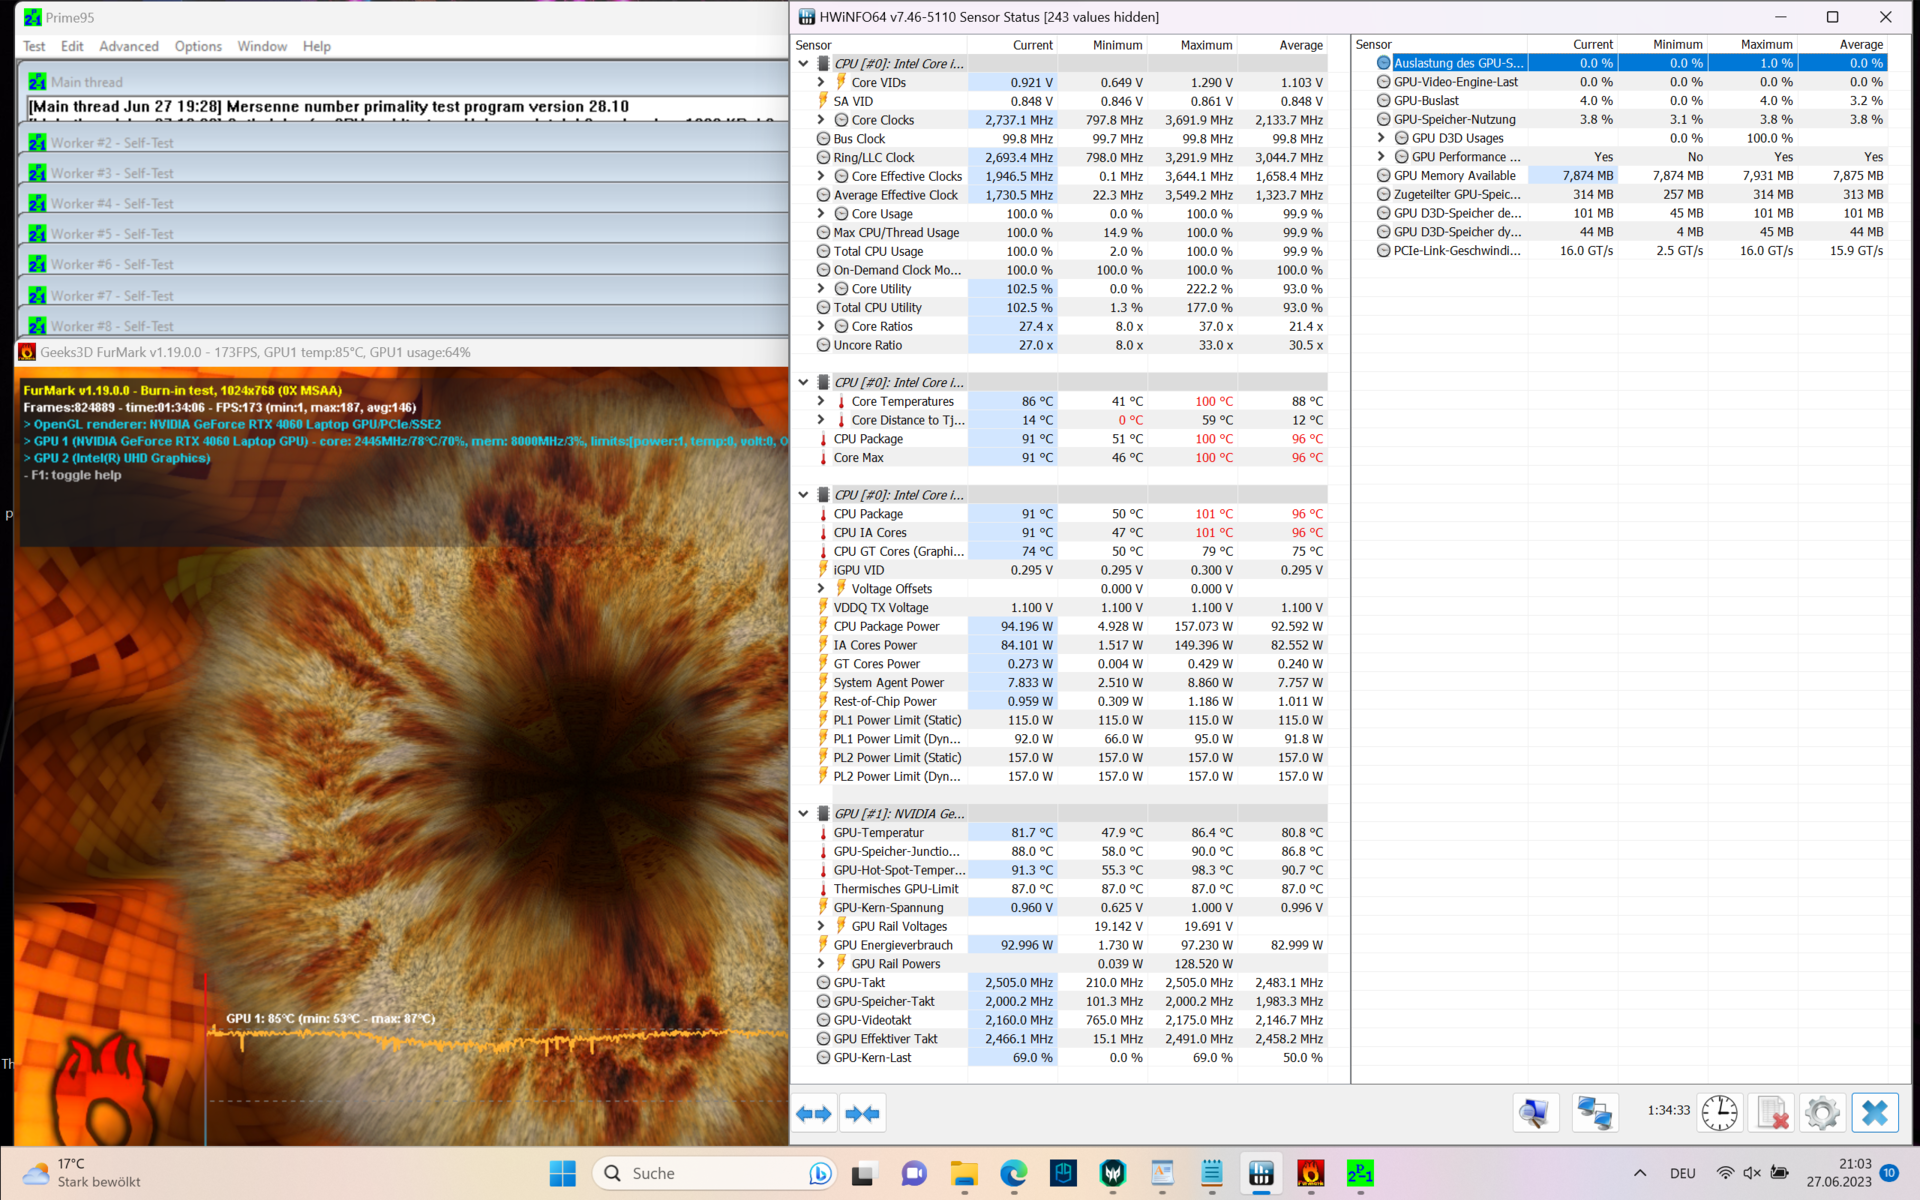
Nel test di stress della GPU pura (FurMark), la GPU ha continuato a raggiungere quasi la velocità massima di clock di circa 2.430 MHz, assorbendo 129 watt e riscaldandosi fino a 76 °C. In modalità turbo + ventole massime, si raggiungono i 2.625 MHz (leggero overclocking), con un consumo di 136 watt (con un picco di 139 watt), mentre la GPU rimane relativamente fresca a 71,5 °C.
Anche durante lo stress puro della CPU, dopo un minuto, i core P hanno un clock di soli 0,92 GHz, in quanto è limitato a 100 watt, anche se la CPU raggiunge solo 70 °C. Il sistema di raffreddamento potrebbe chiaramente gestire di più. Se si attiva la modalità turbo e le ventole massime, si arriva ancora a 1,45 GHz con 115 watt e 73 °C. La possibilità di selezionare i limiti PL sarebbe stata sensata, soprattutto quando si sceglie una SKU con un Core i9-13900HX.
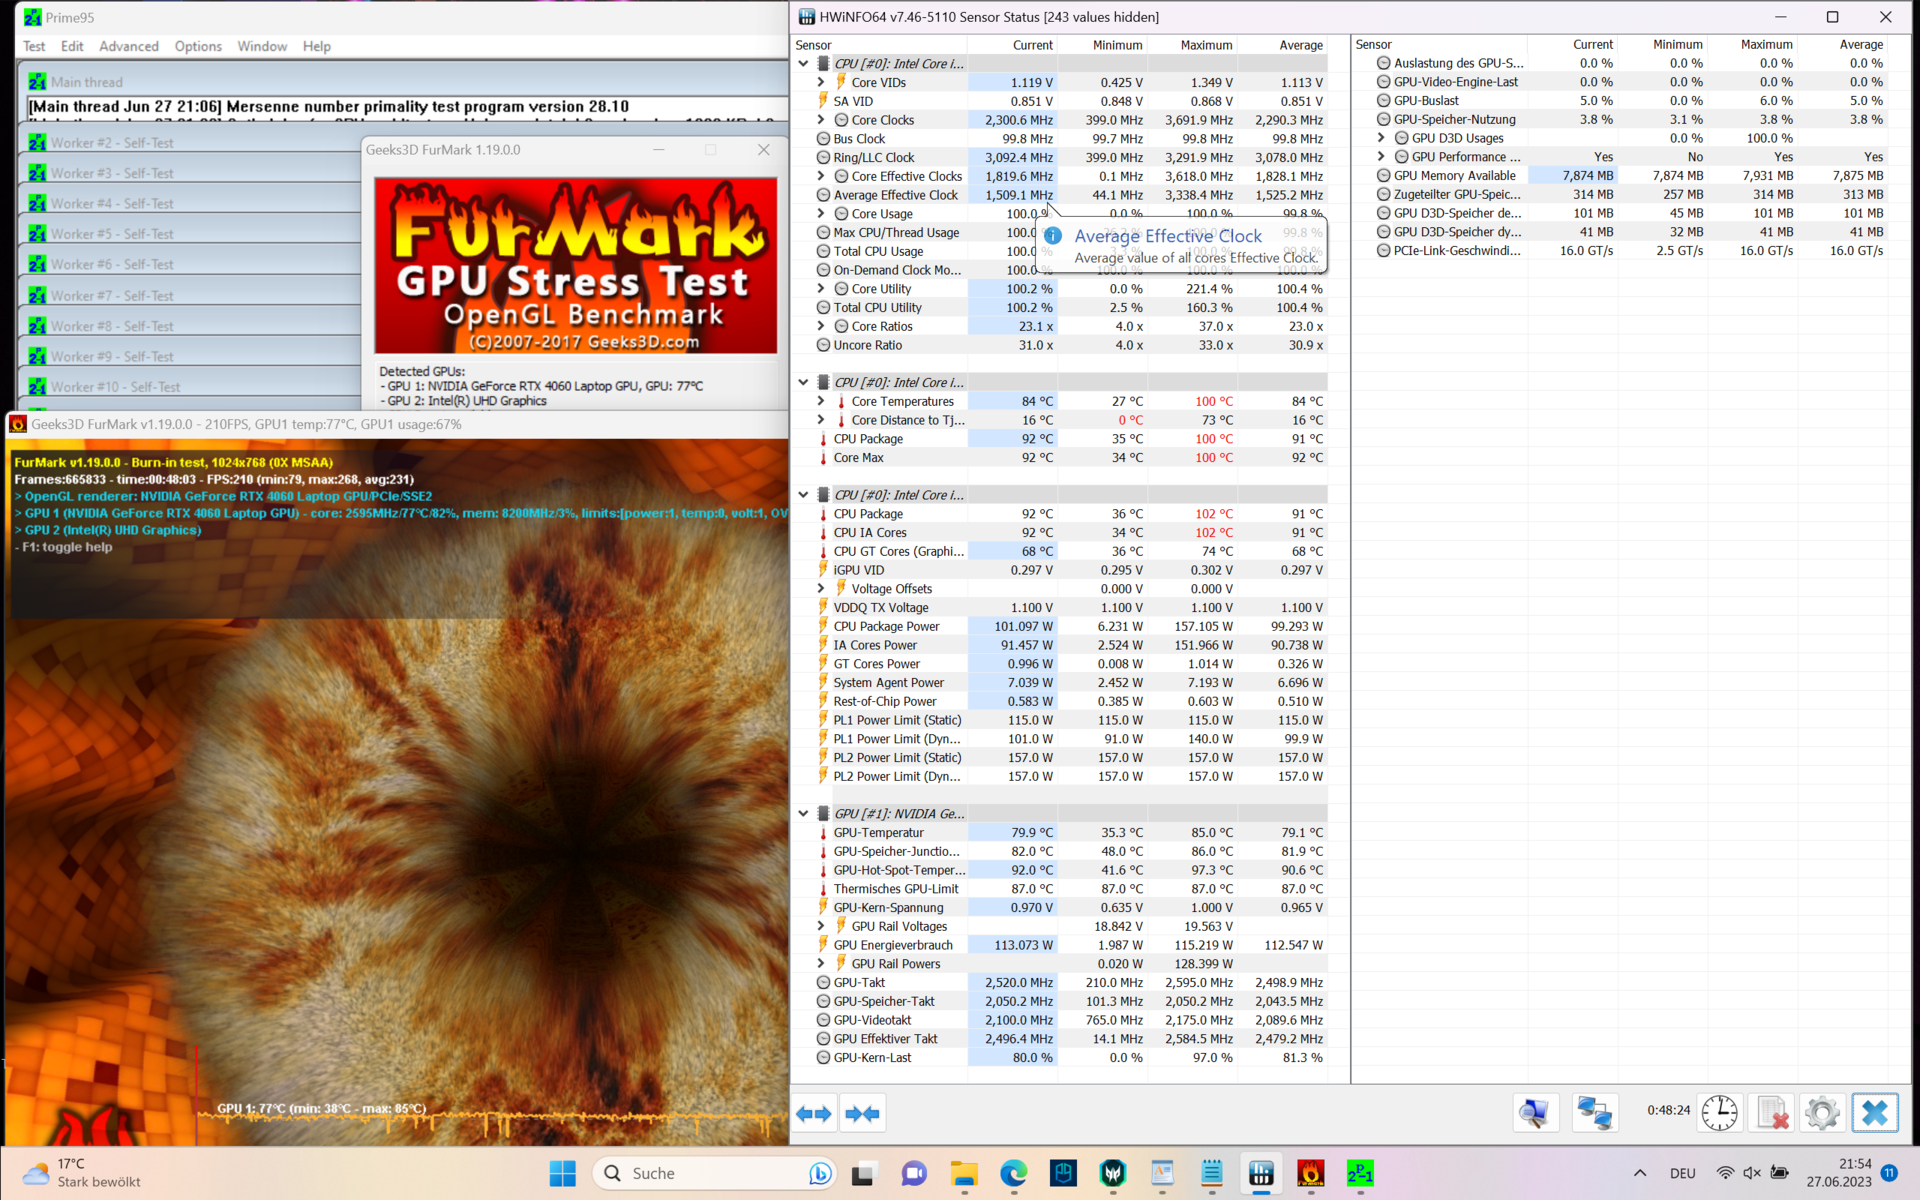
| modalità @Performance | Clock P-Cores/ E-Cores (GHz) | Clock GPU (MHz) | Temperatura media della CPU (°C) | Temperatura media della GPU (°C) |
| Sistema inattivo | 0,07 / 0,07 | - | 33 | 37 |
| Prime95 Stress | 0,95 / 3,5 | 10 | 71 | 49 |
| Prime95 + FurMark | 0,85 / 3,4 | 2.500 | 86 | 81 |
| FurMark Stress | 0,55 / 0,02 | 2.450 | 54 | 76 |
| Witcher 3 Stress | 1,6 / 0,02 | 2.475 | 61 | 73 |
Altoparlanti
Gli altoparlanti stereo da 2 watt con apertura verso il basso producono medi e alti equilibrati, ma i bassi sono quasi del tutto assenti, mentre il volume massimo di 76,1 dB(A) è piuttosto nella media. I portatili da gioco nel nostro campo di confronto non fanno meglio.
In alternativa, il modelloAsus ROG Strix G16, il Lenovo Legion Pro 7offrono un suono migliore, oppure si possono utilizzare cuffie o sistemi audio tramite il jack audio o il Bluetooth.
Acer Predator Helios 16 PH16-71-731Q analisi audio
(±) | potenza degli altiparlanti media ma buona (76.12 dB)
Bassi 100 - 315 Hz
(-) | quasi nessun basso - in media 15% inferiori alla media
(-) | bassi non lineari (15% delta rispetto alla precedente frequenza)
Medi 400 - 2000 Hz
(+) | medi bilanciati - solo only 2.5% rispetto alla media
(+) | medi lineari (5.9% delta rispetto alla precedente frequenza)
Alti 2 - 16 kHz
(+) | Alti bilanciati - appena 2.9% dalla media
(±) | la linearità degli alti è media (8.4% delta rispetto alla precedente frequenza)
Nel complesso 100 - 16.000 Hz
(+) | suono nel complesso lineare (13.6% differenza dalla media)
Rispetto alla stessa classe
» 20% di tutti i dispositivi testati in questa classe è stato migliore, 7% simile, 73% peggiore
» Il migliore ha avuto un delta di 6%, medio di 18%, peggiore di 132%
Rispetto a tutti i dispositivi testati
» 15% di tutti i dispositivi testati in questa classe è stato migliore, 4% similare, 82% peggiore
» Il migliore ha avuto un delta di 4%, medio di 23%, peggiore di 134%
Lenovo Legion Pro 5 16IRX8 analisi audio
(±) | potenza degli altiparlanti media ma buona (72.7 dB)
Bassi 100 - 315 Hz
(-) | quasi nessun basso - in media 23.7% inferiori alla media
(±) | la linearità dei bassi è media (10.7% delta rispetto alla precedente frequenza)
Medi 400 - 2000 Hz
(+) | medi bilanciati - solo only 3.8% rispetto alla media
(±) | linearità dei medi adeguata (7.1% delta rispetto alla precedente frequenza)
Alti 2 - 16 kHz
(+) | Alti bilanciati - appena 3.7% dalla media
(+) | alti lineari (6.7% delta rispetto alla precedente frequenza)
Nel complesso 100 - 16.000 Hz
(±) | la linearità complessiva del suono è media (21.9% di differenza rispetto alla media
Rispetto alla stessa classe
» 79% di tutti i dispositivi testati in questa classe è stato migliore, 6% simile, 16% peggiore
» Il migliore ha avuto un delta di 6%, medio di 18%, peggiore di 132%
Rispetto a tutti i dispositivi testati
» 63% di tutti i dispositivi testati in questa classe è stato migliore, 7% similare, 30% peggiore
» Il migliore ha avuto un delta di 4%, medio di 23%, peggiore di 134%
Gestione dell'energia: Elevato consumo al minimo, minore durata della batteria
Consumo di energia
Con 20 watt, il consumo energetico in idle è molto elevato, anche per un sistema Intel HX, mentre i sistemi AMD HS offrono i risultati migliori tra i concorrenti di Acer.
175 watt quando si gioca è relativamente basso, tuttavia quasi tutti i portatili RTX 4060 registrano questo valore poiché la GPU raggiunge la sua velocità di clock massima a 100 watt. i 240 e i 276 watt vengono raggiunti solo nei test di stress quotidiani (e non tipici) e vengono facilmente assorbiti dall'alimentatore da 330 watt.
| Off / Standby | |
| Idle | |
| Sotto carico |
|
Leggenda:
min: | |
| Acer Predator Helios 16 PH16-71-731Q i7-13700HX, GeForce RTX 4060 Laptop GPU, Micron 3400 1TB MTFDKBA1T0TFH, IPS-LED, 2560x1600, 16" | Acer Nitro 16 AN16-41 R7 7735HS, GeForce RTX 4070 Laptop GPU, Samsung PM9A1 MZVL21T0HCLR, IPS, 2560x1600, 16" | Lenovo Legion Pro 5 16IRX8 i7-13700HX, GeForce RTX 4060 Laptop GPU, SK hynix PC801 HFS512GEJ9X115N, IPS, 2560x1600, 16" | Aorus 15X ASF i7-13700HX, GeForce RTX 4070 Laptop GPU, Gigabyte AG470S1TB-SI B10, IPS, 2560x1440, 15.6" | Asus TUF Gaming A16 FA617 R7 7735HS, Radeon RX 7600S, Micron 2400 MTFDKBA1T0QFM, IPS-Level, 1920x1200, 16" | Dell G15 5530 i7-13650HX, GeForce RTX 4060 Laptop GPU, SSTC CL4-3D512-Q11, IPS, 1920x1080, 15.6" | Media NVIDIA GeForce RTX 4060 Laptop GPU | Media della classe Gaming | |
|---|---|---|---|---|---|---|---|---|
| Power Consumption | 11% | -24% | 6% | 29% | 18% | 18% | 2% | |
| Idle Minimum * (Watt) | 15.9 | 11.6 27% | 24.5 -54% | 11 31% | 8 50% | 8.4 47% | 11.5 ? 28% | 13 ? 18% |
| Idle Average * (Watt) | 20.5 | 15.6 24% | 29.2 -42% | 16 22% | 11 46% | 14.98 27% | 16 ? 22% | 19 ? 7% |
| Idle Maximum * (Watt) | 20.9 | 16.5 21% | 34.3 -64% | 24 -15% | 16 23% | 15.56 26% | 20.3 ? 3% | 24.6 ? -18% |
| Load Average * (Watt) | 106 | 155 -46% | 98.7 7% | 104 2% | 97 8% | 96.8 9% | 92.9 ? 12% | 110.7 ? -4% |
| Witcher 3 ultra * (Watt) | 175 | 154.8 12% | 178.6 -2% | 185.4 -6% | 161.5 8% | 186 -6% | ||
| Load Maximum * (Watt) | 276 | 205 26% | 249.6 10% | 272 1% | 168 39% | 271.42 2% | 210 ? 24% | 259 ? 6% |
* ... Meglio usare valori piccoli
Power consumption Witcher 3 / stress test
Power consumption with an external monitor
Durata della batteria
Con una luminosità di 150 cd/m² durante la navigazione in Internet e una frequenza di aggiornamento variabile da 120 a 240 Hz, la durata della batteria dell'Helios 16 supera di poco le 5,5 ore ed è all'incirca nella media dei portatili da gioco. I sistemi AMD, l'Acer Nitro 16eAsus TUF Gaming A16hanno un'autonomia molto più lunga, rispettivamente di 9 e 12 ore. Con sole 3,5 ore, ilLegion Pro 5 16 si colloca in coda.
Dopo mezz'ora, la batteria viene nuovamente caricata al 50% e il 100% richiede circa 1,15 ore. È possibile caricare il portatile anche tramite USB-C, ma la ricarica è più lenta.
| Acer Predator Helios 16 PH16-71-731Q i7-13700HX, GeForce RTX 4060 Laptop GPU, 90 Wh | Acer Nitro 16 AN16-41 R7 7735HS, GeForce RTX 4070 Laptop GPU, 90 Wh | Lenovo Legion Pro 5 16IRX8 i7-13700HX, GeForce RTX 4060 Laptop GPU, 80 Wh | Aorus 15X ASF i7-13700HX, GeForce RTX 4070 Laptop GPU, 99 Wh | Asus TUF Gaming A16 FA617 R7 7735HS, Radeon RX 7600S, 90 Wh | Dell G15 5530 i7-13650HX, GeForce RTX 4060 Laptop GPU, 86 Wh | Media della classe Gaming | |
|---|---|---|---|---|---|---|---|
| Autonomia della batteria | 65% | -46% | 48% | 58% | -9% | 33% | |
| H.264 (h) | 4.8 | 10.2 113% | 7.9 65% | 6.8 42% | 8.32 ? 73% | ||
| WiFi v1.3 (h) | 5.6 | 9 61% | 3.4 -39% | 8.2 46% | 12.1 116% | 6.5 16% | 7.11 ? 27% |
| Witcher 3 ultra (h) | 1.5 | 0.8 -47% | |||||
| Load (h) | 1.5 | 1.8 20% | 0.7 -53% | 2 33% | 1.5 0% | 0.8 -47% | 1.502 ? 0% |
| Reader / Idle (h) | 12.2 | 6.7 | 11.3 | 20.2 | 8.27 ? |
Pro
Contro
Verdetto: il solido laptop da gioco RTX 4060 può anche essere silenzioso
Il portatile da gioco Acer Predator Helios 16 ha molti punti di forza ma anche alcuni piccoli compromessi. Siamo rimasti positivamente sorpresi dal display QHD a 240 Hz, veloce e dai colori vividi, con il 97% di DCI P3 e Dolby Vision: nulla ostacola il lavoro creativo.
In combinazione con la potenza della CPU Intel HX e una altrettanto potenteRTX 4060si ottiene un portatile da gioco di fascia media con molti elementi di fascia alta.
Siamo rimasti colpiti anche dal case in metallo, nonostante la tastiera si fletta un po'. I tasti stessi avrebbero bisogno di un feedback maggiore, ma, al contrario, abbiamo apprezzato l'illuminazione dei tasti a mini-LED dai colori particolarmente vivaci e a risparmio energetico. Tuttavia, la durata della batteria è mediocre e probabilmente sarà ancora più breve quando si utilizza il display mini-LED disponibile come opzione, soprattutto se abbinato alla SKU più potente (Core i9-13900HX)Core i9-13900HX + RTX 4080).
Prestazioni di alto livello, un vivido display QHD a 240 Hz e la tranquillità durante il gioco sono la ricetta ideale per un portatile da gioco e una workstation creativa. Tuttavia, dobbiamo accettare alcuni compromessi.
Il potente sistema di raffreddamento aiuta a mantenere basse le temperature interne, garantendo prestazioni silenziose e stabili, in particolare nelle modalità bilanciata o silenziosa. Ci mancava la possibilità di personalizzare i limiti di potenza per spingere il sistema di raffreddamento ai suoi limiti. Il throttling dell'SSD legato alle temperature sembra essere una macchia su un quadro generale altrimenti positivo, con un limite apparentemente eccessivo di 25 watt per la CPU in modalità batteria.
Con la SKU della variante recensita, il portatile costa attualmente 1.900 e 1.750 dollari, rispettivamente, ma è occasionalmente possibile acquistare anche un modello più economico per circa 1.450 dollari con un display leggermente meno colorato a 165 Hz. Tuttavia, è spesso possibile trovare il suo principale concorrente, il Lenovo Legion Pro 5 16 per circa 1.400 dollari con il dispositivo che offre quasi gli stessi vantaggi. Le differenze si notano solo nei dettagli, come l'assenza di Advanced Optimus, una tastiera migliore e un display QHD a 165 Hz privo di copertura DCI P3.
Inoltre, l'Asus ROG Strix G16 Recensione del portatile Asus ROG Strix G16 G614JZ: Preparare il terreno per la RTX 4080 è un'opzione interessante, viene fornito con una RTX 4060 e costa circa 1.800 dollari. Con questo investimento si ottengono anche altoparlanti migliori, una maggiore durata della batteria, una tastiera con un feedback più pronunciato e tempi di risposta del display più rapidi.
Prezzo e disponibilità
L'Acer Predator Helios 16 con il numero di modello PH16-71-74UU (Core i7-13700HX, RTX 4060 e display a 165 Hz) costa attualmente 1.650 dollari su Amazon. Il modello mini-LED, abbinato a un Core i9-13900HX e RTX 4080, è attualmente esaurito.
Acer Predator Helios 16 PH16-71-731Q
- 07/05/2023 v7 (old)
Marvin Gollor
Transparency
La selezione dei dispositivi da recensire viene effettuata dalla nostra redazione. Il campione di prova è stato fornito all'autore come prestito dal produttore o dal rivenditore ai fini di questa recensione. L'istituto di credito non ha avuto alcuna influenza su questa recensione, né il produttore ne ha ricevuto una copia prima della pubblicazione. Non vi era alcun obbligo di pubblicare questa recensione. In quanto società mediatica indipendente, Notebookcheck non è soggetta all'autorità di produttori, rivenditori o editori.
Ecco come Notebookcheck esegue i test
Ogni anno, Notebookcheck esamina in modo indipendente centinaia di laptop e smartphone utilizzando procedure standardizzate per garantire che tutti i risultati siano comparabili. Da circa 20 anni sviluppiamo continuamente i nostri metodi di prova e nel frattempo stabiliamo gli standard di settore. Nei nostri laboratori di prova, tecnici ed editori esperti utilizzano apparecchiature di misurazione di alta qualità. Questi test comportano un processo di validazione in più fasi. Il nostro complesso sistema di valutazione si basa su centinaia di misurazioni e parametri di riferimento ben fondati, che mantengono l'obiettività.Price comparison

