Recensione del portatile Asus ROG Flow X16: 2-in-1 con mini-LED
Un display mini-LED da 1.100 nit fa il suo debutto nell'Asus ROG Flow X16, che trae la sua unicità anche dal design convertibile. Una RTX 3070 Ti con 125 watt di TGP lo rende un vero e proprio notebook da gioco con caratteristiche multimediali di alto livello, molto attese da molti.
Abbiamo potuto esaminare in dettaglio un dispositivo campione di pre-produzione. Poiché il modello in esame è rappresentativo del modello di produzione (secondo Asus), ci siamo presi la libertà di assegnargli una valutazione. Sono previste piccole modifiche al dispositivo fino alla versione di produzione finale, che si rifletteranno di conseguenza negli aggiornamenti di questa recensione. Stiamo anche esaminando il dock grafico ROG XG Mobile (disponibile separatamente) con la sua GPU GeForce RTX 3080 Laptop sul Flow X16 (un test simile è stato effettuato anche con il ROG Flow X13 l'anno scorso) e forniremo presto i risultati come aggiornamento di questa recensione.
L'Asus ROG Flow X16 forma la serie di laptop da gioco 2-in-1 di Asus insieme al suo popolare e quasi altrettanto unico fratello, ilROG Flow X13dello scorso anno, così come il ROG Flow Z13 (tablet 2-in1)il display QHD da 16 pollici in formato 16:10 offre un livello di nero simile a quello degli OLED grazie al mini-LED e pubblicizza anche la copertura dello spazio colore DCI-P3 per l'editing professionale delle immagini. Il touchscreen con supporto per l'input tramite penna è plausibilmente utile per i lavori creativi Ryzen 6900HS di AMD di AMD promette un grande potenziale. Sebbene tutte queste specifiche siano meravigliose sulla carta, la nostra recensione rivela fino a che punto questa potenza grezza può essere pienamente utilizzata nel compatto convertibile Asus e quali potrebbero essere gli eventuali svantaggi
Il nostro modello campione di Asus Rog Flow X16 con Nvidia GeForce RTX 3070 Ti, 32 GB di RAM e un'unità SSD da 1 TB non sembra essere ancora disponibile su larga scala. A seconda del luogo in cui ci si trova, possono essere disponibili configurazioni identiche (ovvero hardware identico con layout della tastiera specifico della regione) o leggermente diverse a prezzi variabili, di solito a partire da circa 2500,00 dollari. Per ulteriori dettagli si veda la sezione "Prezzo e disponibilità" alla fine di questa recensione.
I concorrenti diretti del convertibile da gioco da 16 pollici, unico e compatto, sono pochi. Tuttavia, l'Asus Rog Flow X16 è progettato principalmente per attività creative, multimediali e di gioco, quindi lo abbiamo confrontato con i seguenti notebook: Recensione del Gigabyte Aero 16 YE5: Notebook multimediale compatto 4K Gigabyte Aero 16, MSI Stealth GS66, Lenovo Legion 5 Pro, Lenovo ThinkPad X1 Extreme, MacBook Pro 16 (2021), Surface Laptop Studio di Microsoft, XPS 17 compatto di Dell e Zephyrus M16 di Asus.
Quest'ultimo è simile al ROG X16 Flow sotto molti aspetti, che abbiamo sottolineato in vari punti della nostra recensione. Il confronto con il più piccolo ROG Flow X13 è certamente interessante, così come il confronto con i tradizionali e spessi colossi da gioco come ROG Strix Scar 15 Asus. Il convertibile HP Spectre 16 con un Intel Core i7-12700H, grafica Arc di fascia media e uno schermo touchscreen OLED 3K sarà disponibile intorno alla fine di agosto e potrebbe essere interessante anche per un gruppo target non interessato principalmente al gioco. Secondo quanto riferito, anche Legion Slim 7i di Lenovo utilizzerà un mini-LED.
Potenziali concorrenti a confronto
Punteggio | Data | Modello | Peso | Altezza | Dimensione | Risoluzione | Prezzo |
|---|---|---|---|---|---|---|---|
| 89.5 % v7 (old) | 08/2022 | Asus ROG Flow X16 GV601RW-M5082W R9 6900HS, GeForce RTX 3070 Ti Laptop GPU | 2.1 kg | 19.4 mm | 16.10" | 2560x1600 | |
| 85.6 % v7 (old) | 07/2021 | Asus ROG Zephyrus M16 GU603H i9-11900H, GeForce RTX 3070 Laptop GPU | 2 kg | 20 mm | 16.00" | 2560x1600 | |
| 86.3 % v7 (old) | 06/2022 | Asus ROG Strix Scar 15 G533ZW-LN106WS i9-12900H, GeForce RTX 3070 Ti Laptop GPU | 2.3 kg | 27.2 mm | 15.60" | 2560x1440 | |
| 84.7 % v7 (old) | 03/2022 | Gigabyte Aero 16 YE5 i9-12900HK, GeForce RTX 3080 Ti Laptop GPU | 2.3 kg | 22.4 mm | 16.00" | 3840x2400 | |
| 88 % v7 (old) | 03/2022 | Lenovo Legion 5 Pro 16 G7 i7 RTX 3070Ti i7-12700H, GeForce RTX 3070 Ti Laptop GPU | 2.6 kg | 26.6 mm | 16.00" | 2560x1600 | |
| 84.5 % v7 (old) | 02/2022 | MSI Stealth GS66 12UGS i7-12700H, GeForce RTX 3070 Ti Laptop GPU | 2.2 kg | 19.8 mm | 15.60" | 2560x1440 | |
| 93.2 % v7 (old) | 11/2021 | Apple MacBook Pro 16 2021 M1 Pro M1 Pro, M1 Pro 16-Core GPU | 2.2 kg | 16.8 mm | 16.20" | 3456x2234 | |
| 88.3 % v7 (old) | 12/2021 | Lenovo ThinkPad X1 Extreme G4-20Y50040GE i9-11950H, GeForce RTX 3080 Laptop GPU | 1.9 kg | 18.2 mm | 16.00" | 3840x2400 | |
| 88.8 % v7 (old) | 06/2022 | Dell XPS 17 9720 RTX 3060 i7-12700H, GeForce RTX 3060 Laptop GPU | 2.5 kg | 19.5 mm | 17.00" | 3840x2400 | |
| 89 % v7 (old) | 03/2022 | Microsoft Surface Laptop Studio i7 RTX 3050 Ti i7-11370H, GeForce RTX 3050 Ti Laptop GPU | 1.8 kg | 19 mm | 14.40" | 2400x1600 | |
| 84.7 % v7 (old) | 02/2021 | Asus ROG Flow X13 GV301QH R9 5980HS, GeForce GTX 1650 Max-Q | 1.4 kg | 15.8 mm | 13.40" | 3840x2400 |
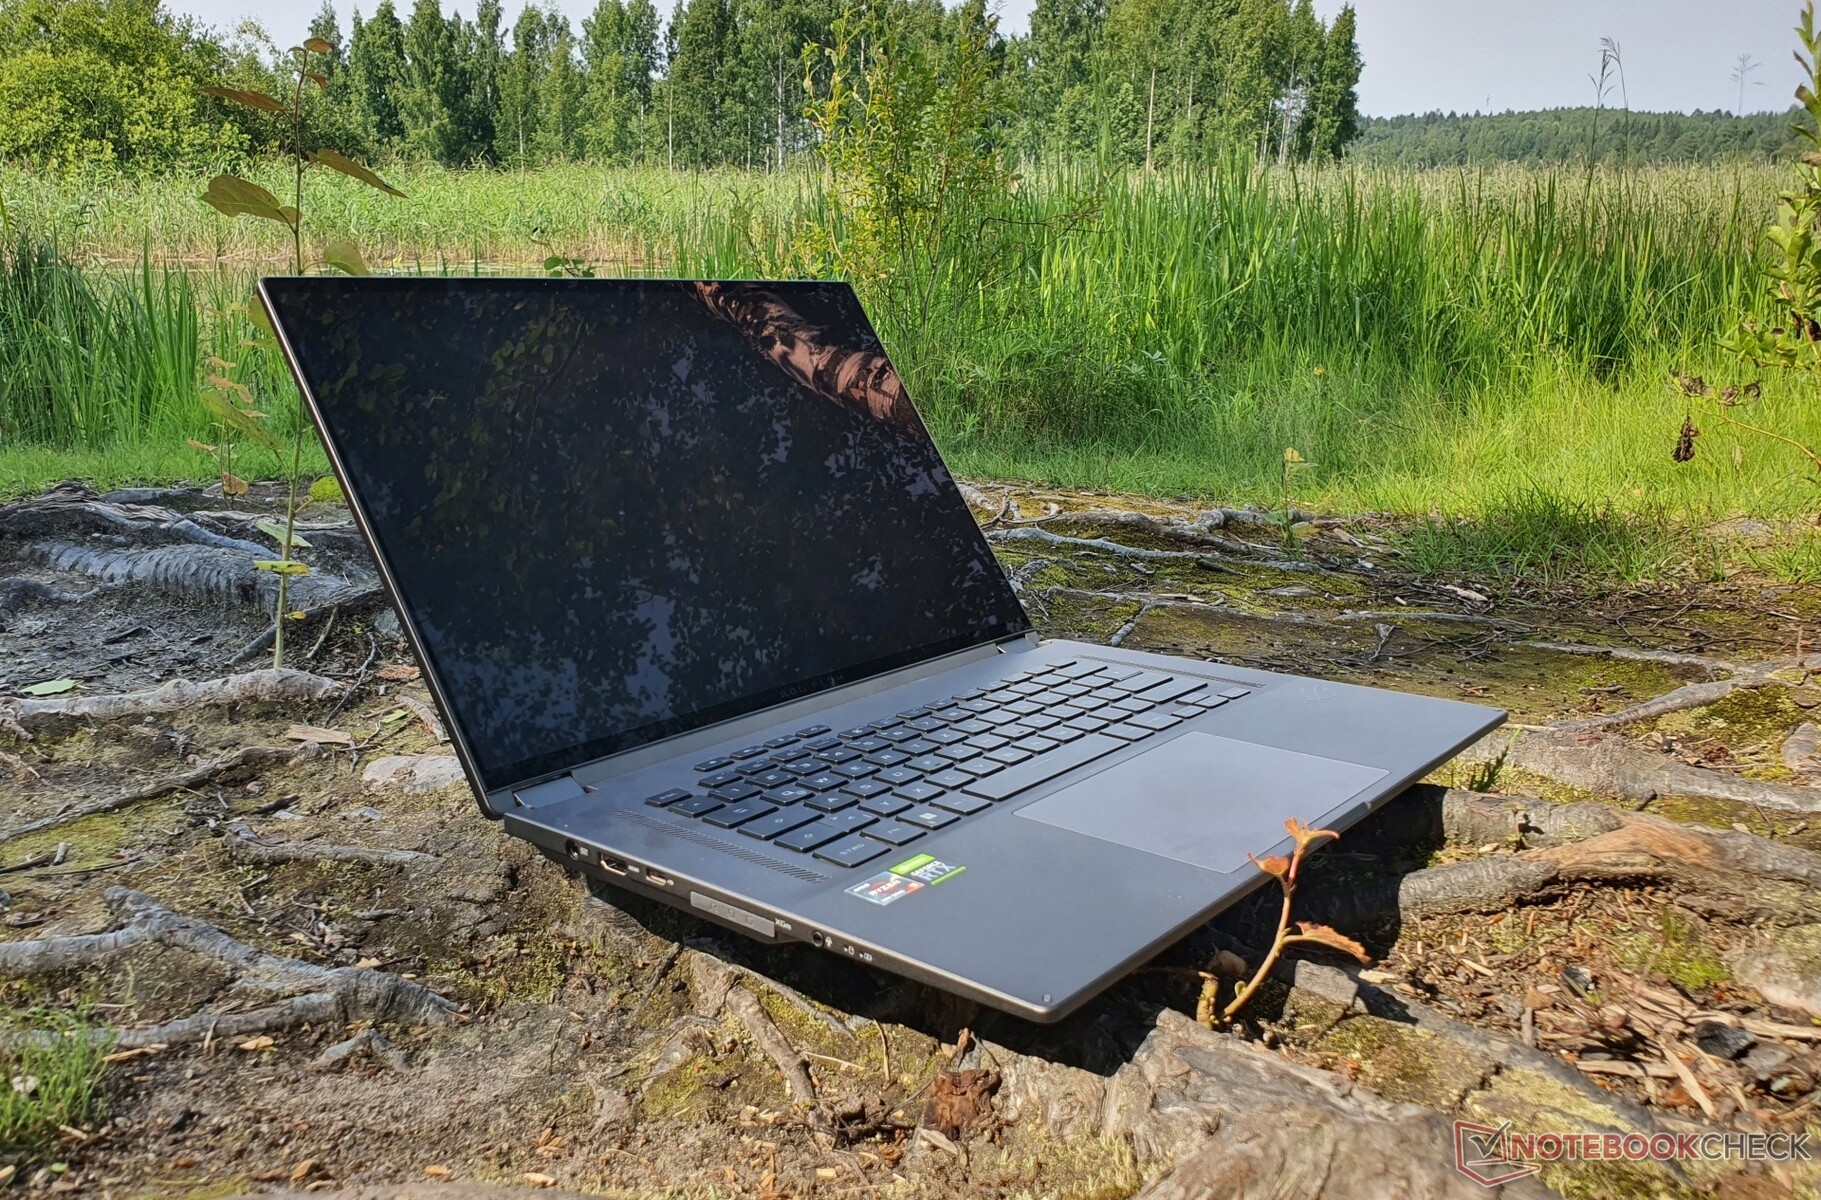
Custodia - Stabile portatile da gioco di Asus
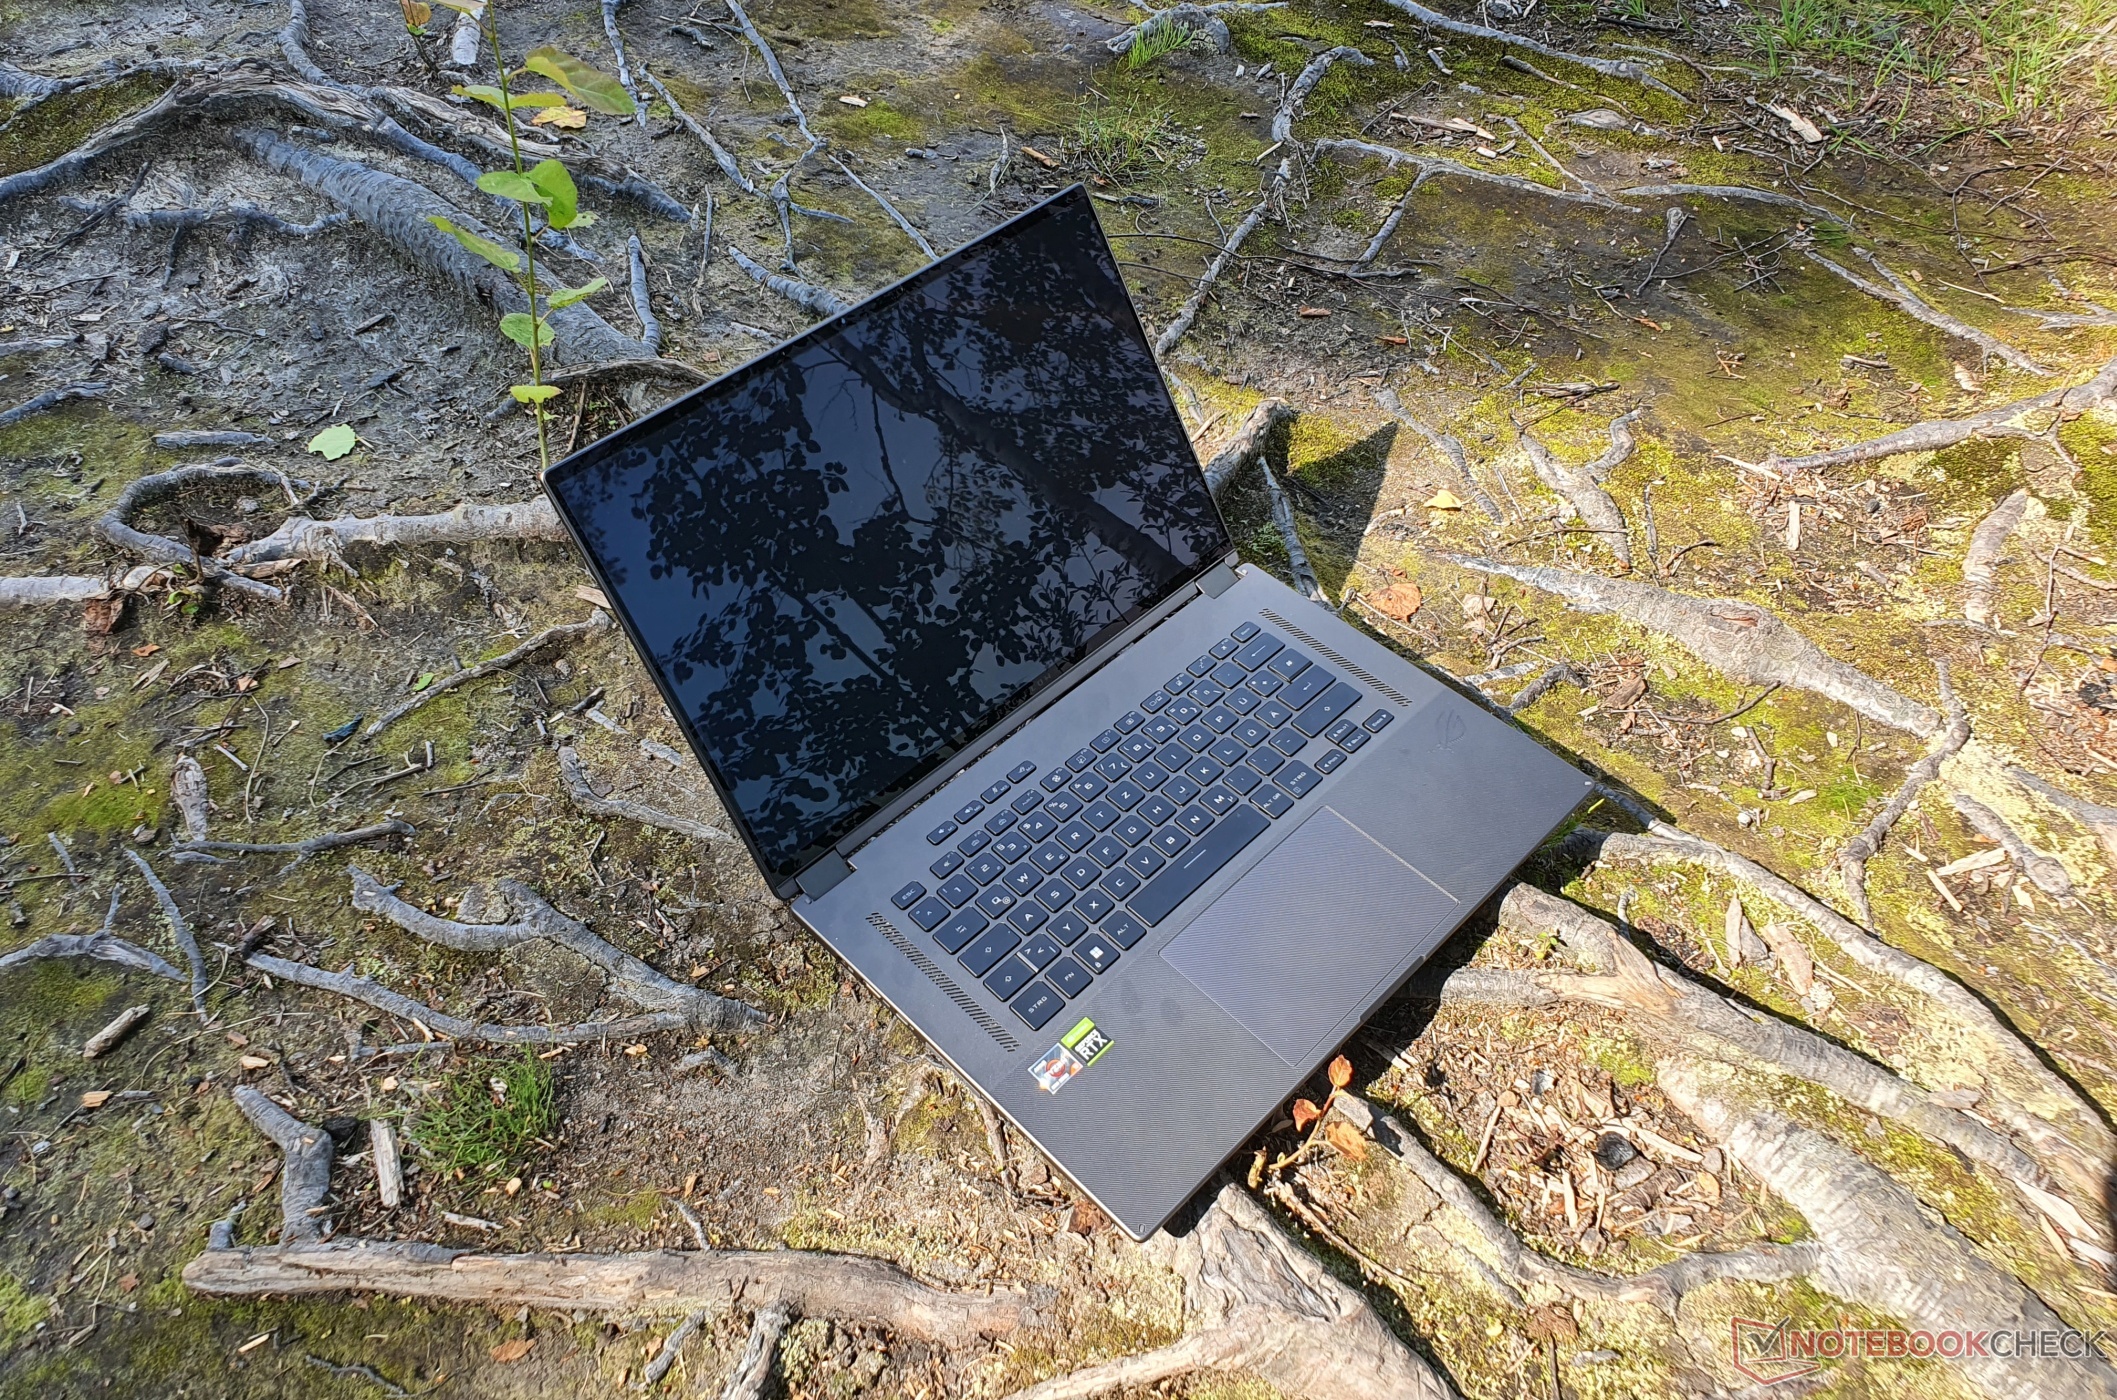
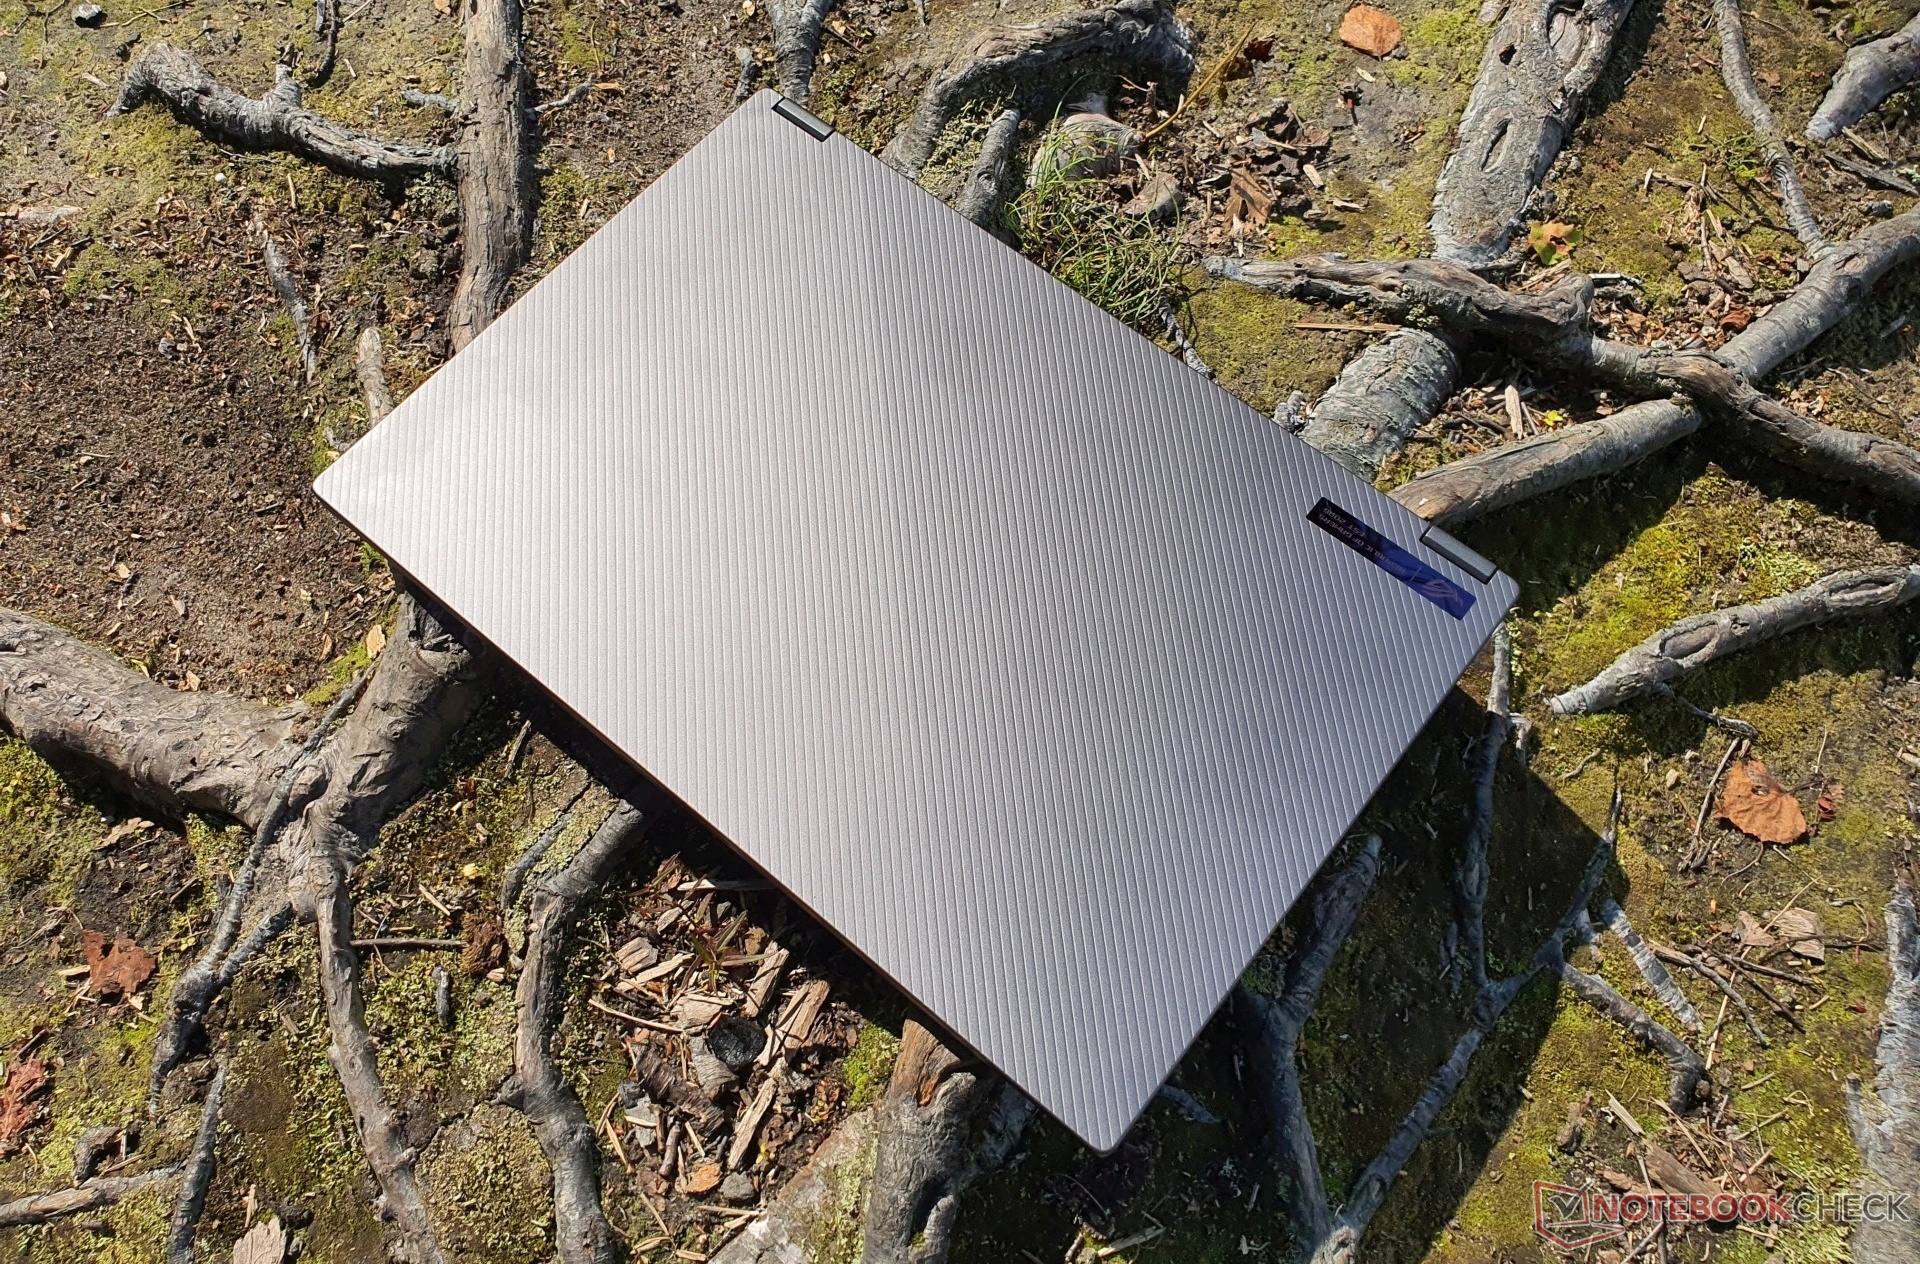
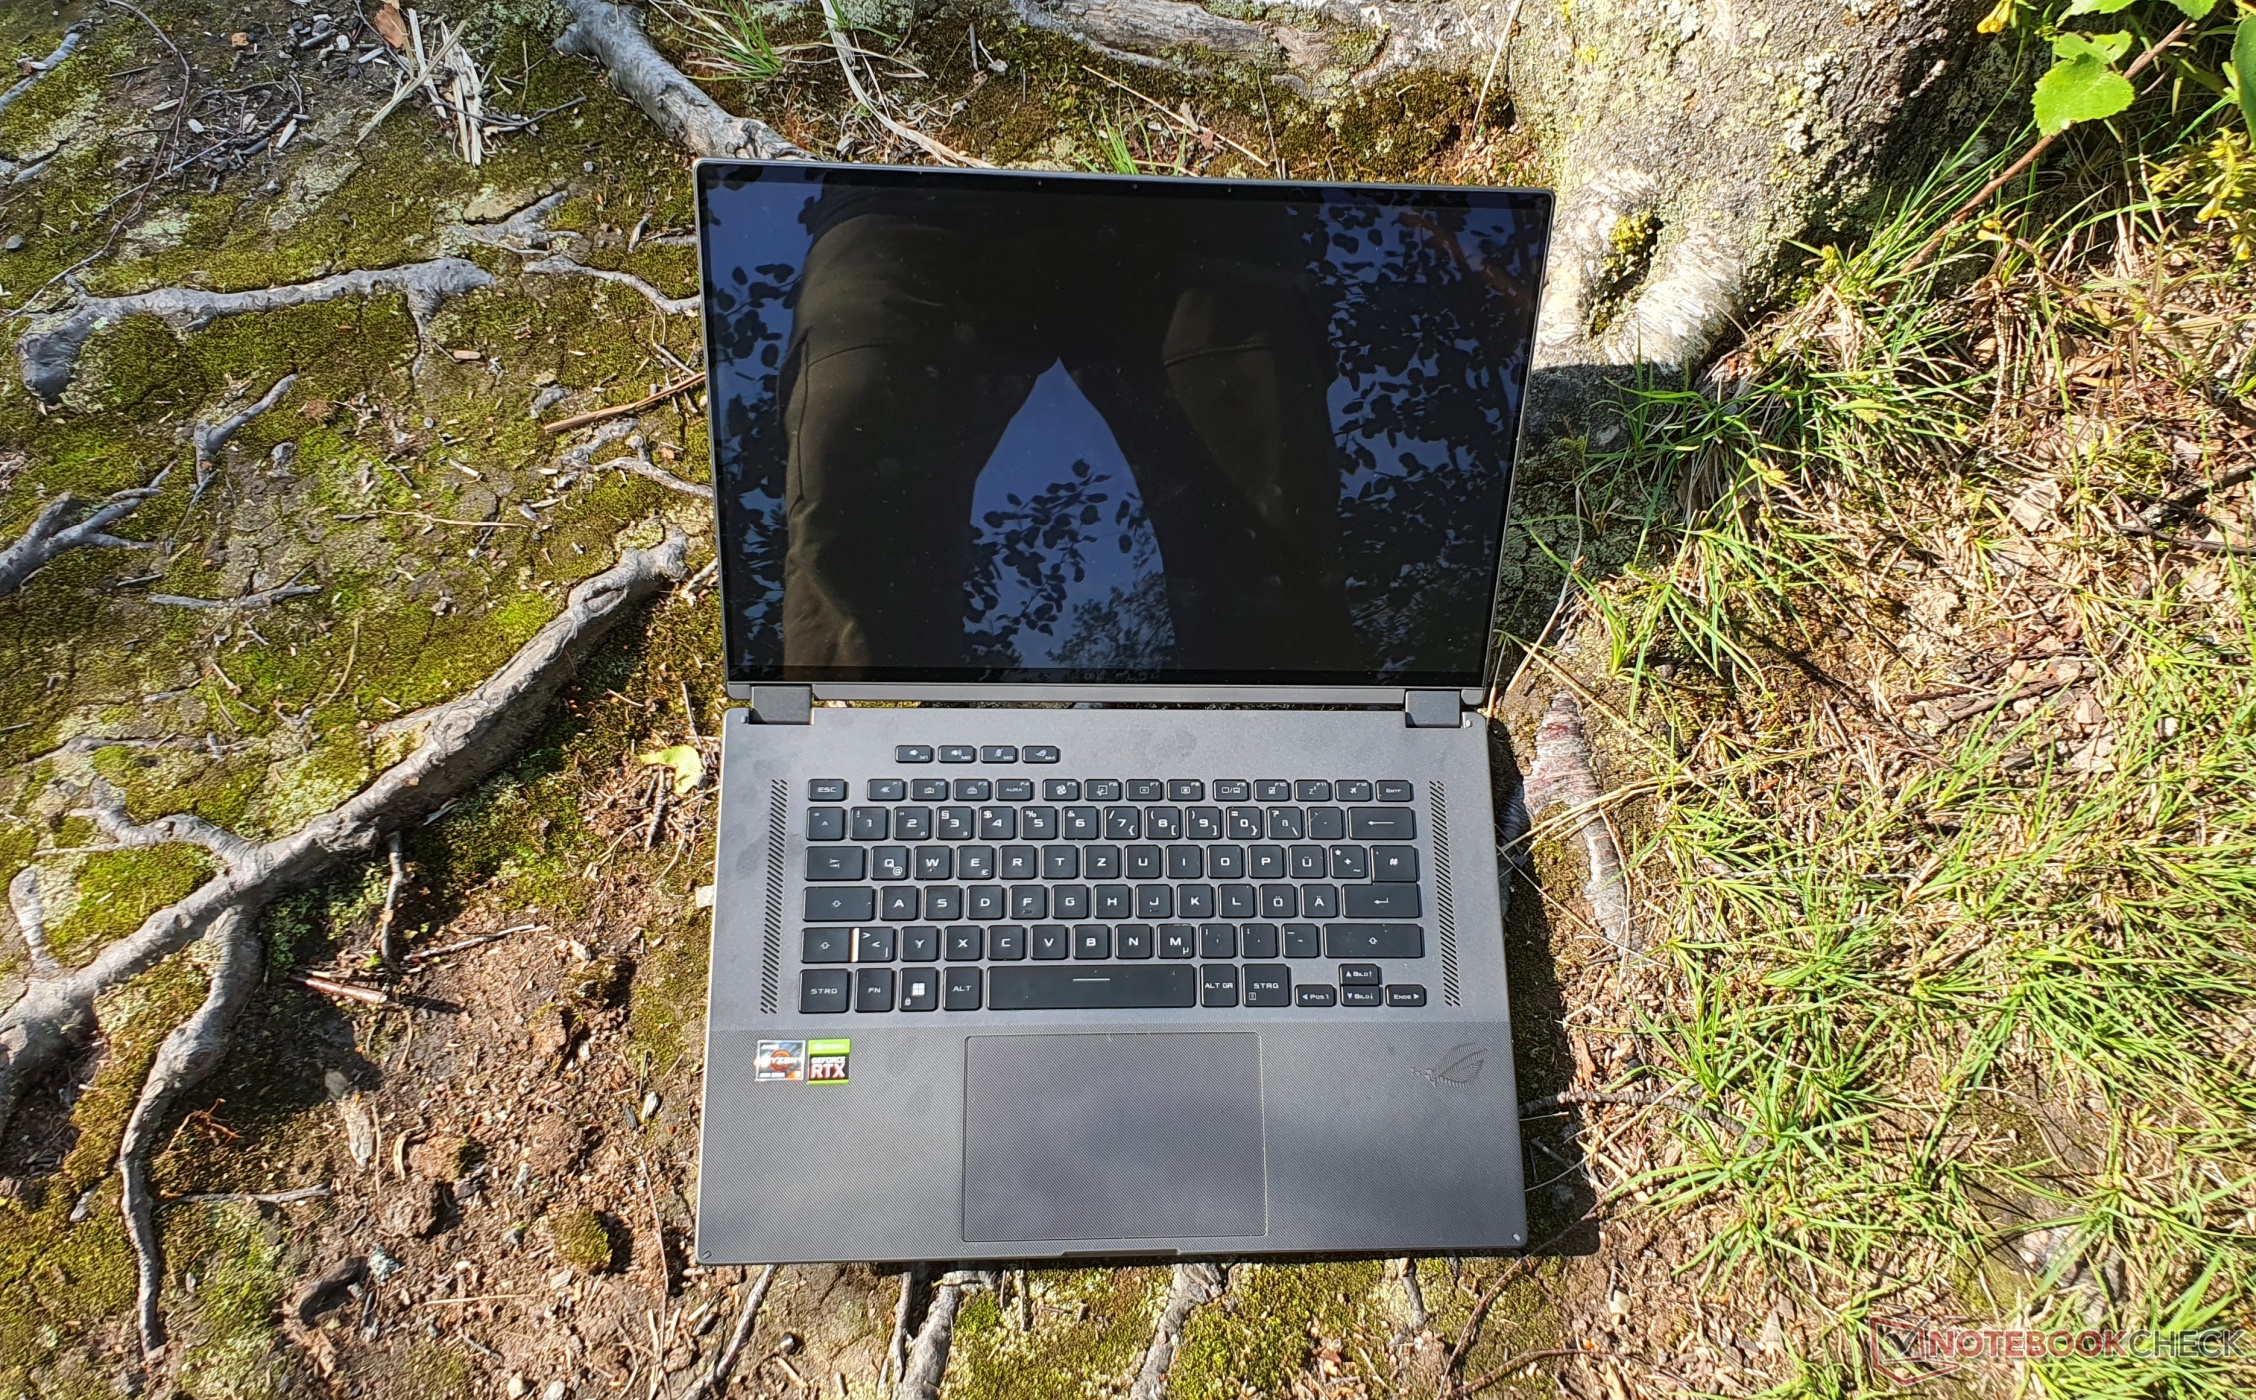
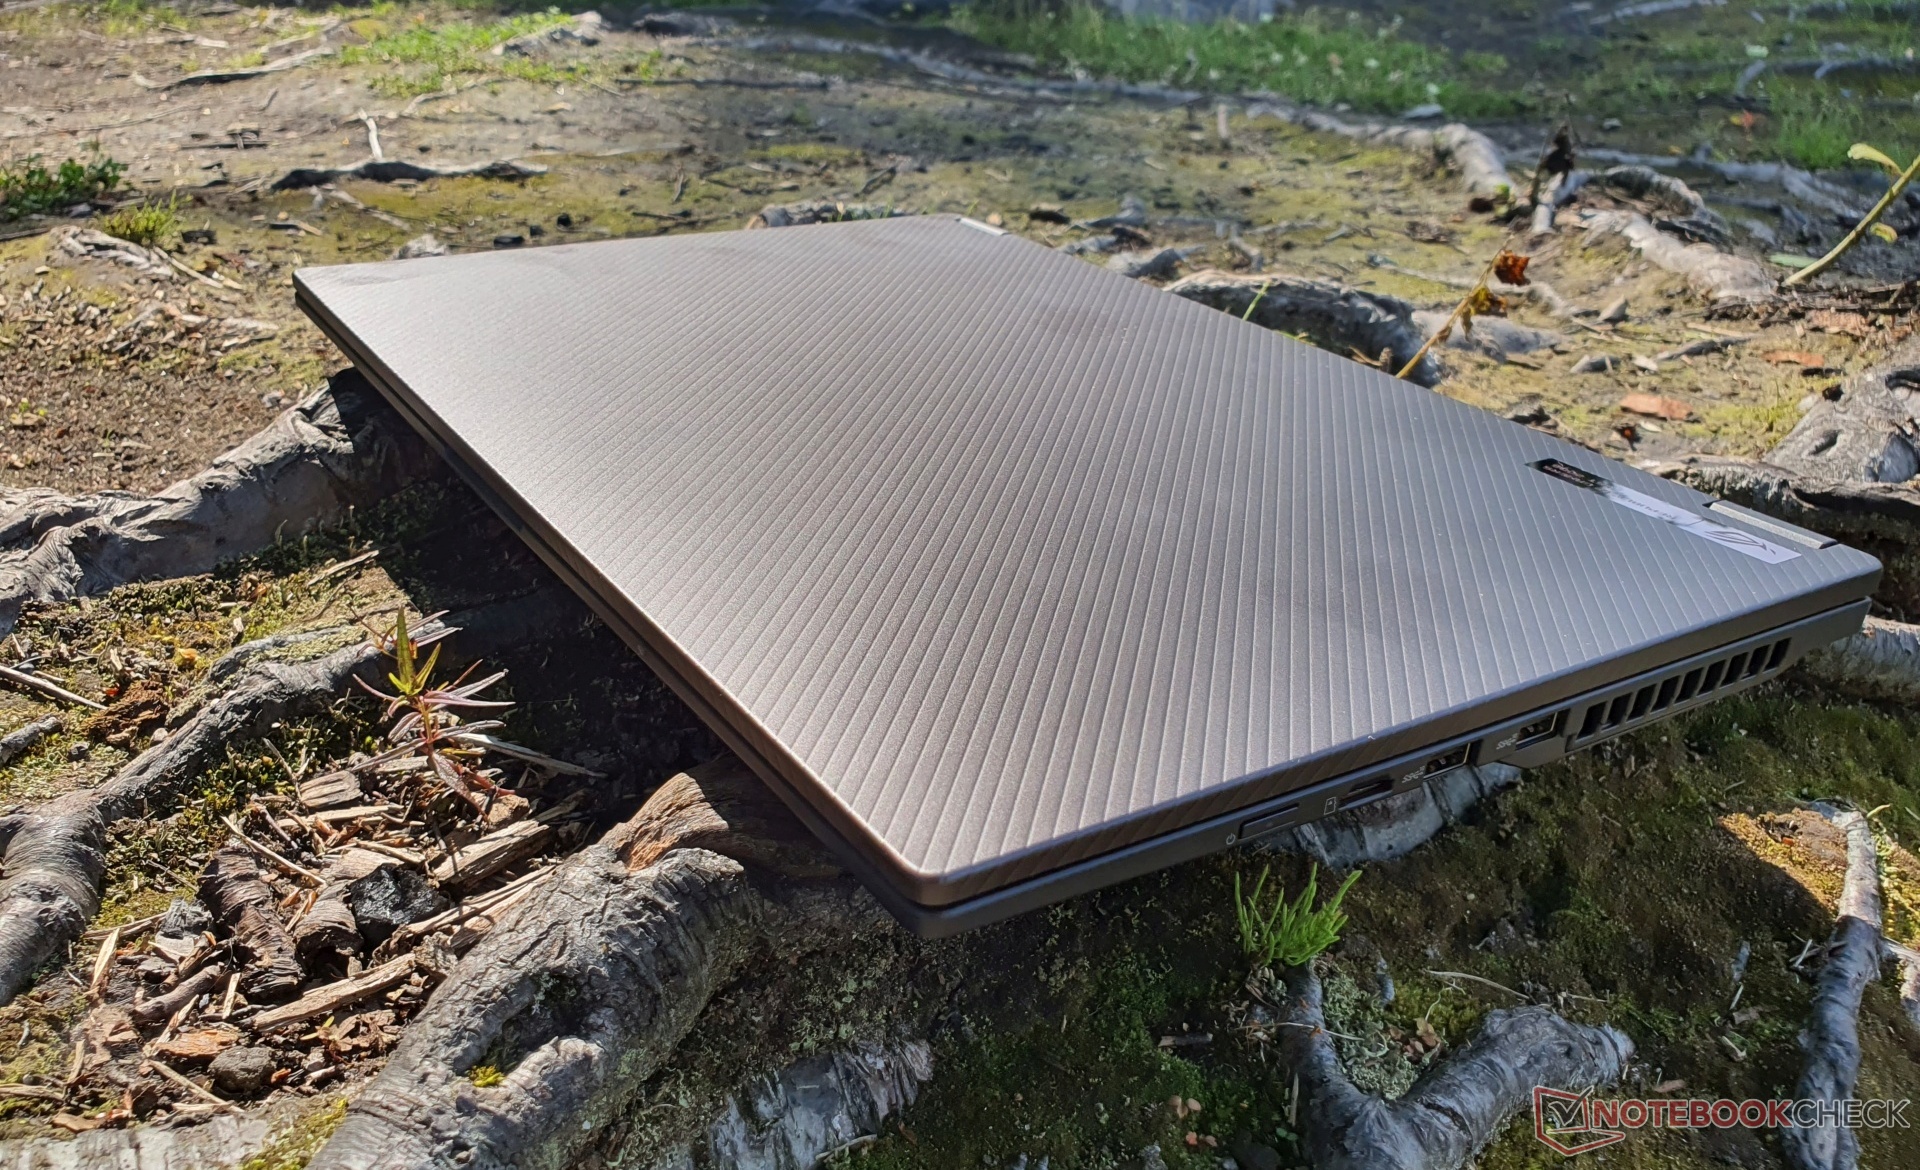
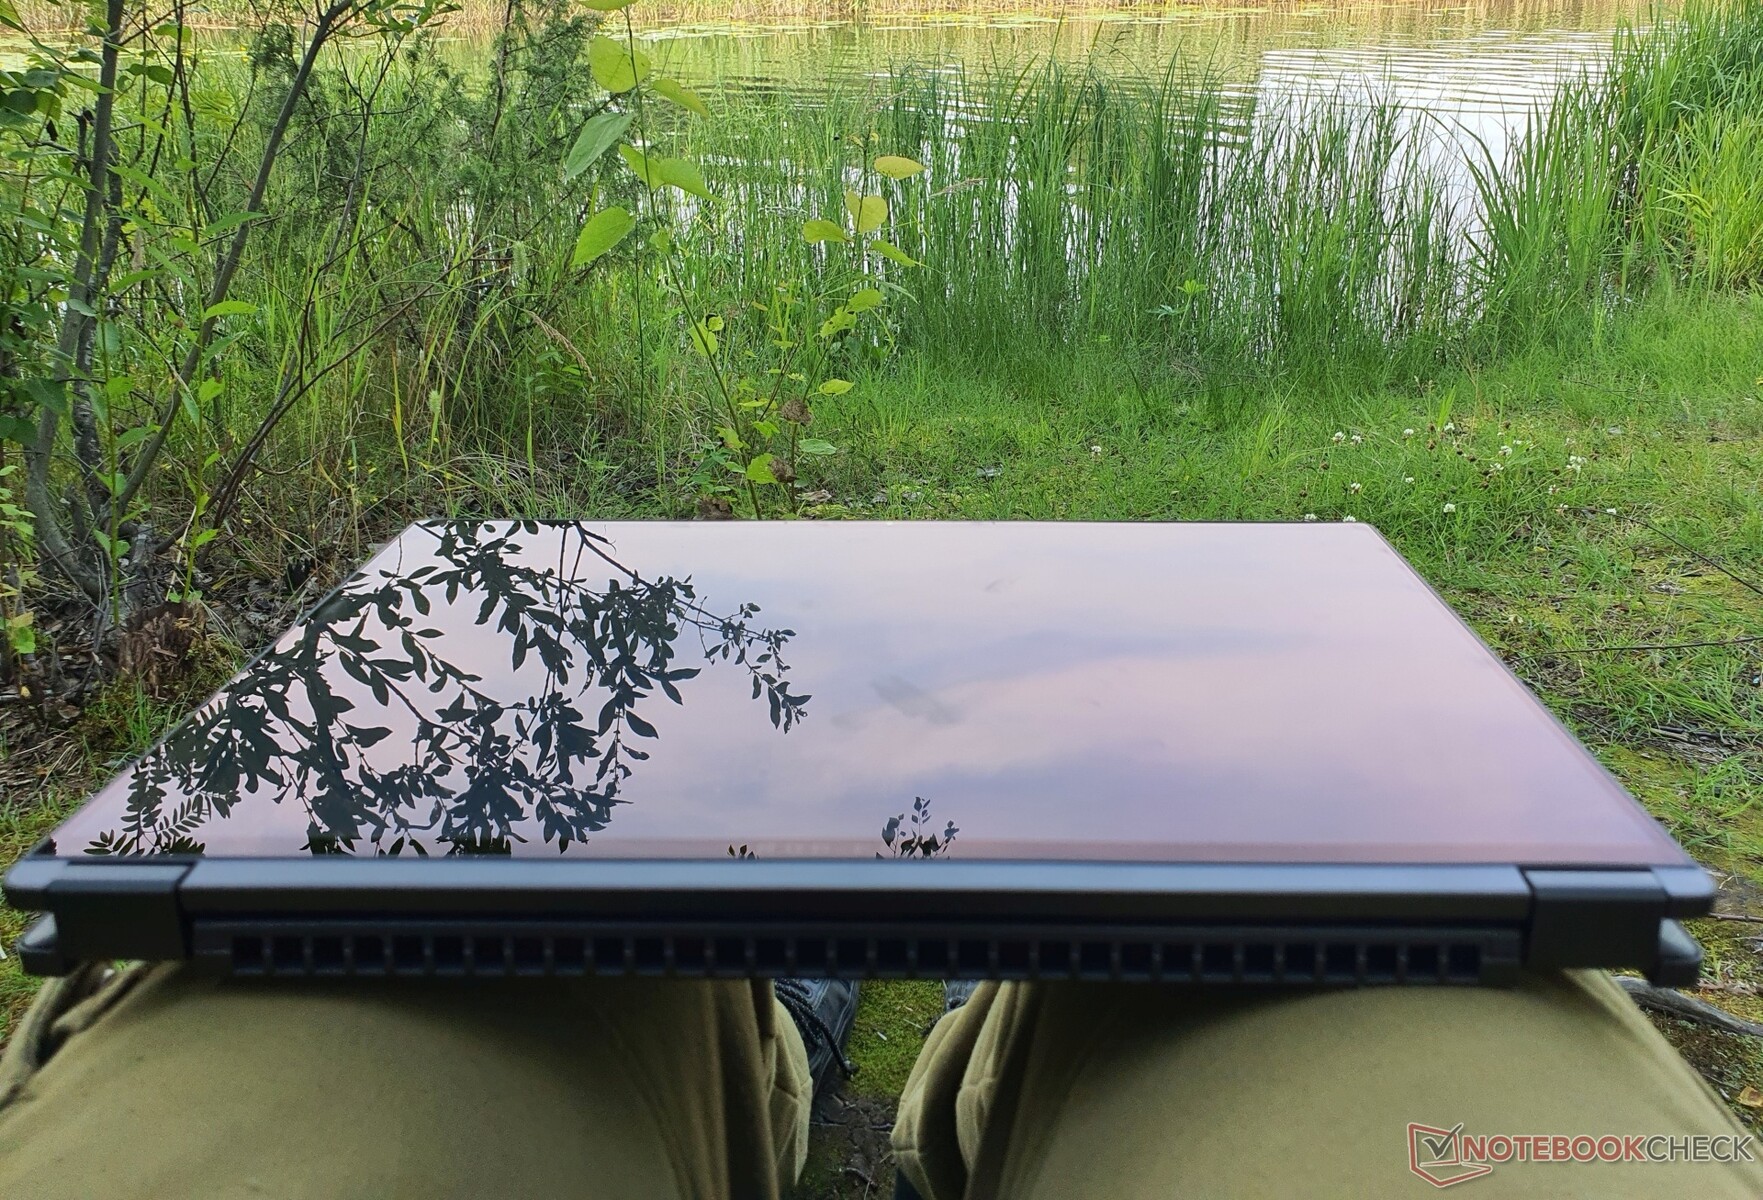
In linea di principio, il ROG Flow X16 è un mix del più piccoloFlow X13 e lo Zephyrus M16la caratteristica scanalatura sul coperchio in plastica grigio ferro del primo è stata replicata, così come la forma generale e la silhouette, solo in dimensioni maggiori. L'unità di base, compresa la piastra di base, ricorda lo Zephyrus M16.
Asus utilizza molto magnesio, per cui il dispositivo risulta complessivamente di alta qualità. Tuttavia, il coperchio e la base sono realizzati in plastica morbida e sono particolarmente suscettibili ai graffi. Questo riduce un po' la nostra impressione inizialmente positiva.
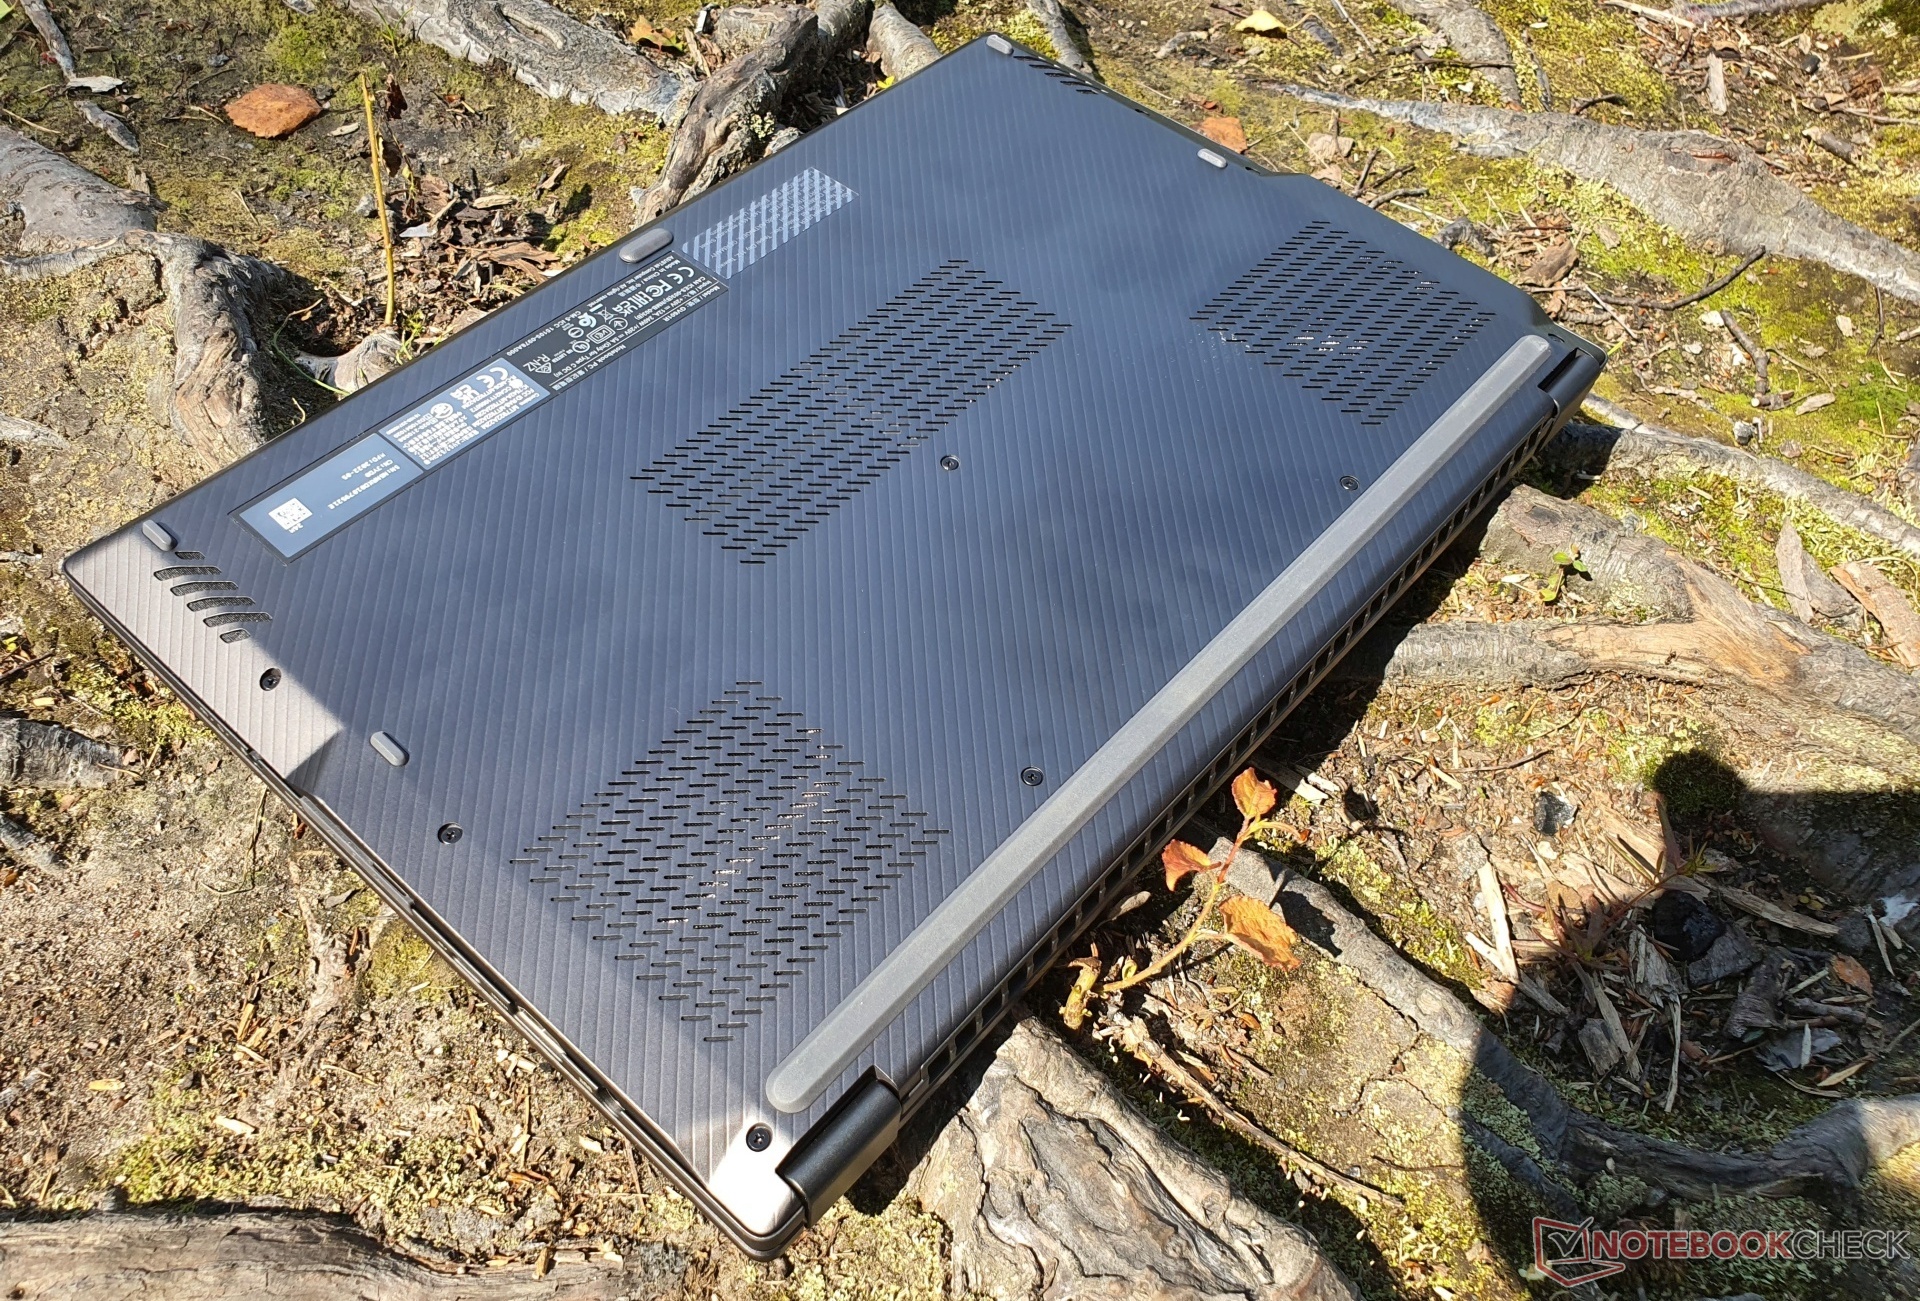
Una pressione mirata sul retro del display non causa distorsioni dell'immagine e la piastra di base è tenuta in posizione da 13 viti. Una volta staccato dall'unità, tuttavia, il basamento si rivela un pezzo di plastica flessibile.
La lavorazione è di alto livello, l'unità di base non può essere attorcigliata e anche il display lascia poco spazio alla torsione. Dal punto di vista tattile, le superfici leggermente ruvide hanno un'ottima sensazione. Il pattern del coperchio è replicato in forma esclusivamente ottica anche sul palm rest, compreso il touchpad. Le impronte digitali sono immediatamente visibili, ma si prevede che la versione finale del Flow X16 non adotterà il motivo ondulato, utilizzando invece uno speciale rivestimento per tenere a bada le impronte.
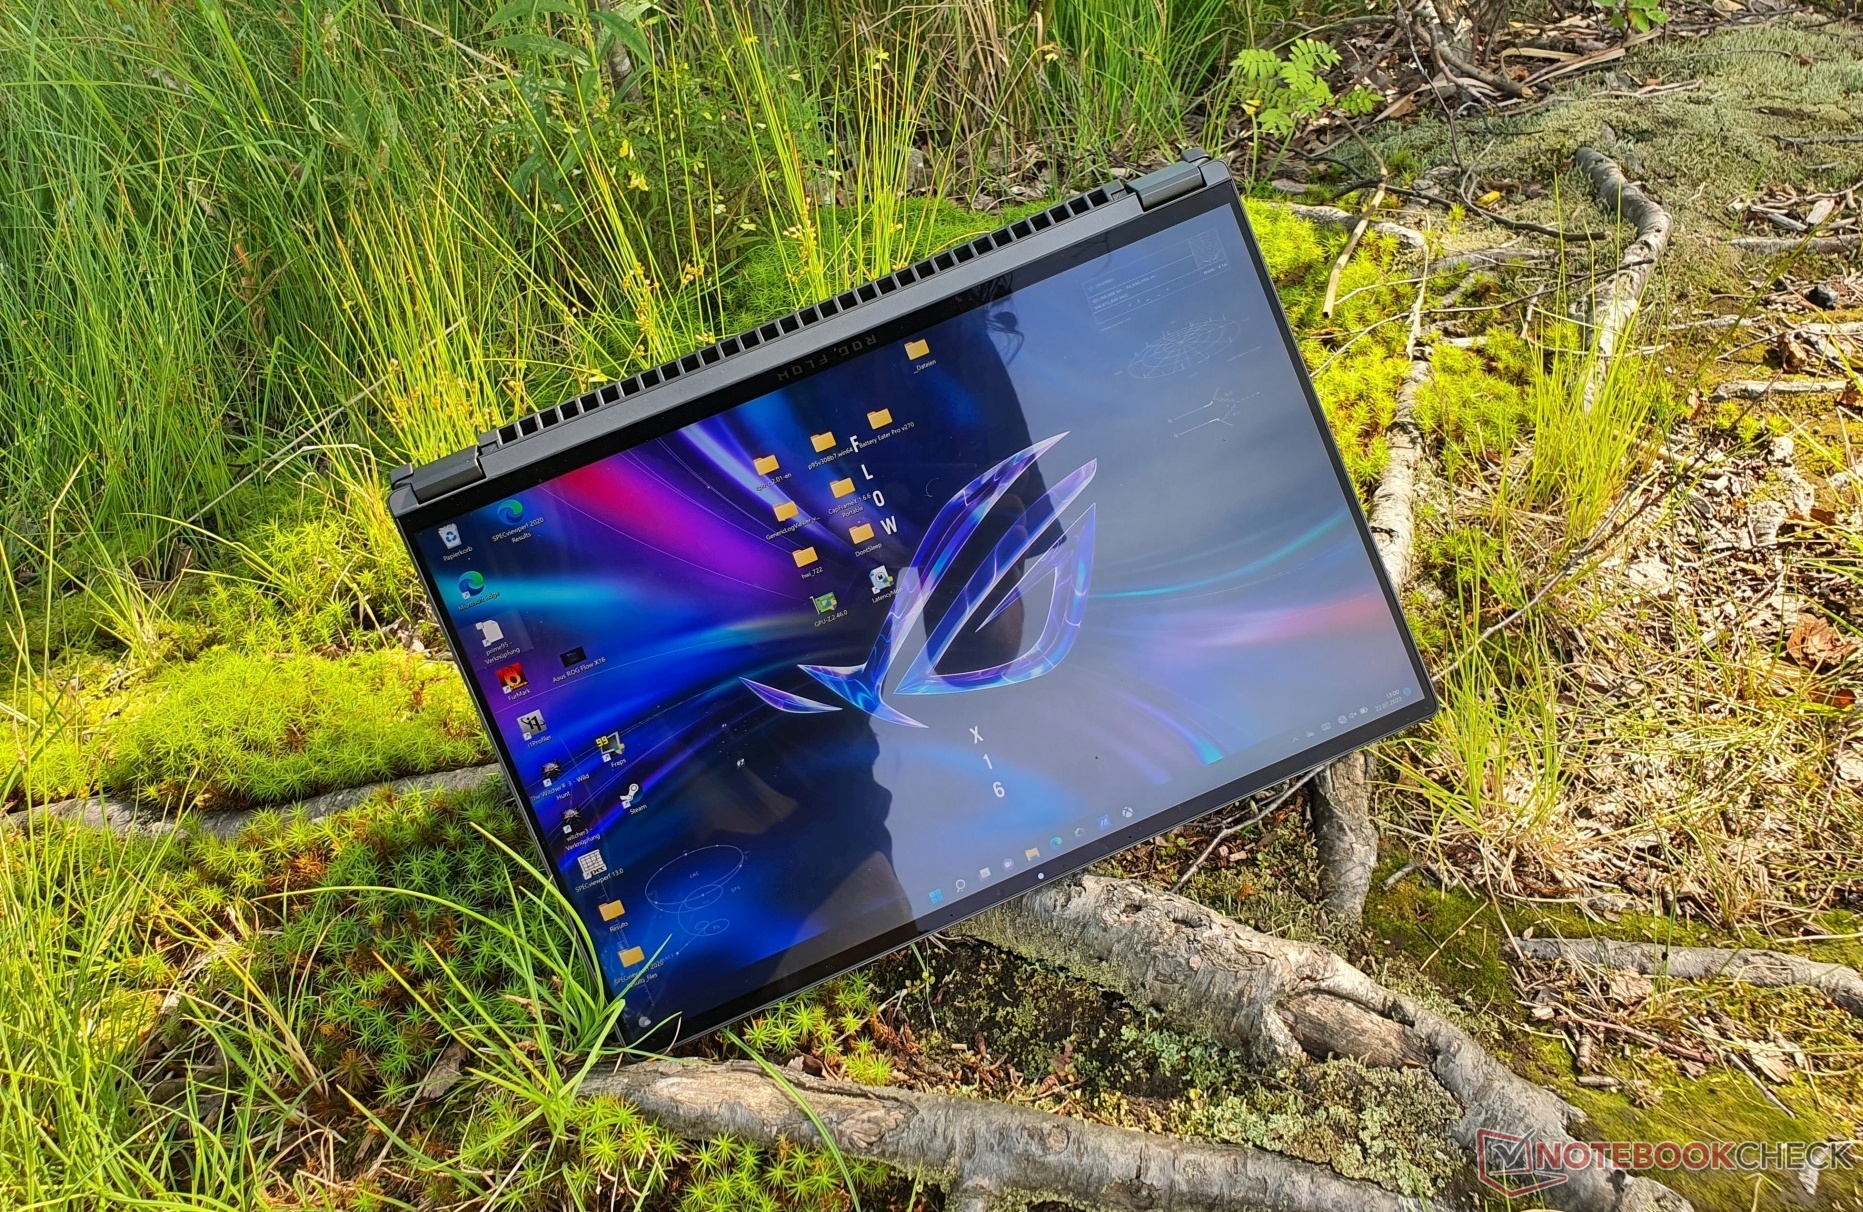
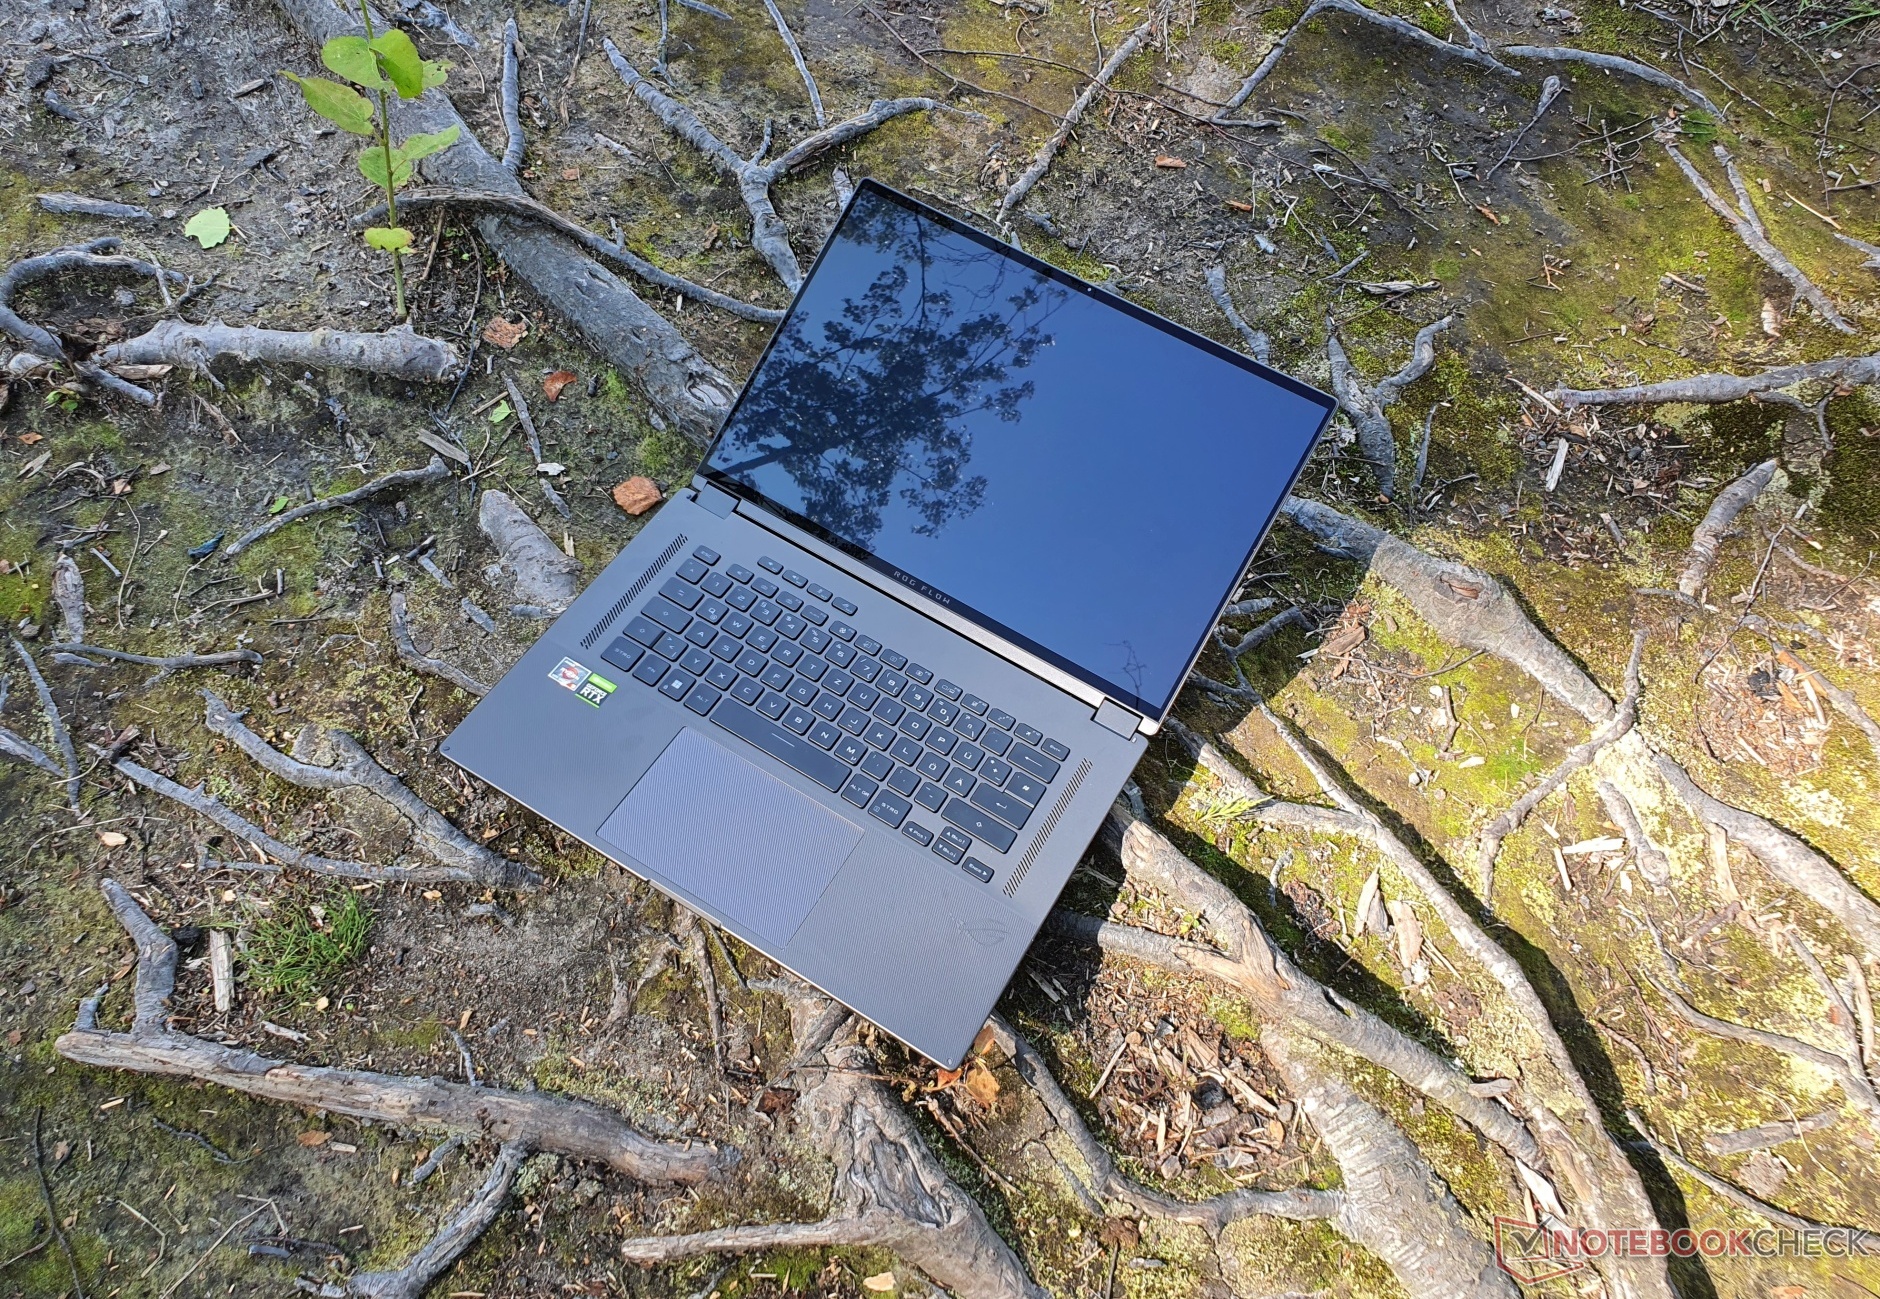
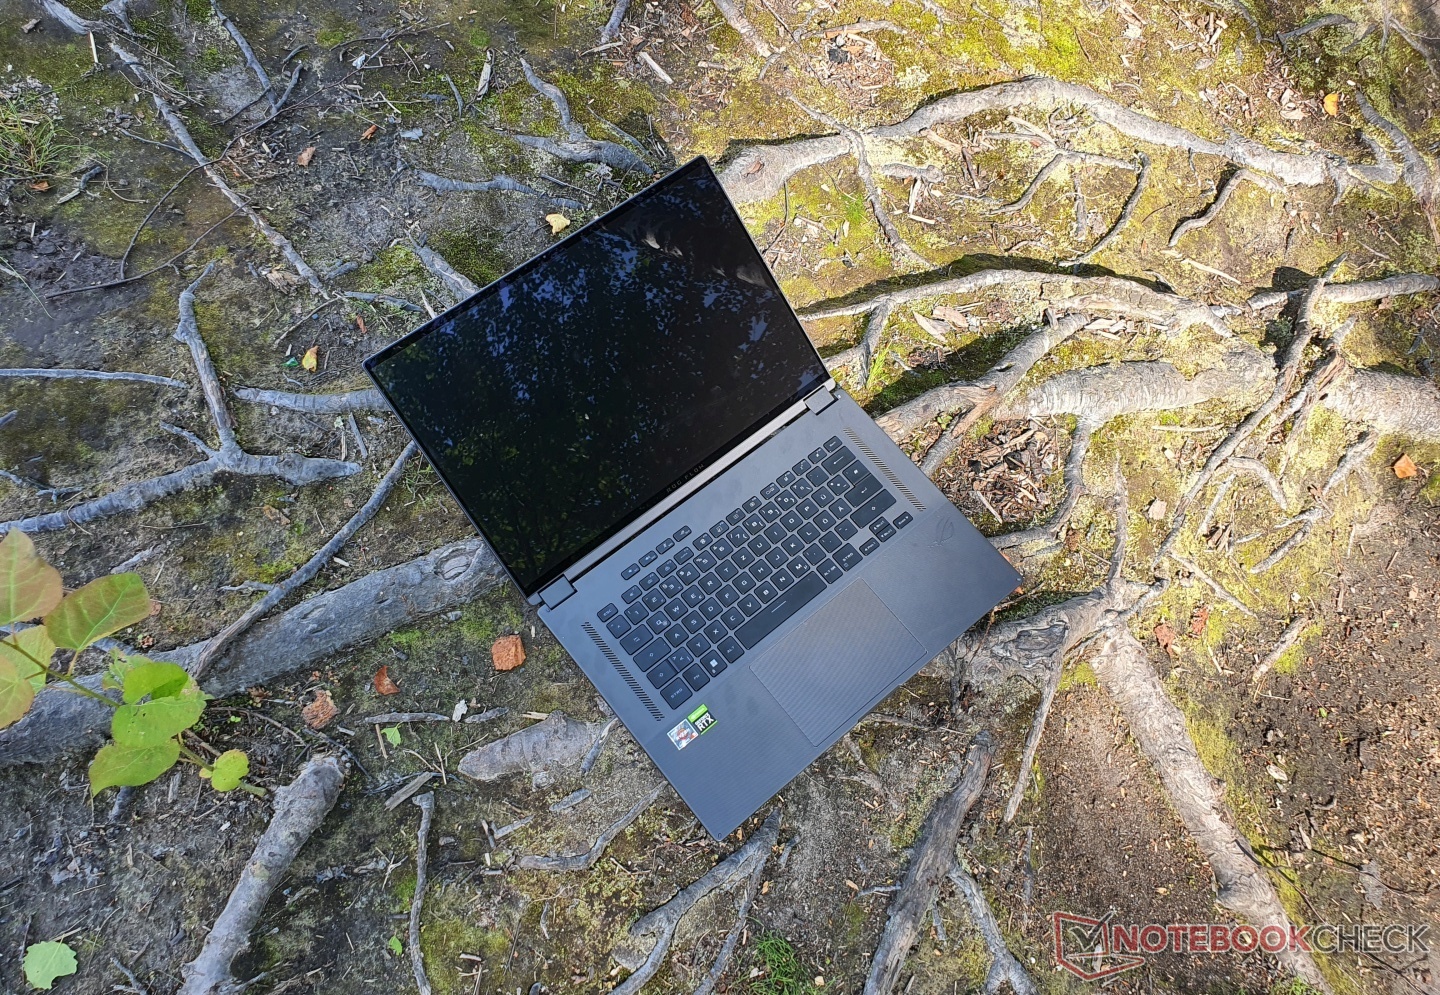
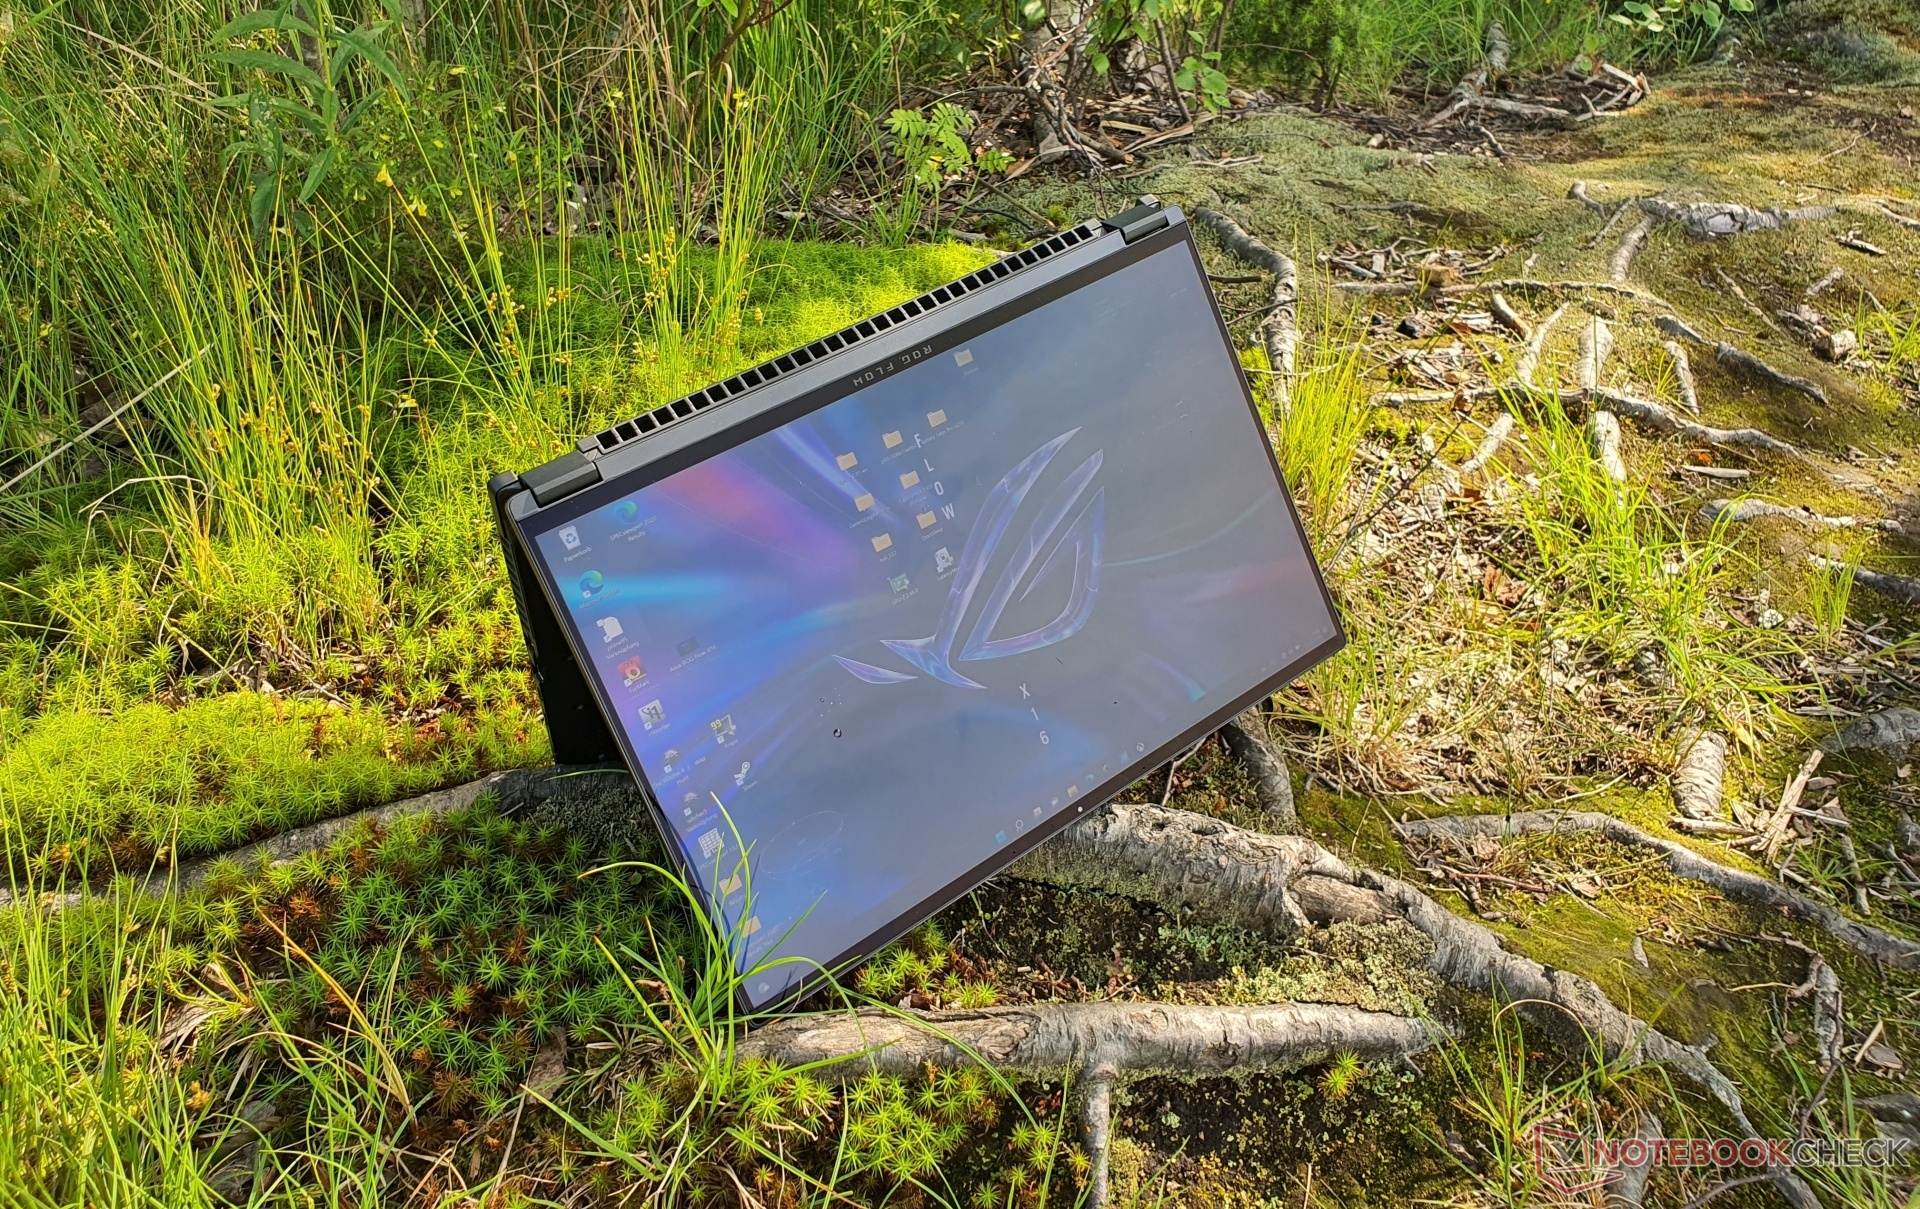
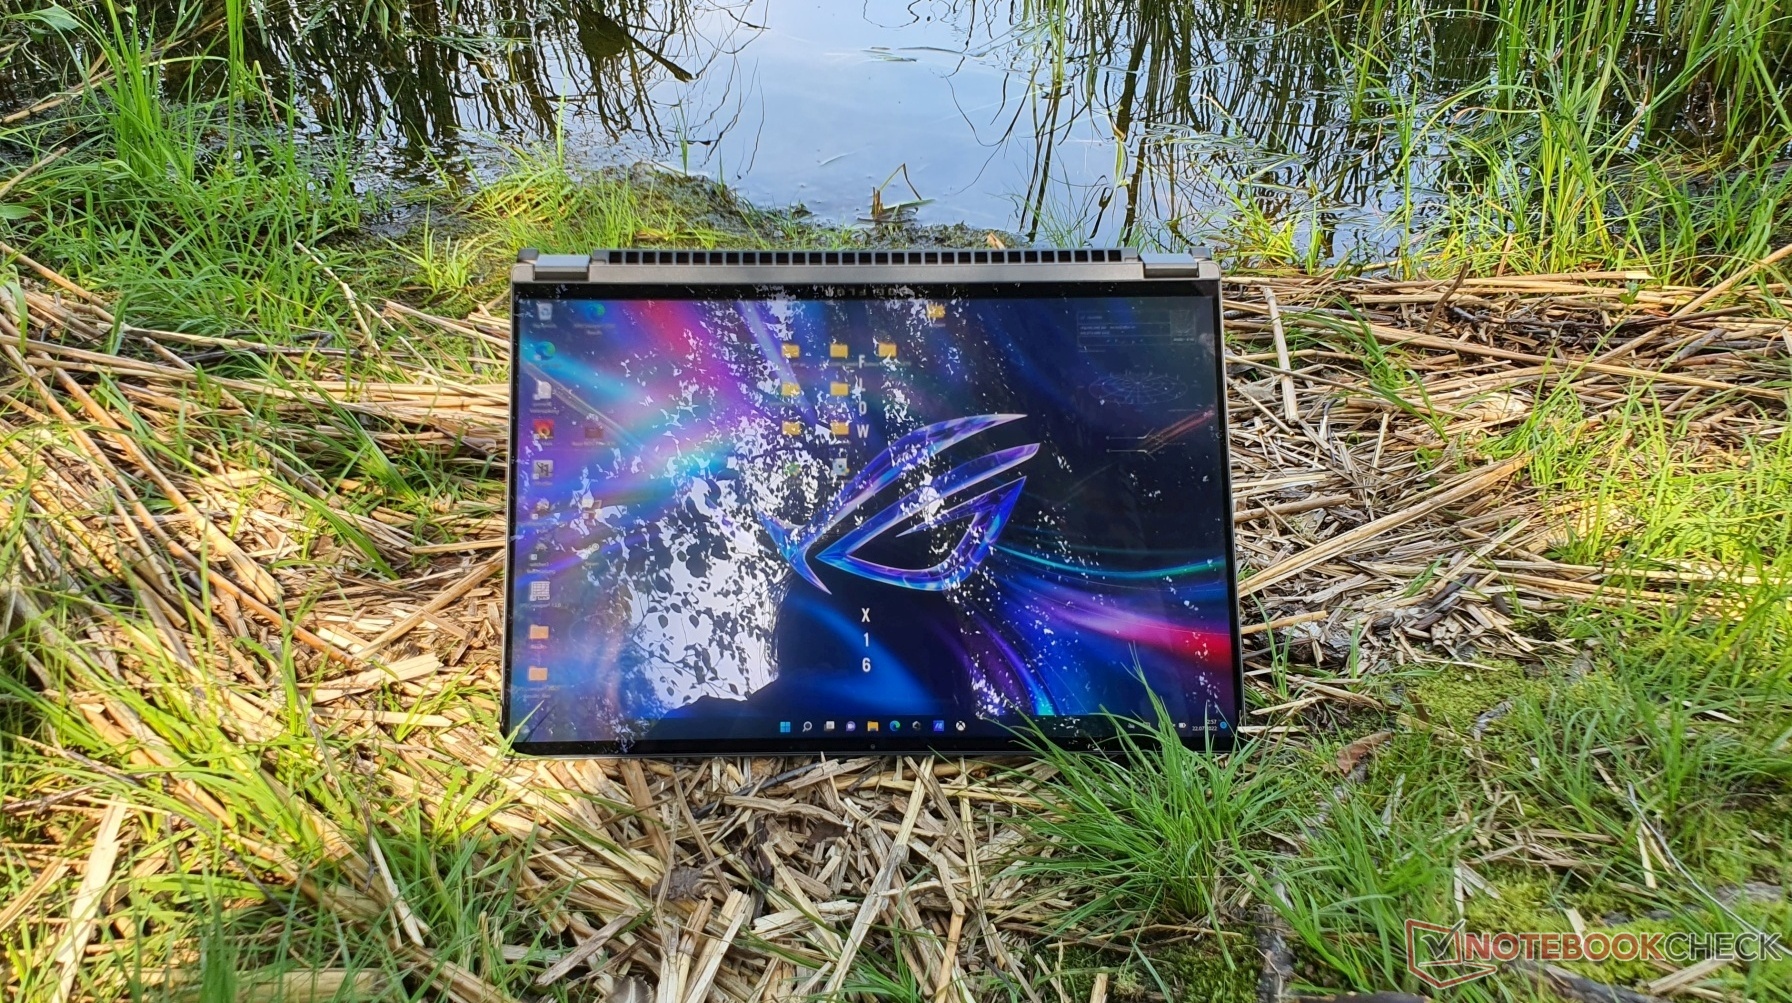
Le due cerniere del convertibile consentono la rotazione a 360° del display e lo tengono saldamente in posizione. Il fatto che il display di un convertibile oscilli un po' non può essere sempre completamente evitato. Nel complesso, è stato raggiunto un buon equilibrio tra fluidità e stabilità. Il ROG Flow X16 può essere aperto anche con una sola mano. Piccoli distanziatori proteggono l'unità base in modalità tablet e tenda.


Con il ROG Flow X16, Asus è riuscita a creare un portatile con le dimensioni più ridotte tra i 16 pollici, surclassando persino alcuni portatili da 15 pollici nel nostro campo di confronto, anche se ilGigabyte Aero 16 e il MSI Stealth GS66sono già modelli molto compatti. Il 14,4 pollici Surface Laptop Studio è ovviamente più compatto, ma non è nemmeno un vero gamer.
Solo ilThinkPad X1 Extremeè superiore in termini di peso tra i dispositivi con una potente GPU, ma i suoi 80 W di TGP richiedono una soluzione di raffreddamento meno elaborata. AsusZephyrus M16è più o meno alla pari grazie al case simile.
Apparecchiature - La serie Flow di Asus offre una speciale eGPU
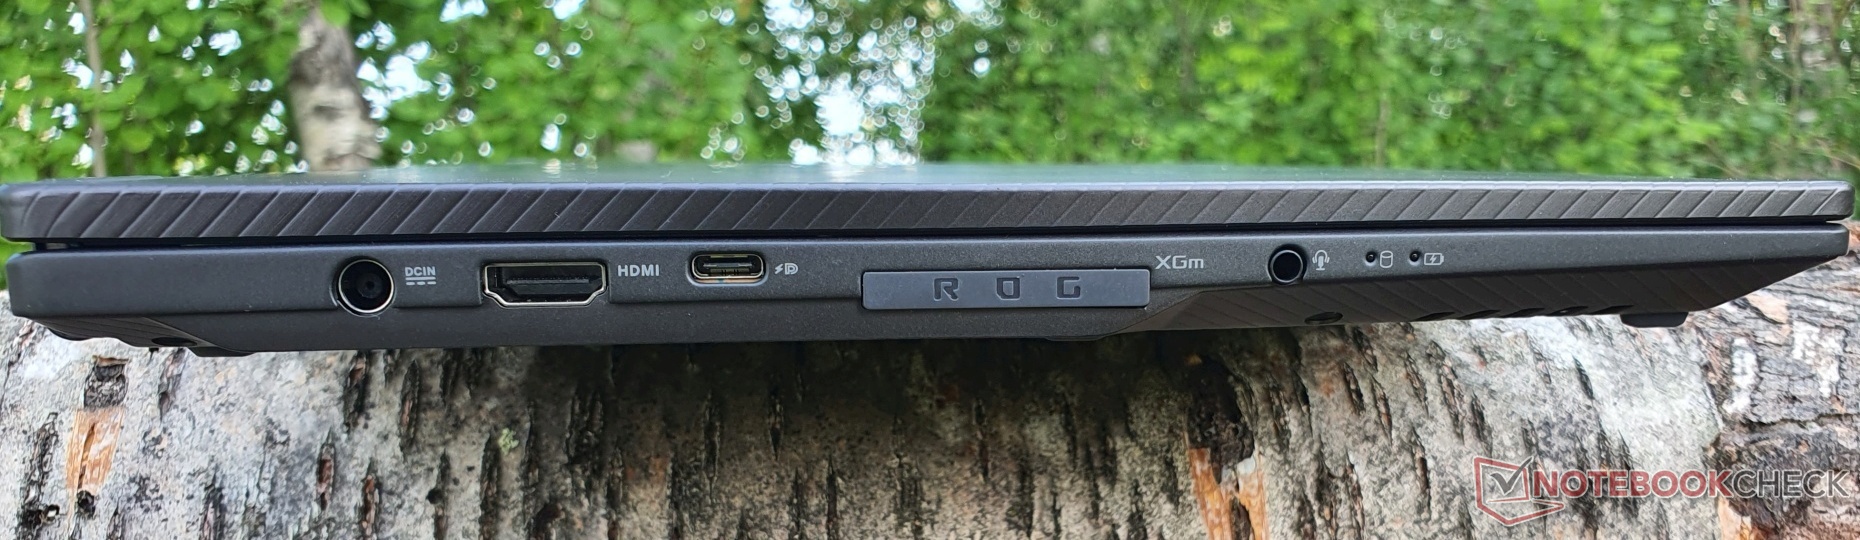
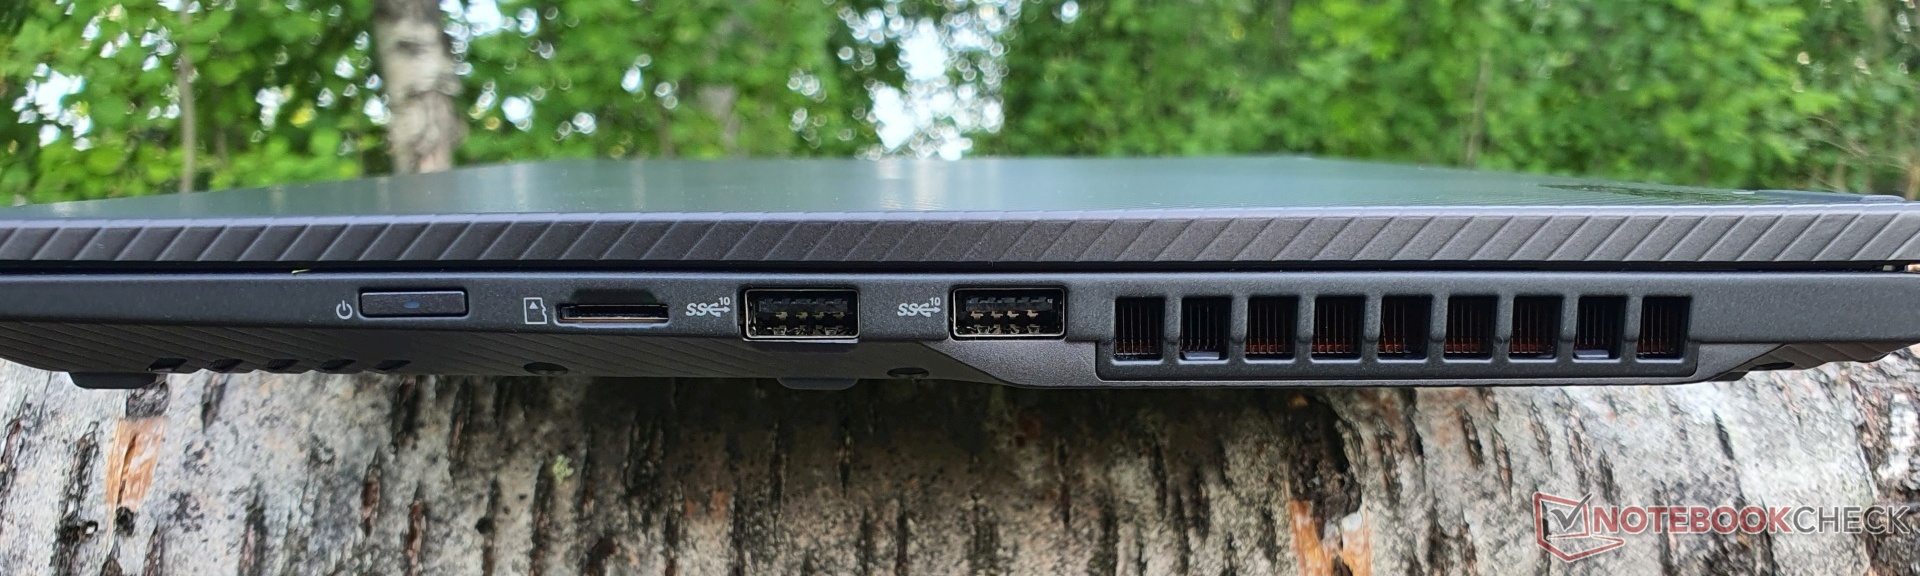
L'Asus ROG Flow X16 offre quattro porte USB 3.2 Gen2, due delle quali sono di tipo A, mentre le altre due sono di tipo C ed entrambe supportano DisplayPort e Power Delivery fino a 100 watt. La DisplayPort della porta USB-C nella porta xGM è collegata alla GPU Nvidia dedicata, mentre l'altra porta USB-C è collegata alla GPU Radeon, così come la porta HDMI 2.0b, che supporta G-Sync. Più avanti nel corso dell'anno, Asus potrebbe fornire un aggiornamento software per l'USB 4.0.
Il lettore di schede SD è disponibile solo nella versione micro e la porta LAN è assente. La serie ROG Flow presenta la porta xGM per un dock grafico opzionale (eGPU) che ospita una RTX 3080 di GeForce (GPU per laptop). Questa è l'unica opzione per il dock finora, è più compatta delle eGPU convenzionali ed è collegata a una larghezza di banda doppia (64 GBit/s @PCIe 3.0 8x contro 32 GBit/s @Thunderbolt 3/4).
Naturalmente, i guadagni in termini di prestazioni saranno probabilmente marginali nel nostro modello con una RTX 3070 Ti mobile integrata, e non è chiaro se il dock riceverà aggiornamenti in futuro. Tuttavia, misureremo le eventuali differenze e le riporteremo presto. Inoltre, il ROG XG Mobile (che abbiamo recensito in precedenza) offre porte aggiuntive, come la LAN GBit e una DisplayPort full-size.
Inoltre, sono presenti anche un jack audio da 3,5 mm e la presa di alimentazione per l'alimentatore da 240 watt. Lo spazio tra le porte è adeguato, ma il pulsante di accensione sul lato destro si trova allentato nel case nella nostra versione di pre-release. Il lettore di impronte digitali è stato omesso.
Lettore di schede SD
Il lettore di schede microSD UHS-II raggiunge ottimi risultati di 158 MB/s nel test di copia e ~183 MB/s in lettura sequenziale con la nostra scheda microSD di riferimento (AV PRO microSD 128 GB V60). In particolare nella copia, il ROG Flow X16 è molto più avanti della concorrenza. Solo l'XPS 17 di Dell raggiunge velocità di copia superiori (~205 MB/s).
| SD Card Reader | |
| average JPG Copy Test (av. of 3 runs) | |
| Dell XPS 17 9720 RTX 3060 (Toshiba Exceria Pro SDXC 64 GB UHS-II) | |
| Asus ROG Flow X16 GV601RW-M5082W (AV Pro SD microSD 128 GB V60) | |
| Media della classe Gaming (20.9 - 210, n=54, ultimi 2 anni) | |
| Apple MacBook Pro 16 2021 M1 Pro (Angelbird AV Pro V60) | |
| Asus ROG Zephyrus M16 GU603H (AV PRO microSD 128 GB V60) | |
| maximum AS SSD Seq Read Test (1GB) | |
| Dell XPS 17 9720 RTX 3060 (Toshiba Exceria Pro SDXC 64 GB UHS-II) | |
| Asus ROG Zephyrus M16 GU603H (AV PRO microSD 128 GB V60) | |
| Asus ROG Flow X16 GV601RW-M5082W (AV Pro SD microSD 128 GB V60) | |
| Media della classe Gaming (25.5 - 261, n=51, ultimi 2 anni) | |
Comunicazione
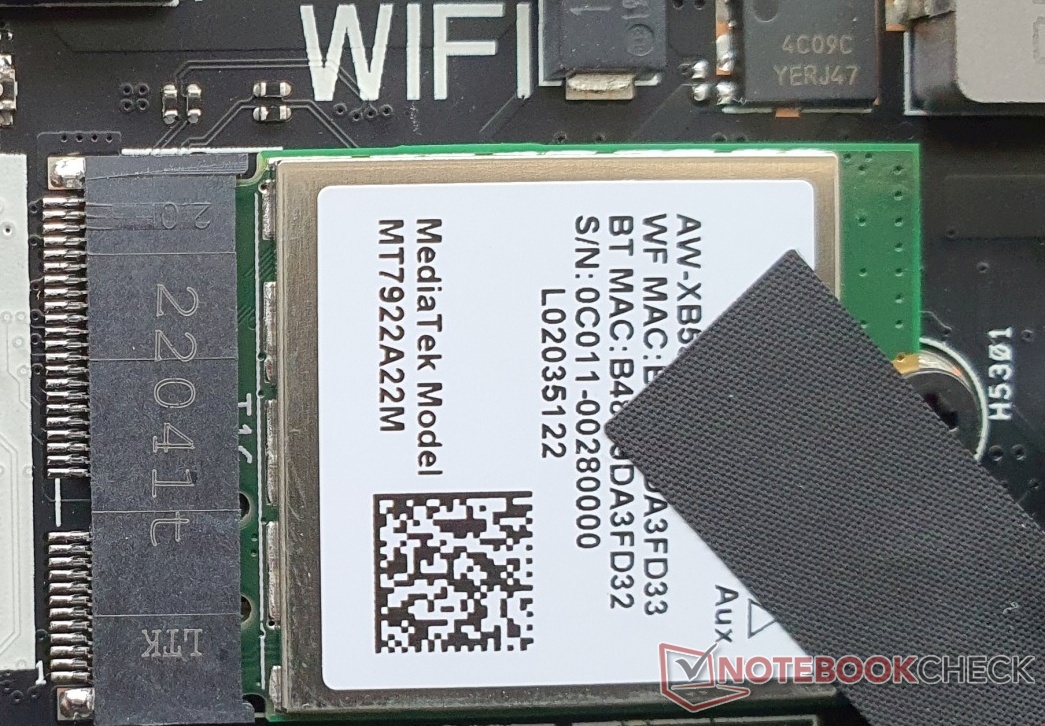
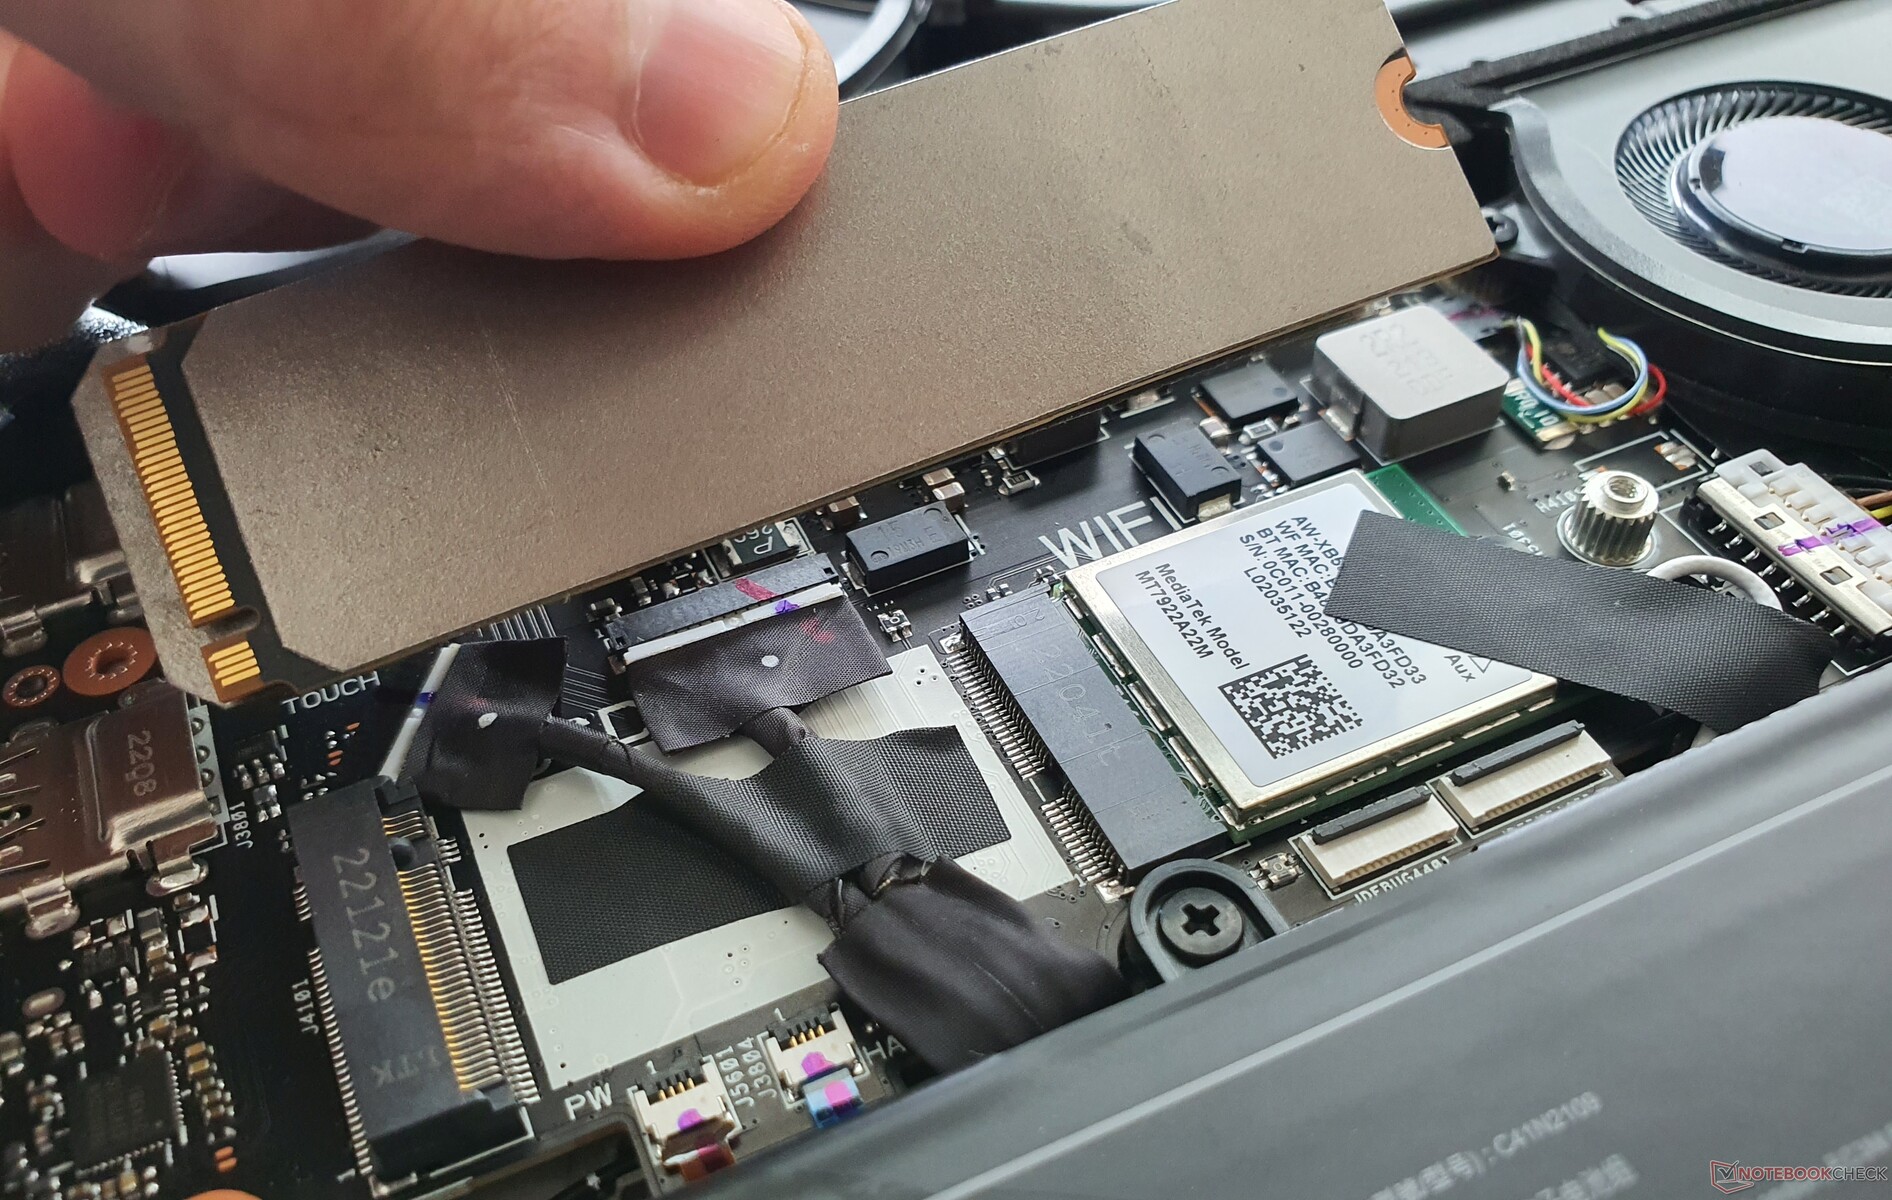
Il modulo WiFi 6E installato proviene da MediaTek e fornisce velocità decenti in entrambe le direzioni. L'MT7922 è quindi due volte più potente dell'MT7921 dello Zephyrus M16 e del MacBook Pro 16.
Webcam

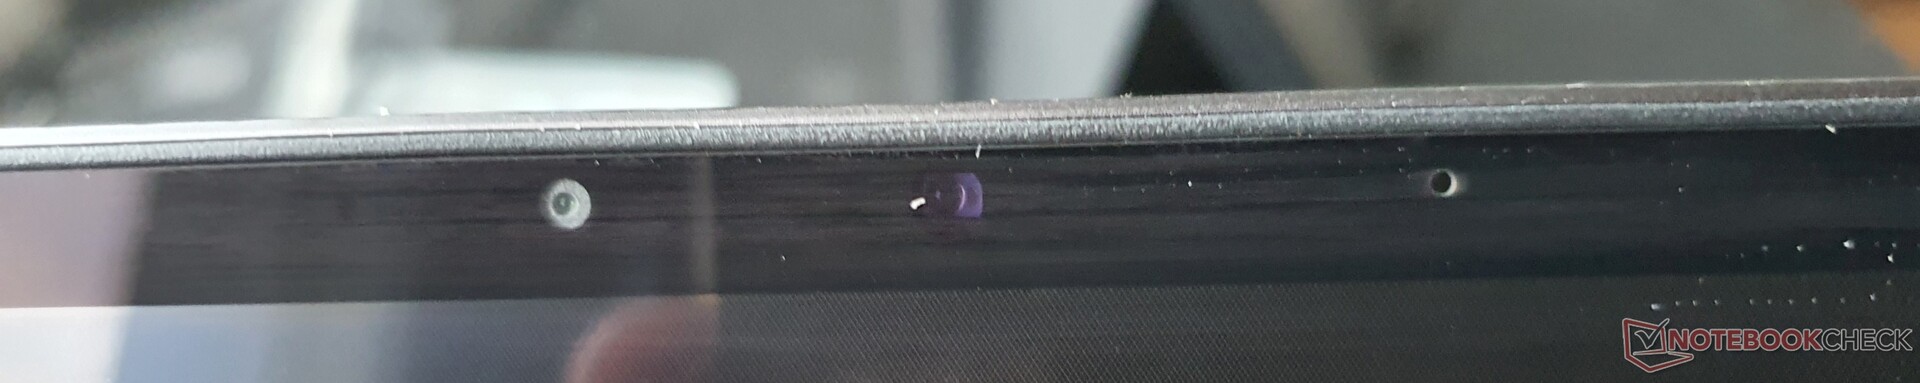
Come webcam viene utilizzata una variante a 720p (1280x720), ma offre una migliore nitidezza e una minore distorsione rispetto al solito. Non c'è un otturatore meccanico, ma sono presenti gli infrarossi per Windows Hello.


Accessori
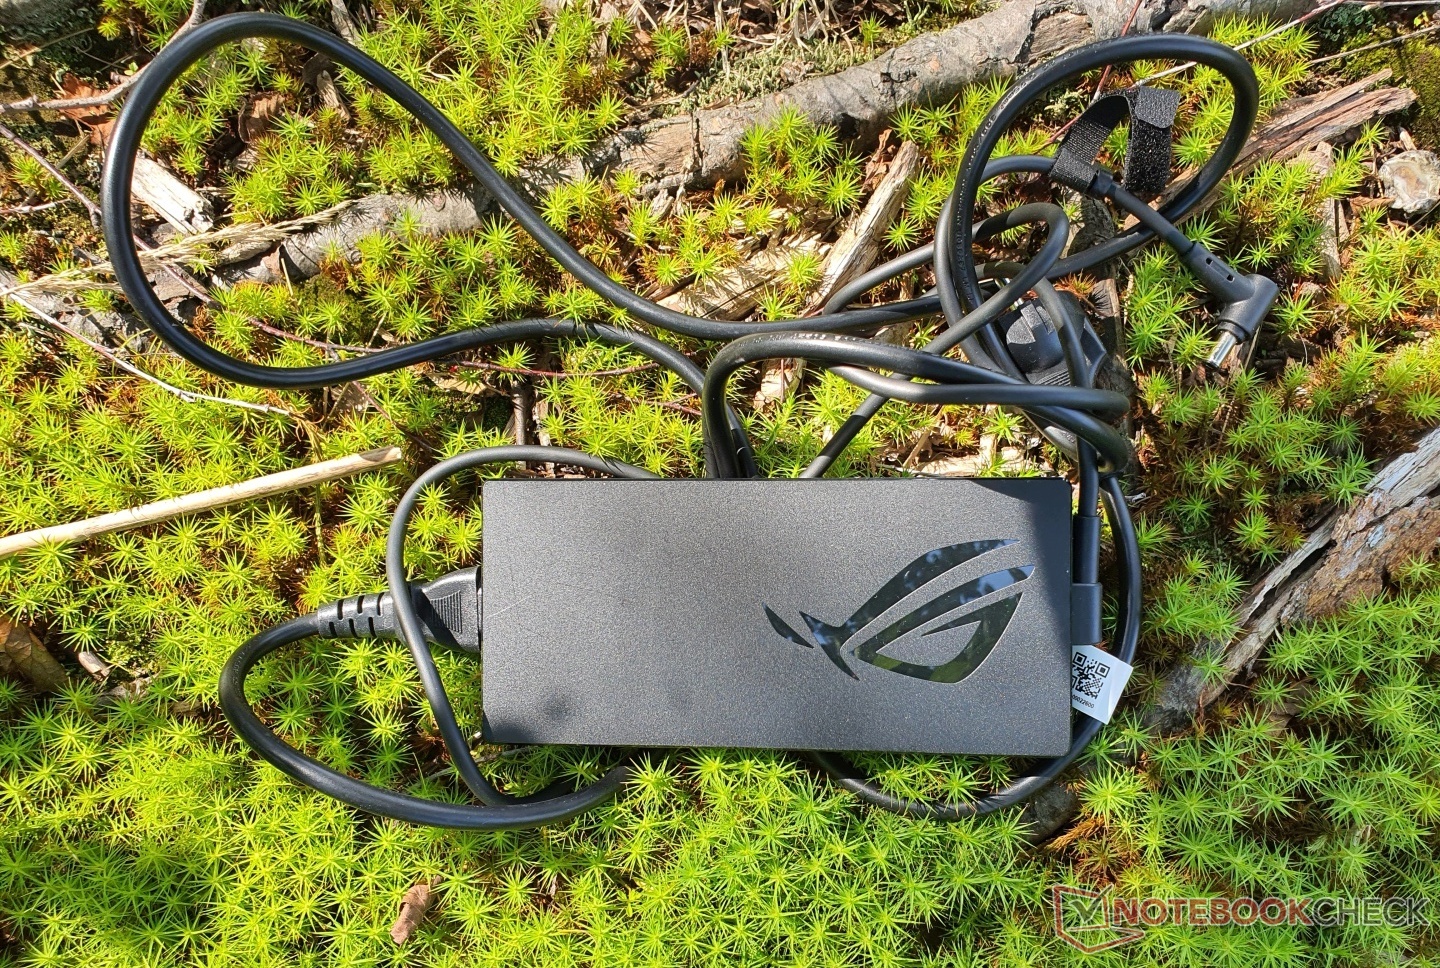
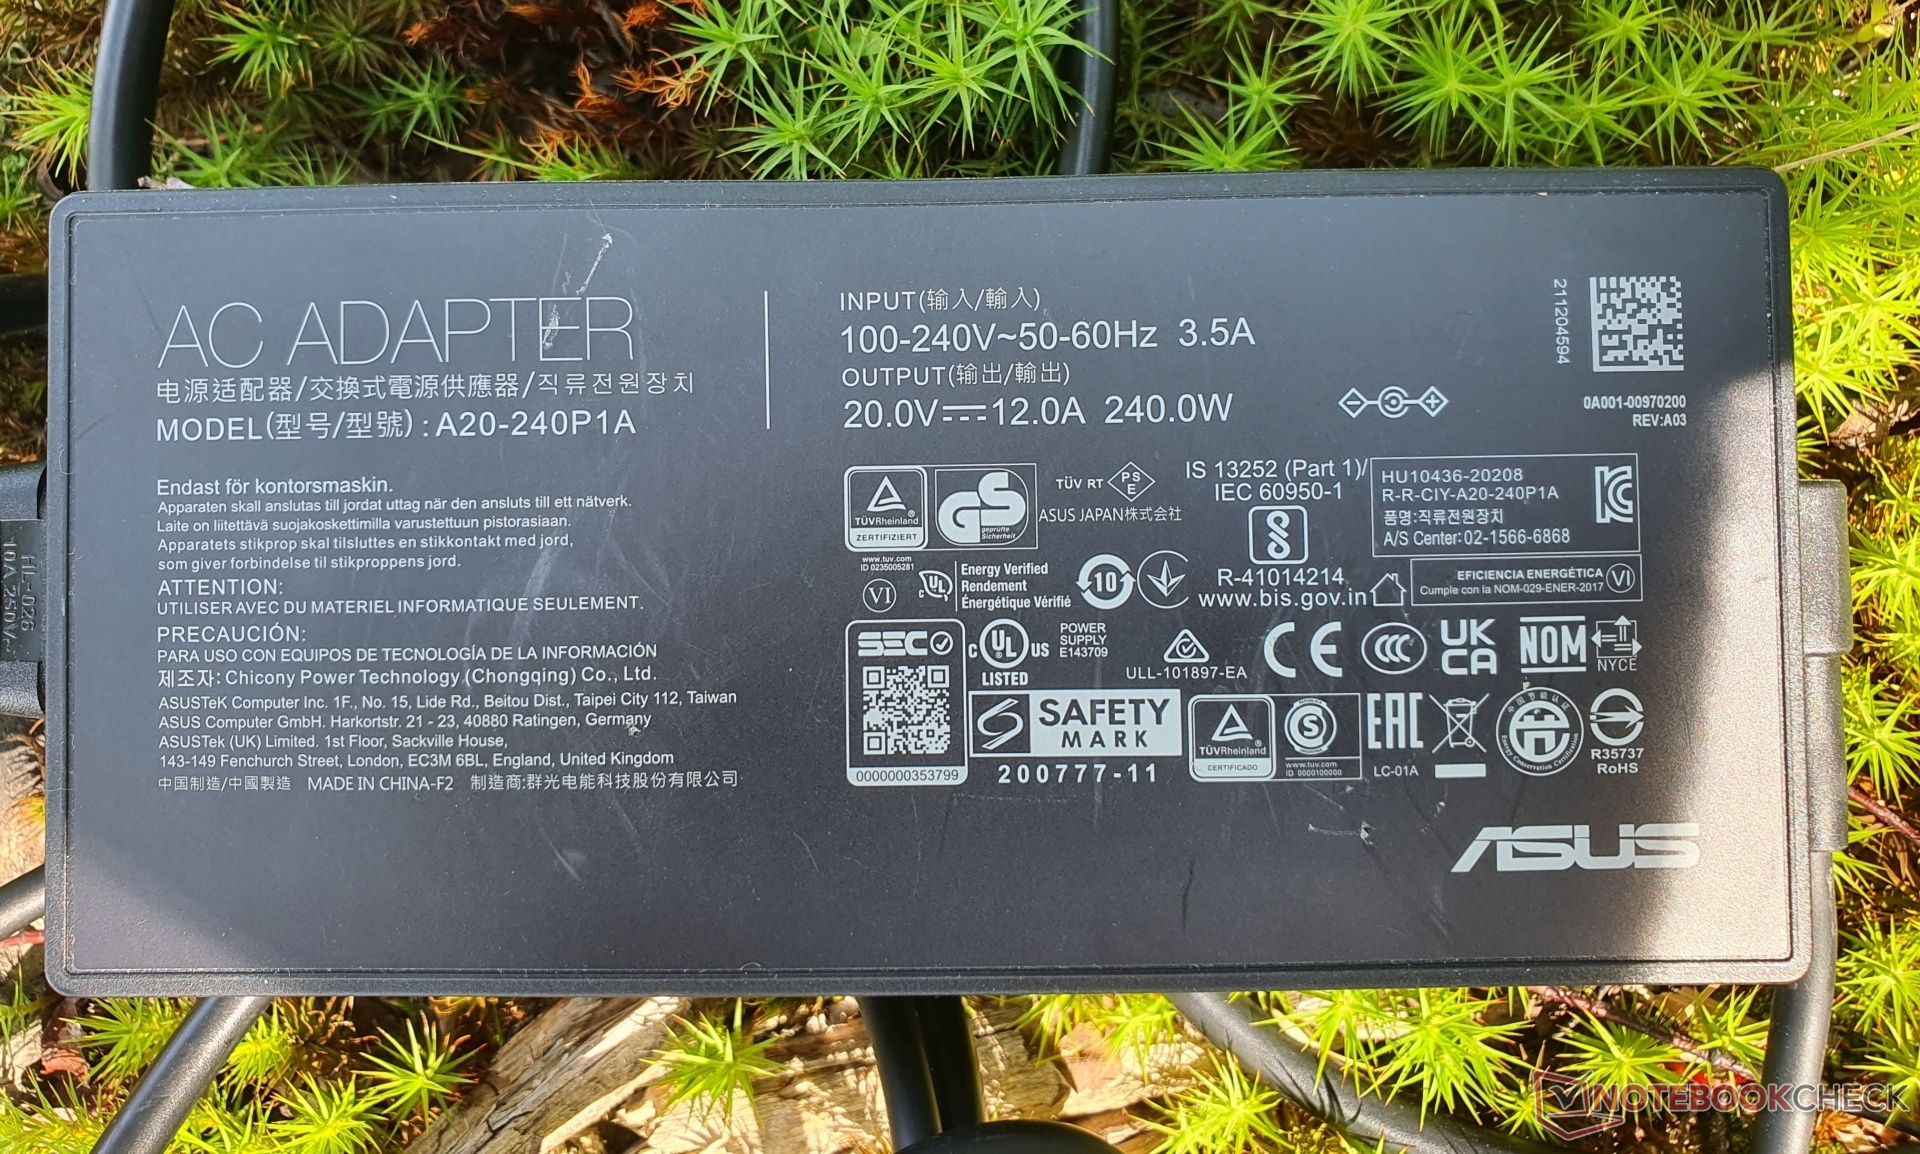
Nella confezione della nostra recensione, Asus fornisce un adattatore di alimentazione da 240 watt e lo stilo Asus SA201Hper l'input del touchscreen (incluso nella confezione). Abbiamo ricevuto anche uno zaino per computer portatile ROG BP4071abbiamo ordinato separatamente il dock grafico esterno e l'alimentatore USB-C ROG da 100 watt
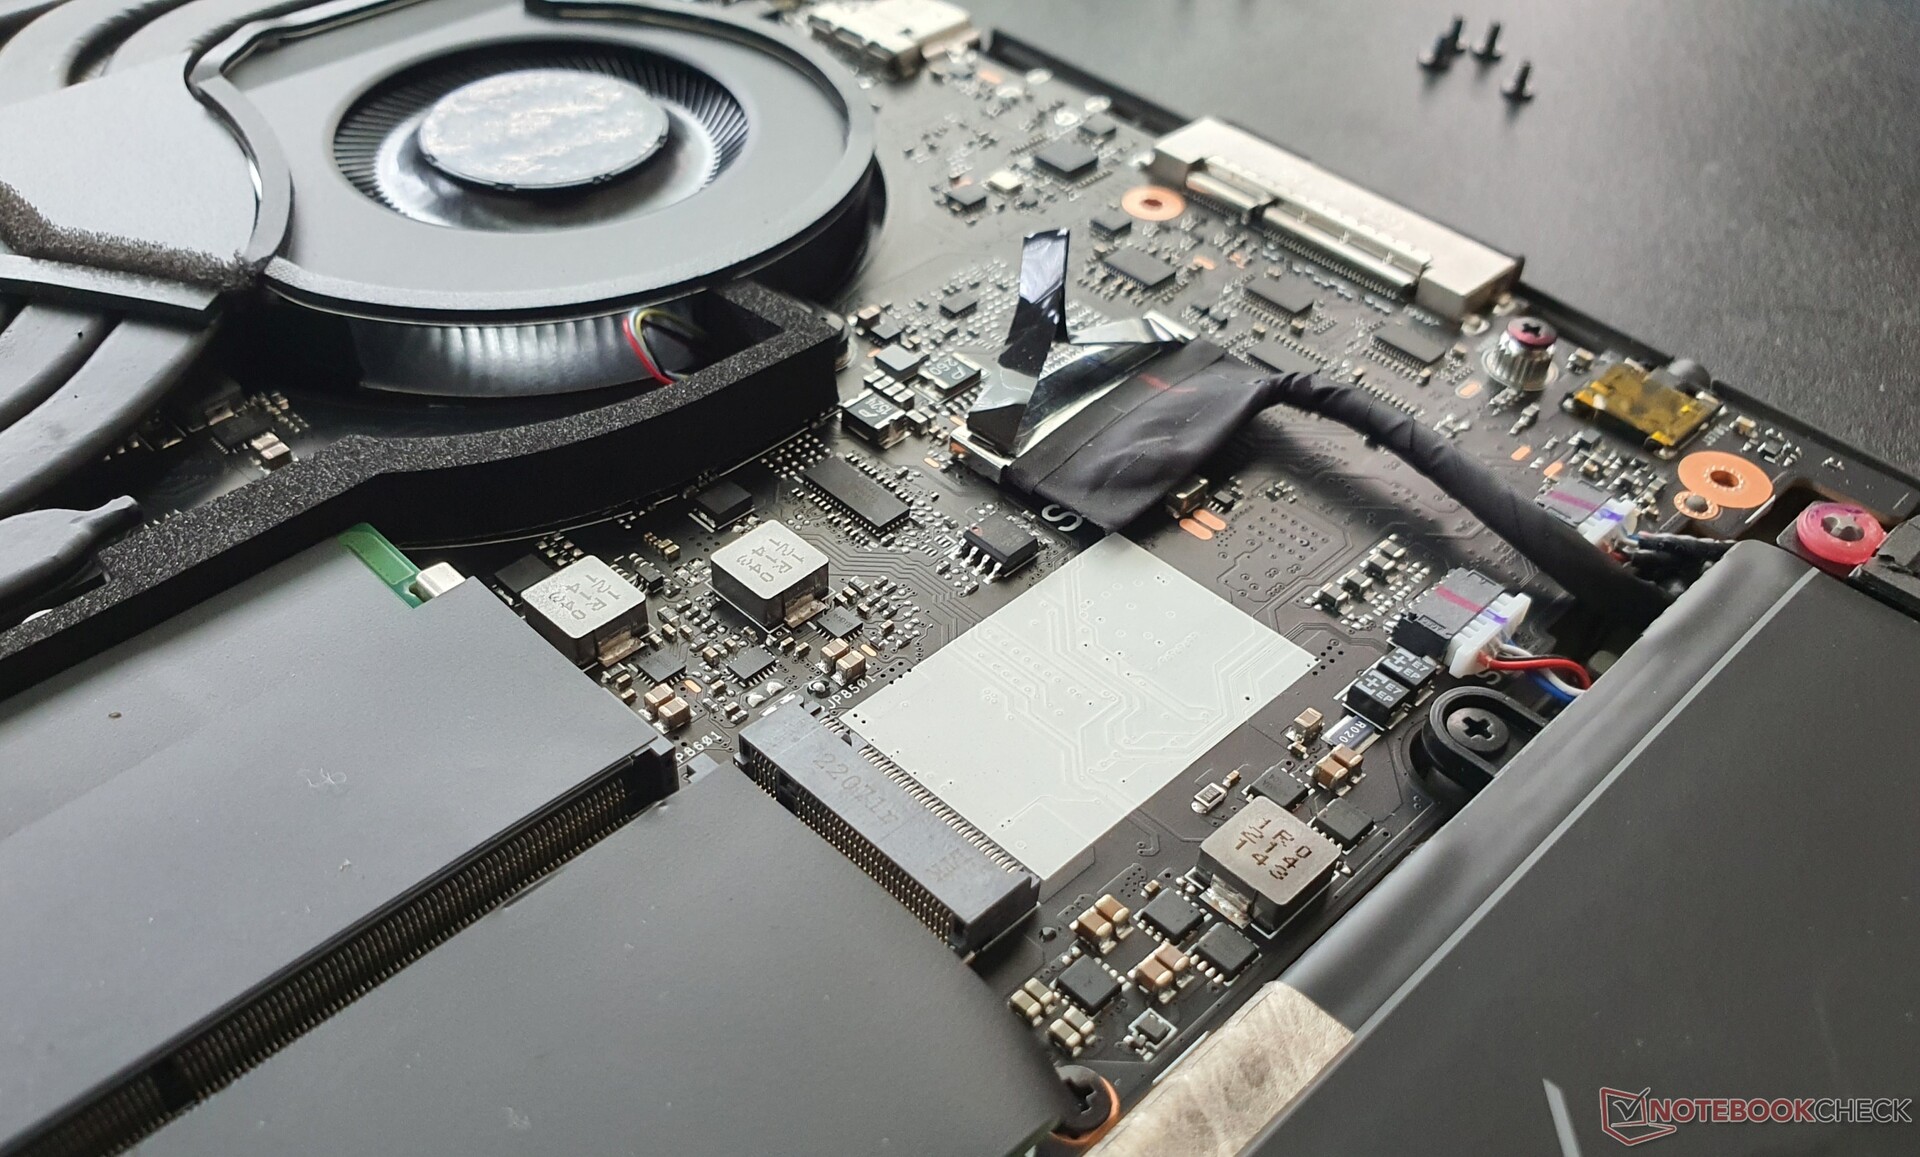
Manutenzione
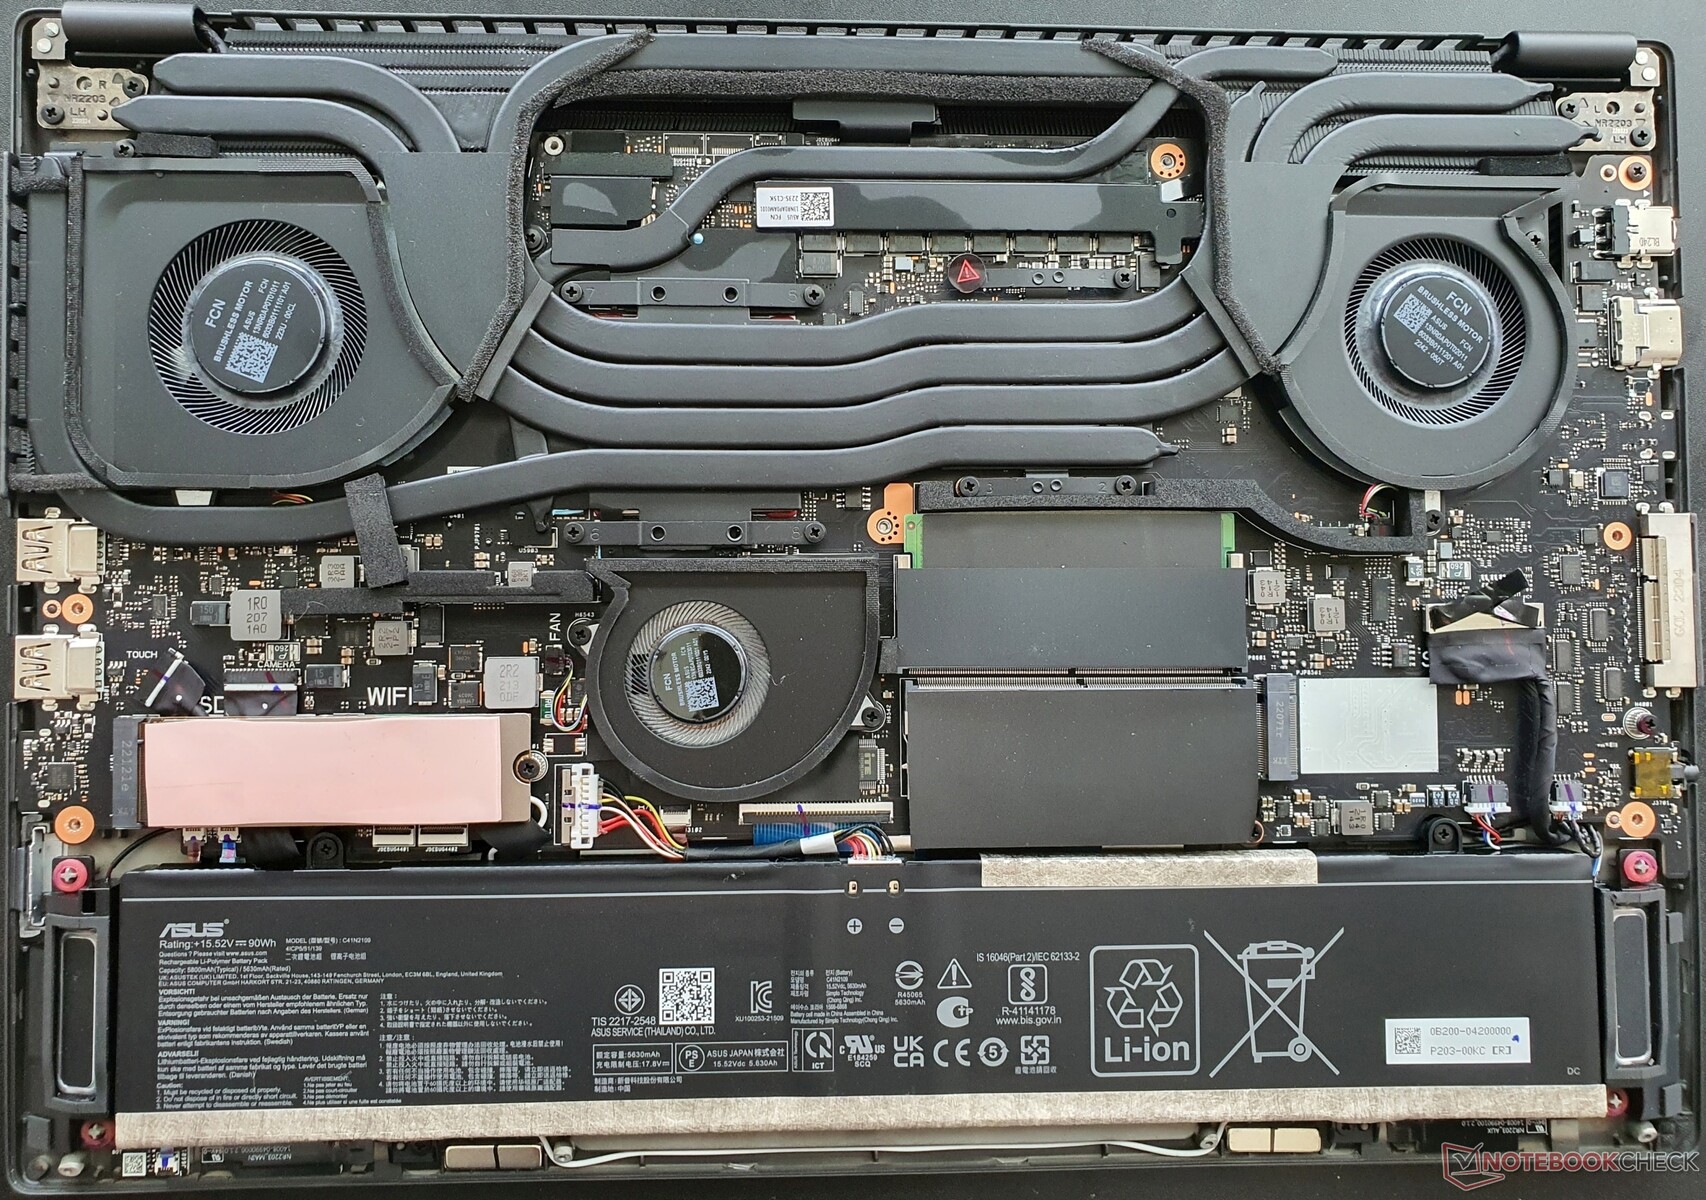
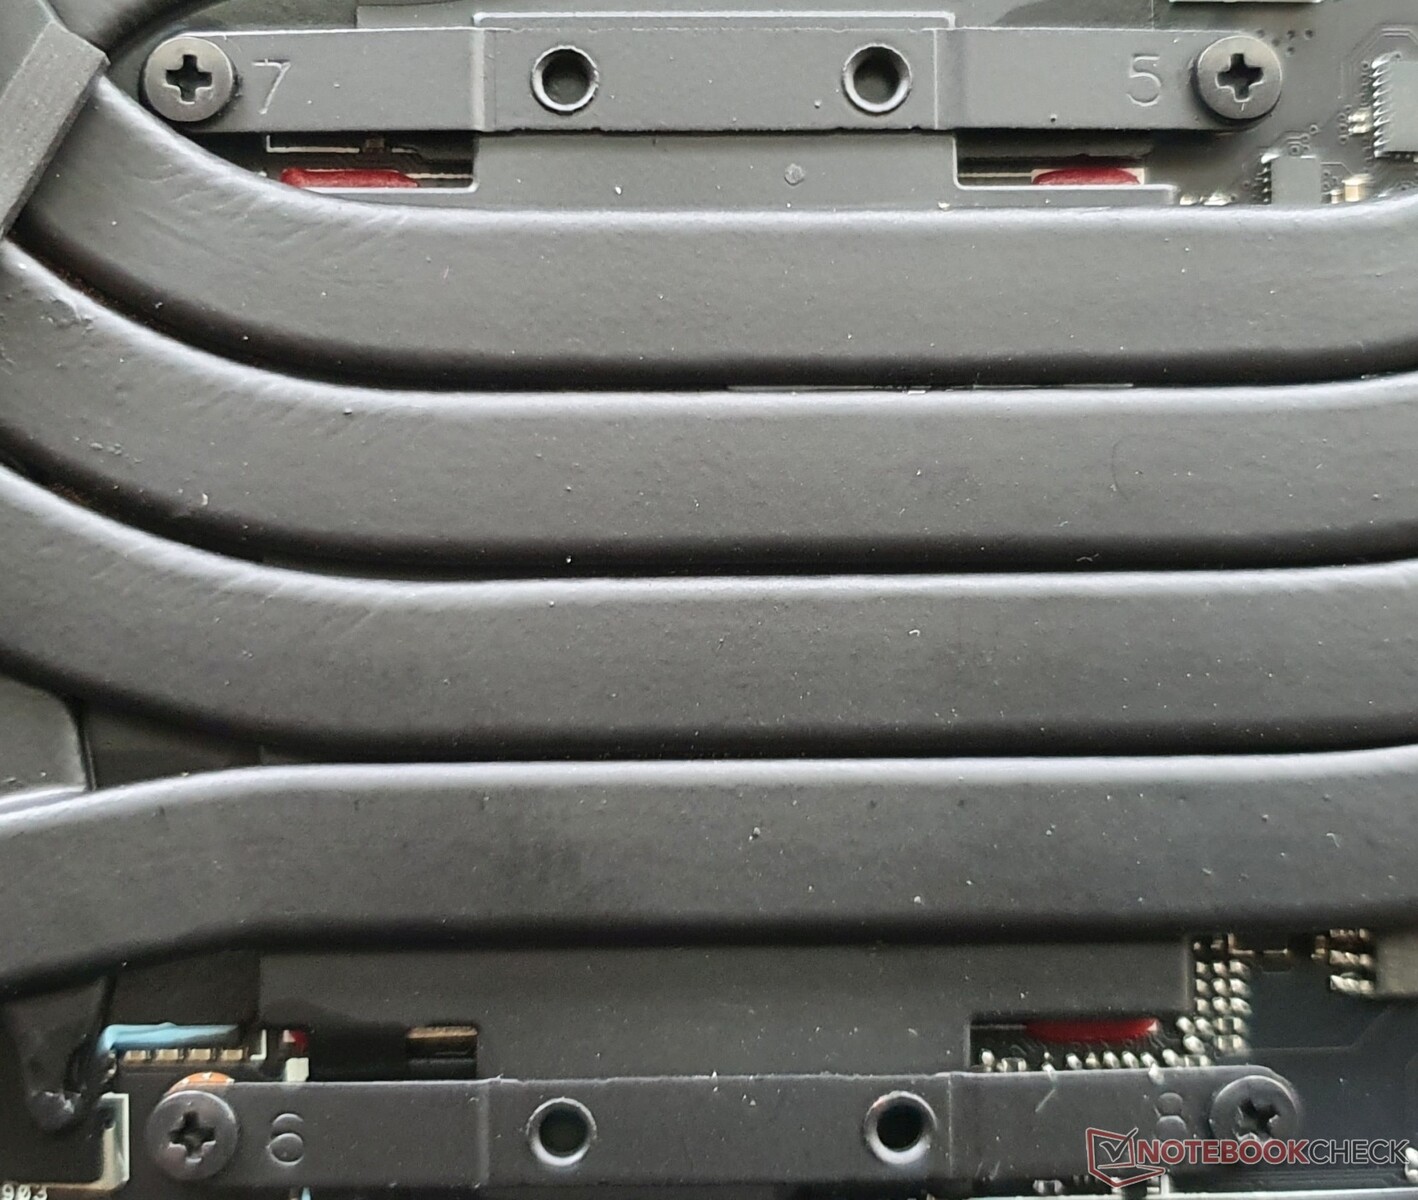
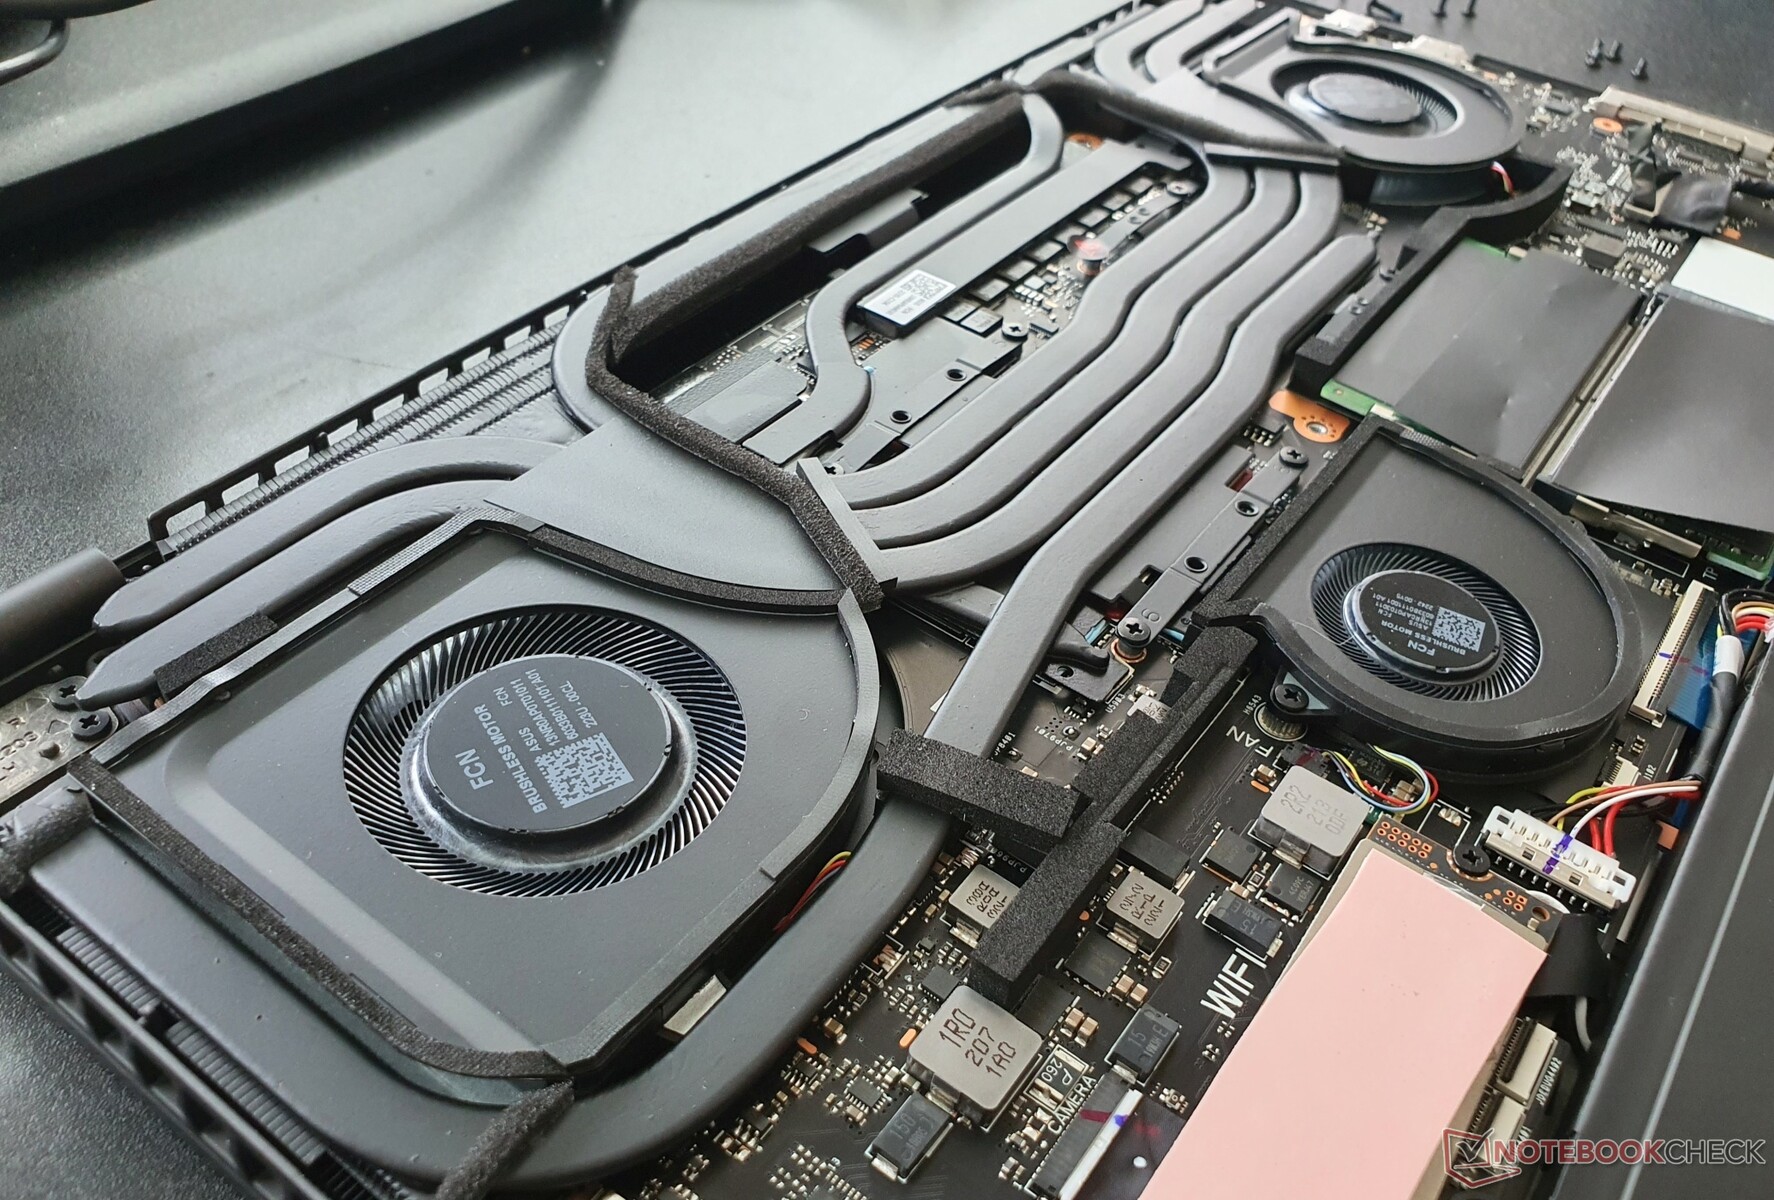
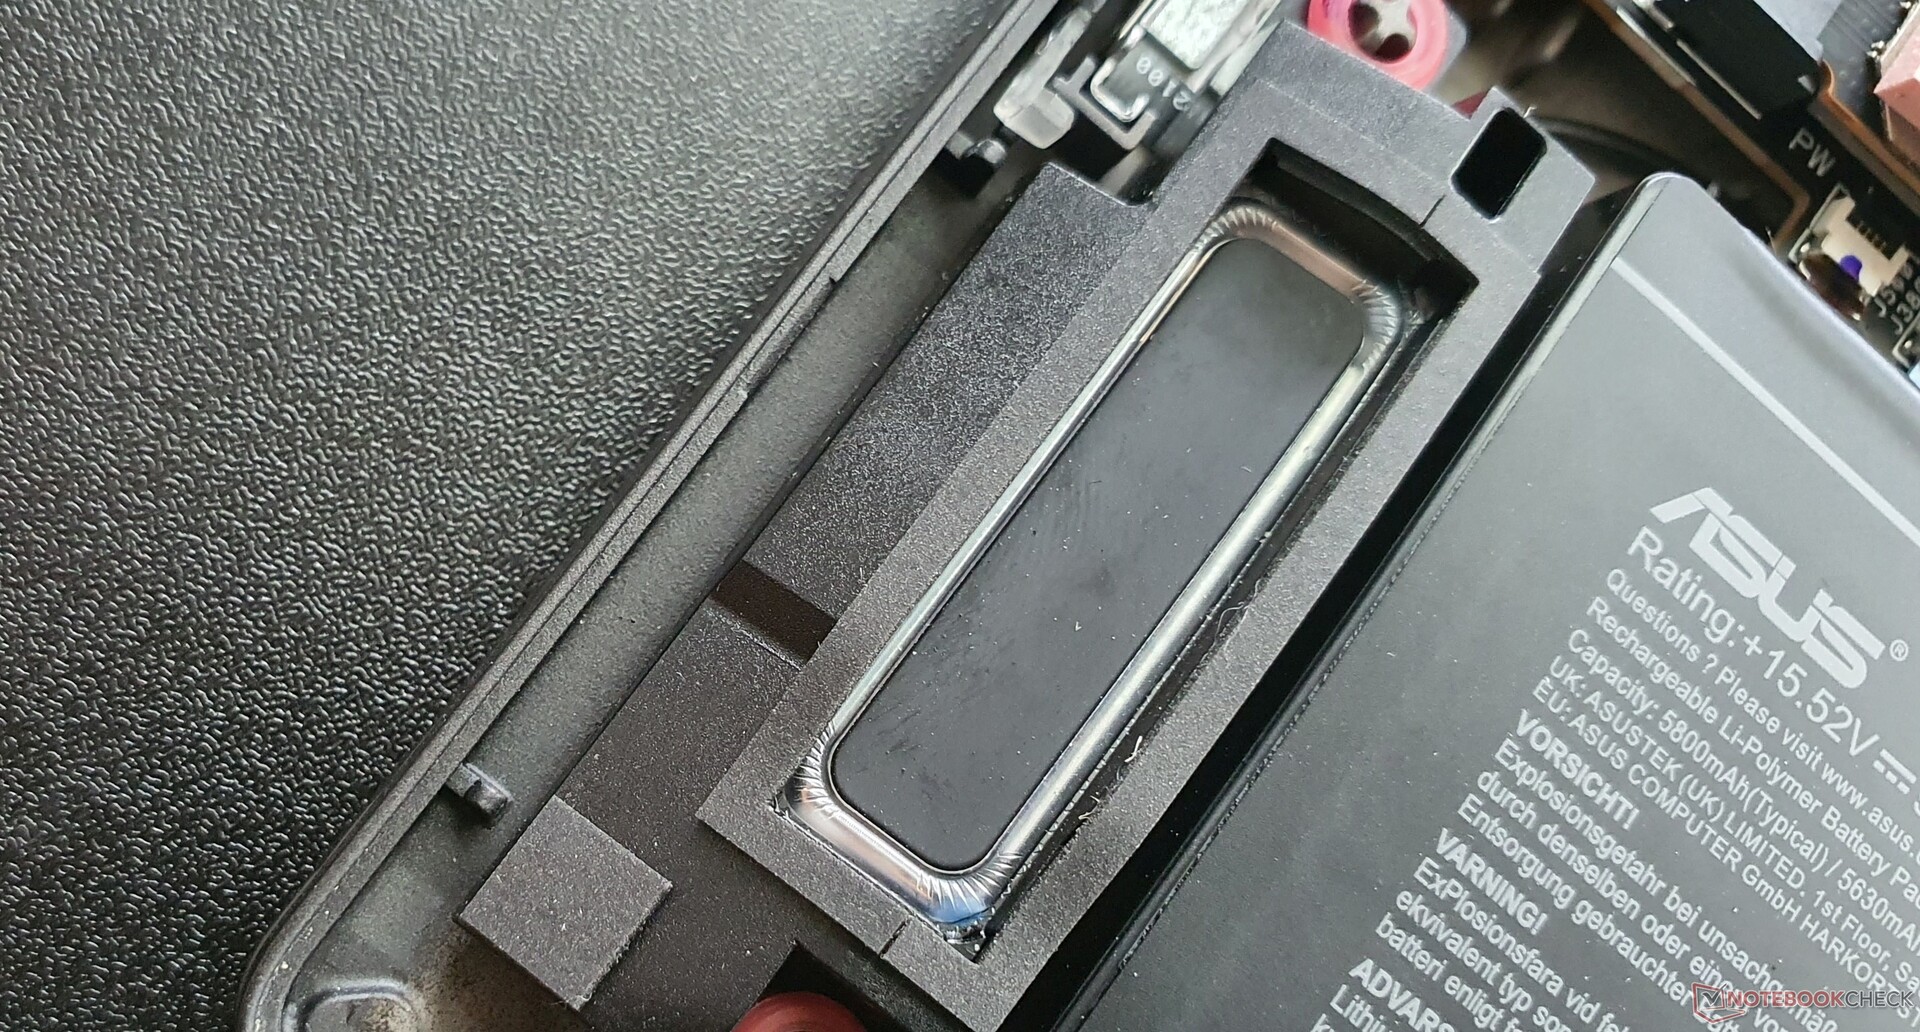
per rimuovere la piastra di base in plastica è necessario allentare 13 viti Phillips. Inoltre, alcune clip devono essere allentate con una spatola o un grimaldello. All'interno ci aspettano tre ventole (1x CPU, 1x GPU e 1x ventola di sistema), che possono essere pulite. La batteria è avvitata e può essere sostituita.
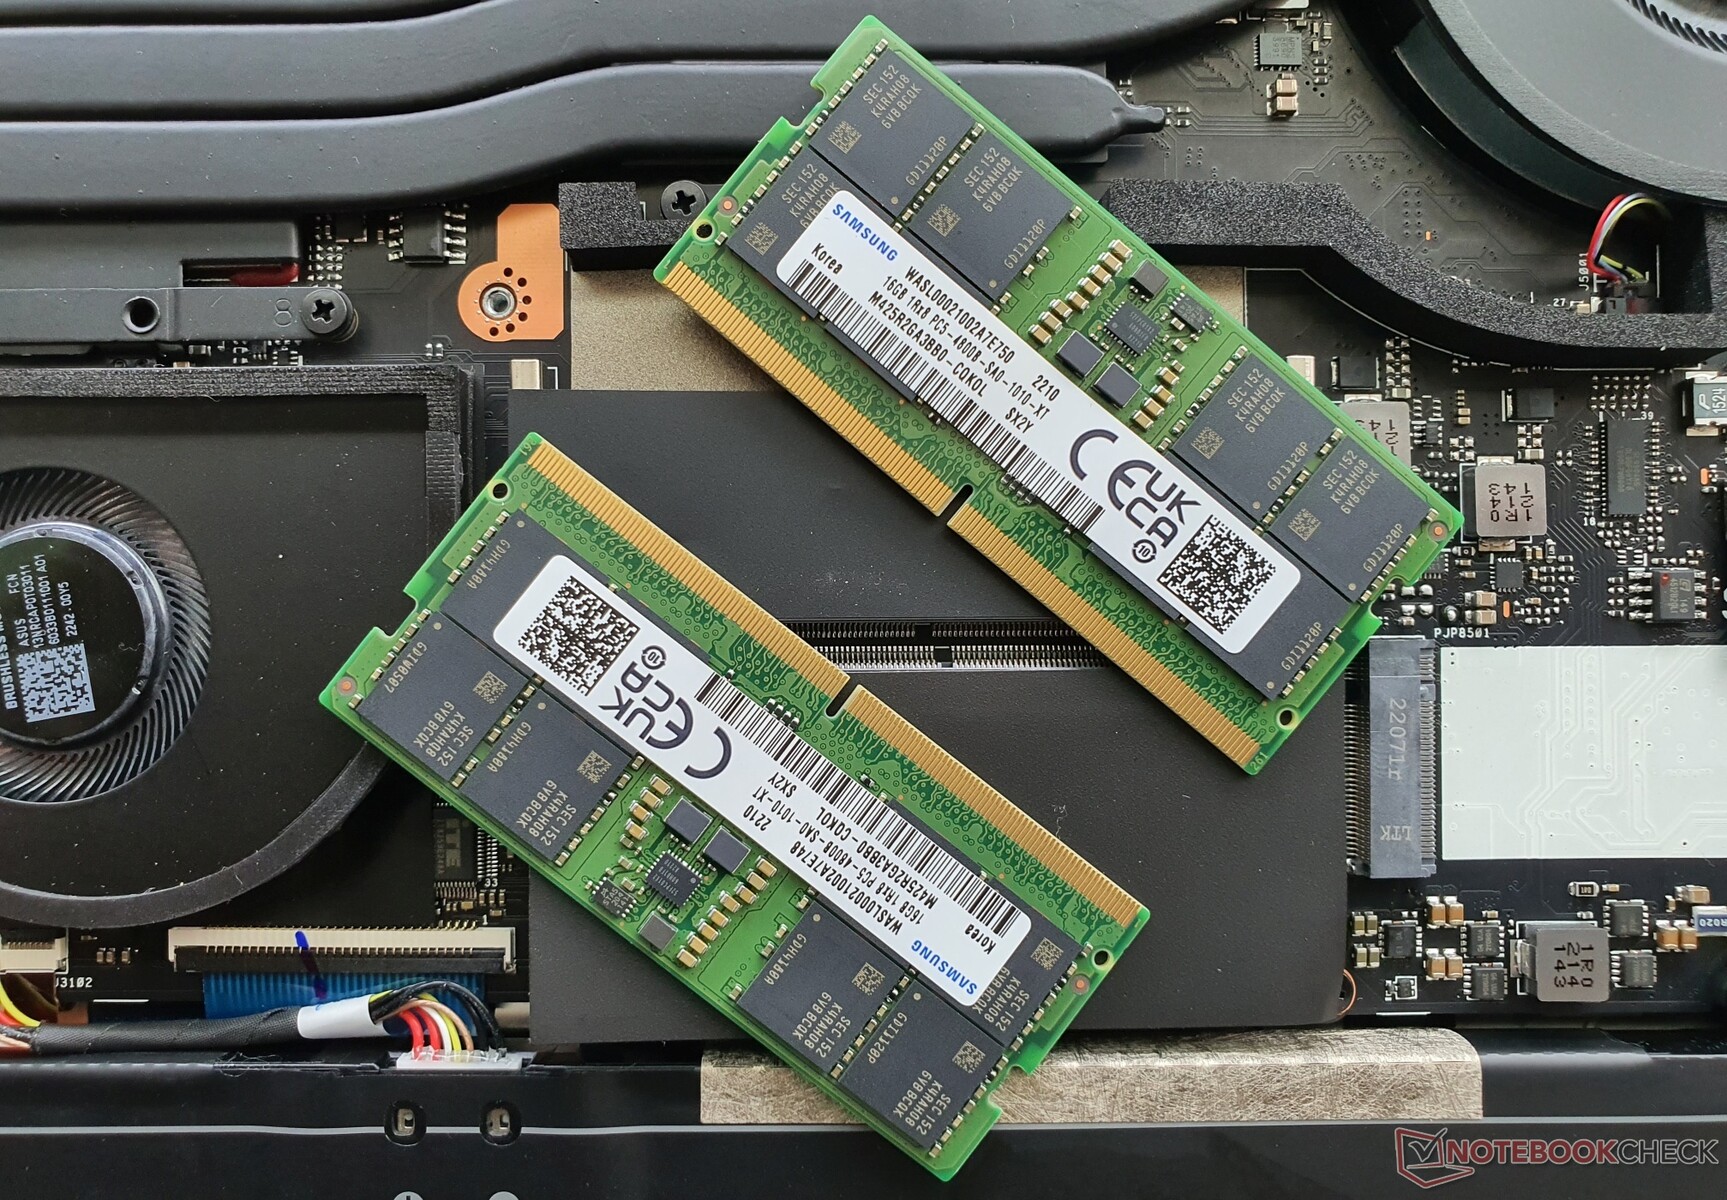
Inoltre, è possibile aggiornare la RAM (due slot) e utilizzare un SSD più grande nello slot M.2-2280 (PCIe 4.0). Uno slot M.2-2242 è libero per un'altra unità SSD.
Garanzia
In Germania, Asus fornisce una garanzia di 24 mesi con servizio di ritiro e restituzione per il ROG Flow X16. La garanzia può variare a seconda della località, quindi assicuratevi di verificare con il vostro fornitore prima dell'acquisto
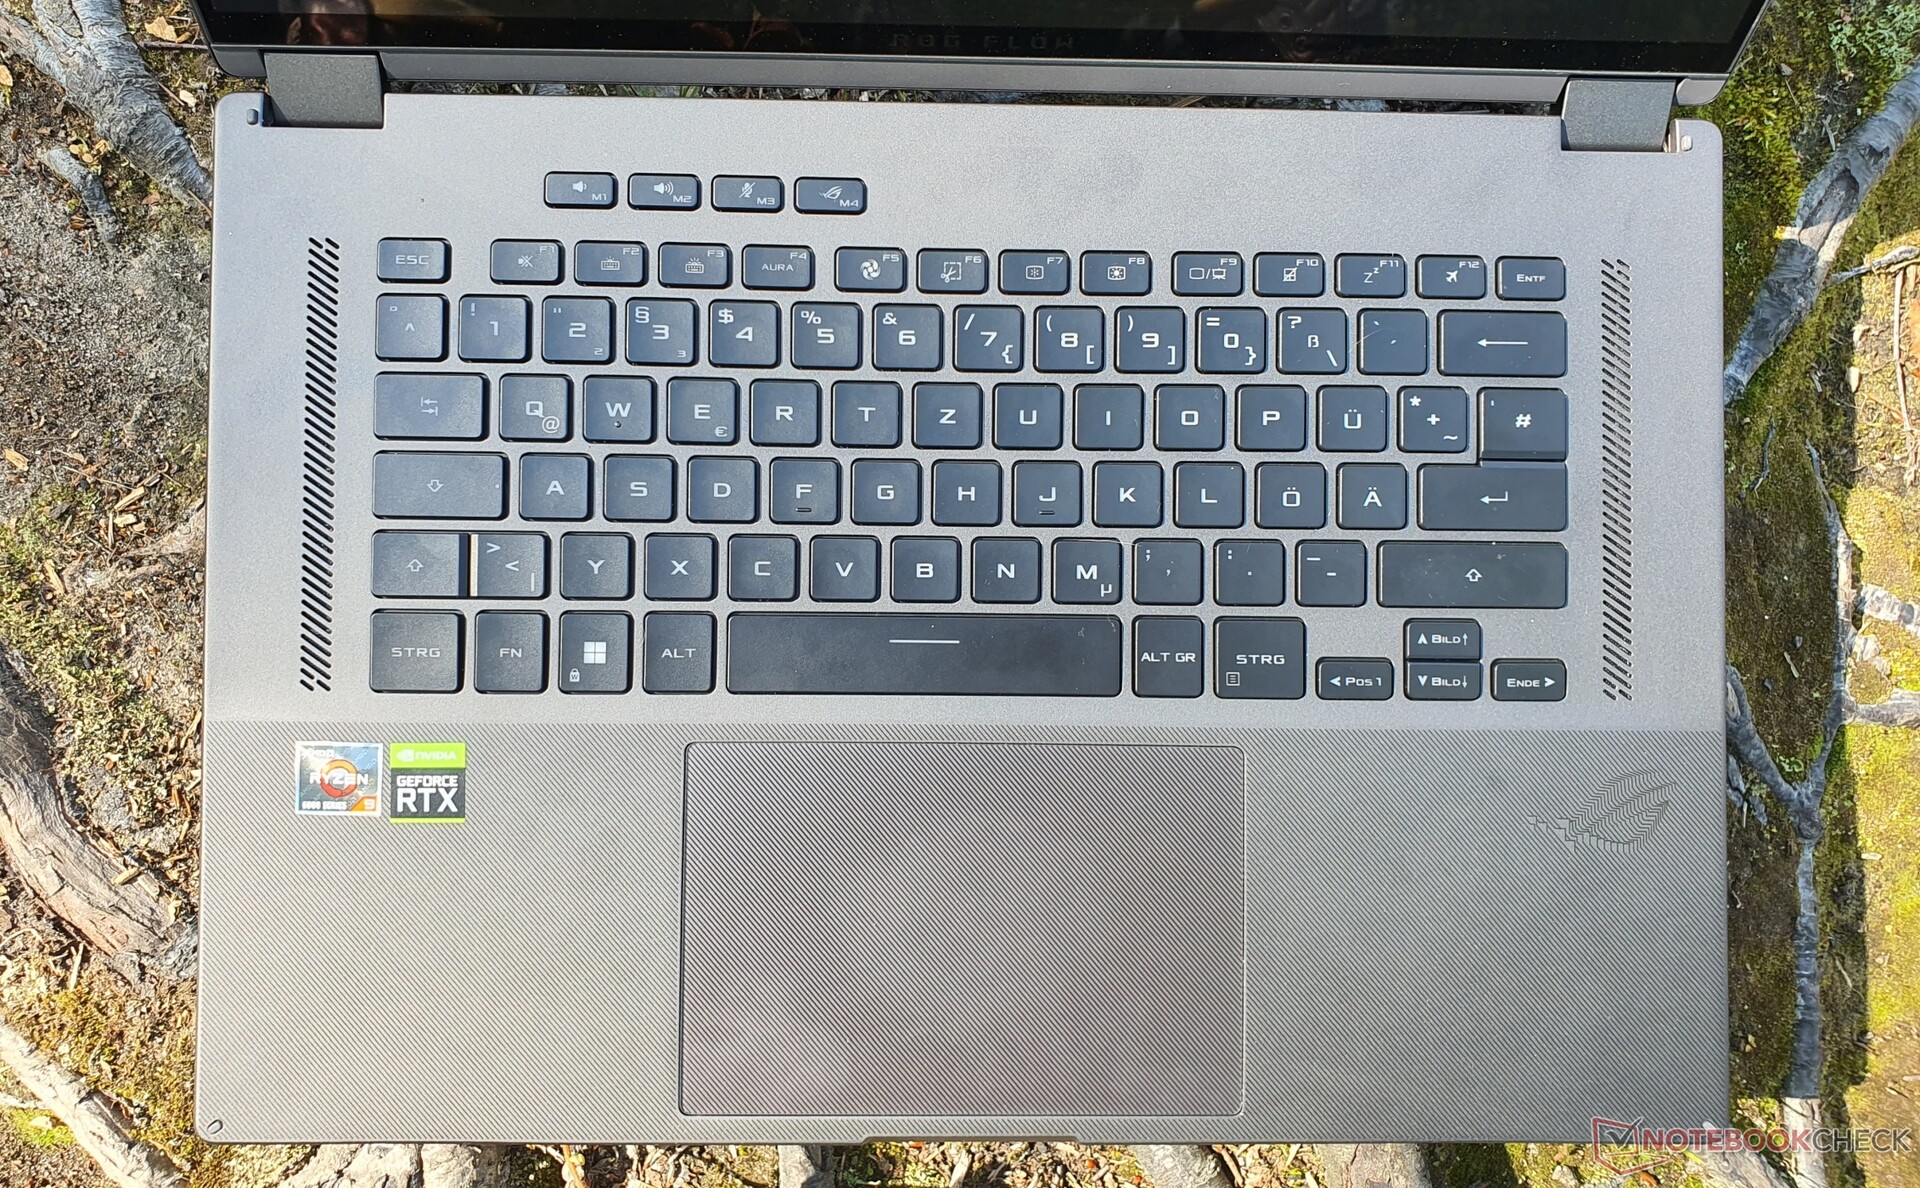
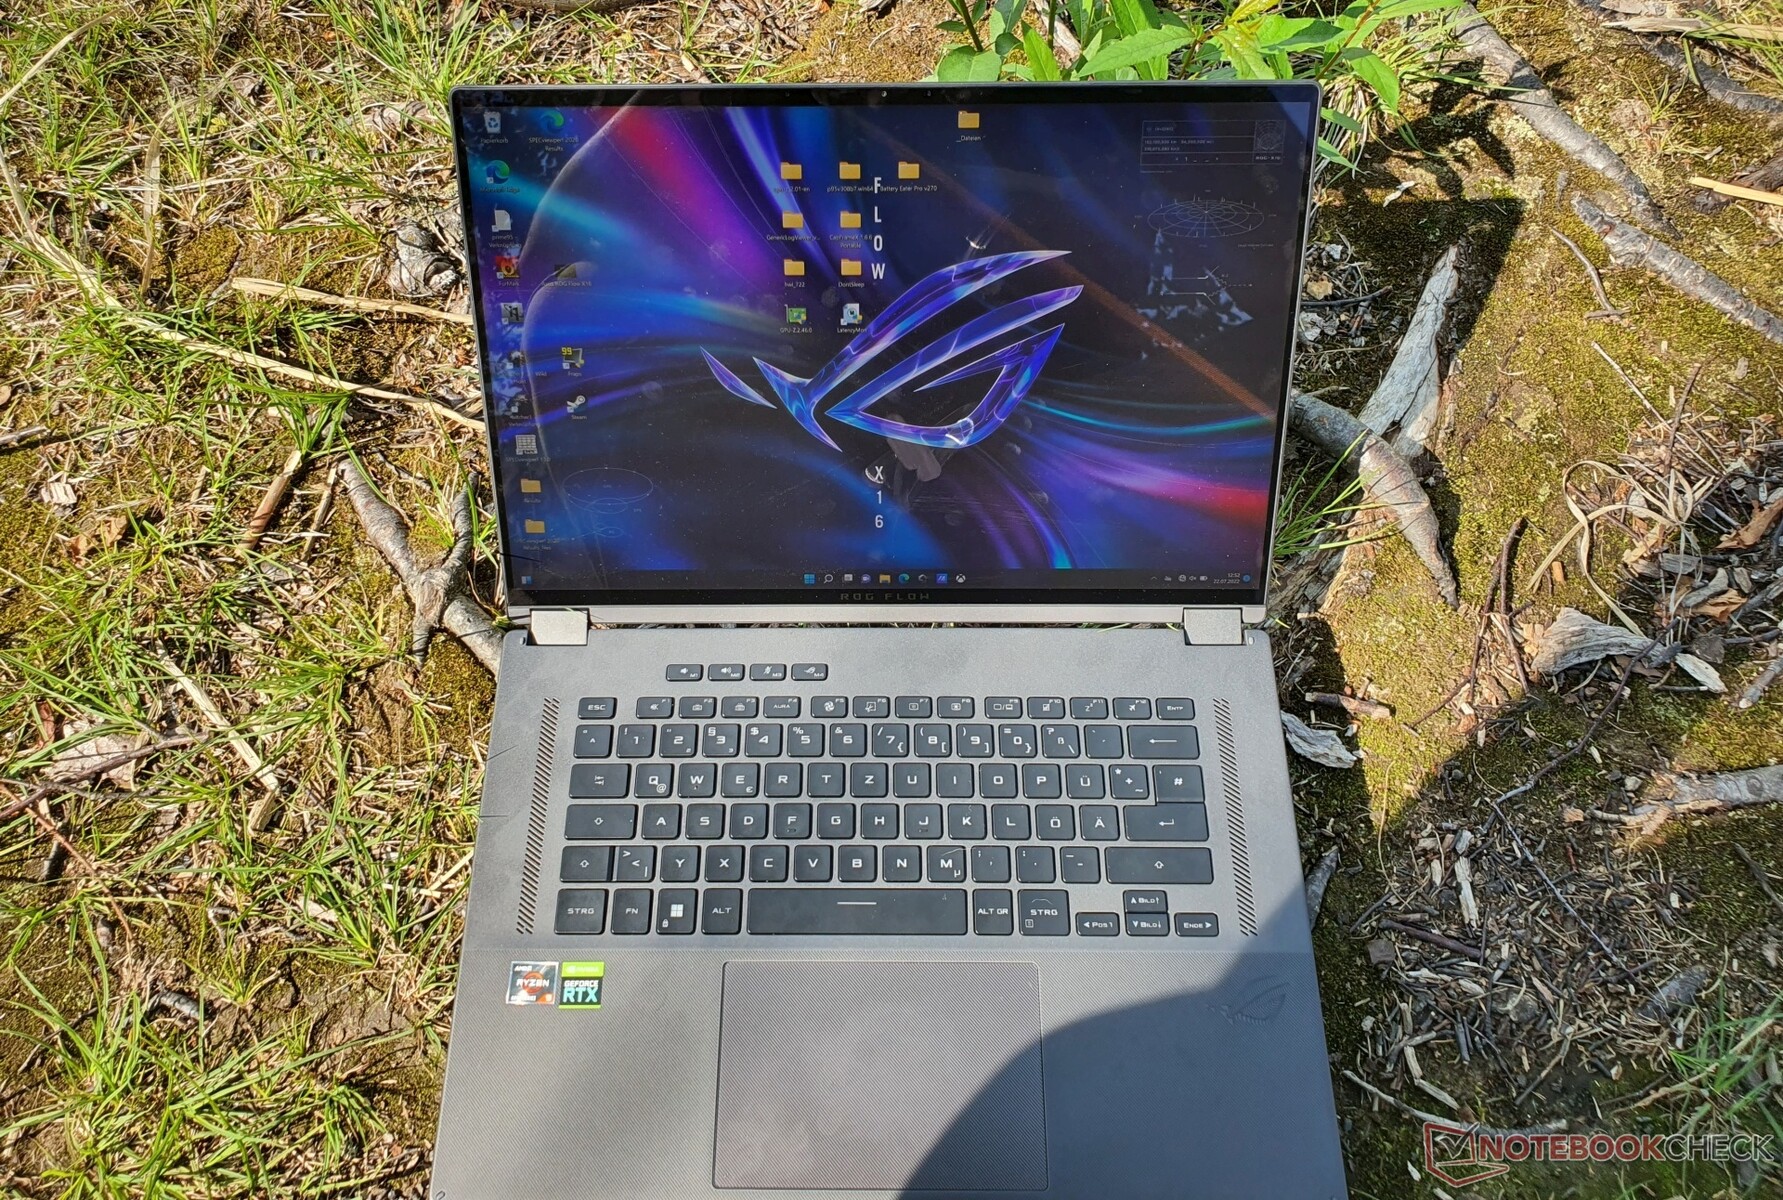
Dispositivi di input - Tastiera retroilluminata RGB con corsa di 1,7 mm
Tastiera
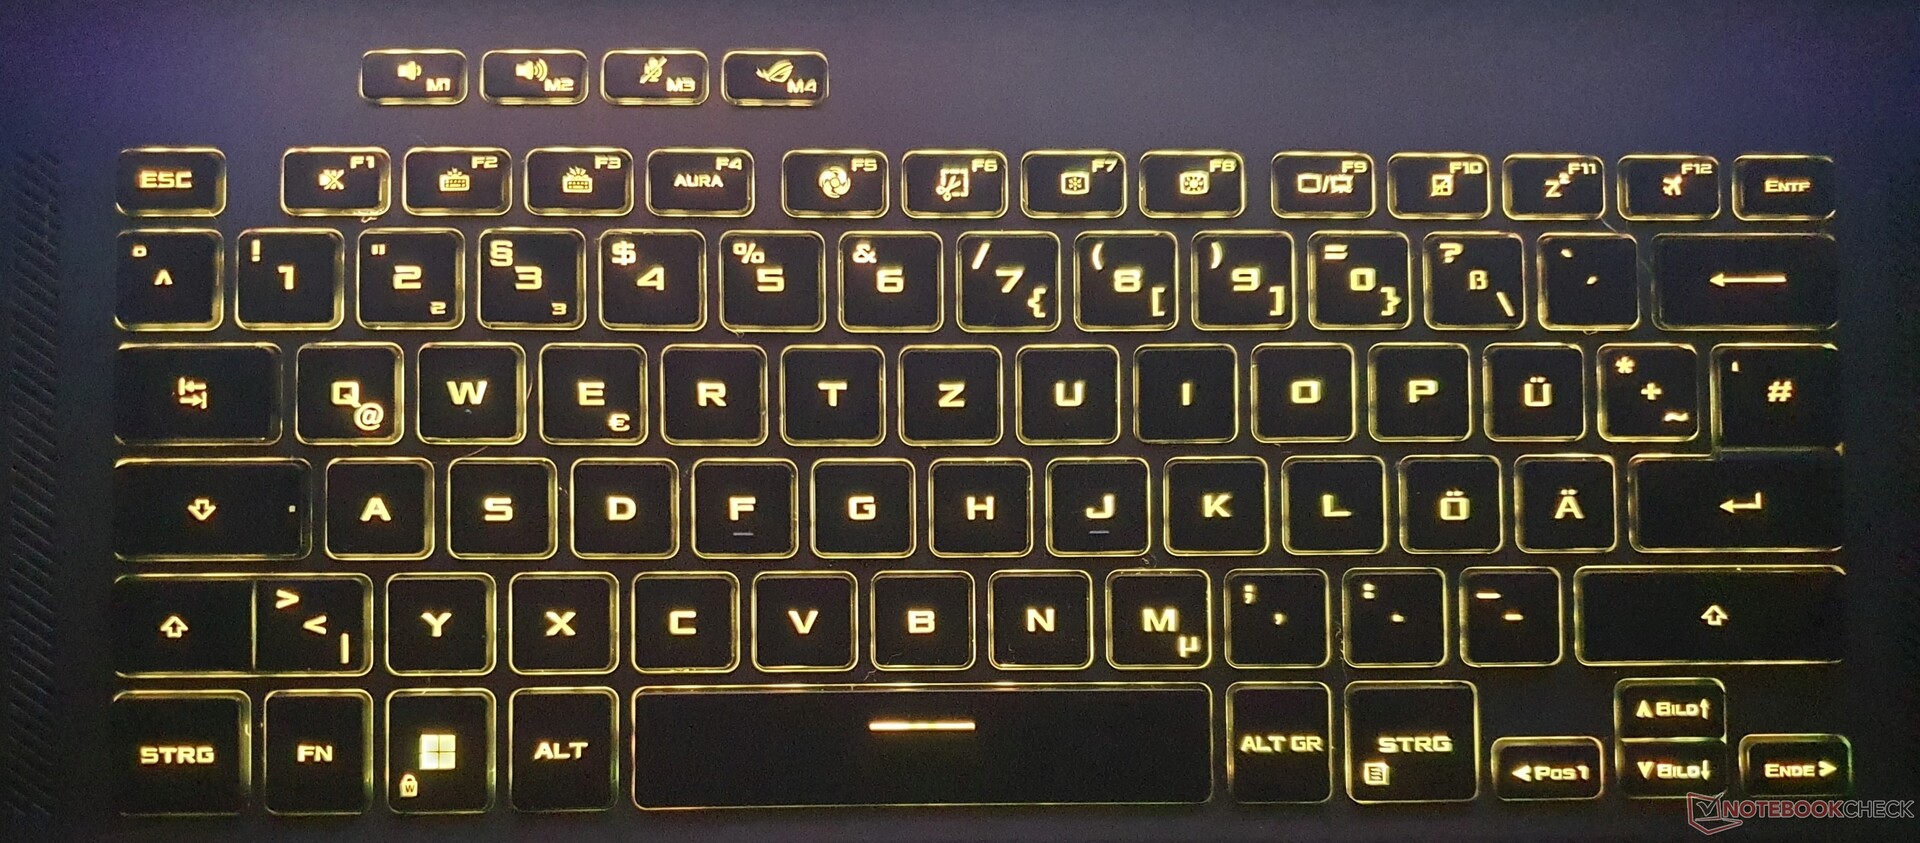
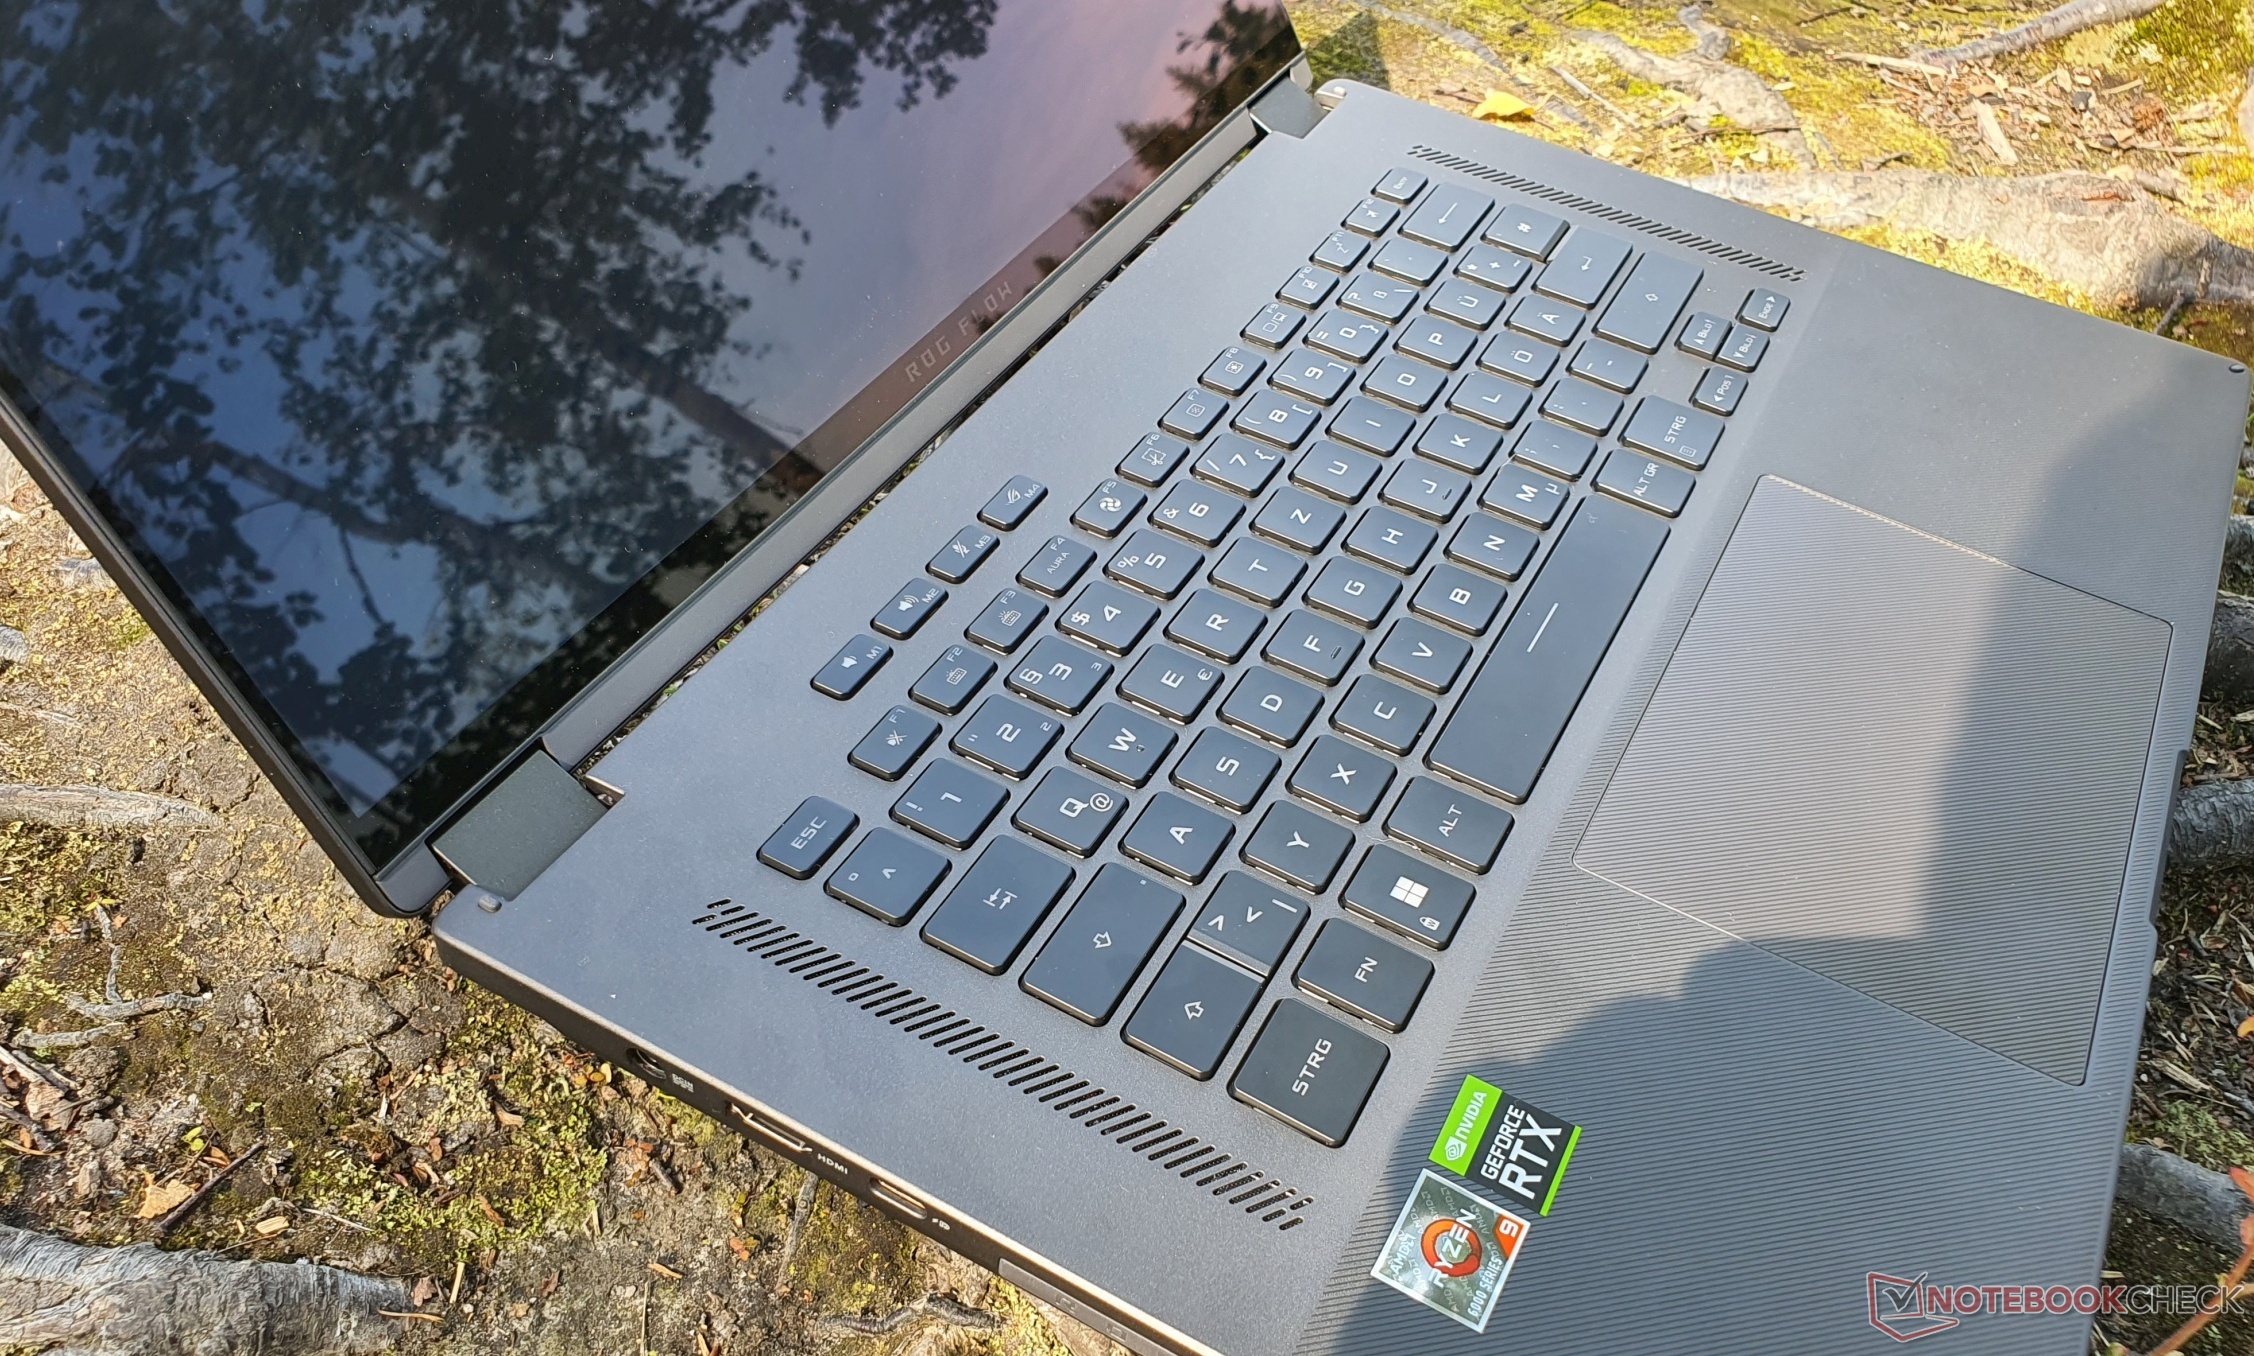
Asus installa una tastiera chiclet a 6 file nel ROG Flow X16, i cui tasti sono leggermente più piccoli, 15 x 15 mm. Le scritte sono ancora più grandi e presentano una tipografia speciale. Tipico portatile da gioco
La corsa di 1,7 mm è generosa e il punto di pressione è evidente con colpi chiari, ma la resistenza dei tasti potrebbe essere un po' troppo bassa per alcuni, in quanto soggettivamente sembra leggermente spugnosa. I tasti non sono concavi, a differenza di alcuni notebook business, ma nulla ostacola la digitazione veloce dopo un breve periodo di familiarizzazione. In pratica, è installata la stessa tastiera dello Zephyrus M16. È supportato il rollover dei tasti per consentire la corretta registrazione di più battute simultanee.
L'illuminazione RGB può essere regolata su tre livelli di intensità. Tuttavia, i tasti non possono essere programmati individualmente (cioè per tasto RGB). Il layout è buono e senza sorprese. I tasti freccia sono dimezzati, il tasto invio è diviso e sono state assegnate le solite doppie assegnazioni.
Touchpad e touchscreen
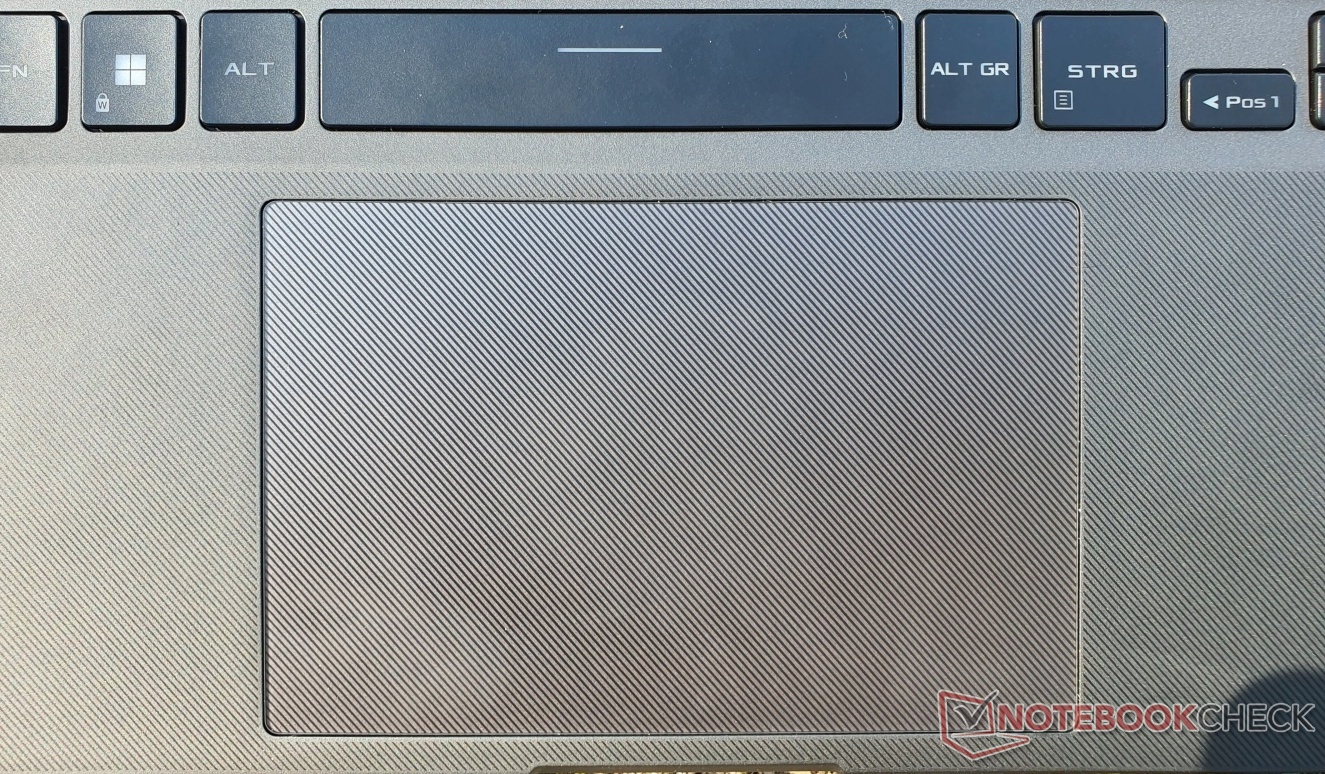
L'ampio touchpad in vetro misura 13 x 8,5 cm e offre eccellenti proprietà di scorrimento. La risposta e la precisione sono di alto livello. I gesti multi-touch e lo scorrimento funzionano senza problemi
I tasti integrati scattano silenziosamente, hanno una corsa breve e un feedback soddisfacente. Tuttavia, il touchpad si è guastato dopo poco tempo e non è stato possibile riattivarlo. Sospettiamo che ciò sia dovuto a un problema di driver che riguarda solo il nostro modello di pre-produzione.
Tutti i modelli di ROG X16 Flow sono dotati di touchscreen. La risposta e la precisione sono buone - lo scorrimento è particolarmente divertente con la frequenza di aggiornamento di 165 Hz. Lo stilo in dotazione (Asus SA201H) ha 4.096 livelli di pressione ed è alimentato da una batteria AAAA. Scivola in modo rapido e preciso sul touchscreen e la punta della penna offre un feedback adeguato, così come i due pulsanti integrati sul lato inferiore.
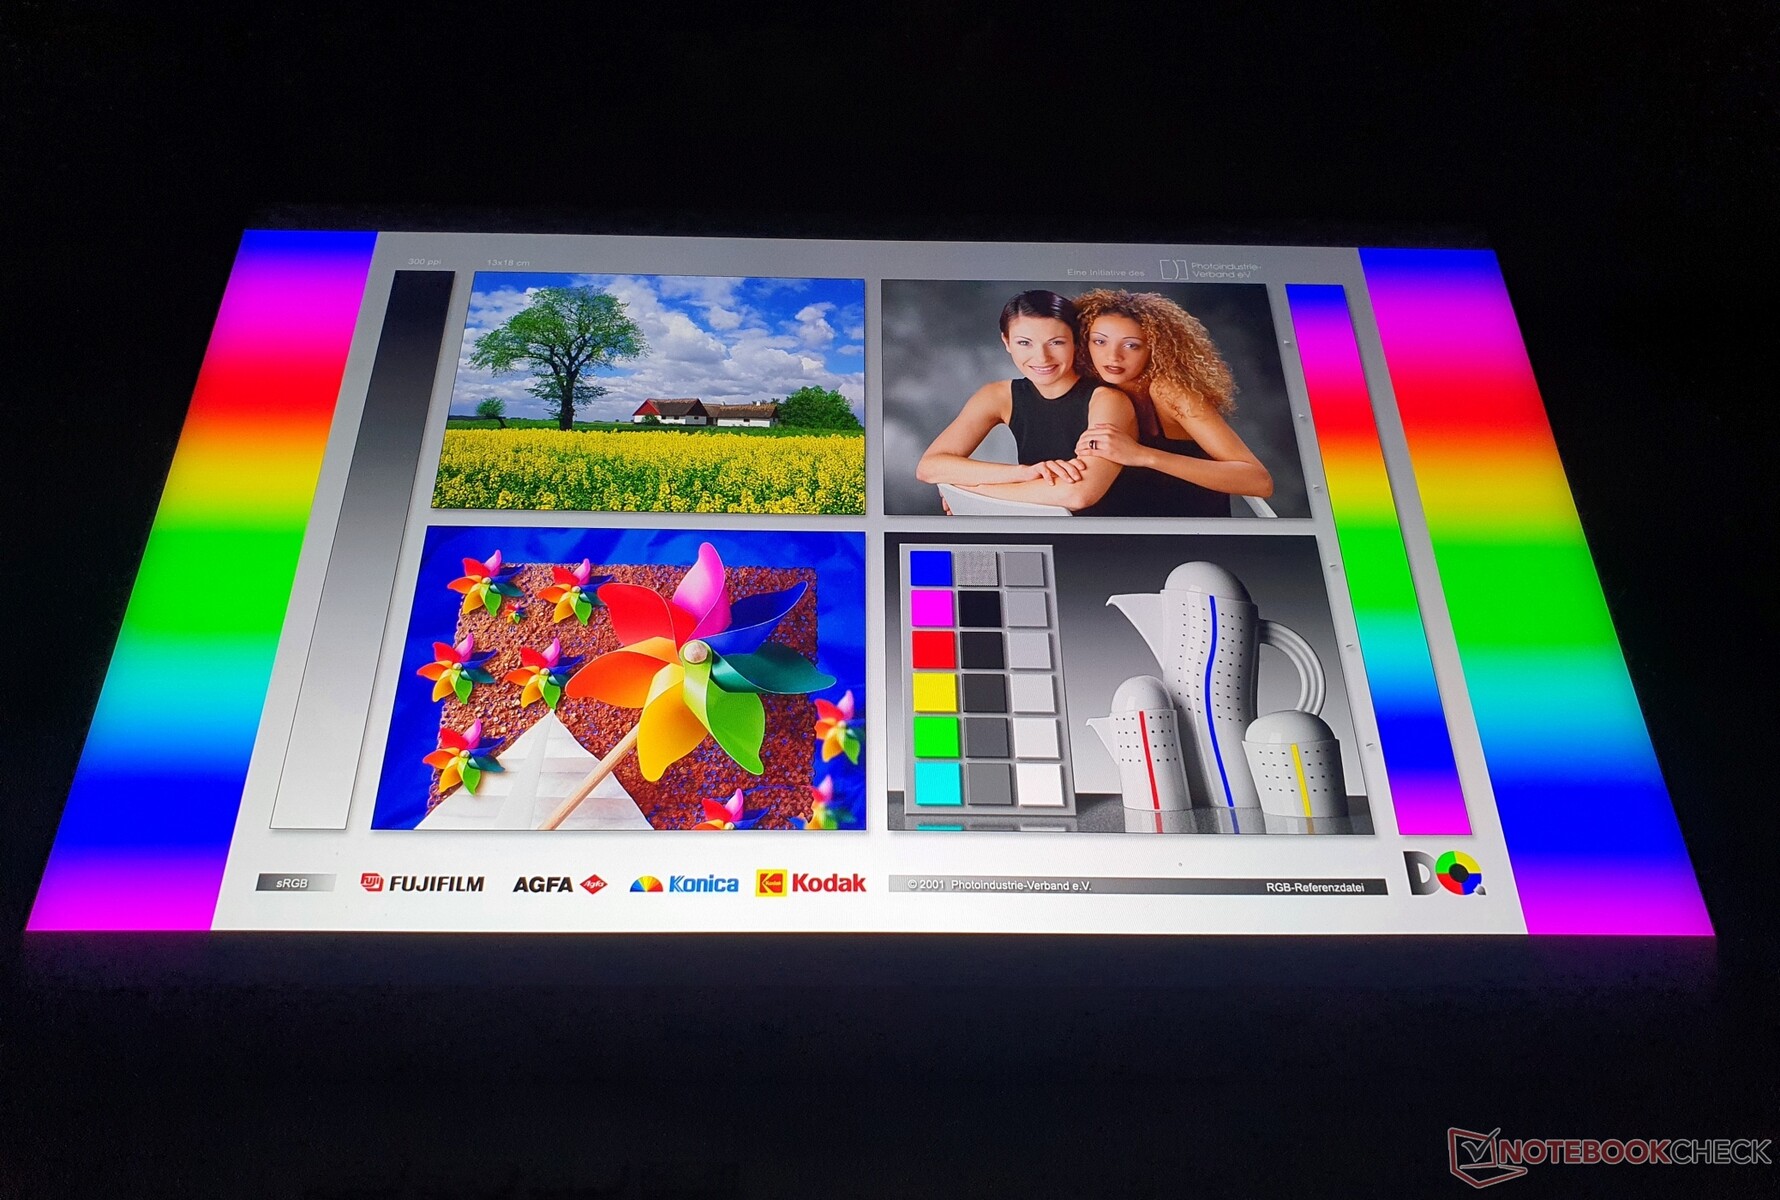
Il miglior display da gioco? Mini-LED con HDR 1000

Il ROG Flow X16 può essere ordinato con o senza retroilluminazione mini-LED. Alcune caratteristiche rimangono invariate: la risoluzione di 2560x1600 in formato 16:10, una frequenza di aggiornamento di 165 Hz e un touchscreen lucido con supporto per stilo.
Il mini-LED installato nella nostra variante supporta DisplayHDR 1000 per la prima volta in un notebook da gioco, insieme a Zephyrus Duo 16 di Asus. Tuttavia, quest'ultimo modello offre anche una variante opaca non touch.
I contenuti appaiono ancora più attraenti con DisplayHDR 1000 attivato, rispetto ai portatili precedenti che supportavano solo HDR 400 con miglioramenti dell'immagine significativamente inferiori. Gli unici altri portatili con DisplayHDR 1000 finora sono stati MSI Creator 17 (2020) e Apple MacBook Pro 16 (2021). Nel corso dell'anno dovrebbe essere disponibile anche Legion Slim 7i di Lenovo con un display mini-LED
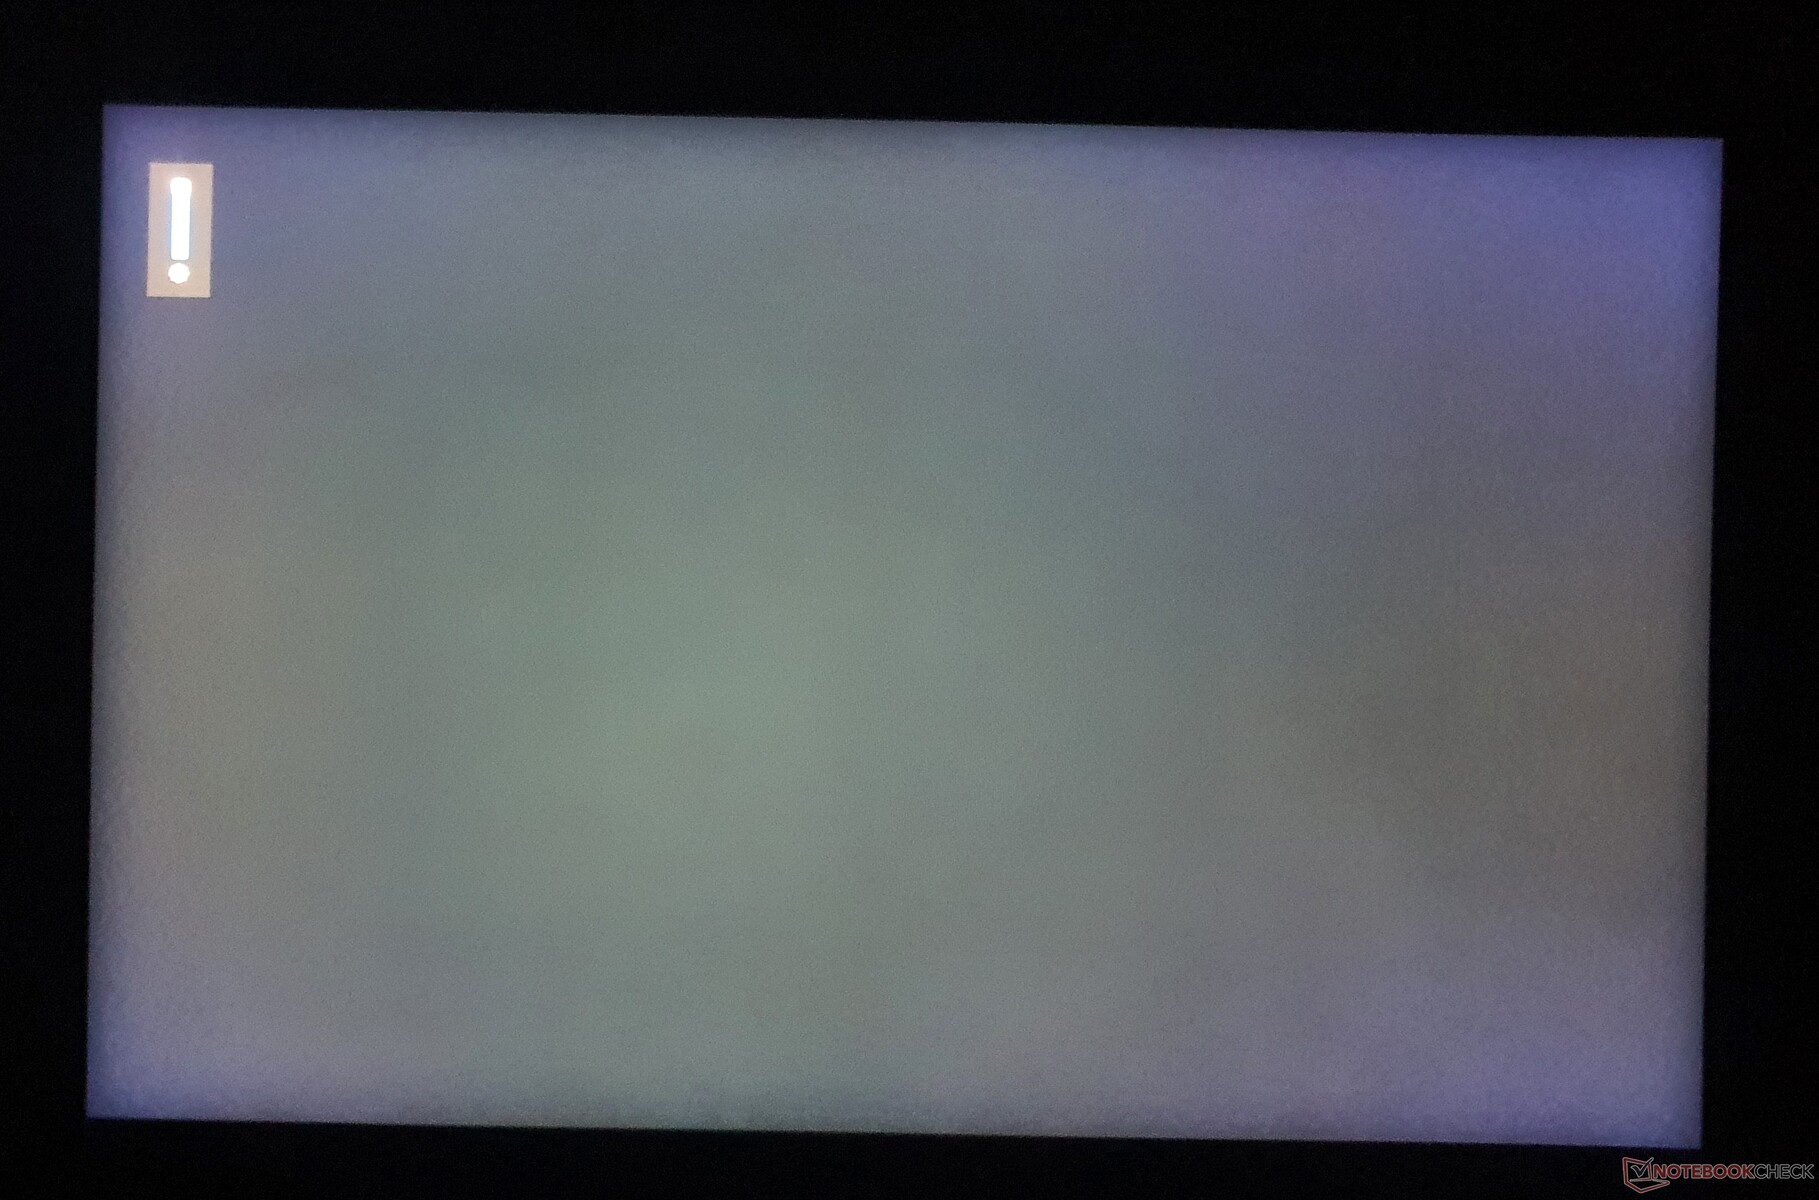
La percezione soggettiva delle immagini è eccellente. I colori vengono visualizzati molto bene, la luminosità di picco di ~1.100 nits con HDR attivato (funziona anche in modalità desktop normale) è eccezionale, e il livello di nero di 0,11 nits è quasi altrettanto ricco di quello dell'OLED, mentre il rapporto di contrasto di 4.527:1 è molto buono, come è tipico per il mini-LED. Le nostre misurazioni sono state effettuate in modalità SDR. In modalità HDR, il rapporto di contrasto è in genere molto più elevato, soprattutto grazie alle zone di local dimming attivate da 512 del nostro display: Singole aree di pixel si spengono completamente non appena viene visualizzato il nero, oppure le aree si illuminano molto con i contenuti HDR. Non ci sono aloni, il che spiega anche la solida omogeneità di illuminazione del 95%. La luminosità media dell'HDR è in genere inferiore di circa il 20% rispetto alla luminosità di picco (non misurata).
Insieme a un frame rate di 165 Hz e a buoni tempi di risposta di 11 ms ciascuno (da grigio a grigio e da nero a bianco), il display non ha rivali nei giochi HDR. È supportata la sincronizzazione adattiva. Solo coloro che giocano prevalentemente a sparatutto dal ritmo incalzante probabilmente cercheranno alternative con frame rate ancora più elevato e tempi di risposta più bassi, come ad esempio l'MSI Stealth GS66.MSI Stealth GS66e potrebbero preferire una risoluzione Full HD inferiore, dato che gli FPS massimi e la velocità hanno la priorità assoluta negli sparatutto veloci. Ma poiché il ROG X16 Flow è stato progettato anche per i creatori, non è ideale solo per i contenuti HDR nei giochi, ma anche per l'editing
Nel complesso, solo Apple's MacBook Pro 16 con il suo display Mini LED si avvicina alla qualità del display. I pannelli OLED, come Gigabyte Aero 16, non sono abbastanza luminosi per DisplayHDR 1000. D'altra parte, il mini-LED presenta un "blooming" (cioè la luce dei LED luminosi si riflette sui contenuti circostanti più scuri, simile al backlight bleeding, poiché le zone di oscuramento locale sono più grandi dei pixel) nel nostro dispositivo di recensione, ma questo è un po' meno pronunciato rispetto al MacBook o all'iPad Pro 12,9 Recensione del tablet Apple iPad Pro 12.9 2021 - Una carta vincente Mini LED? con il chip M1. Il PWM è un aspetto che abbiamo sempre osservato nei display mini-LED, ma la frequenza molto elevata di 7.400 MHz non dovrebbe creare problemi, anche per gli utenti più sensibili.
| |||||||||||||||||||||||||
Distribuzione della luminosità: 94 %
Al centro con la batteria: 502 cd/m²
Contrasto: 4527:1 (Nero: 0.11 cd/m²)
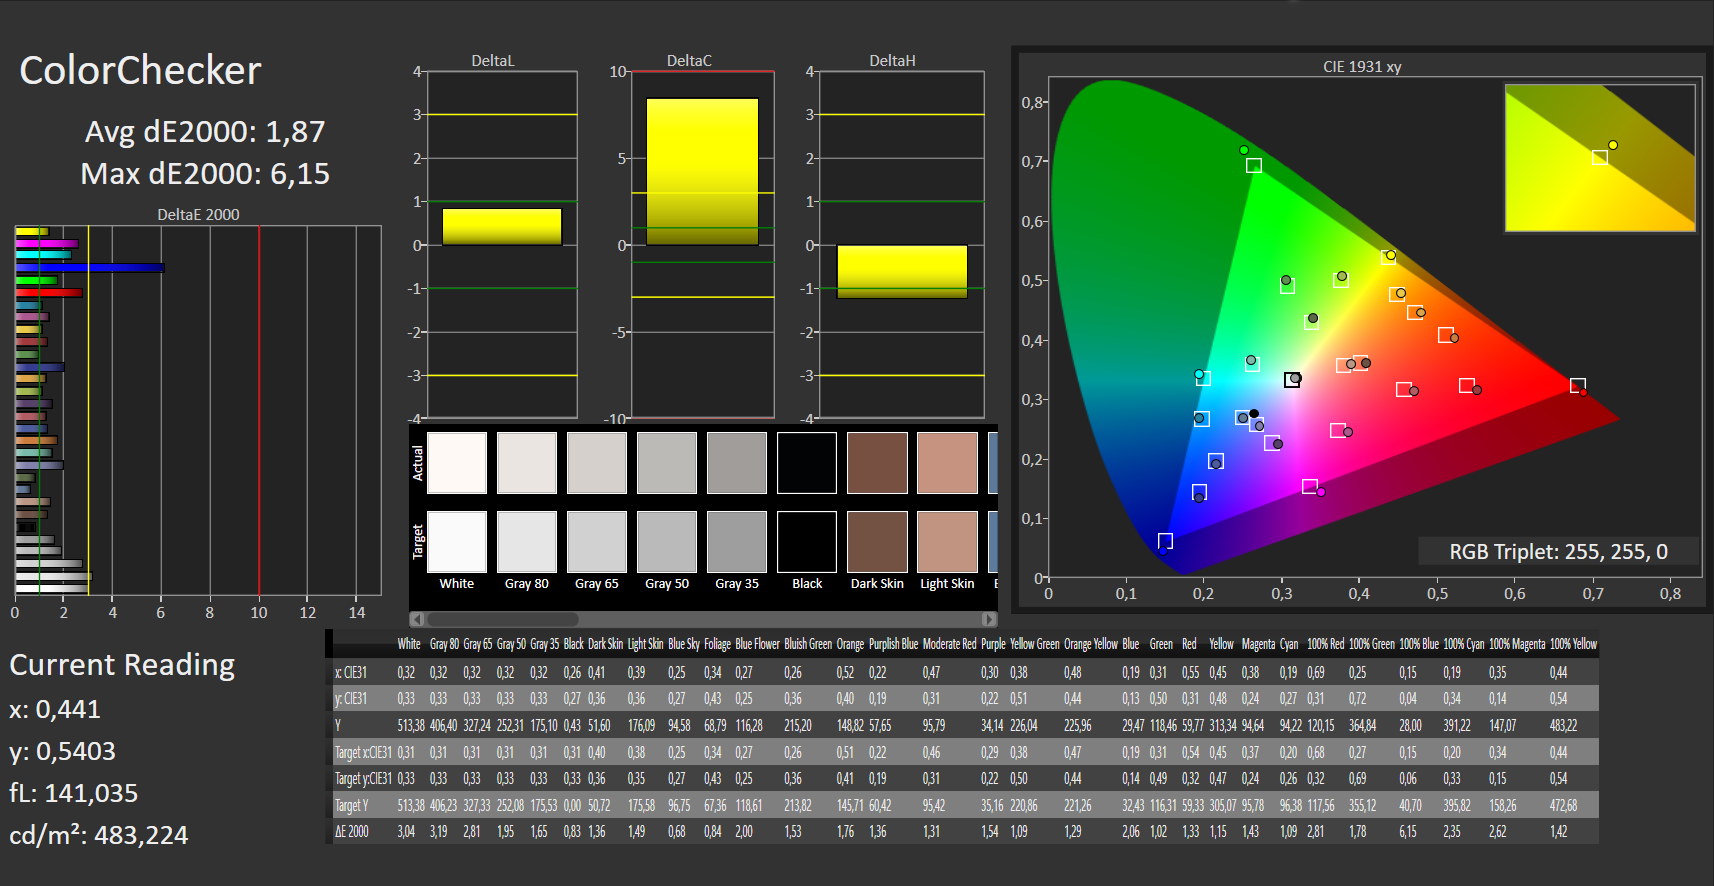
ΔE ColorChecker Calman: 1.87 | ∀{0.5-29.43 Ø4.73}
calibrated: 1.94
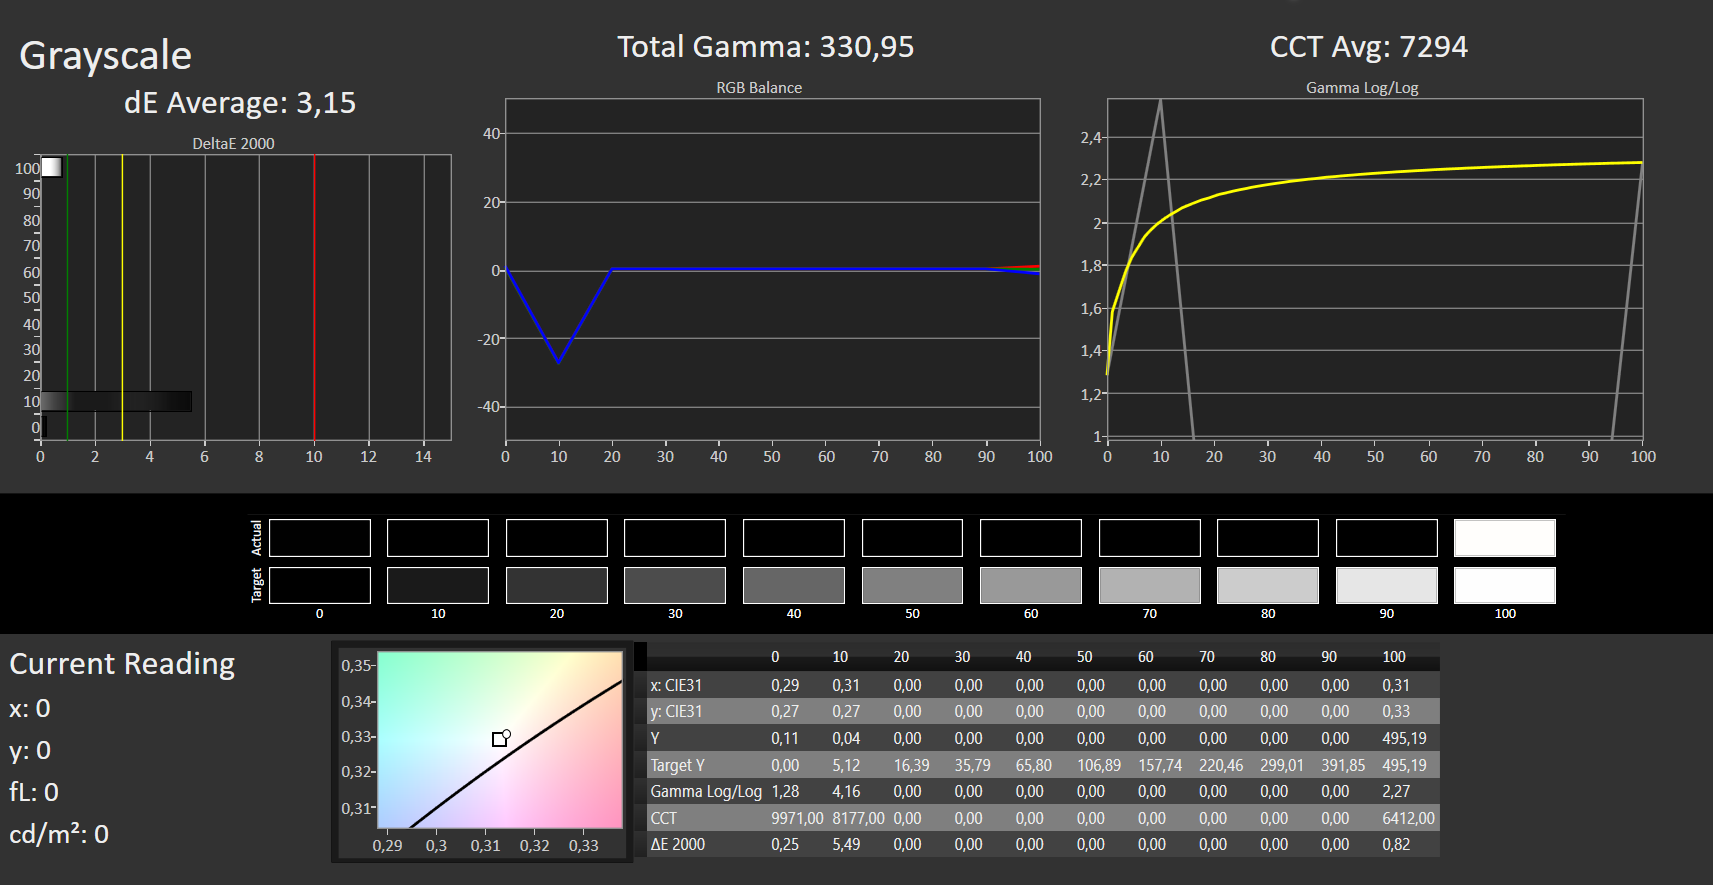
ΔE Greyscale Calman: 3.15 | ∀{0.09-98 Ø4.97}
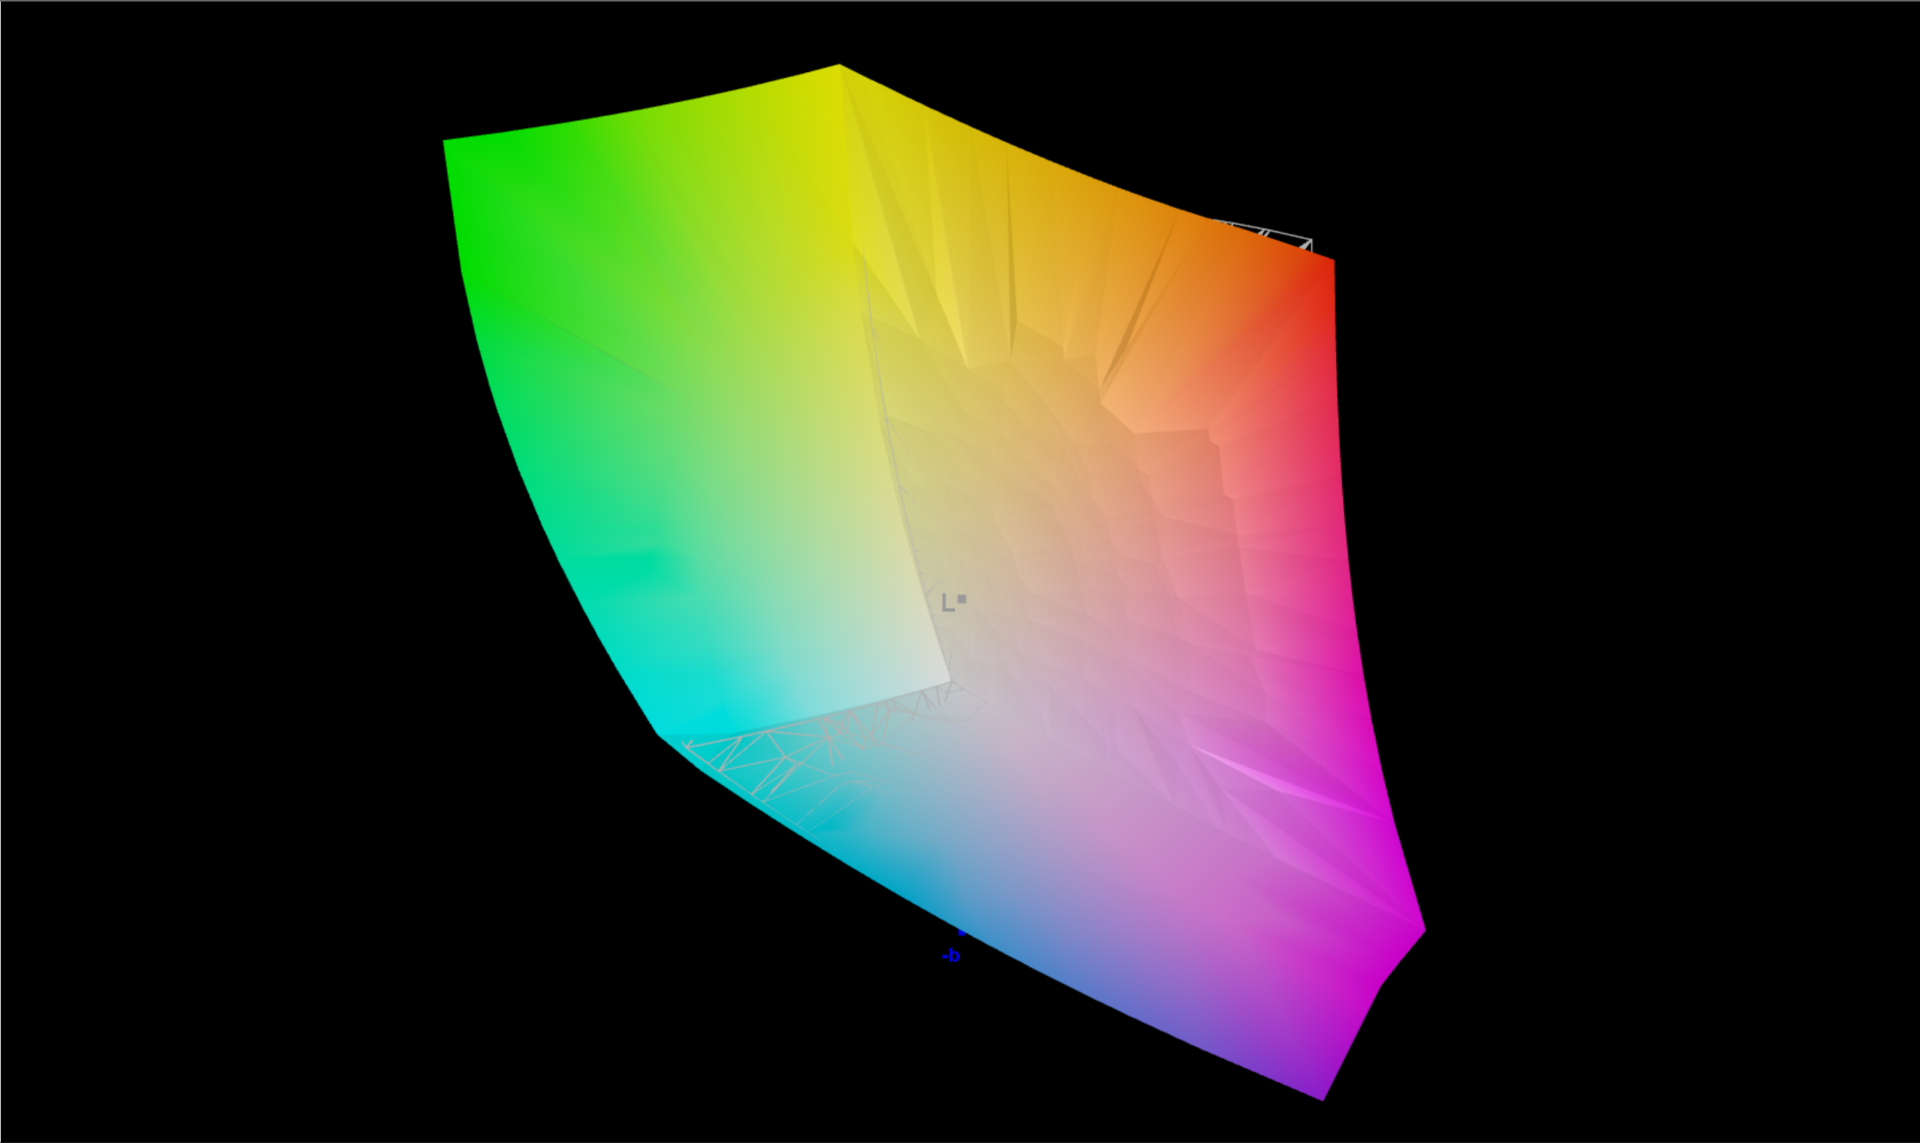
90.21% AdobeRGB 1998 (Argyll 3D)
99.99% sRGB (Argyll 3D)
99.82% Display P3 (Argyll 3D)
Gamma: 330.95
CCT: 7294 K
| Asus ROG Flow X16 GV601RW-M5082W AUO B160QAN02.S, Mini LED, 2560x1600, 16.1" | Asus ROG Zephyrus M16 GU603H AU Optronics AUOC199, IPS, 2560x1600, 16" | Gigabyte Aero 16 YE5 Samsung SDC416B, AMOLED, 3840x2400, 16" | MSI Stealth GS66 12UGS Sharp LQ156T1JW04 (SHP153C), IPS-Level, 2560x1440, 15.6" | Lenovo Legion 5 Pro 16 G7 i7 RTX 3070Ti NE160QDM-NY1, IPS, 2560x1600, 16" | Apple MacBook Pro 16 2021 M1 Pro Liquid Retina XDR, Mini-LED, 3456x2234, 16.2" | Lenovo ThinkPad X1 Extreme G4-20Y5CTO1WW (3050 Ti) LP160UQ1-SPB1, IPS LED, 3840x2400, 16" | Dell XPS 17 9720 RTX 3060 Sharp LQ170R1, IPS, 3840x2400, 17" | Microsoft Surface Laptop Studio i7 RTX 3050 Ti LQ144P1JX01, IPS, 2400x1600, 14.4" | |
|---|---|---|---|---|---|---|---|---|---|
| Display | -3% | -18% | -1% | -3% | -4% | -11% | |||
| Display P3 Coverage (%) | 99.82 | 96.4 -3% | 68.7 -31% | 99.1 -1% | 84.3 -16% | 92.9 -7% | 80.6 -19% | ||
| sRGB Coverage (%) | 99.99 | 99.7 0% | 97.6 -2% | 100 0% | 98.3 -2% | 100 0% | 99.9 0% | ||
| AdobeRGB 1998 Coverage (%) | 90.21 | 85.6 -5% | 70.9 -21% | 88 -2% | 97.8 8% | 85.3 -5% | 78.5 -13% | ||
| Response Times | 51% | 80% | 35% | -15% | -511% | -364% | -293% | -275% | |
| Response Time Grey 50% / Grey 80% * (ms) | 11 ? | 4.8 ? 56% | 2.4 ? 78% | 6 ? 45% | 17.6 ? -60% | 42.8 ? -289% | 60 ? -445% | 51.2 ? -365% | 58.4 ? -431% |
| Response Time Black / White * (ms) | 11 ? | 6 ? 45% | 2 ? 82% | 8.4 ? 24% | 7.6 ? 31% | 91.6 ? -733% | 42 ? -282% | 35.2 ? -220% | 24 ? -118% |
| PWM Frequency (Hz) | 7400 ? | 60 ? | 14880 | 5000 ? | |||||
| Screen | -61% | 104% | -57% | -32% | 82% | -32% | -90% | -5% | |
| Brightness middle (cd/m²) | 498 | 448 -10% | 368 -26% | 272 -45% | 502 1% | 514 3% | 639 28% | 512.7 3% | 497 0% |
| Brightness (cd/m²) | 502 | 446 -11% | 368 -27% | 253 -50% | 491 -2% | 497 -1% | 612 22% | 463 -8% | 491 -2% |
| Brightness Distribution (%) | 94 | 86 -9% | 93 -1% | 87 -7% | 91 -3% | 95 1% | 84 -11% | 85 -10% | 92 -2% |
| Black Level * (cd/m²) | 0.11 | 0.48 -336% | 0.01 91% | 0.25 -127% | 0.37 -236% | 0.02 82% | 0.47 -327% | 0.32 -191% | 0.29 -164% |
| Contrast (:1) | 4527 | 933 -79% | 36800 713% | 1088 -76% | 1357 -70% | 25700 468% | 1360 -70% | 1602 -65% | 1714 -62% |
| Colorchecker dE 2000 * | 1.87 | 2.76 -48% | 2.33 -25% | 3.73 -99% | 2.7 -44% | 1.4 25% | 2.2 -18% | 5.98 -220% | 1.2 36% |
| Colorchecker dE 2000 max. * | 6.15 | 7.09 -15% | 4.34 29% | 9.43 -53% | 4.5 27% | 2.8 54% | 5.3 14% | 12.09 -97% | 2.8 54% |
| Colorchecker dE 2000 calibrated * | 1.94 | 2.86 -47% | 0.98 49% | 1.4 28% | 1.4 28% | 0.8 59% | |||
| Greyscale dE 2000 * | 3.15 | 3.1 2% | 0.8 75% | 6.5 -106% | 2.7 14% | 2.3 27% | 1.7 46% | 7.2 -129% | 1.9 40% |
| Gamma | 330.95 1% | 2.153 102% | 2.119 104% | 2.172 101% | 2.44 90% | 2.27 97% | 2.31 95% | 2.54 87% | 2.14 103% |
| CCT | 7294 89% | 6826 95% | 6569 99% | 6485 100% | 6326 103% | 6792 96% | 6390 102% | 6914 94% | 6821 95% |
| Color Space (Percent of AdobeRGB 1998) (%) | 87 | ||||||||
| Color Space (Percent of sRGB) (%) | 100 | ||||||||
| Media totale (Programma / Settaggio) | -5% /
-41% | 92% /
99% | -8% /
-32% | -22% /
-26% | -143% /
-28% | -133% /
-73% | -129% /
-101% | -97% /
-44% |
* ... Meglio usare valori piccoli
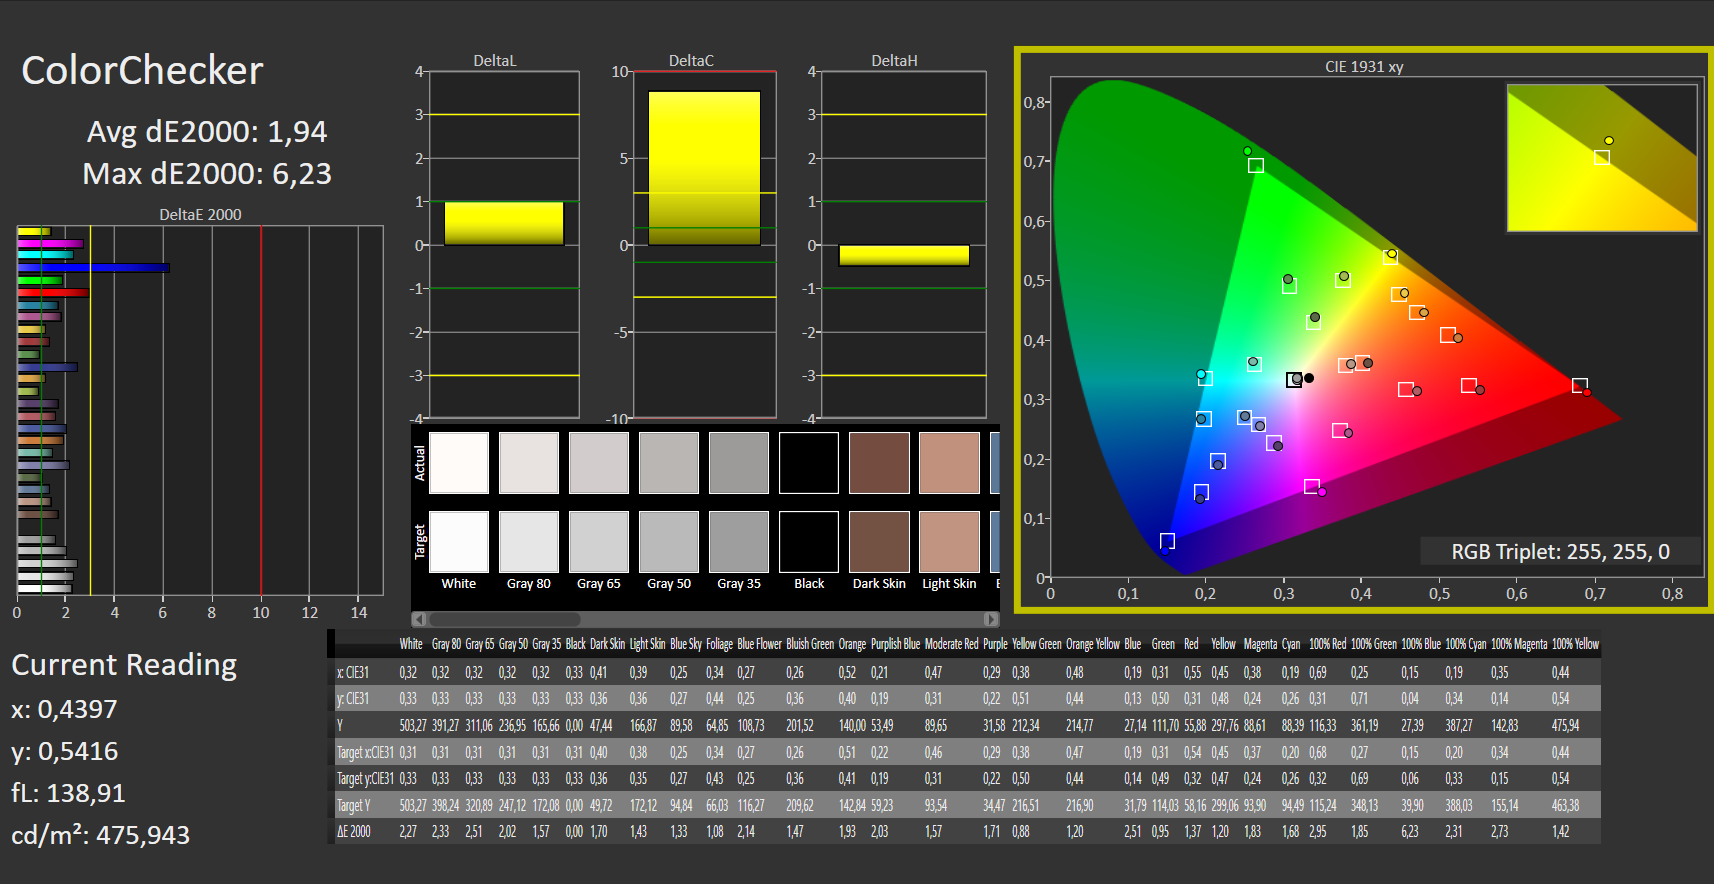
Nel nostro test, il ROG Flow X16 è l'unico notebook che copre più del 90% dello spazio colore Adobe RGB (90,2%). sRGB e DCI-P3 sono coperti fino a ~100%. Pertanto, nulla ostacola l'editing di immagini e video più impegnativo.
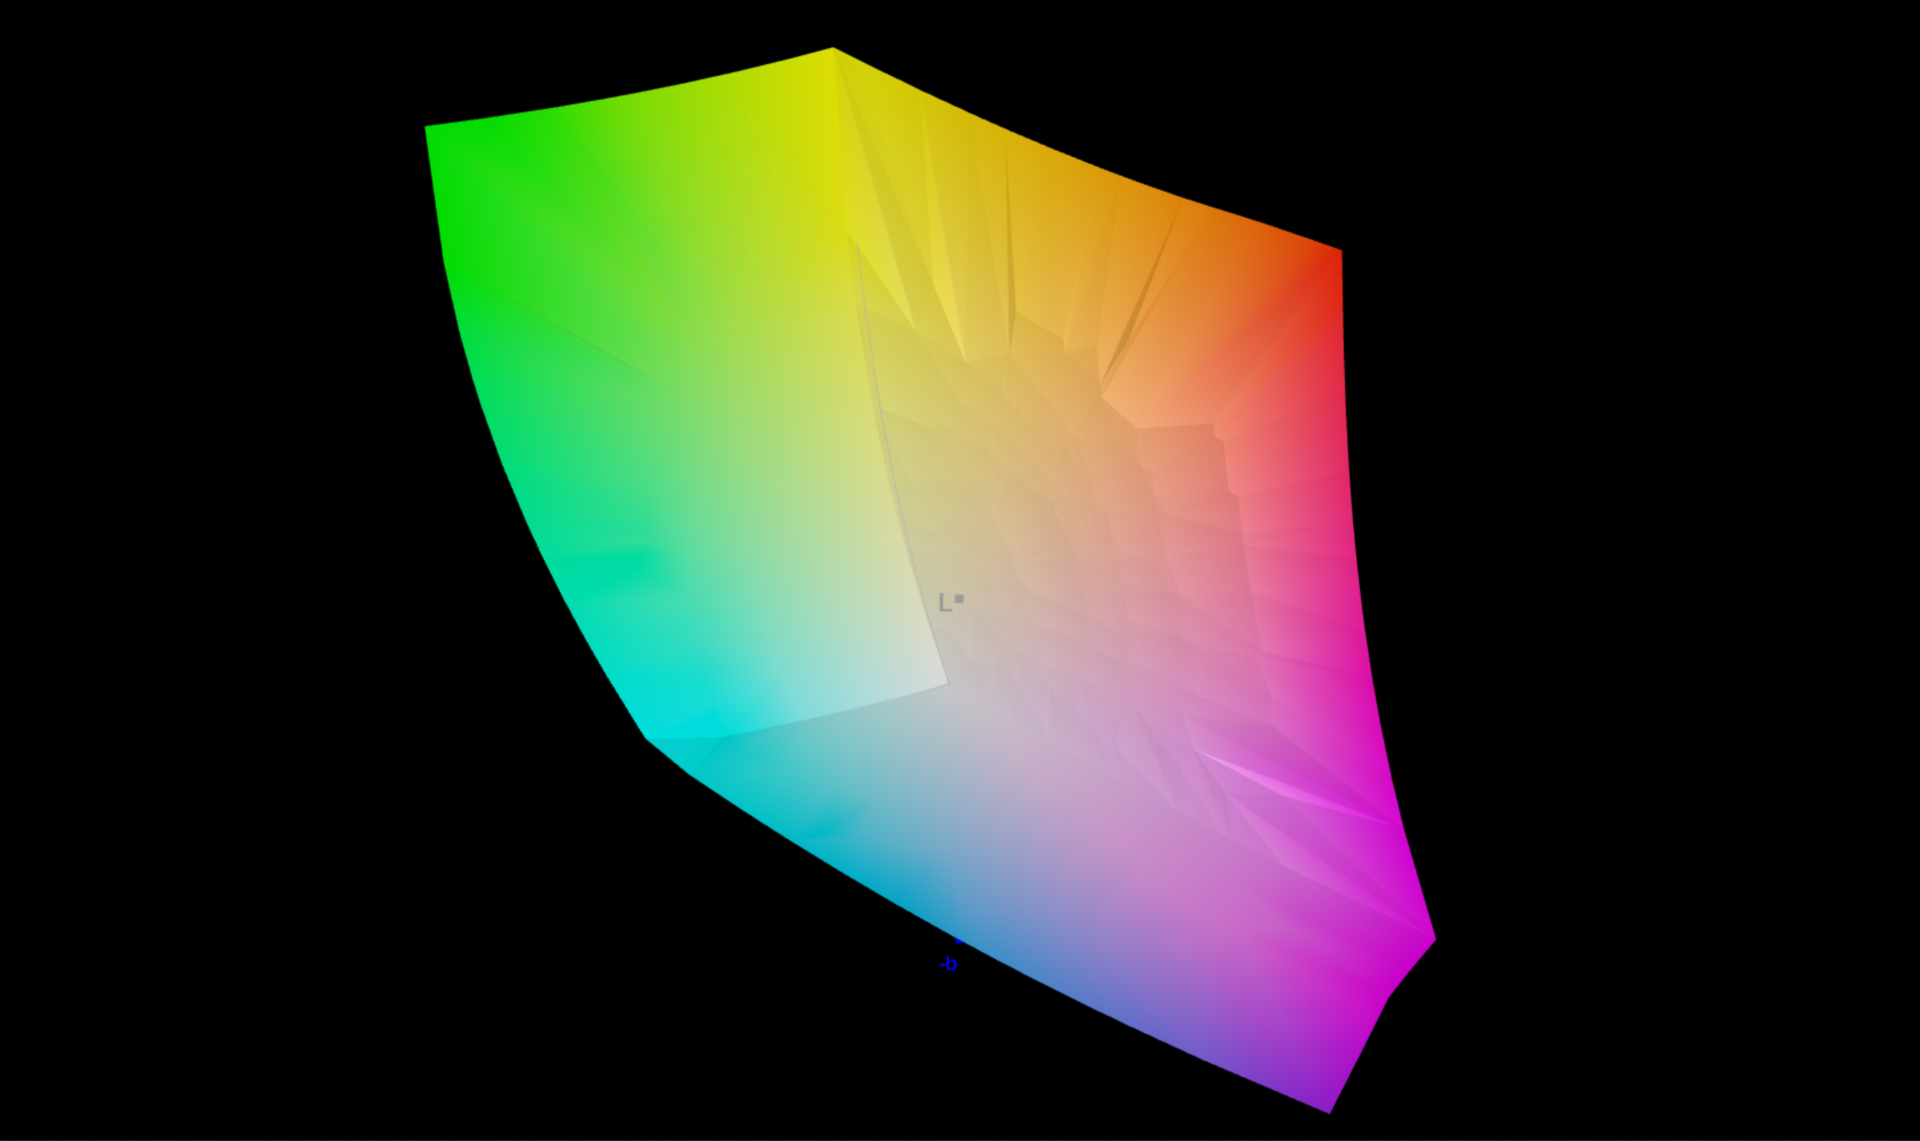
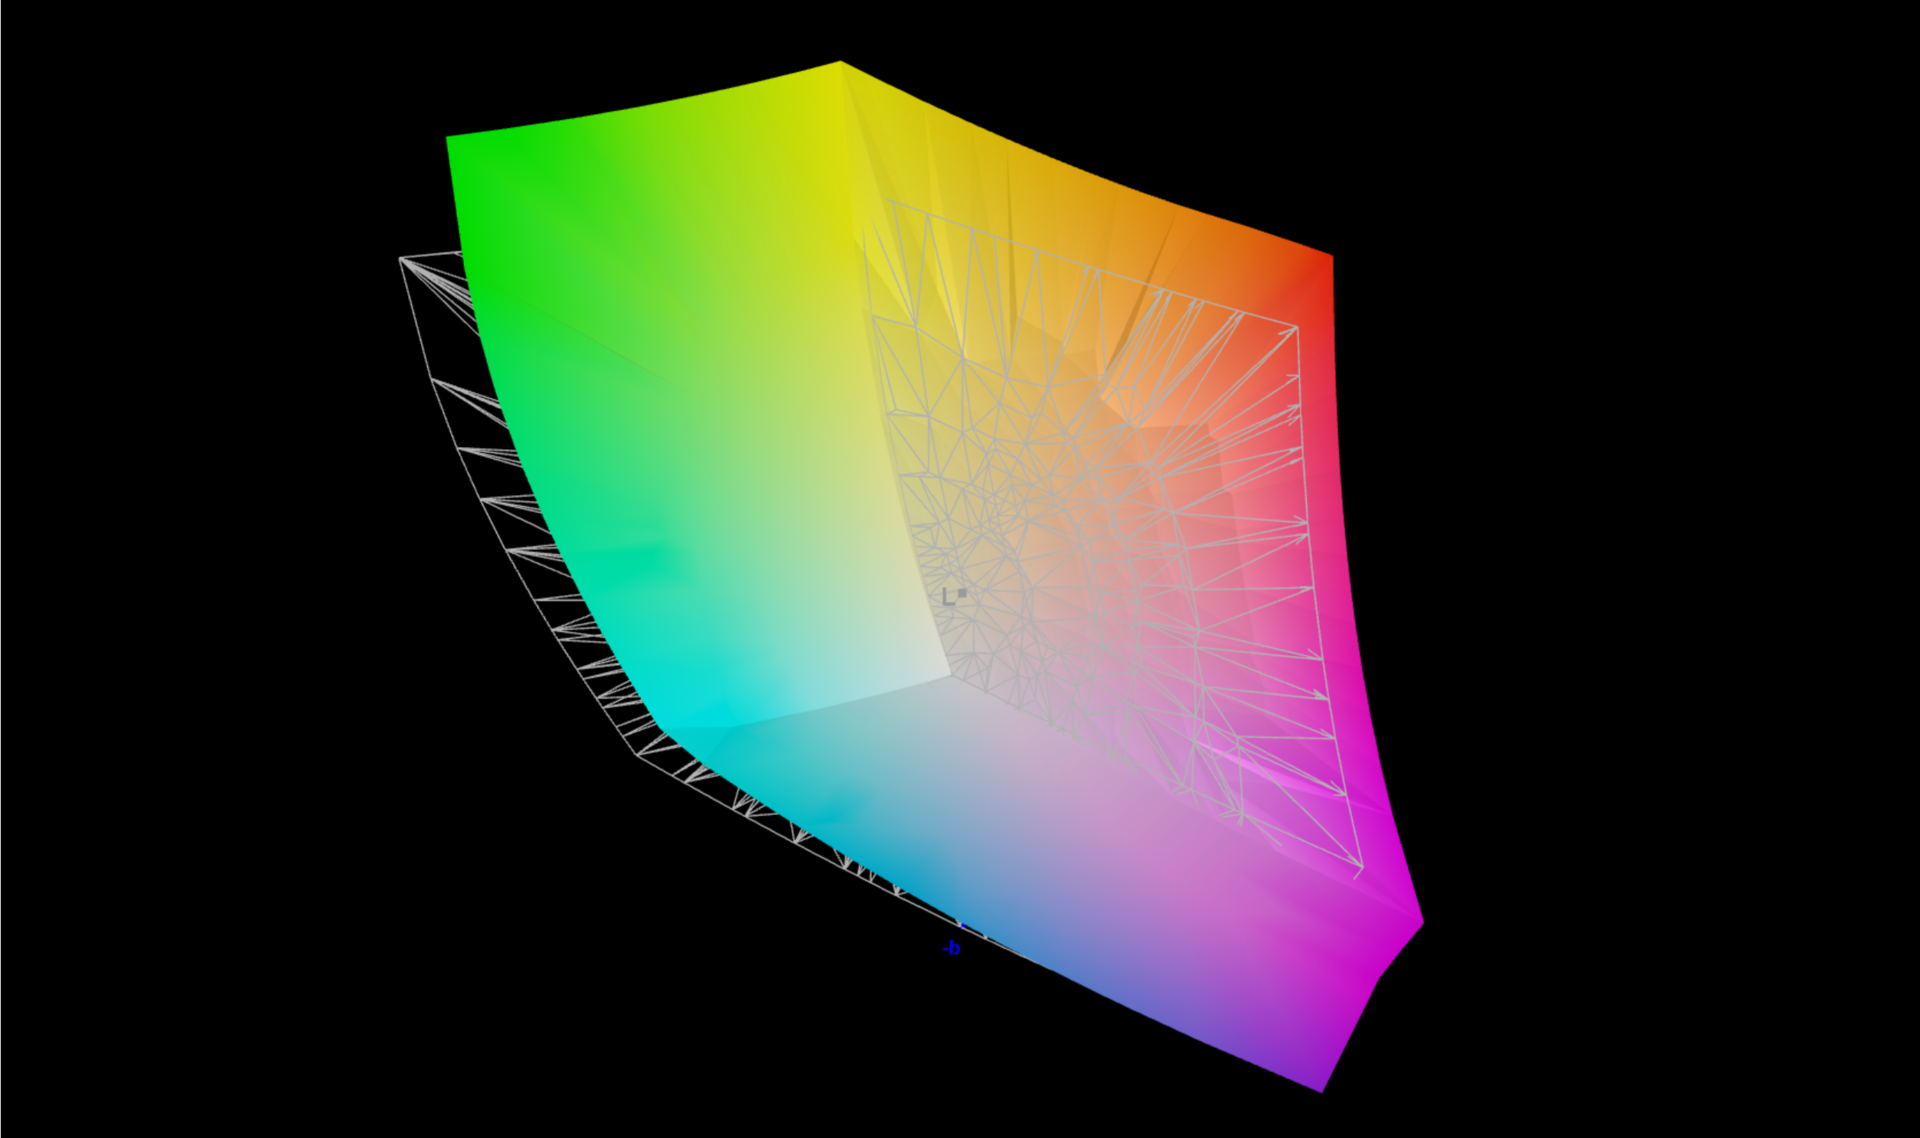
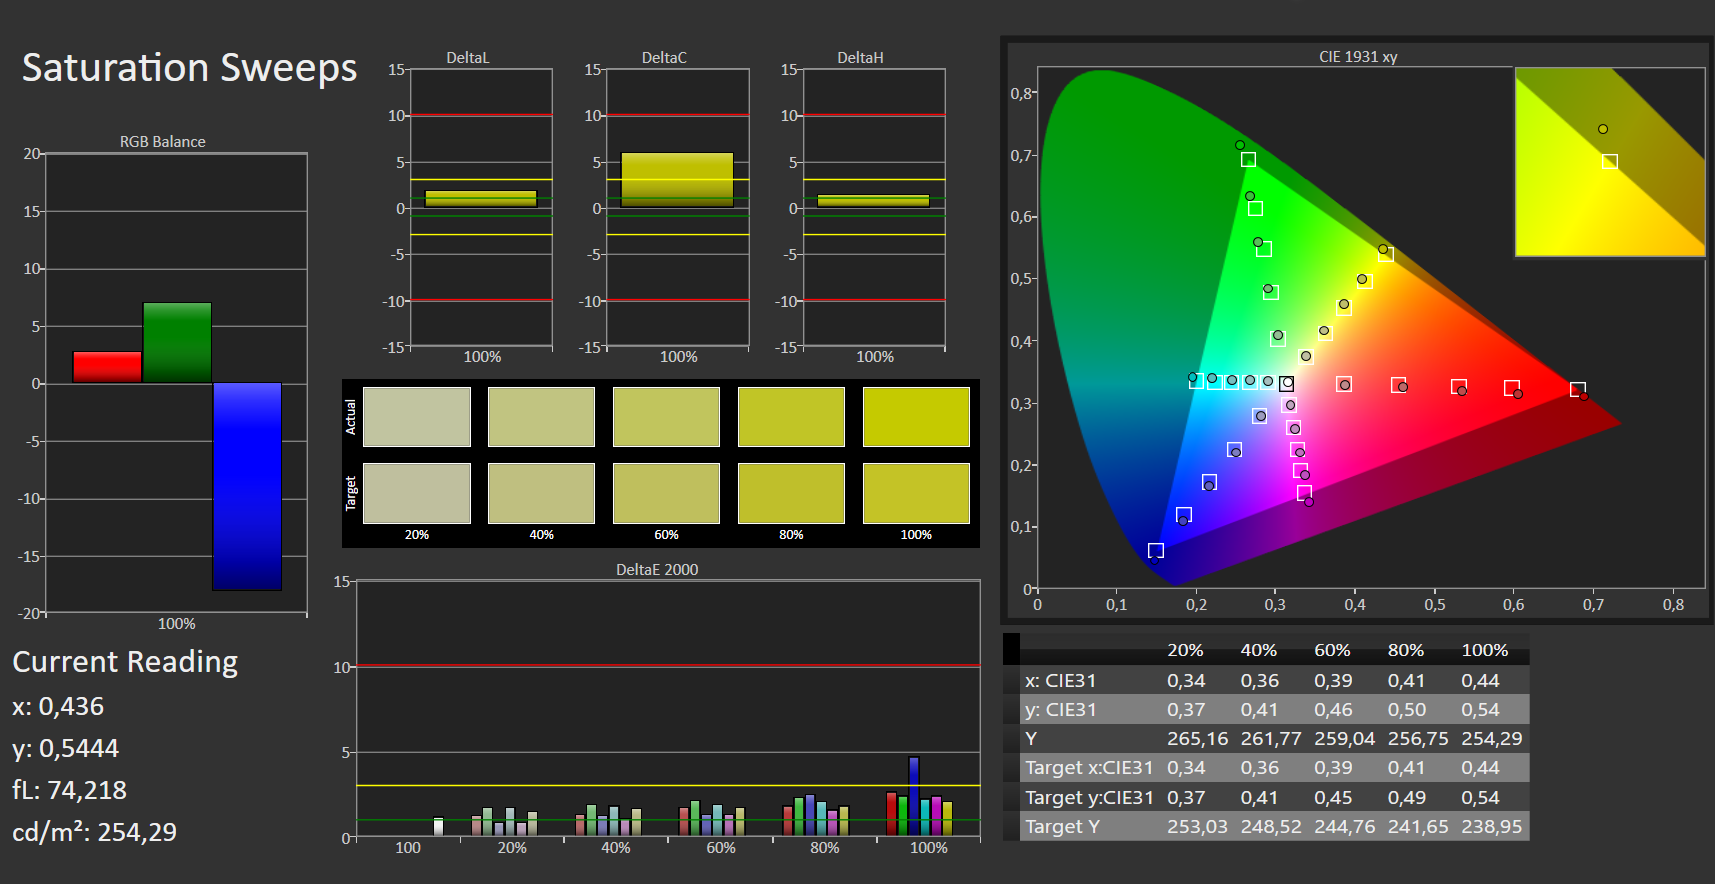
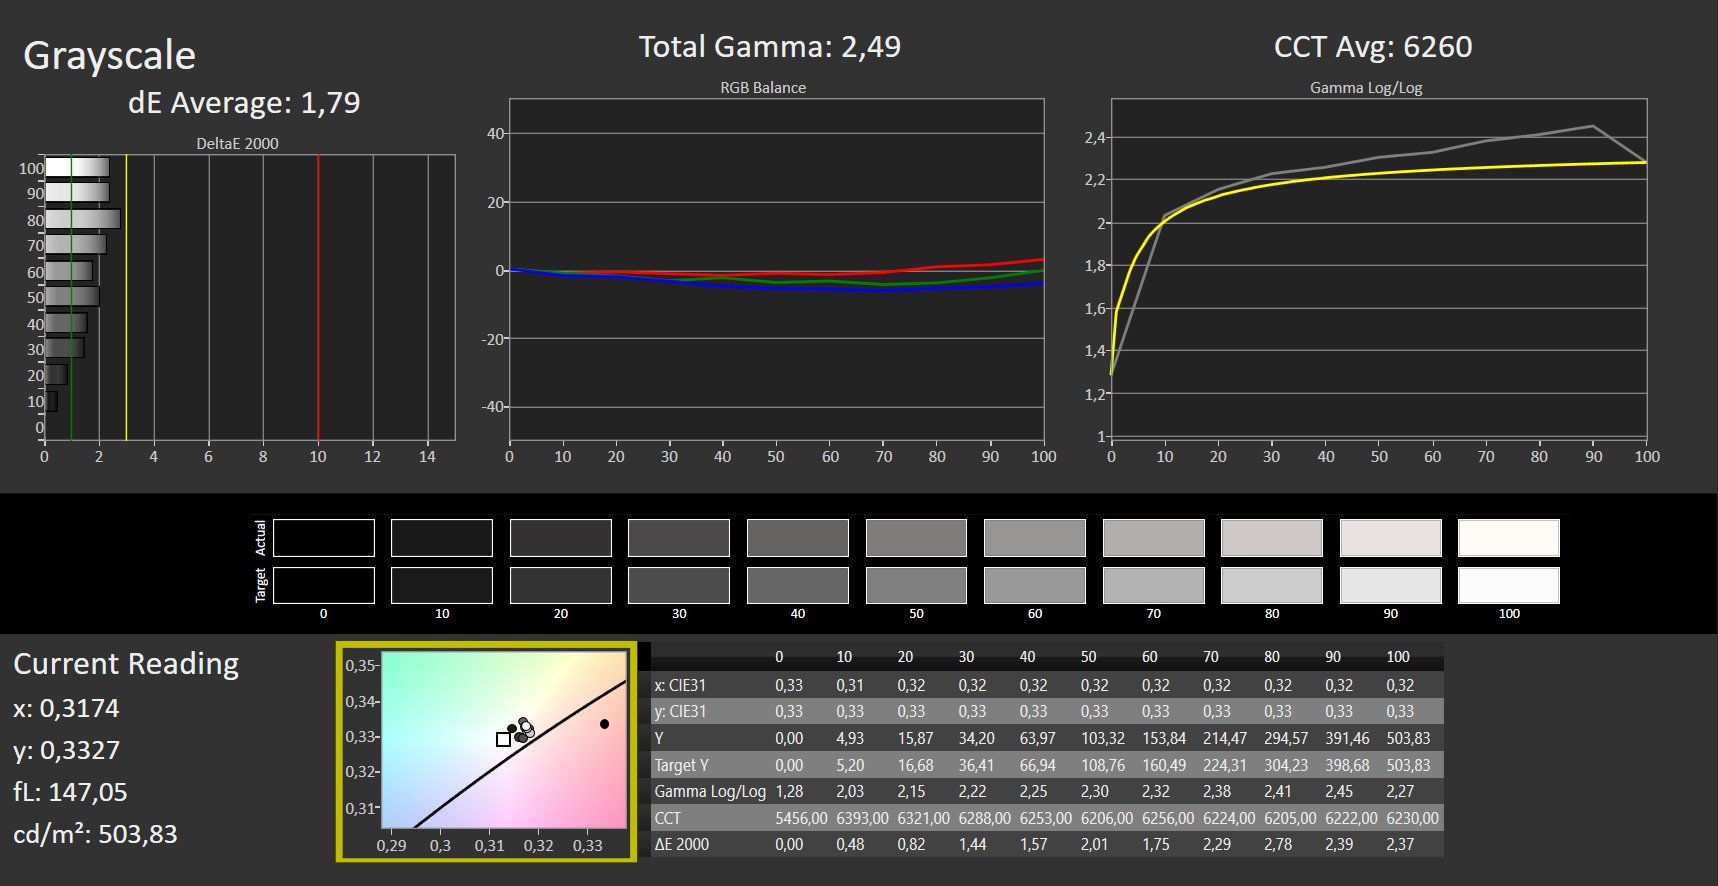
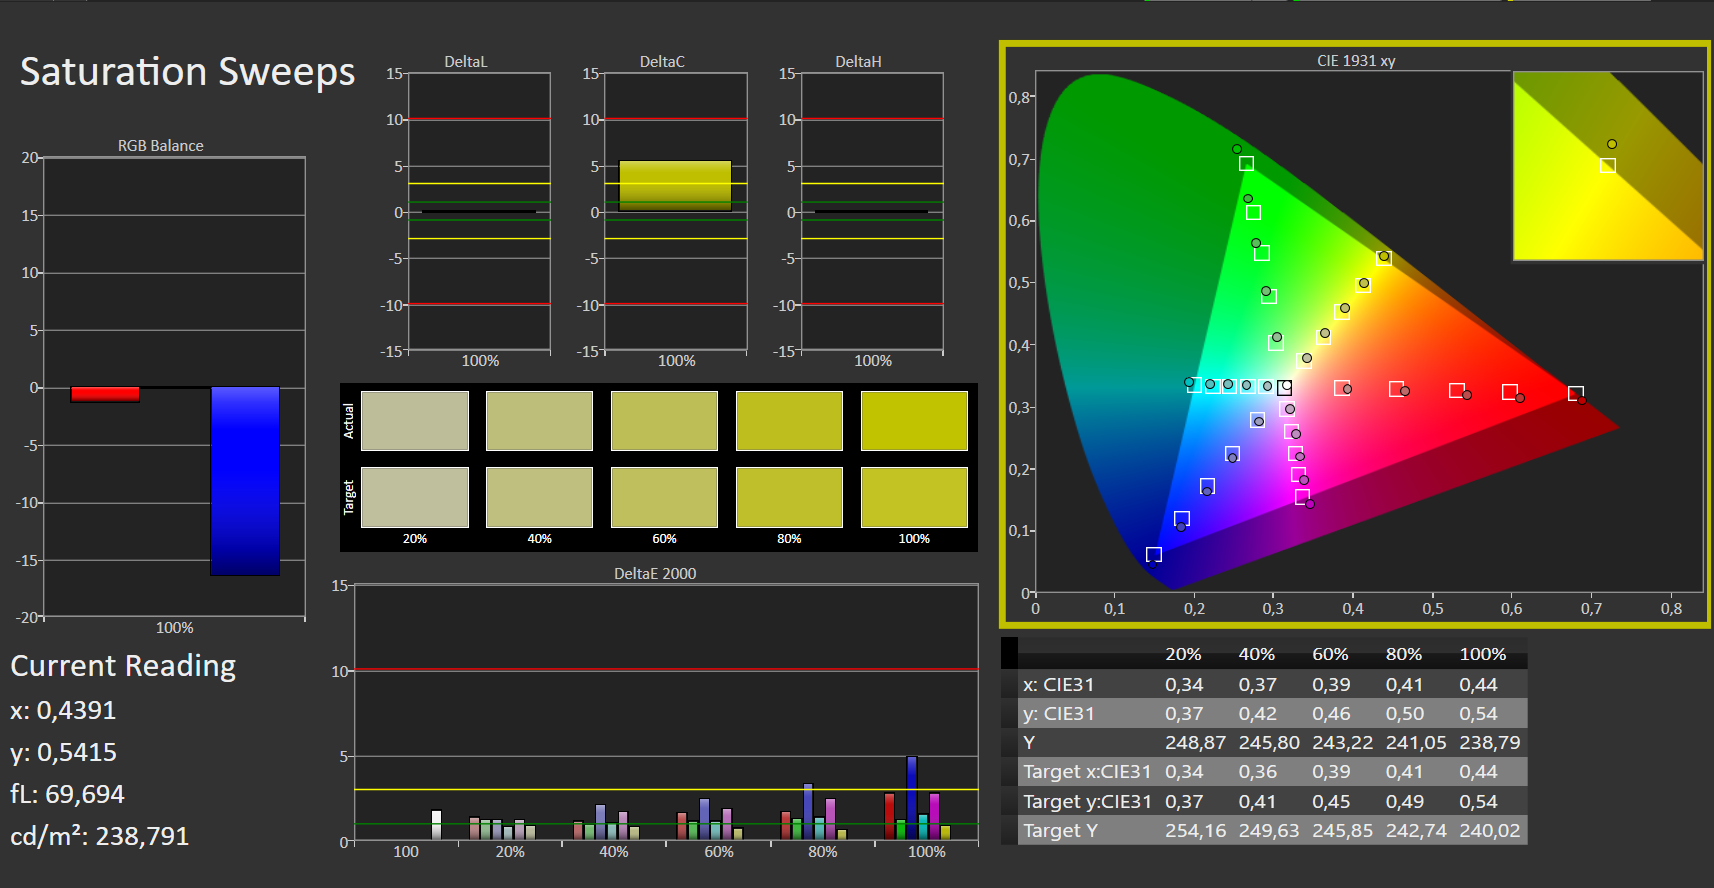
I valori DeltaE-2000 del display mini-LED calibrato in fabbrica (certificazione Pantone) sono inferiori alla soglia di 3 per i colori e per la scala di grigi. Tuttavia, il blu si discosta con un valore di 6,15, che non siamo riusciti a migliorare tramite la calibrazione. L'equilibrio tra rosso, verde e blu può essere definito perfetto. Quindi non c'è assolutamente alcun colore proiettato.
Come sempre, il profilo colore calibrato è disponibile per il download accanto al grafico dell'illuminazione.
Tempi di risposta del Display
| ↔ Tempi di risposta dal Nero al Bianco | ||
|---|---|---|
| 11 ms ... aumenta ↗ e diminuisce ↘ combinato | ↗ 1 ms Incremento |  |
| ↘ 10 ms Calo | ||
| Lo schermo mostra buoni tempi di risposta durante i nostri tests, ma potrebbe essere troppo lento per i gamers competitivi. In confronto, tutti i dispositivi di test variano da 0.1 (minimo) a 240 (massimo) ms. » 29 % di tutti i dispositivi è migliore. Questo significa che i tempi di risposta rilevati sono migliori rispettto alla media di tutti i dispositivi testati (19.9 ms). | ||
| ↔ Tempo di risposta dal 50% Grigio all'80% Grigio | ||
| 11 ms ... aumenta ↗ e diminuisce ↘ combinato | ↗ 1 ms Incremento |   |
| ↘ 10 ms Calo | ||
| Lo schermo mostra buoni tempi di risposta durante i nostri tests, ma potrebbe essere troppo lento per i gamers competitivi. In confronto, tutti i dispositivi di test variano da 0.165 (minimo) a 636 (massimo) ms. » 24 % di tutti i dispositivi è migliore. Questo significa che i tempi di risposta rilevati sono migliori rispettto alla media di tutti i dispositivi testati (31.1 ms). | ||
Sfarfallio dello schermo / PWM (Pulse-Width Modulation)
| flickering dello schermo / PWM rilevato | 7400 Hz | ≤ 100 % settaggio luminosita' |    |
Il display sfarfalla a 7400 Hz (Probabilmente a causa dell'uso di PWM) Flickering rilevato ad una luminosita' di 100 % o inferiore. Non dovrebbe verificarsi flickering o PWM sopra questo valore di luminosita'. La frequenza di 7400 Hz è abbastanza alta, quindi la maggioranza degli utenti sensibili al PWM non dovrebbero notare alcun flickering. In confronto: 52 % di tutti i dispositivi testati non utilizza PWM per ridurre la luminosita' del display. Se è rilevato PWM, una media di 7784 (minimo: 5 - massimo: 343500) Hz è stata rilevata. | |||
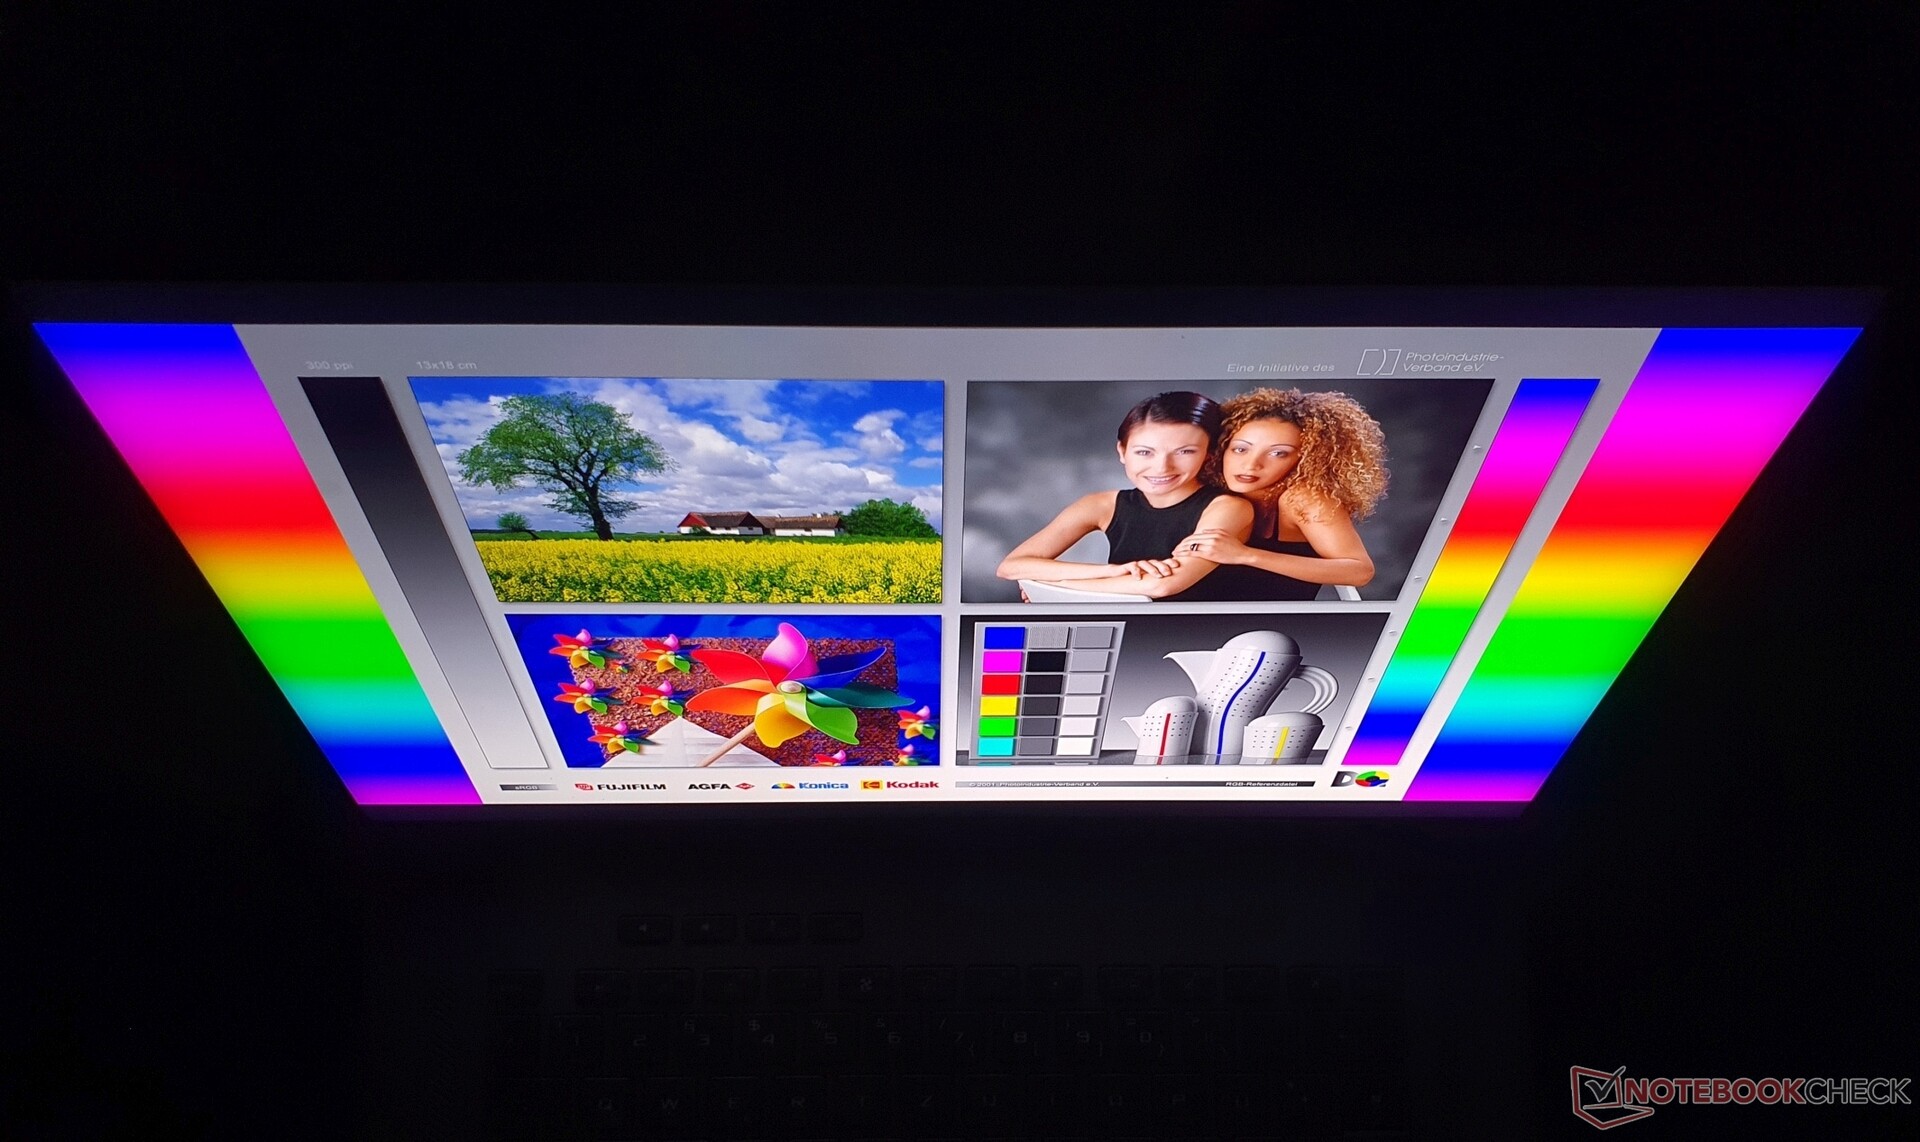
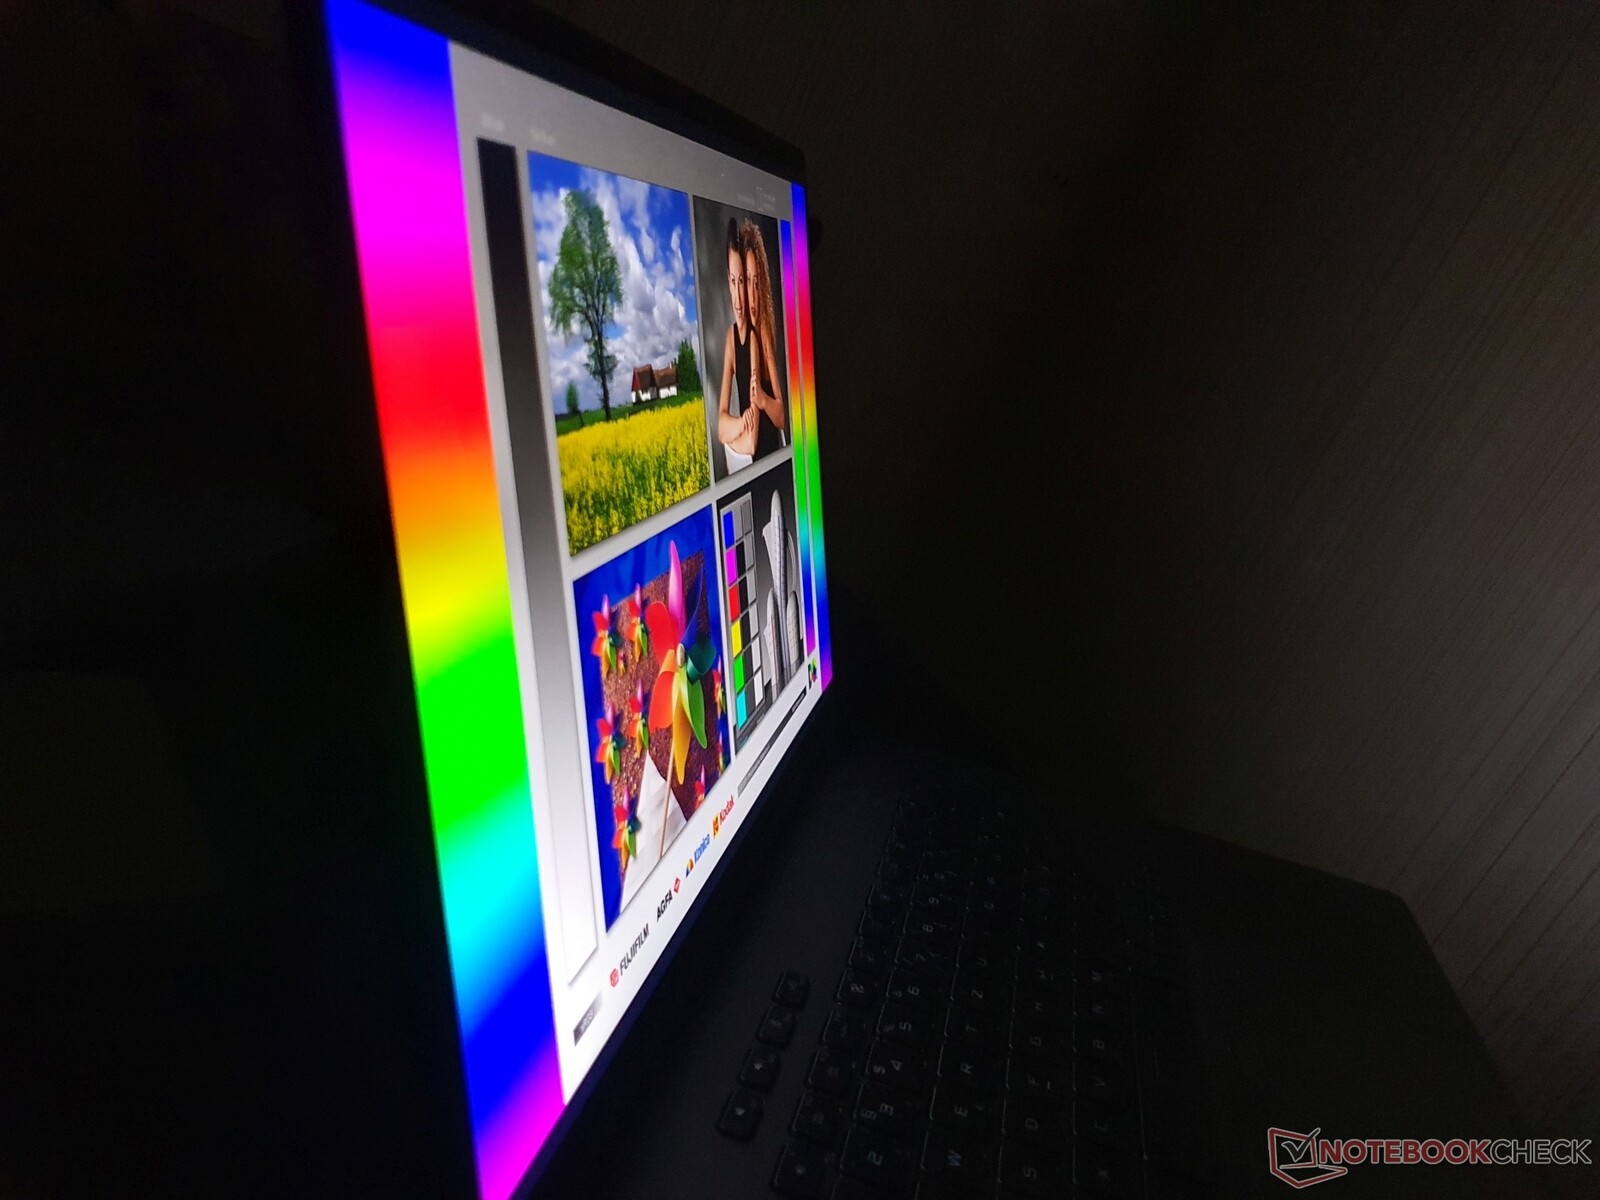
Il display riflette molto, tanto che per l'uso in ombra (parziale) sono necessari anche 500 nits di luminosità. L'uso dell'HDR con una luminosità massima di 1.100 nits è rimasto disattivato in modalità batteria per risparmiare energia.
I display OLED hanno ancora un leggero vantaggio nella stabilità dell'angolo di visione, ma come è tipico per gli IPS, lo schermo dell'Asus ROG Flow X16 è di alto livello
Prestazioni - RTX 3070 Ti con 125 W in un portatile da gioco compatto
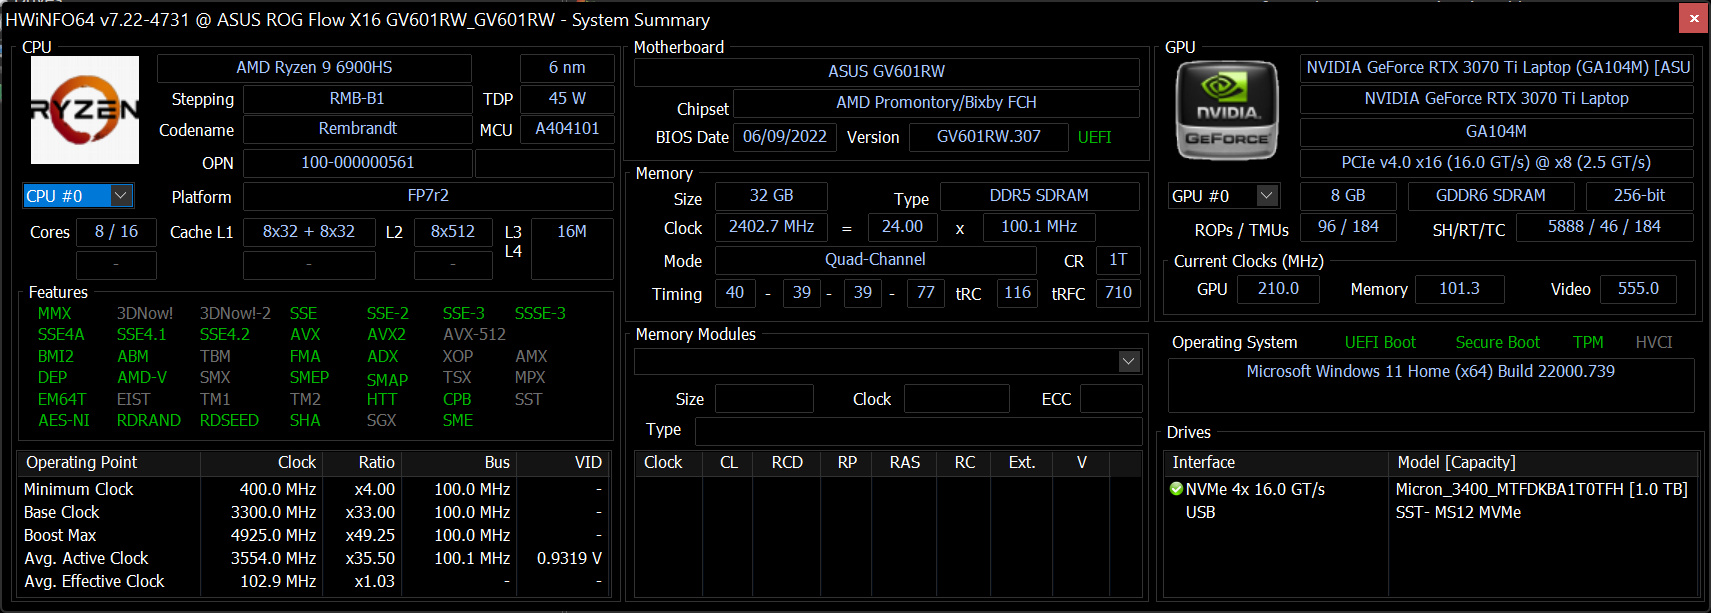
La nostra configurazione è dotata di un AMD Ryzen 9 6900HS octa-core e un processore Nvidia GeForce RTX 3070 Ti con 125 watt di TGP (incluso Dynamic Boost). È stato integrato anche uno switch MUX.
I modelli più economici sono dotati di unaRTX 3060 o una RTX 3050 Tiquest'ultima viene sempre fornita con un Ryzen 7 6800HS(clock inferiore di 200 MHz).
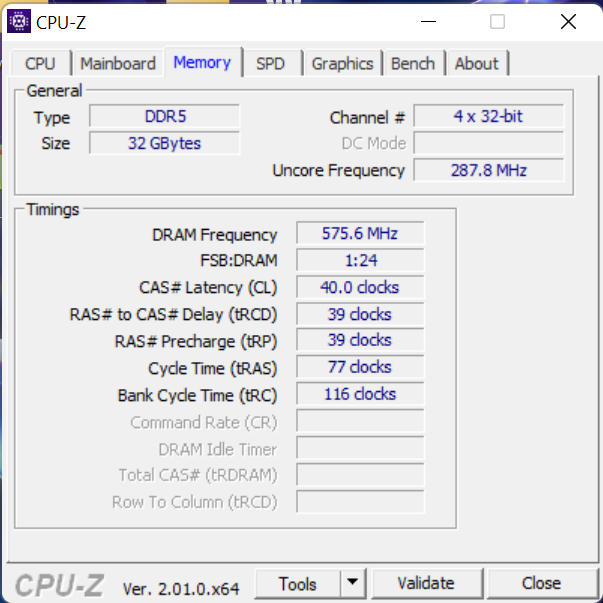
Il ROG Flow X16 viene fornito con 8 o 32 GB di RAM DDR5-4800. La nostra unità di recensione ha 32 GB di RAM (2 moduli da 16 GB in modalità dual-channel) e ospita un'unità SSD da 1 TB, che è la capacità minima offerta. È possibile ordinare un massimo di 2 TB e far funzionare fino a due SSD PCIe 4.0.
Condizioni di test
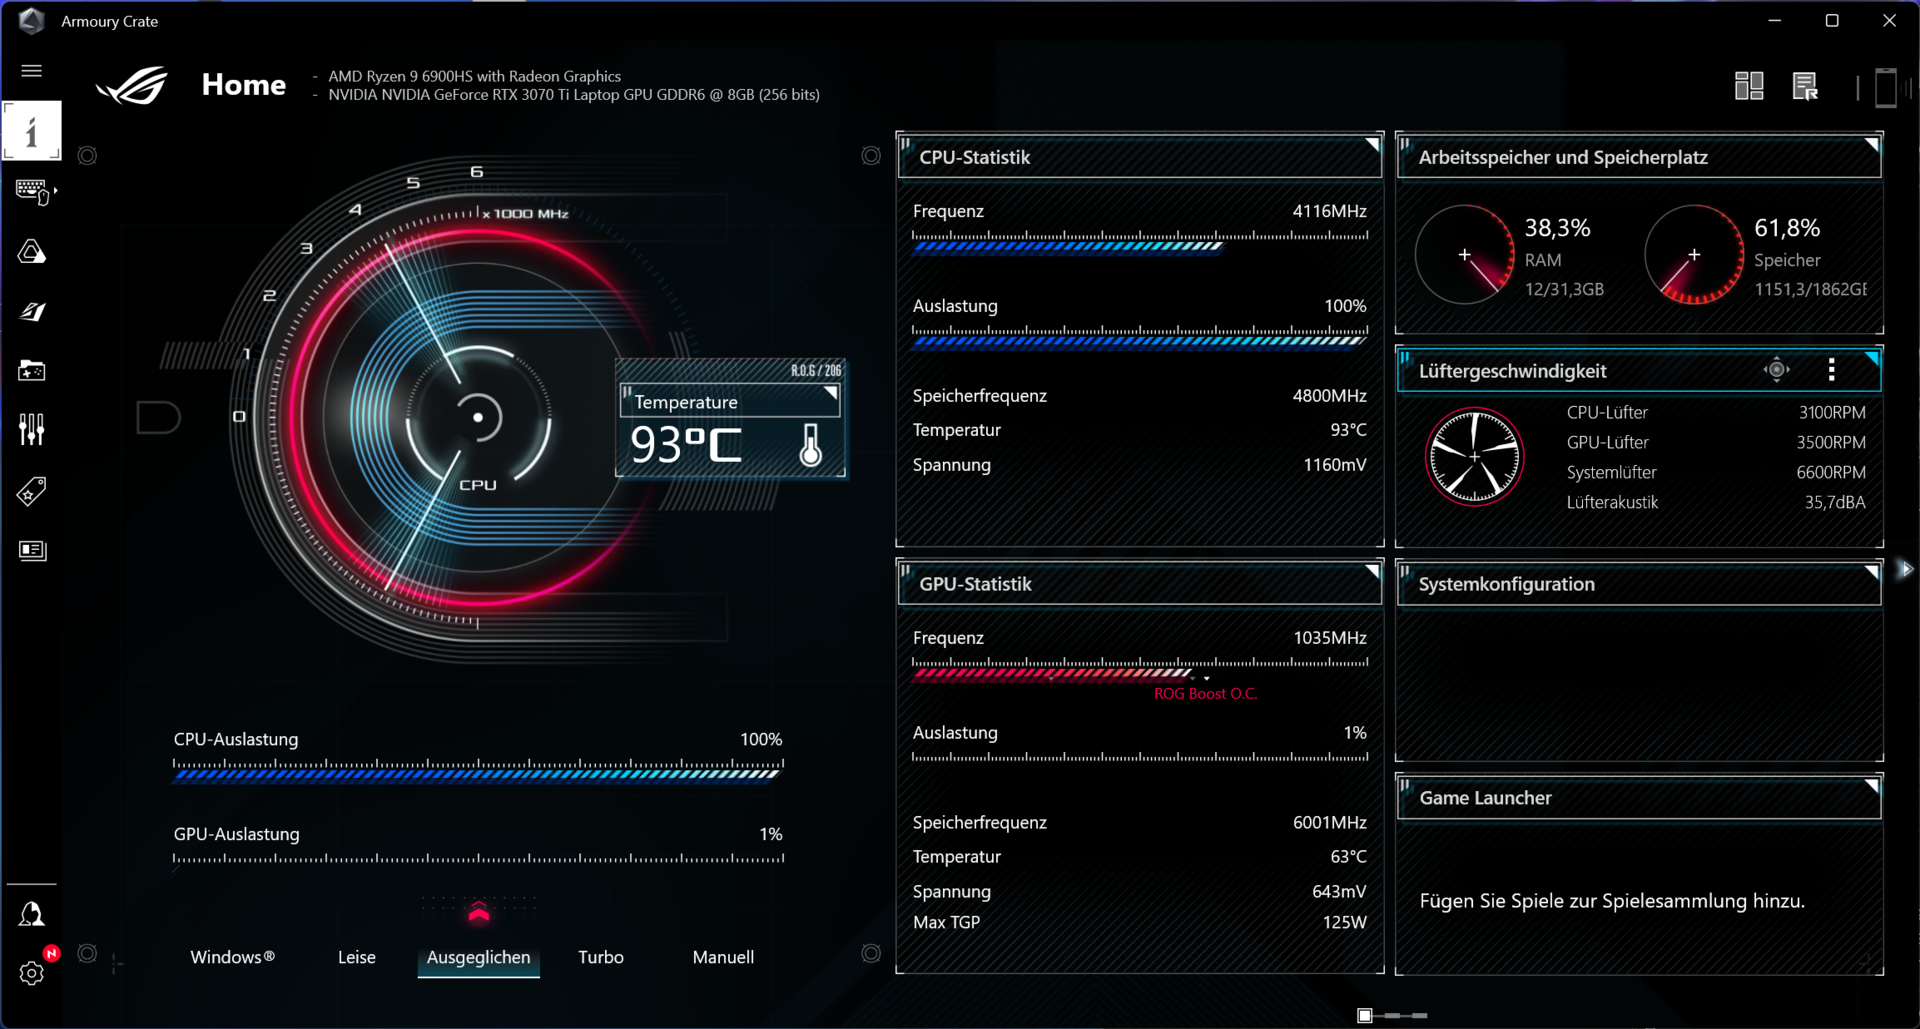
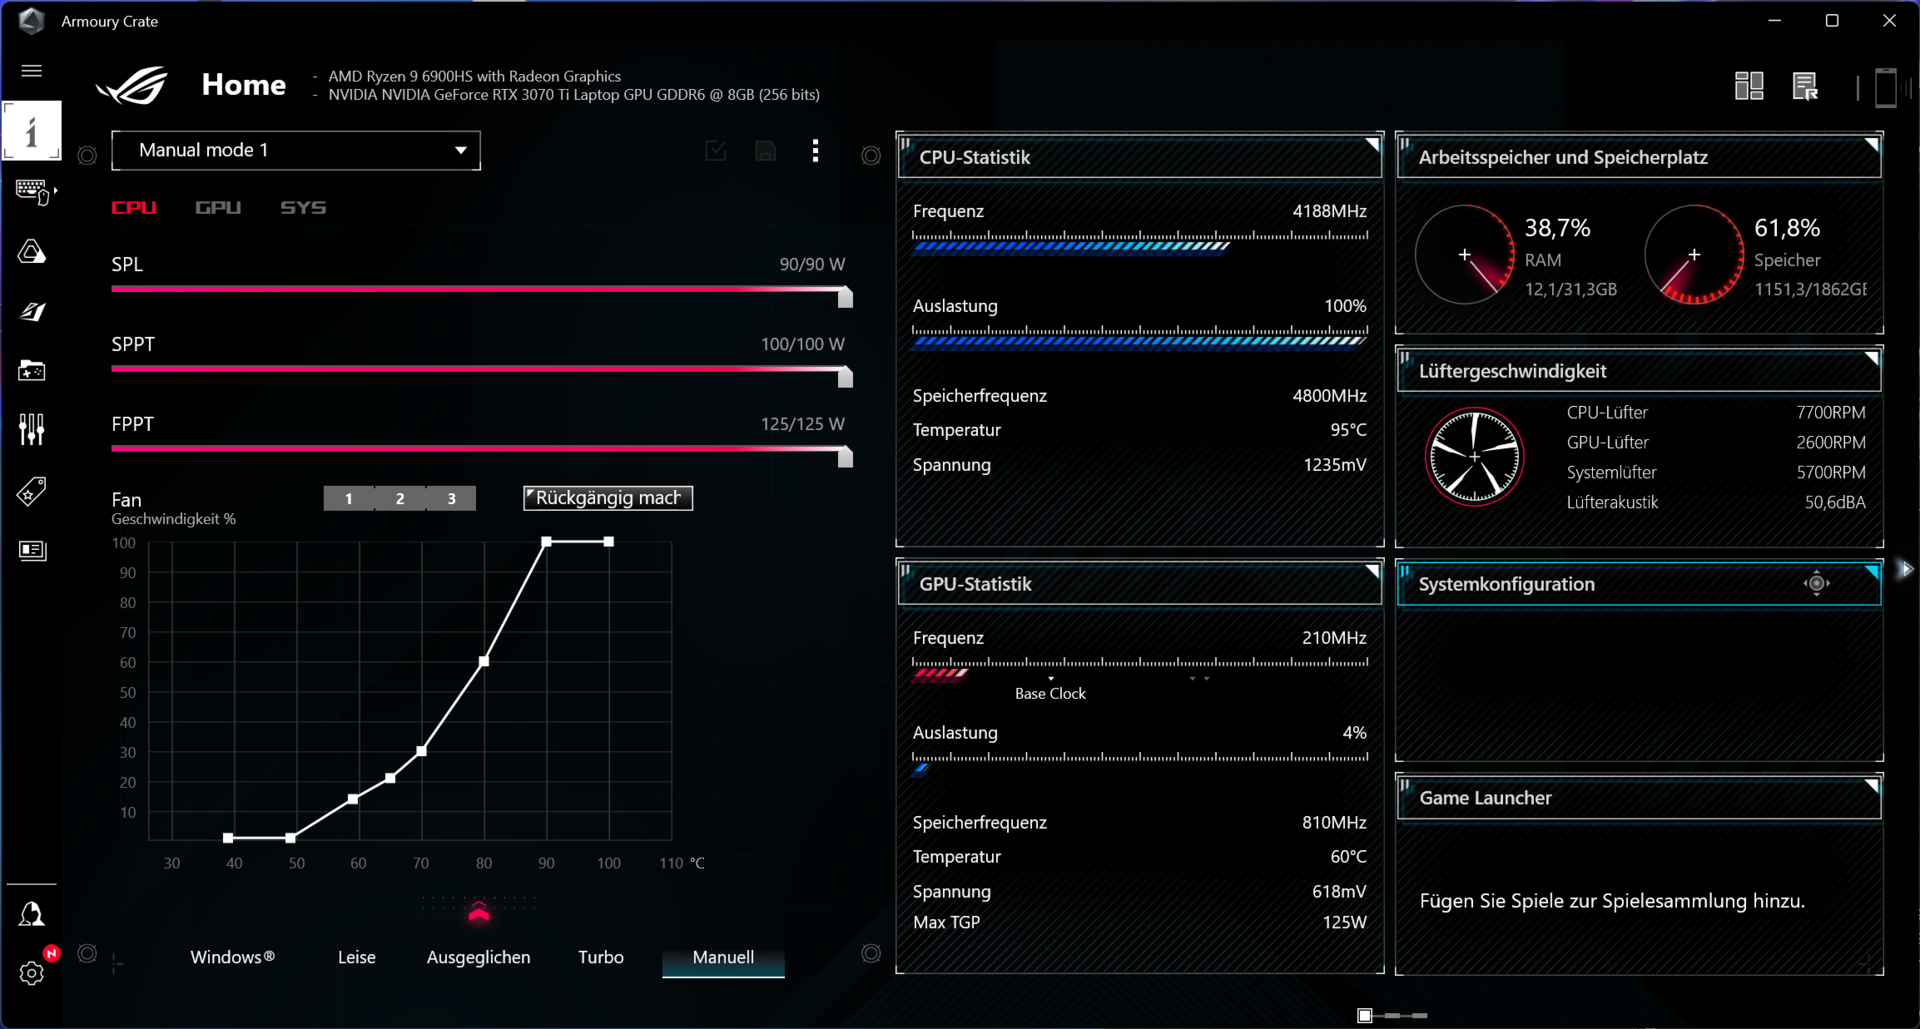
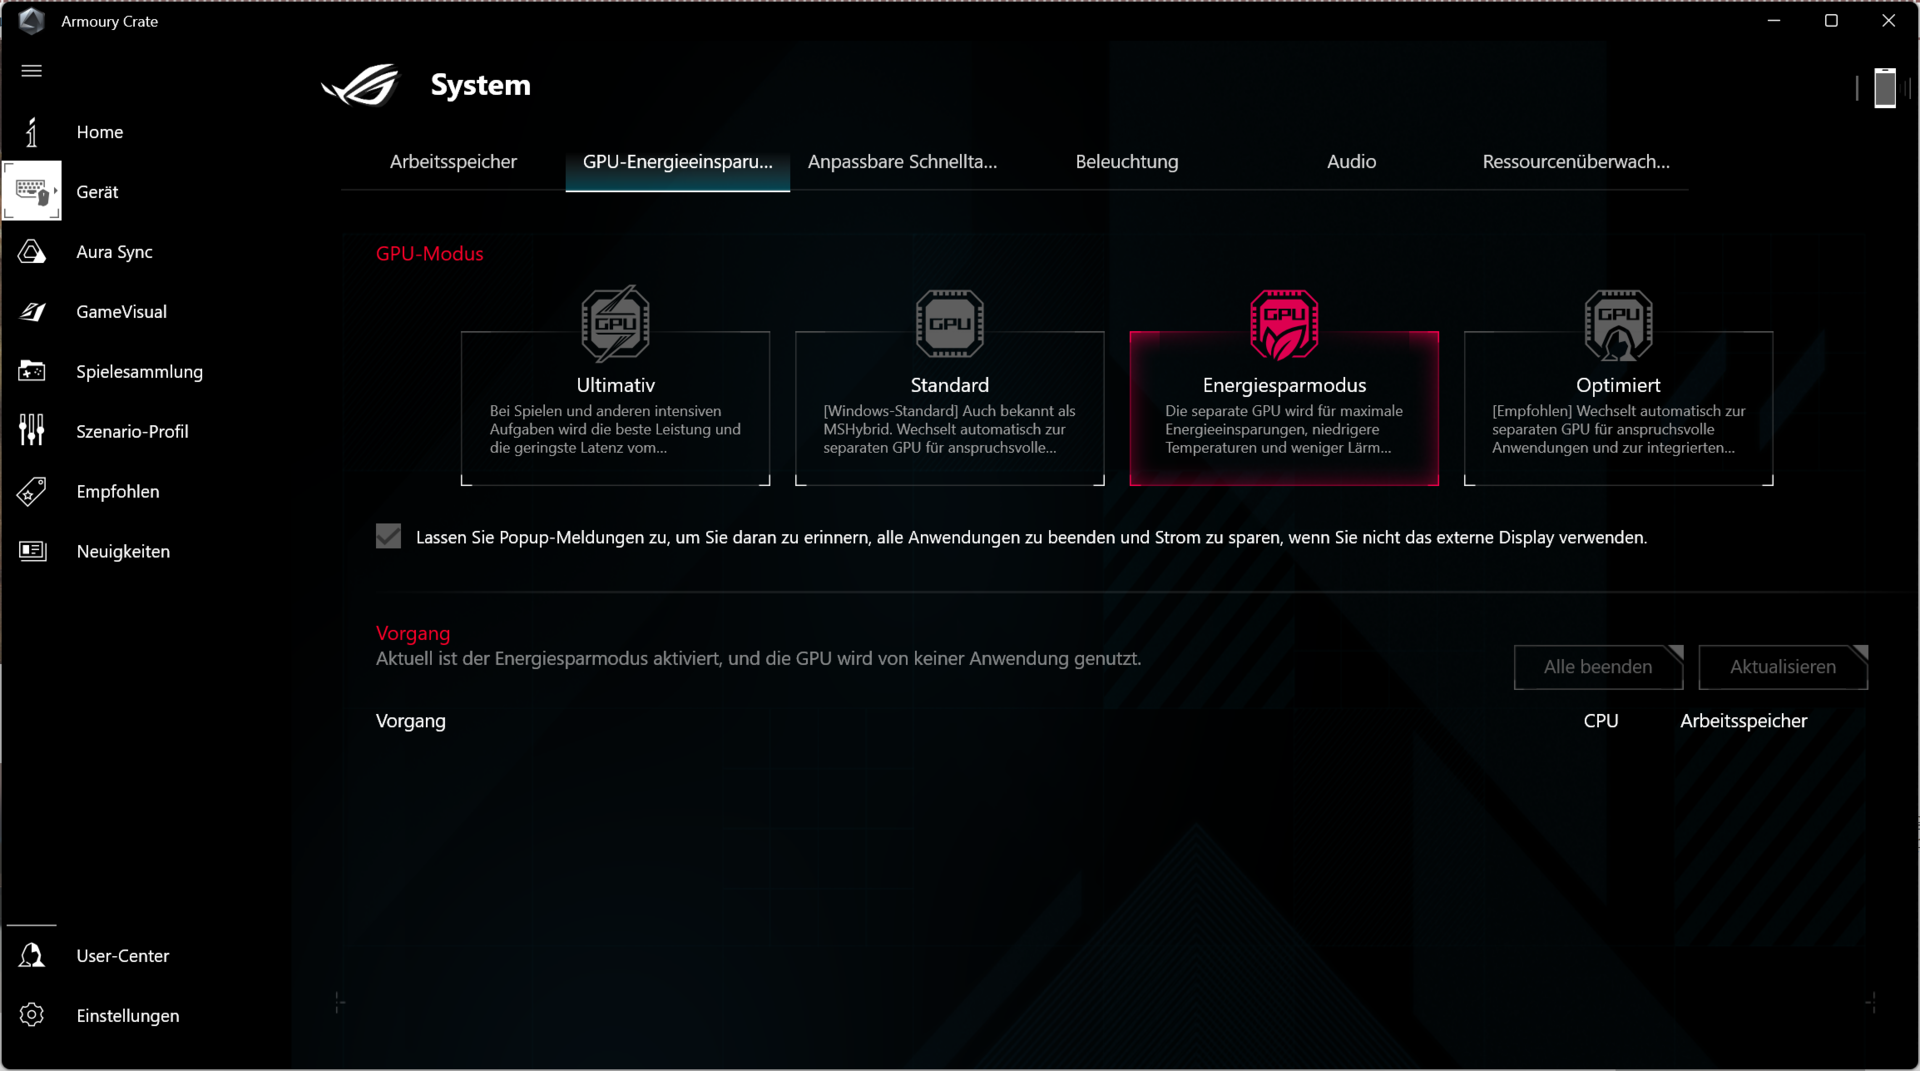
Il software Armoury Crate di Asus offre quattro diverse modalità di prestazioni: Silenziosa, Bilanciata ( "Performance" dalla versione 5.2.12), Turbo e Manuale, di cui Manuale consente di impostare le proprie curve della ventola e di regolare le impostazioni TDP, nonché di overcloccare la dGPU.
Ci sono anche quattro modalità GPU: Ultimate, Standard, Energy Saving e Optimized. la modalità "Ultimate" abilita l'interruttore MUX, che mantiene la GPURTX 3070 Ti come GPU attiva in ogni momento e la collega direttamente al display interno invece di passare attraverso l'iGPU Radeon. L'attivazione richiede un riavvio (senza Advanced Optimus). In modalità Standard è possibile passare dall'unità grafica integrata a quella dedicata a seconda delle esigenze (Optimus / "MSHybrid"), mentre in modalità Risparmio energetico la GPU Nvidia viene disattivata (anche nel funzionamento a rete) e viene utilizzata la iGPU. La modalità ottimizzata corrisponde alla modalità standard, con la differenza che la GPU Nvidia è completamente disattivata in modalità batteria.
Gli effetti delle diverse modalità su TDP/TGP, velocità di clock, temperature e comportamento della ventola sono discussi nelle corrispondenti sezioni "Processore", "Scheda grafica" e "Emissioni". Abbiamo eseguito i benchmark relativi alle prestazioni in modalità Turbo e in modalità Standard per la GPU. I test delle altre modalità sono discussi nel corso della recensione. I tempi di esecuzione della batteria in modalità WLAN sono stati determinati in modalità Bilanciata e con la modalità di risparmio energetico della GPU attivata.
Si potrebbe fare molto per migliorare Amoury Crate, i valori delle prestazioni e i tempi di esecuzione della batteria fino al rilascio. Il nostro dispositivo in prova funziona con la versione 5.1.8(aggiornamento: per mantenere Armoury Crate utilizzabile, è stato necessario installare un aggiornamento alla versione 5.2.12), la versione 307 del BIOS e il driver 512.78 di GeForce.

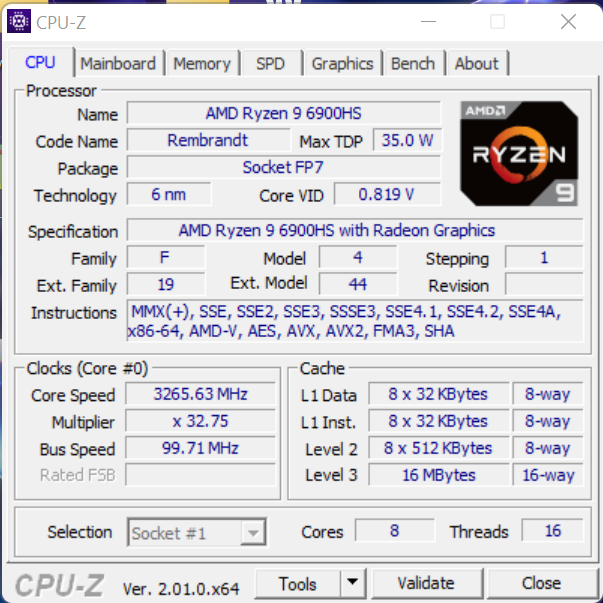
Processore
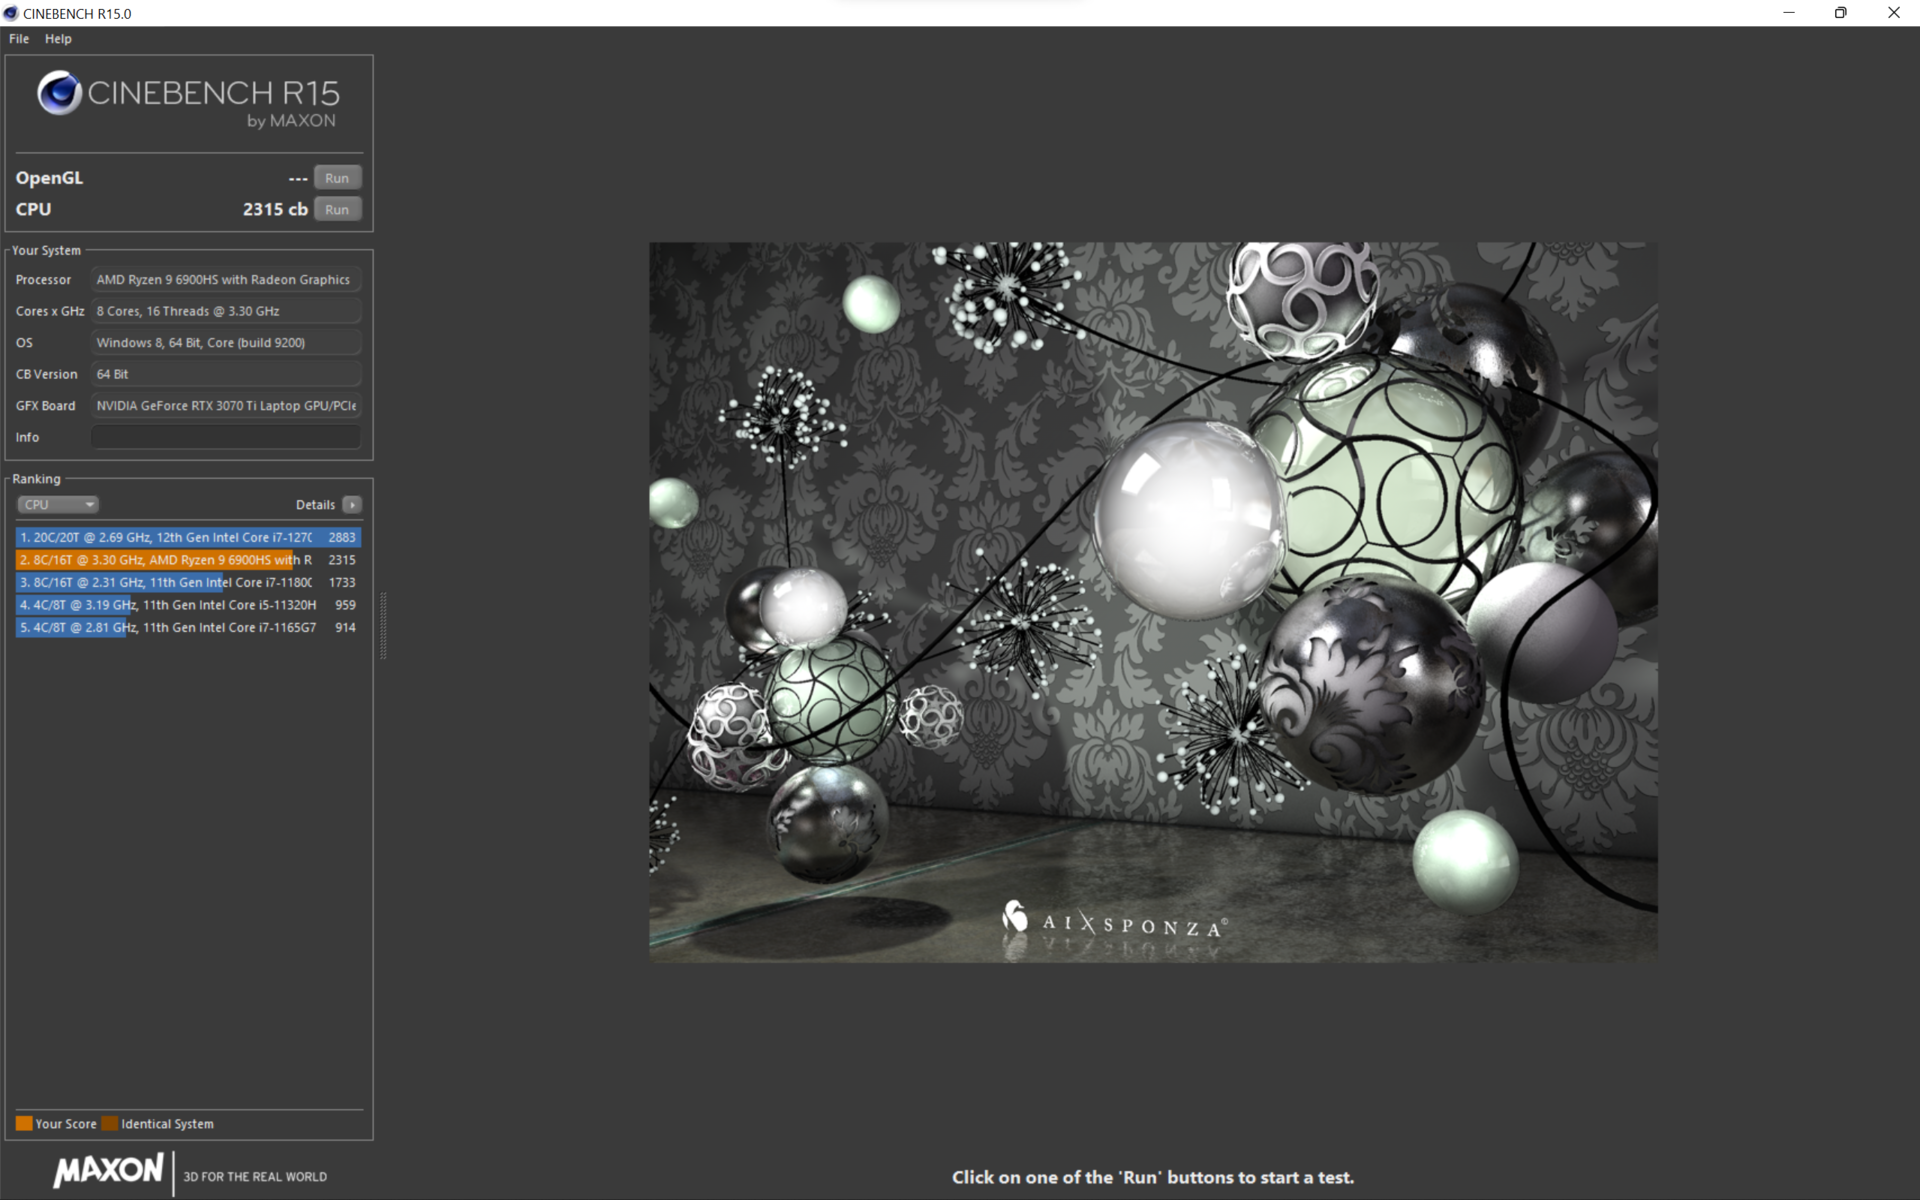
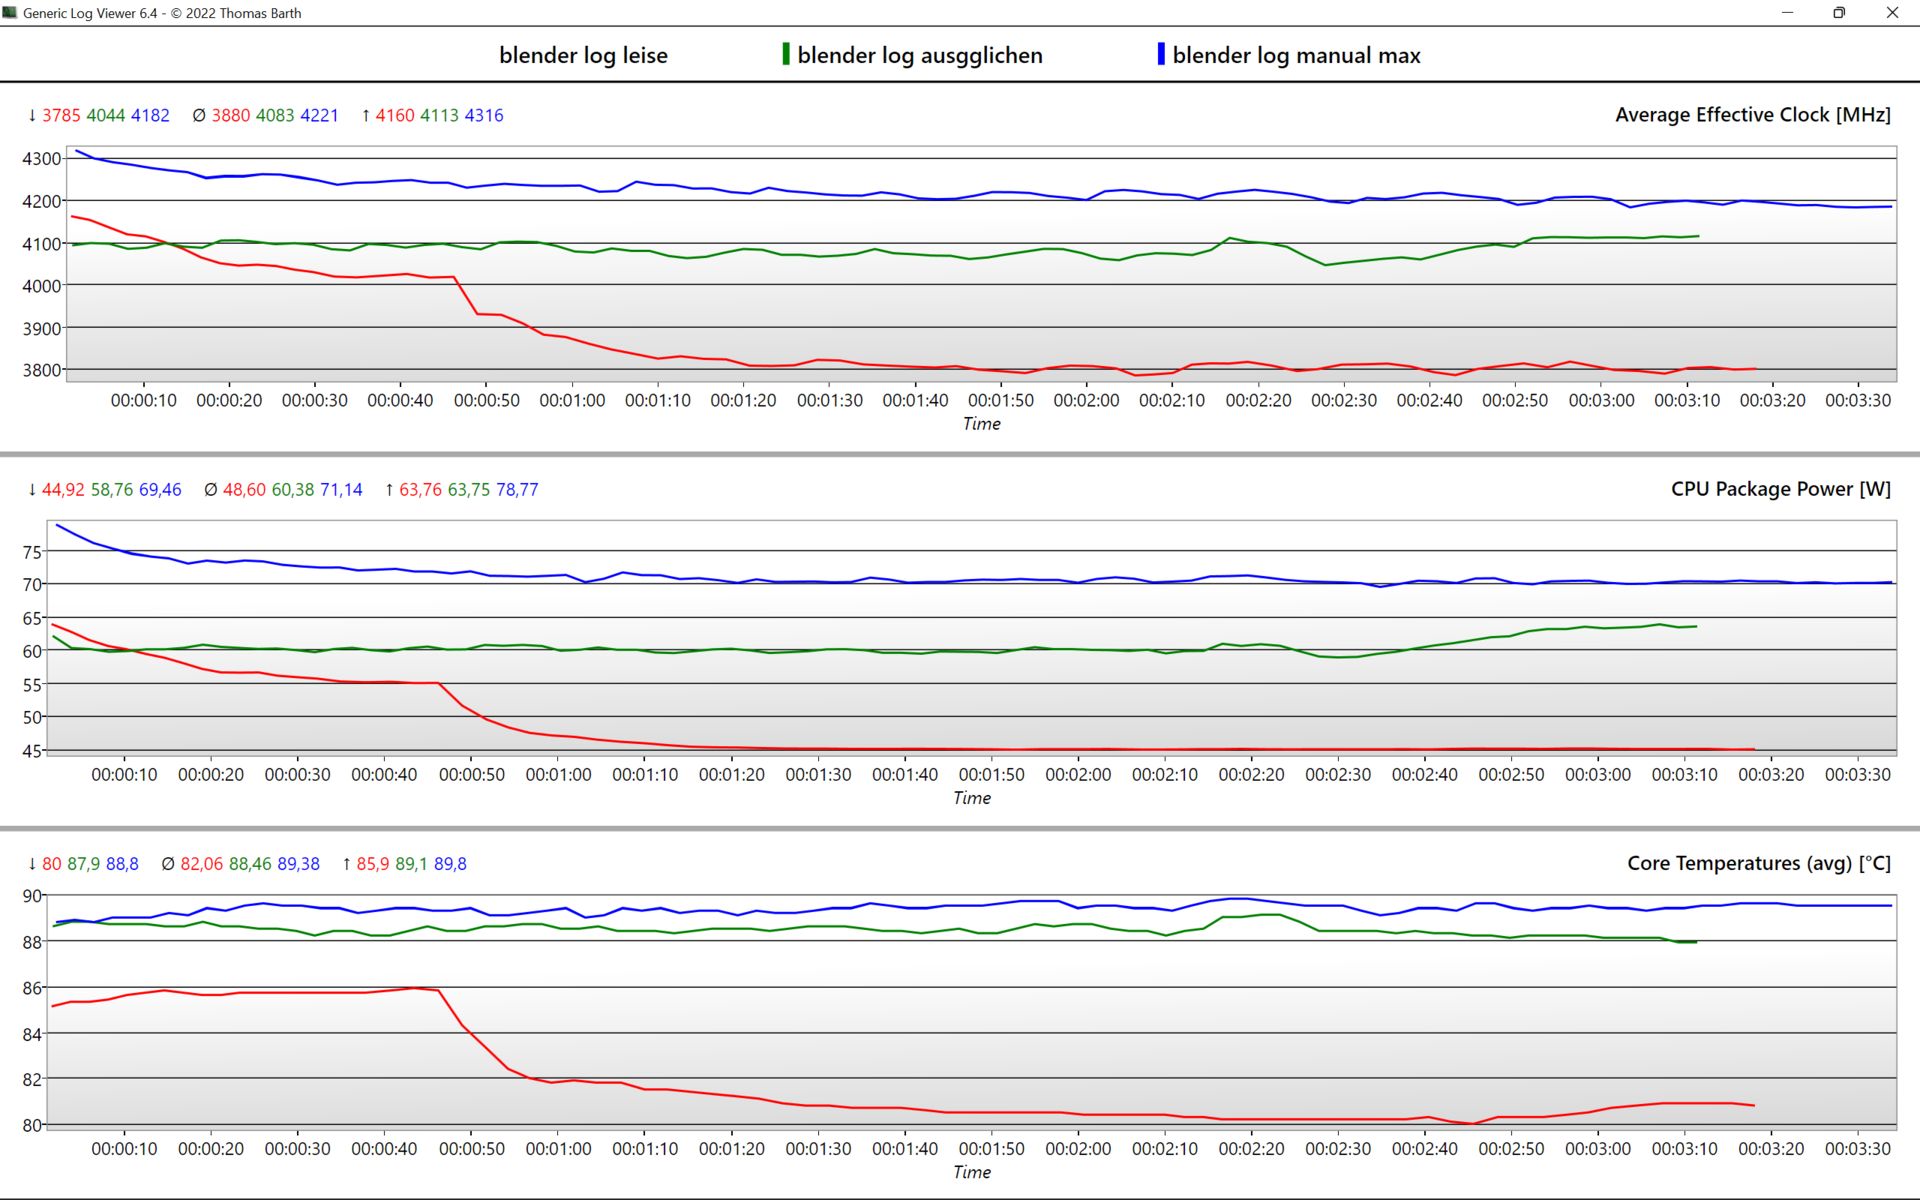
Il modello AMD Ryzen 6900HS è una CPU octa-core con clock di base 8x 3,3 GHz, oltre a un Turbo di 4,9 GHz su 1 core e 4,36 GHz su 8 core. Di questi, 4,26 GHz sono mantenuti permanentemente in modalità Turbo mentre la CPU consuma continuamente 74 watt e si riscalda fino a 91 °C
La CPU da 35 W viene quindi sfruttata molto bene. Il consumo iniziale è di circa 90 watt a 4,36 GHz. Il limite di potenza a breve termine "SPPT" (chiamato "PL2" da Intel), fissato a 100 watt, non viene quindi raggiunto, così come il limite di potenza a lungo termine "SPL" (PL1) di 90 watt. AMD ha ancora FPPT (Fast Package Power Tracking) con 125 watt impostati qui.
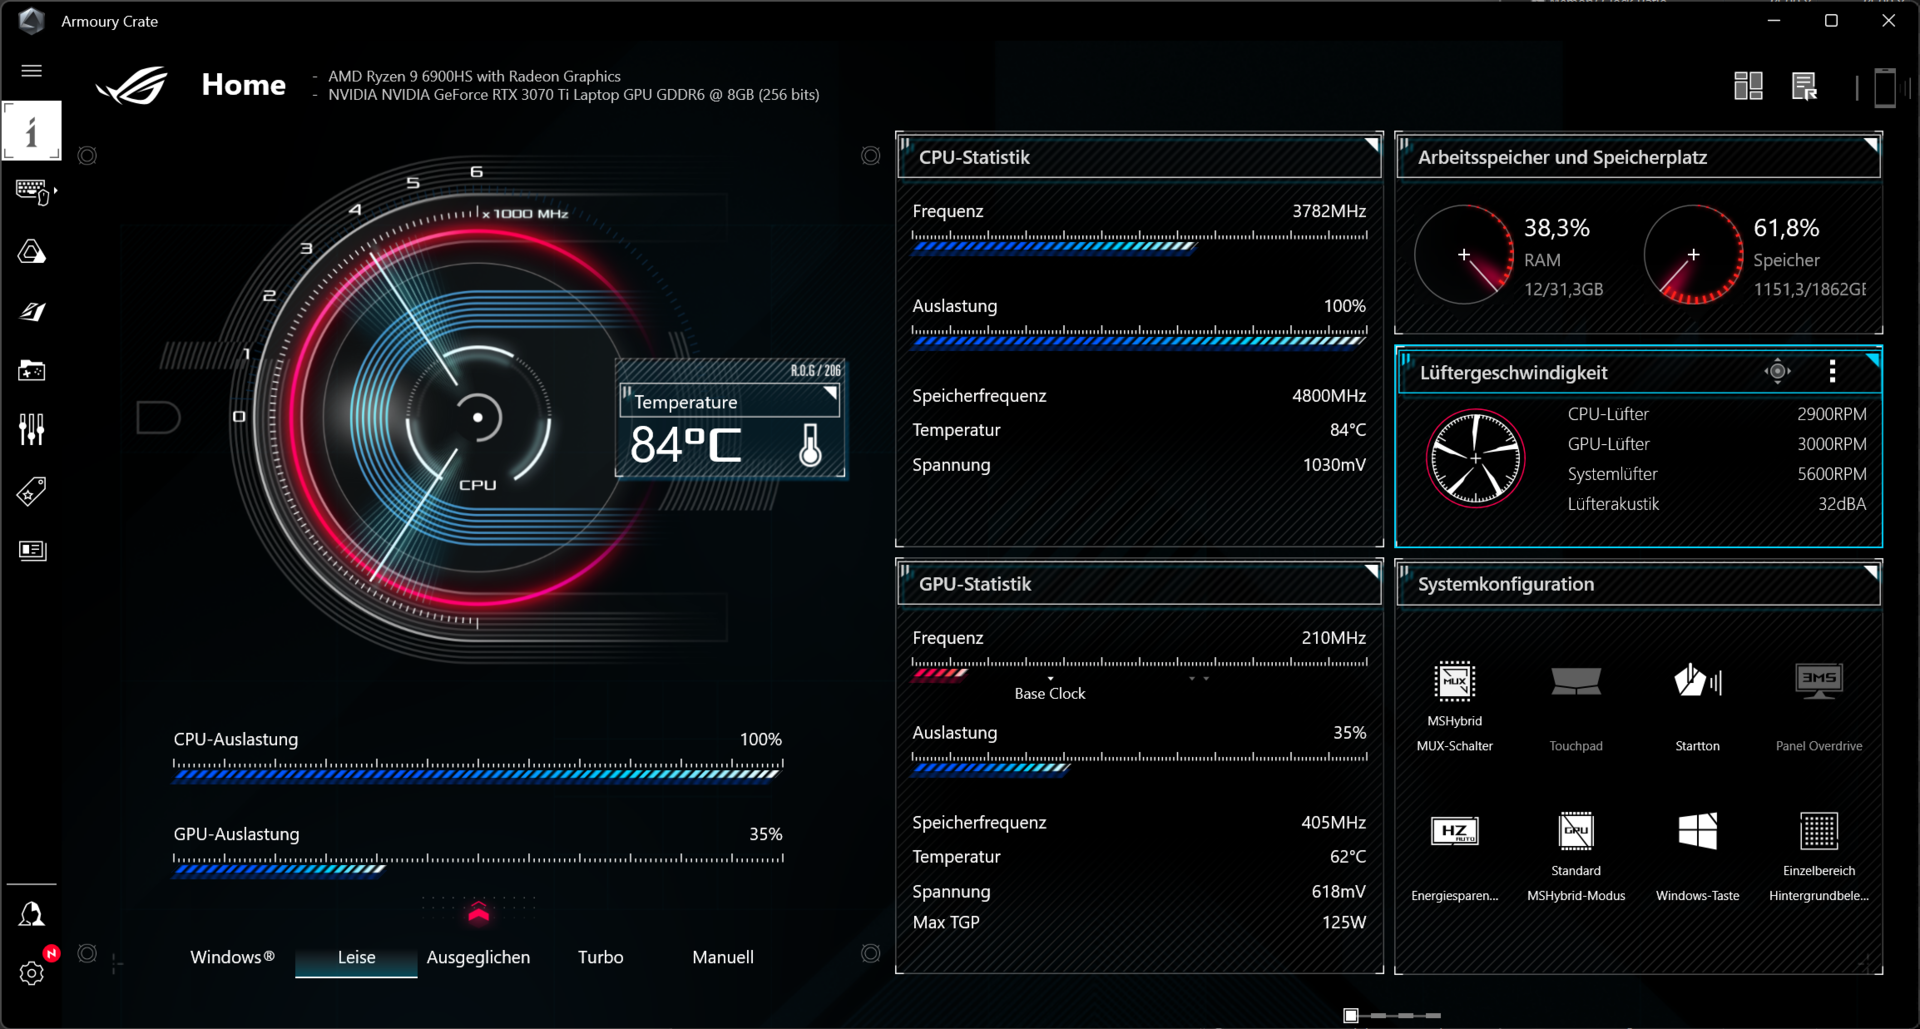
In modalità Balanced
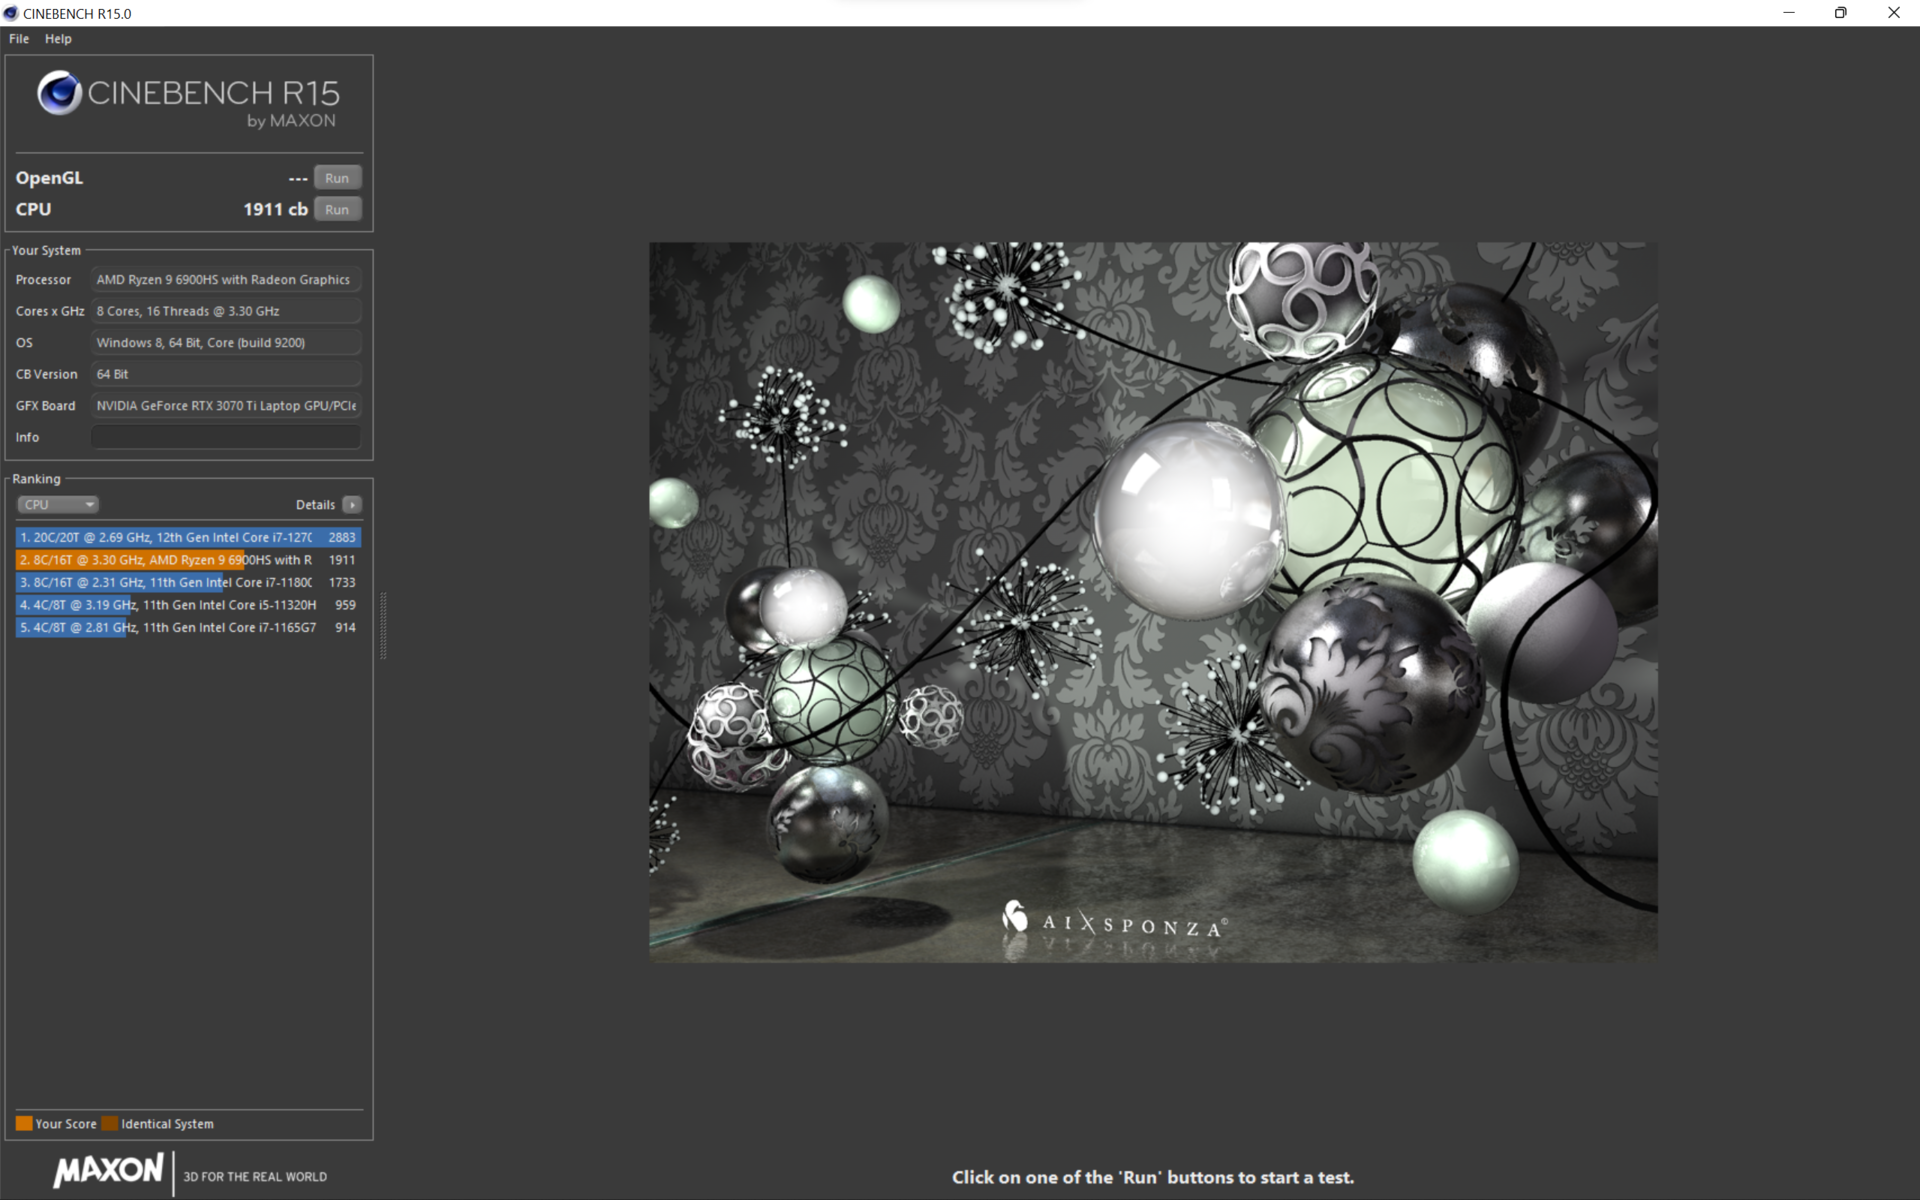
, il clock della CPU scende leggermente a 4,1 GHz, riducendo le prestazioni solo del 3%, ma migliorando sensibilmente il rumore della ventola: 35.7 db(A) contro 45,1 db(A). Il limite di potenza viene abbassato di 10 watt a 65 watt e la CPU rimane più fredda di circa 2 °C.In modalità Silent
, il clock scende a 8x 3,8 GHz dopo 50 secondi e il consumo energetico scende dai 65 watt iniziali a 45 watt. Le ventole diventano molto piacevoli, con 32 db(A), e la temperatura della CPU è significativamente più bassa (80 °C). Le prestazioni a lungo termine sono inferiori di circa il 15%.In modalità batteria, non c'è alcun boost e tutti i limiti di potenza sono limitati a 35 watt, il che porta a una riduzione delle prestazioni di circa il 20%. Le controparti Intel spesso registrano un calo delle prestazioni molto più significativo in modalità batteria, soprattutto con un limite di 35 watt (50% e oltre). Le ventole sono ancora più silenziose sotto carico.
In CBR15, il Ryzen 9 è quindi in grado di battere i rivali Alder Lake, come il più grande Dell XPS 17. I sottili Stealth GS66 e Aero 16 sono più veloci del 20%, poiché Alder Lake beneficia fortemente di un elevato consumo energetico. I portatili da gioco più spessi come Scar 15 o Legion 5 Pro sono ancora più veloci.
Nella valutazione complessiva, il nostro dispositivo di prova si colloca a metà classifica. Il Apple M1 Pro è del 36% più veloce in Geekbench 5.4.


| Modalità di alimentazione | Clock della CPU (GHz) | Temperatura della CPU (°C) | Consumo di potenza della CPU (W) | Loudness in db(A) @Blender |
|---|---|---|---|---|
| Manuale (Max) | 4,2 | 89 | 70 | 50,6 |
| Turbo | 4,26 | 91 | 75 | 45,1 |
| Bilanciato / Performance | 4,1 | 89 | 60 | 36 |
| Silenzioso | 3,8 | 80 | 45 | 32 |
| Batteria | 3,5 | 72 | 35 | 26,7 - 30,7 |
Cinebench R15 Multi Sustained Load
Cinebench R23: Multi Core | Single Core
Cinebench R20: CPU (Multi Core) | CPU (Single Core)
Cinebench R15: CPU Multi 64Bit | CPU Single 64Bit
Blender: v2.79 BMW27 CPU | v3.3 Classroom CPU | v3.3 Classroom CUDA
7-Zip 18.03: 7z b 4 | 7z b 4 -mmt1
Geekbench 5.5: Multi-Core | Single-Core | OpenCL Score
HWBOT x265 Benchmark v2.2: 4k Preset
LibreOffice : 20 Documents To PDF
R Benchmark 2.5: Overall mean
V-Ray 5 Benchmark: CPU | GPU CUDA | GPU RTX
V-Ray Benchmark Next 4.10: CPU | GPU
Mozilla Kraken 1.1: Total
WebXPRT 3: Overall
WebXPRT 4: Overall
Octane V2: Total Score
Jetstream 2: 2.0 Total
Sunspider: 1.0 Total Score
Speedometer 2.0: Result 2.0
| CPU Performance rating | |
| Media della classe Gaming -1! | |
| Asus ROG Strix Scar 15 G533ZW-LN106WS -11! | |
| Lenovo Legion 5 Pro 16 G7 i7 RTX 3070Ti -7! | |
| MSI Stealth GS66 12UGS -10! | |
| Gigabyte Aero 16 YE5 -3! | |
| Dell XPS 17 9720 RTX 3060 -10! | |
| Asus ROG Zephyrus M16 GU603H -12! | |
| Asus ROG Flow X16 GV601RW-M5082W | |
| Lenovo ThinkPad X1 Extreme G4-20Y50040GE -9! | |
| Apple MacBook Pro 16 2021 M1 Pro -11! | |
| Asus ROG Flow X13 GV301QH -5! | |
| Media AMD Ryzen 9 6900HS | |
| Microsoft Surface Laptop Studio i7 RTX 3050 Ti -7! | |
| Blender / v3.3 Classroom CPU | |
| Media AMD Ryzen 9 6900HS (378 - 469, n=3) | |
| Asus ROG Flow X16 GV601RW-M5082W | |
| Media della classe Gaming (122 - 565, n=105, ultimi 2 anni) | |
| Blender / v3.3 Classroom CUDA | |
| Media AMD Ryzen 9 6900HS (42 - 116, n=2) | |
| Asus ROG Flow X16 GV601RW-M5082W | |
| Media della classe Gaming (15 - 228, n=109, ultimi 2 anni) | |
| 7-Zip 18.03 / 7z b 4 -mmt1 | |
| Media della classe Gaming (4199 - 7436, n=108, ultimi 2 anni) | |
| Gigabyte Aero 16 YE5 | |
| Asus ROG Strix Scar 15 G533ZW-LN106WS | |
| Lenovo Legion 5 Pro 16 G7 i7 RTX 3070Ti | |
| MSI Stealth GS66 12UGS | |
| Media AMD Ryzen 9 6900HS (5538 - 5958, n=5) | |
| Asus ROG Flow X16 GV601RW-M5082W | |
| Dell XPS 17 9720 RTX 3060 | |
| Asus ROG Flow X13 GV301QH | |
| Asus ROG Zephyrus M16 GU603H | |
| Microsoft Surface Laptop Studio i7 RTX 3050 Ti | |
| HWBOT x265 Benchmark v2.2 / 4k Preset | |
| Media della classe Gaming (11.5 - 44.3, n=108, ultimi 2 anni) | |
| Lenovo Legion 5 Pro 16 G7 i7 RTX 3070Ti | |
| Asus ROG Strix Scar 15 G533ZW-LN106WS | |
| MSI Stealth GS66 12UGS | |
| Gigabyte Aero 16 YE5 | |
| Asus ROG Flow X16 GV601RW-M5082W | |
| Media AMD Ryzen 9 6900HS (14.2 - 17.9, n=5) | |
| Dell XPS 17 9720 RTX 3060 | |
| Asus ROG Flow X13 GV301QH | |
| Asus ROG Zephyrus M16 GU603H | |
| Lenovo ThinkPad X1 Extreme G4-20Y50040GE | |
| Microsoft Surface Laptop Studio i7 RTX 3050 Ti | |
| V-Ray 5 Benchmark / CPU | |
| Media della classe Gaming (5864 - 30302, n=34, ultimi 2 anni) | |
| Dell XPS 17 9720 RTX 3060 | |
| Gigabyte Aero 16 YE5 | |
| Asus ROG Flow X16 GV601RW-M5082W | |
| Lenovo ThinkPad X1 Extreme G4-20Y50040GE | |
| Media AMD Ryzen 9 6900HS (8067 - 9648, n=3) | |
| Apple MacBook Pro 16 2021 M1 Pro | |
| Asus ROG Flow X13 GV301QH | |
| V-Ray 5 Benchmark / GPU CUDA | |
| Media della classe Gaming (887 - 3288, n=35, ultimi 2 anni) | |
| Gigabyte Aero 16 YE5 | |
| Asus ROG Flow X16 GV601RW-M5082W | |
| Lenovo ThinkPad X1 Extreme G4-20Y50040GE | |
| Media AMD Ryzen 9 6900HS (210 - 1224, n=3) | |
| Apple MacBook Pro 16 2021 M1 Pro | |
| Asus ROG Flow X13 GV301QH | |
| V-Ray 5 Benchmark / GPU RTX | |
| Media della classe Gaming (1146 - 4363, n=35, ultimi 2 anni) | |
| Asus ROG Flow X13 GV301QH | |
| Lenovo ThinkPad X1 Extreme G4-20Y50040GE | |
| Gigabyte Aero 16 YE5 | |
| Asus ROG Flow X16 GV601RW-M5082W | |
| Media AMD Ryzen 9 6900HS (538 - 1510, n=2) | |
| V-Ray Benchmark Next 4.10 / CPU | |
| Media della classe Gaming (10048 - 45327, n=102, ultimi 2 anni) | |
| Lenovo Legion 5 Pro 16 G7 i7 RTX 3070Ti | |
| Asus ROG Strix Scar 15 G533ZW-LN106WS | |
| MSI Stealth GS66 12UGS | |
| Gigabyte Aero 16 YE5 | |
| Asus ROG Zephyrus M16 GU603H | |
| Media AMD Ryzen 9 6900HS (13527 - 15533, n=4) | |
| Asus ROG Flow X16 GV601RW-M5082W | |
| Asus ROG Flow X13 GV301QH | |
| Microsoft Surface Laptop Studio i7 RTX 3050 Ti | |
| V-Ray Benchmark Next 4.10 / GPU | |
| Media della classe Gaming (427 - 1333, n=103, ultimi 2 anni) | |
| Lenovo Legion 5 Pro 16 G7 i7 RTX 3070Ti | |
| Gigabyte Aero 16 YE5 | |
| MSI Stealth GS66 12UGS | |
| Asus ROG Flow X16 GV601RW-M5082W | |
| Asus ROG Zephyrus M16 GU603H | |
| Asus ROG Strix Scar 15 G533ZW-LN106WS | |
| Microsoft Surface Laptop Studio i7 RTX 3050 Ti | |
| Media AMD Ryzen 9 6900HS (75 - 427, n=4) | |
| Asus ROG Flow X13 GV301QH | |
| WebXPRT 4 / Overall | |
| Media della classe Gaming (176.4 - 354, n=99, ultimi 2 anni) | |
| Asus ROG Flow X16 GV601RW-M5082W | |
| Media AMD Ryzen 9 6900HS (184.4 - 225, n=3) | |
| Octane V2 / Total Score | |
| Media della classe Gaming (89353 - 139447, n=29, ultimi 2 anni) | |
| Gigabyte Aero 16 YE5 | |
| Lenovo Legion 5 Pro 16 G7 i7 RTX 3070Ti | |
| Lenovo ThinkPad X1 Extreme G4-20Y50040GE | |
| Asus ROG Flow X16 GV601RW-M5082W | |
| Media AMD Ryzen 9 6900HS (n=1) | |
| Asus ROG Flow X13 GV301QH | |
| Apple MacBook Pro 16 2021 M1 Pro | |
| Microsoft Surface Laptop Studio i7 RTX 3050 Ti | |
| Jetstream 2 / 2.0 Total | |
| Media della classe Gaming (291 - 516, n=30, ultimi 2 anni) | |
| Gigabyte Aero 16 YE5 | |
| Lenovo Legion 5 Pro 16 G7 i7 RTX 3070Ti | |
| Dell XPS 17 9720 RTX 3060 | |
| Asus ROG Flow X16 GV601RW-M5082W | |
| Media AMD Ryzen 9 6900HS (223 - 236, n=2) | |
| Lenovo ThinkPad X1 Extreme G4-20Y50040GE | |
| Apple MacBook Pro 16 2021 M1 Pro | |
| Microsoft Surface Laptop Studio i7 RTX 3050 Ti | |
| Asus ROG Flow X13 GV301QH | |
| Sunspider / 1.0 Total Score | |
| Media AMD Ryzen 9 6900HS (94 - 119.2, n=2) | |
| Gigabyte Aero 16 YE5 | |
| Asus ROG Flow X16 GV601RW-M5082W | |
| Apple MacBook Pro 16 2021 M1 Pro | |
| Speedometer 2.0 / Result 2.0 | |
| Media della classe Gaming (29 - 686, n=28, ultimi 2 anni) | |
| Apple MacBook Pro 16 2021 M1 Pro | |
| Gigabyte Aero 16 YE5 | |
| Lenovo Legion 5 Pro 16 G7 i7 RTX 3070Ti | |
| Media AMD Ryzen 9 6900HS (n=1) | |
| Asus ROG Flow X16 GV601RW-M5082W | |
| Lenovo ThinkPad X1 Extreme G4-20Y50040GE | |
| Microsoft Surface Laptop Studio i7 RTX 3050 Ti | |
* ... Meglio usare valori piccoli
AIDA64: FP32 Ray-Trace | FPU Julia | CPU SHA3 | CPU Queen | FPU SinJulia | FPU Mandel | CPU AES | CPU ZLib | FP64 Ray-Trace | CPU PhotoWorxx
| AIDA64 / FP32 Ray-Trace | |
| Media della classe Gaming (10227 - 85542, n=107, ultimi 2 anni) | |
| Asus ROG Flow X16 GV601RW-M5082W | |
| Media AMD Ryzen 9 6900HS (14212 - 16072, n=5) | |
| Lenovo ThinkPad X1 Extreme G4-20Y50040GE | |
| Asus ROG Strix Scar 15 G533ZW-LN106WS | |
| Lenovo Legion 5 Pro 16 G7 i7 RTX 3070Ti | |
| MSI Stealth GS66 12UGS | |
| Gigabyte Aero 16 YE5 | |
| Dell XPS 17 9720 RTX 3060 | |
| Microsoft Surface Laptop Studio i7 RTX 3050 Ti | |
| AIDA64 / FP64 Ray-Trace | |
| Media della classe Gaming (5509 - 45446, n=107, ultimi 2 anni) | |
| Asus ROG Flow X16 GV601RW-M5082W | |
| Lenovo ThinkPad X1 Extreme G4-20Y50040GE | |
| Media AMD Ryzen 9 6900HS (7530 - 8981, n=5) | |
| Lenovo Legion 5 Pro 16 G7 i7 RTX 3070Ti | |
| Asus ROG Strix Scar 15 G533ZW-LN106WS | |
| MSI Stealth GS66 12UGS | |
| Gigabyte Aero 16 YE5 | |
| Dell XPS 17 9720 RTX 3060 | |
| Microsoft Surface Laptop Studio i7 RTX 3050 Ti | |
| AIDA64 / CPU PhotoWorxx | |
| Media della classe Gaming (12271 - 89891, n=107, ultimi 2 anni) | |
| Dell XPS 17 9720 RTX 3060 | |
| MSI Stealth GS66 12UGS | |
| Asus ROG Strix Scar 15 G533ZW-LN106WS | |
| Gigabyte Aero 16 YE5 | |
| Microsoft Surface Laptop Studio i7 RTX 3050 Ti | |
| Lenovo Legion 5 Pro 16 G7 i7 RTX 3070Ti | |
| Asus ROG Flow X16 GV601RW-M5082W | |
| Media AMD Ryzen 9 6900HS (25757 - 30291, n=5) | |
| Lenovo ThinkPad X1 Extreme G4-20Y50040GE | |
Prestazioni del sistema
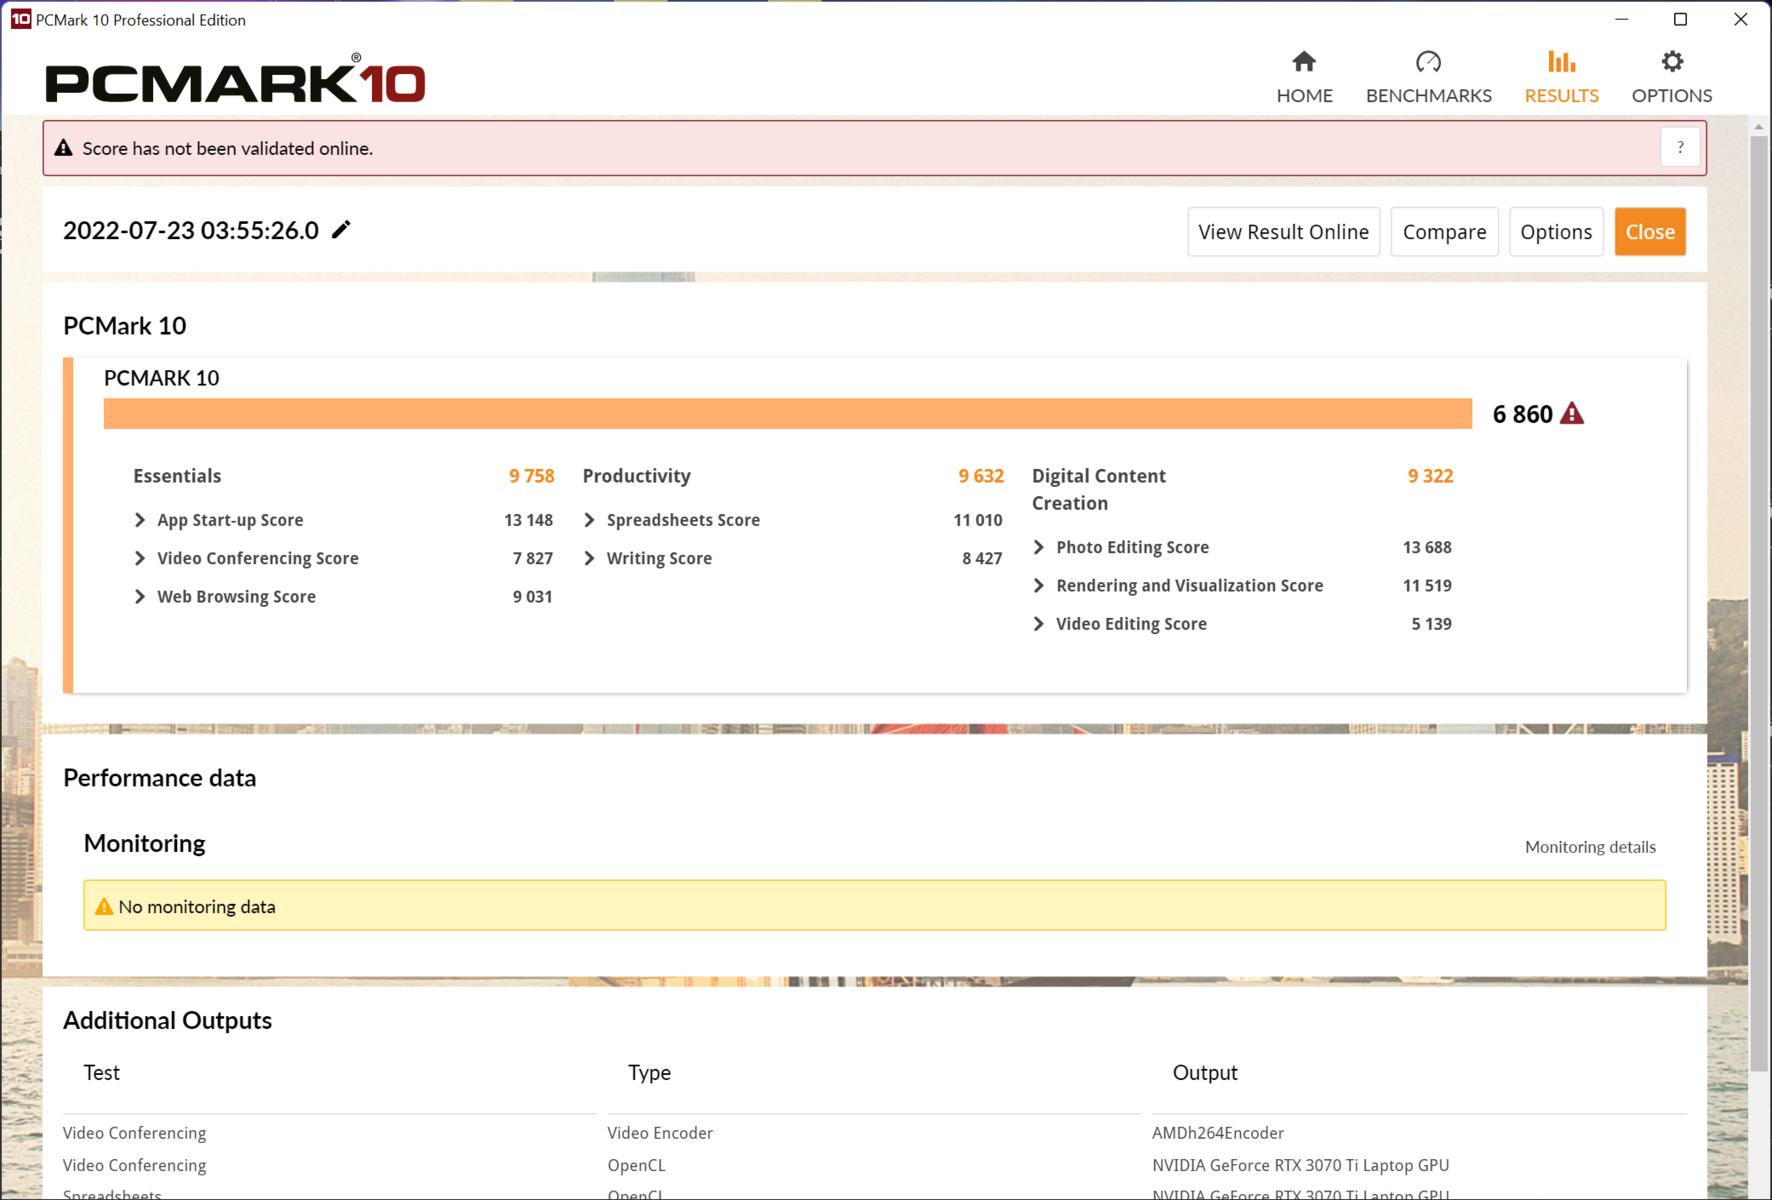
PCMark 10: il ROG Flow X16 si colloca a metà classifica. Le prestazioni soggettive del sistema sono molto buone e completamente prive di lag. Qualsiasi input non potrebbe essere più veloce con MS Windows. La navigazione intensiva con più schede e la riproduzione di un video YouTube in 4K non sono un problema per il portatile AMD. C'è persino abbastanza potenza per i giochi in streaming.
CrossMark: Overall | Productivity | Creativity | Responsiveness
| PCMark 10 / Score | |
| Media della classe Gaming (5828 - 11574, n=94, ultimi 2 anni) | |
| Asus ROG Strix Scar 15 G533ZW-LN106WS | |
| Gigabyte Aero 16 YE5 | |
| MSI Stealth GS66 12UGS | |
| Lenovo Legion 5 Pro 16 G7 i7 RTX 3070Ti | |
| Dell XPS 17 9720 RTX 3060 | |
| Asus ROG Zephyrus M16 GU603H | |
| Lenovo ThinkPad X1 Extreme G4-20Y50040GE | |
| Asus ROG Flow X16 GV601RW-M5082W | |
| Media AMD Ryzen 9 6900HS, NVIDIA GeForce RTX 3070 Ti Laptop GPU (n=1) | |
| Asus ROG Flow X13 GV301QH | |
| Microsoft Surface Laptop Studio i7 RTX 3050 Ti | |
| PCMark 10 / Essentials | |
| Gigabyte Aero 16 YE5 | |
| MSI Stealth GS66 12UGS | |
| Dell XPS 17 9720 RTX 3060 | |
| Asus ROG Strix Scar 15 G533ZW-LN106WS | |
| Media della classe Gaming (8810 - 12600, n=98, ultimi 2 anni) | |
| Asus ROG Zephyrus M16 GU603H | |
| Lenovo ThinkPad X1 Extreme G4-20Y50040GE | |
| Lenovo Legion 5 Pro 16 G7 i7 RTX 3070Ti | |
| Asus ROG Flow X13 GV301QH | |
| Asus ROG Flow X16 GV601RW-M5082W | |
| Media AMD Ryzen 9 6900HS, NVIDIA GeForce RTX 3070 Ti Laptop GPU (n=1) | |
| Microsoft Surface Laptop Studio i7 RTX 3050 Ti | |
| PCMark 10 / Productivity | |
| Media della classe Gaming (6845 - 18766, n=96, ultimi 2 anni) | |
| Asus ROG Strix Scar 15 G533ZW-LN106WS | |
| Gigabyte Aero 16 YE5 | |
| Lenovo Legion 5 Pro 16 G7 i7 RTX 3070Ti | |
| Asus ROG Flow X16 GV601RW-M5082W | |
| Media AMD Ryzen 9 6900HS, NVIDIA GeForce RTX 3070 Ti Laptop GPU (n=1) | |
| MSI Stealth GS66 12UGS | |
| Dell XPS 17 9720 RTX 3060 | |
| Asus ROG Zephyrus M16 GU603H | |
| Lenovo ThinkPad X1 Extreme G4-20Y50040GE | |
| Asus ROG Flow X13 GV301QH | |
| Microsoft Surface Laptop Studio i7 RTX 3050 Ti | |
| PCMark 10 / Digital Content Creation | |
| Media della classe Gaming (7602 - 19657, n=96, ultimi 2 anni) | |
| Asus ROG Strix Scar 15 G533ZW-LN106WS | |
| Lenovo Legion 5 Pro 16 G7 i7 RTX 3070Ti | |
| Gigabyte Aero 16 YE5 | |
| MSI Stealth GS66 12UGS | |
| Dell XPS 17 9720 RTX 3060 | |
| Asus ROG Zephyrus M16 GU603H | |
| Lenovo ThinkPad X1 Extreme G4-20Y50040GE | |
| Asus ROG Flow X16 GV601RW-M5082W | |
| Media AMD Ryzen 9 6900HS, NVIDIA GeForce RTX 3070 Ti Laptop GPU (n=1) | |
| Asus ROG Flow X13 GV301QH | |
| Microsoft Surface Laptop Studio i7 RTX 3050 Ti | |
| CrossMark / Overall | |
| Gigabyte Aero 16 YE5 | |
| Asus ROG Strix Scar 15 G533ZW-LN106WS | |
| Media della classe Gaming (1366 - 2409, n=96, ultimi 2 anni) | |
| Lenovo Legion 5 Pro 16 G7 i7 RTX 3070Ti | |
| Dell XPS 17 9720 RTX 3060 | |
| Asus ROG Flow X16 GV601RW-M5082W | |
| Media AMD Ryzen 9 6900HS, NVIDIA GeForce RTX 3070 Ti Laptop GPU (n=1) | |
| Lenovo ThinkPad X1 Extreme G4-20Y50040GE | |
| Apple MacBook Pro 16 2021 M1 Pro | |
| Microsoft Surface Laptop Studio i7 RTX 3050 Ti | |
| CrossMark / Productivity | |
| Gigabyte Aero 16 YE5 | |
| Asus ROG Strix Scar 15 G533ZW-LN106WS | |
| Lenovo Legion 5 Pro 16 G7 i7 RTX 3070Ti | |
| Media della classe Gaming (1386 - 2254, n=96, ultimi 2 anni) | |
| Dell XPS 17 9720 RTX 3060 | |
| Lenovo ThinkPad X1 Extreme G4-20Y50040GE | |
| Asus ROG Flow X16 GV601RW-M5082W | |
| Media AMD Ryzen 9 6900HS, NVIDIA GeForce RTX 3070 Ti Laptop GPU (n=1) | |
| Microsoft Surface Laptop Studio i7 RTX 3050 Ti | |
| Apple MacBook Pro 16 2021 M1 Pro | |
| CrossMark / Creativity | |
| Media della classe Gaming (1343 - 2729, n=96, ultimi 2 anni) | |
| Gigabyte Aero 16 YE5 | |
| Asus ROG Strix Scar 15 G533ZW-LN106WS | |
| Dell XPS 17 9720 RTX 3060 | |
| Apple MacBook Pro 16 2021 M1 Pro | |
| Lenovo Legion 5 Pro 16 G7 i7 RTX 3070Ti | |
| Asus ROG Flow X16 GV601RW-M5082W | |
| Media AMD Ryzen 9 6900HS, NVIDIA GeForce RTX 3070 Ti Laptop GPU (n=1) | |
| Lenovo ThinkPad X1 Extreme G4-20Y50040GE | |
| Microsoft Surface Laptop Studio i7 RTX 3050 Ti | |
| CrossMark / Responsiveness | |
| Gigabyte Aero 16 YE5 | |
| Asus ROG Strix Scar 15 G533ZW-LN106WS | |
| Lenovo Legion 5 Pro 16 G7 i7 RTX 3070Ti | |
| Media della classe Gaming (1226 - 2334, n=96, ultimi 2 anni) | |
| Dell XPS 17 9720 RTX 3060 | |
| Lenovo ThinkPad X1 Extreme G4-20Y50040GE | |
| Asus ROG Flow X16 GV601RW-M5082W | |
| Media AMD Ryzen 9 6900HS, NVIDIA GeForce RTX 3070 Ti Laptop GPU (n=1) | |
| Microsoft Surface Laptop Studio i7 RTX 3050 Ti | |
| Apple MacBook Pro 16 2021 M1 Pro | |
| PCMark 10 Score | 6860 punti | |
Aiuto | ||
| AIDA64 / Memory Latency | |
| Media della classe Gaming (75.3 - 259, n=107, ultimi 2 anni) | |
| Microsoft Surface Laptop Studio i7 RTX 3050 Ti | |
| Asus ROG Strix Scar 15 G533ZW-LN106WS | |
| Lenovo Legion 5 Pro 16 G7 i7 RTX 3070Ti | |
| MSI Stealth GS66 12UGS | |
| Asus ROG Flow X16 GV601RW-M5082W | |
| Dell XPS 17 9720 RTX 3060 | |
| Media AMD Ryzen 9 6900HS (79.2 - 110.9, n=5) | |
| Gigabyte Aero 16 YE5 | |
| Lenovo ThinkPad X1 Extreme G4-20Y50040GE | |
* ... Meglio usare valori piccoli
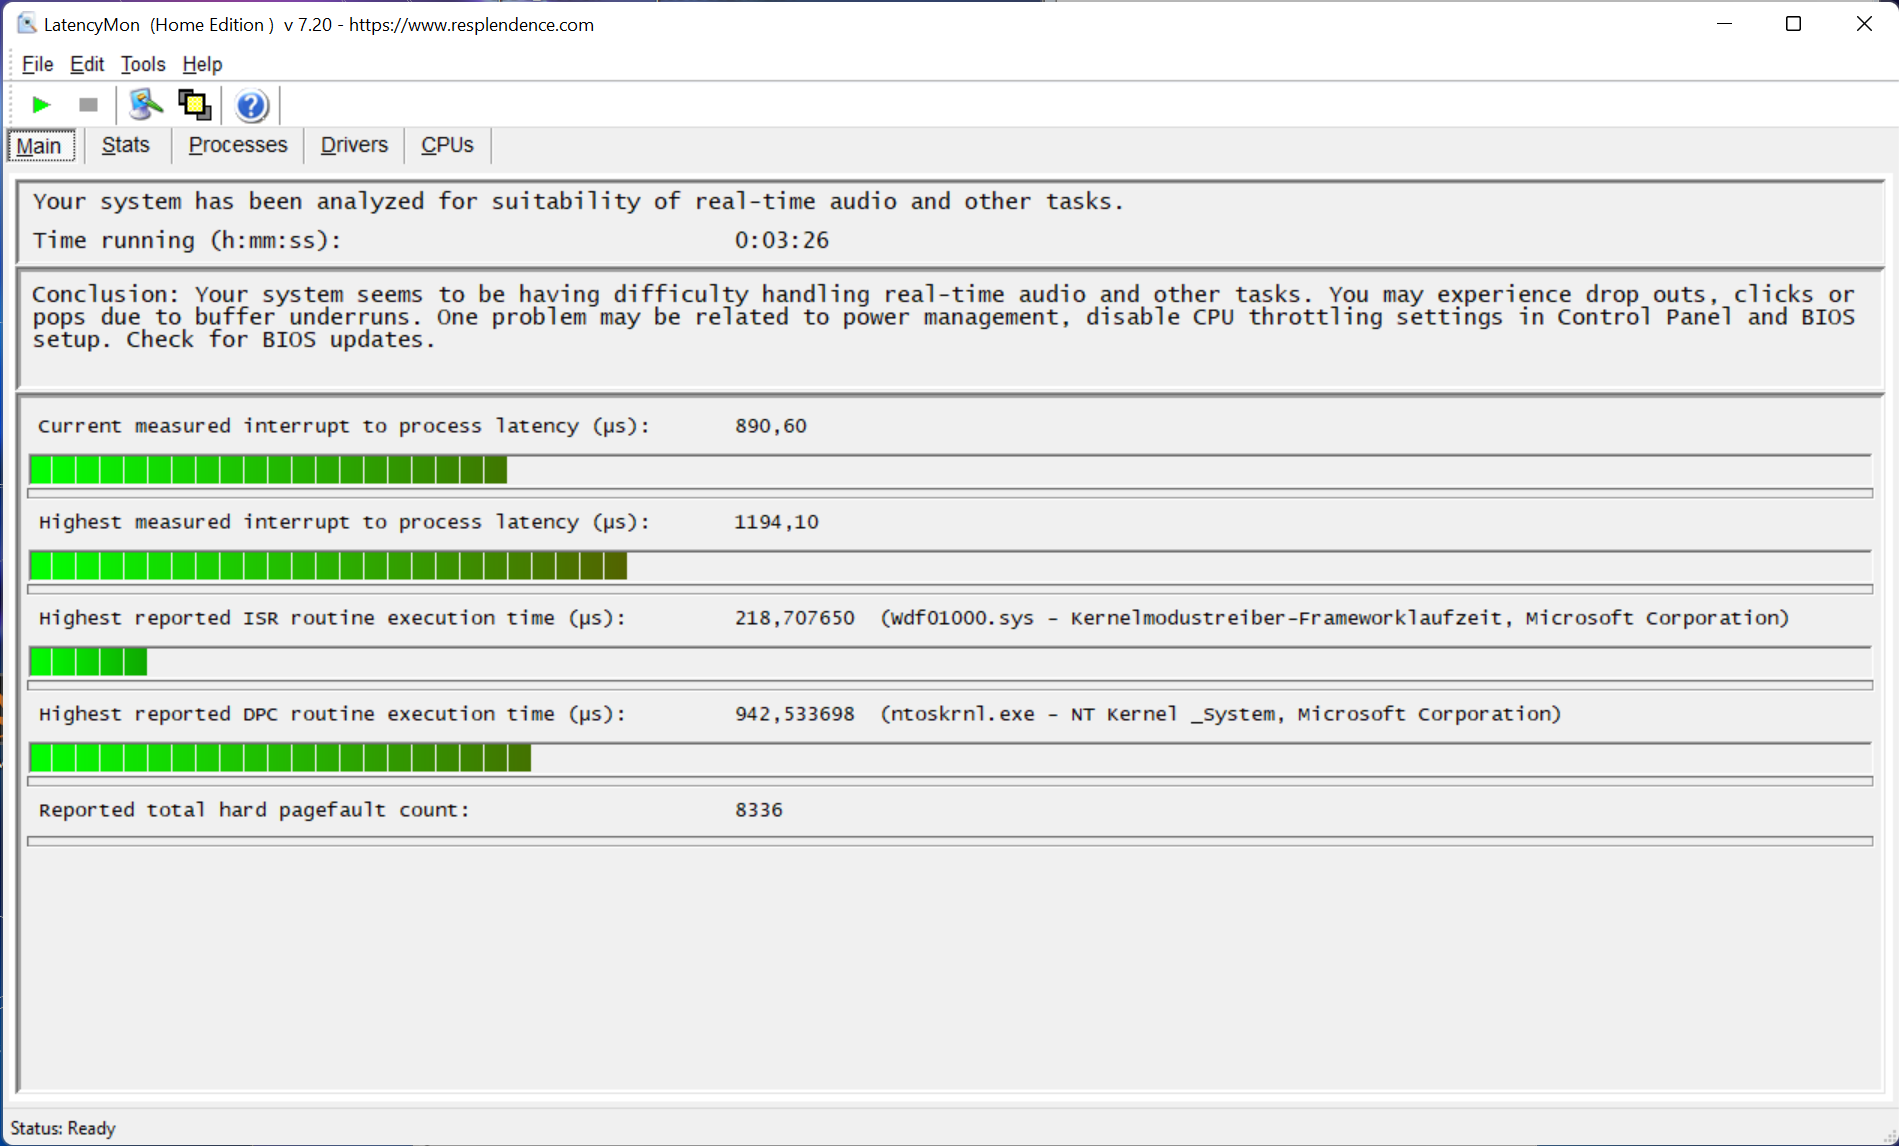
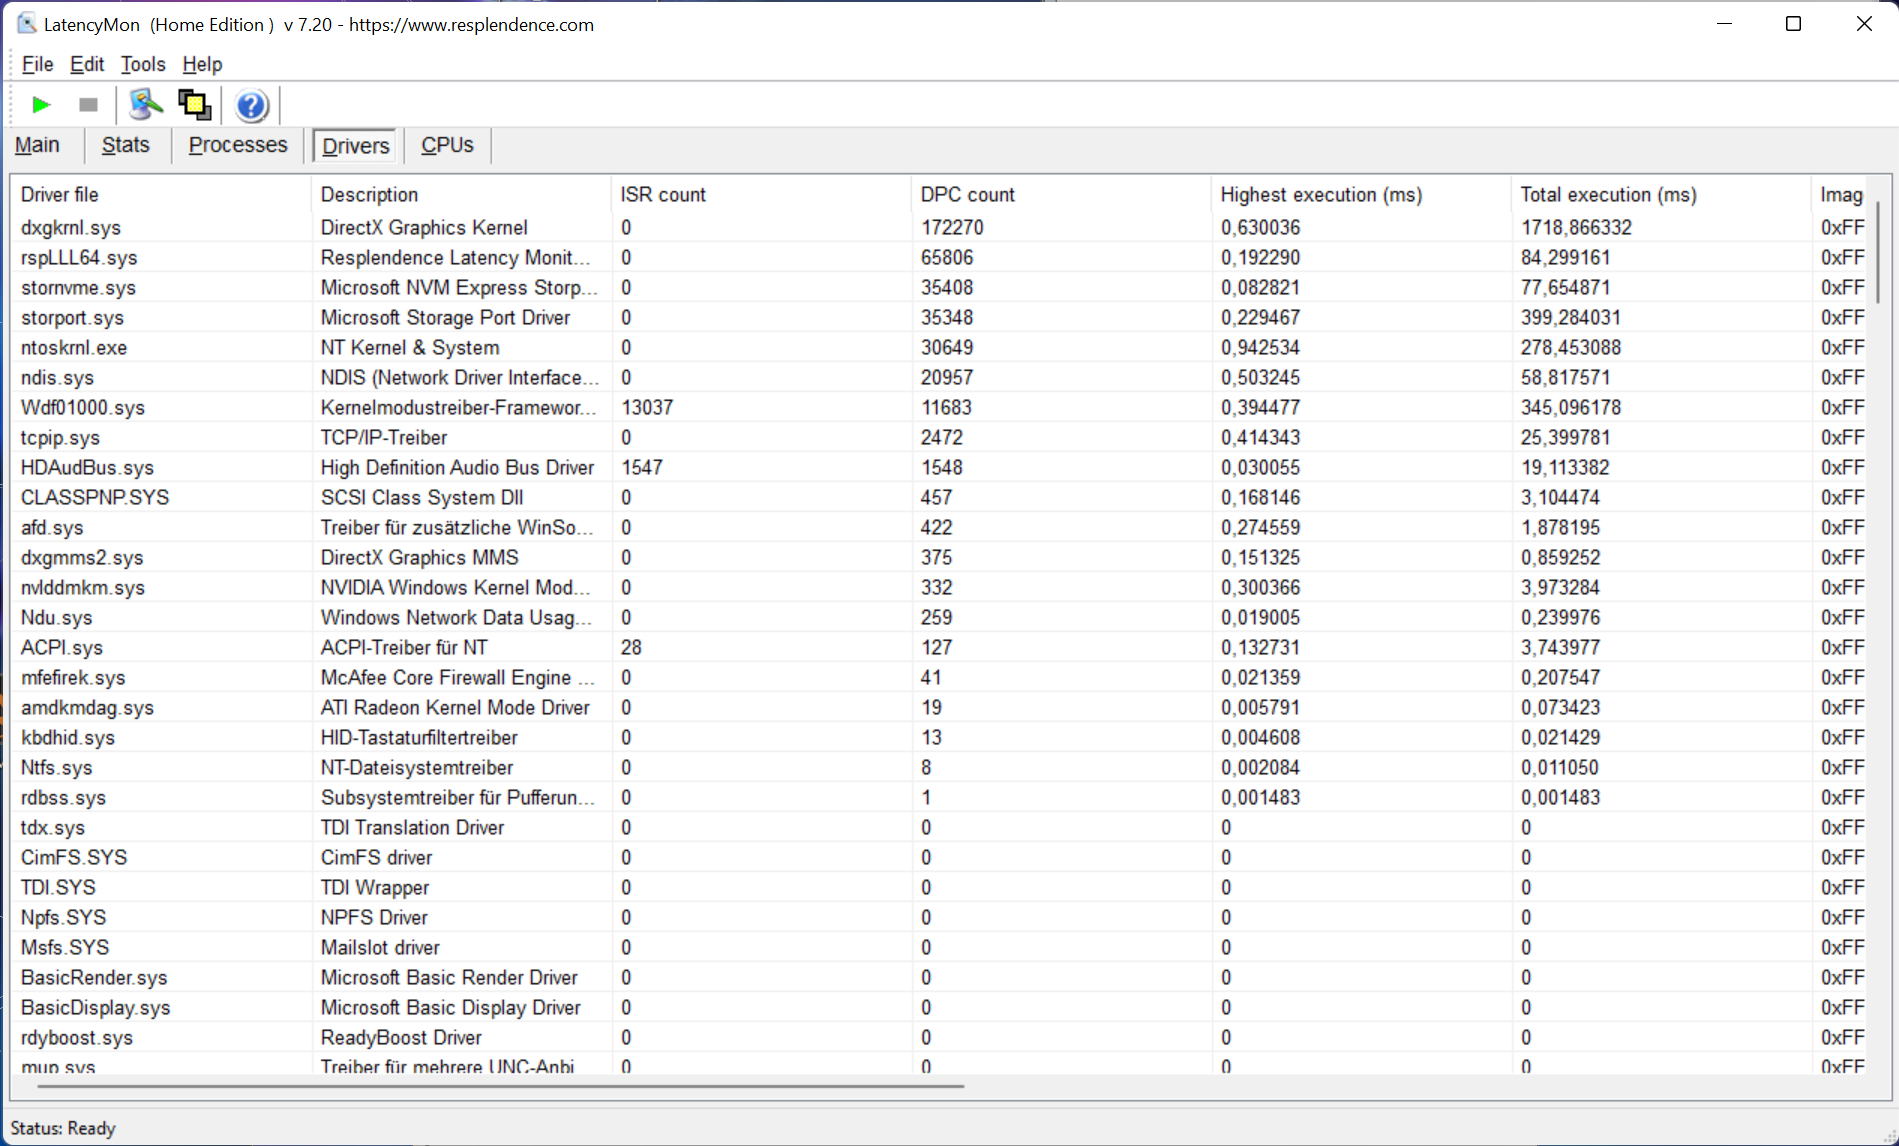
Latenza DPC
Il ROG Flow X16, ovvero il nostro modello in prova, sembra avere problemi a gestire l'editing audio e video in tempo reale. Il kernel grafico DirectX è il principale responsabile. I futuri aggiornamenti del BIOS potrebbero migliorare questo aspetto.
la riproduzione 4K su YouTube causa un carico della CPU del 4% e del ~20% sulla iGPU Radeon. Non sono stati registrati fotogrammi saltati.
| DPC Latencies / LatencyMon - interrupt to process latency (max), Web, Youtube, Prime95 | |
| Asus ROG Flow X13 GV301QH | |
| MSI Stealth GS66 12UGS | |
| Lenovo ThinkPad X1 Extreme G4-20Y50040GE | |
| Asus ROG Flow X16 GV601RW-M5082W | |
| Asus ROG Zephyrus M16 GU603H | |
| Asus ROG Strix Scar 15 G533ZW-LN106WS | |
| Microsoft Surface Laptop Studio i7 RTX 3050 Ti | |
| Lenovo Legion 5 Pro 16 G7 i7 RTX 3070Ti | |
| Gigabyte Aero 16 YE5 | |
| Dell XPS 17 9720 RTX 3060 | |
* ... Meglio usare valori piccoli
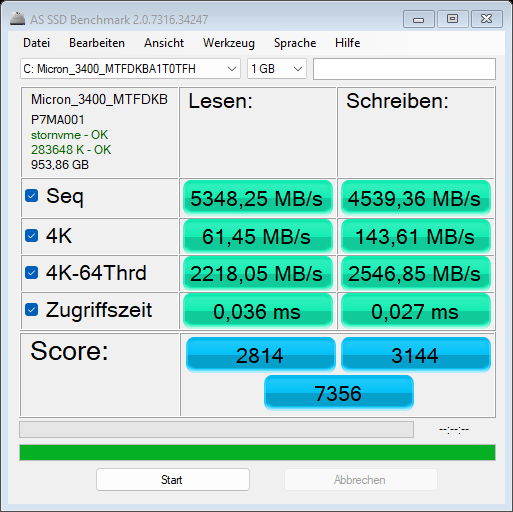
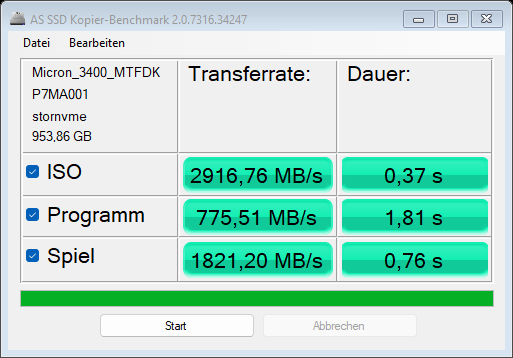
Dispositivi di archiviazione
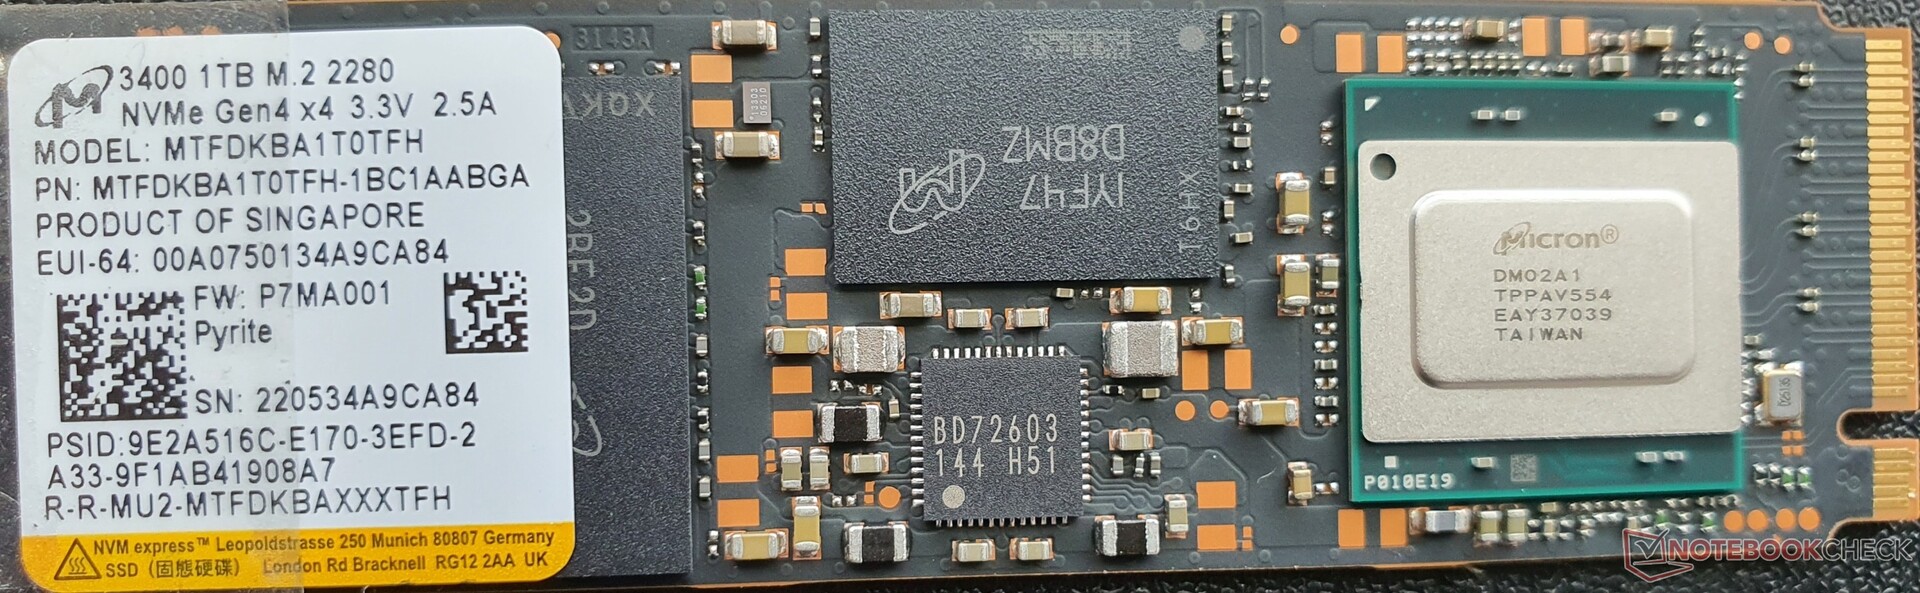
Il modello da 1 terabyteMicron 3400 è collegato tramite PCIe 4.0 ed è in grado di funzionare ad alta velocità. Il nostro test di resistenza delle prestazioni di lettura non mostra cali. Tuttavia, i valori 4K sono leggermente inferiori alla concorrenza.
| Asus ROG Flow X16 GV601RW-M5082W GeForce RTX 3070 Ti Laptop GPU, R9 6900HS, Micron 3400 1TB MTFDKBA1T0TFH | Asus ROG Zephyrus M16 GU603H GeForce RTX 3070 Laptop GPU, i9-11900H, Samsung PM9A1 MZVL22T0HBLB | Asus ROG Strix Scar 15 G533ZW-LN106WS GeForce RTX 3070 Ti Laptop GPU, i9-12900H, Samsung PM9A1 MZVL22T0HBLB | Gigabyte Aero 16 YE5 GeForce RTX 3080 Ti Laptop GPU, i9-12900HK, Phison ESR01TBMFCT | Lenovo Legion 5 Pro 16 G7 i7 RTX 3070Ti GeForce RTX 3070 Ti Laptop GPU, i7-12700H, Samsung PM9A1 MZVL21T0HCLR | Lenovo ThinkPad X1 Extreme G4-20Y50040GE GeForce RTX 3080 Laptop GPU, i9-11950H, Kioxia XG7 KXG7AZNV1T02 | Dell XPS 17 9720 RTX 3060 GeForce RTX 3060 Laptop GPU, i7-12700H, Samsung PM9A1 MZVL21T0HCLR | Microsoft Surface Laptop Studio i7 RTX 3050 Ti GeForce RTX 3050 Ti Laptop GPU, i7-11370H, SK Hynix PC711 1TB HFS001TDE9X084N | |
|---|---|---|---|---|---|---|---|---|
| AS SSD | 9% | 15% | 26% | 24% | -4% | -14% | -21% | |
| Seq Read (MB/s) | 5348.25 | 5615 5% | 5563.48 4% | 5588 4% | 5036 -6% | 5386 1% | 5241.84 -2% | 2768 -48% |
| Seq Write (MB/s) | 4539.36 | 4297 -5% | 4045.87 -11% | 3267 -28% | 3784 -17% | 4218 -7% | 2208.41 -51% | 1683 -63% |
| 4K Read (MB/s) | 61.45 | 55.3 -10% | 81.3 32% | 109.4 78% | 88.1 43% | 65.9 7% | 79.6 30% | 63.7 4% |
| 4K Write (MB/s) | 143.61 | 170.5 19% | 248.96 73% | 321.6 124% | 240.4 67% | 223.2 55% | 221.57 54% | 191.1 33% |
| 4K-64 Read (MB/s) | 2218.05 | 2591 17% | 2740.24 24% | 2966 34% | 2788 26% | 2757 24% | 1264.16 -43% | 917 -59% |
| 4K-64 Write (MB/s) | 2546.85 | 3190 25% | 3345.62 31% | 3342 31% | 3424 34% | 1736 -32% | 3070.83 21% | 1983 -22% |
| Access Time Read * (ms) | 0.036 | 0.04 -11% | 0.022 39% | 0.056 -56% | 0.02 44% | 0.049 -36% | 0.031 14% | 0.024 33% |
| Access Time Write * (ms) | 0.027 | 0.025 7% | 0.017 37% | 0.012 56% | 0.018 33% | 0.02 26% | 0.056 -107% | 0.019 30% |
| Score Read (Points) | 2814 | 3208 14% | 3378 20% | 3634 29% | 3380 20% | 3361 19% | 1868 -34% | 1257 -55% |
| Score Write (Points) | 3144 | 3790 21% | 3999 27% | 3991 27% | 4043 29% | 2381 -24% | 3513 12% | 2343 -25% |
| Score Total (Points) | 7356 | 8563 16% | 9031 23% | 9380 28% | 9094 24% | 7397 1% | 6203 -16% | 4206 -43% |
| Copy ISO MB/s (MB/s) | 2916.76 | 2358.18 -19% | 2352 -19% | 3221 10% | 2598 -11% | 2874.04 -1% | 1991 -32% | |
| Copy Program MB/s (MB/s) | 775.51 | 466.47 -40% | 1031 33% | 939 21% | 434.7 -44% | 447.82 -42% | 606 -22% | |
| Copy Game MB/s (MB/s) | 1821.2 | 1211.65 -33% | 2188 20% | 1995 10% | 1230 -32% | 1327.42 -27% | 1435 -21% |
* ... Meglio usare valori piccoli
* ... Meglio usare valori piccoli
Sustained Performance Read: DiskSpd Read Loop, Queue Depth 8
Scheda grafica
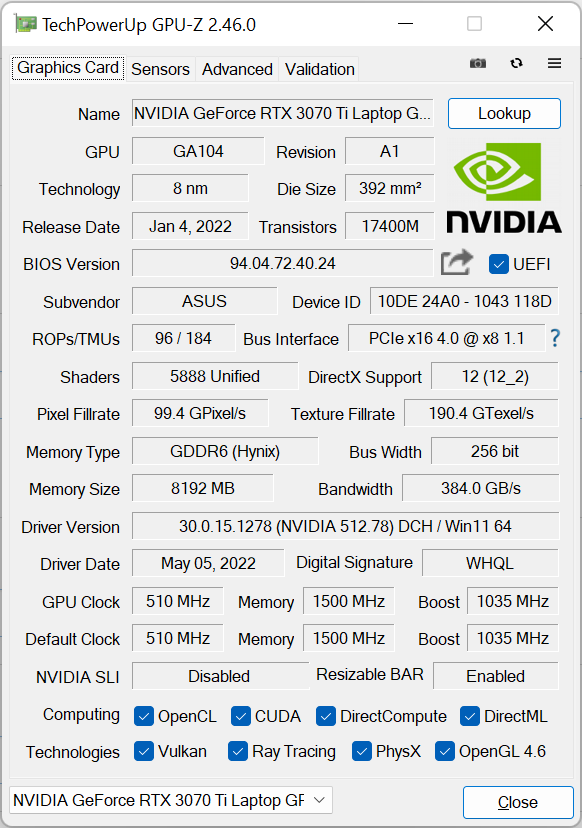
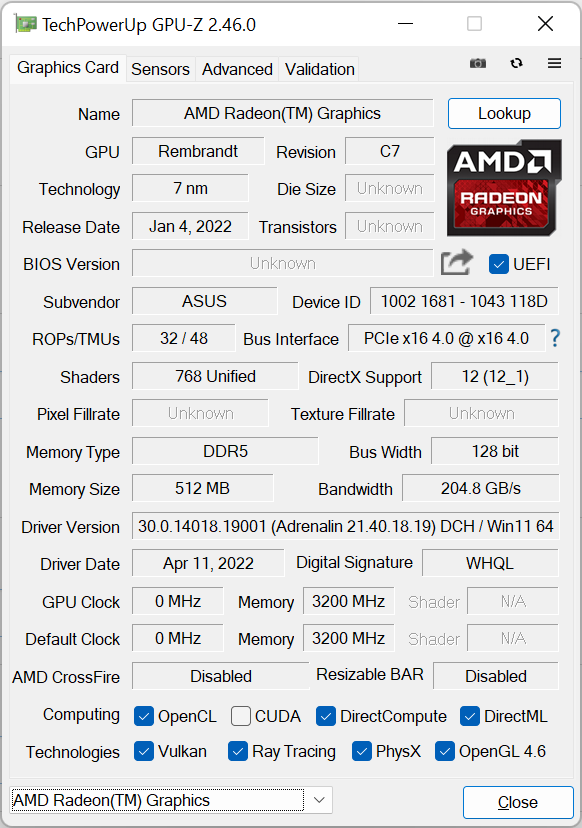
Nvidia GeForce RTX 3070 Ti è utilizzata come unità grafica dedicata, che ha accesso a 8 GB di VRAM GDDR6. Le prestazioni sono di alto livello grazie alla variante più potente (125 watt TGP, incluso Dynamic Boost), che non è necessariamente quello che ci si aspetta da un convertibile da 16 pollici compatto e leggero
Anche il modelloMSI Stealth GS66deve ammettere di essere sconfitto come notebook da gioco puro a causa del suo TGP inferiore di 105 watt, mentre il Gigabyte Aero 16 con la sua RTX 3080 Ti rimane indietro di circa il 10%, poiché raffredda solo 90 watt nonostante una struttura simile. Solo i portatili da gioco più spessi, come il modello Legion 5 Pro e il ROG Strix Scar 15 sono in grado di far funzionare la RTX 3070 Ti con un TGP ancora più elevato di 150 watt (125 W + 25 W Dynamic Boost) e sono quindi dal 10 al 15% superiori al ROG Flow X16 nei benchmark 3DMark
Utilizzando l'iGPU Radeon 680M, il Flow X16 dura quasi il doppio durante il gioco a batteria rispetto a quello con la RTX 3070 Ti attivata (2:06 ore contro 0:56 ore). Le prestazioni della dGPU sono ancora due volte superiori a quelle della iGPU e almeno il 50% delle prestazioni originali della dGPU è ancora disponibile. In confronto, ilXMG Neo 15 limita le sue prestazioni grafiche del 90% in modalità batteria. Con un alimentatore USB-C da 100 watt, è disponibile solo la metà delle prestazioni della dGPU
Sebbene la RTX 3070 Ti non sia una GPU per workstation professionali, le prestazioni corrispondenti, come nei test SpecViewPerf, sono impressionanti e anche i benchmark CUDA sono di alto livello. Tuttavia, il ROG Flow X16 non è stato progettato come un portatile per workstation, per cui mancano i driver speciali.
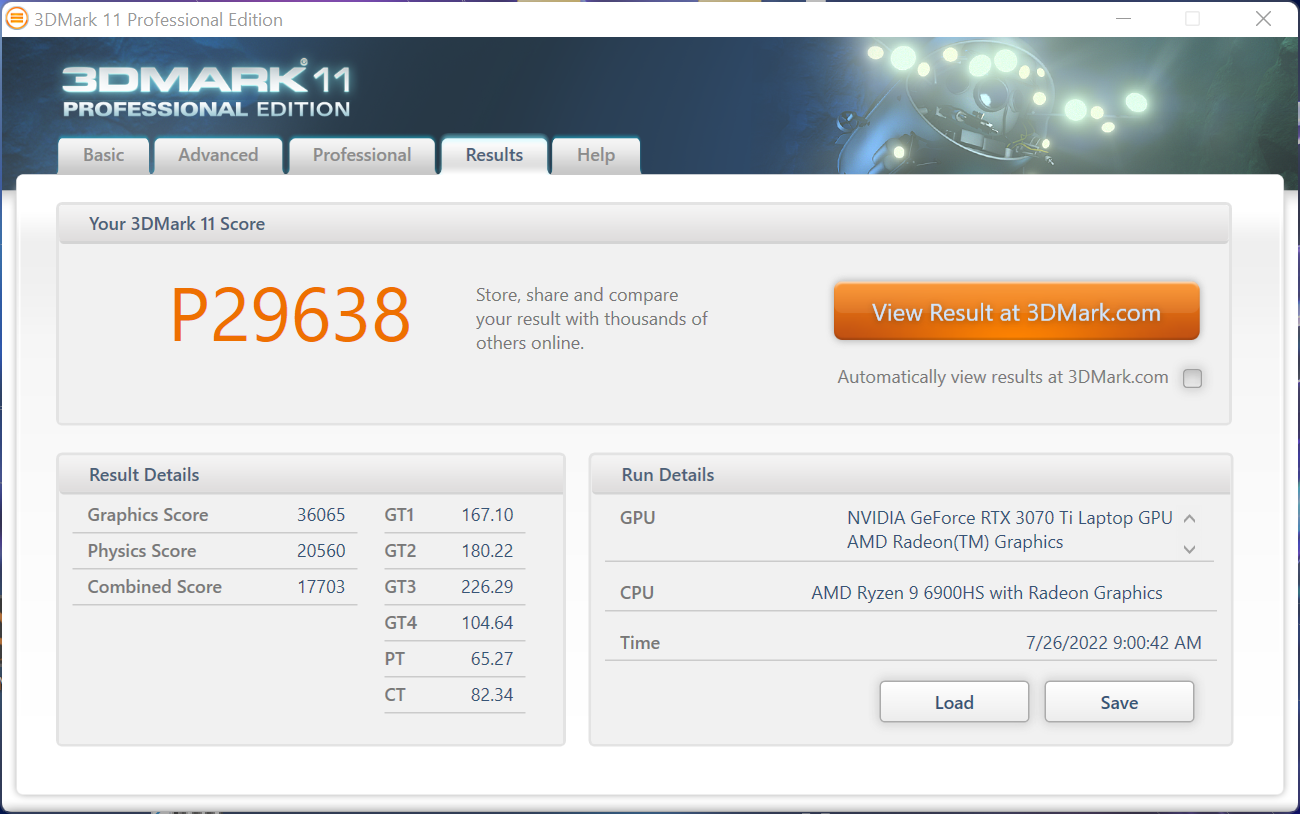


| 3DMark 11 Performance | 29638 punti | |
| 3DMark Cloud Gate Standard Score | 51280 punti | |
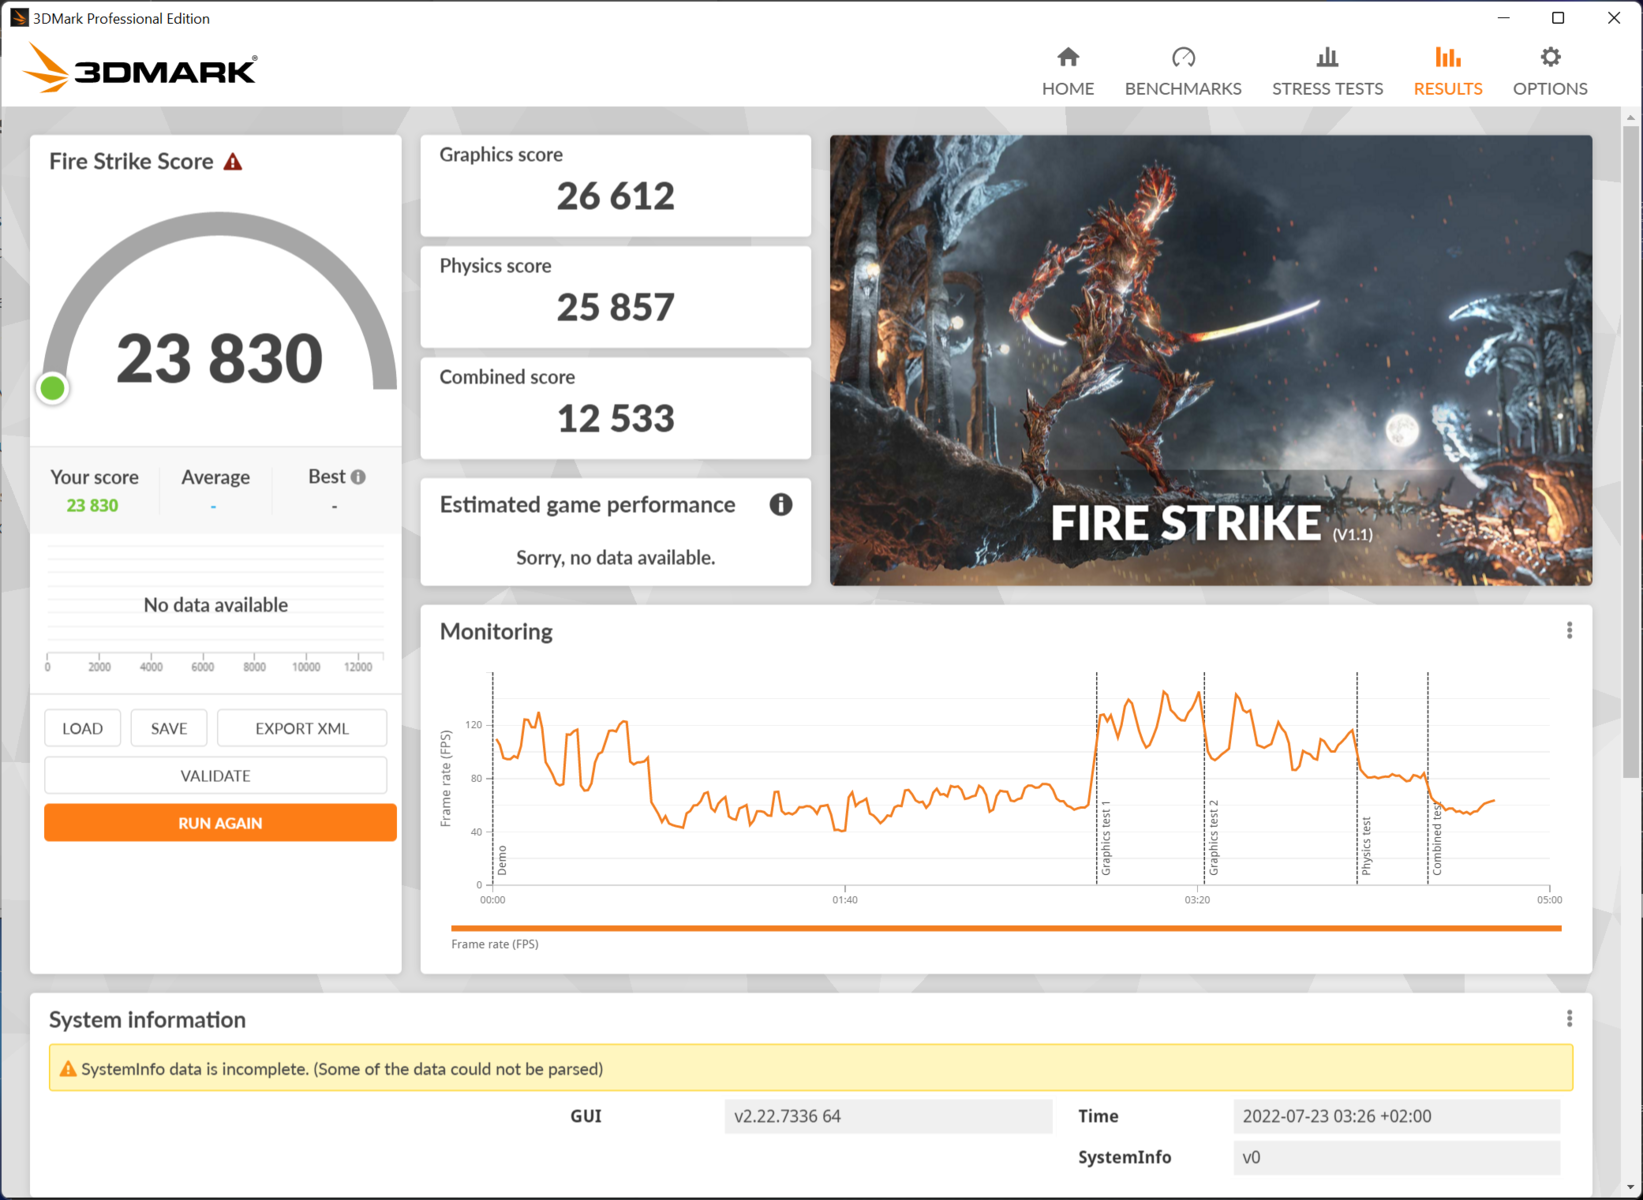
| 3DMark Fire Strike Score | 23830 punti | |
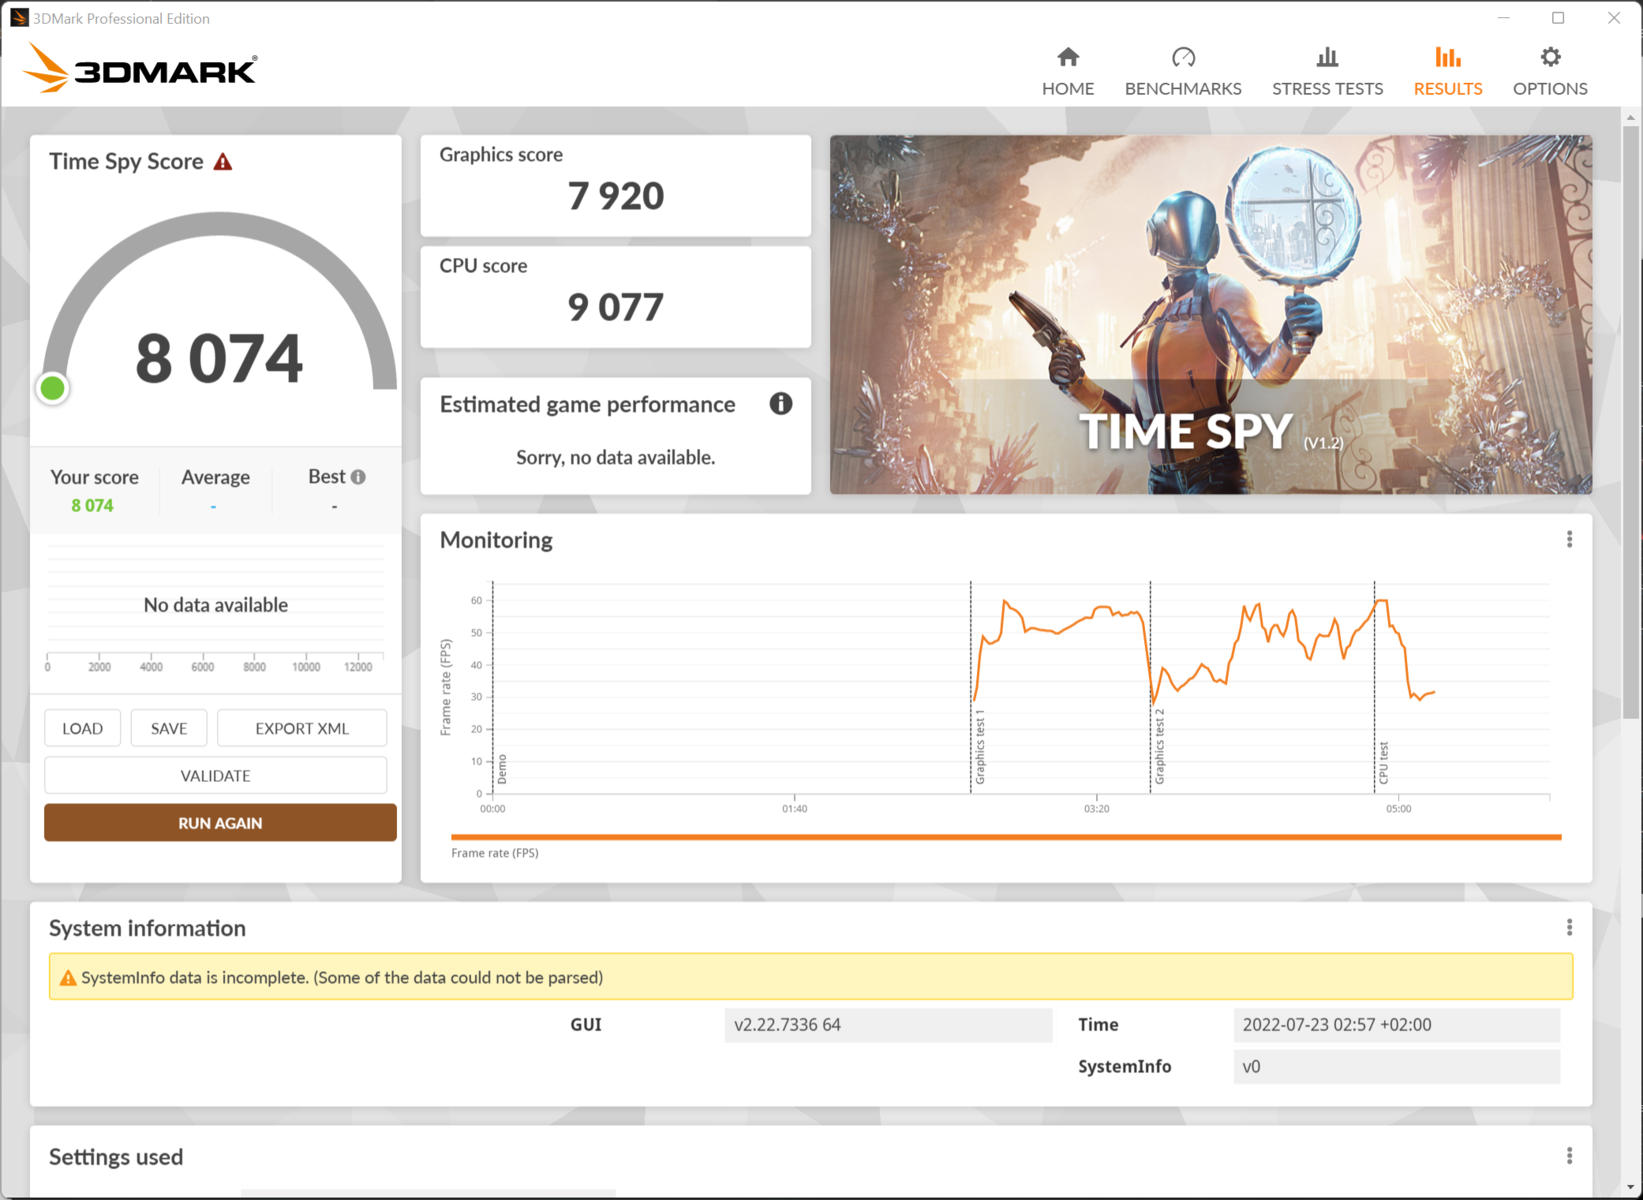
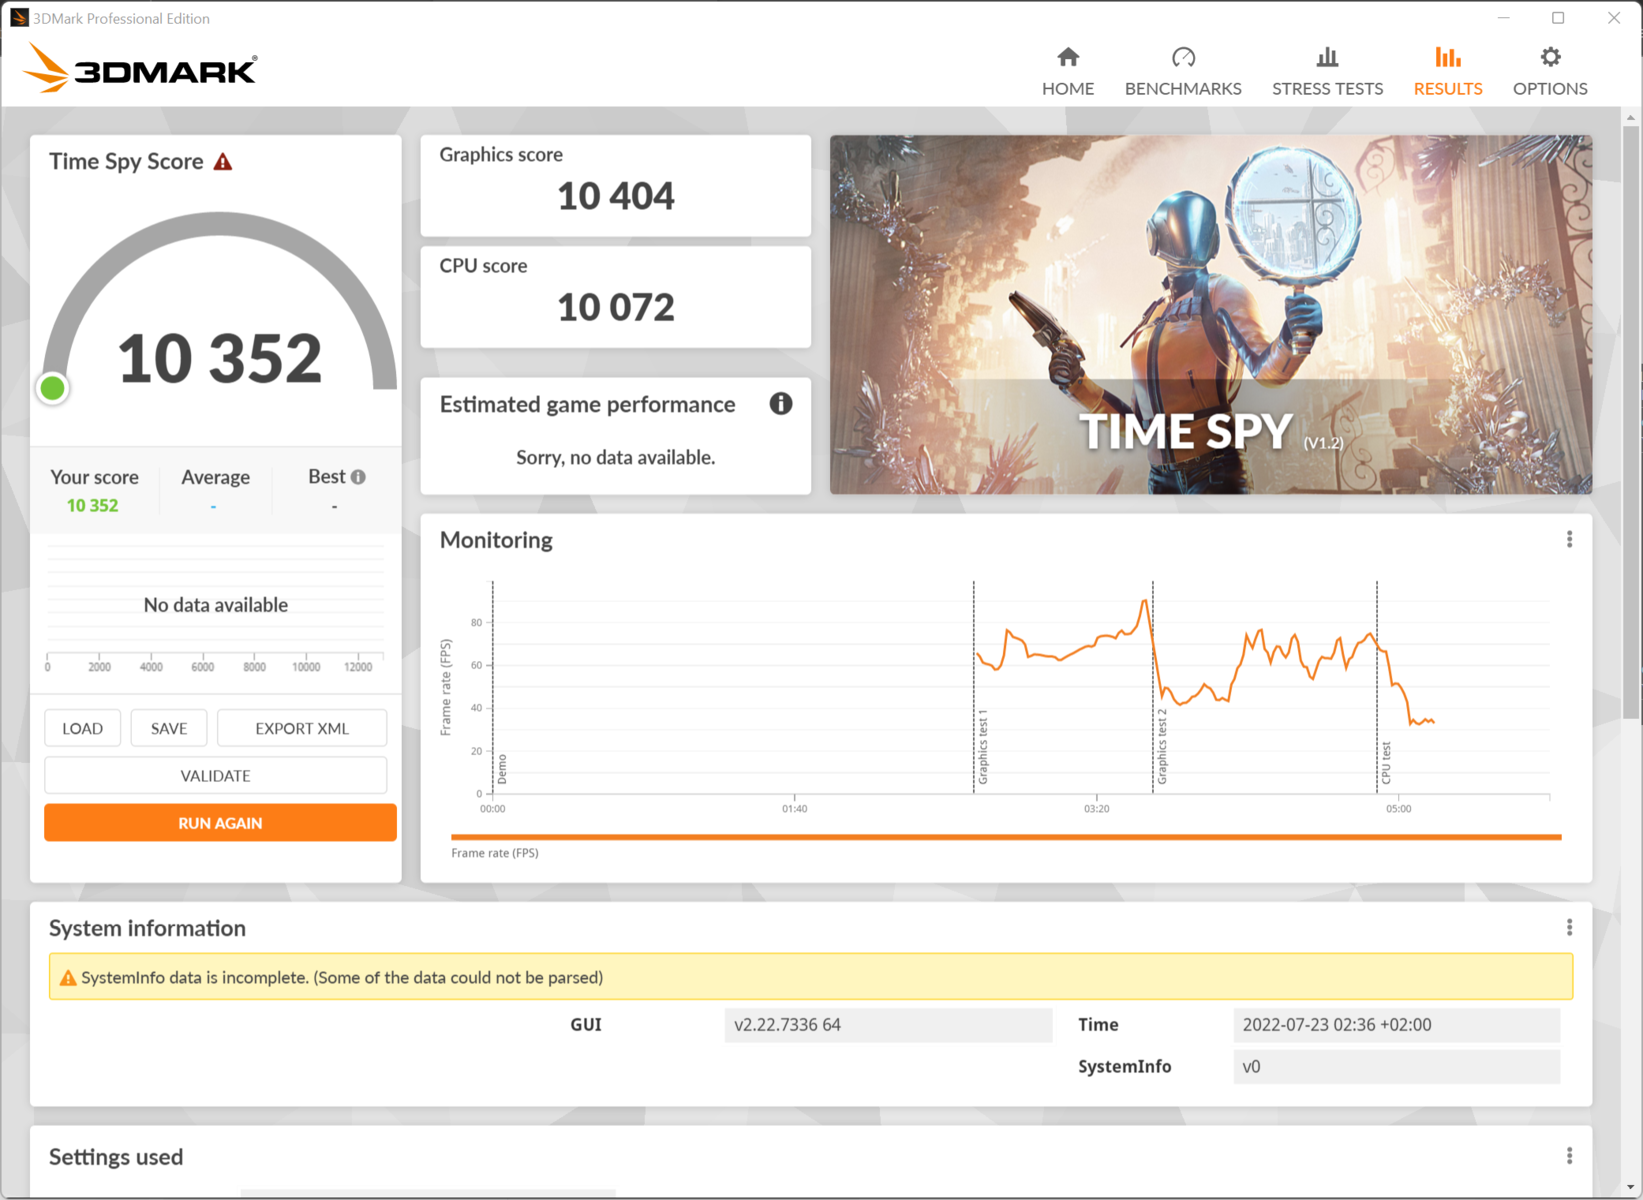
| 3DMark Time Spy Score | 10352 punti | |
Aiuto | ||
| Blender - v3.3 Classroom CUDA | |
| Asus ROG Flow X16 GV601RW-M5082W | |
| MSI Raider GE77 HX 12UHS | |
* ... Meglio usare valori piccoli
Prestazioni di gioco
I dispositivi concorrenti funzionano in media solo dal 5 al 10% più velocemente ad alte risoluzioni con la RTX 3070 Ti di GeForce (ROG Strix Scar 15, Legion 5 Pro, Acer Predator Triton 500 SE), e il divario con Legion 5 Pro in Witcher 3 si riduce persino quando overcloccchiamo la GPU tramite l'Armoury Crate di Asus o attiviamo l'interruttore MUX.
Una RTX 3080 Ti con 105 W di TGP, come nel caso del modello MSI Steath GS77è solo il 10% più veloce. Nel più sottile Aero 16funziona ancora più lentamente rispetto al nostro ROG Flow X16, poiché l'Aero 16 può raffreddare solo ~90 watt.
Con circa 150 W di TGP (XMG Pro 17, Razer Blade 17, Medion Erazer Beast X30), la RTX 3080 Ti è più veloce del 15-20%. I migliori risultati nel nostro database per le GPU mobili sono superiori di circa il 30% rispetto al nostro dispositivo di recensione, ottenuti dai pochi notebook da gioco puro che hanno 165-175 W di TGP grazie a un maggiore spazio per sistemi di raffreddamento più potenti (MSI Raider GE77 HX, Alienware x17 R2nel complesso, si tratta di un risultato molto buono per un convertibile compatto da 16 pollici che può facilmente eseguire i giochi più recenti con risoluzione QHD. I giochi in Full HD con dettagli elevati sono ancora possibili con la batteria.
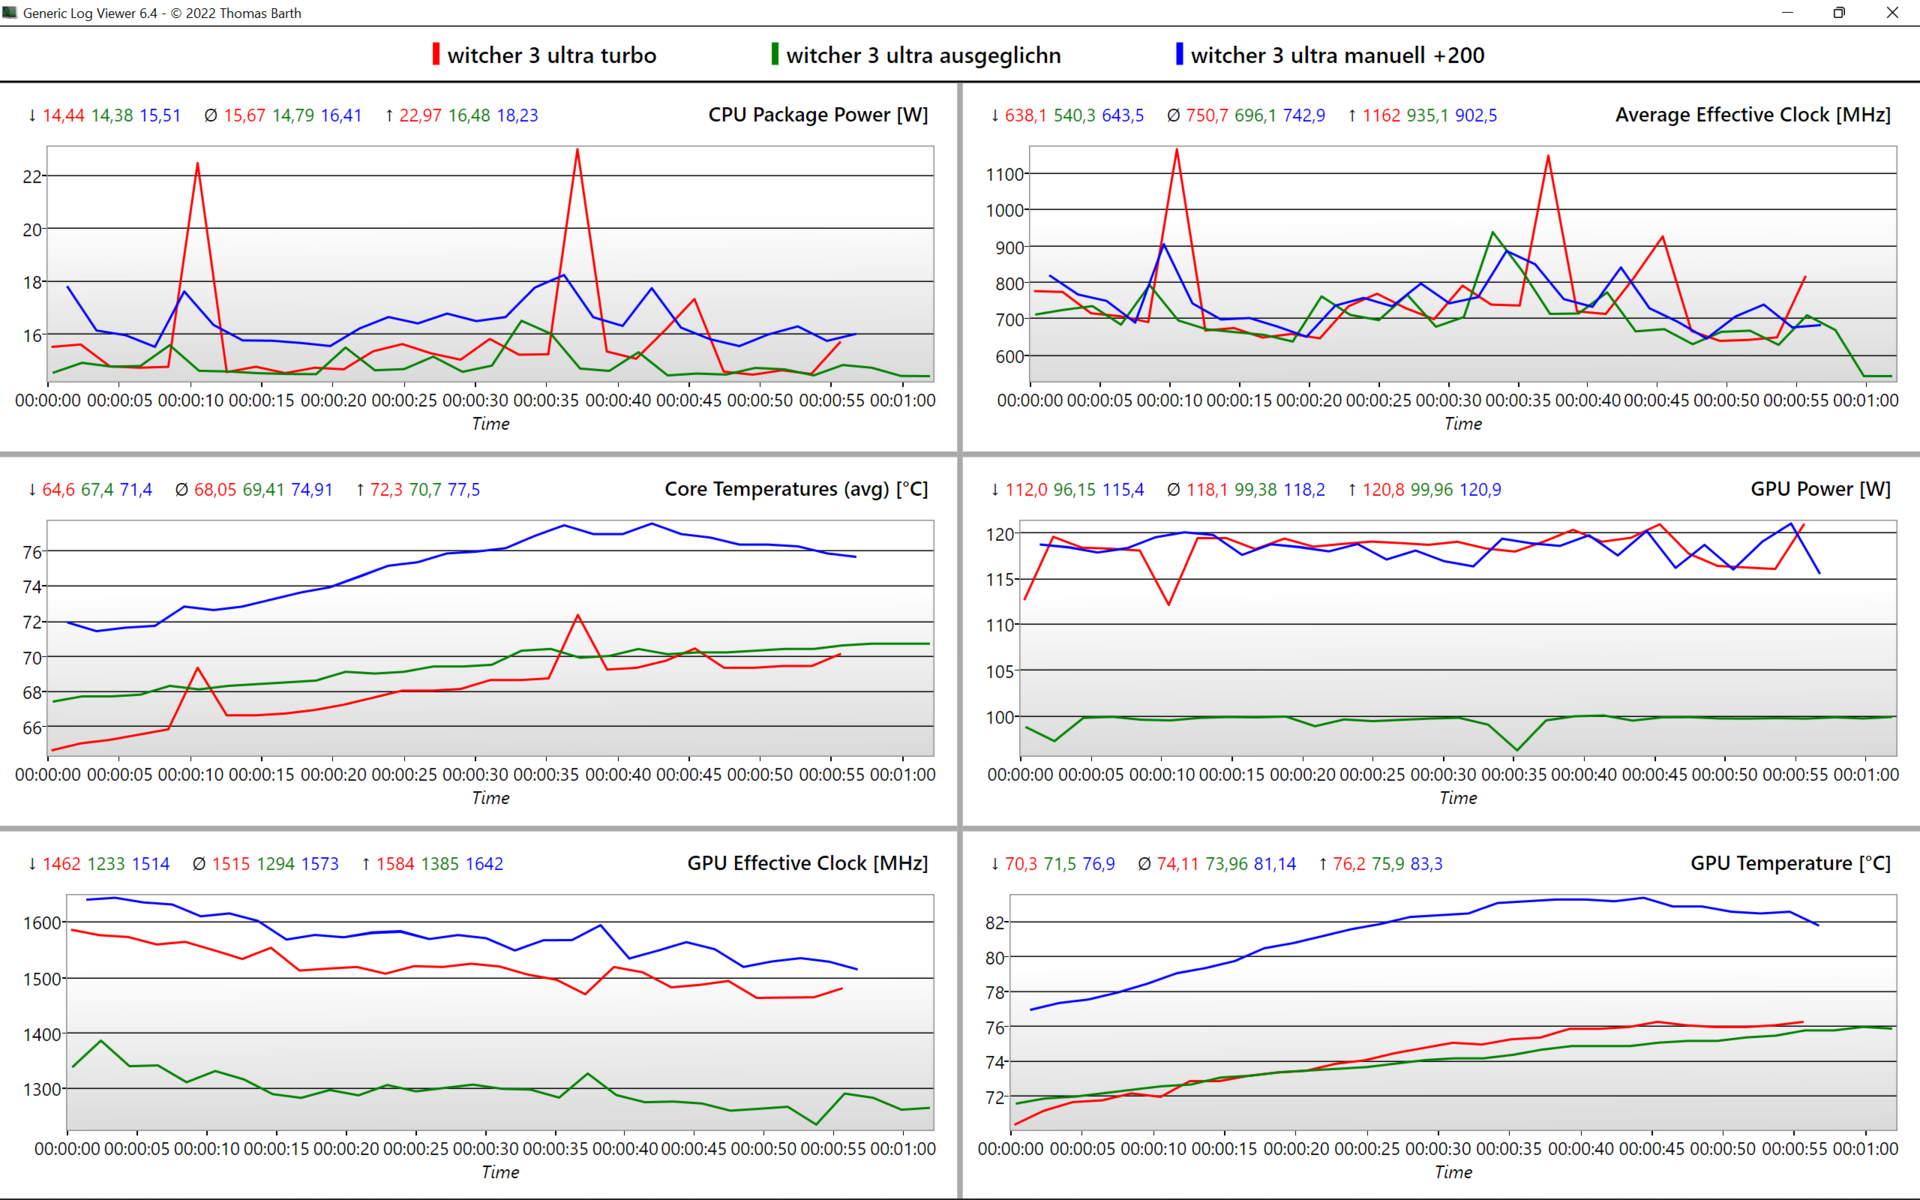
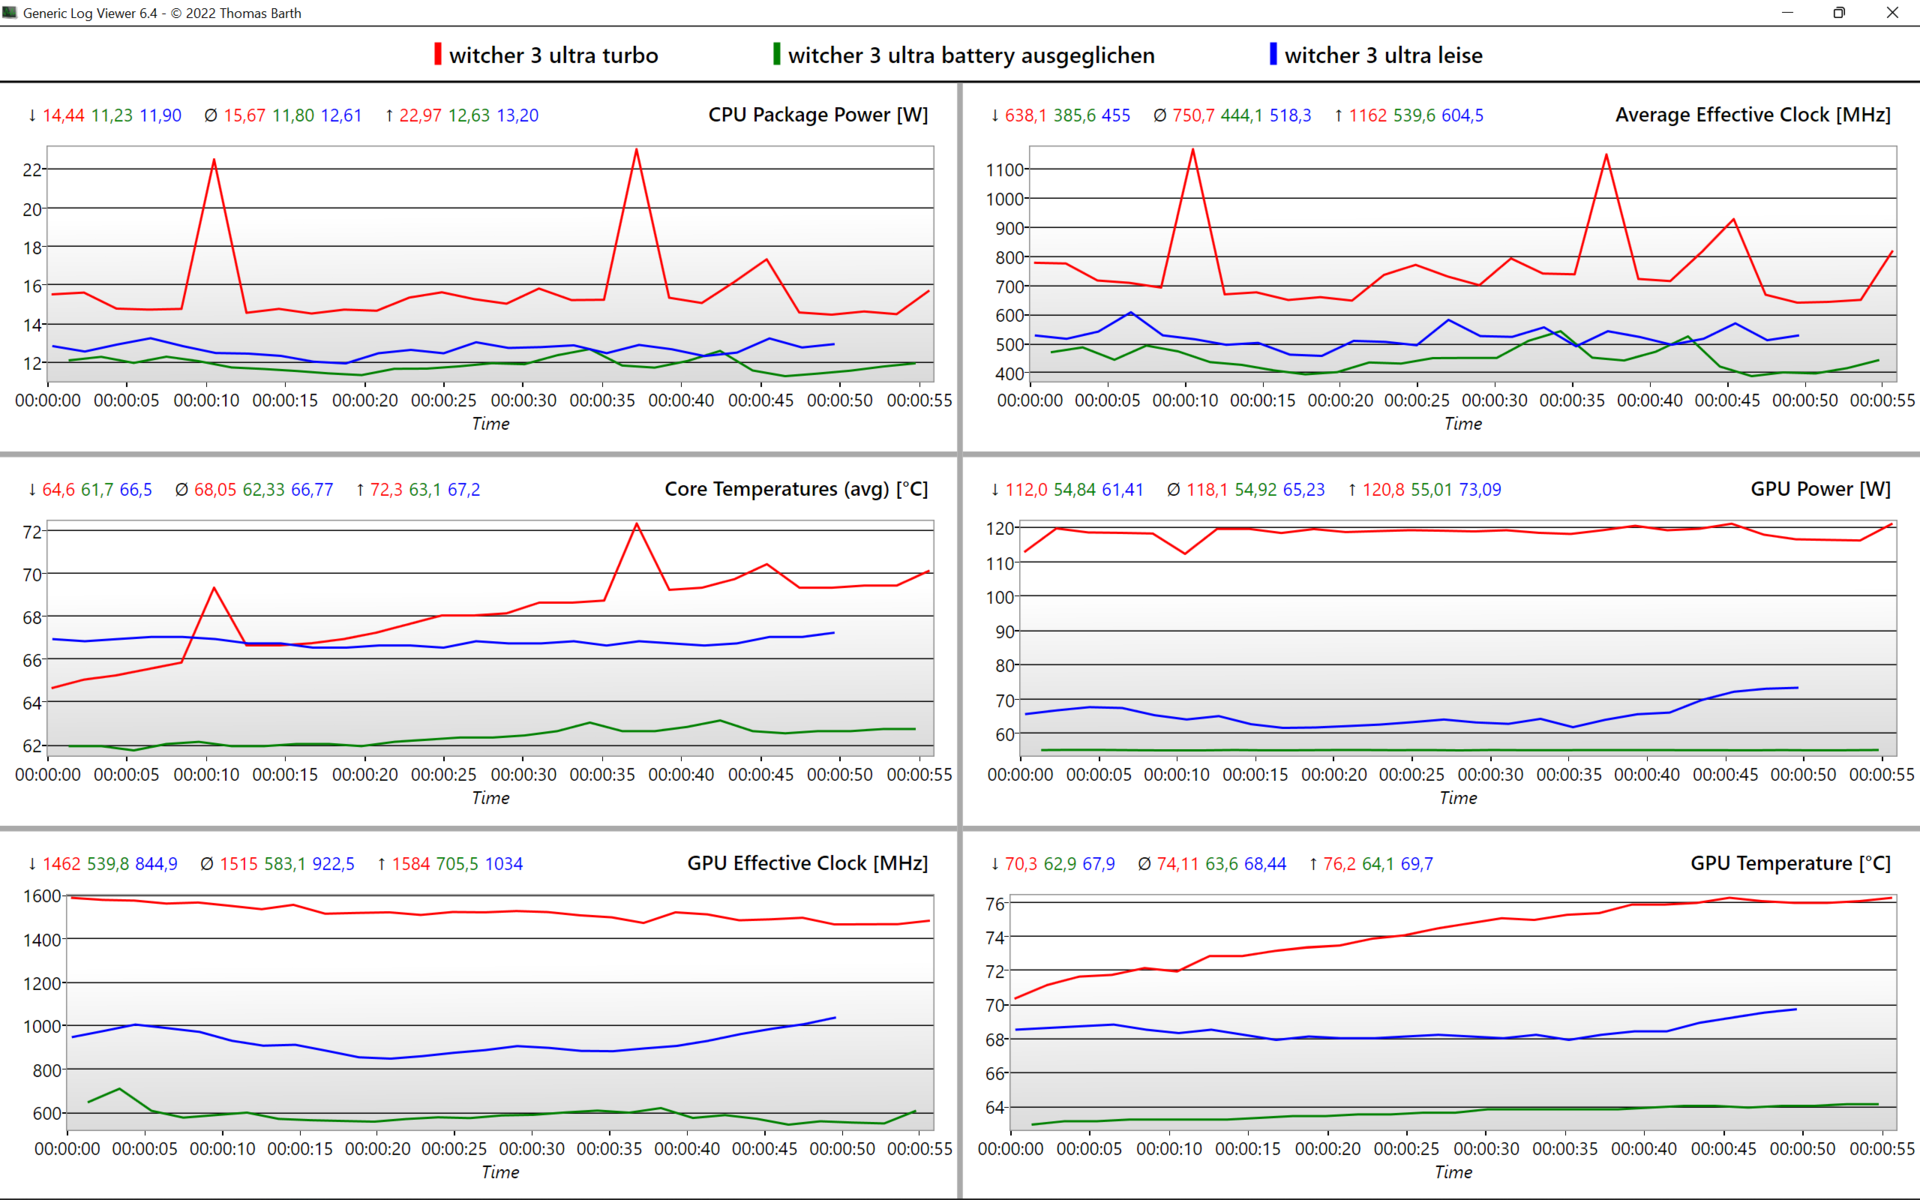
Le prestazioni di gioco aumentano del 6-7% con l'attivazione dell'interruttore MUX e l'overclocking in "modalità manuale" ottiene un incremento simile. Tuttavia, la combinazione di entrambe non aumenta ulteriormente le prestazioni. Tutti gli effetti delle diverse modalità sono visibili nella tabella seguente. L'interruttore MUX senza overclocking offre il risultato migliore, che mantiene anche il sistema più silenzioso a 45,4 db(A). In modalità Silent , si perde il 30% delle prestazioni della GPU in cambio di una silenziosità di 35,5 db(A).
| Modalità di alimentazione | Witcher 3 Ultra (FPS) | Clock della GPU (MHz) | Temperatura della GPU (°C) | Assorbimento della GPU (W) | Loudness in db(A) |
|---|---|---|---|---|---|
| MUX +200MHz | 104,4 | 1.550 | 75 | 116 | 51,2 |
| MUX @Turbo | 104,9 | 1.500 | 71 | 116 | 45,4 |
| Manuale +200MHz | 102,3 | 1.550 | 75 | 116 | 51,2 |
| Turbo | 97,8 | 1.500 | 71 | 116 | 45,4 |
| Bilanciato / Performance | 89,3 | 1.270 | 72 | 100 | 42,4 |
| Silenzioso | 59,9 | 1.000 | 69 | 65 | 35,5 |
| Batteria @Silent | 48,4 | 600 | 64 | 55 | 32 |
| Radeon 680M iGPU | 25,6 | 2.200 | 65 | 35 | 25,8 |
| Shadow of the Tomb Raider | |
| 1920x1080 Highest Preset AA:T | |
| Media NVIDIA GeForce RTX 3070 Ti Laptop GPU (119 - 129, n=2) | |
| Asus ROG Flow X16 GV601RW-M5082W | |
| Media della classe Gaming (96 - 116, n=2, ultimi 2 anni) | |
| Apple MacBook Pro 16 2021 M1 Max | |
| Apple MacBook Pro 16 2021 M1 Pro | |
| 2560x1440 Highest Preset AA:T | |
| Asus ROG Flow X16 GV601RW-M5082W | |
| Media NVIDIA GeForce RTX 3070 Ti Laptop GPU (n=1) | |
| Dying Light 2 | |
| 1920x1080 High Quality | |
| Media NVIDIA GeForce RTX 3070 Ti Laptop GPU (66 - 85.5, n=7) | |
| Asus ROG Flow X16 GV601RW-M5082W | |
| MSI Stealth GS66 12UGS | |
| Gigabyte Aero 16 YE5 | |
| 1920x1080 High Quality Raytracing | |
| Asus ROG Flow X16 GV601RW-M5082W | |
| Media NVIDIA GeForce RTX 3070 Ti Laptop GPU (28.7 - 54.9, n=6) | |
| Gigabyte Aero 16 YE5 | |
| MSI Stealth GS66 12UGS | |
| 2560x1440 High Quality | |
| Media NVIDIA GeForce RTX 3070 Ti Laptop GPU (46.7 - 60, n=7) | |
| MSI Stealth GS66 12UGS | |
| Gigabyte Aero 16 YE5 | |
| Asus ROG Flow X16 GV601RW-M5082W | |
| Ghostwire Tokyo | |
| 1920x1080 Highest Settings | |
| Media NVIDIA GeForce RTX 3070 Ti Laptop GPU (115.4 - 145.1, n=4) | |
| Asus ROG Flow X16 GV601RW-M5082W | |
| 2560x1440 Highest Settings | |
| Media NVIDIA GeForce RTX 3070 Ti Laptop GPU (83.9 - 93.1, n=2) | |
| Asus ROG Flow X16 GV601RW-M5082W | |
| 1920x1080 Highest Settings + Maximum Ray Tracing | |
| Asus ROG Flow X16 GV601RW-M5082W | |
| Media NVIDIA GeForce RTX 3070 Ti Laptop GPU (48.9 - 59.9, n=3) | |
| Tiny Tina's Wonderlands | |
| 1920x1080 High Preset (DX12) | |
| Media della classe Gaming (72.1 - 203, n=5, ultimi 2 anni) | |
| Media NVIDIA GeForce RTX 3070 Ti Laptop GPU (115 - 118.3, n=3) | |
| Asus ROG Flow X16 GV601RW-M5082W | |
| 1920x1080 Badass Preset (DX12) | |
| Media della classe Gaming (55 - 159.4, n=5, ultimi 2 anni) | |
| Media NVIDIA GeForce RTX 3070 Ti Laptop GPU (89.8 - 93.7, n=4) | |
| Asus ROG Flow X16 GV601RW-M5082W | |
| 2560x1440 Badass Preset (DX12) | |
| Media della classe Gaming (58.9 - 111.2, n=3, ultimi 2 anni) | |
| Media NVIDIA GeForce RTX 3070 Ti Laptop GPU (59.3 - 63.9, n=3) | |
| Asus ROG Flow X16 GV601RW-M5082W | |
| Borderlands 3 | |
| 1920x1080 High Overall Quality (DX11) | |
| Asus ROG Flow X16 GV601RW-M5082W | |
| Media NVIDIA GeForce RTX 3070 Ti Laptop GPU (n=1) | |
| Apple MacBook Pro 16 2021 M1 Max | |
| Apple MacBook Pro 16 2021 M1 Pro | |
| 1920x1080 Badass Overall Quality (DX11) | |
| Asus ROG Flow X16 GV601RW-M5082W | |
| Media NVIDIA GeForce RTX 3070 Ti Laptop GPU (n=1) | |
| Apple MacBook Pro 16 2021 M1 Max | |
| Apple MacBook Pro 16 2021 M1 Pro | |
| 2560x1440 Badass Overall Quality (DX11) | |
| Asus ROG Flow X16 GV601RW-M5082W | |
| Media NVIDIA GeForce RTX 3070 Ti Laptop GPU (n=1) | |
| Assassin´s Creed Valhalla | |
| 1920x1080 High Preset | |
| Asus ROG Strix Scar 15 G533ZW-LN106WS | |
| Media NVIDIA GeForce RTX 3070 Ti Laptop GPU (85 - 94, n=4) | |
| Asus ROG Flow X16 GV601RW-M5082W | |
| MSI Stealth GS66 12UGS | |
| 1920x1080 Ultra High Preset | |
| Asus ROG Strix Scar 15 G533ZW-LN106WS | |
| Asus ROG Flow X16 GV601RW-M5082W | |
| Media NVIDIA GeForce RTX 3070 Ti Laptop GPU (73 - 80, n=4) | |
| MSI Stealth GS66 12UGS | |
| 2560x1440 Ultra High Preset | |
| Asus ROG Strix Scar 15 G533ZW-LN106WS | |
| Asus ROG Flow X16 GV601RW-M5082W | |
| Media NVIDIA GeForce RTX 3070 Ti Laptop GPU (56 - 62, n=3) | |
| MSI Stealth GS66 12UGS | |
| Metro Exodus | |
| 1920x1080 Ultra Quality AF:16x | |
| Media NVIDIA GeForce RTX 3070 Ti Laptop GPU (71 - 77.2, n=2) | |
| Asus ROG Flow X16 GV601RW-M5082W | |
| 1920x1080 Ultra Quality DXR AF:16x | |
| Media NVIDIA GeForce RTX 3070 Ti Laptop GPU (61.3 - 65.1, n=2) | |
| Asus ROG Flow X16 GV601RW-M5082W | |
| 2560x1440 Ultra Quality AF:16x | |
| Asus ROG Flow X16 GV601RW-M5082W | |
| Media NVIDIA GeForce RTX 3070 Ti Laptop GPU (n=1) | |
| Hunt Showdown | |
| 1920x1080 High Preset | |
| Asus ROG Flow X16 GV601RW-M5082W | |
| Media NVIDIA GeForce RTX 3070 Ti Laptop GPU (116 - 125.9, n=2) | |
| MSI Stealth GS66 12UGS | |
| 2560x1440 High Preset | |
| Asus ROG Flow X16 GV601RW-M5082W | |
| Media NVIDIA GeForce RTX 3070 Ti Laptop GPU (75.1 - 82.5, n=2) | |
| MSI Stealth GS66 12UGS | |
Il nostro test di un'ora su Witcher 3 mostra un frame rate stabile senza cali.
Witcher 3 FPS Chart
| basso | medio | alto | ultra | QHD | |
|---|---|---|---|---|---|
| GTA V (2015) | 179.3 | 156.3 | 94.6 | 83.7 | |
| The Witcher 3 (2015) | 264 | 189 | 97.8 | ||
| Dota 2 Reborn (2015) | 135.4 | 128.9 | 116 | 112.1 | |
| Final Fantasy XV Benchmark (2018) | 170.6 | 123.5 | 94.9 | 75.5 | |
| X-Plane 11.11 (2018) | 97.4 | 87.9 | 70.8 | ||
| Far Cry 5 (2018) | 113 | 109 | 88 | ||
| Strange Brigade (2018) | 304 | 214 | 184 | 167.2 | |
| Shadow of the Tomb Raider (2018) | 124 | 119 | 83 | ||
| Metro Exodus (2019) | 149.2 | 114.3 | 88.3 | 71 | 52.7 |
| Borderlands 3 (2019) | 104.2 | 92.4 | 80.9 | 58.7 | |
| Hunt Showdown (2020) | 125.9 | 82.5 | |||
| Assassin´s Creed Valhalla (2020) | 88 | 79 | 61 | ||
| God of War (2022) | 83.6 | 59.8 | 44.7 | ||
| Dying Light 2 (2022) | 119.6 | 80.7 | 71.1 | 48.7 | |
| Cyberpunk 2077 1.6 (2022) | 108.8 | 89.2 | 75.6 | 43.1 | |
| Ghostwire Tokyo (2022) | 131 | 130.2 | 83.9 | ||
| Tiny Tina's Wonderlands (2022) | 115.2 | 90.7 | 59.3 |
Emissioni - Giocatore silenzioso grazie alla soluzione a tripla ventola di Asus
Rumore del sistema
Quando è inattivo, ci troviamo di fronte a un portatile silenzioso. Le ventole rimangono ferme. Solo sotto carico multi-core si accendono di tanto in tanto, ma anche in questo caso sono contenute, come quando si naviga con più schede.
Sotto carico permanente in modalità Performance , il rumore delle ventole, a seconda dello scenario, si aggira intorno ai 36 db(A) (benchmark CPU @Blender) o 42,4 db(A) nei giochi. In modalità Turbo , il portatile emette in media 45 db(A) in entrambi gli scenari, ma può salire a poco meno di 50 db(A) in caso di carico combinato elevato. Nel test di stress (Prime95 + FurMark) si arriva addirittura a 55 db(A). Almeno le ventole non emettono alcun rumore ad alta frequenza. Non sono stati rilevati nemmeno i fruscii della bobina.
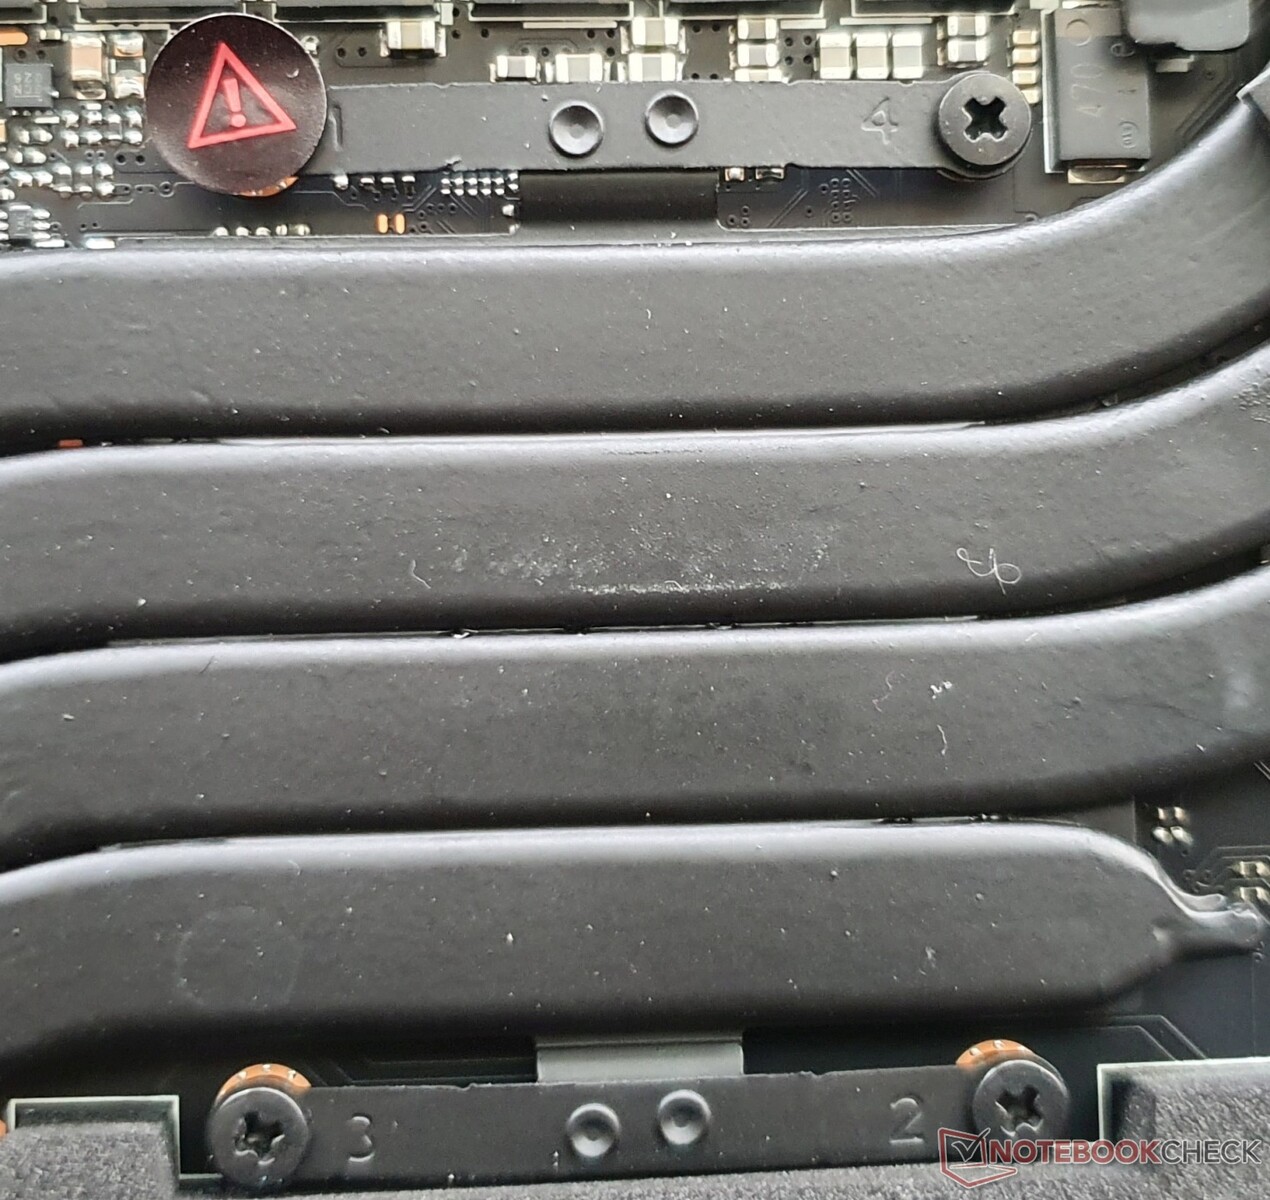
I valori relativamente buoni sono dovuti alla combinazione di diversi fattori: cinque heatpipes, tre ventole, pasta termica in metallo liquido, un'uscita della ventola edge-to-edge sul retro del dispositivo ed elementi in schiuma all'interno che concentrano e dirigono il flusso d'aria. Questo sistema riesce a raffreddare 140 watt (15-40 W per la CPU e 100-125 W per la GPU), un valore molto buono per un convertibile compatto da 16 pollici.
Anche i portatili da gioco puro nel nostro campo di confronto non hanno ventole che rimangono ferme quando sono al minimo e generano volumi simili sotto carico. Il rappresentante di gran lunga più silenzioso è il MacBook Pro 16grazie all'efficiente processore ARM Apple M1.
Rumorosità
| Idle |
| 25.5 / 25.5 / 27.4 dB(A) |
| Sotto carico |
| 49.9 / 55 dB(A) |
 | ||
30 dB silenzioso 40 dB(A) udibile 50 dB(A) rumoroso |
||
min: | ||
| Asus ROG Flow X16 GV601RW-M5082W GeForce RTX 3070 Ti Laptop GPU, R9 6900HS, Micron 3400 1TB MTFDKBA1T0TFH | Asus ROG Zephyrus M16 GU603H GeForce RTX 3070 Laptop GPU, i9-11900H, Samsung PM9A1 MZVL22T0HBLB | Asus ROG Strix Scar 15 G533ZW-LN106WS GeForce RTX 3070 Ti Laptop GPU, i9-12900H, Samsung PM9A1 MZVL22T0HBLB | Gigabyte Aero 16 YE5 GeForce RTX 3080 Ti Laptop GPU, i9-12900HK, Phison ESR01TBMFCT | Lenovo Legion 5 Pro 16 G7 i7 RTX 3070Ti GeForce RTX 3070 Ti Laptop GPU, i7-12700H, Samsung PM9A1 MZVL21T0HCLR | MSI Stealth GS66 12UGS GeForce RTX 3070 Ti Laptop GPU, i7-12700H, WDC PC SN810 1TB | Apple MacBook Pro 16 2021 M1 Pro M1 Pro 16-Core GPU, M1 Pro, Apple SSD AP1024R | Lenovo ThinkPad X1 Extreme G4-20Y50040GE GeForce RTX 3080 Laptop GPU, i9-11950H, Kioxia XG7 KXG7AZNV1T02 | Dell XPS 17 9720 RTX 3060 GeForce RTX 3060 Laptop GPU, i7-12700H, Samsung PM9A1 MZVL21T0HCLR | |
|---|---|---|---|---|---|---|---|---|---|
| Noise | -12% | -27% | -8% | -3% | -9% | 17% | 4% | 9% | |
| off /ambiente * (dB) | 25.5 | 25 2% | 26.86 -5% | 25 2% | 24.6 4% | 24 6% | 24.7 3% | 24.7 3% | 23.8 7% |
| Idle Minimum * (dB) | 25.5 | 25 2% | 39.07 -53% | 30 -18% | 28.4 -11% | 31 -22% | 24.7 3% | 24.7 3% | 24.1 5% |
| Idle Average * (dB) | 25.5 | 31 -22% | 39.07 -53% | 32 -25% | 28.4 -11% | 32 -25% | 24.7 3% | 24.7 3% | 24.1 5% |
| Idle Maximum * (dB) | 27.4 | 42 -53% | 39.07 -43% | 33 -20% | 28.4 -4% | 35 -28% | 24.7 10% | 28.1 -3% | 24.1 12% |
| Load Average * (dB) | 49.9 | 48 4% | 53.34 -7% | 45 10% | 49.4 1% | 48 4% | 26.1 48% | 42.5 15% | 43.2 13% |
| Load Maximum * (dB) | 55 | 56 -2% | 56.6 -3% | 52 5% | 54.7 1% | 48 13% | 37.4 32% | 52.1 5% | 48 13% |
| Witcher 3 ultra * (dB) | 52 | 56.6 | 50 | 49.4 | 43 | 46.4 | 48 |
* ... Meglio usare valori piccoli
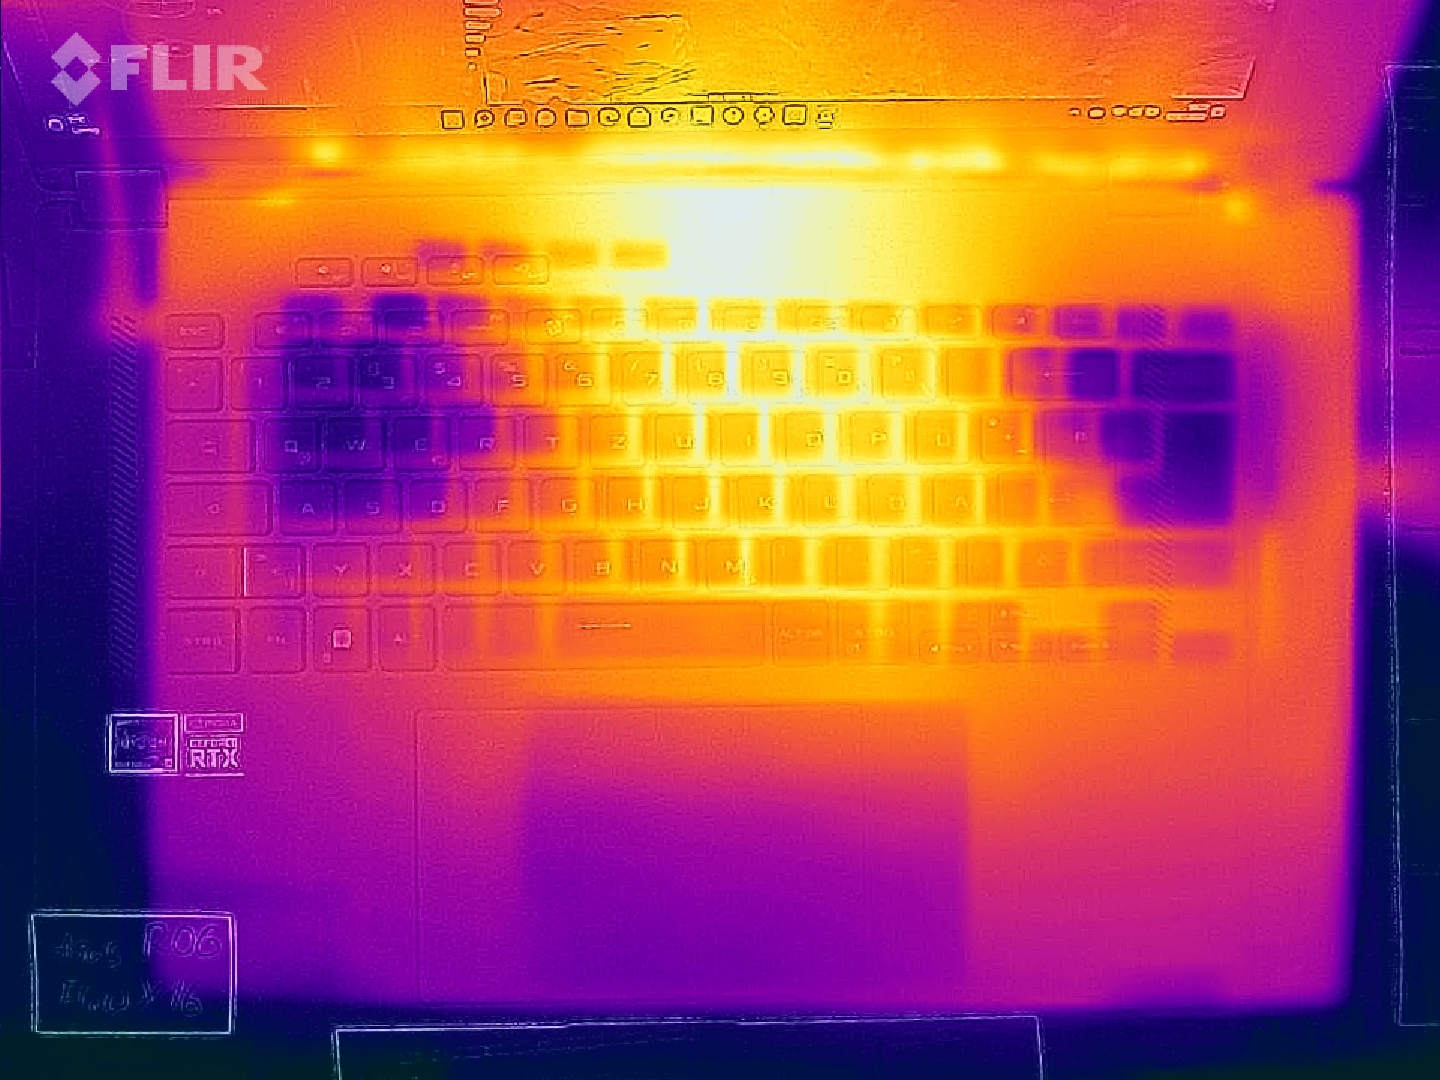
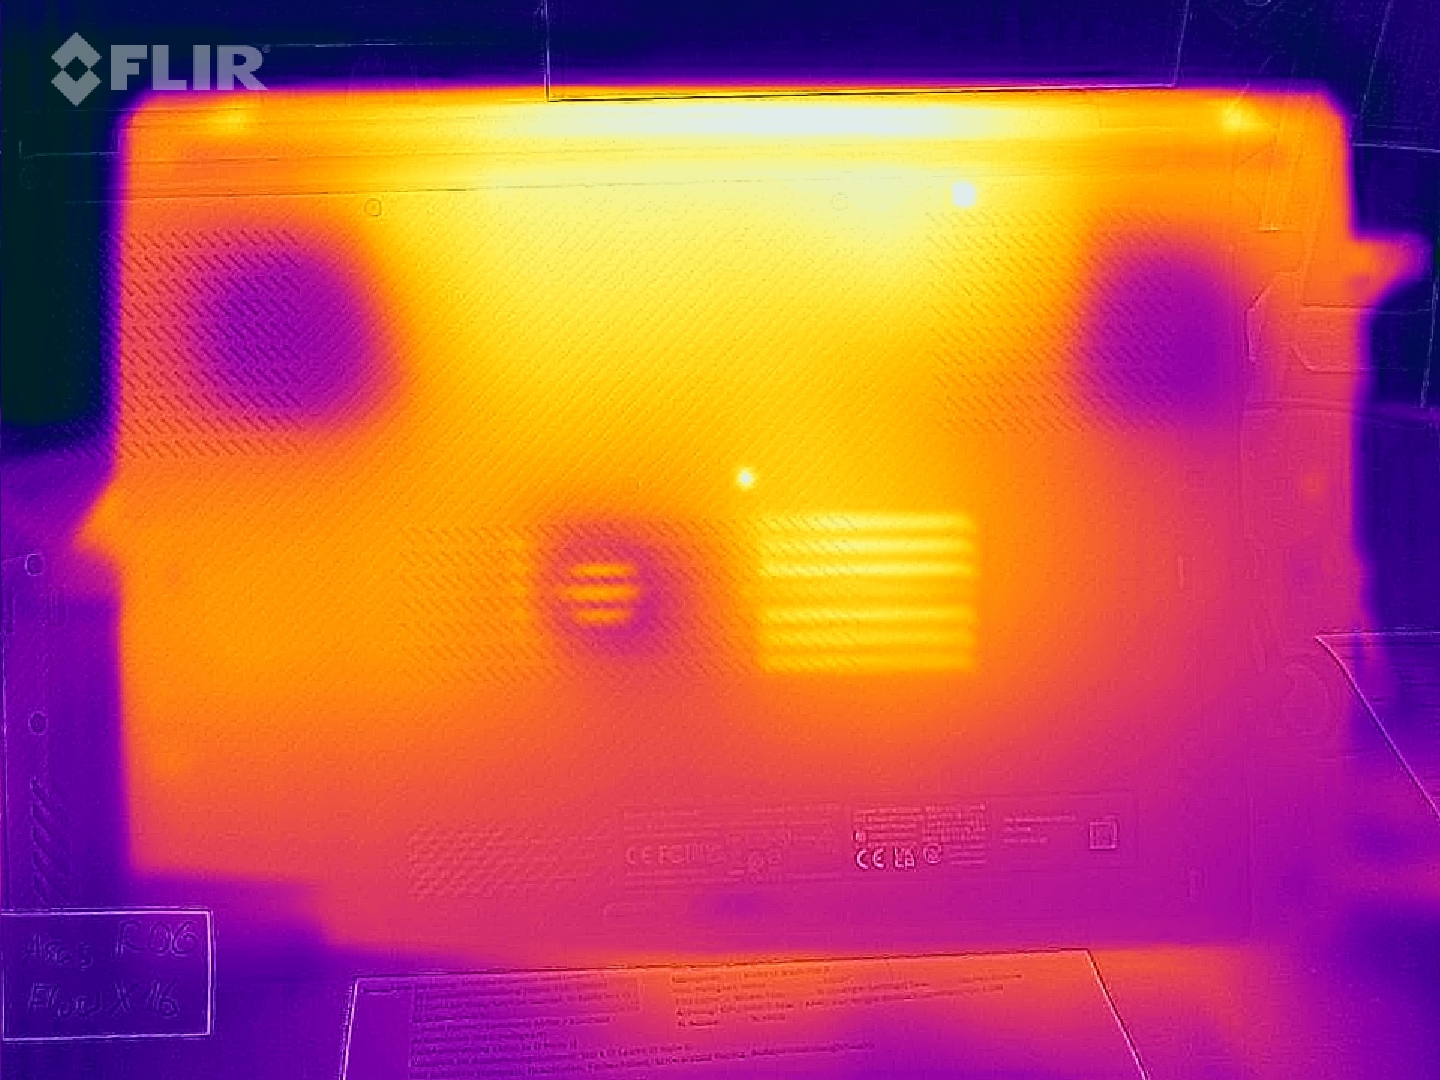
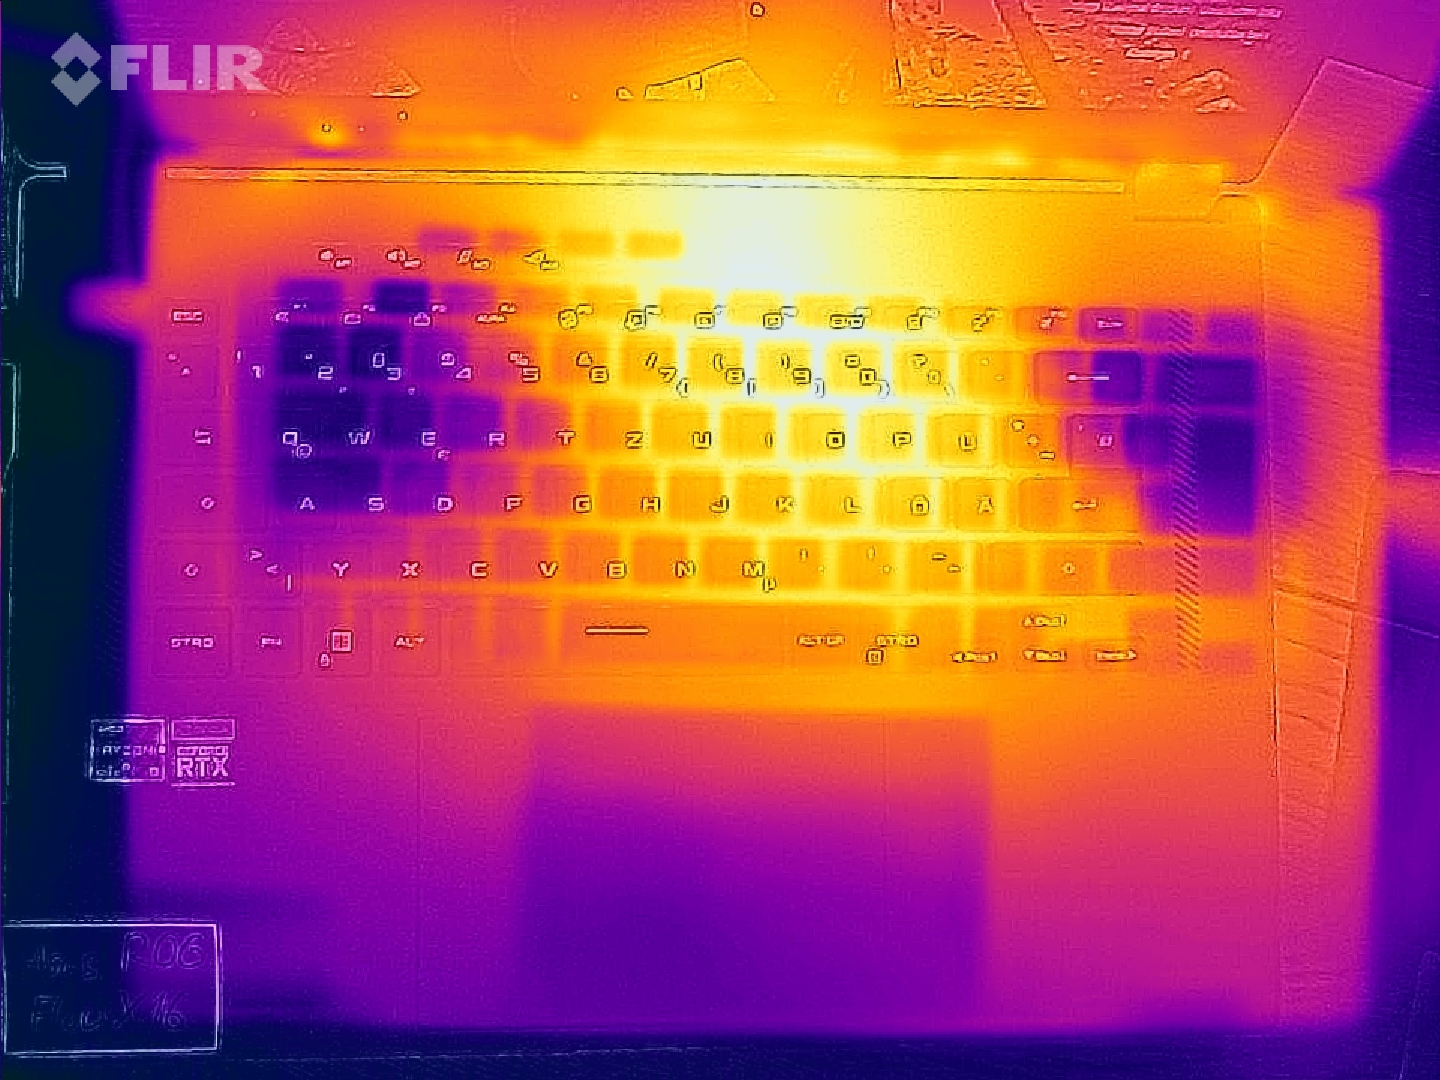
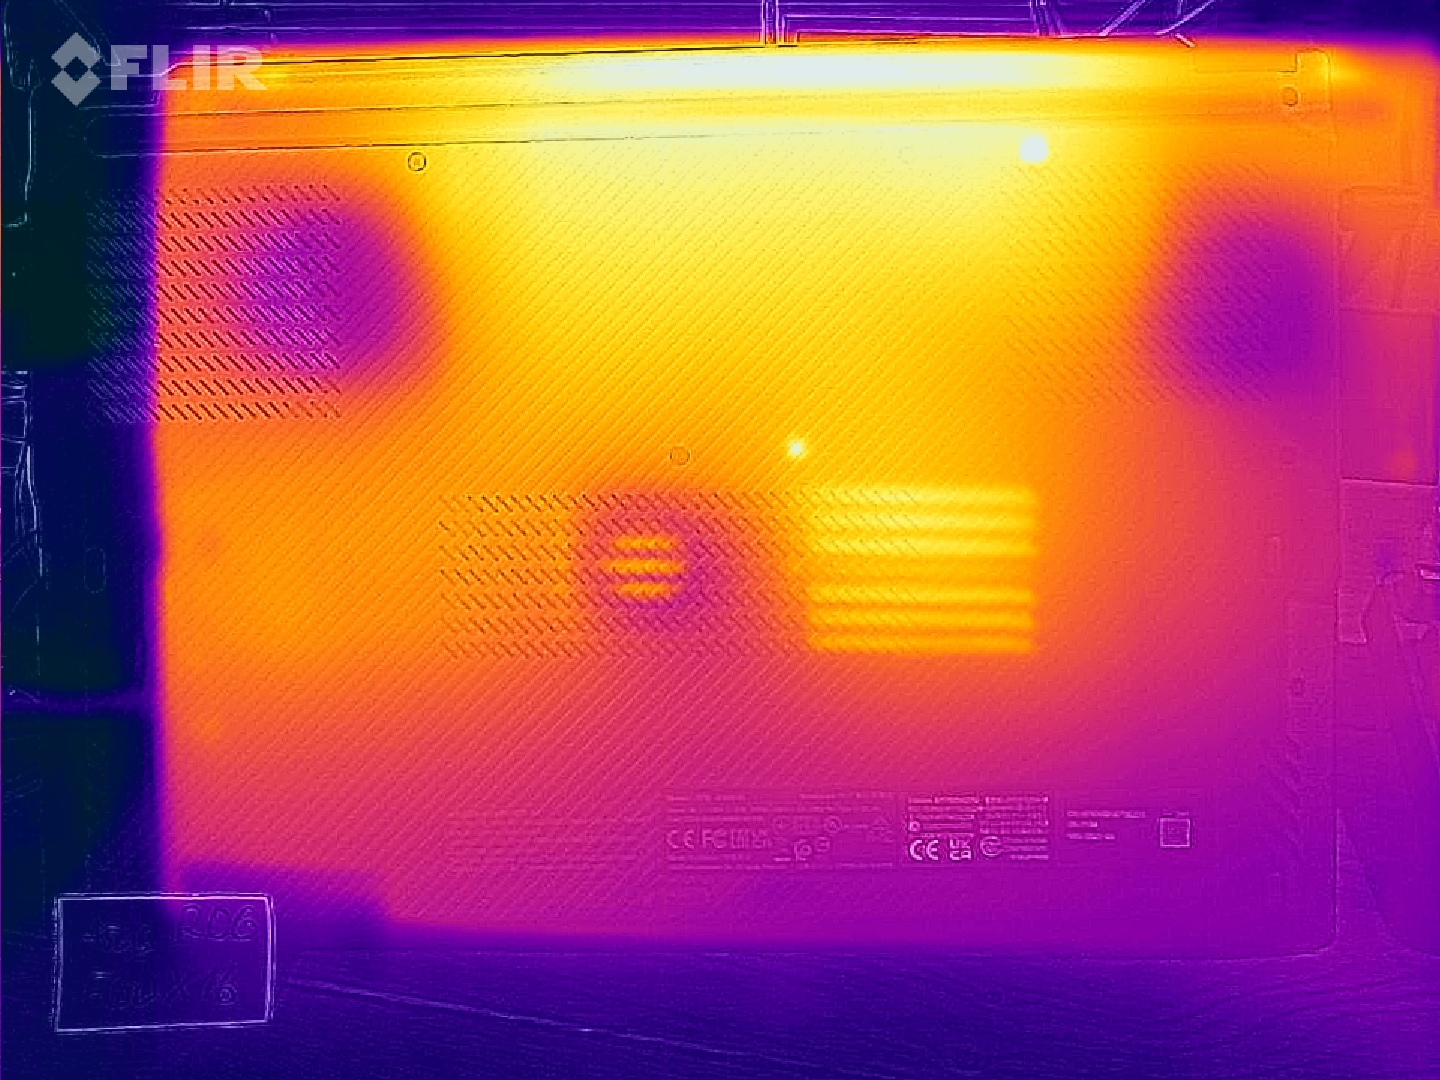
Temperatura
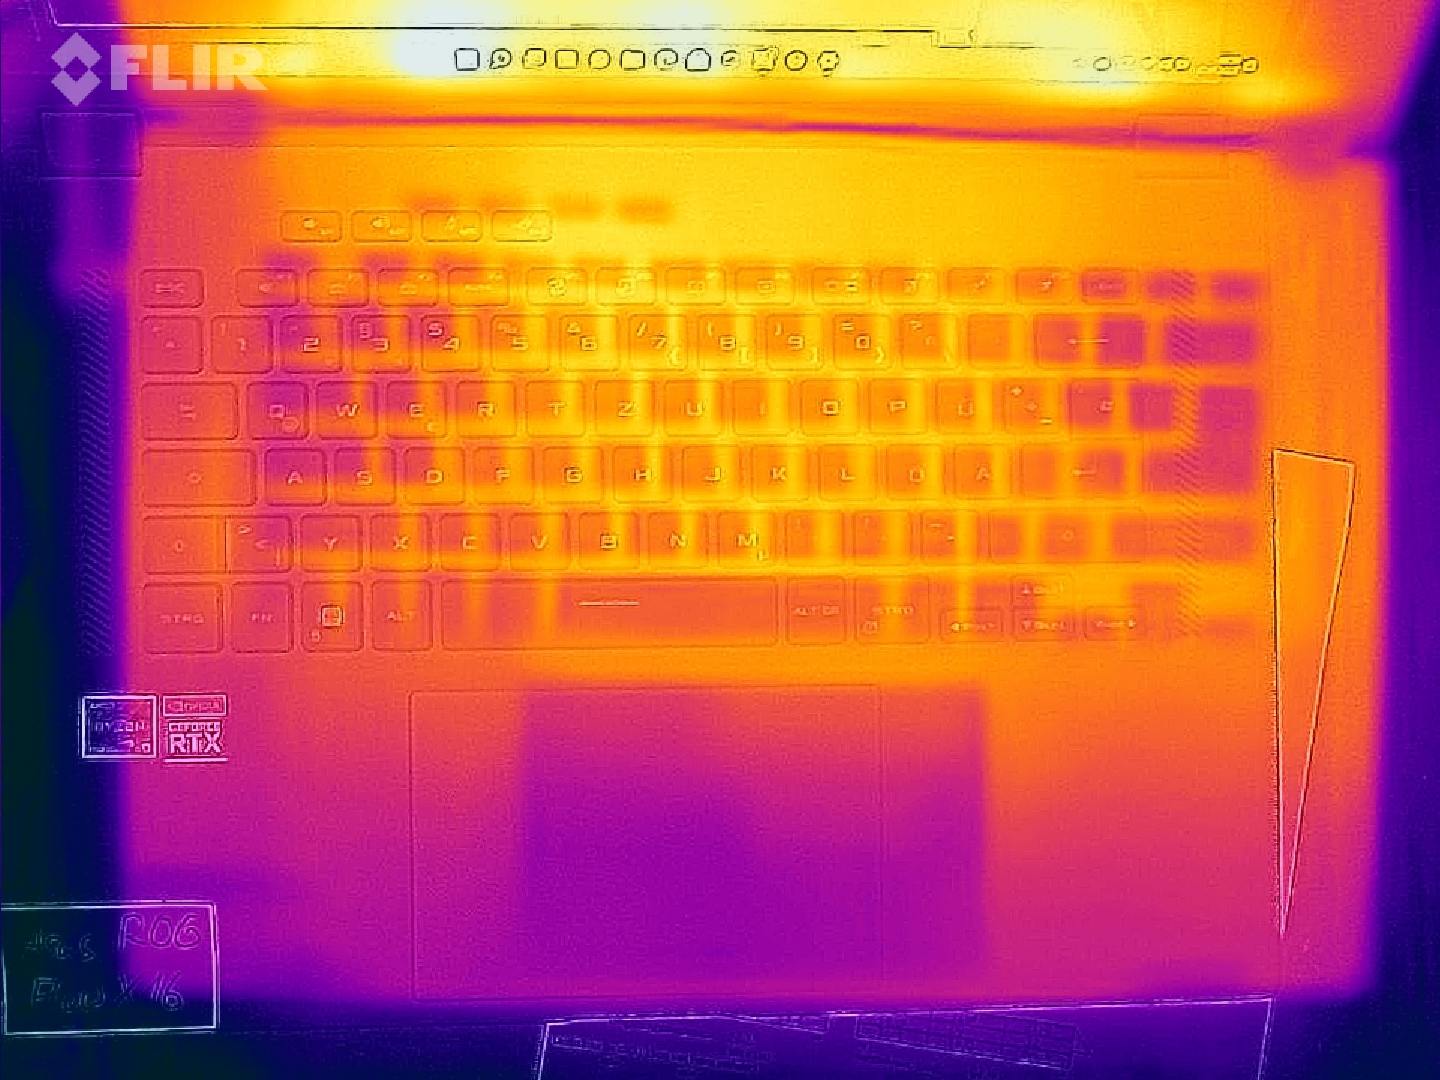
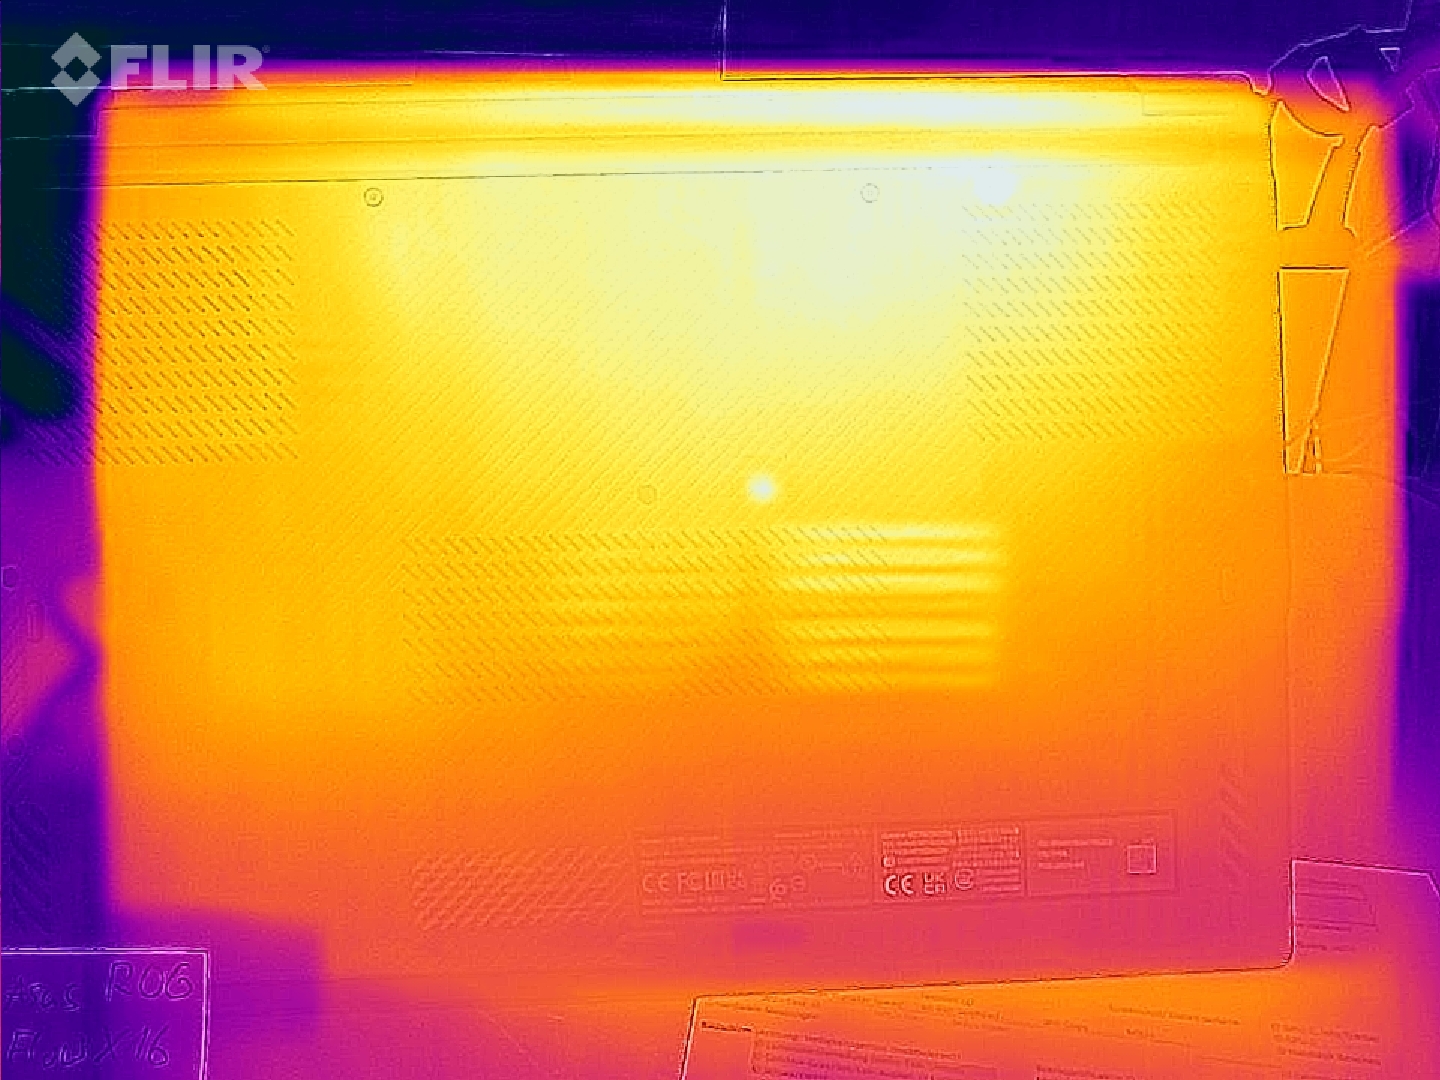
La temperatura della superficie può diventare piuttosto calda al centro, sopra la tastiera. Abbiamo misurato 55 °C al massimo carico e 52,8 °C durante il gioco. Questi punti caldi rimangono sensibilmente più freschi quando il convertibile viene appoggiato sul retro in modo che le ventole sul lato inferiore abbiano un migliore afflusso d'aria. Notebook altrettanto sottili con hardware potente si riscaldano in modo simile sotto carico (Stealth GS66, Aero 16 e ThinkPad X1 Extreme).
Il display può anche riscaldarsi durante lunghi periodi di visualizzazione di contenuti HDR alla massima luminosità (a causa dell'elevato consumo energetico), ma non in misura tale da risultare fastidioso.
(-) La temperatura massima sul lato superiore è di 55.1 °C / 131 F, rispetto alla media di 40.4 °C / 105 F, che varia da 21.2 a 68.8 °C per questa classe Gaming.
(-) Il lato inferiore si riscalda fino ad un massimo di 50.3 °C / 123 F, rispetto alla media di 43.2 °C / 110 F
(±) In idle, la temperatura media del lato superiore è di 32.8 °C / 91 F, rispetto alla media deld ispositivo di 33.9 °C / 93 F.
(-) Riproducendo The Witcher 3, la temperatura media per il lato superiore e' di 40.5 °C / 105 F, rispetto alla media del dispositivo di 33.9 °C / 93 F.
(-) I poggiapolsi e il touchpad possono diventare molto caldi al tatto con un massimo di 40.8 °C / 105.4 F.
(-) La temperatura media della zona del palmo della mano di dispositivi simili e'stata di 28.8 °C / 83.8 F (-12 °C / -21.6 F).
| Asus ROG Flow X16 GV601RW-M5082W AMD Ryzen 9 6900HS, NVIDIA GeForce RTX 3070 Ti Laptop GPU | Asus ROG Strix Scar 15 G533ZW-LN106WS Intel Core i9-12900H, NVIDIA GeForce RTX 3070 Ti Laptop GPU | Gigabyte Aero 16 YE5 Intel Core i9-12900HK, NVIDIA GeForce RTX 3080 Ti Laptop GPU | Lenovo Legion 5 Pro 16 G7 i7 RTX 3070Ti Intel Core i7-12700H, NVIDIA GeForce RTX 3070 Ti Laptop GPU | MSI Stealth GS66 12UGS Intel Core i7-12700H, NVIDIA GeForce RTX 3070 Ti Laptop GPU | Apple MacBook Pro 16 2021 M1 Pro Apple M1 Pro, Apple M1 Pro 16-Core GPU | Lenovo ThinkPad X1 Extreme G4-20Y50040GE Intel Core i9-11950H, NVIDIA GeForce RTX 3080 Laptop GPU | Dell XPS 17 9720 RTX 3060 Intel Core i7-12700H, NVIDIA GeForce RTX 3060 Laptop GPU | Microsoft Surface Laptop Studio i7 RTX 3050 Ti Intel Core i7-11370H, NVIDIA GeForce RTX 3050 Ti Laptop GPU | |
|---|---|---|---|---|---|---|---|---|---|
| Heat | 3% | 5% | 7% | 9% | 29% | 10% | 7% | 29% | |
| Maximum Upper Side * (°C) | 55.1 | 42.6 23% | 49 11% | 45.3 18% | 54 2% | 41 26% | 51.4 7% | 51.8 6% | 42.3 23% |
| Maximum Bottom * (°C) | 50.3 | 50.2 -0% | 55 -9% | 61.2 -22% | 59 -17% | 39 22% | 55.9 -11% | 44.2 12% | 38.2 24% |
| Idle Upper Side * (°C) | 35.5 | 36.2 -2% | 33 7% | 28.6 19% | 26 27% | 24 32% | 27.2 23% | 34.8 2% | 23.4 34% |
| Idle Bottom * (°C) | 36.1 | 40.2 -11% | 33 9% | 31.4 13% | 27 25% | 24 34% | 28.8 20% | 33.2 8% | 23.5 35% |
* ... Meglio usare valori piccoli
Stress test
In condizioni di puro stress della CPU, ilRyzen 9 6900HSsi attesta ancora a 3,9 GHz e la temperatura si mantiene intorno ai 90 °C. In condizioni di stress combinato (Prime95 + FurMark), il clock rimane a 3 GHz, ovvero 300 MHz al di sotto del clock di base. La GPU si alterna tra 800 MHz e 1,4 GHz, mentre la RTX 3070 Ti si attesta a 1,5 GHz nel test di stress Witcher 3. La sua temperatura è ben al di sotto dei 90 °C in ogni scenario.
| Clock della CPU (GHz) | Clock della GPU (MHz) | Temperatura della CPU (°C) | Temperatura della GPU (°C) | Assorbimento della CPU (W) | Assorbimento della GPU (W) | Assorbimento combinato (W) | |
| Sistema inattivo | 0,07 | 0,2 | 43 | 39 | 7,5 | 13 | 20,5 |
| Stress Prime95 | 3,9 | - | 87 | -- | 75 | - | 75 |
| Prime95 + FurMark Stress | 3 | 800 - 1.400 | 87 | 81 | 40 | 100 | 140 |
| FurMark Stress | 0,2 | 1.150 | 75 | 83 | 20 | 120 | 140 |
| Witcher 3 Stress | 0,75 | 1.500 | 70 | 74 | 15 | 125 | 140 |
Altoparlanti
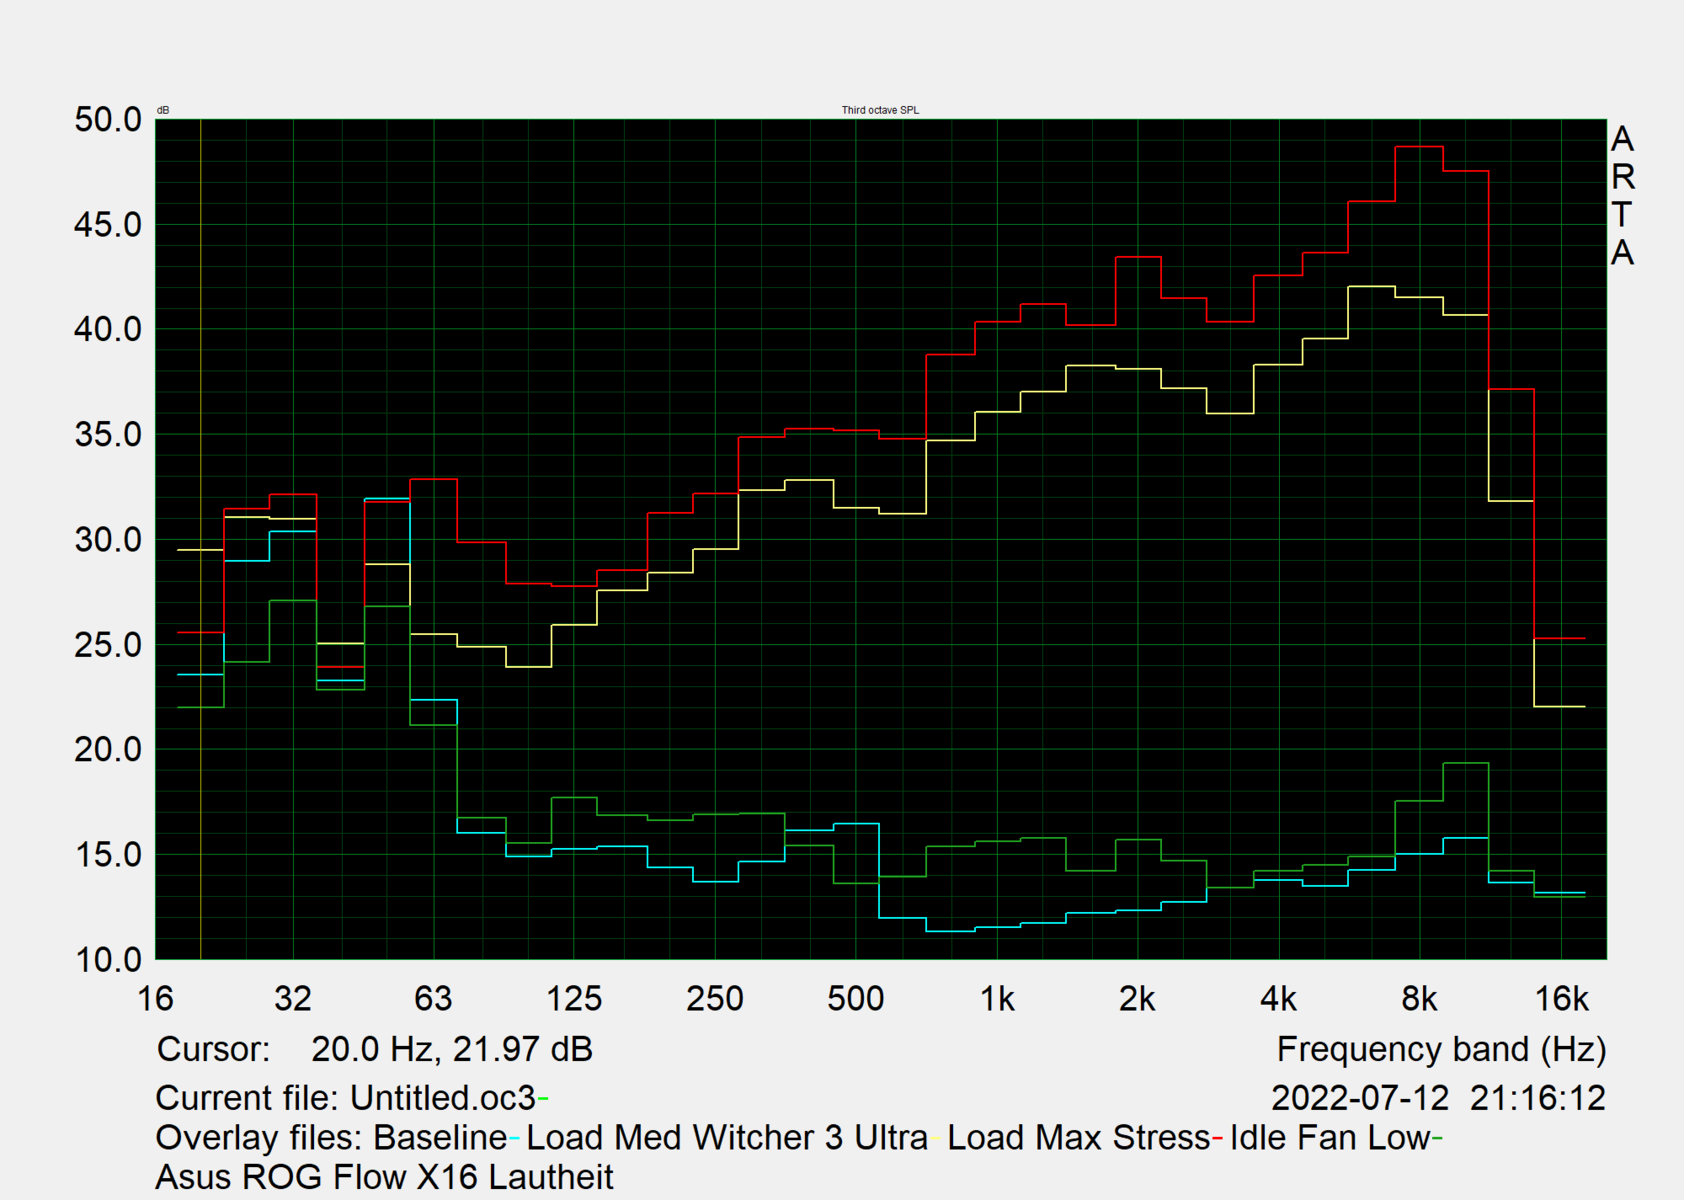
Asus utilizza fondamentalmente lo stesso sistema audio delloZephyrus M16 e del ROG Strix G15, il che significa che ci sono quattro woofer, ma mancano i due tweeter aggiuntivi. Gli altoparlanti producono una pressione sonora massima di 80,7 db(A), che è decente per un portatile, ma non sufficiente per giocare con ventole ad alto volume.
I bassi sono carenti solo in minima parte, i medi sono molto equilibrati e gli alti si discostano un po'. Soggettivamente, non sono molti i portatili che offrono una qualità audio migliore; secondo il nostro database, solo il 6% di tutti i dispositivi recensiti riesce a fare meglio.
Asus ROG Flow X16 GV601RW-M5082W analisi audio
(±) | potenza degli altiparlanti media ma buona (80.7 dB)
Bassi 100 - 315 Hz
(±) | bassi ridotti - in media 12.7% inferiori alla media
(±) | la linearità dei bassi è media (13.8% delta rispetto alla precedente frequenza)
Medi 400 - 2000 Hz
(+) | medi bilanciati - solo only 1.3% rispetto alla media
(+) | medi lineari (4.7% delta rispetto alla precedente frequenza)
Alti 2 - 16 kHz
(±) | alti elevati - circa 6.4% superiori alla media
(+) | alti lineari (6.8% delta rispetto alla precedente frequenza)
Nel complesso 100 - 16.000 Hz
(+) | suono nel complesso lineare (12.9% differenza dalla media)
Rispetto alla stessa classe
» 17% di tutti i dispositivi testati in questa classe è stato migliore, 4% simile, 79% peggiore
» Il migliore ha avuto un delta di 6%, medio di 18%, peggiore di 132%
Rispetto a tutti i dispositivi testati
» 12% di tutti i dispositivi testati in questa classe è stato migliore, 3% similare, 85% peggiore
» Il migliore ha avuto un delta di 4%, medio di 24%, peggiore di 134%
Apple MacBook Pro 16 2021 M1 Pro analisi audio
(+) | gli altoparlanti sono relativamente potenti (84.7 dB)
Bassi 100 - 315 Hz
(+) | bassi buoni - solo 3.8% dalla media
(+) | bassi in lineaa (5.2% delta rispetto alla precedente frequenza)
Medi 400 - 2000 Hz
(+) | medi bilanciati - solo only 1.3% rispetto alla media
(+) | medi lineari (2.1% delta rispetto alla precedente frequenza)
Alti 2 - 16 kHz
(+) | Alti bilanciati - appena 1.9% dalla media
(+) | alti lineari (2.7% delta rispetto alla precedente frequenza)
Nel complesso 100 - 16.000 Hz
(+) | suono nel complesso lineare (4.6% differenza dalla media)
Rispetto alla stessa classe
» 0% di tutti i dispositivi testati in questa classe è stato migliore, 0% simile, 100% peggiore
» Il migliore ha avuto un delta di 5%, medio di 17%, peggiore di 45%
Rispetto a tutti i dispositivi testati
» 0% di tutti i dispositivi testati in questa classe è stato migliore, 0% similare, 100% peggiore
» Il migliore ha avuto un delta di 4%, medio di 24%, peggiore di 134%
Gestione dell'energia - Valori di inattività insolitamente elevati
Consumo di energia
Durante il funzionamento al minimo, sono necessari 12,2 watt in modalità Silent + GPU Energy Saving. In modalità Quiet + GPU Balanced , il sistema richiede ben 25,5 watt e poco meno di 30 watt in modalità Turbo . Si tratta di valori insolitamente elevati, anche per un portatile da gioco, che potrebbero essere in parte dovuti al display mini-LED.
Scar 15, Legion 5 Pro e MSI Stealth GS66 richiedono tutti un consumo energetico significativamente inferiore quando sono al minimo. I laptop OLED, invece, condividono gli elevati valori di idle del ROG Flow X16.
Poiché la CPU e la GPU insieme richiedono circa 140 watt in
Witcher 3
, rimangono 43 watt per il resto del sistema. Il test di stress massimo richiede inizialmente 253 watt dall'alimentatore da 240 watt. Tuttavia, il valore scende bruscamente dopo pochi secondi e si assesta su un valore accettabile di 217 watt dopo un minuto.| Off / Standby | |
| Idle | |
| Sotto carico |
|
Leggenda:
min: | |
| Asus ROG Flow X16 GV601RW-M5082W R9 6900HS, GeForce RTX 3070 Ti Laptop GPU, Micron 3400 1TB MTFDKBA1T0TFH, Mini LED, 2560x1600, 16.1" | Asus ROG Zephyrus M16 GU603H i9-11900H, GeForce RTX 3070 Laptop GPU, Samsung PM9A1 MZVL22T0HBLB, IPS, 2560x1600, 16" | Asus ROG Strix Scar 15 G533ZW-LN106WS i9-12900H, GeForce RTX 3070 Ti Laptop GPU, Samsung PM9A1 MZVL22T0HBLB, IPS-level, 2560x1440, 15.6" | Gigabyte Aero 16 YE5 i9-12900HK, GeForce RTX 3080 Ti Laptop GPU, Phison ESR01TBMFCT, AMOLED, 3840x2400, 16" | Lenovo Legion 5 Pro 16 G7 i7 RTX 3070Ti i7-12700H, GeForce RTX 3070 Ti Laptop GPU, Samsung PM9A1 MZVL21T0HCLR, IPS, 2560x1600, 16" | MSI Stealth GS66 12UGS i7-12700H, GeForce RTX 3070 Ti Laptop GPU, WDC PC SN810 1TB, IPS-Level, 2560x1440, 15.6" | Apple MacBook Pro 16 2021 M1 Pro M1 Pro, M1 Pro 16-Core GPU, Apple SSD AP1024R, Mini-LED, 3456x2234, 16.2" | Lenovo ThinkPad X1 Extreme G4-20Y50040GE i9-11950H, GeForce RTX 3080 Laptop GPU, Kioxia XG7 KXG7AZNV1T02, IPS, 3840x2400, 16" | Dell XPS 17 9720 RTX 3060 i7-12700H, GeForce RTX 3060 Laptop GPU, Samsung PM9A1 MZVL21T0HCLR, IPS, 3840x2400, 17" | Media NVIDIA GeForce RTX 3070 Ti Laptop GPU | Media della classe Gaming | |
|---|---|---|---|---|---|---|---|---|---|---|---|
| Power Consumption | 18% | 24% | -19% | 17% | 23% | 56% | 27% | 37% | 10% | 15% | |
| Idle Minimum * (Watt) | 12.2 | 11 10% | 7.56 38% | 26 -113% | 8.6 30% | 11 10% | 5 59% | 12.3 -1% | 5.9 52% | 14.2 ? -16% | 13.2 ? -8% |
| Idle Average * (Watt) | 25.5 | 20 22% | 13.5 47% | 30 -18% | 17.6 31% | 16 37% | 15.1 41% | 22.8 11% | 15.8 38% | 19.9 ? 22% | 18.9 ? 26% |
| Idle Maximum * (Watt) | 29.8 | 30 -1% | 16.87 43% | 37 -24% | 18.5 38% | 23 23% | 15.5 48% | 13.9 53% | 26.7 10% | 26.2 ? 12% | 24.3 ? 18% |
| Load Average * (Watt) | 183 | 111 39% | 128.9 30% | 127 31% | 110 40% | 110 40% | 54 70% | 95.4 48% | 117.4 36% | 125.8 ? 31% | 108.3 ? 41% |
| Witcher 3 ultra * (Watt) | 183.6 | 156 15% | 196.2 -7% | 176 4% | 227 -24% | 151 18% | 154 16% | 114.8 37% | |||
| Load Maximum * (Watt) | 253 | 197 22% | 274.86 -9% | 236 7% | 294.6 -16% | 230 9% | 90 64% | 170.7 33% | 136.6 46% | 248 ? 2% | 254 ? -0% |
* ... Meglio usare valori piccoli
Power consumption Witcher 3 / Stress test
Power consumption with an external monitor
Durata della batteria
Abbiamo misurato i tempi di esecuzione della batteria WLAN con HDR disattivato e in modalità Balanced di Armoury Crate e in modalità GPU Energy Saving (dGPU disattivata). La frequenza dei fotogrammi è impostata automaticamente a 60 Hz in modalità batteria (questa funzione può essere disattivata), mentre la luminosità era di 173 nits durante il test. In seguito abbiamo eseguito uno script standardizzato che richiama le pagine web a intervalli diversi, le scorre se necessario, clicca sui link, guarda le immagini e le animazioni e tutto ciò che le persone fanno sui siti web.
Il risultato è mediocre: sarebbe interessante un confronto con un modello identico senza display mini-LED. Poco più di 5:39 ore è il nostro risultato (1 ora in meno a 165 Hz). Alla massima luminosità SDR di 500 nit, perdiamo quasi altre 2 ore (3:45 h), mentre il gioco a batteria termina dopo circa 50 minuti.
Il modello più o meno identicoZephyrus M16con le stesse dimensioni della batteria e un processore Intel più affamato, riesce a superare le 7 ore e mezza. Tuttavia, ci sono molti portatili da gioco tra i concorrenti che non durano 6 ore nel test WLAN, il che non è insolito per questa classe di portatili. Gli aggiornamenti del firmware e del BIOS potrebbero migliorare la durata della batteria del Flow X16. Una ricarica completa della batteria da 90 Wh richiede un'ora e mezza.
Apple's MacBook Pro 16 si distingue con quasi 17 ore di autonomia, un risultato ancora più impressionante se si considera che è dotato anche di un display mini-LED.
| Asus ROG Flow X16 GV601RW-M5082W R9 6900HS, GeForce RTX 3070 Ti Laptop GPU, 90 Wh | Asus ROG Zephyrus M16 GU603H i9-11900H, GeForce RTX 3070 Laptop GPU, 90 Wh | Asus ROG Strix Scar 15 G533ZW-LN106WS i9-12900H, GeForce RTX 3070 Ti Laptop GPU, 90 Wh | Gigabyte Aero 16 YE5 i9-12900HK, GeForce RTX 3080 Ti Laptop GPU, 99 Wh | Lenovo Legion 5 Pro 16 G7 i7 RTX 3070Ti i7-12700H, GeForce RTX 3070 Ti Laptop GPU, 80 Wh | MSI Stealth GS66 12UGS i7-12700H, GeForce RTX 3070 Ti Laptop GPU, 99.9 Wh | Apple MacBook Pro 16 2021 M1 Pro M1 Pro, M1 Pro 16-Core GPU, 99.6 Wh | Lenovo ThinkPad X1 Extreme G4-20Y50040GE i9-11950H, GeForce RTX 3080 Laptop GPU, 90 Wh | Dell XPS 17 9720 RTX 3060 i7-12700H, GeForce RTX 3060 Laptop GPU, 97 Wh | Asus ROG Flow X13 GV301QH R9 5980HS, GeForce GTX 1650 Max-Q, 62 Wh | Media della classe Gaming | |
|---|---|---|---|---|---|---|---|---|---|---|---|
| Autonomia della batteria | 57% | 27% | 45% | -19% | 37% | 196% | 21% | 32% | 51% | 44% | |
| WiFi v1.3 (h) | 5.7 | 7.7 35% | 8.4 47% | 6.4 12% | 5.4 -5% | 5.4 -5% | 16.9 196% | 6.8 19% | 8.7 53% | 5.8 2% | 7.04 ? 24% |
| Witcher 3 ultra (h) | 0.9 | 1.2 33% | |||||||||
| Load (h) | 0.9 | 1.6 78% | 0.9 0% | 1.6 78% | 0.6 -33% | 1.6 78% | 1.1 22% | 1 11% | 1.8 100% | 1.47 ? 63% | |
| Reader / Idle (h) | 13.3 | 8.9 | 7.8 | 10.4 | 8.71 ? | ||||||
| H.264 (h) | 8.5 | 7.5 | 6.3 | 17.5 | 6.9 | 6.9 | 8.26 ? |
Pro
Contro
Verdetto - Asus ROG Flow X16: convertibile da gioco di successo
Asus è riuscita a creare un vero e proprio ibrido tra portatile da gioco e convertibile multimediale con il ROG Flow X16. Le temperature e i livelli di rumore rimangono entro i limiti nonostante il design compatto, grazie a uno speciale design di raffreddamento. Questo permette anche l'utilizzo di una GeForce RTX 3070 Ti con 125 W di TGP, mentre molti portatili multimediali di classe superiore, come il Dell XPS 17 o il Gigabyte Aero 16devono accontentarsi di 80-105 watt.
Di conseguenza, le prestazioni del Flow X16 sono buone, aiutate dallo switch MUX esistente. Il frugale Ryzen 9 6900HS di AMD Ryzen 9 6900HS di AMD fornisce anche una potenza sufficiente, che rimane altamente accessibile anche in modalità batteria, a differenza di molte controparti Intel.
Un altro fattore essenziale per i giochi e le attività creative è il display, e Asus non avrebbe potuto fare di meglio in questo caso, dato che gli schermi mini-LED sono tra i migliori del loro genere e sono superiori ai display OLED ad alto contrasto in termini di luminosità, anche se non possono essere sfruttati appieno con l'alimentazione a batteria. Tuttavia, il DisplayHDR 1000 rende i contenuti corrispondenti (ad esempio nei giochi) incredibilmente belli da vedere e migliora anche il contrasto e i valori del nero in modalità desktop (sono attivate 512 zone di local dimming). La copertura quasi al 100% dello spazio colore DCI-P3 di un pannello QHD ben calibrato in stato di consegna è un vantaggio garantito per l'editing professionale delle immagini, mentre il leggero effetto blooming è solo leggermente fastidioso.
Le cerniere a 360° sono vantaggiose anche per situazioni come il gioco in modalità tenda con un controller o quando si è in movimento, a patto che non si intenda farlo per più di qualche ora alla volta. A ciò si aggiungono i buoni altoparlanti e la possibilità di passare a 64 GB di RAM DDR5 e di installare un secondo SSD. La lavorazione è di alto livello e i dispositivi di input sono buoni, anche se alcuni avrebbero preferito che la tastiera silenziosa con una corsa generosa di 1,7 mm fosse più nitida, mentre altri avrebbero preferito che l'illuminazione RGB fosse programmabile individualmente.
Il ROG Flow X16 convince come unico 2-in-1 per videogiocatori grazie alle sue elevate prestazioni, al sistema di raffreddamento ben studiato e al luminoso display mini-LED, non solo nei giochi, ma in tutte le attività multimediali. La durata della batteria è il nostro principale punto critico.
Manca l'USB 4, ma la porta xGM di Asus fa sperare in una eGPU più potente in futuro. Avremmo voluto una porta LAN, un lettore di impronte digitali, un lettore di schede SD full-size e una webcam a 1080p. Bisogna anche convivere con un elevato consumo energetico quando è al minimo, che può essere ridotto con i profili di risparmio energetico di Asus. L'autonomia della batteria non è buona, ma normale per la classe del dispositivo e potrebbe essere migliorata con aggiornamenti futuri.
In definitiva, solo due aspetti ostacolano la decisione: Il prezzo di poco meno di 3.000 dollari (o 2.000 dollari nella configurazione base senza Mini LED e con una RTX 3050 Ti) e la questione di ciò che serve davvero: Un giocatore classico con il massimo TGP, i migliori tempi di risposta e i più alti FPS possibili? Allora fareste meglio a scegliere il modello MSI Raider GE77 HX. Il potente Legion 5 Proè anche notevolmente più economico, a circa 1.900 dollari, ma è meno compatto e fatica a gestire le emissioni più elevate rispetto al ROG Flow X16.
Detto questo, le prestazioni della GPU del Flow X16 non sono disponibili in nessun altro notebook con queste dimensioni compatte, per non parlare della funzionalità 2-in-1. Per coloro che possono fare a meno di Windows e quindi della maggior parte dei giochi, il MacBook Pro 16 con il suo SoC M1 offre numerosi vantaggi, come un'autonomia molto lunga, un funzionamento per lo più silenzioso e un ottimo display mini-LED.
Prezzo e disponibilità
Il nostro esemplare in prova (GV601RW-M5082W) con Ryzen 9 6900HS, 32 GB di RAM, 1 TB di SSD, RTX 3070 Ti e display mini-LED è un modello di pre-release destinato al mercato di lingua tedesca, dove non è ancora disponibile.
In alcuni Paesi sono già disponibili altri modelli in diverse configurazioni. Ad esempio, una configurazione quasi identica (con 16 GB di RAM invece di 32) è disponibile sul sito USA per 2.699,99 dollari. Una configurazione del tutto identica è disponibile sul sito UK tramite Amazonma al momento non è disponibile. L'India elenca due modelli con configurazioni diverse a prezzi diversi. L'Australia, da parte sua, offre una configurazione identica a 4.099,00 dollari australiani. I prezzi e la disponibilità al momento della scrittura (04.08.2022) sono soggetti a modifiche
Gli esempi citati non sono esaustivi: Si consiglia agli utenti di verificare (se del caso) direttamente sul sito Republic of Gamers di Asus. È sufficiente cercare ROG Flow X 16 alla voce Prodotti -> Computer portatili, quindi cliccare su Dove acquistare.
Asus ROG Flow X16 GV601RW-M5082W
- 08/03/2022 v7 (old)
Marvin Gollor
Price comparison

