Recensione del laptop Dell XPS 17 9720 RTX 3060: processore più veloce del 50% rispetto al passato
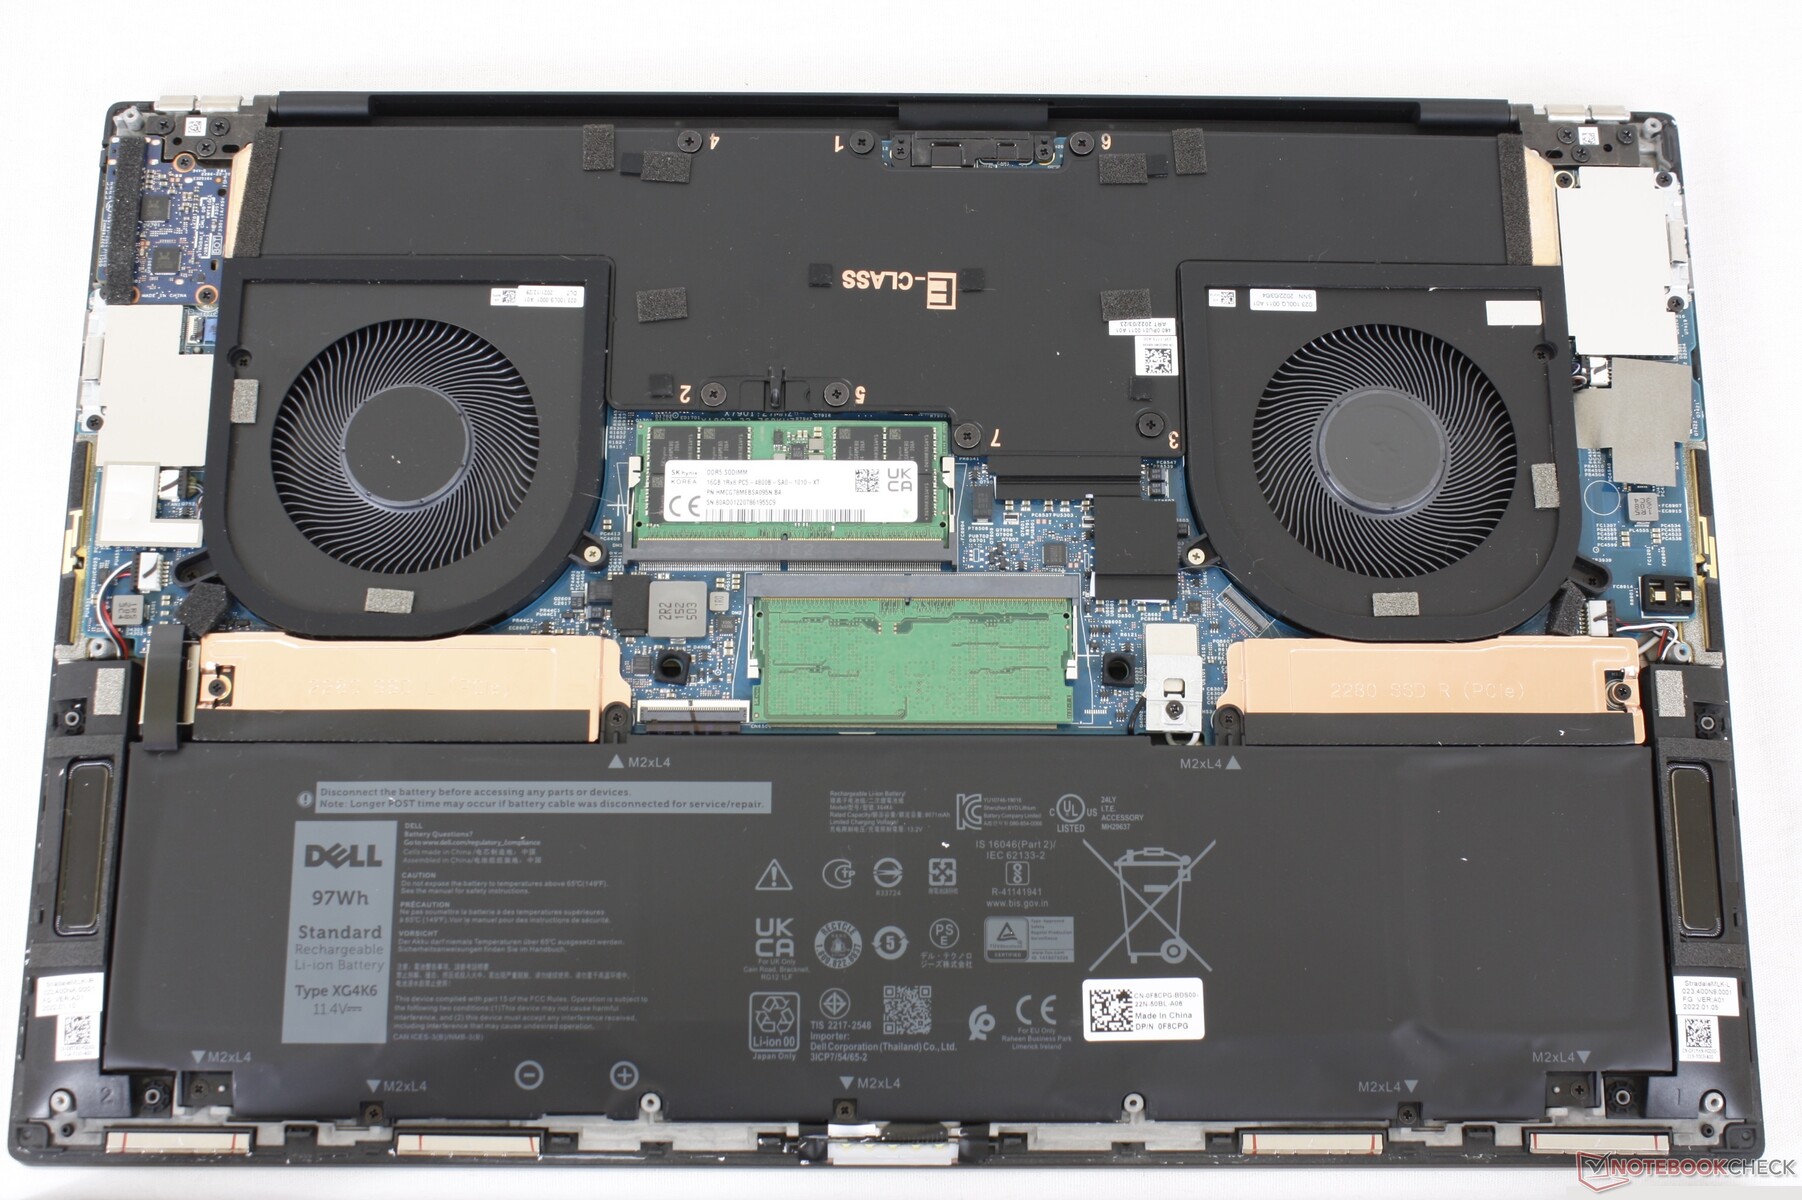
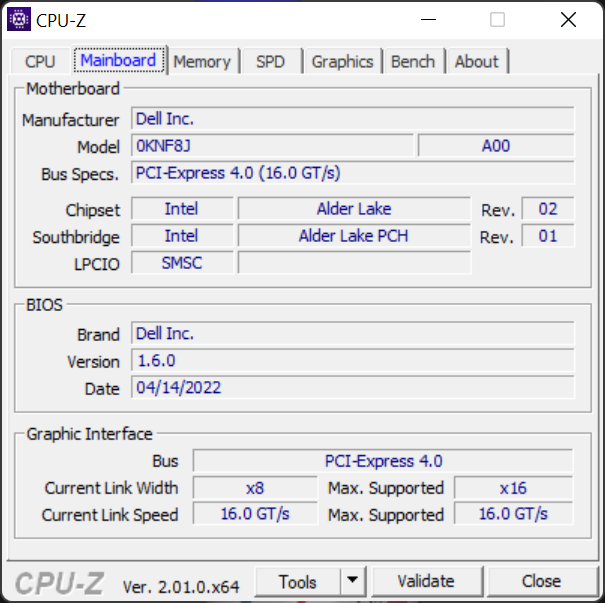
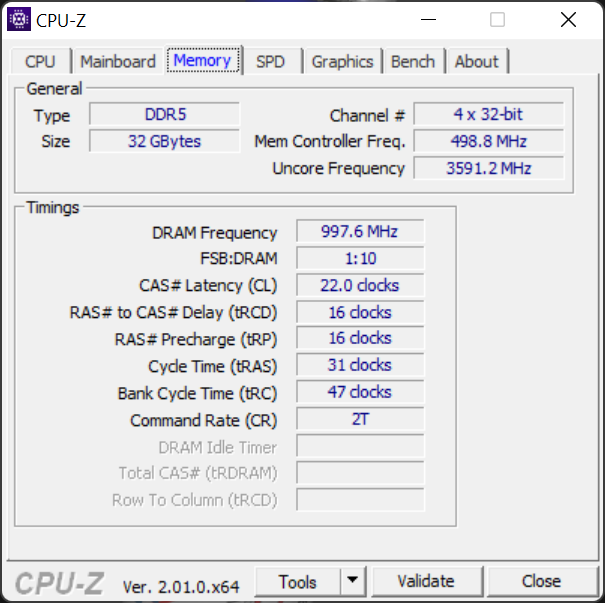
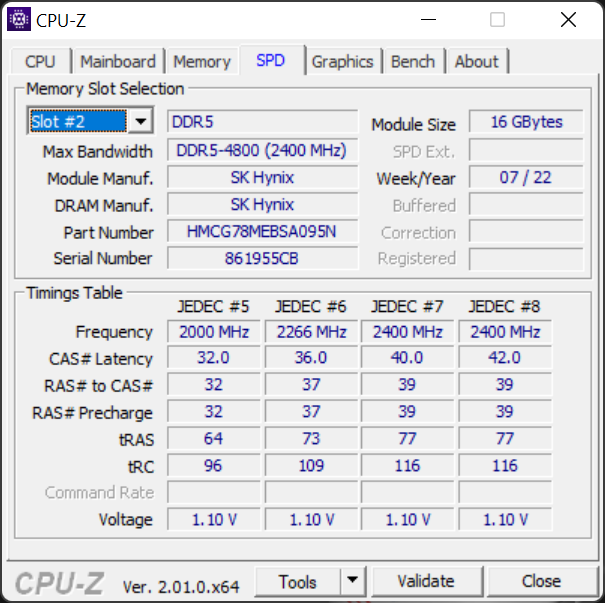
Il Dell XPS 17 9720 è la terza iterazione della serie XPS 17 da 17,0 pollici, iniziata con l'XPS 17 9700 del 2020. Mentre le versioni XPS 17 9700 e 2021 9710 erano dotate rispettivamente di CPU Intel di 10a e 11a generazione, il modello 2022 9720 ha aggiunto CPU di 12a generazione e opzioni di RAM DDR5. Altre caratteristiche fondamentali, come lo chassis e le opzioni per le GPU, sono per il resto identiche a quelle dell'XPS 17 9700 o 9710, per cui vi consigliamo di consultare le nostre recensioni sulla serie per saperne di più sulle caratteristiche fisiche del modello
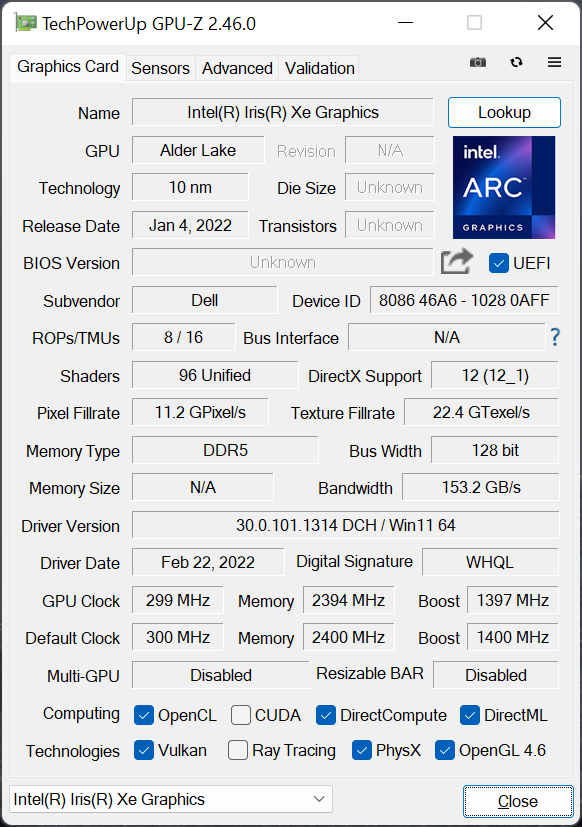
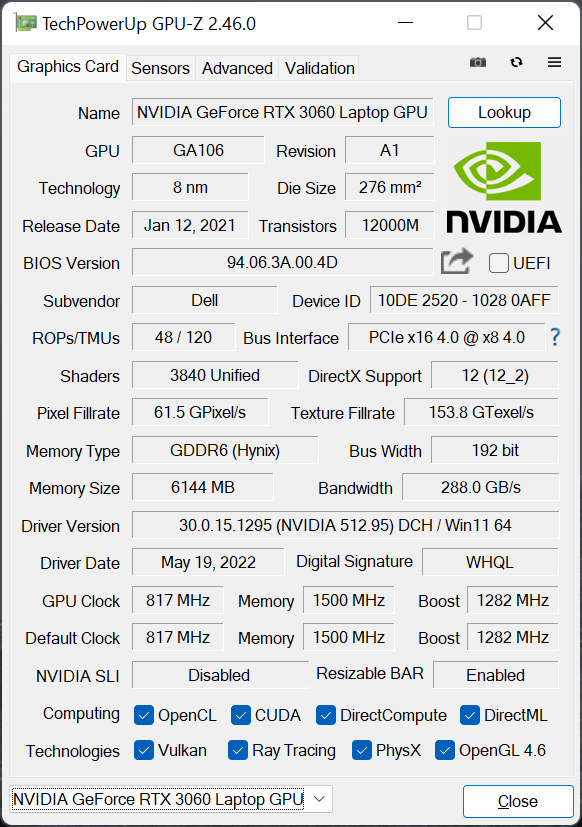
La nostra unità in prova è una configurazione di fascia medio-alta con CPU Core i7-12700H, schermo touchscreen IPS UHD+ (3840 x 2400) e GPU RTX 3060 di GeForce al prezzo di circa 3000 dollari. Sono disponibili anche altre SKU con i5-12500H, i9-12900HK, GeForce RTX 3050 Ti, display a 1200p o solo grafica integrata
I concorrenti dell'XPS 17 9720 includono computer portatili multimediali o prosumer da 17,3 pollici come il modello Gigabyte Aero 17, Razer Blade 17, HP Envy 17, o Lenovo Legion 5 17
Altre recensioni Dell
Potenziali concorrenti a confronto
Punteggio | Data | Modello | Peso | Altezza | Dimensione | Risoluzione | Prezzo |
|---|---|---|---|---|---|---|---|
| 88.8 % v7 (old) | 06/2022 | Dell XPS 17 9720 RTX 3060 i7-12700H, GeForce RTX 3060 Laptop GPU | 2.5 kg | 19.5 mm | 17.00" | 3840x2400 | |
| 82.4 % v7 (old) | 08/2021 | HP Envy 17-cg i5-1135G7, GeForce MX450 | 2.7 kg | 19.3 mm | 17.30" | 1920x1080 | |
| 87.9 % v7 (old) | 07/2021 | Dell XPS 17 9710 Core i7 RTX 3060 i7-11800H, GeForce RTX 3060 Laptop GPU | 2.5 kg | 19.5 mm | 17.00" | 3840x2400 | |
| 87.9 % v7 (old) | 07/2020 | Dell XPS 17 9700 Core i7 RTX 2060 Max-Q i7-10875H, GeForce RTX 2060 Max-Q | 2.5 kg | 19.5 mm | 17.00" | 3840x2400 | |
| 85.2 % v7 (old) | 02/2022 | Lenovo Legion 5 17ACH6H-82JY0003GE R5 5600H, GeForce RTX 3060 Laptop GPU | 3.1 kg | 24.3 mm | 17.30" | 1920x1080 | |
| 76.5 % v7 (old) | 05/2022 | Asus VivoBook 17 F712JA-AU708W i7-1065G7, Iris Plus Graphics G7 (Ice Lake 64 EU) | 2.2 kg | 21.4 mm | 17.30" | 1920x1080 | |
| 90.1 % v7 (old) | 05/2022 | Razer Blade 17 (i7-12800H, RTX 3070 Ti) i7-12800H, GeForce RTX 3070 Ti Laptop GPU | 2.8 kg | 19.9 mm | 17.30" | 2560x1440 |
Caso: lo stesso, ma sempre ottimo
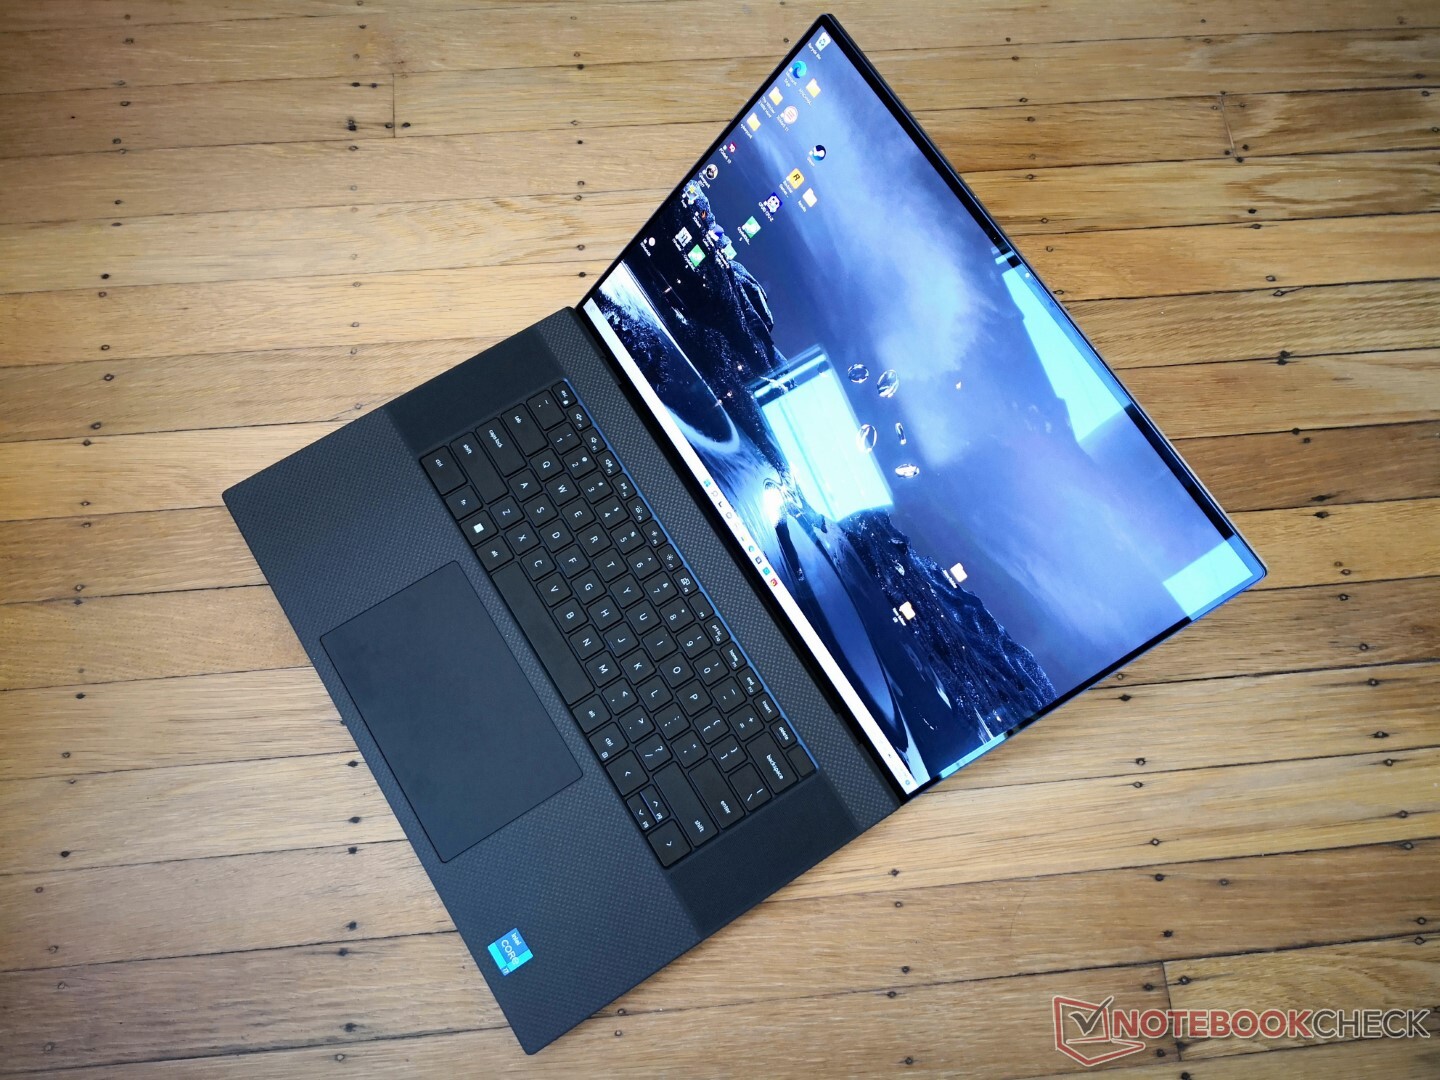
Lo chassis non è cambiato rispetto a quello degli XPS 17 9700 o 9710. Nonostante il design risalga a due anni fa, l'esclusivo fattore di forma 16:10 da 17,0 pollici consente al modello di essere notevolmente più piccolo e sottile rispetto ad altri modelli della stessa categoria.
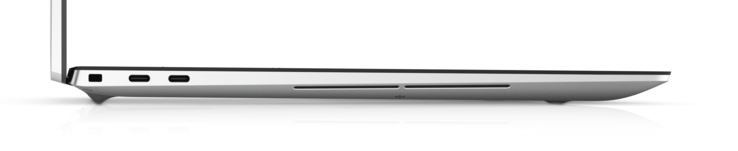
Lettore di schede SD
| SD Card Reader | |
| average JPG Copy Test (av. of 3 runs) | |
| Dell XPS 17 9720 RTX 3060 (Toshiba Exceria Pro SDXC 64 GB UHS-II) | |
| Dell XPS 17 9700 Core i7 RTX 2060 Max-Q (Toshiba Exceria Pro SDXC 64 GB UHS-II) | |
| Dell XPS 17 9710 Core i7 RTX 3060 (AV PRO microSD 128 GB V60) | |
| Razer Blade 17 (i7-12800H, RTX 3070 Ti) | |
| Lenovo Legion 5 17ACH6H-82JY0003GE (AV Pro SD microSD 128 GB V60) | |
| HP Envy 17-cg (AV Pro microSD 128 GB V60) | |
| Asus VivoBook 17 F712JA-AU708W (AV Pro SD microSD 128 GB V60) | |
| maximum AS SSD Seq Read Test (1GB) | |
| Dell XPS 17 9720 RTX 3060 (Toshiba Exceria Pro SDXC 64 GB UHS-II) | |
| Dell XPS 17 9700 Core i7 RTX 2060 Max-Q (Toshiba Exceria Pro SDXC 64 GB UHS-II) | |
| Razer Blade 17 (i7-12800H, RTX 3070 Ti) | |
| Dell XPS 17 9710 Core i7 RTX 3060 (AV PRO microSD 128 GB V60) | |
| Lenovo Legion 5 17ACH6H-82JY0003GE (AV Pro SD microSD 128 GB V60) | |
| HP Envy 17-cg (AV Pro microSD 128 GB V60) | |
| Asus VivoBook 17 F712JA-AU708W (AV Pro SD microSD 128 GB V60) | |
Comunicazione - No Wi-Fi 6E
Dell ha aggiornato la WLAN dall'Intel AX1650 dell'XPS 17 9710 all'Intel AX1675 (o AX211) dell'XPS 17 9720. Il nuovo chip supporta il Wi-Fi 6E, ma la funzione è disabilitata sull'XPS 17 9720, come abbiamo scoperto sull'XPS 15 9520 come abbiamo scoperto sull'XPS 15 9520. Pertanto, gli utenti potranno connettersi solo alle reti a 2,4 GHz o 5 GHz e non a quelle a 6 GHz.
| Networking | |
| iperf3 transmit AX12 | |
| HP Envy 17-cg | |
| Dell XPS 17 9710 Core i7 RTX 3060 | |
| Asus VivoBook 17 F712JA-AU708W | |
| Lenovo Legion 5 17ACH6H-82JY0003GE | |
| Dell XPS 17 9700 Core i7 RTX 2060 Max-Q | |
| iperf3 receive AX12 | |
| HP Envy 17-cg | |
| Dell XPS 17 9710 Core i7 RTX 3060 | |
| Dell XPS 17 9700 Core i7 RTX 2060 Max-Q | |
| Asus VivoBook 17 F712JA-AU708W | |
| Lenovo Legion 5 17ACH6H-82JY0003GE | |
| iperf3 receive AXE11000 | |
| Dell XPS 17 9720 RTX 3060 | |
| iperf3 transmit AXE11000 | |
| Dell XPS 17 9720 RTX 3060 | |
Webcam
La fotocamera continua a essere di soli 720p senza otturatore privato. La bassa risoluzione nativa si accoppia male con il display ad alta risoluzione per un'immagine inevitabilmente confusa. Dell afferma che i sensori IR e RGB sono ora separati per migliorare le prestazioni, ma la densità di pixel è ancora molto bassa. In confronto, il Razer Blade 17 viene fornito con una webcam a 1080p a risoluzione più elevata.
Windows Hello è ancora supportato.


Manutenzione
Accessori e garanzia
L'XPS 17 9720 viene fornito con lo stesso adattatore CA da 130 W e lo stesso adattatore da USB-C a HDMI e USB-A dei modelli XPS 15 9520, XPS 17 9710 e XPS 17 9700. Se acquistato negli Stati Uniti, viene applicata una garanzia limitata del produttore di un anno.
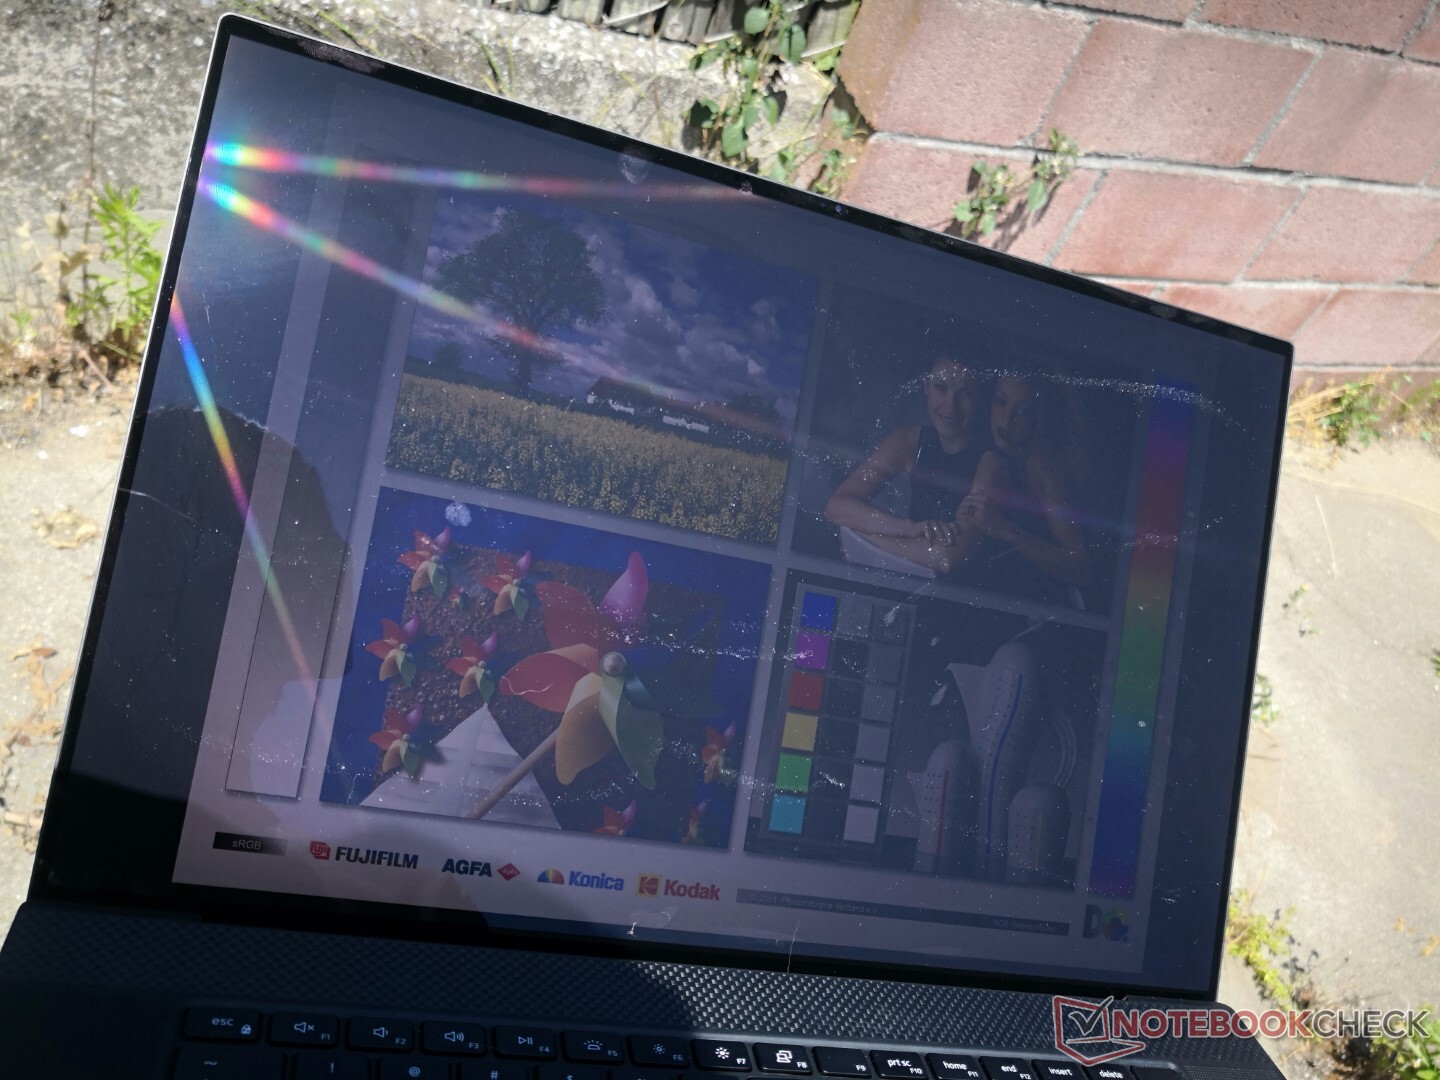
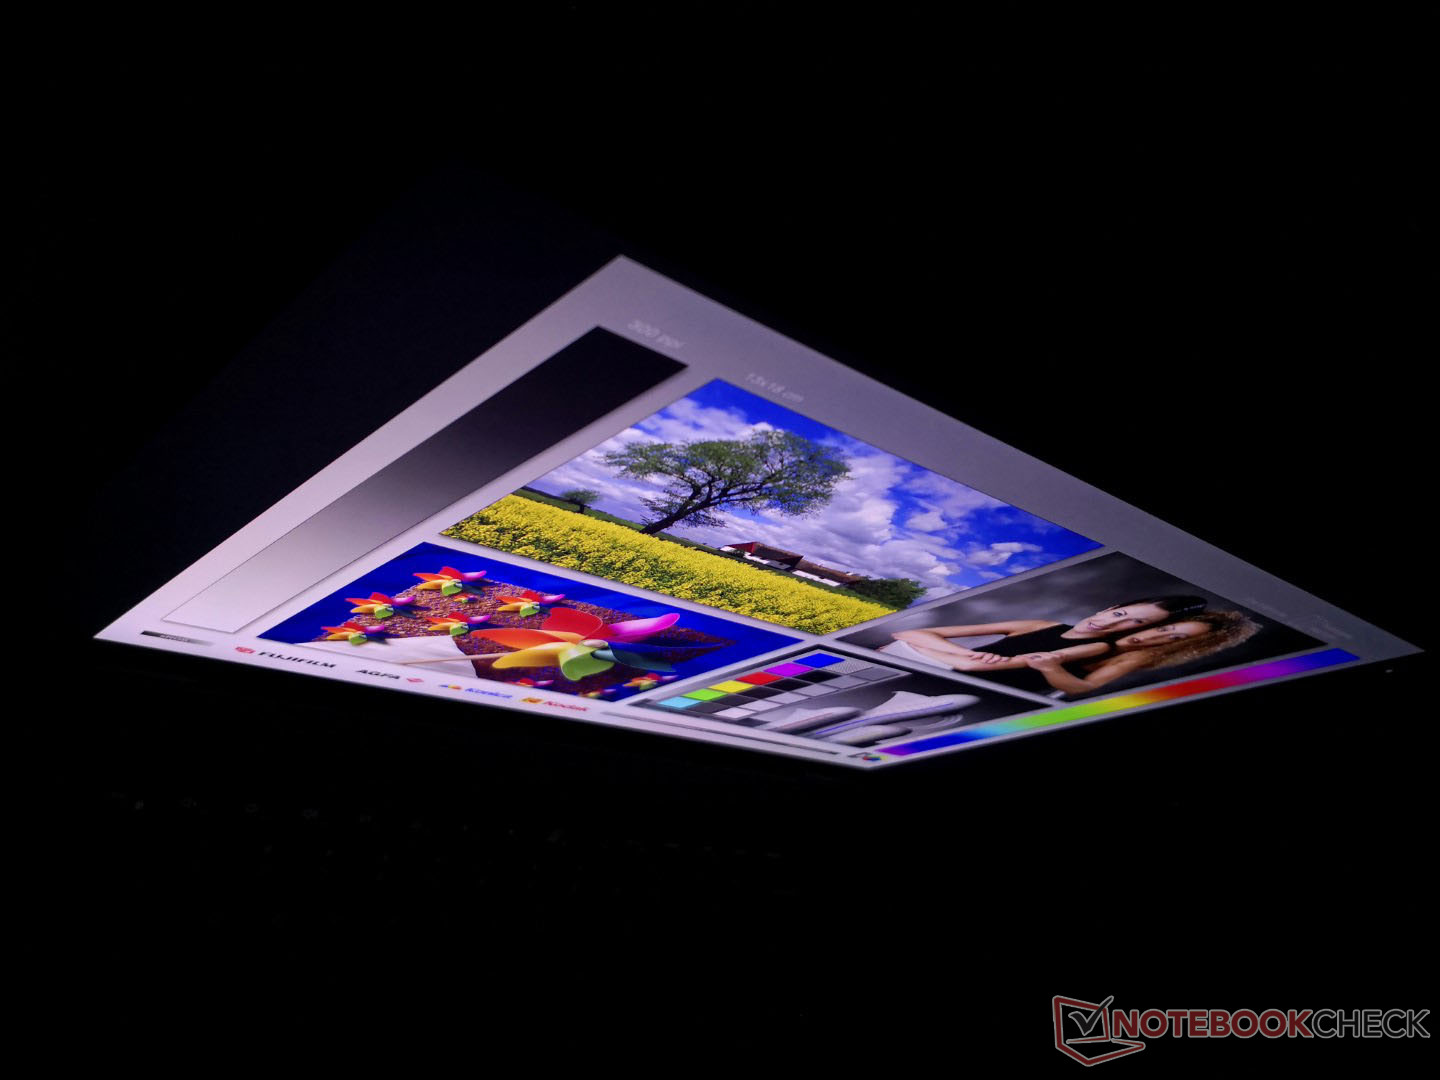
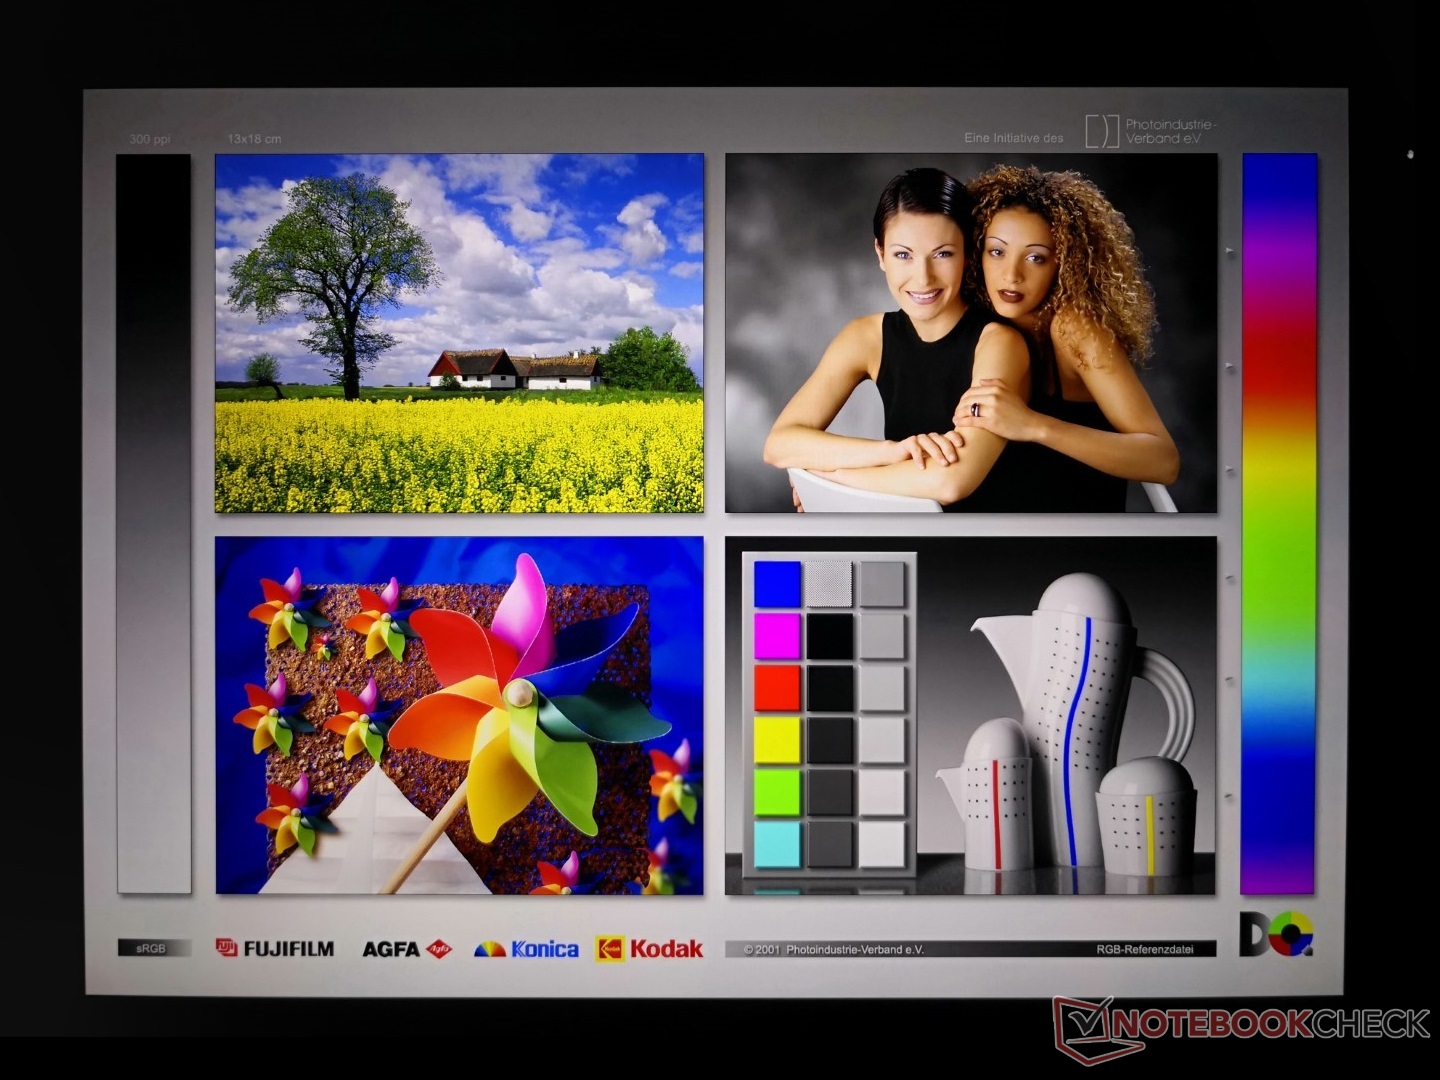
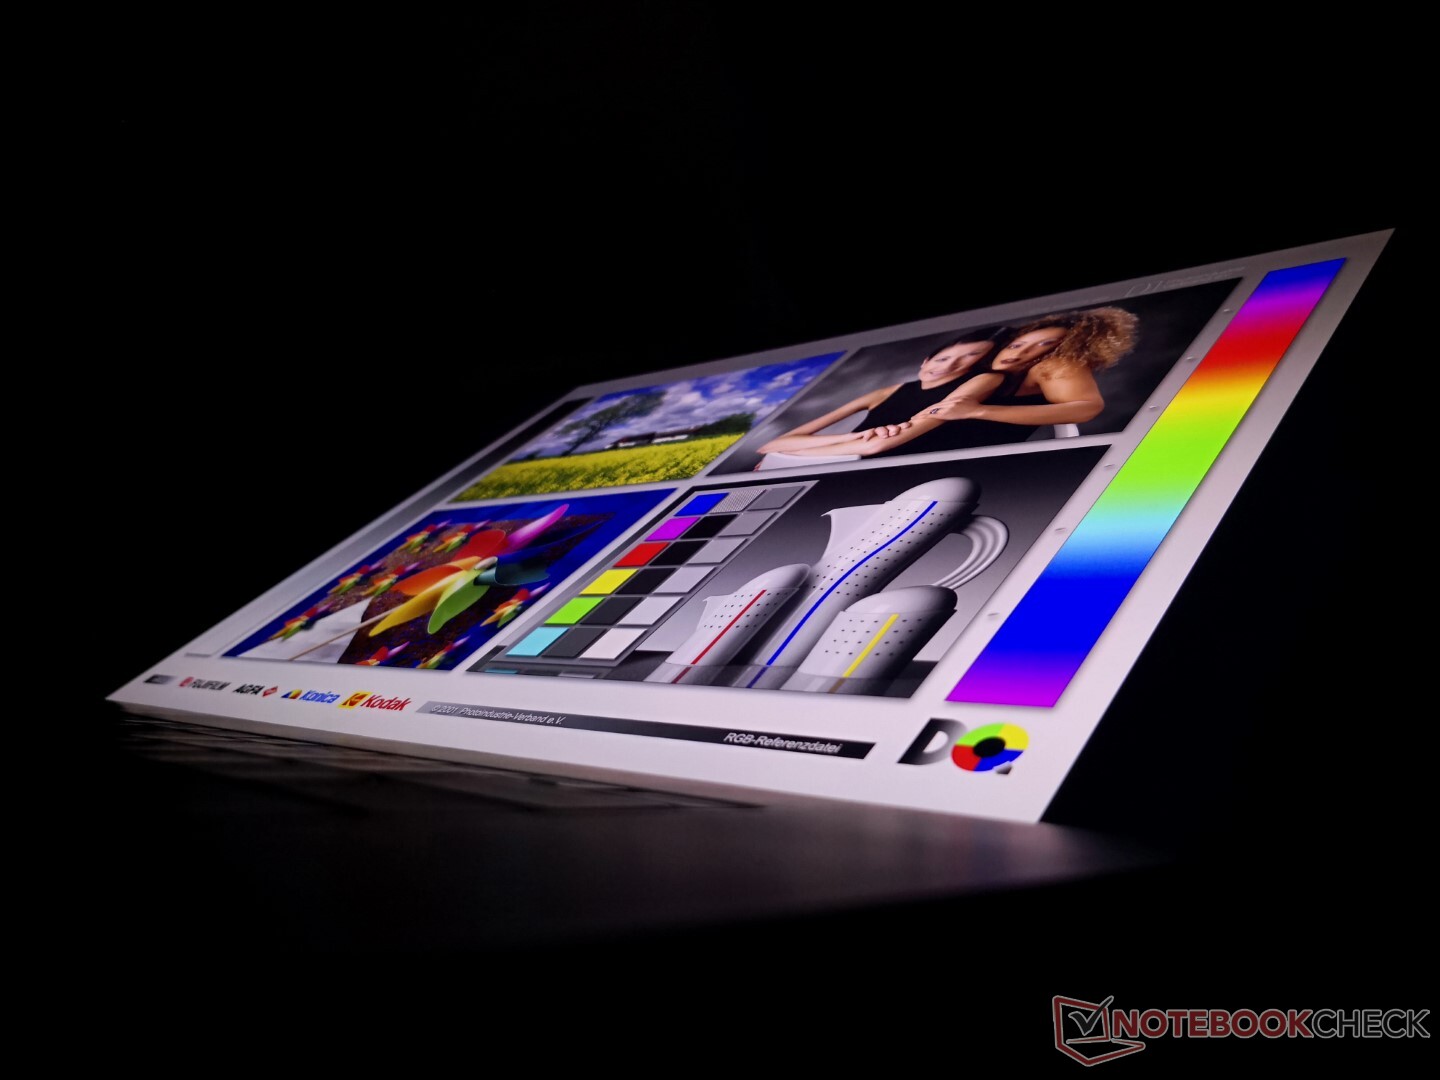
Display - 16:10 60 Hz IPS
È possibile scegliere tra due opzioni di visualizzazione (1200p e 2400p) rispetto alle tre del modello XPS 15 9520. Il pannello della nostra unità è lo stesso pannello IPS Sharp LQ170R1 presente sull'XPS 17 9710 o 9700, il che significa che l'esperienza visiva non è cambiata dal modello originale del 2020. Era un display eccellente all'epoca e lo è ancora oggi, soprattutto in termini di rapporto di contrasto rispetto ad altri pannelli IPS, ma vorremmo vedere in futuro opzioni con frequenza di aggiornamento di 90 Hz o più veloci, simili a quelle già disponibili sui più recenti modelli IdeaPad Slim 7i Pro IdeaPad Slim 7i Pro o sul prossimo Zenbook Pro 14 Duo.
| |||||||||||||||||||||||||
Distribuzione della luminosità: 85 %
Al centro con la batteria: 512.7 cd/m²
Contrasto: 1602:1 (Nero: 0.32 cd/m²)
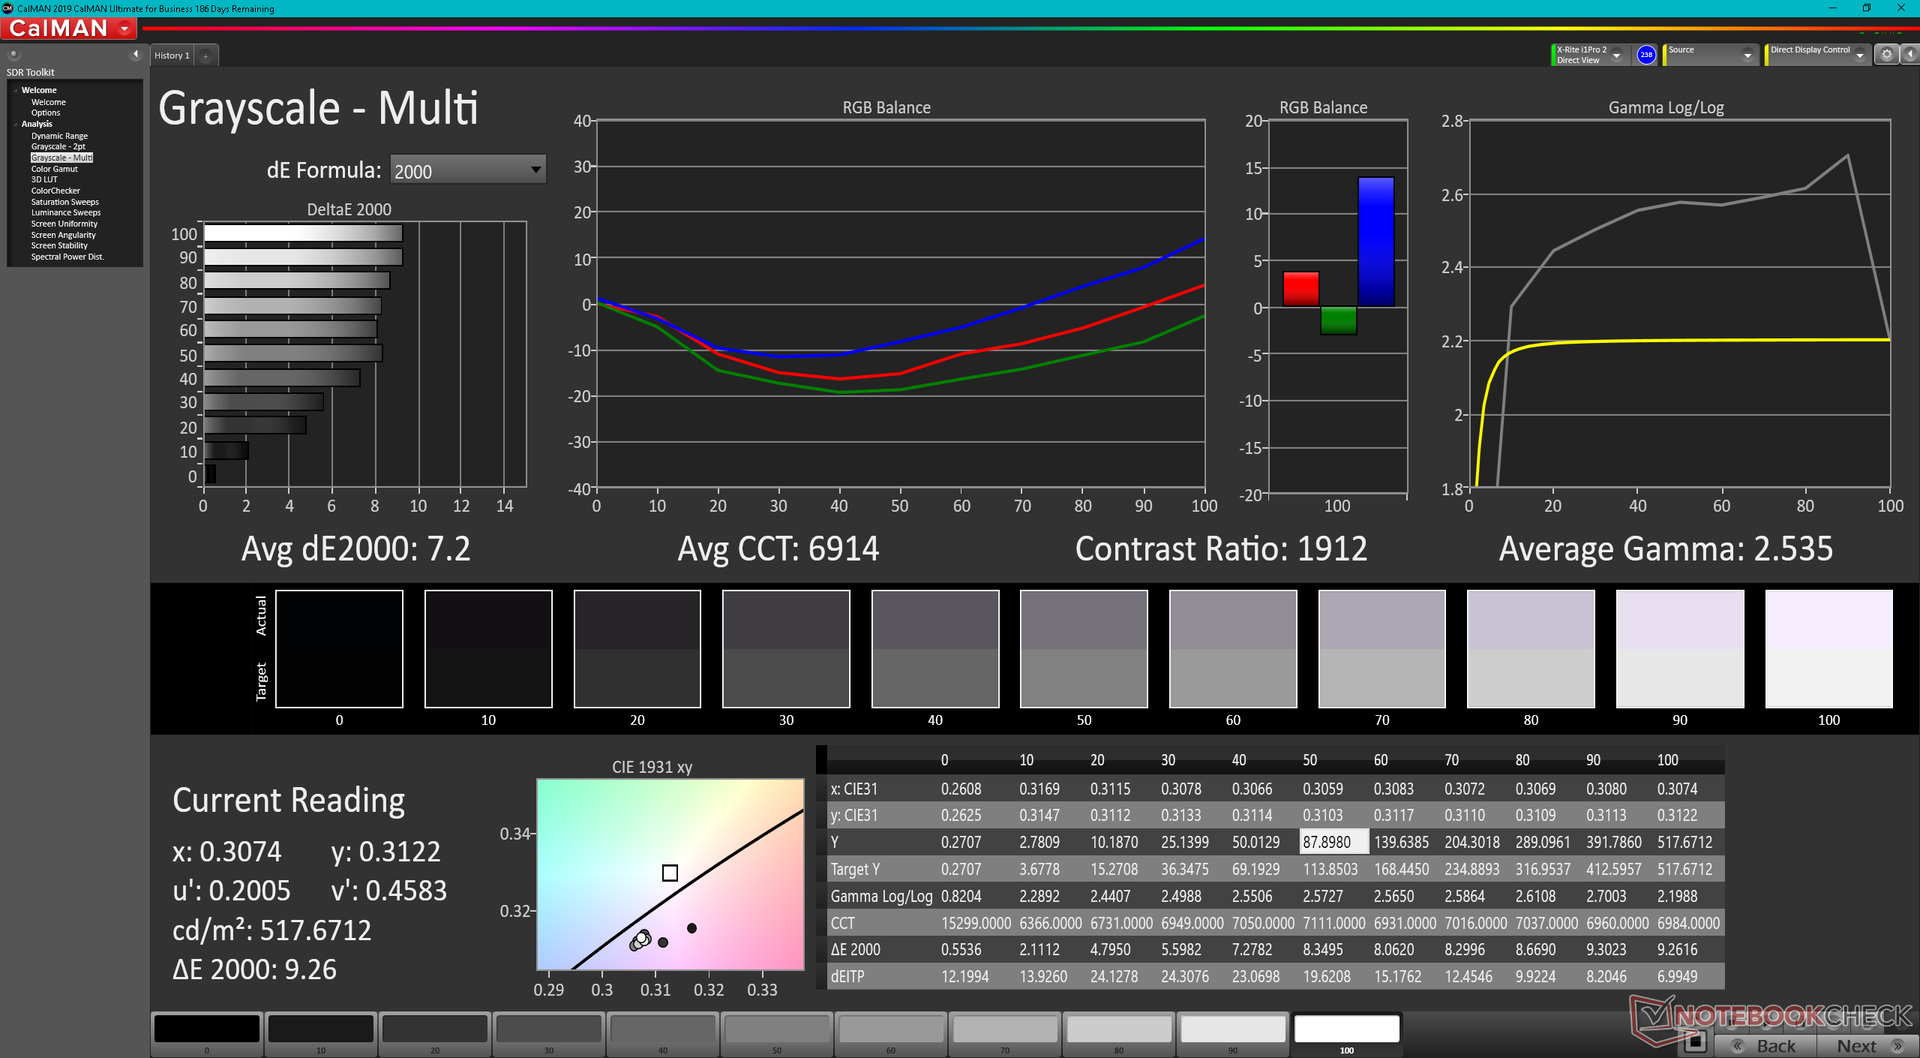
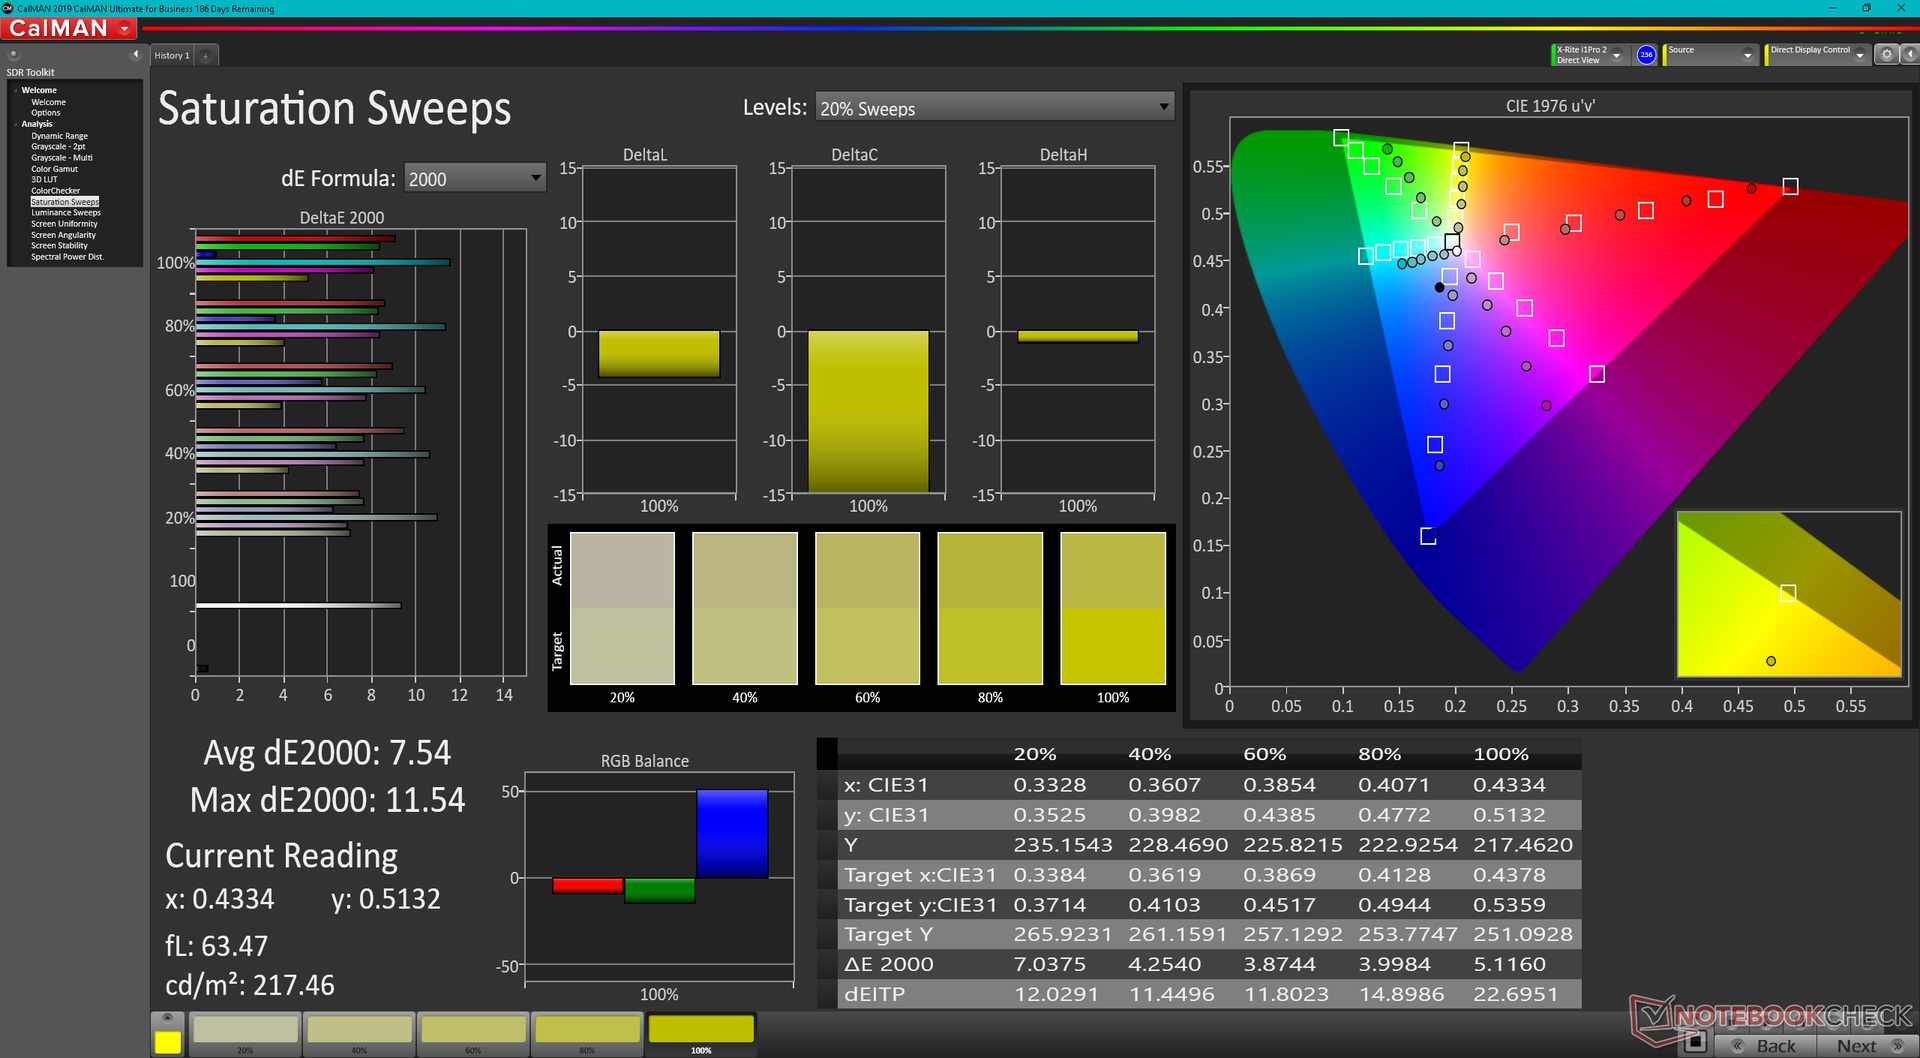
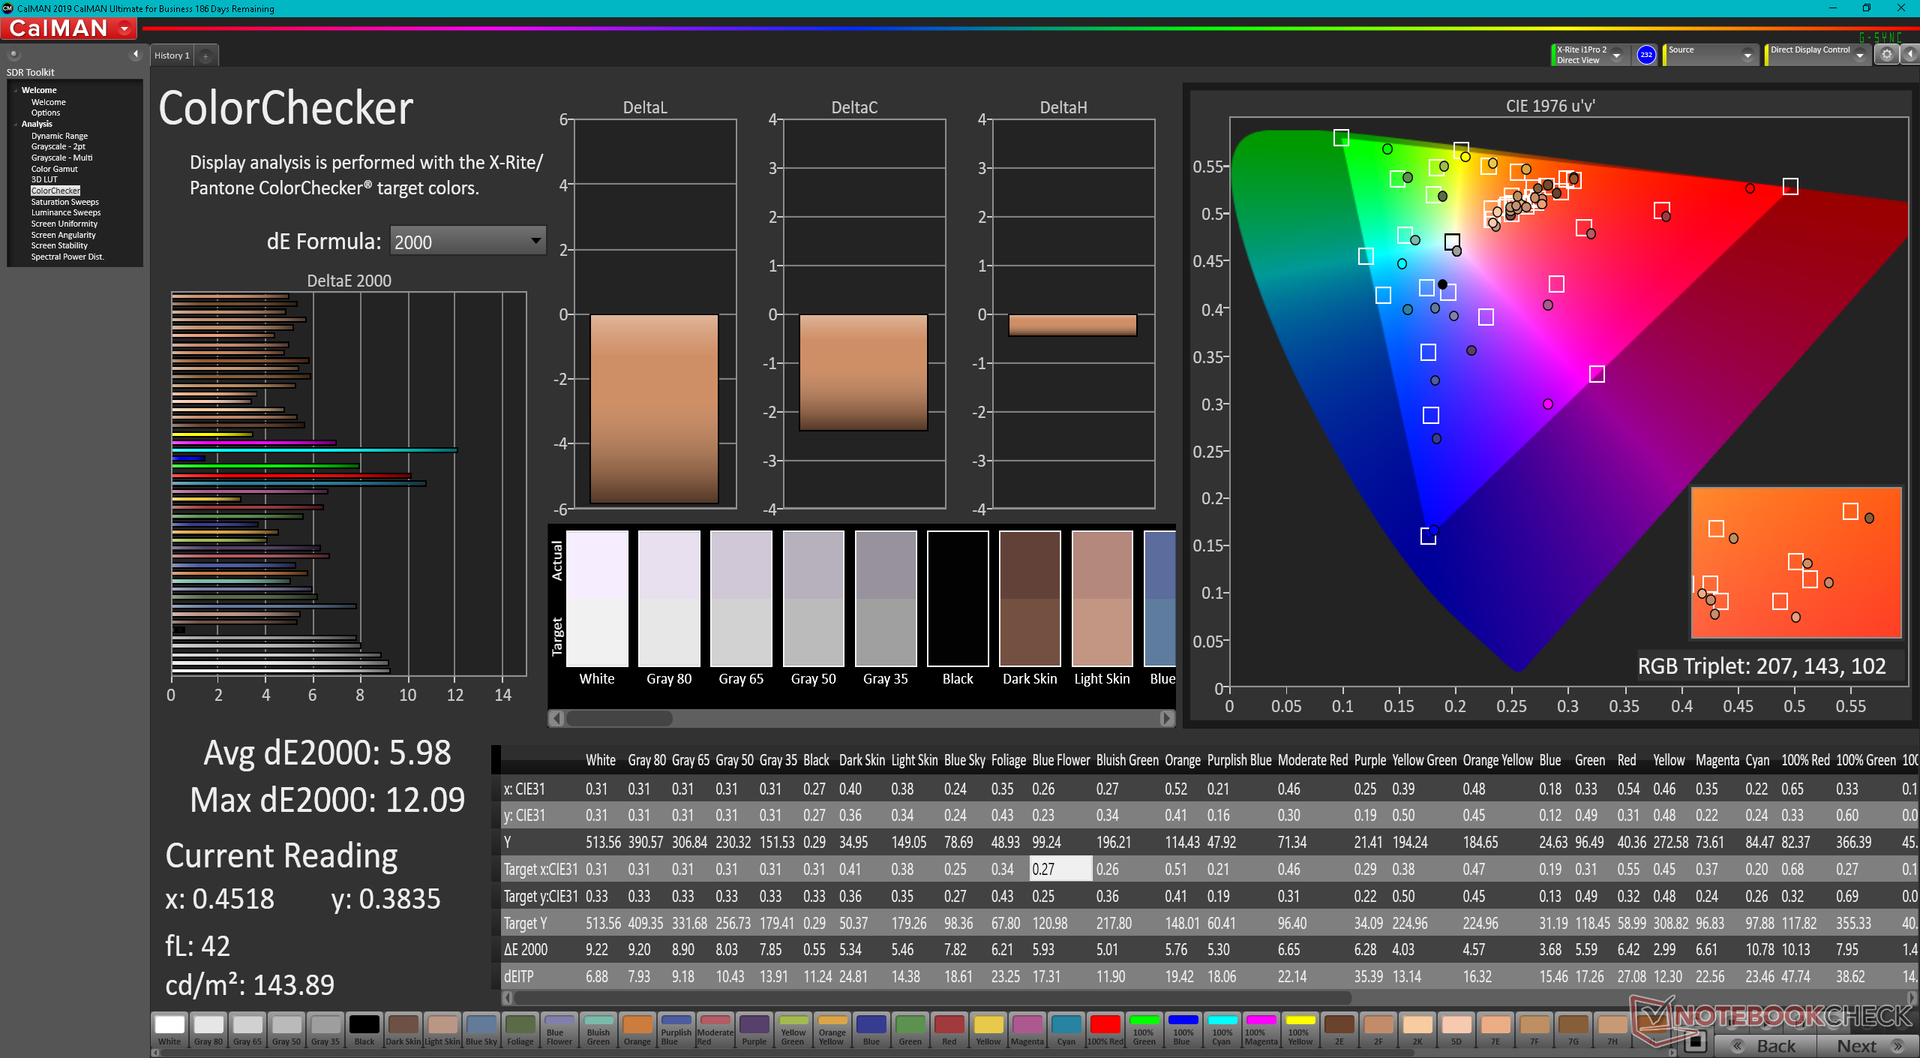
ΔE ColorChecker Calman: 5.98 | ∀{0.5-29.43 Ø4.72}
ΔE Greyscale Calman: 7.2 | ∀{0.09-98 Ø4.97}
85.3% AdobeRGB 1998 (Argyll 3D)
100% sRGB (Argyll 3D)
92.9% Display P3 (Argyll 3D)
Gamma: 2.54
CCT: 6914 K
| Dell XPS 17 9720 RTX 3060 Sharp LQ170R1, IPS, 3840x2400, 17" | Dell XPS 17 9700 Core i7 RTX 2060 Max-Q Sharp LQ170R1, IPS, 3840x2400, 17" | Dell XPS 17 9700 i5-10300H SHP14D7, IPS, 1920x1200, 17.3" | HP Envy 17-cg AU Optronics AUO439D, IPS, 1920x1080, 17.3" | Lenovo Legion 5 17ACH6H-82JY0003GE LEN173FHD, IPS, 1920x1080, 17.3" | Asus VivoBook 17 F712JA-AU708W BOE NV173FHM-N49, IPS, 1920x1080, 17.3" | Razer Blade 17 (i7-12800H, RTX 3070 Ti) BOE CQ NE173QHM-NZ1 (BOE09F9), IPS, 2560x1440, 17.3" | |
|---|---|---|---|---|---|---|---|
| Display | 5% | -9% | -17% | -18% | -50% | 2% | |
| Display P3 Coverage (%) | 92.9 | 90.5 -3% | 77.4 -17% | 68 -27% | 64.8 -30% | 39.53 -57% | 97.9 5% |
| sRGB Coverage (%) | 100 | 100 0% | 100 0% | 95 -5% | 97.2 -3% | 58.85 -41% | 99.9 0% |
| AdobeRGB 1998 Coverage (%) | 85.3 | 99.8 17% | 76.6 -10% | 69 -19% | 66.7 -22% | 40.84 -52% | 85.5 0% |
| Response Times | 5% | -13% | 19% | 73% | 57% | 69% | |
| Response Time Grey 50% / Grey 80% * (ms) | 51.2 ? | 51.2 ? -0% | 60.4 ? -18% | 40 ? 22% | 15 ? 71% | 22 ? 57% | 15.2 ? 70% |
| Response Time Black / White * (ms) | 35.2 ? | 32 ? 9% | 37.6 ? -7% | 30 ? 15% | 9 ? 74% | 15 ? 57% | 11.2 ? 68% |
| PWM Frequency (Hz) | 2500 ? | ||||||
| Screen | 20% | 33% | 6% | 16% | -16% | -9% | |
| Brightness middle (cd/m²) | 512.7 | 539.4 5% | 636 24% | 347 -32% | 323 -37% | 269 -48% | 341 -33% |
| Brightness (cd/m²) | 463 | 494 7% | 580 25% | 329 -29% | 305 -34% | 263 -43% | 308 -33% |
| Brightness Distribution (%) | 85 | 84 -1% | 86 1% | 89 5% | 89 5% | 88 4% | 82 -4% |
| Black Level * (cd/m²) | 0.32 | 0.32 -0% | 0.34 -6% | 0.27 16% | 0.25 22% | 0.3 6% | 0.45 -41% |
| Contrast (:1) | 1602 | 1686 5% | 1871 17% | 1285 -20% | 1292 -19% | 897 -44% | 758 -53% |
| Colorchecker dE 2000 * | 5.98 | 4.12 31% | 2.4 60% | 3.75 37% | 1.87 69% | 5.8 3% | 4.16 30% |
| Colorchecker dE 2000 max. * | 12.09 | 7.65 37% | 3.5 71% | 7.53 38% | 4.84 60% | 18.46 -53% | 8.14 33% |
| Greyscale dE 2000 * | 7.2 | 1.5 79% | 2 72% | 4.88 32% | 2.57 64% | 3.64 49% | 5.09 29% |
| Gamma | 2.54 87% | 2.15 102% | 2.08 106% | 2.53 87% | 2.42 91% | 2.35 94% | 2.48 89% |
| CCT | 6914 94% | 6438 101% | 6704 97% | 6624 98% | 7012 93% | 6995 93% | 6884 94% |
| Colorchecker dE 2000 calibrated * | 3.91 | 1.5 | 0.92 | 3 | |||
| Color Space (Percent of AdobeRGB 1998) (%) | 90.4 | 67.5 | |||||
| Color Space (Percent of sRGB) (%) | 100 | 100 | |||||
| Media totale (Programma / Settaggio) | 10% /
14% | 4% /
16% | 3% /
3% | 24% /
17% | -3% /
-12% | 21% /
5% |
* ... Meglio usare valori piccoli
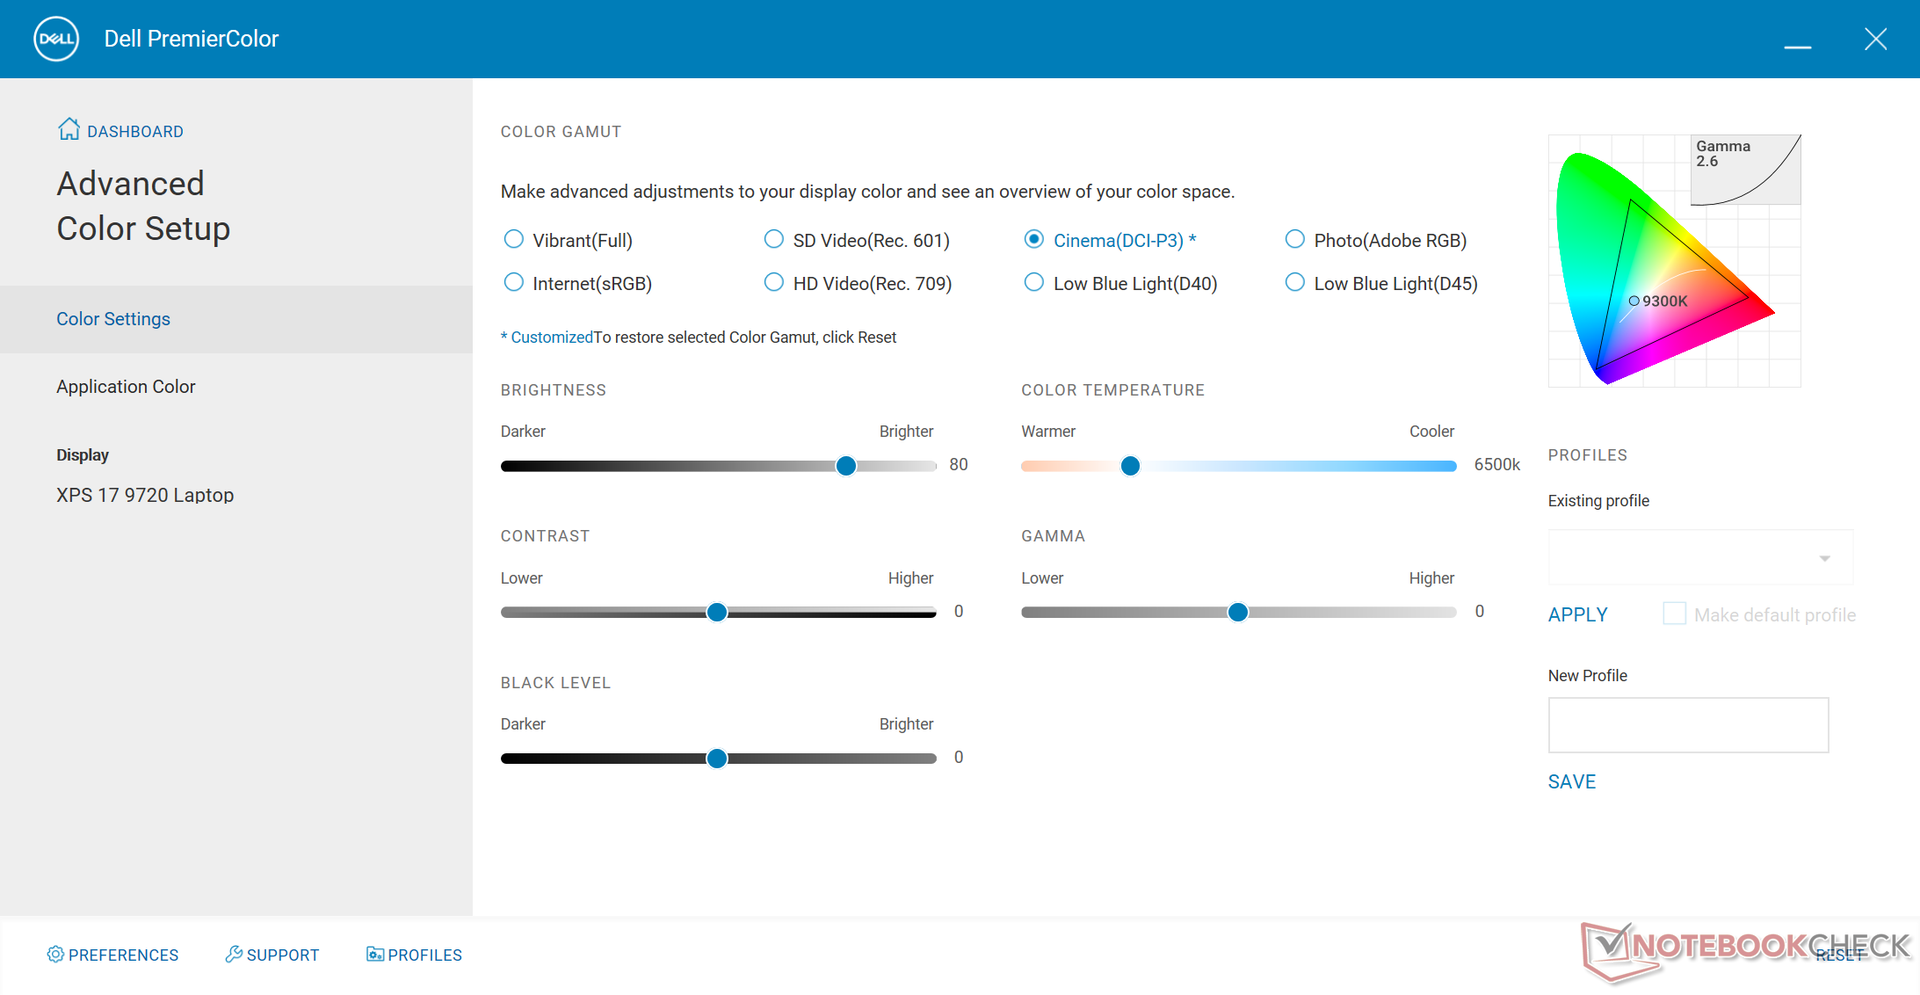
La temperatura del colore è più calda del previsto quando viene impostata sullo standard cromatico DCI-P3 tramite il software Dell PremierColor. A differenza di molti portatili professionali come Dell Precision, Gigabyte Aero o HP ZBook, la serie XPS non è calibrata X-Rite in fabbrica. Per sfruttare al meglio l'ampia gamma cromatica del pannello, sarebbe necessaria una calibrazione da parte dell'utente finale.
Tempi di risposta del Display
| ↔ Tempi di risposta dal Nero al Bianco | ||
|---|---|---|
| 35.2 ms ... aumenta ↗ e diminuisce ↘ combinato | ↗ 18.8 ms Incremento | 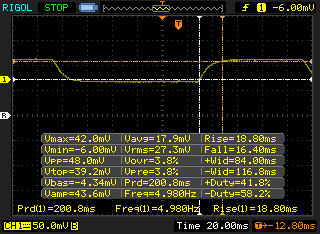 |
| ↘ 16.4 ms Calo | ||
| Lo schermo mostra tempi di risposta lenti nei nostri tests e sarà insoddisfacente per i gamers. In confronto, tutti i dispositivi di test variano da 0.1 (minimo) a 240 (massimo) ms. » 93 % di tutti i dispositivi è migliore. Questo significa che i tempi di risposta rilevati sono peggiori rispetto alla media di tutti i dispositivi testati (19.8 ms). | ||
| ↔ Tempo di risposta dal 50% Grigio all'80% Grigio | ||
| 51.2 ms ... aumenta ↗ e diminuisce ↘ combinato | ↗ 26 ms Incremento | 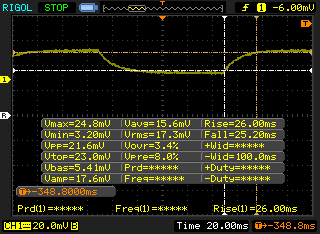 |
| ↘ 25.2 ms Calo | ||
| Lo schermo mostra tempi di risposta lenti nei nostri tests e sarà insoddisfacente per i gamers. In confronto, tutti i dispositivi di test variano da 0.165 (minimo) a 636 (massimo) ms. » 88 % di tutti i dispositivi è migliore. Questo significa che i tempi di risposta rilevati sono peggiori rispetto alla media di tutti i dispositivi testati (31 ms). | ||
Sfarfallio dello schermo / PWM (Pulse-Width Modulation)
| flickering dello schermo / PWM non rilevato |  | ||
In confronto: 52 % di tutti i dispositivi testati non utilizza PWM per ridurre la luminosita' del display. Se è rilevato PWM, una media di 7775 (minimo: 5 - massimo: 343500) Hz è stata rilevata. | |||
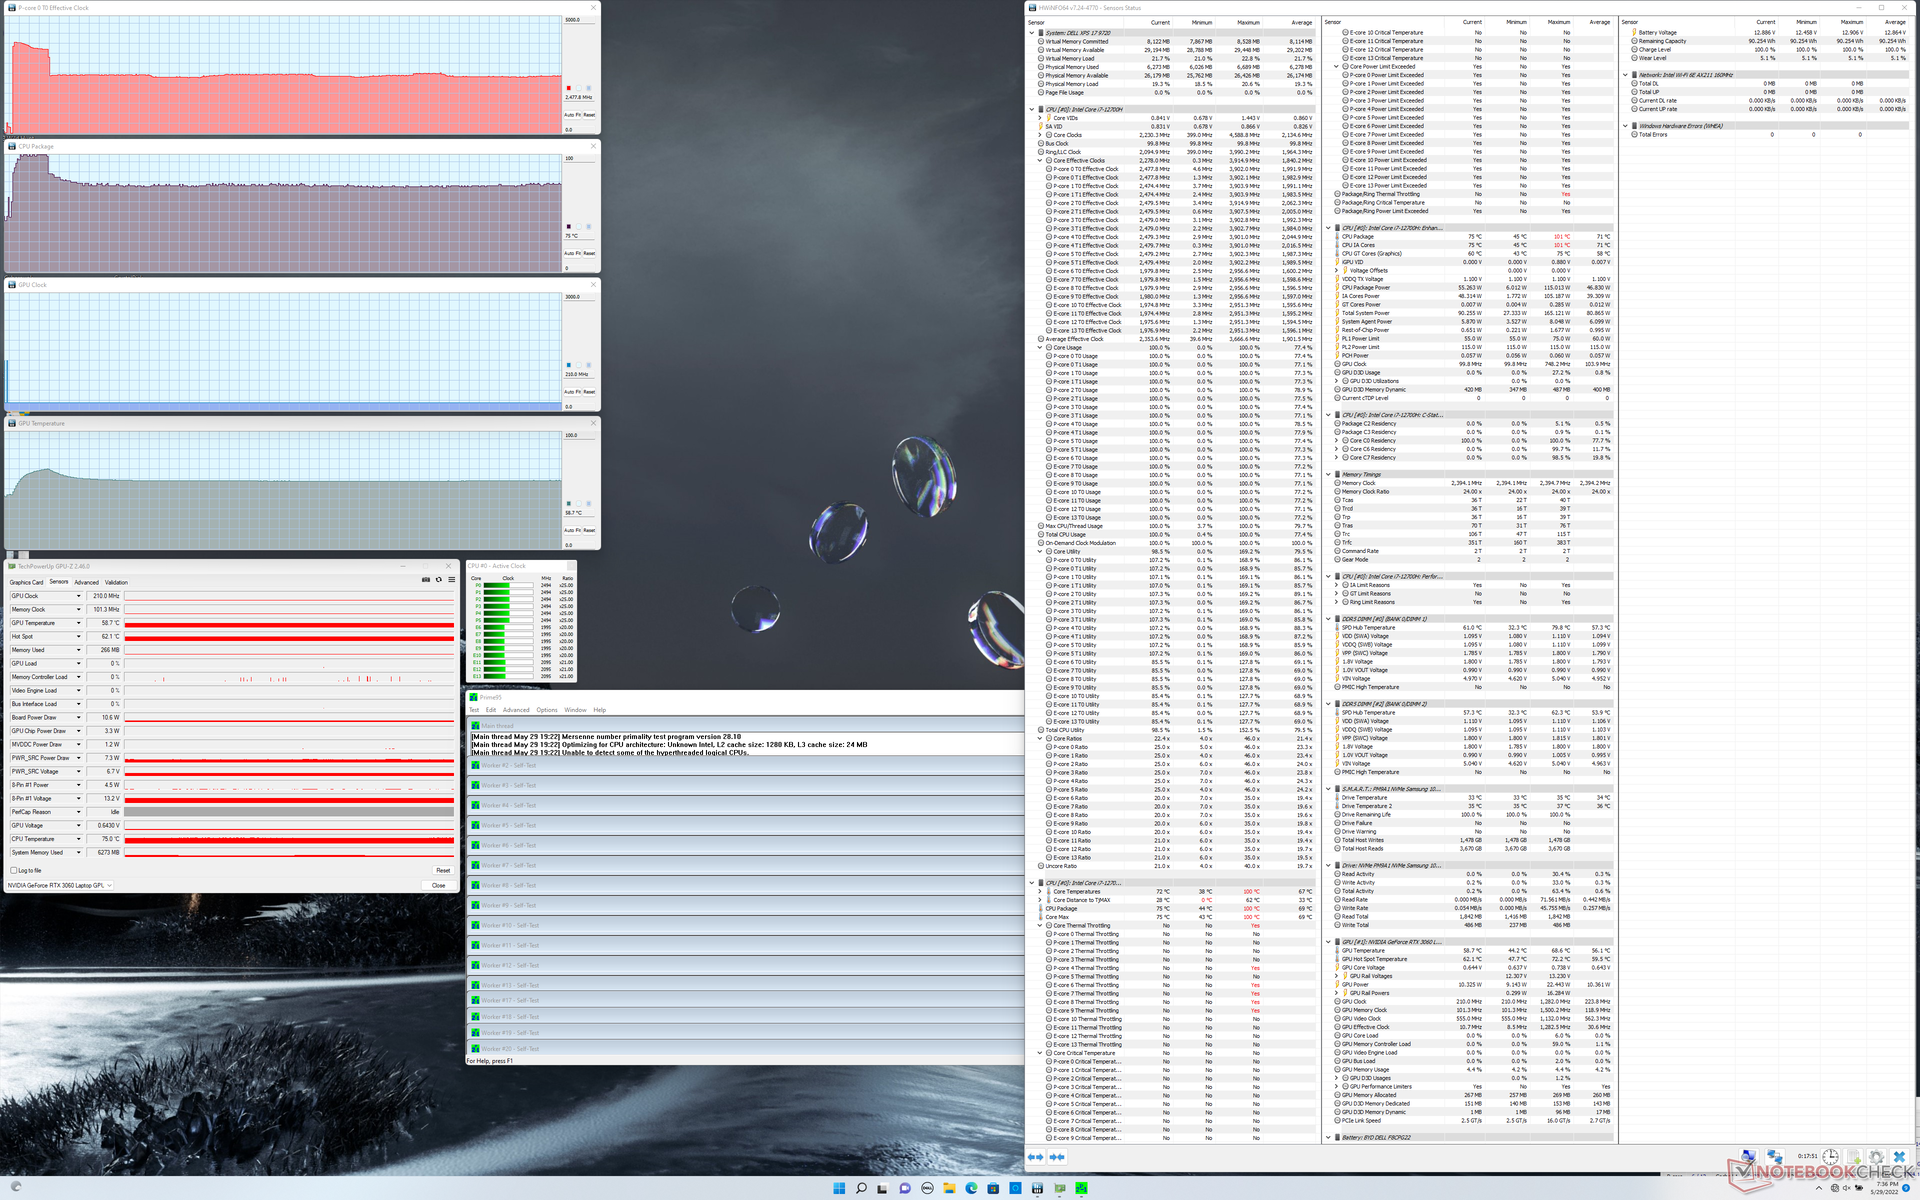
Performance - Alder Lake-H alza la posta in gioco
Condizioni di test
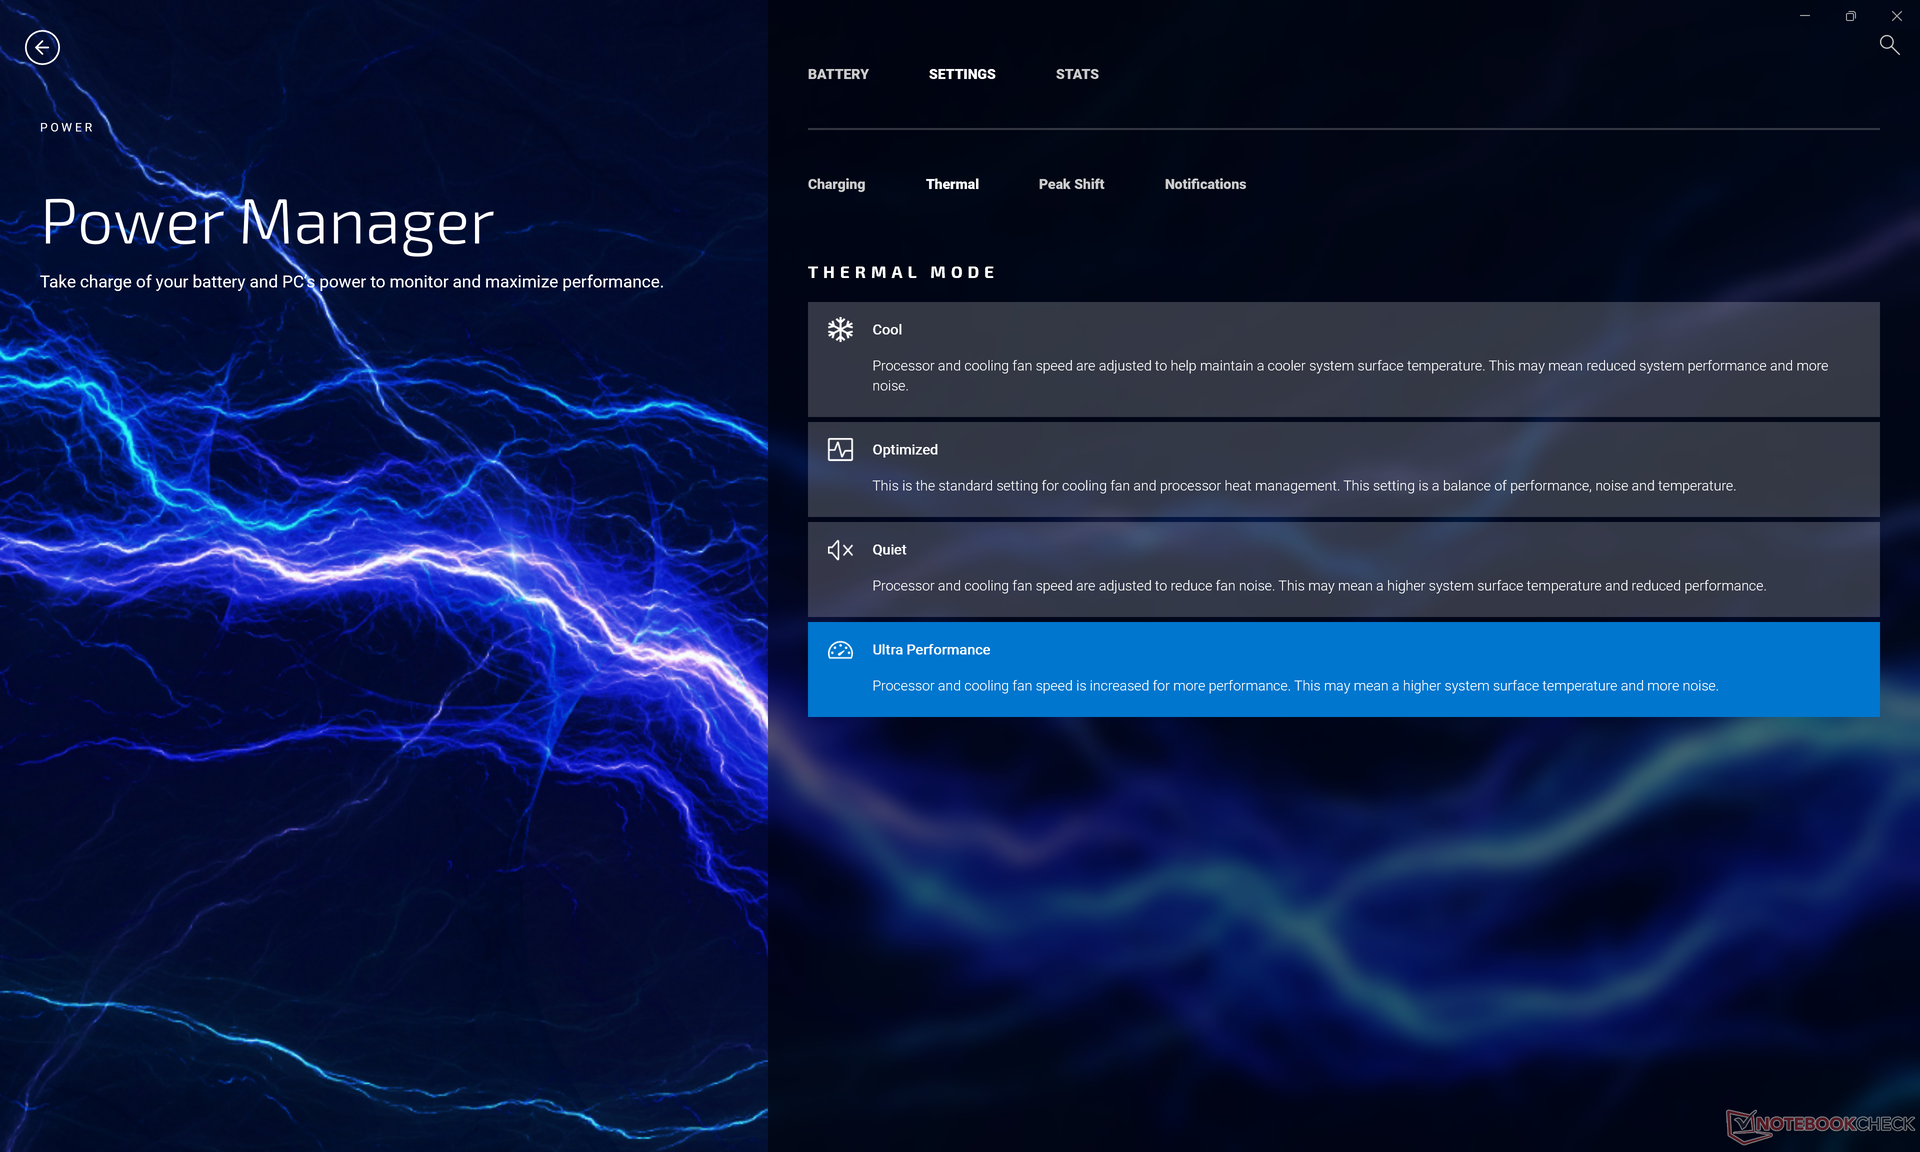
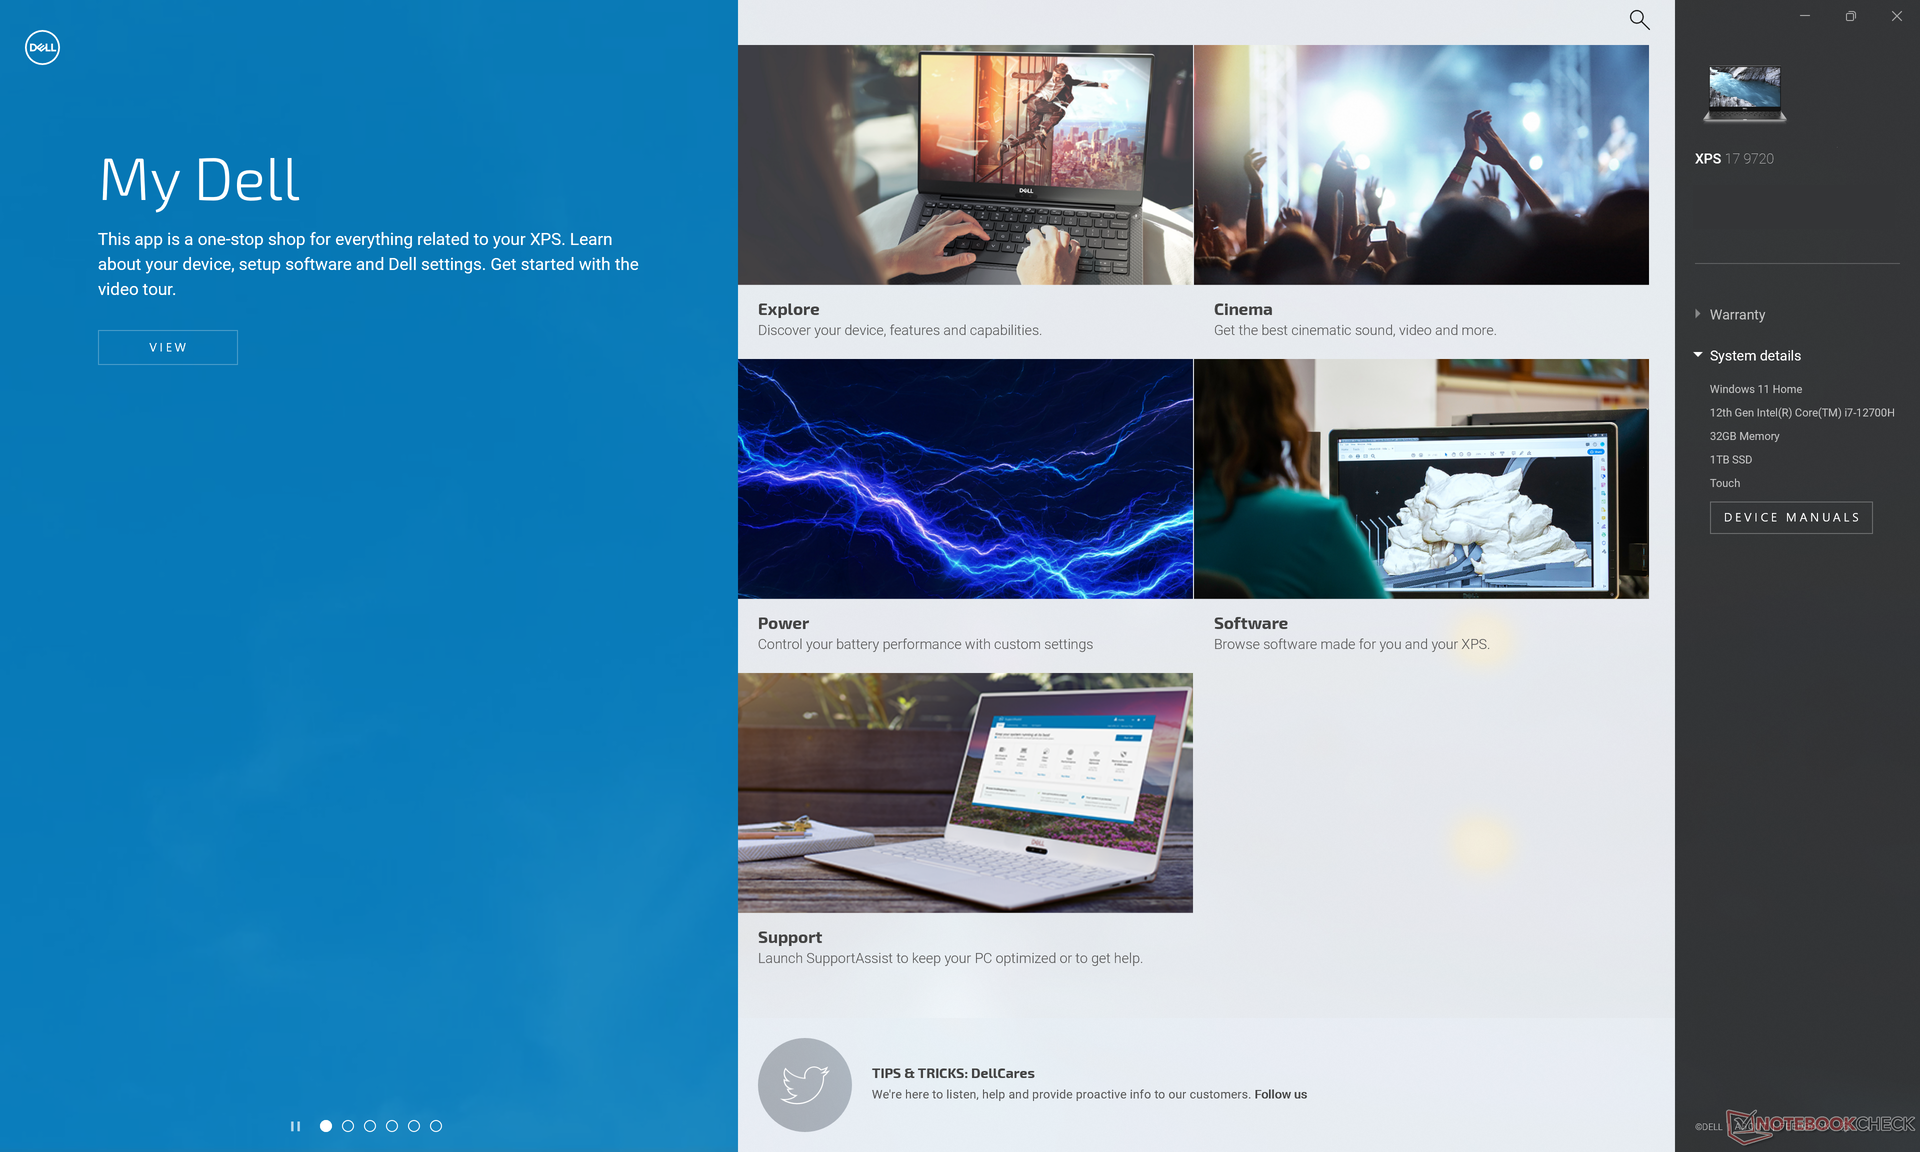
La nostra unità è stata impostata in modalità Ultra Performance tramite il software My Dell prima di eseguire i benchmark qui sotto per ottenere i punteggi più alti possibili. Raccomandiamo agli utenti di familiarizzare con i software My Dell, Dell Update e PremierColor, in quanto le funzioni chiave del sistema vengono attivate tramite queste applicazioni
Optimus 1.0 è di serie per la commutazione grafica automatica tra la GPU integrata e la discreta GeForce RTX 3060. La sincronizzazione adattiva interna e il MUX non sono supportati in quanto l'XPS 17 non è una macchina da gioco.
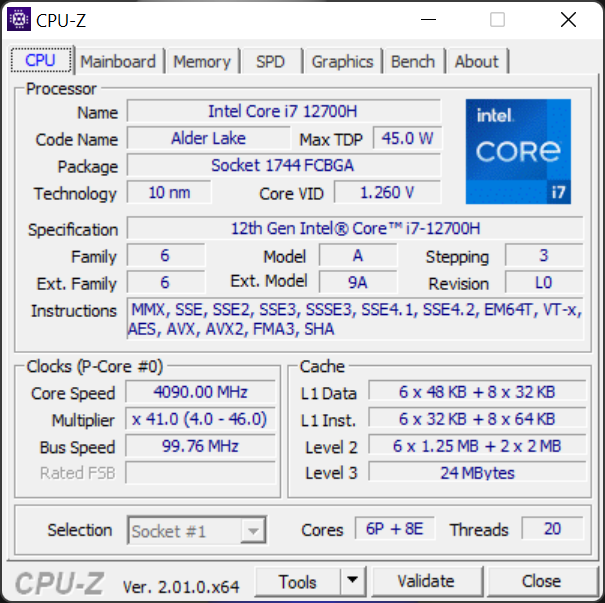
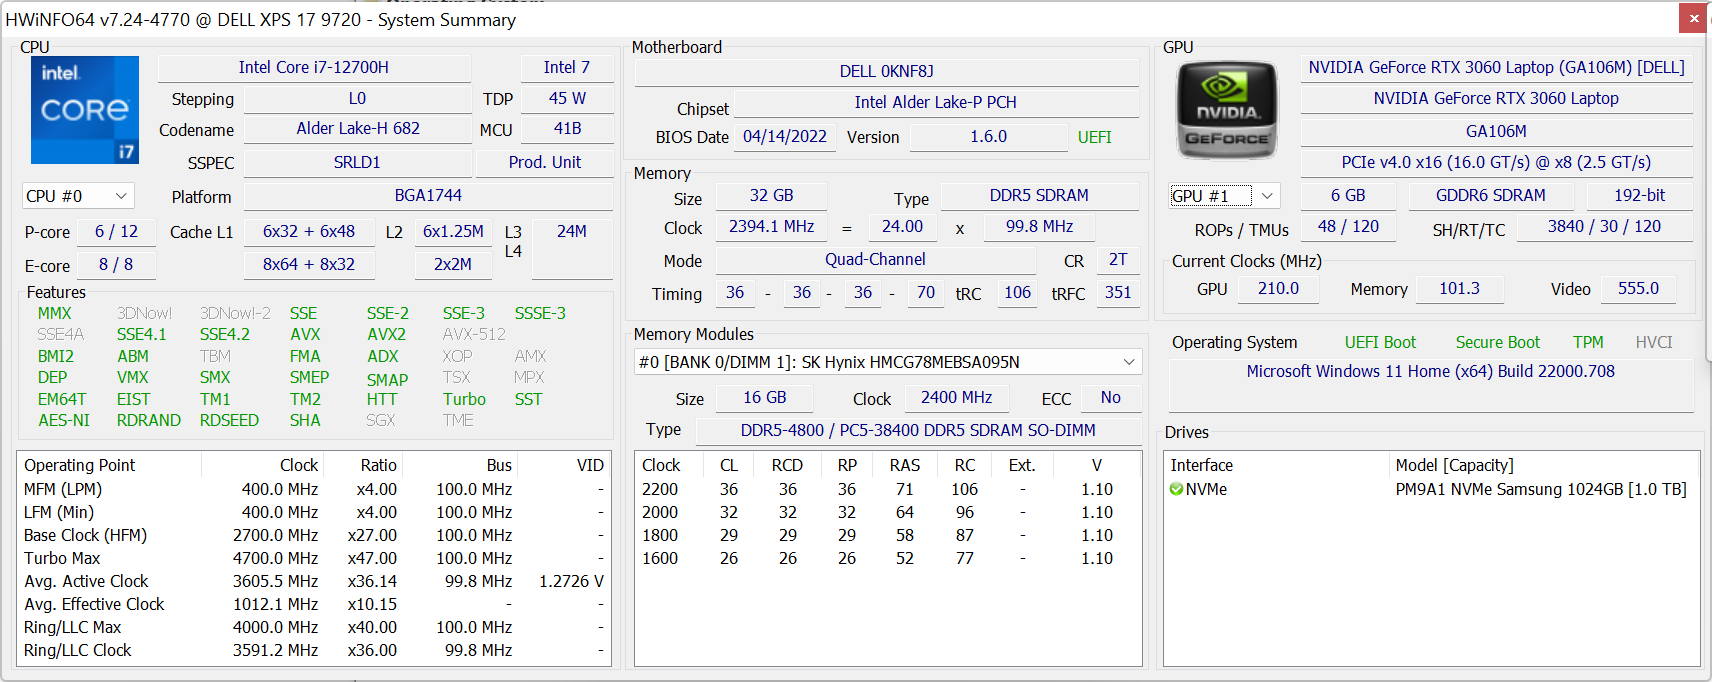
Processore
I benchmark CineBench xT e alcuni subtest AIDA64 possono essere fino al 50% più veloci rispetto all'XPS 15 9710 equipaggiato con il Core i71818 di ultima generazione Core i7-11800H e ciò rappresenta un significativo miglioramento delle prestazioni del processore rispetto all'anno precedente. I guadagni sono invece molto più contenuti in altri test, tra cui Blender e HWBOT x265, ma i guadagni medi sono comunque superiori a quelli osservati tra l'XPS 17 9700 e l'XPS 17 9710.
Curiosamente, il Core i7-12700H è inferiore al Core i7-10875H di 10a generazione in una serie di benchmark AIDA64, come mostrato di seguito.
Alcuni portatili più spessi con la stessa CPU Core i7-12800H sono in grado di far funzionare il processore a velocità di clock più elevate, fino al 20% in più, come nel caso dell'HP Omen 1610 HP Omen 16
L'esecuzione di CineBench R15 xT in loop non mostra problemi di strozzatura delle prestazioni se sottoposto a carichi di elaborazione estremi per lunghi periodi.
Cinebench R15 Multi Loop
Cinebench R23: Multi Core | Single Core
Cinebench R15: CPU Multi 64Bit | CPU Single 64Bit
Blender: v2.79 BMW27 CPU
7-Zip 18.03: 7z b 4 | 7z b 4 -mmt1
Geekbench 5.5: Multi-Core | Single-Core
HWBOT x265 Benchmark v2.2: 4k Preset
LibreOffice : 20 Documents To PDF
R Benchmark 2.5: Overall mean
Cinebench R23: Multi Core | Single Core
Cinebench R15: CPU Multi 64Bit | CPU Single 64Bit
Blender: v2.79 BMW27 CPU
7-Zip 18.03: 7z b 4 | 7z b 4 -mmt1
Geekbench 5.5: Multi-Core | Single-Core
HWBOT x265 Benchmark v2.2: 4k Preset
LibreOffice : 20 Documents To PDF
R Benchmark 2.5: Overall mean
* ... Meglio usare valori piccoli
| AIDA64 / FP32 Ray-Trace | |
| Eurocom RX315 NH57AF1 | |
| Lenovo Legion 5 17ACH6H-82JY0003GE | |
| Media Intel Core i7-12700H (2585 - 17957, n=64) | |
| Dell XPS 17 9700 Core i7 RTX 2060 Max-Q | |
| Razer Blade 17 (i7-12800H, RTX 3070 Ti) | |
| Dell XPS 17 9720 RTX 3060 | |
| Asus VivoBook 17 F712JA-AU708W | |
| AIDA64 / FP64 Ray-Trace | |
| Eurocom RX315 NH57AF1 | |
| Lenovo Legion 5 17ACH6H-82JY0003GE | |
| Media Intel Core i7-12700H (1437 - 9692, n=64) | |
| Dell XPS 17 9700 Core i7 RTX 2060 Max-Q | |
| Dell XPS 17 9720 RTX 3060 | |
| Razer Blade 17 (i7-12800H, RTX 3070 Ti) | |
| Asus VivoBook 17 F712JA-AU708W | |
| AIDA64 / CPU PhotoWorxx | |
| Dell XPS 17 9720 RTX 3060 | |
| Media Intel Core i7-12700H (12863 - 52207, n=64) | |
| Razer Blade 17 (i7-12800H, RTX 3070 Ti) | |
| Dell XPS 17 9700 Core i7 RTX 2060 Max-Q | |
| Eurocom RX315 NH57AF1 | |
| Asus VivoBook 17 F712JA-AU708W | |
| Lenovo Legion 5 17ACH6H-82JY0003GE | |
Prestazioni del sistema
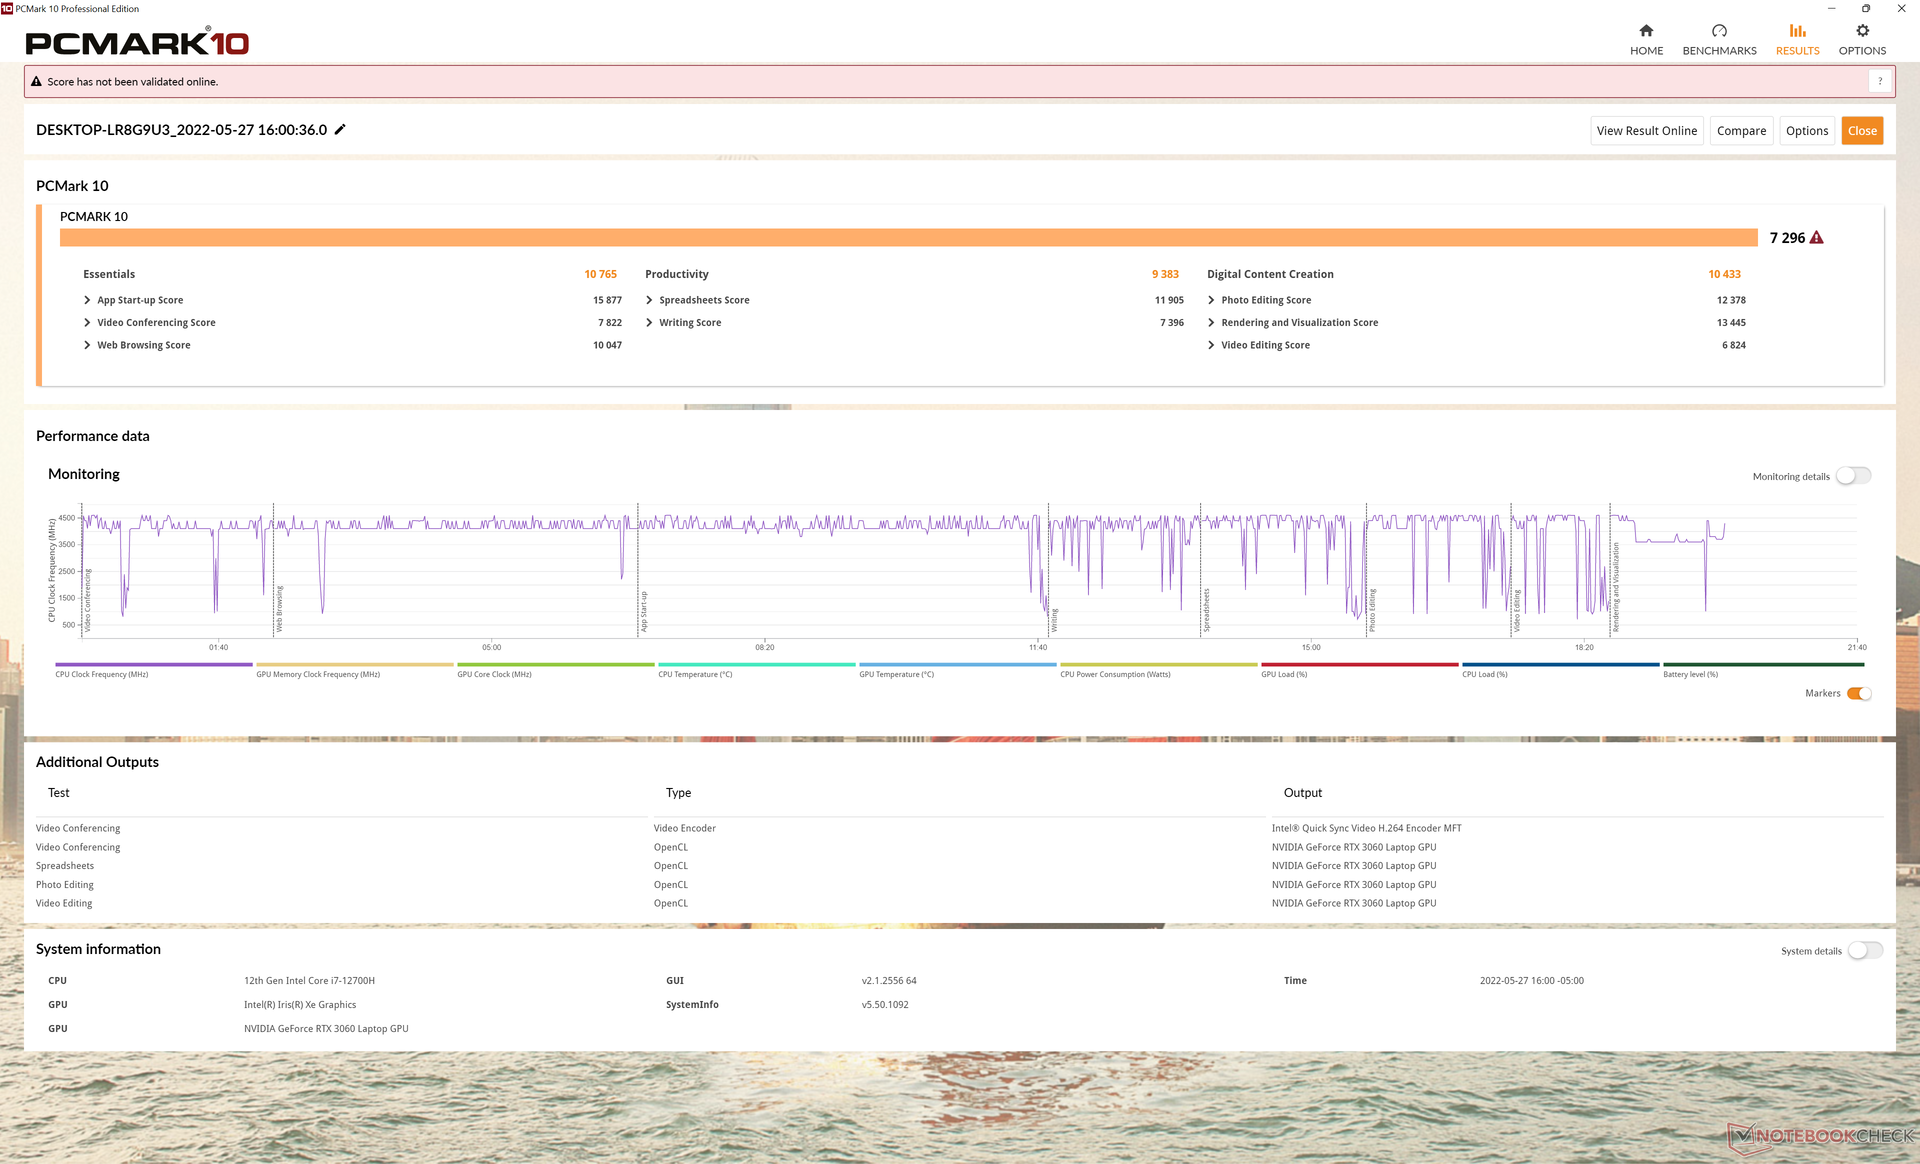
I risultati di PCMark 10 sono costantemente superiori a quelli registrati sull'XPS 17 9710, anche se di poco. I punteggi dell'XPS 17 9720 sono ancora tra i più veloci nella categoria multimedia.
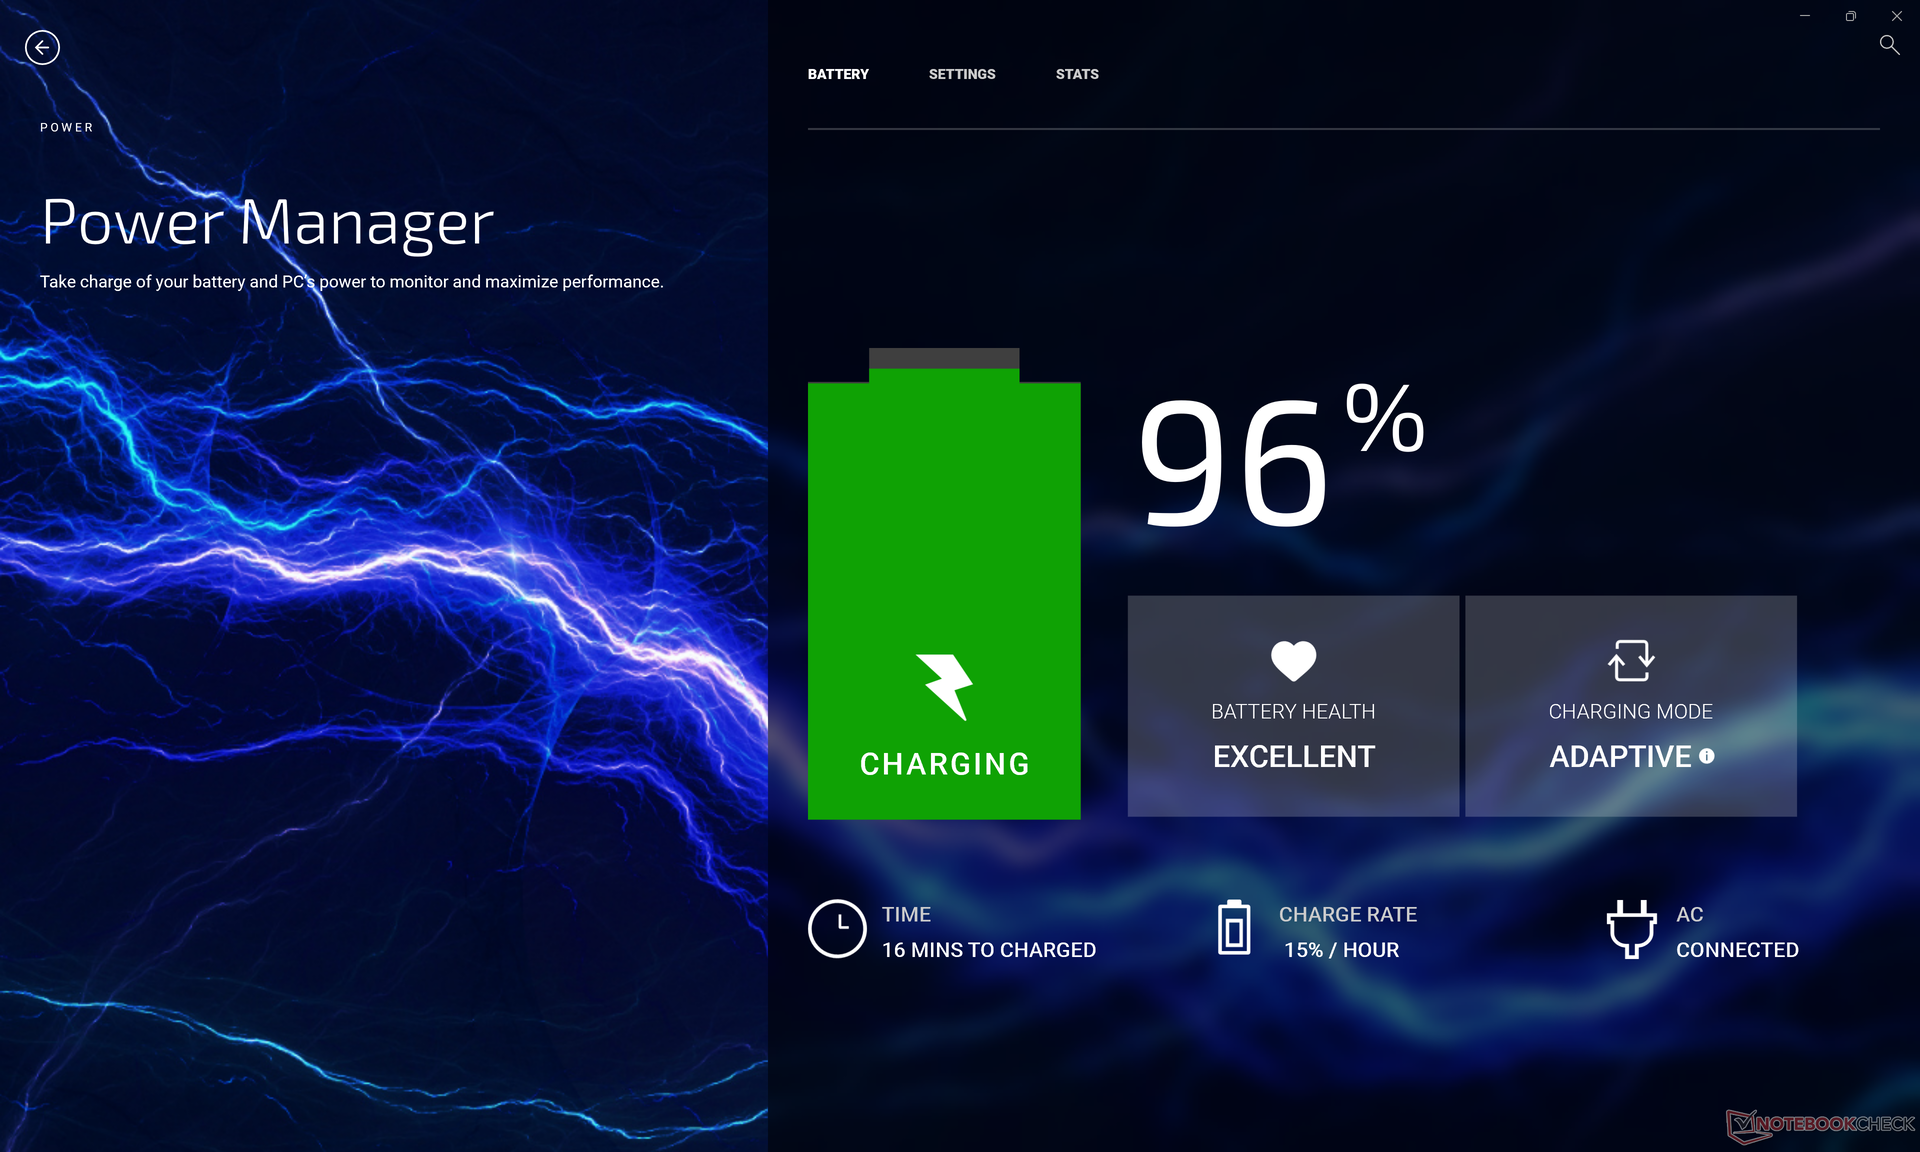
Abbiamo riscontrato un bug sulla nostra unità in cui il consumo di energia si stabilizzava stranamente a 40 W in modalità Sleep invece dei soliti <2 W, causando temperature superficiali molto calde e sprechi di energia. La modifica dei profili di alimentazione tramite My Dell sembra essere una soluzione temporanea al problema.
CrossMark: Overall | Productivity | Creativity | Responsiveness
| PCMark 10 / Score | |
| Media della classe Multimedia (4325 - 10386, n=58, ultimi 2 anni) | |
| Dell XPS 17 9720 RTX 3060 | |
| Razer Blade 17 (i7-12800H, RTX 3070 Ti) | |
| Media Intel Core i7-12700H, NVIDIA GeForce RTX 3060 Laptop GPU (5986 - 8156, n=12) | |
| Dell XPS 17 9710 Core i7 RTX 3060 | |
| Lenovo Legion 5 17ACH6H-82JY0003GE | |
| Dell XPS 17 9700 Core i7 RTX 2060 Max-Q | |
| HP Envy 17-cg | |
| Asus VivoBook 17 F712JA-AU708W | |
| PCMark 10 / Essentials | |
| Dell XPS 17 9720 RTX 3060 | |
| Media Intel Core i7-12700H, NVIDIA GeForce RTX 3060 Laptop GPU (9289 - 12144, n=12) | |
| Media della classe Multimedia (8025 - 11664, n=57, ultimi 2 anni) | |
| Razer Blade 17 (i7-12800H, RTX 3070 Ti) | |
| Dell XPS 17 9710 Core i7 RTX 3060 | |
| Lenovo Legion 5 17ACH6H-82JY0003GE | |
| Dell XPS 17 9700 Core i7 RTX 2060 Max-Q | |
| HP Envy 17-cg | |
| Asus VivoBook 17 F712JA-AU708W | |
| PCMark 10 / Productivity | |
| Media della classe Multimedia (7323 - 18233, n=57, ultimi 2 anni) | |
| Dell XPS 17 9720 RTX 3060 | |
| Media Intel Core i7-12700H, NVIDIA GeForce RTX 3060 Laptop GPU (6161 - 10362, n=12) | |
| Razer Blade 17 (i7-12800H, RTX 3070 Ti) | |
| Lenovo Legion 5 17ACH6H-82JY0003GE | |
| Dell XPS 17 9710 Core i7 RTX 3060 | |
| HP Envy 17-cg | |
| Dell XPS 17 9700 Core i7 RTX 2060 Max-Q | |
| Asus VivoBook 17 F712JA-AU708W | |
| PCMark 10 / Digital Content Creation | |
| Razer Blade 17 (i7-12800H, RTX 3070 Ti) | |
| Media Intel Core i7-12700H, NVIDIA GeForce RTX 3060 Laptop GPU (8950 - 12554, n=12) | |
| Dell XPS 17 9720 RTX 3060 | |
| Media della classe Multimedia (3651 - 16240, n=57, ultimi 2 anni) | |
| Dell XPS 17 9710 Core i7 RTX 3060 | |
| Lenovo Legion 5 17ACH6H-82JY0003GE | |
| Dell XPS 17 9700 Core i7 RTX 2060 Max-Q | |
| HP Envy 17-cg | |
| Asus VivoBook 17 F712JA-AU708W | |
| CrossMark / Overall | |
| Dell XPS 17 9720 RTX 3060 | |
| Media della classe Multimedia (866 - 2728, n=67, ultimi 2 anni) | |
| Media Intel Core i7-12700H, NVIDIA GeForce RTX 3060 Laptop GPU (1649 - 2017, n=11) | |
| Razer Blade 17 (i7-12800H, RTX 3070 Ti) | |
| Lenovo Legion 5 17ACH6H-82JY0003GE | |
| Asus VivoBook 17 F712JA-AU708W | |
| CrossMark / Productivity | |
| Dell XPS 17 9720 RTX 3060 | |
| Media della classe Multimedia (931 - 2489, n=67, ultimi 2 anni) | |
| Media Intel Core i7-12700H, NVIDIA GeForce RTX 3060 Laptop GPU (1536 - 1958, n=11) | |
| Razer Blade 17 (i7-12800H, RTX 3070 Ti) | |
| Lenovo Legion 5 17ACH6H-82JY0003GE | |
| Asus VivoBook 17 F712JA-AU708W | |
| CrossMark / Creativity | |
| Media della classe Multimedia (907 - 3465, n=67, ultimi 2 anni) | |
| Dell XPS 17 9720 RTX 3060 | |
| Media Intel Core i7-12700H, NVIDIA GeForce RTX 3060 Laptop GPU (1816 - 2084, n=11) | |
| Razer Blade 17 (i7-12800H, RTX 3070 Ti) | |
| Lenovo Legion 5 17ACH6H-82JY0003GE | |
| Asus VivoBook 17 F712JA-AU708W | |
| CrossMark / Responsiveness | |
| Dell XPS 17 9720 RTX 3060 | |
| Media Intel Core i7-12700H, NVIDIA GeForce RTX 3060 Laptop GPU (1210 - 2207, n=11) | |
| Razer Blade 17 (i7-12800H, RTX 3070 Ti) | |
| Media della classe Multimedia (605 - 2024, n=67, ultimi 2 anni) | |
| Lenovo Legion 5 17ACH6H-82JY0003GE | |
| Asus VivoBook 17 F712JA-AU708W | |
| PCMark 10 Score | 7296 punti | |
Aiuto | ||
| AIDA64 / Memory Copy | |
| Dell XPS 17 9720 RTX 3060 | |
| Media Intel Core i7-12700H (25615 - 80511, n=64) | |
| Razer Blade 17 (i7-12800H, RTX 3070 Ti) | |
| Dell XPS 17 9700 Core i7 RTX 2060 Max-Q | |
| Lenovo Legion 5 17ACH6H-82JY0003GE | |
| Asus VivoBook 17 F712JA-AU708W | |
| AIDA64 / Memory Read | |
| Dell XPS 17 9720 RTX 3060 | |
| Media Intel Core i7-12700H (25586 - 79442, n=64) | |
| Razer Blade 17 (i7-12800H, RTX 3070 Ti) | |
| Lenovo Legion 5 17ACH6H-82JY0003GE | |
| Dell XPS 17 9700 Core i7 RTX 2060 Max-Q | |
| Asus VivoBook 17 F712JA-AU708W | |
| AIDA64 / Memory Write | |
| Dell XPS 17 9720 RTX 3060 | |
| Media Intel Core i7-12700H (23679 - 88660, n=64) | |
| Razer Blade 17 (i7-12800H, RTX 3070 Ti) | |
| Dell XPS 17 9700 Core i7 RTX 2060 Max-Q | |
| Lenovo Legion 5 17ACH6H-82JY0003GE | |
| Asus VivoBook 17 F712JA-AU708W | |
* ... Meglio usare valori piccoli
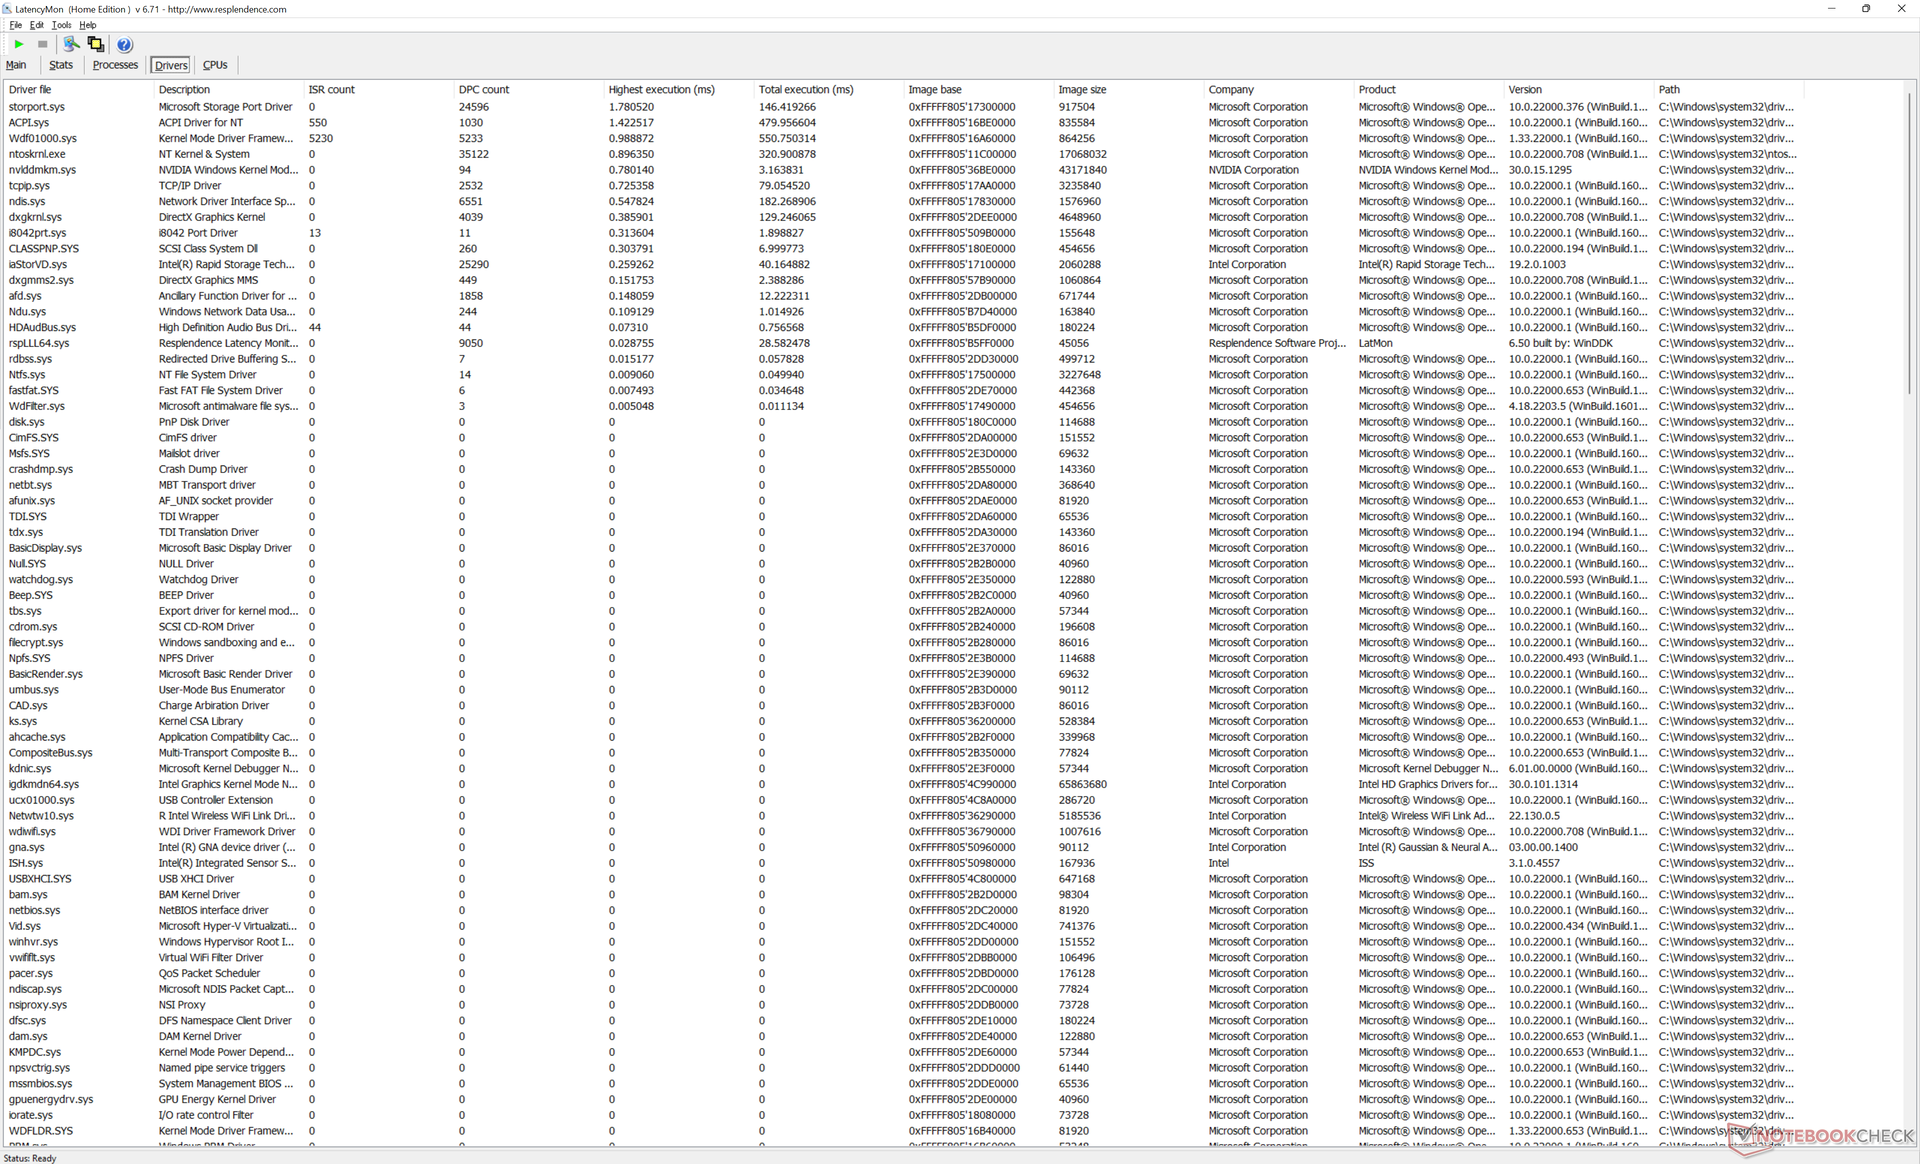
Latenza DPC
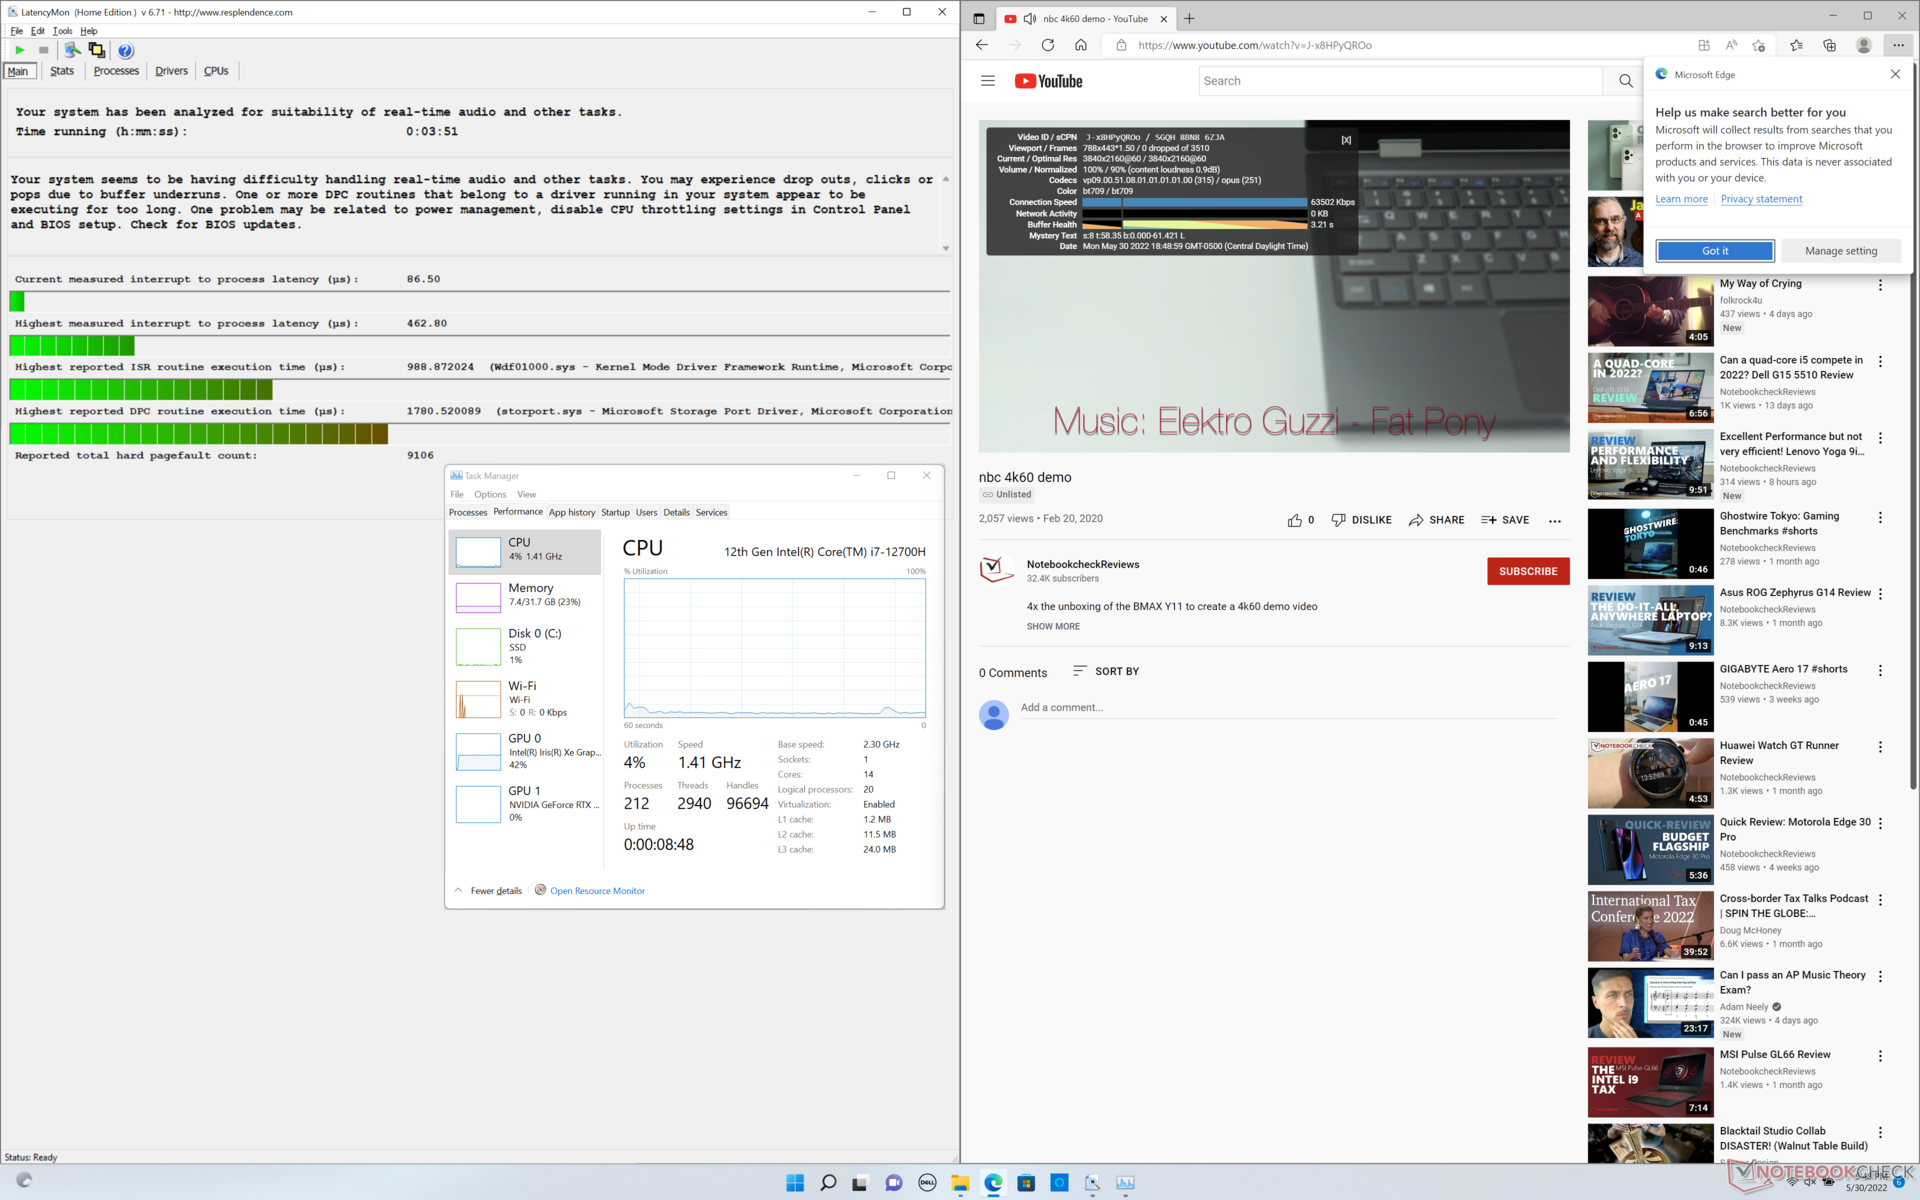
LatencyMon rivela lievi problemi di DPC quando si aprono più schede del browser sulla nostra homepage, proprio come abbiamo osservato sugli XPS 17 9710 e 9700. la riproduzione di video 4K a 60 FPS è invece perfettamente fluida, senza cadute di fotogrammi, come ci si può aspettare da qualsiasi portatile multimediale dotato di Core H.
| DPC Latencies / LatencyMon - interrupt to process latency (max), Web, Youtube, Prime95 | |
| HP Envy 17-cg | |
| Lenovo Legion 5 17ACH6H-82JY0003GE | |
| Asus VivoBook 17 F712JA-AU708W | |
| Razer Blade 17 (i7-12800H, RTX 3070 Ti) | |
| Dell XPS 17 9700 Core i7 RTX 2060 Max-Q | |
| Dell XPS 17 9710 Core i7 RTX 3060 | |
| Dell XPS 17 9720 RTX 3060 | |
* ... Meglio usare valori piccoli
Dispositivi di archiviazione
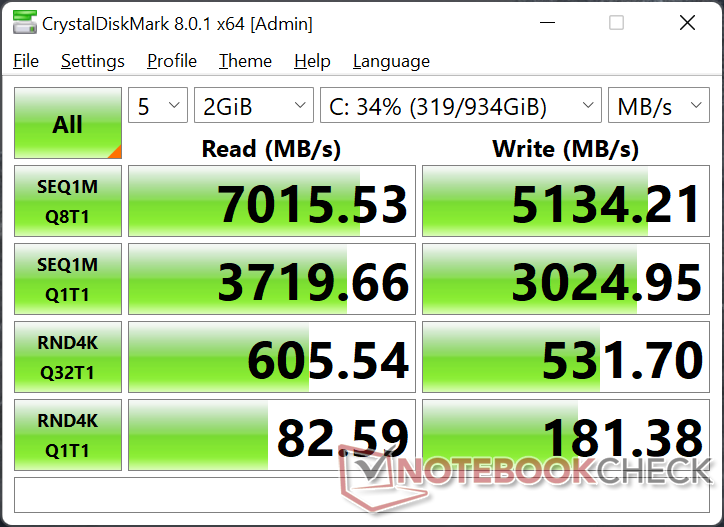
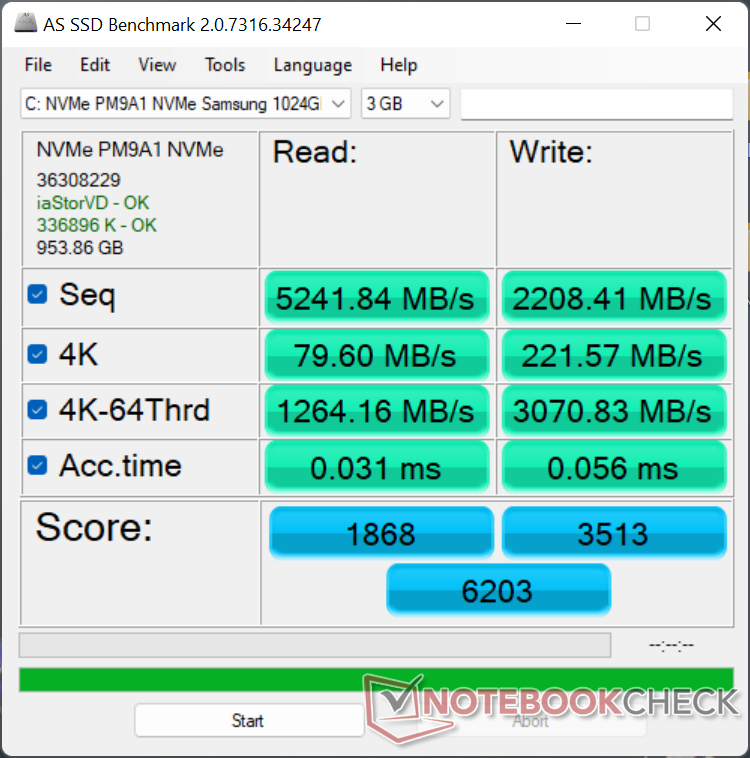
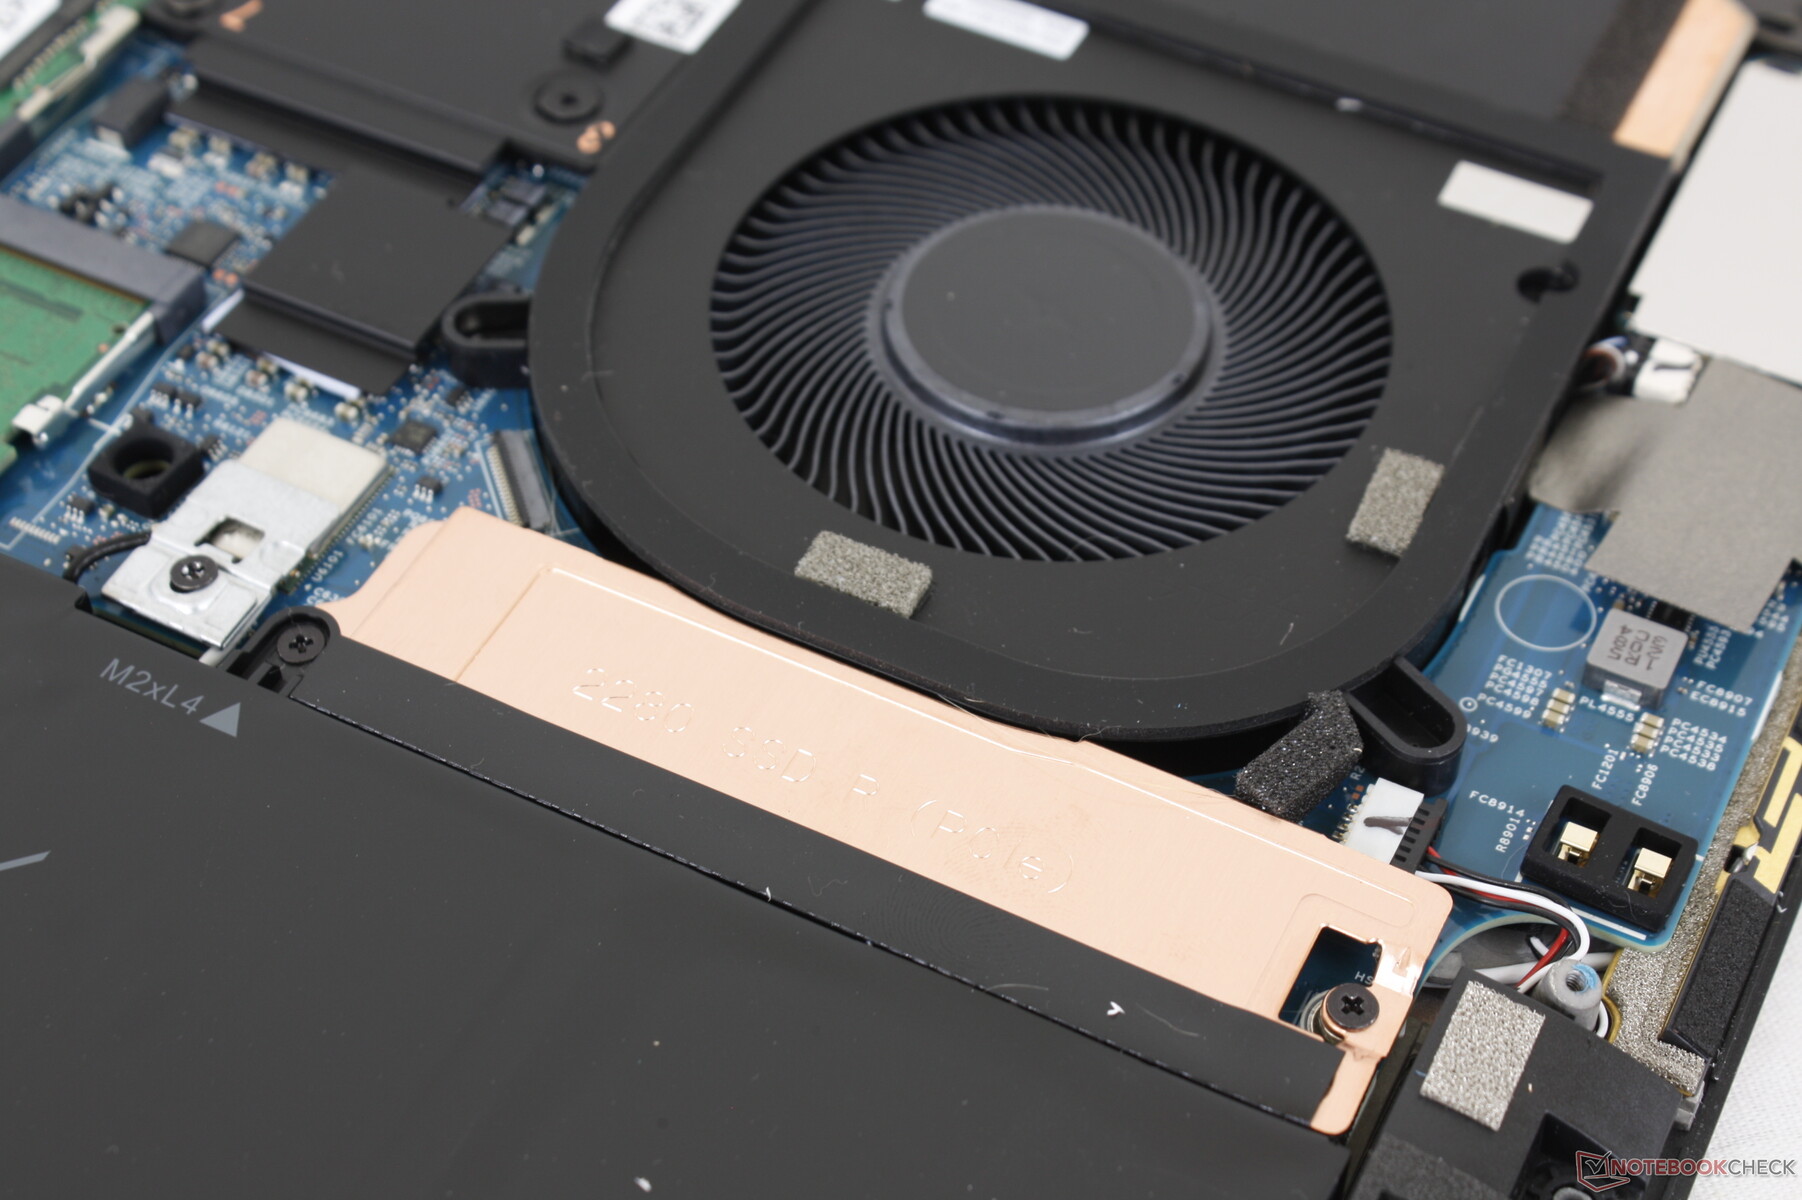
L'XPS 17 9710 è stato distribuito in un periodo in cui le unità SSD NVMe PCIe4 x4 non erano ancora ampiamente disponibili e quindi le SKU erano disponibili solo con opzioni PCIe3 x4. Le unità PCIe4 sono fortunatamente più diffuse al giorno d'oggi ed è bello vedere che l'XPS 17 9720 ha adottato una veloce unità SSMe.Samsung PM9A1 samsung. I nostri test di stress mostrano che l'unità nella nostra unità non ha avuto problemi a mantenere la velocità massima di lettura sequenziale di oltre 7000 MB/s per periodi prolungati senza dover ricorrere al throttling, anche se le prestazioni complessive sono ancora più lente di quelle registrate sul Razer Blade 1720.Razer Blade 17 dotato della stessa unità Samsung da 1 TB.

* ... Meglio usare valori piccoli
Disk Throttling: DiskSpd Read Loop, Queue Depth 8
Prestazioni della GPU
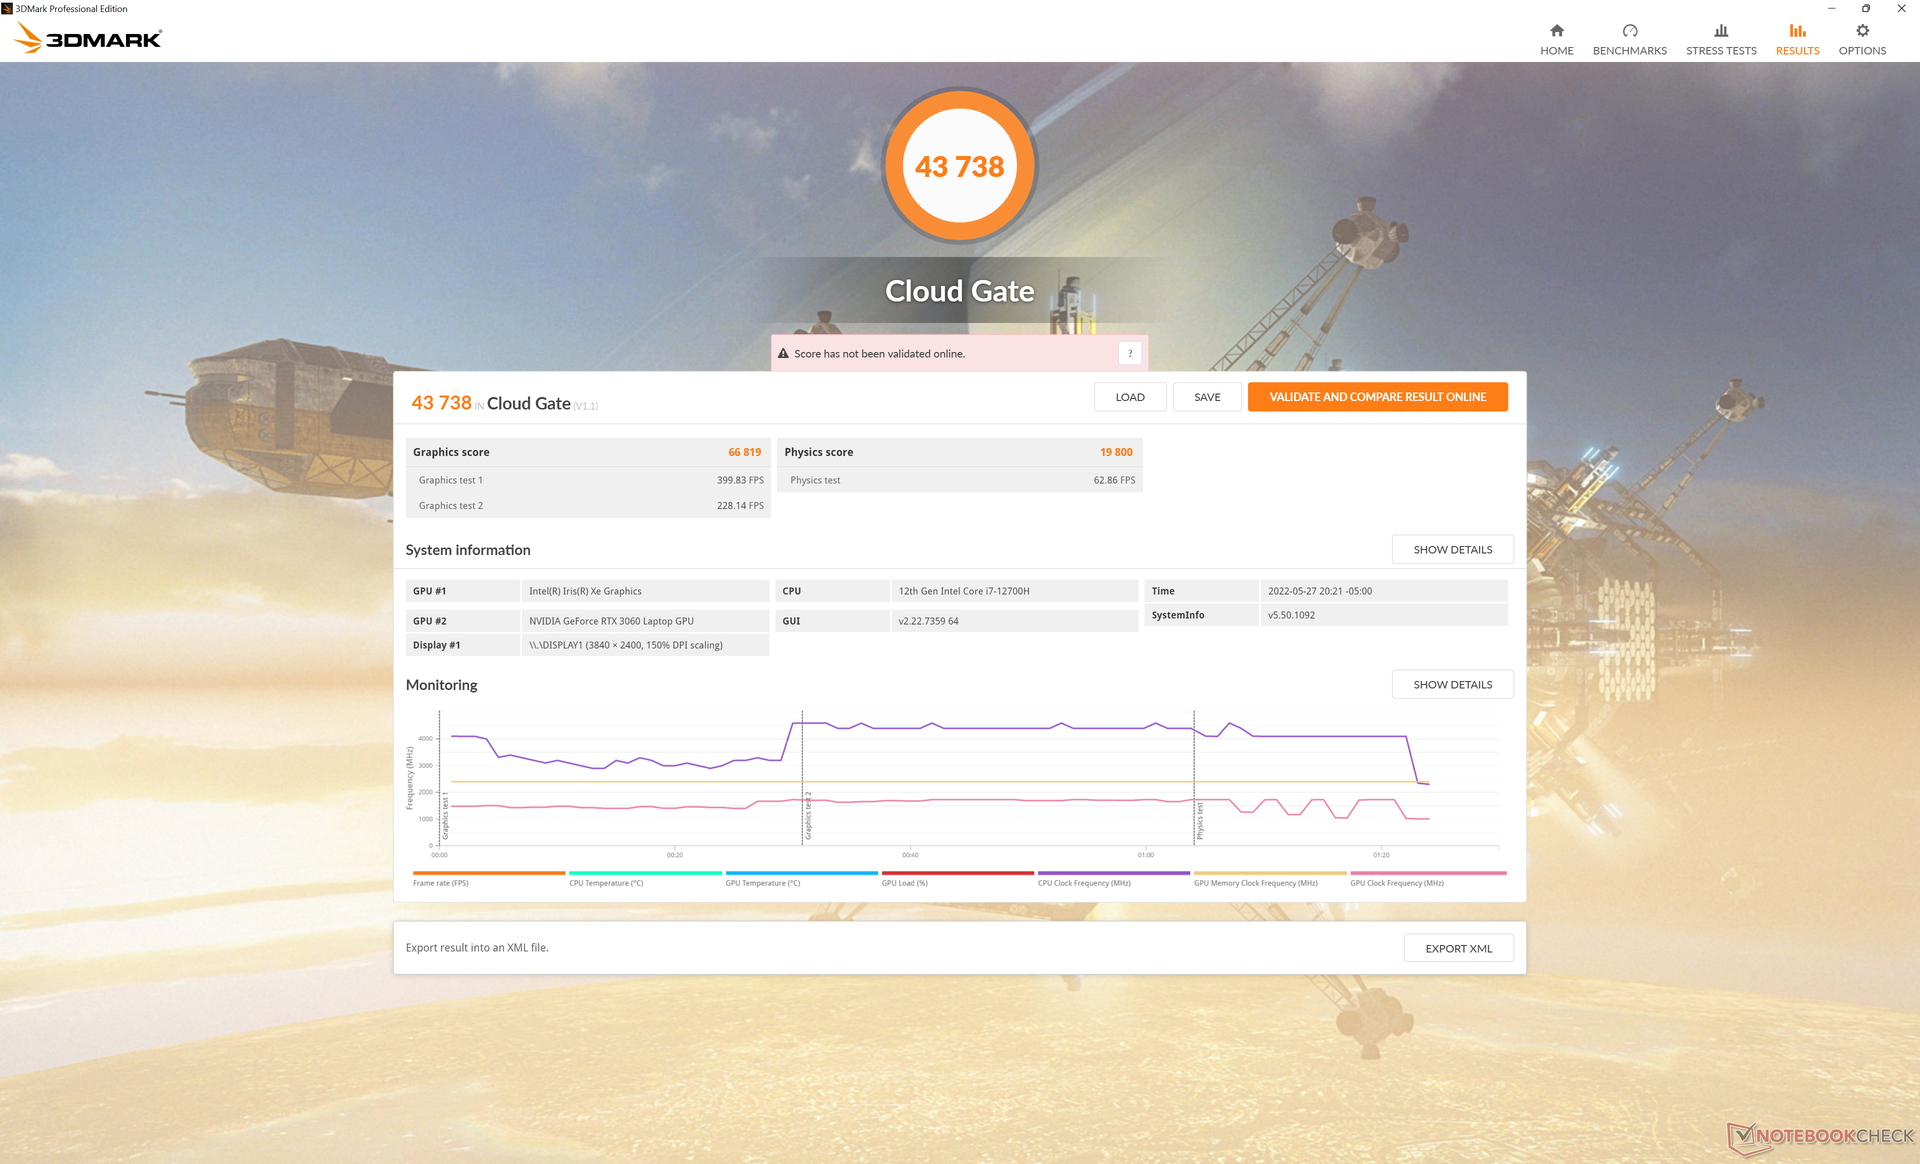
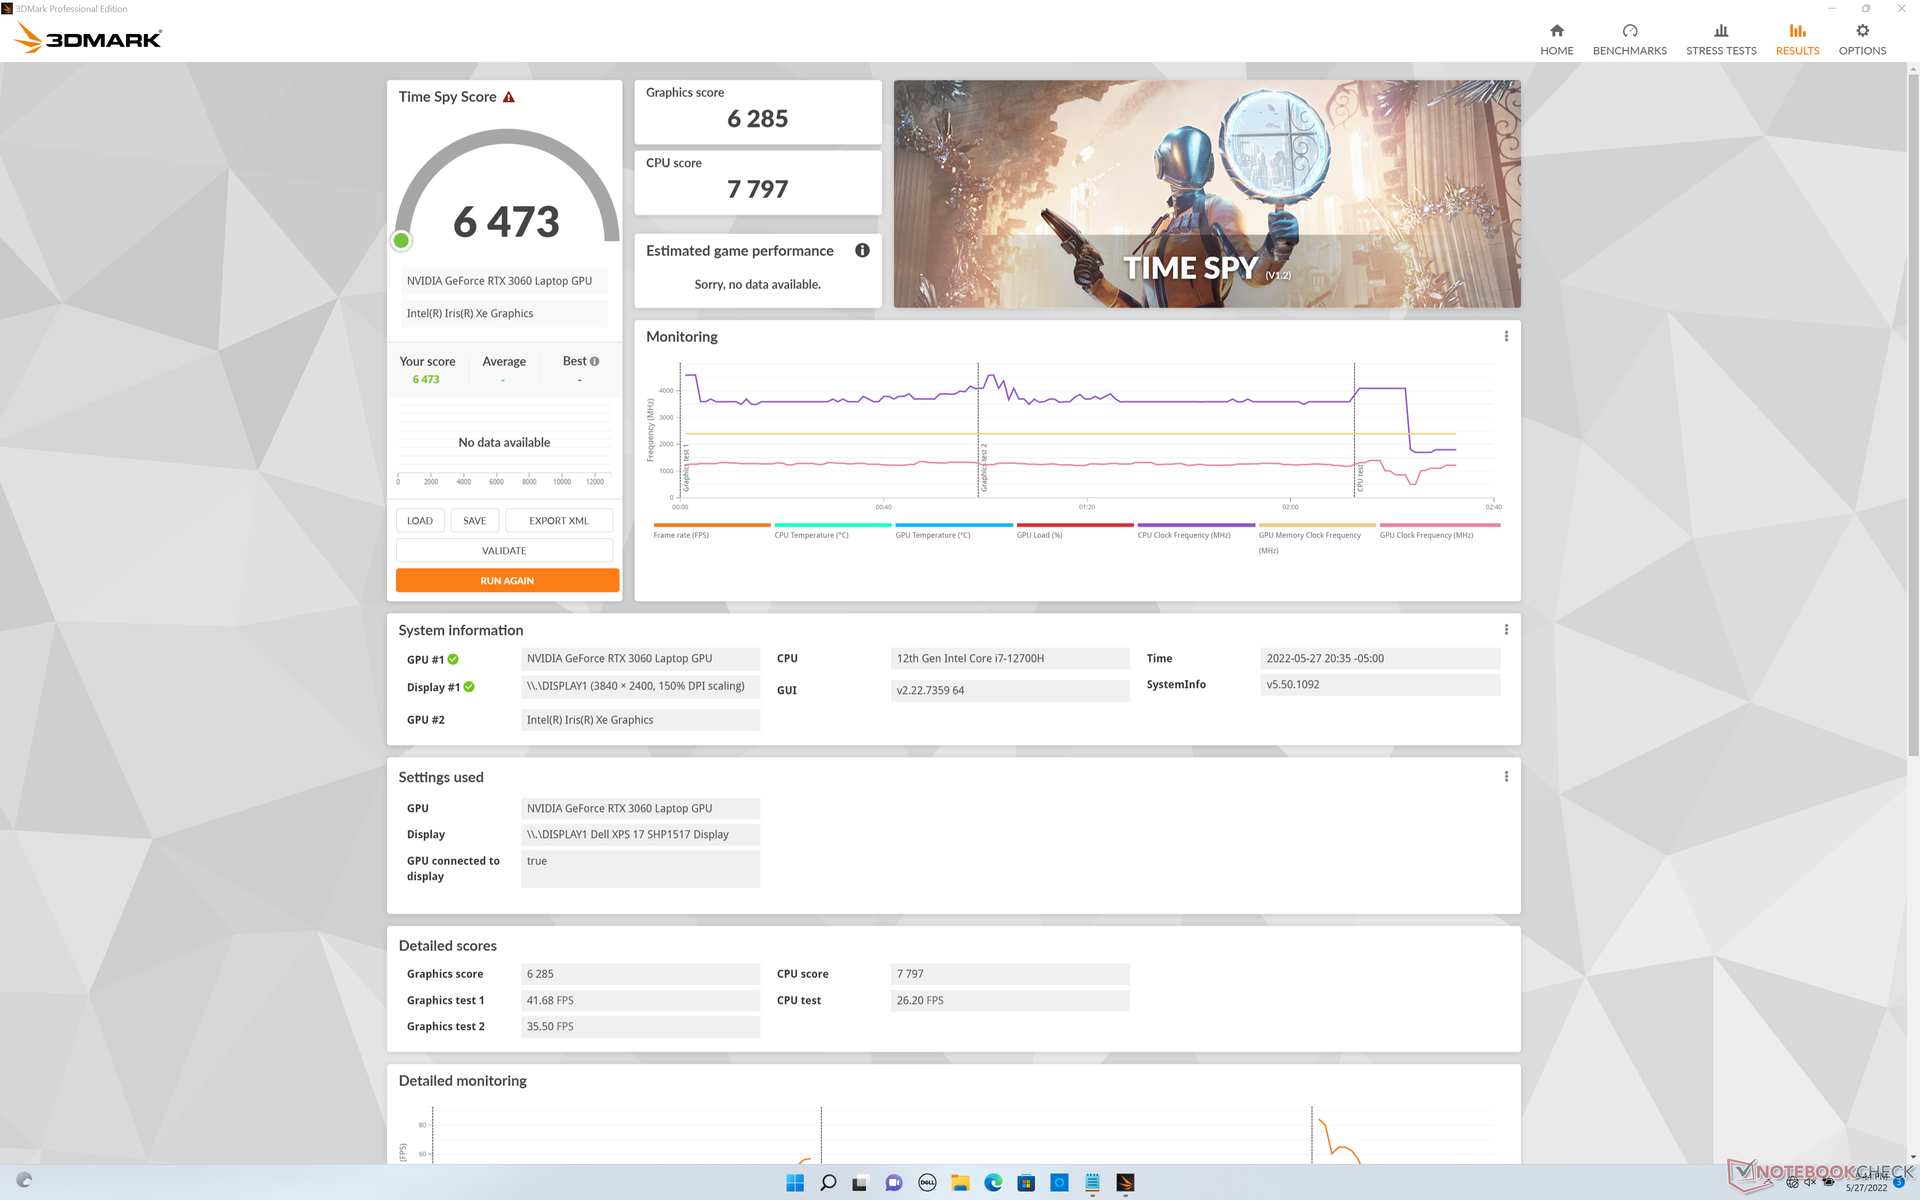
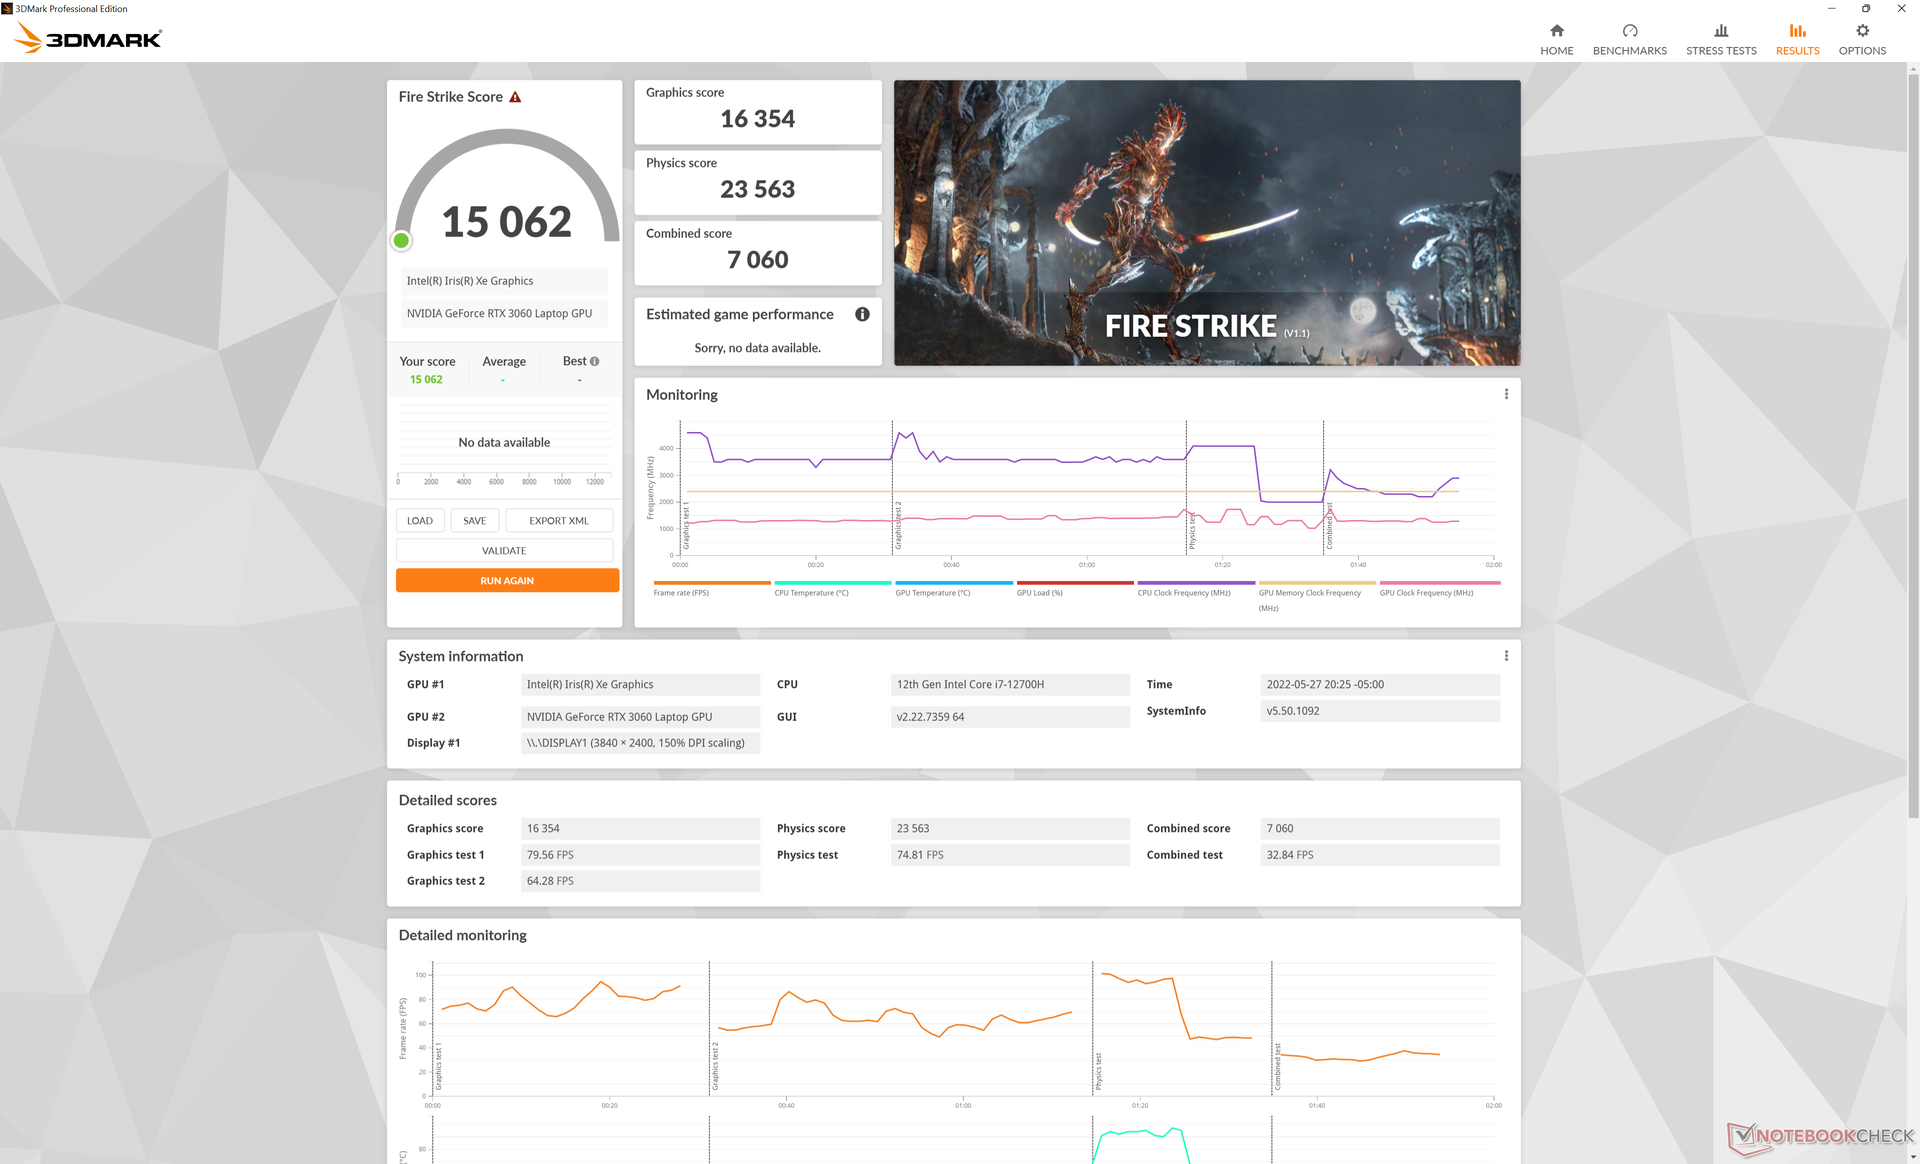
Dell ha ridotto il TGP GeForce RTX 3060 da 70 W sull'XPS 17 9710 a 65 W sull'XPS 17 9720. Sebbene Dell pubblicizzi una GPU da 60 W per il modello 9720, possiamo confermare che il pannello di controllo Nvidia indica invece 65 W, il che è più vicino ai nostri risultati indipendenti durante i test. L'effetto è una diminuzione del 10% delle prestazioni grafiche grezze secondo i benchmark 3DMark e i giochi testati legati alla GPU come Witcher 3 final Fantasy XV o Strange Brigade.
Rispetto alla media dei laptop con la stessa GPU GeForce RTX 3060, quella dell'XPS 17 9720 è circa il 20% più lenta. Vale la pena notare che la maggior parte degli altri portatili con la RTX 3060 punta a raggiungere massimali TGP di 80 W o più. Come minimo, la GPU è ancora migliore della RTX 2060 Max-Q dell'XPS 17 9700 originale di circa il 15%. Nel frattempo, il downgrade alla SKU RTX 3050 Ti comporterebbe un deficit di prestazioni del 25-30%.
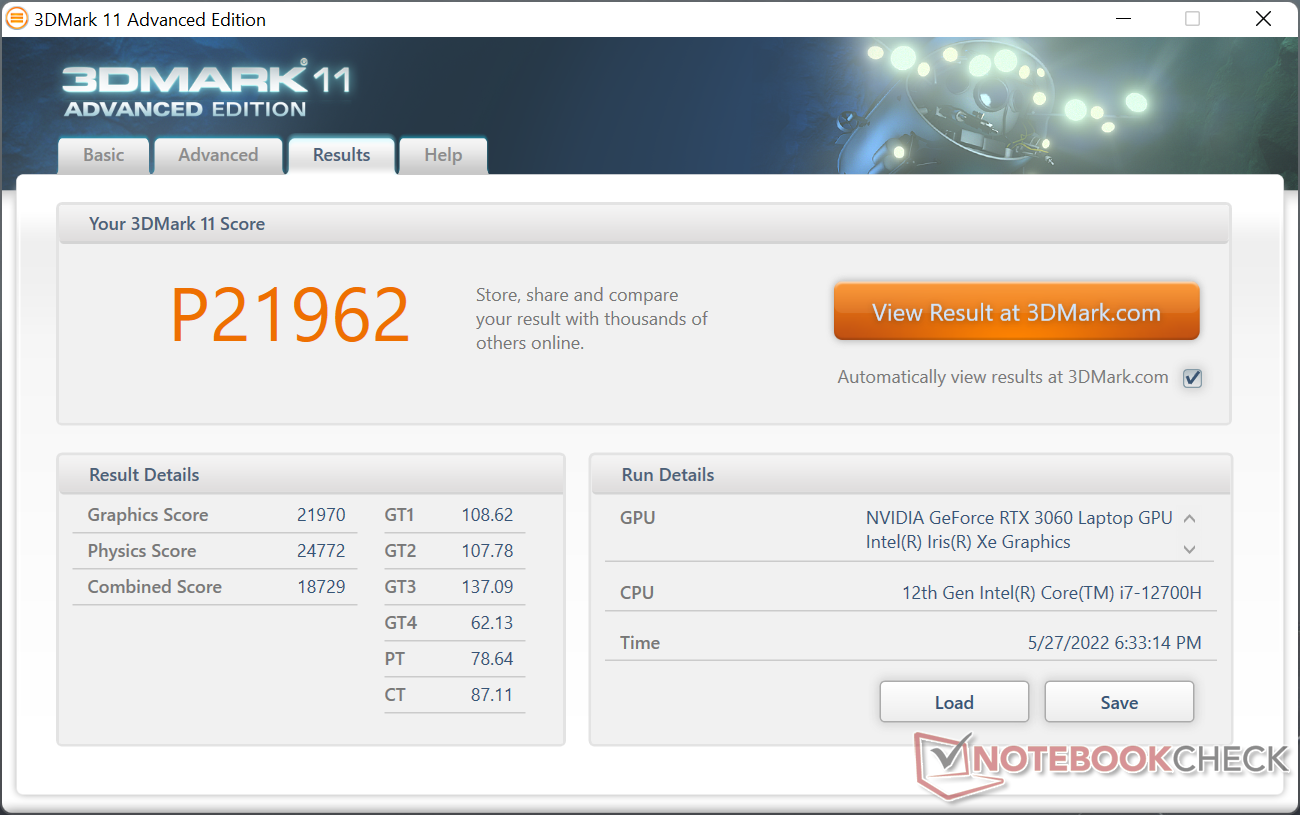
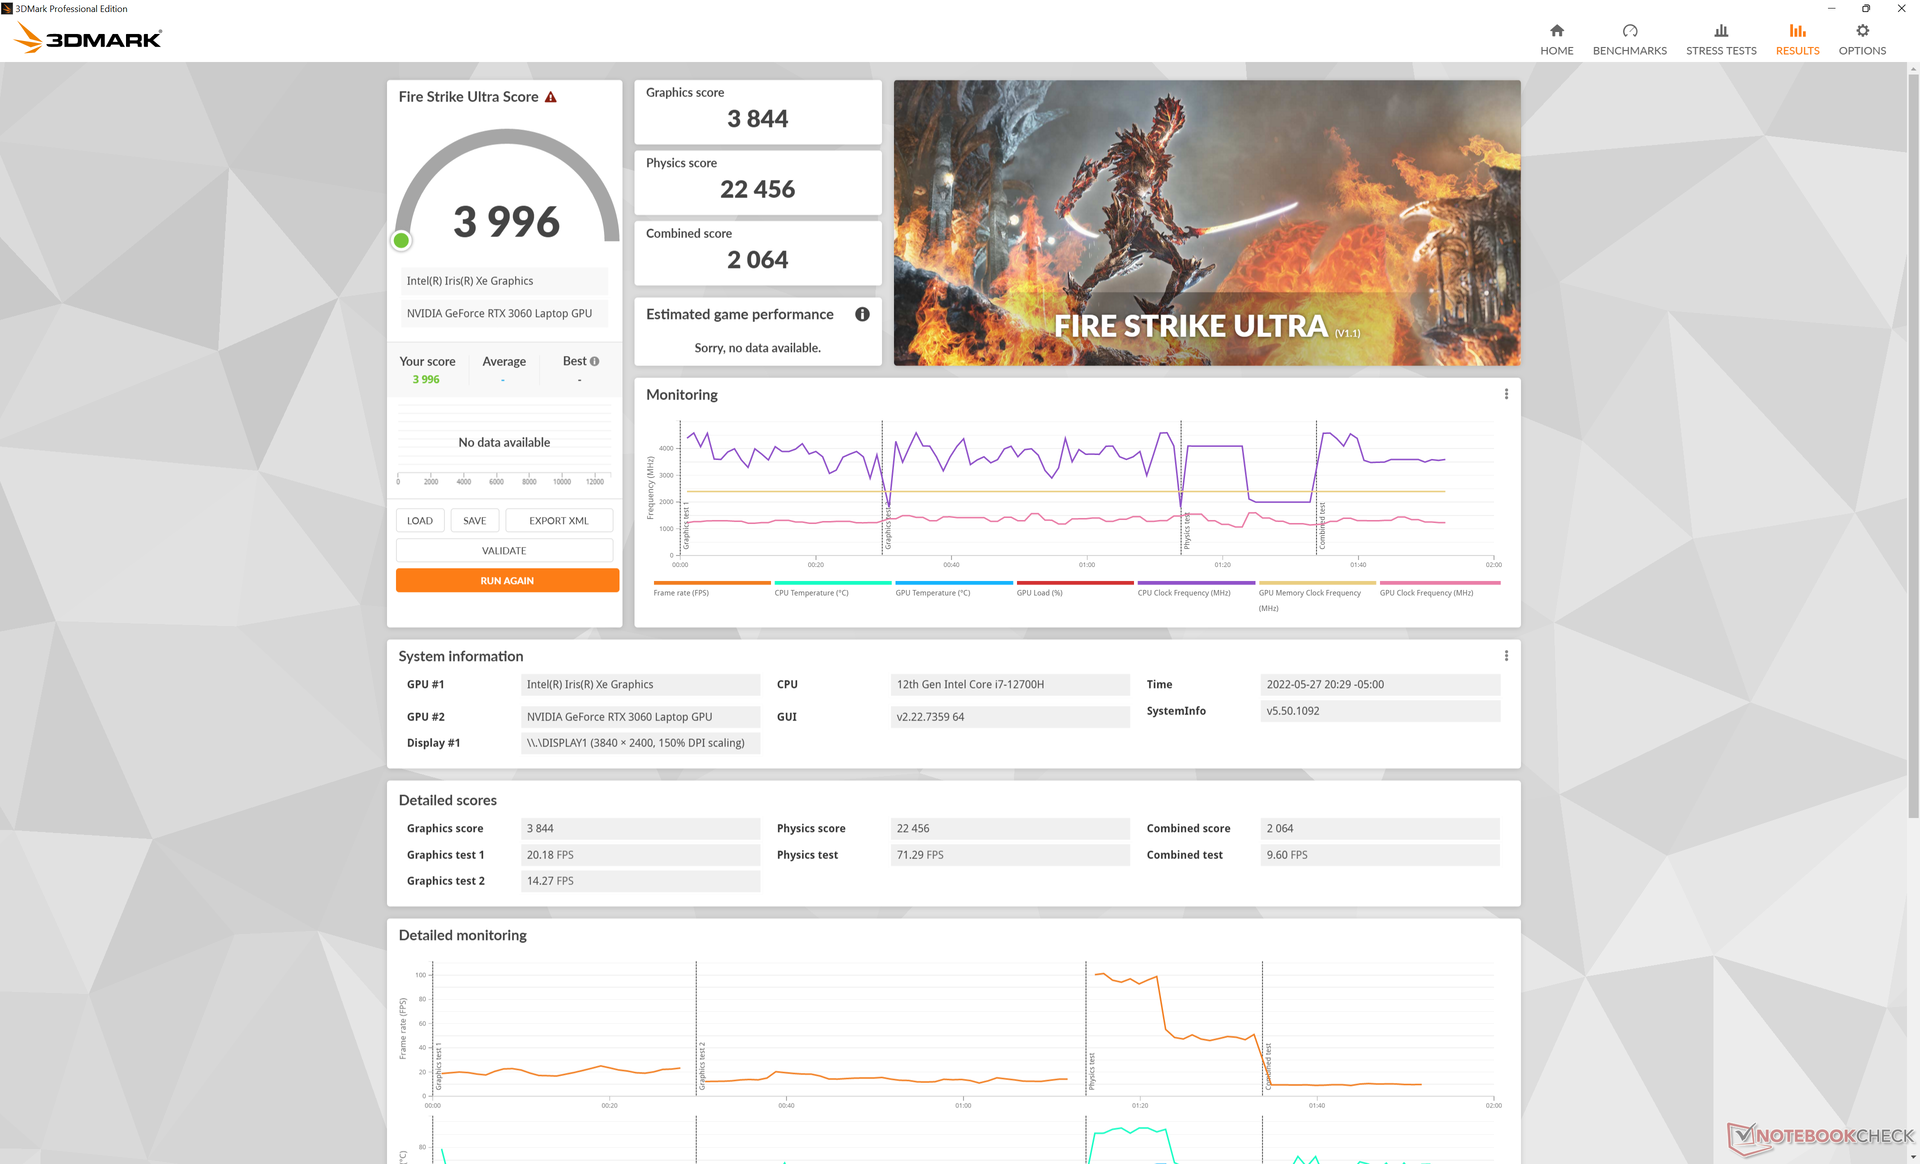
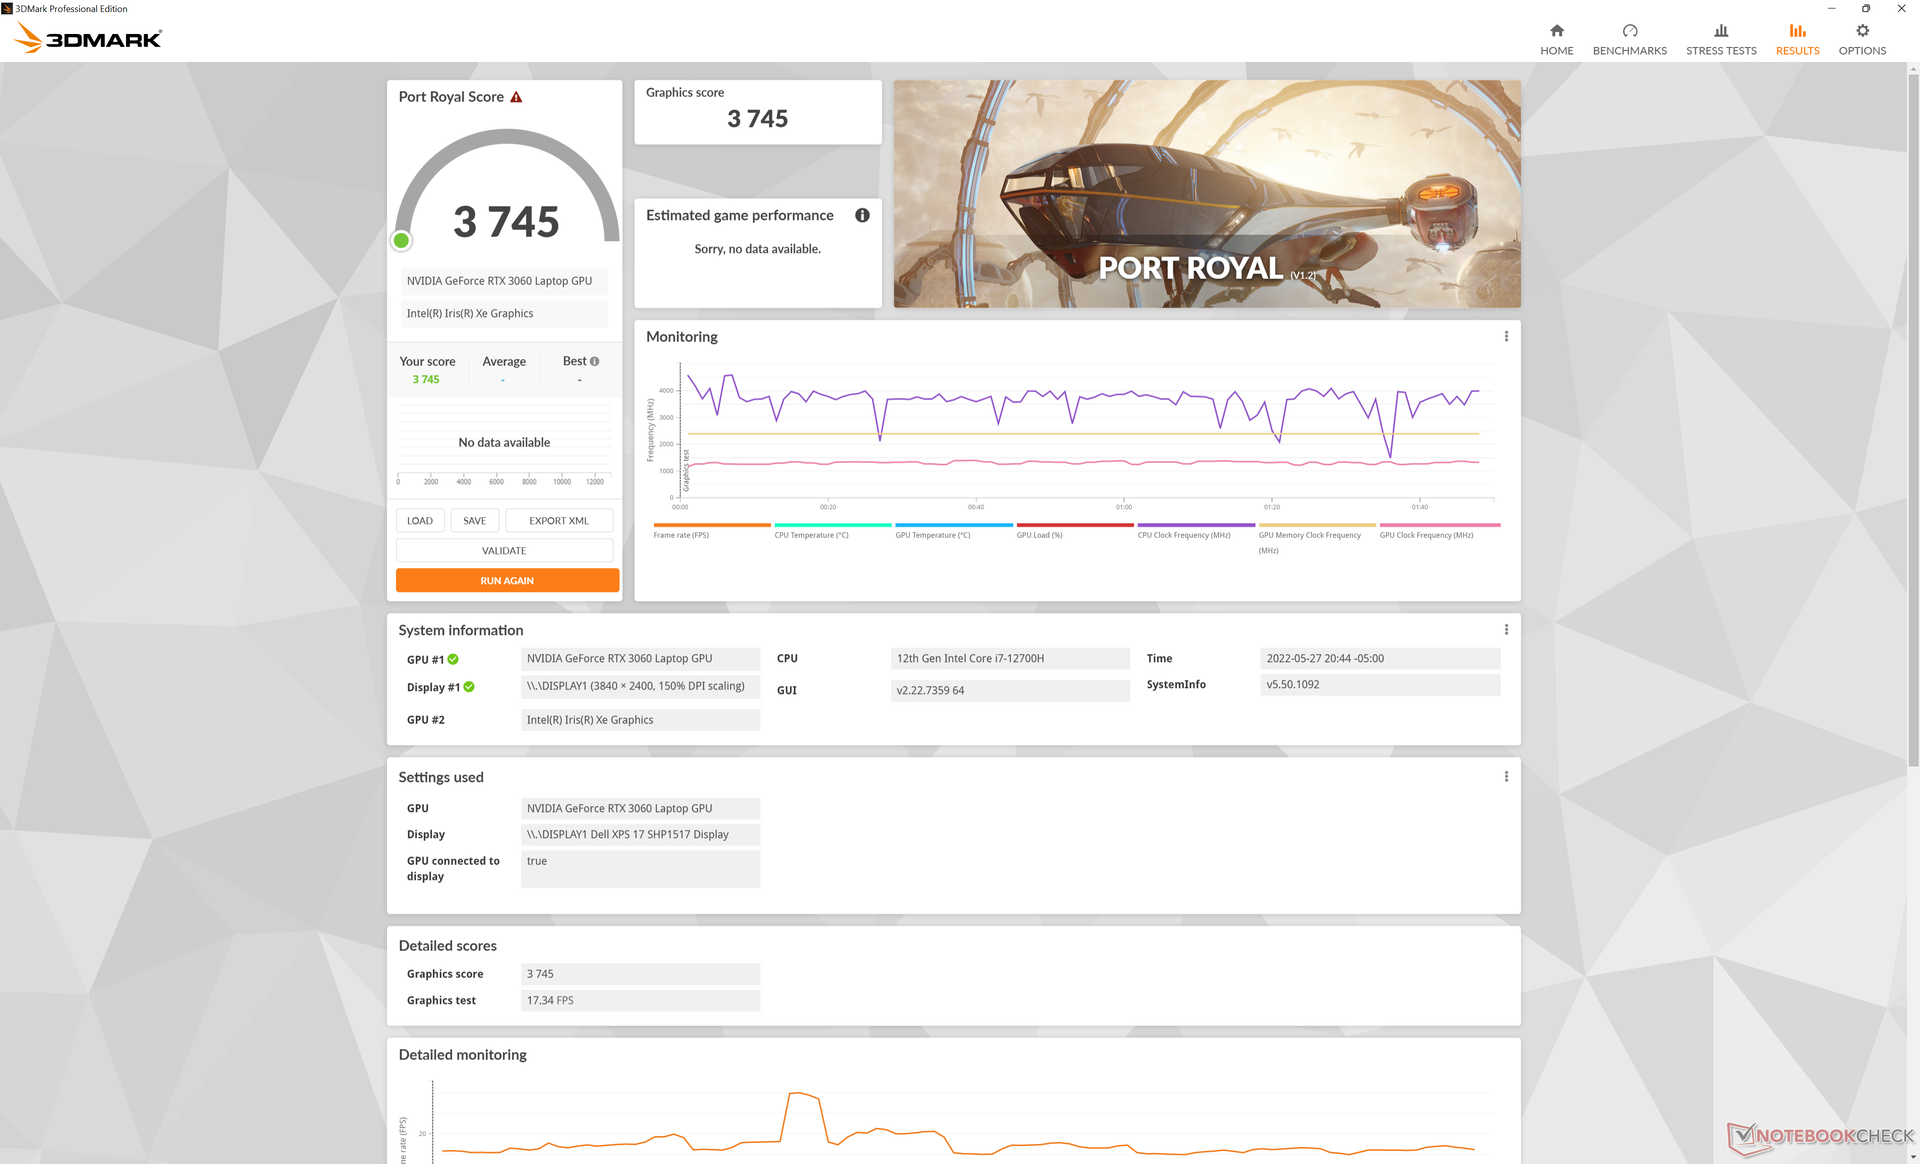
| 3DMark 11 Performance | 21962 punti | |
| 3DMark Cloud Gate Standard Score | 43738 punti | |
| 3DMark Fire Strike Score | 15062 punti | |
| 3DMark Time Spy Score | 6473 punti | |
Aiuto | ||
Witcher 3 FPS Chart
| basso | medio | alto | ultra | QHD | 4K | |
|---|---|---|---|---|---|---|
| GTA V (2015) | 186.6 | 179 | 152.8 | 83.8 | 63.4 | |
| The Witcher 3 (2015) | 347.7 | 214.6 | 133.9 | 67.8 | ||
| Dota 2 Reborn (2015) | 185.7 | 169.9 | 163 | 133.5 | 84.6 | |
| Final Fantasy XV Benchmark (2018) | 137.9 | 90.5 | 69.3 | 49.1 | 28.3 | |
| X-Plane 11.11 (2018) | 133.3 | 111.6 | 93.8 | 92.3 | ||
| Strange Brigade (2018) | 352 | 162.6 | 130.6 | 113.4 | 82.3 | |
| Cyberpunk 2077 1.6 (2022) | 95.4 | 78.1 | 60 | 48.9 | 29 | 11.6 |
Emissioni - Rumore e temperature dei portatili da gioco
Rumore del sistema
Il rumore e il comportamento della ventola non sono cambiati rispetto all'XPS 17 9700 originale, il che significa che il rumore della ventola raggiunge ancora quasi i 50 db(A) quando si gioca o si esegue un carico elevato. Il rumore è paragonabile a quello di molti portatili da gioco in queste condizioni di stress.
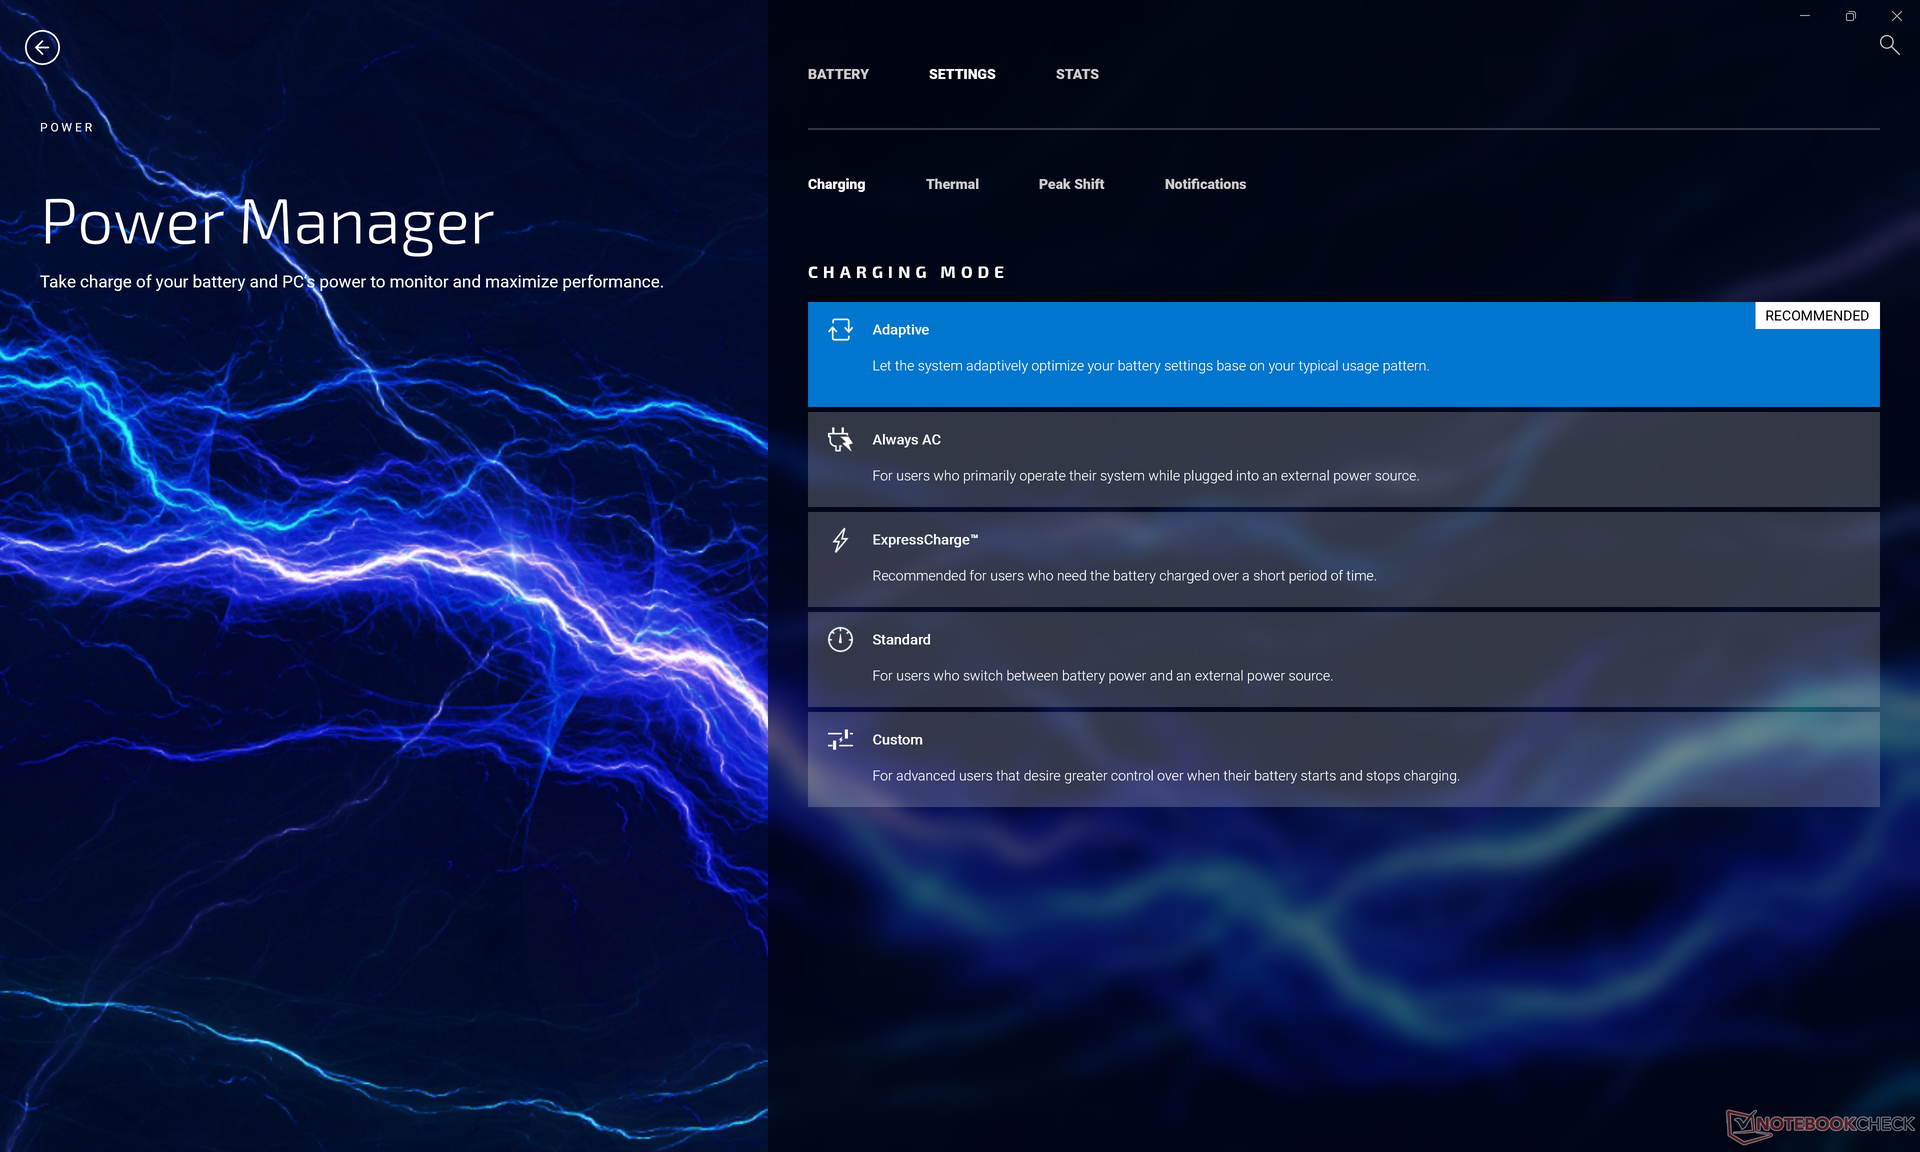
Le ventole passano da silenziose a rumorose abbastanza rapidamente quando si introducono carichi medio-alti, per cui consigliamo il profilo di alimentazione Quiet per limitare le pulsazioni delle ventole se la potenza extra non è necessaria.
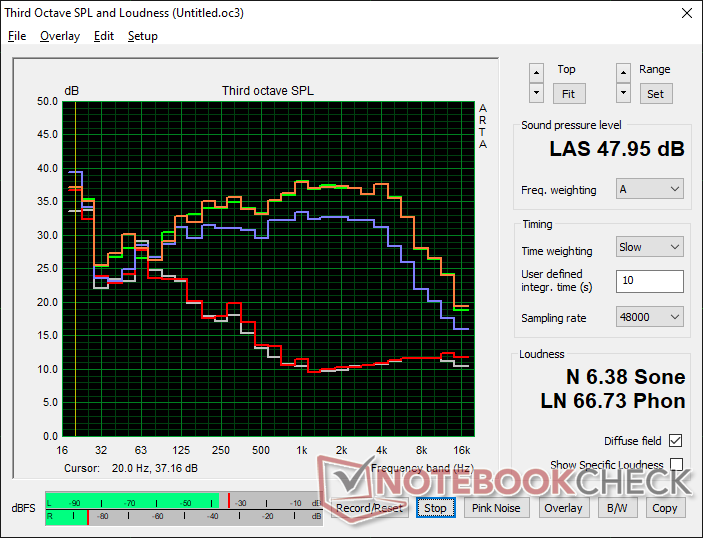
Rumorosità
| Idle |
| 24.1 / 24.1 / 24.1 dB(A) |
| Sotto carico |
| 43.2 / 48 dB(A) |
 | ||
30 dB silenzioso 40 dB(A) udibile 50 dB(A) rumoroso |
||
min: | ||
| Dell XPS 17 9720 RTX 3060 GeForce RTX 3060 Laptop GPU, i7-12700H, Samsung PM9A1 MZVL21T0HCLR | HP Envy 17-cg GeForce MX450, i5-1135G7, Samsung PM991 MZVLQ1T0HALB | Dell XPS 17 9710 Core i7 RTX 3060 GeForce RTX 3060 Laptop GPU, i7-11800H, Micron 2300 1TB MTFDHBA1T0TDV | Dell XPS 17 9700 Core i7 RTX 2060 Max-Q GeForce RTX 2060 Max-Q, i7-10875H, Micron 2200S 1TB MTFDHBA1T0TCK | Lenovo Legion 5 17ACH6H-82JY0003GE GeForce RTX 3060 Laptop GPU, R5 5600H, Samsung PM991a MZALQ512HBLU | Asus VivoBook 17 F712JA-AU708W Iris Plus Graphics G7 (Ice Lake 64 EU), i7-1065G7, Kingston OM8PCP3512F-AB | Razer Blade 17 (i7-12800H, RTX 3070 Ti) GeForce RTX 3070 Ti Laptop GPU, i7-12800H, Samsung PM9A1 MZVL21T0HCLR | |
|---|---|---|---|---|---|---|---|
| Noise | -9% | -5% | -10% | -6% | -14% | 4% | |
| off /ambiente * (dB) | 23.8 | 26 -9% | 25.5 -7% | 28 -18% | 25 -5% | 29.6 -24% | 23 3% |
| Idle Minimum * (dB) | 24.1 | 26 -8% | 25.2 -5% | 28 -16% | 25 -4% | 31.4 -30% | 23 5% |
| Idle Average * (dB) | 24.1 | 31.7 -32% | 25.2 -5% | 28 -16% | 25 -4% | 31.4 -30% | 23 5% |
| Idle Maximum * (dB) | 24.1 | 25.2 -5% | 28 -16% | 30.5 -27% | 31.4 -30% | 23 5% | |
| Load Average * (dB) | 43.2 | 43.2 -0% | 45.9 -6% | 43.2 -0% | 37.5 13% | 36.1 16% | 36.92 15% |
| Witcher 3 ultra * (dB) | 48 | 49 -2% | 49 -2% | 50 -4% | |||
| Load Maximum * (dB) | 48 | 46.6 3% | 50.4 -5% | 50.5 -5% | 51 -6% | 40.1 16% | 50 -4% |
* ... Meglio usare valori piccoli
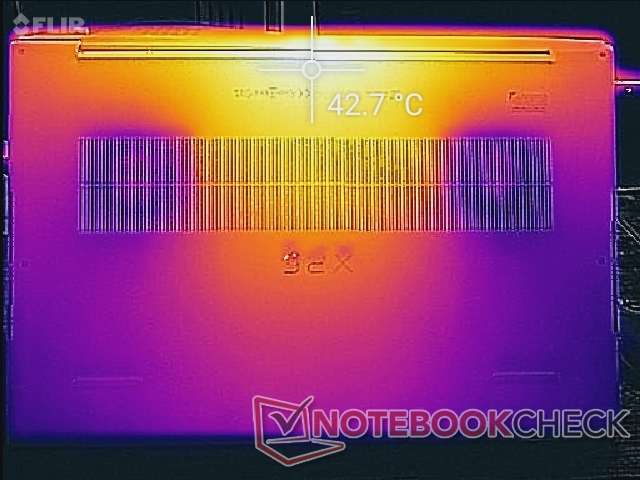
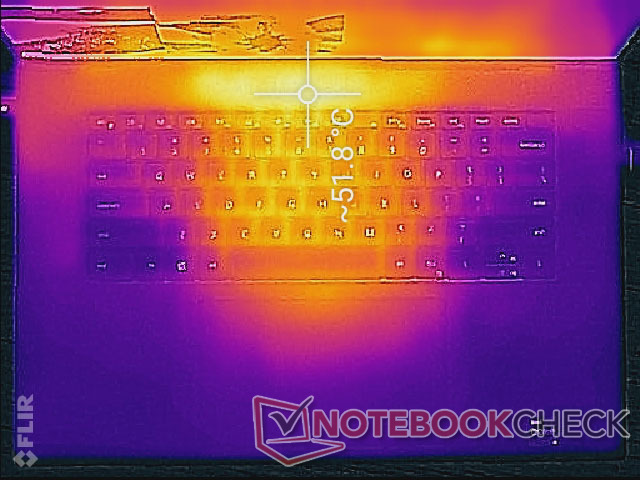
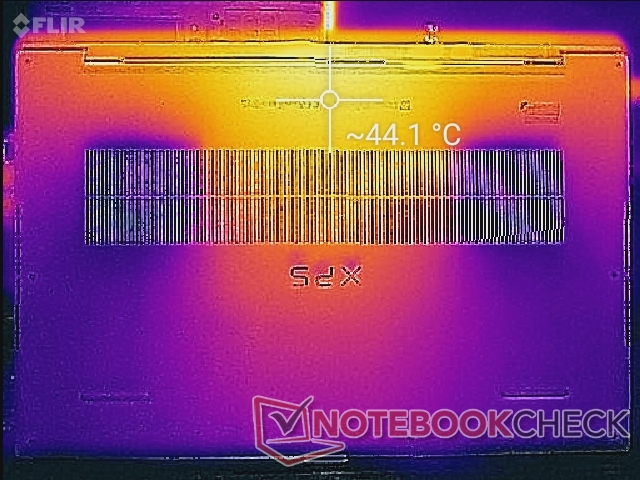
Temperatura
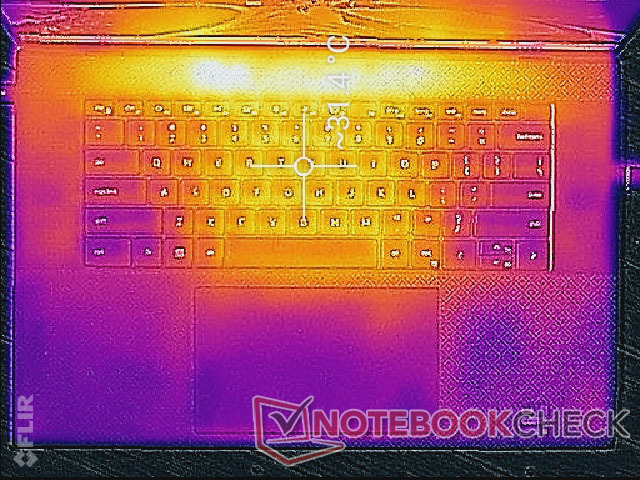
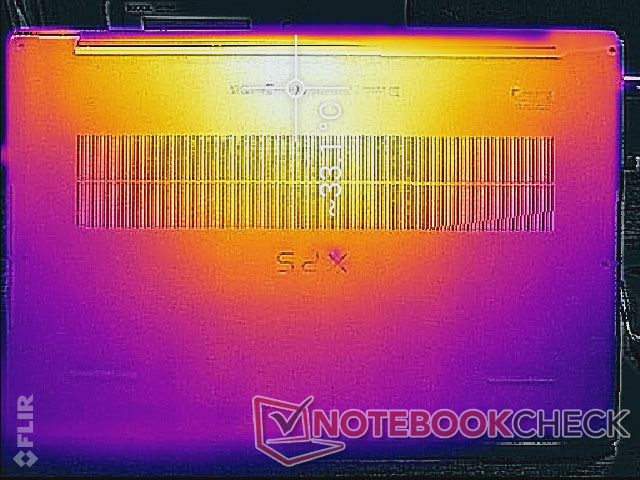
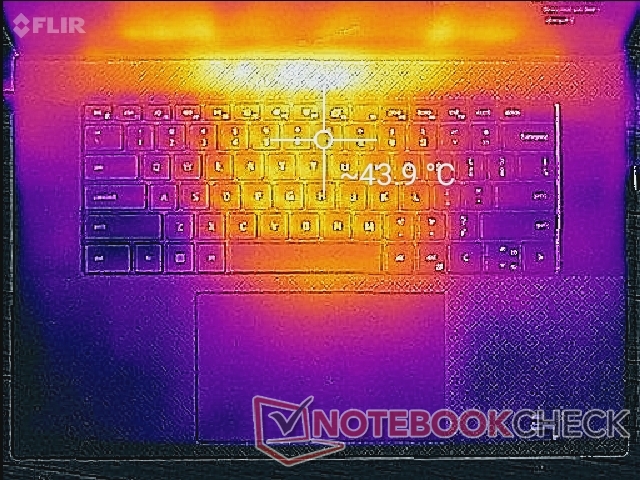
I punti caldi possono raggiungere oltre 52 C e 44 C sui lati superiore e inferiore, rispettivamente, quando si utilizzano carichi stressanti per lunghi periodi. Queste aree si trovano strategicamente verso la parte posteriore dello chassis e lontano dai poggiapolsi e dalla maggior parte dei tasti. La superficie inferiore è comunque molto calda, poiché la piastra inferiore è un unico pezzo di metallo.
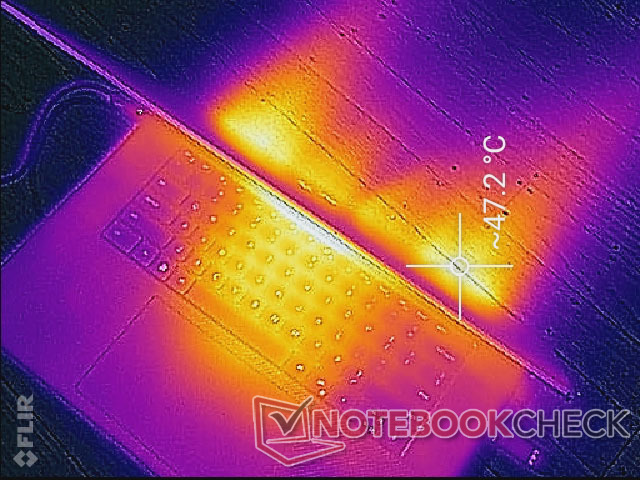
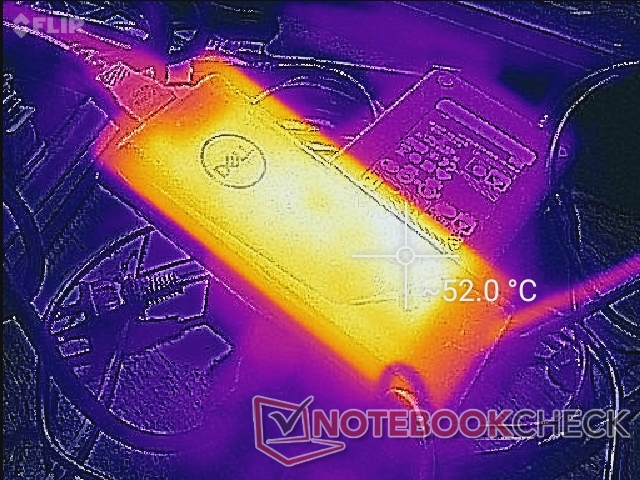
(-) La temperatura massima sul lato superiore è di 51.8 °C / 125 F, rispetto alla media di 36.8 °C / 98 F, che varia da 21 a 71 °C per questa classe Multimedia.
(±) Il lato inferiore si riscalda fino ad un massimo di 44.2 °C / 112 F, rispetto alla media di 39.1 °C / 102 F
(+) In idle, la temperatura media del lato superiore è di 28.6 °C / 83 F, rispetto alla media deld ispositivo di 31.3 °C / 88 F.
(±) Riproducendo The Witcher 3, la temperatura media per il lato superiore e' di 33.9 °C / 93 F, rispetto alla media del dispositivo di 31.3 °C / 88 F.
(+) I poggiapolsi e il touchpad raggiungono la temperatura massima della pelle (33.2 °C / 91.8 F) e quindi non sono caldi.
(-) La temperatura media della zona del palmo della mano di dispositivi simili e'stata di 28.7 °C / 83.7 F (-4.5 °C / -8.1 F).
| Dell XPS 17 9720 RTX 3060 Intel Core i7-12700H, NVIDIA GeForce RTX 3060 Laptop GPU | HP Envy 17-cg Intel Core i5-1135G7, NVIDIA GeForce MX450 | Dell XPS 17 9710 Core i7 RTX 3060 Intel Core i7-11800H, NVIDIA GeForce RTX 3060 Laptop GPU | Dell XPS 17 9700 Core i7 RTX 2060 Max-Q Intel Core i7-10875H, NVIDIA GeForce RTX 2060 Max-Q | Lenovo Legion 5 17ACH6H-82JY0003GE AMD Ryzen 5 5600H, NVIDIA GeForce RTX 3060 Laptop GPU | Asus VivoBook 17 F712JA-AU708W Intel Core i7-1065G7, Intel Iris Plus Graphics G7 (Ice Lake 64 EU) | Razer Blade 17 (i7-12800H, RTX 3070 Ti) Intel Core i7-12800H, NVIDIA GeForce RTX 3070 Ti Laptop GPU | |
|---|---|---|---|---|---|---|---|
| Heat | 14% | 1% | -1% | 2% | 12% | 6% | |
| Maximum Upper Side * (°C) | 51.8 | 45.9 11% | 50.2 3% | 53 -2% | 42.2 19% | 40.2 22% | 43 17% |
| Maximum Bottom * (°C) | 44.2 | 49.7 -12% | 38.4 13% | 39.2 11% | 50.9 -15% | 47.9 -8% | 44 -0% |
| Idle Upper Side * (°C) | 34.8 | 24.2 30% | 37.6 -8% | 37 -6% | 34.3 1% | 27.3 22% | 32 8% |
| Idle Bottom * (°C) | 33.2 | 24.8 25% | 34.2 -3% | 35.8 -8% | 32 4% | 28.9 13% | 34 -2% |
* ... Meglio usare valori piccoli
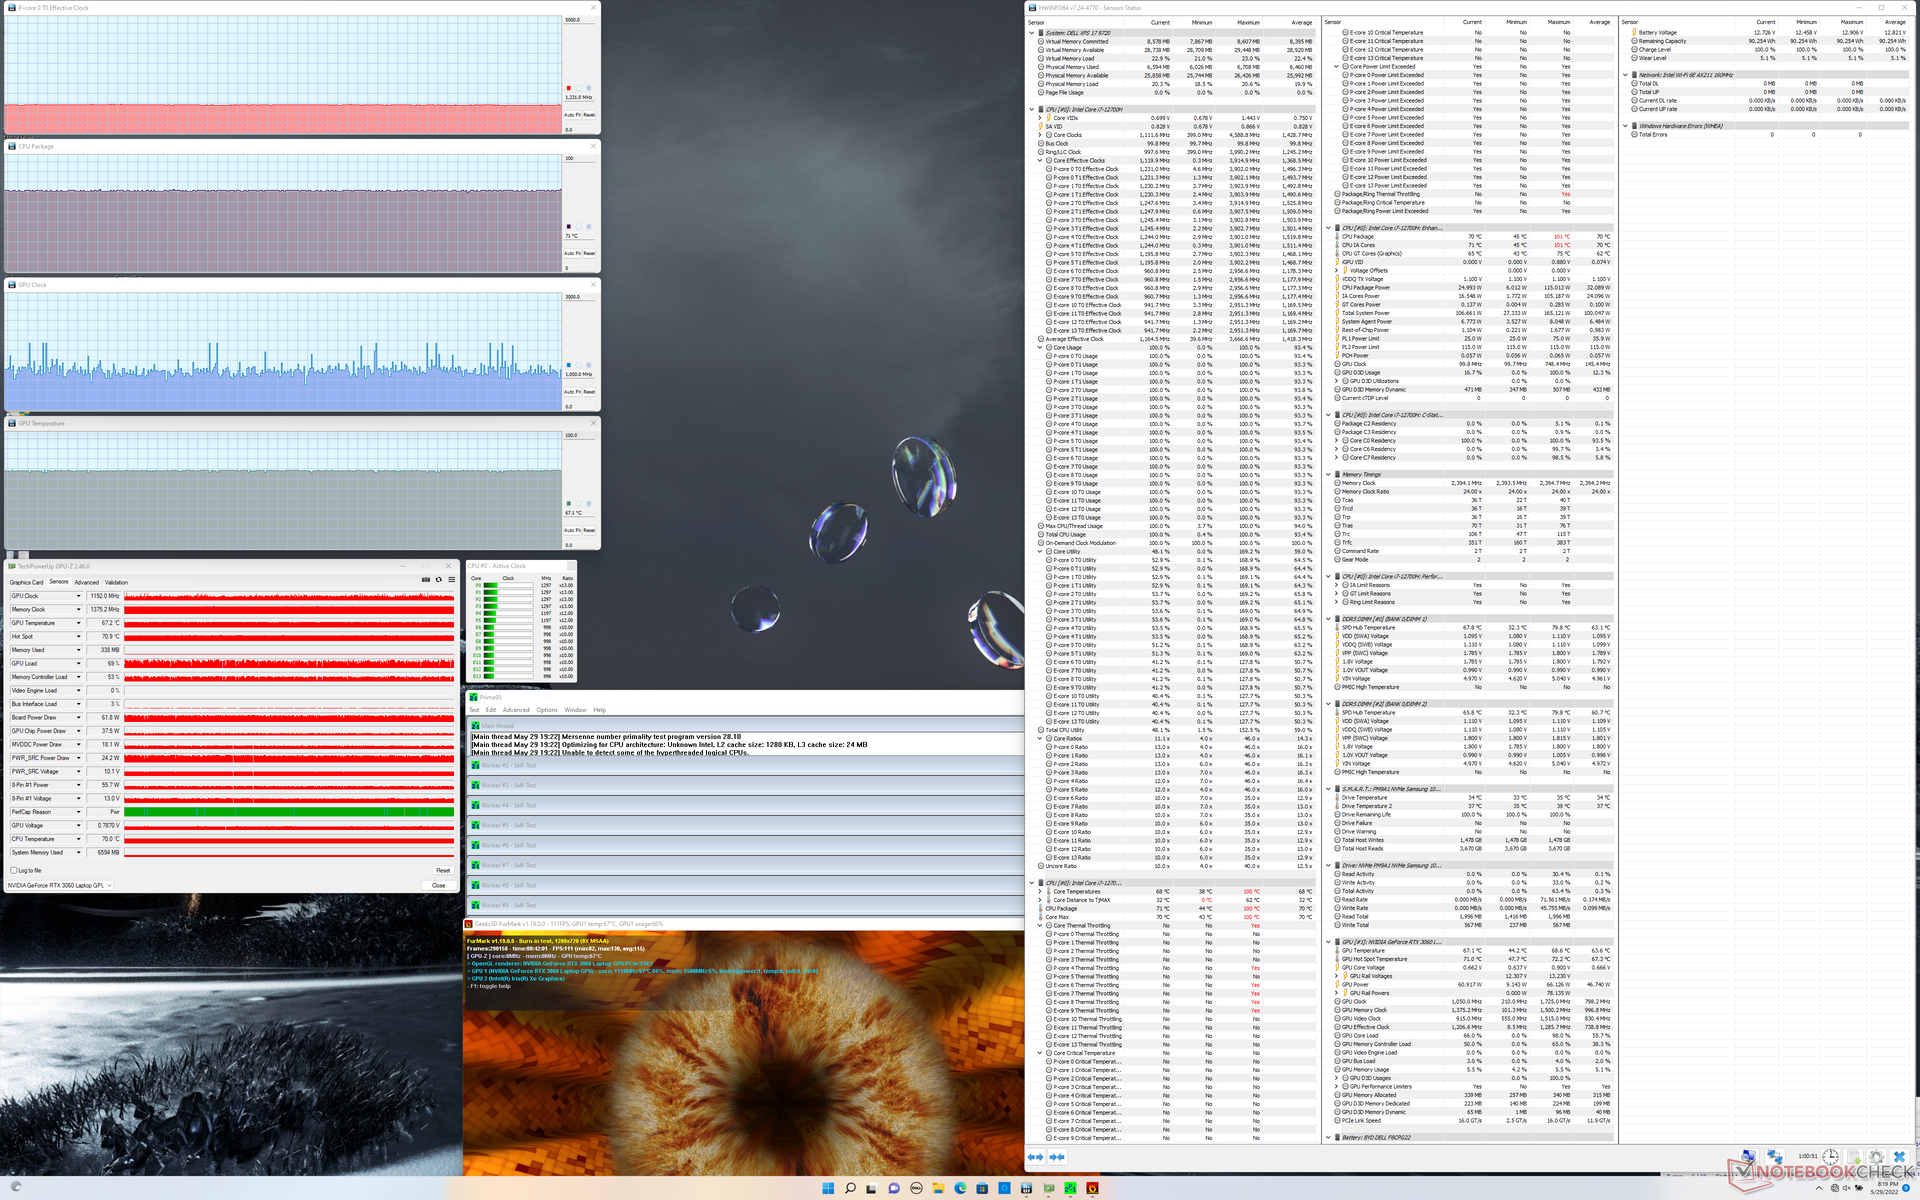
Stress test
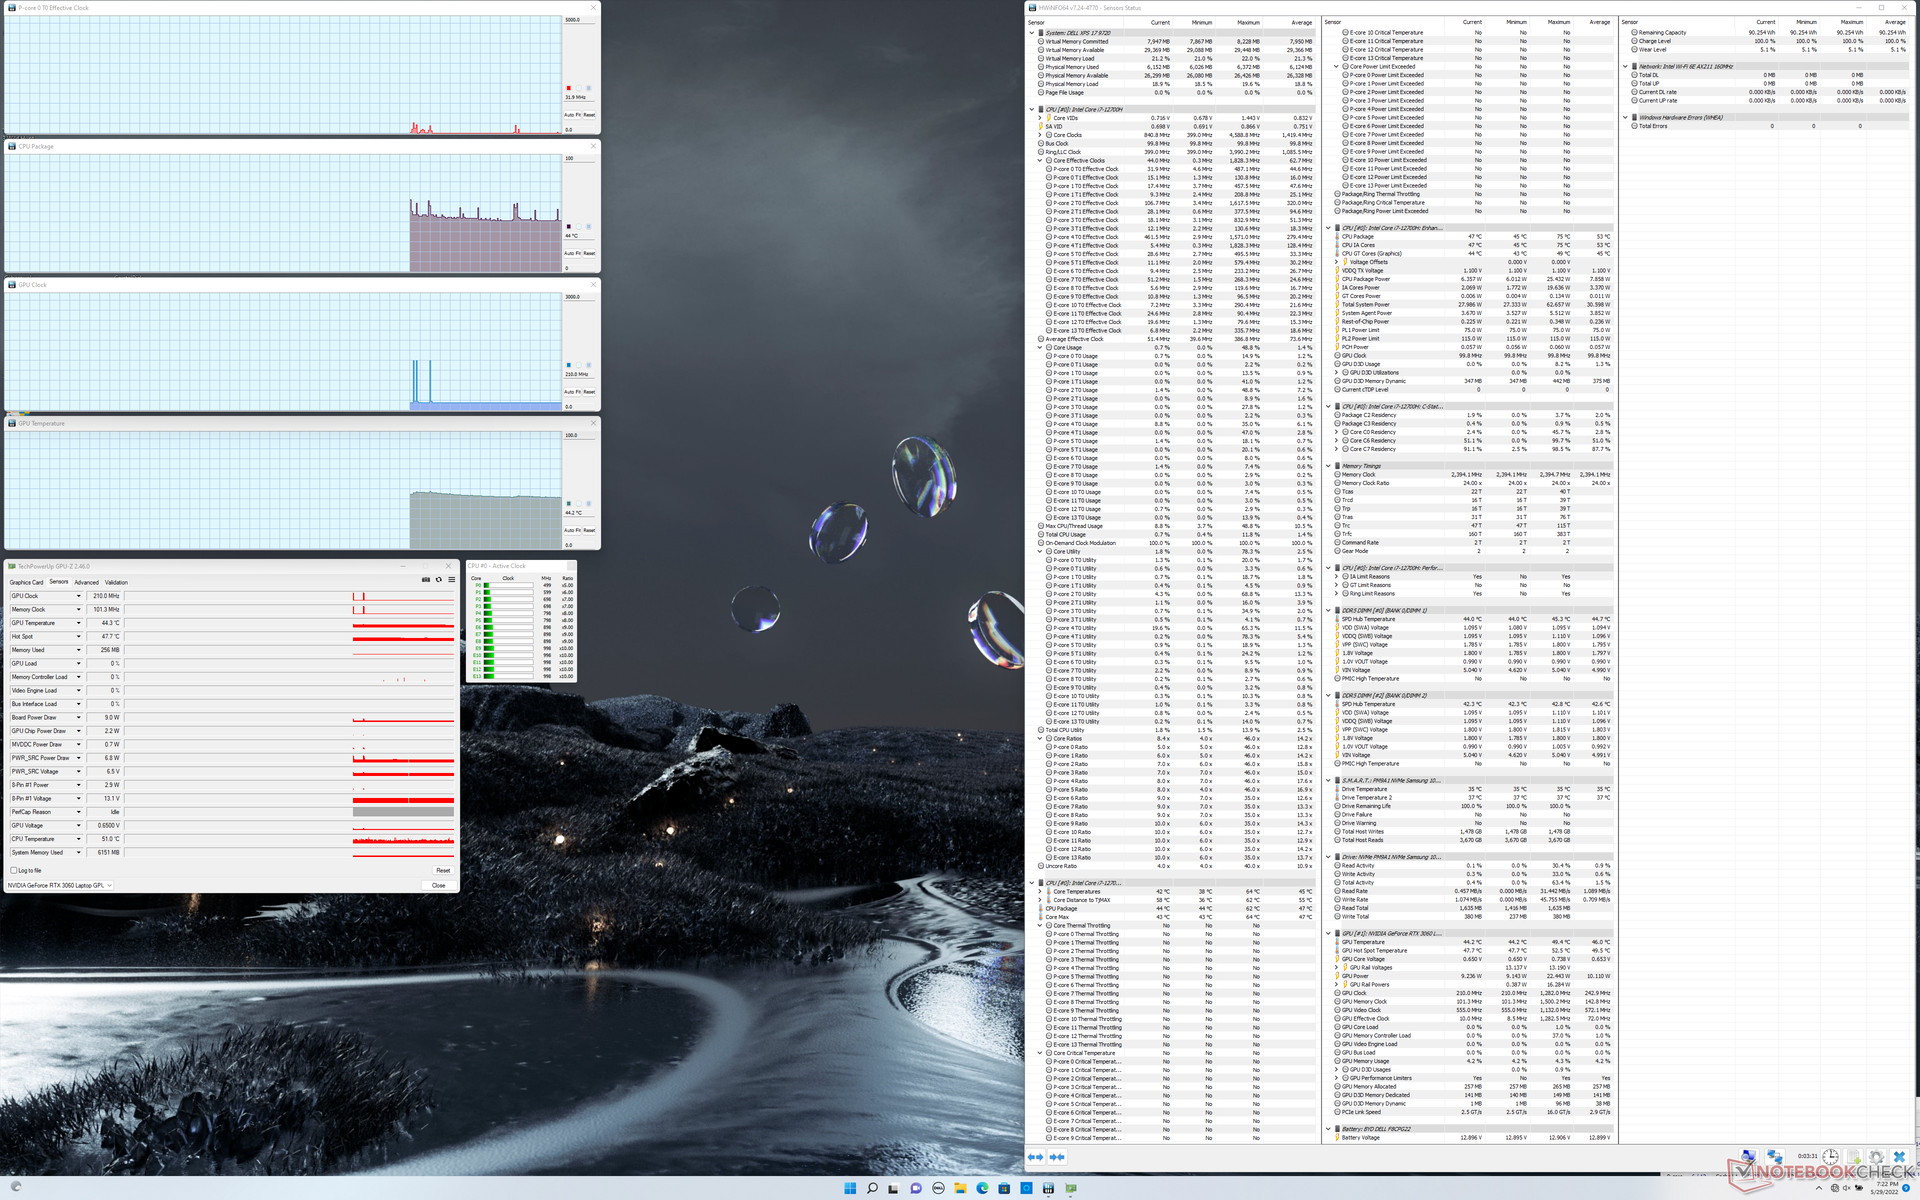
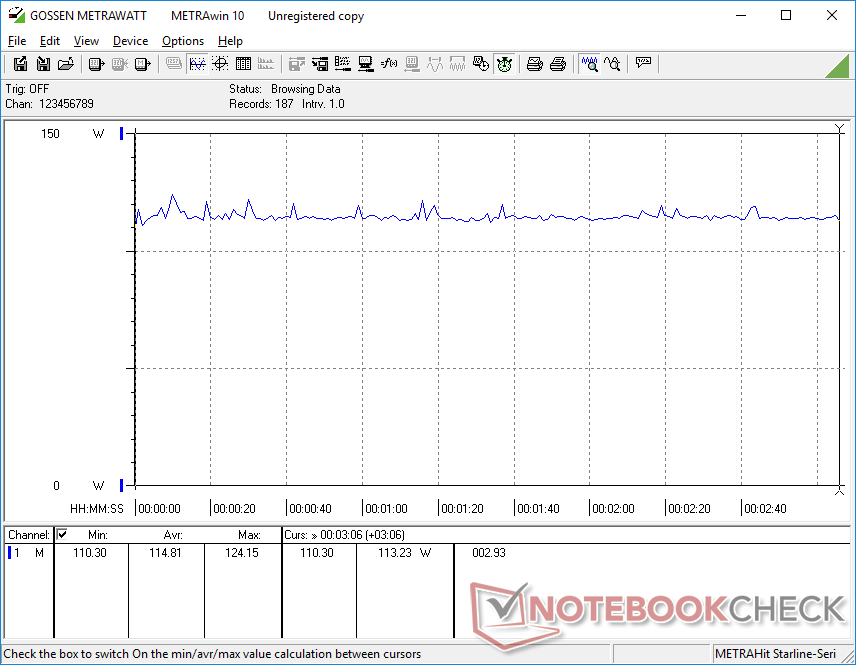
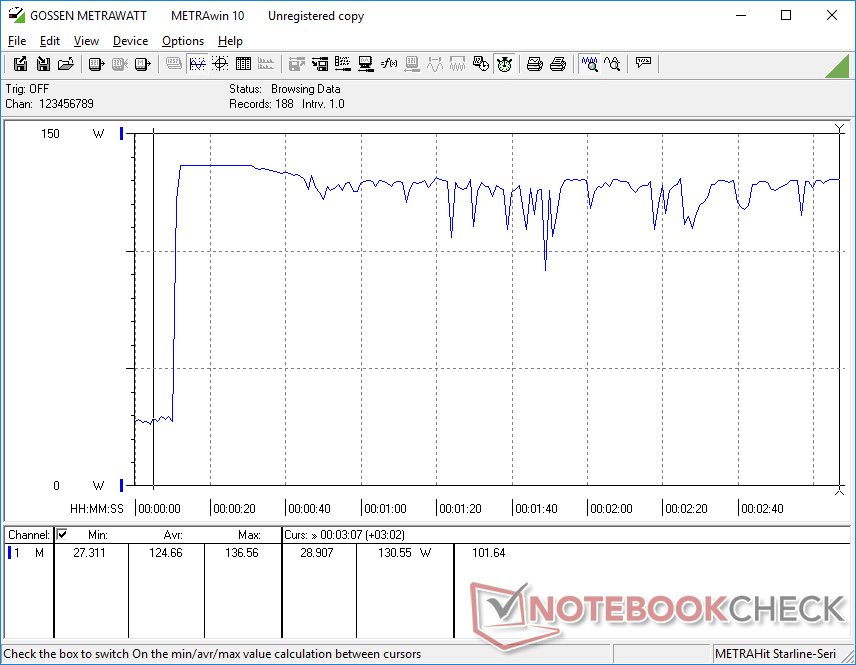
Sottoposta a Prime95, la CPU ha raggiunto i 3,8 GHz, i 100 C e i 115 W per circa 10-15 secondi, prima di scendere e stabilizzarsi a 2,5 GHz, 75 C e 55 W. Rispetto al Core i7-11800H dell'XPS 17 9710, la nostra unità 9720 può raggiungere un consumo iniziale più elevato (115 W contro 87 W), mentre si stabilizza a una temperatura del nucleo più bassa (75 C contro 82 C) e a un consumo energetico identico (55 W). Pertanto, il sistema XPS è in grado di sfruttare gli intervalli di TDP o le frequenze di clock più elevate della piattaforma Alder Lake solo per brevi periodi prima che intervengano le limitazioni termiche.
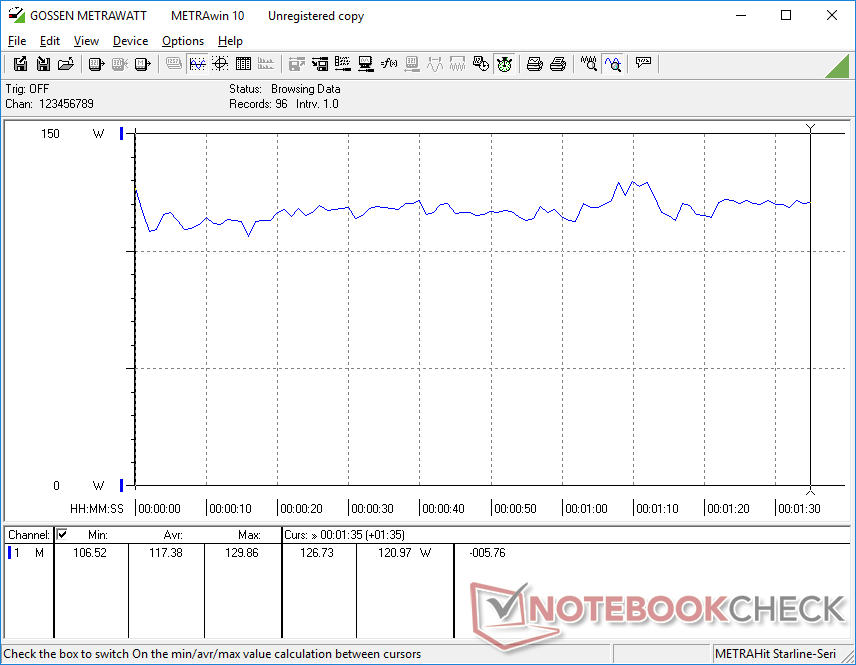
La frequenza di clock della GPU, la temperatura e l'assorbimento di potenza della scheda quando è in funzione Witcher 3 si stabilizzerebbero rispettivamente a 1312 MHz, 66 C e 65 W, rispetto ai 1530 MHz, 67 C e 69 W dell'XPS 17 9710. Il rallentamento complessivo delle prestazioni grafiche rispetto all'anno precedente riflette i risultati di 3DMark peggiori registrati in precedenza.
Il guadagno in termini di prestazioni della GPU ottenuto con la modalità Ultra Performance rispetto alla modalità Ottimizzata sembra essere trascurabile.
Il funzionamento a batteria limita le prestazioni di CPU e GPU. Un test di Fire Strike con alimentazione a batteria restituirebbe punteggi di Fisica e Grafica rispettivamente di 14770 e 24927 punti, rispetto a 16354 e 23563 punti con alimentazione a rete.
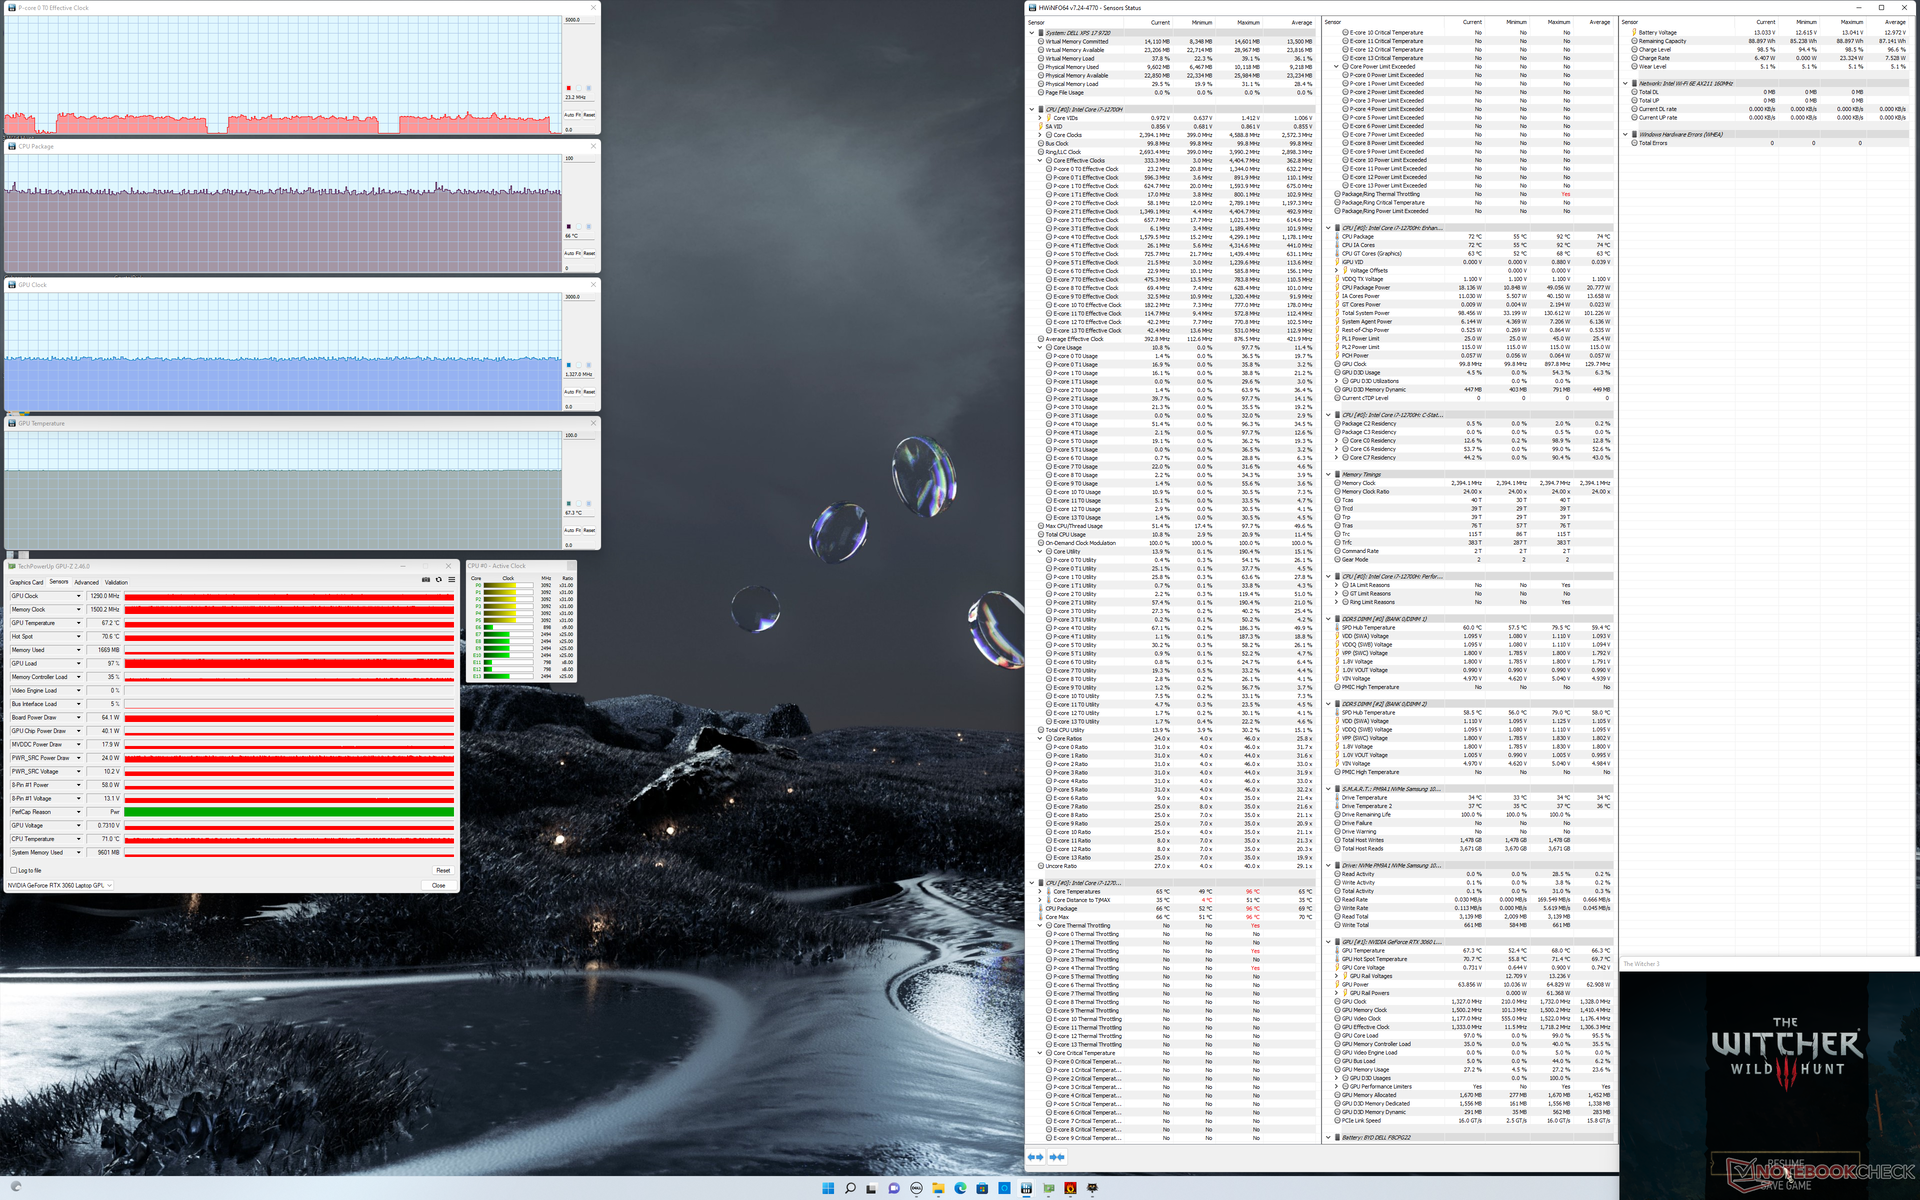
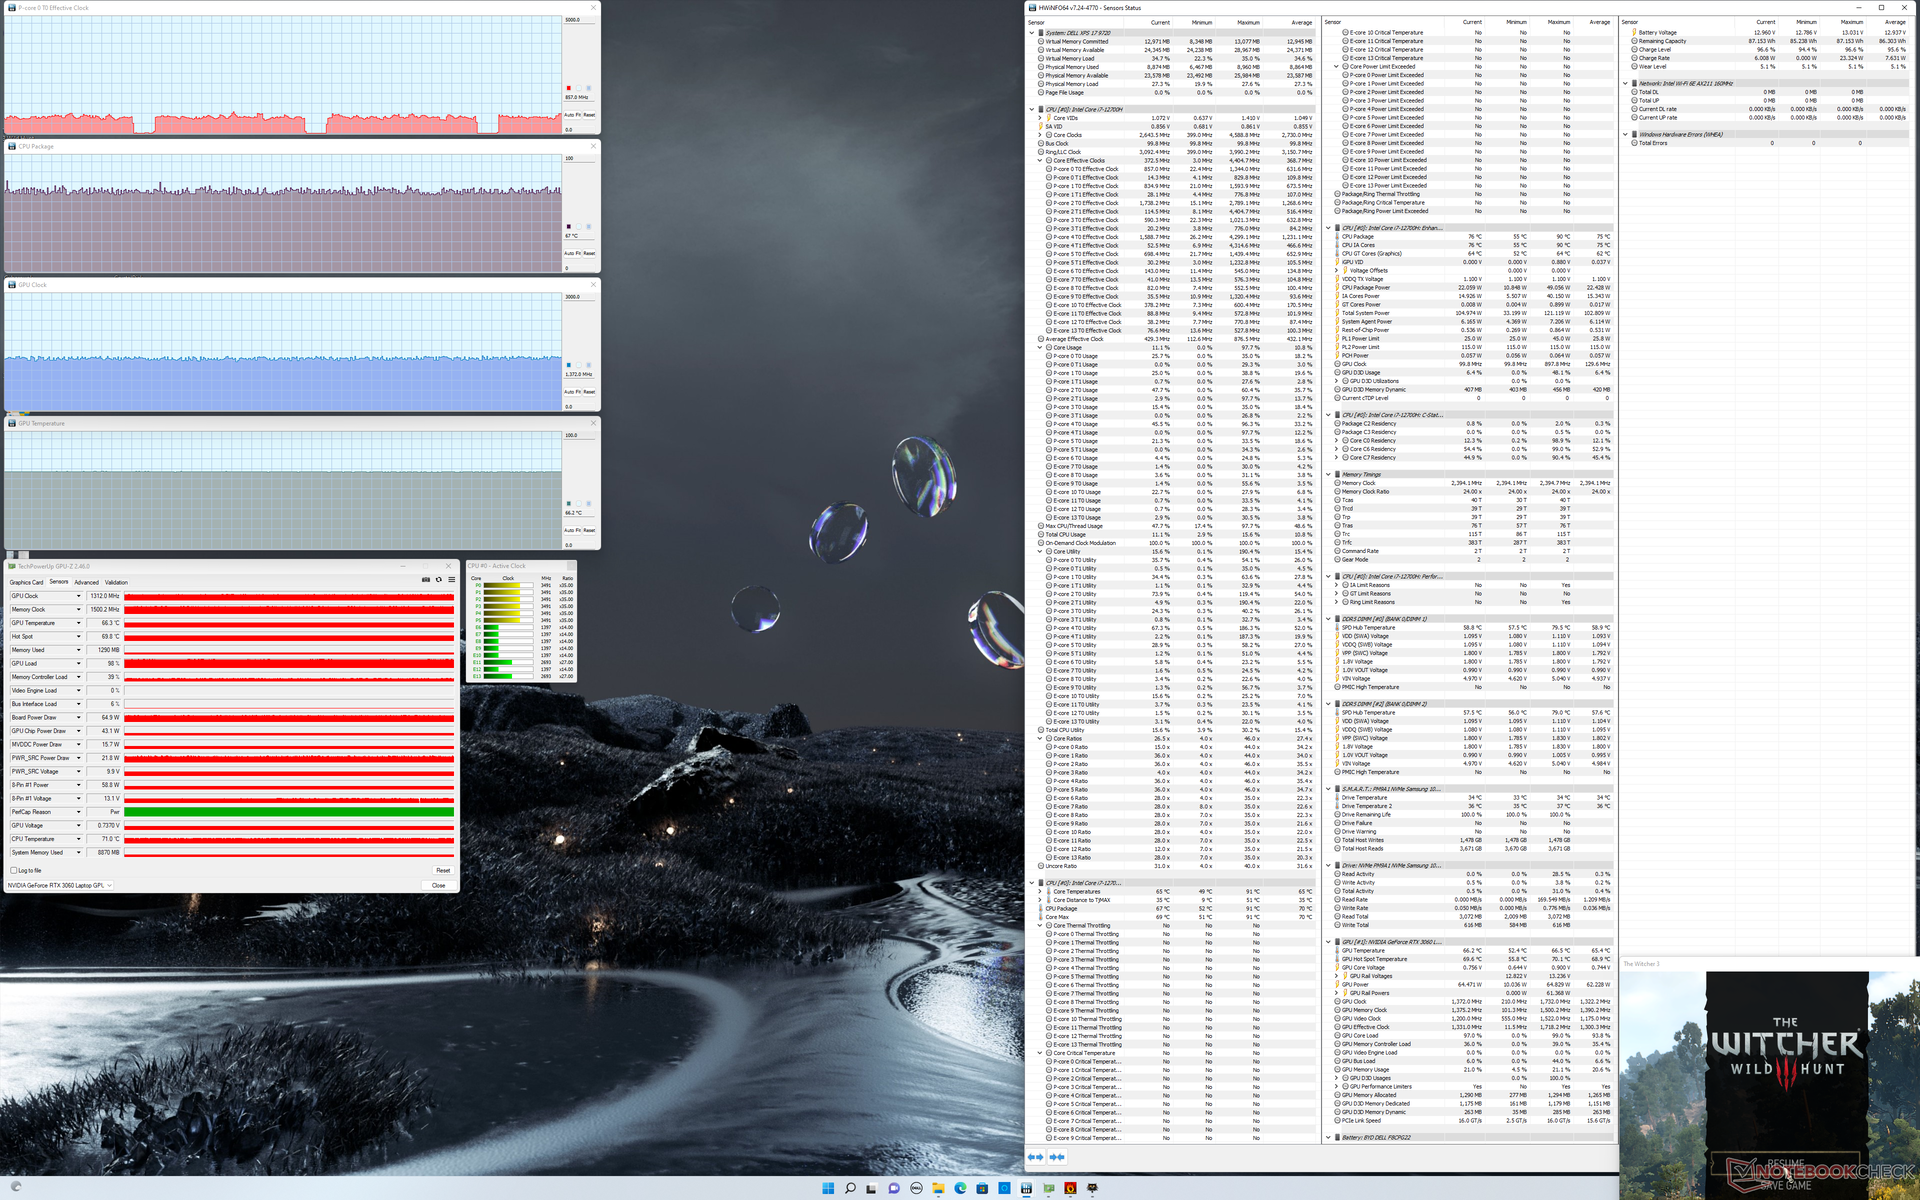
| Clock della CPU (GHz) | Clock della GPU (MHz) | Temperatura media della CPU (°C) | Temperatura media della GPU (°C) | |
| Sistema inattivo | -- | -- | 44 | 44 |
| Stress Prime95 | 2,5 | -- | 75 | 59 |
| Prime95 + FurMark Stress | ||||
| Witcher 3 Stress (modalità ottimizzata) | ~0,7 | 1290 | 66 | 67 |
| Witcher 3 Stress (modalità Ultra Performance) | ~0,8 | 1312 | 67 | 66 |
Altoparlanti
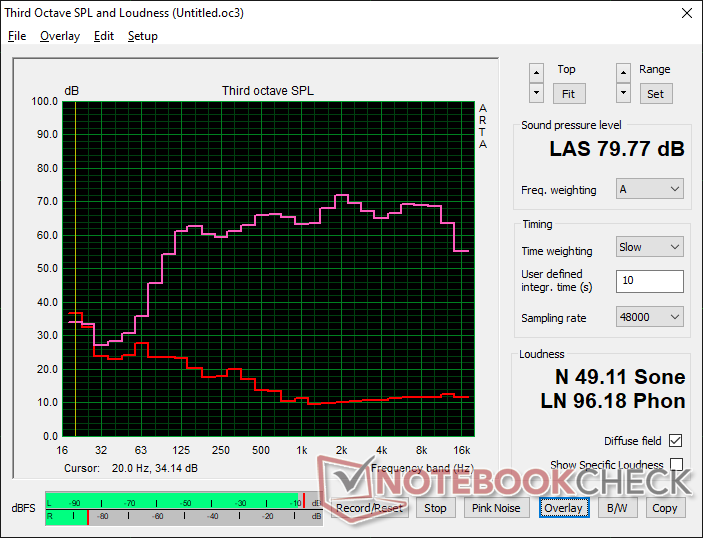
Dell XPS 17 9720 RTX 3060 analisi audio
(±) | potenza degli altiparlanti media ma buona (79.8 dB)
Bassi 100 - 315 Hz
(±) | bassi ridotti - in media 5.2% inferiori alla media
(±) | la linearità dei bassi è media (7% delta rispetto alla precedente frequenza)
Medi 400 - 2000 Hz
(+) | medi bilanciati - solo only 2.2% rispetto alla media
(+) | medi lineari (3.8% delta rispetto alla precedente frequenza)
Alti 2 - 16 kHz
(+) | Alti bilanciati - appena 2.8% dalla media
(+) | alti lineari (3.1% delta rispetto alla precedente frequenza)
Nel complesso 100 - 16.000 Hz
(+) | suono nel complesso lineare (8.3% differenza dalla media)
Rispetto alla stessa classe
» 9% di tutti i dispositivi testati in questa classe è stato migliore, 2% simile, 89% peggiore
» Il migliore ha avuto un delta di 5%, medio di 17%, peggiore di 45%
Rispetto a tutti i dispositivi testati
» 2% di tutti i dispositivi testati in questa classe è stato migliore, 1% similare, 97% peggiore
» Il migliore ha avuto un delta di 4%, medio di 24%, peggiore di 134%
Apple MacBook Pro 16 2021 M1 Pro analisi audio
(+) | gli altoparlanti sono relativamente potenti (84.7 dB)
Bassi 100 - 315 Hz
(+) | bassi buoni - solo 3.8% dalla media
(+) | bassi in lineaa (5.2% delta rispetto alla precedente frequenza)
Medi 400 - 2000 Hz
(+) | medi bilanciati - solo only 1.3% rispetto alla media
(+) | medi lineari (2.1% delta rispetto alla precedente frequenza)
Alti 2 - 16 kHz
(+) | Alti bilanciati - appena 1.9% dalla media
(+) | alti lineari (2.7% delta rispetto alla precedente frequenza)
Nel complesso 100 - 16.000 Hz
(+) | suono nel complesso lineare (4.6% differenza dalla media)
Rispetto alla stessa classe
» 0% di tutti i dispositivi testati in questa classe è stato migliore, 0% simile, 100% peggiore
» Il migliore ha avuto un delta di 5%, medio di 17%, peggiore di 45%
Rispetto a tutti i dispositivi testati
» 0% di tutti i dispositivi testati in questa classe è stato migliore, 0% similare, 100% peggiore
» Il migliore ha avuto un delta di 4%, medio di 24%, peggiore di 134%
Gestione dell'energia - Consumo di energia Turbo Boost più elevato
Consumo di energia
L'XPS 17 9700 ha mostrato problemi di carica in cui il sistema non era in grado di assorbire più di 100 W dall'adattatore CA da 130 W. Fortunatamente Dell ha risolto il problema con il successivo XPS 17 9710 e il 9720 non è da meno. Quando è in funzione Witcher 3la nostra unità 9720 assorbe 115 W, quasi identica a quella registrata sul vecchio 9710. La serie XPS 15 e la serie XPS 17 continuano a essere gli unici modelli sul mercato a essere forniti con un adattatore USB-C da 130 W.
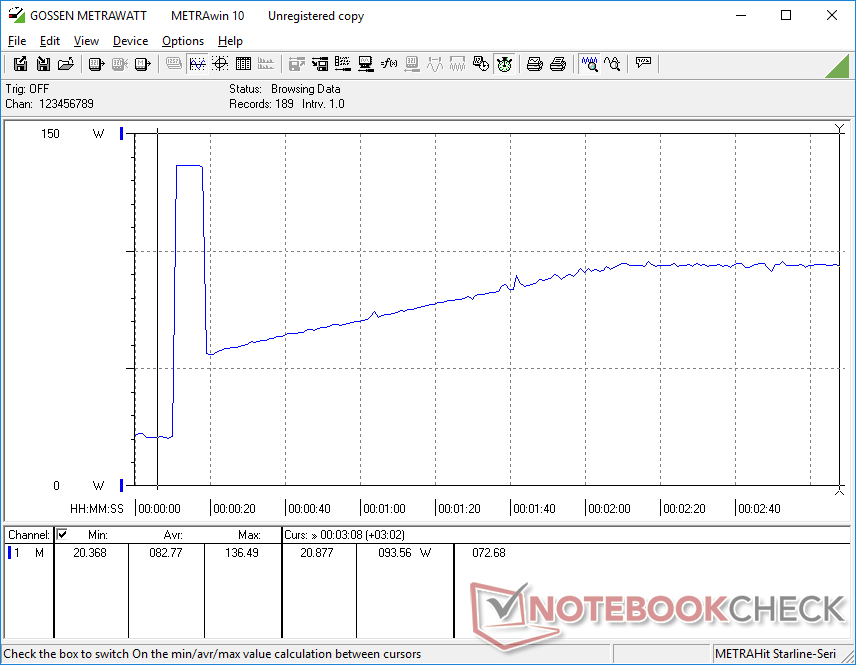
In particolare, il consumo energetico durante l'esecuzione di Prime95 è leggermente superiore a quello del 9710 all'inizio del test, prima di stabilizzarsi a circa 94 W ciascuno. Il consumo energetico più elevato della CPU di 12a generazione è quindi di breve durata prima di diventare simile a quello del modello 9710 con processori di 11a generazione
La ricarica è notevolmente rallentata quando si gioca o si eseguono carichi elevati. Quando è in funzione Witcher 3 al 13% di capacità della batteria e con l'alimentazione a corrente alternata, ad esempio, la batteria aumenterebbe solo di un altro 12% nel corso di un'ora.
| Off / Standby | |
| Idle | |
| Sotto carico |
|
Leggenda:
min: | |
| Dell XPS 17 9720 RTX 3060 i7-12700H, GeForce RTX 3060 Laptop GPU, Samsung PM9A1 MZVL21T0HCLR, IPS, 3840x2400, 17" | HP Envy 17-cg i5-1135G7, GeForce MX450, Samsung PM991 MZVLQ1T0HALB, IPS, 1920x1080, 17.3" | Dell XPS 17 9710 Core i7 RTX 3060 i7-11800H, GeForce RTX 3060 Laptop GPU, Micron 2300 1TB MTFDHBA1T0TDV, IPS, 3840x2400, 17" | Dell XPS 17 9700 Core i7 RTX 2060 Max-Q i7-10875H, GeForce RTX 2060 Max-Q, Micron 2200S 1TB MTFDHBA1T0TCK, IPS, 3840x2400, 17" | Lenovo Legion 5 17ACH6H-82JY0003GE R5 5600H, GeForce RTX 3060 Laptop GPU, Samsung PM991a MZALQ512HBLU, IPS, 1920x1080, 17.3" | Asus VivoBook 17 F712JA-AU708W i7-1065G7, Iris Plus Graphics G7 (Ice Lake 64 EU), Kingston OM8PCP3512F-AB, IPS, 1920x1080, 17.3" | Razer Blade 17 (i7-12800H, RTX 3070 Ti) i7-12800H, GeForce RTX 3070 Ti Laptop GPU, Samsung PM9A1 MZVL21T0HCLR, IPS, 2560x1440, 17.3" | |
|---|---|---|---|---|---|---|---|
| Power Consumption | 46% | 3% | 7% | -40% | 61% | -54% | |
| Idle Minimum * (Watt) | 5.9 | 3.8 36% | 7.5 -27% | 5.8 2% | 15.6 -164% | 4.2 29% | 14.4 -144% |
| Idle Average * (Watt) | 15.8 | 9.4 41% | 15.7 1% | 20.6 -30% | 20.7 -31% | 7.9 50% | 20 -27% |
| Idle Maximum * (Watt) | 26.7 | 10.1 62% | 23.1 13% | 21 21% | 22.9 14% | 8.8 67% | 21.5 19% |
| Load Average * (Watt) | 117.4 | 64.4 45% | 87.2 26% | 104.7 11% | 134 -14% | 29.7 75% | 119 -1% |
| Witcher 3 ultra * (Watt) | 114.8 | 64.4 44% | 116 -1% | 99.2 14% | 135 -18% | 28.8 75% | 218 -90% |
| Load Maximum * (Watt) | 136.6 | 68 50% | 131.6 4% | 107.6 21% | 170 -24% | 44 68% | 248 -82% |
* ... Meglio usare valori piccoli
Power Consumption Witcher 3 / Stresstest
Power Consumption external Monitor
Durata della batteria
I tempi di esecuzione non sono cambiati in modo significativo rispetto ai modelli 9710 e 9700 della generazione precedente. Ci si aspetta poco meno di 9 ore di utilizzo reale della WLAN quando si utilizza il profilo energetico Bilanciato o Ottimizzato con la GPU integrata attiva. La ricarica da vuoto a pieno regime richiede poco più di 2 ore, a patto che non si eseguano applicazioni impegnative come indicato sopra.
| Dell XPS 17 9720 RTX 3060 i7-12700H, GeForce RTX 3060 Laptop GPU, 97 Wh | HP Envy 17-cg i5-1135G7, GeForce MX450, 55.67 Wh | Dell XPS 17 9710 Core i7 RTX 3060 i7-11800H, GeForce RTX 3060 Laptop GPU, 97 Wh | Dell XPS 17 9700 Core i7 RTX 2060 Max-Q i7-10875H, GeForce RTX 2060 Max-Q, 97 Wh | Lenovo Legion 5 17ACH6H-82JY0003GE R5 5600H, GeForce RTX 3060 Laptop GPU, 80 Wh | Asus VivoBook 17 F712JA-AU708W i7-1065G7, Iris Plus Graphics G7 (Ice Lake 64 EU), 32 Wh | Razer Blade 17 (i7-12800H, RTX 3070 Ti) i7-12800H, GeForce RTX 3070 Ti Laptop GPU, 82 Wh | |
|---|---|---|---|---|---|---|---|
| Autonomia della batteria | 46% | 74% | 56% | 21% | 11% | 24% | |
| WiFi v1.3 (h) | 8.7 | 7.9 -9% | 7.6 -13% | 9.7 11% | 4.4 -49% | 4.4 -49% | 5.9 -32% |
| Load (h) | 1 | 2 100% | 2.6 160% | 2 100% | 1.9 90% | 1.7 70% | 1.8 80% |
| Reader / Idle (h) | 17.7 | 17.7 | 23.8 | 5.5 | |||
| H.264 (h) | 3.5 | 4.9 |
Pro
Contro
Verdetto - Tutto sulla CPU
C'è poco da lamentarsi della CPU aggiornata. Se è vero che la piattaforma Alder Lake può essere molto avida di energia, i guadagni in termini di prestazioni sono almeno rispettabili. Gli utenti potenti che sanno di poter sfruttare le prestazioni extra apprezzeranno sicuramente il compromesso in questo senso.
Il Dell XPS 17 9720 introduce un processore nuovo di zecca con significativi guadagni di prestazioni rispetto alle vecchie opzioni di 10a e 11a generazione. Al di fuori della CPU, tuttavia, rimangono gli stessi svantaggi dell'XPS 17 9710 o 9700.
Sfortunatamente, ci sono alcuni piccoli inconvenienti che non sono ancora stati risolti a due anni di distanza da questo design. La qualità video della webcam rimane scarsa, la ricarica è significativamente più lenta quando si eseguono carichi impegnativi, il coperchio è difficile da aprire con la sua scarsa presa e non c'è ancora l'otturatore della privacy della webcam o il supporto Wi-Fi 6E. Il fatto che la GPU abbia subito un calo apparentemente all'improvviso può essere una pillola difficile da digerire per gli appassionati di XPS. I maggiori vantaggi dell'XPS 17 9720 rispetto ad alternative con più funzioni come il Gigabyte Aero 17 continuano a essere le dimensioni più compatte dello chassis e il rapporto di aspetto 16:10.
Prezzo e disponibilità
Amazon al momento è disponibile solo una SKU di XPS 17 9720 al prezzo di 2250 dollari con Core i7-12700H, GeForce RTX 3050 e display a 1200p. Per avere più opzioni, gli utenti possono ordinare direttamente da Dell invece.
Dell XPS 17 9720 RTX 3060
- 05/31/2022 v7 (old)
Allen Ngo
Price comparison

