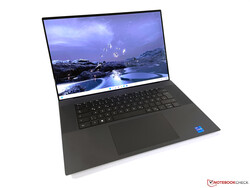
Recensione di Dell XPS 17 9720 - Il portatile multimediale di qualità inizia a mostrare la sua età

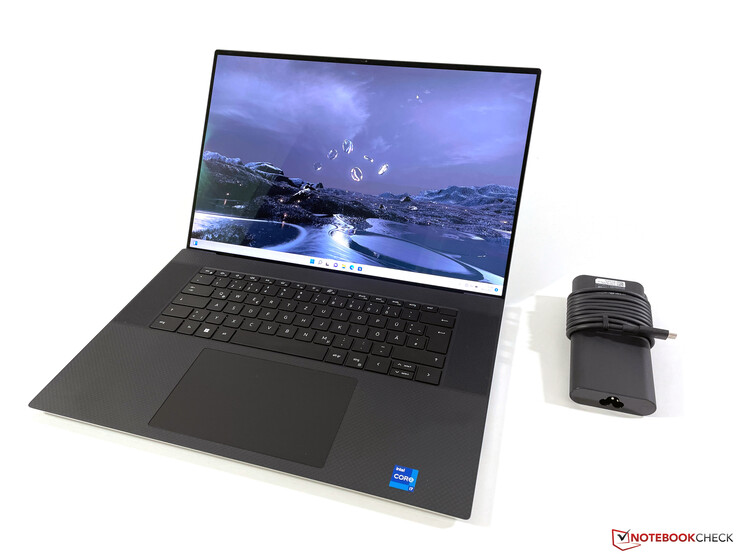
Mentre altri produttori si orientano sempre più verso portatili multimediali da 16 pollici, Dell continua a rimanere fedele al noto XPS 17, apportando anche quest'anno un piccolo aggiornamento, anche se particolarmente incentrato sulle CPU Intel di 12a generazione. Oltre alle CPU da 45 watt (Alder Lake), è possibile scegliere ancora una volta tra due GPU RTX di GeForce, laRTX 3050e RTX 3060entrambe con un TGP di 60 watt. Ciò significa che Dell ha effettuato un downgrade in questo caso, dato che le GPU potevano ancora consumare 70 watt nell'XPS 17 9710 dello scorso anno.
Abbiamo già avuto modo di testare unModello statunitense con la RTX 3060 di GeForce e ora diamo un'occhiata alla configurazione con la RTX 3050. Mentre le prestazioni scendono, il prezzo rimane alto, dato che Dell chiede 3000 euro (~$3135) per la nostra configurazione di test con Core i7-12700H, RTX 3050, display 4K, 32 GB di RAM e un SSD da 512 GB.
Possibili concorrenti a confronto
r_totale | Data | Modello | Peso | Altezza | Dimensione | Risoluzione | Prezzo |
|---|---|---|---|---|---|---|---|
v7 (old) | 06/2022 | Dell XPS 17 9720 i7-12700H, GeForce RTX 3050 4GB Laptop GPU | 2.5 kg | 19.5 mm | 17.00" | 3840x2400 | |
v7 (old) | 11/2021 | Apple MacBook Pro 16 2021 M1 Pro M1 Pro, M1 Pro 16-Core GPU | 2.2 kg | 16.8 mm | 16.20" | 3456x2234 | |
v7 (old) | 06/2022 | Dell XPS 17 9720 RTX 3060 i7-12700H, GeForce RTX 3060 Laptop GPU | 2.5 kg | 19.5 mm | 17.00" | 3840x2400 | |
v7 (old) | 11/2021 | Lenovo ThinkPad X1 Extreme G4-20Y5CTO1WW (3050 Ti) i7-11800H, GeForce RTX 3050 Ti Laptop GPU | 2 kg | 18.2 mm | 16.00" | 3840x2400 | |
v (old) | 12/2021 | Asus Vivobook Pro 16X-M7600QE R9 5900HX, GeForce RTX 3050 Ti Laptop GPU | 1.9 kg | 19 mm | 16.10" | 3840x2400 | |
v7 (old) | 09/2021 | Lenovo ThinkBook 16p G2 ACH R9 5900HX, GeForce RTX 3060 Laptop GPU | 2 kg | 19.5 mm | 16.00" | 2560x1600 |
I nostri Top 10
» Top 10 Portatili Multimedia
» Top 10 Portatili Gaming
» Top 10 Portatili Gaming Leggeri
» Top 10 Portatili da Ufficio e Business economici
» Top 10 Portatili Premium da Ufficio/Business
» Top 10 Portatili sotto i 300 Euro
» Top 10 Portatili sotto i 500 Euro
» Top 10 dei Portatili Workstation
» Top 10 Subnotebooks
» Top 10 Ultrabooks
» Top 10 Convertibili
» Top 10 Tablets
» Top 10 Tablets Windows
» Top 10 Smartphones
Custodia - L'XPS 17 continua ad offrire un'elevata qualità ed è ancora pesante
Non c'è bisogno di dire molto sul case dell'XPS 17, poiché la lavorazione offre una qualità estremamente elevata e la costruzione è molto robusta. Con le sue cornici molto sottili (con un rapporto schermo/corpo del 91%), il dispositivo continua ad avere un aspetto molto moderno e per nulla invecchiato. Tuttavia, il design in carbonio nero sulla parte superiore dell'unità base si sporca facilmente. Quando si maneggia l'XPS 17, diventa subito chiaro che non si tratta di un portatile leggero, e la nostra bilancia indica quasi 2,5 kg (~5,5 lb). Per l'alimentatore bisogna aggiungere altri 400 grammi (~0,9 lb).
Confronto delle dimensioni
Apparecchiatura - XPS 17 senza supporto Wi-Fi 6E
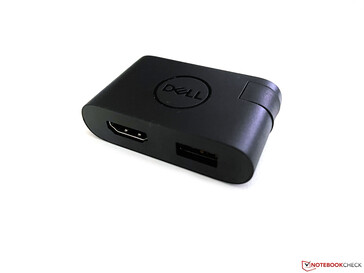
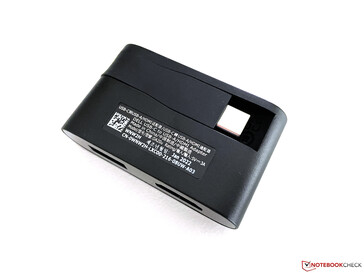
L'XPS 17 continua a offrire quattro moderne porte Thunderbolt con connettori USB-C. Sebbene siano ovviamente molto versatili, nella pratica potrebbero richiedere alcuni adattatori. A quanto pare anche Dell lo sa, visto che è incluso un adattatore USB-C con USB-A e HDMI. In passato, Dell ha spesso seguito Apple, quindi siamo curiosi di sapere se anche la prossima generazione di Dell inizierà a offrire nuovamente connessioni più integrate, come ad esempio l'HDMI.
Lettore di schede SD
Come in precedenza, l'XPS offre un lettore di schede SDXC a grandezza naturale, con le schede inserite che sporgono minimamente. In termini di velocità, possiamo notare una differenza significativa tra la nostra scheda di riferimento, poiché la Angelbird AV Pro V60, che ha raggiunto velocità di trasferimento di oltre 220 MB/s in altri portatili, è limitata a soli 84 MB/s circa qui. D'altra parte, la nostra vecchia scheda di riferimento Toshiba è in grado di andare meglio con il lettore di schede di Dell, raggiungendo quasi 200 MB/s.
| SD Card Reader | |
| average JPG Copy Test (av. of 3 runs) | |
| Dell XPS 17 9720 RTX 3060 (Toshiba Exceria Pro SDXC 64 GB UHS-II) | |
| Dell XPS 17 9720 (Toshiba Exceria Pro SDXC 64 GB UHS-II) | |
| Dell XPS 17 9710 Core i7 RTX 3060 (AV PRO microSD 128 GB V60) | |
| Lenovo ThinkPad X1 Extreme G4-20Y5CTO1WW (3050 Ti) (AV Pro V60) | |
| Apple MacBook Pro 16 2021 M1 Pro (Angelbird AV Pro V60) | |
| Media della classe Multimedia (21.1 - 531, n=45, ultimi 2 anni) | |
| Lenovo ThinkBook 16p G2 ACH | |
| Asus Vivobook Pro 16X-M7600QE (AV Pro SD microSD 128 GB V60) | |
| maximum AS SSD Seq Read Test (1GB) | |
| Dell XPS 17 9720 RTX 3060 (Toshiba Exceria Pro SDXC 64 GB UHS-II) | |
| Dell XPS 17 9720 (Toshiba Exceria Pro SDXC 64 GB UHS-II) | |
| Dell XPS 17 9710 Core i7 RTX 3060 (AV PRO microSD 128 GB V60) | |
| Lenovo ThinkPad X1 Extreme G4-20Y5CTO1WW (3050 Ti) (AV Pro V60) | |
| Media della classe Multimedia (27.4 - 1455, n=45, ultimi 2 anni) | |
| Lenovo ThinkBook 16p G2 ACH | |
| Asus Vivobook Pro 16X-M7600QE (AV Pro SD microSD 128 GB V60) | |
Comunicazione
Come abbiamo già visto negli altri test degli XPS attuali (e confermato anche da Dell), le antenne dell'XPS 17 non supportano affatto le reti a 6-GHz e non siamo nemmeno riusciti a connetterci alla rete a 6-GHz del nostro router di riferimento Asus. Il fatto che Dell utilizzi ancora un modulo Wi-Fi 6E con l'Intel AX211E ha senso solo per la scheda tecnica
Tuttavia, le prestazioni nelle normali reti a 5-GHz (Wi-Fi 6) sono ancora buone, ma durante l'invio di dati ci sono alcune variazioni significative che sono riproducibili (come già nell'unità di test statunitense). D'altra parte, poiché i valori sono ancora superiori a 1 GB/s, non ci saranno limitazioni significative nel funzionamento quotidiano.
Webcam
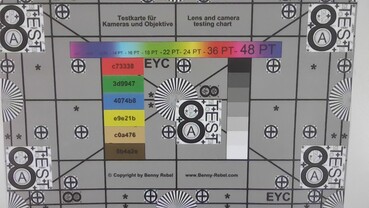
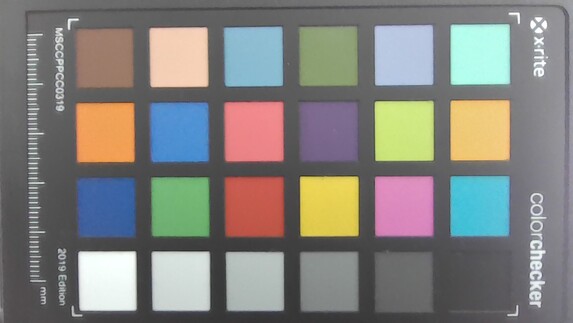
L'XPS 17 mantiene la consueta fotocamera da 720p. Pur facendo il suo lavoro, la qualità delle immagini non è particolarmente buona.
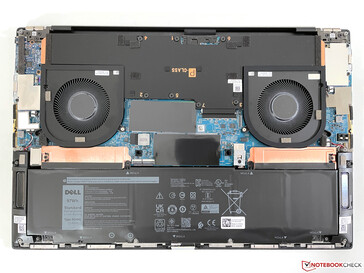
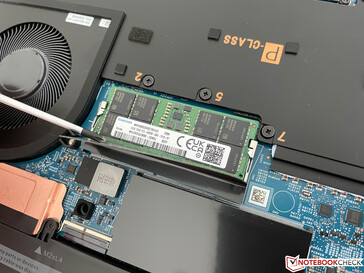
Manutenzione
Dispositivi di input - La tastiera è ancora nella media
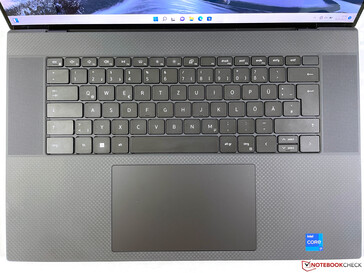
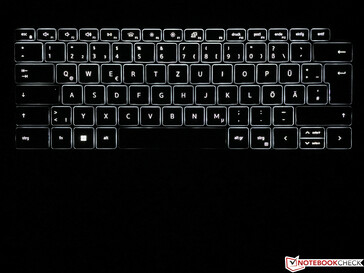
I dispositivi di input non sono cambiati rispetto ai modelli precedenti. La tastiera è posizionata al centro ed è affiancata dalle aperture per gli altoparlanti. Il suo colore corrisponde a quello del case, quindi è nero o bianco. Per quanto riguarda la meccanica, la corsa dei tasti è ancora breve (1,3 mm) e l'esperienza di digitazione complessiva è mediocre. Ma questo è dovuto anche all'impressione di sferragliamento. C'è sicuramente un margine di miglioramento, e Dell utilizza tastiere migliori anche nei suoi modelli business e workstation. L'illuminazione dello sfondo bianco funziona bene, ma non può essere attivata automaticamente dal sensore di luminosità.
D'altra parte, l'ampio ClickPad non dà adito a lamentele. Non solo funziona in modo molto affidabile, ma offre anche molto spazio per i gesti fino a quattro dita. Nel nostro modello, anche il touchscreen capacitivo è disponibile per gli input, e anche qui non ci sono problemi. Tuttavia, non c'è il supporto per l'input tramite penna con livelli di pressione.
Display - L'XPS 17 continua ad offrire un ottimo display IPS 4K
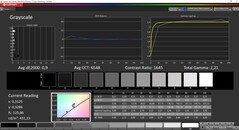
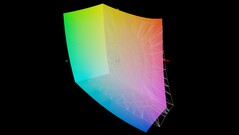
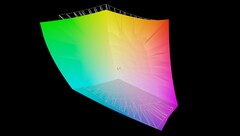
Il Dell XPS 17 è ancora uno dei pochi portatili che offre pannelli con copertura AdobeRGB completa. A questo punto, si tratta di un'eccezione, poiché la maggior parte dei pannelli OLED e persino gli attuali display DreamColor di HP sono regolati in base allo standard DCI-P3. Conosciamo già molto bene il pannello 16:10 di Sharp con una risoluzione di 3840 x 2400 pixel e l'impressione soggettiva dell'immagine è semplicemente eccezionale.
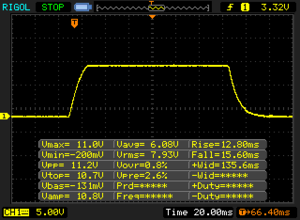
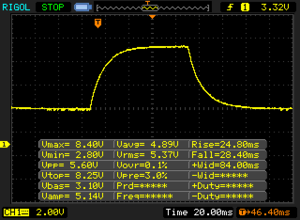
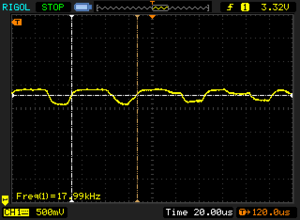
Tuttavia, per quanto riguarda la luminosità, la nostra unità di test si discosta leggermente dal valore massimo: mentre l'unità di test statunitense raggiunge più di 500 cd/m², qui il massimo è di soli 438 cd/m². D'altra parte, anche il valore del nero è molto basso, pari a 0,27 cd/m², con un rapporto di contrasto complessivo molto elevato, superiore a 1600:1. Il bleeding dello schermo non è un problema, ma i tempi di risposta del pannello IPS non sono tra i più veloci. In pratica, è possibile notare alcuni effetti di ghosting, ad esempio sul puntatore del mouse. A partire da livelli di luminosità del 40% o inferiori, si nota anche un po' di sfarfallio a 17,9 kHz, ma questo non dovrebbe comportare alcun problema.
| |||||||||||||||||||||||||
Distribuzione della luminosità: 86 %
Al centro con la batteria: 437 cd/m²
Contrasto: 1622:1 (Nero: 0.27 cd/m²)
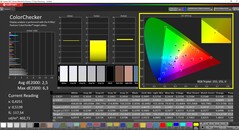
ΔE ColorChecker Calman: 2.5 | ∀{0.5-29.43 Ø4.76}
calibrated: 0.8
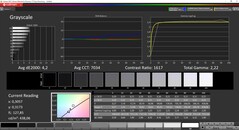
ΔE Greyscale Calman: 4.2 | ∀{0.09-98 Ø5}
100% AdobeRGB 1998 (Argyll 3D)
100% sRGB (Argyll 3D)
94.8% Display P3 (Argyll 3D)
Gamma: 2.22
CCT: 7034 K
| Dell XPS 17 9720 Sharp LQ170R1, IPS, 3840x2400, 17" | Apple MacBook Pro 16 2021 M1 Pro Liquid Retina XDR, Mini-LED, 3456x2234, 16.2" | Dell XPS 17 9720 RTX 3060 Sharp LQ170R1, IPS, 3840x2400, 17" | Lenovo ThinkPad X1 Extreme G4-20Y5CTO1WW (3050 Ti) LP160UQ1-SPB1, IPS LED, 3840x2400, 16" | Asus Vivobook Pro 16X-M7600QE Samsung ATNA60YV02-0, OLED, 3840x2400, 16.1" | Lenovo ThinkBook 16p G2 ACH Lenovo LEN8A95 (AUO B160QAN02.M), IPS, 2560x1600, 16" | Dell XPS 17 9710 Core i7 RTX 3060 Sharp LQ170R1, IPS, 3840x2400, 17" | |
|---|---|---|---|---|---|---|---|
| Display | -2% | -6% | -5% | 1% | -14% | 0% | |
| Display P3 Coverage (%) | 94.8 | 99.1 5% | 92.9 -2% | 84.3 -11% | 99.8 5% | 76.4 -19% | 94.8 0% |
| sRGB Coverage (%) | 100 | 100 0% | 100 0% | 98.3 -2% | 100 0% | 100 0% | 100 0% |
| AdobeRGB 1998 Coverage (%) | 100 | 88 -12% | 85.3 -15% | 97.8 -2% | 96.9 -3% | 77.4 -23% | 100 0% |
| Response Times | -102% | -10% | -31% | 95% | 37% | 2% | |
| Response Time Grey 50% / Grey 80% * (ms) | 53.2 ? | 42.8 ? 20% | 51.2 ? 4% | 60 ? -13% | 2 ? 96% | 36 32% | 44.8 ? 16% |
| Response Time Black / White * (ms) | 28.4 ? | 91.6 ? -223% | 35.2 ? -24% | 42 ? -48% | 2 ? 93% | 16.4 42% | 32 ? -13% |
| PWM Frequency (Hz) | 17990 ? | 14880 | 60 ? | ||||
| Screen | 221% | -37% | 2% | 1% | -5% | -14% | |
| Brightness middle (cd/m²) | 438 | 514 17% | 512.7 17% | 639 46% | 392 -11% | 439 0% | 536.5 22% |
| Brightness (cd/m²) | 411 | 497 21% | 463 13% | 612 49% | 396 -4% | 397 -3% | 489 19% |
| Brightness Distribution (%) | 86 | 95 10% | 85 -1% | 84 -2% | 98 14% | 83 -3% | 85 -1% |
| Black Level * (cd/m²) | 0.27 | 0.02 93% | 0.32 -19% | 0.47 -74% | 0.44 -63% | 0.37 -37% | |
| Contrast (:1) | 1622 | 25700 1484% | 1602 -1% | 1360 -16% | 998 -38% | 1450 -11% | |
| Colorchecker dE 2000 * | 2.5 | 1.4 44% | 5.98 -139% | 2.2 12% | 1.74 30% | 1.68 33% | 2.46 2% |
| Colorchecker dE 2000 max. * | 6.3 | 2.8 56% | 12.09 -92% | 5.3 16% | 3.18 50% | 2.36 63% | 7.74 -23% |
| Colorchecker dE 2000 calibrated * | 0.8 | 1.4 -75% | 1.85 -131% | 1.57 -96% | 1.85 -131% | ||
| Greyscale dE 2000 * | 4.2 | 2.3 45% | 7.2 -71% | 1.7 60% | 1.77 58% | 1.64 61% | 2.9 31% |
| Gamma | 2.22 99% | 2.27 97% | 2.54 87% | 2.31 95% | 2.22 99% | 2.39 92% | 2.12 104% |
| CCT | 7034 92% | 6792 96% | 6914 94% | 6390 102% | 6483 100% | 6616 98% | 6868 95% |
| Media totale (Programma / Settaggio) | 39% /
120% | -18% /
-25% | -11% /
-4% | 32% /
16% | 6% /
-1% | -4% /
-9% |
* ... Meglio usare valori piccoli
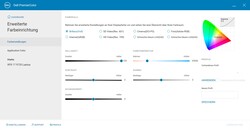
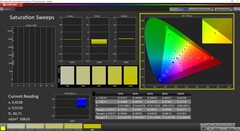
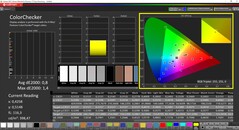
Dell include il software Premier Color che consente di passare da un profilo all'altro e da uno spazio colore all'altro. Abbiamo misurato il display con il software professionale CalMAN e il fotometro spettrale X-Rite i1 Pro 2 e abbiamo scoperto che il profilo Photo (Adobe RGB) offre la migliore qualità dell'immagine. Dovreste anche controllare le regolazioni nel software Premier Color, poiché nella nostra unità di prova la temperatura del colore era regolata di default in modo troppo caldo (5000 K invece di 6500 K) (come potete vedere anche nelle immagini esterne più in basso).
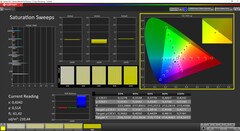
In fase di consegna, il display presenta una leggera tinta blu e una temperatura del colore leggermente troppo fredda. Tuttavia, la riproduzione dei colori è già molto buona e ci sono solo pochi valori anomali che superano l'importante deviazione DeltaE 2000 di 3. La nostra calibrazione mostra il pieno potenziale del pannello (il profilo calibrato è disponibile per il download gratuito qui sopra). Grazie alla copertura completa dello spazio colore AdobeRGB, il pannello è particolarmente adatto all'elaborazione di immagini e video.
Tempi di risposta del Display
| ↔ Tempi di risposta dal Nero al Bianco | ||
|---|---|---|
| 28.4 ms ... aumenta ↗ e diminuisce ↘ combinato | ↗ 12.8 ms Incremento | |
| ↘ 15.6 ms Calo | ||
| Lo schermo mostra tempi di risposta relativamente lenti nei nostri tests e potrebbe essere troppo lento per i gamers. In confronto, tutti i dispositivi di test variano da 0.1 (minimo) a 240 (massimo) ms. » 75 % di tutti i dispositivi è migliore. Questo significa che i tempi di risposta rilevati sono peggiori rispetto alla media di tutti i dispositivi testati (20.1 ms). | ||
| ↔ Tempo di risposta dal 50% Grigio all'80% Grigio | ||
| 53.2 ms ... aumenta ↗ e diminuisce ↘ combinato | ↗ 24.8 ms Incremento | |
| ↘ 28.4 ms Calo | ||
| Lo schermo mostra tempi di risposta lenti nei nostri tests e sarà insoddisfacente per i gamers. In confronto, tutti i dispositivi di test variano da 0.165 (minimo) a 636 (massimo) ms. » 90 % di tutti i dispositivi è migliore. Questo significa che i tempi di risposta rilevati sono peggiori rispetto alla media di tutti i dispositivi testati (31.5 ms). | ||
Sfarfallio dello schermo / PWM (Pulse-Width Modulation)
| flickering dello schermo / PWM rilevato | 17990 Hz | ≤ 40 % settaggio luminosita' | |
Il display sfarfalla a 17990 Hz (Probabilmente a causa dell'uso di PWM) Flickering rilevato ad una luminosita' di 40 % o inferiore. Non dovrebbe verificarsi flickering o PWM sopra questo valore di luminosita'. La frequenza di 17990 Hz è abbastanza alta, quindi la maggioranza degli utenti sensibili al PWM non dovrebbero notare alcun flickering. In confronto: 53 % di tutti i dispositivi testati non utilizza PWM per ridurre la luminosita' del display. Se è rilevato PWM, una media di 8039 (minimo: 5 - massimo: 343500) Hz è stata rilevata. | |||
All'aperto, il display riflettente sarà sempre in difficoltà con i riflessi, e soggettivamente la quantità di riflessi è anche leggermente superiore a quella dei MacBook Apple MacBook, ad esempio. Tuttavia, grazie alla discreta luminosità, nella maggior parte dei casi si riesce a trovare una posizione da cui è possibile leggere agevolmente i contenuti del display. La stabilità dell'angolo di visione del pannello IPS non offre motivi di lamentela.
Prestazioni: Intel Alder Lake con 45 watt
Condizioni di prova
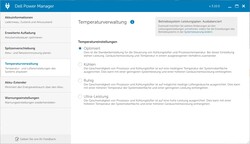
Dell offre le proprie impostazioni di gestione dell'energia che si possono selezionare dall'applicazione Power Manager preinstallata. Per impostazione predefinita, è selezionato il profilo Ottimizzato, che abbiamo utilizzato anche per i seguenti benchmark e misurazioni. Poiché il raffreddamento funziona già quasi dall'inizio, la modalità di prestazioni Ultra aggiunge solo un moderato vantaggio in termini di prestazioni sotto il puro carico della CPU (multi-core) e nello stress test. Tuttavia, nel funzionamento quotidiano questo non fa praticamente alcuna differenza e il leggero aumento delle prestazioni non giustifica, a nostro avviso, la maggiore rumorosità della ventola.
| Modalità prestazioni | Carico della CPU | Carico della GPU | Stress Test |
|---|---|---|---|
| Ottimizzato | 115W -> 45W | 65W | CPU: 40W -> 25WGPU : 60W |
| Ultra Performance | 115W -> 55W | 65W | CPU: 40W -> 25WGPU : 65W |
| Silenzioso | 96W -> 30W | 65W | CPU: 25WGPU : 30W |
Processore - Core i7-12700H
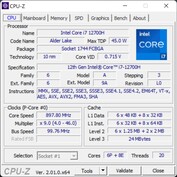
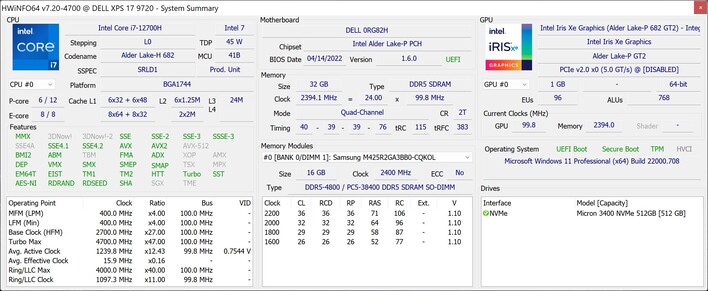
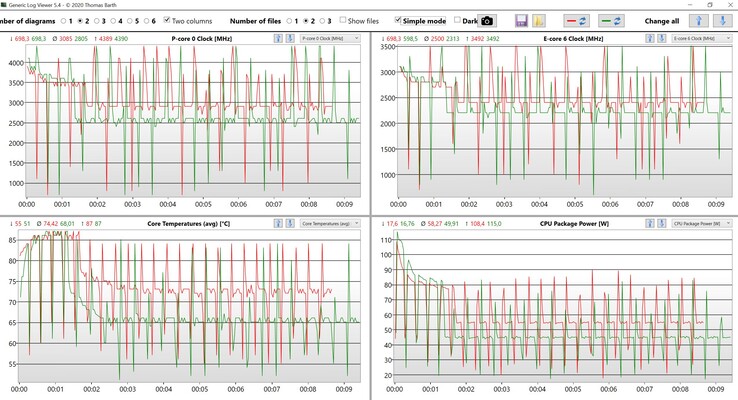
A questo punto, sappiamo già che ilIntel Core i7-12700Hmolto bene. L'architettura ibrida composta da 6 core per le prestazioni e 8 per l'efficienza (per un totale di 20 thread) offre molte prestazioni ma consuma anche molta energia per un processore da 45 watt. Nel caso dell'XPS 17, si arriva a 115 watt, ma solo per una frazione di secondo, prima che il valore scenda rapidamente. Dopo poco più di un minuto, il consumo si stabilizza a 45 watt o 55 watt in modalità Ultra performance.
Cinebench R15 Multi Constant Load Test
L'elevato limite di potenza porta naturalmente anche a risultati di benchmark molto buoni, in particolare nei test brevi. Tuttavia, se si sottopone il dispositivo a un carico continuo, il vantaggio si riduce drasticamente. Ad esempio, se le prestazioni sono ancora superiori di quasi il 50% rispetto a quelle dell' XPS 17 9710 con Core i7-11800Hnel primo ciclo CB R15, il vantaggio scende già dopo il sesto ciclo (circa 3 minuti) ad appena l'8%. In modalità Ultra performance, almeno è ancora intorno al 20%.
Sotto carico di un solo core, i nuovi core ad alte prestazioni dei chip Alder Lake raggiungono valori elevati di prestazioni, ma si pagano anche con un consumo energetico elevato (~26 watt per un singolo core)
Nel funzionamento a batteria, le prestazioni del singolo core rimangono invariate, ma sotto il carico di più core, la CPU scende più rapidamente fino al limite di 45 watt, con una riduzione delle prestazioni di circa il 25%. È possibile trovare altri benchmark della CPU qui.
Cinebench R23: Multi Core | Single Core
Cinebench R20: CPU (Multi Core) | CPU (Single Core)
Cinebench R15: CPU Multi 64Bit | CPU Single 64Bit
Blender: v2.79 BMW27 CPU
7-Zip 18.03: 7z b 4 | 7z b 4 -mmt1
Geekbench 5.5: Multi-Core | Single-Core
HWBOT x265 Benchmark v2.2: 4k Preset
LibreOffice : 20 Documents To PDF
R Benchmark 2.5: Overall mean
| CPU Performance rating | |
| Dell XPS 17 9720 RTX 3060 | |
| Media della classe Multimedia | |
| Dell XPS 17 9720 | |
| Media Intel Core i7-12700H | |
| Apple MacBook Pro 16 2021 M1 Pro -5! | |
| Lenovo ThinkBook 16p G2 ACH | |
| Asus Vivobook Pro 16X-M7600QE | |
| Lenovo ThinkPad X1 Extreme G4-20Y5CTO1WW (3050 Ti) | |
| Dell XPS 17 9710 Core i7 RTX 3060 -2! | |
| Cinebench R23 / Multi Core | |
| Dell XPS 17 9720 RTX 3060 | |
| Dell XPS 17 9720 | |
| Media della classe Multimedia (4861 - 33362, n=78, ultimi 2 anni) | |
| Media Intel Core i7-12700H (4032 - 19330, n=64) | |
| Lenovo ThinkBook 16p G2 ACH | |
| Lenovo ThinkPad X1 Extreme G4-20Y5CTO1WW (3050 Ti) | |
| Apple MacBook Pro 16 2021 M1 Pro | |
| Asus Vivobook Pro 16X-M7600QE | |
| Asus Vivobook Pro 16X-M7600QE | |
| Dell XPS 17 9710 Core i7 RTX 3060 | |
| Cinebench R23 / Single Core | |
| Media della classe Multimedia (1128 - 2459, n=70, ultimi 2 anni) | |
| Dell XPS 17 9720 RTX 3060 | |
| Media Intel Core i7-12700H (778 - 1826, n=63) | |
| Dell XPS 17 9720 | |
| Apple MacBook Pro 16 2021 M1 Pro | |
| Lenovo ThinkPad X1 Extreme G4-20Y5CTO1WW (3050 Ti) | |
| Dell XPS 17 9710 Core i7 RTX 3060 | |
| Asus Vivobook Pro 16X-M7600QE | |
| Asus Vivobook Pro 16X-M7600QE | |
| Lenovo ThinkBook 16p G2 ACH | |
| Cinebench R20 / CPU (Multi Core) | |
| Dell XPS 17 9720 RTX 3060 | |
| Media della classe Multimedia (1887 - 12912, n=61, ultimi 2 anni) | |
| Media Intel Core i7-12700H (1576 - 7407, n=64) | |
| Lenovo ThinkBook 16p G2 ACH | |
| Dell XPS 17 9720 | |
| Asus Vivobook Pro 16X-M7600QE | |
| Asus Vivobook Pro 16X-M7600QE | |
| Lenovo ThinkPad X1 Extreme G4-20Y5CTO1WW (3050 Ti) | |
| Dell XPS 17 9710 Core i7 RTX 3060 | |
| Apple MacBook Pro 16 2021 M1 Pro | |
| Cinebench R20 / CPU (Single Core) | |
| Media della classe Multimedia (420 - 853, n=61, ultimi 2 anni) | |
| Media Intel Core i7-12700H (300 - 704, n=64) | |
| Dell XPS 17 9720 RTX 3060 | |
| Dell XPS 17 9720 | |
| Lenovo ThinkPad X1 Extreme G4-20Y5CTO1WW (3050 Ti) | |
| Lenovo ThinkBook 16p G2 ACH | |
| Dell XPS 17 9710 Core i7 RTX 3060 | |
| Asus Vivobook Pro 16X-M7600QE | |
| Asus Vivobook Pro 16X-M7600QE | |
| Apple MacBook Pro 16 2021 M1 Pro | |
| Cinebench R15 / CPU Multi 64Bit | |
| Dell XPS 17 9720 | |
| Dell XPS 17 9720 | |
| Media della classe Multimedia (856 - 5224, n=67, ultimi 2 anni) | |
| Media Intel Core i7-12700H (1379 - 2916, n=70) | |
| Dell XPS 17 9720 RTX 3060 | |
| Lenovo ThinkBook 16p G2 ACH | |
| Asus Vivobook Pro 16X-M7600QE | |
| Asus Vivobook Pro 16X-M7600QE | |
| Lenovo ThinkPad X1 Extreme G4-20Y5CTO1WW (3050 Ti) | |
| Dell XPS 17 9710 Core i7 RTX 3060 | |
| Apple MacBook Pro 16 2021 M1 Pro | |
| Cinebench R15 / CPU Single 64Bit | |
| Media della classe Multimedia (99.6 - 326, n=64, ultimi 2 anni) | |
| Dell XPS 17 9720 RTX 3060 | |
| Dell XPS 17 9720 | |
| Media Intel Core i7-12700H (113 - 263, n=65) | |
| Asus Vivobook Pro 16X-M7600QE | |
| Asus Vivobook Pro 16X-M7600QE | |
| Lenovo ThinkBook 16p G2 ACH | |
| Lenovo ThinkPad X1 Extreme G4-20Y5CTO1WW (3050 Ti) | |
| Dell XPS 17 9710 Core i7 RTX 3060 | |
| Apple MacBook Pro 16 2021 M1 Pro | |
| Blender / v2.79 BMW27 CPU | |
| Dell XPS 17 9710 Core i7 RTX 3060 | |
| Asus Vivobook Pro 16X-M7600QE | |
| Asus Vivobook Pro 16X-M7600QE | |
| Lenovo ThinkPad X1 Extreme G4-20Y5CTO1WW (3050 Ti) | |
| Media della classe Multimedia (100 - 557, n=62, ultimi 2 anni) | |
| Dell XPS 17 9720 | |
| Lenovo ThinkBook 16p G2 ACH | |
| Media Intel Core i7-12700H (168 - 732, n=63) | |
| Dell XPS 17 9720 RTX 3060 | |
| Apple MacBook Pro 16 2021 M1 Pro | |
| 7-Zip 18.03 / 7z b 4 | |
| Dell XPS 17 9720 RTX 3060 | |
| Media Intel Core i7-12700H (22844 - 73067, n=63) | |
| Media della classe Multimedia (29095 - 130368, n=60, ultimi 2 anni) | |
| Lenovo ThinkBook 16p G2 ACH | |
| Dell XPS 17 9720 | |
| Asus Vivobook Pro 16X-M7600QE | |
| Asus Vivobook Pro 16X-M7600QE | |
| Dell XPS 17 9710 Core i7 RTX 3060 | |
| Lenovo ThinkPad X1 Extreme G4-20Y5CTO1WW (3050 Ti) | |
| 7-Zip 18.03 / 7z b 4 -mmt1 | |
| Asus Vivobook Pro 16X-M7600QE | |
| Asus Vivobook Pro 16X-M7600QE | |
| Lenovo ThinkBook 16p G2 ACH | |
| Dell XPS 17 9720 | |
| Media della classe Multimedia (3666 - 7545, n=60, ultimi 2 anni) | |
| Dell XPS 17 9720 RTX 3060 | |
| Media Intel Core i7-12700H (2743 - 5972, n=63) | |
| Lenovo ThinkPad X1 Extreme G4-20Y5CTO1WW (3050 Ti) | |
| Dell XPS 17 9710 Core i7 RTX 3060 | |
| Geekbench 5.5 / Multi-Core | |
| Dell XPS 17 9720 | |
| Apple MacBook Pro 16 2021 M1 Pro | |
| Media della classe Multimedia (4652 - 20422, n=61, ultimi 2 anni) | |
| Dell XPS 17 9720 RTX 3060 | |
| Media Intel Core i7-12700H (5144 - 13745, n=64) | |
| Lenovo ThinkBook 16p G2 ACH | |
| Asus Vivobook Pro 16X-M7600QE | |
| Asus Vivobook Pro 16X-M7600QE | |
| Lenovo ThinkPad X1 Extreme G4-20Y5CTO1WW (3050 Ti) | |
| Geekbench 5.5 / Single-Core | |
| Media della classe Multimedia (805 - 2974, n=61, ultimi 2 anni) | |
| Apple MacBook Pro 16 2021 M1 Pro | |
| Dell XPS 17 9720 | |
| Media Intel Core i7-12700H (803 - 1851, n=64) | |
| Dell XPS 17 9720 RTX 3060 | |
| Lenovo ThinkPad X1 Extreme G4-20Y5CTO1WW (3050 Ti) | |
| Asus Vivobook Pro 16X-M7600QE | |
| Asus Vivobook Pro 16X-M7600QE | |
| Lenovo ThinkBook 16p G2 ACH | |
| HWBOT x265 Benchmark v2.2 / 4k Preset | |
| Media della classe Multimedia (5.26 - 36.1, n=60, ultimi 2 anni) | |
| Media Intel Core i7-12700H (4.67 - 21.8, n=64) | |
| Lenovo ThinkBook 16p G2 ACH | |
| Dell XPS 17 9720 RTX 3060 | |
| Asus Vivobook Pro 16X-M7600QE | |
| Asus Vivobook Pro 16X-M7600QE | |
| Dell XPS 17 9720 | |
| Dell XPS 17 9710 Core i7 RTX 3060 | |
| Lenovo ThinkPad X1 Extreme G4-20Y5CTO1WW (3050 Ti) | |
| LibreOffice / 20 Documents To PDF | |
| Lenovo ThinkBook 16p G2 ACH | |
| Asus Vivobook Pro 16X-M7600QE | |
| Asus Vivobook Pro 16X-M7600QE | |
| Media della classe Multimedia (23.9 - 146.7, n=61, ultimi 2 anni) | |
| Media Intel Core i7-12700H (34.2 - 95.3, n=63) | |
| Dell XPS 17 9710 Core i7 RTX 3060 | |
| Dell XPS 17 9720 | |
| Dell XPS 17 9720 RTX 3060 | |
| Lenovo ThinkPad X1 Extreme G4-20Y5CTO1WW (3050 Ti) | |
| R Benchmark 2.5 / Overall mean | |
| Dell XPS 17 9710 Core i7 RTX 3060 | |
| Lenovo ThinkPad X1 Extreme G4-20Y5CTO1WW (3050 Ti) | |
| Lenovo ThinkBook 16p G2 ACH | |
| Asus Vivobook Pro 16X-M7600QE | |
| Asus Vivobook Pro 16X-M7600QE | |
| Media della classe Multimedia (0.3604 - 0.947, n=60, ultimi 2 anni) | |
| Media Intel Core i7-12700H (0.4441 - 1.052, n=63) | |
| Dell XPS 17 9720 RTX 3060 | |
| Dell XPS 17 9720 | |
* ... Meglio usare valori piccoli
AIDA64: FP32 Ray-Trace | FPU Julia | CPU SHA3 | CPU Queen | FPU SinJulia | FPU Mandel | CPU AES | CPU ZLib | FP64 Ray-Trace | CPU PhotoWorxx
| Performance rating | |
| Lenovo ThinkBook 16p G2 ACH | |
| Media della classe Multimedia | |
| Asus Vivobook Pro 16X-M7600QE | |
| Lenovo ThinkPad X1 Extreme G4-20Y5CTO1WW (3050 Ti) | |
| Media Intel Core i7-12700H | |
| Dell XPS 17 9720 RTX 3060 | |
| Dell XPS 17 9720 | |
| Dell XPS 17 9710 Core i7 RTX 3060 -9! | |
| AIDA64 / FP32 Ray-Trace | |
| Media della classe Multimedia (2214 - 50388, n=58, ultimi 2 anni) | |
| Lenovo ThinkBook 16p G2 ACH | |
| Lenovo ThinkPad X1 Extreme G4-20Y5CTO1WW (3050 Ti) | |
| Asus Vivobook Pro 16X-M7600QE | |
| Asus Vivobook Pro 16X-M7600QE | |
| Media Intel Core i7-12700H (2585 - 17957, n=64) | |
| Dell XPS 17 9720 RTX 3060 | |
| Dell XPS 17 9720 | |
| AIDA64 / FPU Julia | |
| Lenovo ThinkBook 16p G2 ACH | |
| Asus Vivobook Pro 16X-M7600QE | |
| Asus Vivobook Pro 16X-M7600QE | |
| Media della classe Multimedia (12867 - 201874, n=59, ultimi 2 anni) | |
| Lenovo ThinkPad X1 Extreme G4-20Y5CTO1WW (3050 Ti) | |
| Media Intel Core i7-12700H (12439 - 90760, n=64) | |
| Dell XPS 17 9720 RTX 3060 | |
| Dell XPS 17 9720 | |
| AIDA64 / CPU SHA3 | |
| Lenovo ThinkPad X1 Extreme G4-20Y5CTO1WW (3050 Ti) | |
| Media della classe Multimedia (653 - 8623, n=59, ultimi 2 anni) | |
| Lenovo ThinkBook 16p G2 ACH | |
| Asus Vivobook Pro 16X-M7600QE | |
| Asus Vivobook Pro 16X-M7600QE | |
| Media Intel Core i7-12700H (833 - 4242, n=64) | |
| Dell XPS 17 9720 RTX 3060 | |
| Dell XPS 17 9720 | |
| AIDA64 / CPU Queen | |
| Lenovo ThinkBook 16p G2 ACH | |
| Asus Vivobook Pro 16X-M7600QE | |
| Asus Vivobook Pro 16X-M7600QE | |
| Dell XPS 17 9720 | |
| Dell XPS 17 9720 RTX 3060 | |
| Media Intel Core i7-12700H (57923 - 103202, n=63) | |
| Lenovo ThinkPad X1 Extreme G4-20Y5CTO1WW (3050 Ti) | |
| Media della classe Multimedia (13483 - 181505, n=59, ultimi 2 anni) | |
| AIDA64 / FPU SinJulia | |
| Asus Vivobook Pro 16X-M7600QE | |
| Asus Vivobook Pro 16X-M7600QE | |
| Lenovo ThinkBook 16p G2 ACH | |
| Lenovo ThinkPad X1 Extreme G4-20Y5CTO1WW (3050 Ti) | |
| Media della classe Multimedia (1240 - 28794, n=59, ultimi 2 anni) | |
| Media Intel Core i7-12700H (3249 - 9939, n=64) | |
| Dell XPS 17 9720 RTX 3060 | |
| Dell XPS 17 9720 | |
| AIDA64 / FPU Mandel | |
| Lenovo ThinkBook 16p G2 ACH | |
| Asus Vivobook Pro 16X-M7600QE | |
| Asus Vivobook Pro 16X-M7600QE | |
| Media della classe Multimedia (6395 - 105740, n=58, ultimi 2 anni) | |
| Lenovo ThinkPad X1 Extreme G4-20Y5CTO1WW (3050 Ti) | |
| Media Intel Core i7-12700H (7135 - 44760, n=64) | |
| Dell XPS 17 9720 RTX 3060 | |
| Dell XPS 17 9720 | |
| AIDA64 / CPU AES | |
| Lenovo ThinkPad X1 Extreme G4-20Y5CTO1WW (3050 Ti) | |
| Lenovo ThinkBook 16p G2 ACH | |
| Asus Vivobook Pro 16X-M7600QE | |
| Asus Vivobook Pro 16X-M7600QE | |
| Media Intel Core i7-12700H (31839 - 144360, n=64) | |
| Dell XPS 17 9720 RTX 3060 | |
| Dell XPS 17 9720 | |
| Media della classe Multimedia (13243 - 152179, n=59, ultimi 2 anni) | |
| AIDA64 / CPU ZLib | |
| Media della classe Multimedia (167.2 - 2022, n=59, ultimi 2 anni) | |
| Media Intel Core i7-12700H (305 - 1171, n=64) | |
| Dell XPS 17 9720 RTX 3060 | |
| Dell XPS 17 9720 | |
| Lenovo ThinkBook 16p G2 ACH | |
| Asus Vivobook Pro 16X-M7600QE | |
| Asus Vivobook Pro 16X-M7600QE | |
| Lenovo ThinkPad X1 Extreme G4-20Y5CTO1WW (3050 Ti) | |
| Dell XPS 17 9710 Core i7 RTX 3060 | |
| AIDA64 / FP64 Ray-Trace | |
| Media della classe Multimedia (1014 - 26875, n=59, ultimi 2 anni) | |
| Lenovo ThinkBook 16p G2 ACH | |
| Lenovo ThinkPad X1 Extreme G4-20Y5CTO1WW (3050 Ti) | |
| Asus Vivobook Pro 16X-M7600QE | |
| Asus Vivobook Pro 16X-M7600QE | |
| Media Intel Core i7-12700H (1437 - 9692, n=64) | |
| Dell XPS 17 9720 RTX 3060 | |
| Dell XPS 17 9720 | |
| AIDA64 / CPU PhotoWorxx | |
| Media della classe Multimedia (12860 - 65787, n=59, ultimi 2 anni) | |
| Dell XPS 17 9720 | |
| Dell XPS 17 9720 RTX 3060 | |
| Media Intel Core i7-12700H (12863 - 52207, n=64) | |
| Asus Vivobook Pro 16X-M7600QE | |
| Asus Vivobook Pro 16X-M7600QE | |
| Lenovo ThinkBook 16p G2 ACH | |
| Lenovo ThinkPad X1 Extreme G4-20Y5CTO1WW (3050 Ti) | |
Prestazioni del sistema
L'impressione soggettiva sulle prestazioni dell'XPS 17 9720 è molto buona. Oltre al processore veloce, ciò è dovuto ovviamente anche all'unità SSD PCIe, che consente di tradurre tutti gli input senza ritardi evidenti. L'XPS viene fornito con Windows 11 installato e non abbiamo riscontrato alcun problema durante la nostra fase di test.
CrossMark: Overall | Productivity | Creativity | Responsiveness
| PCMark 10 / Score | |
| Dell XPS 17 9720 RTX 3060 | |
| Media della classe Multimedia (4325 - 10386, n=54, ultimi 2 anni) | |
| Dell XPS 17 9720 | |
| Media Intel Core i7-12700H, NVIDIA GeForce RTX 3050 4GB Laptop GPU (6660 - 6879, n=3) | |
| Lenovo ThinkBook 16p G2 ACH | |
| Dell XPS 17 9710 Core i7 RTX 3060 | |
| Asus Vivobook Pro 16X-M7600QE | |
| Lenovo ThinkPad X1 Extreme G4-20Y5CTO1WW (3050 Ti) | |
| PCMark 10 / Essentials | |
| Lenovo ThinkPad X1 Extreme G4-20Y5CTO1WW (3050 Ti) | |
| Dell XPS 17 9720 RTX 3060 | |
| Asus Vivobook Pro 16X-M7600QE | |
| Media della classe Multimedia (8025 - 11664, n=54, ultimi 2 anni) | |
| Dell XPS 17 9720 | |
| Lenovo ThinkBook 16p G2 ACH | |
| Media Intel Core i7-12700H, NVIDIA GeForce RTX 3050 4GB Laptop GPU (10150 - 10369, n=3) | |
| Dell XPS 17 9710 Core i7 RTX 3060 | |
| PCMark 10 / Productivity | |
| Asus Vivobook Pro 16X-M7600QE | |
| Media della classe Multimedia (7323 - 18233, n=54, ultimi 2 anni) | |
| Dell XPS 17 9720 RTX 3060 | |
| Dell XPS 17 9720 | |
| Media Intel Core i7-12700H, NVIDIA GeForce RTX 3050 4GB Laptop GPU (8995 - 9397, n=3) | |
| Lenovo ThinkBook 16p G2 ACH | |
| Dell XPS 17 9710 Core i7 RTX 3060 | |
| Lenovo ThinkPad X1 Extreme G4-20Y5CTO1WW (3050 Ti) | |
| PCMark 10 / Digital Content Creation | |
| Dell XPS 17 9720 RTX 3060 | |
| Media della classe Multimedia (3651 - 16240, n=54, ultimi 2 anni) | |
| Dell XPS 17 9710 Core i7 RTX 3060 | |
| Dell XPS 17 9720 | |
| Media Intel Core i7-12700H, NVIDIA GeForce RTX 3050 4GB Laptop GPU (8779 - 9203, n=3) | |
| Lenovo ThinkBook 16p G2 ACH | |
| Lenovo ThinkPad X1 Extreme G4-20Y5CTO1WW (3050 Ti) | |
| Asus Vivobook Pro 16X-M7600QE | |
| CrossMark / Overall | |
| Dell XPS 17 9720 RTX 3060 | |
| Dell XPS 17 9720 | |
| Media Intel Core i7-12700H, NVIDIA GeForce RTX 3050 4GB Laptop GPU (1717 - 1857, n=3) | |
| Media della classe Multimedia (866 - 2426, n=62, ultimi 2 anni) | |
| Apple MacBook Pro 16 2021 M1 Pro | |
| CrossMark / Productivity | |
| Dell XPS 17 9720 RTX 3060 | |
| Dell XPS 17 9720 | |
| Media della classe Multimedia (913 - 2344, n=62, ultimi 2 anni) | |
| Media Intel Core i7-12700H, NVIDIA GeForce RTX 3050 4GB Laptop GPU (1620 - 1735, n=3) | |
| Apple MacBook Pro 16 2021 M1 Pro | |
| CrossMark / Creativity | |
| Dell XPS 17 9720 RTX 3060 | |
| Dell XPS 17 9720 | |
| Apple MacBook Pro 16 2021 M1 Pro | |
| Media Intel Core i7-12700H, NVIDIA GeForce RTX 3050 4GB Laptop GPU (1911 - 2067, n=3) | |
| Media della classe Multimedia (907 - 2820, n=62, ultimi 2 anni) | |
| CrossMark / Responsiveness | |
| Dell XPS 17 9720 RTX 3060 | |
| Dell XPS 17 9720 | |
| Media Intel Core i7-12700H, NVIDIA GeForce RTX 3050 4GB Laptop GPU (1481 - 1651, n=3) | |
| Media della classe Multimedia (605 - 2024, n=62, ultimi 2 anni) | |
| Apple MacBook Pro 16 2021 M1 Pro | |
| PCMark 10 Score | 6879 punti | |
Aiuto | ||
| AIDA64 / Memory Copy | |
| Media della classe Multimedia (21158 - 109252, n=59, ultimi 2 anni) | |
| Dell XPS 17 9720 | |
| Dell XPS 17 9720 RTX 3060 | |
| Media Intel Core i7-12700H (25615 - 80511, n=64) | |
| Asus Vivobook Pro 16X-M7600QE | |
| Asus Vivobook Pro 16X-M7600QE | |
| Lenovo ThinkBook 16p G2 ACH | |
| Lenovo ThinkPad X1 Extreme G4-20Y5CTO1WW (3050 Ti) | |
| AIDA64 / Memory Read | |
| Media della classe Multimedia (19699 - 125604, n=59, ultimi 2 anni) | |
| Dell XPS 17 9720 RTX 3060 | |
| Dell XPS 17 9720 | |
| Media Intel Core i7-12700H (25586 - 79442, n=64) | |
| Asus Vivobook Pro 16X-M7600QE | |
| Asus Vivobook Pro 16X-M7600QE | |
| Lenovo ThinkBook 16p G2 ACH | |
| Lenovo ThinkPad X1 Extreme G4-20Y5CTO1WW (3050 Ti) | |
| AIDA64 / Memory Write | |
| Media della classe Multimedia (17733 - 117933, n=59, ultimi 2 anni) | |
| Dell XPS 17 9720 | |
| Dell XPS 17 9720 RTX 3060 | |
| Media Intel Core i7-12700H (23679 - 88660, n=64) | |
| Asus Vivobook Pro 16X-M7600QE | |
| Asus Vivobook Pro 16X-M7600QE | |
| Lenovo ThinkBook 16p G2 ACH | |
| Lenovo ThinkPad X1 Extreme G4-20Y5CTO1WW (3050 Ti) | |
| AIDA64 / Memory Latency | |
| Media della classe Multimedia (7 - 535, n=59, ultimi 2 anni) | |
| Dell XPS 17 9720 RTX 3060 | |
| Dell XPS 17 9720 | |
| Lenovo ThinkPad X1 Extreme G4-20Y5CTO1WW (3050 Ti) | |
| Media Intel Core i7-12700H (76.2 - 133.9, n=62) | |
| Lenovo ThinkBook 16p G2 ACH | |
| Asus Vivobook Pro 16X-M7600QE | |
| Asus Vivobook Pro 16X-M7600QE | |
| Dell XPS 17 9710 Core i7 RTX 3060 | |
* ... Meglio usare valori piccoli
Latenze DPC
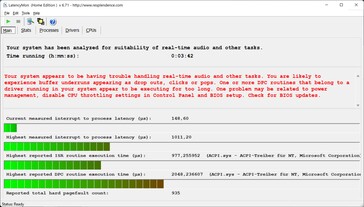
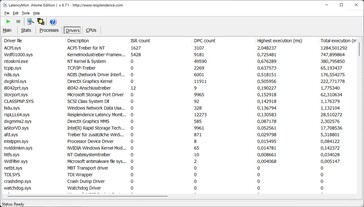
Nel nostro test di latenza standardizzato (navigazione web, YouTube 4K, carico della CPU), la nostra unità di test con l'attuale versione del BIOS mostra alcune lievi limitazioni e non è quindi adatta in modo ottimale all'uso di applicazioni audio in tempo reale.
| DPC Latencies / LatencyMon - interrupt to process latency (max), Web, Youtube, Prime95 | |
| Asus Vivobook Pro 16X-M7600QE | |
| Dell XPS 17 9720 | |
| Lenovo ThinkPad X1 Extreme G4-20Y5CTO1WW (3050 Ti) | |
| Dell XPS 17 9710 Core i7 RTX 3060 | |
| Lenovo ThinkBook 16p G2 ACH | |
| Dell XPS 17 9720 RTX 3060 | |
* ... Meglio usare valori piccoli
Soluzione di stoccaggio
La nostra unità di test XPS 17 9720 utilizza un'unità SSD Micron 3400 con una capacità di archiviazione di 512 GB. Dopo la prima esecuzione, sono ancora disponibili 391 GB per l'utente. Si tratta di un'unità SSD PCIe 4.0 molto veloce che raggiunge velocità di trasferimento superiori a 6 GB/s nei benchmark in lettura e circa 4 GB/s in scrittura.
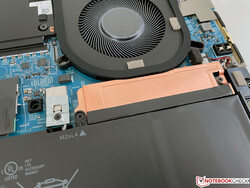
Sopra i due slot M.2 sono presenti ulteriori coperture in rame che apparentemente sono in grado di svolgere il loro lavoro. A differenza delle unità veloci PCIe 4.0 nei nostri test, dove si notano sempre più spesso cali di prestazioni dopo alcuni minuti a causa delle alte temperature, la nostra unità di prova dell'XPS 17 non ha alcun problema. Potete trovare altri benchmark sulle unità SSD nella nostra sezione tecnica.
* ... Meglio usare valori piccoli
Constant Performance Reading: DiskSpd Read Loop, Queue Depth 8
Scheda grafica - GeForce RTX 3050
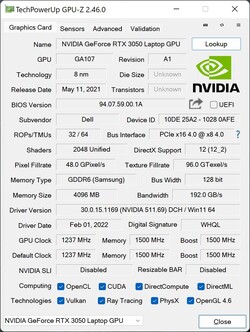
Nel funzionamento quotidiano, soprattutto l'efficiente grafica integrata Grafica Iris Xe G7del processore, che è anche in grado di gestire senza problemi la riproduzione di video ad alta risoluzione. Se avete bisogno di prestazioni grafiche ancora più elevate, la scheda grafica dedicata Nvidia GeForce RTX 3050con 4 GB di RAM e una velocità di clock massima di 1875 MHz viene attivata automaticamente. Come abbiamo già detto, quest'anno solo le versioni da 60 watt della RTX 3050 o dellaRTX 3060mentre nel vecchio XPS 17 9710 il consumo era ancora di 70 watt XPS 17 9710. Se il carico del processore è minimo, è possibile utilizzare altri 5 watt dal processore.
Anche se non abbiamo testato il vecchio 9710 con la RTX 3050, la versione Versione RTX 3060 dell'XPS 17 9720rimane circa il 10% indietro rispetto al predecessore, in particolare nei test con elevate esigenze grafiche, quindi ci aspettiamo una distanza simile anche per la RTX 3050. Si tratta di uno sviluppo che va chiaramente nella direzione sbagliata.
Ci sono anche alcuni limiti nella stabilità delle prestazioni, ma questo dipende dal carico della CPU. Le prestazioni della GPU rimangono stabili, ma sotto carico simultaneo il consumo della CPU scende a 25 watt dopo pochi minuti. Questo è anche il motivo per cui l'XPS 17 9720 non riesce a superare lo stress test 3DMark Time Spy (nemmeno in modalità prestazioni Ultra), e bisogna aspettarsi un deficit di circa il 10%.
Inoltre, il consumo delle prestazioni della GPU è limitato a 30 watt durante il funzionamento a batteria, causando un calo delle prestazioni di circa il 30% (4960 contro 3438 punti @ Time Spy Graphics). Potete trovare altri benchmark della GPU qui.
| 3DMark 11 Performance | 18259 punti | |
| 3DMark Cloud Gate Standard Score | 42029 punti | |
| 3DMark Fire Strike Score | 11906 punti | |
| 3DMark Time Spy Score | 5470 punti | |
Aiuto | ||
Prestazioni di gioco
Le prestazioni di gioco della RTX 3050 sono sostanzialmente decenti, ma la risoluzione 4K nativa è troppo impegnativa nella maggior parte dei casi. In particolare nei giochi attuali come Cyberpunk 2077, è necessario ridurre leggermente i dettagli per consentire un'esperienza davvero fluida. Chi vuole giocare di più con l'XPS 17 dovrebbe sicuramente optare per la RTX 3060 (con un sovrapprezzo di 200 euro=~209 dollari).
| Cyberpunk 2077 1.6 | |
| 1920x1080 High Preset | |
| Dell XPS 17 9720 RTX 3060 | |
| Dell XPS 17 9720 | |
| Media NVIDIA GeForce RTX 3050 4GB Laptop GPU (28.4 - 45.5, n=7) | |
| 1920x1080 Ultra Preset | |
| Dell XPS 17 9720 RTX 3060 | |
| Dell XPS 17 9720 | |
| Media NVIDIA GeForce RTX 3050 4GB Laptop GPU (25.3 - 36.5, n=7) | |
| F1 2021 | |
| 1920x1080 High Preset AA:T AF:16x | |
| Media della classe Multimedia (n=1ultimi 2 anni) | |
| Dell XPS 17 9720 | |
| Media NVIDIA GeForce RTX 3050 4GB Laptop GPU (93.4 - 130.1, n=7) | |
| Asus Vivobook Pro 16X-M7600QE | |
| 1920x1080 Ultra High Preset + Raytracing AA:T AF:16x | |
| Media della classe Multimedia (n=1ultimi 2 anni) | |
| Dell XPS 17 9720 | |
| Asus Vivobook Pro 16X-M7600QE | |
| Media NVIDIA GeForce RTX 3050 4GB Laptop GPU (44.1 - 62, n=8) | |
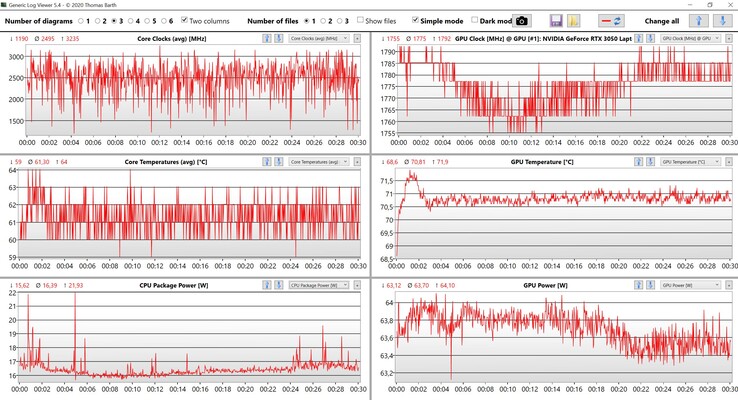
Nel nostro ciclo di The Witcher 3, le prestazioni di gioco rimangono stabili, ma anche la CPU non viene quasi mai messa sotto carico. Nella nostra valutazione vediamo che il processore consuma solo circa 17 watt. Tuttavia, se si gioca a un gioco che richiede maggiori sforzi al processore, dopo alcuni minuti si verificherà un leggero deficit di prestazioni, non appena si raggiungerà il limite di 25 watt del processore.
Durante il funzionamento a batteria, le prestazioni della GPU vengono ridotte in modo significativo, causando anche un calo delle prestazioni di gioco. Quando si gioca a The Witcher 3 con l'impostazione Ultra, ad esempio, si raggiungono solo 31 invece di 49 FPS. È possibile trovare altri benchmark di gioco qui.
The Witcher 3 FPS Chart
| basso | medio | alto | ultra | QHD | 4K | |
|---|---|---|---|---|---|---|
| GTA V (2015) | 186.8 | 180.2 | 146.6 | 72.5 | 51.3 | 43.6 |
| The Witcher 3 (2015) | 283 | 179 | 99 | 49 | ||
| Dota 2 Reborn (2015) | 187 | 170.8 | 160.3 | 145 | 70.4 | |
| Final Fantasy XV Benchmark (2018) | 128.4 | 73.1 | 52.7 | 38.5 | 21 | |
| X-Plane 11.11 (2018) | 135.7 | 114.8 | 95.8 | 66.1 | ||
| Far Cry 5 (2018) | 156 | 94 | 85 | 80 | 55 | |
| Strange Brigade (2018) | 296 | 131 | 105.3 | 90.6 | 66.1 | 35.7 |
| F1 2021 (2021) | 282 | 164.7 | 130.1 | 62 | 43 | 20.9 |
| Cyberpunk 2077 1.6 (2022) | 63 | 52 | 43 | 34 | 21 |
Emissioni - XPS spesso silenzioso durante il funzionamento quotidiano
Emissioni sonore
Dell utilizza tutti i materiali e le caratteristiche di raffreddamento di cui dispone il produttore nell'XPS 17, come la camera di vapore e lo speciale isolamento termico GORE, tra gli altri. Dell dichiara di essere in grado di raffreddare costantemente 90 watt (ma il caricatore USB-C potrebbe essere il fattore limitante). Anche i nostri test lo confermano. Ma nonostante tutte queste soluzioni di fascia alta, l'XPS 17 diventa piuttosto rumoroso, soprattutto considerando le prestazioni grafiche ridotte (rispetto all'XPS 17 9710) XPS 17 9710). Già sotto carico puro della CPU (CB R23 Multi), è di quasi 44 dB(A) nonostante la limitazione a 45 Watt, e durante il gioco e nello stress test, di quasi 49 dB(A). Se si utilizza il profilo di prestazioni Ultra, si arriva rapidamente a quasi 51 dB(A).
| Modalità di prestazioni | Cinebench R23 Multi | Il Witcher 3 Ultra | Stress Test |
|---|---|---|---|
| Ottimizzato | 43,9 dB(A) | 48,4 dB(A) | 48,4 dB(A) |
| Ultra Performance | 48,4 dB(A) | 50,9 dB(A) | 50,9 dB(A) |
| Silent | 38,8 dB(A) | 41,3 dB(A) | 41,3 dB(A) |
D'altra parte, vogliamo anche menzionare che il rumore della ventola non contiene frequenze fastidiose. L'XPS 17 è anche un portatile generalmente silenzioso durante le attività semplici e le situazioni quotidiane, ed è in grado di gestire brevi picchi di carico senza avviare le ventole. Non abbiamo notato altri rumori elettronici.
Rumorosità
| Idle |
| 24 / 24 / 24 dB(A) |
| Sotto carico |
| 43.9 / 48.4 dB(A) |
 | ||
30 dB silenzioso 40 dB(A) udibile 50 dB(A) rumoroso |
||
min: | ||
| Dell XPS 17 9720 GeForce RTX 3050 4GB Laptop GPU, i7-12700H, Micron 3400 MTFDKBA512TFH 512GB | Apple MacBook Pro 16 2021 M1 Pro M1 Pro 16-Core GPU, M1 Pro, Apple SSD AP1024R | Dell XPS 17 9720 RTX 3060 GeForce RTX 3060 Laptop GPU, i7-12700H, Samsung PM9A1 MZVL21T0HCLR | Lenovo ThinkPad X1 Extreme G4-20Y5CTO1WW (3050 Ti) GeForce RTX 3050 Ti Laptop GPU, i7-11800H, Samsung PM9A1 MZVL21T0HCLR | Asus Vivobook Pro 16X-M7600QE GeForce RTX 3050 Ti Laptop GPU, R9 5900HX, SK Hynix HFM001TD3JX013N | Lenovo ThinkBook 16p G2 ACH GeForce RTX 3060 Laptop GPU, R9 5900HX, WDC PC SN730 SDBPNTY-1T00 | Dell XPS 17 9710 Core i7 RTX 3060 GeForce RTX 3060 Laptop GPU, i7-11800H, Micron 2300 1TB MTFDHBA1T0TDV | |
|---|---|---|---|---|---|---|---|
| Noise | 9% | 1% | -1% | -6% | 5% | -4% | |
| off /ambiente * (dB) | 24 | 24.7 -3% | 23.8 1% | 23.52 2% | 26 -8% | 23 4% | 25.5 -6% |
| Idle Minimum * (dB) | 24 | 24.7 -3% | 24.1 -0% | 23.52 2% | 27 -13% | 23 4% | 25.2 -5% |
| Idle Average * (dB) | 24 | 24.7 -3% | 24.1 -0% | 23.52 2% | 27 -13% | 23 4% | 25.2 -5% |
| Idle Maximum * (dB) | 24 | 24.7 -3% | 24.1 -0% | 23.52 2% | 27.5 -15% | 23 4% | 25.2 -5% |
| Load Average * (dB) | 43.9 | 26.1 41% | 43.2 2% | 42.9 2% | 41.7 5% | 35.66 19% | 45.9 -5% |
| Witcher 3 ultra * (dB) | 48.4 | 48 1% | 52.5 -8% | 48.7 -1% | 49 -1% | ||
| Load Maximum * (dB) | 48.4 | 37.4 23% | 48 1% | 52.45 -8% | 45.3 6% | 48.13 1% | 50.4 -4% |
* ... Meglio usare valori piccoli
Temperature
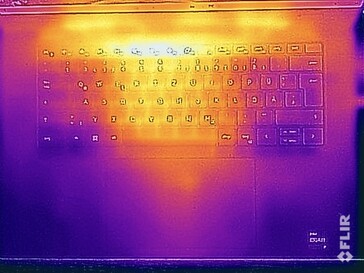
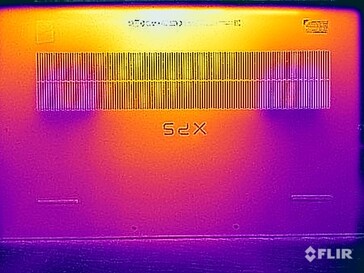
Nell'uso quotidiano, l'XPS 17 non ha alcun problema di temperature elevate e non ci sono preoccupazioni nel posizionare il portatile sulle ginocchia anche sotto carico, anche se questo sembra improbabile considerando le dimensioni del case. L'hotspot si trova nella parte superiore dell'unità di base, nell'area centrale verso il retro, e anche l'area centrale della tastiera si scalda sensibilmente. Anche se in questo caso non ci sono limitazioni o preoccupazioni, è possibile che le dita si scaldino
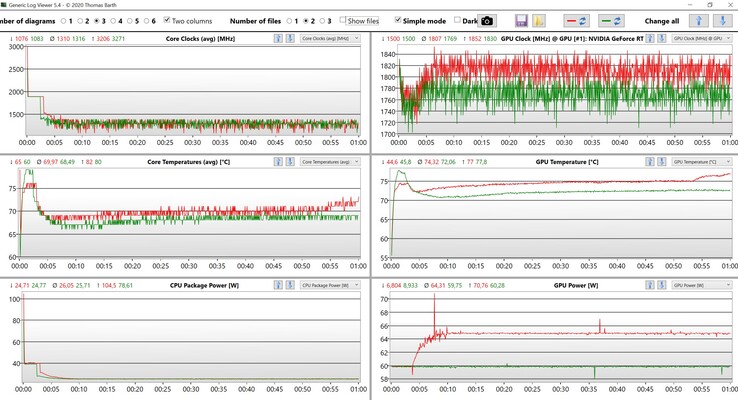
Durante lo stress test, le prestazioni della scheda grafica rimangono stabili a 60 watt. Mentre il processore si stabilizza inizialmente a 40 watt, per poi scendere a 25 watt dopo pochi minuti. In linea di principio vediamo lo stesso comportamento anche nella modalità Ultra performance, ma non appena viene attivato il limite di 25 watt per la CPU, la GPU può consumare altri 5 watt (per un totale di 65 watt).
(-) La temperatura massima sul lato superiore è di 49.5 °C / 121 F, rispetto alla media di 36.9 °C / 98 F, che varia da 21.1 a 71 °C per questa classe Multimedia.
(+) Il lato inferiore si riscalda fino ad un massimo di 38.4 °C / 101 F, rispetto alla media di 39.2 °C / 103 F
(+) In idle, la temperatura media del lato superiore è di 26.7 °C / 80 F, rispetto alla media deld ispositivo di 31.3 °C / 88 F.
(±) Riproducendo The Witcher 3, la temperatura media per il lato superiore e' di 37.3 °C / 99 F, rispetto alla media del dispositivo di 31.3 °C / 88 F.
(+) I poggiapolsi e il touchpad raggiungono la temperatura massima della pelle (33.1 °C / 91.6 F) e quindi non sono caldi.
(-) La temperatura media della zona del palmo della mano di dispositivi simili e'stata di 28.7 °C / 83.7 F (-4.4 °C / -7.9 F).
| Dell XPS 17 9720 Intel Core i7-12700H, NVIDIA GeForce RTX 3050 4GB Laptop GPU | Apple MacBook Pro 16 2021 M1 Pro Apple M1 Pro, Apple M1 Pro 16-Core GPU | Dell XPS 17 9720 RTX 3060 Intel Core i7-12700H, NVIDIA GeForce RTX 3060 Laptop GPU | Lenovo ThinkPad X1 Extreme G4-20Y5CTO1WW (3050 Ti) Intel Core i7-11800H, NVIDIA GeForce RTX 3050 Ti Laptop GPU | Asus Vivobook Pro 16X-M7600QE AMD Ryzen 9 5900HX, NVIDIA GeForce RTX 3050 Ti Laptop GPU | Lenovo ThinkBook 16p G2 ACH AMD Ryzen 9 5900HX, NVIDIA GeForce RTX 3060 Laptop GPU | Dell XPS 17 9710 Core i7 RTX 3060 Intel Core i7-11800H, NVIDIA GeForce RTX 3060 Laptop GPU | |
|---|---|---|---|---|---|---|---|
| Heat | 11% | -16% | -9% | 2% | -13% | -15% | |
| Maximum Upper Side * (°C) | 49.5 | 41 17% | 51.8 -5% | 49 1% | 39.4 20% | 50 -1% | 50.2 -1% |
| Maximum Bottom * (°C) | 38.4 | 39 -2% | 44.2 -15% | 44.4 -16% | 43.6 -14% | 53 -38% | 38.4 -0% |
| Idle Upper Side * (°C) | 28 | 24 14% | 34.8 -24% | 32.1 -15% | 27.6 1% | 29 -4% | 37.6 -34% |
| Idle Bottom * (°C) | 27.8 | 24 14% | 33.2 -19% | 29.8 -7% | 27.5 1% | 30 -8% | 34.2 -23% |
* ... Meglio usare valori piccoli
Altoparlanti
Il sistema di altoparlanti è composto da due woofer da 2,5 watt ciascuno e da due tweeter da 1,5 watt ciascuno. Inoltre, è preinstallato il software audio MaxxAudio Pro, che aggiunge una notevole dinamica al suono. Offre alcune opzioni di regolazione aggiuntive, tra cui un equalizzatore completo. Il suono appare molto pieno e i diffusori possono anche diventare molto rumorosi. D'altra parte, il sistema manca di un po' di grinta rispetto al MacBook Pro 16.
Dell XPS 17 9720 analisi audio
(+) | gli altoparlanti sono relativamente potenti (83.6 dB)
Bassi 100 - 315 Hz
(±) | bassi ridotti - in media 7.3% inferiori alla media
(±) | la linearità dei bassi è media (11.4% delta rispetto alla precedente frequenza)
Medi 400 - 2000 Hz
(+) | medi bilanciati - solo only 3.4% rispetto alla media
(±) | linearità dei medi adeguata (7.6% delta rispetto alla precedente frequenza)
Alti 2 - 16 kHz
(+) | Alti bilanciati - appena 3.7% dalla media
(±) | la linearità degli alti è media (7.1% delta rispetto alla precedente frequenza)
Nel complesso 100 - 16.000 Hz
(+) | suono nel complesso lineare (8.8% differenza dalla media)
Rispetto alla stessa classe
» 9% di tutti i dispositivi testati in questa classe è stato migliore, 2% simile, 89% peggiore
» Il migliore ha avuto un delta di 5%, medio di 17%, peggiore di 45%
Rispetto a tutti i dispositivi testati
» 2% di tutti i dispositivi testati in questa classe è stato migliore, 1% similare, 97% peggiore
» Il migliore ha avuto un delta di 4%, medio di 24%, peggiore di 134%
Apple MacBook Pro 16 2021 M1 Pro analisi audio
(+) | gli altoparlanti sono relativamente potenti (84.7 dB)
Bassi 100 - 315 Hz
(+) | bassi buoni - solo 3.8% dalla media
(+) | bassi in lineaa (5.2% delta rispetto alla precedente frequenza)
Medi 400 - 2000 Hz
(+) | medi bilanciati - solo only 1.3% rispetto alla media
(+) | medi lineari (2.1% delta rispetto alla precedente frequenza)
Alti 2 - 16 kHz
(+) | Alti bilanciati - appena 1.9% dalla media
(+) | alti lineari (2.7% delta rispetto alla precedente frequenza)
Nel complesso 100 - 16.000 Hz
(+) | suono nel complesso lineare (4.6% differenza dalla media)
Rispetto alla stessa classe
» 0% di tutti i dispositivi testati in questa classe è stato migliore, 0% simile, 100% peggiore
» Il migliore ha avuto un delta di 5%, medio di 17%, peggiore di 45%
Rispetto a tutti i dispositivi testati
» 0% di tutti i dispositivi testati in questa classe è stato migliore, 0% similare, 100% peggiore
» Il migliore ha avuto un delta di 4%, medio di 24%, peggiore di 134%
Gestione dell'alimentazione - Alimentatore da 130 Watt vicino ai suoi limiti
Consumo di energia
Nelle nostre misurazioni del consumo energetico, il luminoso e ampio display 4K si fa ovviamente notare, ma con un massimo di 17 watt, i valori durante il funzionamento inattivo non sono affatto male nel confronto di classe. Sotto carico, osserviamo quasi 136 watt (40W CPU + 60W GPU), quindi il caricatore da 130 watt (USB-C) in dotazione sta raggiungendo i suoi limiti. Abbiamo verificato se l'XPS 17 inizia a consumare la batteria durante lo stress test, ma non è questo il caso. Non appena la CPU raggiunge il suo limite di 25 Watt, anche il consumo complessivo scende a circa 122 Watt. Il fatto che i risultati sotto carico siano praticamente identici a quelli della versione con la più veloce RTX 3060 non sorprende, dato che anche in questo caso vigono gli stessi limiti di potenza.
| Off / Standby | |
| Idle | |
| Sotto carico |
|
Leggenda:
min: | |
| Dell XPS 17 9720 i7-12700H, GeForce RTX 3050 4GB Laptop GPU, Micron 3400 MTFDKBA512TFH 512GB, IPS, 3840x2400, 17" | Apple MacBook Pro 16 2021 M1 Pro M1 Pro, M1 Pro 16-Core GPU, Apple SSD AP1024R, Mini-LED, 3456x2234, 16.2" | Dell XPS 17 9720 RTX 3060 i7-12700H, GeForce RTX 3060 Laptop GPU, Samsung PM9A1 MZVL21T0HCLR, IPS, 3840x2400, 17" | Lenovo ThinkPad X1 Extreme G4-20Y5CTO1WW (3050 Ti) i7-11800H, GeForce RTX 3050 Ti Laptop GPU, Samsung PM9A1 MZVL21T0HCLR, IPS LED, 3840x2400, 16" | Asus Vivobook Pro 16X-M7600QE R9 5900HX, GeForce RTX 3050 Ti Laptop GPU, SK Hynix HFM001TD3JX013N, OLED, 3840x2400, 16.1" | Lenovo ThinkBook 16p G2 ACH R9 5900HX, GeForce RTX 3060 Laptop GPU, WDC PC SN730 SDBPNTY-1T00, IPS, 2560x1600, 16" | Dell XPS 17 9710 Core i7 RTX 3060 i7-11800H, GeForce RTX 3060 Laptop GPU, Micron 2300 1TB MTFDHBA1T0TDV, IPS, 3840x2400, 17" | Media NVIDIA GeForce RTX 3050 4GB Laptop GPU | Media della classe Multimedia | |
|---|---|---|---|---|---|---|---|---|---|
| Power Consumption | 26% | -7% | -17% | 13% | -11% | -2% | 16% | 26% | |
| Idle Minimum * (Watt) | 7.8 | 5 36% | 5.9 24% | 10.3 -32% | 8.2 -5% | 13.2 -69% | 7.5 4% | 7.17 ? 8% | 6.09 ? 22% |
| Idle Average * (Watt) | 15.1 | 15.1 -0% | 15.8 -5% | 22.06 -46% | 16.2 -7% | 17 -13% | 15.7 -4% | 10.4 ? 31% | 10.6 ? 30% |
| Idle Maximum * (Watt) | 17 | 15.5 9% | 26.7 -57% | 23 -35% | 19.7 -16% | 18.6 -9% | 23.1 -36% | 14.8 ? 13% | 12.6 ? 26% |
| Load Average * (Watt) | 114 | 54 53% | 117.4 -3% | 102.57 10% | 65.8 42% | 88.8 22% | 87.2 24% | 89.7 ? 21% | 69.2 ? 39% |
| Witcher 3 ultra * (Watt) | 115.2 | 114.8 -0% | 106 8% | 65.6 43% | 123 -7% 123 -7% | 116 -1% | |||
| Load Maximum * (Watt) | 135.6 | 90 34% | 136.6 -1% | 147.8 -9% | 104 23% | 132 3% | 131.6 3% | 124.8 ? 8% | 115.8 ? 15% |
* ... Meglio usare valori piccoli
Power Consumption The Witcher 3 / Stress Test
Power Consumption With External Monitor
Durata della batteria
L'autonomia della batteria da 97 Wh non è affatto male rispetto ai concorrenti, e solo il MacBook Pro 16 è in grado di offrire un'autonomia di 97 Wh MacBook Pro 16ha una marcia in più. Nel test WLAN a 150 cd/m² (corrispondente a una luminosità del 52% nella nostra unità di test), abbiamo misurato ben 9 ore, e ancora circa 6 ore a piena luminosità. È anche possibile riprodurre video a 150 cd/m² per 11 ore
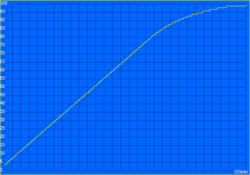
A pieno carico, ci si può aspettare una durata leggermente superiore a un'ora di funzionamento a batteria, nonostante la riduzione delle prestazioni. Eseguendo The Witcher 3, la batteria ha resistito per un'ora e 45 minuti. Se il portatile è acceso, ci vogliono circa 2,5 ore per ricaricarlo completamente, con il 50% della capacità disponibile dopo quasi un'ora, quindi non c'è una funzione di ricarica rapida.
| Dell XPS 17 9720 i7-12700H, GeForce RTX 3050 4GB Laptop GPU, 97 Wh | Apple MacBook Pro 16 2021 M1 Pro M1 Pro, M1 Pro 16-Core GPU, 99.6 Wh | Dell XPS 17 9720 RTX 3060 i7-12700H, GeForce RTX 3060 Laptop GPU, 97 Wh | Lenovo ThinkPad X1 Extreme G4-20Y5CTO1WW (3050 Ti) i7-11800H, GeForce RTX 3050 Ti Laptop GPU, 90 Wh | Asus Vivobook Pro 16X-M7600QE R9 5900HX, GeForce RTX 3050 Ti Laptop GPU, 96 Wh | Lenovo ThinkBook 16p G2 ACH R9 5900HX, GeForce RTX 3060 Laptop GPU, 71 Wh | Dell XPS 17 9710 Core i7 RTX 3060 i7-11800H, GeForce RTX 3060 Laptop GPU, 97 Wh | Media della classe Multimedia | |
|---|---|---|---|---|---|---|---|---|
| Autonomia della batteria | 70% | -11% | -23% | 8% | 7% | 50% | 35% | |
| H.264 (h) | 11.2 | 17.5 56% | 6.7 -40% | 7 -37% | 16 ? 43% | |||
| WiFi v1.3 (h) | 9.2 | 16.9 84% | 8.7 -5% | 6.6 -28% | 11.3 23% | 8.5 -8% | 7.6 -17% | 11.3 ? 23% |
| Witcher 3 ultra (h) | 1.7 | |||||||
| Load (h) | 1.2 | 1 -17% | 1.2 0% | 1.1 -8% | 2 67% | 2.6 117% | 1.667 ? 39% | |
| Reader / Idle (h) | 20.3 | 17.7 | 25.2 ? |
Pro
Contro
Verdetto - XPS 17 9720 con downgrade della GPU
L'XPS 17 è disponibile sul mercato da circa due anni, ma il design di base è basato sul più piccoloXPS 15e questo è il motivo per cui il concetto generale appare così familiare. Non c'è dubbio che si tratti ancora di un prodotto di alta qualità, come si può notare già dal prezzo di 3000 euro (~$3135). Tuttavia, nel test il portatile multimediale mostra anche un paio di punti deboli che rovinano leggermente l'impressione generale.
A nostro avviso, il problema principale è rappresentato dalle prestazioni. Sebbene il nuovo processore Intel offra valori di prestazioni decenti, non porta grandi vantaggi sotto carico costante rispetto al predecessore. Ma non è colpa di Dell, perché le nuove CPU Alder Lake consumano molta energia. La cosa migliore che Dell potrebbe fare è passare ad AMD, ma questo è un altro argomento. Anche le prestazioni grafiche della RTX 3050NVIDIA GeForce RTX 3050 Laptop GPU - Benchmarks and Specs vanno bene di per sé, ma non capiamo perché Dell faccia funzionare la GPU con meno energia rispetto al predecessore, riducendo ulteriormente le prestazioni di gioco effettive. Anche sotto carico combinato, l'XPS 17 non è in grado di brillare e le prestazioni non sono del tutto stabili nei giochi ad alta intensità di CPU, ad esempio. Allo stesso tempo, l'XPS 17 non è particolarmente silenzioso nemmeno sotto carico. Un altro problema è il modulo WLAN, poiché nonostante l'utilizzo di un moderno modulo Wi-Fi-6E, l'XPS 17 non supporta affatto le reti a 6-GHz.
L'XPS 17 brilla soprattutto per il suo pannello AdobeRGB dai colori estremamente precisi, che lo rende particolarmente adatto all'elaborazione delle immagini. Tuttavia, è necessario accettare alcuni compromessi nelle prestazioni e, nonostante l'utilizzo dello stesso raffreddamento, Dell ha leggermente ridotto le prestazioni della scheda grafica rispetto all'XPS 17 9710 dello scorso anno.
Il case continua a offrire una lavorazione di alta qualità, ma non è nemmeno leggero con i suoi 2,5 kg. Il vero punto di forza è il display, poiché questo è uno degli ultimi portatili con un pannello di alta qualità che copre lo standard AdobeRGB, a differenza della maggior parte dei concorrenti che a questo punto sono saliti sul carro del DCI-P3, compresi i display DreamColor di HP. Anche se il pannello deve essere calibrato, non ci sono limitazioni in seguito.
Nel complesso, l'XPS 17 continua a essere un ottimo portatile multimediale, ma Dell deve fare attenzione a non perdere terreno rispetto ai concorrenti. Il MacBook Pro 16 o ilThinkPad X1 Extreme, ad esempio, hanno già utilizzato il fattore di forma da 16 pollici e sono semplicemente più compatti pur offrendo valori di prestazioni comparabili (o addirittura migliori). Siamo curiosi di sapere come Dell gestirà questa situazione in futuro. Mentre i ben noti modelli XPS 15 e XPS 17 potrebbero essere ancora disponibili per un po', potremmo anche immaginare che il produttore reintroduca anche un XPS 16 sul mercato nel prossimo futuro.
Prezzo e disponibilità
Il nuovo XPS 17 9720 è disponibile presso Dell a partire da 1949 dollaricon varie opzioni di configurazione, ma è possibile acquistarlo anche da Amazon, ad esempio.
Dell XPS 17 9720
- 06/17/2022 v7 (old)
Andreas Osthoff


