Recensione del Laptop Dell XPS 17 9710 11a generazione Intel: Piccoli cambiamenti che contano
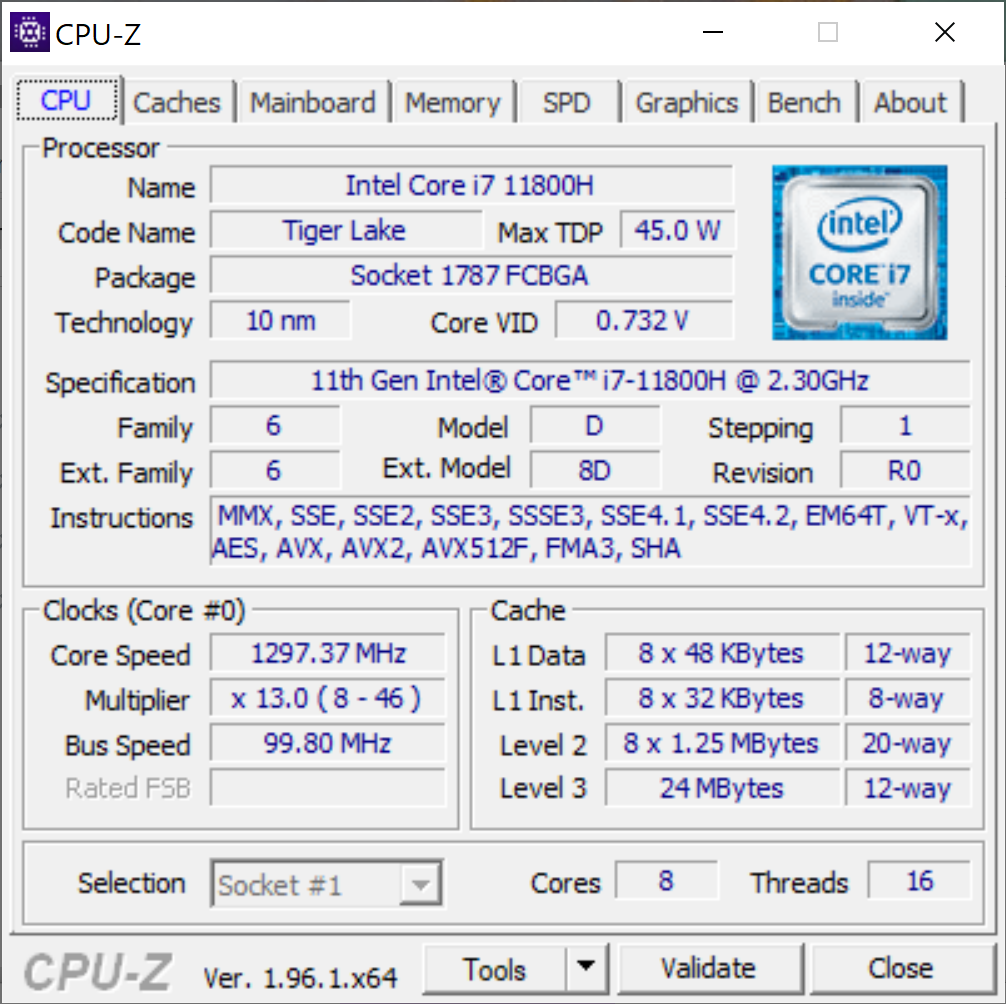
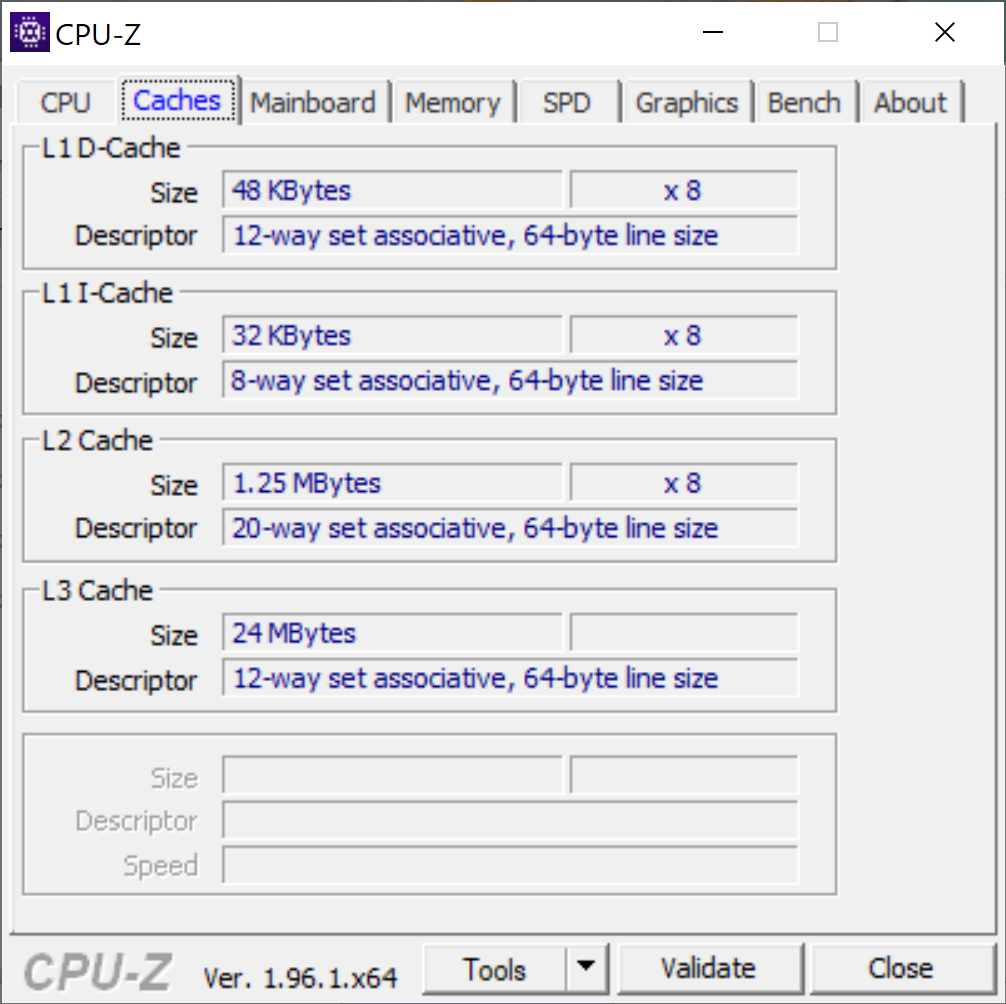
È passato esattamente un anno da quando abbiamo recensito l'xPS 17 9700 originale con Intel 10° gen e GeForce RTX 2060 Max-Q graphics. Ora, Dell è pronta a lanciare la sua seconda generazione della serie XPS 17 9710 aggiornata con Intel 11° gen e GeForce RTX 3060 graphics. La nostra unità di test di oggi è una configurazione di fascia media superiore con CPU Core i7-11800H, GPU RTX 3060 e touchscreen 2400p che costa poco meno di 2900 dollari. Altre versioni includono il Core i9-11900H o la RTX 3050 con display a 1200p per prezzi di partenza più alti e più bassi, rispettivamente.
L'XPS 17 del 2021 è fisicamente identico alla versione 2020 e quindi vi consigliamo di controllare le nostre due precedenti recensioni sul modello dell'anno scorso per saperne di più sul telaio e le sue caratteristiche. Tuttavia, ci sono alcuni aggiornamenti sotto il cofano che rendono l'XPS 17 9710 degno di considerazione rispetto al 9700.
Le alternative all'XPS 17 includono portatili ad alte prestazioni da 17.3" come il Gigabyte Aero 17, l'LG Ultra 17 o il Razer Blade Pro 17 in una certa misura. Tuttavia, l'XPS 17 rimane unico con i suoi 17.0" in formato 16:10 4K.
Altre recensioni su Dell:
Confronto con i potenziali concorrenti
Punteggio | Data | Modello | Peso | Altezza | Dimensione | Risoluzione | Prezzo |
|---|---|---|---|---|---|---|---|
| 87.9 % v7 (old) | 07/2021 | Dell XPS 17 9710 Core i7 RTX 3060 i7-11800H, GeForce RTX 3060 Laptop GPU | 2.5 kg | 19.5 mm | 17.00" | 3840x2400 | |
| 87.9 % v7 (old) | 07/2020 | Dell XPS 17 9700 Core i7 RTX 2060 Max-Q i7-10875H, GeForce RTX 2060 Max-Q | 2.5 kg | 19.5 mm | 17.00" | 3840x2400 | |
| 87.8 % v7 (old) | 02/2021 | Razer Blade Pro 17 2021 (QHD Touch) i7-10875H, GeForce RTX 3080 Laptop GPU | 3 kg | 19.9 mm | 17.30" | 3840x2160 | |
| 87.6 % v7 (old) | 01/2021 | Gigabyte Aero 17 HDR YC i9-10980HK, GeForce RTX 3080 Laptop GPU | 2.8 kg | 21.4 mm | 17.30" | 3840x2160 | |
| 82.8 % v7 (old) | 10/2020 | LG Ultra 17U70N i5-10210U, GeForce GTX 1650 Mobile | 2 kg | 20.4 mm | 17.00" | 2560x1600 | |
| 84.3 % v7 (old) | 08/2020 | Eluktronics RP-17 R7 4800H, GeForce RTX 2060 Mobile | 2.6 kg | 30 mm | 17.30" | 1920x1080 |
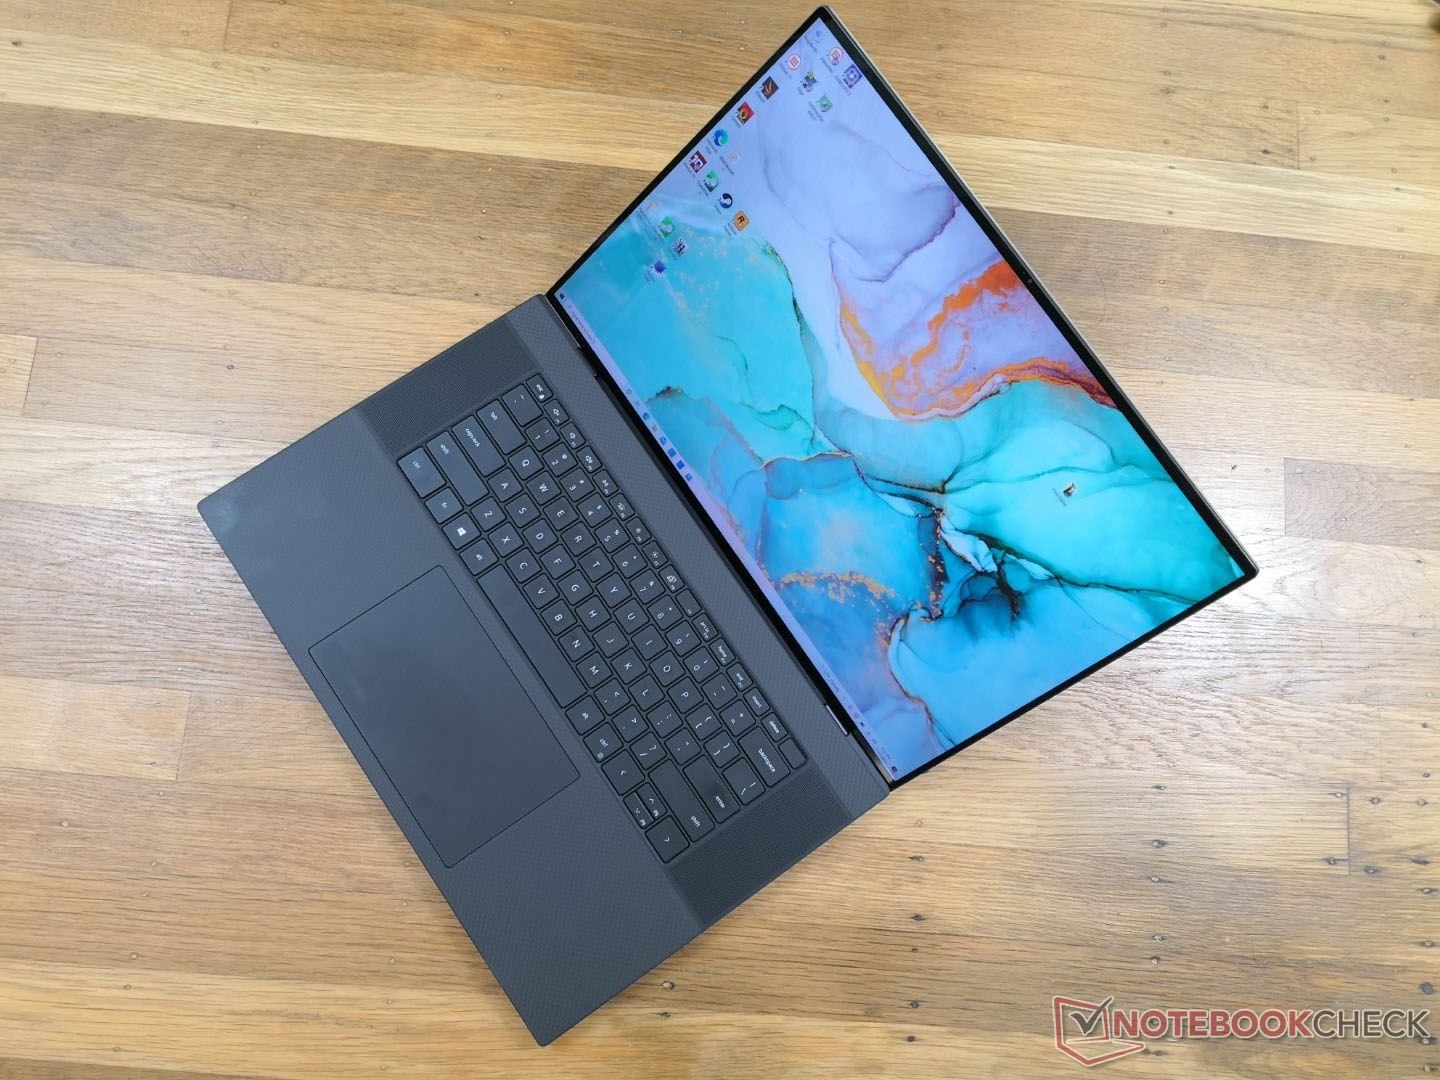
Case - Rapporto schermo/corpo incredibilmente alto
Il telaio ha solo un anno di vita e quindi Dell non ha apportato modifiche al design esterno dell'XPS 17 9710. Anche così, sarebbe stato bello vedere almeno un'opzione di colore aggiuntiva come l'XPS 13 in fibra di vetro o anche un otturatore della webcam che continua a mancare.
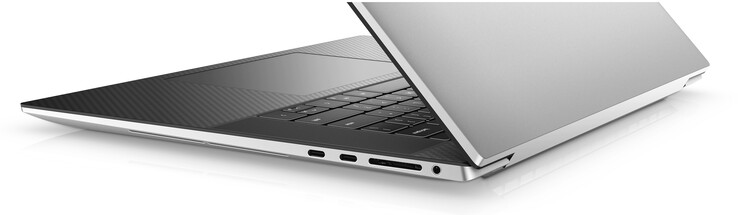
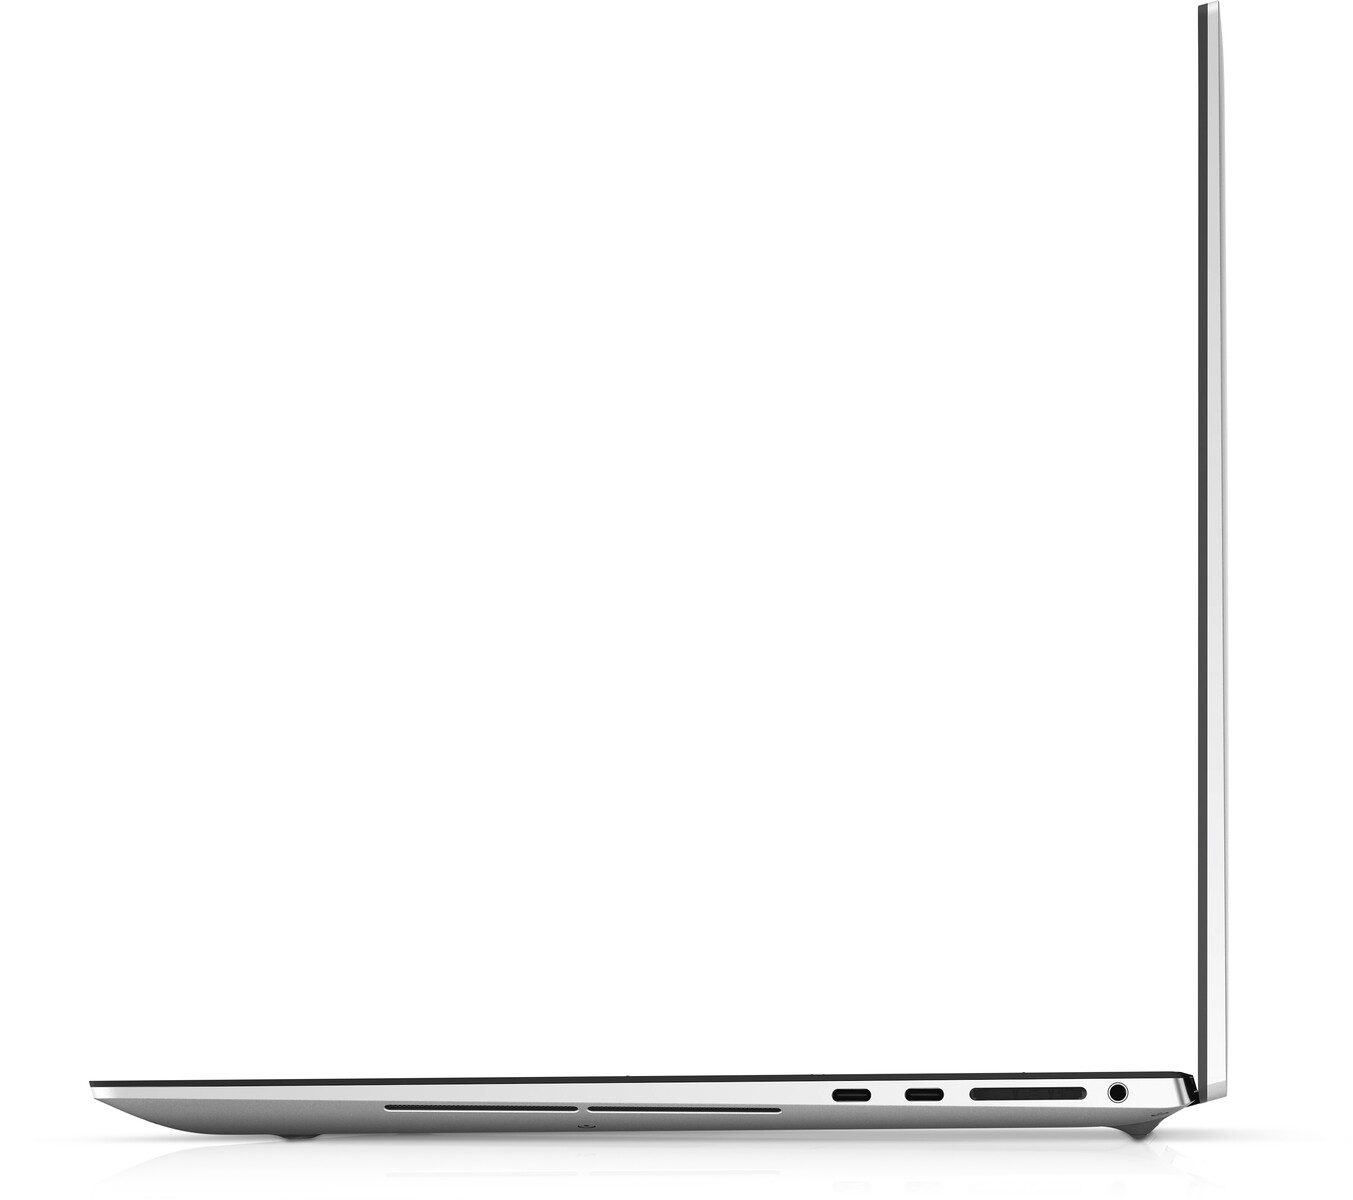
Connettività - Troppe porte Thunderbolt 4?
Come se le quattro porte Thunderbolt 3 sull'XPS 17 9700 non fossero abbastanza, sono state tutte aggiornate a Thunderbolt 4 su quest'ultimo modello. La maggior parte degli accessori al di fuori delle eGPU difficilmente beneficeranno dell'aggiornamento, dato che Thunderbolt 3 e Thunderbolt 4 condividono lo stesso tetto di 40 Gbps.
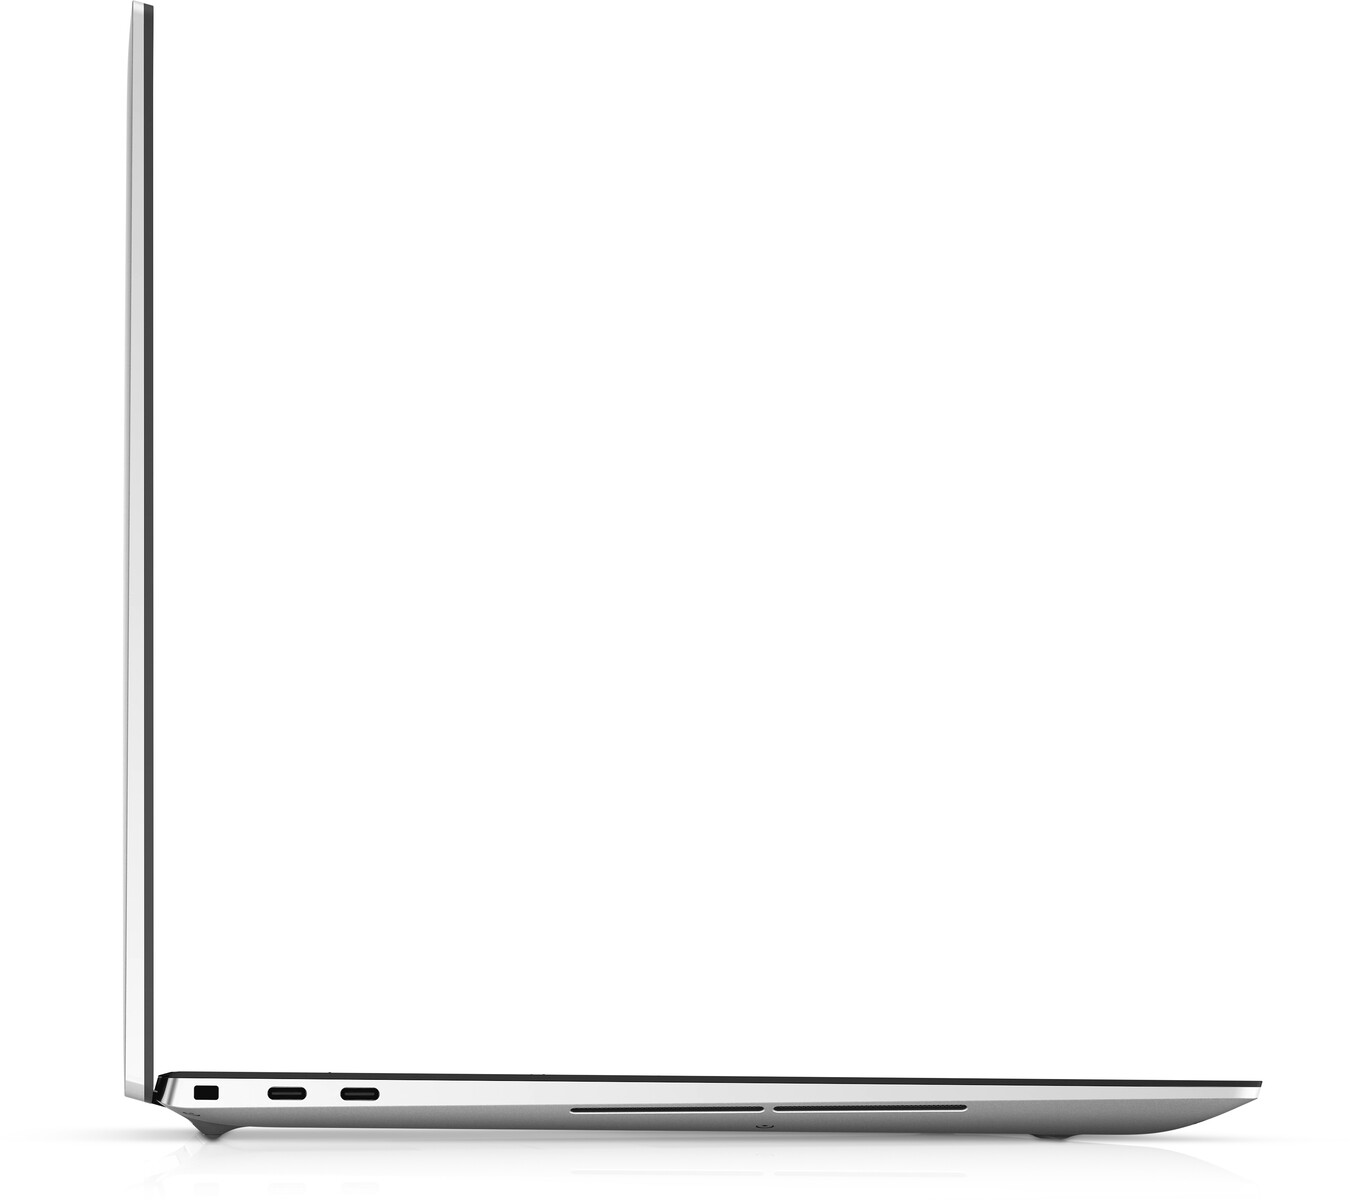
Lettore di schede SD: non è morto
Il lettore di schede SD è presente e siamo felici di vederlo supportato su modelli consumer come l'XPS 17. Spostare 1 GB di immagini dalla nostra scheda di test UHS-II richiede solo 5-6 secondi.
| SD Card Reader | |
| average JPG Copy Test (av. of 3 runs) | |
| Razer Blade Pro 17 2021 (QHD Touch) (Toshiba Exceria Pro SDXC 64 GB UHS-II) | |
| Dell XPS 17 9700 Core i7 RTX 2060 Max-Q (Toshiba Exceria Pro SDXC 64 GB UHS-II) | |
| Gigabyte Aero 17 HDR YC (Toshiba Exceria Pro SDXC 64 GB UHS-II) | |
| Dell XPS 17 9710 Core i7 RTX 3060 (AV PRO microSD 128 GB V60) | |
| LG Ultra 17U70N (Toshiba Exceria Pro M501 microSDXC 64GB) | |
| Eluktronics RP-17 (Toshiba Exceria Pro SDXC 64 GB UHS-II) | |
| maximum AS SSD Seq Read Test (1GB) | |
| Gigabyte Aero 17 HDR YC (Toshiba Exceria Pro SDXC 64 GB UHS-II) | |
| Dell XPS 17 9700 Core i7 RTX 2060 Max-Q (Toshiba Exceria Pro SDXC 64 GB UHS-II) | |
| Razer Blade Pro 17 2021 (QHD Touch) (Toshiba Exceria Pro SDXC 64 GB UHS-II) | |
| Dell XPS 17 9710 Core i7 RTX 3060 (AV PRO microSD 128 GB V60) | |
| LG Ultra 17U70N (Toshiba Exceria Pro M501 microSDXC 64GB) | |
| Eluktronics RP-17 (Toshiba Exceria Pro SDXC 64 GB UHS-II) | |
Comunicazioni
L'Intel-Killer 1650s ha come standard la connettività Wi-Fi 6 e Bluetooth 5.2. La differenza principale tra questo e il più comune Intel AX200/201 è il suo supporto per il Software Killer Networking che offre funzioni aggiuntive che gli appassionati potrebbero apprezzare.
Webcam
La webcam a 720p rimane la stessa. Sarebbe stato bello vedere un aggiornamento a 1080p come sull'ultimo Razer Blade 15.


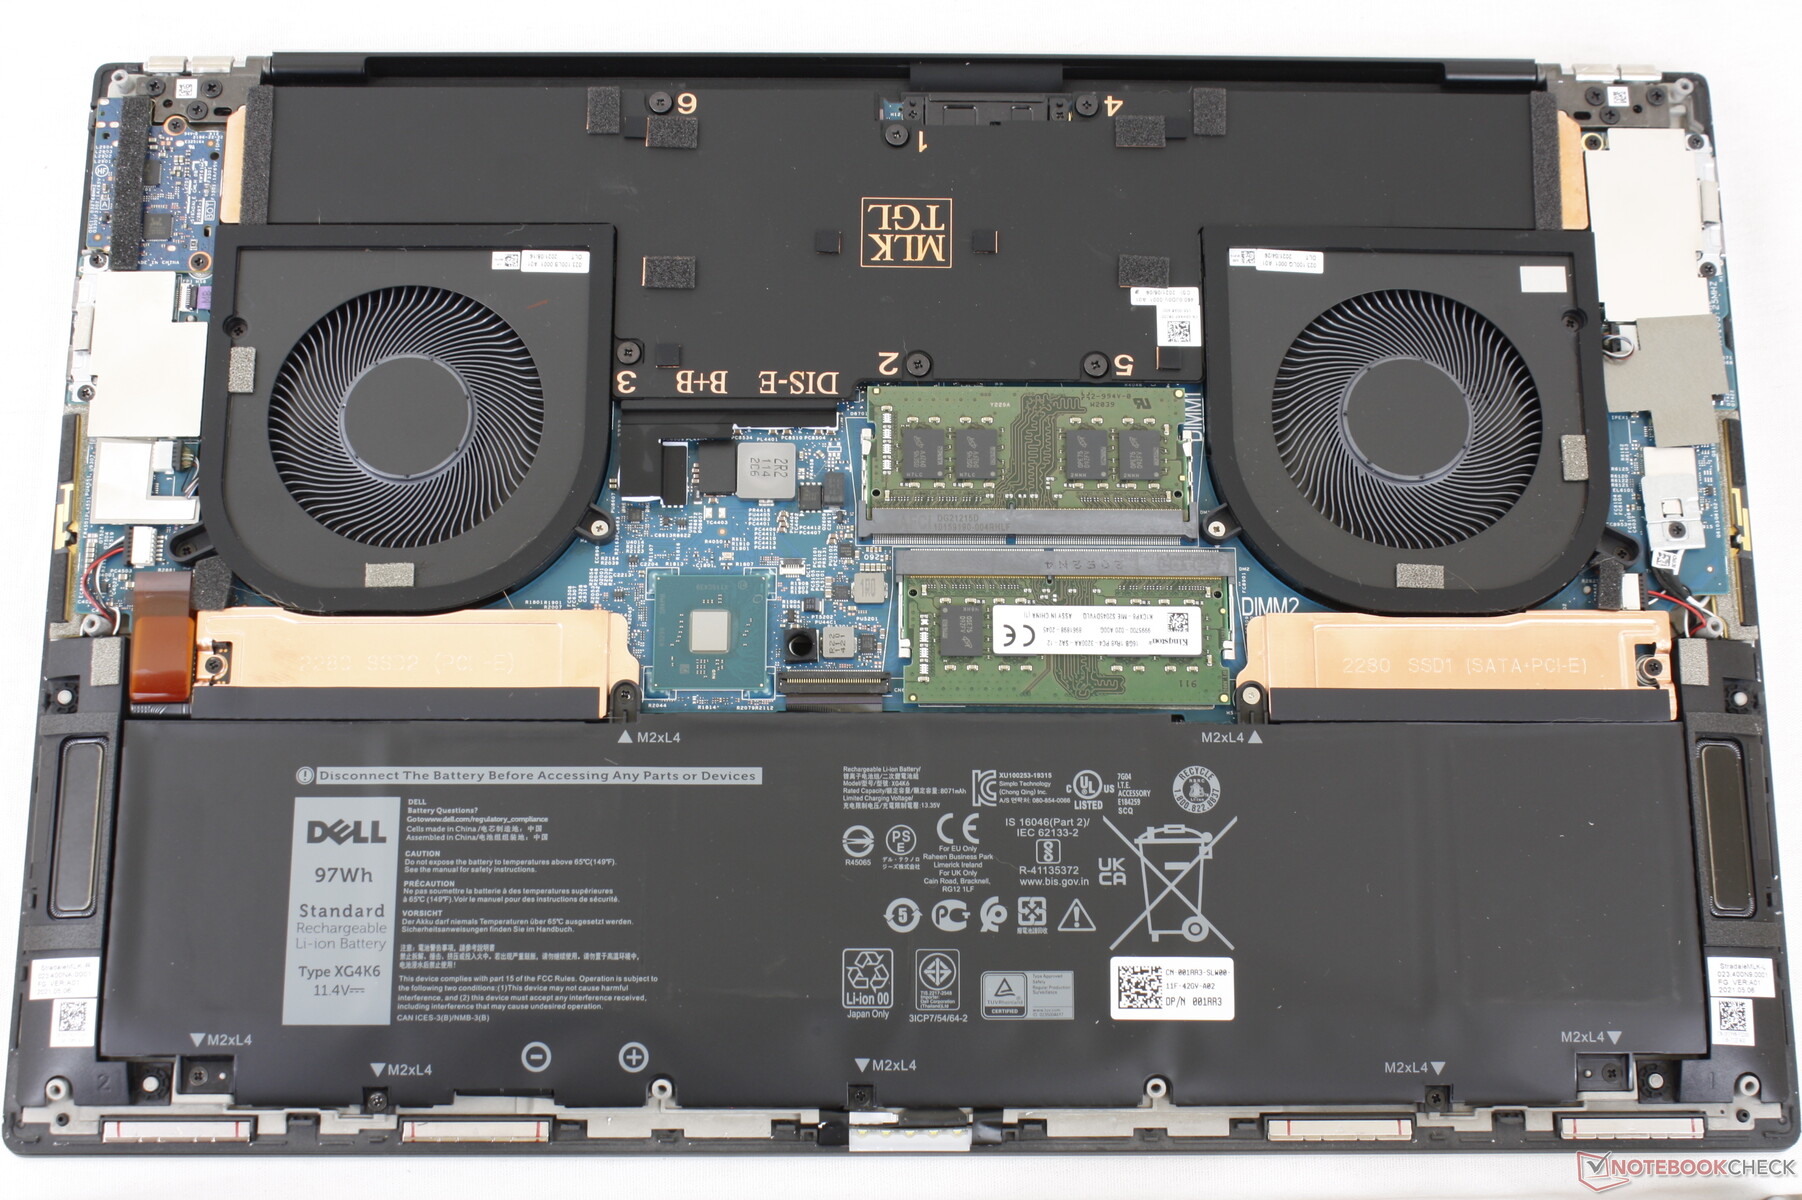
Manutenzione
Il pannello inferiore è più difficile da rimuovere rispetto all'XPS 15 poiché i suoi bordi e gli angoli sono più stretti e taglienti.
Accessori e garanzia
Dell include un comodo adattatore da USB-C a HDMI e USB-A per compensare il fatto che lo chassis non integra nessuna di queste porte. La garanzia limitata standard di un anno si applica con molte opzioni di estensione se ordinata direttamente da Dell.
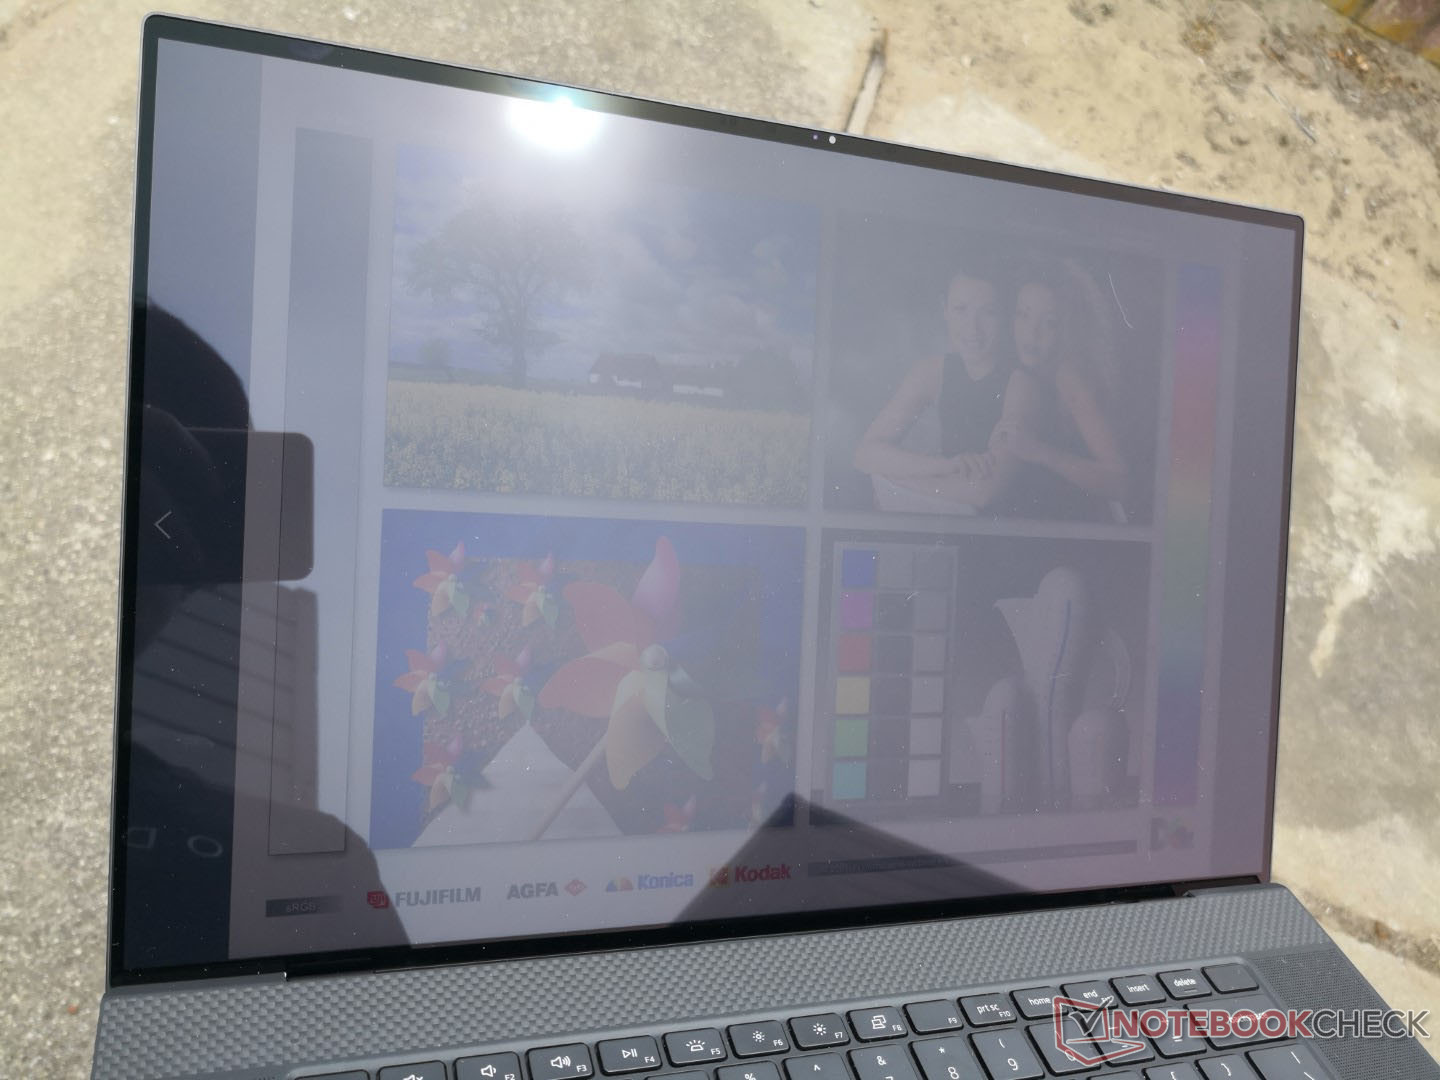
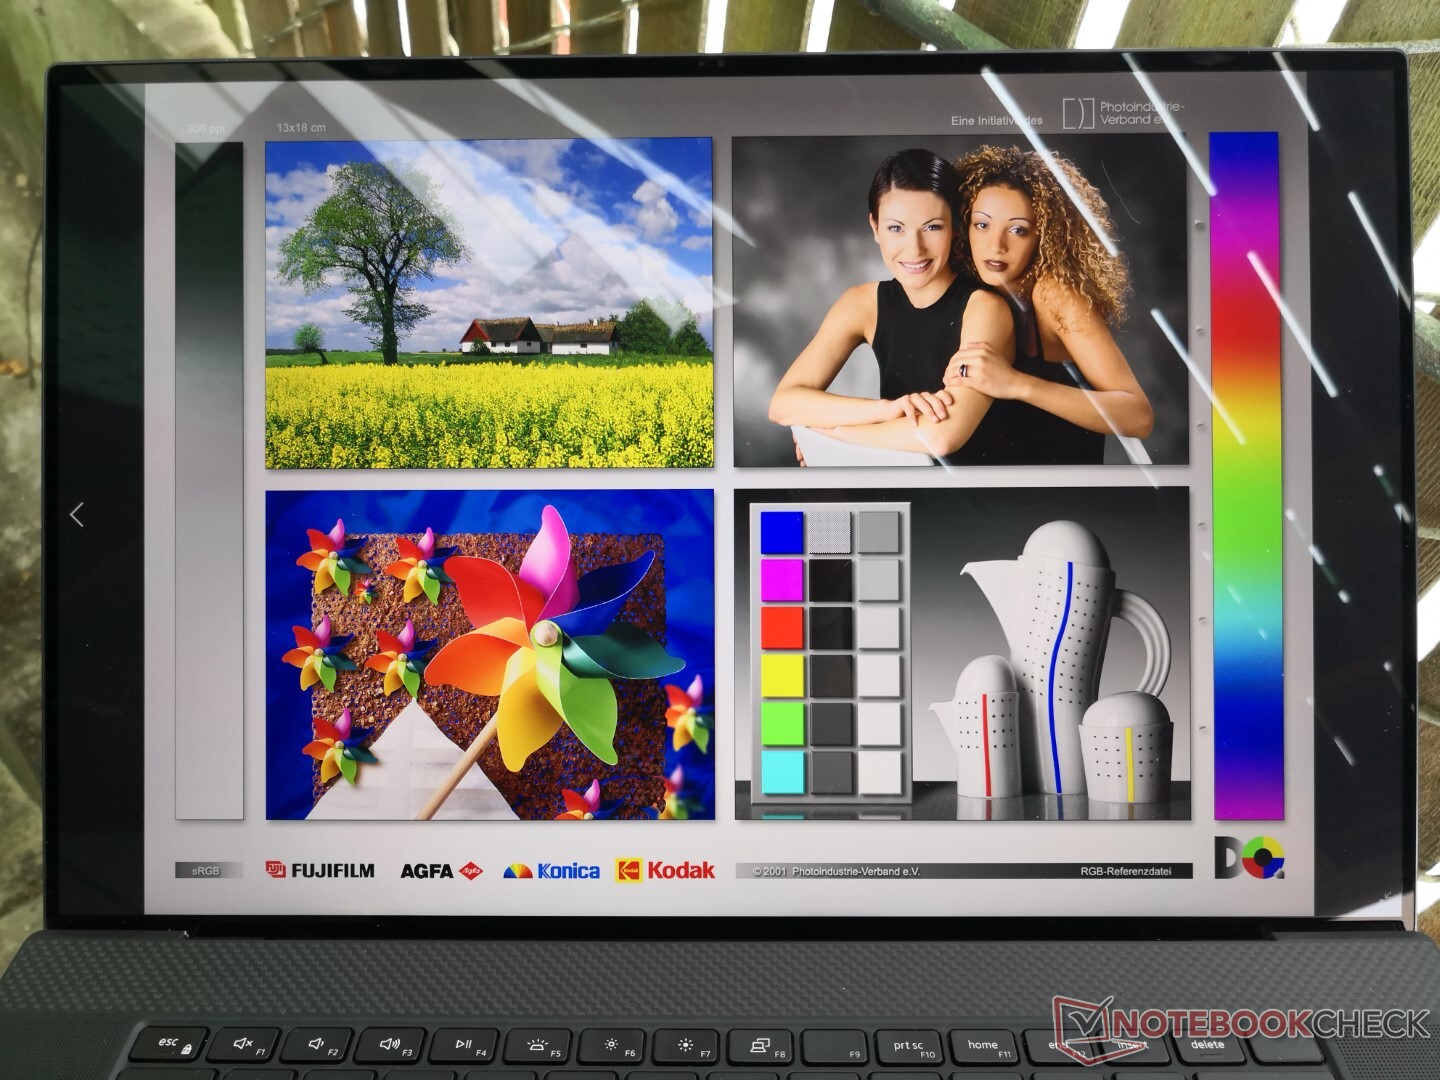
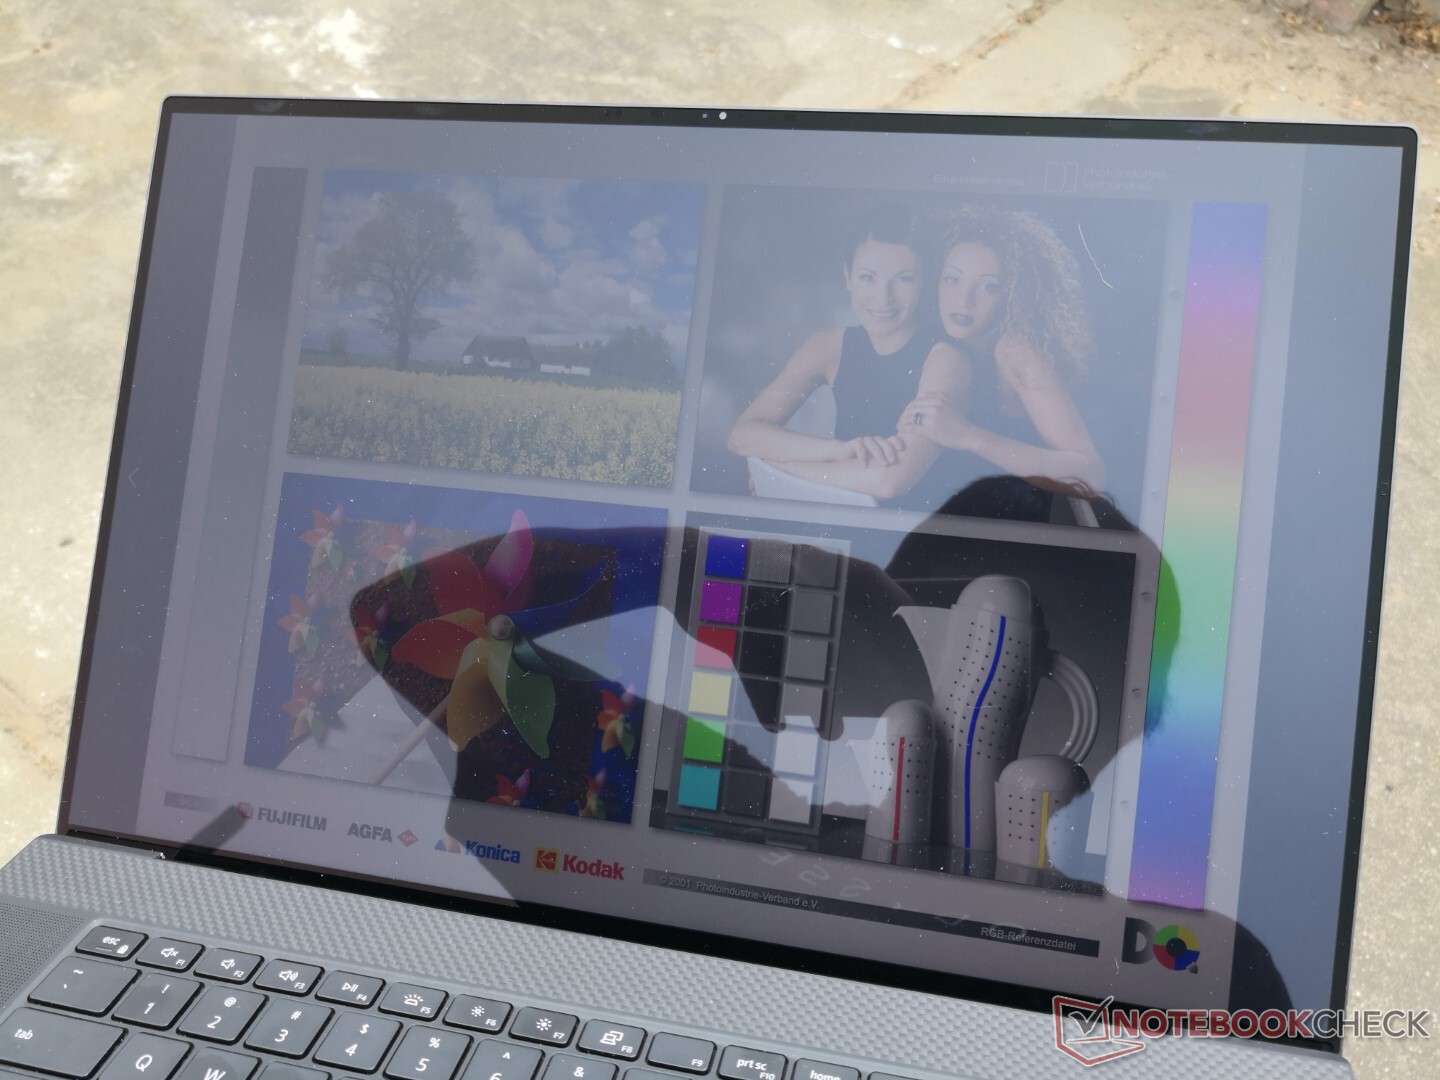
Display - Il primo 17.0 pollici in 16:10 4K Touchscreen
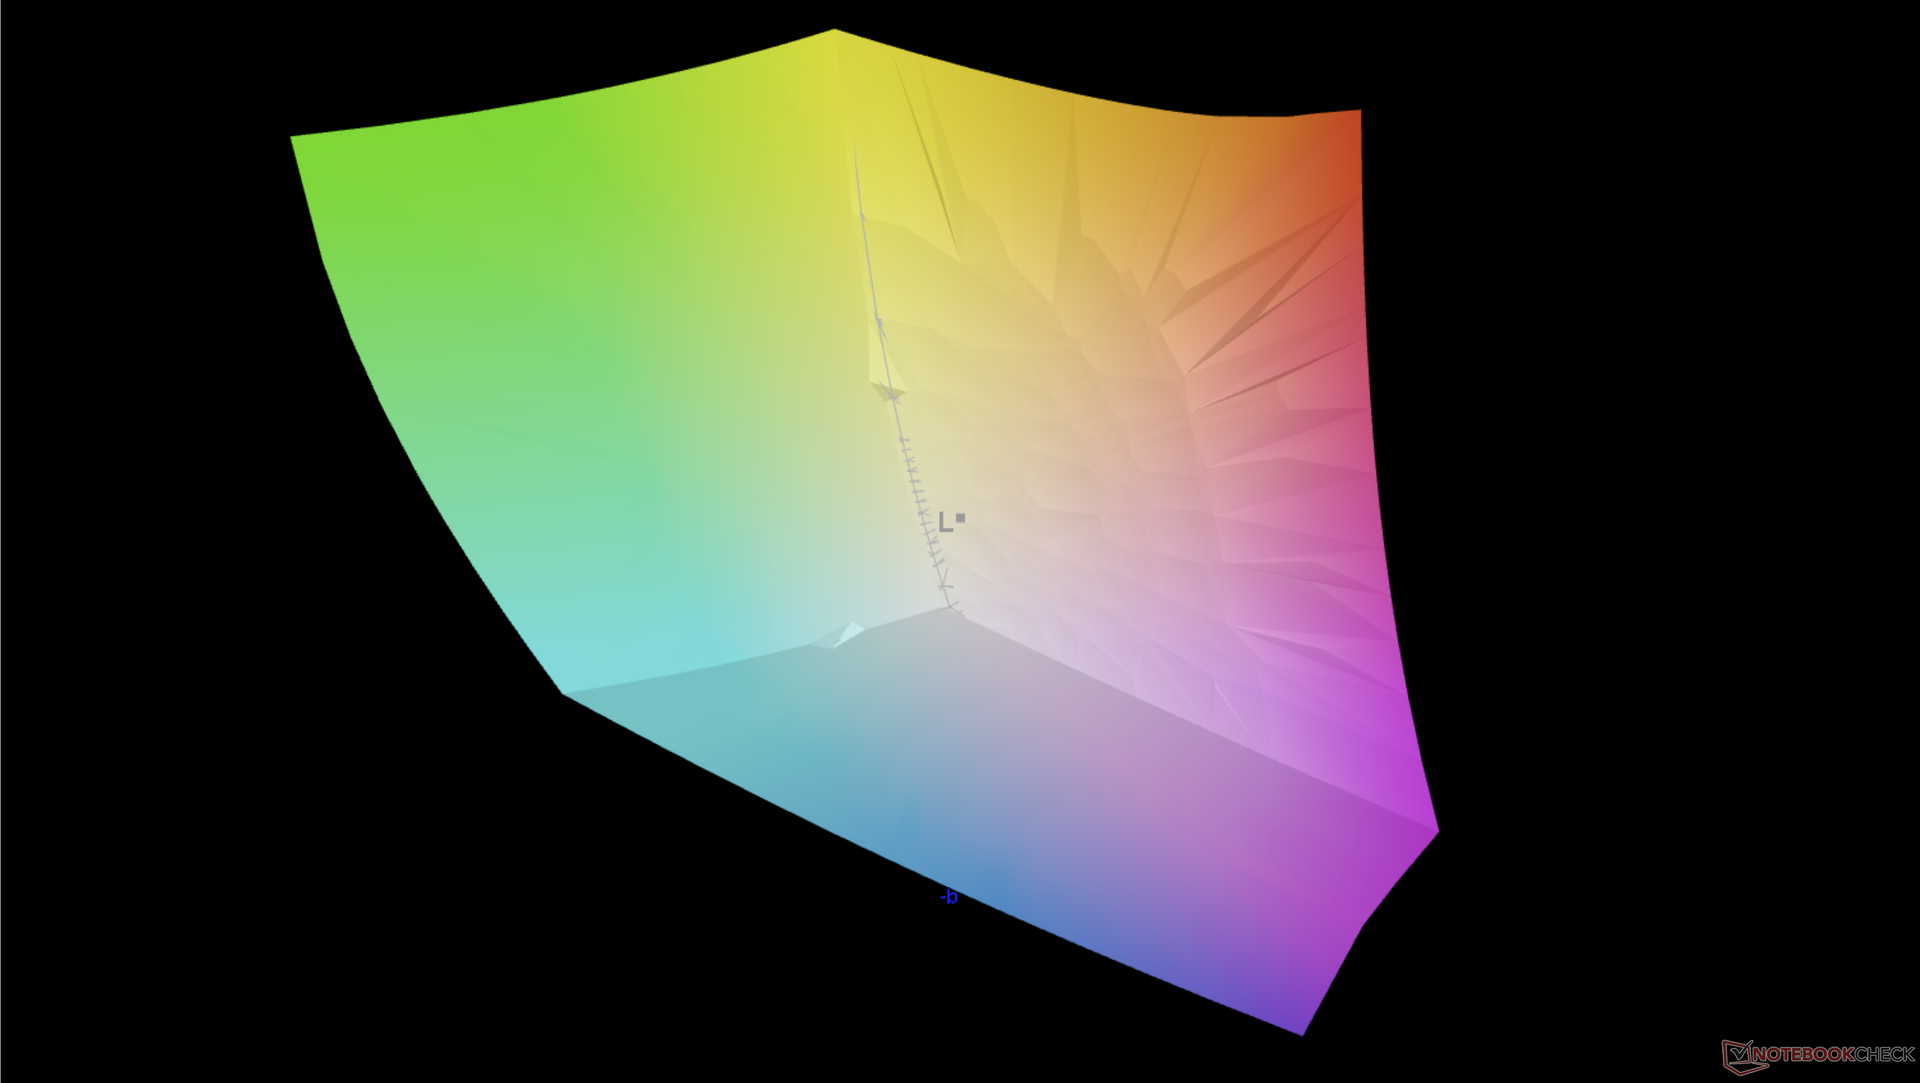
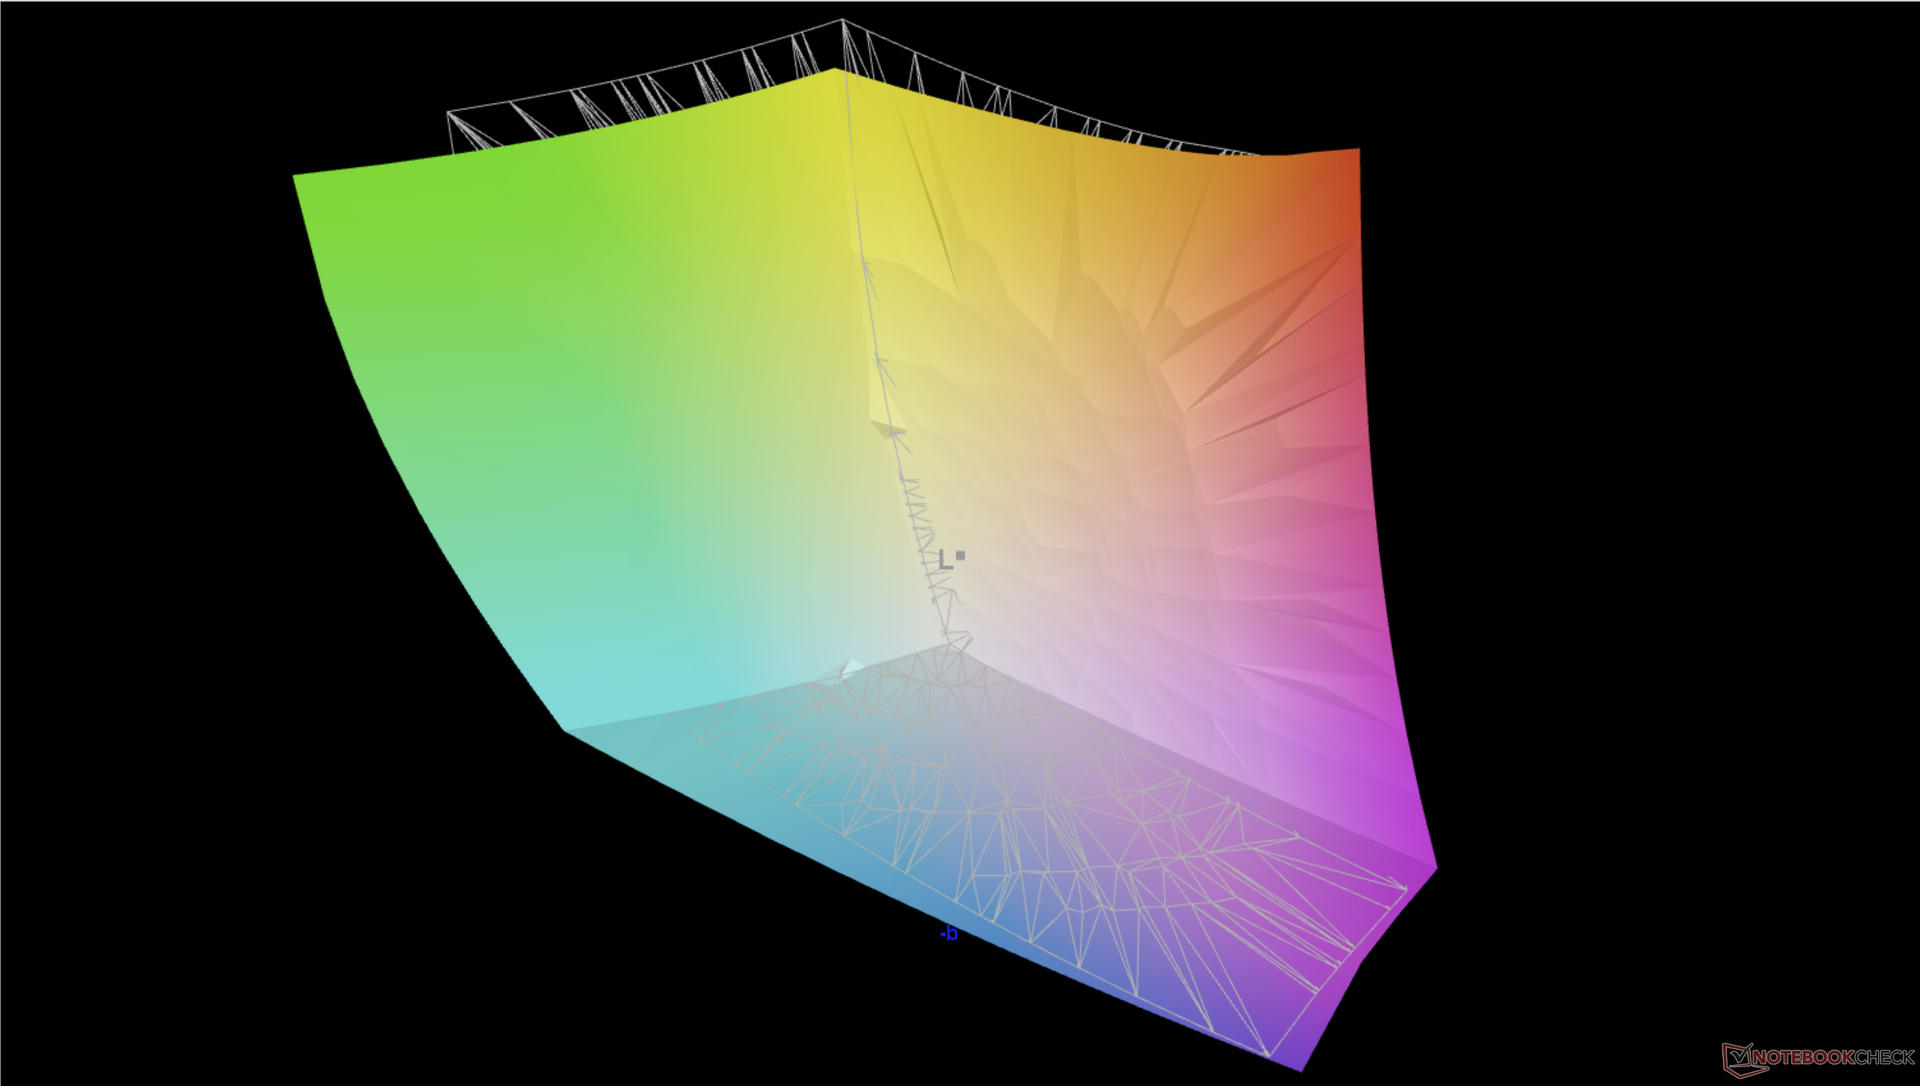
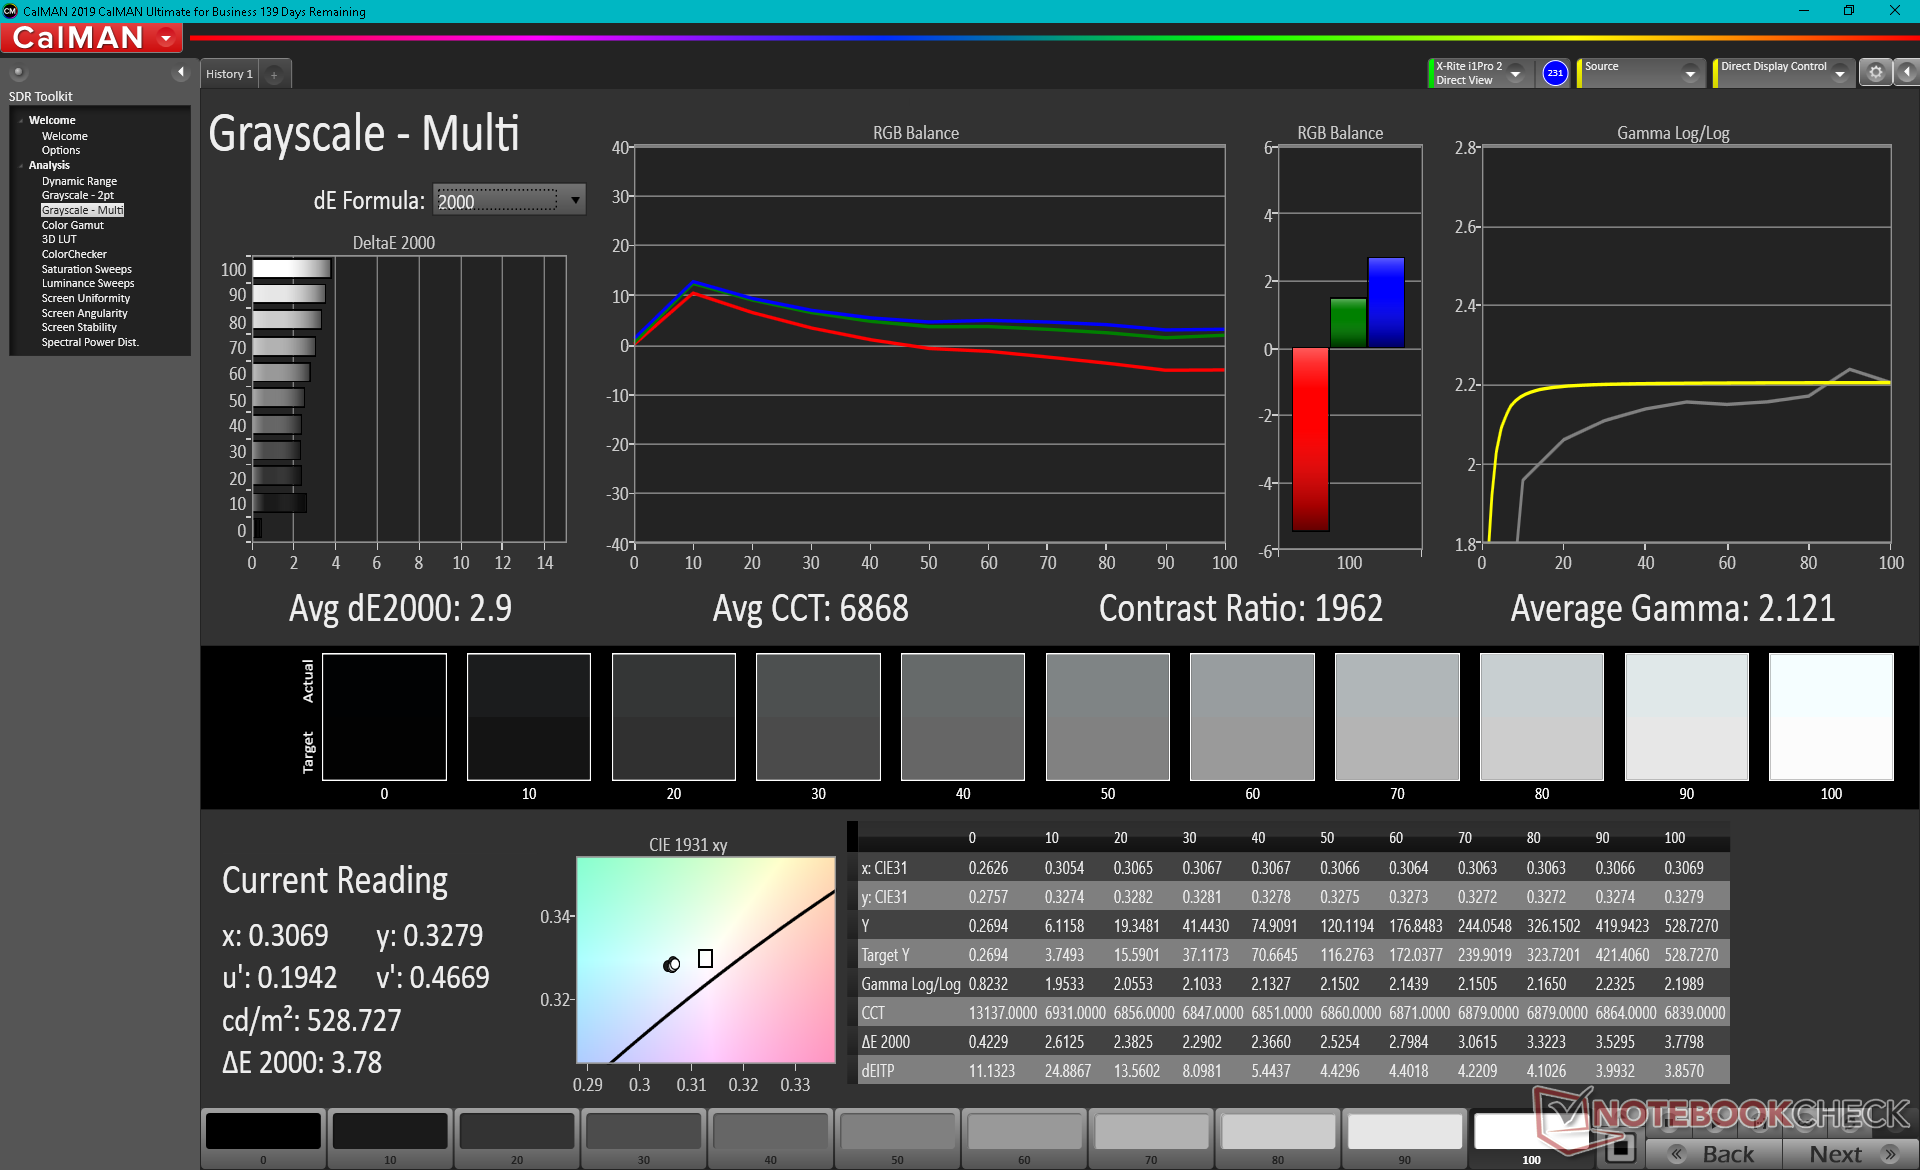
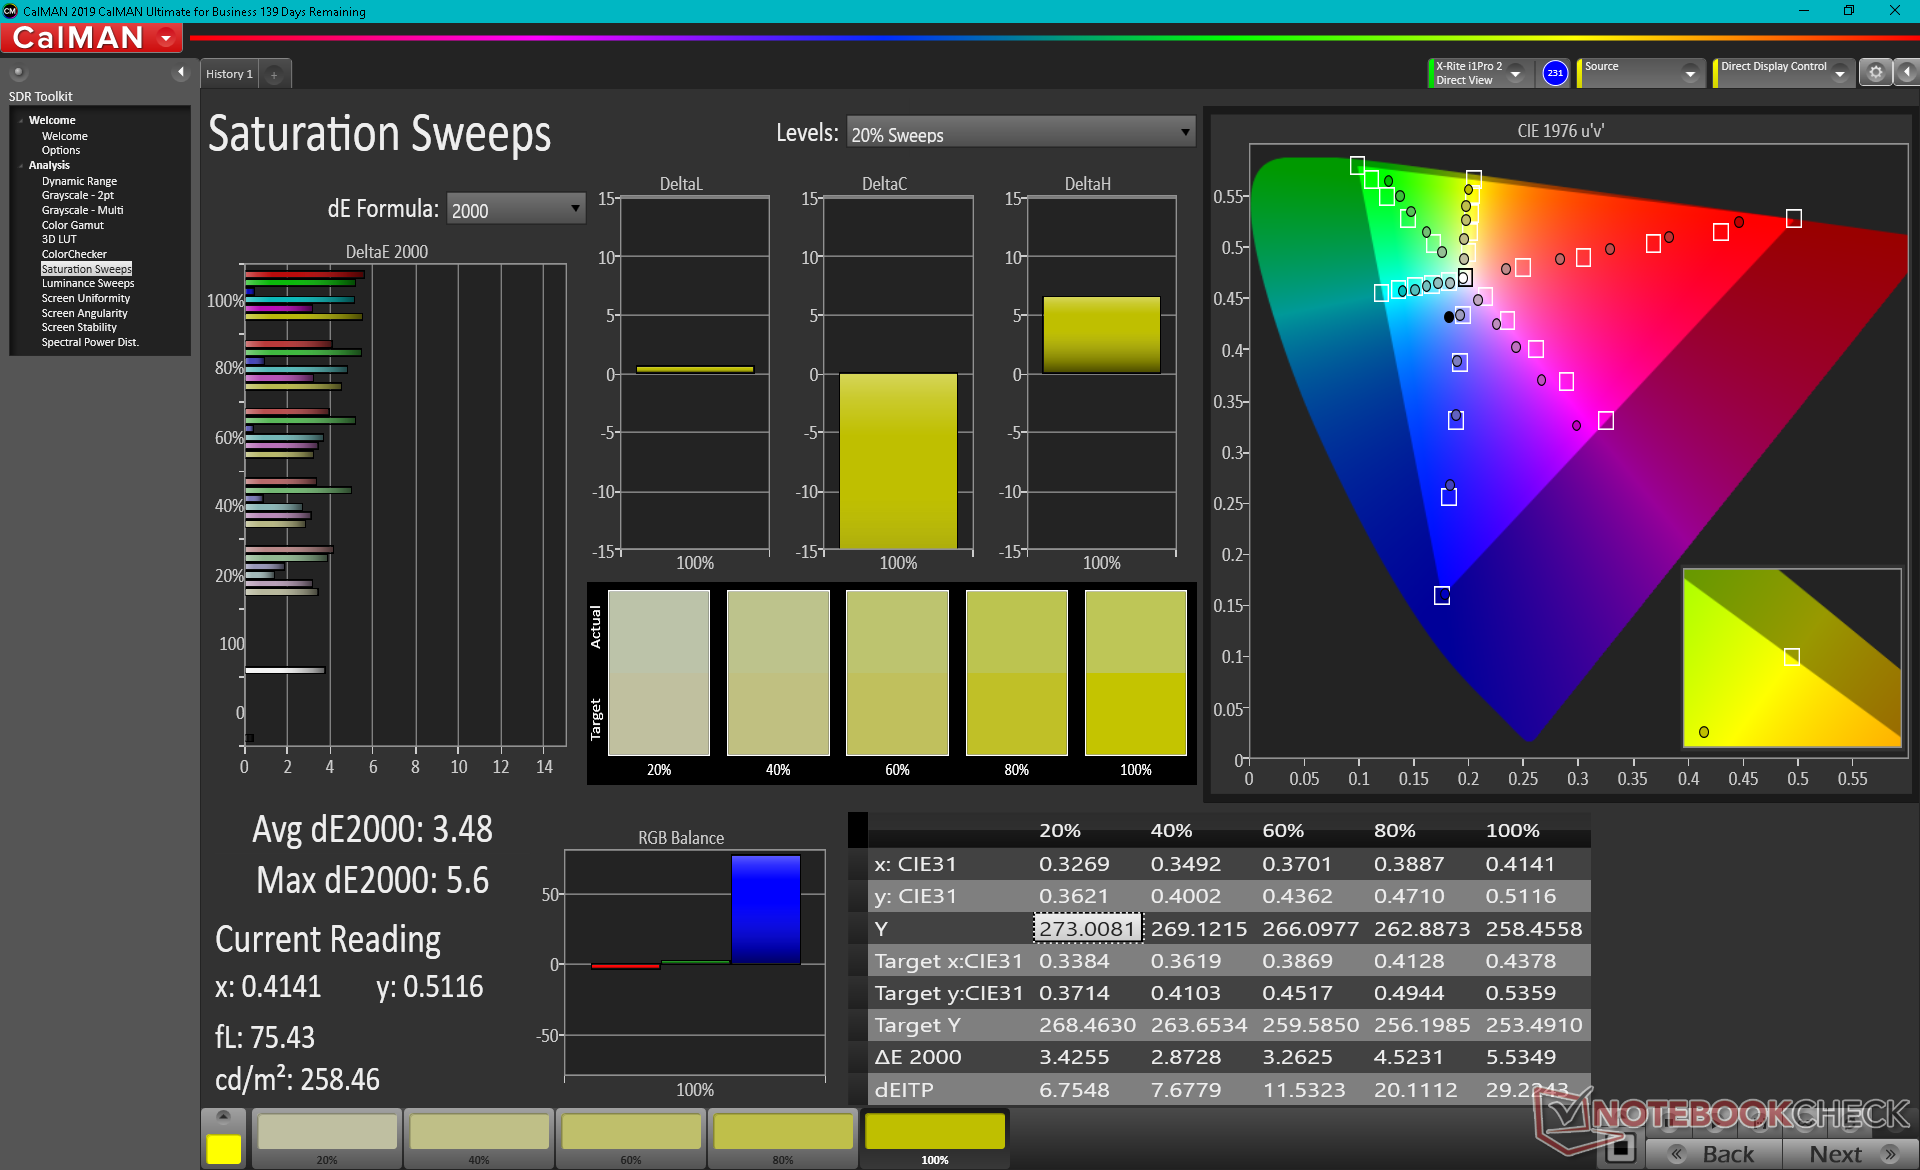
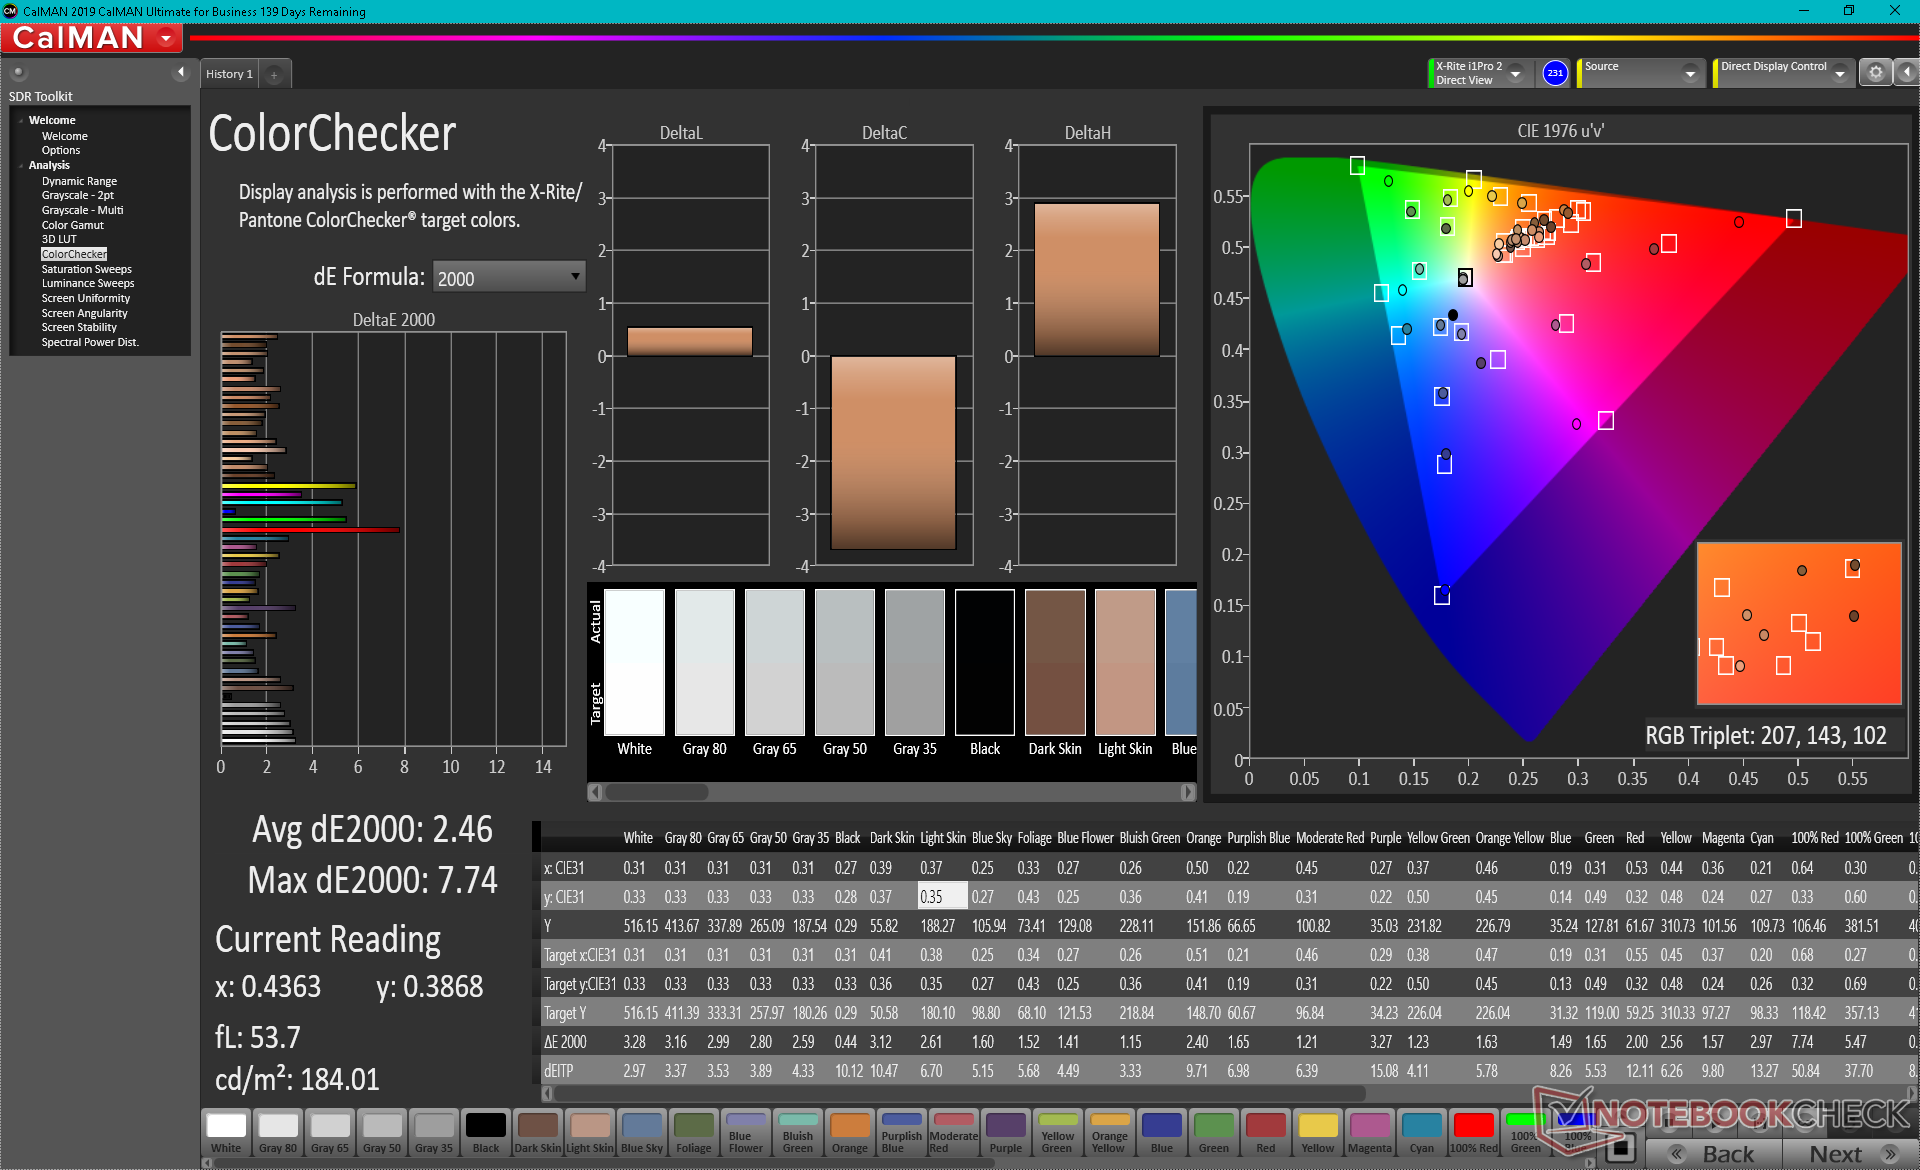
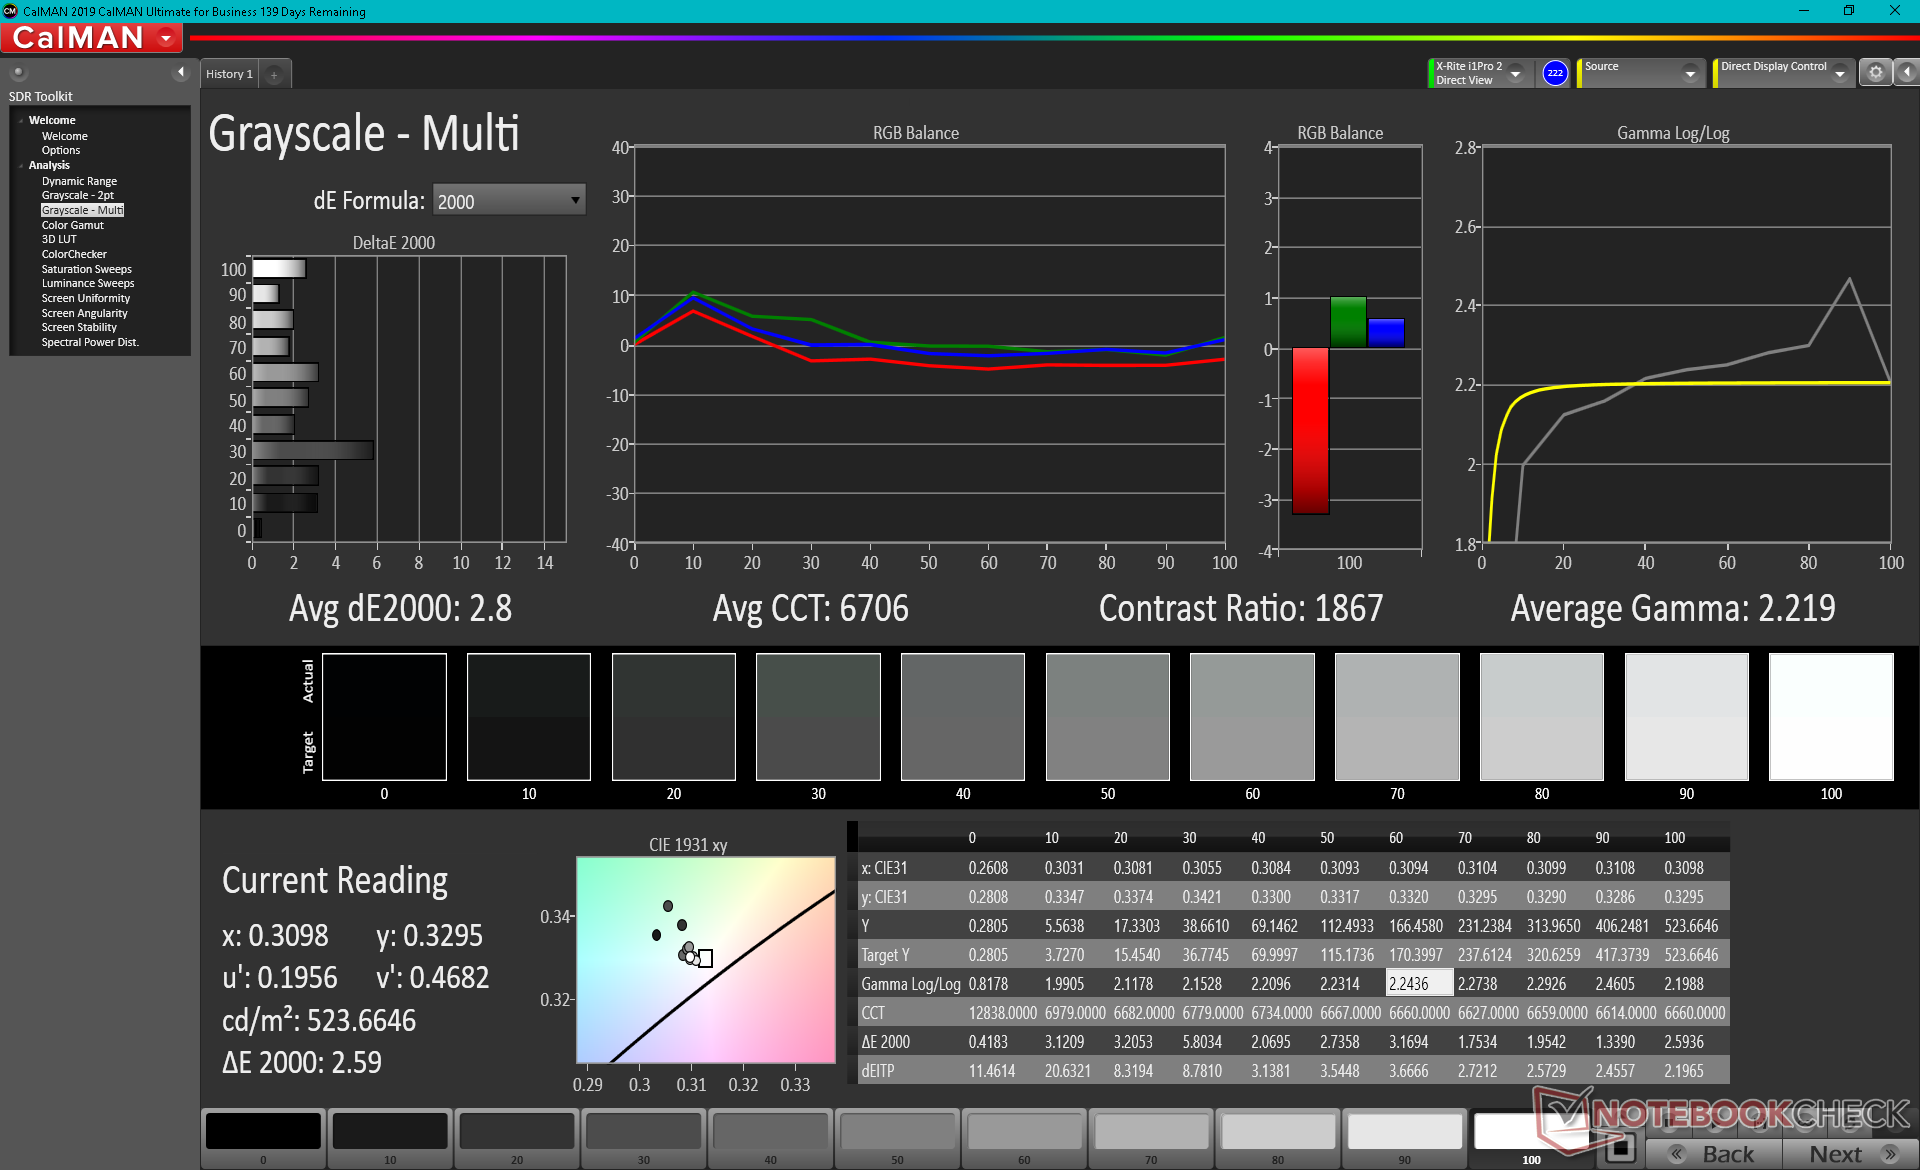
Anche se i processori sono cambiati, il display no. L'XPS 17 del 2021 usa lo stesso touchscreen Sharp LQ170R1 3840 x 2400 che si trova sulla versione 2020 per la stessa esperienza visiva. Non lo vediamo come un problema dato che l'XPS 17 continua ad avere uno dei più alti rapporti schermo-corpo e display di più alta qualità in termini di copertura del colore (95% DCI-P3), contrasto (~1500:1) e luminosità (~500 nits) per la sua categoria 16:10.

| |||||||||||||||||||||||||
Distribuzione della luminosità: 85 %
Al centro con la batteria: 536.5 cd/m²
Contrasto: 1450:1 (Nero: 0.37 cd/m²)
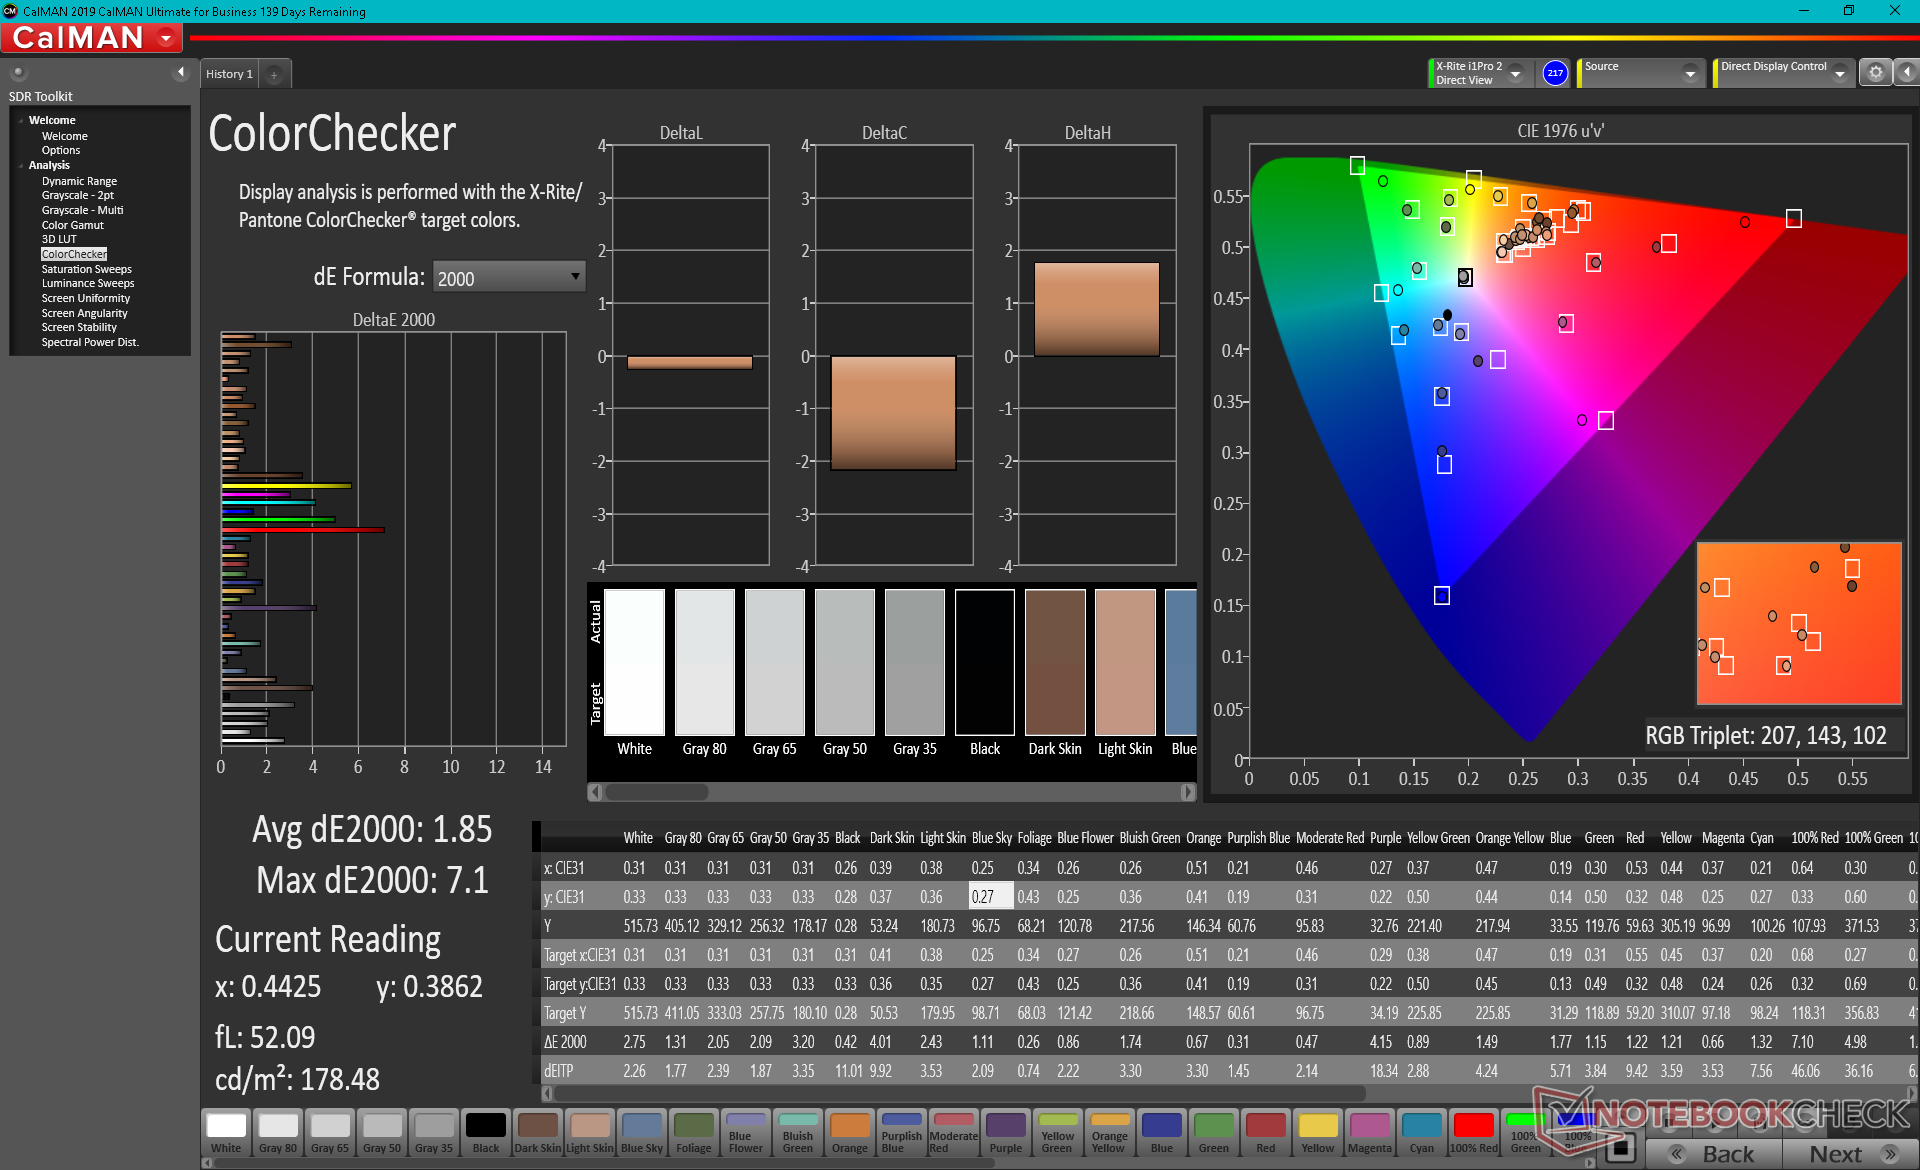
ΔE ColorChecker Calman: 2.46 | ∀{0.5-29.43 Ø4.71}
calibrated: 1.85
ΔE Greyscale Calman: 2.9 | ∀{0.09-98 Ø4.96}
100% AdobeRGB 1998 (Argyll 3D)
100% sRGB (Argyll 3D)
94.8% Display P3 (Argyll 3D)
Gamma: 2.12
CCT: 6868 K
| Dell XPS 17 9710 Core i7 RTX 3060 Sharp LQ170R1, IPS, 17", 3840x2400 | Dell XPS 17 9700 Core i7 RTX 2060 Max-Q Sharp LQ170R1, IPS, 17", 3840x2400 | Razer Blade Pro 17 2021 (QHD Touch) AU Optronics B173ZAN03.3, IPS, 17.3", 3840x2160 | Gigabyte Aero 17 HDR YC AUO B173ZAN03.2 (AUO329B), IPS-Level, 17.3", 3840x2160 | LG Ultra 17U70N LG LP170WQ1-SPA1, IPS, 17", 2560x1600 | Eluktronics RP-17 BOE NV173FHM-N44, IPS, 17.3", 1920x1080 | |
|---|---|---|---|---|---|---|
| Display | -2% | -2% | -3% | -24% | -25% | |
| Display P3 Coverage (%) | 94.8 | 90.5 -5% | 88.6 -7% | 87.3 -8% | 64.2 -32% | 64.7 -32% |
| sRGB Coverage (%) | 100 | 100 0% | 100 0% | 100 0% | 94.5 -5% | 92 -8% |
| AdobeRGB 1998 Coverage (%) | 100 | 99.8 0% | 99.9 0% | 99.9 0% | 65.2 -35% | 65.8 -34% |
| Response Times | -7% | 64% | 4% | 10% | 56% | |
| Response Time Grey 50% / Grey 80% * (ms) | 44.8 ? | 51.2 ? -14% | 15.2 ? 66% | 51.6 ? -15% | 41.2 ? 8% | 22.4 ? 50% |
| Response Time Black / White * (ms) | 32 ? | 32 ? -0% | 12 ? 62% | 24.8 ? 22% | 28.4 ? 11% | 12 ? 62% |
| PWM Frequency (Hz) | 943 | |||||
| Screen | -11% | -68% | 19% | 6% | -25% | |
| Brightness middle (cd/m²) | 536.5 | 539.4 1% | 407.2 -24% | 458 -15% | 415.4 -23% | 311.5 -42% |
| Brightness (cd/m²) | 489 | 494 1% | 403 -18% | 446 -9% | 385 -21% | 301 -38% |
| Brightness Distribution (%) | 85 | 84 -1% | 90 6% | 92 8% | 88 4% | 91 7% |
| Black Level * (cd/m²) | 0.37 | 0.32 14% | 0.42 -14% | 0.37 -0% | 0.24 35% | 0.31 16% |
| Contrast (:1) | 1450 | 1686 16% | 970 -33% | 1238 -15% | 1731 19% | 1005 -31% |
| Colorchecker dE 2000 * | 2.46 | 4.12 -67% | 7.25 -195% | 1.52 38% | 2.42 2% | 4.13 -68% |
| Colorchecker dE 2000 max. * | 7.74 | 7.65 1% | 12.51 -62% | 2.51 68% | 5.55 28% | 7.32 5% |
| Colorchecker dE 2000 calibrated * | 1.85 | 3.91 -111% | 3.62 -96% | 0.66 64% | 1.68 9% | 2.93 -58% |
| Greyscale dE 2000 * | 2.9 | 1.5 48% | 8.1 -179% | 1.9 34% | 2.9 -0% | 3.3 -14% |
| Gamma | 2.12 104% | 2.15 102% | 2.24 98% | 2.145 103% | 2.21 100% | 2.17 101% |
| CCT | 6868 95% | 6438 101% | 5925 110% | 6534 99% | 6864 95% | 7157 91% |
| Color Space (Percent of AdobeRGB 1998) (%) | 90.4 | 88.1 | 100 | 60.2 | 59.5 | |
| Color Space (Percent of sRGB) (%) | 100 | 100 | 100 | 94.2 | 91.6 | |
| Media totale (Programma / Settaggio) | -7% /
-8% | -2% /
-35% | 7% /
12% | -3% /
0% | 2% /
-13% |
* ... Meglio usare valori piccoli
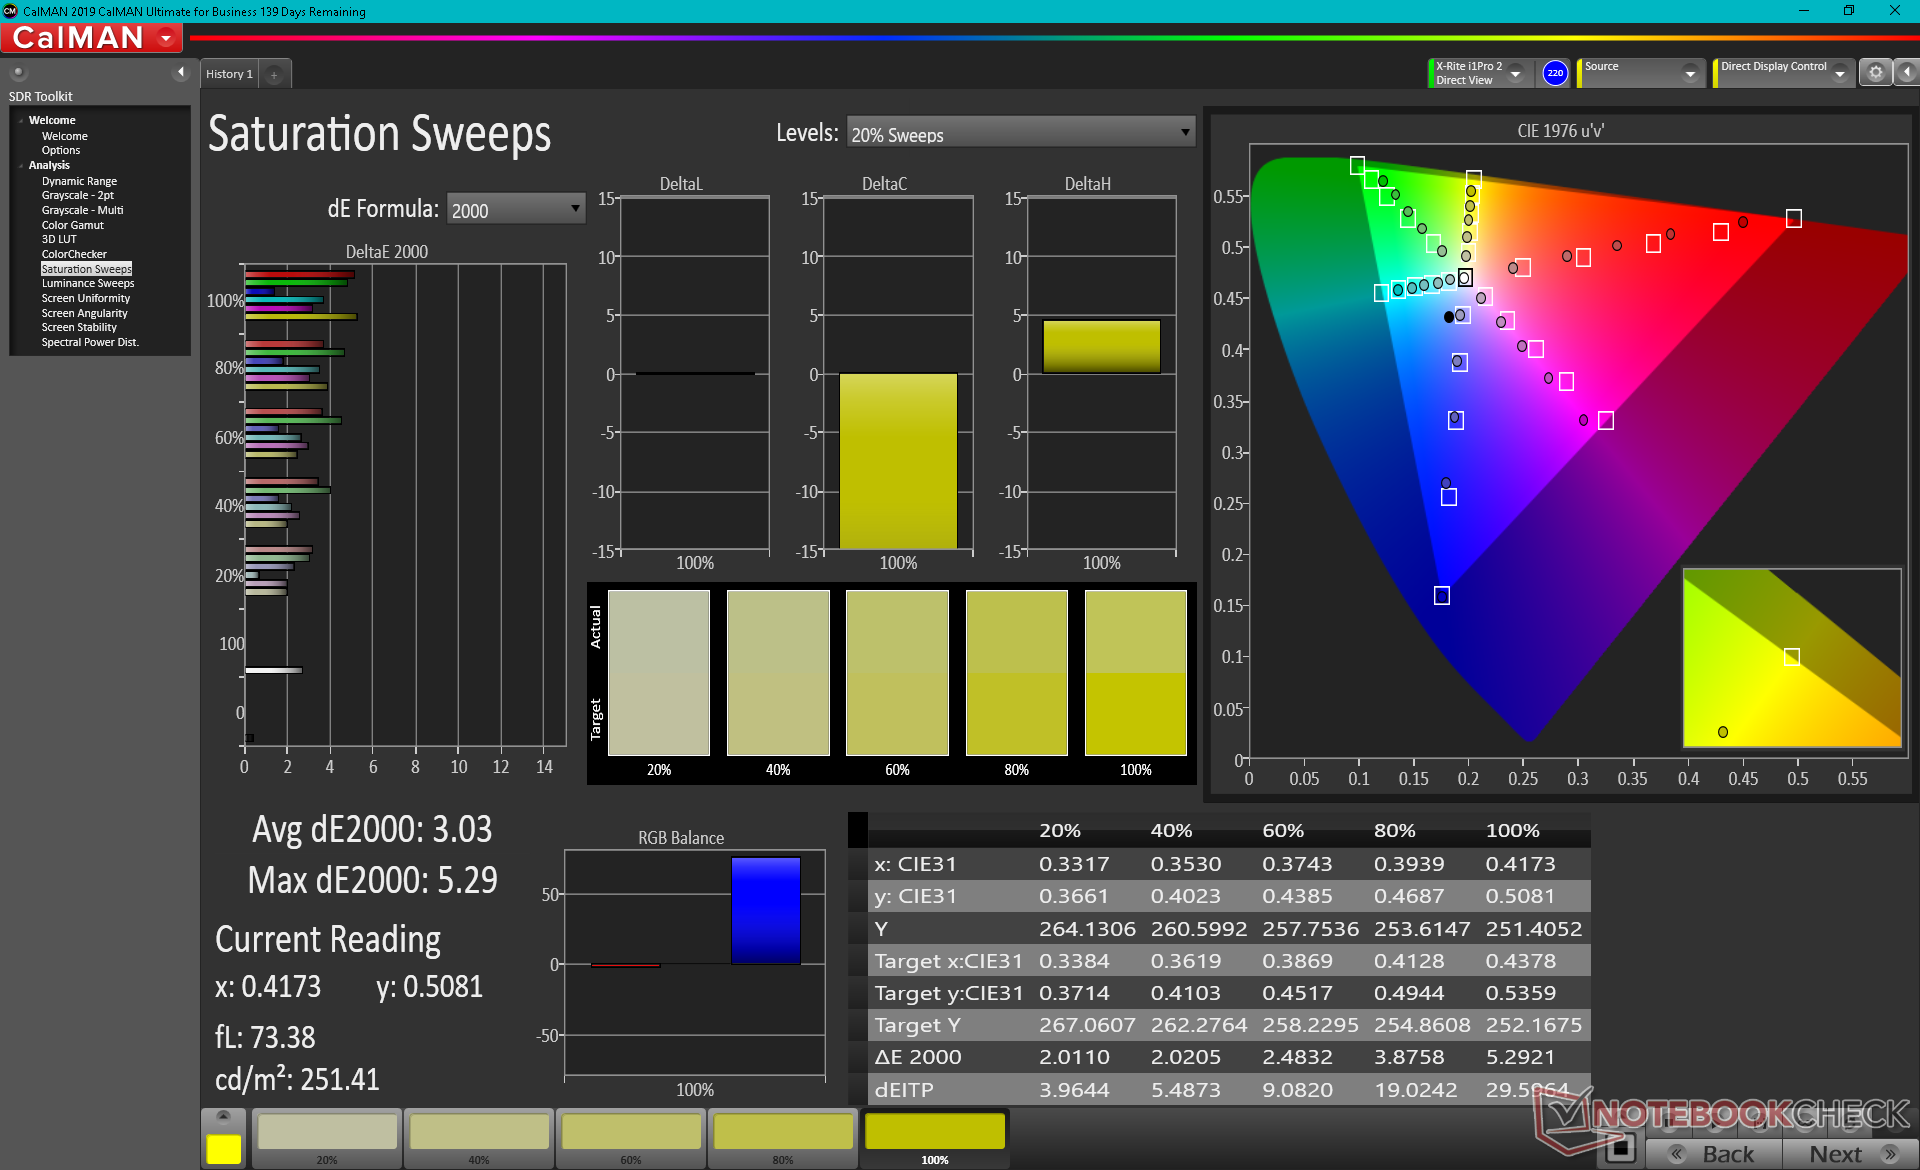
Il display è ben calibrato con valori medi di DeltaE della scala di grigi e del colore di appena 2,9 e 2,46, rispettivamente. Calibrando il pannello ancora di più noi stessi si ridurrebbe il DeltaE medio del colore a 1,85, ma i colori solidi primari e secondari rimarrebbero più imprecisi degli altri colori.
Tempi di risposta del Display
| ↔ Tempi di risposta dal Nero al Bianco | ||
|---|---|---|
| 32 ms ... aumenta ↗ e diminuisce ↘ combinato | ↗ 15.6 ms Incremento | 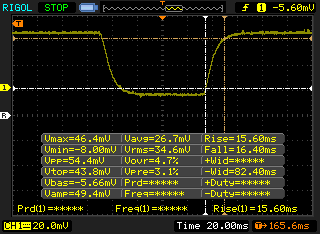 |
| ↘ 16.4 ms Calo | ||
| Lo schermo mostra tempi di risposta lenti nei nostri tests e sarà insoddisfacente per i gamers. In confronto, tutti i dispositivi di test variano da 0.1 (minimo) a 240 (massimo) ms. » 86 % di tutti i dispositivi è migliore. Questo significa che i tempi di risposta rilevati sono peggiori rispetto alla media di tutti i dispositivi testati (19.8 ms). | ||
| ↔ Tempo di risposta dal 50% Grigio all'80% Grigio | ||
| 44.8 ms ... aumenta ↗ e diminuisce ↘ combinato | ↗ 20.8 ms Incremento | 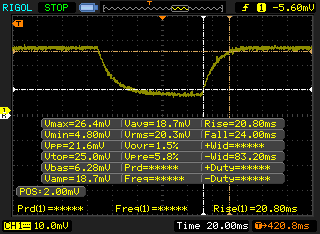 |
| ↘ 24 ms Calo | ||
| Lo schermo mostra tempi di risposta lenti nei nostri tests e sarà insoddisfacente per i gamers. In confronto, tutti i dispositivi di test variano da 0.165 (minimo) a 636 (massimo) ms. » 76 % di tutti i dispositivi è migliore. Questo significa che i tempi di risposta rilevati sono peggiori rispetto alla media di tutti i dispositivi testati (30.9 ms). | ||
Sfarfallio dello schermo / PWM (Pulse-Width Modulation)
| flickering dello schermo / PWM non rilevato | 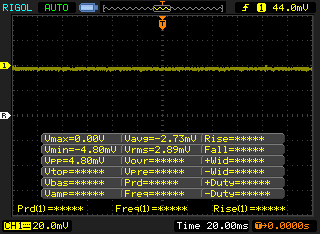 | ||
In confronto: 52 % di tutti i dispositivi testati non utilizza PWM per ridurre la luminosita' del display. Se è rilevato PWM, una media di 7748 (minimo: 5 - massimo: 343500) Hz è stata rilevata. | |||

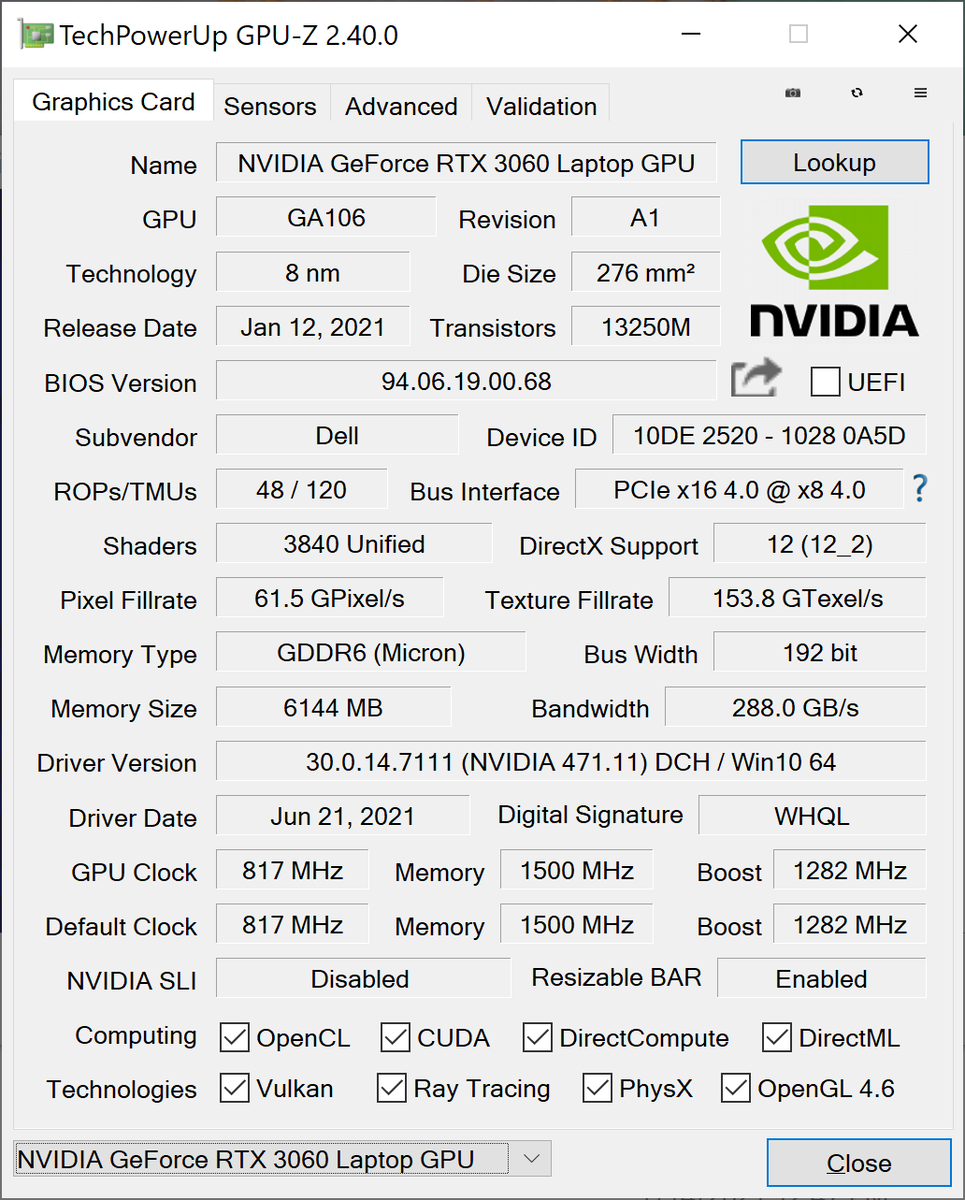
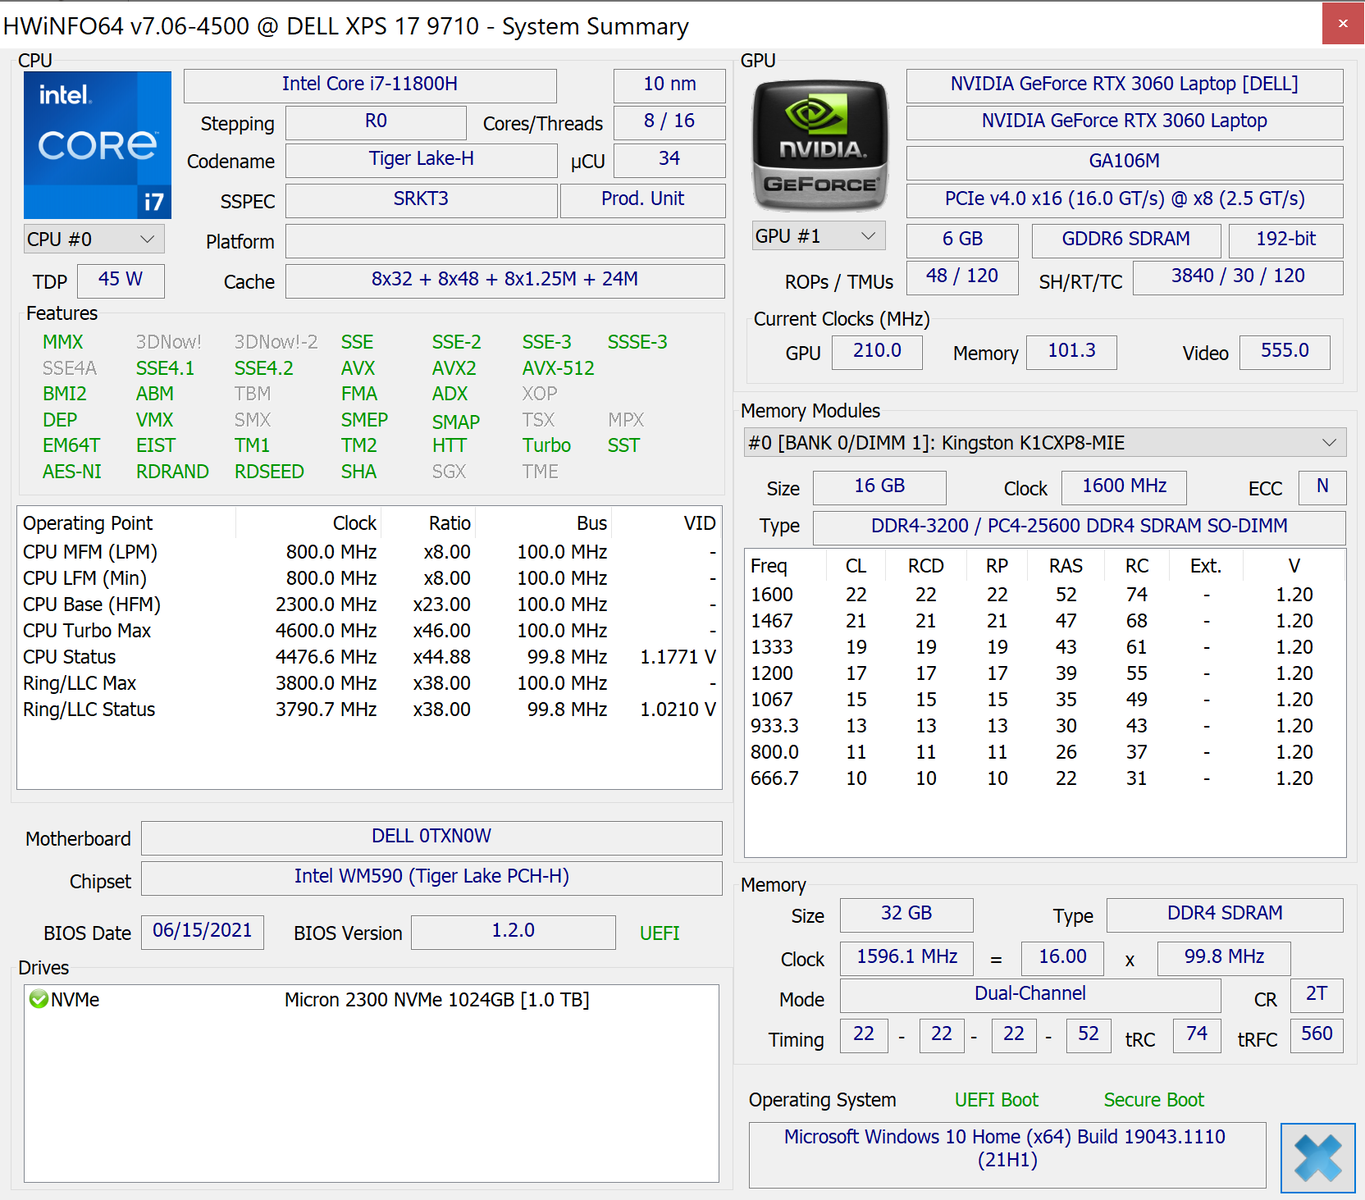
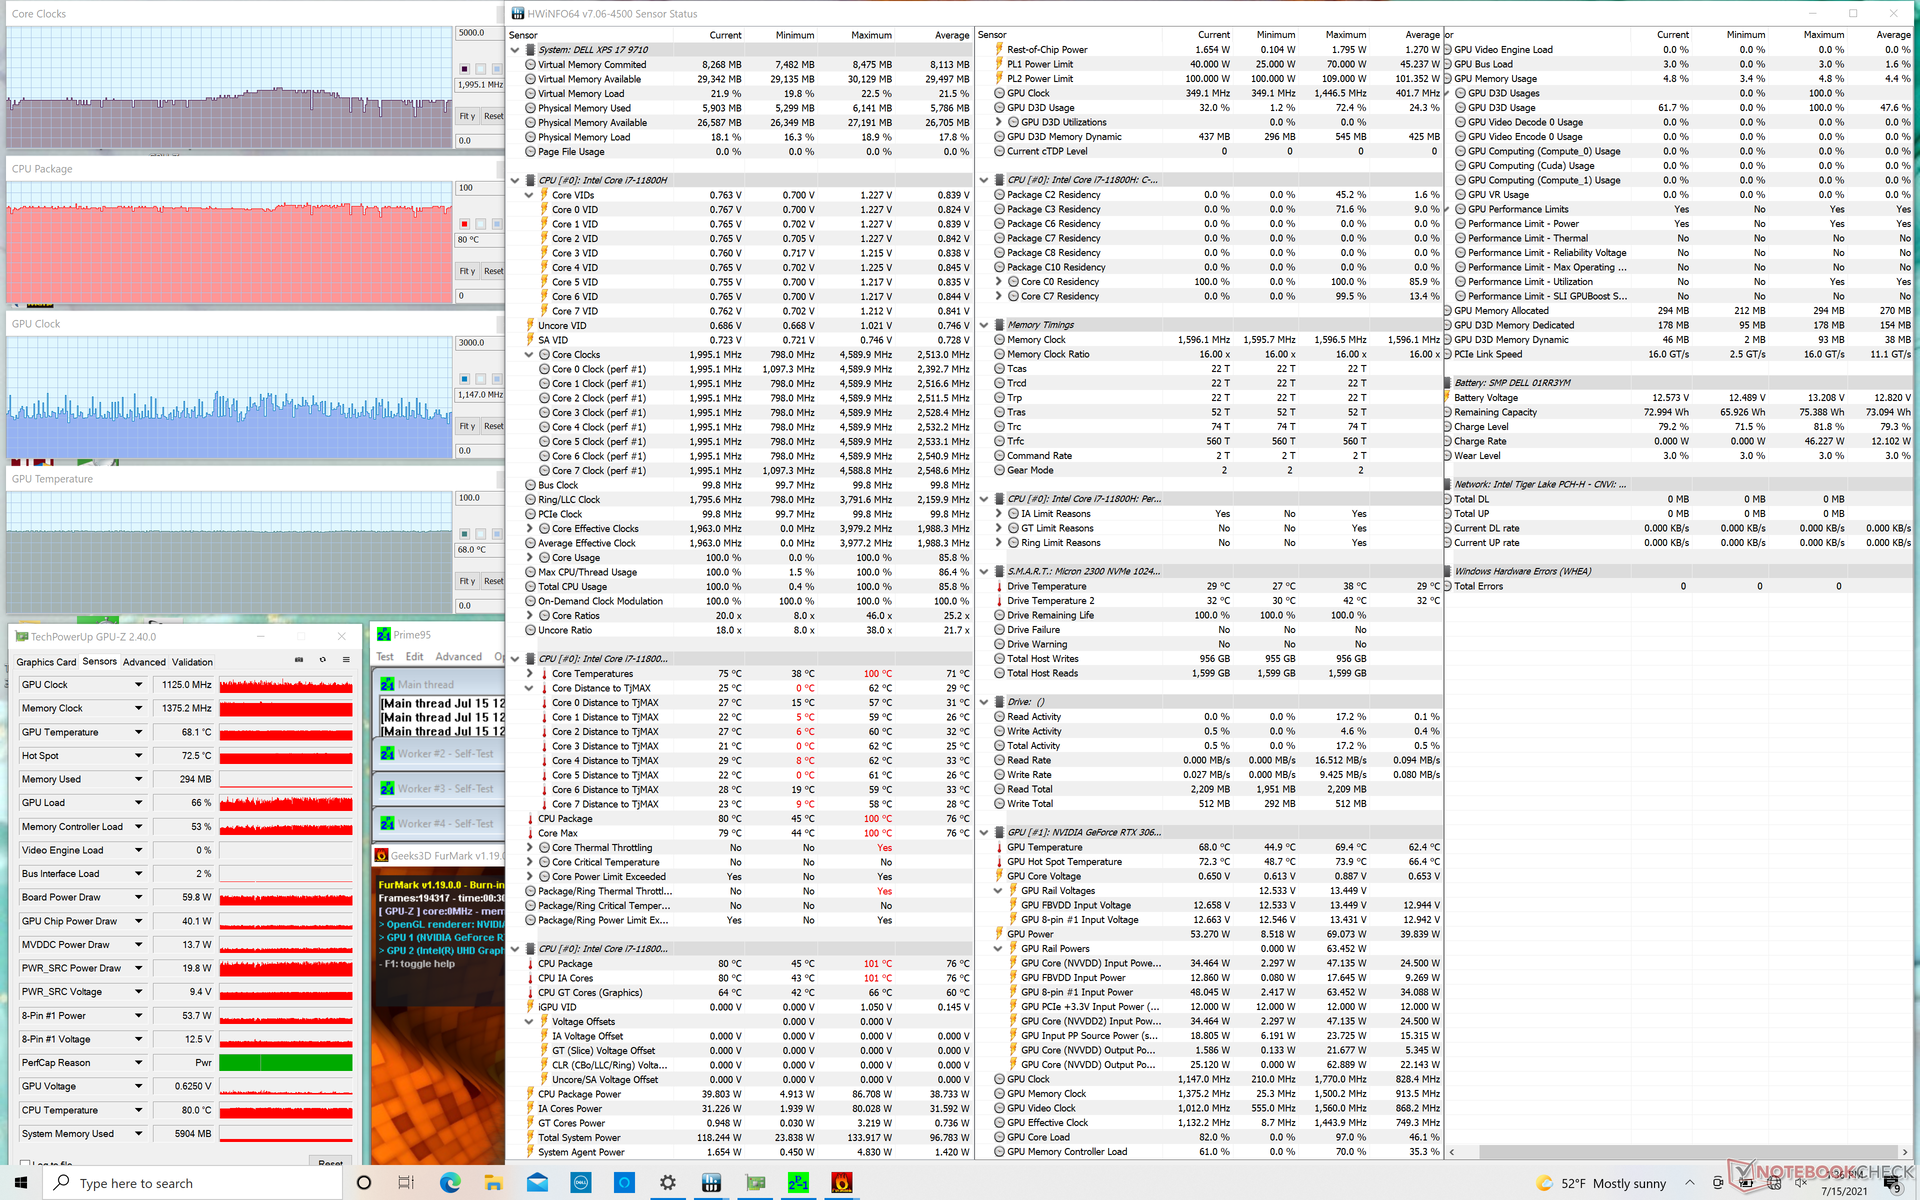
Prestazioni - COU con TDP da 45 W e GPU con TGP da 70 W
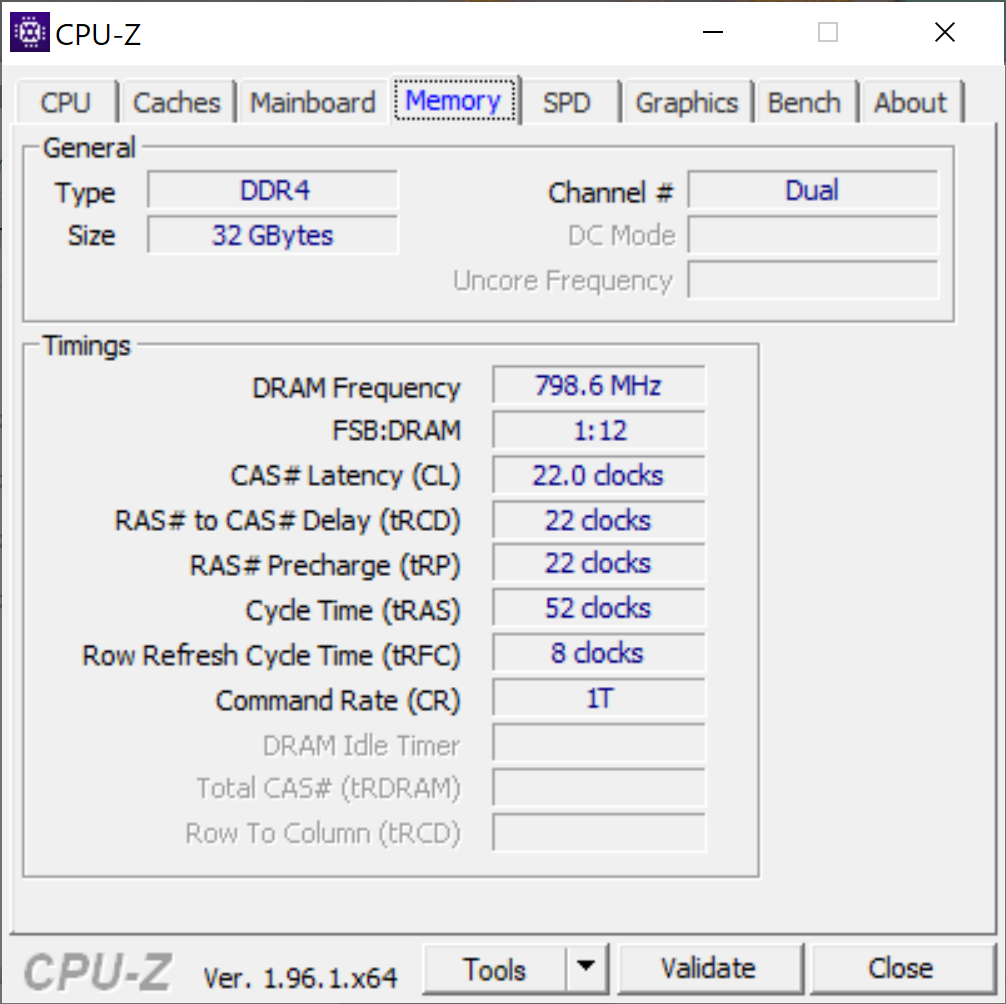
Le opzioni del core includono la CPU Core i5-11400H, i7-11800H o i9-11900H di 11a generazione con UHD Graphics, GeForce RTX 3050 o RTX 3060. La velocità della RAM (3200 MHz) rimane la stessa dell'XPS 17 9700. Resizable BAR, Optimus, e Dynamic Book 2.0 sono standard se configurati con grafica dedicata, ma senza supporto per G-Sync interno (Advanced Optimus) o WhisperMode 2.0.
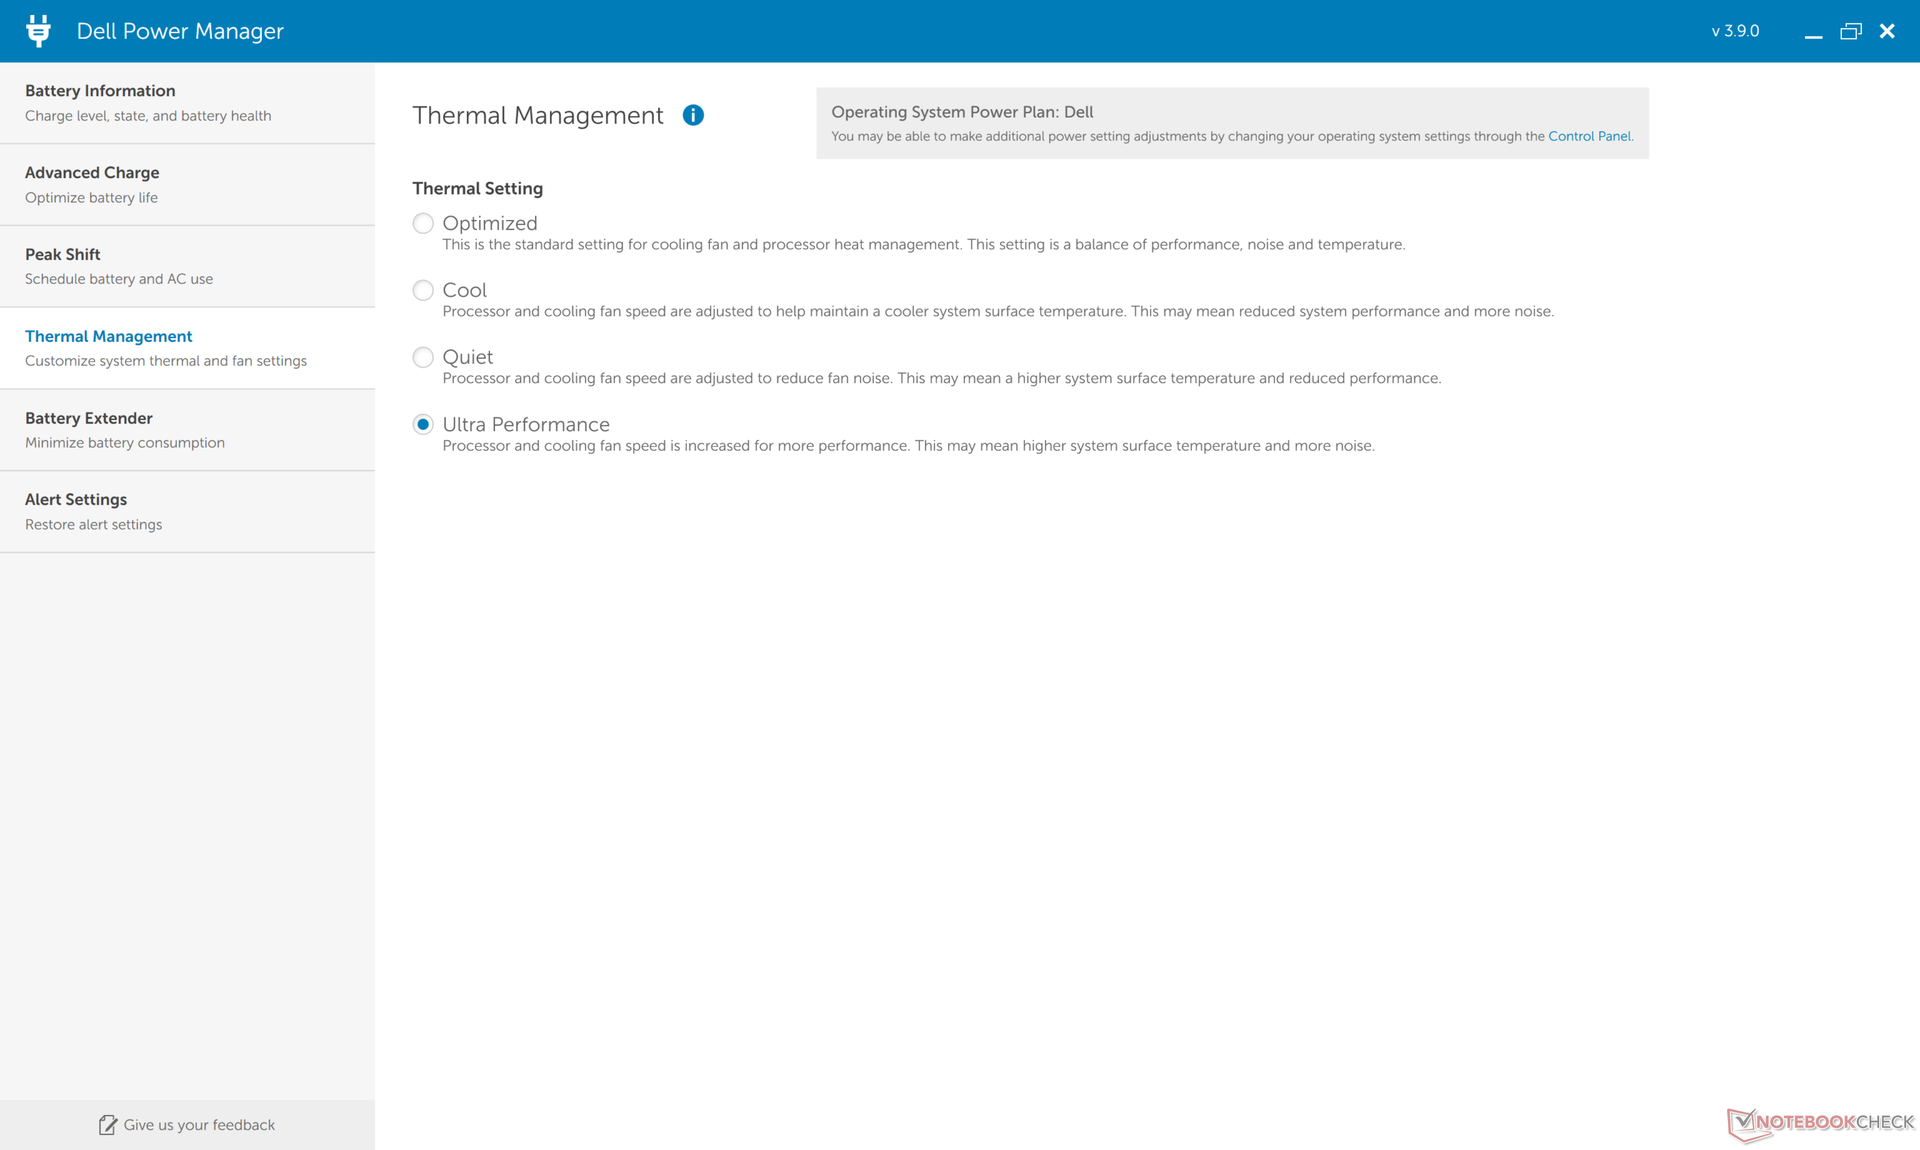
La nostra unità di test è stata impostata in modalità Ultra Performance tramite Dell Power Manager per ottenere i punteggi più alti possibili.
Processore
Le prestazioni single-thread e multi-thread sono aumentate rispettivamente del 20% e del 30% rispetto al Core i7-10875H nel modello dell'anno scorso. La sostenibilità delle prestazioni rimane eccellente, come mostrato dai nostri risultati del ciclo CineBench R15 xT qui sotto.
L'aggiornamento alla versione più costosa Core i9-11900H porterà più che probabilmente solo benefici marginali di prestazioni di pochi punti percentuali. Le temperature del core sul nostro i7-11800H si aggirano già intorno ai 90° C quando sono sotto carico e quindi una parte Core i9 con un clock più alto non avrà quasi nessun margine aggiuntivo.
Cinebench R15 Multi Loop
Cinebench R23: Multi Core | Single Core
Cinebench R15: CPU Multi 64Bit | CPU Single 64Bit
Blender: v2.79 BMW27 CPU
7-Zip 18.03: 7z b 4 -mmt1 | 7z b 4
Geekbench 5.5: Single-Core | Multi-Core
HWBOT x265 Benchmark v2.2: 4k Preset
LibreOffice : 20 Documents To PDF
R Benchmark 2.5: Overall mean
| Cinebench R23 / Multi Core | |
| Schenker XMG Ultra 17 Rocket Lake | |
| Schenker XMG Neo 17 (Early 2021, RTX 3070, 5800H) | |
| Dell XPS 17 9710 Core i7 RTX 3060 | |
| Media Intel Core i7-11800H (6508 - 14088, n=48) | |
| Asus TUF Gaming F17 FX706HM | |
| Gigabyte Aero 17 HDR YC | |
| Razer Blade Pro 17 2021 (QHD Touch) | |
| Cinebench R23 / Single Core | |
| Schenker XMG Ultra 17 Rocket Lake | |
| Asus TUF Gaming F17 FX706HM | |
| Dell XPS 17 9710 Core i7 RTX 3060 | |
| Media Intel Core i7-11800H (1386 - 1522, n=45) | |
| Schenker XMG Neo 17 (Early 2021, RTX 3070, 5800H) | |
| Gigabyte Aero 17 HDR YC | |
| Razer Blade Pro 17 2021 (QHD Touch) | |
Cinebench R23: Multi Core | Single Core
Cinebench R15: CPU Multi 64Bit | CPU Single 64Bit
Blender: v2.79 BMW27 CPU
7-Zip 18.03: 7z b 4 -mmt1 | 7z b 4
Geekbench 5.5: Single-Core | Multi-Core
HWBOT x265 Benchmark v2.2: 4k Preset
LibreOffice : 20 Documents To PDF
R Benchmark 2.5: Overall mean
* ... Meglio usare valori piccoli
Prestazioni del sistema
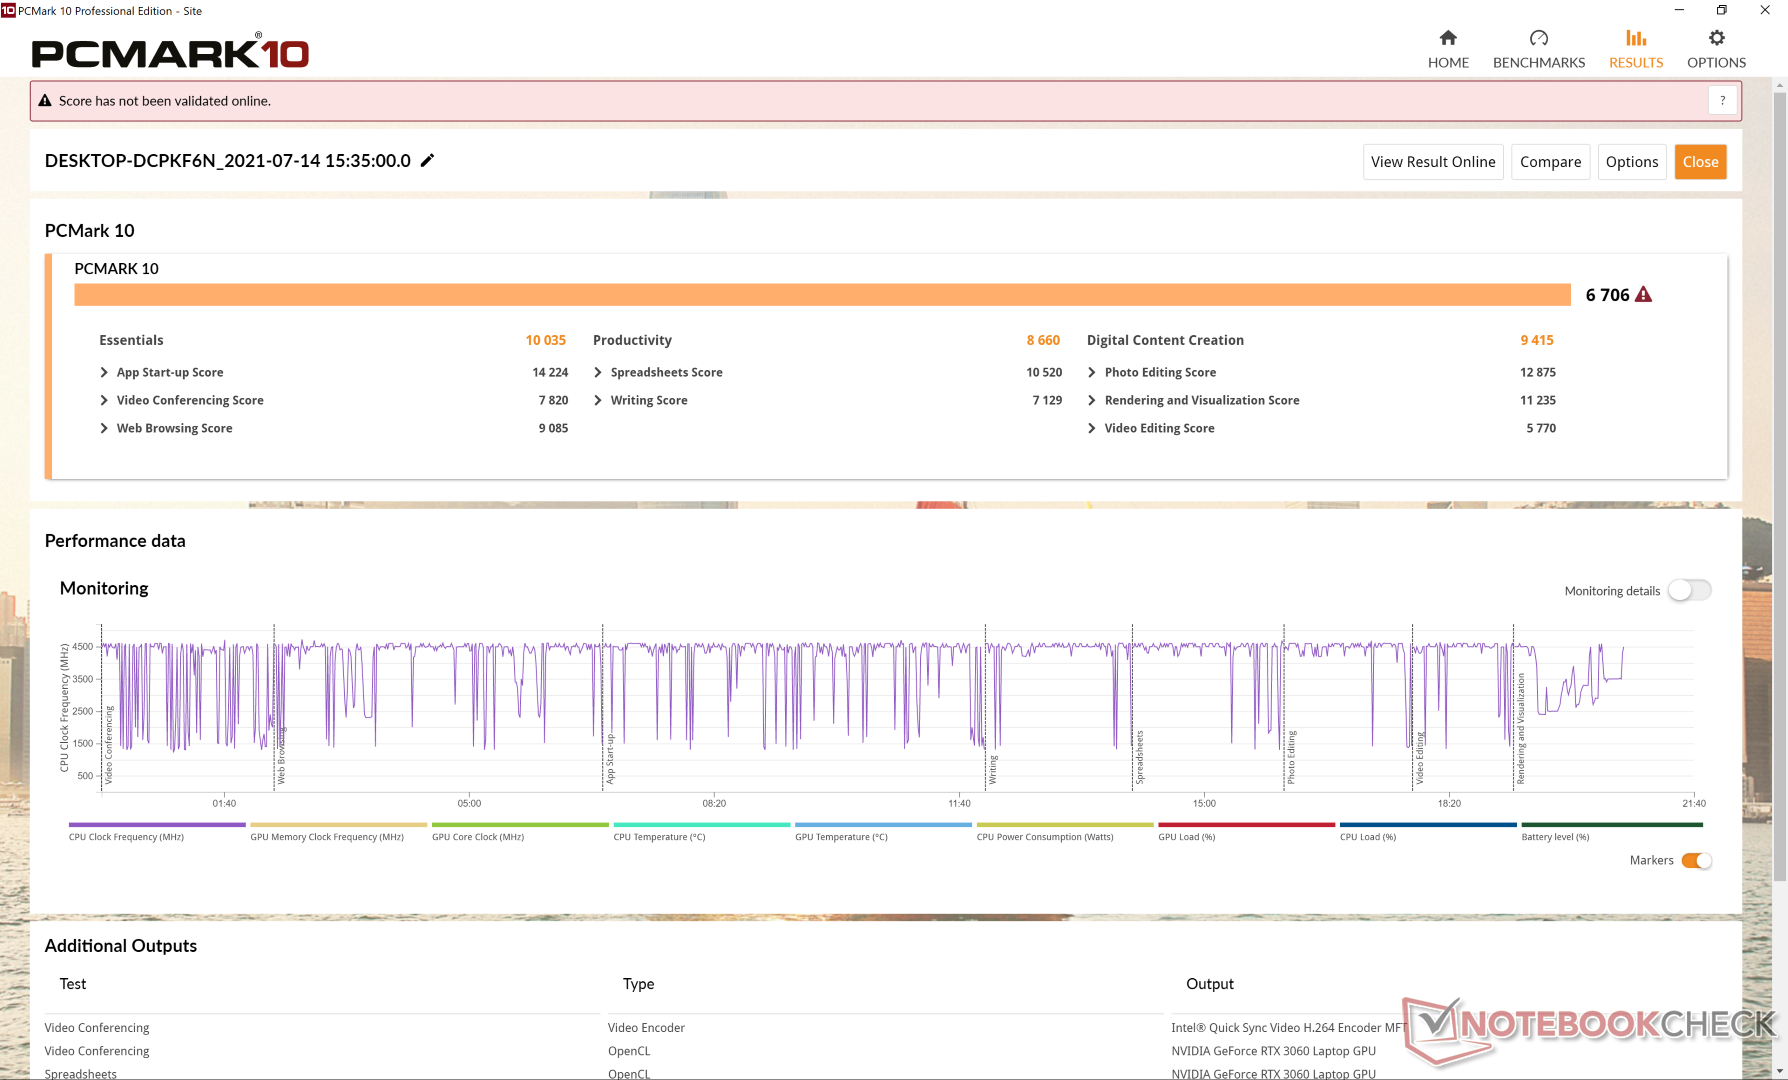
I punteggi PCMark sono costantemente più alti rispetto all'XPS 17 9700 dell'anno scorso e alla maggior parte degli altri portatili con CPU Comet Lake-H di decima generazione. La spinta maggiore è nella creazione di contenuti digitali, dove le prestazioni grafiche contano di più.
| PCMark 10 / Score | |
| Dell XPS 17 9710 Core i7 RTX 3060 | |
| Media Intel Core i7-11800H, NVIDIA GeForce RTX 3060 Laptop GPU (6156 - 6865, n=4) | |
| Razer Blade Pro 17 2021 (QHD Touch) | |
| Gigabyte Aero 17 HDR YC | |
| Dell XPS 17 9700 Core i7 RTX 2060 Max-Q | |
| Eluktronics RP-17 | |
| LG Ultra 17U70N | |
| PCMark 10 / Essentials | |
| Dell XPS 17 9710 Core i7 RTX 3060 | |
| Razer Blade Pro 17 2021 (QHD Touch) | |
| Media Intel Core i7-11800H, NVIDIA GeForce RTX 3060 Laptop GPU (9063 - 10522, n=4) | |
| Dell XPS 17 9700 Core i7 RTX 2060 Max-Q | |
| Gigabyte Aero 17 HDR YC | |
| Eluktronics RP-17 | |
| LG Ultra 17U70N | |
| PCMark 10 / Productivity | |
| Gigabyte Aero 17 HDR YC | |
| Dell XPS 17 9710 Core i7 RTX 3060 | |
| Media Intel Core i7-11800H, NVIDIA GeForce RTX 3060 Laptop GPU (8200 - 8874, n=4) | |
| Razer Blade Pro 17 2021 (QHD Touch) | |
| Dell XPS 17 9700 Core i7 RTX 2060 Max-Q | |
| LG Ultra 17U70N | |
| Eluktronics RP-17 | |
| PCMark 10 / Digital Content Creation | |
| Dell XPS 17 9710 Core i7 RTX 3060 | |
| Gigabyte Aero 17 HDR YC | |
| Razer Blade Pro 17 2021 (QHD Touch) | |
| Media Intel Core i7-11800H, NVIDIA GeForce RTX 3060 Laptop GPU (8520 - 9423, n=4) | |
| Dell XPS 17 9700 Core i7 RTX 2060 Max-Q | |
| Eluktronics RP-17 | |
| LG Ultra 17U70N | |
| PCMark 10 Score | 6706 punti | |
Aiuto | ||
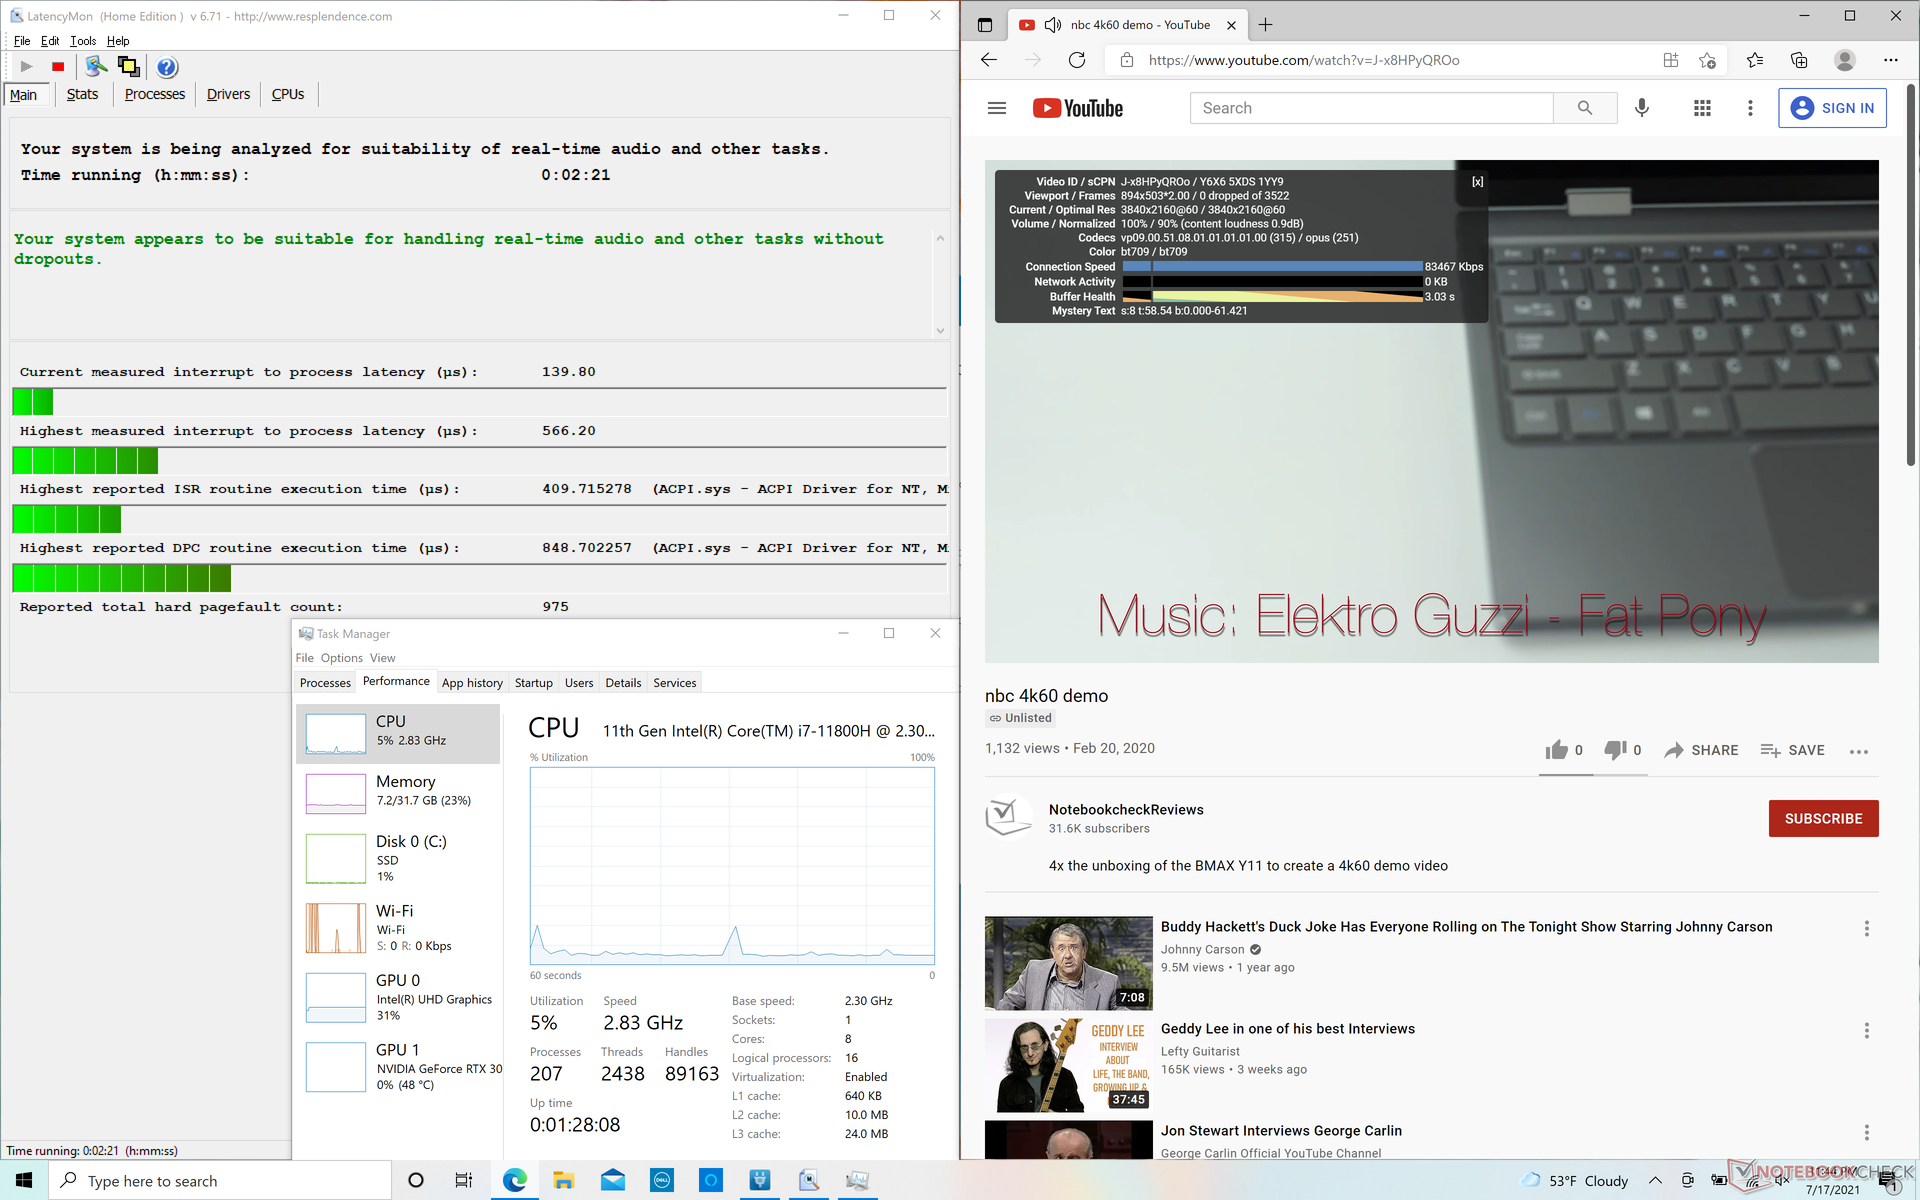
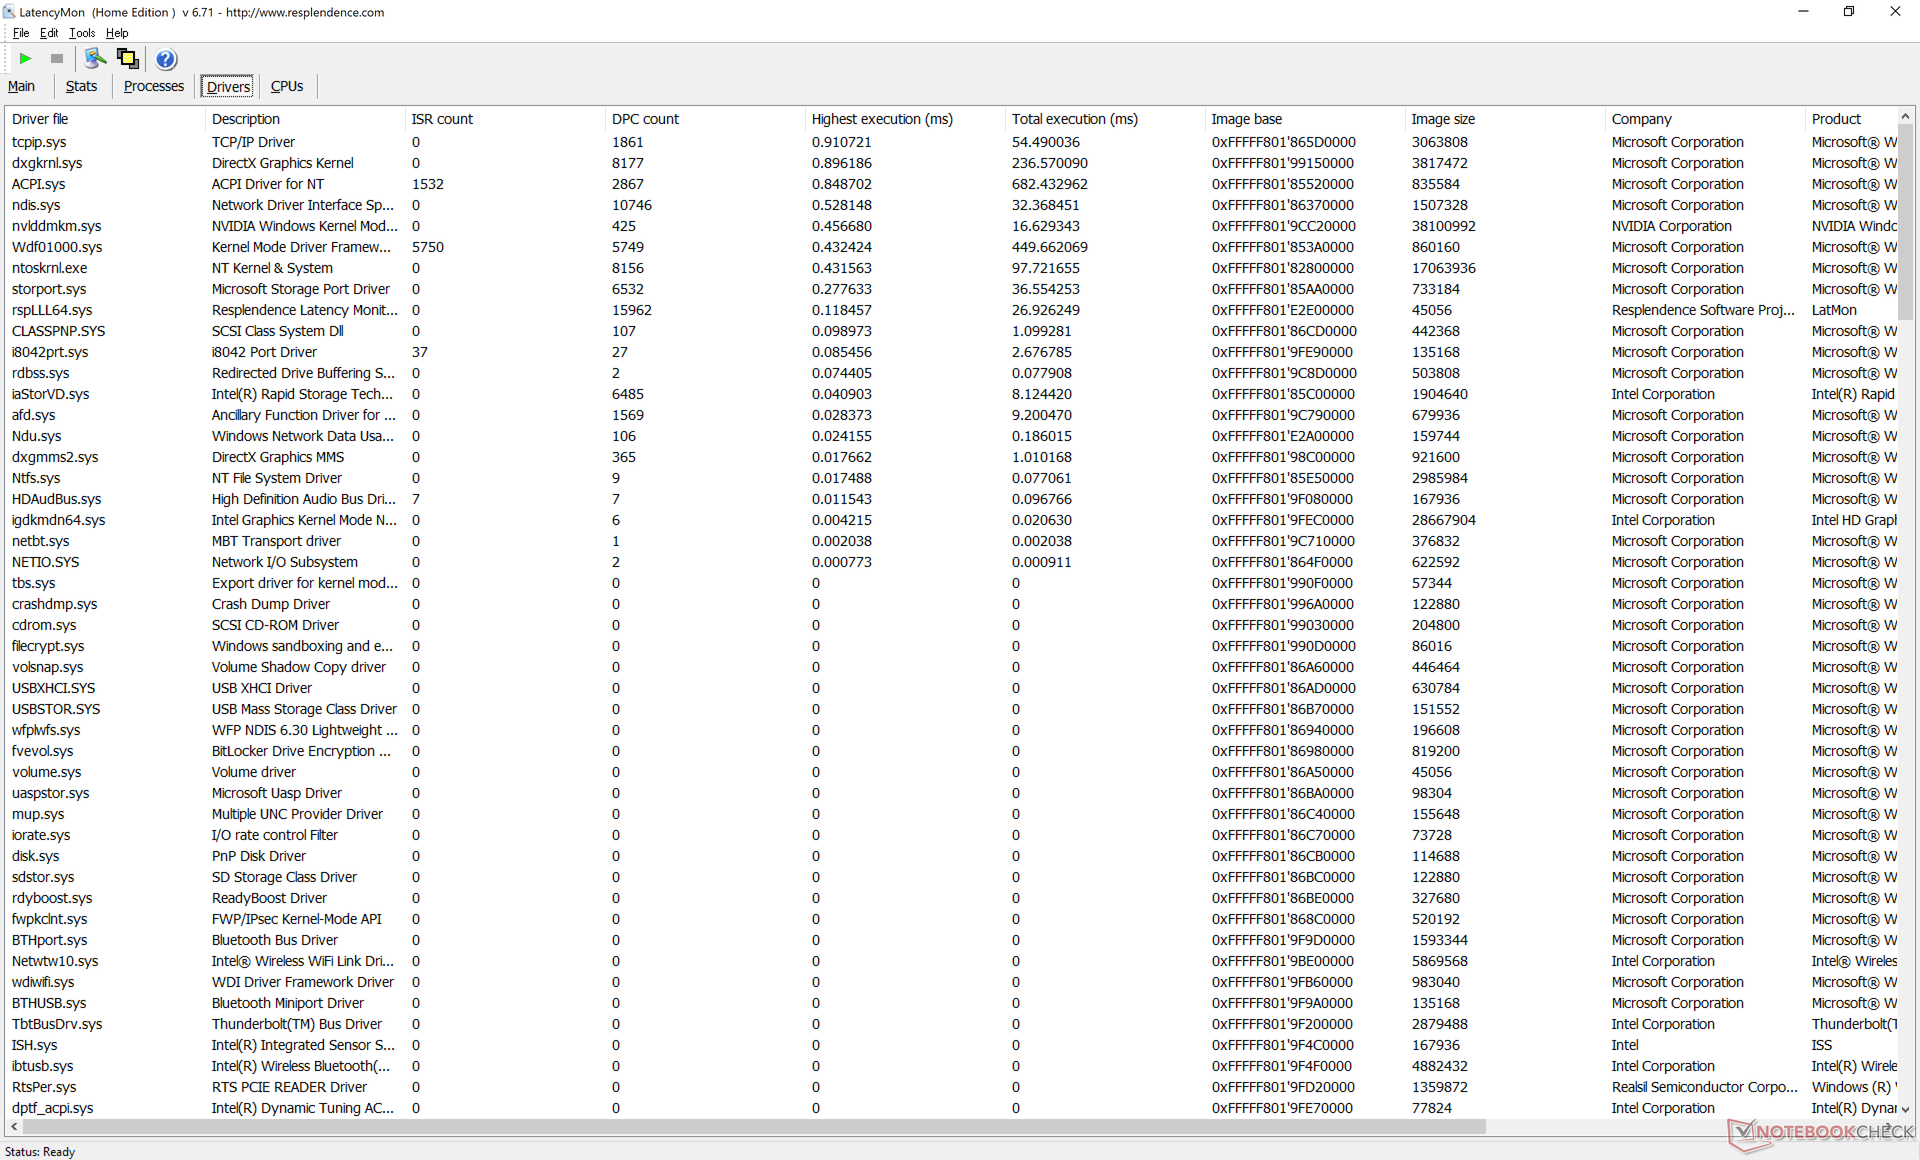
Latenza DPC
LatencyMon non mostra alcun problema di latenza DPC durante la navigazione attraverso più schede sulla nostra homepage. Anche la riproduzione di video 4K a 60 FPS è fluida e senza perdita di fotogrammi.
| DPC Latencies / LatencyMon - interrupt to process latency (max), Web, Youtube, Prime95 | |
| Gigabyte Aero 17 HDR YC | |
| Razer Blade Pro 17 2021 (QHD Touch) | |
| Eluktronics RP-17 | |
| LG Ultra 17U70N | |
| Dell XPS 17 9700 Core i7 RTX 2060 Max-Q | |
| Dell XPS 17 9710 Core i7 RTX 3060 | |
* ... Meglio usare valori piccoli
Dispositivi di archiviazione
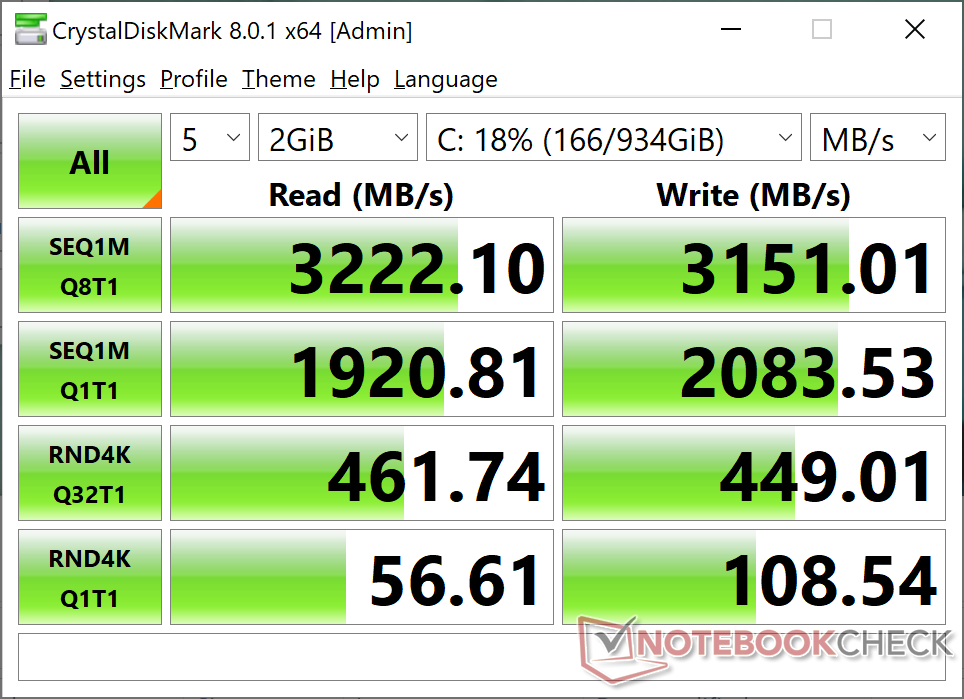
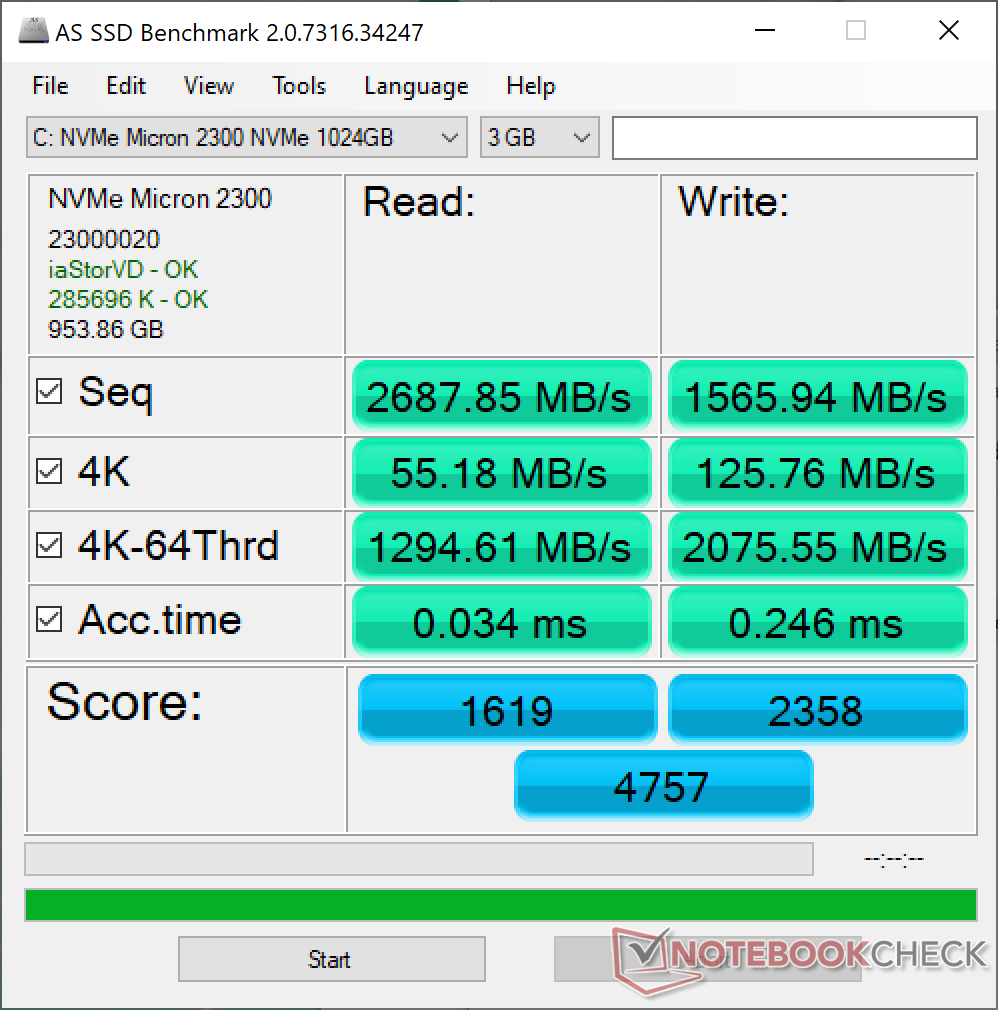
Dell ha aggiornato entrambi gli slot PCIe 3.0 M.2 2280 dell'XPS 17 9700 a PCIe 4 x4 per il 9710. Tuttavia, la nostra unità di test è dotata di un DDS NVMe PCIe 3.0 da 1 TB Micron 2300 che non può utilizzare pienamente la più ampia larghezza di banda PCIe 4. Le prestazioni sono ancora molto più veloci del Micron 2200S che è stato fornito sulla nostra vecchia unità XPS 17 9700.
| Dell XPS 17 9710 Core i7 RTX 3060 Micron 2300 1TB MTFDHBA1T0TDV | Dell XPS 17 9700 Core i7 RTX 2060 Max-Q Micron 2200S 1TB MTFDHBA1T0TCK | Razer Blade Pro 17 2021 (QHD Touch) Samsung PM981a MZVLB1T0HBLR | Gigabyte Aero 17 HDR YC ESR01TBTLCG-EAC-4 | Eluktronics RP-17 Phison PS5013 PRO-X-1TB-G2R NVMe SSD | |
|---|---|---|---|---|---|
| AS SSD | -53% | 4% | 11% | -4% | |
| Seq Read (MB/s) | 2688 | 1141 -58% | 2068 -23% | 2674 -1% | 1689 -37% |
| Seq Write (MB/s) | 1566 | 994 -37% | 2047 31% | 2458 57% | 1695 8% |
| 4K Read (MB/s) | 55.2 | 31.98 -42% | 47.85 -13% | 52.1 -6% | 50 -9% |
| 4K Write (MB/s) | 125.8 | 61 -52% | 87.4 -31% | 113.4 -10% | 182.9 45% |
| 4K-64 Read (MB/s) | 1295 | 790 -39% | 1932 49% | 1881 45% | 1043 -19% |
| 4K-64 Write (MB/s) | 2076 | 845 -59% | 2017 -3% | 2849 37% | 1841 -11% |
| Access Time Read * (ms) | 0.034 | 0.063 -85% | 0.055 -62% | 0.102 -200% | 0.04 -18% |
| Access Time Write * (ms) | 0.246 | 0.679 -176% | 0.128 48% | 0.033 87% | 0.102 59% |
| Score Read (Points) | 1619 | 966 -40% | 2187 35% | 2201 36% | 1262 -22% |
| Score Write (Points) | 2358 | 1005 -57% | 2309 -2% | 3208 36% | 2194 -7% |
| Score Total (Points) | 4757 | 2448 -49% | 5612 18% | 6524 37% | 4112 -14% |
| Copy ISO MB/s (MB/s) | 1563 | 1732 11% | 2400 54% | 2124 36% | |
| Copy Program MB/s (MB/s) | 976 | 717 -27% | 684 -30% | 579 -41% | |
| Copy Game MB/s (MB/s) | 1786 | 1343 -25% | 1629 -9% | 1304 -27% | |
| CrystalDiskMark 5.2 / 6 | -29% | -2% | 10% | 4% | |
| Write 4K (MB/s) | 109.2 | 64.1 -41% | 123.5 13% | 141.2 29% | 226.1 107% |
| Read 4K (MB/s) | 56.6 | 39.93 -29% | 45.96 -19% | 46.48 -18% | 54.7 -3% |
| Write Seq (MB/s) | 2073 | 1191 -43% | 1861 -10% | 2433 17% | 1868 -10% |
| Read Seq (MB/s) | 1916 | 1418 -26% | 1584 -17% | 1742 -9% | 1648 -14% |
| Write 4K Q32T1 (MB/s) | 487 | 450.3 -8% | 466.4 -4% | 565 16% | 429.9 -12% |
| Read 4K Q32T1 (MB/s) | 463.2 | 365 -21% | 566 22% | 655 41% | 521 12% |
| Write Seq Q32T1 (MB/s) | 3155 | 1563 -50% | 2981 -6% | 3028 -4% | 2248 -29% |
| Read Seq Q32T1 (MB/s) | 3209 | 2683 -16% | 3260 2% | 3424 7% | 2484 -23% |
| Media totale (Programma / Settaggio) | -41% /
-44% | 1% /
2% | 11% /
10% | 0% /
-1% |
* ... Meglio usare valori piccoli

Throttling Disco: DiskSpd Read Loop, Queue Depth 8
Prestazioni della GPU - Max-Q nel cuore
Le prestazioni grafiche grezze sono circa il 30% più veloci della RTX 2060 Max-Q nell'XPS 17 9700 dell'anno scorso risultando essere un aggiornamento rispettabile anno dopo anno. Forse più sorprendentemente, le prestazioni sono solo circa il 10% più lente di una GeForce RTX 3060 da 130 W nonostante il TGP molto più basso di 70 W sulla nostra GPU Dell.
Le prestazioni gaming sono eccellenti con risultati che sono molto vicini ai computer portatili dotati di grafica GeForce RTX 2070. Tuttavia, raccomandiamo di giocare su un monitor esterno quando possibile a causa dei lenti tempi di risposta bianco-nero e grigio-grigio sul display interno dell'XPS 17 per un ghosting molto evidente. Il gaming non è l'obiettivo primario dei portatili XPS, dopo tutto.
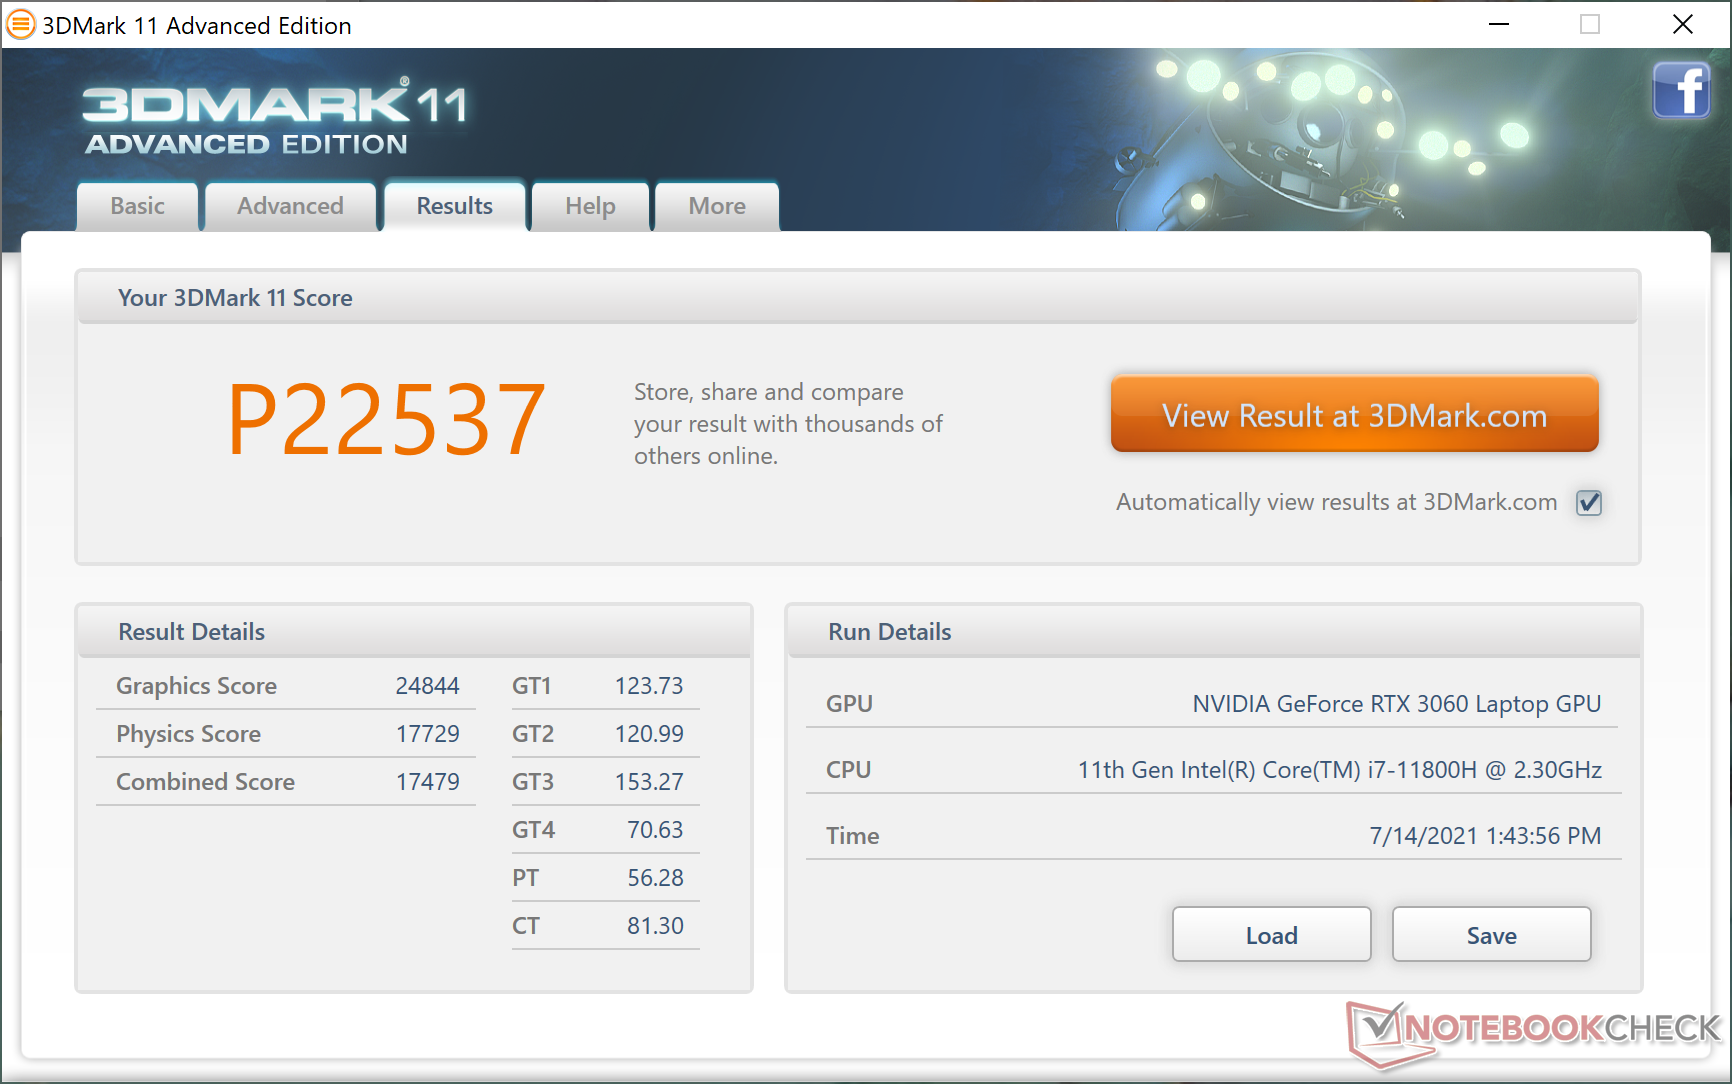
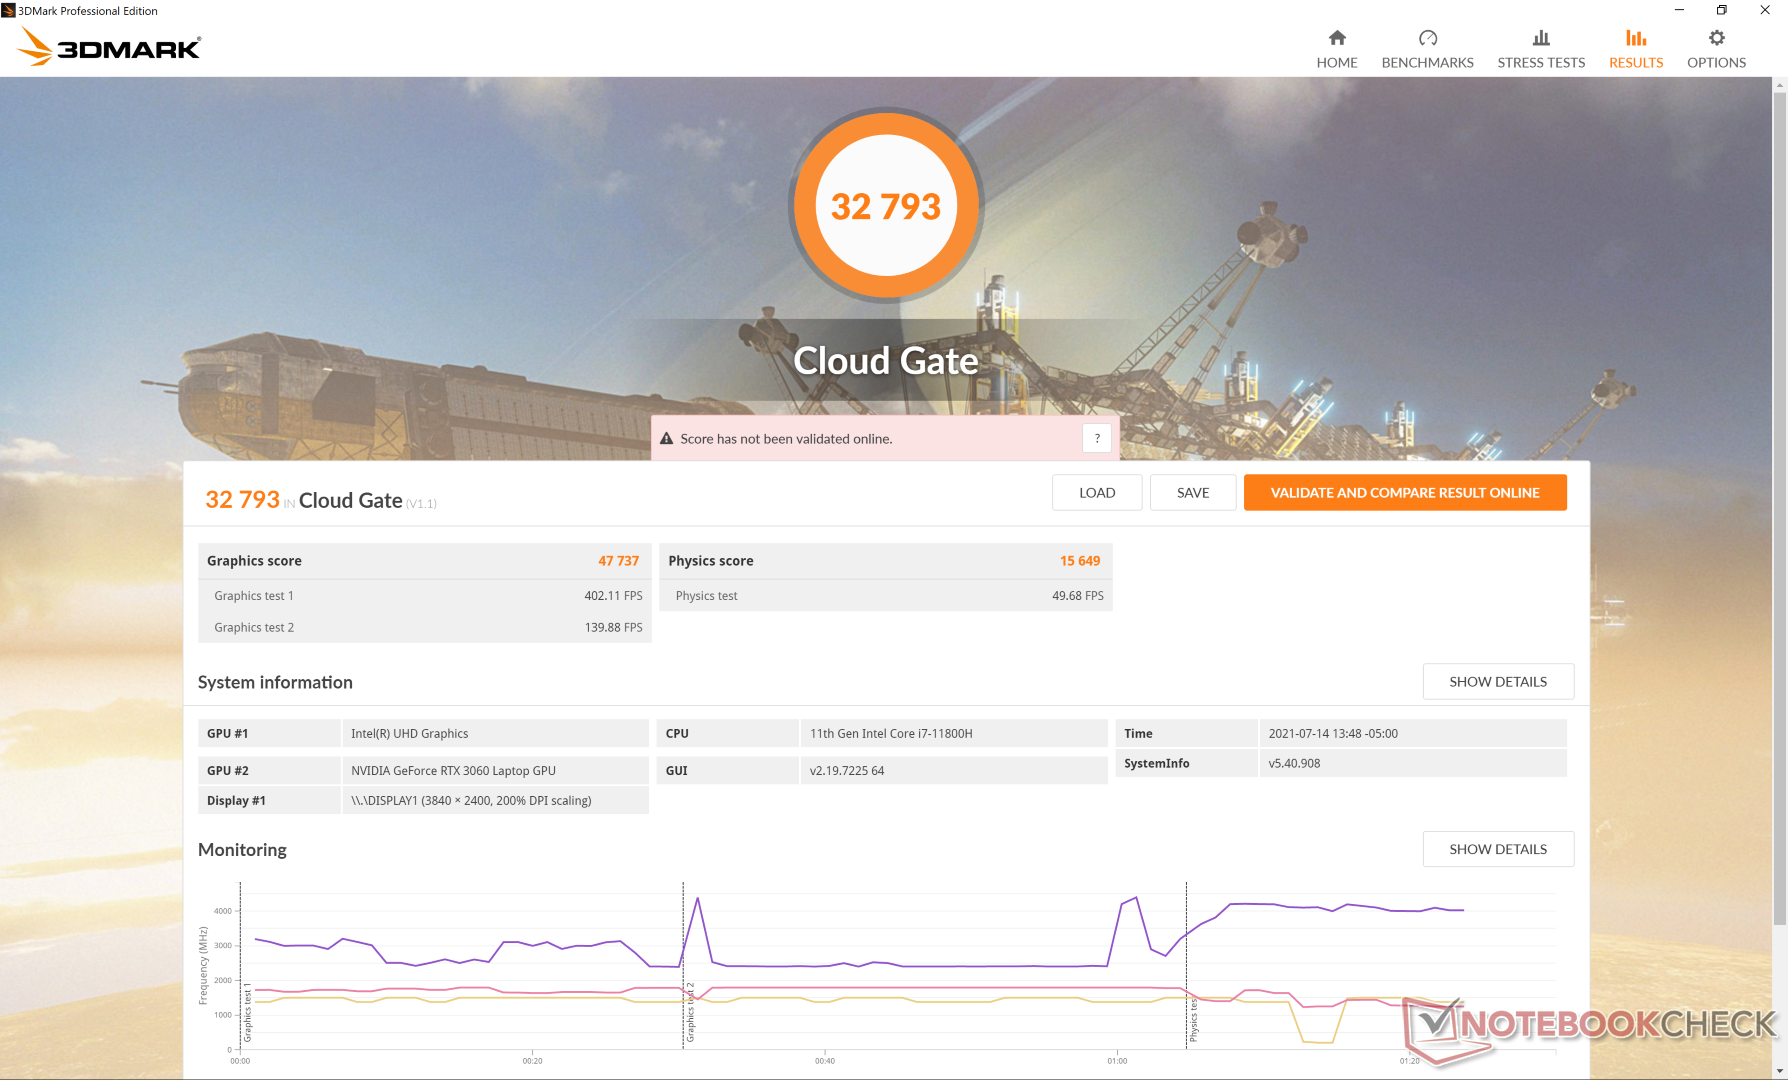
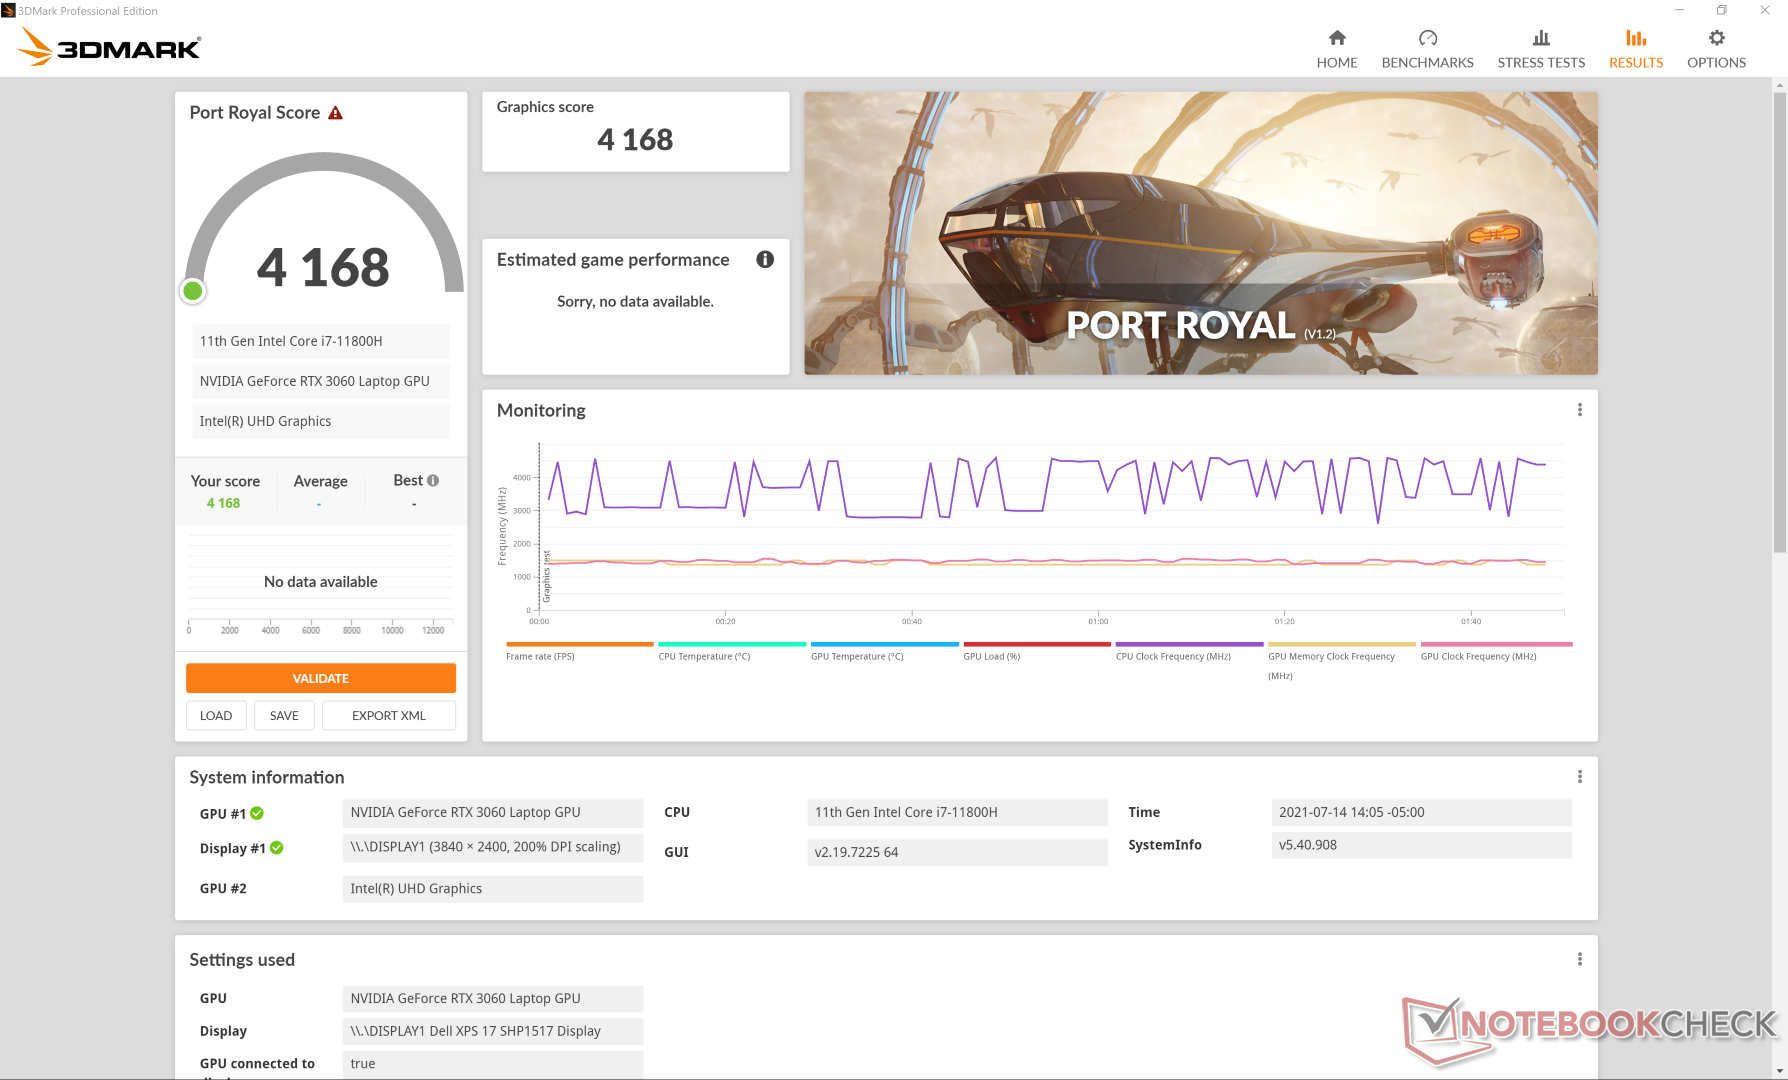
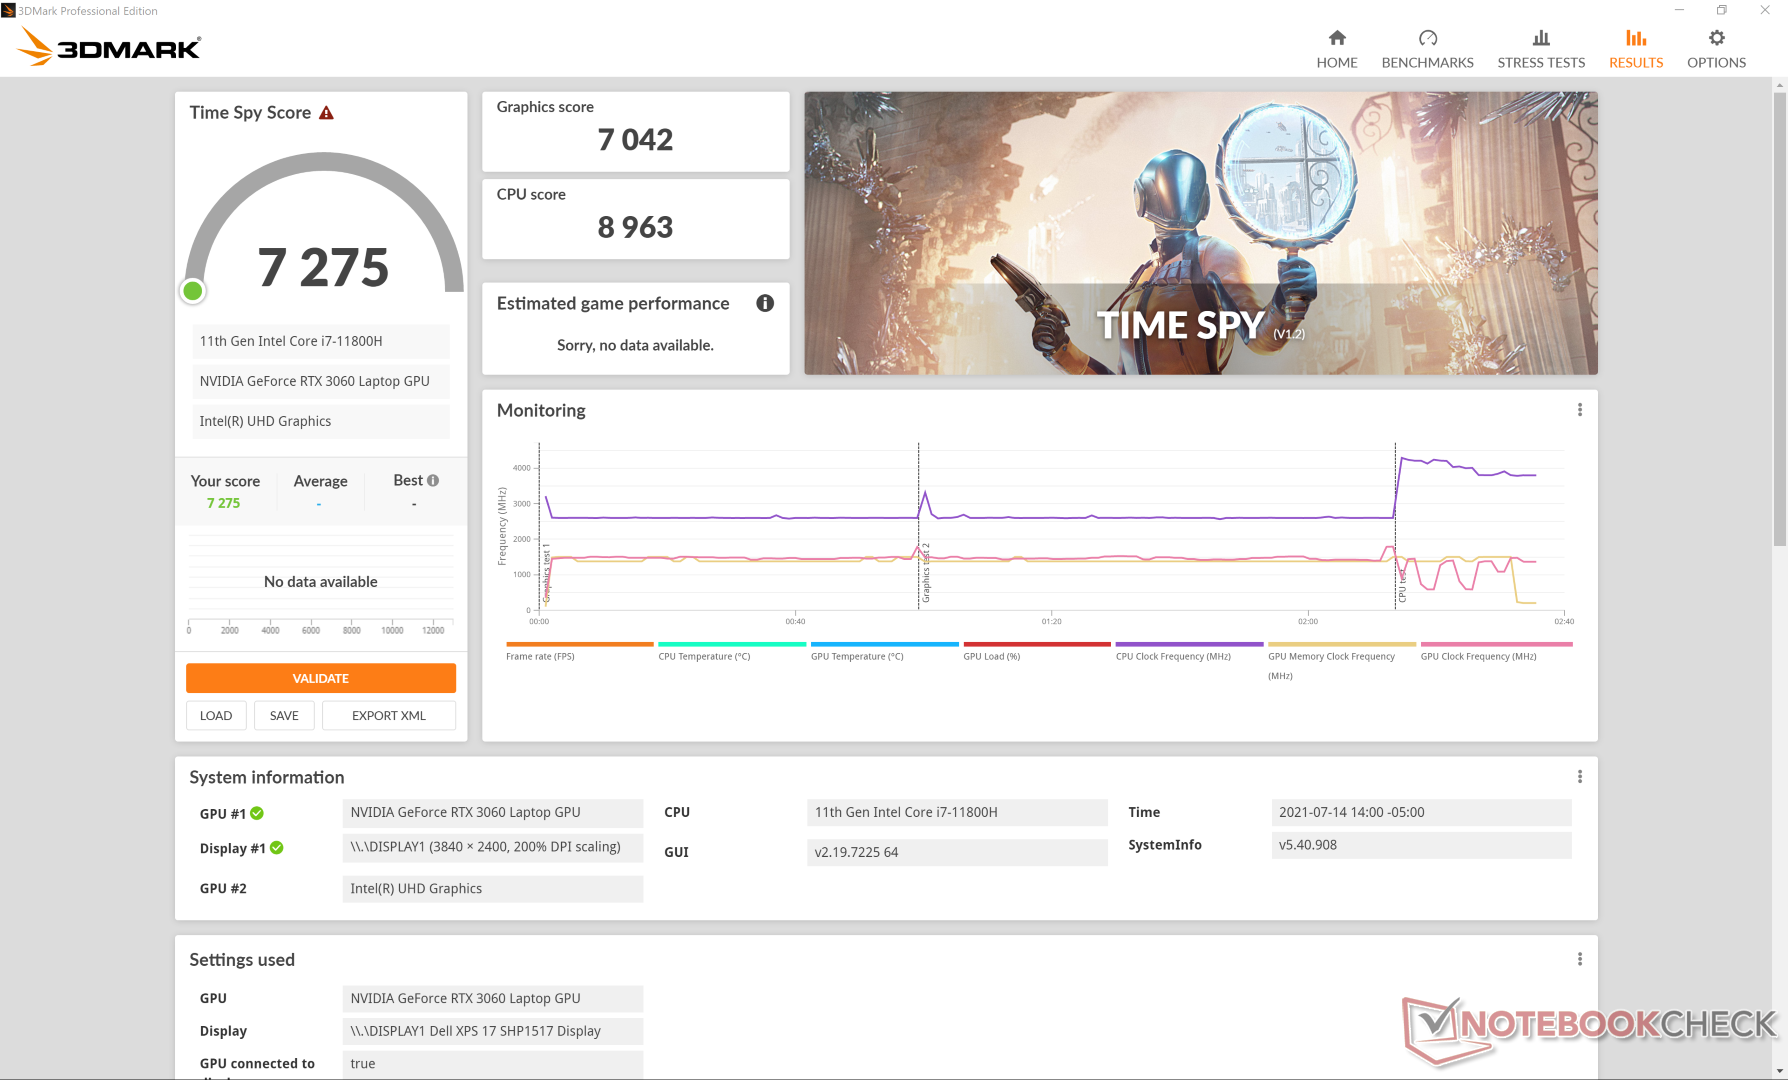
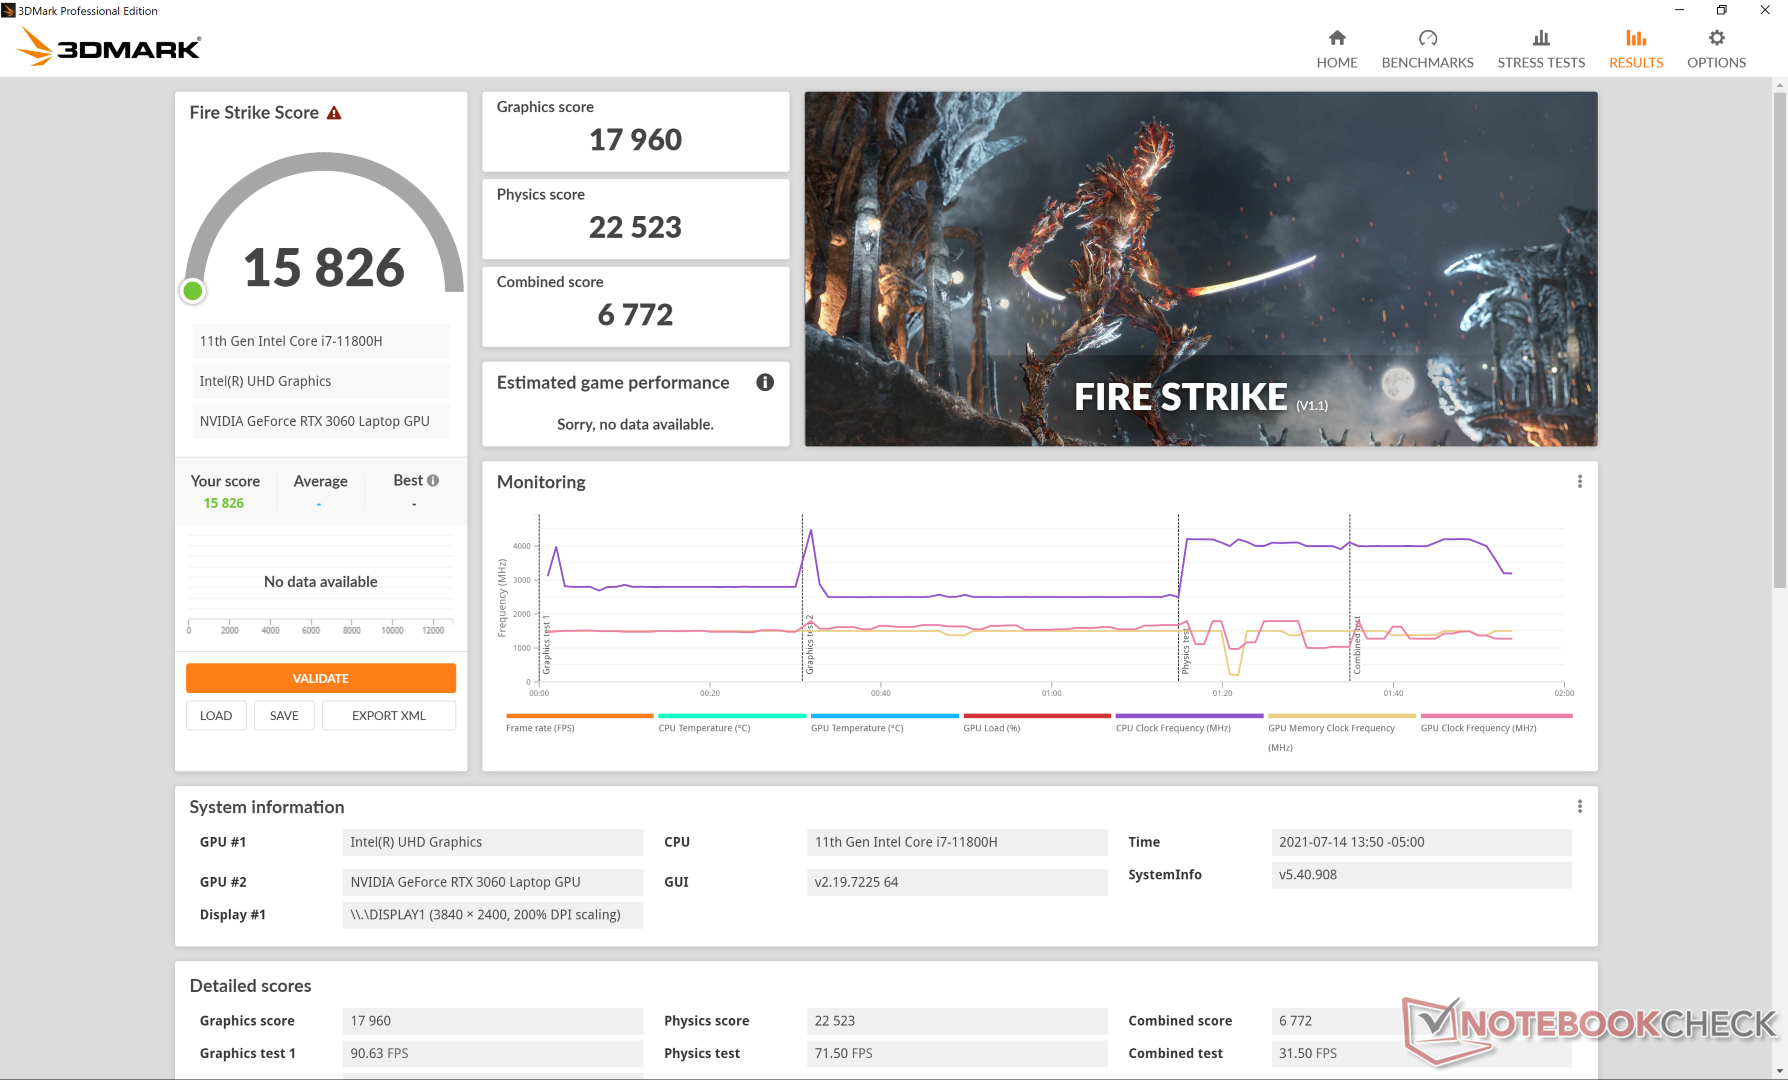
| 3DMark 11 Performance | 22537 punti | |
| 3DMark Cloud Gate Standard Score | 32793 punti | |
| 3DMark Fire Strike Score | 15826 punti | |
| 3DMark Time Spy Score | 7275 punti | |
Aiuto | ||
Diagramma FPS The Witcher 3
| basso | medio | alto | ultra | QHD | 4K | |
|---|---|---|---|---|---|---|
| GTA V (2015) | 181 | 178 | 155 | 81.6 | 63.6 | |
| The Witcher 3 (2015) | 341.6 | 218.1 | 142.2 | 72.3 | ||
| Dota 2 Reborn (2015) | 168 | 148 | 133 | 126 | ||
| Final Fantasy XV Benchmark (2018) | 140 | 98.2 | 73.5 | 54.9 | 31.4 | |
| X-Plane 11.11 (2018) | 125 | 105 | 84.6 | 60.2 | ||
| Strange Brigade (2018) | 348 | 176 | 140 | 123 | 91.1 |
Emissioni
Rumorosità - Silenzioso come un Ultrabook, potente come gamer
Il comportamento della ventola non è realmente cambiato dato che sia il soffitto di potenza che la soluzione di raffreddamento sono rimasti gli stessi. Quando si esegue 3DMark 06 e The Witcher 3 inmodalità ottimizzata, il rumore della ventola si stabilizza a 29,2 dB(A) e 46,2 dB(A), rispettivamente. Quando si esegue The Witcher 3 in modalità Ultra Performance, il rumore della ventola raggiunge i 49 dB(A) che è quello che abbiamo registrato sul modello dell'anno scorso. Questa gamma è più simile ai portatili gaming che ad altri Ultrabooks, dato che l'XPS 17 ha una GPU di livello gaming.
Si raccomanda di eseguire il sistema in modalità ottimizzata o inferiore e con l'iGPU attiva quando le prestazioni extra non sono necessarie. Per il resto, le ventole pulseranno più frequentemente soprattutto quando si lanciano le applicazioni.
| Dell XPS 17 9710 Core i7 RTX 3060 GeForce RTX 3060 Laptop GPU, i7-11800H, Micron 2300 1TB MTFDHBA1T0TDV | Dell XPS 17 9700 Core i7 RTX 2060 Max-Q GeForce RTX 2060 Max-Q, i7-10875H, Micron 2200S 1TB MTFDHBA1T0TCK | Razer Blade Pro 17 2021 (QHD Touch) GeForce RTX 3080 Laptop GPU, i7-10875H, Samsung PM981a MZVLB1T0HBLR | Gigabyte Aero 17 HDR YC GeForce RTX 3080 Laptop GPU, i9-10980HK, ESR01TBTLCG-EAC-4 | LG Ultra 17U70N GeForce GTX 1650 Mobile, i5-10210U, Samsung SSD PM981a MZVLB512HBJQ | Eluktronics RP-17 GeForce RTX 2060 Mobile, R7 4800H, Phison PS5013 PRO-X-1TB-G2R NVMe SSD | |
|---|---|---|---|---|---|---|
| Noise | -5% | -7% | -10% | -3% | -3% | |
| off /ambiente * (dB) | 25.5 | 28 -10% | 26.1 -2% | 26 -2% | 27 -6% | 26.2 -3% |
| Idle Minimum * (dB) | 25.2 | 28 -11% | 26.1 -4% | 30 -19% | 27.3 -8% | 26.2 -4% |
| Idle Average * (dB) | 25.2 | 28 -11% | 26.5 -5% | 32 -27% | 27.3 -8% | 26.2 -4% |
| Idle Maximum * (dB) | 25.2 | 28 -11% | 30.7 -22% | 36 -43% | 31.7 -26% | 30 -19% |
| Load Average * (dB) | 45.9 | 43.2 6% | 43.5 5% | 45 2% | 43.6 5% | 38.5 16% |
| Witcher 3 ultra * (dB) | 49 | 49 -0% | 54 -10% | 42 14% | 45.3 8% | 47.2 4% |
| Load Maximum * (dB) | 50.4 | 50.5 -0% | 55 -9% | 49 3% | 44.7 11% | 54.6 -8% |
* ... Meglio usare valori piccoli
Rumorosità
| Idle |
| 25.2 / 25.2 / 25.2 dB(A) |
| Sotto carico |
| 45.9 / 50.4 dB(A) |
 | ||
30 dB silenzioso 40 dB(A) udibile 50 dB(A) rumoroso |
||
min: | ||
Temperature
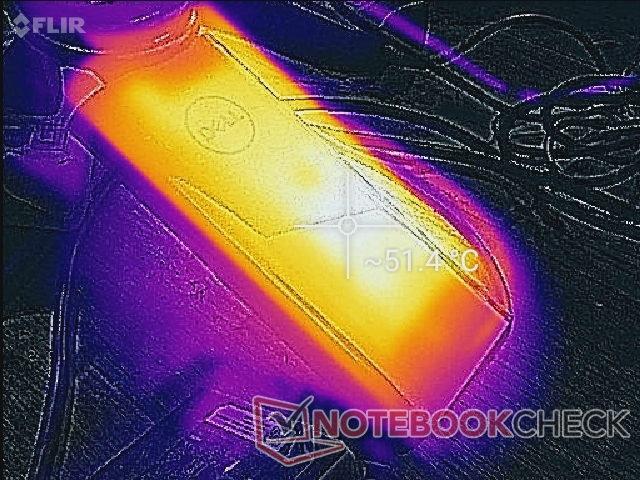
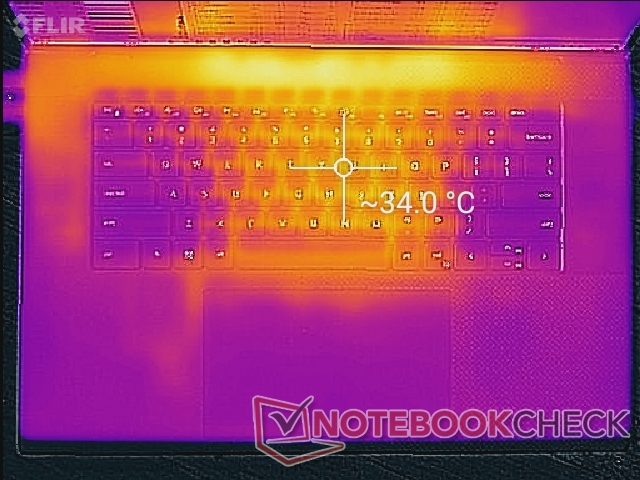
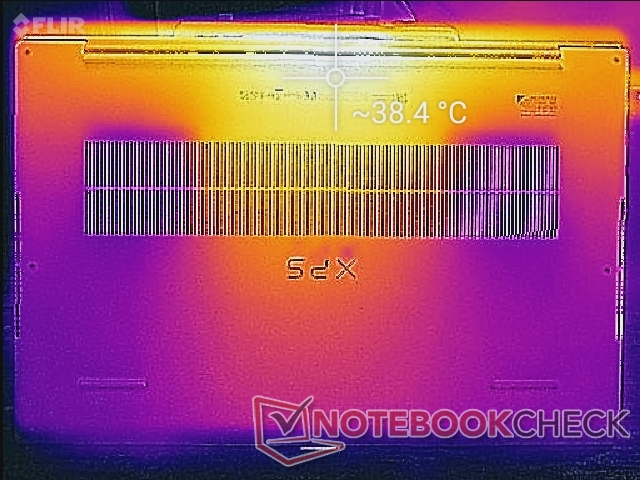
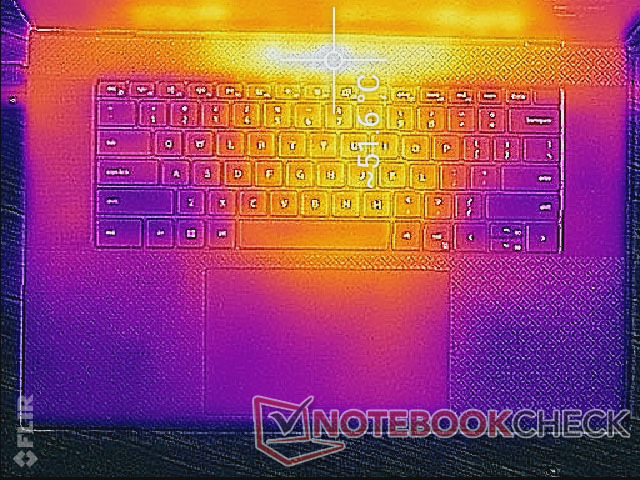
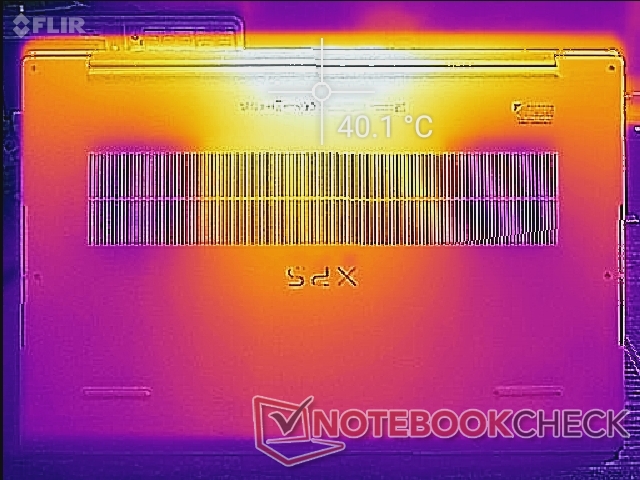
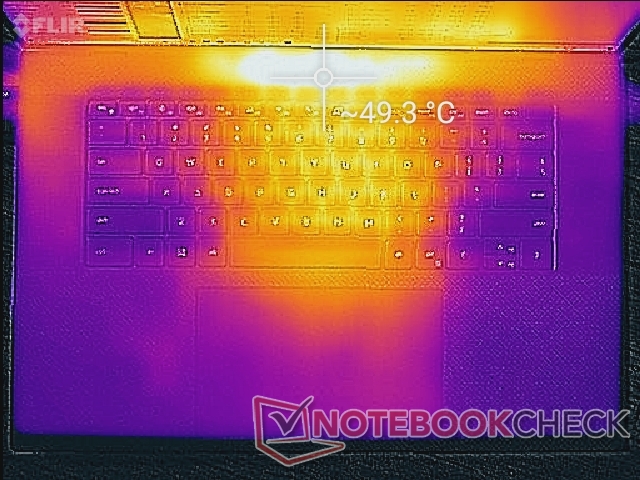
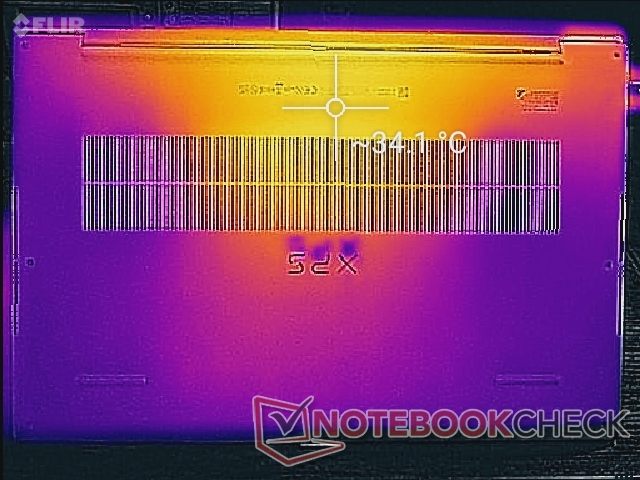
I punti caldi quando si eseguono carichi elevati per lunghi periodi possono raggiungere fino a 51° C e 41° C sulle superfici superiore e inferiore del portatile, rispettivamente. Questi stessi punti arrivano da 34° C a 37° C anche quando sono al minimo sul desktop. Tuttavia, i punti caldi sono concentrati verso il centro posteriore dello chassis mentre i poggiapolsi rimangono molto più freddi. Questo è simile a quello che abbiamo osservato sul Razer Blade Pro 17 ma in misura ancora maggiore sul Dell.
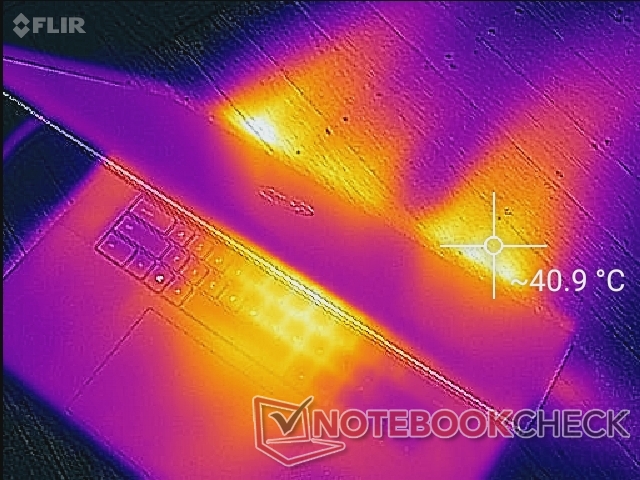
(-) La temperatura massima sul lato superiore è di 50.2 °C / 122 F, rispetto alla media di 36.8 °C / 98 F, che varia da 21 a 71 °C per questa classe Multimedia.
(+) Il lato inferiore si riscalda fino ad un massimo di 38.4 °C / 101 F, rispetto alla media di 39.1 °C / 102 F
(+) In idle, la temperatura media del lato superiore è di 29.4 °C / 85 F, rispetto alla media deld ispositivo di 31.3 °C / 88 F.
(±) Riproducendo The Witcher 3, la temperatura media per il lato superiore e' di 33.9 °C / 93 F, rispetto alla media del dispositivo di 31.3 °C / 88 F.
(+) I poggiapolsi e il touchpad sono piu' freddi della temperatura della pelle con un massimo di 29.8 °C / 85.6 F e sono quindi freddi al tatto.
(±) La temperatura media della zona del palmo della mano di dispositivi simili e'stata di 28.7 °C / 83.7 F (-1.1 °C / -1.9 F).
Stress test
Quando viene stressata con Prime95, la CPU si spinge fino a 3,6-4 GHz e a una temperatura del core mite di 100° C. Dopo circa 90 secondi, tuttavia, la frequenza di clock varia tra 2,5 GHz e 3,4 GHz per mantenere una temperatura del core più fresca di 82° C. Eseguendo questo stesso test sull'XPS 17 9700 si ottengono frequenze di clock del core e temperature da 2,9 a 3,1 GHz e 99° C, rispettivamente, per suggerire che l'XPS 19 9710 può downcloccare ulteriormente la CPU Turbo Boost per temperature più basse quando necessario.
L'esecuzione di The Witcher 3 mostra sia i clock della GPU che le temperature del core più elevate rispetto alla RTX 2060 Max-Q. D'altra parte, le frequenze di clock della CPU sono più basse per una temperatura inferiore della CPU. Di conseguenza, la distribuzione dell'energia sembra essere più perfezionata sull'XPS 17 9710 che sul 9700. Le temperature del core sono in realtà molto vicine a quelle che abbiamo osservato sull'Eluktronics RP-17 che è un portatile da 17,3" più spesso ma con la vecchia GPU RTX 2060.
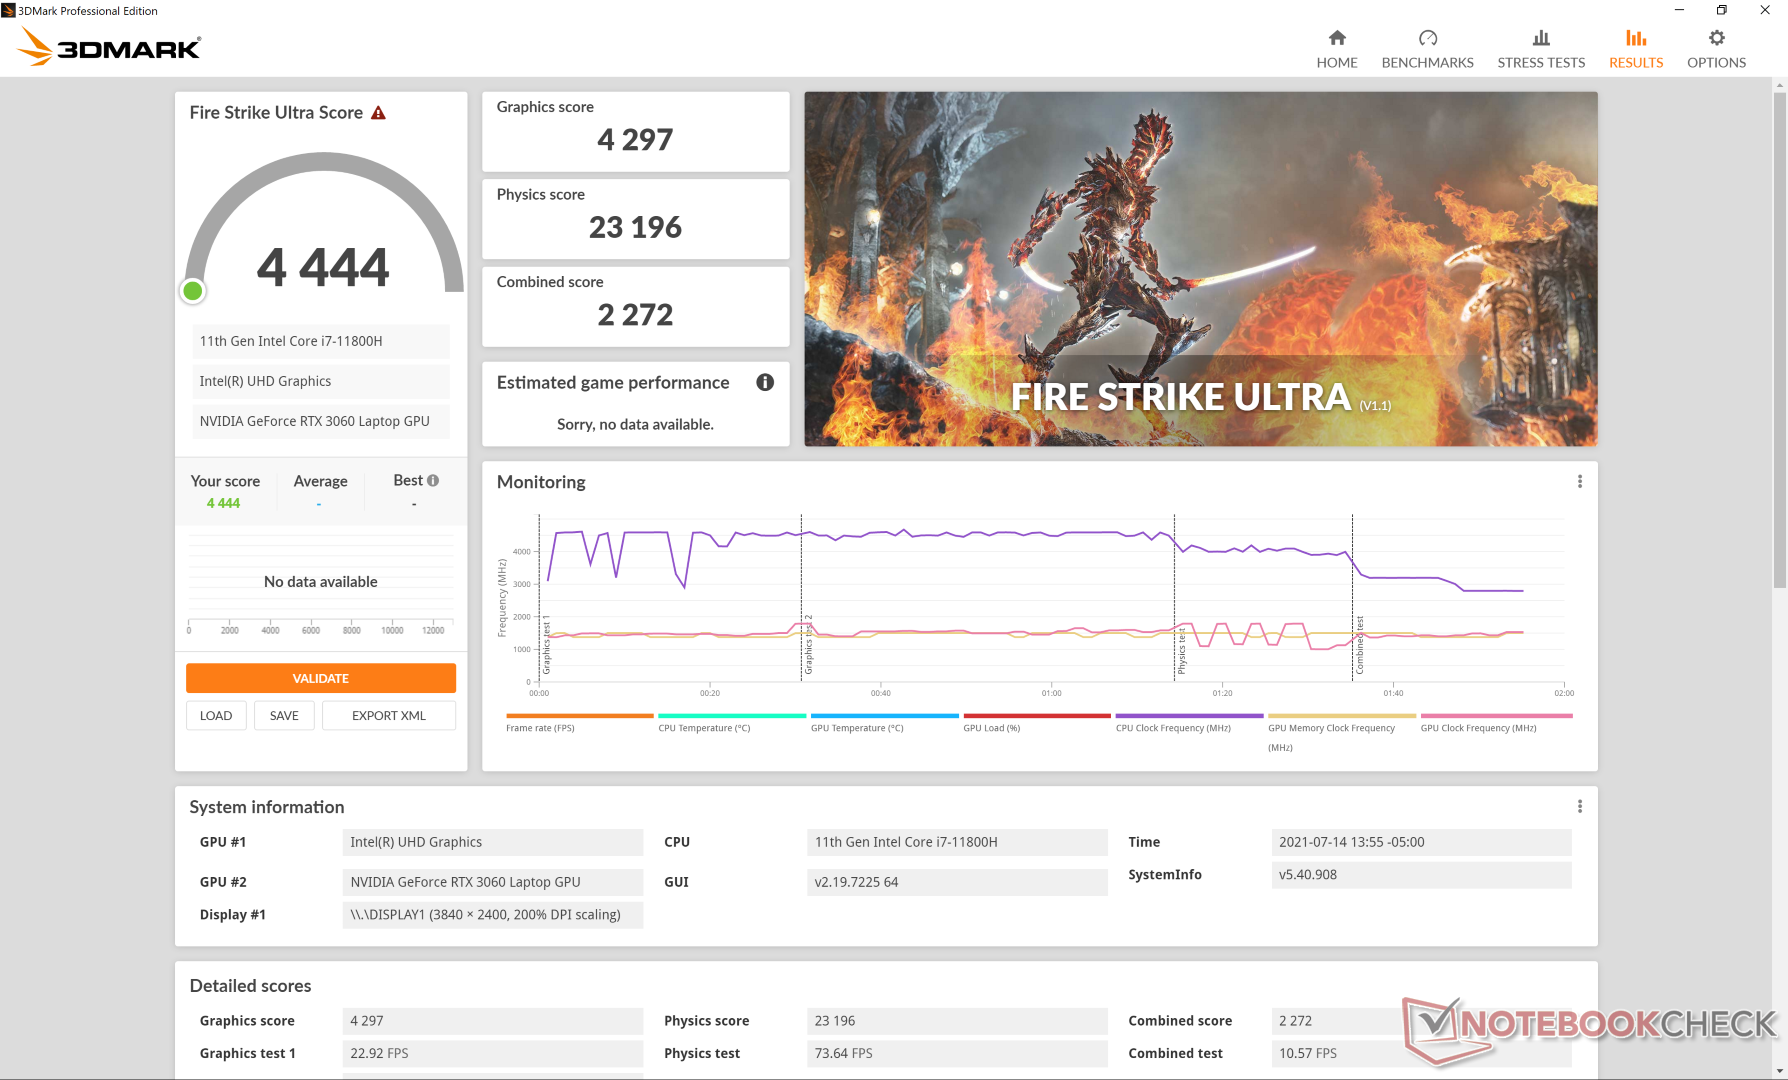
Il funzionamento a batterie limiterà le prestazioni. Un test Fire Strike a batteria restituisce punteggi di Physics e Graphics di 14102 e 13572 punti, rispettivamente, rispetto a 22523 e 17960 punti con l'alimentazione di rete.
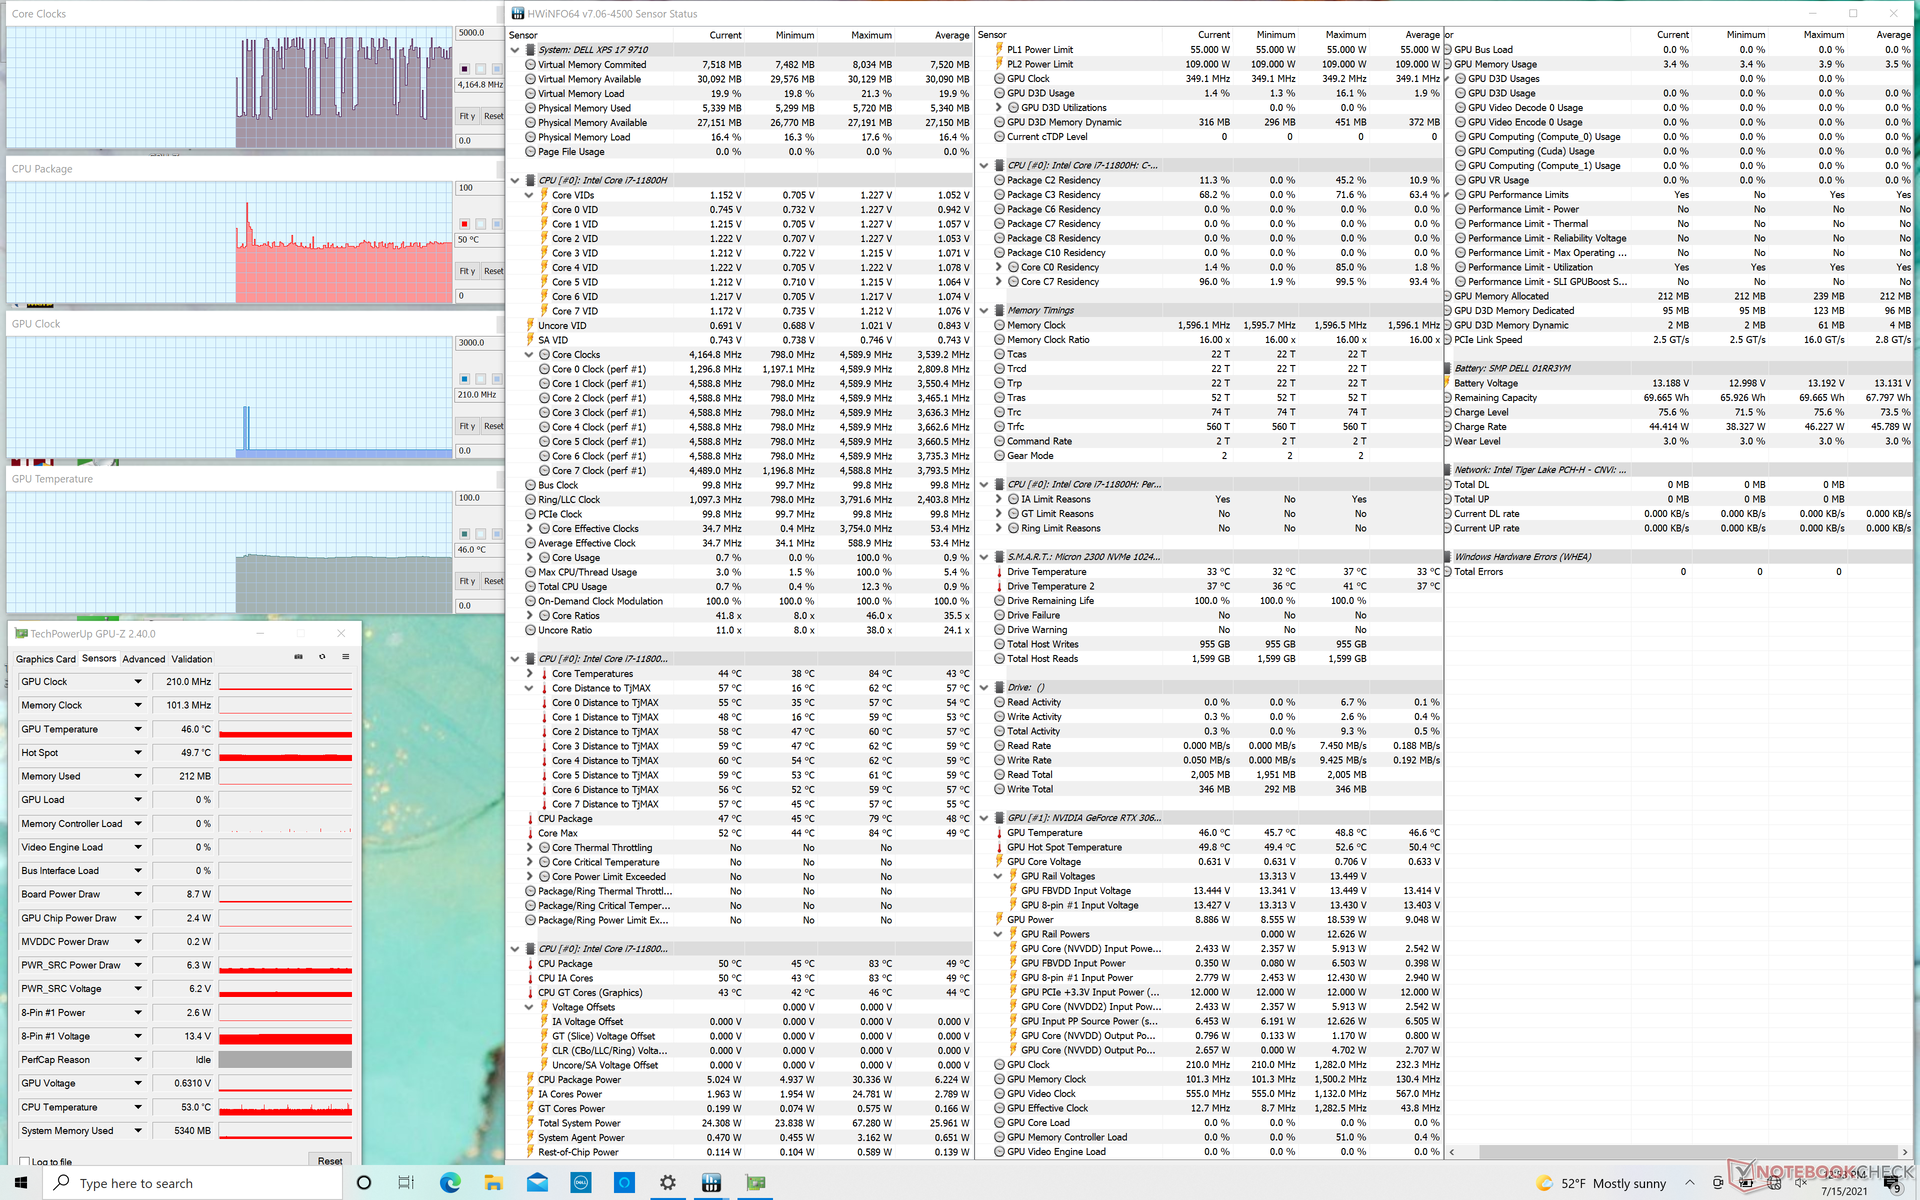
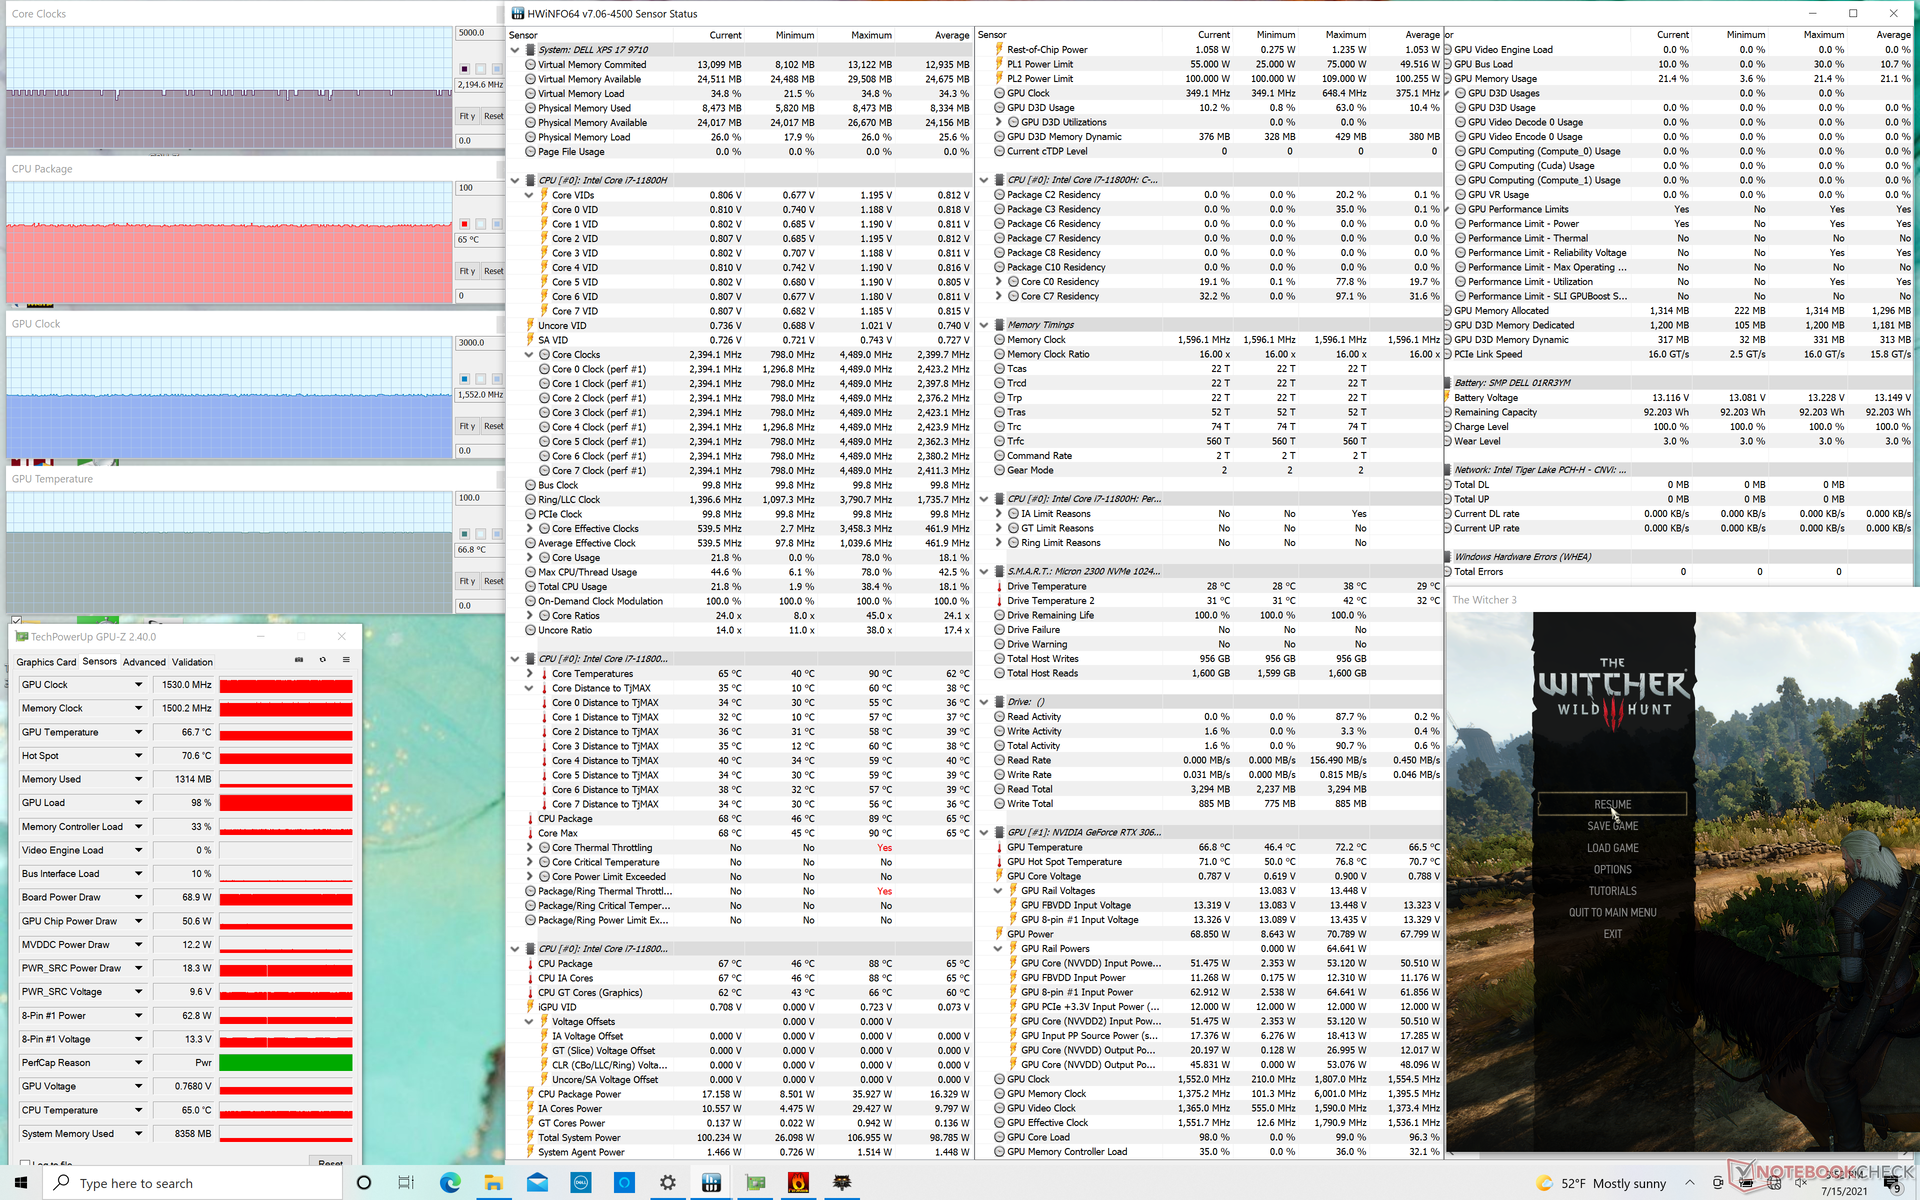
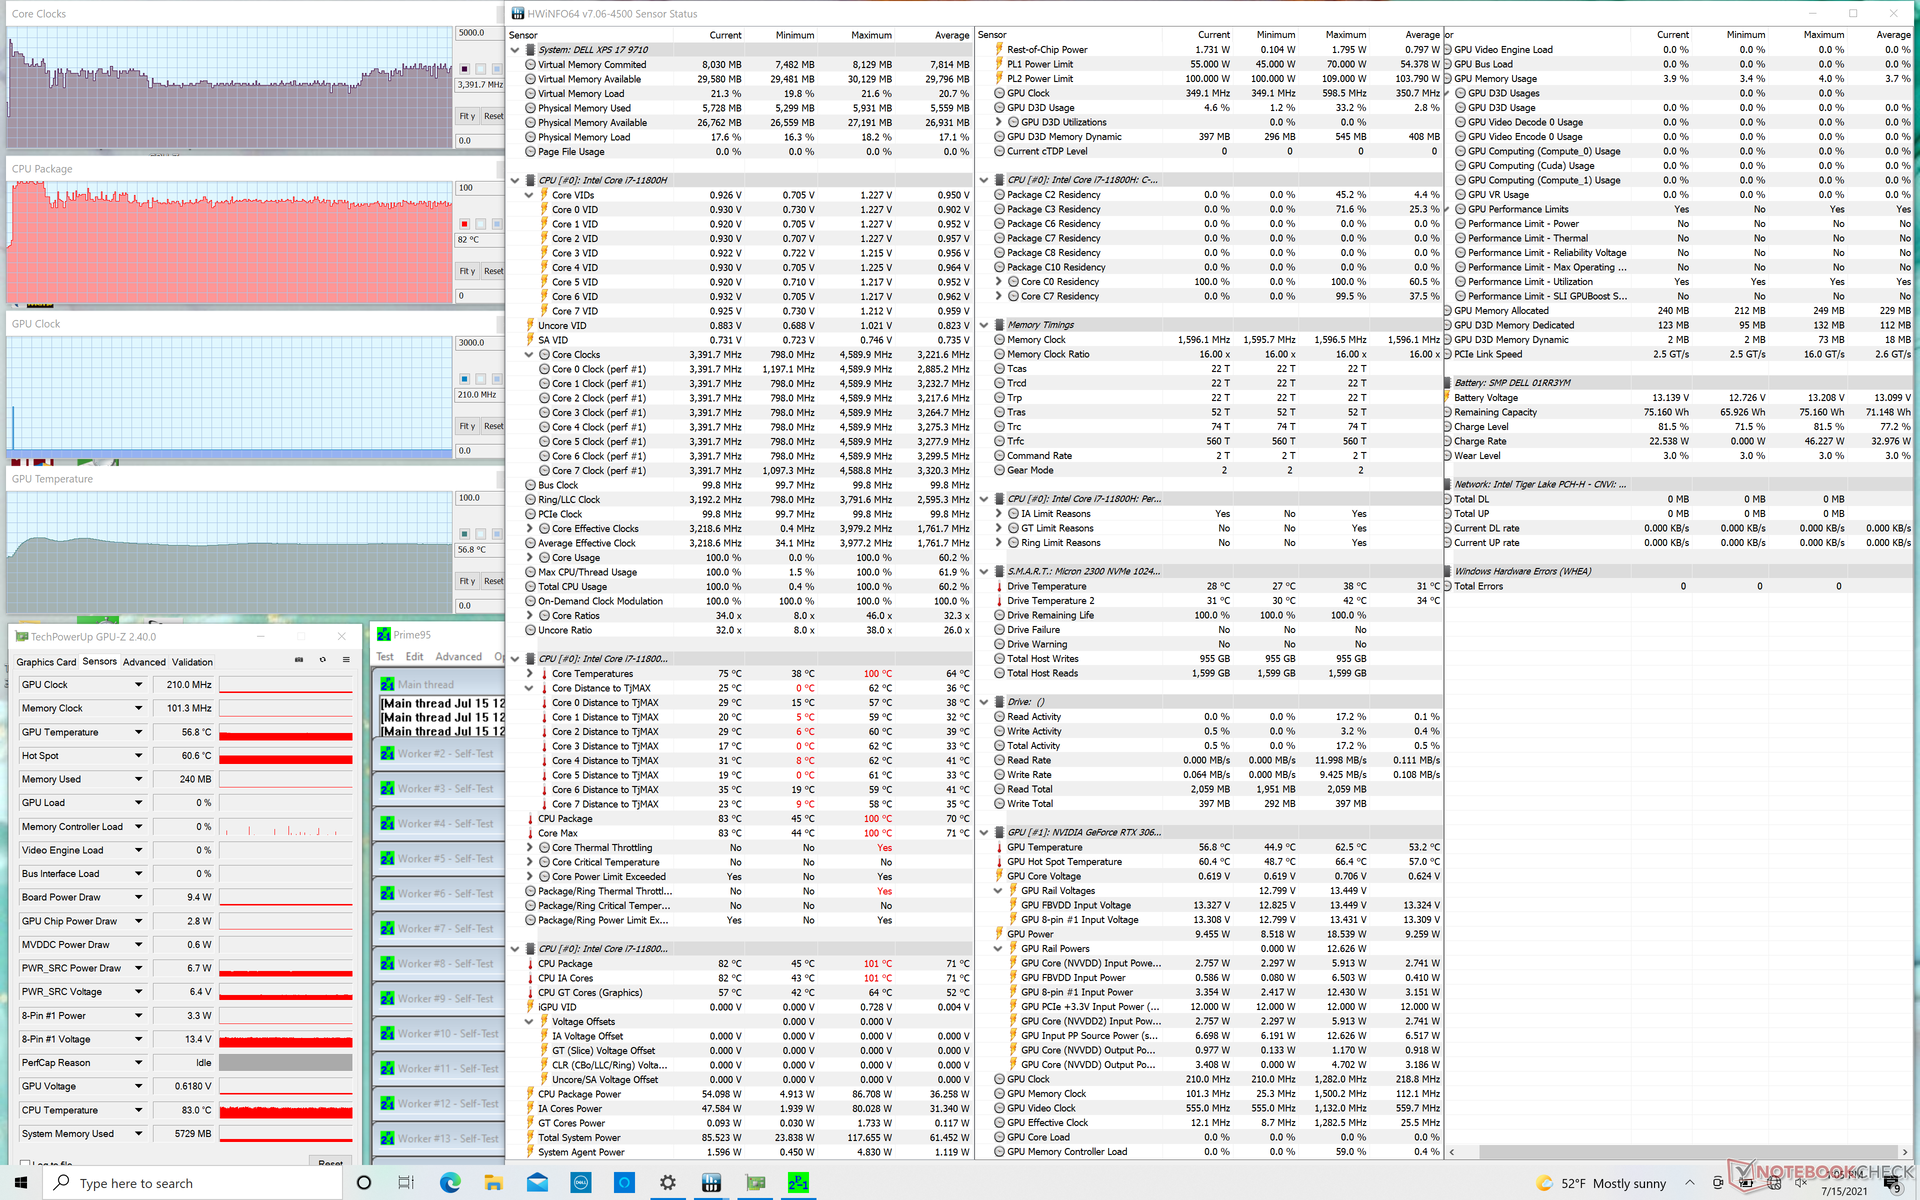
| Clock della CPU (GHz)Clock della GPU(MHz)Temperatura media dellaCPU (°C)Temperaturamedia dellaGPU (°C) |
| Sistema inattivo |
| StressPrime95 |
| Prime95 + FurMark Stress |
| Witcher 3 Stress |
Altoparlanti
I quattro altoparlanti (2x 2.5 W subwoofer + 2x 1.5 W tweeter) rimangono invariati rispetto all'XPS 17 9700 dello scorso anno. La qualità audio è più bilanciata rispetto alla maggior parte degli altri portatili, come esemplificato dalla curva del rumore rosa relativamente piatta. Tuttavia, il volume massimo avrebbe potuto essere un po' più alto.


Dell XPS 17 9710 Core i7 RTX 3060 analisi audio
(±) | potenza degli altiparlanti media ma buona (78.3 dB)
Bassi 100 - 315 Hz
(±) | bassi ridotti - in media 5.2% inferiori alla media
(±) | la linearità dei bassi è media (10.7% delta rispetto alla precedente frequenza)
Medi 400 - 2000 Hz
(+) | medi bilanciati - solo only 2.6% rispetto alla media
(+) | medi lineari (4.5% delta rispetto alla precedente frequenza)
Alti 2 - 16 kHz
(+) | Alti bilanciati - appena 2.2% dalla media
(+) | alti lineari (5% delta rispetto alla precedente frequenza)
Nel complesso 100 - 16.000 Hz
(+) | suono nel complesso lineare (8.7% differenza dalla media)
Rispetto alla stessa classe
» 11% di tutti i dispositivi testati in questa classe è stato migliore, 2% simile, 87% peggiore
» Il migliore ha avuto un delta di 5%, medio di 17%, peggiore di 45%
Rispetto a tutti i dispositivi testati
» 3% di tutti i dispositivi testati in questa classe è stato migliore, 1% similare, 97% peggiore
» Il migliore ha avuto un delta di 4%, medio di 23%, peggiore di 134%
Apple MacBook 12 (Early 2016) 1.1 GHz analisi audio
(+) | gli altoparlanti sono relativamente potenti (83.6 dB)
Bassi 100 - 315 Hz
(±) | bassi ridotti - in media 11.3% inferiori alla media
(±) | la linearità dei bassi è media (14.2% delta rispetto alla precedente frequenza)
Medi 400 - 2000 Hz
(+) | medi bilanciati - solo only 2.4% rispetto alla media
(+) | medi lineari (5.5% delta rispetto alla precedente frequenza)
Alti 2 - 16 kHz
(+) | Alti bilanciati - appena 2% dalla media
(+) | alti lineari (4.5% delta rispetto alla precedente frequenza)
Nel complesso 100 - 16.000 Hz
(+) | suono nel complesso lineare (10.2% differenza dalla media)
Rispetto alla stessa classe
» 7% di tutti i dispositivi testati in questa classe è stato migliore, 2% simile, 90% peggiore
» Il migliore ha avuto un delta di 5%, medio di 18%, peggiore di 53%
Rispetto a tutti i dispositivi testati
» 5% di tutti i dispositivi testati in questa classe è stato migliore, 1% similare, 94% peggiore
» Il migliore ha avuto un delta di 4%, medio di 23%, peggiore di 134%
Gestione energetica
Consumo di energia
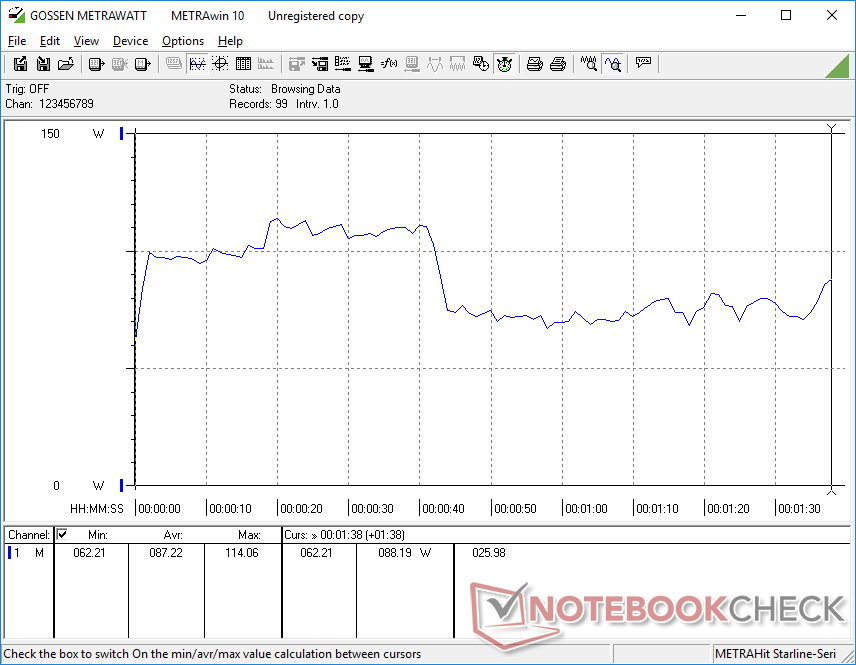
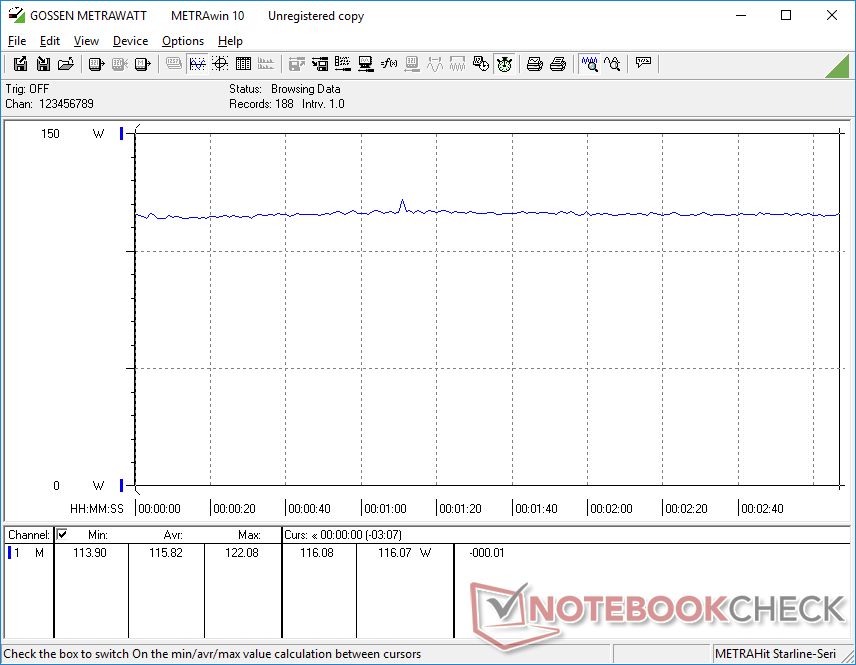
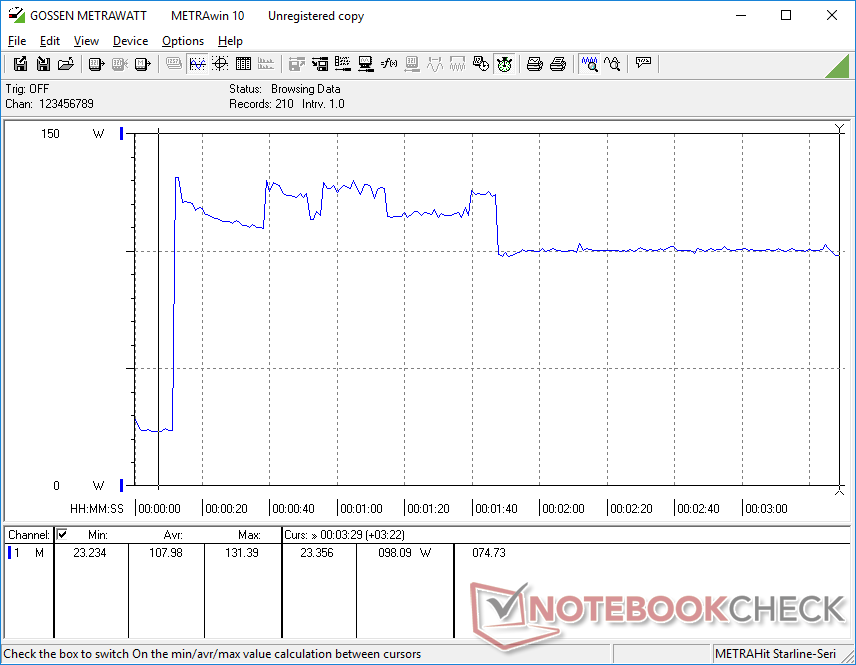
Come notato due precedenti volte abbiamo registrato letture di consumo energetico inferiori al previsto dal nostro XPS 17 9700, che hanno portato al prosciugamento della batteria anche quando collegato ad una presa di corrente. Fortunatamente, Dell ha rimediato al problema sull'XPS 17 9710. La batteria non si scaricherà più quando si eseguono carichi impegnativi e rimarrà invece a qualsiasi carica su cui si trova attualmente. Per esempio, l'esecuzione The Witcher 3 all'80% o al 100% di carica della batteria mentre è collegato alla rete elettrica non scaricherà né caricherà la batteria nei nostri test.
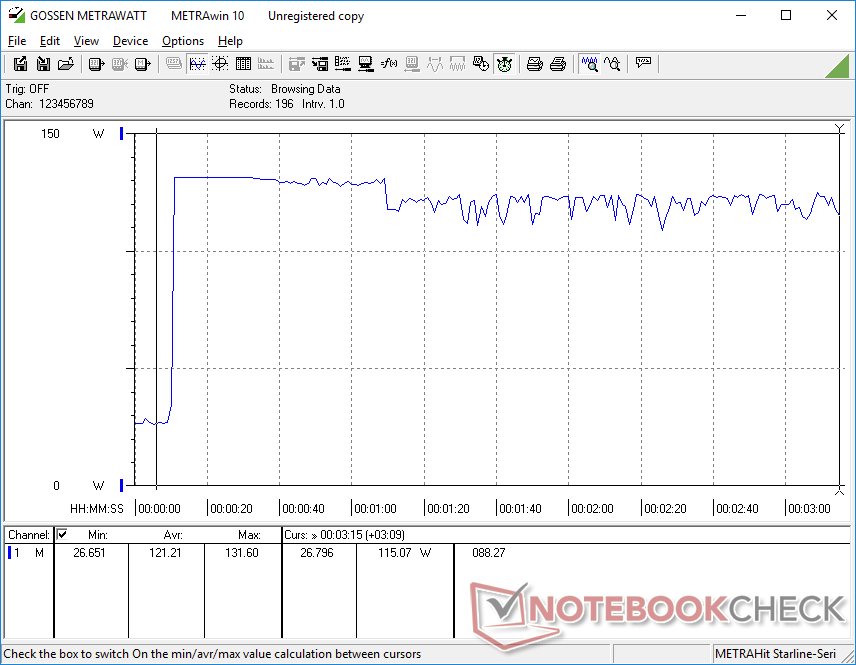
Siamo in grado di registrare un nuovo massimo di 131,6 W dallo stesso adattatore AC da 130 W quando sia la CPU che la GPU sono al 100% di utilizzo. Dell utilizza il proprio metodo proprietario di alimentazione USB-C per spingere oltre il limite standard di 100 W USB-C. Forse un obiettivo ancora più alto di 150 W o più avrebbe permesso al portatile di caricare e giocare contemporaneamente.
Il sistema Dell verrà spedito con un adattatore AC USB-C da 90 W invece di 130 W se configurato senza grafica GeForce.
| Off / Standby | |
| Idle | |
| Sotto carico |
|
Leggenda:
min: | |
| Dell XPS 17 9710 Core i7 RTX 3060 i7-11800H, GeForce RTX 3060 Laptop GPU, Micron 2300 1TB MTFDHBA1T0TDV, IPS, 3840x2400, 17" | Dell XPS 17 9700 Core i7 RTX 2060 Max-Q i7-10875H, GeForce RTX 2060 Max-Q, Micron 2200S 1TB MTFDHBA1T0TCK, IPS, 3840x2400, 17" | Gigabyte Aero 17 HDR YC i9-10980HK, GeForce RTX 3080 Laptop GPU, ESR01TBTLCG-EAC-4, IPS-Level, 3840x2160, 17.3" | LG Ultra 17U70N i5-10210U, GeForce GTX 1650 Mobile, Samsung SSD PM981a MZVLB512HBJQ, IPS, 2560x1600, 17" | Eluktronics RP-17 R7 4800H, GeForce RTX 2060 Mobile, Phison PS5013 PRO-X-1TB-G2R NVMe SSD, IPS, 1920x1080, 17.3" | |
|---|---|---|---|---|---|
| Power Consumption | 2% | -58% | 21% | -64% | |
| Idle Minimum * (Watt) | 7.5 | 5.8 23% | 17 -127% | 3.7 51% | 20.2 -169% |
| Idle Average * (Watt) | 15.7 | 20.6 -31% | 21 -34% | 8.8 44% | 24.5 -56% |
| Idle Maximum * (Watt) | 23.1 | 21 9% | 33 -43% | 30.6 -32% | 28.7 -24% |
| Load Average * (Watt) | 87.2 | 104.7 -20% | 113 -30% | 67.4 23% | 110.4 -27% |
| Witcher 3 ultra * (Watt) | 116 | 99.2 14% | 157 -35% | 84.5 27% | 166.3 -43% |
| Load Maximum * (Watt) | 131.6 | 107.6 18% | 237 -80% | 114 13% | 217.4 -65% |
* ... Meglio usare valori piccoli
Consumo energetico Witcher 3 / Stresstest
Durata della batteria
L'autonomia è generalmente la stessa dell'XPS 9700, se non un po' più breve. Siamo in grado di raggiungere 7,5 ore di uso reale della WLAN rispetto alle 9,5 ore del modello dell'anno scorso.
La ricarica completa richiede poco più di 2 ore rispetto a 1,5 ore sulla maggior parte degli altri Ultrabooks, dato che l'XPS 17 ha una batteria più grande della media di 97 Wh.
| Dell XPS 17 9710 Core i7 RTX 3060 i7-11800H, GeForce RTX 3060 Laptop GPU, 97 Wh | Dell XPS 17 9700 Core i7 RTX 2060 Max-Q i7-10875H, GeForce RTX 2060 Max-Q, 97 Wh | Razer Blade Pro 17 2021 (QHD Touch) i7-10875H, GeForce RTX 3080 Laptop GPU, 70.5 Wh | Gigabyte Aero 17 HDR YC i9-10980HK, GeForce RTX 3080 Laptop GPU, 99 Wh | LG Ultra 17U70N i5-10210U, GeForce GTX 1650 Mobile, 72 Wh | Eluktronics RP-17 R7 4800H, GeForce RTX 2060 Mobile, 62 Wh | |
|---|---|---|---|---|---|---|
| Autonomia della batteria | 13% | -37% | -35% | 23% | -50% | |
| Reader / Idle (h) | 17.7 | 23.8 34% | 9.9 -44% | 10.3 -42% | 24.8 40% | |
| WiFi v1.3 (h) | 7.6 | 9.7 28% | 5.9 -22% | 5.9 -22% | 13.7 80% | 4.4 -42% |
| Load (h) | 2.6 | 2 -23% | 1.4 -46% | 1.5 -42% | 1.3 -50% | 1.1 -58% |
Pro
Contro
Valutazione complessive del Dell XPS 17 2021 - La seconda volta è quella buona
Se eravate interessati all'XPS 17 ma avete esitato a comprare un modello di prima generazione, allora questo aggiornamento di seconda generazione sembra il momento migliore per saltare a bordo. Non solo affronta alcuni dei bugs che abbiamo riscontrato sul modello dell'anno scorso, ma riesce anche ad aumentare le prestazioni di CPU e GPU di circa il 30% senza bisogno di affidarsi a ventole più rumorose o a un nuovo raffreddamento. L'XPS 17 9710 è il modello più ottimizzato che l'originale XPS 17 9700 avrebbe dovuto essere.
Le cose buone arrivano a chi sa aspettare. L'XPS 17 2021 è la versione più veloce e ottimizzata dell'XPS 17 2020, essenzialmente allo stesso prezzo di lancio.
Anche il prezzo è rimasto più o meno lo stesso. L'anno scorso l'XPS 17 9700 con Core i7-10875H e RTX 2060 Max-Q è stato lanciato per poco meno di 3000 dollari USA, mentre la nostra configurazione con Core i7-11800H e RTX 3060 arriva a circa 2900 dollari. I nuovi proprietari avranno prestazioni migliori senza dover pagare di più rispetto a prima.
Altri aggiornamenti minori come le porte Thunderbolt 4 e gli slot SSD PCIe 4 sono belle aggiunte, ma la maggior parte degli utenti al di fuori degli appassionati non apprezzeranno pienamente questi cambiamenti. Ci piacerebbe ancora vedere aggiornamenti più cospicui come un otturatore per la webcam, una webcam di qualità superiore, o potenziali opzioni di colore per rendere il sistema ancora più attraente di quanto non sia già.
Non ci sono ancora molti concorrenti diretti all'XPS 17, anche dopo un anno intero sul mercato, a causa del formato esclusivo da 17.0" e 16:10 del sistema. Il più leggero LG Ultra 17 o il Gram 17 vengono in mente, ma questi sono nettamente più lenti e di qualità costruttiva inferiore. Gli utenti che non si preoccupano del più comune formato da 17,3" e 16:9 possono trovare opzioni da Razer o MSI con opzioni più veloci GeForce RTX rispetto al Dell.
Prezzo e disponibilità
L'XPS 17 9710 non è ancora ampiamente disponibile tra i principali rivenditori al momento della stesura di questo articolo, tranne che per la vetrina online di Dell. La nostra configurazione esatta può essere trovata per $2900 USD mentre SKU minori con il Core i5 di base, grafica integrata, 8 GB di RAM, 512 GB di SSD e display FHD+ partono da $1500.
Dell XPS 17 9710 Core i7 RTX 3060
- 07/19/2021 v7 (old)
Allen Ngo
Price comparison
