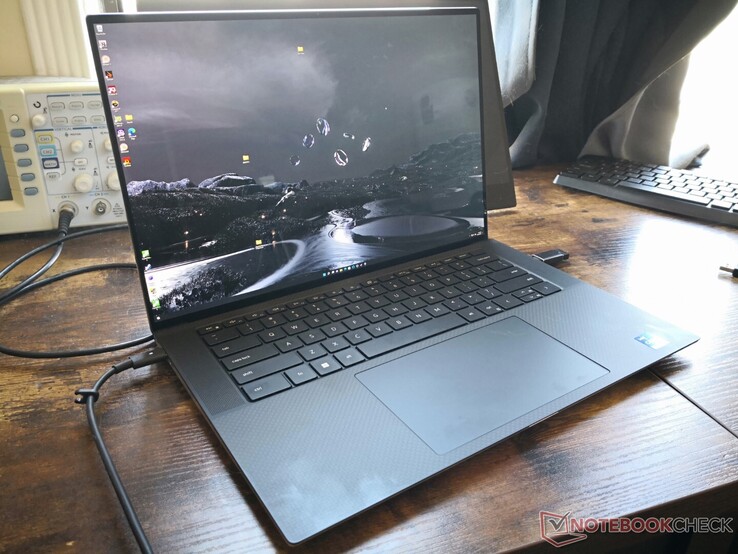
Recensione del portatile Dell XPS 15 9520 3.5K OLED 2022: da comprare o da evitare?

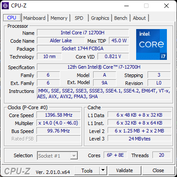
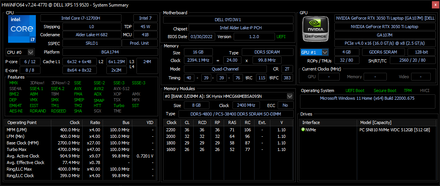
Dell ha dato il via al decennio con il botto presentando l'XPS 15 9500, completamente rinnovato, che succede alla generazione precedente XPS 15 7590. Il modello ha spostato la famiglia XPS 15 da 16:9 a 16:10 insieme a un nuovissimo design dello chassis con CPU Intel Comet Lake-H di 10a generazione e GPU GeForce GTX 1650 Ti. L'XPS 15 9510 ha fatto un ulteriore passo avanti con le CPU Tiger Lake-H di 11a generazione e i pannelli OLED da 3,5K opzionali. Ora, l'XPS 15 9520 rappresenta un ulteriore aggiornamento incrementale con CPU Alder Lake-H di 12a generazione e RAM DDR5 più veloce.
Consigliamo di consultare la nostra recensione dell'XPS 15 9500 poiché lo chassis dell'XPS 15 9520 rimane identico. Questa recensione si concentra sulle prestazioni dell'XPS 15 9520 e sulle altre differenze che gli utenti possono aspettarsi rispetto ai modelli precedenti.
Le alternative al Dell XPS 15 9520 includono altri computer portatili multimediali di fascia alta da 15,6 pollici con grafica discreta, come l'Asus Zenbook Pro 15 OLED Asus Zenbook Pro 15 OLED, Lenovo Yoga Creator 7 15, HP Spectre x360 15, HP Envy 15, o il MSI Creator 15.
Altre recensioni Dell:
Potenziali concorrenti a confronto
Punteggio | Data | Modello | Peso | Altezza | Dimensione | Risoluzione | Prezzo |
|---|---|---|---|---|---|---|---|
| 89.5 % v7 (old) | 05/2022 | Dell XPS 15 9520 RTX 3050 Ti i7-12700H, GeForce RTX 3050 Ti Laptop GPU | 1.9 kg | 18 mm | 15.60" | 3456x2160 | |
| 88.4 % v7 (old) | 08/2021 | Dell XPS 15 9510 11800H RTX 3050 Ti OLED i7-11800H, GeForce RTX 3050 Ti Laptop GPU | 1.9 kg | 18 mm | 15.60" | 3456x2160 | |
| 85 % v7 (old) | 01/2020 | HP Spectre X360 15-5ZV31AV i7-10510U, GeForce MX250 | 2.1 kg | 19.3 mm | 15.60" | 3840x2160 | |
| 87.7 % v7 (old) | 05/2022 | Asus Zenbook Pro 15 OLED UM535Q R9 5900HX, GeForce RTX 3050 Ti Laptop GPU | 1.9 kg | 18 mm | 15.60" | 1920x1080 | |
| 82.4 % v7 (old) | 02/2021 | MSI Stealth 15M A11SEK i7-1185G7, GeForce RTX 2060 Max-Q | 1.7 kg | 16.15 mm | 15.60" | 1920x1080 | |
| 93.2 % v7 (old) | 11/2021 | Apple MacBook Pro 16 2021 M1 Pro M1 Pro, M1 Pro 16-Core GPU | 2.2 kg | 16.8 mm | 16.20" | 3456x2234 |
I nostri Top 10
» Top 10 Portatili Multimedia
» Top 10 Portatili Gaming
» Top 10 Portatili Gaming Leggeri
» Top 10 Portatili da Ufficio e Business economici
» Top 10 Portatili Premium da Ufficio/Business
» Top 10 Portatili sotto i 300 Euro
» Top 10 Portatili sotto i 500 Euro
» Top 10 dei Portatili Workstation
» Top 10 Subnotebooks
» Top 10 Ultrabooks
» Top 10 Convertibili
» Top 10 Tablets
» Top 10 Tablets Windows
» Top 10 Smartphones
Caso
Lo chassis dell'XPS 15 9520 è ancora uno dei più piccoli nella sua categoria di dimensioni, nonostante abbia due anni. Le cornici molto strette su tutti e quattro i lati, compreso il mento, contribuiscono a ridurre l'ingombro con margini maggiori rispetto, ad esempio, allo Zenbook Pro 15 o allo Spectre x360 15.
Lettore di schede SD
| SD Card Reader | |
| average JPG Copy Test (av. of 3 runs) | |
| Dell XPS 15 9510 11800H RTX 3050 Ti OLED (AV Pro V60) | |
| Dell XPS 15 9500 Core i7 4K UHD (Toshiba Exceria Pro SDXC 64 GB UHS-II) | |
| MSI Stealth 15M A11SEK (Toshiba Exceria Pro M501 microSDXC 32GB) | |
| Dell XPS 15 9520 RTX 3050 Ti (Toshiba Exceria Pro SDXC 64 GB UHS-II) | |
| HP Spectre X360 15-5ZV31AV (Toshiba Exceria Pro M501 UHS-II) | |
| Asus Zenbook Pro 15 OLED UM535Q (Toshiba Exceria Pro SDXC 64 GB UHS-II) | |
| maximum AS SSD Seq Read Test (1GB) | |
| MSI Stealth 15M A11SEK (Toshiba Exceria Pro M501 microSDXC 32GB) | |
| Dell XPS 15 9510 11800H RTX 3050 Ti OLED (AV Pro V60) | |
| Dell XPS 15 9500 Core i7 4K UHD (Toshiba Exceria Pro SDXC 64 GB UHS-II) | |
| HP Spectre X360 15-5ZV31AV (Toshiba Exceria Pro M501 UHS-II) | |
| Dell XPS 15 9520 RTX 3050 Ti (Toshiba Exceria Pro SDXC 64 GB UHS-II) | |
| Asus Zenbook Pro 15 OLED UM535Q (Toshiba Exceria Pro SDXC 64 GB UHS-II) | |
Comunicazione
Il chip Intel AX211 è fornito di serie per la connettività Wi-Fi 6E e Bluetooth 5.2. Tuttavia, Dell ci ha confermato che l'XPS 15 9520 non è stato progettato per supportare le reti Wi-Fi 6E a 6 GHz, nonostante il chip AX211 sia in grado di farlo. Pertanto, i possessori dell'XPS 15 9520 saranno in grado di connettersi solo alle reti a 2,4 GHz e 5 GHz fino al Wi-Fi 6.
| Networking | |
| iperf3 transmit AX12 | |
| Dell XPS 15 9510 11800H RTX 3050 Ti OLED | |
| Dell XPS 15 9500 Core i7 4K UHD | |
| MSI Stealth 15M A11SEK | |
| Asus Zenbook Pro 15 OLED UM535Q | |
| iperf3 receive AX12 | |
| Dell XPS 15 9500 Core i7 4K UHD | |
| Dell XPS 15 9510 11800H RTX 3050 Ti OLED | |
| MSI Stealth 15M A11SEK | |
| Asus Zenbook Pro 15 OLED UM535Q | |
| iperf3 receive AXE11000 | |
| Dell XPS 15 9520 RTX 3050 Ti | |
| iperf3 transmit AXE11000 | |
| Dell XPS 15 9520 RTX 3050 Ti | |
Webcam
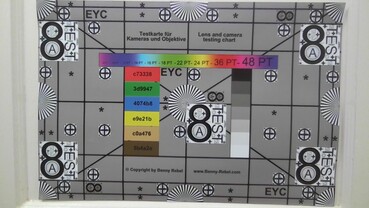
Dell ha migliorato i colori della webcam separando i sensori IR e RGB rispetto all'XPS 15 9510 o 9500. Tuttavia, la webcam rimane di appena 1 MP, rispetto ai 2 MP di altri portatili da 15,6 pollici di punta come il Razer Blade 15. Pertanto, anche se i colori sono leggermente migliori, l'immagine è ancora confusa.

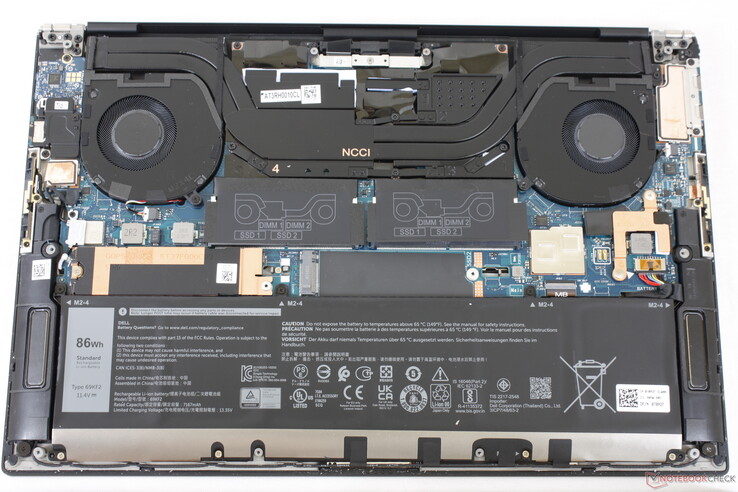
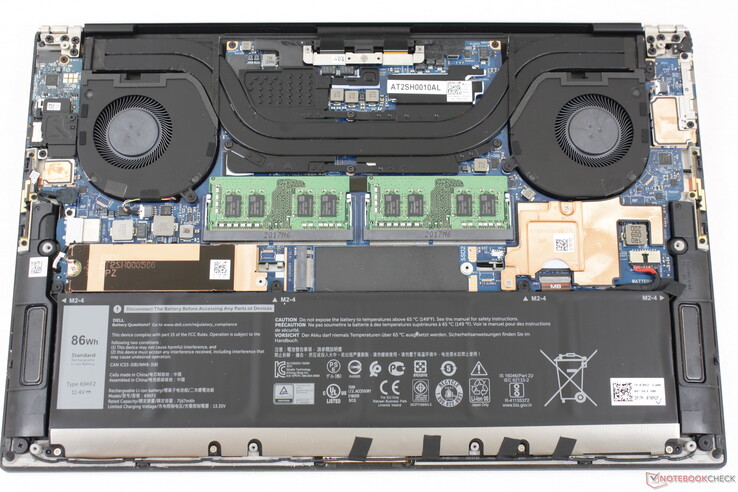
Manutenzione
Accessori e garanzia
La confezione include l'adattatore CA USB-C, la documentazione e un adattatore da USB-C a HDMI full-size e USB-A. Quest'ultimo è particolarmente utile in quanto il sistema integra solo porte USB-C.
Display - OLED 3,5K non comune
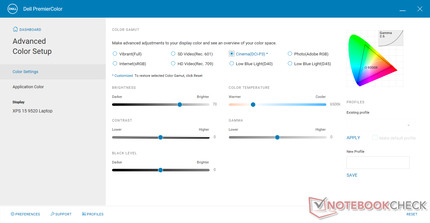
L'unità in esame è dotata dello stesso schermo touchscreen OLED da 3,5K disponibile sull'XPS 15 9510 dello scorso anno, il che significa che l'esperienza visiva non è cambiata rispetto all'anno precedente. Sono disponibili anche un'opzione IPS a risoluzione inferiore 1920 x 1200 e un'opzione IPS a risoluzione superiore 3840 x 2400, ma tutti i pannelli sono purtroppo limitati a una frequenza di aggiornamento di 60 Hz. Alcuni Ultrabook come il Lenovo IdeaPad Slim 7i Pro o l'Asus Vivobook Pro 14 sono già disponibili con pannelli più veloci da 90 Hz per un'esperienza dell'interfaccia utente notevolmente più fluida.
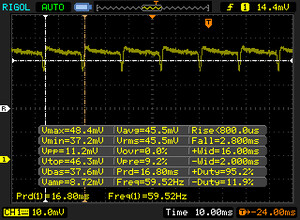
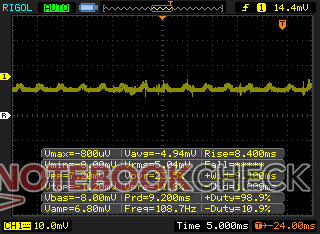
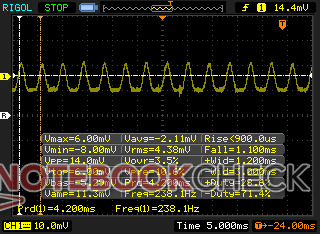
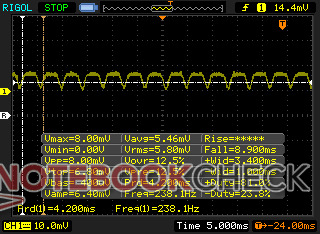
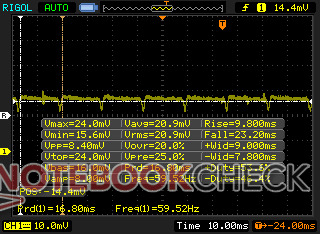
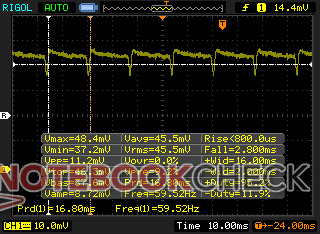
Tenete presente che la modulazione dell'ampiezza degli impulsi è presente su tutta la luminosità a 238 Hz dallo 0 al 25 percento di luminosità e a 59 Hz dal 26 al 100 percento di luminosità. Se lo sfarfallio dello schermo è un problema, si consiglia di configurare un pannello IPS.
| |||||||||||||||||||||||||
Distribuzione della luminosità: 95 %
Al centro con la batteria: 381.4 cd/m²
Contrasto: ∞:1 (Nero: 0 cd/m²)
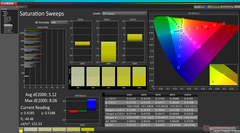
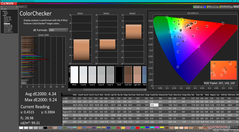
ΔE ColorChecker Calman: 4.34 | ∀{0.5-29.43 Ø4.77}
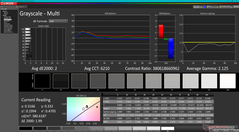
ΔE Greyscale Calman: 2 | ∀{0.09-98 Ø5}
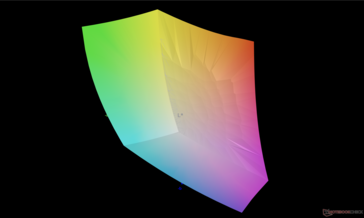
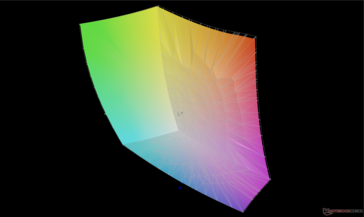
86% AdobeRGB 1998 (Argyll 3D)
99.9% sRGB (Argyll 3D)
97.8% Display P3 (Argyll 3D)
Gamma: 2.13
CCT: 6210 K
| Dell XPS 15 9520 RTX 3050 Ti Samsung 156XG01, OLED, 3456x2160, 15.6" | Dell XPS 15 9510 11800H RTX 3050 Ti OLED SDC414D, OLED, 3456x2160, 15.6" | Dell XPS 15 9500 Core i7 4K UHD Sharp LQ156R1, IPS, 3840x2400, 15.6" | HP Spectre X360 15-5ZV31AV AU Optronics AUO30EB, IPS, 3840x2160, 15.6" | Asus Zenbook Pro 15 OLED UM535Q Samsung ATNA56YX03-0, OLED, 1920x1080, 15.6" | MSI Stealth 15M A11SEK Chi Mei N156HCE-EN1, IPS, 1920x1080, 15.6" | |
|---|---|---|---|---|---|---|
| Display | 5% | 3% | -19% | -7% | -23% | |
| Display P3 Coverage (%) | 97.8 | 99.9 2% | 89.7 -8% | 68.3 -30% | 79.3 -19% | 62 -37% |
| sRGB Coverage (%) | 99.9 | 100 0% | 100 0% | 94.3 -6% | 95.6 -4% | 93.4 -7% |
| AdobeRGB 1998 Coverage (%) | 86 | 98.1 14% | 99.8 16% | 68.4 -20% | 87.3 2% | 64.1 -25% |
| Response Times | -68% | -2195% | -2468% | -16% | -2079% | |
| Response Time Grey 50% / Grey 80% * (ms) | 1.9 ? | 3.6 ? -89% | 54 ? -2742% | 56.8 ? -2889% | 2.1 ? -11% | 47.6 ? -2405% |
| Response Time Black / White * (ms) | 1.9 ? | 2.8 ? -47% | 33.2 ? -1647% | 40.8 ? -2047% | 2.3 ? -21% | 35.2 ? -1753% |
| PWM Frequency (Hz) | 59.52 ? | 59.5 ? | 60.2 | 25000 ? | ||
| Screen | 22% | 5% | -11% | 13% | -4% | |
| Brightness middle (cd/m²) | 381.4 | 362 -5% | 557.9 46% | 284.6 -25% | 342.9 -10% | 279 -27% |
| Brightness (cd/m²) | 384 | 367 -4% | 541 41% | 285 -26% | 346 -10% | 252 -34% |
| Brightness Distribution (%) | 95 | 97 2% | 91 -4% | 85 -11% | 98 3% | 82 -14% |
| Black Level * (cd/m²) | 0.06 | 0.39 | 0.25 | 0.32 | ||
| Colorchecker dE 2000 * | 4.34 | 2.1 52% | 4.54 -5% | 3.52 19% | 2.42 44% | 1.72 60% |
| Colorchecker dE 2000 max. * | 9.24 | 4.1 56% | 7.92 14% | 5.56 40% | 4.05 56% | 5.62 39% |
| Greyscale dE 2000 * | 2 | 1.4 30% | 3.2 -60% | 3.2 -60% | 2.1 -5% | 2.9 -45% |
| Gamma | 2.13 103% | 2.18 101% | 1.99 111% | 2.28 96% | 2.21 100% | 2.3 96% |
| CCT | 6210 105% | 6608 98% | 6451 101% | 7070 92% | 6364 102% | 6700 97% |
| Contrast (:1) | 6033 | 1431 | 1138 | 872 | ||
| Colorchecker dE 2000 calibrated * | 2.5 | 3.82 | 3 | 1.39 | ||
| Color Space (Percent of AdobeRGB 1998) (%) | 89.5 | 61.1 | 59 | |||
| Color Space (Percent of sRGB) (%) | 100 | 93.8 | 93.2 | |||
| Media totale (Programma / Settaggio) | -14% /
1% | -729% /
-395% | -833% /
-460% | -3% /
2% | -702% /
-386% |
* ... Meglio usare valori piccoli
Tempi di risposta del Display
| ↔ Tempi di risposta dal Nero al Bianco | ||
|---|---|---|
| 1.9 ms ... aumenta ↗ e diminuisce ↘ combinato | ↗ 1.1 ms Incremento | |
| ↘ 0.8 ms Calo | ||
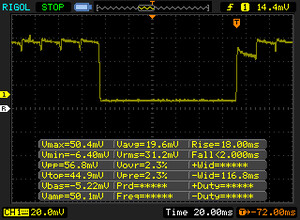
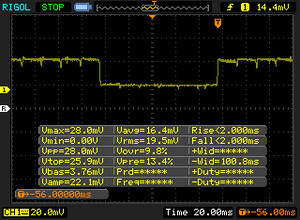
| Lo schermo ha mostrato valori di risposta molto veloci nei nostri tests ed è molto adatto per i gaming veloce. In confronto, tutti i dispositivi di test variano da 0.1 (minimo) a 240 (massimo) ms. » 9 % di tutti i dispositivi è migliore. Questo significa che i tempi di risposta rilevati sono migliori rispettto alla media di tutti i dispositivi testati (20.2 ms). | ||
| ↔ Tempo di risposta dal 50% Grigio all'80% Grigio | ||
| 1.9 ms ... aumenta ↗ e diminuisce ↘ combinato | ↗ 1.1 ms Incremento | |
| ↘ 0.8 ms Calo | ||
| Lo schermo ha mostrato valori di risposta molto veloci nei nostri tests ed è molto adatto per i gaming veloce. In confronto, tutti i dispositivi di test variano da 0.165 (minimo) a 636 (massimo) ms. » 8 % di tutti i dispositivi è migliore. Questo significa che i tempi di risposta rilevati sono migliori rispettto alla media di tutti i dispositivi testati (31.5 ms). | ||
Sfarfallio dello schermo / PWM (Pulse-Width Modulation)
| flickering dello schermo / PWM rilevato | 59.52 Hz | ≤ 100 % settaggio luminosita' | |
Il display sfarfalla a 59.52 Hz (Probabilmente a causa dell'uso di PWM) Flickering rilevato ad una luminosita' di 100 % o inferiore. Non dovrebbe verificarsi flickering o PWM sopra questo valore di luminosita'. La frequenza di 59.52 Hz è molto bassa, quindi il flickering potrebbe causare stanchezza agli occhi e mal di testa con un utilizzo prolungato. In confronto: 53 % di tutti i dispositivi testati non utilizza PWM per ridurre la luminosita' del display. Se è rilevato PWM, una media di 8070 (minimo: 5 - massimo: 343500) Hz è stata rilevata. | |||
Prestazioni - Opzioni Intel 12th Gen
Condizioni di test
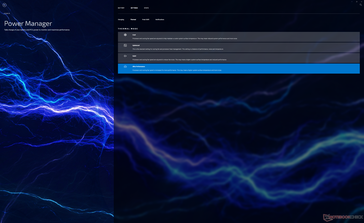
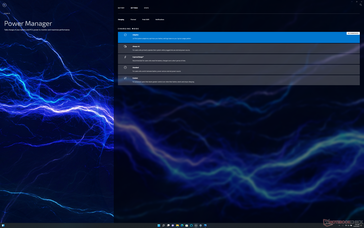
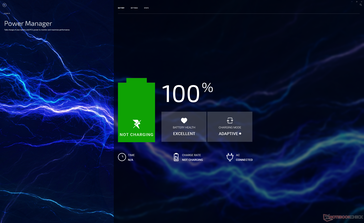
La nostra unità è stata impostata in modalità Performance tramite Windows e in modalità Ultra Performance tramite l'applicazione My Dell prima di eseguire i benchmark qui sotto per ottenere i punteggi più alti possibili. Si noti che My Dell ha effettivamente sostituito il vecchio software Dell Power Manager. Si consiglia agli utenti di familiarizzare con la nuova applicazione, in quanto è il punto di riferimento unico per gli aggiornamenti Dell e le impostazioni delle prestazioni
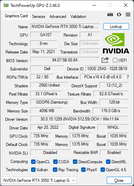
La GPU TGP GeForce RTX 3050 Ti da 45 W non è cambiata rispetto al precedente XPS 15 9510. Non è previsto alcun interruttore MUX o sincronizzazione adattiva, poiché l'XPS 15 non è progettato per il gioco.
Processore
L'aumento delle prestazioni della CPU dall'XPS 15 9510 al 9520 è più significativo rispetto all'aumento delle prestazioni della CPU dall'XPS 9500 al 9510. Il salto dalCore i7-11800H dell'XPS 15 9510 al Core i7-12700H del 9520 garantisce un aumento del 35-40% delle prestazioni multi-thread e del 15-20% delle prestazioni single-thread. Il salto è sufficiente a spingere la CPU Intel di 12a generazione leggermente avanti rispetto al popolare Ryzen 7 5800H che ha notoriamente superato la maggior parte delle CPU Intel Core-H di 11a generazione nei carichi di lavoro multi-thread
Le prestazioni della CPU avrebbero potuto essere migliori, nonostante il suddetto aumento di anno in anno. Rispetto agli oltre 20 laptop che abbiamo testato finora con la stessa CPU Core i7-12700H, quella del nostro XPS 15 9520 è più lenta della media di circa il 5-15%. L'esecuzione di CineBench R15 xT in loop mostra che la CPU del Dell non è in grado di mantenere elevate velocità di clock Turbo Boost per un tempo pari a quello della maggior parte degli altri portatili con lo stesso processore. Modelli come ilAsus TUF Gaming F15 FX507ZM possono far funzionare la stessa CPU fino al 36% più velocemente rispetto al nostro Dell.
Cinebench R15 Multi Loop
Cinebench R23: Multi Core | Single Core
Cinebench R15: CPU Multi 64Bit | CPU Single 64Bit
Blender: v2.79 BMW27 CPU
7-Zip 18.03: 7z b 4 | 7z b 4 -mmt1
Geekbench 5.5: Multi-Core | Single-Core
HWBOT x265 Benchmark v2.2: 4k Preset
LibreOffice : 20 Documents To PDF
R Benchmark 2.5: Overall mean
* ... Meglio usare valori piccoli
AIDA64: FP32 Ray-Trace | FPU Julia | CPU SHA3 | CPU Queen | FPU SinJulia | FPU Mandel | CPU AES | CPU ZLib | FP64 Ray-Trace | CPU PhotoWorxx
| Performance rating | |
| Asus Zenbook Pro 15 OLED UM535Q | |
| Media Intel Core i7-12700H | |
| Dell XPS 15 9520 RTX 3050 Ti | |
| Dell XPS 15 9500 Core i7 4K UHD | |
| Dell XPS 15 9510 11800H RTX 3050 Ti OLED -9! | |
| AIDA64 / FP32 Ray-Trace | |
| Asus Zenbook Pro 15 OLED UM535Q | |
| Media Intel Core i7-12700H (2585 - 17957, n=63) | |
| Dell XPS 15 9500 Core i7 4K UHD | |
| Dell XPS 15 9520 RTX 3050 Ti | |
| AIDA64 / FPU Julia | |
| Asus Zenbook Pro 15 OLED UM535Q | |
| Dell XPS 15 9500 Core i7 4K UHD | |
| Media Intel Core i7-12700H (12439 - 90760, n=63) | |
| Dell XPS 15 9520 RTX 3050 Ti | |
| AIDA64 / CPU SHA3 | |
| Asus Zenbook Pro 15 OLED UM535Q | |
| Media Intel Core i7-12700H (833 - 4242, n=63) | |
| Dell XPS 15 9500 Core i7 4K UHD | |
| Dell XPS 15 9520 RTX 3050 Ti | |
| AIDA64 / CPU Queen | |
| Asus Zenbook Pro 15 OLED UM535Q | |
| Dell XPS 15 9520 RTX 3050 Ti | |
| Media Intel Core i7-12700H (57923 - 103202, n=63) | |
| Dell XPS 15 9500 Core i7 4K UHD | |
| AIDA64 / FPU SinJulia | |
| Asus Zenbook Pro 15 OLED UM535Q | |
| Dell XPS 15 9500 Core i7 4K UHD | |
| Media Intel Core i7-12700H (3249 - 9939, n=63) | |
| Dell XPS 15 9520 RTX 3050 Ti | |
| AIDA64 / FPU Mandel | |
| Asus Zenbook Pro 15 OLED UM535Q | |
| Dell XPS 15 9500 Core i7 4K UHD | |
| Media Intel Core i7-12700H (7135 - 44760, n=63) | |
| Dell XPS 15 9520 RTX 3050 Ti | |
| AIDA64 / CPU AES | |
| Asus Zenbook Pro 15 OLED UM535Q | |
| Media Intel Core i7-12700H (31839 - 144360, n=63) | |
| Dell XPS 15 9520 RTX 3050 Ti | |
| Dell XPS 15 9500 Core i7 4K UHD | |
| AIDA64 / CPU ZLib | |
| Media Intel Core i7-12700H (305 - 1171, n=63) | |
| Dell XPS 15 9520 RTX 3050 Ti | |
| Asus Zenbook Pro 15 OLED UM535Q | |
| Dell XPS 15 9500 Core i7 4K UHD | |
| Dell XPS 15 9510 11800H RTX 3050 Ti OLED | |
| AIDA64 / FP64 Ray-Trace | |
| Asus Zenbook Pro 15 OLED UM535Q | |
| Media Intel Core i7-12700H (1437 - 9692, n=63) | |
| Dell XPS 15 9520 RTX 3050 Ti | |
| Dell XPS 15 9500 Core i7 4K UHD | |
| AIDA64 / CPU PhotoWorxx | |
| Dell XPS 15 9520 RTX 3050 Ti | |
| Media Intel Core i7-12700H (12863 - 52207, n=63) | |
| Dell XPS 15 9500 Core i7 4K UHD | |
| Asus Zenbook Pro 15 OLED UM535Q | |
Prestazioni del sistema
CrossMark: Overall | Productivity | Creativity | Responsiveness
| PCMark 10 / Score | |
| Dell XPS 15 9520 RTX 3050 Ti | |
| Media Intel Core i7-12700H, NVIDIA GeForce RTX 3050 Ti Laptop GPU (6623 - 7075, n=5) | |
| Asus Zenbook Pro 15 OLED UM535Q | |
| Dell XPS 15 9510 11800H RTX 3050 Ti OLED | |
| MSI Stealth 15M A11SEK | |
| Dell XPS 15 9500 Core i7 4K UHD | |
| HP Spectre X360 15-5ZV31AV | |
| PCMark 10 / Essentials | |
| Dell XPS 15 9520 RTX 3050 Ti | |
| Asus Zenbook Pro 15 OLED UM535Q | |
| Media Intel Core i7-12700H, NVIDIA GeForce RTX 3050 Ti Laptop GPU (9540 - 10970, n=5) | |
| Dell XPS 15 9500 Core i7 4K UHD | |
| MSI Stealth 15M A11SEK | |
| Dell XPS 15 9510 11800H RTX 3050 Ti OLED | |
| HP Spectre X360 15-5ZV31AV | |
| PCMark 10 / Productivity | |
| Asus Zenbook Pro 15 OLED UM535Q | |
| Dell XPS 15 9520 RTX 3050 Ti | |
| Media Intel Core i7-12700H, NVIDIA GeForce RTX 3050 Ti Laptop GPU (8530 - 9555, n=5) | |
| MSI Stealth 15M A11SEK | |
| Dell XPS 15 9510 11800H RTX 3050 Ti OLED | |
| Dell XPS 15 9500 Core i7 4K UHD | |
| HP Spectre X360 15-5ZV31AV | |
| PCMark 10 / Digital Content Creation | |
| Media Intel Core i7-12700H, NVIDIA GeForce RTX 3050 Ti Laptop GPU (8855 - 9542, n=5) | |
| Dell XPS 15 9520 RTX 3050 Ti | |
| Asus Zenbook Pro 15 OLED UM535Q | |
| Dell XPS 15 9510 11800H RTX 3050 Ti OLED | |
| MSI Stealth 15M A11SEK | |
| Dell XPS 15 9500 Core i7 4K UHD | |
| HP Spectre X360 15-5ZV31AV | |
| CrossMark / Overall | |
| Dell XPS 15 9520 RTX 3050 Ti | |
| Media Intel Core i7-12700H, NVIDIA GeForce RTX 3050 Ti Laptop GPU (1654 - 1872, n=5) | |
| Asus Zenbook Pro 15 OLED UM535Q | |
| CrossMark / Productivity | |
| Dell XPS 15 9520 RTX 3050 Ti | |
| Media Intel Core i7-12700H, NVIDIA GeForce RTX 3050 Ti Laptop GPU (1595 - 1792, n=5) | |
| Asus Zenbook Pro 15 OLED UM535Q | |
| CrossMark / Creativity | |
| Dell XPS 15 9520 RTX 3050 Ti | |
| Media Intel Core i7-12700H, NVIDIA GeForce RTX 3050 Ti Laptop GPU (1699 - 1993, n=5) | |
| Asus Zenbook Pro 15 OLED UM535Q | |
| CrossMark / Responsiveness | |
| Dell XPS 15 9520 RTX 3050 Ti | |
| Media Intel Core i7-12700H, NVIDIA GeForce RTX 3050 Ti Laptop GPU (1383 - 1768, n=5) | |
| Asus Zenbook Pro 15 OLED UM535Q | |
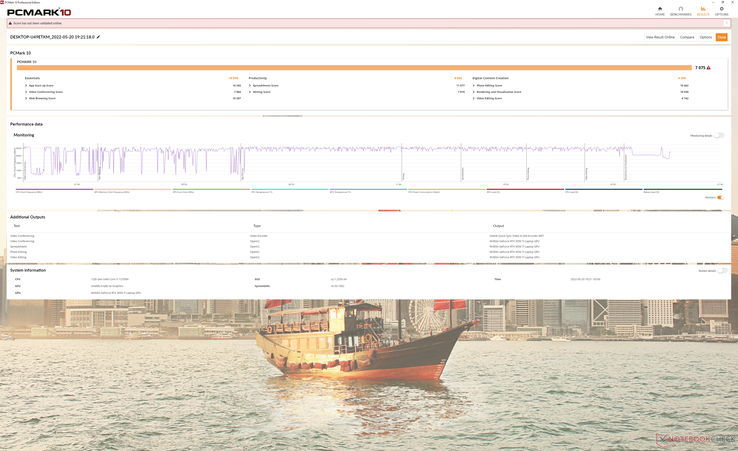
| PCMark 10 Score | 7075 punti | |
Aiuto | ||
| AIDA64 / Memory Copy | |
| Dell XPS 15 9520 RTX 3050 Ti | |
| Media Intel Core i7-12700H (25615 - 80511, n=63) | |
| Asus Zenbook Pro 15 OLED UM535Q | |
| Dell XPS 15 9500 Core i7 4K UHD | |
| AIDA64 / Memory Read | |
| Dell XPS 15 9520 RTX 3050 Ti | |
| Media Intel Core i7-12700H (25586 - 79442, n=63) | |
| Asus Zenbook Pro 15 OLED UM535Q | |
| Dell XPS 15 9500 Core i7 4K UHD | |
| AIDA64 / Memory Write | |
| Dell XPS 15 9520 RTX 3050 Ti | |
| Media Intel Core i7-12700H (23679 - 88660, n=63) | |
| Asus Zenbook Pro 15 OLED UM535Q | |
| Dell XPS 15 9500 Core i7 4K UHD | |
| AIDA64 / Memory Latency | |
| Dell XPS 15 9520 RTX 3050 Ti | |
| Asus Zenbook Pro 15 OLED UM535Q | |
| Media Intel Core i7-12700H (76.2 - 133.9, n=61) | |
| Dell XPS 15 9500 Core i7 4K UHD | |
| Dell XPS 15 9510 11800H RTX 3050 Ti OLED | |
* ... Meglio usare valori piccoli
Latenza DPC
| DPC Latencies / LatencyMon - interrupt to process latency (max), Web, Youtube, Prime95 | |
| Dell XPS 15 9500 Core i7 4K UHD | |
| Dell XPS 15 9510 11800H RTX 3050 Ti OLED | |
| Dell XPS 15 9520 RTX 3050 Ti | |
| MSI Stealth 15M A11SEK | |
| Asus Zenbook Pro 15 OLED UM535Q | |
* ... Meglio usare valori piccoli
Dispositivi di archiviazione - Supporta fino a due unità SSD PCIe4 NVMe
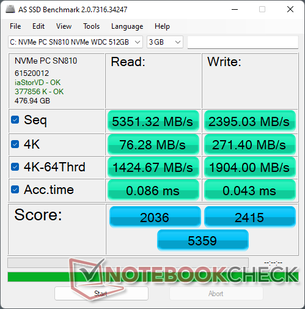
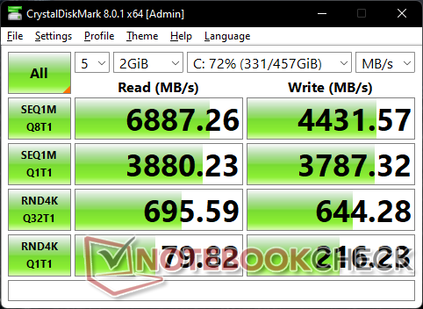
La nostra unità di prova viene fornita con un'unità PCIe4 x4 Western Digital SN810 NVMe rispetto alle soluzioni PCIe3 x4 dei modelli precedenti. Di conseguenza, le velocità di trasferimento sono significativamente più elevate, fino a ~6700 MB/s o più del doppio rispetto alla maggior parte delle unità PCIe3. L'unità SN810 nella nostra unità non ha avuto problemi a mantenere la velocità di trasferimento massima per periodi prolungati quando è stata sottoposta a DiskSpd, suggerendo un'eccellente dissipazione del calore.
* ... Meglio usare valori piccoli
Disk Throttling: DiskSpd Read Loop, Queue Depth 8
Prestazioni della GPU - GeForce RTX 3050 Ti per il secondo anno consecutivo
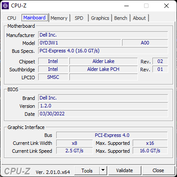
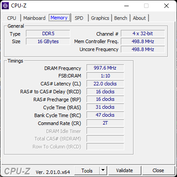
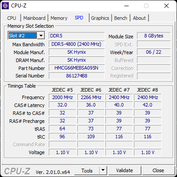
L'XPS 15 9520 è dotato di una RAM più veloce rispetto all'XPS 15 9510 (DDR5-4800 contro DDR4-3200), che dovrebbe portare a prestazioni grafiche leggermente superiori. Sfortunatamente, Dell ha abbassato la frequenza di clock della GPU da 1530 MHz sull'XPS 15 9510 a 1035 MHz sul 9520, annullando così ogni potenziale guadagno di prestazioni derivante dalla RAM più veloce GeForce RTX 3050 Ti i risultati di 3DMark tra l'XPS 15 9510 e il 9520 sono quasi identici.
Le prestazioni grafiche rimangono circa il 20-30% più veloci della GTX 1650 Ti sul vecchio XPS 15 9500.
| 3DMark 11 Performance | 13912 punti | |
| 3DMark Cloud Gate Standard Score | 39980 punti | |
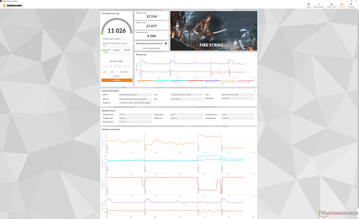
| 3DMark Fire Strike Score | 11026 punti | |
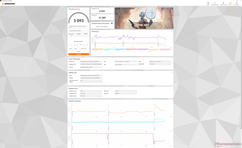
| 3DMark Time Spy Score | 5093 punti | |
Aiuto | ||
| Cyberpunk 2077 1.6 | |
| 1920x1080 Low Preset | |
| Asus Zenbook Pro 15 OLED UM535Q | |
| Media NVIDIA GeForce RTX 3050 Ti Laptop GPU (48.2 - 81.9, n=9) | |
| Dell XPS 15 9520 RTX 3050 Ti | |
| 1920x1080 Medium Preset | |
| Asus Zenbook Pro 15 OLED UM535Q | |
| Media NVIDIA GeForce RTX 3050 Ti Laptop GPU (47.4 - 67.4, n=9) | |
| Dell XPS 15 9520 RTX 3050 Ti | |
| 1920x1080 High Preset | |
| Media NVIDIA GeForce RTX 3050 Ti Laptop GPU (39 - 51.5, n=9) | |
| Asus Zenbook Pro 15 OLED UM535Q | |
| Dell XPS 15 9520 RTX 3050 Ti | |
| 1920x1080 Ultra Preset | |
| Asus Zenbook Pro 15 OLED UM535Q | |
| Media NVIDIA GeForce RTX 3050 Ti Laptop GPU (31 - 50.5, n=9) | |
| Dell XPS 15 9520 RTX 3050 Ti | |
Witcher 3 FPS Chart
| basso | medio | alto | ultra | QHD | 4K | |
|---|---|---|---|---|---|---|
| GTA V (2015) | 185 | 181.3 | 90.3 | 49.9 | 37.4 | |
| The Witcher 3 (2015) | 226.5 | 127.1 | 62.4 | 34.2 | ||
| Dota 2 Reborn (2015) | 180.3 | 166.1 | 116.1 | 104.5 | 47.1 | |
| Final Fantasy XV Benchmark (2018) | 106.6 | 62.9 | 45.7 | 34.1 | ||
| X-Plane 11.11 (2018) | 137.6 | 117 | 100.6 | 73.7 | ||
| Strange Brigade (2018) | 206 | 109.6 | 91.1 | 79.4 | 60.4 | |
| Cyberpunk 2077 1.6 (2022) | 59.4 | 47.4 | 39.3 | 39.5 | 20.2 |
Emissioni
Rumore del sistema
Il rumore della ventola sembra essere più silenzioso rispetto ai modelli XPS più vecchi quando vengono sottoposti a carichi simili. O, per lo meno, le ventole del 9520 impiegano un po' più di tempo a salire di giri quando vengono introdotti carichi impegnativi. Alla fine della prima scena del benchmark 3DMark 06, ad esempio, il rumore delle ventole è di soli 31 dB(A) rispetto ai 36 dB(A) e 46 dB(A) degli XPS 15 9510 e 9500, rispettivamente. Il sistema è comunque più silenzioso del previsto nella maggior parte delle condizioni, anche quando è impostato sulla modalità Ultra Performance.
Rumorosità
| Idle |
| 22.9 / 22.9 / 22.9 dB(A) |
| Sotto carico |
| 30.9 / 44.7 dB(A) |
 | ||
30 dB silenzioso 40 dB(A) udibile 50 dB(A) rumoroso |
||
min: | ||
| Dell XPS 15 9520 RTX 3050 Ti GeForce RTX 3050 Ti Laptop GPU, i7-12700H, WDC PC SN810 512GB | Dell XPS 15 9510 11800H RTX 3050 Ti OLED GeForce RTX 3050 Ti Laptop GPU, i7-11800H, Micron 2300 512GB MTFDHBA512TDV | Dell XPS 15 9500 Core i7 4K UHD GeForce GTX 1650 Ti Mobile, i7-10875H, SK Hynix PC611 512GB | HP Spectre X360 15-5ZV31AV GeForce MX250, i7-10510U, Intel SSD 660p 2TB SSDPEKNW020T8 | Asus Zenbook Pro 15 OLED UM535Q GeForce RTX 3050 Ti Laptop GPU, R9 5900HX, WDC PC SN730 SDBPNTY-1T00 | MSI Stealth 15M A11SEK GeForce RTX 2060 Max-Q, i7-1185G7, WDC PC SN530 SDBPNPZ-1T00 | |
|---|---|---|---|---|---|---|
| Noise | -2% | -23% | -17% | -7% | -34% | |
| off /ambiente * (dB) | 22.8 | 23.8 -4% | 28.4 -25% | 30.1 -32% | 22.8 -0% | 27.5 -21% |
| Idle Minimum * (dB) | 22.9 | 23.8 -4% | 28.4 -24% | 30.1 -31% | 22.9 -0% | 32.3 -41% |
| Idle Average * (dB) | 22.9 | 23.8 -4% | 28.4 -24% | 30.1 -31% | 22.9 -0% | 32.3 -41% |
| Idle Maximum * (dB) | 22.9 | 23.8 -4% | 28.4 -24% | 30.1 -31% | 22.9 -0% | 33.7 -47% |
| Load Average * (dB) | 30.9 | 36 -17% | 46 -49% | 30.1 3% | 33.2 -7% | 46.3 -50% |
| Witcher 3 ultra * (dB) | 37.8 | 36 5% | 42 -11% | 39.7 -5% | 47.3 -25% | 41.3 -9% |
| Load Maximum * (dB) | 44.7 | 38.2 15% | 47.1 -5% | 42 6% | 52.8 -18% | 56.2 -26% |
* ... Meglio usare valori piccoli
Temperatura: leggermente più calda in generale
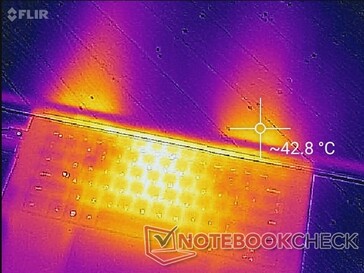
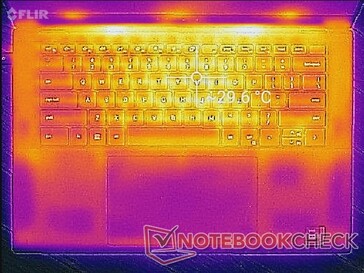
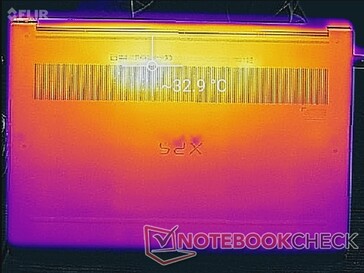
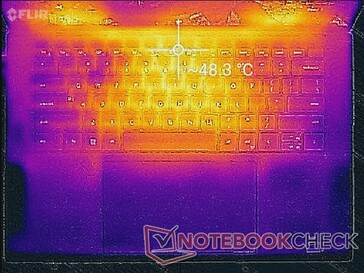
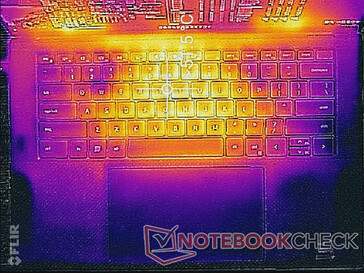
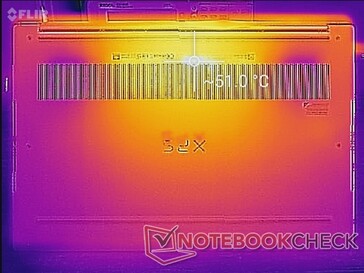
Le temperature di superficie sotto carico sono più alte di quelle registrate sui vecchi modelli XPS 15 9510 e 9500. I punti caldi possono raggiungere i 51 C e i 52 C rispettivamente sulla parte superiore e inferiore, rispetto ai 44 C e 47 C di ciascuna delle versioni precedenti. I punti caldi dei concorrenti, come lo Zenbook Pro 15 OLED, sono più freddi di qualche grado C in condizioni simili. Dopotutto, l'XPS 9520 è uno dei più piccoli laptop da 15,6 pollici con processore Core H presenti sul mercato.
(-) La temperatura massima sul lato superiore è di 51.4 °C / 125 F, rispetto alla media di 36.9 °C / 98 F, che varia da 21.1 a 71 °C per questa classe Multimedia.
(-) Il lato inferiore si riscalda fino ad un massimo di 51 °C / 124 F, rispetto alla media di 39.2 °C / 103 F
(+) In idle, la temperatura media del lato superiore è di 27.8 °C / 82 F, rispetto alla media deld ispositivo di 31.3 °C / 88 F.
(±) Riproducendo The Witcher 3, la temperatura media per il lato superiore e' di 35.2 °C / 95 F, rispetto alla media del dispositivo di 31.3 °C / 88 F.
(+) I poggiapolsi e il touchpad sono piu' freddi della temperatura della pelle con un massimo di 31.6 °C / 88.9 F e sono quindi freddi al tatto.
(-) La temperatura media della zona del palmo della mano di dispositivi simili e'stata di 28.7 °C / 83.7 F (-2.9 °C / -5.2 F).
| Dell XPS 15 9520 RTX 3050 Ti Intel Core i7-12700H, NVIDIA GeForce RTX 3050 Ti Laptop GPU | Dell XPS 15 9510 11800H RTX 3050 Ti OLED Intel Core i7-11800H, NVIDIA GeForce RTX 3050 Ti Laptop GPU | Dell XPS 15 9500 Core i7 4K UHD Intel Core i7-10875H, NVIDIA GeForce GTX 1650 Ti Mobile | HP Spectre X360 15-5ZV31AV Intel Core i7-10510U, NVIDIA GeForce MX250 | Asus Zenbook Pro 15 OLED UM535Q AMD Ryzen 9 5900HX, NVIDIA GeForce RTX 3050 Ti Laptop GPU | MSI Stealth 15M A11SEK Intel Core i7-1185G7, NVIDIA GeForce RTX 2060 Max-Q | |
|---|---|---|---|---|---|---|
| Heat | 13% | 3% | 17% | -1% | 10% | |
| Maximum Upper Side * (°C) | 51.4 | 45.5 11% | 44 14% | 47 9% | 36 30% | 47.2 8% |
| Maximum Bottom * (°C) | 51 | 44.2 13% | 48.8 4% | 47.4 7% | 47.2 7% | 47.4 7% |
| Idle Upper Side * (°C) | 30 | 27 10% | 33 -10% | 22.8 24% | 37 -23% | 27.2 9% |
| Idle Bottom * (°C) | 33 | 26.7 19% | 32.4 2% | 23.6 28% | 39.2 -19% | 28.2 15% |
* ... Meglio usare valori piccoli
Stress test
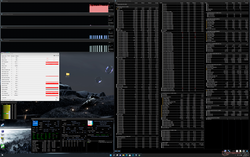
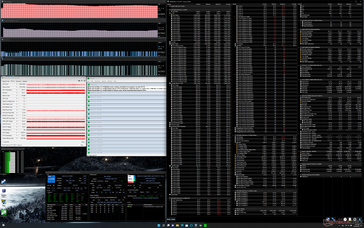
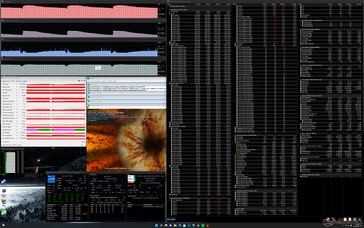
Quando è stata sottoposta a Prime95, la CPU è salita a 81 W, 100 C e 3,3 GHz per i primi 10 secondi circa, prima di scendere rapidamente e stabilizzarsi a 45 W, 85 C e 2,5 GHz per mantenere le temperature sotto controllo. Eseguendo lo stesso test sull'XPS 15 9500 si otterrebbe una temperatura stabile della CPU pari a 73 C. Sembra quindi che l'XPS 15 9520 sia più caldo dei suoi predecessori per ottenere maggiori prestazioni dal processore con lo stesso design complessivo dello chassis.
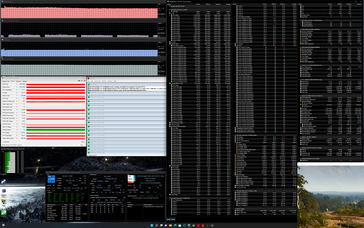
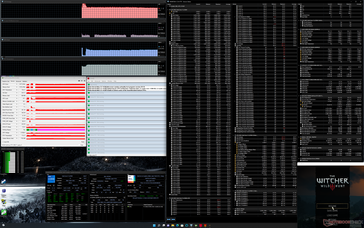
La velocità di clock della GPU, l'assorbimento di energia e la temperatura si stabilizzano rispettivamente a 1477 MHz, 46 W e 74 C quando si utilizza la modalità Ultra Performance Witcher 3 in modalità Ultra Performance. L'esecuzione in modalità Ottimizzata comporta velocità di clock e temperature leggermente inferiori, come mostrato dalla tabella sottostante, e un minore assorbimento di potenza di 41 W. Gli utenti devono eseguire il sistema in modalità Ultra Performance se vogliono estrarre il massimo delle prestazioni dalla GPU. Eseguendo questo stesso test sull'XPS 15 9500 con la più lenta GeForce GTX 1650 Ti si otterrebbero temperature simili per CPU e GPU.
Il funzionamento a batteria limita le prestazioni. Un test di Fire Strike a batteria restituirebbe punteggi di Fisica e Grafica rispettivamente di 9450 e 8332 punti, rispetto a 27077 e 12154 punti con alimentazione a rete.
| Clock della CPU (GHz) | Clock della GPU (MHz) | Temperatura media della CPU (°C) | Temperatura media della GPU (°C) | |
| Sistema inattivo | -- | -- | 79 | 64 |
| Stress Prime95 | 2,4 | 85 | -- | 67 |
| StressPrime95 + FurMark | 0,8 - 2,3 | 700 - 1100 | 79 - 86 | 62 - 75 |
| Witcher 3 Stress (modalità bilanciata) | 0,7 | 1357 | 67 | 71 |
| Witcher 3 Stress (modalità Performance) | 0,8 | 1477 | 71 | 74 |
Altoparlanti
Dell XPS 15 9520 RTX 3050 Ti analisi audio
(+) | gli altoparlanti sono relativamente potenti (83.1 dB)
Bassi 100 - 315 Hz
(+) | bassi buoni - solo 4.4% dalla media
(+) | bassi in lineaa (6.8% delta rispetto alla precedente frequenza)
Medi 400 - 2000 Hz
(+) | medi bilanciati - solo only 2.6% rispetto alla media
(+) | medi lineari (4.1% delta rispetto alla precedente frequenza)
Alti 2 - 16 kHz
(+) | Alti bilanciati - appena 1.9% dalla media
(+) | alti lineari (5.4% delta rispetto alla precedente frequenza)
Nel complesso 100 - 16.000 Hz
(+) | suono nel complesso lineare (6.4% differenza dalla media)
Rispetto alla stessa classe
» 3% di tutti i dispositivi testati in questa classe è stato migliore, 1% simile, 96% peggiore
» Il migliore ha avuto un delta di 5%, medio di 17%, peggiore di 45%
Rispetto a tutti i dispositivi testati
» 0% di tutti i dispositivi testati in questa classe è stato migliore, 0% similare, 99% peggiore
» Il migliore ha avuto un delta di 4%, medio di 24%, peggiore di 134%
Apple MacBook Pro 16 2021 M1 Pro analisi audio
(+) | gli altoparlanti sono relativamente potenti (84.7 dB)
Bassi 100 - 315 Hz
(+) | bassi buoni - solo 3.8% dalla media
(+) | bassi in lineaa (5.2% delta rispetto alla precedente frequenza)
Medi 400 - 2000 Hz
(+) | medi bilanciati - solo only 1.3% rispetto alla media
(+) | medi lineari (2.1% delta rispetto alla precedente frequenza)
Alti 2 - 16 kHz
(+) | Alti bilanciati - appena 1.9% dalla media
(+) | alti lineari (2.7% delta rispetto alla precedente frequenza)
Nel complesso 100 - 16.000 Hz
(+) | suono nel complesso lineare (4.6% differenza dalla media)
Rispetto alla stessa classe
» 0% di tutti i dispositivi testati in questa classe è stato migliore, 0% simile, 100% peggiore
» Il migliore ha avuto un delta di 5%, medio di 17%, peggiore di 45%
Rispetto a tutti i dispositivi testati
» 0% di tutti i dispositivi testati in questa classe è stato migliore, 0% similare, 100% peggiore
» Il migliore ha avuto un delta di 4%, medio di 24%, peggiore di 134%
Gestione dell'energia - Più potenza
Consumo di energia
Gli XPS 15 9500, 9510 e 9520 sono gli unici laptop di rilievo attualmente sul mercato a disporre di adattatori USB-C da 130 W per superare il limite di 100 W USB-C Power Delivery fissato dall'USB-IF. L'overhead più elevato consente alla batteria di continuare a caricarsi a una velocità decente anche quando si eseguono carichi impegnativi come i giochi. Vale la pena notare che l'unità di prova non ha mostrato i problemi di ricarica che abbiamo riscontrato con l'XPS 17 9700 XPS 17 9700.
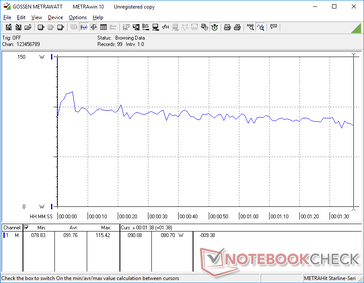
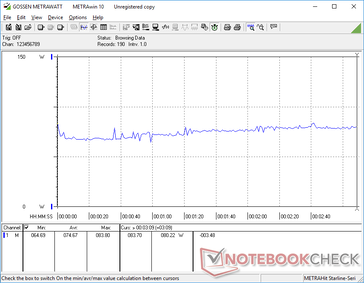
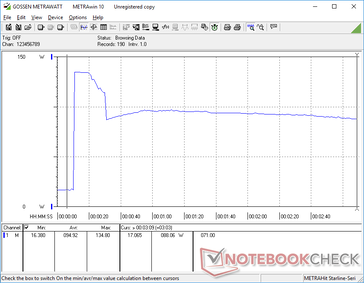
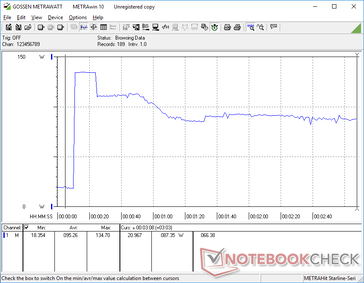
In esecuzione Witcher 3 consuma 75 W, avvicinandosi a quanto registrato sull'XPS 15 9510 o sul concorrente Zenbook Pro 15 OLED alimentato da AMD. L'aspetto forse più interessante è che l'esecuzione di Prime95 consuma costantemente 88 W rispetto ai 65 W dell'XPS 15 9510 con Core 7-11800H. Pertanto, il consumo energetico è aumentato di circa il 35% per il guadagno del 35-42% rispetto all'anno precedente nelle prestazioni multi-thread che abbiamo registrato sopra. Il consumo energetico generalmente più elevato è in linea con quanto osservato sulla piattaforma Alder Lake nel suo complesso Piattaforma Alder Lake nel suo complesso
L'adattatore CA USB-C da 130 W, di dimensioni medio-piccole (~14,3 x 6,6 x 2,3 cm), fornito con l'XPS 15 9520, è identico a quello fornito con gli XPS 9500 e 9510.
| Off / Standby | |
| Idle | |
| Sotto carico |
|
Leggenda:
min: | |
| Dell XPS 15 9520 RTX 3050 Ti i7-12700H, GeForce RTX 3050 Ti Laptop GPU, WDC PC SN810 512GB, OLED, 3456x2160, 15.6" | Dell XPS 15 9510 11800H RTX 3050 Ti OLED i7-11800H, GeForce RTX 3050 Ti Laptop GPU, Micron 2300 512GB MTFDHBA512TDV, OLED, 3456x2160, 15.6" | Dell XPS 15 9500 Core i7 4K UHD i7-10875H, GeForce GTX 1650 Ti Mobile, SK Hynix PC611 512GB, IPS, 3840x2400, 15.6" | HP Spectre X360 15-5ZV31AV i7-10510U, GeForce MX250, Intel SSD 660p 2TB SSDPEKNW020T8, IPS, 3840x2160, 15.6" | Asus Zenbook Pro 15 OLED UM535Q R9 5900HX, GeForce RTX 3050 Ti Laptop GPU, WDC PC SN730 SDBPNTY-1T00, OLED, 1920x1080, 15.6" | MSI Stealth 15M A11SEK i7-1185G7, GeForce RTX 2060 Max-Q, WDC PC SN530 SDBPNPZ-1T00, IPS, 1920x1080, 15.6" | |
|---|---|---|---|---|---|---|
| Power Consumption | -5% | -27% | 20% | 5% | -25% | |
| Idle Minimum * (Watt) | 5.5 | 7.6 -38% | 5.7 -4% | 5.2 5% | 5.5 -0% | 7.3 -33% |
| Idle Average * (Watt) | 7.2 | 9.9 -38% | 13.5 -88% | 8.5 -18% | 7.4 -3% | 10.1 -40% |
| Idle Maximum * (Watt) | 16 | 10.8 32% | 19.6 -23% | 8.7 46% | 14.9 7% | 17.6 -10% |
| Load Average * (Watt) | 91.8 | 81 12% | 114.1 -24% | 65.6 29% | 78.2 15% | 106.6 -16% |
| Witcher 3 ultra * (Watt) | 74.6 | 76.2 -2% | 93 -25% | 56.5 24% | 80.1 -7% | 105.4 -41% |
| Load Maximum * (Watt) | 134.7 | 131 3% | 135.2 -0% | 92.4 31% | 110.9 18% | 151.2 -12% |
* ... Meglio usare valori piccoli
Power Consumption Witcher 3 / Stresstest
Power Consumption external Monitor
Durata della batteria
Con quasi 9 ore di utilizzo costante nel mondo reale della WLAN, i tempi di esecuzione sono complessivamente simili a quelli registrati sull'XPS 9500 e quasi 2 ore in più rispetto all'XPS 9510. Tuttavia, si tenga presente che i colori bianchi richiederanno alcuni watt in più rispetto ai colori scuri a parità di luminosità, poiché la nostra configurazione utilizza un pannello OLED.
La ricarica da vuoto a pieno regime con l'adattatore CA in dotazione richiede dalle 2 alle 2,5 ore al minimo o con carichi ridotti.
| Dell XPS 15 9520 RTX 3050 Ti i7-12700H, GeForce RTX 3050 Ti Laptop GPU, 86 Wh | Dell XPS 15 9510 11800H RTX 3050 Ti OLED i7-11800H, GeForce RTX 3050 Ti Laptop GPU, 86 Wh | Dell XPS 15 9500 Core i7 4K UHD i7-10875H, GeForce GTX 1650 Ti Mobile, 86 Wh | HP Spectre X360 15-5ZV31AV i7-10510U, GeForce MX250, 84 Wh | Asus Zenbook Pro 15 OLED UM535Q R9 5900HX, GeForce RTX 3050 Ti Laptop GPU, 96 Wh | MSI Stealth 15M A11SEK i7-1185G7, GeForce RTX 2060 Max-Q, 52 Wh | |
|---|---|---|---|---|---|---|
| Autonomia della batteria | -32% | 7% | 22% | 45% | -42% | |
| Reader / Idle (h) | 14.8 | 23 55% | 22.6 53% | 26.2 77% | 10.5 -29% | |
| WiFi v1.3 (h) | 8.8 | 7 -20% | 9.1 3% | 10.8 23% | 12.8 45% | 6.3 -28% |
| Load (h) | 3.2 | 1.8 -44% | 2 -37% | 2.9 -9% | 3.6 13% | 1 -69% |
| H.264 (h) | 10.4 |
Pro
Contro
Verdetto - La differenza di Alder Lake
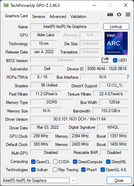
Se le CPU degli XPS 15 9500 o 9510 sono troppo lente per le vostre applicazioni specifiche, allora vale la pena prendere in considerazione il modello 9520. Il suo Core i7-12700H di 12a generazione Core i7-12700H è in grado di offrire prestazioni multi-thread superiori del 70% e del 40% rispetto al Core i7-12700H di 10a generazione Core i7-10875H e del Core i7-11800H di 11a generazioneCore i7-11800Hrispettivamente, senza impattare in modo significativo sulla durata della batteria. L'aumento delle prestazioni della grafica integrata può essere sufficiente a soddisfare la maggior parte degli utenti d'ufficio senza dover passare a costose opzioni Nvidia.
Gli utenti più esigenti apprezzeranno i significativi guadagni in termini di prestazioni del processore rispetto alle opzioni Intel di 11a o 10a generazione. Per le attività d'ufficio più semplici o moderate, tuttavia, la potenza extra della serie 12th gen potrebbe non valere l'aumento di prezzo.
Al di fuori delle prestazioni della CPU, tuttavia, l'esperienza rimane la stessa dell'XPS 9510 XPS 9510 o anche 9500. La GPU Nvidia è stata declassata rispetto al 9510 e quindi i vantaggi della RAM DDR5 più veloce sono stati ridotti al minimo. Alcuni cambiamenti che avremmo voluto vedere, come display con un refresh più elevato, una webcam a risoluzione più alta, un supporto Wi-Fi 6E adeguato o un otturatore per la privacy, continuano ad essere assenti. Se la CPU di 12a generazione più veloce non vi attira, potete acquistare l'XPS 15 9510, che ha le stesse opzioni di display e GPU del 9520, ma a prezzi inferiori.
Prezzo e disponibilità
Dell dell sta attualmente distribuendo la serie XPS 15 9520 a partire da 1500 dollari per il modello base fino a 3500 dollari se configurato al massimo.
Dell XPS 15 9520 RTX 3050 Ti
- 08/30/2022 v7 (old)
Allen Ngo


