Corsair One i300 desktop PC doma Core i9-12900K e RTX 3080 Ti in un case da 12 litri

Corsair vende la serie One dal 2018, confezionando l'attuale hardware da gioco in un case compatto che include il raffreddamento ad acqua. Abbiamo già visto nelCorsair One i160che questo sistema funziona.
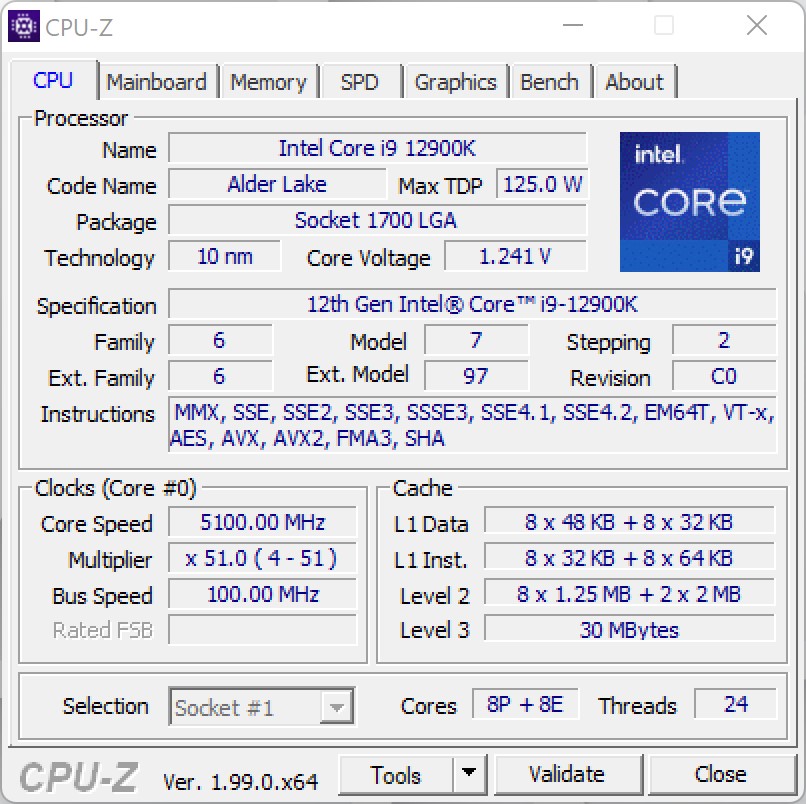
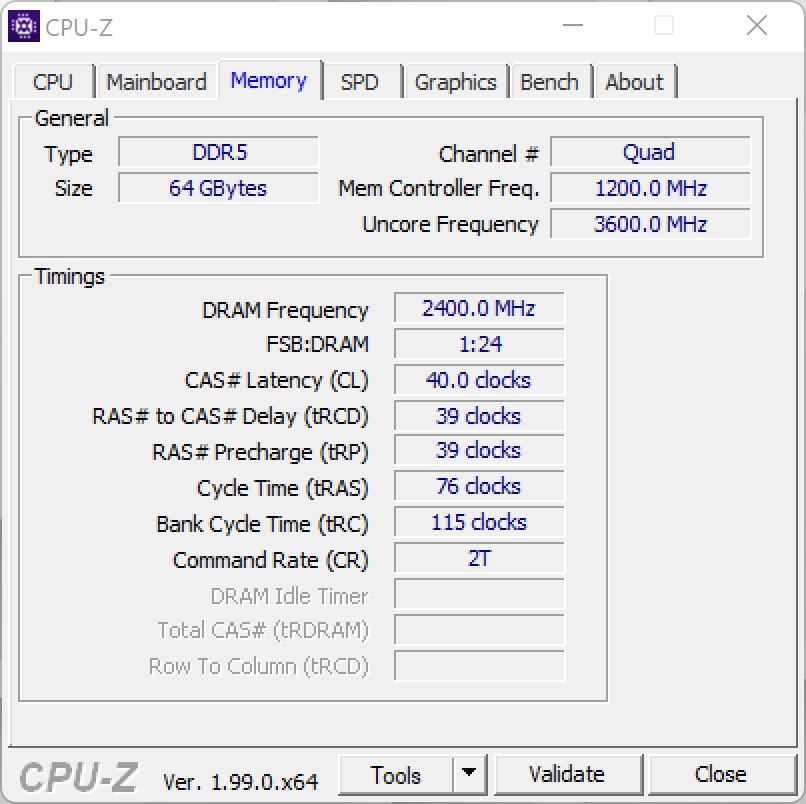
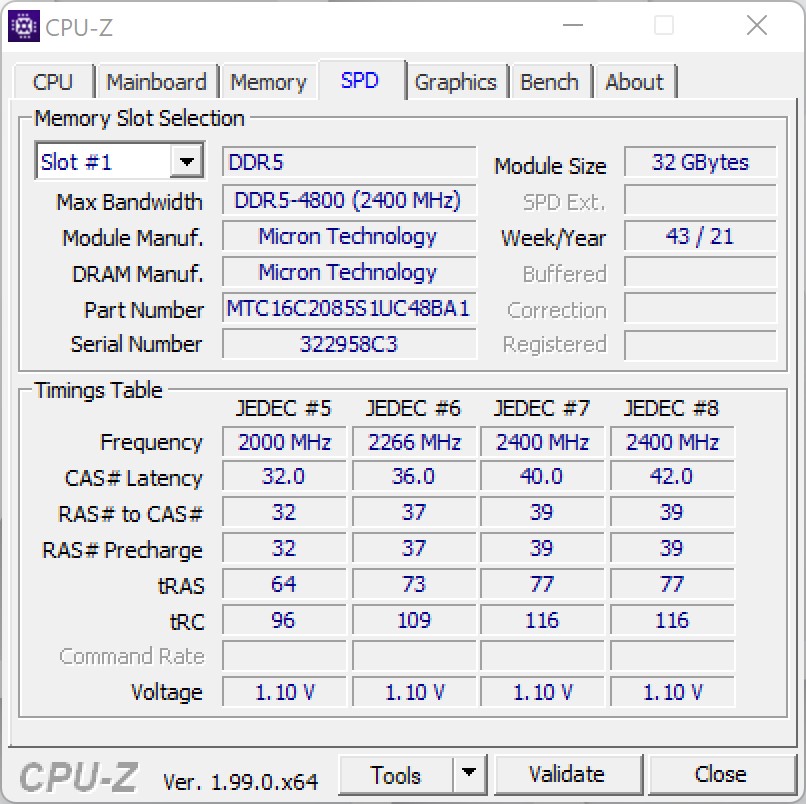
Al CES di quest'anno, Corsair ha annunciato un aggiornamento per il Corsair One che è dotato dell'attuale serie Alder Lake, che ora ha riconquistato la corona delle prestazioni come CPU da gioco più veloce. Oltre al Intel Core i9-12900Kcorsair include anche unNvidia GeForce RTX 3080 Ti. Entrambi i componenti forniscono una base eccellente per il gioco 4K senza compromessi. Dopo i nostri test iniziali, siamo stati anche in grado di confermare questo, anche se il produttore tiene ancora l'Intel Core i9-12900K un po' al guinzaglio. Di più su questo più avanti nel test. In termini di componenti potenti, ci sono anche ampi 64 GB di memoria di lavoro e un fulmineo SSD da 2 TB che include la versione professionale di Windows 11.
Corsair chiede 5100 euro (~$5724) per il sistema come equipaggiato nel nostro test. Se vi accontentate di 32 GB di memoria di lavoro e unNvidia GeForce RTX 3080dovete pagare esattamente 1000 euro (~$1122) in meno.
Caso
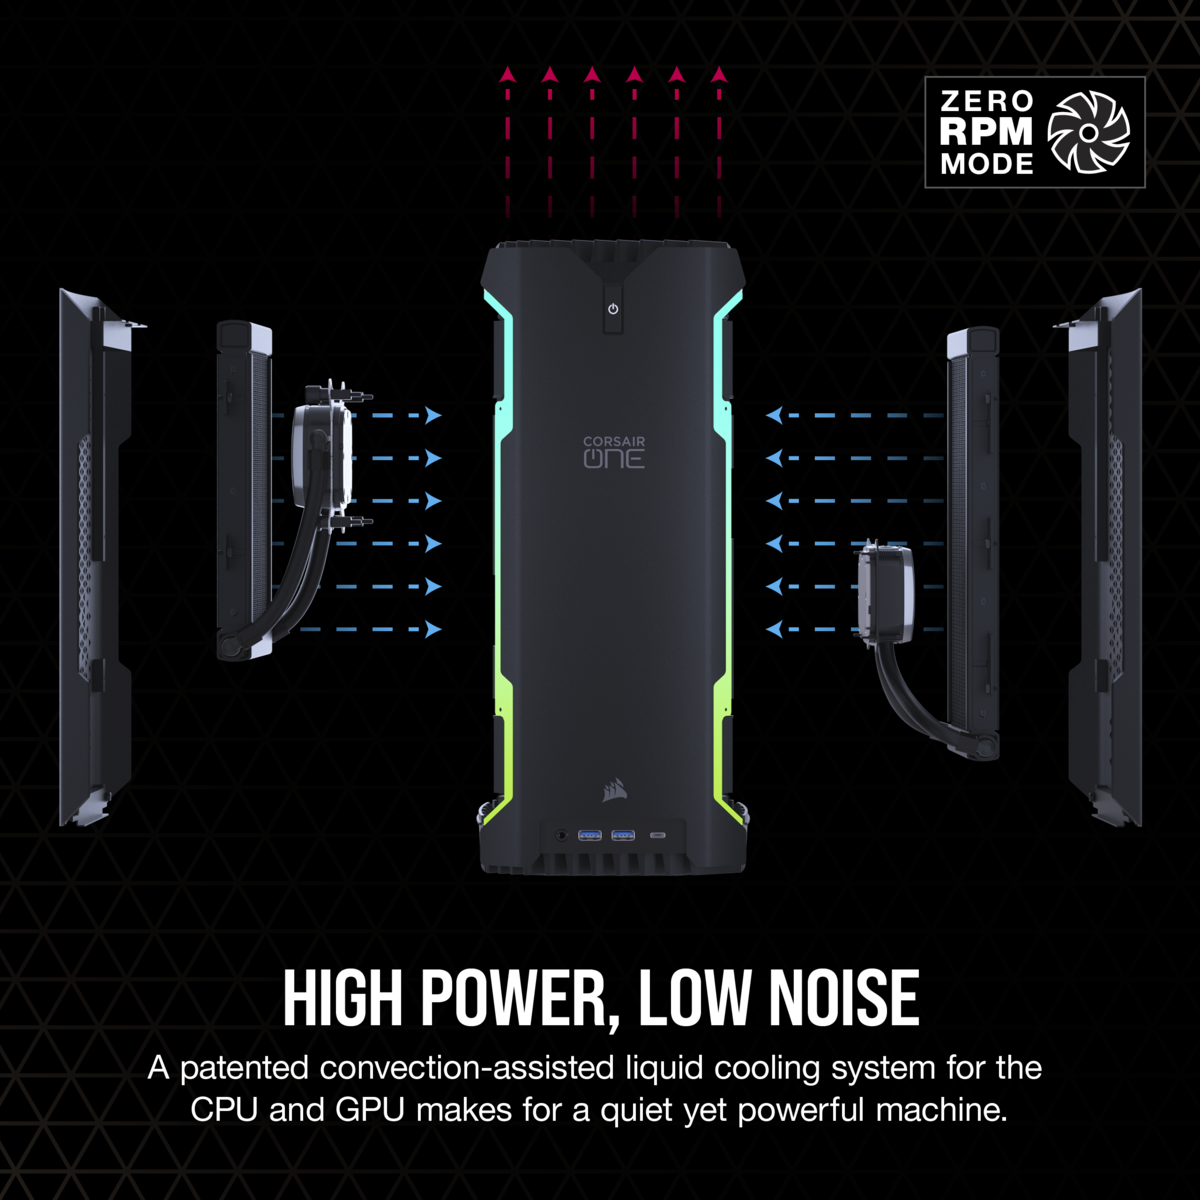
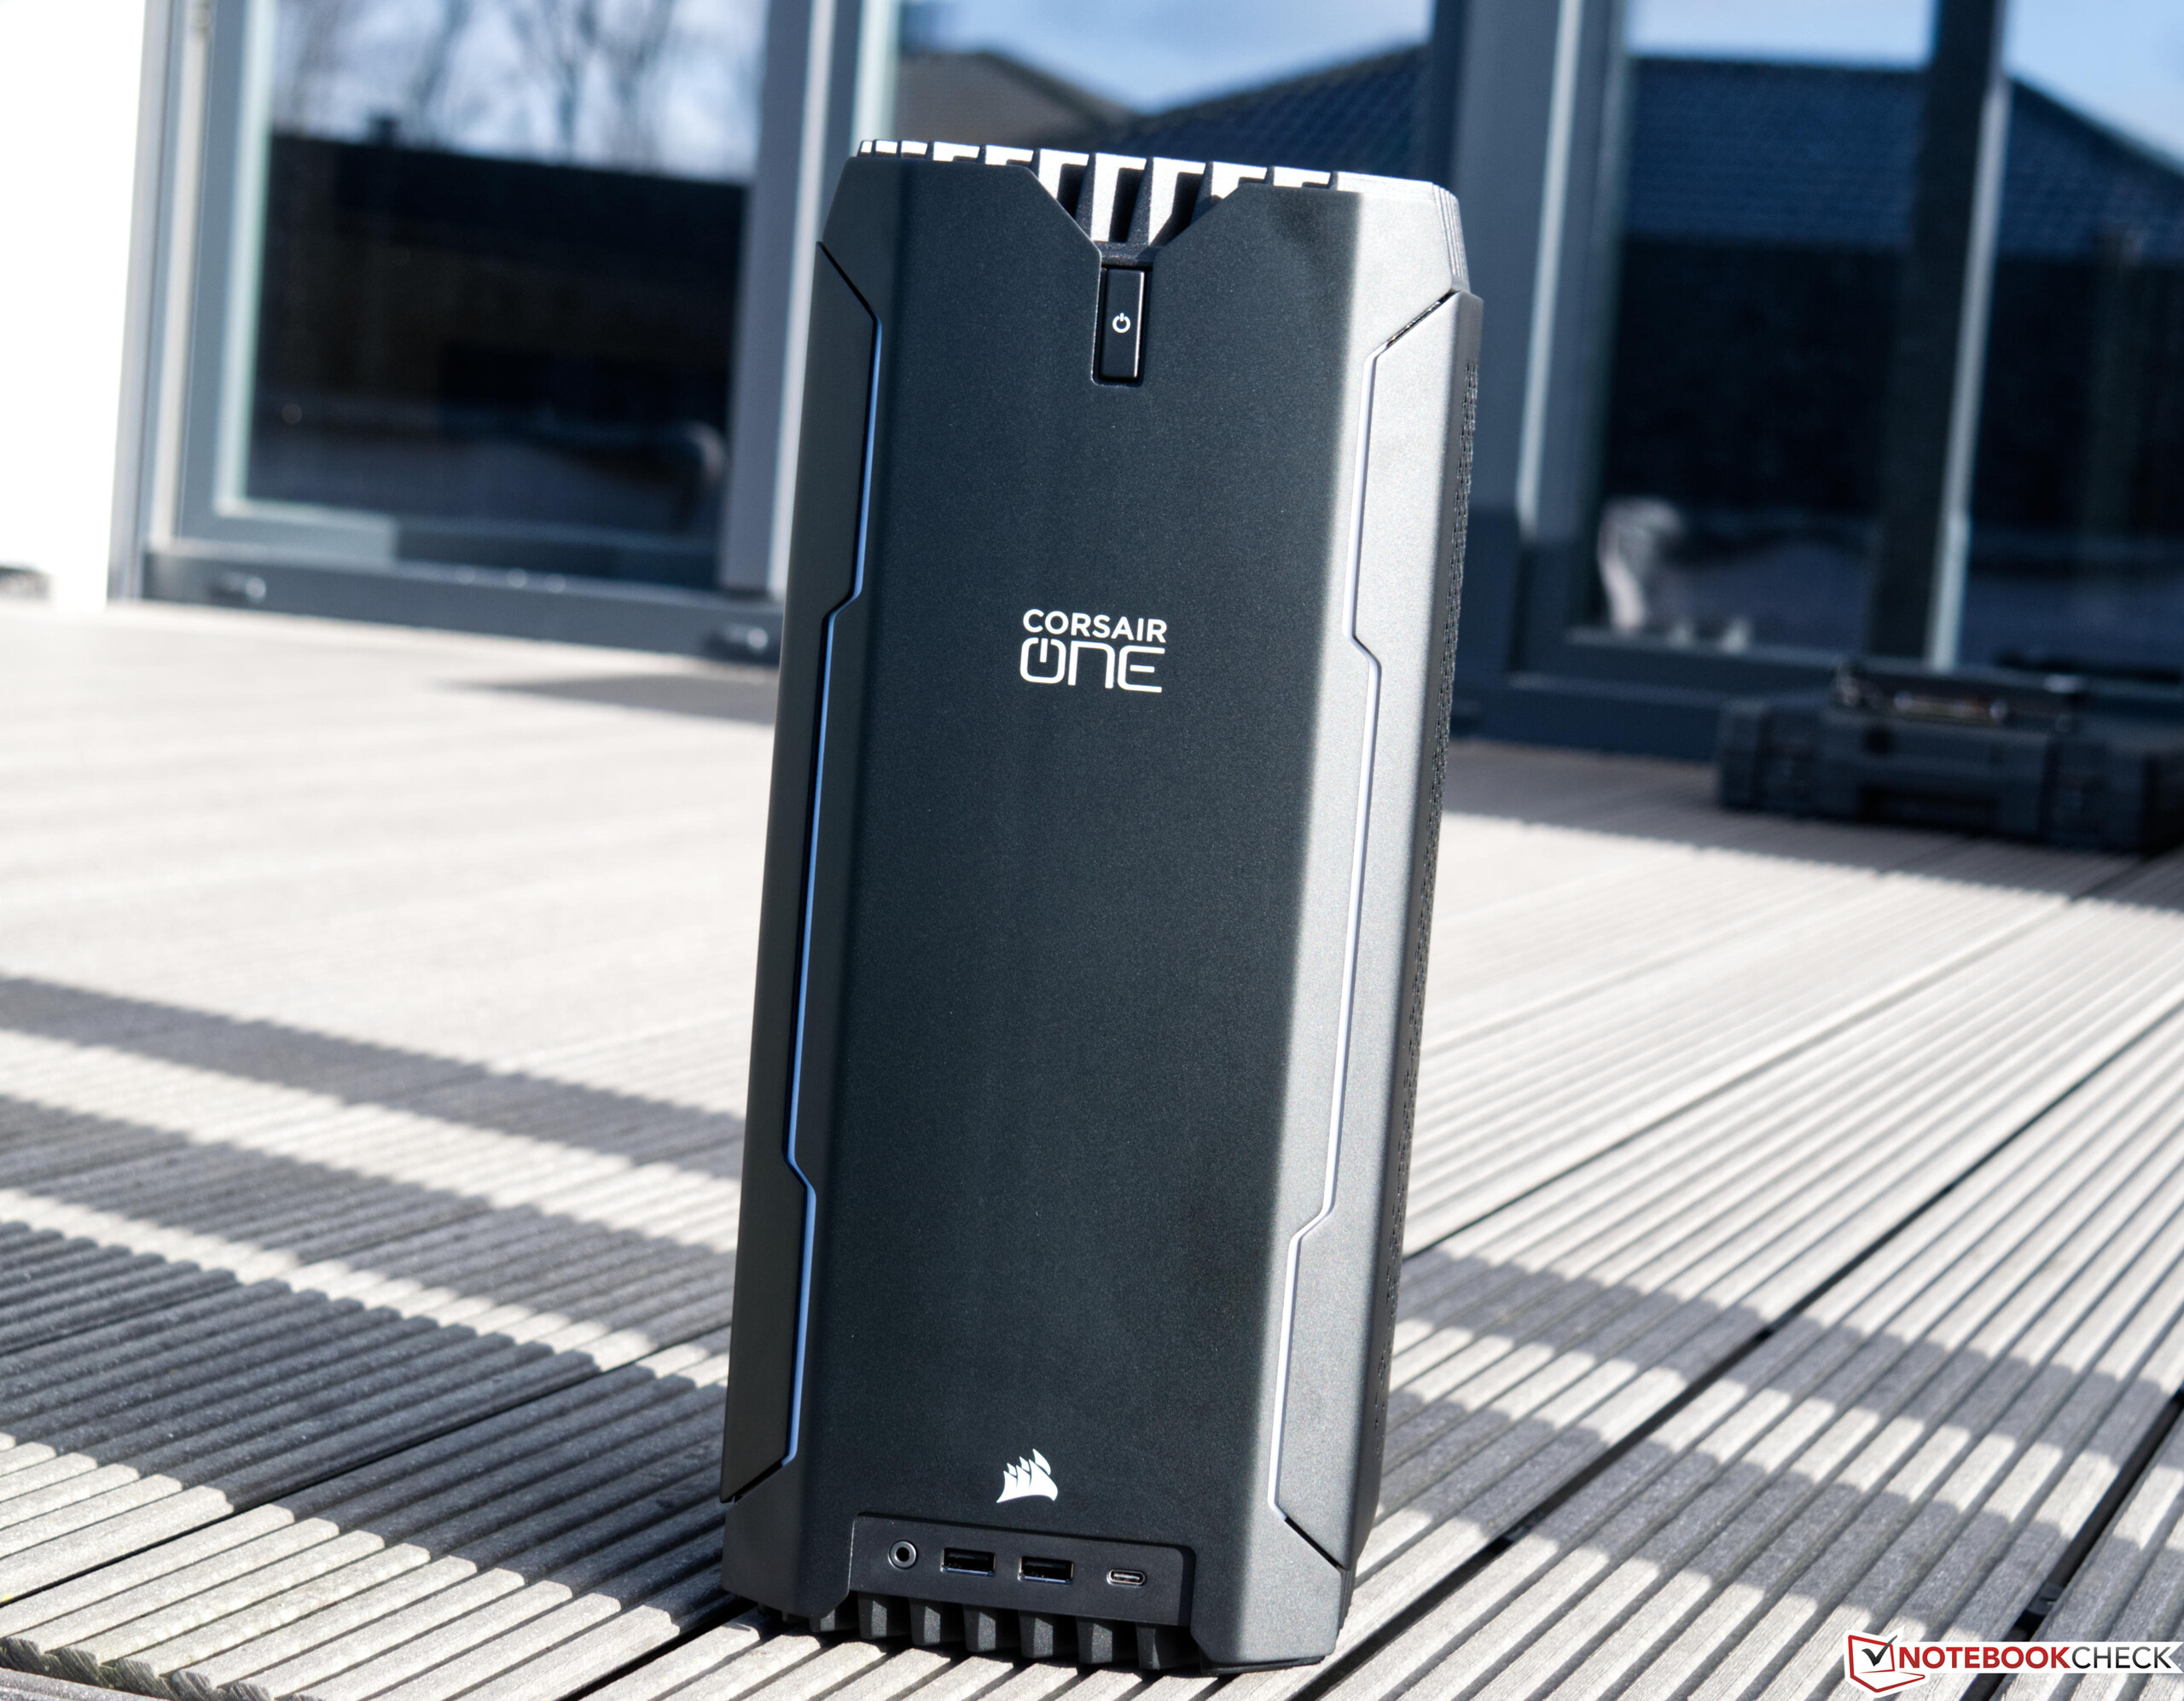
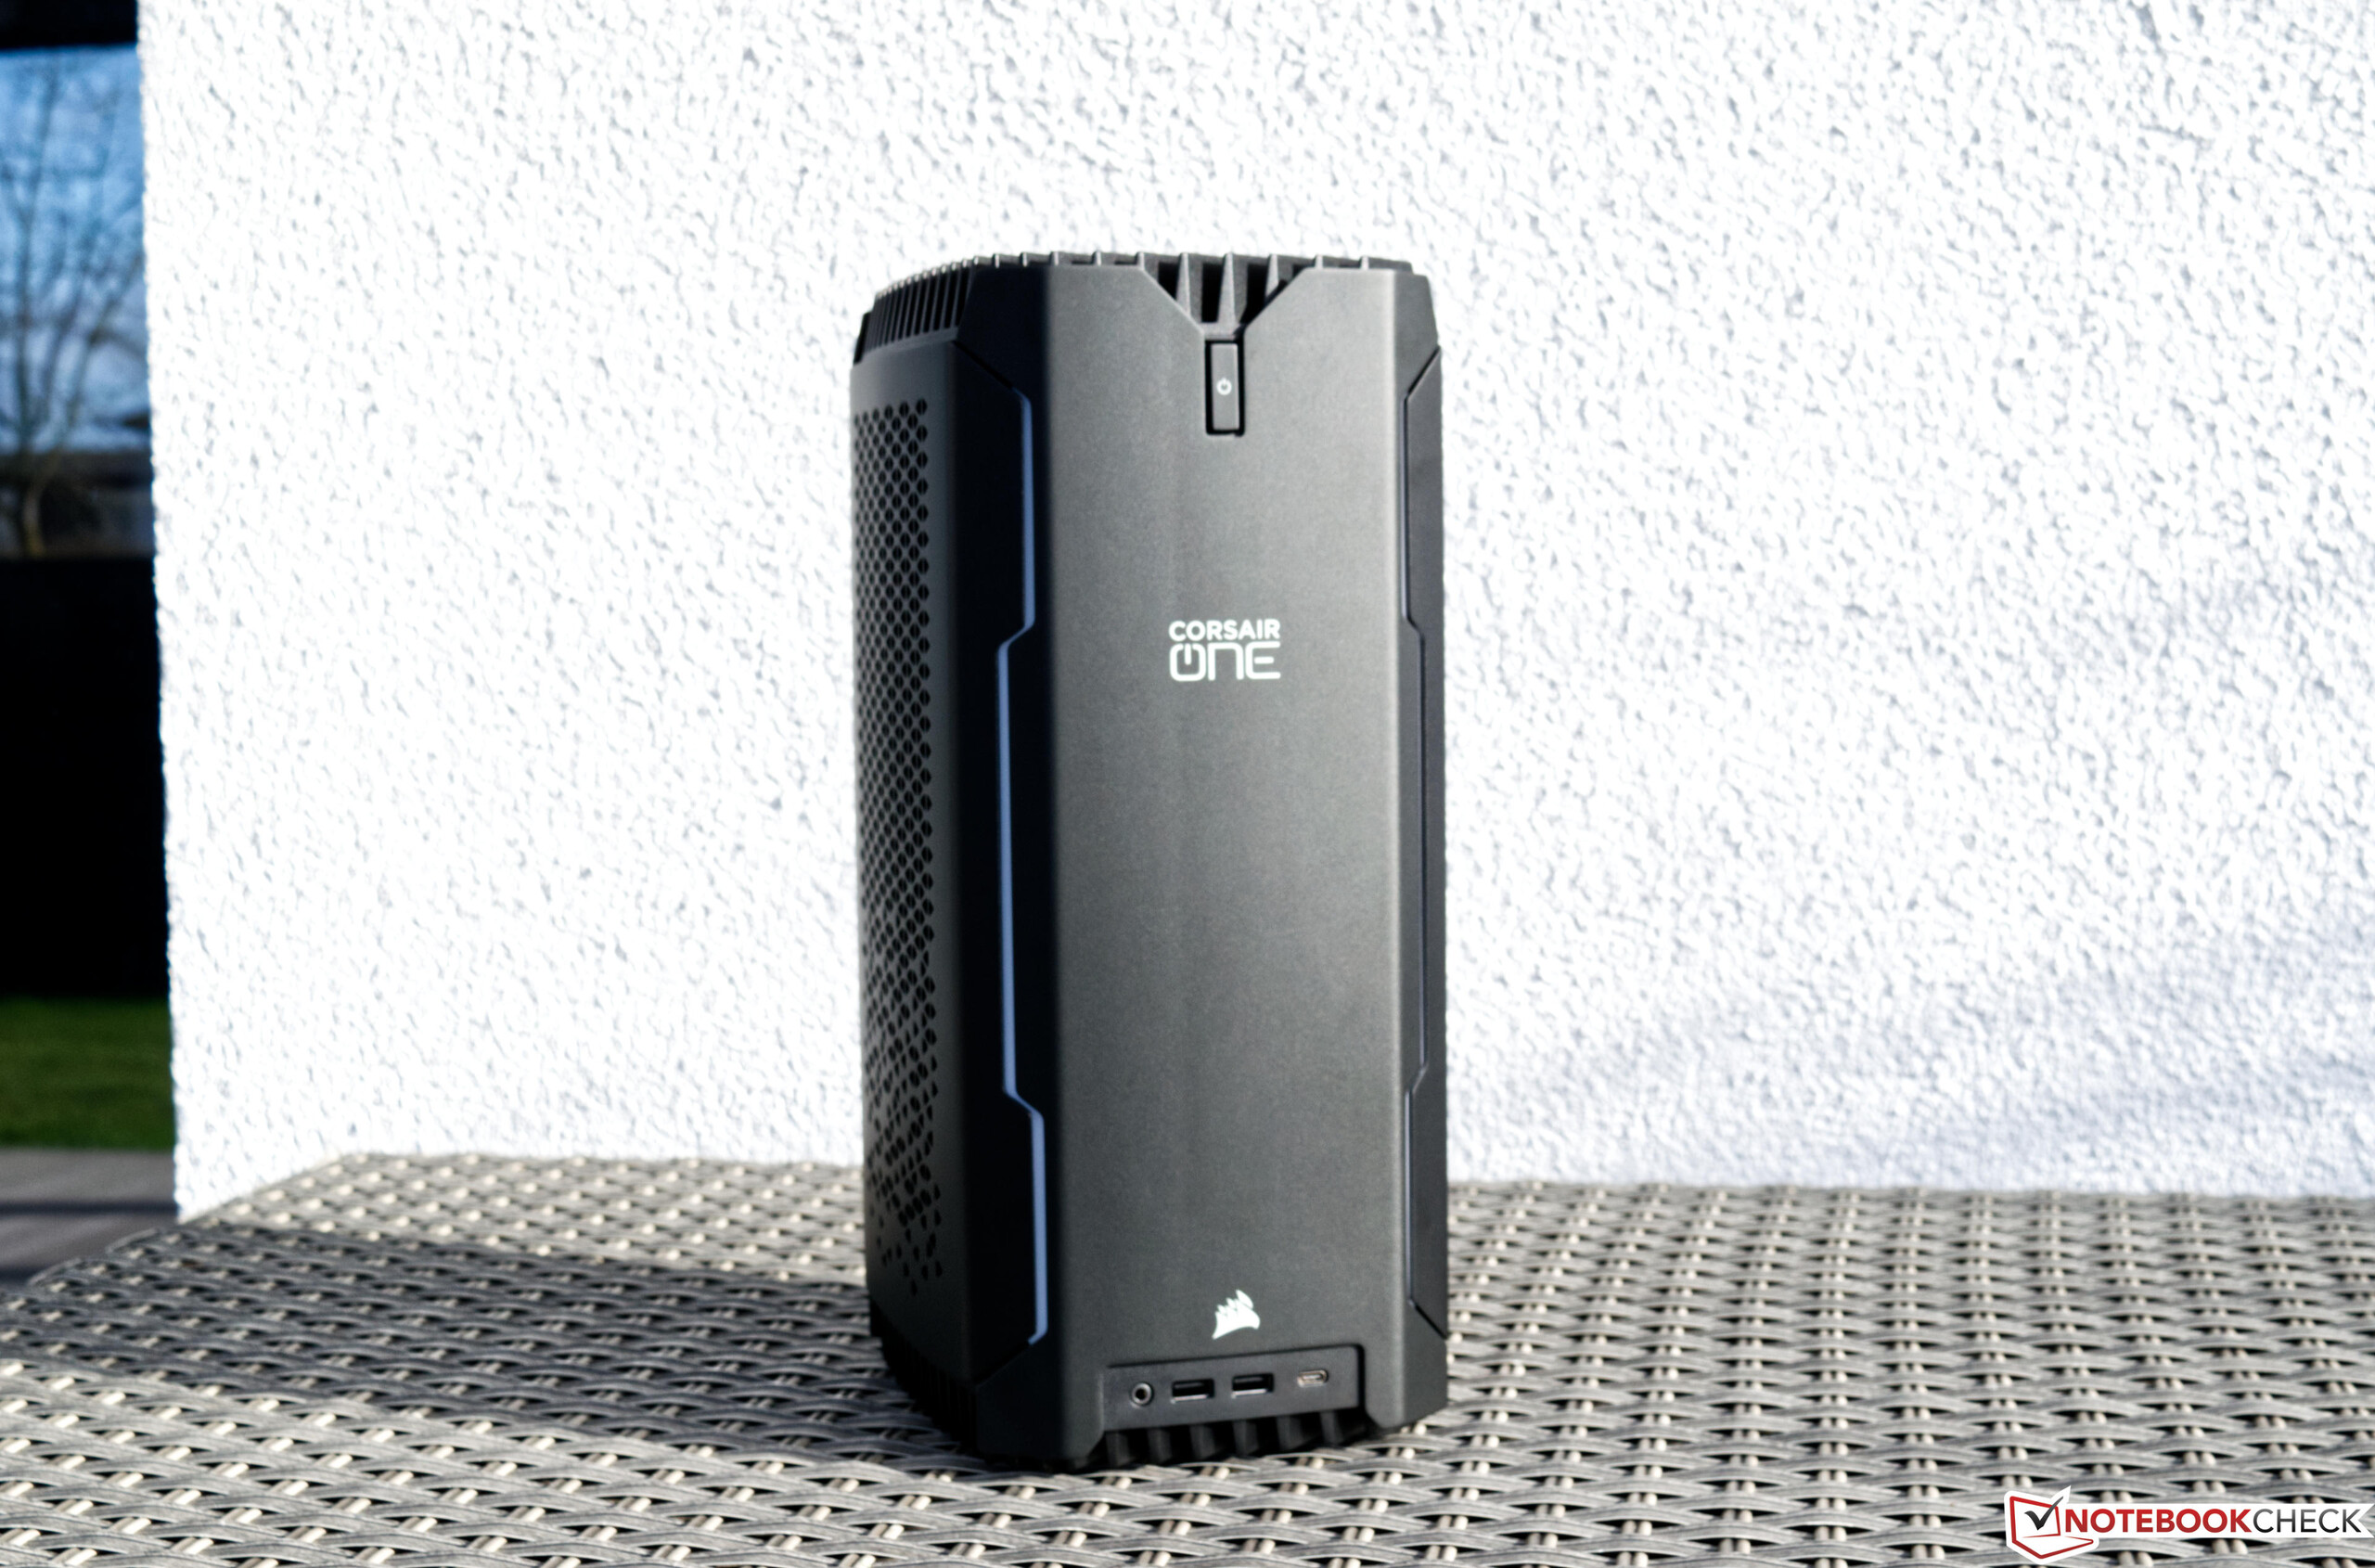
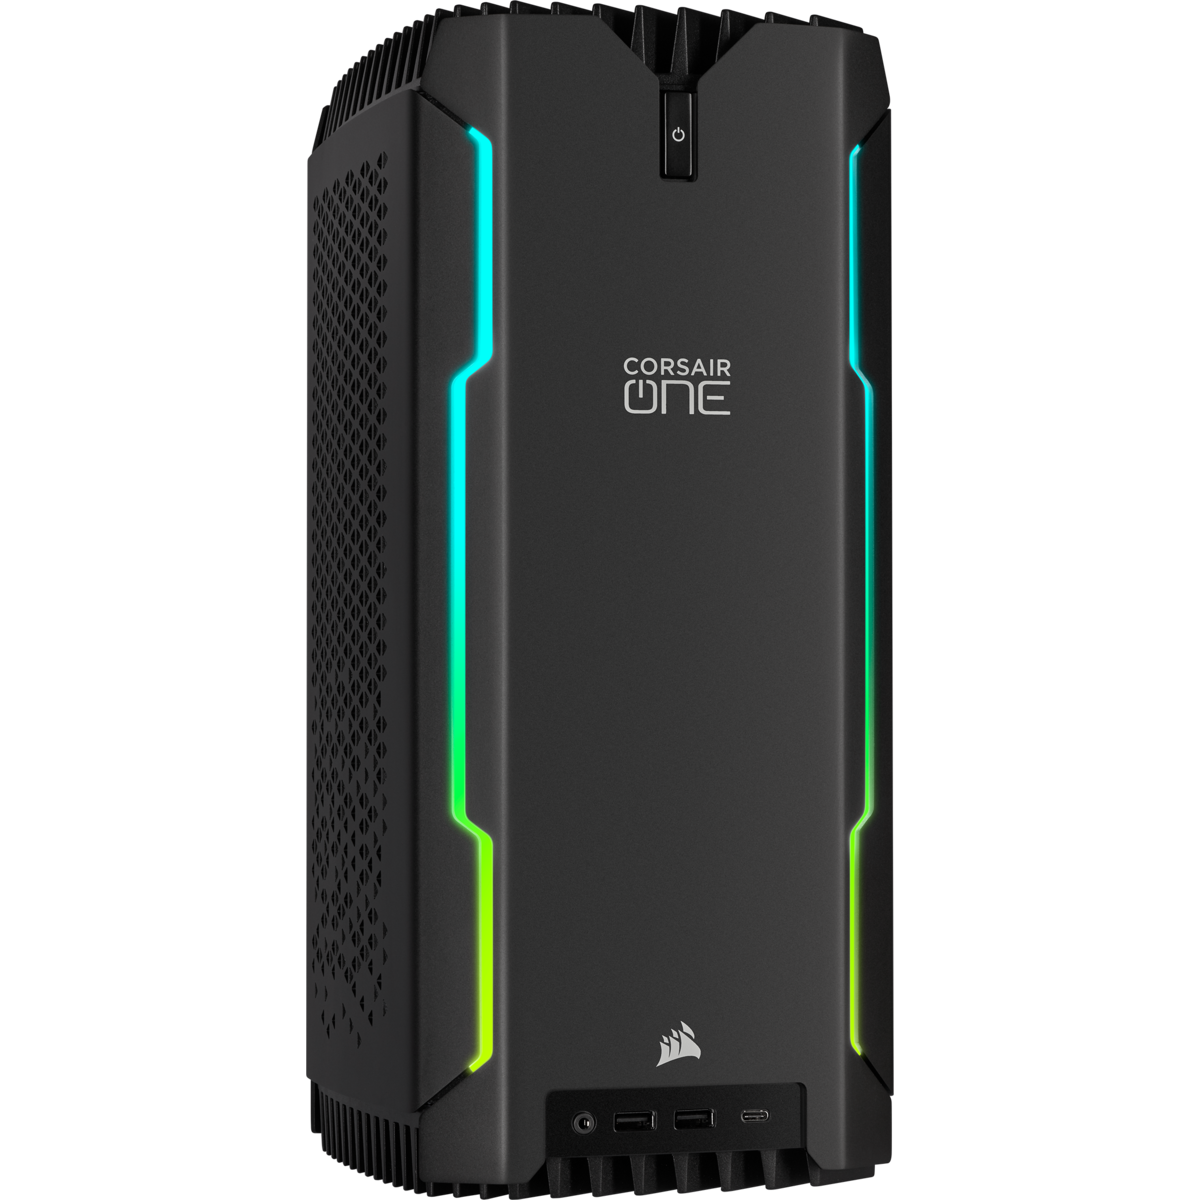
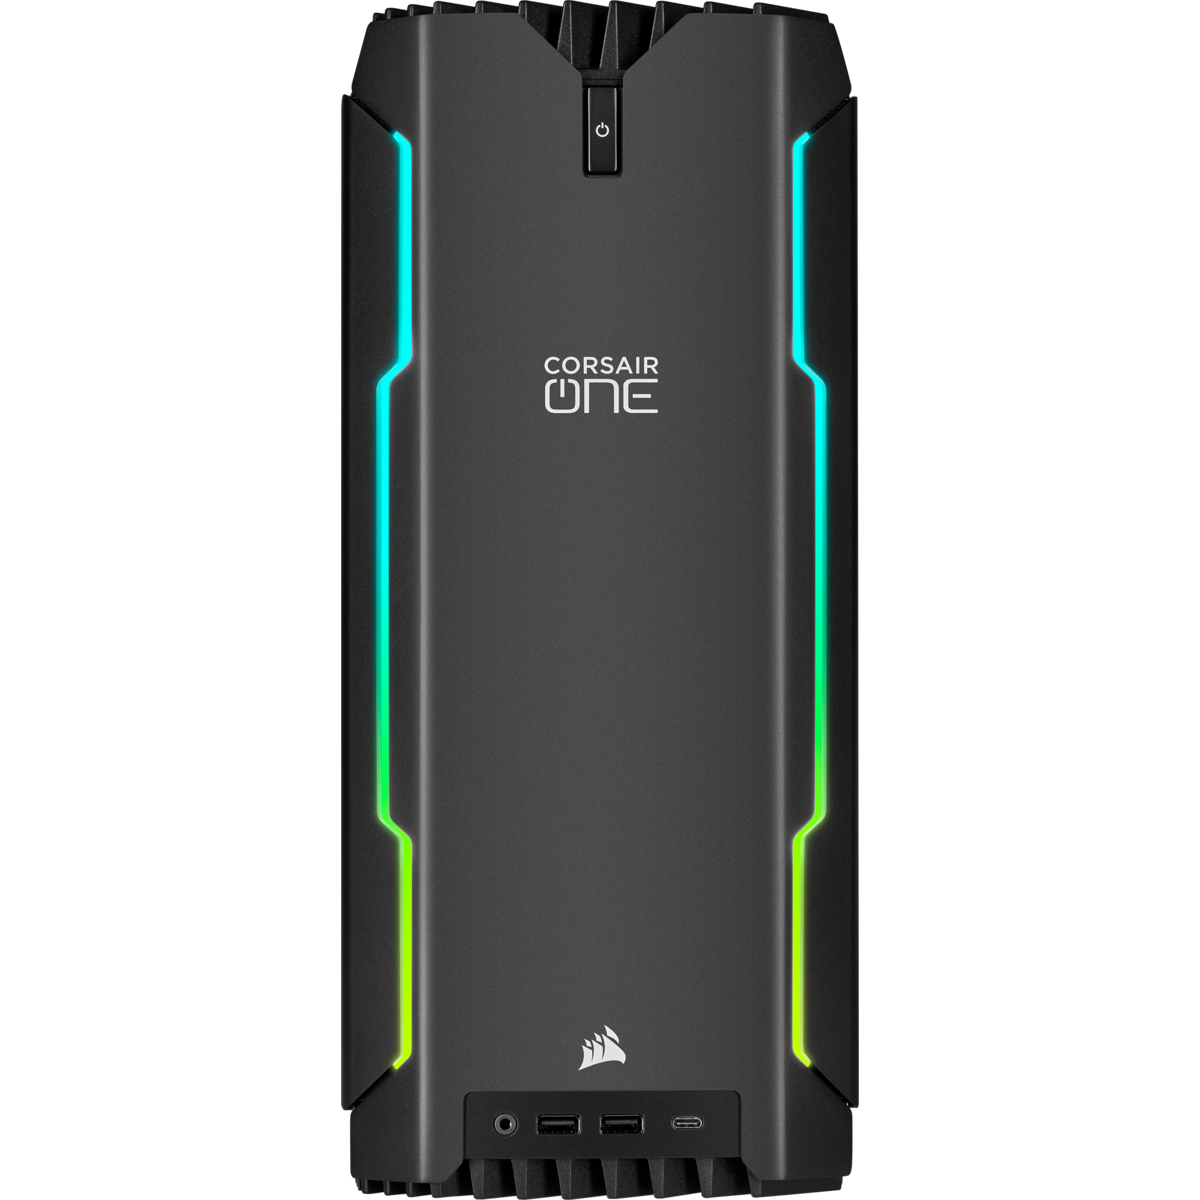
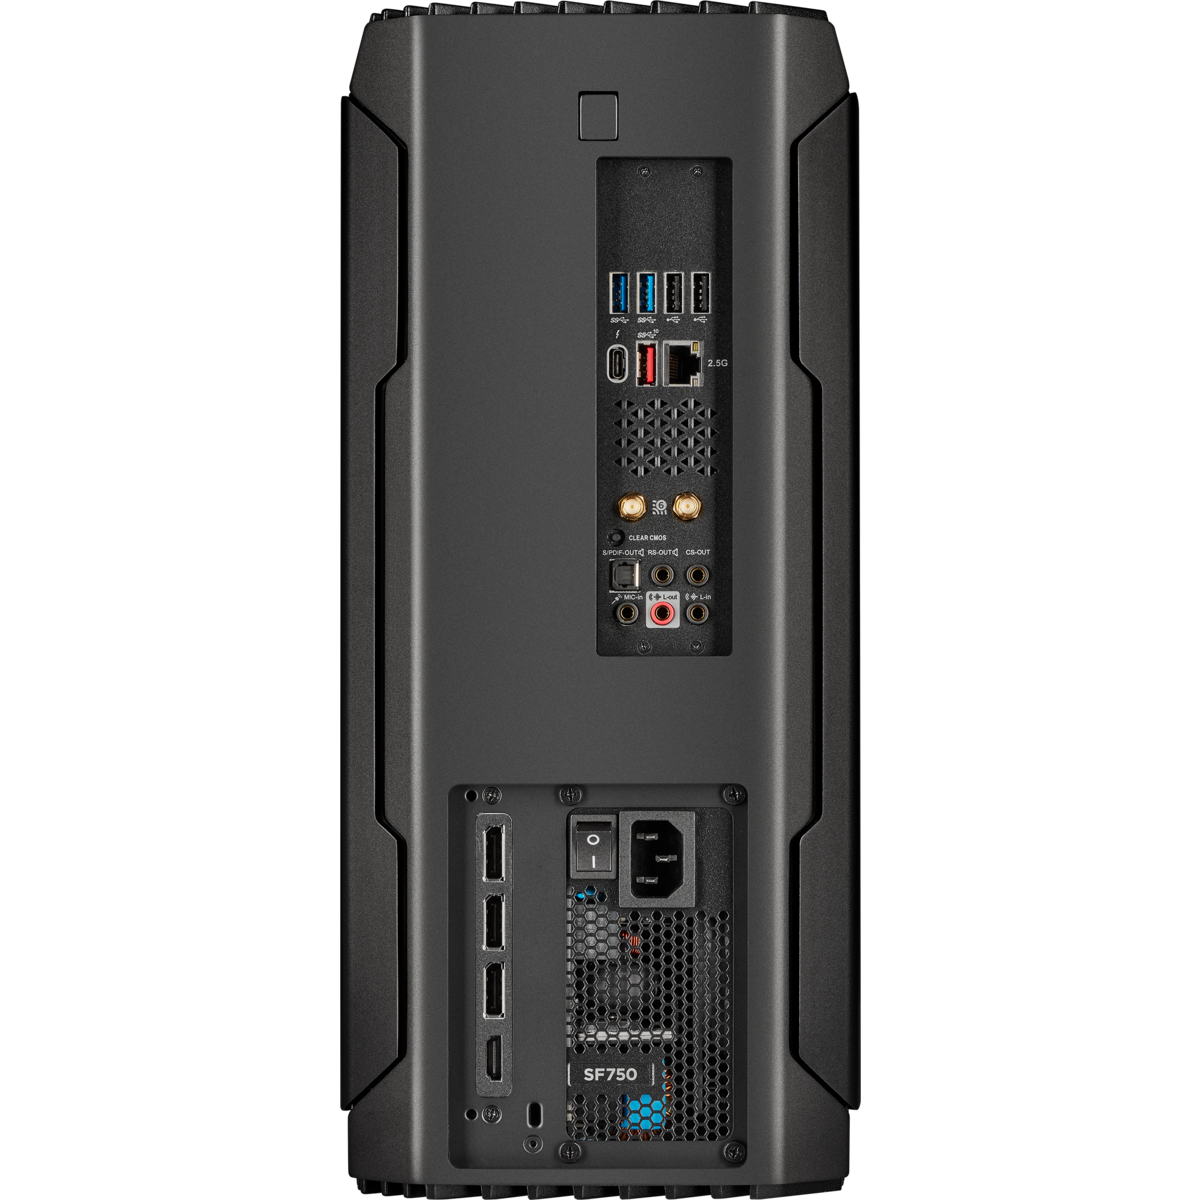
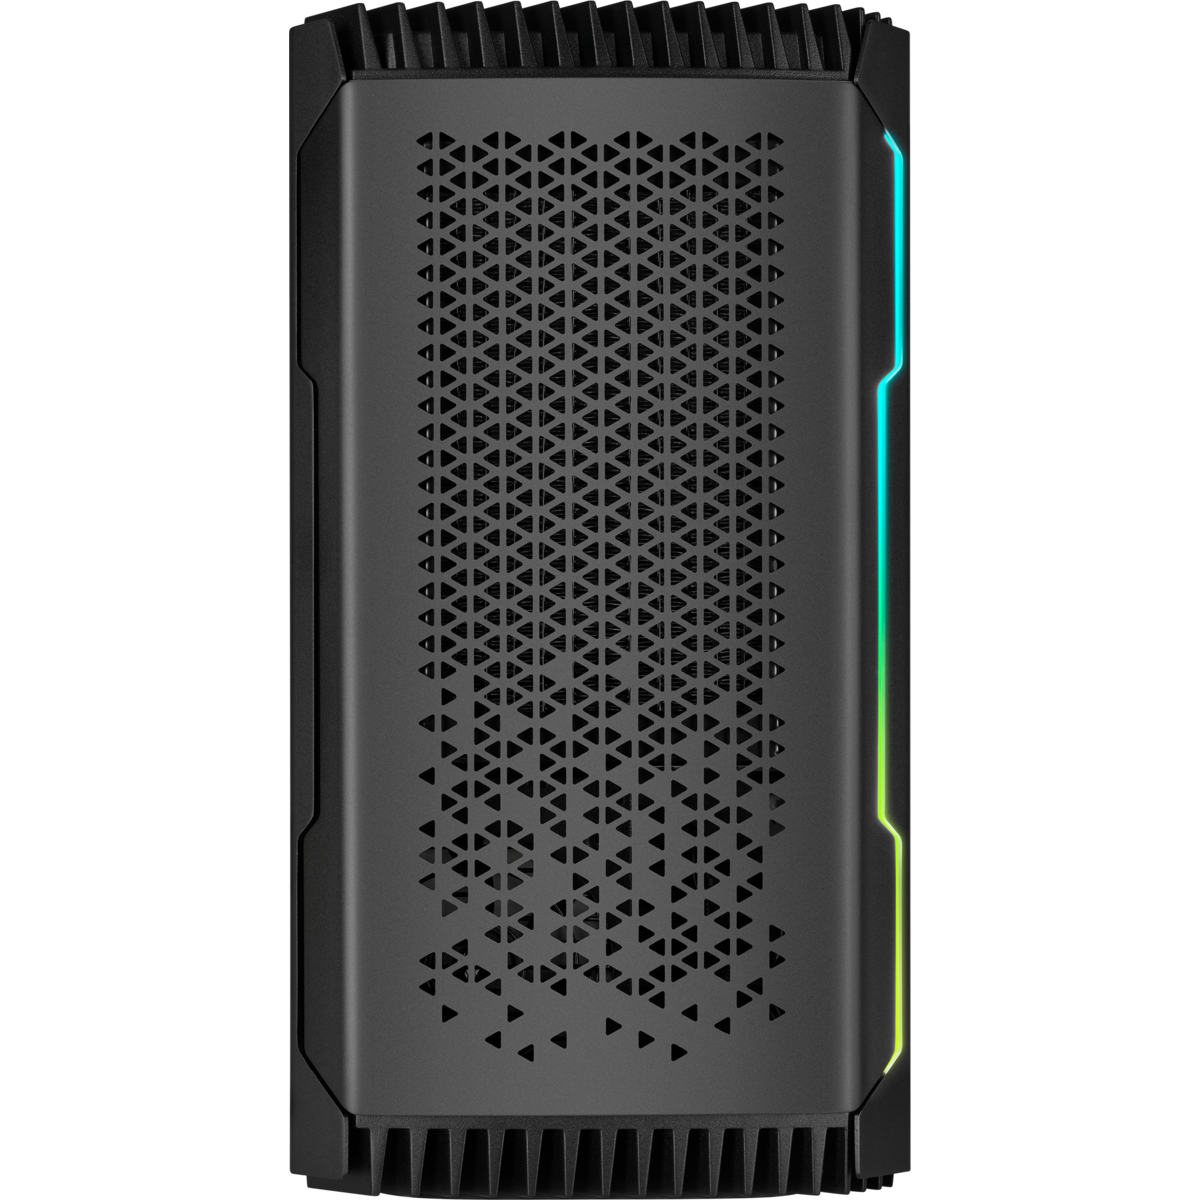
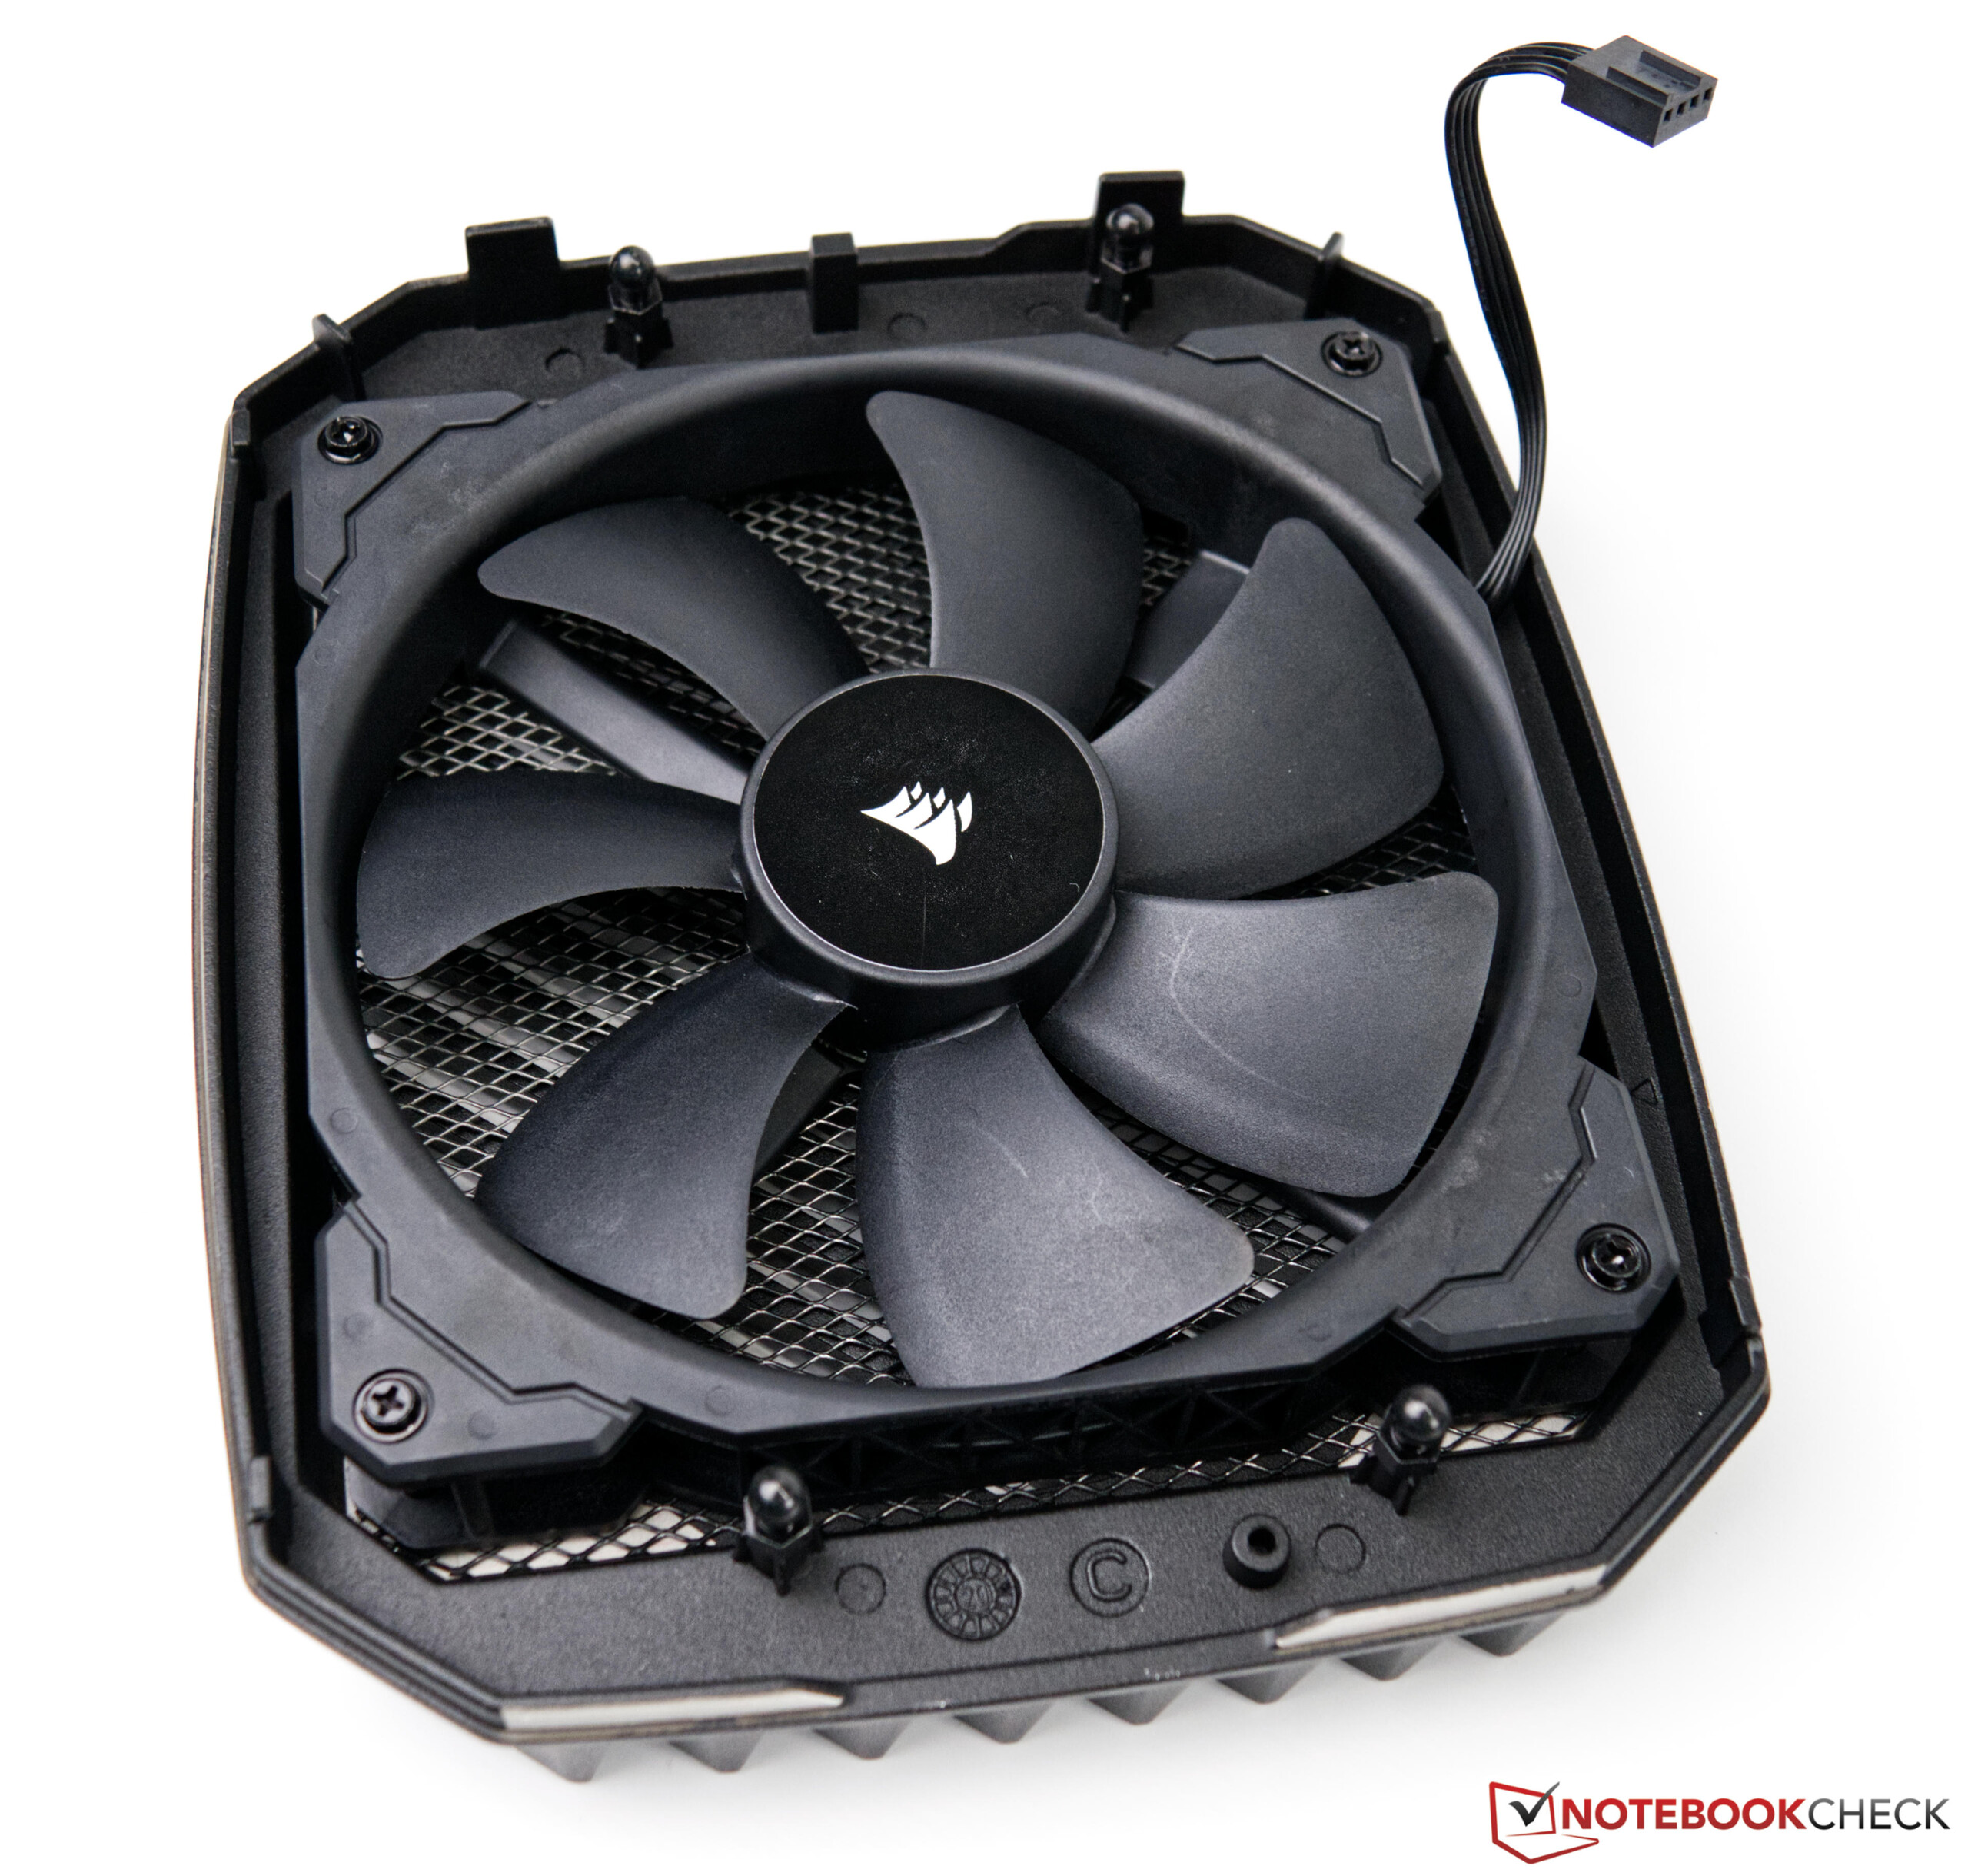
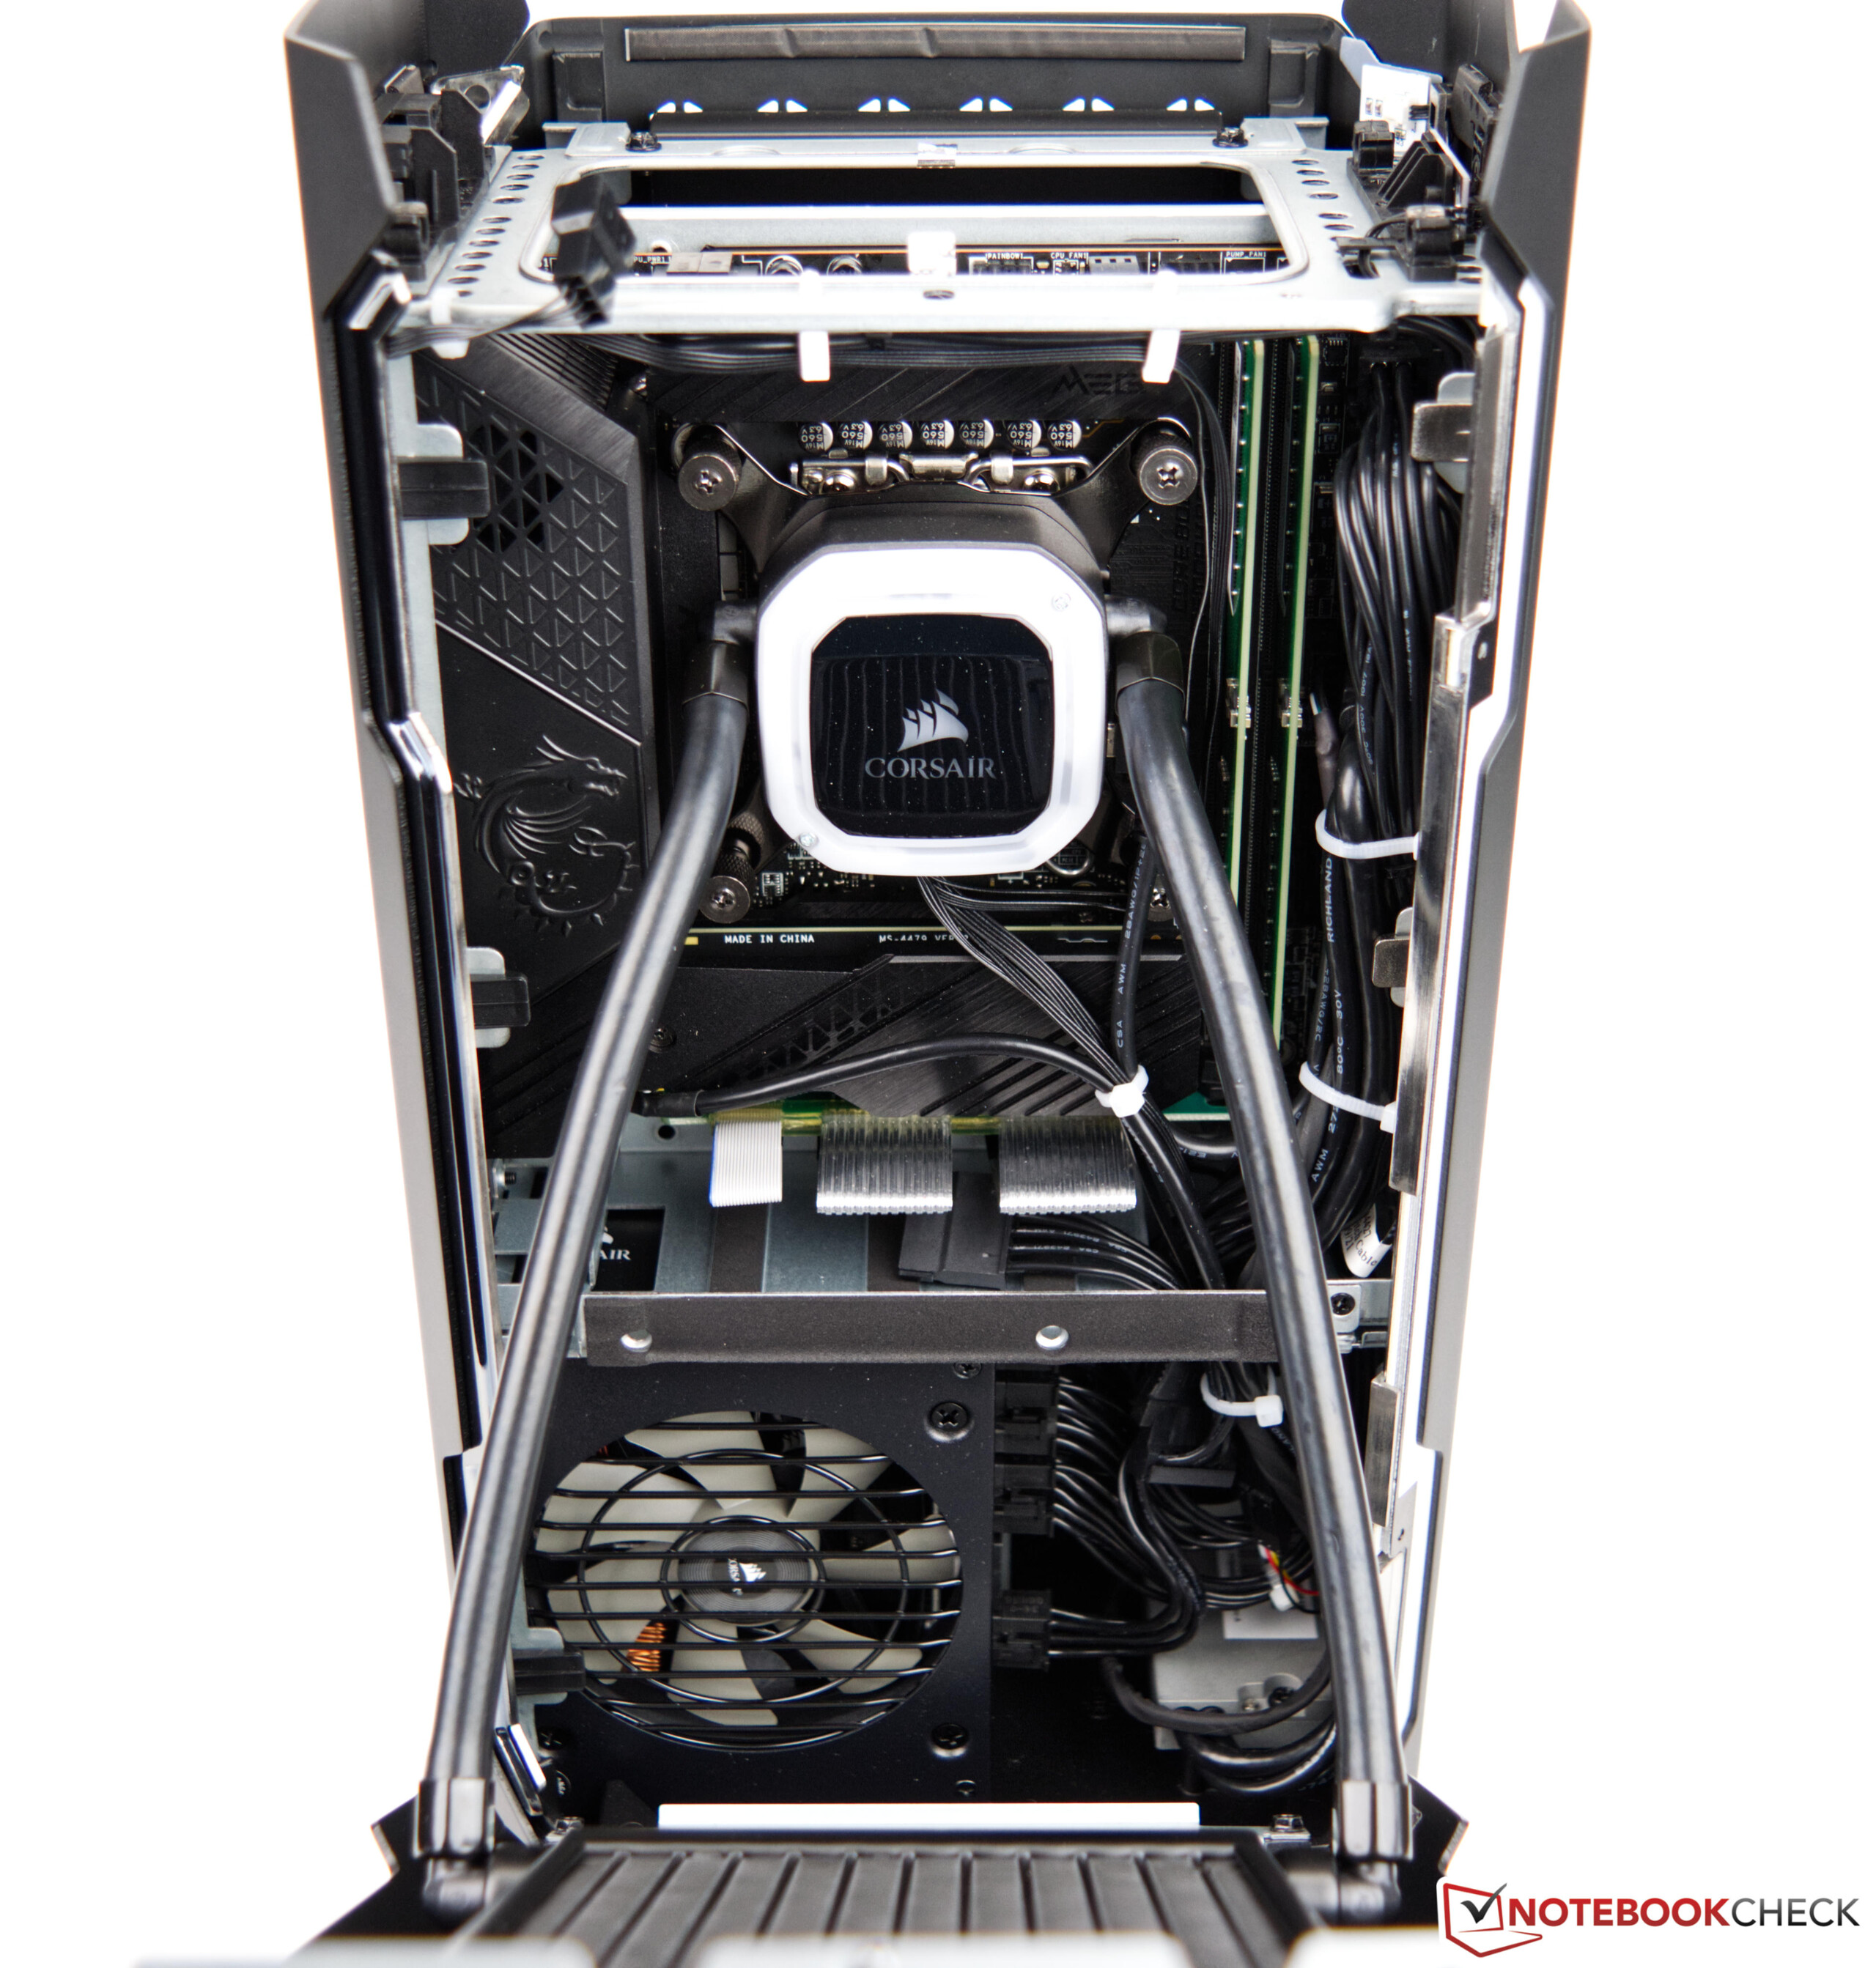
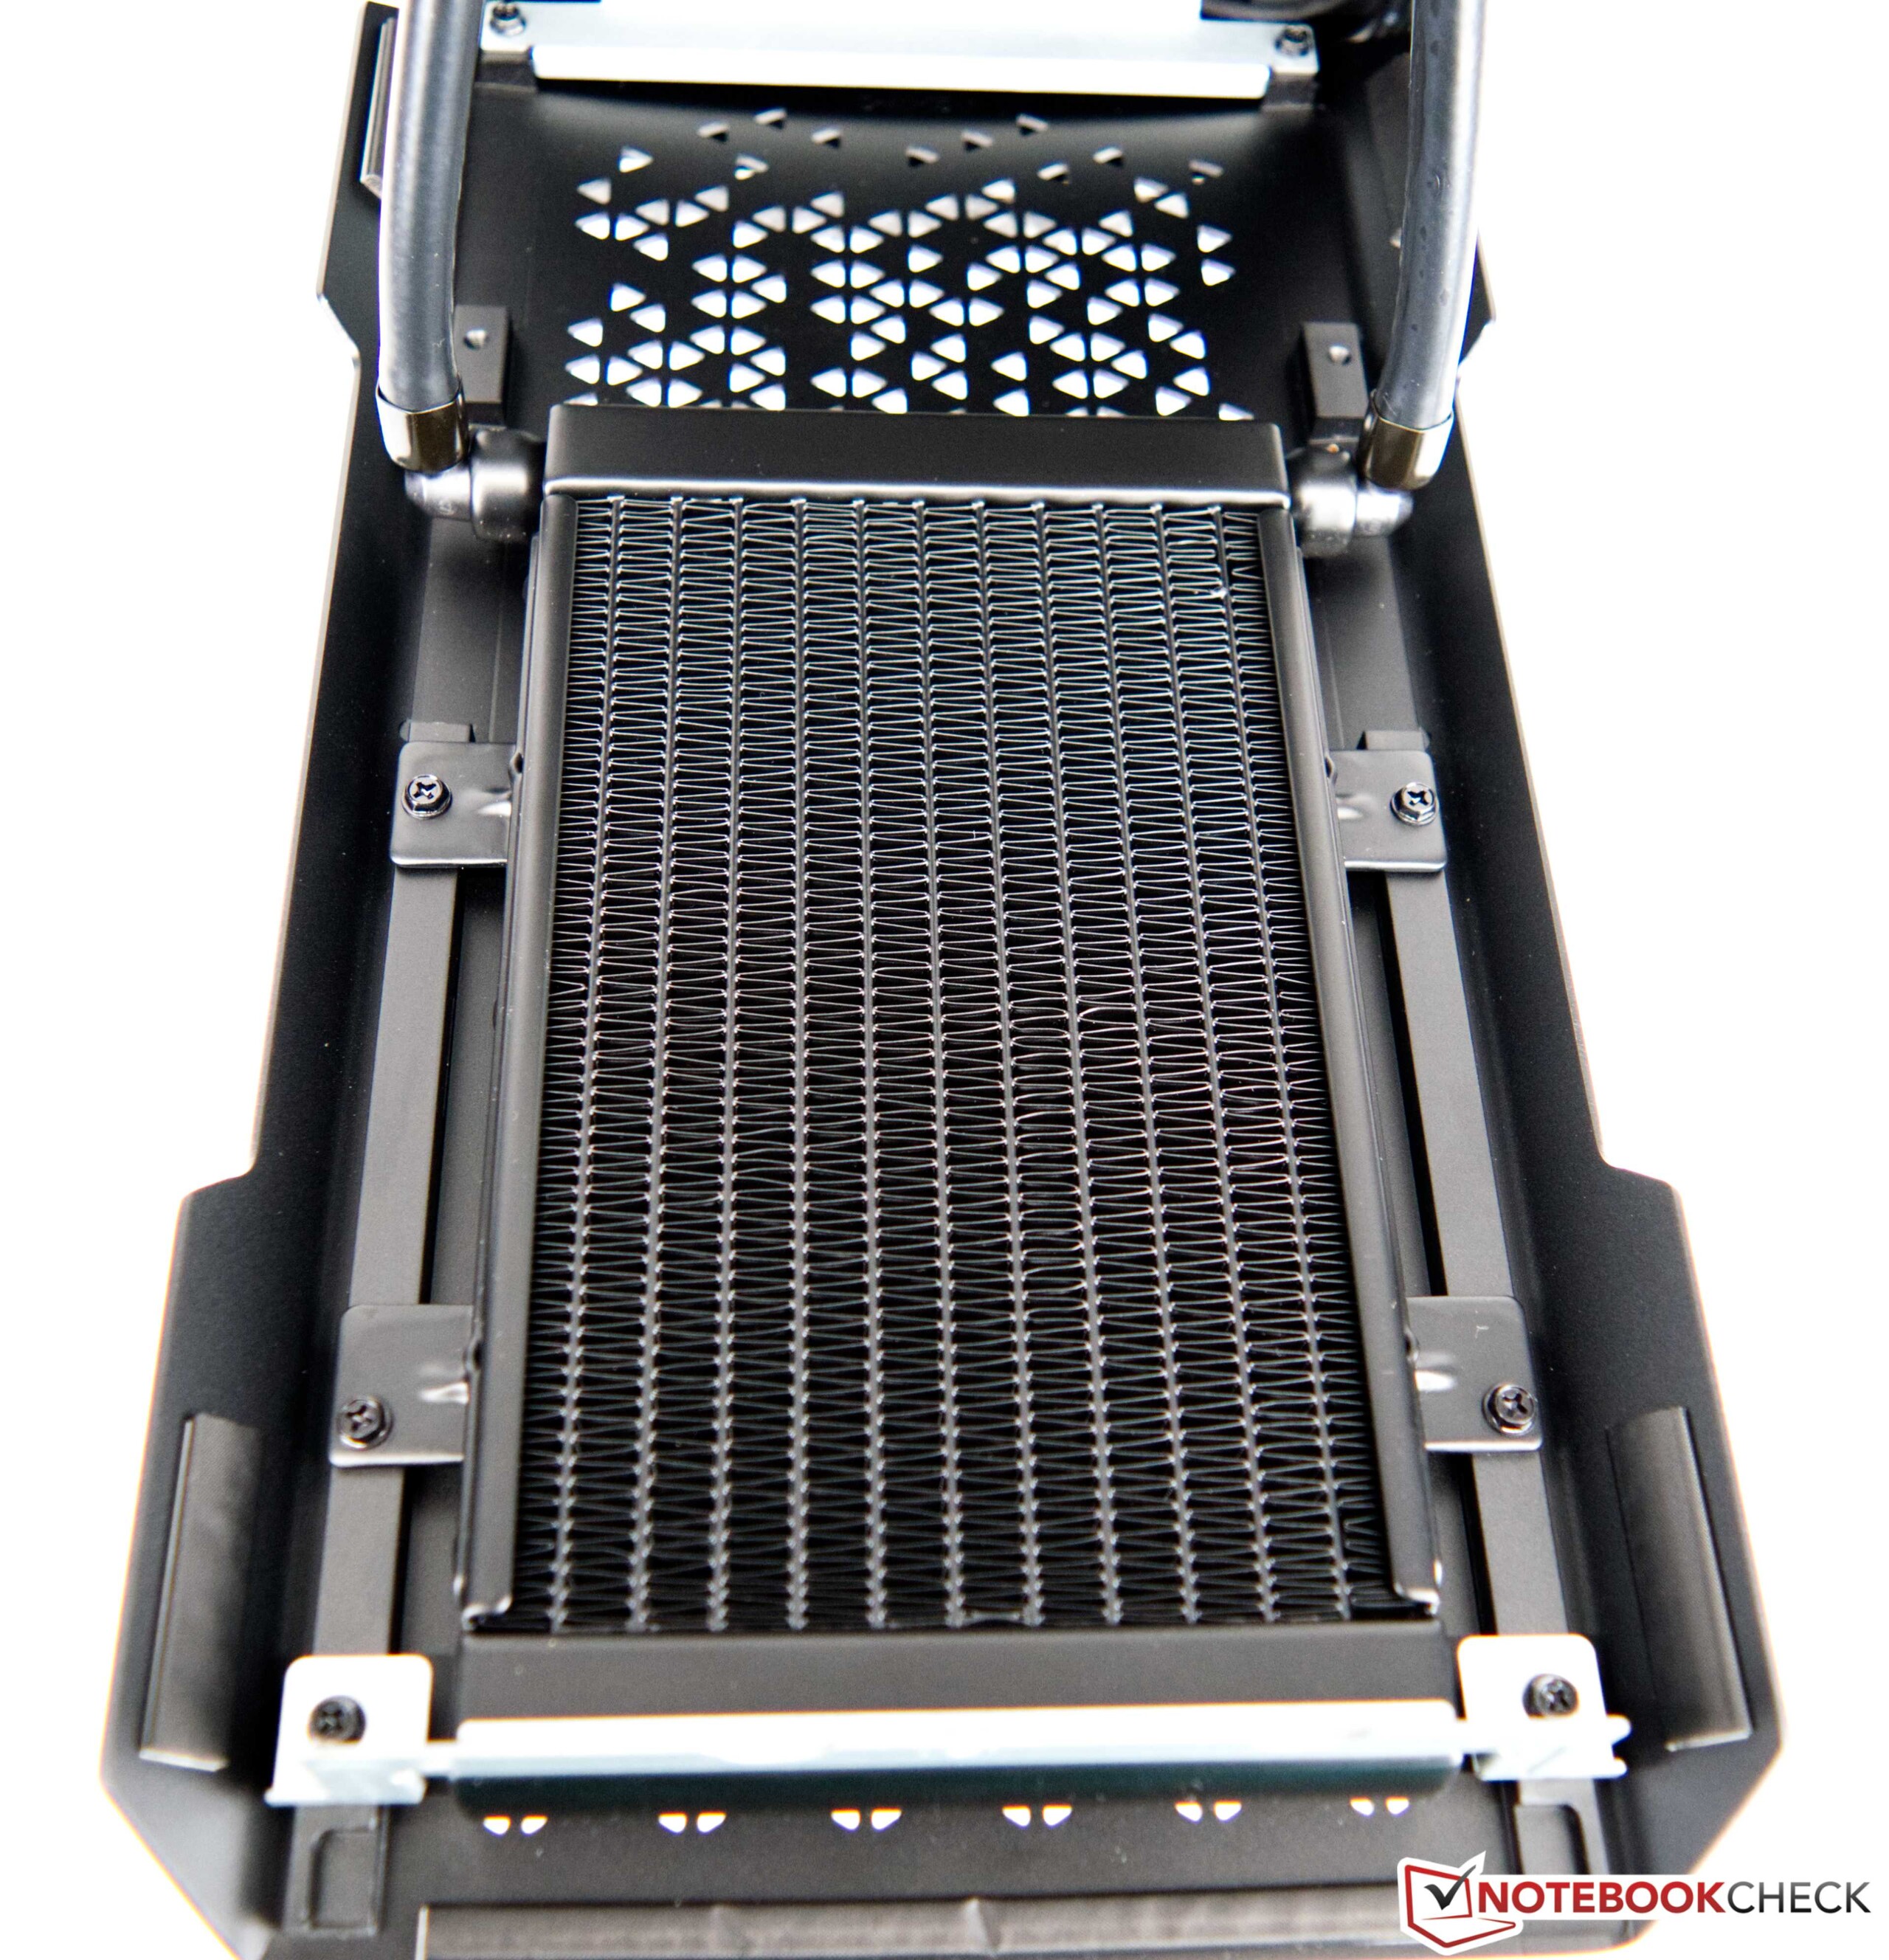
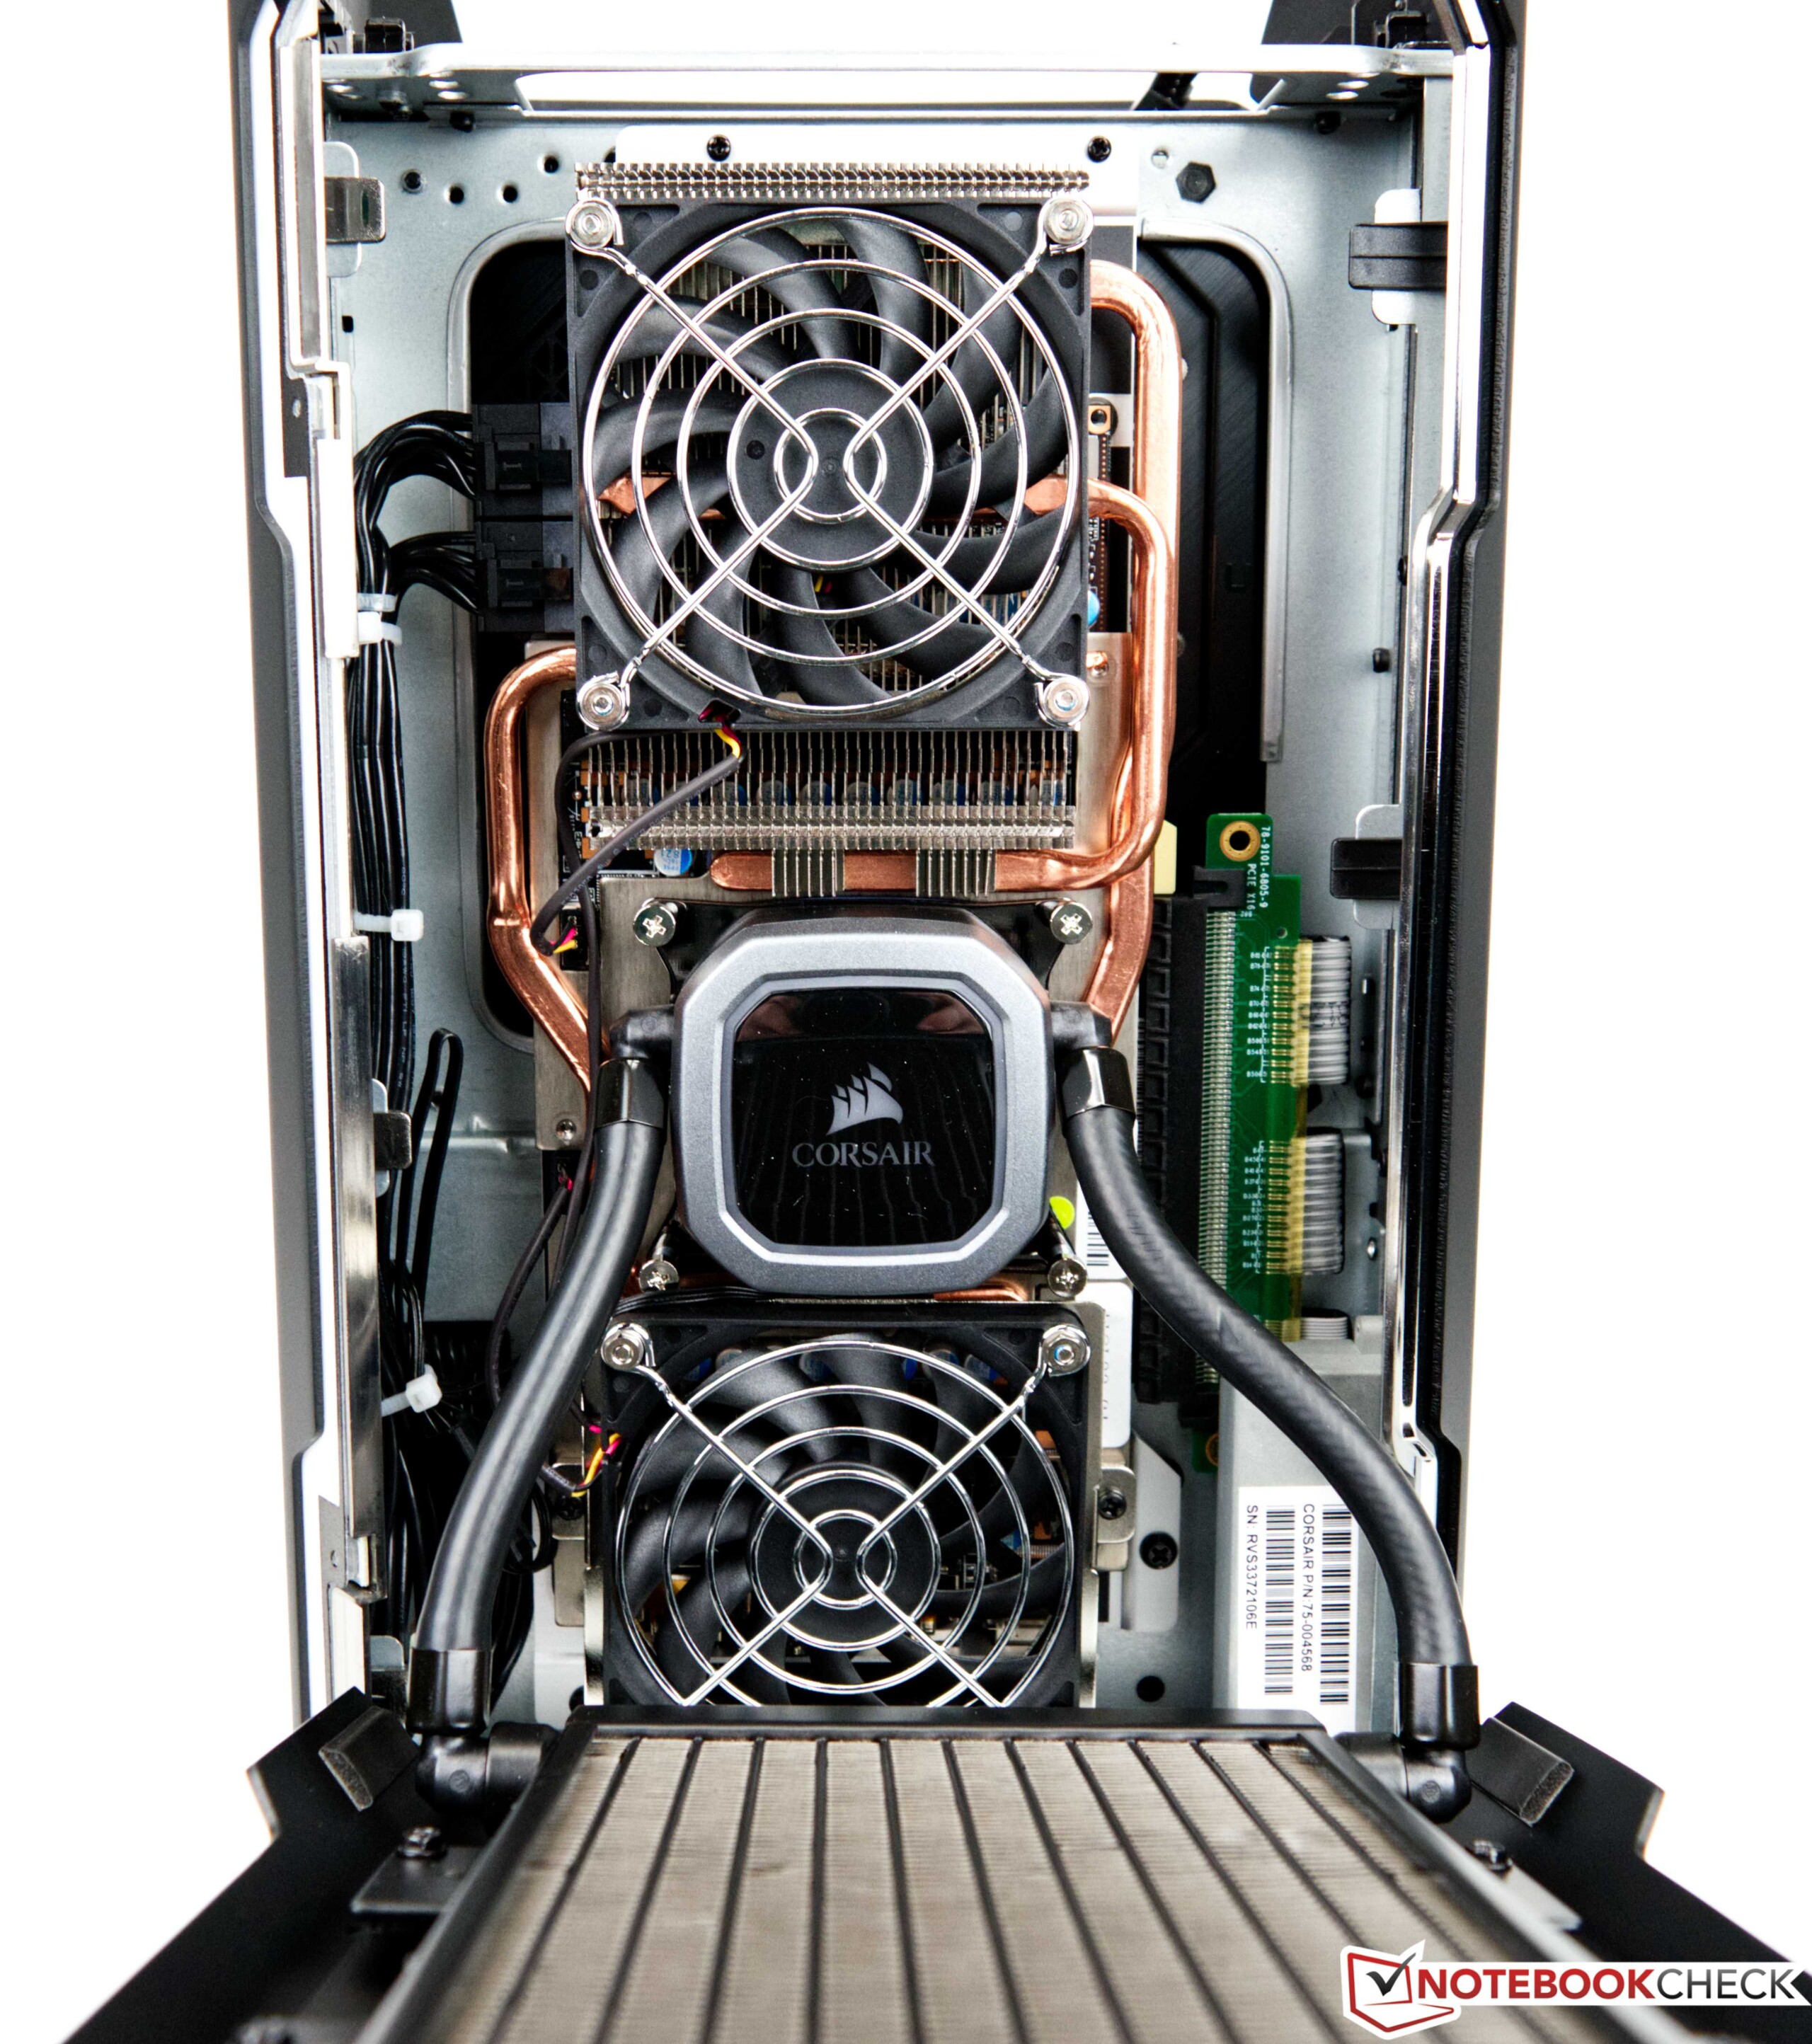
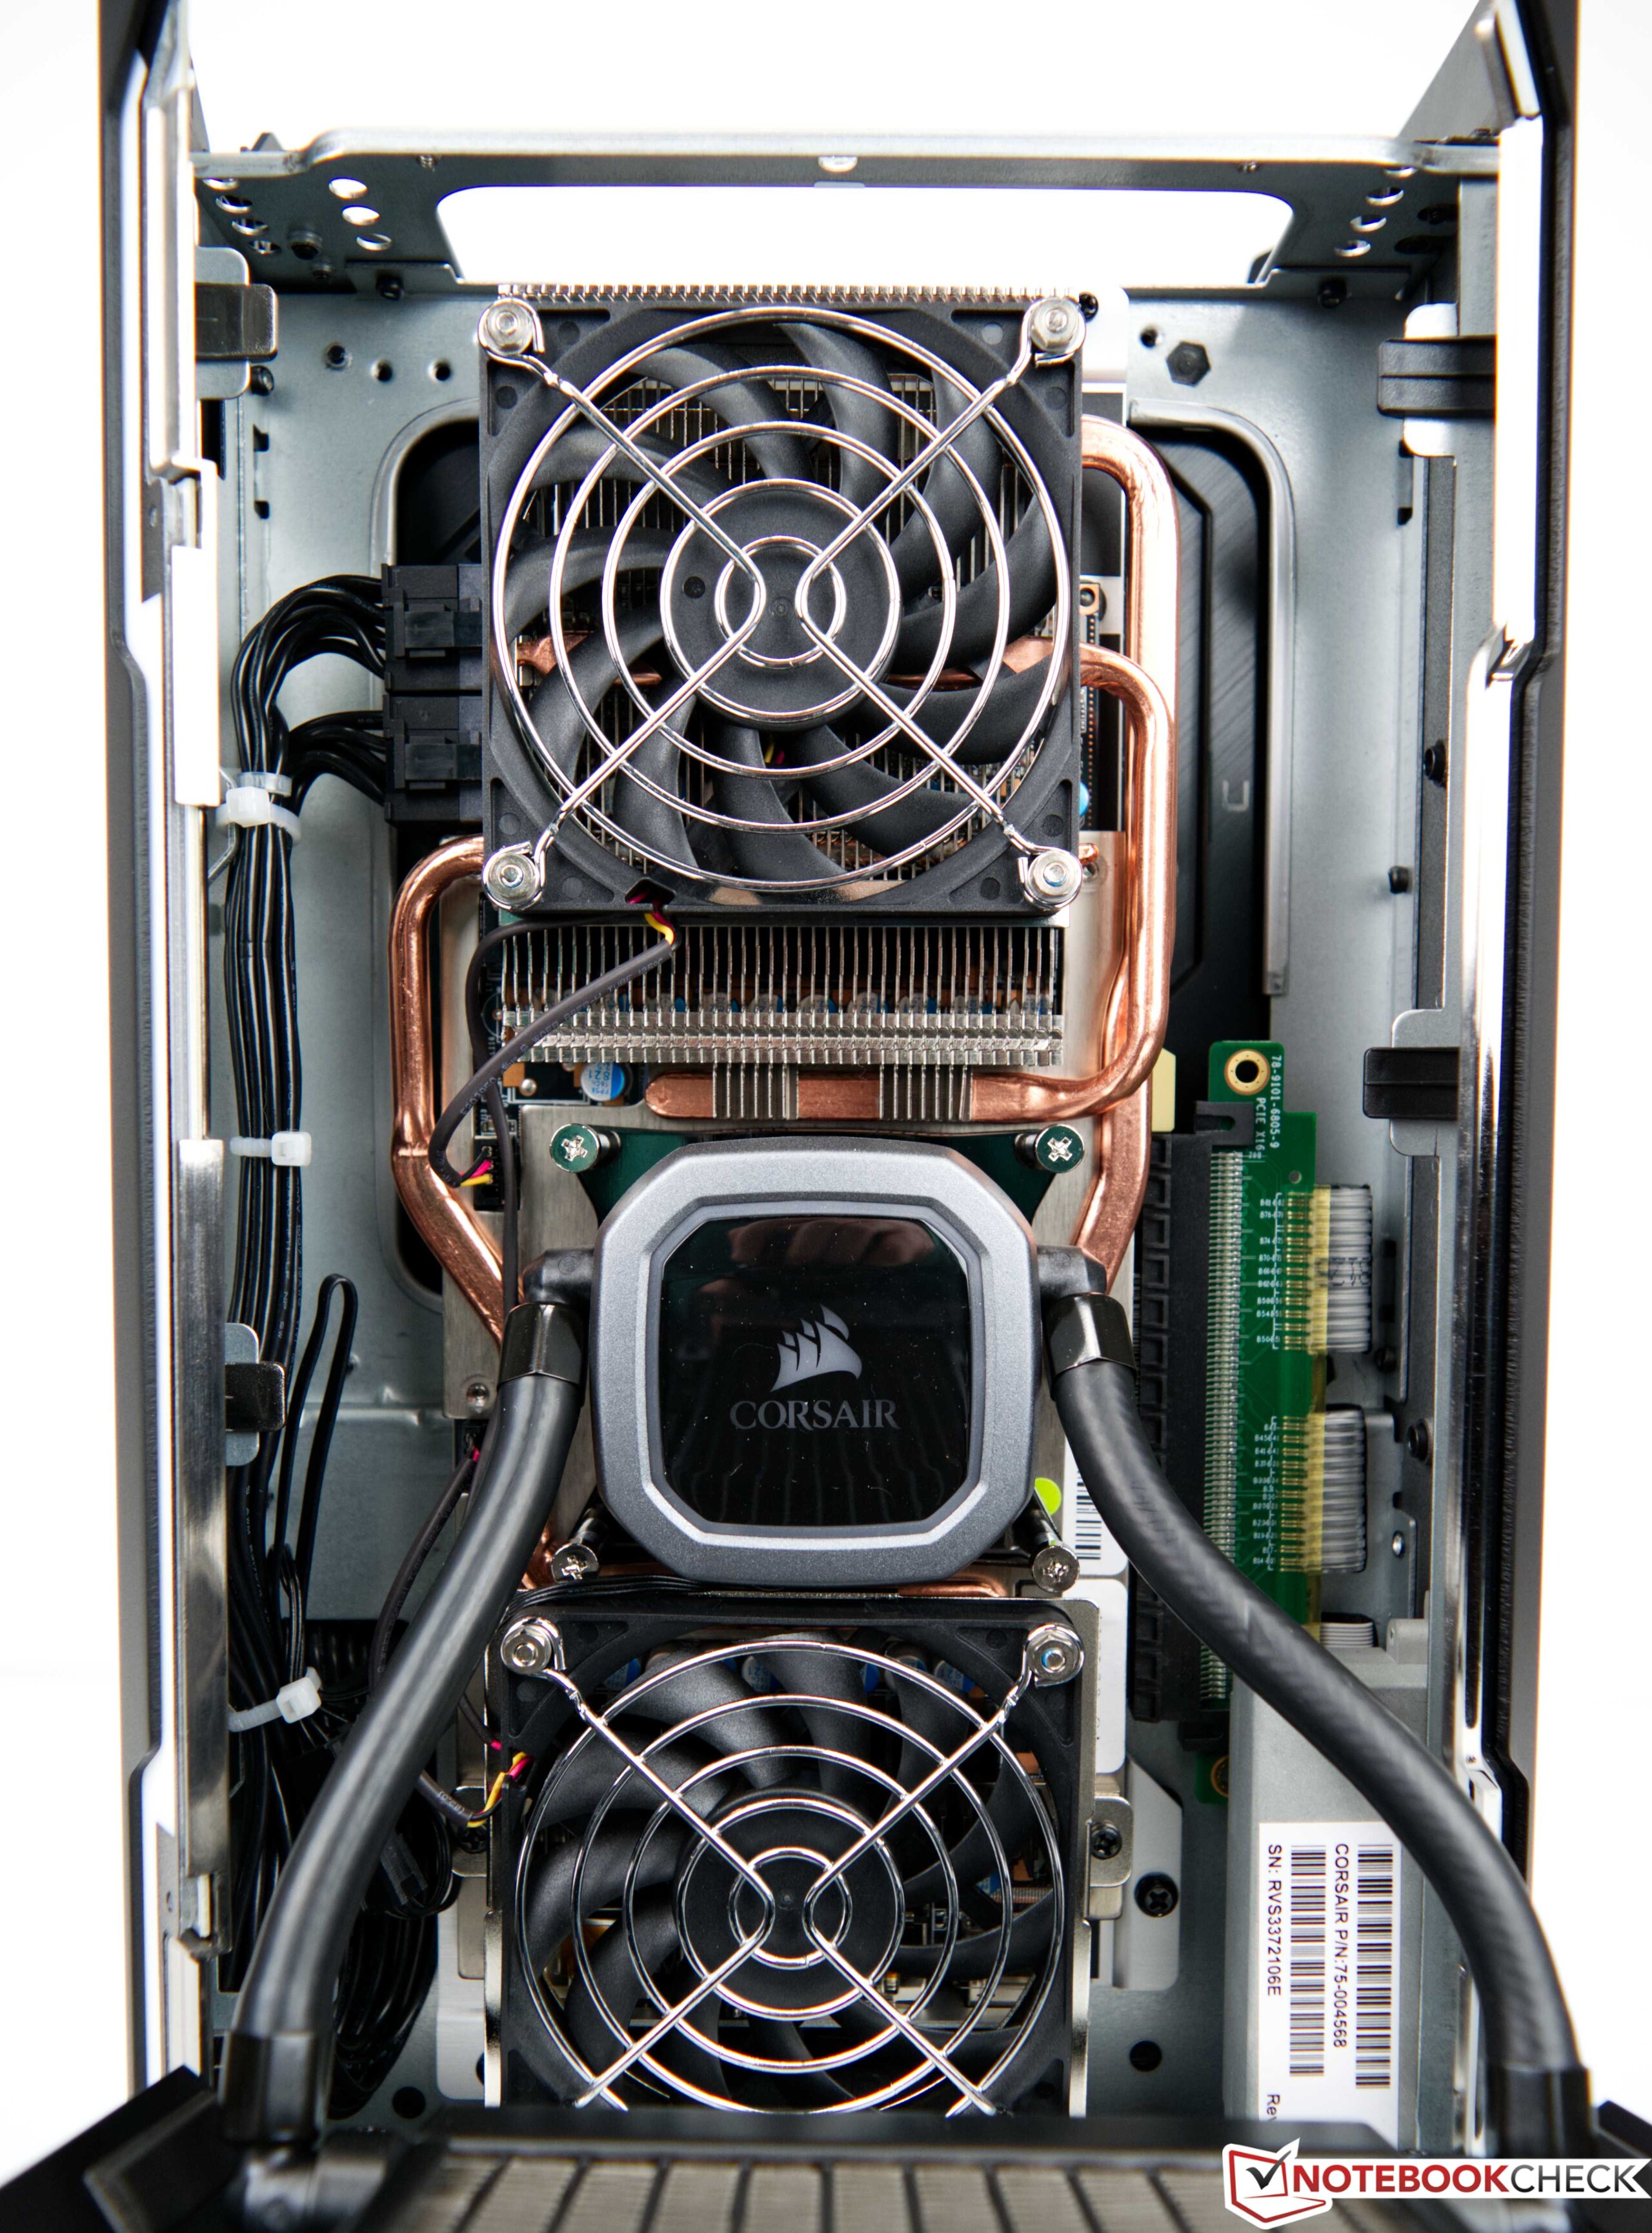
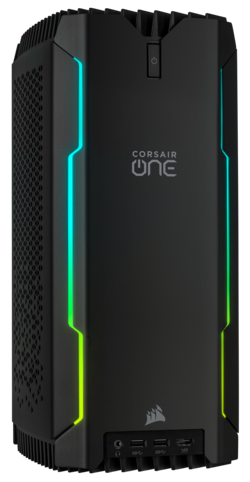
Visivamente, il case del Corsair One i300 difficilmente può essere distinto dalCorsair One i160e in termini di scelta dei materiali, il produttore ha anche mantenuto lo stesso concetto con tutte le superfici in metallo che offre un'impressione di alta qualità non solo in termini di aspetto. Anche l'aptica dà l'impressione di avere sempre un prodotto di alta qualità tra le mani. Il design nero e modesto è caratterizzato da due barre luminose RGB nella parte anteriore, che possono essere regolate secondo le vostre preferenze utilizzando il software iCUE. La lavorazione è al top, e non abbiamo visto alcun difetto. Il design degli interni offre spazio per due sistemi di raffreddamento ad acqua indipendenti per CPU e GPU.
Nonostante la sua compattezza, il piccolo PC porta 7,5 kg sulla bilancia. Non ve lo aspettereste a prima vista, ma questo conferma anche i materiali utilizzati, poiché in un case così piccolo, tutto il possibile deve essere utilizzato per trasferire il calore creato

Attrezzatura - Il più attuale
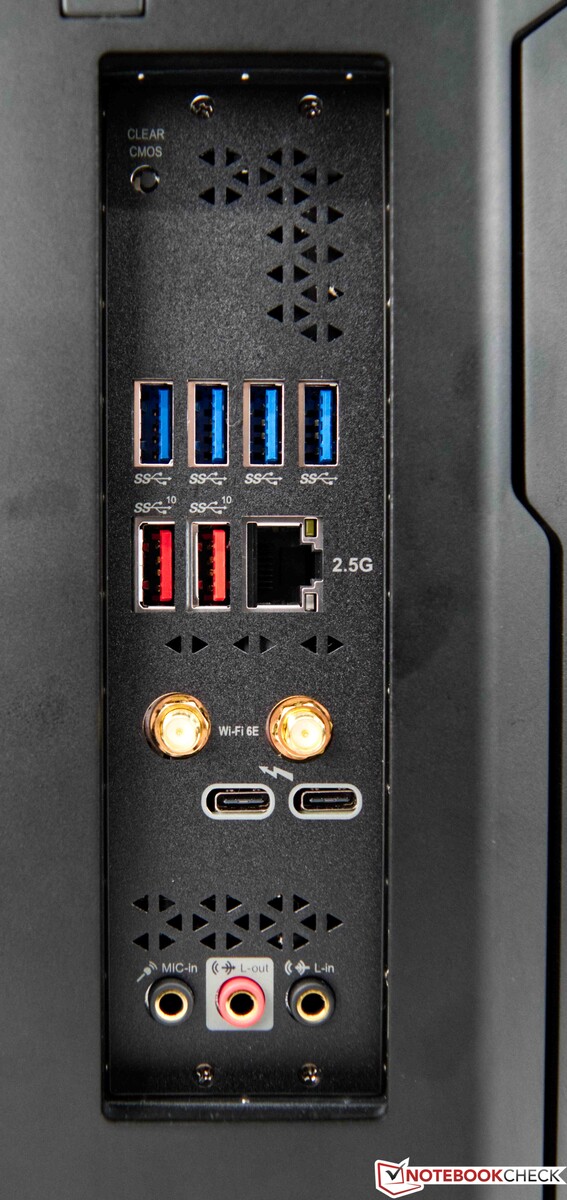
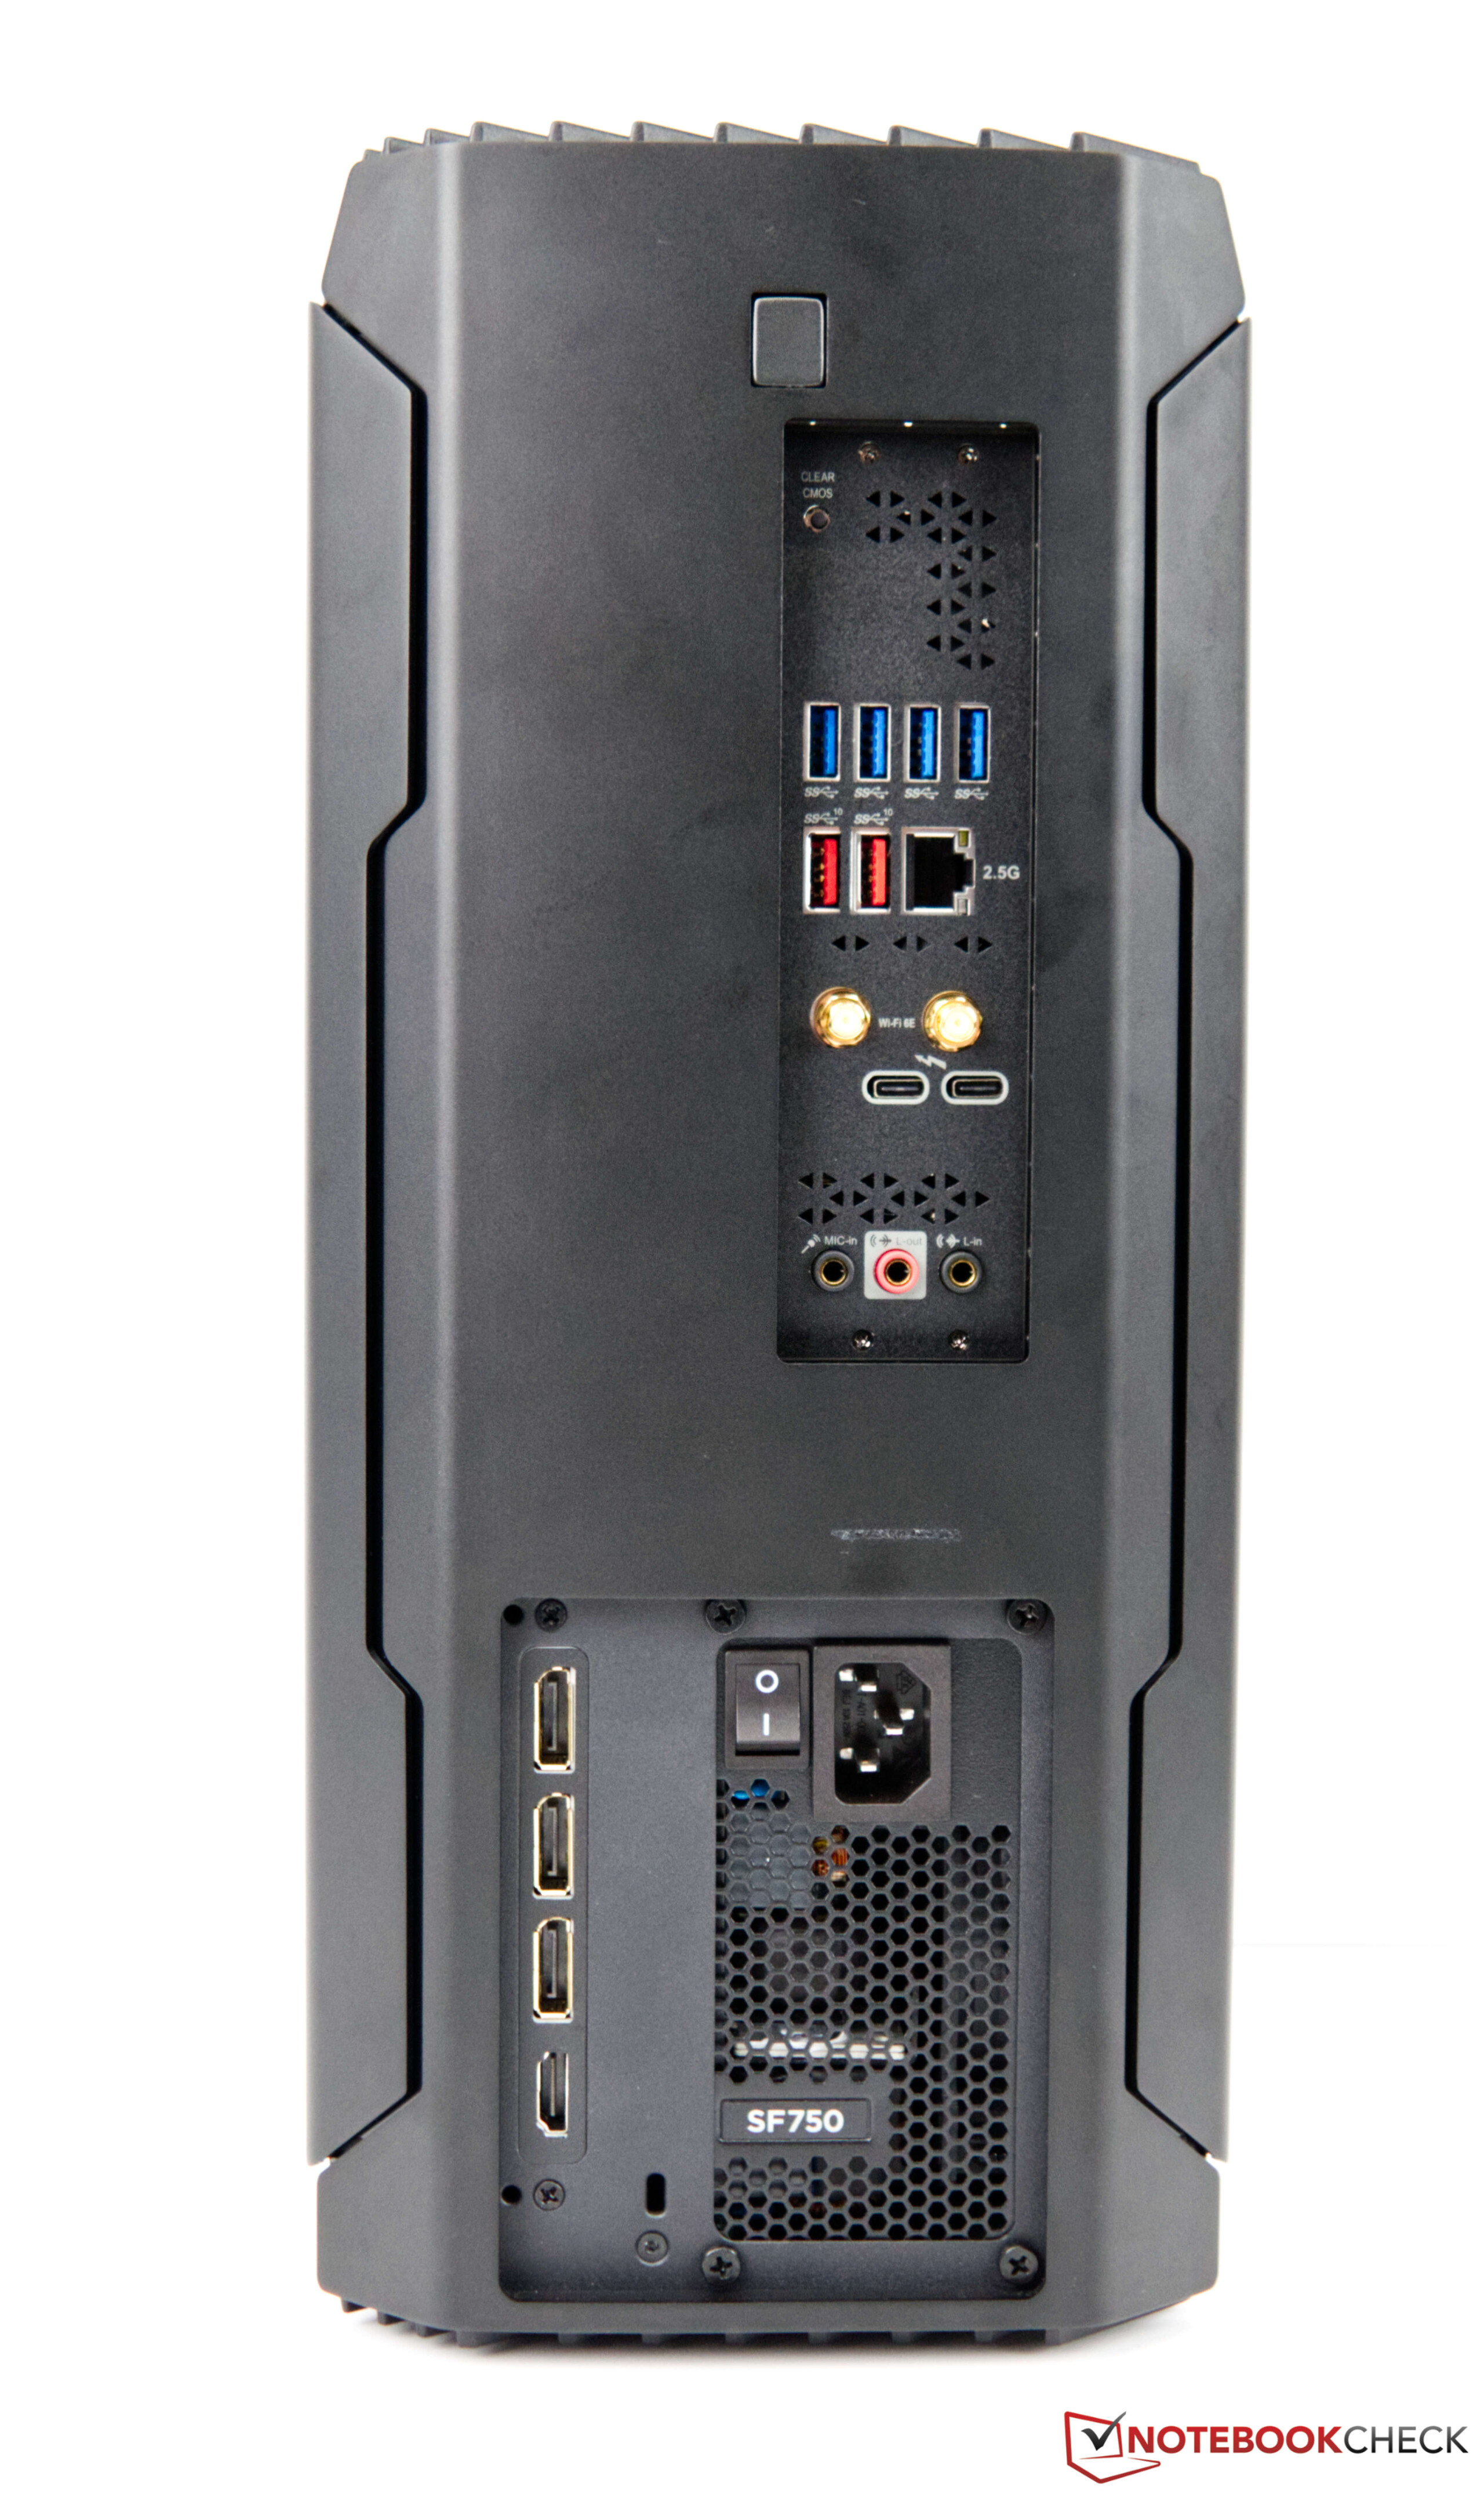
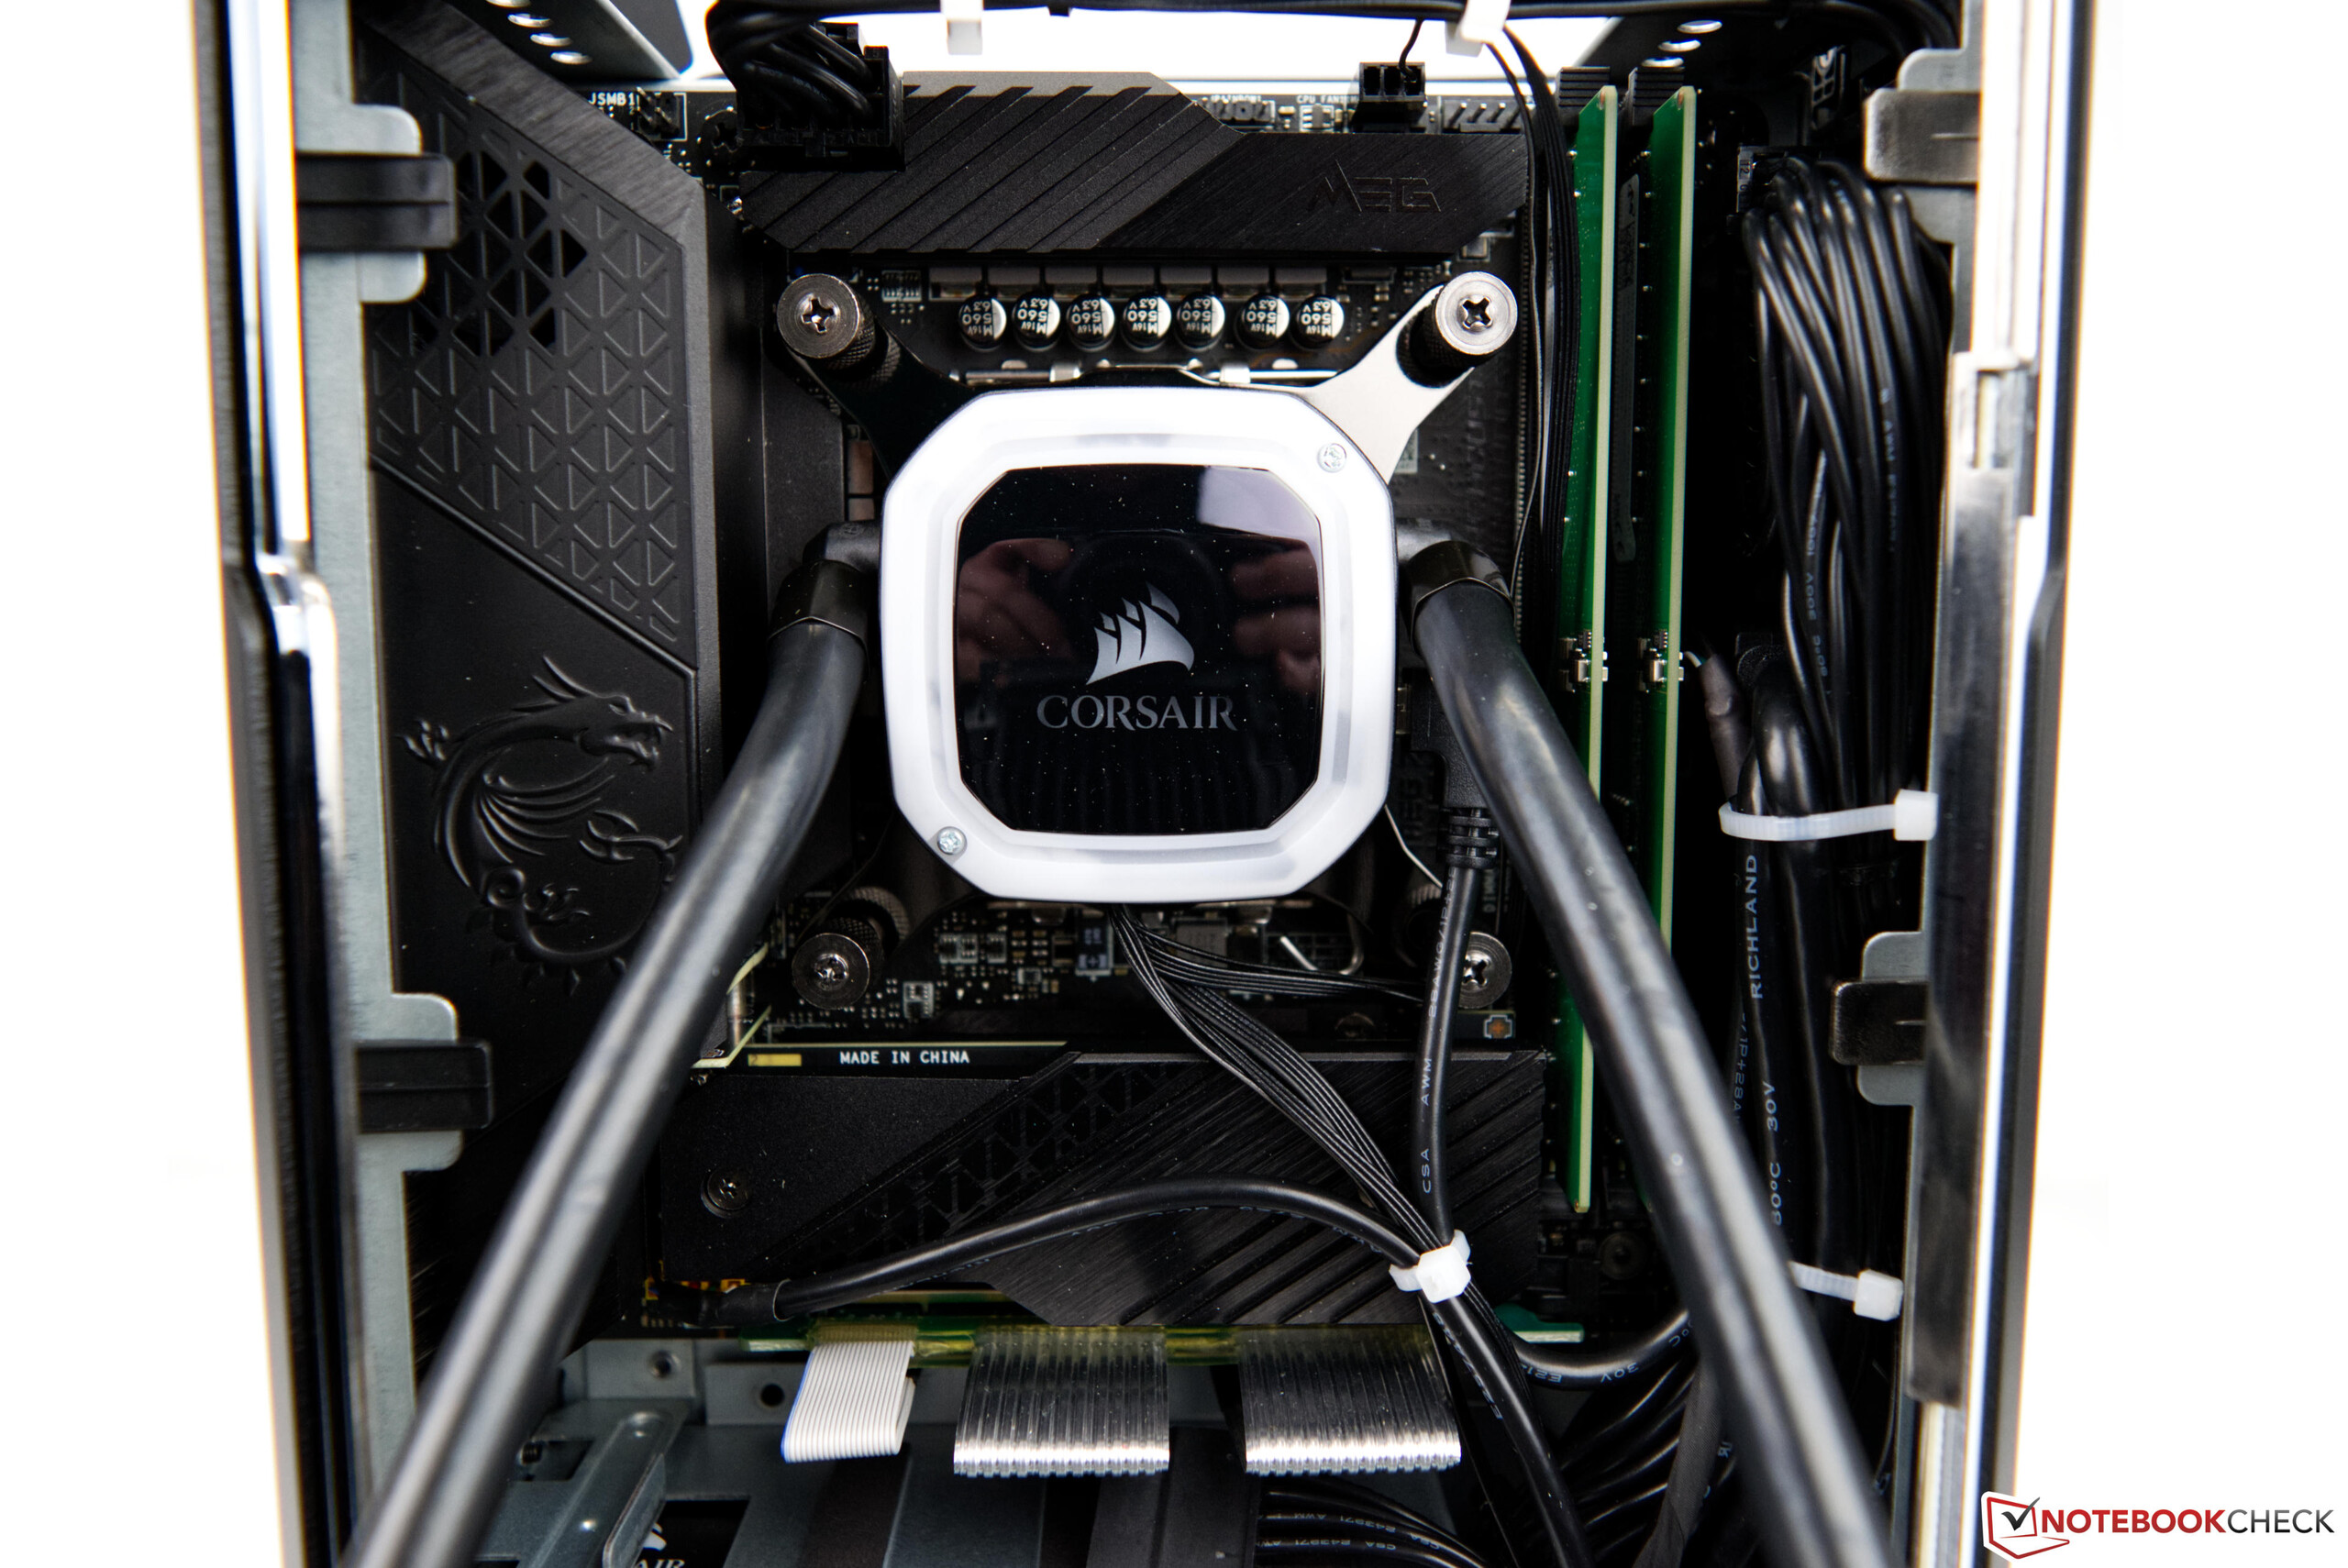
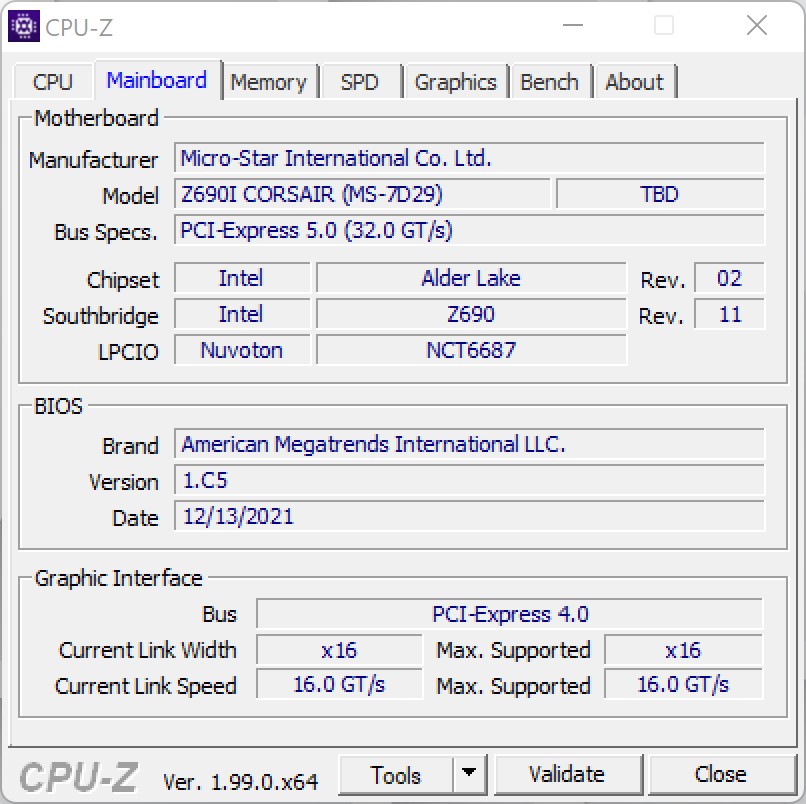
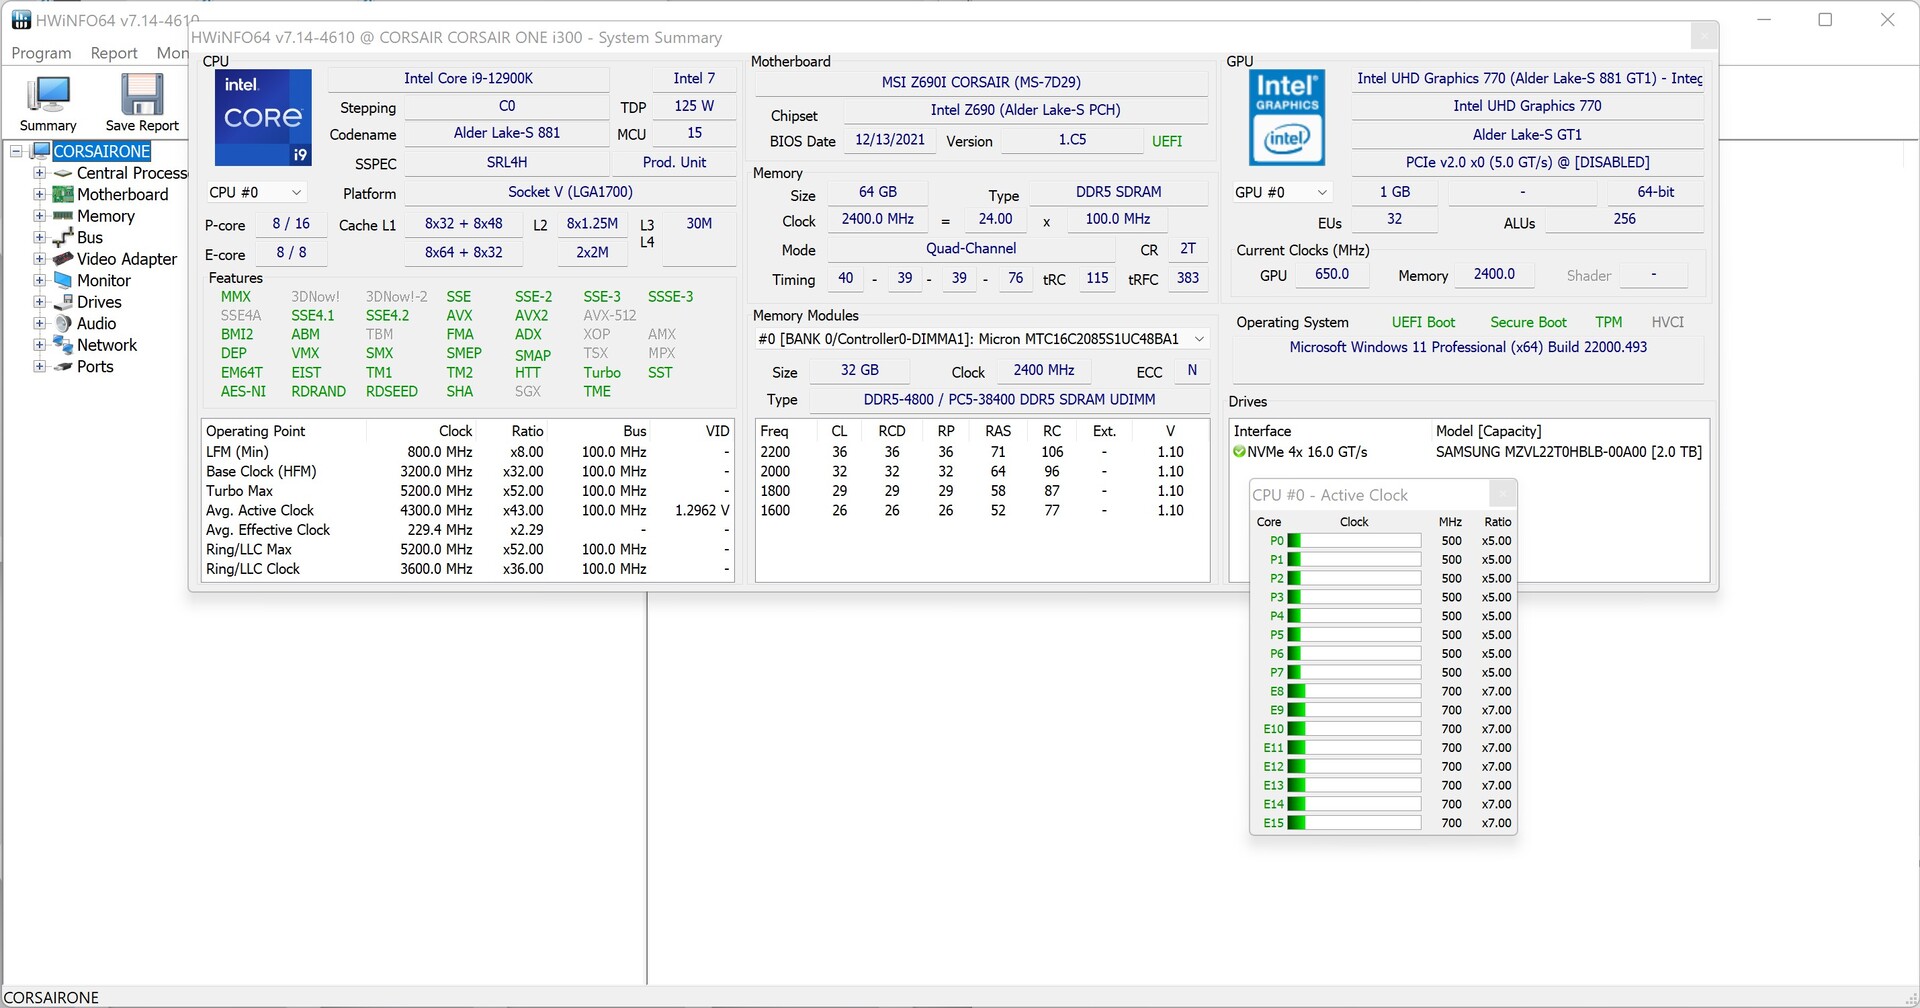
Nel One i300, Corsair utilizza una scheda madre Mini-ITX convenzionale di MSI. Per essere precisi, Corsair utilizza la MSI MEG Z690I Unify nella nostra unità di test. Con questo, il PC desktop è anche ben equipaggiato con connessioni esterne. Ci sono un totale di 8 porte USB sul retro, due delle quali supportano anche Thunderbolt 4. La parte anteriore ospita altre 3 porte USB. La stessa Nvidia GeForce RTX 3080 Ti aggiunge anche 3 DisplayPort e una connessione HDMI.
In termini di connessioni di rete, l'utente può scegliere tra WLAN allo standard più attuale o Ethernet (2.5G).
Comunicazione
Il modulo Intel Wi-Fi 6E AX211 integrato nella scheda principale è il più attuale disponibile, quindi è possibile utilizzare anche le reti Wi-Fi 6G. Utilizzando il nostro attuale router di test, che supporta anche il più recente standard, il Corsair One i300 offre velocità di trasferimento veloci e stabili nel nostro test WLAN.
Nota: poiché la nostra unità di test ci è stata purtroppo inviata senza le antenne WLAN originali, abbiamo eseguito questo test utilizzando antenne alternative. Al momento non siamo in grado di dire se le velocità di trasferimento sono anche solo leggermente migliori quando si usano le antenne originali.
| Networking | |
| iperf3 transmit AX12 | |
| Asus ROG Flow Z13 GZ301ZE | |
| Media Intel Wi-Fi 6E AX211 (1003 - 1501, n=4) | |
| Huawei MateBook 13s i5 11300H | |
| iperf3 receive AX12 | |
| Media Intel Wi-Fi 6E AX211 (1178 - 1623, n=4) | |
| Asus ROG Flow Z13 GZ301ZE | |
| Huawei MateBook 13s i5 11300H | |
| iperf3 receive AXE11000 | |
| MSI Stealth GS66 12UGS | |
| Media Intel Wi-Fi 6E AX211 (582 - 1890, n=276) | |
| Corsair One i300 | |
| Media della classe Desktop (n=1ultimi 2 anni) | |
| iperf3 transmit AXE11000 | |
| Corsair One i300 | |
| Media Intel Wi-Fi 6E AX211 (64 - 1921, n=276) | |
| Media della classe Desktop (n=1ultimi 2 anni) | |
Manutenzione
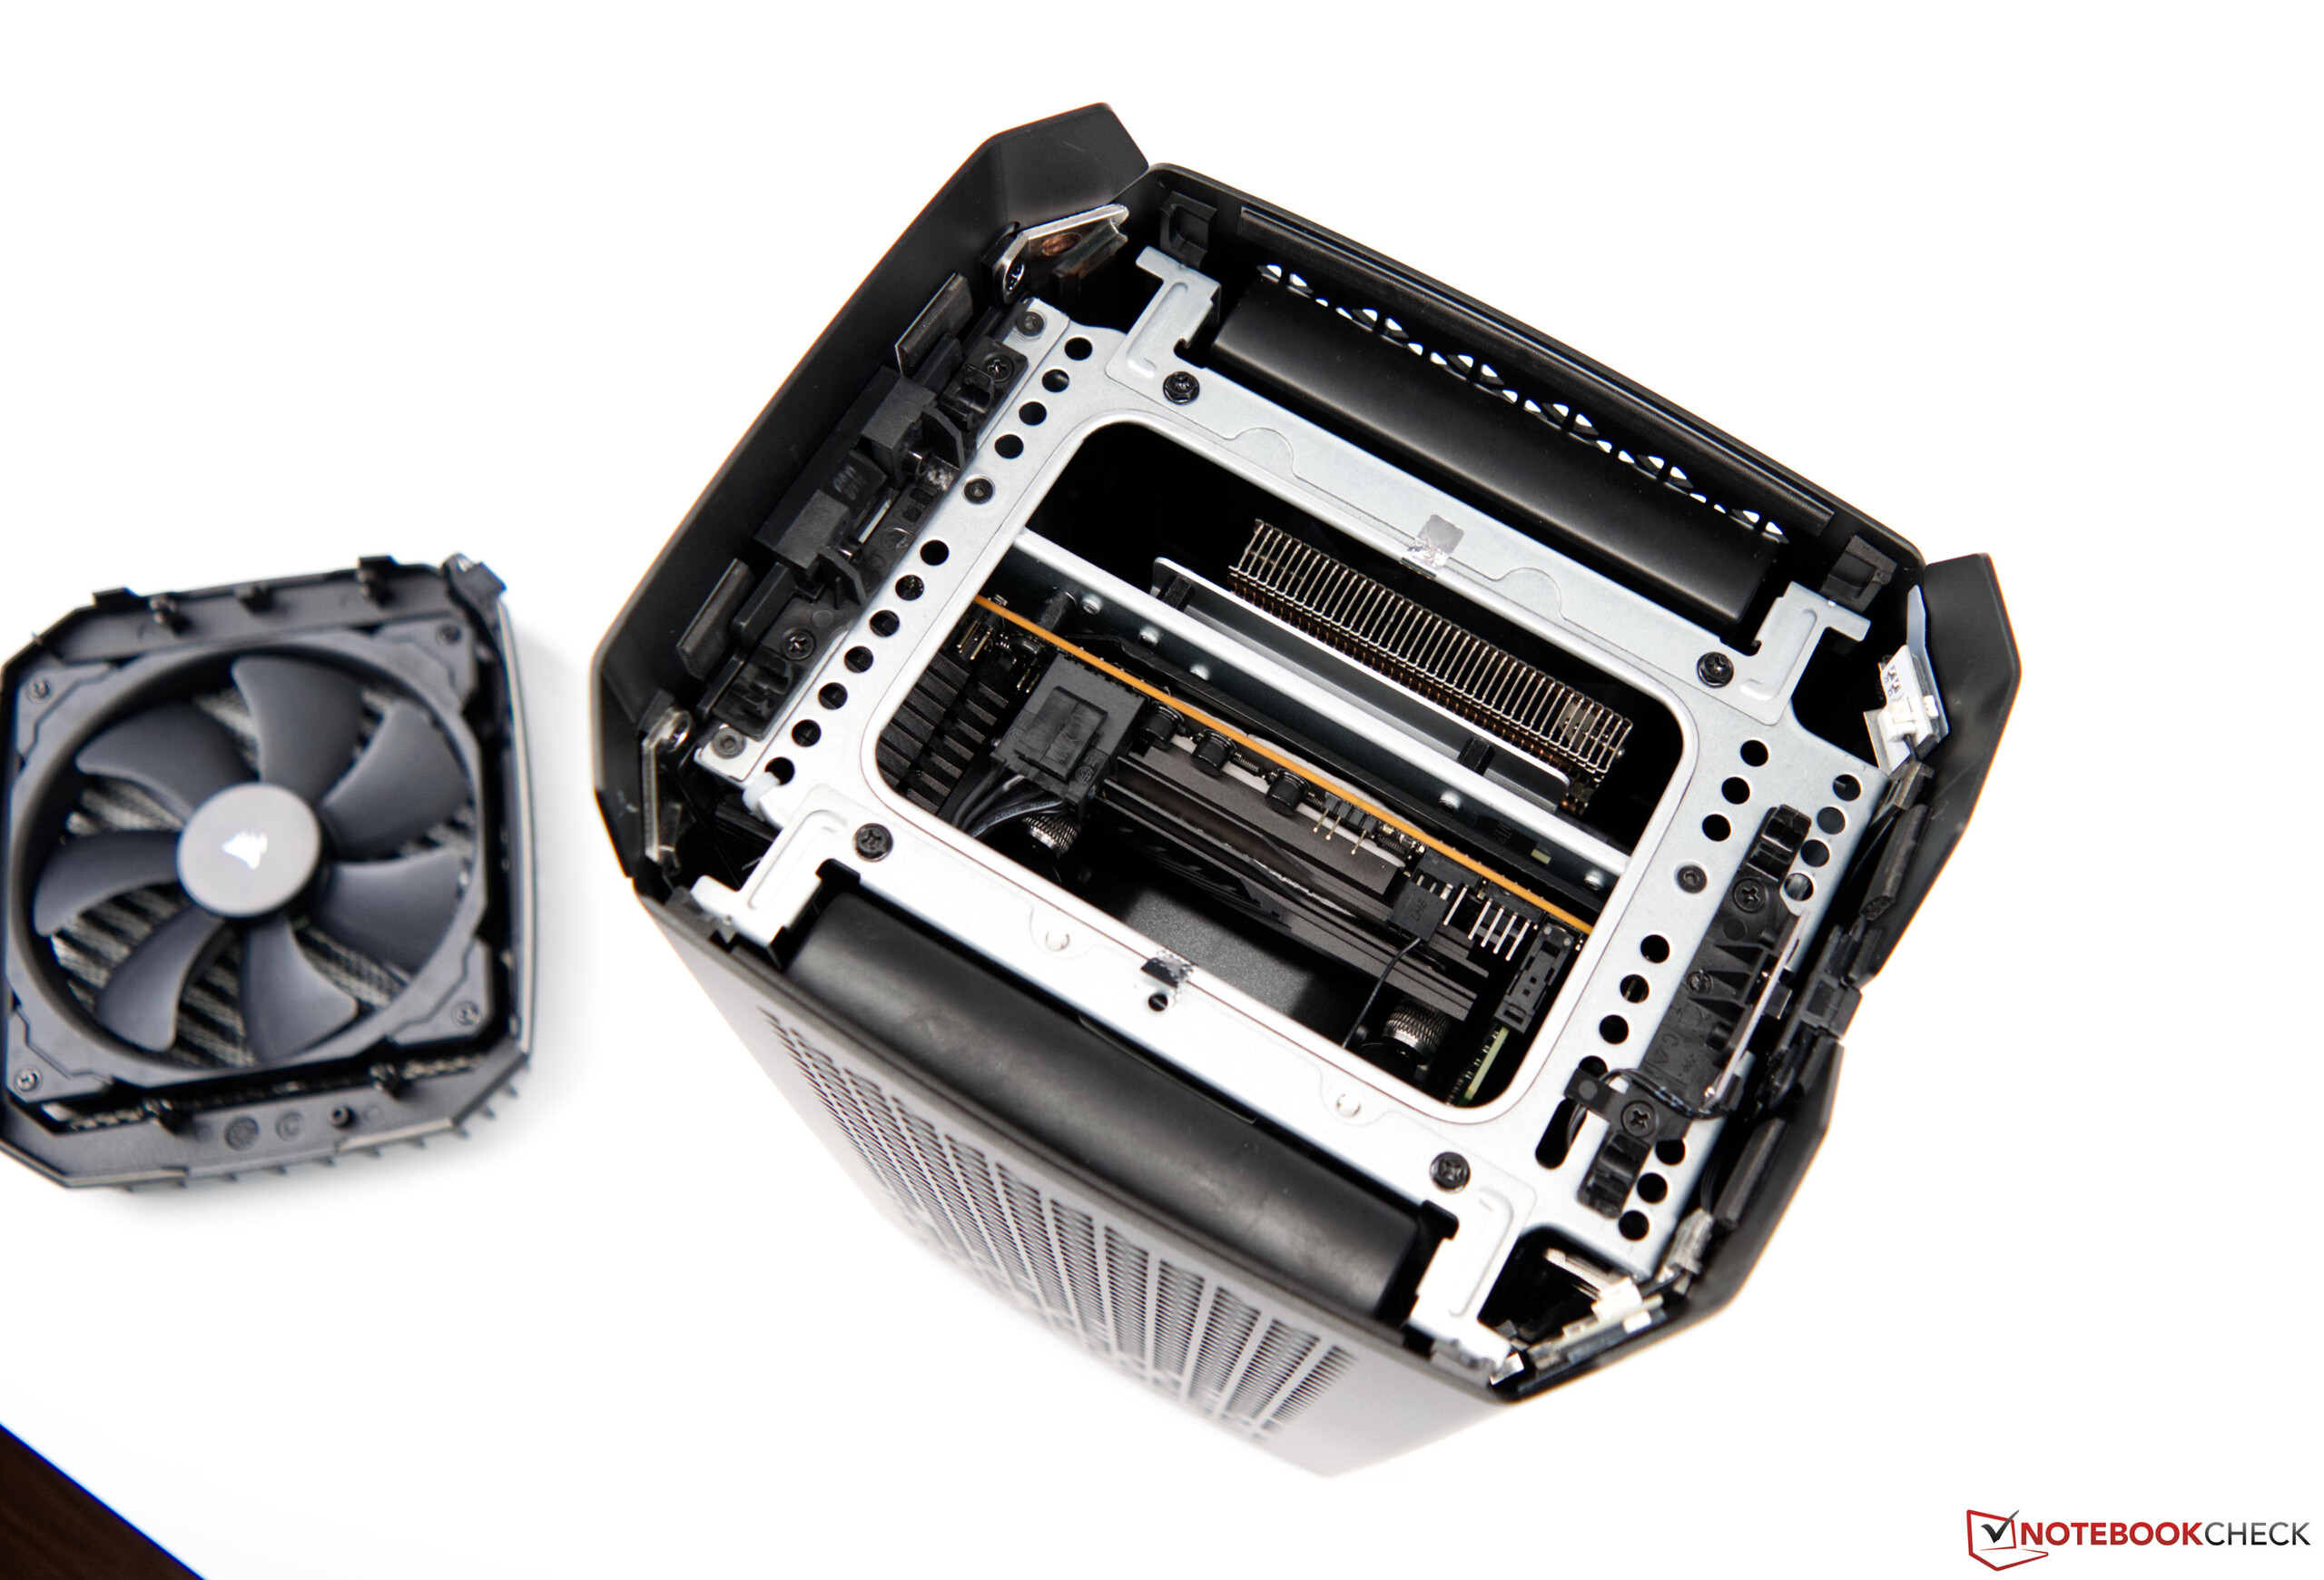
Nel caso in cui le prestazioni del Corsair One i300 siano insufficienti o la soluzione di archiviazione risulti troppo piccola, è anche possibile aggiornare il computer. Tuttavia, bisogna fare attenzione, poiché lo spazio interno è molto limitato. Il PC desktop può essere aperto facilmente. Il coperchio superiore del case con la ventola da 140 mm si rimuove rapidamente e i coperchi laterali sono fissati solo con due viti. Ma poi i tubi dell'AiOs ostacoleranno una rapida sostituzione dei componenti. Mentre è ancora possibile accedere alla memoria di lavoro abbastanza facilmente, le cose sembrano più difficili se si vuole arrivare alla soluzione di archiviazione. Per questo motivo, avremmo voluto un'altra opzione nelle configurazioni disponibili, dato che c'è un totale di tre slot M.2 sulla scheda madre. Tuttavia, il sistema è già ben equipaggiato con 2 TB di storage.
Performance
Guardando puramente in termini di componenti utilizzati, il Corsair One i300 offre processori molto veloci per il gioco con il Intel Core i9-12900Ke ilNvidia GeForce RTX 3080 Ti. Attualmente, la GeForce RTX 3080 Ti è la seconda scheda grafica più veloce di Nvidia, rimanendo solo pochi punti percentuali dietro la GeForce RTX 3090. Anche se questo avrebbe potuto anche adattarsi al caso se si considerano solo le dimensioni fisiche, il raffreddamento dei chip VRAM ha probabilmente portato Corsair a utilizzare "solo" una GeForce RTX 3080 Ti. Il modello leggermente più debole del Corsair One i300 è dotato di una GeForce RTX 3080, che potrebbe essere la scelta più ragionevole a causa del suo prezzo di acquisto inferiore.
Processore
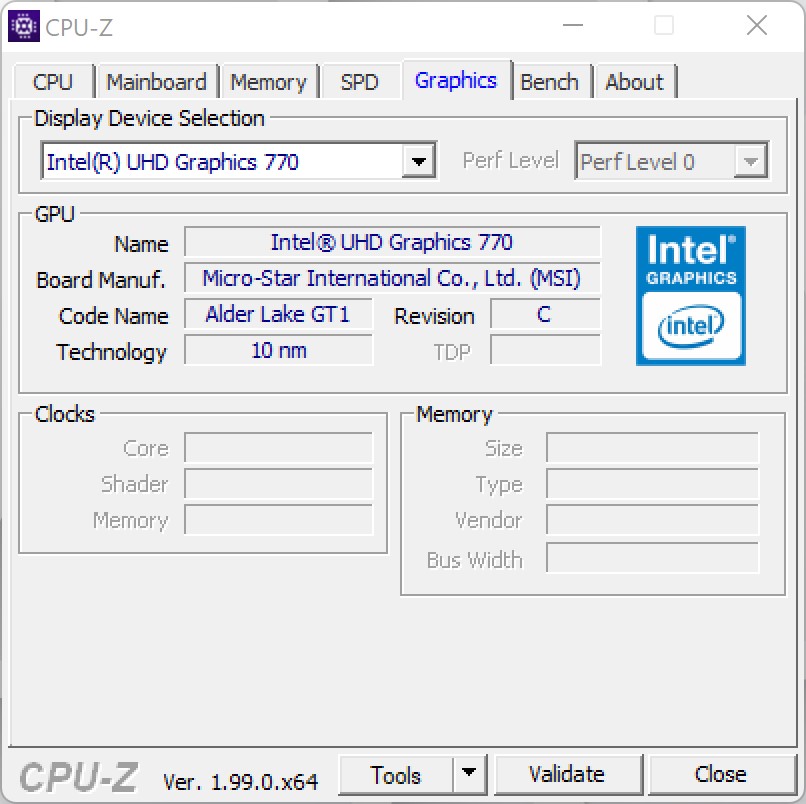
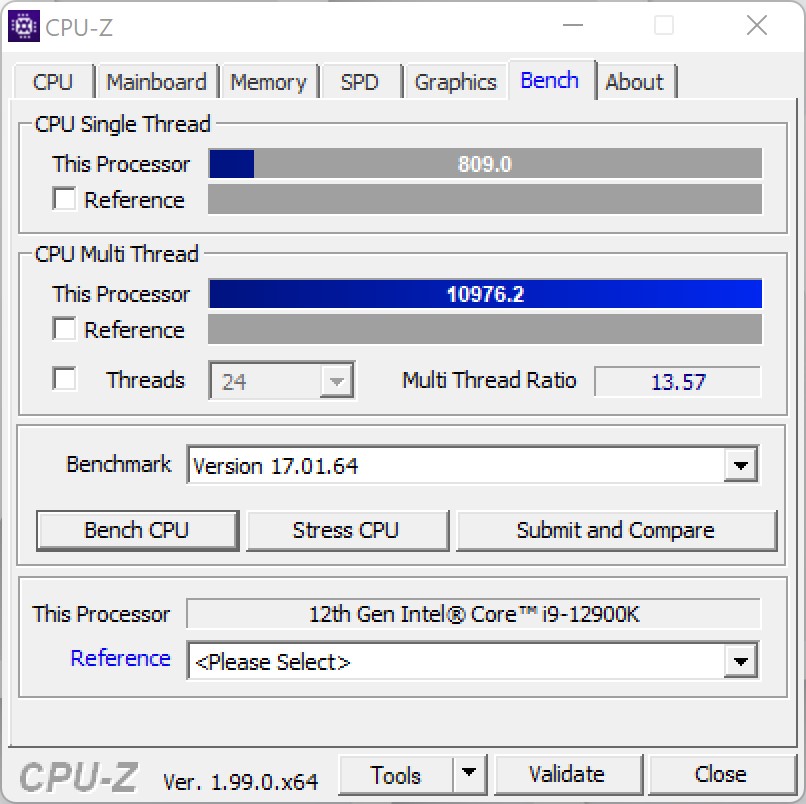
Il Corsair One i300 è dotato del processore Intel più veloce attualmente disponibile per il gioco. Per essere esatti, Corsair utilizza ilIntel Core i9-12900Kbasato su una scheda Z690 di MSI. Siamo già stati in grado di vedere in anticipo quali prestazioni possono essere fornite dalla nuova ammiraglia di Intel. Per ulteriori dettagli riguardanti l Intel Core i9-12900Kfacciamo riferimento a questa pagina. Tuttavia, c'è una piccola limitazione nel Corsair One i300 in termini di consumo massimo di energia. PL1 e anche PL2 sono limitati ai valori di 165 e 175 watt rispettivamente, il che significa che il processore è leggermente strozzato sotto carico. Senza questa limitazione, il Intel Core i9-12900Kdovrebbe essere in grado di consumare fino a 241 watt. D'altra parte, questa opzione può essere modificata nel BIOS. Ma questo comporterebbe anche un volume di rumore più elevato e temperature più alte.
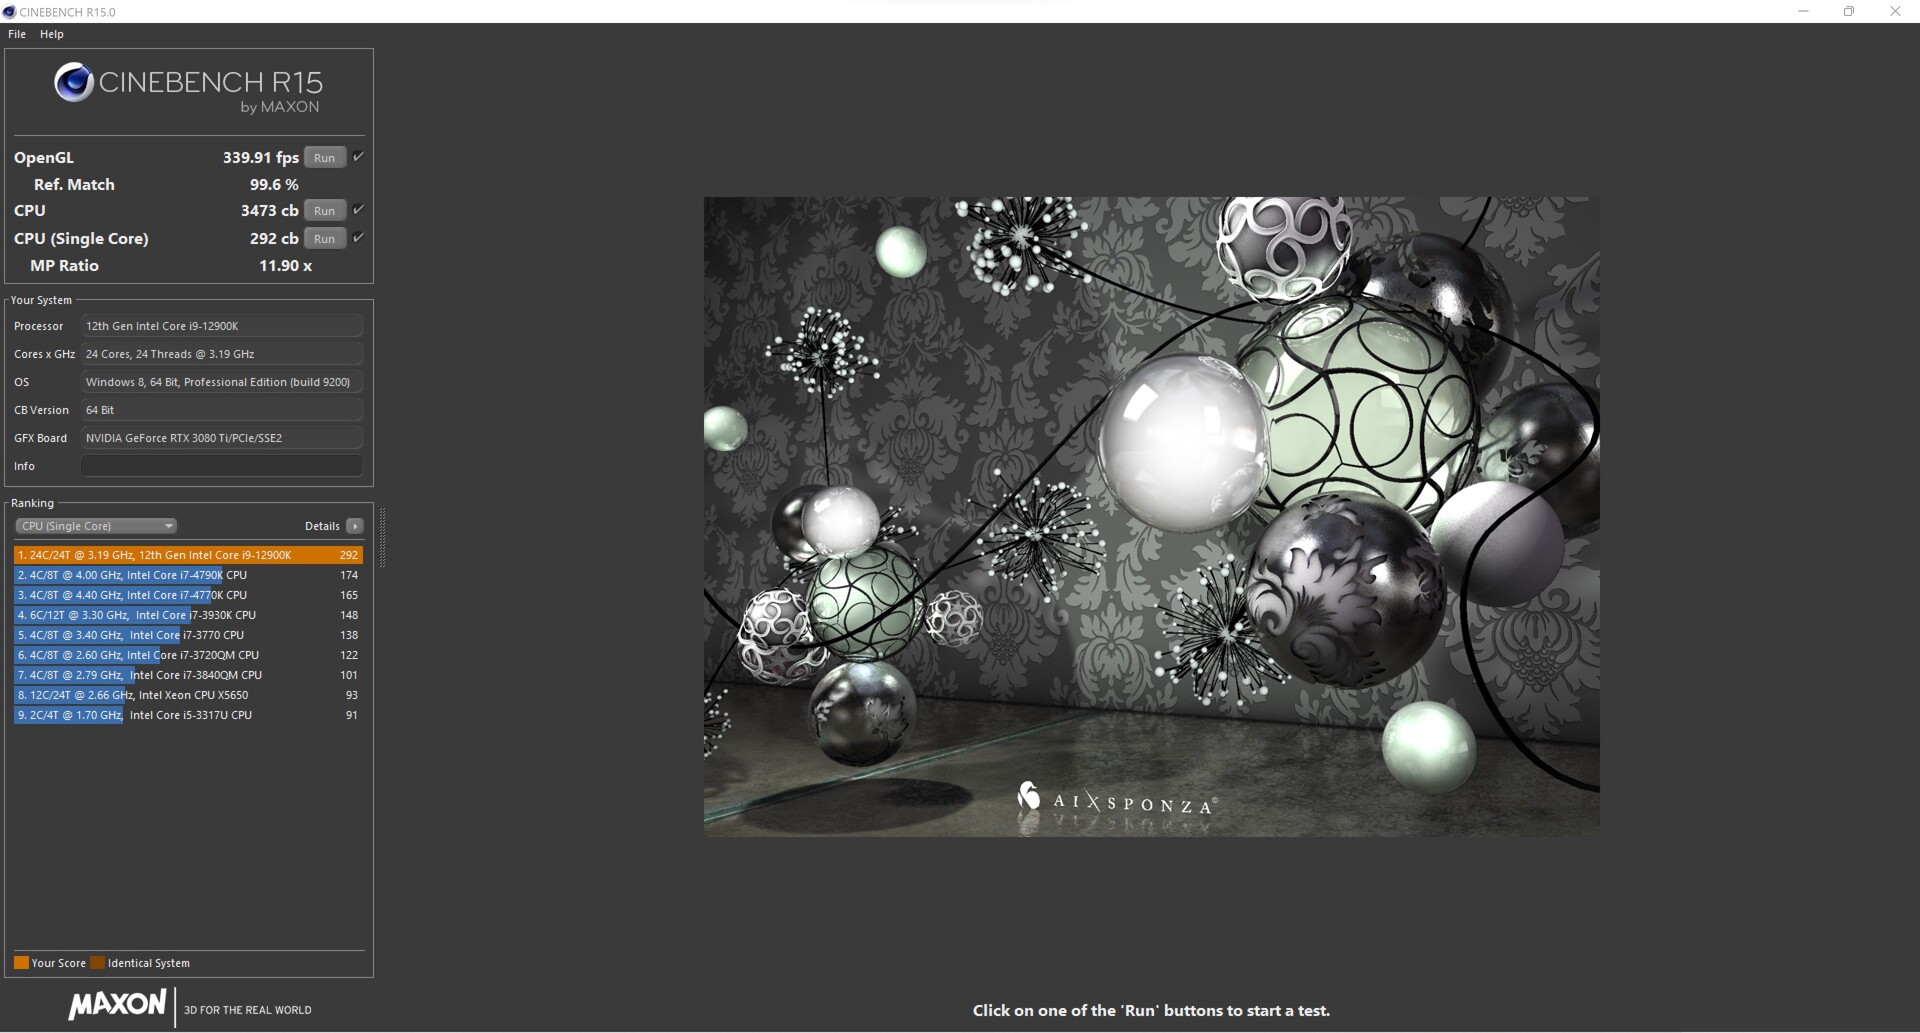
Nel benchmark che stiamo eseguendo, l'Intel Core i9-12900K si comporta molto bene, anche se non è in grado di utilizzare tutte le sue prestazioni sotto carico. L'aumento delle prestazioni rispetto al Corsair One i160 è immenso. Nella valutazione complessiva, il sistema attuale offre il 48% di prestazioni in più.
Per ulteriori confronti e benchmark, vi rimandiamo alla nostra Tabella di confronto della CPU.
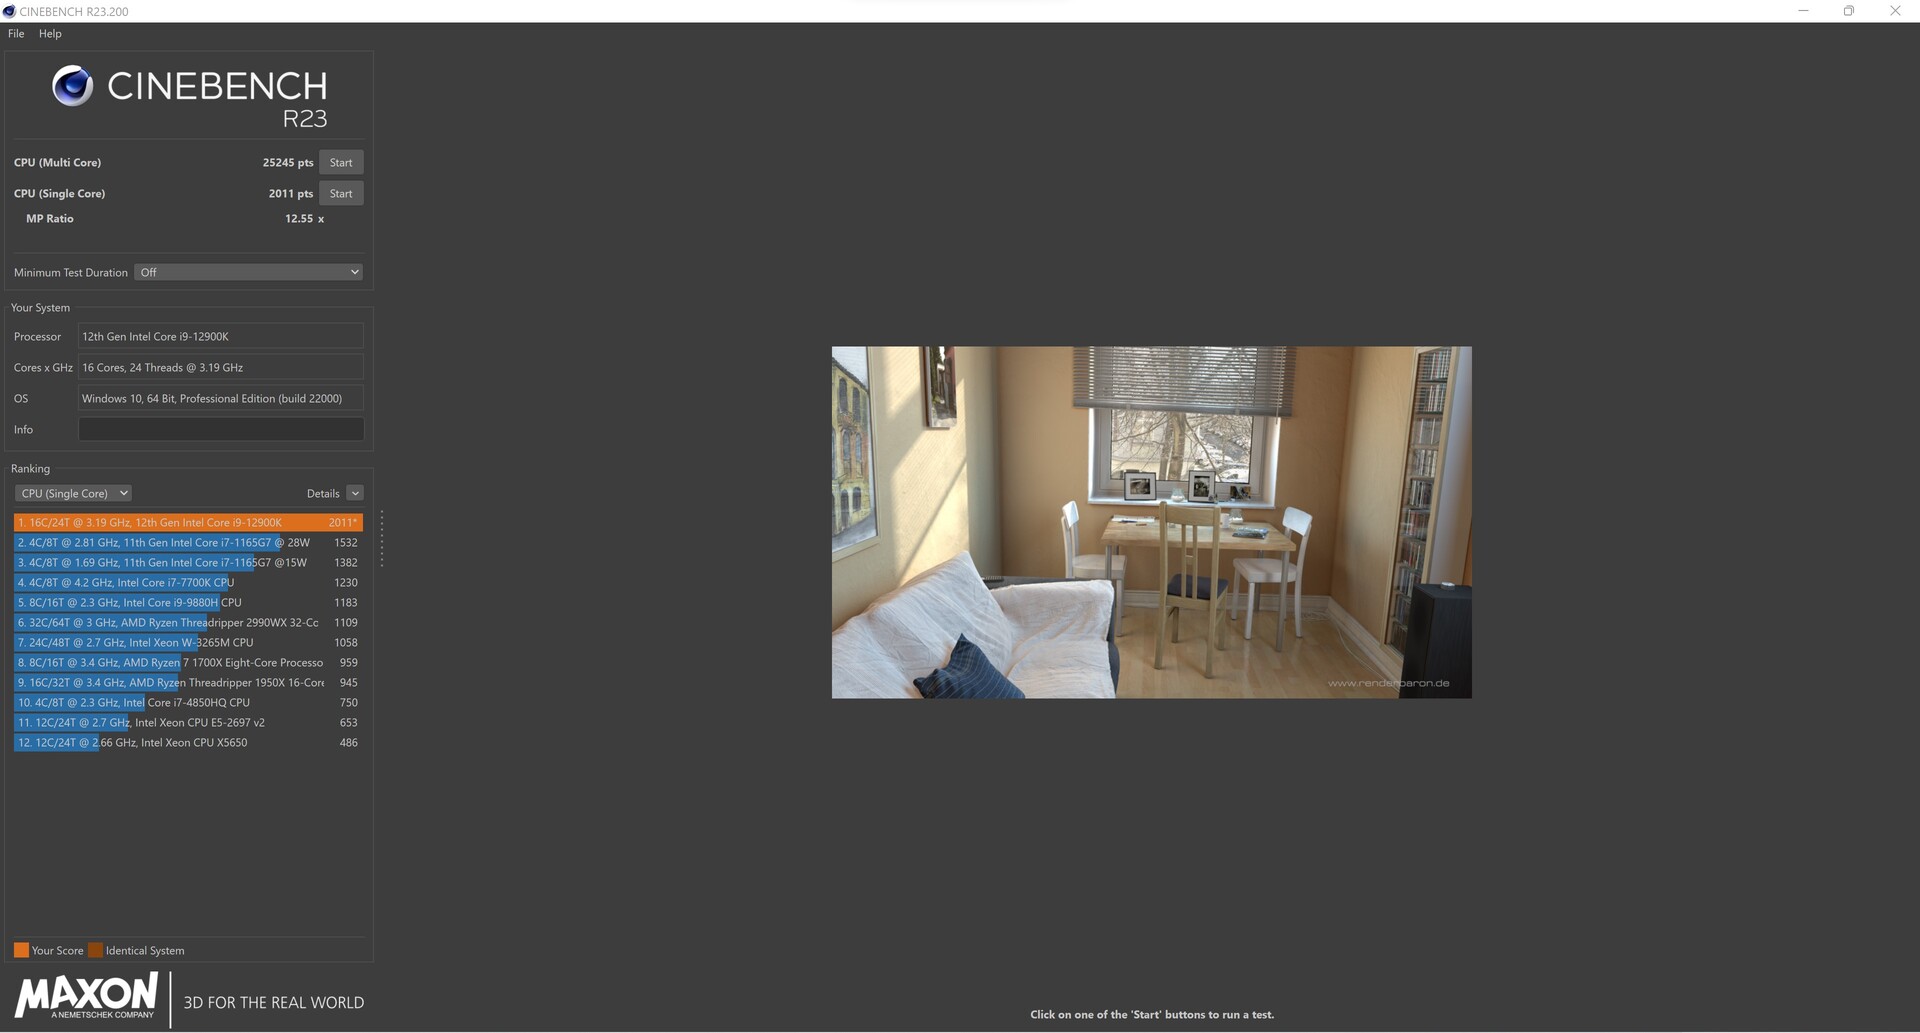
Cinebench R23: Multi Core | Single Core
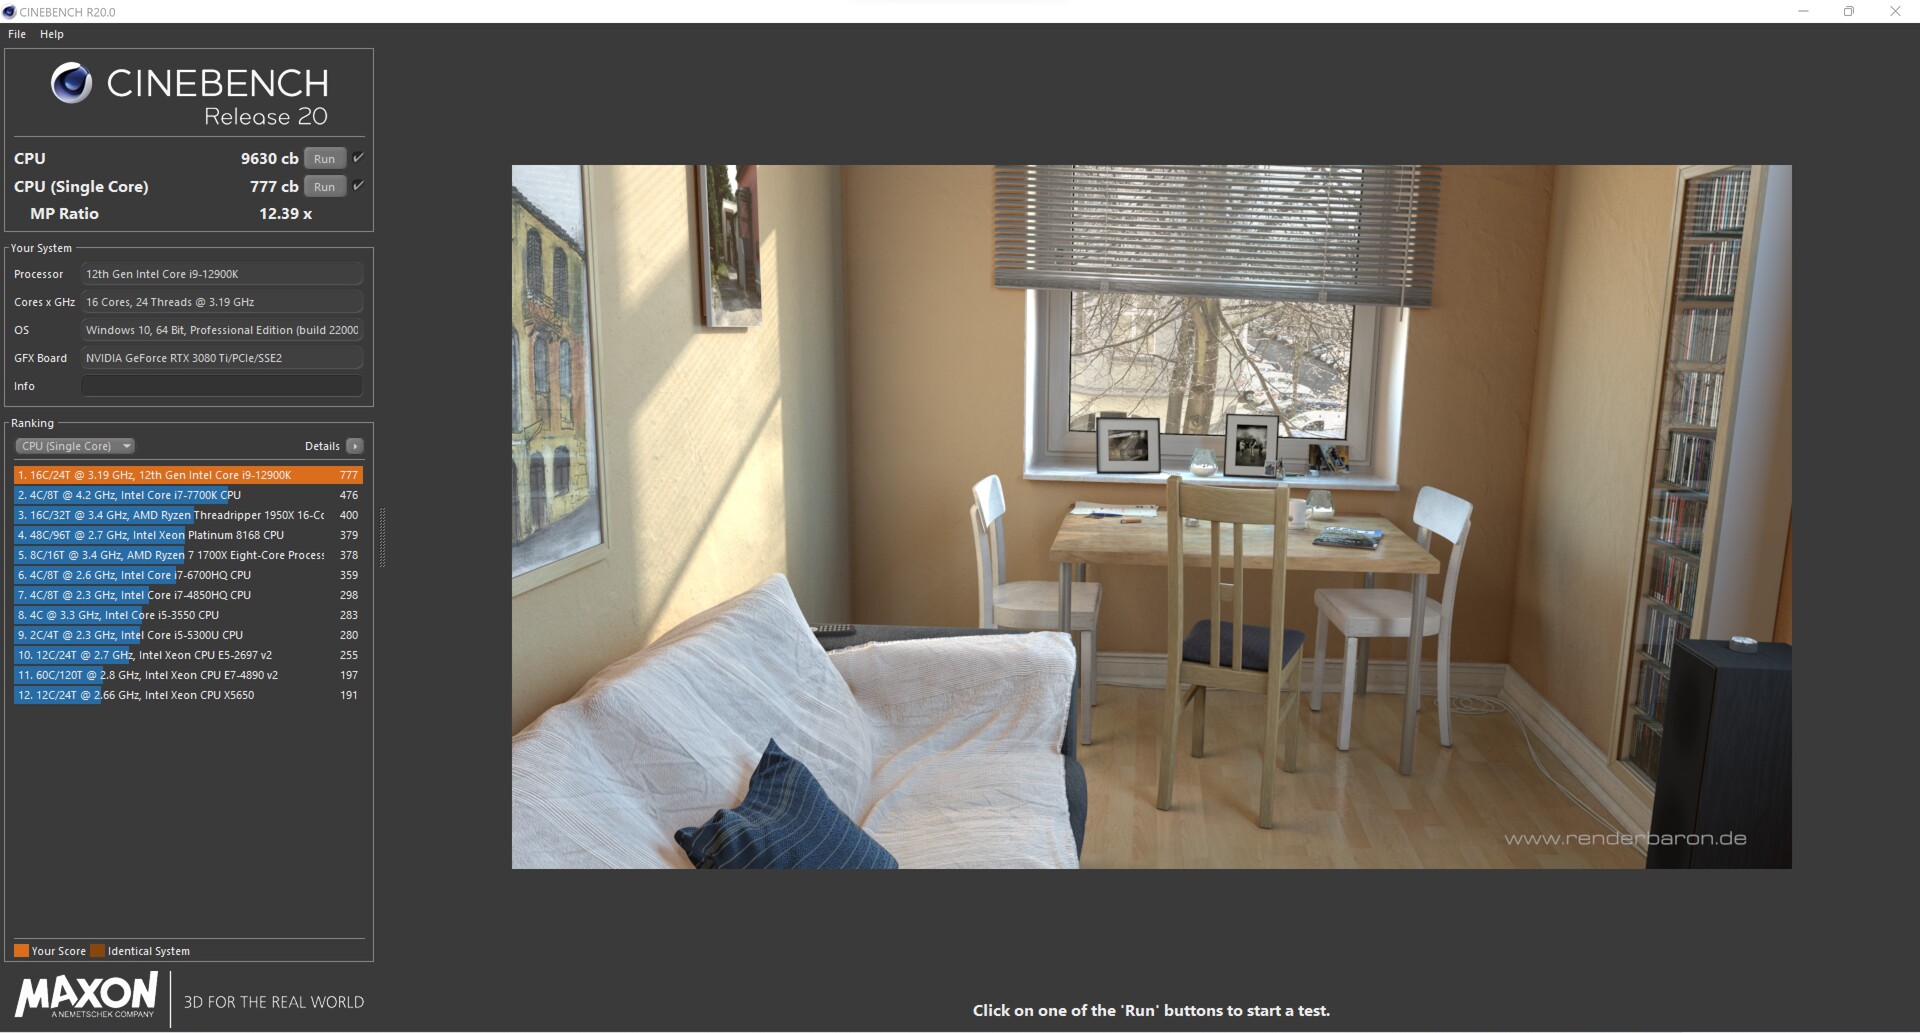
Cinebench R20: CPU (Multi Core) | CPU (Single Core)
Cinebench R15: CPU Multi 64Bit | CPU Single 64Bit
Blender: v2.79 BMW27 CPU
7-Zip 18.03: 7z b 4 | 7z b 4 -mmt1
Geekbench 5.5: Multi-Core | Single-Core
HWBOT x265 Benchmark v2.2: 4k Preset
LibreOffice : 20 Documents To PDF
R Benchmark 2.5: Overall mean
| CPU Performance rating | |
| Media della classe Desktop | |
| Intel Core i9-12900K | |
| Media Intel Core i9-12900K | |
| AMD Ryzen 9 5950X | |
| Intel Core i9-12900K | |
| AMD Ryzen 9 5900X | |
| Intel Core i9-11900K | |
| Intel Core i9-10900K | |
| Intel Core i9-9900K -6! | |
| Cinebench R23 / Multi Core | |
| Media della classe Desktop (16119 - 44253, n=16, ultimi 2 anni) | |
| AMD Ryzen 9 5950X | |
| Intel Core i9-12900K | |
| Media Intel Core i9-12900K (25245 - 27005, n=2) | |
| Intel Core i9-12900K | |
| AMD Ryzen 9 5900X | |
| Intel Core i9-10900K | |
| Intel Core i9-11900K | |
| Cinebench R23 / Single Core | |
| Media della classe Desktop (1722 - 2439, n=16, ultimi 2 anni) | |
| Intel Core i9-12900K | |
| Media Intel Core i9-12900K (1998 - 2011, n=2) | |
| Intel Core i9-12900K | |
| Intel Core i9-11900K | |
| AMD Ryzen 9 5950X | |
| AMD Ryzen 9 5900X | |
| Intel Core i9-10900K | |
| Cinebench R20 / CPU (Multi Core) | |
| Media della classe Desktop (5710 - 17190, n=15, ultimi 2 anni) | |
| AMD Ryzen 9 5950X | |
| Intel Core i9-12900K | |
| Media Intel Core i9-12900K (9630 - 10240, n=2) | |
| Intel Core i9-12900K | |
| AMD Ryzen 9 5900X | |
| Intel Core i9-10900K | |
| Intel Core i9-11900K | |
| Intel Core i9-9900K | |
| Cinebench R20 / CPU (Single Core) | |
| Media della classe Desktop (674 - 922, n=15, ultimi 2 anni) | |
| Intel Core i9-12900K | |
| Media Intel Core i9-12900K (766 - 777, n=2) | |
| Intel Core i9-12900K | |
| Intel Core i9-11900K | |
| AMD Ryzen 9 5950X | |
| AMD Ryzen 9 5900X | |
| Intel Core i9-10900K | |
| Intel Core i9-9900K | |
| Cinebench R15 / CPU Multi 64Bit | |
| Media della classe Desktop (2652 - 6656, n=16, ultimi 2 anni) | |
| AMD Ryzen 9 5950X | |
| Intel Core i9-12900K | |
| Media Intel Core i9-12900K (3473 - 4102, n=3) | |
| AMD Ryzen 9 5900X | |
| Intel Core i9-12900K | |
| Intel Core i9-10900K | |
| Intel Core i9-11900K | |
| Intel Core i9-9900K | |
| Cinebench R15 / CPU Single 64Bit | |
| Media della classe Desktop (246 - 356, n=16, ultimi 2 anni) | |
| Intel Core i9-12900K | |
| Media Intel Core i9-12900K (286 - 292, n=3) | |
| Intel Core i9-12900K | |
| AMD Ryzen 9 5950X | |
| AMD Ryzen 9 5900X | |
| Intel Core i9-11900K | |
| Intel Core i9-10900K | |
| Intel Core i9-9900K | |
| Blender / v2.79 BMW27 CPU | |
| Intel Core i9-9900K | |
| Intel Core i9-11900K | |
| Intel Core i9-10900K | |
| AMD Ryzen 9 5900X | |
| Intel Core i9-12900K | |
| Media Intel Core i9-12900K (121.1 - 128.3, n=2) | |
| Intel Core i9-12900K | |
| Media della classe Desktop (75 - 218, n=15, ultimi 2 anni) | |
| AMD Ryzen 9 5950X | |
| 7-Zip 18.03 / 7z b 4 | |
| AMD Ryzen 9 5950X | |
| Media della classe Desktop (91898 - 163125, n=17, ultimi 2 anni) | |
| Intel Core i9-12900K | |
| Media Intel Core i9-12900K (96960 - 97671, n=2) | |
| Intel Core i9-12900K | |
| AMD Ryzen 9 5900X | |
| Intel Core i9-10900K | |
| Intel Core i9-11900K | |
| Intel Core i9-9900K | |
| 7-Zip 18.03 / 7z b 4 -mmt1 | |
| Media della classe Desktop (5092 - 8790, n=17, ultimi 2 anni) | |
| AMD Ryzen 9 5950X | |
| AMD Ryzen 9 5900X | |
| Intel Core i9-11900K | |
| Intel Core i9-12900K | |
| Media Intel Core i9-12900K (6571 - 6580, n=2) | |
| Intel Core i9-12900K | |
| Intel Core i9-10900K | |
| Intel Core i9-9900K | |
| Geekbench 5.5 / Multi-Core | |
| Media della classe Desktop (12626 - 28535, n=30, ultimi 2 anni) | |
| Intel Core i9-12900K | |
| Media Intel Core i9-12900K (17698 - 17854, n=2) | |
| Intel Core i9-12900K | |
| AMD Ryzen 9 5950X | |
| AMD Ryzen 9 5900X | |
| Intel Core i9-10900K | |
| Intel Core i9-11900K | |
| Geekbench 5.5 / Single-Core | |
| Media della classe Desktop (1755 - 2597, n=30, ultimi 2 anni) | |
| Intel Core i9-12900K | |
| Media Intel Core i9-12900K (1969 - 2042, n=2) | |
| Intel Core i9-12900K | |
| Intel Core i9-11900K | |
| AMD Ryzen 9 5950X | |
| AMD Ryzen 9 5900X | |
| Intel Core i9-10900K | |
| HWBOT x265 Benchmark v2.2 / 4k Preset | |
| Media della classe Desktop (18.6 - 48.5, n=15, ultimi 2 anni) | |
| AMD Ryzen 9 5950X | |
| Intel Core i9-12900K | |
| Media Intel Core i9-12900K (29 - 30, n=2) | |
| Intel Core i9-12900K | |
| AMD Ryzen 9 5900X | |
| Intel Core i9-10900K | |
| Intel Core i9-11900K | |
| Intel Core i9-9900K | |
| LibreOffice / 20 Documents To PDF | |
| Intel Core i9-10900K | |
| Intel Core i9-11900K | |
| AMD Ryzen 9 5900X | |
| AMD Ryzen 9 5950X | |
| Media della classe Desktop (35.5 - 79.2, n=16, ultimi 2 anni) | |
| Intel Core i9-12900K | |
| Media Intel Core i9-12900K (38.1 - 40.6, n=2) | |
| Intel Core i9-12900K | |
| R Benchmark 2.5 / Overall mean | |
| Intel Core i9-10900K | |
| Intel Core i9-11900K | |
| AMD Ryzen 9 5950X | |
| AMD Ryzen 9 5900X | |
| Intel Core i9-12900K | |
| Media Intel Core i9-12900K (0.3946 - 0.4216, n=2) | |
| Intel Core i9-12900K | |
| Media della classe Desktop (0.3299 - 0.4909, n=16, ultimi 2 anni) | |
* ... Meglio usare valori piccoli
AIDA64: FP32 Ray-Trace | FPU Julia | CPU SHA3 | CPU Queen | FPU SinJulia | FPU Mandel | CPU AES | CPU ZLib | FP64 Ray-Trace | CPU PhotoWorxx
| Performance rating | |
| Media della classe Desktop | |
| AMD Ryzen 9 5950X, NVIDIA Titan RTX | |
| AMD Ryzen 9 5900X, NVIDIA Titan RTX | |
| Intel Core i9-11900K, NVIDIA Titan RTX | |
| Intel Core i9-12900K, NVIDIA GeForce RTX 3080 Ti | |
| Media Intel Core i9-12900K | |
| Intel Core i9-12900K, NVIDIA Titan RTX | |
| AIDA64 / FP32 Ray-Trace | |
| Media della classe Desktop (12248 - 84577, n=21, ultimi 2 anni) | |
| AMD Ryzen 9 5950X, NVIDIA Titan RTX | |
| AMD Ryzen 9 5900X, NVIDIA Titan RTX | |
| Intel Core i9-11900K, NVIDIA Titan RTX | |
| Intel Core i9-12900K, NVIDIA Titan RTX | |
| Media Intel Core i9-12900K (12739 - 13345, n=3) | |
| Intel Core i9-12900K, NVIDIA GeForce RTX 3080 Ti | |
| AIDA64 / FPU Julia | |
| Media della classe Desktop (65152 - 246125, n=21, ultimi 2 anni) | |
| AMD Ryzen 9 5950X, NVIDIA Titan RTX | |
| AMD Ryzen 9 5900X, NVIDIA Titan RTX | |
| Intel Core i9-11900K, NVIDIA Titan RTX | |
| Intel Core i9-12900K, NVIDIA Titan RTX | |
| Media Intel Core i9-12900K (58406 - 59419, n=3) | |
| Intel Core i9-12900K, NVIDIA GeForce RTX 3080 Ti | |
| AIDA64 / CPU SHA3 | |
| Media della classe Desktop (2982 - 10804, n=21, ultimi 2 anni) | |
| Intel Core i9-11900K, NVIDIA Titan RTX | |
| Media Intel Core i9-12900K (4796 - 5127, n=3) | |
| Intel Core i9-12900K, NVIDIA Titan RTX | |
| Intel Core i9-12900K, NVIDIA GeForce RTX 3080 Ti | |
| AMD Ryzen 9 5950X, NVIDIA Titan RTX | |
| AMD Ryzen 9 5900X, NVIDIA Titan RTX | |
| AIDA64 / CPU Queen | |
| AMD Ryzen 9 5950X, NVIDIA Titan RTX | |
| AMD Ryzen 9 5900X, NVIDIA Titan RTX | |
| Media della classe Desktop (76512 - 187912, n=18, ultimi 2 anni) | |
| Intel Core i9-12900K, NVIDIA Titan RTX | |
| Media Intel Core i9-12900K (112066 - 112694, n=3) | |
| Intel Core i9-12900K, NVIDIA GeForce RTX 3080 Ti | |
| Intel Core i9-11900K, NVIDIA Titan RTX | |
| AIDA64 / FPU SinJulia | |
| AMD Ryzen 9 5950X, NVIDIA Titan RTX | |
| AMD Ryzen 9 5900X, NVIDIA Titan RTX | |
| Media della classe Desktop (6443 - 35251, n=21, ultimi 2 anni) | |
| Intel Core i9-12900K, NVIDIA Titan RTX | |
| Media Intel Core i9-12900K (14590 - 14664, n=3) | |
| Intel Core i9-12900K, NVIDIA GeForce RTX 3080 Ti | |
| Intel Core i9-11900K, NVIDIA Titan RTX | |
| AIDA64 / FPU Mandel | |
| Media della classe Desktop (31697 - 129745, n=21, ultimi 2 anni) | |
| AMD Ryzen 9 5950X, NVIDIA Titan RTX | |
| AMD Ryzen 9 5900X, NVIDIA Titan RTX | |
| Intel Core i9-11900K, NVIDIA Titan RTX | |
| Intel Core i9-12900K, NVIDIA Titan RTX | |
| Media Intel Core i9-12900K (35801 - 39323, n=3) | |
| Intel Core i9-12900K, NVIDIA GeForce RTX 3080 Ti | |
| AIDA64 / CPU AES | |
| Intel Core i9-11900K, NVIDIA Titan RTX | |
| AMD Ryzen 9 5950X, NVIDIA Titan RTX | |
| Media della classe Desktop (57777 - 513073, n=21, ultimi 2 anni) | |
| Intel Core i9-12900K, NVIDIA GeForce RTX 3080 Ti | |
| Media Intel Core i9-12900K (94062 - 140055, n=3) | |
| AMD Ryzen 9 5900X, NVIDIA Titan RTX | |
| Intel Core i9-12900K, NVIDIA Titan RTX | |
| AIDA64 / CPU ZLib | |
| AMD Ryzen 9 5950X, NVIDIA Titan RTX | |
| Media della classe Desktop (887 - 2674, n=21, ultimi 2 anni) | |
| Media Intel Core i9-12900K (1537 - 1608, n=3) | |
| Intel Core i9-12900K, NVIDIA Titan RTX | |
| Intel Core i9-12900K, NVIDIA GeForce RTX 3080 Ti | |
| AMD Ryzen 9 5900X, NVIDIA Titan RTX | |
| Intel Core i9-11900K, NVIDIA Titan RTX | |
| AIDA64 / FP64 Ray-Trace | |
| Media della classe Desktop (6471 - 44013, n=21, ultimi 2 anni) | |
| AMD Ryzen 9 5950X, NVIDIA Titan RTX | |
| AMD Ryzen 9 5900X, NVIDIA Titan RTX | |
| Intel Core i9-11900K, NVIDIA Titan RTX | |
| Intel Core i9-12900K, NVIDIA Titan RTX | |
| Media Intel Core i9-12900K (7586 - 8283, n=3) | |
| Intel Core i9-12900K, NVIDIA GeForce RTX 3080 Ti | |
| AIDA64 / CPU PhotoWorxx | |
| Intel Core i9-12900K, NVIDIA GeForce RTX 3080 Ti | |
| Intel Core i9-12900K, NVIDIA Titan RTX | |
| Media della classe Desktop (38071 - 63949, n=21, ultimi 2 anni) | |
| Media Intel Core i9-12900K (33311 - 49236, n=3) | |
| Intel Core i9-11900K, NVIDIA Titan RTX | |
| AMD Ryzen 9 5950X, NVIDIA Titan RTX | |
| AMD Ryzen 9 5900X, NVIDIA Titan RTX | |
Cinebench R15 Multi Test a carico costante
Diamo un'occhiata al sistema sotto carico costante utilizzando il ciclo Cinebench-R15 Multi. In questo modo, possiamo determinare se il sistema di raffreddamento è abbastanza potente da raffreddare efficacemente il processore. Nel Corsair One i300, il lavoro dell'AiO è molto affidabile, e il risultato rimane costante anche dopo 50 esecuzioni. Tuttavia, il TDP leggermente inferiore delIntel Core i9-12900K si nota chiaramente qui. Se si lascia il Core i9-12900K libero dalle limitazioni, può raggiungere quasi 500 punti in più.
Prestazioni del sistema
Durante il nostro periodo di test, l'intero sistema è stato molto veloce. Questo si riflette anche nei benchmark di sistema. Nei test PCMark 10, il Corsair One i300 è in testa in tutti i test individuali. Solo nei test di rendering, il Corsair One i300 non è in grado di tenere il passo a causa della scheda grafica. Il Nvidia Titan RTXdei sistemi di confronto è la scelta migliore qui, il che è dovuto alla vicinanza alla serie quad.
| PCMark 10 | |
| Score | |
| Intel Core i9-12900K | |
| AMD Ryzen 9 5950X | |
| Intel Core i9-12900K | |
| AMD Ryzen 9 5900X | |
| Intel Core i9-11900K | |
| Intel Core i9-10900K | |
| Intel Core i9-9900K | |
| Essentials | |
| Intel Core i9-12900K | |
| AMD Ryzen 9 5950X | |
| Intel Core i9-12900K | |
| AMD Ryzen 9 5900X | |
| Intel Core i9-9900K | |
| Intel Core i9-11900K | |
| Intel Core i9-10900K | |
| Productivity | |
| AMD Ryzen 9 5950X | |
| Intel Core i9-12900K | |
| Intel Core i9-12900K | |
| AMD Ryzen 9 5900X | |
| Intel Core i9-11900K | |
| Intel Core i9-10900K | |
| Intel Core i9-9900K | |
| Digital Content Creation | |
| Intel Core i9-12900K | |
| AMD Ryzen 9 5950X | |
| Intel Core i9-12900K | |
| AMD Ryzen 9 5900X | |
| Intel Core i9-10900K | |
| Intel Core i9-9900K | |
| Intel Core i9-11900K | |
| LuxMark v2.0 64Bit | |
| Room GPUs-only | |
| Intel Core i9-12900K | |
| Intel Core i9-9900K | |
| Sala GPUs-only | |
| Intel Core i9-12900K | |
| Intel Core i9-9900K | |
| ComputeMark v2.1 | |
| 1024x600 Normal, Score | |
| Intel Core i9-12900K | |
| Intel Core i9-9900K | |
| 1024x600 Normal, Fluid 3DTex | |
| Intel Core i9-12900K | |
| Intel Core i9-9900K | |
| 1024x600 Normal, Fluid 2DTexArr | |
| Intel Core i9-12900K | |
| Intel Core i9-9900K | |
| 1024x600 Normal, Mandel Vector | |
| Intel Core i9-12900K | |
| Intel Core i9-9900K | |
| 1024x600 Normal, Mandel Scalar | |
| Intel Core i9-12900K | |
| Intel Core i9-9900K | |
| 1024x600 Normal, QJuliaRayTrace | |
| Intel Core i9-12900K | |
| Intel Core i9-9900K | |
| PCMark 10 Score | 8897 punti | |
Aiuto | ||
Soluzione di stoccaggio
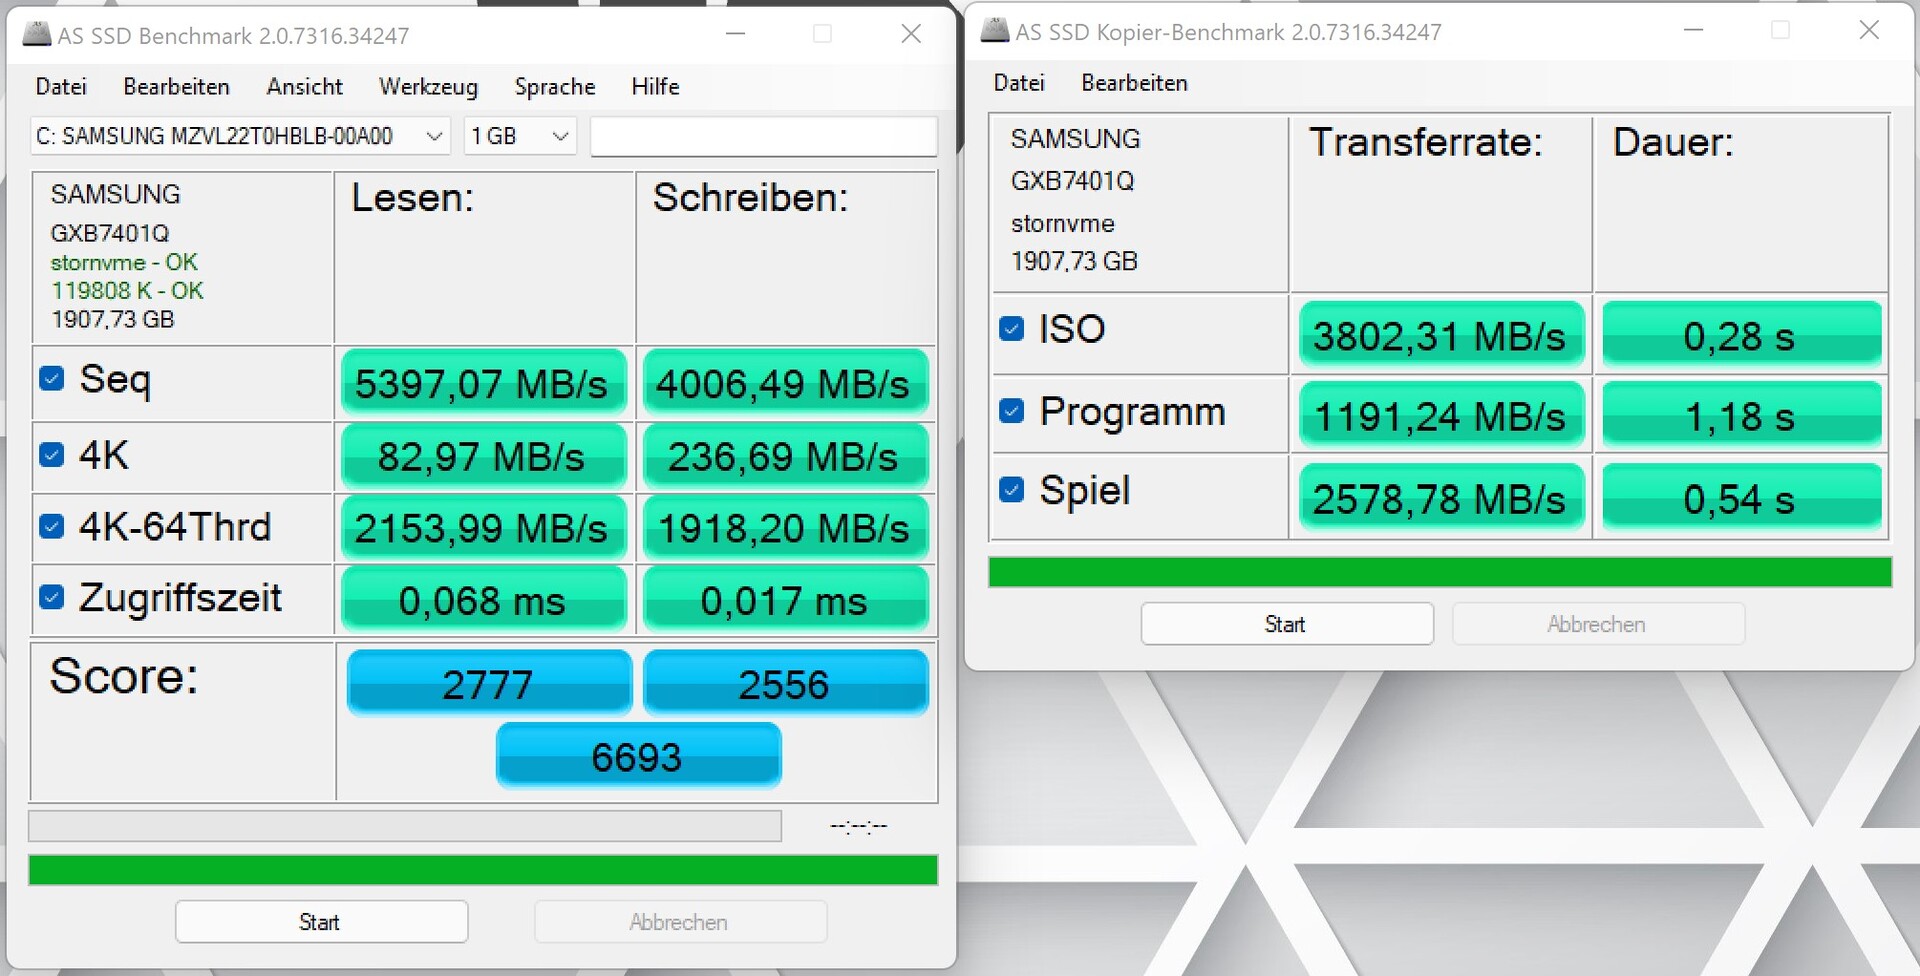
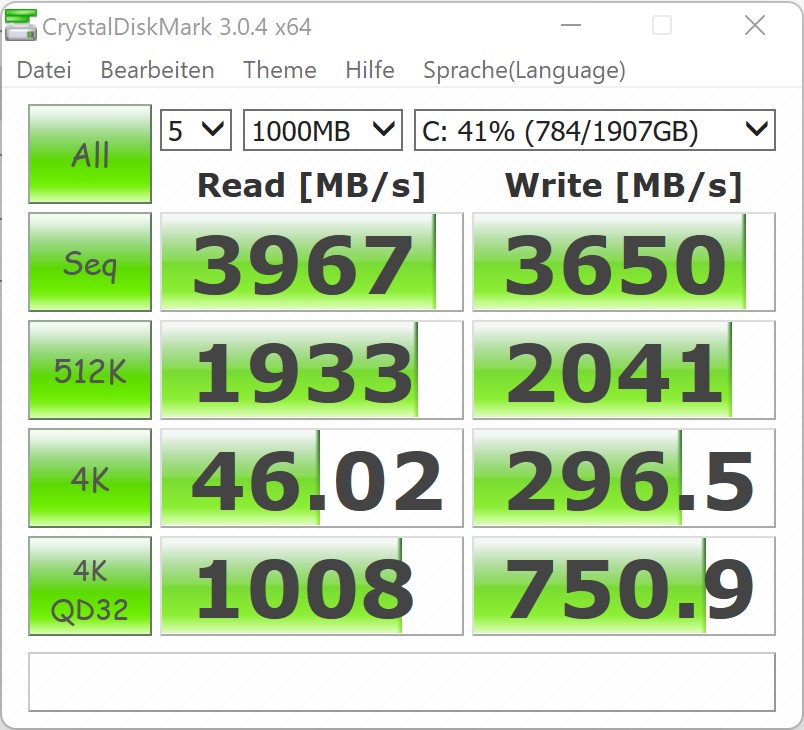
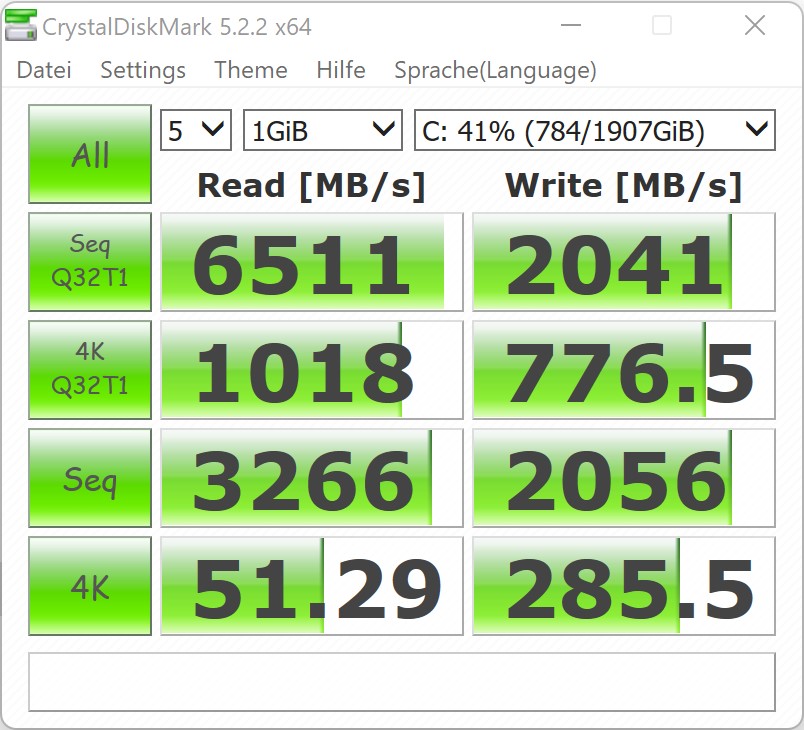
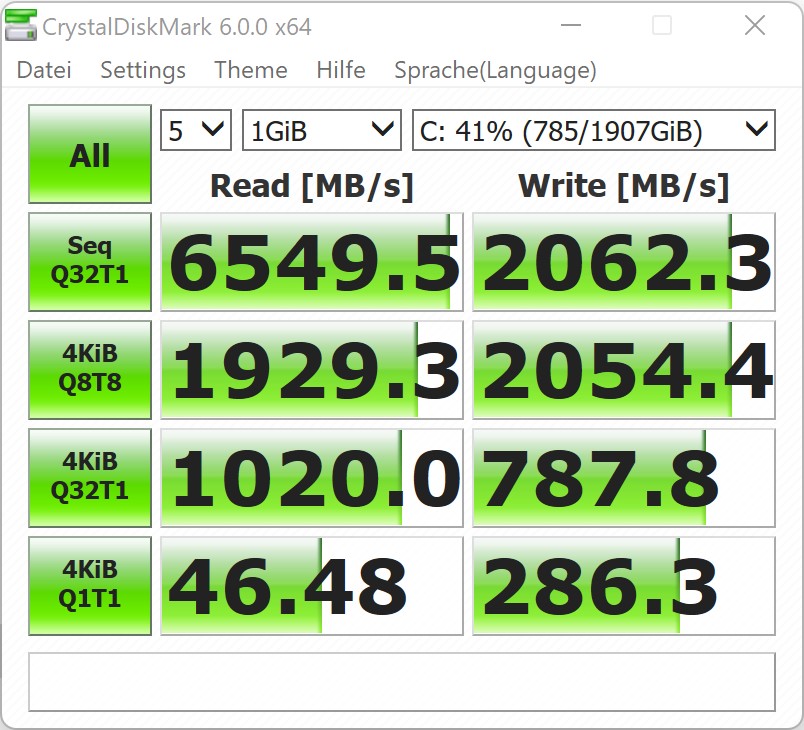
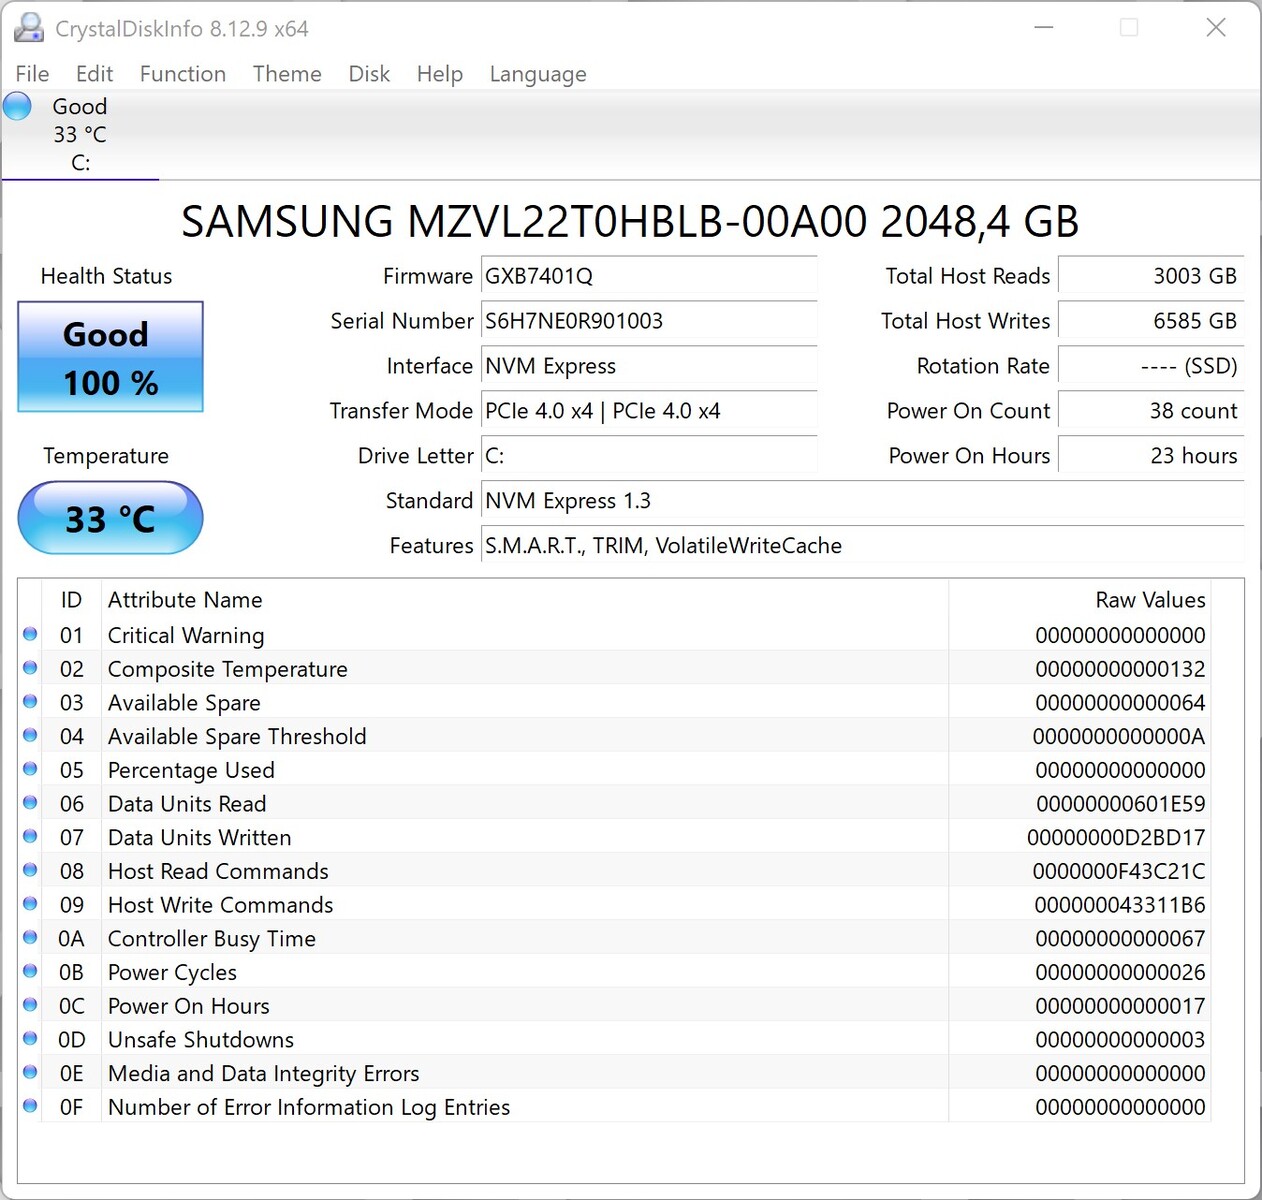
Come già detto sopra, il Corsair One i160 è dotato di due moduli di archiviazione. Il sistema è installato su un veloce SSD PCIe con 512 GB da Samsung, e c'è anche un disco rigido convenzionale che offre 2 TB di storage.
Nel test, l'SSD Samsung ha fornito una prestazione molto buona a beneficio di tutto il sistema. Tuttavia, per una performance complessiva ancora migliore, Corsair avrebbe dovuto equipaggiare il PC esclusivamente con SSD. La velocità media di trasferimento del disco rigido Seagate è stata di 107 MB/s. Anche se questo valore non è male, rispetto a un SSD, un disco rigido ha svantaggi significativi in termini di prestazioni.
Sfortunatamente, il case compatto non offre spazio per moduli di archiviazione aggiuntivi.

| Drive Performance rating - Percent | |
| Media della classe Desktop | |
| Corsair One i300 | |
| Media Samsung PM9A1 MZVL22T0HBLB | |
| AMD Ryzen 9 5950X | |
| Intel Beast Canyon NUC | |
| Corsair One i160 -8! | |
| Zotac Magnus One (ECM73070C) | |
* ... Meglio usare valori piccoli
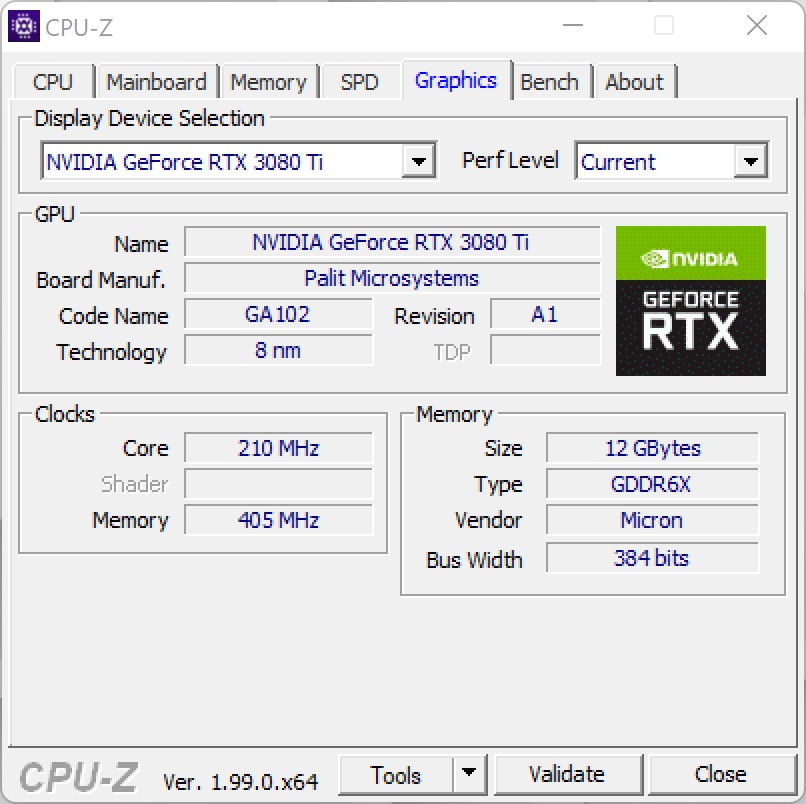
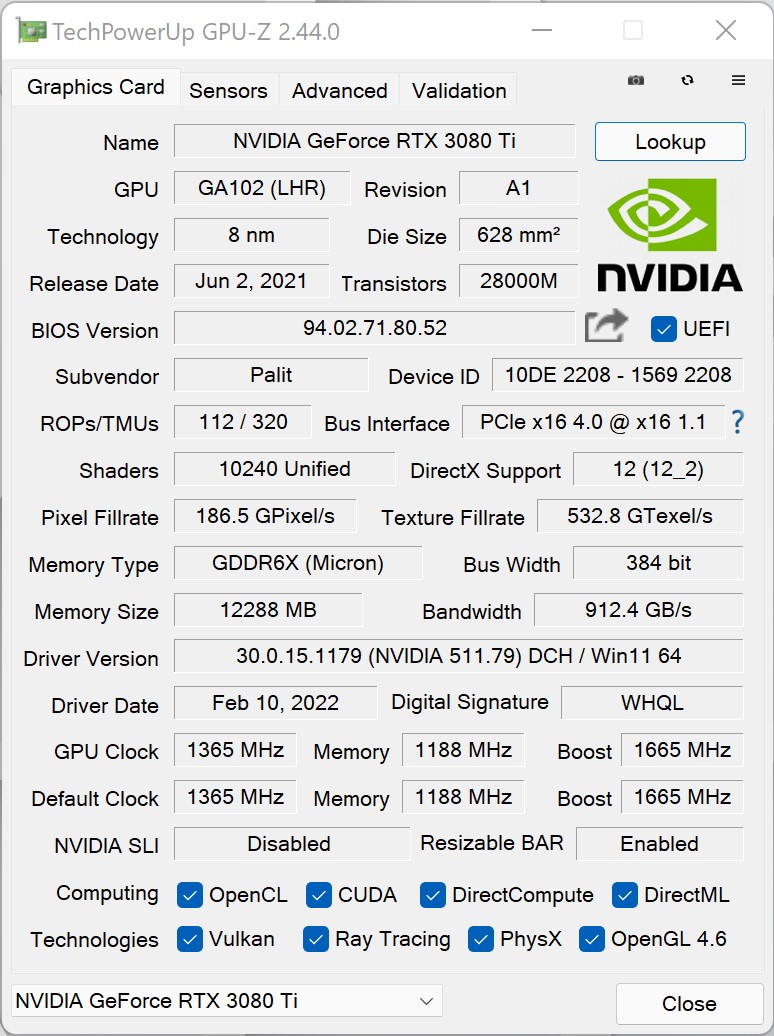
Scheda grafica
Nel sistema di gioco compatto, Corsair utilizza unNvidia GeForce RTX 3080 Tiche è quasi identica a una Nvidia GeForce RTX 3090 in termini di prestazioni. Tuttavia, con 12 GB di VRAM, offre solo la metà della RAM del modello di punta di Nvidia, ma questo non importa molto con i giochi attuali. Con questo, il sistema offre prestazioni assolute in termini di gioco. Il raffreddamento della scheda grafica è molto ben progettato, poiché viene utilizzato un AiO come nella CPU. Inoltre, ci sono anche due piccole ventole sulla scheda grafica, al fine di fornire qualche ulteriore raffreddamento attivo al trasformatore e alla VRAM. Si può vedere che questo design funziona bene, se si dà un'occhiata ai benchmark sintetici. Il Corsair One i300 raggiunge anche i migliori valori grazie al Intel Core i9-12900K.
Rispetto al Corsair One i160ci si può aspettare un aumento delle prestazioni dal 20 al 30%.
| 3DMark 05 Standard | 63621 punti | |
| 3DMark 06 Standard Score | 66161 punti | |
| 3DMark Vantage P Result | 120236 punti | |
| 3DMark 11 Performance | 47170 punti | |
| 3DMark Ice Storm Standard Score | 336443 punti | |
| 3DMark Cloud Gate Standard Score | 81921 punti | |
| 3DMark Fire Strike Score | 40079 punti | |
| 3DMark Fire Strike Extreme Score | 23109 punti | |
| 3DMark Time Spy Score | 18985 punti | |
Aiuto | ||
Prestazioni di gioco
Poiché Corsair utilizza l'hardware più attuale nel One i300, era chiaro che anche le prestazioni di gioco del sistema sono al massimo livello. Attualmente, è possibile godere di tutti i giochi senza alcun compromesso a 2160p. Rispetto alle altre GPU desktop che abbiamo testato in precedenza, le prestazioni della nostra unità di test risultano significativamente migliori. Il vantaggio relativamente alto rispetto alla Nvidia GeForce RTX 3090 è dovuto alla migliore CPU del Corsair One i300. Il nostro sistema di test della GPU è basato su un AMD Ryzen 9 5900Xche ha uno svantaggio significativo rispetto all Intel Core i9-12900K.
Come già nei test della CPU, abbiamo anche messo la scheda grafica sotto carico per un periodo di tempo più lungo. Per fare questo, usiamo "The Witcher 3" con il preset Ultra. Durante il test, le prestazioni della Nvidia GeForce RTX 3080 Tirimane stabile per tutto il tempo, e non notiamo alcun calo di prestazioni. Con una media di 189 fotogrammi al secondo, il gioco gira molto bene, permettendo di utilizzare anche monitor con 165 Hz.
| The Witcher 3 | |
| 1920x1080 Ultra Graphics & Postprocessing (HBAO+) | |
| Corsair One i300 | |
| Media NVIDIA GeForce RTX 3090 (160 - 192.6, n=18) | |
| Media AMD Radeon RX 6800 (152.1 - 156, n=3) | |
| Media NVIDIA GeForce RTX 3080 (145 - 152, n=2) | |
| Media NVIDIA Titan RTX (124 - 150, n=28) | |
| Media AMD Radeon RX 6700 XT (117 - 130.4, n=3) | |
| Media NVIDIA GeForce RTX 3070 (52.8 - 132.2, n=7) | |
| 3840x2160 High Graphics & Postprocessing (Nvidia HairWorks Off) | |
| Media NVIDIA GeForce RTX 3090 (128 - 160.2, n=14) | |
| Corsair One i300 | |
| Media NVIDIA GeForce RTX 3080 (114 - 115, n=2) | |
| Media NVIDIA Titan RTX (94 - 107.1, n=28) | |
| Media AMD Radeon RX 6800 (96.8 - 100.7, n=3) | |
| Media NVIDIA GeForce RTX 3070 (84 - 93.9, n=5) | |
| Media AMD Radeon RX 6700 XT (63 - 75.7, n=3) | |
| Rise of the Tomb Raider | |
| 1920x1080 Very High Preset AA:FX AF:16x | |
| Media NVIDIA GeForce RTX 3090 (240 - 254, n=2) | |
| Media NVIDIA GeForce RTX 3080 (217 - 233, n=2) | |
| Corsair One i300 | |
| Media NVIDIA Titan RTX (n=1) | |
| Media AMD Radeon RX 6800 (n=1) | |
| Media NVIDIA GeForce RTX 3070 (151 - 169, n=3) | |
| Media AMD Radeon RX 6700 XT (n=1) | |
| 3840x2160 High Preset AA:FX AF:4x | |
| Media NVIDIA GeForce RTX 3090 (128 - 128.1, n=2) | |
| Corsair One i300 | |
| Media NVIDIA GeForce RTX 3080 (107 - 114, n=2) | |
| Media NVIDIA Titan RTX (n=1) | |
| Media AMD Radeon RX 6800 (n=1) | |
| Media NVIDIA GeForce RTX 3070 (76.7 - 83.8, n=3) | |
| Media AMD Radeon RX 6700 XT (n=1) | |
| Far Cry 6 | |
| 1920x1080 Ultra Graphics Quality + HD Textures AA:T | |
| Corsair One i300 | |
| Media NVIDIA GeForce RTX 3090 (94 - 177.6, n=10) | |
| Media AMD Radeon RX 6800 (116 - 152.5, n=3) | |
| Media NVIDIA Titan RTX (94.7 - 138.9, n=6) | |
| Media AMD Radeon RX 6700 XT (102 - 136.6, n=3) | |
| Media NVIDIA GeForce RTX 3070 (91 - 114.2, n=2) | |
| Media NVIDIA GeForce RTX 3080 (n=1) | |
| 3840x2160 Ultra Graphics Quality + HD Textures AA:T | |
| Media NVIDIA GeForce RTX 3090 (77 - 86.7, n=10) | |
| Corsair One i300 | |
| Media NVIDIA GeForce RTX 3080 (n=1) | |
| Media AMD Radeon RX 6800 (68.1 - 69.7, n=3) | |
| Media NVIDIA Titan RTX (52.8 - 64.2, n=6) | |
| Media AMD Radeon RX 6700 XT (50 - 52.7, n=3) | |
| Media NVIDIA GeForce RTX 3070 (26.4 - 57, n=2) | |
| Anno 1800 | |
| 1920x1080 Ultra Graphics Quality (DX11) | |
| Corsair One i300 | |
| Media NVIDIA GeForce RTX 3090 (51.5 - 85.5, n=4) | |
| Media NVIDIA GeForce RTX 3070 (46.5 - 74.7, n=3) | |
| Media NVIDIA GeForce RTX 3080 (54 - 54.1, n=2) | |
| Media AMD Radeon RX 6800 (n=1) | |
| Media AMD Radeon RX 6700 XT (n=1) | |
| Media NVIDIA Titan RTX (33.9 - 54.5, n=2) | |
| 3840x2160 Ultra Graphics Quality (DX11) | |
| Media NVIDIA GeForce RTX 3090 (51.3 - 87.4, n=4) | |
| Corsair One i300 | |
| Media NVIDIA GeForce RTX 3080 (43.2 - 46.3, n=2) | |
| Media AMD Radeon RX 6800 (n=1) | |
| Media NVIDIA GeForce RTX 3070 (34.3 - 41.8, n=3) | |
| Media NVIDIA Titan RTX (33 - 40.4, n=2) | |
| Media AMD Radeon RX 6700 XT (n=1) | |
| F1 2021 | |
| 1920x1080 Ultra High Preset + Raytracing AA:T AF:16x | |
| Corsair One i300 | |
| Media NVIDIA GeForce RTX 3090 (154 - 244, n=13) | |
| Media AMD Radeon RX 6800 (167 - 175.5, n=3) | |
| Media NVIDIA Titan RTX (160 - 172, n=6) | |
| Media NVIDIA GeForce RTX 3070 (148 - 158, n=2) | |
| Media NVIDIA GeForce RTX 3080 (n=1) | |
| Media AMD Radeon RX 6700 XT (143 - 145.2, n=3) | |
| 3840x2160 Ultra High Preset + Raytracing AA:T AF:16x | |
| Media NVIDIA GeForce RTX 3090 (100.4 - 110, n=13) | |
| Corsair One i300 | |
| Media NVIDIA GeForce RTX 3080 (n=1) | |
| Media NVIDIA Titan RTX (71.9 - 74.5, n=6) | |
| Media AMD Radeon RX 6800 (71.8 - 74, n=3) | |
| Media NVIDIA GeForce RTX 3070 (64 - 67.3, n=2) | |
| Media AMD Radeon RX 6700 XT (56.3 - 56.9, n=3) | |
| New World | |
| 1920x1080 Very High Video Quality | |
| Corsair One i300 | |
| Media NVIDIA Titan RTX (n=1) | |
| Media AMD Radeon RX 6700 XT (n=1) | |
| Media NVIDIA GeForce RTX 3070 (68.6 - 117.5, n=2) | |
| Media NVIDIA GeForce RTX 3090 (70.1 - 126, n=3) | |
| Media AMD Radeon RX 6800 (n=1) | |
| Media NVIDIA GeForce RTX 3080 (n=1) | |
| 3840x2160 Very High Video Quality | |
| Corsair One i300 | |
| Media NVIDIA GeForce RTX 3090 (n=1) | |
| Media NVIDIA GeForce RTX 3080 (n=1) | |
| Media NVIDIA Titan RTX (n=1) | |
| Media NVIDIA GeForce RTX 3070 (48.9 - 52.6, n=2) | |
| Media AMD Radeon RX 6800 (n=1) | |
| Media AMD Radeon RX 6700 XT (n=1) | |
The Witcher 3 FPS Chart
| basso | medio | alto | ultra | QHD | 4K | |
|---|---|---|---|---|---|---|
| GTA V (2015) | 187 | 187 | 187 | 149 | 147 | 180 |
| The Witcher 3 (2015) | 681 | 554 | 365 | 183 | 149 | |
| Dota 2 Reborn (2015) | 240.3 | 214.8 | 207.6 | 196.1 | 191.5 | |
| Rise of the Tomb Raider (2016) | 487 | 340 | 257 | 221 | 114 | |
| Final Fantasy XV Benchmark (2018) | 232 | 227 | 175 | 136 | 84 | |
| X-Plane 11.11 (2018) | 205 | 178 | 135 | 118 | ||
| Far Cry 5 (2018) | 230 | 200 | 190 | 175 | 168 | 108 |
| Strange Brigade (2018) | 667 | 484 | 392 | 345 | 260 | 156 |
| Shadow of the Tomb Raider (2018) | 245 | 226 | 226 | 212 | 164 | 93.7 |
| Far Cry New Dawn (2019) | 190 | 165 | 157 | 141 | 137 | 107 |
| Metro Exodus (2019) | 258 | 212 | 169 | 137 | 113 | 75 |
| Anno 1800 (2019) | 159 | 163 | 124 | 69.4 | 66.1 | 55.9 |
| Control (2019) | 240 | 233 | 187 | 124 | 63.9 | |
| Borderlands 3 (2019) | 208 | 181 | 167 | 152 | 125 | 72 |
| F1 2020 (2020) | 478 | 379 | 397 | 298 | 233 | 143 |
| F1 2021 (2021) | 534 | 498 | 410 | 219 | 170 | 101 |
| New World (2021) | 194 | 165 | 153 | 142 | 133 | 79.2 |
| Far Cry 6 (2021) | 200 | 176 | 155 | 149 | 129 | 81.6 |
| Guardians of the Galaxy (2021) | 194 | 196 | 191 | 191 | 186 | 110 |
| Riders Republic (2021) | 284 | 220 | 188 | 176 | 136 | 80 |
| Forza Horizon 5 (2021) | 292 | 200 | 188 | 126 | 111 | 84 |
| Battlefield 2042 (2021) | 216 | 194 | 169 | 150 | 123 | 83 |
| Farming Simulator 22 (2021) | 349 | 270 | 226 | 203 | 201 | 157 |
| Halo Infinite (2021) | 229 | 198 | 188 | 142 | 83.1 | |
| God of War (2022) | 209 | 181 | 163 | 117 | 98.7 | 64.7 |
| Rainbow Six Extraction (2022) | 365 | 353 | 348 | 282 | 194 | 104 |
| Dying Light 2 (2022) | 189 | 164 | 149 | 109 | 61.5 |
Emissioni
Emissioni di rumore
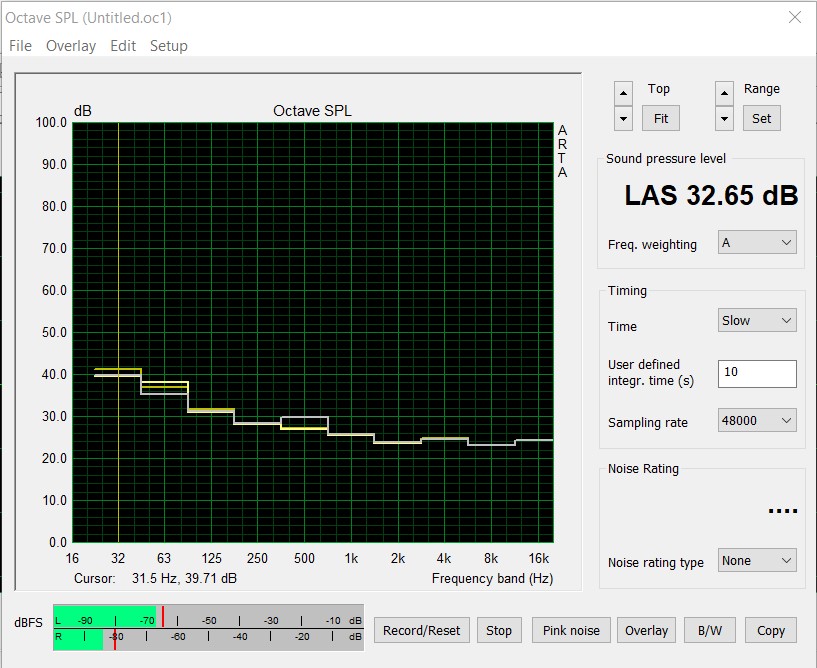
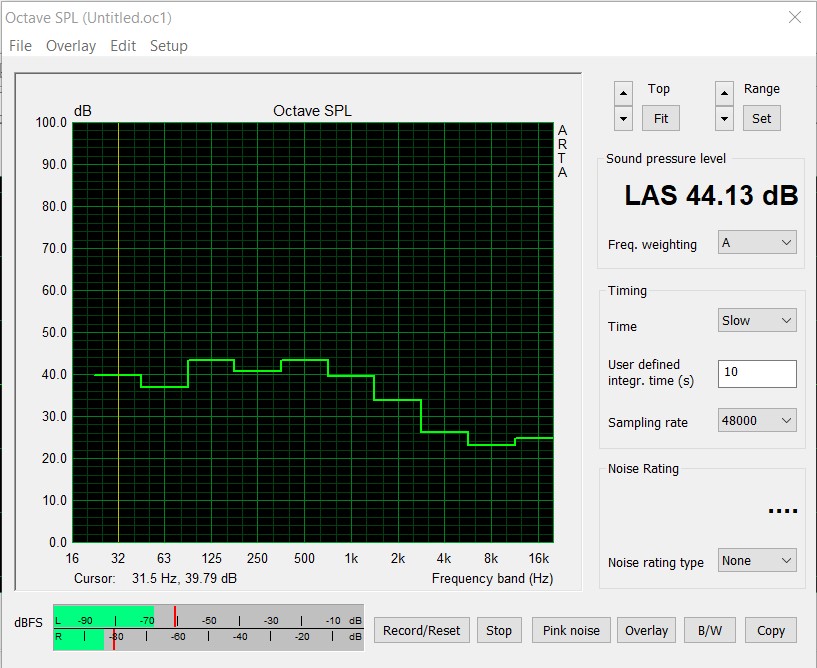
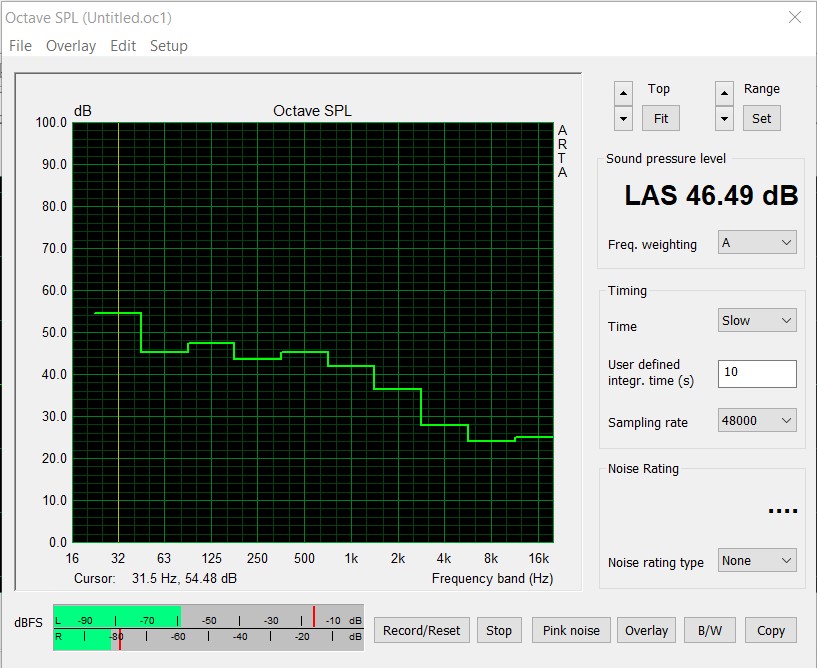
Il raffreddamento del Corsair One i300 è basato sullo stesso metodo del Corsair One i160. In funzionamento 2D, il sistema funziona in modo relativamente silenzioso a circa 32,6 dB(A). A questo punto, la grande ventola da 140 mm non gira ancora, ma si possono sentire le due pompe dell'AiO e il loro suono rimane sempre presente. Sfortunatamente, questo non è molto piacevole a lungo termine. Ci devono essere alcune pompe che possono fare il loro lavoro rimanendo significativamente più silenziose. Sotto carico, anche la ventola da 140 mm nel coperchio del case inizia a funzionare dopo poco tempo. A 44 dB(A) durante lo stress test, il sistema si sente chiaramente. Mentre si gioca, diventa anche un po' più forte con poco più di 46 dB(A).
Rumorosità
| Idle |
| 32.4 / 32.5 / 32.6 dB(A) |
| Sotto carico |
| / 44.13 dB(A) |
 | ||
30 dB silenzioso 40 dB(A) udibile 50 dB(A) rumoroso |
||
min: | ||
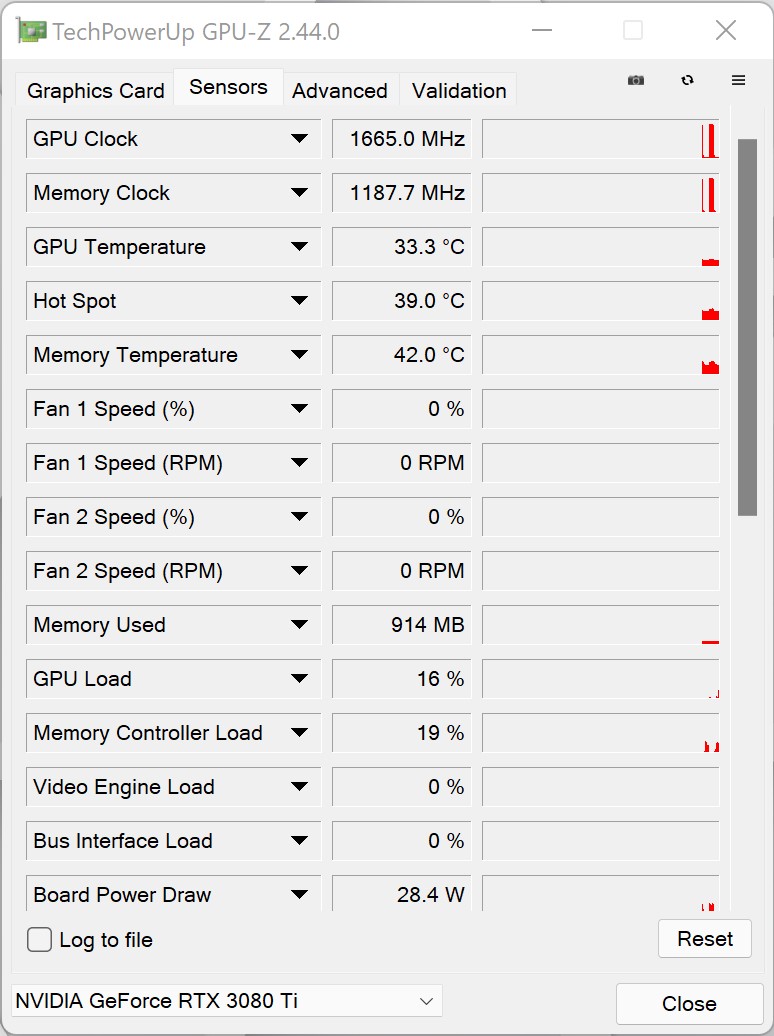
Temperatura e consumo di energia
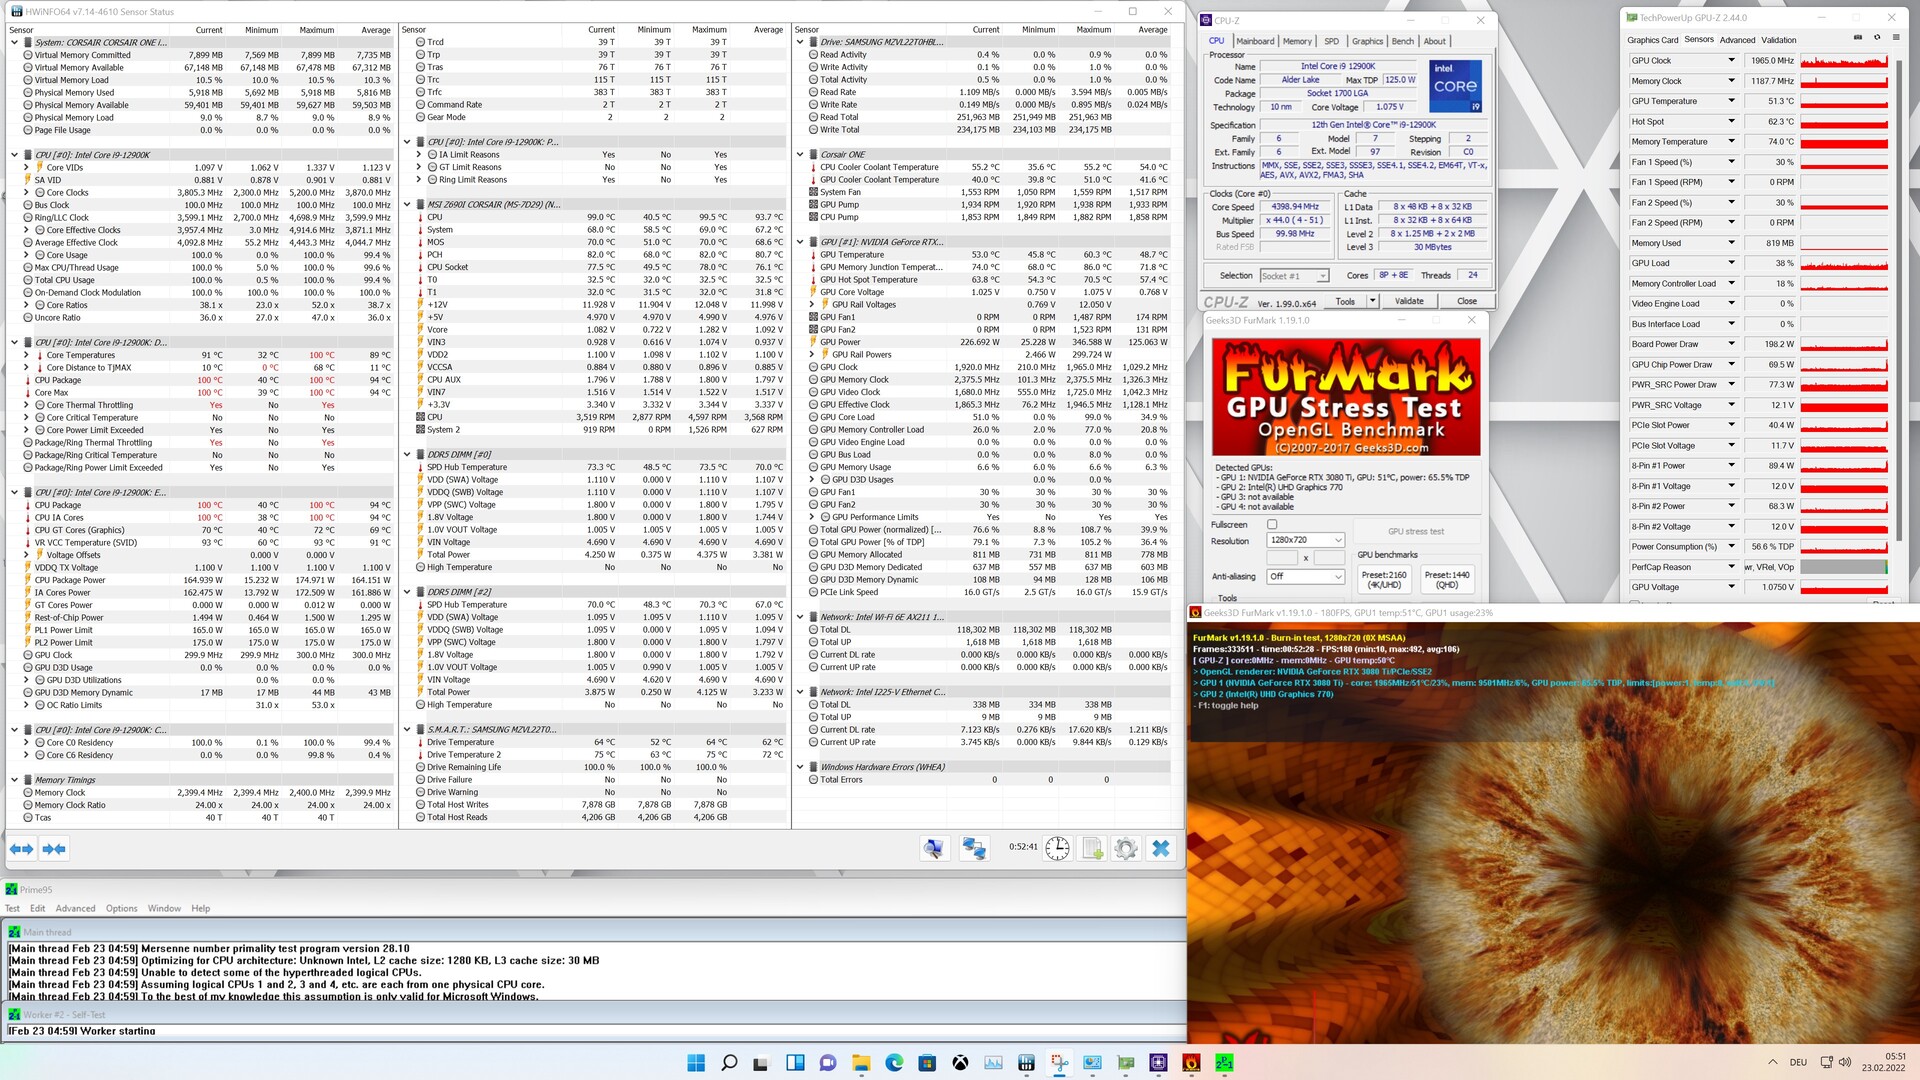
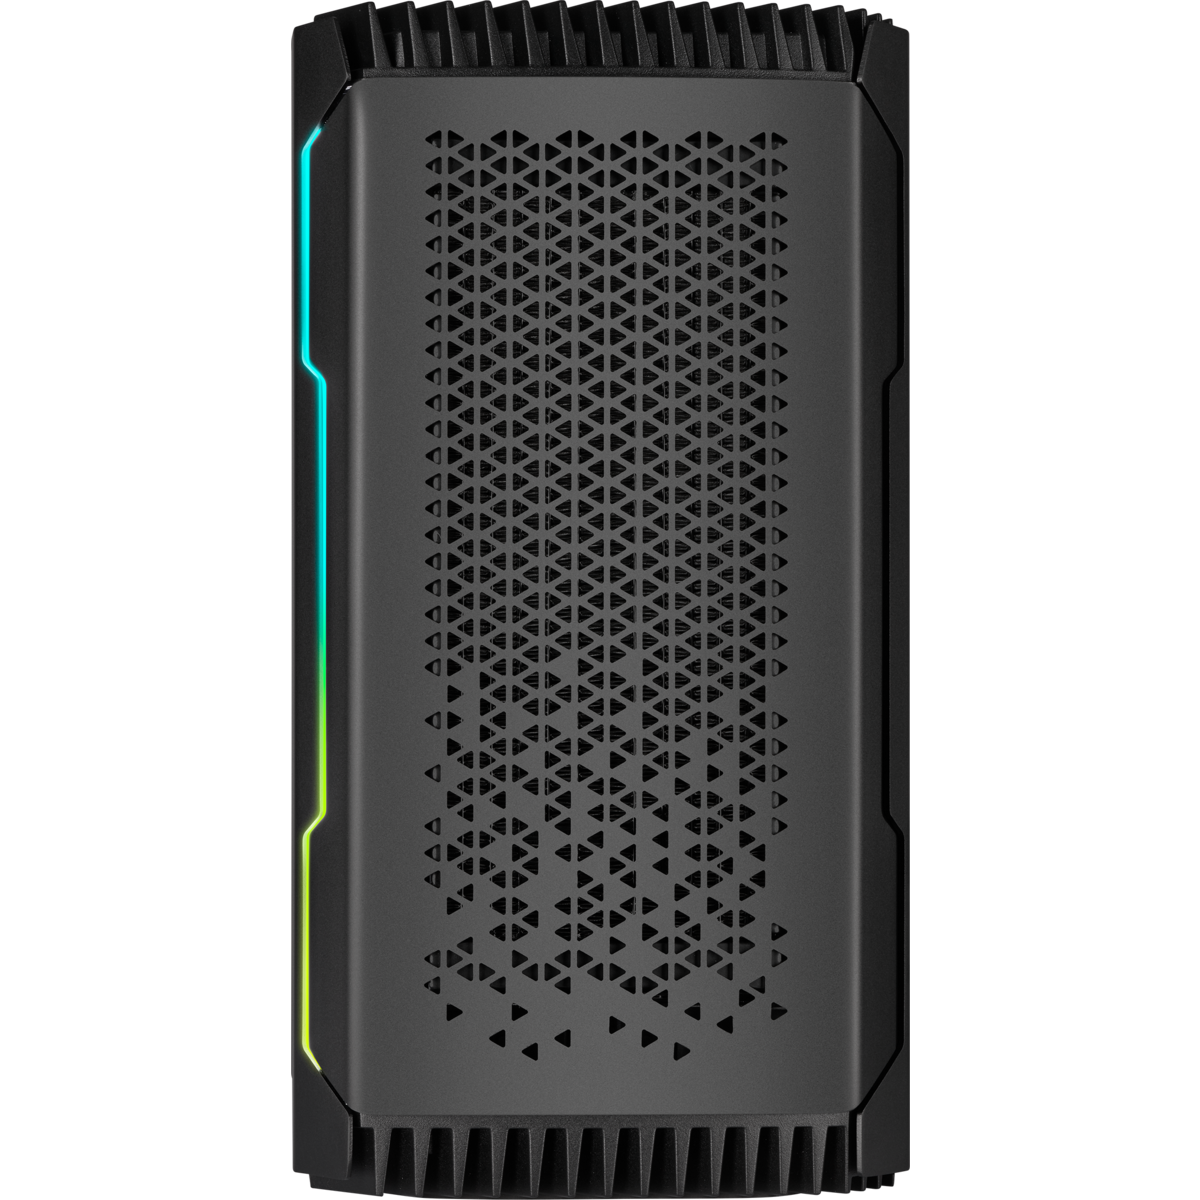
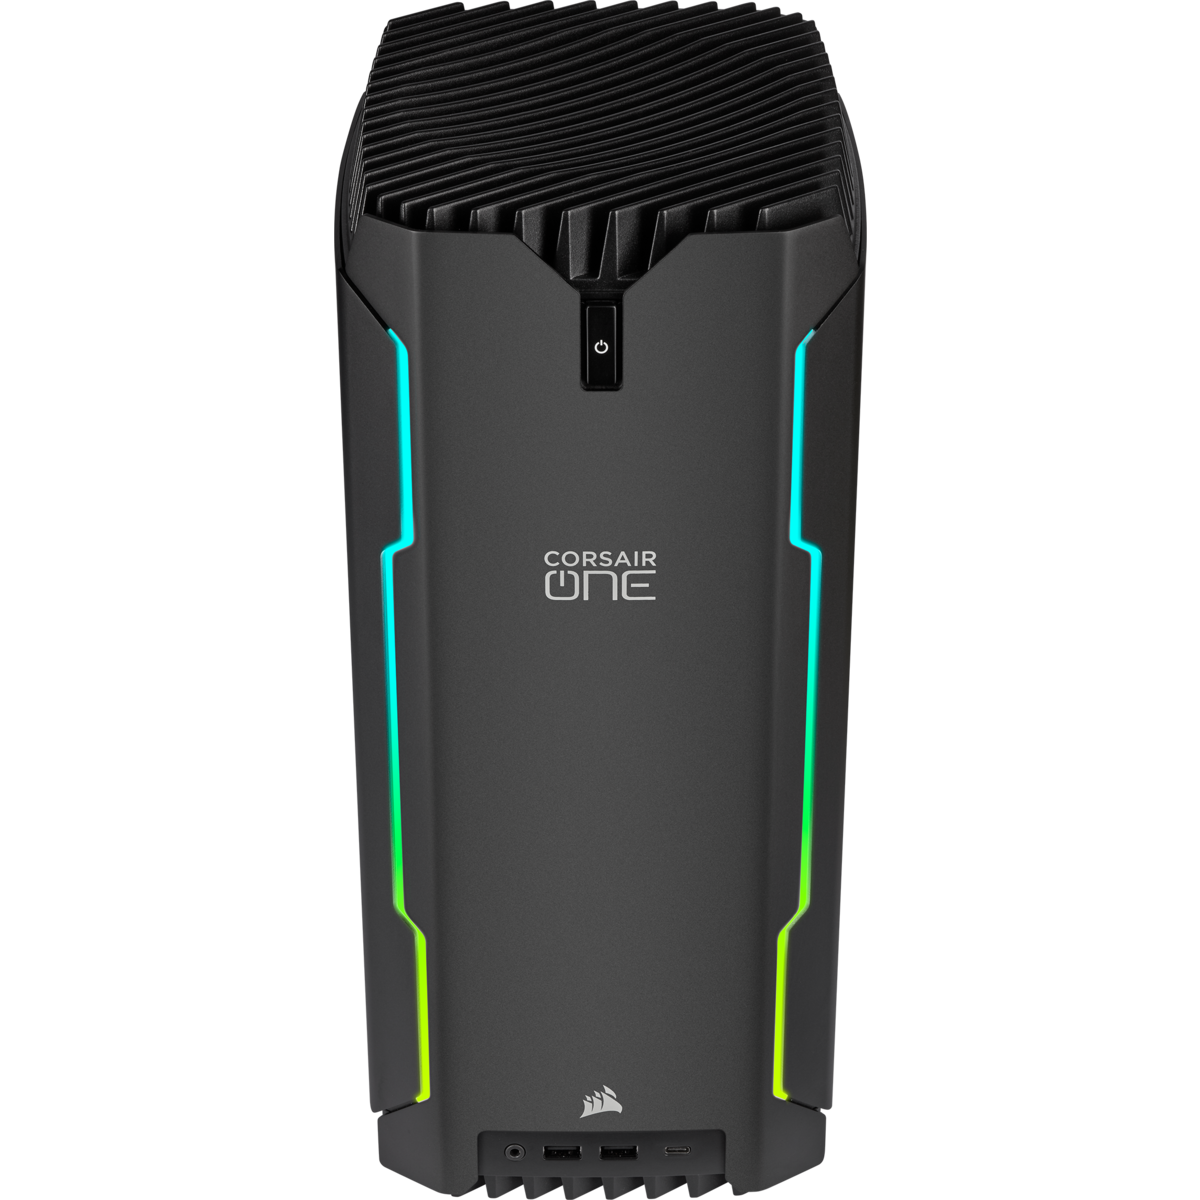
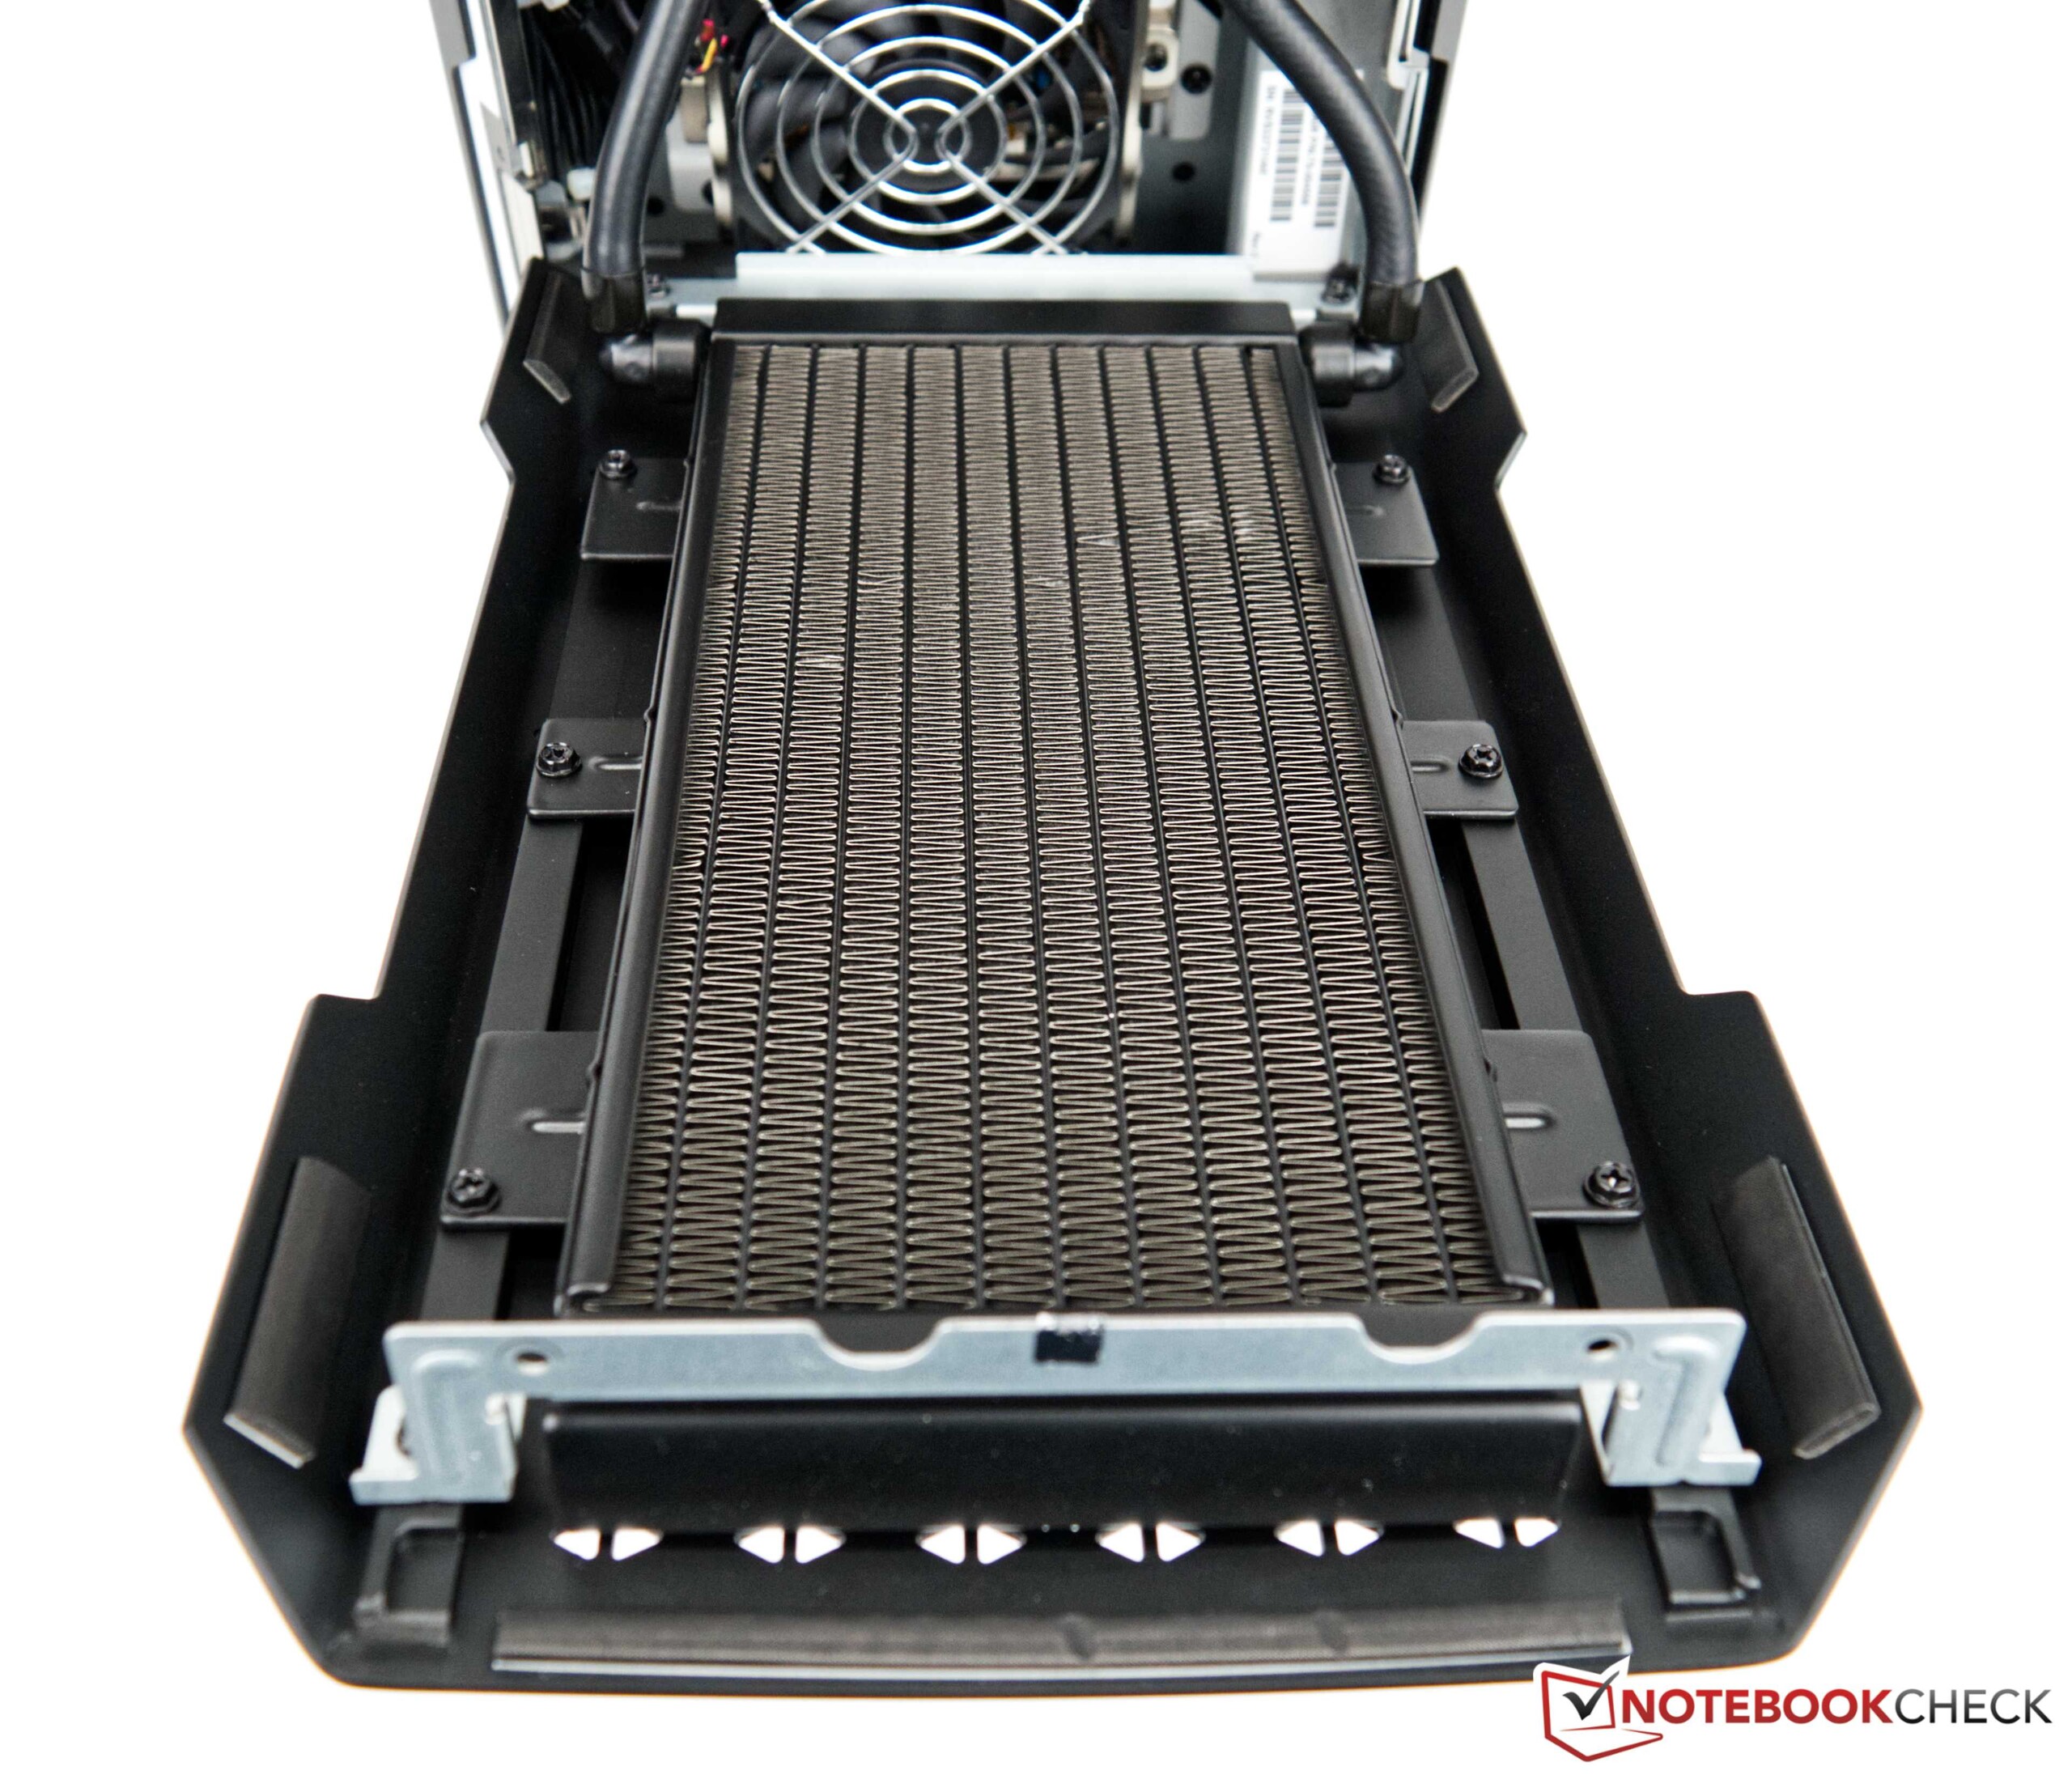
Il massiccio case offre una superficie molto ampia per consentire il trasferimento di calore. Sotto carico, questo si scalda notevolmente, e il cosiddetto effetto camino assicura che l'aria fredda sia tirata dentro dai lati e guidata direttamente oltre le alette di raffreddamento dei due AiO per poi essere spinta fuori dal case dalla grande ventola da 140 mm sulla parte superiore. Per un raffreddamento efficace della scheda grafica, questa è inoltre dotata di due ventole più piccole per raffreddare il trasformatore e la VRAM.
Questo concetto di raffreddamento funziona bene, e tutti i componenti sono raffreddati efficacemente, senza surriscaldamento sotto pieno carico. Tuttavia, la CPU ha ancora raggiunto i 100 °C (212 °F) durante lo stress test. Questo dimostra perché Corsair strozza le sue prestazioni a un massimo di 175 watt. Coloro per i quali i 100 °C sono ancora troppo caldi possono anche ridurre ulteriormente le prestazioni nel BIOS. Tuttavia, le temperature dell Intel Core i9-12900Knon pongono ancora alcun problema, come abbiamo già scoperto durante il Cinebench R15 Multi loop. Lo stress test con FurMark e Prime95 in esecuzione allo stesso tempo rappresenta uno scenario estremo che difficilmente dovrebbe accadere nel funzionamento quotidiano
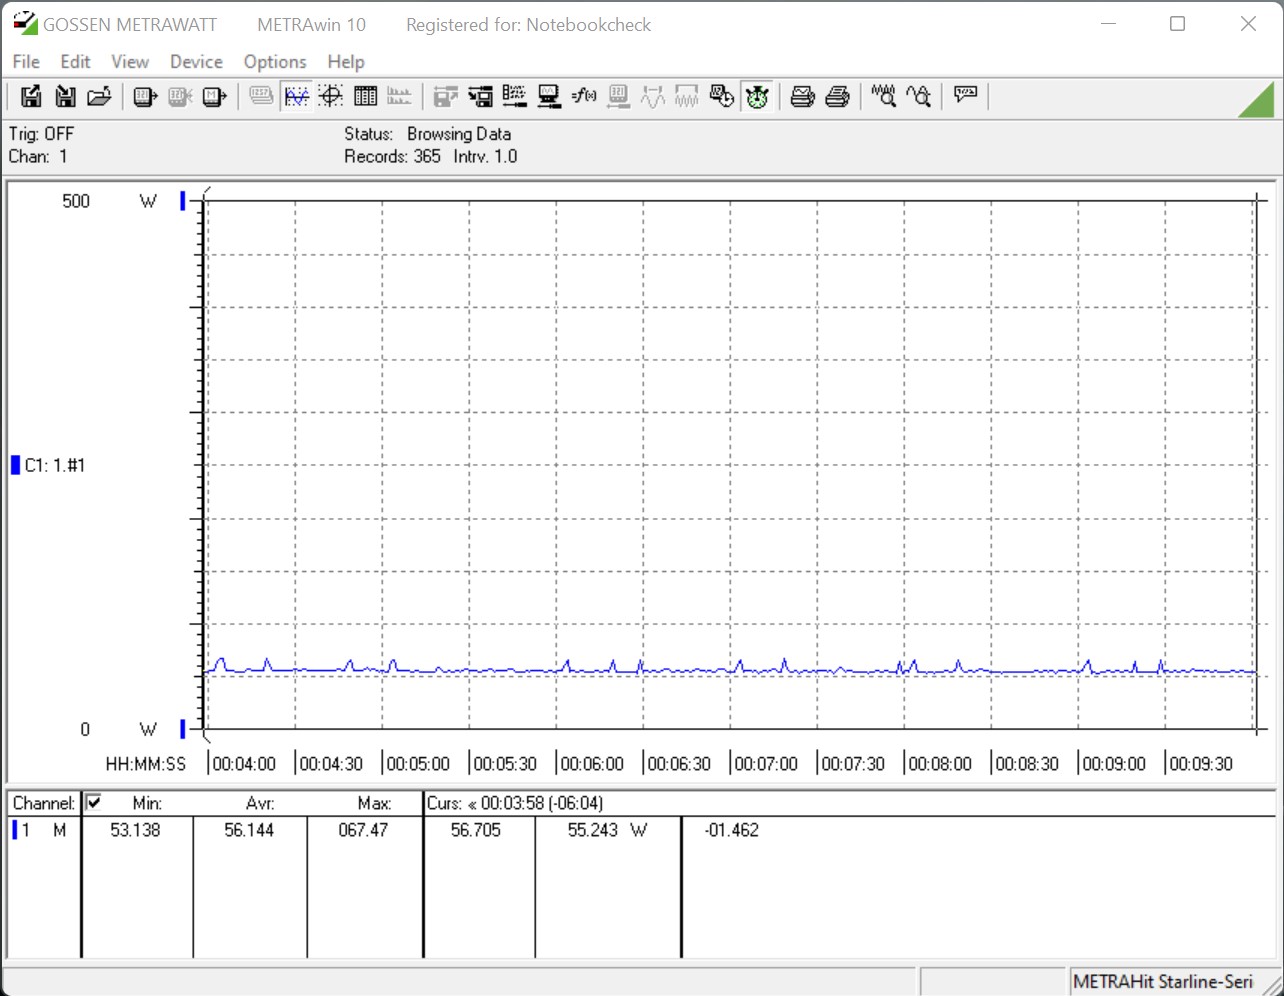
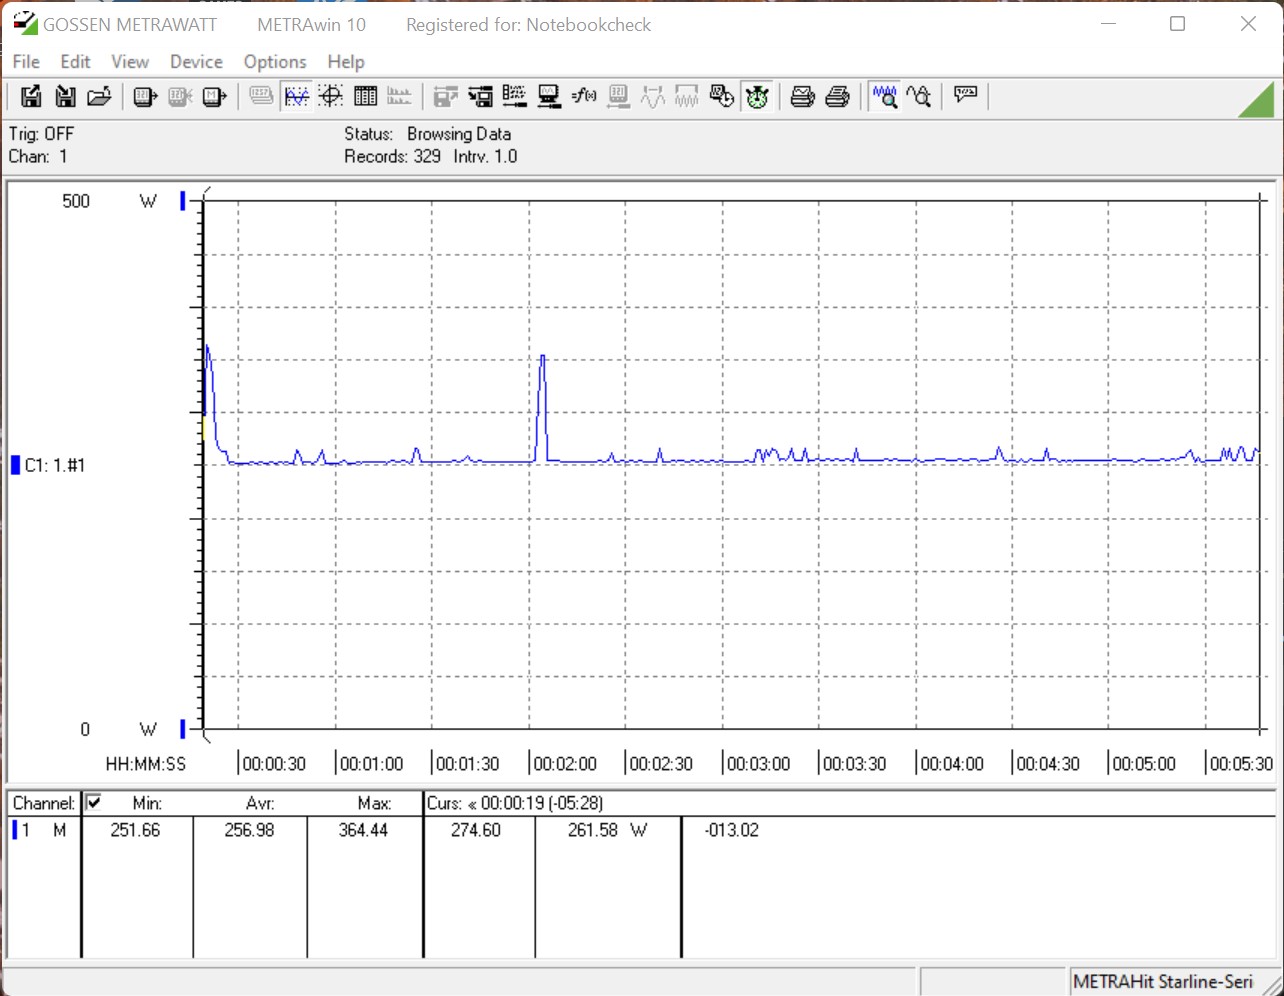
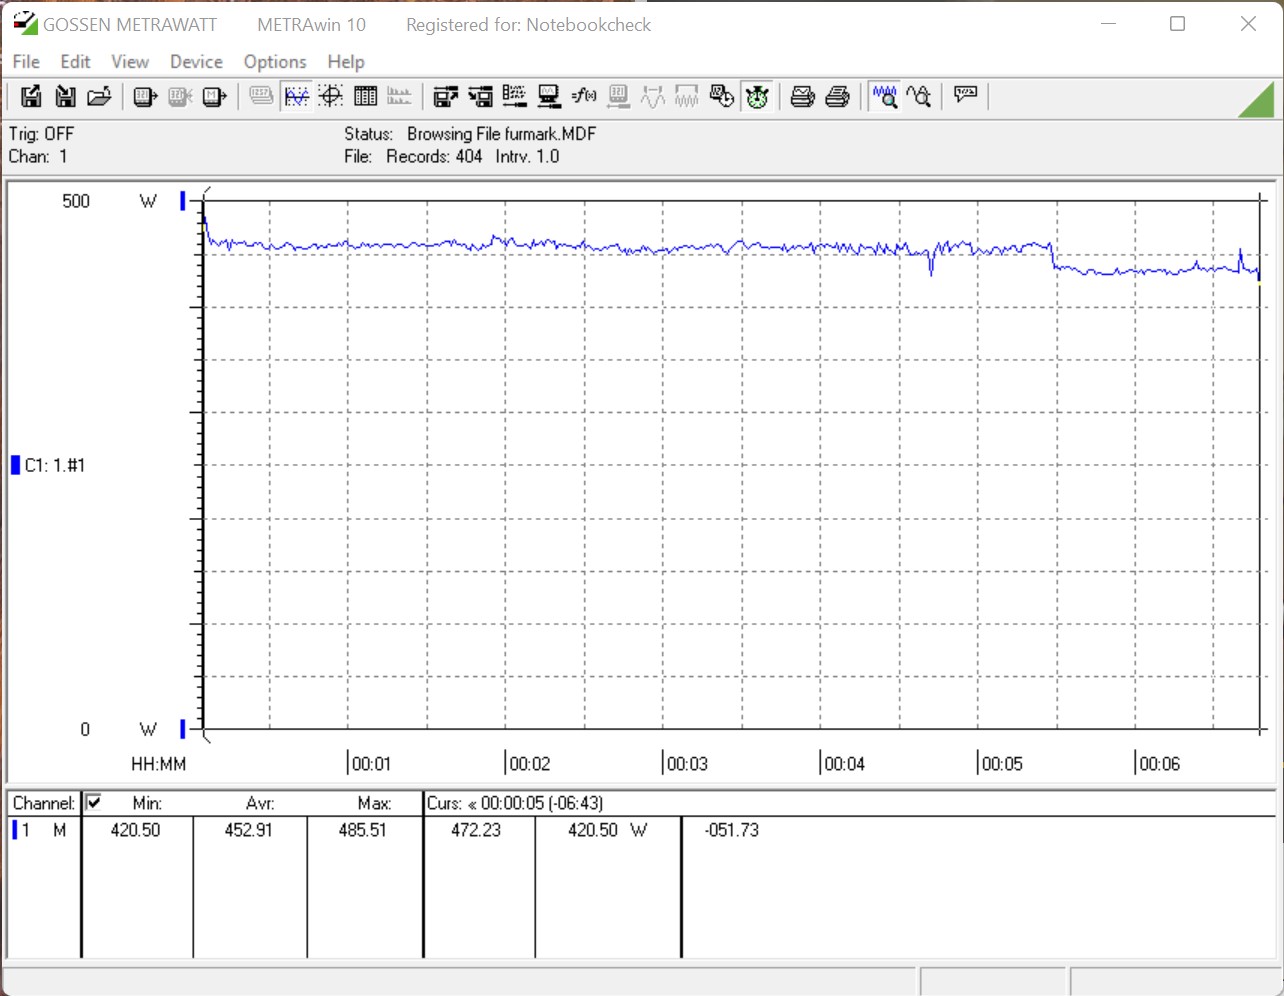
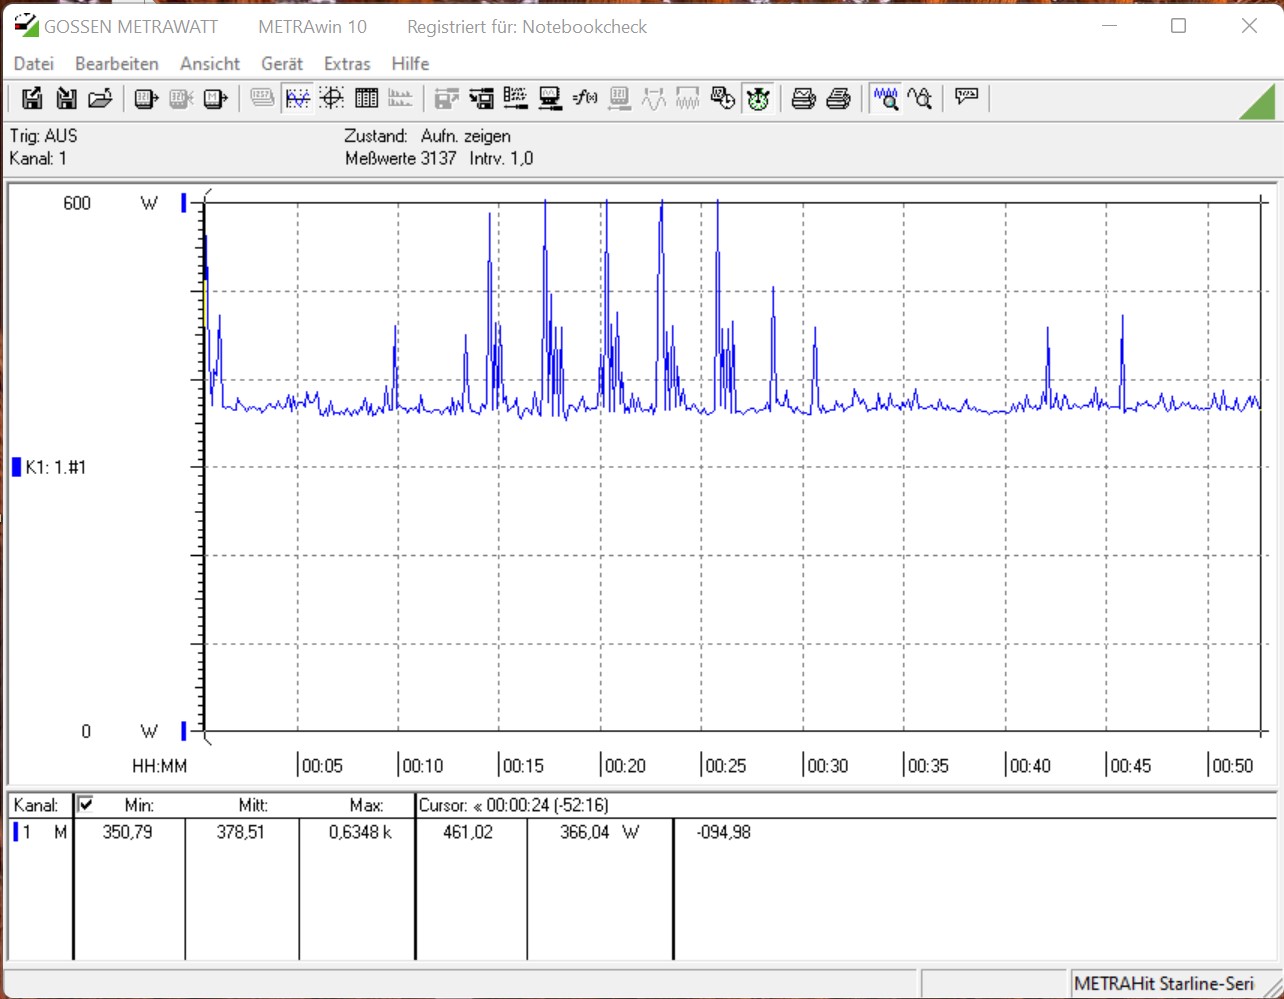
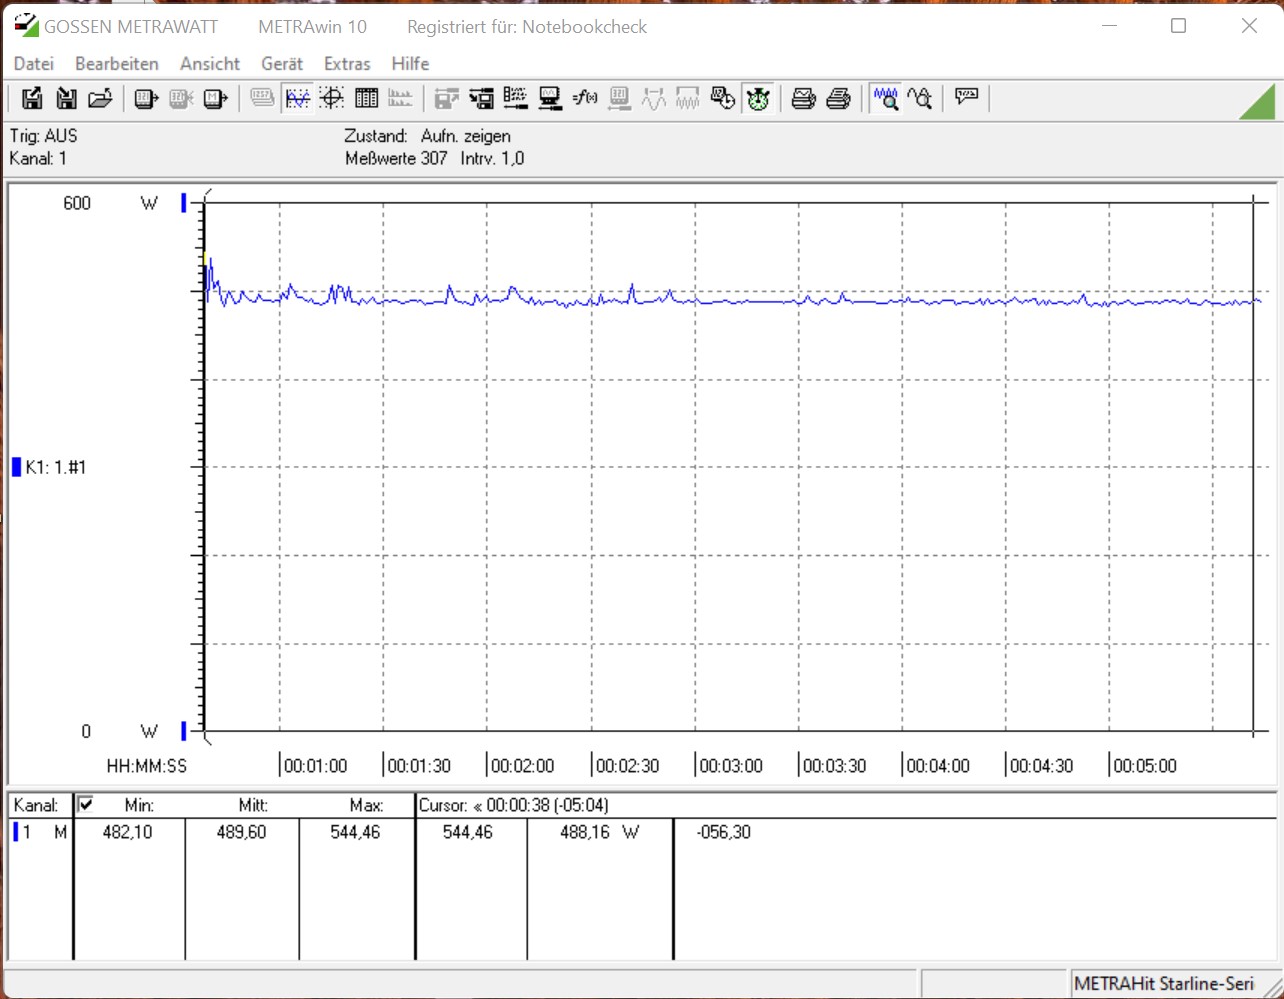
In termini di consumo energetico, il sistema si distingue per un basso consumo durante il funzionamento in idle. Solo 56 watt è un buon valore. Durante il gioco, il compatto alimentatore da 750 watt (costruzione SFF) deve fornire 489 watt in media, con i picchi che arrivano fino a 544 watt. Durante lo stress test, abbiamo anche misurato brevemente 635 watt. L'alimentatore è sempre stato in grado di gestire tutto questo, e non abbiamo notato alcun problema.
| Power Consumption - 1920x1080 The Witcher 3 ultra (external Monitor) | |
| Intel Core i9-12900K, NVIDIA GeForce RTX 3080 Ti | |
| Intel Core i9-12900K, NVIDIA Titan RTX (Idle: 70.5 W) | |
| AMD Ryzen 9 5950X, NVIDIA Titan RTX (Idle: 78 W) | |
| AMD Ryzen 9 5900X, NVIDIA Titan RTX (Idle: 78.1 W) | |
| Intel Core i5-11600K, NVIDIA Titan RTX (Idle: 69.49 W) | |
| Intel Core i5-12600K, NVIDIA Titan RTX (Idle: 70.45 W) | |
| Intel Core i9-11900K, NVIDIA Titan RTX (Idle: 57.3 W) | |
* ... Meglio usare valori piccoli
| Power Consumption - 1280x720 FurMark 1.19 GPU Stress Test (external Monitor) | |
| AMD Ryzen 9 5900X, NVIDIA GeForce RTX 3090 (Idle: 105.9 W) | |
| AMD Ryzen 9 5900X, NVIDIA GeForce RTX 3080 (Idle: 88.3 W) | |
| Intel Core i9-12900K, NVIDIA GeForce RTX 3080 Ti | |
| AMD Ryzen 9 5950X, AMD Radeon RX 6800 XT (Idle: 99.5 W) | |
| AMD Ryzen 9 5900X, NVIDIA GeForce RTX 3070 (Idle: 95.1 W) | |
| AMD Ryzen 9 5900X, AMD Radeon RX 6800 (Idle: 81.4 W) | |
| AMD Ryzen 9 5900X, AMD Radeon RX 6700 XT (Idle: 77.1 W) | |
* ... Meglio usare valori piccoli
Power consumption The Witcher 3 / stress test
Power consumption with external monitor
Verdetto - Un perfetto PC da gioco 4K
Pro
Contro
Mentre il Corsair One i300 non è una novità assoluta, questo non è assolutamente necessario. L'aspetto del compatto PC premium è semplice e moderno. Inoltre, il design interno permette di utilizzare componenti convenzionali in termini di scheda madre e alimentazione. Solo il sistema di raffreddamento è un design interno. Nel nostro modello di test, purtroppo non rende giustizia al segmento premium. Tuttavia, i due AiO funzionano bene, raffreddando il sistema in modo affidabile. Tuttavia, le due pompe si sono fatte notare acusticamente. A lungo andare, questo è spiacevole e considerando il prezzo di acquisto di 5099 euro (~$5722), non è nemmeno qualcosa che si deve accettare. Ma il design del sistema di raffreddamento è ancora il punto forte oltre ai componenti più attuali. Con il Intel Core i9-12900Kc'è la CPU di gioco più veloce, che combinato con una scheda madre corrente tra cui DDR5 RAM e unNvidia GeForce RTX 3080 Tipermette di giocare in 4K senza compromessi. Inoltre, c'è anche un SSD da 2 TB con velocità di trasferimento molto buone.
Grazie a un Intel Core i9-12900K e Nvidia GeForce RTX 3080 Ti, ilCorsair One i300 fornisceprestazioni di gioco4K
utilizzando il minimo spazio.
Un prodotto premium ha naturalmente anche il suo prezzo. A 5099 euro (~5722) per la nostra unità di test, questo non è esattamente economico, e non dovremmo comunque parlare male dei componenti separati. Il case non è off-the-shelf e non può essere acquistato separatamente. Inoltre, la disponibilità di varie schede grafiche e altri componenti attuali è ancora un problema, il che rende quasi giustificabile il prezzo complessivo. Il sistema è anche dotato di due AiO che sono stati sviluppati specificamente per la serie Corsair One. Questo deve essere preso in considerazione quando si considera il prezzo. Tuttavia, secondo noi il Corsair One i300 con un Intel Core i9-12900K e Nvidia GeForce RTX 3080 sarebbe il sistema più ragionevole in termini di prezzo. Ma poi la RAM e l'SSD sarebbero solo la metà con 32 GB e 1 TB rispettivamente. Un sistema con quei componenti è disponibile per 4099 euro (4562 dollari). Il deficit di prestazioni della Nvidia GeForce RTX 3080 rispetto al modello Ti è limitato e accettabile.
Prezzo e disponibilità
Al momento di questo test, il dispositivo può essere acquistato direttamente da Corsair per $5000. In alternativa, il modello più piccolo può anche essere acquistato da Amazon per $4000.

