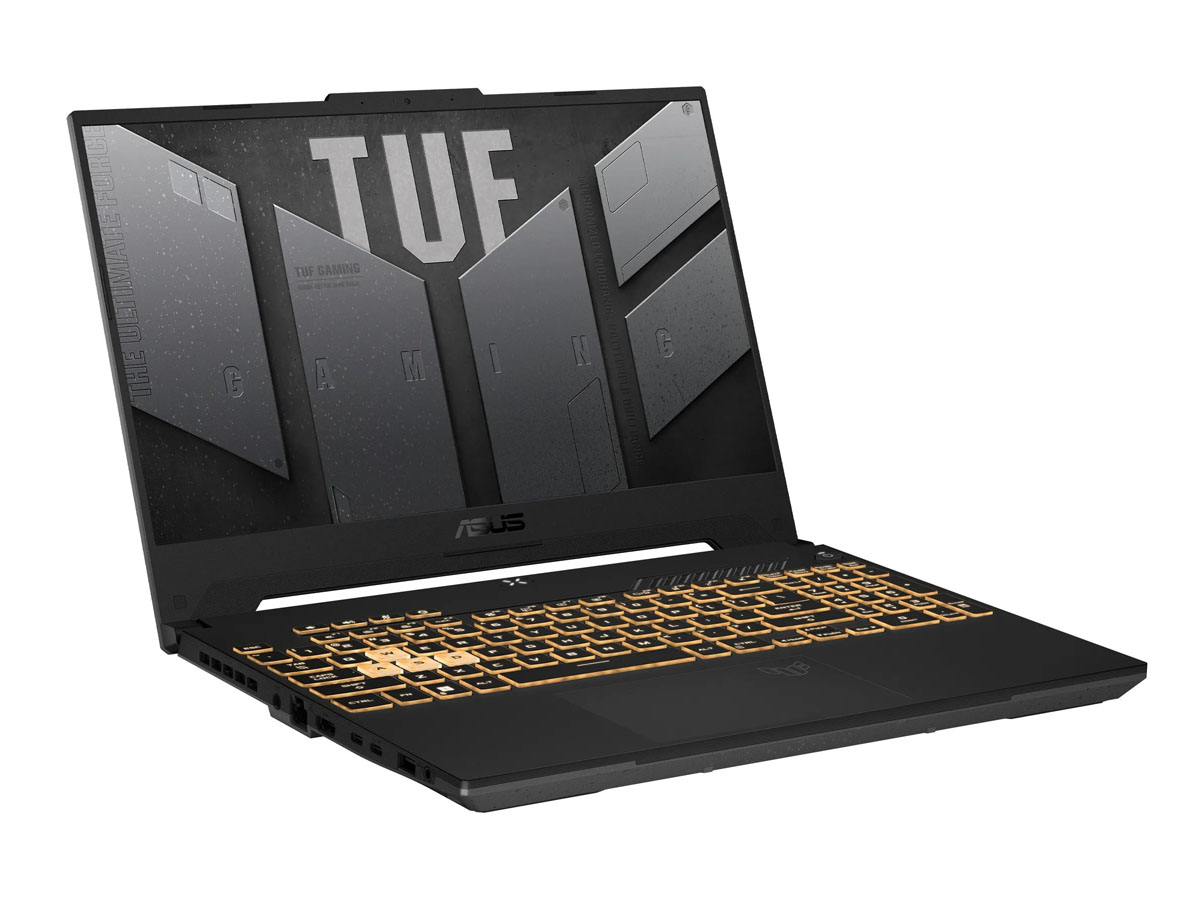
Recensione del portatile Asus TUF Gaming F15 FX507ZM: Prestazioni di picco GeForce RTX 3060
Asus ha rinfrescato la sua serie TUF Gaming F15 per il 2022 ora che la serie di CPU Intel 12th gen è ampiamente disponibile. Invece di un semplice scambio di CPU, tuttavia, il produttore ha aggiornato aspetti significativi del telaio FX506 dello scorso anno per creare l'FX507. Questa recensione esaminerà tutte le differenze chiave tra l'FX506 del 2021 e l'FX507 del 2022, così come i livelli di prestazioni che gli utenti possono aspettarsi dall'FX507.
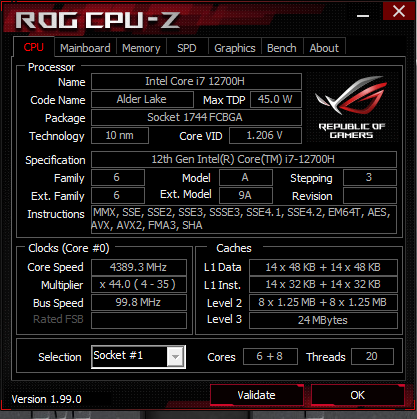
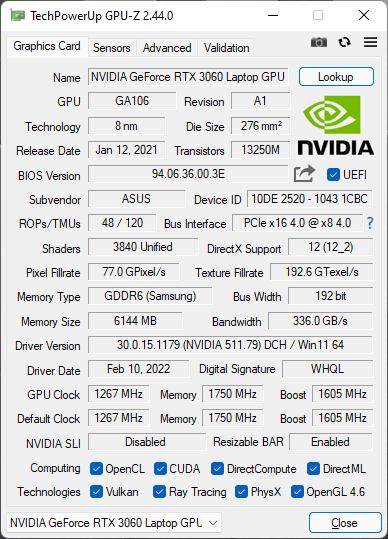
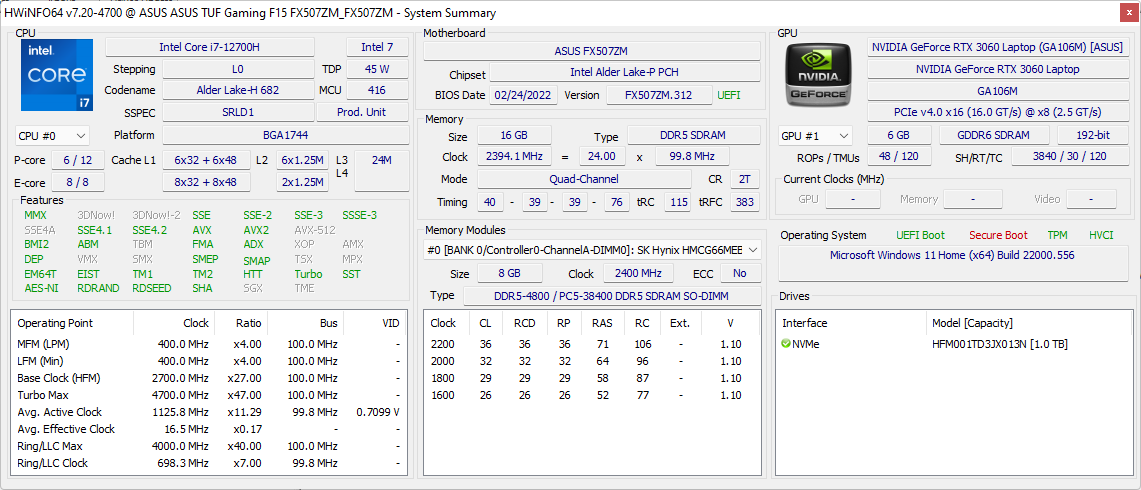
La nostra configurazione in esame è dotata di CPU Alder Lake-H Core i7-12700H, GeForce RTX 3060 GPU, pannello IPS 300 Hz 1080p e batteria da 90 Wh per circa $1500 USD al dettaglio. Altre SKU con frequenze di aggiornamento del display più lente, batteria più piccola da 56 Wh e opzioni di CPU più lente possono essere disponibili. Si noti che anche se l'FX507 viene fornito con la stessa GPU GeForce RTX 3060 come sul vecchio FX506, la GPU nel modello più recente si rivolge a un TGP molto più alto per spremere più prestazioni (140 W contro 95 W).
I concorrenti dell'FX507 includono altri portatili da gioco leggeri e sottili da 15,6 pollici di fascia media come il Razer Blade 15 Modello Base, MSI GP66, Acer Predator Tritono la Gigabyte Aorus 5 serie.
Altre recensioni su Asus:
Potenziali concorrenti a confronto
Punteggio | Data | Modello | Peso | Altezza | Dimensione | Risoluzione | Prezzo |
|---|---|---|---|---|---|---|---|
| 87.2 % v7 (old) | 03/2022 | Asus TUF Gaming F15 FX507ZM i7-12700H, GeForce RTX 3060 Laptop GPU | 2.1 kg | 24.95 mm | 15.60" | 1920x1080 | |
| 85.9 % v7 (old) | 06/2021 | Asus TUF Gaming F15 FX506HM i7-11800H, GeForce RTX 3060 Laptop GPU | 2.3 kg | 24.9 mm | 15.60" | 1920x1080 | |
| 82.4 % v7 (old) | 02/2021 | Asus TUF Dash F15 FX516PR i7-11370H, GeForce RTX 3070 Laptop GPU | 2 kg | 20 mm | 15.60" | 1920x1080 | |
| 86.3 % v7 (old) | 07/2021 | Asus ROG Strix Scar 15 G533QS R9 5900HX, GeForce RTX 3080 Laptop GPU | 2.3 kg | 27.2 mm | 15.60" | 2560x1440 | |
| 82.9 % v7 (old) | 10/2020 | Asus Zephyrus S15 GX502L i7-10875H, GeForce RTX 2070 Super Mobile | 2.1 kg | 19 mm | 15.60" | 1920x1080 | |
| 85.8 % v7 (old) | 06/2021 | Asus ZenBook Pro Duo UX582 LR-1BH2 i7-10870H, GeForce RTX 3070 Laptop GPU | 2.4 kg | 21.5 mm | 15.60" | 3840x2160 |
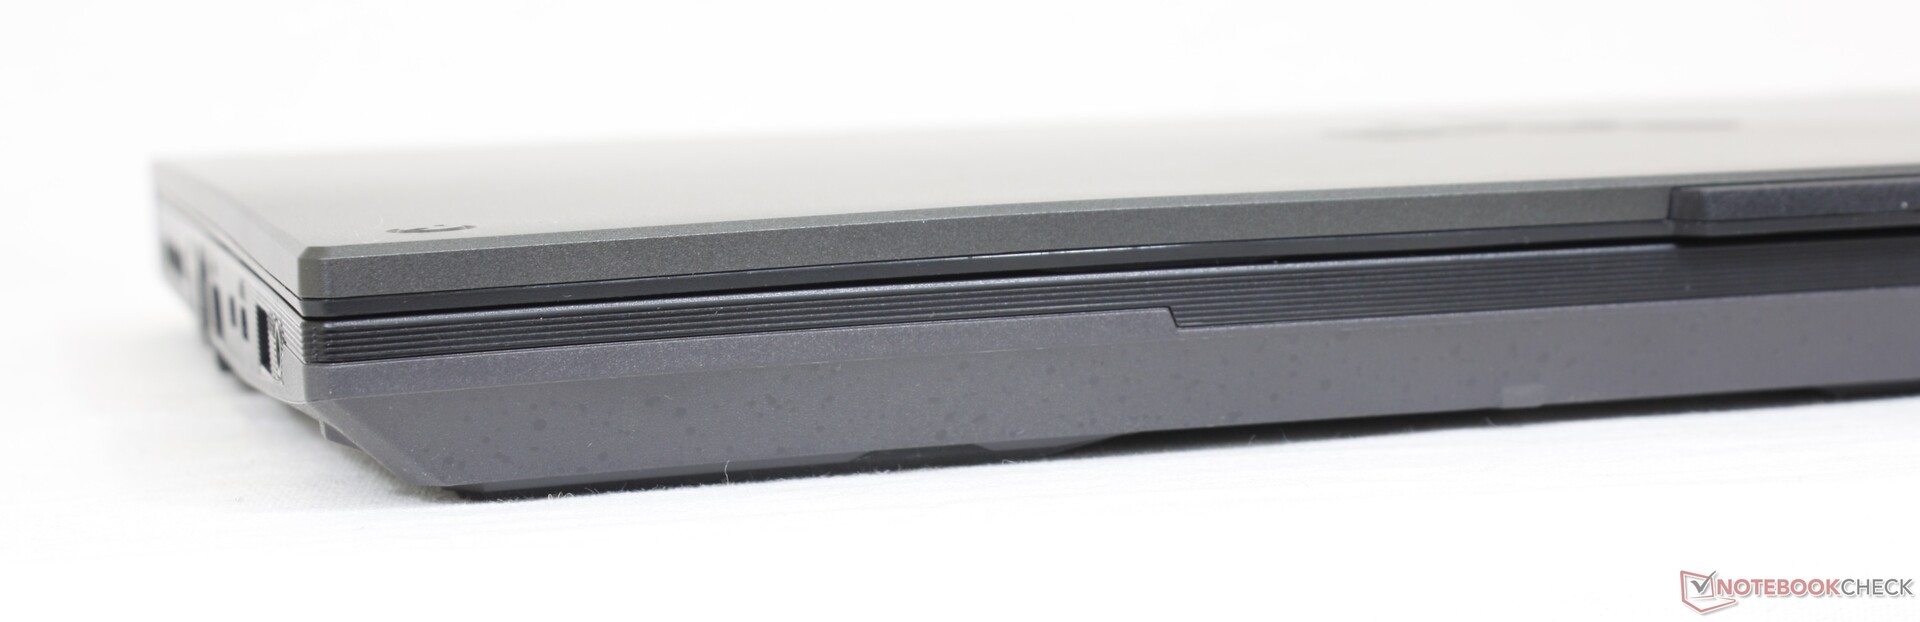
Caso - Più piccolo e più leggero
L'FX507 può sembrare identico all'FX506 a prima vista, ma ci sono in realtà numerosi piccoli cambiamenti. Gli angoli, per esempio, sono più nitidi di prima, mentre i poggiapolsi lucidi fintamente spazzolati sono ora una texture opaca più piatta. La maggior parte delle protuberanze e delle texture alternate sull'FX506 sono state rimosse per un look più pulito e minimalista. I materiali del telaio sembrano essere altrimenti gli stessi del modello dell'anno scorso per un livello simile di rigidità.
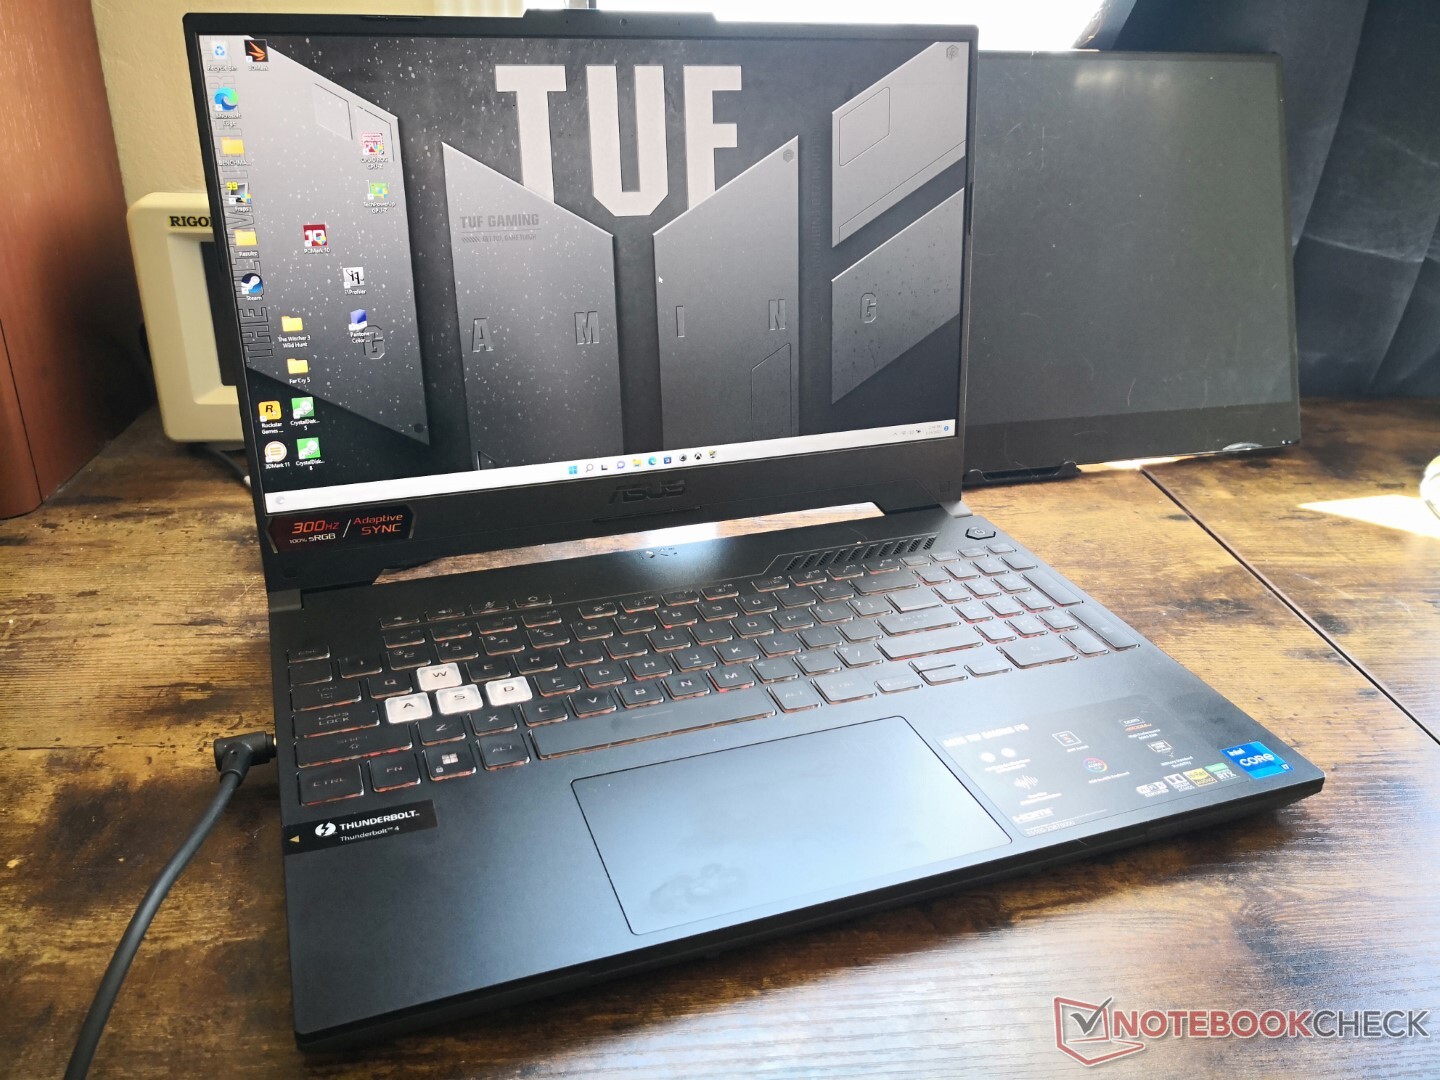
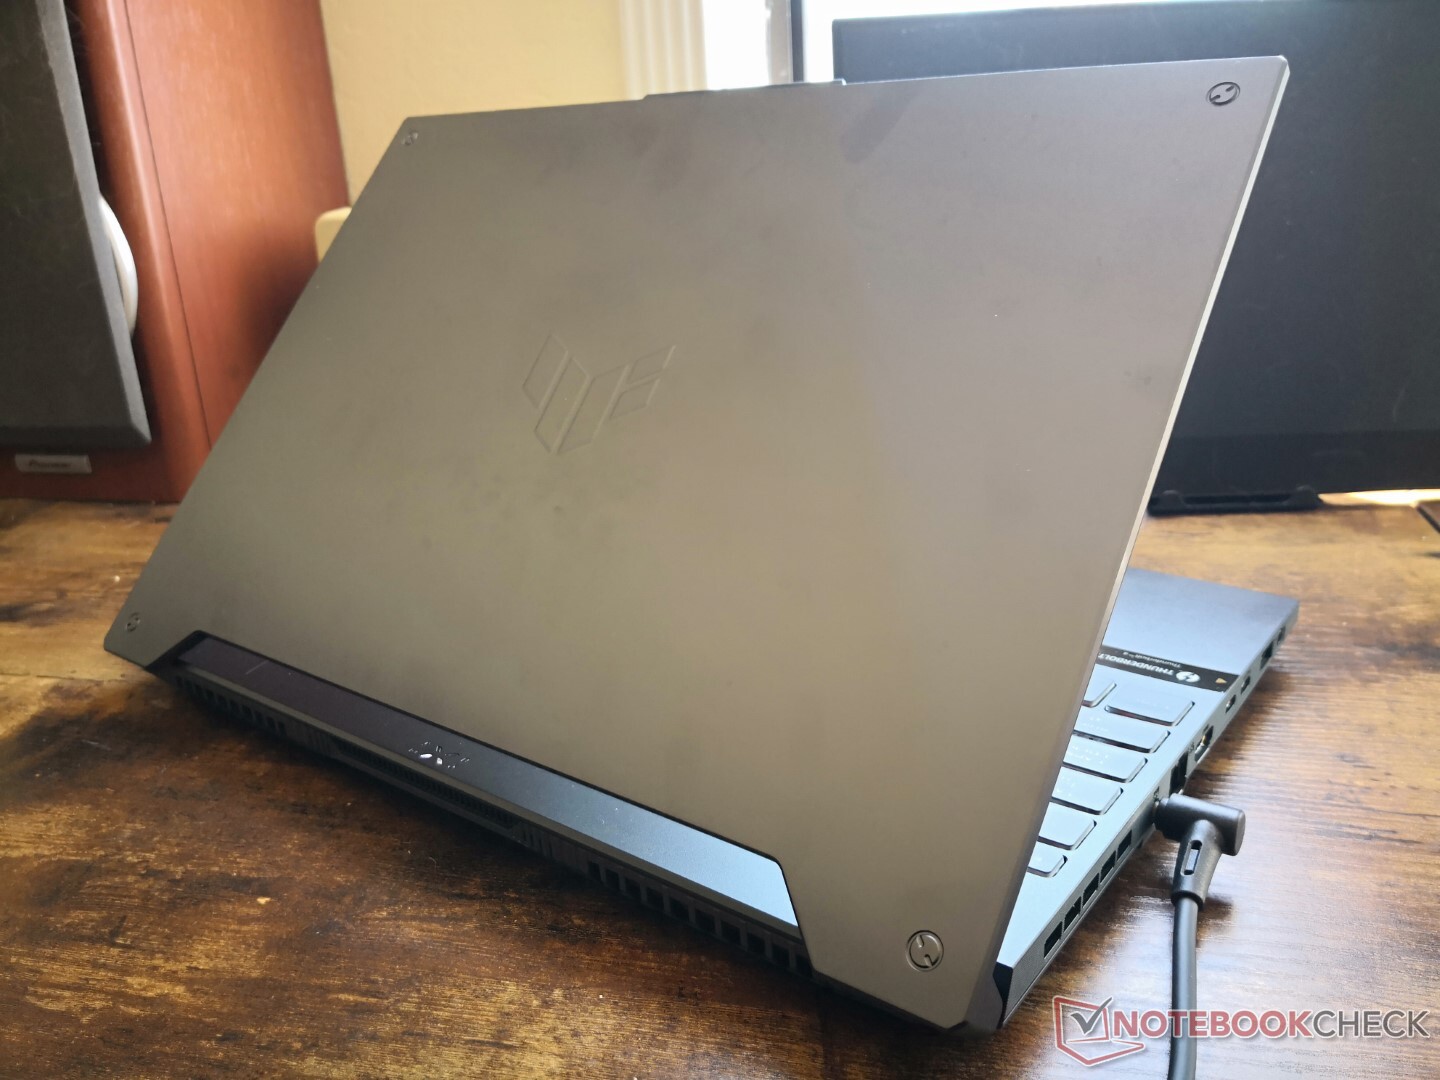
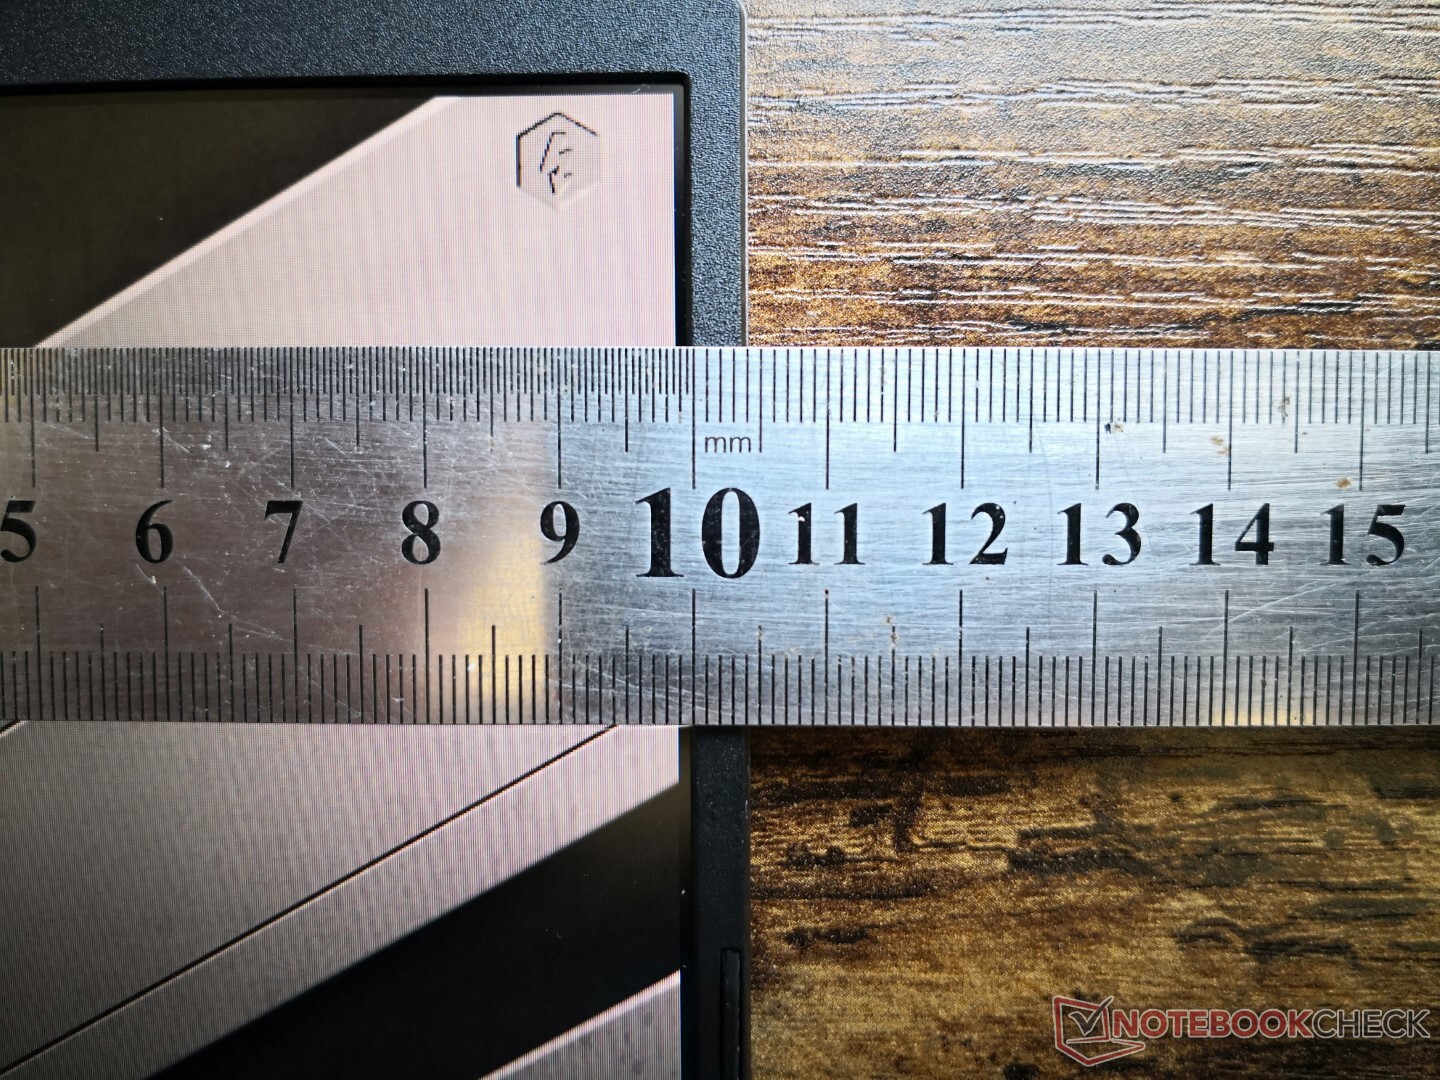
Asus è riuscita a ridurre sia le dimensioni che il peso dell'FX507 rispetto al suo predecessore FX506. Il nuovo modello è leggermente più corto (354,9 mm contro 359,8 mm), leggermente più stretto (251,9 mm x 256 mm), e un po' più leggero (2,1 kg contro 2,3 kg) per essere altrettanto leggero del più sottile Zephyrus S15.
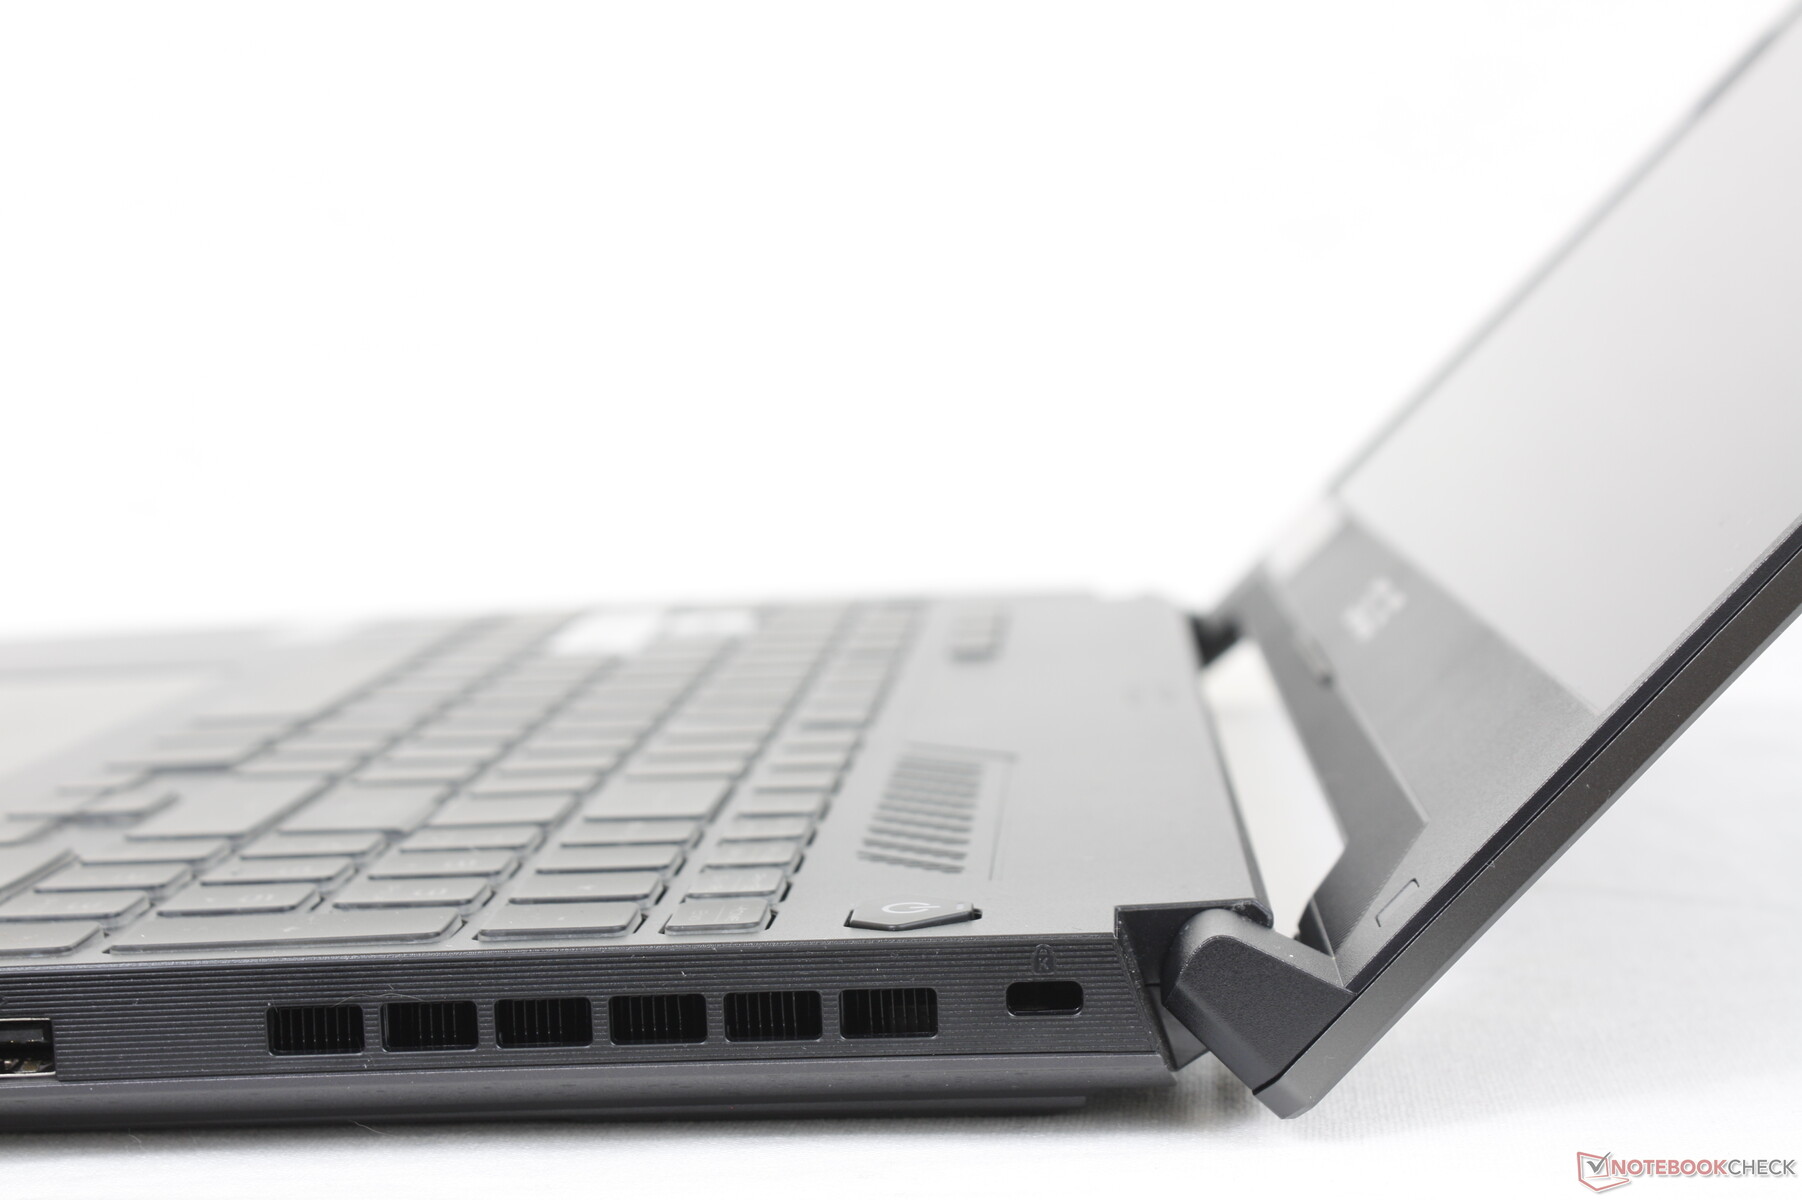
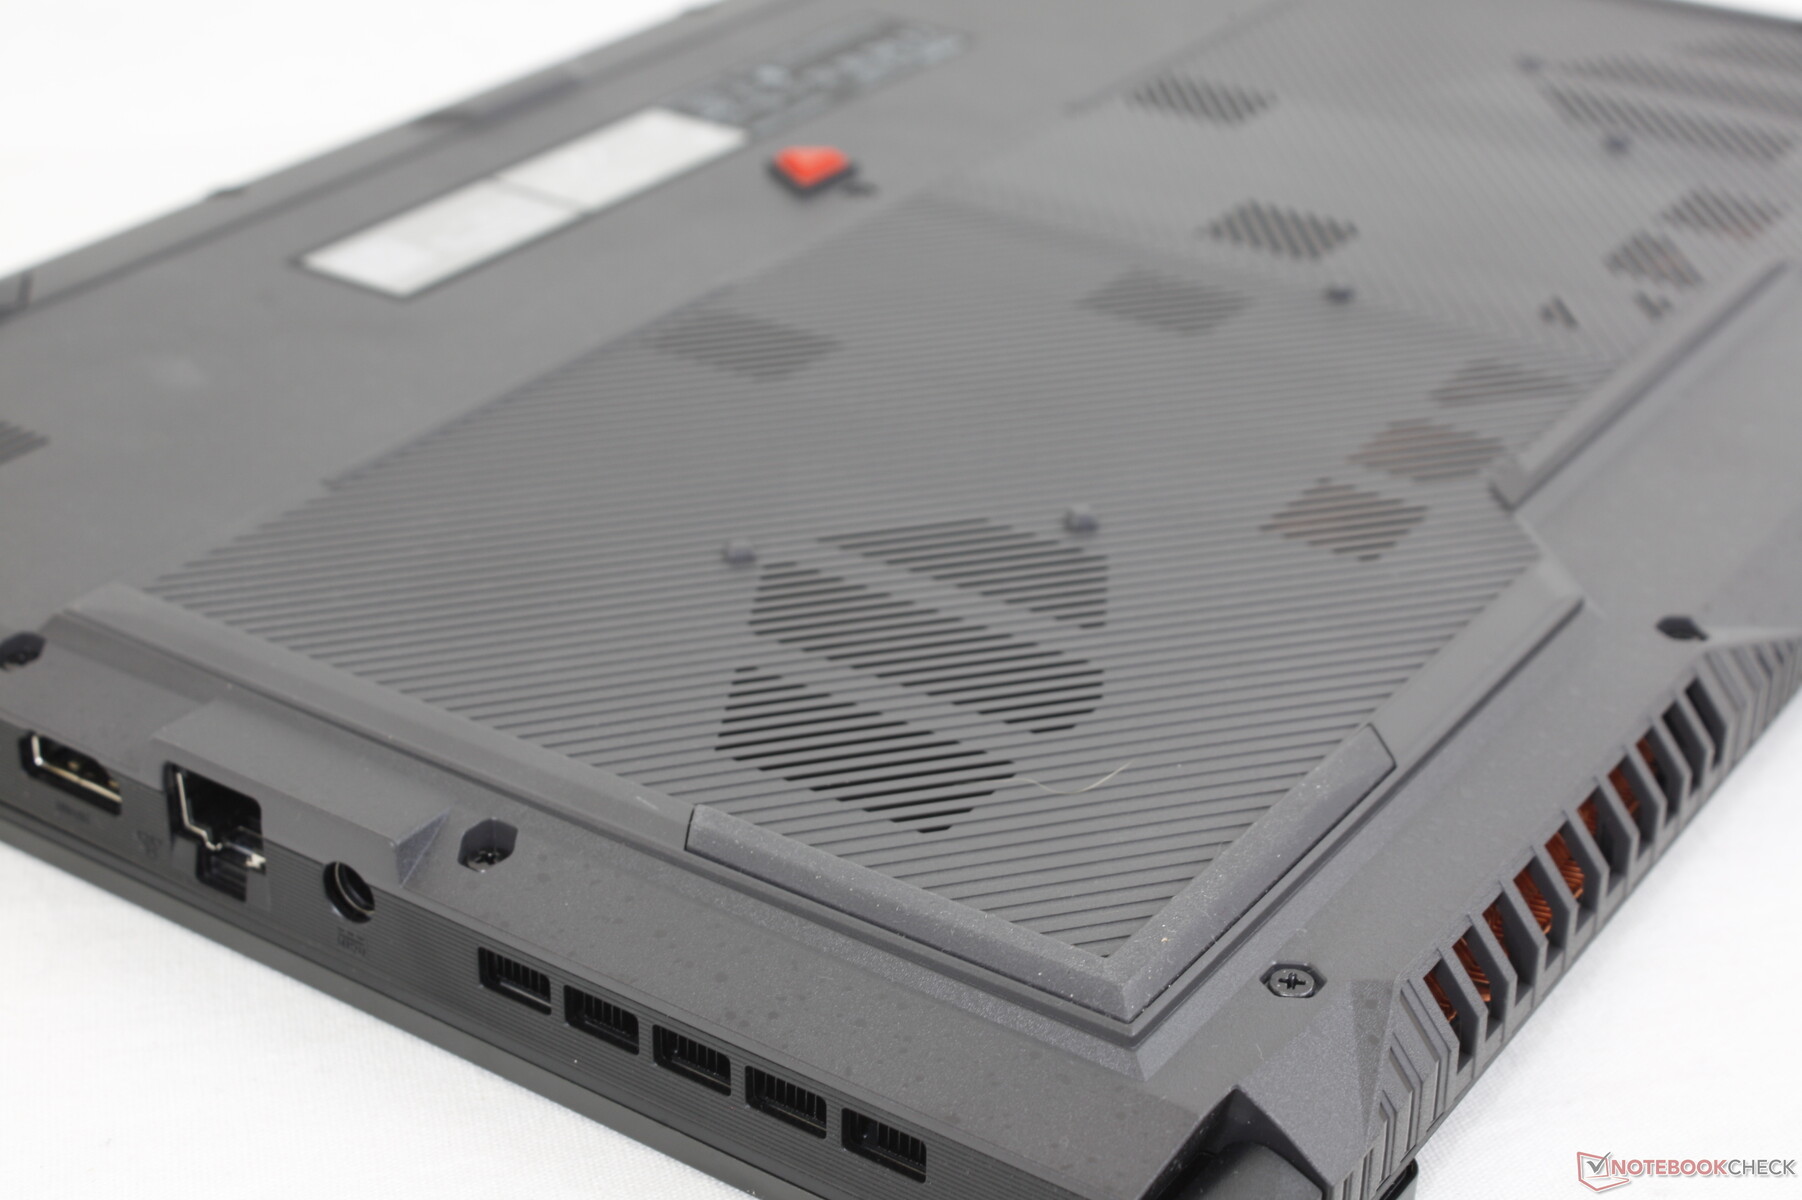
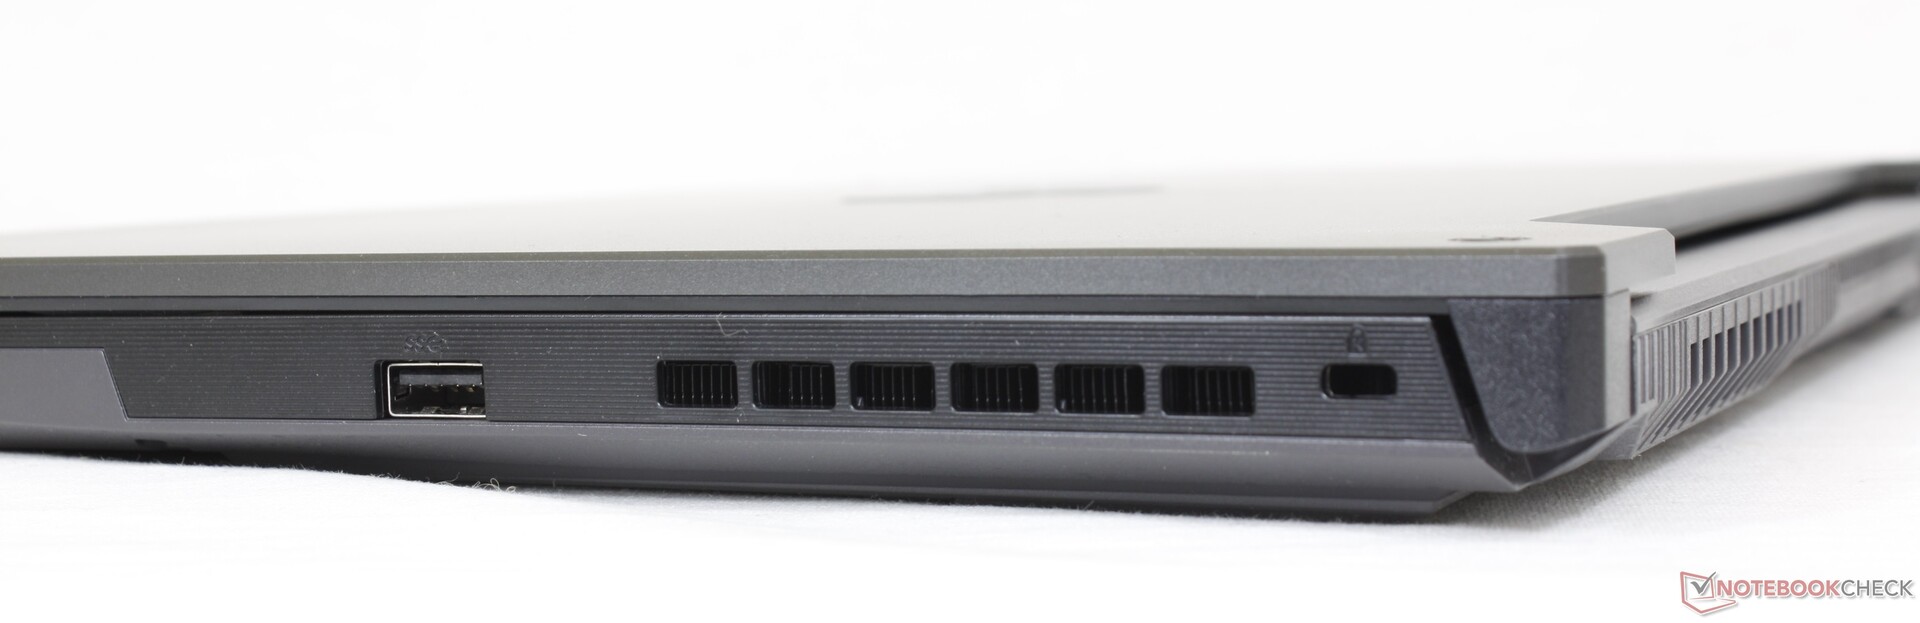
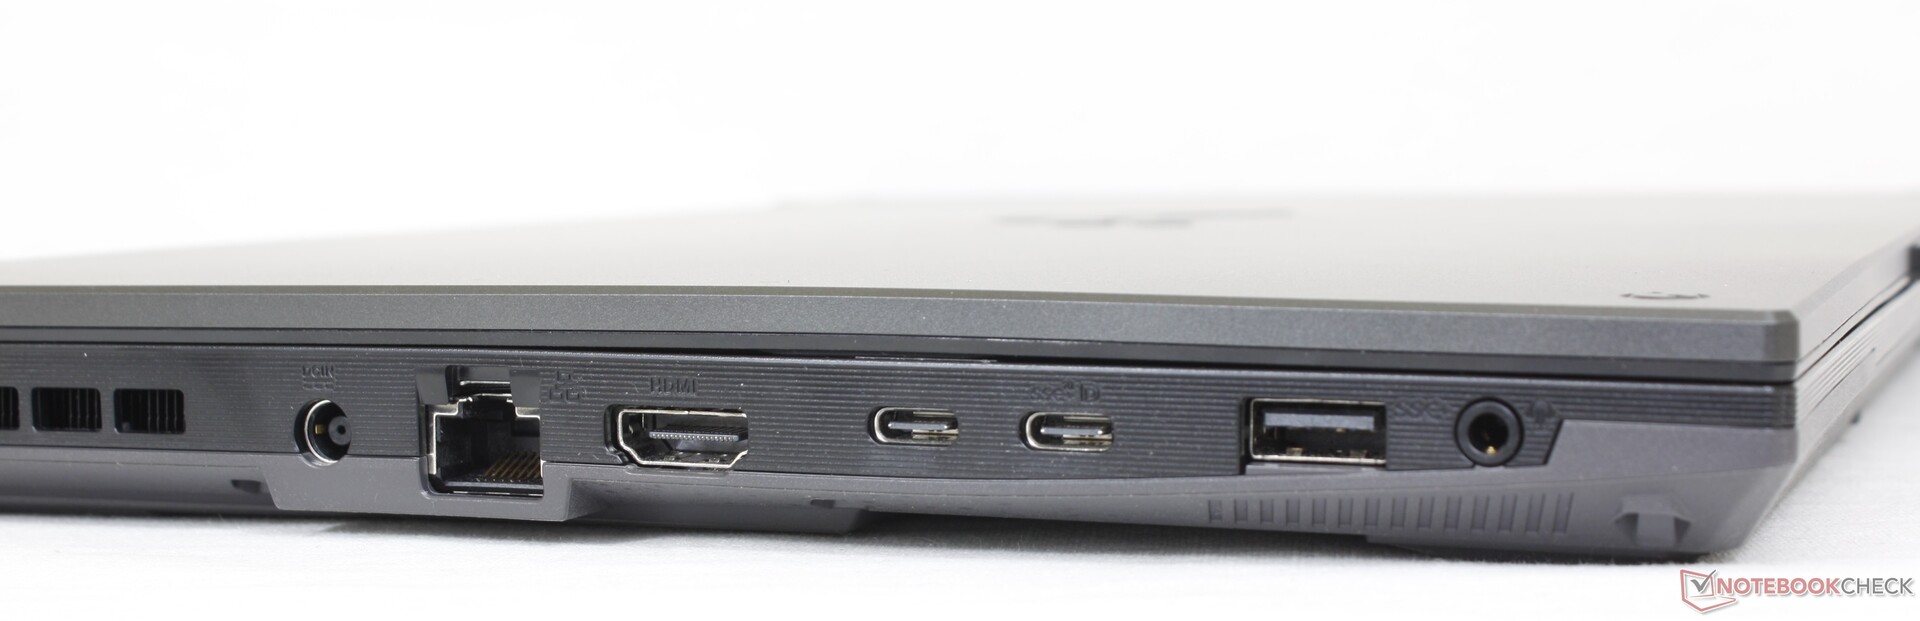
Connettività - Una porta USB-C in più
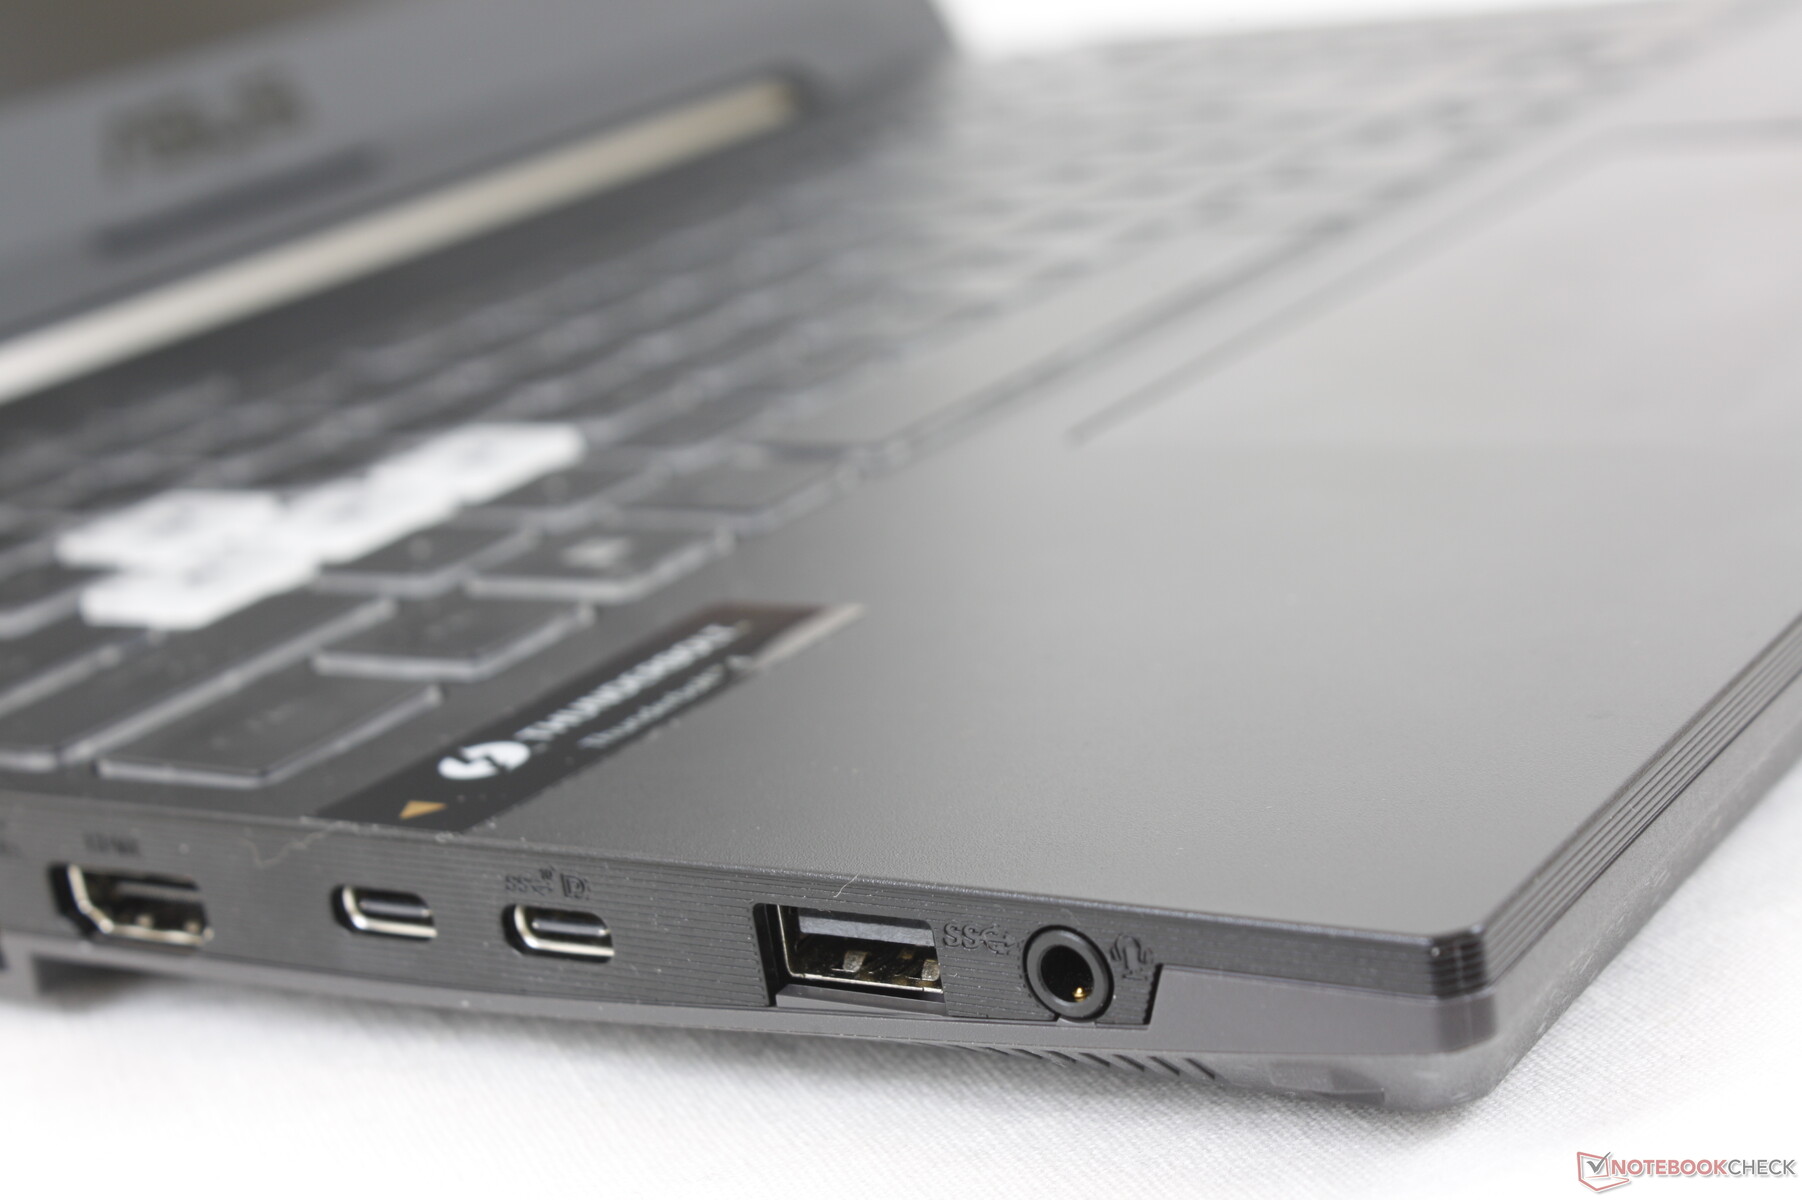
Le opzioni delle porte sono cambiate leggermente rispetto all'FX506. In particolare, l'FX507 ha eliminato una porta USB-A per una seconda porta USB-C. Tutte le altre porte sono altrimenti identiche.
Tenete a mente che il computer portatile deve essere in modalità MSHybrid se si collega qualsiasi dispositivo Thunderbolt 4. Questa è una limitazione per tutti i computer portatili che girano su CPU Alder Lake-H di 12a generazione finora.
Comunicazione
Webcam
La qualità della fotocamera è scarsa dalla webcam 720p. Non c'è nemmeno l'otturatore per la privacy o il supporto di Windows Hello.


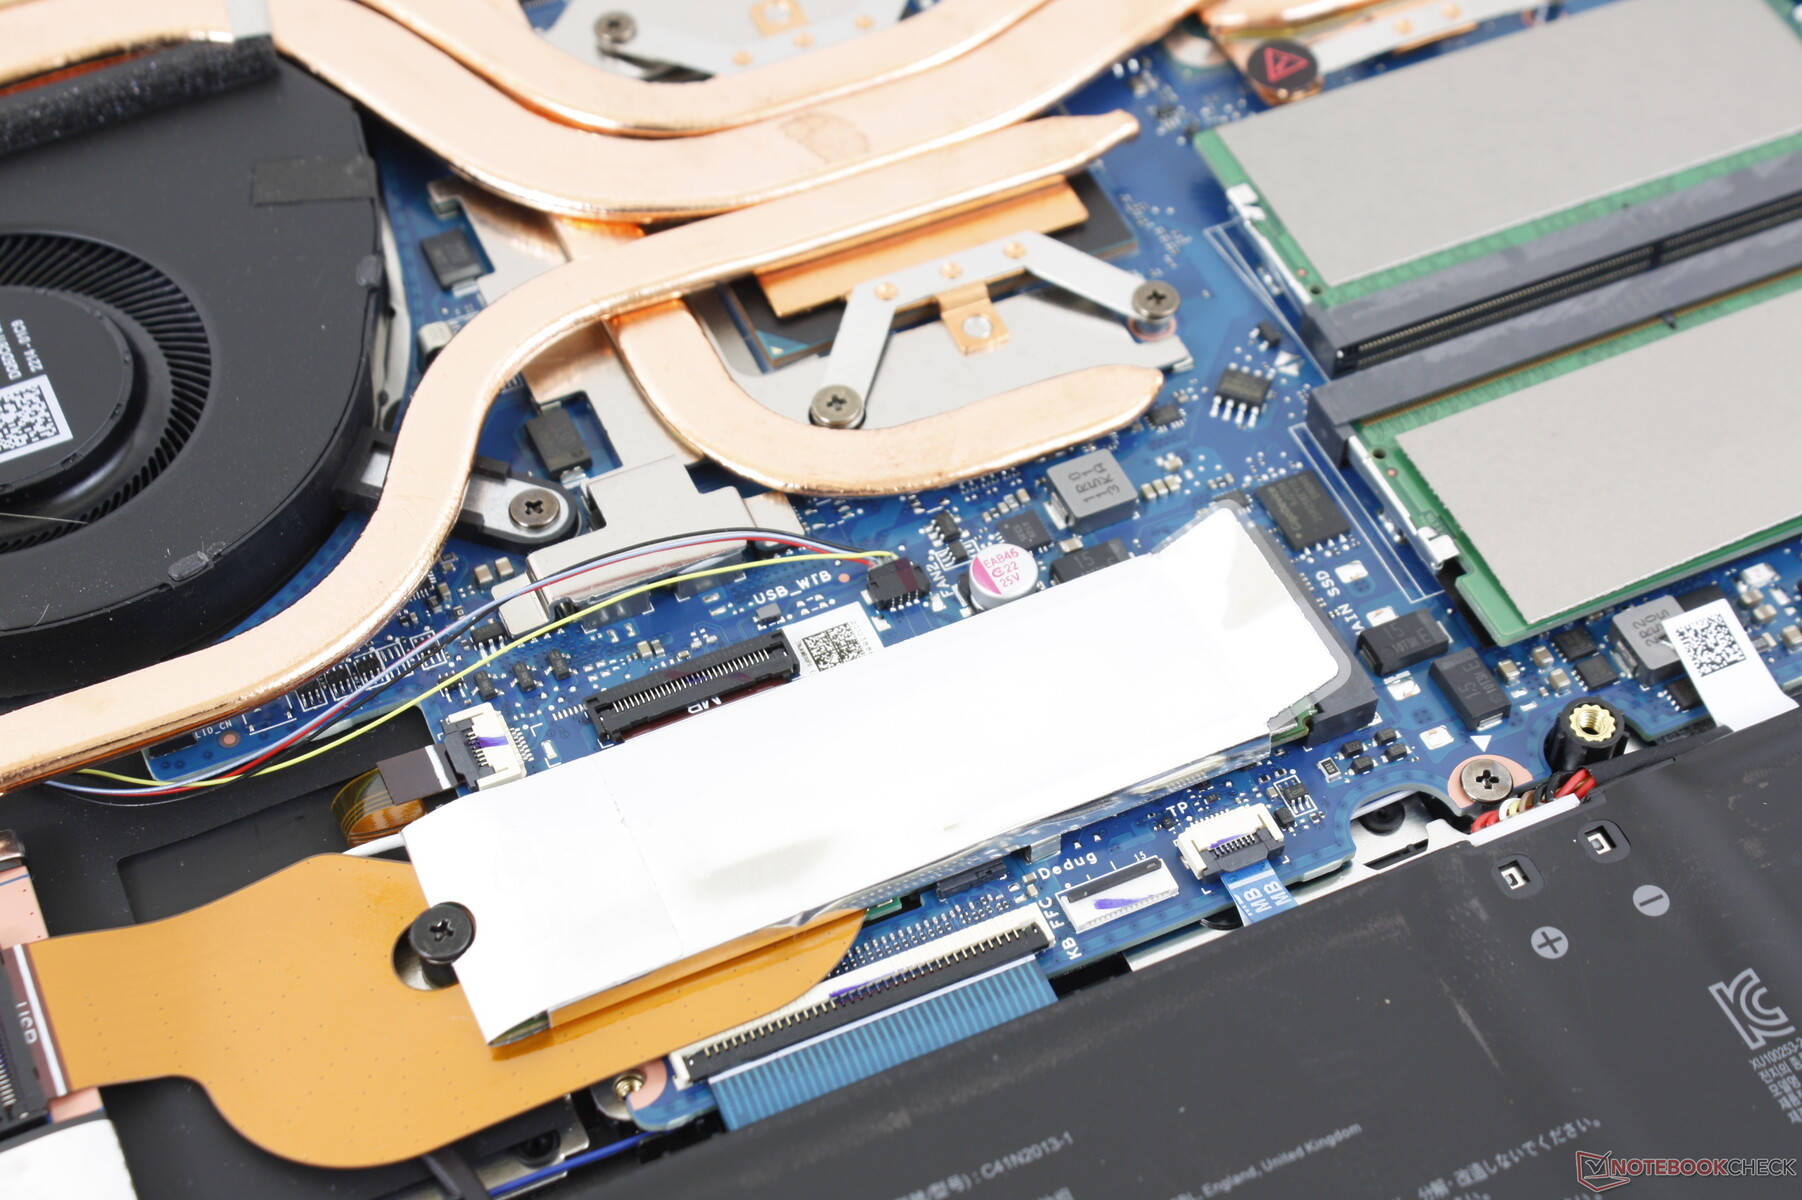
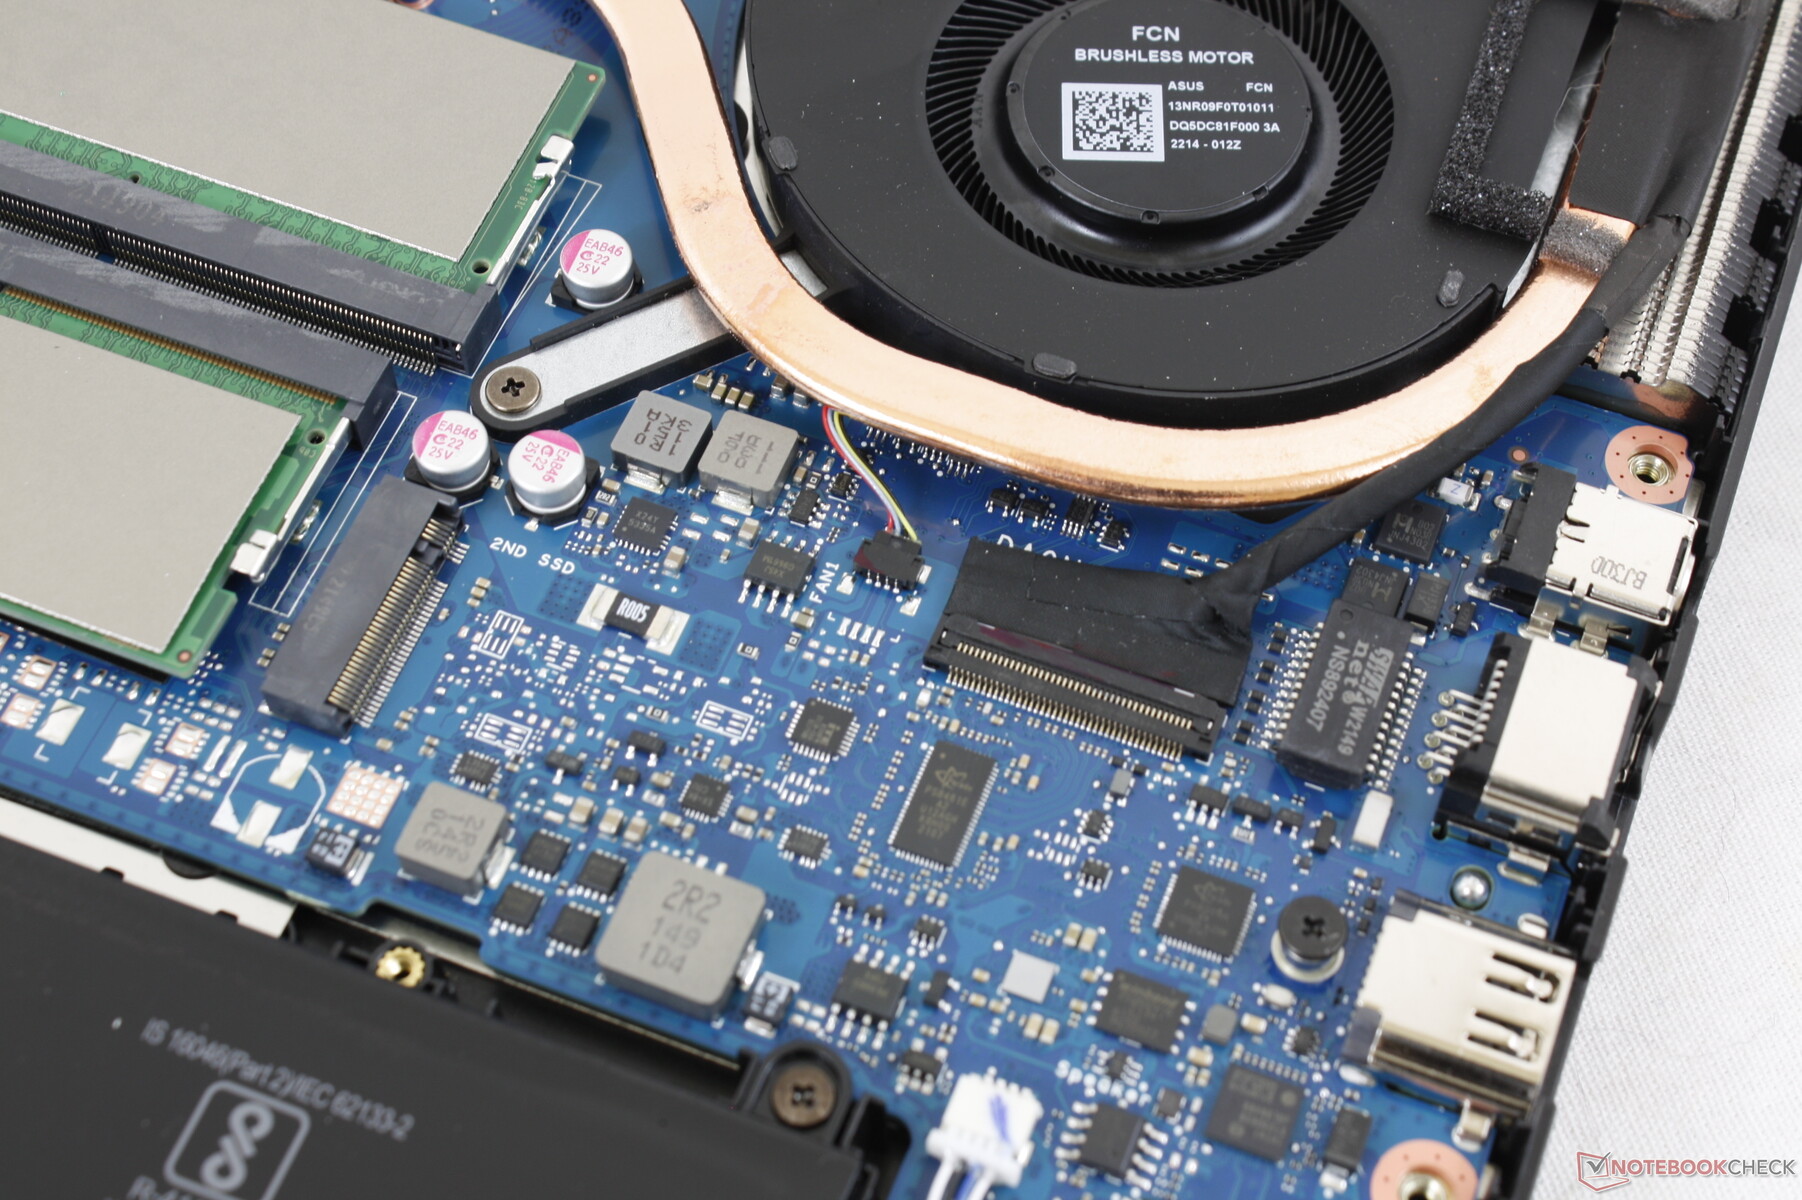
Manutenzione
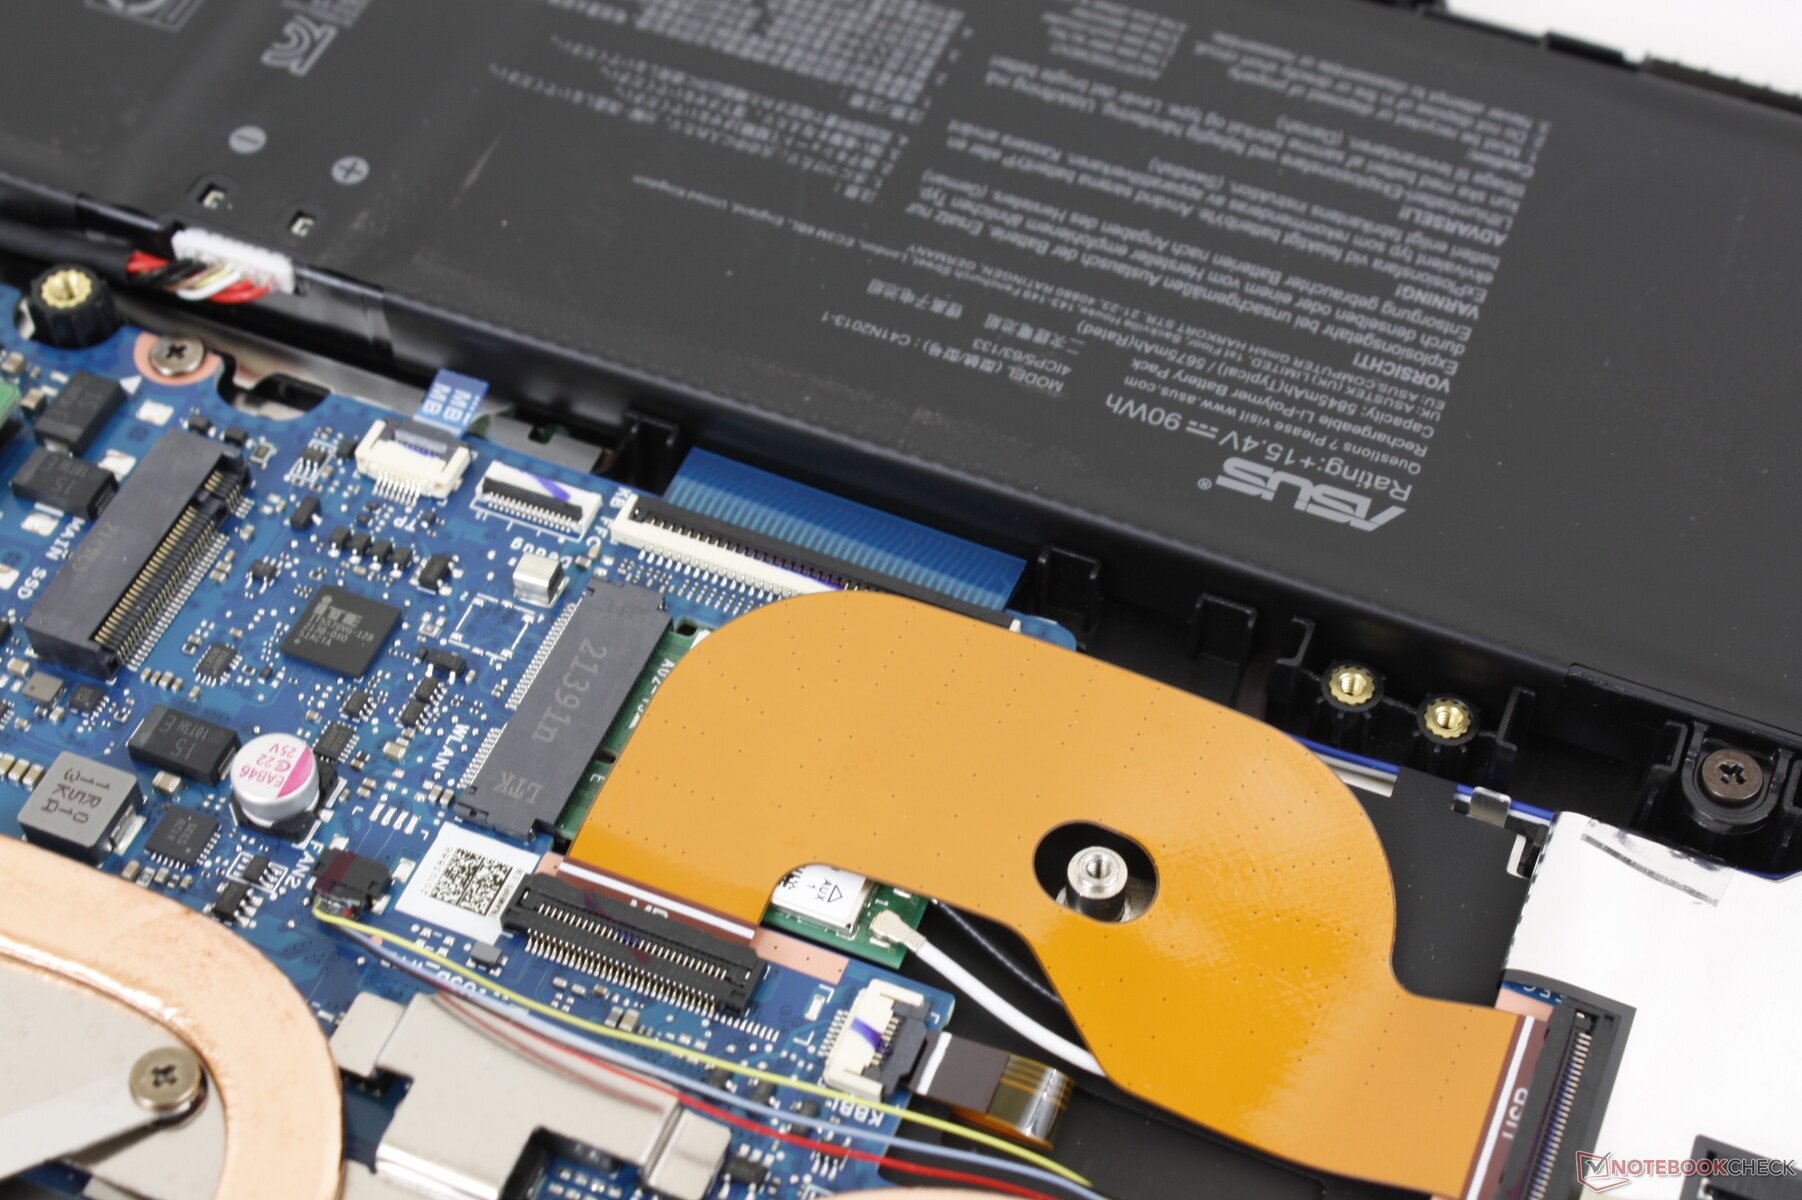
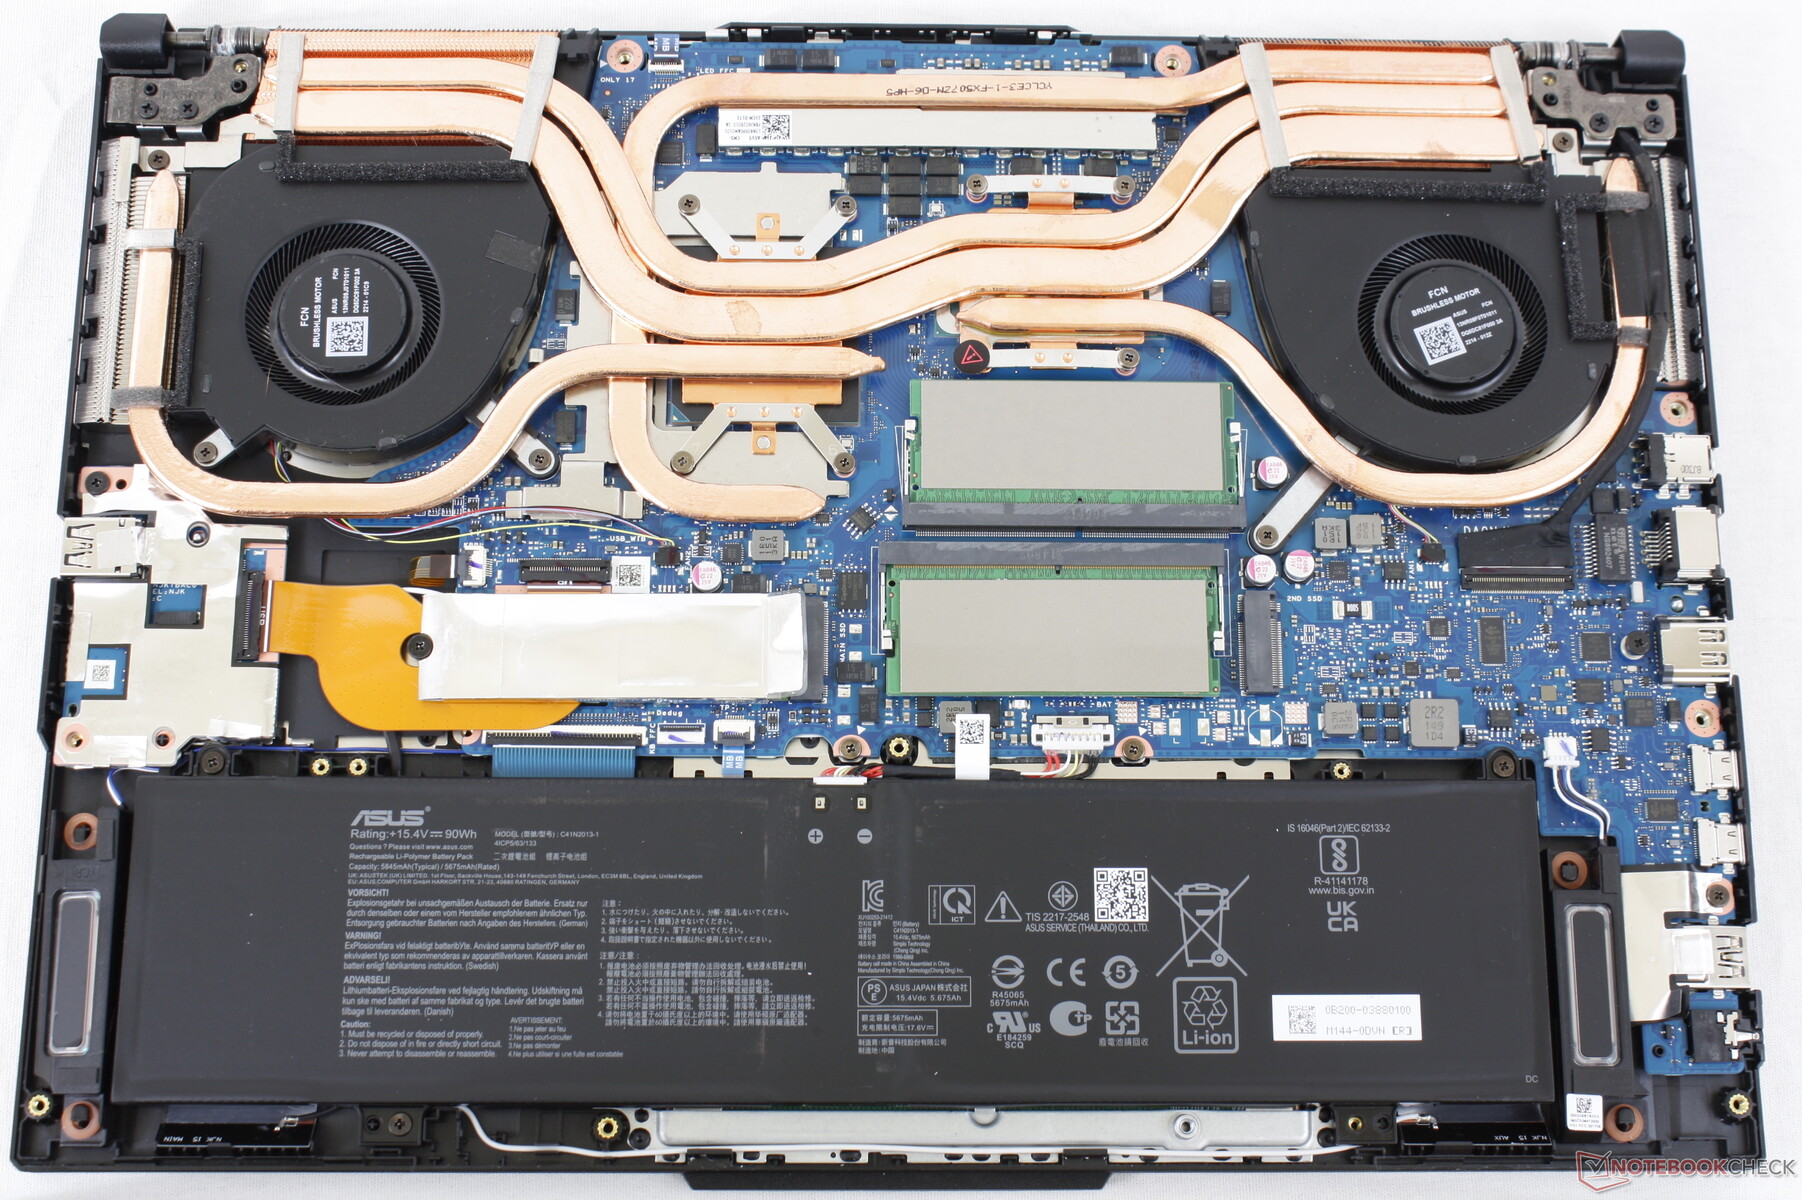
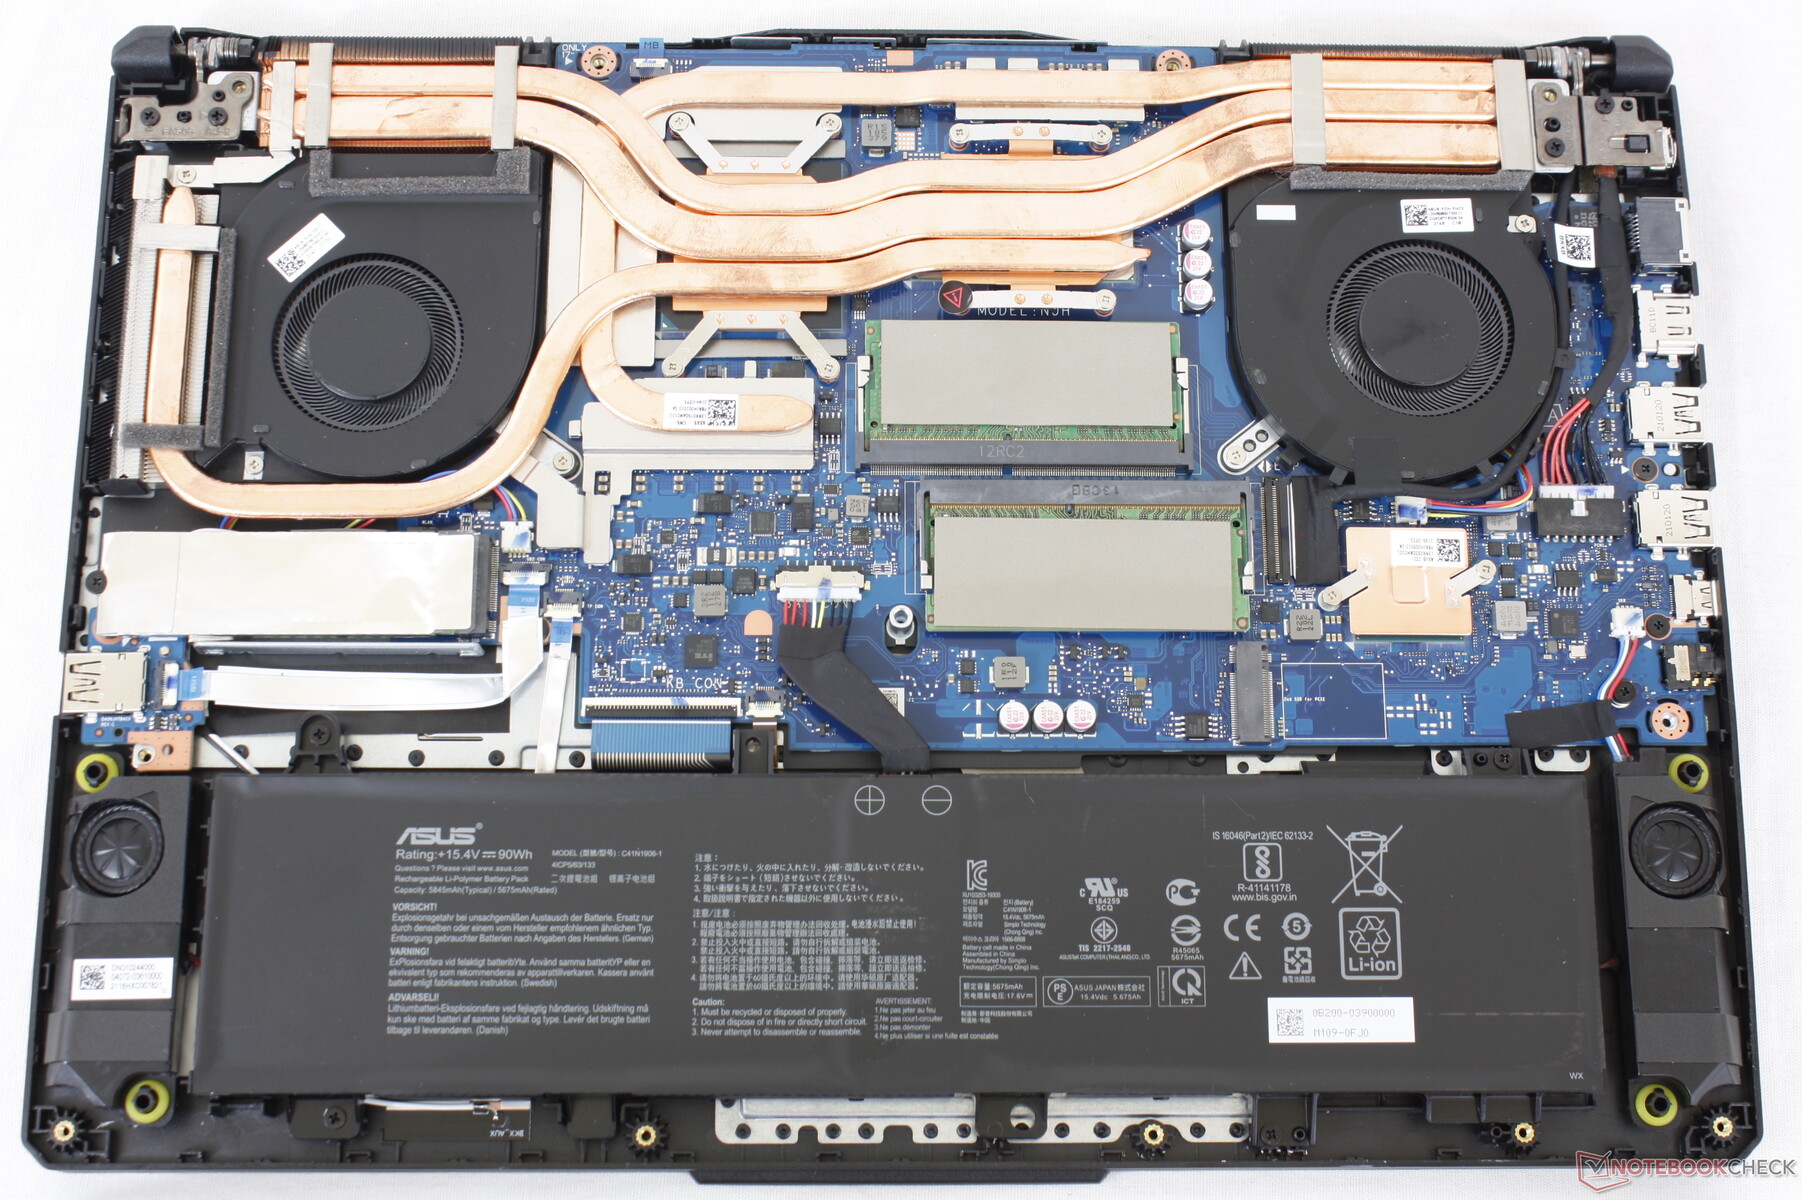
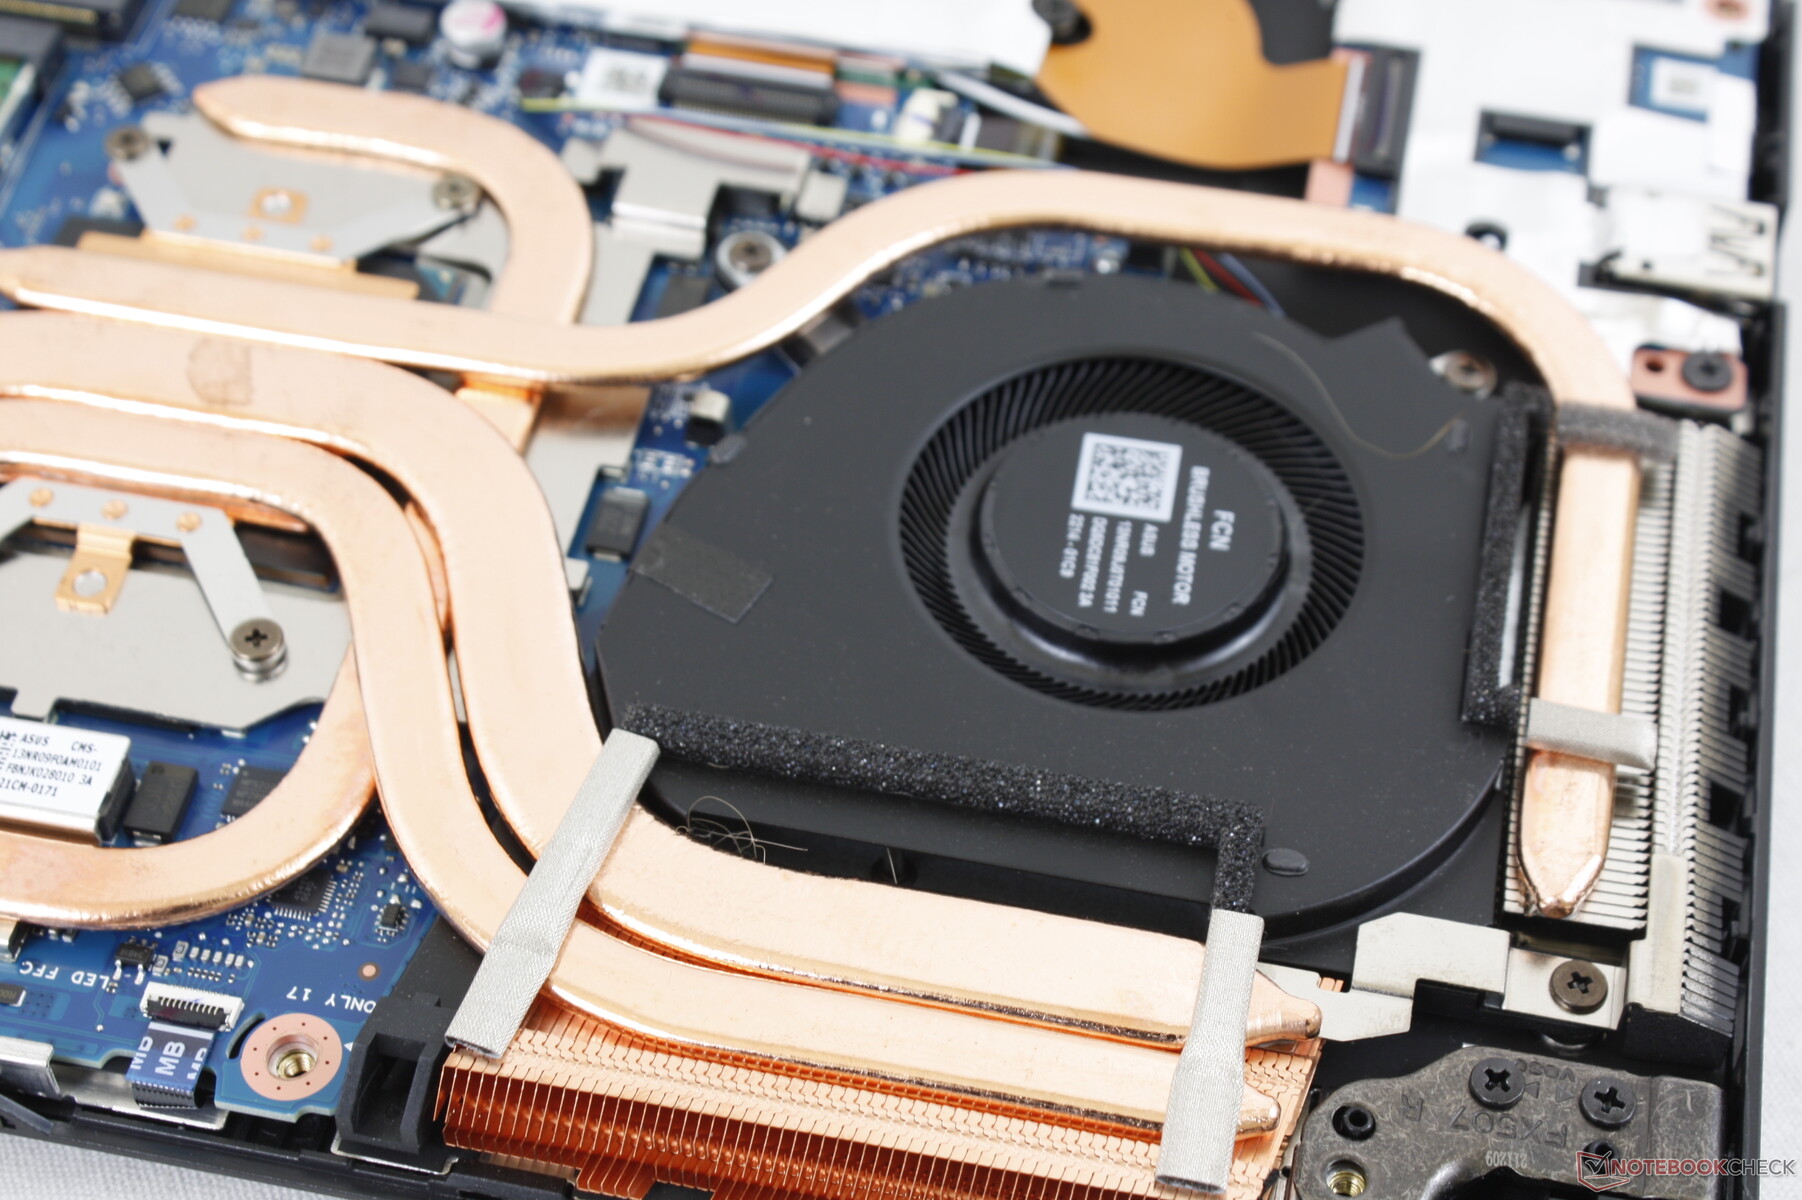
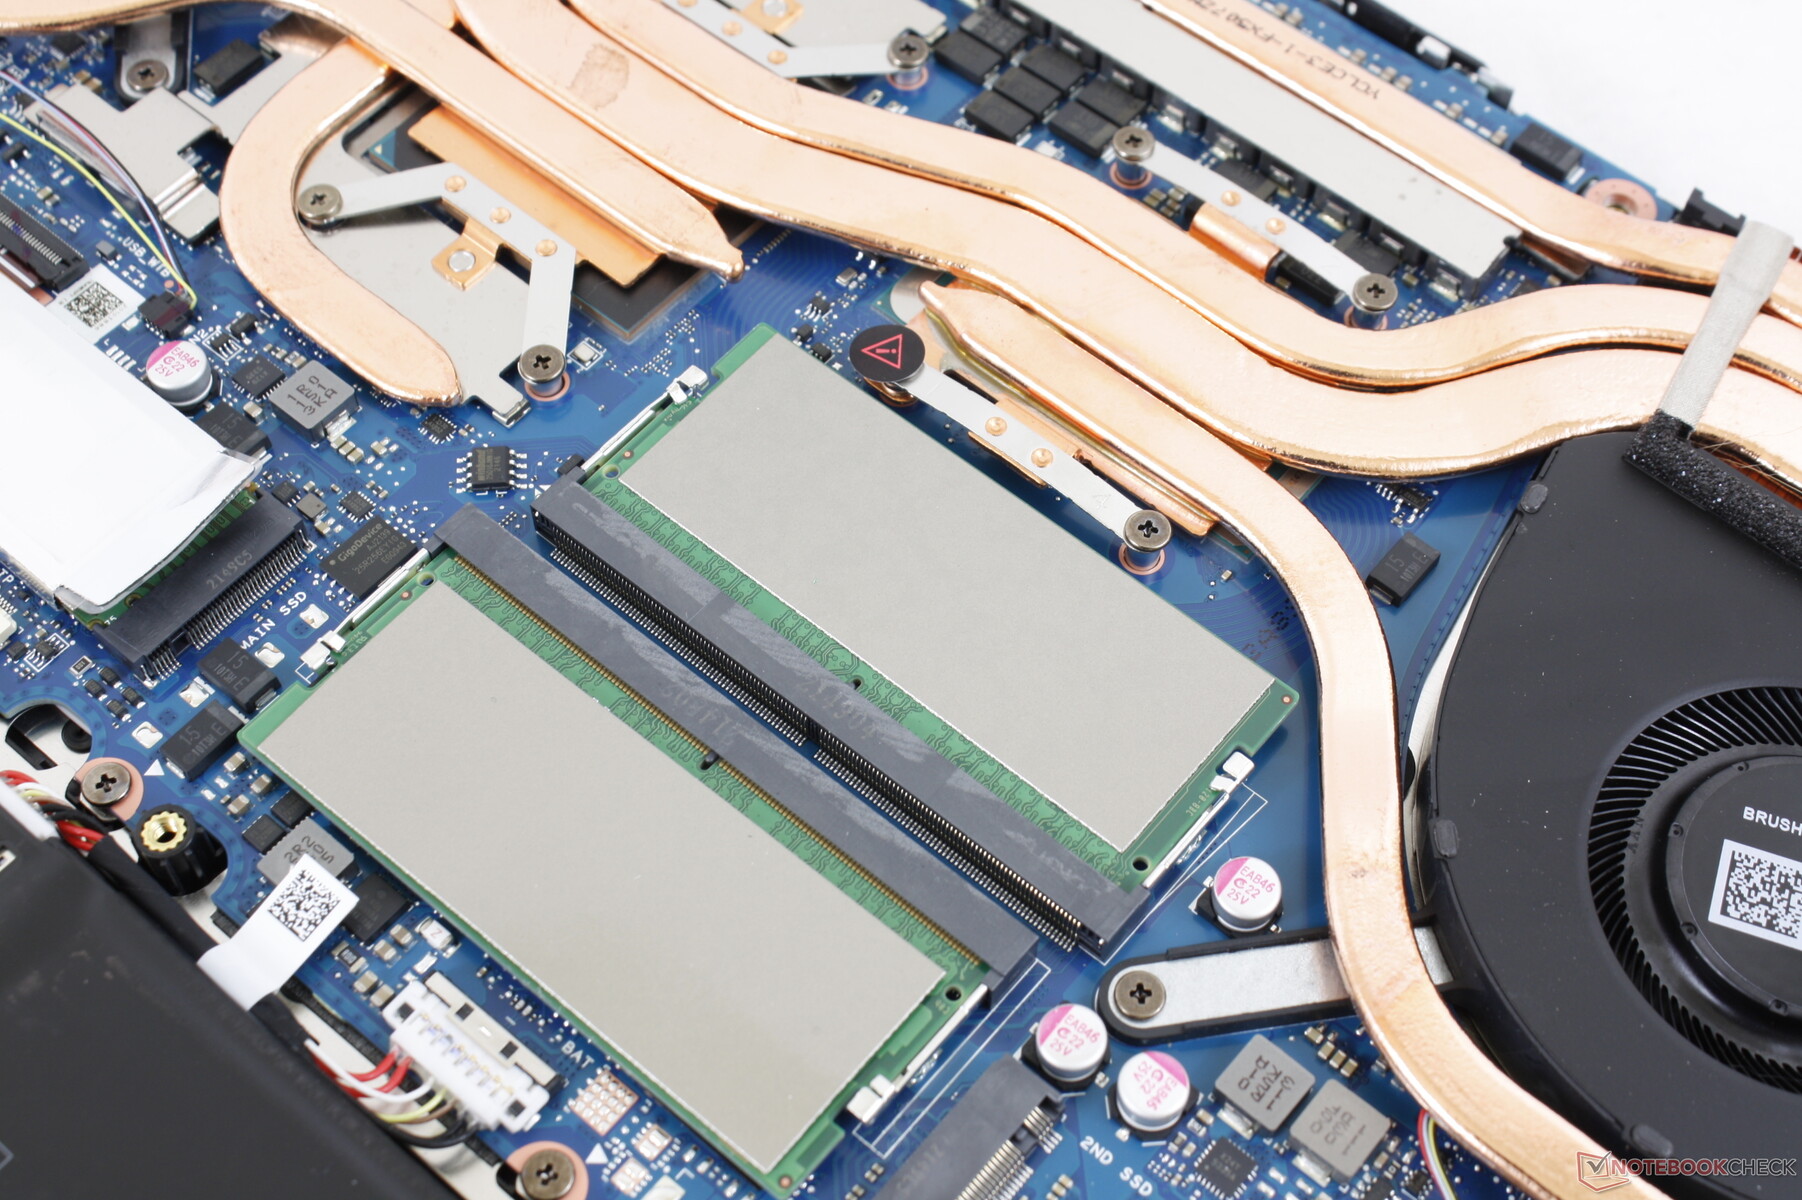
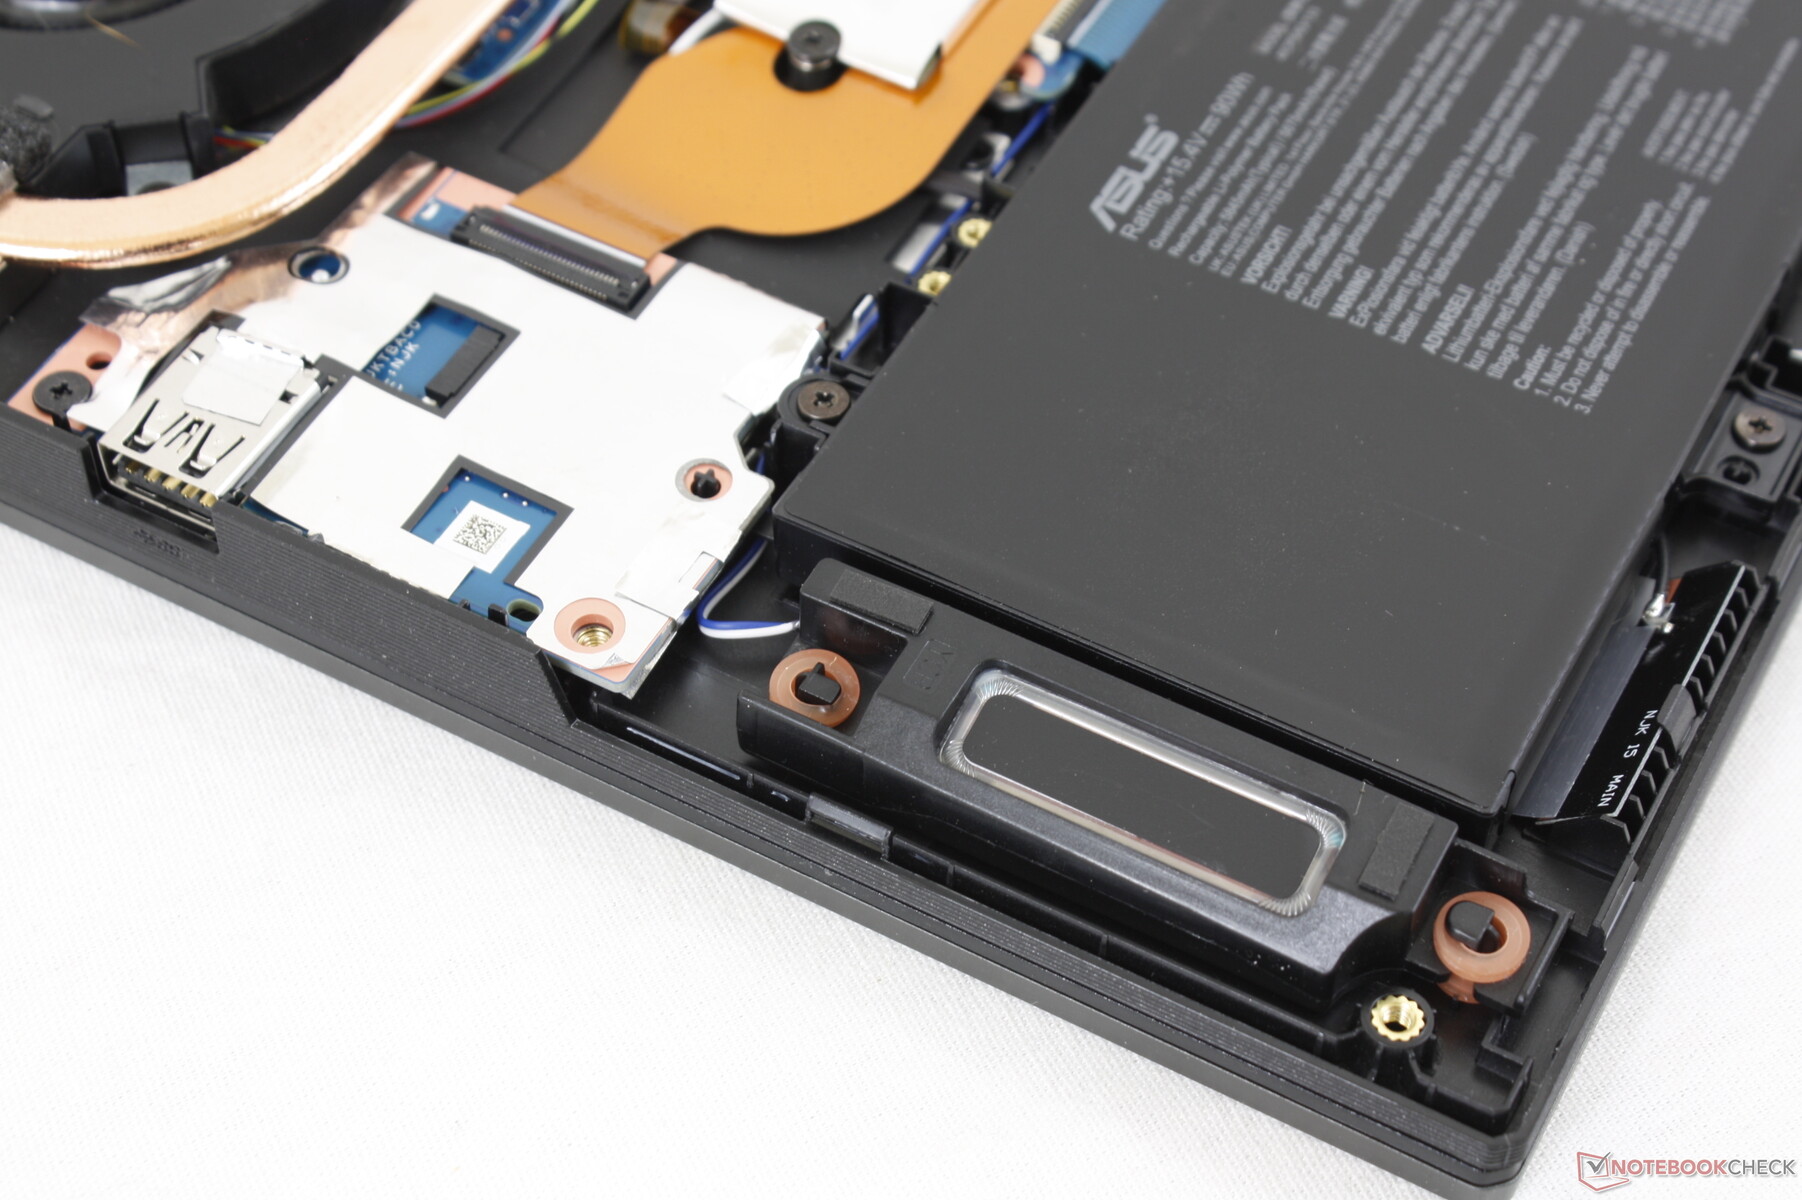
Il pannello inferiore è relativamente facile da rimuovere con un cacciavite Philips e un bordo piatto. Gli interni sono stati rinnovati come mostrato dalle immagini di confronto qui sotto, ma i 2 slot SODIMM, i 2 slot SSD M.2 e il modulo WLAN rimovibile rimangono.
Accessori e garanzia
Non ci sono extra nella scatola, a parte il solito adattatore AC e la documentazione. Si applica la tipica garanzia di un anno del produttore.
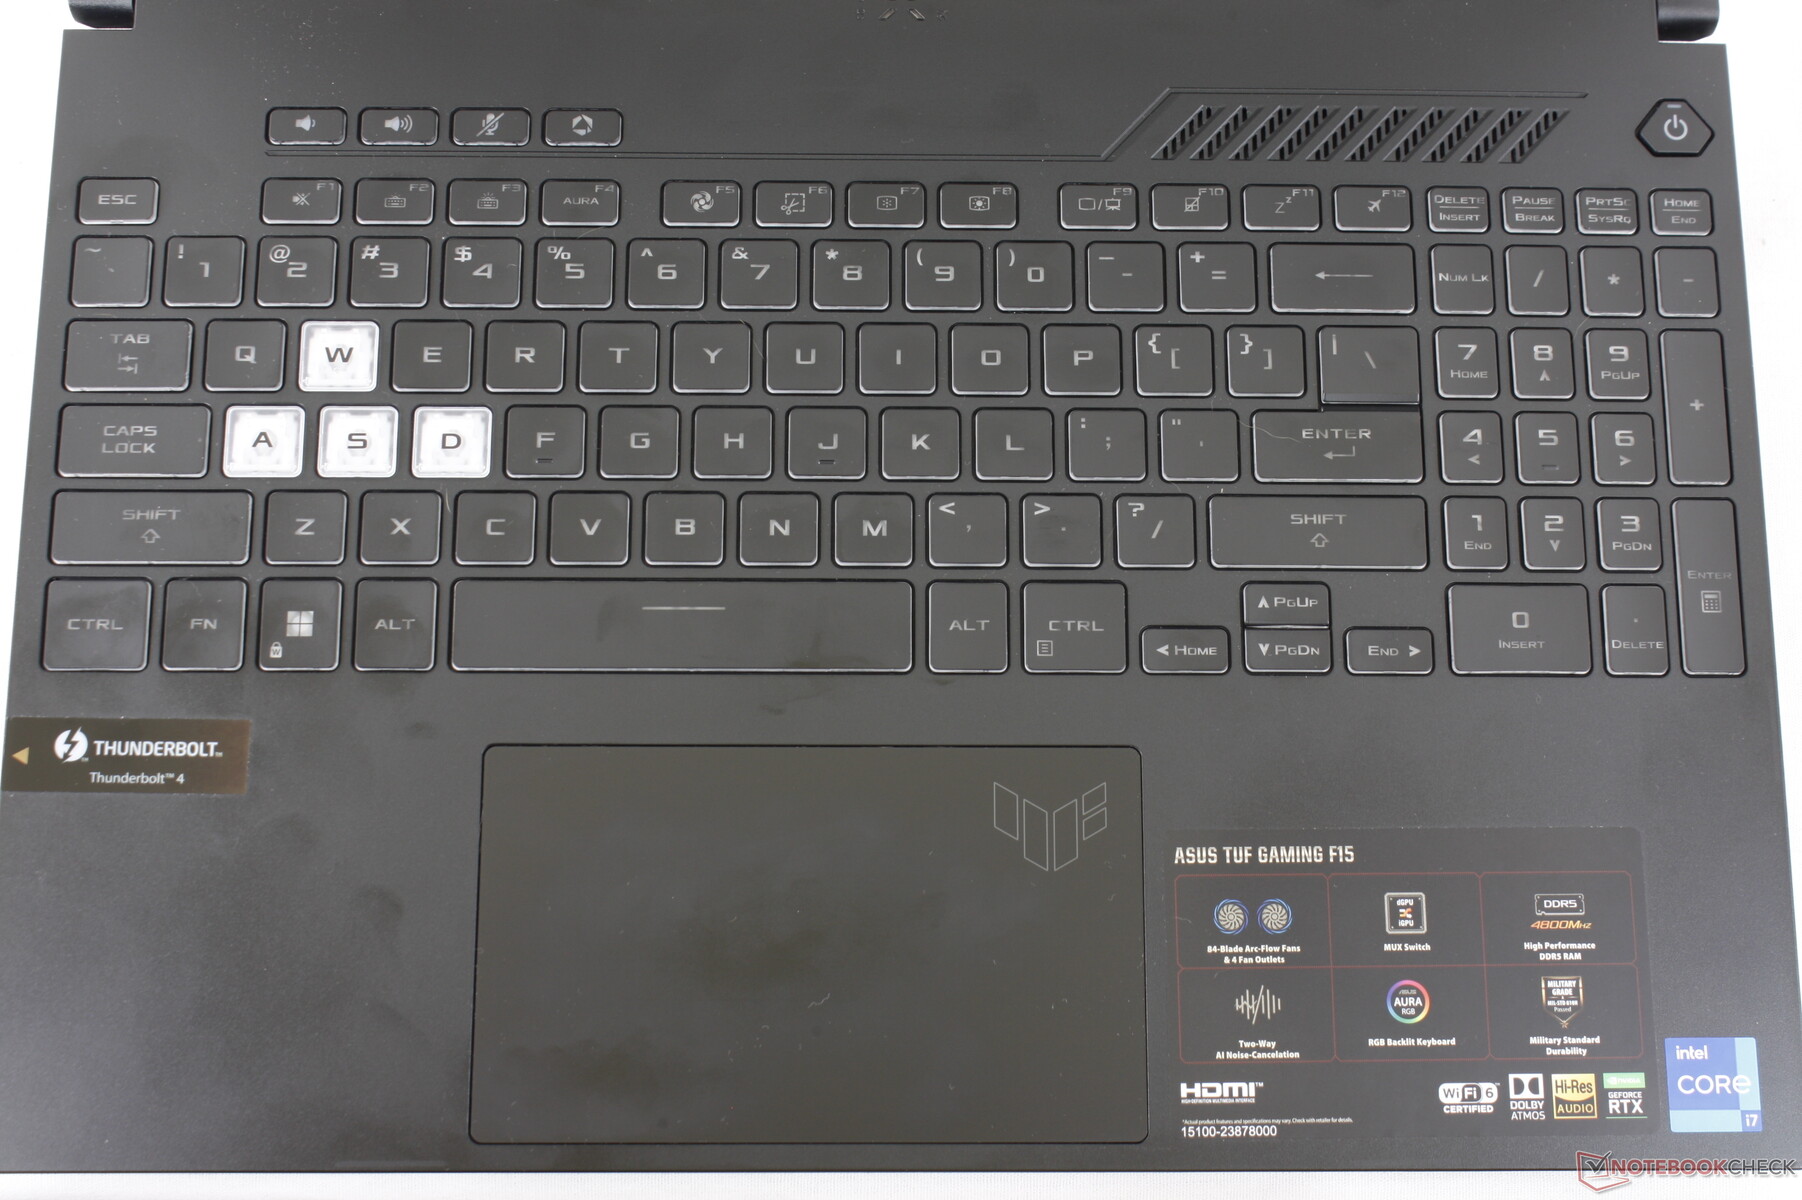
Dispositivi di input - diversi ma non necessariamente migliori
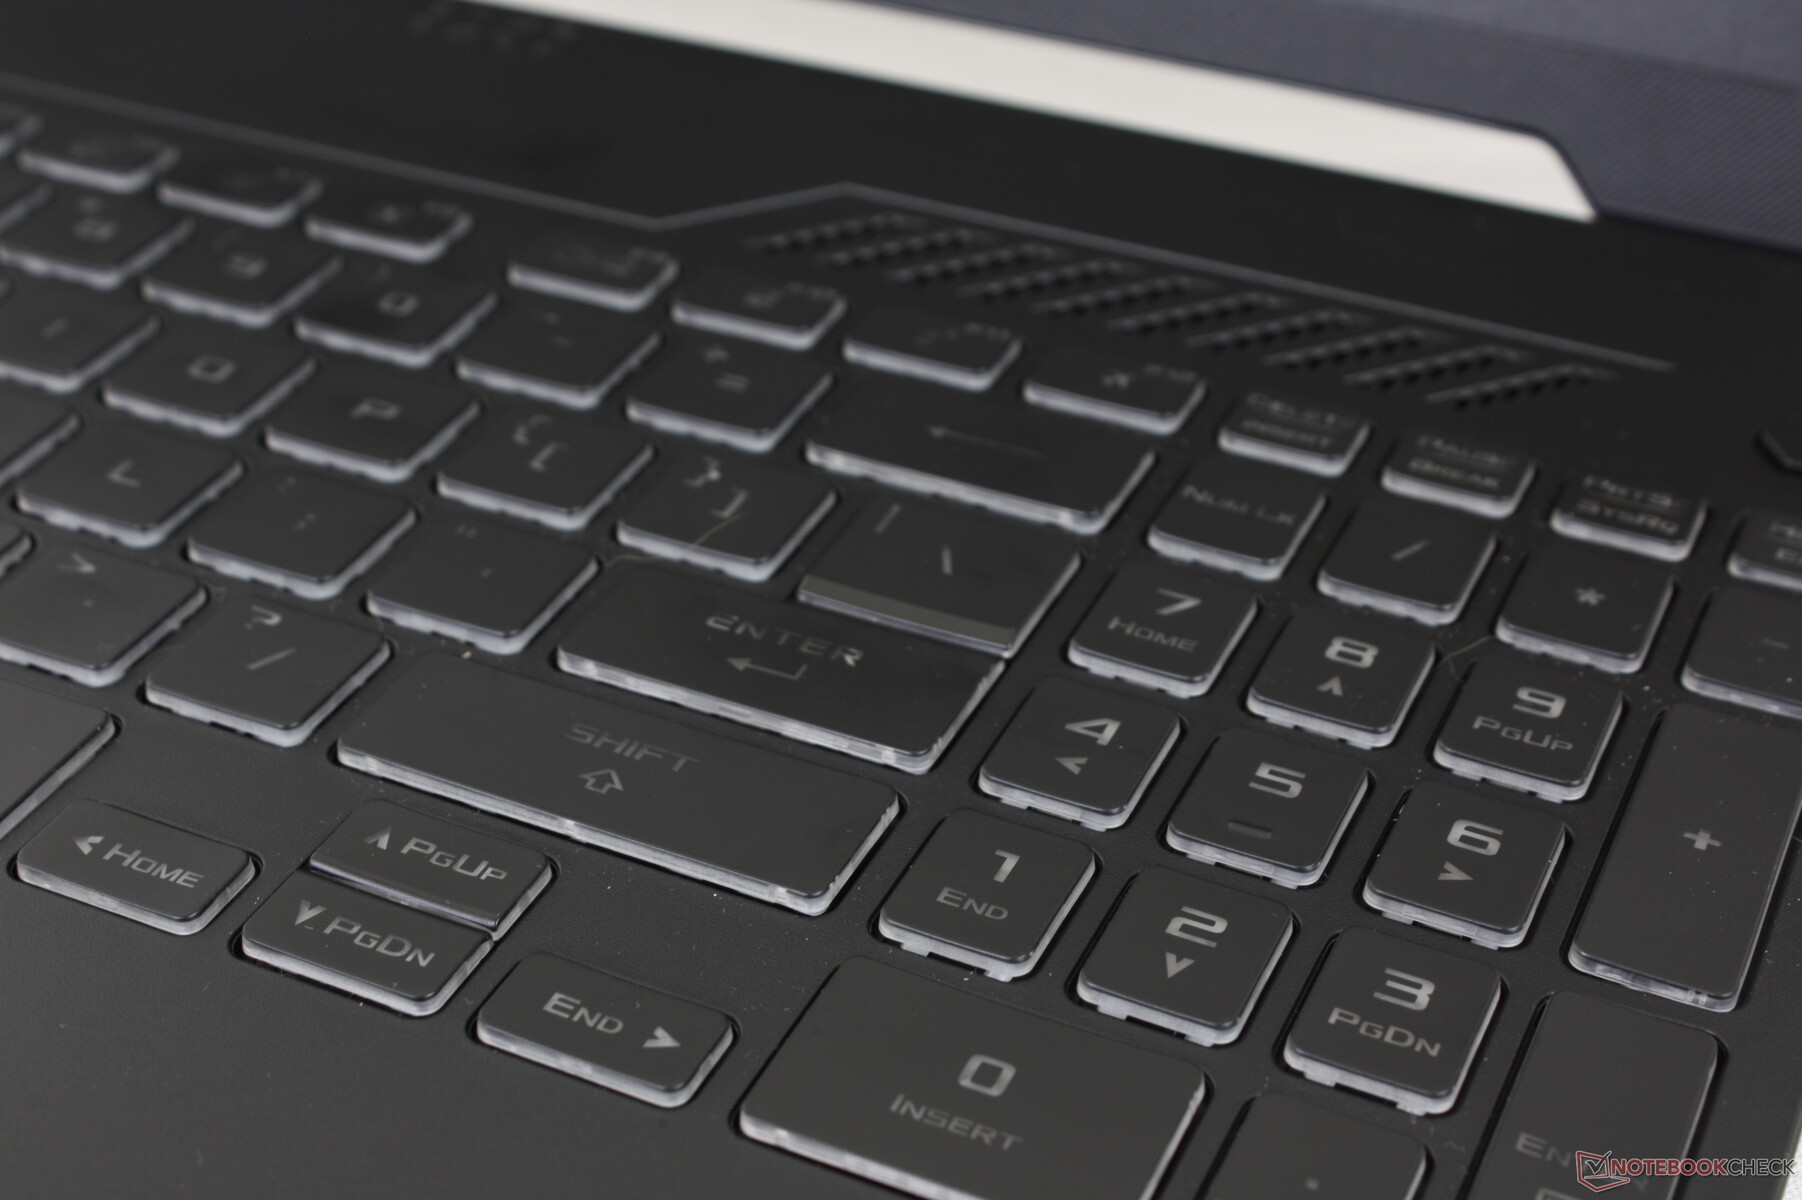
Tastiera
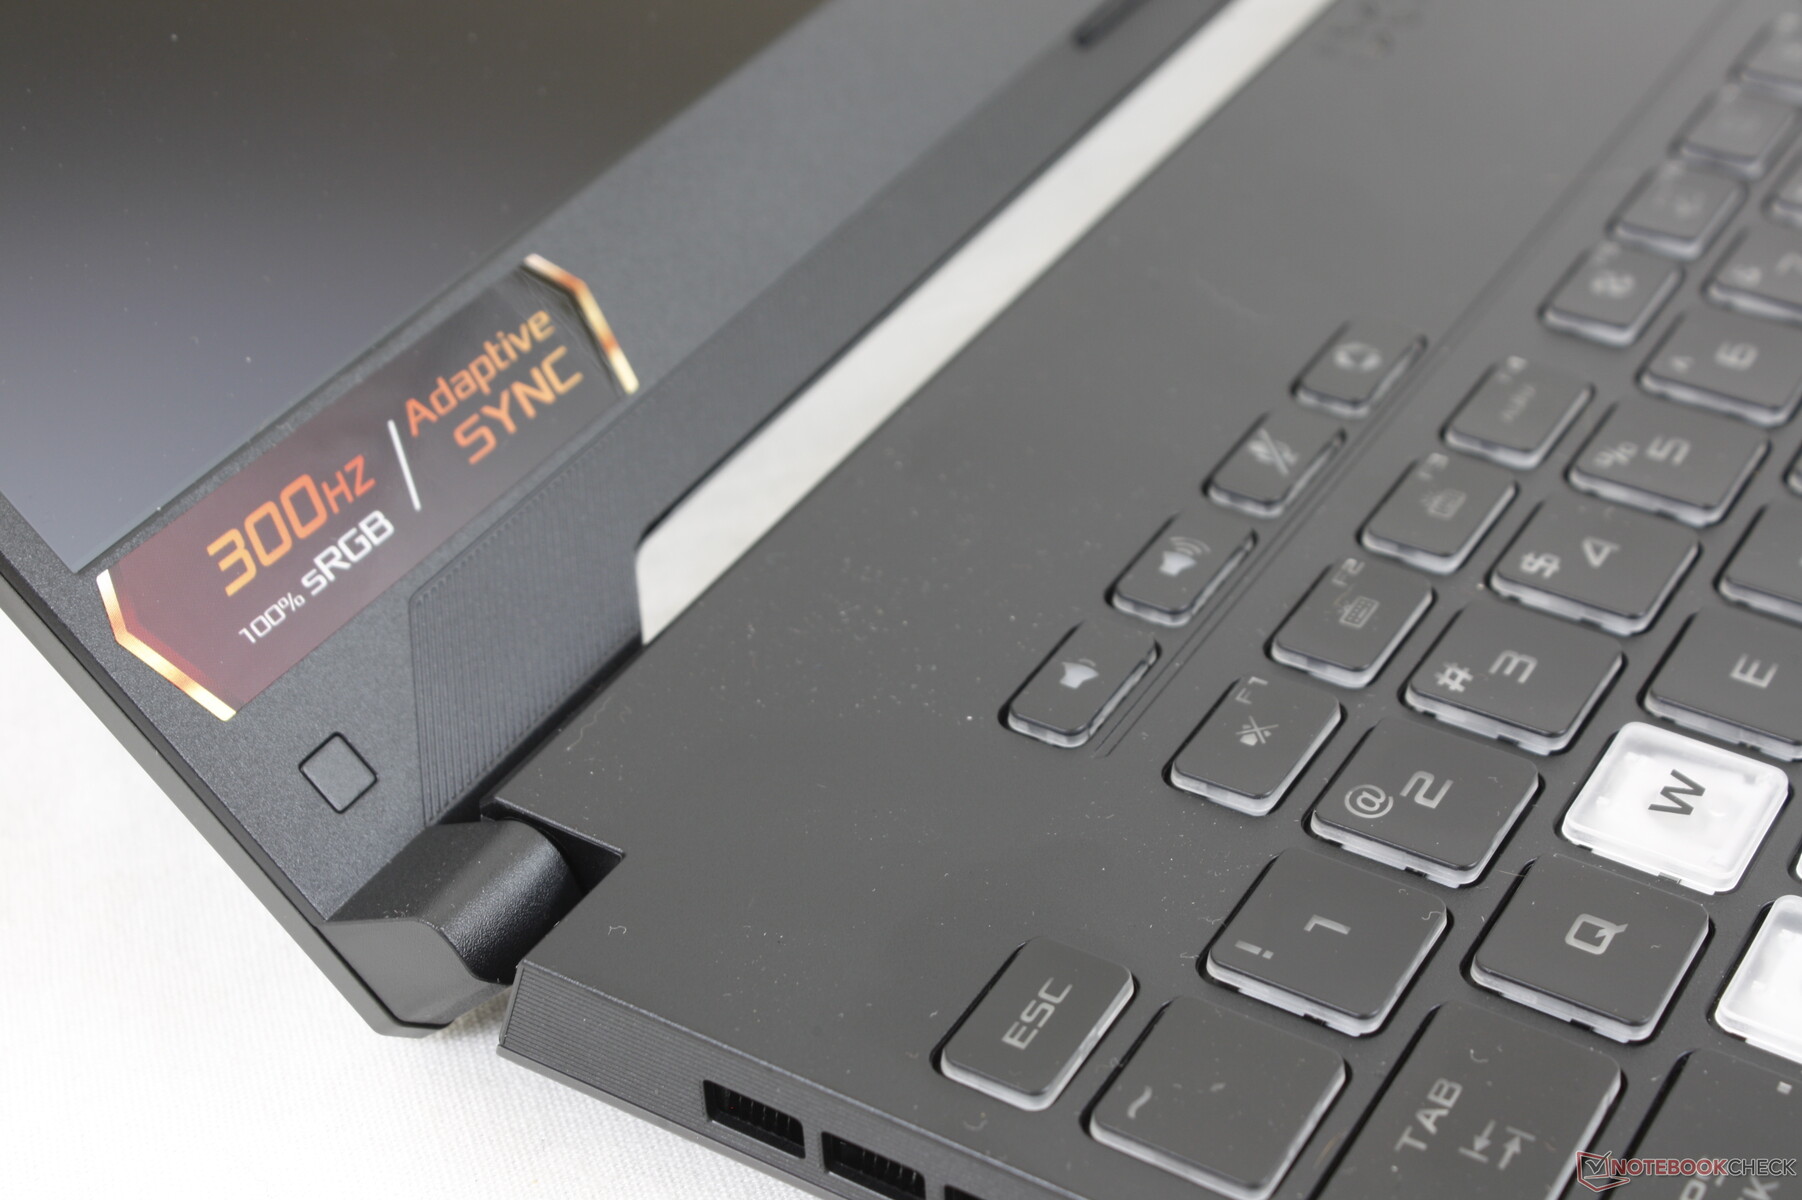
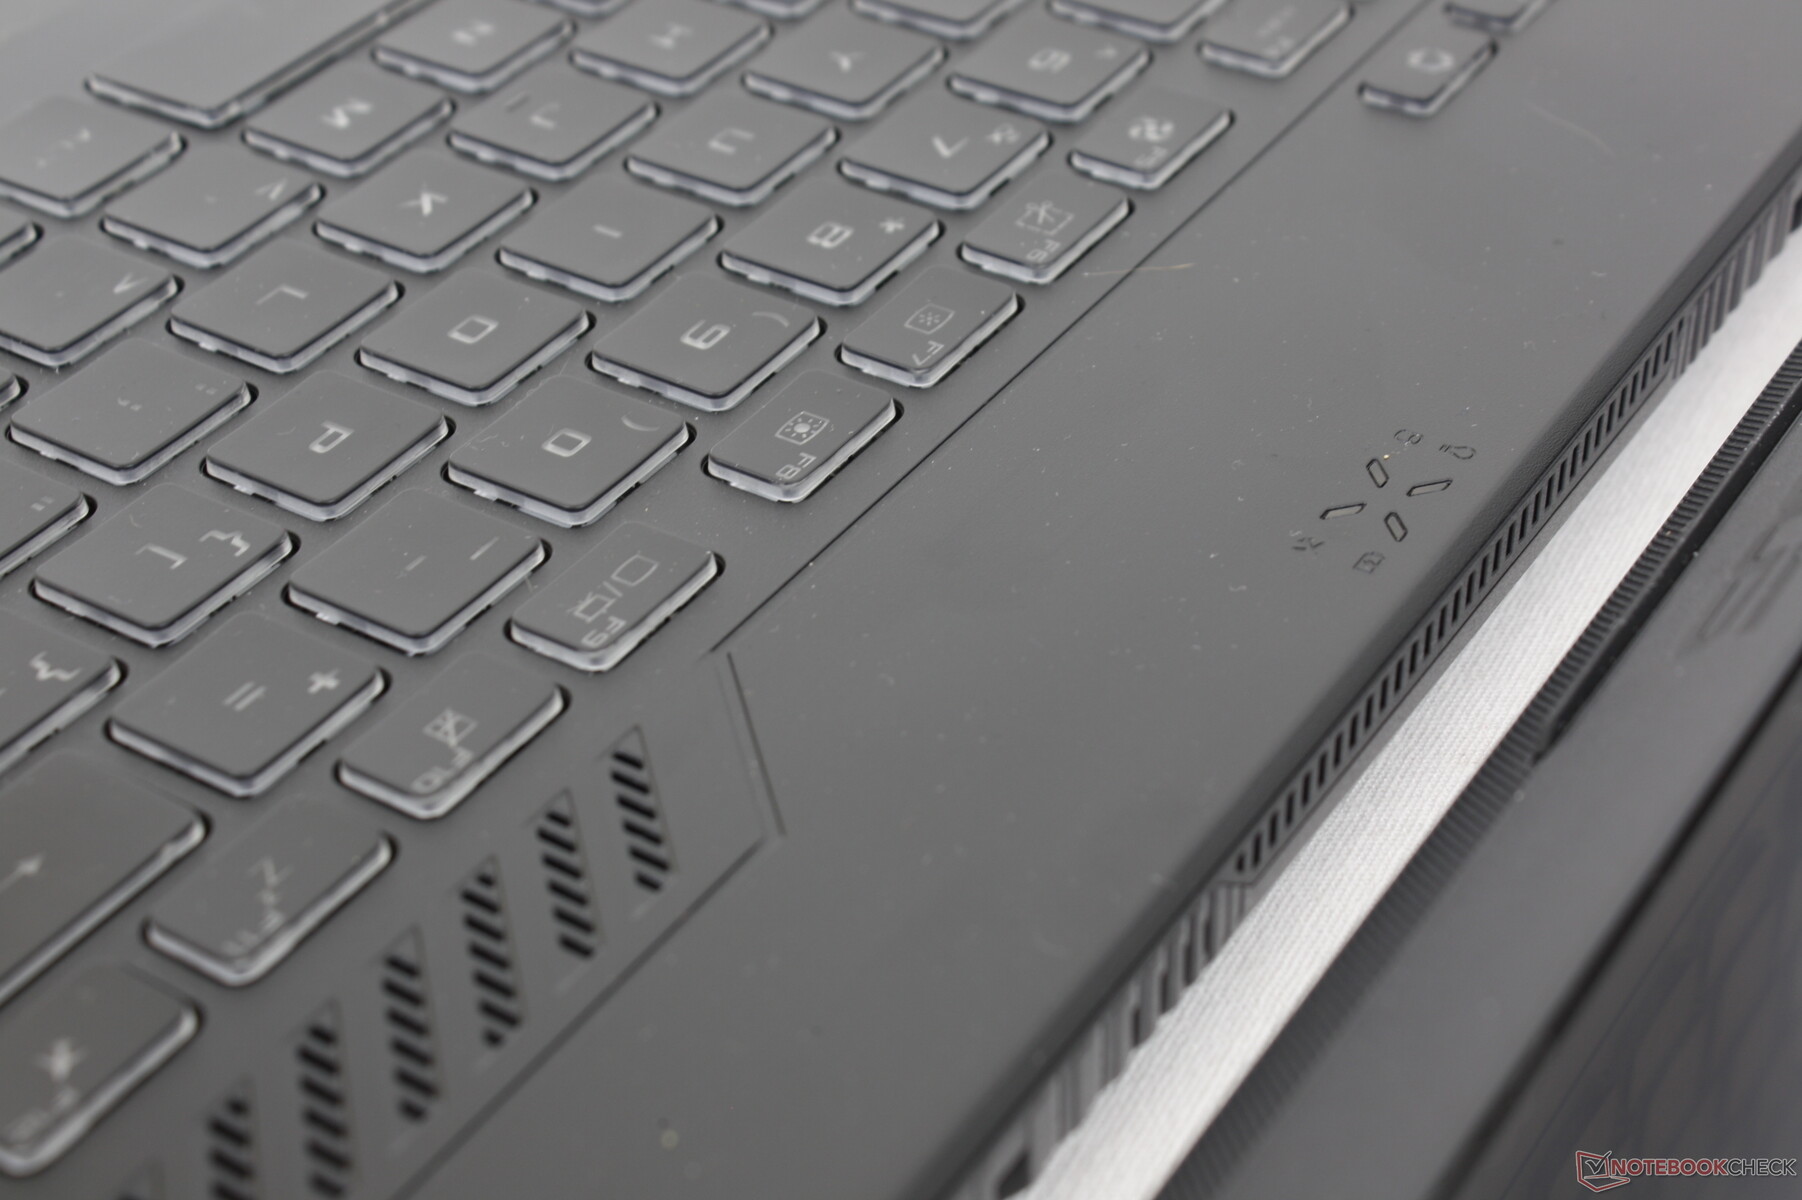
Asus ha rivisto il layout della tastiera rispetto all'FX506. Alcuni dei tasti ausiliari sono ora nella propria fila in alto a sinistra, mentre i tasti freccia sono ora leggermente più lunghi. Il carattere su ogni tasto è anche più scuro e grigio, il che purtroppo lo rende più difficile da leggere.
Sia il feedback dei tasti che la retroilluminazione RGB monozona rimangono identici rispetto all'anno precedente. Troviamo i tasti più leggeri e morbidi rispetto ai tasti dell Eurocom RX315 mentre sono molto vicini alle tastiere della maggior parte dei modelli Zephyrus S.
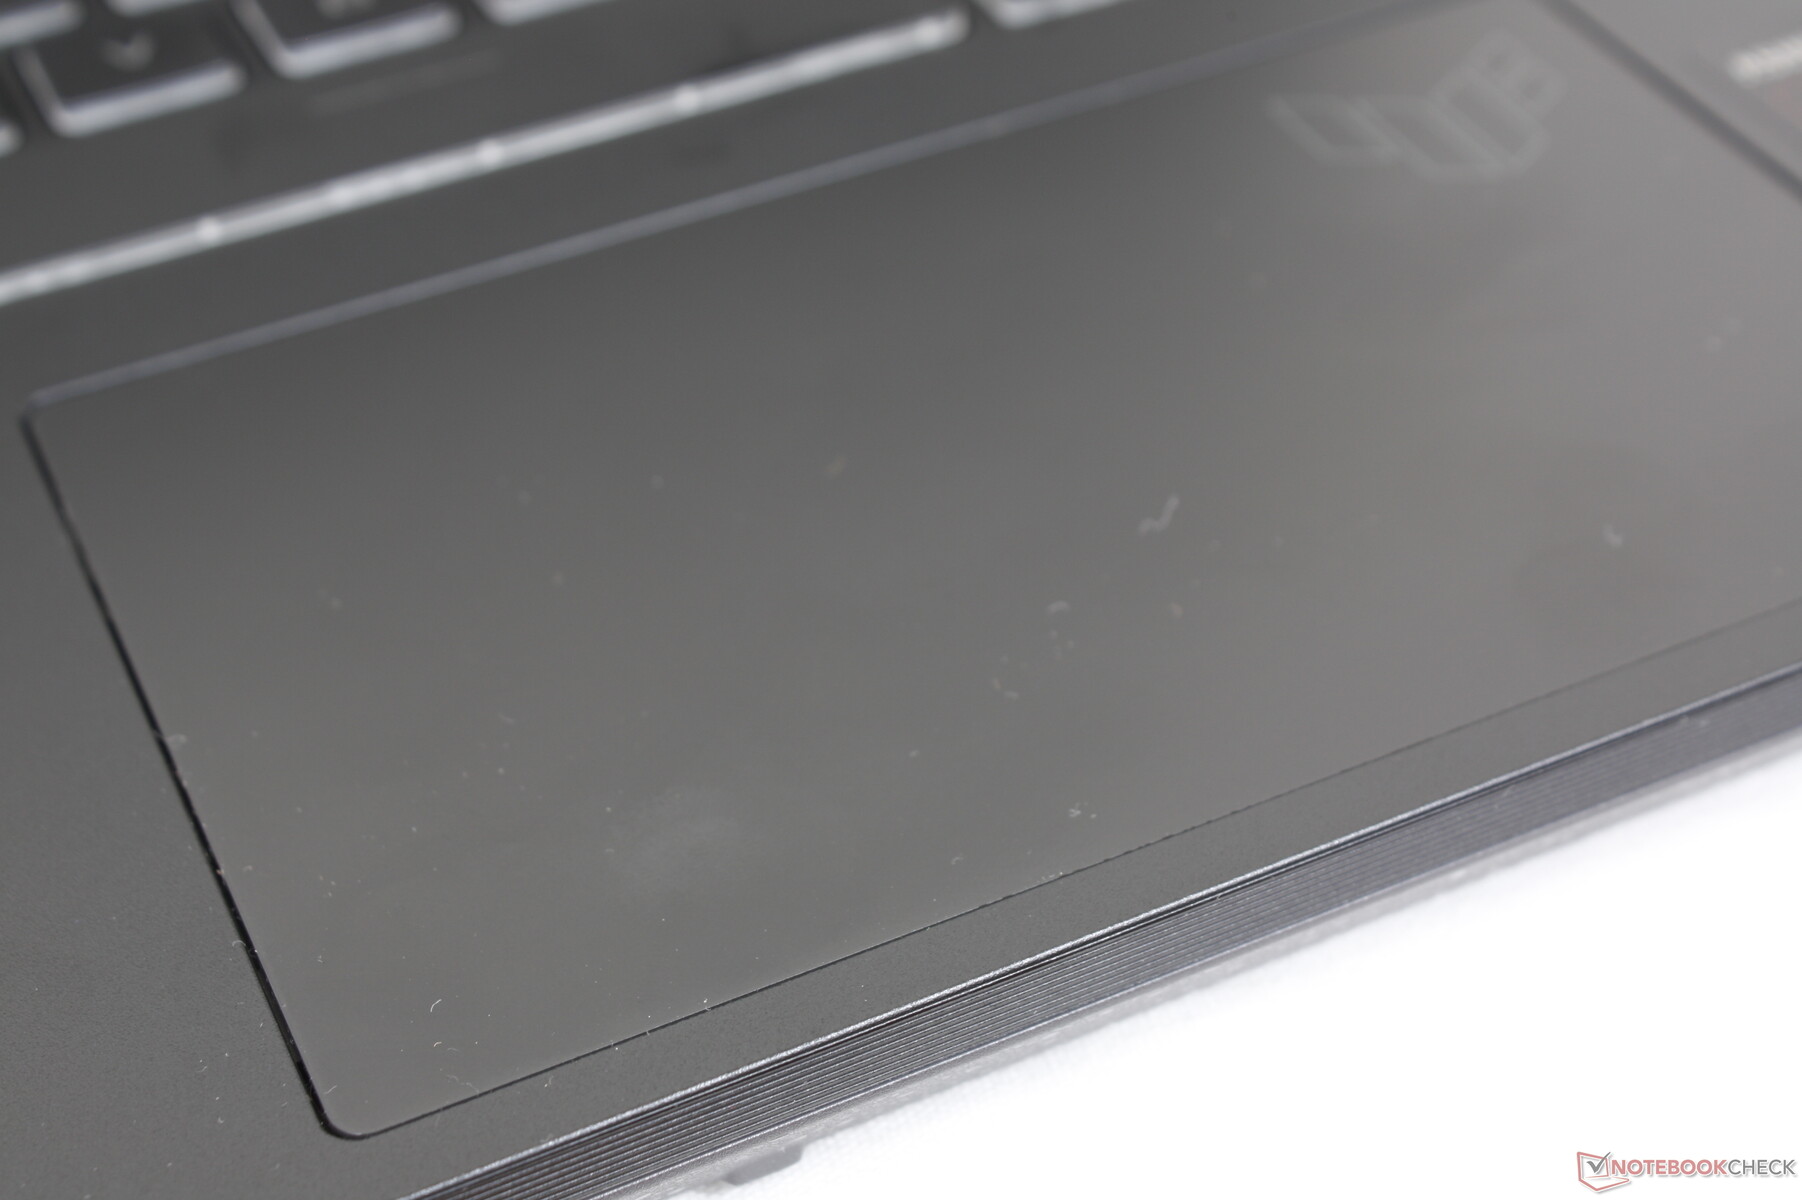
Touchpad
L'FX507 ha abbandonato i pulsanti dedicati del mouse dell'FX506 per una superficie del clickpad più ampia (13 x 7,8 cm contro 10,6 x 8,0 cm). Lo scorrimento è fluido a tutte le velocità con pochissimo sticking, ma il feedback è debole e un po' spugnoso quando si inseriscono i click. Le azioni di trascinamento non sono quindi così comode come sul vecchio FX506.

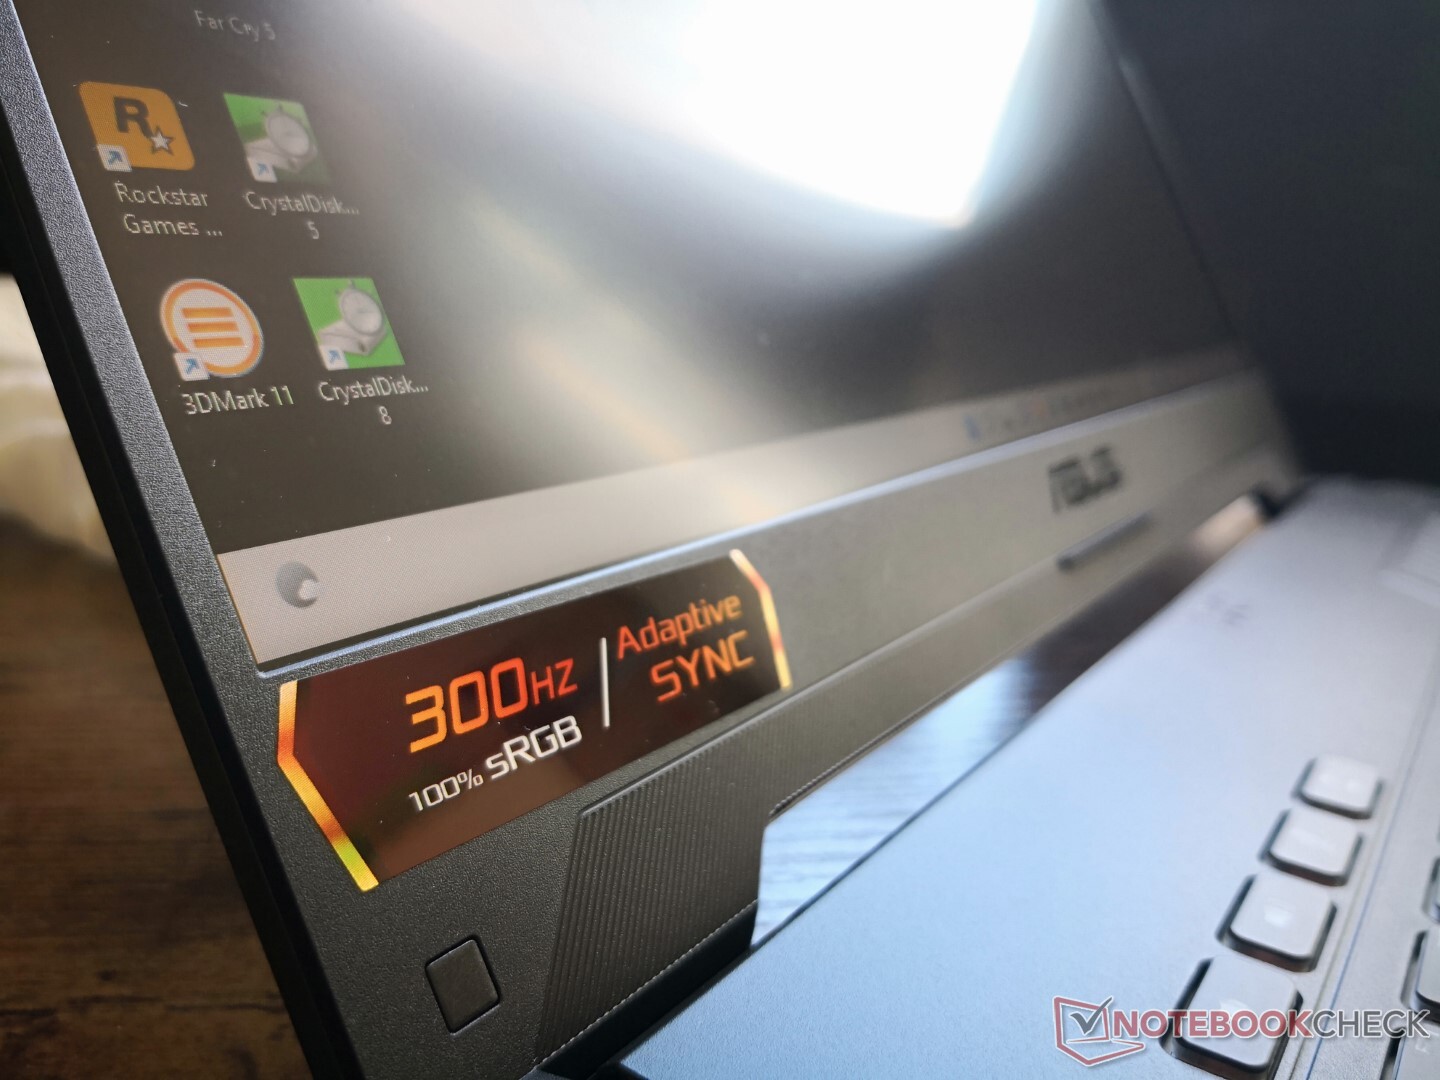
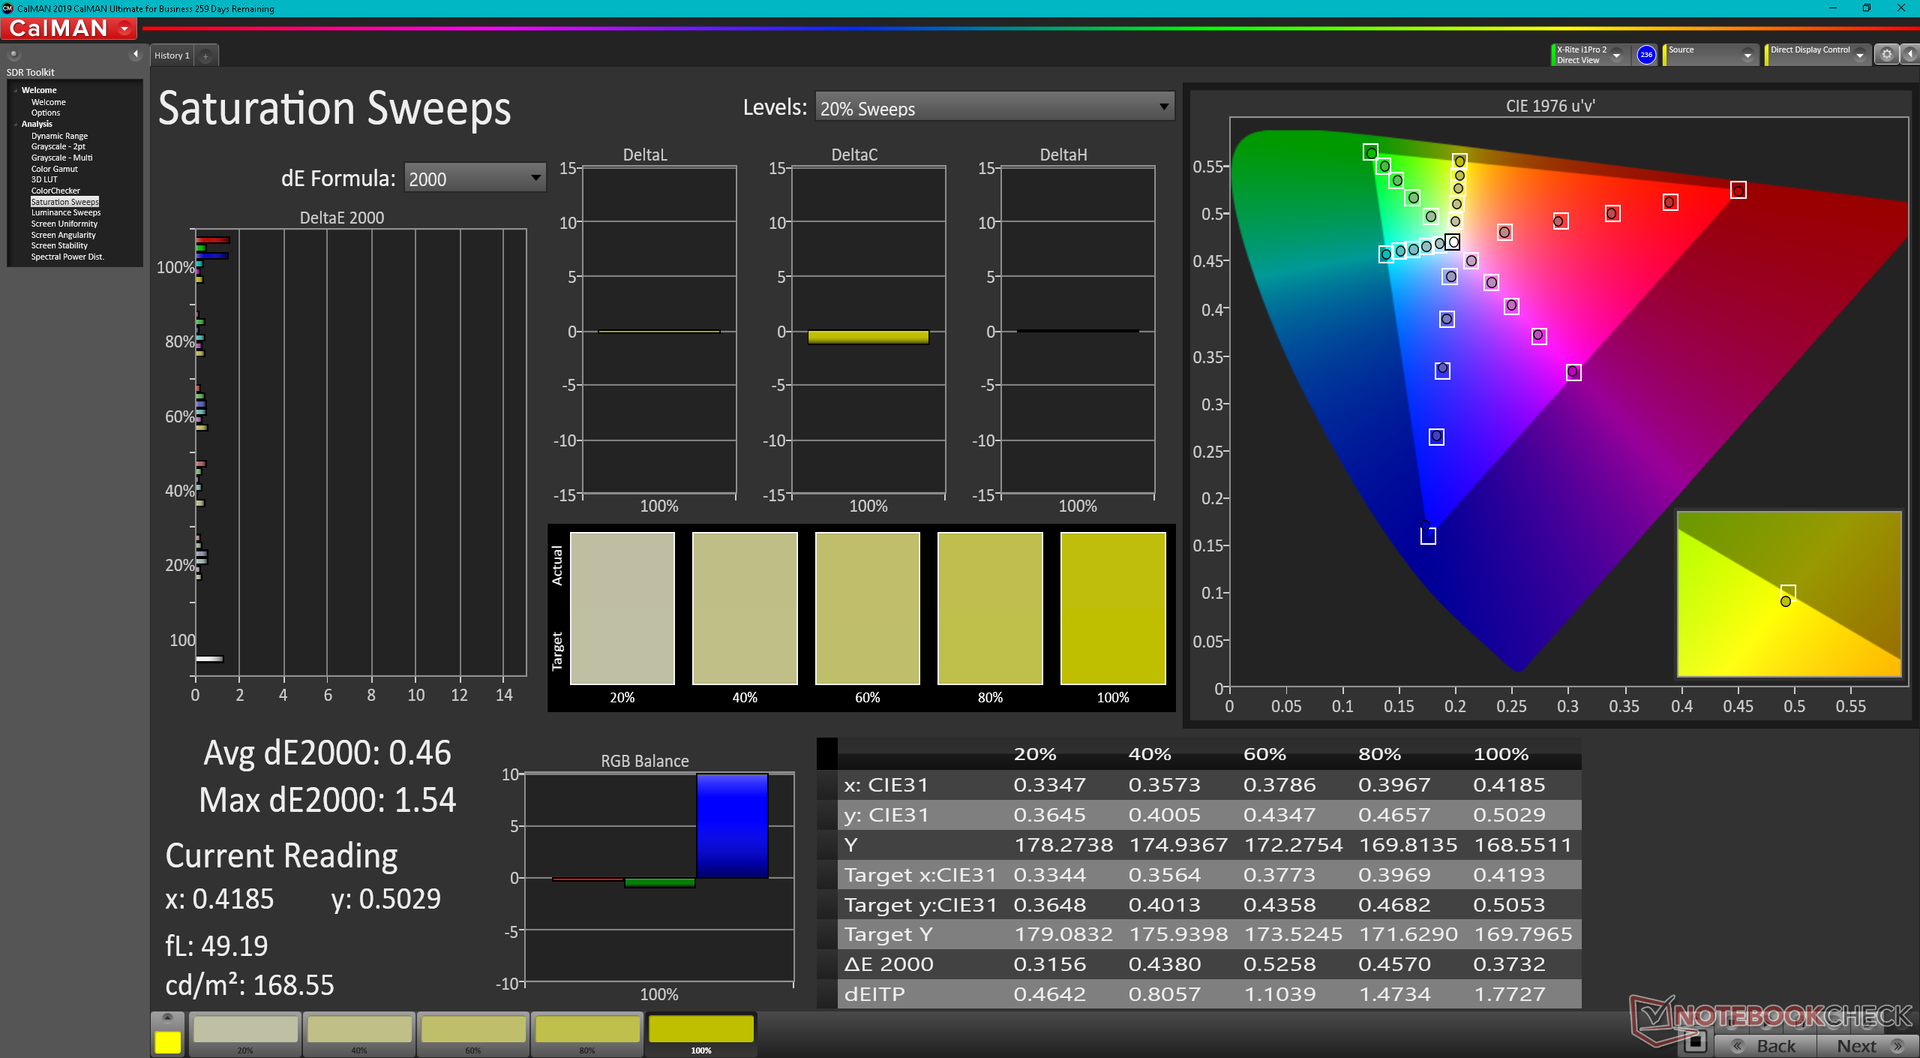
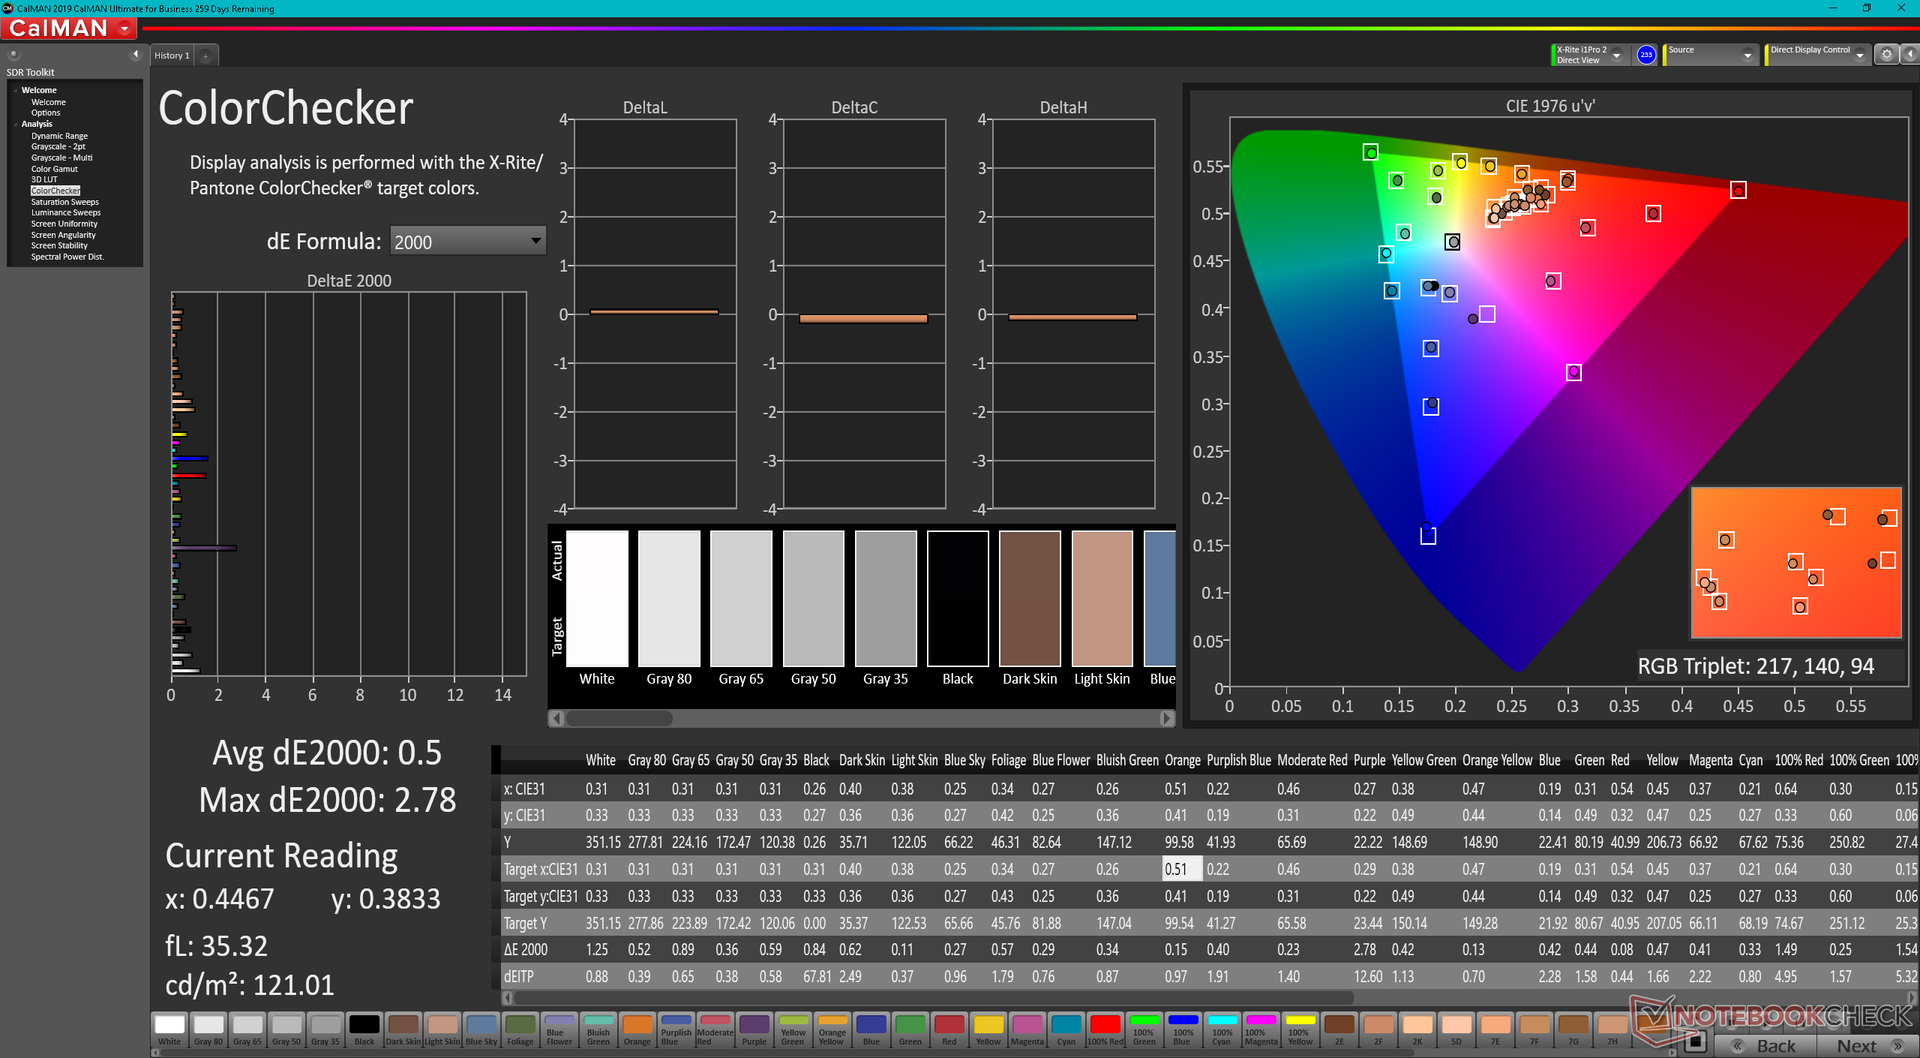
Display - 300 Hz con Adaptive Sync
Asus ha aggiornato il pannello IPS Sharp LQ156M1JW26 da 240 Hz del vecchio FX516PR per un più veloce pannello IPS Sharp TL156VDXP0101 da 300 Hz sull'FX507. Oltre alla maggiore frequenza di aggiornamento, il nuovo pannello fornisce anche tempi di risposta grigio-grigio più veloci e una retroilluminazione più luminosa, pur mantenendo più o meno lo stesso rapporto di contrasto e la gamma di colori dell'FX516PR.
Siamo felici di vedere che Asus ha abbandonato l'orrido pannello Chi Mei dell'FX506 che aveva colori e tempi di risposta significativamente inferiori.

| |||||||||||||||||||||||||
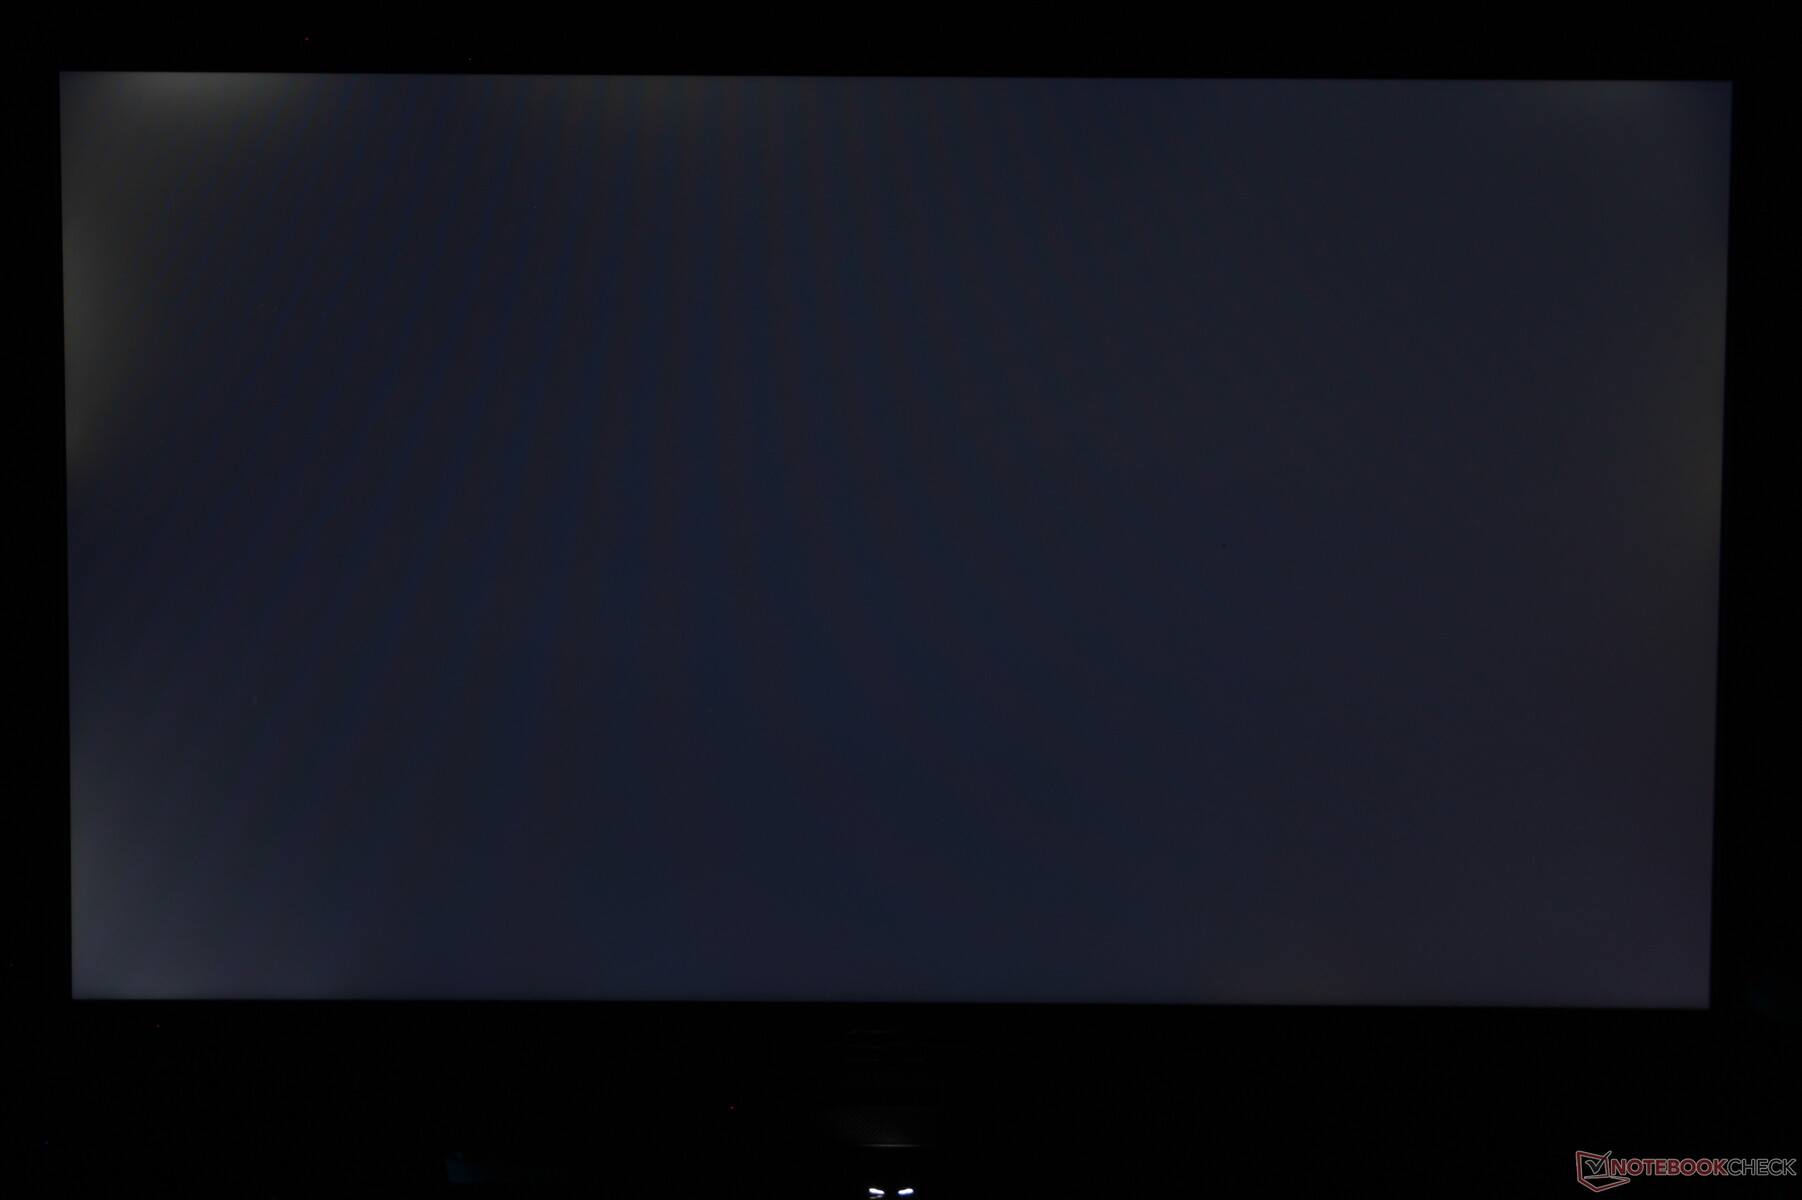
Distribuzione della luminosità: 89 %
Al centro con la batteria: 353.7 cd/m²
Contrasto: 1040:1 (Nero: 0.34 cd/m²)
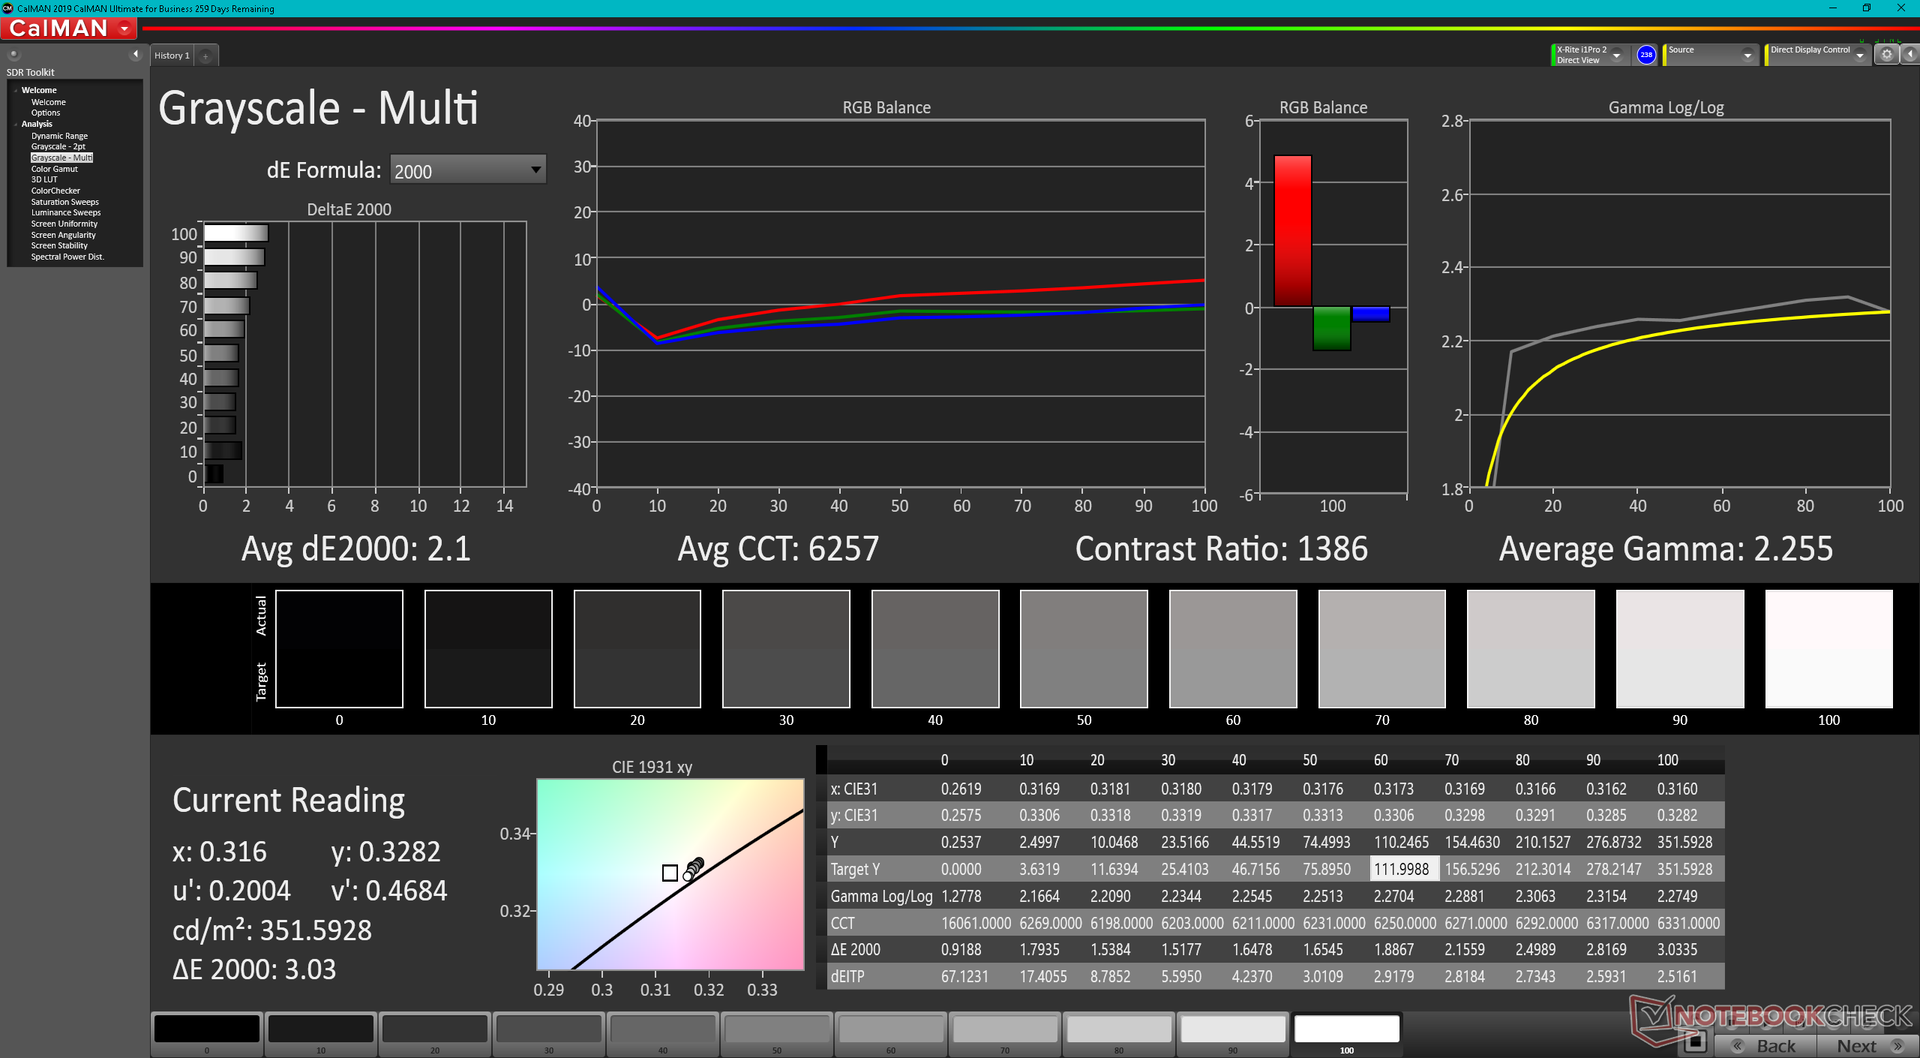
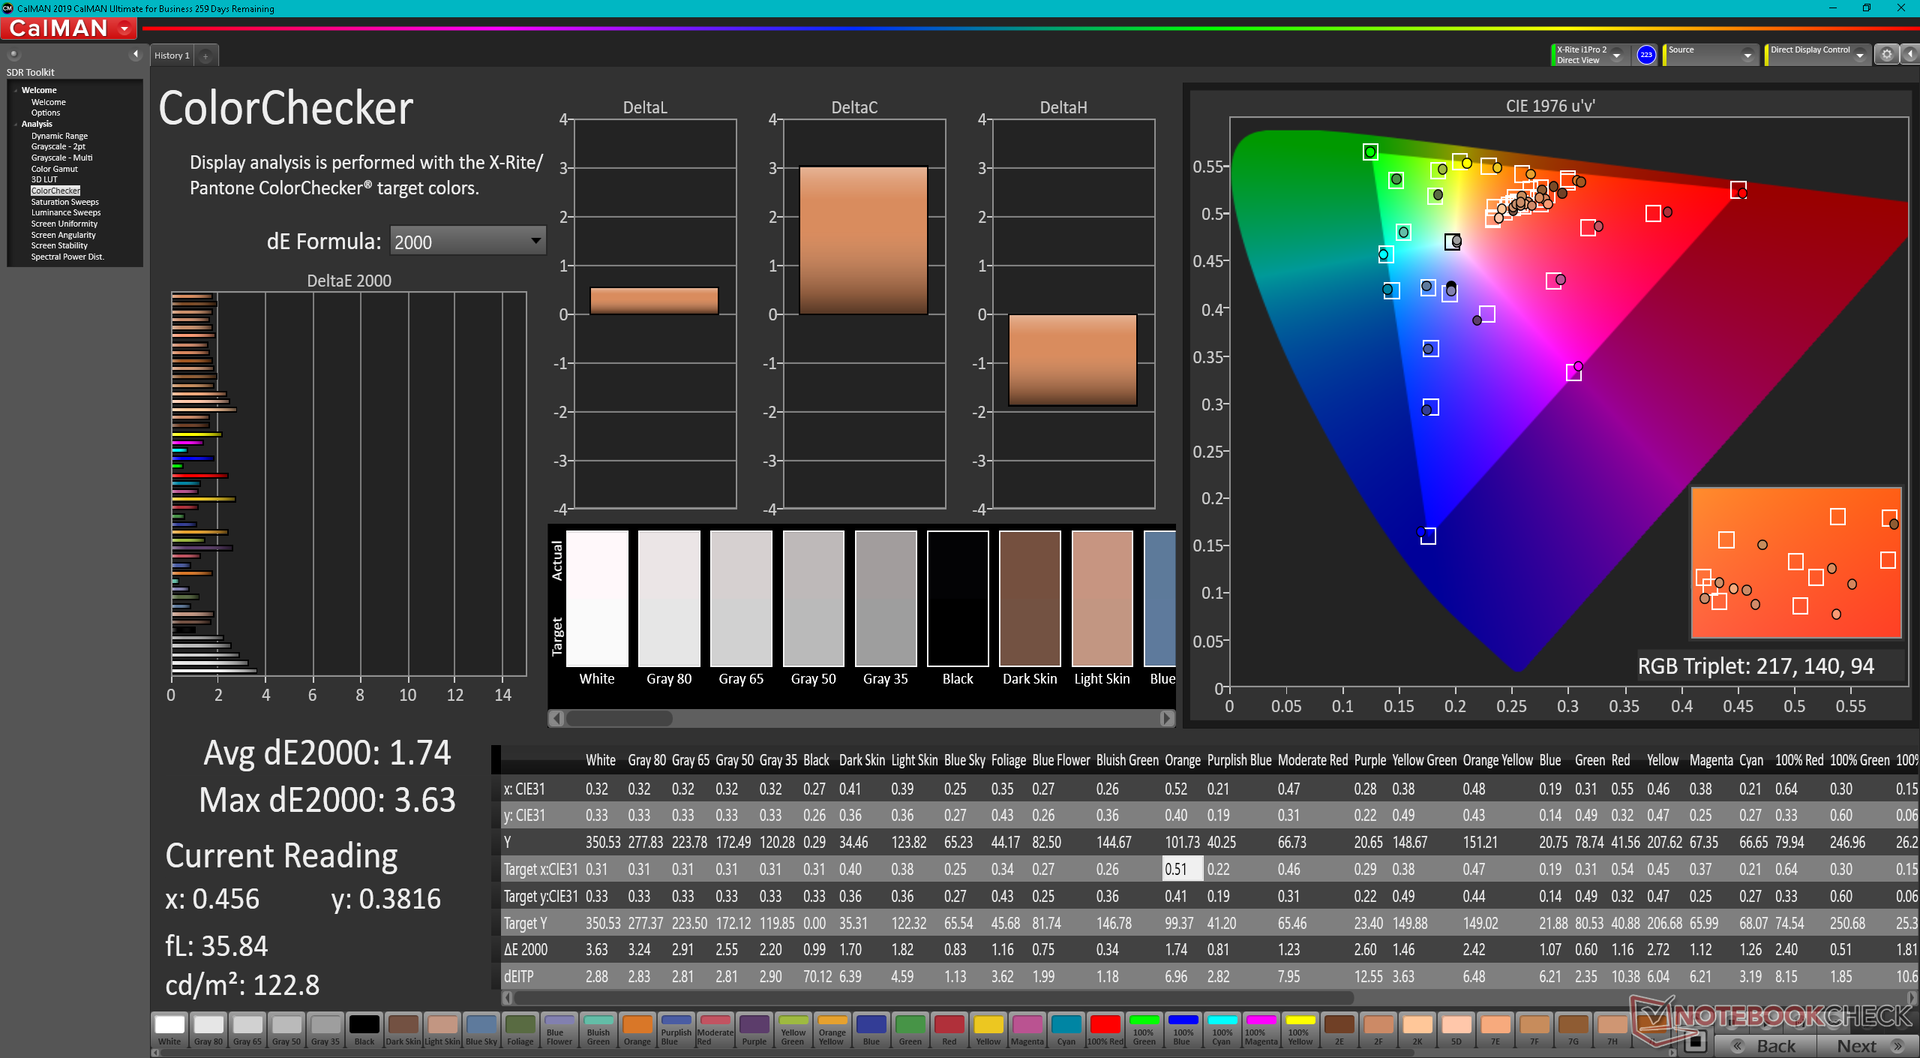
ΔE ColorChecker Calman: 1.74 | ∀{0.5-29.43 Ø4.72}
calibrated: 0.5
ΔE Greyscale Calman: 2.1 | ∀{0.09-98 Ø4.97}
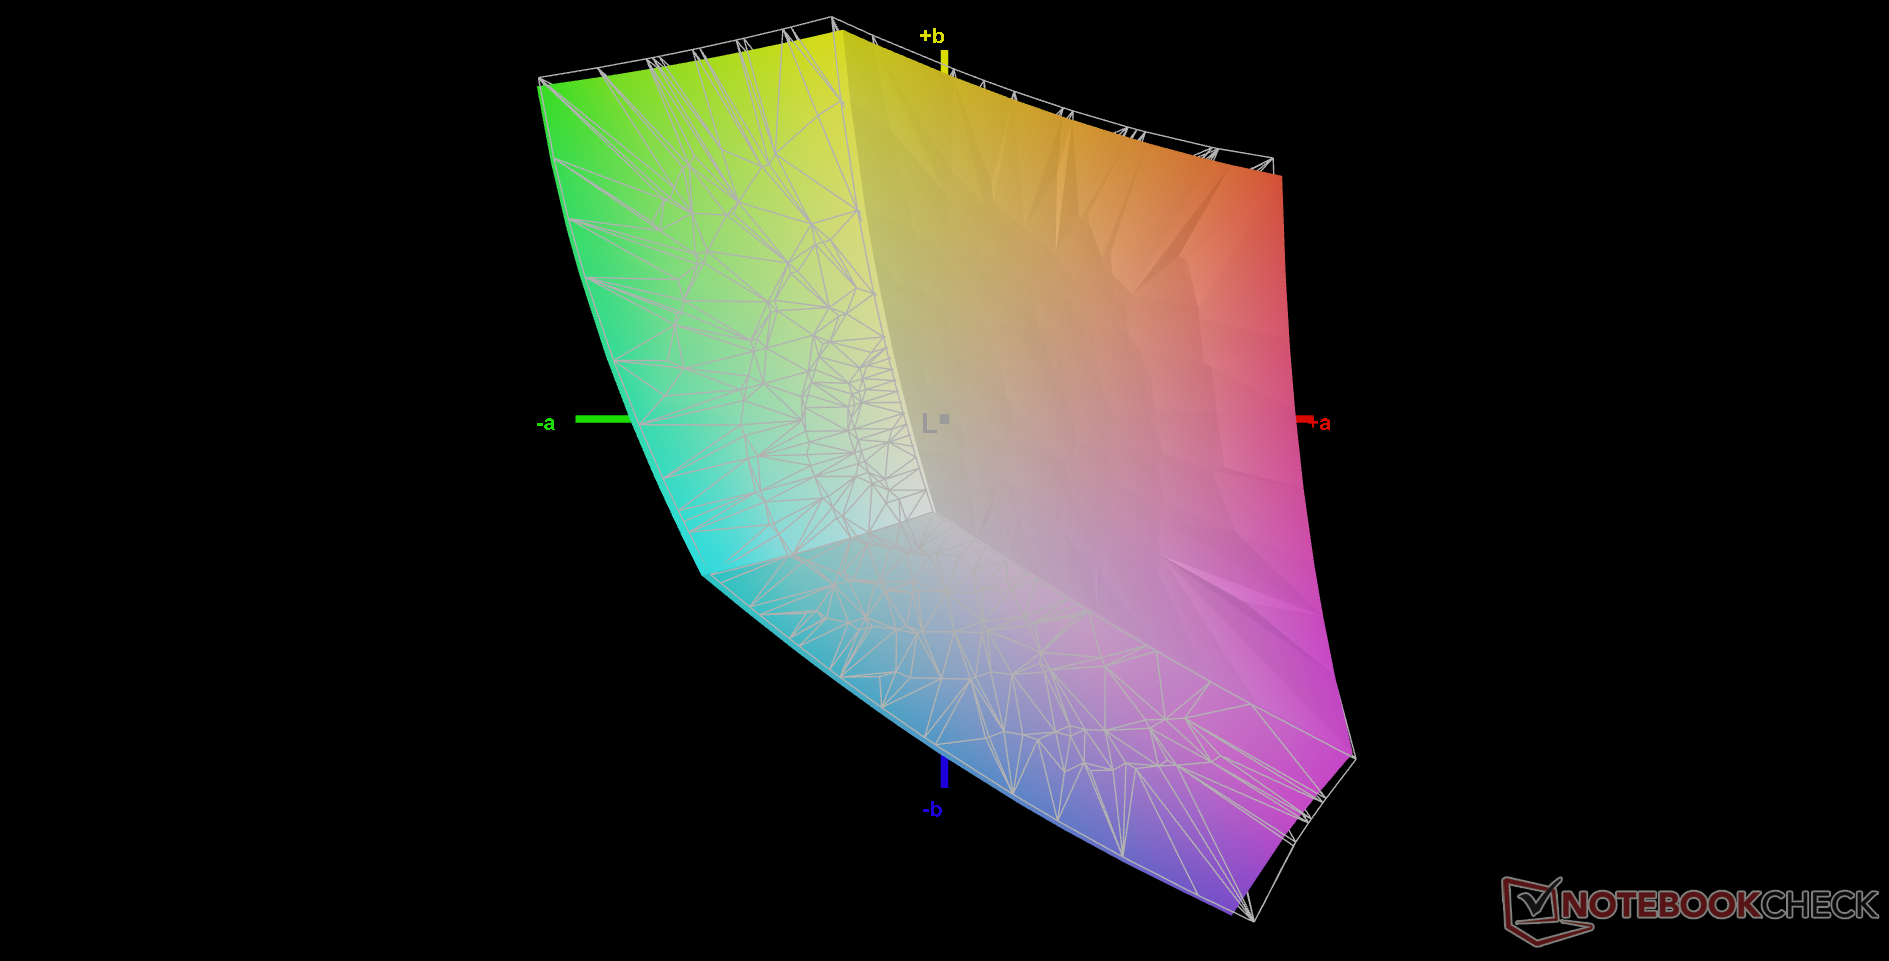
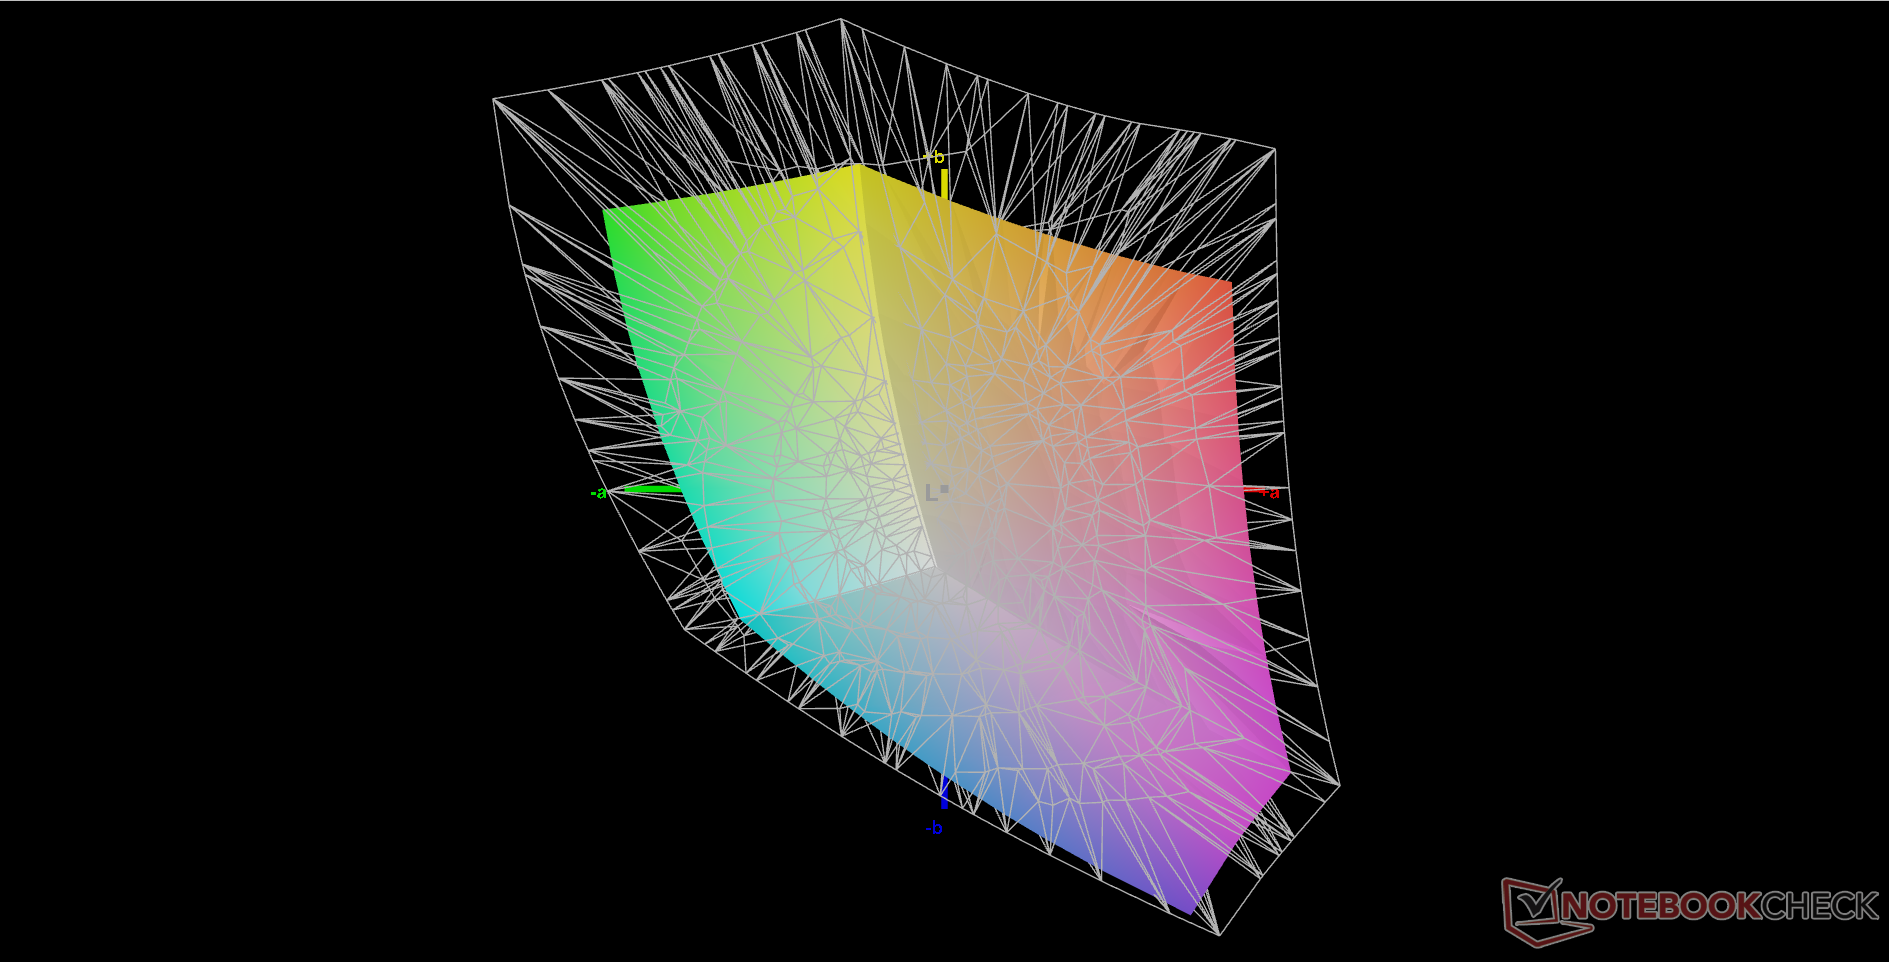
68.5% AdobeRGB 1998 (Argyll 3D)
97% sRGB (Argyll 3D)
66.4% Display P3 (Argyll 3D)
Gamma: 2.3
CCT: 6257 K
| Asus TUF Gaming F15 FX507ZM TL156VDXP0101, IPS, 1920x1080, 15.6" | Asus TUF Gaming F15 FX506HM Chi Mei N156HRA-EA1, IPS, 1920x1080, 15.6" | Asus TUF Dash F15 FX516PR LQ156M1JW26 (SHP1532), IPS, 1920x1080, 15.6" | Asus ROG Strix Scar 15 G533QS BOE CQ NE156QHM-NY1, IPS, 2560x1440, 15.6" | Asus Zephyrus S15 GX502L B156HAN12.0 (AUOBC8C), IPS, 1920x1080, 15.6" | Asus ZenBook Pro Duo UX582 LR-1BH2 SDC4143, OLED + IPS, 3840x2160, 15.6" | |
|---|---|---|---|---|---|---|
| Display | -36% | 0% | 25% | 4% | 33% | |
| Display P3 Coverage (%) | 66.4 | 41.9 -37% | 66.9 1% | 97.6 47% | 69.7 5% | 99.9 50% |
| sRGB Coverage (%) | 97 | 62.9 -35% | 98.1 1% | 99.9 3% | 99.7 3% | 100 3% |
| AdobeRGB 1998 Coverage (%) | 68.5 | 43.3 -37% | 67.9 -1% | 85.3 25% | 71.1 4% | 99.7 46% |
| Response Times | -238% | -46% | -74% | -63% | 69% | |
| Response Time Grey 50% / Grey 80% * (ms) | 5.6 ? | 28.4 ? -407% | 12 ? -114% | 14 ? -150% | 14 ? -150% | 2.4 ? 57% |
| Response Time Black / White * (ms) | 12.8 ? | 21.6 ? -69% | 10 ? 22% | 12.4 ? 3% | 9.6 ? 25% | 2.4 ? 81% |
| PWM Frequency (Hz) | 23580 ? | 59.5 ? | ||||
| Screen | -144% | -27% | -70% | -29% | -87% | |
| Brightness middle (cd/m²) | 353.7 | 268.3 -24% | 286 -19% | 304.3 -14% | 283 -20% | 345 -2% |
| Brightness (cd/m²) | 340 | 257 -24% | 275 -19% | 286 -16% | 289 -15% | 332 -2% |
| Brightness Distribution (%) | 89 | 84 -6% | 91 2% | 76 -15% | 90 1% | 87 -2% |
| Black Level * (cd/m²) | 0.34 | 0.34 -0% | 0.25 26% | 0.33 3% | 0.24 29% | |
| Contrast (:1) | 1040 | 789 -24% | 1144 10% | 922 -11% | 1179 13% | |
| Colorchecker dE 2000 * | 1.74 | 5.05 -190% | 2.43 -40% | 2.76 -59% | 2.26 -30% | 3.3 -90% |
| Colorchecker dE 2000 max. * | 3.63 | 15.43 -325% | 6.33 -74% | 5.57 -53% | 5.64 -55% | 7.2 -98% |
| Colorchecker dE 2000 calibrated * | 0.5 | 3.21 -542% | 0.83 -66% | 2.38 -376% | 1.11 -122% | 2.6 -420% |
| Greyscale dE 2000 * | 2.1 | 5.5 -162% | 3.5 -67% | 4 -90% | 3.4 -62% | 2 5% |
| Gamma | 2.3 96% | 2.35 94% | 2.32 95% | 2.14 103% | 2.228 99% | 2.01 109% |
| CCT | 6257 104% | 7392 88% | 7145 91% | 6844 95% | 7249 90% | 6566 99% |
| Color Space (Percent of AdobeRGB 1998) (%) | 68 | 71 | 89.2 | |||
| Color Space (Percent of sRGB) (%) | 91 | 93 | 100 | |||
| Media totale (Programma / Settaggio) | -139% /
-134% | -24% /
-24% | -40% /
-50% | -29% /
-27% | 5% /
-31% |
* ... Meglio usare valori piccoli
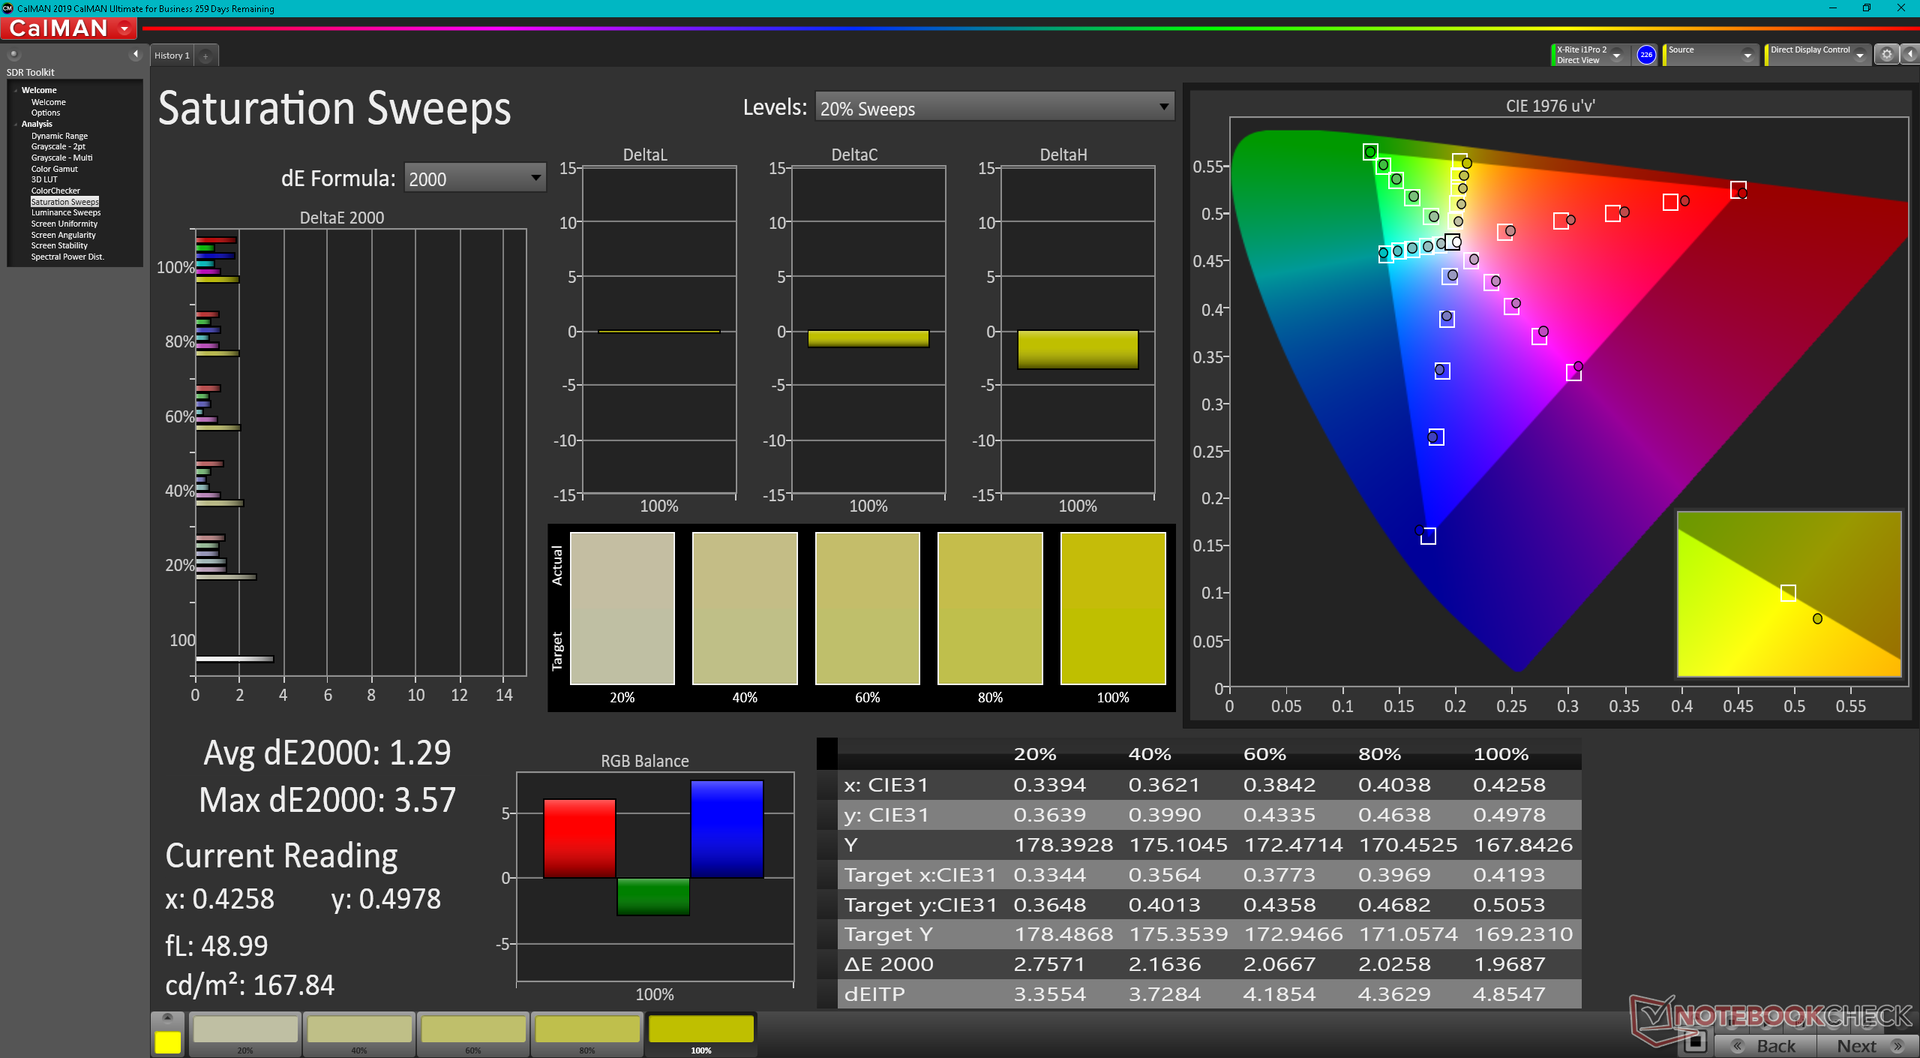
Non ci sono cambiamenti significativi di spazio colore tra l'FX506 e l'FX507. Asus non offre alcuna opzione di copertura AdobeRGB o DCI-P3 per la sua serie FX507 a differenza del Razer Blade 15 o della serie ZenBook professionale.
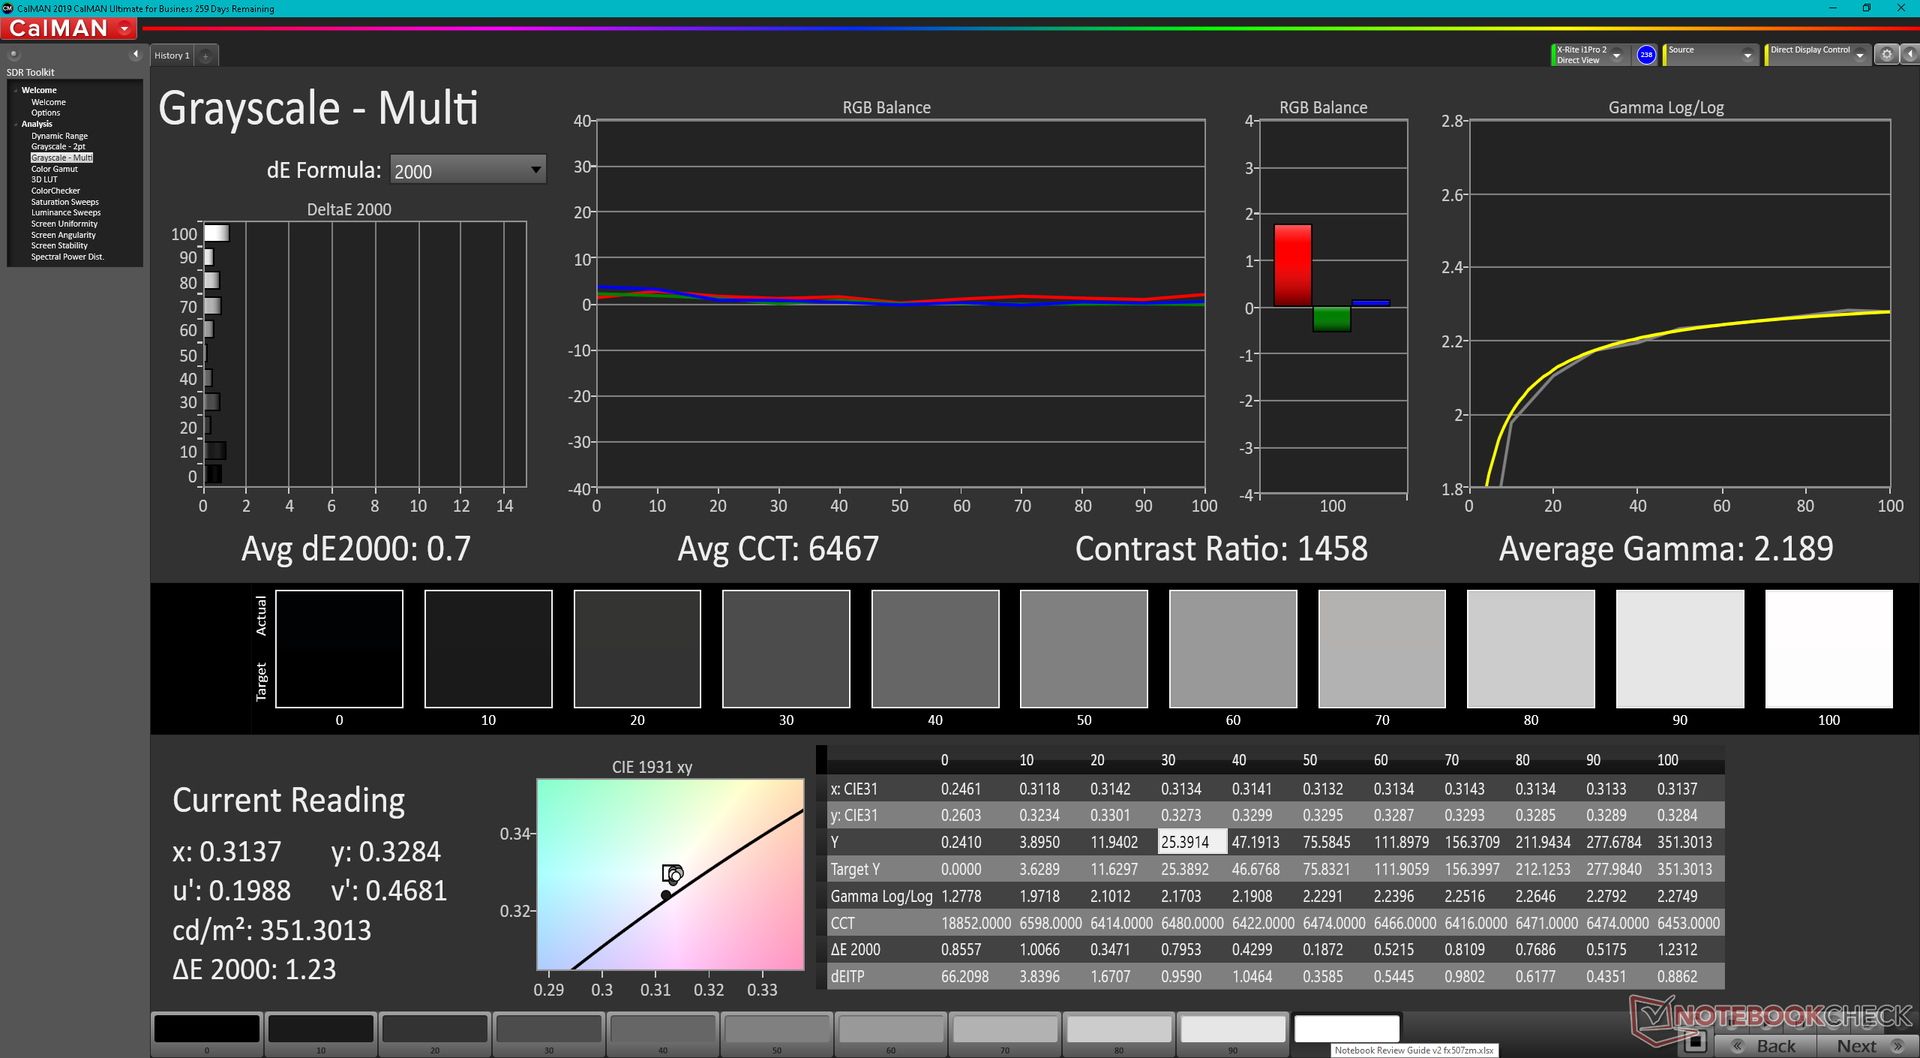
Il display è ben calibrato fuori dalla scatola con valori medi di deltaE in scala di grigi e colore di solo 2,1 e 1,74, rispettivamente. Calibrando ulteriormente il display con un colorimetro X-Rite, il deltaE migliorerebbe ancora di più fino a meno di 1 ciascuno.
Tempi di risposta del Display
| ↔ Tempi di risposta dal Nero al Bianco | ||
|---|---|---|
| 12.8 ms ... aumenta ↗ e diminuisce ↘ combinato | ↗ 6.8 ms Incremento | 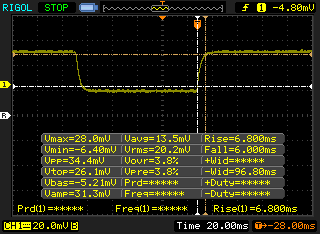 |
| ↘ 6 ms Calo | ||
| Lo schermo mostra buoni tempi di risposta durante i nostri tests, ma potrebbe essere troppo lento per i gamers competitivi. In confronto, tutti i dispositivi di test variano da 0.1 (minimo) a 240 (massimo) ms. » 33 % di tutti i dispositivi è migliore. Questo significa che i tempi di risposta rilevati sono migliori rispettto alla media di tutti i dispositivi testati (19.8 ms). | ||
| ↔ Tempo di risposta dal 50% Grigio all'80% Grigio | ||
| 5.6 ms ... aumenta ↗ e diminuisce ↘ combinato | ↗ 3.2 ms Incremento | 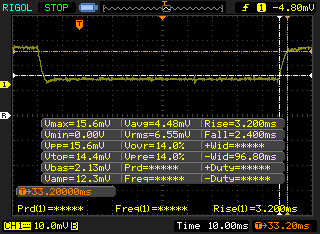 |
| ↘ 2.4 ms Calo | ||
| Lo schermo ha mostrato valori di risposta molto veloci nei nostri tests ed è molto adatto per i gaming veloce. In confronto, tutti i dispositivi di test variano da 0.165 (minimo) a 636 (massimo) ms. » 18 % di tutti i dispositivi è migliore. Questo significa che i tempi di risposta rilevati sono migliori rispettto alla media di tutti i dispositivi testati (31 ms). | ||
Sfarfallio dello schermo / PWM (Pulse-Width Modulation)
| flickering dello schermo / PWM non rilevato | 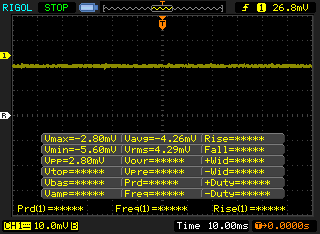 | ||
In confronto: 52 % di tutti i dispositivi testati non utilizza PWM per ridurre la luminosita' del display. Se è rilevato PWM, una media di 7769 (minimo: 5 - massimo: 343500) Hz è stata rilevata. | |||

Prestazioni - La differenza Intel 12a generazione
Condizioni di test
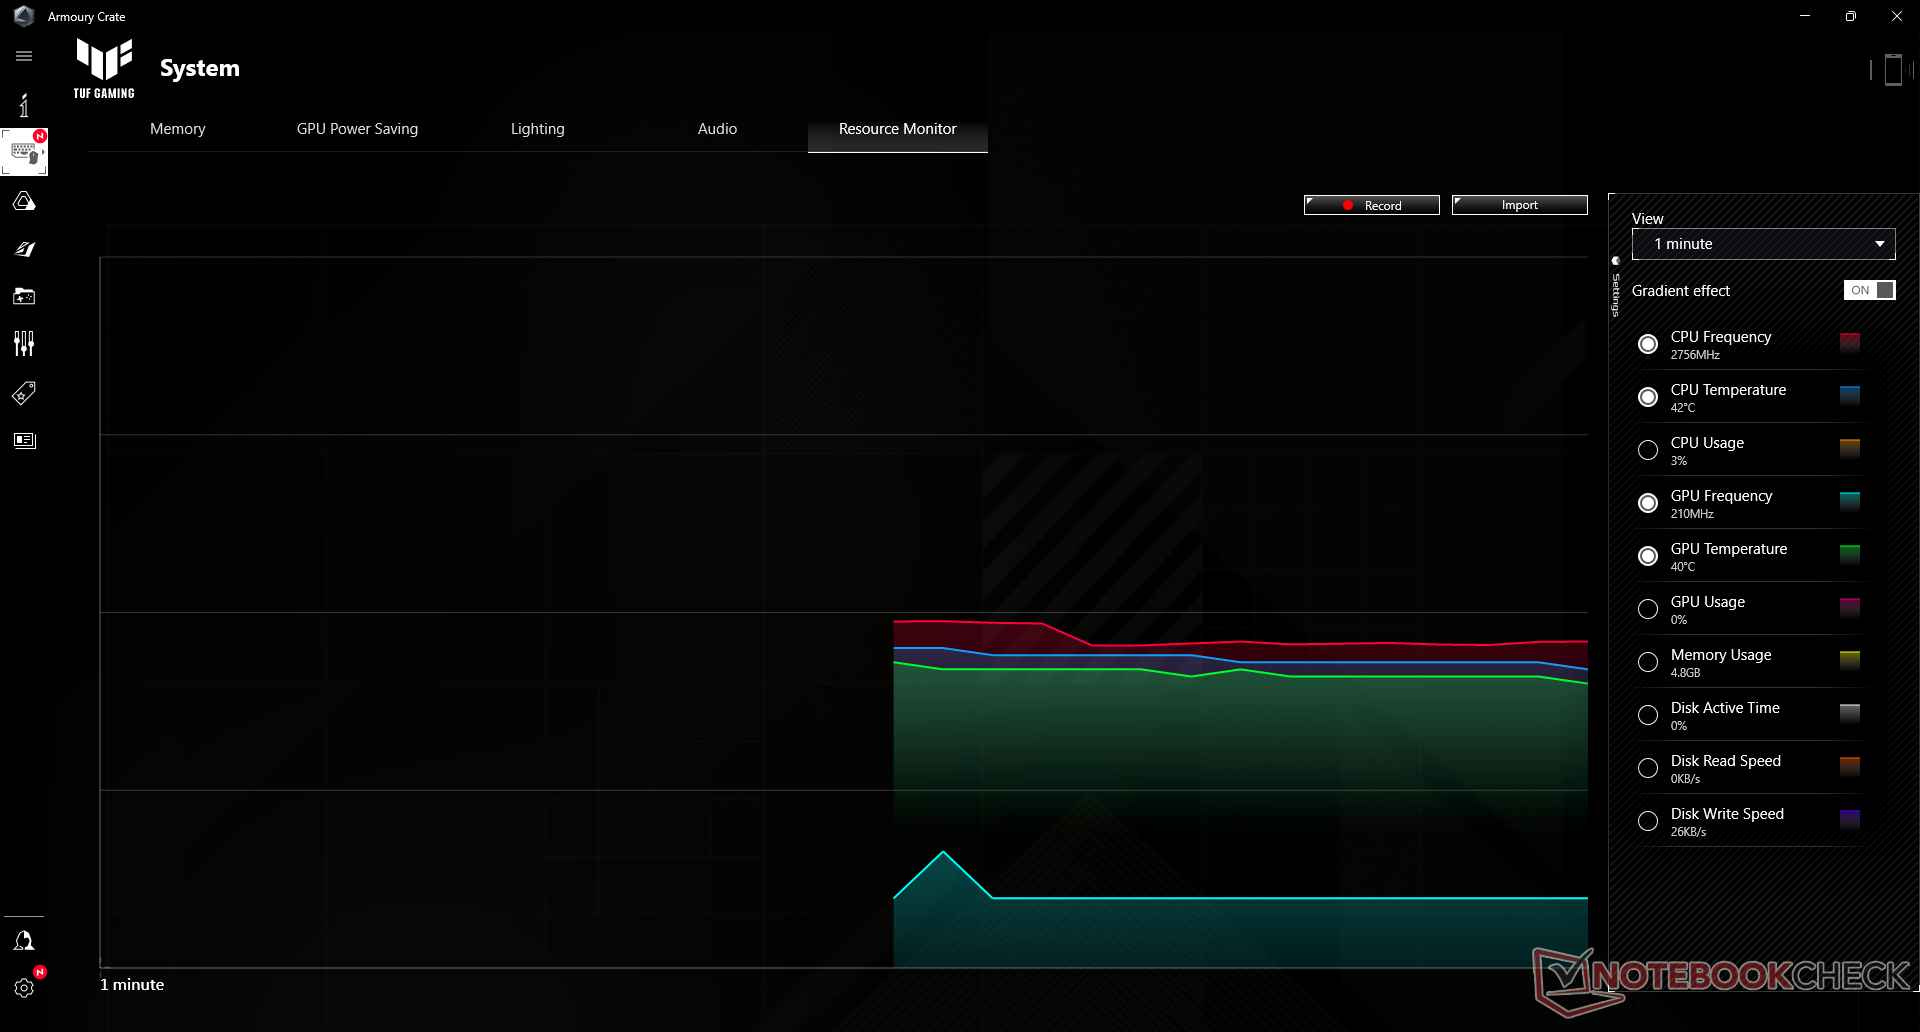
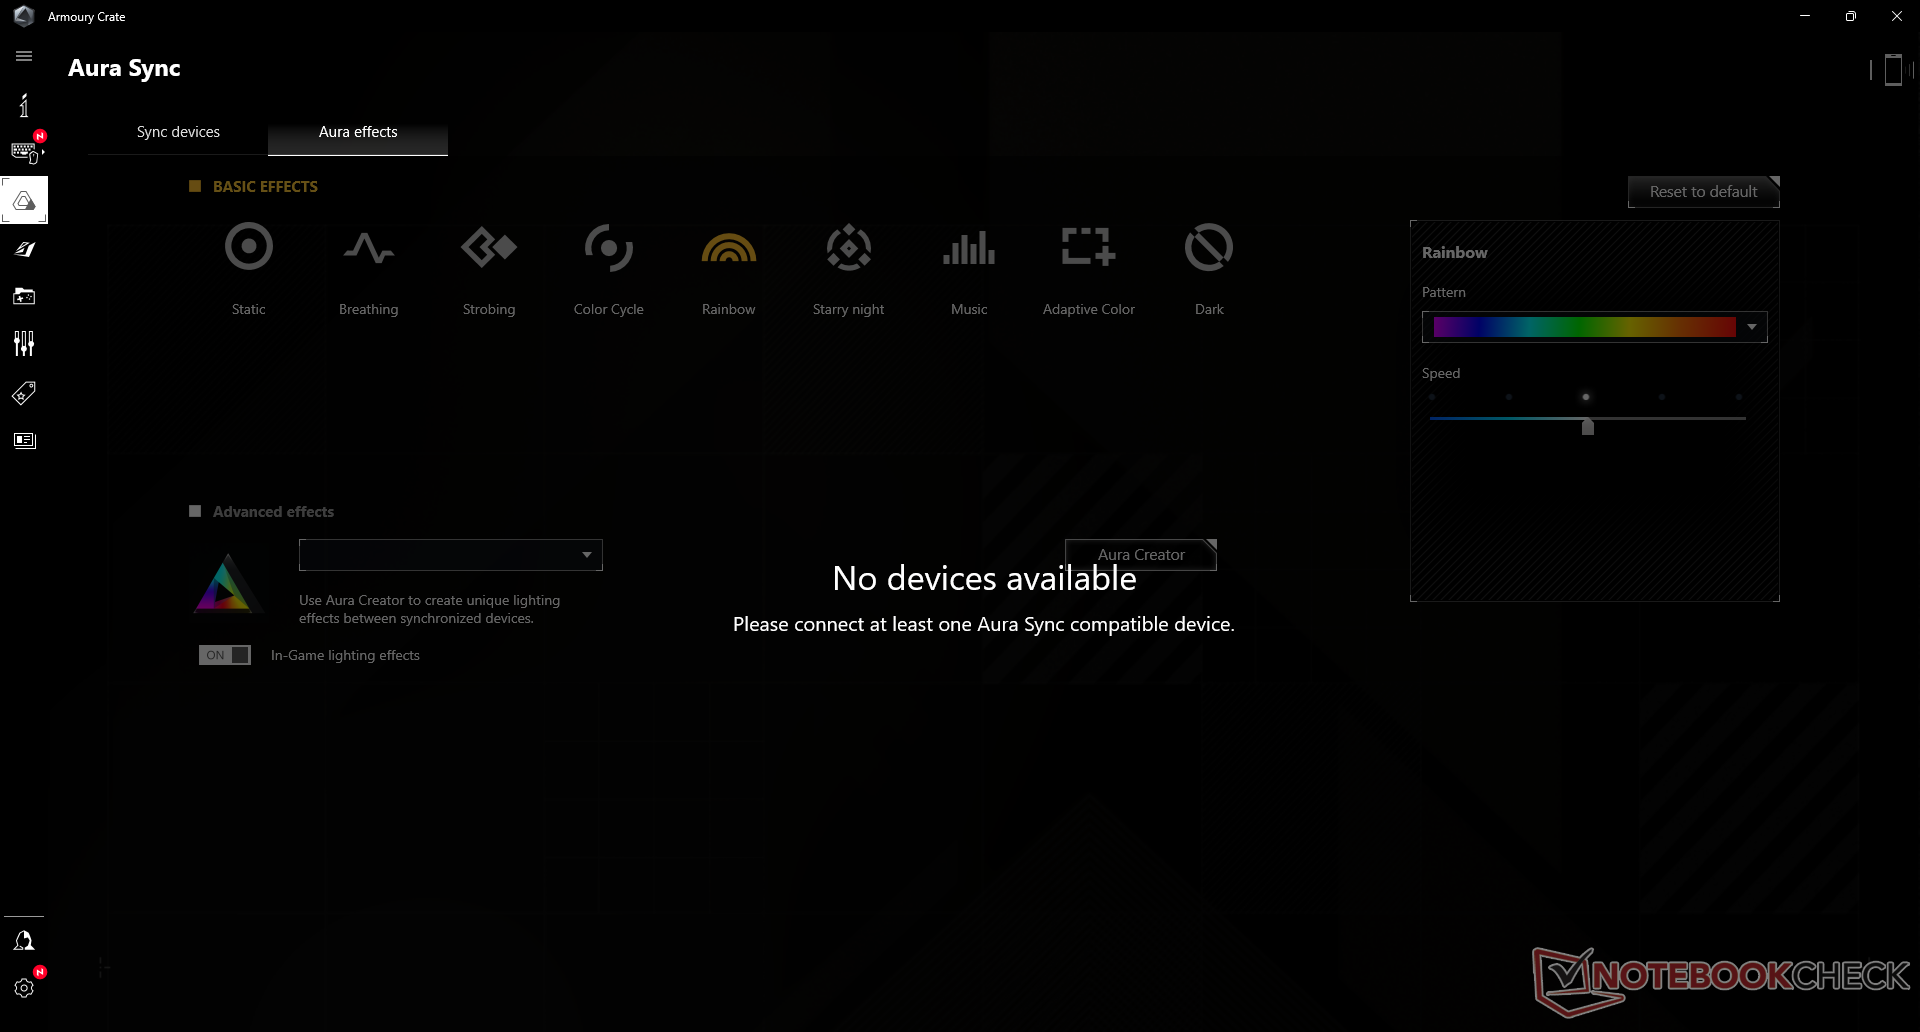
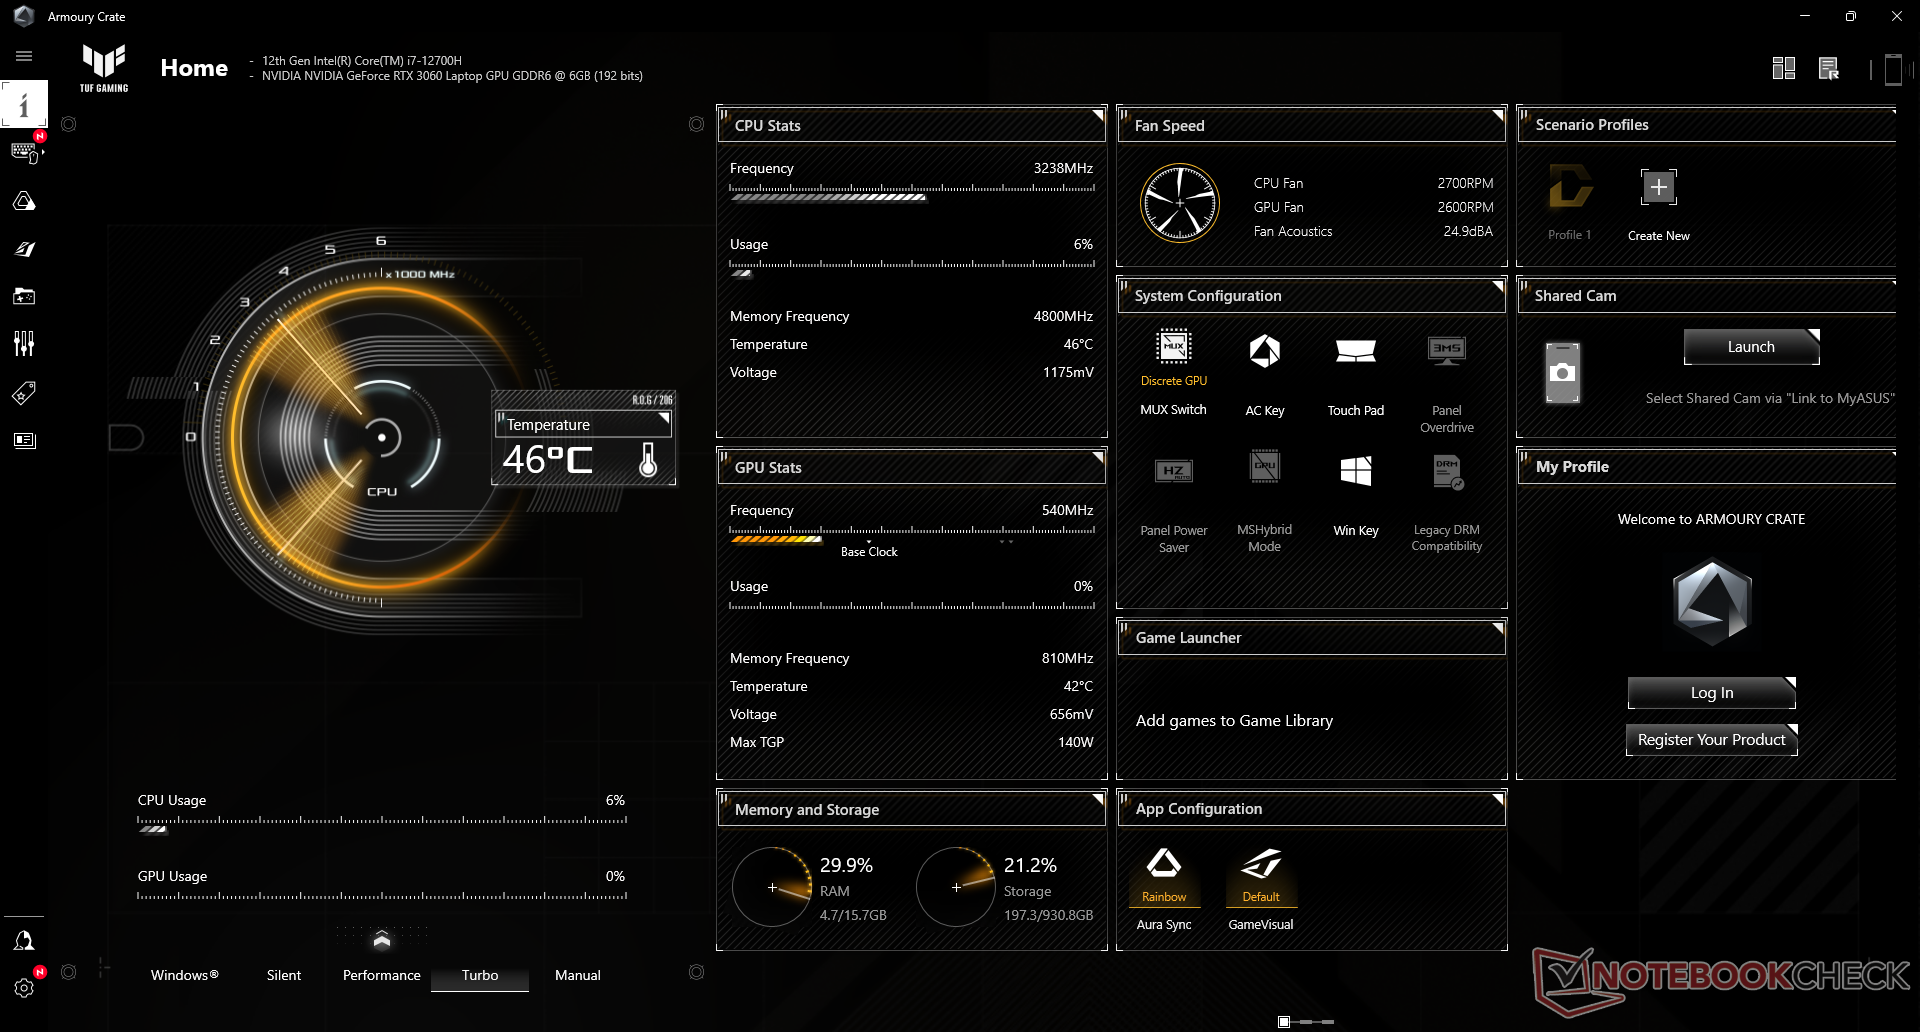
La nostra unità è stata impostata in modalità Turbo e in modalità GPU discreta tramite il profilo Armoury Crate preinstallato prima di eseguire qualsiasi benchmark di prestazioni qui sotto. Si raccomanda ai proprietari di acquisire familiarità con questo software in quanto serve come hub per il monitoraggio delle prestazioni, per alternare le funzioni ausiliarie e per passare da un profilo di prestazioni all'altro. In particolare, gli utenti possono passare tra le modalità grafiche MSHybrid o MUX direttamente attraverso il software. Il precedente modello FX506 non aveva un interruttore MUX
Optimus avanzato non è supportato, il che significa che è necessario un riavvio morbido quando si passa tra la grafica discreta o Optimus. Per far funzionare l'Adaptive Sync sul display interno, gli utenti devono eseguire in modalità MSHybrid, poiché la modalità dGPU MUX non supporta l'Adaptive Sync. G-Sync e FreeSync possono essere abilitati su un monitor esterno supportato, indipendentemente dalla modalità GPU, purché sia collegato tramite USB-C DisplayPort e non HDMI.
Gli obiettivi TDP della CPU e TGP della GPU variano a seconda del profilo di alimentazione Armoury Crate come dettagliato dalla tabella sottostante. Pertanto, i proprietari devono eseguire il sistema in modalità Turbo o Manuale per ottenere la massima potenza dall'FX507.
| Profilo di potenza | Silenzioso | Prestazioni | Turbo | Manuale |
| Obiettivo CPU PL1 | 45 W | 70 W | 90 W | 100 W |
| CPU target PL2 | 60 W | 105 W | 115 W | 135 W |
| Target GPU TGP | <115 W (WhisperMode 2.0 attivo) | 100 W + 15 W | 115 W + 25 W | 115 W + 25 W |
| Target Max TDP+TGP | 25 W + <100 W (WhisperMode 2.0 attivo) | 35 W + 100 W | 45 W + 115 W | 45 W + 115 W |
| Obiettivo dB(A) (fornito dal produttore) | <35 dB(A) | 40 dB(A) | 48 dB(A) | 52 dB(A) |
Processore
Le prestazioni della CPU sono eccellenti ed esattamente dove ci aspettiamo che siano rispetto ad altri portatili con la stessa CPU. Se paragonato al Core i7-11800H sull'FX506 dell'anno scorso, il Core i7-12700H può offrire circa il 17 per cento e il 30 per cento di prestazioni single-thread e multi-thread più veloci, rispettivamente. Le prestazioni complessive sono essenzialmente alla pari con il più costoso Core i9-12900H mentre è in vantaggio rispetto al Core i7-12800H che si trova sul Razer Blade 15
La sostenibilità del Turbo Boost è buona in quanto il nostro punteggio iniziale di 2735 punti sarebbe sceso solo di pochi punti percentuali quando si esegue CineBench R15 xT in un ciclo.
Cinebench R15 Multi Loop
Cinebench R23: Multi Core | Single Core
Cinebench R15: CPU Multi 64Bit | CPU Single 64Bit
Blender: v2.79 BMW27 CPU
7-Zip 18.03: 7z b 4 | 7z b 4 -mmt1
Geekbench 5.5: Multi-Core | Single-Core
HWBOT x265 Benchmark v2.2: 4k Preset
LibreOffice : 20 Documents To PDF
R Benchmark 2.5: Overall mean
* ... Meglio usare valori piccoli
AIDA64: FP32 Ray-Trace | FPU Julia | CPU SHA3 | CPU Queen | FPU SinJulia | FPU Mandel | CPU AES | CPU ZLib | FP64 Ray-Trace | CPU PhotoWorxx
| Performance rating | |
| Asus ROG Strix Scar 15 G533QS | |
| Media Intel Core i7-12700H | |
| Asus Zephyrus S15 GX502L | |
| Asus TUF Gaming F15 FX507ZM | |
| Asus ZenBook Pro Duo UX582 LR-1BH2 | |
| Asus TUF Dash F15 FX516PR | |
| Asus TUF Gaming F15 FX506HM -9! | |
| AIDA64 / FP32 Ray-Trace | |
| Asus ROG Strix Scar 15 G533QS | |
| Asus Zephyrus S15 GX502L | |
| Asus ZenBook Pro Duo UX582 LR-1BH2 | |
| Media Intel Core i7-12700H (2585 - 17957, n=64) | |
| Asus TUF Gaming F15 FX507ZM | |
| Asus TUF Dash F15 FX516PR | |
| AIDA64 / FPU Julia | |
| Asus ROG Strix Scar 15 G533QS | |
| Asus Zephyrus S15 GX502L | |
| Asus ZenBook Pro Duo UX582 LR-1BH2 | |
| Media Intel Core i7-12700H (12439 - 90760, n=64) | |
| Asus TUF Gaming F15 FX507ZM | |
| Asus TUF Dash F15 FX516PR | |
| AIDA64 / CPU SHA3 | |
| Asus ROG Strix Scar 15 G533QS | |
| Asus TUF Gaming F15 FX507ZM | |
| Asus Zephyrus S15 GX502L | |
| Media Intel Core i7-12700H (833 - 4242, n=64) | |
| Asus ZenBook Pro Duo UX582 LR-1BH2 | |
| Asus TUF Dash F15 FX516PR | |
| AIDA64 / CPU Queen | |
| Asus ROG Strix Scar 15 G533QS | |
| Asus TUF Gaming F15 FX507ZM | |
| Media Intel Core i7-12700H (57923 - 103202, n=63) | |
| Asus Zephyrus S15 GX502L | |
| Asus ZenBook Pro Duo UX582 LR-1BH2 | |
| Asus TUF Dash F15 FX516PR | |
| AIDA64 / FPU SinJulia | |
| Asus ROG Strix Scar 15 G533QS | |
| Asus Zephyrus S15 GX502L | |
| Asus TUF Gaming F15 FX507ZM | |
| Asus ZenBook Pro Duo UX582 LR-1BH2 | |
| Media Intel Core i7-12700H (3249 - 9939, n=64) | |
| Asus TUF Dash F15 FX516PR | |
| AIDA64 / FPU Mandel | |
| Asus ROG Strix Scar 15 G533QS | |
| Asus Zephyrus S15 GX502L | |
| Asus ZenBook Pro Duo UX582 LR-1BH2 | |
| Media Intel Core i7-12700H (7135 - 44760, n=64) | |
| Asus TUF Gaming F15 FX507ZM | |
| Asus TUF Dash F15 FX516PR | |
| AIDA64 / CPU AES | |
| Asus ROG Strix Scar 15 G533QS | |
| Media Intel Core i7-12700H (31839 - 144360, n=64) | |
| Asus TUF Dash F15 FX516PR | |
| Asus TUF Gaming F15 FX507ZM | |
| Asus Zephyrus S15 GX502L | |
| Asus ZenBook Pro Duo UX582 LR-1BH2 | |
| AIDA64 / CPU ZLib | |
| Asus TUF Gaming F15 FX507ZM | |
| Media Intel Core i7-12700H (305 - 1171, n=64) | |
| Asus ROG Strix Scar 15 G533QS | |
| Asus Zephyrus S15 GX502L | |
| Asus ZenBook Pro Duo UX582 LR-1BH2 | |
| Asus TUF Dash F15 FX516PR | |
| Asus TUF Gaming F15 FX506HM | |
| AIDA64 / FP64 Ray-Trace | |
| Asus ROG Strix Scar 15 G533QS | |
| Asus Zephyrus S15 GX502L | |
| Asus ZenBook Pro Duo UX582 LR-1BH2 | |
| Media Intel Core i7-12700H (1437 - 9692, n=64) | |
| Asus TUF Gaming F15 FX507ZM | |
| Asus TUF Dash F15 FX516PR | |
| AIDA64 / CPU PhotoWorxx | |
| Asus TUF Gaming F15 FX507ZM | |
| Media Intel Core i7-12700H (12863 - 52207, n=64) | |
| Asus ROG Strix Scar 15 G533QS | |
| Asus Zephyrus S15 GX502L | |
| Asus TUF Dash F15 FX516PR | |
| Asus ZenBook Pro Duo UX582 LR-1BH2 | |
Prestazioni del sistema
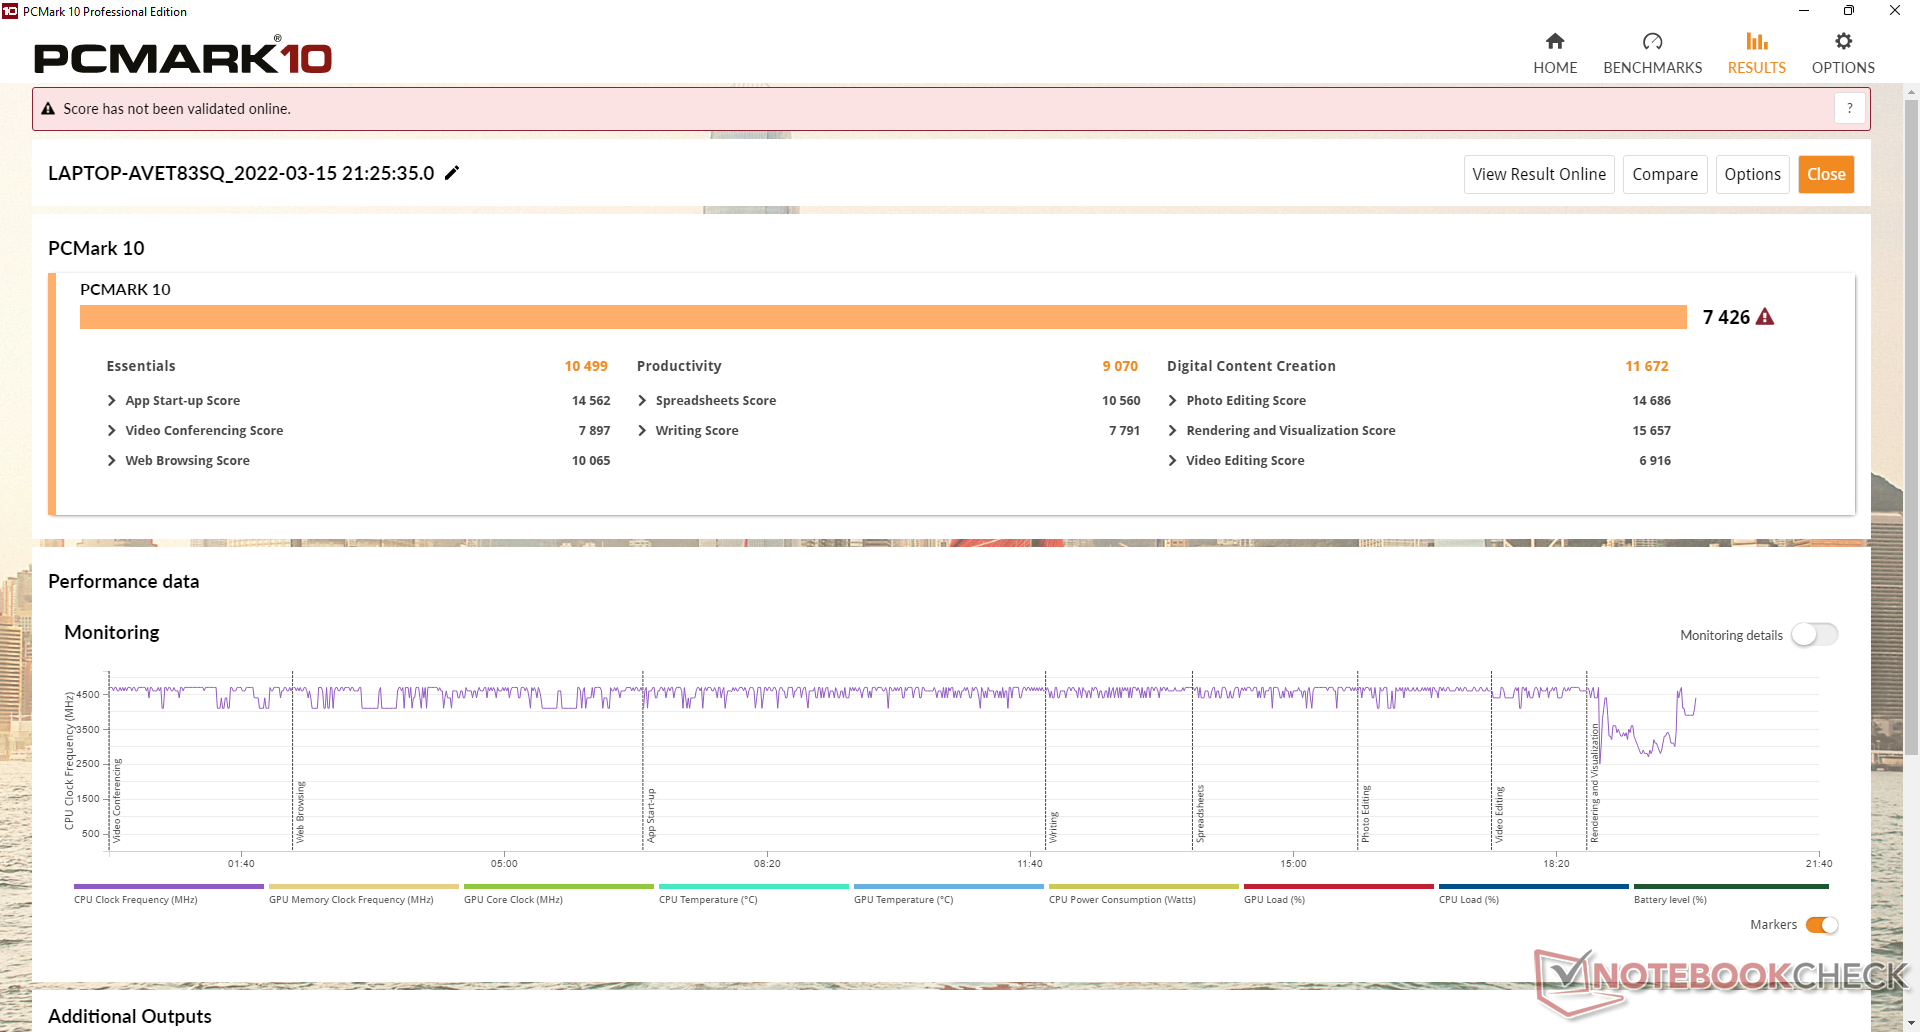
I risultati di PCMark 10 sono essenzialmente identici a quelli dell'FX506, il che significa che le attività quotidiane non saranno necessariamente più veloci nonostante gli aggiornamenti di CPU e GPU. Il subtest Digital Content Creation è notevolmente più alto, tuttavia, probabilmente a causa delle frequenze di clock della GPU più veloci rispetto alla vecchia RTX 3060.
| PCMark 10 / Score | |
| Asus TUF Gaming F15 FX507ZM | |
| Media Intel Core i7-12700H, NVIDIA GeForce RTX 3060 Laptop GPU (5986 - 8156, n=12) | |
| Asus ROG Strix Scar 15 G533QS | |
| Asus TUF Gaming F15 FX506HM | |
| Asus TUF Dash F15 FX516PR | |
| Asus ZenBook Pro Duo UX582 LR-1BH2 | |
| Asus Zephyrus S15 GX502L | |
| PCMark 10 / Essentials | |
| Media Intel Core i7-12700H, NVIDIA GeForce RTX 3060 Laptop GPU (9289 - 12144, n=12) | |
| Asus TUF Gaming F15 FX506HM | |
| Asus TUF Gaming F15 FX507ZM | |
| Asus ROG Strix Scar 15 G533QS | |
| Asus Zephyrus S15 GX502L | |
| Asus TUF Dash F15 FX516PR | |
| Asus ZenBook Pro Duo UX582 LR-1BH2 | |
| PCMark 10 / Productivity | |
| Asus ROG Strix Scar 15 G533QS | |
| Asus TUF Dash F15 FX516PR | |
| Media Intel Core i7-12700H, NVIDIA GeForce RTX 3060 Laptop GPU (6161 - 10362, n=12) | |
| Asus TUF Gaming F15 FX507ZM | |
| Asus TUF Gaming F15 FX506HM | |
| Asus Zephyrus S15 GX502L | |
| Asus ZenBook Pro Duo UX582 LR-1BH2 | |
| PCMark 10 / Digital Content Creation | |
| Asus TUF Gaming F15 FX507ZM | |
| Media Intel Core i7-12700H, NVIDIA GeForce RTX 3060 Laptop GPU (8950 - 12554, n=12) | |
| Asus ROG Strix Scar 15 G533QS | |
| Asus TUF Gaming F15 FX506HM | |
| Asus ZenBook Pro Duo UX582 LR-1BH2 | |
| Asus TUF Dash F15 FX516PR | |
| Asus Zephyrus S15 GX502L | |
| PCMark 10 Score | 7426 punti | |
Aiuto | ||
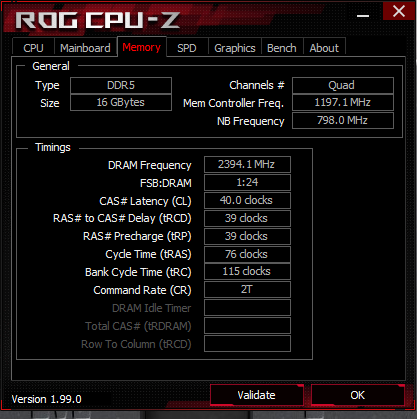
| AIDA64 / Memory Copy | |
| Media Intel Core i7-12700H (25615 - 80511, n=64) | |
| Asus TUF Gaming F15 FX507ZM | |
| Asus ROG Strix Scar 15 G533QS | |
| Asus Zephyrus S15 GX502L | |
| Asus ZenBook Pro Duo UX582 LR-1BH2 | |
| Asus TUF Dash F15 FX516PR | |
| AIDA64 / Memory Read | |
| Asus TUF Gaming F15 FX507ZM | |
| Media Intel Core i7-12700H (25586 - 79442, n=64) | |
| Asus ROG Strix Scar 15 G533QS | |
| Asus Zephyrus S15 GX502L | |
| Asus ZenBook Pro Duo UX582 LR-1BH2 | |
| Asus TUF Dash F15 FX516PR | |
| AIDA64 / Memory Write | |
| Asus TUF Gaming F15 FX507ZM | |
| Media Intel Core i7-12700H (23679 - 88660, n=64) | |
| Asus ROG Strix Scar 15 G533QS | |
| Asus Zephyrus S15 GX502L | |
| Asus ZenBook Pro Duo UX582 LR-1BH2 | |
| Asus TUF Dash F15 FX516PR | |
| AIDA64 / Memory Latency | |
| Asus TUF Dash F15 FX516PR | |
| Asus ROG Strix Scar 15 G533QS | |
| Media Intel Core i7-12700H (76.2 - 133.9, n=62) | |
| Asus Zephyrus S15 GX502L | |
| Asus ZenBook Pro Duo UX582 LR-1BH2 | |
| Asus TUF Gaming F15 FX506HM | |
| Asus TUF Gaming F15 FX507ZM | |
* ... Meglio usare valori piccoli
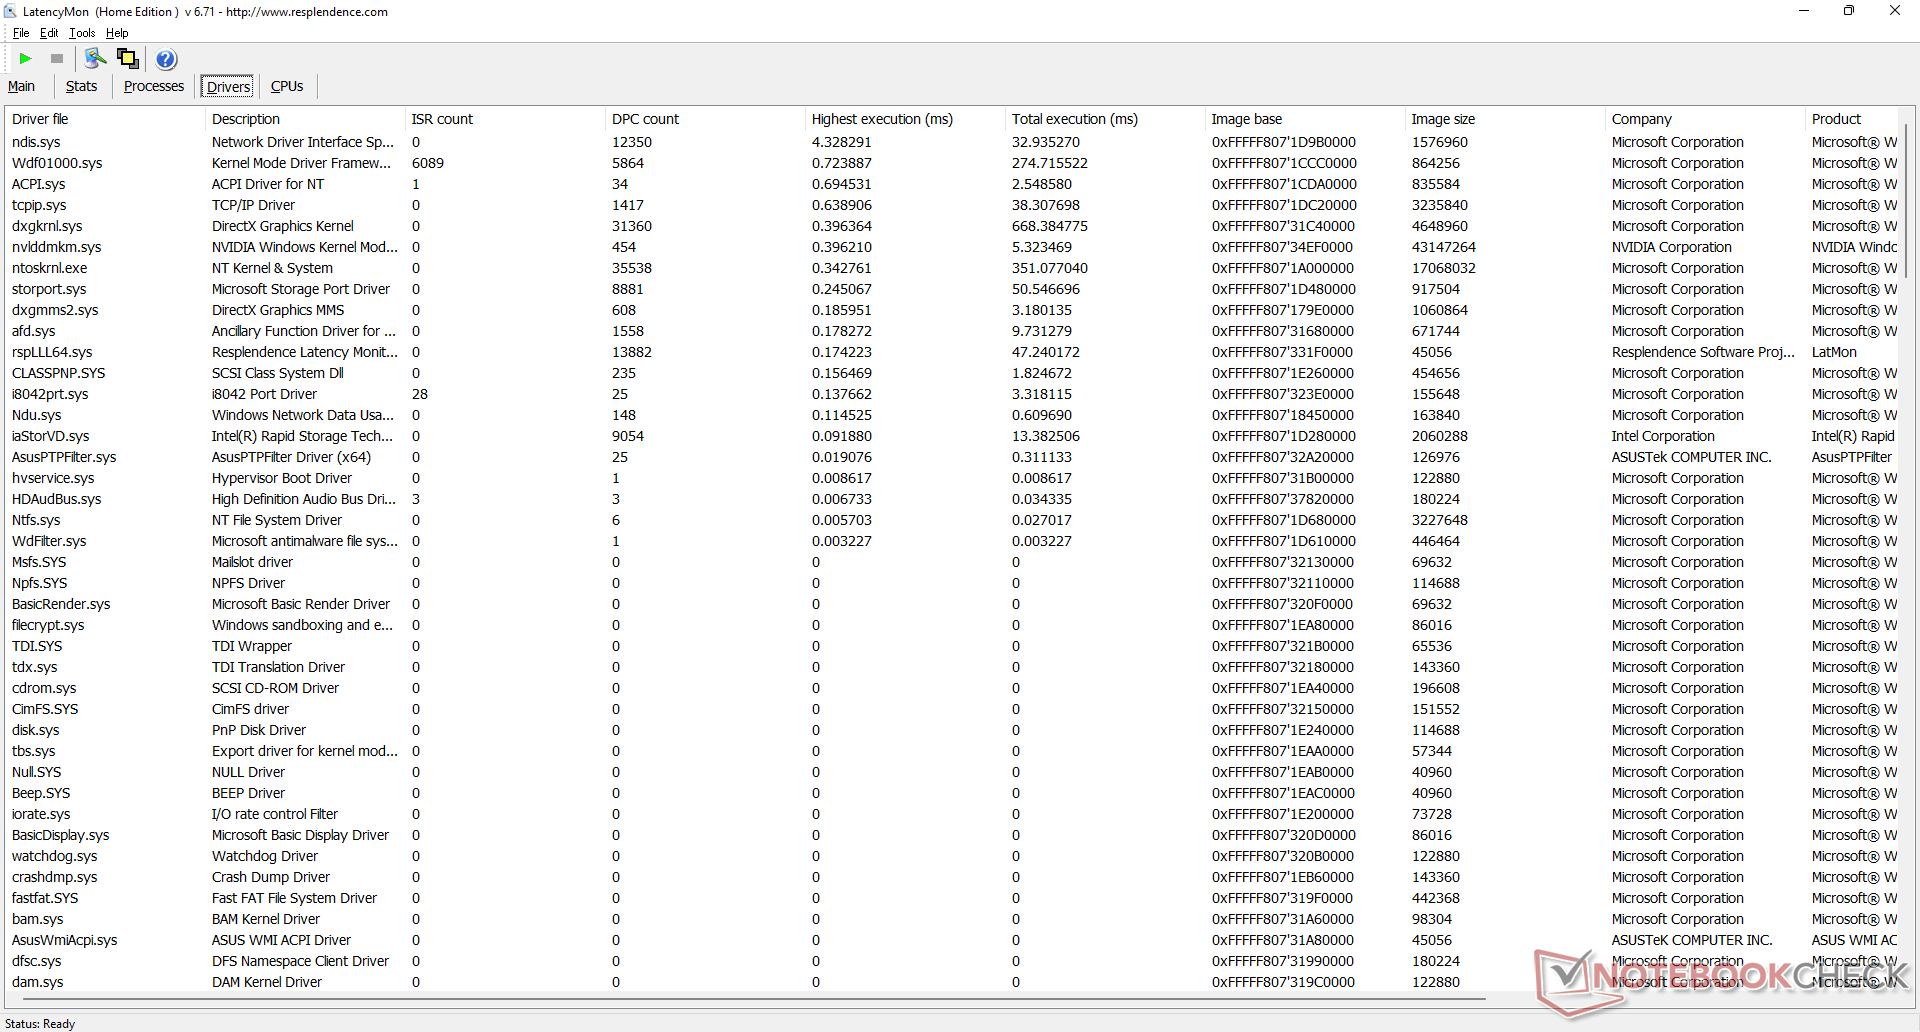
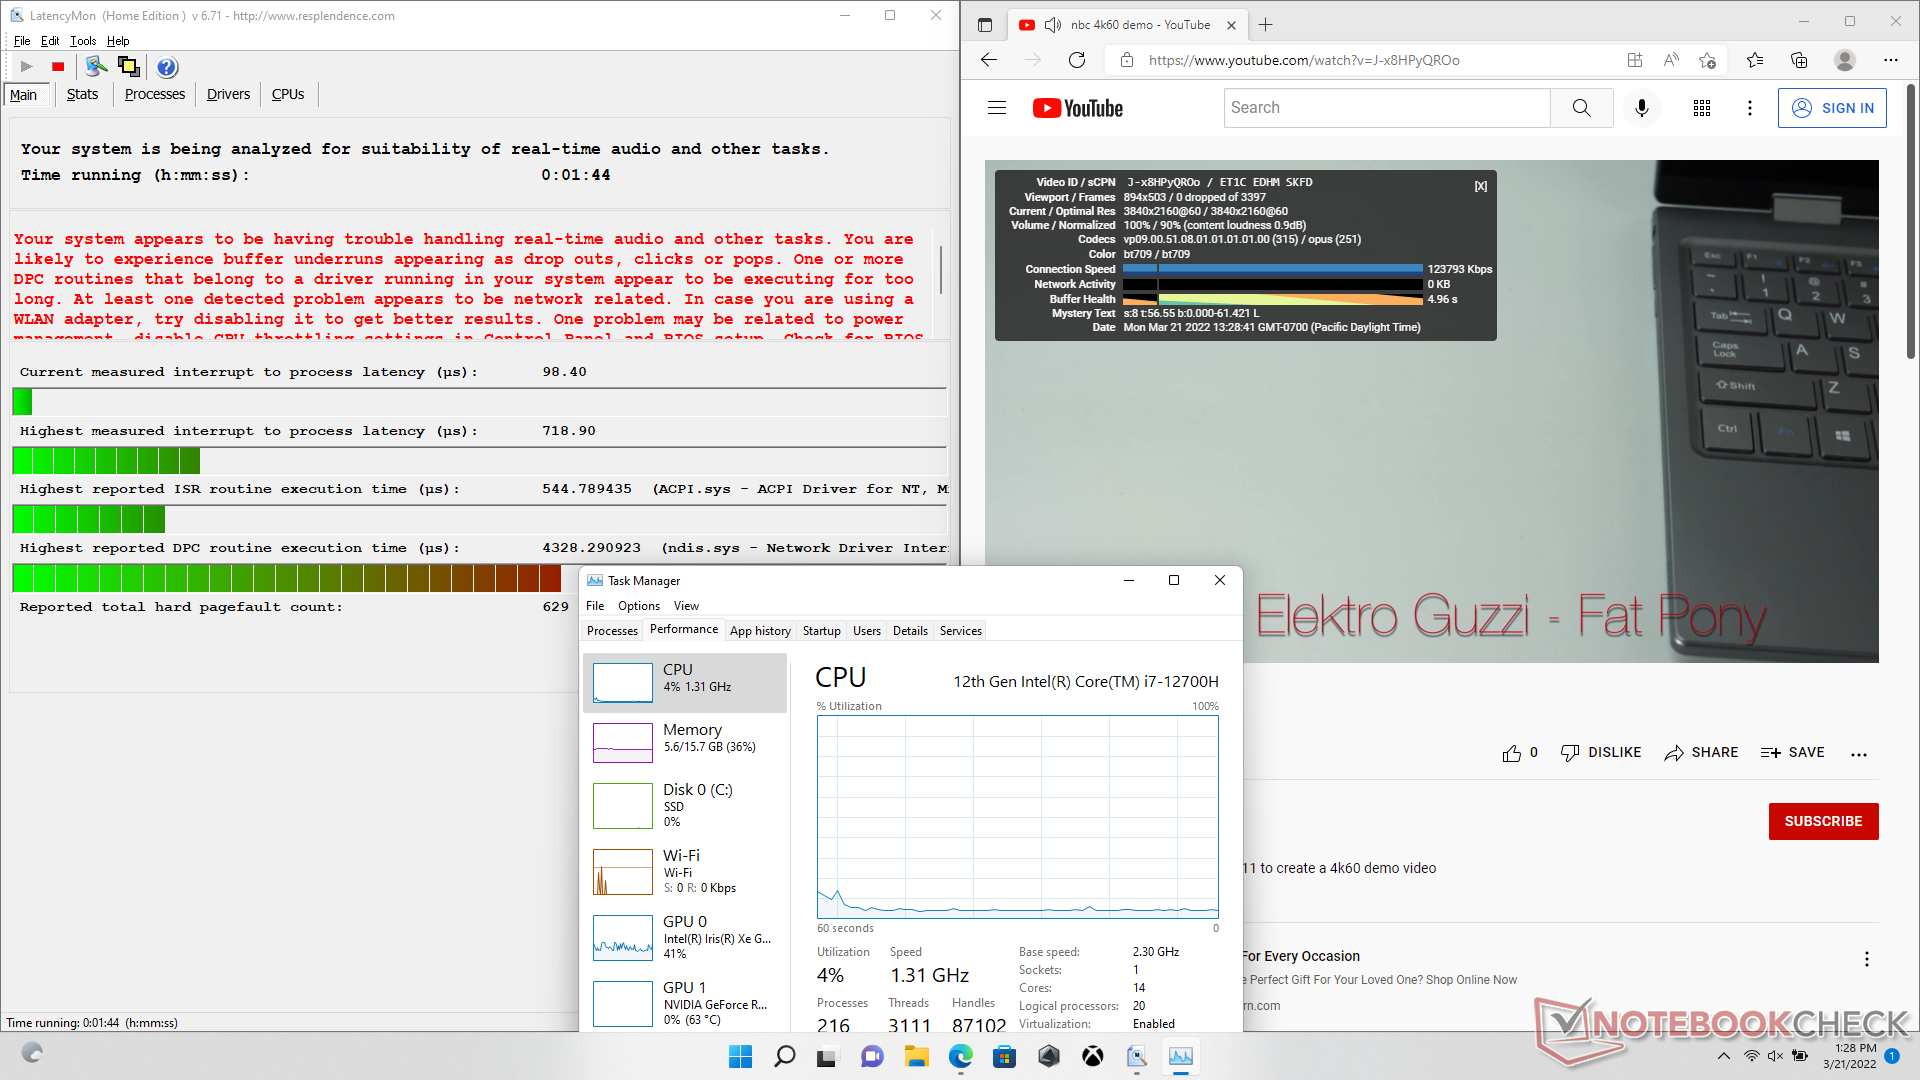
Latenza DPC
LatencyMon rivela problemi di DPC quando si aprono più schede del browser della nostra homepage. la riproduzione di video 4K a 60 FPS è altrimenti fluida e senza perdita di fotogrammi.
| DPC Latencies / LatencyMon - interrupt to process latency (max), Web, Youtube, Prime95 | |
| Asus Zephyrus S15 GX502L | |
| Asus TUF Gaming F15 FX506HM | |
| Asus ROG Strix Scar 15 G533QS | |
| Asus TUF Dash F15 FX516PR | |
| Asus ZenBook Pro Duo UX582 LR-1BH2 | |
| Asus TUF Gaming F15 FX507ZM | |
* ... Meglio usare valori piccoli
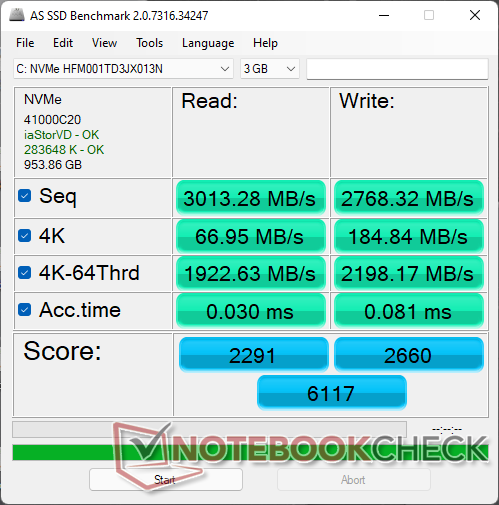
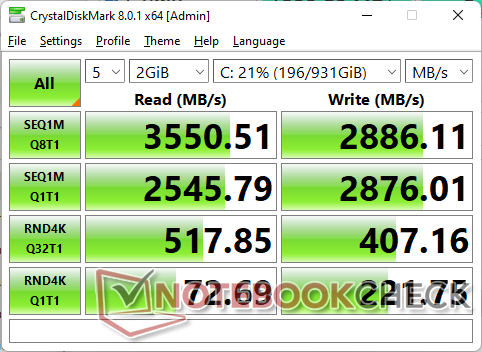
Dispositivi di archiviazione - Fino a due unità M.2 PCIe4 x4
La nostra unità viene spedita con lo stessoSK Hynix HFM001TD3JX013N SSD PCIe3 x4 NVMe come sul modello dell'anno scorso. Tuttavia, tenete a mente che l'FX507 supporta SSD PCIe4 x4, il che significa che gli utenti finali possono installare unità ancora più veloci se lo desiderano. La sostenibilità delle prestazioni può essere limitata dal momento che non c'è uno spreader di calore in cima ai due slot M.2.

* ... Meglio usare valori piccoli
Disk Throttling: DiskSpd Read Loop, Queue Depth 8
Prestazioni della GPU - Grafica TGP da 140 W
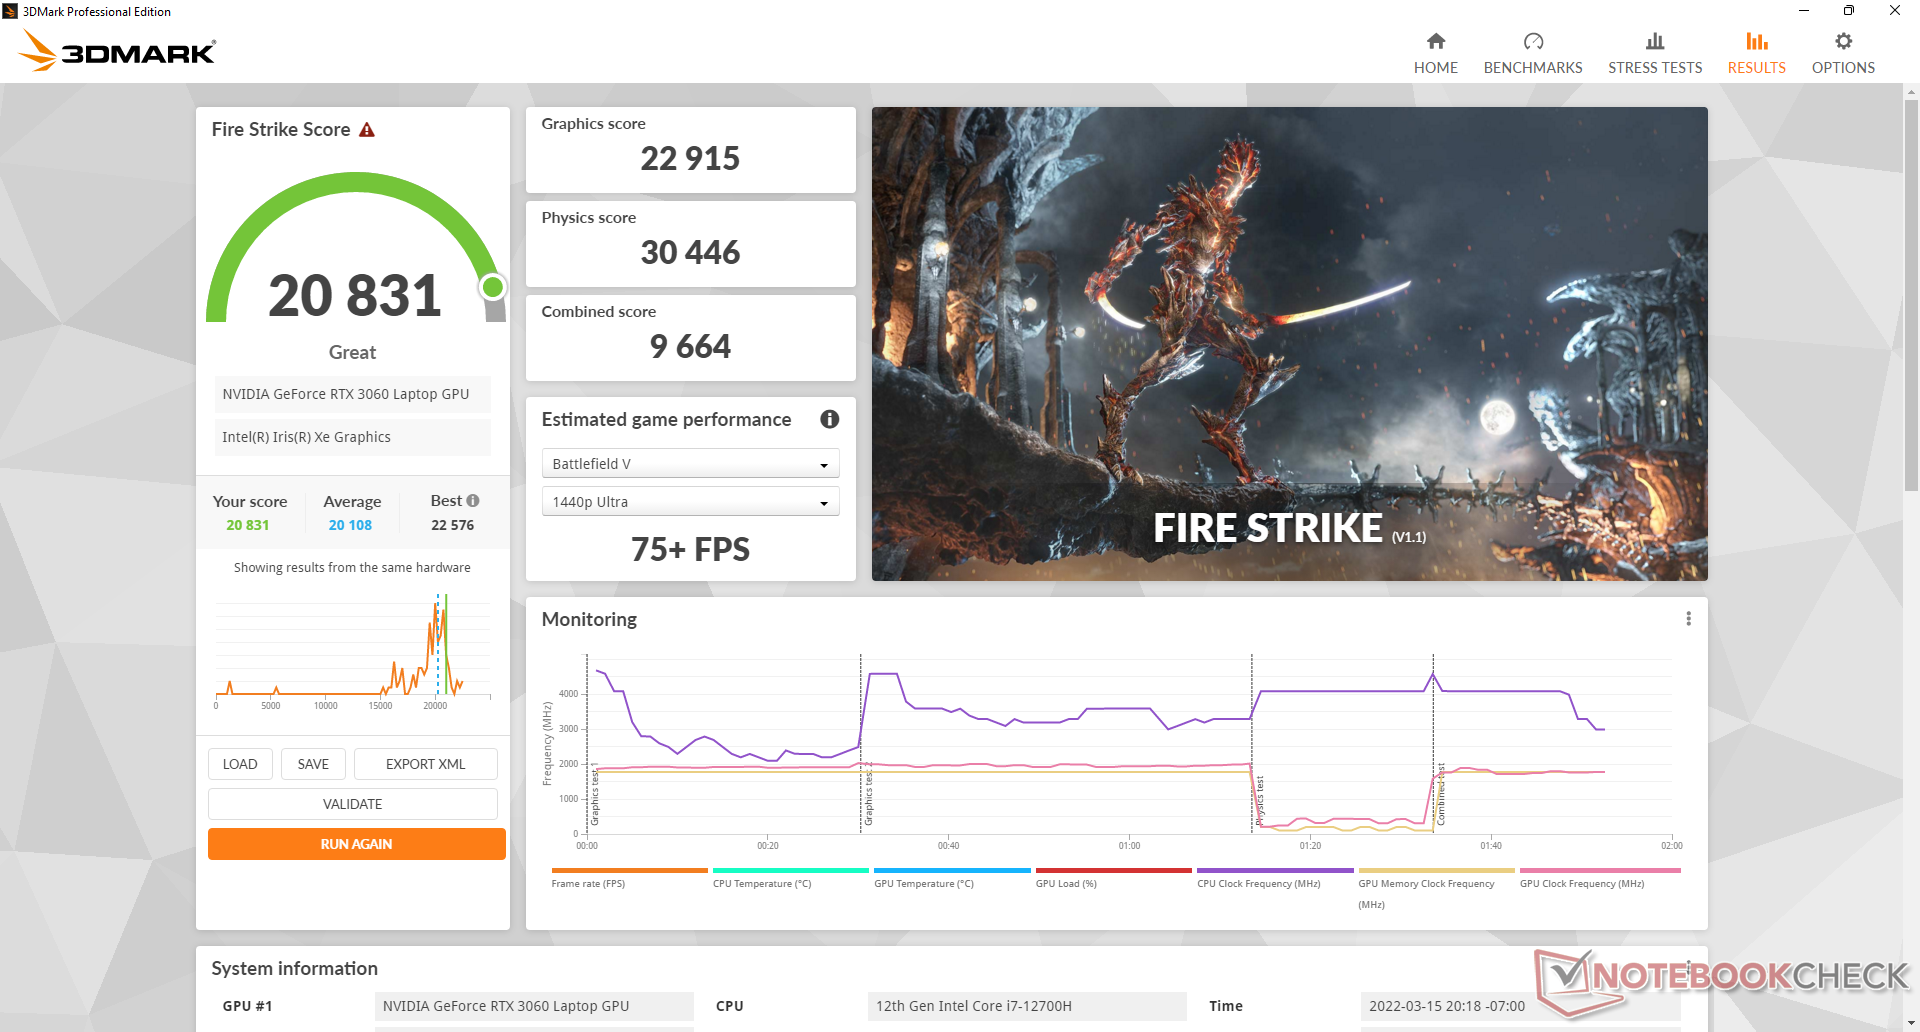
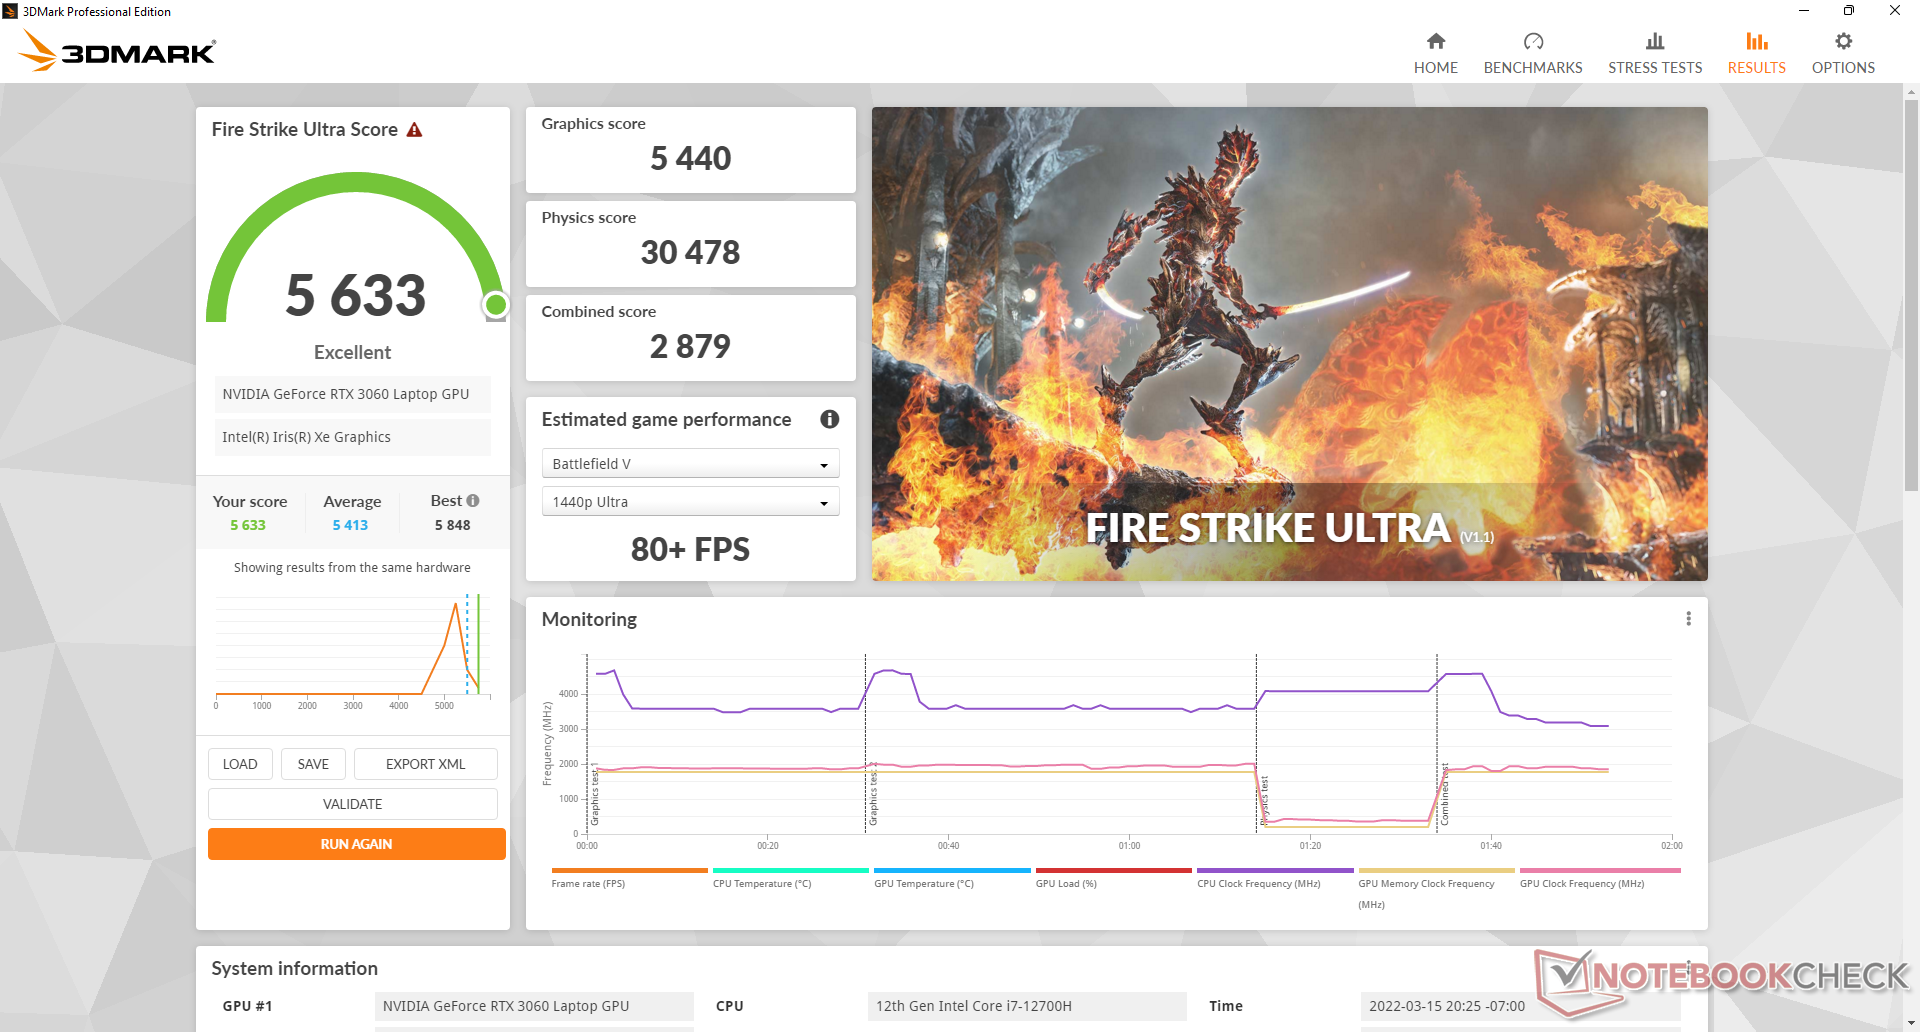
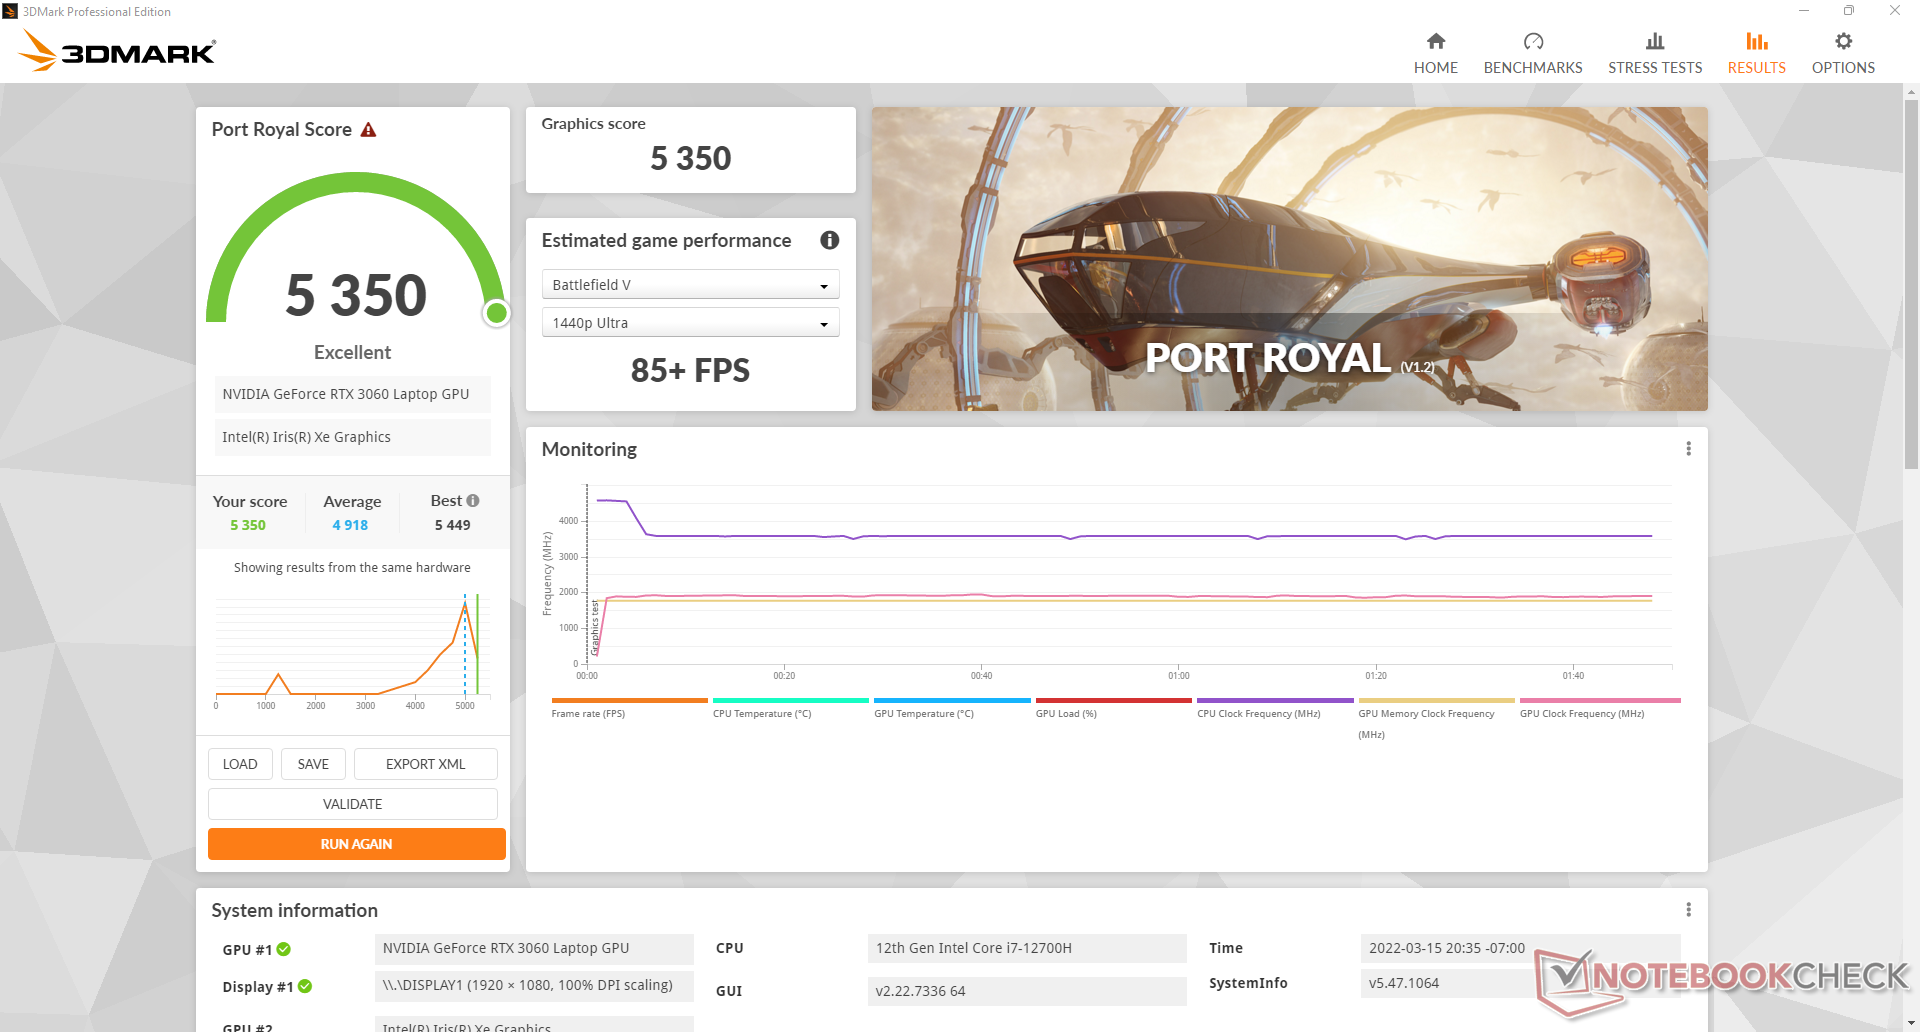
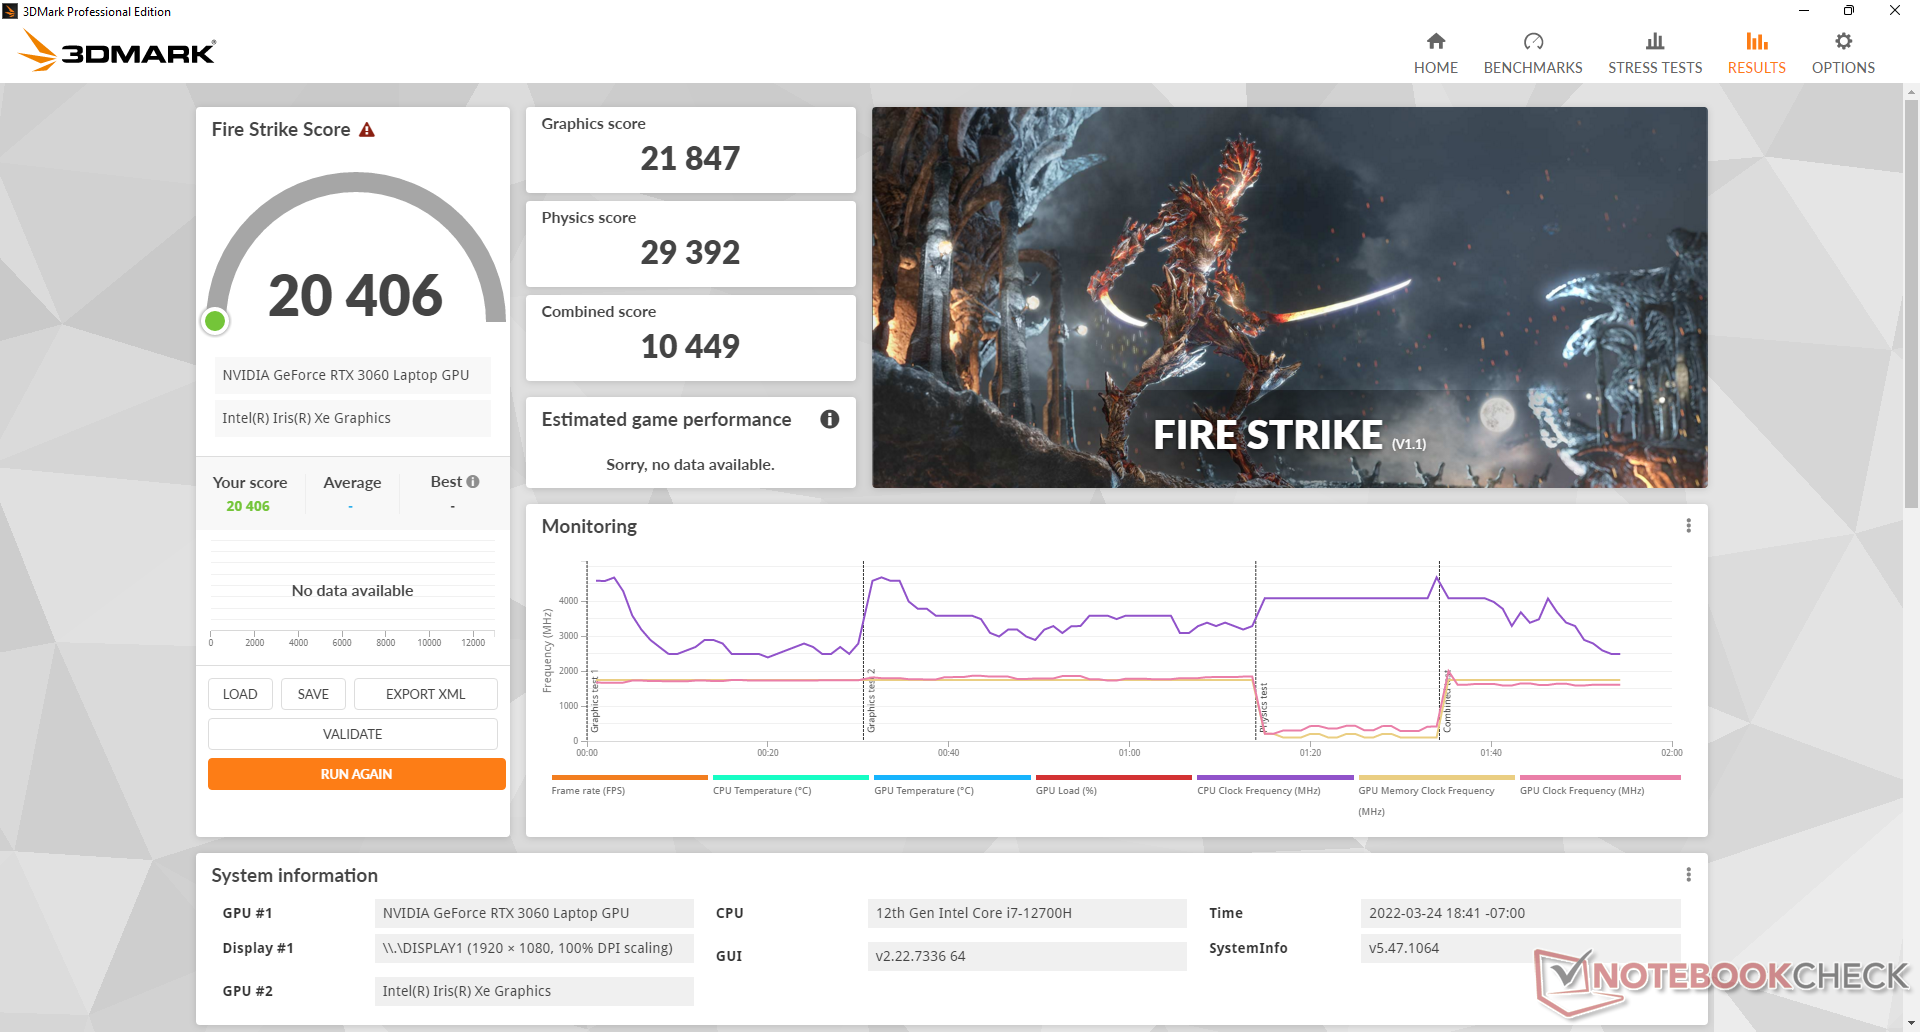
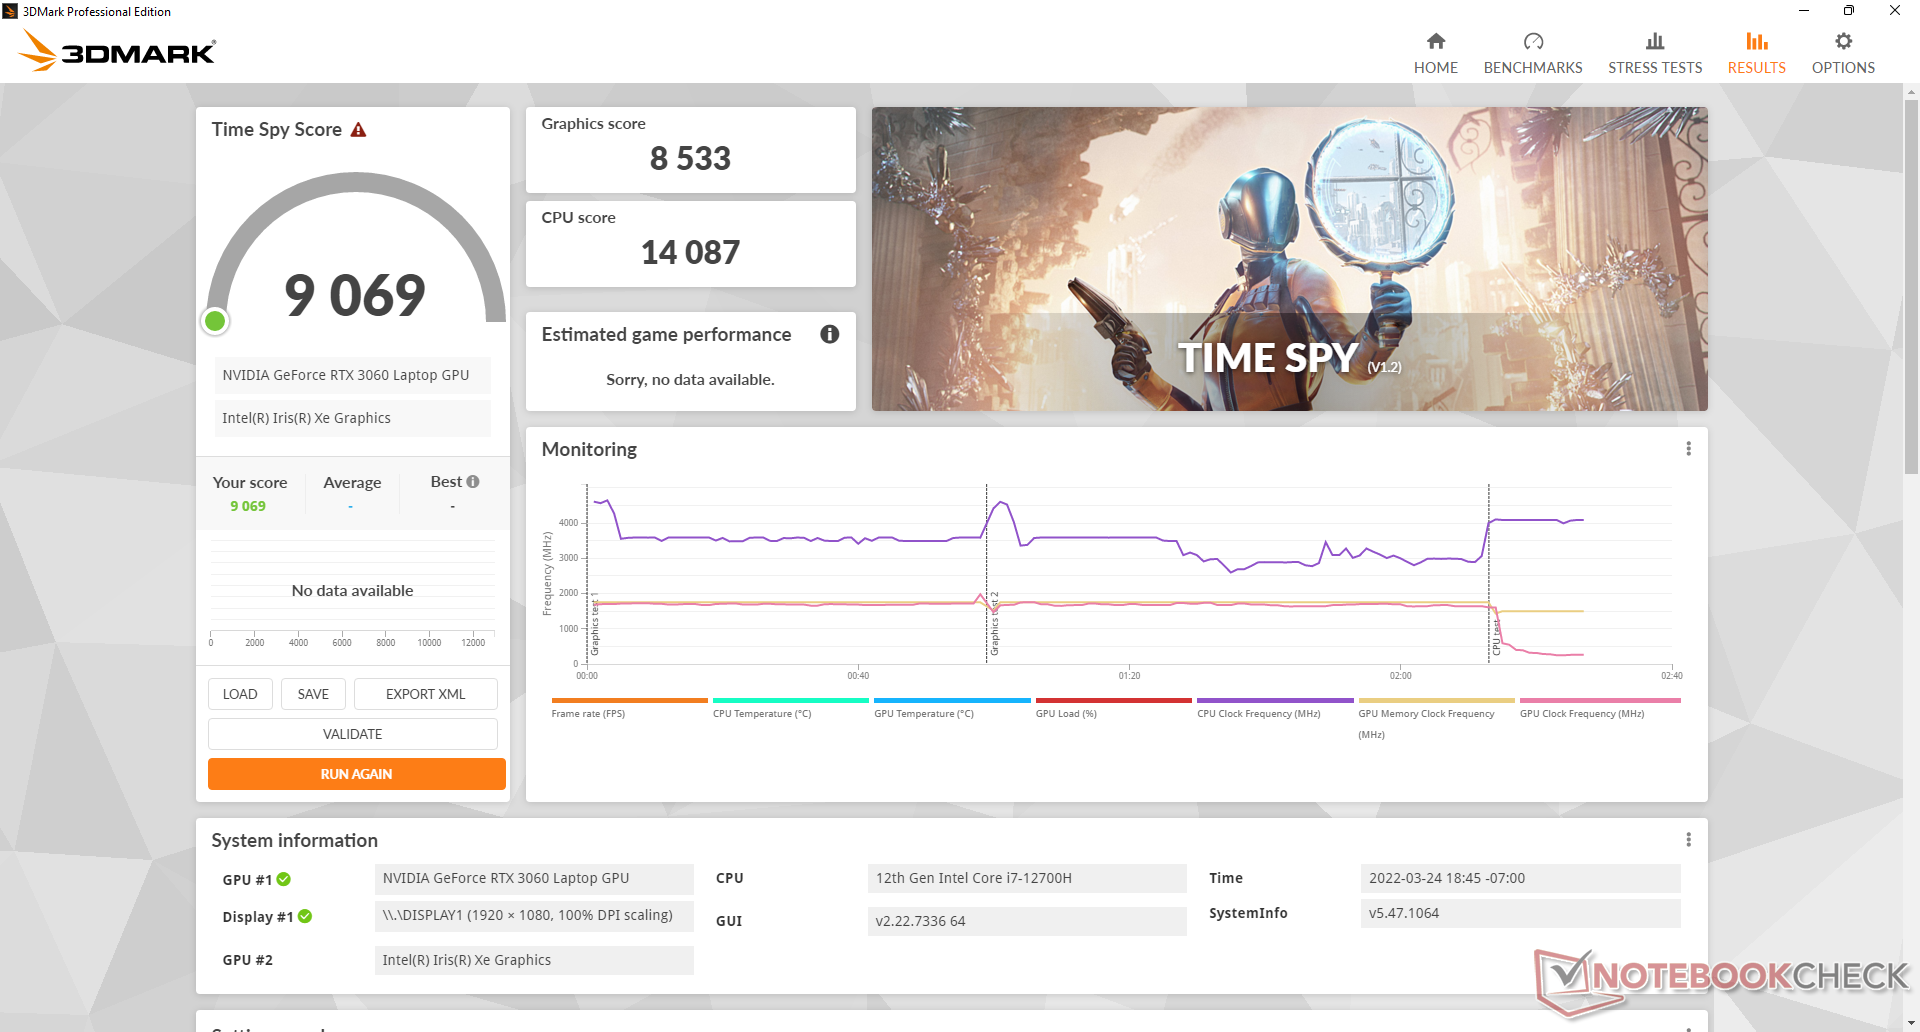
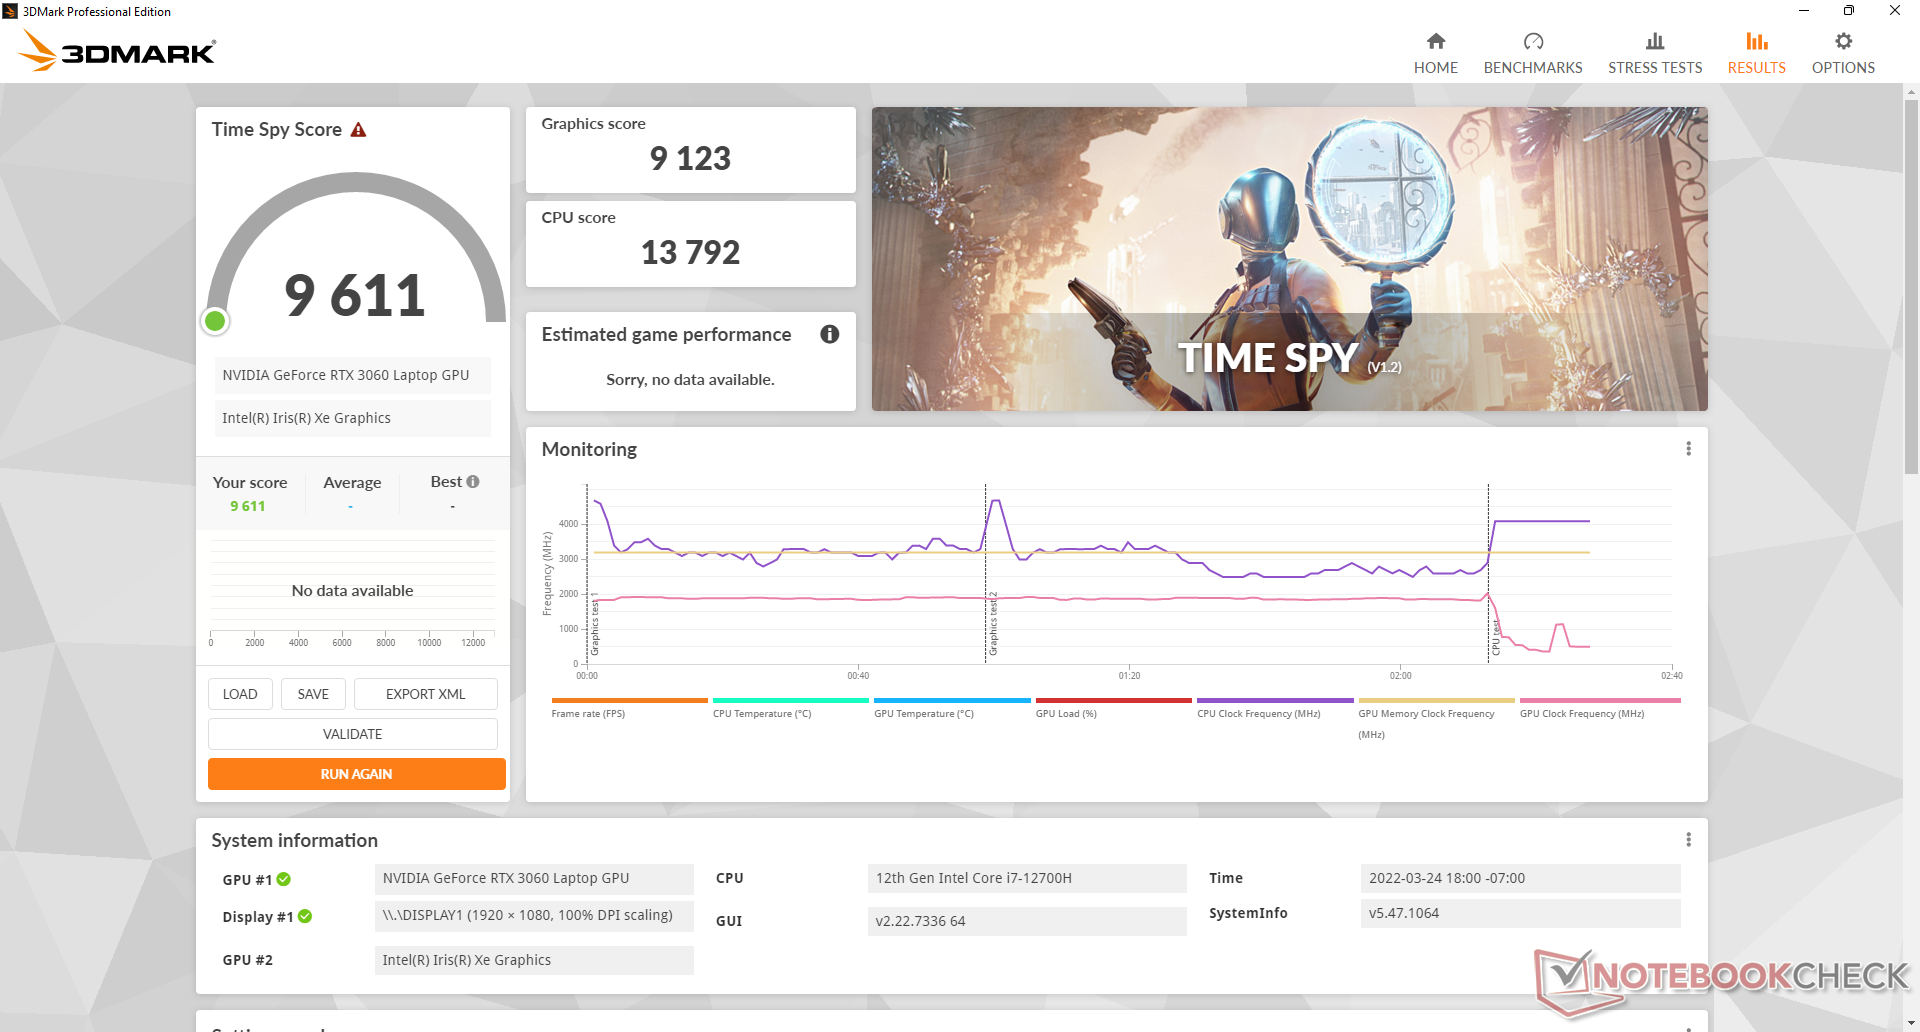
Il target più alto GeForce RTX 3060 TGP rispetto al modello dell'anno scorso (140 W contro 95 W) ha naturalmente portato a prestazioni grafiche più elevate. Gli utenti possono aspettarsi un aumento delle prestazioni dal 10 al 20 per cento rispetto all'FX506 dotato della stessa GPU RTX 3060. In effetti, l'FX507 è uno dei laptop più veloci GeForce RTX 3060 che si possono acquistare al momento, con risultati che sono circa il 15 per cento superiori alla media dei laptop equipaggiati con la stessa GPU.
L'esecuzione in modalità MSHybrid invece della modalità GPU discreta comporterebbe solo deficit di prestazioni molto piccoli o quasi nulli. i risultati di 3DMark sarebbero quasi identici tra le due modalità, mentre il frame rate durante il gioco sarebbe più lento solo di un paio di punti percentuali nei nostri test.
L'esecuzione in modalità dGPU Performance invece della modalità dGPU Turbo porterebbe a un deficit di prestazioni della GPU dal 5 al 10%.
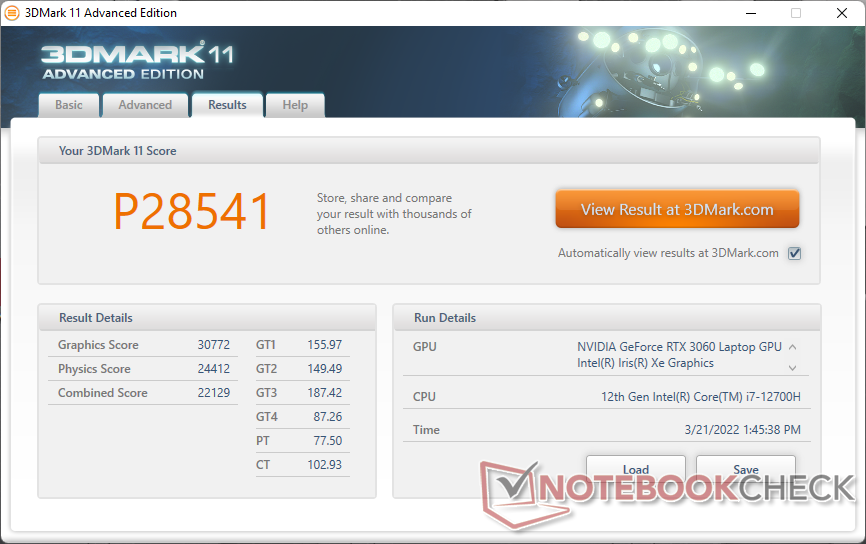

| 3DMark 11 Performance | 28541 punti | |
| 3DMark Cloud Gate Standard Score | 58475 punti | |
| 3DMark Fire Strike Score | 20831 punti | |
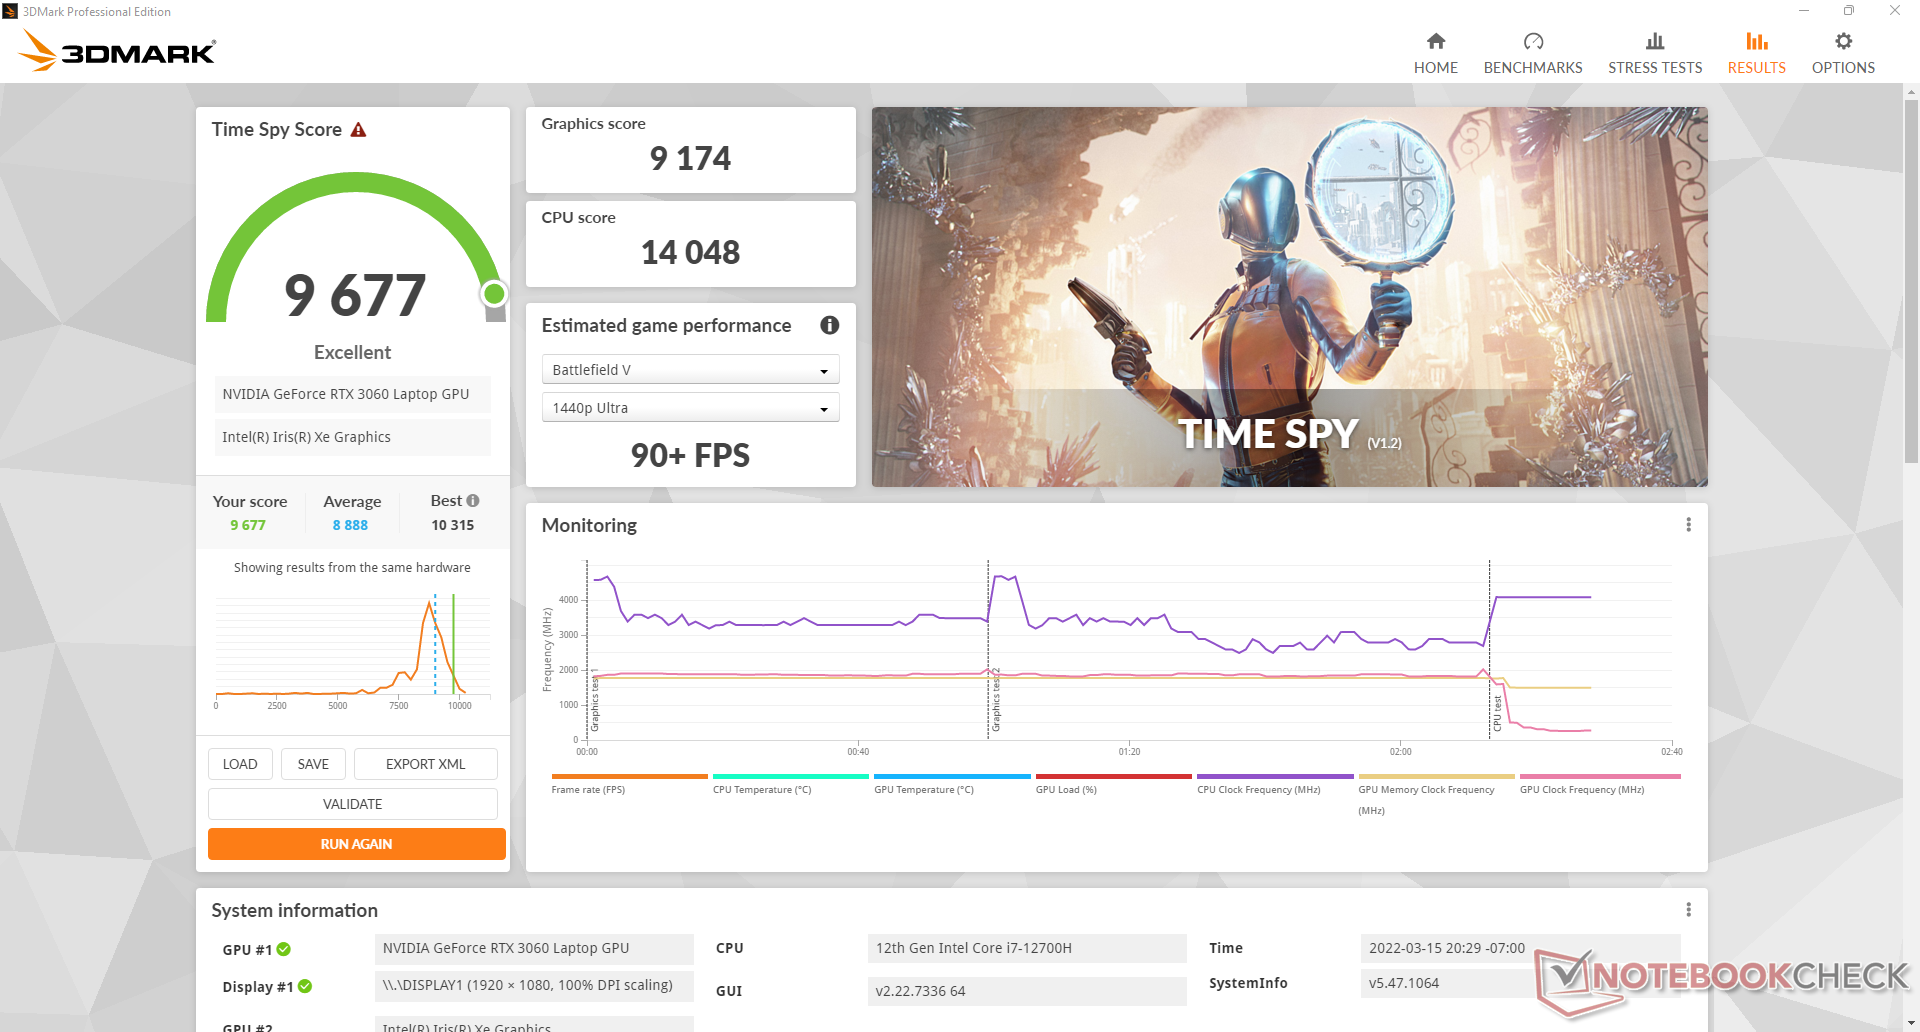
| 3DMark Time Spy Score | 9677 punti | |
Aiuto | ||
Witcher 3 FPS Chart
| basso | medio | alto | ultra | |
|---|---|---|---|---|
| GTA V (2015) | 186 | 182 | 162 | 97.9 |
| The Witcher 3 (2015) | 395.4 | 291.8 | 186.8 | 91.5 |
| Dota 2 Reborn (2015) | 172 | 161 | 154 | 148 |
| Final Fantasy XV Benchmark (2018) | 161 | 122 | 91.9 | |
| X-Plane 11.11 (2018) | 153 | 136 | 107 | |
| Far Cry 5 (2018) | 156 | 123 | 114 | 114 |
| Strange Brigade (2018) | 345 | 232 | 185 | 160 |
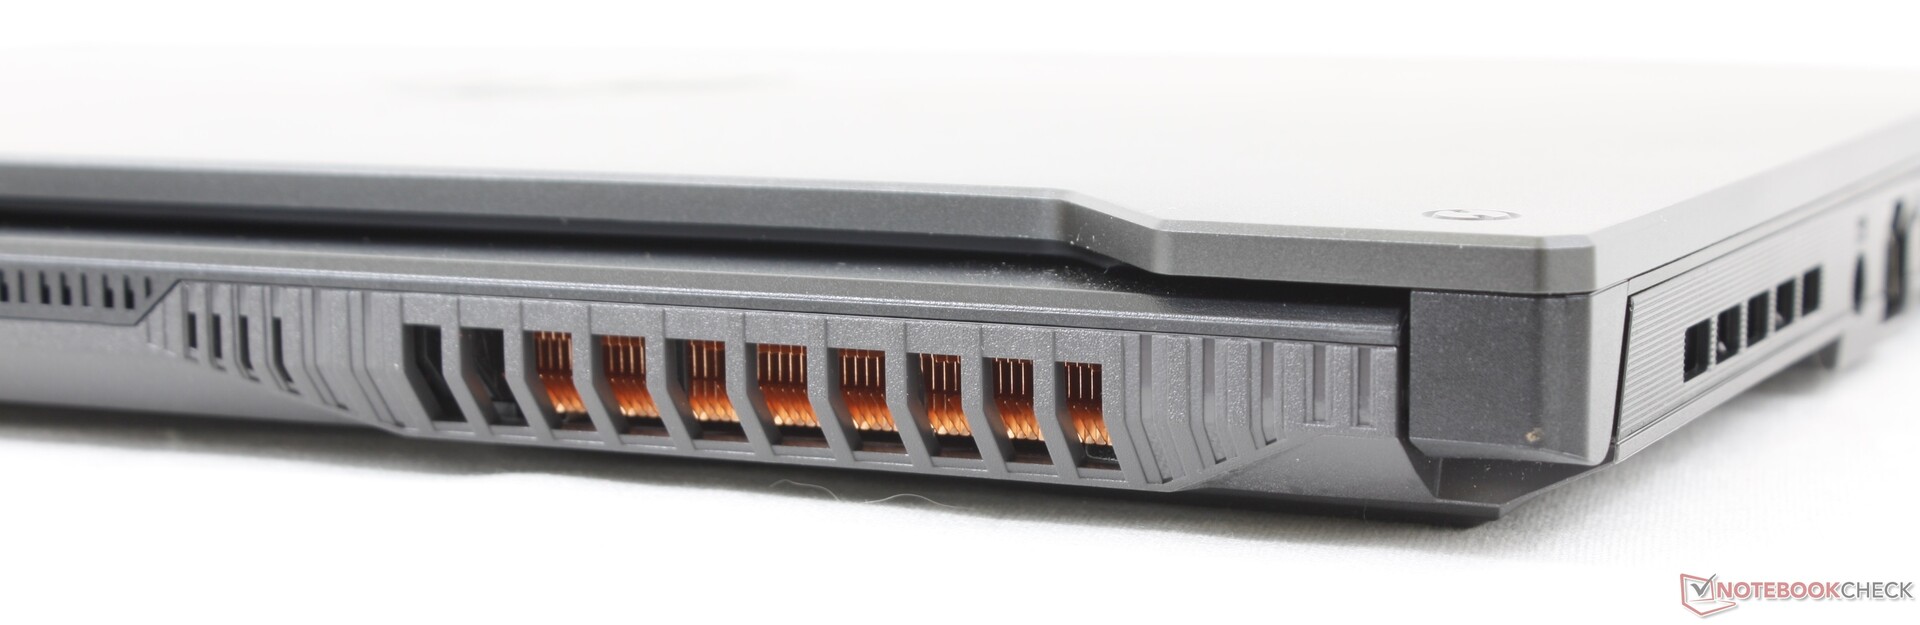
Emissioni
Rumore di sistema
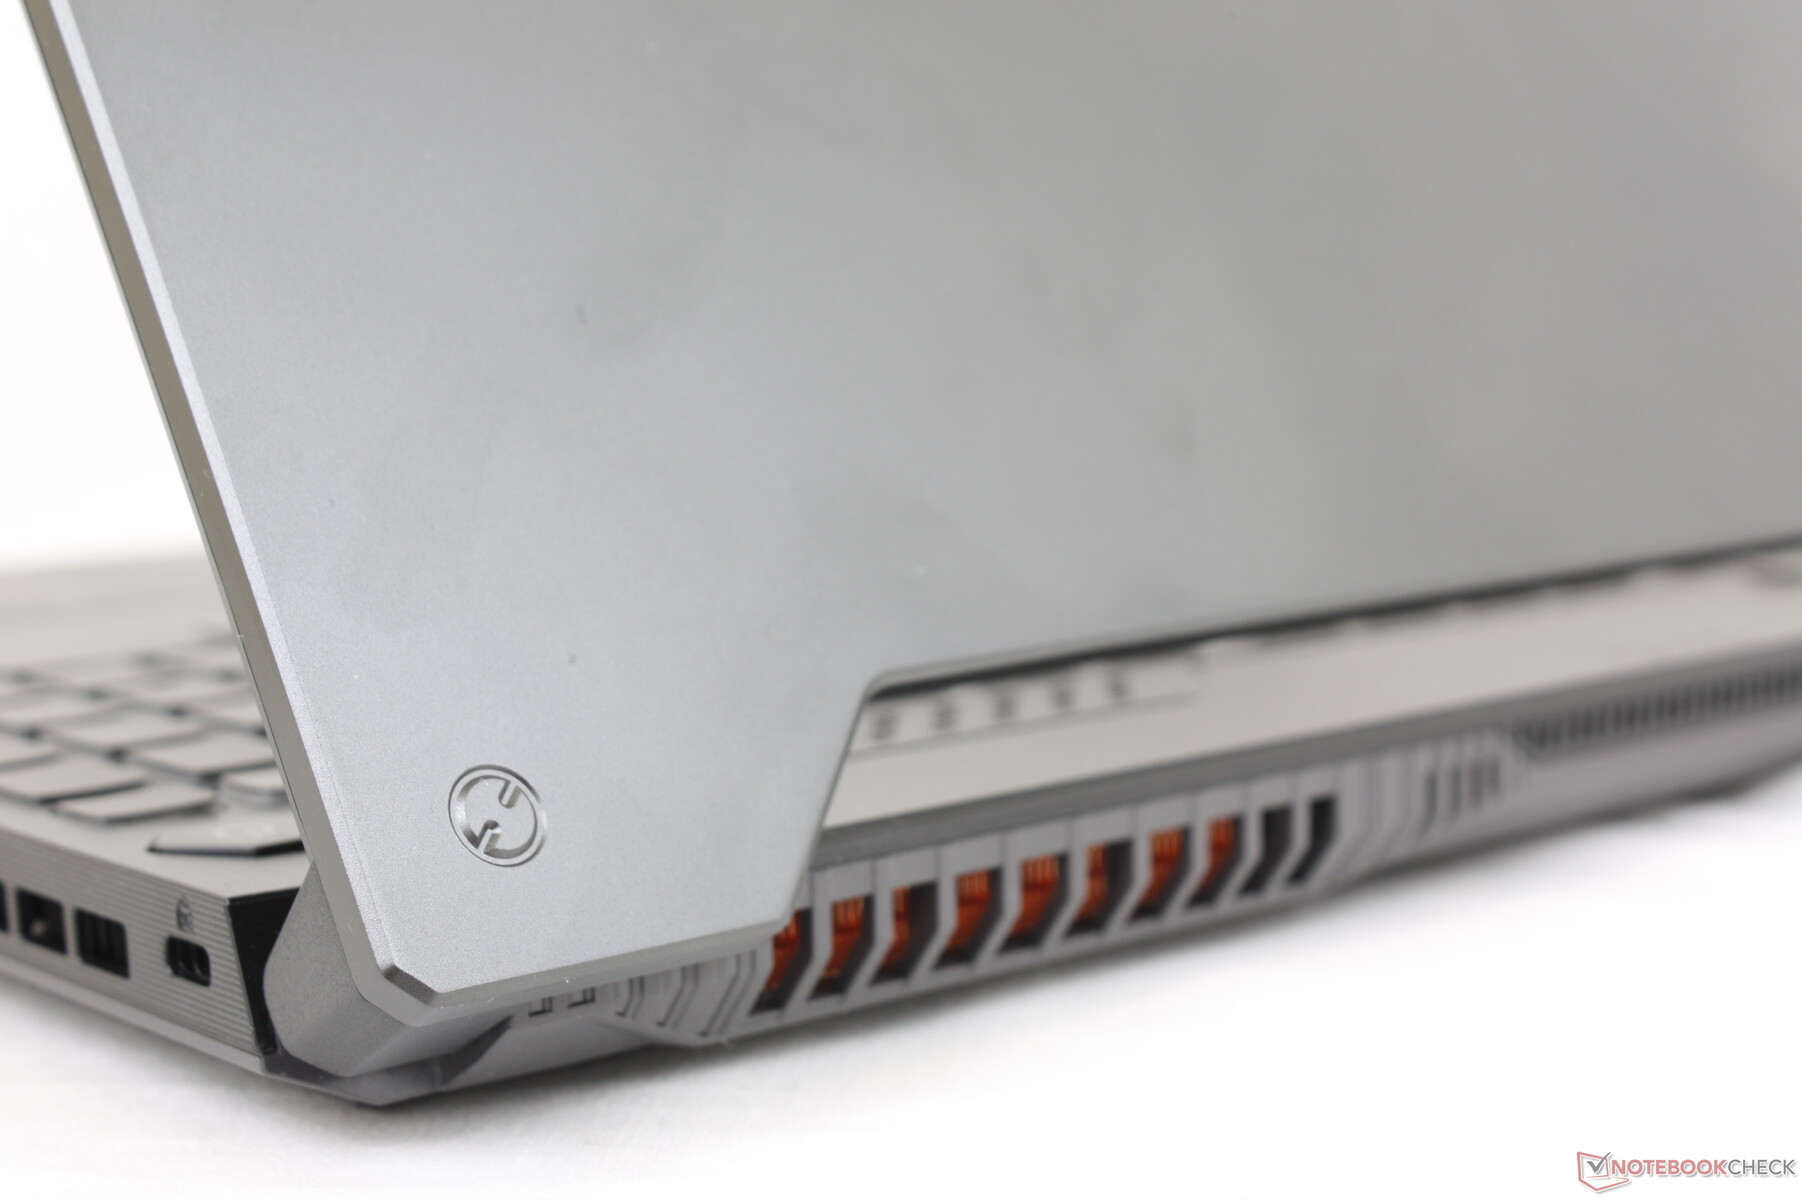
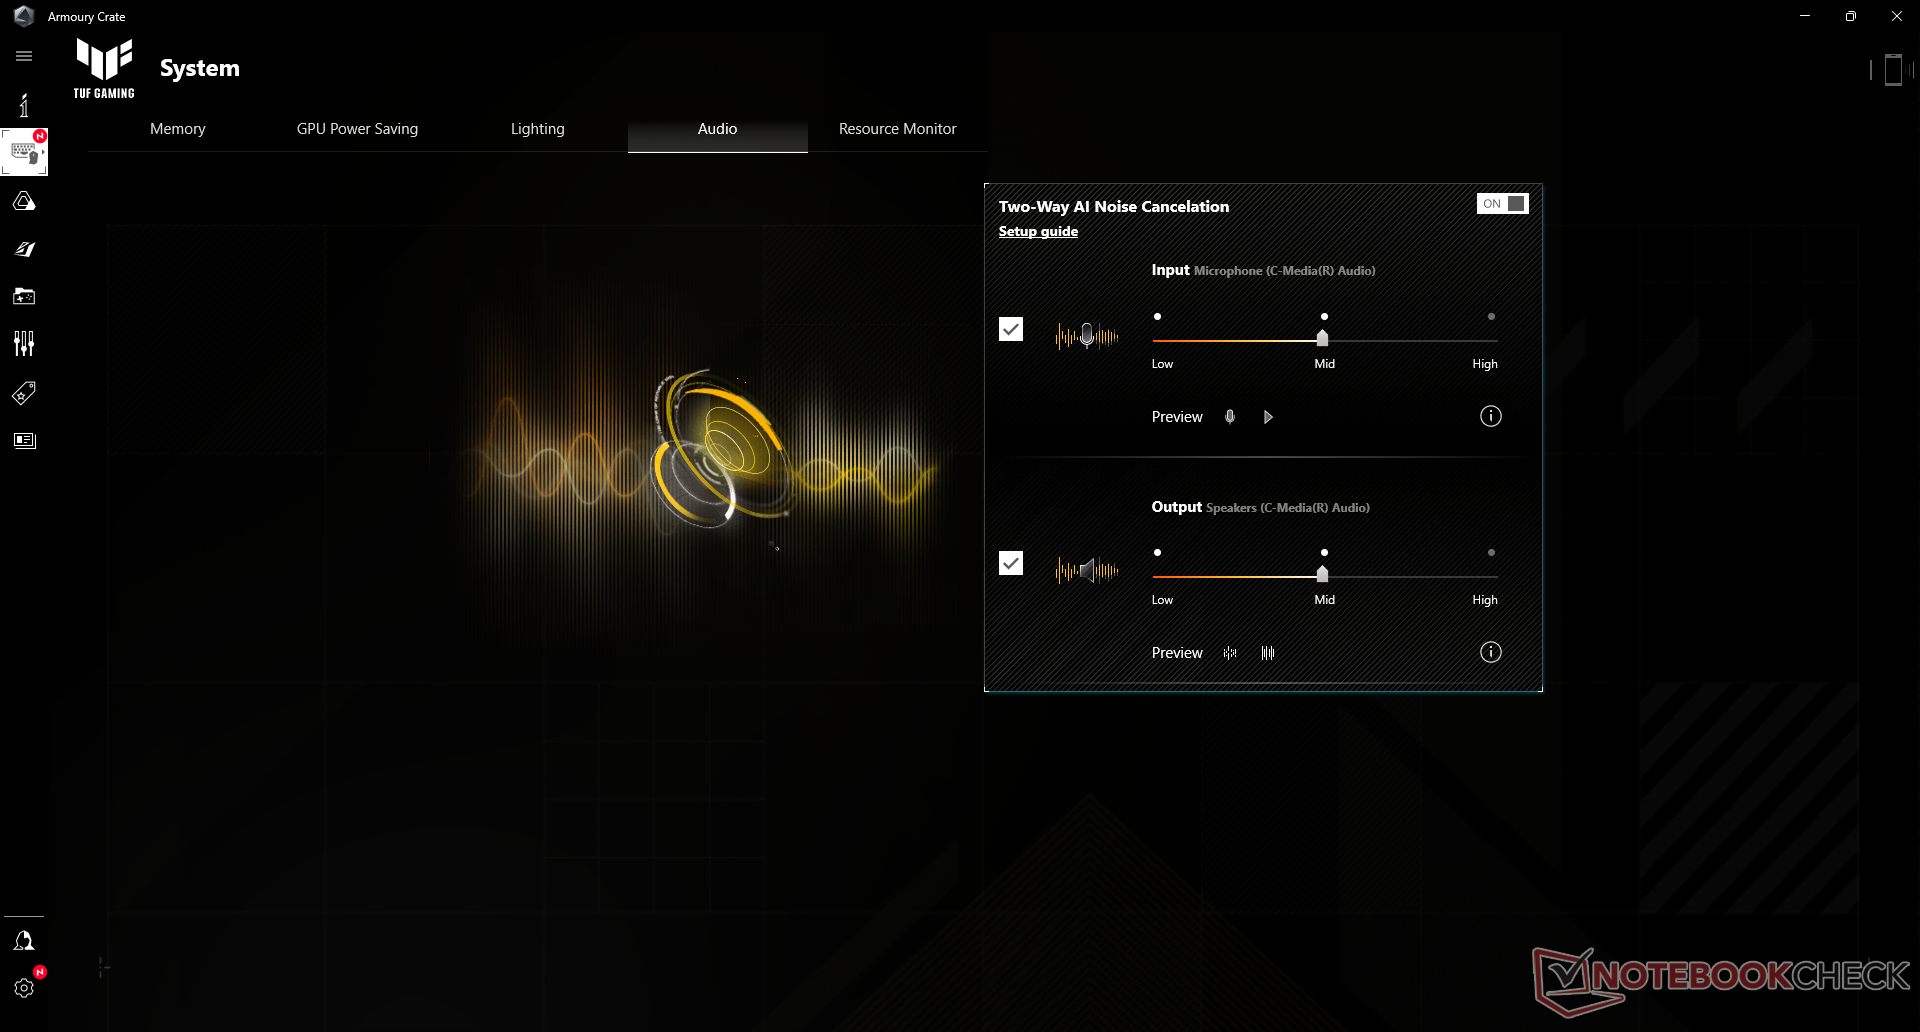
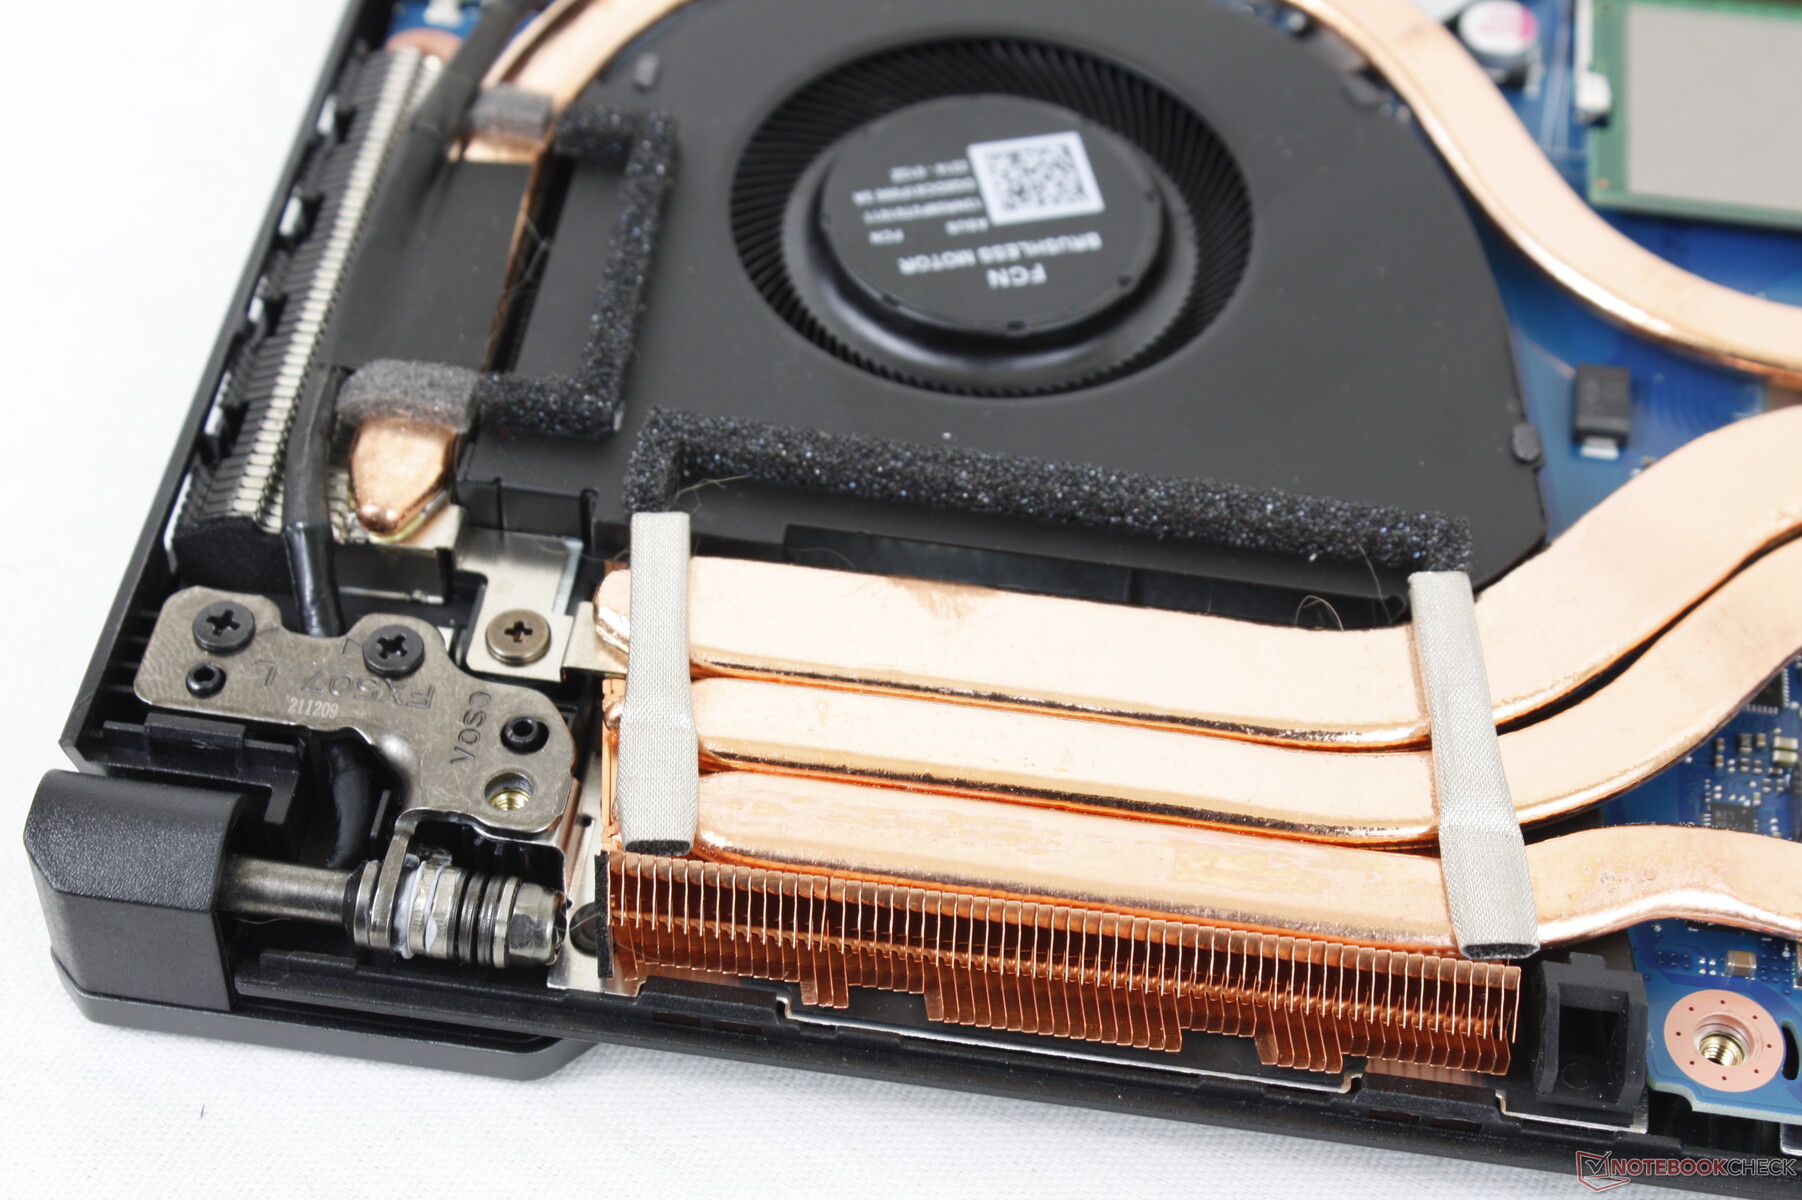
Asus ha aggiornato la soluzione di raffreddamento per l'FX507 nonostante il suo peso complessivo più leggero rispetto all'FX506. Cinque modalità di ventilazione sono disponibili tramite Armoury Crate: Windows, Silent, Performance, Turbo e Manual. Windows o Silent è raccomandato durante la navigazione o l'elaborazione di testi per evitare le ventole pulsanti.
L'esecuzione di Witcher 3 in modalità Performance e Turbo comporterebbe un rumore della ventola di 45,8 dB(A) e 54,1 dB(A), rispettivamente. La minore rumorosità della ventola in modalità Performance è significativa rispetto alla piccola diminuzione del 5-10% delle prestazioni grafiche rispetto alla modalità Turbo. Quindi, gli utenti potrebbero voler considerare di giocare in modalità Performance se il rumore della ventola è una preoccupazione.

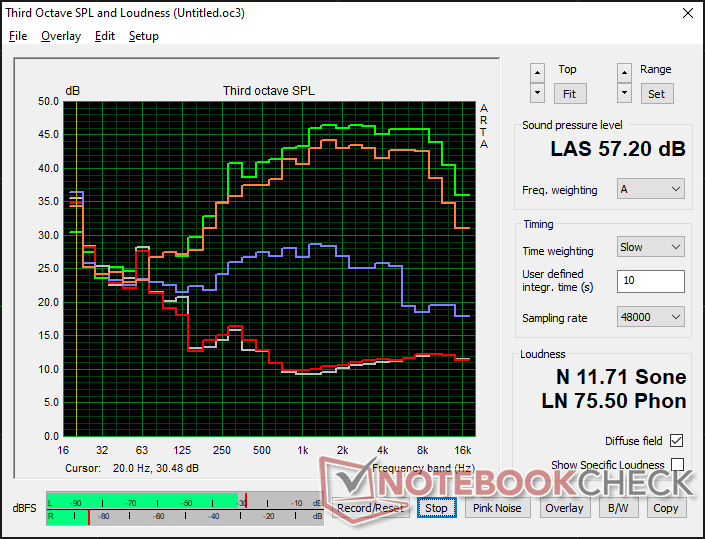
Rumorosità
| Idle |
| 23.6 / 23.6 / 25.4 dB(A) |
| Sotto carico |
| 38 / 57.2 dB(A) |
 | ||
30 dB silenzioso 40 dB(A) udibile 50 dB(A) rumoroso |
||
min: | ||
| Asus TUF Gaming F15 FX507ZM GeForce RTX 3060 Laptop GPU, i7-12700H, SK Hynix HFM001TD3JX013N | Asus TUF Gaming F15 FX506HM GeForce RTX 3060 Laptop GPU, i7-11800H, SK Hynix HFM001TD3JX013N | Asus TUF Dash F15 FX516PR GeForce RTX 3070 Laptop GPU, i7-11370H, SK Hynix HFM001TD3JX013N | Asus ROG Strix Scar 15 G533QS GeForce RTX 3080 Laptop GPU, R9 5900HX, ADATA Swordfish 2 TB | Asus Zephyrus S15 GX502L GeForce RTX 2070 Super Mobile, i7-10875H, WDC PC SN730 SDBPNTY-1T00 | Asus ZenBook Pro Duo UX582 LR-1BH2 GeForce RTX 3070 Laptop GPU, i7-10870H, Samsung PM981a MZVLB1T0HBLR | |
|---|---|---|---|---|---|---|
| Noise | 6% | -14% | -8% | -21% | -1% | |
| off /ambiente * (dB) | 23.2 | 24.8 -7% | 24 -3% | 25.5 -10% | 25 -8% | 24.6 -6% |
| Idle Minimum * (dB) | 23.6 | 24.6 -4% | 25 -6% | 25.5 -8% | 28 -19% | 24.6 -4% |
| Idle Average * (dB) | 23.6 | 24.9 -6% | 30 -27% | 25.5 -8% | 31 -31% | 24.6 -4% |
| Idle Maximum * (dB) | 25.4 | 24.9 2% | 35 -38% | 37.1 -46% | 36 -42% | 25.9 -2% |
| Load Average * (dB) | 38 | 27.1 29% | 53 -39% | 39.2 -3% | 56 -47% | 39.6 -4% |
| Witcher 3 ultra * (dB) | 54.1 | 46.4 14% | 48 11% | 50.5 7% | 55 -2% | 49.8 8% |
| Load Maximum * (dB) | 57.2 | 49 14% | 54 6% | 51.8 9% | 57 -0% | 54.2 5% |
* ... Meglio usare valori piccoli
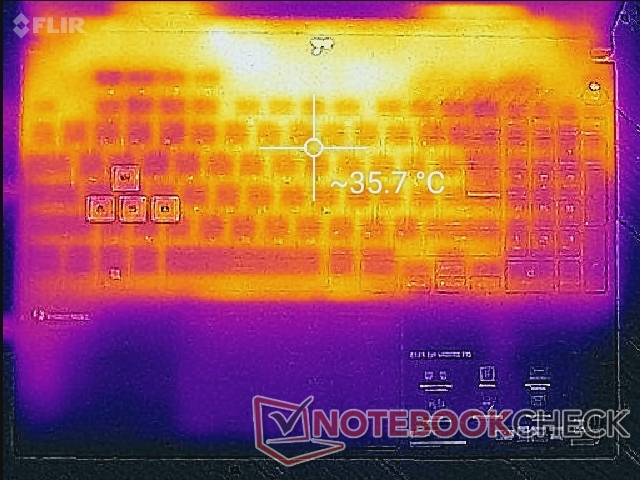
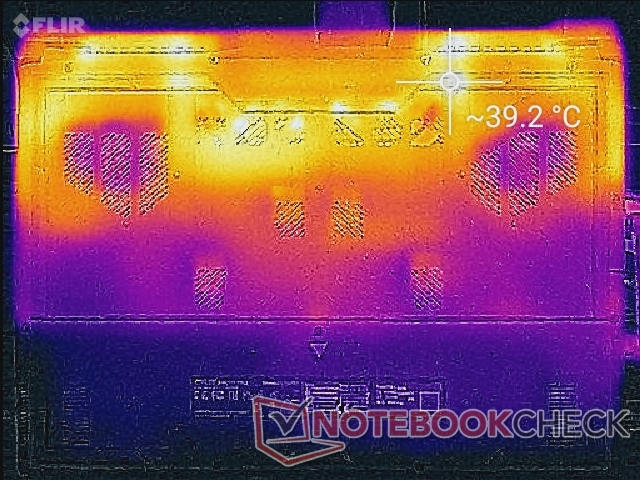
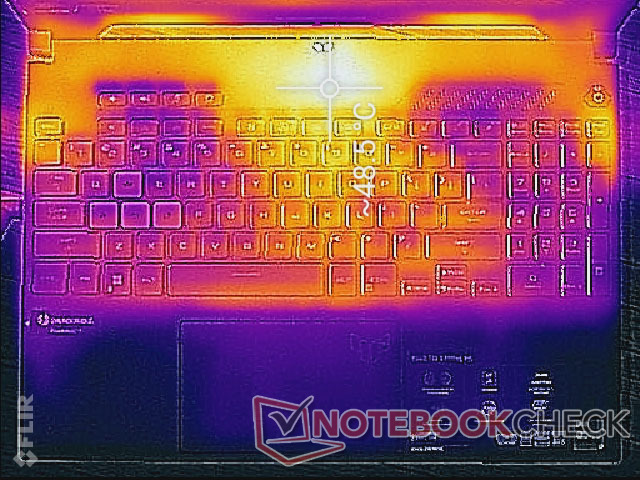
Temperatura
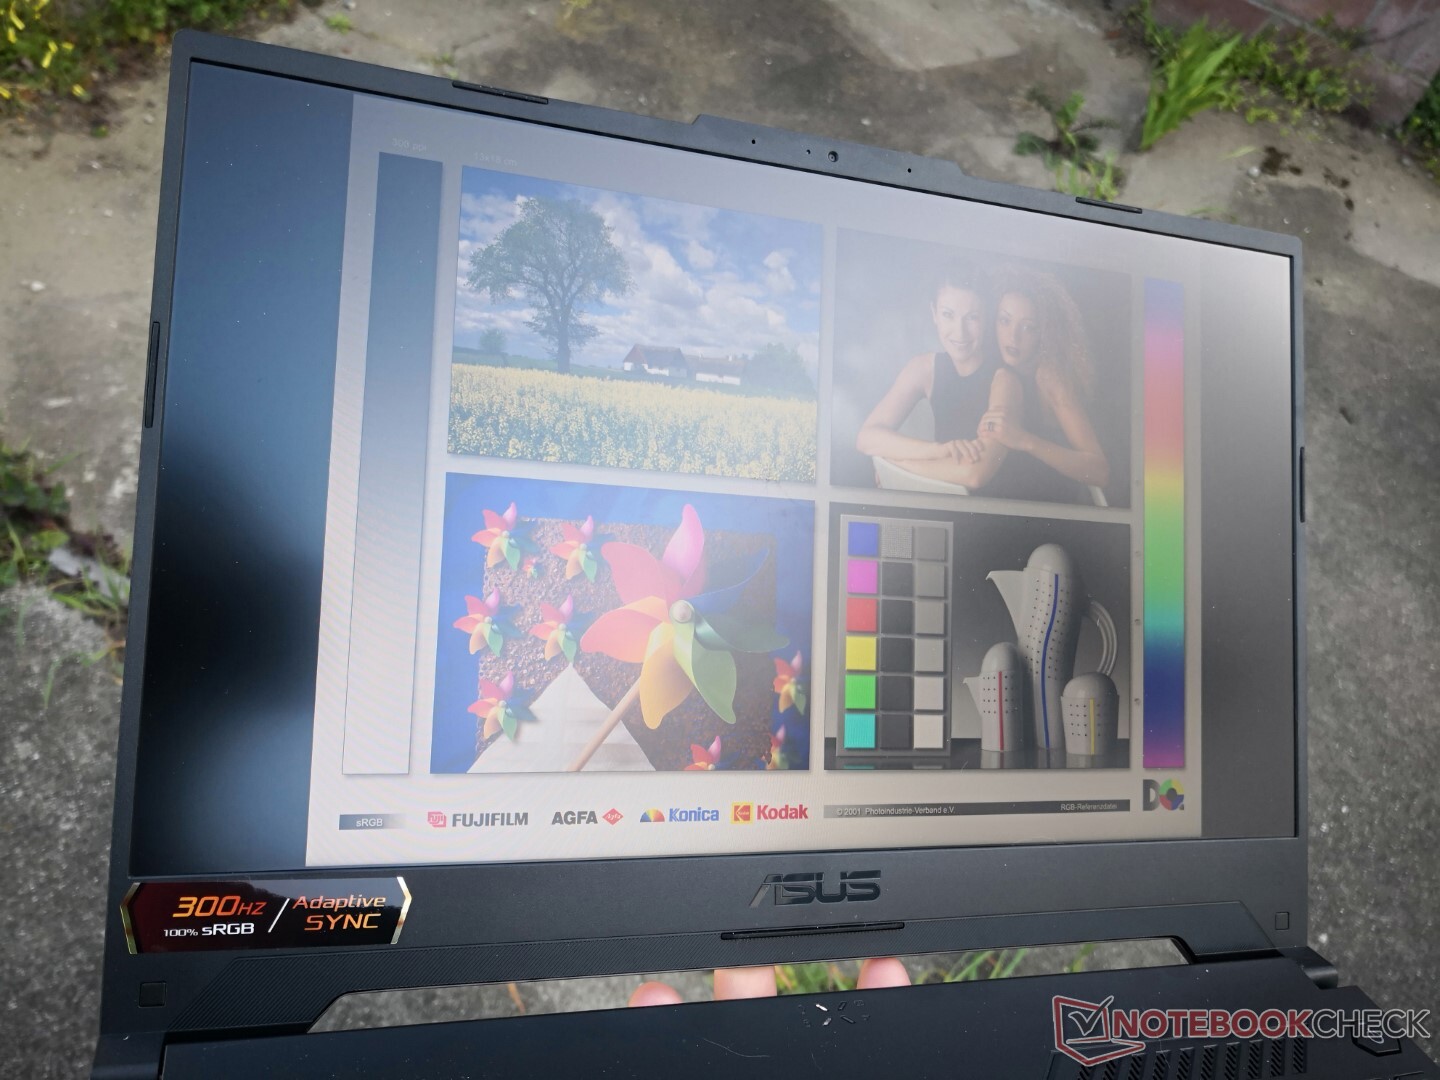
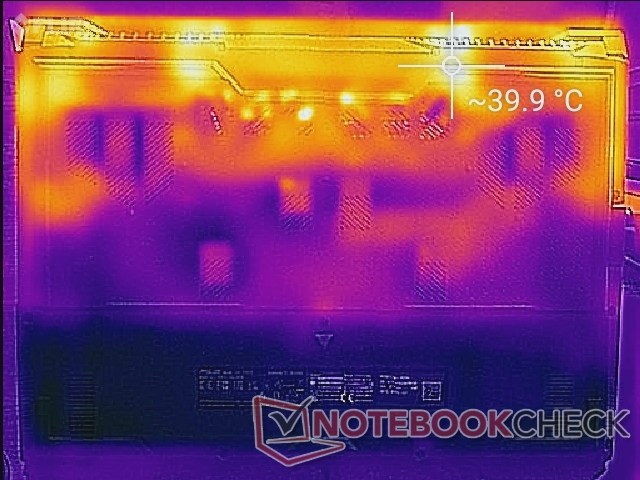
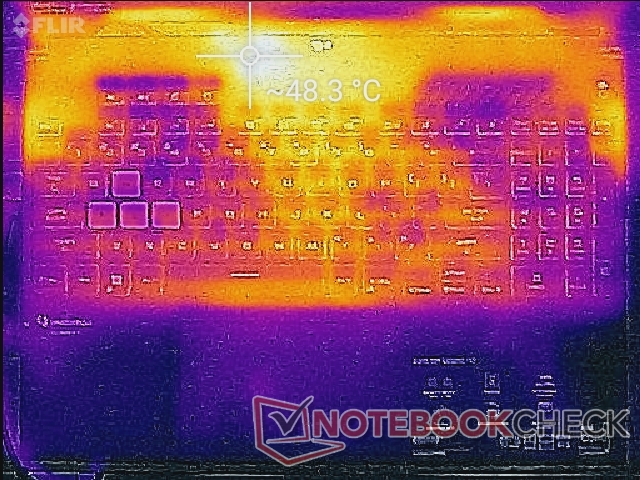
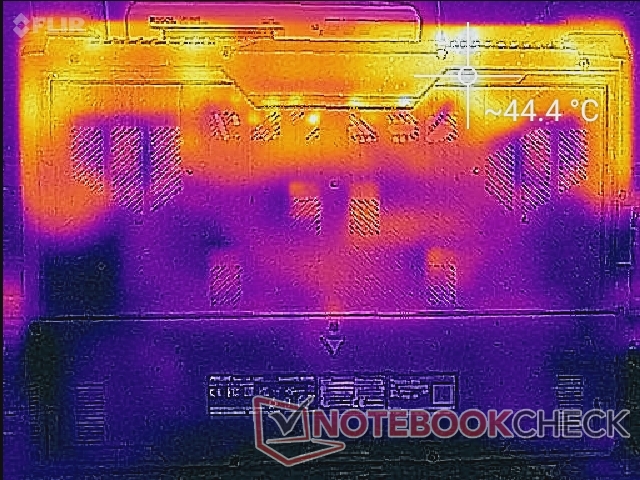
I punti caldi della temperatura superficiale sono più caldi di quelli registrati nel modello dell'anno scorso. Quando si corre Witcher 3per esempio, il punto caldo superiore dell'FX507 può essere caldo fino a 49 C rispetto ai soli 37 C dell'FX506. Tuttavia, la soluzione di raffreddamento migliorata dell'FX507 ha spostato il punto caldo lontano dai tasti della tastiera per mantenere i palmi e le dita freschi indipendentemente dal carico sullo schermo
Le temperature di superficie sono più calde del previsto anche quando sono al minimo sul desktop, ma questo perché le ventole tendono a girare al minimo o a velocità molto basse quando l'attività è bassa. Troviamo che questo sia un compromesso accettabile soprattutto quando si è in classe o durante la riproduzione di video o musica.
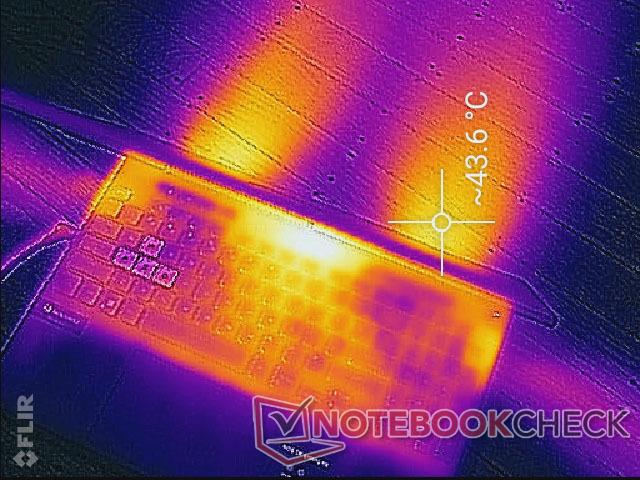
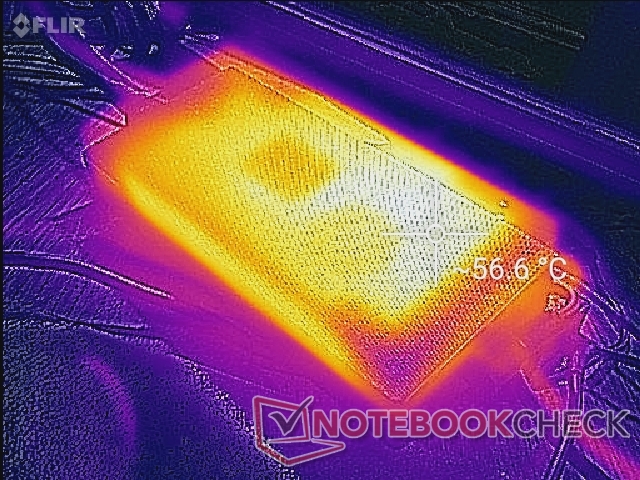
(±) La temperatura massima sul lato superiore è di 44.4 °C / 112 F, rispetto alla media di 40.4 °C / 105 F, che varia da 21.2 a 68.8 °C per questa classe Gaming.
(-) Il lato inferiore si riscalda fino ad un massimo di 48.8 °C / 120 F, rispetto alla media di 43.2 °C / 110 F
(+) In idle, la temperatura media del lato superiore è di 30.2 °C / 86 F, rispetto alla media deld ispositivo di 33.9 °C / 93 F.
(+) Riproducendo The Witcher 3, la temperatura media per il lato superiore e' di 31.4 °C / 89 F, rispetto alla media del dispositivo di 33.9 °C / 93 F.
(+) I poggiapolsi e il touchpad sono piu' freddi della temperatura della pelle con un massimo di 28 °C / 82.4 F e sono quindi freddi al tatto.
(±) La temperatura media della zona del palmo della mano di dispositivi simili e'stata di 28.8 °C / 83.8 F (+0.8 °C / 1.4 F).
| Asus TUF Gaming F15 FX507ZM Intel Core i7-12700H, NVIDIA GeForce RTX 3060 Laptop GPU | Asus TUF Gaming F15 FX506HM Intel Core i7-11800H, NVIDIA GeForce RTX 3060 Laptop GPU | Asus TUF Dash F15 FX516PR Intel Core i7-11370H, NVIDIA GeForce RTX 3070 Laptop GPU | Asus ROG Strix Scar 15 G533QS AMD Ryzen 9 5900HX, NVIDIA GeForce RTX 3080 Laptop GPU | Asus Zephyrus S15 GX502L Intel Core i7-10875H, NVIDIA GeForce RTX 2070 Super Mobile | Asus ZenBook Pro Duo UX582 LR-1BH2 Intel Core i7-10870H, NVIDIA GeForce RTX 3070 Laptop GPU | |
|---|---|---|---|---|---|---|
| Heat | 16% | 1% | 4% | 11% | 14% | |
| Maximum Upper Side * (°C) | 44.4 | 46.4 -5% | 55 -24% | 43.4 2% | 51 -15% | 47.7 -7% |
| Maximum Bottom * (°C) | 48.8 | 45.4 7% | 56 -15% | 48.2 1% | 44 10% | 53.8 -10% |
| Idle Upper Side * (°C) | 37.8 | 26 31% | 29 23% | 35.2 7% | 29 23% | 24.4 35% |
| Idle Bottom * (°C) | 39.6 | 27.4 31% | 32 19% | 37 7% | 30 24% | 24.7 38% |
* ... Meglio usare valori piccoli
Test di stress
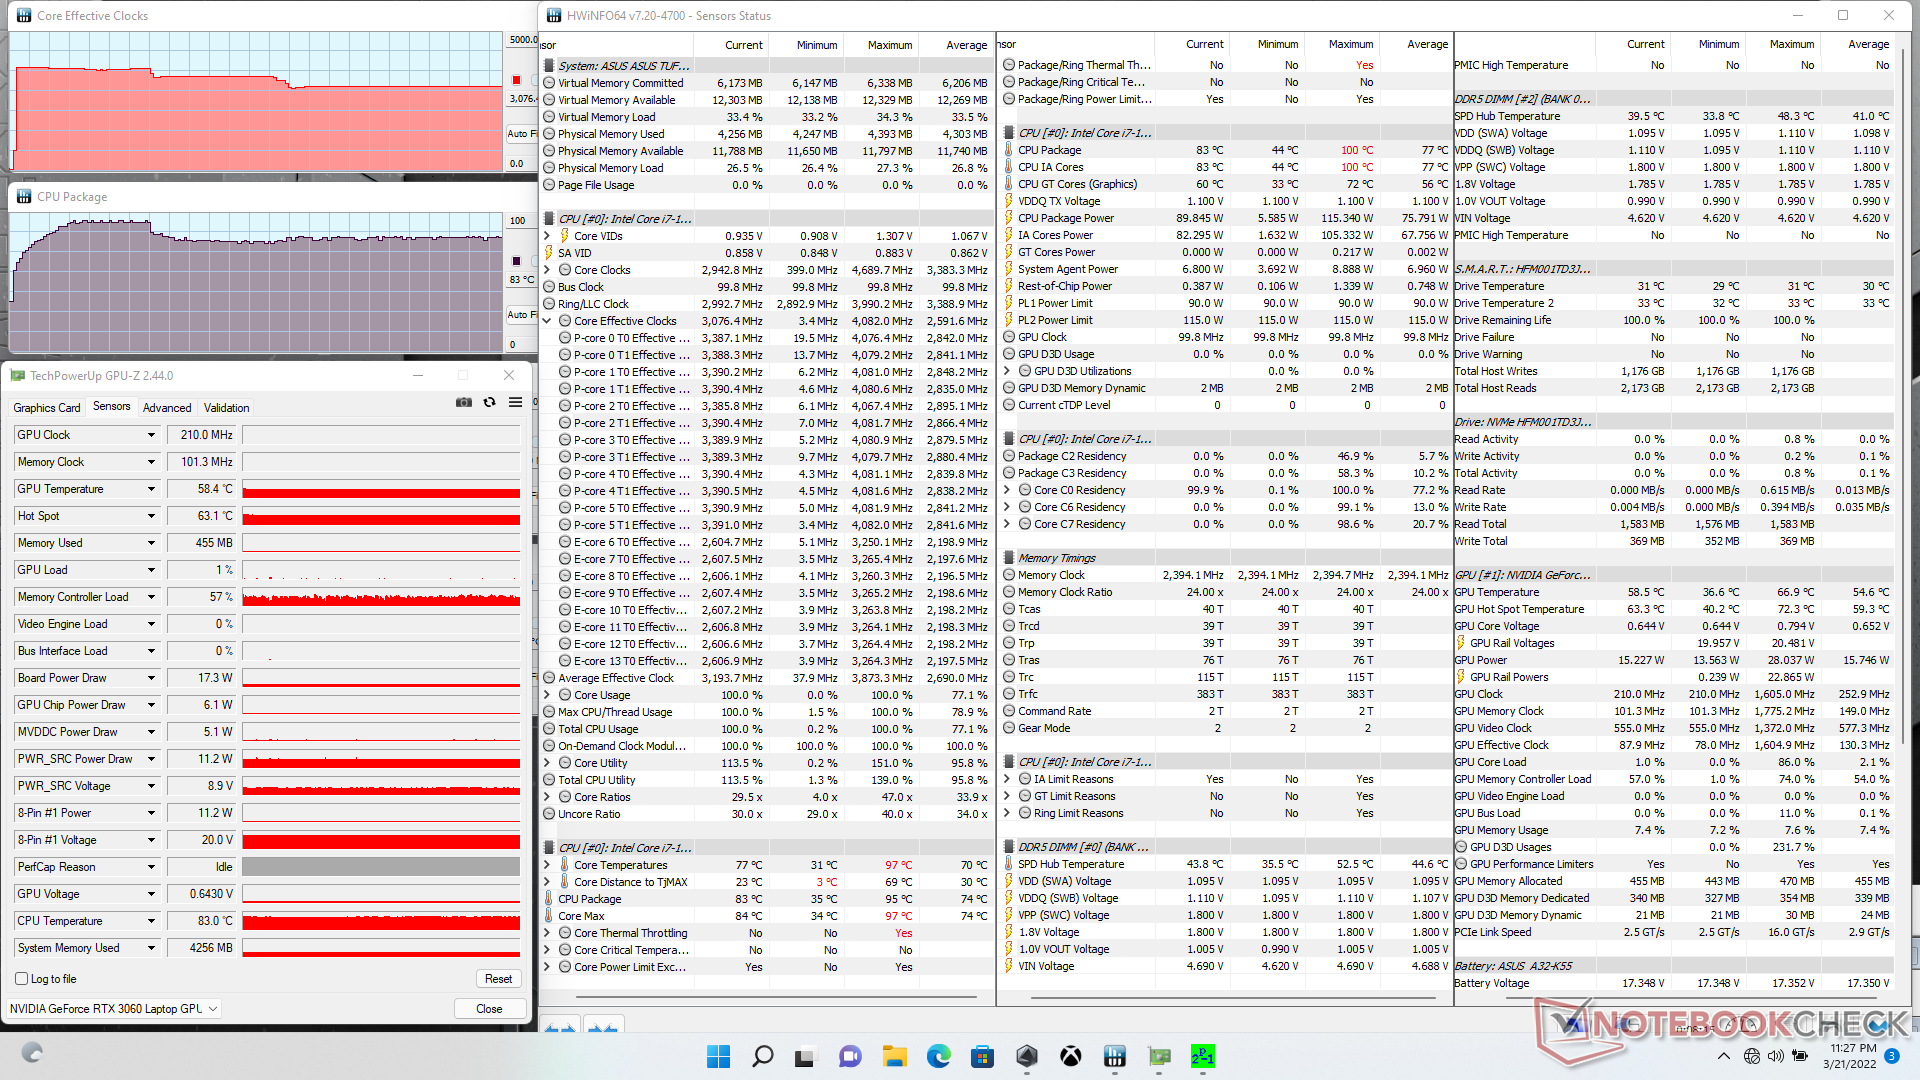
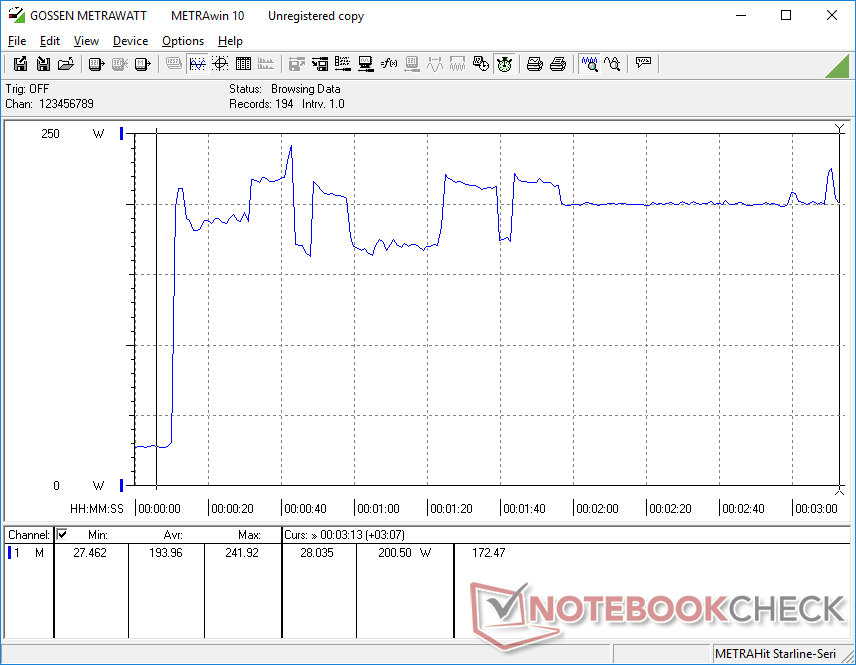
Durante l'esecuzione di Prime95, la CPU aumentava a 3,8 GHz per i primi 100 secondi circa e a una temperatura del core di 95 C. La frequenza di clock e la temperatura alla fine scendevano e si stabilizzavano rispettivamente a 3,1 GHz e 83 C. Anche la potenza del pacchetto diminuirebbe da 115 W a 90 W durante questo periodo, secondo HWiNFO.
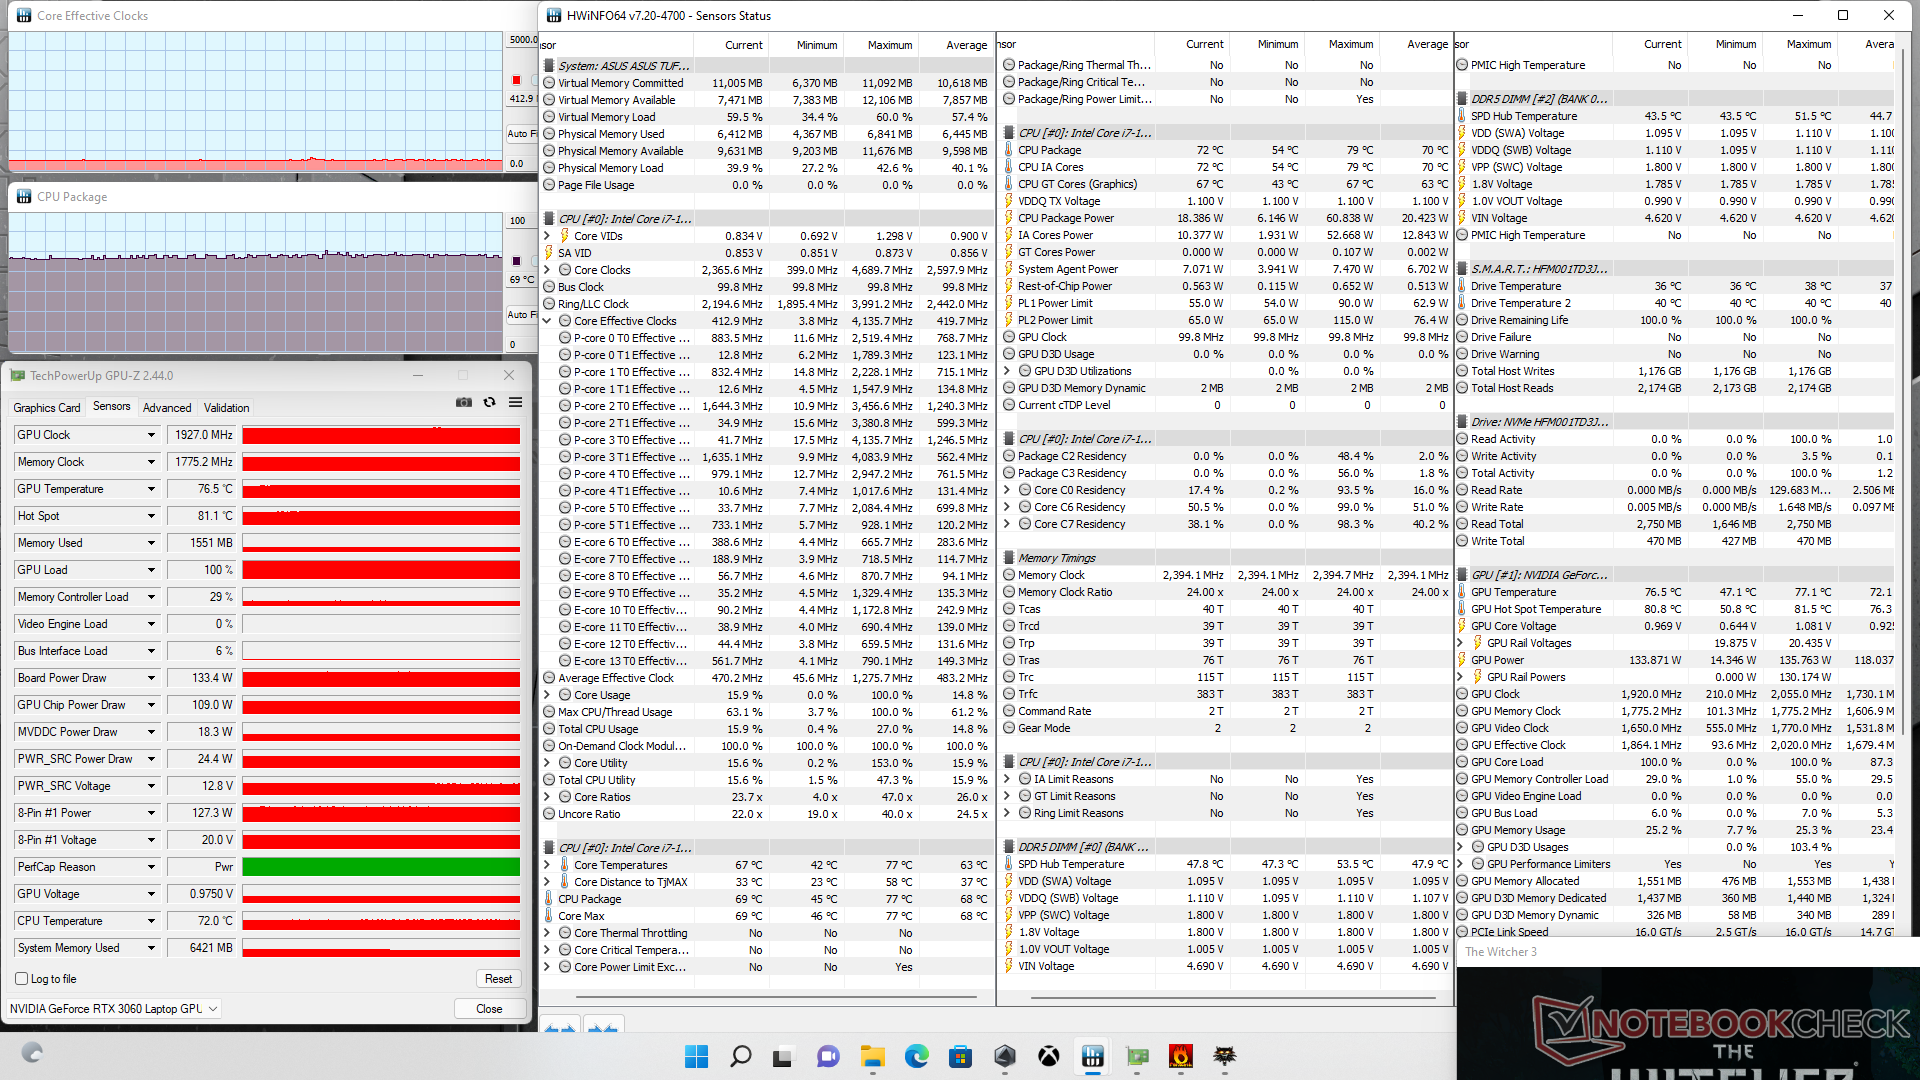
Quando si esegue Witcher 3 per rappresentare il tipico stress da gioco, le temperature di CPU e GPU si stabilizzerebbero a 69 C e 77 C, rispettivamente, con la GPU a 1927 MHz e un assorbimento di potenza della scheda di 133,4 W. L'esecuzione di questo stesso test sull'FX506 vedrebbe temperature più calde di CPU e GPU di 75 C e 81 C, rispettivamente, ma una frequenza di clock della GPU più lenta di 1717 MHz e un assorbimento inferiore di 90,4 W.
Il funzionamento a batteria limita le prestazioni. Un test su Fire Strike con le batterie restituirebbe punteggi di Fisica e Grafica di 21169 e 15715 punti, rispettivamente, rispetto a 30446 e 22915 punti con l'alimentazione di rete.
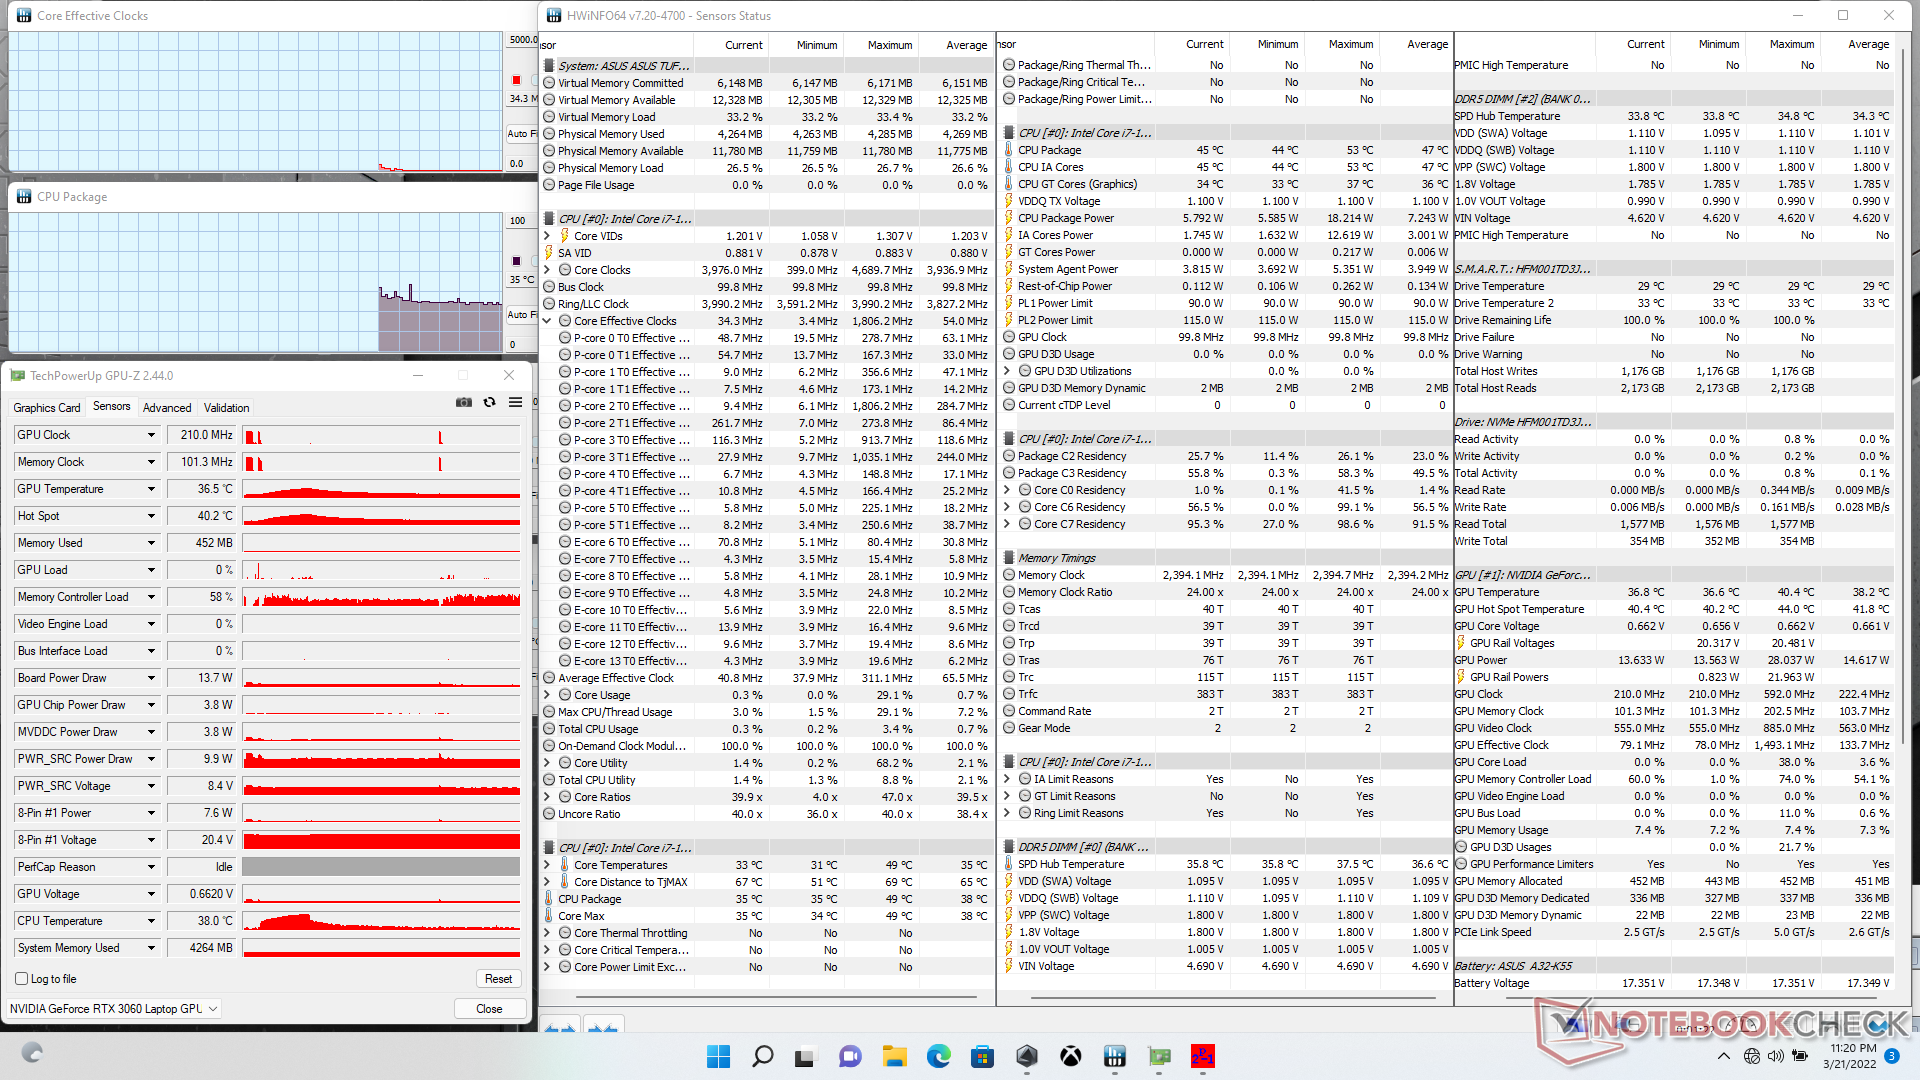
| Clock della CPU (GHz) | Clock della GPU (MHz) | Temperatura media della CPU (°C) | Temperatura media della GPU (°C) | |
| Sistema inattivo | -- | -- | 35 | 37 |
| Prime95 Stress | 3.1 | -- | 83 | 58 |
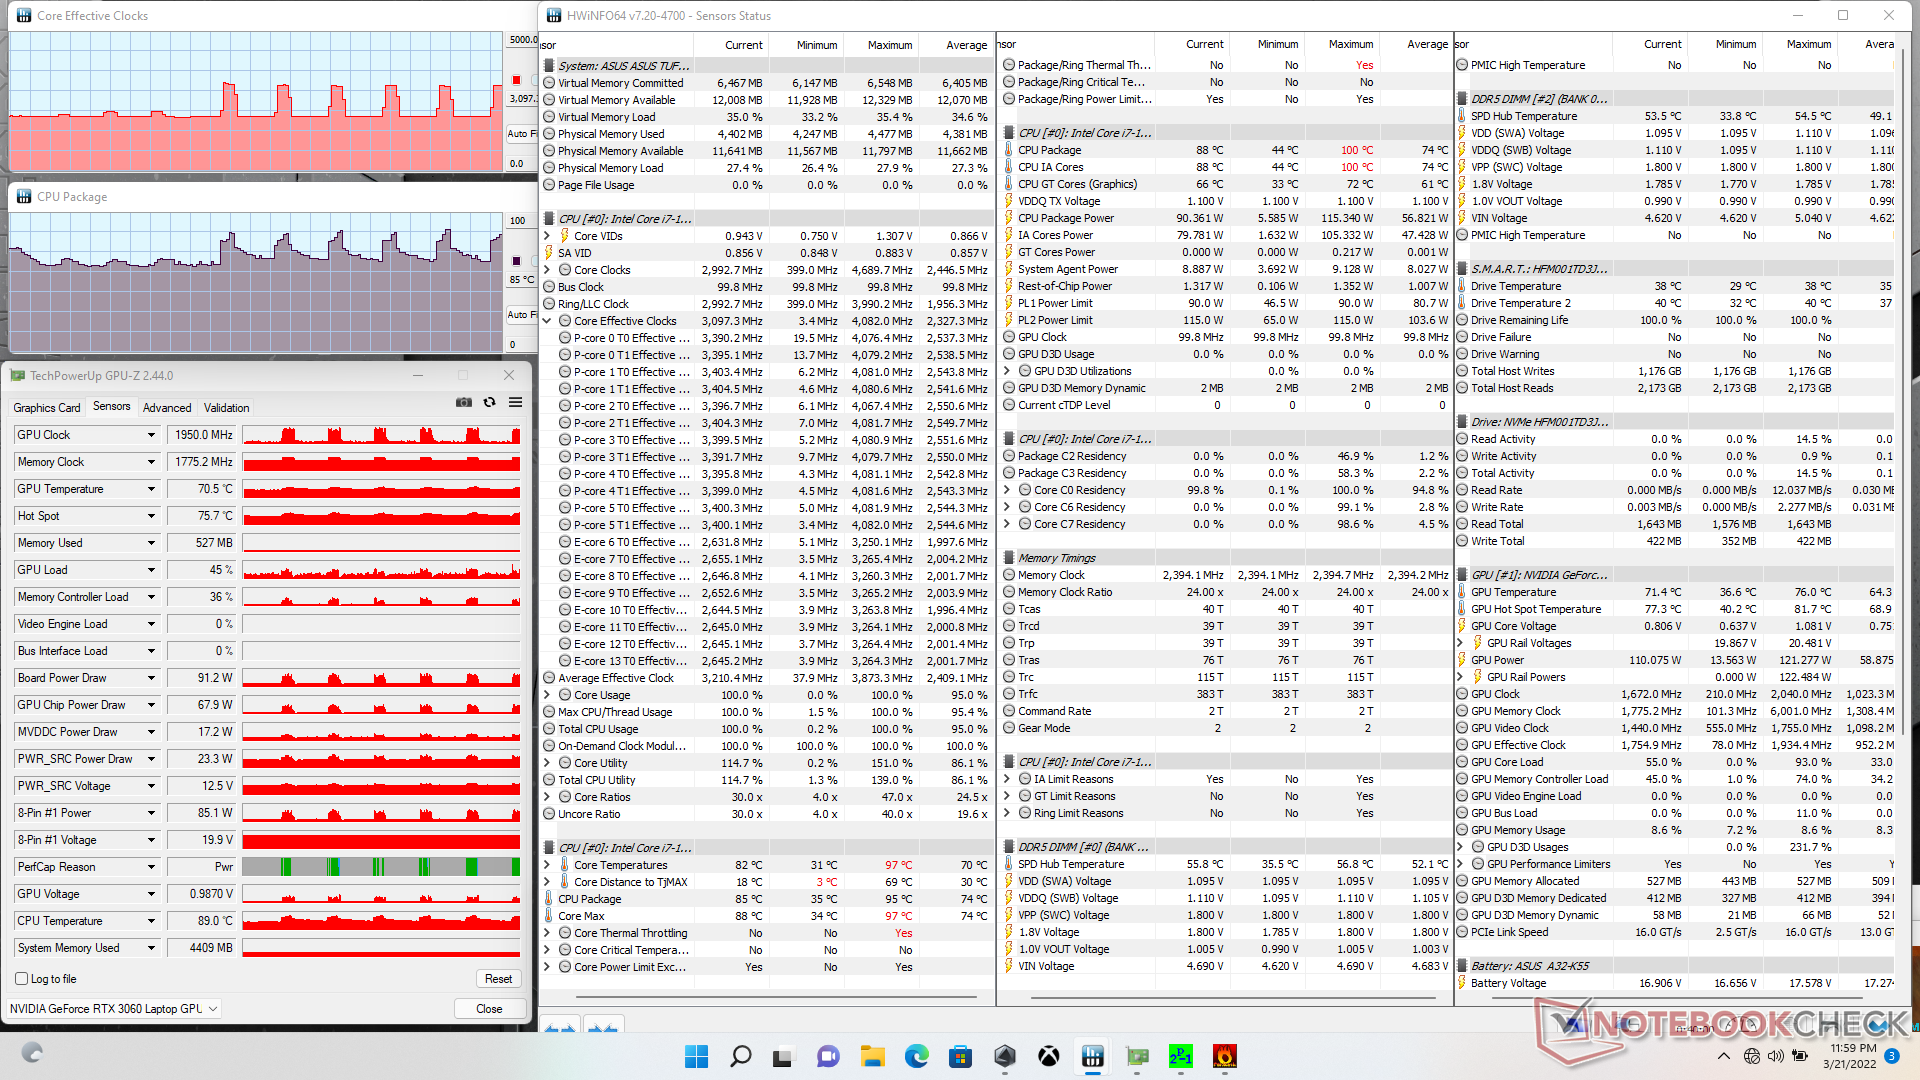
| Prime95 + FurMark Stress | 2.0 - 3.0 | 450 - 2000 | 66 - 89 | 58 - 72 |
| Witcher 3 Stress | 0.412 | 1927 | 69 | 77 |
Altoparlanti
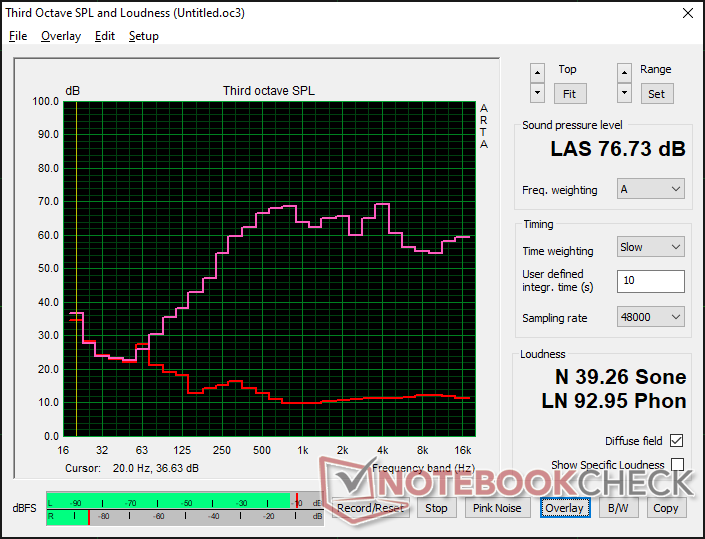
Asus TUF Gaming F15 FX507ZM analisi audio
(±) | potenza degli altiparlanti media ma buona (76.7 dB)
Bassi 100 - 315 Hz
(±) | bassi ridotti - in media 13.7% inferiori alla media
(±) | la linearità dei bassi è media (10.1% delta rispetto alla precedente frequenza)
Medi 400 - 2000 Hz
(±) | medi elevati - circa 5.2% superiore alla media
(+) | medi lineari (4.9% delta rispetto alla precedente frequenza)
Alti 2 - 16 kHz
(+) | Alti bilanciati - appena 4.1% dalla media
(±) | la linearità degli alti è media (8.6% delta rispetto alla precedente frequenza)
Nel complesso 100 - 16.000 Hz
(±) | la linearità complessiva del suono è media (15.9% di differenza rispetto alla media
Rispetto alla stessa classe
» 38% di tutti i dispositivi testati in questa classe è stato migliore, 7% simile, 56% peggiore
» Il migliore ha avuto un delta di 6%, medio di 18%, peggiore di 132%
Rispetto a tutti i dispositivi testati
» 25% di tutti i dispositivi testati in questa classe è stato migliore, 5% similare, 70% peggiore
» Il migliore ha avuto un delta di 4%, medio di 24%, peggiore di 134%
Apple MacBook Pro 16 2021 M1 Pro analisi audio
(+) | gli altoparlanti sono relativamente potenti (84.7 dB)
Bassi 100 - 315 Hz
(+) | bassi buoni - solo 3.8% dalla media
(+) | bassi in lineaa (5.2% delta rispetto alla precedente frequenza)
Medi 400 - 2000 Hz
(+) | medi bilanciati - solo only 1.3% rispetto alla media
(+) | medi lineari (2.1% delta rispetto alla precedente frequenza)
Alti 2 - 16 kHz
(+) | Alti bilanciati - appena 1.9% dalla media
(+) | alti lineari (2.7% delta rispetto alla precedente frequenza)
Nel complesso 100 - 16.000 Hz
(+) | suono nel complesso lineare (4.6% differenza dalla media)
Rispetto alla stessa classe
» 0% di tutti i dispositivi testati in questa classe è stato migliore, 0% simile, 100% peggiore
» Il migliore ha avuto un delta di 5%, medio di 17%, peggiore di 45%
Rispetto a tutti i dispositivi testati
» 0% di tutti i dispositivi testati in questa classe è stato migliore, 0% similare, 100% peggiore
» Il migliore ha avuto un delta di 4%, medio di 24%, peggiore di 134%
Gestione dell'energia - Hardware più esigente su tutta la linea
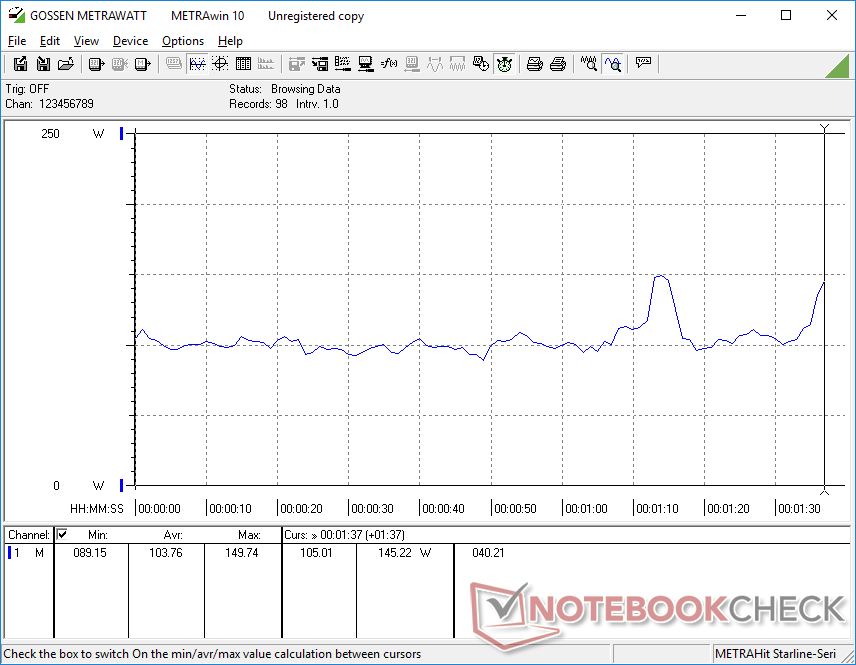
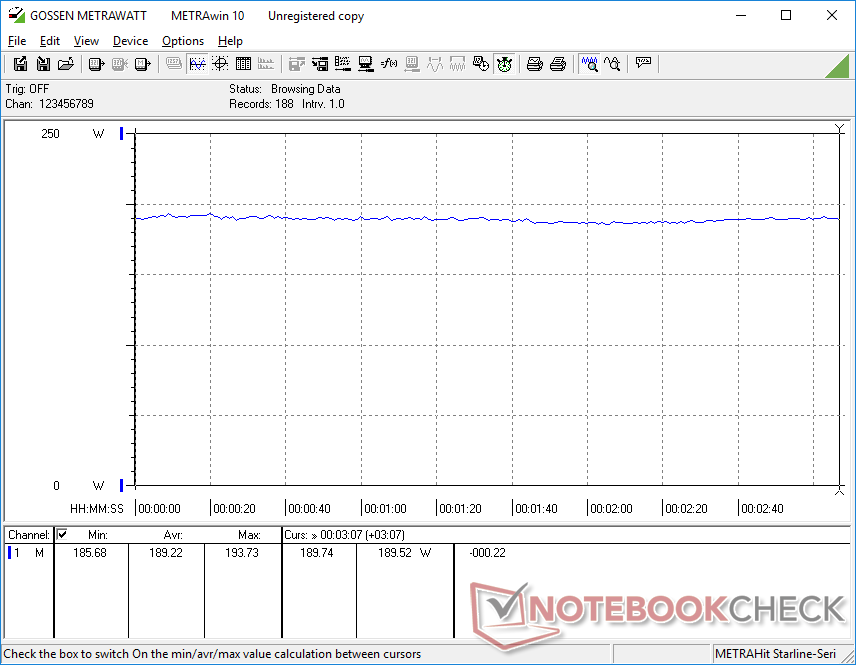
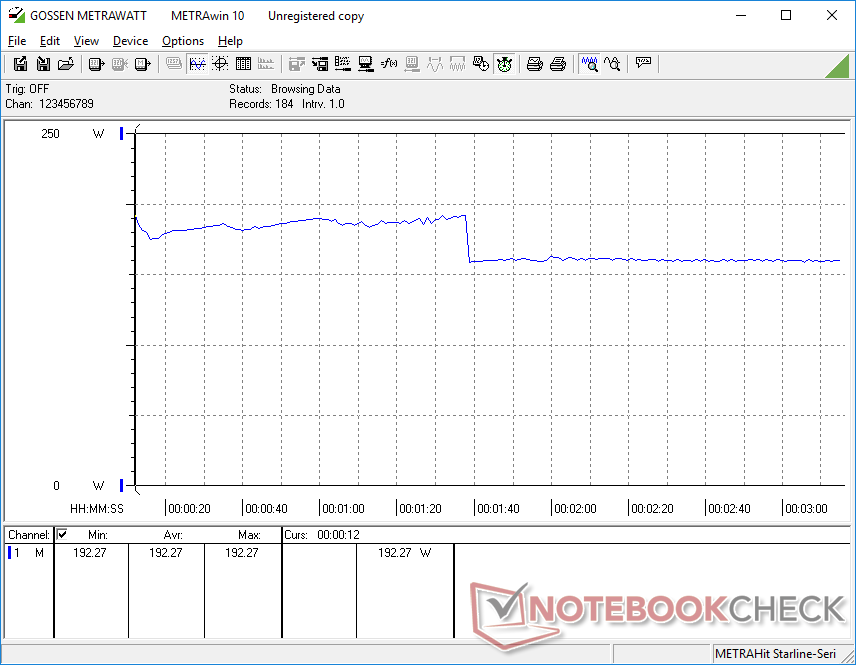
Consumo di energia
Il consumo complessivo è superiore a quello registrato sul modello dell'anno precedente. Questo è da aspettarselo a causa delle maggiori richieste di energia della nuova CPU Intel di 12a generazione, la maggiore RTX 3060 TGP e la soluzione di raffreddamento interno più grande dell'FX507. L'esecuzione di Witcher 3 consuma circa il 20 per cento in più di potenza rispetto all'anno precedente, per una spinta dal 10 al 20 per cento nelle prestazioni grafiche rispetto all'Asus FX506 del 2021
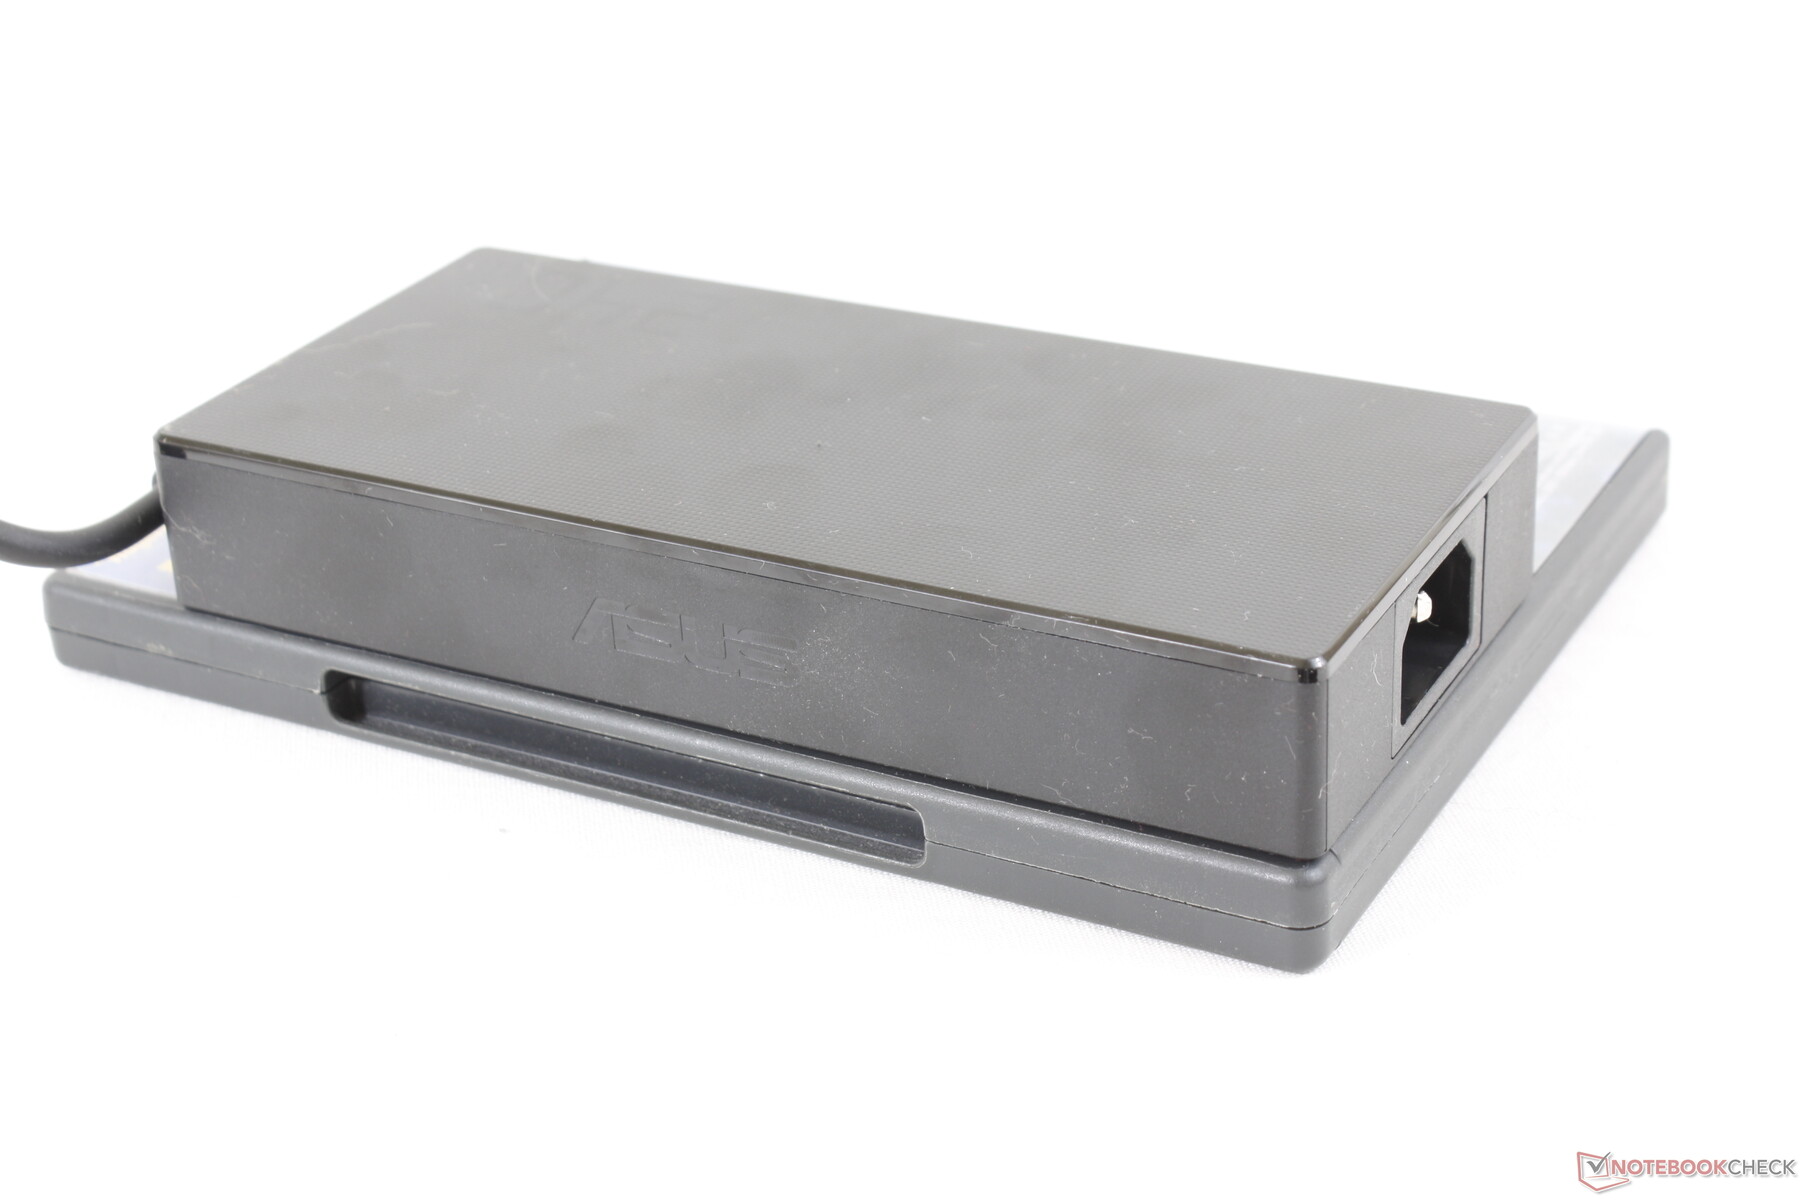
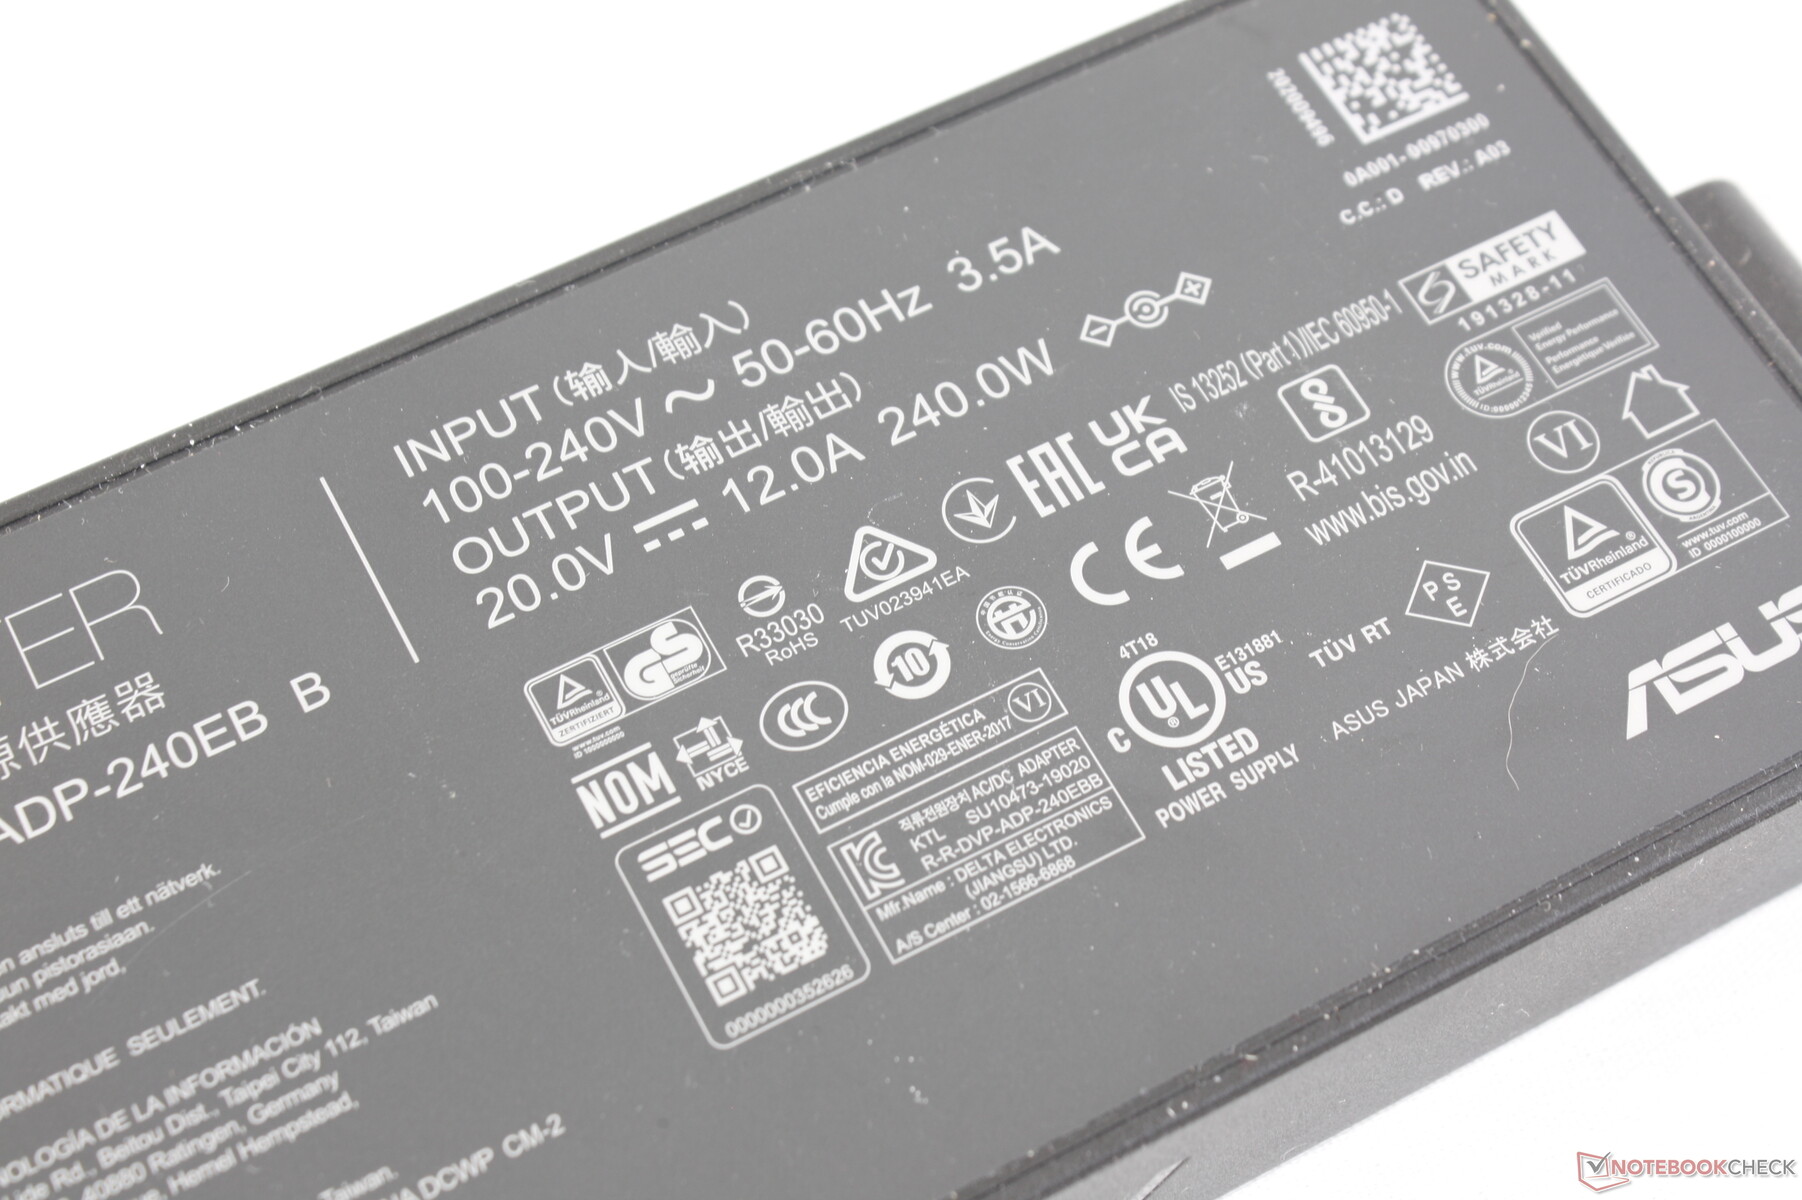
L'FX507 viene spedito con un adattatore AC da 240 W di potenza superiore rispetto all'adattatore AC da 200 W che viene spedito con l'FX506 per accogliere meglio gli interni più affamati di energia. Il nuovo adattatore è successivamente più grande del vecchio (~16.5 x 7.6 x 2.6 cm contro ~15.1 x 7.2 x 2.3 cm).
| Off / Standby | |
| Idle | |
| Sotto carico |
|
Leggenda:
min: | |
| Asus TUF Gaming F15 FX507ZM i7-12700H, GeForce RTX 3060 Laptop GPU, SK Hynix HFM001TD3JX013N, IPS, 1920x1080, 15.6" | Asus TUF Gaming F15 FX506HM i7-11800H, GeForce RTX 3060 Laptop GPU, SK Hynix HFM001TD3JX013N, IPS, 1920x1080, 15.6" | Asus TUF Dash F15 FX516PR i7-11370H, GeForce RTX 3070 Laptop GPU, SK Hynix HFM001TD3JX013N, IPS, 1920x1080, 15.6" | Asus ROG Strix Scar 15 G533QS R9 5900HX, GeForce RTX 3080 Laptop GPU, ADATA Swordfish 2 TB, IPS, 2560x1440, 15.6" | Asus Zephyrus S15 GX502L i7-10875H, GeForce RTX 2070 Super Mobile, WDC PC SN730 SDBPNTY-1T00, IPS, 1920x1080, 15.6" | Asus ZenBook Pro Duo UX582 LR-1BH2 i7-10870H, GeForce RTX 3070 Laptop GPU, Samsung PM981a MZVLB1T0HBLR, OLED + IPS, 3840x2160, 15.6" | |
|---|---|---|---|---|---|---|
| Power Consumption | -2% | 9% | -24% | -12% | -4% | |
| Idle Minimum * (Watt) | 6.3 | 9.5 -51% | 9 -43% | 11.2 -78% | 7 -11% | 9 -43% |
| Idle Average * (Watt) | 9.8 | 12.1 -23% | 11 -12% | 16.4 -67% | 13 -33% | 14 -43% |
| Idle Maximum * (Watt) | 26.5 | 22.5 15% | 16 40% | 29.4 -11% | 25 6% | 15 43% |
| Load Average * (Watt) | 103.8 | 99.5 4% | 107 -3% | 106.2 -2% | 148 -43% | 107.2 -3% |
| Witcher 3 ultra * (Watt) | 189 | 157 17% | 121 36% | 189 -0% | 175 7% | 156 17% |
| Load Maximum * (Watt) | 241.9 | 173.5 28% | 162 33% | 213.6 12% | 232 4% | 235 3% |
* ... Meglio usare valori piccoli
Power Consumption Witcher 3 / Stresstest
Power Consumption external Monitor
Durata della batteria - più breve rispetto al modello di ultima generazione
I tempi di funzionamento della WLAN sono più brevi di quelli che abbiamo registrato sul modello dell'anno scorso di diverse ore, nonostante la stessa batteria da 90 Wh di capacità tra di loro. Abbiamo testato questo due volte sul profilo di alimentazione Balanced con MSHybrid attivo e abbiamo ottenuto gli stessi risultati. I tempi di esecuzione WLAN più brevi rispetto all'anno scorso sono coerenti con ciò che abbiamo osservato tra il 2021 Razer Blade 15 e 2022 Razer Blade 15.
La ricarica da vuoto a piena capacità con l'adattatore AC incluso richiede circa 90 minuti. Purtroppo, questo modello non supporta la ricarica USB-C a differenza della serie Razer Blade o della serie MSI GS.
| Asus TUF Gaming F15 FX507ZM i7-12700H, GeForce RTX 3060 Laptop GPU, 90 Wh | Asus TUF Gaming F15 FX506HM i7-11800H, GeForce RTX 3060 Laptop GPU, 90 Wh | Asus TUF Dash F15 FX516PR i7-11370H, GeForce RTX 3070 Laptop GPU, 76 Wh | Asus ROG Strix Scar 15 G533QS R9 5900HX, GeForce RTX 3080 Laptop GPU, 90 Wh | Asus Zephyrus S15 GX502L i7-10875H, GeForce RTX 2070 Super Mobile, 76 Wh | Asus ZenBook Pro Duo UX582 LR-1BH2 i7-10870H, GeForce RTX 3070 Laptop GPU, 92 Wh | |
|---|---|---|---|---|---|---|
| Autonomia della batteria | 39% | 46% | 16% | -15% | 36% | |
| Reader / Idle (h) | 15.8 | 11 -30% | 16 1% | 11.1 -30% | 8.7 -45% | |
| WiFi v1.3 (h) | 4.8 | 7.9 65% | 9.1 90% | 7.3 52% | 3 -37% | 7.4 54% |
| Load (h) | 1.1 | 2 82% | 1.4 27% | 1.5 36% | 1.3 18% | |
| H.264 (h) | 8.2 |
Pro
Contro
Verdetto - 140 W GeForce RTX 3060 Grafica
A parte tutti gli aggiornamenti dello chassis, l'FX507 è più notevole per il suo obiettivo TGP molto più alto di 140 W rispetto ai soli 95 W del FX506. I produttori di PC di tutto il mondo stanno usando le stesse GPU GeForce quest'anno, dato che Nvidia deve ancora lanciare il successore della serie mobile RTX 3000. Quindi, per offrire migliori prestazioni grafiche dalla stessa GPU, l'FX507 deve consumare più energia dell'FX506. Il risultato è una GeForce RTX 3060 è più veloce della maggior parte dei portatili attualmente disponibili equipaggiati con la stessa GPU.
Per alleviare alcune delle conseguenze di un sistema più affamato di energia, Asus ha aggiornato la soluzione di raffreddamento per tenere sotto controllo le temperature e il rumore della ventola. L'FX507 non è quindi significativamente più caldo o più rumoroso del suo predecessore nonostante il suo peso complessivo più leggero.
I processori più esigenti dell'FX507 hanno avuto un impatto diretto sulla durata della batteria e sulle dimensioni dell'adattatore AC. Non aspettatevi tempi di esecuzione più lunghi di quelli dell'FX506 nella maggior parte delle condizioni e preparatevi a portare in giro un adattatore AC ancora più grande di prima. È un peccato che il sistema non possa essere ricaricato tramite adattatori USB-C di terze parti.
Le modifiche alla tastiera e al clickpad sono un mix, considerando che il carattere grigio scuro contrasta male con i keycaps scuri. Le azioni di drag-and-drop sono più facili sul modello di ultima generazione a causa dei suoi pulsanti del mouse dedicati.
Prezzo e disponibilità
L'Asus TUF Gaming F15 FX507ZM come recensito è ora disponibile su Amazon per $1750 USD.
Asus TUF Gaming F15 FX507ZM
- 03/26/2022 v7 (old)
Allen Ngo
Price comparison

