Recensione del portatile Razer Blade 17 2022 Core i7 RTX 3080 Ti: Prestazioni sovralimentate
Ogni volta che una nuova generazione di processori Intel o Nvidia diventa disponibile, puoi contare su Razer per aggiornare la sua serie Blade con le ultime opzioni di CPU o GPU. Il Blade 17 2022 è un aggiornamento interno al Blade 17 2021 con CPU Intel Alder Lake-H di 12a generazione e GPU GeForce RTX 3070 Ti e 3080 Ti che sostituiscono le opzioni di 11a gen Tiger Lake-H e RTX 3070 e 3080 di un tempo. Come dettagliato nella nostra panoramica di Alder Lakele nuove CPU di 12esima generazione introducono performance P-cores ed efficienti E-cores mentre la serie mobile GeForce Ti è destinata a spremere più prestazioni essenzialmente dallo stesso chipset Nvidia Ampere
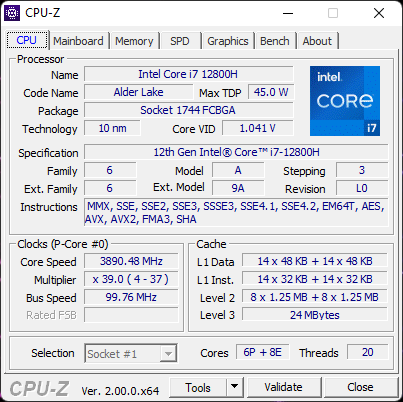
La nostra unità Blade 17 recensita è una configurazione di fascia alta con Core i7-12800H, GPU RTX 3080 Ti e pannello QHD a 240 Hz per circa 4000 dollari. Altre SKU sono disponibili con le GPU RTX 3060 o RTX 3070 Ti, display FHD o UHD, o la CPU Core i9-12900H a vari punti di partenza. A differenza della GPU da 100 W del Blade 17 Intel di decima generazione o della GPU da 130 W del Blade 17 di undicesima generazione, la GPU di questo Blade 17 di dodicesima generazione punta a un TGP ancora più alto di 165 W per prestazioni potenzialmente maggiori
Le alternative al Blade 17 includono altri portatili da gioco ultrasottili di punta come il MSI GS76 o GS77, Asus Zephyrus S17, Aorus 17G, Alienware x17, o Maingear Vector Pro
Altre recensioni su Razer
Potenziali concorrenti a confronto
Punteggio | Data | Modello | Peso | Altezza | Dimensione | Risoluzione | Prezzo |
|---|---|---|---|---|---|---|---|
| 91.2 % v7 (old) | 03/2022 | Razer Blade 17 RTX 3080 Ti i7-12800H, GeForce RTX 3080 Ti Laptop GPU | 2.7 kg | 19.9 mm | 17.30" | 2560x1440 | |
| 87.8 % v7 (old) | 02/2021 | Razer Blade Pro 17 2021 (QHD Touch) i7-10875H, GeForce RTX 3080 Laptop GPU | 3 kg | 19.9 mm | 17.30" | 3840x2160 | |
| 86.2 % v7 (old) | 09/2021 | MSI GS76 Stealth 11UH i9-11900H, GeForce RTX 3080 Laptop GPU | 2.4 kg | 20 mm | 17.30" | 3840x2160 | |
| 90.1 % v7 (old) | 07/2021 | Asus ROG Zephyrus S17 GX703HSD i9-11900H, GeForce RTX 3080 Laptop GPU | 2.8 kg | 19.9 mm | 17.30" | 2560x1440 | |
| 86 % v7 (old) | 06/2021 | Aorus 17G YD i7-11800H, GeForce RTX 3080 Laptop GPU | 2.8 kg | 26 mm | 17.30" | 1920x1080 | |
| 89 % v7 (old) | 09/2021 | Alienware x17 RTX 3080 P48E i7-11800H, GeForce RTX 3080 Laptop GPU | 3.2 kg | 21.4 mm | 17.30" | 3840x2160 |
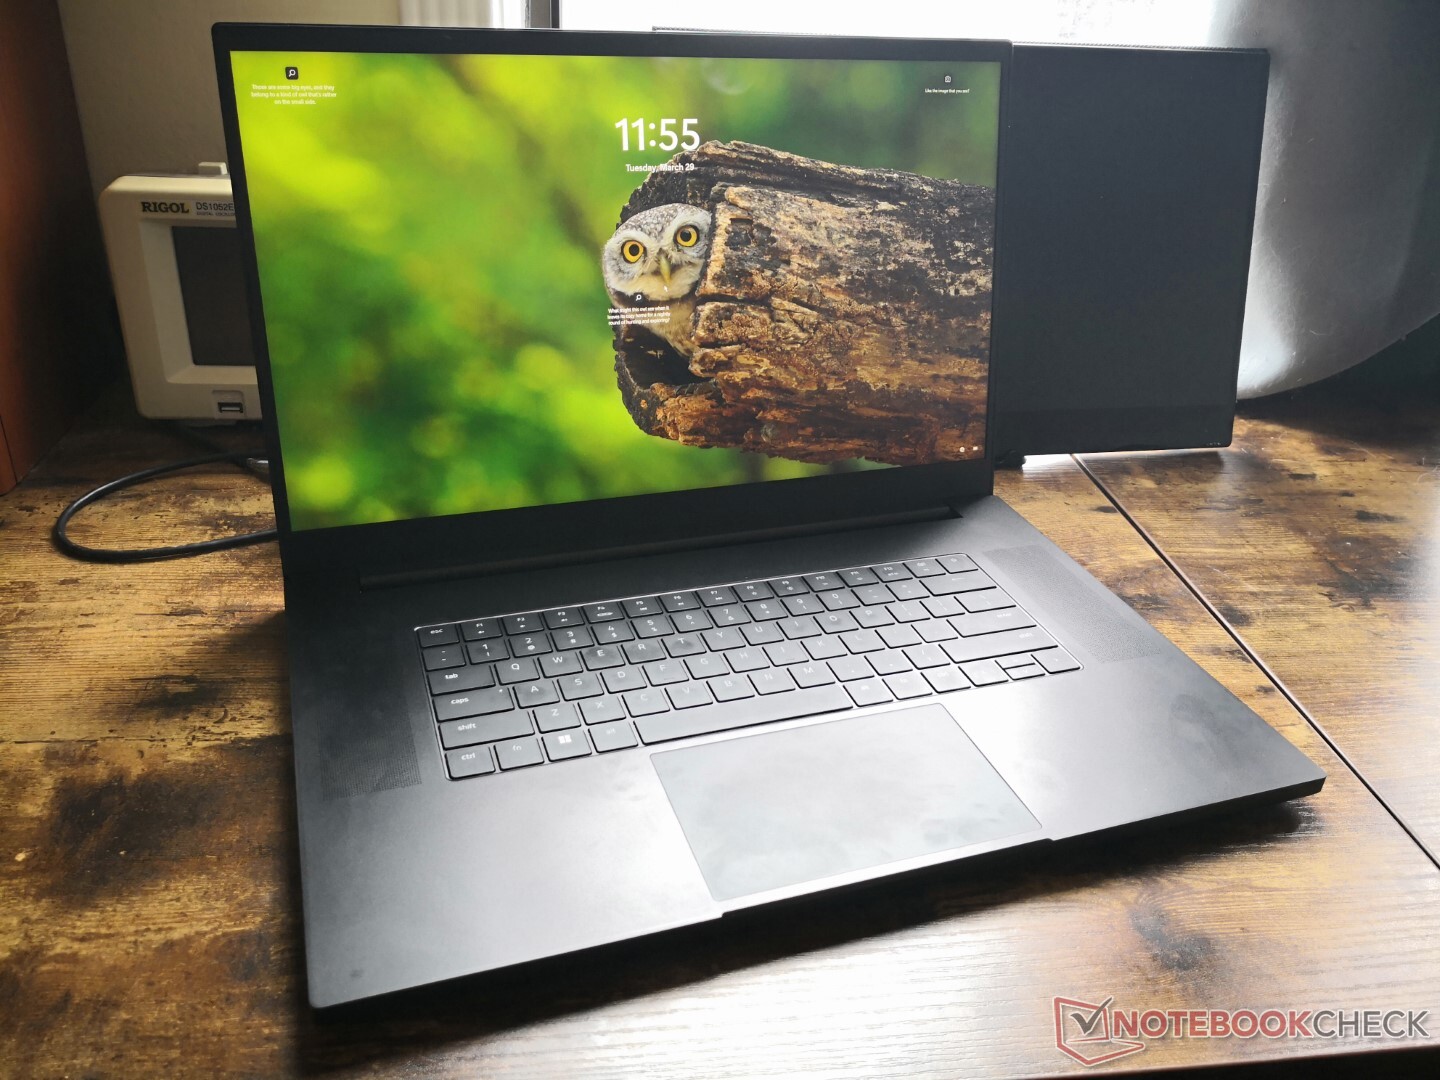
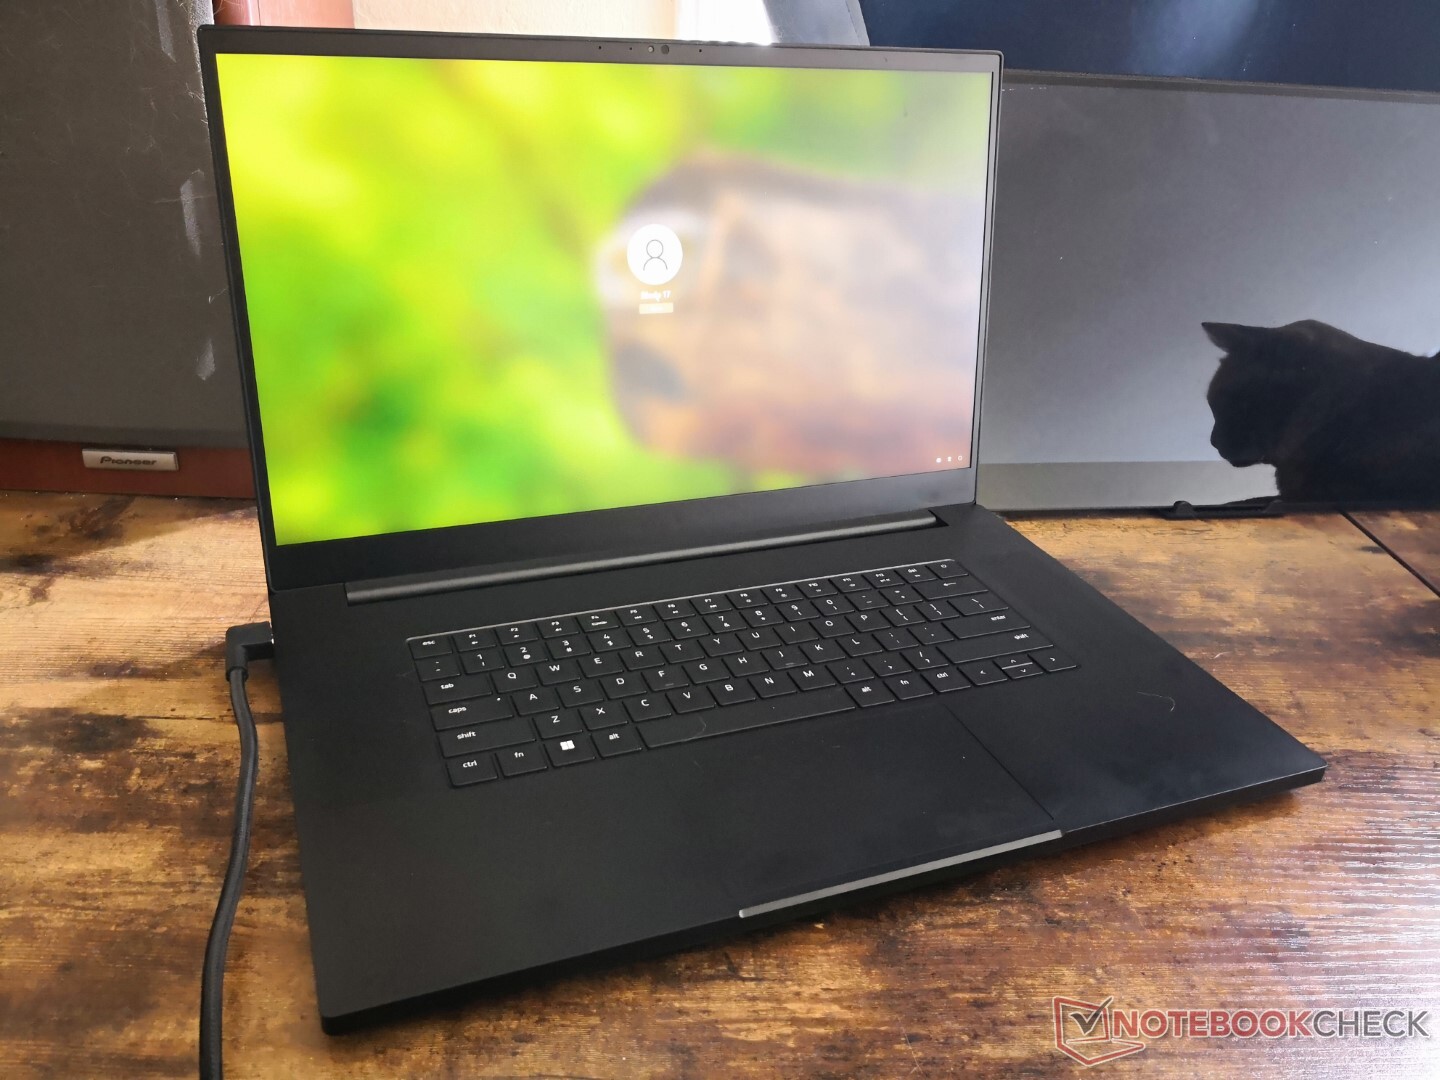
Caso - Stesso, ma diverso
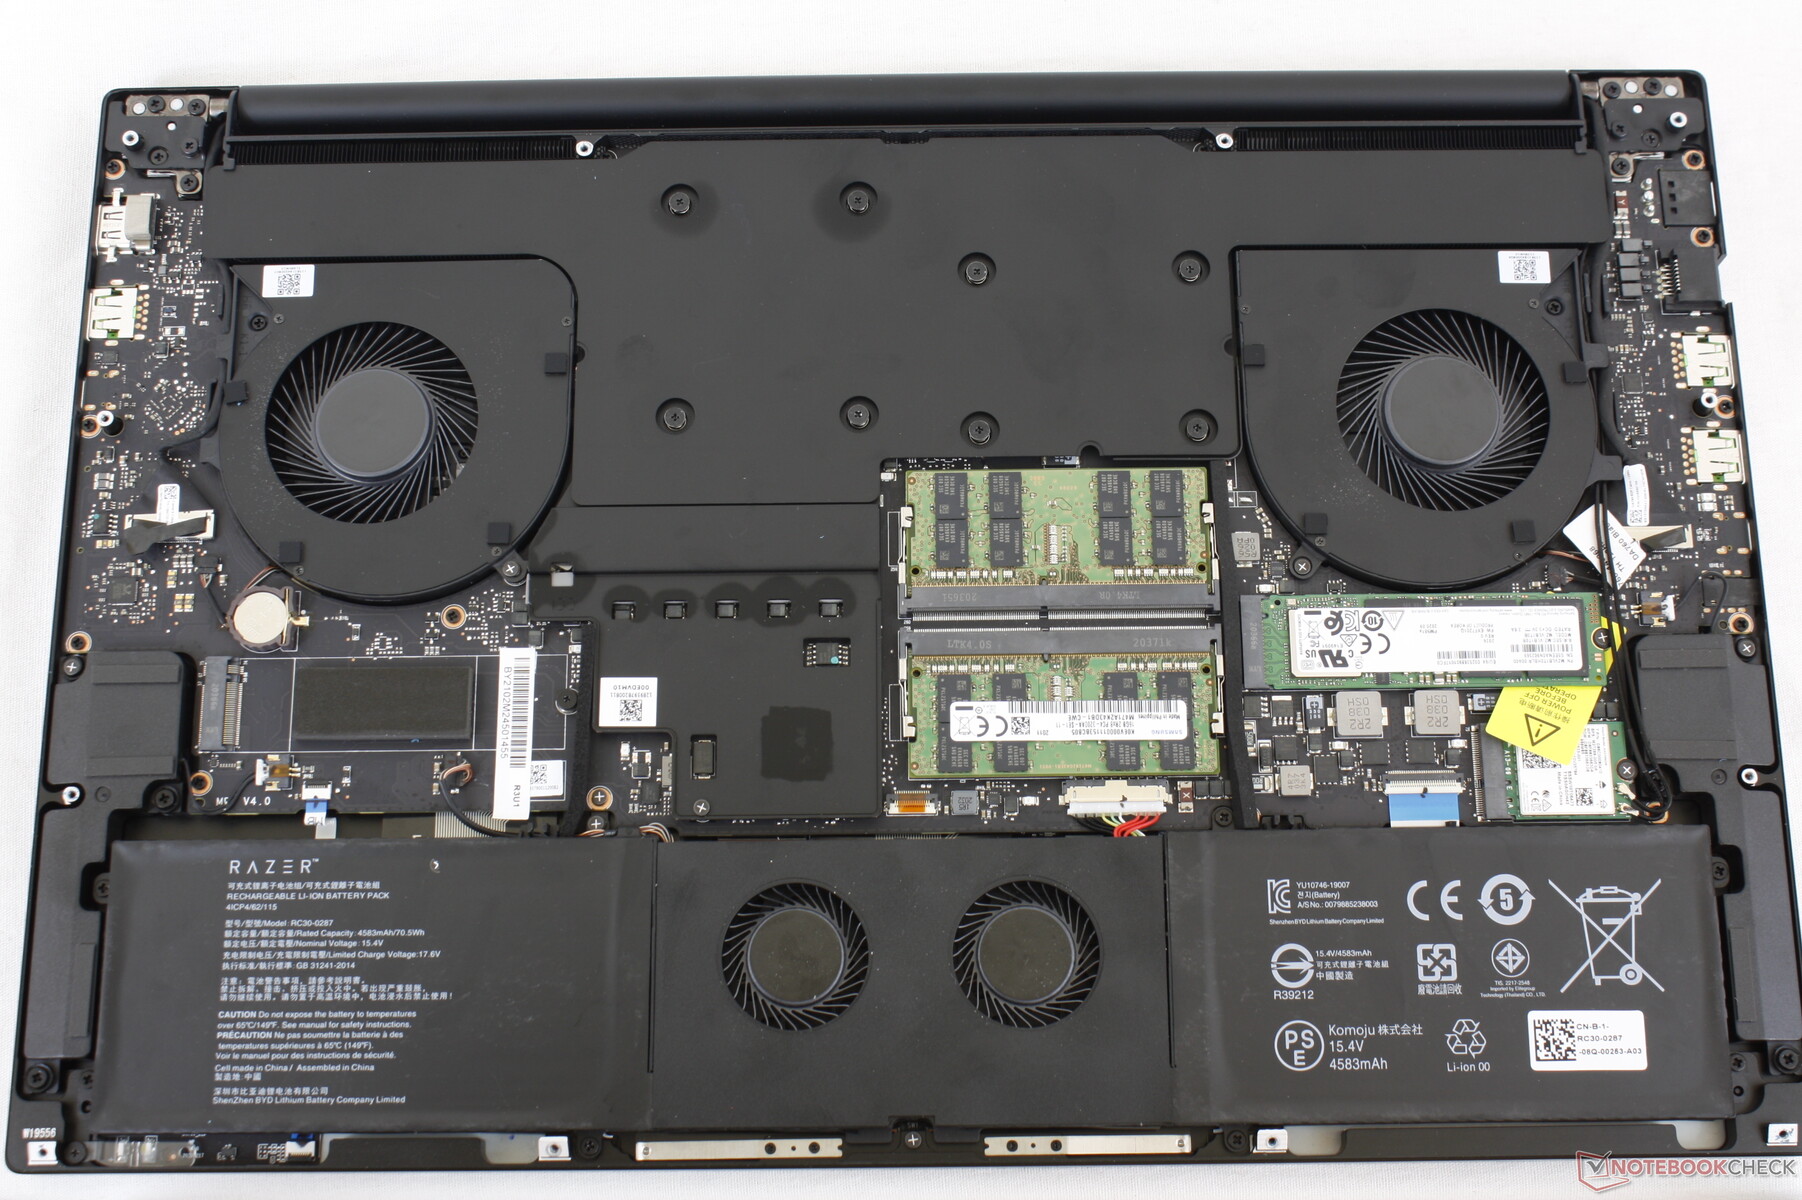
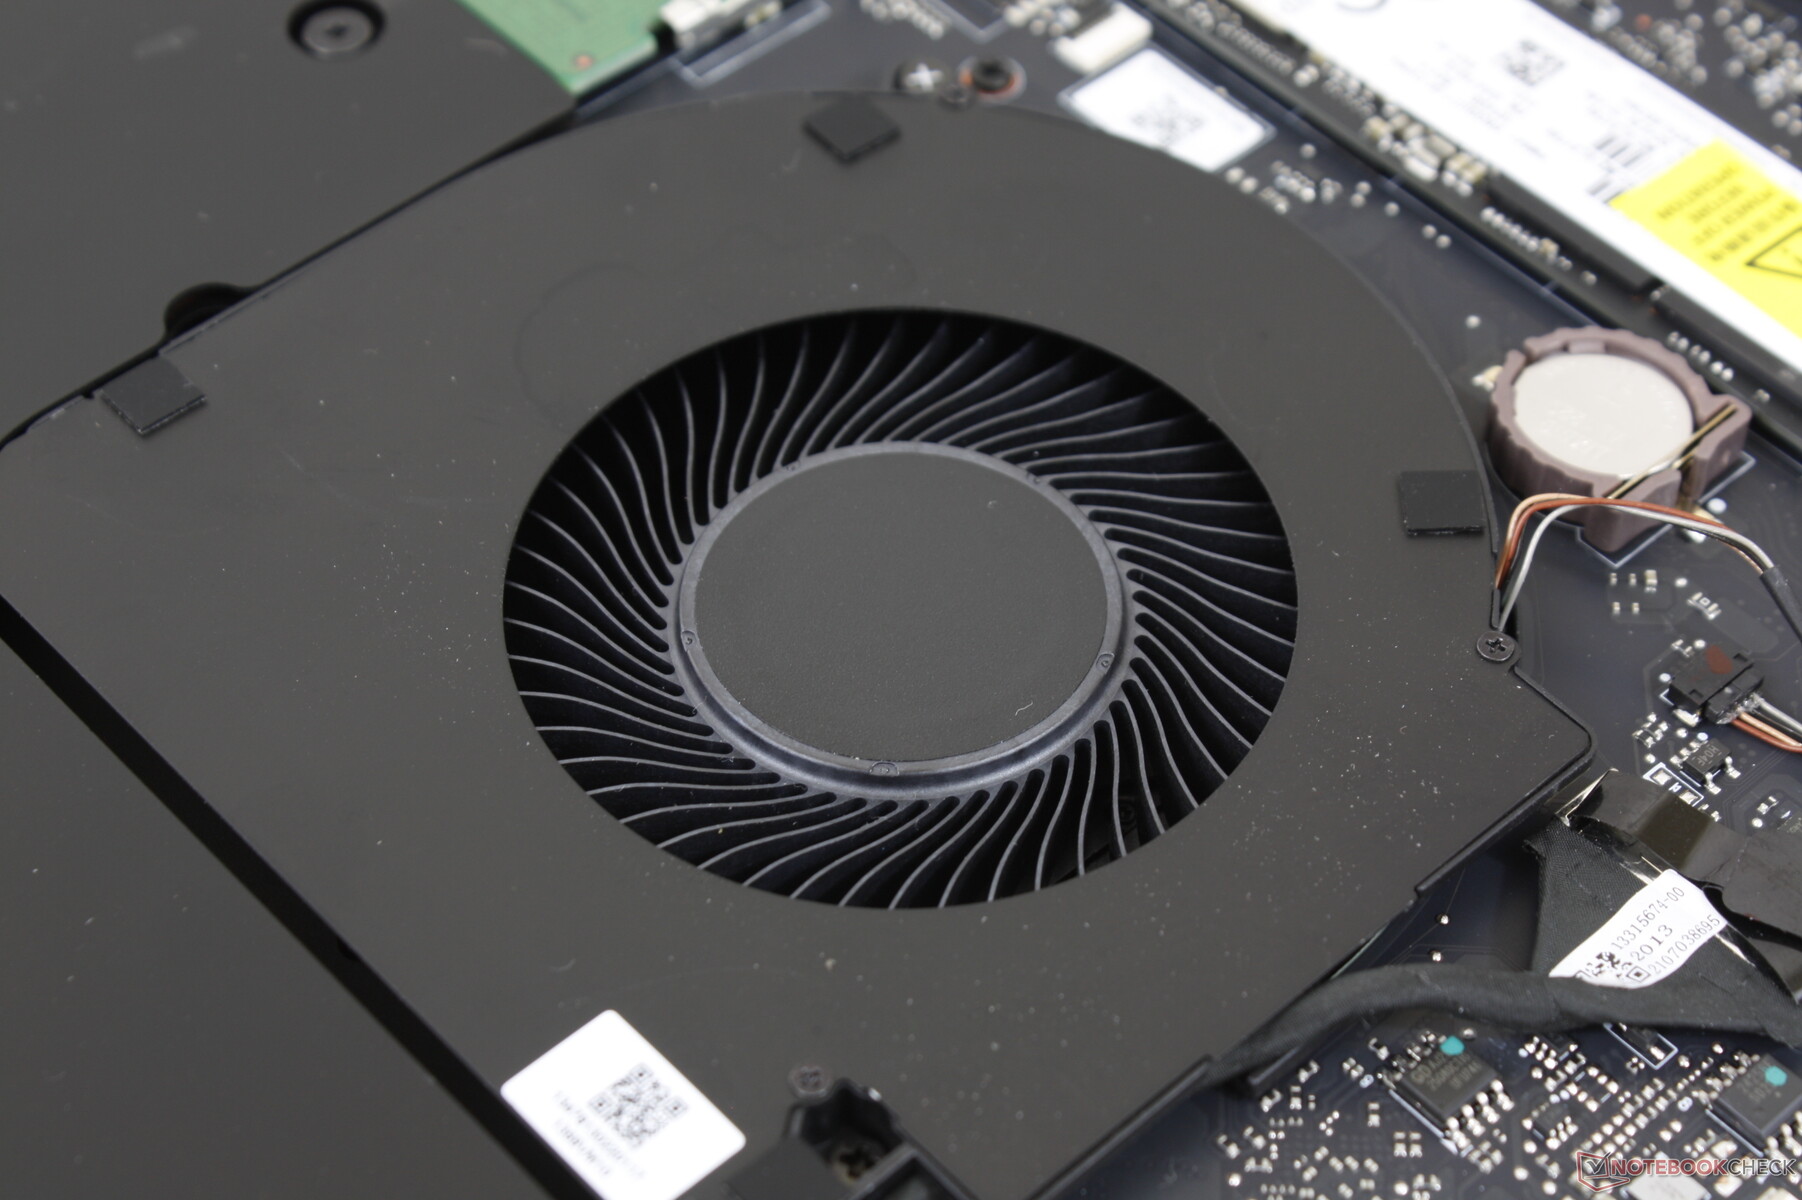
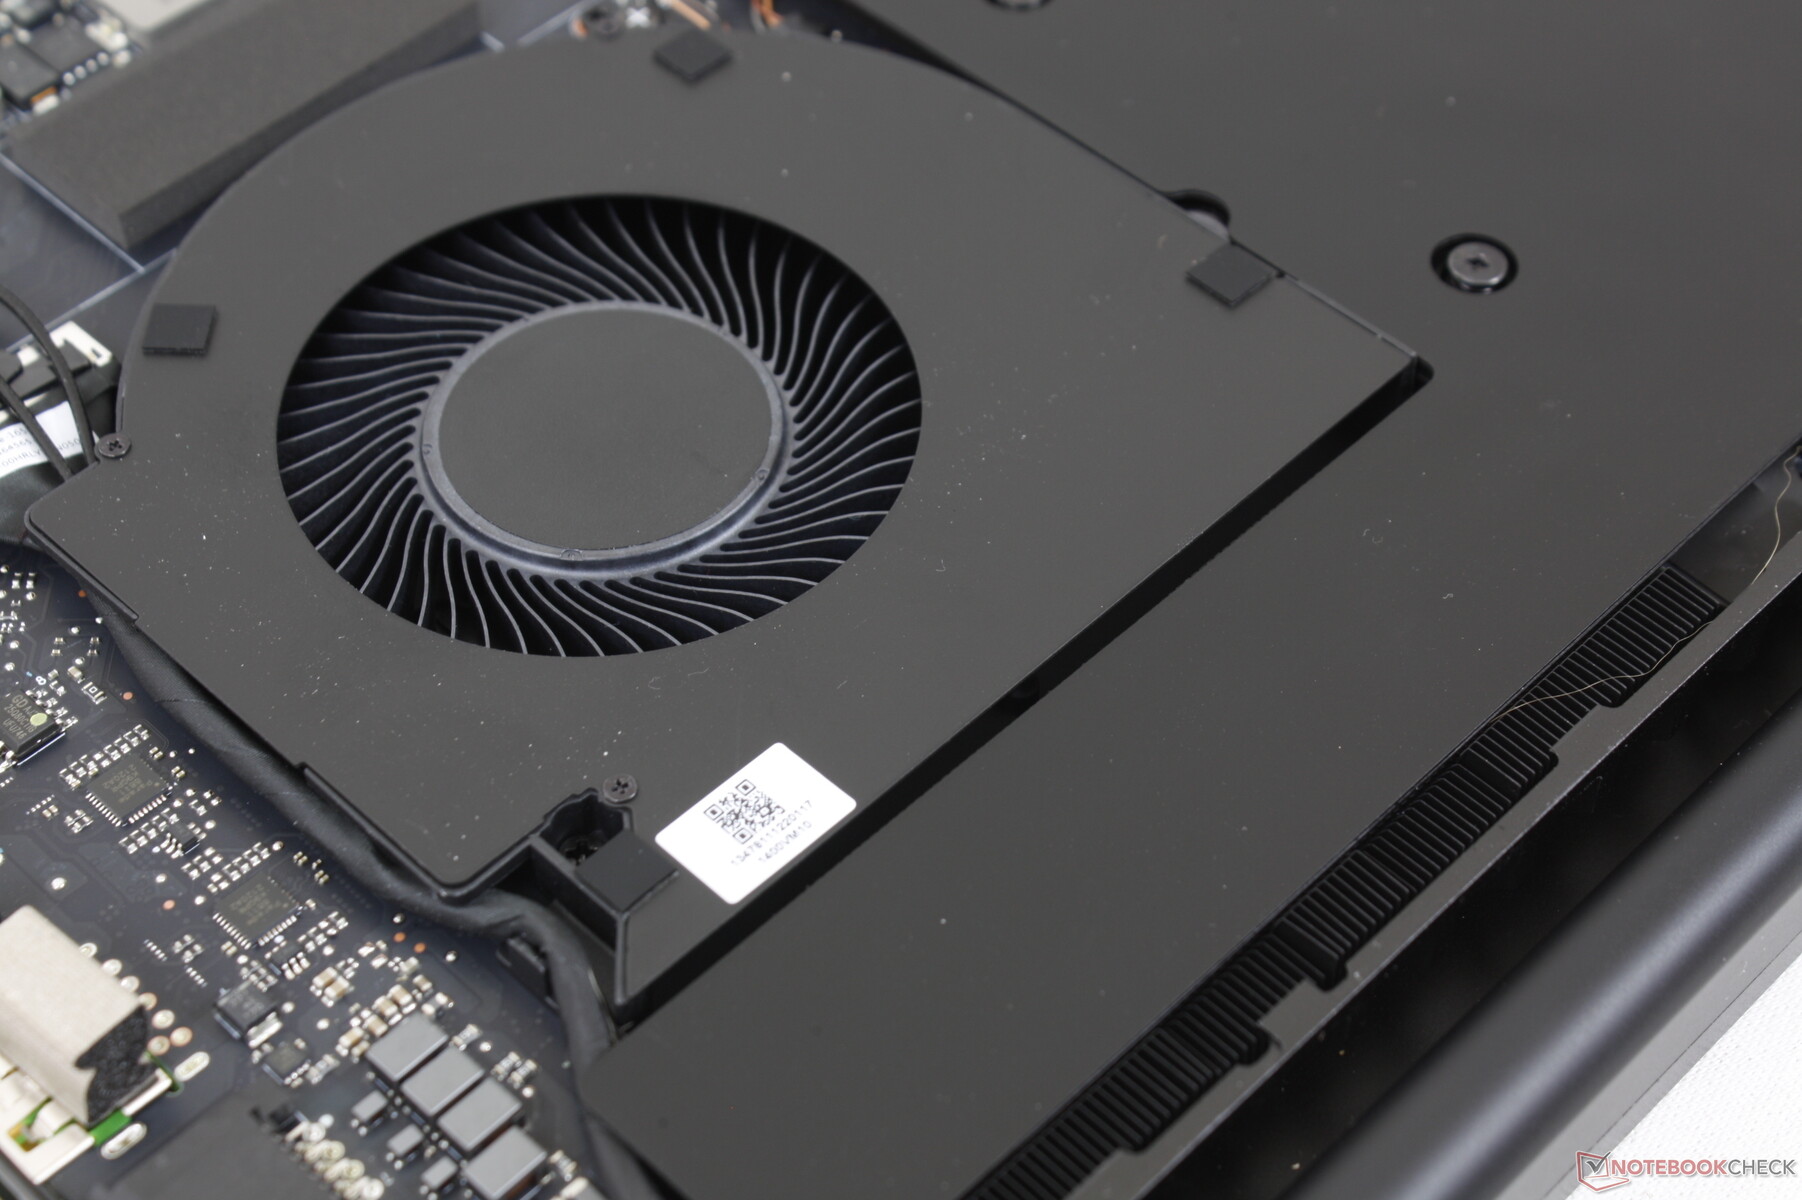
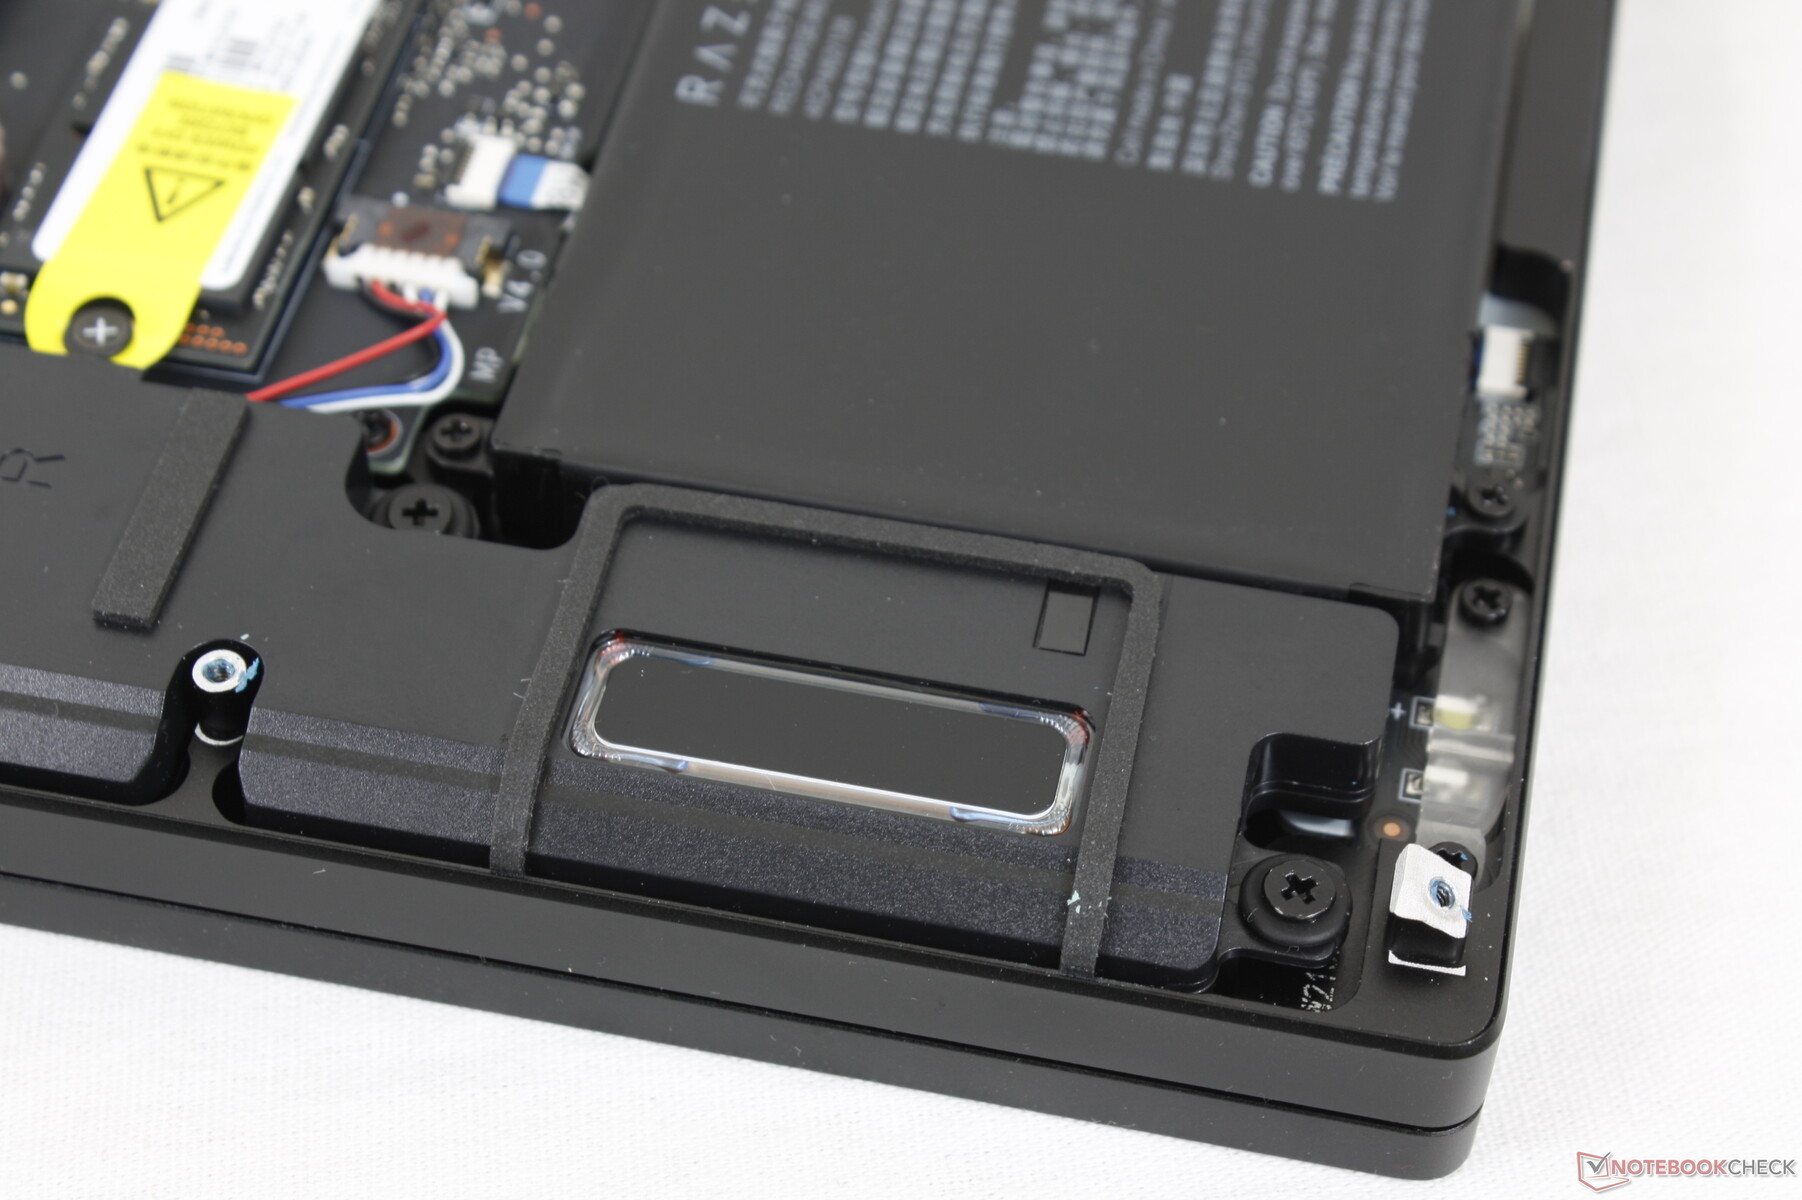
Lo chassis esterno è identico al modello dell'anno scorso, ma con due differenze visive chiave. In primo luogo, i cappucci della tastiera sono ora più grandi di quanto lo fossero nei modelli precedenti. In secondo luogo, ora si possono vedere solo tre ventole attraverso le griglie sul fondo dell'unità invece di quattro, poiché Razer ha rimosso una delle ventole. Questi piccoli cambiamenti hanno un impatto sulla batteria e sulle temperature complessive, come mostrerà la nostra recensione.

Connettività - Ora con due porte Thunderbolt 4
Le opzioni delle porte rimangono identiche al modello Intel di decima generazione, tranne che per una differenza chiave: entrambe le porte USB-C ora supportano Thunderbolt invece di una sola. Il nuovo modello è compatibile anche con l'adattatore AC dell'anno scorso, ma le prestazioni possono essere influenzate dal fatto che il nuovo modello 2022 utilizza un adattatore da 280 W di capacità superiore.
Lettore di schede SD
| SD Card Reader | |
| average JPG Copy Test (av. of 3 runs) | |
| Razer Blade Pro 17 2021 (QHD Touch) (Toshiba Exceria Pro SDXC 64 GB UHS-II) | |
| MSI GS76 Stealth 11UH (AV PRO microSD 128 GB V60) | |
| Aorus 17G YD (AV PRO microSD 128 GB V60) | |
| Asus ROG Zephyrus S17 GX703HSD | |
| Alienware x17 RTX 3080 P48E (AV Pro V60) | |
| Razer Blade 17 RTX 3080 Ti (AV Pro V60) | |
| maximum AS SSD Seq Read Test (1GB) | |
| Asus ROG Zephyrus S17 GX703HSD | |
| Alienware x17 RTX 3080 P48E (AV Pro V60) | |
| MSI GS76 Stealth 11UH (AV PRO microSD 128 GB V60) | |
| Aorus 17G YD (AV PRO microSD 128 GB V60) | |
| Razer Blade Pro 17 2021 (QHD Touch) (Toshiba Exceria Pro SDXC 64 GB UHS-II) | |
| Razer Blade 17 RTX 3080 Ti (AV Pro V60) | |
Comunicazione
Webcam
La webcam è 1080p o 2 MP a differenza delle webcam 720p o 1 MP sulla maggior parte degli altri portatili per un'immagine più nitida. Windows Hello è anche supportato, ma continua a non esserci un otturatore per la privacy.


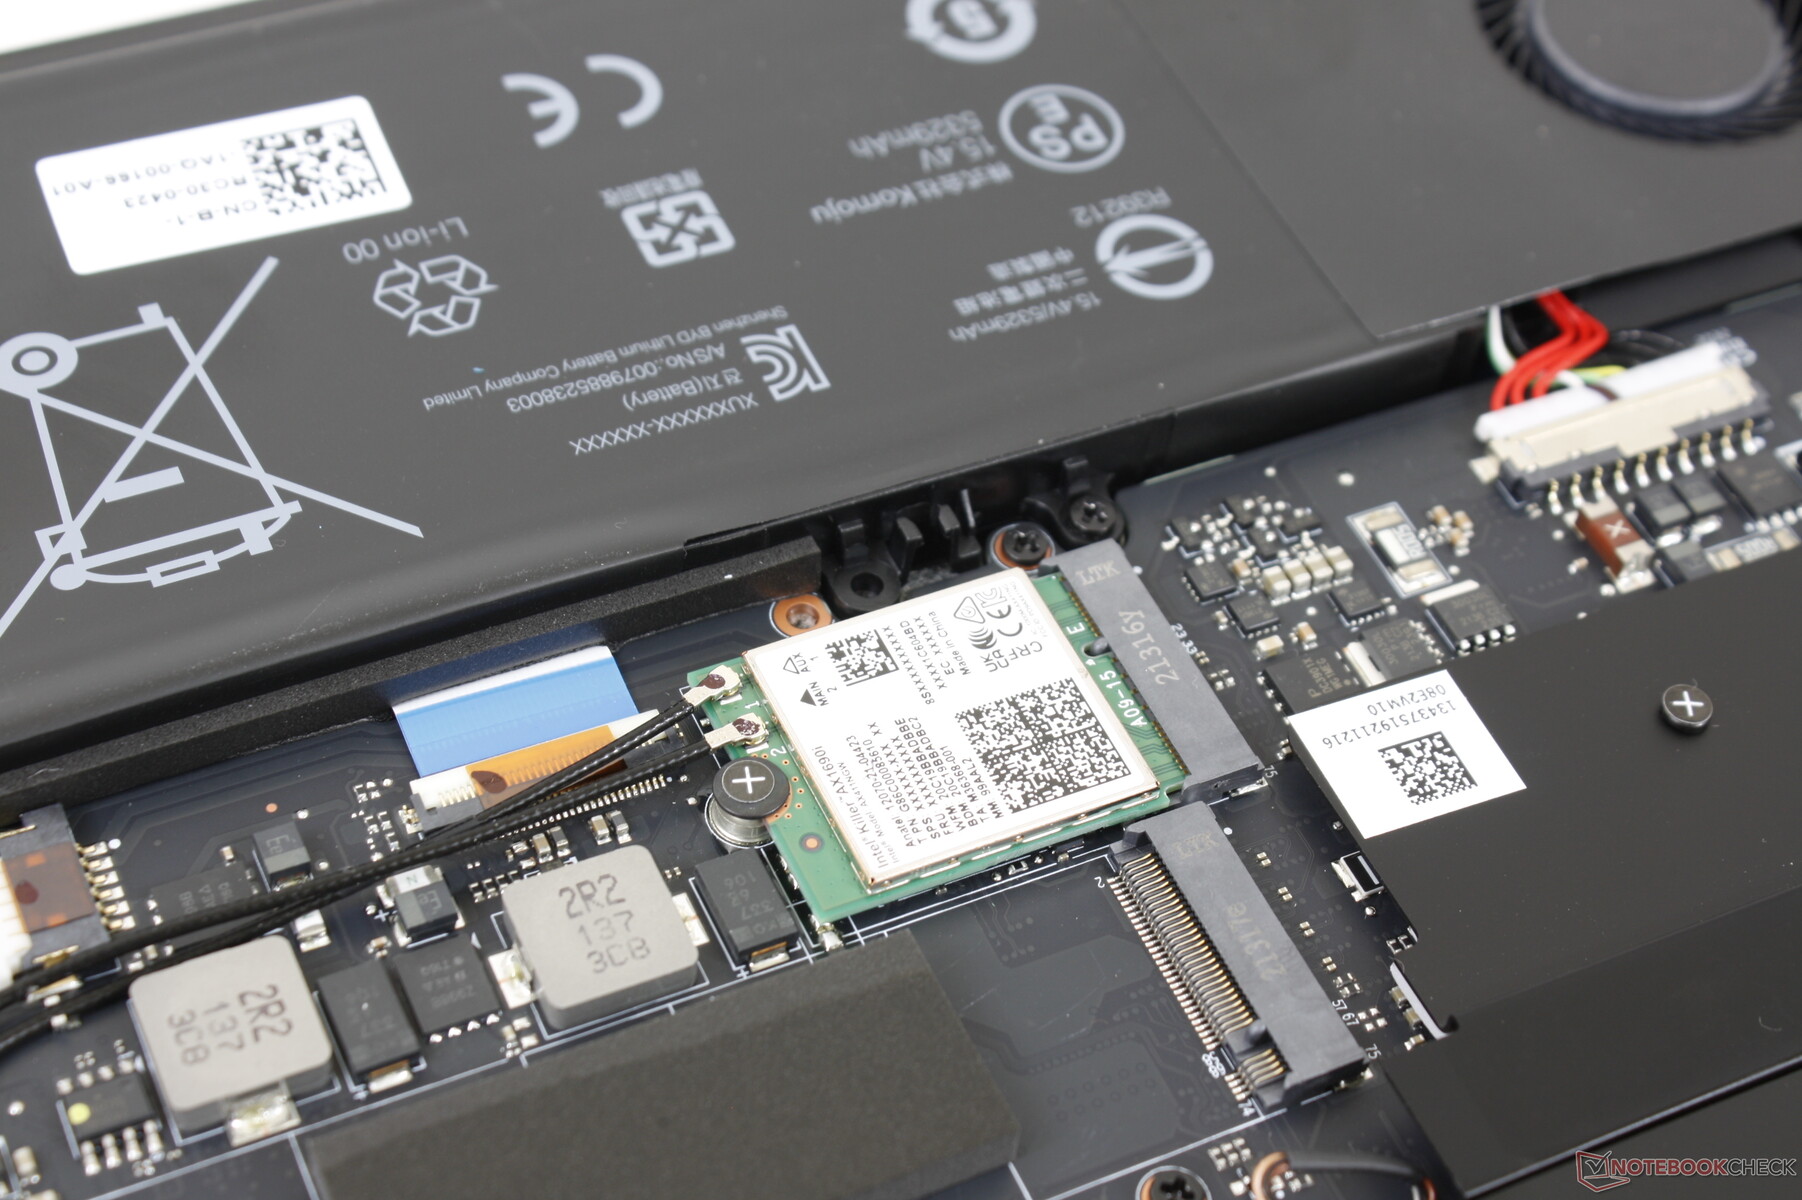
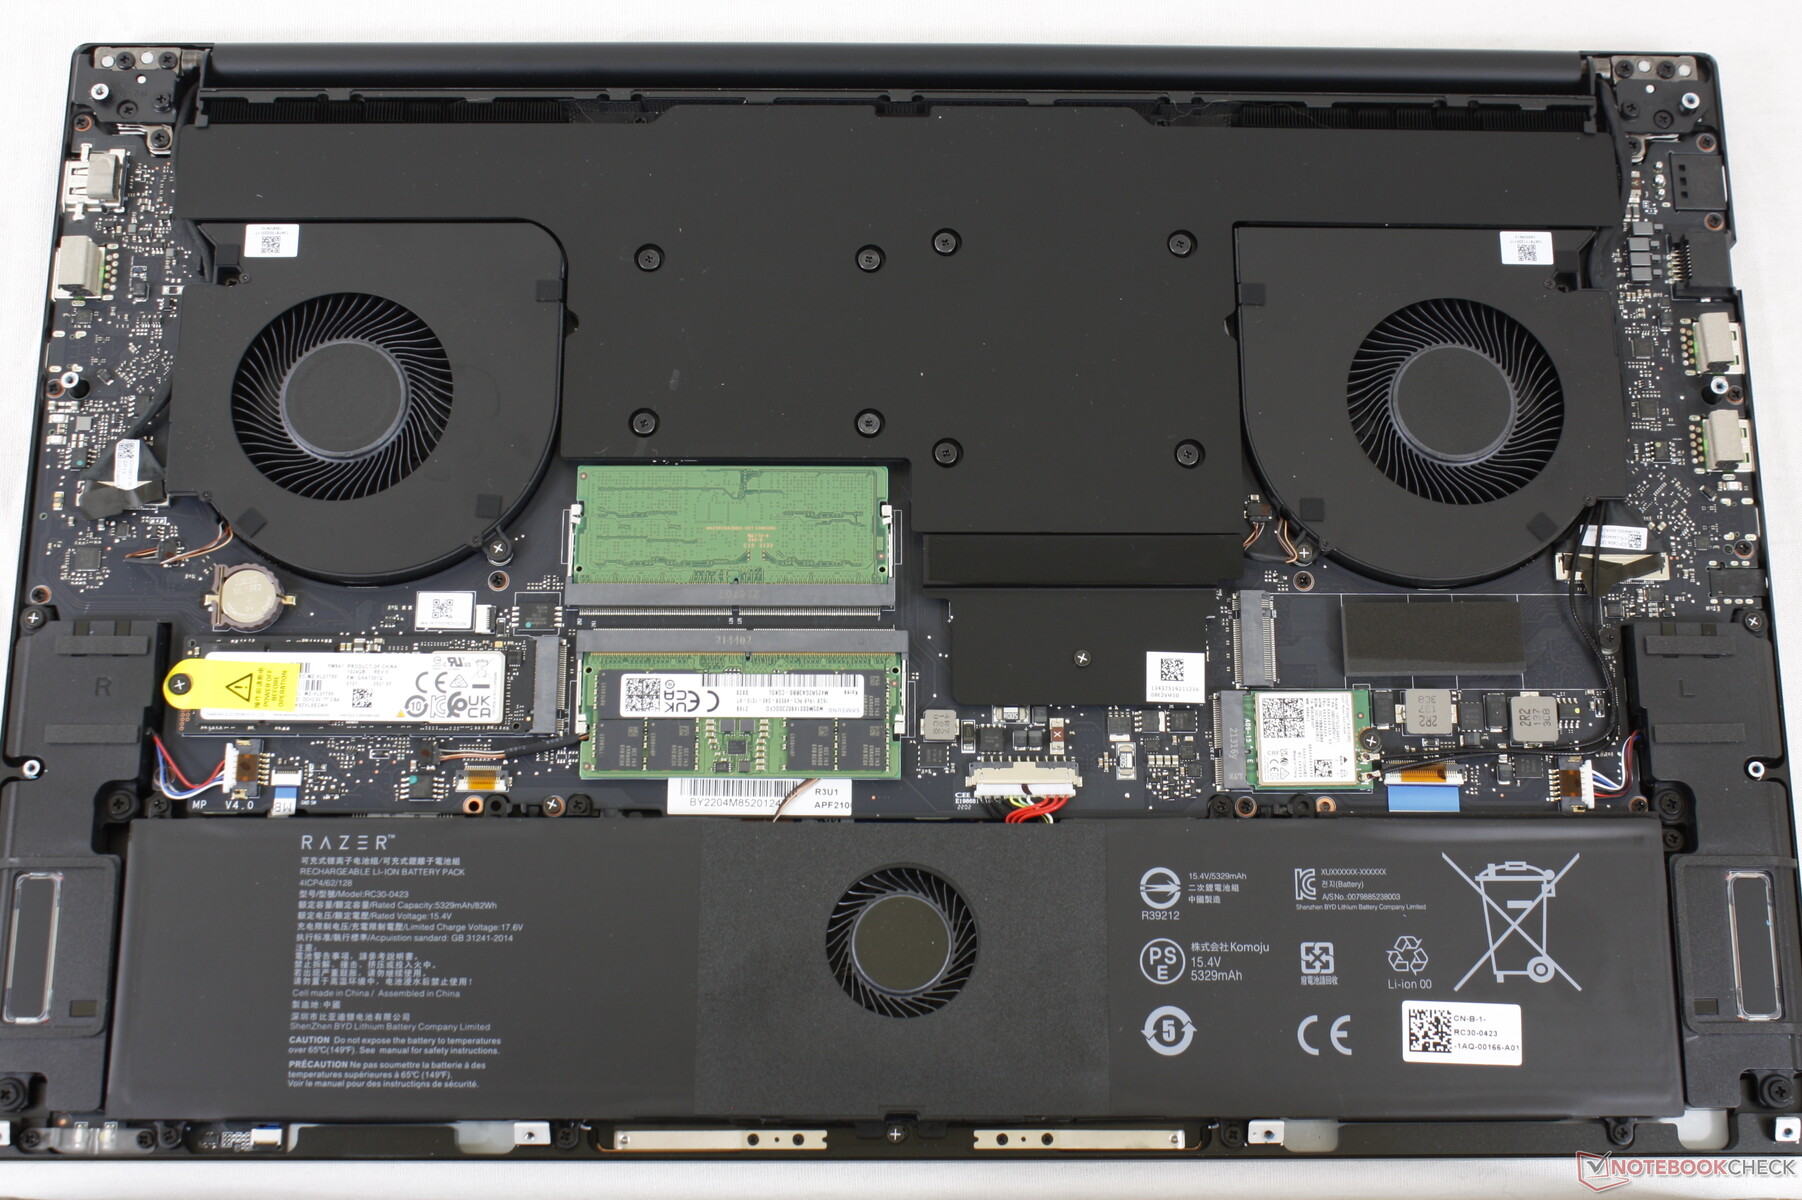
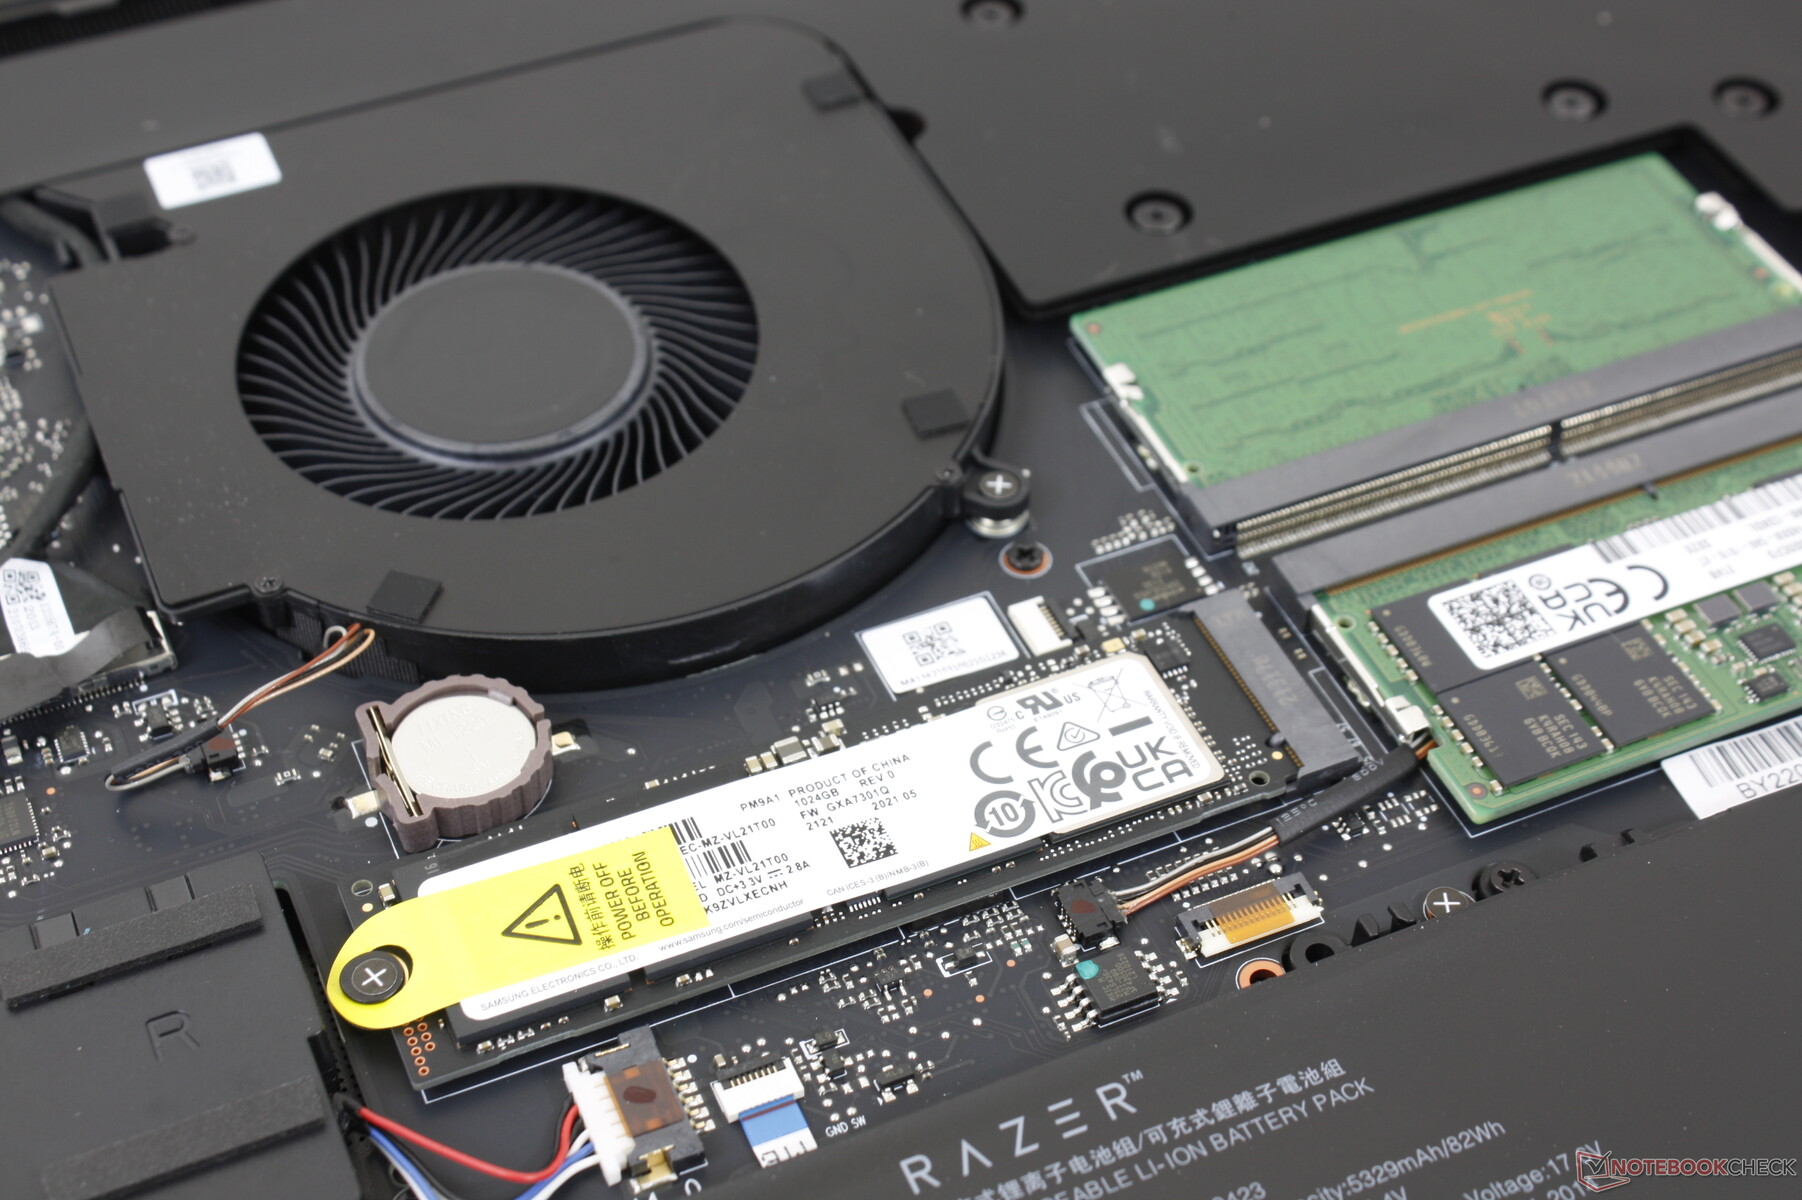
Manutenzione
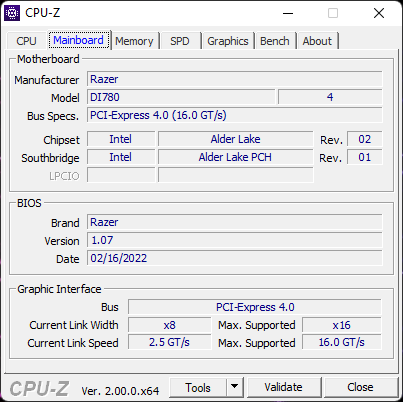
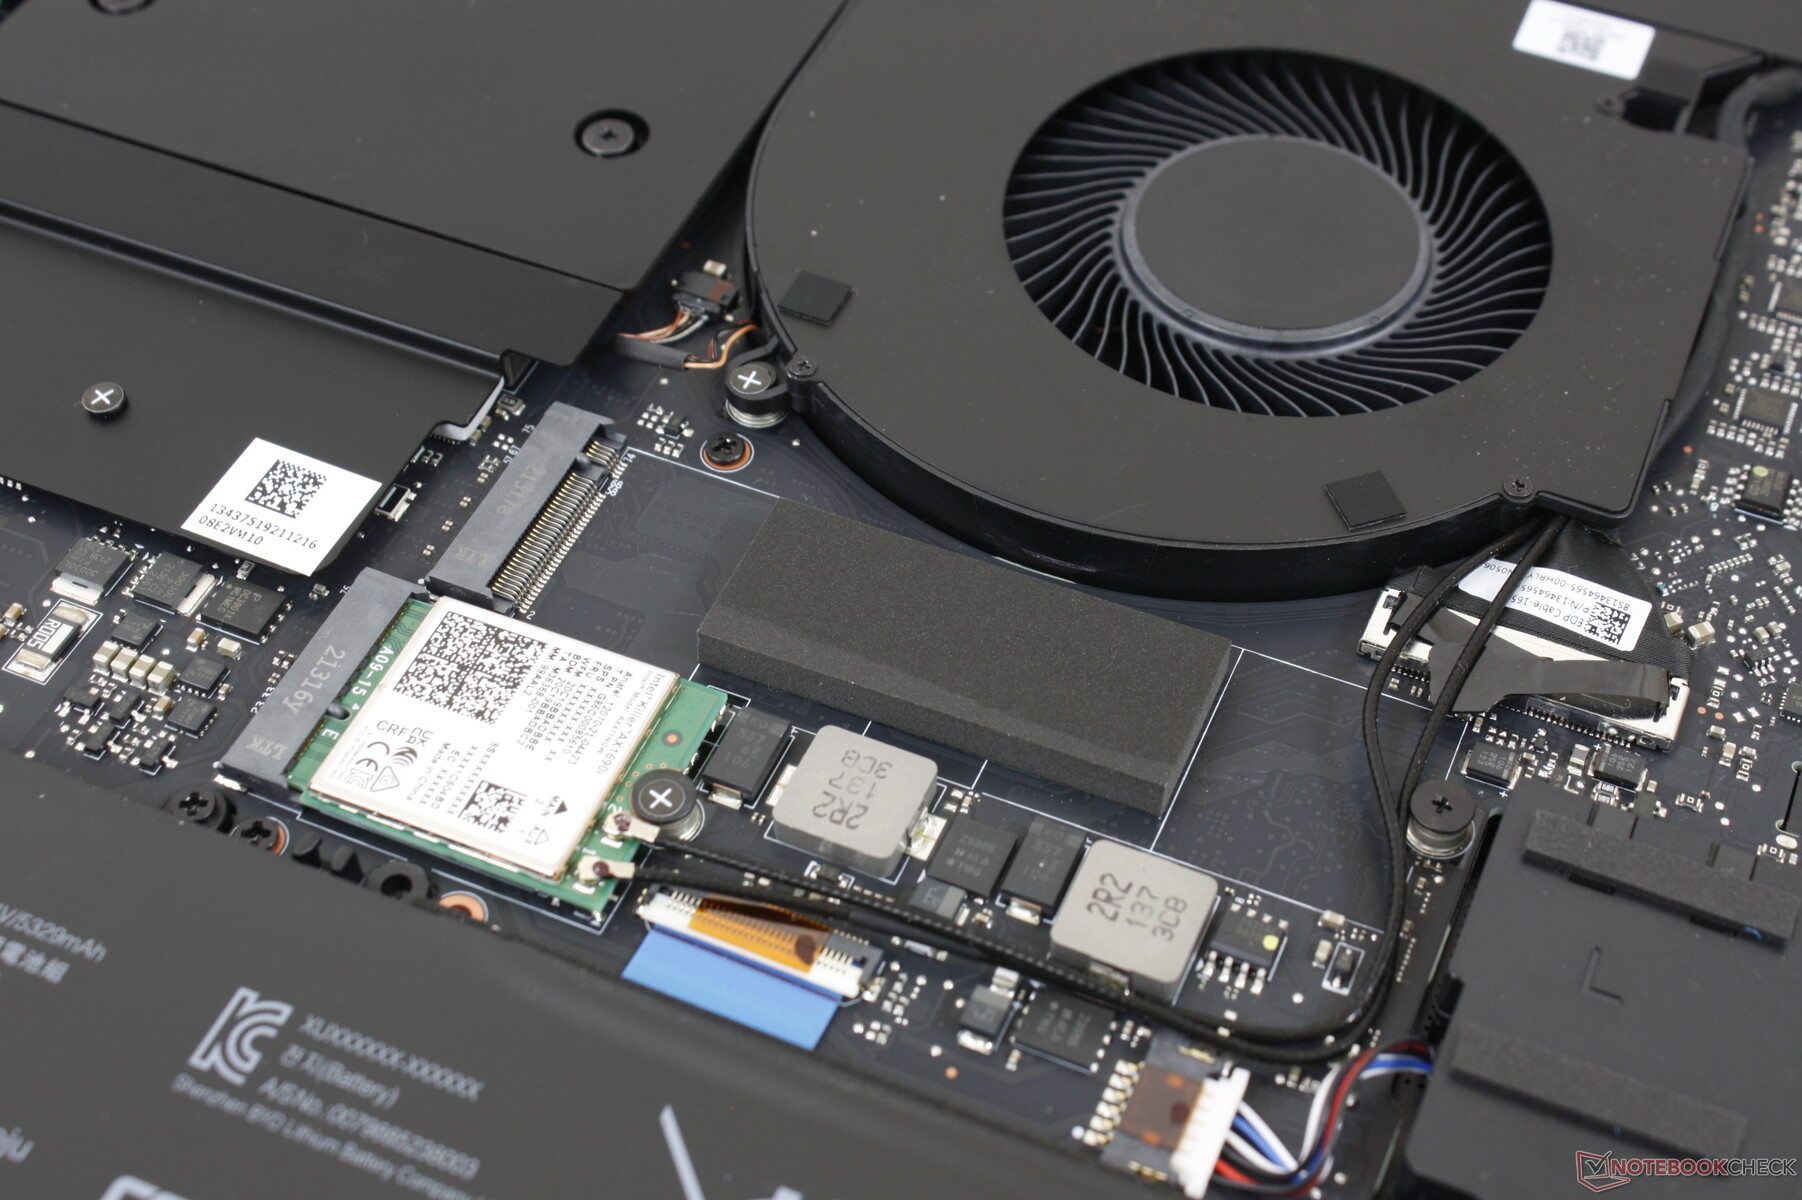
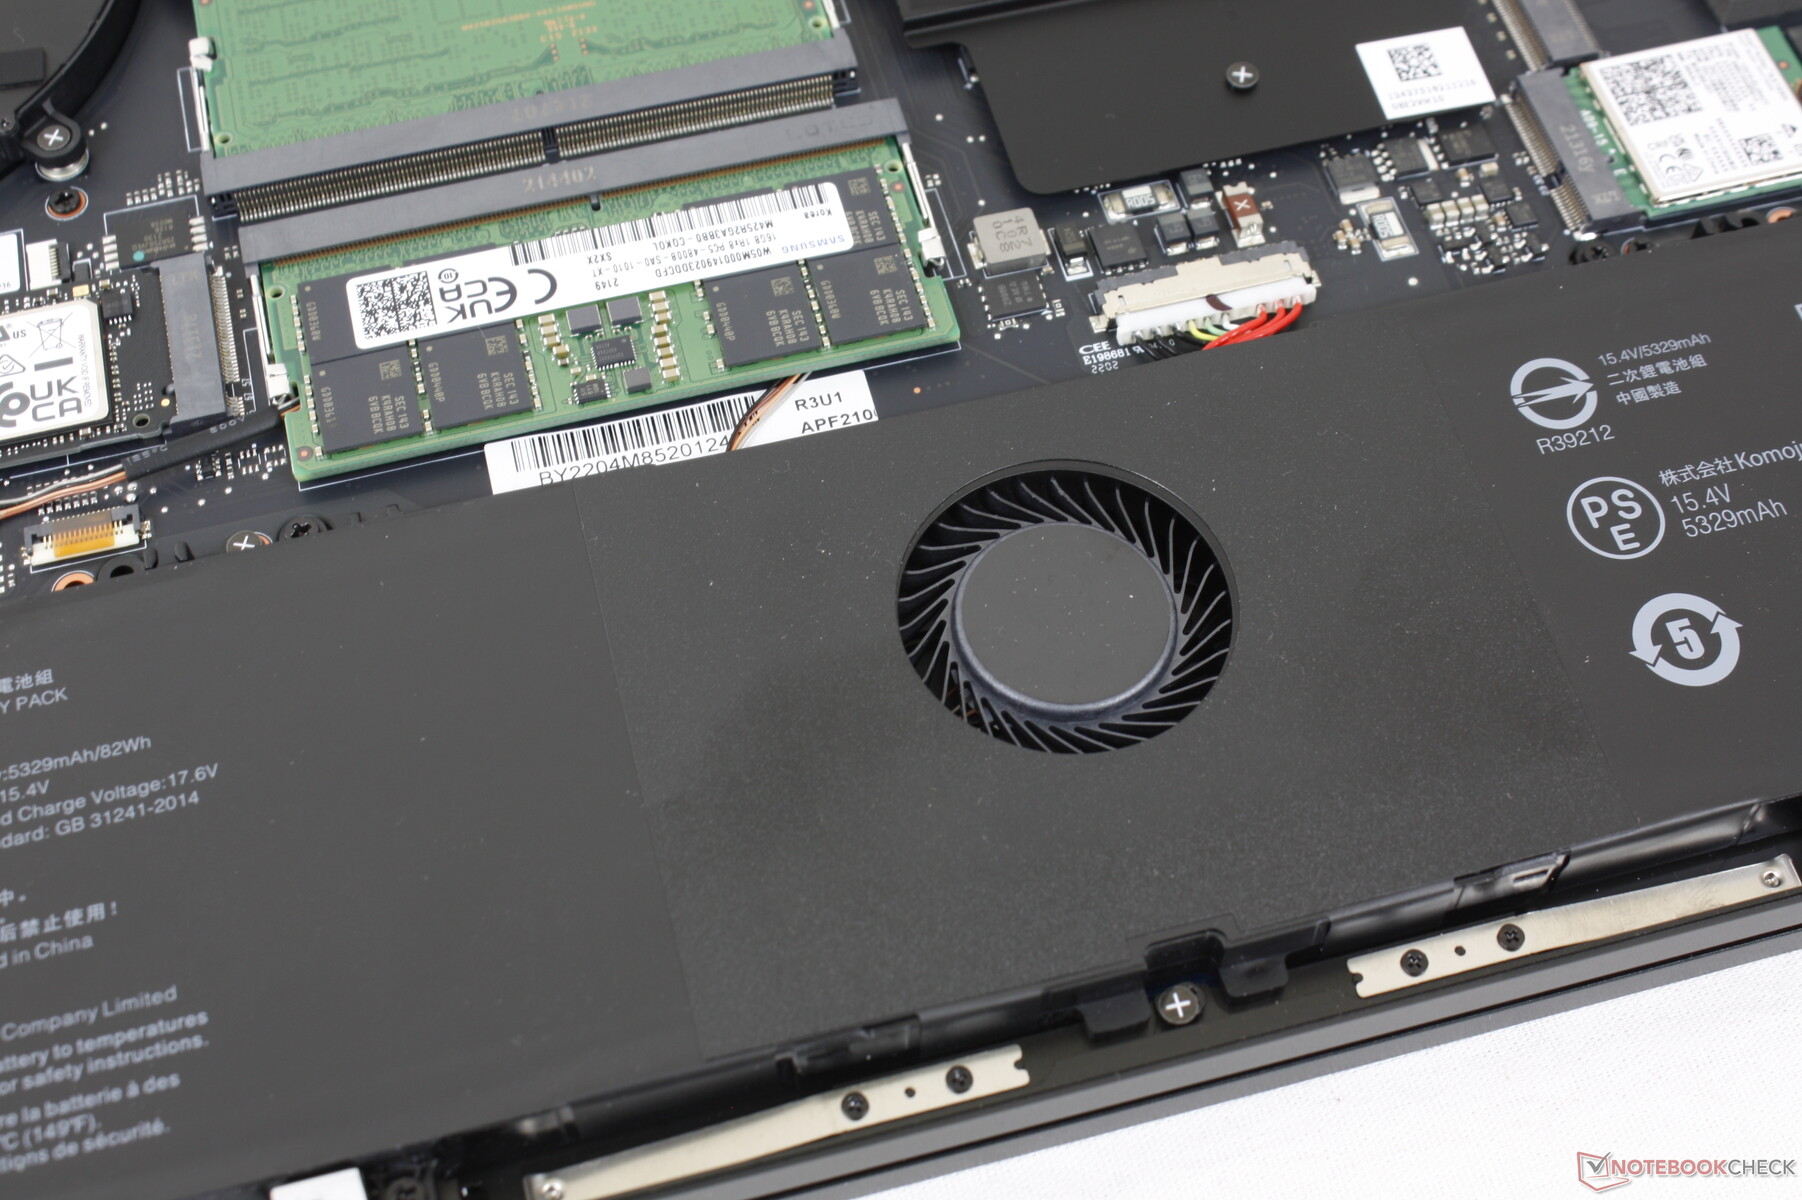
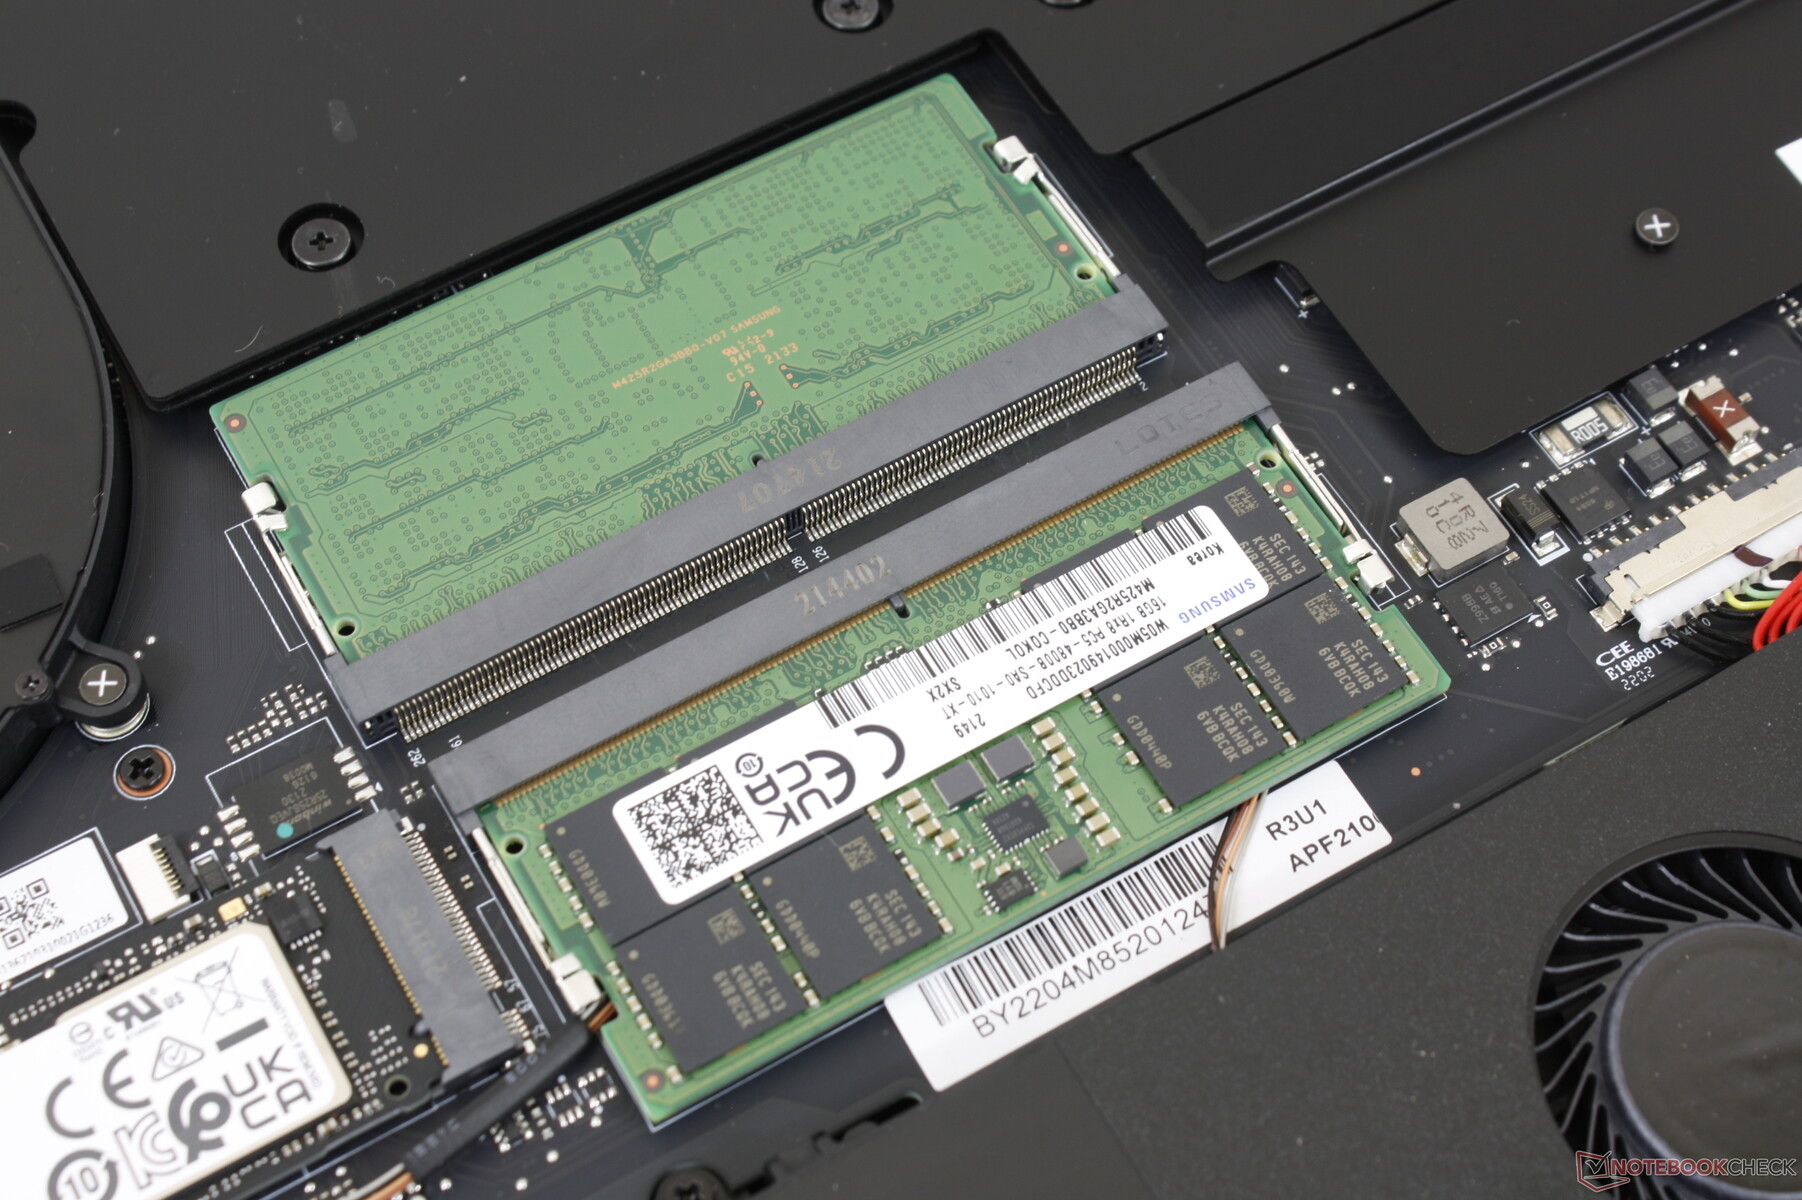
Il pannello inferiore è di nuovo relativamente facile da rimuovere con una chiave Torx T5. Mentre gli utenti hanno accesso diretto ai 2x slot DDR5 SODIMM e 2x slot SSD M.2 PCIe4, il layout della scheda madre è cambiato notevolmente dal modello dell'anno scorso, come mostrato dalle immagini di confronto qui sotto.
Accessori e garanzia
La scatola include l'adattatore AC, la documentazione e un foglio di adesivi con il logo Razer. Razer sta introducendo una garanzia limitata di due anni per la batteria come standard insieme alla garanzia limitata di un anno per il laptop con ogni nuovo acquisto di un modello Blade di 12a generazione.
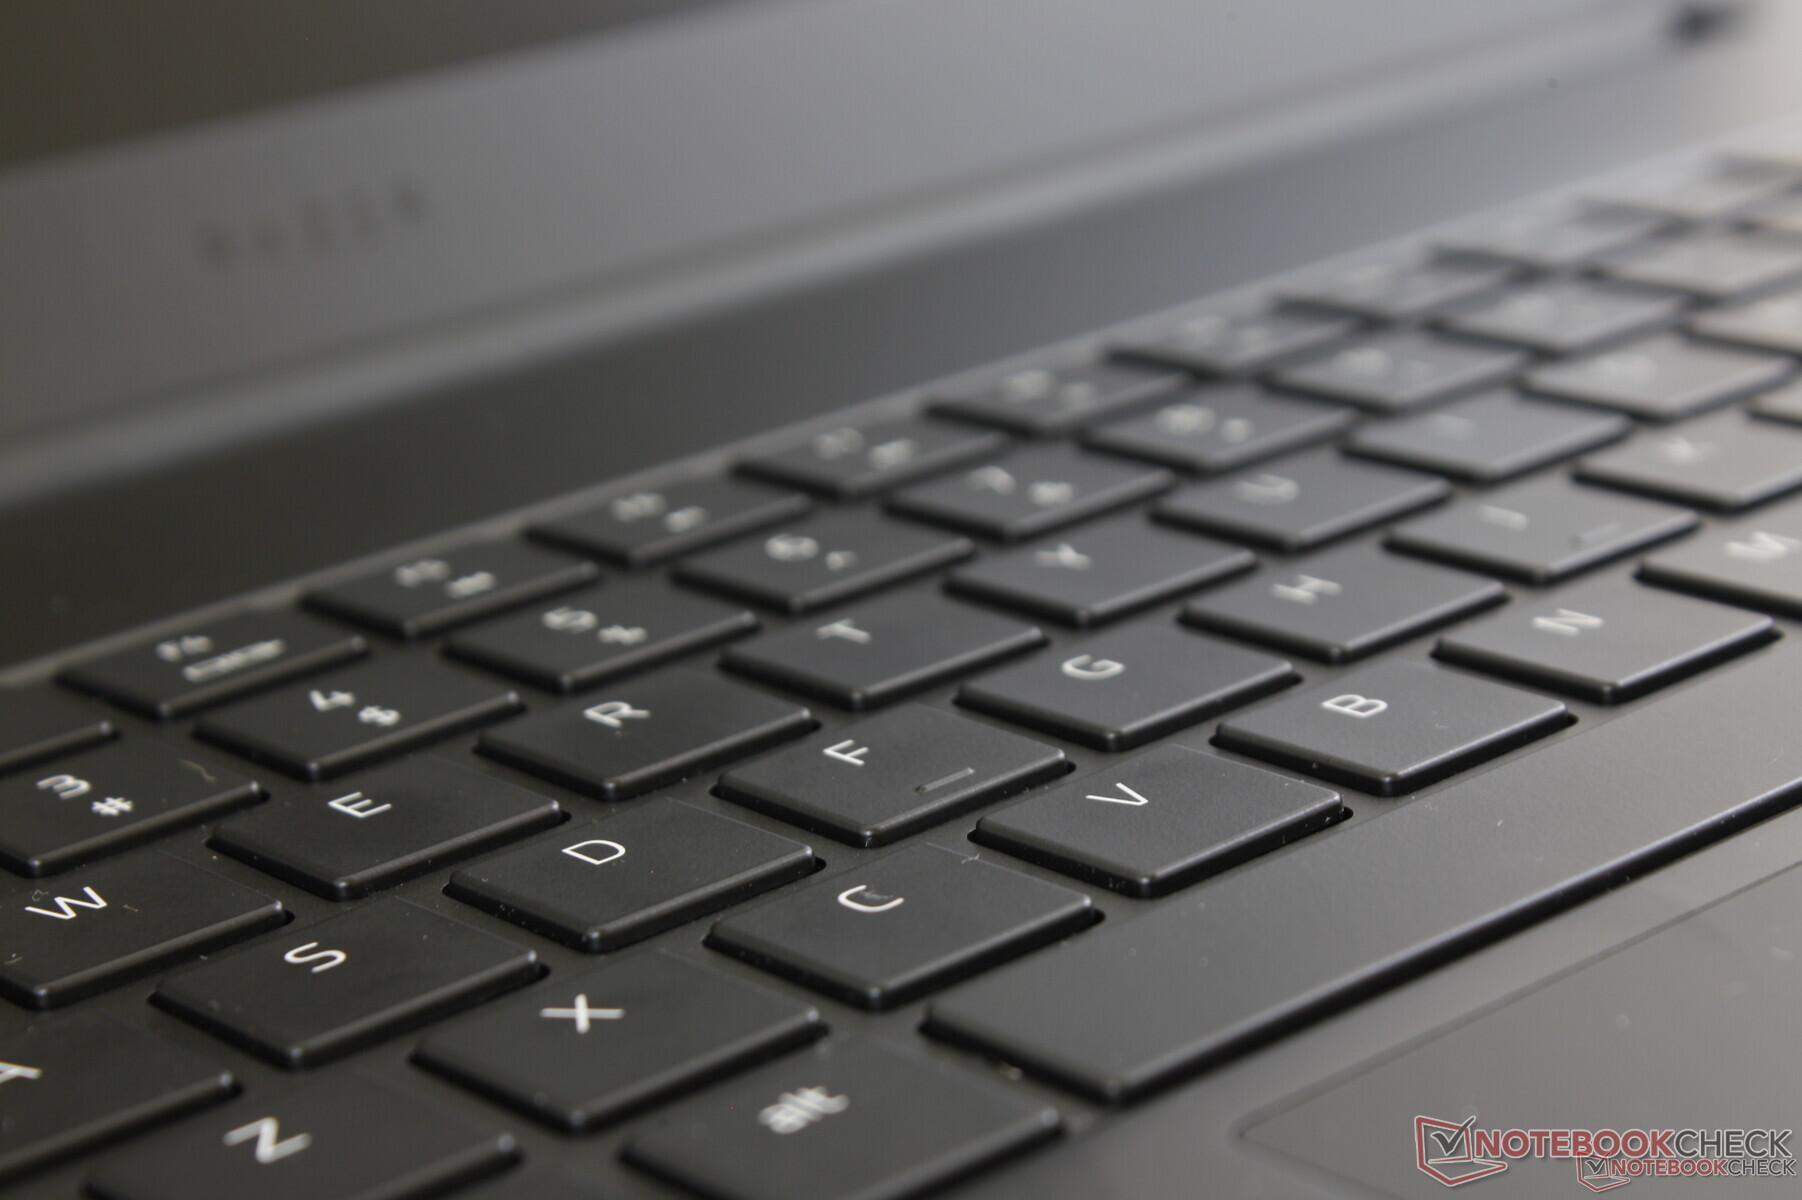
Dispositivi di input - Tasti più grandi, stesso clickpad
Tastiera
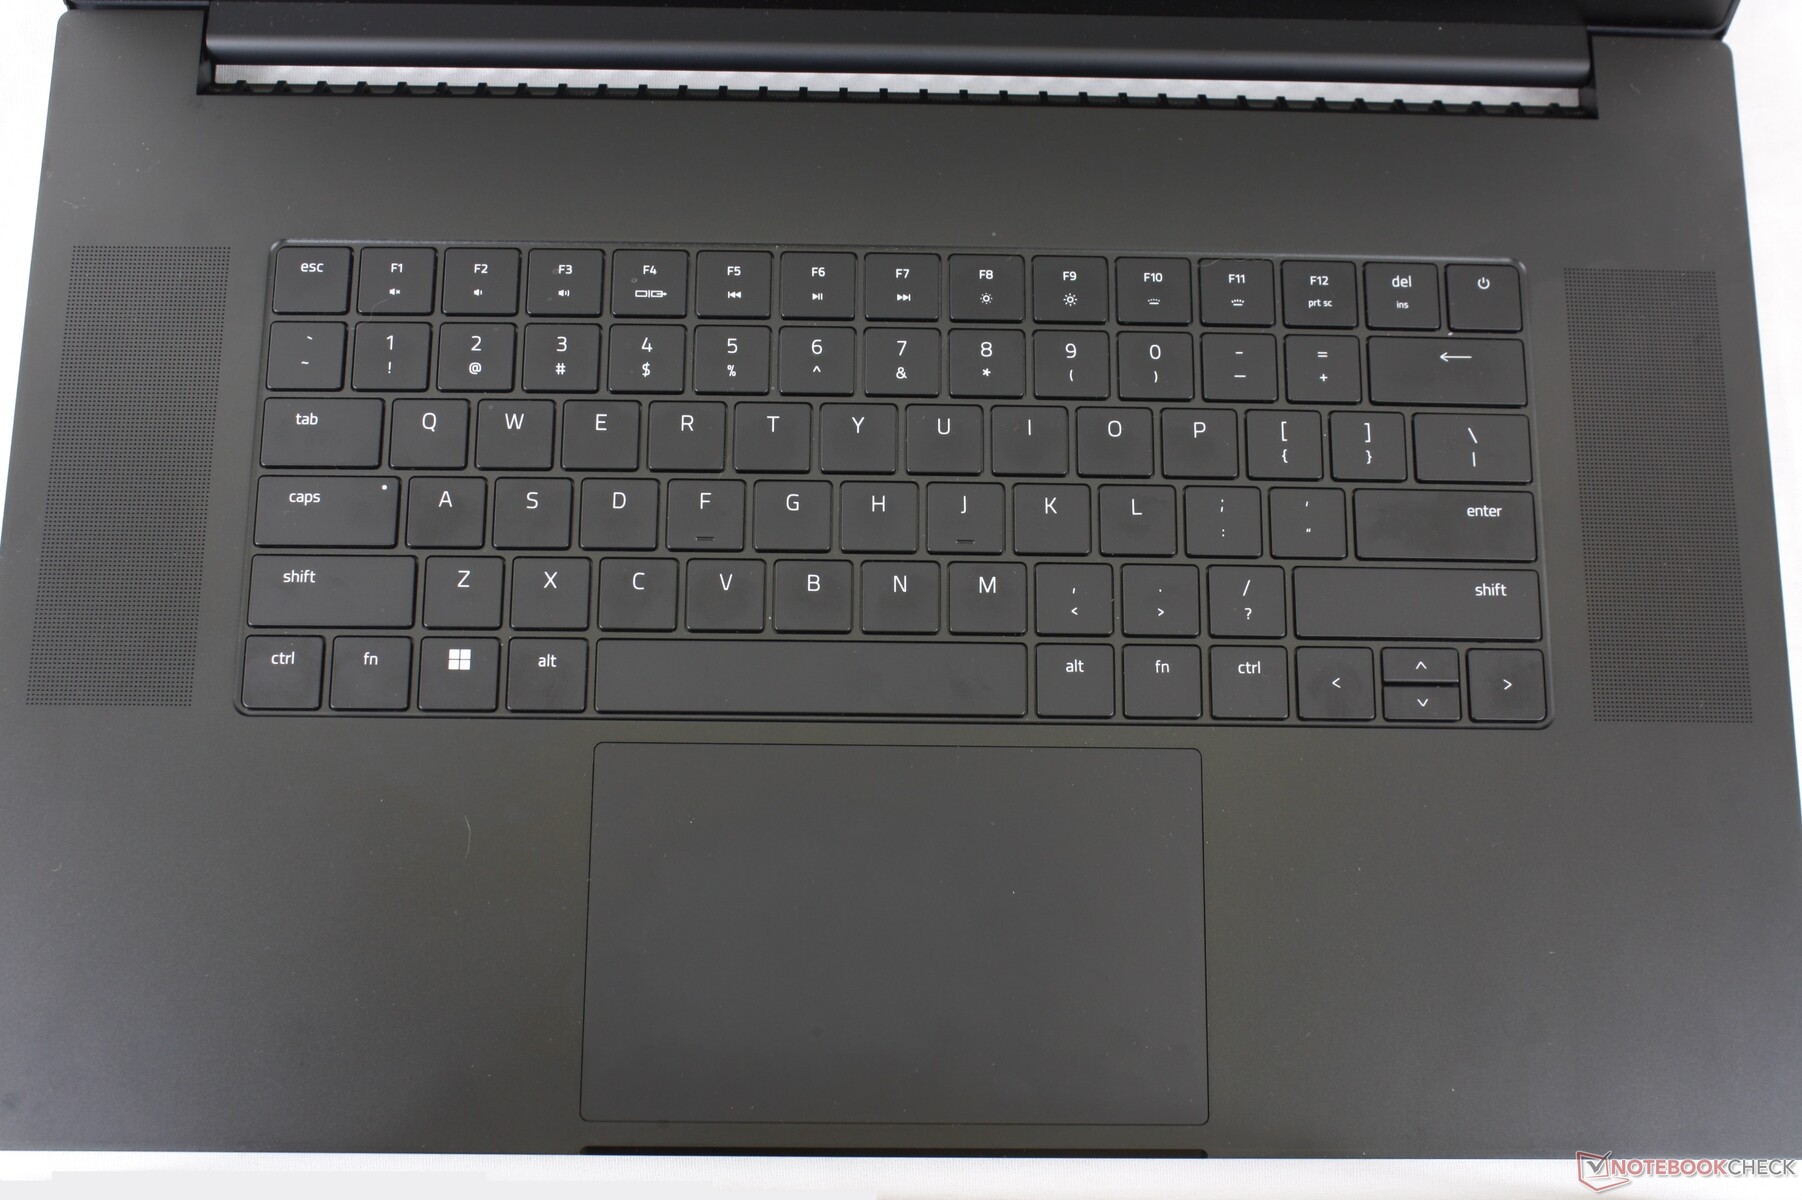
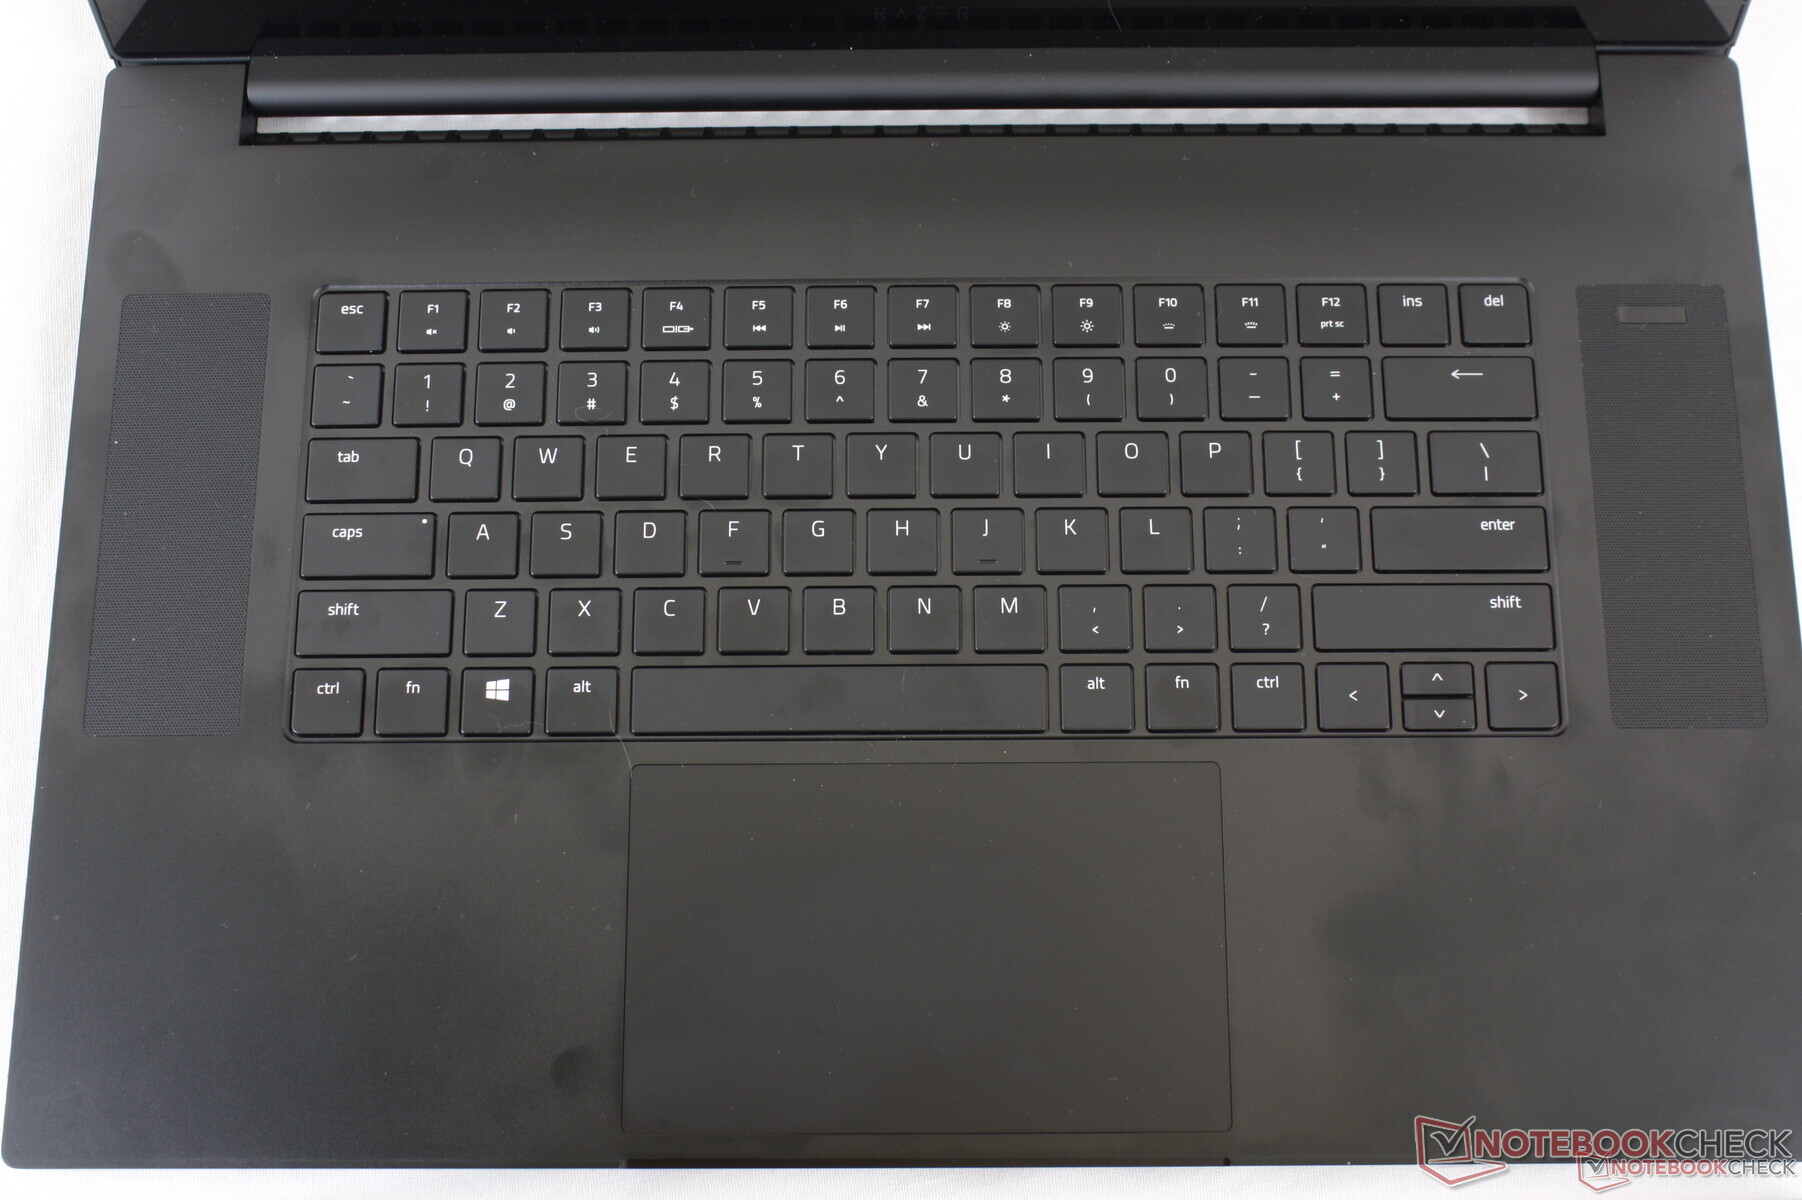
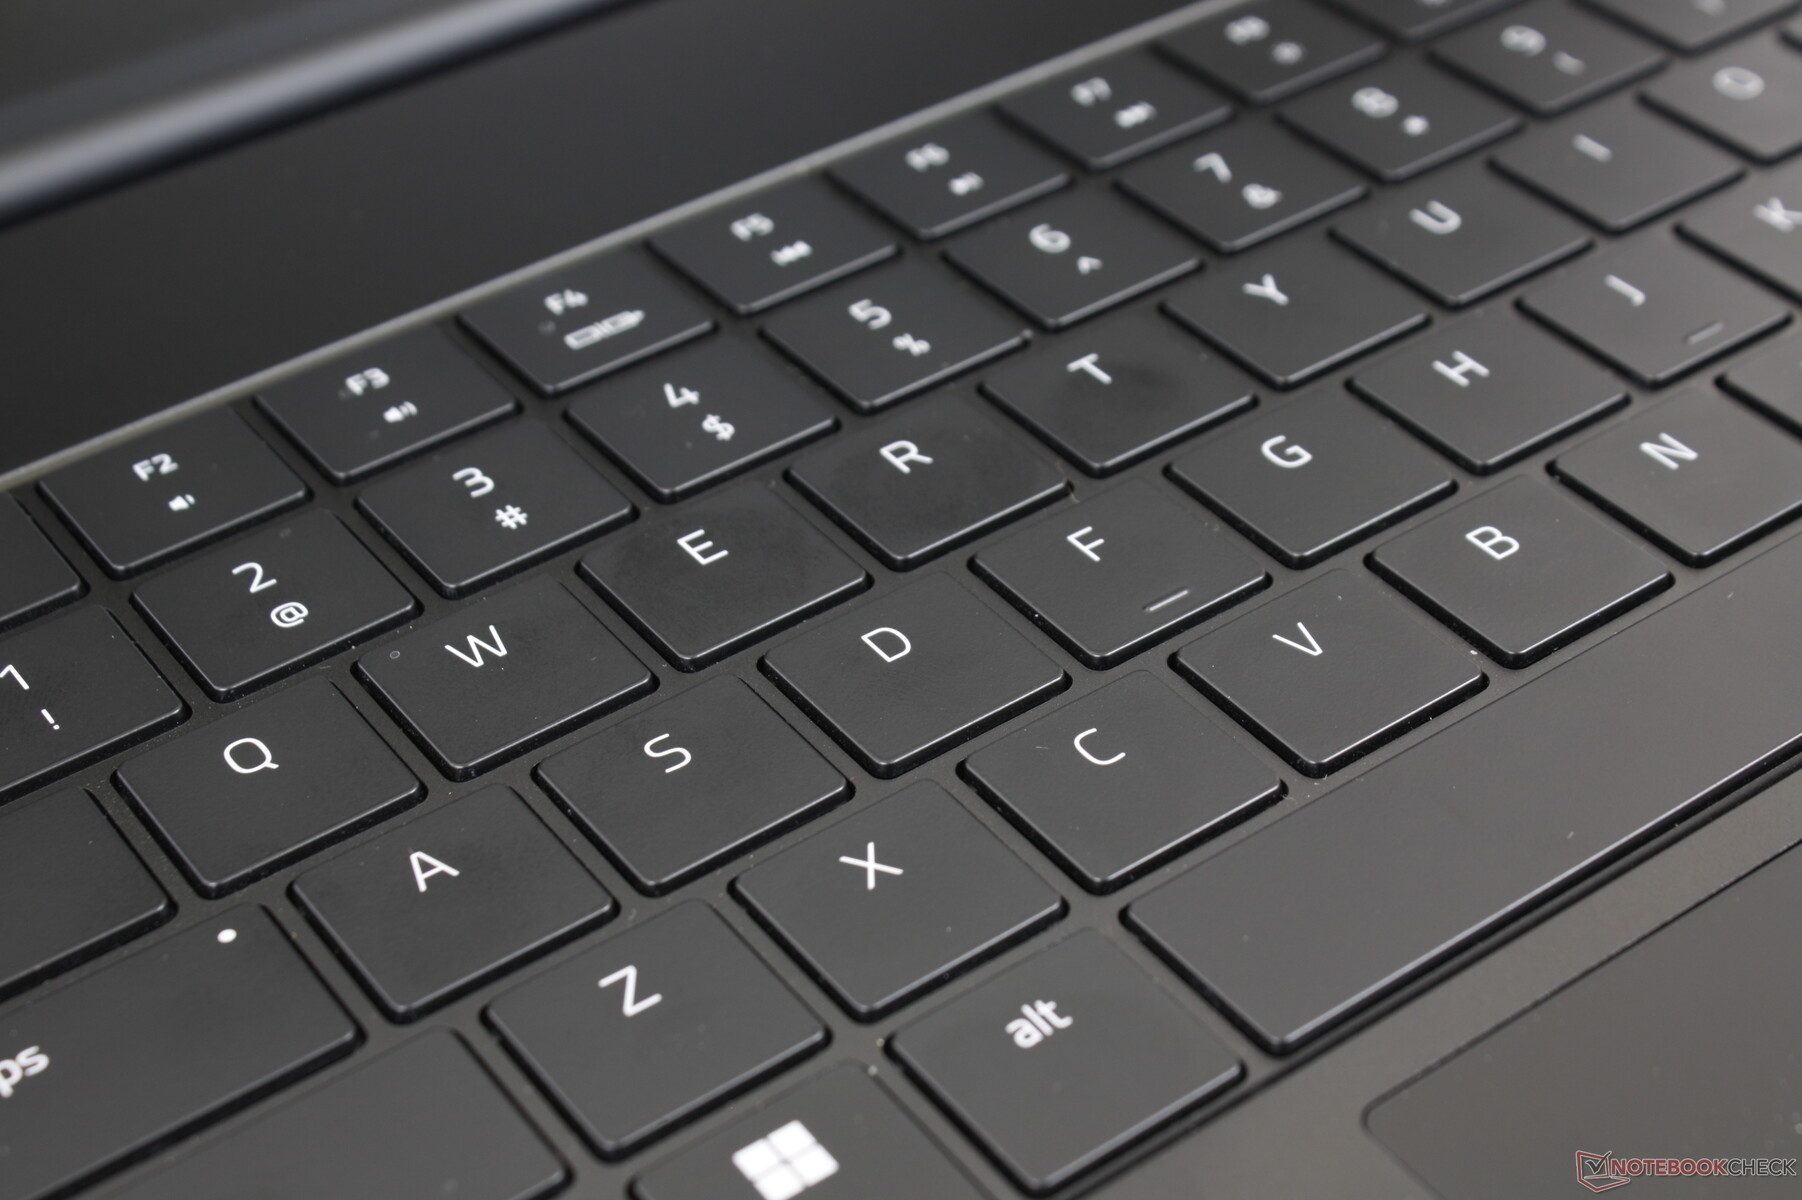
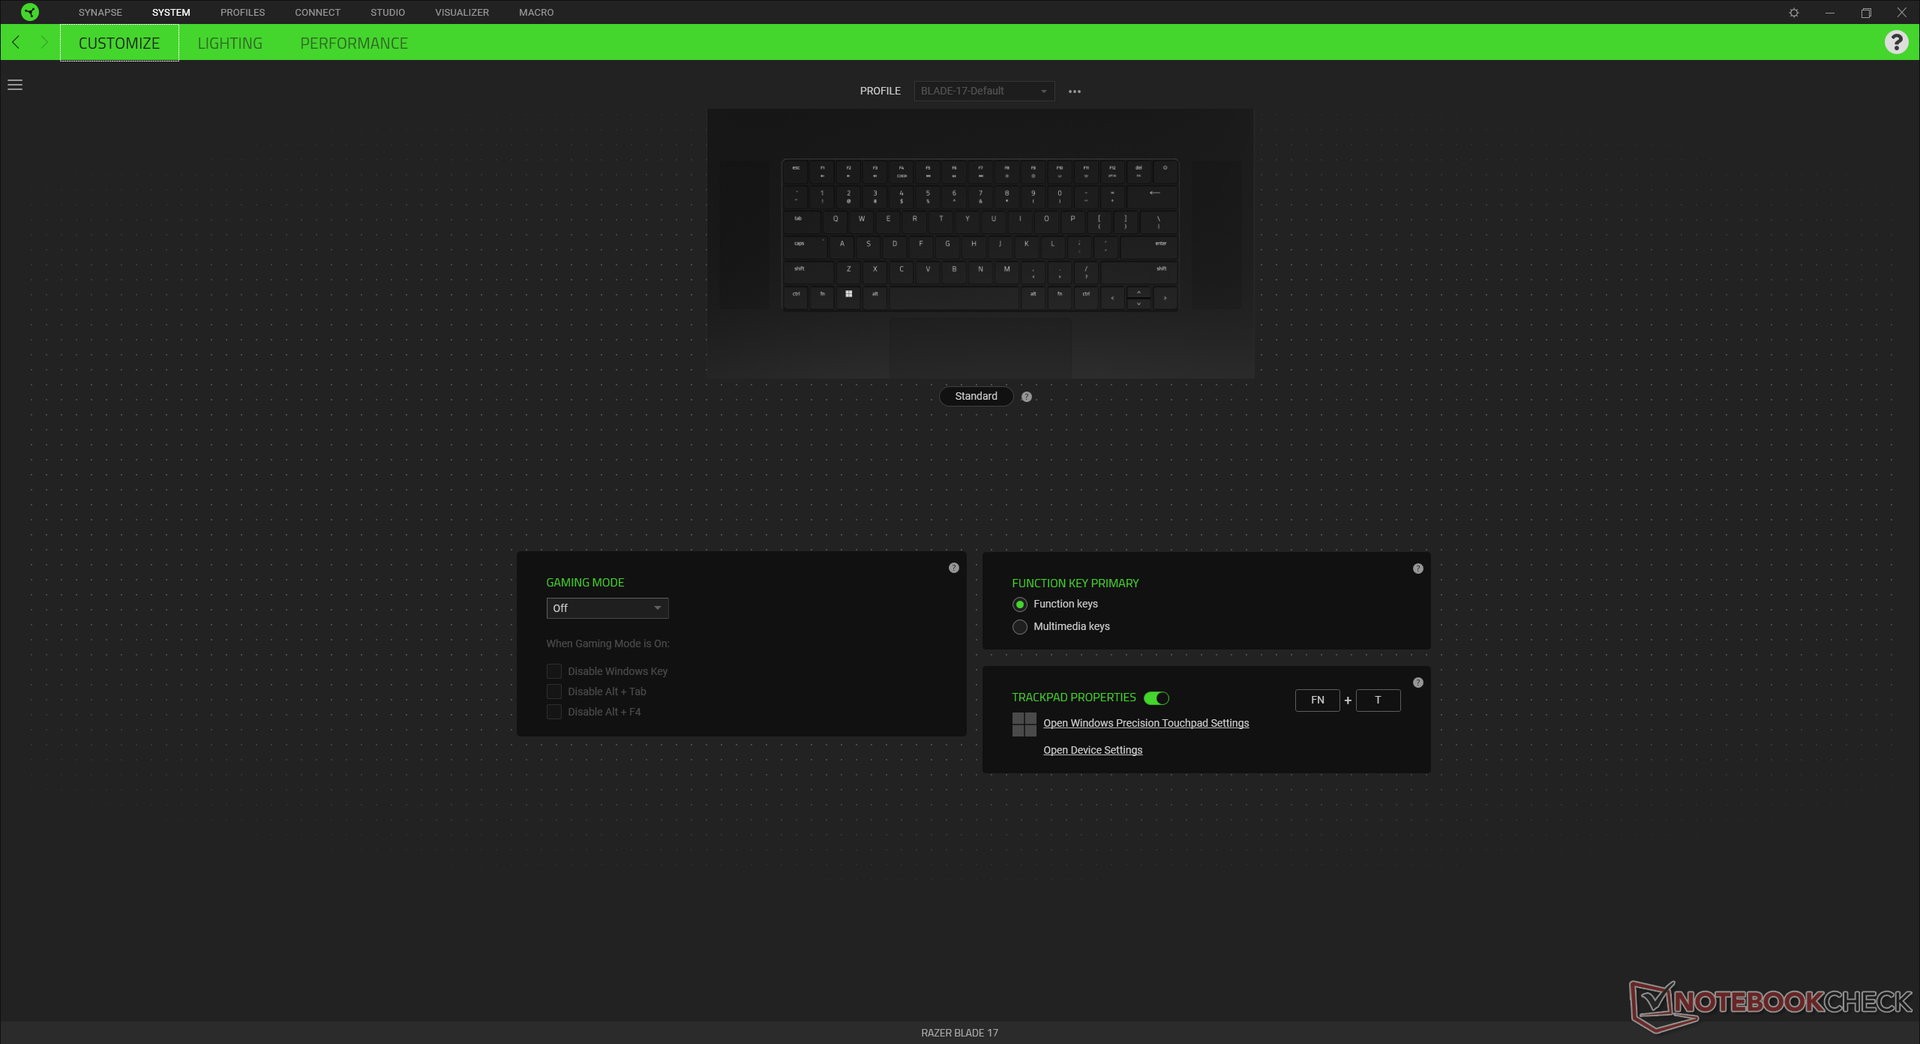
Il 2022 Blade 17 condivide la stessa tastiera del 2022 Blade 15. Razer ha aumentato le dimensioni dei cappucci dei tasti mantenendo la stessa lunghezza complessiva e la stessa larghezza della tastiera per una digitazione più facile. Il feedback e la corsa sono altrimenti identici al modello dell'anno scorso, nonostante il cambiamento di dimensioni. Sospettiamo che più utenti abbracceranno questo piccolo aggiornamento di anno in anno piuttosto che un cambio completo di tasti ottici o meccanici che avrebbe probabilmente diviso i fan di Razer.
Touchpad
Non ci sono cambiamenti al touchpad, in meglio o in peggio. Anche se ci piace l'ampia superficie (13 x 8 cm) e la trazione fluida, il feedback spugnoso quando viene premuto rimane insoddisfacente. Le azioni di drag-and-drop sono quindi più difficili rispetto ai portatili con pulsanti del mouse dedicati come il Asus TUF FX506 serie. Anche l'antiestetico grasso tende ad accumularsi sulla superficie opaca.
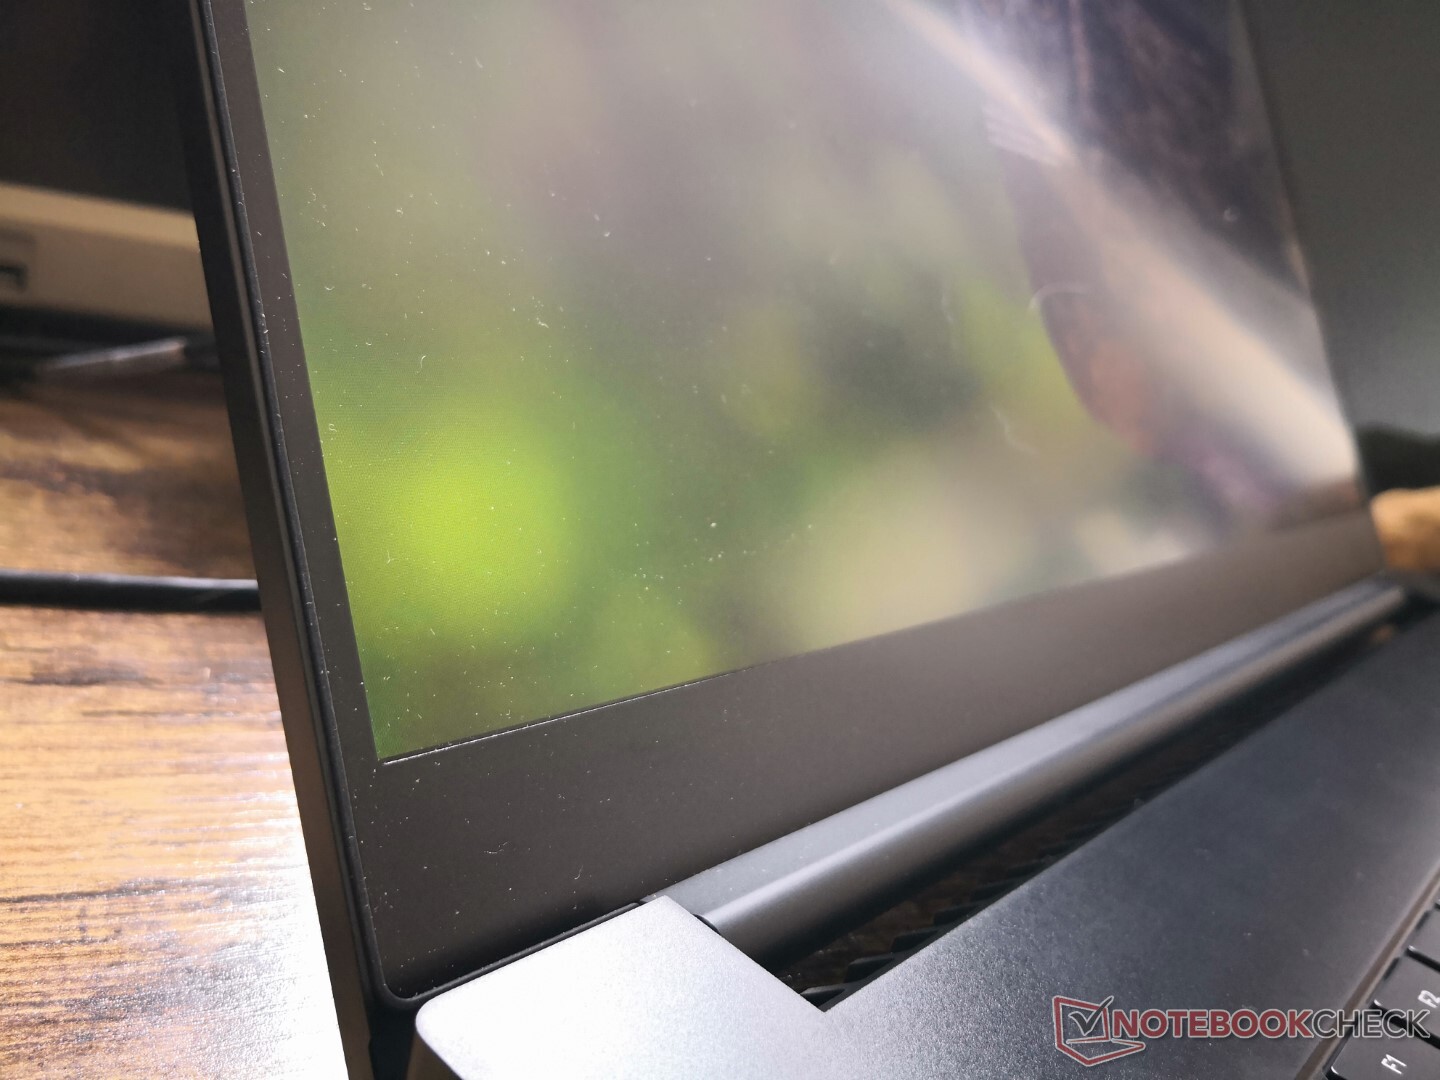
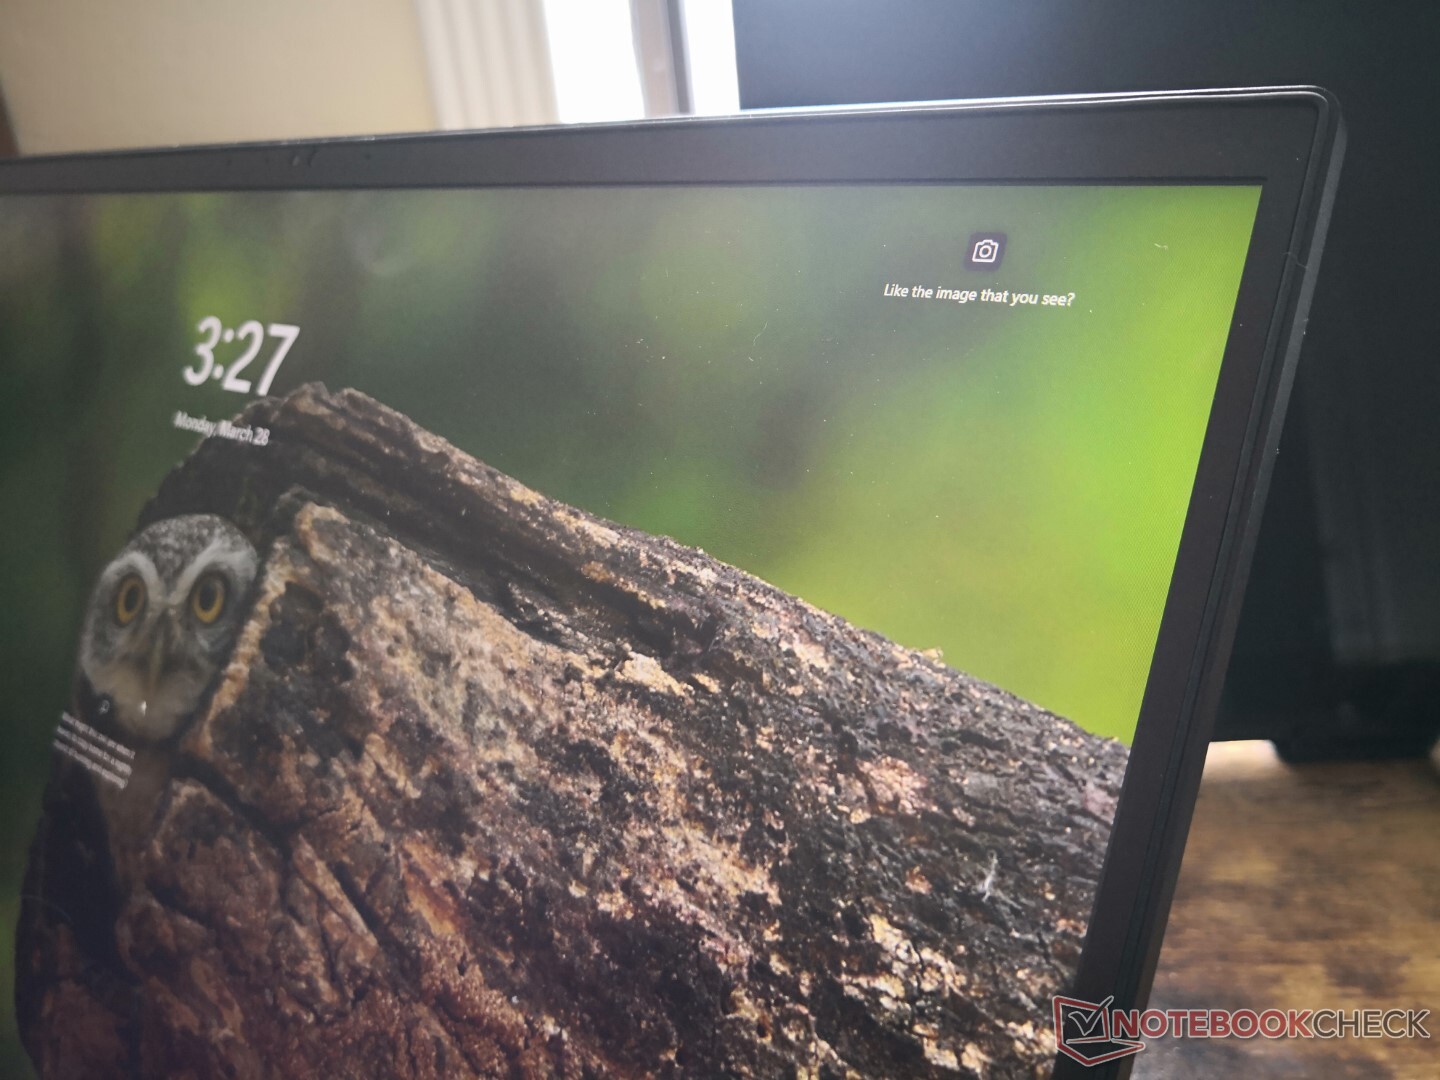
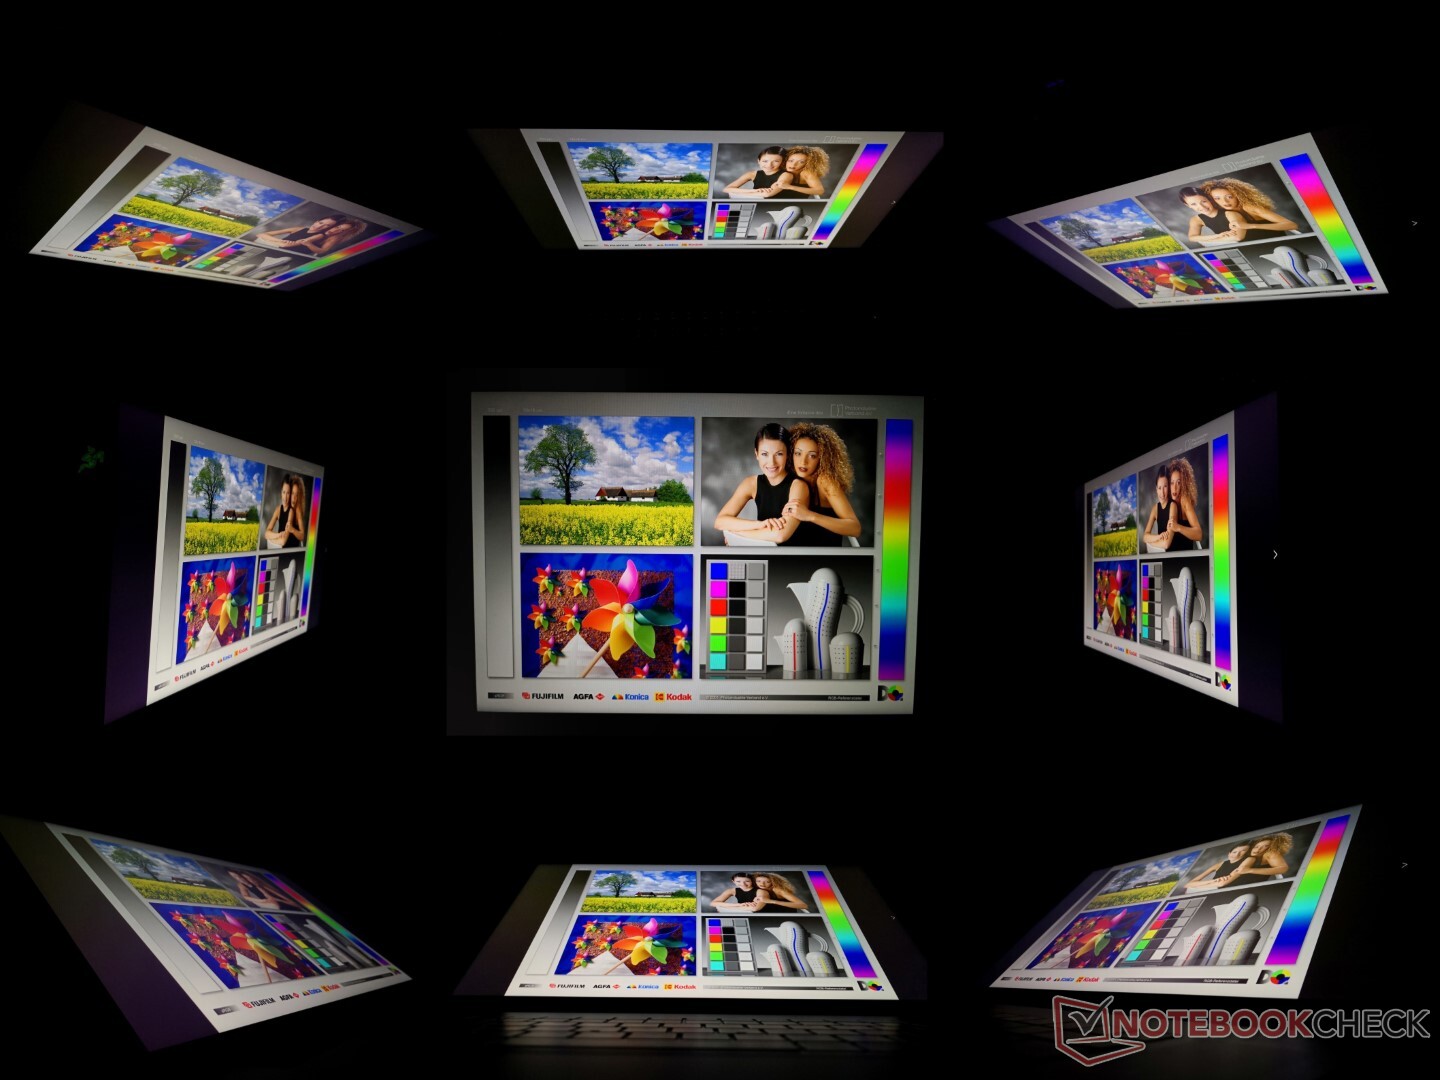
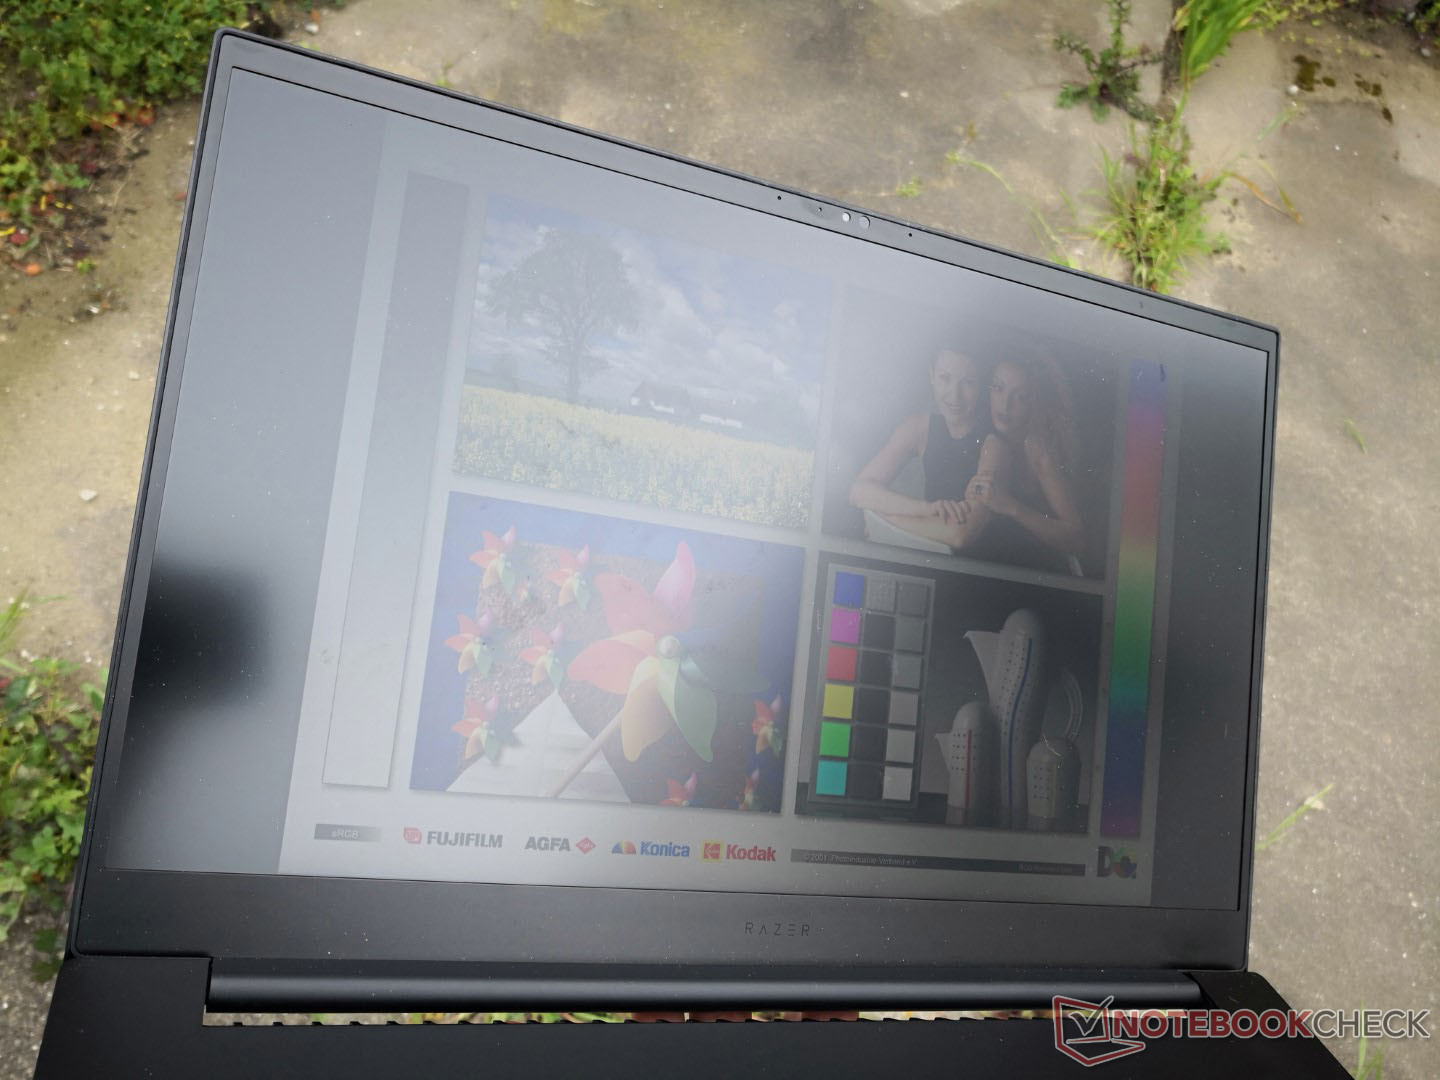
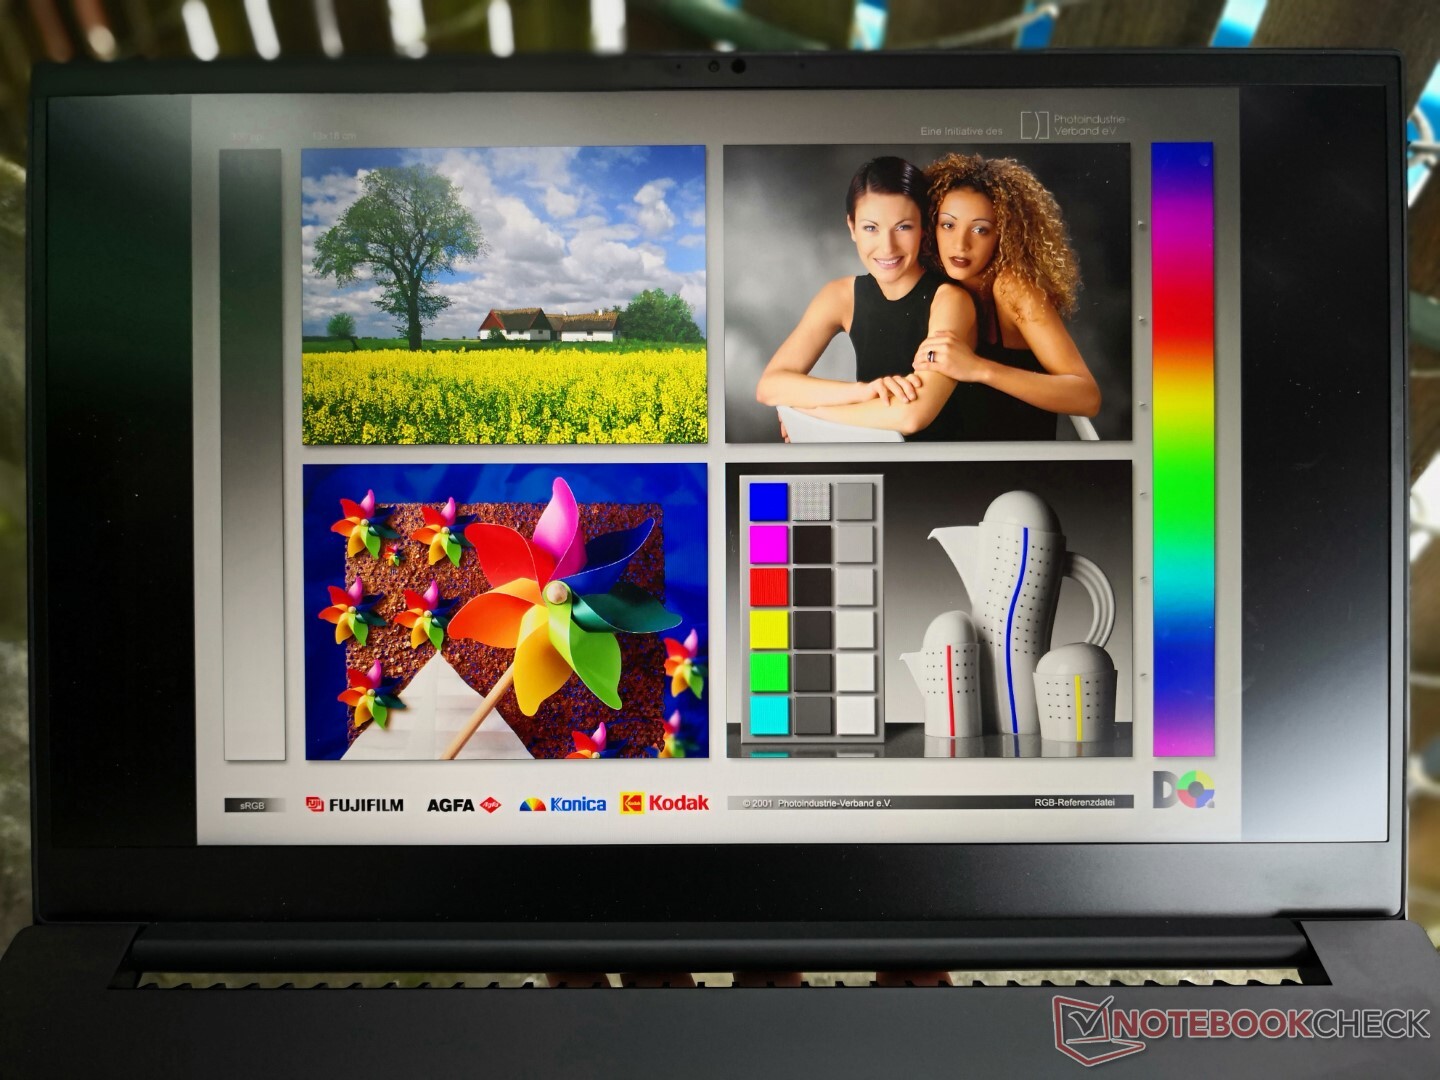
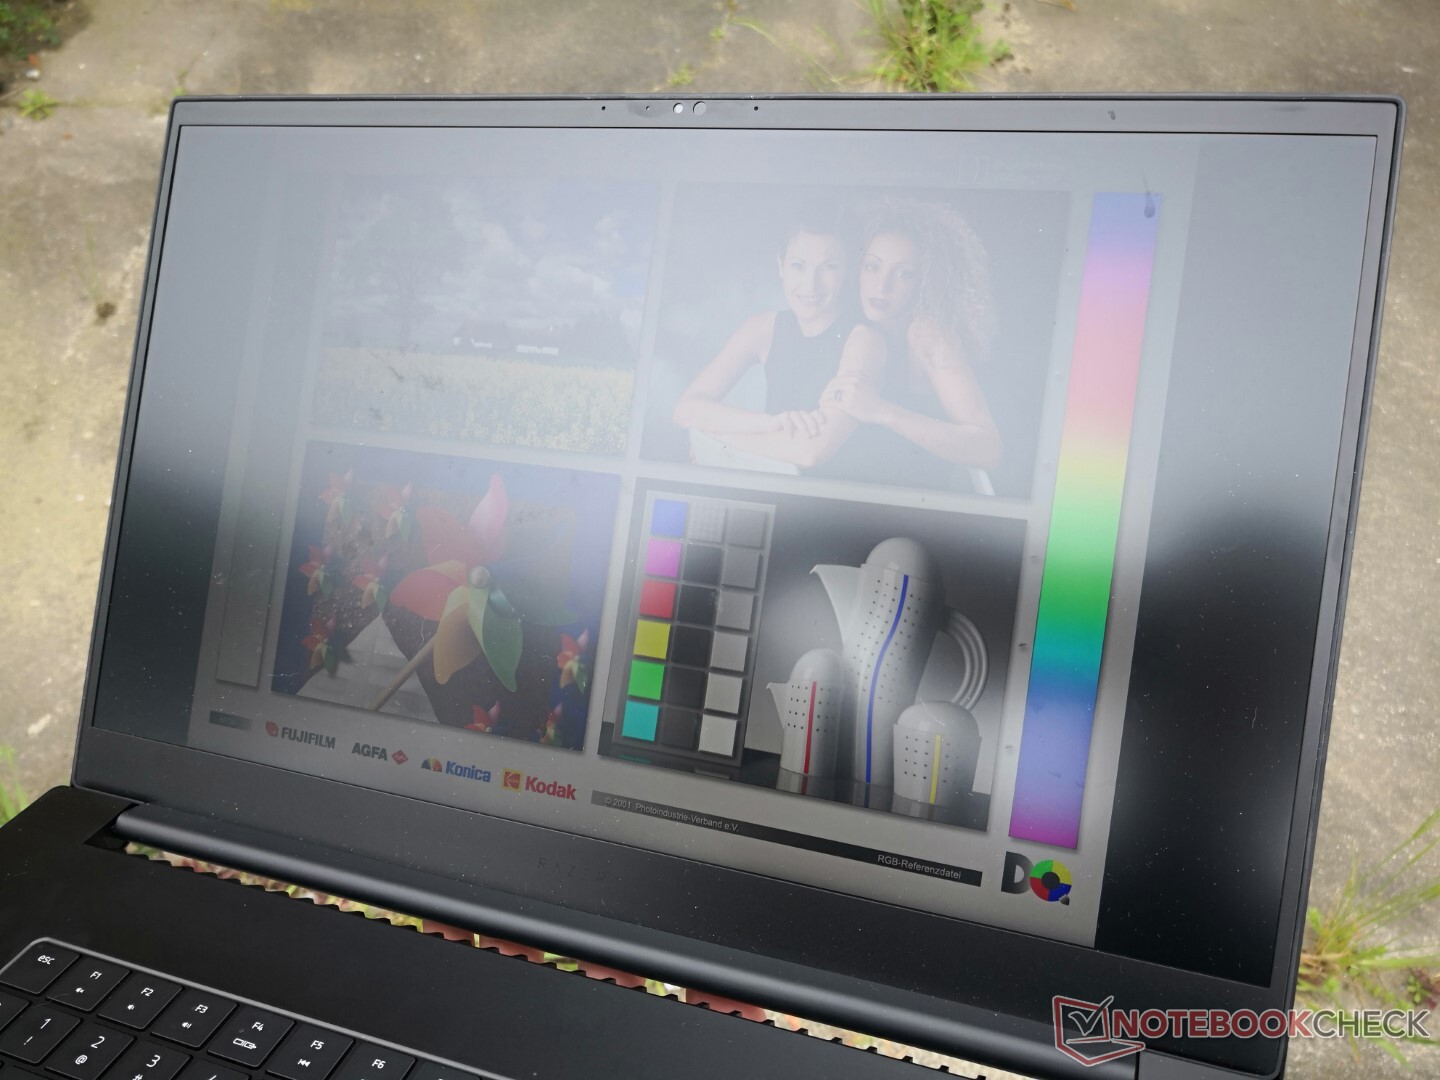
Display - Nessuna opzione OLED per ora
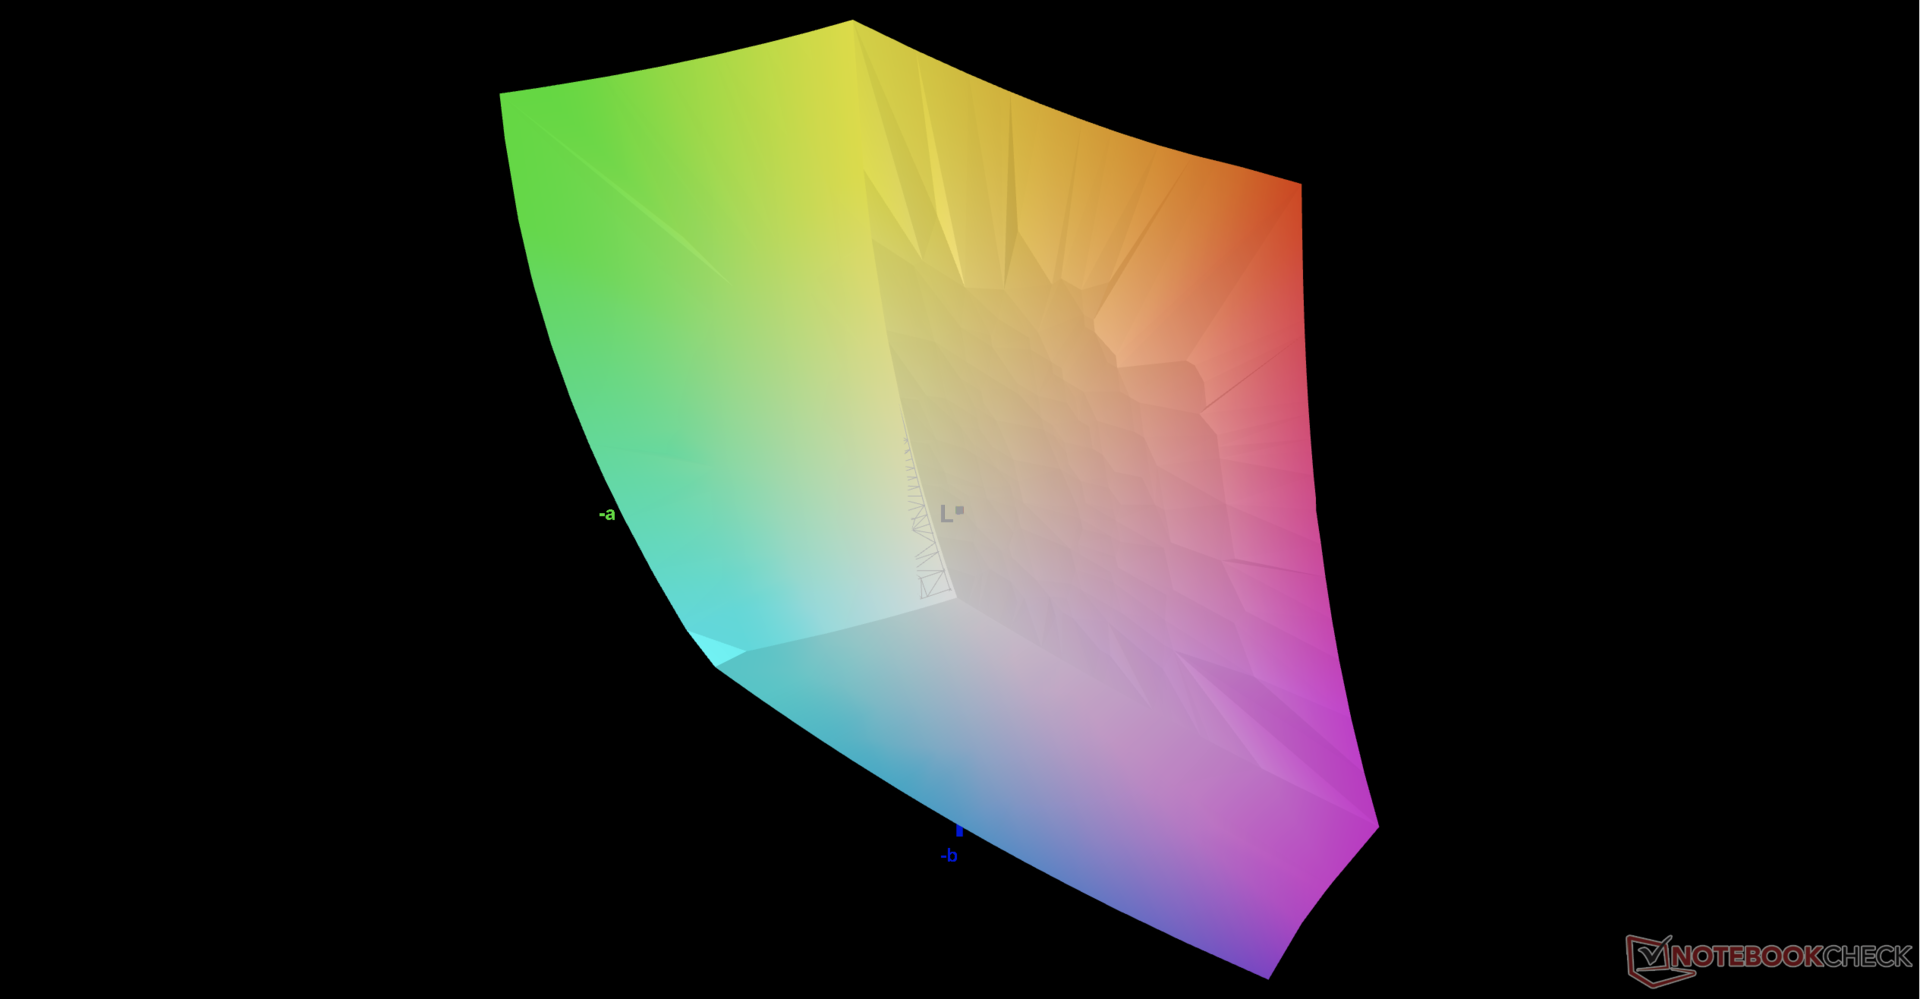
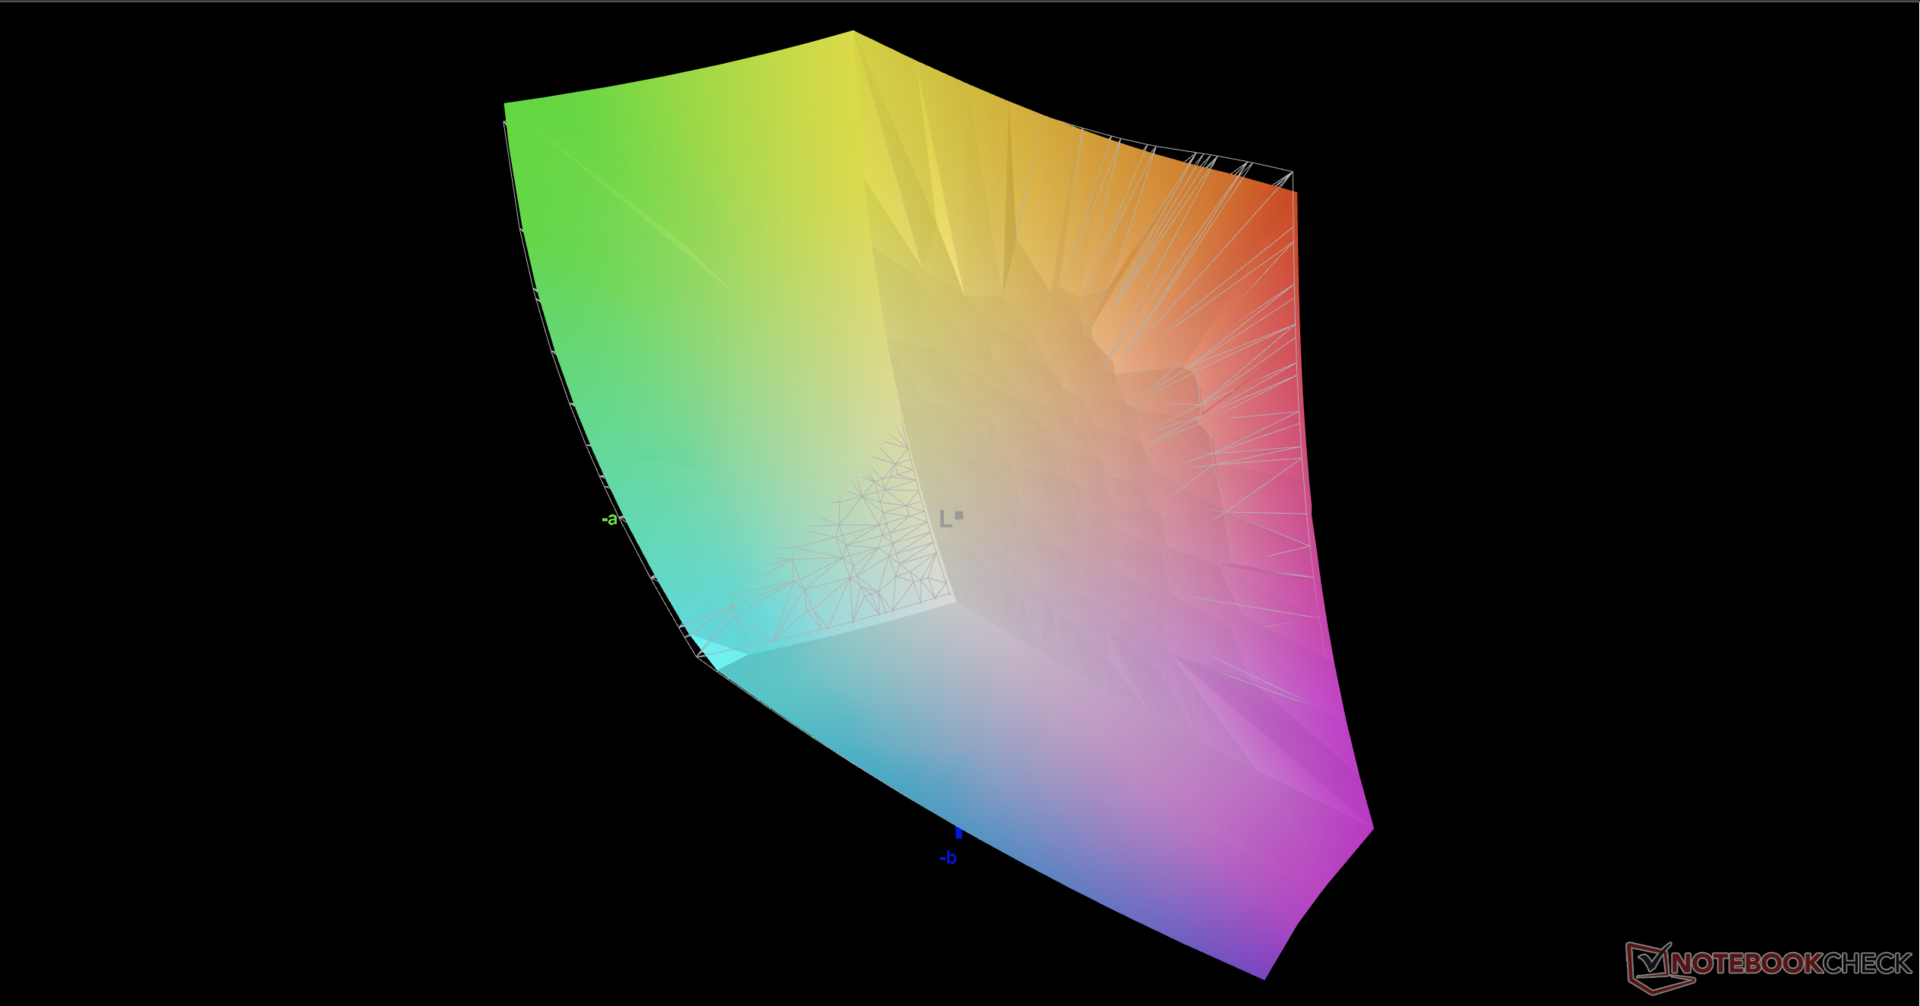
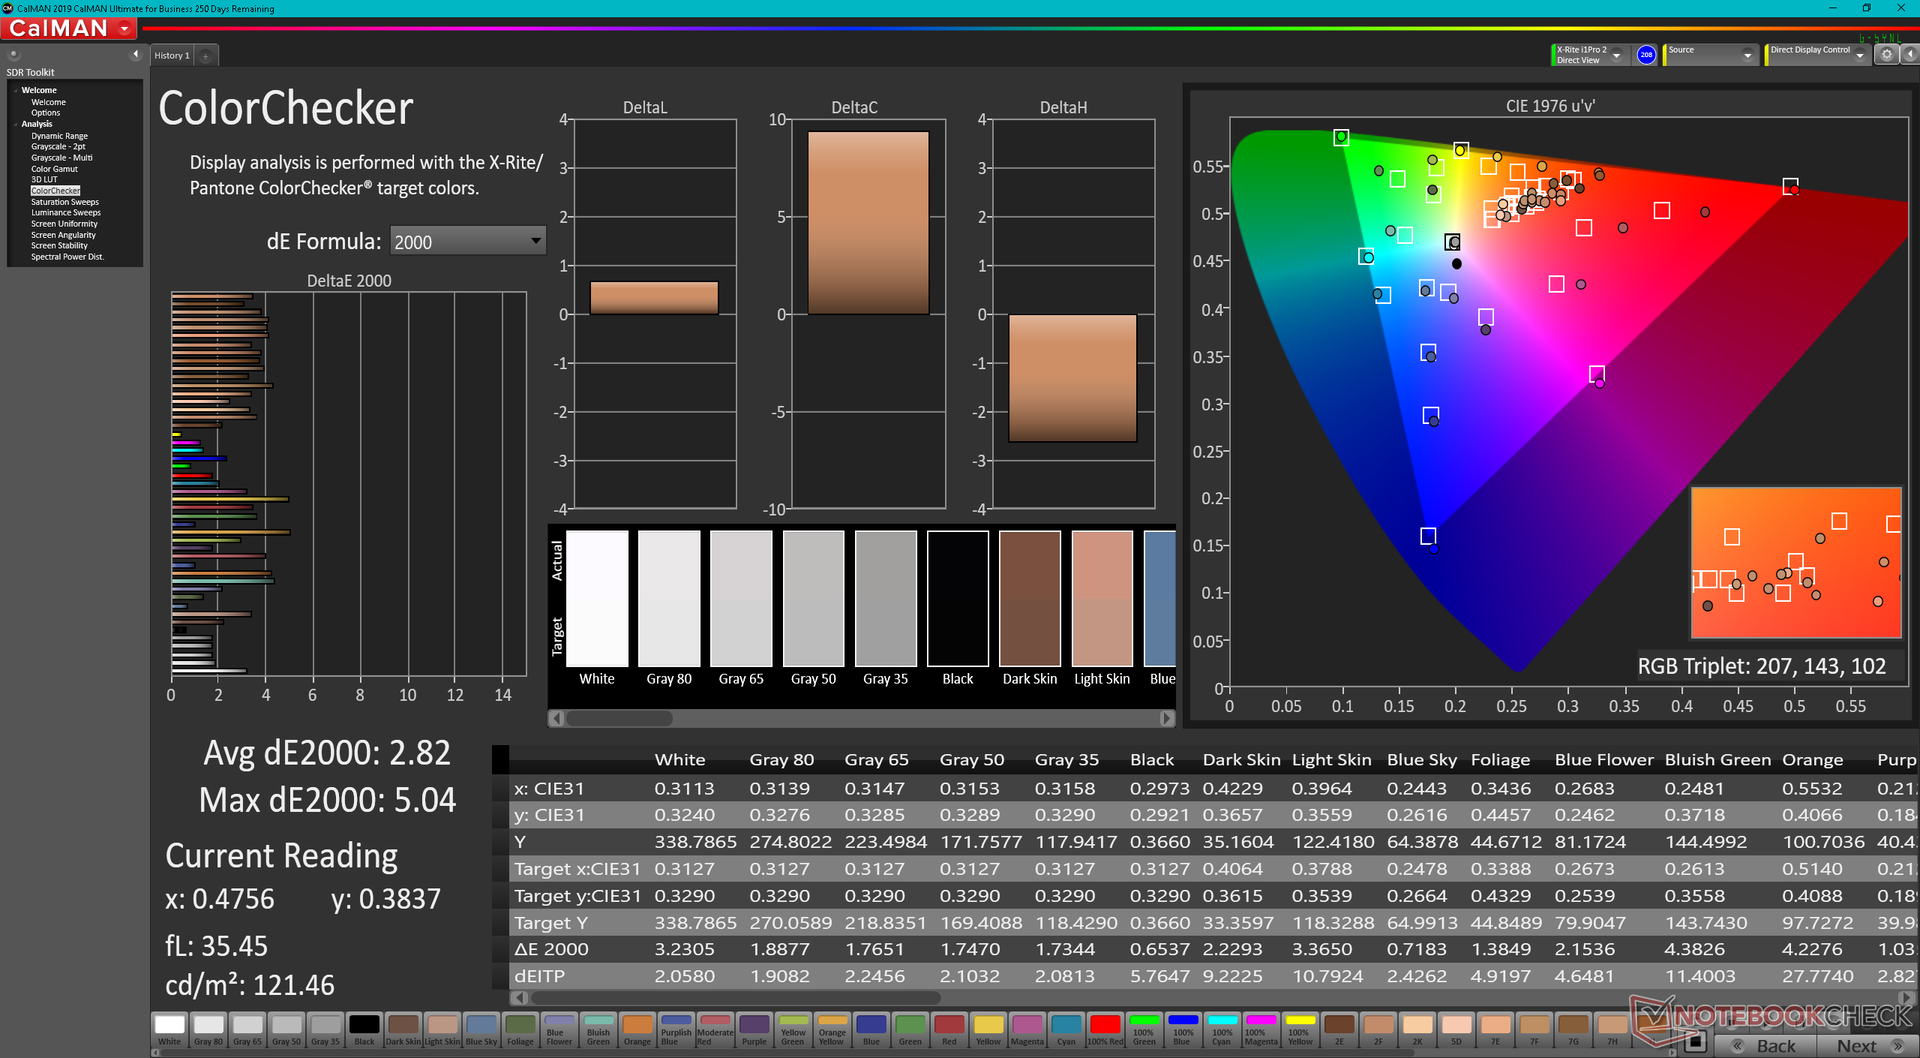
Il pannello IPS BOE NE173QHM-NZ1 sulla nostra unità di test è adatto sia all'editing grafico che ai giochi. Copre completamente la gamma di colori DCI-P3 per soddisfare gli artisti digitali, mentre offre tempi di risposta in bianco e nero, velocità di aggiornamento e compatibilità G-Sync che i giocatori vorranno. Il contrasto potrebbe essere migliore soprattutto rispetto alle opzioni OLED che Razer ha a disposizione su alcune unità Blade 15, ma questo è tipico dei pannelli IPS.

| |||||||||||||||||||||||||
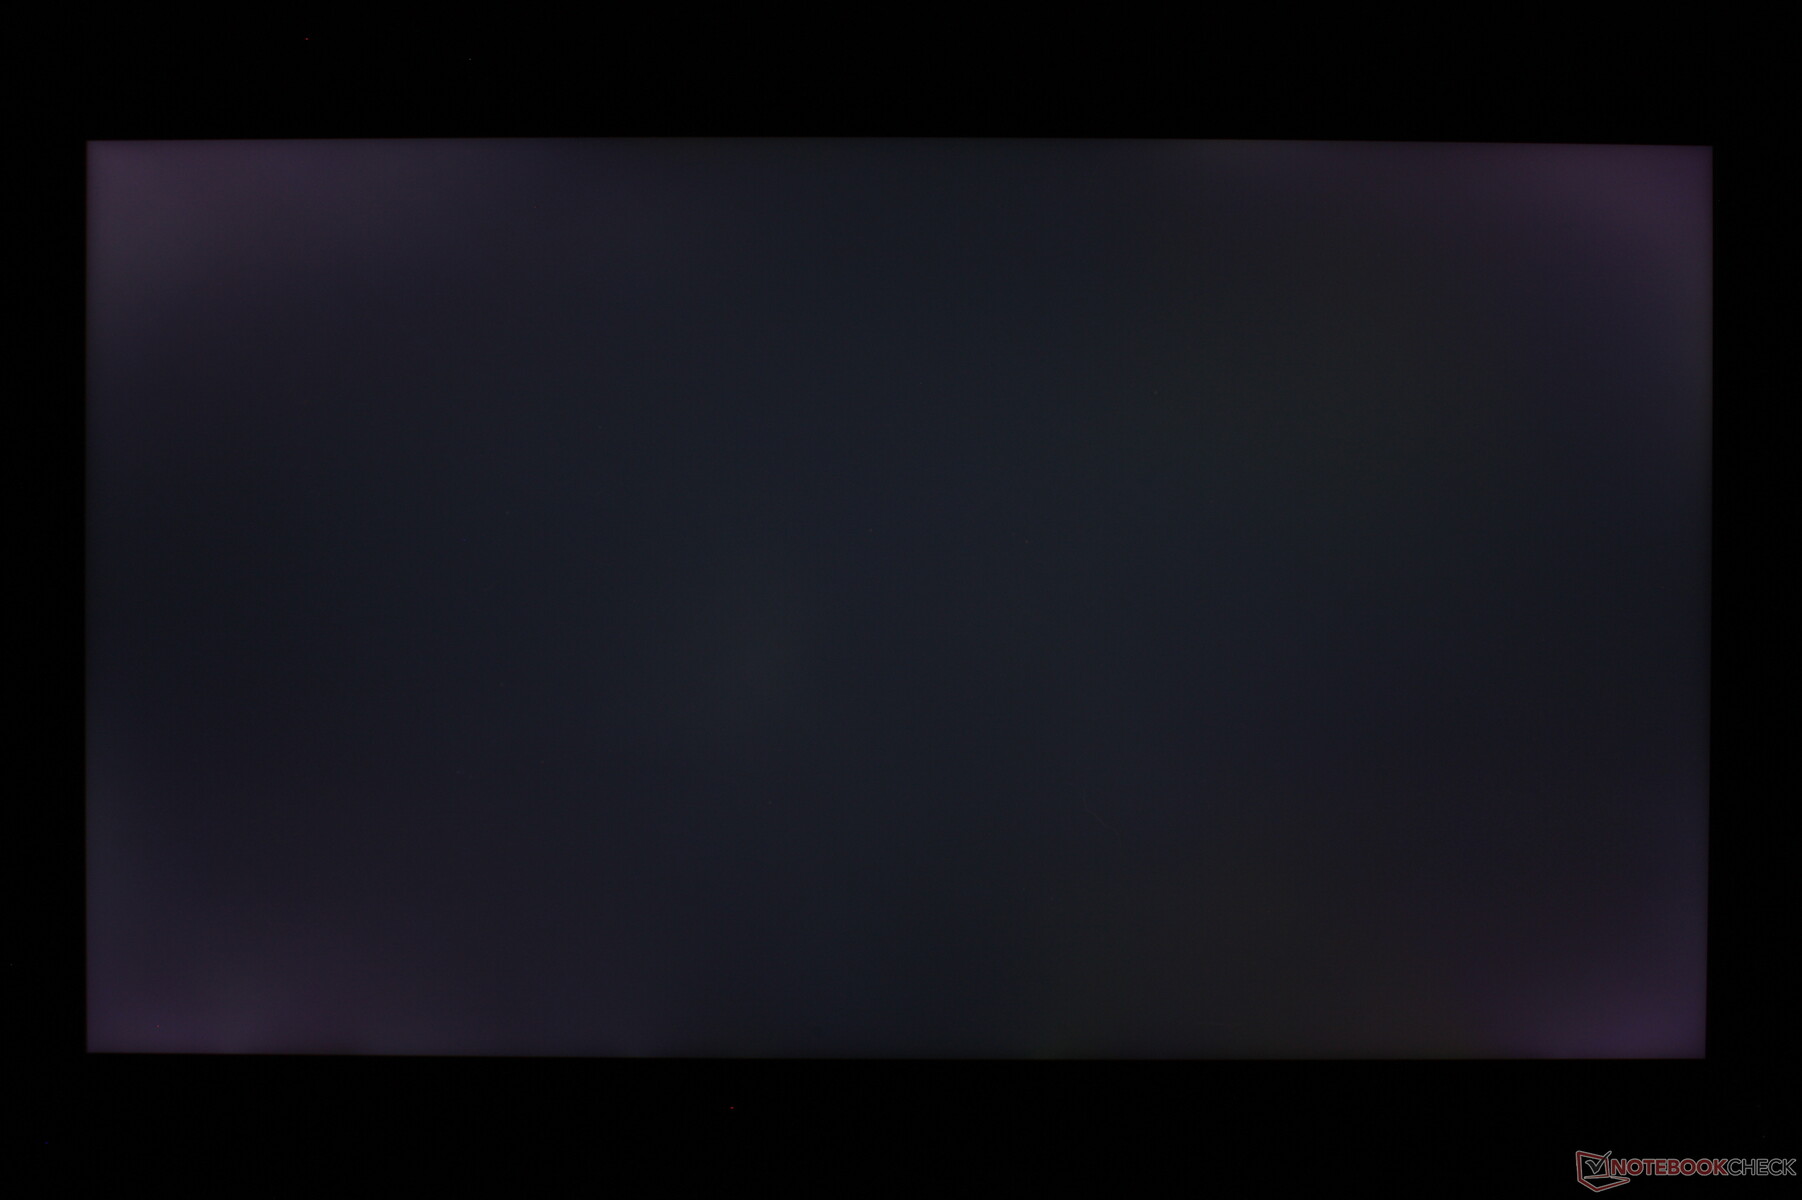
Distribuzione della luminosità: 75 %
Al centro con la batteria: 335.8 cd/m²
Contrasto: 884:1 (Nero: 0.38 cd/m²)
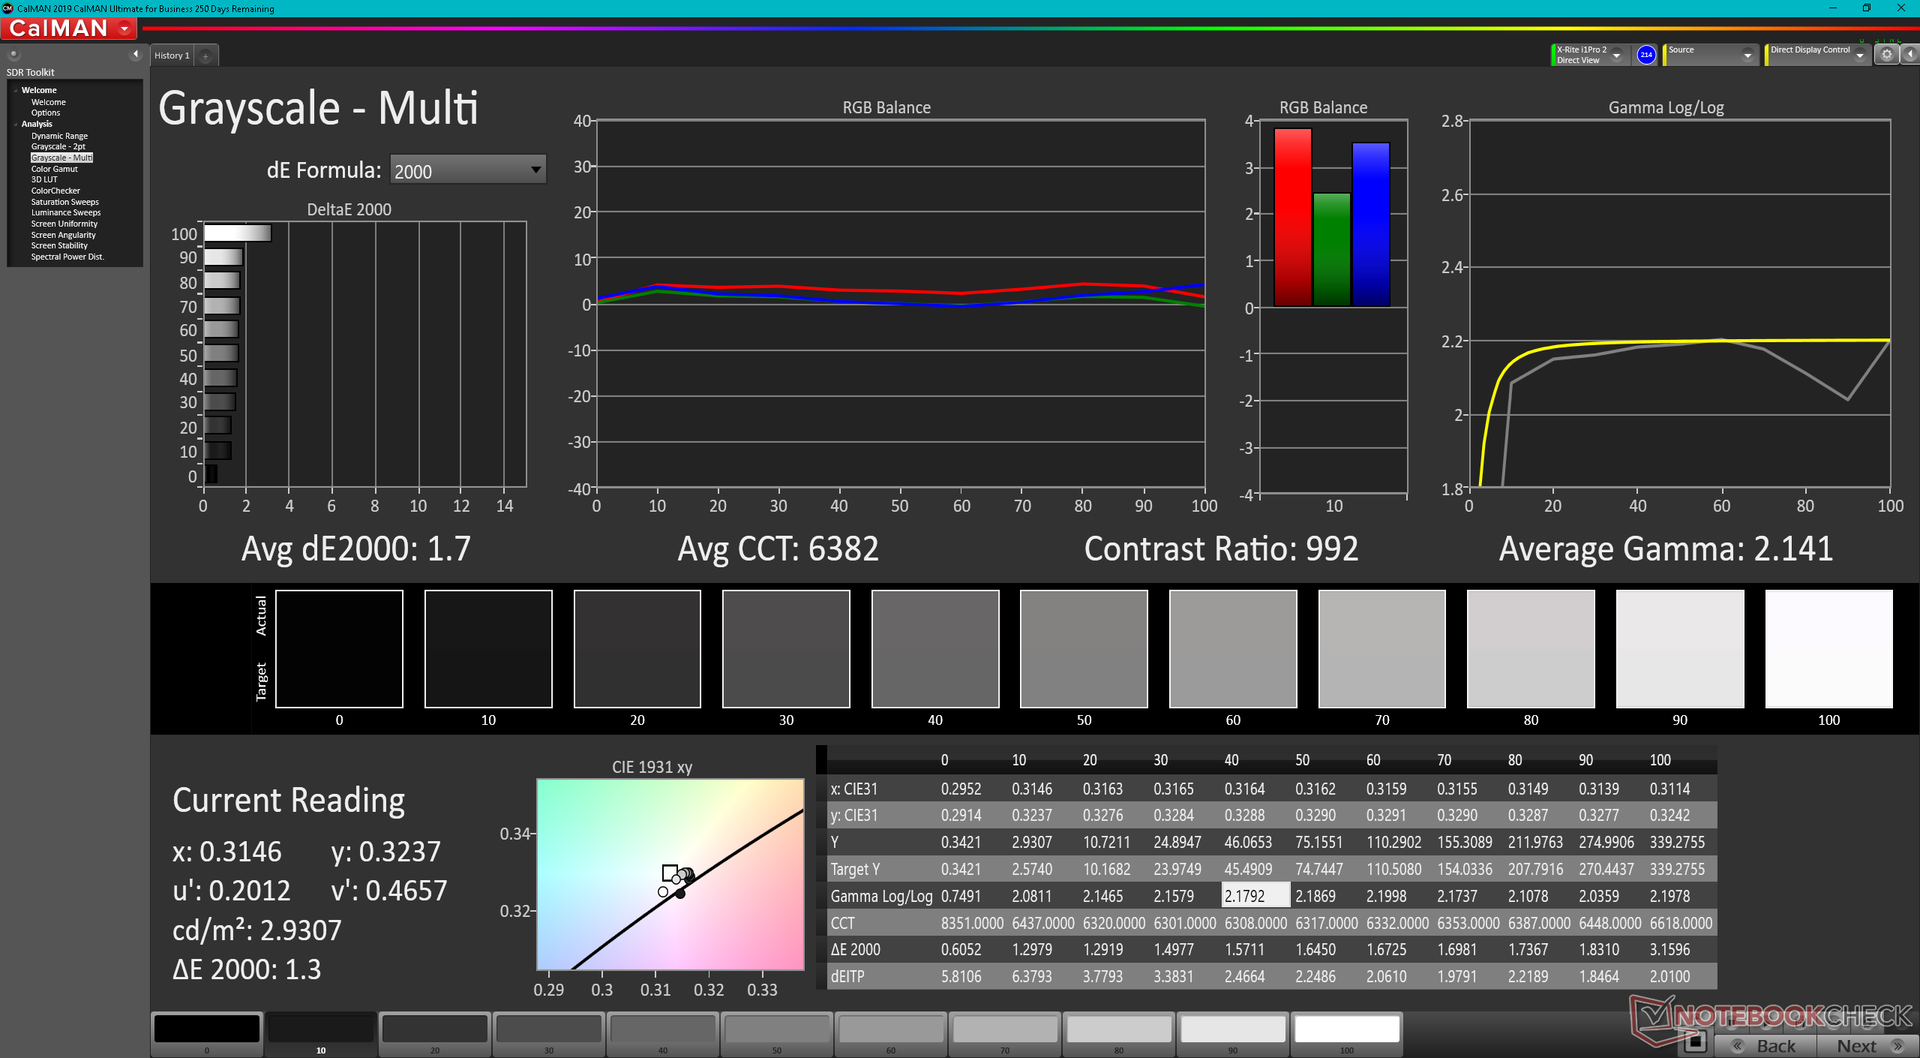
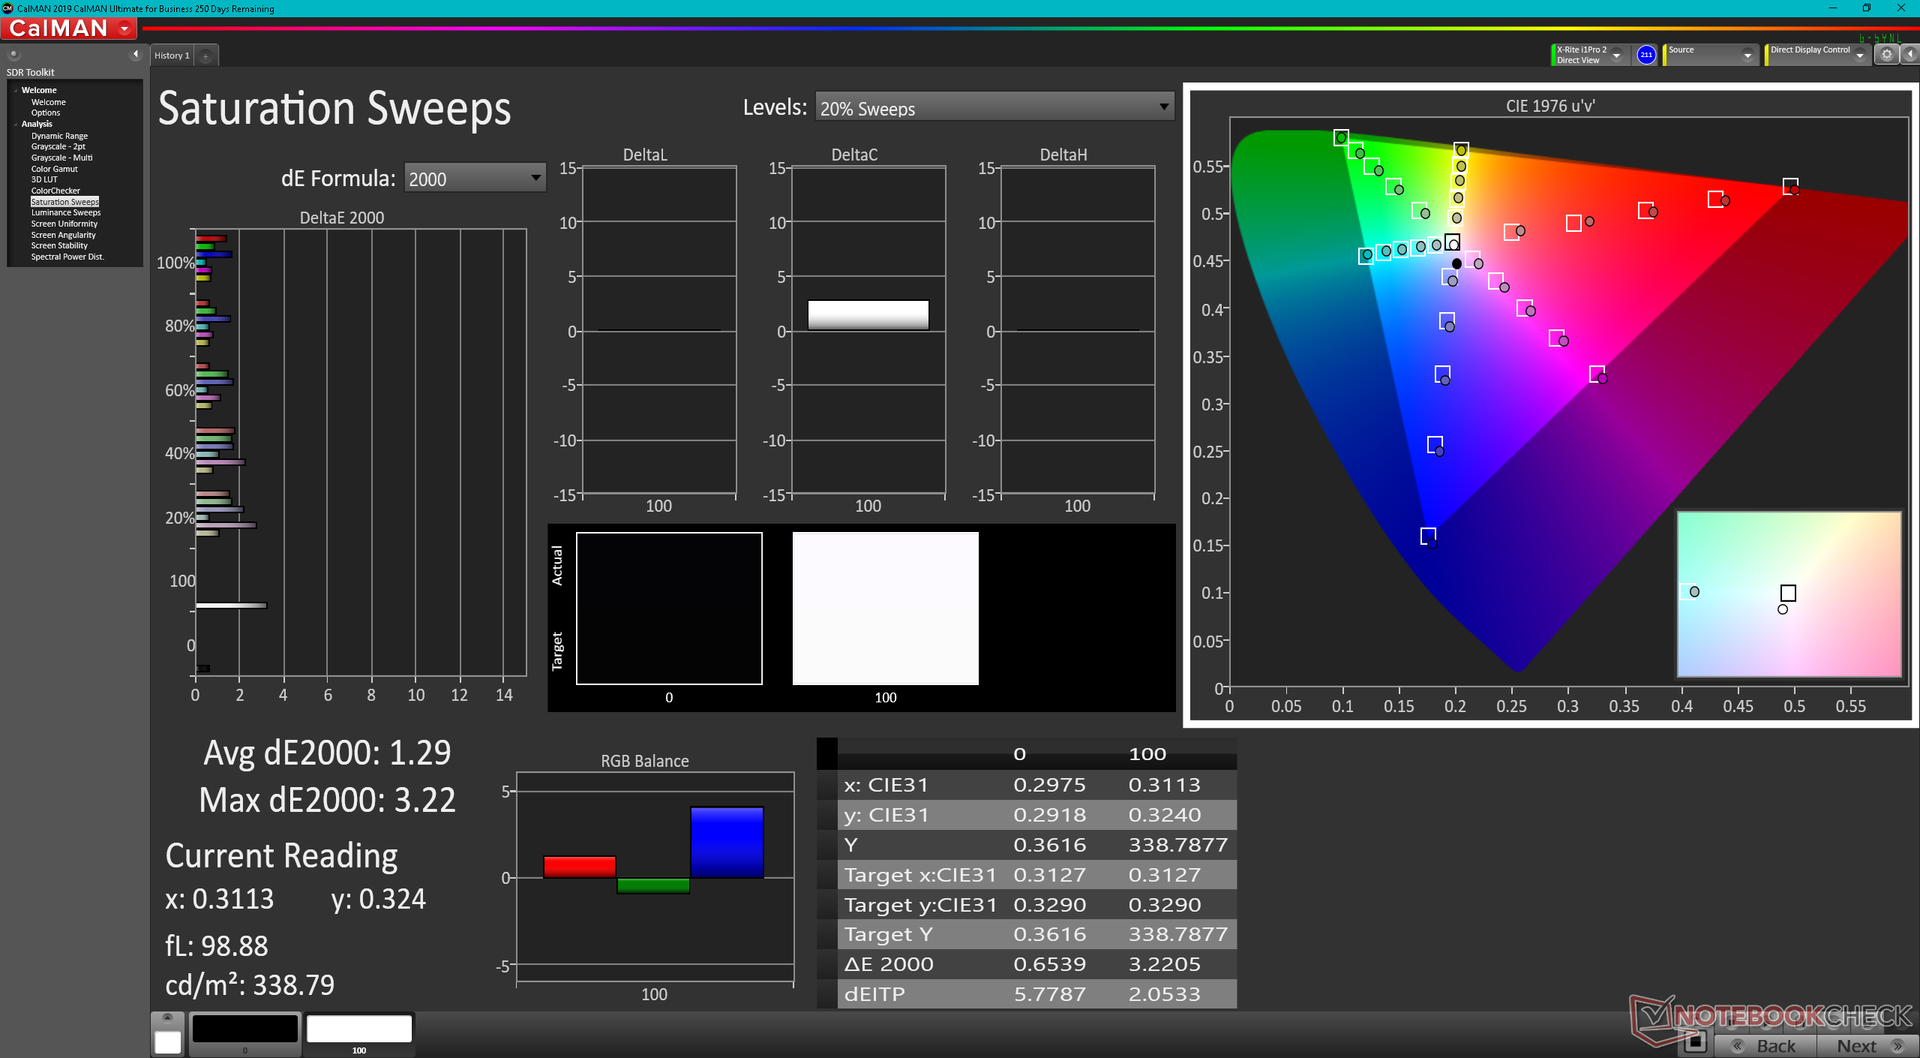
ΔE ColorChecker Calman: 2.82 | ∀{0.5-29.43 Ø4.73}
ΔE Greyscale Calman: 1.7 | ∀{0.09-98 Ø4.97}
86.2% AdobeRGB 1998 (Argyll 3D)
99.9% sRGB (Argyll 3D)
98.7% Display P3 (Argyll 3D)
Gamma: 2.14
CCT: 6382 K
| Razer Blade 17 RTX 3080 Ti BOE NE173QHM-NZ1, IPS, 2560x1440, 17.3" | Razer Blade Pro 17 2021 (QHD Touch) AU Optronics B173ZAN03.3, IPS, 3840x2160, 17.3" | MSI GS76 Stealth 11UH AUO B173ZAN06.1 (AUODE95), IPS, 3840x2160, 17.3" | Asus ROG Zephyrus S17 GX703HSD BOE099D (BOE CQ NE173QHM-NY3), IPS, 2560x1440, 17.3" | Aorus 17G YD Sharp LQ173M1JW04, IPS, 1920x1080, 17.3" | Alienware x17 RTX 3080 P48E AU Optronics B173ZAN, IPS, 3840x2160, 17.3" | |
|---|---|---|---|---|---|---|
| Display | 2% | -22% | -3% | -14% | 2% | |
| Display P3 Coverage (%) | 98.7 | 88.6 -10% | 63 -36% | 94.2 -5% | 72.3 -27% | 88.3 -11% |
| sRGB Coverage (%) | 99.9 | 100 0% | 94.8 -5% | 98.7 -1% | 100 0% | 100 0% |
| AdobeRGB 1998 Coverage (%) | 86.2 | 99.9 16% | 65 -25% | 84.4 -2% | 73.7 -15% | 100 16% |
| Response Times | 5% | 47% | 52% | 21% | 14% | |
| Response Time Grey 50% / Grey 80% * (ms) | 17.6 ? | 15.2 ? 14% | 8.8 ? 50% | 4.8 73% | 13.6 ? 23% | 14.4 ? 18% |
| Response Time Black / White * (ms) | 11.4 ? | 12 ? -5% | 6.4 ? 44% | 8 30% | 9.2 ? 19% | 10.4 ? 9% |
| PWM Frequency (Hz) | ||||||
| Screen | -76% | 10% | -8% | -10% | -8% | |
| Brightness middle (cd/m²) | 335.9 | 407.2 21% | 474 41% | 322 -4% | 286 -15% | 438.7 31% |
| Brightness (cd/m²) | 294 | 403 37% | 454 54% | 288 -2% | 282 -4% | 435 48% |
| Brightness Distribution (%) | 75 | 90 20% | 88 17% | 72 -4% | 73 -3% | 91 21% |
| Black Level * (cd/m²) | 0.38 | 0.42 -11% | 0.46 -21% | 0.3 21% | 0.24 37% | 0.48 -26% |
| Contrast (:1) | 884 | 970 10% | 1030 17% | 1073 21% | 1192 35% | 914 3% |
| Colorchecker dE 2000 * | 2.82 | 7.25 -157% | 1.5 47% | 3.05 -8% | 2.79 1% | 4.34 -54% |
| Colorchecker dE 2000 max. * | 5.04 | 12.51 -148% | 5.59 -11% | 5.23 -4% | 6.23 -24% | 7.3 -45% |
| Greyscale dE 2000 * | 1.7 | 8.1 -376% | 2.8 -65% | 3.11 -83% | 3.5 -106% | 2.4 -41% |
| Gamma | 2.14 103% | 2.24 98% | 2.158 102% | 2.13 103% | 2.358 93% | 2.09 105% |
| CCT | 6382 102% | 5925 110% | 6597 99% | 6553 99% | 6147 106% | 6413 101% |
| Colorchecker dE 2000 calibrated * | 3.62 | 0.86 | 1.92 | 0.82 | 0.72 | |
| Color Space (Percent of AdobeRGB 1998) (%) | 88.1 | 84 | 74 | |||
| Color Space (Percent of sRGB) (%) | 100 | 99 | 96 | |||
| Media totale (Programma / Settaggio) | -23% /
-45% | 12% /
8% | 14% /
2% | -1% /
-6% | 3% /
-2% |
* ... Meglio usare valori piccoli
Razer calibra ogni display in fabbrica e le nostre misurazioni indipendenti con un colorimetro X-Rite lo dimostrano. I valori medi della scala di grigi e del ColorChecker DeltaE sono solo 1,7 e 2,82, rispettivamente, per dimostrare che la calibrazione dell'utente finale non è necessaria.
Tempi di risposta del Display
| ↔ Tempi di risposta dal Nero al Bianco | ||
|---|---|---|
| 11.4 ms ... aumenta ↗ e diminuisce ↘ combinato | ↗ 4.8 ms Incremento | 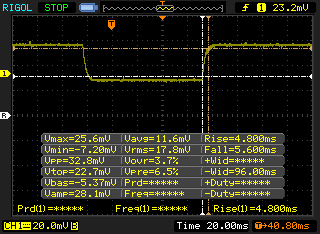 |
| ↘ 5.6 ms Calo | ||
| Lo schermo mostra buoni tempi di risposta durante i nostri tests, ma potrebbe essere troppo lento per i gamers competitivi. In confronto, tutti i dispositivi di test variano da 0.1 (minimo) a 240 (massimo) ms. » 31 % di tutti i dispositivi è migliore. Questo significa che i tempi di risposta rilevati sono migliori rispettto alla media di tutti i dispositivi testati (19.9 ms). | ||
| ↔ Tempo di risposta dal 50% Grigio all'80% Grigio | ||
| 17.6 ms ... aumenta ↗ e diminuisce ↘ combinato | ↗ 8.4 ms Incremento | 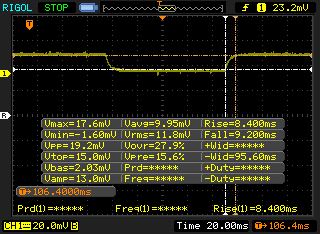 |
| ↘ 9.2 ms Calo | ||
| Lo schermo mostra buoni tempi di risposta durante i nostri tests, ma potrebbe essere troppo lento per i gamers competitivi. In confronto, tutti i dispositivi di test variano da 0.165 (minimo) a 636 (massimo) ms. » 31 % di tutti i dispositivi è migliore. Questo significa che i tempi di risposta rilevati sono migliori rispettto alla media di tutti i dispositivi testati (31.1 ms). | ||
Sfarfallio dello schermo / PWM (Pulse-Width Modulation)
| flickering dello schermo / PWM non rilevato | 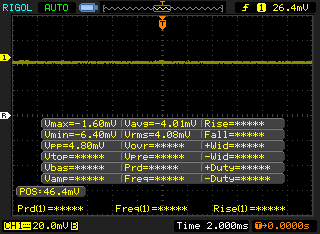 | ||
In confronto: 52 % di tutti i dispositivi testati non utilizza PWM per ridurre la luminosita' del display. Se è rilevato PWM, una media di 7798 (minimo: 5 - massimo: 343500) Hz è stata rilevata. | |||
Prestazioni - 165 W di grafica con Intel di 12a generazione
Condizioni di test
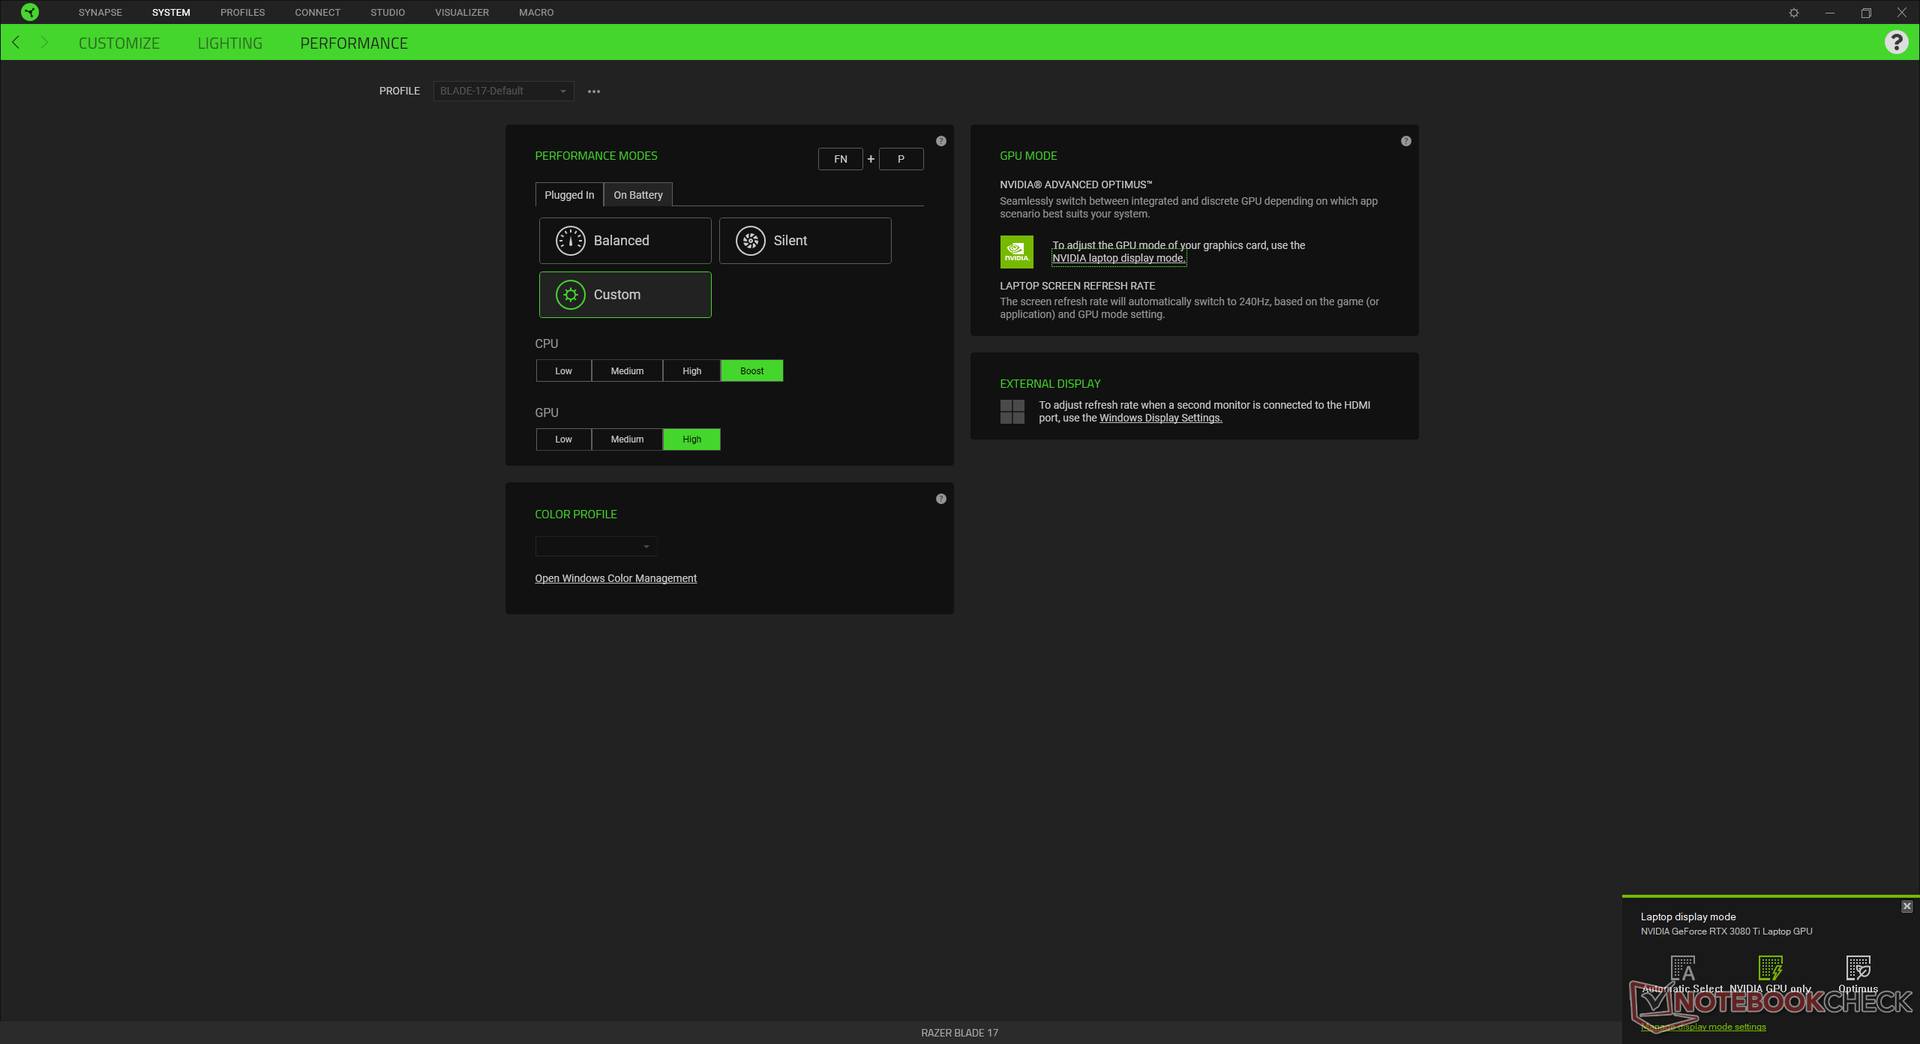
La nostra unità è stata impostata in modalità manuale con la CPU e la GPU rispettivamente su Boost e High, per ottenere i punteggi di benchmark più alti possibili. Gli utenti dovrebbero familiarizzare con il software Synapse in quanto serve come hub di controllo per le caratteristiche specifiche del sistema e i profili di performance.
Il Blade 17 è uno dei pochi portatili da gioco a supportare Advanced Optimus, il che significa che gli utenti possono passare tra le modalità Optimus e dGPU G-Sync senza bisogno di riavviare.

Processore
Le prestazioni della CPU sono dove ci aspettiamo che siano rispetto ad altri portatili che girano con lo stesso Core i7-12800H processore. Le prestazioni grezze sono circa dal 20 al 25 per cento e dal 50 al 70 per cento rispetto al Core i7-11800H e il Core i7-10875H di 10a generazione Core i7-10875Hrispettivamente, sui modelli Blade 17 di vecchia generazione. L'aggiornamento alla SKU Core i9-12900H dovrebbe offrire solo un aumento delle prestazioni del 10 per cento rispetto alla nostra configurazione Core i7-12800H.
La sostenibilità delle prestazioni è eccellente, senza grandi cali di clock nel tempo quando si esegue CineBench R15 xT in un ciclo.
Cinebench R15 Multi Loop
Cinebench R20: CPU (Multi Core) | CPU (Single Core)
Cinebench R15: CPU Multi 64Bit | CPU Single 64Bit
Blender: v2.79 BMW27 CPU
7-Zip 18.03: 7z b 4 | 7z b 4 -mmt1
Geekbench 5.5: Multi-Core | Single-Core
HWBOT x265 Benchmark v2.2: 4k Preset
LibreOffice : 20 Documents To PDF
R Benchmark 2.5: Overall mean
| HWBOT x265 Benchmark v2.2 / 4k Preset | |
| MSI GE76 Raider | |
| Schenker Uniwill Technology GM7AG8P | |
| Razer Blade 17 RTX 3080 Ti | |
| Media Intel Core i7-12800H (11.7 - 19.4, n=5) | |
| Schenker XMG Apex 17 M21 | |
| Razer Blade 17 RTX 3070 | |
| Gigabyte A7 X1 | |
| MSI GE76 Raider 10UH | |
| Lenovo Legion 5 17ACH6H-82JY0003GE | |
| Razer Blade Pro 17 2021 (QHD Touch) | |
| Acer Nitro 5 AN517-53-54DQ | |
* ... Meglio usare valori piccoli
AIDA64: FP32 Ray-Trace | FPU Julia | CPU SHA3 | CPU Queen | FPU SinJulia | FPU Mandel | CPU AES | CPU ZLib | FP64 Ray-Trace | CPU PhotoWorxx
| Performance rating | |
| Schenker XMG Pro 17 (Late 2021, RTX 3080) | |
| MSI GE76 Raider | |
| Lenovo Legion 5 17ACH6H-82JY0003GE | |
| Schenker Uniwill Technology GM7AG8P | |
| Media Intel Core i7-12800H | |
| Razer Blade 17 RTX 3080 Ti | |
| AIDA64 / FP32 Ray-Trace | |
| Schenker XMG Pro 17 (Late 2021, RTX 3080) | |
| Lenovo Legion 5 17ACH6H-82JY0003GE | |
| MSI GE76 Raider | |
| Media Intel Core i7-12800H (5839 - 15206, n=5) | |
| Schenker Uniwill Technology GM7AG8P | |
| Razer Blade 17 RTX 3080 Ti | |
| AIDA64 / FPU Julia | |
| Lenovo Legion 5 17ACH6H-82JY0003GE | |
| Schenker XMG Pro 17 (Late 2021, RTX 3080) | |
| Media Intel Core i7-12800H (27801 - 80002, n=5) | |
| MSI GE76 Raider | |
| Schenker Uniwill Technology GM7AG8P | |
| Razer Blade 17 RTX 3080 Ti | |
| AIDA64 / CPU SHA3 | |
| Schenker XMG Pro 17 (Late 2021, RTX 3080) | |
| MSI GE76 Raider | |
| Schenker Uniwill Technology GM7AG8P | |
| Media Intel Core i7-12800H (2013 - 3684, n=5) | |
| Lenovo Legion 5 17ACH6H-82JY0003GE | |
| Razer Blade 17 RTX 3080 Ti | |
| AIDA64 / CPU Queen | |
| MSI GE76 Raider | |
| Razer Blade 17 RTX 3080 Ti | |
| Schenker Uniwill Technology GM7AG8P | |
| Media Intel Core i7-12800H (85965 - 108084, n=5) | |
| Schenker XMG Pro 17 (Late 2021, RTX 3080) | |
| Lenovo Legion 5 17ACH6H-82JY0003GE | |
| AIDA64 / FPU SinJulia | |
| MSI GE76 Raider | |
| Schenker Uniwill Technology GM7AG8P | |
| Schenker XMG Pro 17 (Late 2021, RTX 3080) | |
| Lenovo Legion 5 17ACH6H-82JY0003GE | |
| Razer Blade 17 RTX 3080 Ti | |
| Media Intel Core i7-12800H (7027 - 9658, n=5) | |
| AIDA64 / FPU Mandel | |
| Lenovo Legion 5 17ACH6H-82JY0003GE | |
| Schenker XMG Pro 17 (Late 2021, RTX 3080) | |
| MSI GE76 Raider | |
| Media Intel Core i7-12800H (15765 - 38179, n=5) | |
| Schenker Uniwill Technology GM7AG8P | |
| Razer Blade 17 RTX 3080 Ti | |
| AIDA64 / CPU AES | |
| Schenker XMG Pro 17 (Late 2021, RTX 3080) | |
| MSI GE76 Raider | |
| Lenovo Legion 5 17ACH6H-82JY0003GE | |
| Schenker Uniwill Technology GM7AG8P | |
| Media Intel Core i7-12800H (55371 - 73928, n=5) | |
| Razer Blade 17 RTX 3080 Ti | |
| AIDA64 / CPU ZLib | |
| MSI GE76 Raider | |
| Schenker Uniwill Technology GM7AG8P | |
| Media Intel Core i7-12800H (701 - 1047, n=5) | |
| Razer Blade 17 RTX 3080 Ti | |
| Schenker XMG Pro 17 (Late 2021, RTX 3080) | |
| Lenovo Legion 5 17ACH6H-82JY0003GE | |
| AIDA64 / FP64 Ray-Trace | |
| Schenker XMG Pro 17 (Late 2021, RTX 3080) | |
| Lenovo Legion 5 17ACH6H-82JY0003GE | |
| MSI GE76 Raider | |
| Schenker Uniwill Technology GM7AG8P | |
| Media Intel Core i7-12800H (3257 - 8559, n=5) | |
| Razer Blade 17 RTX 3080 Ti | |
| AIDA64 / CPU PhotoWorxx | |
| Razer Blade 17 RTX 3080 Ti | |
| Schenker Uniwill Technology GM7AG8P | |
| MSI GE76 Raider | |
| Media Intel Core i7-12800H (31329 - 40992, n=5) | |
| Schenker XMG Pro 17 (Late 2021, RTX 3080) | |
| Lenovo Legion 5 17ACH6H-82JY0003GE | |
Prestazioni del sistema
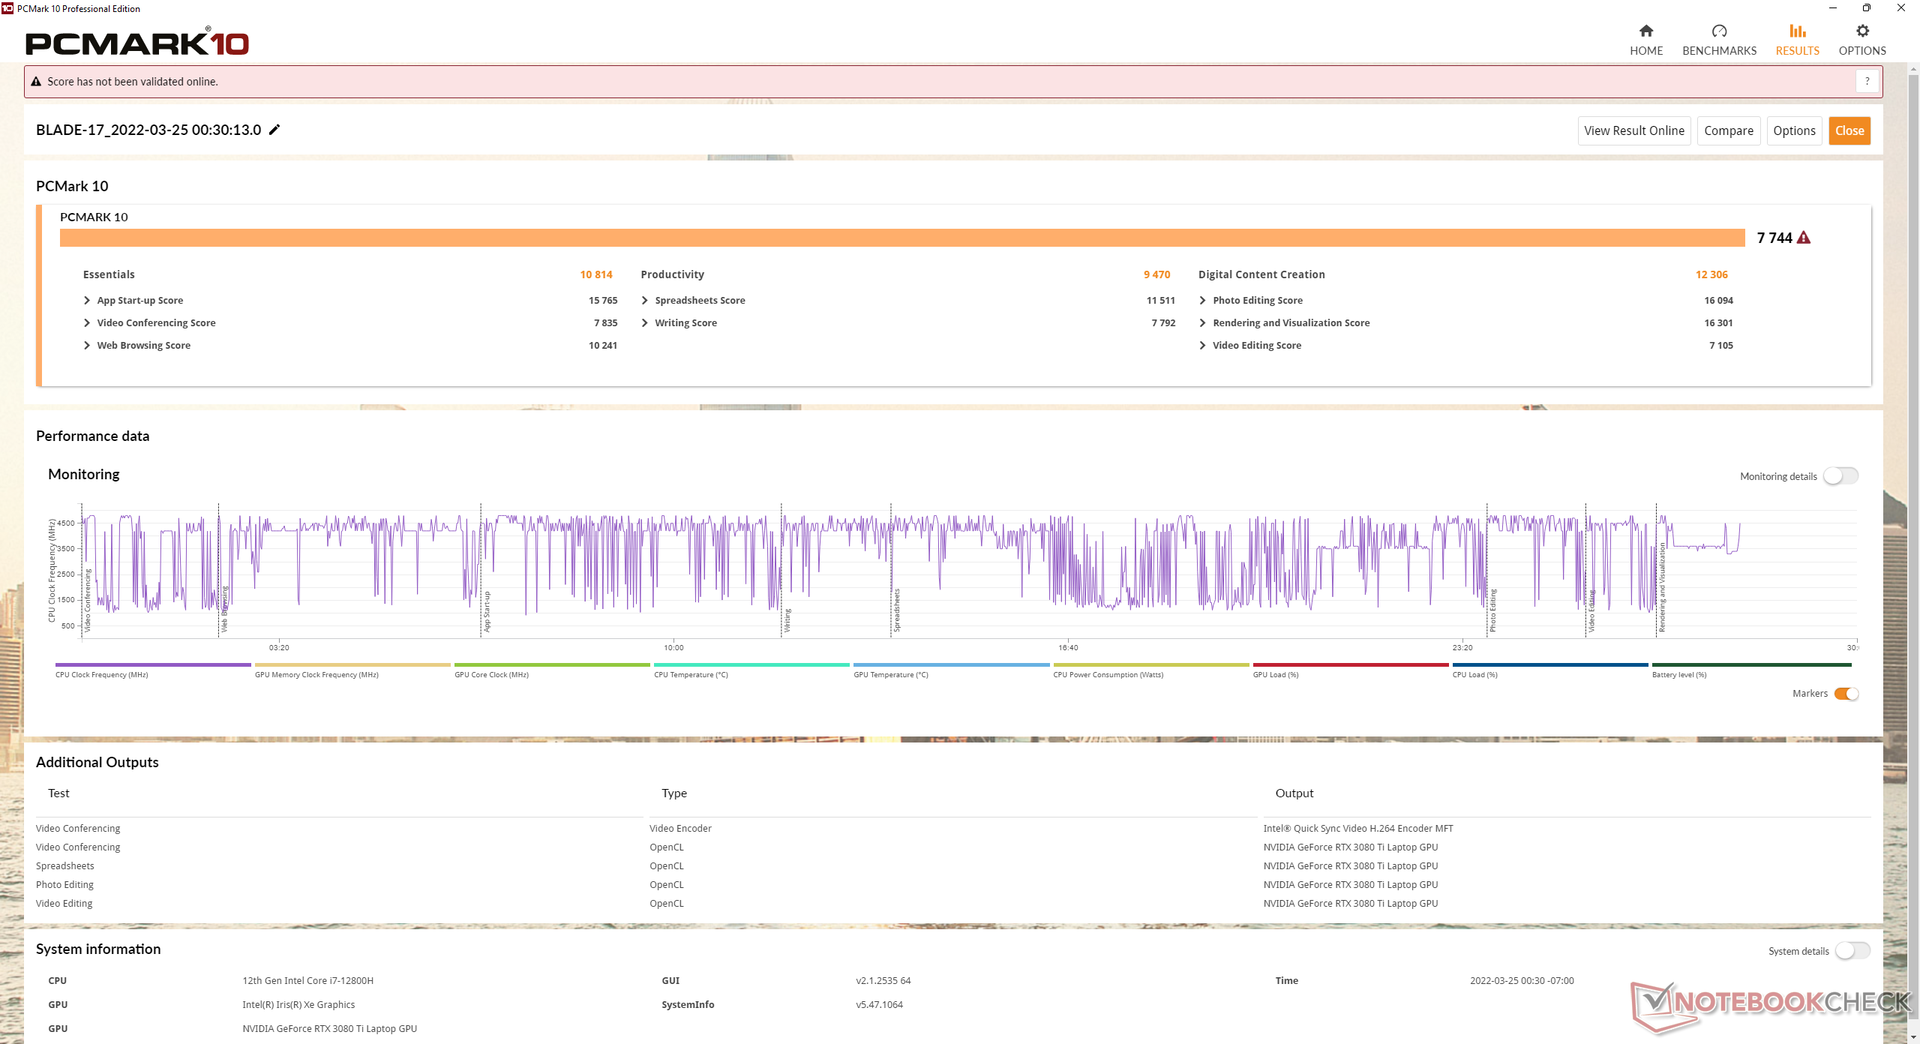
I risultati di PCMark 10 sono costantemente superiori a quelli che abbiamo registrato sul modello dell'anno scorso, specialmente nel subtest Digital Content Creation. Razer sembra anche aver risolto il problema relativo al software Synapse che non si avvia quando non è connesso a Internet.
| PCMark 10 / Score | |
| Razer Blade 17 RTX 3080 Ti | |
| Media Intel Core i7-12800H, NVIDIA GeForce RTX 3080 Ti Laptop GPU (7313 - 7744, n=3) | |
| Alienware x17 RTX 3080 P48E | |
| Asus ROG Zephyrus S17 GX703HSD | |
| Aorus 17G YD | |
| MSI GS76 Stealth 11UH | |
| Razer Blade Pro 17 2021 (QHD Touch) | |
| PCMark 10 / Essentials | |
| Razer Blade 17 RTX 3080 Ti | |
| Media Intel Core i7-12800H, NVIDIA GeForce RTX 3080 Ti Laptop GPU (10597 - 10814, n=3) | |
| Asus ROG Zephyrus S17 GX703HSD | |
| Aorus 17G YD | |
| Alienware x17 RTX 3080 P48E | |
| Razer Blade Pro 17 2021 (QHD Touch) | |
| MSI GS76 Stealth 11UH | |
| PCMark 10 / Productivity | |
| Alienware x17 RTX 3080 P48E | |
| Media Intel Core i7-12800H, NVIDIA GeForce RTX 3080 Ti Laptop GPU (9470 - 9675, n=3) | |
| Razer Blade 17 RTX 3080 Ti | |
| Aorus 17G YD | |
| Asus ROG Zephyrus S17 GX703HSD | |
| MSI GS76 Stealth 11UH | |
| Razer Blade Pro 17 2021 (QHD Touch) | |
| PCMark 10 / Digital Content Creation | |
| Razer Blade 17 RTX 3080 Ti | |
| Media Intel Core i7-12800H, NVIDIA GeForce RTX 3080 Ti Laptop GPU (10351 - 12306, n=3) | |
| Alienware x17 RTX 3080 P48E | |
| Asus ROG Zephyrus S17 GX703HSD | |
| Aorus 17G YD | |
| MSI GS76 Stealth 11UH | |
| Razer Blade Pro 17 2021 (QHD Touch) | |
| PCMark 10 Score | 7744 punti | |
Aiuto | ||
| AIDA64 / Memory Copy | |
| MSI GE76 Raider | |
| Razer Blade 17 RTX 3080 Ti | |
| Schenker Uniwill Technology GM7AG8P | |
| Media Intel Core i7-12800H (48643 - 62522, n=5) | |
| Schenker XMG Pro 17 (Late 2021, RTX 3080) | |
| Schenker XMG Apex 17 M21 | |
| Lenovo Legion 5 17ACH6H-82JY0003GE | |
| AIDA64 / Memory Read | |
| Razer Blade 17 RTX 3080 Ti | |
| MSI GE76 Raider | |
| Schenker Uniwill Technology GM7AG8P | |
| Media Intel Core i7-12800H (56629 - 66199, n=5) | |
| Schenker XMG Pro 17 (Late 2021, RTX 3080) | |
| Schenker XMG Apex 17 M21 | |
| Lenovo Legion 5 17ACH6H-82JY0003GE | |
| AIDA64 / Memory Write | |
| Razer Blade 17 RTX 3080 Ti | |
| Schenker Uniwill Technology GM7AG8P | |
| MSI GE76 Raider | |
| Media Intel Core i7-12800H (50923 - 66074, n=5) | |
| Schenker XMG Apex 17 M21 | |
| Schenker XMG Pro 17 (Late 2021, RTX 3080) | |
| Lenovo Legion 5 17ACH6H-82JY0003GE | |
| AIDA64 / Memory Latency | |
| MSI GE76 Raider | |
| Schenker XMG Pro 17 (Late 2021, RTX 3080) | |
| Schenker XMG Apex 17 M21 | |
| Lenovo Legion 5 17ACH6H-82JY0003GE | |
| Media Intel Core i7-12800H (89.3 - 95.2, n=5) | |
| Schenker Uniwill Technology GM7AG8P | |
| Razer Blade 17 RTX 3080 Ti | |
* ... Meglio usare valori piccoli
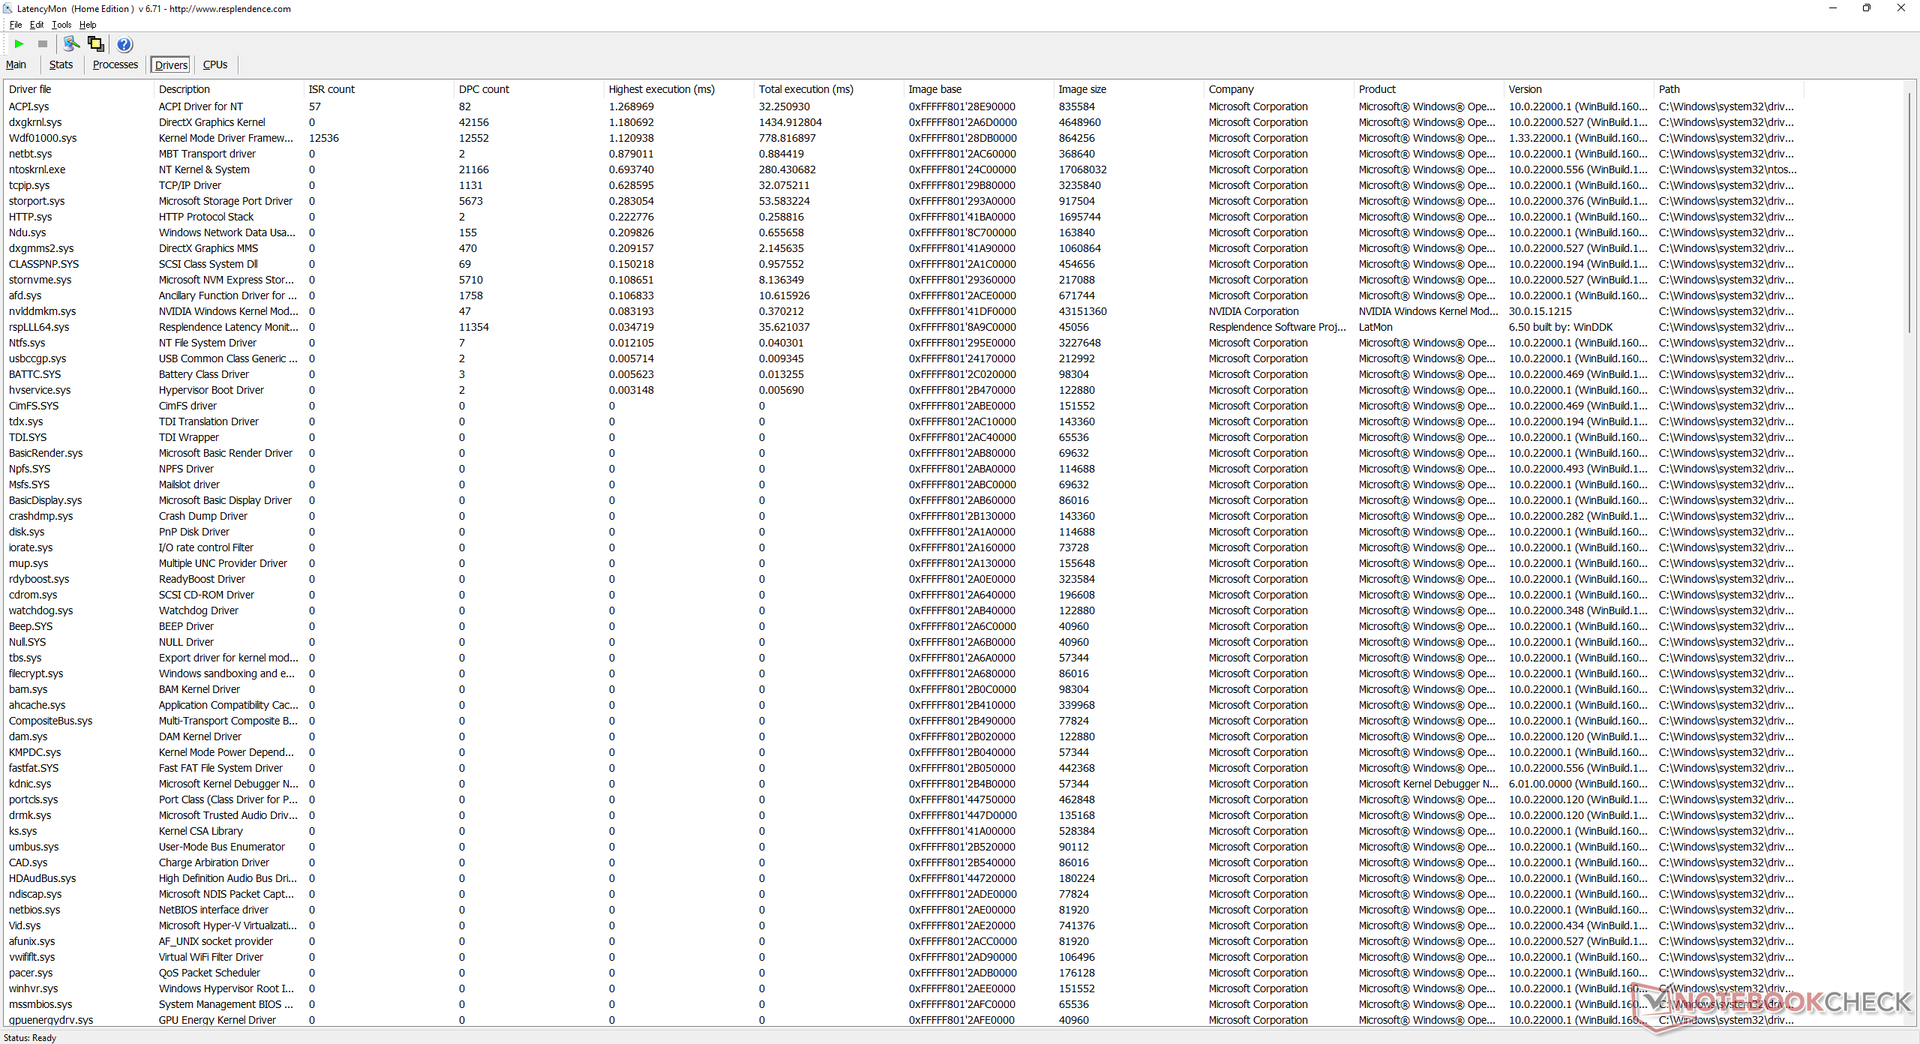
Latenza DPC
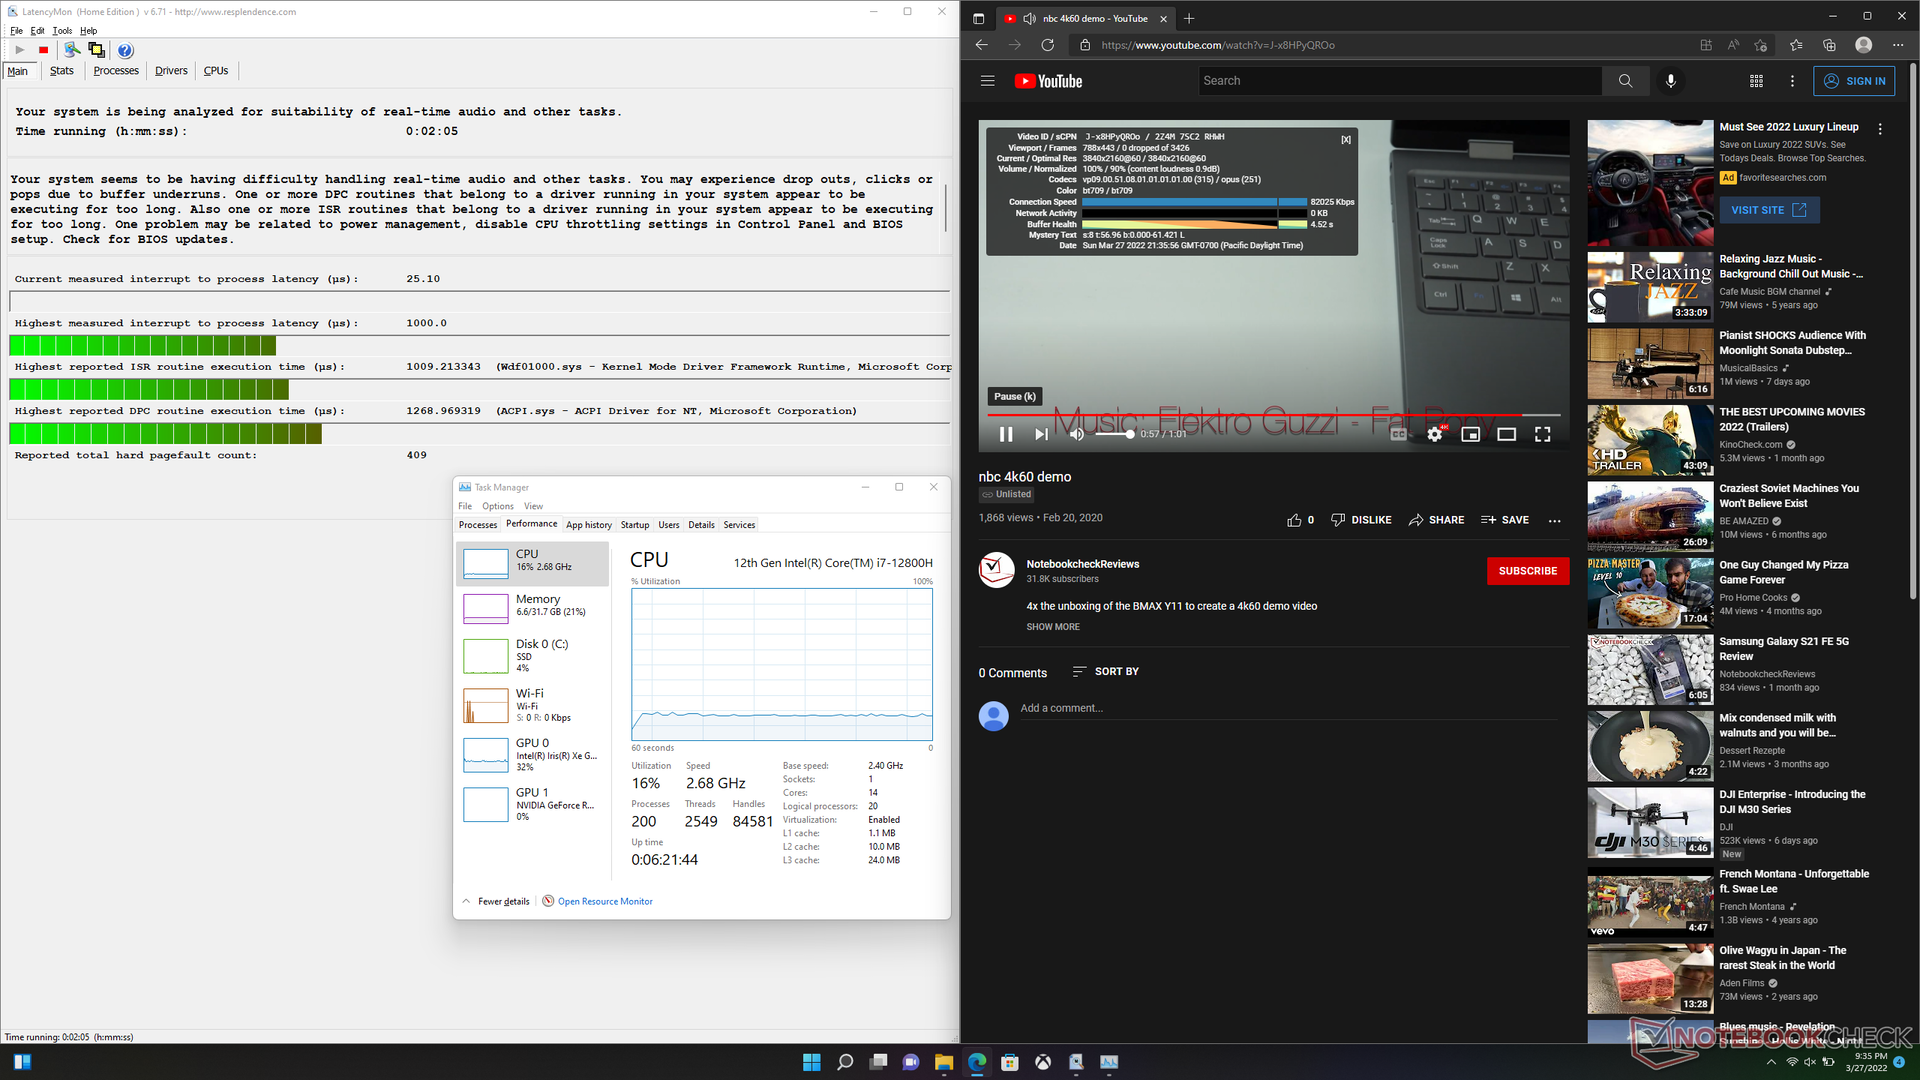
LatencyMon mostra piccoli problemi di DPC quando si aprono più schede del browser sulla nostra homepage. la riproduzione di video 4K a 60 FPS è altrimenti perfetta senza perdita di fotogrammi.
| DPC Latencies / LatencyMon - interrupt to process latency (max), Web, Youtube, Prime95 | |
| Alienware x17 RTX 3080 P48E | |
| Razer Blade Pro 17 2021 (QHD Touch) | |
| Asus ROG Zephyrus S17 GX703HSD | |
| Aorus 17G YD | |
| Razer Blade 17 RTX 3080 Ti | |
| MSI GS76 Stealth 11UH | |
* ... Meglio usare valori piccoli
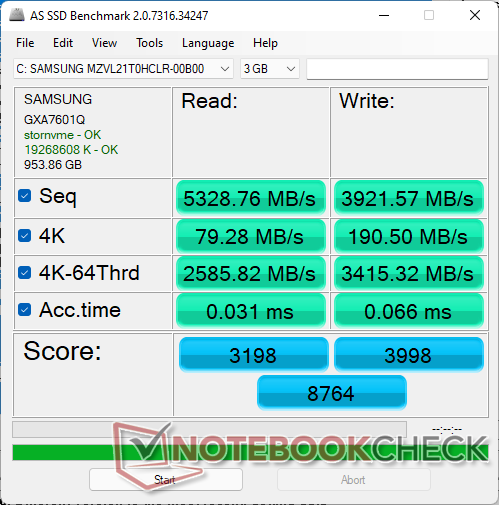
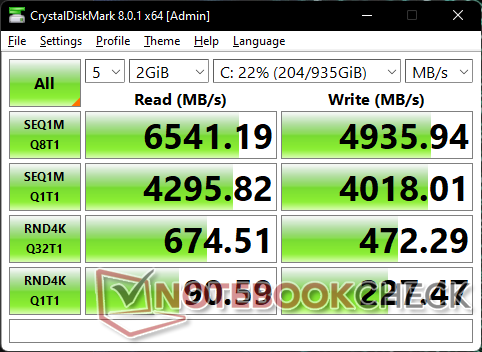
Dispositivi di archiviazione - Fino a due SSD M.2 PCIe4 x4
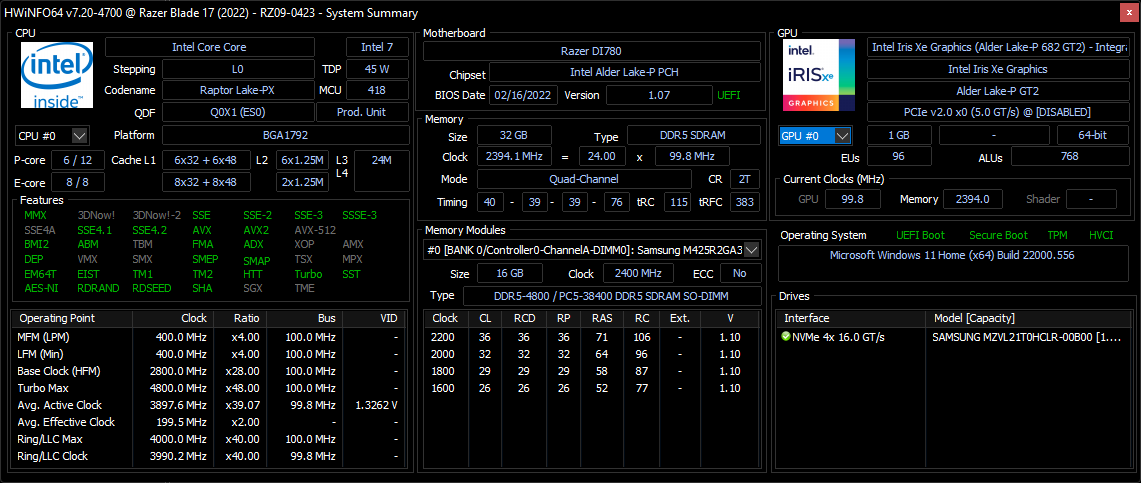
La maggior parte, se non tutte, le SKU del Blade 17 sono dotate di SSD Samsung. La nostra unità di test viene fornita con ilSamsung PM9A1 che è uno dei più veloci SSD PCIe4 x4 di classe consumer disponibili. L'unità non mostra problemi nel sostenere velocità di trasferimento molto elevate di oltre 6600 MB/s nella nostra unità, il che suggerisce un'eccellente dissipazione del calore a differenza del modelloUniwill Technology GM7AG8P.

* ... Meglio usare valori piccoli
Disk Throttling: DiskSpd Read Loop, Queue Depth 8
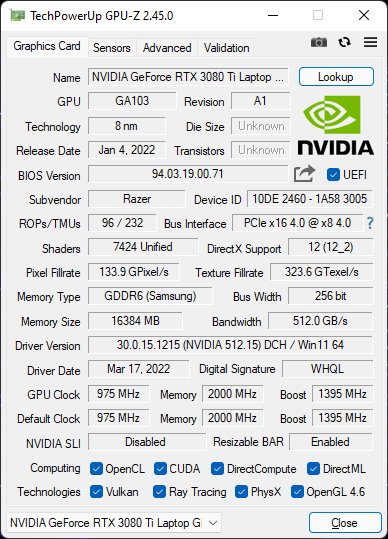
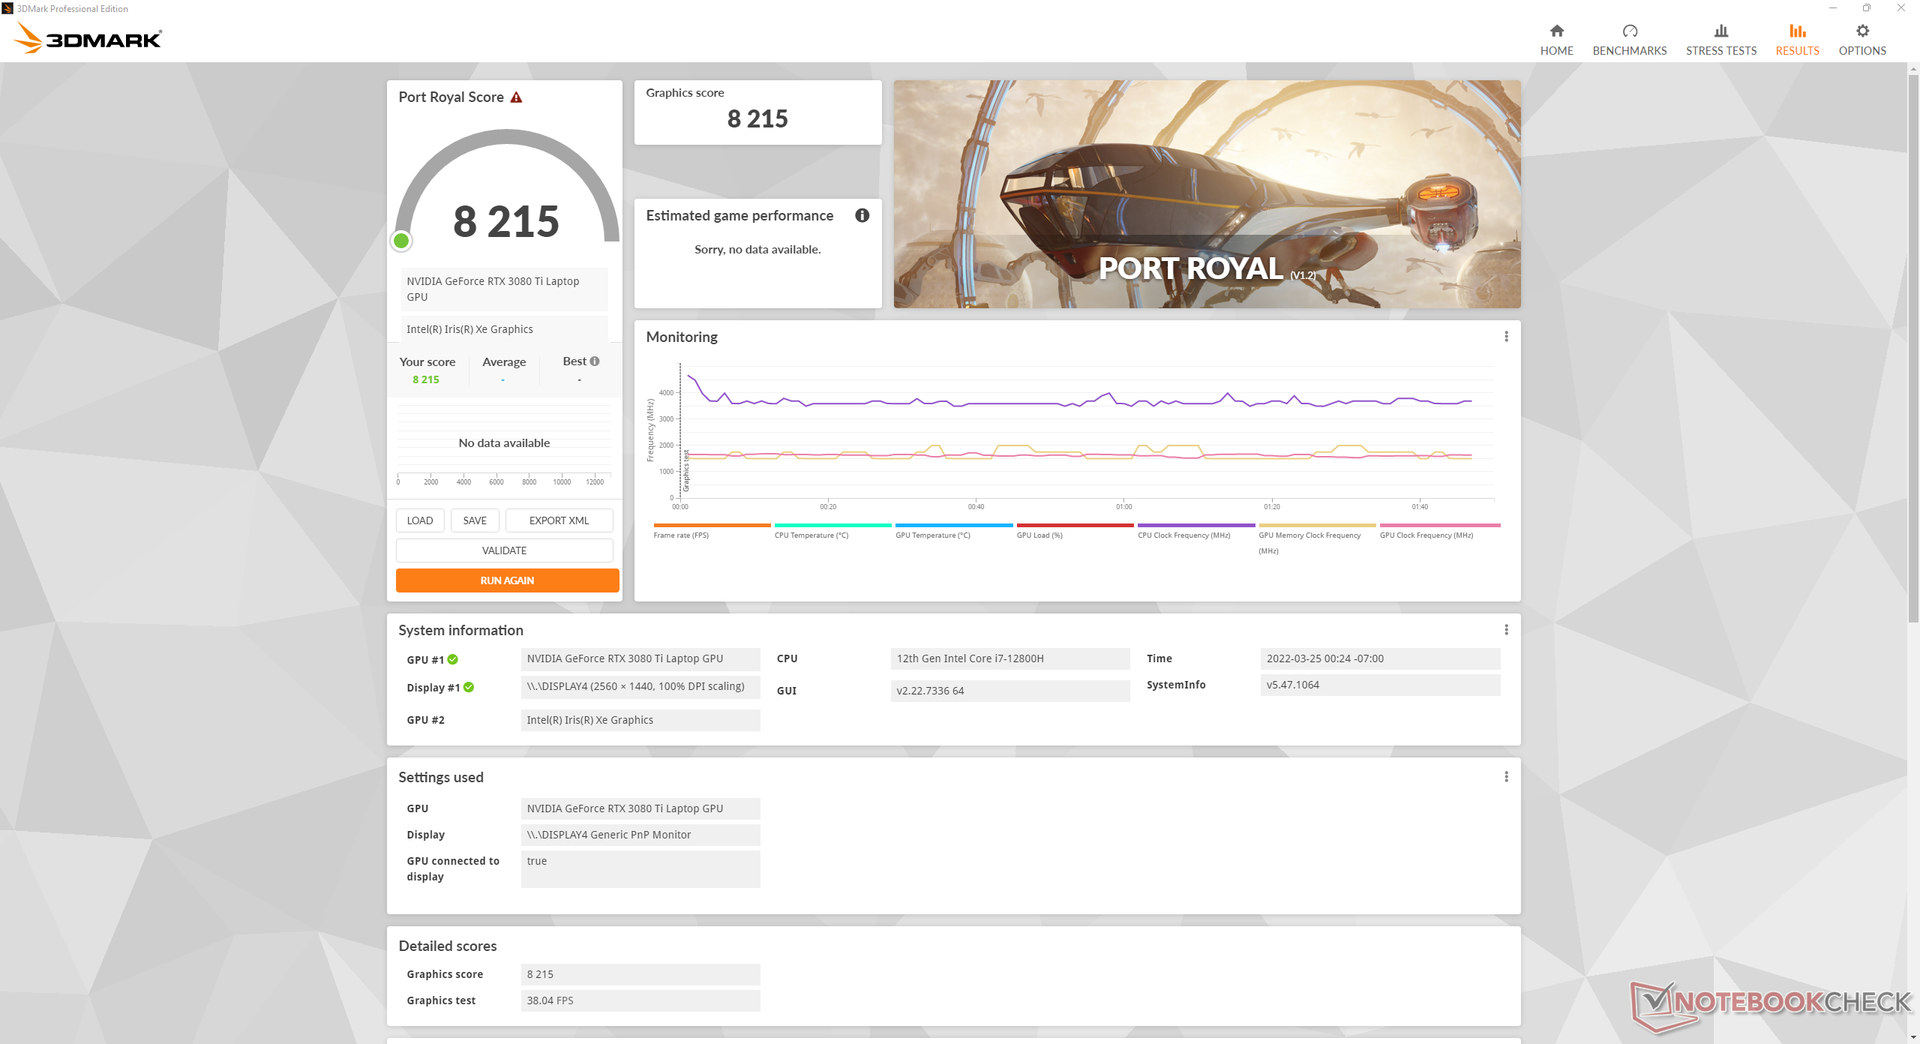
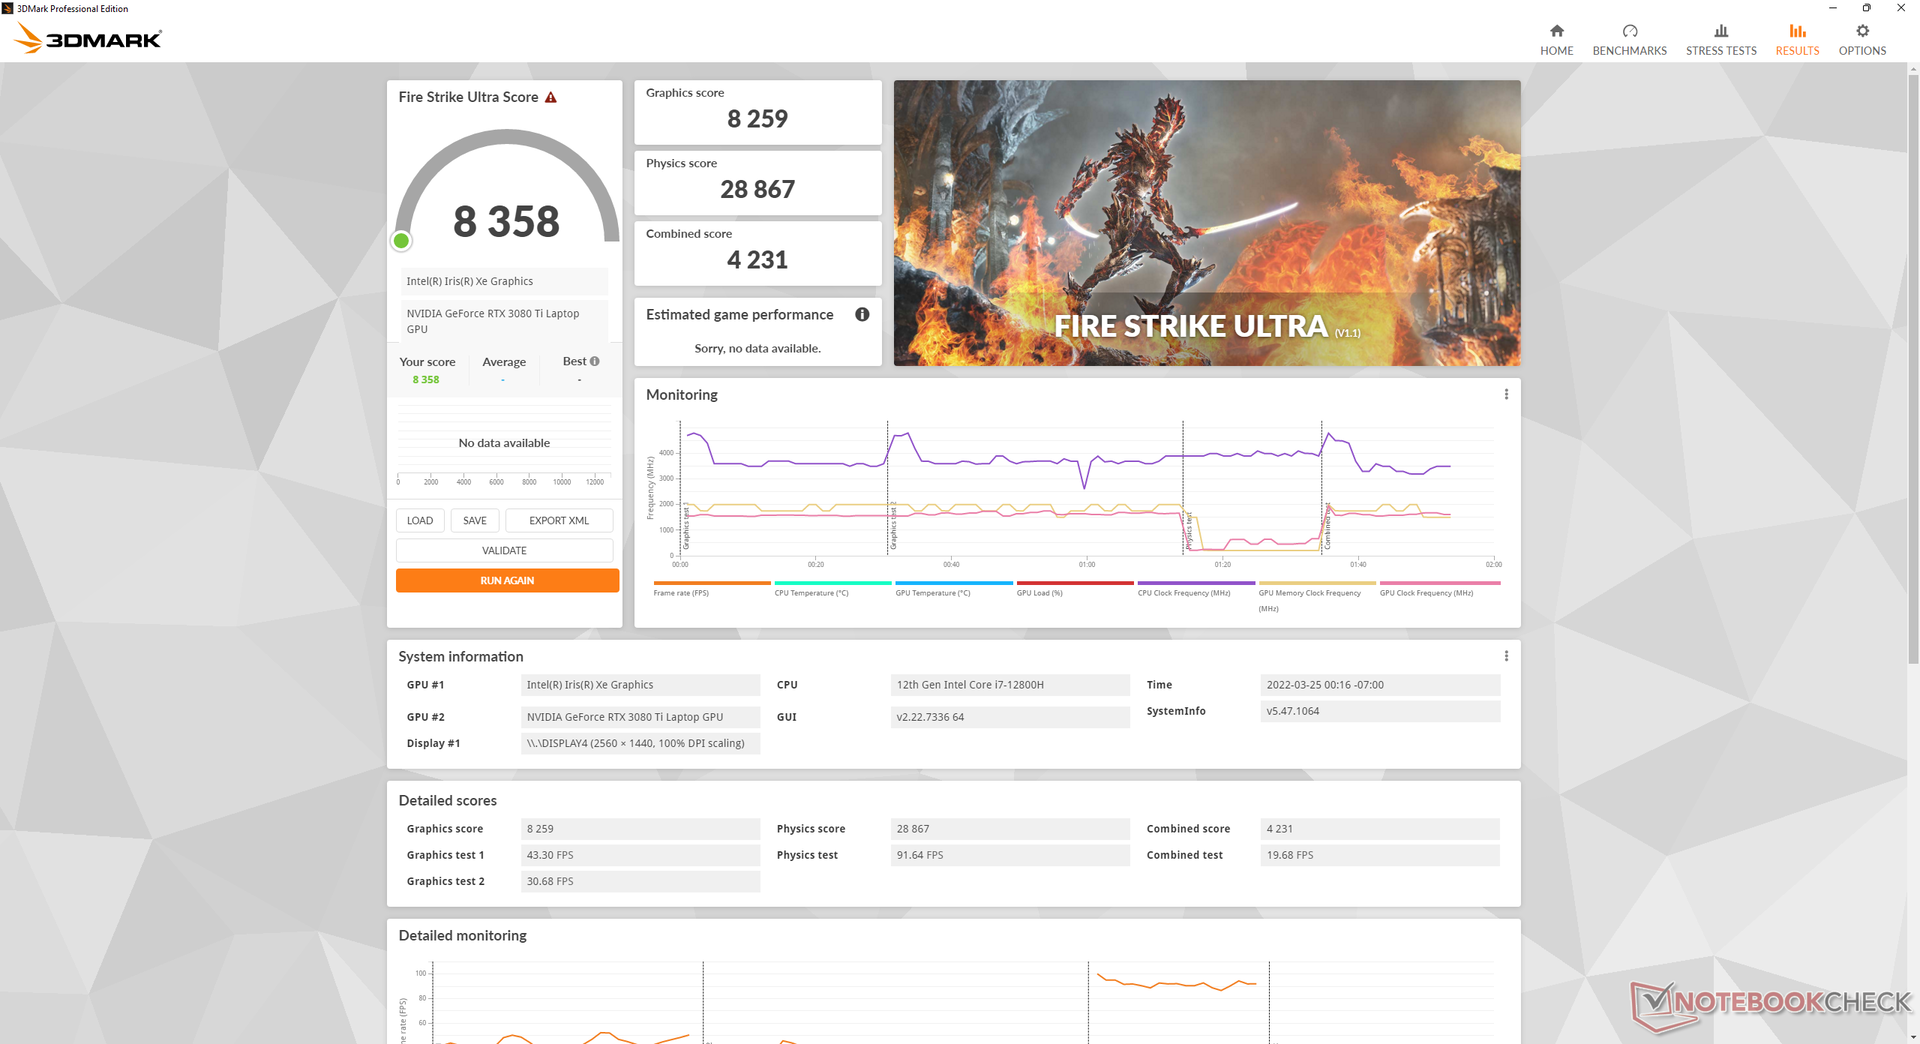
Prestazioni della GPU
Dopo aver testato più di una mezza dozzina di computer portatili con mobile GeForce RTX 3080 Ti al momento della recensione, quello del nostro Blade 17 ha prestazioni comodamente sopra la media di circa il 15 percento. L'alto obiettivo TGP di 165 W è senza dubbio una grande ragione per il vantaggio prestazionale come altri portatili con la stessa GPU RTX 3080 Ti come il Blade 15 o Gigabyte Aero 16 YE5 tendono invece a puntare a obiettivi TGP molto più bassi di circa 100 W. Gli utenti possono aspettarsi un aumento delle prestazioni grafiche grezze di circa il 20 per cento rispetto all'Intel Blade 17 di 10a o 11a generazione con regolare rTX 3080 mobile grafica.
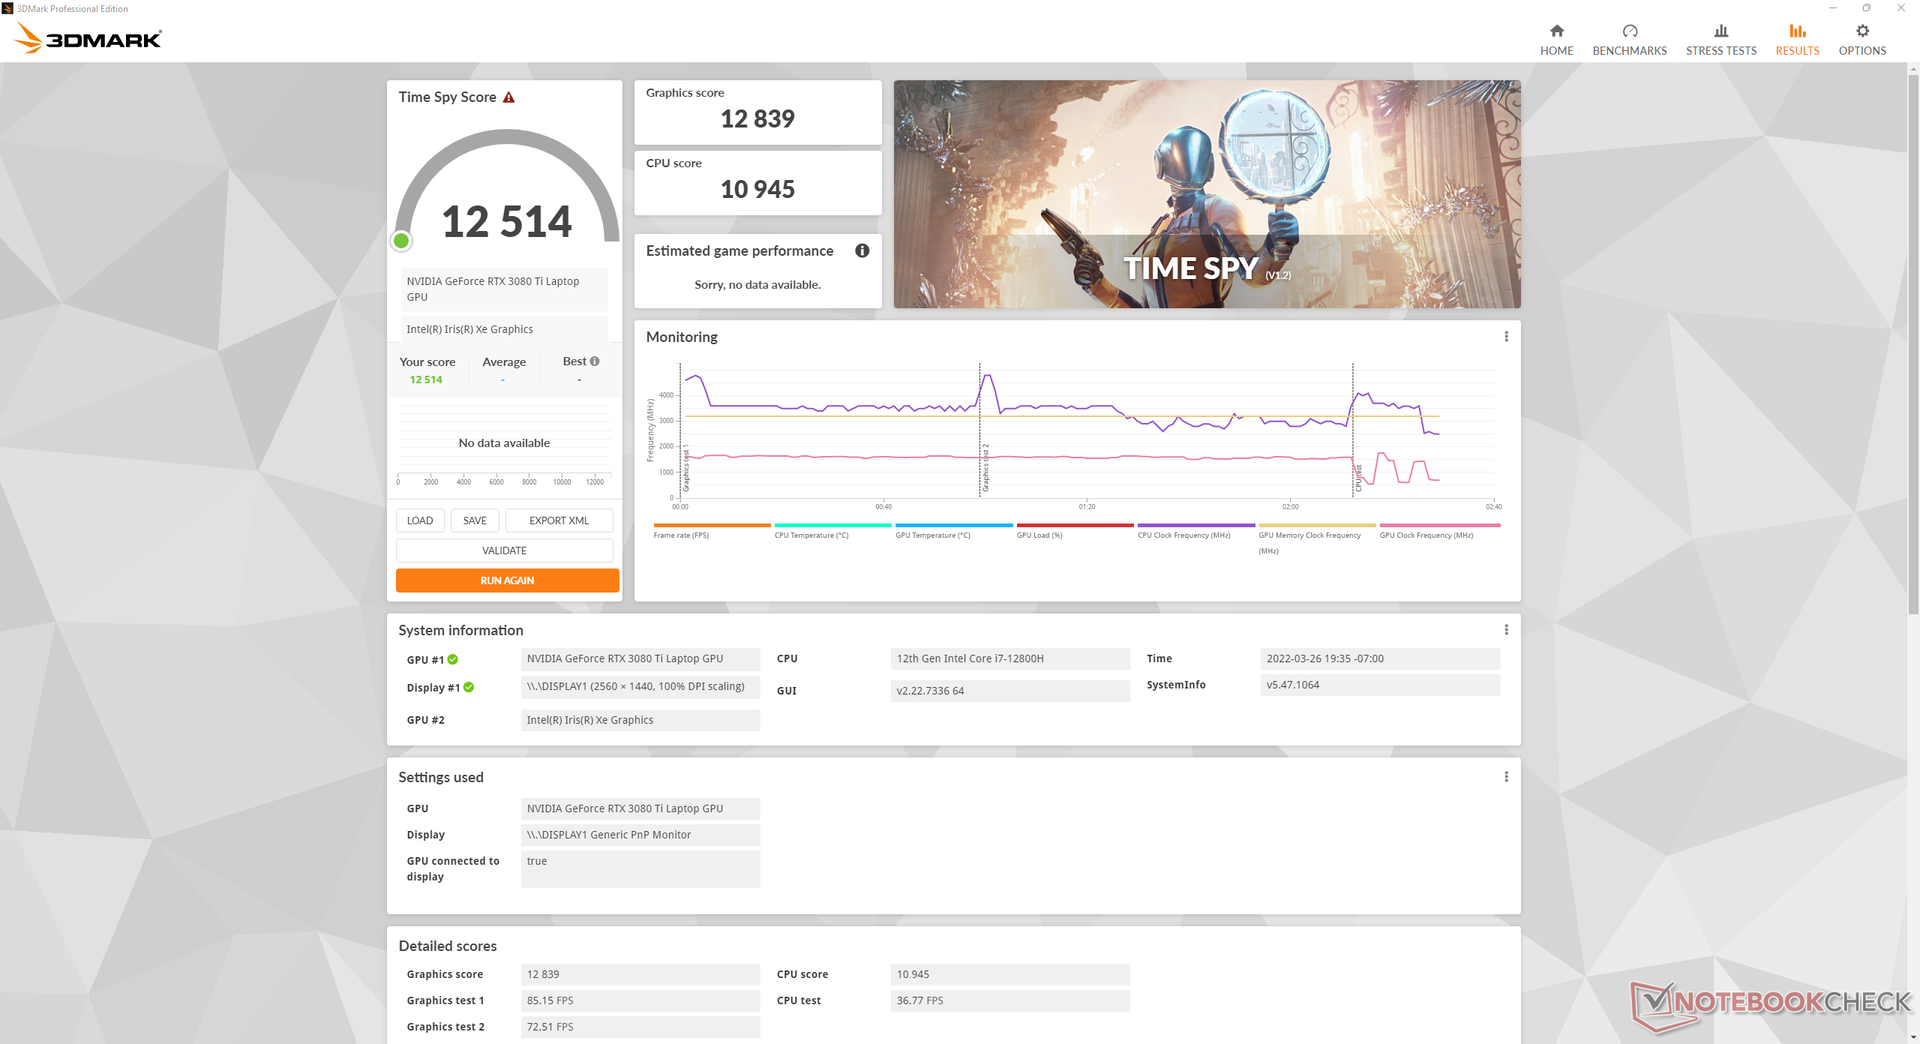
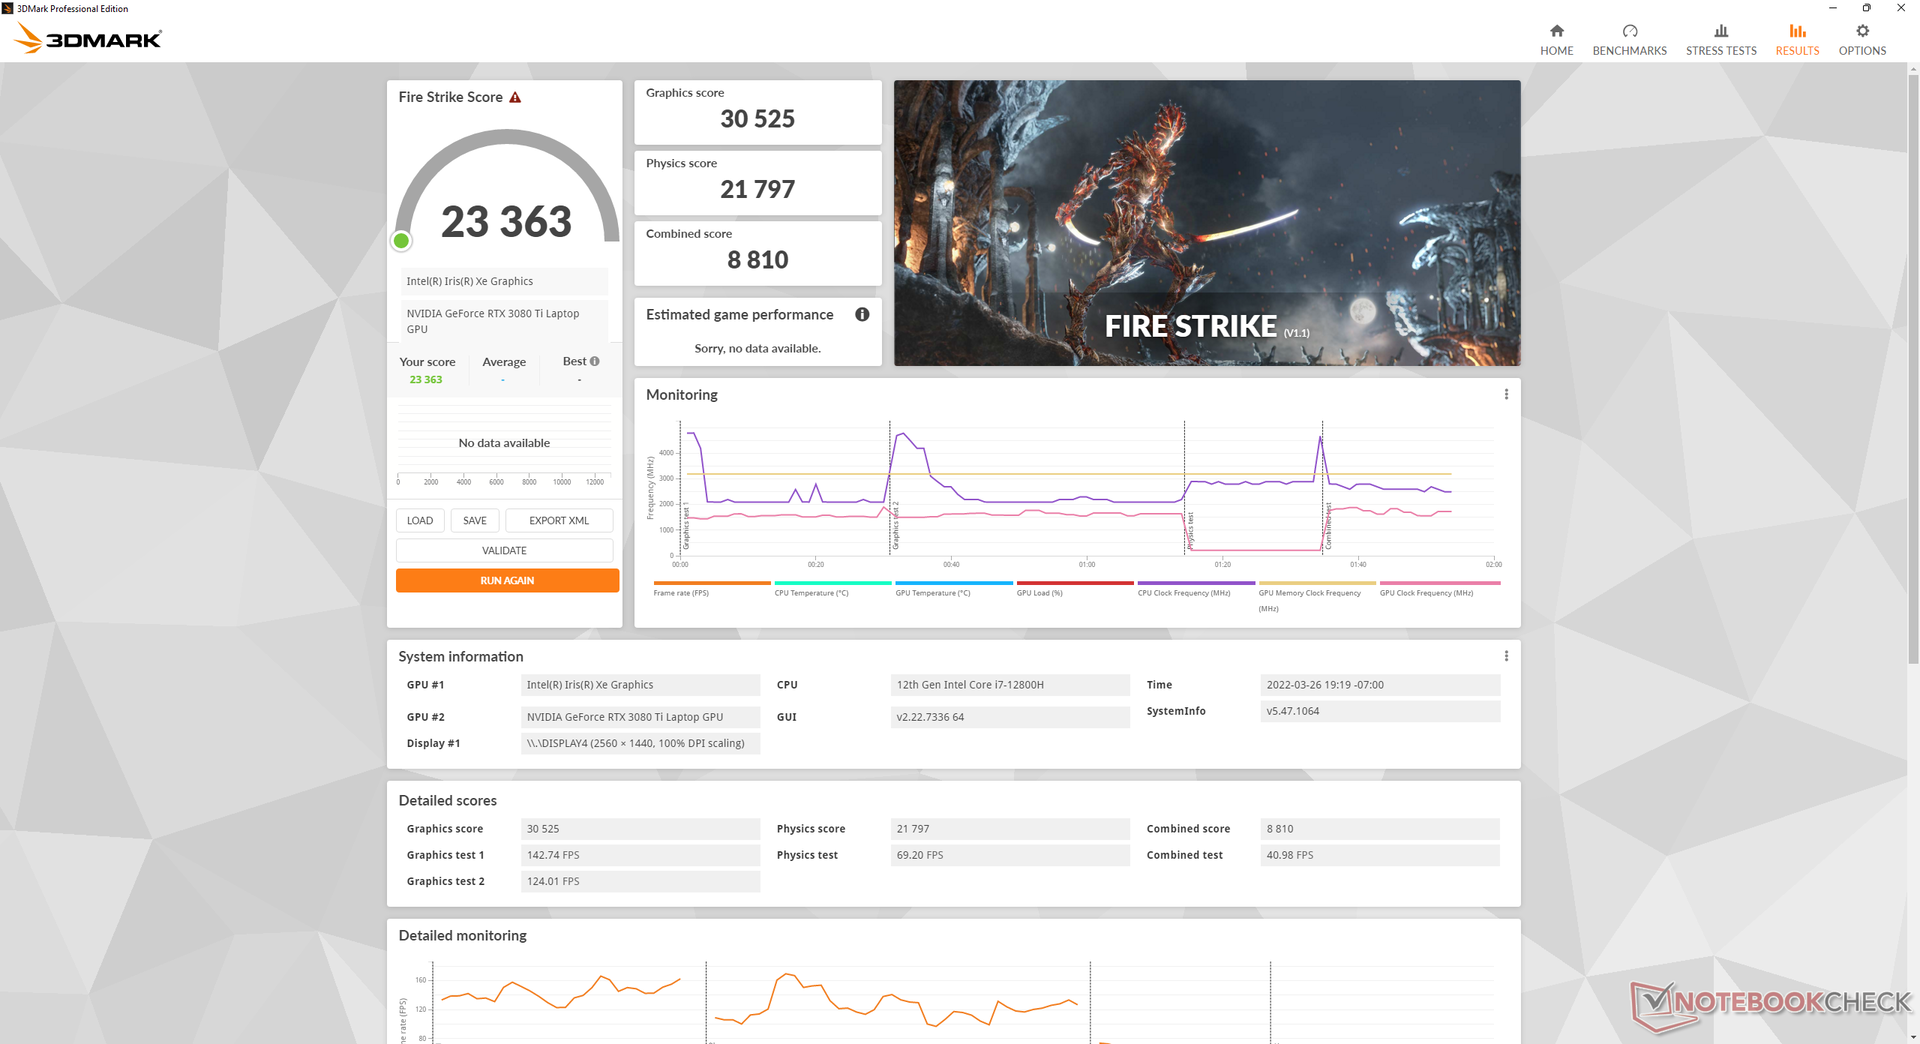
L'esecuzione del sistema in modalità Balanced dGPU invece della modalità dGPU a prestazioni massime comporterà un deficit di prestazioni grafiche di solo circa il 5-7 per cento.
Il downgrade alla rTX 3070 Ti mobile dalla nostra RTX 3080 Ti mobile comporterà un deficit di prestazioni di solo circa il 10 per cento
Naturalmente, la "vera" RTX 3080 Ti per desktop offrirà ancora un grande salto di prestazioni della GPU di quasi il 50 per cento rispetto alla nostra versione mobile.
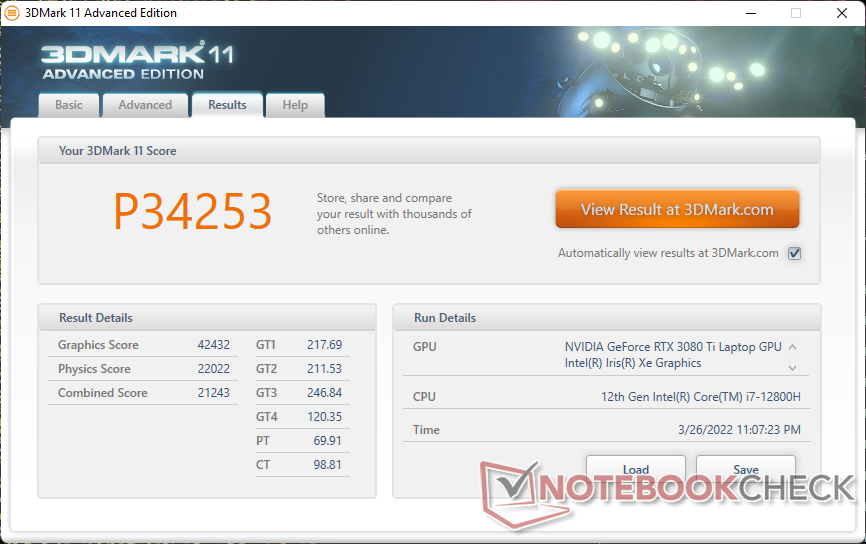
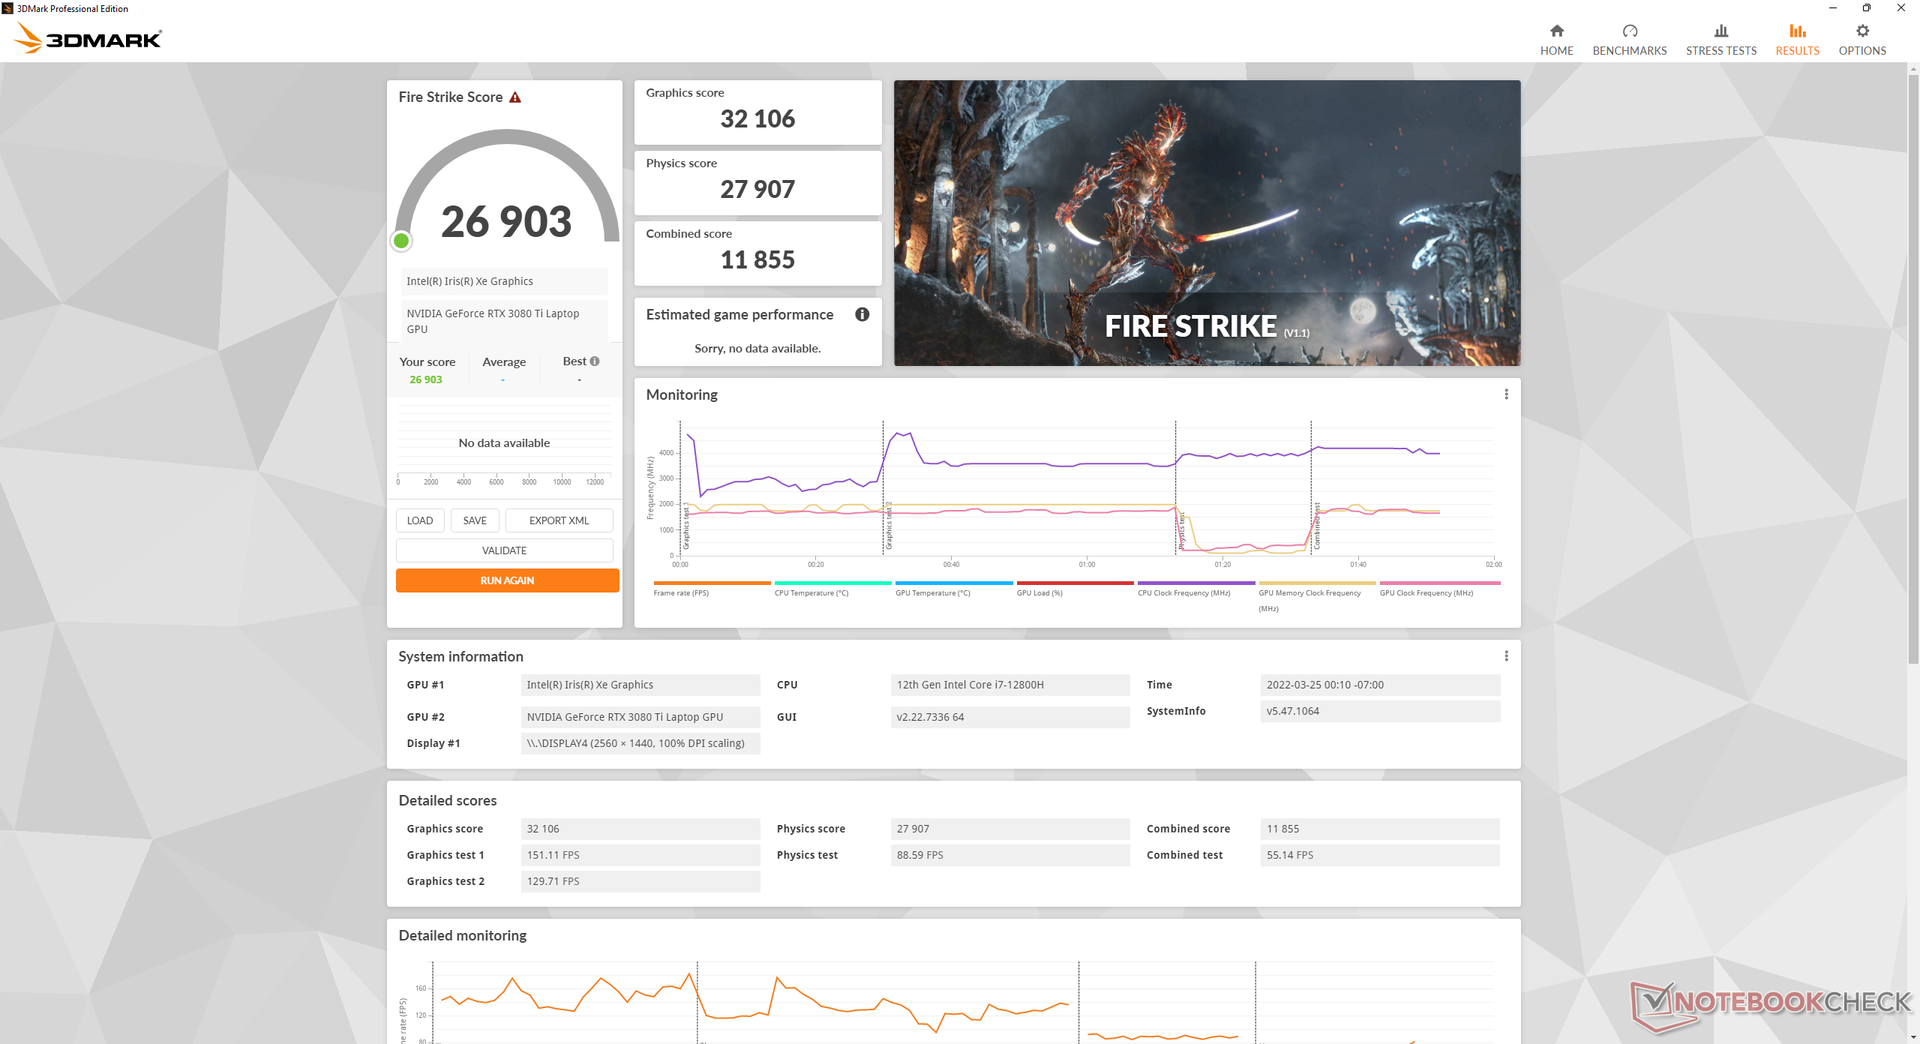
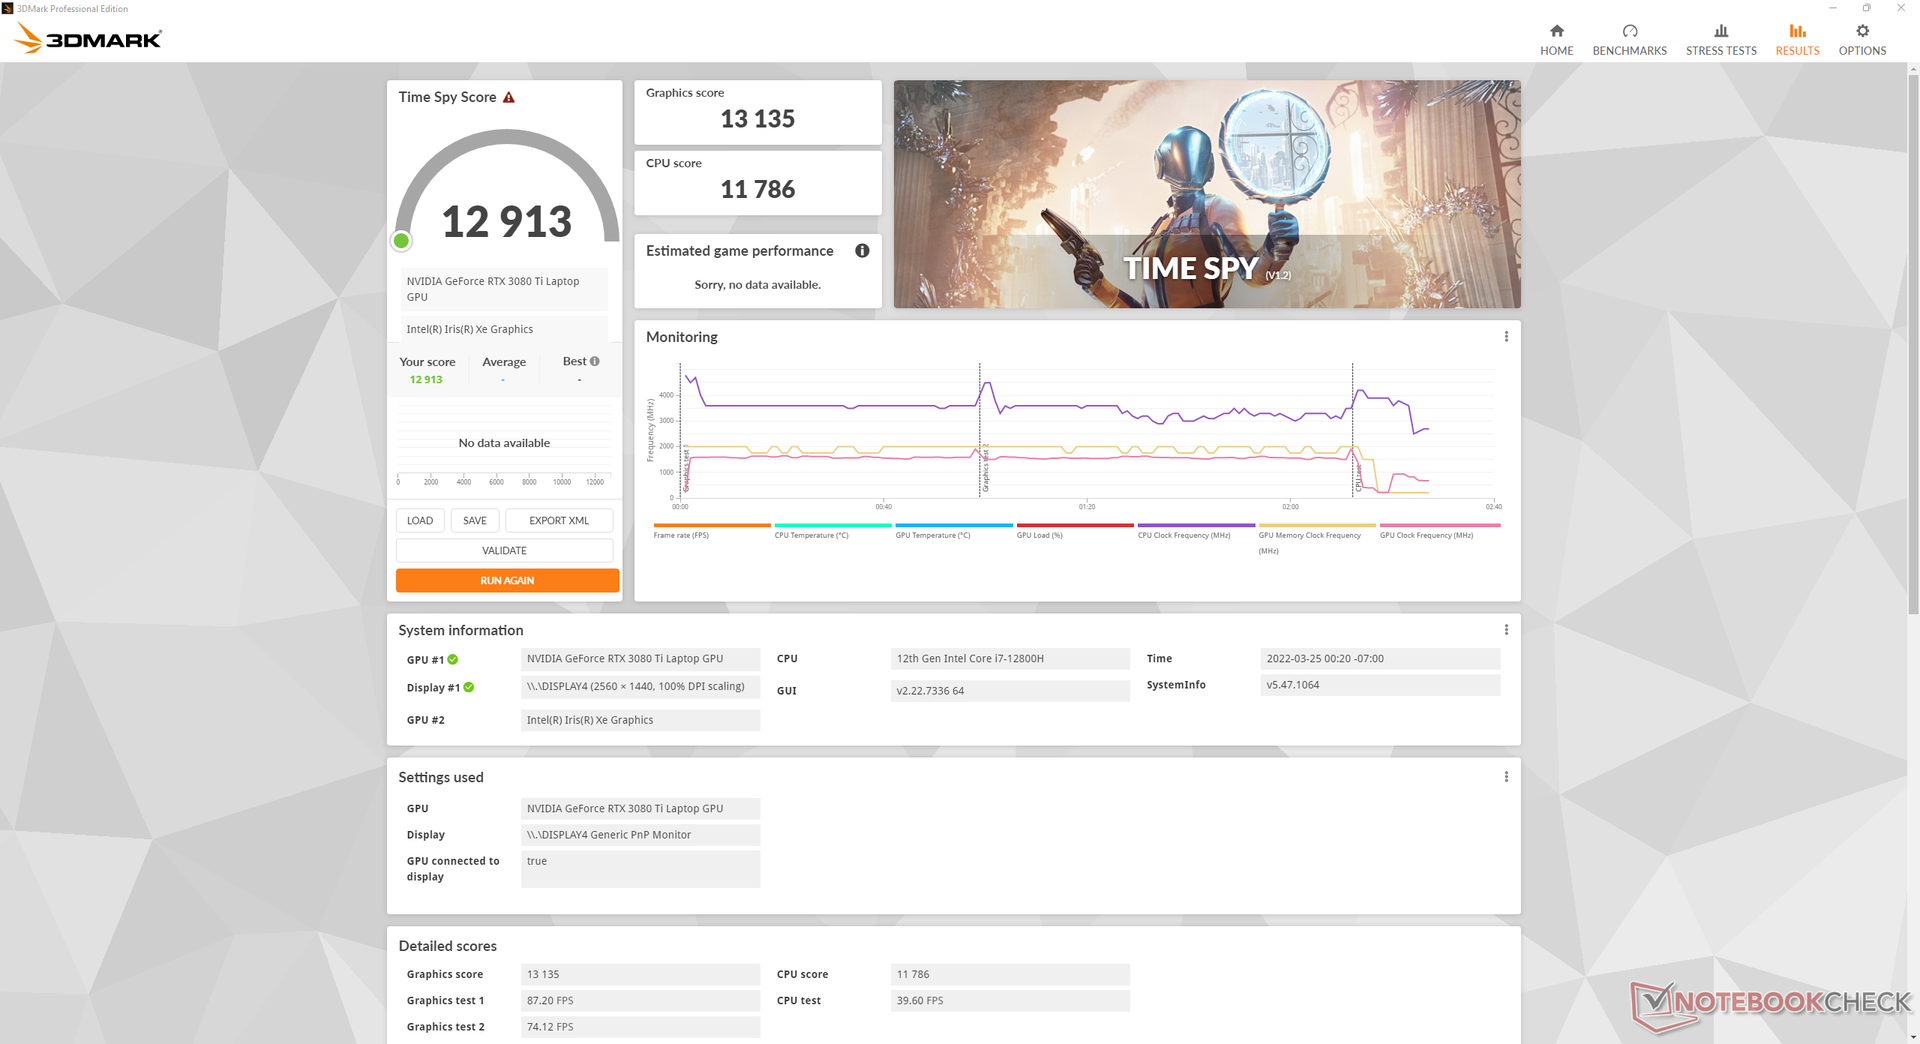


| 3DMark 11 Performance | 34253 punti | |
| 3DMark Cloud Gate Standard Score | 62059 punti | |
| 3DMark Fire Strike Score | 26903 punti | |
| 3DMark Time Spy Score | 12913 punti | |
Aiuto | ||
Witcher 3 FPS Chart
| basso | medio | alto | ultra | QHD | |
|---|---|---|---|---|---|
| GTA V (2015) | 186 | 182 | 176 | 113 | 105 |
| The Witcher 3 (2015) | 459 | 340.9 | 250.4 | 124.6 | |
| Dota 2 Reborn (2015) | 183 | 171 | 165 | 157 | |
| Final Fantasy XV Benchmark (2018) | 168 | 152 | 121 | 93.3 | |
| X-Plane 11.11 (2018) | 158 | 139 | 111 | ||
| Far Cry 5 (2018) | 171 | 149 | 134 | 125 | 120 |
| Strange Brigade (2018) | 431 | 296 | 242 | 215 | 158 |
| Cyberpunk 2077 1.6 (2022) | 119.1 | 112.1 | 106 | 106.5 | 59.7 |
Emissioni
Rumore di sistema - Forte solo quando si gioca
Non ci sono cambiamenti significativi al rumore delle ventole nonostante il passaggio da quattro a tre ventole. Gli utenti vorranno essere in modalità Power Saver o Balanced quando non si eseguono applicazioni impegnative per avere ventole più silenziose.
Il rumore della ventola quando si gioca in modalità Balanced è di circa 43,2 dB(A) rispetto a 50,9 dB(A) quando si gioca in modalità Maximum Performance nonostante il piccolo deficit grafico del 5-7%. Quindi, gli utenti potrebbero voler considerare il gioco in modalità bilanciata se il rumore della ventola è una preoccupazione.
Rumorosità
| Idle |
| 23.3 / 23.3 / 26.3 dB(A) |
| Sotto carico |
| 38.2 / 49.1 dB(A) |
 | ||
30 dB silenzioso 40 dB(A) udibile 50 dB(A) rumoroso |
||
min: | ||
| Razer Blade 17 RTX 3080 Ti GeForce RTX 3080 Ti Laptop GPU, i7-12800H, Samsung PM9A1 MZVL21T0HCLR | Razer Blade Pro 17 2021 (QHD Touch) GeForce RTX 3080 Laptop GPU, i7-10875H, Samsung PM981a MZVLB1T0HBLR | MSI GS76 Stealth 11UH GeForce RTX 3080 Laptop GPU, i9-11900H, Samsung PM9A1 MZVL22T0HBLB | Asus ROG Zephyrus S17 GX703HSD GeForce RTX 3080 Laptop GPU, i9-11900H, Samsung PM9A1 MZVL22T0HBLB | Aorus 17G YD GeForce RTX 3080 Laptop GPU, i7-11800H, Samsung PM9A1 MZVL2512HCJQ | Alienware x17 RTX 3080 P48E GeForce RTX 3080 Laptop GPU, i7-11800H, 2x WDC PC SN730 SDBPNTY-1T00 (RAID 0) | |
|---|---|---|---|---|---|---|
| Noise | -12% | -12% | 2% | -25% | -4% | |
| off /ambiente * (dB) | 23.3 | 26.1 -12% | 24 -3% | 23 1% | 25 -7% | 24.9 -7% |
| Idle Minimum * (dB) | 23.3 | 26.1 -12% | 24 -3% | 23 1% | 32 -37% | 24.9 -7% |
| Idle Average * (dB) | 23.3 | 26.5 -14% | 25 -7% | 23 1% | 33 -42% | 24.9 -7% |
| Idle Maximum * (dB) | 26.3 | 30.7 -17% | 42 -60% | 23 13% | 39 -48% | 29.6 -13% |
| Load Average * (dB) | 38.2 | 43.5 -14% | 46 -20% | 41 -7% | 43 -13% | 31.1 19% |
| Witcher 3 ultra * (dB) | 50.9 | 54 -6% | 48 6% | 45 12% | 52 -2% | 49.7 2% |
| Load Maximum * (dB) | 49.1 | 55 -12% | 48 2% | 52 -6% | 61 -24% | 54.8 -12% |
* ... Meglio usare valori piccoli
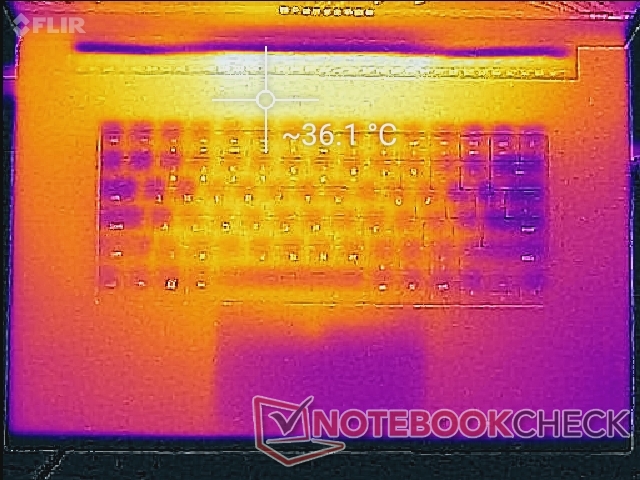
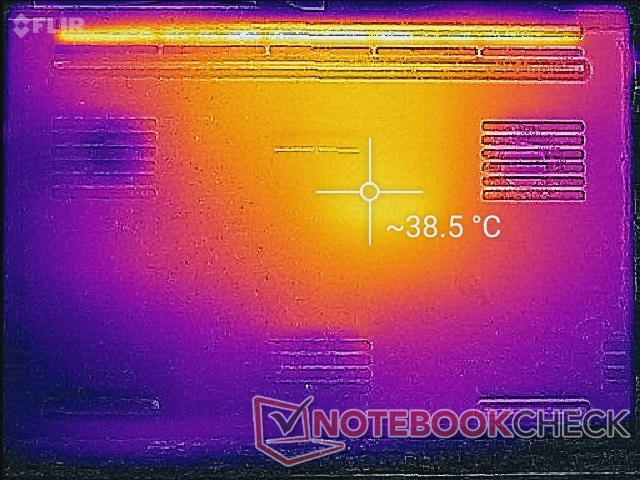
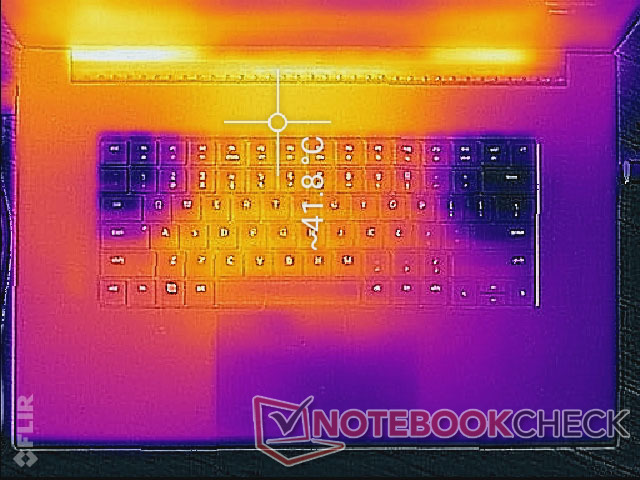
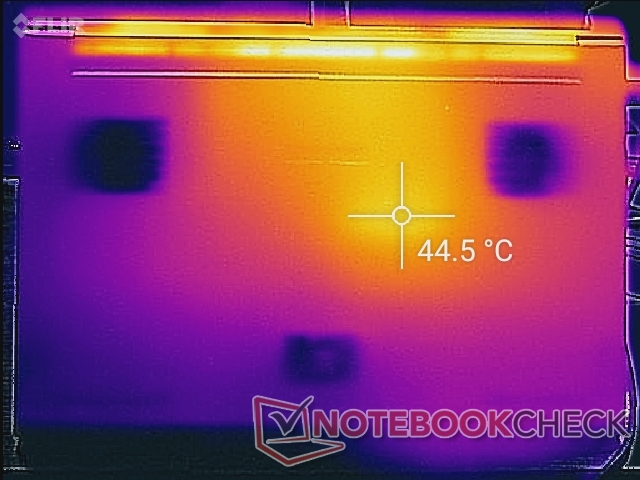
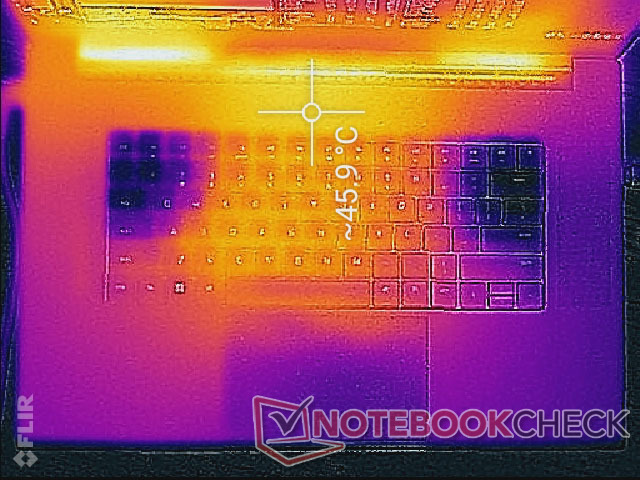
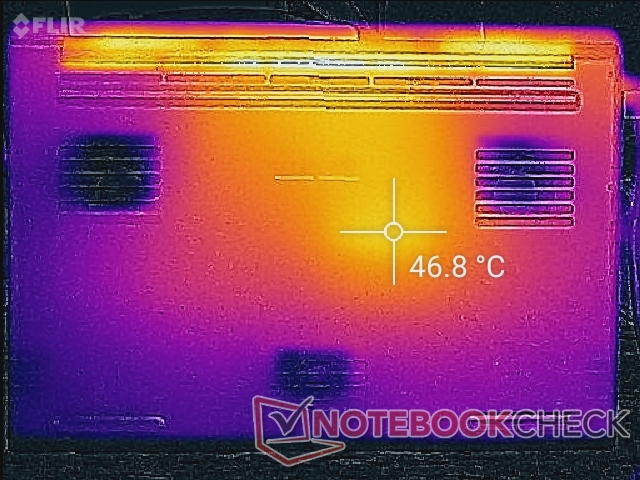
Temperatura - più calda di prima
Le temperature della superficie sono leggermente più calde sul modello 2022 rispetto al modello 2021. Il centro della tastiera può essere caldo fino a 38 C quando si gioca, mentre questo stesso punto sul modello 2021 sarebbe un po' più fresco di qualche grado. Inoltre, il sistema continua ad essere molto caldo a circa 31 C - 35 C quando non si eseguono carichi impegnativi rispetto ai soli 27 C - 30 C del modello MSI GS76. Le temperature della pelle più alte sono il prezzo da pagare per le ventole più silenziose durante i bassi carichi di lavoro.
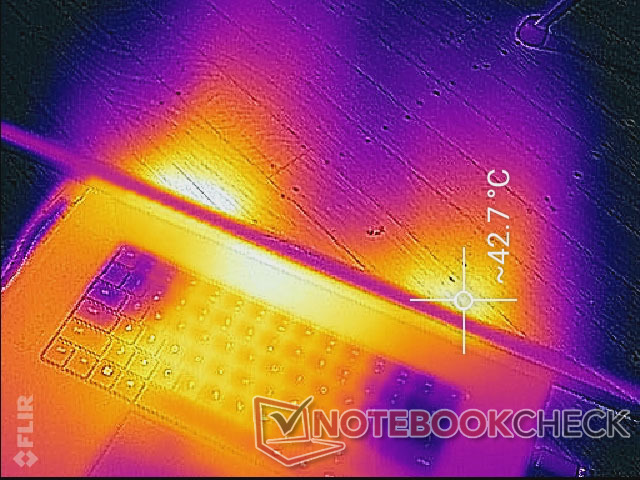
(-) La temperatura massima sul lato superiore è di 46 °C / 115 F, rispetto alla media di 40.4 °C / 105 F, che varia da 21.2 a 68.8 °C per questa classe Gaming.
(-) Il lato inferiore si riscalda fino ad un massimo di 46.8 °C / 116 F, rispetto alla media di 43.2 °C / 110 F
(+) In idle, la temperatura media del lato superiore è di 31.5 °C / 89 F, rispetto alla media deld ispositivo di 33.9 °C / 93 F.
(±) Riproducendo The Witcher 3, la temperatura media per il lato superiore e' di 33.2 °C / 92 F, rispetto alla media del dispositivo di 33.9 °C / 93 F.
(+) I poggiapolsi e il touchpad raggiungono la temperatura massima della pelle (32.4 °C / 90.3 F) e quindi non sono caldi.
(-) La temperatura media della zona del palmo della mano di dispositivi simili e'stata di 28.8 °C / 83.8 F (-3.6 °C / -6.5 F).
| Razer Blade 17 RTX 3080 Ti Intel Core i7-12800H, NVIDIA GeForce RTX 3080 Ti Laptop GPU | Razer Blade Pro 17 2021 (QHD Touch) Intel Core i7-10875H, NVIDIA GeForce RTX 3080 Laptop GPU | MSI GS76 Stealth 11UH Intel Core i9-11900H, NVIDIA GeForce RTX 3080 Laptop GPU | Asus ROG Zephyrus S17 GX703HSD Intel Core i9-11900H, NVIDIA GeForce RTX 3080 Laptop GPU | Aorus 17G YD Intel Core i7-11800H, NVIDIA GeForce RTX 3080 Laptop GPU | Alienware x17 RTX 3080 P48E Intel Core i7-11800H, NVIDIA GeForce RTX 3080 Laptop GPU | |
|---|---|---|---|---|---|---|
| Heat | 10% | 4% | -7% | 12% | -4% | |
| Maximum Upper Side * (°C) | 46 | 38.2 17% | 49 -7% | 59 -28% | 36 22% | 58.4 -27% |
| Maximum Bottom * (°C) | 46.8 | 42.2 10% | 57 -22% | 53 -13% | 52 -11% | 49 -5% |
| Idle Upper Side * (°C) | 36.2 | 33.6 7% | 28 23% | 35 3% | 29 20% | 33.6 7% |
| Idle Bottom * (°C) | 38.6 | 36.2 6% | 30 22% | 35 9% | 33 15% | 34.6 10% |
* ... Meglio usare valori piccoli
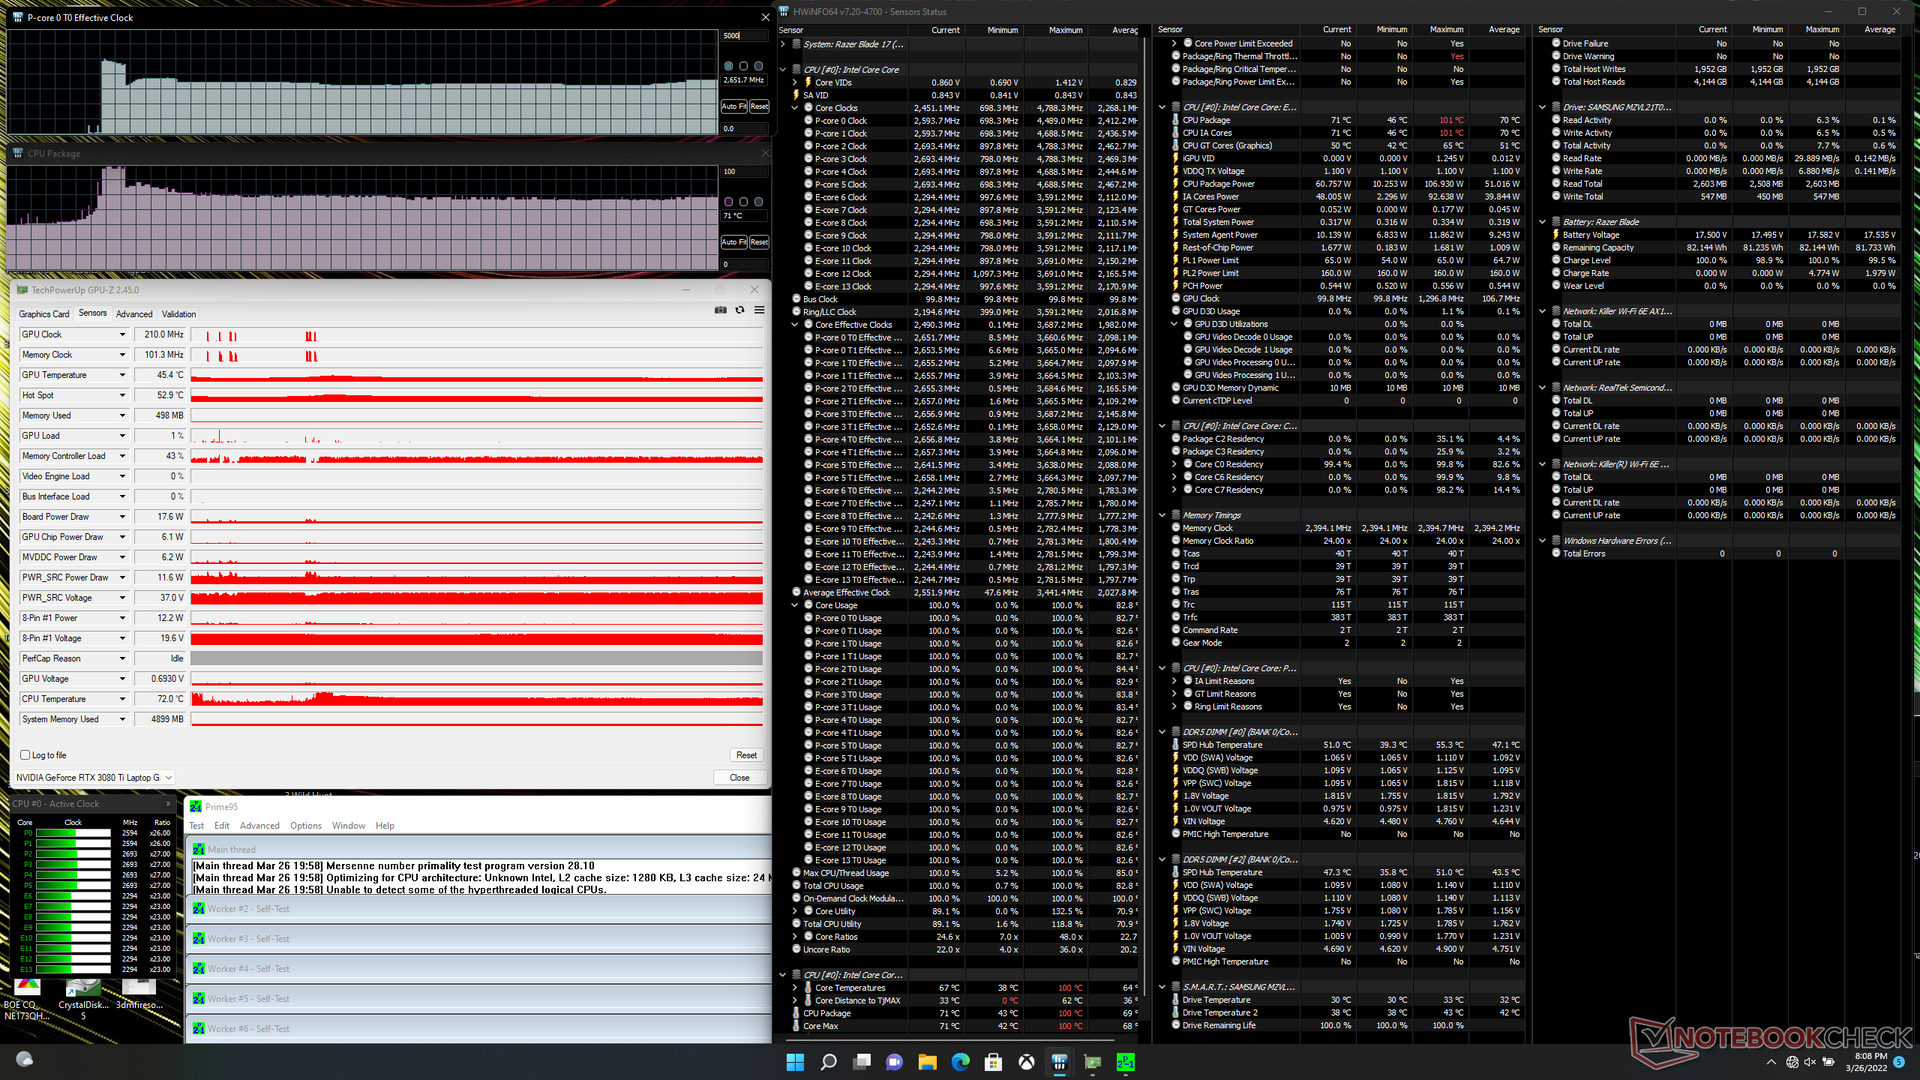
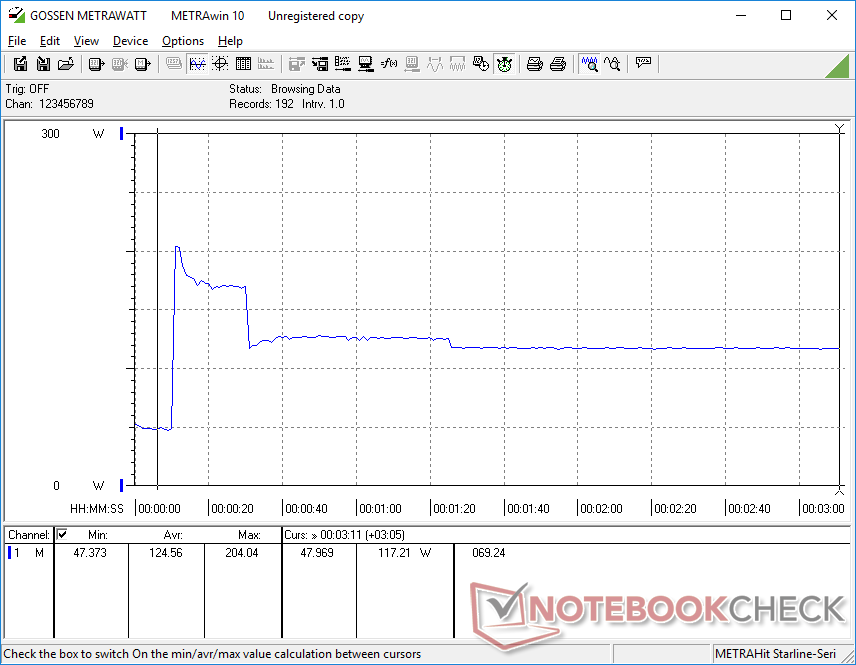
Test di stress
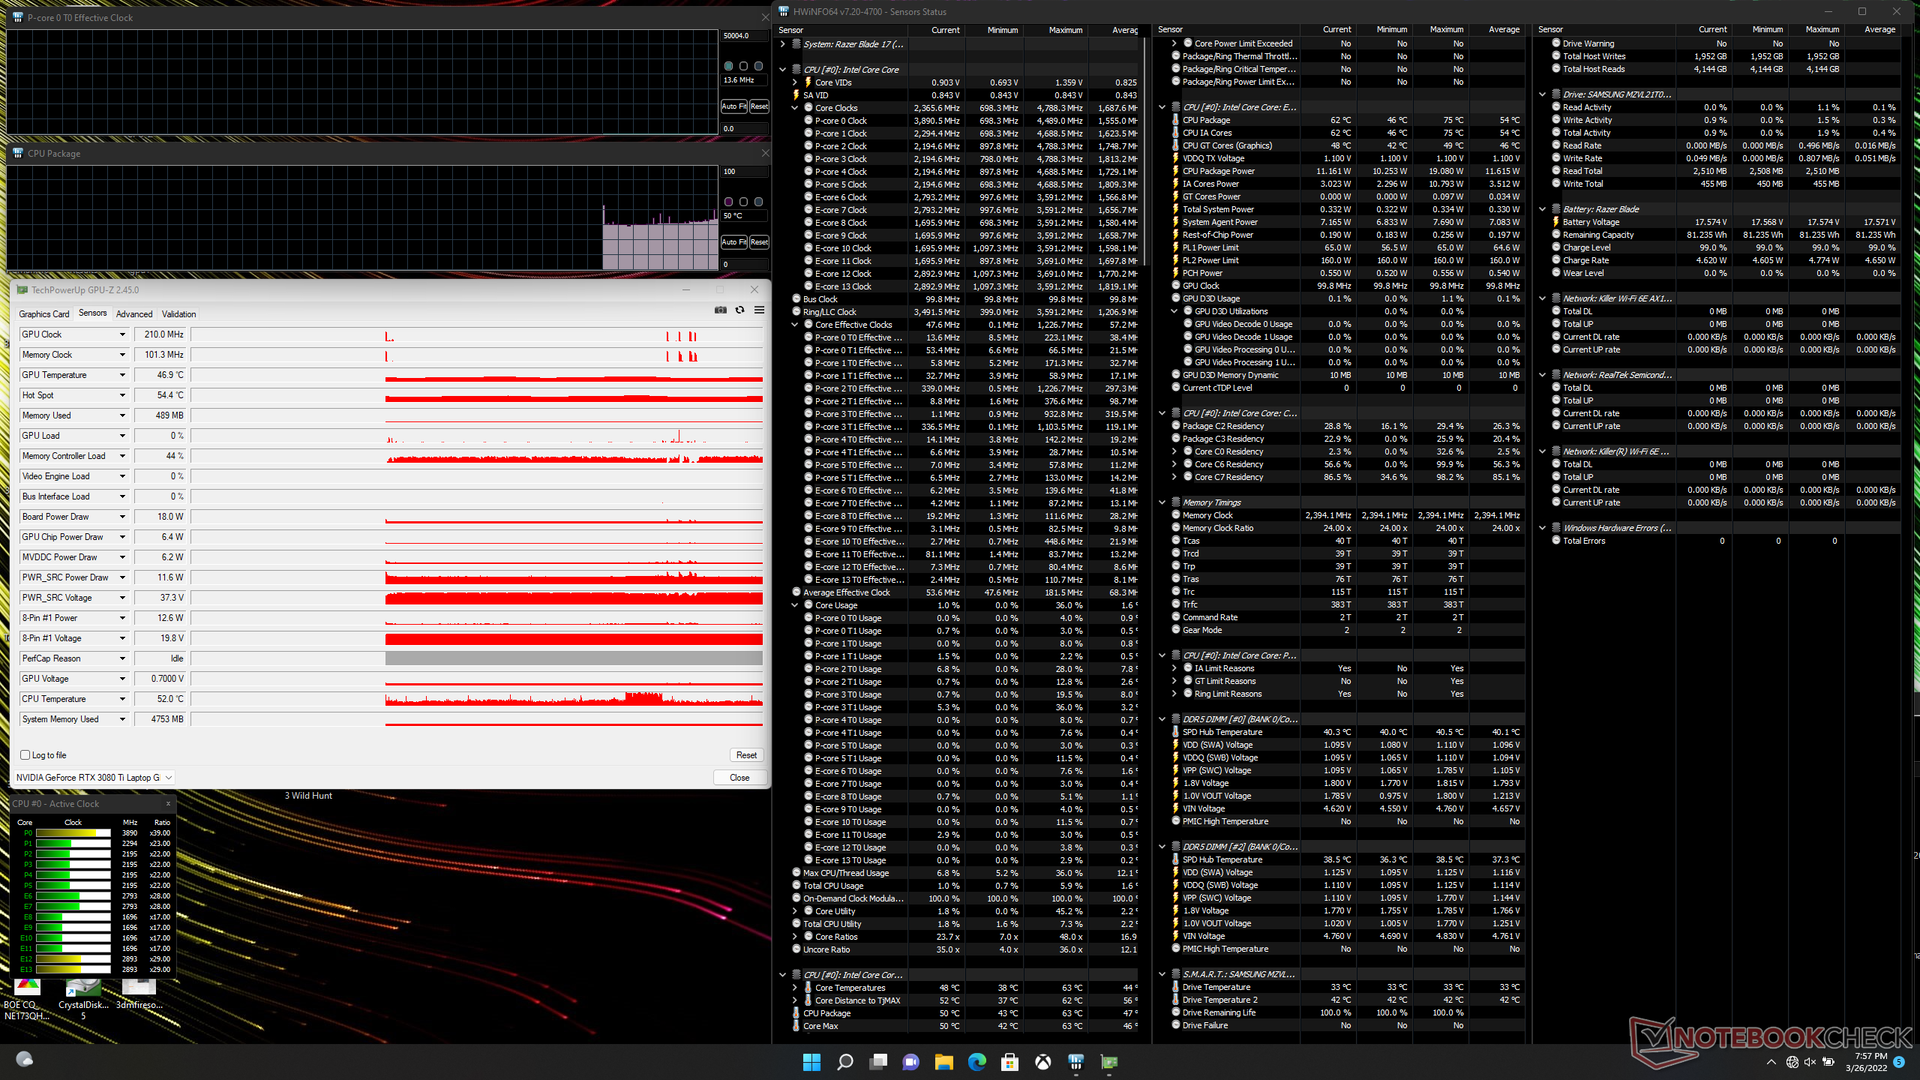
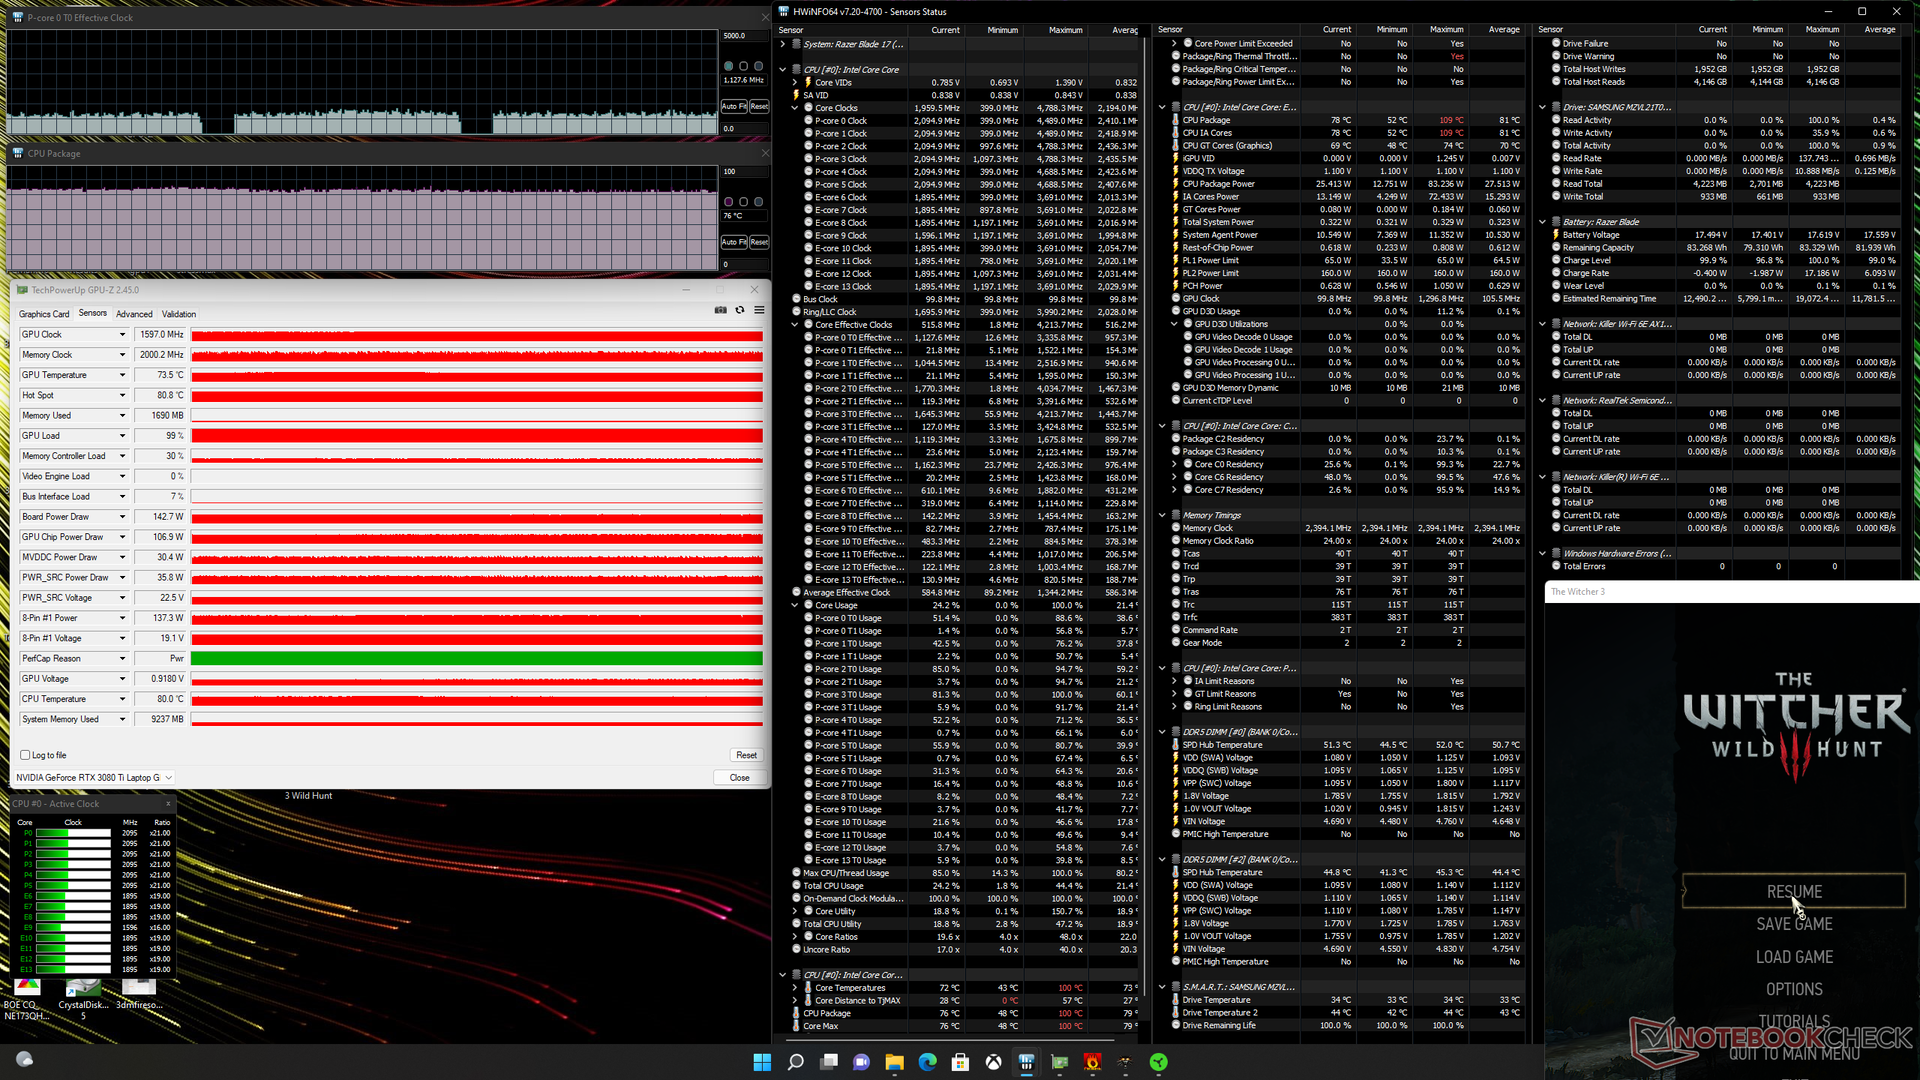
Quando è stato stressato con Prime95 in modalità Maximum Performance, la CPU ha raggiunto i 3,6 GHz per i primi 20 secondi circa e con una temperatura del core di 99 C. Le frequenze di clock e la temperatura scendevano poi a 2.7 GHz e 83 C prima di stabilizzarsi a 2.5 GHz e 72 C. La potenza del pacchetto CPU arrivava a 107 W durante l'inizio dello stress test prima di stabilizzarsi a 61 W rispetto ai 90 W e 65 W dell'Intel Blade 17 di 11a generazione.
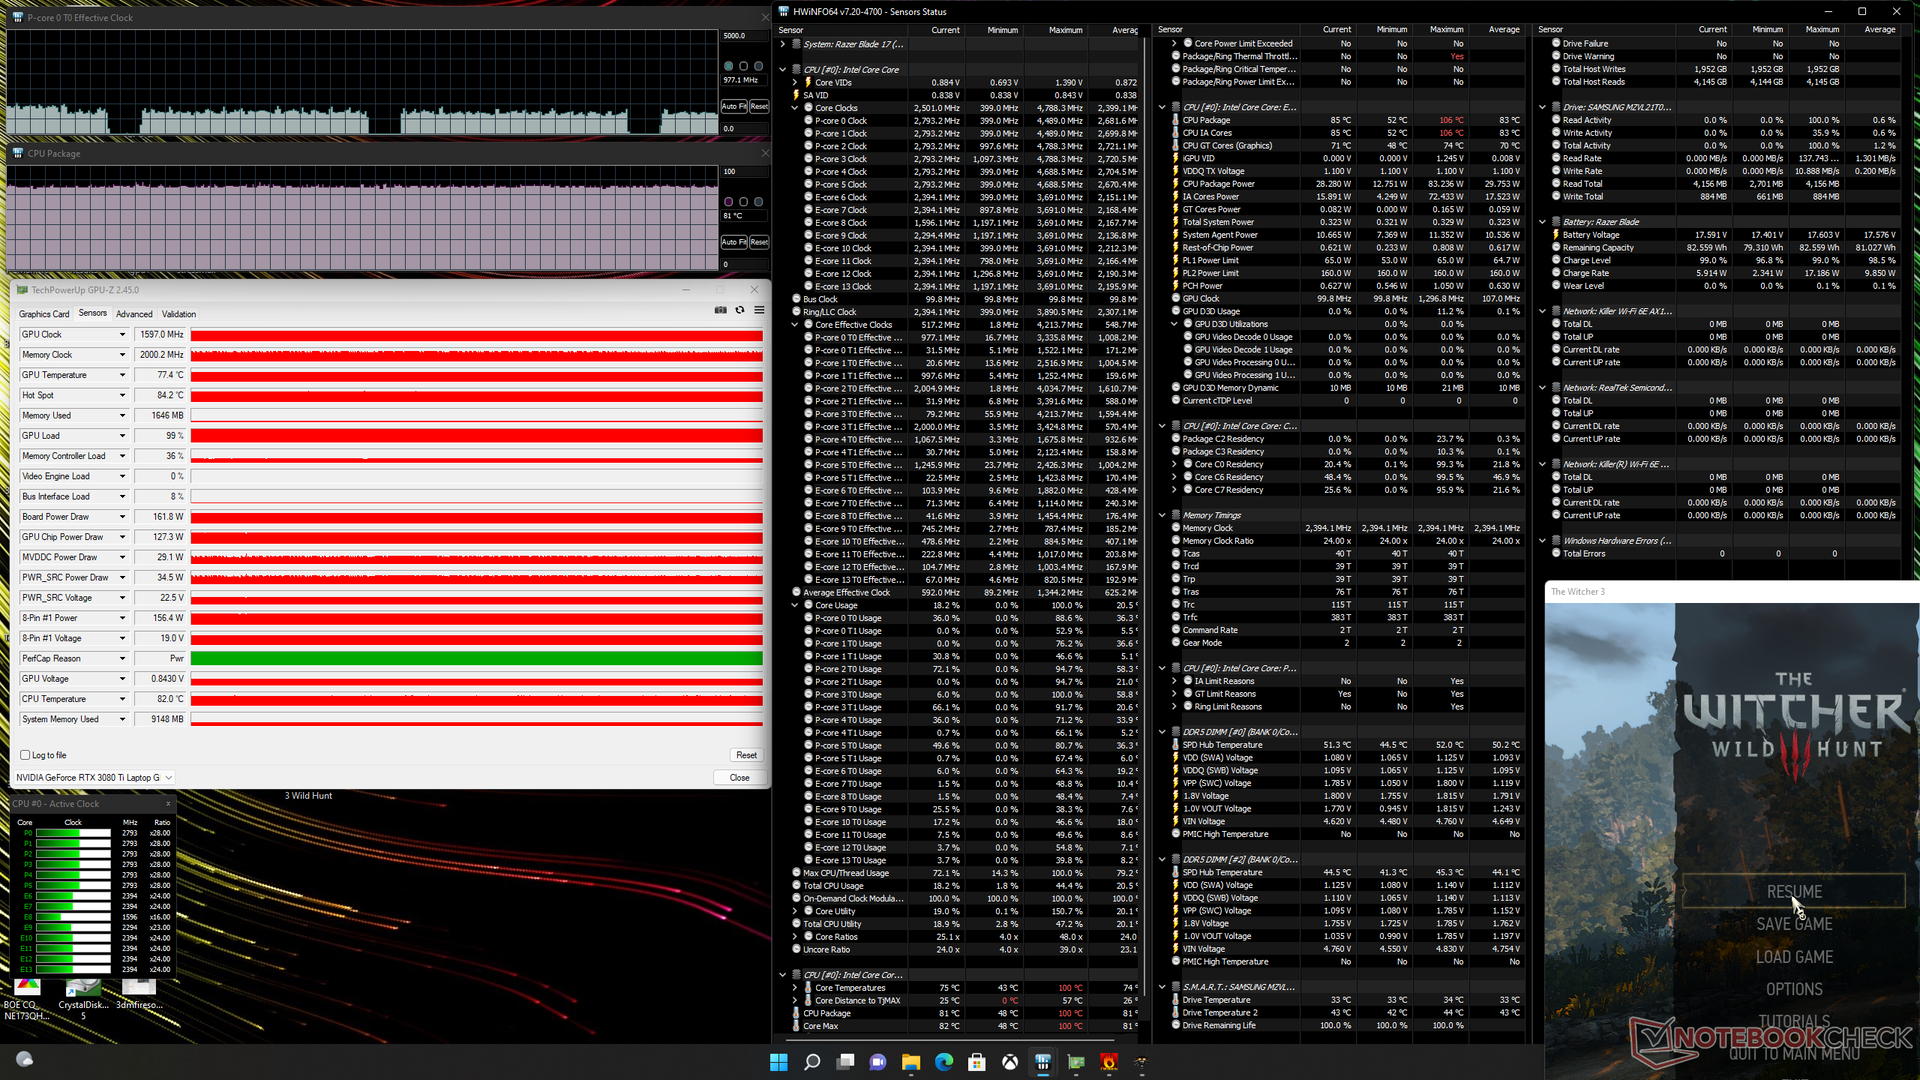
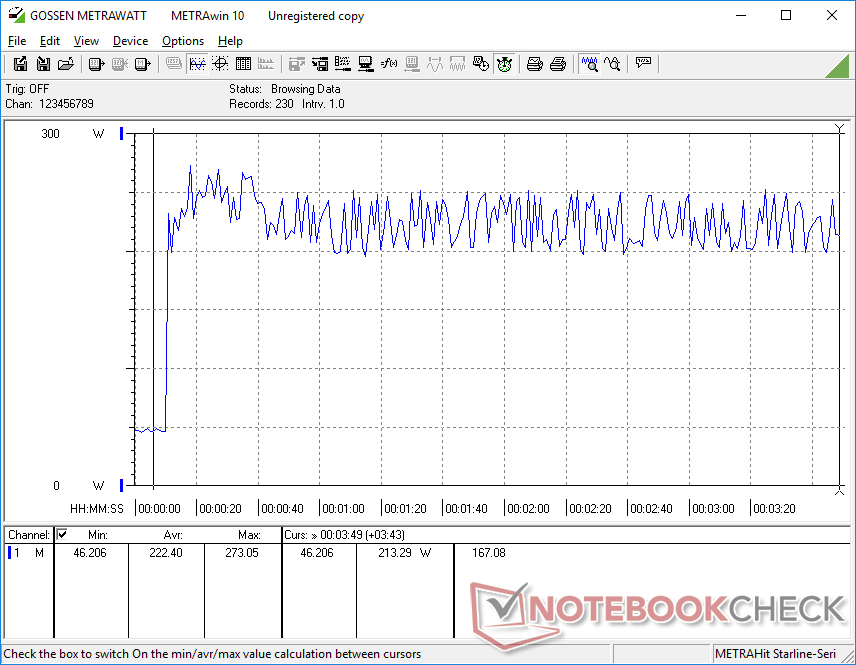
L'esecuzione di Witcher 3 in modalità Maximum Performance risulterebbe in un costante assorbimento di potenza della scheda GPU di 162 W rispetto a soli 143 W se in modalità Balanced. Quindi, gli utenti devono far funzionare il Blade 17 sulle sue impostazioni di prestazioni massime per estrarre più prestazioni possibili quando si gioca. Le temperature di CPU e GPU si stabilizzano rispettivamente a 81 C e 77 C, rispetto ai 79 C e 72 C dell'Intel Blade 17 di 11a generazione con grafica RTX 3070 o ai 65 C e 64 C dell'Intel Blade 17 di 10a generazione con grafica RTX 3080. Le temperature del core più alte sul nostro modello Intel di 12a generazione non è sorprendente, dato il suo TDP più alto e gli obiettivi TGP.
Il funzionamento a batteria limita significativamente le prestazioni in quanto il sistema non può essere impostato su qualcosa di più alto del profilo di alimentazione Balanced. Un test su Fire Strike con le batterie restituirebbe punteggi di Fisica e Grafica di 11785 e 9465 punti, rispettivamente, rispetto a 27907 e 32106 punti con l'alimentazione di rete.
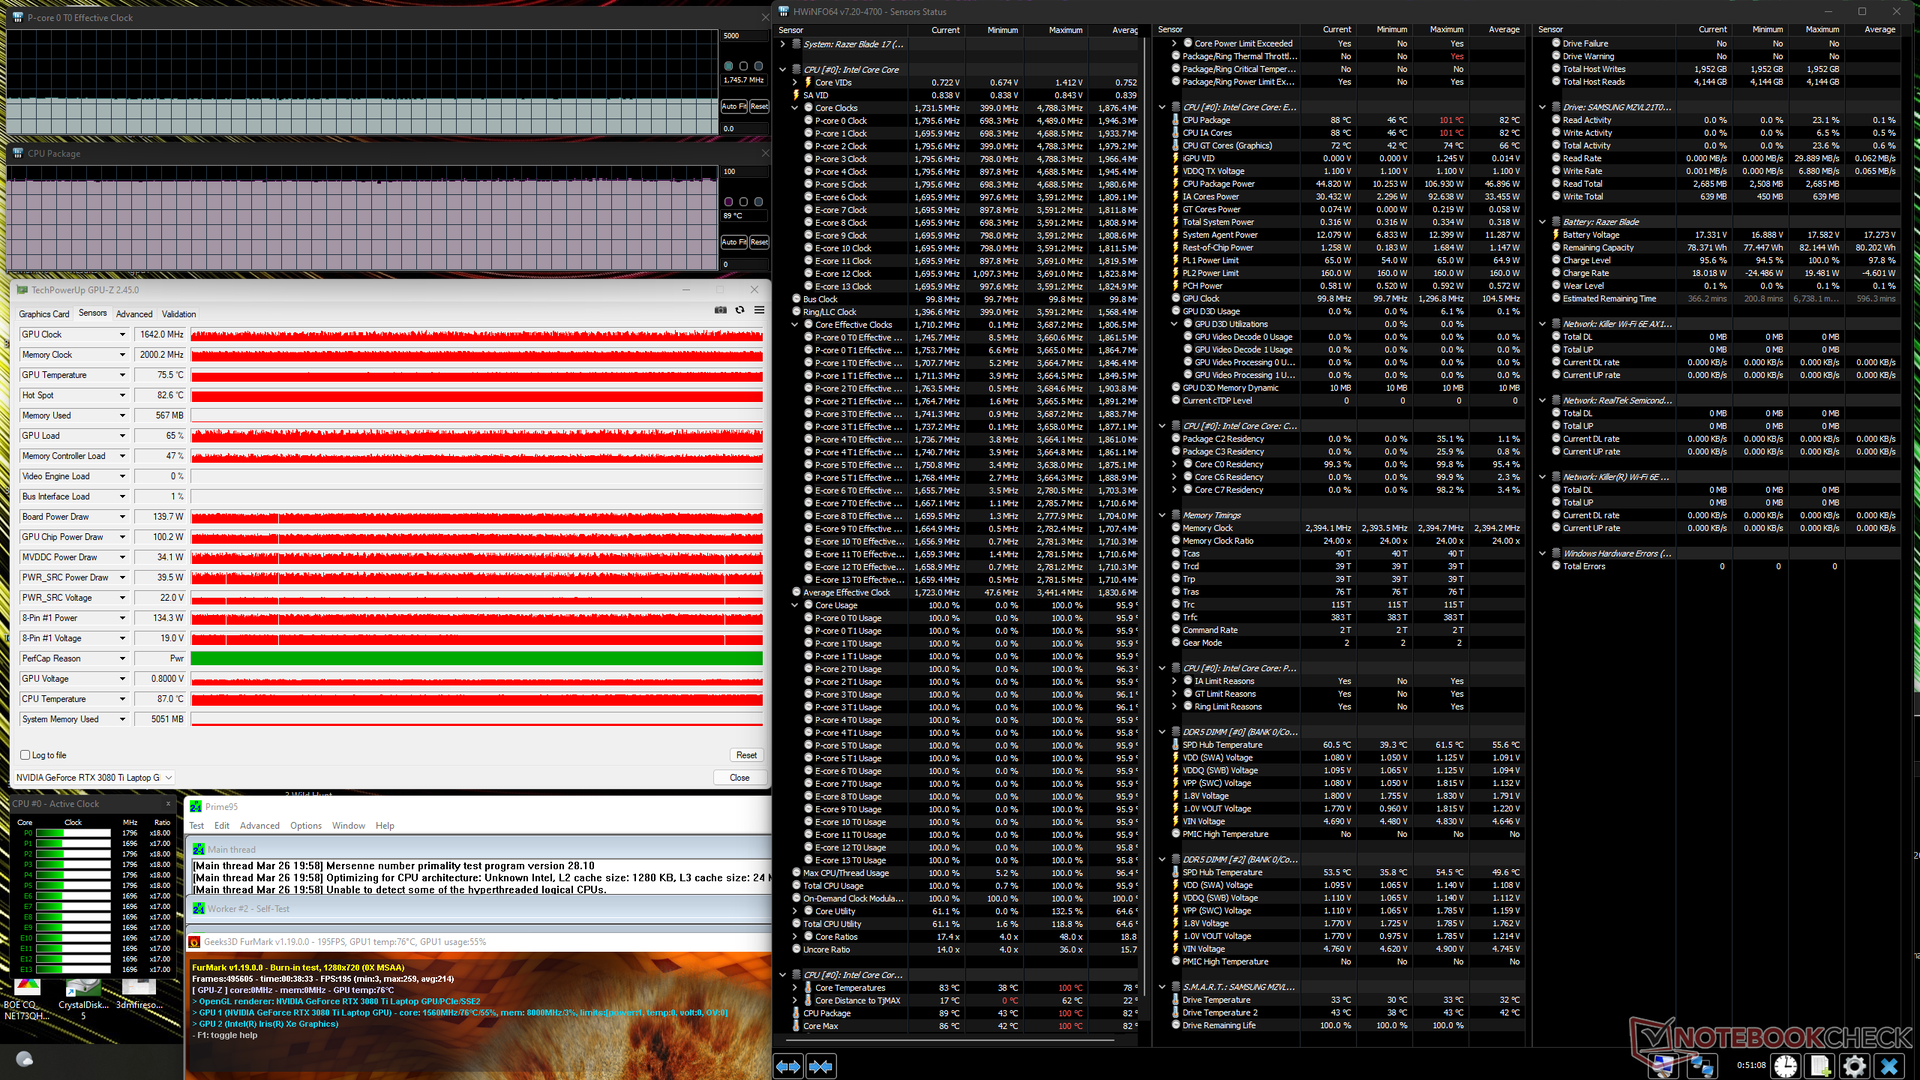
| Clock della CPU (GHz) | Clock della GPU (MHz) | Temperatura media della CPU (°C) | Temperatura media della GPU (°C) | |
| Sistema inattivo | -- | -- | 50 | 47 |
| Prime95 Stress | 2.4 - 2.6 | -- | 71 | 45 |
| Prime95 + FurMark Stress | 1,8 | ~1642 | 89 | 76 |
| Witcher 3 Stress(modalità bilanciata) | ~1.1 | 1597 | 76 | 74 |
| Witcher 3 Stress (modalità Maximum Performance) | ~1.1 | 1597 | 81 | 77 |
Altoparlanti
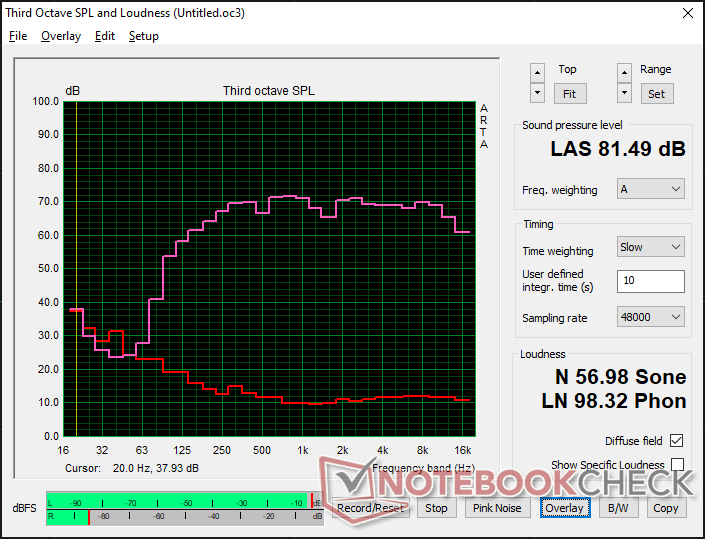
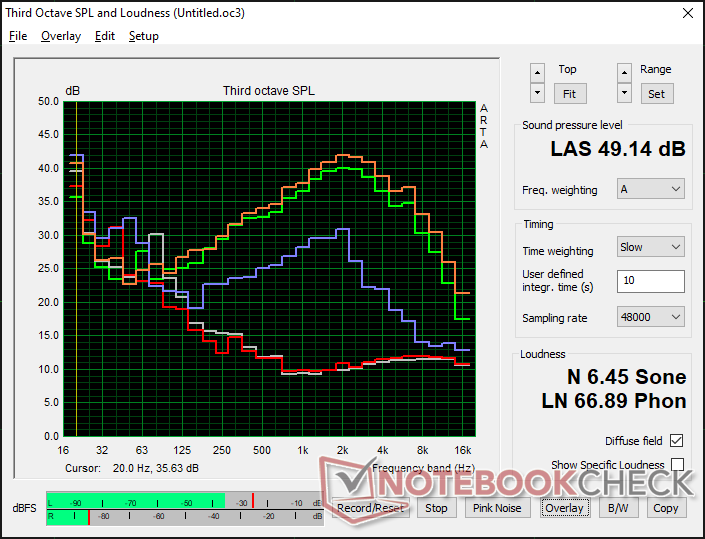
Razer Blade 17 RTX 3080 Ti analisi audio
(±) | potenza degli altiparlanti media ma buona (81.5 dB)
Bassi 100 - 315 Hz
(±) | bassi ridotti - in media 6.7% inferiori alla media
(±) | la linearità dei bassi è media (8.3% delta rispetto alla precedente frequenza)
Medi 400 - 2000 Hz
(+) | medi bilanciati - solo only 2.1% rispetto alla media
(+) | medi lineari (4.3% delta rispetto alla precedente frequenza)
Alti 2 - 16 kHz
(+) | Alti bilanciati - appena 0.7% dalla media
(+) | alti lineari (1.7% delta rispetto alla precedente frequenza)
Nel complesso 100 - 16.000 Hz
(+) | suono nel complesso lineare (6.8% differenza dalla media)
Rispetto alla stessa classe
» 0% di tutti i dispositivi testati in questa classe è stato migliore, 0% simile, 99% peggiore
» Il migliore ha avuto un delta di 6%, medio di 18%, peggiore di 132%
Rispetto a tutti i dispositivi testati
» 1% di tutti i dispositivi testati in questa classe è stato migliore, 0% similare, 99% peggiore
» Il migliore ha avuto un delta di 4%, medio di 24%, peggiore di 134%
Apple MacBook Pro 16 2021 M1 Pro analisi audio
(+) | gli altoparlanti sono relativamente potenti (84.7 dB)
Bassi 100 - 315 Hz
(+) | bassi buoni - solo 3.8% dalla media
(+) | bassi in lineaa (5.2% delta rispetto alla precedente frequenza)
Medi 400 - 2000 Hz
(+) | medi bilanciati - solo only 1.3% rispetto alla media
(+) | medi lineari (2.1% delta rispetto alla precedente frequenza)
Alti 2 - 16 kHz
(+) | Alti bilanciati - appena 1.9% dalla media
(+) | alti lineari (2.7% delta rispetto alla precedente frequenza)
Nel complesso 100 - 16.000 Hz
(+) | suono nel complesso lineare (4.6% differenza dalla media)
Rispetto alla stessa classe
» 0% di tutti i dispositivi testati in questa classe è stato migliore, 0% simile, 100% peggiore
» Il migliore ha avuto un delta di 5%, medio di 17%, peggiore di 45%
Rispetto a tutti i dispositivi testati
» 0% di tutti i dispositivi testati in questa classe è stato migliore, 0% similare, 100% peggiore
» Il migliore ha avuto un delta di 4%, medio di 24%, peggiore di 134%
Gestione dell'energia
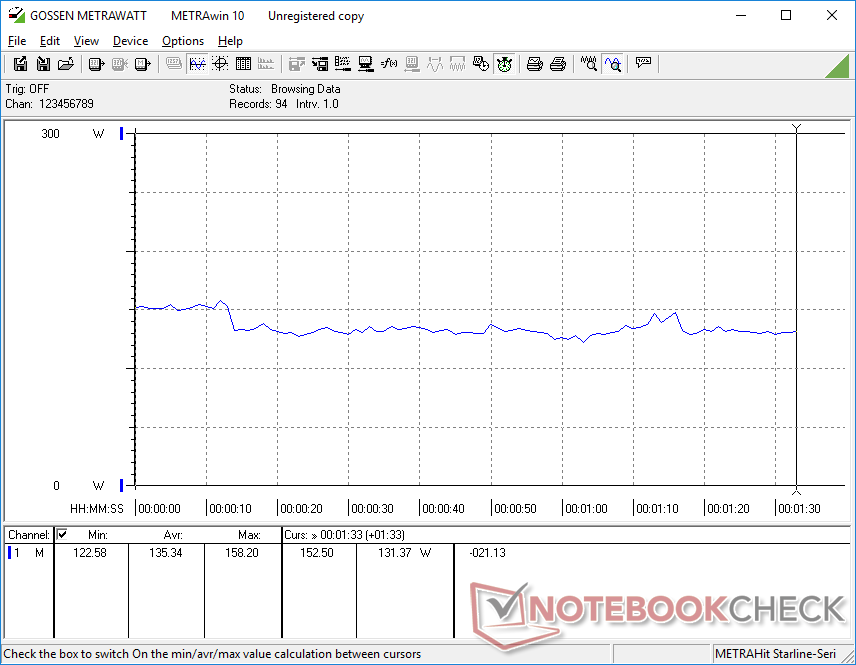
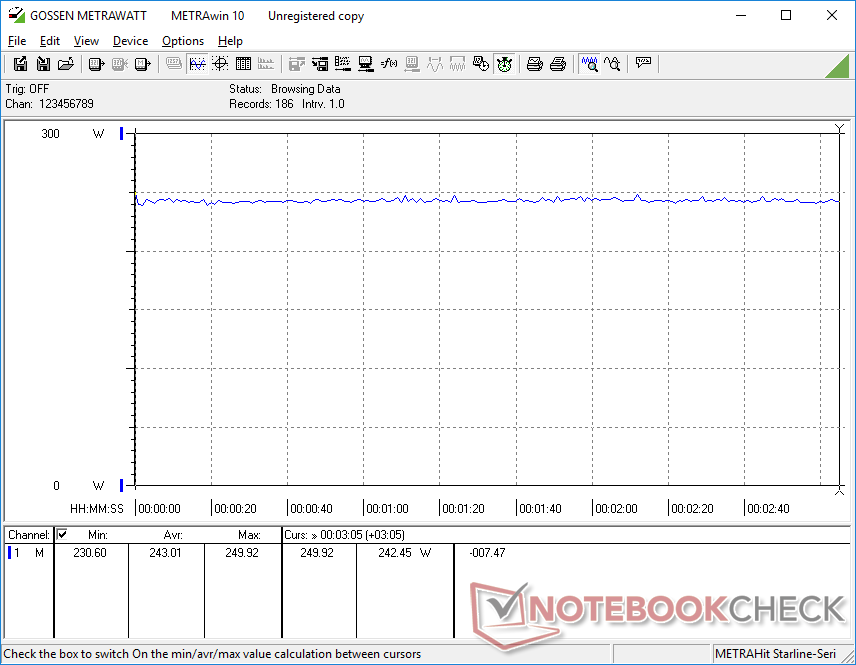
Consumo energetico - il più alto finora per la serie Blade
Il nuovo modello è molto più avido di energia di prima. Semplicemente inattivo sul desktop consumerebbe tra i 30 W e i 61 W a seconda dell'impostazione della luminosità e del profilo energetico rispetto a quasi la metà del 2021 Blade 17, MSI GS76, o Asus ROG Zephyrus S17. Infatti, l'esecuzione Witcher 3 consumerebbe il 30 per cento di energia in più per un aumento del 20-25 per cento delle prestazioni grafiche e del 25 per cento delle prestazioni della CPU rispetto alla RTX 3070 e al Core i7-11800H del 2021 Blade 17.
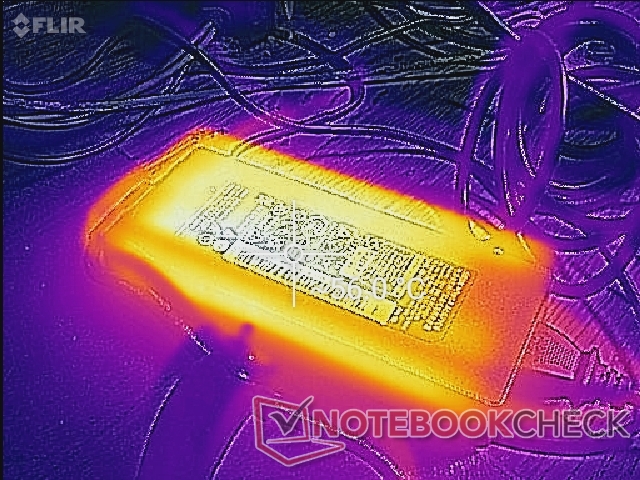
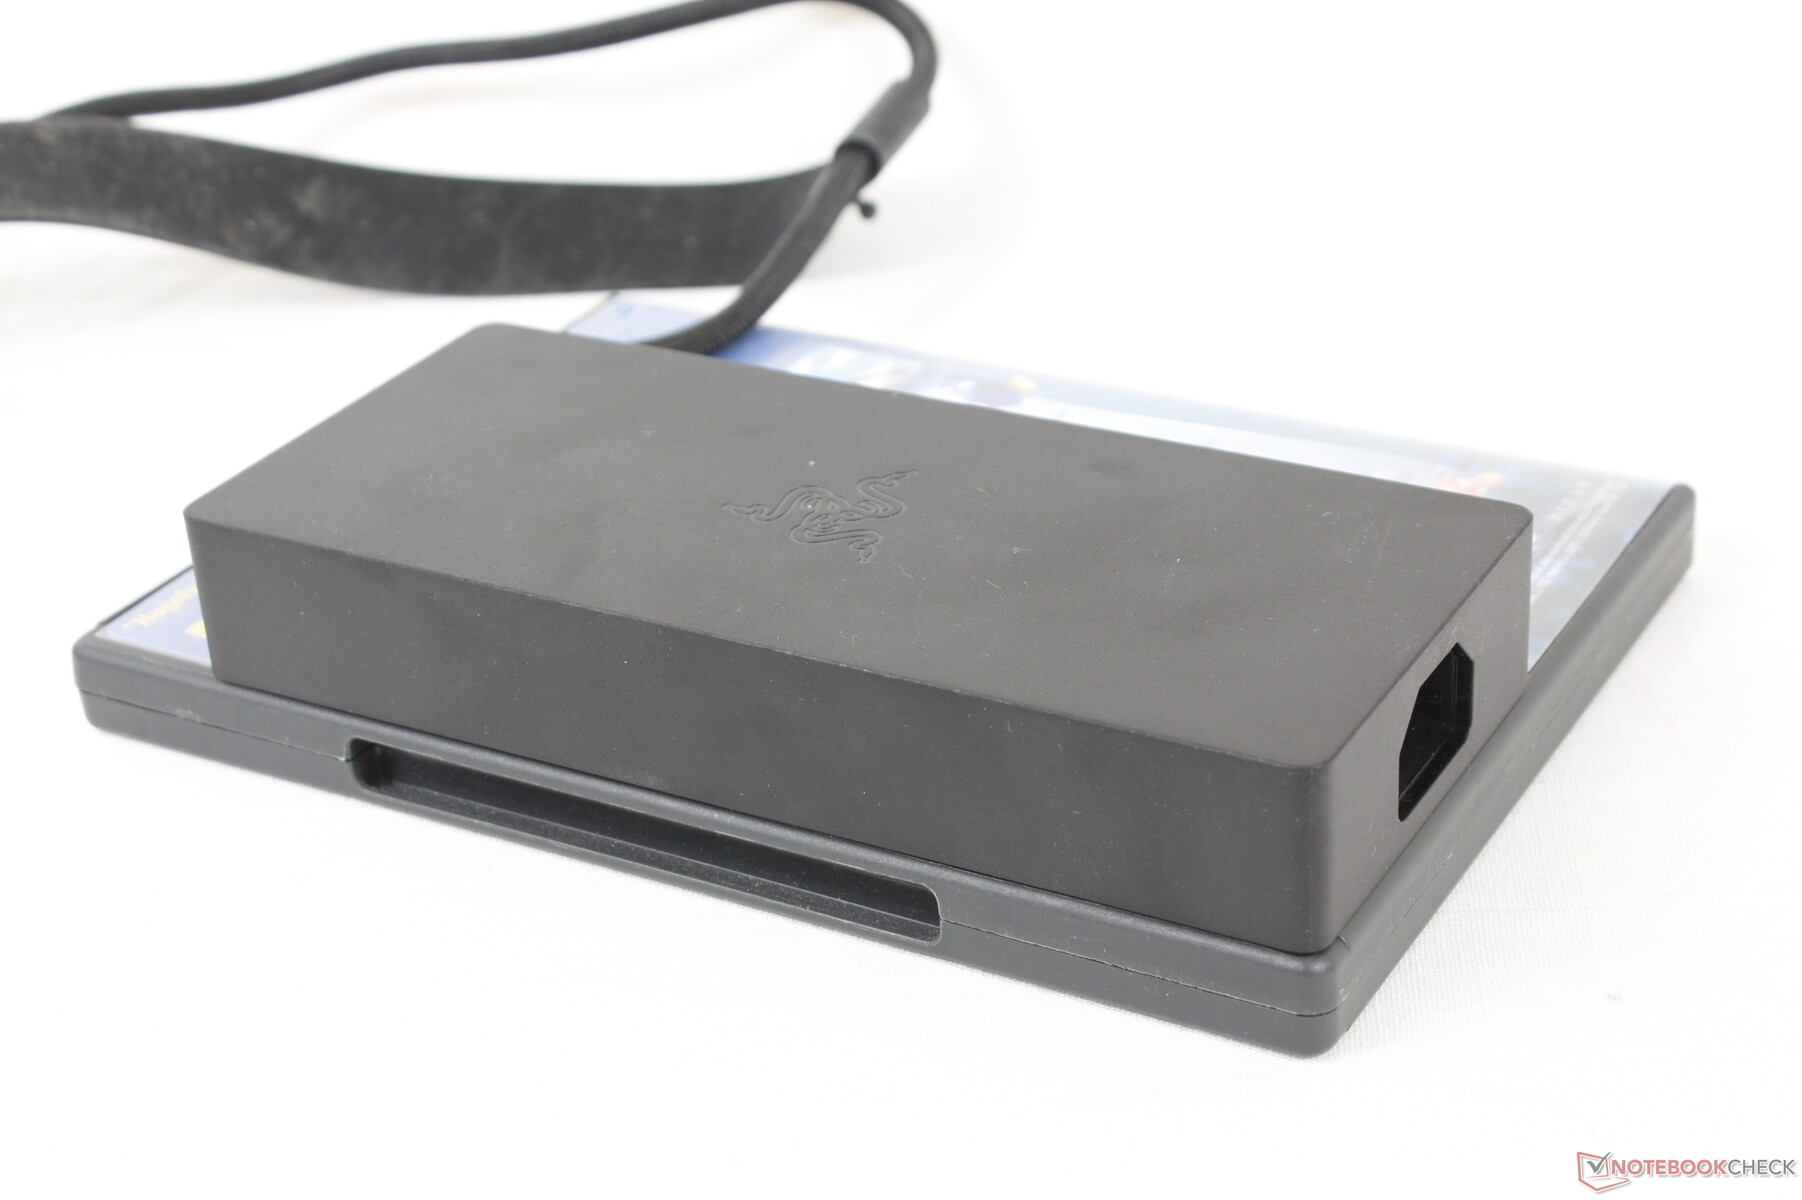
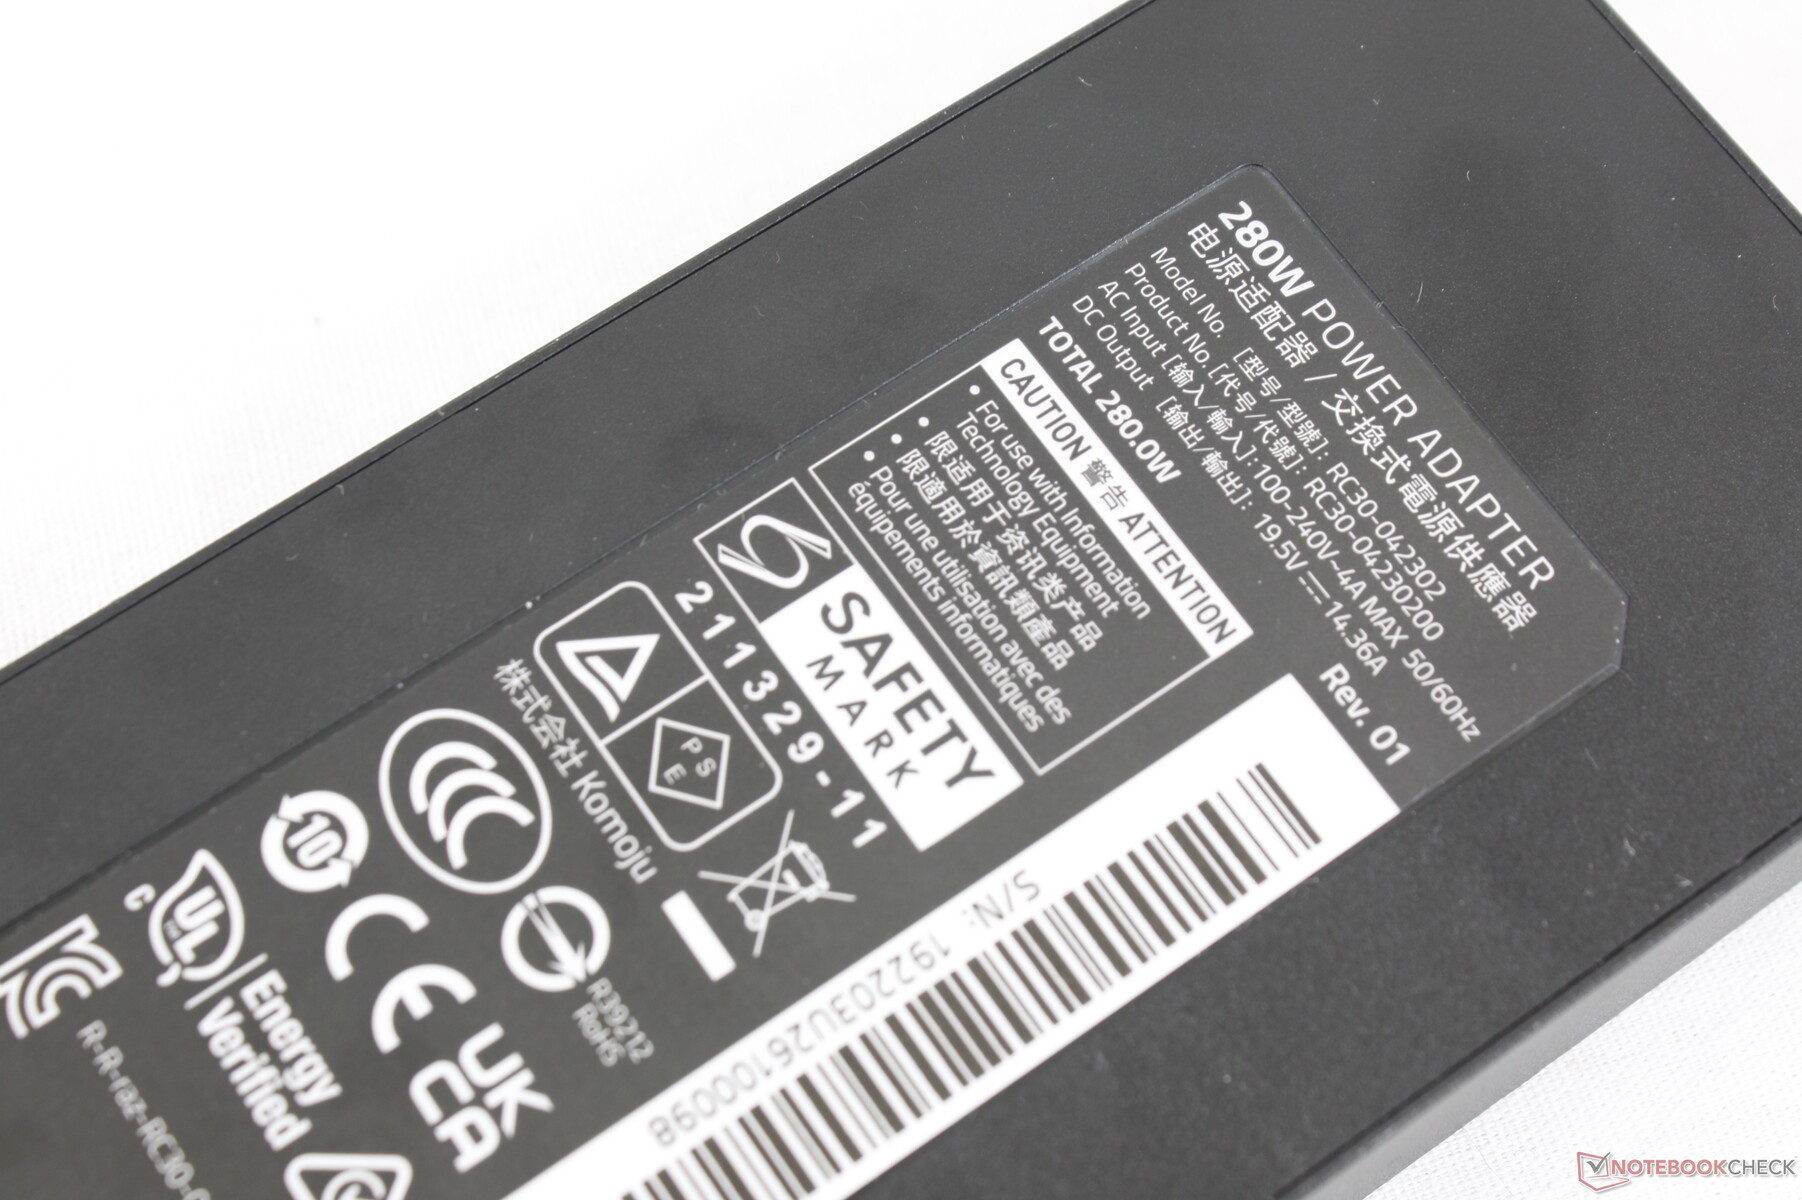
Per accogliere i processori più esigenti di quest'anno, il Blade 17 2022 viene spedito con un adattatore AC da 280 W di capacità superiore rispetto all'adattatore AC da 230 W fornito con il modello 2021. Fortunatamente, le dimensioni complessive dell'adattatore AC sono rimaste quasi le stesse da un anno all'altro (~16.4 x 7 x 2.5 cm contro ~17 x 7 x 2.5 cm) nonostante la maggiore potenza in uscita.
| Off / Standby | |
| Idle | |
| Sotto carico |
|
Leggenda:
min: | |
| Razer Blade 17 RTX 3080 Ti i7-12800H, GeForce RTX 3080 Ti Laptop GPU, Samsung PM9A1 MZVL21T0HCLR, IPS, 2560x1440, 17.3" | Razer Blade Pro 17 2021 (QHD Touch) i7-10875H, GeForce RTX 3080 Laptop GPU, Samsung PM981a MZVLB1T0HBLR, IPS, 3840x2160, 17.3" | MSI GS76 Stealth 11UH i9-11900H, GeForce RTX 3080 Laptop GPU, Samsung PM9A1 MZVL22T0HBLB, IPS, 3840x2160, 17.3" | Asus ROG Zephyrus S17 GX703HSD i9-11900H, GeForce RTX 3080 Laptop GPU, Samsung PM9A1 MZVL22T0HBLB, IPS, 2560x1440, 17.3" | Aorus 17G YD i7-11800H, GeForce RTX 3080 Laptop GPU, Samsung PM9A1 MZVL2512HCJQ, IPS, 1920x1080, 17.3" | Alienware x17 RTX 3080 P48E i7-11800H, GeForce RTX 3080 Laptop GPU, 2x WDC PC SN730 SDBPNTY-1T00 (RAID 0), IPS, 3840x2160, 17.3" | |
|---|---|---|---|---|---|---|
| Power Consumption | 34% | 38% | 27% | 27% | 24% | |
| Idle Minimum * (Watt) | 29.8 | 15.2 49% | 14 53% | 21.7 27% | 24 19% | 10.2 66% |
| Idle Average * (Watt) | 37.1 | 20.3 45% | 19 49% | 27 27% | 26 30% | 21.2 43% |
| Idle Maximum * (Watt) | 60.8 | 37.3 39% | 31 49% | 33 46% | 38 37% | 48.4 20% |
| Load Average * (Watt) | 135.3 | 114.9 15% | 97 28% | 108 20% | 101 25% | 118.7 12% |
| Witcher 3 ultra * (Watt) | 243 | 158.4 35% | 156 36% | 195 20% | 164 33% | 249 -2% |
| Load Maximum * (Watt) | 273.1 | 223.7 18% | 231 15% | 210 23% | 230 16% | 262 4% |
* ... Meglio usare valori piccoli
Power Consumption Witcher 3 / Stresstest
Power Consumption external Monitor
Durata della batteria - piatta da un anno all'altro
La capacità della batteria è maggiore di quella del Blade 17 del 2021 a causa della rimozione della quarta ventola. I tempi di esecuzione non sono migliori, tuttavia, poiché la nuova CPU e la GPU sono più esigenti questa volta. Abbiamo notato risultati simili tra il 2021 e il 2022 Blade 15 del 2021 e del 2022.
La ricarica da vuoto a pieno con l'adattatore AC incluso richiede circa 90 minuti. La ricarica USB-C è supportata a differenza del modello Asus TUF Gaming F15.
| Razer Blade 17 RTX 3080 Ti i7-12800H, GeForce RTX 3080 Ti Laptop GPU, 82 Wh | Razer Blade Pro 17 2021 (QHD Touch) i7-10875H, GeForce RTX 3080 Laptop GPU, 70.5 Wh | MSI GS76 Stealth 11UH i9-11900H, GeForce RTX 3080 Laptop GPU, 99.9 Wh | Asus ROG Zephyrus S17 GX703HSD i9-11900H, GeForce RTX 3080 Laptop GPU, 90 Wh | Aorus 17G YD i7-11800H, GeForce RTX 3080 Laptop GPU, 99 Wh | Alienware x17 RTX 3080 P48E i7-11800H, GeForce RTX 3080 Laptop GPU, 87 Wh | |
|---|---|---|---|---|---|---|
| Autonomia della batteria | 19% | 19% | 91% | 22% | -11% | |
| Reader / Idle (h) | 8 | 9.9 24% | 9.9 24% | 9 13% | 7 -12% | |
| WiFi v1.3 (h) | 5.5 | 5.9 7% | 6.4 16% | 7.5 36% | 6 9% | 5.9 7% |
| Load (h) | 1.1 | 1.4 27% | 1.3 18% | 2.7 145% | 1.6 45% | 0.8 -27% |
| H.264 (h) | 7.2 | 6.2 | ||||
| Witcher 3 ultra (h) | 1 |
Pro
Contro
Verdetto - Più watt, più potenza
Il design del Blade 17 è stato introdotto nel 2019 con una grafica da 100 W GeForce. Questo refresh del 2022 porta una GPU ancora più potente da 165 W senza modifiche significative alle dimensioni o al design dello chassis. Le prestazioni sono migliorate, ovviamente, ma il consumo energetico complessivo più elevato comporta temperature più elevate, un mattone di alimentazione più denso e una durata della batteria generalmente più breve rispetto ai precedenti modelli Blade 17 con processori più vecchi.
Fortunatamente, Razer ha regolato alcuni aspetti del modello 2022 per compensare i suoi requisiti di alimentazione più elevati. La batteria interna, per esempio, è più grande anche se a scapito di un'intera ventola che altrimenti avrebbe aiutato nel raffreddamento. Nel frattempo, lo spesso trascurato adattatore AC da 280 W è uno dei più piccoli e leggeri che abbiamo visto rispetto ad altri adattatori ad alta capacità per rendere il viaggio con il Blade 17 un po' più facile. Il produttore era ben consapevole dei componenti sempre più affamati di energia durante lo sviluppo e ha preso provvedimenti per alleviare alcuni degli inevitabili inconvenienti.
Concentrandosi così fortemente sulle prestazioni, la GPU da 165 W del Razer è in grado di superare la maggior parte degli altri portatili dotati della stessa GPU. Altri portatili ultrasottili tendono ad avere obiettivi TGP più bassi del Blade 17 per prestazioni costantemente più lente. Il Blade 17 2022 è quindi una delle migliori raccomandazioni per i giocatori che vogliono massimizzare le prestazioni grafiche mobili senza accontentarsi di opzioni più spesse come la serie MSI GT o un Asus ROG Chimera. Forse i futuri modelli Blade 17 potrebbero incorporare un raffreddamento a metallo liquido per migliorare le temperature.
Prezzo e disponibilità
Razer è ora in vendita la nostra configurazione come recensita per circa $4000 USD. Amazon e Best Buy non hanno scorte al momento della scrittura.
Razer Blade 17 RTX 3080 Ti
- 07/05/2022 v7 (old)
Allen Ngo
Price comparison

