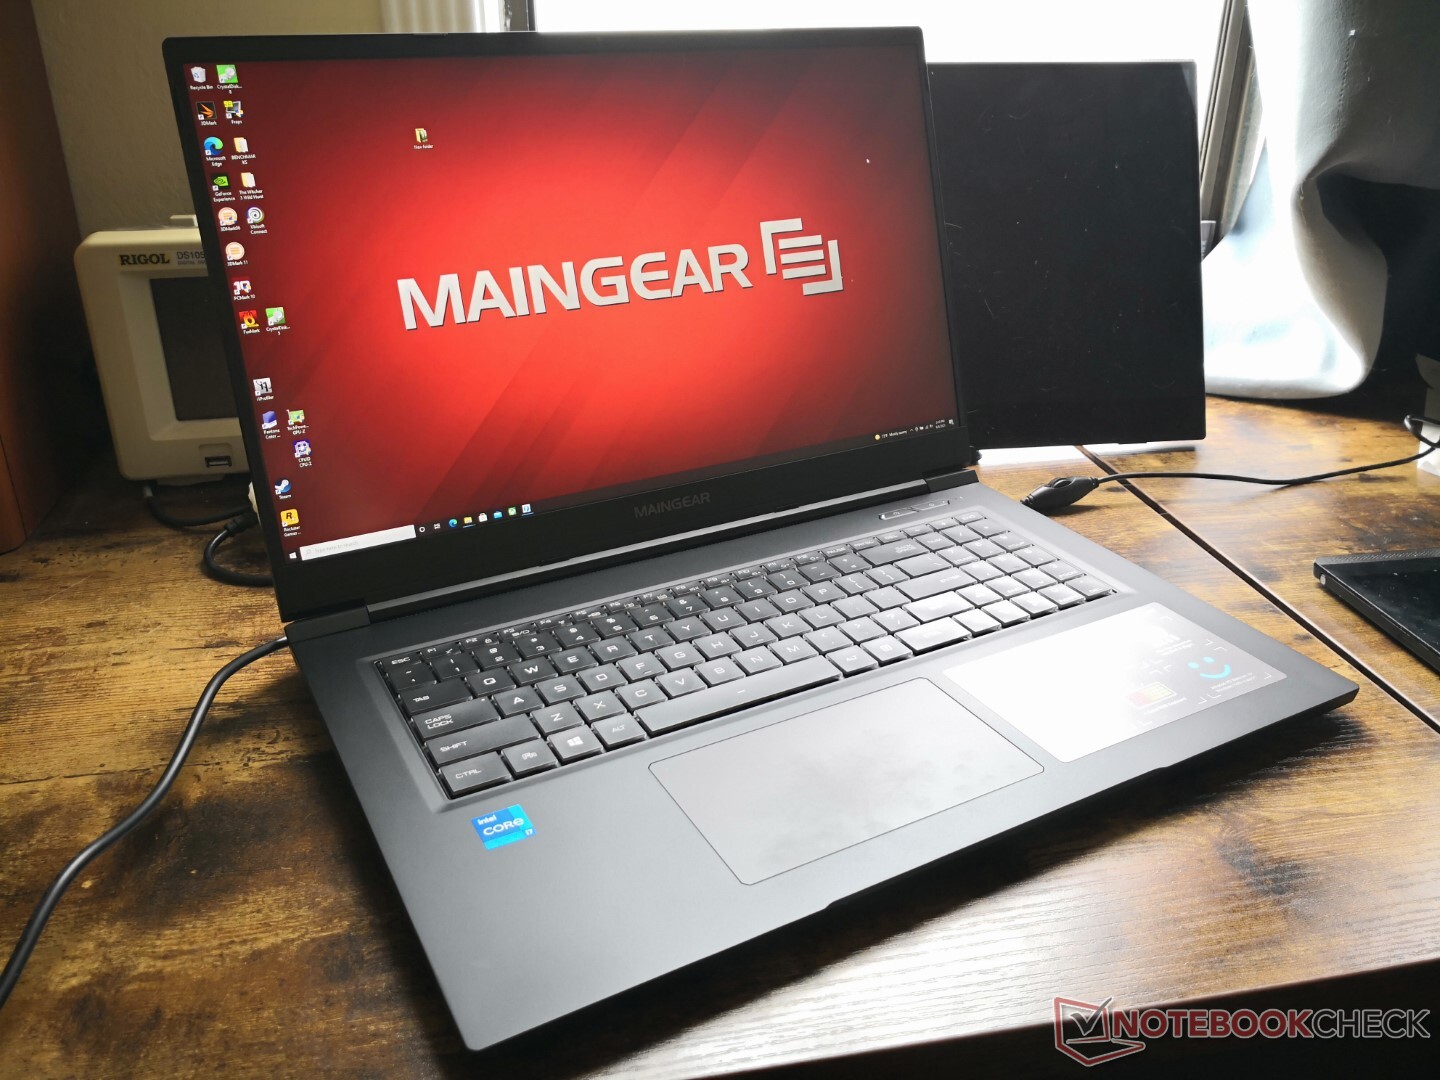
Recensione del computer portatile Maingear Vector Pro MG-VCP17: GeForce RTX 3080 da 165 W in dimensioni ultrasottili
Confronto con i potenziali concorrenti
Punteggio | Data | Modello | Peso | Altezza | Dimensione | Risoluzione | Prezzo |
|---|---|---|---|---|---|---|---|
| 87.8 % v7 (old) | 09/2021 | Maingear Vector Pro MG-VCP17 i7-11800H, GeForce RTX 3080 Laptop GPU | 2.3 kg | 19.81 mm | 17.30" | 2560x1440 | |
| 90.1 % v7 (old) | 07/2021 | Asus ROG Zephyrus S17 GX703HSD i9-11900H, GeForce RTX 3080 Laptop GPU | 2.8 kg | 19.9 mm | 17.30" | 2560x1440 | |
| 83.9 % v7 (old) | 06/2021 | Schenker XMG Core 17 (Early 2021) i7-10870H, GeForce RTX 3060 Laptop GPU | 2.5 kg | 30.05 mm | 17.30" | 2560x1440 | |
| 85.1 % v7 (old) | 02/2021 | Schenker XMG Neo 17 (Early 2021, RTX 3070, 5800H) R7 5800H, GeForce RTX 3070 Laptop GPU | 2.5 kg | 27 mm | 17.30" | 2560x1440 | |
| 84 % v7 (old) | 12/2020 | Schenker Compact 17 i7-10875H, GeForce RTX 2070 Super Mobile | 2.9 kg | 29.9 mm | 17.30" | 3840x2160 | |
| 83.7 % v7 (old) | 07/2020 | MSI GS75 10SF-609US i7-10875H, GeForce RTX 2070 Max-Q | 2.3 kg | 18.9 mm | 17.30" | 1920x1080 |
| SD Card Reader | |
| average JPG Copy Test (av. of 3 runs) | |
| MSI GS75 10SF-609US (Toshiba Exceria Pro M501 UHS-II) | |
| Asus ROG Zephyrus S17 GX703HSD | |
| Schenker Compact 17 (Toshiba Exceria Pro SDXC 64 GB UHS-II) | |
| Schenker XMG Neo 17 (Early 2021, RTX 3070, 5800H) (Toshiba Exceria Pro SDXC 64 GB UHS-II) | |
| Maingear Vector Pro MG-VCP17 (AV Pro V60) | |
| Schenker XMG Core 17 (Early 2021) (AV PRO microSD 128 GB V60) | |
| maximum AS SSD Seq Read Test (1GB) | |
| Asus ROG Zephyrus S17 GX703HSD | |
| MSI GS75 10SF-609US (Toshiba Exceria Pro M501 UHS-II) | |
| Schenker Compact 17 (Toshiba Exceria Pro SDXC 64 GB UHS-II) | |
| Schenker XMG Neo 17 (Early 2021, RTX 3070, 5800H) (Toshiba Exceria Pro SDXC 64 GB UHS-II) | |
| Maingear Vector Pro MG-VCP17 (AV Pro V60) | |
| Schenker XMG Core 17 (Early 2021) (AV PRO microSD 128 GB V60) | |


| |||||||||||||||||||||||||
Distribuzione della luminosità: 84 %
Al centro con la batteria: 389.7 cd/m²
Contrasto: 829:1 (Nero: 0.47 cd/m²)
ΔE ColorChecker Calman: 1.93 | ∀{0.5-29.43 Ø4.71}
calibrated: 1.31
ΔE Greyscale Calman: 2.4 | ∀{0.09-98 Ø4.96}
71.7% AdobeRGB 1998 (Argyll 3D)
99.4% sRGB (Argyll 3D)
70.7% Display P3 (Argyll 3D)
Gamma: 2.12
CCT: 6658 K
| Maingear Vector Pro MG-VCP17 BOE NE173QHM-NY2, IPS, 17.3", 2560x1440 | Asus ROG Zephyrus S17 GX703HSD BOE099D (BOE CQ NE173QHM-NY3), IPS, 17.3", 2560x1440 | Schenker XMG Core 17 (Early 2021) BOE CQ NE173QHM-NY2, IPS, 17.3", 2560x1440 | Schenker XMG Neo 17 (Early 2021, RTX 3070, 5800H) BOE NE173QHM-NY2 (BOE0977), IPS, 17.3", 2560x1440 | Schenker Compact 17 AU Optronics B173ZAN03.0, IPS, 17.3", 3840x2160 | MSI GS75 10SF-609US Sharp LQ173M1JW05, IPS, 17.3", 1920x1080 | |
|---|---|---|---|---|---|---|
| Display | 17% | -3% | 0% | 19% | 4% | |
| Display P3 Coverage (%) | 70.7 | 94.2 33% | 68.1 -4% | 70.5 0% | 84.4 19% | 75.6 7% |
| sRGB Coverage (%) | 99.4 | 98.7 -1% | 98.5 -1% | 99.5 0% | 99.9 1% | 99.8 0% |
| AdobeRGB 1998 Coverage (%) | 71.7 | 84.4 18% | 69.3 -3% | 71.8 0% | 98 37% | 75.1 5% |
| Response Times | 51% | 5% | 5% | -197% | 57% | |
| Response Time Grey 50% / Grey 80% * (ms) | 15.6 ? | 4.8 69% | 16.8 ? -8% | 16.8 ? -8% | 51 ? -227% | 5 ? 68% |
| Response Time Black / White * (ms) | 12 ? | 8 33% | 10 ? 17% | 10 ? 17% | 32 ? -167% | 6.6 ? 45% |
| PWM Frequency (Hz) | ||||||
| Screen | -11% | -7% | 4% | -40% | 3% | |
| Brightness middle (cd/m²) | 389.7 | 322 -17% | 370 -5% | 410 5% | 437 12% | 299.4 -23% |
| Brightness (cd/m²) | 363 | 288 -21% | 333 -8% | 381 5% | 413 14% | 299 -18% |
| Brightness Distribution (%) | 84 | 72 -14% | 84 0% | 88 5% | 88 5% | 84 0% |
| Black Level * (cd/m²) | 0.47 | 0.3 36% | 0.38 19% | 0.37 21% | 0.6 -28% | 0.31 34% |
| Contrast (:1) | 829 | 1073 29% | 974 17% | 1108 34% | 728 -12% | 966 17% |
| Colorchecker dE 2000 * | 1.93 | 3.05 -58% | 2.41 -25% | 2.55 -32% | 4.28 -122% | 1.82 6% |
| Colorchecker dE 2000 max. * | 6.84 | 5.23 24% | 7.32 -7% | 4.33 37% | 7.65 -12% | 3.91 43% |
| Colorchecker dE 2000 calibrated * | 1.31 | 1.92 -47% | 1.19 9% | 1.28 2% | 3.41 -160% | 1.59 -21% |
| Greyscale dE 2000 * | 2.4 | 3.11 -30% | 3.9 -63% | 3.4 -42% | 3.8 -58% | 2.7 -13% |
| Gamma | 2.12 104% | 2.13 103% | 2.287 96% | 2.275 97% | 2.49 88% | 2.18 101% |
| CCT | 6658 98% | 6553 99% | 7302 89% | 6637 98% | 7363 88% | 6837 95% |
| Color Space (Percent of AdobeRGB 1998) (%) | 84 | 69 | 72 | 87 | 67.1 | |
| Color Space (Percent of sRGB) (%) | 99 | 93 | 95 | 100 | 99.8 | |
| Media totale (Programma / Settaggio) | 19% /
4% | -2% /
-4% | 3% /
3% | -73% /
-50% | 21% /
11% |
* ... Meglio usare valori piccoli
Tempi di risposta del Display
| ↔ Tempi di risposta dal Nero al Bianco | ||
|---|---|---|
| 12 ms ... aumenta ↗ e diminuisce ↘ combinato | ↗ 6.8 ms Incremento | 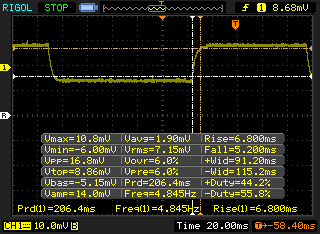 |
| ↘ 5.2 ms Calo | ||
| Lo schermo mostra buoni tempi di risposta durante i nostri tests, ma potrebbe essere troppo lento per i gamers competitivi. In confronto, tutti i dispositivi di test variano da 0.1 (minimo) a 240 (massimo) ms. » 32 % di tutti i dispositivi è migliore. Questo significa che i tempi di risposta rilevati sono migliori rispettto alla media di tutti i dispositivi testati (19.8 ms). | ||
| ↔ Tempo di risposta dal 50% Grigio all'80% Grigio | ||
| 15.6 ms ... aumenta ↗ e diminuisce ↘ combinato | ↗ 8.4 ms Incremento | 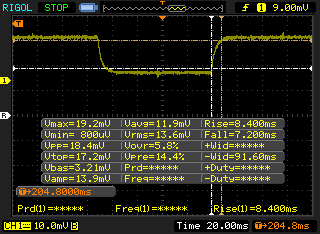 |
| ↘ 7.2 ms Calo | ||
| Lo schermo mostra buoni tempi di risposta durante i nostri tests, ma potrebbe essere troppo lento per i gamers competitivi. In confronto, tutti i dispositivi di test variano da 0.165 (minimo) a 636 (massimo) ms. » 30 % di tutti i dispositivi è migliore. Questo significa che i tempi di risposta rilevati sono migliori rispettto alla media di tutti i dispositivi testati (31 ms). | ||
Sfarfallio dello schermo / PWM (Pulse-Width Modulation)
| flickering dello schermo / PWM non rilevato |  | ||
In confronto: 52 % di tutti i dispositivi testati non utilizza PWM per ridurre la luminosita' del display. Se è rilevato PWM, una media di 7747 (minimo: 5 - massimo: 343500) Hz è stata rilevata. | |||
Cinebench R15 Multi Loop
Cinebench R23: Multi Core | Single Core
Cinebench R15: CPU Multi 64Bit | CPU Single 64Bit
Blender: v2.79 BMW27 CPU
7-Zip 18.03: 7z b 4 -mmt1 | 7z b 4
Geekbench 5.5: Single-Core | Multi-Core
HWBOT x265 Benchmark v2.2: 4k Preset
LibreOffice : 20 Documents To PDF
R Benchmark 2.5: Overall mean
* ... Meglio usare valori piccoli
| PCMark 10 / Score | |
| Maingear Vector Pro MG-VCP17 | |
| Asus ROG Zephyrus S17 GX703HSD | |
| Media Intel Core i7-11800H, NVIDIA GeForce RTX 3080 Laptop GPU (6673 - 7470, n=11) | |
| Schenker XMG Neo 17 (Early 2021, RTX 3070, 5800H) | |
| MSI GS75 10SF-609US | |
| Schenker Compact 17 | |
| Schenker XMG Core 17 (Early 2021) | |
| PCMark 10 / Essentials | |
| Maingear Vector Pro MG-VCP17 | |
| Asus ROG Zephyrus S17 GX703HSD | |
| Media Intel Core i7-11800H, NVIDIA GeForce RTX 3080 Laptop GPU (9862 - 11064, n=11) | |
| MSI GS75 10SF-609US | |
| Schenker XMG Neo 17 (Early 2021, RTX 3070, 5800H) | |
| Schenker Compact 17 | |
| Schenker XMG Core 17 (Early 2021) | |
| PCMark 10 / Productivity | |
| Asus ROG Zephyrus S17 GX703HSD | |
| Media Intel Core i7-11800H, NVIDIA GeForce RTX 3080 Laptop GPU (8278 - 9803, n=11) | |
| Maingear Vector Pro MG-VCP17 | |
| Schenker XMG Neo 17 (Early 2021, RTX 3070, 5800H) | |
| Schenker Compact 17 | |
| MSI GS75 10SF-609US | |
| Schenker XMG Core 17 (Early 2021) | |
| PCMark 10 / Digital Content Creation | |
| Maingear Vector Pro MG-VCP17 | |
| Asus ROG Zephyrus S17 GX703HSD | |
| Media Intel Core i7-11800H, NVIDIA GeForce RTX 3080 Laptop GPU (9881 - 11323, n=11) | |
| Schenker XMG Neo 17 (Early 2021, RTX 3070, 5800H) | |
| MSI GS75 10SF-609US | |
| Schenker Compact 17 | |
| Schenker XMG Core 17 (Early 2021) | |
| PCMark 10 Score | 7286 punti | |
Aiuto | ||
| DPC Latencies / LatencyMon - interrupt to process latency (max), Web, Youtube, Prime95 | |
| Schenker XMG Neo 17 (Early 2021, RTX 3070, 5800H) | |
| Asus ROG Zephyrus S17 GX703HSD | |
| Schenker XMG Core 17 (Early 2021) | |
| Schenker Compact 17 | |
| Maingear Vector Pro MG-VCP17 | |
| MSI GS75 10SF-609US | |
* ... Meglio usare valori piccoli
| Maingear Vector Pro MG-VCP17 Samsung PM9A1 MZVL21T0HCLR | Asus ROG Zephyrus S17 GX703HSD Samsung PM9A1 MZVL22T0HBLB | Schenker XMG Core 17 (Early 2021) Samsung SSD 970 EVO Plus 1TB | Schenker XMG Neo 17 (Early 2021, RTX 3070, 5800H) Samsung SSD 970 EVO Plus 500GB | Schenker Compact 17 Samsung SSD 970 EVO Plus 1TB | MSI GS75 10SF-609US WDC PC SN730 SDBPNTY-512G | |
|---|---|---|---|---|---|---|
| AS SSD | 7% | -38% | -28% | -28% | -50% | |
| Seq Read (MB/s) | 5367 | 5085 -5% | 2876 -46% | 3020 -44% | 2879 -46% | 2327 -57% |
| Seq Write (MB/s) | 3965 | 4434 12% | 2803 -29% | 2631 -34% | 2842 -28% | 2479 -37% |
| 4K Read (MB/s) | 79.9 | 80.3 1% | 55.3 -31% | 60.3 -25% | 51.6 -35% | 45.46 -43% |
| 4K Write (MB/s) | 194.2 | 214.7 11% | 106.9 -45% | 171.6 -12% | 142.5 -27% | 157.4 -19% |
| 4K-64 Read (MB/s) | 2684 | 2573 -4% | 1662 -38% | 1410 -47% | 1672 -38% | 1050 -61% |
| 4K-64 Write (MB/s) | 3335 | 2972 -11% | 2101 -37% | 2324 -30% | 2293 -31% | 938 -72% |
| Access Time Read * (ms) | 0.027 | 0.018 33% | 0.067 -148% | 0.045 -67% | 0.034 -26% | 0.076 -181% |
| Access Time Write * (ms) | 0.066 | 0.02 70% | 0.037 44% | 0.024 64% | 0.027 59% | 0.071 -8% |
| Score Read (Points) | 3301 | 3161 -4% | 2005 -39% | 1773 -46% | 2012 -39% | 1328 -60% |
| Score Write (Points) | 3926 | 3631 -8% | 2488 -37% | 2759 -30% | 2719 -31% | 1343 -66% |
| Score Total (Points) | 8847 | 8380 -5% | 5520 -38% | 5429 -39% | 5760 -35% | 3366 -62% |
| Copy ISO MB/s (MB/s) | 2579 | 3239 26% | 2029 -21% | 2383 -8% | 3092 20% | |
| Copy Program MB/s (MB/s) | 1133 | 899 -21% | 691 -39% | 603 -47% | 733 -35% | |
| Copy Game MB/s (MB/s) | 2161 | 2171 0% | 1513 -30% | 873 -60% | 1683 -22% | |
| CrystalDiskMark 5.2 / 6 | 1% | -32% | -28% | -31% | -37% | |
| Write 4K (MB/s) | 227.2 | 244.2 7% | 145.7 -36% | 206.1 -9% | 167.8 -26% | 177.9 -22% |
| Read 4K (MB/s) | 89 | 89.8 1% | 51.3 -42% | 53 -40% | 53.5 -40% | 47.42 -47% |
| Write Seq (MB/s) | 4256 | 3036 -29% | 3018 -29% | 3073 -28% | 2707 -36% | |
| Read Seq (MB/s) | 4364 | 2837 -35% | 2575 -41% | 2488 -43% | 2369 -46% | |
| Write 4K Q32T1 (MB/s) | 614 | 607 -1% | 511 -17% | 535 -13% | 524 -15% | 427.8 -30% |
| Read 4K Q32T1 (MB/s) | 659 | 658 0% | 582 -12% | 608 -8% | 595 -10% | 543 -18% |
| Write Seq Q32T1 (MB/s) | 5216 | 5270 1% | 3294 -37% | 3242 -38% | 3324 -36% | 2703 -48% |
| Read Seq Q32T1 (MB/s) | 7073 | 7091 0% | 3522 -50% | 3617 -49% | 3564 -50% | 3387 -52% |
| Write 4K Q8T8 (MB/s) | 2270 | |||||
| Read 4K Q8T8 (MB/s) | 2490 | |||||
| Media totale (Programma / Settaggio) | 4% /
5% | -35% /
-36% | -28% /
-28% | -30% /
-29% | -44% /
-46% |
* ... Meglio usare valori piccoli

Throttling Disco: DiskSpd Read Loop, Queue Depth 8
| 3DMark 11 Performance | 29298 punti | |
| 3DMark Cloud Gate Standard Score | 56574 punti | |
| 3DMark Fire Strike Score | 23301 punti | |
| 3DMark Time Spy Score | 11052 punti | |
Aiuto | ||
Grafico FPS The Witcher 3
| basso | medio | alto | ultra | QHD | |
|---|---|---|---|---|---|
| GTA V (2015) | 184 | 179 | 173 | 109 | 99.1 |
| The Witcher 3 (2015) | 439.6 | 321.2 | 212.9 | 108.6 | |
| Dota 2 Reborn (2015) | 164 | 145 | 142 | 127 | |
| Final Fantasy XV Benchmark (2018) | 184 | 144 | 108 | 83.5 | |
| X-Plane 11.11 (2018) | 126 | 114 | 85.7 | ||
| Far Cry 5 (2018) | 162 | 140 | 134 | 124 | 110 |
| Strange Brigade (2018) | 521 | 289 | 233 | 204 | 151 |
| Maingear Vector Pro MG-VCP17 GeForce RTX 3080 Laptop GPU, i7-11800H, Samsung PM9A1 MZVL21T0HCLR | Asus ROG Zephyrus S17 GX703HSD GeForce RTX 3080 Laptop GPU, i9-11900H, Samsung PM9A1 MZVL22T0HBLB | Schenker XMG Core 17 (Early 2021) GeForce RTX 3060 Laptop GPU, i7-10870H, Samsung SSD 970 EVO Plus 1TB | Schenker XMG Neo 17 (Early 2021, RTX 3070, 5800H) GeForce RTX 3070 Laptop GPU, R7 5800H, Samsung SSD 970 EVO Plus 500GB | Schenker Compact 17 GeForce RTX 2070 Super Mobile, i7-10875H, Samsung SSD 970 EVO Plus 1TB | MSI GS75 10SF-609US GeForce RTX 2070 Max-Q, i7-10875H, WDC PC SN730 SDBPNTY-512G | |
|---|---|---|---|---|---|---|
| Noise | 5% | -20% | -20% | -21% | -21% | |
| off /ambiente * (dB) | 23.8 | 23 3% | 25 -5% | 24 -1% | 25.4 -7% | 26.2 -10% |
| Idle Minimum * (dB) | 23.9 | 23 4% | 30 -26% | 29 -21% | 25.4 -6% | 31.2 -31% |
| Idle Average * (dB) | 23.9 | 23 4% | 32 -34% | 32 -34% | 25.4 -6% | 31.4 -31% |
| Idle Maximum * (dB) | 23.9 | 23 4% | 36 -51% | 38 -59% | 40 -67% | 34 -42% |
| Load Average * (dB) | 38 | 41 -8% | 53 -39% | 49 -29% | 54.6 -44% | 49.5 -30% |
| Witcher 3 ultra * (dB) | 55.9 | 45 19% | 51 9% | 53 5% | 50.6 9% | |
| Load Maximum * (dB) | 55.9 | 52 7% | 54 3% | 55 2% | 54.6 2% | 60.7 -9% |
* ... Meglio usare valori piccoli
Rumorosità
| Idle |
| 23.9 / 23.9 / 23.9 dB(A) |
| Sotto carico |
| 38 / 55.9 dB(A) |
 | ||
30 dB silenzioso 40 dB(A) udibile 50 dB(A) rumoroso |
||
min: | ||
(-) La temperatura massima sul lato superiore è di 54.2 °C / 130 F, rispetto alla media di 40.4 °C / 105 F, che varia da 21.2 a 68.8 °C per questa classe Gaming.
(-) Il lato inferiore si riscalda fino ad un massimo di 52.2 °C / 126 F, rispetto alla media di 43.2 °C / 110 F
(+) In idle, la temperatura media del lato superiore è di 31.5 °C / 89 F, rispetto alla media deld ispositivo di 33.9 °C / 93 F.
(±) Riproducendo The Witcher 3, la temperatura media per il lato superiore e' di 36.1 °C / 97 F, rispetto alla media del dispositivo di 33.9 °C / 93 F.
(+) I poggiapolsi e il touchpad raggiungono la temperatura massima della pelle (32.6 °C / 90.7 F) e quindi non sono caldi.
(-) La temperatura media della zona del palmo della mano di dispositivi simili e'stata di 28.8 °C / 83.8 F (-3.8 °C / -6.9 F).
Maingear Vector Pro MG-VCP17 analisi audio
(±) | potenza degli altiparlanti media ma buona (75.5 dB)
Bassi 100 - 315 Hz
(-) | quasi nessun basso - in media 19.3% inferiori alla media
(±) | la linearità dei bassi è media (11.7% delta rispetto alla precedente frequenza)
Medi 400 - 2000 Hz
(+) | medi bilanciati - solo only 2.1% rispetto alla media
(+) | medi lineari (4.5% delta rispetto alla precedente frequenza)
Alti 2 - 16 kHz
(+) | Alti bilanciati - appena 3.4% dalla media
(+) | alti lineari (6.6% delta rispetto alla precedente frequenza)
Nel complesso 100 - 16.000 Hz
(±) | la linearità complessiva del suono è media (17.5% di differenza rispetto alla media
Rispetto alla stessa classe
» 49% di tutti i dispositivi testati in questa classe è stato migliore, 12% simile, 40% peggiore
» Il migliore ha avuto un delta di 6%, medio di 18%, peggiore di 132%
Rispetto a tutti i dispositivi testati
» 34% di tutti i dispositivi testati in questa classe è stato migliore, 8% similare, 58% peggiore
» Il migliore ha avuto un delta di 4%, medio di 23%, peggiore di 134%
Apple MacBook 12 (Early 2016) 1.1 GHz analisi audio
(+) | gli altoparlanti sono relativamente potenti (83.6 dB)
Bassi 100 - 315 Hz
(±) | bassi ridotti - in media 11.3% inferiori alla media
(±) | la linearità dei bassi è media (14.2% delta rispetto alla precedente frequenza)
Medi 400 - 2000 Hz
(+) | medi bilanciati - solo only 2.4% rispetto alla media
(+) | medi lineari (5.5% delta rispetto alla precedente frequenza)
Alti 2 - 16 kHz
(+) | Alti bilanciati - appena 2% dalla media
(+) | alti lineari (4.5% delta rispetto alla precedente frequenza)
Nel complesso 100 - 16.000 Hz
(+) | suono nel complesso lineare (10.2% differenza dalla media)
Rispetto alla stessa classe
» 7% di tutti i dispositivi testati in questa classe è stato migliore, 2% simile, 90% peggiore
» Il migliore ha avuto un delta di 5%, medio di 18%, peggiore di 53%
Rispetto a tutti i dispositivi testati
» 5% di tutti i dispositivi testati in questa classe è stato migliore, 1% similare, 94% peggiore
» Il migliore ha avuto un delta di 4%, medio di 23%, peggiore di 134%
| Off / Standby | |
| Idle | |
| Sotto carico |
|
Leggenda:
min: | |
| Maingear Vector Pro MG-VCP17 i7-11800H, GeForce RTX 3080 Laptop GPU, Samsung PM9A1 MZVL21T0HCLR, IPS, 2560x1440, 17.3" | Asus ROG Zephyrus S17 GX703HSD i9-11900H, GeForce RTX 3080 Laptop GPU, Samsung PM9A1 MZVL22T0HBLB, IPS, 2560x1440, 17.3" | Schenker XMG Core 17 (Early 2021) i7-10870H, GeForce RTX 3060 Laptop GPU, Samsung SSD 970 EVO Plus 1TB, IPS, 2560x1440, 17.3" | Schenker XMG Neo 17 (Early 2021, RTX 3070, 5800H) R7 5800H, GeForce RTX 3070 Laptop GPU, Samsung SSD 970 EVO Plus 500GB, IPS, 2560x1440, 17.3" | Schenker Compact 17 i7-10875H, GeForce RTX 2070 Super Mobile, Samsung SSD 970 EVO Plus 1TB, IPS, 3840x2160, 17.3" | MSI GS75 10SF-609US i7-10875H, GeForce RTX 2070 Max-Q, WDC PC SN730 SDBPNTY-512G, IPS, 1920x1080, 17.3" | |
|---|---|---|---|---|---|---|
| Power Consumption | -30% | 1% | -7% | -9% | -21% | |
| Idle Minimum * (Watt) | 11 | 21.7 -97% | 13 -18% | 13 -18% | 13.6 -24% | 19.2 -75% |
| Idle Average * (Watt) | 15.6 | 27 -73% | 16 -3% | 16 -3% | 19.8 -27% | 22.4 -44% |
| Idle Maximum * (Watt) | 34 | 33 3% | 29 15% | 26 24% | 23.5 31% | 34.7 -2% |
| Load Average * (Watt) | 81.2 | 108 -33% | 100 -23% | 125 -54% | 105 -29% | 106.7 -31% |
| Witcher 3 ultra * (Watt) | 204 | 195 4% | 173 15% | 187 8% | 160.5 21% | |
| Load Maximum * (Watt) | 257.3 | 210 18% | 213 17% | 259 -1% | 243 6% | 248.7 3% |
* ... Meglio usare valori piccoli
Consumo energetico The Witcher 3 / Stresstest
| Maingear Vector Pro MG-VCP17 i7-11800H, GeForce RTX 3080 Laptop GPU, 91 Wh | Asus ROG Zephyrus S17 GX703HSD i9-11900H, GeForce RTX 3080 Laptop GPU, 90 Wh | Schenker XMG Core 17 (Early 2021) i7-10870H, GeForce RTX 3060 Laptop GPU, 62 Wh | Schenker XMG Neo 17 (Early 2021, RTX 3070, 5800H) R7 5800H, GeForce RTX 3070 Laptop GPU, 62 Wh | Schenker Compact 17 i7-10875H, GeForce RTX 2070 Super Mobile, 62 Wh | MSI GS75 10SF-609US i7-10875H, GeForce RTX 2070 Max-Q, 80.25 Wh | |
|---|---|---|---|---|---|---|
| Autonomia della batteria | 9% | -29% | -49% | -32% | -29% | |
| WiFi v1.3 (h) | 6.9 | 7.5 9% | 4.9 -29% | 3.5 -49% | 4.7 -32% | 4.9 -29% |
| Witcher 3 ultra (h) | 1 | |||||
| Load (h) | 2.7 | 1.3 | 0.7 | 4.1 | ||
| Reader / Idle (h) | 7.7 | 4.7 | 8.6 |
Pro
Contro
Valutazione complessiva del Maingear Vector Pro MG-VCP17 - Eccellente equilibrio tra peso e prestazioni
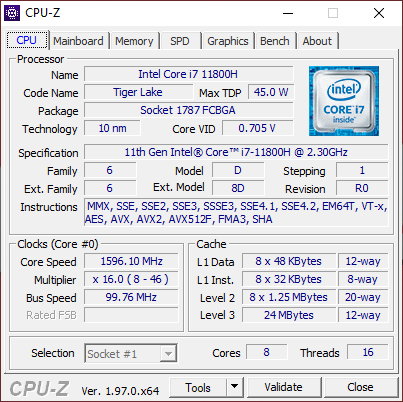
Si può davvero far girare una GPU TGP da 165 W in uno chassis delle dimensioni di un Razer Blade Pro pur pesando 500 grammi in meno? I nostri test mostrano che la GPU nel Maingear si aggira intorno ai 130 W quando si gioca, che è circa nella media se si considerano altri portatili RTX 3080 attualmente sul mercato. Se volete massimizzare le prestazioni della RTX 3080, allora dovrete ancora considerare portatili più ingombranti come lo Schenker XMG Ultra 17.
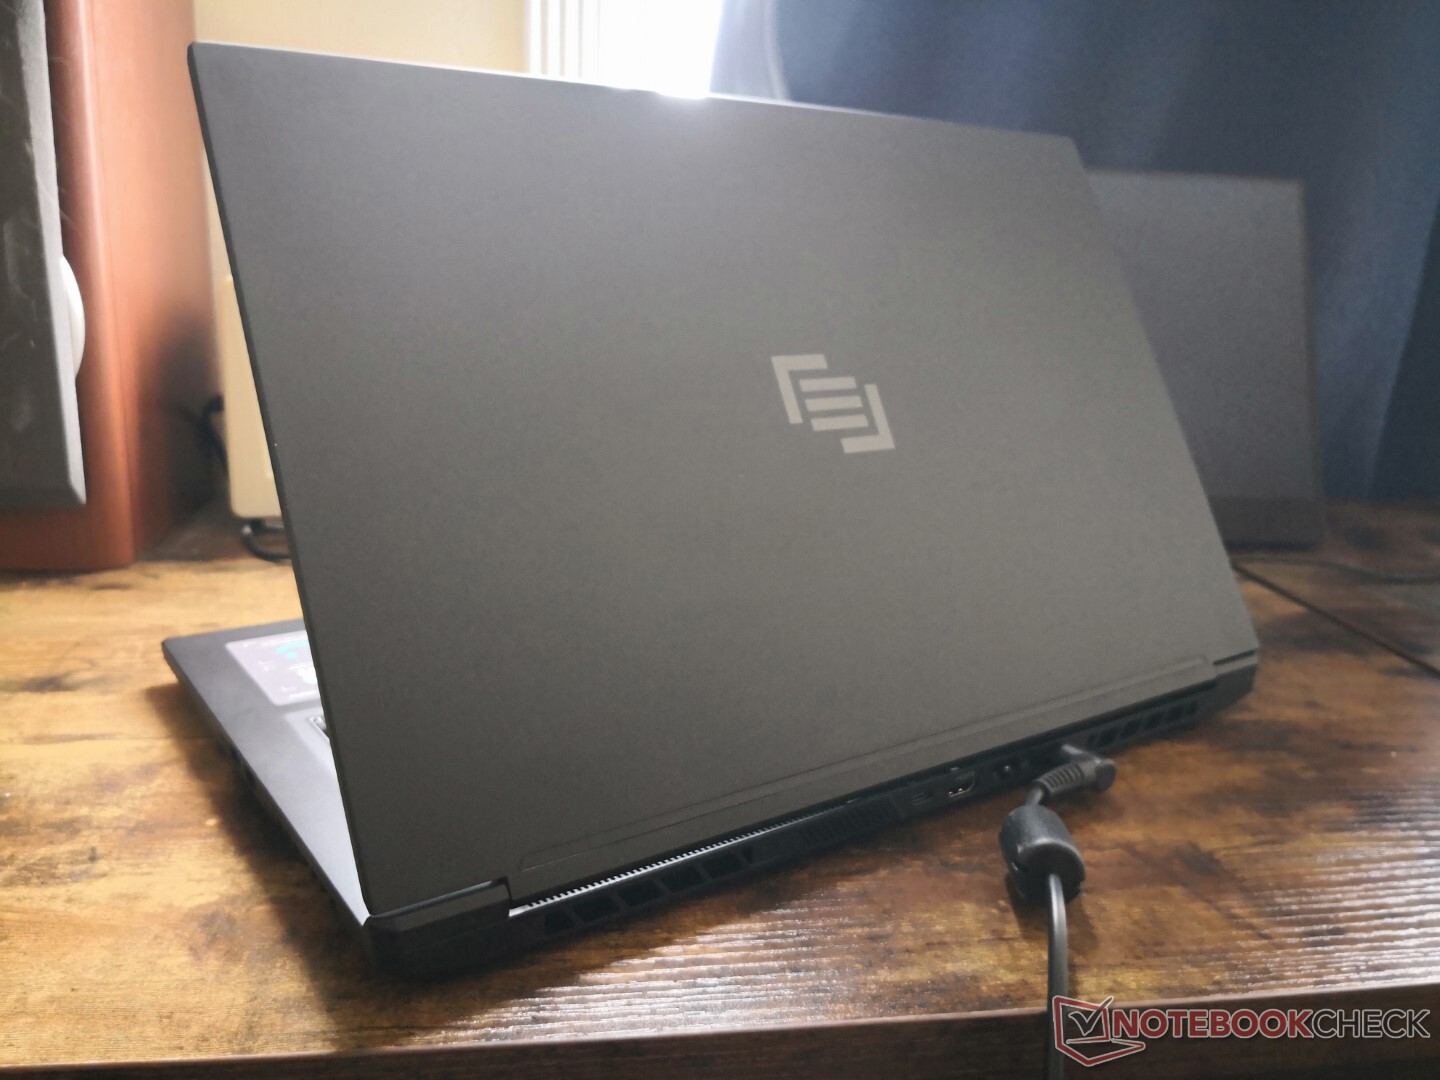
Il sistema Maingear potrebbe apportare alcuni miglioramenti per quanto riguarda la rigidità della cerniera. Mentre la sua base sembra più robusta di un Asus Zephyrus S, le sue cerniere avrebbero potuto essere più rigide per un migliore senso di longevità e qualità. Le ventole sono molto rumorose quando si gioca, ma questa è una caratteristica condivisa tra altri portatili gaming ultrasottili e quindi non possiamo rimproverare unicamente il Vector Pro per il suo rumore.
Potente e sorprendentemente leggero per le dimensioni. Alcune caratteristiche minori sono state omesse, ma il sistema di base, il display, le prestazioni e l'espandibilità sono buoni.
La lunga durata della batteria e i facili aggiornamenti sono menzioni degne per un portatile gaming ultrasottile. Per i modelli futuri, ci piacerebbe vedere l'illuminazione RGB per tasto, USB-C PD, altoparlanti più potenti e un otturatore della webcam, tutte cose che stanno diventando standard sui modelli di fascia alta.
Maingear Vector Pro MG-VCP17
- 09/10/2021 v7 (old)
Allen Ngo
Price comparison
