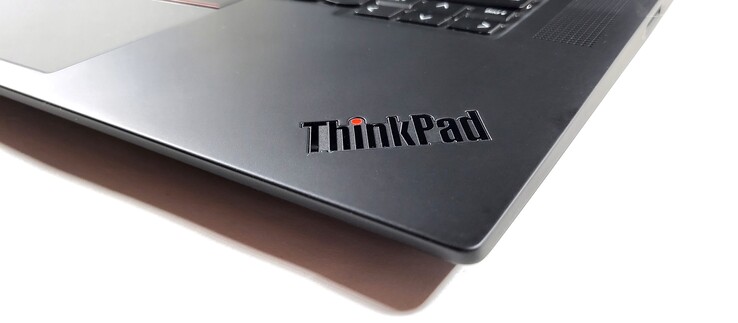
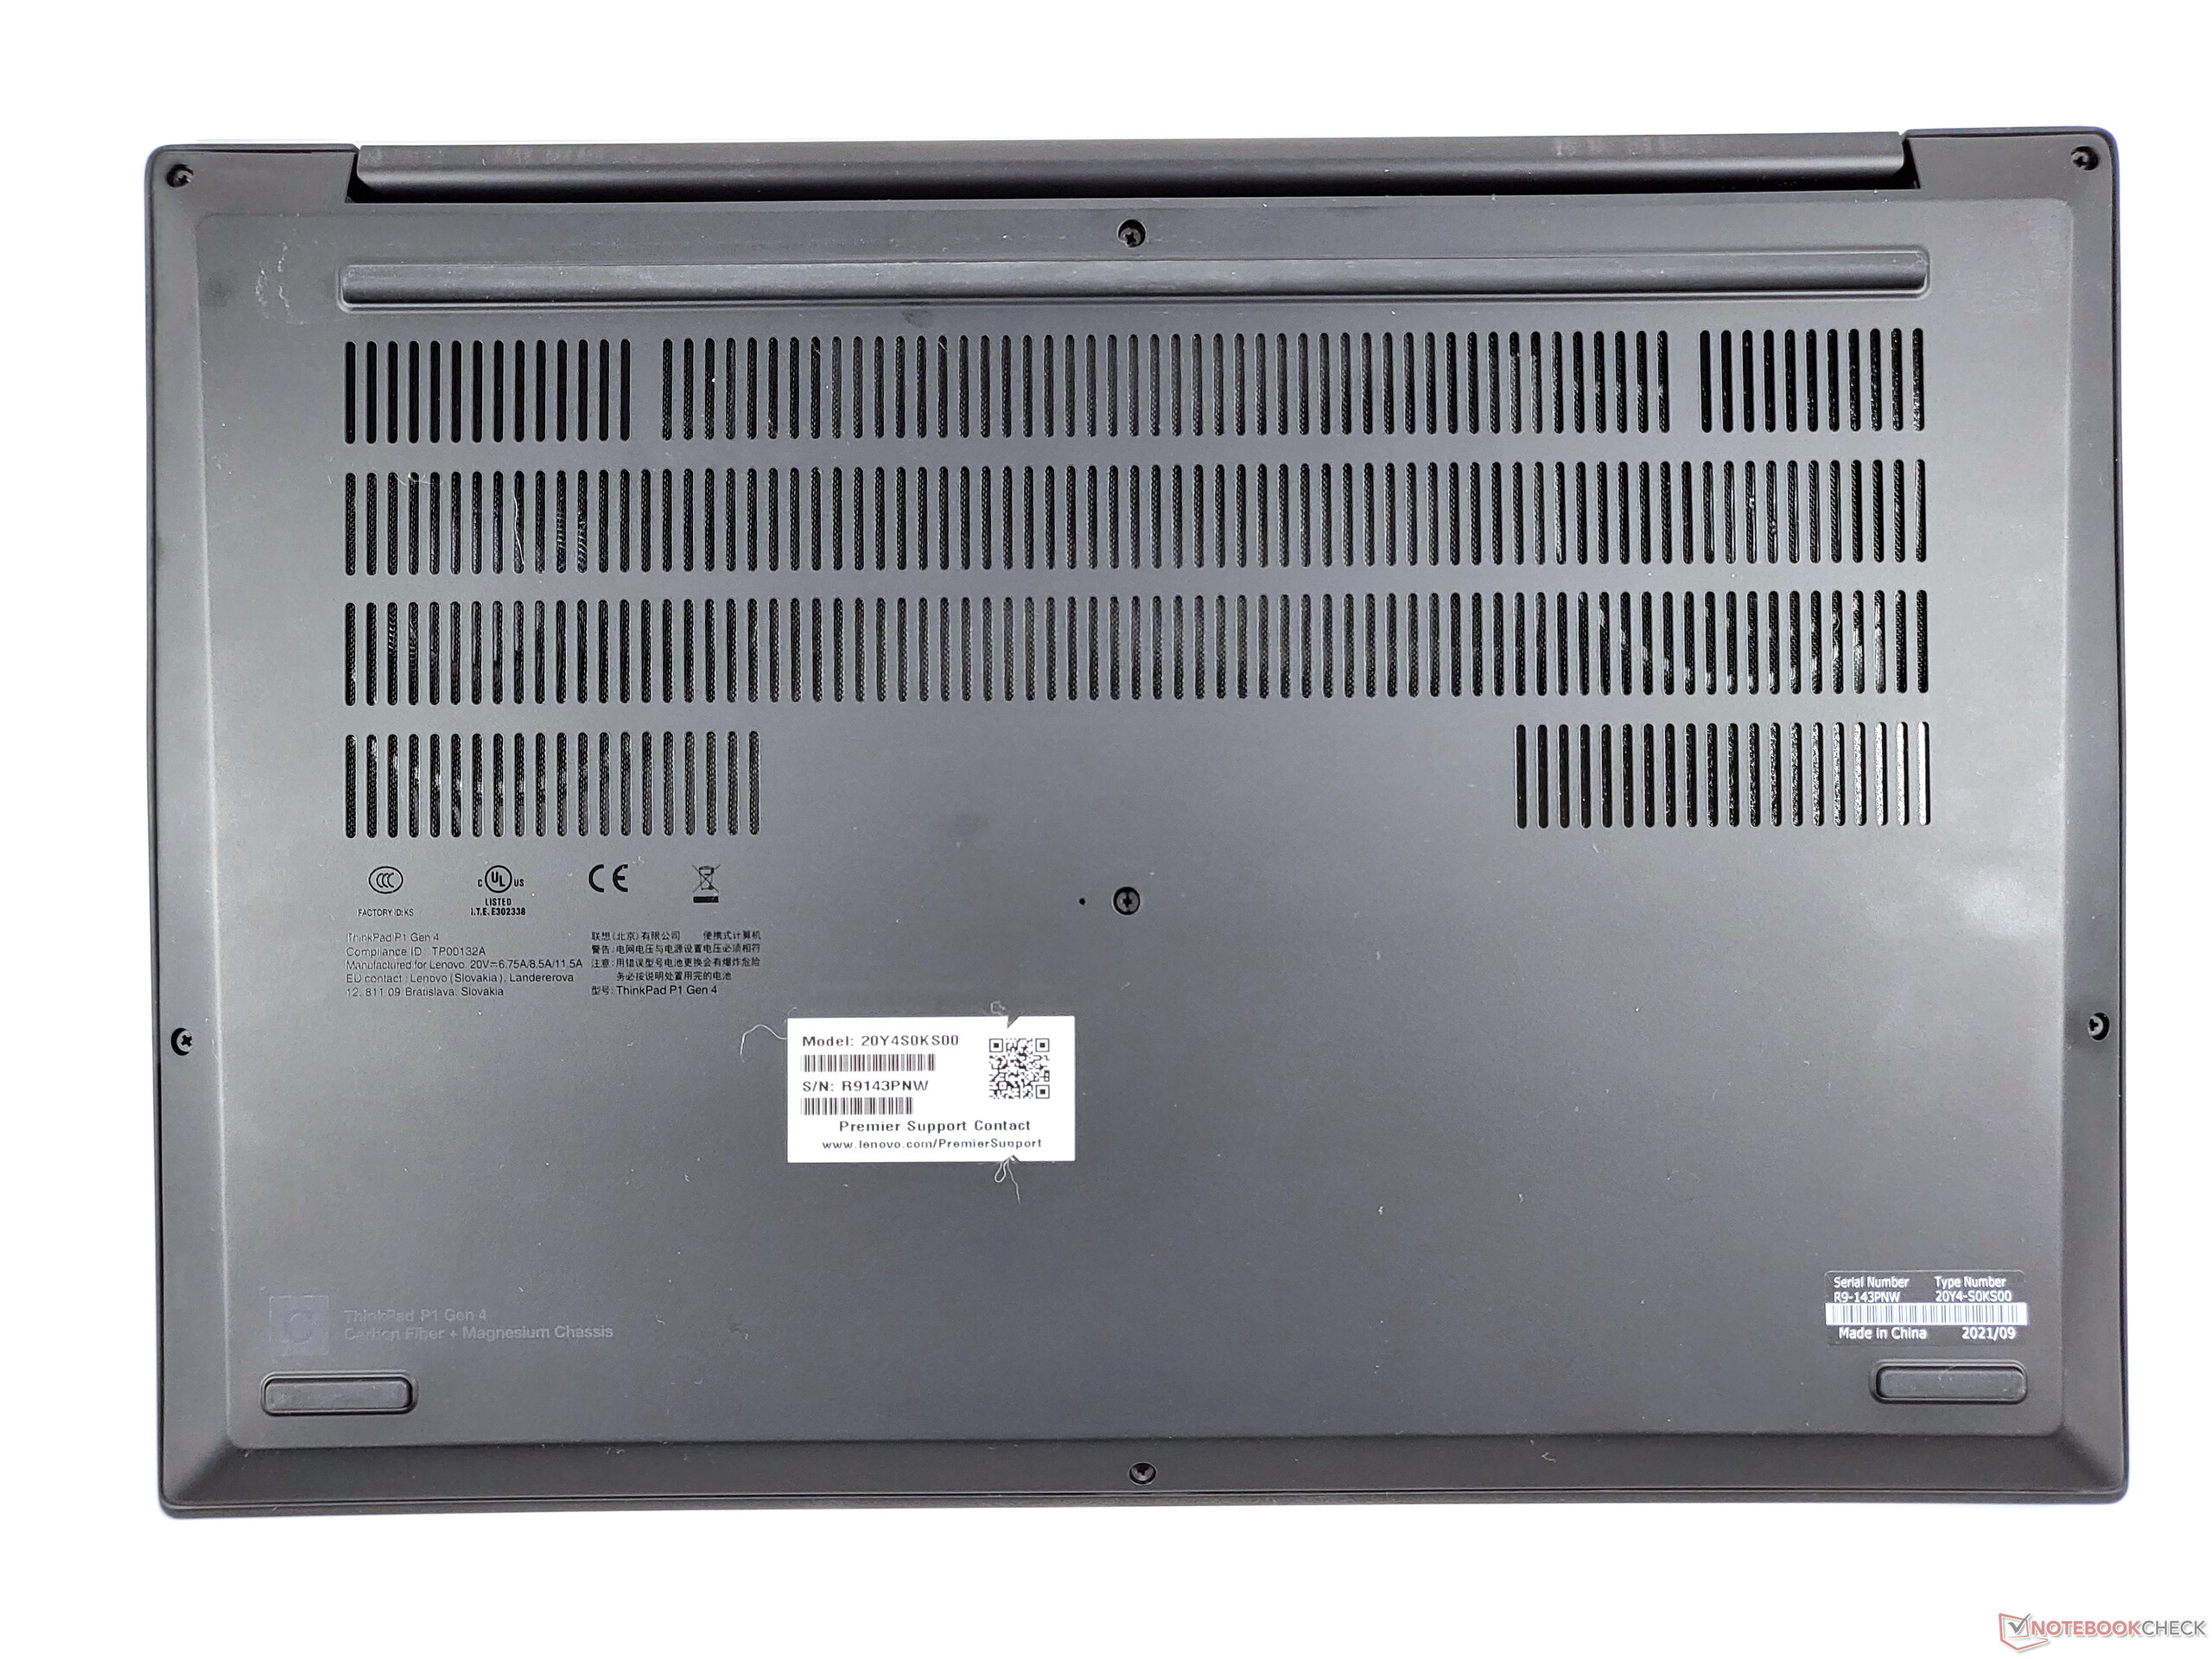
Recensione del portatile Lenovo ThinkPad P1 G4: Successo con Vapor-Chamber & GeForce RTX 3070
Quando Lenovo ha lanciato il ThinkPad P1 nel 2018, la distribuzione dei ruoli nella linea di workstation era chiara: il nuovo modello premium doveva raccogliere gli acquirenti che avevano bisogno di una workstation mobile particolarmente sottile e leggera e che potevano sacrificare alcune prestazioni per questo. Il modello classico di workstation Lenovo ThinkPad P52 d'altra parte, offriva più prestazioni con meno mobilità.
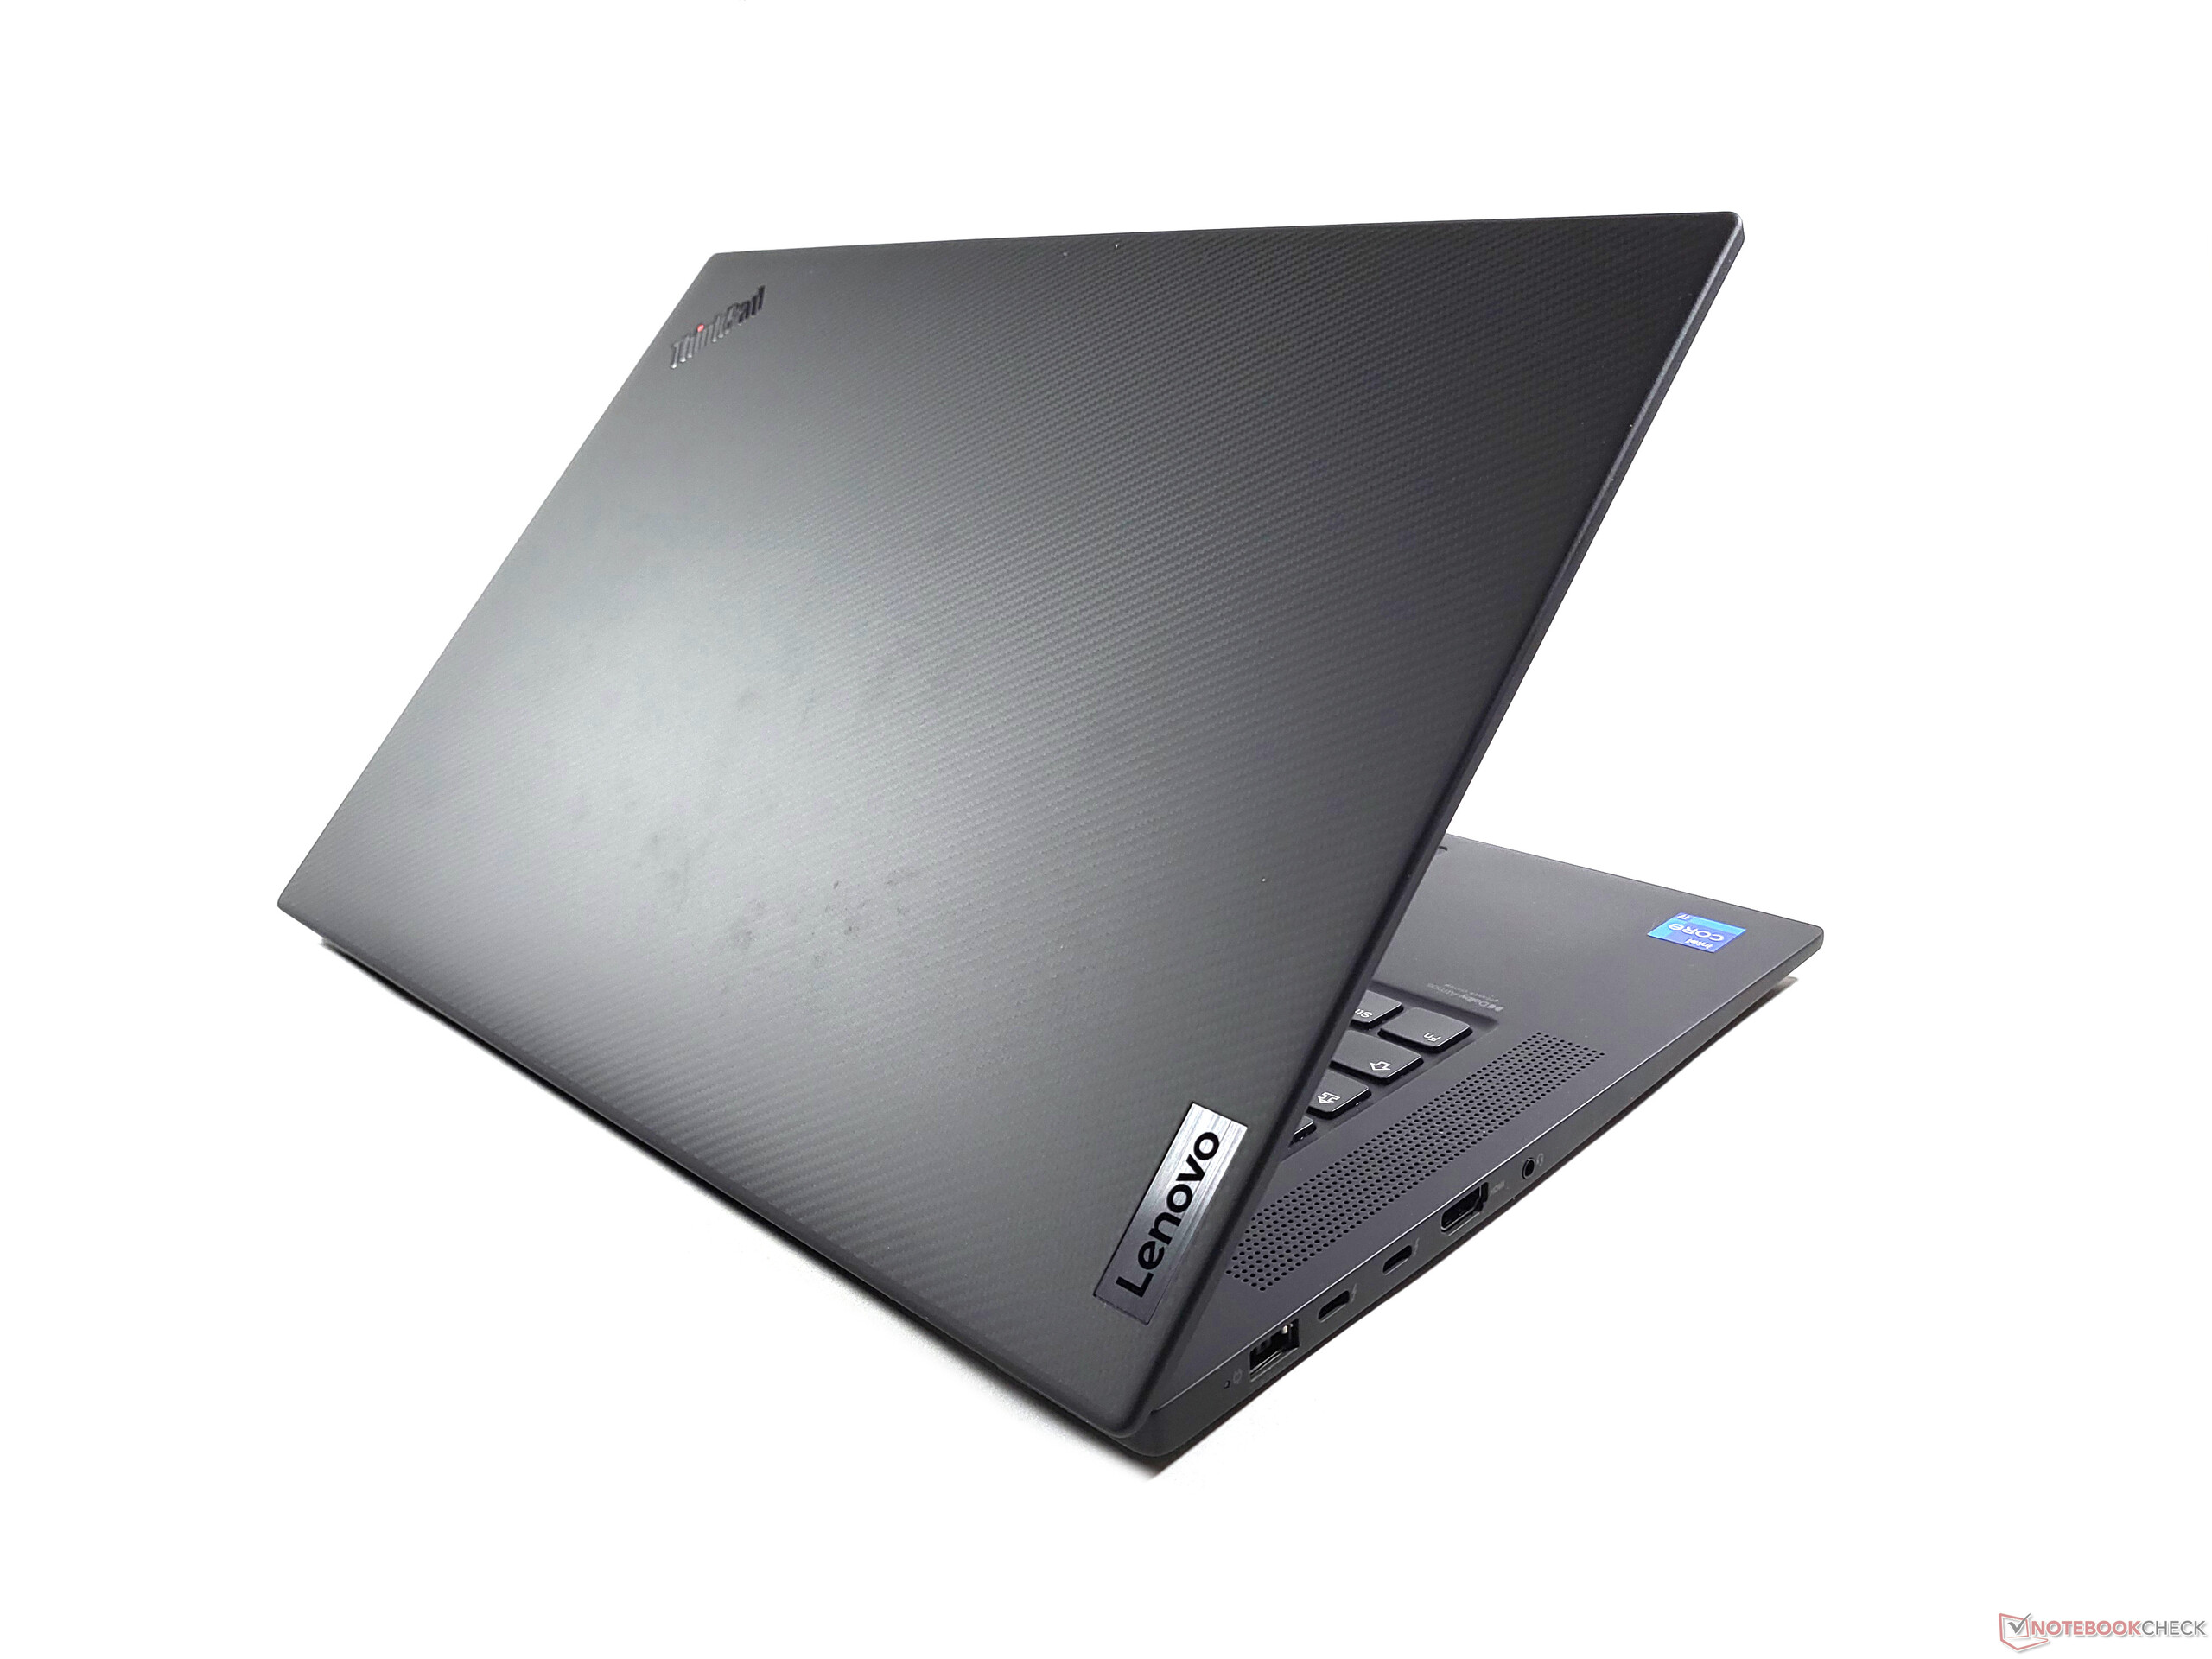
Il nuovo Lenovo ThinkPad P1 G4 ha ancora il suo vantaggio di mobilità rispetto al ThinkPad P15 G2l'attuale workstation ThinkPad full-fat. Tuttavia, i clienti non devono più necessariamente sacrificare le prestazioni - almeno sulla carta. Lenovo ha aggiornato significativamente il ThinkPad P1 e ha equipaggiato il nostro modello di test con un Nvidia GeForce RTX 3070 e una risoluzione 4K UHD+ che corrisponde ad una delle varianti di configurazione più forti. Poiché abbiamo recentemente testato il ThinkPad P1 2021 in una configurazione di fascia bassa, facciamo riferimento alla recensione delThinkPad P1 Gen 4 con Nvidia T1200 per i dettagli sulla configurazione, i dispositivi di input e il design
Possible competitors in comparison
Punteggio | Data | Modello | Peso | Altezza | Dimensione | Risoluzione | Prezzo |
|---|---|---|---|---|---|---|---|
| 89.8 % v7 (old) | 11/2021 | Lenovo ThinkPad P1 G4-20Y4S0KS00 i7-11850H, GeForce RTX 3070 Laptop GPU | 2 kg | 17.7 mm | 16.00" | 3840x2400 | |
| 89.4 % v7 (old) | 10/2021 | Lenovo ThinkPad P1 G4-20Y30017GE i7-11800H, T1200 Laptop GPU | 1.8 kg | 17.7 mm | 16.00" | 2560x1600 | |
| 88.3 % v7 (old) | 10/2021 | Dell Precision 5000 5560 i7-11850H, RTX A2000 Laptop GPU | 2 kg | 18 mm | 15.60" | 3840x2400 | |
| 89.7 % v7 (old) | 12/2019 | Apple MacBook Pro 16 2019 i9 5500M i9-9880H, Radeon Pro 5500M | 2 kg | 16.2 mm | 16.00" | 3072x1920 | |
| 87.8 % v7 (old) | 08/2021 | HP ZBook Studio 15 G8 i9-11950H, GeForce RTX 3070 Laptop GPU | 1.9 kg | 18 mm | 15.60" | 3840x2160 | |
| 90.1 % v7 (old) | 01/2021 | Lenovo ThinkPad X1 Extreme Gen3-20TLS0UV00 i7-10750H, GeForce GTX 1650 Ti Max-Q | 1.7 kg | 18.7 mm | 15.60" | 1920x1080 |
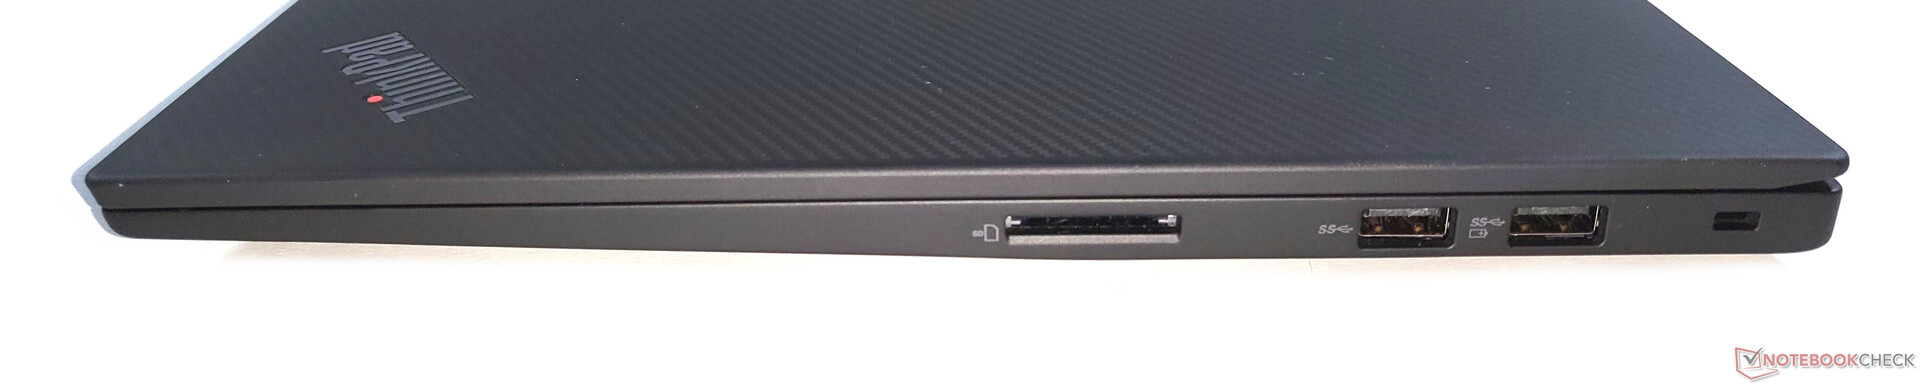
| SD Card Reader | |
| average JPG Copy Test (av. of 3 runs) | |
| Lenovo ThinkPad P1 G4-20Y30017GE (AV PRO V60) | |
| Dell Precision 5000 5560 (AV Pro V60) | |
| Media della classe Workstation (49.6 - 681, n=14, ultimi 2 anni) | |
| Lenovo ThinkPad X1 Extreme Gen3-20TLS0UV00 (Toshiba Exceria Pro SDXC 64 GB UHS-II) | |
| HP ZBook Studio 15 G8 (AV Pro V60) | |
| maximum AS SSD Seq Read Test (1GB) | |
| Media della classe Workstation (87.6 - 1455, n=14, ultimi 2 anni) | |
| Lenovo ThinkPad X1 Extreme Gen3-20TLS0UV00 (Toshiba Exceria Pro SDXC 64 GB UHS-II) | |
| Dell Precision 5000 5560 (AV Pro V60) | |
| Lenovo ThinkPad P1 G4-20Y30017GE (AV PRO V60) | |
| HP ZBook Studio 15 G8 (AV Pro V60) | |


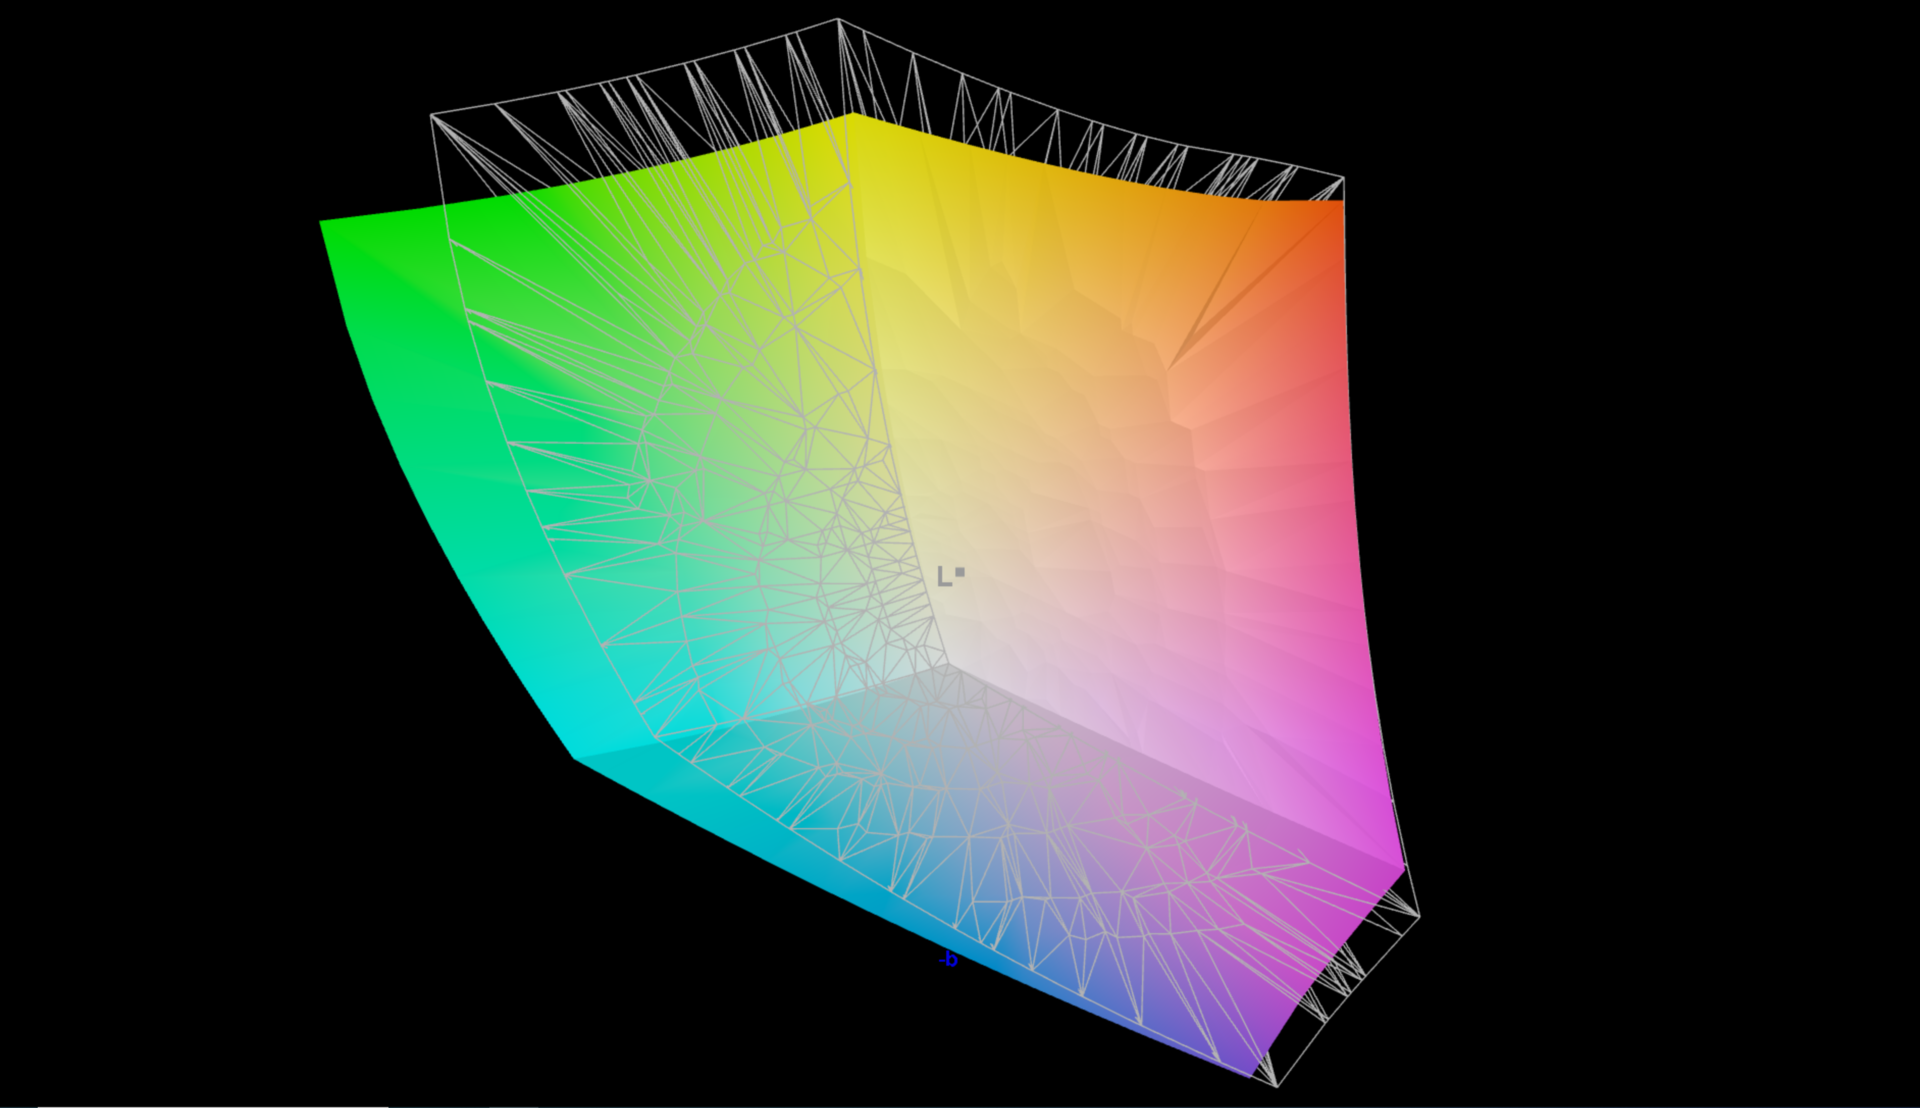
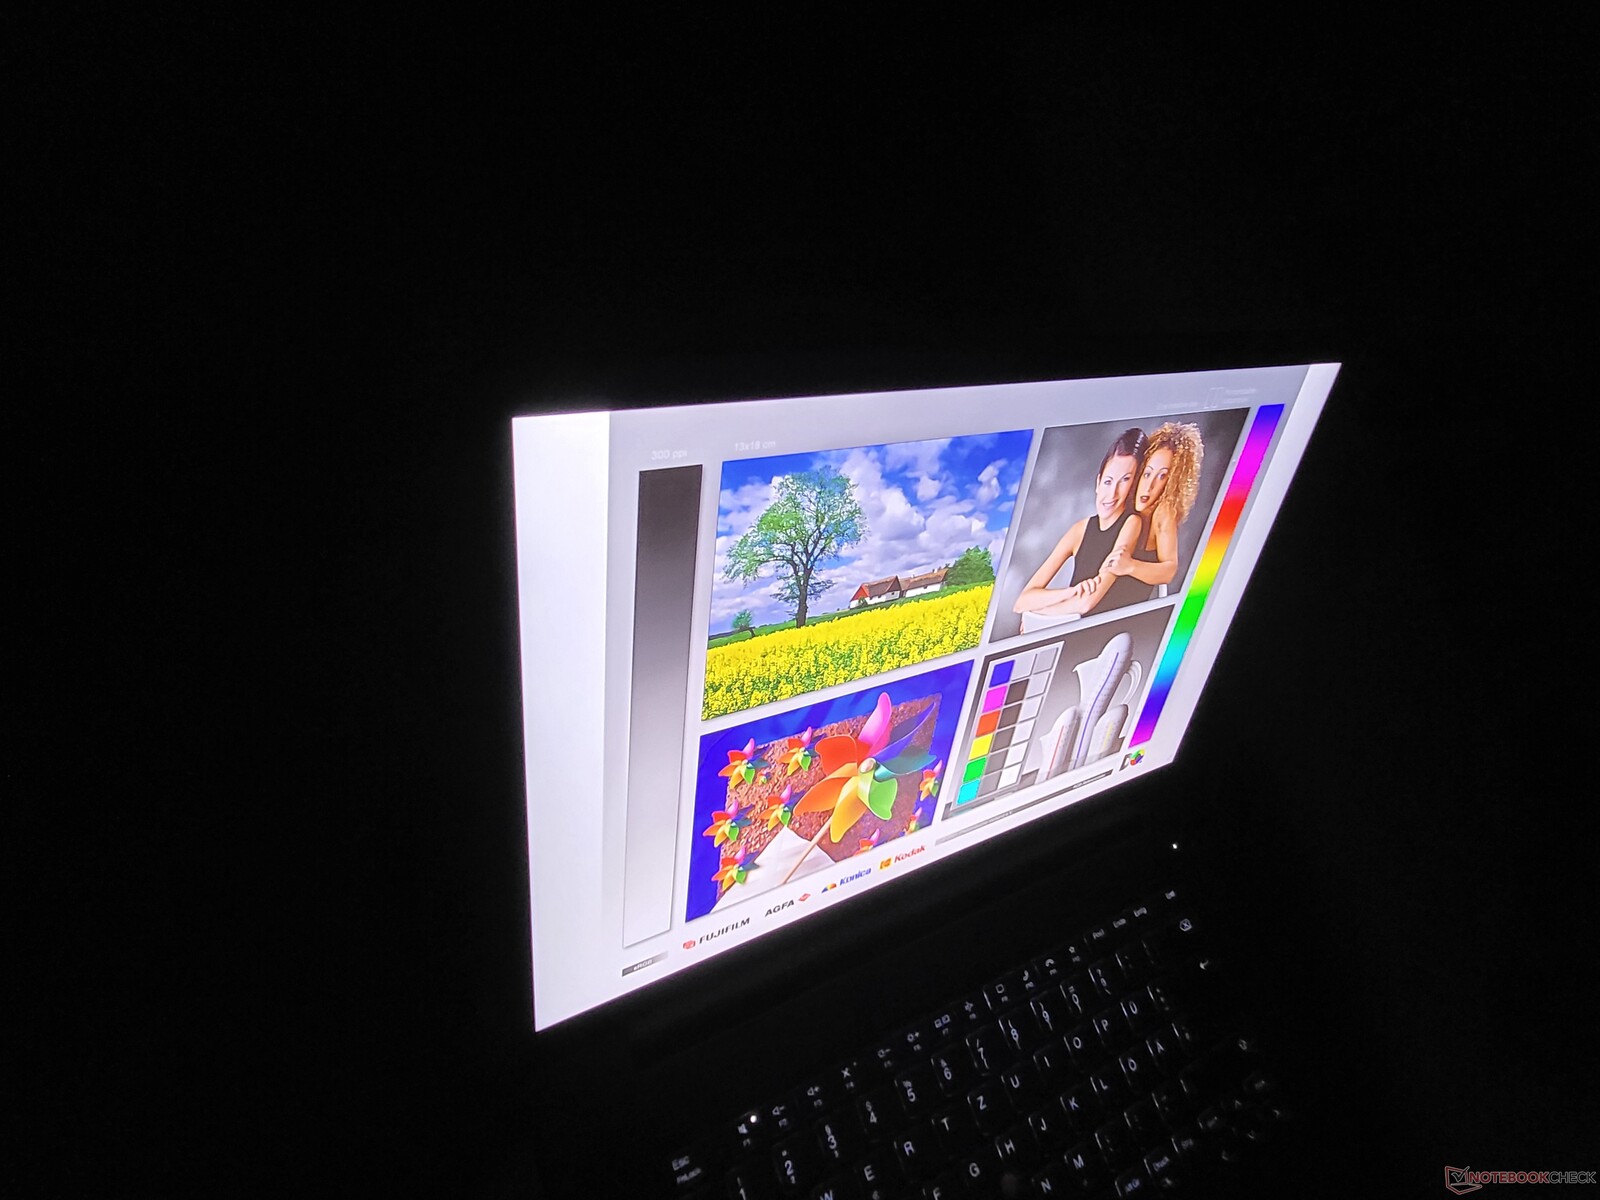
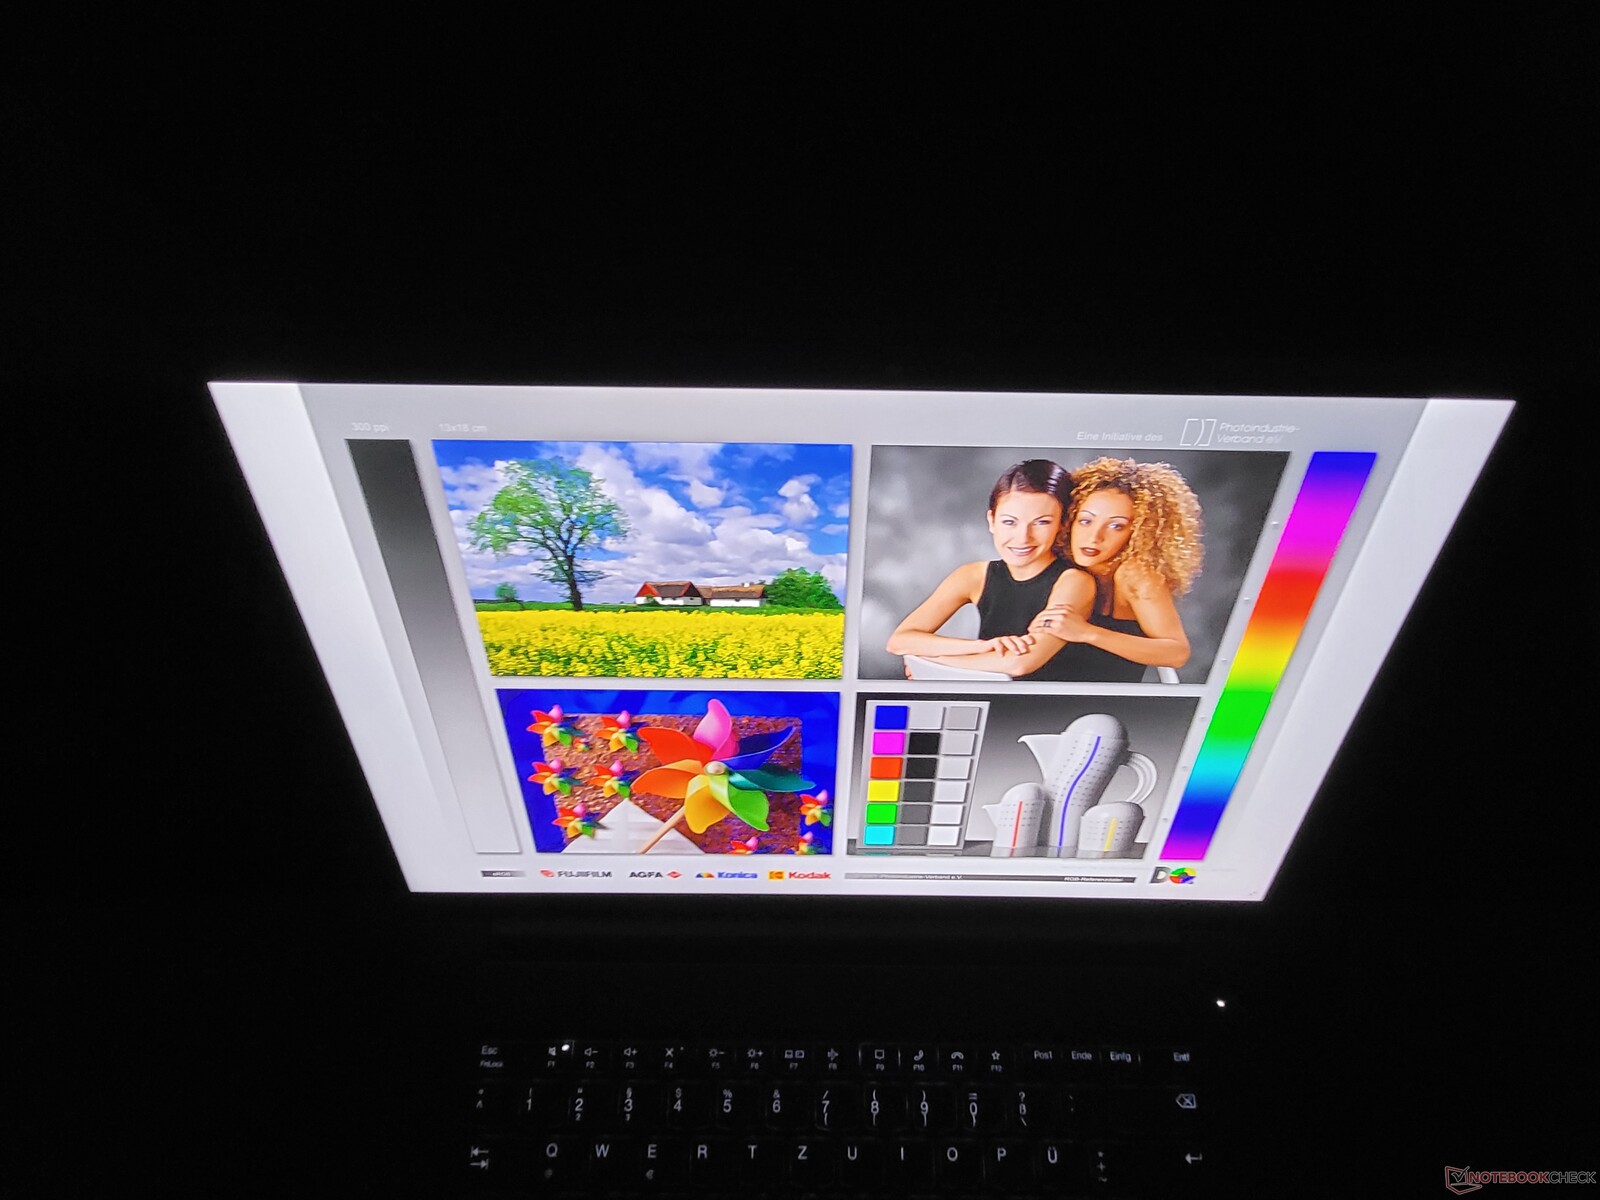
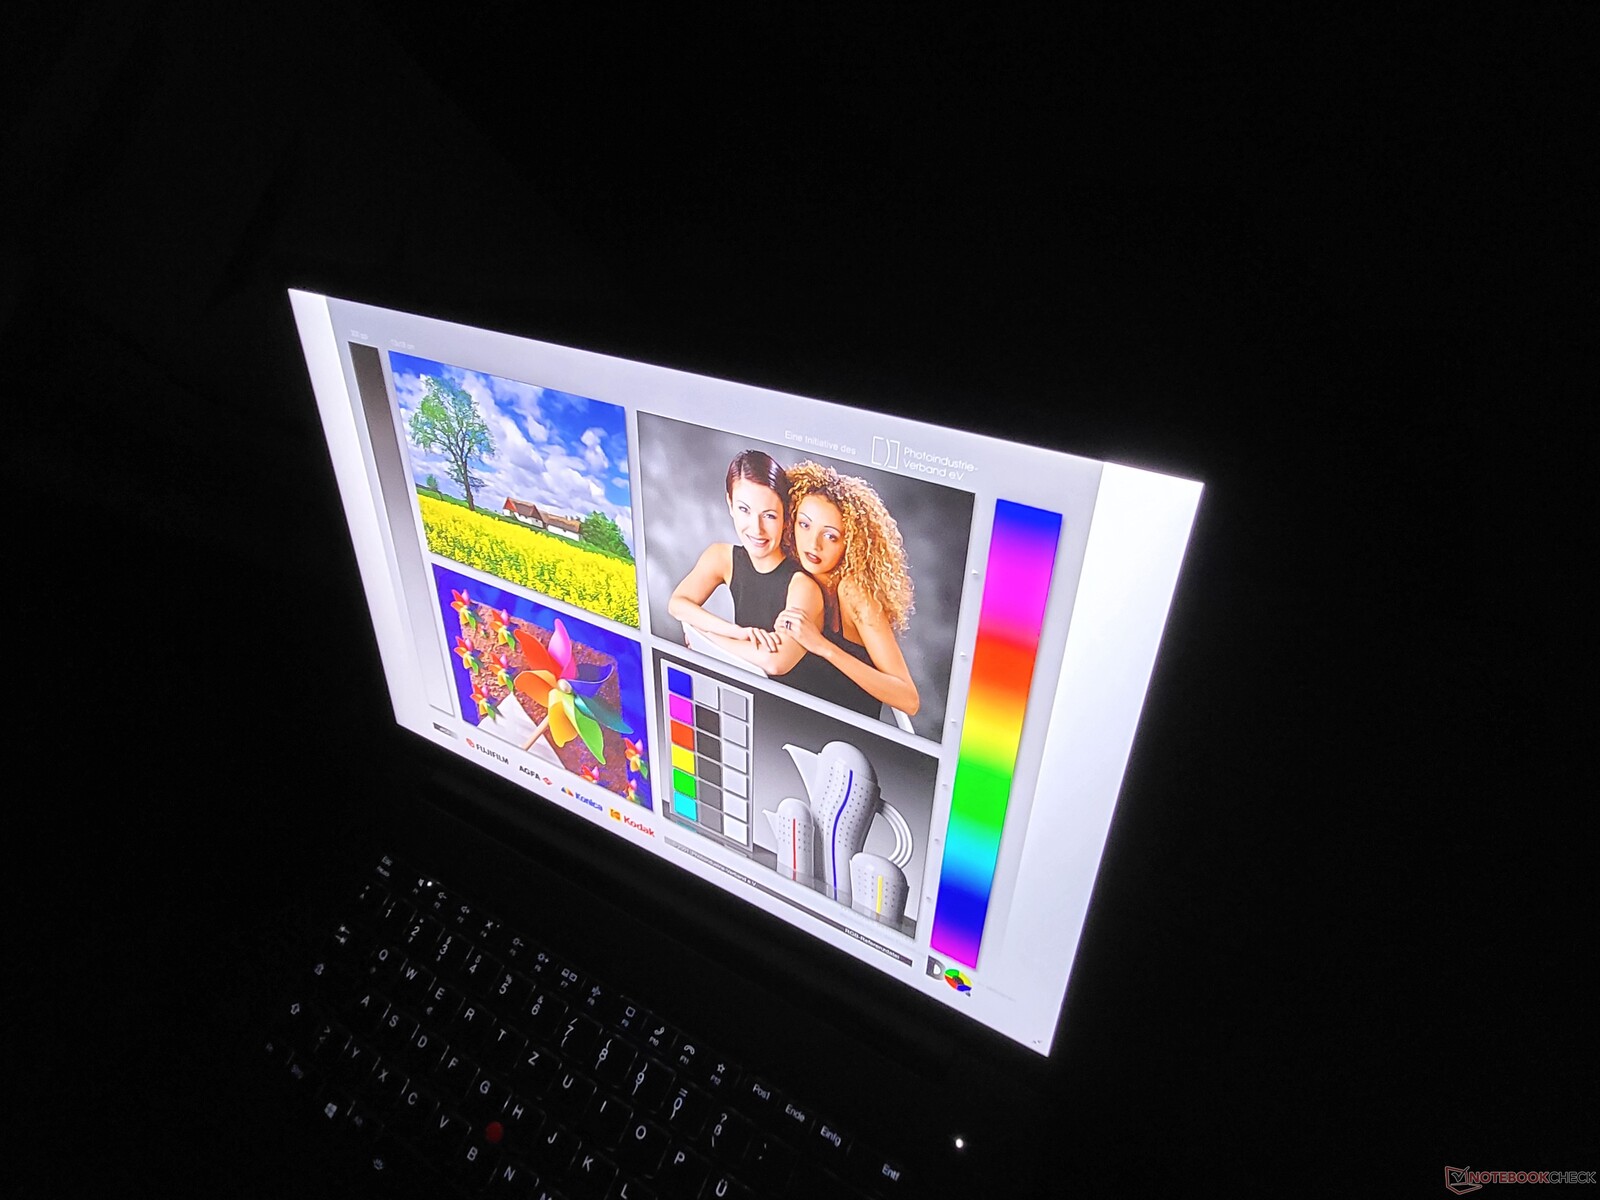
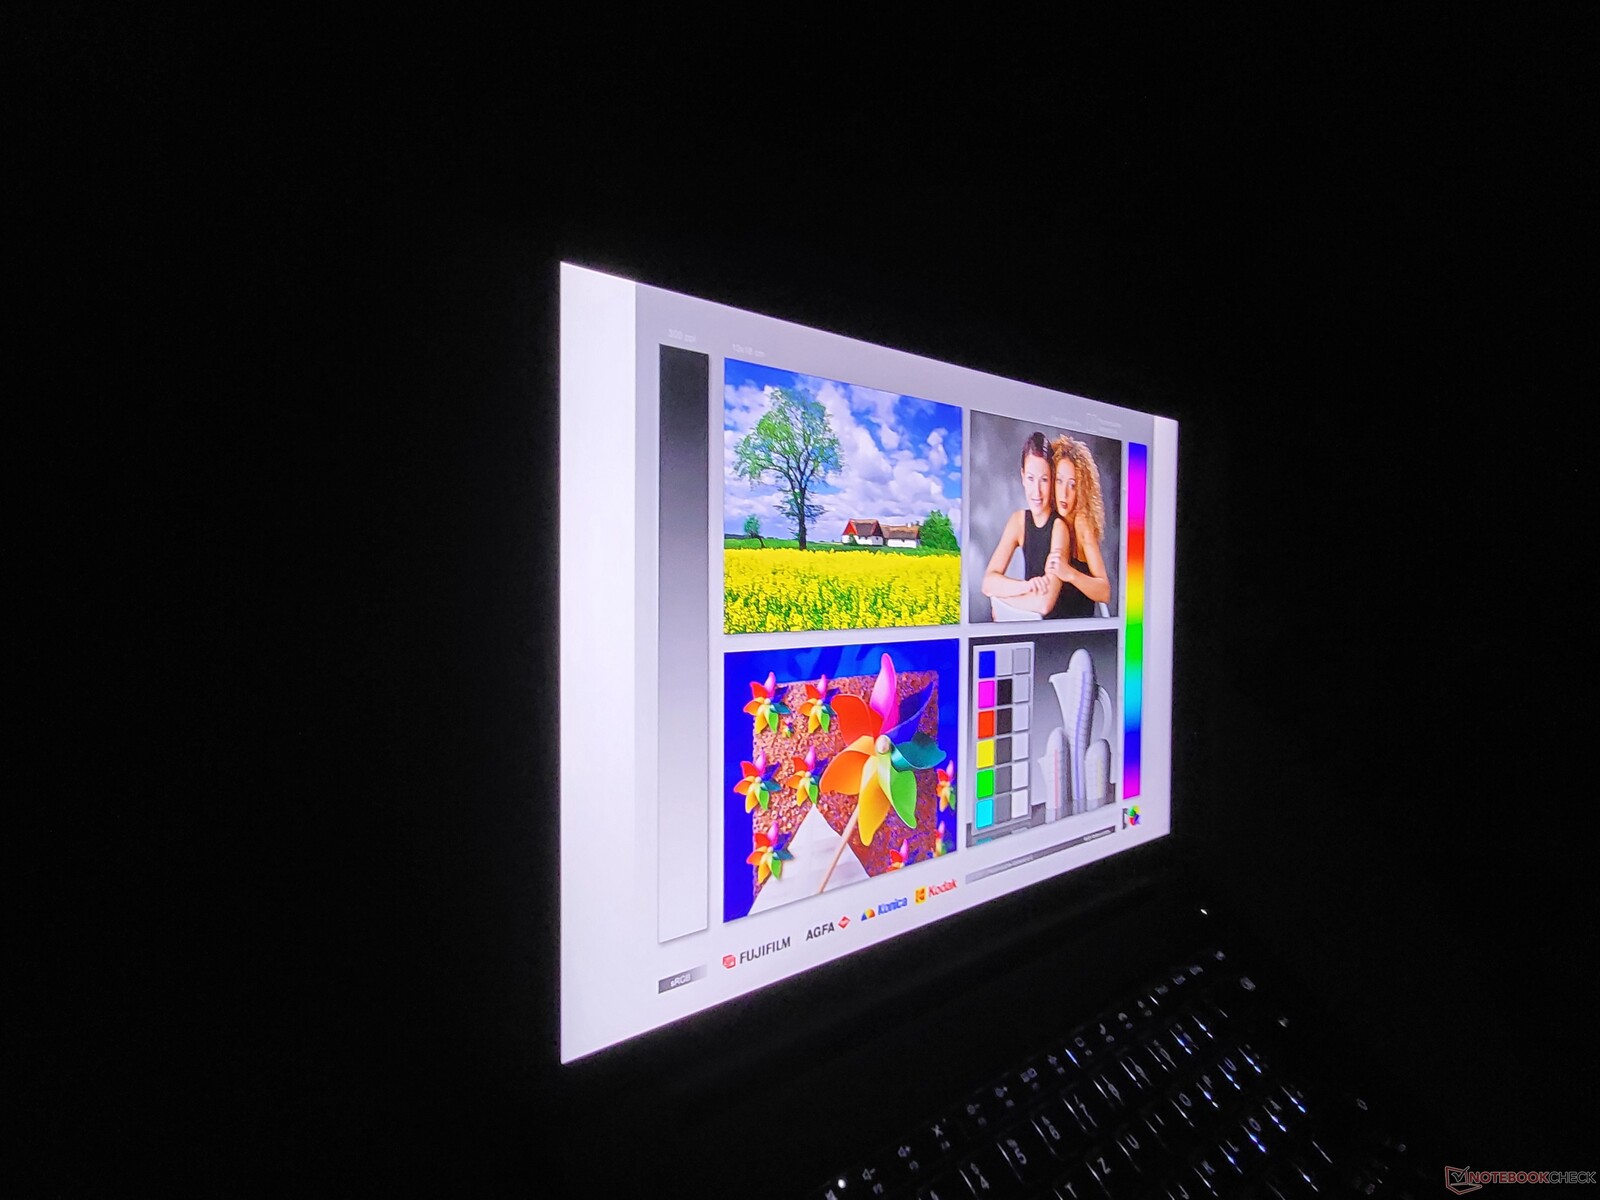
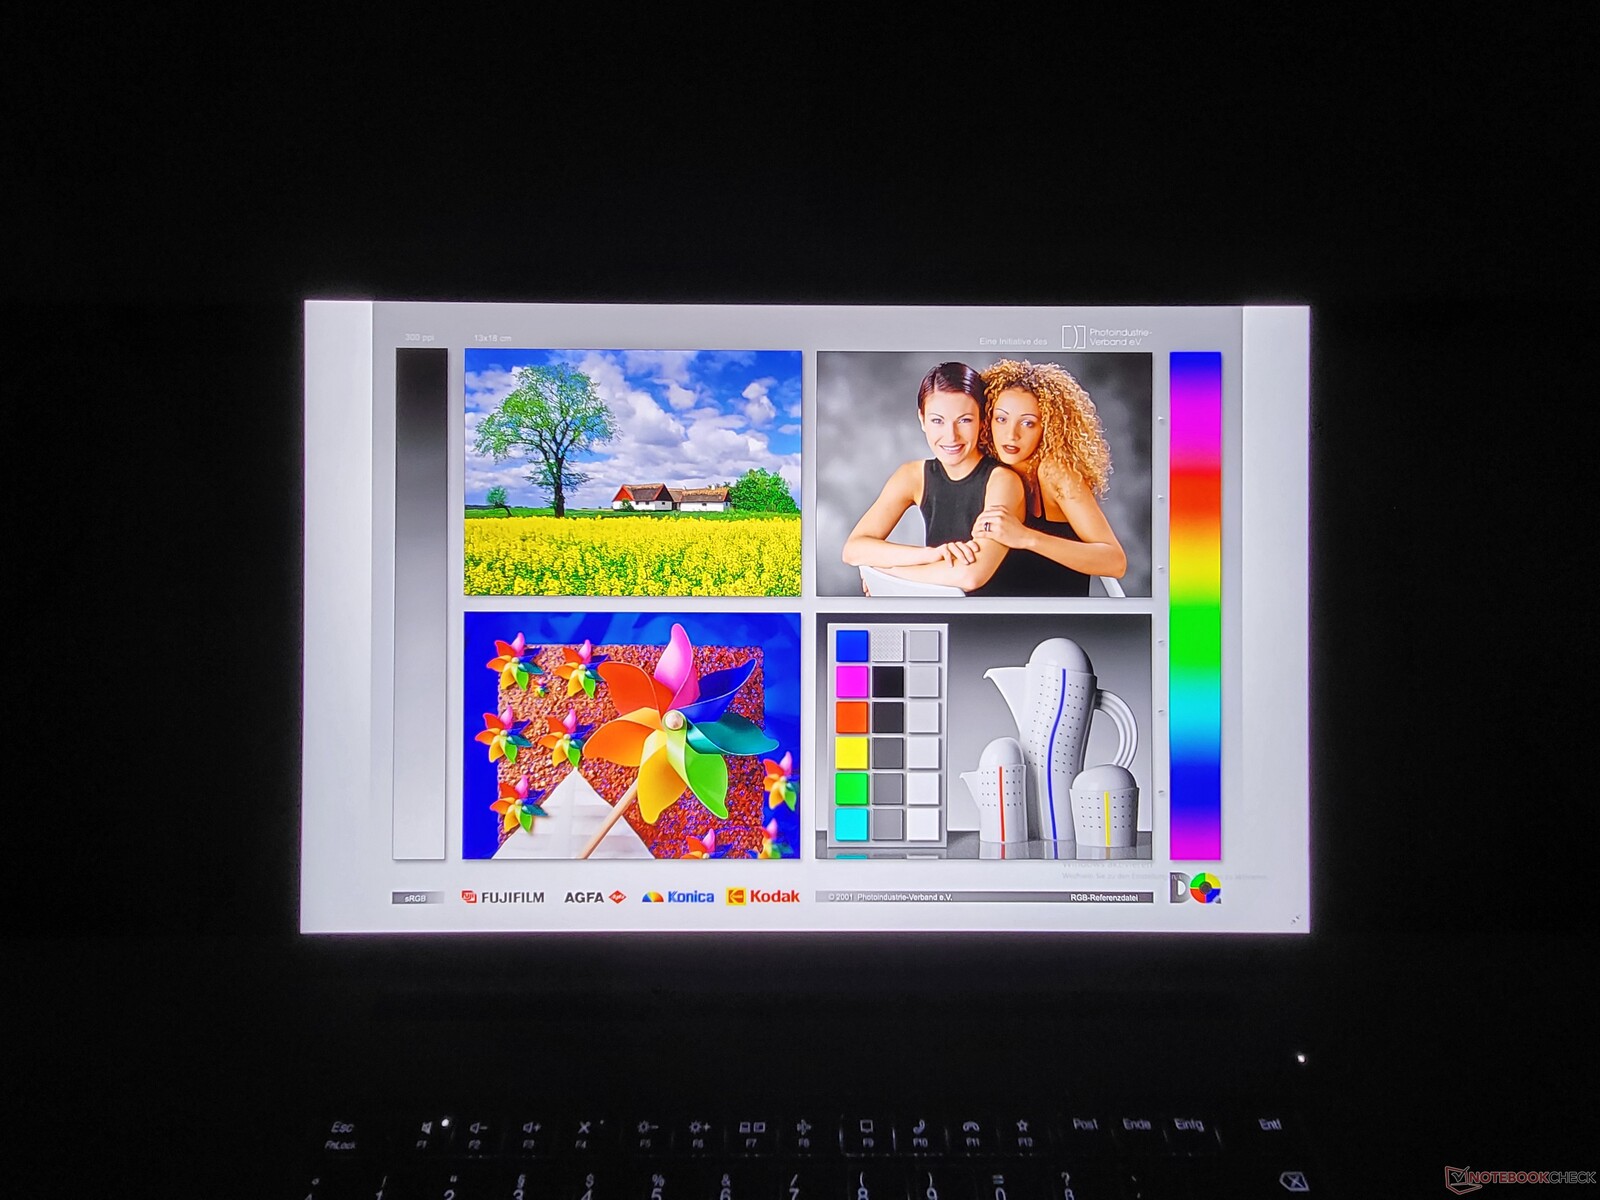
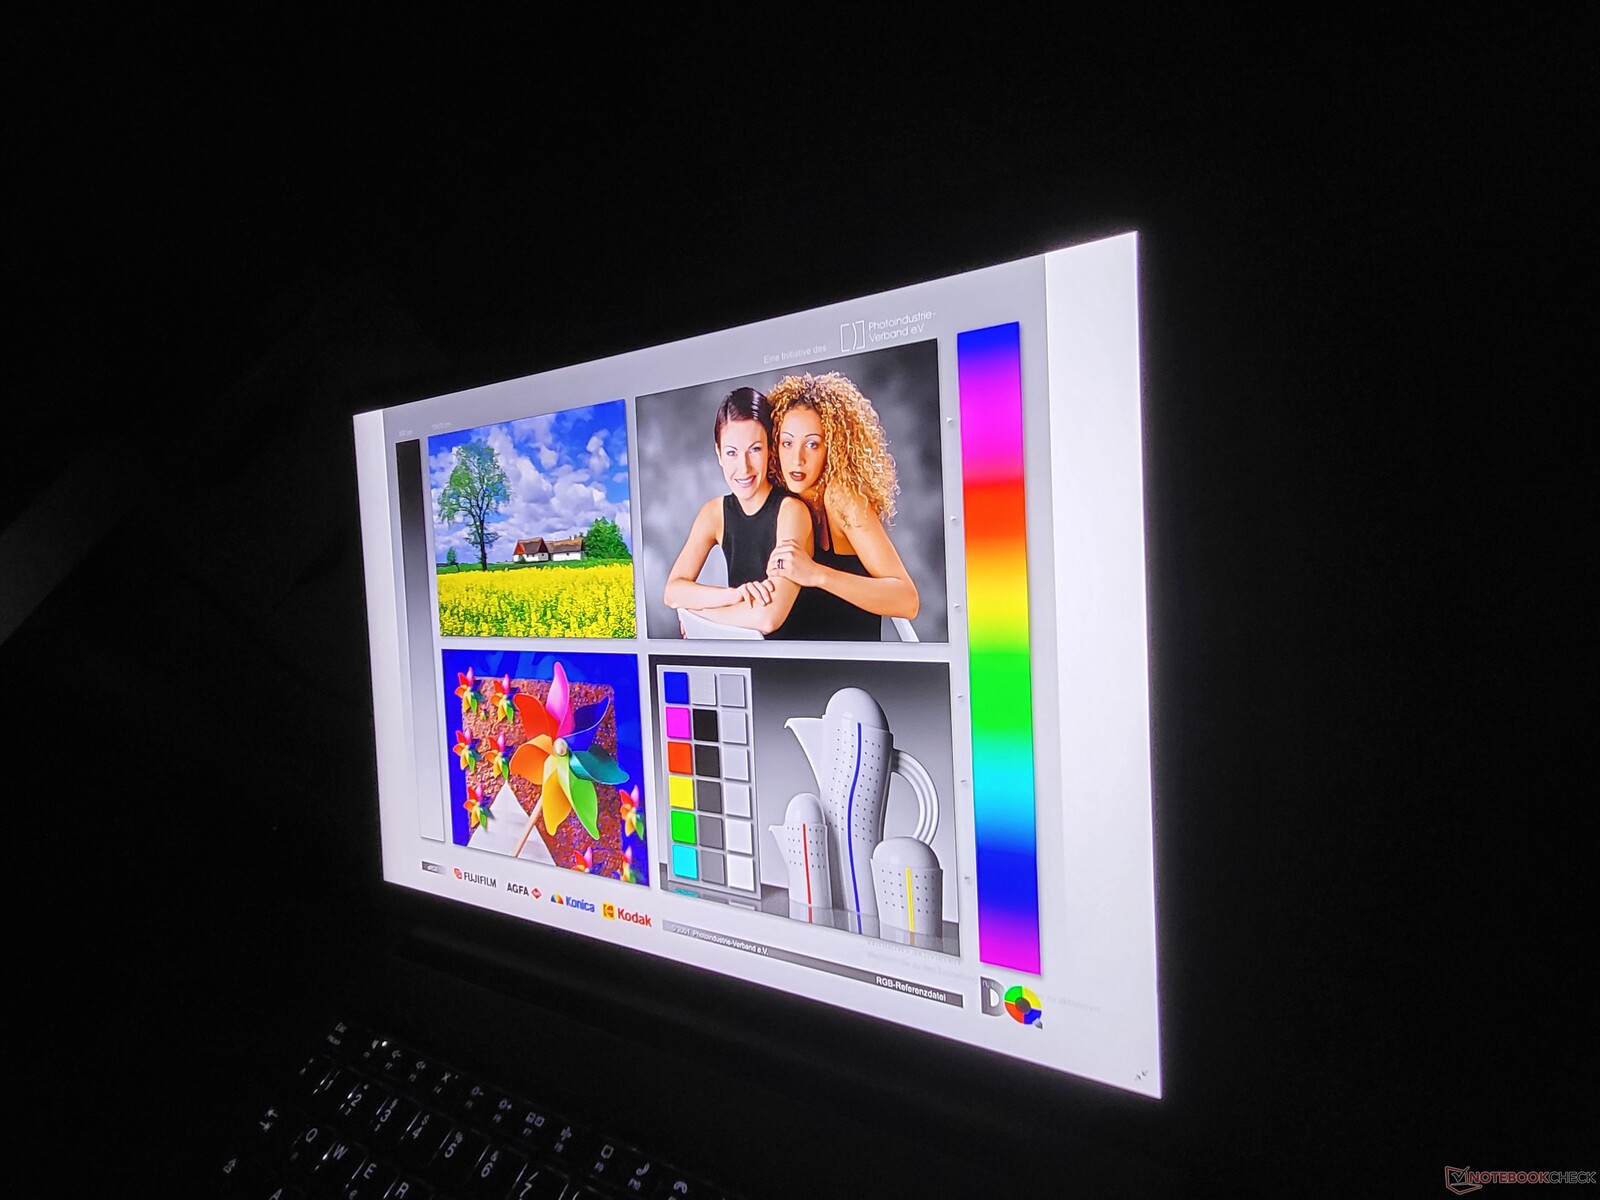
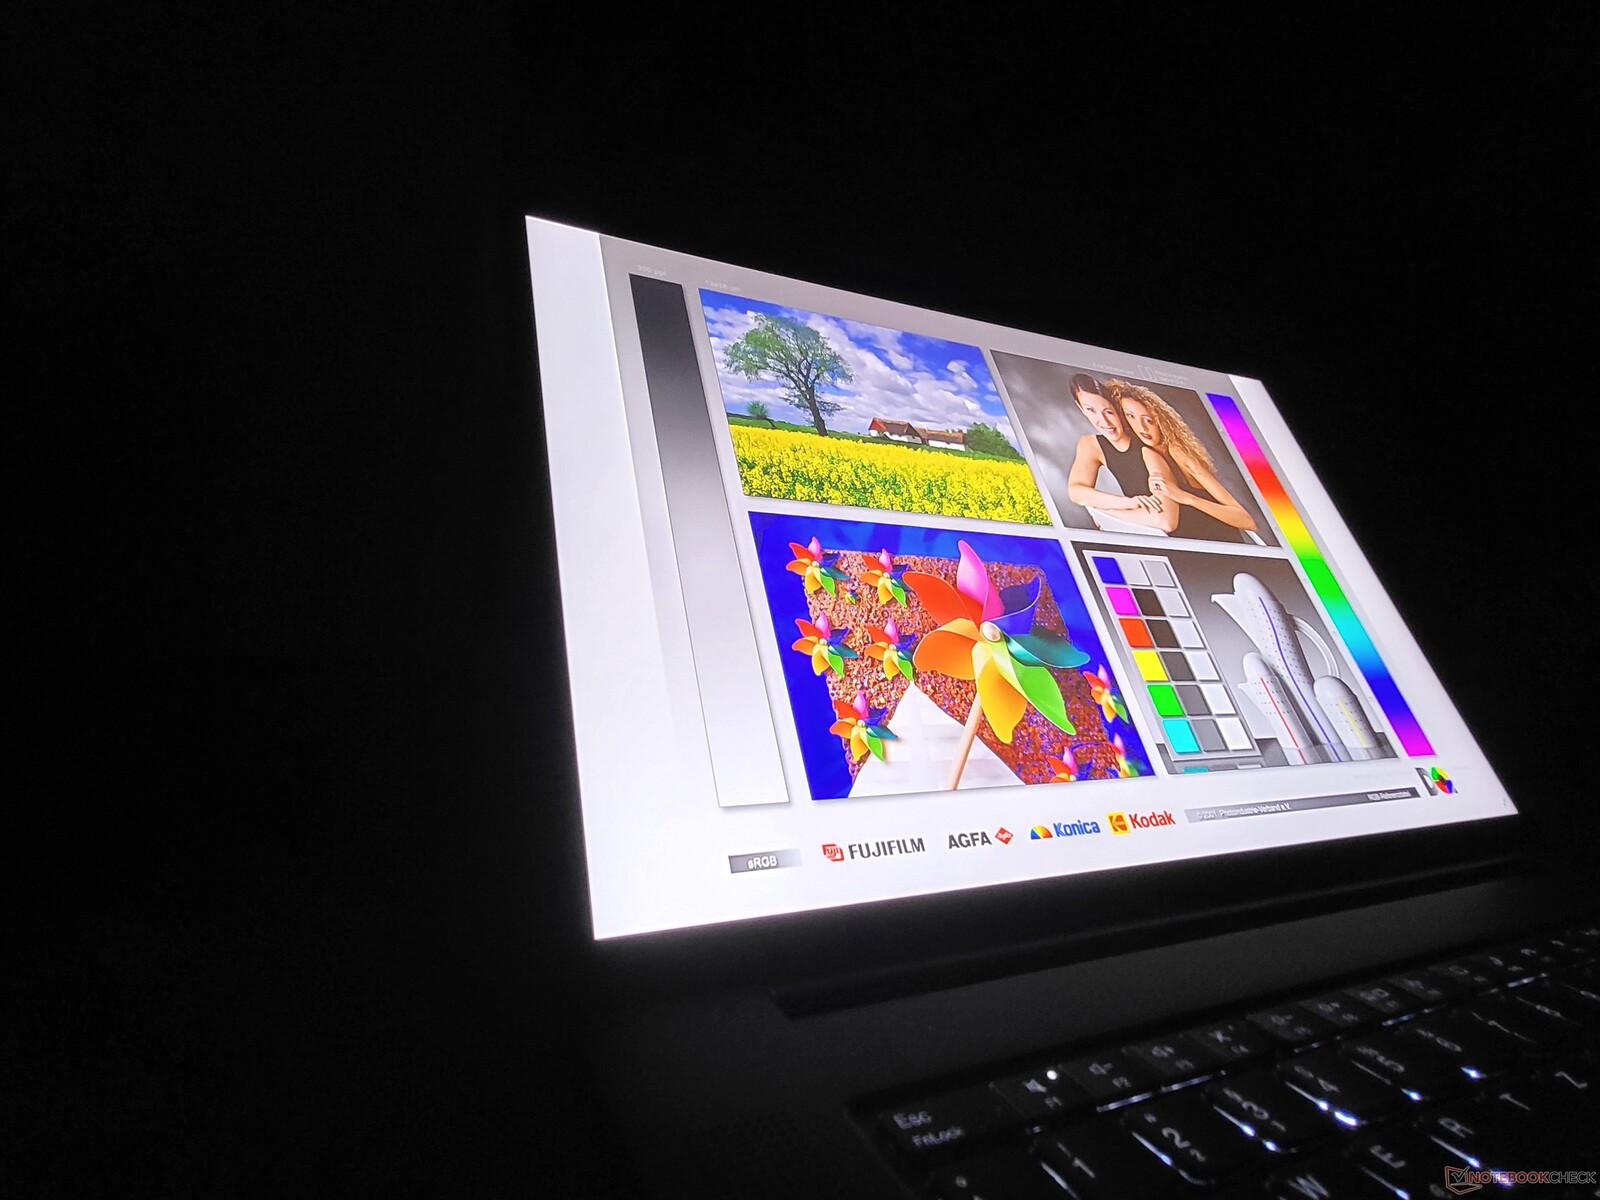
Il display opaco 4K UHD+ del Lenovo ThinkPad P1 G4 è eccellente

Il Lenovo ThinkPad P1 Gen 4 è disponibile con tre diversi display da 16 pollici in formato 16:10. L'opzione di base, un LCD WQXGA (2.560 x 1.600),che abbiamo già testato. La nostra unità di recensione include lo schermo opaco 4K UHD+/WQUXGA senza touch - la terza opzione è lo stesso display, in lucido, con touch e digitalizzatore Wacom.
Il valore di luminosità di 600 cd/m² dichiarato da Lenovo è superato dal pannello LG con una media di 610 cd/m². Nel campo di prova dei portatili premium nel formato da 15 a 16 pollici, lo schermo del ThinkPad P1 G4 di Lenovo è chiaramente il più luminoso.
I tempi di risposta non sono particolarmente buoni - l'opzione WQXGA è migliore sotto questo aspetto. La differenza è particolarmente evidente rispetto al display OLED del HP ZBook Studio 15 G8la variante OLED del ThinkPad P1 G3 purtroppo non è più disponibile nel ThinkPad P1 2021.
| |||||||||||||||||||||||||
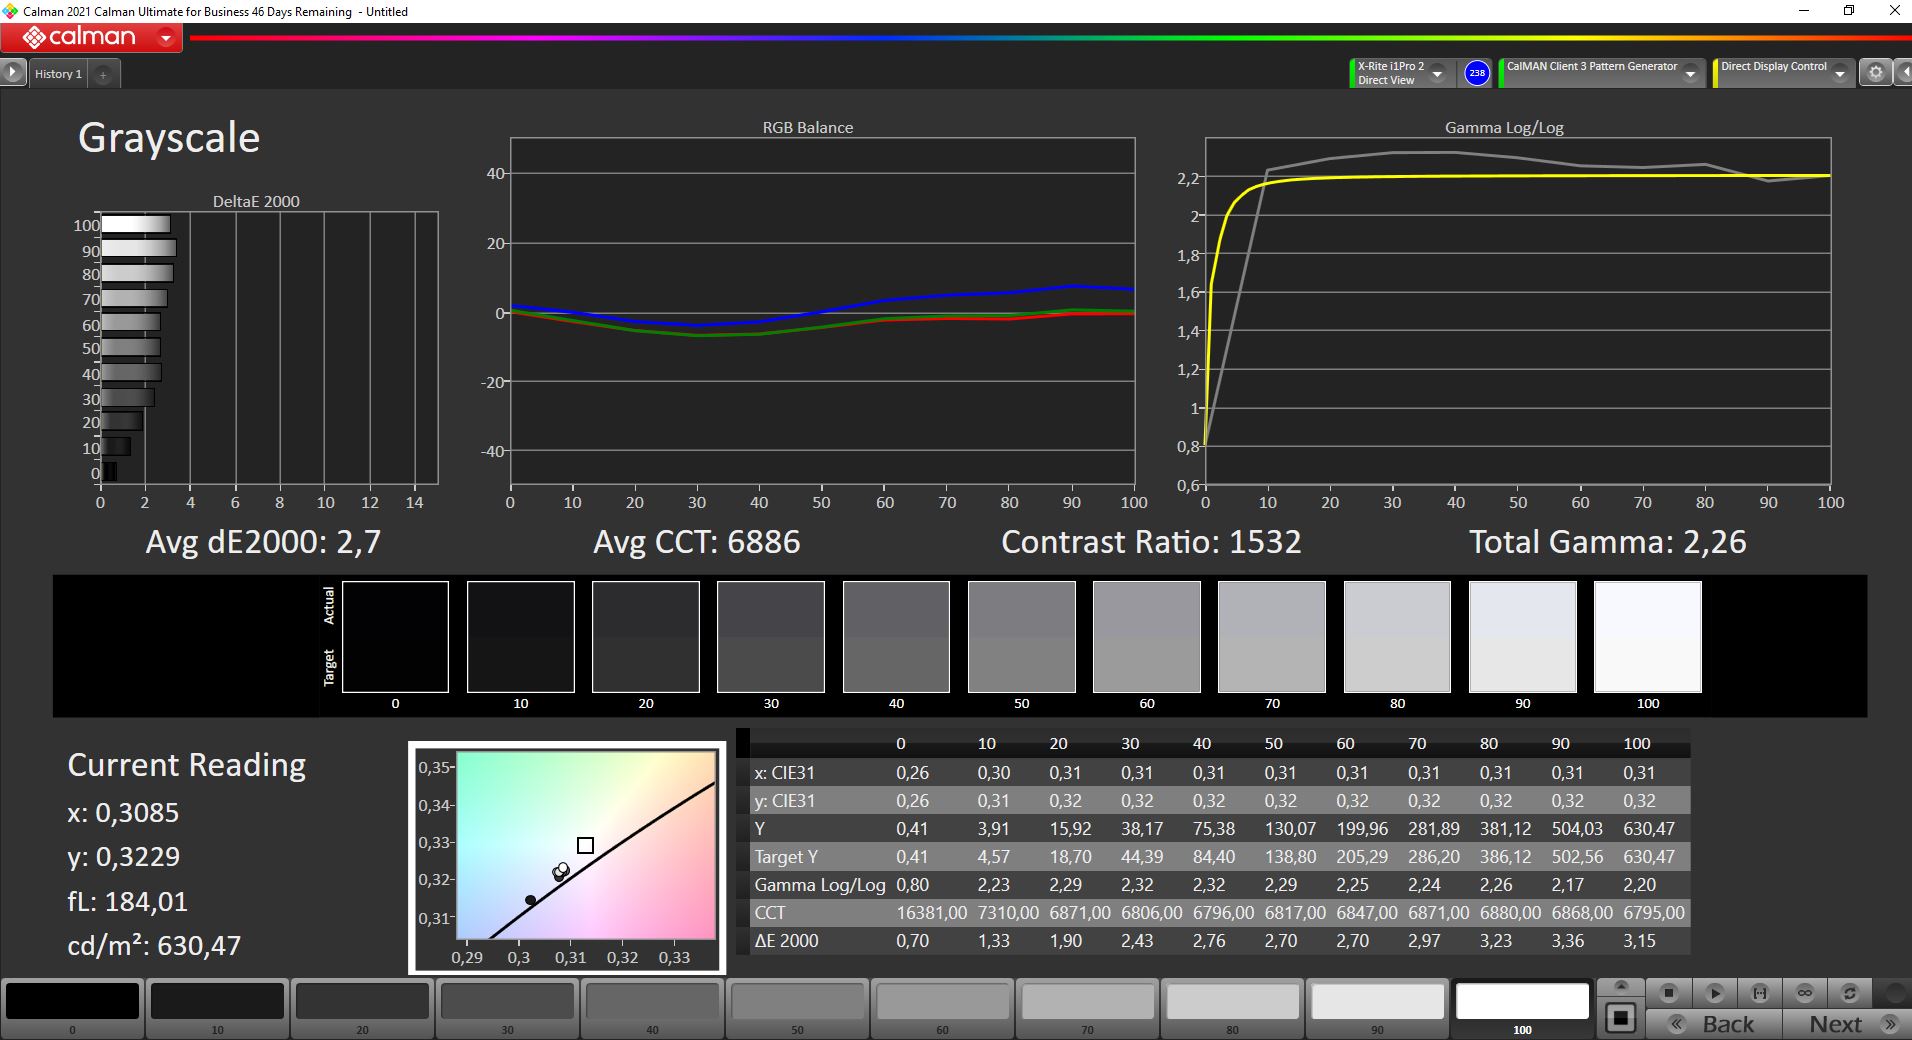
Distribuzione della luminosità: 90 %
Al centro con la batteria: 629 cd/m²
Contrasto: 1537:1 (Nero: 0.41 cd/m²)
ΔE ColorChecker Calman: 2.2 | ∀{0.5-29.43 Ø4.71}
calibrated: 1
ΔE Greyscale Calman: 2.7 | ∀{0.09-98 Ø4.96}
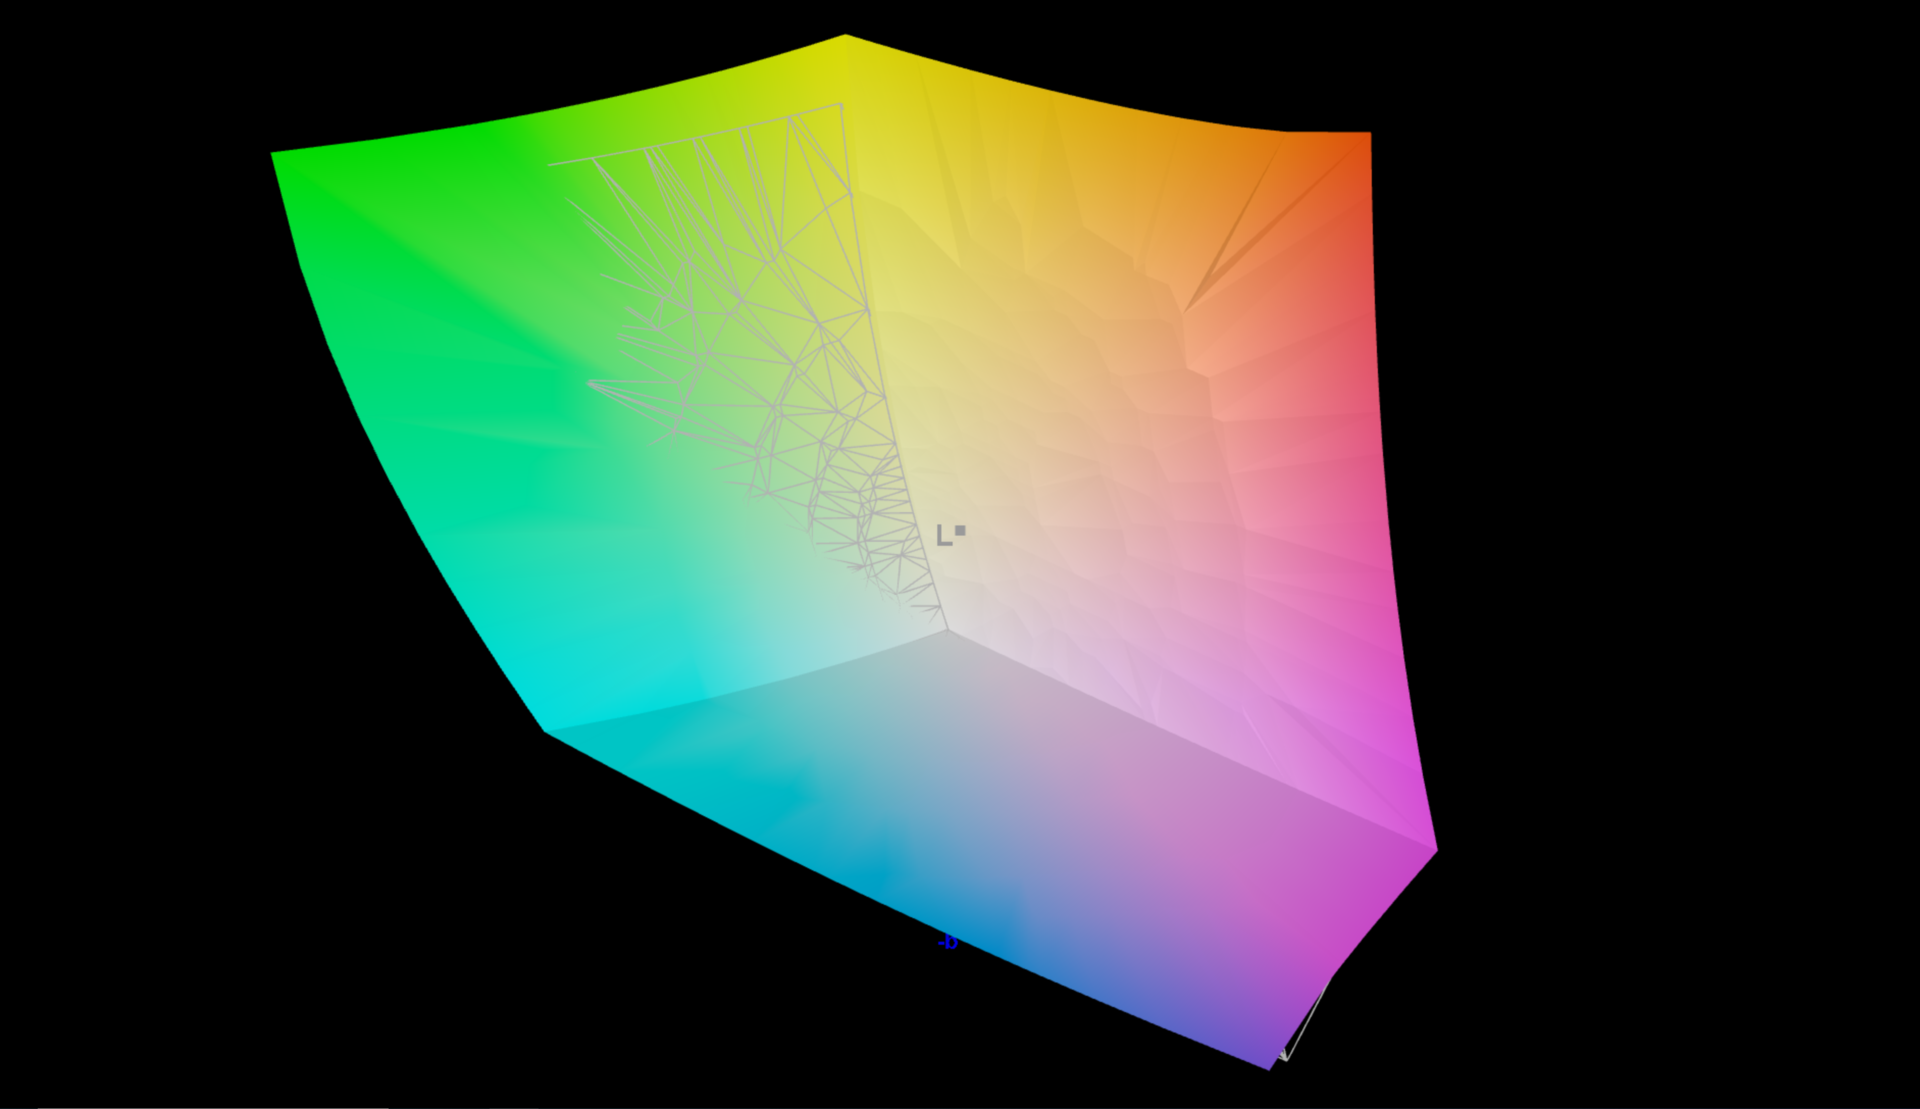
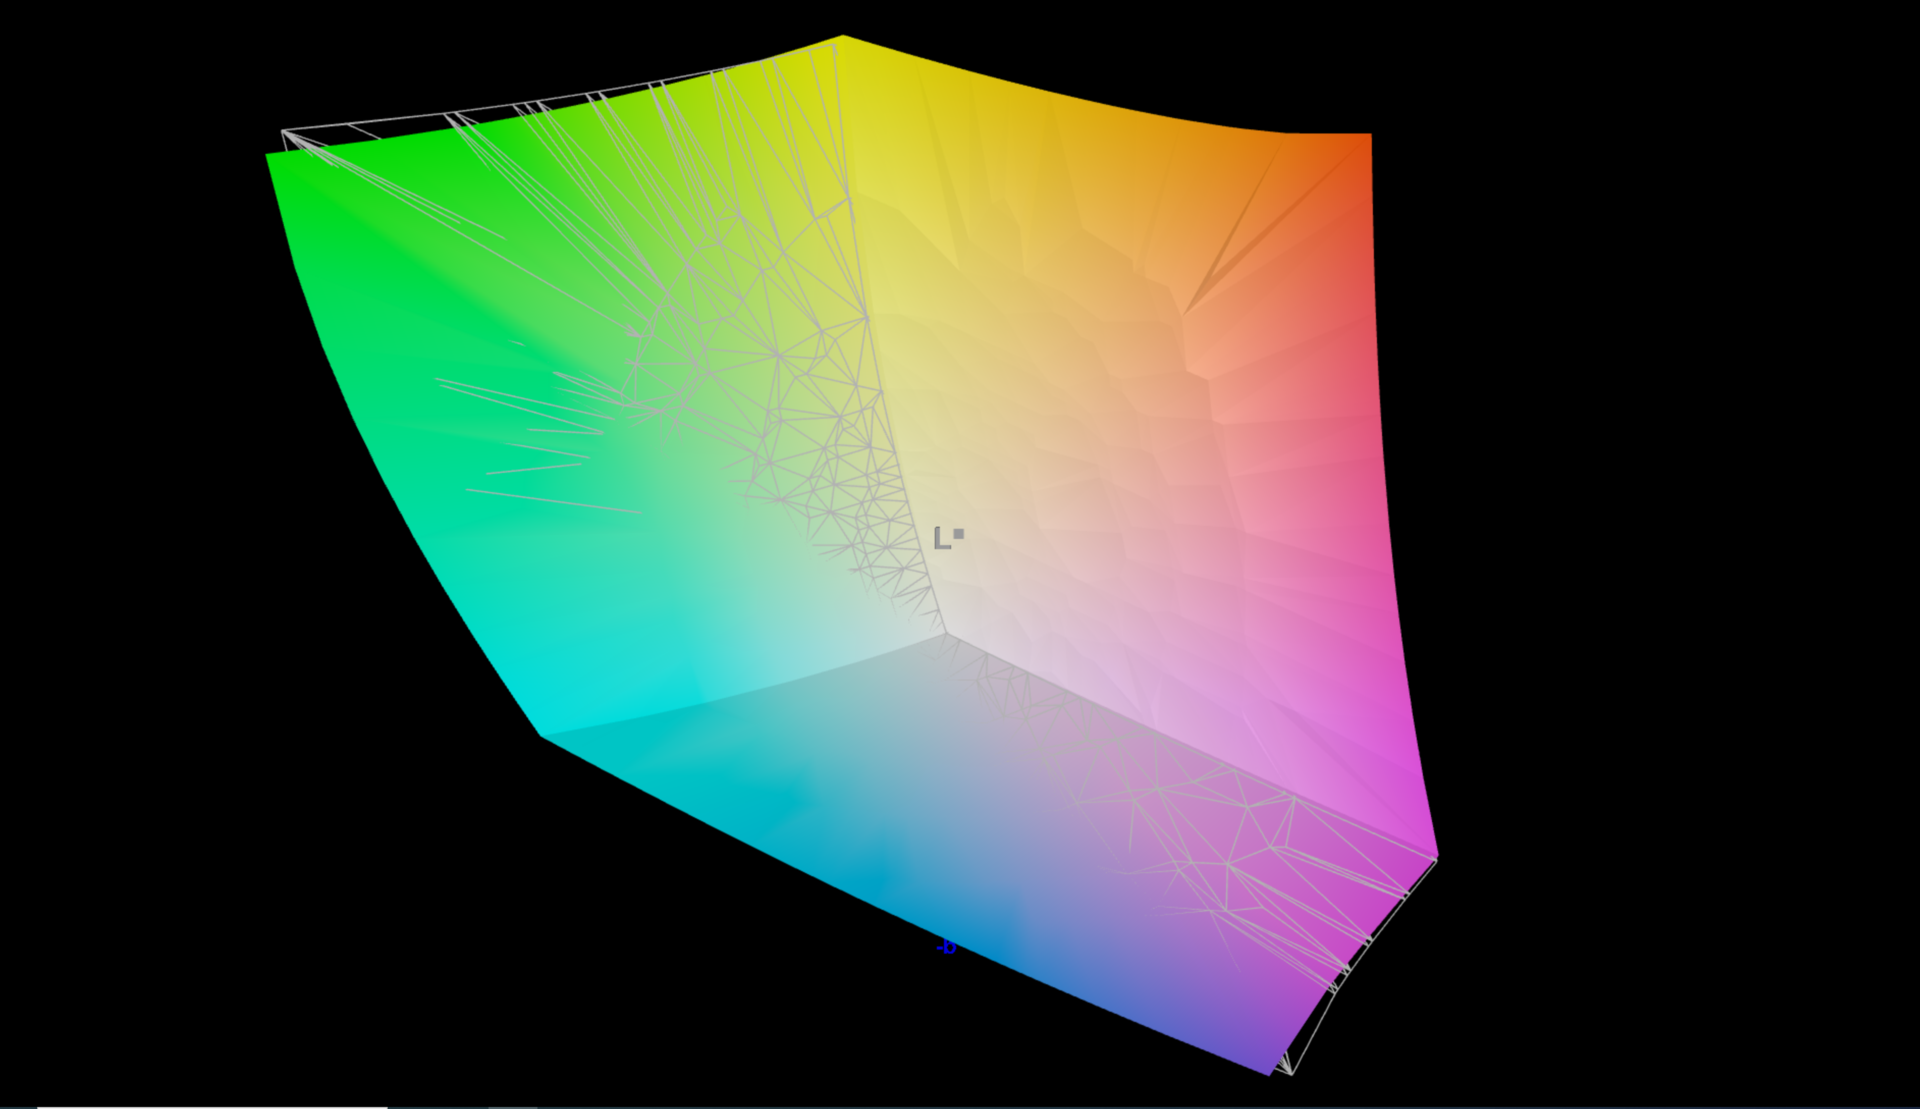
98.9% AdobeRGB 1998 (Argyll 3D)
99.4% sRGB (Argyll 3D)
85.7% Display P3 (Argyll 3D)
Gamma: 2.26
CCT: 6886 K
| Lenovo ThinkPad P1 G4-20Y4S0KS00 LP160UQ1-SPB1, IPS LED, 3840x2400, 16" | Lenovo ThinkPad P1 G4-20Y30017GE B160QAN02.M, IPS, 2560x1600, 16" | Dell Precision 5000 5560 Sharp LQ156R1, IPS, 3840x2400, 15.6" | Apple MacBook Pro 16 2019 i9 5500M APPA044, IPS, 3072x1920, 16" | HP ZBook Studio 15 G8 SDC4145, OLED, 3840x2160, 15.6" | Lenovo ThinkPad X1 Extreme Gen3-20TLS0UV00 N156HCE-GN1, IPS, 1920x1080, 15.6" | |
|---|---|---|---|---|---|---|
| Display | -10% | 4% | 5% | -25% | ||
| Display P3 Coverage (%) | 85.7 | 77.3 -10% | 94.9 11% | 99.9 17% | 61 -29% | |
| sRGB Coverage (%) | 99.4 | 99.9 1% | 100 1% | 100 1% | 89.9 -10% | |
| AdobeRGB 1998 Coverage (%) | 98.9 | 78.1 -21% | 100 1% | 95.3 -4% | 62.2 -37% | |
| Response Times | 21% | 9% | -4% | 94% | 34% | |
| Response Time Grey 50% / Grey 80% * (ms) | 55.2 ? | 40.8 ? 26% | 47.2 ? 14% | 52.4 ? 5% | 2.4 ? 96% | 33.6 ? 39% |
| Response Time Black / White * (ms) | 31.2 ? | 26.4 ? 15% | 30.4 ? 3% | 34.9 ? -12% | 2.4 ? 92% | 22.4 ? 28% |
| PWM Frequency (Hz) | 131700 | 240.4 ? | 26040 ? | |||
| Screen | -17% | -28% | -1% | -67% | -6% | |
| Brightness middle (cd/m²) | 630 | 420 -33% | 501.5 -20% | 519 -18% | 379.6 -40% | 518 -18% |
| Brightness (cd/m²) | 622 | 401 -36% | 467 -25% | 477 -23% | 380 -39% | 513 -18% |
| Brightness Distribution (%) | 90 | 90 0% | 83 -8% | 86 -4% | 95 6% | 88 -2% |
| Black Level * (cd/m²) | 0.41 | 0.3 27% | 0.44 -7% | 0.39 5% | 0.38 7% | |
| Contrast (:1) | 1537 | 1400 -9% | 1140 -26% | 1331 -13% | 1363 -11% | |
| Colorchecker dE 2000 * | 2.2 | 2.5 -14% | 4.73 -115% | 2.28 -4% | 5.15 -134% | 2.1 5% |
| Colorchecker dE 2000 max. * | 5 | 4.9 2% | 8.45 -69% | 6.54 -31% | 7.79 -56% | 4.5 10% |
| Colorchecker dE 2000 calibrated * | 1 | 1.6 -60% | 0.51 49% | 0.86 14% | 3.1 -210% | 1.3 -30% |
| Greyscale dE 2000 * | 2.7 | 3.4 -26% | 3.6 -33% | 0.9 67% | 2.6 4% | 2.7 -0% |
| Gamma | 2.26 97% | 2.24 98% | 2.08 106% | 2145 0% | 1.99 111% | 2.35 94% |
| CCT | 6886 94% | 6479 100% | 6447 101% | 6572 99% | 6166 105% | 7042 92% |
| Color Space (Percent of AdobeRGB 1998) (%) | 78 | 57.7 | ||||
| Color Space (Percent of sRGB) (%) | 90.4 | |||||
| Media totale (Programma / Settaggio) | -2% /
-10% | -5% /
-16% | -3% /
-1% | 11% /
-22% | 1% /
-5% |
* ... Meglio usare valori piccoli
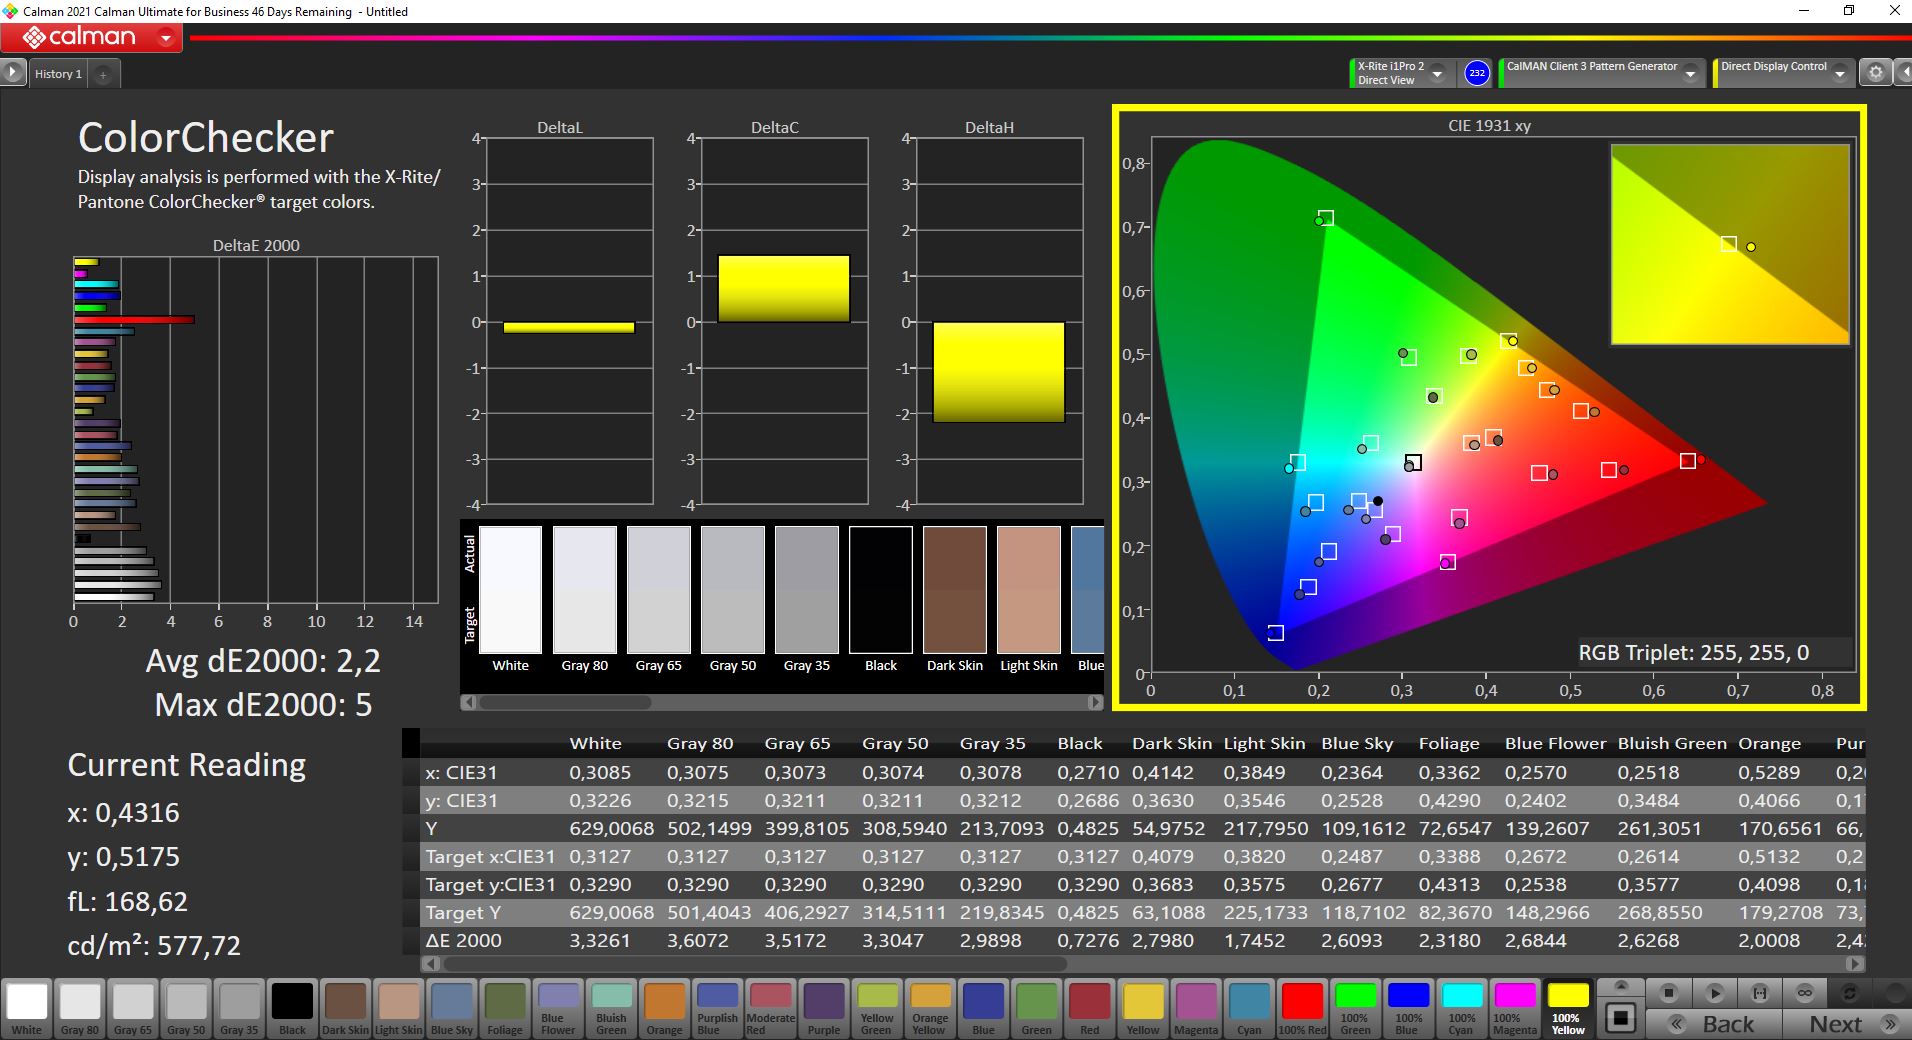
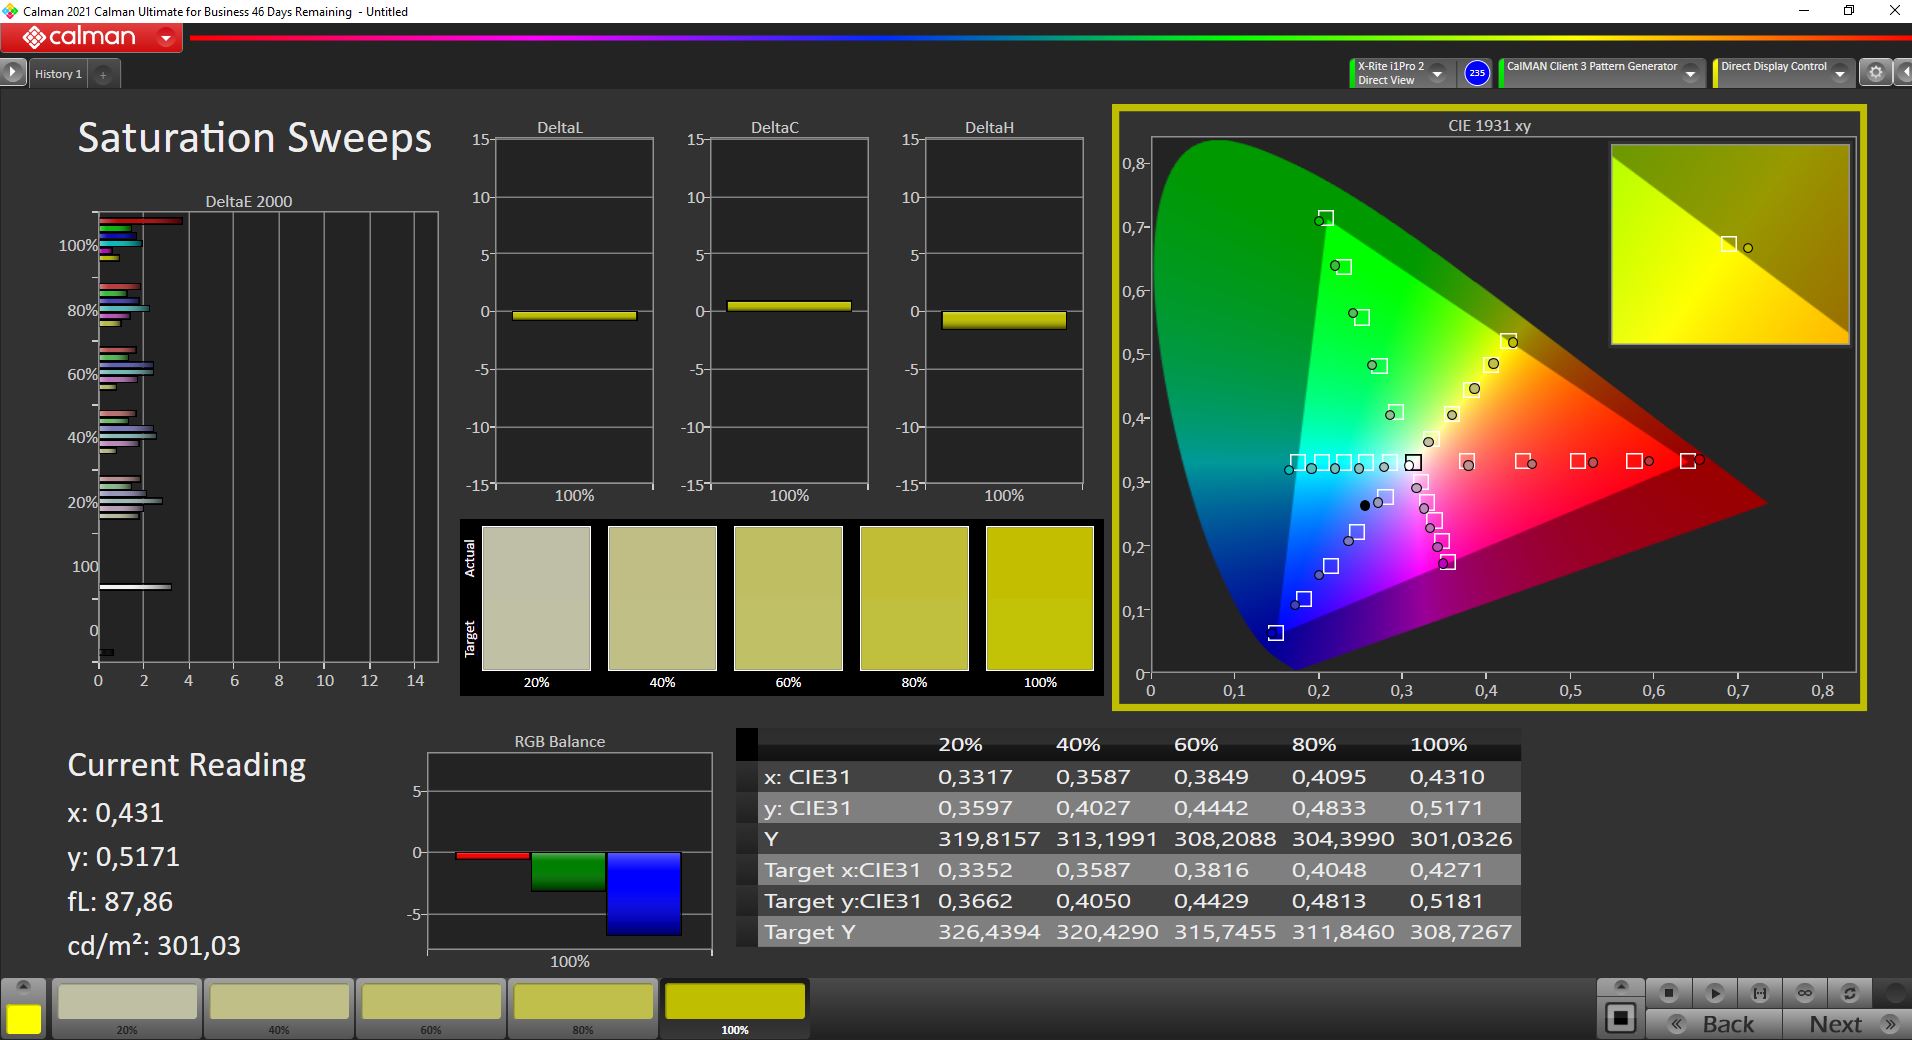
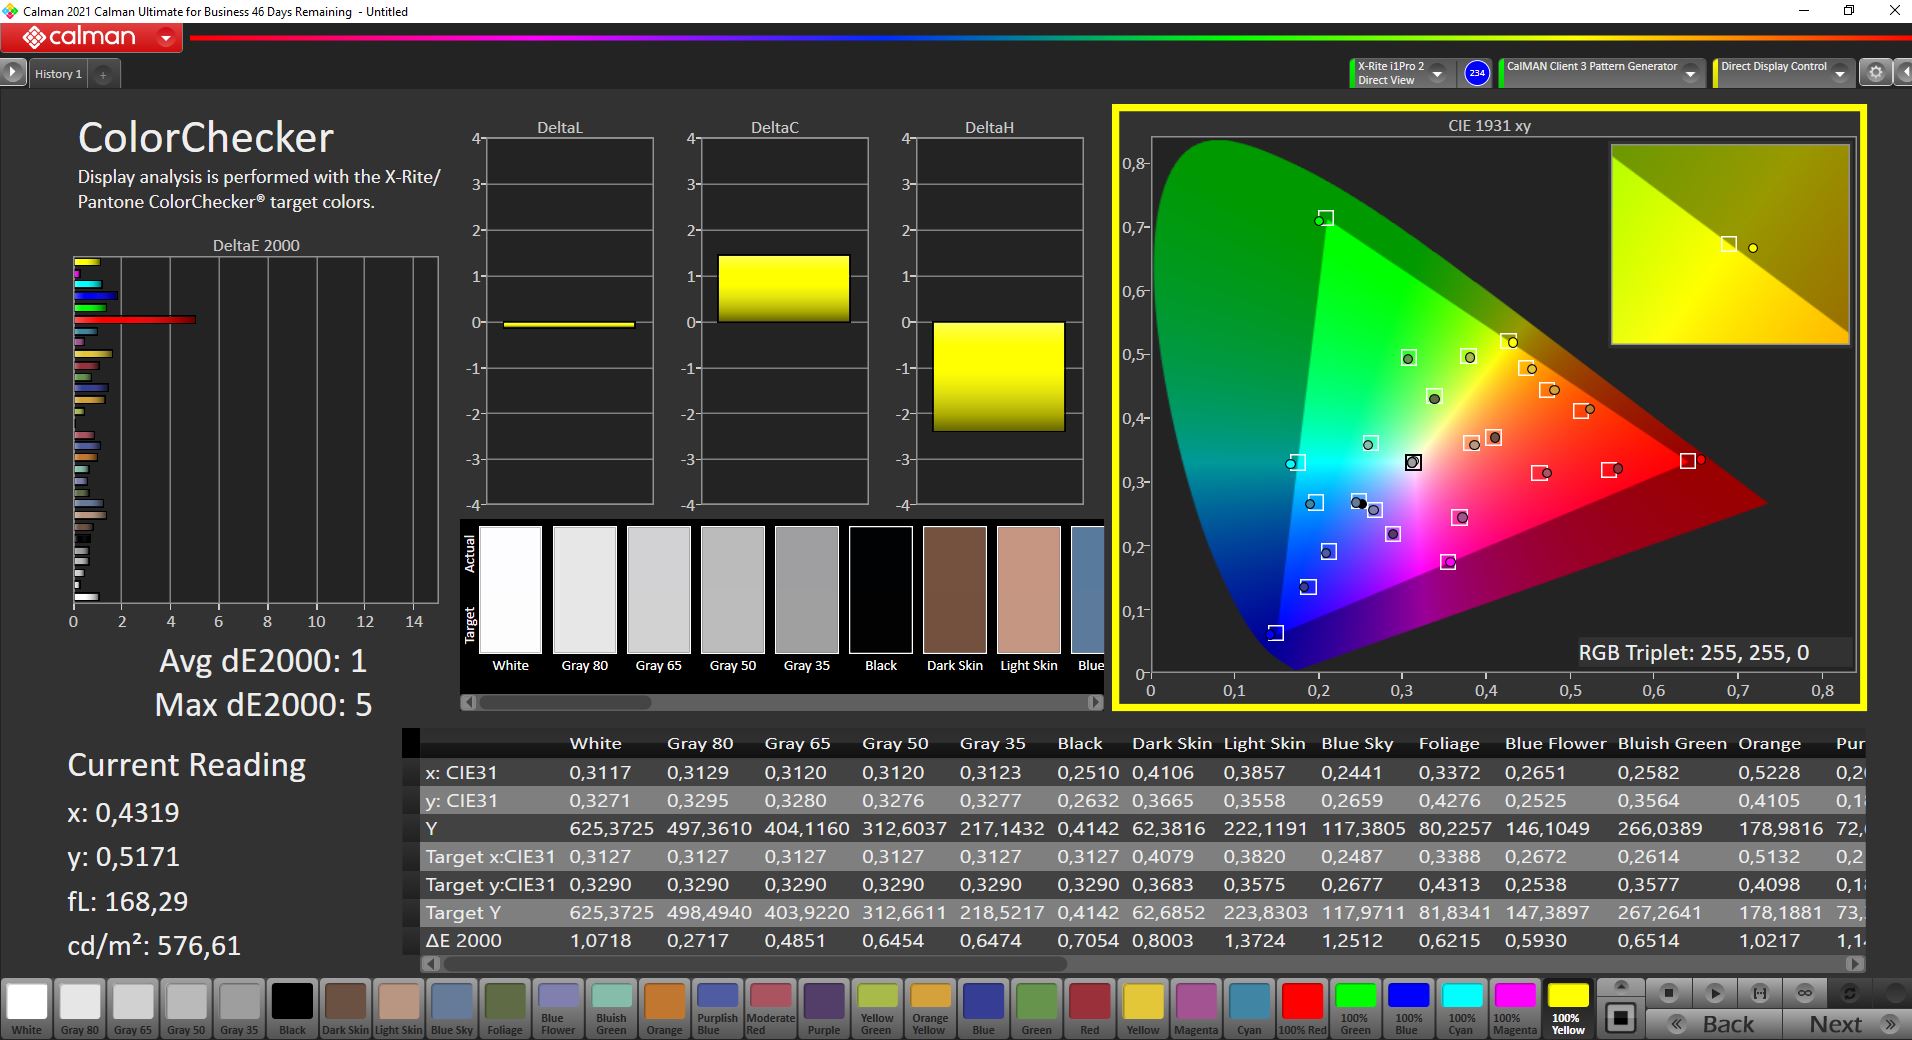
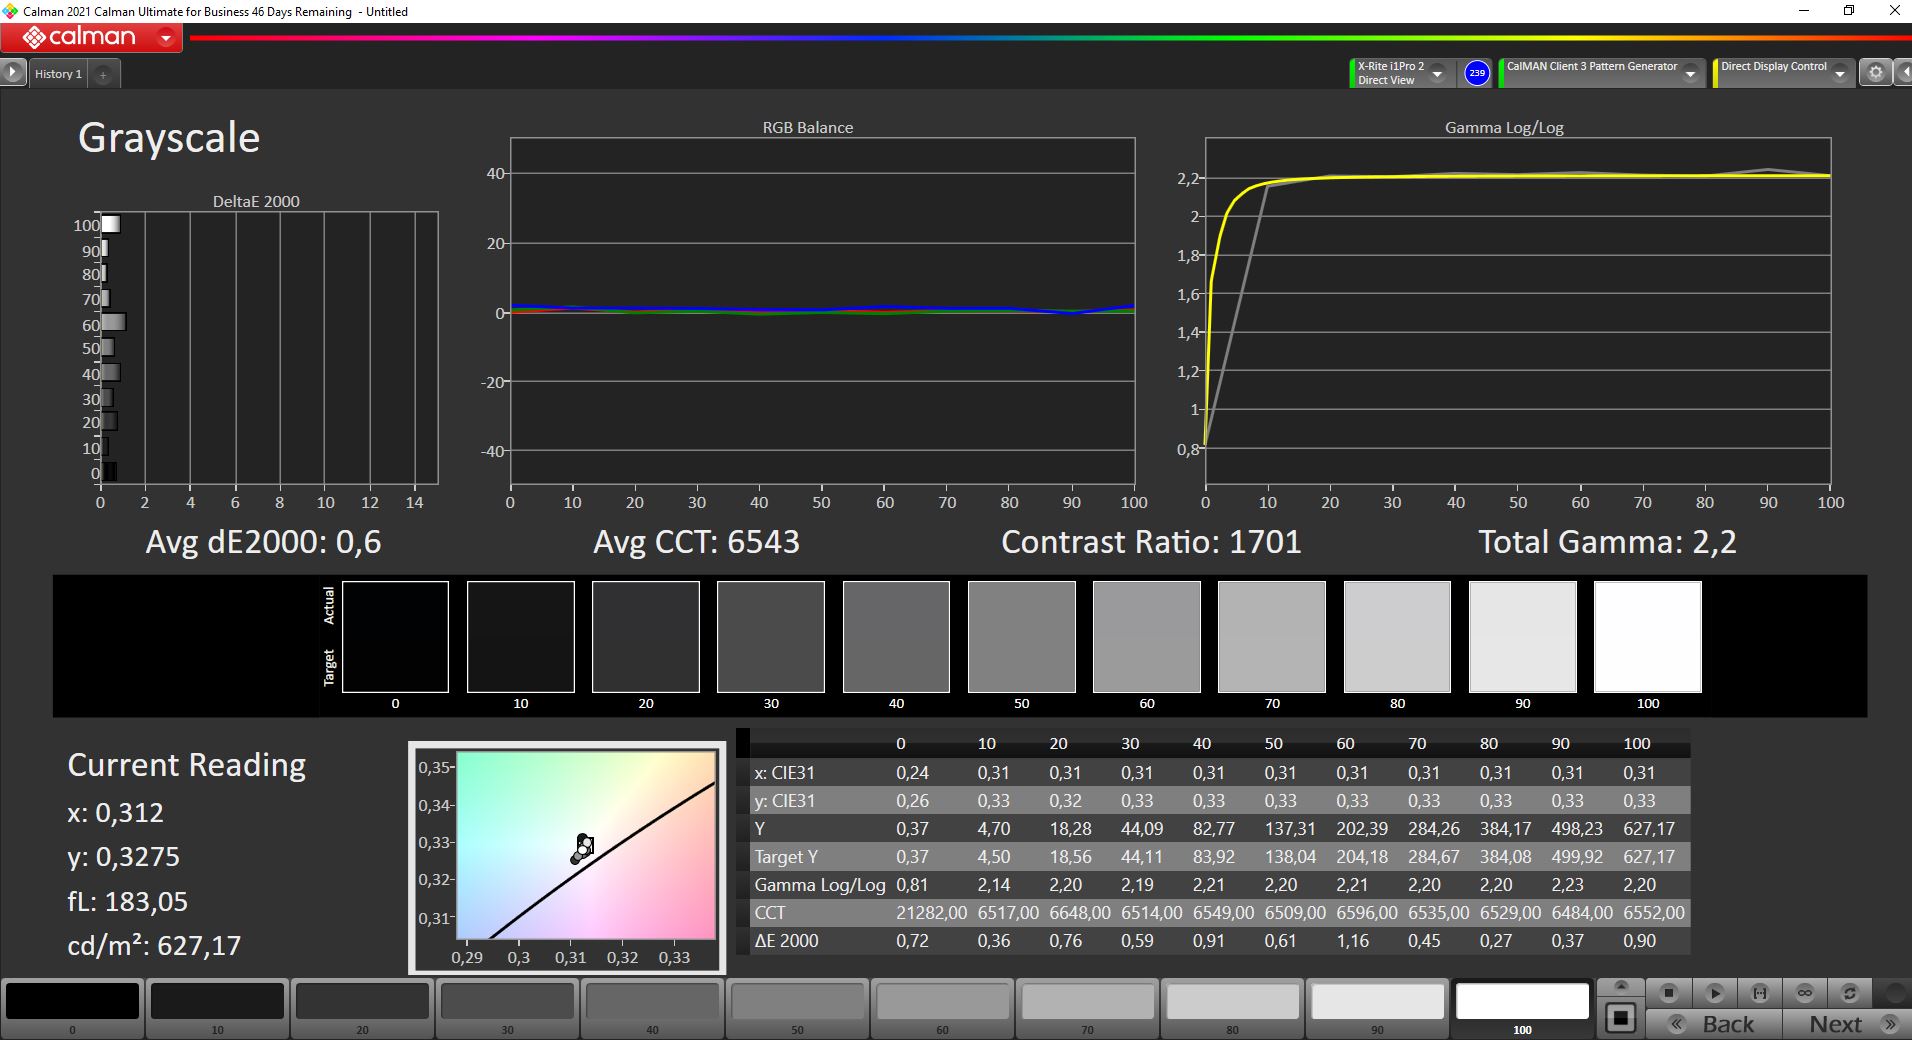

Lenovo pubblicizza lo schermo WQUXGA qui installato con una calibrazione di fabbrica. In effetti, misuriamo valori abbastanza buoni ex-factory con Calman e X-Rite i1Pro 2. Un valore DeltaE di 2,2 per i valori di colore significa che le deviazioni sono minori. Tuttavia, c'è ancora margine di miglioramento. Dopo la calibrazione con l'X-Rite i1Profiler, il DeltaE è sceso a 1,0. Come sempre, forniamo il profilo colore corrispondente per il download gratuito.
Il valore del nero di 0,41 cd/m² non è particolarmente eccezionale per un display IPS LED, ma l'alta luminosità assicura comunque un buon contrasto di 1537:1. Insieme all'elevata copertura dello spazio colore del 98,9% dell'ampio spazio colore AdobeRGB (Lenovo pubblicizza il 100% di AdobeRGB), la qualità dell'immagine del Lenovo ThinkPad P1 Gen 4 è eccellente, e il pannello a 8-bit è adatto all'editing delle immagini
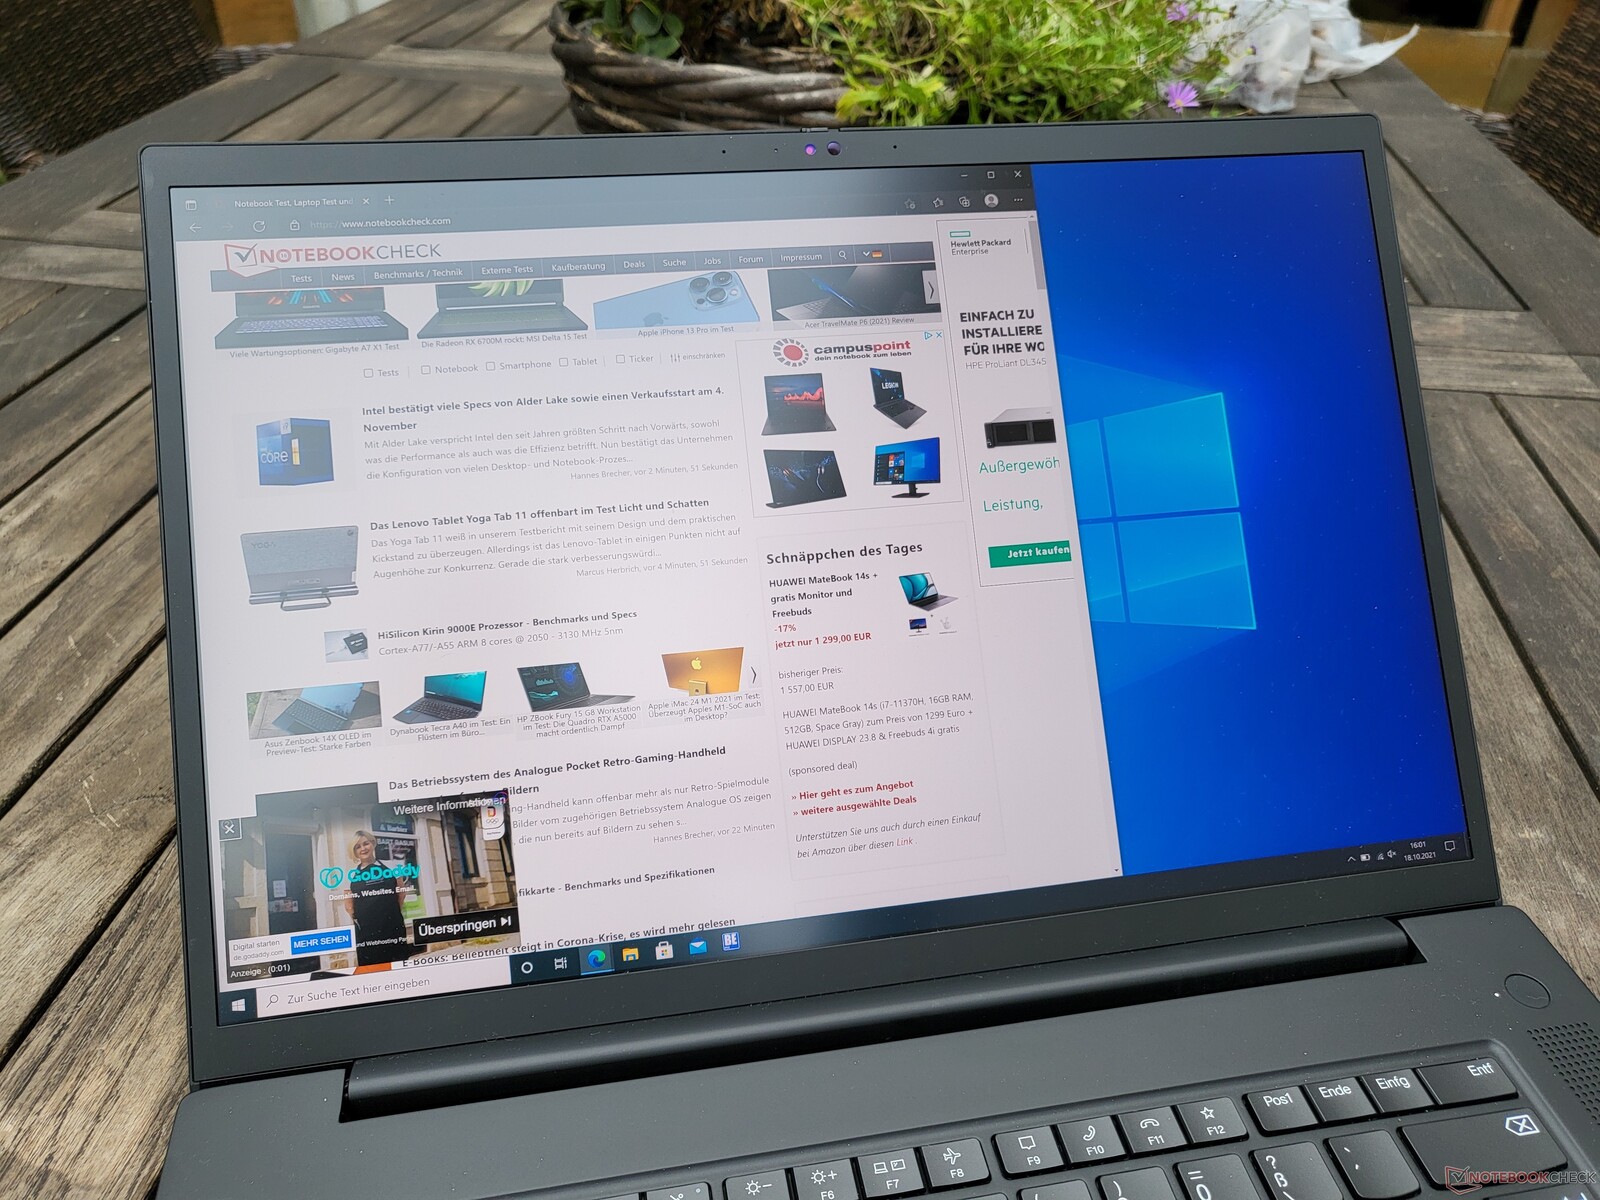
Il Lenovo ThinkPad P1 2021 domina facilmente l'uso all'aperto. La superficie opaca aiuta il luminoso display 4K UHD+ a superare facilmente la luce del giorno nelle giornate nuvolose. Tuttavia, la luce diretta del sole può essere una sfida anche a 600 cd/m²
Tempi di risposta del Display
| ↔ Tempi di risposta dal Nero al Bianco | ||
|---|---|---|
| 31.2 ms ... aumenta ↗ e diminuisce ↘ combinato | ↗ 16.4 ms Incremento | 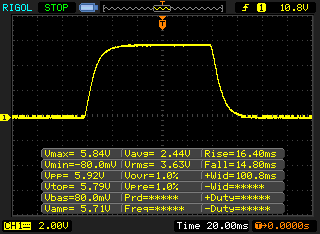 |
| ↘ 14.8 ms Calo | ||
| Lo schermo mostra tempi di risposta lenti nei nostri tests e sarà insoddisfacente per i gamers. In confronto, tutti i dispositivi di test variano da 0.1 (minimo) a 240 (massimo) ms. » 84 % di tutti i dispositivi è migliore. Questo significa che i tempi di risposta rilevati sono peggiori rispetto alla media di tutti i dispositivi testati (19.8 ms). | ||
| ↔ Tempo di risposta dal 50% Grigio all'80% Grigio | ||
| 55.2 ms ... aumenta ↗ e diminuisce ↘ combinato | ↗ 26.8 ms Incremento | 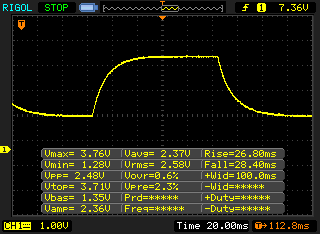 |
| ↘ 28.4 ms Calo | ||
| Lo schermo mostra tempi di risposta lenti nei nostri tests e sarà insoddisfacente per i gamers. In confronto, tutti i dispositivi di test variano da 0.165 (minimo) a 636 (massimo) ms. » 92 % di tutti i dispositivi è migliore. Questo significa che i tempi di risposta rilevati sono peggiori rispetto alla media di tutti i dispositivi testati (31 ms). | ||
Sfarfallio dello schermo / PWM (Pulse-Width Modulation)
| flickering dello schermo / PWM non rilevato |  | ||
In confronto: 52 % di tutti i dispositivi testati non utilizza PWM per ridurre la luminosita' del display. Se è rilevato PWM, una media di 7757 (minimo: 5 - massimo: 343500) Hz è stata rilevata. | |||
La qualità della tecnologia IPS si riflette nell'eccellente stabilità dell'angolo di visione, che è anche senza difetti nel ThinkPad P1 2021 di Lenovo.
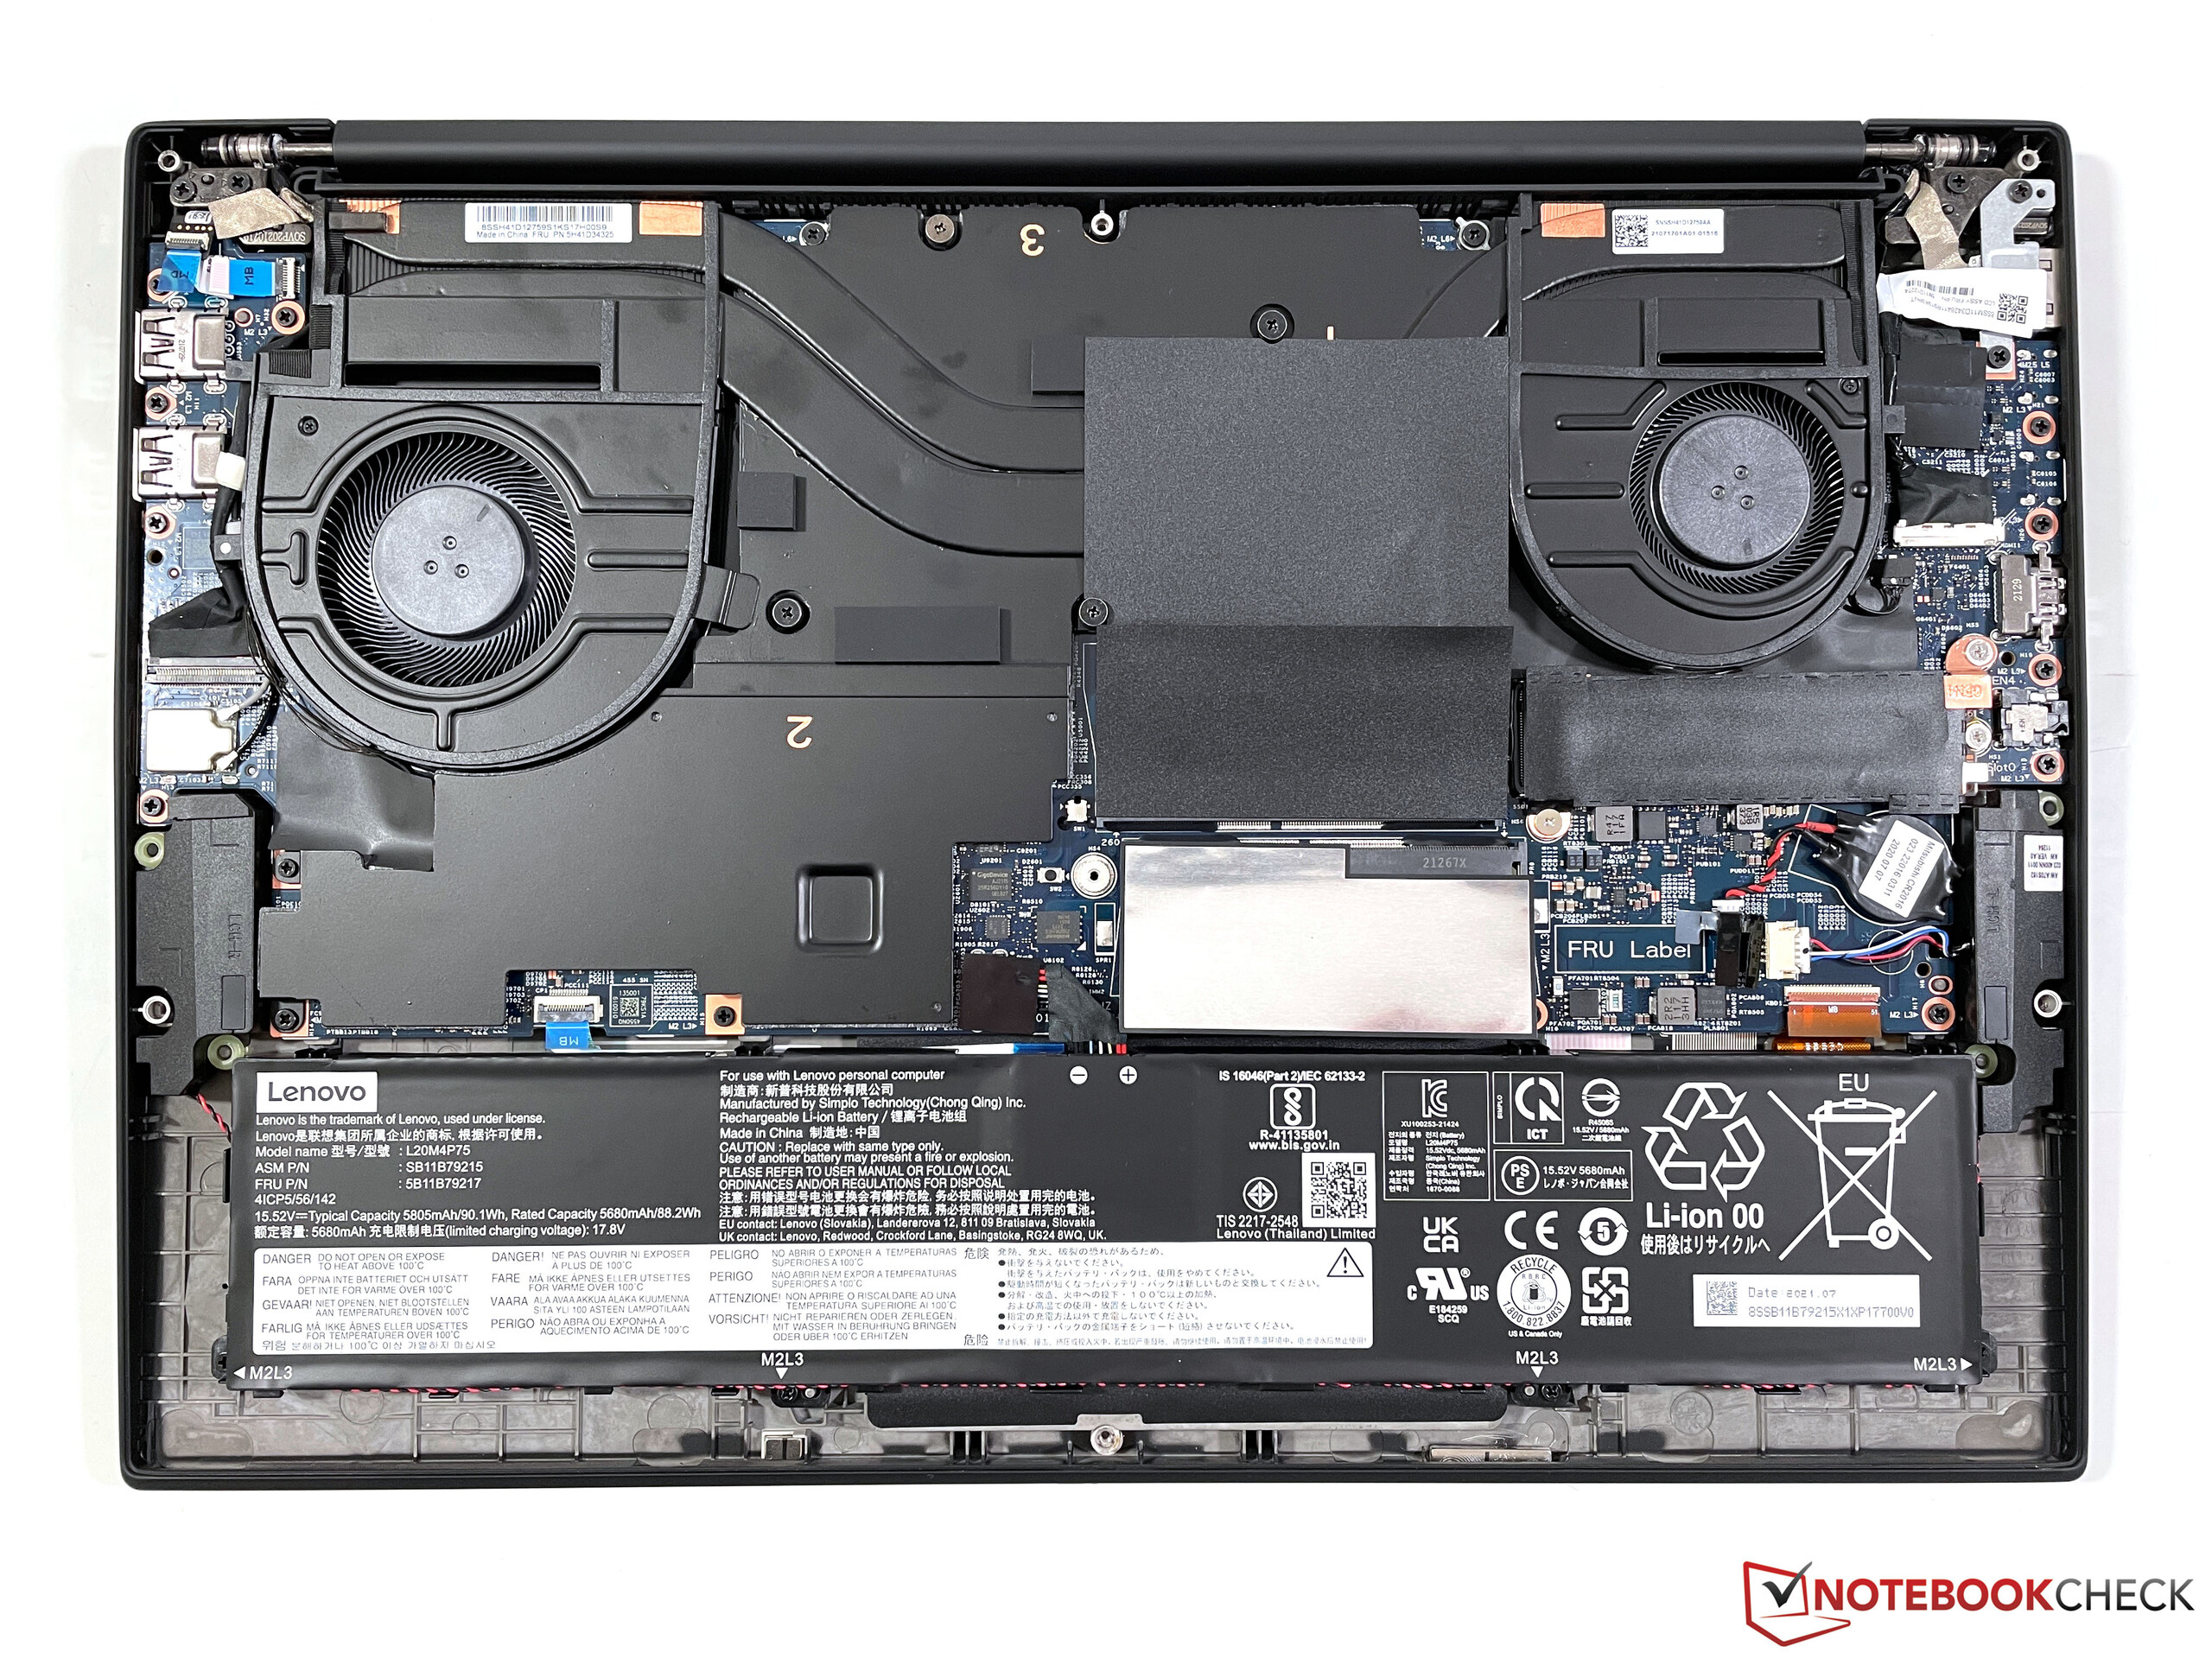
Prestazioni delle workstation Lenovo significativamente migliori con VaporChamber
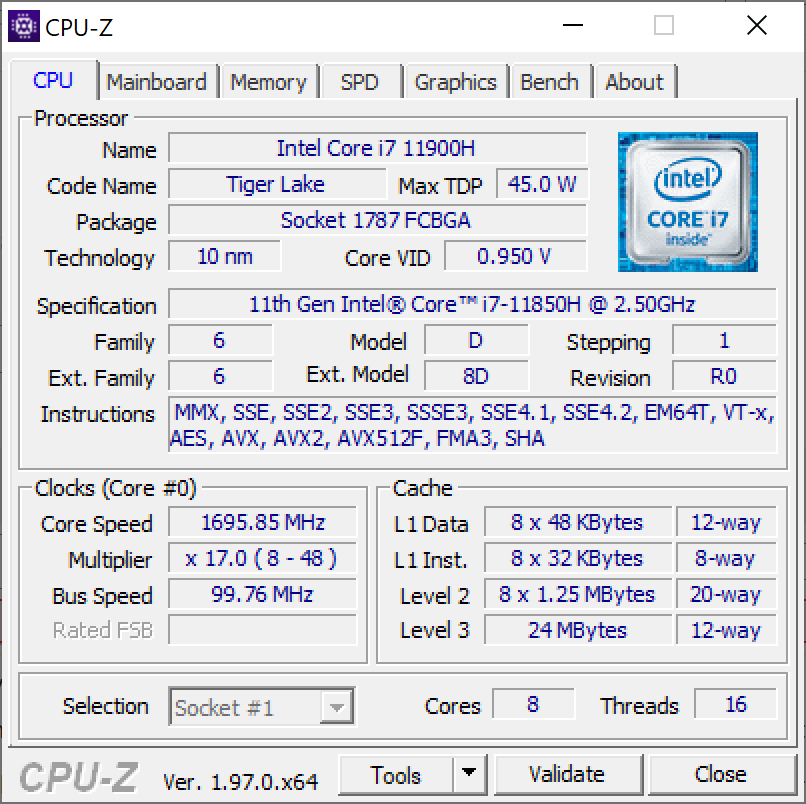
Lenovo si affida agli ultimi e più potenti componenti che Intel e Nvidia offrono attualmente. Nel caso di Intel, questo significa processori della serie Tiger-Lake H. Le tre CPU Core (i7-11800H, i7-11850H, i9-11950H) hanno otto core, lo Xeon W-11855M è un sei core.
La selezione di chip grafici disponibili è molto più grande. Come opzione di base assoluta, il P1 G4 è disponibile senza una GPU dedicata, cioè solo con la grafica integrata Intel. Ci sono sette chip grafici dedicati;Nvidia T1200, RTX A2000, RTX A3000, RTX A4000, RTX 5000 e per la prima volta nel P1 GeForce RTX 3070 e RTX 3080.
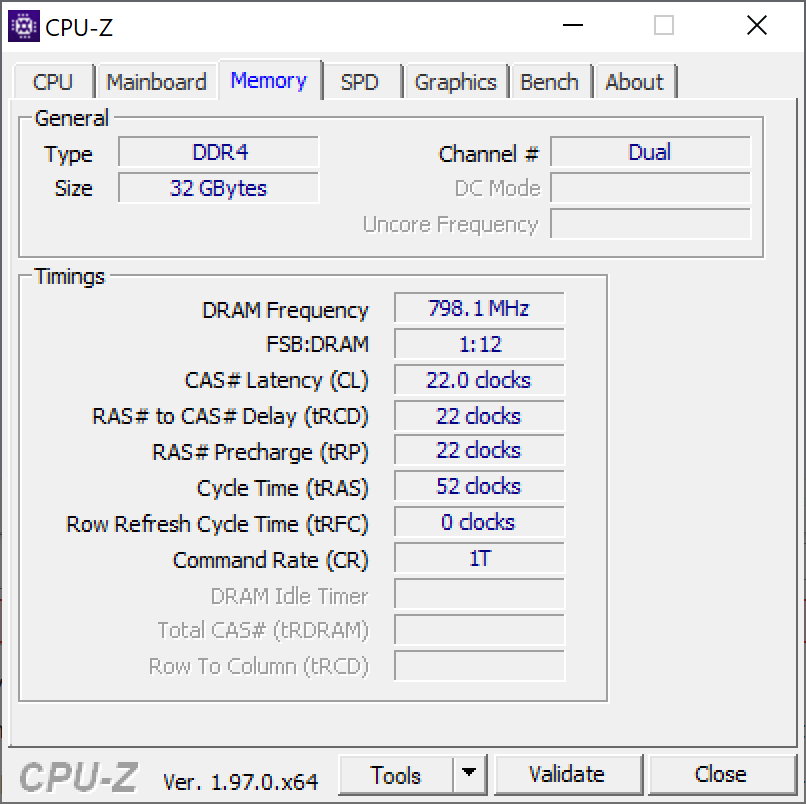
In ogni caso, il Lenovo ThinkPad P1 Gen 4 ha due slot SO-DIMM per un massimo di 64 GB di memoria. Questa può anche essere RAM ECC quando il portatile ThinkPad è configurato con Xeon. A seconda della variante del modello, il portatile Lenovo ha una o due porte M.2 2280 - le varianti di modello con GPU Intel, T1200 o RTX A2000 ne hanno due, tutti gli altri hanno solo uno slot di memoria di massa
Processore
Il Intel Core i7-11850H è un processore attuale della serie "Tiger-Lake" con otto core e 16 thread. Nominalmente, il TDP di questa CPU è di 45 watt; tuttavia, questo consumo non è sufficiente per raggiungere la frequenza di clock massima di 4,8 GHz su tutti i core. Con la nostra Elenco CPU il processore Intel può essere confrontato con altre CPU.
In realtà, l'i7-11850H è praticamente veloce come l'i7-11800H, la differenza è dovuta principalmente al supporto vPro del 11850H - ma nel ThinkPad P1 G4, la differenza tra i due è grande. La ragione non è il processore, ma il sistema di raffreddamento: Il modello con GeForce RTX 3070 testato qui contiene un raffreddamento a camera di vapore. Pertanto, il processore può consumare permanentemente circa 60 watts sotto il puro carico della CPU, mentre la CPU del meno equipaggiato ThinkPad P1 Gen 4 con Nvidia T1200 era limitata a circa 40 watt. Nel test Cinebench R23 multi-core, il Vapor-Chamber P1 è il 27% più veloce del modello più economico, è più o meno alla pari con l HP ZBook Studio 15 G8.
Non abbiamo potuto determinare una limitazione delle prestazioni della CPU in modalità batteria
Cinebench R15 Multi Endurance test
Cinebench R23: Multi Core | Single Core
Cinebench R20: CPU (Multi Core) | CPU (Single Core)
Cinebench R15: CPU Multi 64Bit | CPU Single 64Bit
Blender: v2.79 BMW27 CPU
7-Zip 18.03: 7z b 4 | 7z b 4 -mmt1
Geekbench 5.5: Multi-Core | Single-Core
HWBOT x265 Benchmark v2.2: 4k Preset
LibreOffice : 20 Documents To PDF
R Benchmark 2.5: Overall mean
| CPU Performance rating | |
| Media della classe Workstation | |
| Lenovo ThinkPad P1 G4-20Y4S0KS00 | |
| HP ZBook Studio 15 G8 | |
| Media Intel Core i7-11850H | |
| Huawei MateBook 16 R7 5800H | |
| Apple MacBook Pro 13 Late 2020 M1 Entry (8 / 256 GB) -6! | |
| Dell Precision 5000 5560 -2! | |
| Lenovo ThinkPad P1 G4-20Y30017GE | |
| Apple MacBook Pro 16 2019 i9 5500M | |
| Lenovo ThinkPad X1 Extreme Gen3-20TLS0UV00 | |
| Cinebench R23 / Multi Core | |
| Media della classe Workstation (14621 - 38520, n=23, ultimi 2 anni) | |
| HP ZBook Studio 15 G8 | |
| Lenovo ThinkPad P1 G4-20Y4S0KS00 | |
| Media Intel Core i7-11850H (9779 - 11935, n=2) | |
| Huawei MateBook 16 R7 5800H | |
| Dell Precision 5000 5560 | |
| Lenovo ThinkPad P1 G4-20Y30017GE | |
| Apple MacBook Pro 16 2019 i9 5500M | |
| Apple MacBook Pro 16 2019 i9 5500M | |
| Apple MacBook Pro 13 Late 2020 M1 Entry (8 / 256 GB) | |
| Lenovo ThinkPad X1 Extreme Gen3-20TLS0UV00 | |
| Cinebench R23 / Single Core | |
| Media della classe Workstation (1712 - 2228, n=23, ultimi 2 anni) | |
| HP ZBook Studio 15 G8 | |
| Lenovo ThinkPad P1 G4-20Y4S0KS00 | |
| Media Intel Core i7-11850H (1513 - 1552, n=2) | |
| Apple MacBook Pro 13 Late 2020 M1 Entry (8 / 256 GB) | |
| Dell Precision 5000 5560 | |
| Lenovo ThinkPad P1 G4-20Y30017GE | |
| Huawei MateBook 16 R7 5800H | |
| Lenovo ThinkPad X1 Extreme Gen3-20TLS0UV00 | |
| Apple MacBook Pro 16 2019 i9 5500M | |
| Cinebench R20 / CPU (Multi Core) | |
| Media della classe Workstation (5760 - 15043, n=23, ultimi 2 anni) | |
| Lenovo ThinkPad P1 G4-20Y4S0KS00 | |
| HP ZBook Studio 15 G8 | |
| Media Intel Core i7-11850H (3826 - 4663, n=2) | |
| Huawei MateBook 16 R7 5800H | |
| Dell Precision 5000 5560 | |
| Lenovo ThinkPad P1 G4-20Y30017GE | |
| Apple MacBook Pro 16 2019 i9 5500M | |
| Apple MacBook Pro 16 2019 i9 5500M | |
| Lenovo ThinkPad X1 Extreme Gen3-20TLS0UV00 | |
| Apple MacBook Pro 13 Late 2020 M1 Entry (8 / 256 GB) | |
| Cinebench R20 / CPU (Single Core) | |
| Media della classe Workstation (671 - 857, n=23, ultimi 2 anni) | |
| HP ZBook Studio 15 G8 | |
| Lenovo ThinkPad P1 G4-20Y4S0KS00 | |
| Media Intel Core i7-11850H (583 - 607, n=2) | |
| Dell Precision 5000 5560 | |
| Lenovo ThinkPad P1 G4-20Y30017GE | |
| Huawei MateBook 16 R7 5800H | |
| Lenovo ThinkPad X1 Extreme Gen3-20TLS0UV00 | |
| Apple MacBook Pro 16 2019 i9 5500M | |
| Apple MacBook Pro 16 2019 i9 5500M | |
| Apple MacBook Pro 13 Late 2020 M1 Entry (8 / 256 GB) | |
| Cinebench R15 / CPU Multi 64Bit | |
| Media della classe Workstation (2489 - 5810, n=23, ultimi 2 anni) | |
| Huawei MateBook 16 R7 5800H | |
| Lenovo ThinkPad P1 G4-20Y4S0KS00 | |
| HP ZBook Studio 15 G8 | |
| Media Intel Core i7-11850H (1547 - 1988, n=2) | |
| Lenovo ThinkPad P1 G4-20Y30017GE | |
| Dell Precision 5000 5560 | |
| Apple MacBook Pro 16 2019 i9 5500M | |
| Apple MacBook Pro 16 2019 i9 5500M | |
| Lenovo ThinkPad X1 Extreme Gen3-20TLS0UV00 | |
| Apple MacBook Pro 13 Late 2020 M1 Entry (8 / 256 GB) | |
| Cinebench R15 / CPU Single 64Bit | |
| Media della classe Workstation (191.4 - 328, n=23, ultimi 2 anni) | |
| HP ZBook Studio 15 G8 | |
| Lenovo ThinkPad P1 G4-20Y4S0KS00 | |
| Media Intel Core i7-11850H (232 - 233, n=2) | |
| Huawei MateBook 16 R7 5800H | |
| Dell Precision 5000 5560 | |
| Lenovo ThinkPad P1 G4-20Y30017GE | |
| Apple MacBook Pro 13 Late 2020 M1 Entry (8 / 256 GB) | |
| Lenovo ThinkPad X1 Extreme Gen3-20TLS0UV00 | |
| Apple MacBook Pro 16 2019 i9 5500M | |
| Apple MacBook Pro 16 2019 i9 5500M | |
| Blender / v2.79 BMW27 CPU | |
| Lenovo ThinkPad X1 Extreme Gen3-20TLS0UV00 | |
| Apple MacBook Pro 16 2019 i9 5500M | |
| Lenovo ThinkPad P1 G4-20Y30017GE | |
| Dell Precision 5000 5560 | |
| Media Intel Core i7-11850H (257 - 313, n=2) | |
| Lenovo ThinkPad P1 G4-20Y4S0KS00 | |
| HP ZBook Studio 15 G8 | |
| Huawei MateBook 16 R7 5800H | |
| Media della classe Workstation (91 - 222, n=23, ultimi 2 anni) | |
| 7-Zip 18.03 / 7z b 4 | |
| Media della classe Workstation (60489 - 116969, n=23, ultimi 2 anni) | |
| Huawei MateBook 16 R7 5800H | |
| Lenovo ThinkPad P1 G4-20Y4S0KS00 | |
| HP ZBook Studio 15 G8 | |
| Media Intel Core i7-11850H (44890 - 50552, n=2) | |
| Dell Precision 5000 5560 | |
| Apple MacBook Pro 16 2019 i9 5500M | |
| Lenovo ThinkPad P1 G4-20Y30017GE | |
| Lenovo ThinkPad X1 Extreme Gen3-20TLS0UV00 | |
| 7-Zip 18.03 / 7z b 4 -mmt1 | |
| Media della classe Workstation (5126 - 6960, n=23, ultimi 2 anni) | |
| HP ZBook Studio 15 G8 | |
| Lenovo ThinkPad P1 G4-20Y4S0KS00 | |
| Media Intel Core i7-11850H (5727 - 5762, n=2) | |
| Dell Precision 5000 5560 | |
| Huawei MateBook 16 R7 5800H | |
| Lenovo ThinkPad P1 G4-20Y30017GE | |
| Lenovo ThinkPad X1 Extreme Gen3-20TLS0UV00 | |
| Apple MacBook Pro 16 2019 i9 5500M | |
| Geekbench 5.5 / Multi-Core | |
| Media della classe Workstation (11542 - 25554, n=23, ultimi 2 anni) | |
| Lenovo ThinkPad P1 G4-20Y4S0KS00 | |
| Media Intel Core i7-11850H (9049 - 9451, n=2) | |
| Huawei MateBook 16 R7 5800H | |
| Apple MacBook Pro 13 Late 2020 M1 Entry (8 / 256 GB) | |
| HP ZBook Studio 15 G8 | |
| Apple MacBook Pro 16 2019 i9 5500M | |
| Lenovo ThinkPad P1 G4-20Y30017GE | |
| Lenovo ThinkPad X1 Extreme Gen3-20TLS0UV00 | |
| Geekbench 5.5 / Single-Core | |
| Media della classe Workstation (1783 - 2183, n=23, ultimi 2 anni) | |
| Apple MacBook Pro 13 Late 2020 M1 Entry (8 / 256 GB) | |
| HP ZBook Studio 15 G8 | |
| Media Intel Core i7-11850H (1659 - 1686, n=2) | |
| Lenovo ThinkPad P1 G4-20Y4S0KS00 | |
| Lenovo ThinkPad P1 G4-20Y30017GE | |
| Huawei MateBook 16 R7 5800H | |
| Lenovo ThinkPad X1 Extreme Gen3-20TLS0UV00 | |
| Apple MacBook Pro 16 2019 i9 5500M | |
| HWBOT x265 Benchmark v2.2 / 4k Preset | |
| Media della classe Workstation (17.8 - 40.5, n=23, ultimi 2 anni) | |
| HP ZBook Studio 15 G8 | |
| Huawei MateBook 16 R7 5800H | |
| Lenovo ThinkPad P1 G4-20Y4S0KS00 | |
| Media Intel Core i7-11850H (12.6 - 14.4, n=2) | |
| Dell Precision 5000 5560 | |
| Lenovo ThinkPad P1 G4-20Y30017GE | |
| Apple MacBook Pro 16 2019 i9 5500M | |
| Lenovo ThinkPad X1 Extreme Gen3-20TLS0UV00 | |
| LibreOffice / 20 Documents To PDF | |
| Apple MacBook Pro 16 2019 i9 5500M | |
| Apple MacBook Pro 16 2019 i9 5500M | |
| Huawei MateBook 16 R7 5800H | |
| Lenovo ThinkPad X1 Extreme Gen3-20TLS0UV00 | |
| Lenovo ThinkPad P1 G4-20Y30017GE | |
| HP ZBook Studio 15 G8 | |
| Dell Precision 5000 5560 | |
| Media della classe Workstation (37.1 - 74.7, n=23, ultimi 2 anni) | |
| Media Intel Core i7-11850H (45.8 - 48, n=2) | |
| Lenovo ThinkPad P1 G4-20Y4S0KS00 | |
| R Benchmark 2.5 / Overall mean | |
| Apple MacBook Pro 16 2019 i9 5500M | |
| Apple MacBook Pro 16 2019 i9 5500M | |
| Lenovo ThinkPad X1 Extreme Gen3-20TLS0UV00 | |
| Lenovo ThinkPad P1 G4-20Y30017GE | |
| HP ZBook Studio 15 G8 | |
| Dell Precision 5000 5560 | |
| Media Intel Core i7-11850H (0.541 - 0.543, n=2) | |
| Lenovo ThinkPad P1 G4-20Y4S0KS00 | |
| Huawei MateBook 16 R7 5800H | |
| Media della classe Workstation (0.3825 - 0.603, n=23, ultimi 2 anni) | |
* ... Meglio usare valori piccoli
Prestazioni del sistema
Il Lenovo ThinkPad P1 G4 è molto veloce nell'uso quotidiano. In PCMark10, è complessivamente nella prima posizione nel campo del confronto, il che parla anche delle ottime prestazioni del sistema.
Per quanto buone siano le prestazioni: Abbiamo dovuto riavviare il portatile ThinkPad molto spesso. Il motivo erano errori grafici che a volte si verificavano dopo lo standby; l'intera immagine era poi coperta da strisce bianche e nere. Dato che questo errore non si è verificato nel primo modello di test, presumiamo che sia un problema singolare di questo dispositivo di test
| PCMark 10 / Score | |
| Media della classe Workstation (6563 - 10409, n=19, ultimi 2 anni) | |
| Lenovo ThinkPad P1 G4-20Y4S0KS00 | |
| Media Intel Core i7-11850H, NVIDIA GeForce RTX 3070 Laptop GPU (n=1) | |
| HP ZBook Studio 15 G8 | |
| Dell Precision 5000 5560 | |
| Lenovo ThinkPad P1 G4-20Y30017GE | |
| Apple MacBook Pro 16 2019 i9 5500M | |
| Lenovo ThinkPad X1 Extreme Gen3-20TLS0UV00 | |
| PCMark 10 / Essentials | |
| Lenovo ThinkPad P1 G4-20Y4S0KS00 | |
| Media Intel Core i7-11850H, NVIDIA GeForce RTX 3070 Laptop GPU (n=1) | |
| Dell Precision 5000 5560 | |
| Media della classe Workstation (9622 - 11157, n=19, ultimi 2 anni) | |
| HP ZBook Studio 15 G8 | |
| Lenovo ThinkPad P1 G4-20Y30017GE | |
| Lenovo ThinkPad X1 Extreme Gen3-20TLS0UV00 | |
| PCMark 10 / Productivity | |
| Media della classe Workstation (8789 - 20616, n=19, ultimi 2 anni) | |
| Dell Precision 5000 5560 | |
| Lenovo ThinkPad P1 G4-20Y4S0KS00 | |
| Media Intel Core i7-11850H, NVIDIA GeForce RTX 3070 Laptop GPU (n=1) | |
| HP ZBook Studio 15 G8 | |
| Lenovo ThinkPad P1 G4-20Y30017GE | |
| Lenovo ThinkPad X1 Extreme Gen3-20TLS0UV00 | |
| PCMark 10 / Digital Content Creation | |
| Media della classe Workstation (8108 - 15631, n=19, ultimi 2 anni) | |
| Lenovo ThinkPad P1 G4-20Y4S0KS00 | |
| Media Intel Core i7-11850H, NVIDIA GeForce RTX 3070 Laptop GPU (n=1) | |
| HP ZBook Studio 15 G8 | |
| Dell Precision 5000 5560 | |
| Lenovo ThinkPad P1 G4-20Y30017GE | |
| Lenovo ThinkPad X1 Extreme Gen3-20TLS0UV00 | |
| PCMark 10 Score | 7156 punti | |
Aiuto | ||
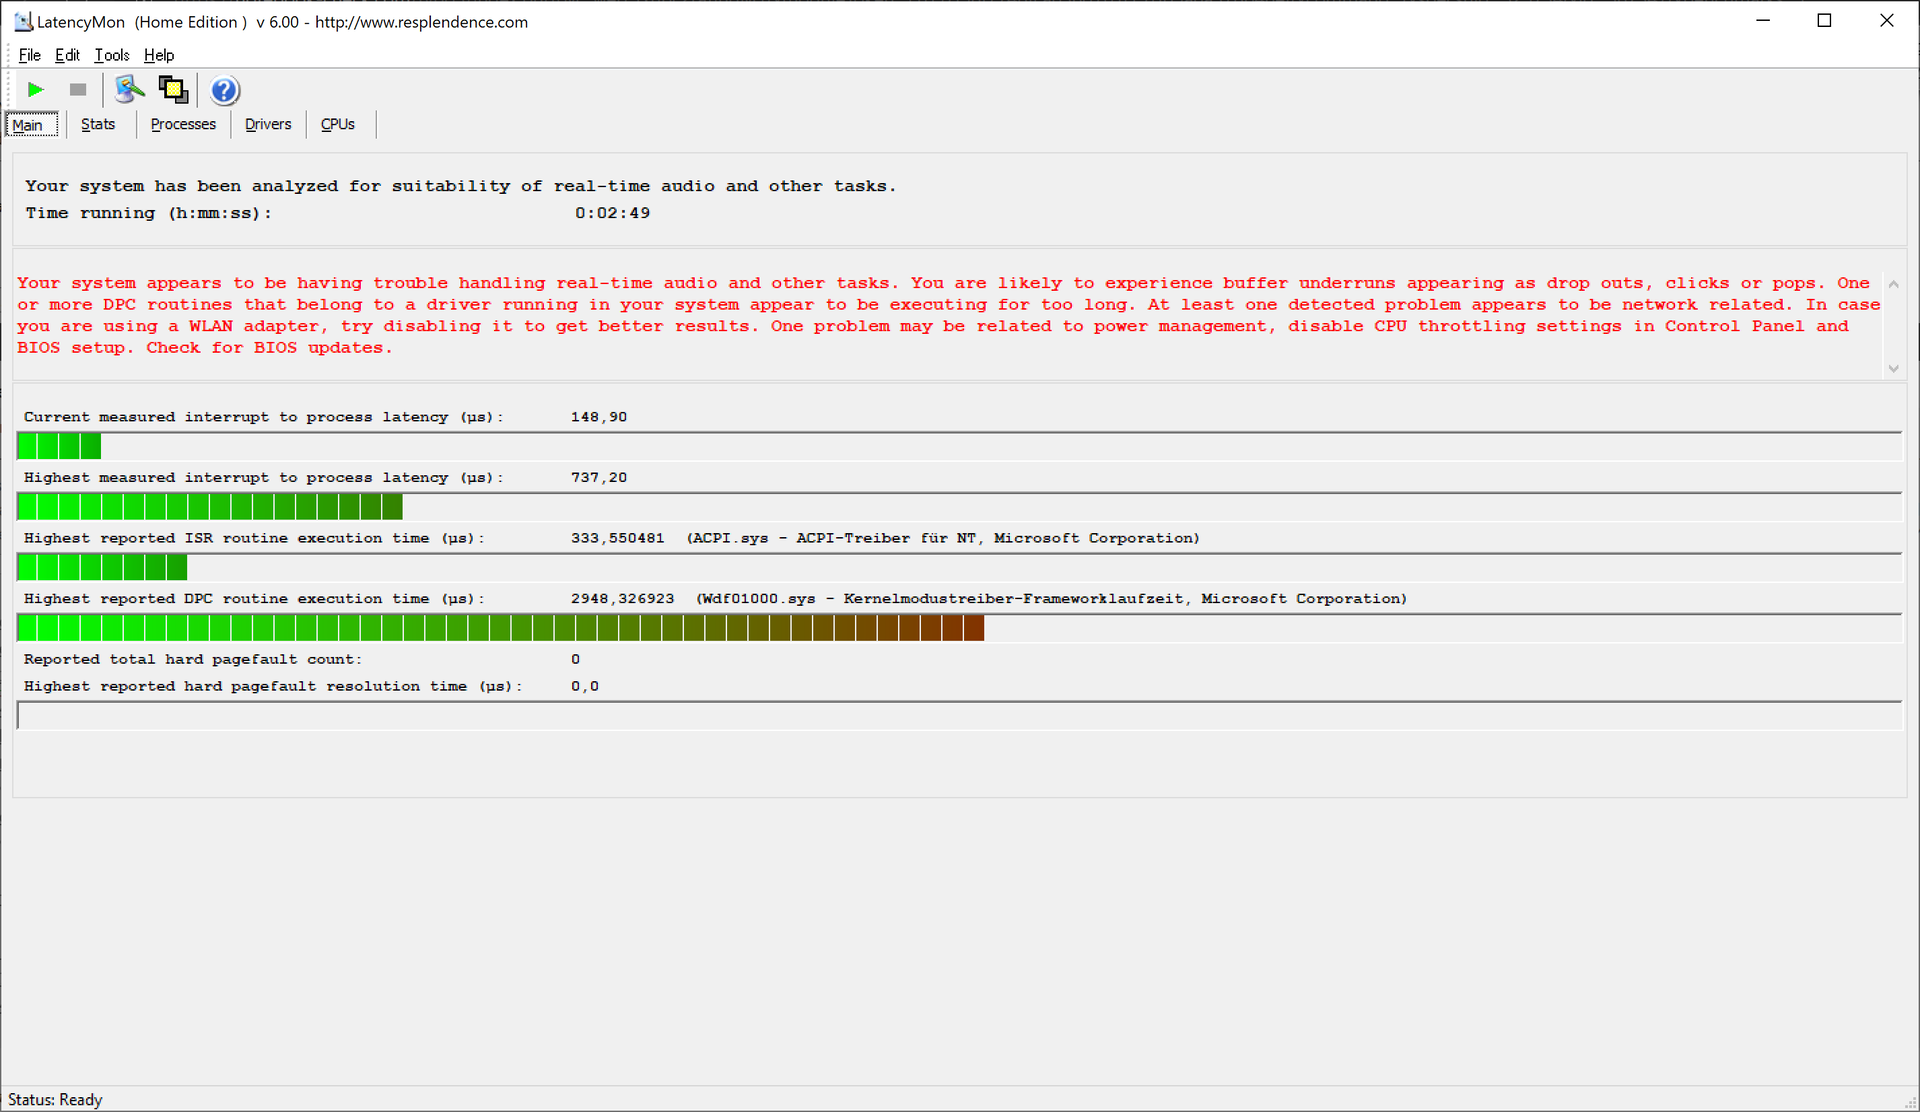
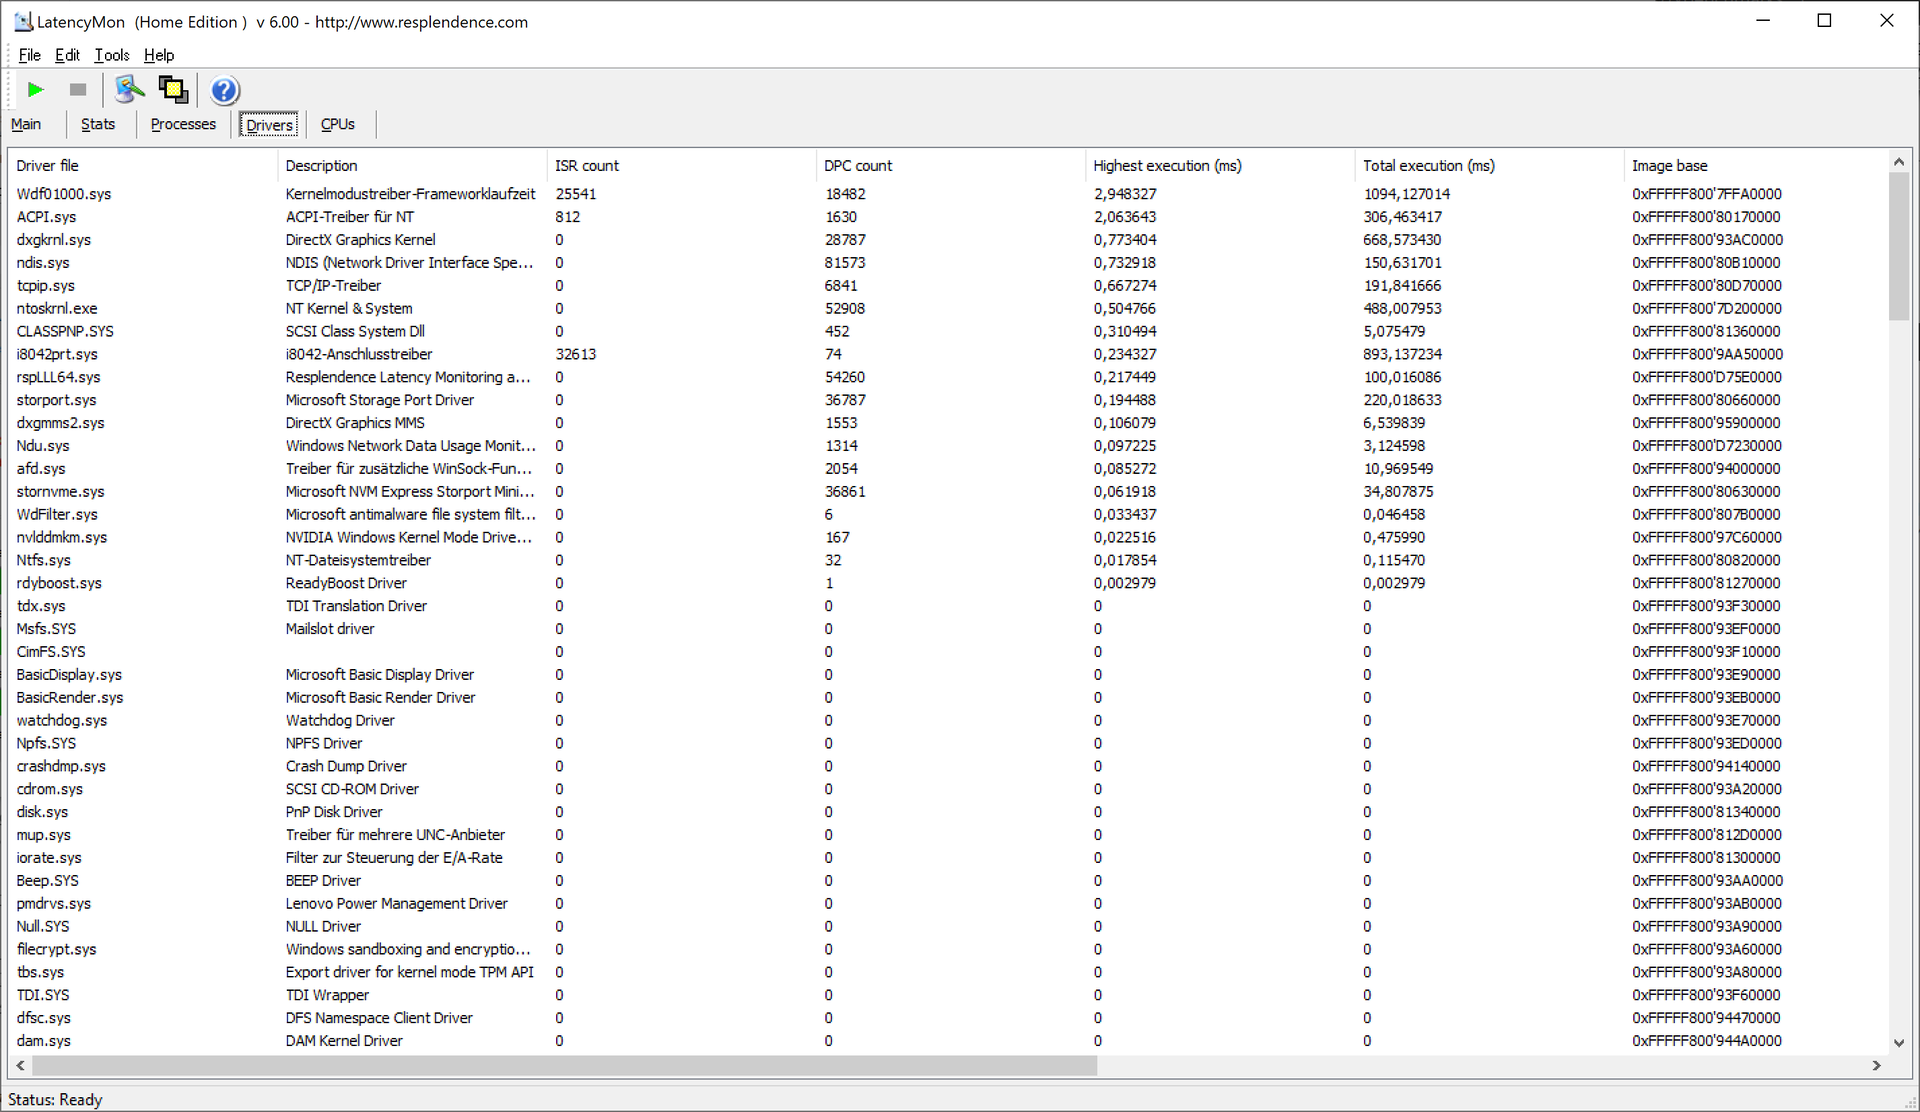
Latenze DPC
Lavorare con file audio e video è uno dei possibili usi di un portatile come il ThinkPad P1 Gen 4. Qui, le latenze DPC potrebbero causare problemi perché le alte velocità hanno portato anche a dropout nel nostro test video su YouTube
| DPC Latencies / LatencyMon - interrupt to process latency (max), Web, Youtube, Prime95 | |
| Lenovo ThinkPad P1 G4-20Y30017GE | |
| HP ZBook Studio 15 G8 | |
| Dell Precision 5000 5560 | |
| Lenovo ThinkPad P1 G4-20Y4S0KS00 | |
| Lenovo ThinkPad X1 Extreme Gen3-20TLS0UV00 | |
* ... Meglio usare valori piccoli
Archiviazione di massa
In questa configurazione, il Lenovo ThinkPad P1 G4 ha solo uno slot M.2-2280. Almeno questo è molto ben equipaggiato con un Samsung PM9A1 da 1 TB. Questo SSD NMVe PCIe 4.0 si comporta estremamente bene nei nostri benchmark
* ... Meglio usare valori piccoli

Continuous load read: DiskSpd Read Loop, Queue Depth 8
Prestazioni della GPU
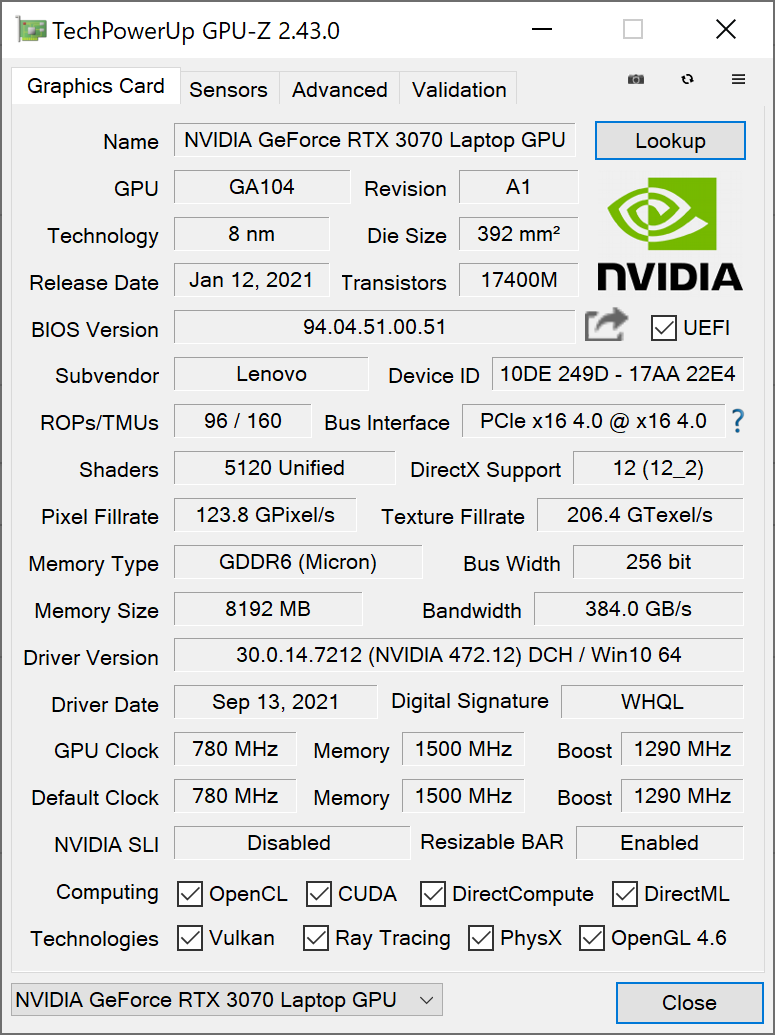
Il sito Nvidia GeForce RTX 3070 è una delle più potenti GPU mobili dell'attuale generazione "Ampere" di Nvidia. Nel caso del ThinkPad P1 G4 di Lenovo, tuttavia, le unità shader 5120 sono lontane dalle loro massime prestazioni perché Lenovo imposta la GPU a un TGP di 80 watt - in passato, questa variante sarebbe stata chiamata "Max-Q".
Quindi, non c'è da stupirsi che la RTX 3070 sia circa il 10% più veloce in media in tutti i portatili rispetto a qui nel Lenovo ThinkPad P1 2021. Tuttavia, il divario con il ThinkPad X1 Extreme G3 con GeForce GTX 1650 Ti Max-Q è enorme (+148%), anche rispetto alla variante Nvidia T1200 del P1, la GeForce RTX 3070 è più del doppio più veloce nei benchmark 3DMark (+118%). In questo caso, il GeForce vale certamente la pena. La conclusione per la suite di benchmark professionale SPECviewperf è più mista: qui, il GeForce-P1 ottiene risultati in parte buoni, ma anche in parte scadenti. Un ThinkPad P1 con una GPU Nvidia certificata ISV dovrebbe essere scelto per il CAD.
Le prestazioni della GPU sono chiaramente limitate in modalità batteria. Il risultato di 3DMark 11 è circa il 56% più basso senza alimentazione (13.508 punti nel punteggio di 3DMark 11 GPU)
| 3DMark 11 Performance | 24753 punti | |
| 3DMark Fire Strike Score | 17860 punti | |
| 3DMark Time Spy Score | 8430 punti | |
Aiuto | ||
Prestazioni di gioco
Il Lenovo ThinkPad P1 G4 non è esplicitamente un portatile da gioco. Allo stesso tempo, la Nvidia GeForce 3070 permette al portatile Lenovo di essere utilizzato per il gioco. Anche per i giochi in 4K, la GPU può essere sufficientemente veloce, a seconda del titolo. Nel nostro Witcher 3 test, il ThinkPad P1 2021 può anche richiamare costantemente le sue prestazioni - con piccole fluttuazioni
| The Witcher 3 - 1920x1080 Ultra Graphics & Postprocessing (HBAO+) | |
| Media NVIDIA GeForce RTX 3070 Laptop GPU (34.9 - 109, n=52) | |
| Media della classe Workstation (n=1ultimi 2 anni) | |
| Lenovo ThinkPad P1 G4-20Y4S0KS00 | |
| HP ZBook Studio 15 G8 | |
| Dell Precision 5000 5560 | |
| Apple MacBook Pro 16 2019 i9 5500M | |
| Lenovo ThinkPad P1 G4-20Y30017GE | |
| Lenovo ThinkPad X1 Extreme Gen3-20TLS0UV00 | |
Witcher 3 FPS-Diagram
| basso | medio | alto | ultra | QHD | 4K | |
|---|---|---|---|---|---|---|
| GTA V (2015) | 185 | 179 | 164 | 88.1 | 74.5 | 74.3 |
| The Witcher 3 (2015) | 345 | 243 | 158 | 86.8 | 56.5 | |
| Dota 2 Reborn (2015) | 171 | 148 | 124 | 106 | 109 | |
| X-Plane 11.11 (2018) | 105 | 102 | 76.8 | 52.4 | ||
| Strange Brigade (2018) | 408 | 206 | 171 | 151 | 113 | 61.1 |
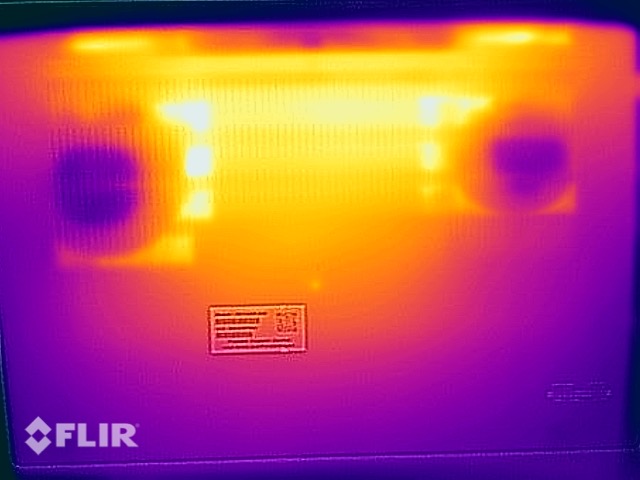
Emissioni: I componenti forti rendono il ThinkPad P1 G4 caldo
Rumore del ventilatore
Lenovo esercita tradizionalmente una certa moderazione quando si tratta del volume delle ventole dei ThinkPad. Tuttavia, questo non si applica al modello di workstation ThinkPad P1. Le due ventole girano ad un massimo di 47.4 dB(a), che è chiaramente udibile. Almeno questo non è sempre il caso, c'è anche un livello più basso a 38.6 dB(a) e il raffreddamento attivo spesso rimane disabilitato in idle.
Il coil whine è purtroppo ancora un problema troppo spesso, ma il Lenovo ThinkPad P1 Gen 4 non ne è affetto
| Lenovo ThinkPad P1 G4-20Y4S0KS00 GeForce RTX 3070 Laptop GPU, i7-11850H, Samsung PM9A1 MZVL21T0HCLR | Lenovo ThinkPad P1 G4-20Y30017GE T1200 Laptop GPU, i7-11800H, Samsung PM9A1 MZVL2512HCJQ | Dell Precision 5000 5560 RTX A2000 Laptop GPU, i7-11850H, Samsung PM9A1 MZVL22T0HBLB | Apple MacBook Pro 16 2019 i9 5500M Radeon Pro 5500M, i9-9880H, Apple SSD AP1024 7171 | HP ZBook Studio 15 G8 GeForce RTX 3070 Laptop GPU, i9-11950H, Samsung PM981a MZVLB2T0HALB | Lenovo ThinkPad X1 Extreme Gen3-20TLS0UV00 GeForce GTX 1650 Ti Max-Q, i7-10750H, Toshiba XG6 KXG6AZNV1T02 | |
|---|---|---|---|---|---|---|
| Noise | -3% | 12% | -12% | -2% | -9% | |
| off /ambiente * (dB) | 23.8 | 24.3 -2% | 23.4 2% | 29.8 -25% | 23.5 1% | 29.5 -24% |
| Idle Minimum * (dB) | 23.8 | 24.3 -2% | 23.6 1% | 29.9 -26% | 25.3 -6% | 29.5 -24% |
| Idle Average * (dB) | 23.8 | 24.3 -2% | 23.6 1% | 29.9 -26% | 25.3 -6% | 29.5 -24% |
| Idle Maximum * (dB) | 28.3 | 26.6 6% | 23.6 17% | 29.9 -6% | 25.3 11% | 29.9 -6% |
| Load Average * (dB) | 38.6 | 46.8 -21% | 25.8 33% | 43 -11% | 41.2 -7% | 44.2 -15% |
| Witcher 3 ultra * (dB) | 47.4 | 46.8 1% | 40.1 15% | 45.4 4% | 49.4 -4% | 36.1 24% |
| Load Maximum * (dB) | 47.4 | 46.8 1% | 41.4 13% | 46.1 3% | 49.4 -4% | 44.2 7% |
* ... Meglio usare valori piccoli
Rumorosità
| Idle |
| 23.8 / 23.8 / 28.3 dB(A) |
| Sotto carico |
| 38.6 / 47.4 dB(A) |
 | ||
30 dB silenzioso 40 dB(A) udibile 50 dB(A) rumoroso |
||
min: | ||
Temperatura
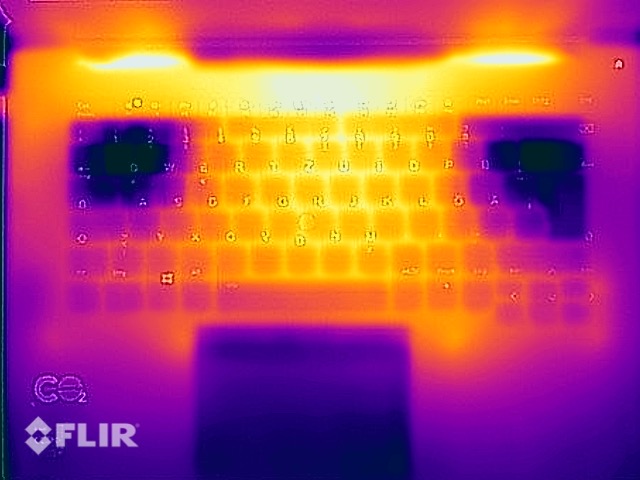
Lenovo ha progettato il ThinkPad P1 Gen 4 al limite termico. Come previsto, il notebook Lenovo rimane fresco in modalità idle, ma il riscaldamento sotto carico si mostra chiaramente: I limiti di ciò che è possibile con le attuali CPU Intel e GPU Nvidia sono esauriti. Con 53.8 gradi Celsius (~129 gradi Fahrenheit) sul lato inferiore, non è tanto la temperatura massima quanto il riscaldamento uniforme del case che lo dimostra. Anche il poggiapolsi si riscalda notevolmente fino a 40gradi Celsius, e le temperature sono solo leggermente inferiori nel Witcher 3 test
(-) La temperatura massima sul lato superiore è di 51 °C / 124 F, rispetto alla media di 38.2 °C / 101 F, che varia da 22.2 a 69.8 °C per questa classe Workstation.
(-) Il lato inferiore si riscalda fino ad un massimo di 53.5 °C / 128 F, rispetto alla media di 41.1 °C / 106 F
(+) In idle, la temperatura media del lato superiore è di 26.7 °C / 80 F, rispetto alla media deld ispositivo di 32 °C / 90 F.
(-) Riproducendo The Witcher 3, la temperatura media per il lato superiore e' di 43 °C / 109 F, rispetto alla media del dispositivo di 32 °C / 90 F.
(-) I poggiapolsi e il touchpad possono diventare molto caldi al tatto con un massimo di 40 °C / 104 F.
(-) La temperatura media della zona del palmo della mano di dispositivi simili e'stata di 27.8 °C / 82 F (-12.2 °C / -22 F).
Test da sforzo
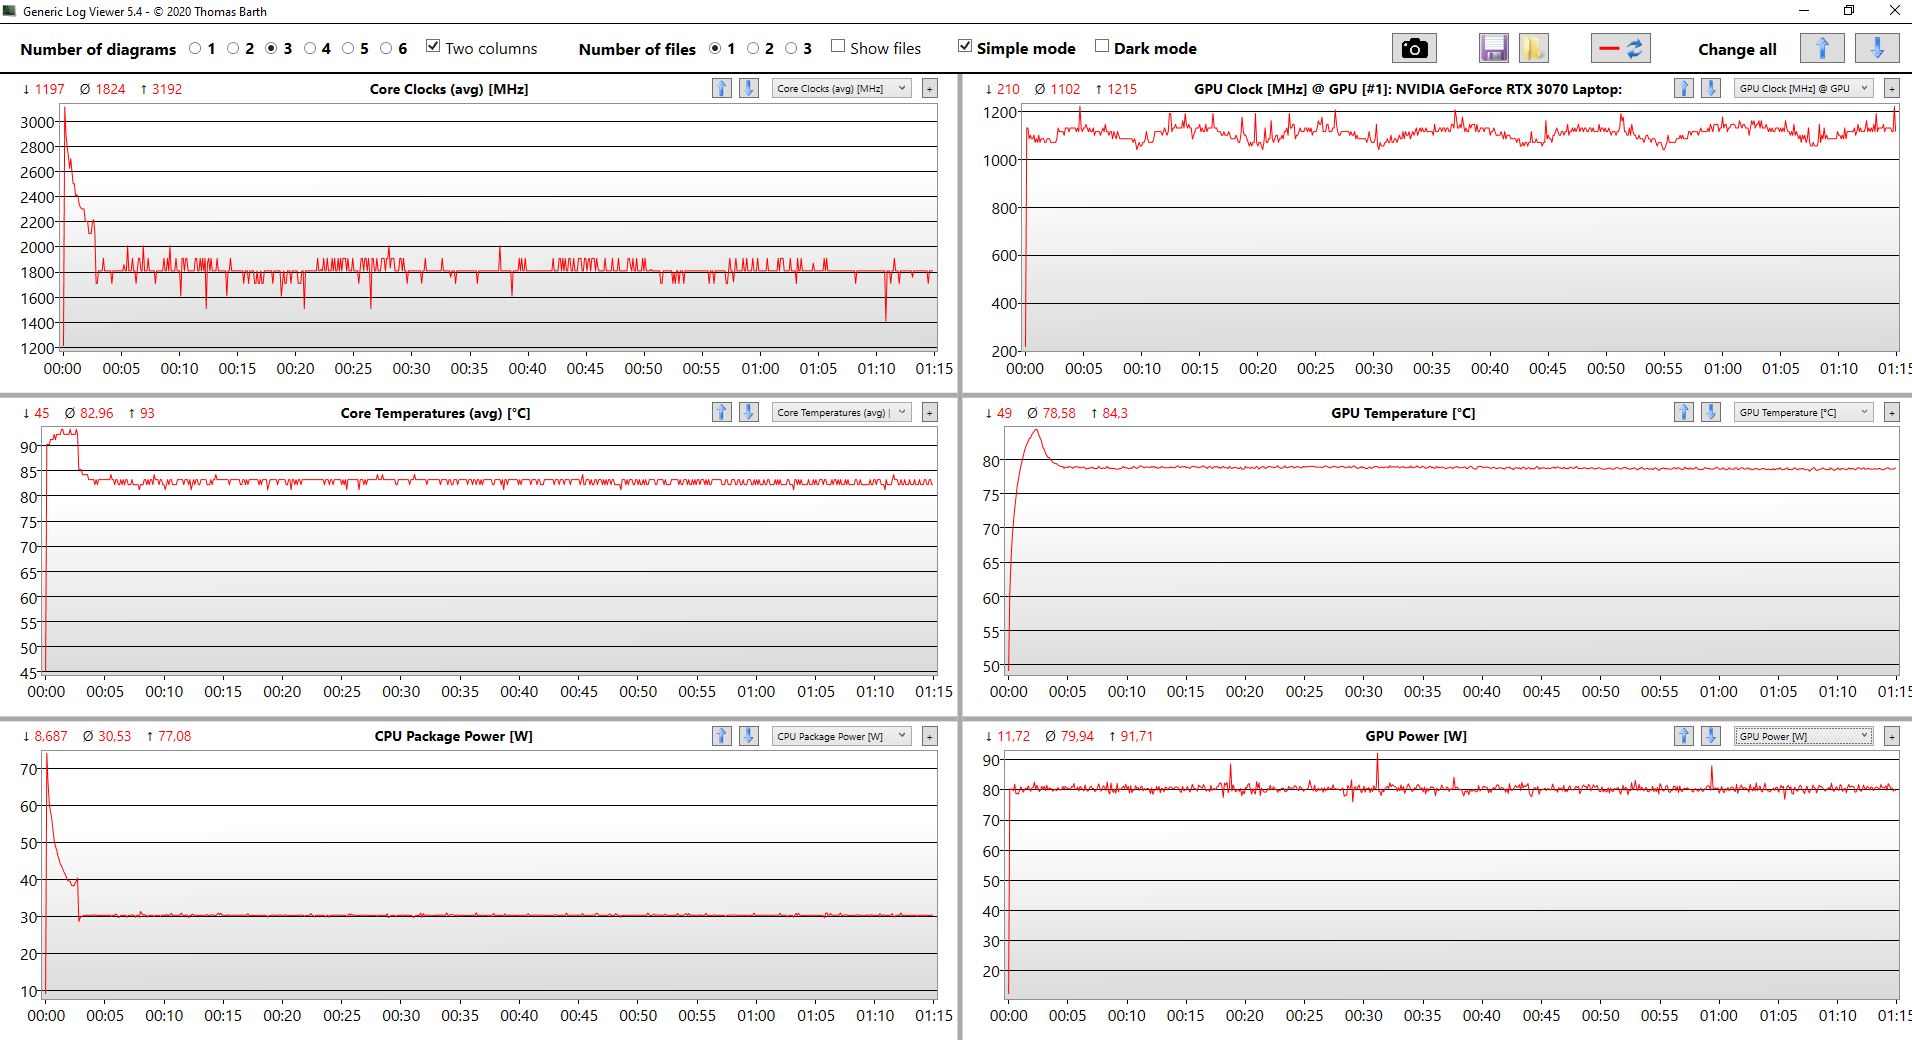
Con le misurazioni della temperatura, era già chiaro che Lenovo non può far funzionare il suo ThinkPad a prestazioni sfrenate nello stress test. Infatti, il processore è rapidamente limitato a 30 watt quando la GPU e la CPU sono completamente caricate allo stesso tempo, mentre le prestazioni della GPU rimangono stabili a 80 watt.
Il chiaro throttling nello stress test dello scenario estremo non dovrebbe riflettersi nell'uso quotidiano, però, perché 3DMark 11 dopo lo stress test ha prodotto un risultato normale.
Altoparlante
Un'analisi della qualità degli altoparlanti può essere trovata nella recensione del modello QHD del Lenovo ThinkPad P1 Gen 4.
Lenovo ThinkPad P1 G4-20Y30017GE analisi audio
(+) | gli altoparlanti sono relativamente potenti (84.3 dB)
Bassi 100 - 315 Hz
(±) | bassi ridotti - in media 12.2% inferiori alla media
(±) | la linearità dei bassi è media (9.8% delta rispetto alla precedente frequenza)
Medi 400 - 2000 Hz
(+) | medi bilanciati - solo only 3.4% rispetto alla media
(+) | medi lineari (3.4% delta rispetto alla precedente frequenza)
Alti 2 - 16 kHz
(+) | Alti bilanciati - appena 2.9% dalla media
(+) | alti lineari (5% delta rispetto alla precedente frequenza)
Nel complesso 100 - 16.000 Hz
(+) | suono nel complesso lineare (11.8% differenza dalla media)
Rispetto alla stessa classe
» 16% di tutti i dispositivi testati in questa classe è stato migliore, 3% simile, 81% peggiore
» Il migliore ha avuto un delta di 7%, medio di 17%, peggiore di 35%
Rispetto a tutti i dispositivi testati
» 9% di tutti i dispositivi testati in questa classe è stato migliore, 3% similare, 89% peggiore
» Il migliore ha avuto un delta di 4%, medio di 23%, peggiore di 134%
Apple MacBook Pro 16 2019 i9 5500M analisi audio
(+) | gli altoparlanti sono relativamente potenti (82.3 dB)
Bassi 100 - 315 Hz
(+) | bassi buoni - solo 2.3% dalla media
(+) | bassi in lineaa (5% delta rispetto alla precedente frequenza)
Medi 400 - 2000 Hz
(+) | medi bilanciati - solo only 2.7% rispetto alla media
(+) | medi lineari (3.4% delta rispetto alla precedente frequenza)
Alti 2 - 16 kHz
(+) | Alti bilanciati - appena 2.1% dalla media
(+) | alti lineari (2.6% delta rispetto alla precedente frequenza)
Nel complesso 100 - 16.000 Hz
(+) | suono nel complesso lineare (6.9% differenza dalla media)
Rispetto alla stessa classe
» 5% di tutti i dispositivi testati in questa classe è stato migliore, 1% simile, 94% peggiore
» Il migliore ha avuto un delta di 5%, medio di 17%, peggiore di 45%
Rispetto a tutti i dispositivi testati
» 1% di tutti i dispositivi testati in questa classe è stato migliore, 0% similare, 99% peggiore
» Il migliore ha avuto un delta di 4%, medio di 23%, peggiore di 134%
Consumo di energia: WQUXGA LCD consuma la batteria del portatile Lenovo
È interessante notare che il consumo minimo di questa versione del ThinkPad P1 Gen 4 è appena superiore a quello già testato con un LCD QHD. La differenza è netta nella media inattiva con luminosità LCD massimizzata: Il consumo di 20.2 watts è estremamente alto qui. Nessuna delle altre workstation o portatili multimediali ha un consumo comparabile a questo ritmo.
Questa variante del ThinkPad P1 2021 di Lenovo viene spedita con un alimentatore da 230 watt. Questo non sarebbe nemmeno necessario; un alimentatore da 170 watt sarebbe anche sufficiente per il consumo massimo
| Off / Standby | |
| Idle | |
| Sotto carico |
|
Leggenda:
min: | |
| Lenovo ThinkPad P1 G4-20Y4S0KS00 i7-11850H, GeForce RTX 3070 Laptop GPU, Samsung PM9A1 MZVL21T0HCLR, IPS LED, 3840x2400, 16" | Lenovo ThinkPad P1 G4-20Y30017GE i7-11800H, T1200 Laptop GPU, Samsung PM9A1 MZVL2512HCJQ, IPS, 2560x1600, 16" | Dell Precision 5000 5560 i7-11850H, RTX A2000 Laptop GPU, Samsung PM9A1 MZVL22T0HBLB, IPS, 3840x2400, 15.6" | Apple MacBook Pro 16 2019 i9 5500M i9-9880H, Radeon Pro 5500M, Apple SSD AP1024 7171, IPS, 3072x1920, 16" | HP ZBook Studio 15 G8 i9-11950H, GeForce RTX 3070 Laptop GPU, Samsung PM981a MZVLB2T0HALB, OLED, 3840x2160, 15.6" | Lenovo ThinkPad X1 Extreme Gen3-20TLS0UV00 i7-10750H, GeForce GTX 1650 Ti Max-Q, Toshiba XG6 KXG6AZNV1T02, IPS, 1920x1080, 15.6" | Media NVIDIA GeForce RTX 3070 Laptop GPU | Media della classe Workstation | |
|---|---|---|---|---|---|---|---|---|
| Power Consumption | 23% | 17% | 31% | -16% | 32% | -36% | 5% | |
| Idle Minimum * (Watt) | 8.1 | 7.7 5% | 6.2 23% | 3.7 54% | 11 -36% | 5 38% | 15.6 ? -93% | 9.11 ? -12% |
| Idle Average * (Watt) | 20.2 | 11.8 42% | 13.9 31% | 12.1 40% | 18.8 7% | 9 55% | 20.1 ? -0% | 13.8 ? 32% |
| Idle Maximum * (Watt) | 21.9 | 12.4 43% | 23.8 -9% | 17 22% | 31.7 -45% | 12.2 44% | 29.4 ? -34% | 17.9 ? 18% |
| Load Average * (Watt) | 88.2 | 94.6 -7% | 95.7 -9% | 91.5 -4% | 105.2 -19% | 94.4 -7% | 110.8 ? -26% | 96 ? -9% |
| Witcher 3 ultra * (Watt) | 149 | 99.6 33% | 87 42% | 103 31% | 148 1% | 89 40% | ||
| Load Maximum * (Watt) | 170.6 | 134 21% | 132.6 22% | 102.3 40% | 171.8 -1% | 133.9 22% | 214 ? -25% | 180.3 ? -6% |
* ... Meglio usare valori piccoli
Energy consumption Witcher 3 / Stress test
Durata della batteria
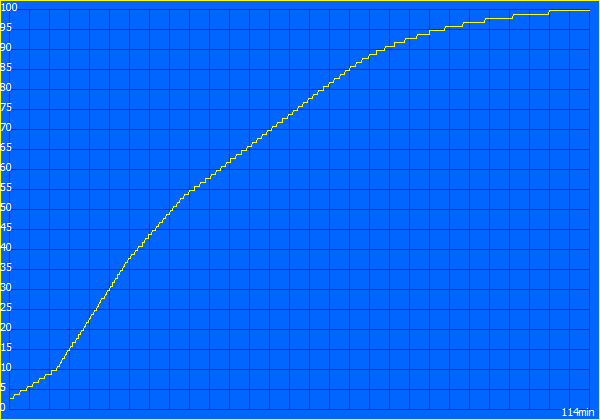
La batteria più grande, rispetto alla generazione precedente, con una capacità di 90 watt ore viene svuotata abbastanza rapidamente dal consumo dello schermo 4K. Il Lenovo ThinkPad P1 G4 dura circa sette ore nel test Wi-Fi quando il display è impostato a 150 cd/m². Alla massima luminosità, la durata della batteria scende a quattro ore. Il modello con un monitor QHD è chiaramente più adatto all'uso mobile - dopo tutto, il ThinkPad 4K riesce a battere i rivali diretti delle workstation Dell Precision 5560 e HP ZBook Studio 15 G8
| Lenovo ThinkPad P1 G4-20Y4S0KS00 i7-11850H, GeForce RTX 3070 Laptop GPU, 90 Wh | Lenovo ThinkPad P1 G4-20Y30017GE i7-11800H, T1200 Laptop GPU, 90 Wh | Dell Precision 5000 5560 i7-11850H, RTX A2000 Laptop GPU, 86 Wh | Apple MacBook Pro 16 2019 i9 5500M i9-9880H, Radeon Pro 5500M, 99.8 Wh | HP ZBook Studio 15 G8 i9-11950H, GeForce RTX 3070 Laptop GPU, 83 Wh | Lenovo ThinkPad X1 Extreme Gen3-20TLS0UV00 i7-10750H, GeForce GTX 1650 Ti Max-Q, 80 Wh | Media della classe Workstation | |
|---|---|---|---|---|---|---|---|
| Autonomia della batteria | 26% | 20% | 30% | 20% | 51% | 27% | |
| H.264 (h) | 7.2 | 9 25% | 9.7 35% | 12.2 69% | 10.1 ? 40% | ||
| WiFi v1.3 (h) | 7 | 9 29% | 6.3 -10% | 12 71% | 6.2 -11% | 11.6 66% | 8.55 ? 22% |
| Load (h) | 1.2 | 1.5 25% | 1.8 50% | 1 -17% | 1.8 50% | 1.4 17% | 1.441 ? 20% |
| Witcher 3 ultra (h) | 0.9 |
Pro
Contro
Verdetto: ThinkPad P1 Gen 4 migliore con un sistema di raffreddamento più forte

Una volta con Vapor-Chamber, una volta senza (ThinkPad P1 con T1200 qui in recensione): Il Lenovo ThinkPad P1 G4 è passato attraverso il nostro test due volte. Diventa subito chiaro quale delle due versioni è migliore: quella con Vapor-Chamber.
In questi giorni, un buon raffreddamento è probabilmente la caratteristica più importante di tutte per i portatili con processori Intel serie H. Il modello con Vapor-Chamber testato qui dà alla CPU un consumo significativamente più alto rispetto al suo modello gemello con raffreddamento convenzionale. La differenza di prestazioni è significativa, ed è per questo che la conclusione deve essere basata solo su questa differenza: Se Lenovo ThinkPad P1 Gen 4, allora con Vapor-Chamber - anche se le opzioni di un secondo SSD M.2-2280 o un modem WWAN sono perse. Solo le varianti con GeForce RTX 3070, RTX 3080 e Nvidia RTX A3000, A4000 e A5000 includono il sistema di raffreddamento migliore.
La nostra conclusione è meno chiara in relazione al secondo grande differenziatore del dispositivo testato: Il WQUXGA LCD mantiene ciò che promette in termini di qualità; è uno dei migliori display LC di tutti i portatili attuali - ma a spese della durata della batteria. A seconda delle priorità dell'utente, il display QHD potrebbe essere la scelta migliore se si desidera un funzionamento prolungato senza un'alimentazione collegata.
Vapor-Chamber, sì per favore: Il sistema di raffreddamento di questo Lenovo ThinkPad P1 G4 è molto meglio di quello della variante con heatpipe.
Nel complesso, il Lenovo ThinkPad P1 G4 si guadagna chiaramente la nostra raccomandazione come portatile da 16 pollici top di gamma. Il prezzo è corrispondentemente alto, e se l'acquirente è disposto a spendere così tanti soldi, dovrebbe essere sicuramente il modello Vapor-Chamber.
I diretti rivali della workstation sono soprattutto il Dell Precision 5560 e l HP ZBook Studio 15 G8 dove entrambi hanno dei punti deboli - il più compatto Precision ha meno porte e offre meno prestazioni, mentre il 16:9 e la RAM saldata non parlano necessariamente per lo ZBook. Al di fuori della sfera Windows, il Apple MacBook Pro 16 dovrebbe essere menzionato, per cui un confronto con il nuovo modello con M1 Max sarà di particolare interesse qui.
Prezzo e disponibilità
Il Lenovo ThinkPad P1 2021 testato costa 2.850 Euro (~$3.266)al Campuspoint. Si tratta di un modello speciale che è disponibile esclusivamente nel Programma Campus di Lenovo per studenti, apprendisti ed altre persone idonee. La stessa configurazione costa 3,982 Euro (~$4,564) nel Lenovo Store
Lenovo ThinkPad P1 G4-20Y4S0KS00
- 10/25/2021 v7 (old)
Benjamin Herzig
Price comparison
