Recensione della workstation Dell Precision 5560: La spinta della Quadro RTX A2000
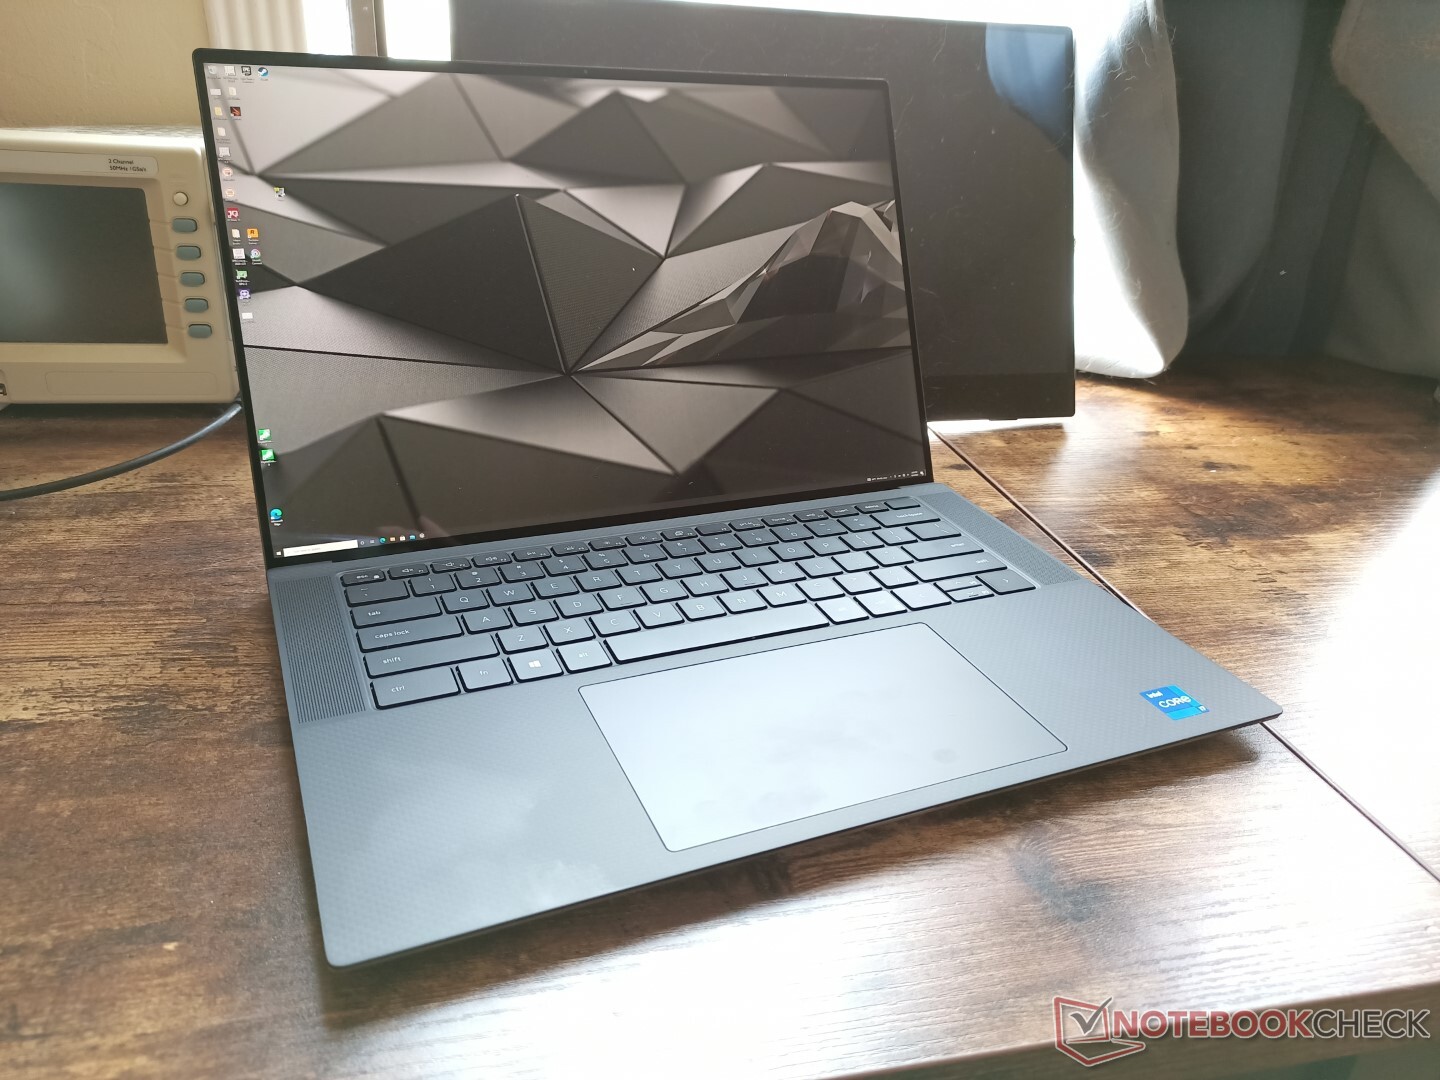
Il Dell Precision 5560 è un aggiornamento interno del Precision 5550 dello scorso anno. Entrambi i modelli sono basati sul nuovo XPS 15 9500/9510 e quindi tutti i modelli hanno pannelli 16:10 simili e altre caratteristiche fisiche. Come tale, vi consigliamo di controllare le nostre recensioni sul Precision 5550, XPS 15 9500, o XPS 15 9510 dato che molti dei nostri commenti sono ancora validi per il Precision 5560
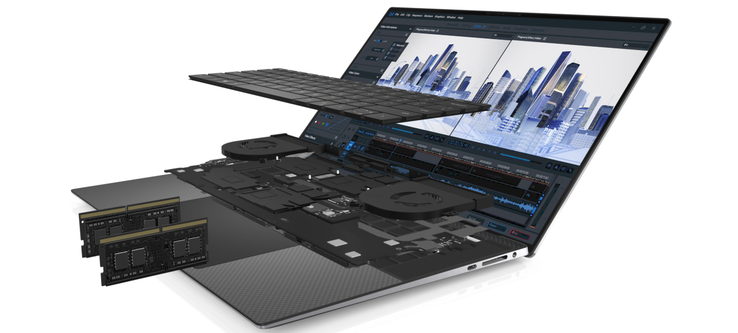
Rispetto al Precision 5550, il Precision 5560 è dotato di CPU Tiger Lake-H di 11a generazione e GPU Nvidia Ampere per sostituire le vecchie CPU Comet Lake-H di 10a generazione e GPU Turing, rispettivamente. Le SKU vanno dal Core i5-11500H di base con grafica Quadro T1200, display 1200p e 8 GB di RAM per $2000 USD fino alla CPU i9-11950H o Xeon W-11955M vPro con grafica Quadro RTX A2000, touchscreen 2400p e 64 GB di RAM ECC per oltre $4000 USD. La nostra specifica unità di test è una configurazione di fascia media venduta al dettaglio per poco più di 3000 dollari
I concorrenti in questo spazio includono altre workstation mobili ultrasottili da 15,6 pollici come HP ZBook Studio 15 G8,Asus ProArt StudioBook Pro 15,Lenovo ThinkPad P15 Gen 2, MSI WS66, oRazer Blade 15 Studio Edition. Una versione da 17 pollici del nostro modello è disponibile chiamata Precision 5750 basata sul XPS 17.
Altre recensioni di Dell:
potential competitors in comparison
Punteggio | Data | Modello | Peso | Altezza | Dimensione | Risoluzione | Prezzo |
|---|---|---|---|---|---|---|---|
| 88.3 % v7 (old) | 10/2021 | Dell Precision 5000 5560 i7-11850H, RTX A2000 Laptop GPU | 2 kg | 18 mm | 15.60" | 3840x2400 | |
| 87.2 % v7 (old) | 10/2021 | Lenovo ThinkPad P15 G2-20YQ001JGE i7-11800H, RTX A3000 Laptop GPU | 2.9 kg | 31.5 mm | 15.60" | 1920x1080 | |
| 87.8 % v7 (old) | 08/2021 | HP ZBook Studio 15 G8 i9-11950H, GeForce RTX 3070 Laptop GPU | 1.9 kg | 18 mm | 15.60" | 3840x2160 | |
| 83.1 % v7 (old) | 11/2020 | Asus ProArt StudioBook Pro 15 W500G5T i7-9750H, Quadro RTX 5000 Max-Q | 2 kg | 18.9 mm | 15.60" | 3840x2160 | |
| 87.8 % v7 (old) | 09/2020 | Dell Precision 7550 W-10885M, Quadro RTX 5000 Max-Q | 2.8 kg | 27.36 mm | 15.60" | 3840x2160 | |
| 86.3 % v7 (old) | 08/2020 | Dell Precision 5550 P91F i7-10875H, Quadro T2000 Max-Q | 2 kg | 18 mm | 15.60" | 3840x2400 | |
| 87 % v7 (old) | 08/2020 | Razer Blade 15 Studio Edition 2020 i7-10875H, Quadro RTX 5000 Max-Q | 2.2 kg | 13.98 mm | 15.60" | 3840x2160 |
Caso - XPS professionale
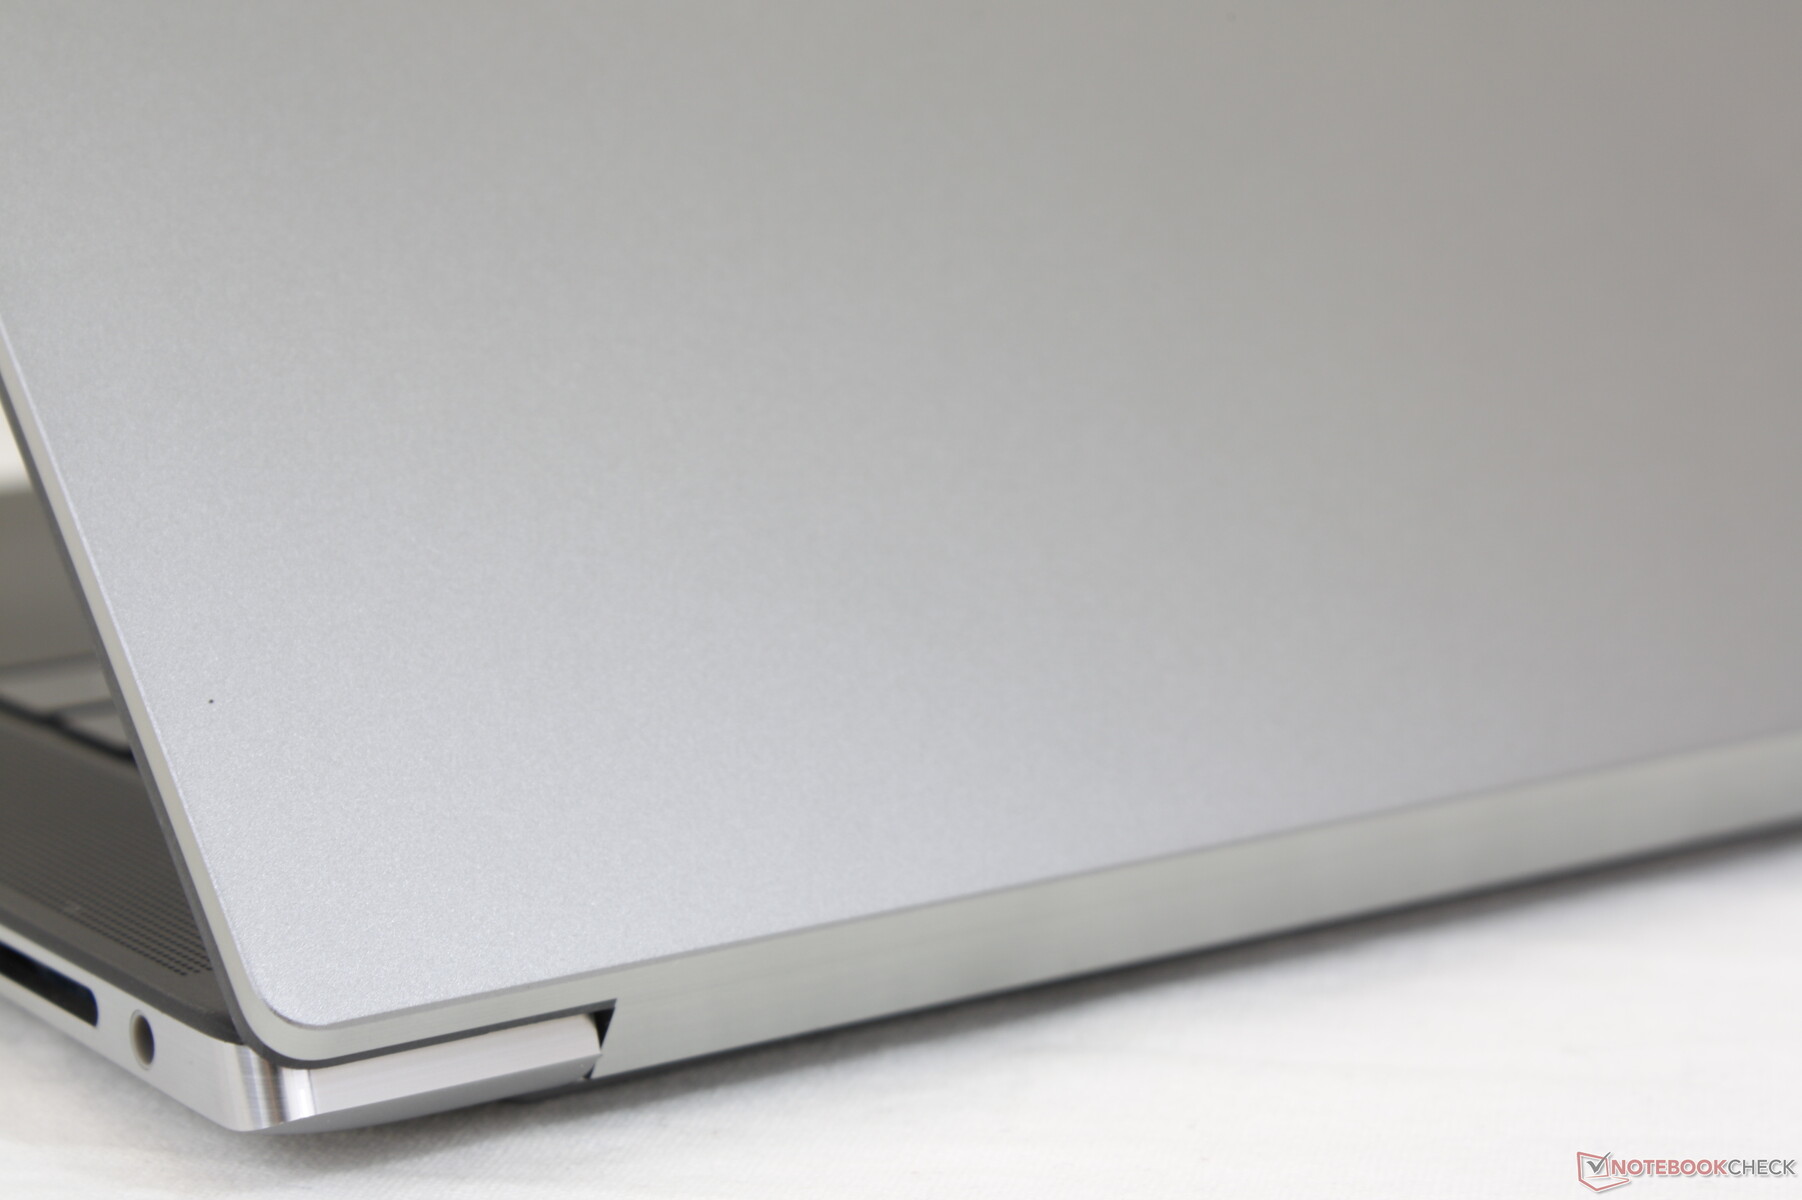
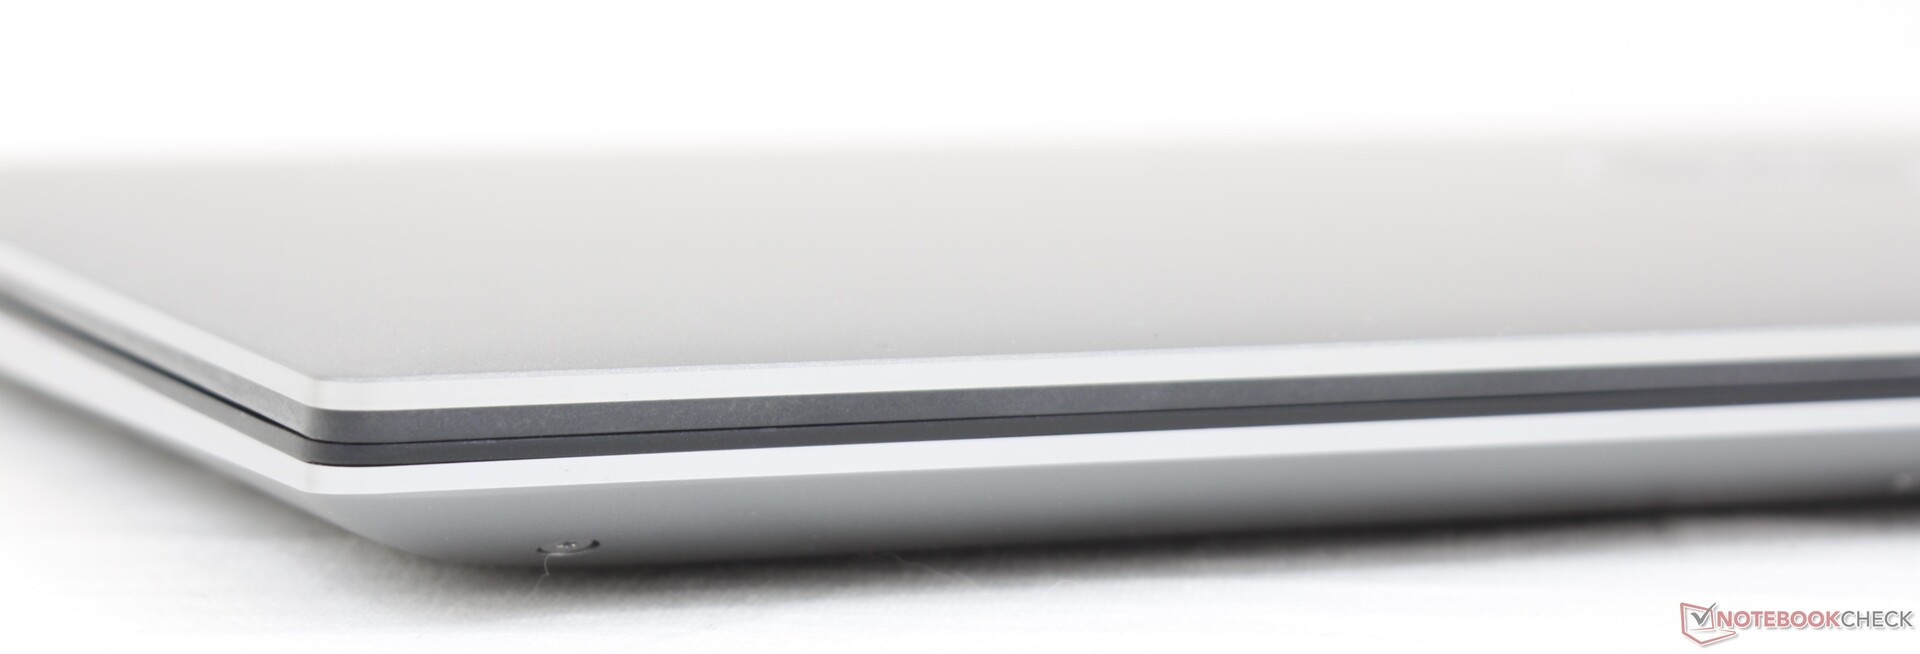
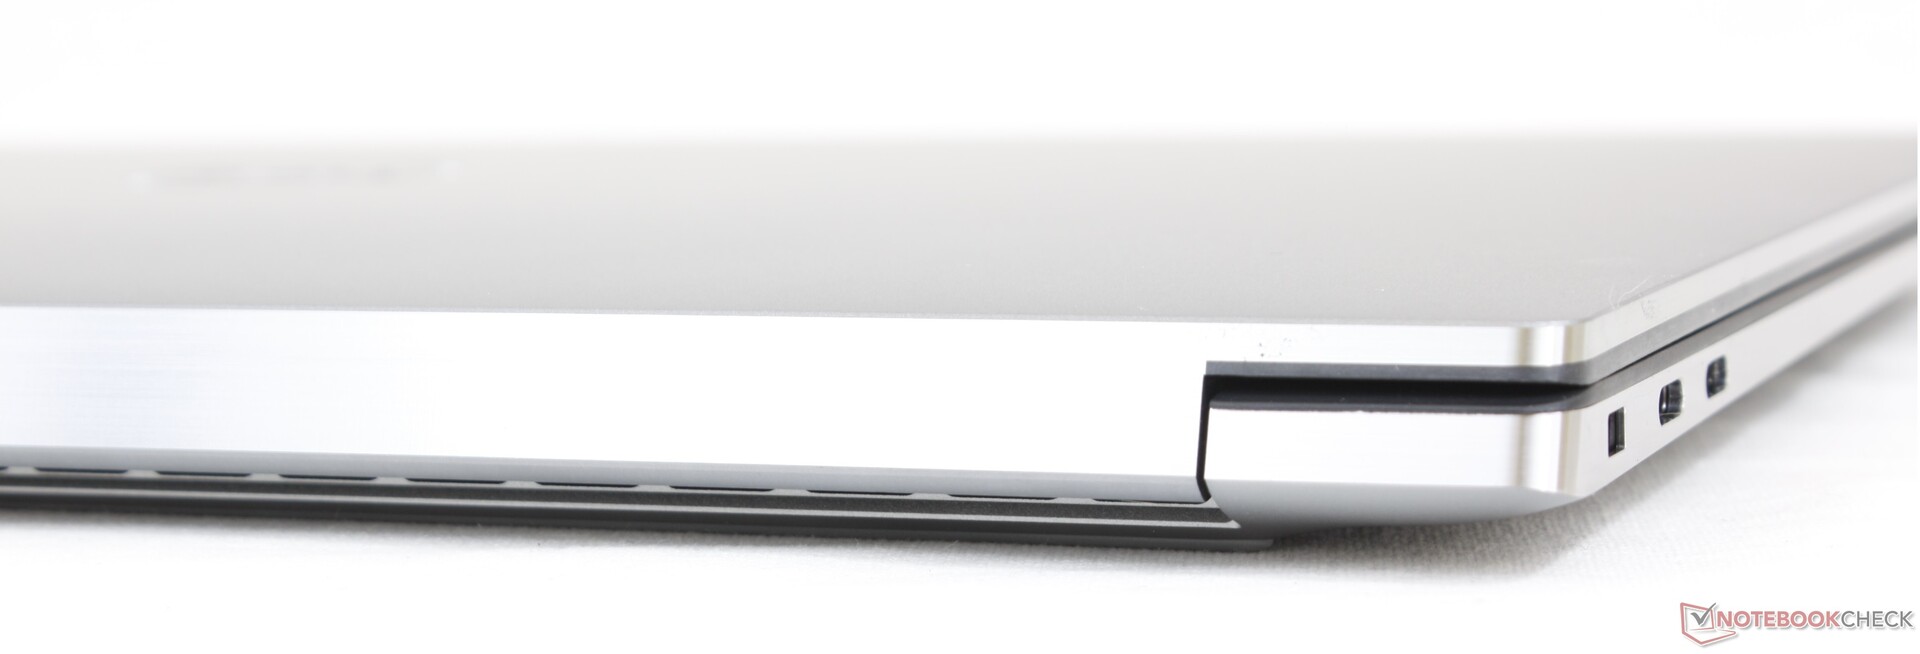
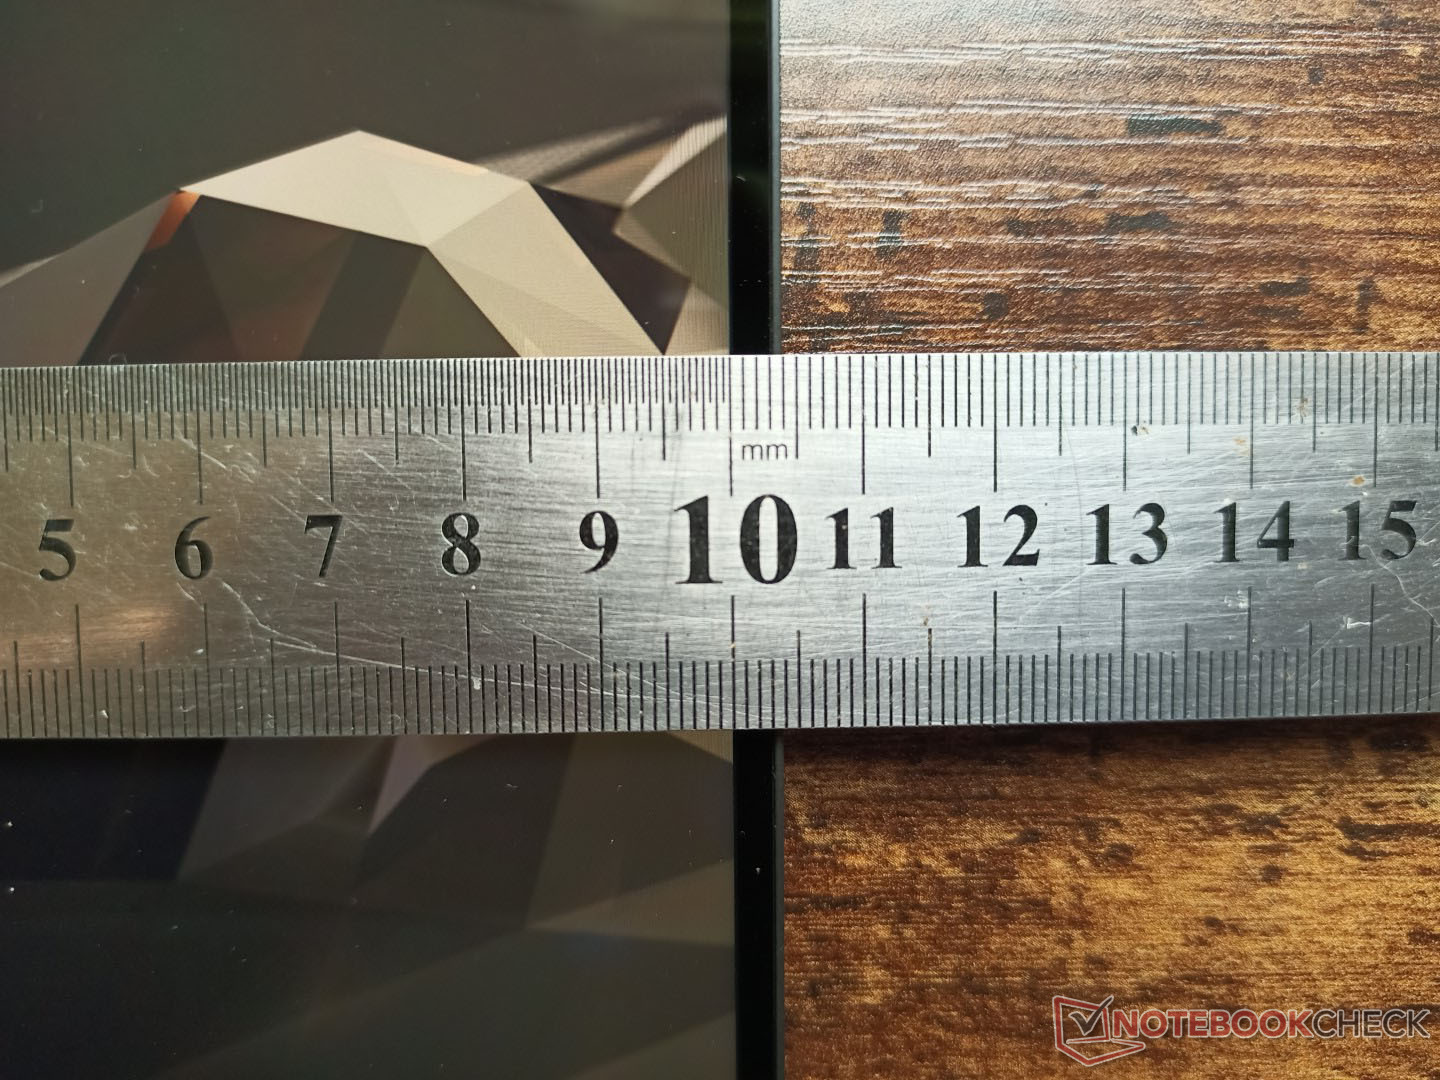
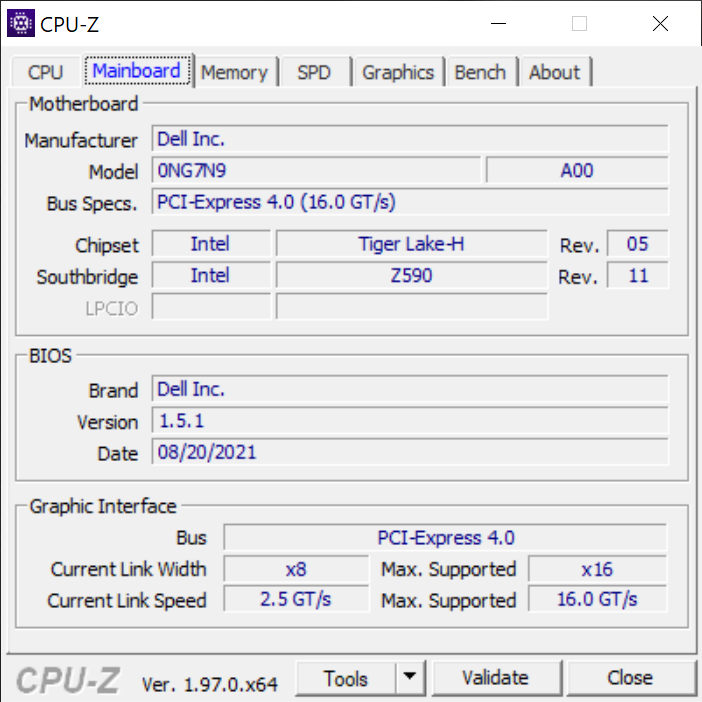
Lo chassis e le dimensioni sono identiche a quelle dell'XPS 15 9500 o 9510 con 18 x 344.72 x 230.14 mm. Tuttavia, la pagina ufficiale del prodotto Dell afferma che il Precision 5560 è molto più sottile a 11.64 mm dal suo punto più spesso, il che è assolutamente falso. Sospettiamo che Dell abbia cambiato il modo di misurare lo spessore che può essere molto ingannevole per i consumatori. Abbiamo osservato una simile discrepanza di spessore tra gli identici XPS 13 7390 2-in-1 e XPS 13 9310 2-in-1.
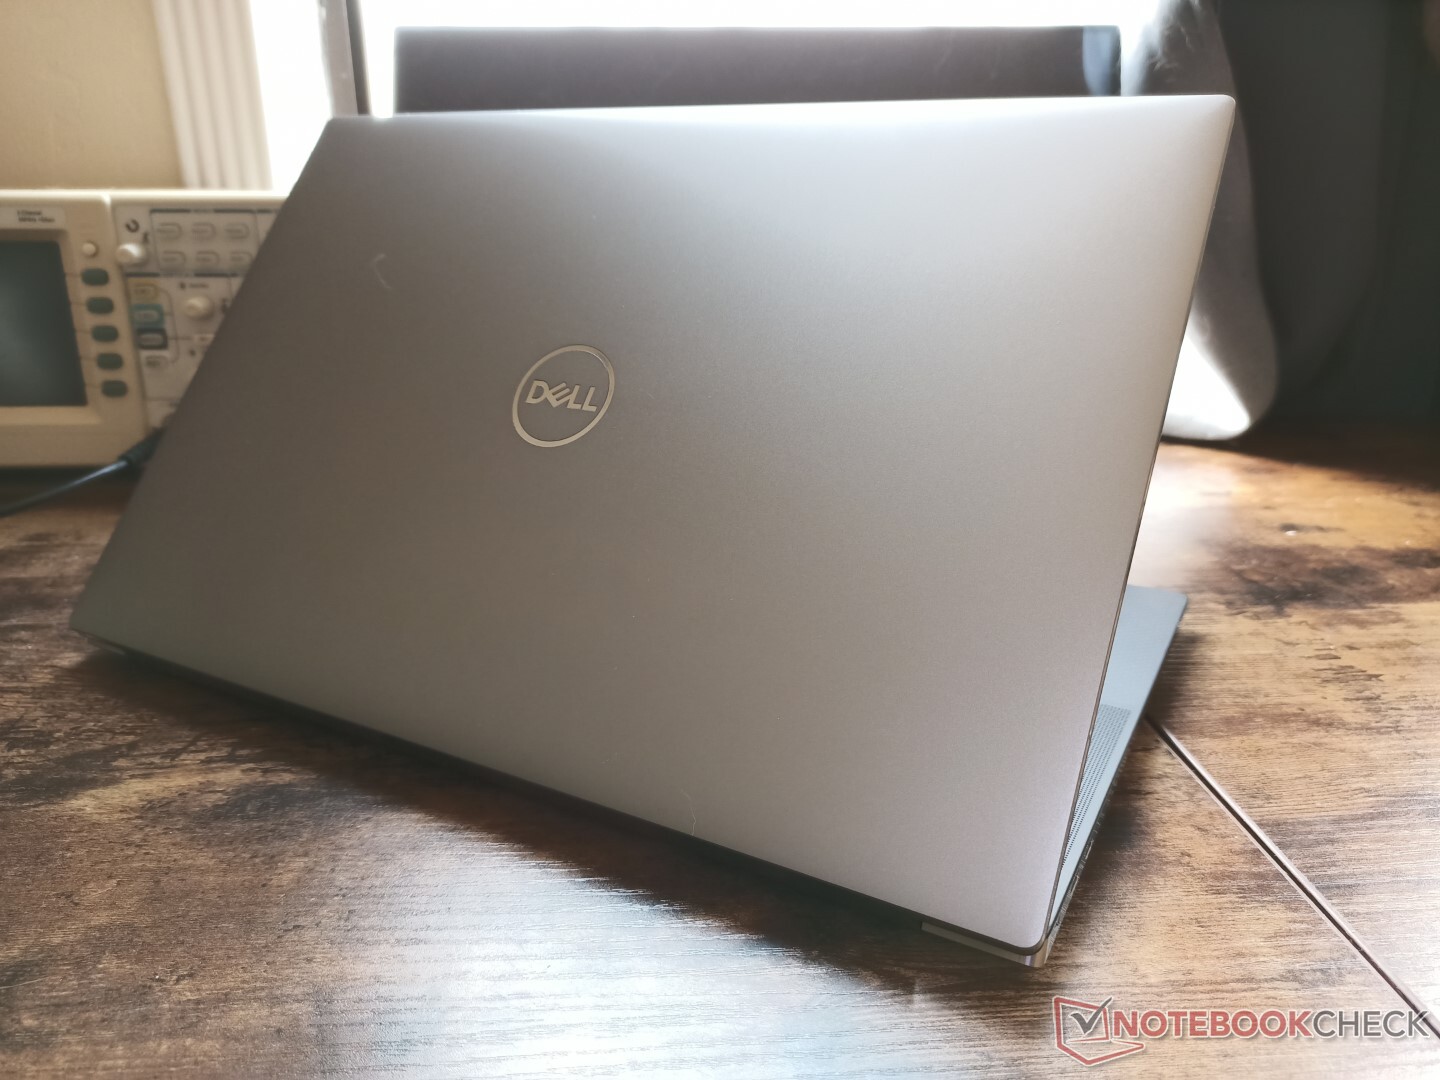
Come al solito, il coperchio esterno in lega di magnesio ha un tono di grigio leggermente più scuro rispetto al tipico XPS 15 per aiutare a identificare visivamente la serie Precision 55x0 dalla serie XPS 15.
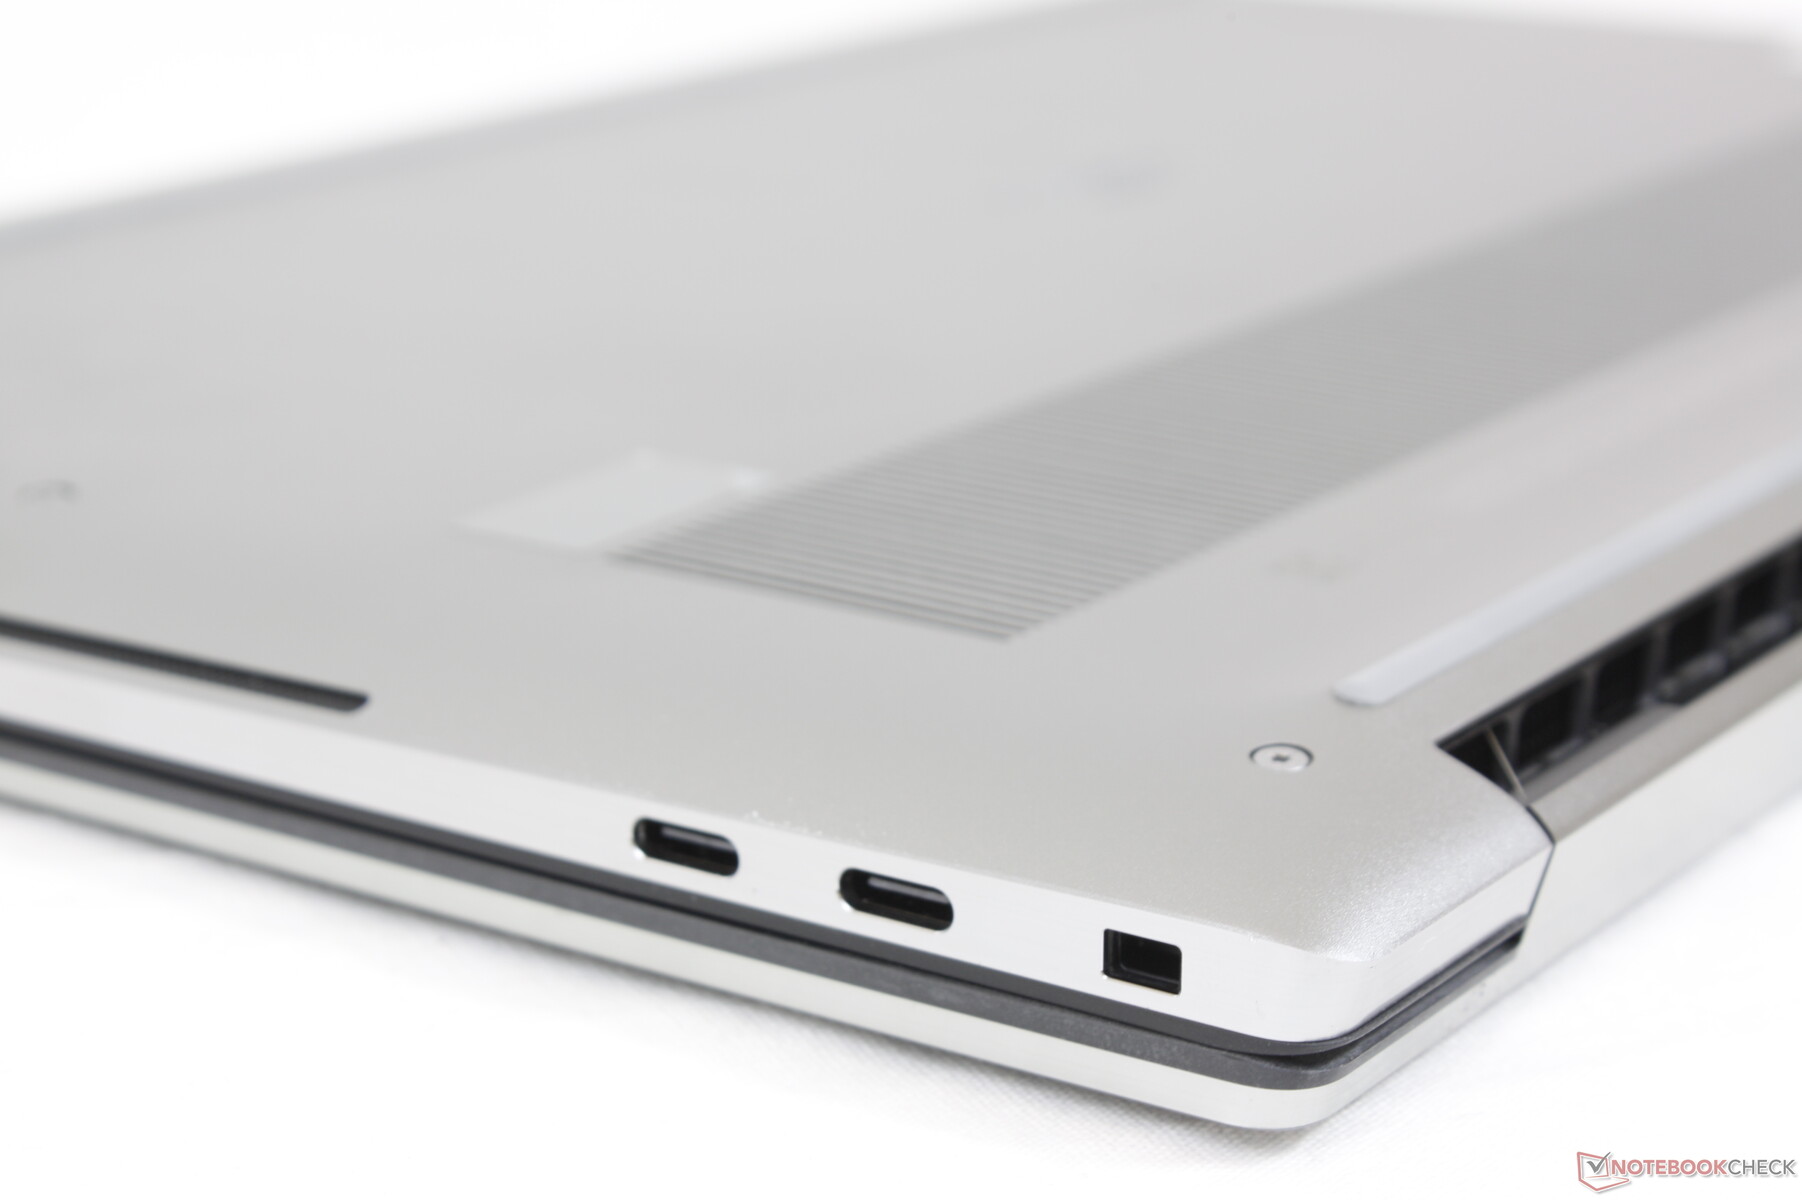
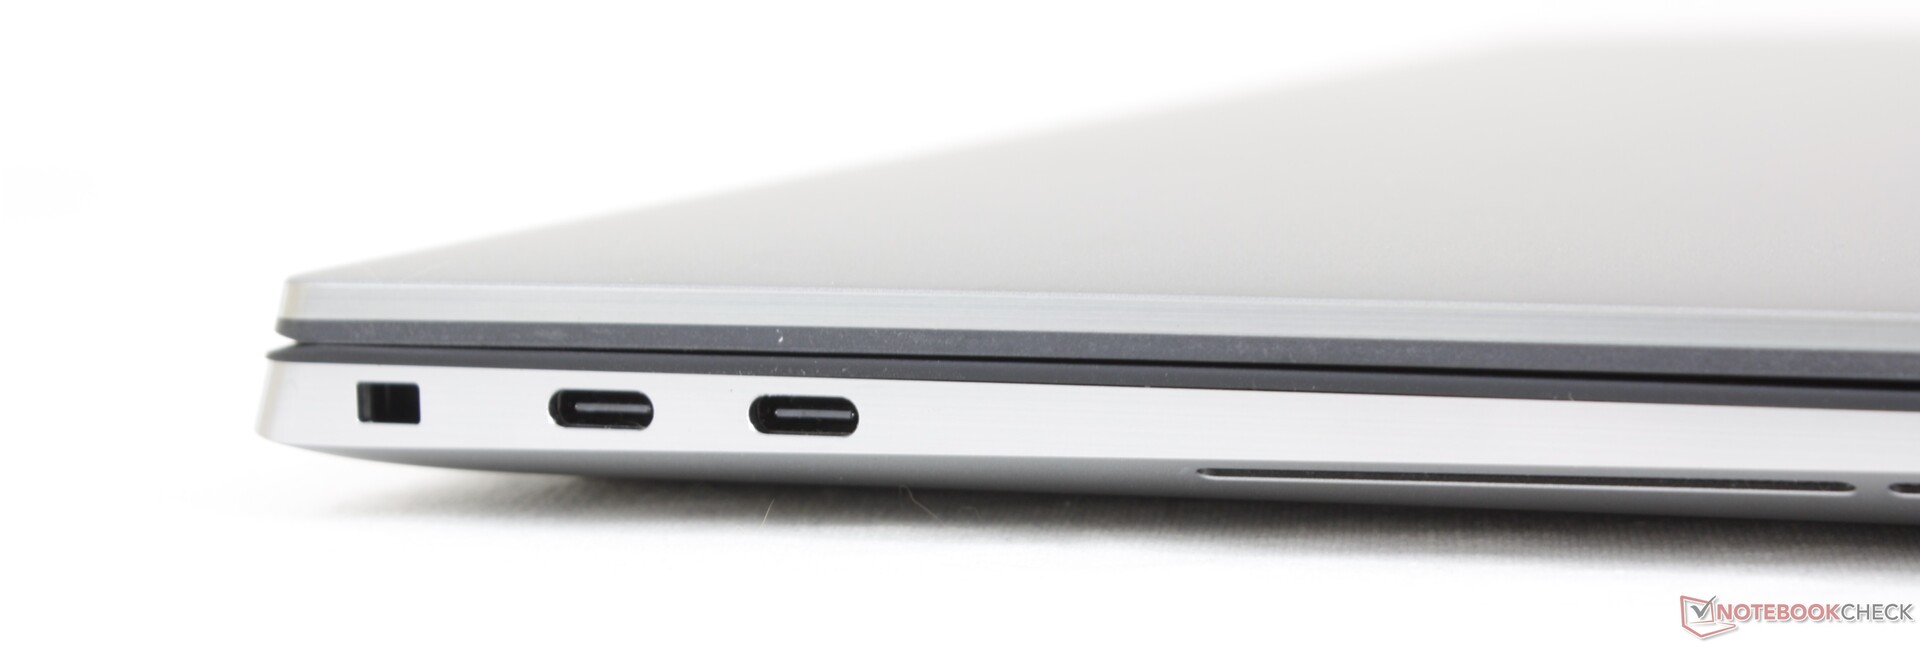
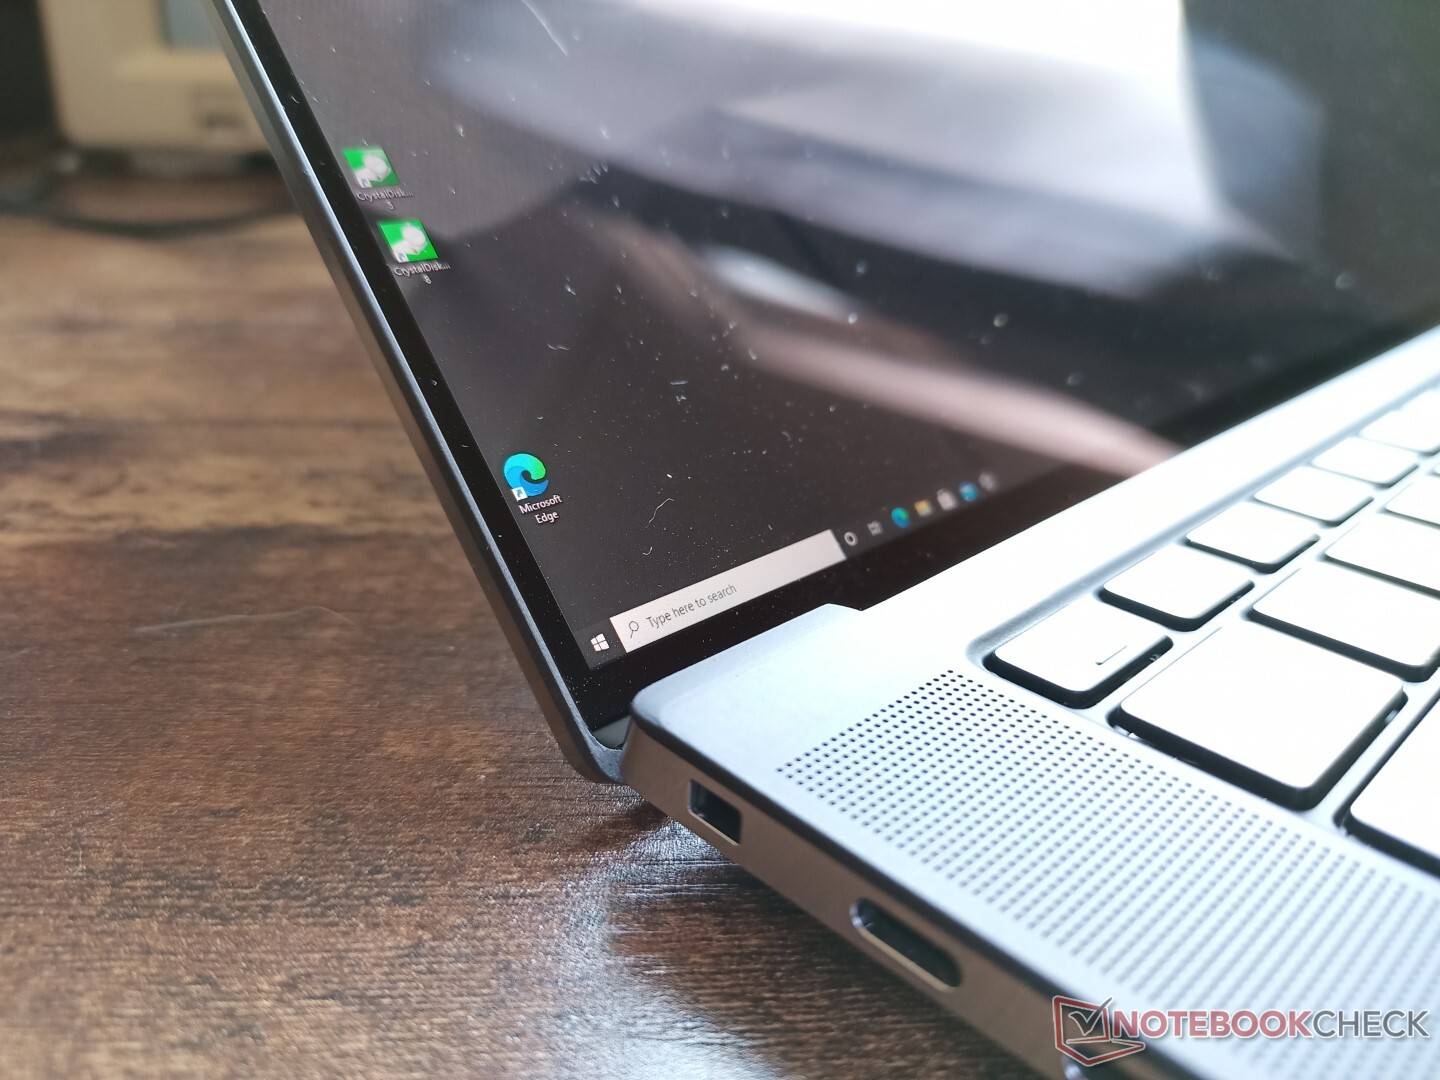
Connettività - Thunderbolt 4 pronto a partire
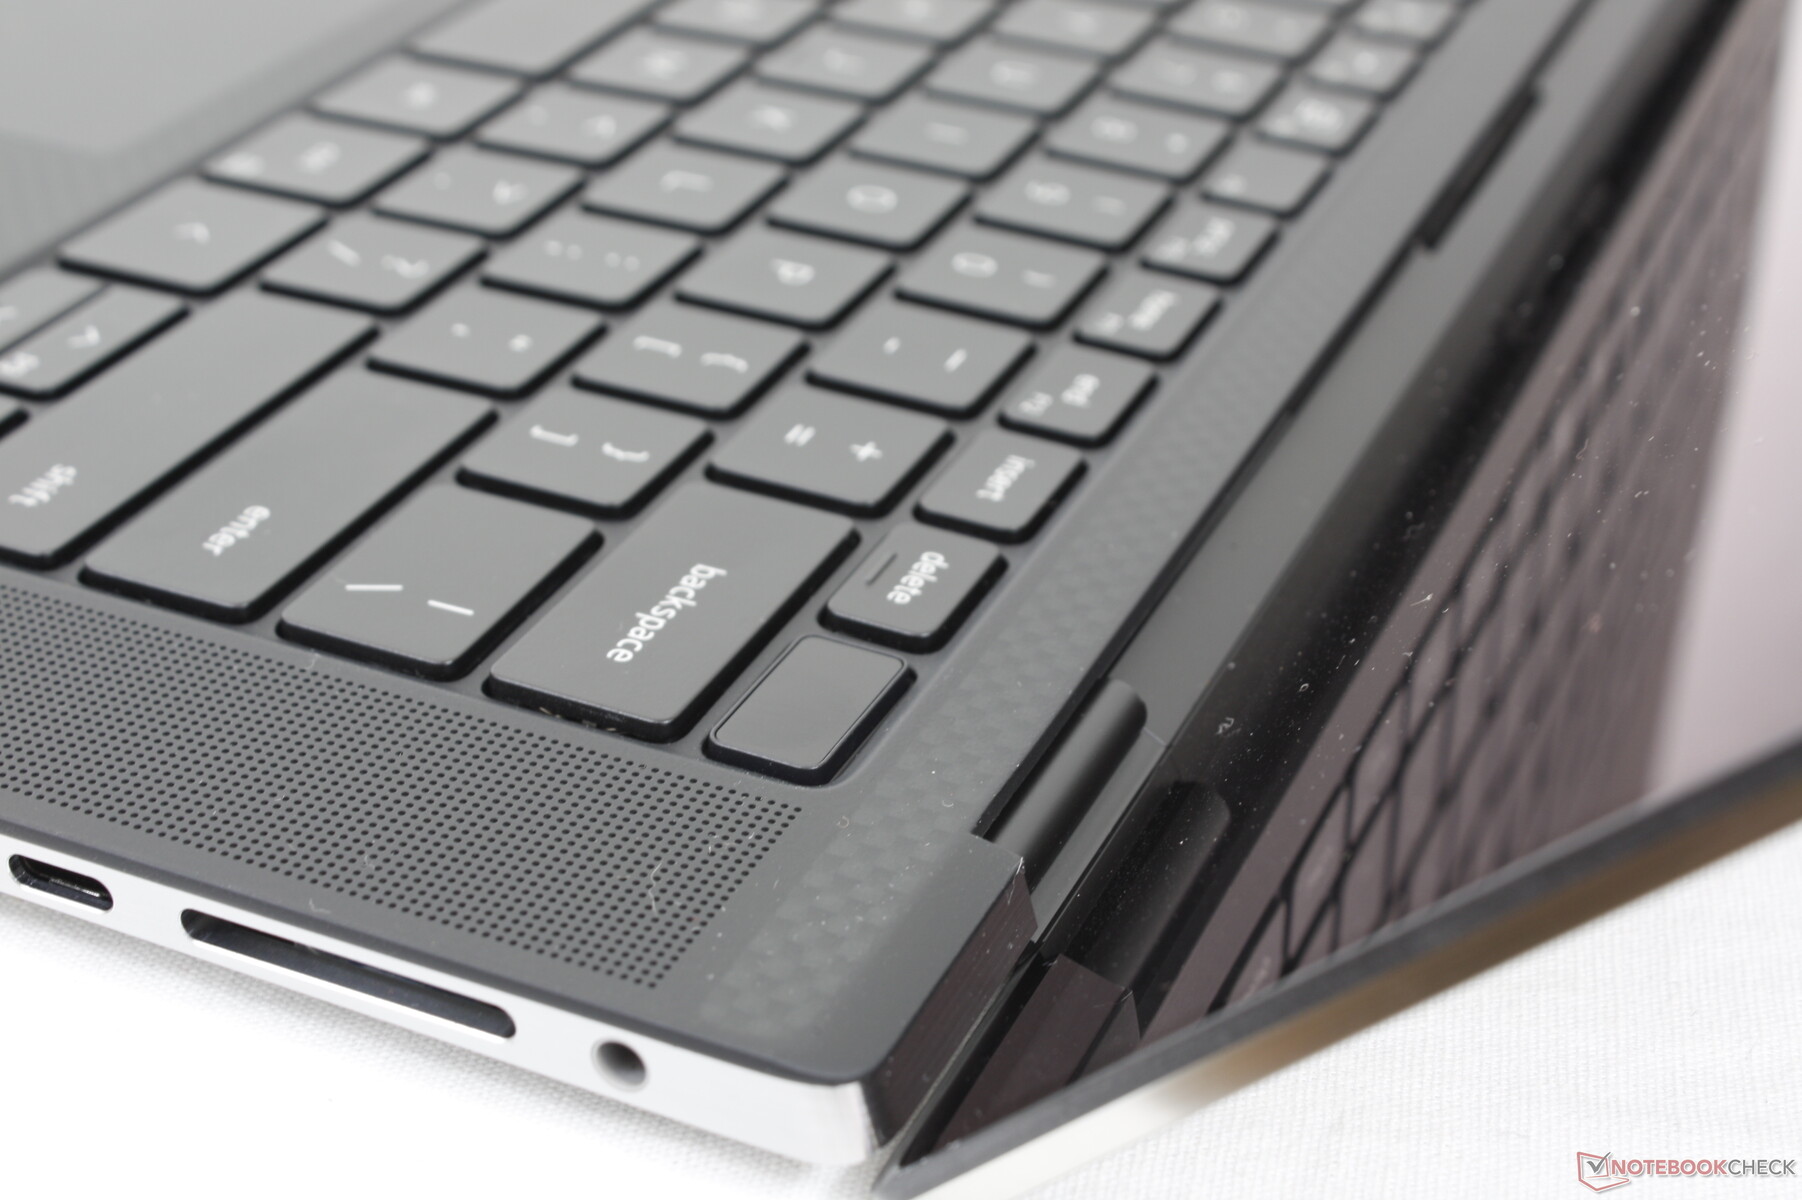
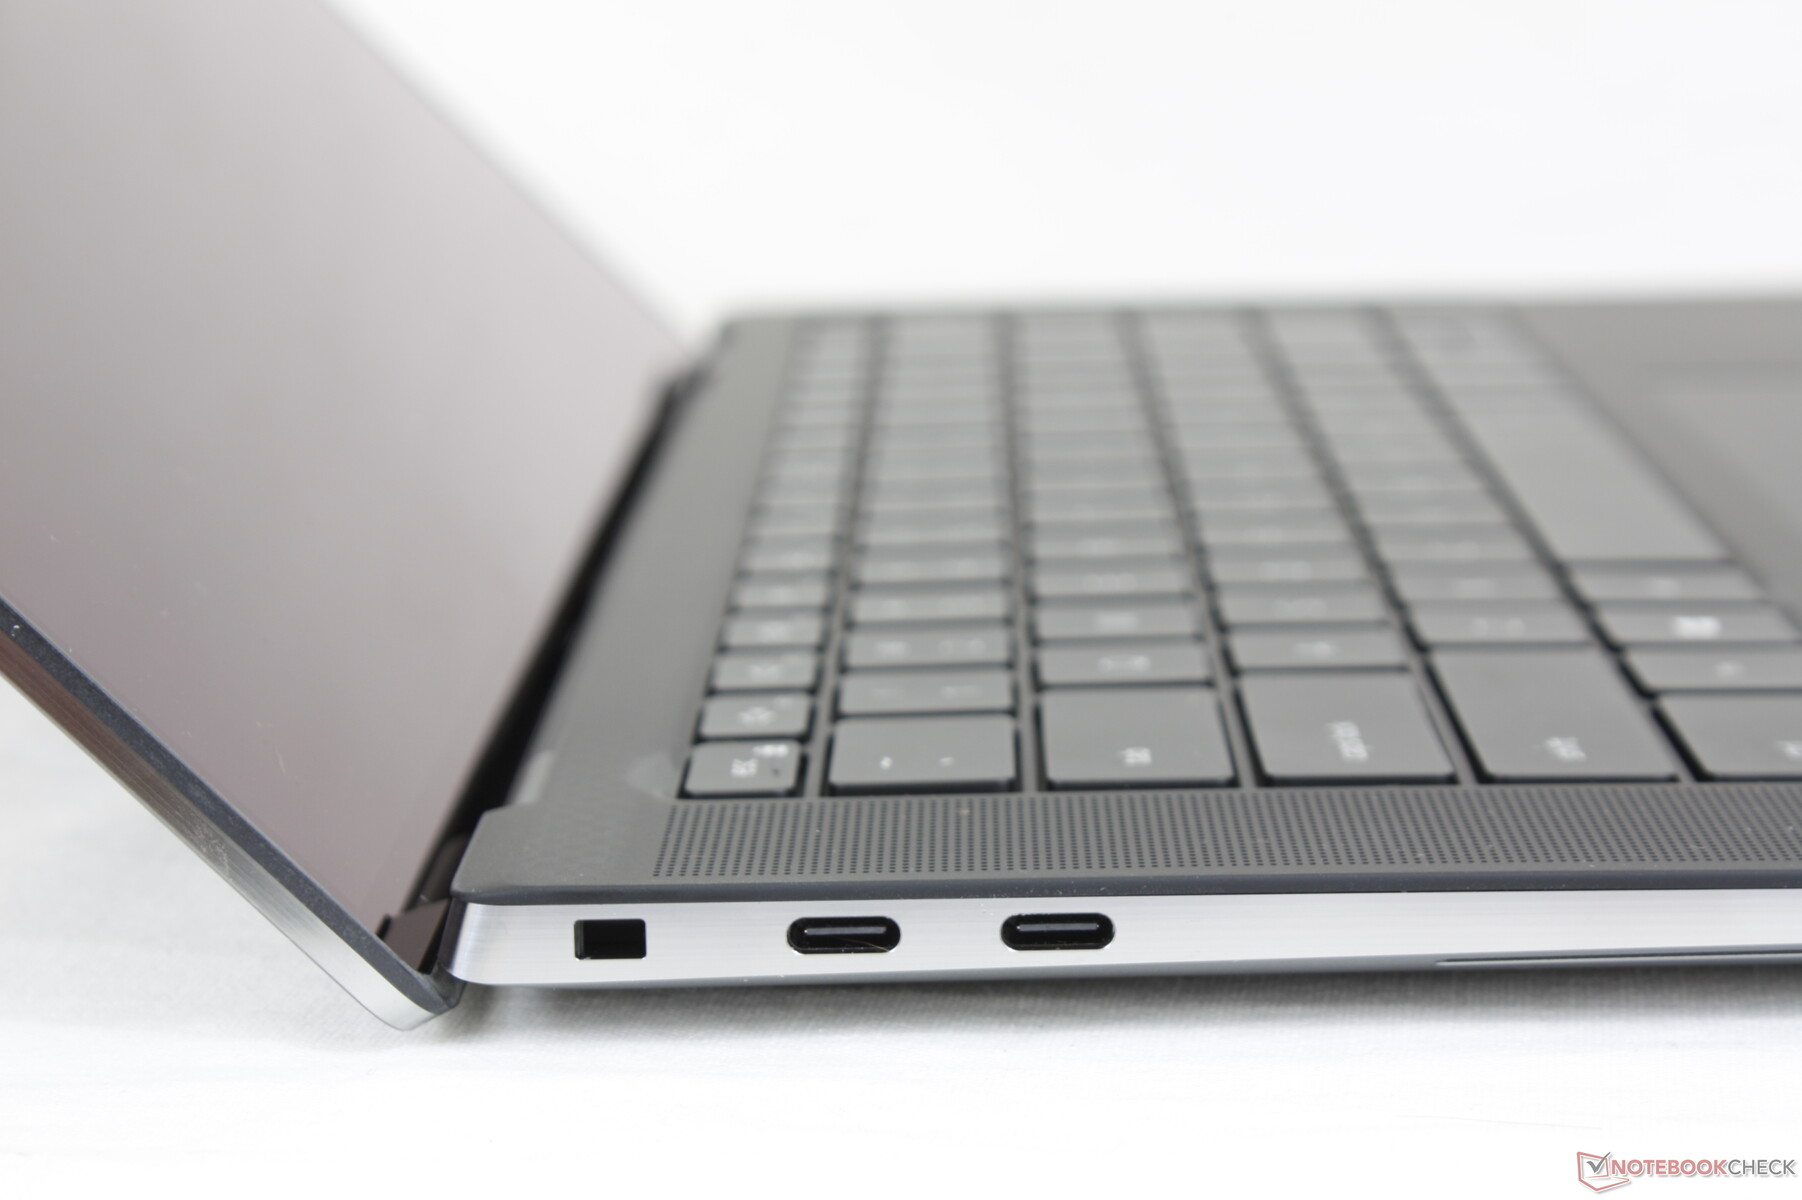
Le opzioni delle porte includono solo USB-C, quindi preparatevi ad avere adattatori ovunque andiate. Tutte e tre le porte USB-C supportano sia DisplayPort che Power Delivery ma solo le due porte USB-C di sinistra supportano i dispositivi Thunderbolt. Queste due porte in particolare sono state aggiornate da Thunderbolt 3 sul Precision 5550 a Thunderbolt 4 sul Precision 5560.
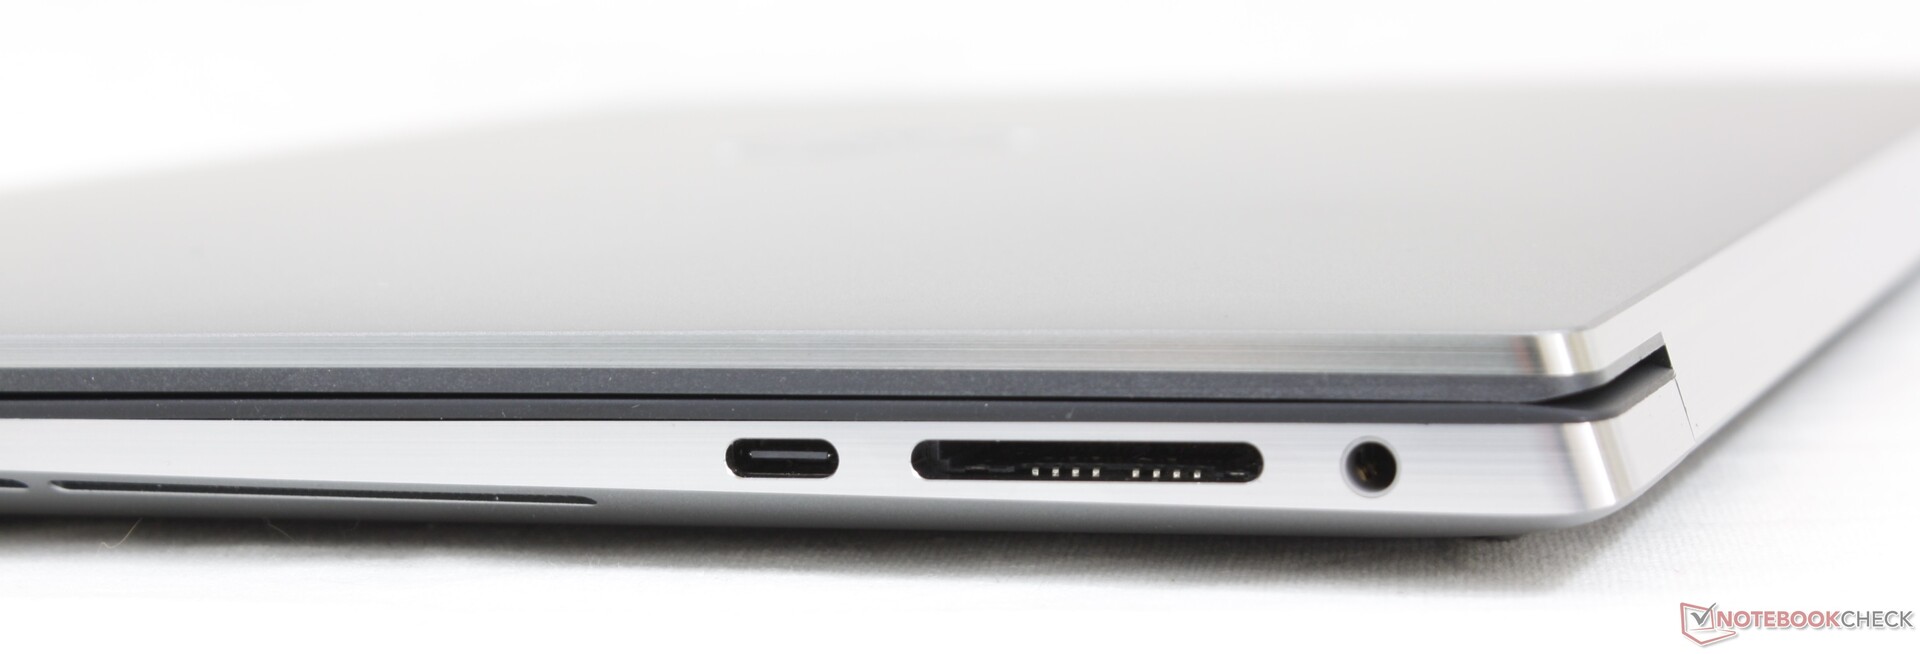
Lettore di schede SD
Le velocità di trasferimento sono molto veloci e raggiungono quasi 200 MB/s sulla nostra scheda di prova UHS-II. Lo slot non è caricato a molla e quindi la scheda SD sporgerà oltre il bordo.
| SD Card Reader | |
| average JPG Copy Test (av. of 3 runs) | |
| Lenovo ThinkPad P15 G2-20YQ001JGE (AV Pro V60) | |
| Dell Precision 5000 5560 (AV Pro V60) | |
| Dell Precision 5550 P91F (Toshiba Exceria Pro SDXC 64 GB UHS-II) | |
| Dell Precision 7550 (Toshiba Exceria Pro SDXC 64 GB UHS-II) | |
| Razer Blade 15 Studio Edition 2020 (Toshiba Exceria Pro SDXC 64 GB UHS-II) | |
| HP ZBook Studio 15 G8 (AV Pro V60) | |
| maximum AS SSD Seq Read Test (1GB) | |
| Lenovo ThinkPad P15 G2-20YQ001JGE (AV Pro V60) | |
| Dell Precision 5000 5560 (AV Pro V60) | |
| Dell Precision 5550 P91F (Toshiba Exceria Pro SDXC 64 GB UHS-II) | |
| Dell Precision 7550 (Toshiba Exceria Pro SDXC 64 GB UHS-II) | |
| HP ZBook Studio 15 G8 (AV Pro V60) | |
Comunicazione
Webcam - Ancora senza otturatore per la privacy


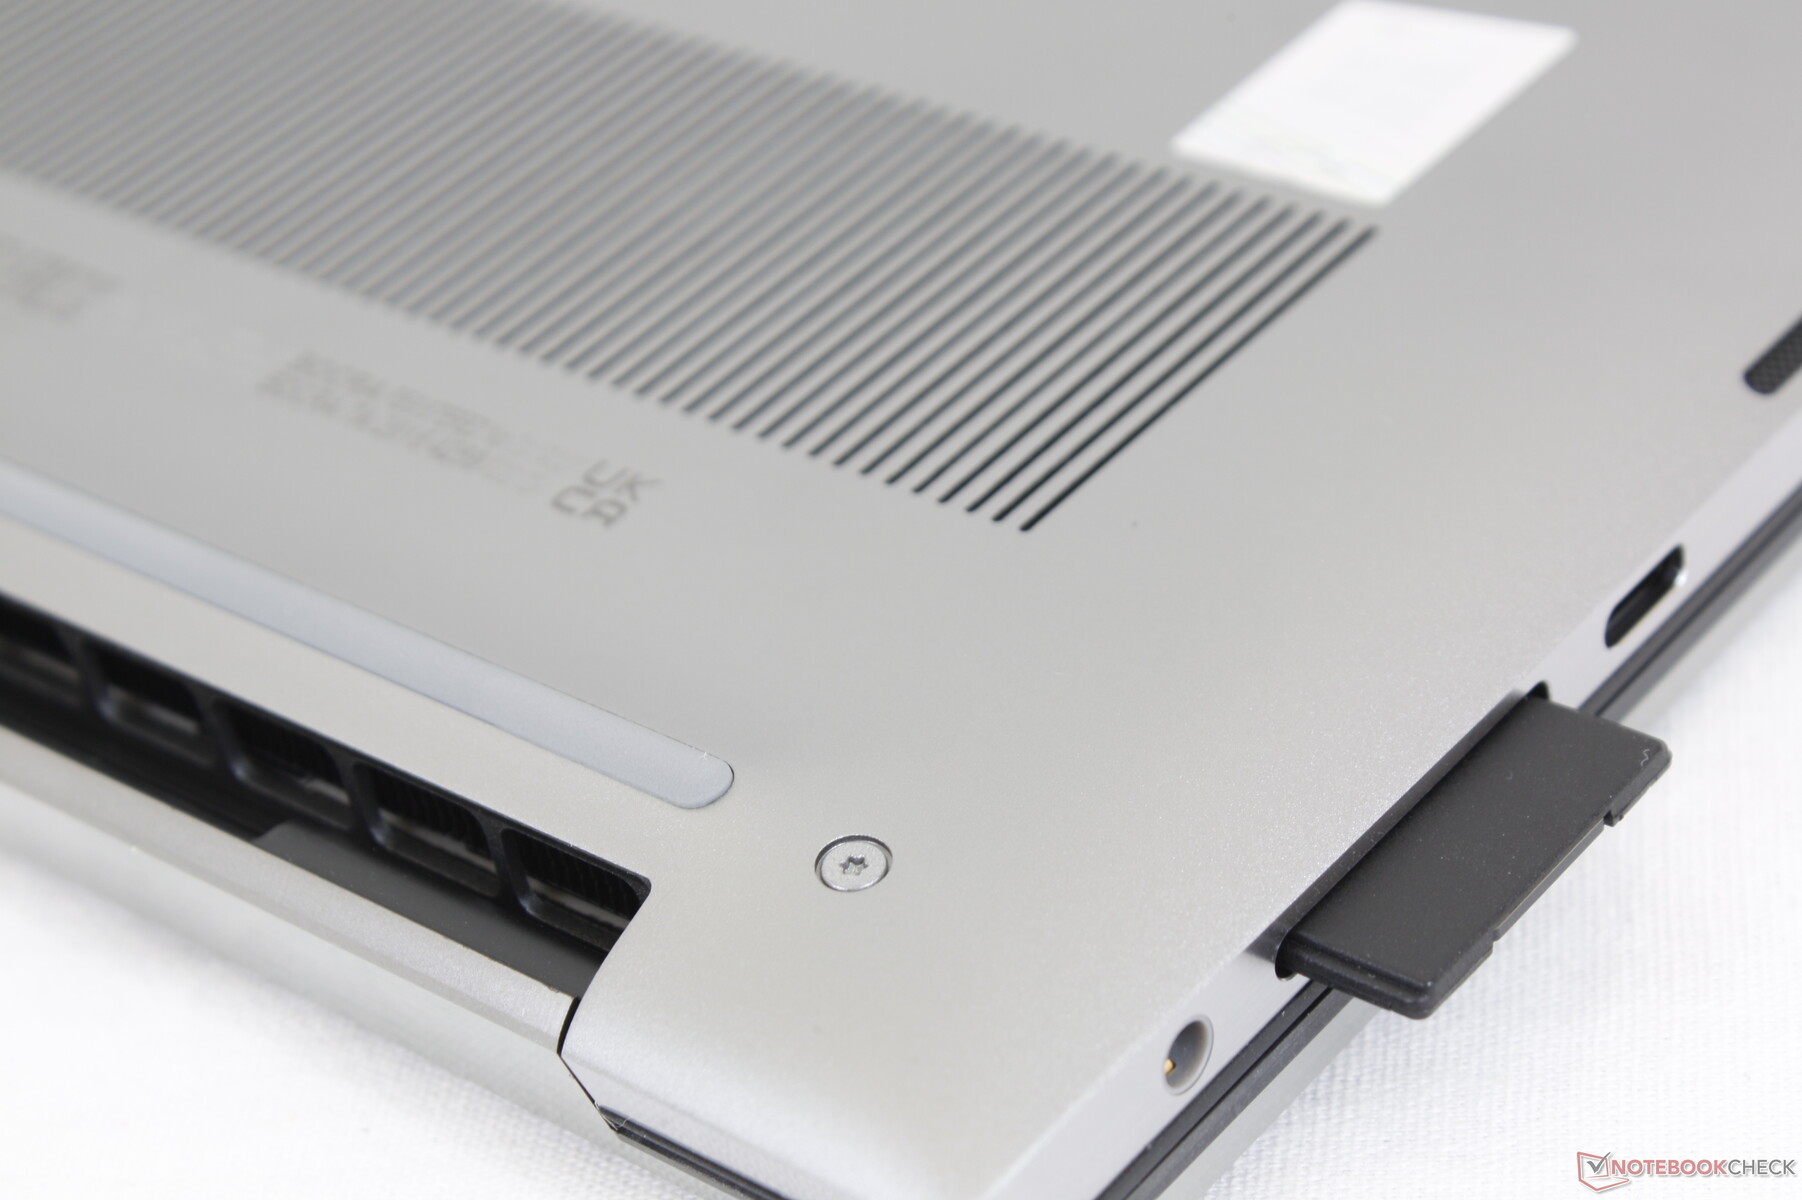
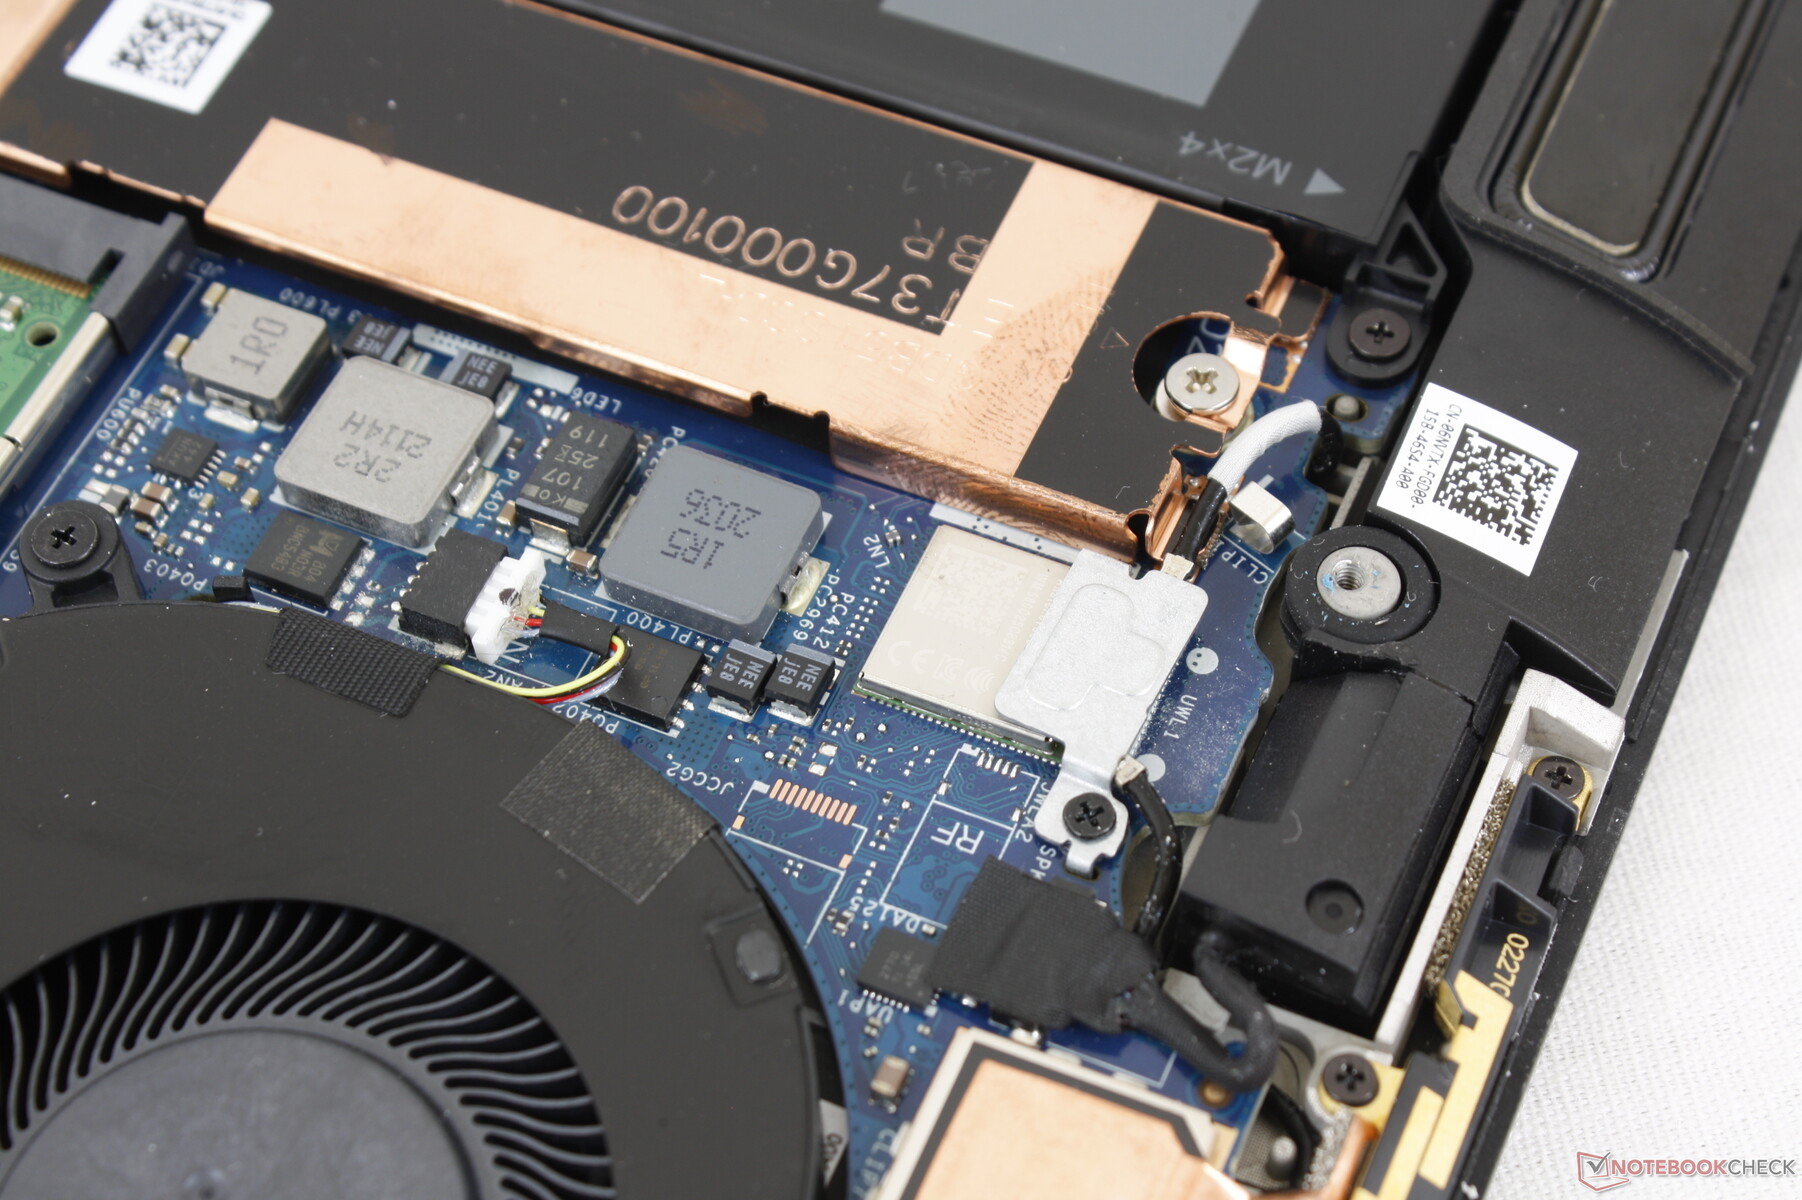
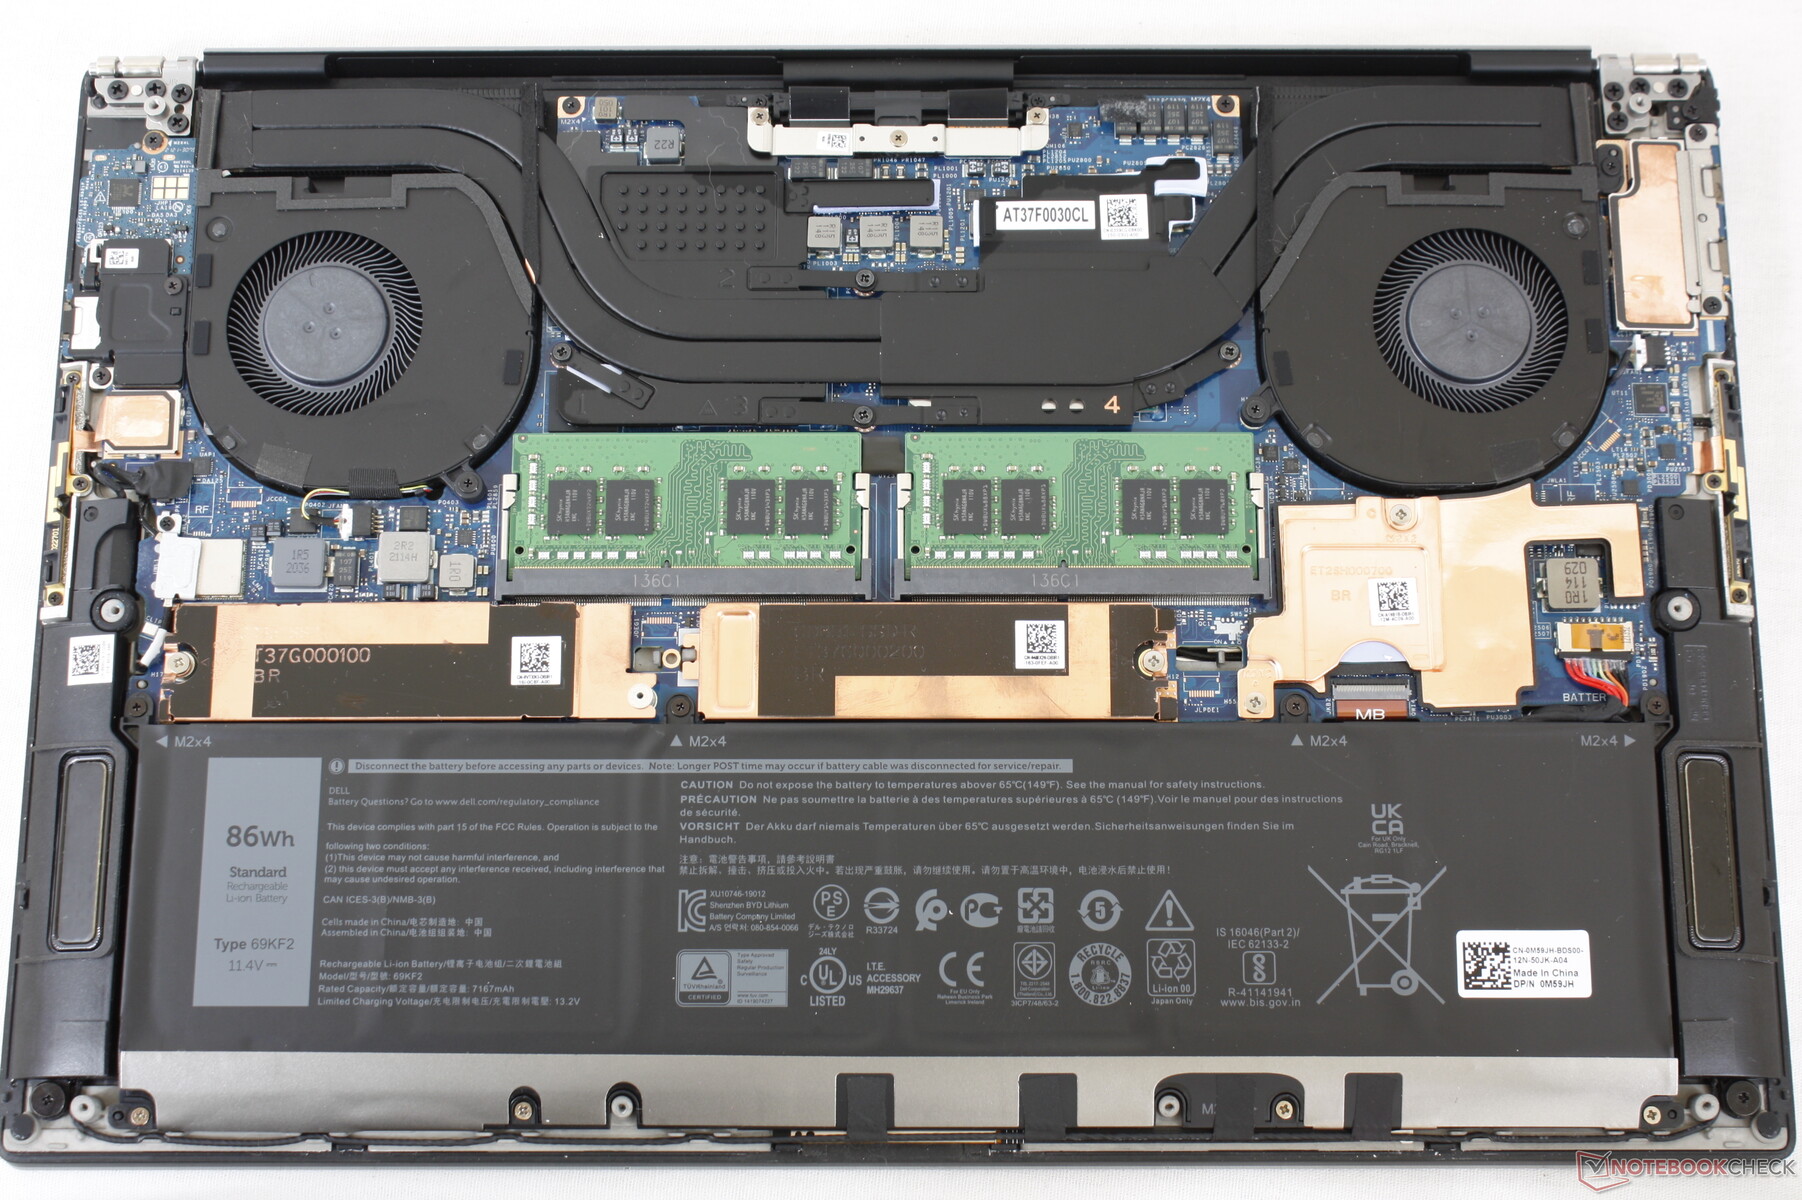
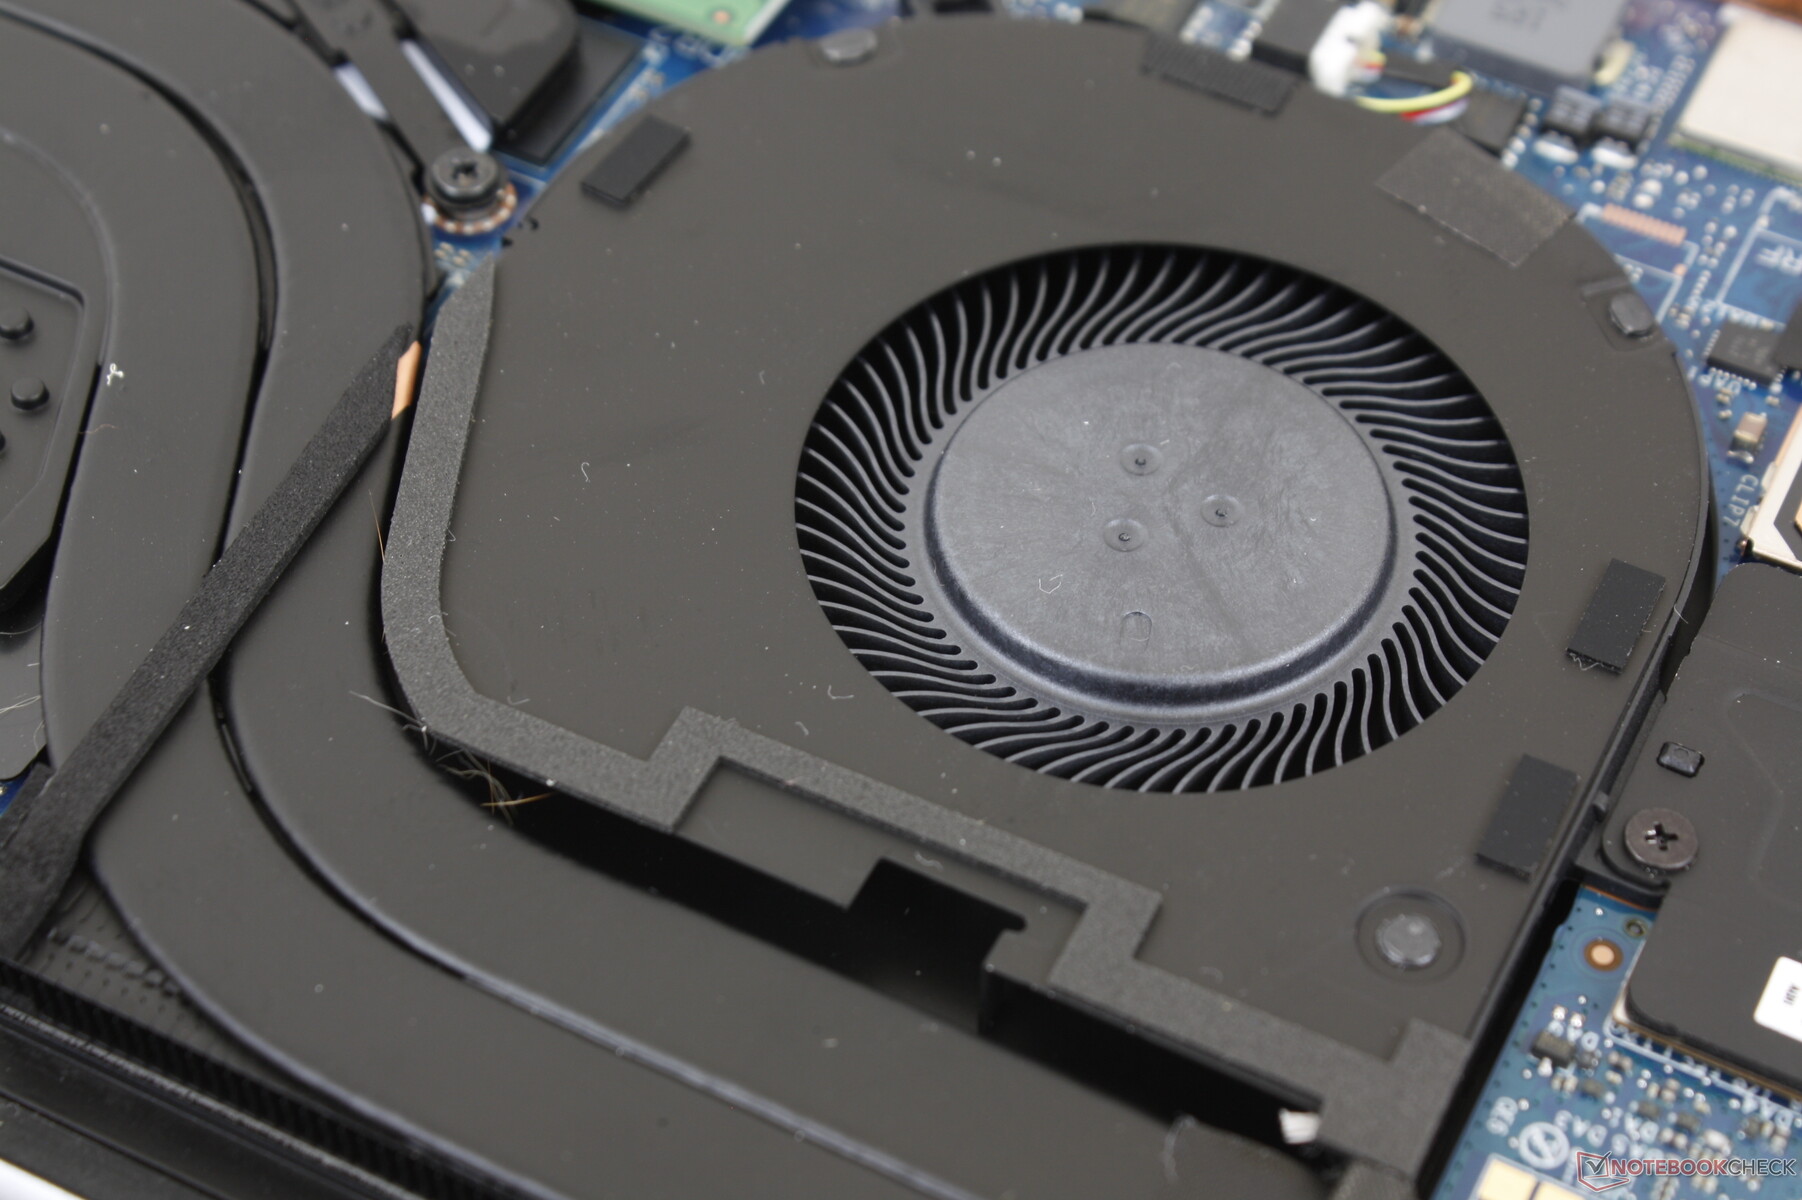
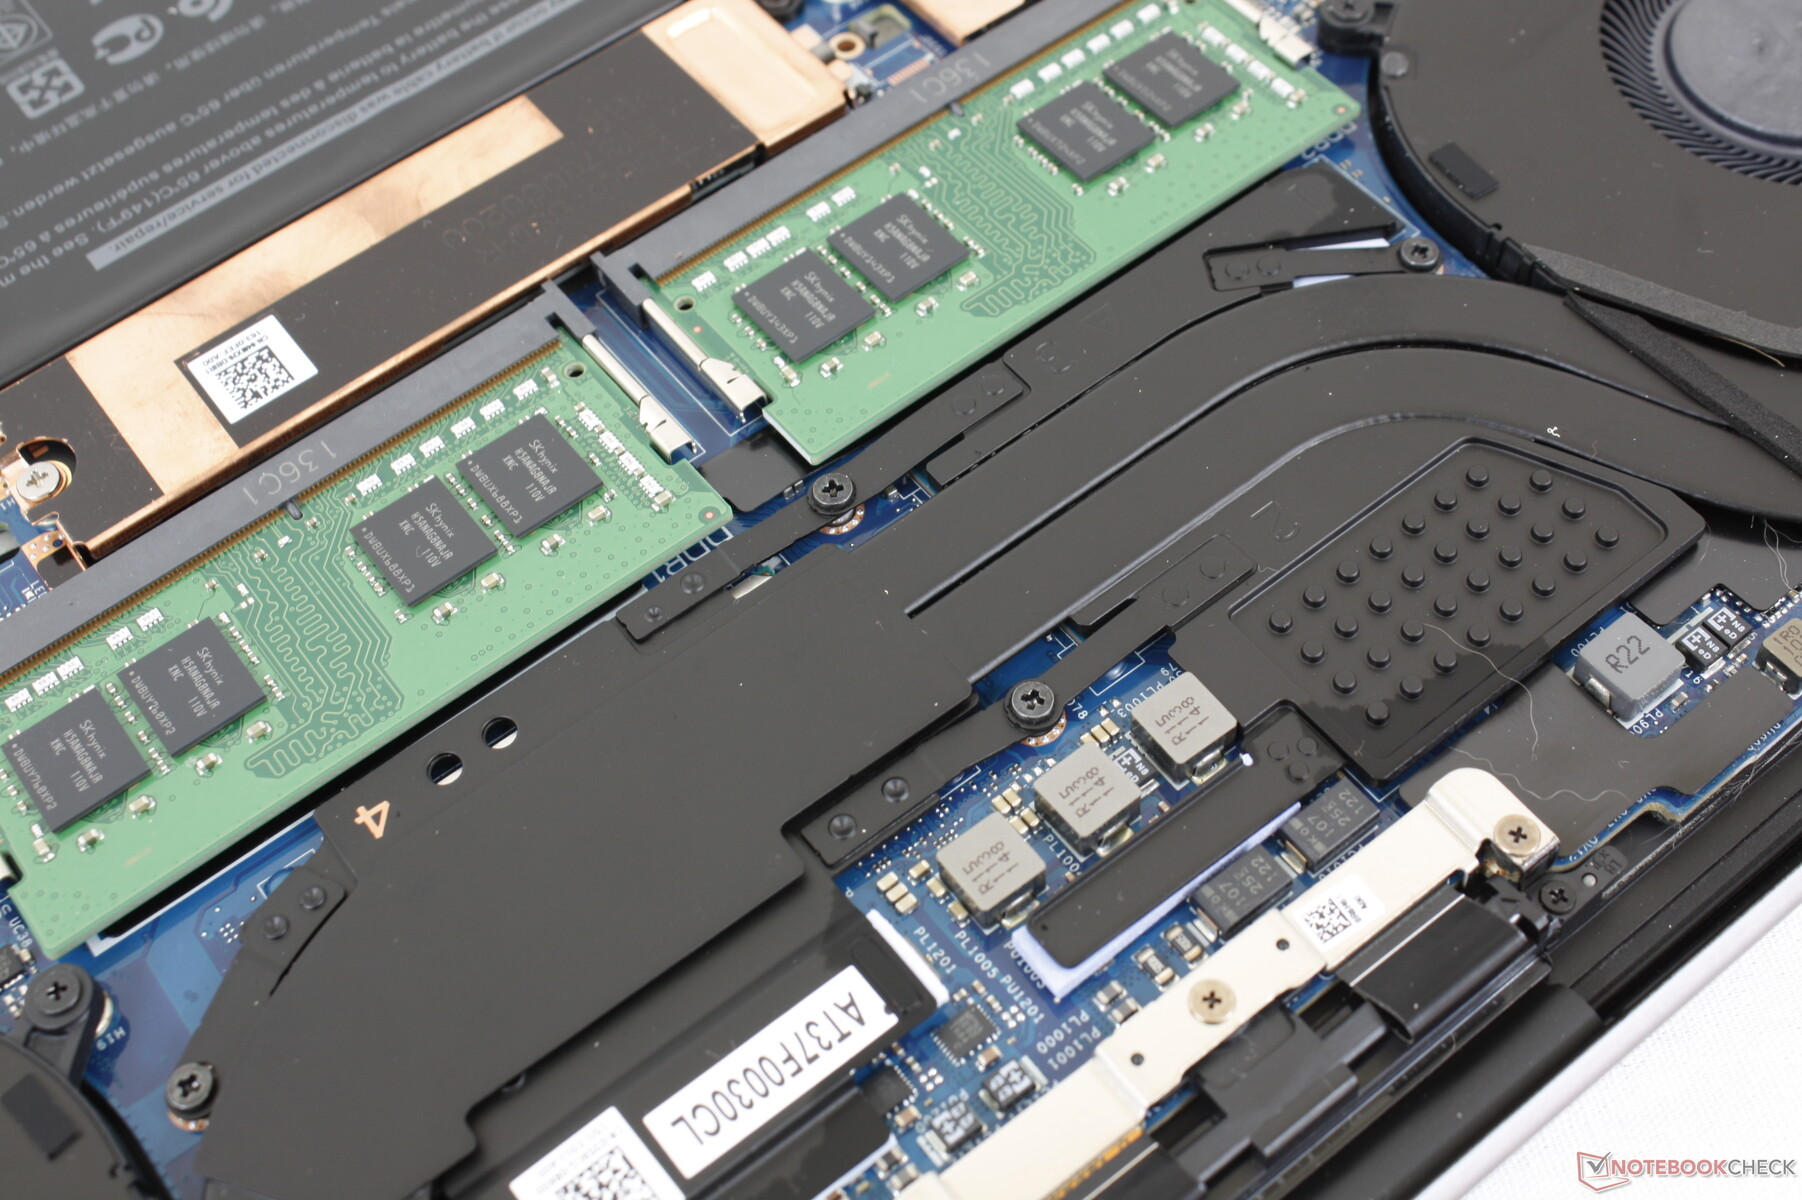
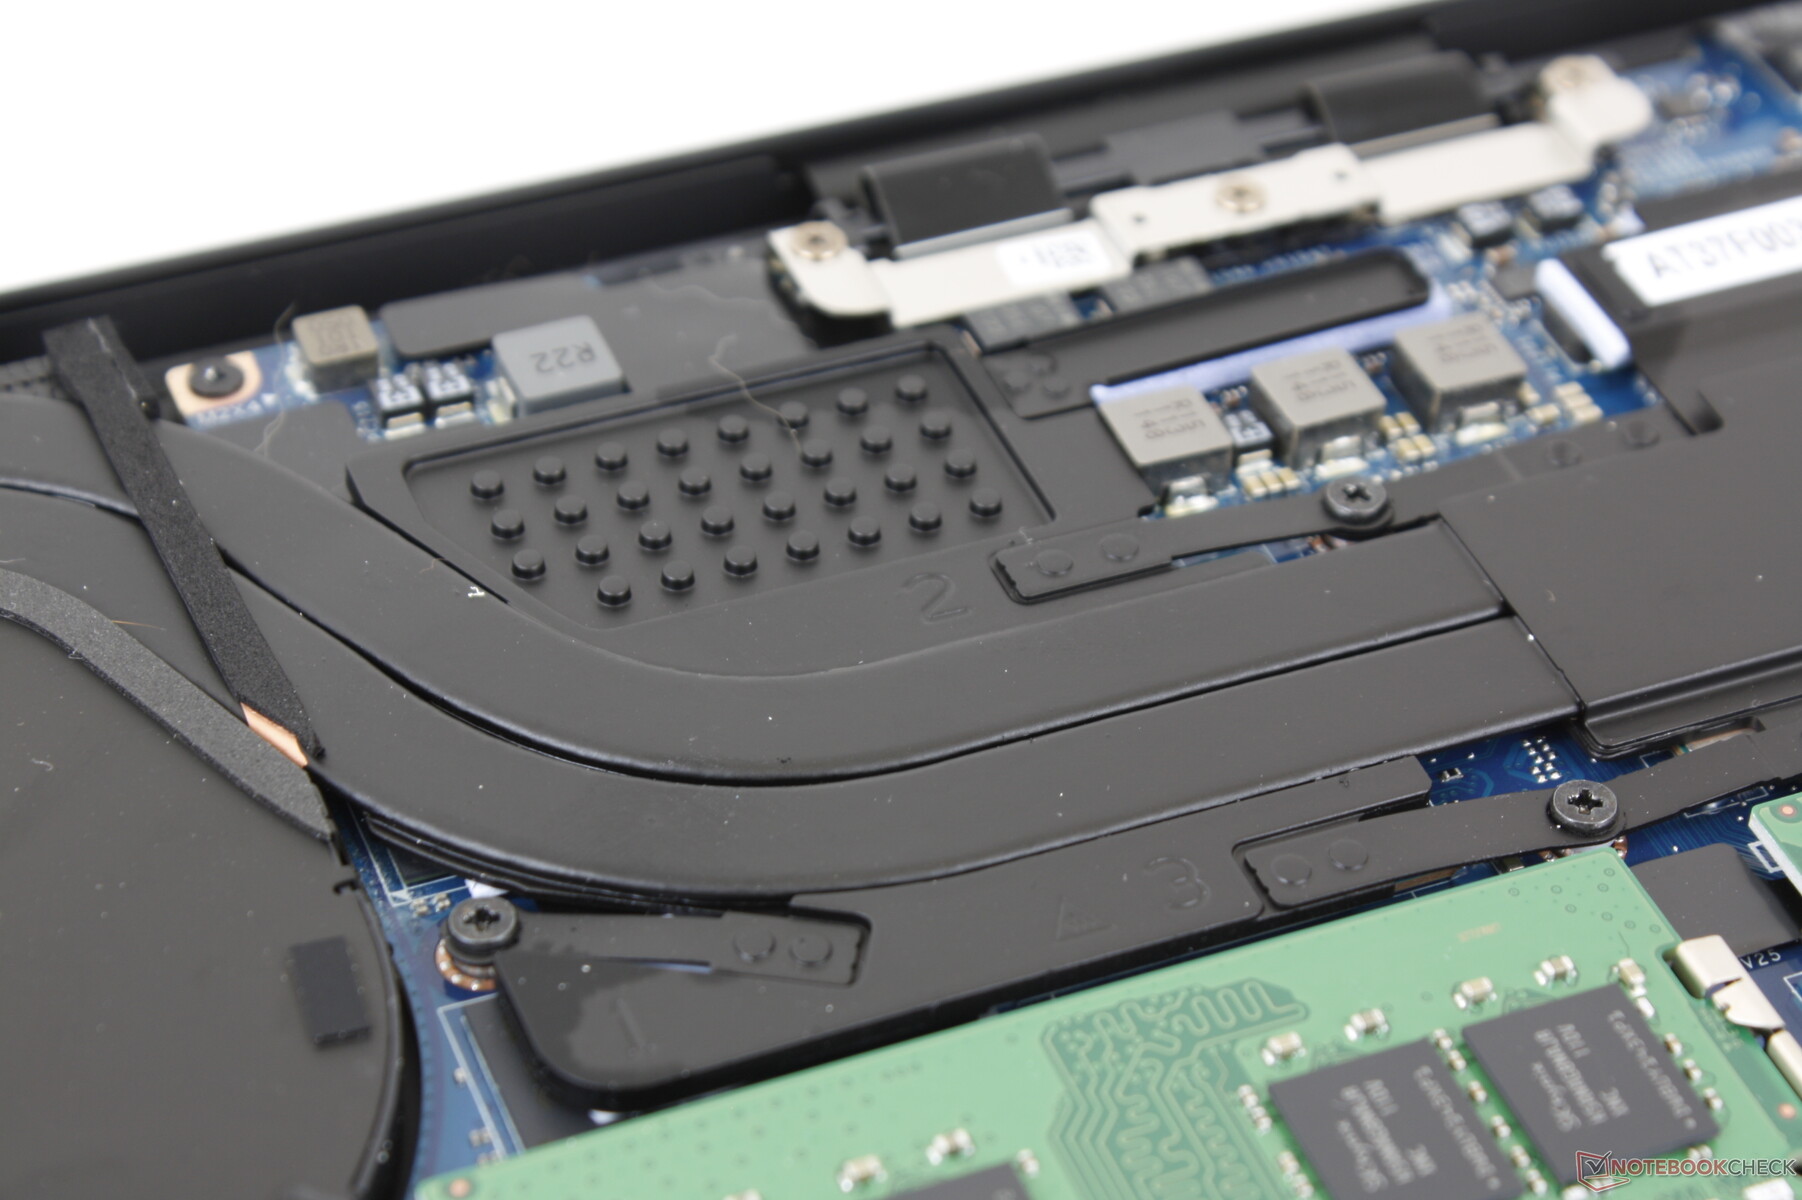
Manutenzione
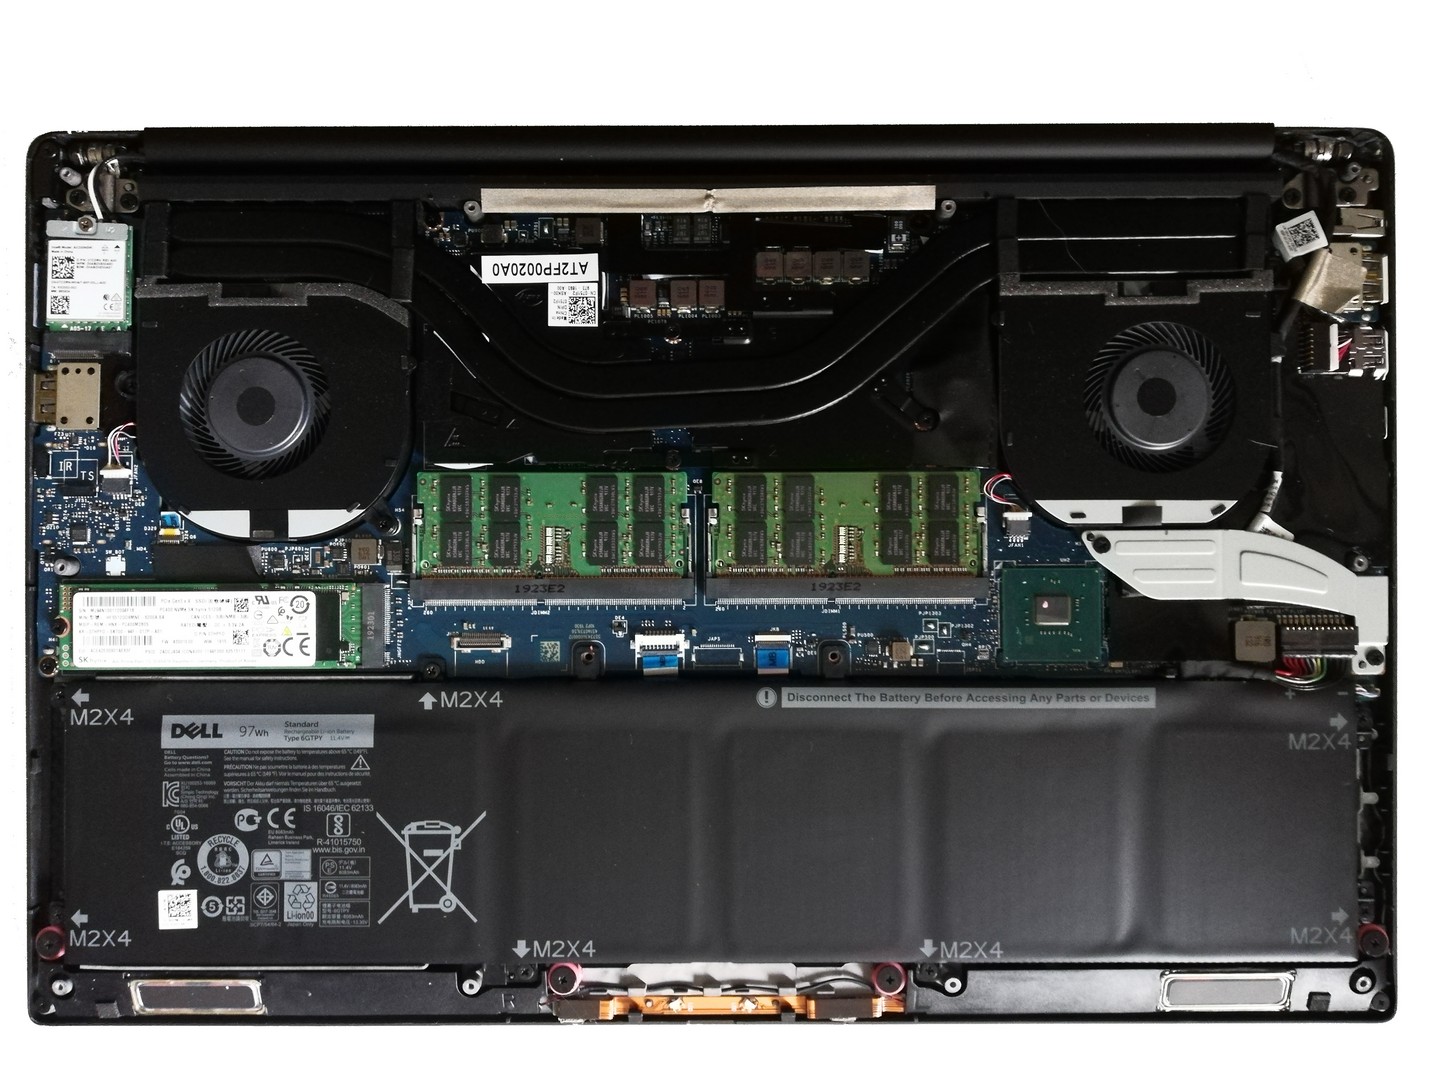
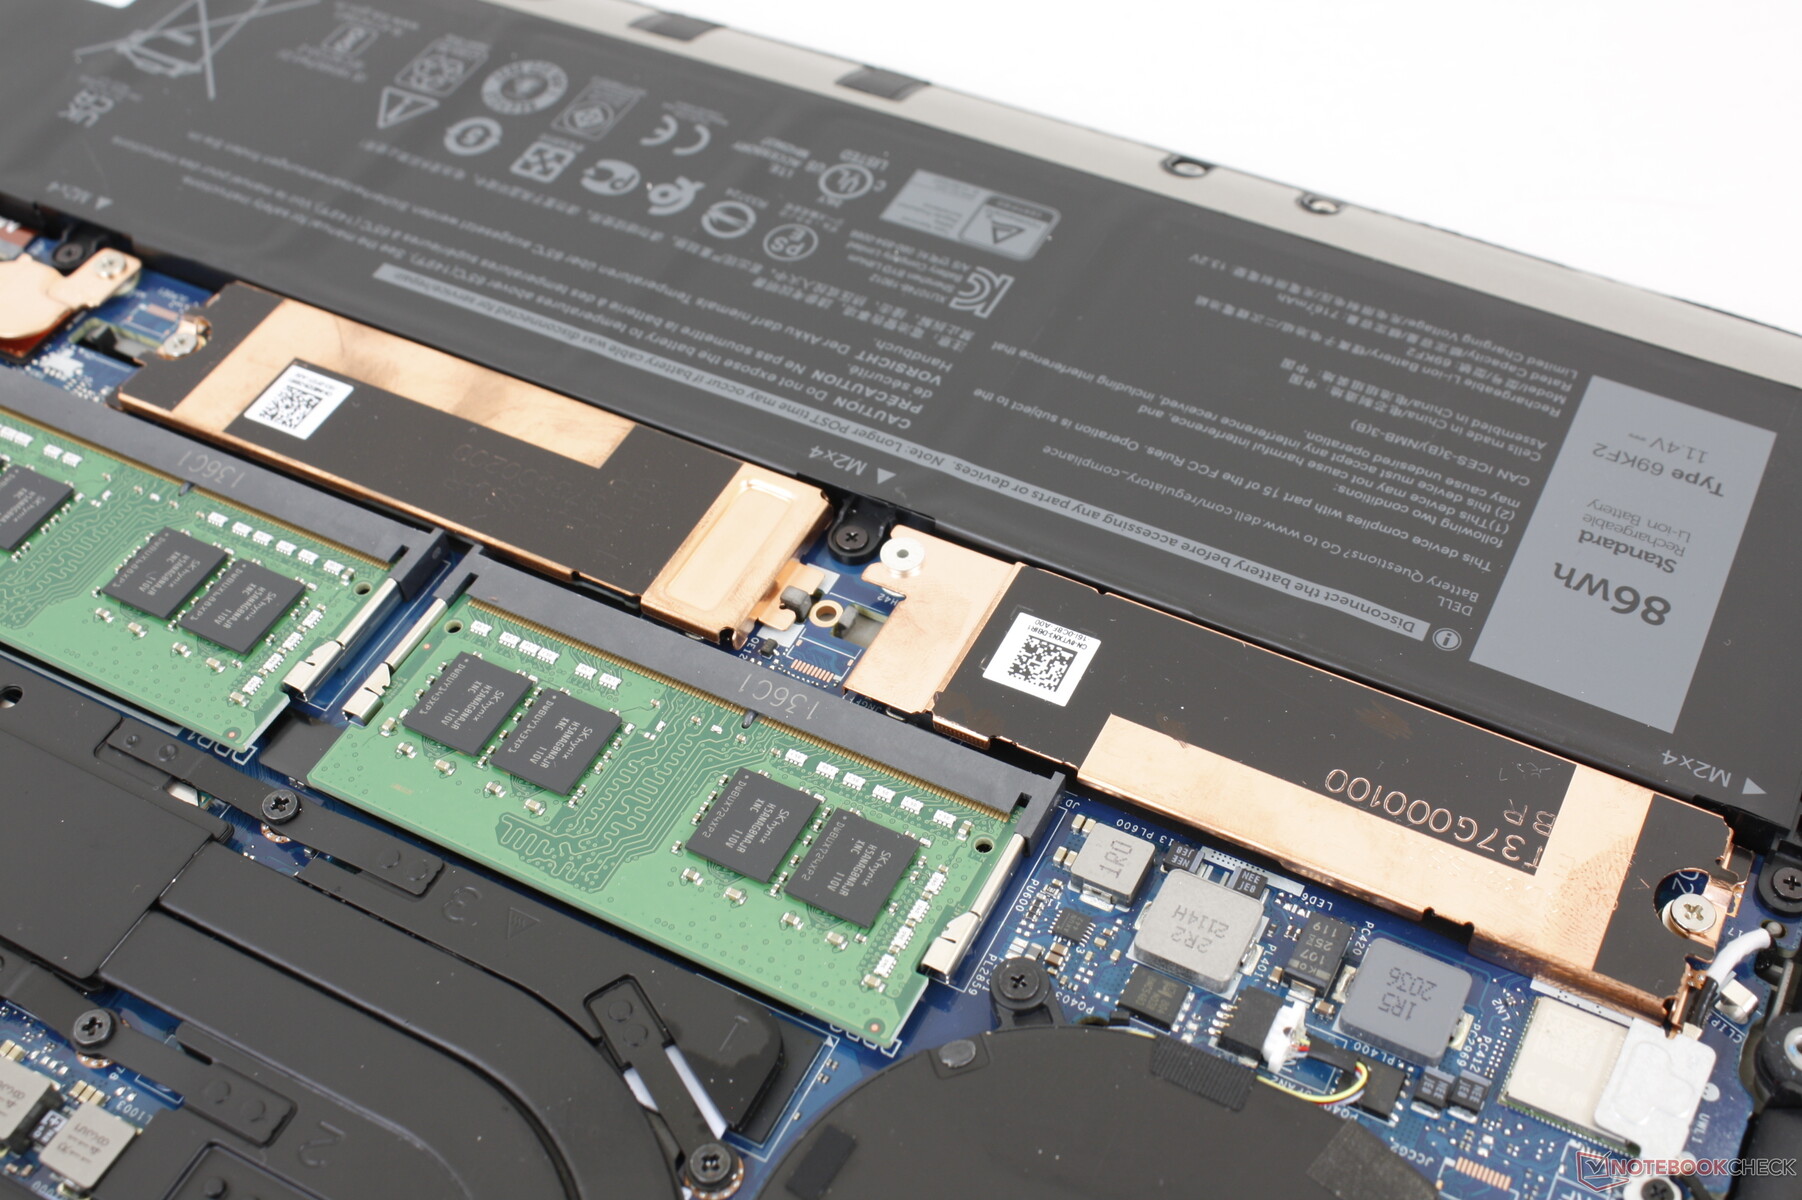
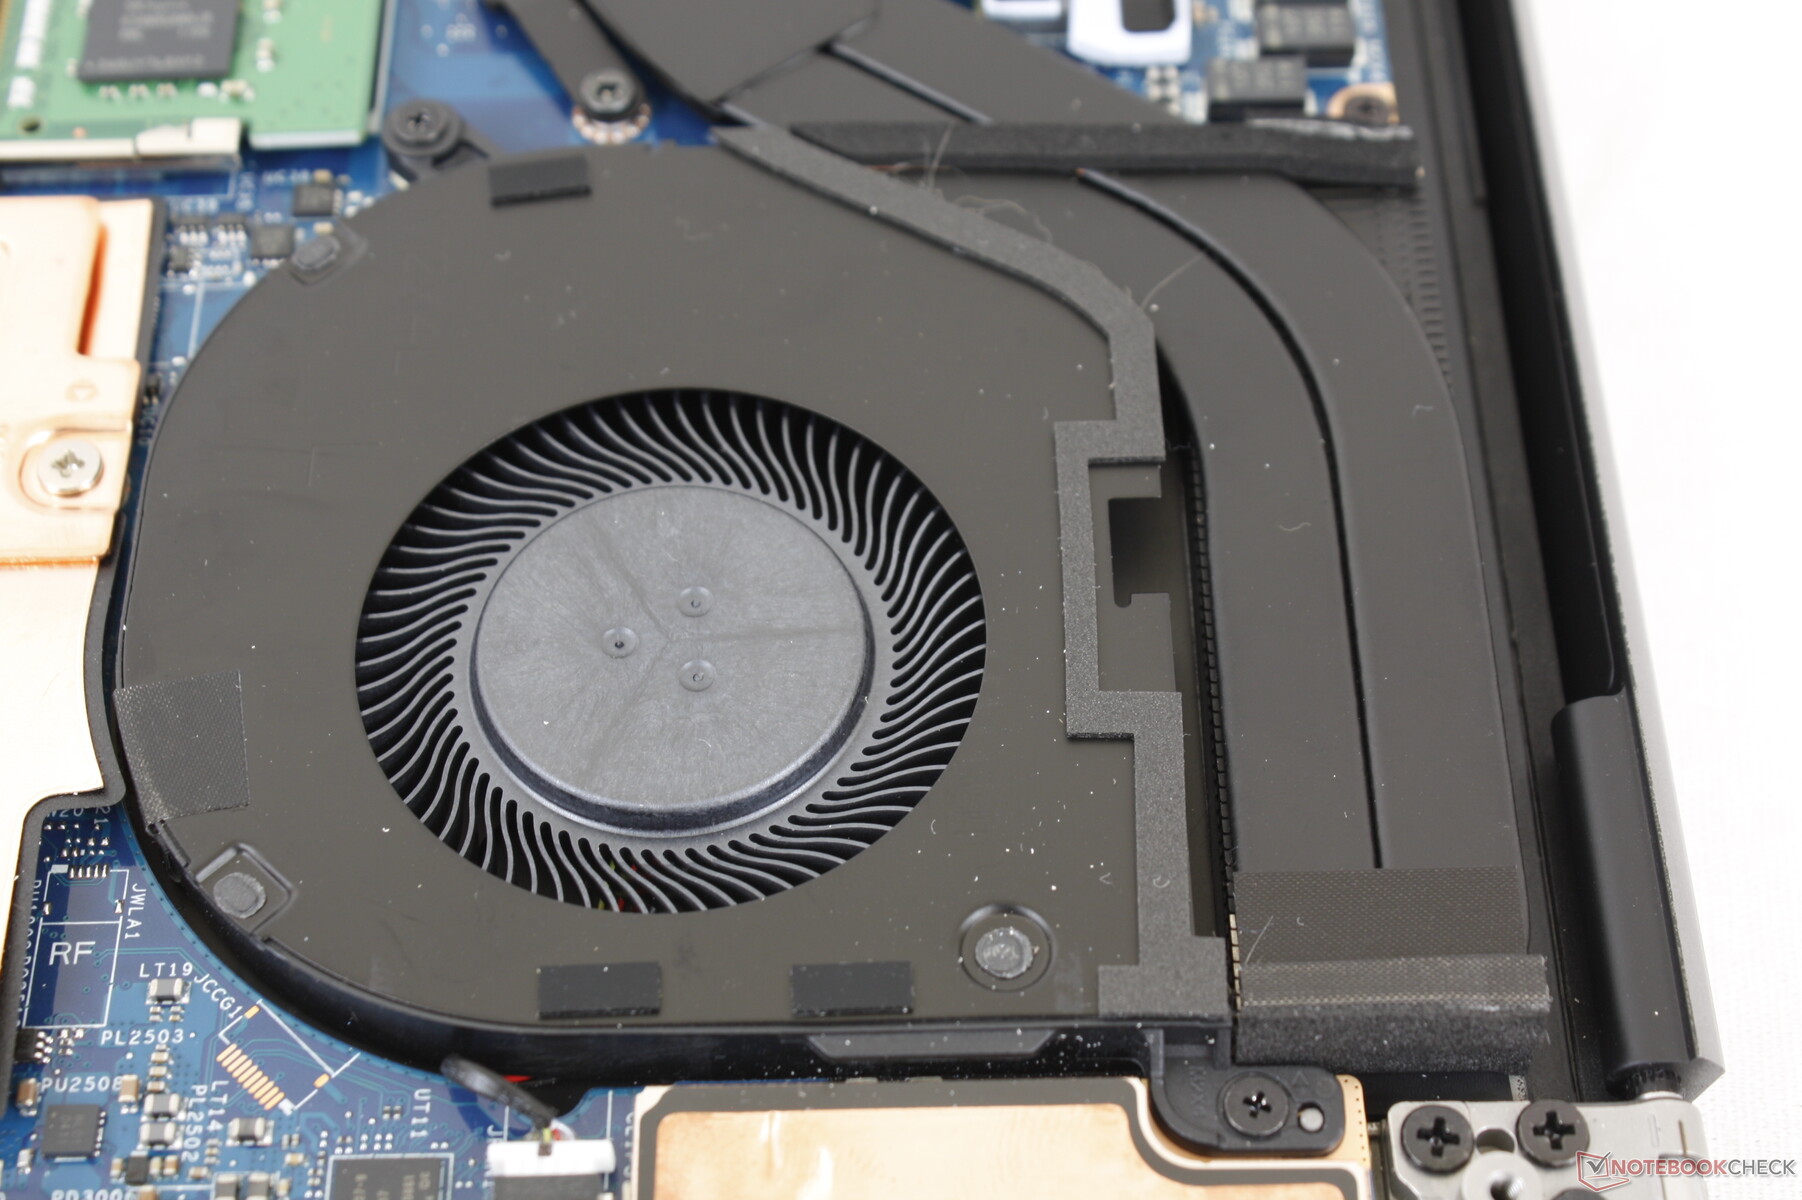
Il pannello inferiore è più difficile da rimuovere rispetto al vecchio design Precision 5540. Il layout interno è altrimenti essenzialmente identico al Precision 5550.
Accessori e garanzia
La scatola di vendita include un pratico adattatore da USB-C a USB-A e HDMI di dimensioni standard, come per l'XPS 15.
Deludente, la garanzia di base è solo di un anno invece di due o tre anni su molte altre workstation mobili. Gli utenti dovrebbero passare alla serie Precision 7000 di fascia alta per avere una garanzia di base più lunga.
Dispositivi di input

Visualizza
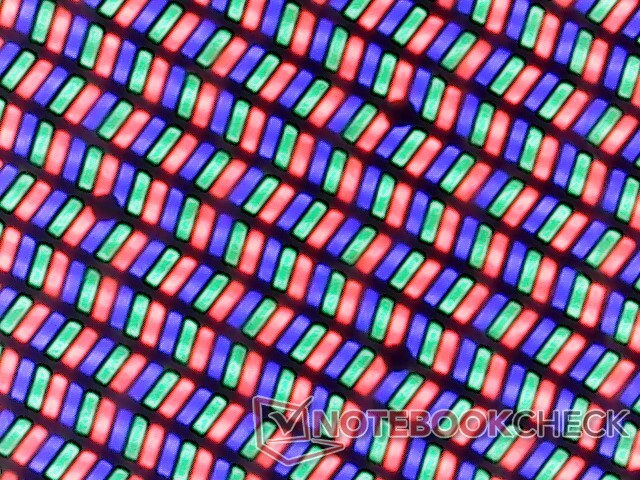
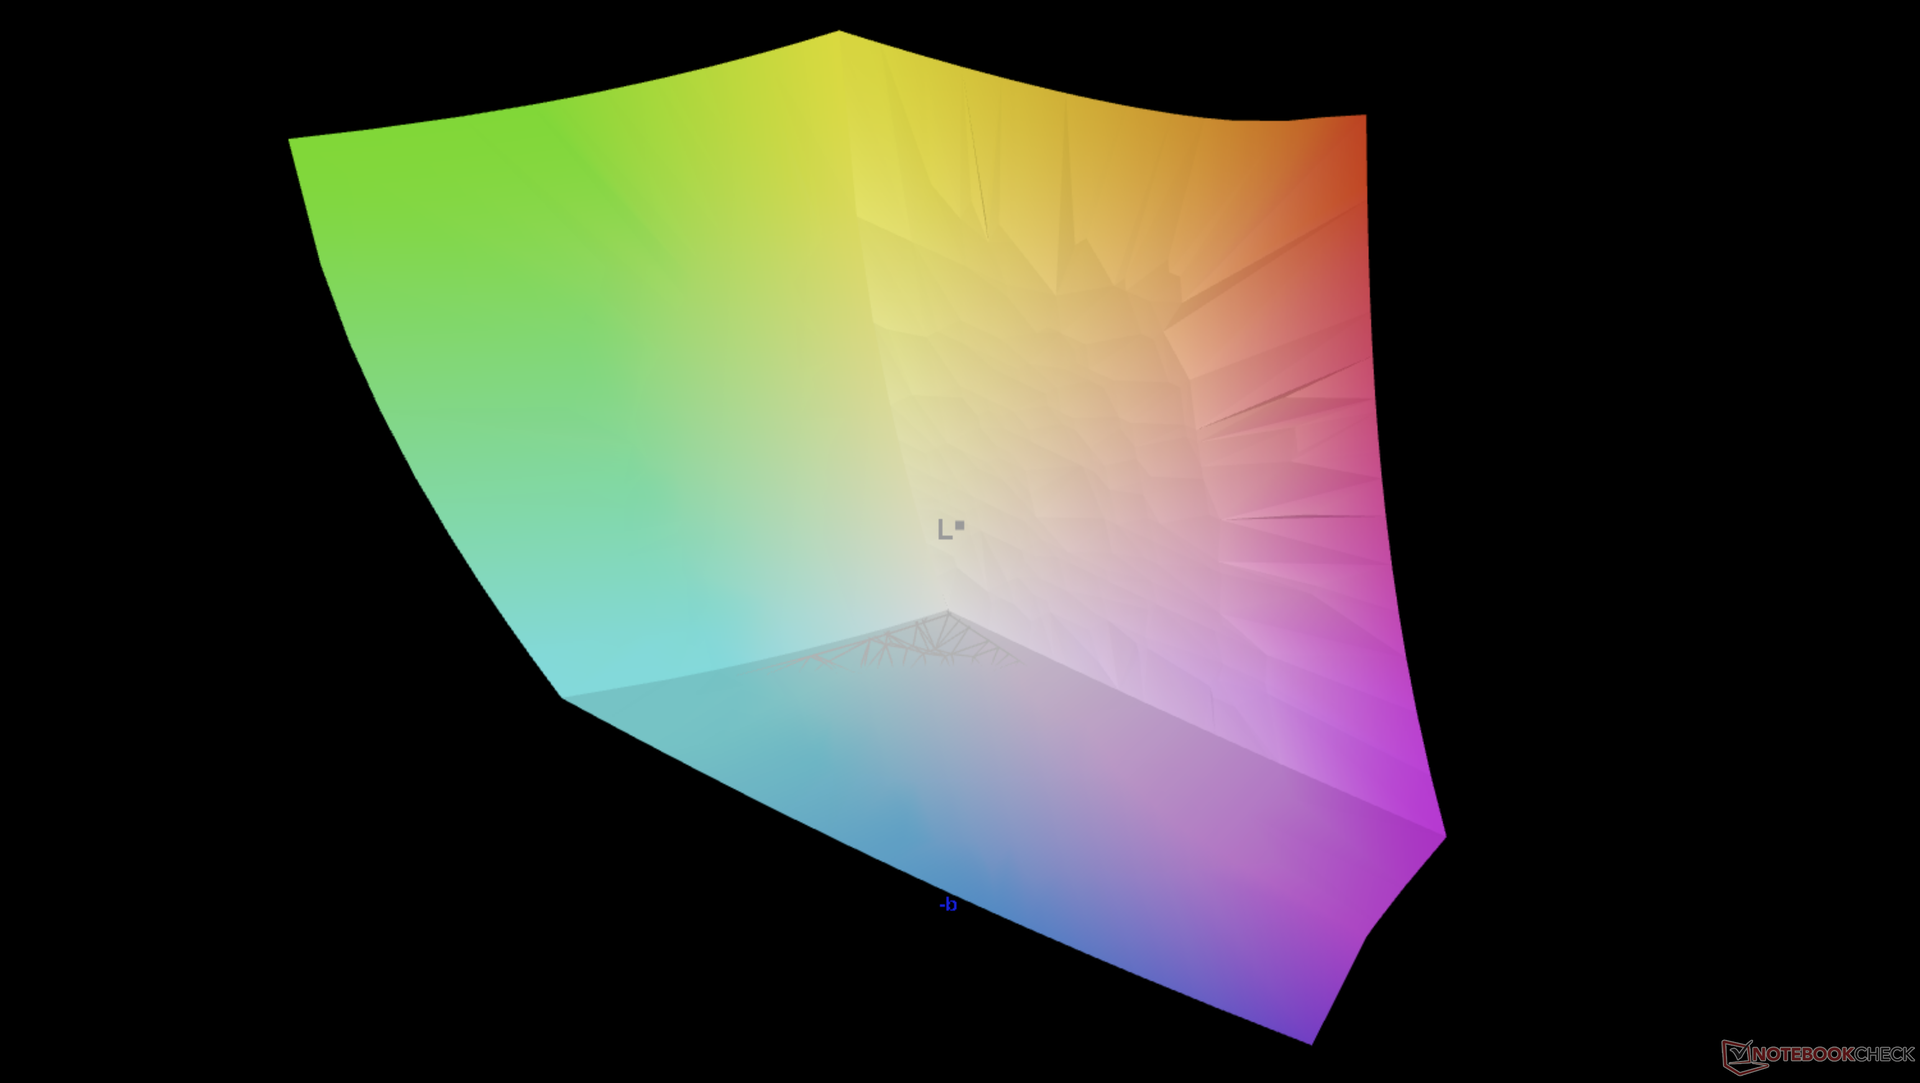
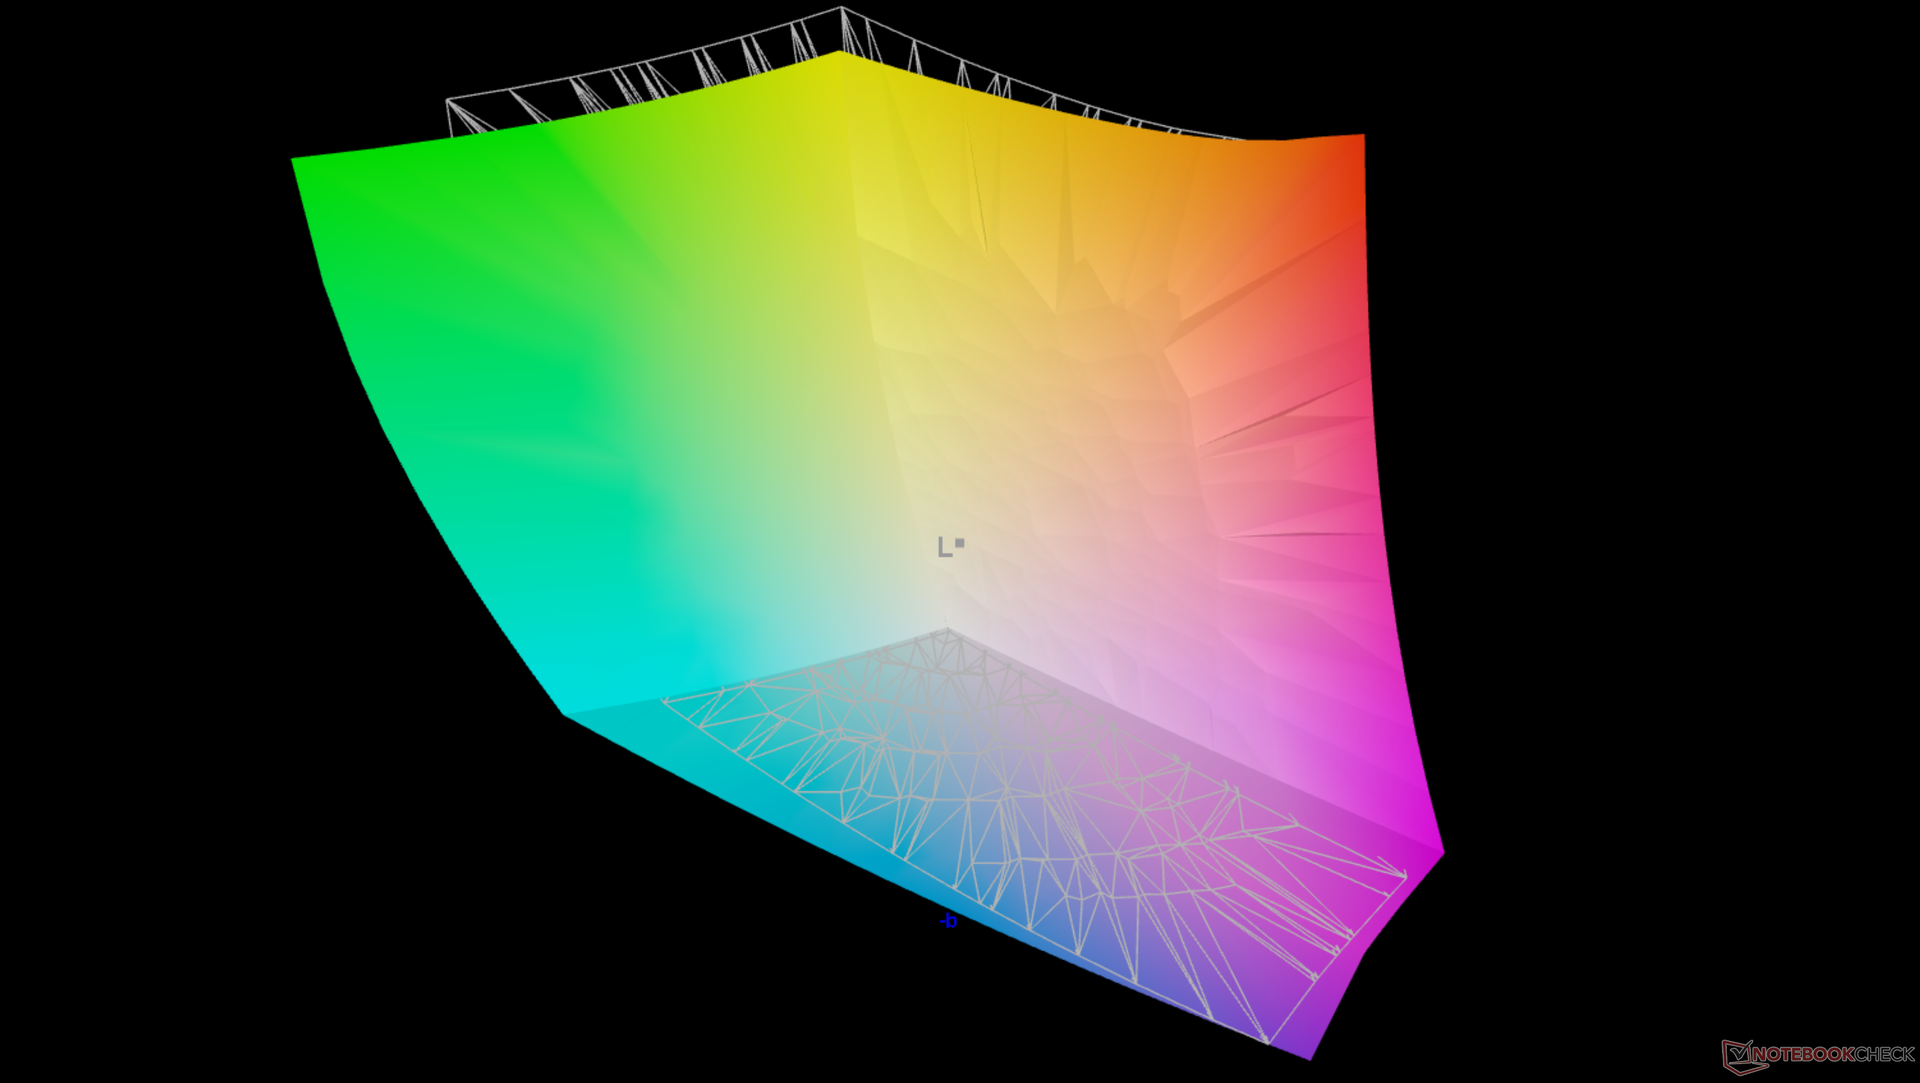
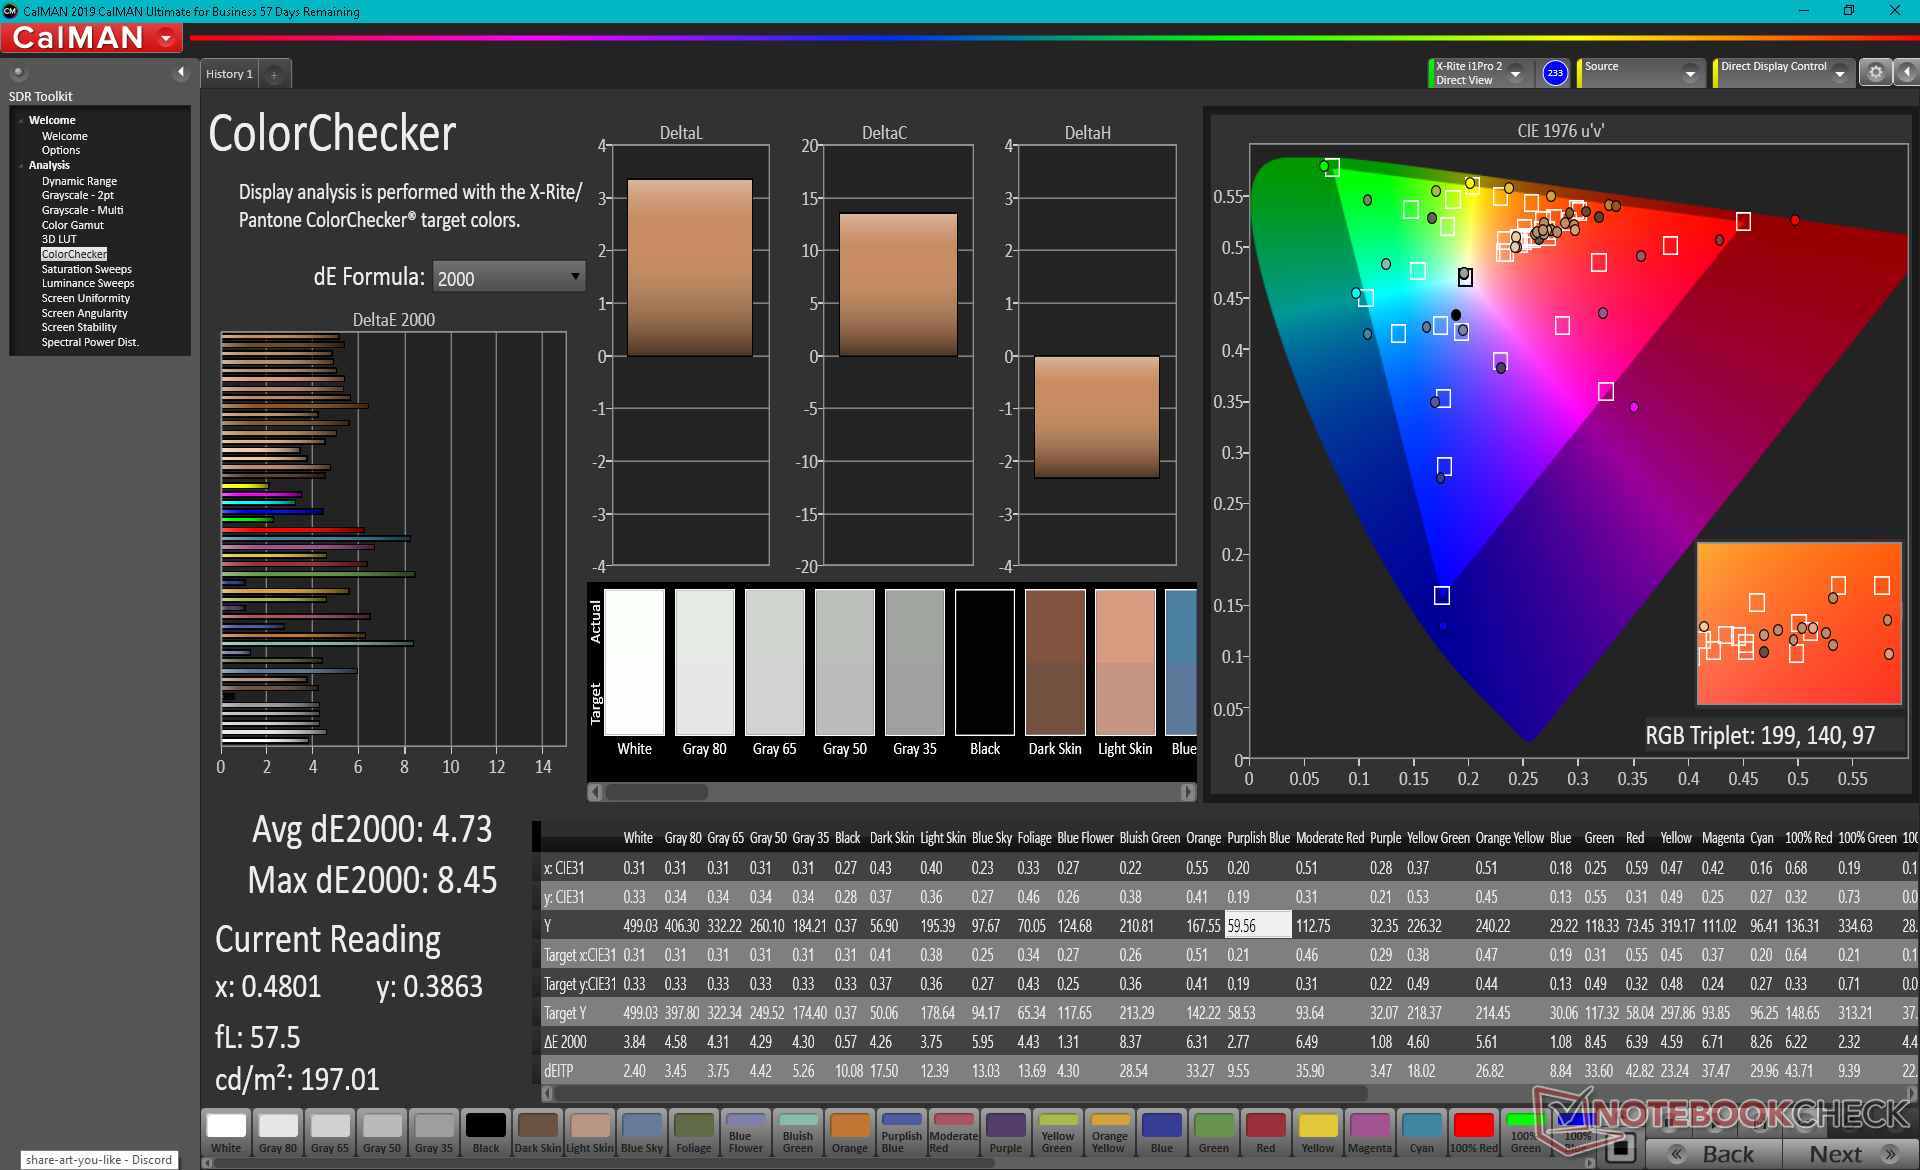
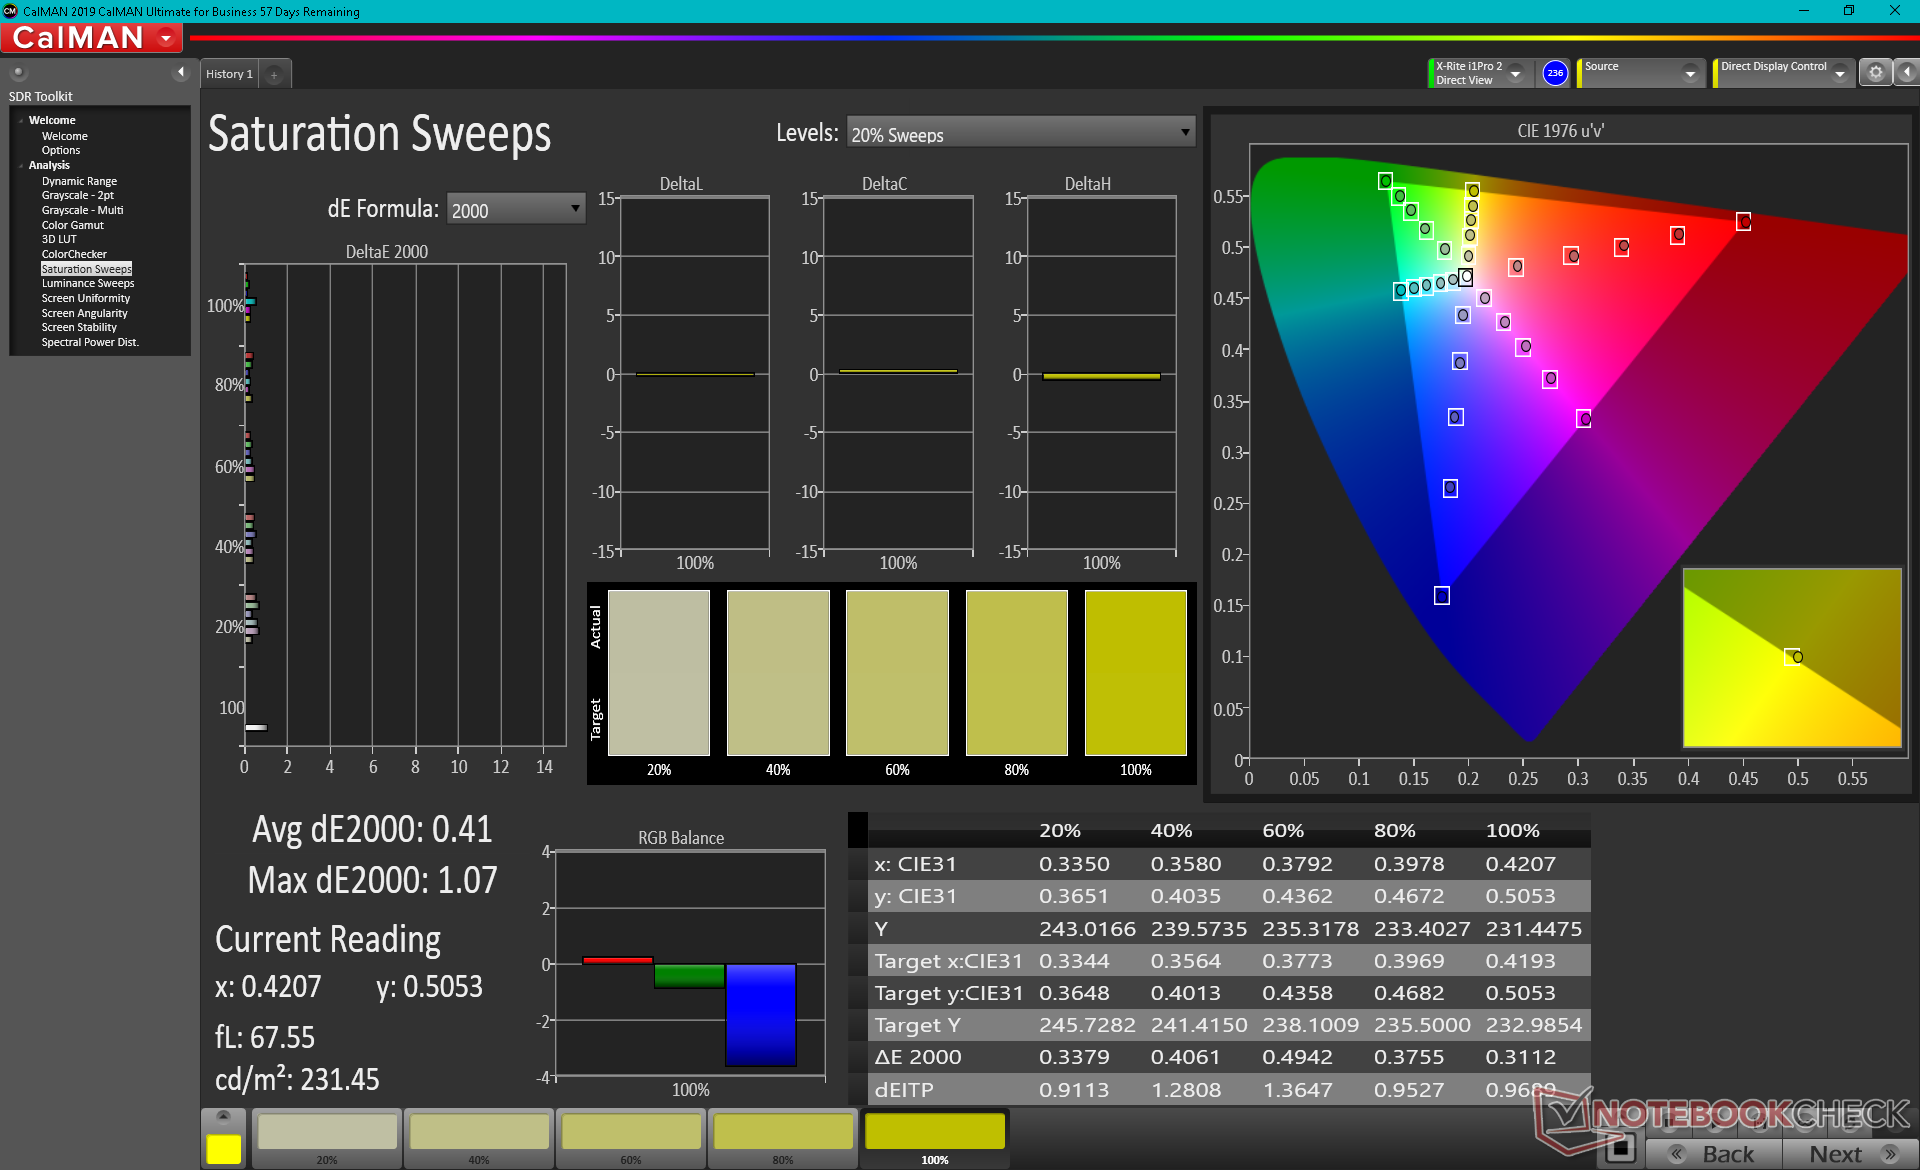
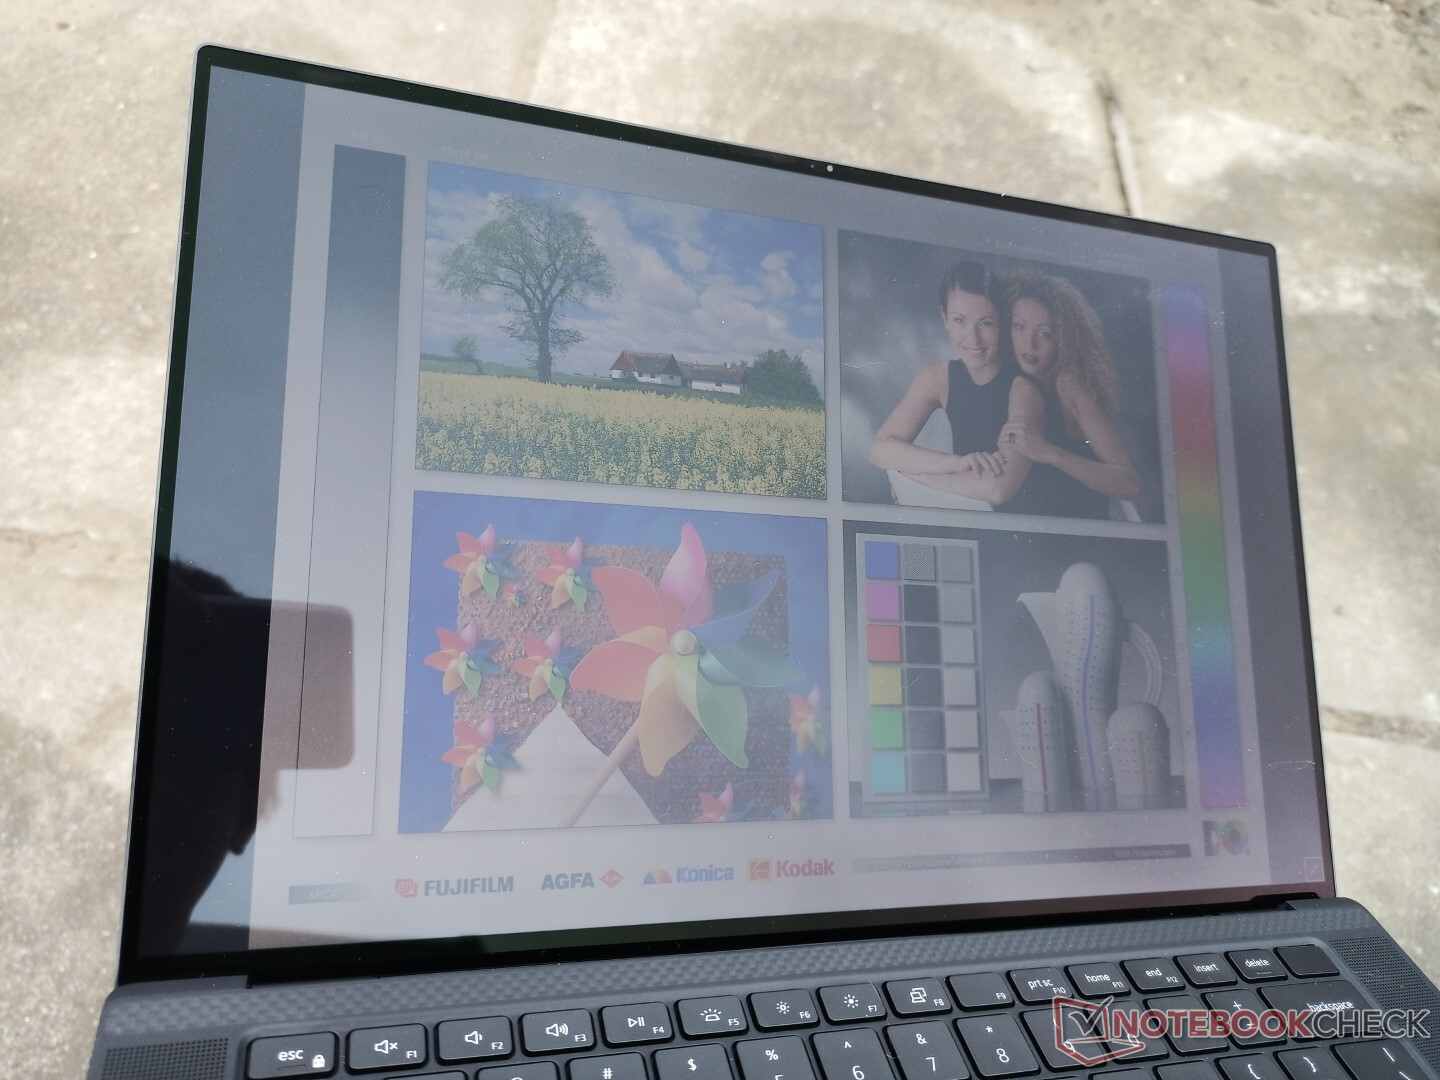
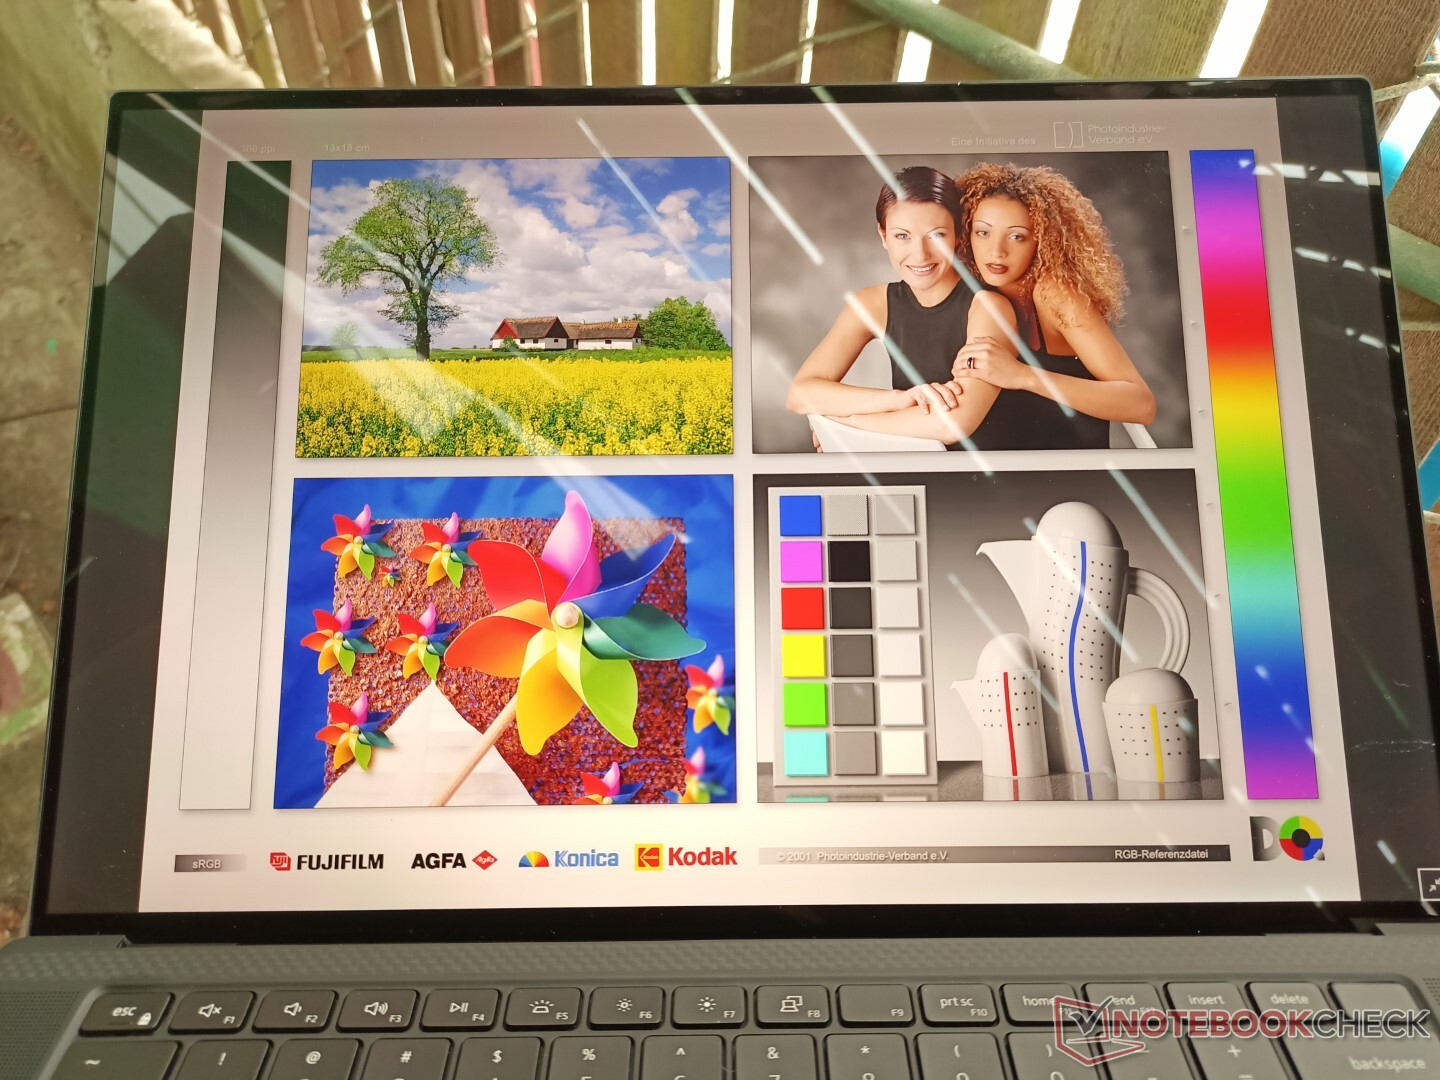
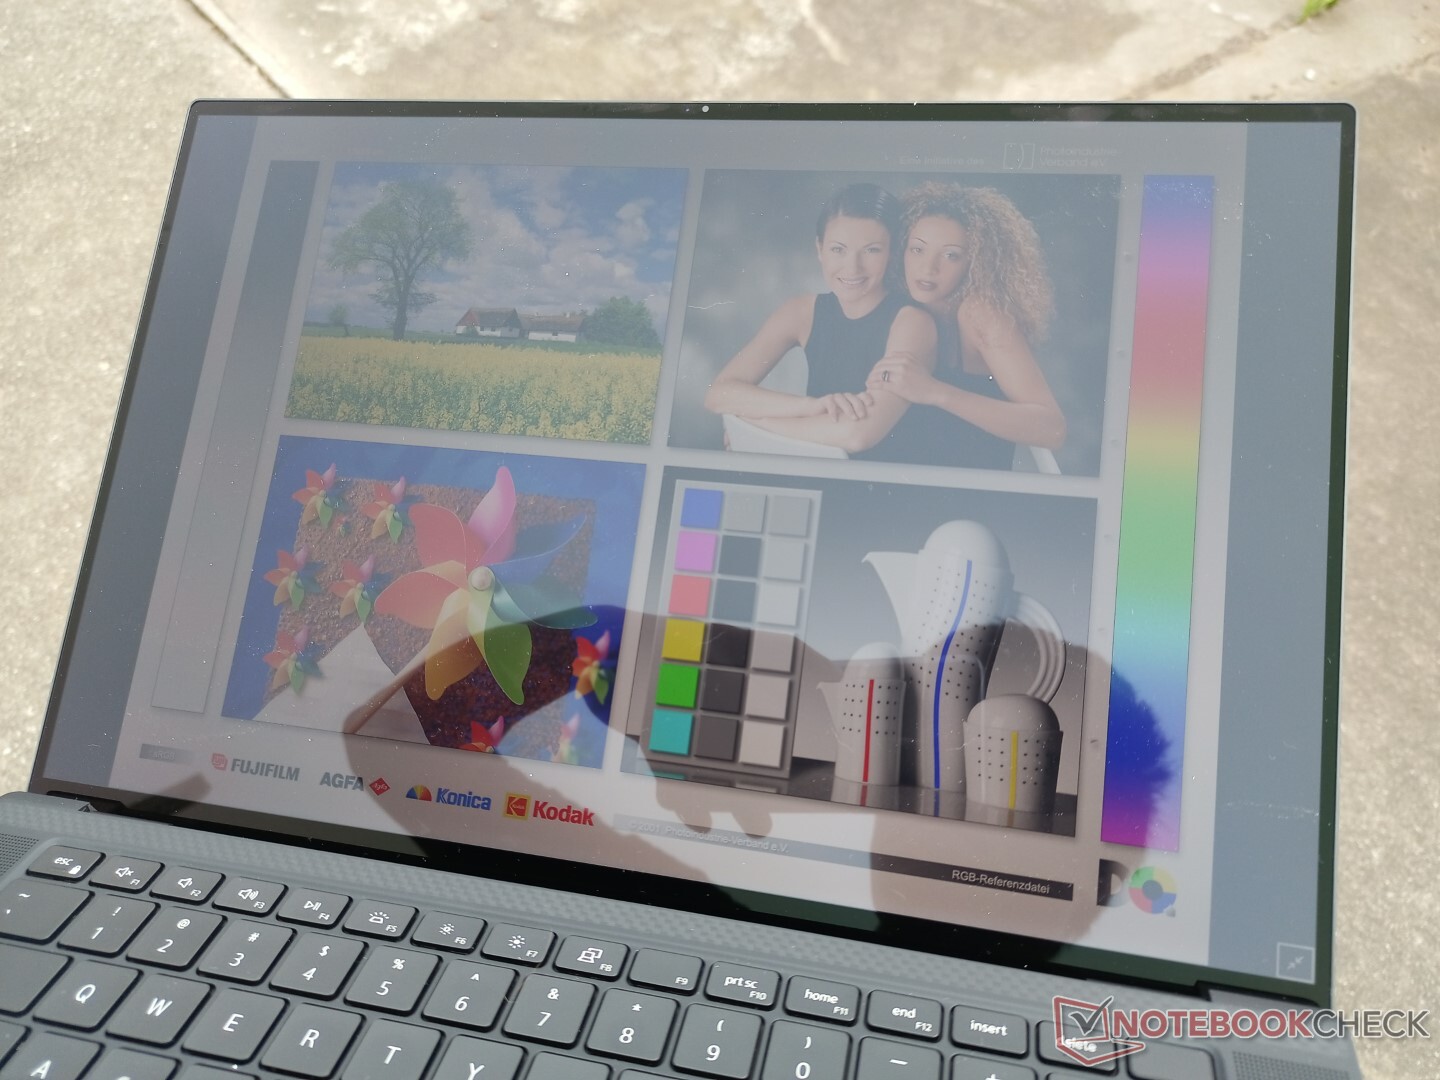
Dell continua ad usare lo stesso touchscreen Sharp LQ156R1 IPS su tutti i suoi XPS 15 16:10 e Precision 5550/5560 4K SKUs che va bene perché questo è ancora un pannello di fascia alta con piena copertura AdobeRGB, alto rapporto di contrasto >1000:1 e retroilluminazione luminosa ~500 nit. L'esperienza visiva è quindi coerente tra gli ultimi modelli XPS 15 e Precision 55x0. Un display meno opaco 1200p non-touch è disponibile su alcune SKU proprio come sull'XPS 15, ma l'OLED è curiosamente omesso sul Precision 5560
I lenti tempi di risposta bianco-nero e grigio-grigio continuano ad essere lo svantaggio principale, il che significa che il ghosting è molto evidente soprattutto se paragonato all'OLED. Questo non sarà un problema enorme per la maggior parte delle applicazioni di tipo CAD.
| |||||||||||||||||||||||||
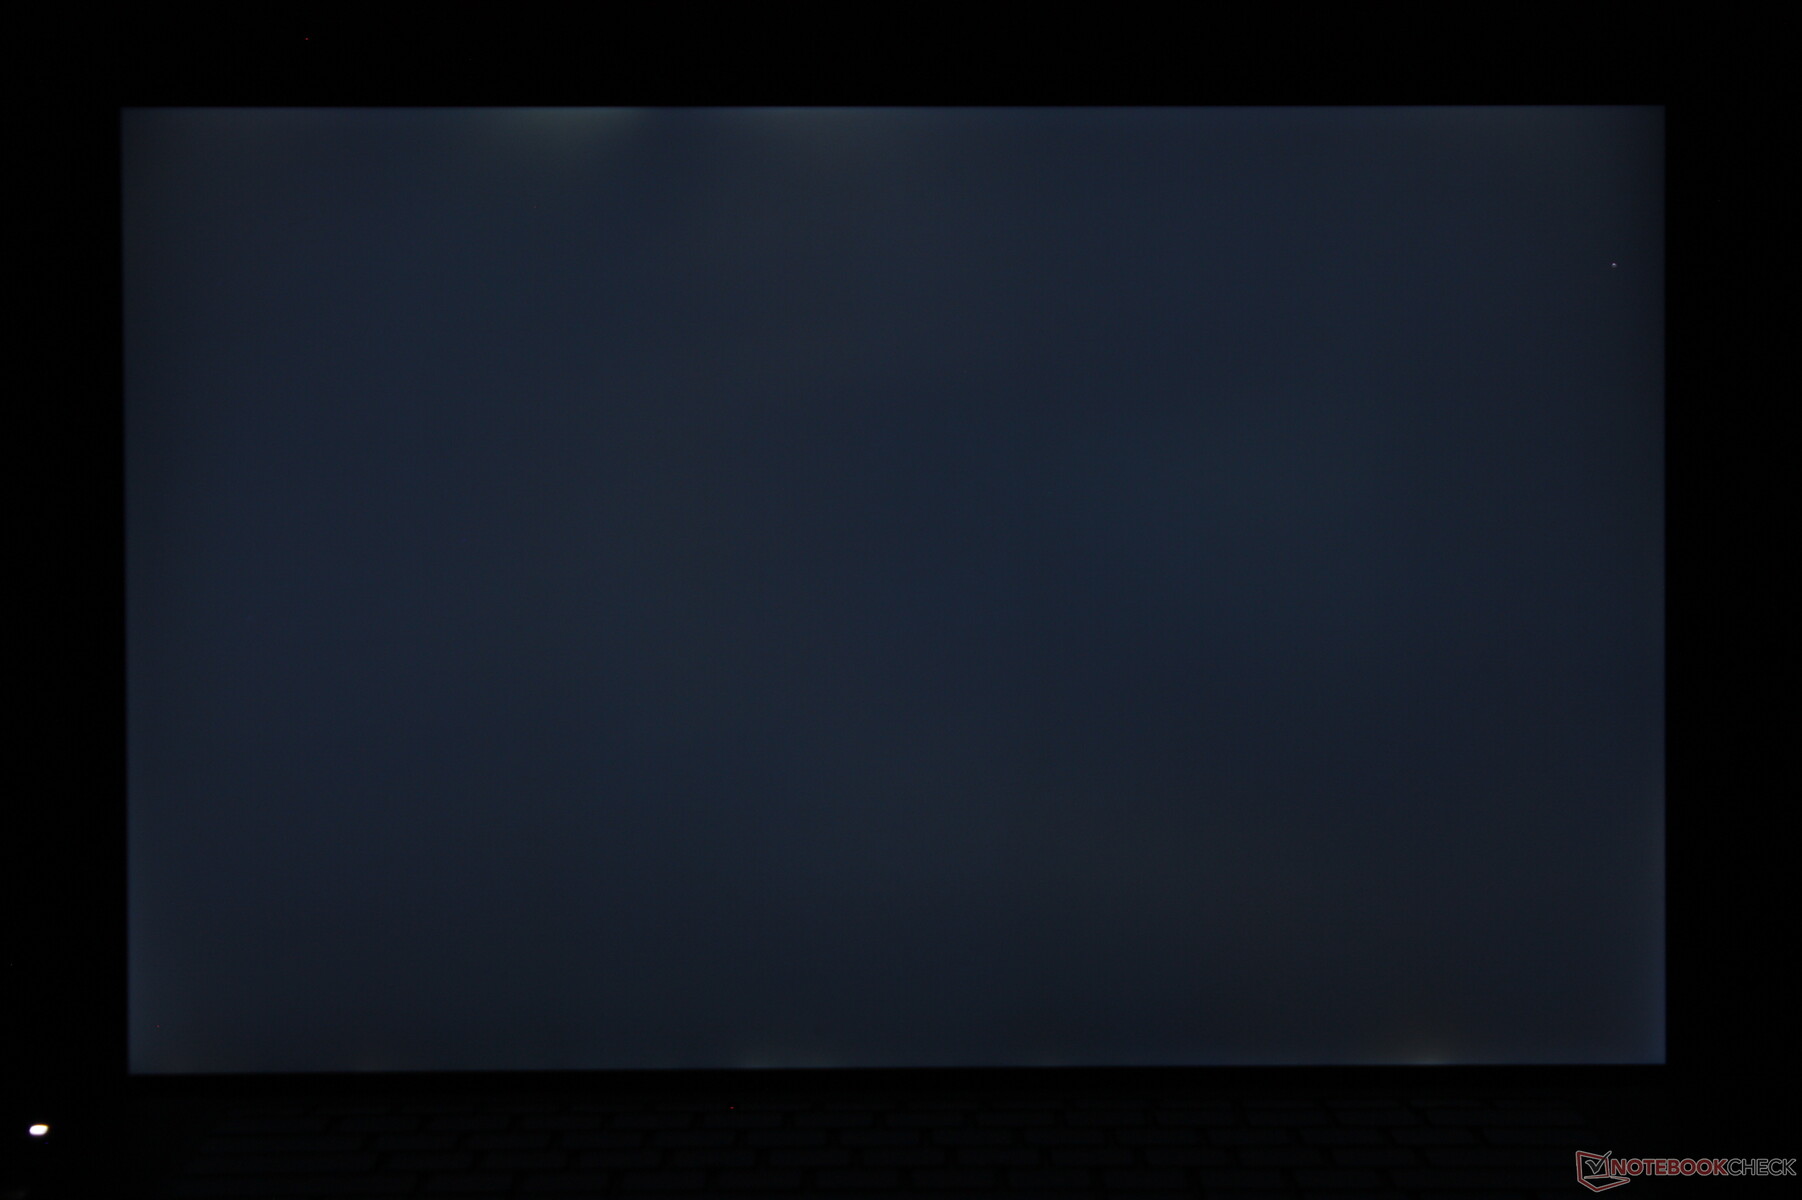
Distribuzione della luminosità: 83 %
Al centro con la batteria: 501.5 cd/m²
Contrasto: 1140:1 (Nero: 0.44 cd/m²)
ΔE ColorChecker Calman: 4.73 | ∀{0.5-29.43 Ø4.71}
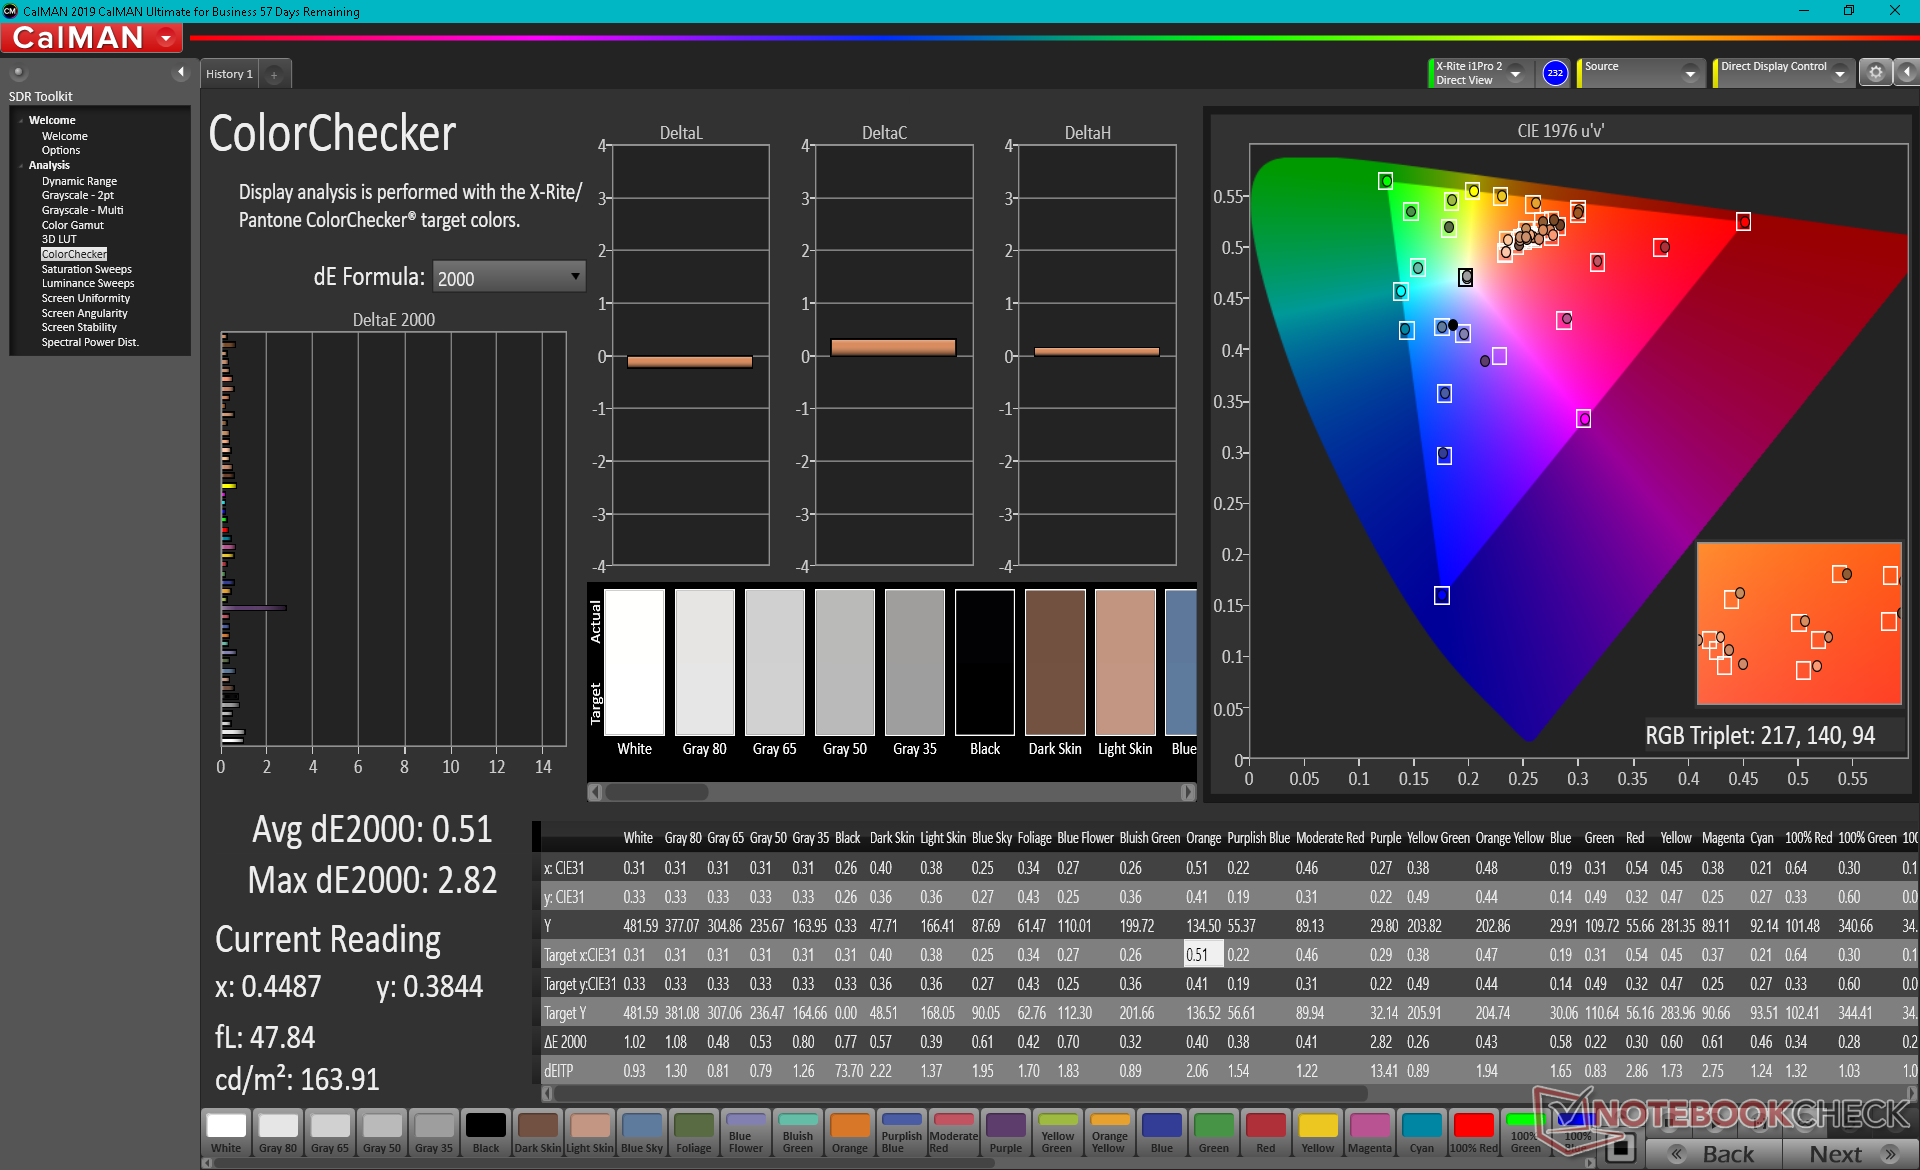
calibrated: 0.51
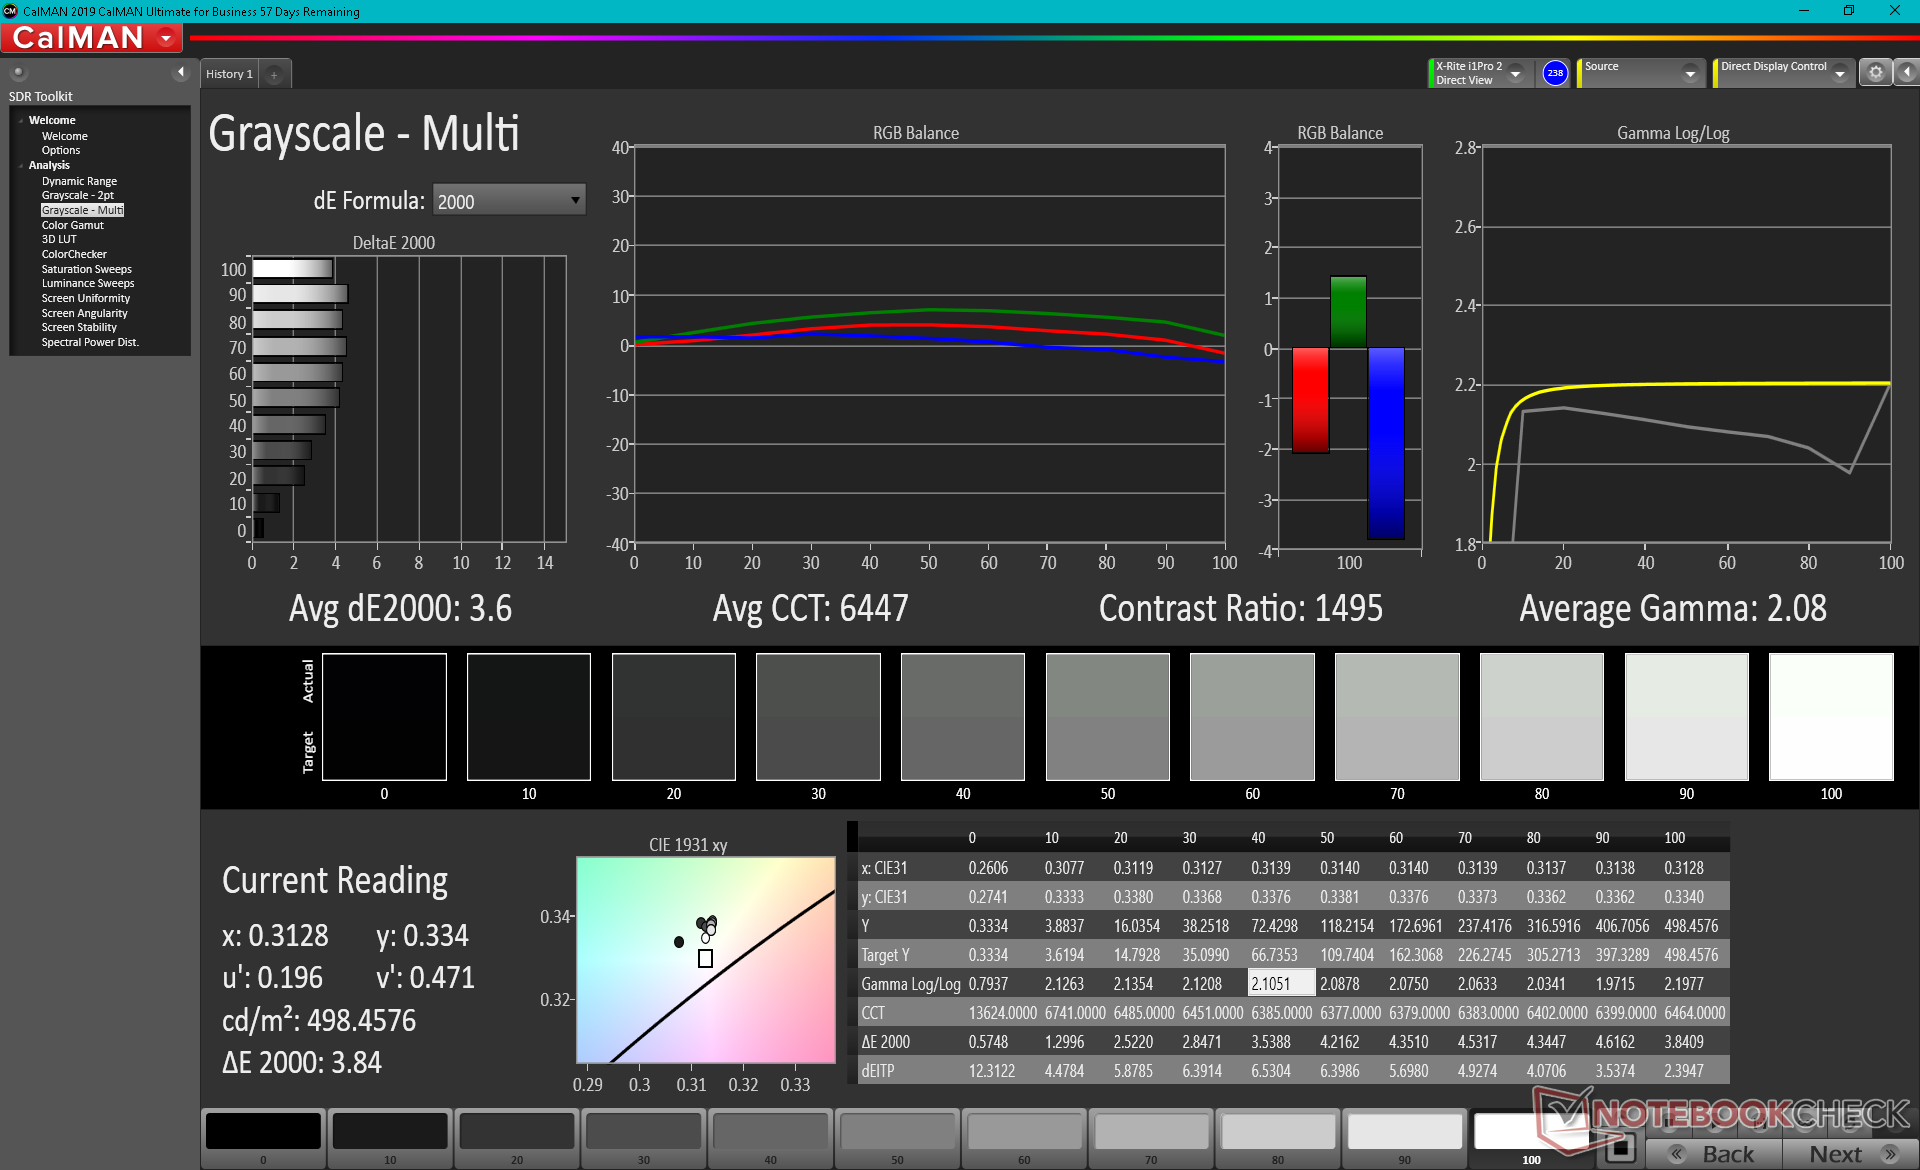
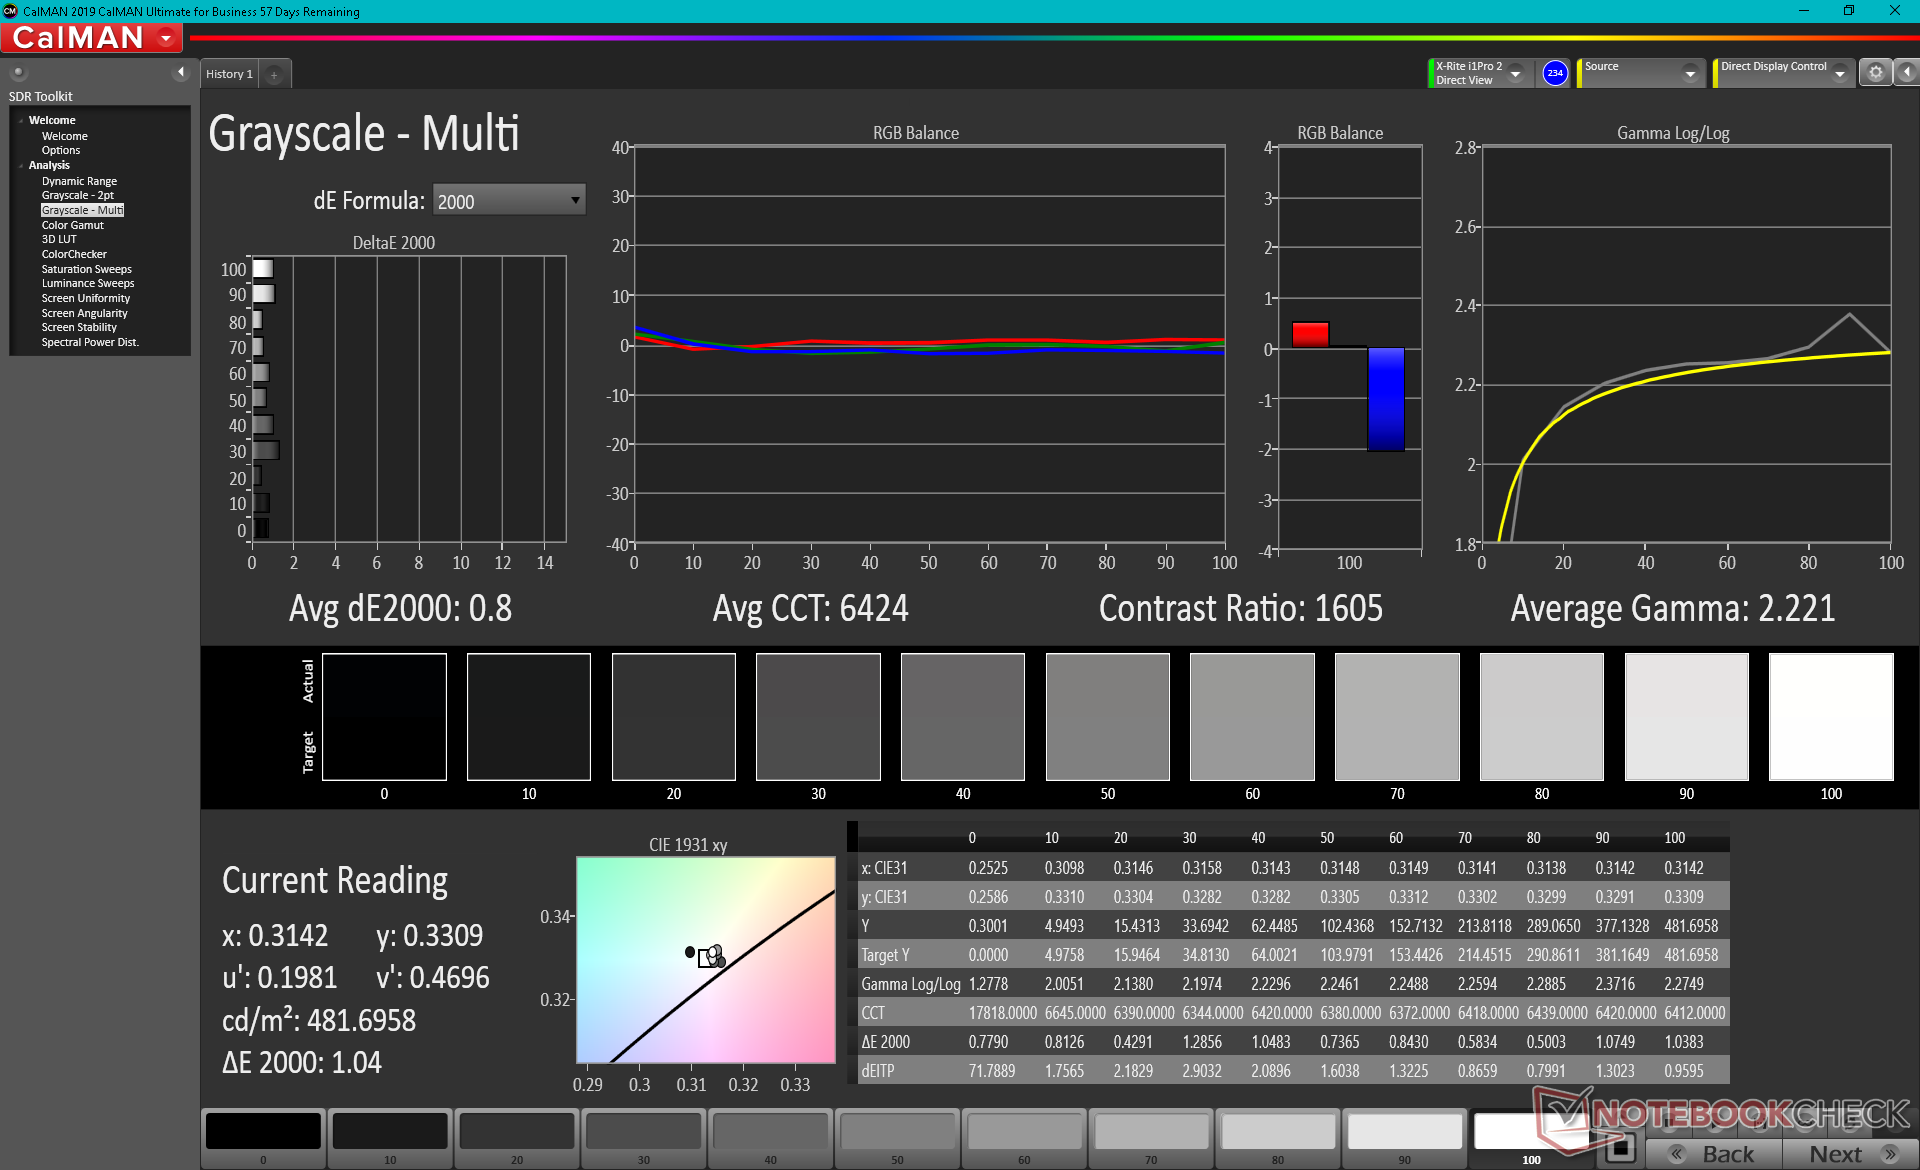
ΔE Greyscale Calman: 3.6 | ∀{0.09-98 Ø4.96}
100% AdobeRGB 1998 (Argyll 3D)
100% sRGB (Argyll 3D)
94.9% Display P3 (Argyll 3D)
Gamma: 2.08
CCT: 6447 K
| Dell Precision 5000 5560 Sharp LQ156R1, IPS, 15.6", 3840x2400 | Lenovo ThinkPad P15 G2-20YQ001JGE N156HCE_GN1, IPS, 15.6", 1920x1080 | HP ZBook Studio 15 G8 SDC4145, OLED, 15.6", 3840x2160 | Asus ProArt StudioBook Pro 15 W500G5T AU Optronics B156ZAN03.1, IPS, 15.6", 3840x2160 | Dell Precision 7550 AU Optronics B156ZAN, IPS, 15.6", 3840x2160 | Dell Precision 5550 P91F Sharp LQ156R1, IPS, 15.6", 3840x2400 | Razer Blade 15 Studio Edition 2020 Samsung SDCA029, OLED, 15.6", 3840x2160 | |
|---|---|---|---|---|---|---|---|
| Display | -19% | 0% | -7% | -5% | -2% | 1% | |
| Display P3 Coverage (%) | 94.9 | 68.6 -28% | 99.9 5% | 82.1 -13% | 82.1 -13% | 89.9 -5% | 99.9 5% |
| sRGB Coverage (%) | 100 | 99.8 0% | 100 0% | 97.6 -2% | 99.6 0% | 100 0% | 100 0% |
| AdobeRGB 1998 Coverage (%) | 100 | 70.6 -29% | 95.3 -5% | 95 -5% | 96.8 -3% | 99.9 0% | 97.3 -3% |
| Response Times | 34% | 94% | -19% | -10% | -5% | 90% | |
| Response Time Grey 50% / Grey 80% * (ms) | 47.2 ? | 37.6 ? 20% | 2.4 ? 95% | 58 ? -23% | 51.2 ? -8% | 46 ? 3% | 4 ? 92% |
| Response Time Black / White * (ms) | 30.4 ? | 16 ? 47% | 2.4 ? 92% | 35 ? -15% | 34 ? -12% | 34 ? -12% | 4 ? 87% |
| PWM Frequency (Hz) | 26040 ? | 240.4 ? | |||||
| Screen | 9% | -73% | 10% | -68% | -79% | 140% | |
| Brightness middle (cd/m²) | 501.5 | 498 -1% | 379.6 -24% | 344 -31% | 473.5 -6% | 469.8 -6% | 380 -24% |
| Brightness (cd/m²) | 467 | 490 5% | 380 -19% | 335 -28% | 461 -1% | 464 -1% | 388 -17% |
| Brightness Distribution (%) | 83 | 95 14% | 95 14% | 93 12% | 90 8% | 85 2% | 93 12% |
| Black Level * (cd/m²) | 0.44 | 0.39 11% | 0.37 16% | 0.55 -25% | 0.42 5% | 0.018 96% | |
| Contrast (:1) | 1140 | 1277 12% | 930 -18% | 861 -24% | 1119 -2% | 21111 1752% | |
| Colorchecker dE 2000 * | 4.73 | 2.1 56% | 5.15 -9% | 1.76 63% | 4.8 -1% | 5.16 -9% | 5.47 -16% |
| Colorchecker dE 2000 max. * | 8.45 | 5.6 34% | 7.79 8% | 4.31 49% | 8.73 -3% | 9.33 -10% | 8.19 3% |
| Colorchecker dE 2000 calibrated * | 0.51 | 0.8 -57% | 3.1 -508% | 3.08 -504% | 3.75 -635% | 3.04 -496% | |
| Greyscale dE 2000 * | 3.6 | 3.4 6% | 2.6 28% | 3.12 13% | 5.6 -56% | 5.5 -53% | 5.3 -47% |
| Gamma | 2.08 106% | 2.32 95% | 1.99 111% | 2.2 100% | 2.34 94% | 2 110% | 2.15 102% |
| CCT | 6447 101% | 7162 91% | 6166 105% | 6563 99% | 7549 86% | 6198 105% | 6128 106% |
| Color Space (Percent of AdobeRGB 1998) (%) | 85 | 86.4 | 89.2 | 86 | |||
| Color Space (Percent of sRGB) (%) | 98 | 99.7 | 100 | 100 | |||
| Media totale (Programma / Settaggio) | 8% /
6% | 7% /
-27% | -5% /
1% | -28% /
-46% | -29% /
-52% | 77% /
103% |
* ... Meglio usare valori piccoli
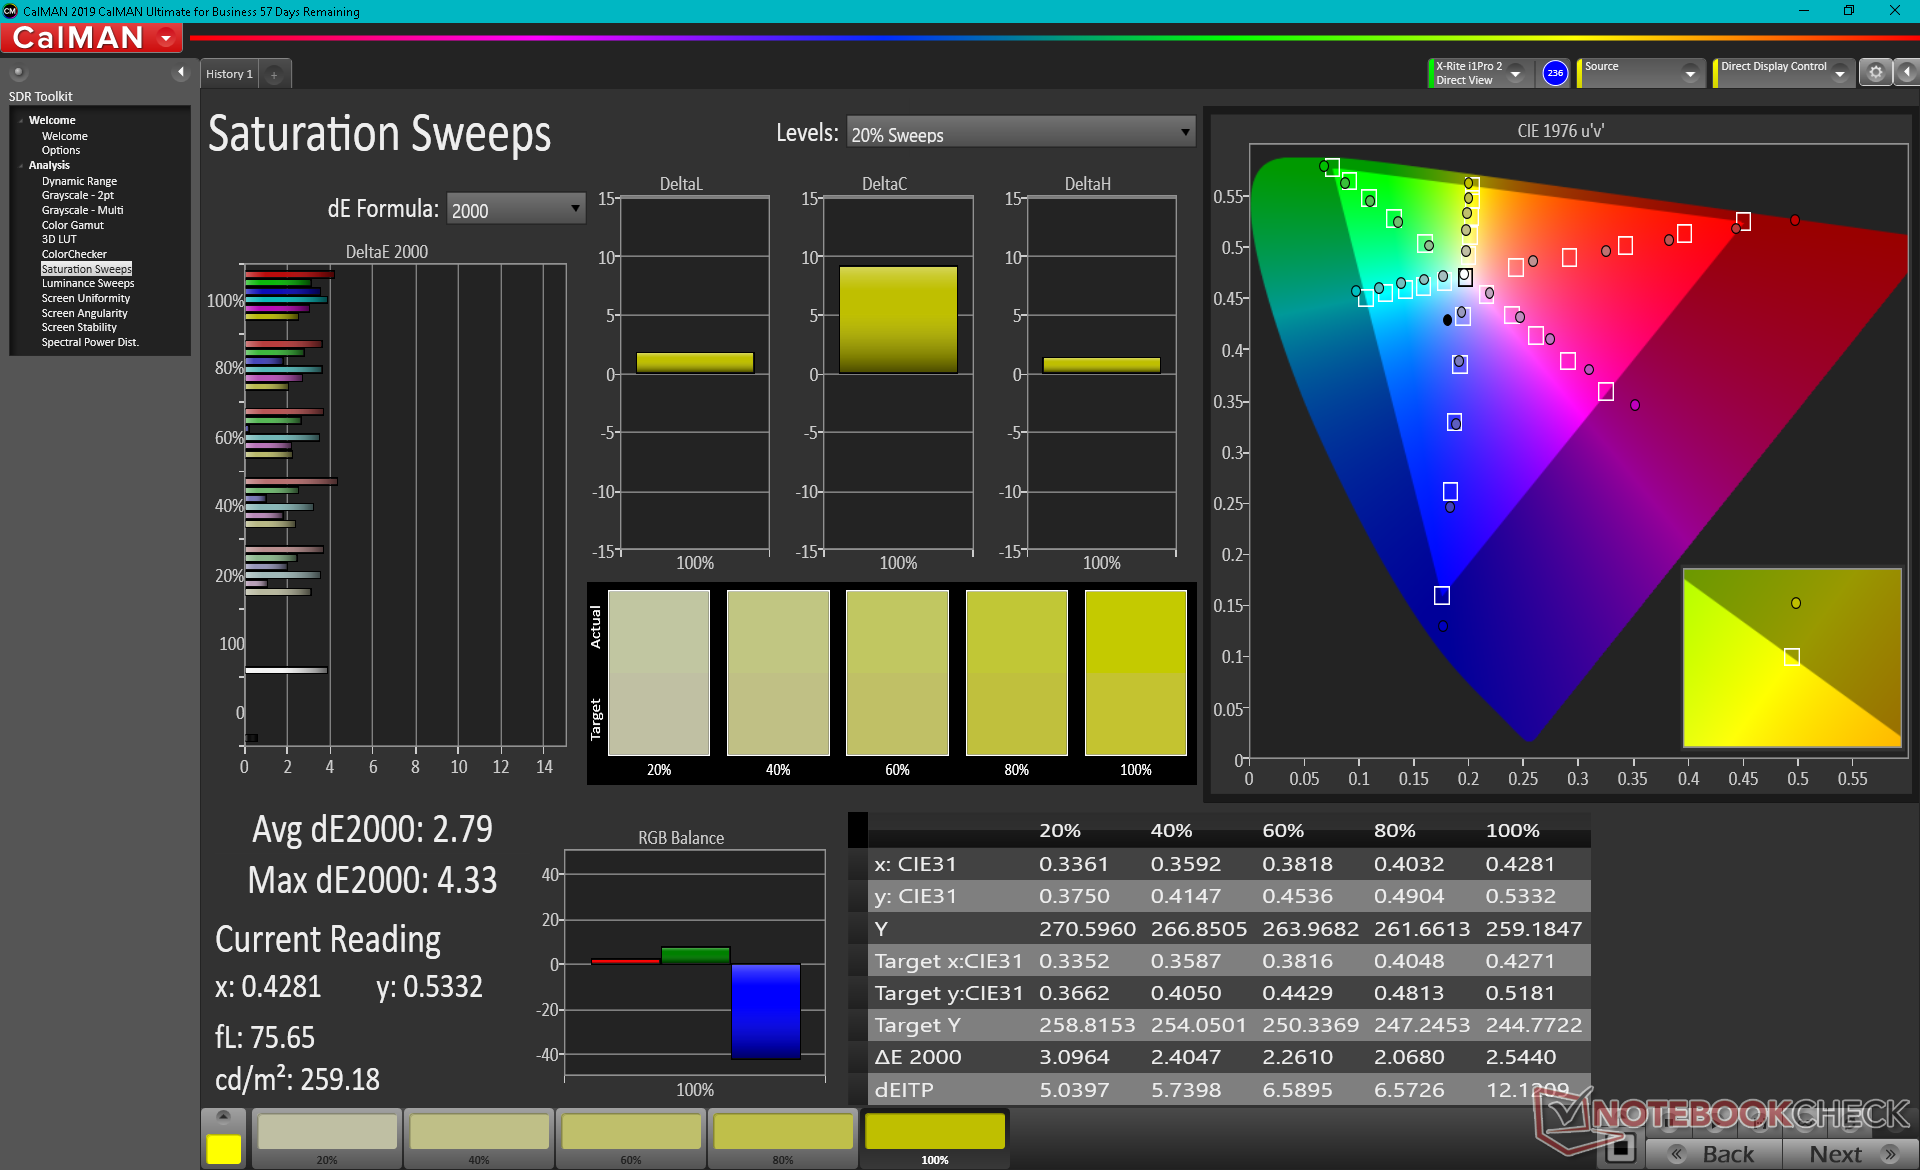
I colori avrebbero potuto essere calibrati meglio fuori dalla scatola, dato che i valori medi della scala di grigi e deltaE del colore sono solo decenti, rispettivamente 3,6 e 4,73. Siamo in grado di ridurre entrambi i valori a meno di uno ciascuno dopo la calibrazione con il nostro colorimetro X-Rite.
Tempi di risposta del Display
| ↔ Tempi di risposta dal Nero al Bianco | ||
|---|---|---|
| 30.4 ms ... aumenta ↗ e diminuisce ↘ combinato | ↗ 16.4 ms Incremento | 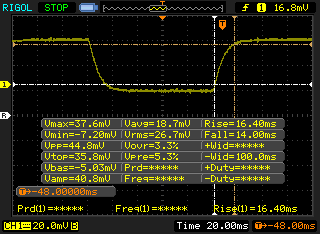 |
| ↘ 14 ms Calo | ||
| Lo schermo mostra tempi di risposta lenti nei nostri tests e sarà insoddisfacente per i gamers. In confronto, tutti i dispositivi di test variano da 0.1 (minimo) a 240 (massimo) ms. » 82 % di tutti i dispositivi è migliore. Questo significa che i tempi di risposta rilevati sono peggiori rispetto alla media di tutti i dispositivi testati (19.8 ms). | ||
| ↔ Tempo di risposta dal 50% Grigio all'80% Grigio | ||
| 47.2 ms ... aumenta ↗ e diminuisce ↘ combinato | ↗ 25.2 ms Incremento | 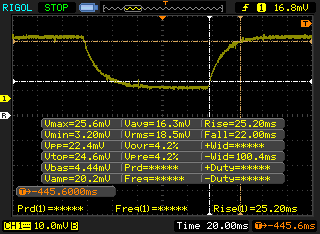 |
| ↘ 22 ms Calo | ||
| Lo schermo mostra tempi di risposta lenti nei nostri tests e sarà insoddisfacente per i gamers. In confronto, tutti i dispositivi di test variano da 0.165 (minimo) a 636 (massimo) ms. » 82 % di tutti i dispositivi è migliore. Questo significa che i tempi di risposta rilevati sono peggiori rispetto alla media di tutti i dispositivi testati (31 ms). | ||
Sfarfallio dello schermo / PWM (Pulse-Width Modulation)
| flickering dello schermo / PWM non rilevato | 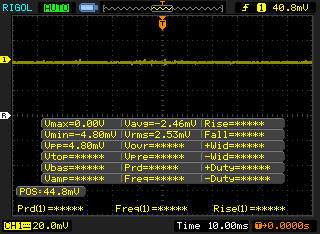 | ||
In confronto: 52 % di tutti i dispositivi testati non utilizza PWM per ridurre la luminosita' del display. Se è rilevato PWM, una media di 7751 (minimo: 5 - massimo: 343500) Hz è stata rilevata. | |||
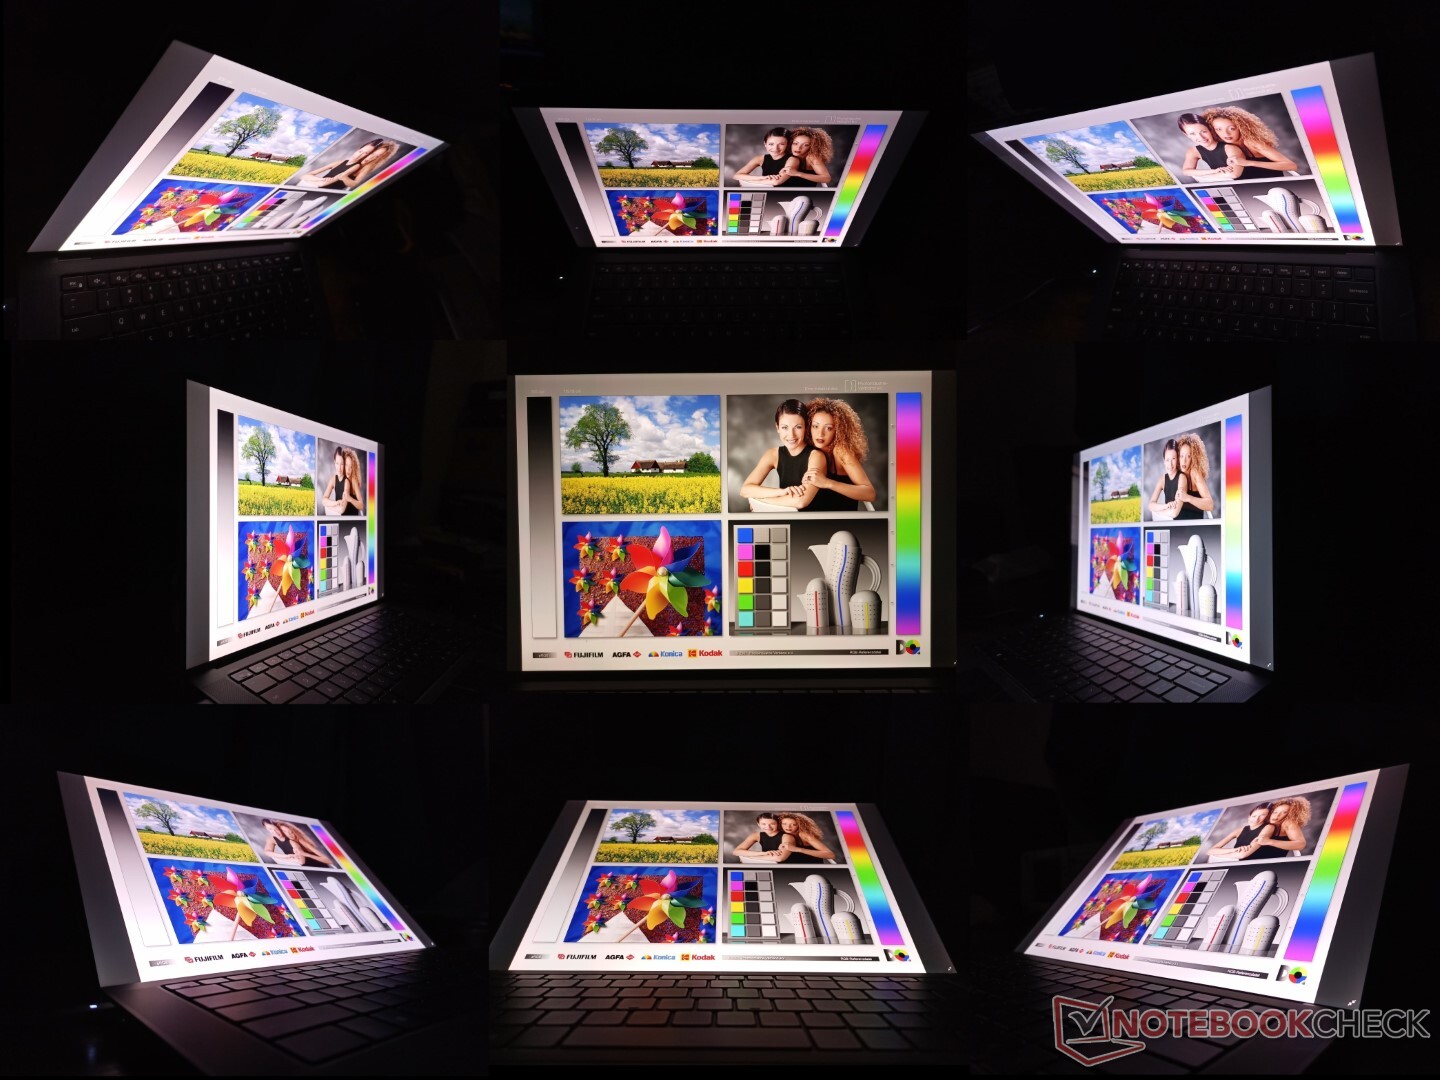
La visibilità esterna è migliore che sul Razer Blade 15 Studio o Asus ProArt a causa della retroilluminazione più luminosa sul nostro Precision 5560. Tuttavia, un po' di riverbero sarà sempre presente sulla sovrapposizione lucida. Gli utenti potrebbero voler considerare l'opzione del display 1200p opaco per ridurre i riflessi.
Prestazioni - 45 W TGP Quadro RTX Graphics
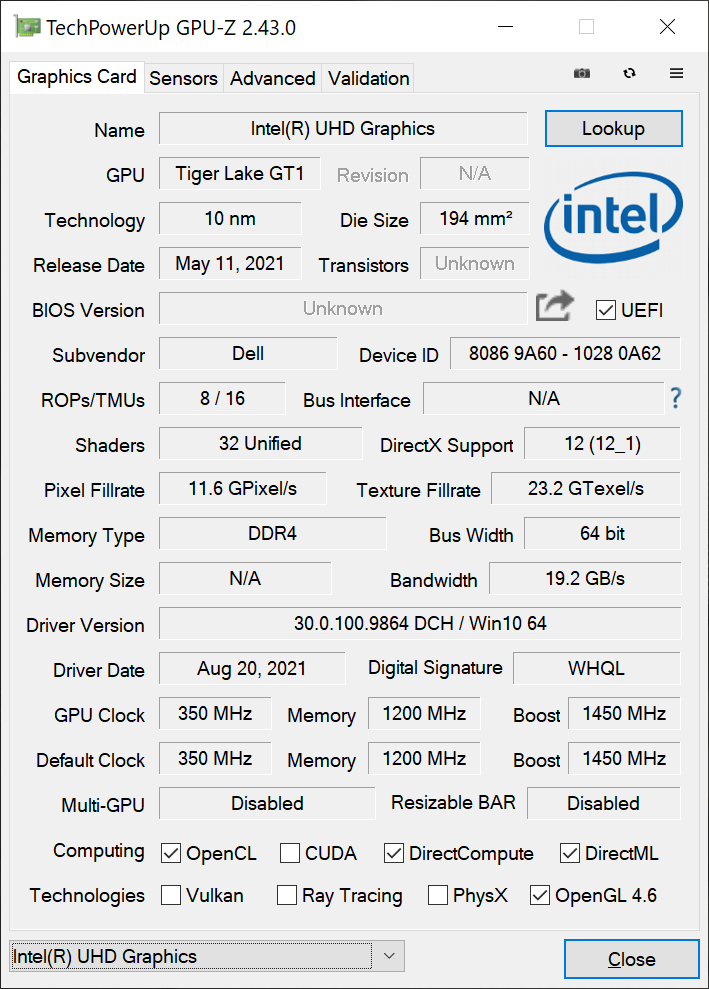
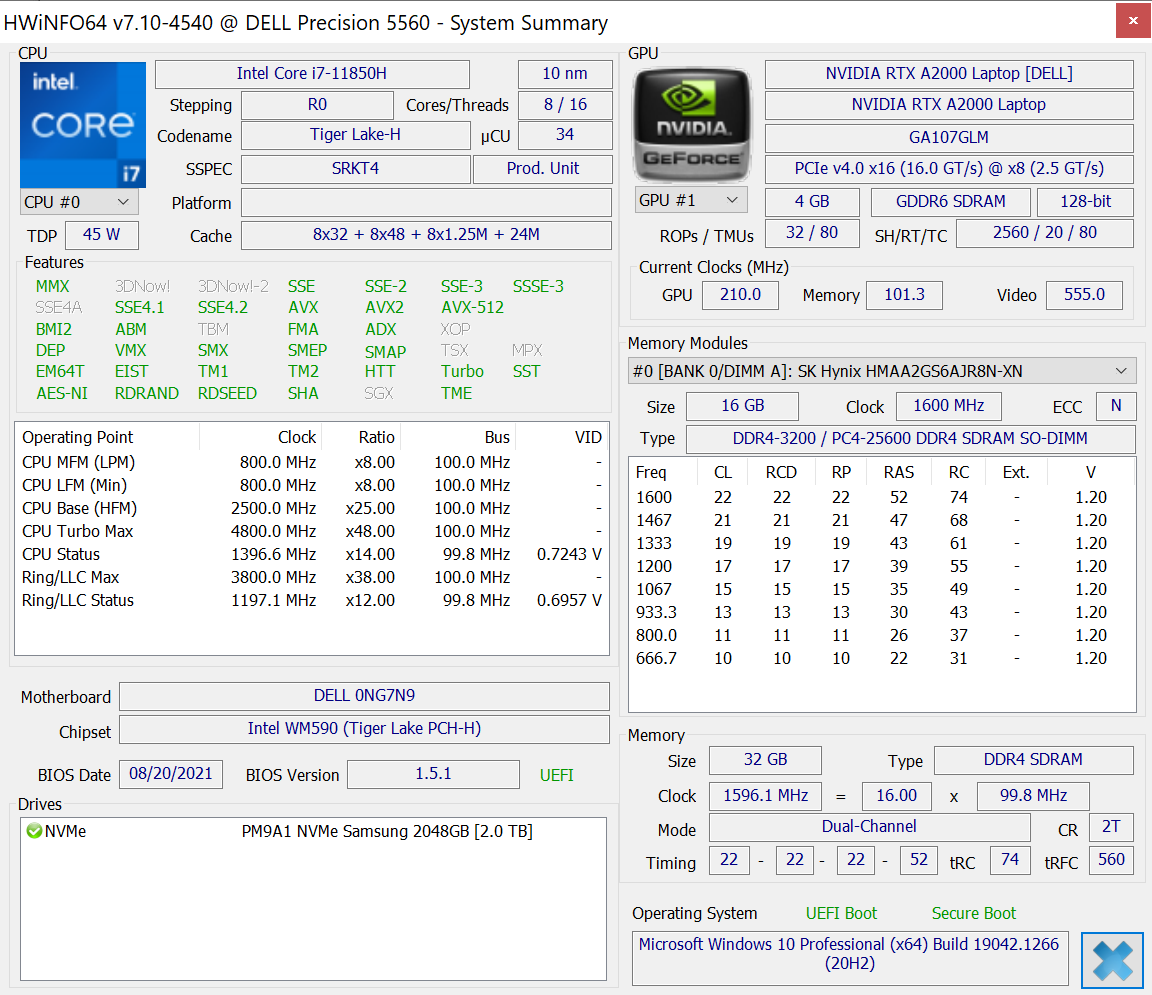
Dell offre sia non-vPro (i5-11500H, i7-11800H) e vPro (i7-11850H, i9-11950H, Xeon W-11955M) Tiger Lake-H insieme alle GPU Nvidia Quadro (NVIDIA T1200, RTX A2000) per quasi tutte le configurazioni. Queste GPU, le CPU vPro e la RAM ECC opzionale associata sono ciò che separa il Precision 5560 dalla serie XPS 15 di livello consumer
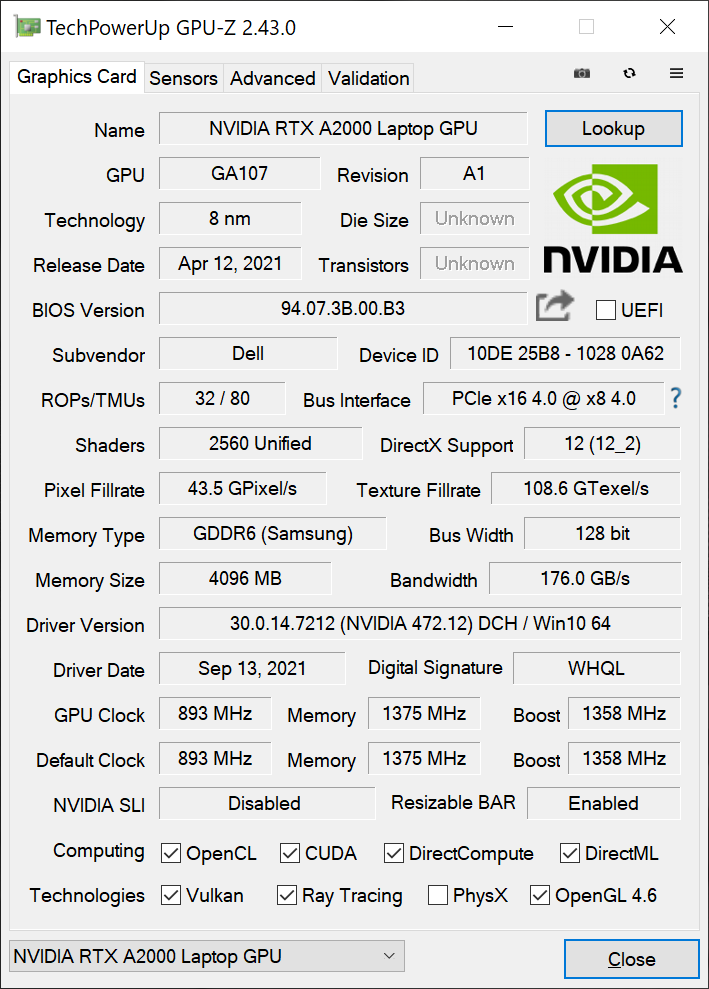
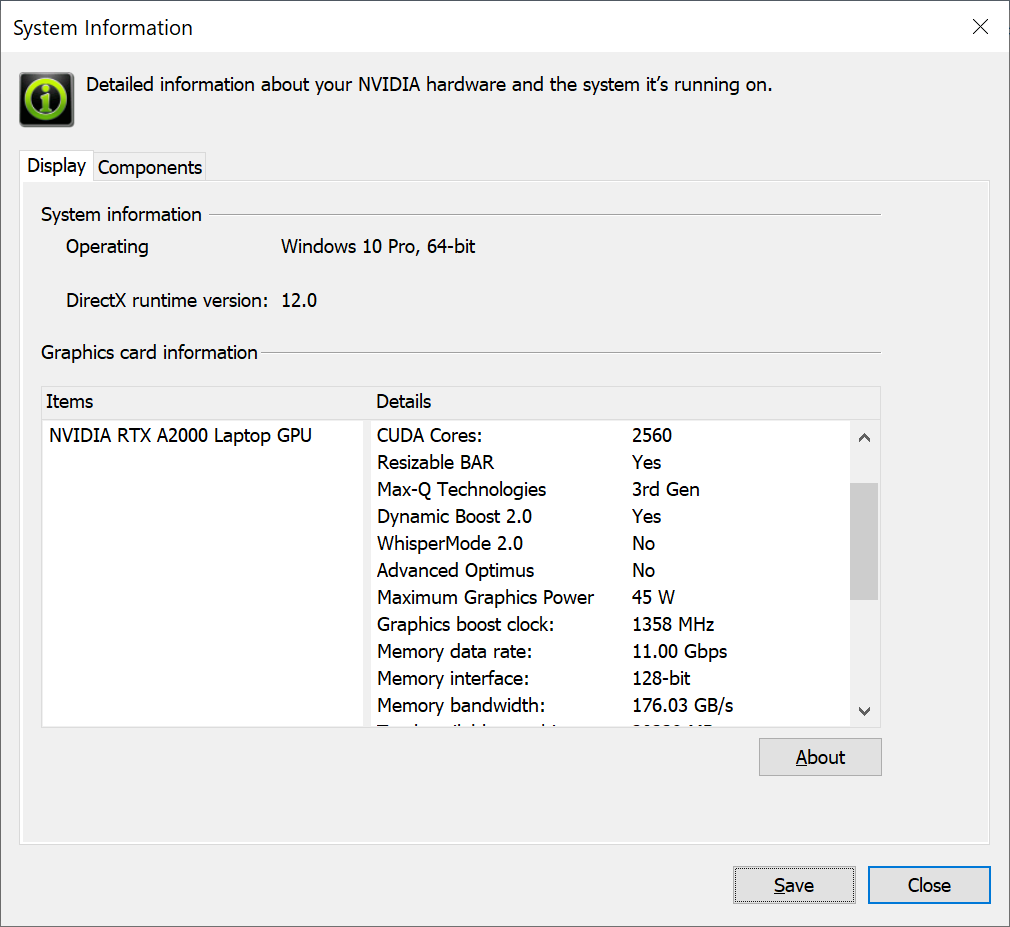
La GPU Quadro RTX A2000 sulla nostra unità di test supporta Resizable Bar e Dynamic Boost 2.0 ma senza supporto per Advanced Optimus o WhisperMode 2.0. Con soli 45 W TGP, questa è tecnicamente una GPU Max-Q anche se Max-Q non è nel nome. La vecchia Quadro T2000 Max-Q in Precision 5550 è stata stimata in 40 W TGP in confronto
La nostra unità è stata impostata in modalità Ultra Performance tramite il software Dell Power Manager prima di eseguire i nostri benchmark qui sotto per ottenere i massimi punteggi possibili.
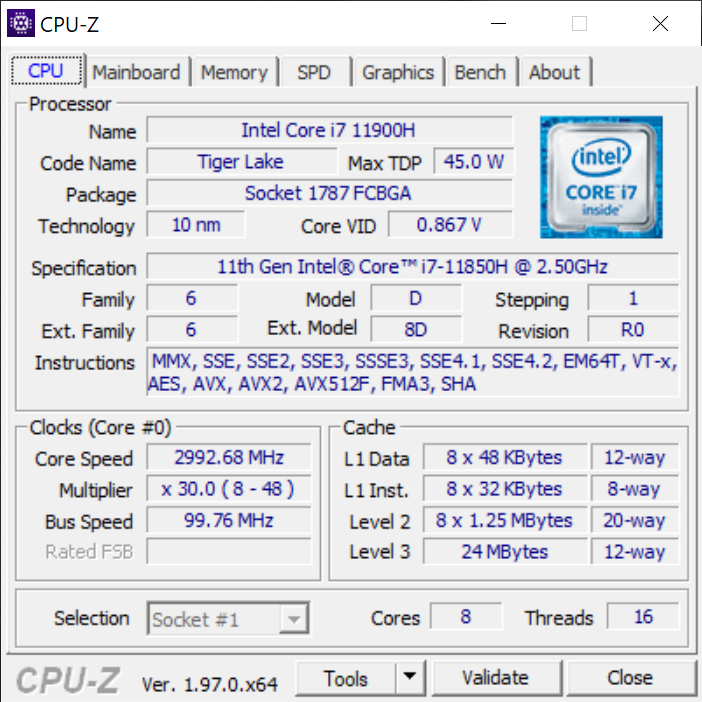
Processore
Le prestazioni complessive multi-thread sono circa il 15 per cento più lente del Core i7-11800H, che è il prezzo da pagare per il supporto vPro integrato. L'aggiornamento al Core i9-11950H dovrebbe aumentare le prestazioni multi-thread fino al 20 per cento sulla base della nostra esperienza con il HP ZBook Studio 15 G8. Le prestazioni single-thread rimangono comunque quasi identiche
La sostenibilità delle prestazioni è eccellente come mostrato dai risultati coerenti di CineBench R15 xT qui sotto.
Cinebench R15 Multi Loop
Cinebench R23: Multi Core | Single Core
Cinebench R15: CPU Multi 64Bit | CPU Single 64Bit
Blender: v2.79 BMW27 CPU
7-Zip 18.03: 7z b 4 -mmt1 | 7z b 4
Geekbench 5.5: Single-Core | Multi-Core
HWBOT x265 Benchmark v2.2: 4k Preset
LibreOffice : 20 Documents To PDF
R Benchmark 2.5: Overall mean
| Cinebench R23 / Multi Core | |
| Lenovo Legion 5 15ACH-82JU00C6GE-FL | |
| HP ZBook Studio 15 G8 | |
| Lenovo ThinkPad P15 G2-20YQ001JGE | |
| Media Intel Core i7-11850H (9779 - 11935, n=2) | |
| HP ZBook Studio G7 | |
| Dell Precision 5000 5560 | |
| Lenovo ThinkPad P15 Gen1-20ST000DGE | |
| Lenovo ThinkPad P15s Gen2-20W6000GGE | |
| Cinebench R23 / Single Core | |
| HP ZBook Studio 15 G8 | |
| Media Intel Core i7-11850H (1513 - 1552, n=2) | |
| Dell Precision 5000 5560 | |
| Lenovo ThinkPad P15 G2-20YQ001JGE | |
| Lenovo ThinkPad P15s Gen2-20W6000GGE | |
| Lenovo Legion 5 15ACH-82JU00C6GE-FL | |
| HP ZBook Studio G7 | |
| Lenovo ThinkPad P15 Gen1-20ST000DGE | |
Cinebench R23: Multi Core | Single Core
Cinebench R15: CPU Multi 64Bit | CPU Single 64Bit
Blender: v2.79 BMW27 CPU
7-Zip 18.03: 7z b 4 -mmt1 | 7z b 4
Geekbench 5.5: Single-Core | Multi-Core
HWBOT x265 Benchmark v2.2: 4k Preset
LibreOffice : 20 Documents To PDF
R Benchmark 2.5: Overall mean
* ... Meglio usare valori piccoli
Prestazioni del sistema
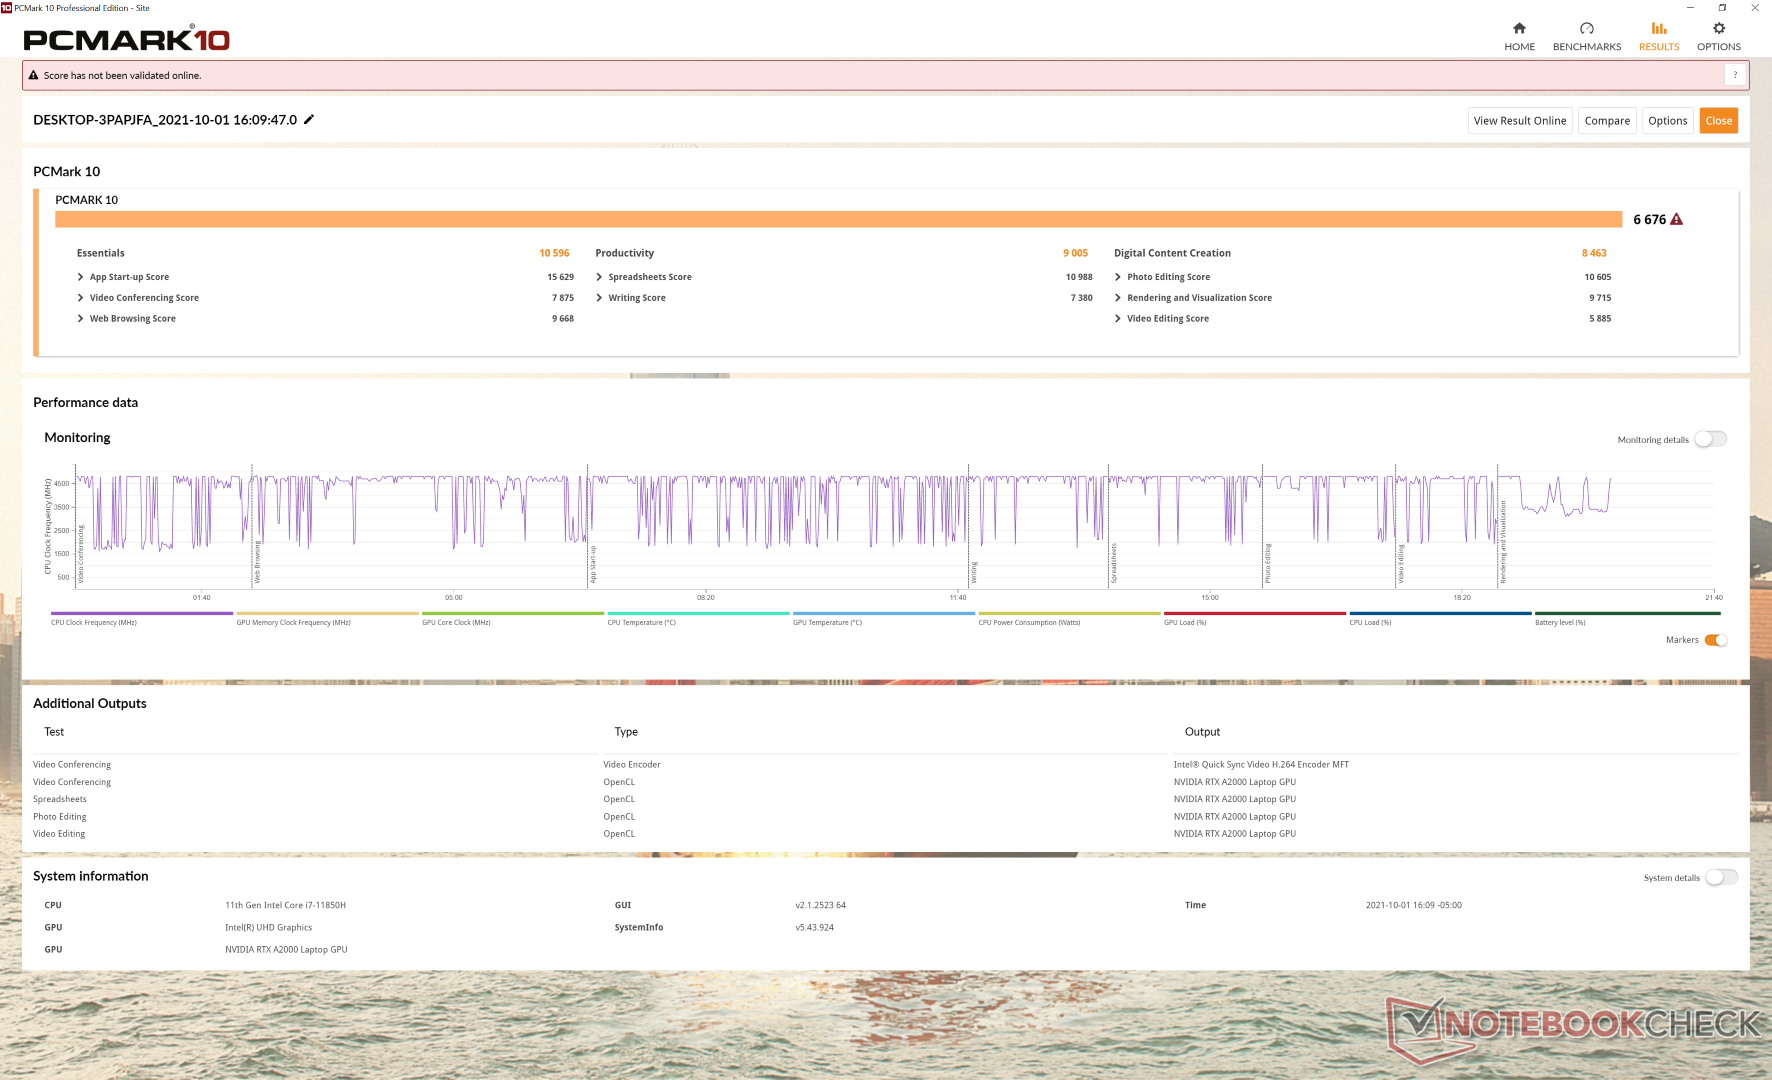
I punteggi PCMark sono costantemente superiori a quelli di Precision 5550, specialmente nel benchmark Digital Content Creation, che è molto intenso per le GPU, dove la RTX A2000 è in grado di superare la Quadro T2000 Max-Q.
| PCMark 10 / Score | |
| HP ZBook Studio 15 G8 | |
| Dell Precision 5000 5560 | |
| Media Intel Core i7-11850H, NVIDIA RTX A2000 Laptop GPU (n=1) | |
| Lenovo ThinkPad P15 G2-20YQ001JGE | |
| Dell Precision 7550 | |
| Dell Precision 5550 P91F | |
| Razer Blade 15 Studio Edition 2020 | |
| Asus ProArt StudioBook Pro 15 W500G5T | |
| PCMark 10 / Essentials | |
| Dell Precision 5000 5560 | |
| Media Intel Core i7-11850H, NVIDIA RTX A2000 Laptop GPU (n=1) | |
| Lenovo ThinkPad P15 G2-20YQ001JGE | |
| HP ZBook Studio 15 G8 | |
| Dell Precision 5550 P91F | |
| Dell Precision 7550 | |
| Razer Blade 15 Studio Edition 2020 | |
| Asus ProArt StudioBook Pro 15 W500G5T | |
| PCMark 10 / Productivity | |
| Dell Precision 5000 5560 | |
| Media Intel Core i7-11850H, NVIDIA RTX A2000 Laptop GPU (n=1) | |
| HP ZBook Studio 15 G8 | |
| Lenovo ThinkPad P15 G2-20YQ001JGE | |
| Razer Blade 15 Studio Edition 2020 | |
| Dell Precision 7550 | |
| Dell Precision 5550 P91F | |
| Asus ProArt StudioBook Pro 15 W500G5T | |
| PCMark 10 / Digital Content Creation | |
| HP ZBook Studio 15 G8 | |
| Lenovo ThinkPad P15 G2-20YQ001JGE | |
| Dell Precision 5000 5560 | |
| Media Intel Core i7-11850H, NVIDIA RTX A2000 Laptop GPU (n=1) | |
| Dell Precision 7550 | |
| Dell Precision 5550 P91F | |
| Asus ProArt StudioBook Pro 15 W500G5T | |
| Razer Blade 15 Studio Edition 2020 | |
| PCMark 10 Score | 6676 punti | |
Aiuto | ||
Latenza DPC
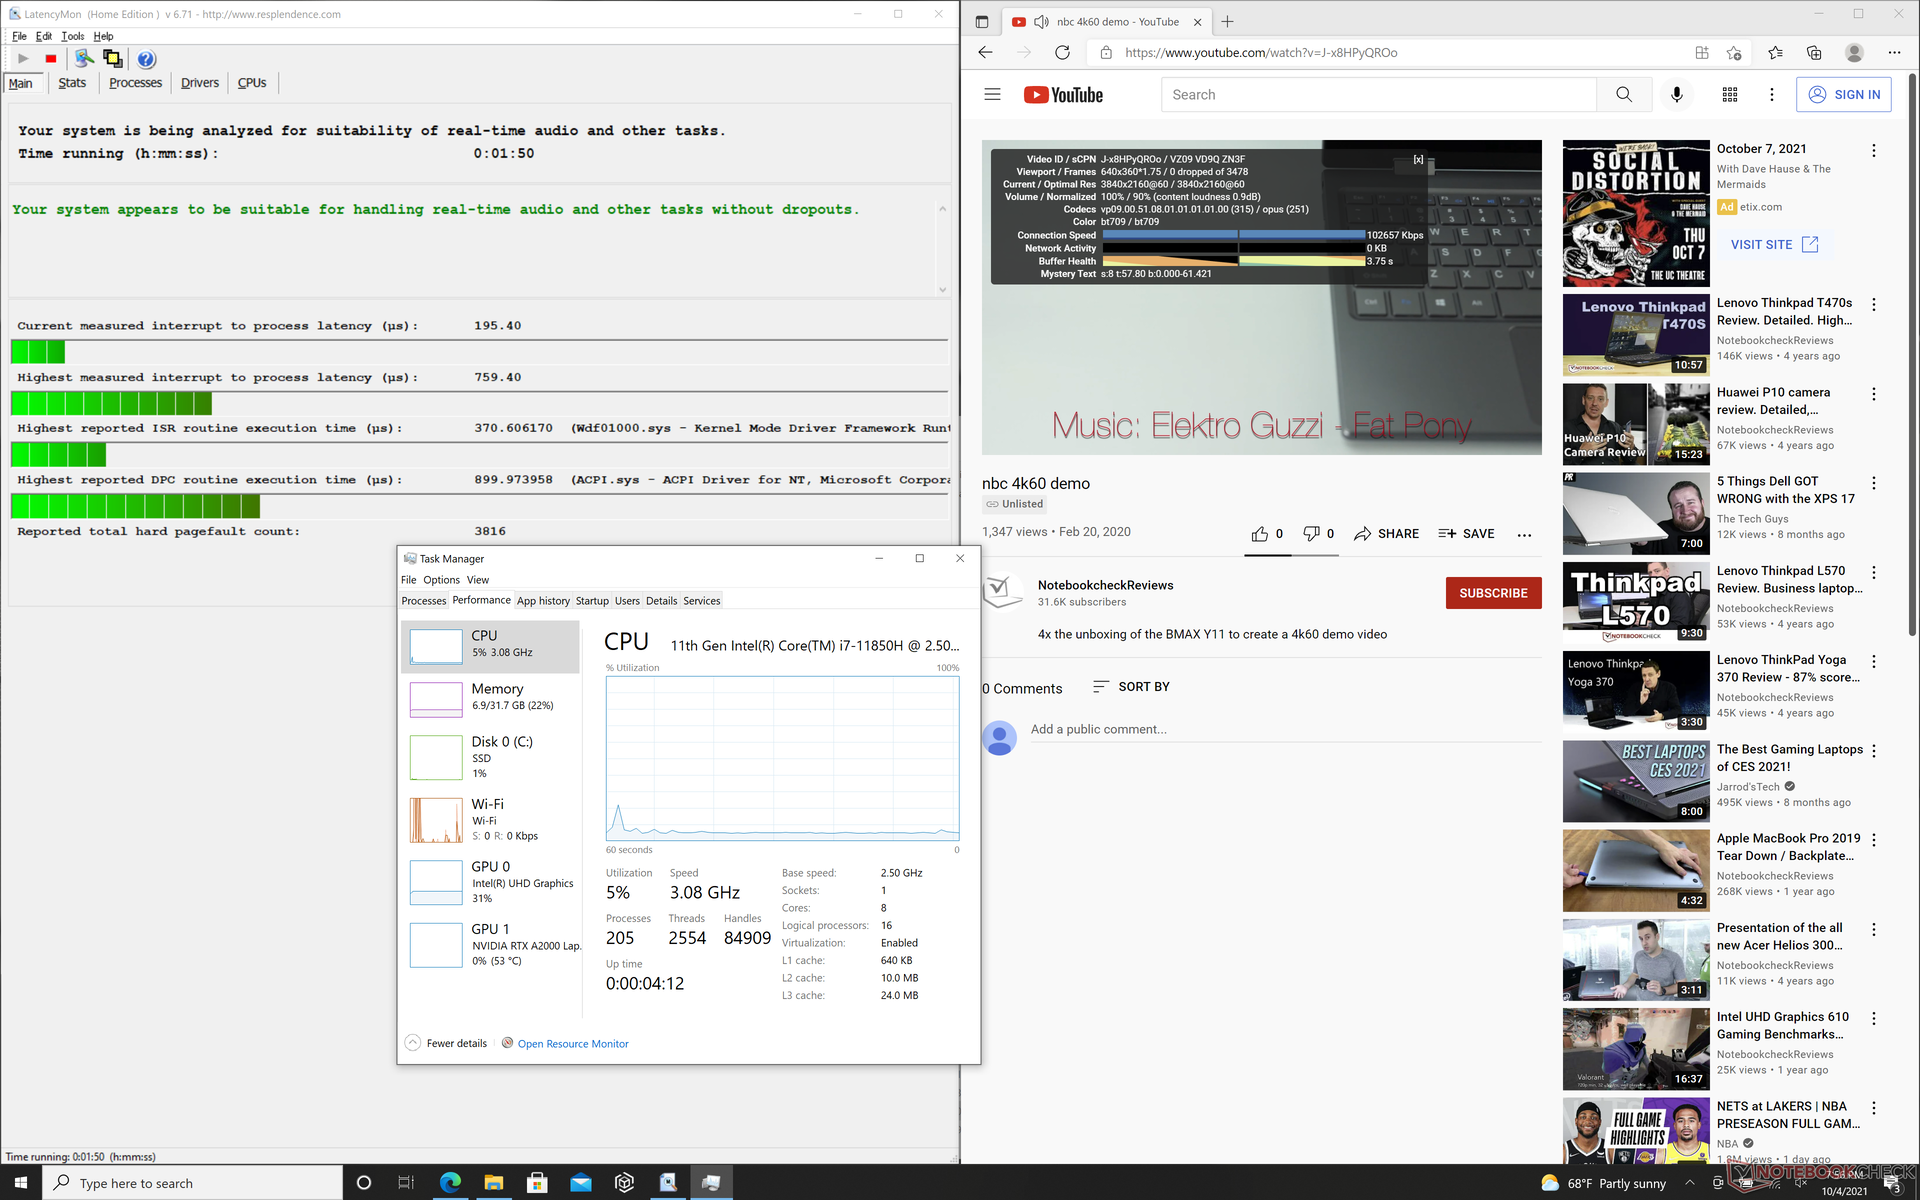
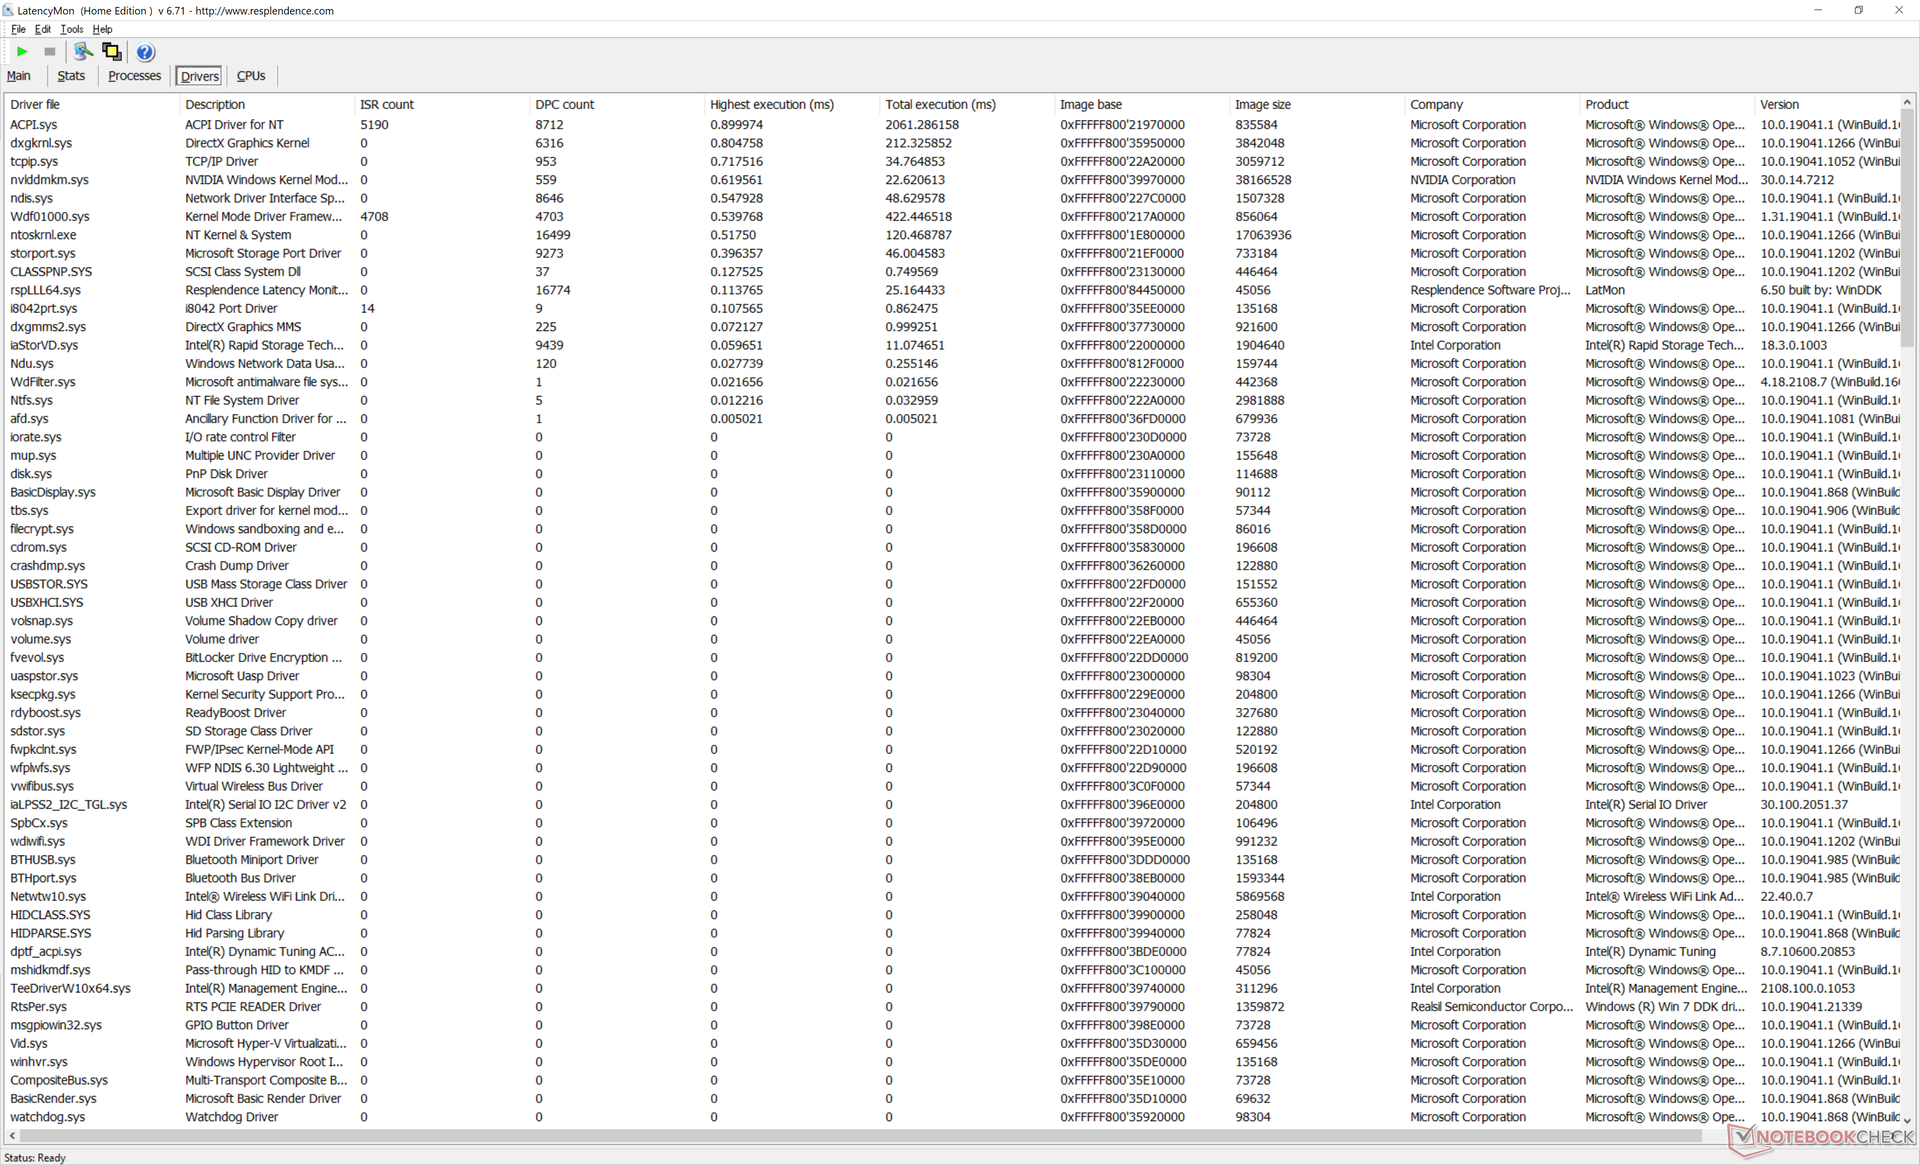
LatencyMon non mostra alcun problema di latenza DPC quando si aprono più schede del browser o quando si esegue Prime95. La riproduzione di video 4K a 60 FPS è anche completamente liscia e senza perdita di fotogrammi. Non ci aspettiamo di meno da nessuna workstation.
| DPC Latencies / LatencyMon - interrupt to process latency (max), Web, Youtube, Prime95 | |
| Dell Precision 7550 | |
| Lenovo ThinkPad P15 G2-20YQ001JGE | |
| Asus ProArt StudioBook Pro 15 W500G5T | |
| HP ZBook Studio 15 G8 | |
| Dell Precision 5000 5560 | |
| Razer Blade 15 Studio Edition 2020 | |
| Dell Precision 5550 P91F | |
* ... Meglio usare valori piccoli
Dispositivi di archiviazione
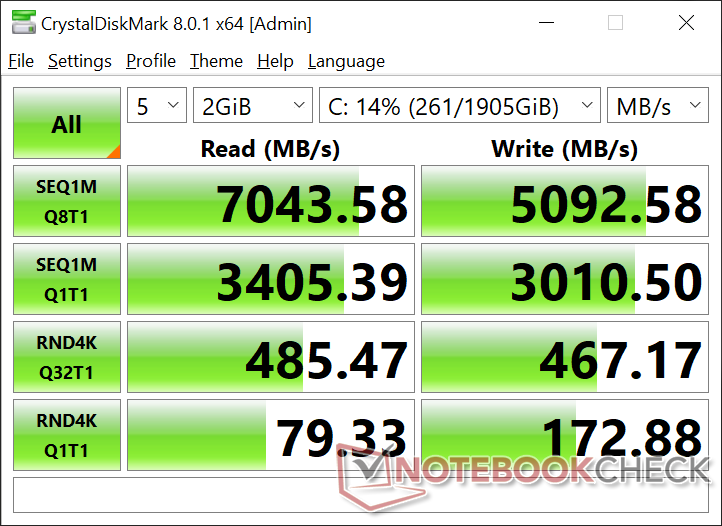
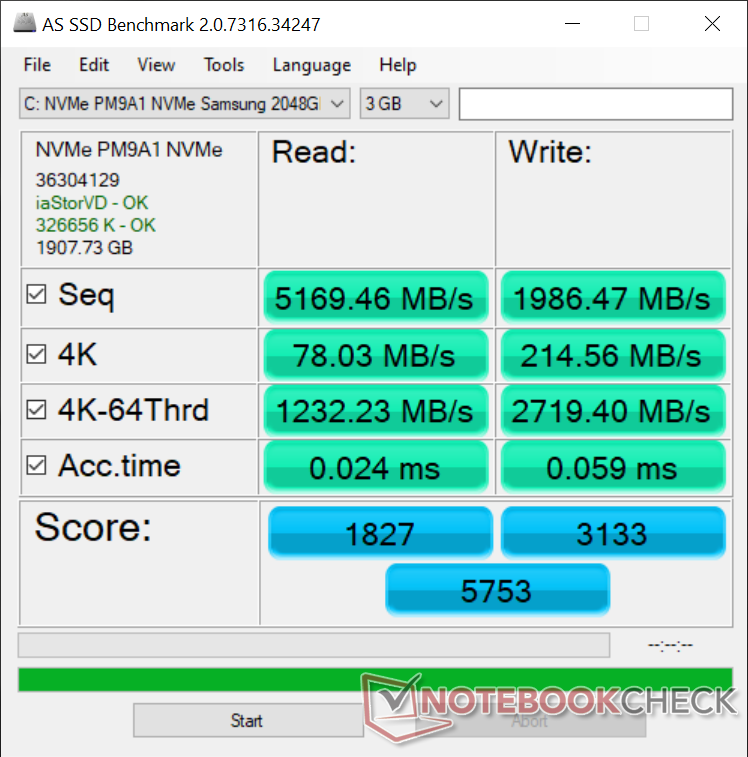
Dell ha confermato con noi che entrambi gli alloggiamenti di archiviazione M.2 supportano ciascuno SSD PCIe4 x4 rispetto al solo PCIe3 sul Precision 5550. Anche l Alienware x17 R1 può supportare solo un SSD PCIe4 x4 nonostante abbia due slot SSD M.2. La nostra unità di test viene spedita con un Samsung PM9A1 che è uno dei più veloci SSD PCIe4 a livello consumer attualmente disponibili ed è di conseguenza un enorme miglioramento delle prestazioni rispetto al SK Hynix PC601A sul modello dell'anno scorso.
| Dell Precision 5000 5560 Samsung PM9A1 MZVL22T0HBLB | Lenovo ThinkPad P15 G2-20YQ001JGE Kioxia XG7 KXG7AZNV512G | HP ZBook Studio 15 G8 Samsung PM981a MZVLB2T0HALB | Asus ProArt StudioBook Pro 15 W500G5T Samsung SSD PM981 MZVLB1T0HALR | Dell Precision 7550 SK Hynix PC601A NVMe 1TB | Dell Precision 5550 P91F SK Hynix PC601A NVMe 1TB | Razer Blade 15 Studio Edition 2020 Samsung PM981a MZVLB1T0HBLR | |
|---|---|---|---|---|---|---|---|
| AS SSD | -8% | -16% | -16% | -42% | -142% | -33% | |
| Seq Read (MB/s) | 5169 | 5105 -1% | 2953 -43% | 2702 -48% | 2028 -61% | 2039 -61% | 1982 -62% |
| Seq Write (MB/s) | 1986 | 1815 -9% | 1691 -15% | 2348 18% | 1193 -40% | 1376 -31% | 2252 13% |
| 4K Read (MB/s) | 78 | 47.46 -39% | 43.98 -44% | 37.59 -52% | 42.31 -46% | 44.11 -43% | 47.13 -40% |
| 4K Write (MB/s) | 214.6 | 137.3 -36% | 105.4 -51% | 107.1 -50% | 105.5 -51% | 113.3 -47% | 88.2 -59% |
| 4K-64 Read (MB/s) | 1232 | 2112 71% | 1065 -14% | 1491 21% | 1128 -8% | 1094 -11% | 1481 20% |
| 4K-64 Write (MB/s) | 2719 | 1702 -37% | 1957 -28% | 1794 -34% | 1537 -43% | 1630 -40% | 1842 -32% |
| Access Time Read * (ms) | 0.024 | 0.065 -171% | 0.04 -67% | 0.046 -92% | 0.069 -188% | 0.059 -146% | 0.087 -262% |
| Access Time Write * (ms) | 0.059 | 0.03 49% | 0.105 -78% | 0.034 42% | 0.106 -80% | 0.99 -1578% | 0.04 32% |
| Score Read (Points) | 1827 | 2670 46% | 1404 -23% | 1798 -2% | 1373 -25% | 1342 -27% | 1726 -6% |
| Score Write (Points) | 3133 | 2021 -35% | 2232 -29% | 2136 -32% | 1762 -44% | 1881 -40% | 2155 -31% |
| Score Total (Points) | 5753 | 5885 2% | 4297 -25% | 4835 -16% | 3801 -34% | 3883 -33% | 4781 -17% |
| Copy ISO MB/s (MB/s) | 3201 | 2054 -36% | 2474 -23% | 2302 -28% | 1768 -45% | 2489 -22% | 1982 -38% |
| Copy Program MB/s (MB/s) | 415.8 | 714 72% | 1074 158% | 564 36% | 627 51% | 682 64% | 501 20% |
| Copy Game MB/s (MB/s) | 1212 | 1431 18% | 1929 59% | 1336 10% | 1477 22% | 1515 25% | 1140 -6% |
| CrystalDiskMark 5.2 / 6 | -9% | -29% | 38% | -35% | -36% | -26% | |
| Write 4K (MB/s) | 172.4 | 141.1 -18% | 110.5 -36% | 1107 542% | 121 -30% | 122.6 -29% | 132.9 -23% |
| Read 4K (MB/s) | 78.8 | 58.8 -25% | 51.8 -34% | 43.38 -45% | 42.16 -46% | 42.4 -46% | 46.73 -41% |
| Write Seq (MB/s) | 2991 | 3320 11% | 2071 -31% | 2387 -20% | 2150 -28% | 2167 -28% | 2214 -26% |
| Read Seq (MB/s) | 3351 | 2994 -11% | 2505 -25% | 2431 -27% | 1755 -48% | 1747 -48% | 2018 -40% |
| Write 4K Q32T1 (MB/s) | 459.2 | 626 36% | 429.8 -6% | 340.7 -26% | 395.3 -14% | 388.8 -15% | 478.9 4% |
| Read 4K Q32T1 (MB/s) | 484.3 | 401.8 -17% | 418.3 -14% | 397.8 -18% | 381.8 -21% | 367.3 -24% | 540 12% |
| Write Seq Q32T1 (MB/s) | 4761 | 3742 -21% | 3060 -36% | 2390 -50% | 2730 -43% | 2629 -45% | 2975 -38% |
| Read Seq Q32T1 (MB/s) | 7071 | 5097 -28% | 3539 -50% | 3502 -50% | 3468 -51% | 3460 -51% | 3195 -55% |
| Media totale (Programma / Settaggio) | -9% /
-8% | -23% /
-21% | 11% /
4% | -39% /
-40% | -89% /
-103% | -30% /
-31% |
* ... Meglio usare valori piccoli

Disk Throttling: DiskSpd Read Loop, Queue Depth 8
Prestazioni della GPU
Le prestazioni grafiche grezze della Quadro RTX A2000 si colloca comodamente tra la GeForce GTX 1650 Ti e GTX 1660 Ti o circa il 10 percento più lenta della vecchia Quadro RTX 3000 Max-Q. L'aumento delle prestazioni è più significativo del 40-50 per cento rispetto alla Quadro T2000 Max-Q in Precision 5550. L'aggiornamento a una Quadro RTX A3000, che non è disponibile sulla serie Precision 5560, può portare un aumento delle prestazioni del 30-40 per cento rispetto alla nostra Quadro RTX A2000
È interessante notare che i punteggi di SpecViewPerf sono più vicini del previsto tra la nostra RTX A2000 e la Quadro RTX 3000 Max-Q di ultima generazione, nonostante la vecchia GPU Turing più affamata di energia, suggerendo una migliore ottimizzazione nei carichi di tipo workstation per la nostra GPU Ampere
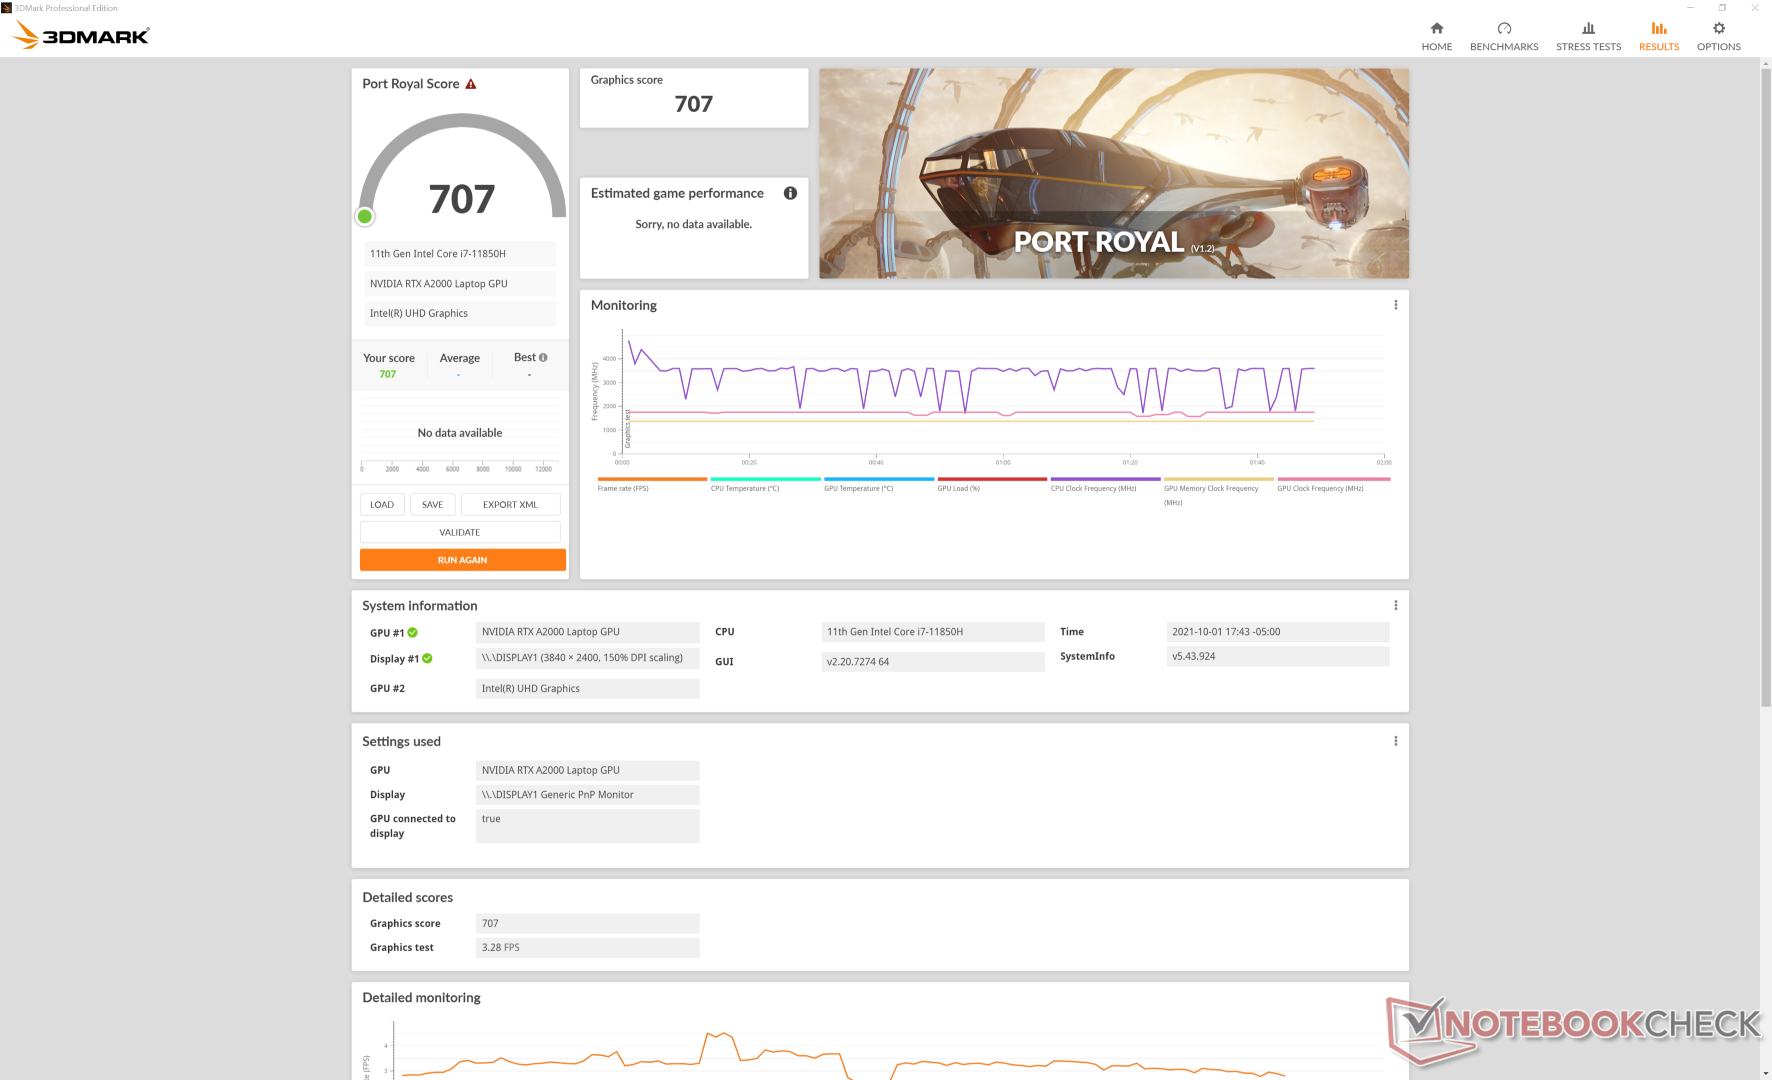
In caso di gioco, aspettatevi che le prestazioni siano circa il 20-30 per cento più lente della GTX 1660 Ti, dato che le GPU Quadro non sono ottimizzate per i giochi. Strange Brigade, per esempio, a volte andava in crash dopo uno o due minuti di benchmark.
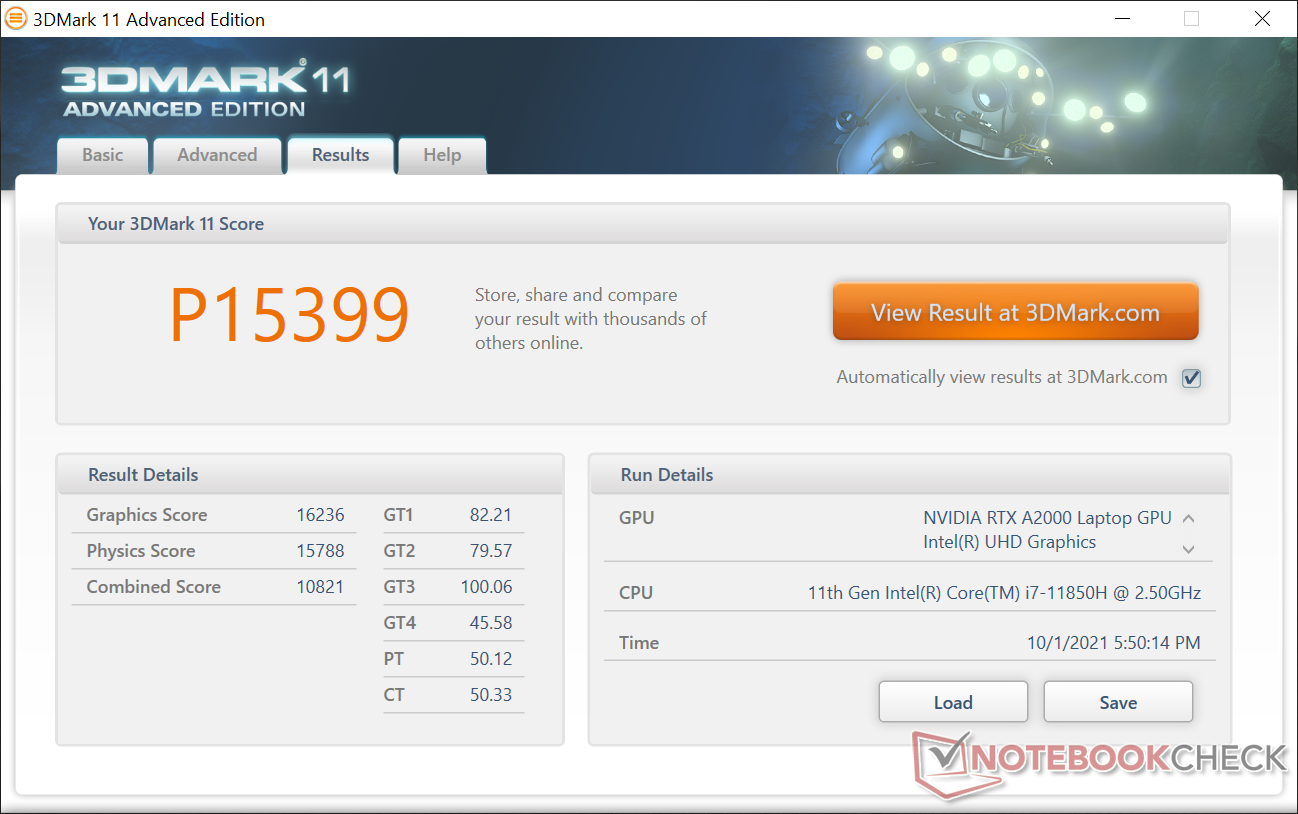
| 3DMark 11 Performance | 15399 punti | |
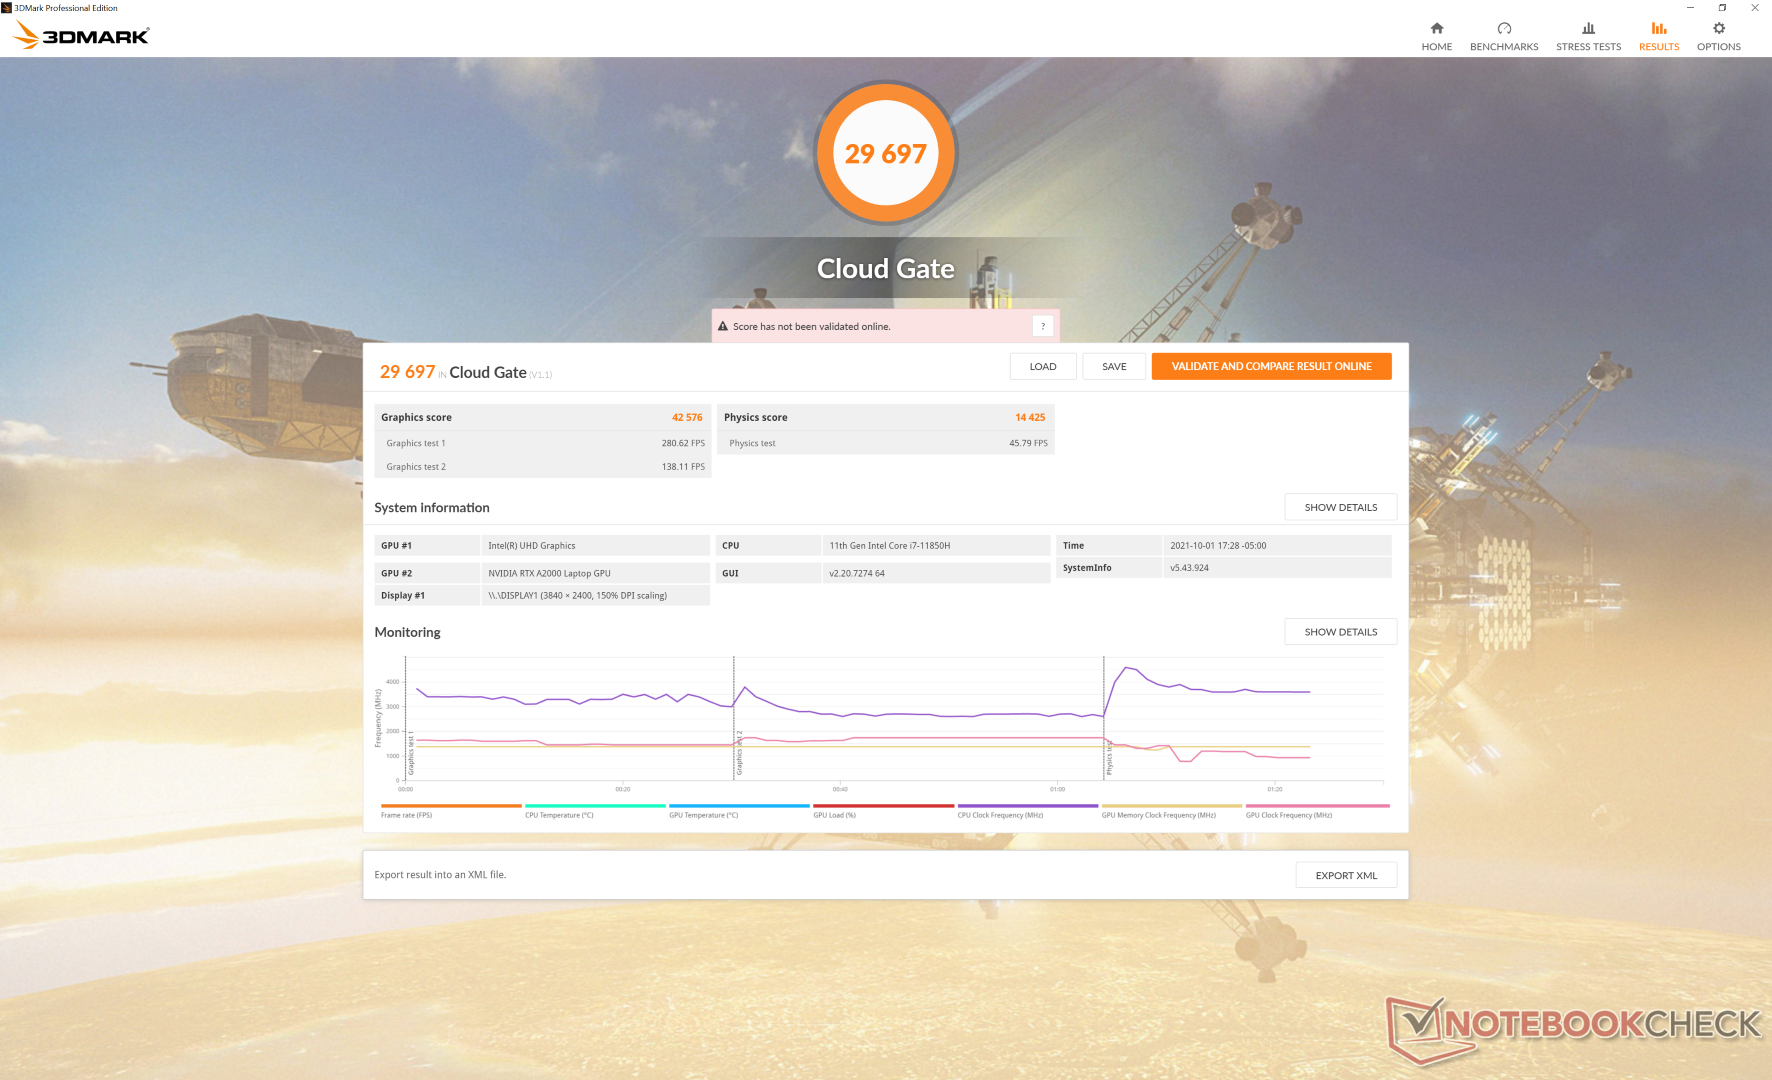
| 3DMark Cloud Gate Standard Score | 29697 punti | |
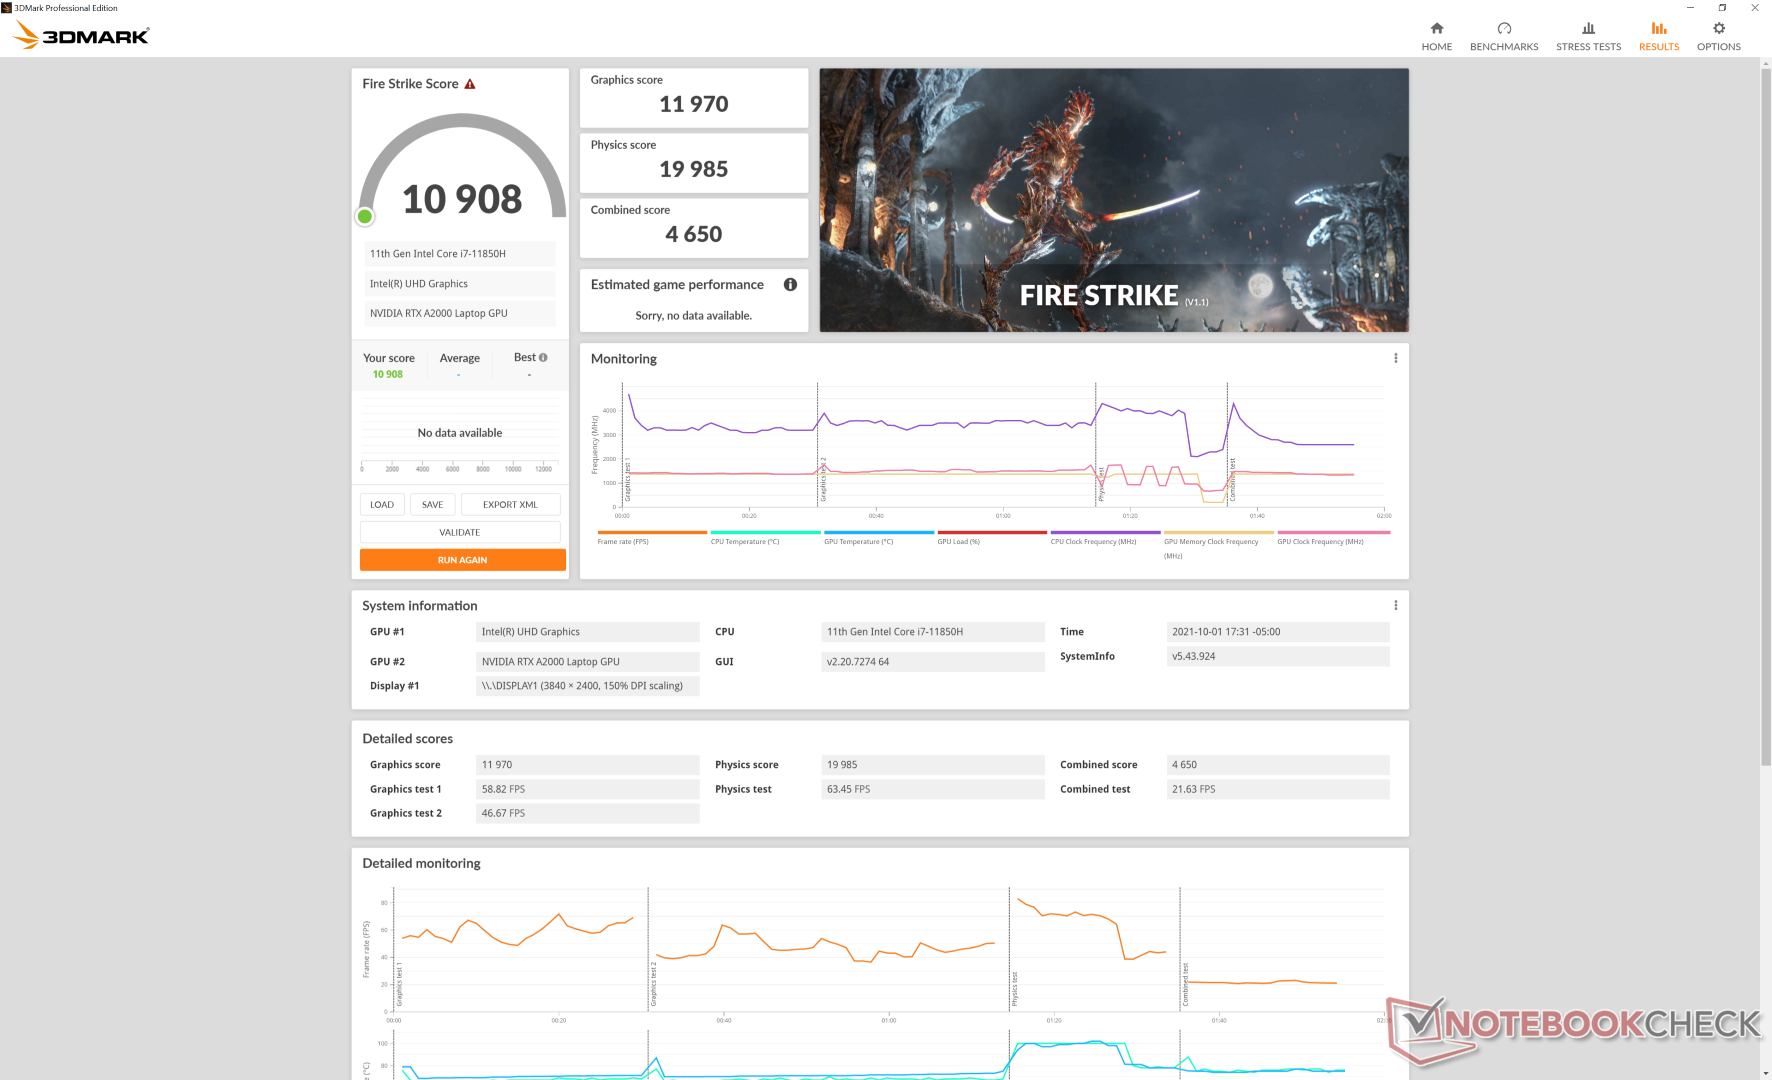
| 3DMark Fire Strike Score | 10908 punti | |
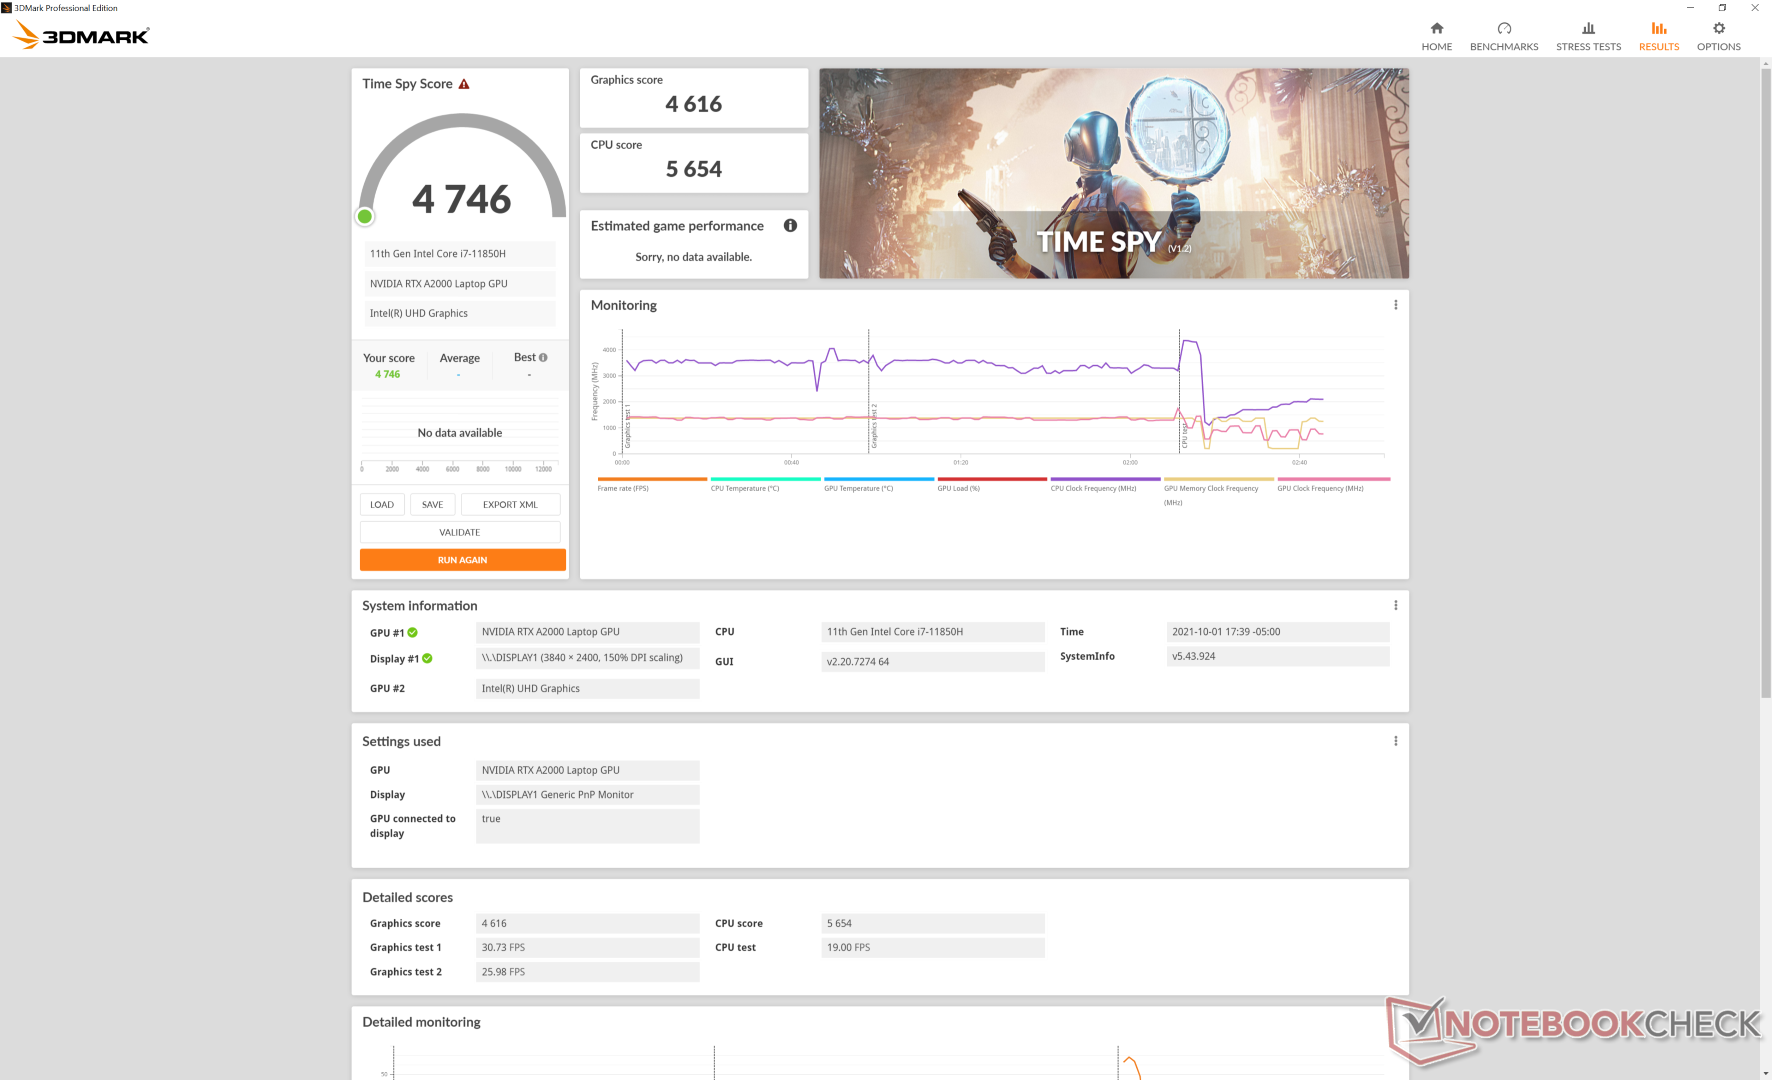
| 3DMark Time Spy Score | 4746 punti | |
Aiuto | ||
Witcher 3 FPS Chart
| basso | medio | alto | ultra | QHD | 4K | |
|---|---|---|---|---|---|---|
| GTA V (2015) | 179 | 170 | 112 | 57.8 | 42.9 | |
| The Witcher 3 (2015) | 259.8 | 151.9 | 92.4 | 50 | 33.1 | |
| Dota 2 Reborn (2015) | 173 | 155 | 130 | 119 | 62.9 | |
| Final Fantasy XV Benchmark (2018) | 86.9 | 63.2 | 46.6 | 34.4 | 19.3 | |
| X-Plane 11.11 (2018) | 112 | 89.2 | 75.1 | 45.3 | ||
| Far Cry 5 (2018) | 120 | 82 | 77 | 69 | 49 | |
| Strange Brigade (2018) | 251 | 60.4 | ||||
| Shadow of the Tomb Raider (2018) | 107 | 62 | 58 | 55 | 40 | 17 |
| Far Cry New Dawn (2019) | 106 | 72 | 71 | 59 | 49 | |
| Metro Exodus (2019) | 110.4 | 55.1 | 42.3 | 34.9 | 27 | |
| Borderlands 3 (2019) | 115.5 | 60.7 | 46.2 | 36 | ||
| Gears Tactics (2020) | 104.3 | 113.7 | 77.5 | 53.4 | 37.3 | |
| Horizon Zero Dawn (2020) | 81 | 60 | 55 | 49 | 41 | |
| Watch Dogs Legion (2020) | 86 | 62 | 51 | 29 | 20 | |
| Dirt 5 (2020) | 86.3 | 68 | 54.6 | 41.9 | 34 | |
| Assassin´s Creed Valhalla (2020) | 80 | 55 | 39 | 32 | 27 | |
| Immortals Fenyx Rising (2020) | 107 | 80 | 72 | 64 | 53 | |
| Hitman 3 (2021) | 166.6 | 83.4 | 78.6 | 73.9 | 48.4 | |
| F1 2021 (2021) | 114 | 120 | 104 | 37 | 24 |
Emissions
Rumore di sistema
È interessante notare che il rumore della ventola è notevolmente più silenzioso di quello che abbiamo osservato su Precision 5550. Mentre il rumore della ventola può raggiungere oltre 50 dB(A) su Precision 5550, siamo in grado di raggiungere solo fino a 41,4 dB(A) al massimo sul nostro Precision 5560 anche se sottoposto alle stesse condizioni di stress. Questo soffitto più basso della ventola sul modello più recente è apprezzato e aiuta effettivamente il sistema ad essere una delle workstation mobili ultrasottili più silenziose sul mercato, ma questo viene al costo di temperature più elevate del core. La nostra sezione Stress Test qui sotto mostra una differenza di temperatura della CPU di 16 C tra i due portatili quando si esegue Prime95.
| Dell Precision 5000 5560 RTX A2000 Laptop GPU, i7-11850H, Samsung PM9A1 MZVL22T0HBLB | Lenovo ThinkPad P15 G2-20YQ001JGE RTX A3000 Laptop GPU, i7-11800H, Kioxia XG7 KXG7AZNV512G | HP ZBook Studio 15 G8 GeForce RTX 3070 Laptop GPU, i9-11950H, Samsung PM981a MZVLB2T0HALB | Asus ProArt StudioBook Pro 15 W500G5T Quadro RTX 5000 Max-Q, i7-9750H, Samsung SSD PM981 MZVLB1T0HALR | Dell Precision 7550 Quadro RTX 5000 Max-Q, W-10885M, SK Hynix PC601A NVMe 1TB | Dell Precision 5550 P91F Quadro T2000 Max-Q, i7-10875H, SK Hynix PC601A NVMe 1TB | Razer Blade 15 Studio Edition 2020 Quadro RTX 5000 Max-Q, i7-10875H, Samsung PM981a MZVLB1T0HBLR | |
|---|---|---|---|---|---|---|---|
| Noise | -25% | -18% | -26% | -27% | -17% | -28% | |
| off /ambiente * (dB) | 23.4 | 24.3 -4% | 23.5 -0% | 25.2 -8% | 25.8 -10% | 26.2 -12% | 30.1 -29% |
| Idle Minimum * (dB) | 23.6 | 24.3 -3% | 25.3 -7% | 27.9 -18% | 25.8 -9% | 26.2 -11% | 30.1 -28% |
| Idle Average * (dB) | 23.6 | 24.3 -3% | 25.3 -7% | 27.9 -18% | 25.8 -9% | 26.2 -11% | 30.1 -28% |
| Idle Maximum * (dB) | 23.6 | 28.6 -21% | 25.3 -7% | 27.9 -18% | 25.9 -10% | 26.2 -11% | 30.1 -28% |
| Load Average * (dB) | 25.8 | 47.5 -84% | 41.2 -60% | 47 -82% | 51.2 -98% | 39.2 -52% | 42.3 -64% |
| Witcher 3 ultra * (dB) | 40.1 | 49.4 -23% | 51.9 -29% | 39 3% | 48.2 -20% | ||
| Load Maximum * (dB) | 41.4 | 54.9 -33% | 49.4 -19% | 46.9 -13% | 51.9 -25% | 50.6 -22% | 42.1 -2% |
* ... Meglio usare valori piccoli
Rumorosità
| Idle |
| 23.6 / 23.6 / 23.6 dB(A) |
| Sotto carico |
| 25.8 / 41.4 dB(A) |
 | ||
30 dB silenzioso 40 dB(A) udibile 50 dB(A) rumoroso |
||
min: | ||
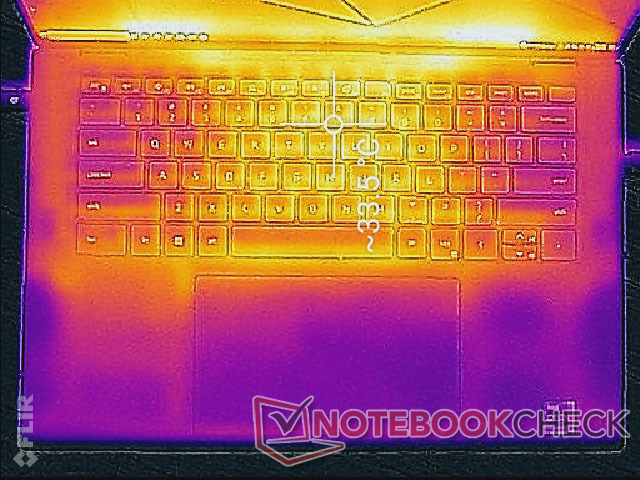
Temperatura
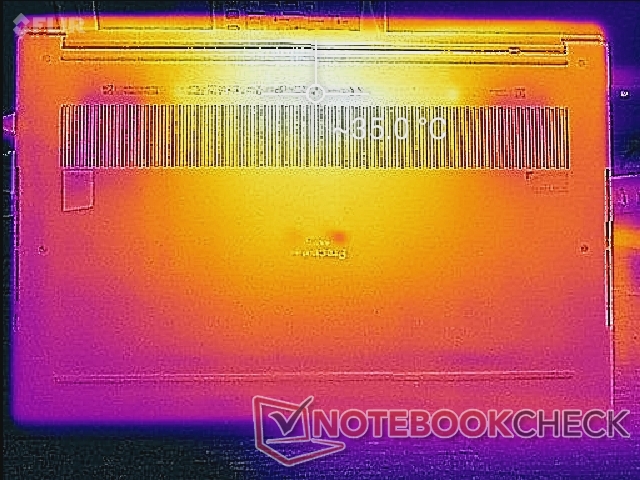
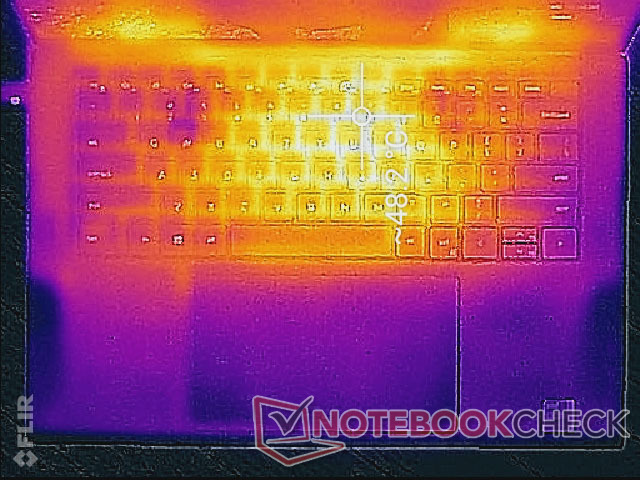
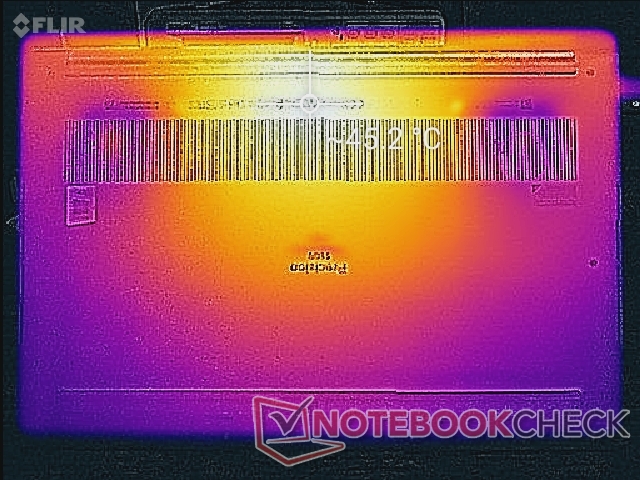
Le temperature superficiali sotto carico sono simili a quelle che abbiamo registrato sul Precision 5550 con punti caldi che si avvicinano a 49 C e 45 C sulla parte superiore e inferiore, rispettivamente. Lo sviluppo della temperatura è in gran parte simmetrico a causa della soluzione di raffreddamento simmetrica all'interno e quindi il centro della tastiera sarà molto più caldo dei poggiapolsi o dei bordi. IlThinkPad P15 Gen 2 è una workstation mobile più potente del nostro Precision 5560, ma i suoi punti caldi possono diventare molto più caldi a più di 63 C come risultato.
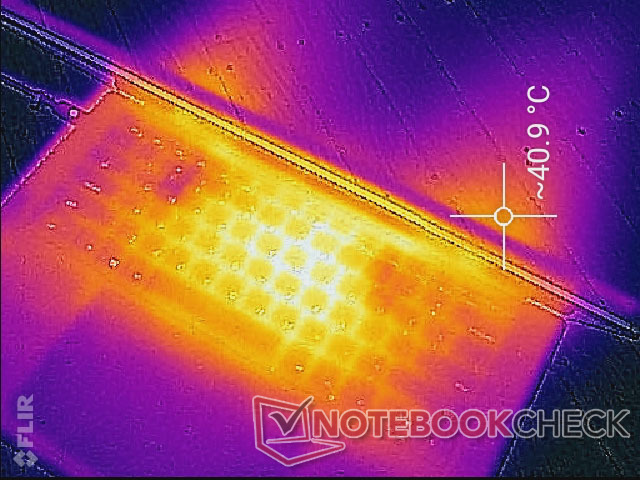
(-) La temperatura massima sul lato superiore è di 48.2 °C / 119 F, rispetto alla media di 38.2 °C / 101 F, che varia da 22.2 a 69.8 °C per questa classe Workstation.
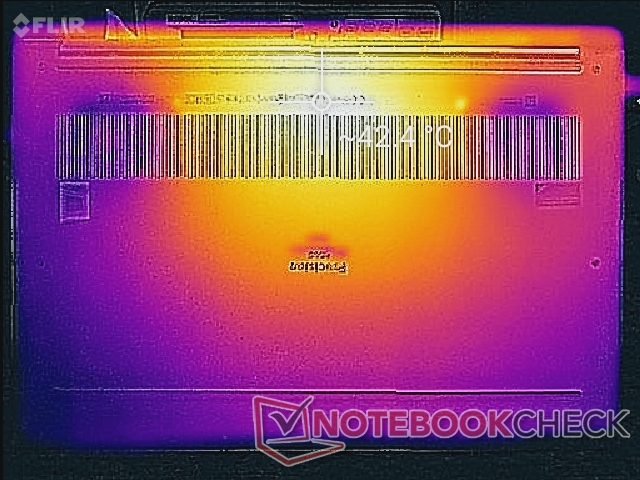
(±) Il lato inferiore si riscalda fino ad un massimo di 42.6 °C / 109 F, rispetto alla media di 41.1 °C / 106 F
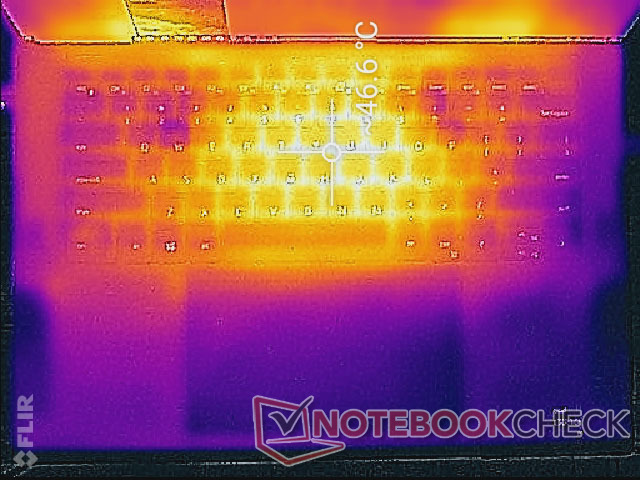
(+) In idle, la temperatura media del lato superiore è di 30.6 °C / 87 F, rispetto alla media deld ispositivo di 32 °C / 90 F.
(±) Riproducendo The Witcher 3, la temperatura media per il lato superiore e' di 35.4 °C / 96 F, rispetto alla media del dispositivo di 32 °C / 90 F.
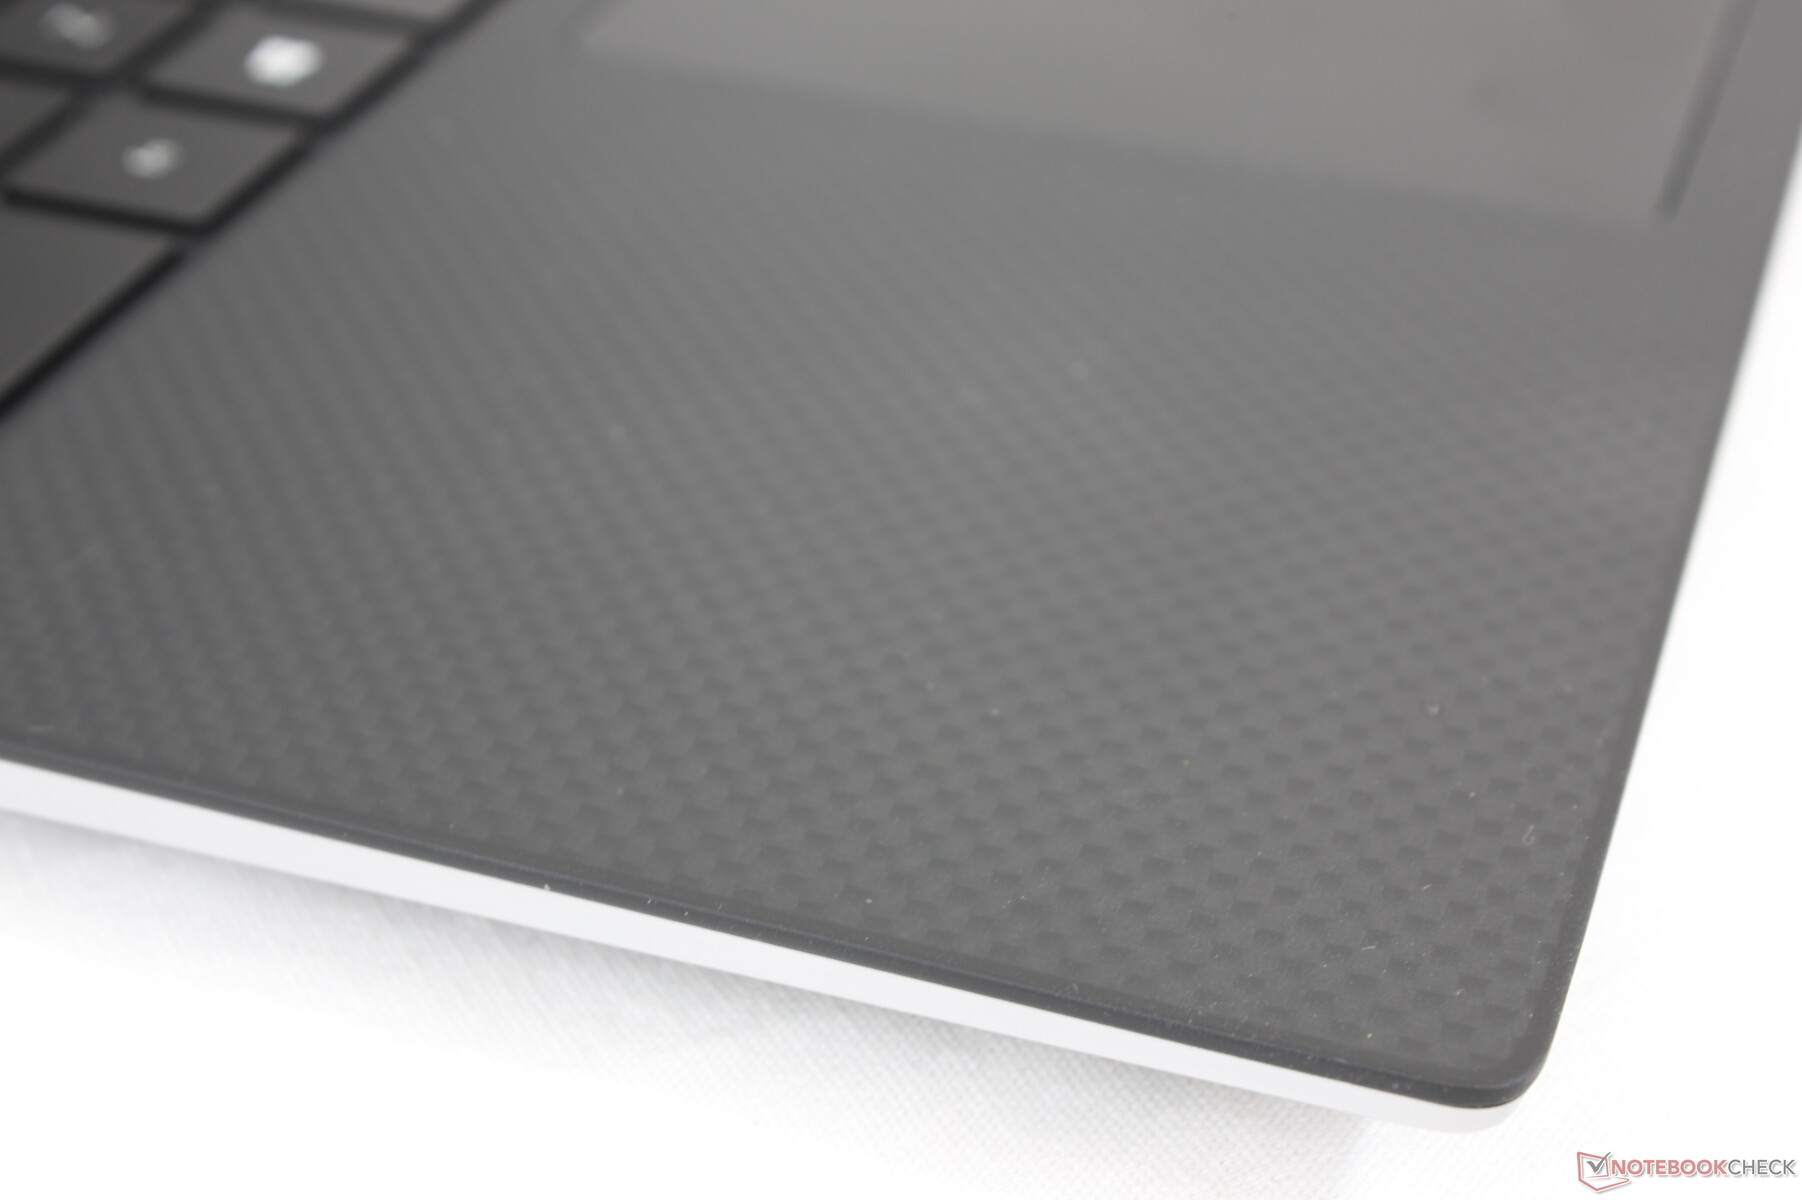
(+) I poggiapolsi e il touchpad sono piu' freddi della temperatura della pelle con un massimo di 30.8 °C / 87.4 F e sono quindi freddi al tatto.
(-) La temperatura media della zona del palmo della mano di dispositivi simili e'stata di 27.8 °C / 82 F (-3 °C / -5.4 F).
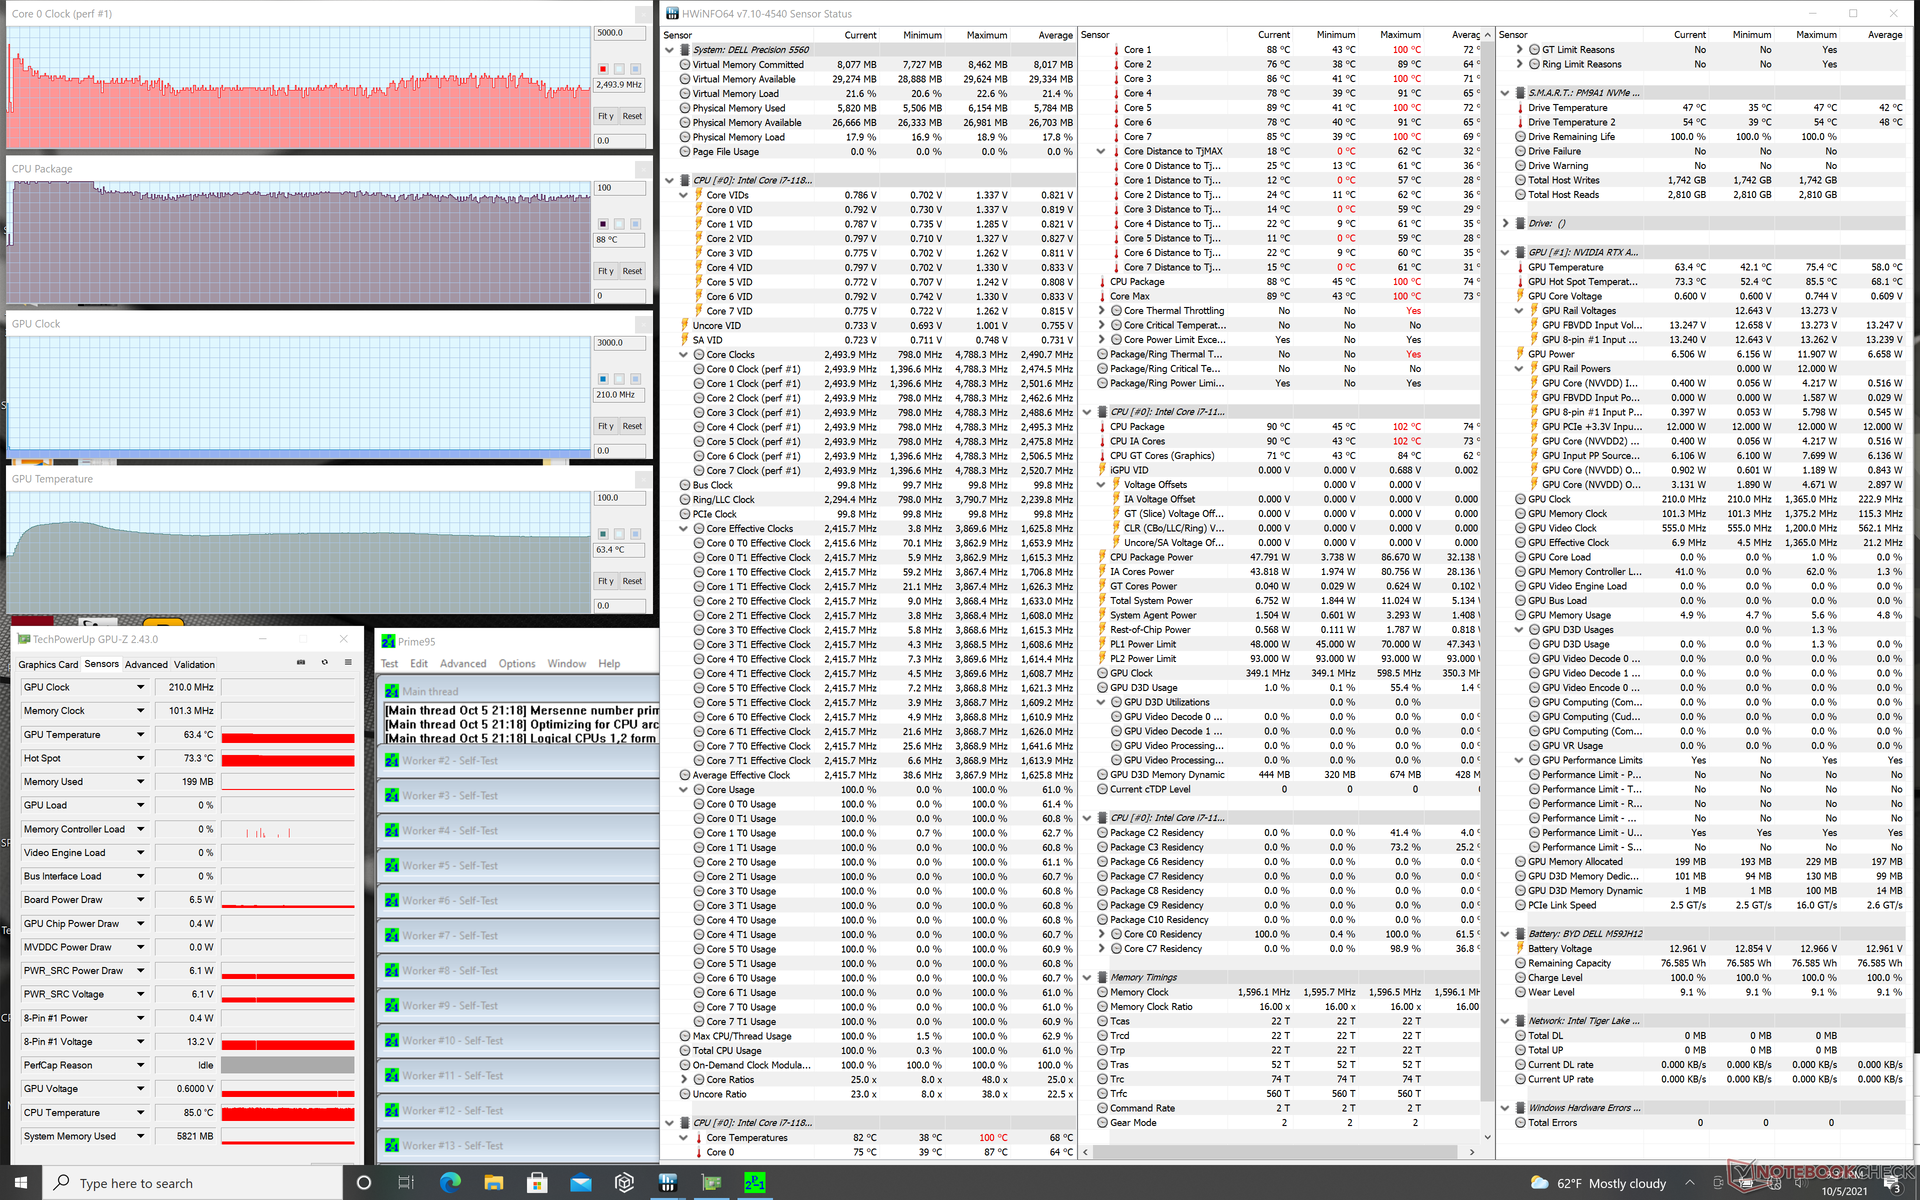
Test di stress
Durante l'esecuzione di Prime95, la CPU saliva a 3.8 GHz per i primi due secondi prima di raggiungere una temperatura del core di 100 C. Il clock rate scendeva poi a 2.8 - 3.0 GHz per il minuto successivo o giù di lì prima di scendere ulteriormente a 2.5 - 2.8 GHz. La temperatura del core alla fine si stabilizza a circa 90 C rispetto ai 98 C dell'HP ZBook Studio 15 G8 o ai soli 74 C del Precision 5550
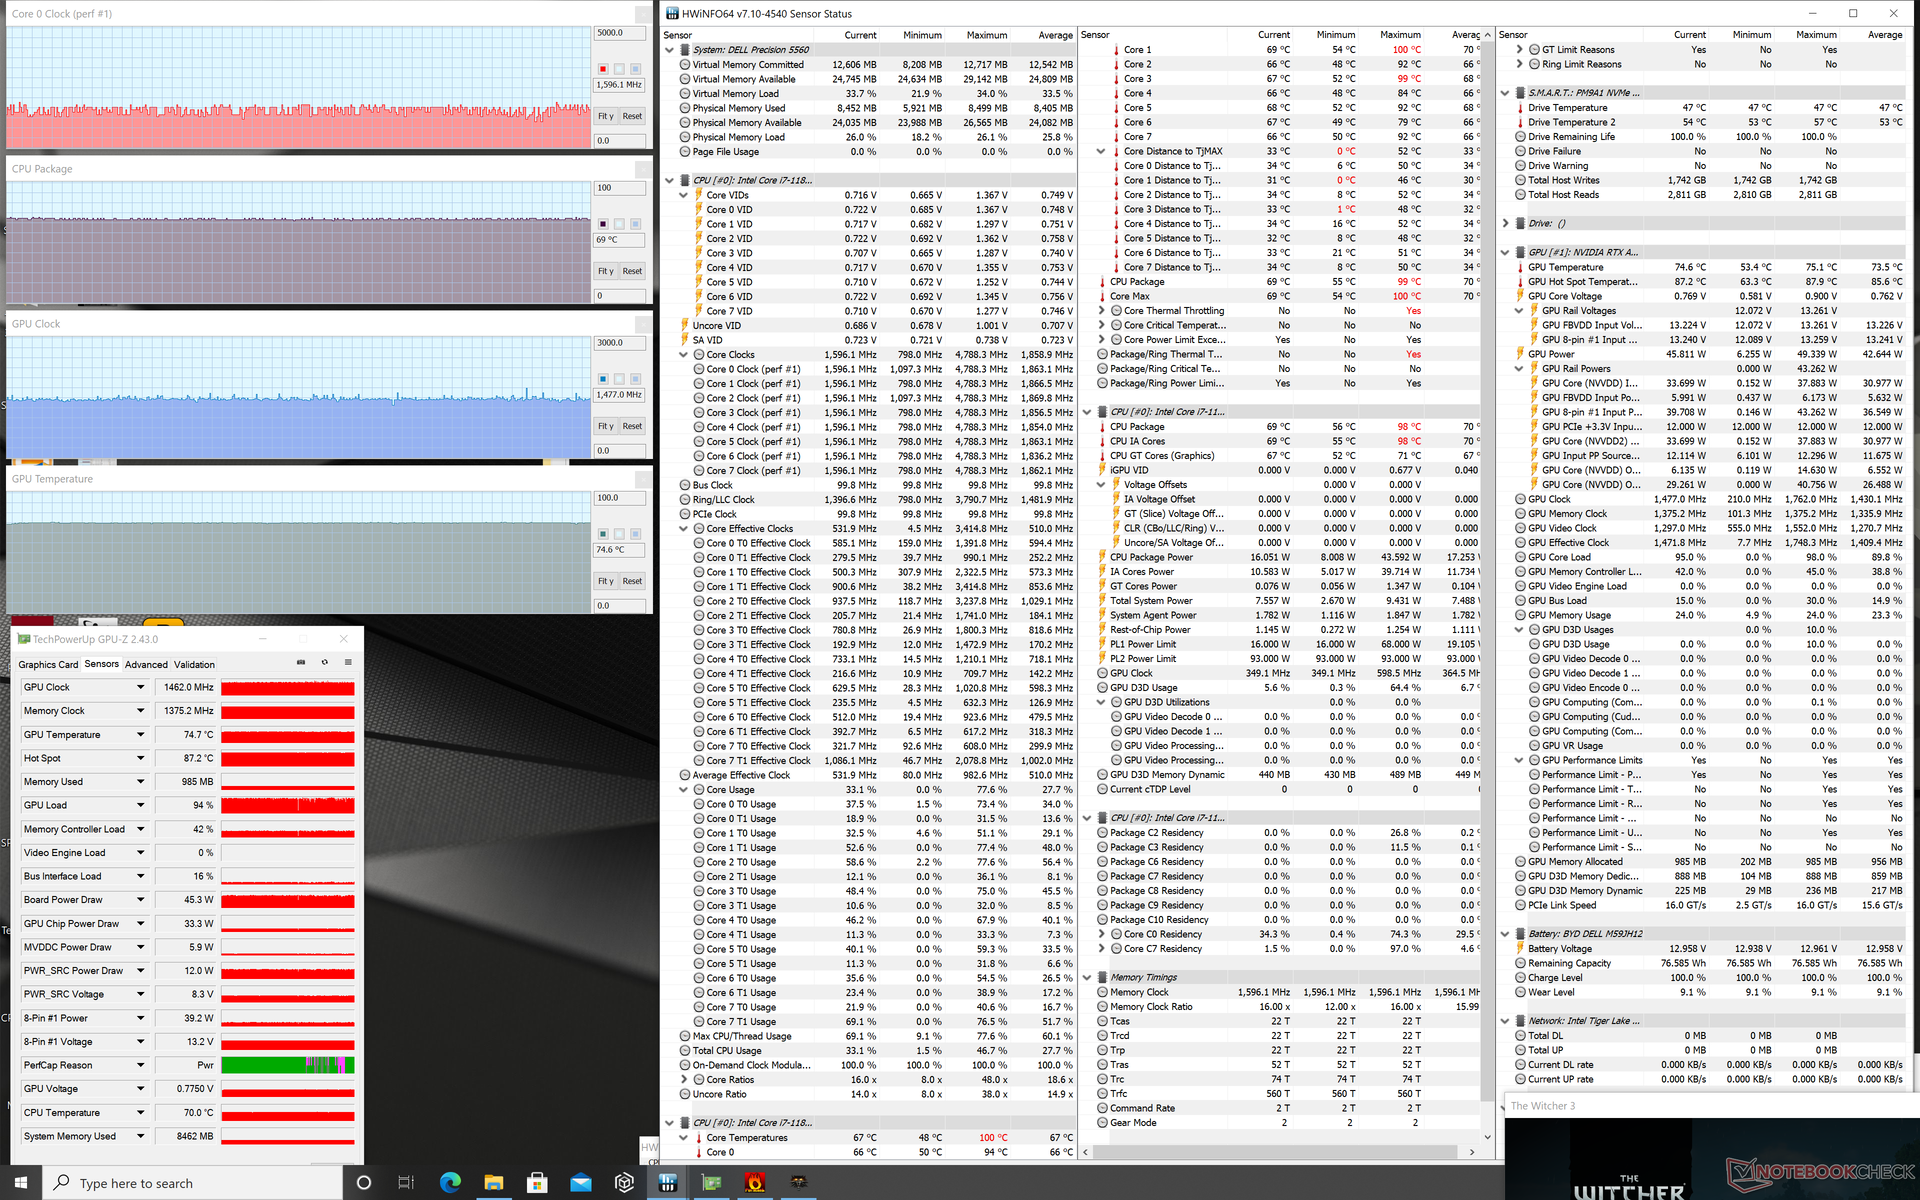
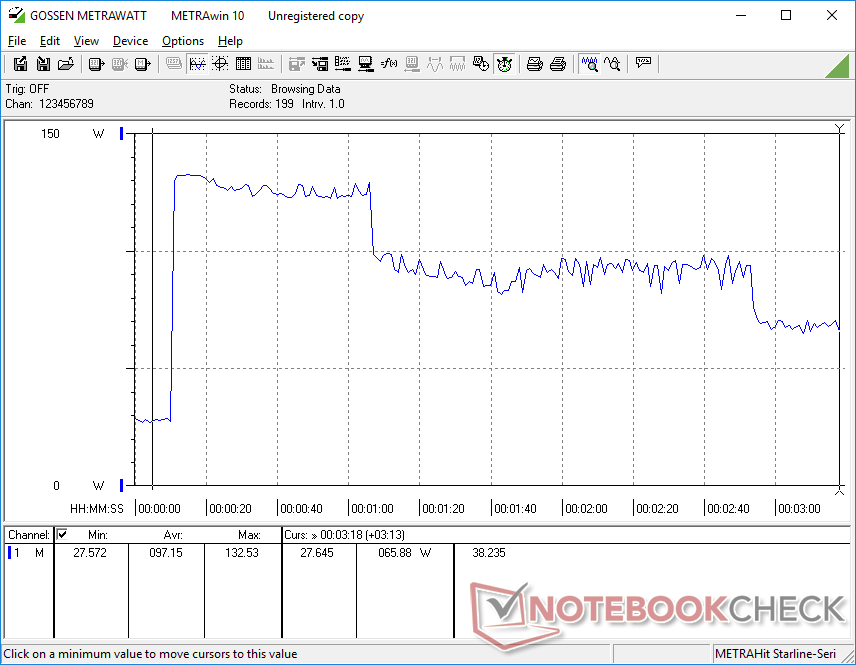
Quando si esegue Witcher 3 a rappresentare carichi stressanti, la CPU e la GPU si stabilizzerebbero a 69 C e 75 C, rispettivamente, rispetto a 66 C e 67 C su Precision 5550. L'assorbimento della GPU in tempo reale sarebbe stabile a 45 W rispetto ai 40 W di Precision 5550, il che potrebbe in parte spiegare la temperatura della GPU leggermente più alta del nostro Precision 5560
L'alimentazione a batteria ha un impatto sulle prestazioni. Un test 3DMark 11 a batteria restituirebbe punteggi di Fisica e Grafica di 14330 e 12191 punti, rispettivamente, rispetto a 15788 e 16236 punti con l'alimentazione di rete.
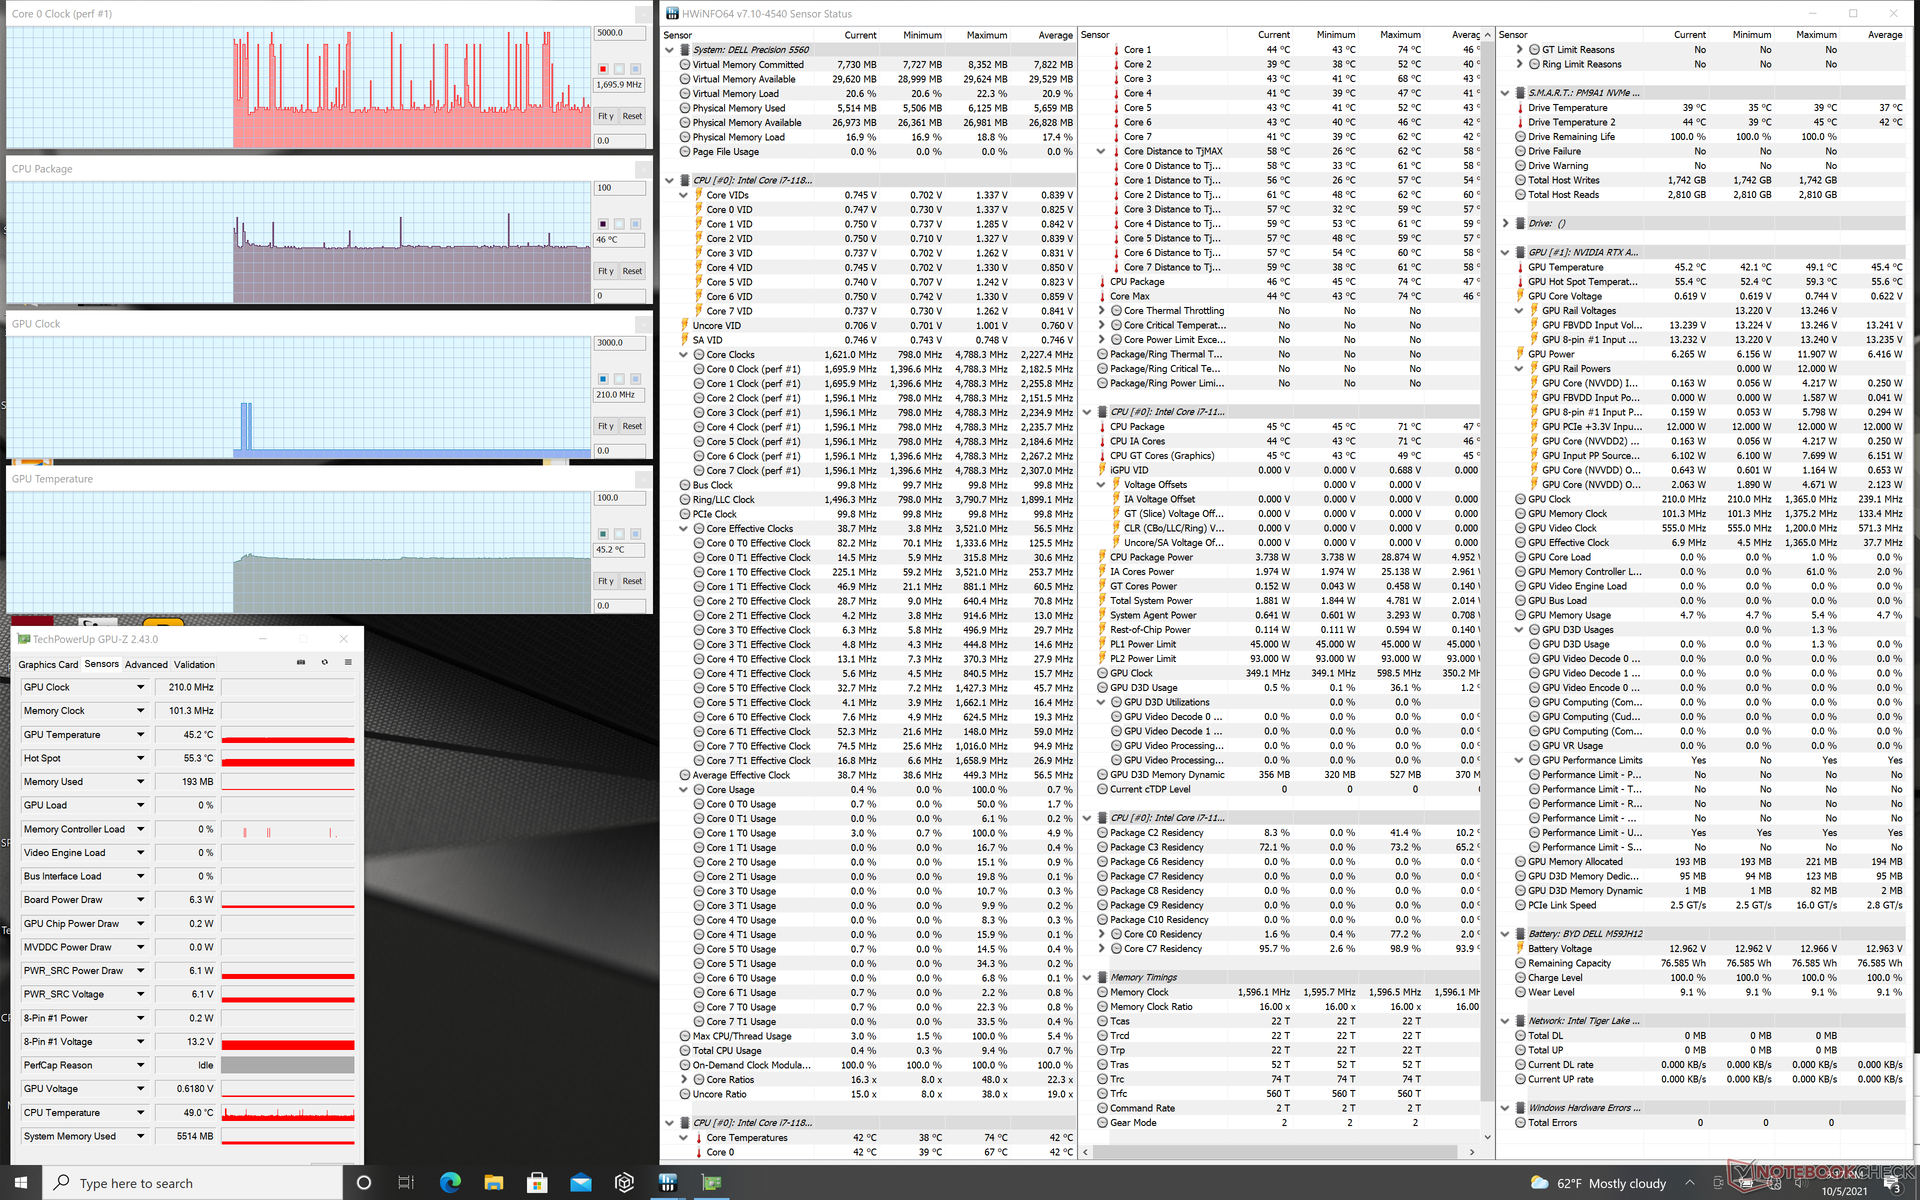
| Clock della CPU (GHz)Clock della GPU(MHz)Temperatura media dellaCPU (°C)Temperaturamedia dellaGPU (°C) |
| Sistema inattivo |
| StressPrime95 |
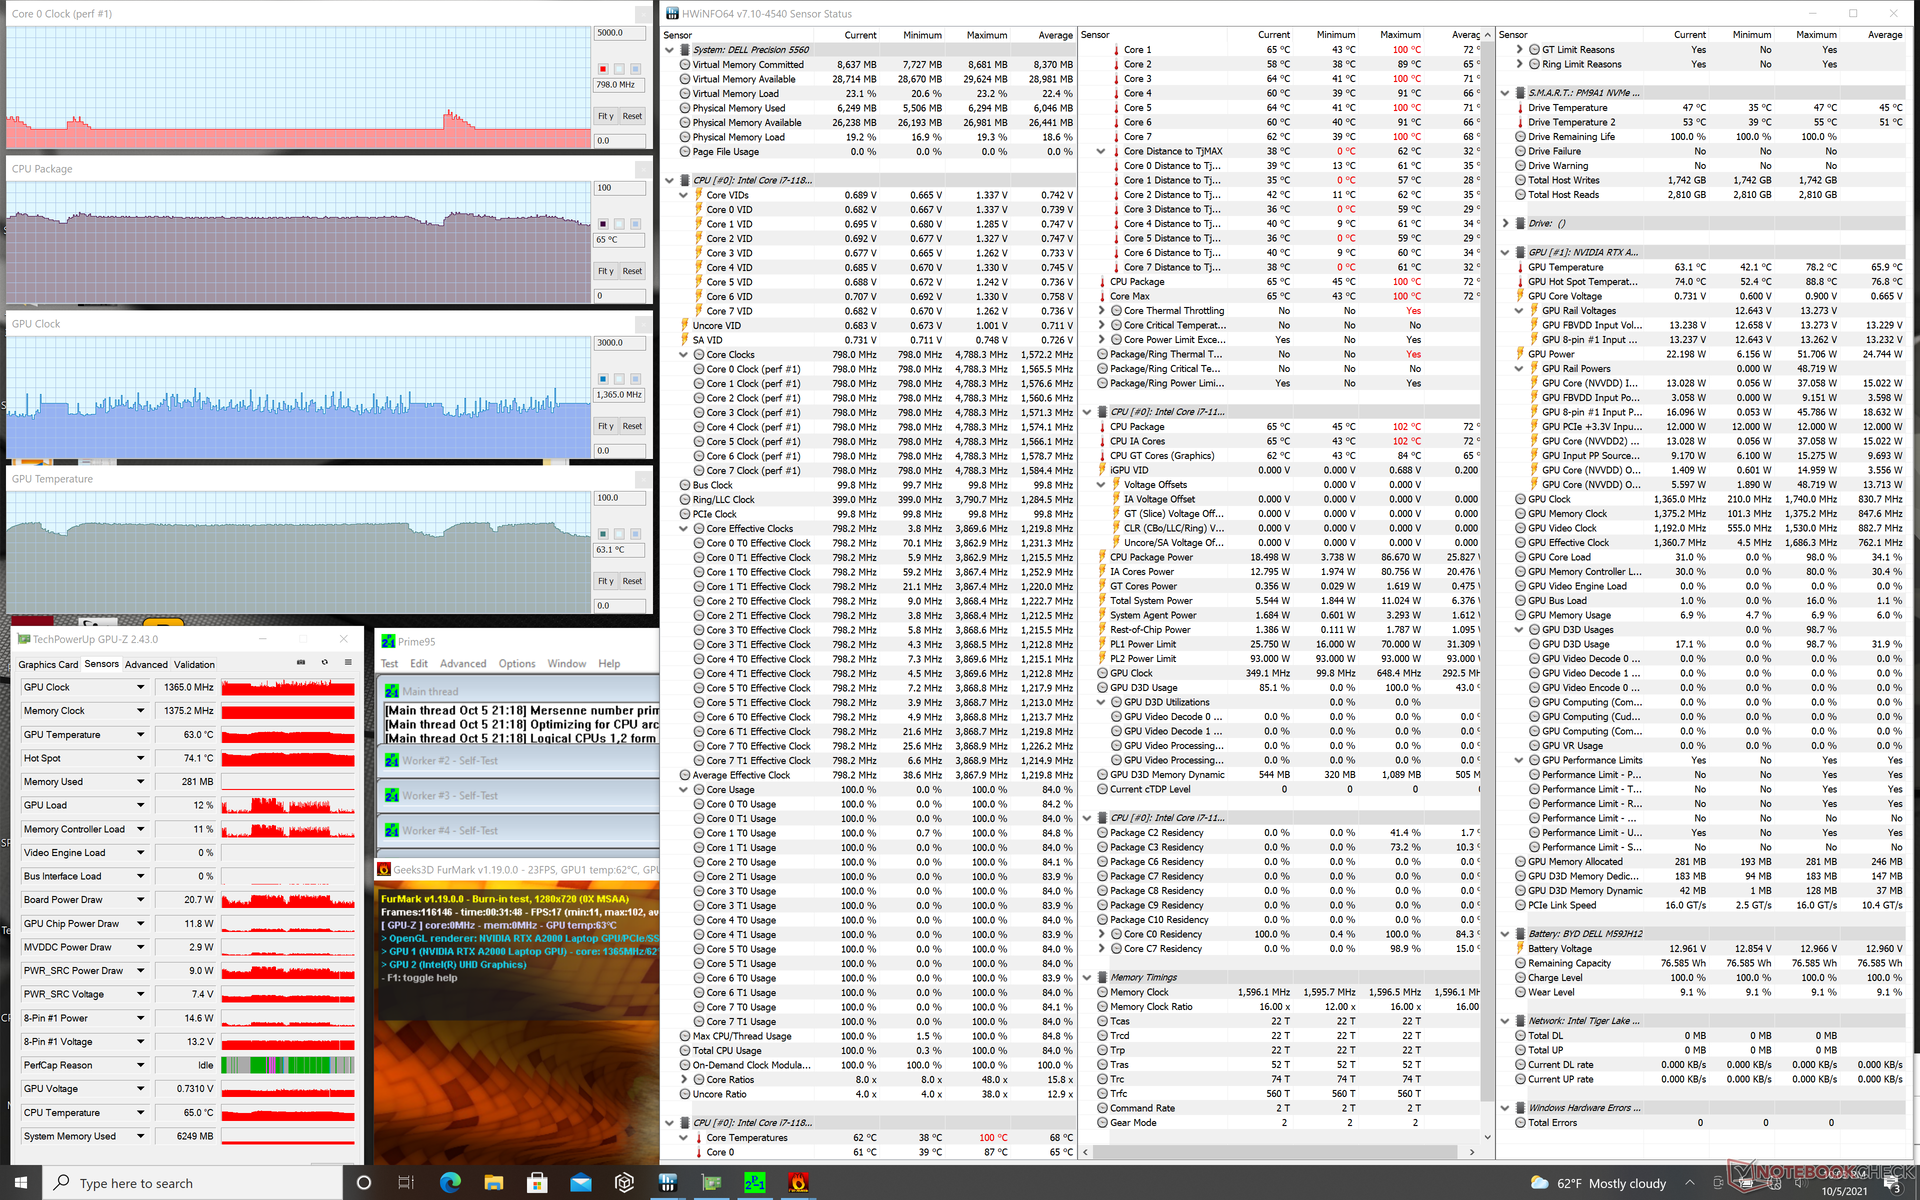
| Prime95 + FurMark Stress |
| Witcher 3 Stress |
Altoparlanti

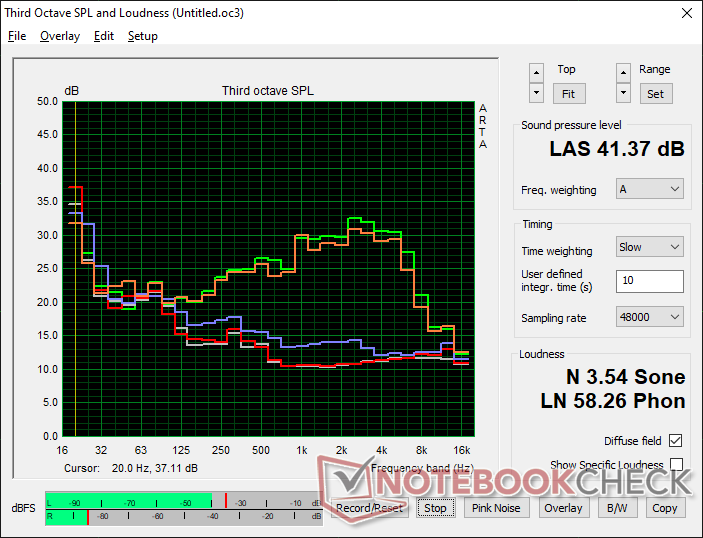
Dell Precision 5000 5560 analisi audio
(±) | potenza degli altiparlanti media ma buona (75.2 dB)
Bassi 100 - 315 Hz
(±) | bassi ridotti - in media 9.8% inferiori alla media
(±) | la linearità dei bassi è media (8.8% delta rispetto alla precedente frequenza)
Medi 400 - 2000 Hz
(±) | medi elevati - circa 5.7% superiore alla media
(+) | medi lineari (3.7% delta rispetto alla precedente frequenza)
Alti 2 - 16 kHz
(+) | Alti bilanciati - appena 2.7% dalla media
(+) | alti lineari (6.4% delta rispetto alla precedente frequenza)
Nel complesso 100 - 16.000 Hz
(+) | suono nel complesso lineare (14.8% differenza dalla media)
Rispetto alla stessa classe
» 33% di tutti i dispositivi testati in questa classe è stato migliore, 6% simile, 61% peggiore
» Il migliore ha avuto un delta di 7%, medio di 17%, peggiore di 35%
Rispetto a tutti i dispositivi testati
» 20% di tutti i dispositivi testati in questa classe è stato migliore, 4% similare, 76% peggiore
» Il migliore ha avuto un delta di 4%, medio di 23%, peggiore di 134%
Apple MacBook 12 (Early 2016) 1.1 GHz analisi audio
(+) | gli altoparlanti sono relativamente potenti (83.6 dB)
Bassi 100 - 315 Hz
(±) | bassi ridotti - in media 11.3% inferiori alla media
(±) | la linearità dei bassi è media (14.2% delta rispetto alla precedente frequenza)
Medi 400 - 2000 Hz
(+) | medi bilanciati - solo only 2.4% rispetto alla media
(+) | medi lineari (5.5% delta rispetto alla precedente frequenza)
Alti 2 - 16 kHz
(+) | Alti bilanciati - appena 2% dalla media
(+) | alti lineari (4.5% delta rispetto alla precedente frequenza)
Nel complesso 100 - 16.000 Hz
(+) | suono nel complesso lineare (10.2% differenza dalla media)
Rispetto alla stessa classe
» 7% di tutti i dispositivi testati in questa classe è stato migliore, 2% simile, 90% peggiore
» Il migliore ha avuto un delta di 5%, medio di 18%, peggiore di 53%
Rispetto a tutti i dispositivi testati
» 5% di tutti i dispositivi testati in questa classe è stato migliore, 1% similare, 94% peggiore
» Il migliore ha avuto un delta di 4%, medio di 23%, peggiore di 134%
Energy Management
Consumo di energia
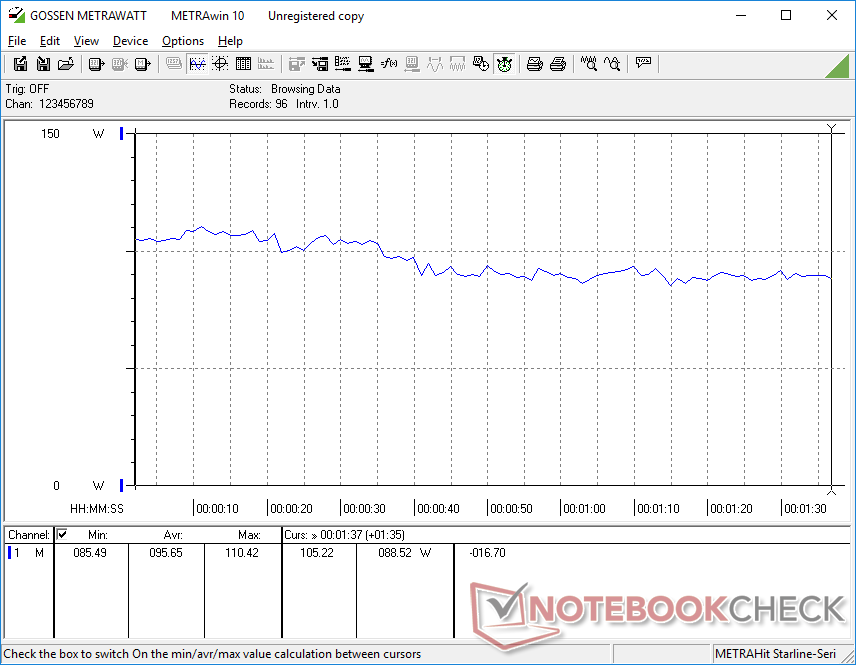
Il consumo di energia è un po' confuso. Sotto carichi più bassi, la nostra unità sarebbe più affamata di energia rispetto al Precision 5550 (da 6 W a 24 W contro 5 W a 19 W) che probabilmente ha contribuito ai risultati di durata della batteria più brevi nella nostra prossima sezione. D'altra parte, il consumo di energia rimarrebbe quasi lo stesso di Precision 5550 quando si eseguono carichi più elevati come i giochi, anche se la nostra CPU e GPU può essere fino al 15 per cento e 50 per cento più veloce del Core i7-10875H e Quadro Quadro T2000 Max-Q, rispettivamente. Le prestazioni per watt sono quindi superiori anno dopo anno quando si eseguono applicazioni esigenti.
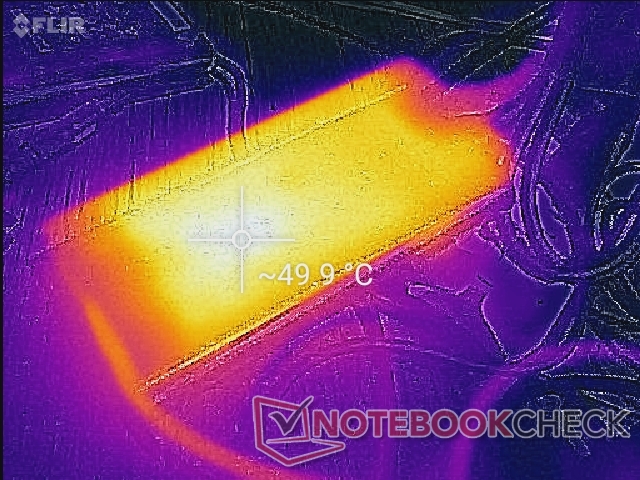
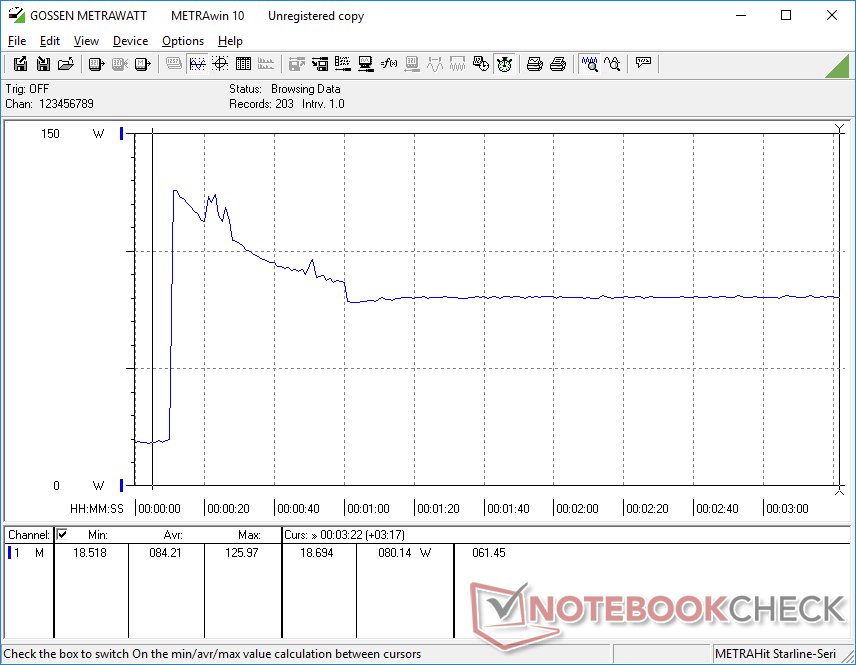
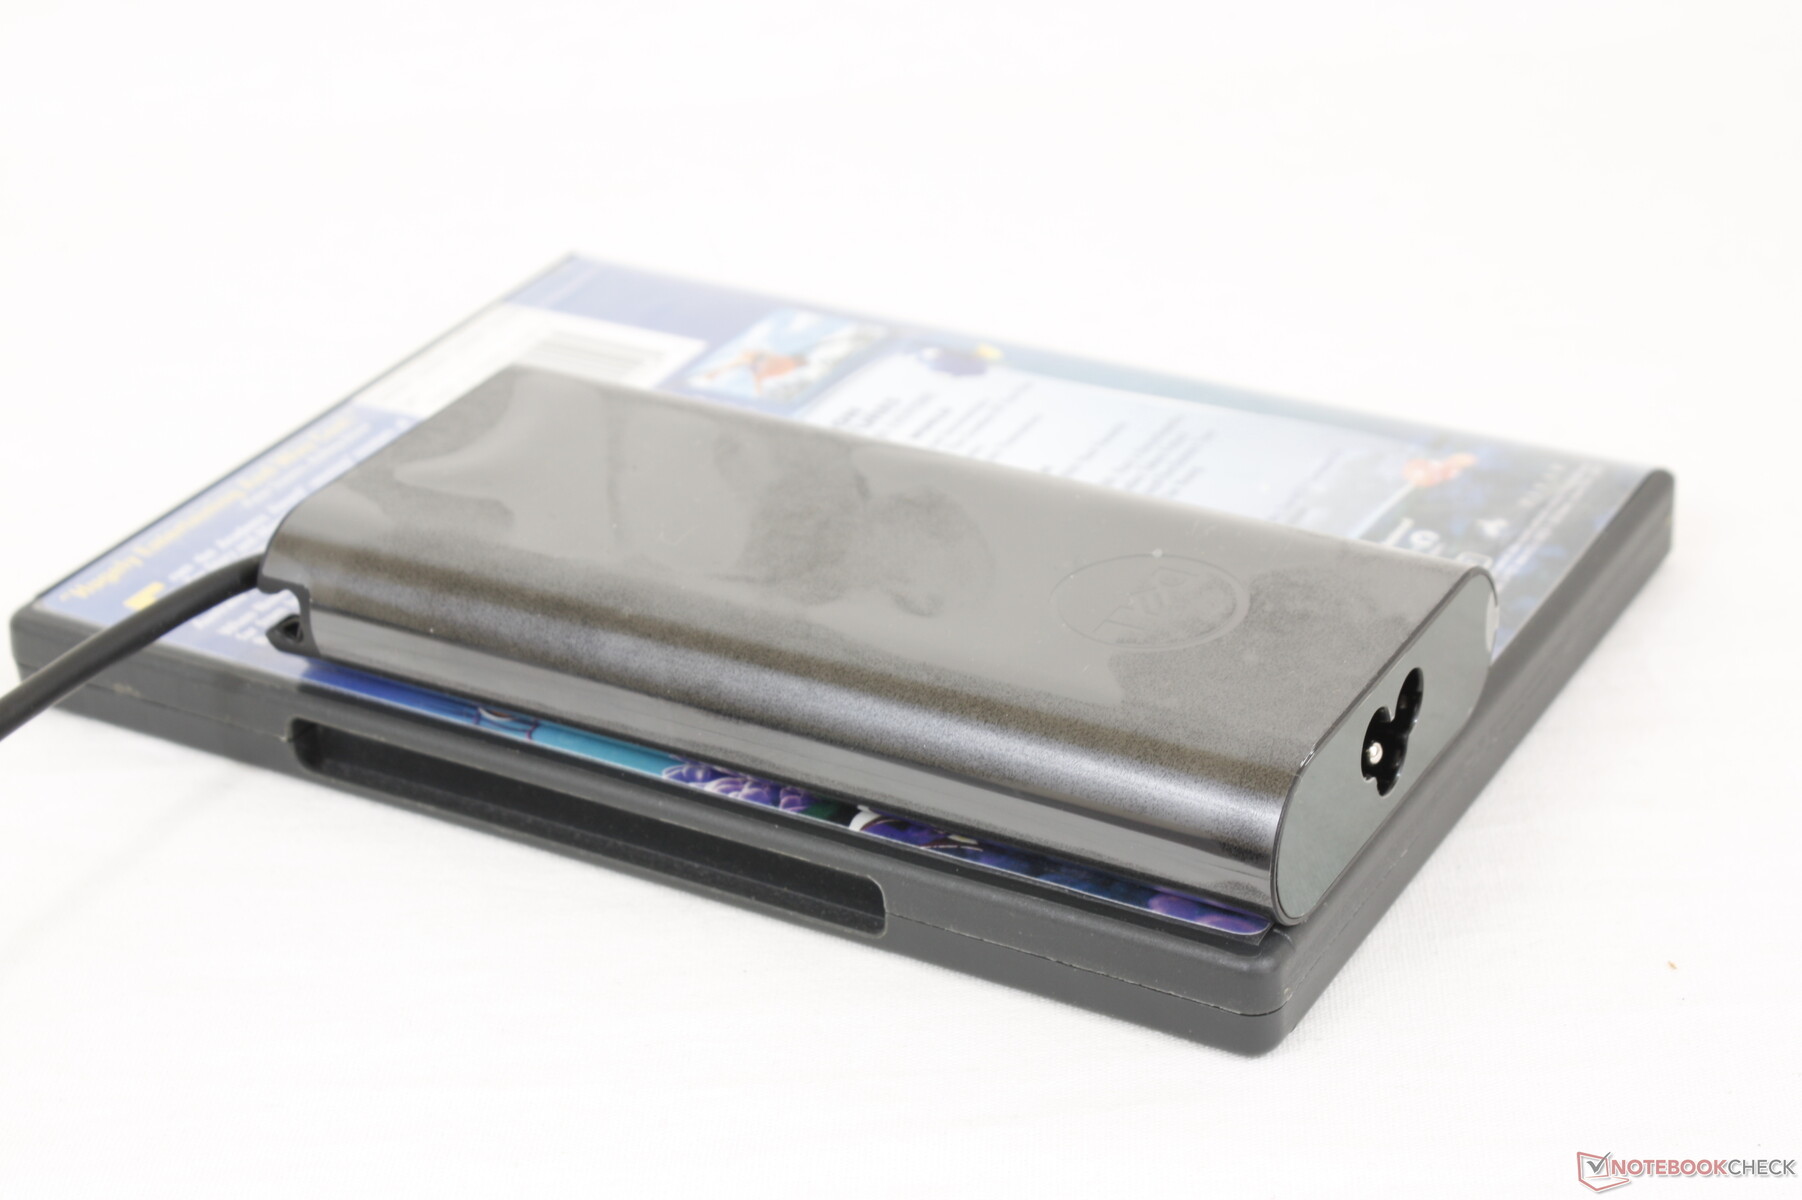
Siamo in grado di registrare un consumo massimo temporaneo di 133 W dal piccolo (~14,3 x 6,5 x 2,2 cm) adattatore AC USB-C da 130 W. Il consumo diminuisce nel tempo come mostrato dai nostri grafici qui sotto a causa delle limitazioni termiche. La batteria non si scarica quando è collegata alla rete elettrica, cosa che non è il caso su alcuni primi modelli Precision 5750.

| Off / Standby | |
| Idle | |
| Sotto carico |
|
Leggenda:
min: | |
| Dell Precision 5000 5560 i7-11850H, RTX A2000 Laptop GPU, Samsung PM9A1 MZVL22T0HBLB, IPS, 3840x2400, 15.6" | Lenovo ThinkPad P15 G2-20YQ001JGE i7-11800H, RTX A3000 Laptop GPU, Kioxia XG7 KXG7AZNV512G, IPS, 1920x1080, 15.6" | HP ZBook Studio 15 G8 i9-11950H, GeForce RTX 3070 Laptop GPU, Samsung PM981a MZVLB2T0HALB, OLED, 3840x2160, 15.6" | Asus ProArt StudioBook Pro 15 W500G5T i7-9750H, Quadro RTX 5000 Max-Q, Samsung SSD PM981 MZVLB1T0HALR, IPS, 3840x2160, 15.6" | Dell Precision 7550 W-10885M, Quadro RTX 5000 Max-Q, SK Hynix PC601A NVMe 1TB, IPS, 3840x2160, 15.6" | Dell Precision 5550 P91F i7-10875H, Quadro T2000 Max-Q, SK Hynix PC601A NVMe 1TB, IPS, 3840x2400, 15.6" | Razer Blade 15 Studio Edition 2020 i7-10875H, Quadro RTX 5000 Max-Q, Samsung PM981a MZVLB1T0HBLR, OLED, 3840x2160, 15.6" | |
|---|---|---|---|---|---|---|---|
| Power Consumption | -11% | -43% | -30% | -38% | 7% | -44% | |
| Idle Minimum * (Watt) | 6.2 | 6.3 -2% | 11 -77% | 11.6 -87% | 8.2 -32% | 5.6 10% | 13.4 -116% |
| Idle Average * (Watt) | 13.9 | 10.7 23% | 18.8 -35% | 19 -37% | 16.8 -21% | 11.2 19% | 18 -29% |
| Idle Maximum * (Watt) | 23.8 | 11.6 51% | 31.7 -33% | 20.6 13% | 24.4 -3% | 18.4 23% | 26.1 -10% |
| Load Average * (Watt) | 95.7 | 99.3 -4% | 105.2 -10% | 102 -7% | 131 -37% | 114 -19% | 115 -20% |
| Witcher 3 ultra * (Watt) | 87 | 154 -77% | 148 -70% | 156.6 -80% | 76.7 12% | 145 -67% | |
| Load Maximum * (Watt) | 132.6 | 210 -58% | 171.8 -30% | 178 -34% | 201.8 -52% | 134.2 -1% | 165 -24% |
* ... Meglio usare valori piccoli
Power Consumption Witcher 3 / Stresstest
Durata della batteria
I tempi di esecuzione sono generalmente più brevi di quelli che abbiamo registrato sul Precision 5550 dell'anno scorso. L'uso della WLAN nel mondo reale durerebbe solo per circa 6,5 ore rispetto alle 9 ore del vecchio modello anche quando entrambi sono impostati su identici profili di alimentazione Balanced con Optimus attivo
La ricarica da vuoto a piena capacità richiede circa 2 ore. Apprezziamo il fatto che il sistema può essere ricaricato tramite una qualsiasi delle sue tre porte USB-C, mentre alcuni computer portatili supportano la ricarica su una sola porta USB-C. Questo stesso caricatore Dell può essere utilizzato anche per caricare i moderni portatili XPS.
| Dell Precision 5000 5560 i7-11850H, RTX A2000 Laptop GPU, 86 Wh | Lenovo ThinkPad P15 G2-20YQ001JGE i7-11800H, RTX A3000 Laptop GPU, 94 Wh | HP ZBook Studio 15 G8 i9-11950H, GeForce RTX 3070 Laptop GPU, 83 Wh | Asus ProArt StudioBook Pro 15 W500G5T i7-9750H, Quadro RTX 5000 Max-Q, 76 Wh | Dell Precision 7550 W-10885M, Quadro RTX 5000 Max-Q, 95 Wh | Dell Precision 5550 P91F i7-10875H, Quadro T2000 Max-Q, 86 Wh | Razer Blade 15 Studio Edition 2020 i7-10875H, Quadro RTX 5000 Max-Q, 80 Wh | |
|---|---|---|---|---|---|---|---|
| Autonomia della batteria | 15% | 2% | -25% | -3% | 36% | -9% | |
| Reader / Idle (h) | 12 | 12.9 8% | 11.1 -7% | 22.6 88% | 8.8 -27% | ||
| WiFi v1.3 (h) | 6.3 | 9.9 57% | 6.2 -2% | 4.7 -25% | 8.9 41% | 9 43% | 5.7 -10% |
| Load (h) | 1.8 | 1.3 -28% | 1.8 0% | 1 -44% | 1.4 -22% | 2 11% |
Pro
Contro
Verdetto - Stesso aspetto, grafica molto più veloce
Perché acquistare il Precision 5560 quando è visivamente identico al Precision 5550? Il salto di potenza della GPU sarà la ragione principale per considerare il modello più recente rispetto a quello più vecchio. La Quadro RTX A2000 di Nvidia è una generazione avanti rispetto alla Quadro T2000 Max-Q per fornire fino al 50 per cento di prestazioni più veloci della GPU a un costo minimo per il consumo energetico, la durata della batteria, il peso, la temperatura della superficie e anche il rumore della ventola. I guadagni in performance-per-watt da soli aiutano a rendere il sistema più veloce di quanto il suo profilo ultrasottile potrebbe altrimenti suggerire. Gli utenti otterranno una spinta alle prestazioni della CPU anche se con margini molto più piccoli.
Una spinta enorme nella potenza della GPU rispetto al Precision 5550. Se la Quadro RTX A2000 non è di vostro interesse, tuttavia, allora potreste prendere in considerazione il modello visivamente identico dell'anno scorso.
Per qualsiasi motivo, il nostro Precision 5560 non riesce a raggiungere lo stesso tetto massimo di rumore della ventola che abbiamo sperimentato sul 5550. Questo potrebbe essere stato potenzialmente fatto di proposito dal produttore nel tentativo di abbassare il rumore della ventola, ma ha un certo impatto sulle temperature del core.
Gli utenti che sanno di poter beneficiare dell'aumento di potenza grafica vorranno saltare il Precision 5550 per il 5560. Altrimenti, il 5550 può offrire un'esperienza utente identica in termini di caratteristiche fisiche e display. Concorrenti come la MSI WS66, Razer Blade 15 Studio, o Lenovo ThinkPad P15 G2 sono leggermente più spessi ma portano GPU ancora più veloci dalla Quadro RTX A3000 in su che non sono disponibili sulla serie Precision 5000.
Prezzo e disponibilità
Dell Precision 5000 5560
- 10/06/2021 v7 (old)
Allen Ngo
Price comparison

