Recensione del Laptop Razer Blade 15 Studio Edition (2020): piccole modifiche, ma nel complesso è migiorato

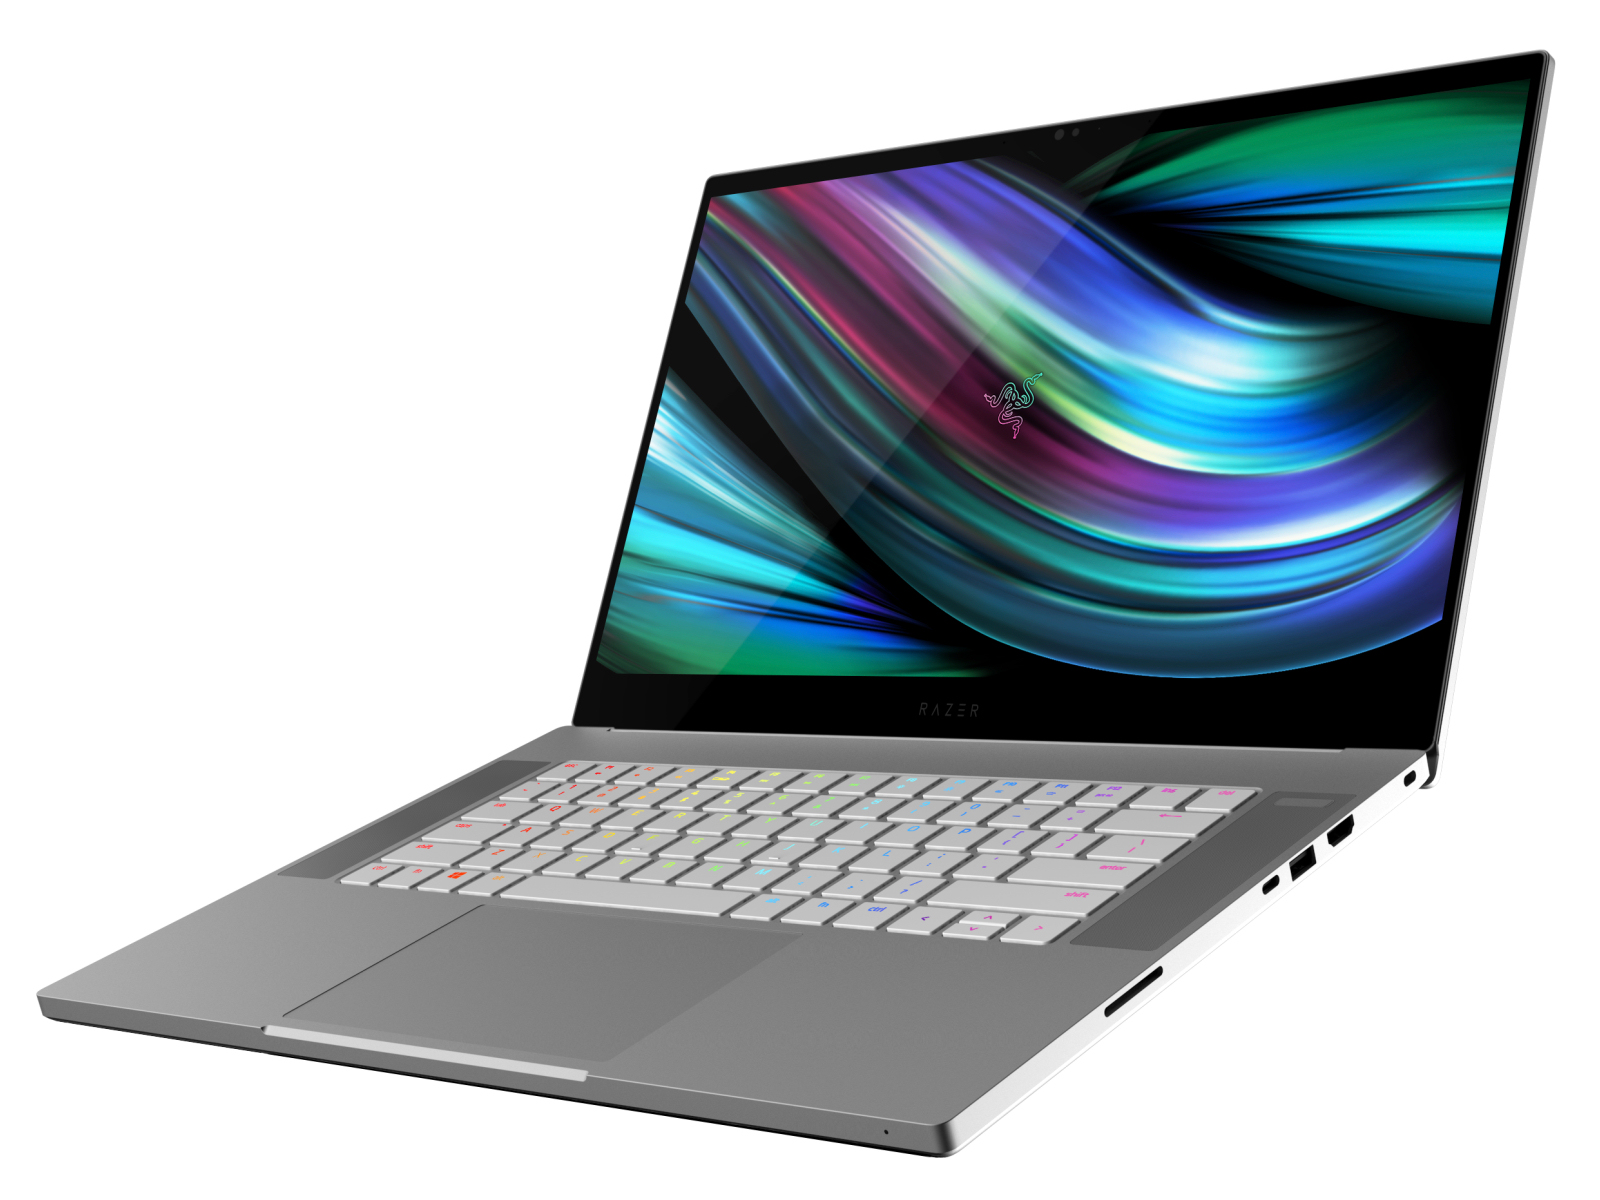
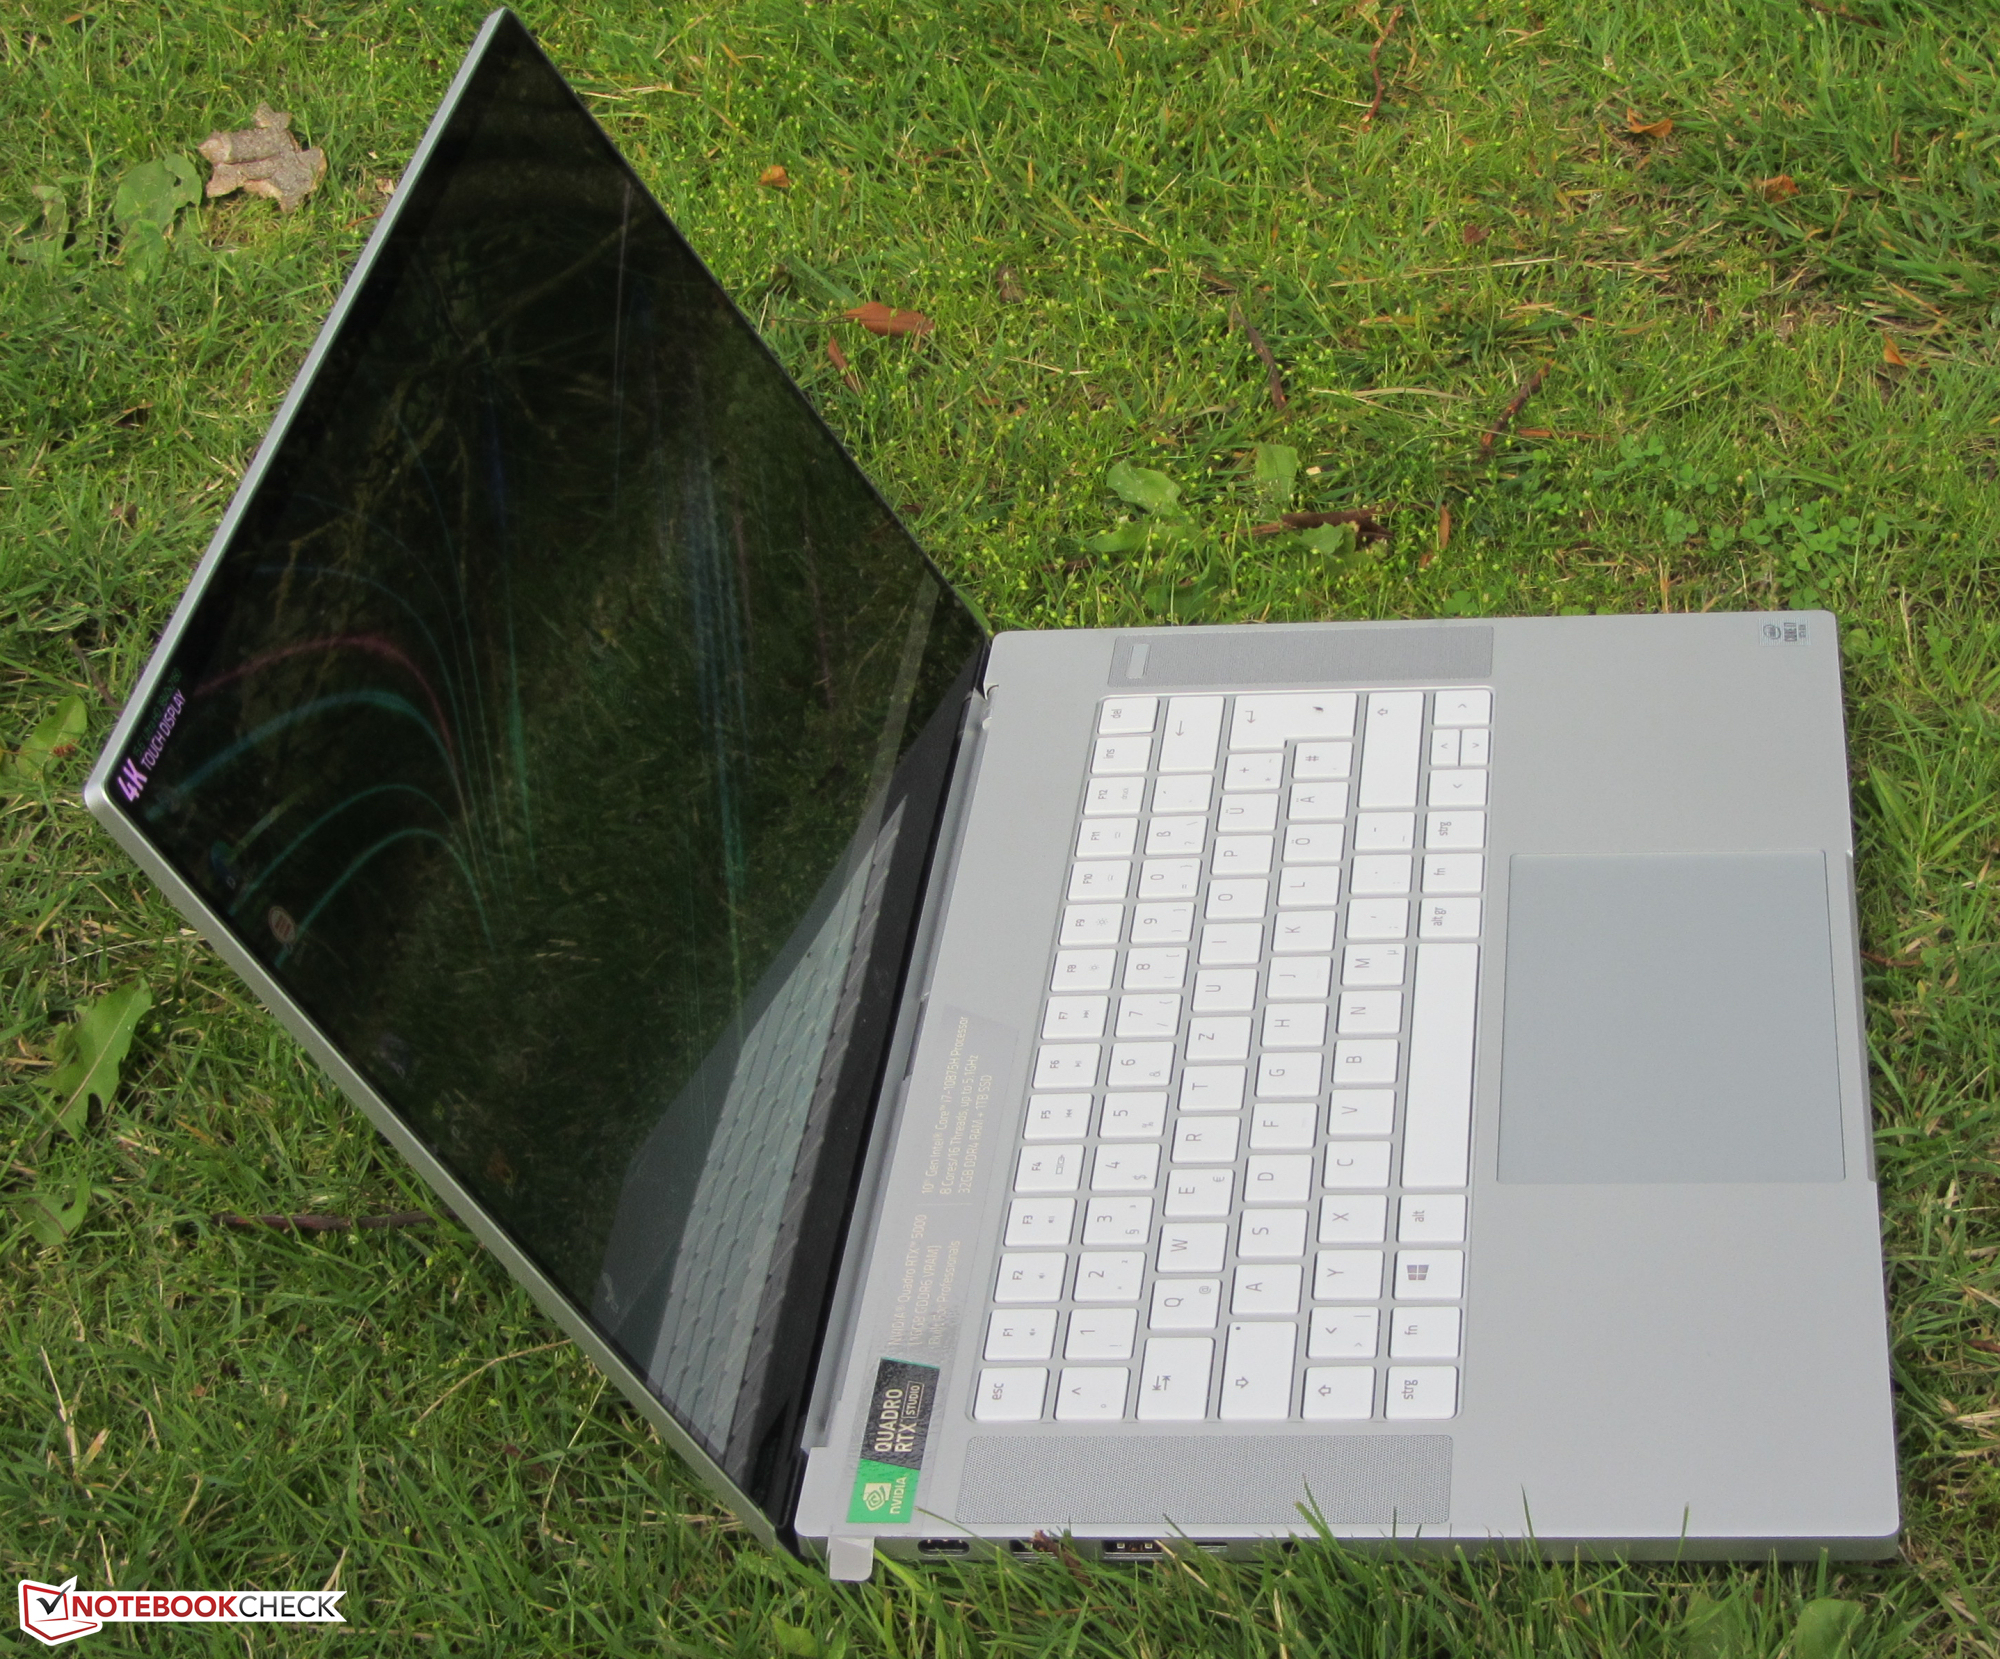
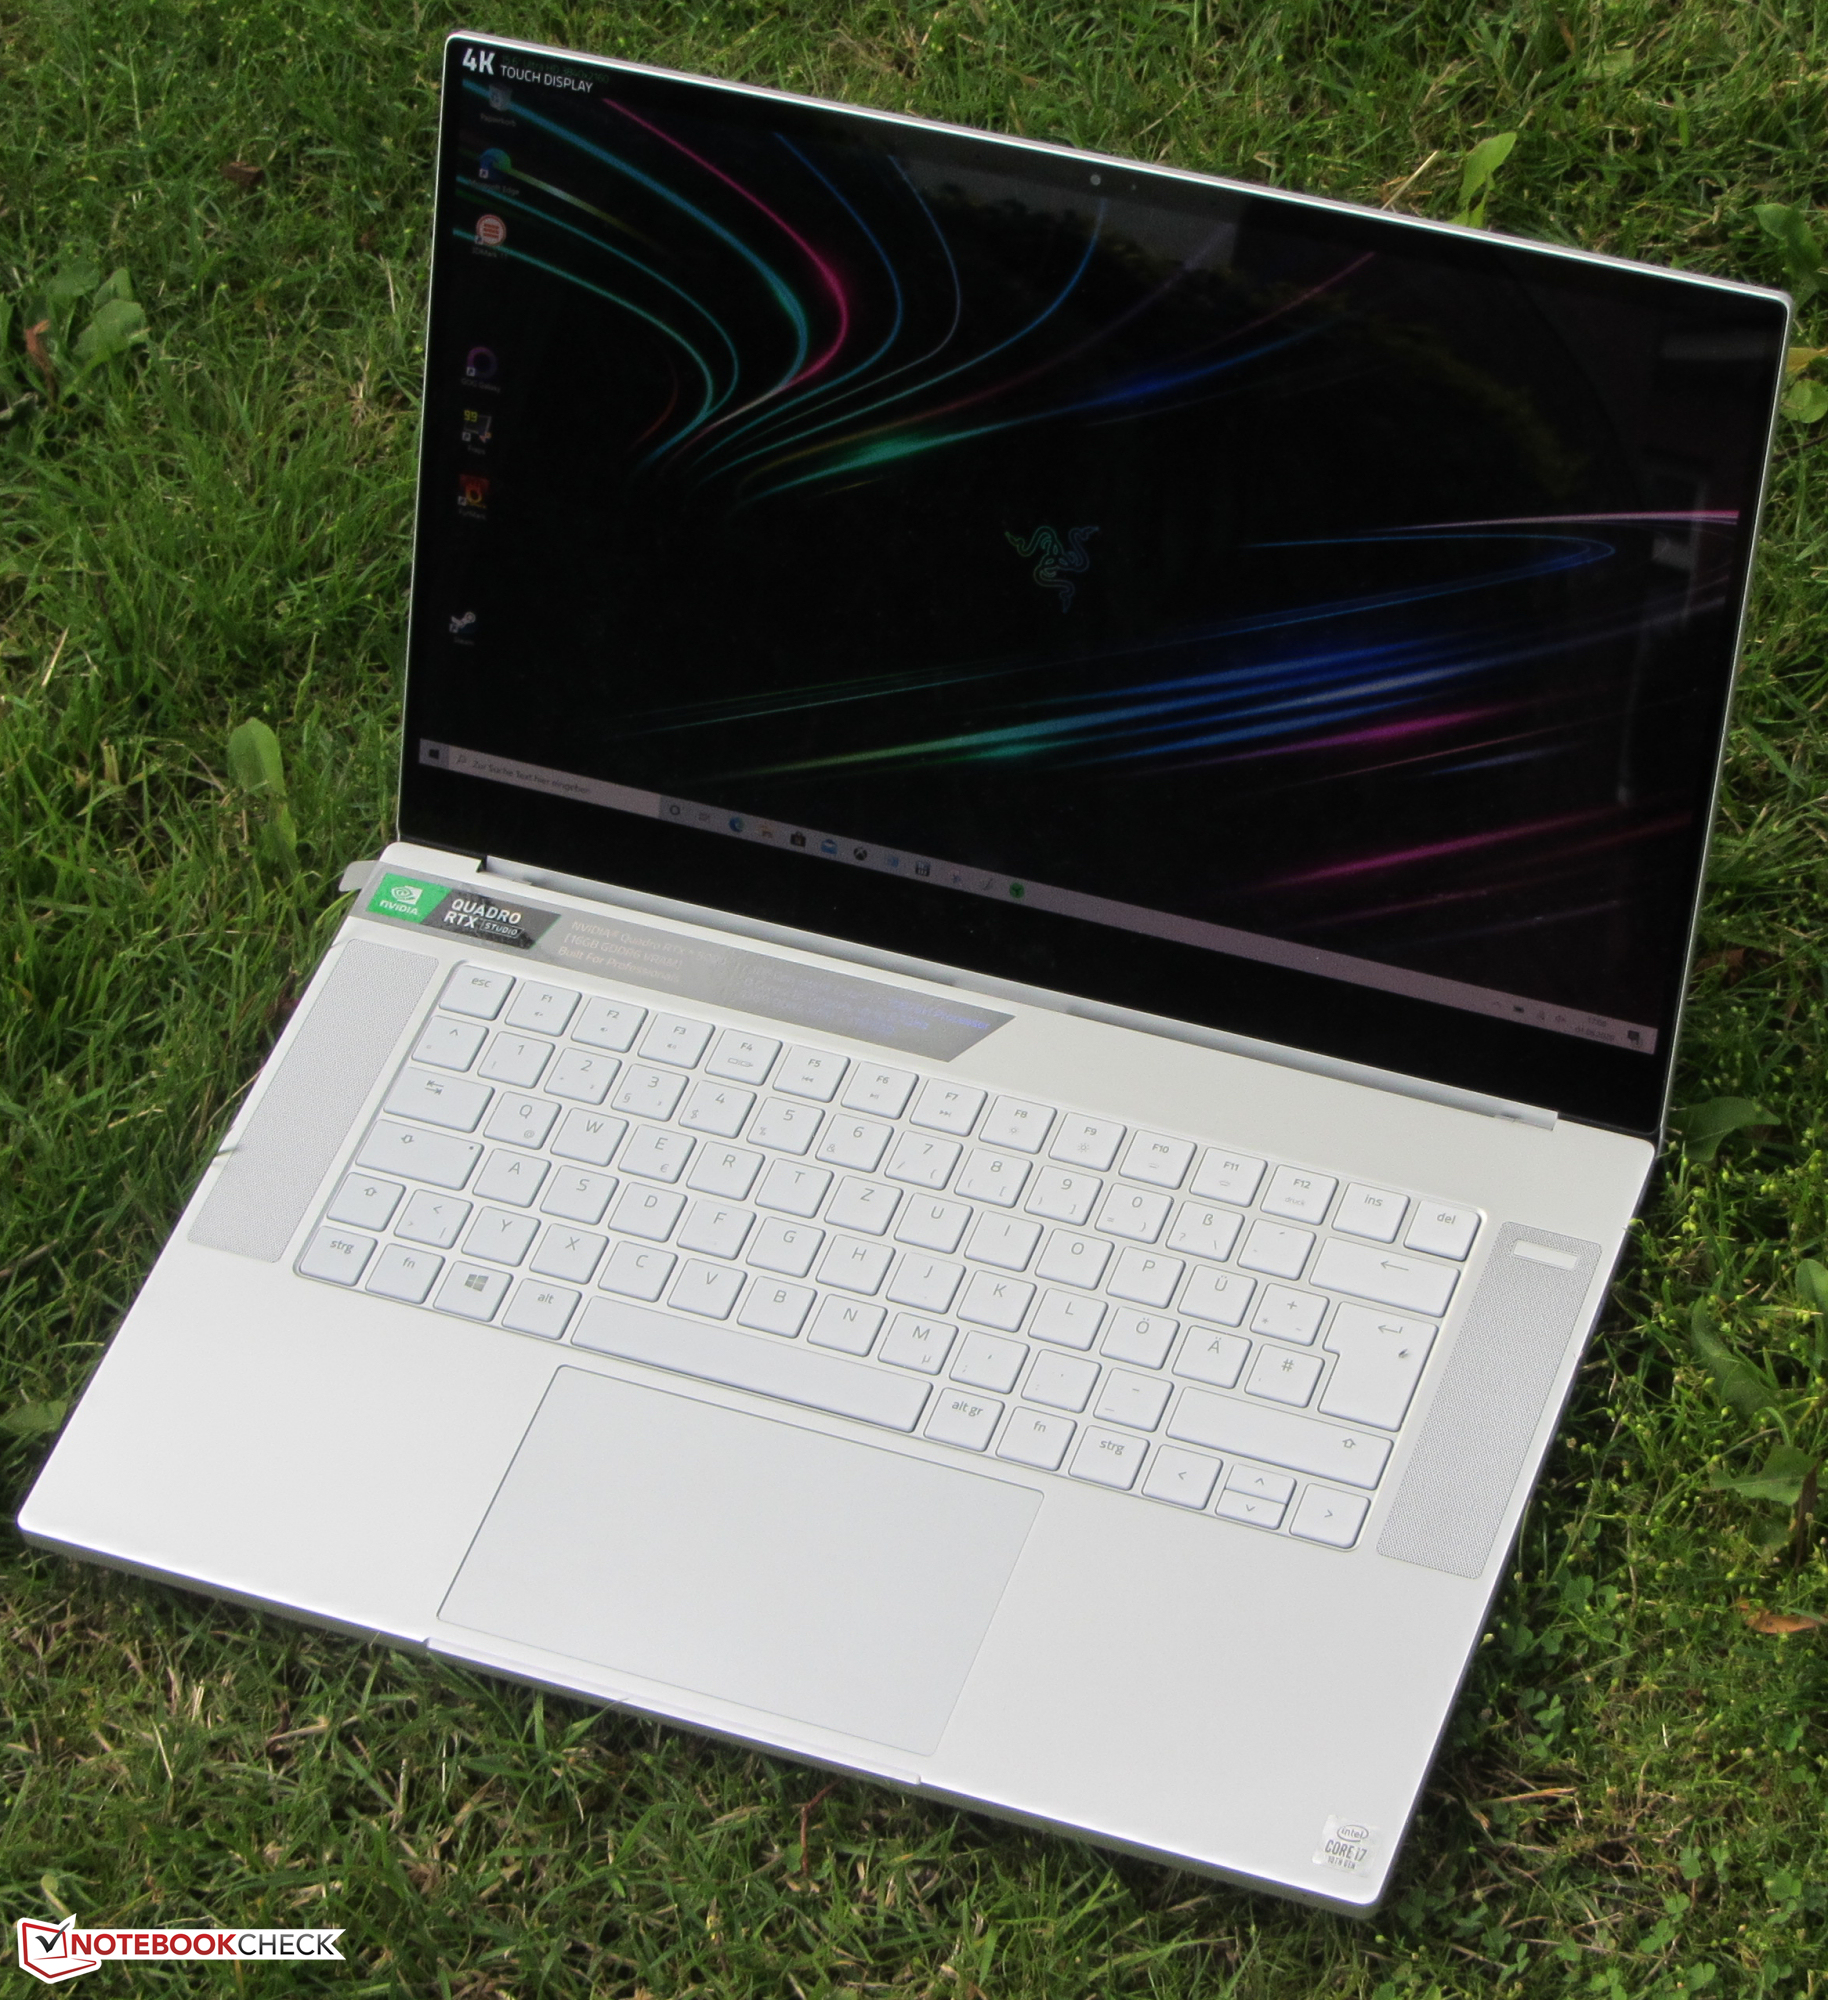
Il Razer Blade 15 Studio Edition è una workstation con un Intel Core i7-10875H e una NVIDIA Quadro RTX 5000 Max-Q. Il gioiello della corona del Blade 15 è un touchscreen OLED 4K, che è stato utilizzato anche nel Blade 15 2019 dello scorso anno, costruito in modo identico. I dispositivi concorrenti includono: il Lenovo ThinkPad P53, l'MSI P65 Creator 9SF e il Dell Precision 5540.
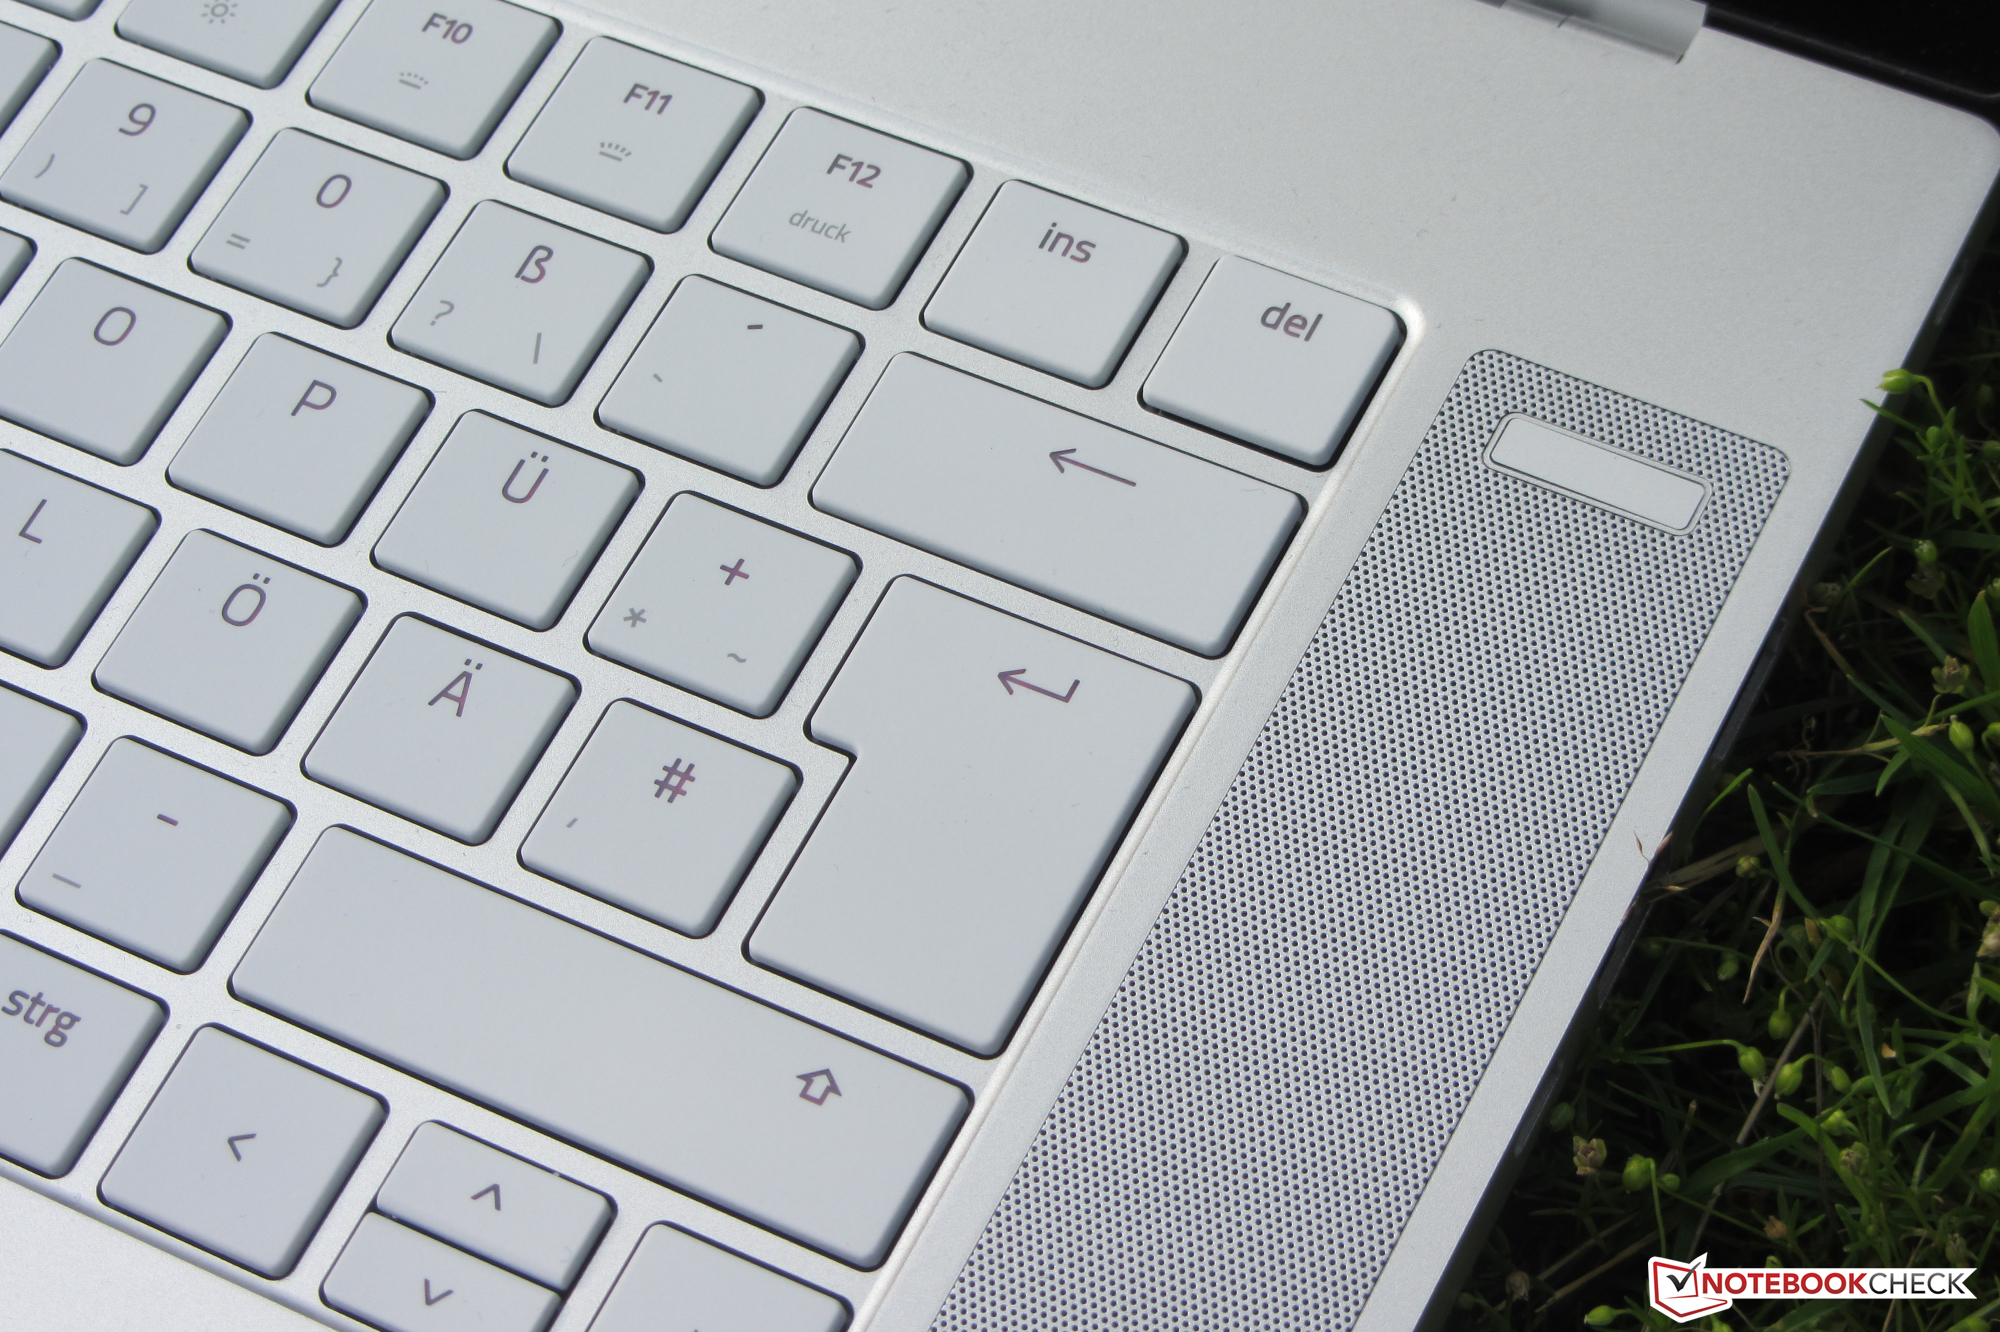
Poiché il Blade 15 2020 e il Blade 15 2019 sono costruiti in modo identico, non forniremo descrizioni dettagliate del case, delle porte, dei dispositivi di input e degli altoparlanti, ad eccezione di eventuali modifiche. Potete trovare tutte le informazioni pertinenti nella nostra recensione del Blade 15 Studio Edition (2019).
Punteggio | Data | Modello | Peso | Altezza | Dimensione | Risoluzione | Prezzo |
|---|---|---|---|---|---|---|---|
| 87 % v7 (old) | 08/2020 | Razer Blade 15 Studio Edition 2020 i7-10875H, Quadro RTX 5000 Max-Q | 2.2 kg | 13.98 mm | 15.60" | 3840x2160 | |
| 86.6 % v7 (old) | 12/2019 | Razer Blade 15 Studio Edition i7-9750H, Quadro RTX 5000 Max-Q | 2.2 kg | 17.8 mm | 15.60" | 3840x2160 | |
| 89.8 % v7 (old) | 11/2019 | Lenovo ThinkPad P53-20QN000YGE i7-9850H, Quadro RTX 5000 Max-Q | 2.7 kg | 29.4 mm | 15.60" | 1920x1080 | |
| 85 % v7 (old) | 06/2019 | MSI P65 Creator 9SF-657 i9-9880H, GeForce RTX 2070 Max-Q | 1.9 kg | 18 mm | 15.60" | 3840x2160 | |
| 86.9 % v7 (old) | 11/2019 | Dell Precision 5540 i9-9980HK, Quadro T2000 Max-Q | 2 kg | 17 mm | 15.60" | 3840x2160 |
Connettività - la USB 3.2 Gen 2 rimpiazza la Mini DisplayPort
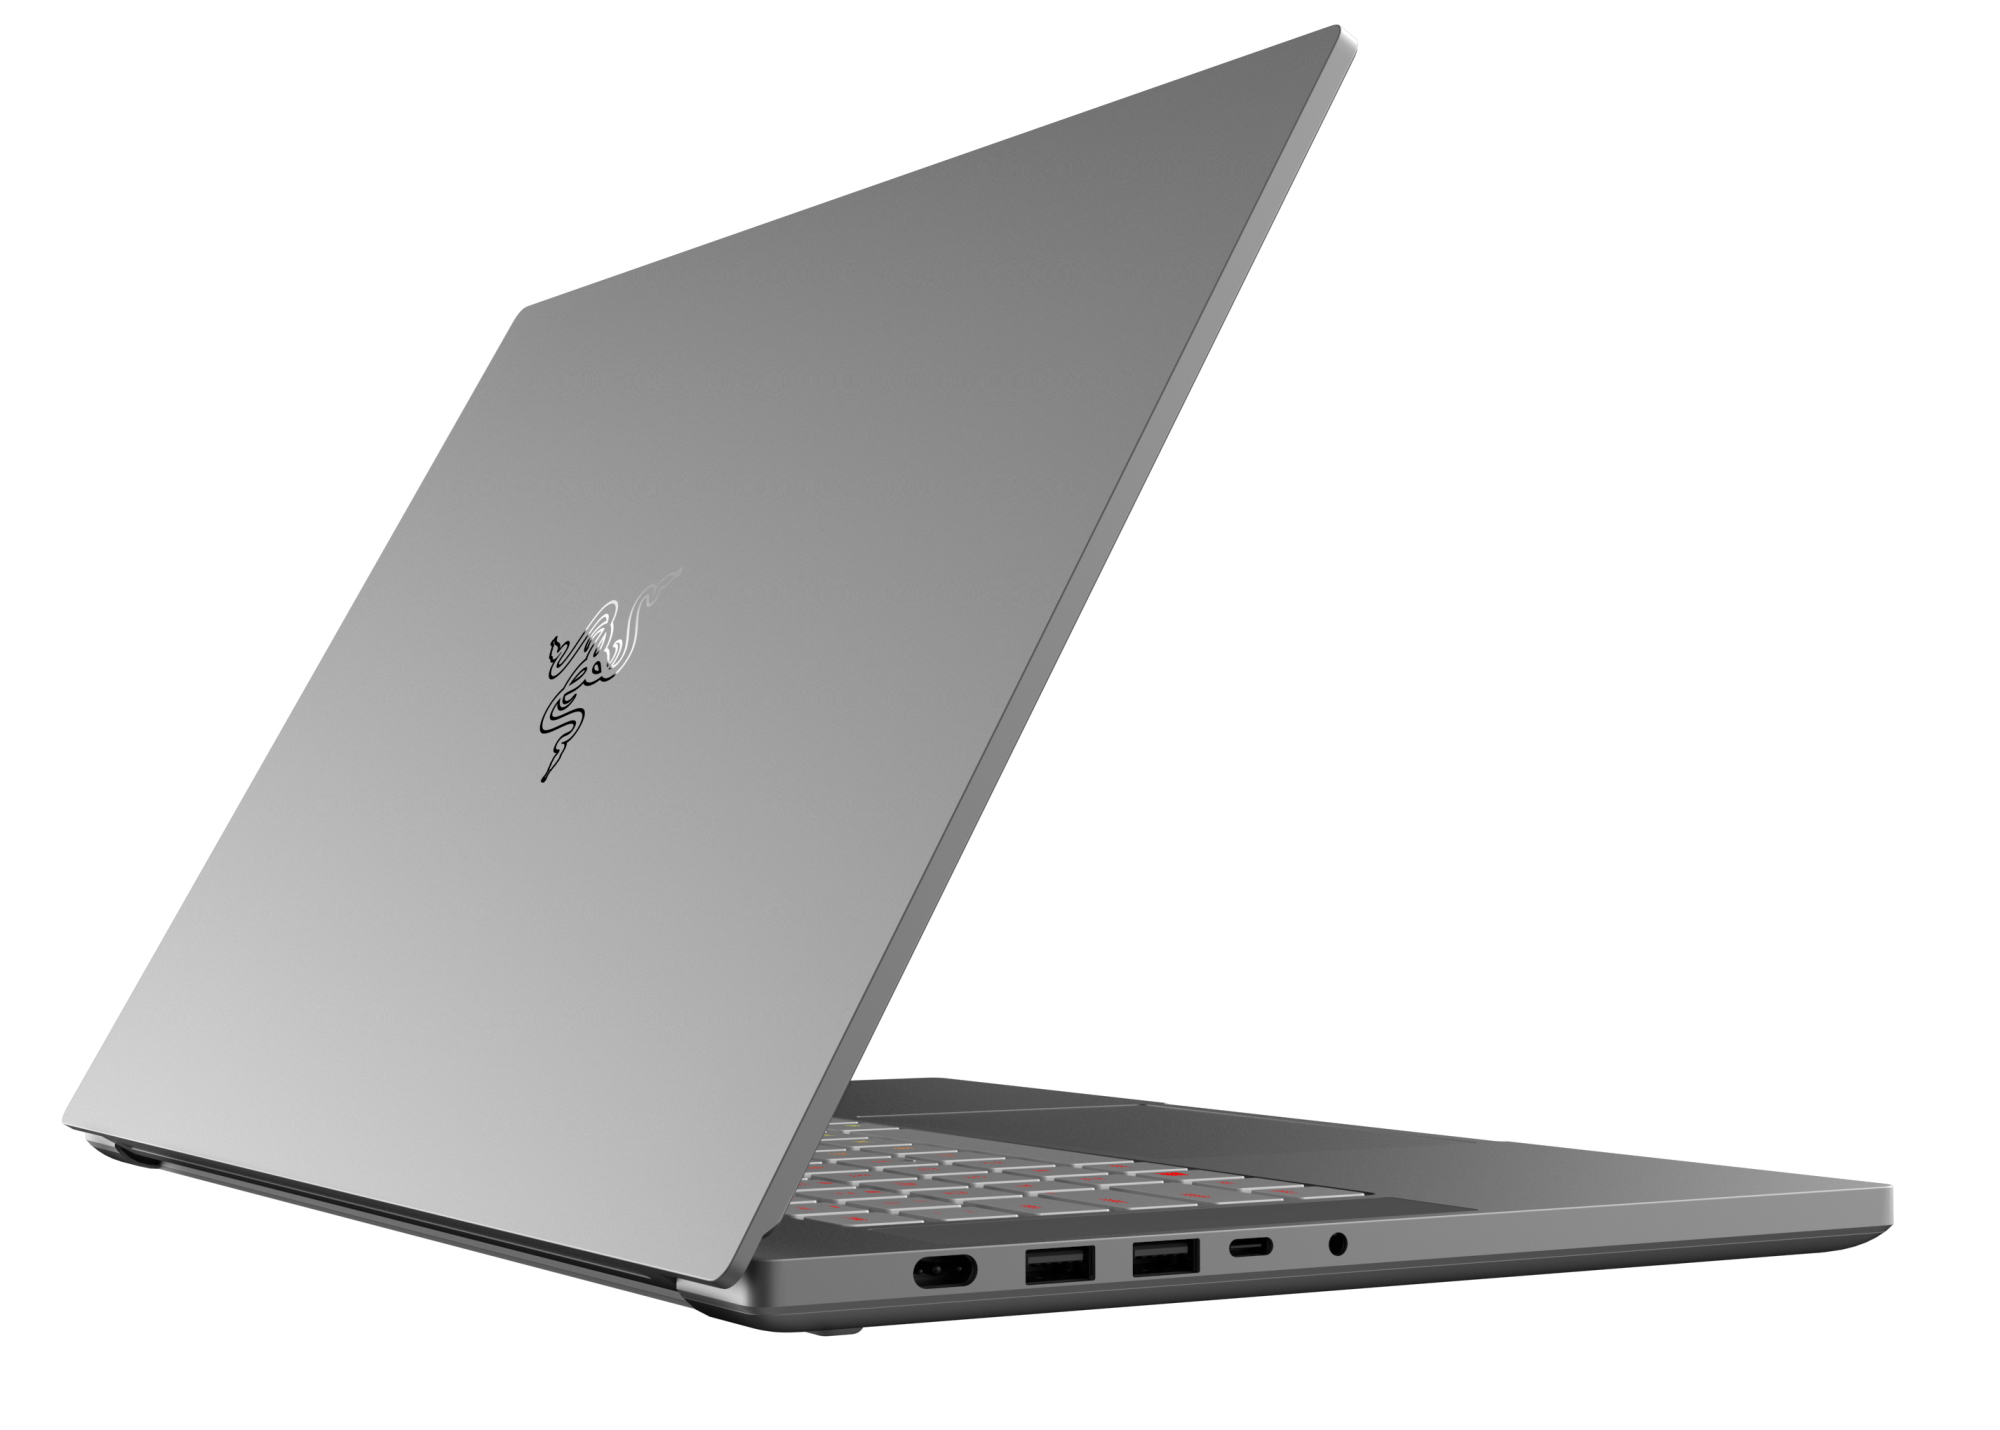
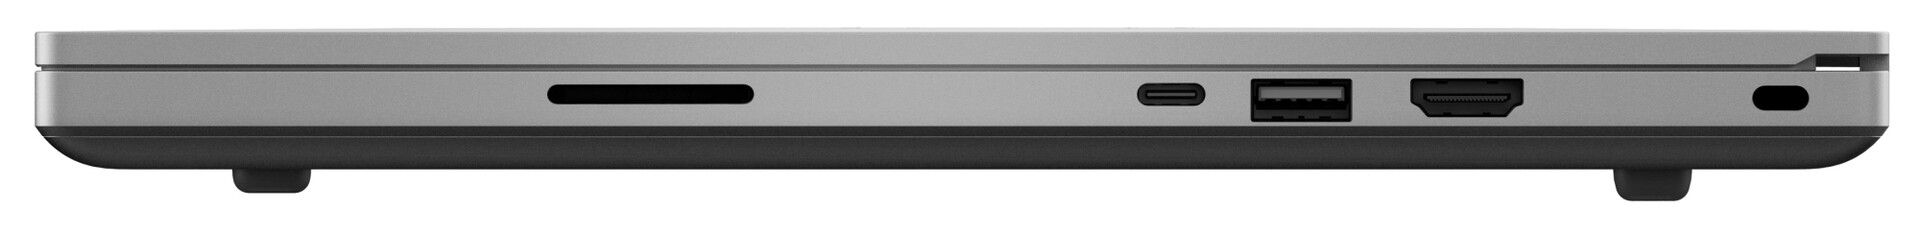
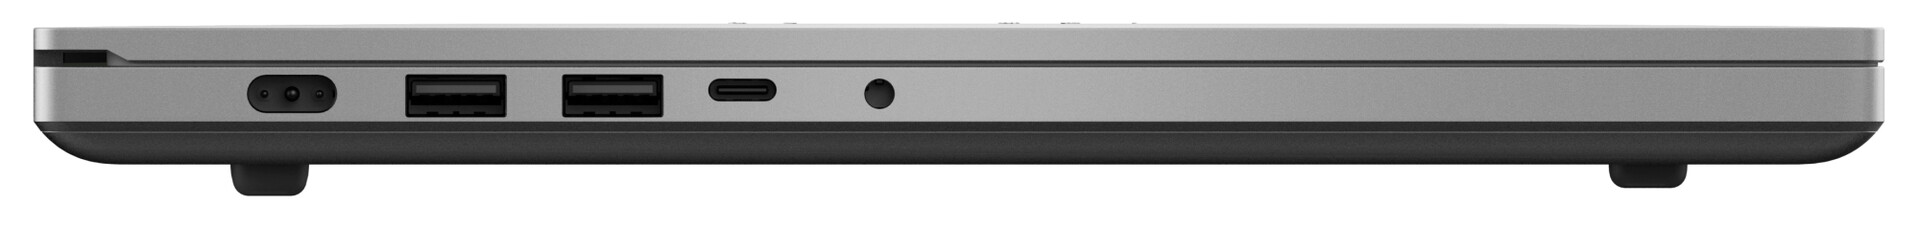
Razer has made a few minor changes when it comes to the selection of ports. The MiniDP port has been replaced by the USB 3.2 Gen 2 Type-C port, which can output a DisplayPort signal. The three Type-A ports now operate at USB 3.2 Gen 2 speeds.
| SD Card Reader | |
| average JPG Copy Test (av. of 3 runs) | |
| Lenovo ThinkPad P53-20QN000YGE (Toshiba Exceria Pro SDXC 64 GB UHS-II) | |
| Dell Precision 5540 (Toshiba Exceria Pro SDXC 64 GB UHS-II) | |
| Media della classe Workstation (49.6 - 681, n=14, ultimi 2 anni) | |
| Razer Blade 15 Studio Edition (Toshiba Exceria Pro SDXC 64 GB UHS-II) | |
| Razer Blade 15 Studio Edition 2020 (Toshiba Exceria Pro SDXC 64 GB UHS-II) | |
| maximum AS SSD Seq Read Test (1GB) | |
| Media della classe Workstation (87.6 - 1455, n=14, ultimi 2 anni) | |
| Lenovo ThinkPad P53-20QN000YGE (Toshiba Exceria Pro SDXC 64 GB UHS-II) | |
| Dell Precision 5540 (Toshiba Exceria Pro SDXC 64 GB UHS-II) | |


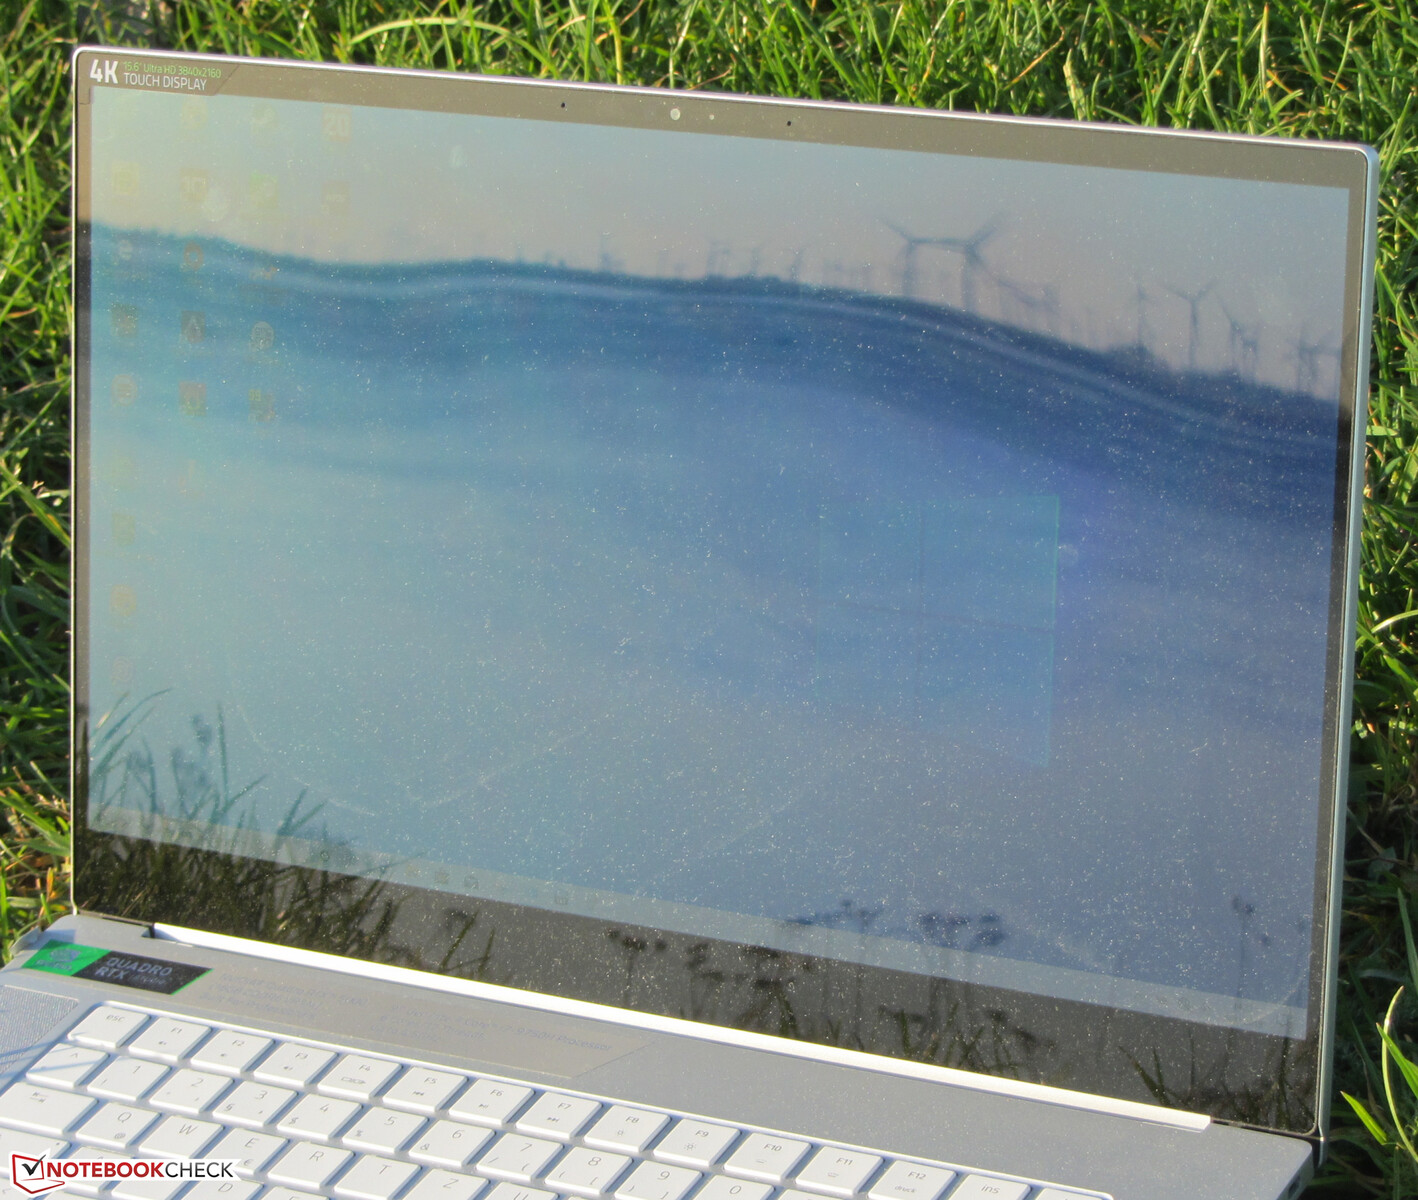
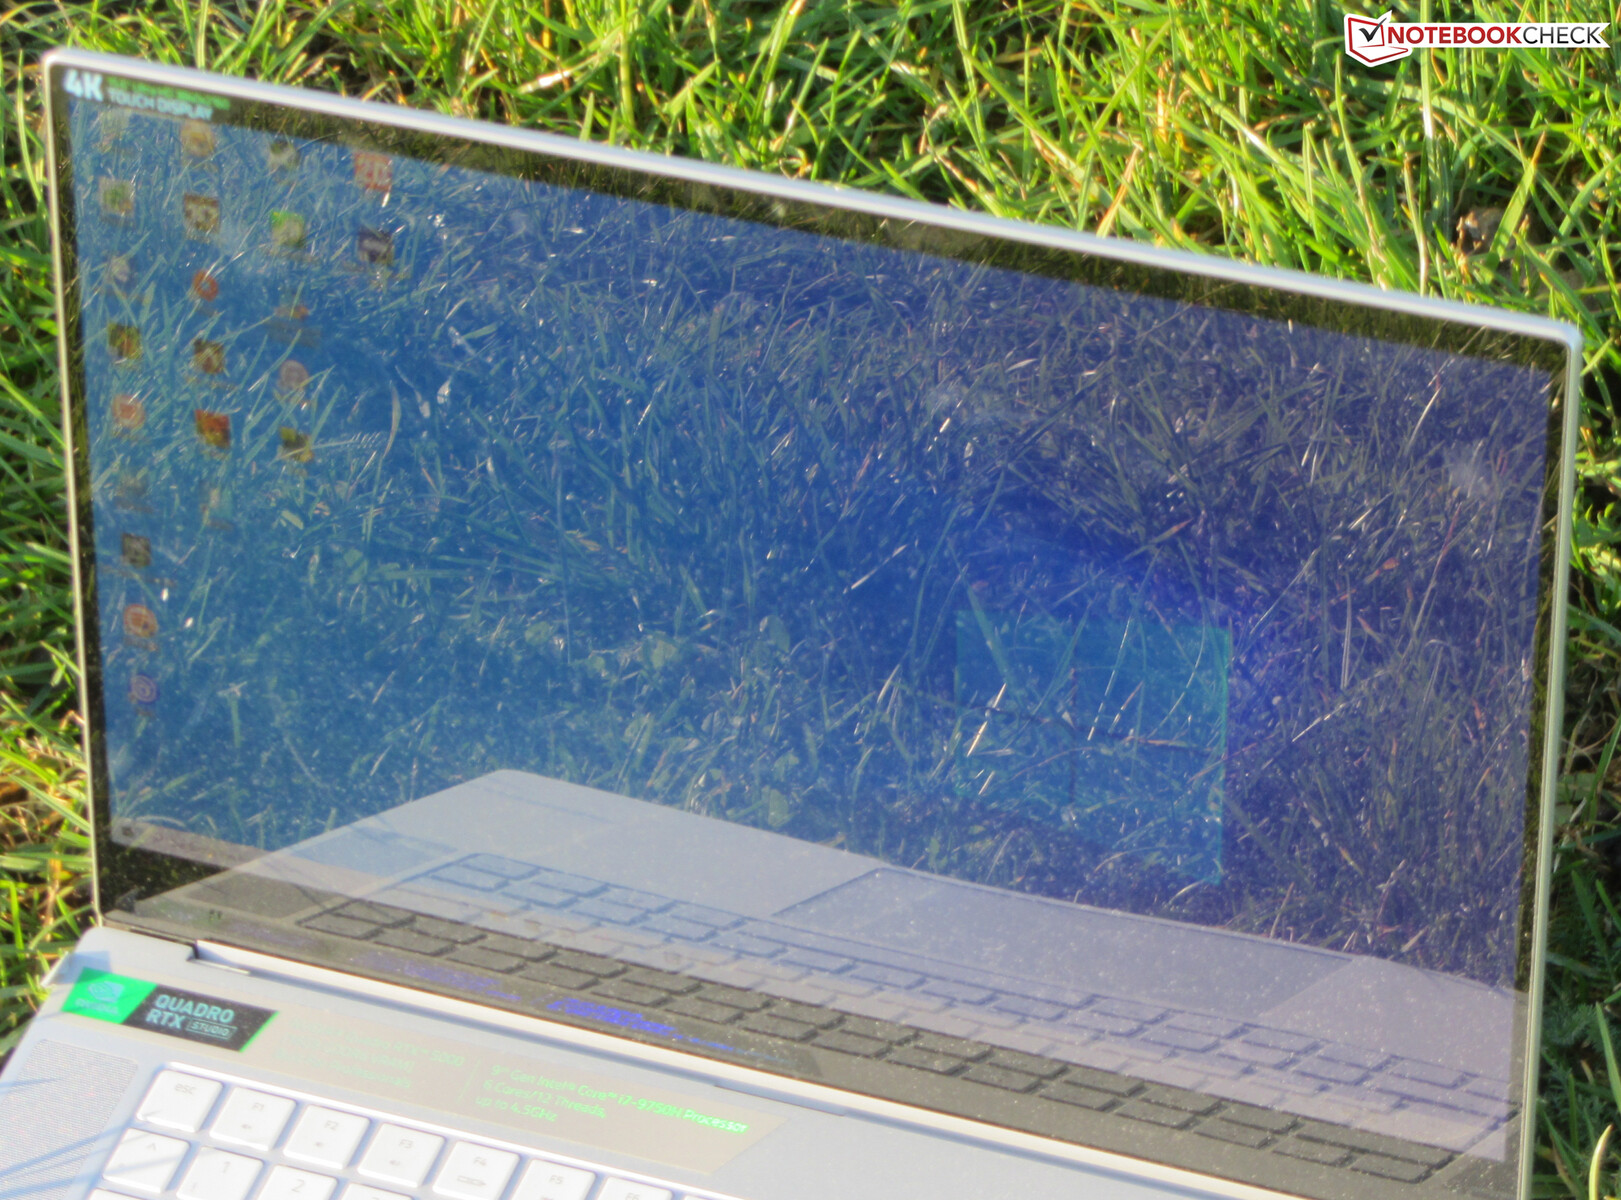
Display - Pannello OLED con un contrasto eccellente
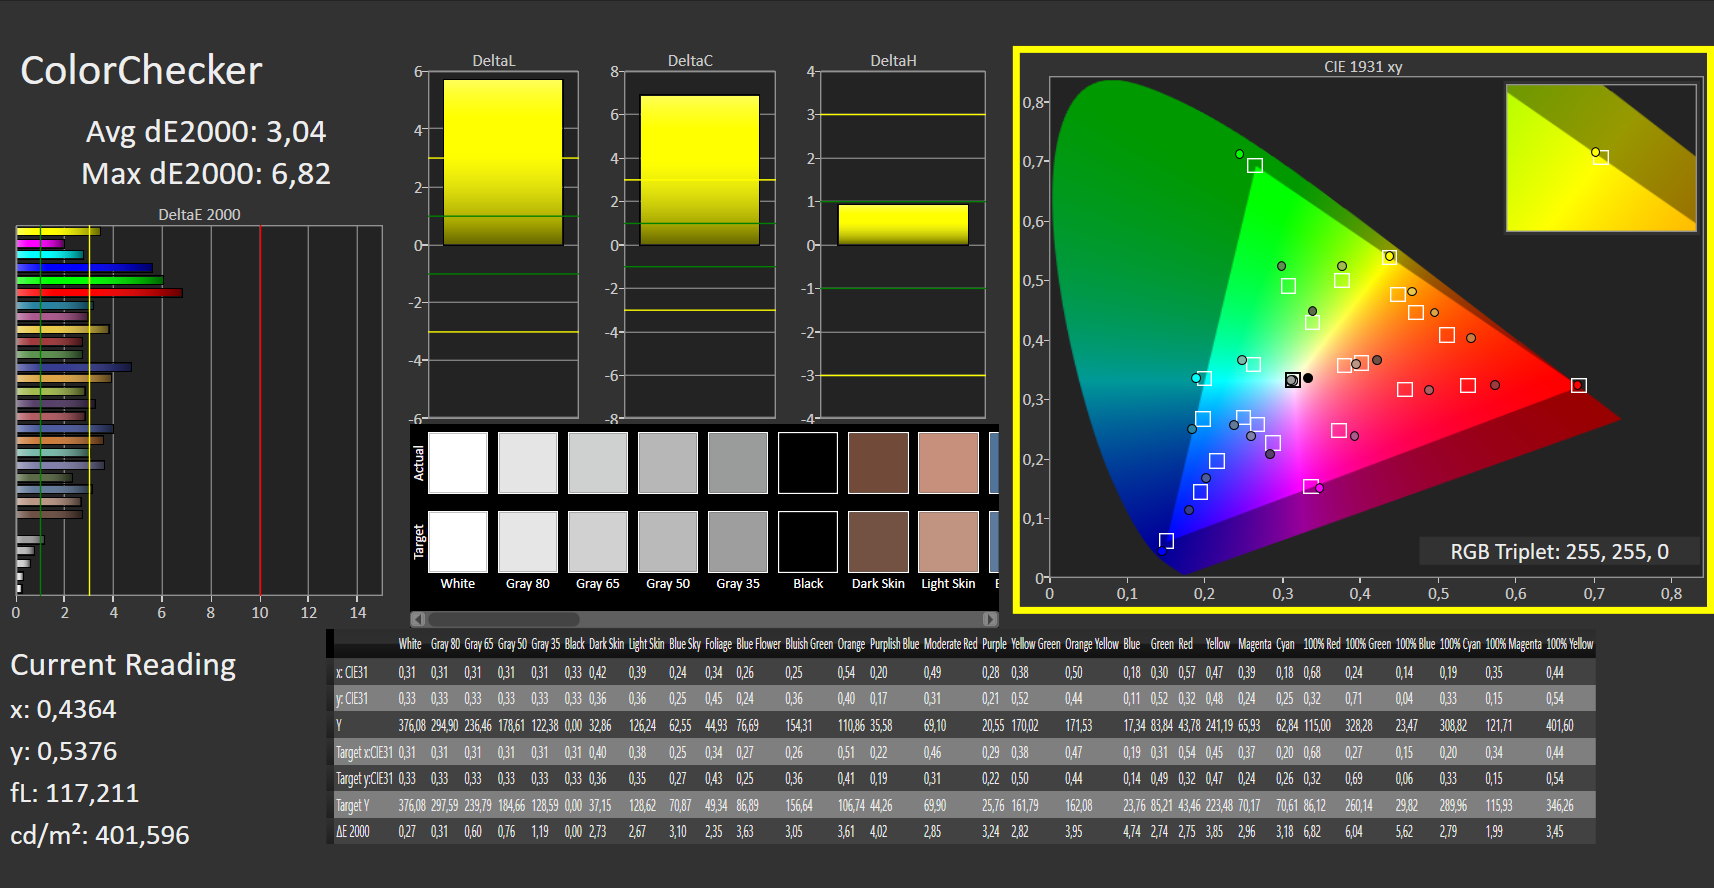
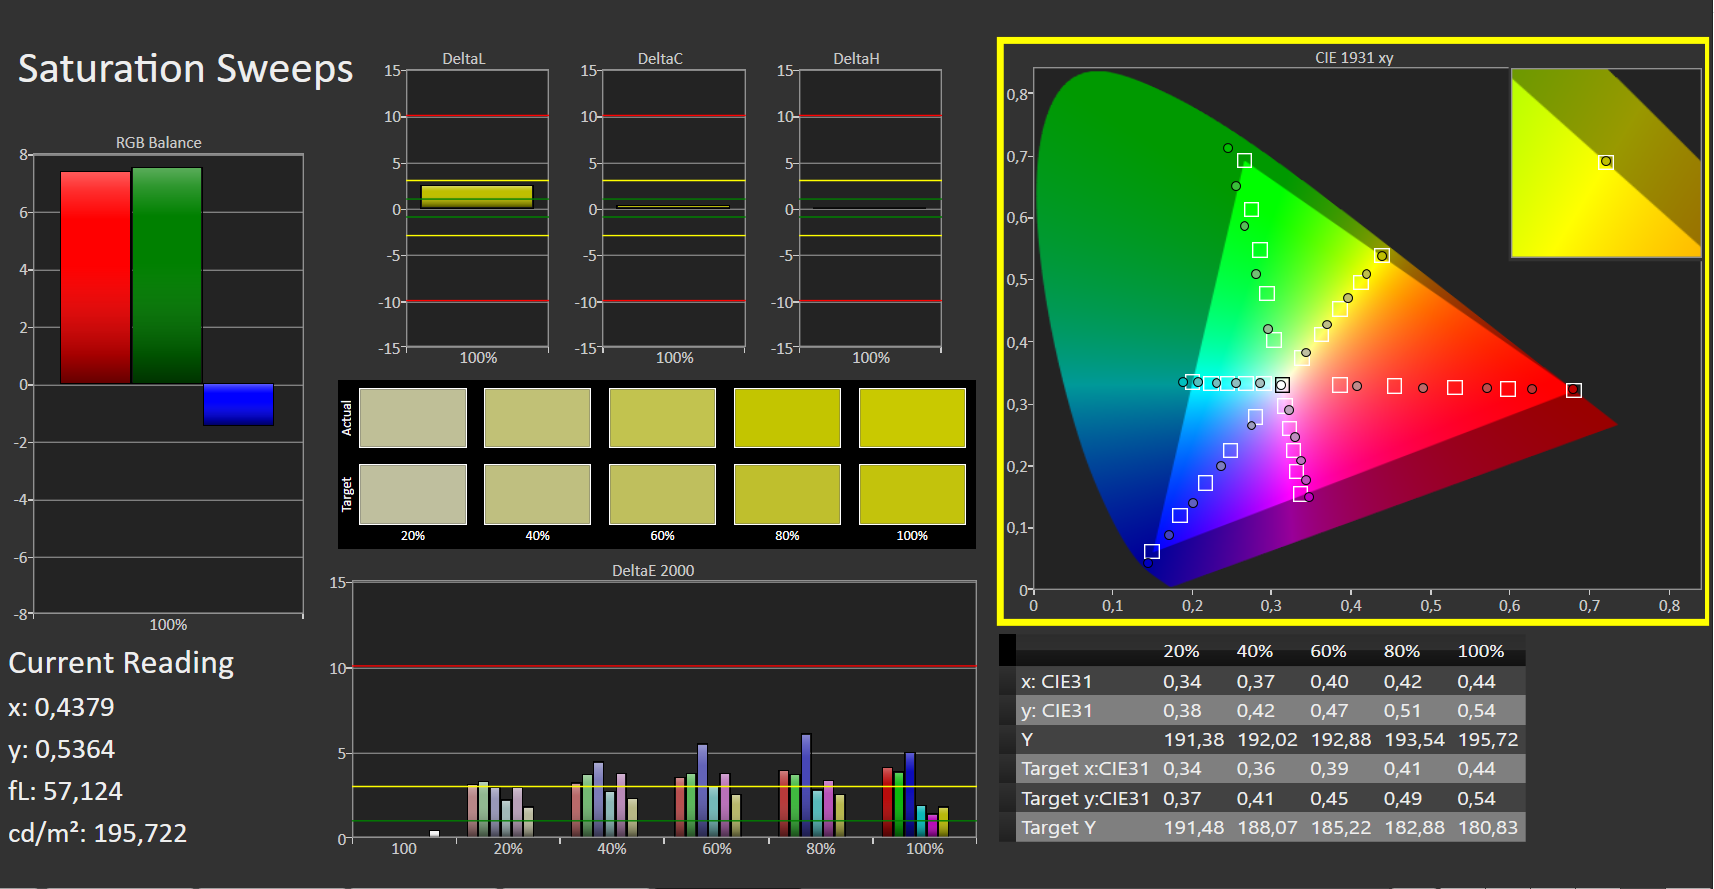
Il Razer Blade 15 ha un touchscreen OLED da 15,6 pollici con una risoluzione nativa di 3840x2160. Il display offre un superbo rapporto di contrasto (21111:1), un impressionante valore di nero (0,018), una buona luminosità massima (388,4 cd/m²) e tempi di risposta rapidi. Copre il 100% dello spazio colore sRGB. Positivo: Lo schermo non soffre di sfarfallio PWM.
Il Blade 15 2020 viene fornito con lo stesso pannello del modello precedente. Tuttavia, c'è una certa differenza tra i due pannelli. Tuttavia, questo è abbastanza normale, perché due schermi di costruzione simile non sono mai identici al 100%.
| |||||||||||||||||||||||||
Distribuzione della luminosità: 93 %
Al centro con la batteria: 380 cd/m²
Contrasto: 21111:1 (Nero: 0.018 cd/m²)
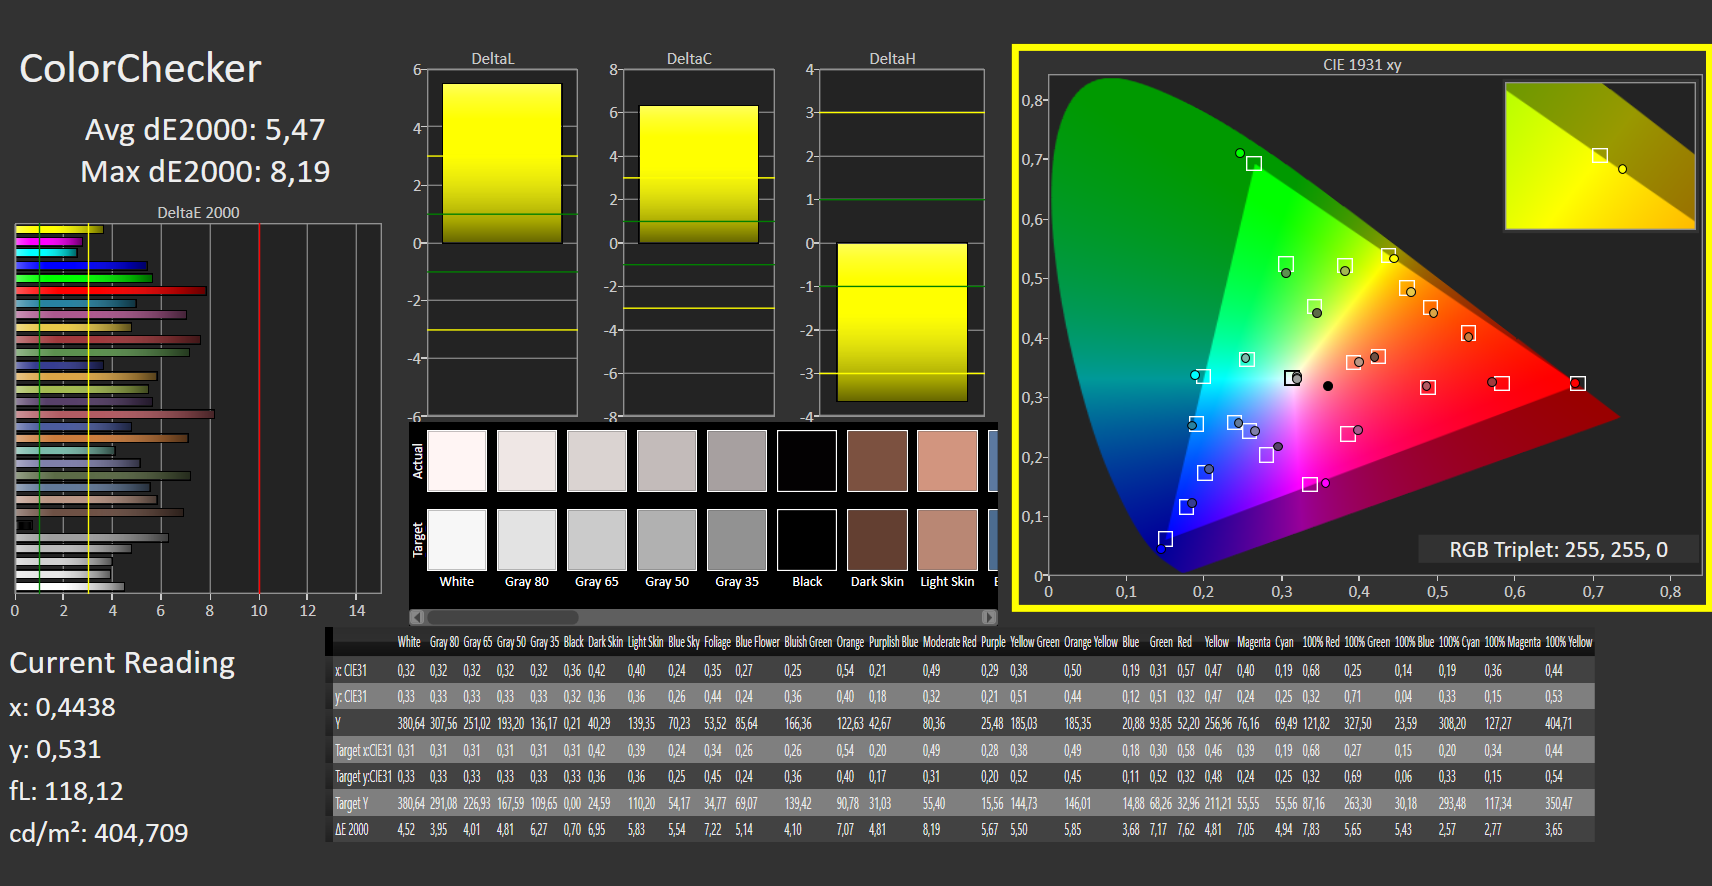
ΔE ColorChecker Calman: 5.47 | ∀{0.5-29.43 Ø4.73}
calibrated: 3.04
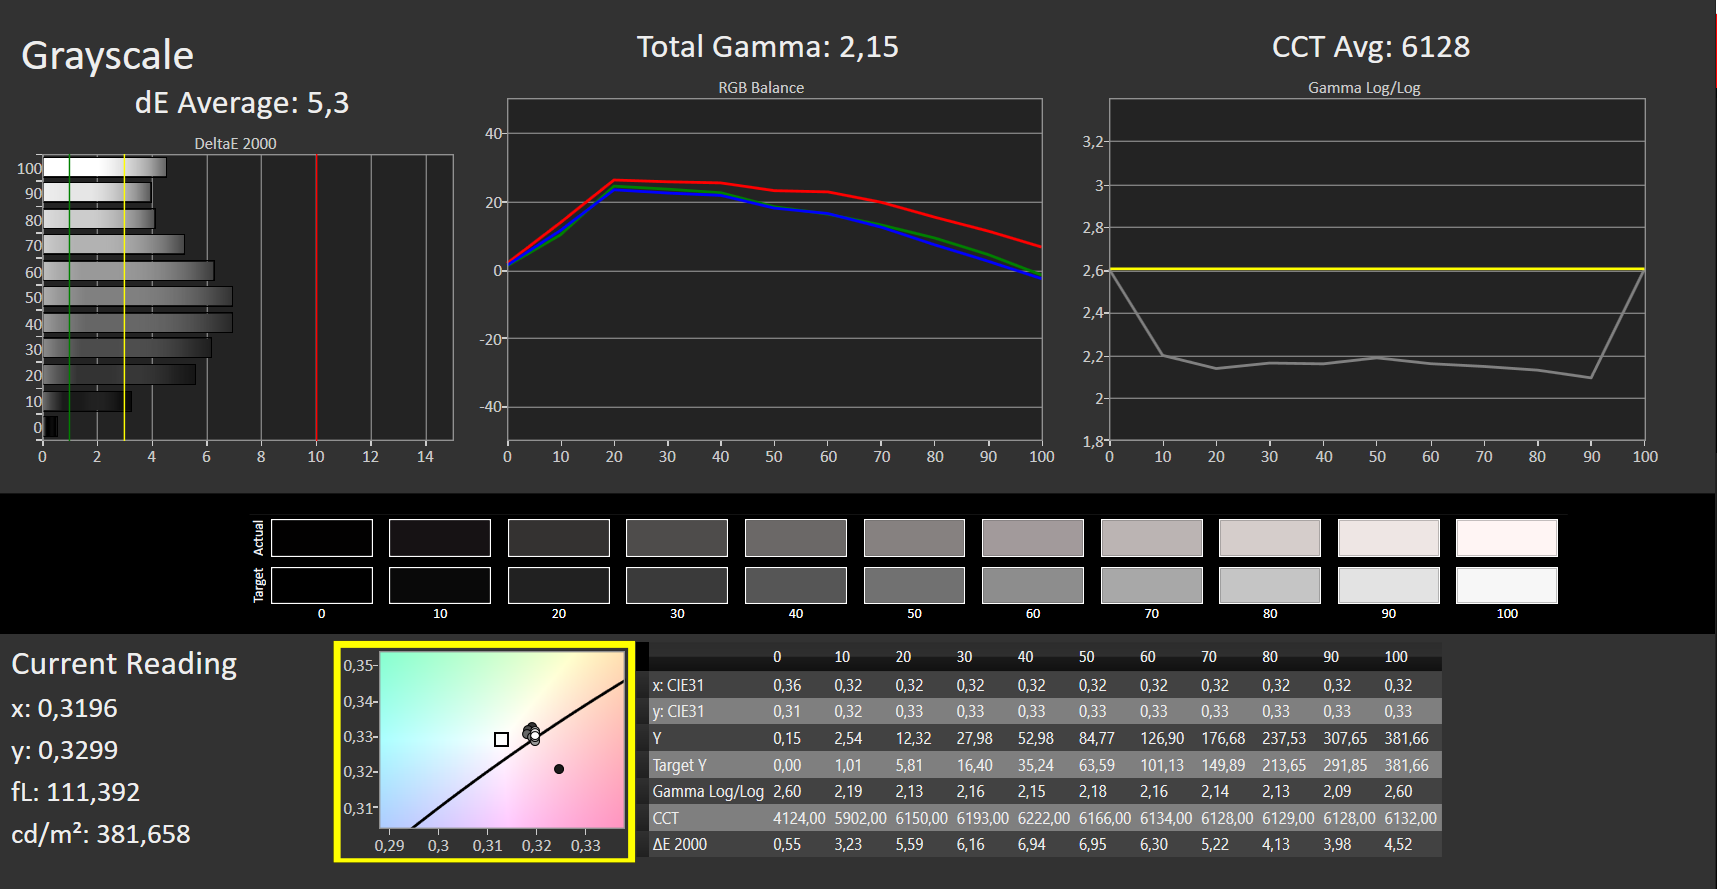
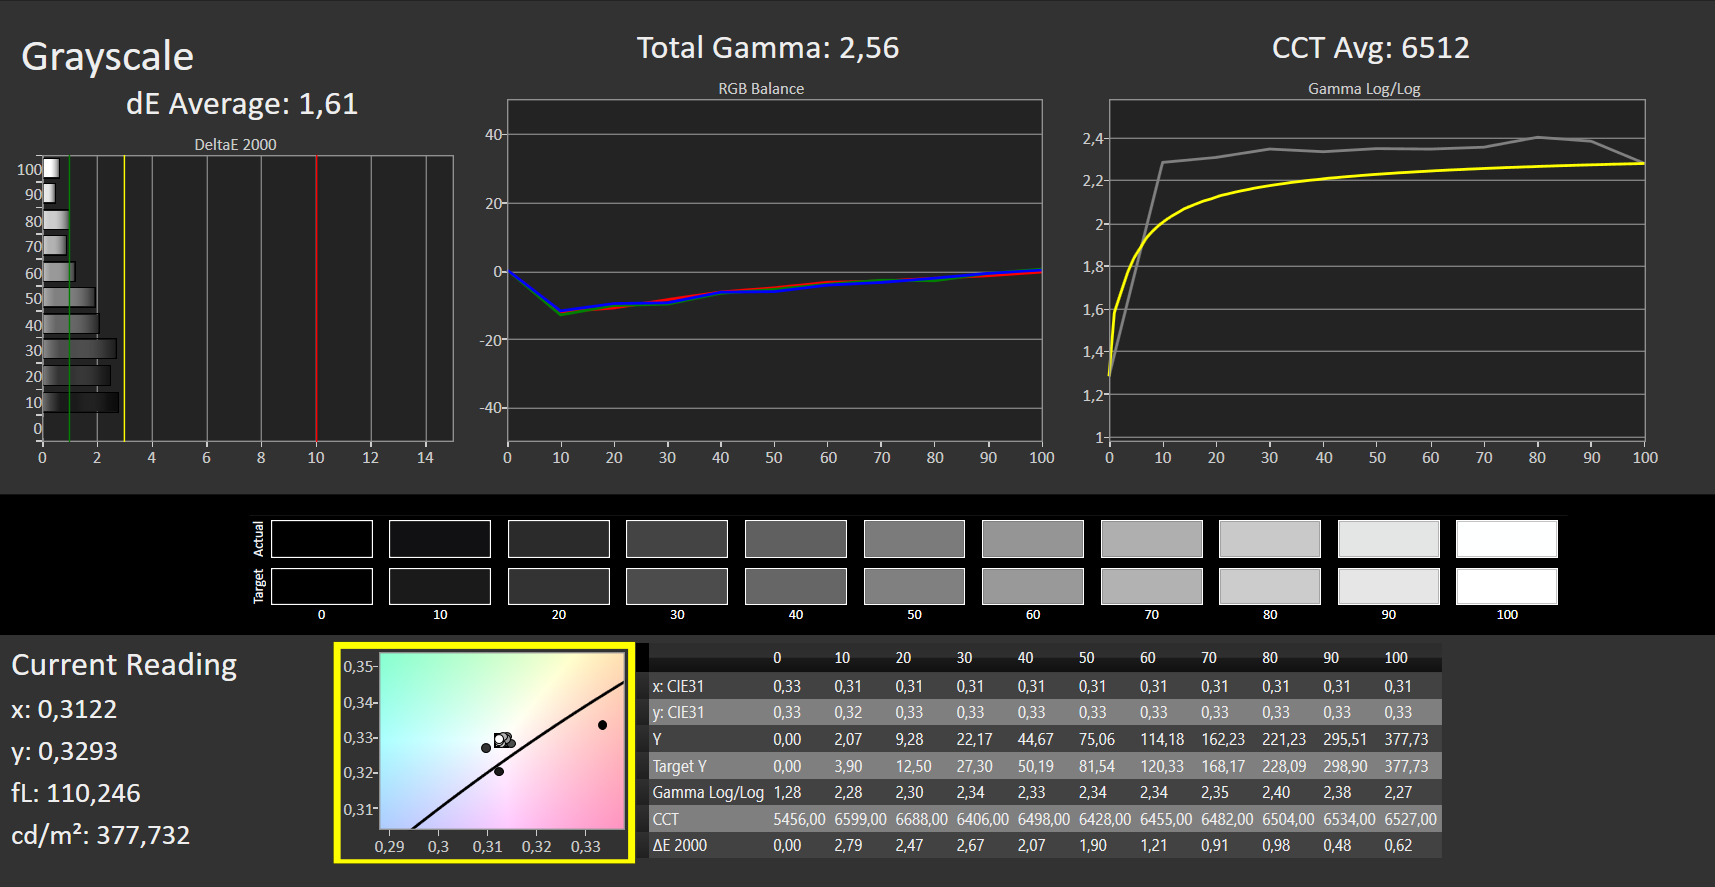
ΔE Greyscale Calman: 5.3 | ∀{0.09-98 Ø4.97}
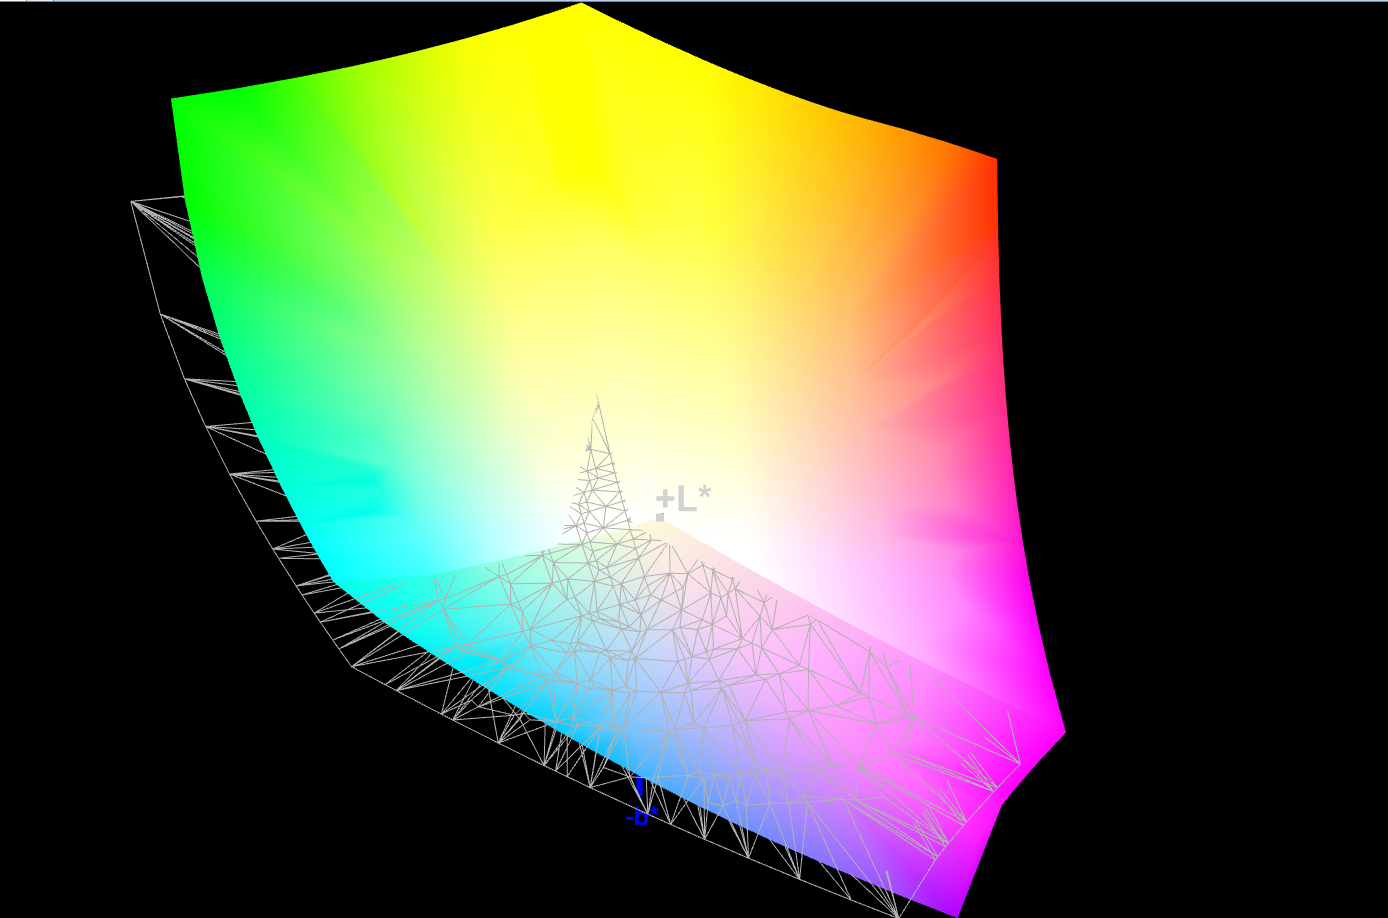
100% sRGB (Argyll 1.6.3 3D)
86% AdobeRGB 1998 (Argyll 1.6.3 3D)
97.3% AdobeRGB 1998 (Argyll 3D)
100% sRGB (Argyll 3D)
99.9% Display P3 (Argyll 3D)
Gamma: 2.15
CCT: 6128 K
| Razer Blade 15 Studio Edition 2020 Samsung SDCA029, OLED, 3840x2160, 15.6" | Razer Blade 15 Studio Edition Samsung SDCA029, OLED, 3840x2160, 15.6" | Lenovo ThinkPad P53-20QN000YGE N156HCE-GN1, IPS, 1920x1080, 15.6" | MSI P65 Creator 9SF-657 AU Optronics AUO41EB, IPS, 3840x2160, 15.6" | Dell Precision 5540 SDCA029, OLED, 3840x2160, 15.6" | |
|---|---|---|---|---|---|
| Display | -0% | -26% | -5% | 0% | |
| Display P3 Coverage (%) | 99.9 | 99.9 0% | 63.2 -37% | 84.4 -16% | 99.9 0% |
| sRGB Coverage (%) | 100 | 100 0% | 92.9 -7% | 100 0% | 100 0% |
| AdobeRGB 1998 Coverage (%) | 97.3 | 96.4 -1% | 64.3 -34% | 98.5 1% | 97.3 0% |
| Response Times | 13% | -695% | -925% | 25% | |
| Response Time Grey 50% / Grey 80% * (ms) | 4 ? | 3 ? 25% | 38.4 ? -860% | 51 ? -1175% | 2.8 ? 30% |
| Response Time Black / White * (ms) | 4 ? | 4 ? -0% | 25.2 ? -530% | 31 ? -675% | 3.2 ? 20% |
| PWM Frequency (Hz) | 26040 ? | 240.9 ? | |||
| Screen | -2% | -163% | -272% | 14% | |
| Brightness middle (cd/m²) | 380 | 361 -5% | 510 34% | 445 17% | 427 12% |
| Brightness (cd/m²) | 388 | 357 -8% | 468 21% | 462 19% | 411 6% |
| Brightness Distribution (%) | 93 | 89 -4% | 89 -4% | 83 -11% | 89 -4% |
| Black Level * (cd/m²) | 0.018 | 0.015 17% | 0.36 -1900% | 0.5 -2678% | |
| Contrast (:1) | 21111 | 24067 14% | 1417 -93% | 890 -96% | |
| Colorchecker dE 2000 * | 5.47 | 5.3 3% | 2.3 58% | 4.75 13% | 3.2 41% |
| Colorchecker dE 2000 max. * | 8.19 | 11.5 -40% | 5.5 33% | 7.79 5% | 8.4 -3% |
| Colorchecker dE 2000 calibrated * | 3.04 | 4.7 -55% | 1.2 61% | 2.8 8% | |
| Greyscale dE 2000 * | 5.3 | 2.1 60% | 3.2 40% | 4.49 15% | 1.8 66% |
| Gamma | 2.15 102% | 2.14 103% | 2.34 94% | 2.49 88% | 2.15 102% |
| CCT | 6128 106% | 6149 106% | 7036 92% | 7374 88% | 6176 105% |
| Color Space (Percent of AdobeRGB 1998) (%) | 86 | 86 0% | 59.4 -31% | 87 1% | 86.8 1% |
| Color Space (Percent of sRGB) (%) | 100 | 100 0% | 93.1 -7% | 100 0% | 100 0% |
| Media totale (Programma / Settaggio) | 4% /
0% | -295% /
-204% | -401% /
-305% | 13% /
13% |
* ... Meglio usare valori piccoli

Tempi di risposta del Display
| ↔ Tempi di risposta dal Nero al Bianco | ||
|---|---|---|
| 4 ms ... aumenta ↗ e diminuisce ↘ combinato | ↗ 2 ms Incremento | 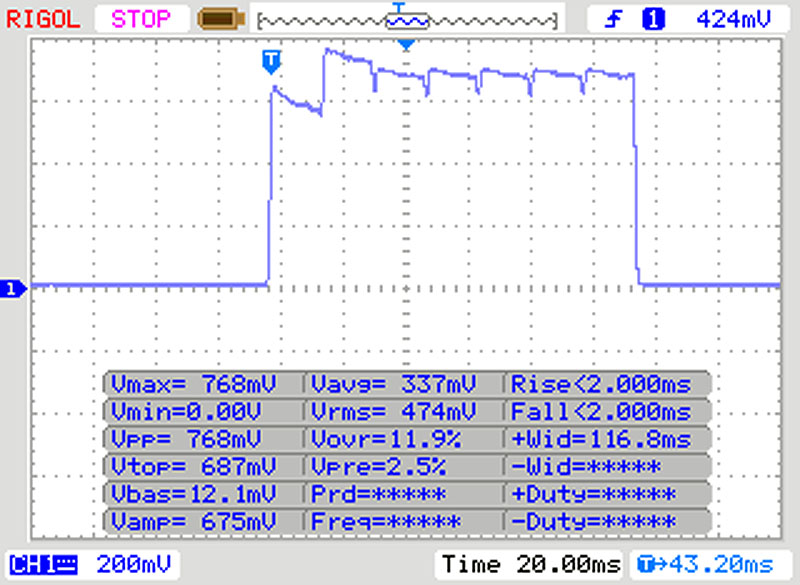 |
| ↘ 2 ms Calo | ||
| Lo schermo ha mostrato valori di risposta molto veloci nei nostri tests ed è molto adatto per i gaming veloce. In confronto, tutti i dispositivi di test variano da 0.1 (minimo) a 240 (massimo) ms. » 16 % di tutti i dispositivi è migliore. Questo significa che i tempi di risposta rilevati sono migliori rispettto alla media di tutti i dispositivi testati (19.9 ms). | ||
| ↔ Tempo di risposta dal 50% Grigio all'80% Grigio | ||
| 4 ms ... aumenta ↗ e diminuisce ↘ combinato | ↗ 2 ms Incremento | 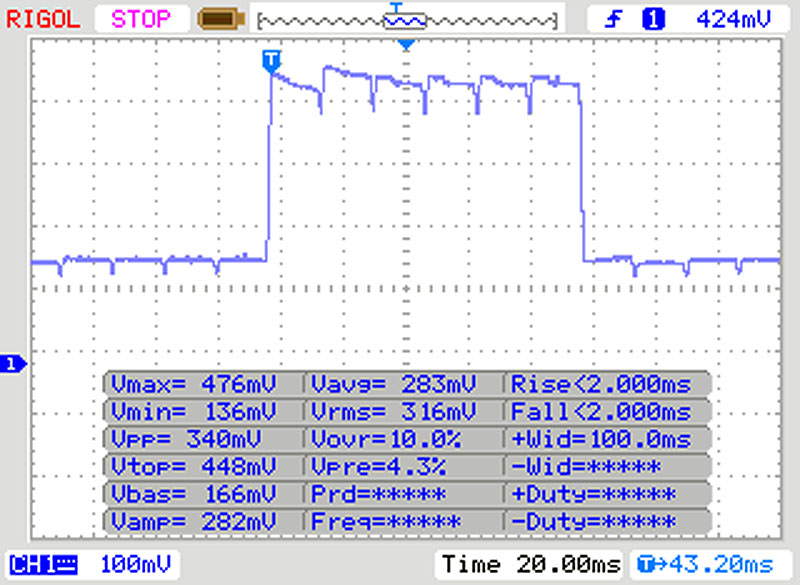 |
| ↘ 2 ms Calo | ||
| Lo schermo ha mostrato valori di risposta molto veloci nei nostri tests ed è molto adatto per i gaming veloce. In confronto, tutti i dispositivi di test variano da 0.165 (minimo) a 636 (massimo) ms. » 15 % di tutti i dispositivi è migliore. Questo significa che i tempi di risposta rilevati sono migliori rispettto alla media di tutti i dispositivi testati (31.1 ms). | ||
Sfarfallio dello schermo / PWM (Pulse-Width Modulation)
| flickering dello schermo / PWM non rilevato |  | ||
In confronto: 52 % di tutti i dispositivi testati non utilizza PWM per ridurre la luminosita' del display. Se è rilevato PWM, una media di 7798 (minimo: 5 - massimo: 343500) Hz è stata rilevata. | |||
Prestazioni - Due CPU cores aggiuntivi per il Blade 15
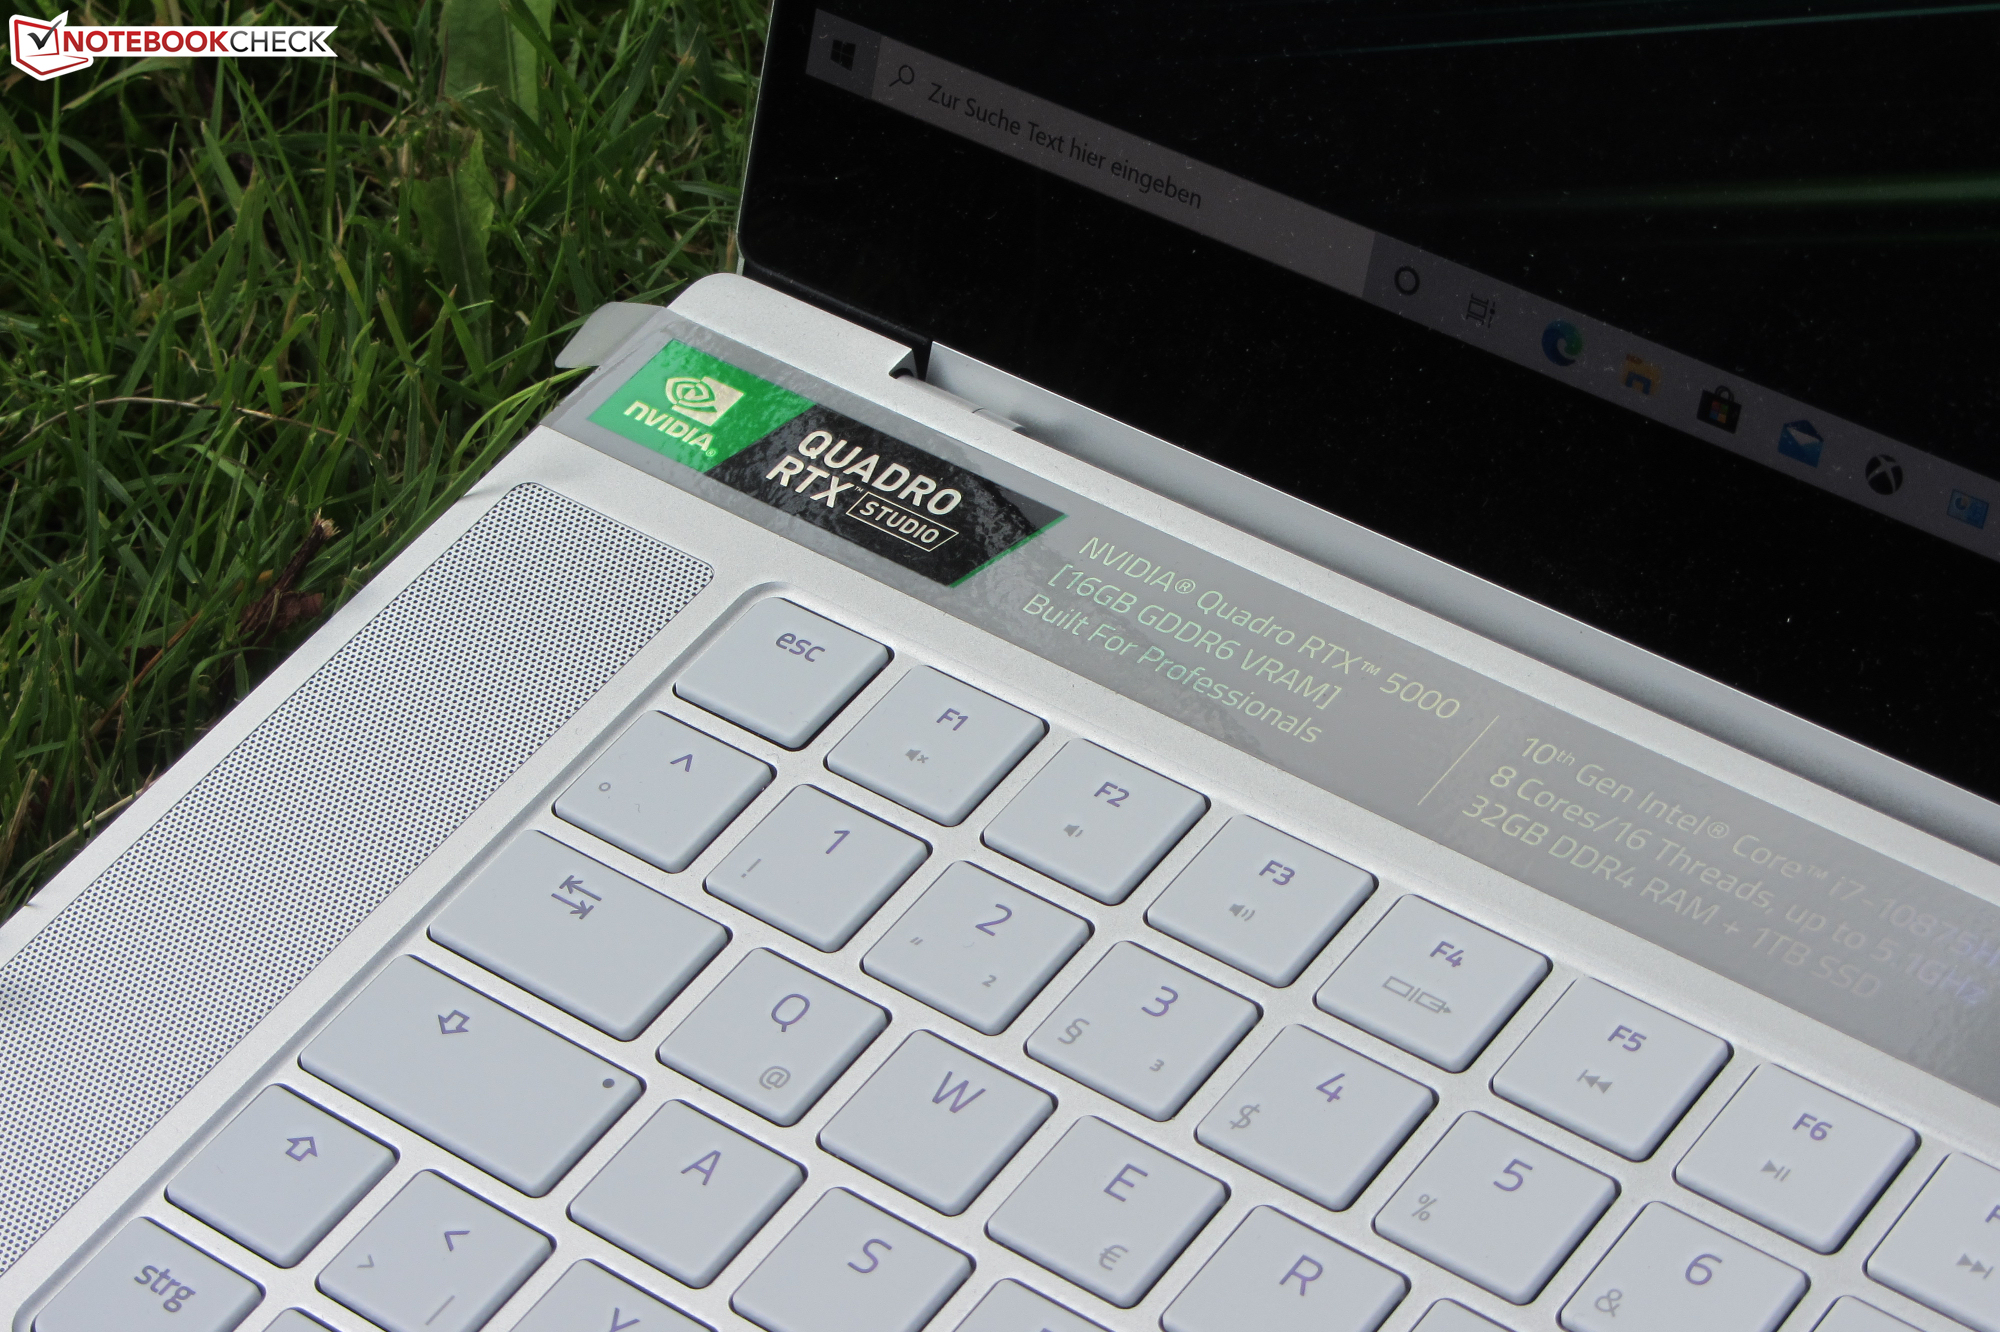
Il Blade 15 Studio Edition di Razer è una workstation da 15,6 pollici. Offre prestazioni sufficienti per tutte le applicazioni attuali. Il nostro dispositivo di prova viene venduto al dettaglio per 4.700 euro (5.526 dollari). Non sono disponibili altre configurazioni hardware.
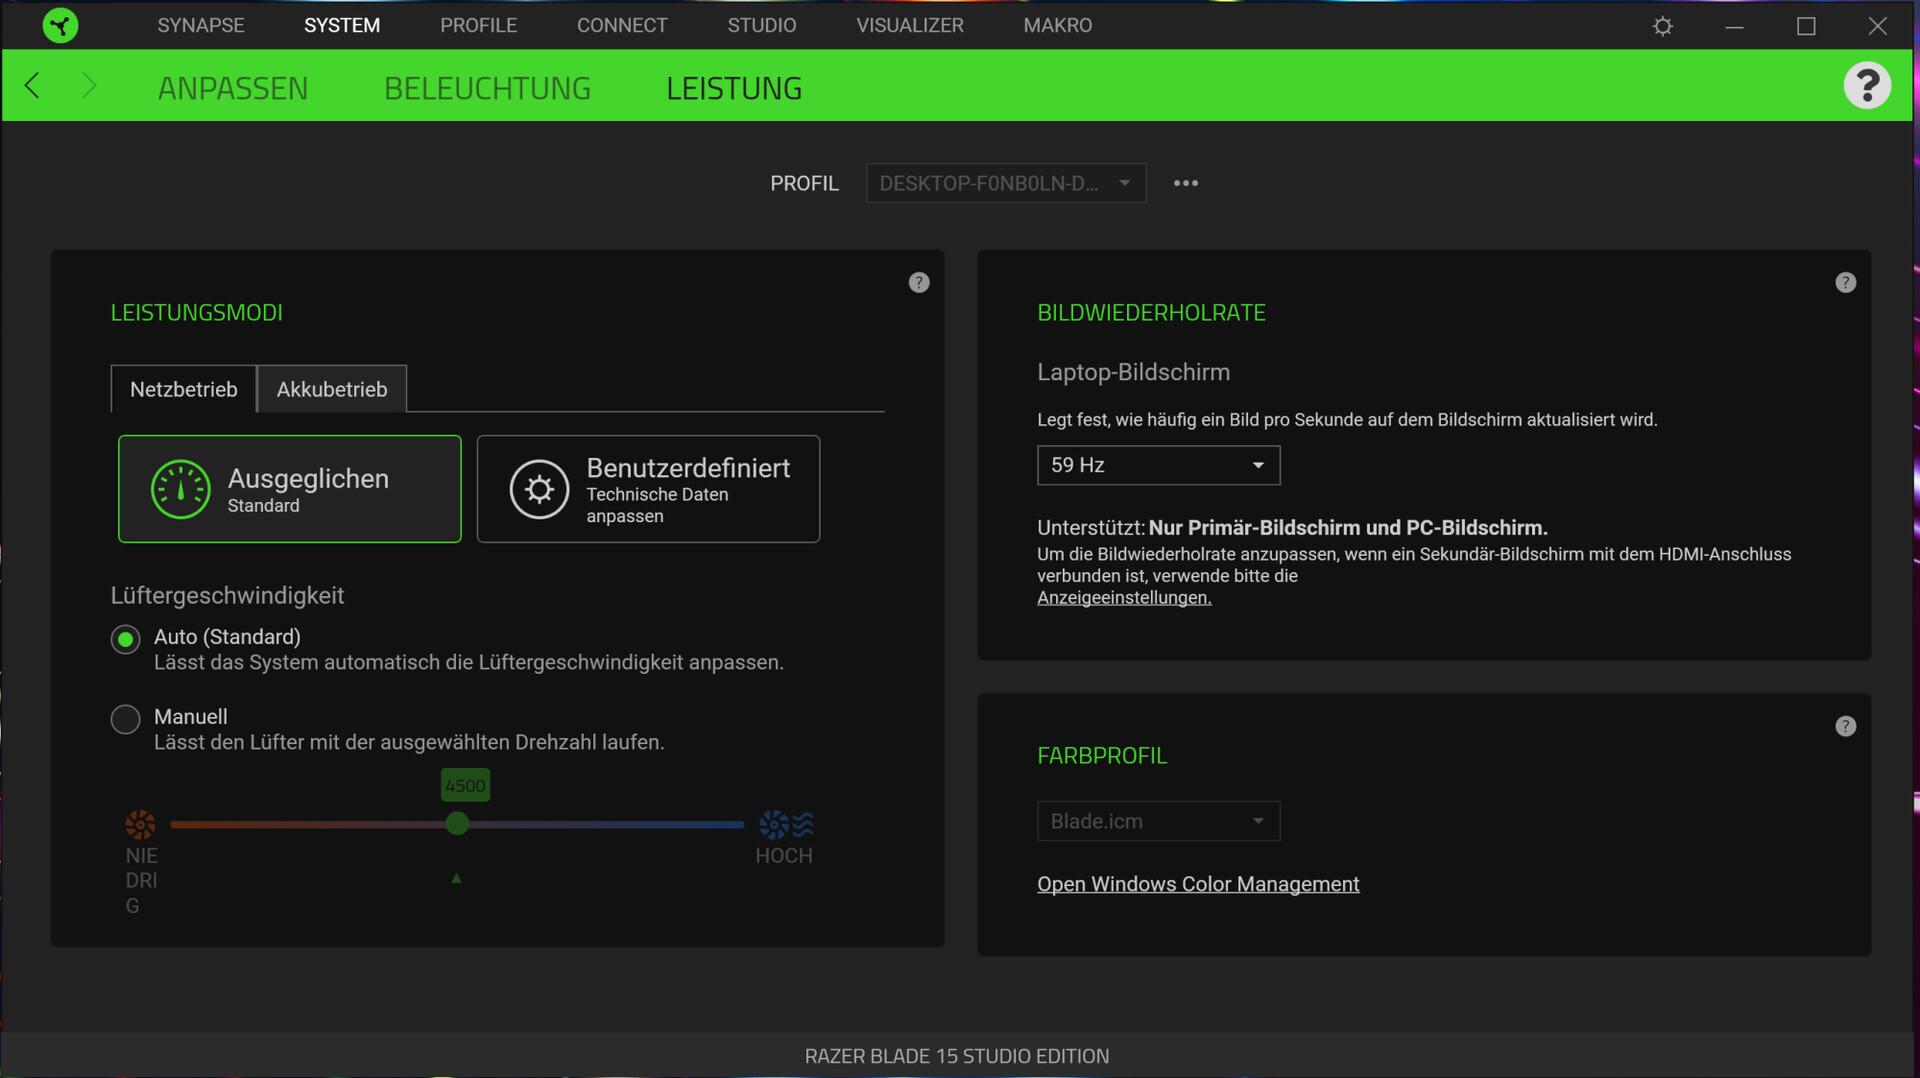
Impostazioni di sistema
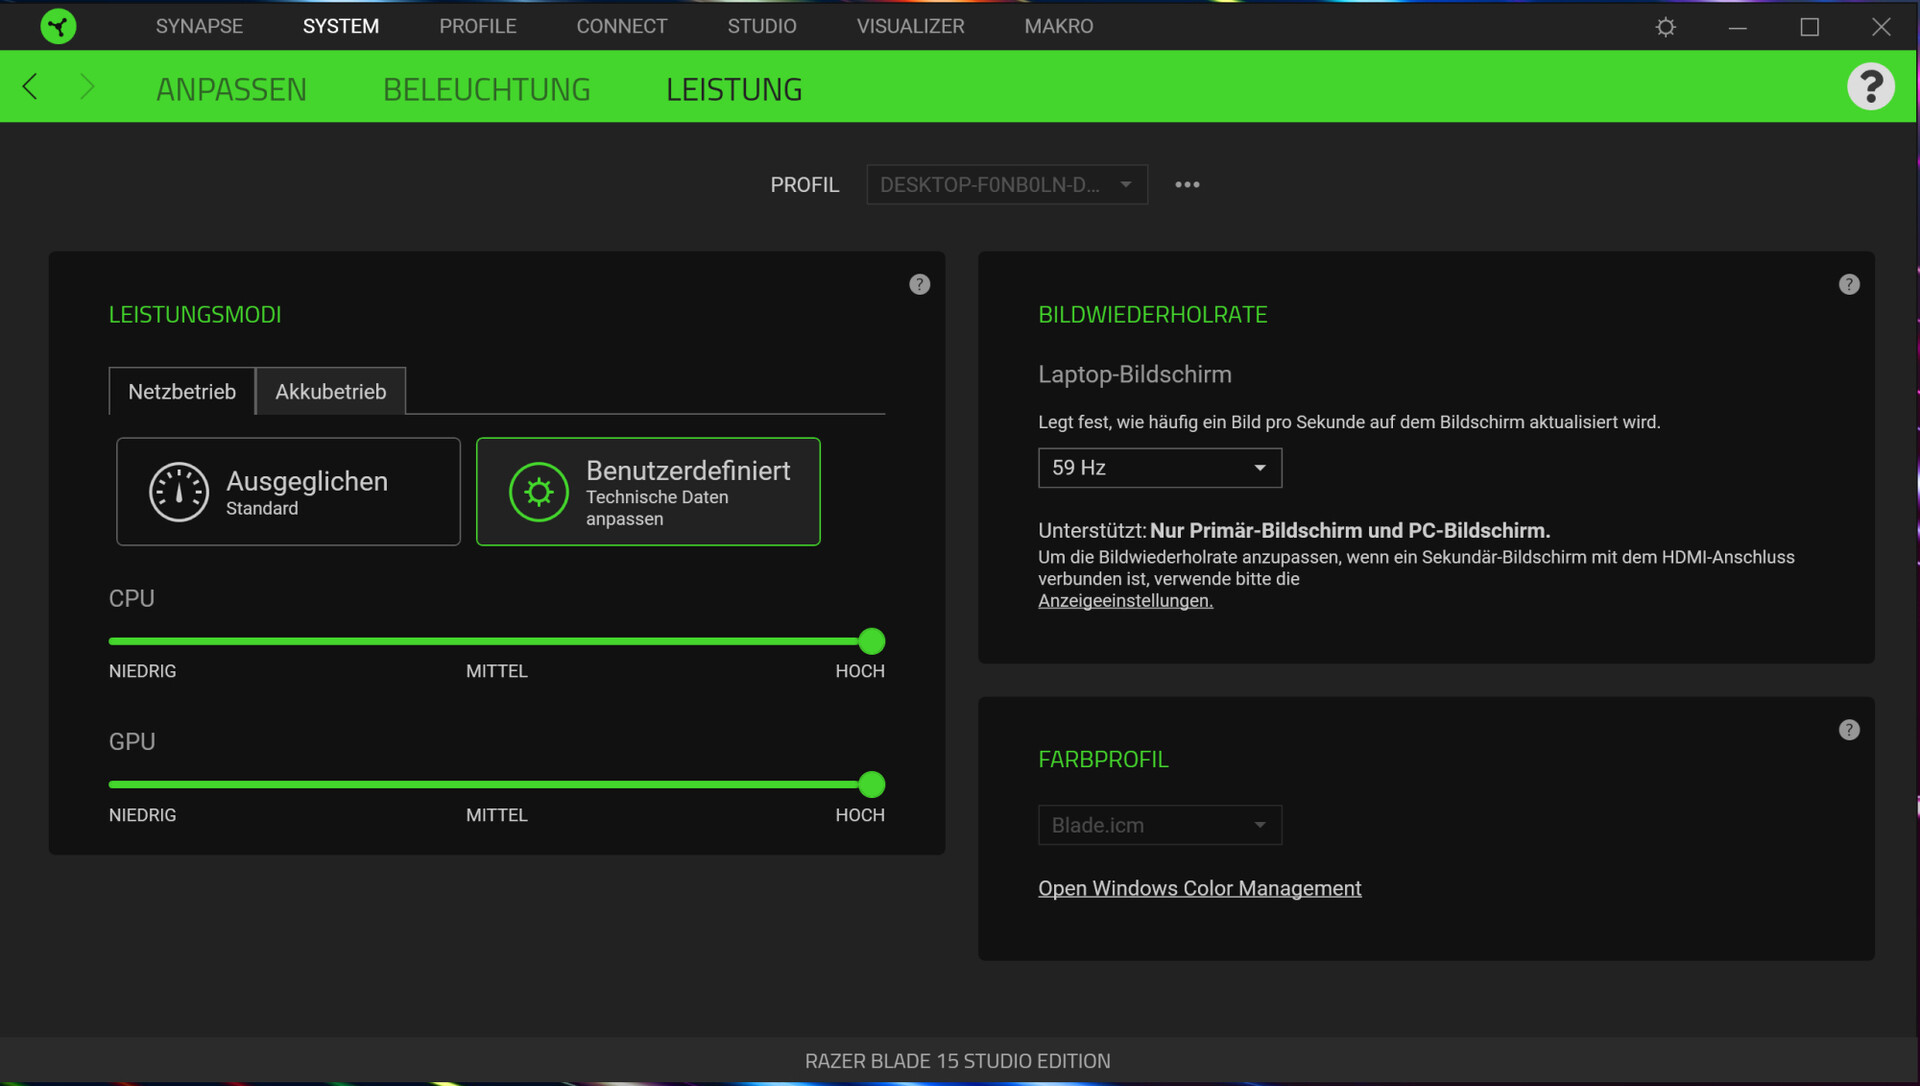
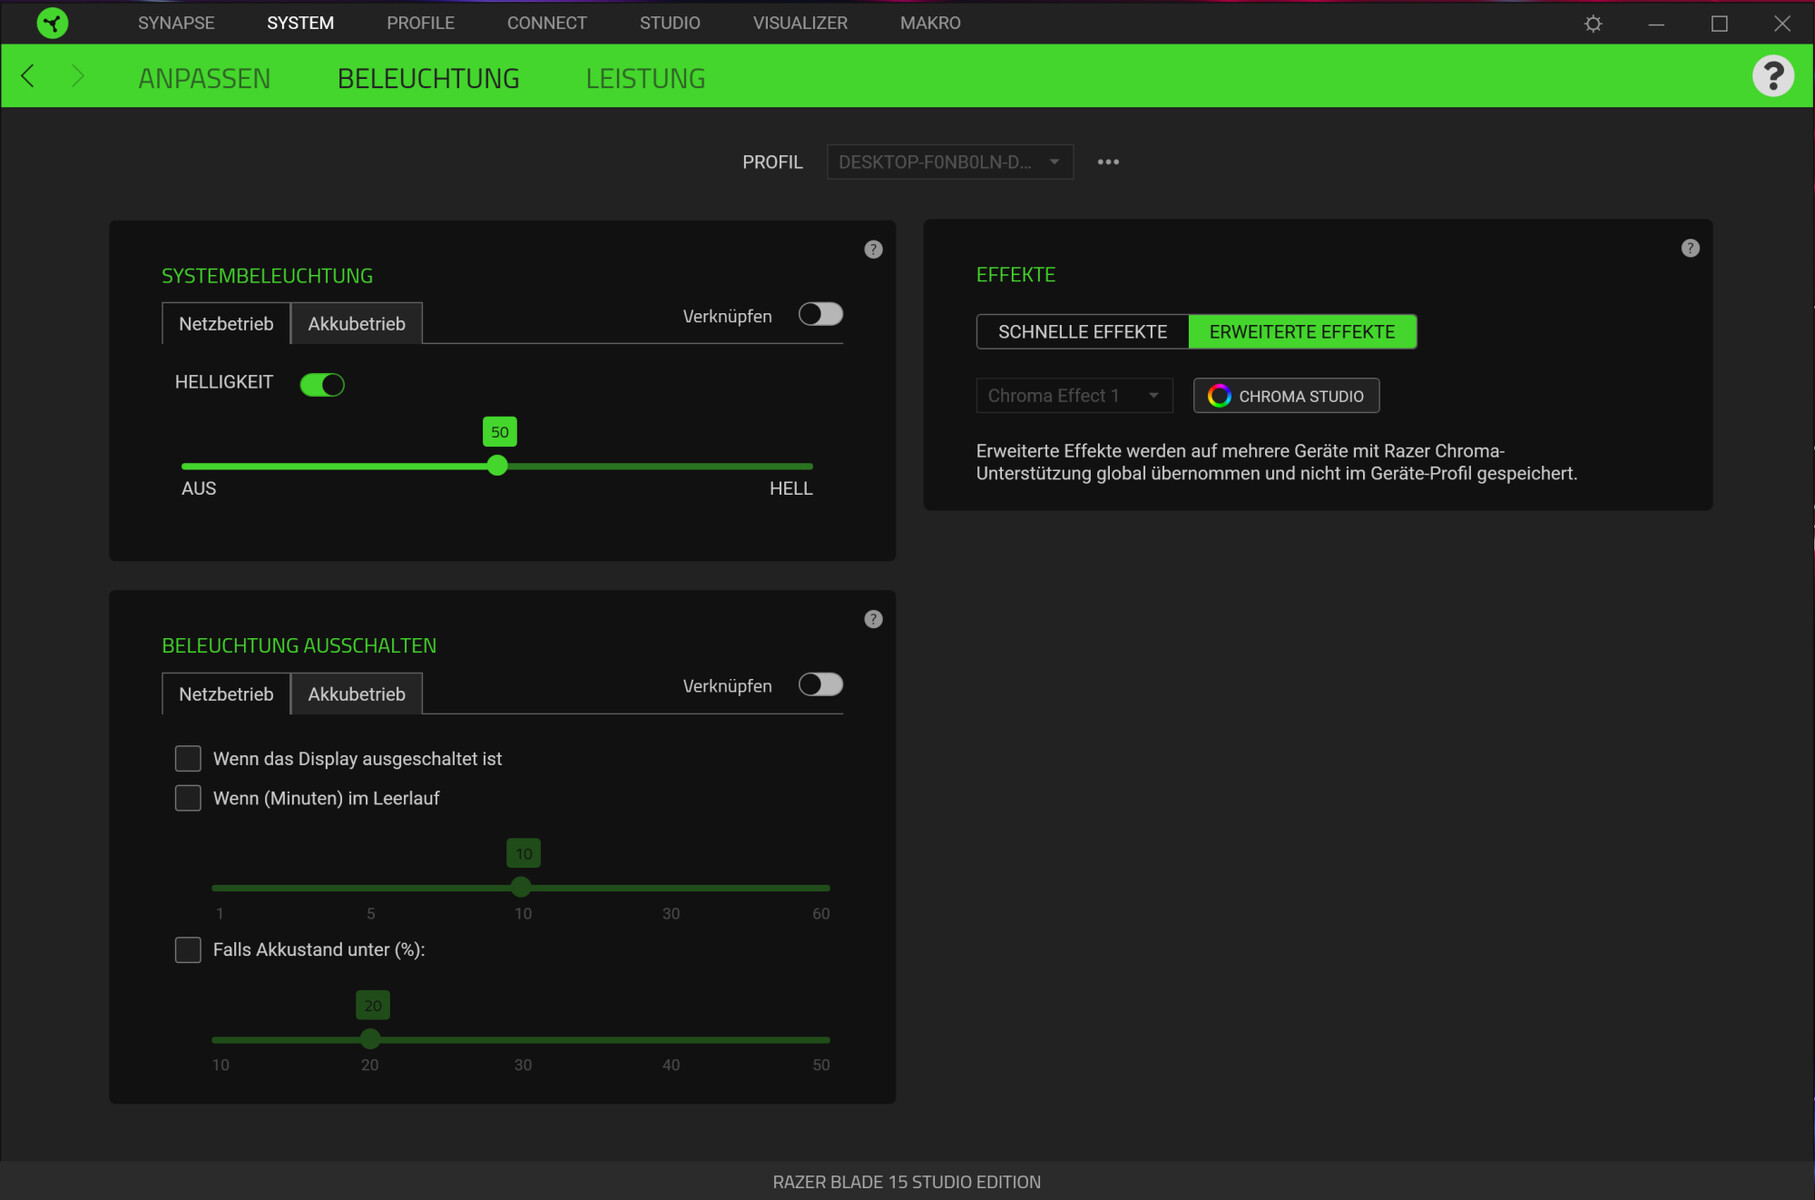
L'utility "Synapse" preinstallata offre opzioni per la personalizzazione delle prestazioni di CPU e GPU. Abbiamo condotto tutti i nostri benchmarks con la velocità della ventola impostata su "Auto". Abbiamo anche usato il profilo di potenza "bilanciato". Tuttavia, alcuni dei nostri benchmarks sono stati eseguiti con la CPU e la GPU al massimo delle prestazioni. Abbiamo segnato chiaramente tutti i risultati dei benchmarks che abbiamo ottenuto con i limiti di potenza disabilitati.
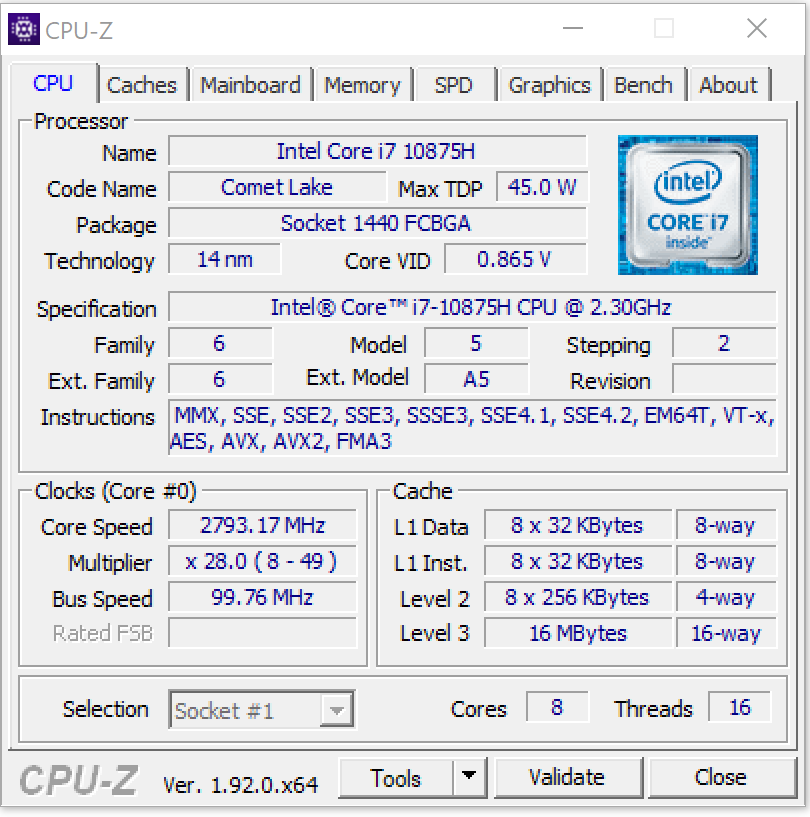
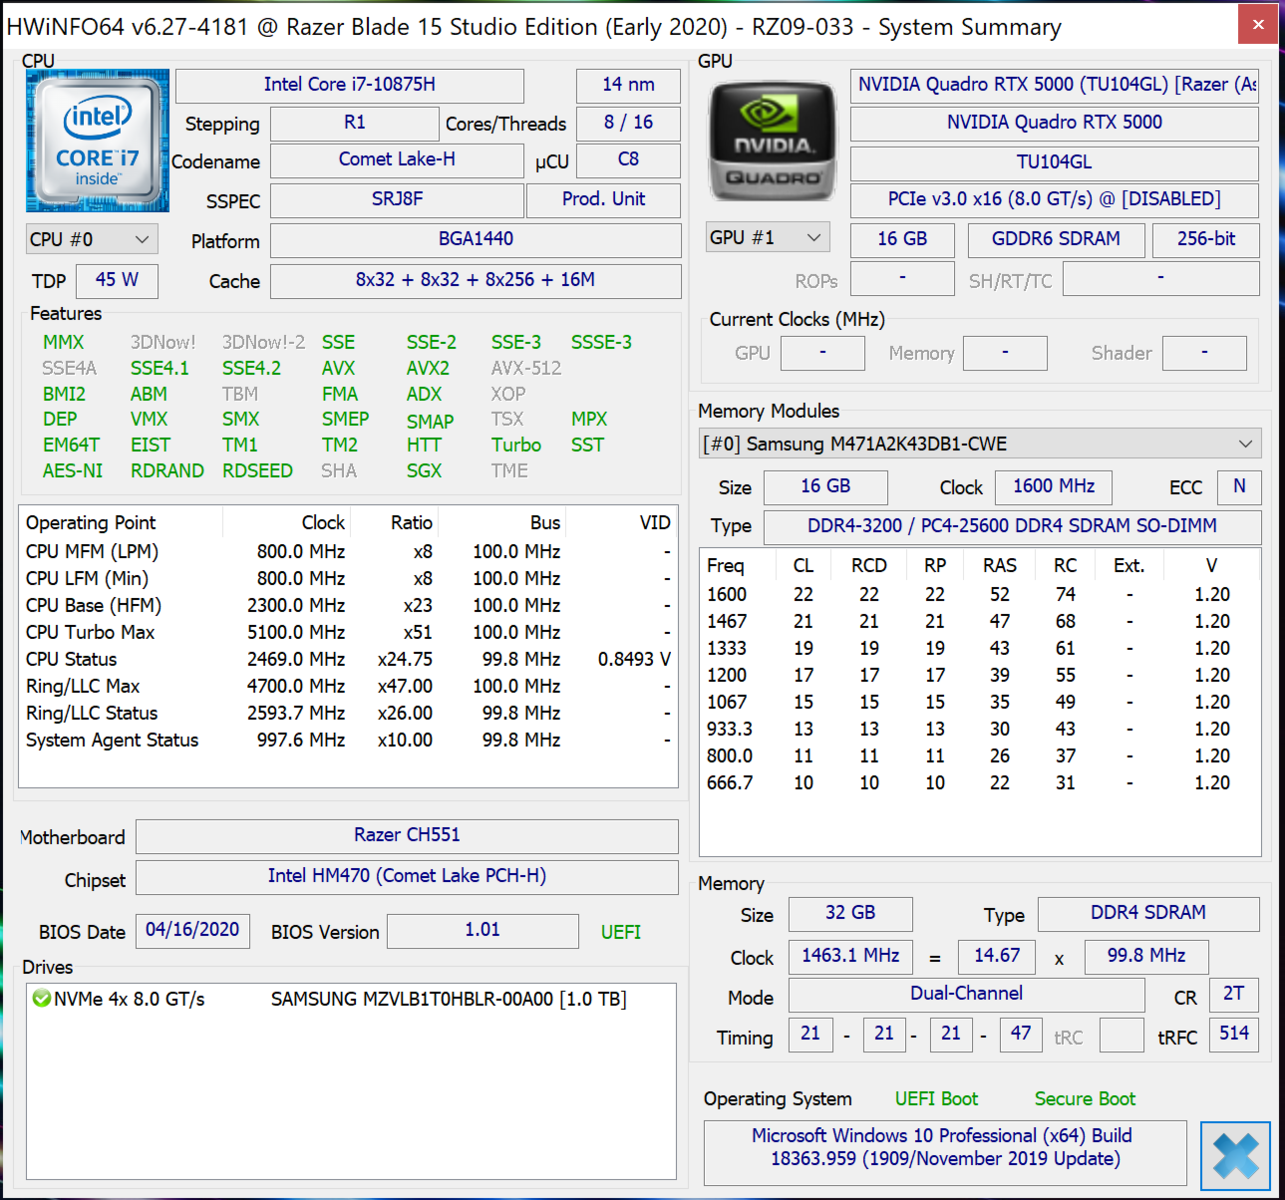
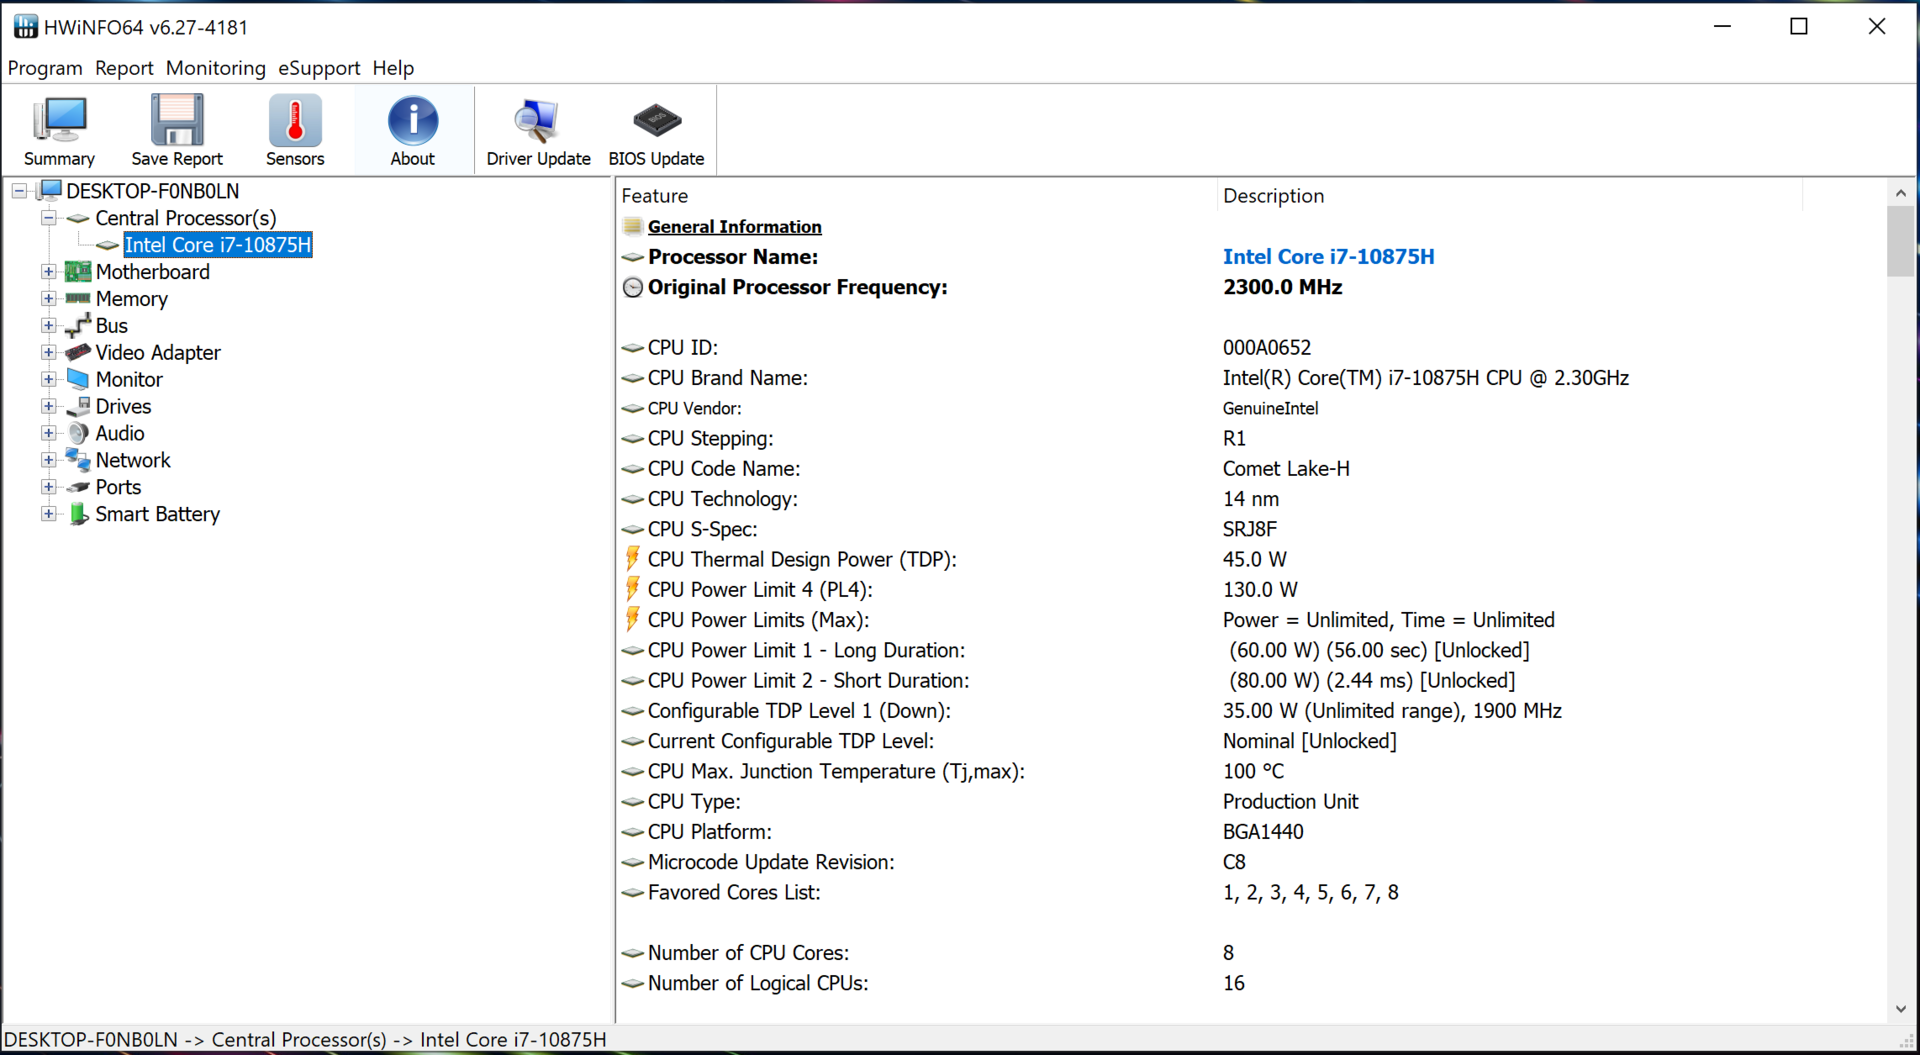
Processore
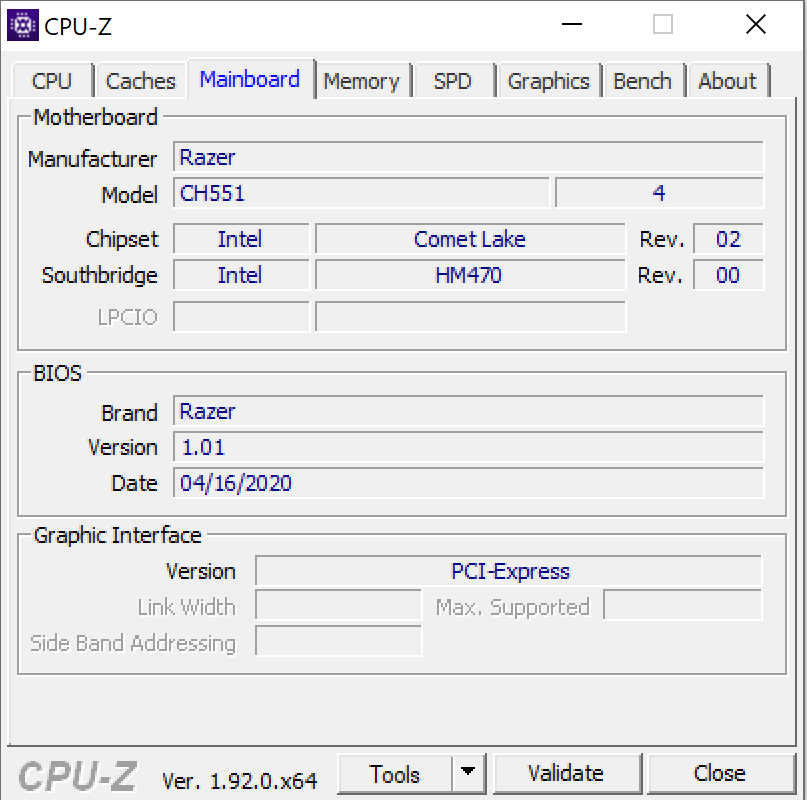
Il Core i7-10875H del Blade 15 è un processore basato su Comet Lake-Octa-core. Ha un clock di base di 2,3 GHz e un boost clock di 4,3 GHz per otto cores e 5,1 GHz per un core. La CPU supporta Hyper-Threading, il che significa che un core può elaborare due threads contemporaneamente.
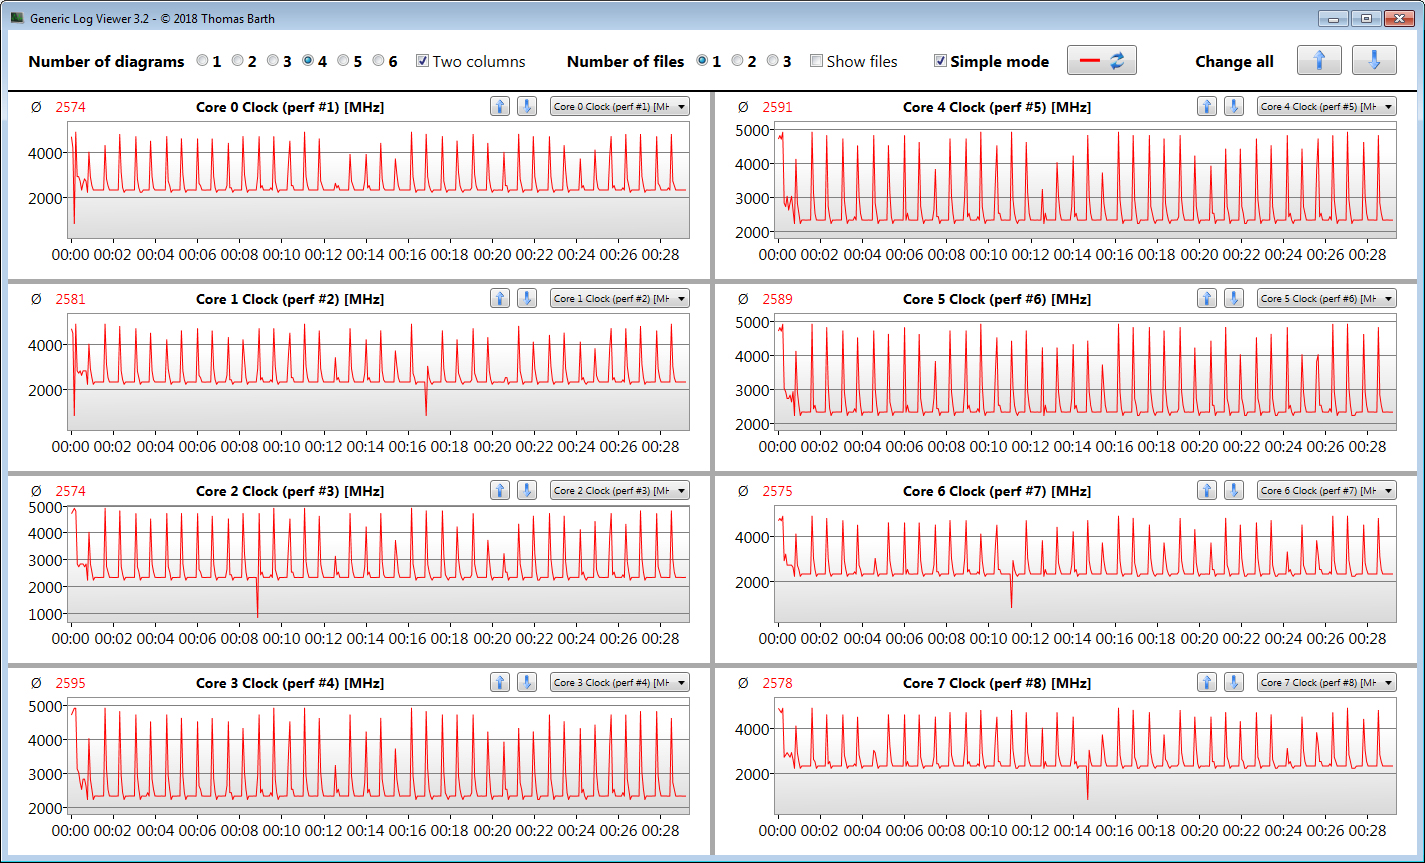
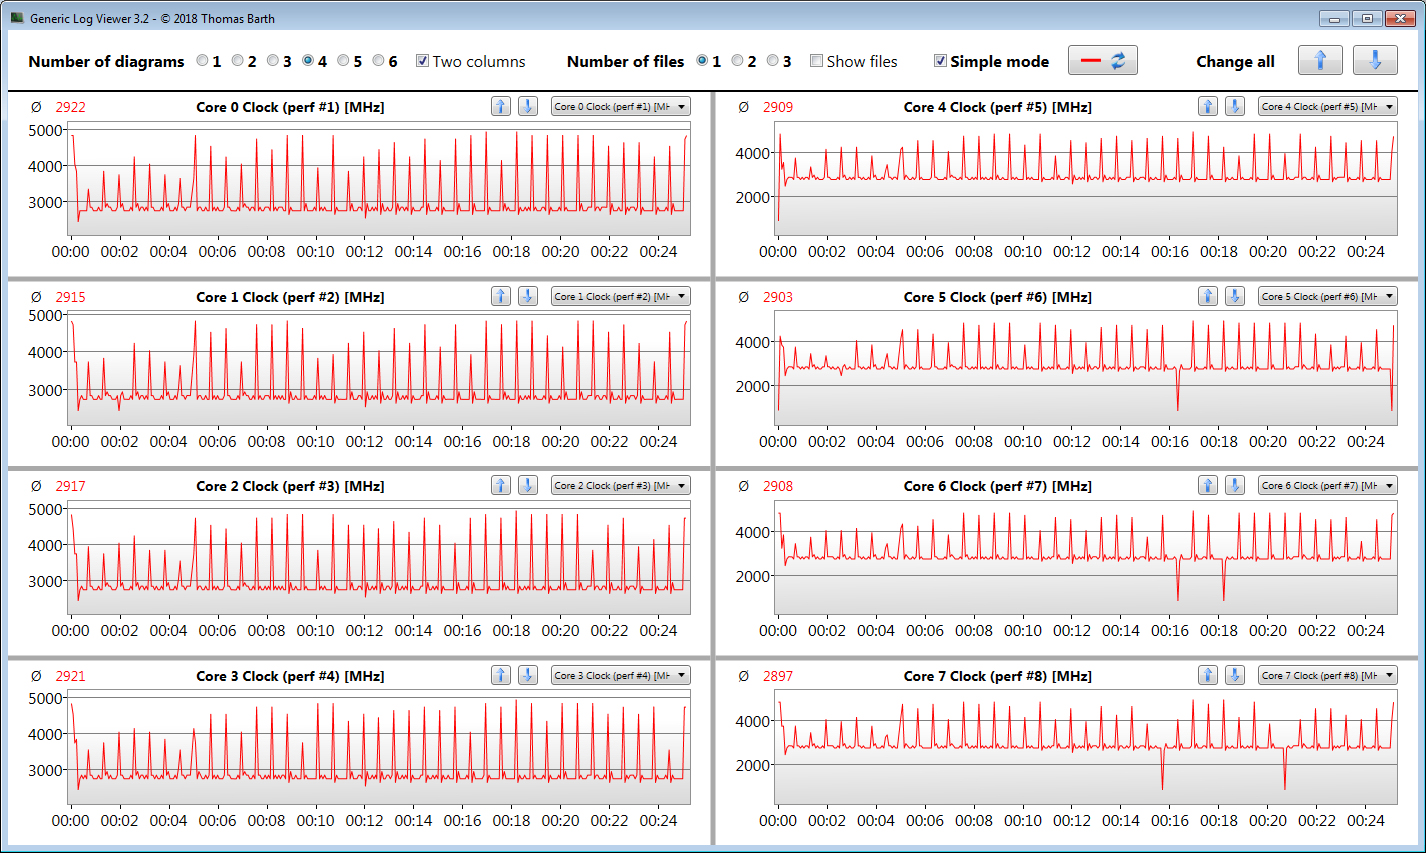
Nei benchmarks multi-core Cinebench R15, la CPU funziona a 2,6 - 3 GHz per un breve periodo di tempo. Successivamente, la frequenza della CPU scende a 2,1 - 2,2 GHz. Nel benchmark single-core, il processore funziona da 4 a 4,9 GHz. Quando funziona a batteria, il processore gira a 1,6-1,7 GHz nel benchmark CB15 multi-core e a 2,2-3,3 GHz nel benchmark CB15 single-core.
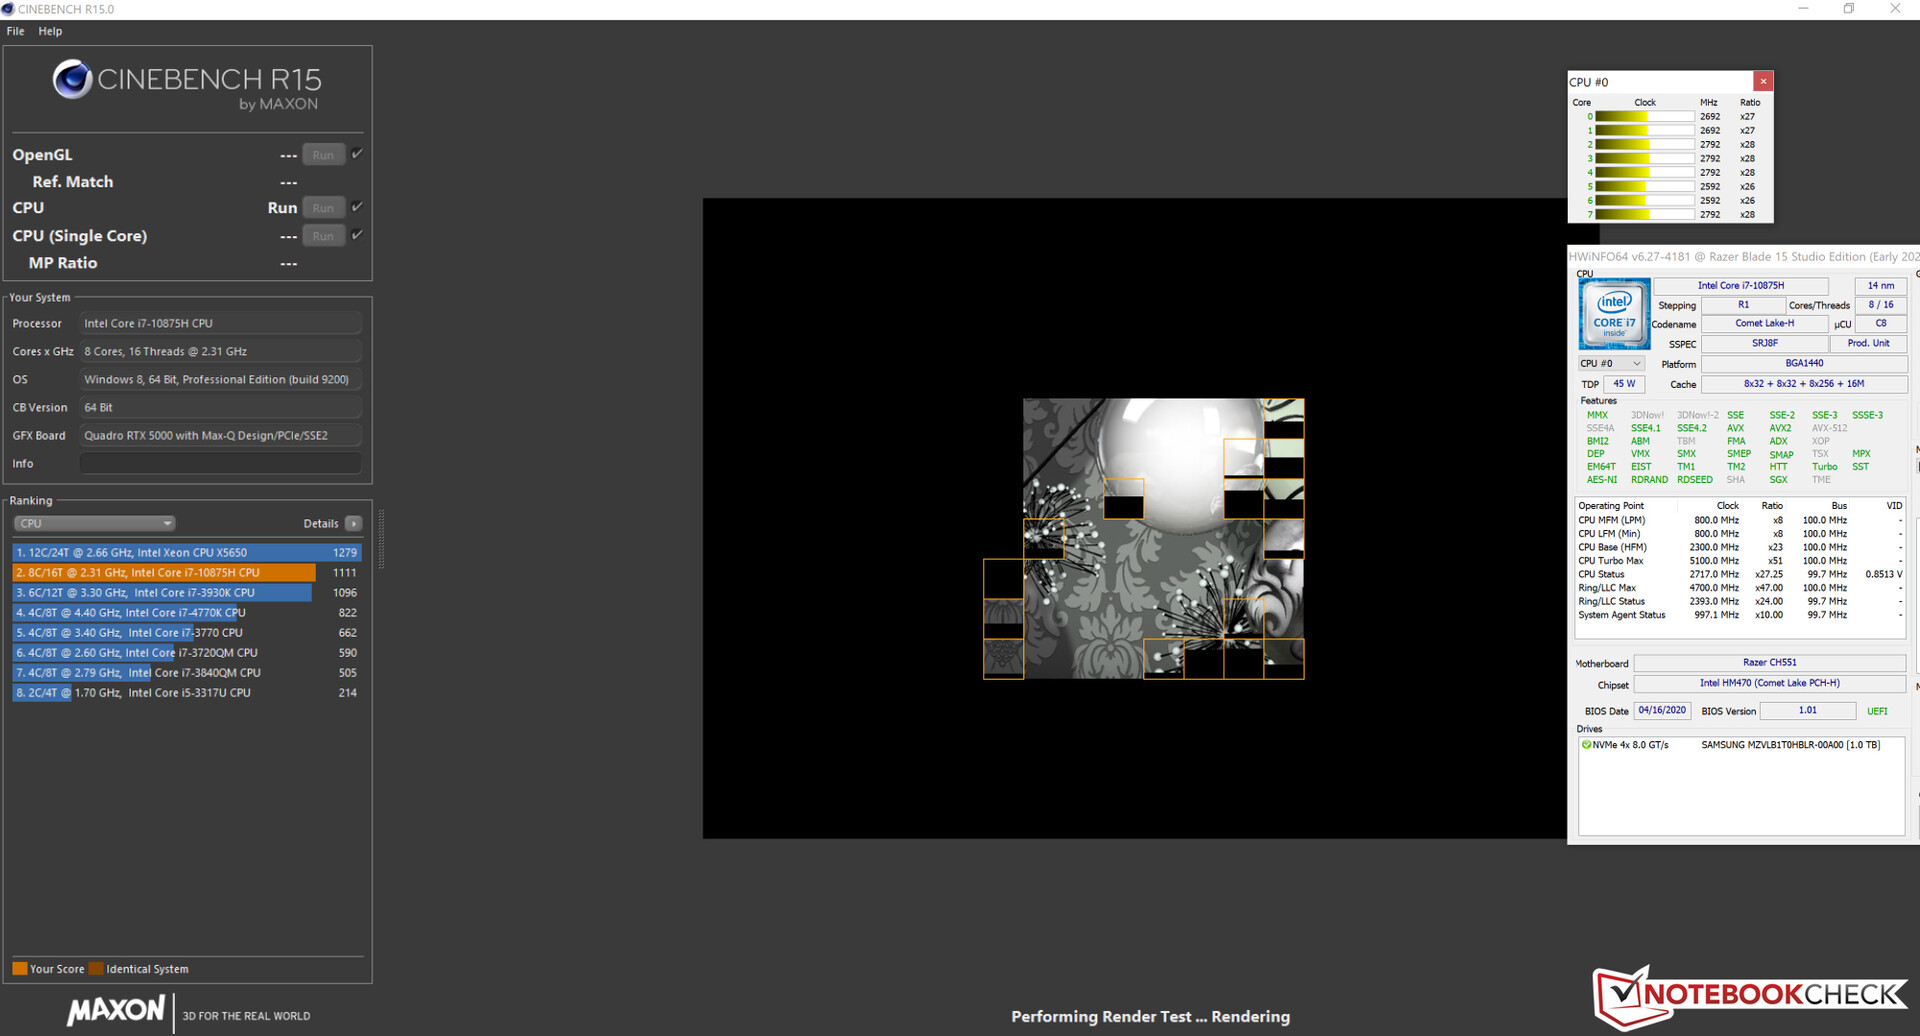
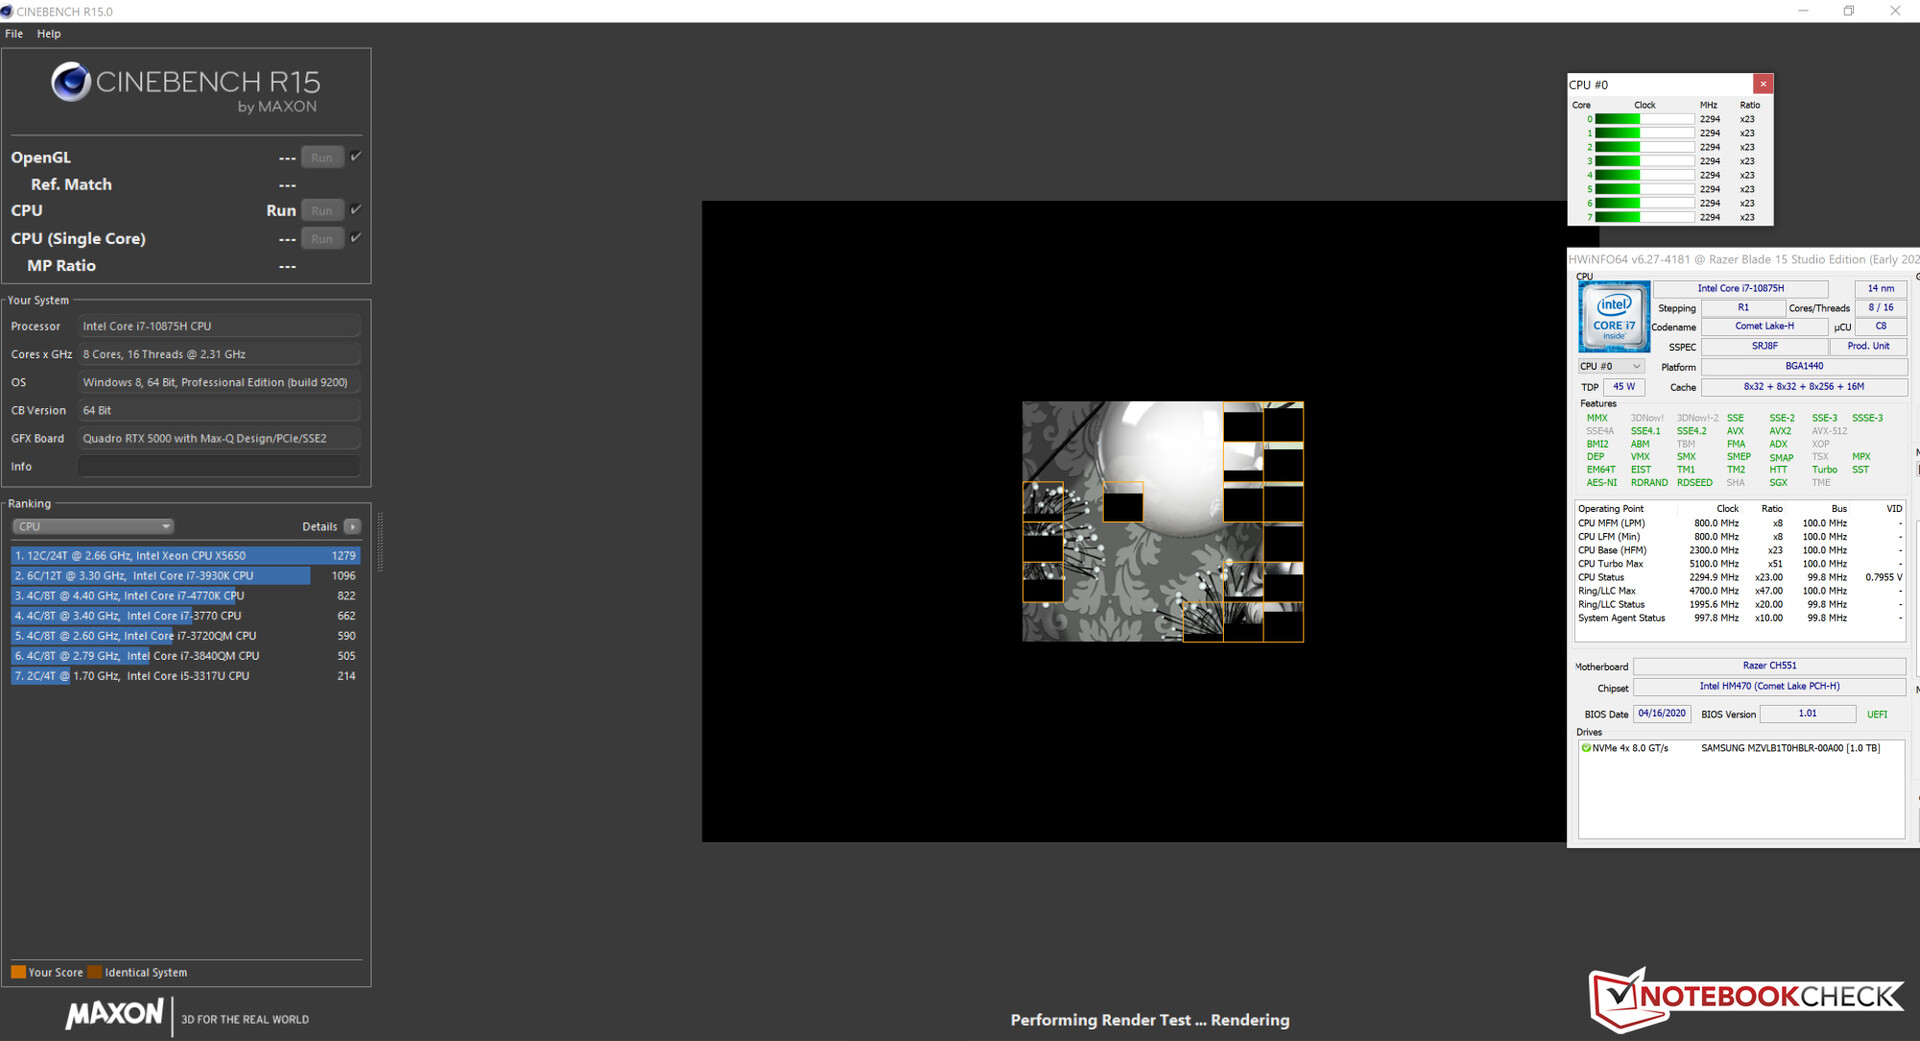
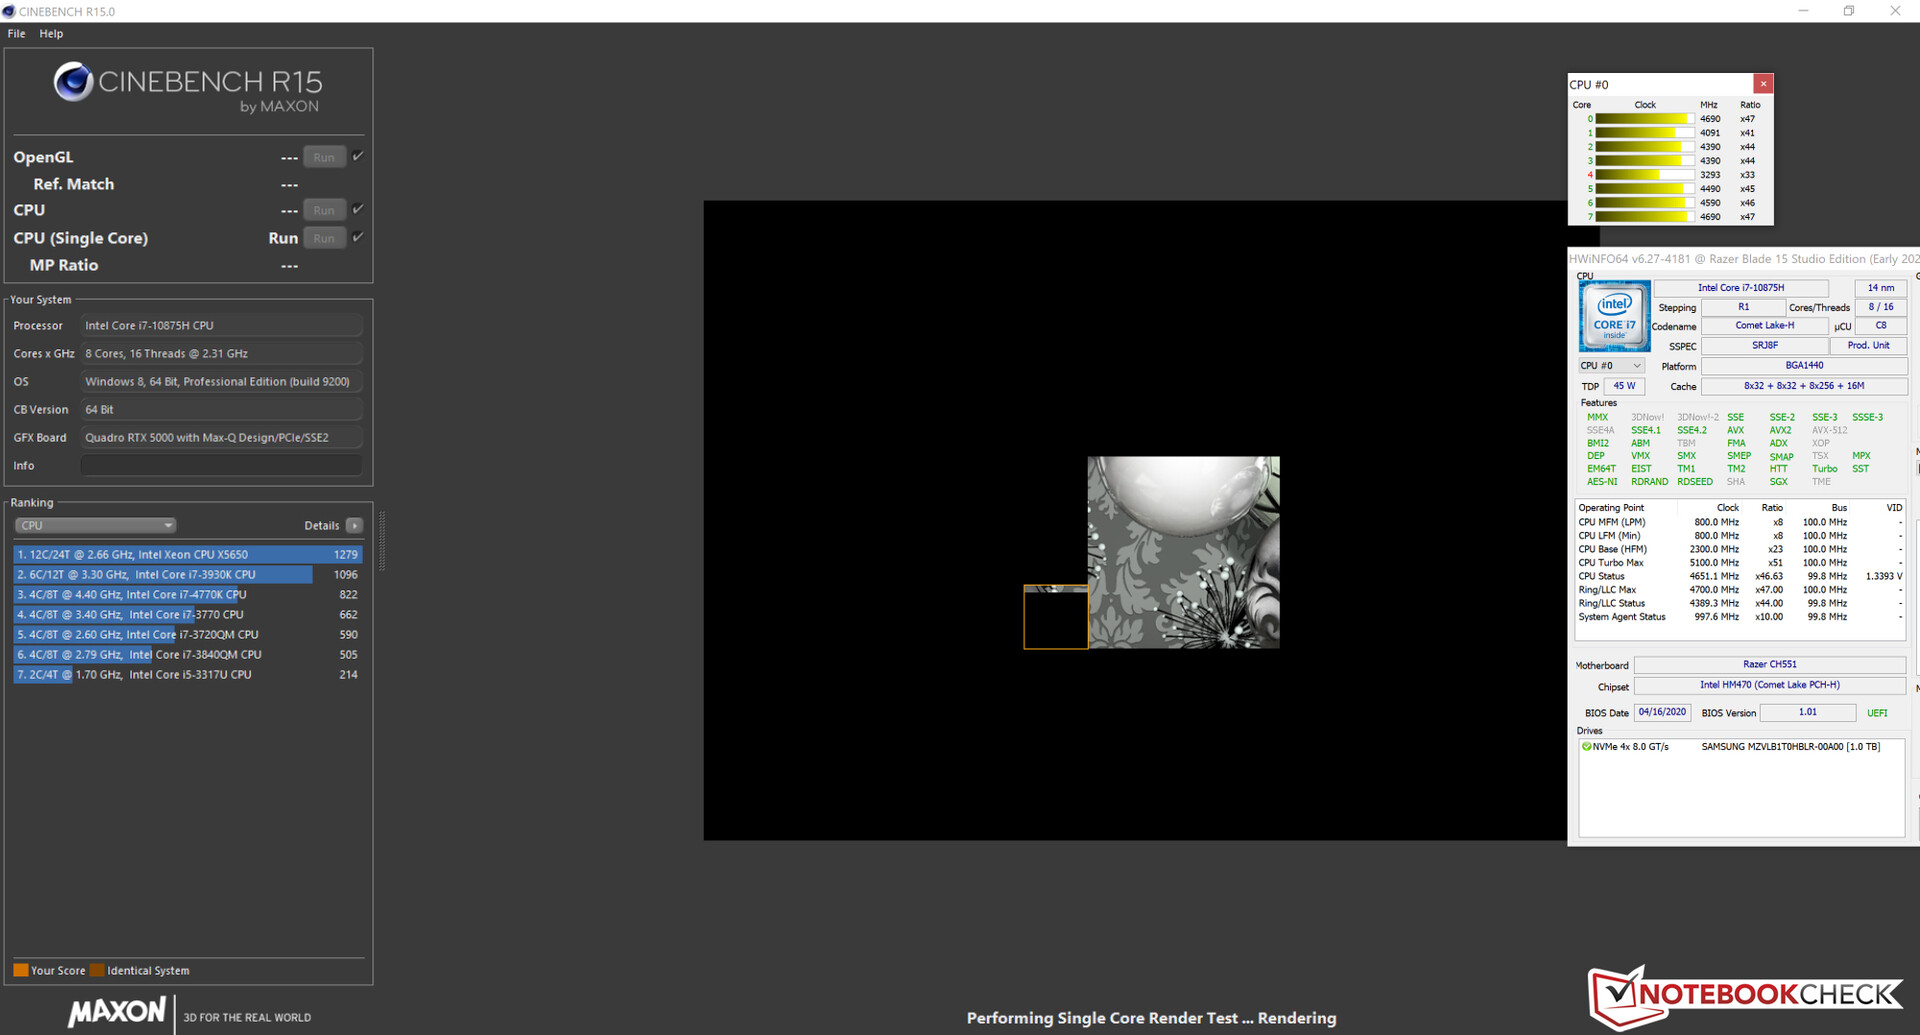
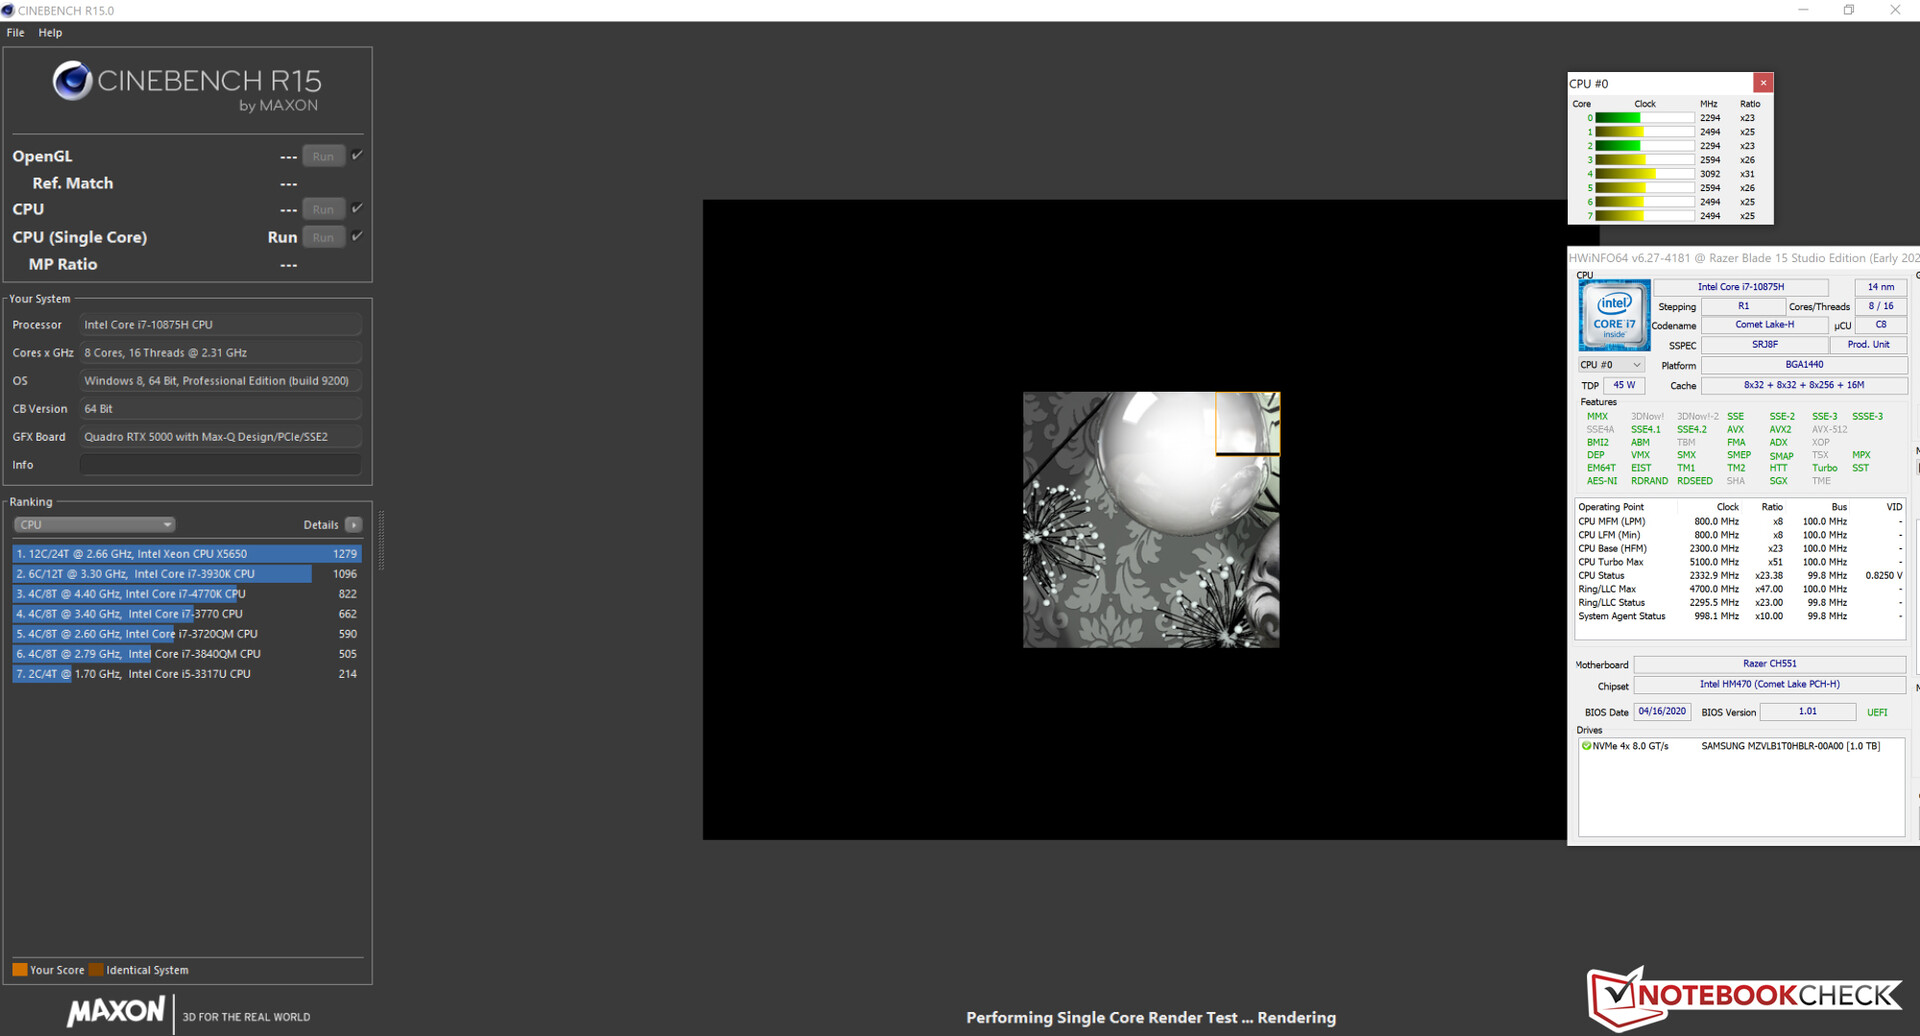
Verifichiamo se il Turbo boost può essere utilizzato in modo coerente facendo funzionare il benchmark multi-core Cinebench R15 in un ciclo continuo per 30 minuti. I risultati scendono dal primo al secondo ciclo di benchmark. Dopo di che, rimangono costantemente sullo stesso livello. Il Turbo boost viene utilizzato ma ad un livello basso.
Se gli utenti selezionano la modalità di prestazione massima della CPU nell'utility "Synapse" di Razer, allora la CPU sarà in grado di aumentare il boost più in alto, il che si tradurrà in un livello di prestazione maggiore.
| Cinebench R15 | |
| CPU Single 64Bit | |
| Media della classe Workstation (191.4 - 328, n=25, ultimi 2 anni) | |
| Media Intel Core i7-10875H (190 - 220, n=37) | |
| Razer Blade 15 Studio Edition 2020 (Max. CPU, max. GPU) | |
| Lenovo ThinkPad P53-20QN000YGE | |
| MSI P65 Creator 9SF-657 | |
| Dell Precision 5540 | |
| Razer Blade 15 Studio Edition 2020 | |
| Razer Blade 15 Studio Edition | |
| CPU Multi 64Bit | |
| Media della classe Workstation (2489 - 5810, n=25, ultimi 2 anni) | |
| Media Intel Core i7-10875H (1003 - 1833, n=38) | |
| MSI P65 Creator 9SF-657 | |
| Dell Precision 5540 | |
| Razer Blade 15 Studio Edition 2020 (Max. CPU, max. GPU) | |
| Lenovo ThinkPad P53-20QN000YGE | |
| Razer Blade 15 Studio Edition 2020 | |
| Razer Blade 15 Studio Edition | |
| LibreOffice - 20 Documents To PDF | |
| Media Intel Core i7-10875H (30.2 - 84.3, n=30) | |
| Media della classe Workstation (37.1 - 74.7, n=25, ultimi 2 anni) | |
| Razer Blade 15 Studio Edition 2020 | |
| R Benchmark 2.5 - Overall mean | |
| Razer Blade 15 Studio Edition 2020 | |
| Media Intel Core i7-10875H (0.546 - 0.662, n=29) | |
| Media della classe Workstation (0.3825 - 0.603, n=25, ultimi 2 anni) | |
* ... Meglio usare valori piccoli
Prestazioni di sistema
Il sistema funziona senza problemi. Non abbiamo riscontrato alcun problema. Il Blade 15 offre prestazioni sufficienti per tutte le applicazioni attuali. I benchmarks PCMark lo confermano.
| PCMark 8 Home Score Accelerated v2 | 3654 punti | |
| PCMark 8 Creative Score Accelerated v2 | 3874 punti | |
| PCMark 8 Work Score Accelerated v2 | 4638 punti | |
| PCMark 10 Score | 4884 punti | |
Aiuto | ||
Latenze DPC
Non abbiamo notato alcun picco nel nostro test di latenza, che comprende la navigazione in Internet, la riproduzione di video 4K e un test di stress ad alto carico (Prime95). Il sistema sembra essere adatto per l'editing audio e video in tempo reale.
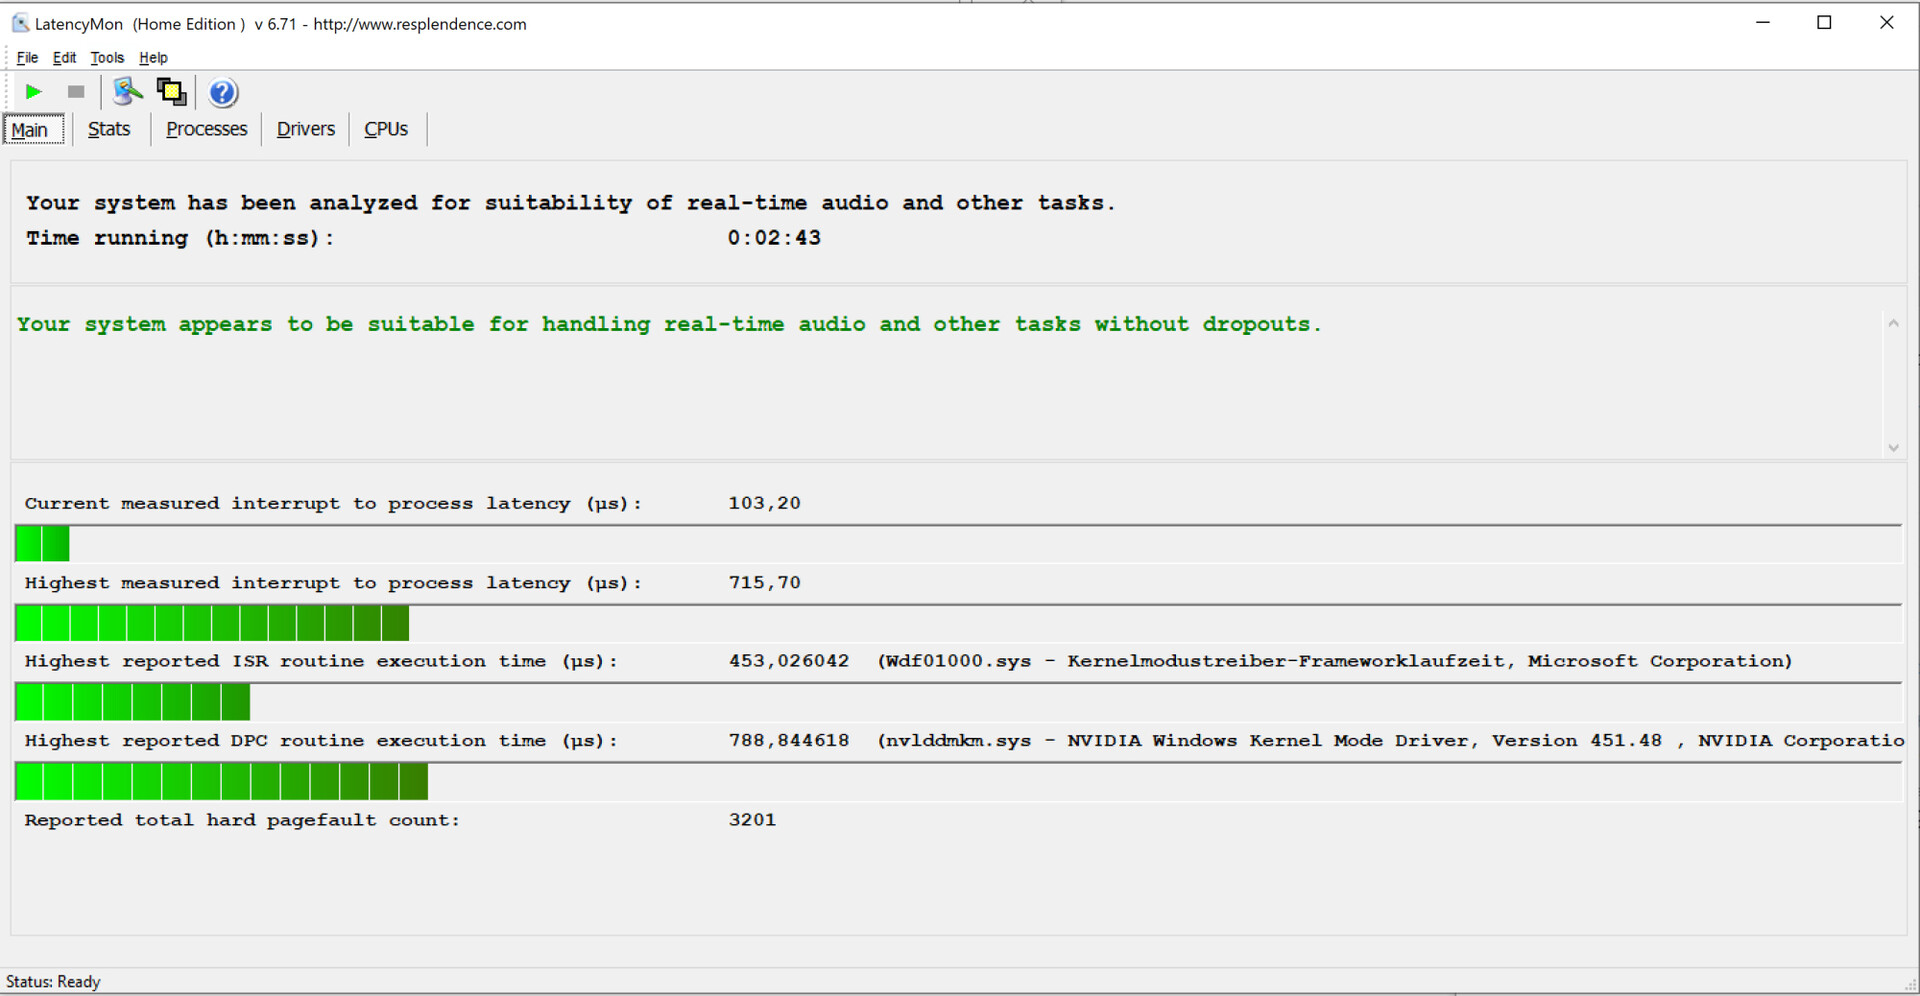
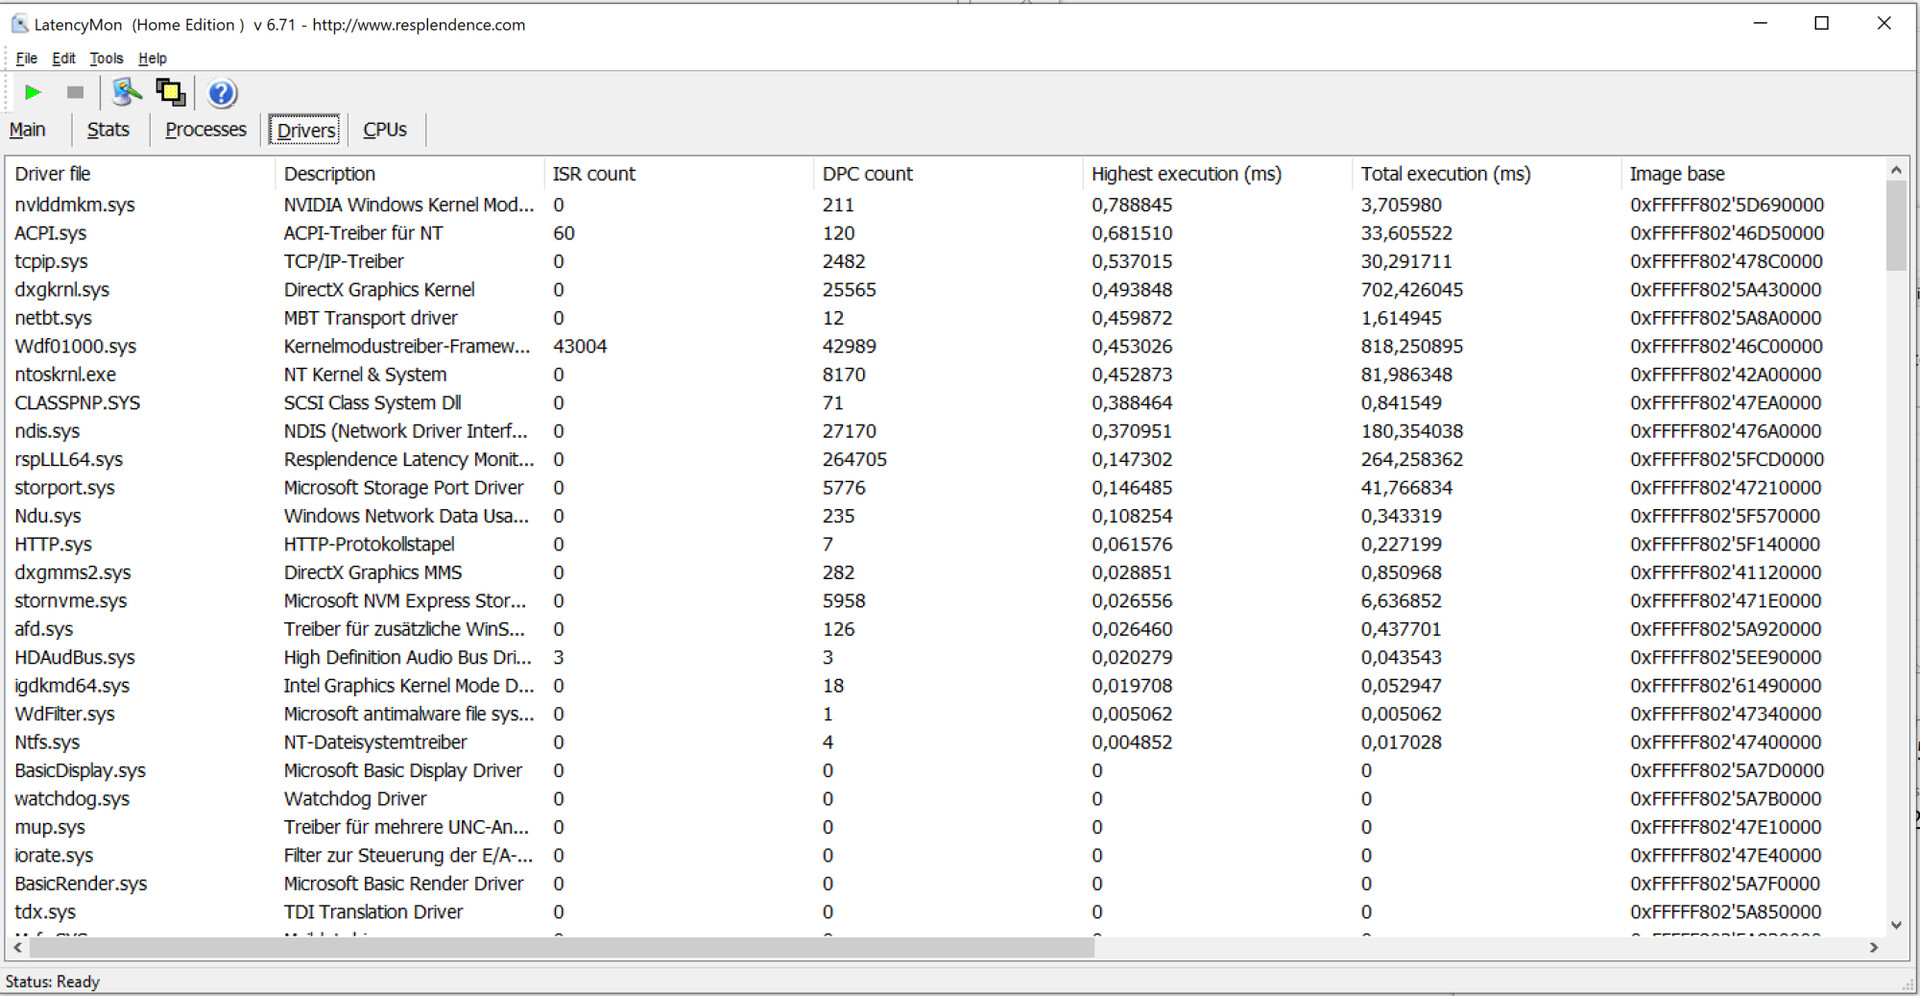
| DPC Latencies / LatencyMon - interrupt to process latency (max), Web, Youtube, Prime95 | |
| Razer Blade 15 Studio Edition 2020 | |
* ... Meglio usare valori piccoli
Dispositivi di archiviazione
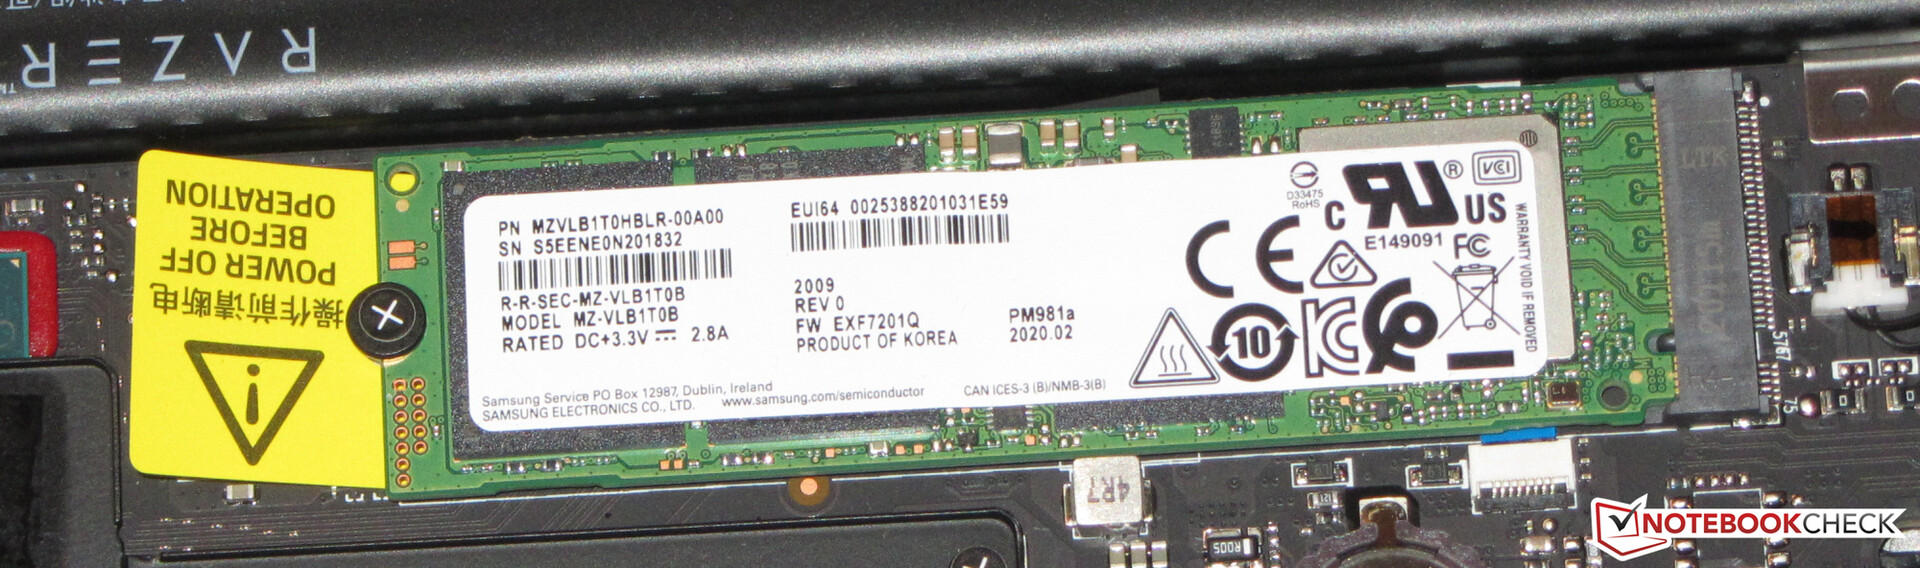
Un SSD M.2-2280 NVMe di Samsung funge da unità di sistema. Offre una capacità di memorizzazione di 1 TB. Le velocità di trasferimento sono superbe.

| Razer Blade 15 Studio Edition 2020 Samsung PM981a MZVLB1T0HBLR | Razer Blade 15 Studio Edition Samsung SSD PM981 MZVLB1T0HALR | Lenovo ThinkPad P53-20QN000YGE Samsung PM981a MZVLB1T0HBLR | MSI P65 Creator 9SF-657 2x Samsung SSD PM981 MZVLB512HAJQ (RAID 0) | Dell Precision 5540 SK hynix PC400 512 GB | Media Samsung PM981a MZVLB1T0HBLR | |
|---|---|---|---|---|---|---|
| CrystalDiskMark 5.2 / 6 | -23% | -4% | 12% | -29% | -0% | |
| Write 4K (MB/s) | 132.9 | 100.4 -24% | 147 11% | 105.6 -21% | 98 -26% | 139.7 ? 5% |
| Read 4K (MB/s) | 46.73 | 42.03 -10% | 48.3 3% | 46.32 -1% | 41.25 -12% | 49.9 ? 7% |
| Write Seq (MB/s) | 2214 | 1185 -46% | 1402 -37% | 2910 31% | 1295 -42% | 2036 ? -8% |
| Read Seq (MB/s) | 2018 | 1132 -44% | 1503 -26% | 2820 40% | 1441 -29% | 2014 ? 0% |
| Write 4K Q32T1 (MB/s) | 478.9 | 371.4 -22% | 475.2 -1% | 545 14% | 429.2 -10% | 461 ? -4% |
| Read 4K Q32T1 (MB/s) | 540 | 422.6 -22% | 581 8% | 632 17% | 400.1 -26% | 499 ? -8% |
| Write Seq Q32T1 (MB/s) | 2975 | 2379 -20% | 2936 -1% | 3349 13% | 1366 -54% | 2903 ? -2% |
| Read Seq Q32T1 (MB/s) | 3195 | 3222 1% | 3539 11% | 3333 4% | 2201 -31% | 3479 ? 9% |
| AS SSD | -12% | 27% | 6% | -29% | 9% | |
| Seq Read (MB/s) | 1982 | 2328 17% | 2655 34% | 2860 44% | 1743 -12% | 2553 ? 29% |
| Seq Write (MB/s) | 2252 | 2344 4% | 2454 9% | 2604 16% | 930 -59% | 2084 ? -7% |
| 4K Read (MB/s) | 47.13 | 43.68 -7% | 59.1 25% | 45.15 -4% | 39.1 -17% | 53.1 ? 13% |
| 4K Write (MB/s) | 88.2 | 10.28 -88% | 138.1 57% | 100.2 14% | 92.1 4% | 131.2 ? 49% |
| 4K-64 Read (MB/s) | 1481 | 1469 -1% | 2009 36% | 1428 -4% | 956 -35% | 1477 ? 0% |
| 4K-64 Write (MB/s) | 1842 | 992 -46% | 1907 4% | 1401 -24% | 863 -53% | 1805 ? -2% |
| Access Time Read * (ms) | 0.087 | 0.067 23% | 0.054 38% | 0.049 44% | 0.074 15% | 0.04983 ? 43% |
| Access Time Write * (ms) | 0.04 | 0.035 12% | 0.028 30% | 0.037 7% | 0.053 -33% | 0.04222 ? -6% |
| Score Read (Points) | 1726 | 1745 1% | 2333 35% | 1759 2% | 1170 -32% | 1786 ? 3% |
| Score Write (Points) | 2155 | 1328 -38% | 2291 6% | 1762 -18% | 1048 -51% | 2144 ? -1% |
| Score Total (Points) | 4781 | 3968 -17% | 5810 22% | 4411 -8% | 2781 -42% | 4826 ? 1% |
| Copy ISO MB/s (MB/s) | 1982 | 1609 -19% | 2098 ? 6% | |||
| Copy Program MB/s (MB/s) | 501 | 445.1 -11% | 500 ? 0% | |||
| Copy Game MB/s (MB/s) | 1140 | 1089 -4% | 1132 ? -1% | |||
| Media totale (Programma / Settaggio) | -18% /
-16% | 12% /
14% | 9% /
9% | -29% /
-29% | 5% /
6% |
* ... Meglio usare valori piccoli
Dauerleistung Lesen: DiskSpd Read Loop, Queue Depth 8
Scheda grafica
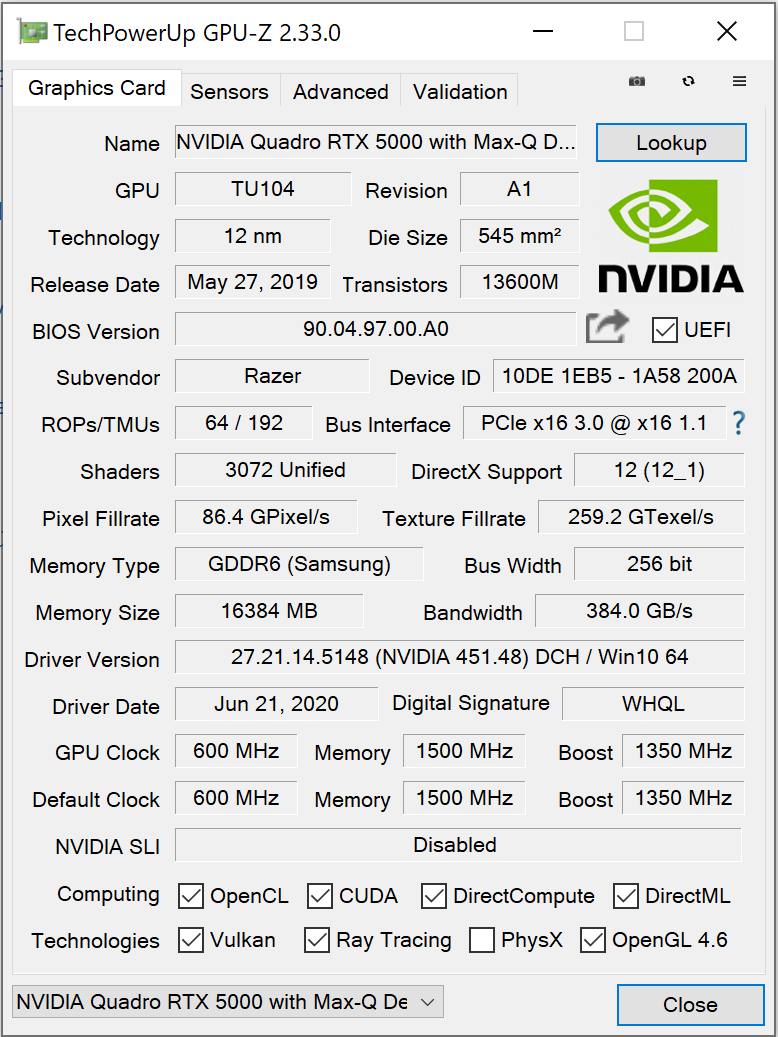
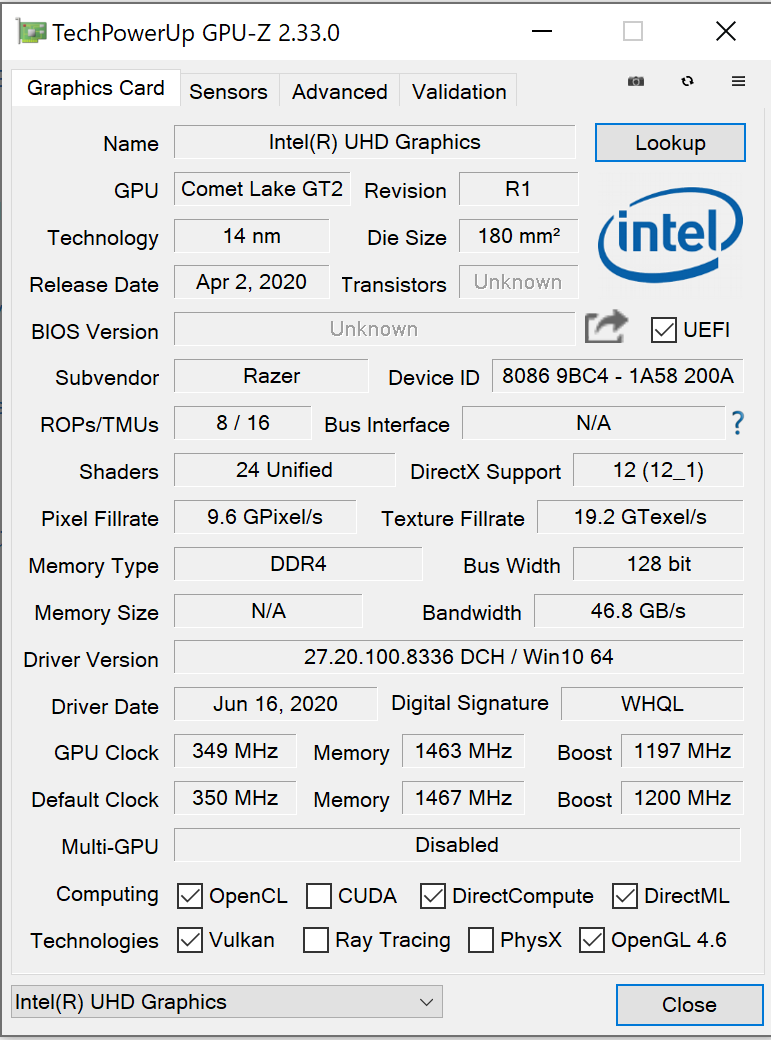
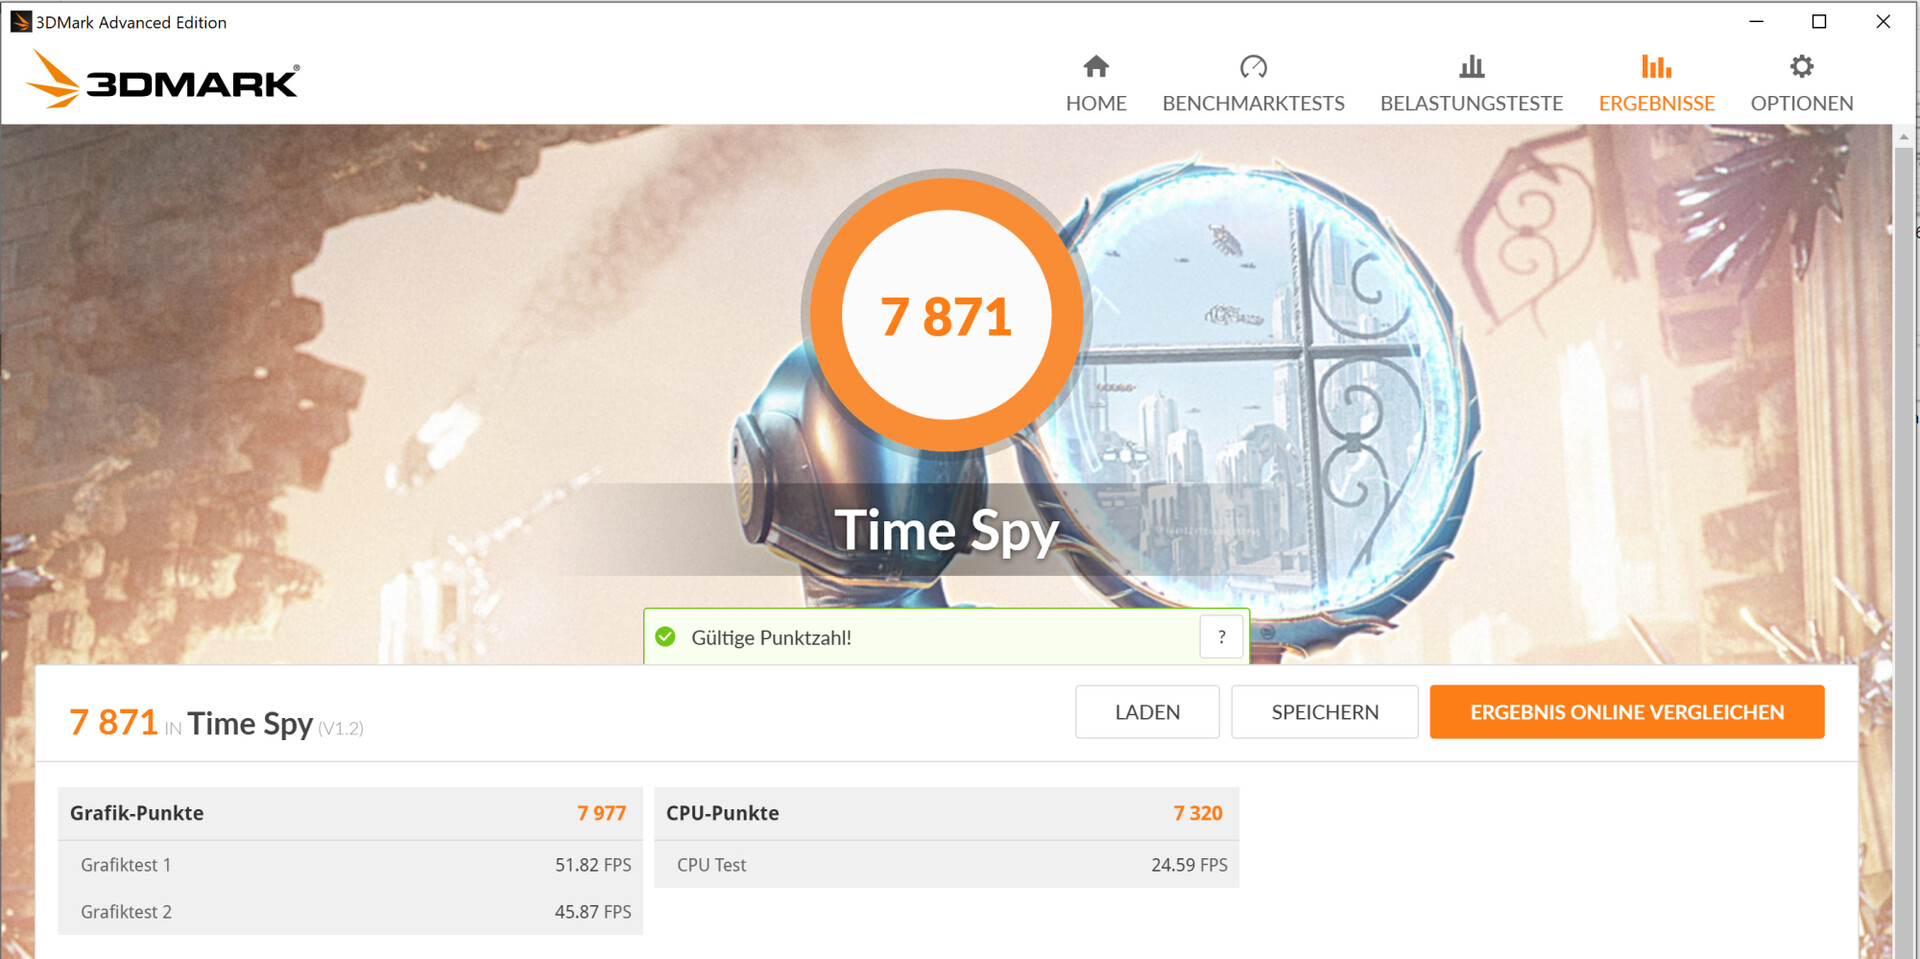
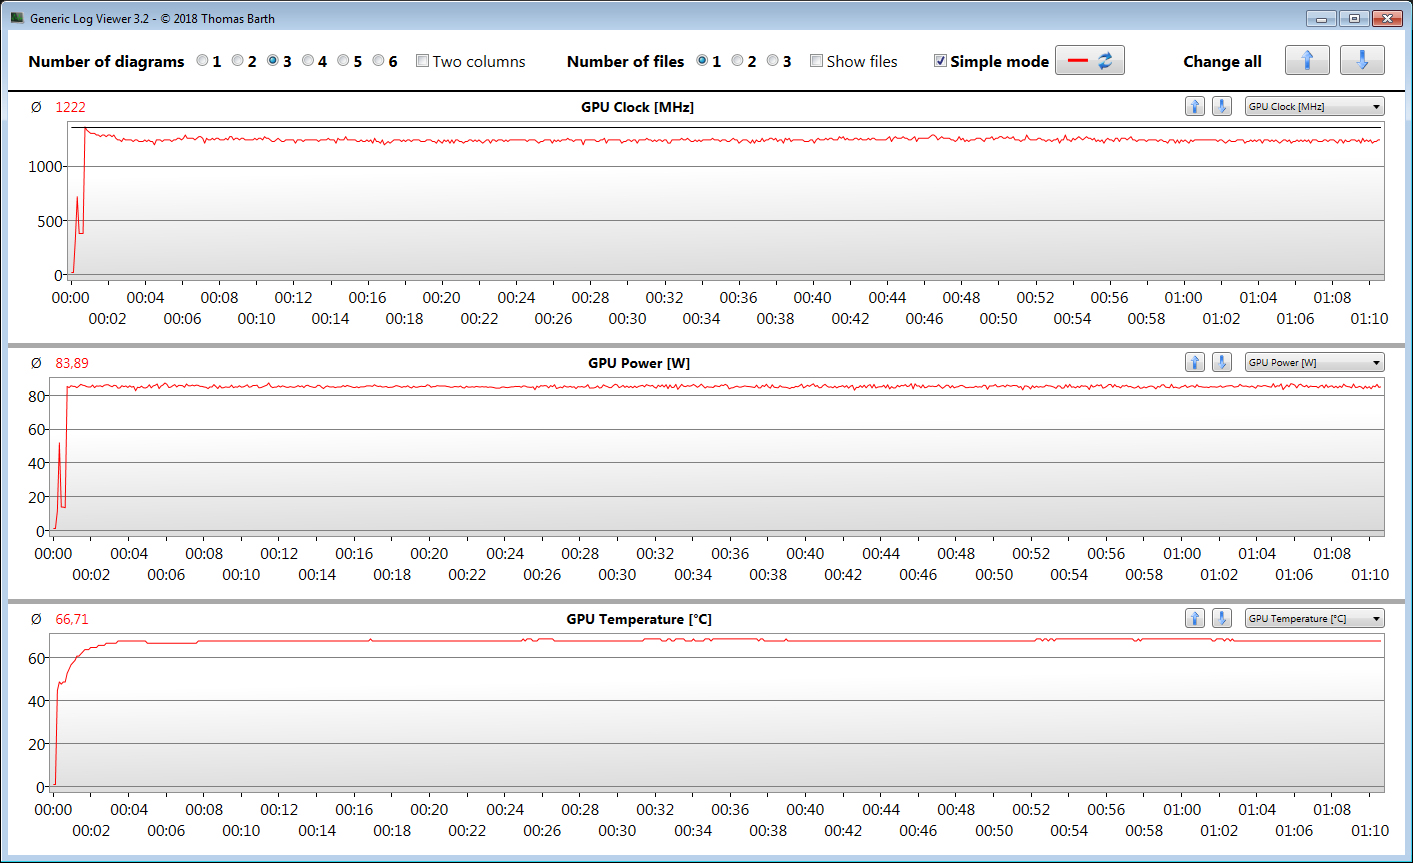
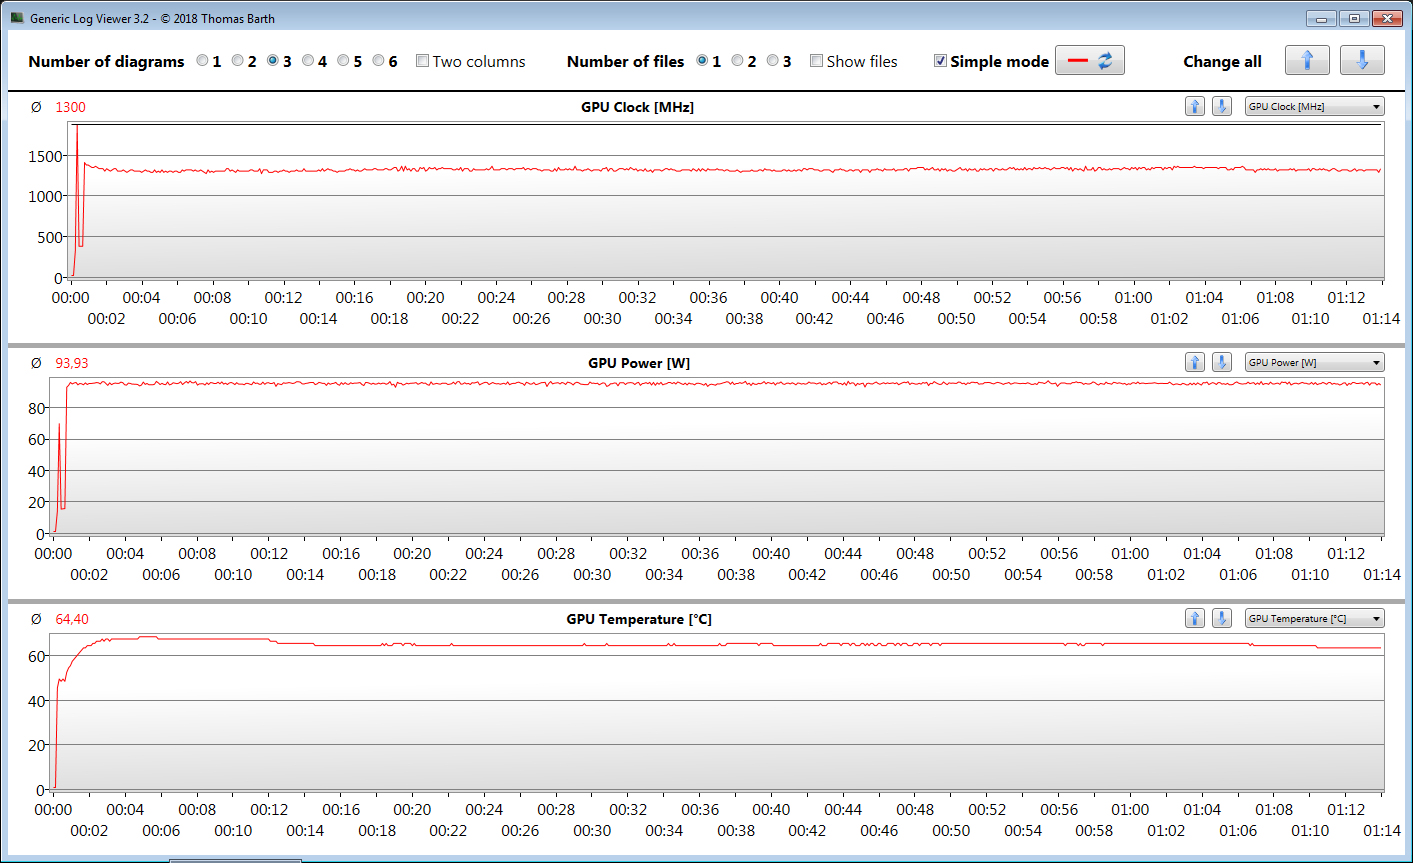
La Quadro RTX 5000 Max-Q di Turing offre un clock di base di 600 MHz e un boost clock di 1350 MHz. La GPU può aumentare ancora di più il boost purché non superi i limiti termici e di potenza. La velocità di clock più alta che abbiamo osservato nella nostra recensione è stata di 1889 MHz. Nel nostro test di stress con The Witcher 3, la GPU ha avuto una velocità di clock media di 1222 MHz in modalità bilanciata e 1300 MHz in modalità performance. La GPU è dotata di 16 GB di memoria veloce GDDR6.
I risultati del 3DMark sono a livello normale. L'UHD Graphics 630 integrata nel Core i7-10875H è abilitata, ed è per questo che viene utilizzata la tecnologia Optimus di NVIDIA.
Se gli utenti selezionano la modalità di prestazione massima della GPU nell'utility "Synapse" di Razer, allora la TGP (Total Graphics Power) aumenta leggermente. Questo si traduce in un leggero aumento dei punteggi dei benchmarks. Anche i frame rate aumentano, ma non di molto. Abbiamo visto un leggero aumento dei frame rate in The Witcher 3.

| 3DMark 11 Performance | 20883 punti | |
| 3DMark Cloud Gate Standard Score | 32096 punti | |
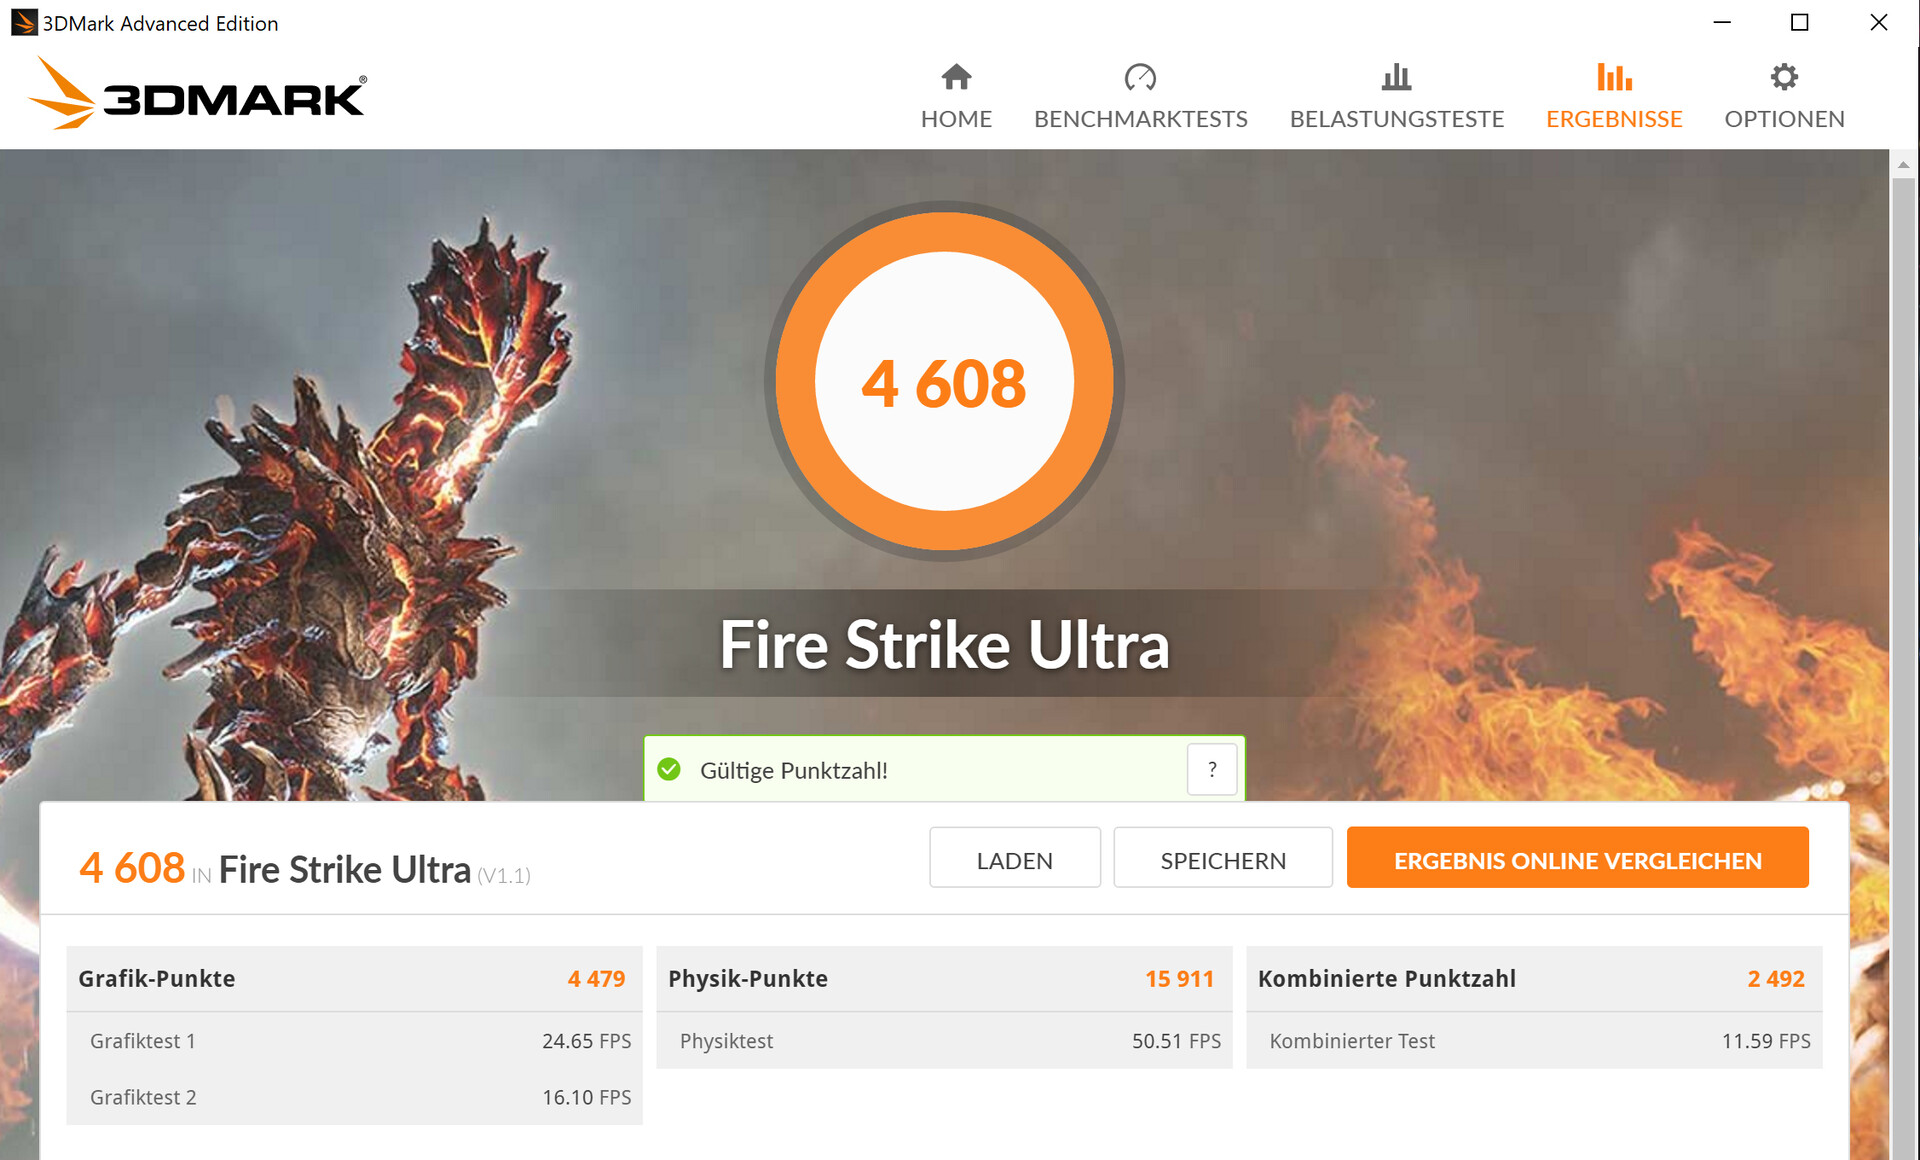
| 3DMark Fire Strike Score | 16179 punti | |
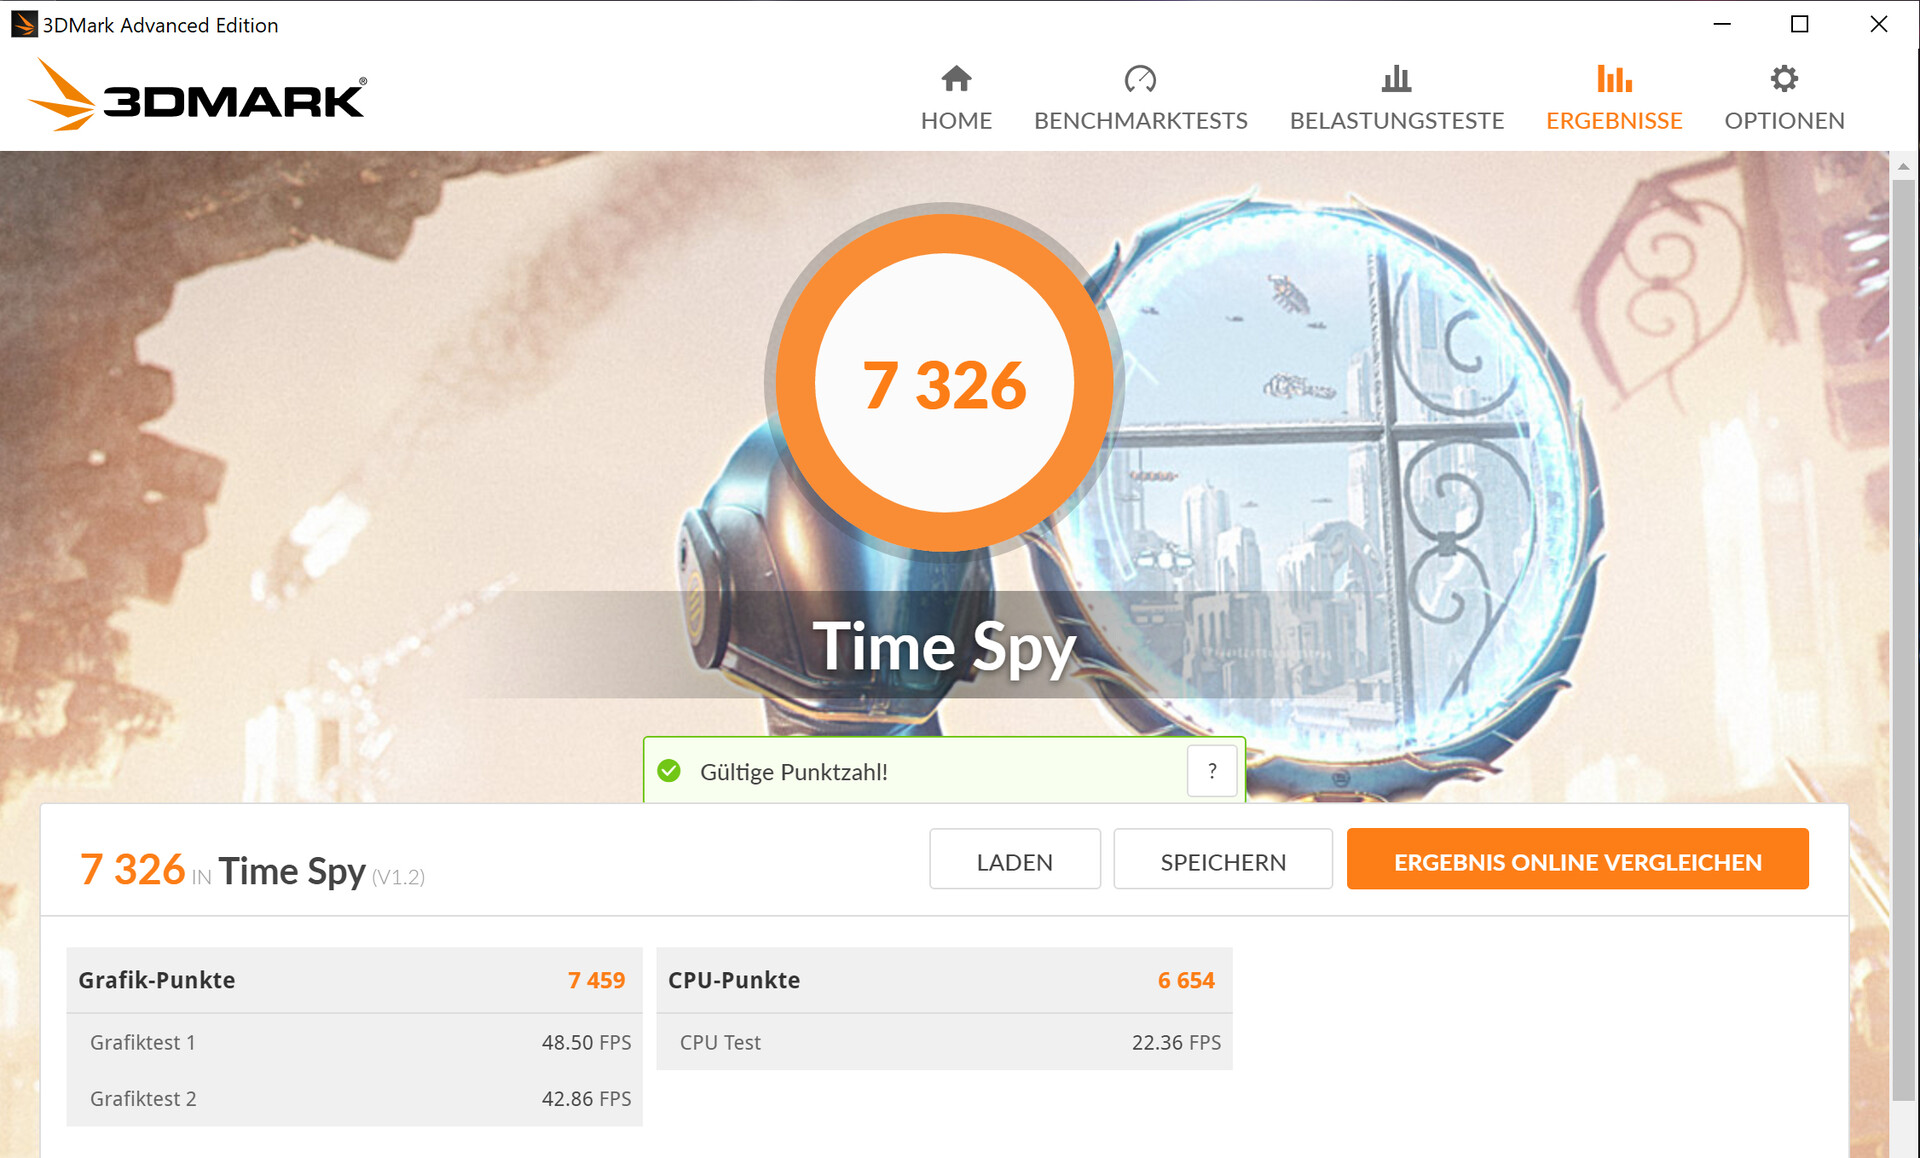
| 3DMark Time Spy Score | 7326 punti | |
Aiuto | ||
| 3DMark 11 - 1280x720 Performance GPU | |
| Media della classe Workstation (10888 - 69594, n=25, ultimi 2 anni) | |
| Razer Blade 15 Studio Edition 2020 (Max. CPU, max. GPU) | |
| Razer Blade 15 Studio Edition 2020 | |
| Media NVIDIA Quadro RTX 5000 Max-Q (24156 - 28524, n=9) | |
| Razer Blade 15 Studio Edition | |
| Lenovo ThinkPad P53-20QN000YGE | |
| MSI P65 Creator 9SF-657 | |
| Dell Precision 5540 | |
| 3DMark | |
| 1280x720 Cloud Gate Standard Graphics | |
| Lenovo ThinkPad P53-20QN000YGE | |
| Media della classe Workstation (46927 - 152418, n=15, ultimi 2 anni) | |
| Media NVIDIA Quadro RTX 5000 Max-Q (50993 - 126073, n=7) | |
| Razer Blade 15 Studio Edition 2020 | |
| MSI P65 Creator 9SF-657 | |
| Razer Blade 15 Studio Edition | |
| Dell Precision 5540 | |
| 1920x1080 Fire Strike Graphics | |
| Media della classe Workstation (7578 - 52560, n=25, ultimi 2 anni) | |
| Razer Blade 15 Studio Edition 2020 (Max. CPU, max. GPU) | |
| Razer Blade 15 Studio Edition 2020 | |
| Media NVIDIA Quadro RTX 5000 Max-Q (18247 - 21115, n=10) | |
| Razer Blade 15 Studio Edition | |
| Lenovo ThinkPad P53-20QN000YGE | |
| MSI P65 Creator 9SF-657 | |
| Dell Precision 5540 | |
| 2560x1440 Time Spy Graphics | |
| Media della classe Workstation (2725 - 24806, n=25, ultimi 2 anni) | |
| Razer Blade 15 Studio Edition 2020 (Max. CPU, max. GPU) | |
| Razer Blade 15 Studio Edition 2020 | |
| Media NVIDIA Quadro RTX 5000 Max-Q (6999 - 7977, n=10) | |
| Razer Blade 15 Studio Edition | |
| Lenovo ThinkPad P53-20QN000YGE | |
| Dell Precision 5540 | |
Prestazioni Gaming
Il Blade 15 può gestire tutti i giochi attuali senza problemi. Di solito può raggiungere frame rate giocabili a 1080p sulle impostazioni più alte. I titoli moderni sono riproducibili anche a risoluzioni superiori a 1080p, ma solo su impostazioni più basse - specialmente a 4K.
| The Witcher 3 - 1920x1080 Ultra Graphics & Postprocessing (HBAO+) | |
| Razer Blade 15 Studio Edition 2020 (Max. CPU, Max. GPU) | |
| Razer Blade 15 Studio Edition 2020 | |
| Razer Blade 15 Studio Edition | |
| Media NVIDIA Quadro RTX 5000 Max-Q (71 - 88.5, n=10) | |
| MSI P65 Creator 9SF-657 | |
| Lenovo ThinkPad P53-20QN000YGE | |
| Media della classe Workstation (26.3 - 91.7, n=3, ultimi 2 anni) | |
| Dell Precision 5540 | |
| BioShock Infinite - 1920x1080 Ultra Preset, DX11 (DDOF) | |
| Razer Blade 15 Studio Edition 2020 (Max. CPU, max. GPU) | |
| Media NVIDIA Quadro RTX 5000 Max-Q (167.2 - 174.3, n=3) | |
| Razer Blade 15 Studio Edition 2020 | |
| Razer Blade 15 Studio Edition | |
| MSI P65 Creator 9SF-657 | |
| Dell Precision 5540 | |
| Shadow of the Tomb Raider - 1920x1080 Highest Preset AA:T | |
| Razer Blade 15 Studio Edition 2020 (Max. CPU, max. GPU) | |
| Media NVIDIA Quadro RTX 5000 Max-Q (85 - 90, n=3) | |
| Lenovo ThinkPad P53-20QN000YGE | |
| Razer Blade 15 Studio Edition 2020 | |
| Metro Exodus - 1920x1080 Ultra Quality AF:16x | |
| Razer Blade 15 Studio Edition 2020 | |
| Media NVIDIA Quadro RTX 5000 Max-Q (55.4 - 59.2, n=2) | |
| Razer Blade 15 Studio Edition | |
| Control - 1920x1080 High Quality Preset | |
| Razer Blade 15 Studio Edition 2020 | |
| Media NVIDIA Quadro RTX 5000 Max-Q (66.5 - 69.9, n=2) | |
| Razer Blade 15 Studio Edition | |
| Total War: Three Kingdoms - 1920x1080 Ultra (incl textures) | |
| Razer Blade 15 Studio Edition | |
| Media NVIDIA Quadro RTX 5000 Max-Q (57.5 - 64.9, n=2) | |
| Razer Blade 15 Studio Edition 2020 | |
| Red Dead Redemption 2 - 1920x1080 High Settings | |
| Media NVIDIA Quadro RTX 5000 Max-Q (54.8 - 63.9, n=2) | |
| Razer Blade 15 Studio Edition 2020 | |
| Doom Eternal - 1920x1080 Ultra Preset | |
| Media NVIDIA Quadro RTX 5000 Max-Q (137.8 - 145.3, n=3) | |
| Razer Blade 15 Studio Edition 2020 | |
Utilizziamo il videogioco The Witcher 3 per verificare se i frame rate possono essere mantenuti costanti per un periodo di tempo prolungato. Per questo, facciamo girare il gioco sulle impostazioni più alte a 1080p per un'ora. Durante l'intera durata del gioco, il personaggio controllato dal giocatore rimane fermo. Non ci sono cadute di frame rate da segnalare.
| basso | medio | alto | ultra | QHD | 4K | |
|---|---|---|---|---|---|---|
| BioShock Infinite (2013) | 365.3 | 321.5 | 296.5 | 168.5 | ||
| The Witcher 3 (2015) | 323.2 | 238.8 | 125.4 | 83.6 | 47.5 | |
| Dota 2 Reborn (2015) | 138.4 | 130.1 | 124.5 | 122.3 | ||
| X-Plane 11.11 (2018) | 109 | 94.9 | 78.7 | |||
| Far Cry 5 (2018) | 128 | 106 | 101 | 96 | 74 | 40 |
| Shadow of the Tomb Raider (2018) | 105 | 94 | 91 | 85 | 62 | 33 |
| Assassin´s Creed Odyssey (2018) | 107 | 91 | 80 | 57 | 48 | 31 |
| Battlefield V (2018) | 156.6 | 130.7 | 124.5 | 114.7 | 90.8 | 53.4 |
| Metro Exodus (2019) | 145.6 | 96.3 | 72.8 | 59.2 | 45.6 | 27 |
| Total War: Three Kingdoms (2019) | 243.7 | 129 | 80.9 | 57.5 | 34.1 | 18.5 |
| Control (2019) | 228.8 | 96.7 | 69.9 | 43 | 20 | |
| Call of Duty Modern Warfare 2019 (2019) | 156.5 | 111.2 | 99 | 86.7 | 62.2 | 34 |
| Star Wars Jedi Fallen Order (2019) | 105 | 99.5 | 89.7 | 66.3 | 34 | |
| Red Dead Redemption 2 (2019) | 124.2 | 84.8 | 54.8 | 39.7 | 32 | 19.8 |
| Doom Eternal (2020) | 216.7 | 161.9 | 145 | 140.6 | 92.5 | 47.1 |
| Gears Tactics (2020) | 177.7 | 126.6 | 90.7 | 73.6 | 50 | 24 |
| F1 2020 (2020) | 214 | 166 | 143 | 107 | 82.8 | 44.4 |
| Death Stranding (2020) | 127.2 | 112.6 | 103.8 | 101.5 | 73.7 | 41.1 |
Emissioni - Il Blade 15 non diventa troppo caldo o troppo rumoroso
Rumorosità di sistema
Quando è a riposto, le ventole spesso rimangono ferme, il che porta al funzionamento silenzioso. Sotto carico, le ventole iniziano a girare. Abbiamo misurato 42,3 dB(A) sotto carico medio, 42,1 dB(A) durante la prova di stress e 48,2 dB(A) nella prova di stabilità di gioco con The Witcher 3.
Rumorosità
| Idle |
| 30.1 / 30.1 / 30.1 dB(A) |
| Sotto carico |
| 42.3 / 42.1 dB(A) |
 | ||
30 dB silenzioso 40 dB(A) udibile 50 dB(A) rumoroso |
||
min: | ||
| Razer Blade 15 Studio Edition 2020 i7-10875H, Quadro RTX 5000 Max-Q | Razer Blade 15 Studio Edition i7-9750H, Quadro RTX 5000 Max-Q | Lenovo ThinkPad P53-20QN000YGE i7-9850H, Quadro RTX 5000 Max-Q | MSI P65 Creator 9SF-657 i9-9880H, GeForce RTX 2070 Max-Q | Dell Precision 5540 i9-9980HK, Quadro T2000 Max-Q | Media NVIDIA Quadro RTX 5000 Max-Q | Media della classe Workstation | |
|---|---|---|---|---|---|---|---|
| Noise | -1% | 12% | -5% | 11% | 3% | 9% | |
| off /ambiente * (dB) | 30.1 | 30.6 -2% | 28.3 6% | 30.2 -0% | 28.6 5% | 27.5 ? 9% | 24.1 ? 20% |
| Idle Minimum * (dB) | 30.1 | 30.6 -2% | 28.3 6% | 32.8 -9% | 28.6 5% | 28.7 ? 5% | 24.8 ? 18% |
| Idle Average * (dB) | 30.1 | 30.6 -2% | 28.3 6% | 32.8 -9% | 28.6 5% | 28.7 ? 5% | 25.4 ? 16% |
| Idle Maximum * (dB) | 30.1 | 30.6 -2% | 28.3 6% | 33.6 -12% | 28.6 5% | 28.7 ? 5% | 26.7 ? 11% |
| Load Average * (dB) | 42.3 | 43 -2% | 29.8 30% | 40.9 3% | 33.3 21% | 41 ? 3% | 39.2 ? 7% |
| Witcher 3 ultra * (dB) | 48.2 | 38.3 21% | 34.7 28% | ||||
| Load Maximum * (dB) | 42.1 | 41 3% | 38.3 9% | 42.7 -1% | 38 10% | 46.7 ? -11% | 50.4 ? -20% |
* ... Meglio usare valori piccoli
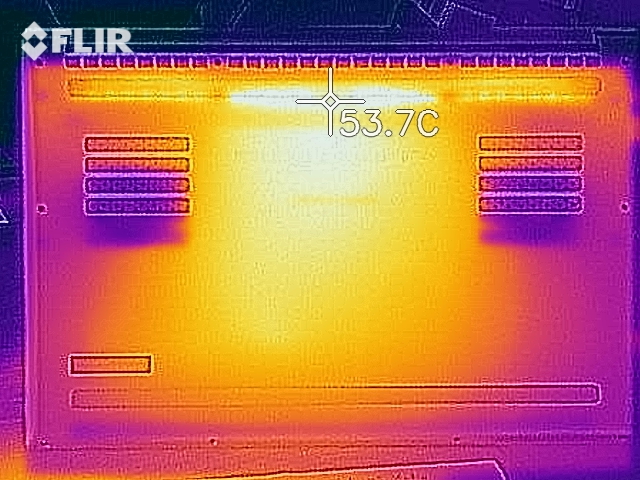
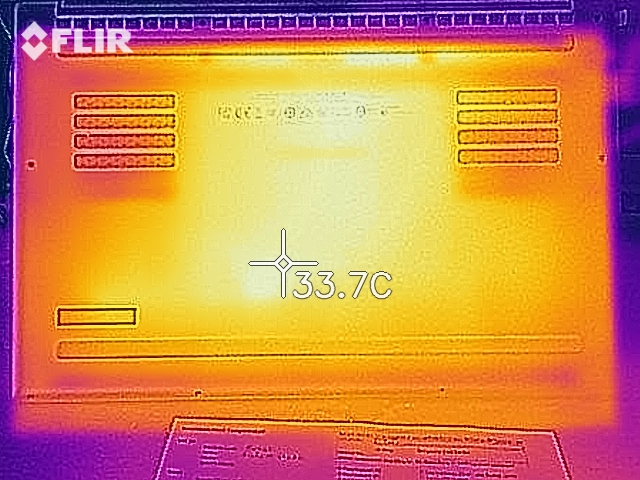
Temperature
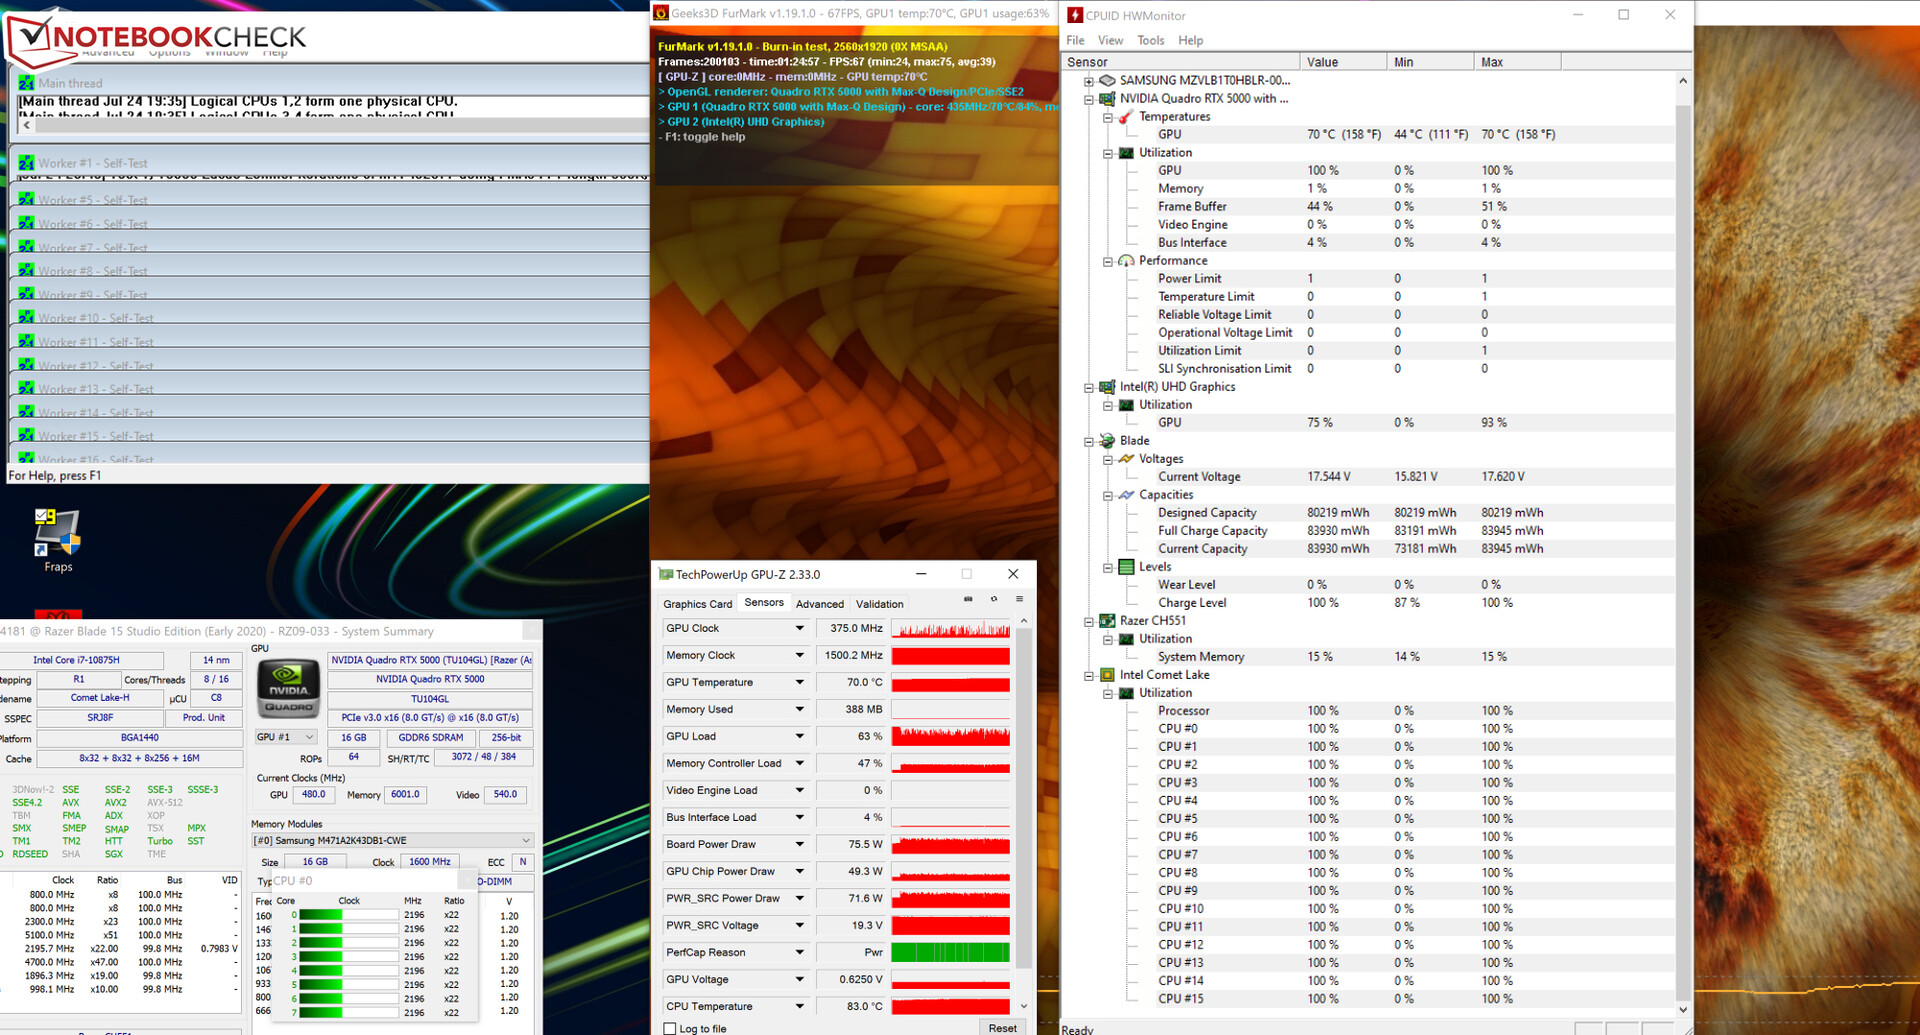
Nel nostro test di stress (Prime95 e FurMark in funzionamento continuo per almeno un'ora), il processore gira da 2,1 a 2,2 GHz. Per i primi 10 minuti, la GPU funziona da 1000 a 1600 MHz. Successivamente, la velocità di clock della GPU scende a 300 MHz. Quando funziona a batteria, la CPU funziona a 800 - 1800 MHz e la GPU a 300 MHz. Lo stress test è uno scenario estremo, che è molto improbabile che si verifichi nella vita reale. Lo usiamo per testare la stabilità del sistema.
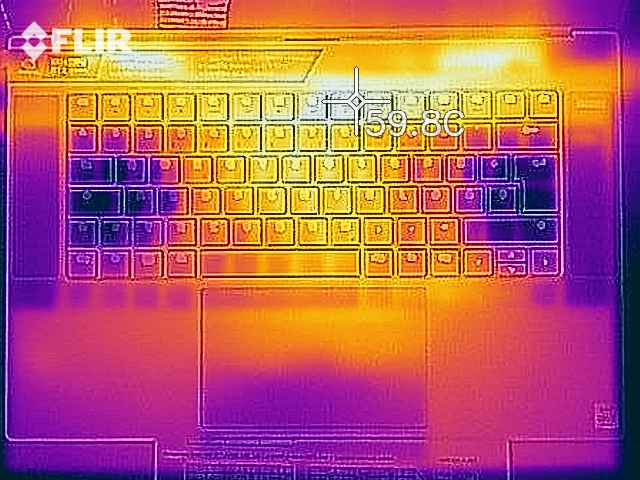
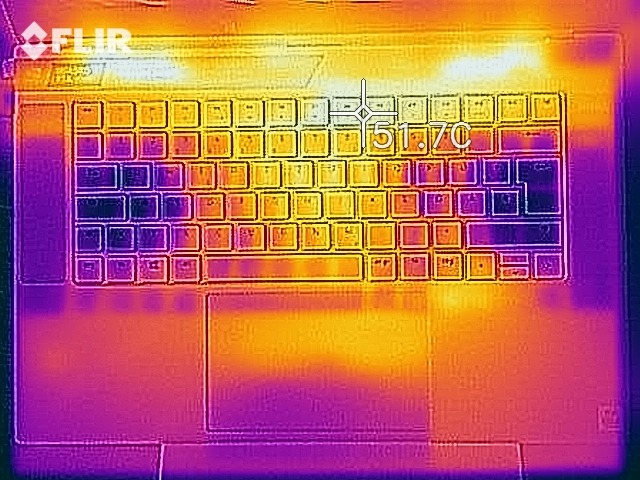
Il Blade si scalda notevolmente. Durante il nostro stress test, la tacca dei 50°C (122 °F) è stata superata in diversi punti di misura. Abbiamo misurato temperature un po' più basse durante la nostra prova di stabilità del sistema con The Witcher 3. Nell'uso quotidiano, le temperature rimangono sempre ragionevoli.
(-) La temperatura massima sul lato superiore è di 54.1 °C / 129 F, rispetto alla media di 38.2 °C / 101 F, che varia da 22.2 a 69.8 °C per questa classe Workstation.
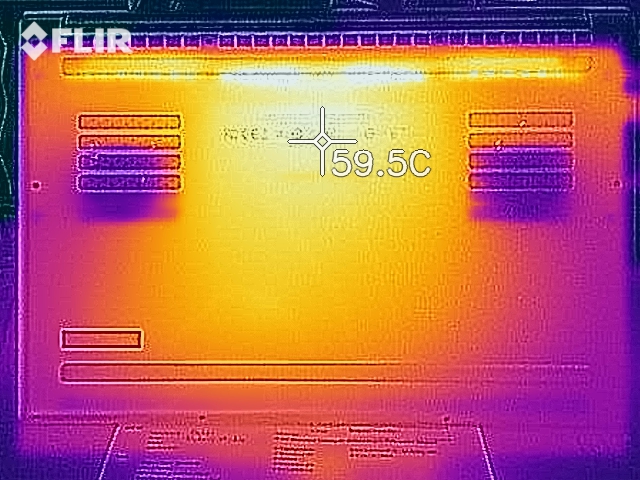
(-) Il lato inferiore si riscalda fino ad un massimo di 54 °C / 129 F, rispetto alla media di 41.1 °C / 106 F
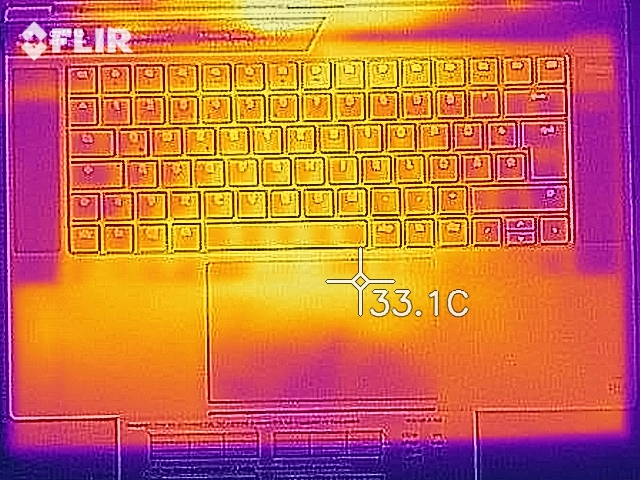
(+) In idle, la temperatura media del lato superiore è di 28.2 °C / 83 F, rispetto alla media deld ispositivo di 32 °C / 90 F.
(-) Riproducendo The Witcher 3, la temperatura media per il lato superiore e' di 39.1 °C / 102 F, rispetto alla media del dispositivo di 32 °C / 90 F.
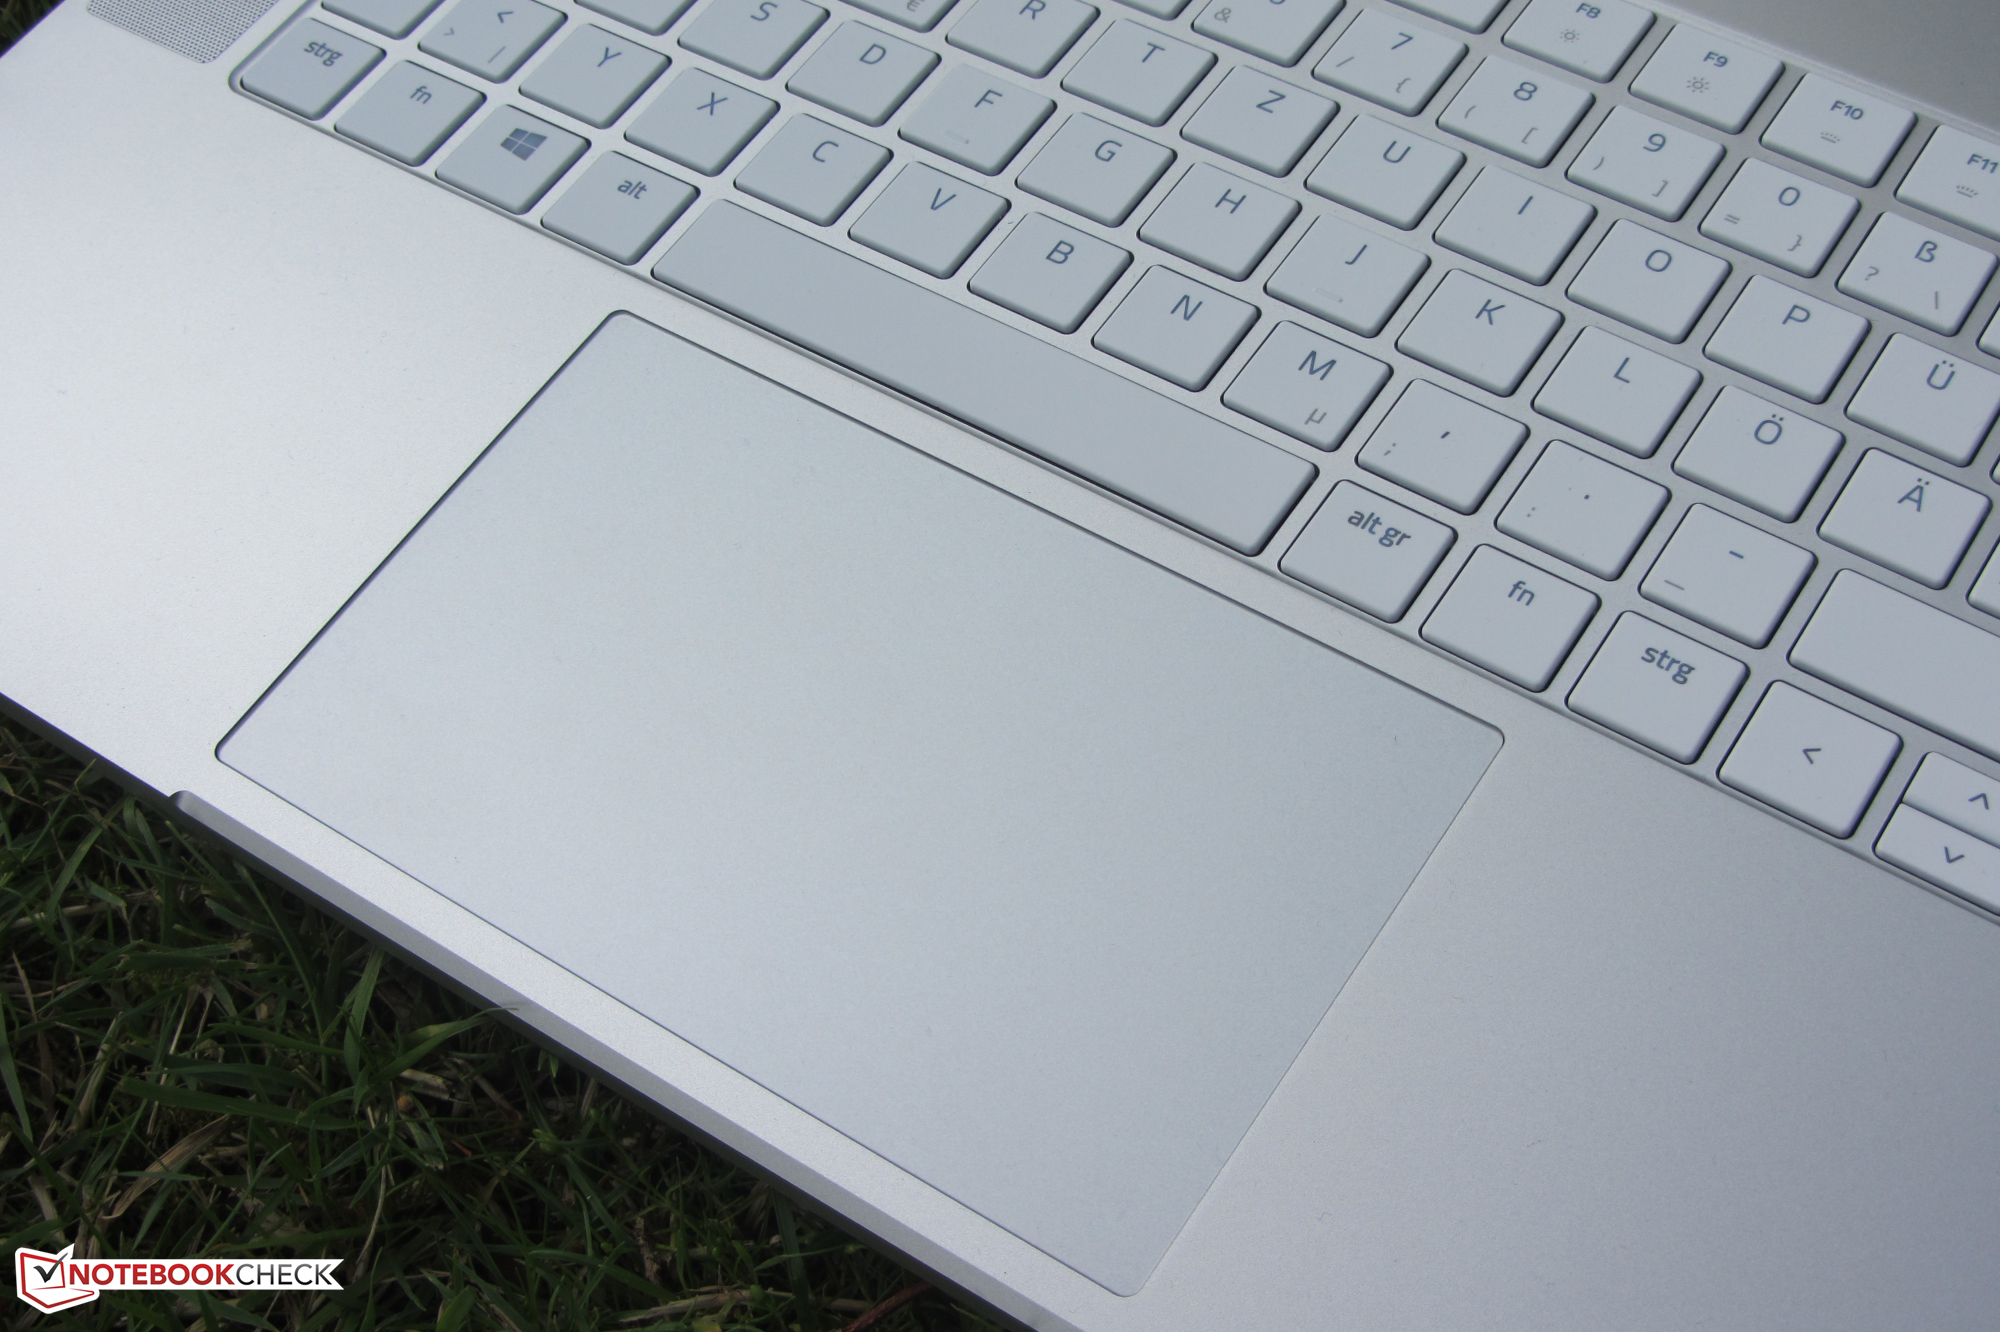
(-) I poggiapolsi e il touchpad possono diventare molto caldi al tatto con un massimo di 40 °C / 104 F.
(-) La temperatura media della zona del palmo della mano di dispositivi simili e'stata di 27.8 °C / 82 F (-12.2 °C / -22 F).
| Razer Blade 15 Studio Edition 2020 i7-10875H, Quadro RTX 5000 Max-Q | Razer Blade 15 Studio Edition i7-9750H, Quadro RTX 5000 Max-Q | Lenovo ThinkPad P53-20QN000YGE i7-9850H, Quadro RTX 5000 Max-Q | MSI P65 Creator 9SF-657 i9-9880H, GeForce RTX 2070 Max-Q | Dell Precision 5540 i9-9980HK, Quadro T2000 Max-Q | Media NVIDIA Quadro RTX 5000 Max-Q | Media della classe Workstation | |
|---|---|---|---|---|---|---|---|
| Heat | 8% | 21% | 0% | 10% | 2% | 6% | |
| Maximum Upper Side * (°C) | 54.1 | 46.1 15% | 41.8 23% | 49.7 8% | 46.2 15% | 49.4 ? 9% | 43.8 ? 19% |
| Maximum Bottom * (°C) | 54 | 45.2 16% | 46.1 15% | 60.4 -12% | 45.7 15% | 53 ? 2% | 45 ? 17% |
| Idle Upper Side * (°C) | 28.9 | 28.9 -0% | 22.2 23% | 28.4 2% | 27.4 5% | 28.6 ? 1% | 30.6 ? -6% |
| Idle Bottom * (°C) | 29.7 | 29.6 -0% | 23 23% | 29.2 2% | 27.8 6% | 30.5 ? -3% | 31.6 ? -6% |
* ... Meglio usare valori piccoli
Altoparlanti
Razer Blade 15 Studio Edition 2020 analisi audio
(±) | potenza degli altiparlanti media ma buona (75.1 dB)
Bassi 100 - 315 Hz
(-) | quasi nessun basso - in media 18.3% inferiori alla media
(±) | la linearità dei bassi è media (10.1% delta rispetto alla precedente frequenza)
Medi 400 - 2000 Hz
(+) | medi bilanciati - solo only 4.6% rispetto alla media
(+) | medi lineari (5.9% delta rispetto alla precedente frequenza)
Alti 2 - 16 kHz
(+) | Alti bilanciati - appena 3.4% dalla media
(+) | alti lineari (3.8% delta rispetto alla precedente frequenza)
Nel complesso 100 - 16.000 Hz
(±) | la linearità complessiva del suono è media (19.1% di differenza rispetto alla media
Rispetto alla stessa classe
» 67% di tutti i dispositivi testati in questa classe è stato migliore, 6% simile, 28% peggiore
» Il migliore ha avuto un delta di 7%, medio di 17%, peggiore di 35%
Rispetto a tutti i dispositivi testati
» 46% di tutti i dispositivi testati in questa classe è stato migliore, 7% similare, 47% peggiore
» Il migliore ha avuto un delta di 4%, medio di 24%, peggiore di 134%
Gestione Energetica - Il Blade Studio ha una buona autonomia della batteria
Consumo energetico
Quando è inattivo, l'apparecchio assorbe 26,1 watt. Quando stavamo testando il sistema sotto sforzo, il consumo di energia ha raggiunto i 195 watt. In The Witcher 3, il Blade 15 ha assorbito in media 145 watt (139-148 watt). La potenza nominale dell'adattatore AC è di 230 watt. Nel complesso, il Blade 15 consuma più energia del suo predecessore.
| Off / Standby | |
| Idle | |
| Sotto carico |
|
Leggenda:
min: | |
| Razer Blade 15 Studio Edition 2020 i7-10875H, Quadro RTX 5000 Max-Q | Razer Blade 15 Studio Edition i7-9750H, Quadro RTX 5000 Max-Q | Lenovo ThinkPad P53-20QN000YGE i7-9850H, Quadro RTX 5000 Max-Q | MSI P65 Creator 9SF-657 i9-9880H, GeForce RTX 2070 Max-Q | Dell Precision 5540 i9-9980HK, Quadro T2000 Max-Q | Media NVIDIA Quadro RTX 5000 Max-Q | Media della classe Workstation | |
|---|---|---|---|---|---|---|---|
| Power Consumption | 15% | 18% | 7% | 33% | 6% | 20% | |
| Idle Minimum * (Watt) | 13.4 | 13.2 1% | 7.9 41% | 9.4 30% | 7.4 45% | 10.4 ? 22% | 8.94 ? 33% |
| Idle Average * (Watt) | 18 | 15 17% | 11.8 34% | 17.4 3% | 12.1 33% | 16.1 ? 11% | 13.8 ? 23% |
| Idle Maximum * (Watt) | 26.1 | 17.4 33% | 14.9 43% | 19.6 25% | 12.7 51% | 23.8 ? 9% | 17.5 ? 33% |
| Load Average * (Watt) | 115 | 99 14% | 96 17% | 103 10% | 98 15% | 109.5 ? 5% | 95 ? 17% |
| Witcher 3 ultra * (Watt) | 145 | 149 -3% | 89.9 38% | ||||
| Load Maximum * (Watt) | 165 | 148 10% | 207.8 -26% | 216 -31% | 135.1 18% | 189.5 ? -15% | 175.2 ? -6% |
* ... Meglio usare valori piccoli
Autonomia della batteria
Il Blade 15 dura 5 h 41 m nel nostro test Wi-Fi pratico, in cui eseguiamo uno script che simula carichi coerenti con la navigazione sul web. Il laptop da 15,6 pollici raggiunge una durata della batteria di 6 h 23 m nel nostro test video. In questo test, riproduciamo il cortometraggio "Big Buck Bunny" (H.264, 1920x1080) in un loop continuo. Impostazioni di sistema: Le funzioni di risparmio energetico e i moduli di comunicazione sono spenti (solo nel test video), la luminosità è impostata su 150 cd/m².
| Razer Blade 15 Studio Edition 2020 i7-10875H, Quadro RTX 5000 Max-Q, 80 Wh | Razer Blade 15 Studio Edition i7-9750H, Quadro RTX 5000 Max-Q, 80 Wh | Lenovo ThinkPad P53-20QN000YGE i7-9850H, Quadro RTX 5000 Max-Q, 90 Wh | MSI P65 Creator 9SF-657 i9-9880H, GeForce RTX 2070 Max-Q, 82 Wh | Dell Precision 5540 i9-9980HK, Quadro T2000 Max-Q, 97 Wh | Media della classe Workstation | |
|---|---|---|---|---|---|---|
| Autonomia della batteria | 5% | 49% | -10% | 39% | 67% | |
| Reader / Idle (h) | 8.8 | 9.6 9% | 9.6 9% | 15 70% | 26.1 ? 197% | |
| H.264 (h) | 6.4 | 7.6 19% | 9.8 53% | 10.6 66% | 9.51 ? 49% | |
| WiFi v1.3 (h) | 5.7 | 5.5 -4% | 11.1 95% | 6 5% | 7.7 35% | 8.53 ? 50% |
| Load (h) | 2 | 1.9 -5% | 2 0% | 1.1 -45% | 1.7 -15% | 1.429 ? -29% |
Pro
Contro
Giudizio Complessivo
Il Razer Blade 15 è dotato di una NVIDIA Quadro RTX 5000 Max-Q e di un Intel Core i7-10875H. Grazie a due cores aggiuntivi, il Core i7-10875H offre più prestazioni rispetto al chip hexa-core Coffee Lake del modello precedente. Anche se non si tratta di un notebook gaming, il Blade 15 Studio Edition può comunque far funzionare tutti i titoli attuali senza problemi.
Razer ha dato a Blade 15 Studio Edition (2020) un lifting. Una nuova architettura della CPU assicura un aumento delle prestazioni e la selezione delle porte è migliore.
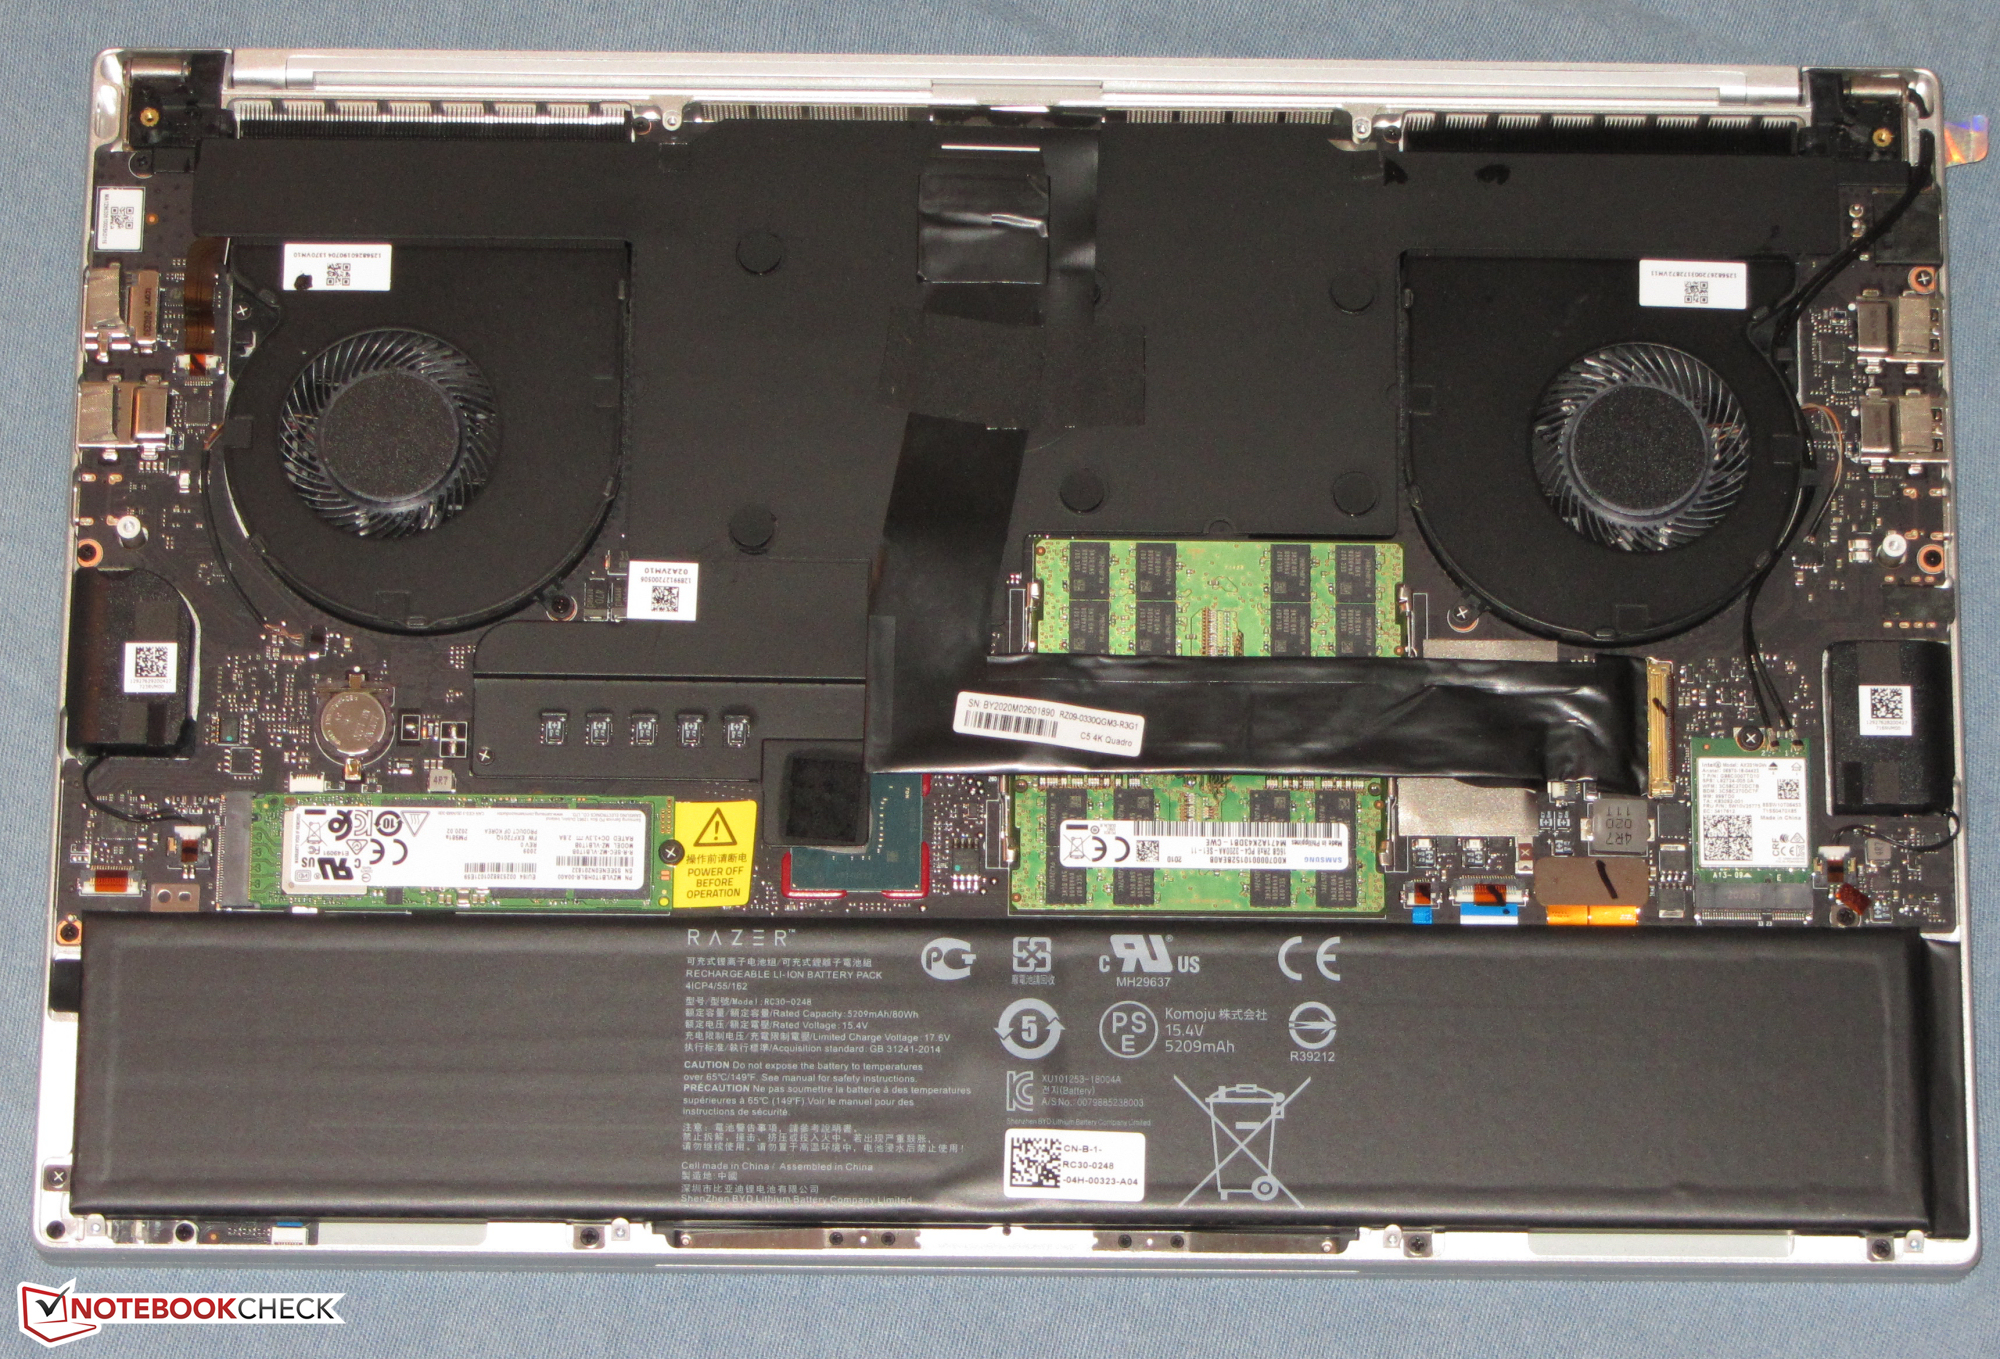
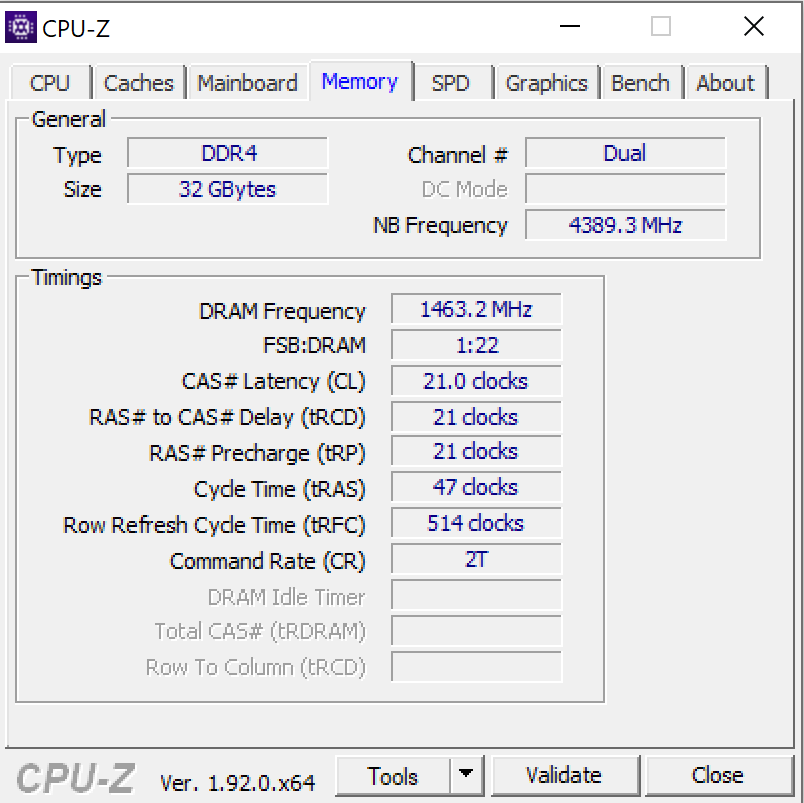
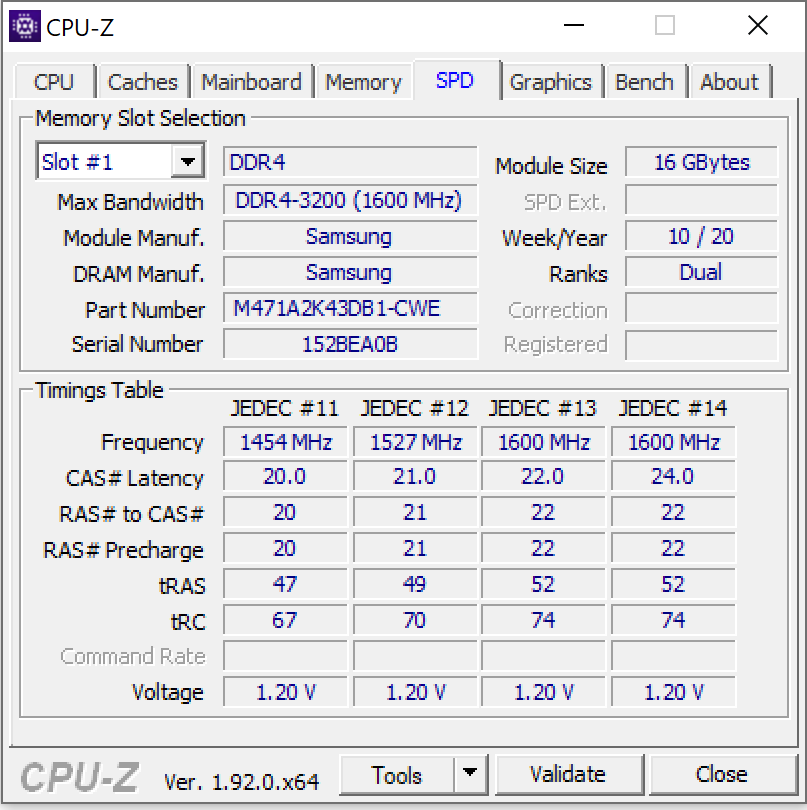
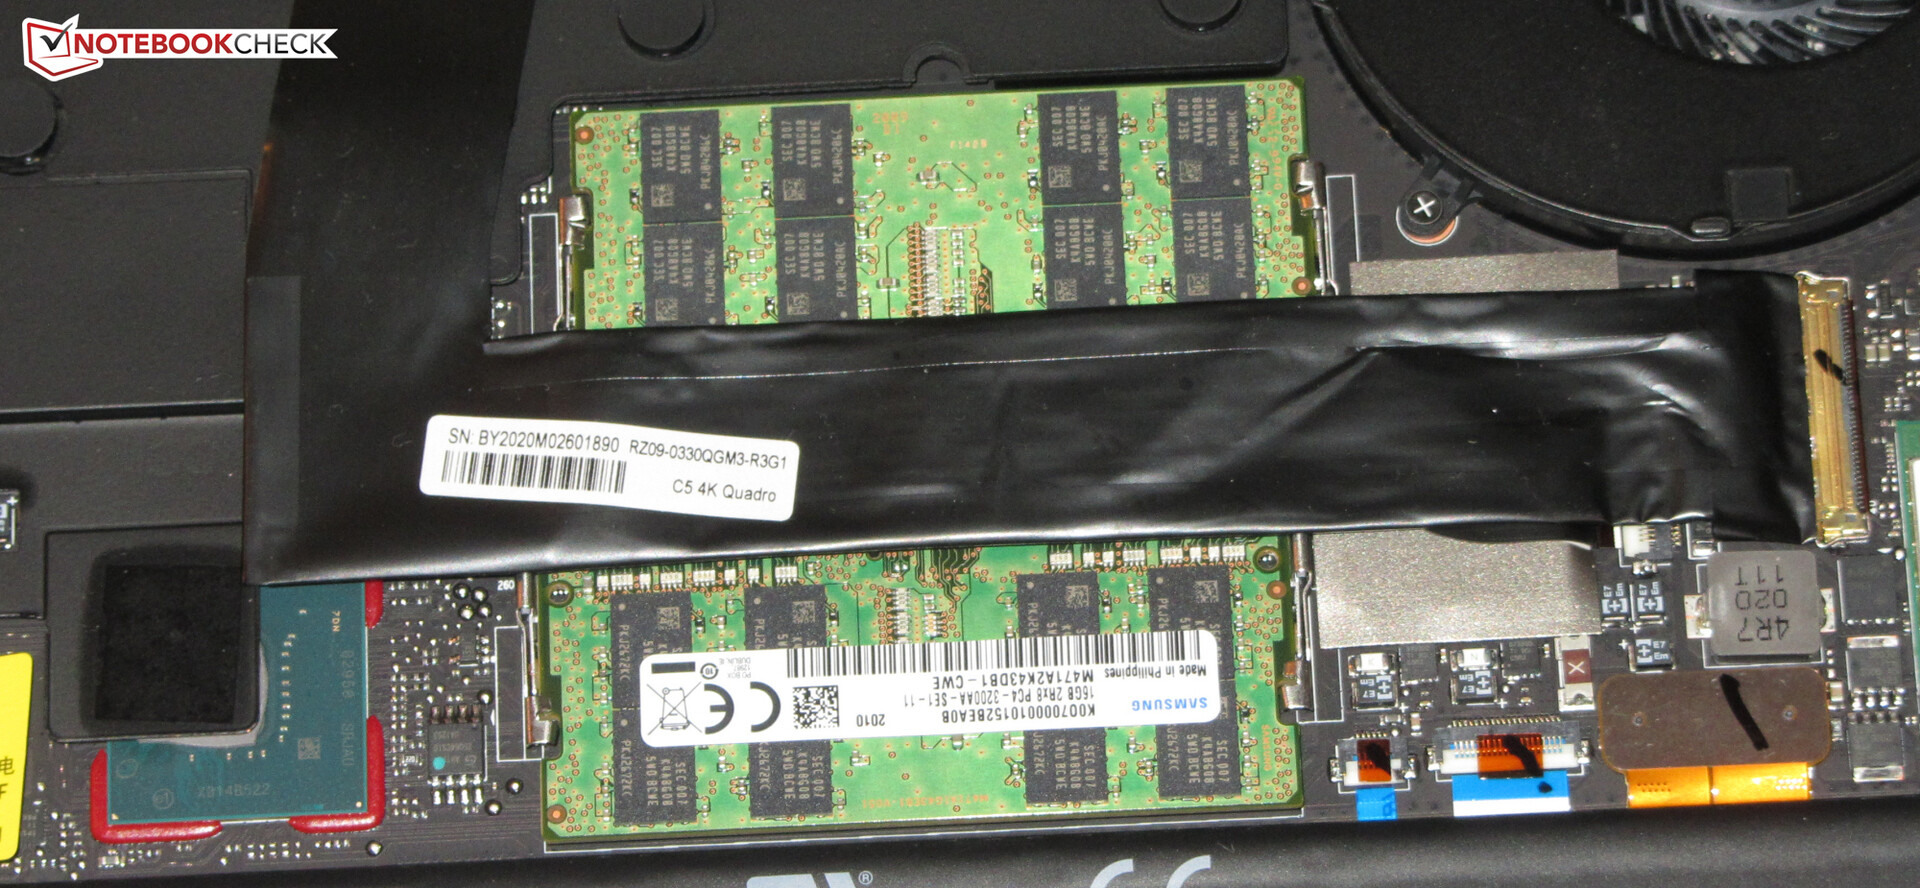
Il sistema ha a disposizione 32 GB di RAM (che funziona in modalità dual-channel). La quantità di RAM può essere ampliata fino a 64 GB. Anche il velocissimo SSD da 1 TB può essere aggiornato. Entrambi gli aggiornamenti possono essere effettuati facilmente, perché il pannello inferiore può essere rimosso senza difficoltà.
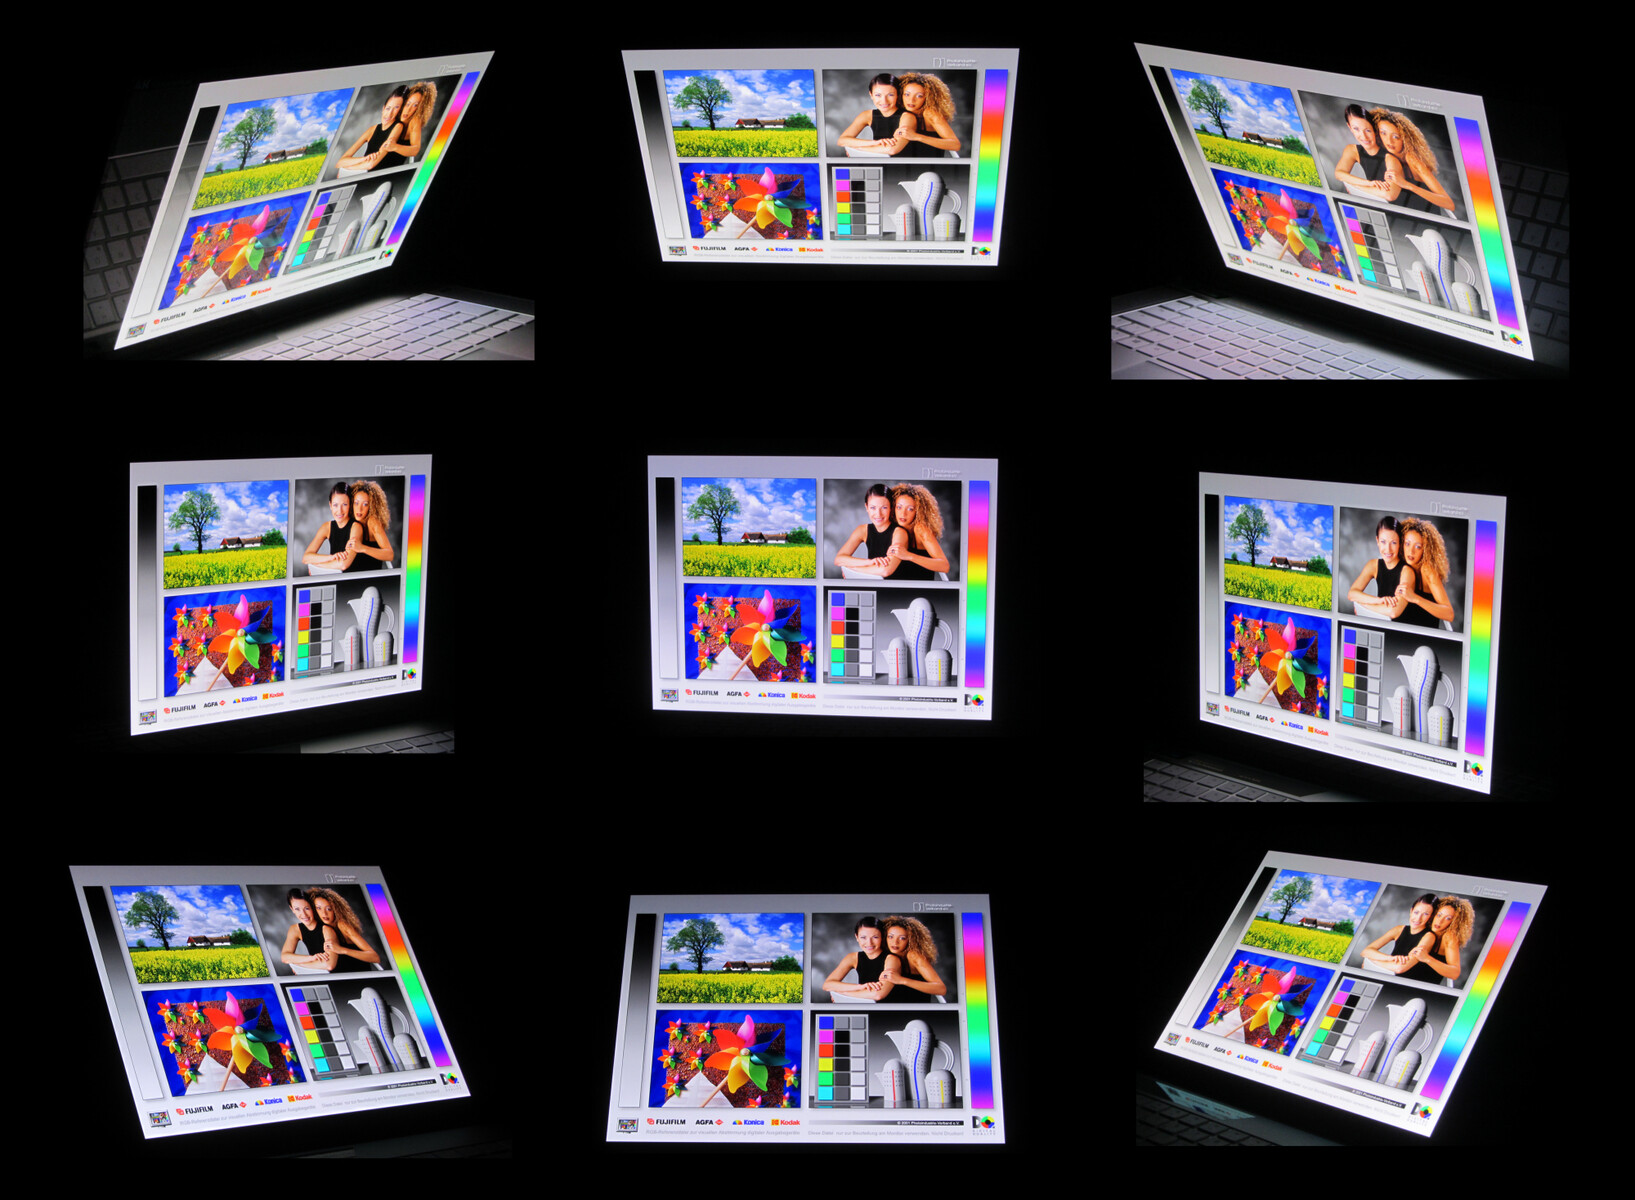
Il touchscreen OLED 4K colpisce per il grande valore del nero, la buona luminosità, gli angoli di visione stabili, i tempi di risposta rapidi e la buona copertura dello spazio colore. Copre il 100% dello spazio colore sRGB. Anche la riproduzione dei colori è piuttosto buona.
La porta miniDP è stata sostituita da una porta USB 3.2 Gen 2 Type-C, che può emettere un segnale DisplayPort. Le porte Type-A ora operano anche a velocità USB 3.2 Gen 2. La porta Thunderbolt 3 è ancora presente. Può essere usata per collegare docking station o GPU esterne al dispositivo. La batteria del Blade 15 può essere caricata tramite la porta Thunderbolt 3. Siamo stati in grado di caricare il dispositivo con un alimentatore da 45 watt.
Razer Blade 15 Studio Edition 2020
- 08/03/2020 v7 (old)
Sascha Mölck