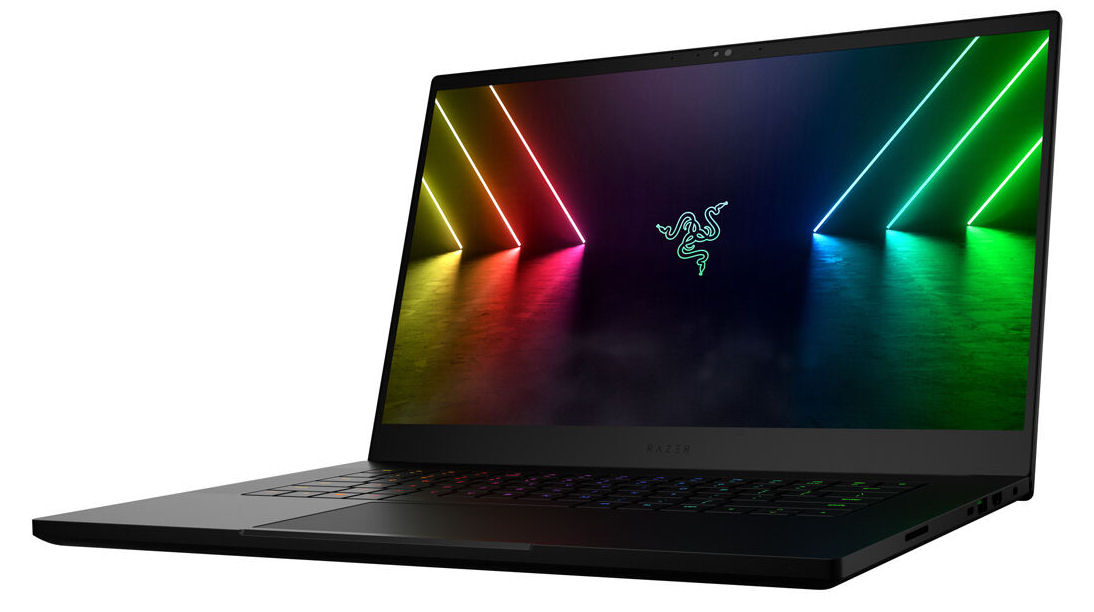
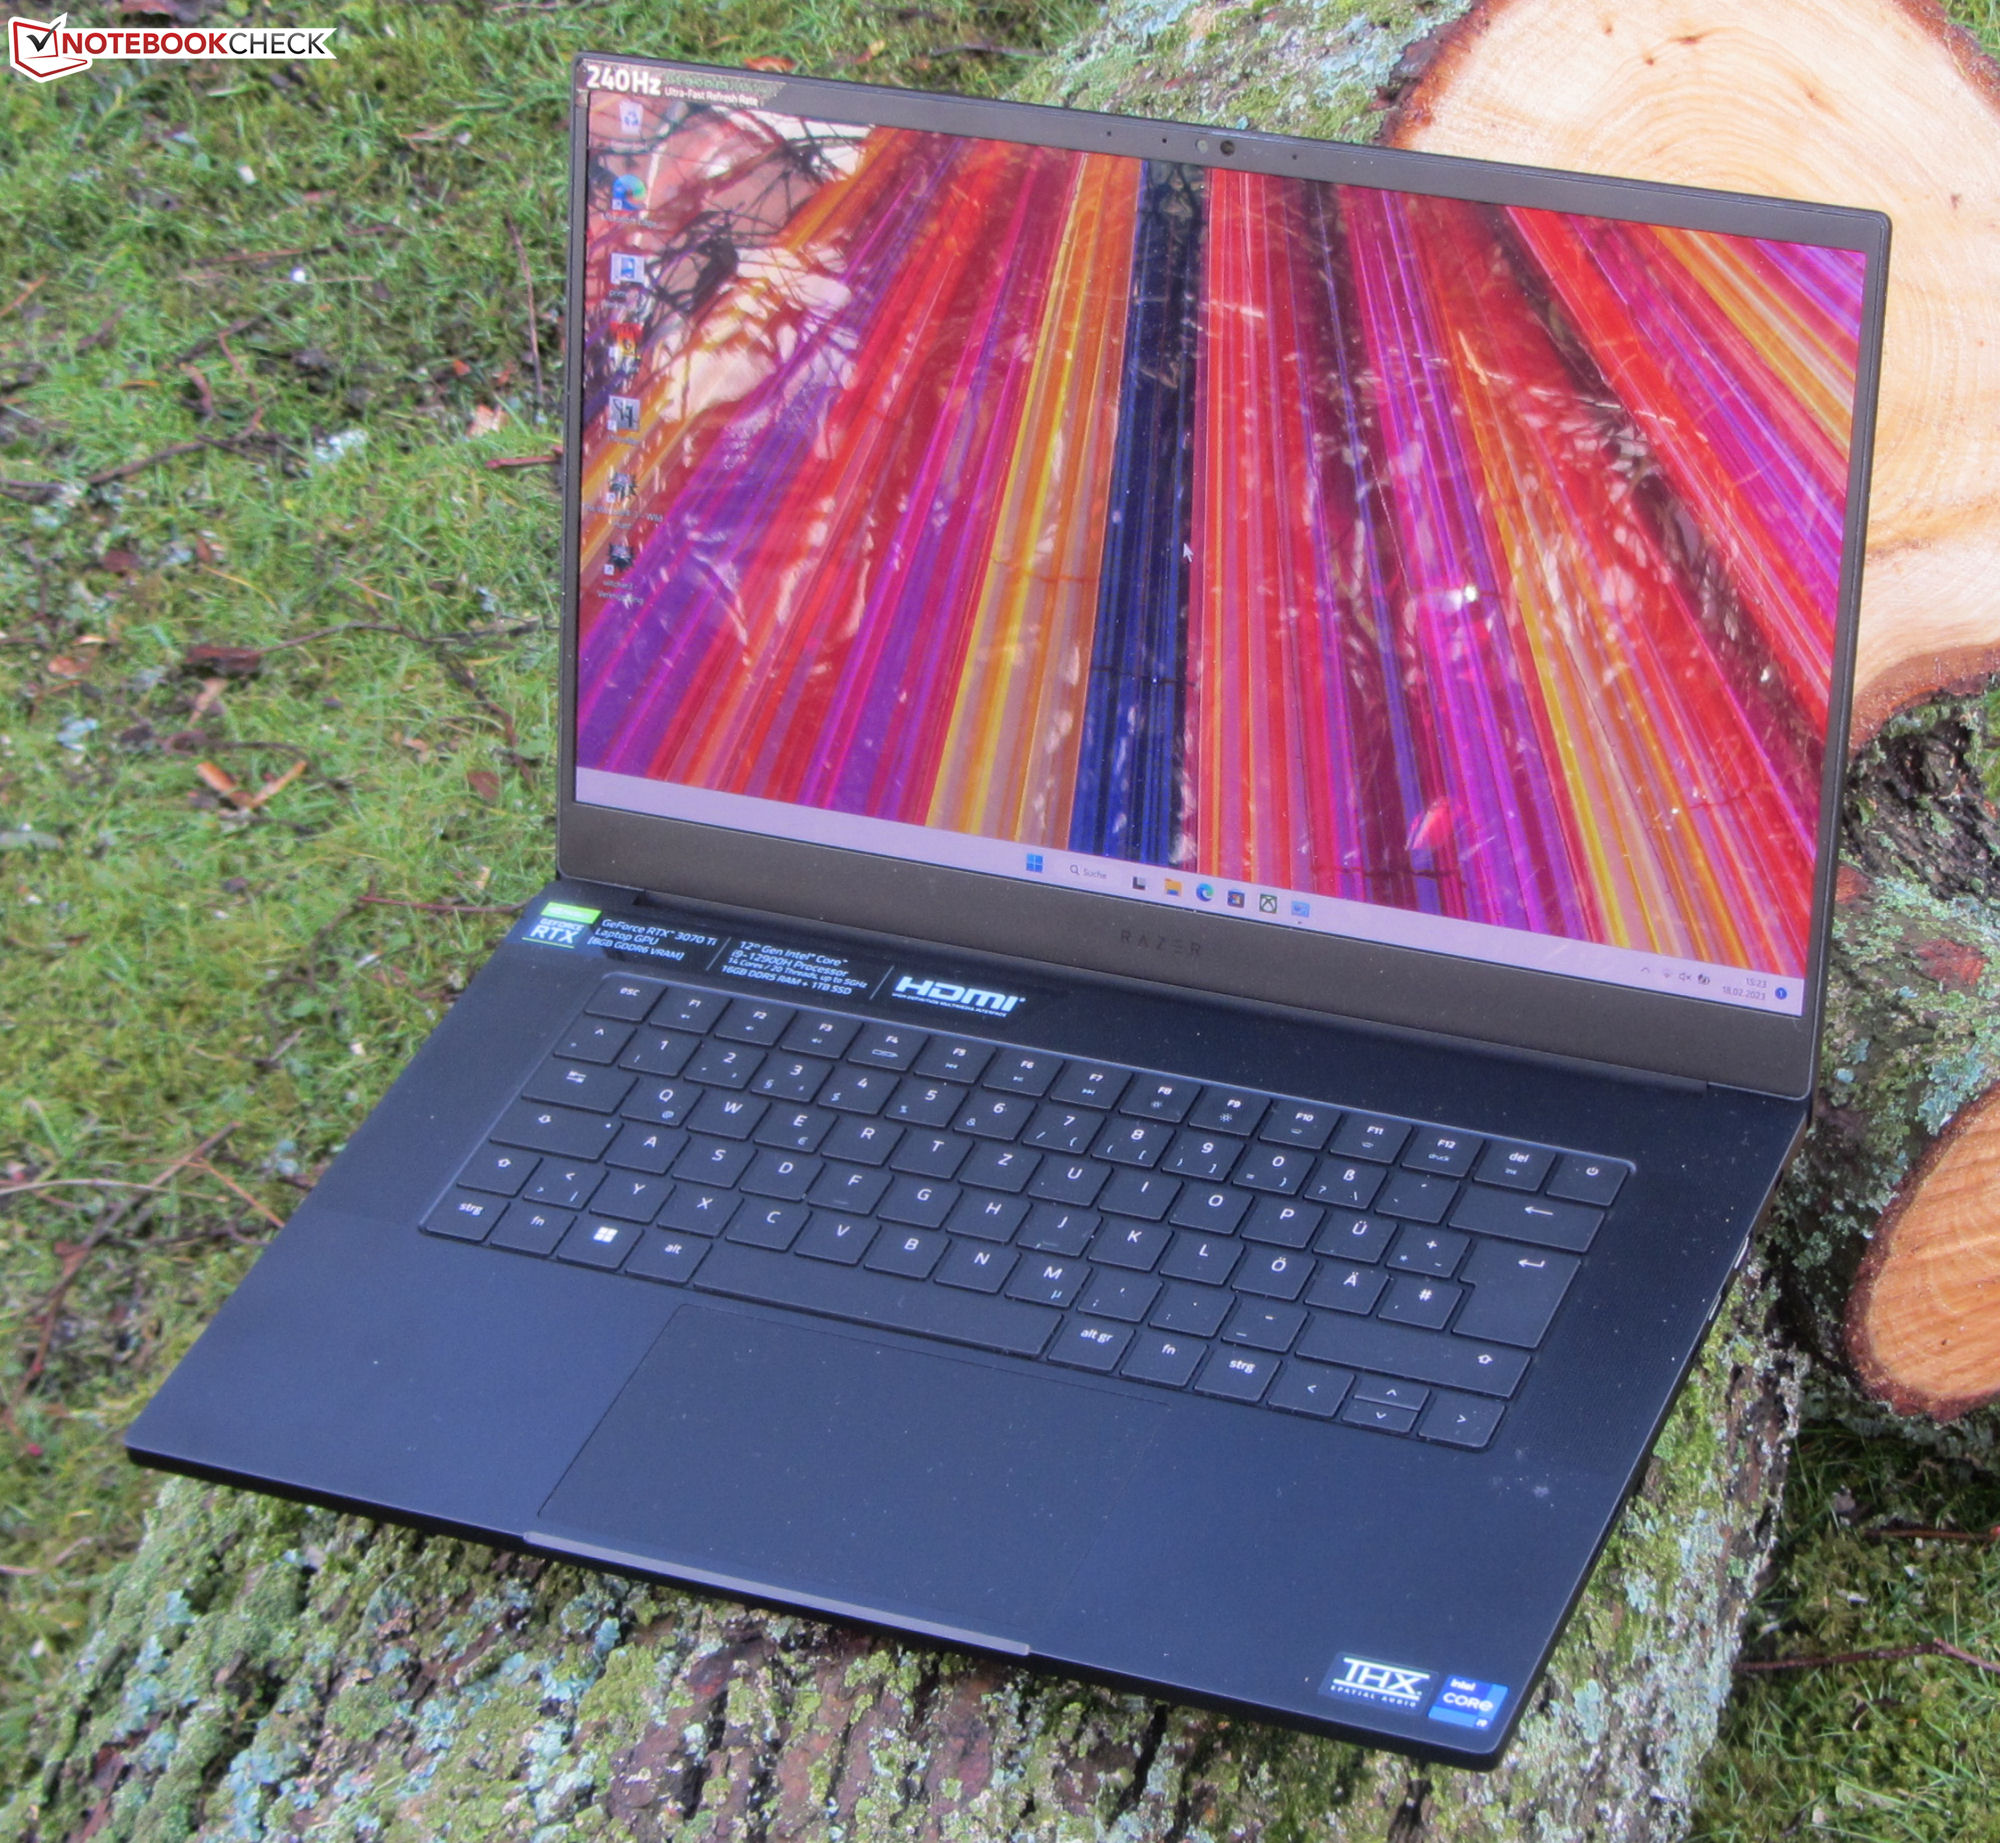
Recensione del Razer Blade 15 OLED (inizio 2022): Un portatile per il gaming compatto con RTX 3070 Ti
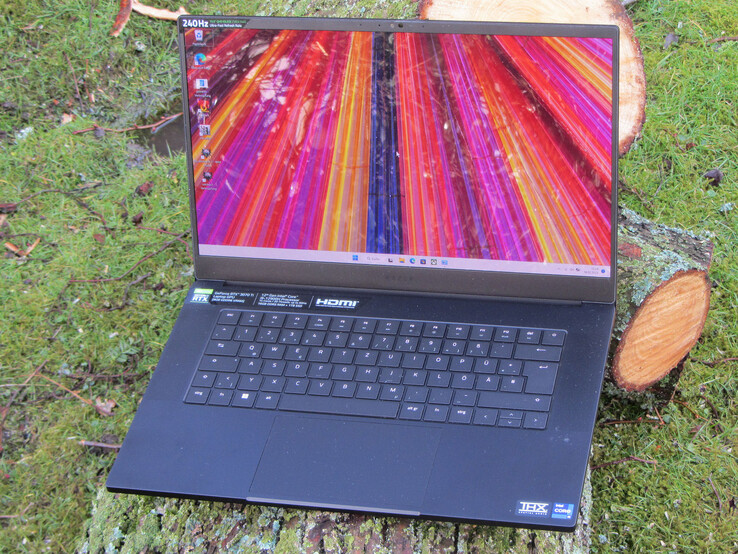
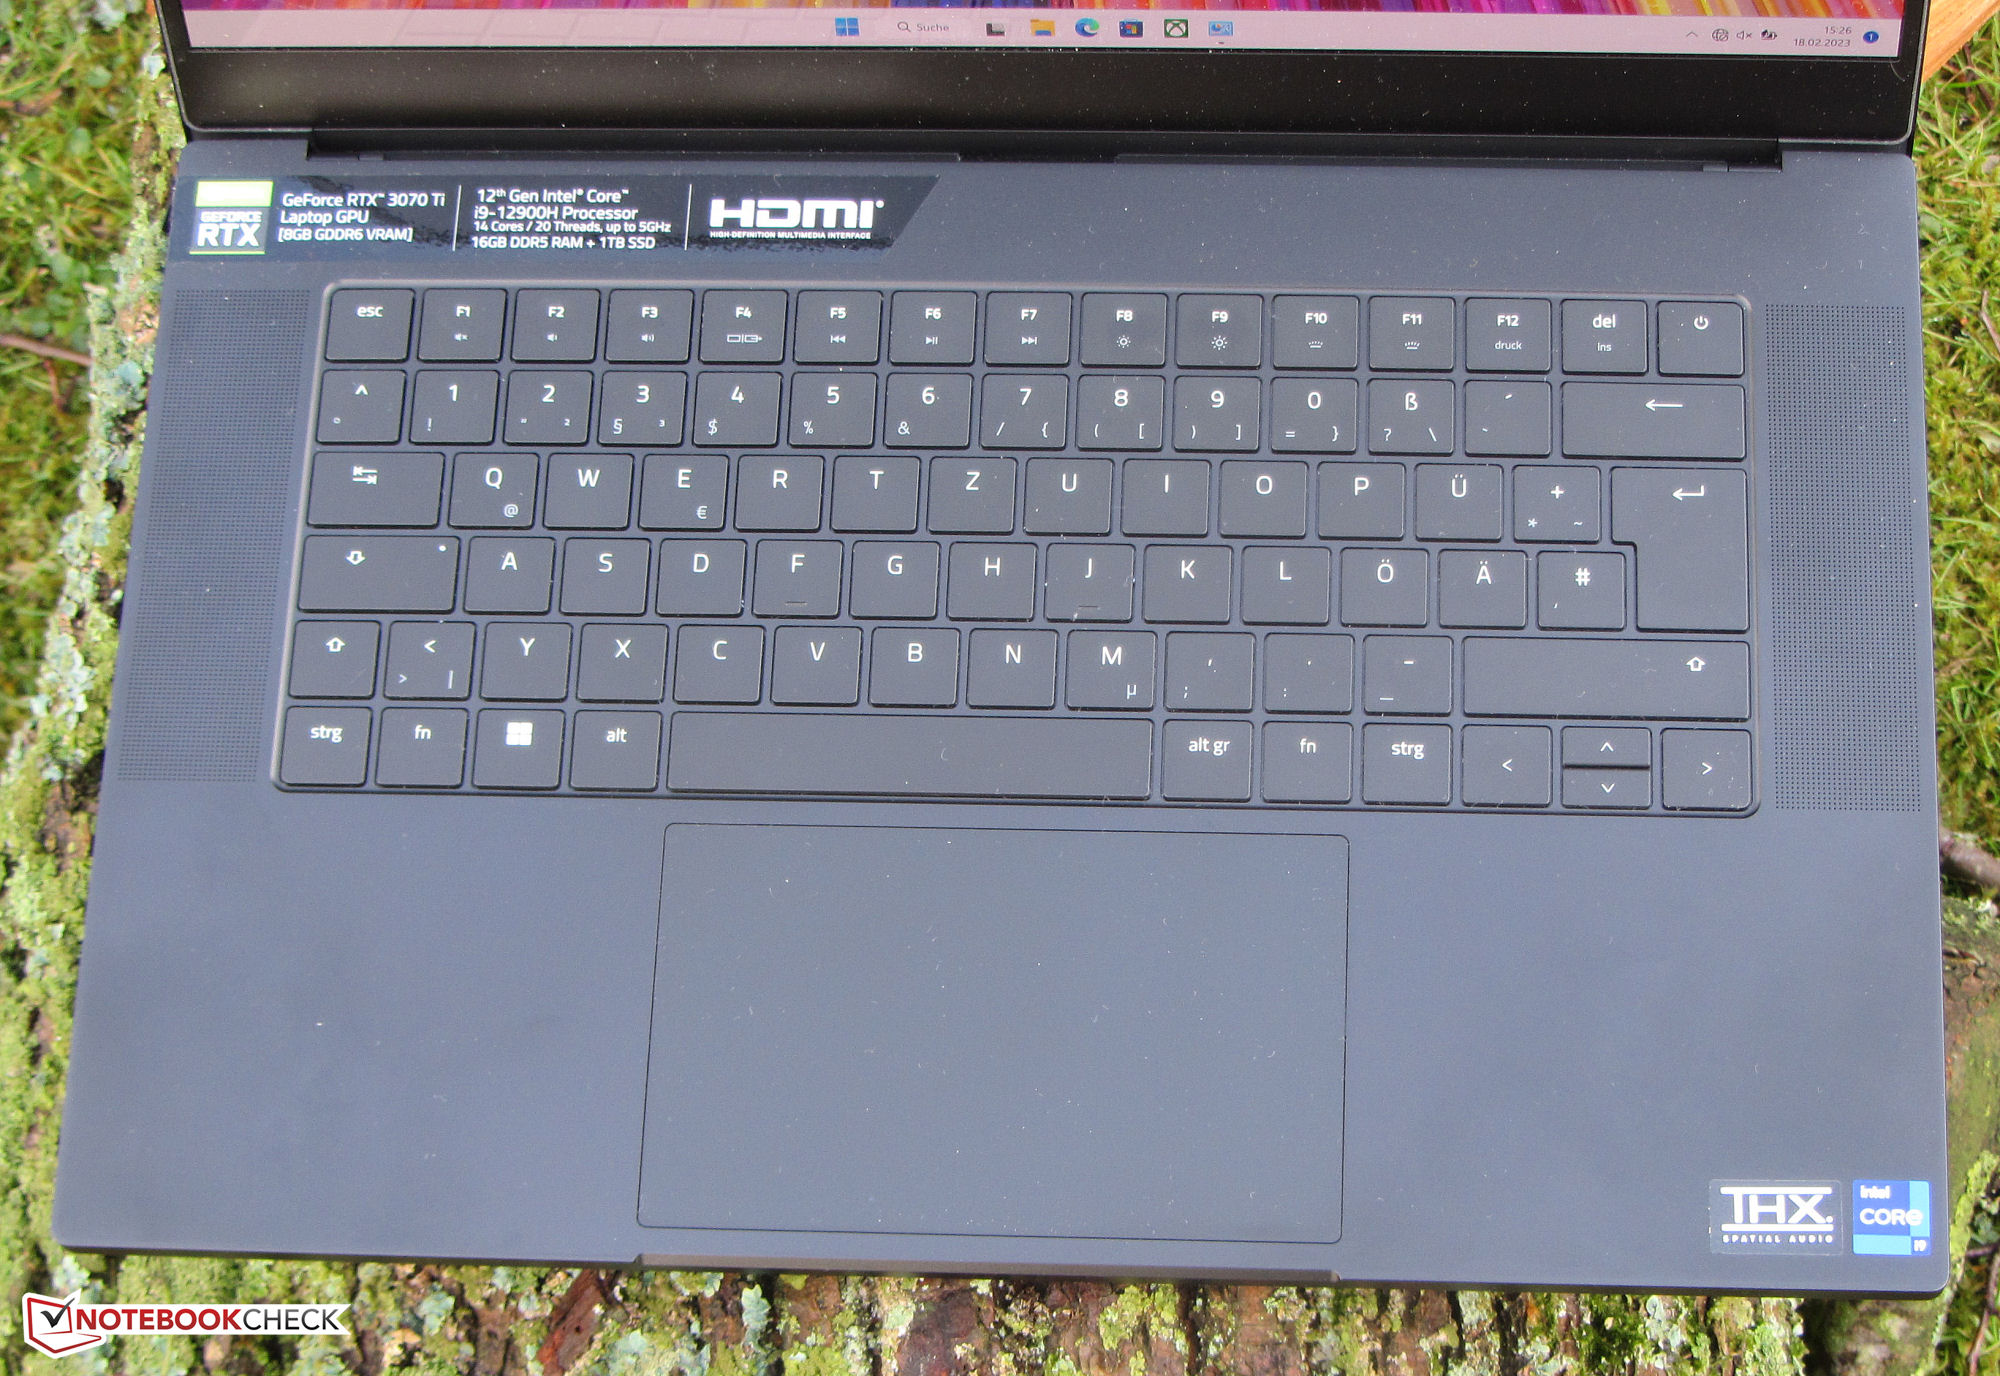
Il Razer Blade 15 (inizio 2022) ha l'ambizione di essere un portatile sia per i giocatori che per gli utenti creativi. La dotazione hardware è adeguata: Core i9-12900HcPU, GeForce RTX 3070 Tie un display OLED con colori accurati (QHD). Concorrenti simili e compatti si possono trovare nel modello Schenker XMG Fusion 15 (Mid 22), ilAorus 15 XE5, ilHP Omen 16e l'Asus ROG Zephyrus M16 GU603Z.
Le informazioni riguardanti il case, le caratteristiche, i dispositivi di input e gli altoparlanti sono già a portata di mano nella nostra recensione del fratello, (12800H, RTX 3080 Ti). Quest'ultimo è dotato di un pannello LED (QHD) - la differenza più rilevante rispetto al dispositivo attuale.
Potenziali concorrenti a confronto
Punteggio | Data | Modello | Peso | Altezza | Dimensione | Risoluzione | Prezzo |
|---|---|---|---|---|---|---|---|
| 89.9 % v7 (old) | 03/2023 | Razer Blade 15 OLED (Early 2022) i9-12900H, GeForce RTX 3070 Ti Laptop GPU | 2 kg | 16.99 mm | 15.60" | 2560x1440 | |
| 87.8 % v7 (old) | 02/2023 | Asus ROG Zephyrus M16 GU603Z i9-12900H, GeForce RTX 3070 Ti Laptop GPU | 2.1 kg | 19.9 mm | 16.00" | 2560x1600 | |
| 85.5 % v7 (old) | 12/2022 | Aorus 15 XE5 i7-12700H, GeForce RTX 3070 Ti Laptop GPU | 2.3 kg | 24 mm | 15.60" | 2560x1440 | |
| 87.4 % v7 (old) | 08/2022 | Schenker XMG Fusion 15 (Mid 22) i7-11800H, GeForce RTX 3070 Laptop GPU | 1.9 kg | 21.65 mm | 15.60" | 2560x1440 | |
| 85.5 % v7 (old) | 05/2022 | HP Omen 16-b1090ng i7-12700H, GeForce RTX 3070 Ti Laptop GPU | 2.3 kg | 23 mm | 16.10" | 2560x1440 |


| SD Card Reader | |
| average JPG Copy Test (av. of 3 runs) | |
| Razer Blade 15 2022 (Toshiba Exceria Pro SDXC 64 GB UHS-II) | |
| Asus ROG Zephyrus M16 GU603Z | |
| Media della classe Gaming (20.9 - 210, n=54, ultimi 2 anni) | |
| Razer Blade 15 OLED (Early 2022) (AV Pro SD microSD 128 GB V60) | |
| Schenker XMG Fusion 15 (Mid 22) (AV PRO microSD 128 GB V60) | |
| HP Omen 16-b1090ng (AV PRO microSD 128 GB V60) | |
| maximum AS SSD Seq Read Test (1GB) | |
| Asus ROG Zephyrus M16 GU603Z | |
| Razer Blade 15 2022 (Toshiba Exceria Pro SDXC 64 GB UHS-II) | |
| Media della classe Gaming (25.5 - 261, n=51, ultimi 2 anni) | |
| Razer Blade 15 OLED (Early 2022) (AV Pro SD microSD 128 GB V60) | |

 GeForce RTX 3070 Ti Laptop GPU, i9-12900H, Samsung PM9A1 MZVL21T0HCLR")
 GeForce RTX 3070 Ti Laptop GPU, i9-12900H, Samsung PM9A1 MZVL21T0HCLR")
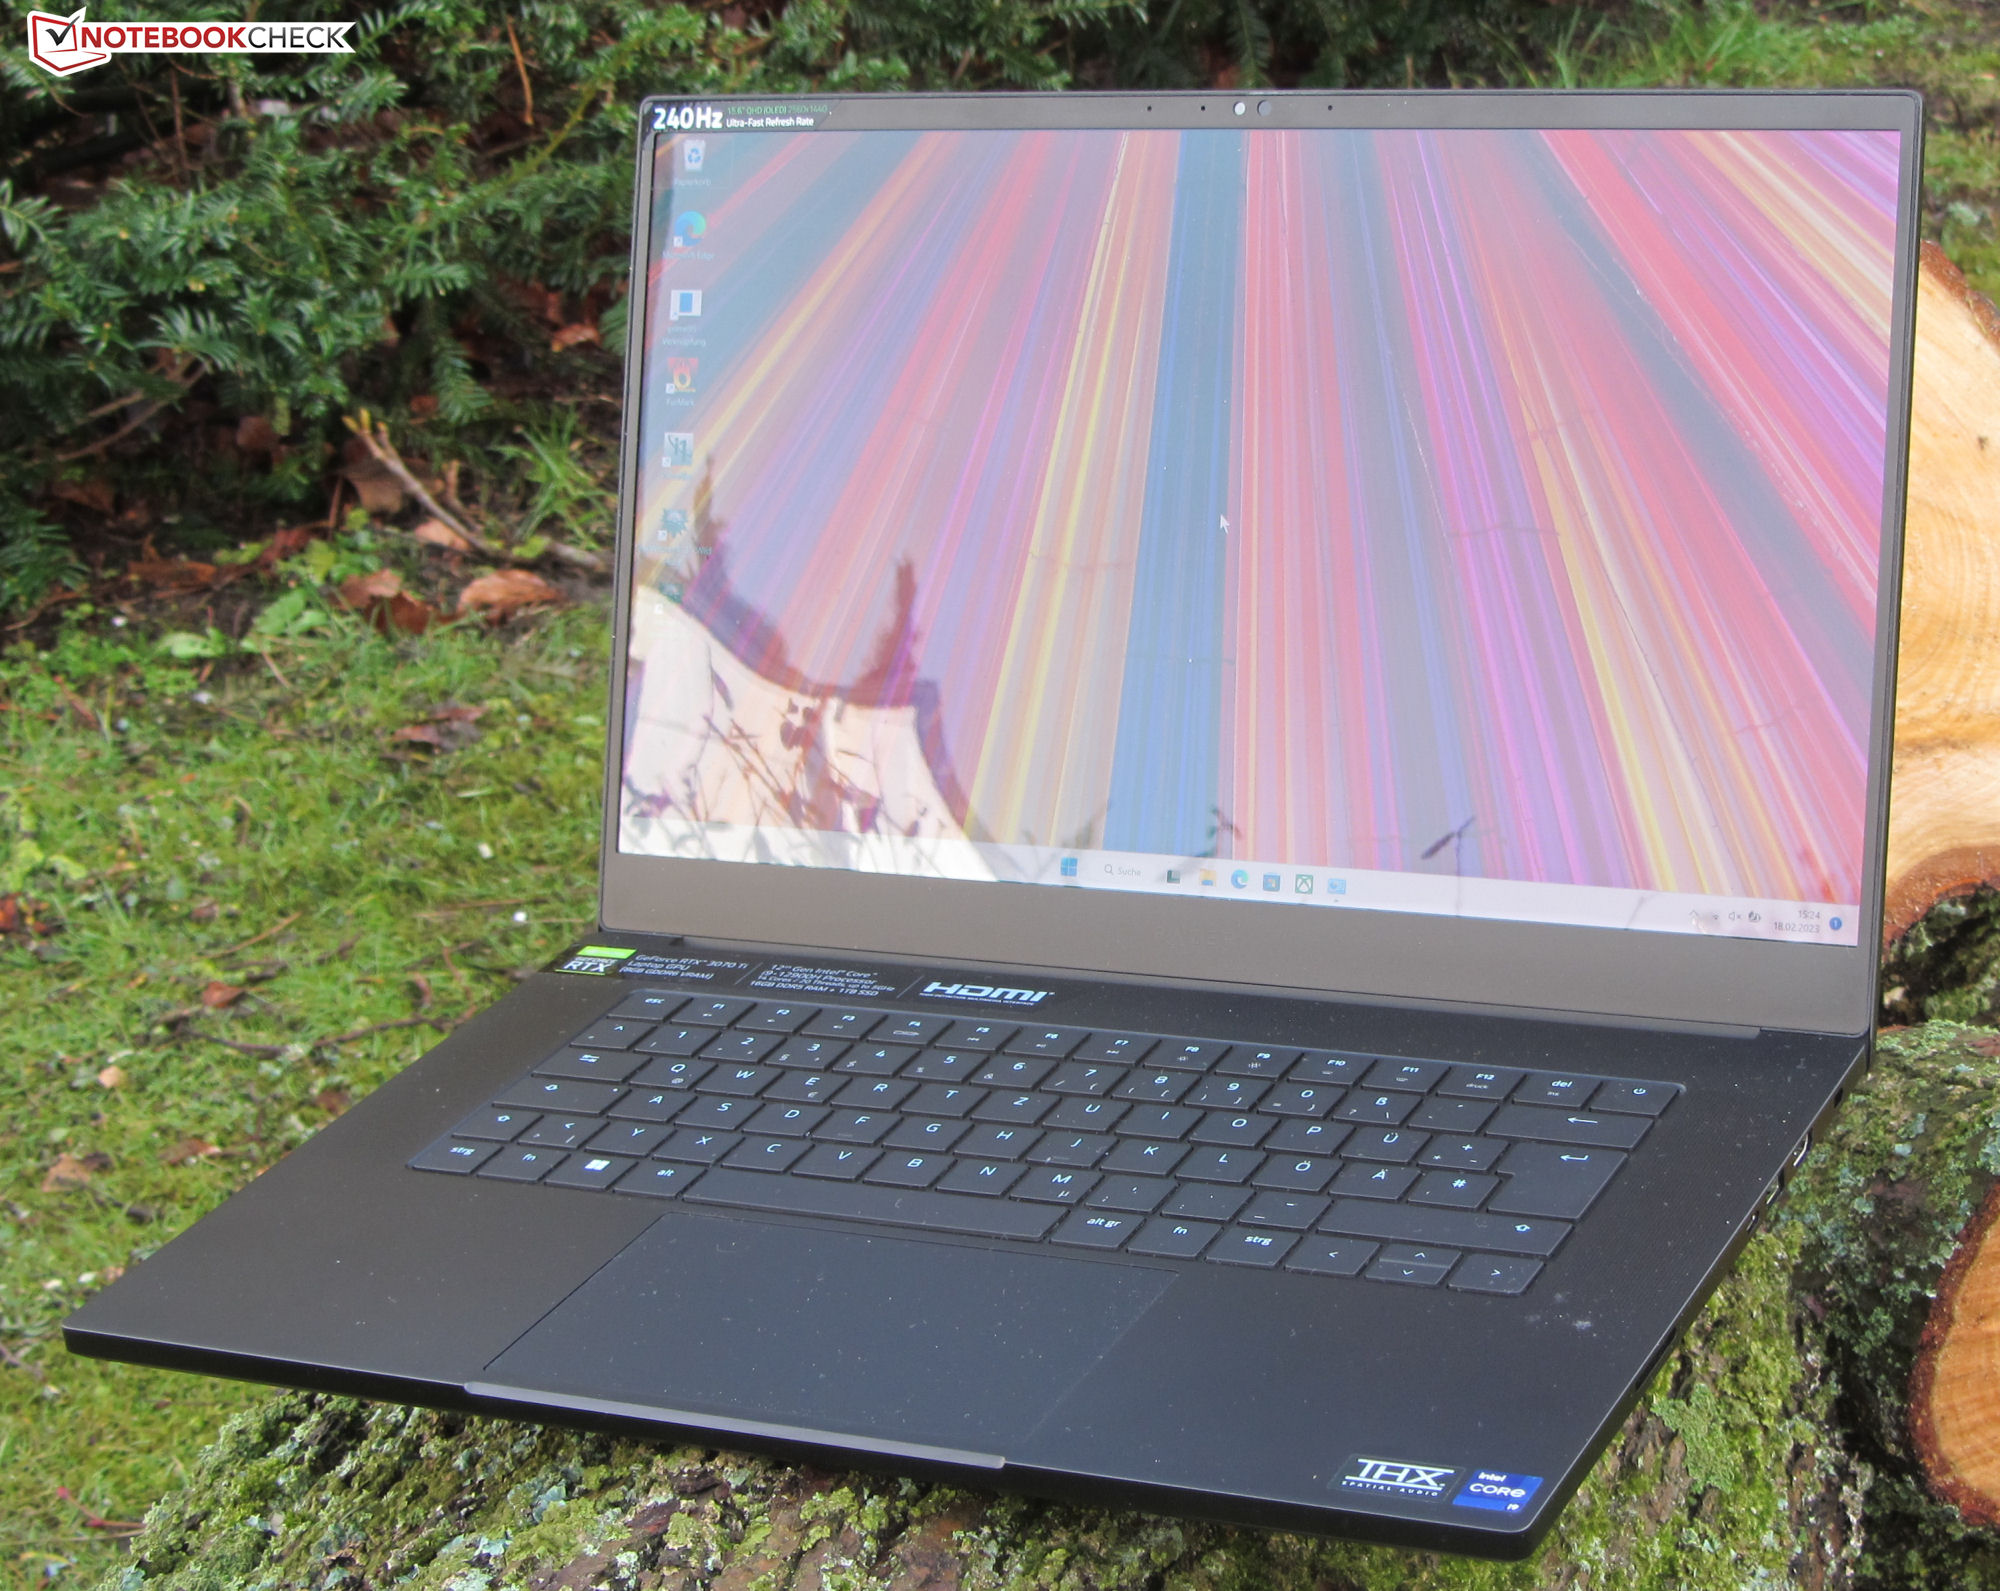
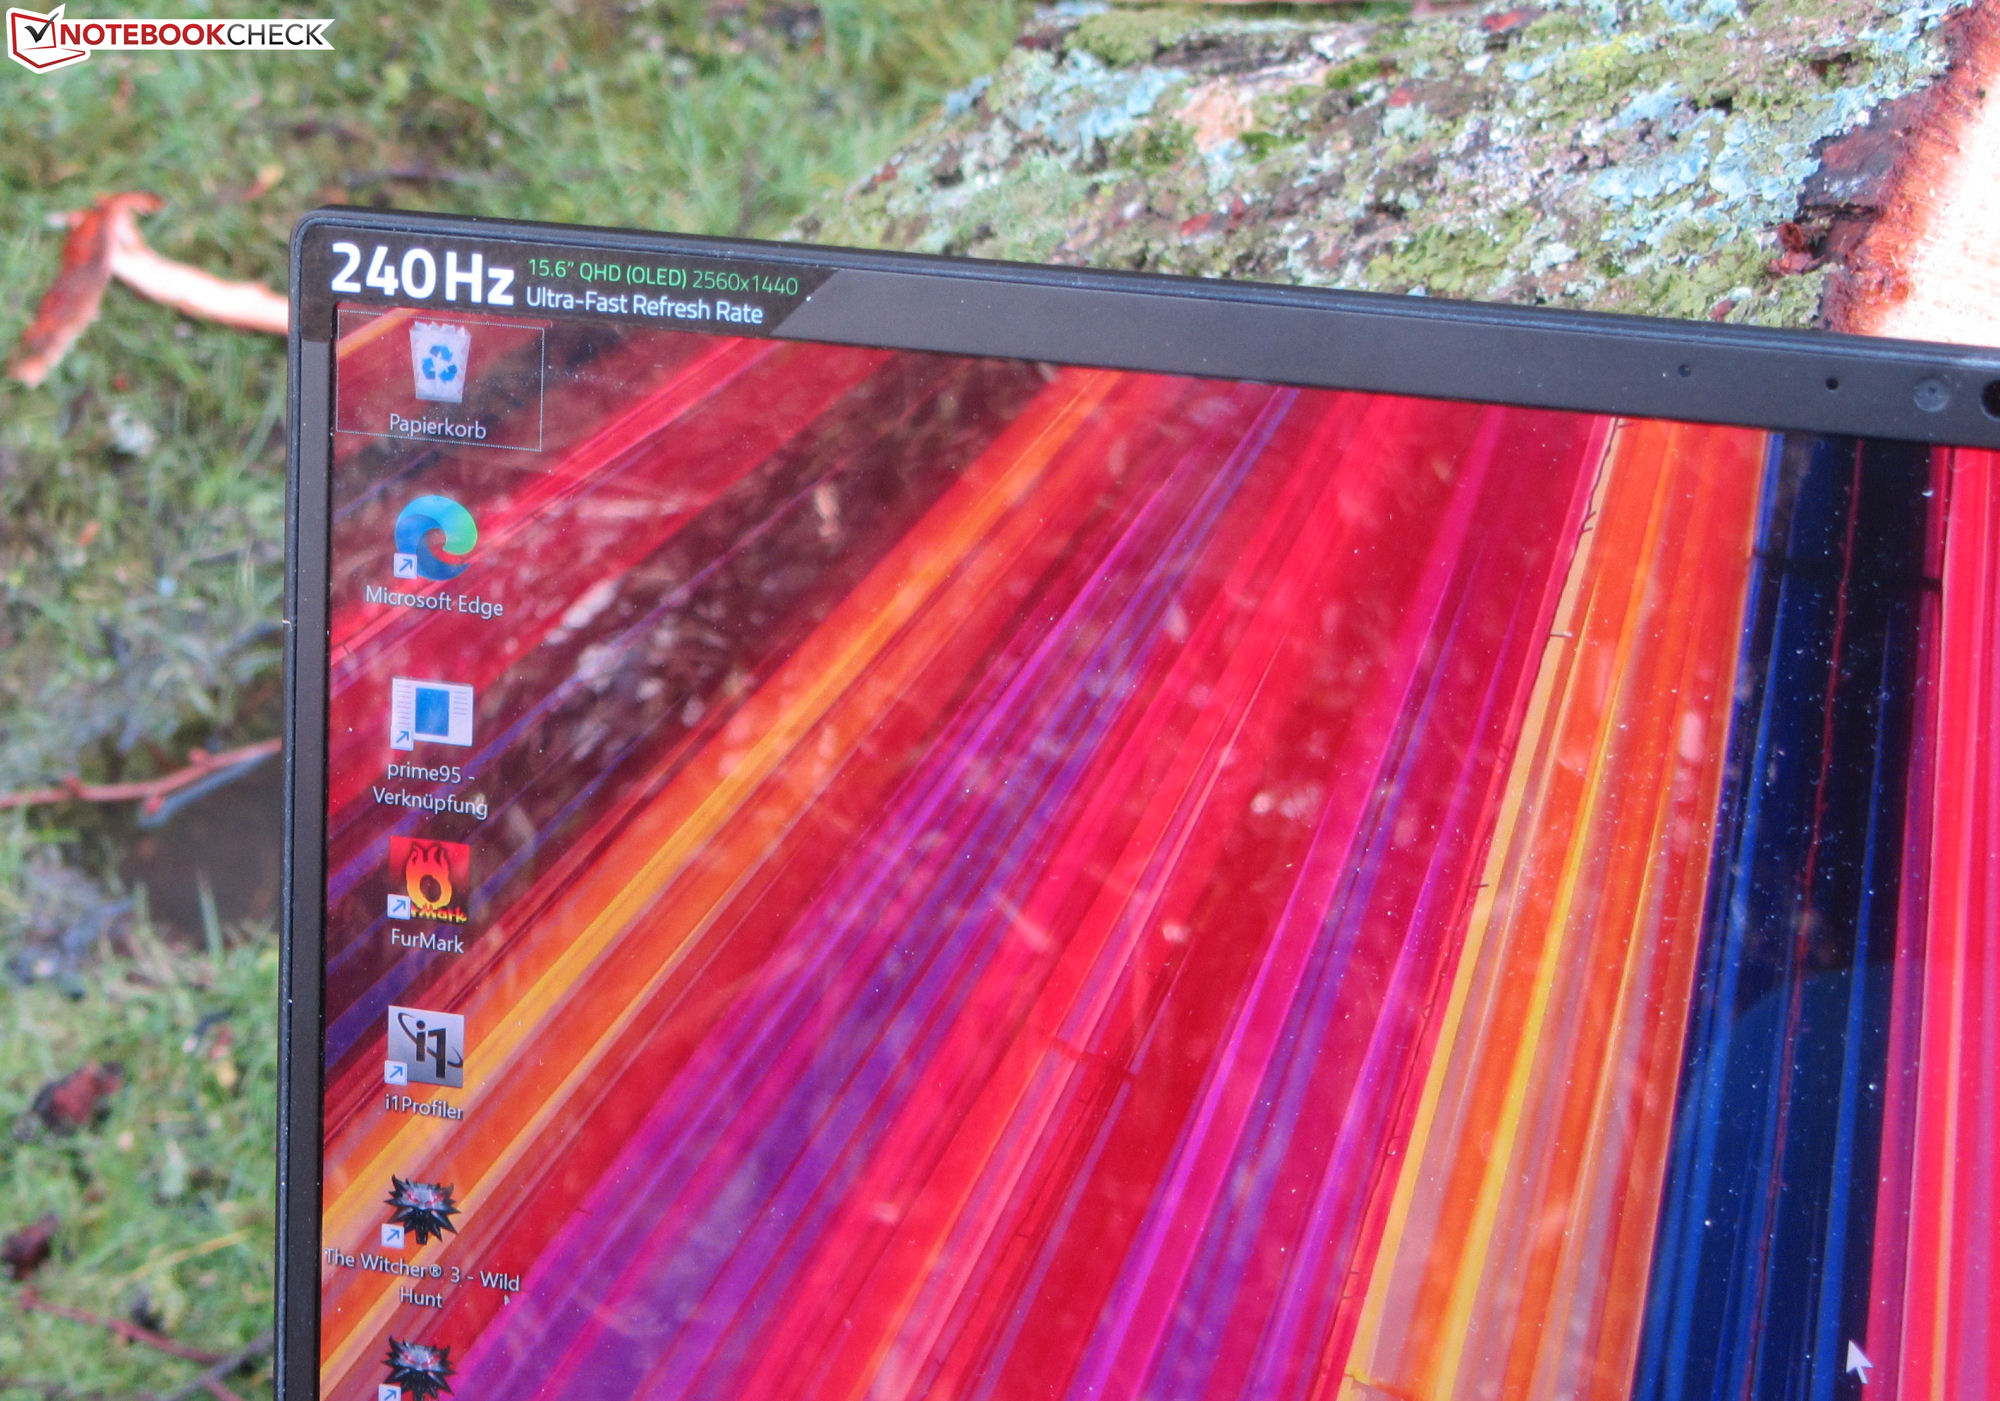
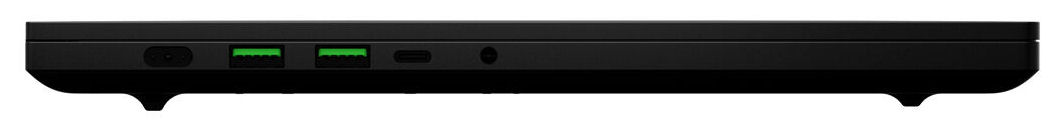
Display - Il computer mobile Razer è dotato di un pannello OLED

Il display OLED offre gli stessi dati chiave del suo fratello a LED: Una risoluzione di 2560 x 1440 pixel (QHD) con una frequenza di aggiornamento di 240 Hz e un diametro di 15,6 pollici.
Come tipico per gli OLED, il pannello si distingue per gli eccellenti livelli di nero e i rapidi tempi di risposta. A ciò si aggiunge una luminosità massima relativamente elevata. Questo è un aspetto che la sua controparte a LED non è in grado di mantenere.
I punti deboli del pannello OLED: Ha una superficie lucida e sfarfalla a un'impostazione di luminosità ≤ 70 percento a una frequenza di 500 Hz. Lo sfarfallio tecnicamente indotto è legato alla regolazione della luminosità del pannello. A questo proposito, il fratello opaco e privo di sfarfallio pannello LED opaco e privo di sfarfallio ha il naso davanti a sé.
| |||||||||||||||||||||||||
Distribuzione della luminosità: 99 %
Al centro con la batteria: 381 cd/m²
Contrasto: 12767:1 (Nero: 0.03 cd/m²)
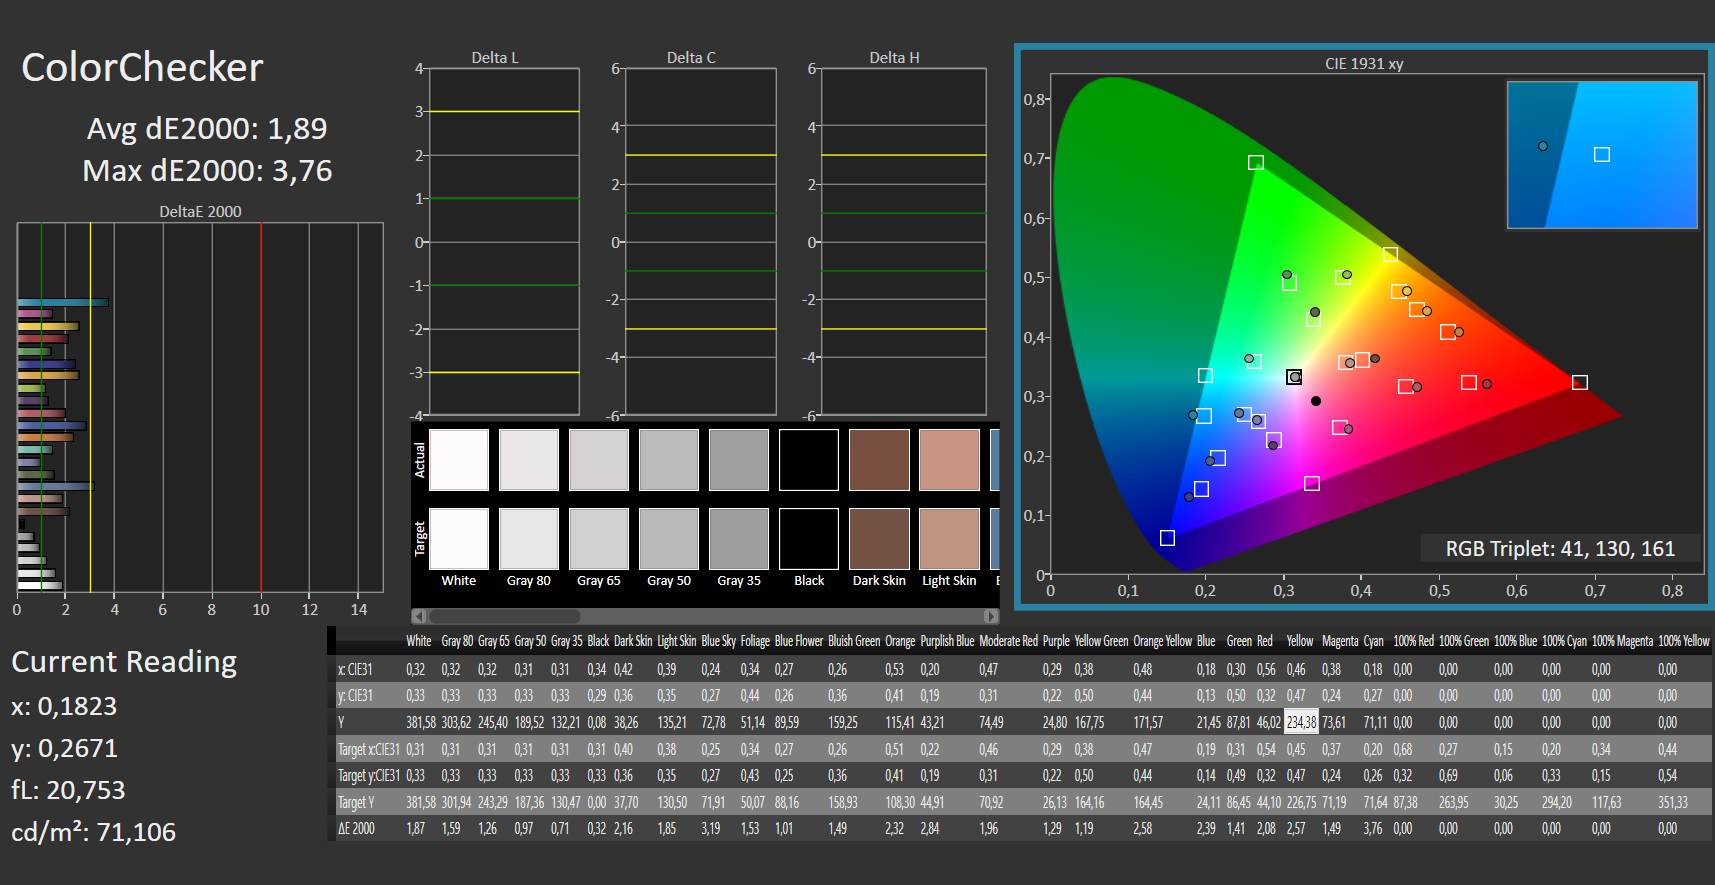
ΔE ColorChecker Calman: 1.89 | ∀{0.5-29.43 Ø4.71}
calibrated: 2.67
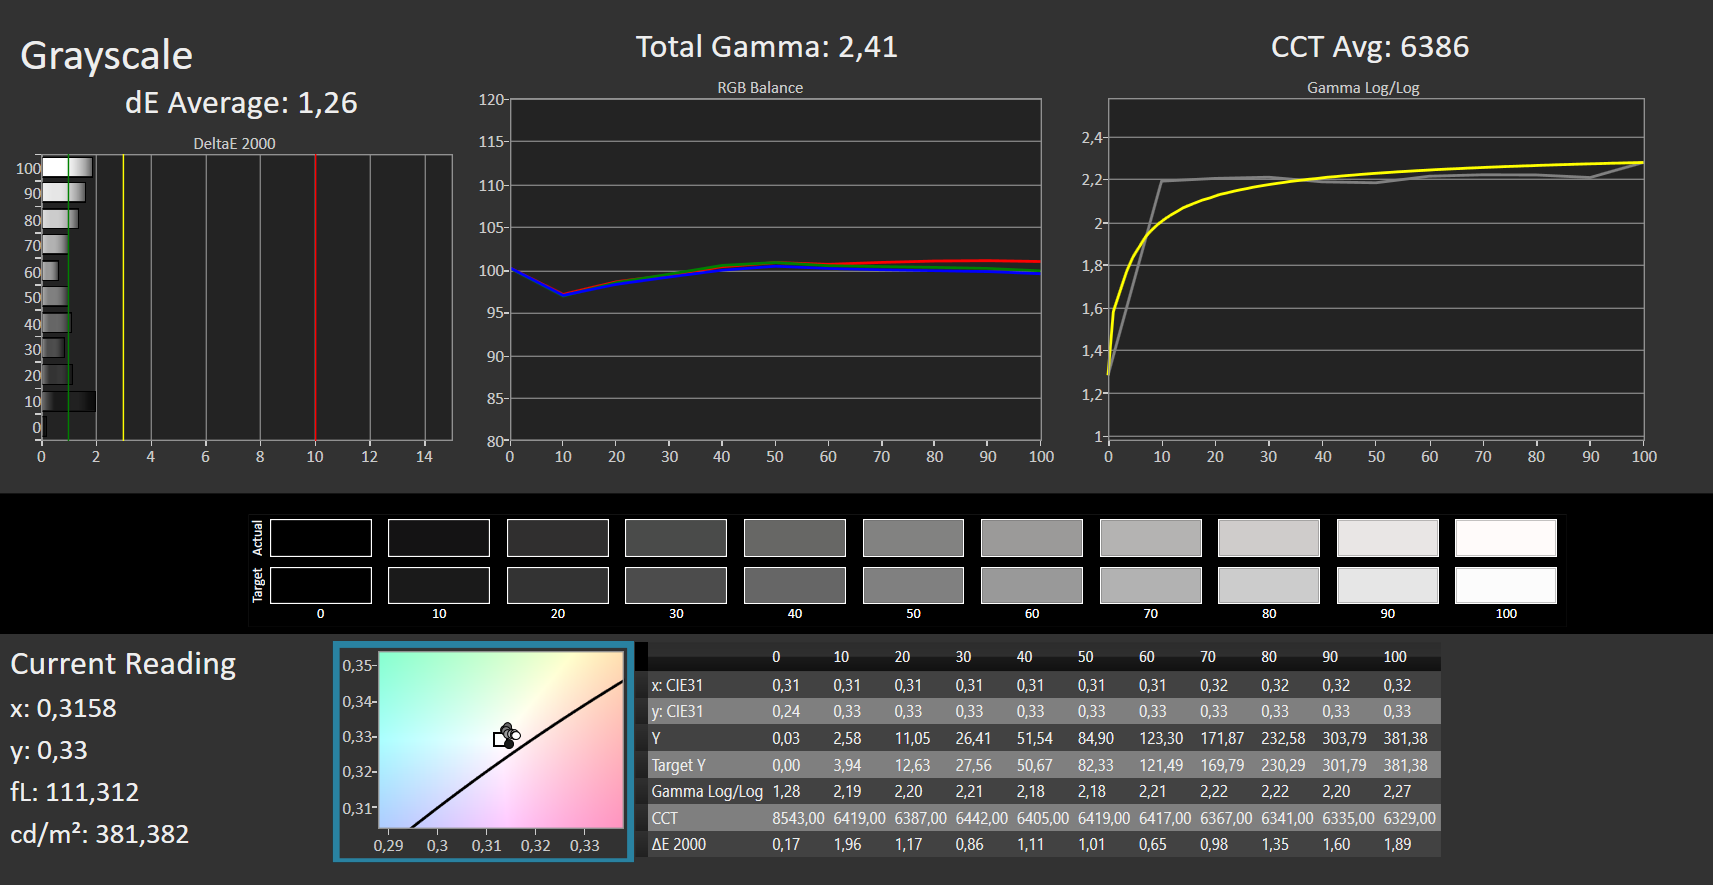
ΔE Greyscale Calman: 1.26 | ∀{0.09-98 Ø4.96}
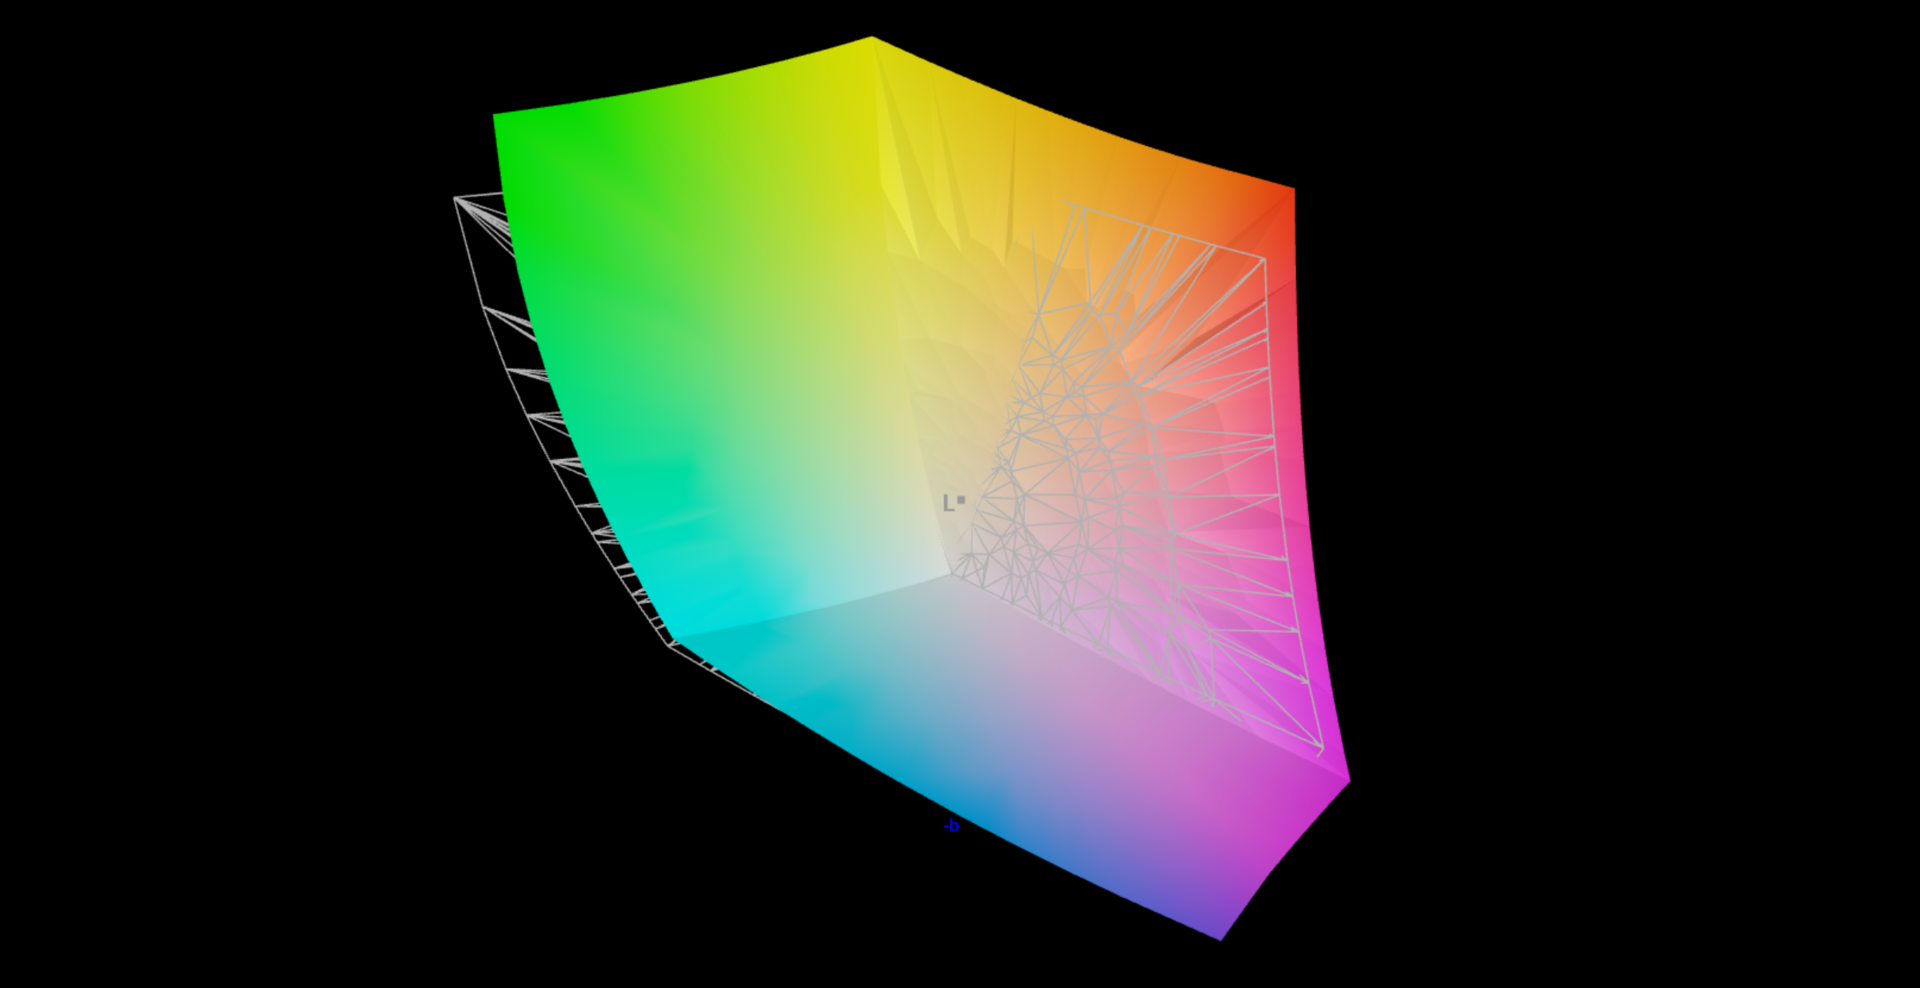
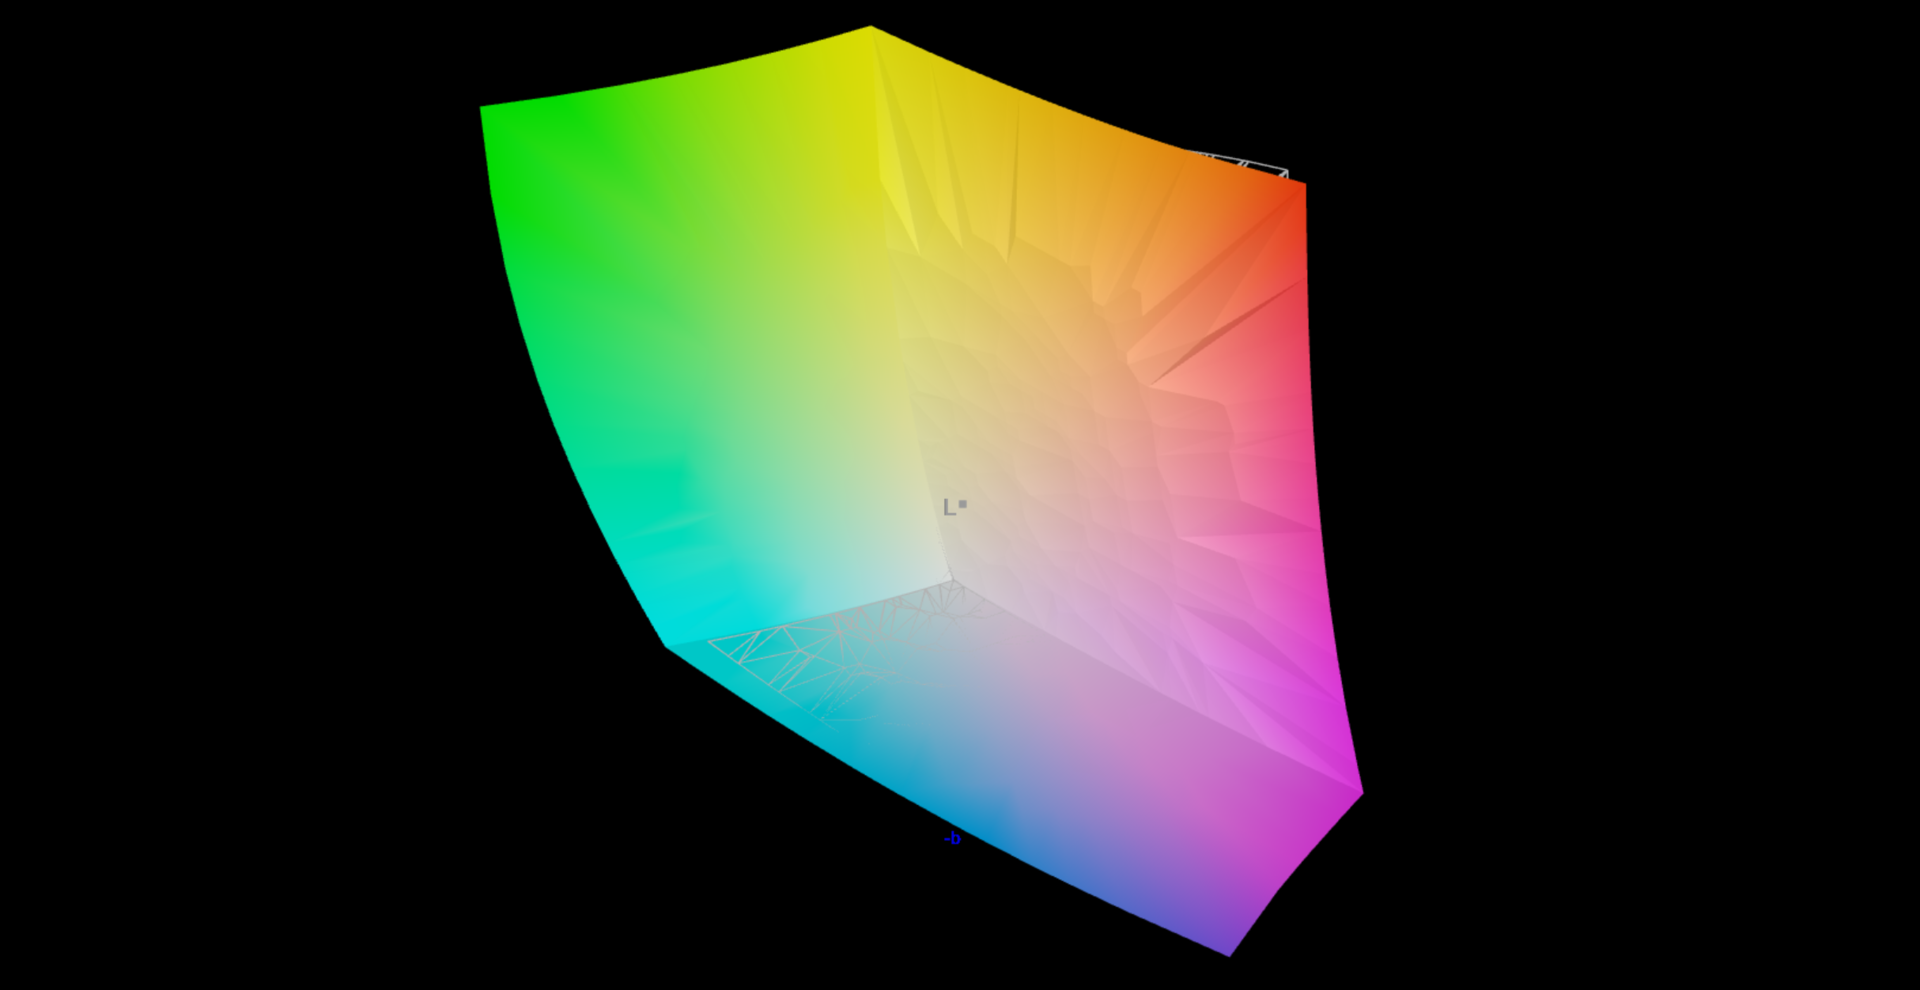
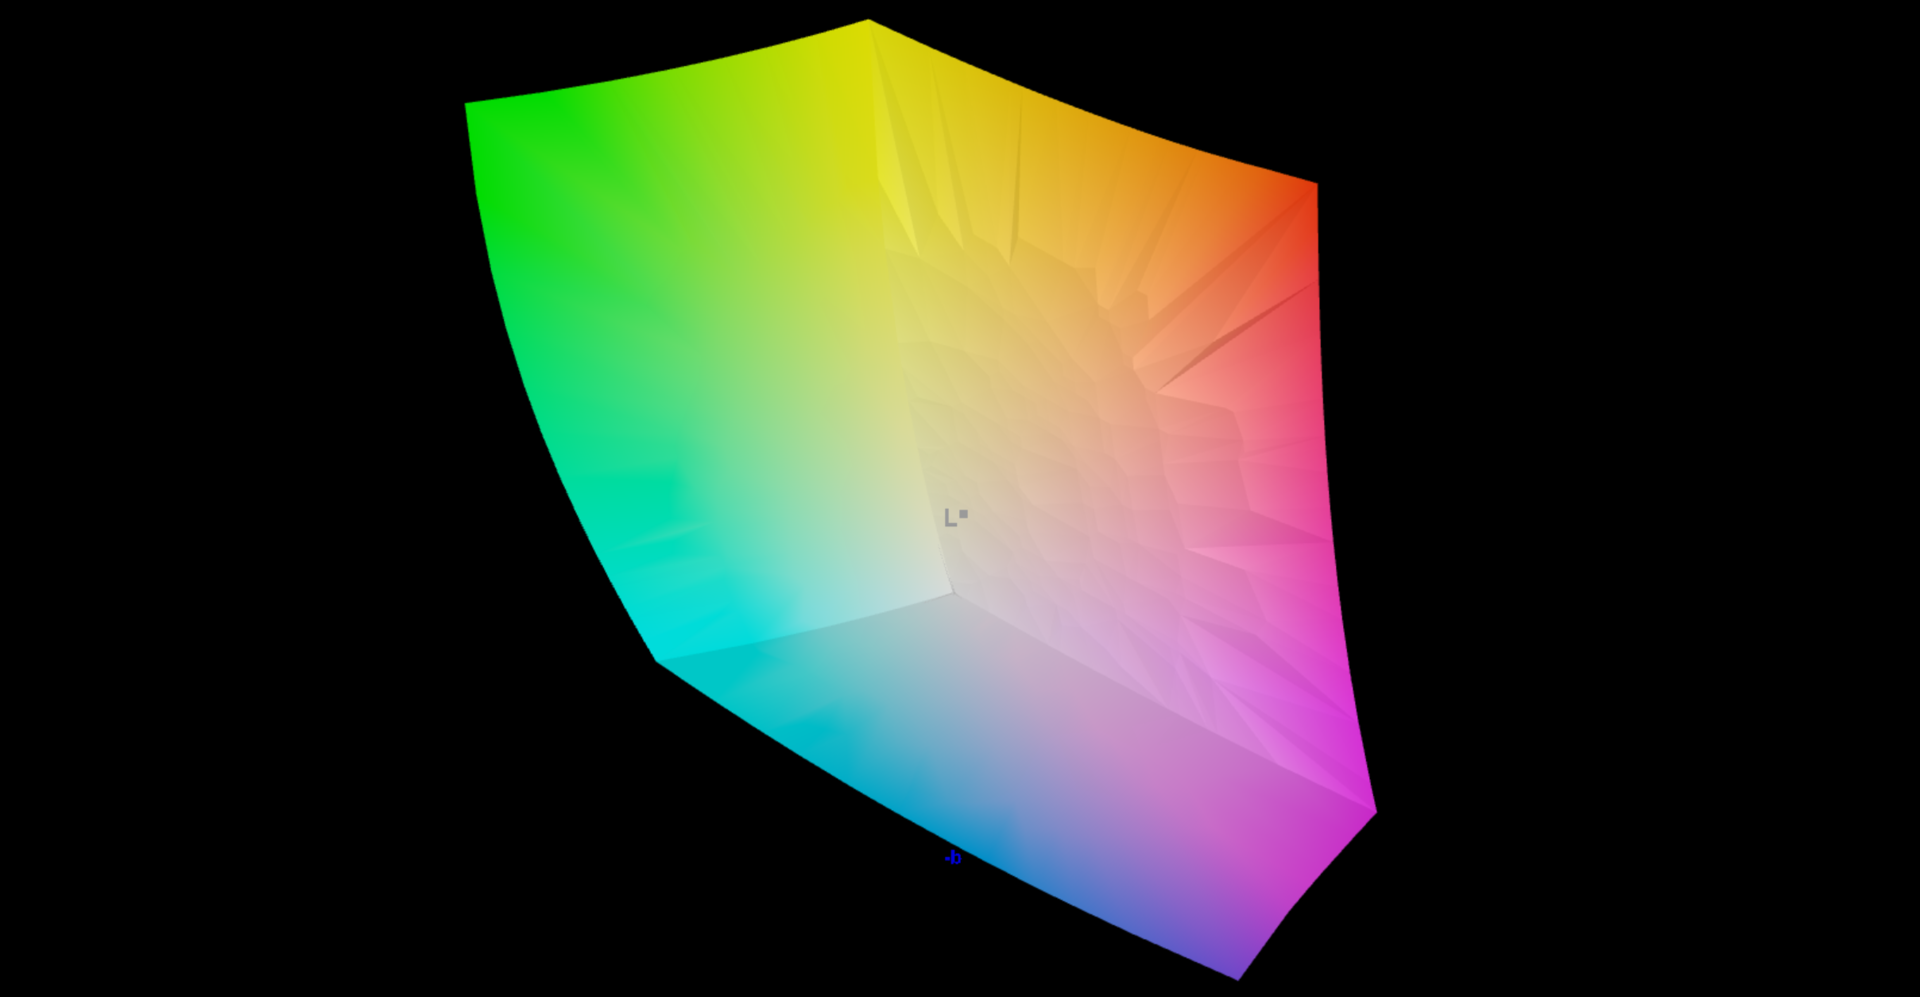
94% AdobeRGB 1998 (Argyll 3D)
99.4% sRGB (Argyll 3D)
97.6% Display P3 (Argyll 3D)
Gamma: 2.41
CCT: 6386 K
| Razer Blade 15 OLED (Early 2022) Samsung ATNA562P02-0, OLED, 2560x1440, 15.6" | Asus ROG Zephyrus M16 GU603Z BOE0A0B (BOE CQ NE160QDM-NY3), IPS, 2560x1600, 16" | Aorus 15 XE5 Chi Mei N156KME-GNA, IPS, 2560x1440, 15.6" | Schenker XMG Fusion 15 (Mid 22) BOE CQ NE156QHM-NY2, IPS, 2560x1440, 15.6" | HP Omen 16-b1090ng BOE09E5, IPS, 2560x1440, 16.1" | Razer Blade 15 2022 Sharp LQ156T1JW03, IPS, 2560x1440, 15.6" | |
|---|---|---|---|---|---|---|
| Display | -6% | -4% | -20% | -17% | -2% | |
| Display P3 Coverage (%) | 97.6 | 92.8 -5% | 95.2 -2% | 67.3 -31% | 71 -27% | 99.1 2% |
| sRGB Coverage (%) | 99.4 | 98.5 -1% | 99.9 1% | 96.7 -3% | 97.9 -2% | 99.9 1% |
| AdobeRGB 1998 Coverage (%) | 94 | 83.1 -12% | 84.5 -10% | 68.2 -27% | 73.3 -22% | 86.8 -8% |
| Response Times | -340% | -475% | -365% | -498% | -550% | |
| Response Time Grey 50% / Grey 80% * (ms) | 2 ? | 7.6 ? -280% | 14.4 ? -620% | 11.6 ? -480% | 14.5 ? -625% | 14.4 ? -620% |
| Response Time Black / White * (ms) | 2 ? | 10 ? -400% | 8.6 ? -330% | 7 ? -250% | 9.4 ? -370% | 11.6 ? -480% |
| PWM Frequency (Hz) | 500 ? | |||||
| Screen | -96% | -169% | -178% | -184% | -106% | |
| Brightness middle (cd/m²) | 383 | 497 30% | 336 -12% | 326 -15% | 335 -13% | 286 -25% |
| Brightness (cd/m²) | 384 | 481 25% | 316 -18% | 303 -21% | 319 -17% | 271 -29% |
| Brightness Distribution (%) | 99 | 82 -17% | 89 -10% | 89 -10% | 90 -9% | 89 -10% |
| Black Level * (cd/m²) | 0.03 | 0.21 -600% | 0.34 -1033% | 0.33 -1000% | 0.28 -833% | 0.25 -733% |
| Contrast (:1) | 12767 | 2367 -81% | 988 -92% | 988 -92% | 1196 -91% | 1144 -91% |
| Colorchecker dE 2000 * | 1.89 | 3.53 -87% | 3.36 -78% | 2.73 -44% | 4.38 -132% | 2.74 -45% |
| Colorchecker dE 2000 max. * | 3.76 | 6.15 -64% | 6.67 -77% | 9.54 -154% | 9.48 -152% | 5.21 -39% |
| Colorchecker dE 2000 calibrated * | 2.67 | 3.53 -32% | 0.74 72% | 1.36 49% | 1.33 50% | 2.52 6% |
| Greyscale dE 2000 * | 1.26 | 1.74 -38% | 4.7 -273% | 5.2 -313% | 7 -456% | 1.1 13% |
| Gamma | 2.41 91% | 2.2 100% | 2.244 98% | 2.074 106% | 2.103 105% | 2.2 100% |
| CCT | 6386 102% | 6418 101% | 6897 94% | 6911 94% | 6244 104% | 6408 101% |
| Media totale (Programma / Settaggio) | -147% /
-112% | -216% /
-177% | -188% /
-171% | -233% /
-193% | -219% /
-147% |
* ... Meglio usare valori piccoli
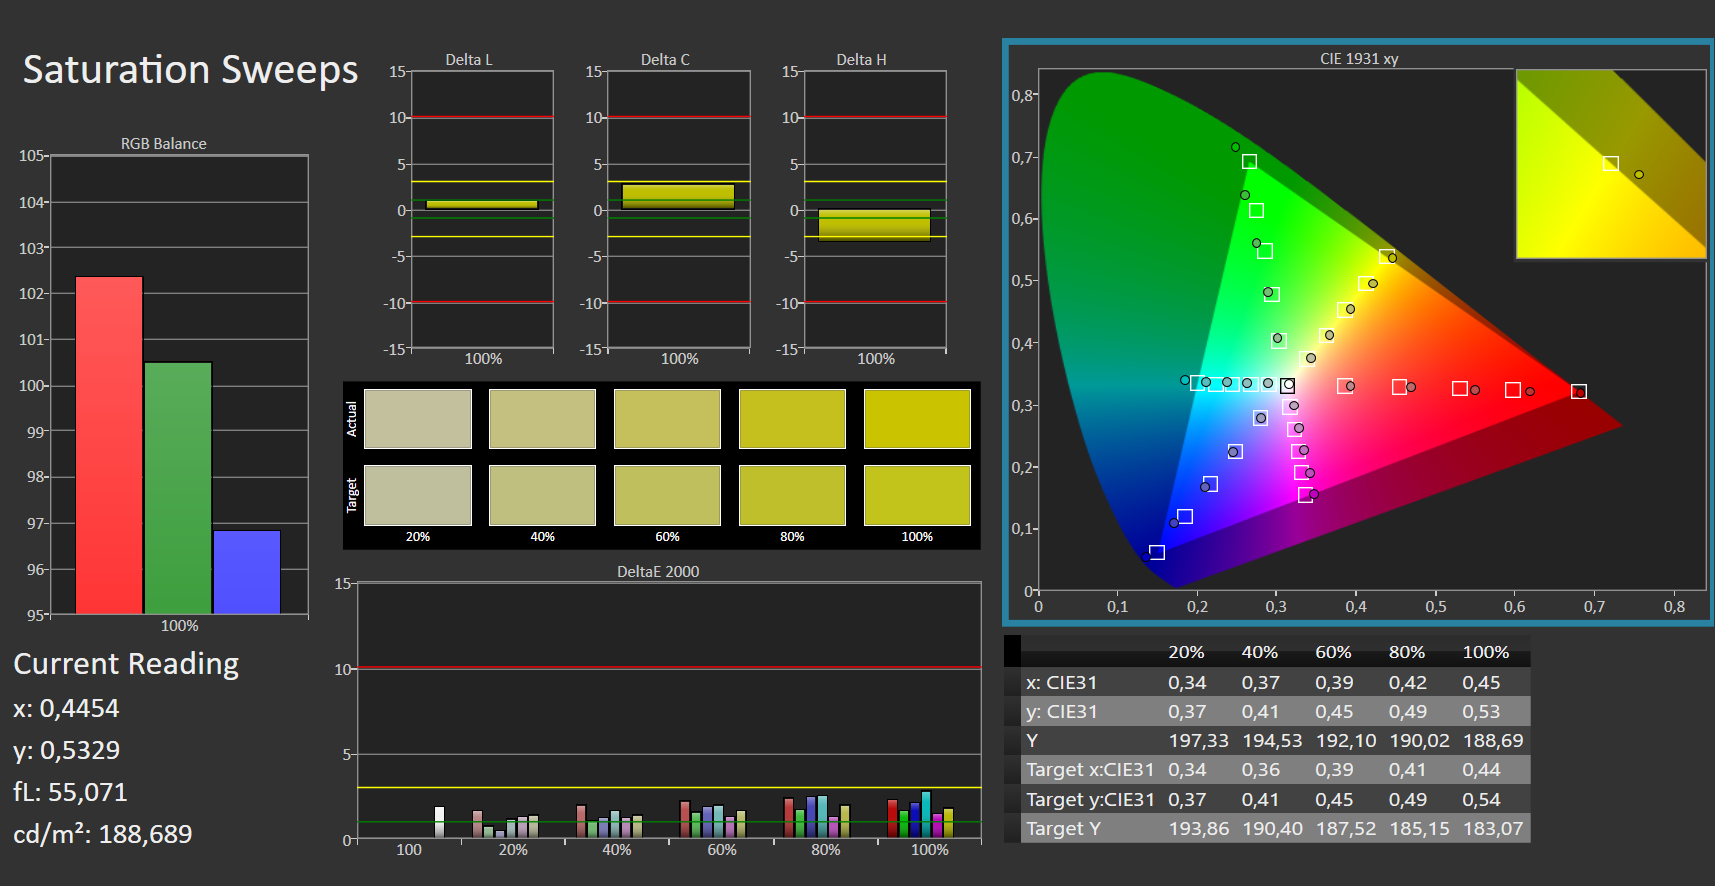
Anche appena uscito dalla confezione, il display offre un'impressionante riproduzione dei colori: Con una deviazione di 1,9, l'obiettivo (DeltaE < 3) è chiaramente raggiunto. La calibrazione non porta ad alcun miglioramento. L'accuratezza del colore è data: Gli spazi colore sRGB e DCI-P3 sono riprodotti completamente e quasi completamente, con lo spazio colore AdobeRGB al 94%. Il pannello LED del fratello offre risultati altrettanto buoni.
Tempi di risposta del Display
| ↔ Tempi di risposta dal Nero al Bianco | ||
|---|---|---|
| 2 ms ... aumenta ↗ e diminuisce ↘ combinato | ↗ 1 ms Incremento |  |
| ↘ 1 ms Calo | ||
| Lo schermo ha mostrato valori di risposta molto veloci nei nostri tests ed è molto adatto per i gaming veloce. In confronto, tutti i dispositivi di test variano da 0.1 (minimo) a 240 (massimo) ms. » 11 % di tutti i dispositivi è migliore. Questo significa che i tempi di risposta rilevati sono migliori rispettto alla media di tutti i dispositivi testati (19.8 ms). | ||
| ↔ Tempo di risposta dal 50% Grigio all'80% Grigio | ||
| 2 ms ... aumenta ↗ e diminuisce ↘ combinato | ↗ 1 ms Incremento |  |
| ↘ 1 ms Calo | ||
| Lo schermo ha mostrato valori di risposta molto veloci nei nostri tests ed è molto adatto per i gaming veloce. In confronto, tutti i dispositivi di test variano da 0.165 (minimo) a 636 (massimo) ms. » 10 % di tutti i dispositivi è migliore. Questo significa che i tempi di risposta rilevati sono migliori rispettto alla media di tutti i dispositivi testati (30.9 ms). | ||
Sfarfallio dello schermo / PWM (Pulse-Width Modulation)
| flickering dello schermo / PWM rilevato | 500 Hz | ≤ 70 % settaggio luminosita' |  |
Il display sfarfalla a 500 Hz (Probabilmente a causa dell'uso di PWM) Flickering rilevato ad una luminosita' di 70 % o inferiore. Non dovrebbe verificarsi flickering o PWM sopra questo valore di luminosita'. La frequenza di 500 Hz è relativamente elevata, quindi la maggioranza degli utenti sensibili al PWM non dovrebbe notare alcun flickering. Tuttavia, è stato segnalato che alcuni utenti sono sensibili al PWM a 500 Hz ed oltre, quindi prestate attenzione. In confronto: 52 % di tutti i dispositivi testati non utilizza PWM per ridurre la luminosita' del display. Se è rilevato PWM, una media di 7741 (minimo: 5 - massimo: 343500) Hz è stata rilevata. | |||
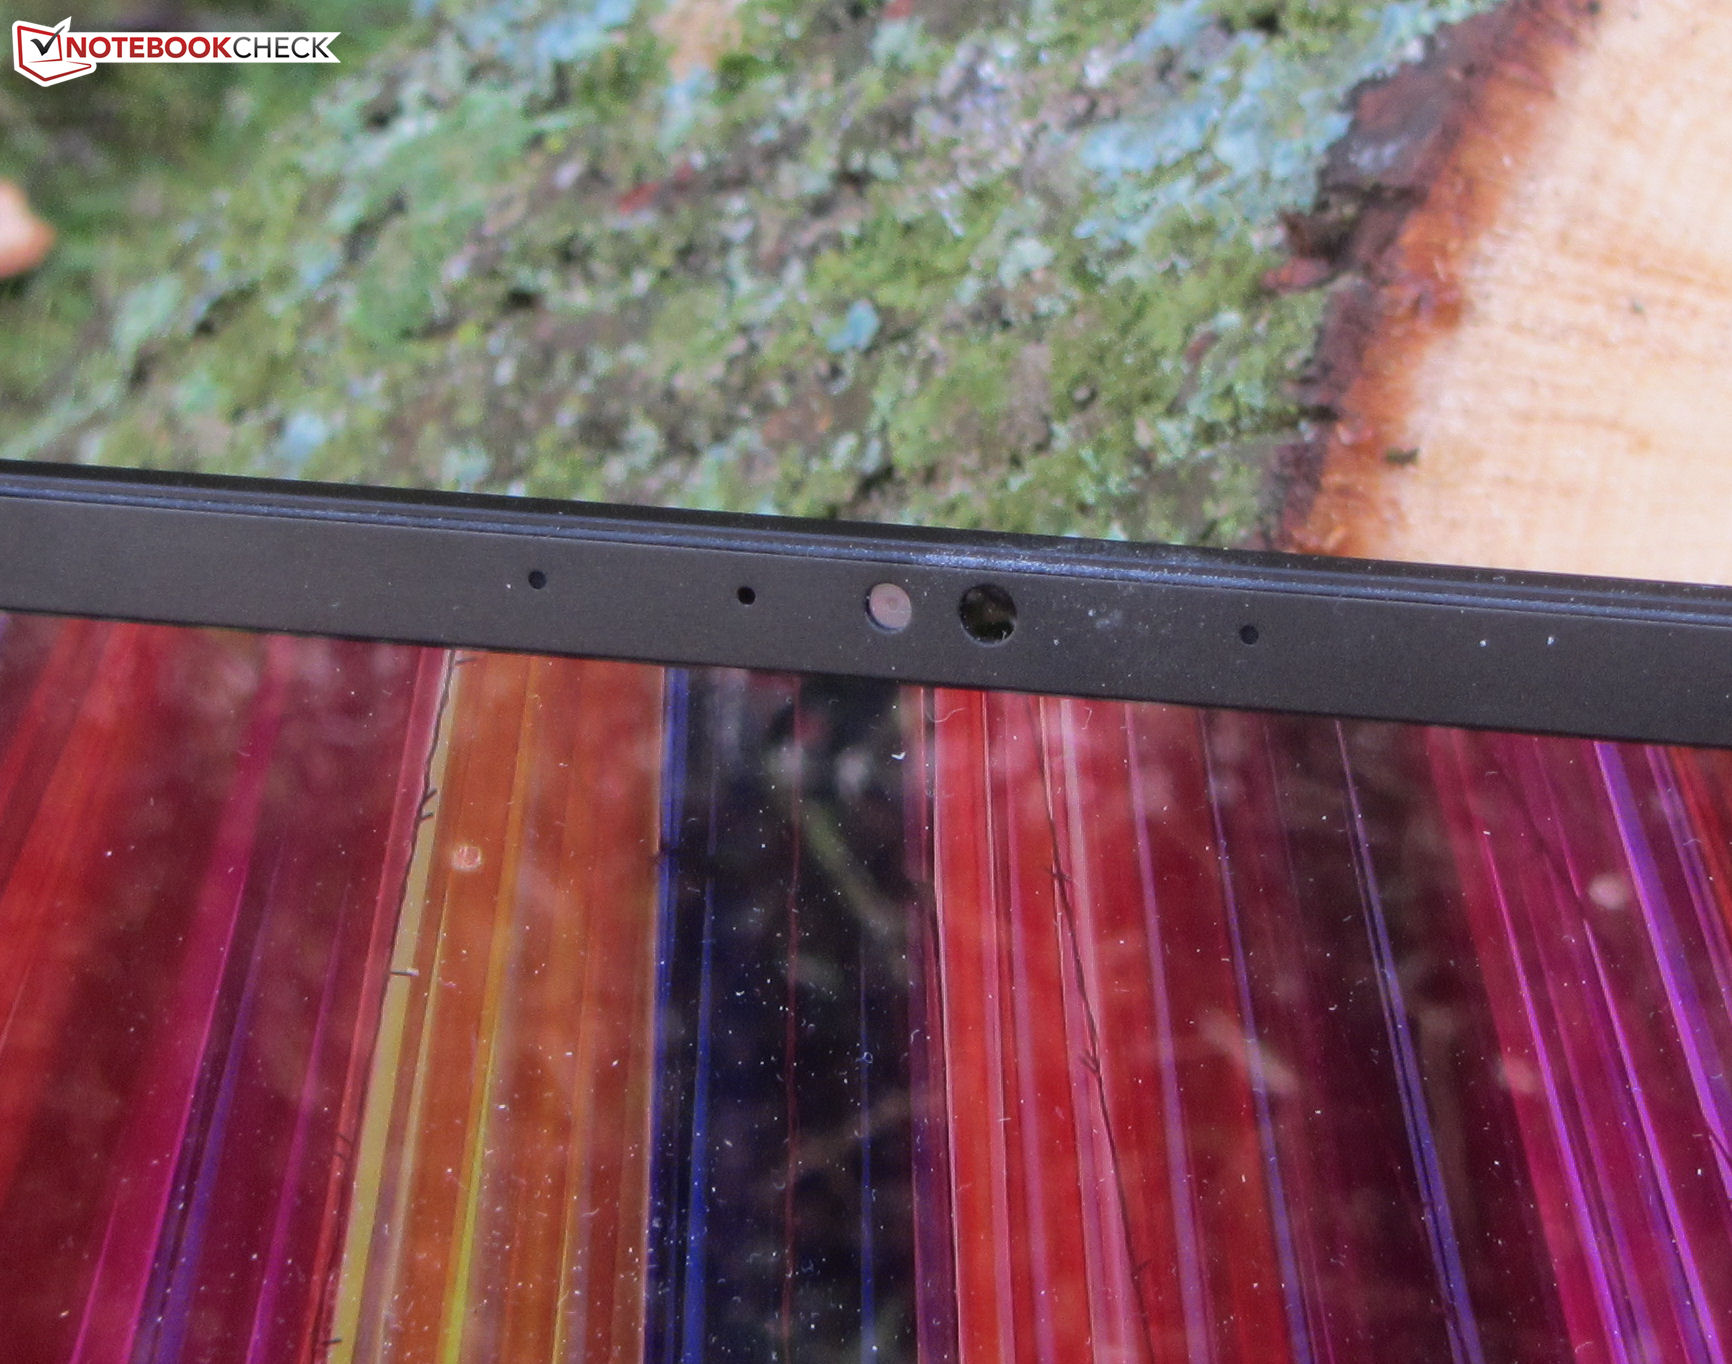
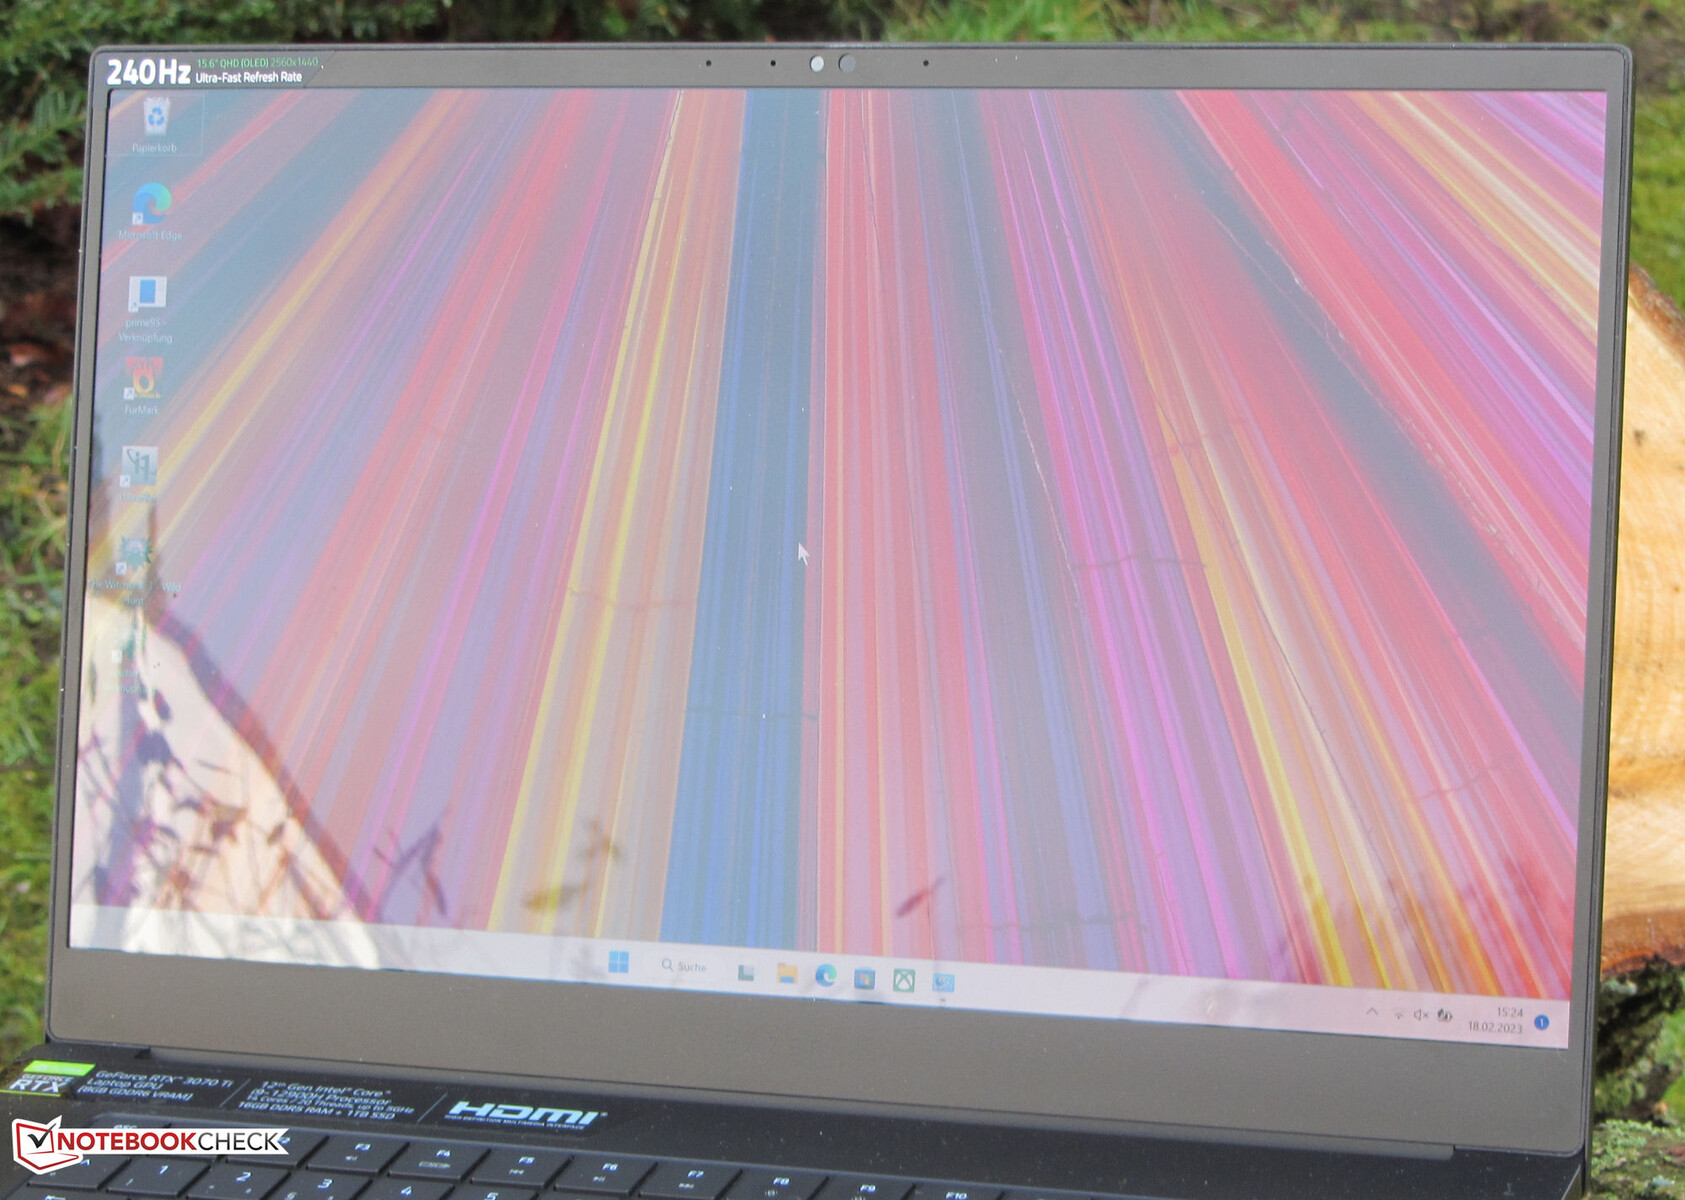
Il pannello è dotato di un'ottima stabilità dell'angolo di visione ed è leggibile da ogni angolazione. Tuttavia, all'aperto questo è difficile a causa della superficie lucida e riflettente del display.

Prestazioni - Blade 15 è basato su Alder Lake e Ampere
Con il Blade 15 (inizio 2022), Razer ha un portatile nella sua gamma di prodotti progettato per il gioco in QHD (impostazioni elevate o massime), ma anche per l'editing video e il rendering. Il modello qui recensito può essere acquistato a circa 1.967 dollari.
Condizioni di prova
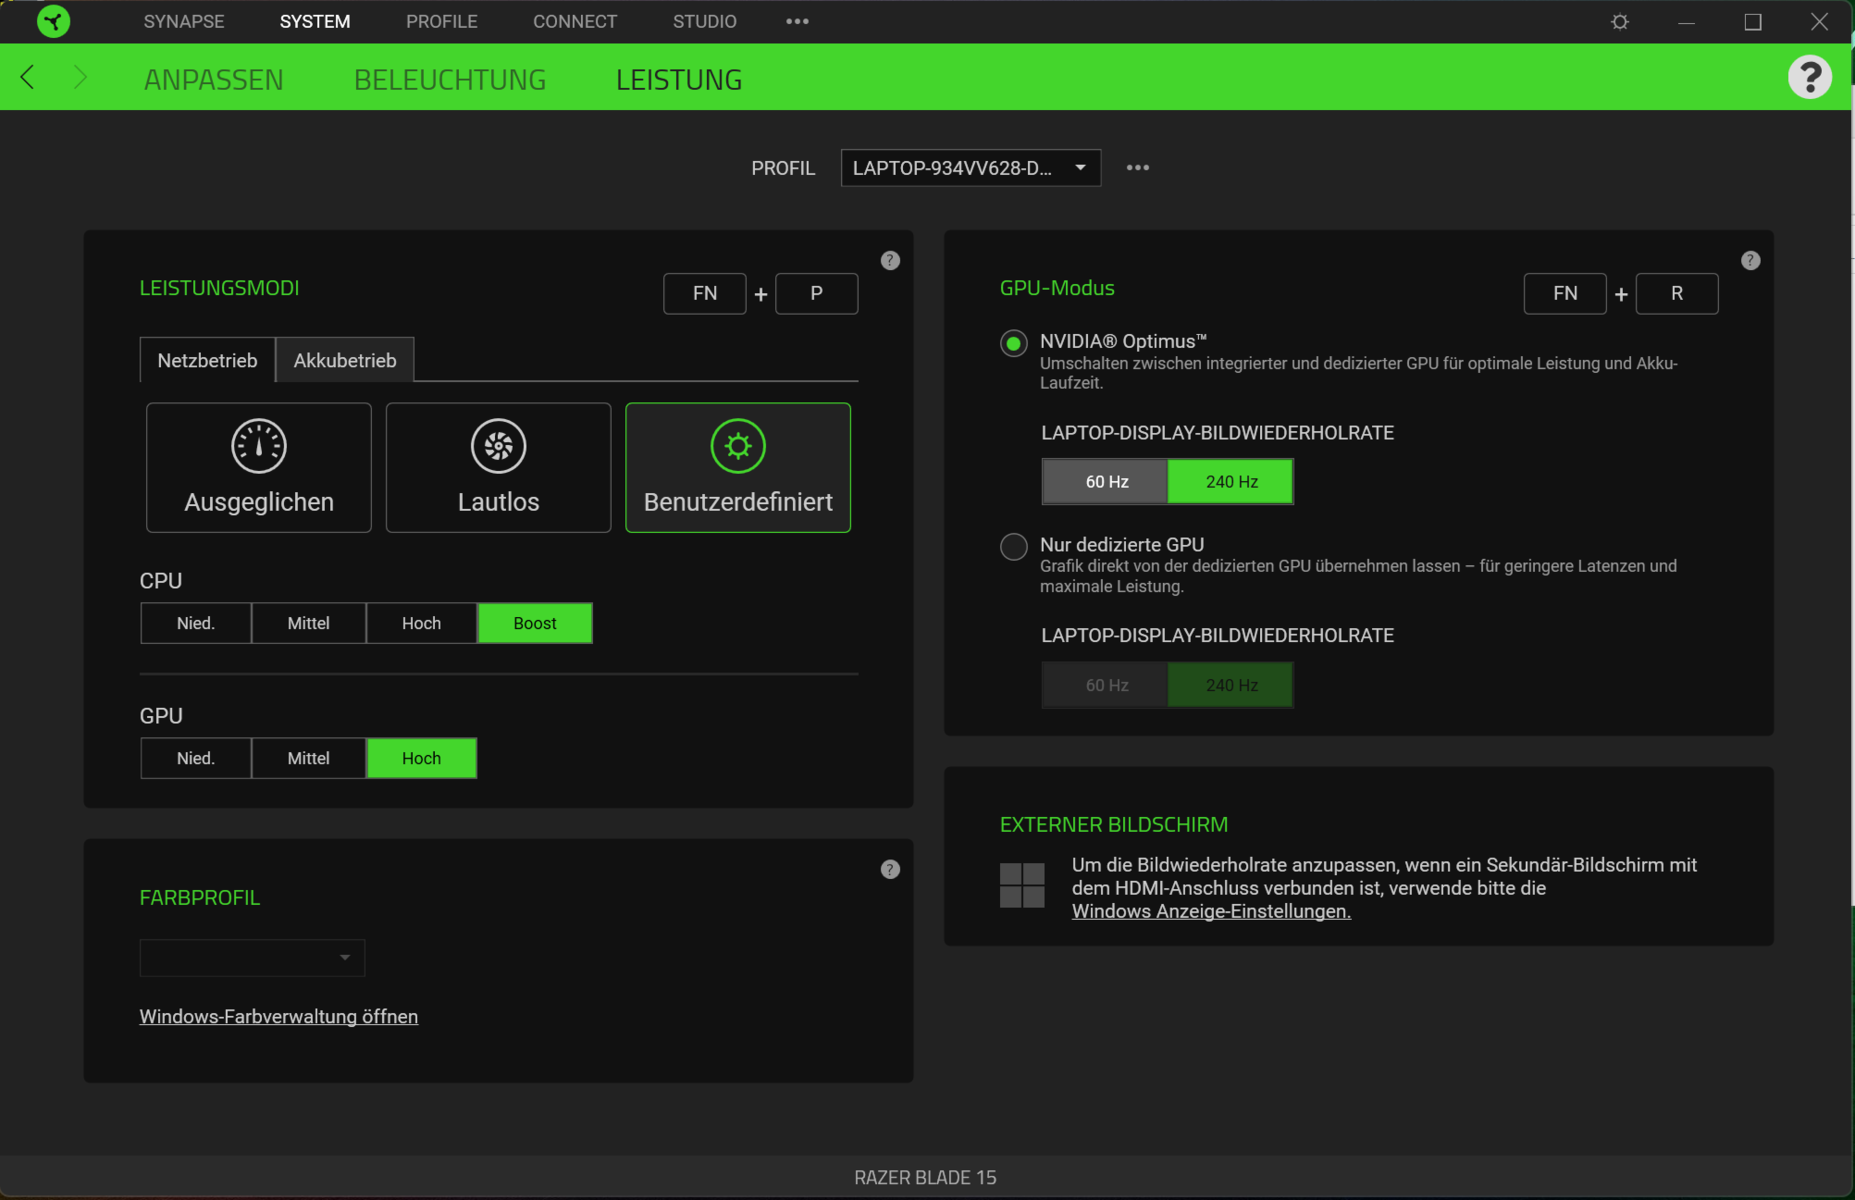
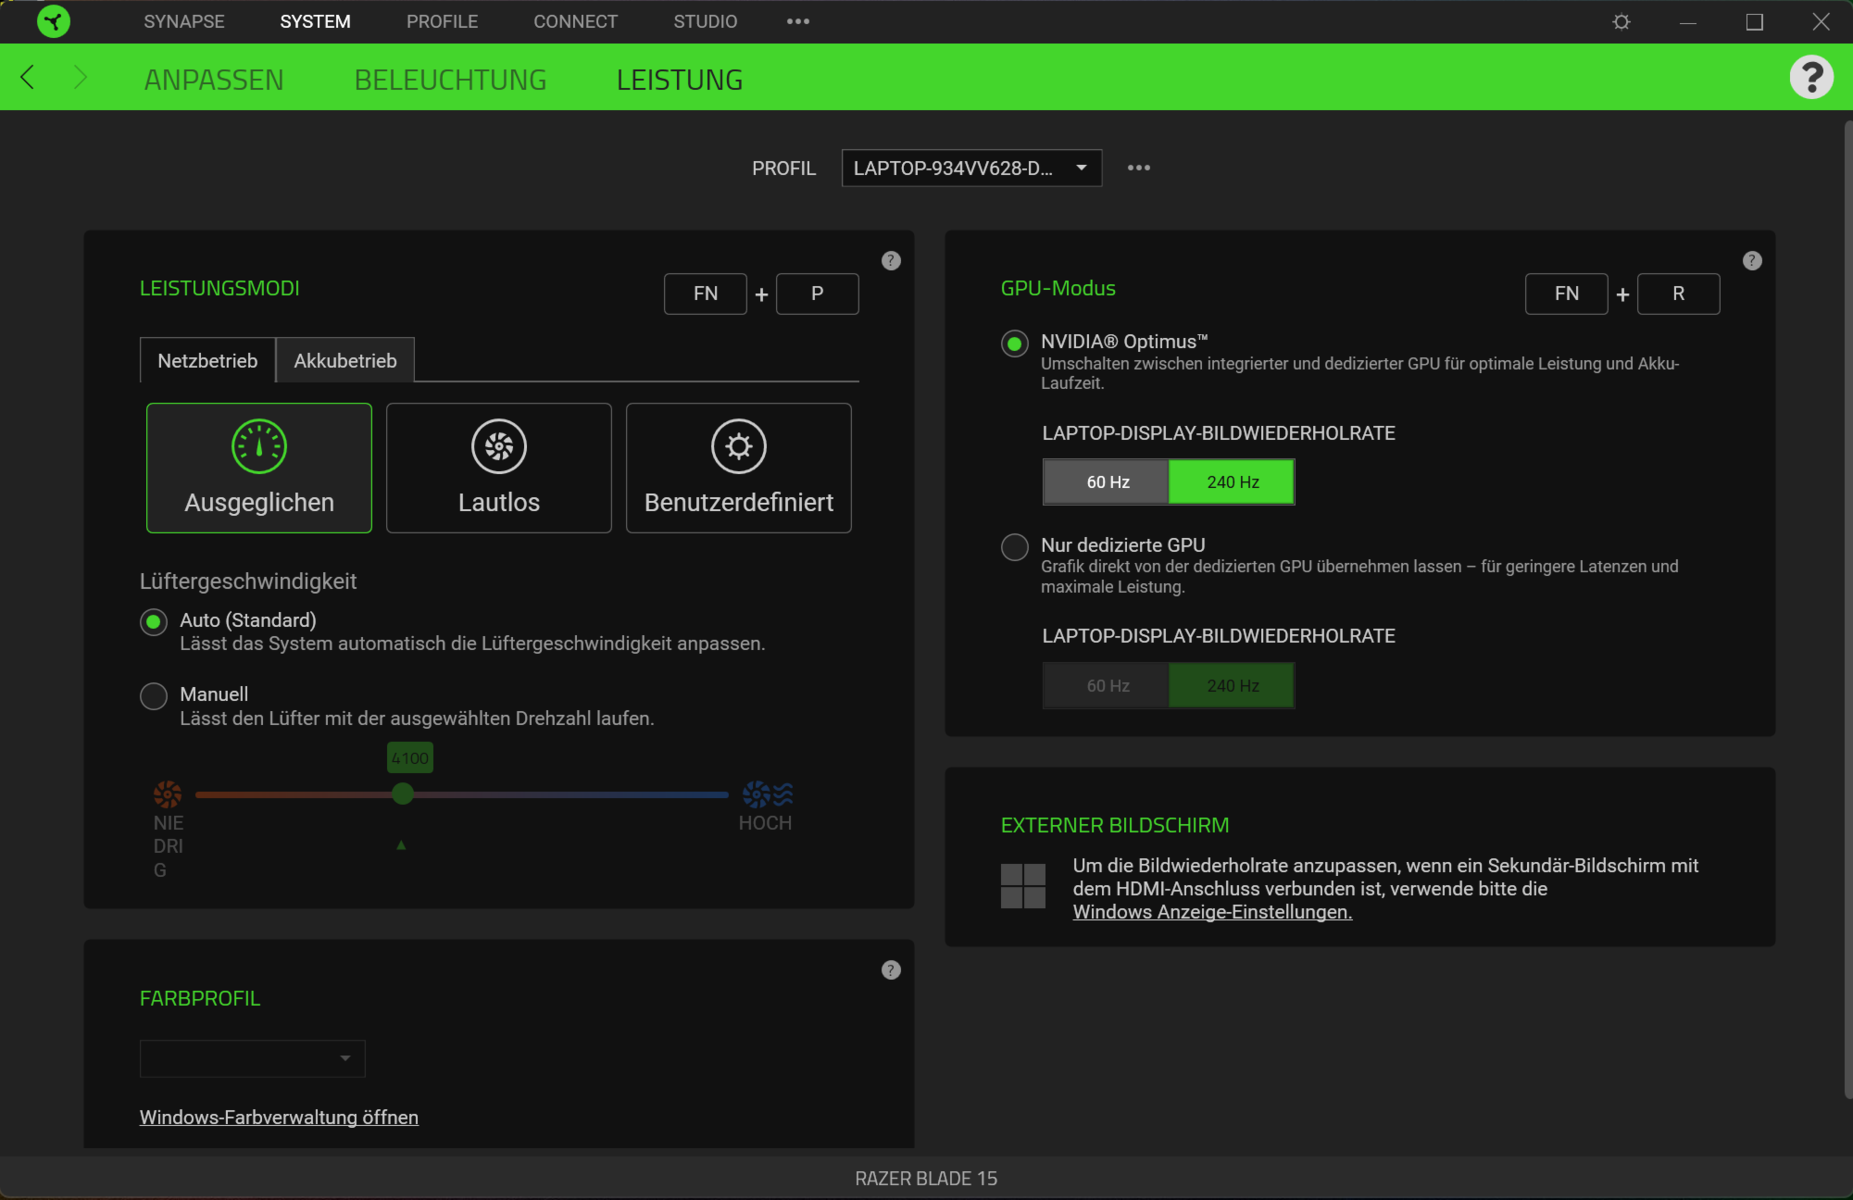
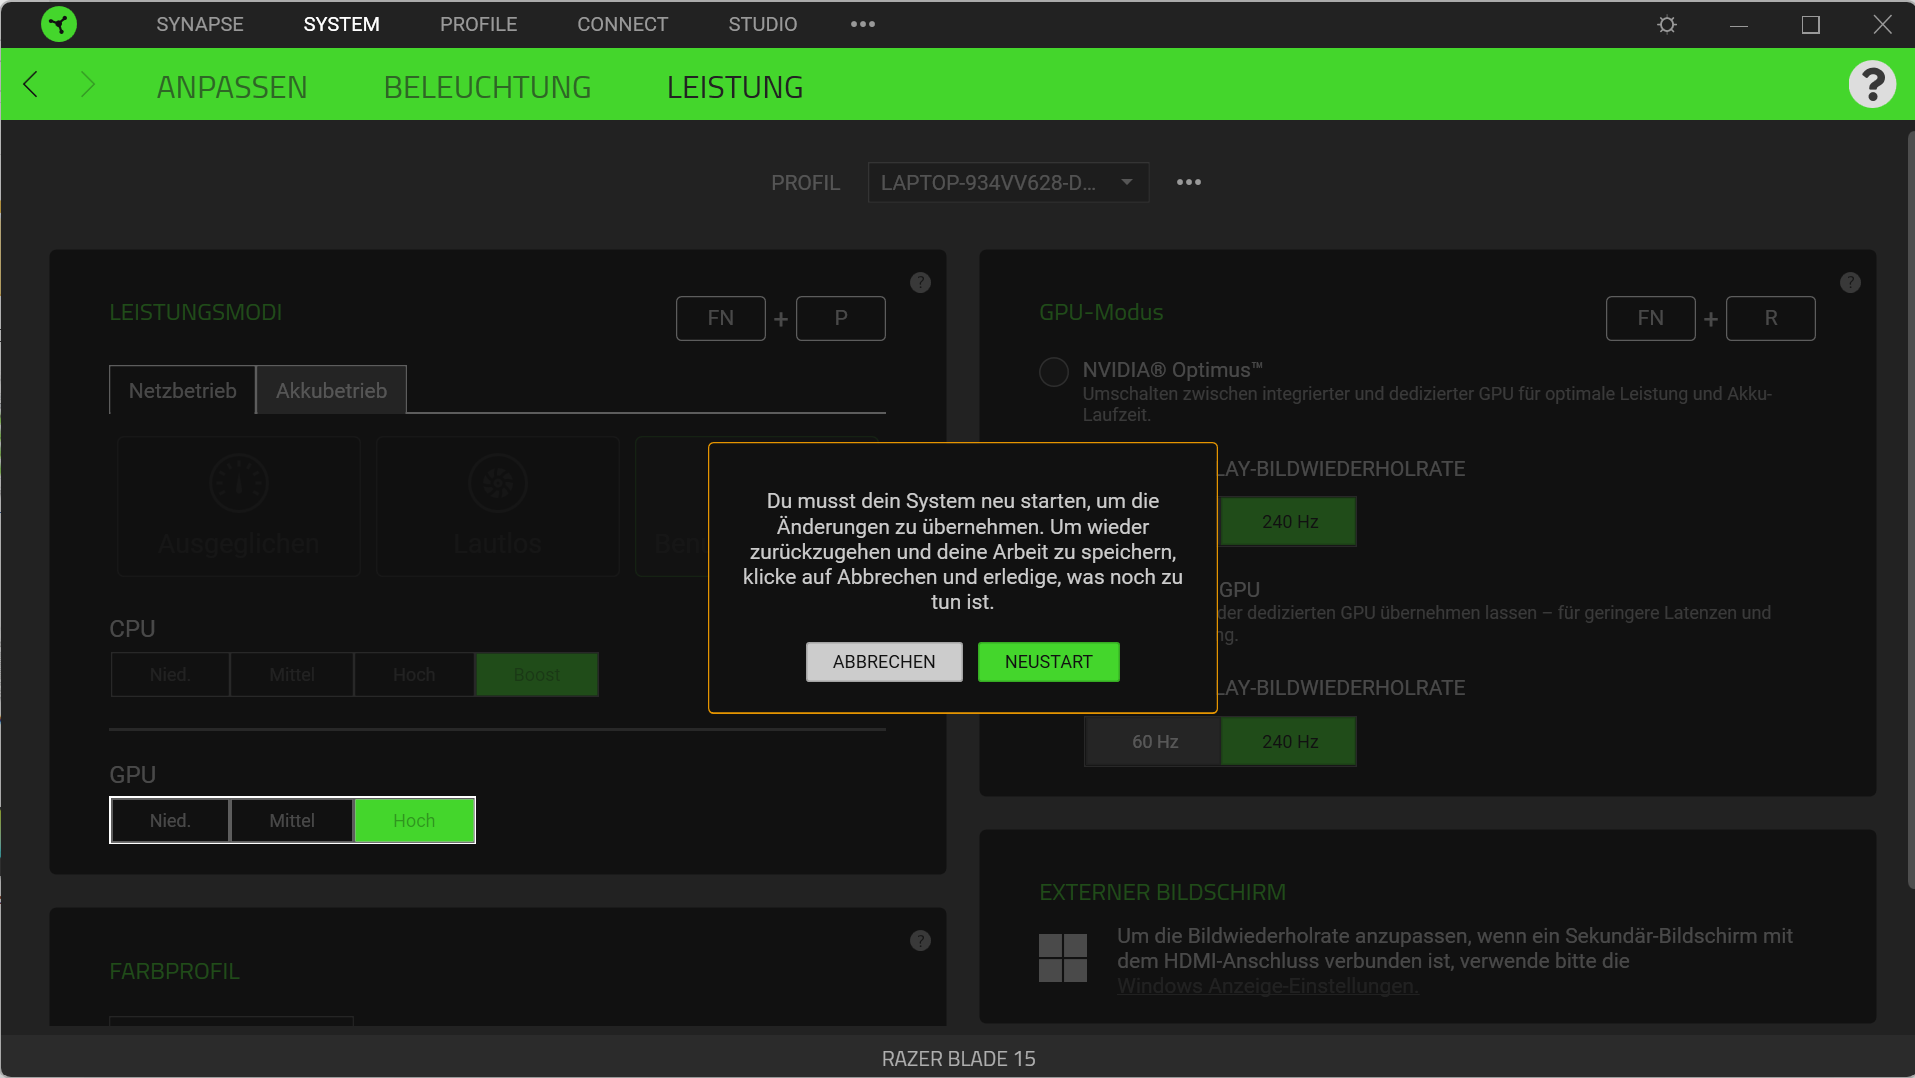
È possibile passare da una modalità all'altra ("Bilanciato", "Silenzioso" e "Definito dall'utente") utilizzando la combinazione di tasti "Fn" + "P". Il profilo "Definito dall'utente" consente di impostare le sottoprestazioni della CPU ("Basso", "Medio", "Alto", "Boost") e della GPU ("Basso", "Medio" e "Alto") tramite il software Razer Synapse preinstallato. In modalità batteria è disponibile solo il profilo "Bilanciato".
I benchmark sono stati eseguiti utilizzando la modalità attiva "Definito dall'utente" con le impostazioni massime (sottoprese "Boost" e "Alto"). Per il test della batteria è stato utilizzato il profilo "Silenzioso".
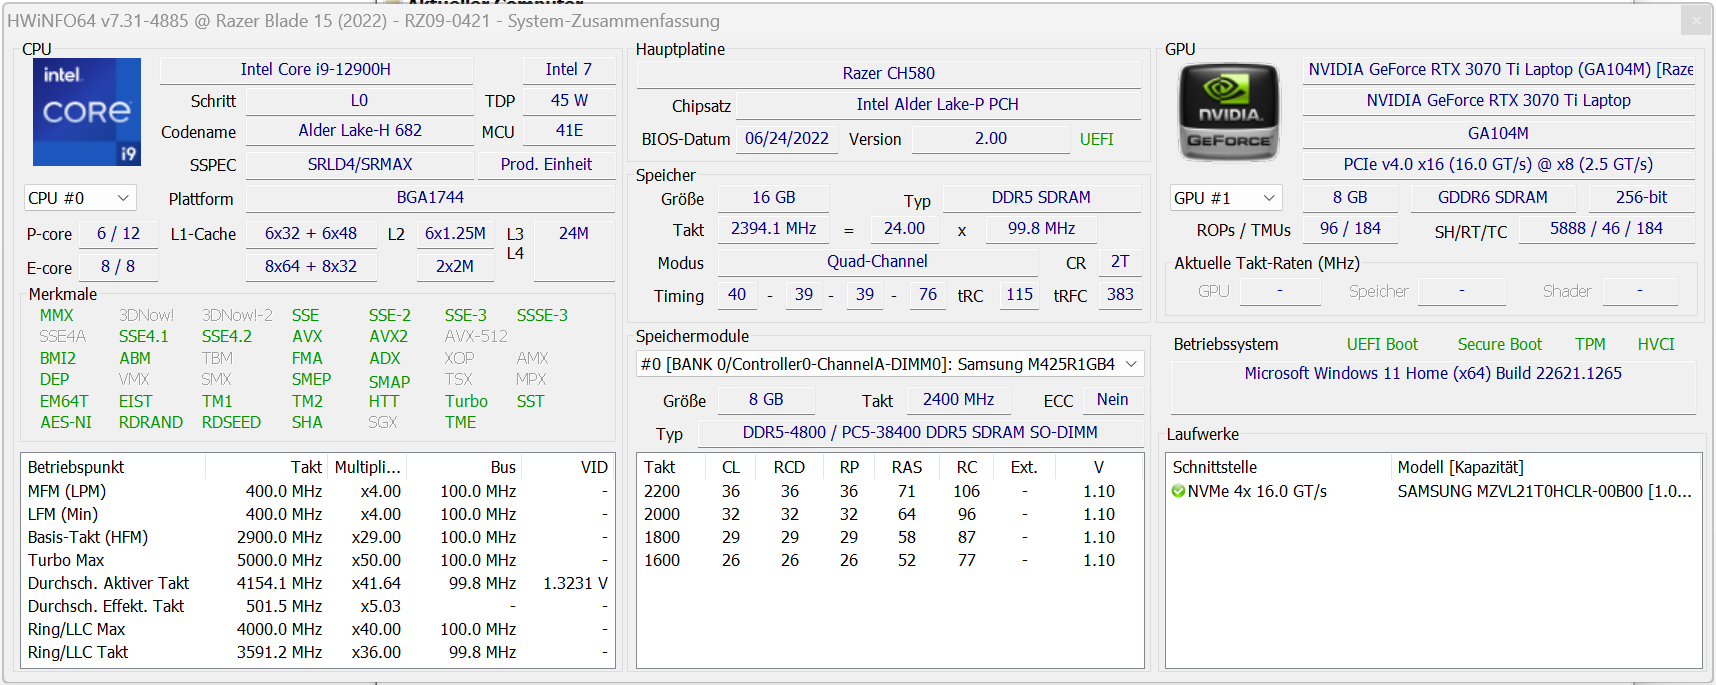
Processore
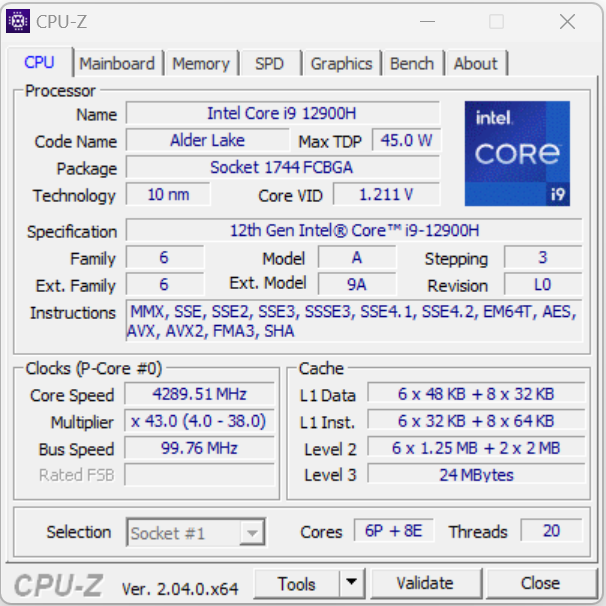
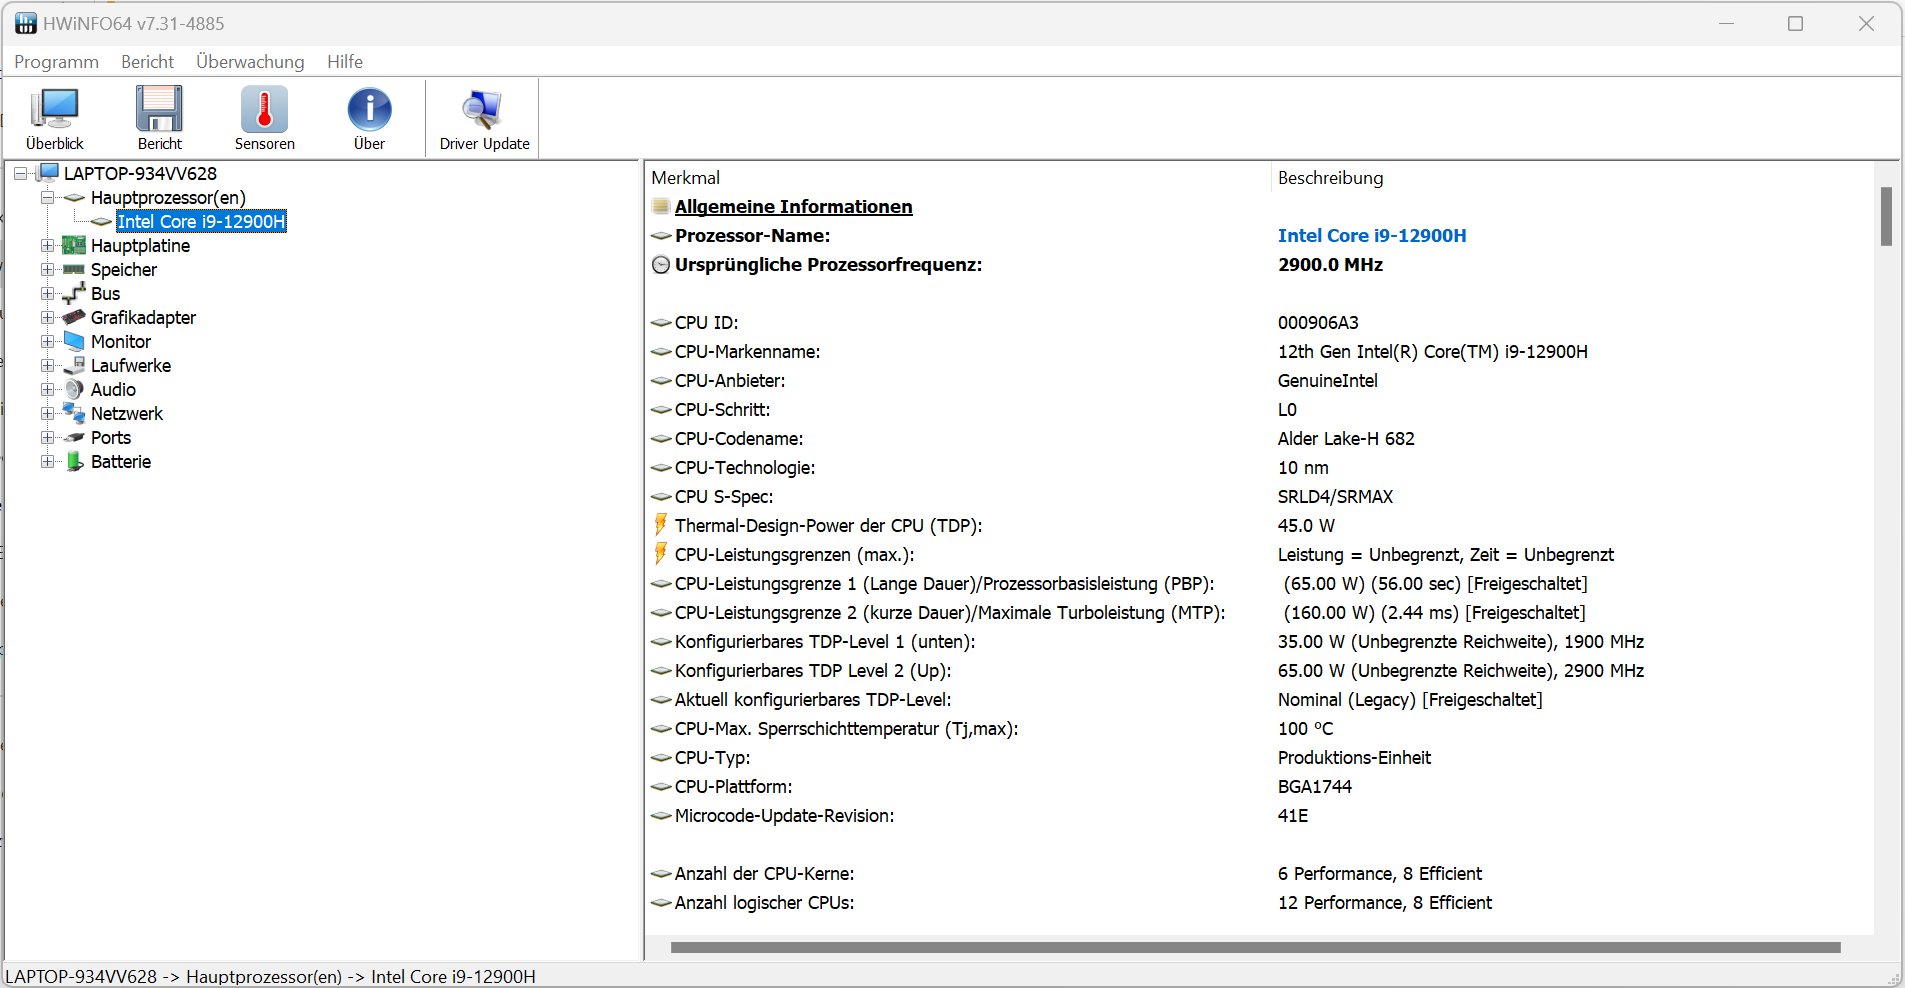
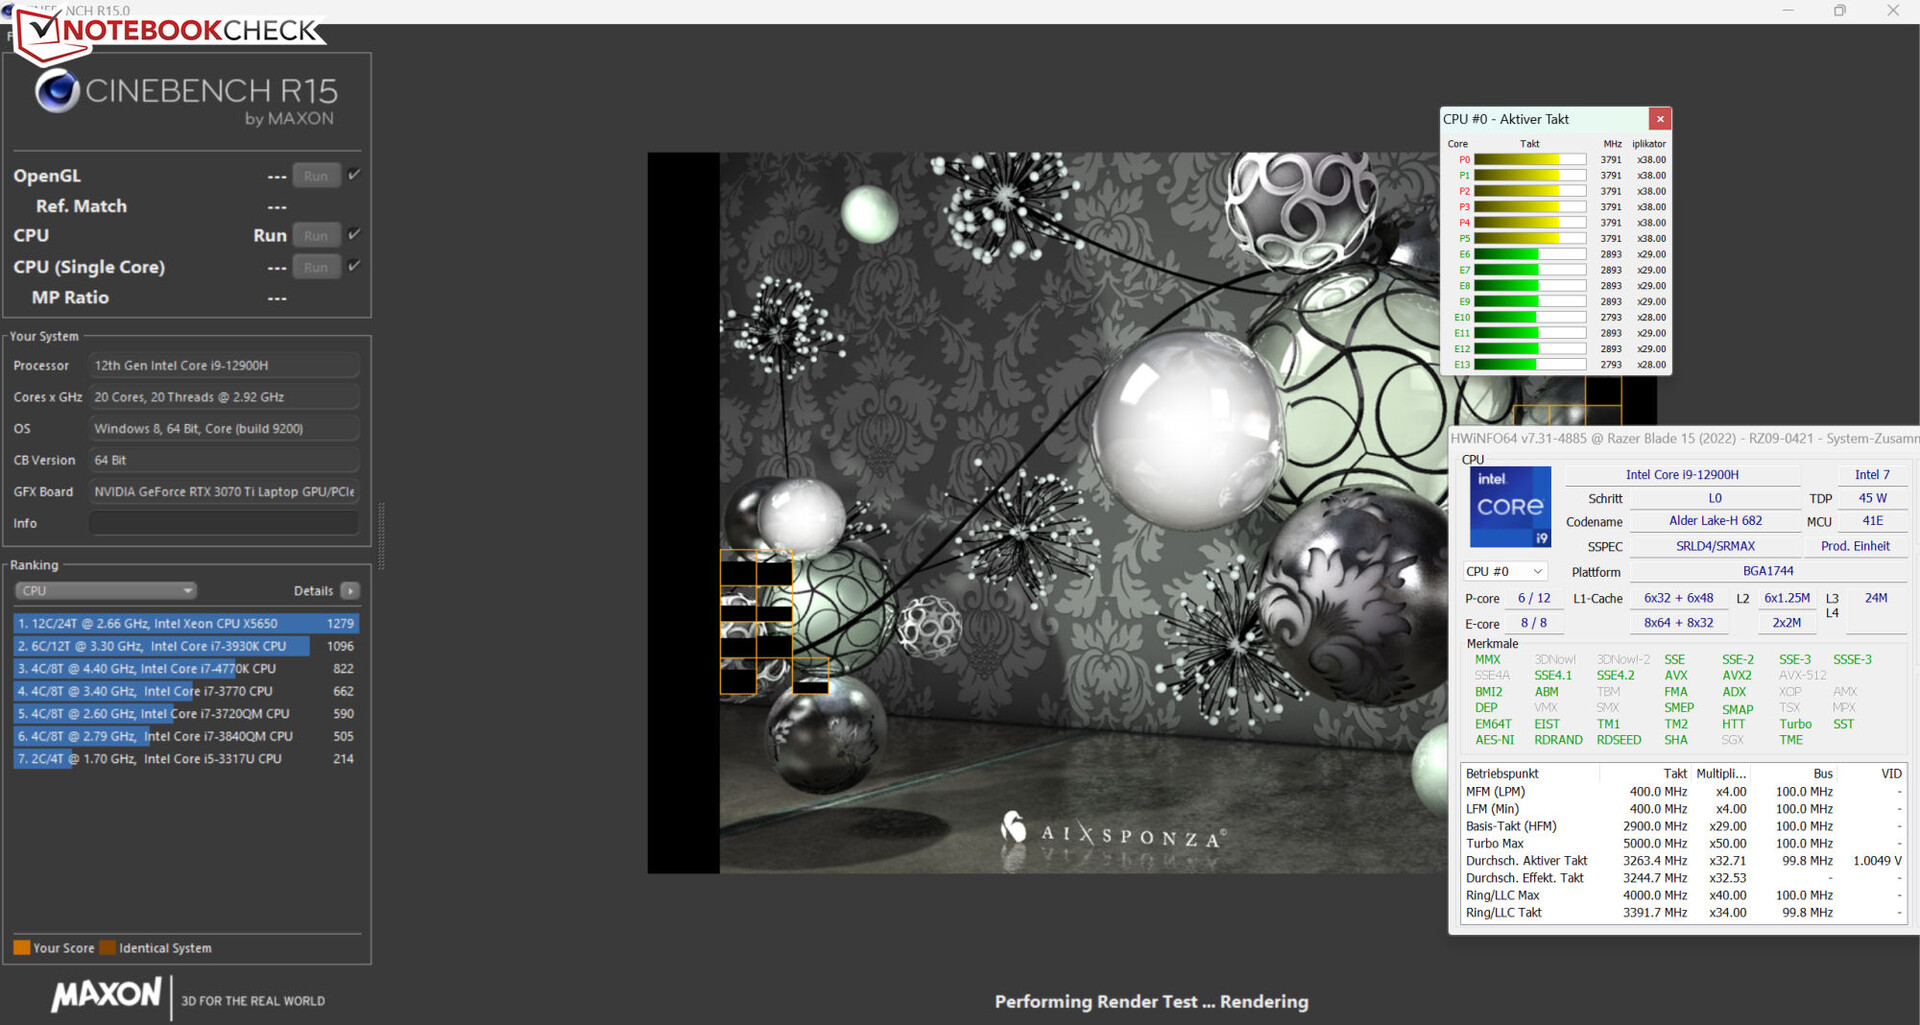
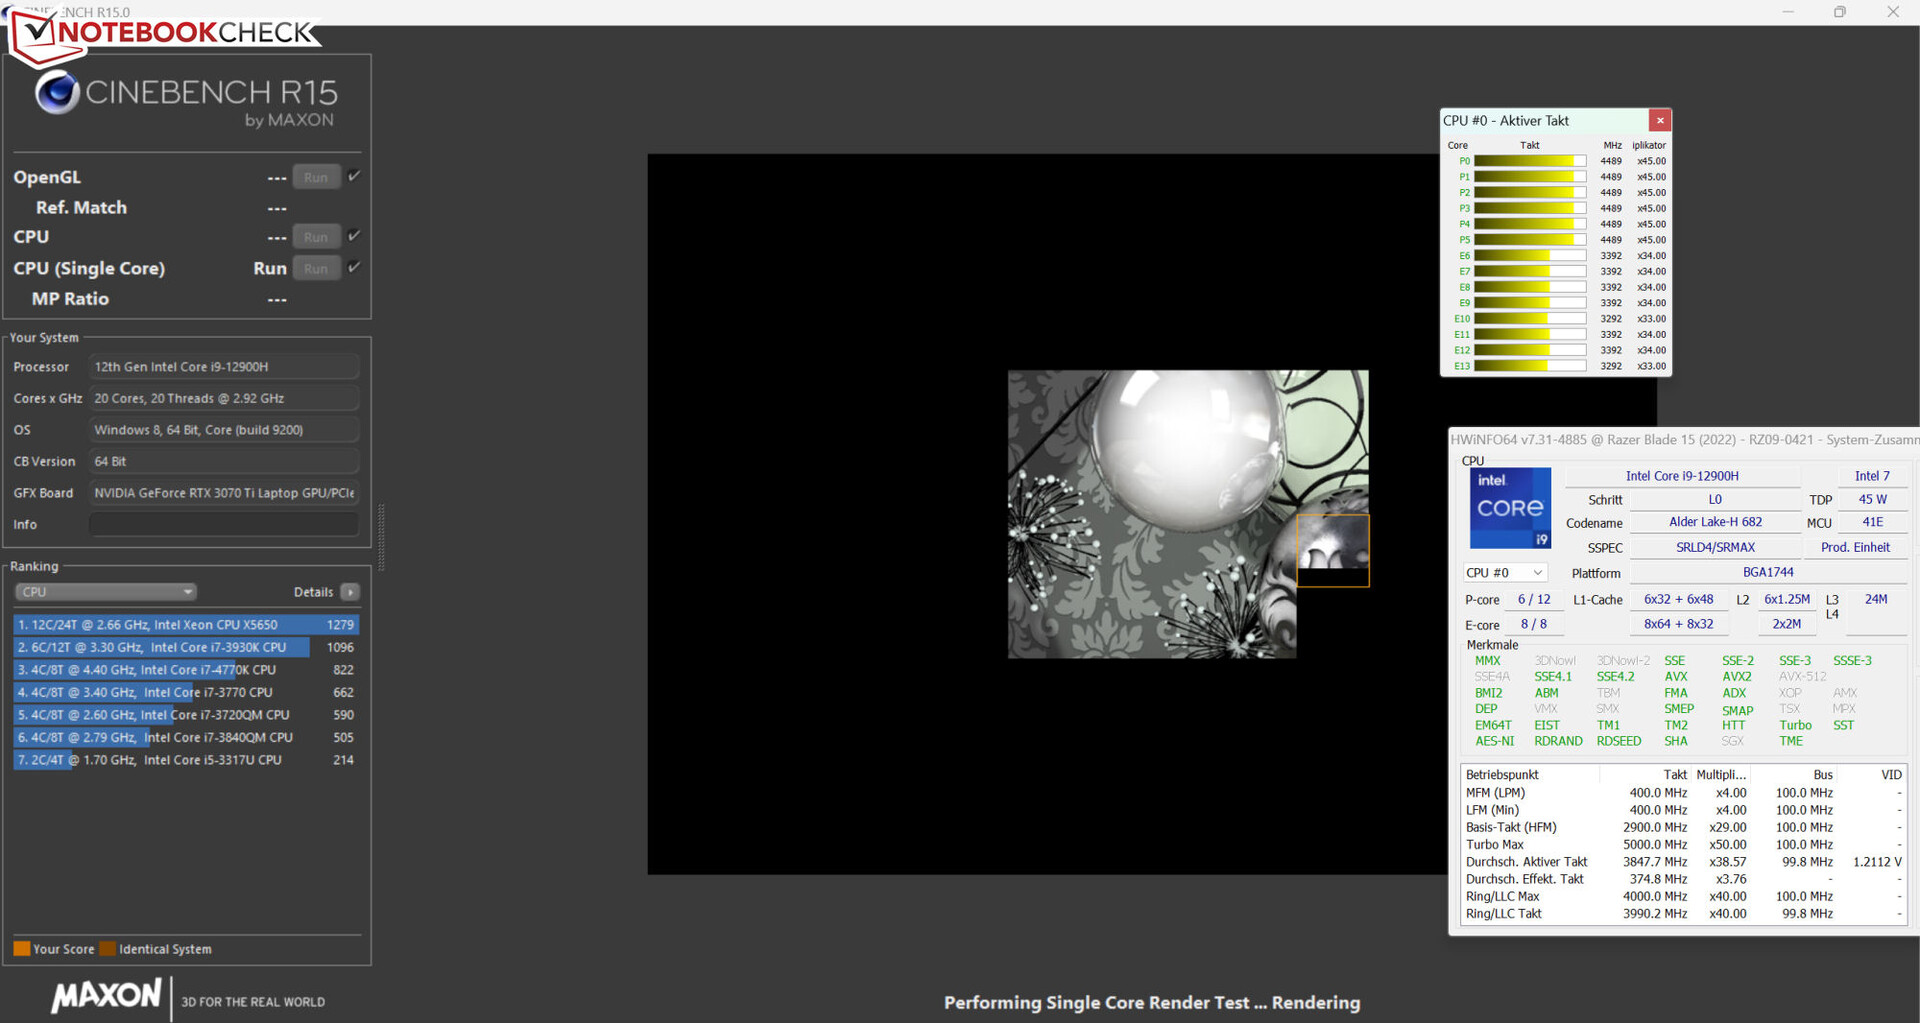
IlCore i9-12900H(Alder Lake) è composto da sei core di prestazioni (hyperthreading, da 2,5 a 5 GHz) e otto core di efficienza (senza hyperthreading, da 1,8 a 3,8 GHz). In totale, ci sono 20 core logici della CPU.
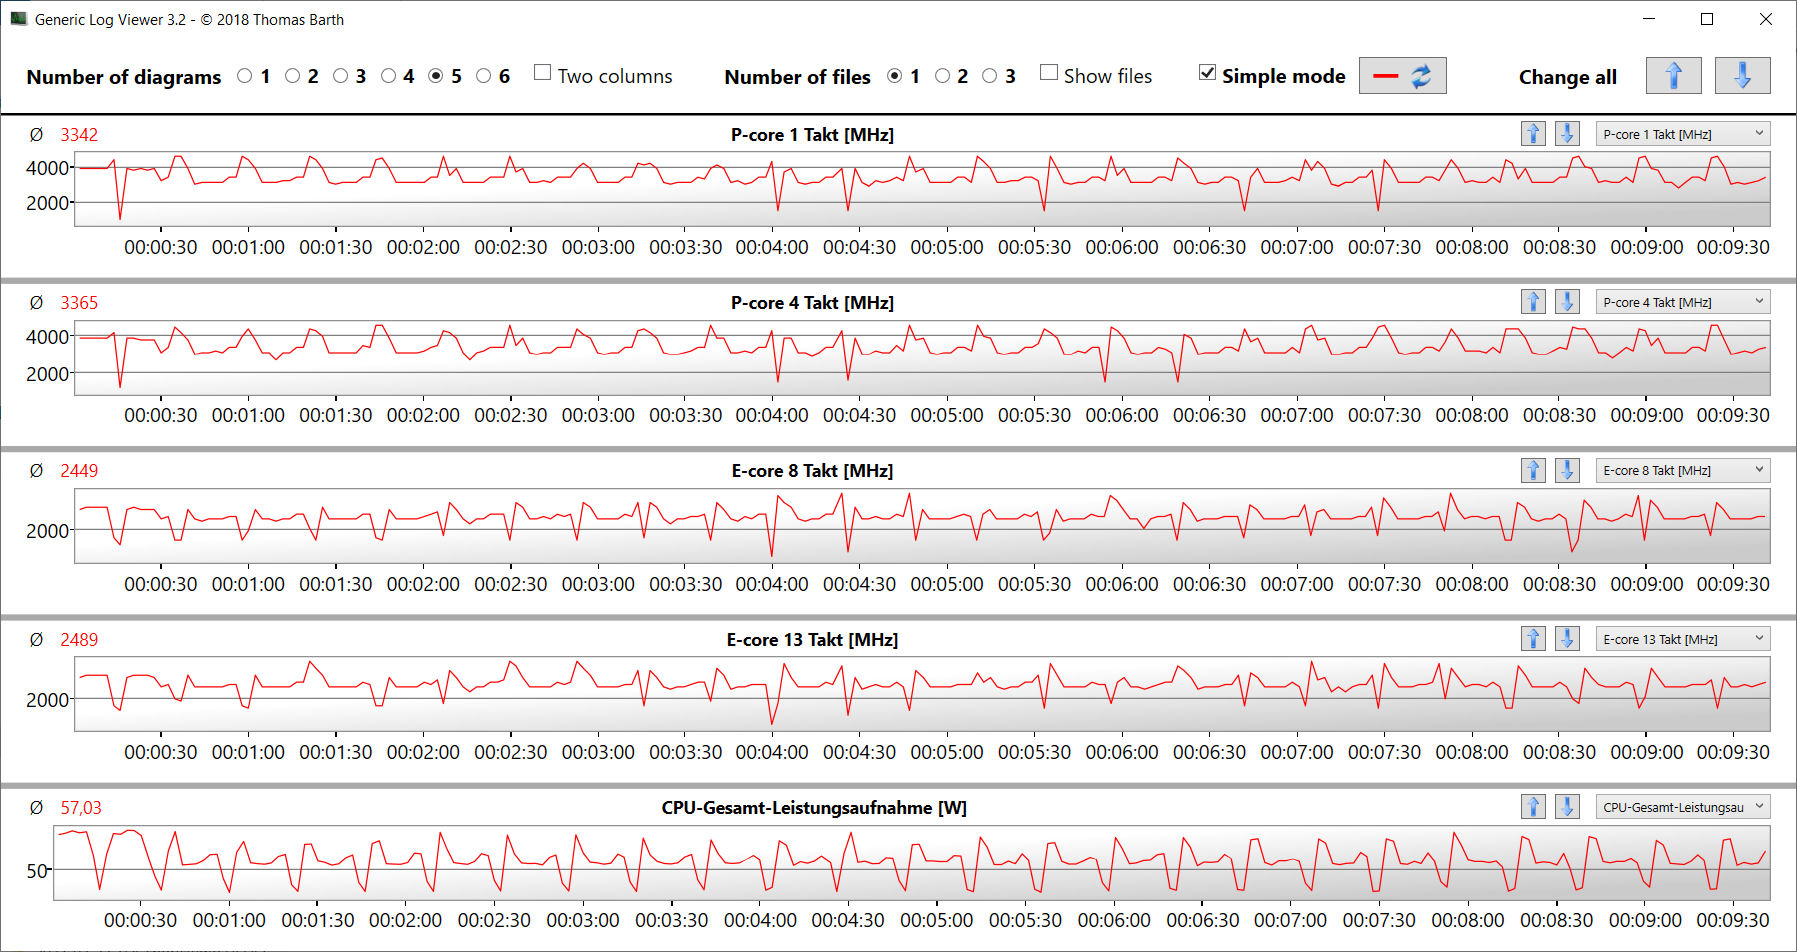
Il test multi-thread del benchmark Cinebench R15 è stato elaborato a 3,6-3,8 GHz (core P) e 2,8-2,9 GHz (core E). Il test single-thread è stato eseguito rispettivamente a 1,4-4,5 GHz (P-cores) e 1,5-3,5 GHz (E-cores). In modalità batteria, le velocità di clock sono inferiori. Il test del ciclo CB15 lo dimostra: Il carico multi-thread viene affrontato con un'elevata velocità di clock del turbo solo per un breve periodo. Dopo 30-40 secondi i valori scendono a circa la velocità di clock di base.
Cinebench R15 Multi Continuous Test
* ... Meglio usare valori piccoli
AIDA64: FP32 Ray-Trace | FPU Julia | CPU SHA3 | CPU Queen | FPU SinJulia | FPU Mandel | CPU AES | CPU ZLib | FP64 Ray-Trace | CPU PhotoWorxx
| Performance rating | |
| Media della classe Gaming | |
| Asus ROG Zephyrus M16 GU603Z | |
| Razer Blade 15 OLED (Early 2022) | |
| Aorus 15 XE5 | |
| Schenker XMG Fusion 15 (Mid 22) | |
| Media Intel Core i9-12900H | |
| HP Omen 16-b1090ng | |
| Razer Blade 15 2022 | |
| AIDA64 / FP32 Ray-Trace | |
| Media della classe Gaming (10227 - 85542, n=102, ultimi 2 anni) | |
| Asus ROG Zephyrus M16 GU603Z | |
| Razer Blade 15 OLED (Early 2022) | |
| Aorus 15 XE5 | |
| Schenker XMG Fusion 15 (Mid 22) | |
| Media Intel Core i9-12900H (4074 - 18289, n=29) | |
| Razer Blade 15 2022 | |
| HP Omen 16-b1090ng | |
| AIDA64 / FPU Julia | |
| Media della classe Gaming (51376 - 372155, n=102, ultimi 2 anni) | |
| Asus ROG Zephyrus M16 GU603Z | |
| Razer Blade 15 OLED (Early 2022) | |
| Aorus 15 XE5 | |
| Schenker XMG Fusion 15 (Mid 22) | |
| Media Intel Core i9-12900H (22307 - 93236, n=29) | |
| Razer Blade 15 2022 | |
| HP Omen 16-b1090ng | |
| AIDA64 / CPU SHA3 | |
| Media della classe Gaming (2180 - 10115, n=102, ultimi 2 anni) | |
| Schenker XMG Fusion 15 (Mid 22) | |
| Asus ROG Zephyrus M16 GU603Z | |
| Razer Blade 15 OLED (Early 2022) | |
| Media Intel Core i9-12900H (1378 - 4215, n=29) | |
| Aorus 15 XE5 | |
| Razer Blade 15 2022 | |
| HP Omen 16-b1090ng | |
| AIDA64 / CPU Queen | |
| Media della classe Gaming (49785 - 173351, n=86, ultimi 2 anni) | |
| Razer Blade 15 OLED (Early 2022) | |
| Asus ROG Zephyrus M16 GU603Z | |
| Aorus 15 XE5 | |
| Media Intel Core i9-12900H (78172 - 111241, n=28) | |
| HP Omen 16-b1090ng | |
| Razer Blade 15 2022 | |
| Schenker XMG Fusion 15 (Mid 22) | |
| AIDA64 / FPU SinJulia | |
| Media della classe Gaming (4424 - 33636, n=102, ultimi 2 anni) | |
| Razer Blade 15 OLED (Early 2022) | |
| Asus ROG Zephyrus M16 GU603Z | |
| HP Omen 16-b1090ng | |
| Razer Blade 15 2022 | |
| Media Intel Core i9-12900H (5709 - 10410, n=29) | |
| Schenker XMG Fusion 15 (Mid 22) | |
| Aorus 15 XE5 | |
| AIDA64 / FPU Mandel | |
| Media della classe Gaming (25115 - 196829, n=102, ultimi 2 anni) | |
| Schenker XMG Fusion 15 (Mid 22) | |
| Asus ROG Zephyrus M16 GU603Z | |
| Razer Blade 15 OLED (Early 2022) | |
| Aorus 15 XE5 | |
| Media Intel Core i9-12900H (11257 - 45581, n=29) | |
| Razer Blade 15 2022 | |
| HP Omen 16-b1090ng | |
| AIDA64 / CPU AES | |
| Schenker XMG Fusion 15 (Mid 22) | |
| Asus ROG Zephyrus M16 GU603Z | |
| Aorus 15 XE5 | |
| Media della classe Gaming (39258 - 247074, n=102, ultimi 2 anni) | |
| Razer Blade 15 OLED (Early 2022) | |
| HP Omen 16-b1090ng | |
| Media Intel Core i9-12900H (31935 - 151546, n=29) | |
| Razer Blade 15 2022 | |
| AIDA64 / CPU ZLib | |
| Media della classe Gaming (574 - 2531, n=102, ultimi 2 anni) | |
| Razer Blade 15 OLED (Early 2022) | |
| Asus ROG Zephyrus M16 GU603Z | |
| HP Omen 16-b1090ng | |
| Razer Blade 15 2022 | |
| Media Intel Core i9-12900H (449 - 1193, n=29) | |
| Aorus 15 XE5 | |
| Schenker XMG Fusion 15 (Mid 22) | |
| AIDA64 / FP64 Ray-Trace | |
| Media della classe Gaming (5509 - 45446, n=102, ultimi 2 anni) | |
| Asus ROG Zephyrus M16 GU603Z | |
| Razer Blade 15 OLED (Early 2022) | |
| Schenker XMG Fusion 15 (Mid 22) | |
| Aorus 15 XE5 | |
| Media Intel Core i9-12900H (2235 - 10511, n=29) | |
| HP Omen 16-b1090ng | |
| Razer Blade 15 2022 | |
| AIDA64 / CPU PhotoWorxx | |
| Media della classe Gaming (12271 - 89891, n=102, ultimi 2 anni) | |
| Asus ROG Zephyrus M16 GU603Z | |
| Razer Blade 15 2022 | |
| HP Omen 16-b1090ng | |
| Media Intel Core i9-12900H (20960 - 48269, n=30) | |
| Aorus 15 XE5 | |
| Razer Blade 15 OLED (Early 2022) | |
| Razer Blade 15 OLED (Early 2022) | |
| Schenker XMG Fusion 15 (Mid 22) | |
Prestazioni del sistema
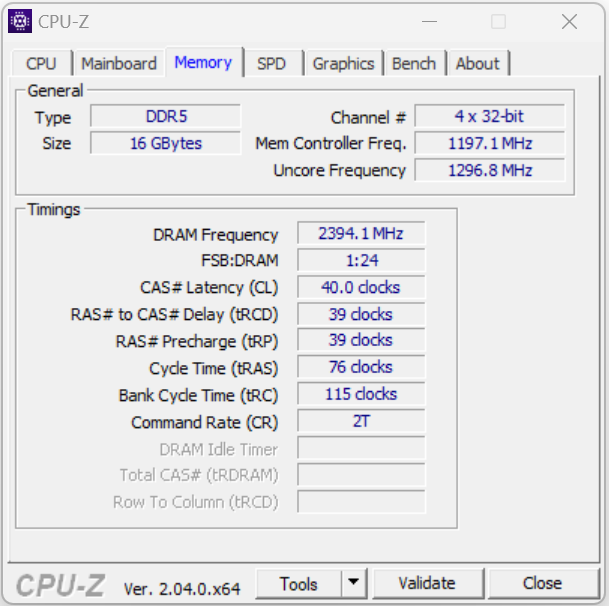
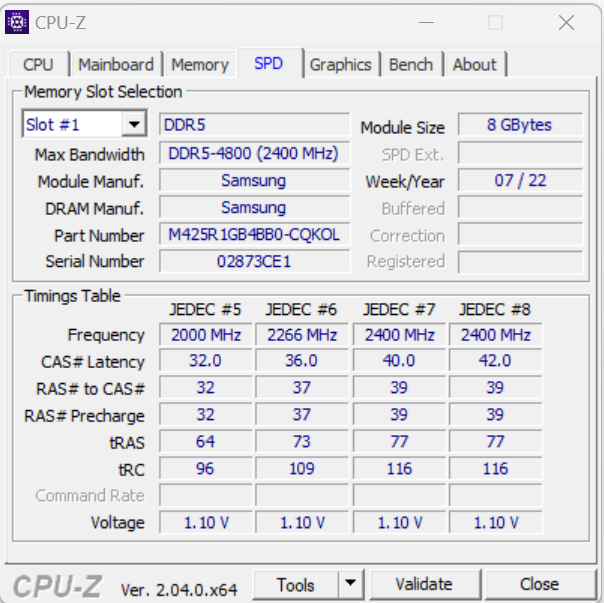
Il sistema funziona in modo fluido e affidabile e fornisce una potenza sufficiente per le applicazioni più esigenti come il rendering, l'editing video e i giochi. La velocità di trasferimento della RAM si attesta su livelli normali per una memoria DDR5-4800 e questo è completato dai buoni risultati di PC-Mark.
CrossMark: Overall | Productivity | Creativity | Responsiveness
| PCMark 10 / Score | |
| Media della classe Gaming (5828 - 12414, n=93, ultimi 2 anni) | |
| Asus ROG Zephyrus M16 GU603Z | |
| Media Intel Core i9-12900H, NVIDIA GeForce RTX 3070 Ti Laptop GPU (7087 - 8072, n=6) | |
| Razer Blade 15 2022 | |
| Aorus 15 XE5 | |
| Razer Blade 15 OLED (Early 2022) | |
| HP Omen 16-b1090ng | |
| Schenker XMG Fusion 15 (Mid 22) | |
| PCMark 10 / Essentials | |
| Asus ROG Zephyrus M16 GU603Z | |
| Media Intel Core i9-12900H, NVIDIA GeForce RTX 3070 Ti Laptop GPU (10266 - 11663, n=6) | |
| Aorus 15 XE5 | |
| Razer Blade 15 2022 | |
| Media della classe Gaming (8810 - 11935, n=97, ultimi 2 anni) | |
| Razer Blade 15 OLED (Early 2022) | |
| HP Omen 16-b1090ng | |
| Schenker XMG Fusion 15 (Mid 22) | |
| PCMark 10 / Productivity | |
| Media della classe Gaming (6845 - 25323, n=95, ultimi 2 anni) | |
| Aorus 15 XE5 | |
| Asus ROG Zephyrus M16 GU603Z | |
| Media Intel Core i9-12900H, NVIDIA GeForce RTX 3070 Ti Laptop GPU (9402 - 10742, n=6) | |
| Razer Blade 15 OLED (Early 2022) | |
| Razer Blade 15 2022 | |
| HP Omen 16-b1090ng | |
| Schenker XMG Fusion 15 (Mid 22) | |
| PCMark 10 / Digital Content Creation | |
| Media della classe Gaming (7602 - 19954, n=95, ultimi 2 anni) | |
| Razer Blade 15 2022 | |
| Asus ROG Zephyrus M16 GU603Z | |
| Media Intel Core i9-12900H, NVIDIA GeForce RTX 3070 Ti Laptop GPU (10009 - 12541, n=6) | |
| Aorus 15 XE5 | |
| HP Omen 16-b1090ng | |
| Razer Blade 15 OLED (Early 2022) | |
| Schenker XMG Fusion 15 (Mid 22) | |
| CrossMark / Overall | |
| Media della classe Gaming (1366 - 2409, n=94, ultimi 2 anni) | |
| Aorus 15 XE5 | |
| Asus ROG Zephyrus M16 GU603Z | |
| Media Intel Core i9-12900H, NVIDIA GeForce RTX 3070 Ti Laptop GPU (1664 - 2044, n=6) | |
| Razer Blade 15 OLED (Early 2022) | |
| Schenker XMG Fusion 15 (Mid 22) | |
| CrossMark / Productivity | |
| Aorus 15 XE5 | |
| Media della classe Gaming (1386 - 2254, n=94, ultimi 2 anni) | |
| Asus ROG Zephyrus M16 GU603Z | |
| Media Intel Core i9-12900H, NVIDIA GeForce RTX 3070 Ti Laptop GPU (1591 - 1968, n=6) | |
| Razer Blade 15 OLED (Early 2022) | |
| Schenker XMG Fusion 15 (Mid 22) | |
| CrossMark / Creativity | |
| Media della classe Gaming (1343 - 2786, n=94, ultimi 2 anni) | |
| Asus ROG Zephyrus M16 GU603Z | |
| Media Intel Core i9-12900H, NVIDIA GeForce RTX 3070 Ti Laptop GPU (1797 - 2148, n=6) | |
| Aorus 15 XE5 | |
| Razer Blade 15 OLED (Early 2022) | |
| Schenker XMG Fusion 15 (Mid 22) | |
| CrossMark / Responsiveness | |
| Aorus 15 XE5 | |
| Asus ROG Zephyrus M16 GU603Z | |
| Media Intel Core i9-12900H, NVIDIA GeForce RTX 3070 Ti Laptop GPU (1514 - 2069, n=6) | |
| Media della classe Gaming (1226 - 2334, n=94, ultimi 2 anni) | |
| Schenker XMG Fusion 15 (Mid 22) | |
| Razer Blade 15 OLED (Early 2022) | |
| PCMark 8 Home Score Accelerated v2 | 5101 punti | |
| PCMark 8 Work Score Accelerated v2 | 5789 punti | |
| PCMark 10 Score | 7336 punti | |
Aiuto | ||
| AIDA64 / Memory Copy | |
| Media della classe Gaming (21750 - 129946, n=102, ultimi 2 anni) | |
| Asus ROG Zephyrus M16 GU603Z | |
| HP Omen 16-b1090ng | |
| Razer Blade 15 2022 | |
| Media Intel Core i9-12900H (34438 - 74264, n=29) | |
| Razer Blade 15 OLED (Early 2022) | |
| Aorus 15 XE5 | |
| Schenker XMG Fusion 15 (Mid 22) | |
| AIDA64 / Memory Read | |
| Media della classe Gaming (22956 - 118858, n=102, ultimi 2 anni) | |
| Asus ROG Zephyrus M16 GU603Z | |
| HP Omen 16-b1090ng | |
| Razer Blade 15 2022 | |
| Media Intel Core i9-12900H (36365 - 74642, n=29) | |
| Razer Blade 15 OLED (Early 2022) | |
| Aorus 15 XE5 | |
| Schenker XMG Fusion 15 (Mid 22) | |
| AIDA64 / Memory Write | |
| Media della classe Gaming (22297 - 135096, n=102, ultimi 2 anni) | |
| Asus ROG Zephyrus M16 GU603Z | |
| Razer Blade 15 2022 | |
| HP Omen 16-b1090ng | |
| Media Intel Core i9-12900H (32276 - 67858, n=29) | |
| Aorus 15 XE5 | |
| Razer Blade 15 OLED (Early 2022) | |
| Schenker XMG Fusion 15 (Mid 22) | |
| AIDA64 / Memory Latency | |
| Media della classe Gaming (75.3 - 165.4, n=102, ultimi 2 anni) | |
| Razer Blade 15 OLED (Early 2022) | |
| Aorus 15 XE5 | |
| Schenker XMG Fusion 15 (Mid 22) | |
| HP Omen 16-b1090ng | |
| Asus ROG Zephyrus M16 GU603Z | |
| Media Intel Core i9-12900H (74.7 - 118.1, n=28) | |
| Razer Blade 15 2022 | |
* ... Meglio usare valori piccoli
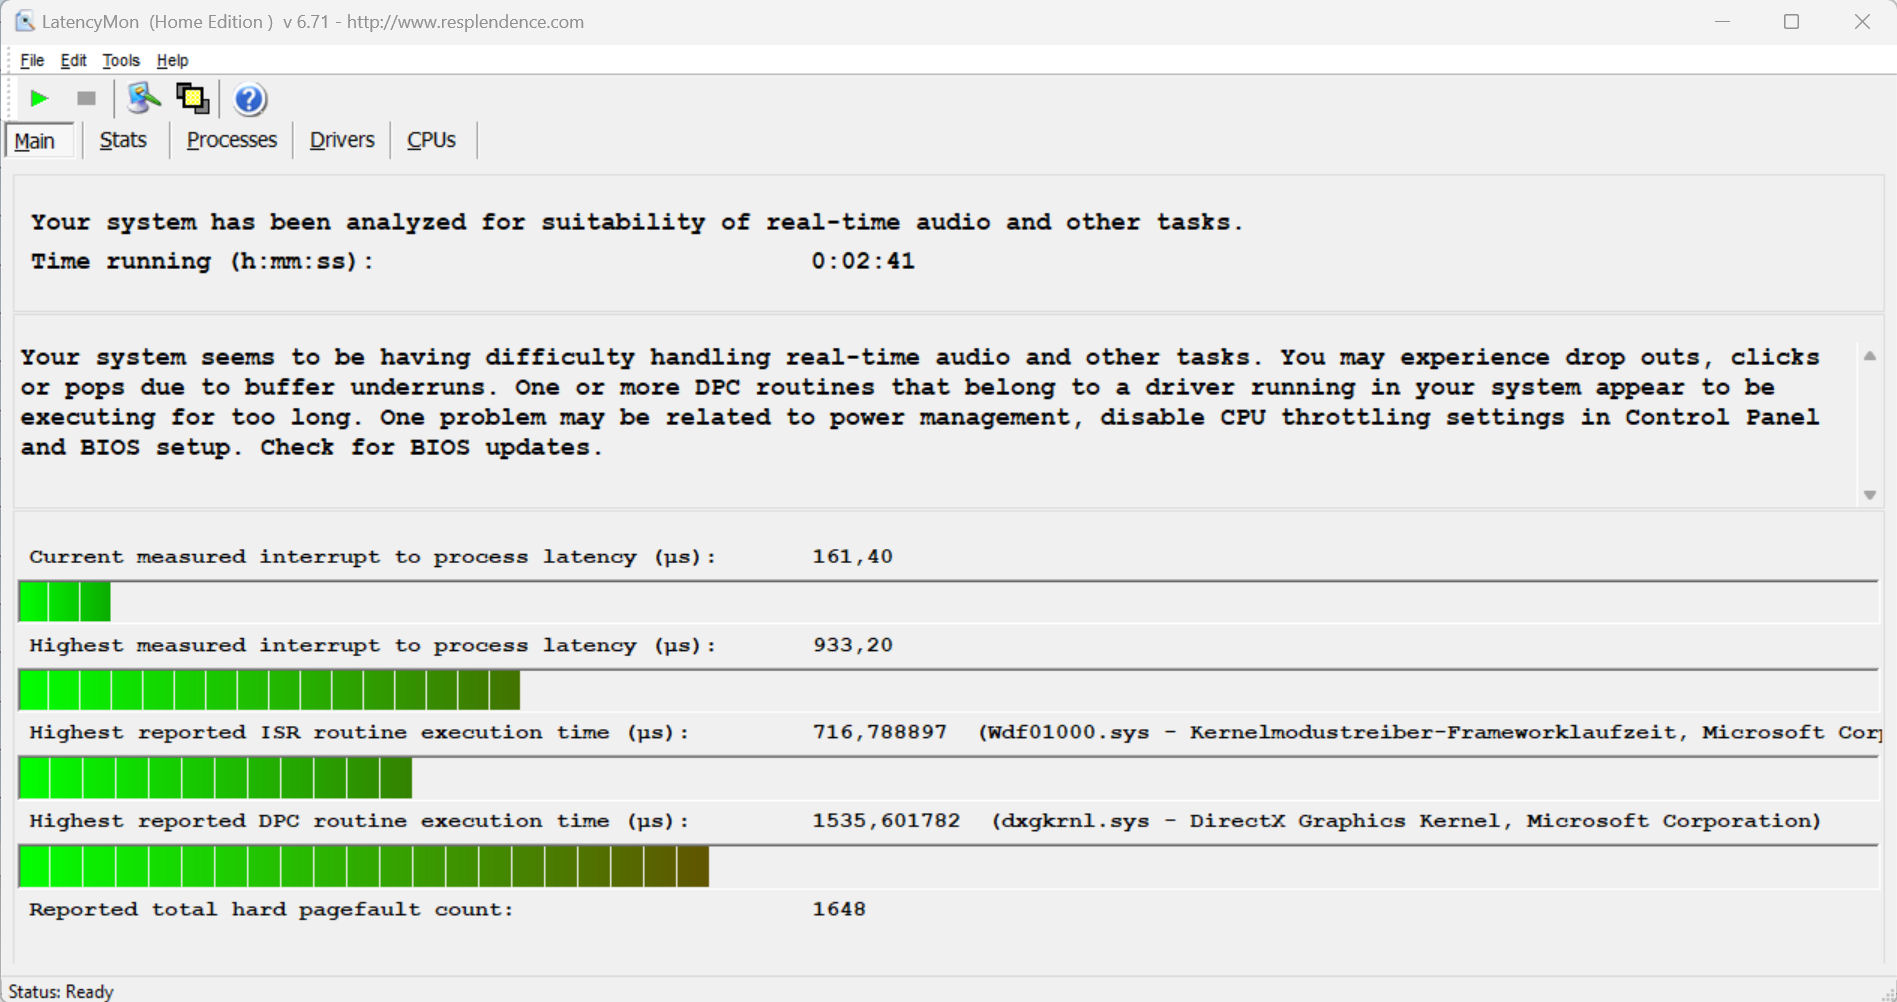
Latenze DPC
Il test standardizzato di monitoraggio della latenza (navigazione internet, riproduzione video 4k, Prime95 ad alto carico) ha rivelato delle anomalie. Il sistema non sembra essere adatto all'editing video e audio in tempo reale. Tuttavia, i futuri aggiornamenti del software potrebbero portare a miglioramenti o peggioramenti delle prestazioni.
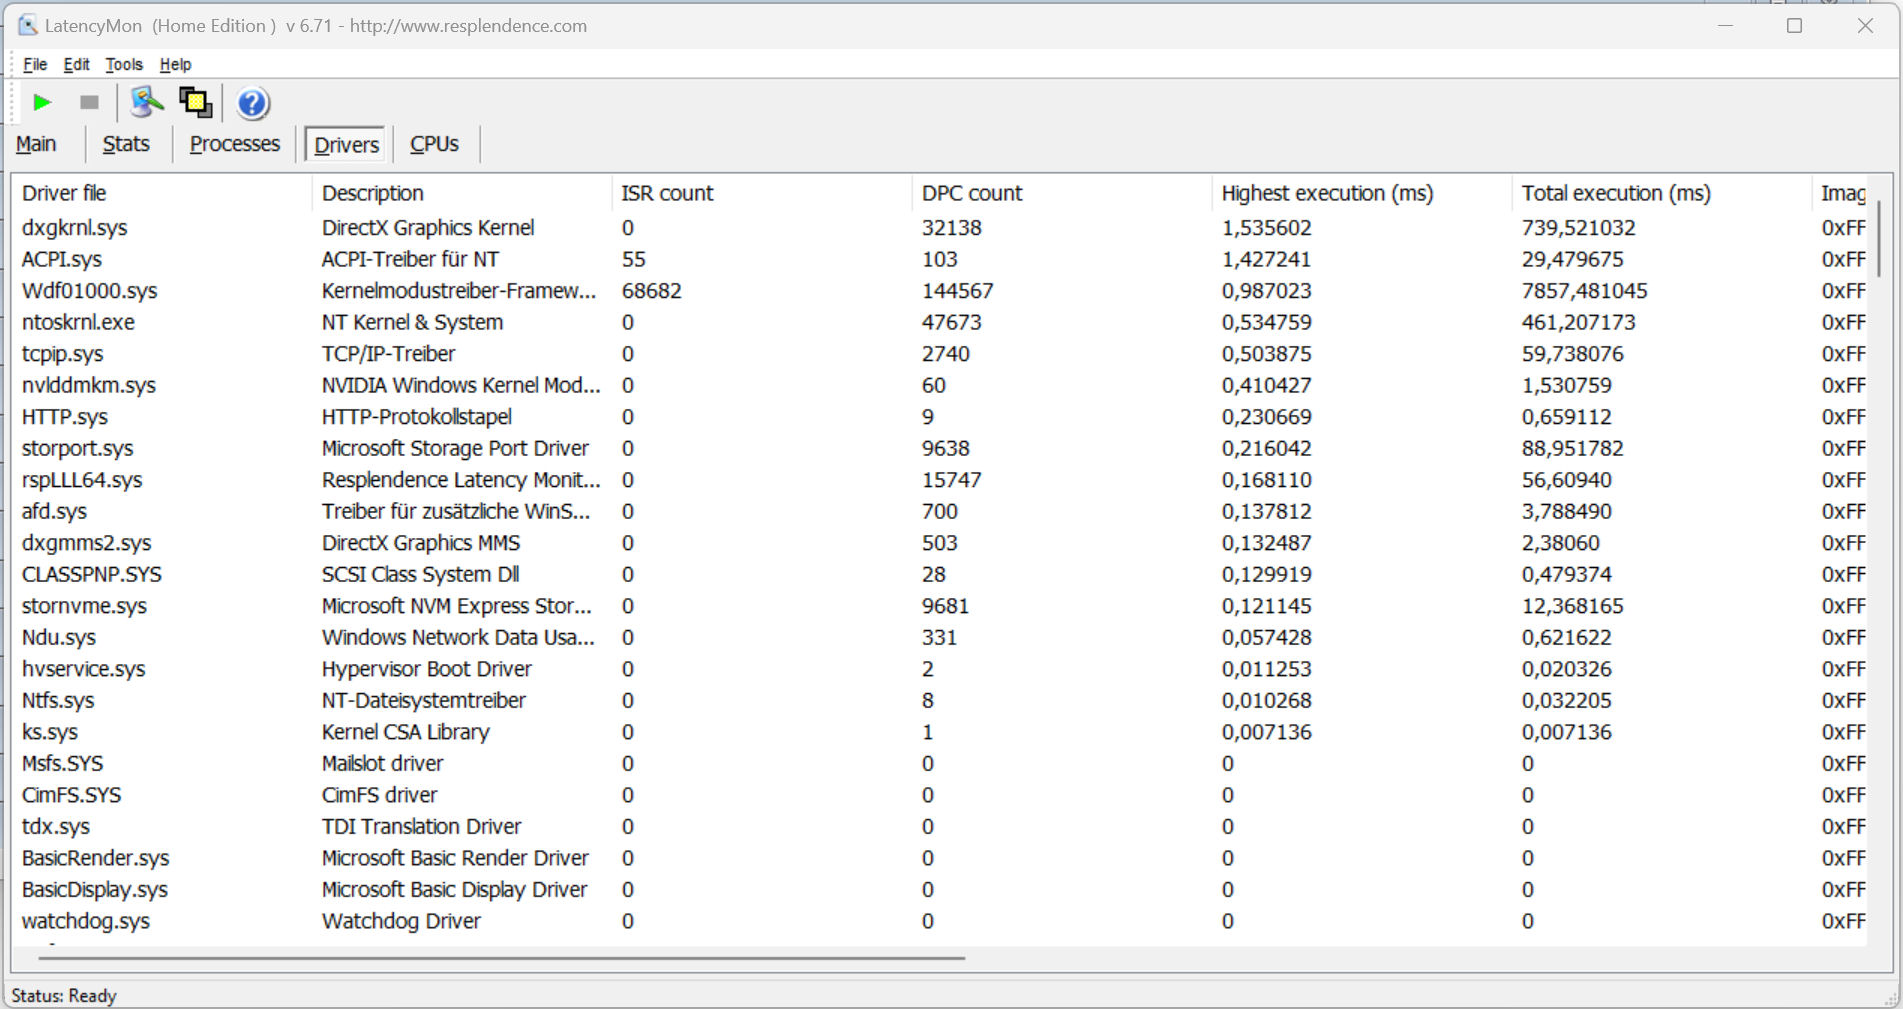
| DPC Latencies / LatencyMon - interrupt to process latency (max), Web, Youtube, Prime95 | |
| Schenker XMG Fusion 15 (Mid 22) | |
| Razer Blade 15 2022 | |
| Aorus 15 XE5 | |
| Asus ROG Zephyrus M16 GU603Z | |
| Razer Blade 15 OLED (Early 2022) | |
| HP Omen 16-b1090ng | |
* ... Meglio usare valori piccoli
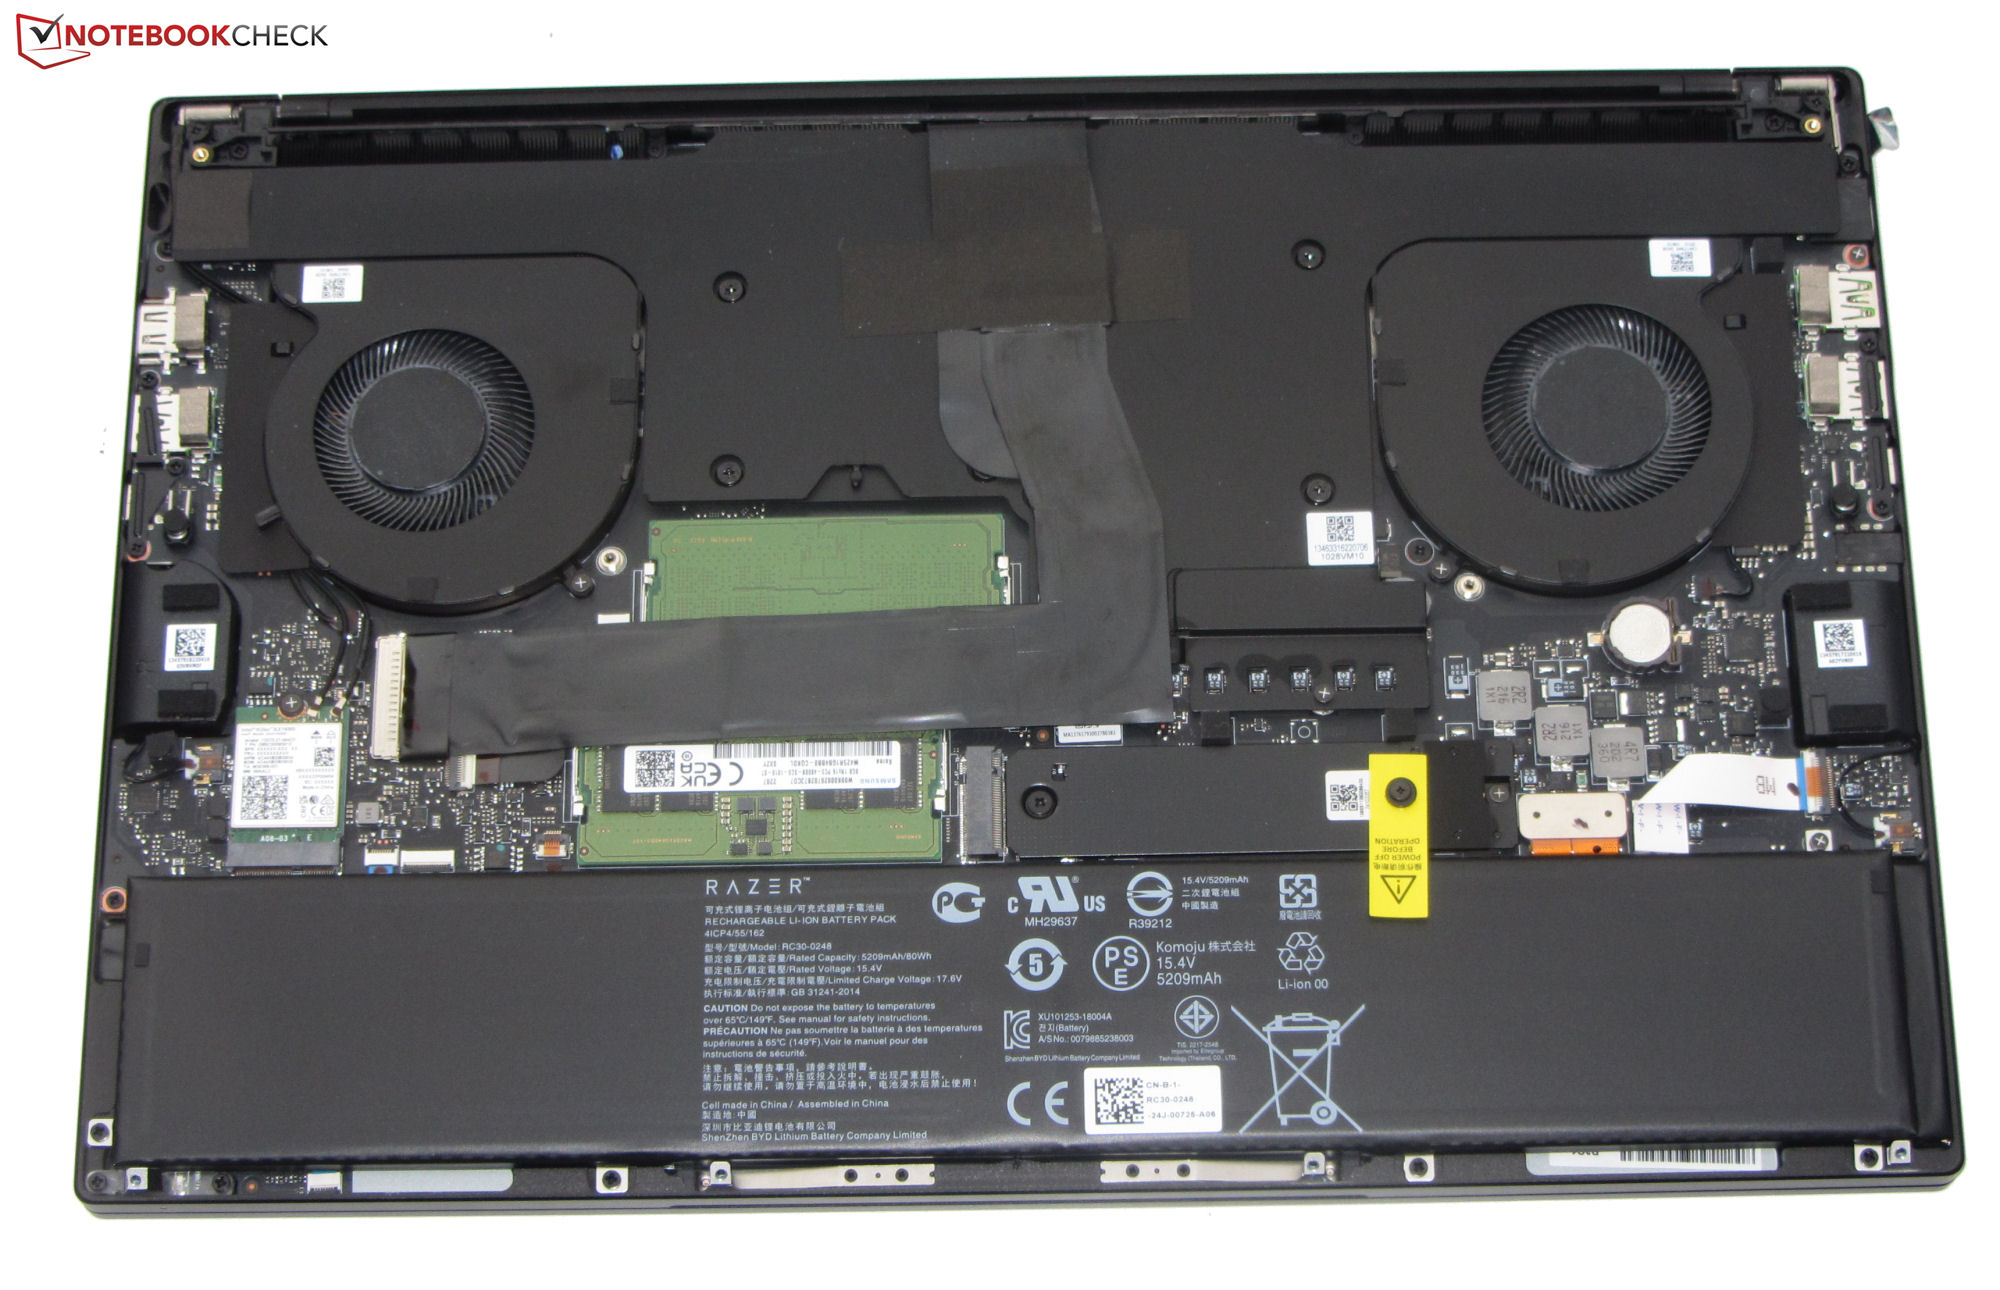
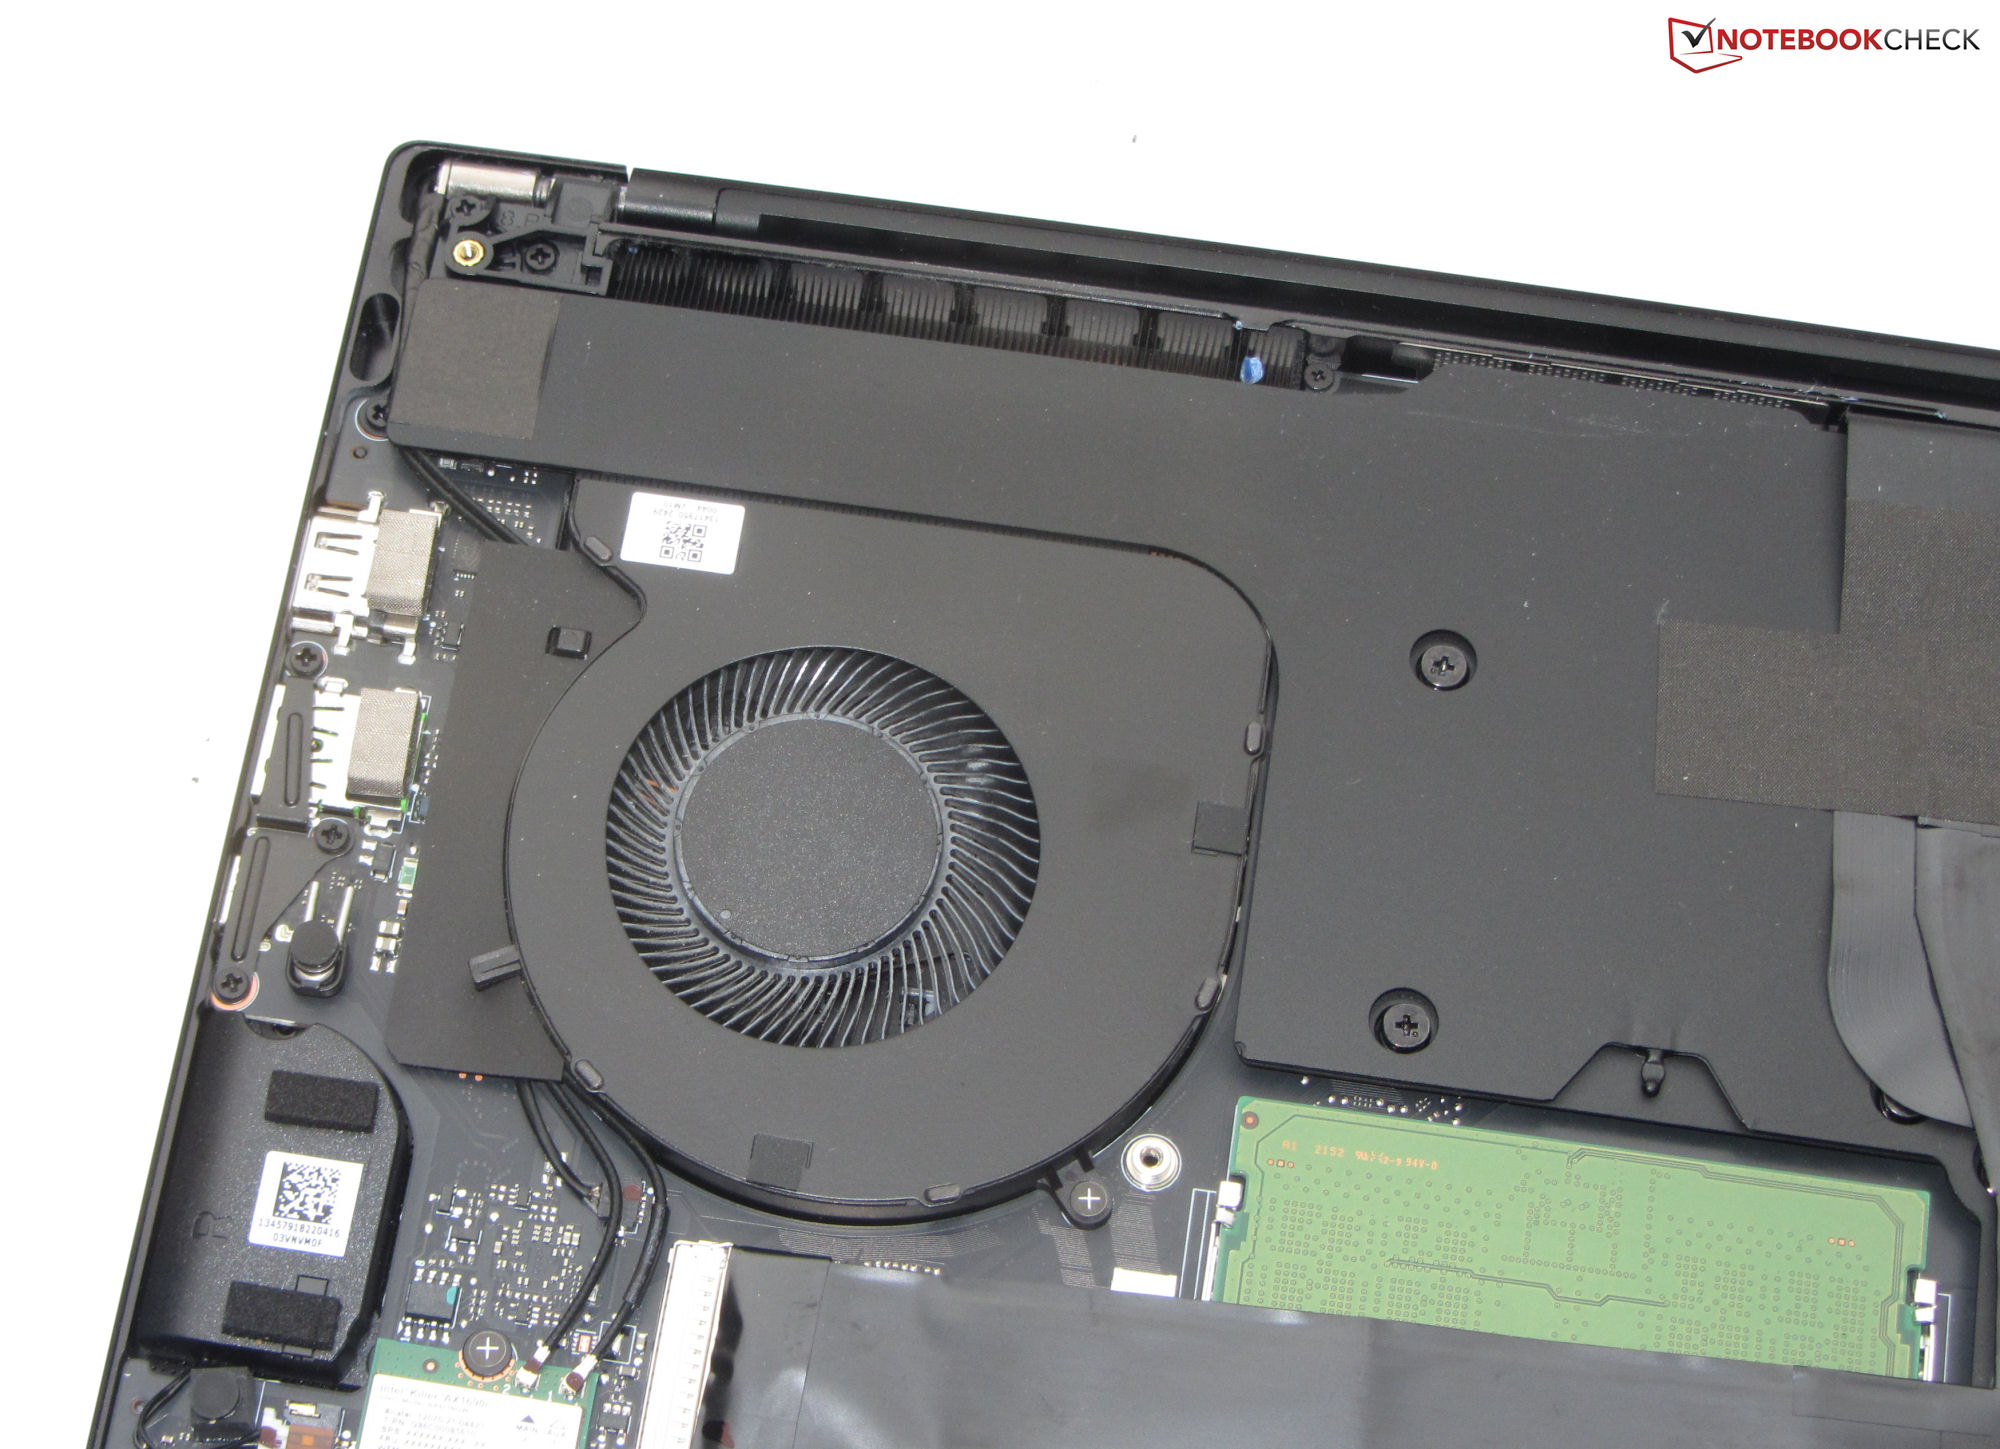
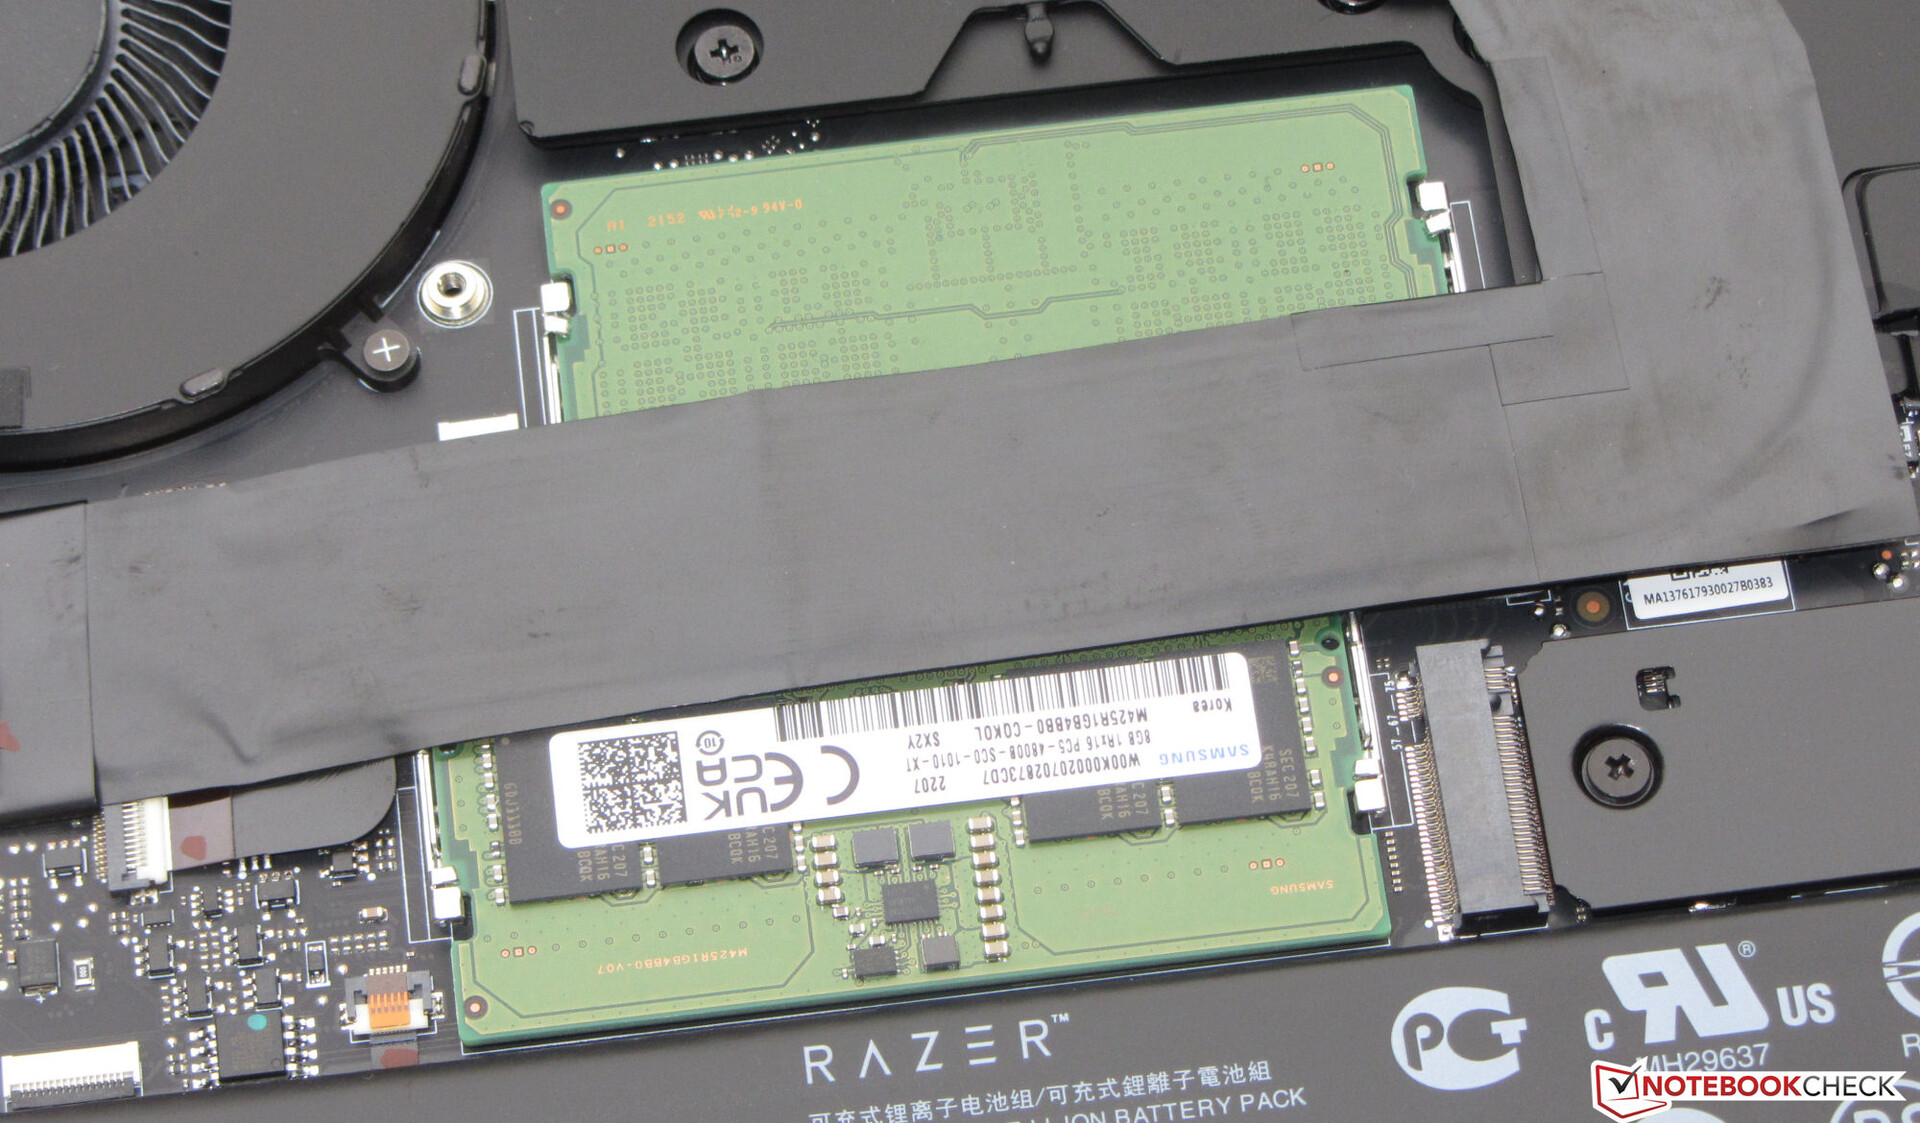
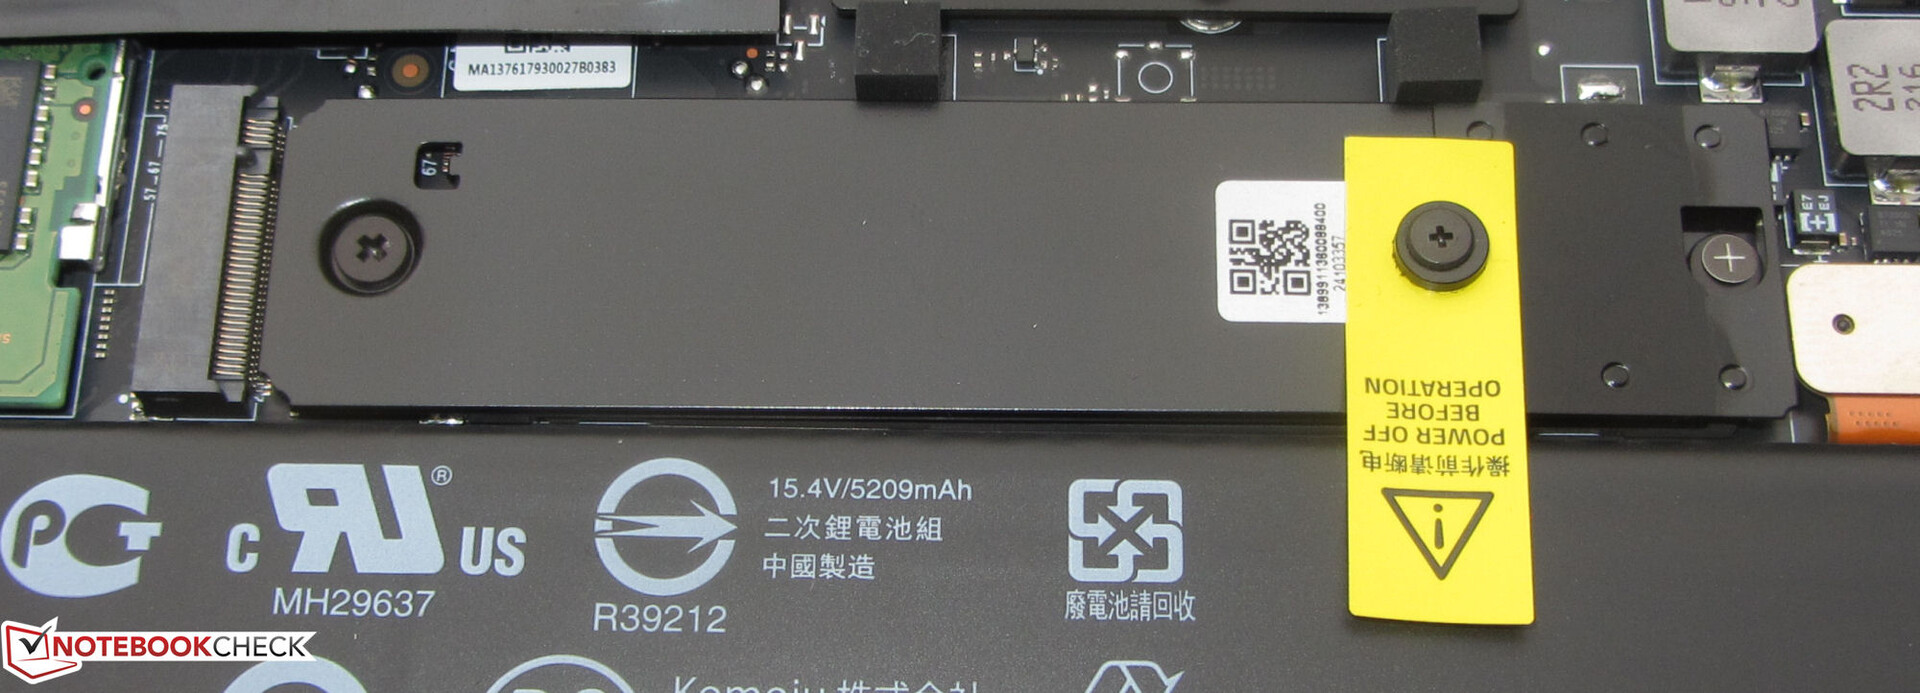
Memoria di massa
Il Blade ha spazio per due SSD PCIe-4 in formato M.2 2280. L'unità SSD PCIe-4 installata (1 TB) di Samsung offre ottime velocità di trasferimento. Non sono stati riscontrati cali di prestazioni dovuti al thermal throttling.

* ... Meglio usare valori piccoli
Continuous Performance Read: DiskSpd Read Loop, Queue Depth 8
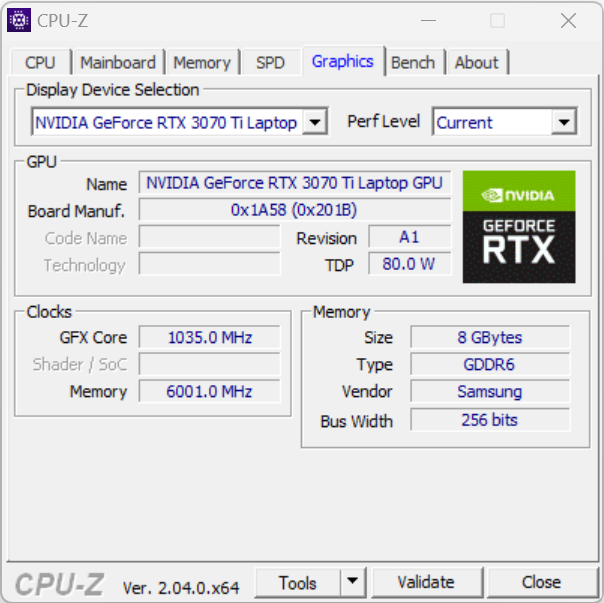
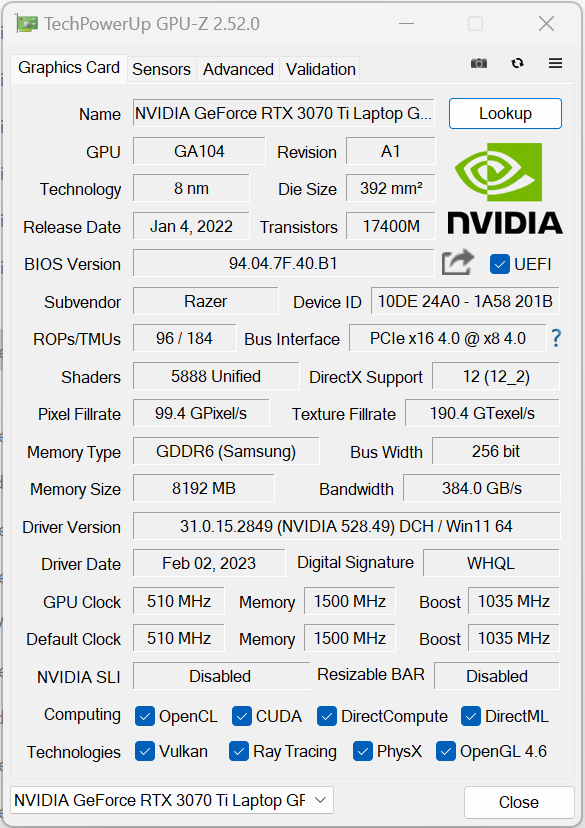
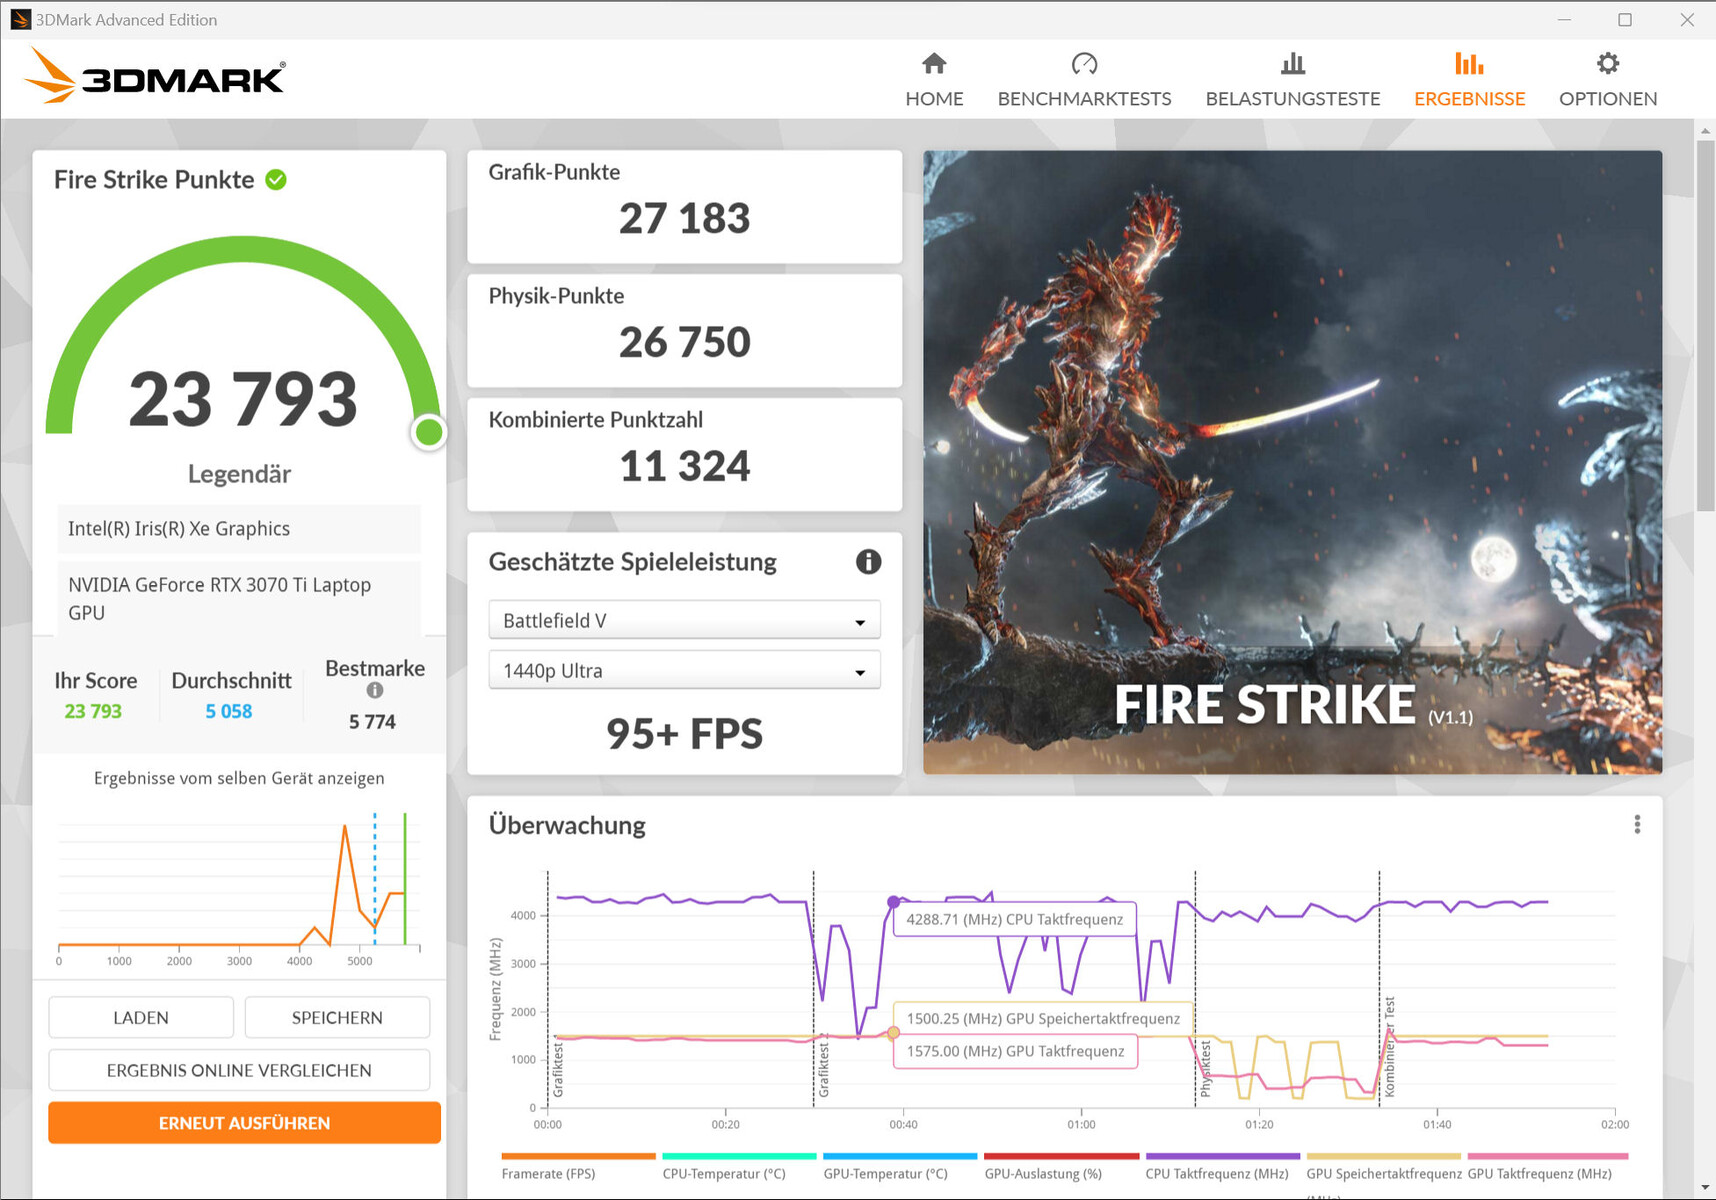
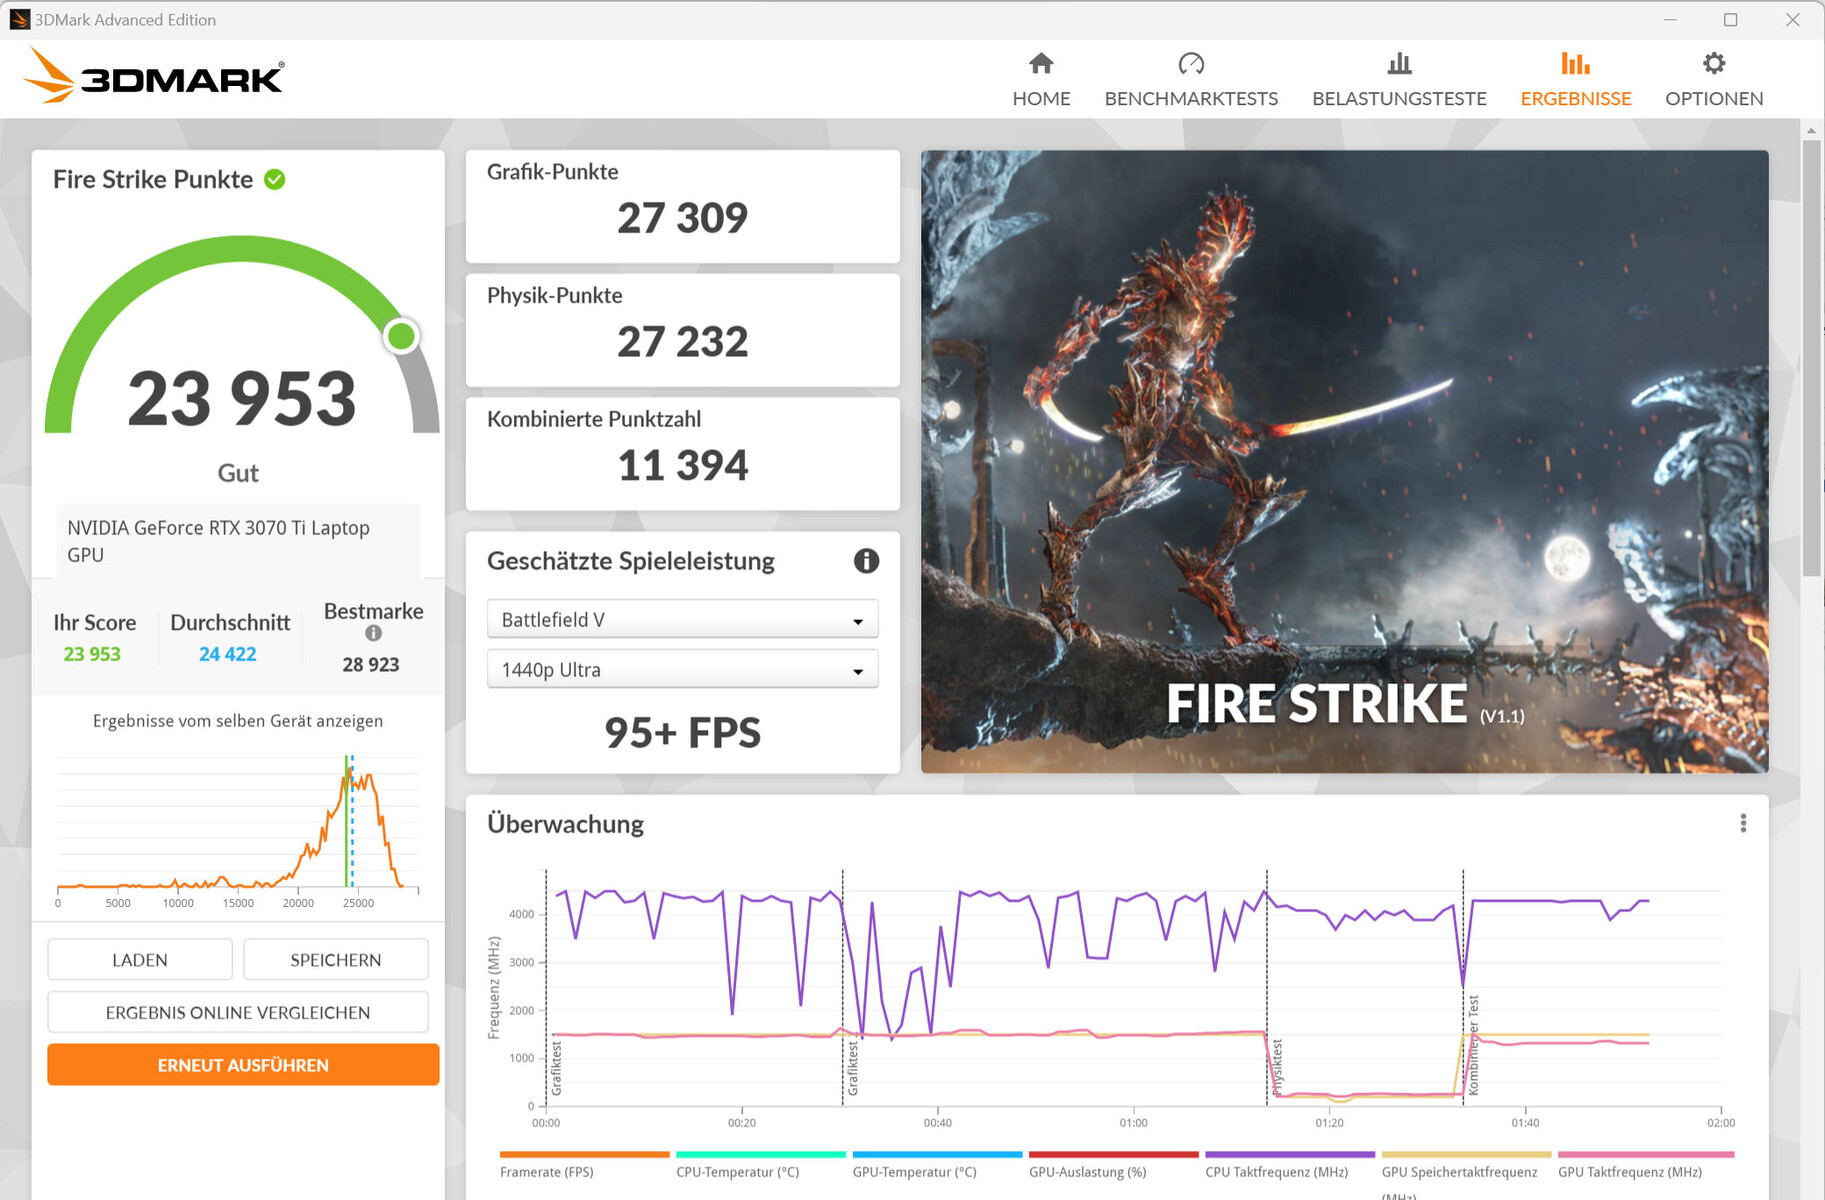
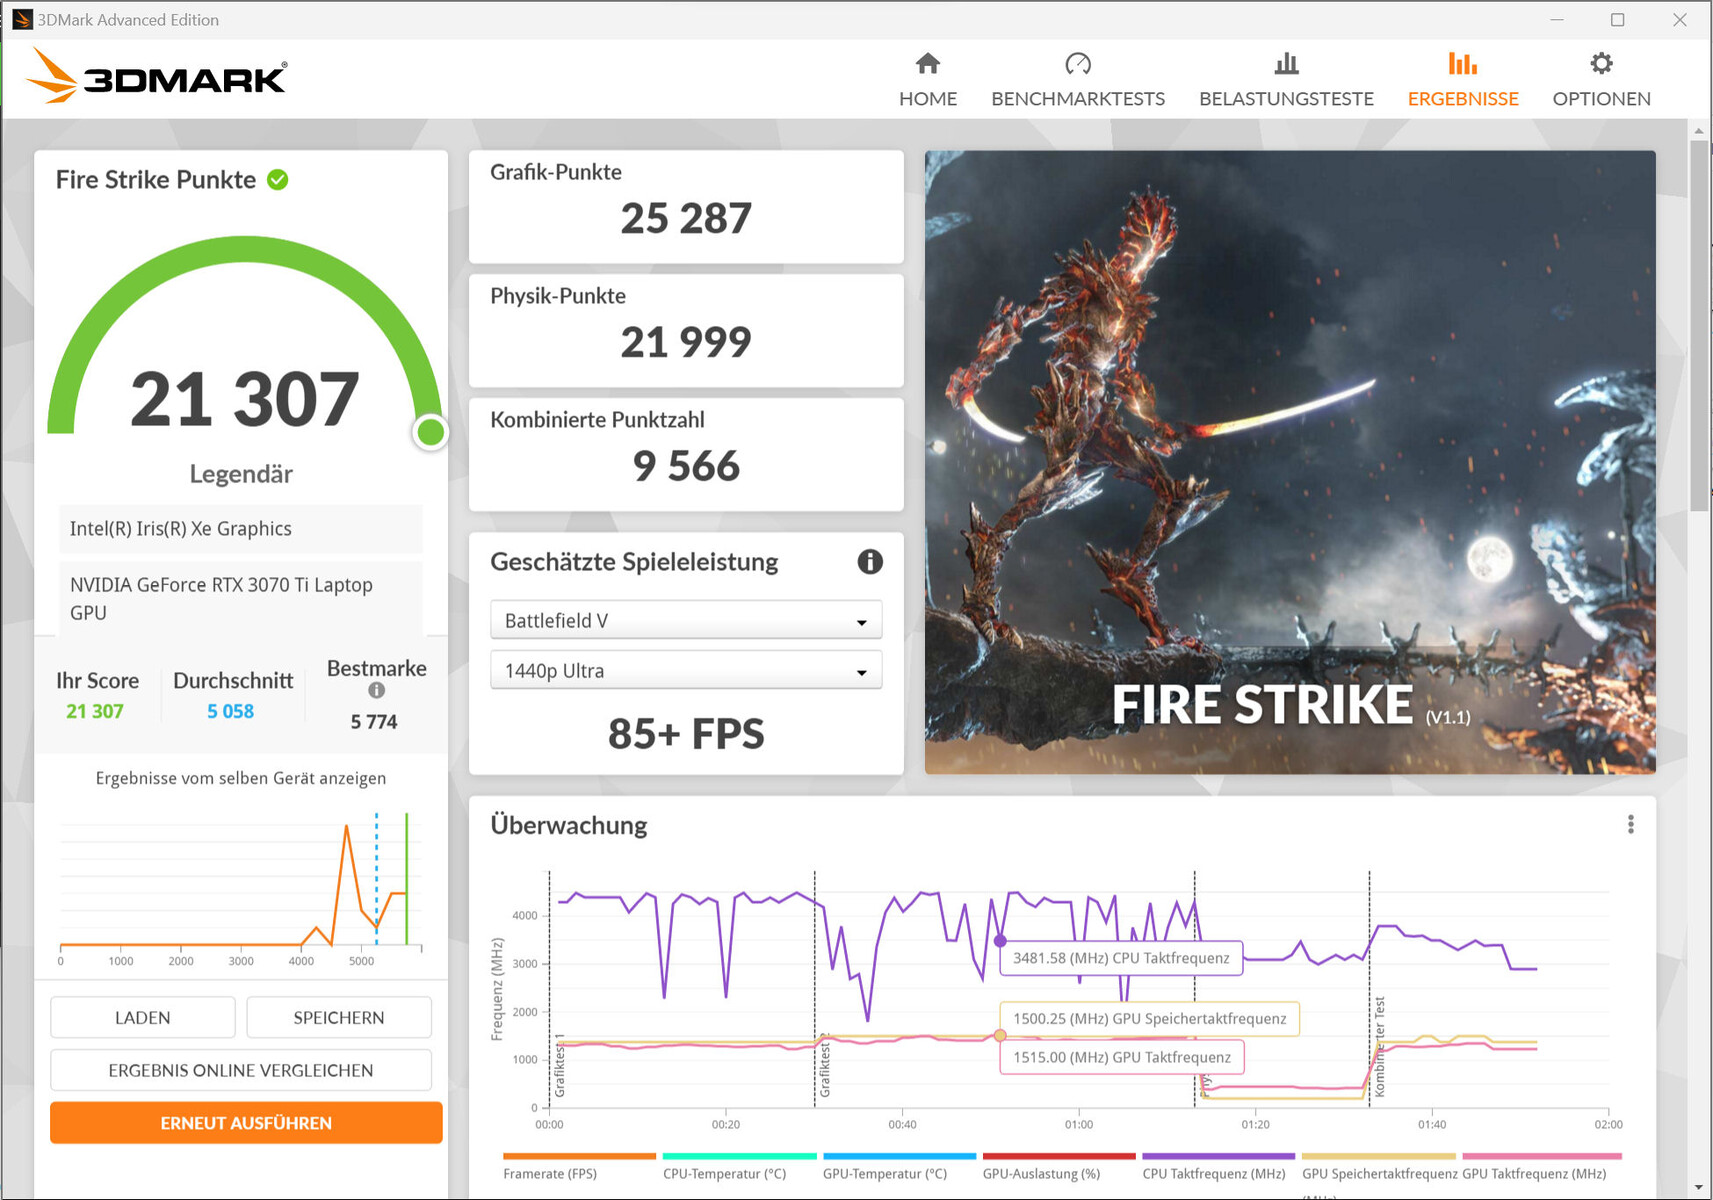
Scheda grafica
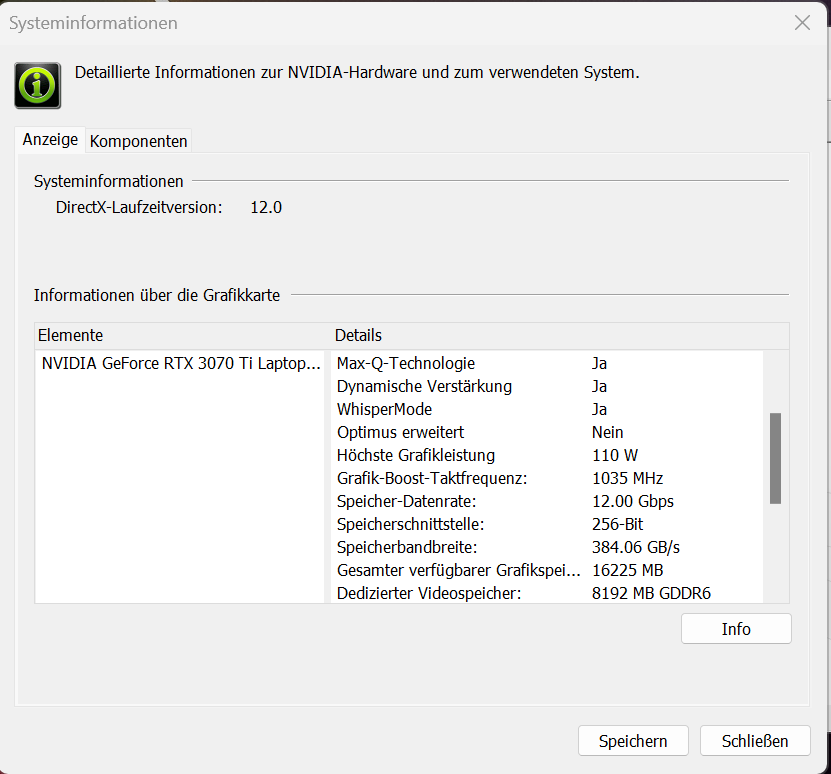
LaGeForce RTX 3070 Ti(VRAM: 8192 MB GDDR6) offre risultati 3D-Mark al livello medio della GPU determinato finora e il TGP massimo relativamente basso di 110 watt si fa notare. L'uscita diretta delle immagini tramite la GPU GeForce porta a un aumento trascurabile delle prestazioni grafiche. La commutazione tra la modalità Optimus e dGPU avviene direttamente nel BIOS o tramite il software Razer Synapse. La modalità Optimus avanzata non è supportata.


| 3DMark Performance rating - Percent | |
| Media della classe Gaming | |
| Razer Blade 15 2022 | |
| Razer Blade 15 OLED (Early 2022) | |
| Razer Blade 15 OLED (Early 2022) | |
| Media NVIDIA GeForce RTX 3070 Ti Laptop GPU | |
| HP Omen 16-b1090ng | |
| Aorus 15 XE5 -1! | |
| Asus ROG Zephyrus M16 GU603Z | |
| Schenker XMG Fusion 15 (Mid 22) | |
| 3DMark 11 - 1280x720 Performance GPU | |
| Media della classe Gaming (21841 - 80022, n=103, ultimi 2 anni) | |
| Razer Blade 15 2022 | |
| Aorus 15 XE5 | |
| Razer Blade 15 OLED (Early 2022) | |
| Media NVIDIA GeForce RTX 3070 Ti Laptop GPU (13799 - 42569, n=36) | |
| Razer Blade 15 OLED (Early 2022) (dGPU) | |
| HP Omen 16-b1090ng | |
| Asus ROG Zephyrus M16 GU603Z | |
| Schenker XMG Fusion 15 (Mid 22) | |
| 3DMark 06 Standard Score | 48871 punti | |
| 3DMark 11 Performance | 30645 punti | |
| 3DMark Cloud Gate Standard Score | 59982 punti | |
| 3DMark Fire Strike Score | 23793 punti | |
| 3DMark Time Spy Score | 10342 punti | |
Aiuto | ||
| Blender | |
| v3.3 Classroom OPTIX/RTX | |
| Asus ROG Zephyrus M16 GU603Z (3.3.3) | |
| Razer Blade 15 OLED (Early 2022) (3.3.3) | |
| Razer Blade 15 OLED (Early 2022) (3.3.3, dGPU) | |
| Media NVIDIA GeForce RTX 3070 Ti Laptop GPU (22 - 30, n=15) | |
| Aorus 15 XE5 (3.3.0) | |
| Media della classe Gaming (9 - 32, n=103, ultimi 2 anni) | |
| v3.3 Classroom CUDA | |
| Asus ROG Zephyrus M16 GU603Z (3.3.3) | |
| Razer Blade 15 OLED (Early 2022) (3.3.3) | |
| Razer Blade 15 OLED (Early 2022) (3.3.3, dGPU) | |
| Media NVIDIA GeForce RTX 3070 Ti Laptop GPU (36 - 46, n=16) | |
| Aorus 15 XE5 (3.3.0) | |
| Media della classe Gaming (15 - 228, n=103, ultimi 2 anni) | |
| v3.3 Classroom CPU | |
| Schenker XMG Fusion 15 (Mid 22) | |
| Aorus 15 XE5 (3.3.0) | |
| Razer Blade 15 OLED (Early 2022) (3.3.3, dGPU) | |
| Razer Blade 15 OLED (Early 2022) (3.3.3) | |
| Media NVIDIA GeForce RTX 3070 Ti Laptop GPU (285 - 459, n=16) | |
| Asus ROG Zephyrus M16 GU603Z (3.3.3) | |
| Media della classe Gaming (122 - 565, n=99, ultimi 2 anni) | |
| GPUScore: Sacred Path | |
| 2560x1440 Official VRS | |
| Razer Blade 15 OLED (Early 2022) (0.9.0 Vulkan 1.3) | |
| Razer Blade 15 OLED (Early 2022) (0.9.0 DirectX 12) | |
| Razer Blade 15 OLED (Early 2022) (0.9.0 Vulkan 1.3, dGPU) | |
| Razer Blade 15 OLED (Early 2022) (0.9.0 DirectX 12. dGPU) | |
| Media della classe Gaming (13.8 - 330, n=139, ultimi 2 anni) | |
| Media NVIDIA GeForce RTX 3070 Ti Laptop GPU (17.9 - 134.8, n=4) | |
| 2560x1440 Official | |
| Razer Blade 15 OLED (Early 2022) (0.9.0 Vulkan 1.3, dGPU) | |
| Razer Blade 15 OLED (Early 2022) (0.9.0 DirectX 12, dGPU) | |
| Razer Blade 15 OLED (Early 2022) (0.9.0 Vulkan 1.3) | |
| Razer Blade 15 OLED (Early 2022) (0.9.0 DirectX 12) | |
| Media della classe Gaming (11 - 331, n=233, ultimi 2 anni) | |
| Asus ROG Zephyrus M16 GU603Z (1.0.0 Vulkan 1.3) | |
| Media NVIDIA GeForce RTX 3070 Ti Laptop GPU (17 - 130.6, n=6) | |
| Geekbench 5.5 | |
| OpenCL Score | |
| Media della classe Gaming (80702 - 277970, n=98, ultimi 2 anni) | |
| Razer Blade 15 2022 | |
| Aorus 15 XE5 | |
| Media NVIDIA GeForce RTX 3070 Ti Laptop GPU (100630 - 150471, n=38) | |
| Razer Blade 15 OLED (Early 2022) | |
| Asus ROG Zephyrus M16 GU603Z | |
| Schenker XMG Fusion 15 (Mid 22) | |
| Razer Blade 15 OLED (Early 2022) (dGPU) | |
| HP Omen 16-b1090ng | |
| Vulkan Score 5.5 | |
| Media della classe Gaming (18857 - 246759, n=72, ultimi 2 anni) | |
| Razer Blade 15 OLED (Early 2022) (dGPU) | |
| Media NVIDIA GeForce RTX 3070 Ti Laptop GPU (52594 - 92020, n=10) | |
| Razer Blade 15 2022 | |
| Asus ROG Zephyrus M16 GU603Z | |
| Geekbench 6.0 | |
| GPU Vulkan 6.0 | |
| Media della classe Gaming (22454 - 184611, n=3, ultimi 2 anni) | |
| Razer Blade 15 OLED (Early 2022) (dGPU) | |
| Media NVIDIA GeForce RTX 3070 Ti Laptop GPU (19109 - 96149, n=2) | |
| Razer Blade 15 OLED (Early 2022) | |
| GPU OpenCL 6.0 | |
| Media della classe Gaming (155885 - 241981, n=3, ultimi 2 anni) | |
| Razer Blade 15 OLED (Early 2022) | |
| Media NVIDIA GeForce RTX 3070 Ti Laptop GPU (103225 - 104147, n=2) | |
| Razer Blade 15 OLED (Early 2022) (dGPU) | |
| V-Ray 5 Benchmark | |
| GPU RTX | |
| Media della classe Gaming (1524 - 4363, n=29, ultimi 2 anni) | |
| Aorus 15 XE5 (5.0.1) | |
| Media NVIDIA GeForce RTX 3070 Ti Laptop GPU (1334 - 1847, n=15) | |
| Razer Blade 15 OLED (Early 2022) (5.0.1) | |
| Razer Blade 15 OLED (Early 2022) (5.0.1, dGPU) | |
| Schenker XMG Fusion 15 (Mid 22) (5.0.1) | |
| GPU CUDA | |
| Media della classe Gaming (1202 - 3288, n=29, ultimi 2 anni) | |
| Aorus 15 XE5 (5.0.1) | |
| Media NVIDIA GeForce RTX 3070 Ti Laptop GPU (1062 - 1391, n=14) | |
| Razer Blade 15 OLED (Early 2022) (5.0.1) | |
| Razer Blade 15 OLED (Early 2022) (5.0.1, dGPU) | |
| Schenker XMG Fusion 15 (Mid 22) (5.0.1) | |
| CPU | |
| Media della classe Gaming (5864 - 30302, n=28, ultimi 2 anni) | |
| Razer Blade 15 OLED (Early 2022) (5.0.1, dGPU) | |
| Razer Blade 15 OLED (Early 2022) (5.0.1) | |
| Razer Blade 15 2022 (5.0.1) | |
| Media NVIDIA GeForce RTX 3070 Ti Laptop GPU (2880 - 11931, n=20) | |
| Aorus 15 XE5 (5.0.1) | |
| Schenker XMG Fusion 15 (Mid 22) (5.0.1) | |
| V-Ray Benchmark Next 4.10 | |
| GPU | |
| Media della classe Gaming (427 - 1627, n=96, ultimi 2 anni) | |
| Aorus 15 XE5 (v4.10.07 ) | |
| Media NVIDIA GeForce RTX 3070 Ti Laptop GPU (277 - 559, n=33) | |
| Schenker XMG Fusion 15 (Mid 22) (v4.10.07 ) | |
| Razer Blade 15 OLED (Early 2022) (v4.10.07 ) | |
| Razer Blade 15 OLED (Early 2022) (v4.10.07, dGPU) | |
| HP Omen 16-b1090ng (v4.10.07 ) | |
| Asus ROG Zephyrus M16 GU603Z (v4.10.07 ) | |
| CPU | |
| Media della classe Gaming (10048 - 45327, n=94, ultimi 2 anni) | |
| HP Omen 16-b1090ng (v4.10.07 ) | |
| Razer Blade 15 OLED (Early 2022) (v4.10.07, dGPU) | |
| Asus ROG Zephyrus M16 GU603Z (v4.10.07 ) | |
| Razer Blade 15 OLED (Early 2022) (v4.10.07 ) | |
| Media NVIDIA GeForce RTX 3070 Ti Laptop GPU (4722 - 19786, n=33) | |
| Aorus 15 XE5 (v4.10.07 ) | |
| Schenker XMG Fusion 15 (Mid 22) (v4.10.07 ) | |
* ... Meglio usare valori piccoli
Prestazioni di gioco
Il portatile è progettato per i giochi in QHD con impostazioni elevate o massime. Risoluzioni più elevate sono possibili collegando un monitor adeguato, anche se a volte con impostazioni ridotte. Il frame rate dei titoli testati è a un livello tipico per la RTX 3070 Ti media. L'uscita diretta dell'immagine tramite la GPU GeForce può portare, a seconda del gioco, a un aumento minimo del frame rate.
| Performance rating - Percent | |
| Media della classe Gaming | |
| Razer Blade 15 2022 | |
| Aorus 15 XE5 | |
| Asus ROG Zephyrus M16 GU603Z | |
| HP Omen 16-b1090ng | |
| Razer Blade 15 OLED (Early 2022) | |
| Media NVIDIA GeForce RTX 3070 Ti Laptop GPU | |
| Razer Blade 15 OLED (Early 2022) | |
| Schenker XMG Fusion 15 (Mid 22) | |
| The Witcher 3 - 1920x1080 Ultra Graphics & Postprocessing (HBAO+) | |
| Media della classe Gaming (104.7 - 240, n=7, ultimi 2 anni) | |
| Razer Blade 15 2022 | |
| Media NVIDIA GeForce RTX 3070 Ti Laptop GPU (76.8 - 124.1, n=39) | |
| Aorus 15 XE5 | |
| Asus ROG Zephyrus M16 GU603Z | |
| HP Omen 16-b1090ng | |
| Razer Blade 15 OLED (Early 2022) (dGPU) | |
| Razer Blade 15 OLED (Early 2022) | |
| Schenker XMG Fusion 15 (Mid 22) | |
| GTA V - 1920x1080 Highest AA:4xMSAA + FX AF:16x | |
| Media della classe Gaming (67.1 - 186.9, n=90, ultimi 2 anni) | |
| Razer Blade 15 2022 | |
| Aorus 15 XE5 | |
| Razer Blade 15 OLED (Early 2022) (dGPU) | |
| Razer Blade 15 OLED (Early 2022) | |
| HP Omen 16-b1090ng | |
| Asus ROG Zephyrus M16 GU603Z | |
| Media NVIDIA GeForce RTX 3070 Ti Laptop GPU (44 - 123.9, n=36) | |
| Schenker XMG Fusion 15 (Mid 22) | |
| Final Fantasy XV Benchmark - 1920x1080 High Quality | |
| Media della classe Gaming (64.2 - 215, n=91, ultimi 2 anni) | |
| Razer Blade 15 2022 (1.3) | |
| Aorus 15 XE5 (1.3) | |
| Razer Blade 15 OLED (Early 2022) (1.3, dGPU) | |
| Razer Blade 15 OLED (Early 2022) (1.3) | |
| HP Omen 16-b1090ng | |
| Media NVIDIA GeForce RTX 3070 Ti Laptop GPU (49.5 - 122.4, n=35) | |
| Asus ROG Zephyrus M16 GU603Z (1.3) | |
| Schenker XMG Fusion 15 (Mid 22) (1.3) | |
| Strange Brigade - 1920x1080 ultra AA:ultra AF:16 | |
| Media della classe Gaming (113.6 - 458, n=83, ultimi 2 anni) | |
| Aorus 15 XE5 (1.47.22.14 D3D12) | |
| Razer Blade 15 2022 (1.47.22.14 D3D12) | |
| Media NVIDIA GeForce RTX 3070 Ti Laptop GPU (109 - 221, n=37) | |
| Razer Blade 15 OLED (Early 2022) (1.47.22.14 D3D12, dGPU) | |
| Razer Blade 15 OLED (Early 2022) (1.47.22.14 D3D12) | |
| Schenker XMG Fusion 15 (Mid 22) (1.47.22.14 D3D12) | |
| Asus ROG Zephyrus M16 GU603Z (1.47.22.14 D3D12) | |
| HP Omen 16-b1090ng (1.47.22.14 D3D12) | |
| Dota 2 Reborn - 1920x1080 ultra (3/3) best looking | |
| Asus ROG Zephyrus M16 GU603Z | |
| Razer Blade 15 2022 | |
| Media della classe Gaming (84.8 - 252, n=104, ultimi 2 anni) | |
| HP Omen 16-b1090ng | |
| Aorus 15 XE5 | |
| Media NVIDIA GeForce RTX 3070 Ti Laptop GPU (68.7 - 160.5, n=38) | |
| Razer Blade 15 OLED (Early 2022) (dGPU) | |
| Razer Blade 15 OLED (Early 2022) | |
| Schenker XMG Fusion 15 (Mid 22) | |
| X-Plane 11.11 - 1920x1080 high (fps_test=3) | |
| Asus ROG Zephyrus M16 GU603Z | |
| HP Omen 16-b1090ng | |
| Razer Blade 15 2022 | |
| Aorus 15 XE5 | |
| Razer Blade 15 OLED (Early 2022) (dGPU) | |
| Media della classe Gaming (55.5 - 148.5, n=106, ultimi 2 anni) | |
| Media NVIDIA GeForce RTX 3070 Ti Laptop GPU (51.6 - 116.9, n=37) | |
| Razer Blade 15 OLED (Early 2022) | |
| Schenker XMG Fusion 15 (Mid 22) | |
Per verificare se la frequenza dei fotogrammi rimane stabile per lunghi periodi di tempo, abbiamo eseguito il gioco "The Witcher 3" per circa 60 minuti alla risoluzione Full HD e con le impostazioni di qualità massime. Il personaggio del gioco non è stato spostato e non si sono verificati cali di frame rate degni di nota.
Witcher 3 FPS Diagram
| basso | medio | alto | ultra | QHD | |
|---|---|---|---|---|---|
| GTA V (2015) | 182.7 | 177.2 | 172.8 | 113 | 94.3 |
| The Witcher 3 (2015) | 365.8 | 288.5 | 176.6 | 96.4 | |
| Dota 2 Reborn (2015) | 162 | 148.2 | 143.4 | 133 | |
| Final Fantasy XV Benchmark (2018) | 174.2 | 133.3 | 100.3 | 75.1 | |
| X-Plane 11.11 (2018) | 133.3 | 121.6 | 95 | ||
| Far Cry 5 (2018) | 170 | 141 | 135 | 126 | 100 |
| Strange Brigade (2018) | 351 | 240 | 197.2 | 173.4 | 130.9 |
| Flight Simulator 2020 (2020) | 124.8 | 97.8 | 70.2 | 52.2 | 41.3 |
| F1 22 (2022) | 203 | 202 | 173.1 | 65.2 | 42.3 |
| FIFA 23 (2022) | 104.3 | ||||
| A Plague Tale Requiem (2022) | 101.6 | 84 | 73.3 | 62.9 | 50.5 |
| Uncharted Legacy of Thieves Collection (2022) | 78 | 75.2 | 71.8 | 69.3 | 56.2 |
| Call of Duty Modern Warfare 2 2022 (2022) | 126 | 112 | 89 | 85 | 63 |
| Spider-Man Miles Morales (2022) | 107 | 102.6 | 94.9 | 93.2 | 69.6 |
| The Callisto Protocol (2022) | 117 | 99.3 | 71 | 70.7 | 52.8 |
| Need for Speed Unbound (2022) | 112.8 | 106.9 | 93 | 84.6 | 66.7 |
| High On Life (2023) | 175.7 | 139.4 | 117.5 | 97.1 | 60.8 |
| The Witcher 3 v4 (2023) | 174.4 | 149.6 | 81.3 | 71.4 | 47.4 |
| Dead Space Remake (2023) | 82.1 | 74.6 | 68.1 | 66.8 | 47.2 |
| Hogwarts Legacy (2023) | 88.5 | 79 | 69.7 | 59.3 | 42.6 |
Emissioni - Il portatile Razer non si riscalda eccessivamente
Emissioni acustiche
Nel complesso, per un portatile da gioco, i livelli di rumorosità sono moderati. Nell'uso inattivo e quotidiano (ufficio e internet), le ventole funzionano a bassa velocità e sono praticamente impercettibili. A pieno carico (stress test, Witcher 3 test) i livelli di pressione sonora possono salire a 43,9 dB (A). Il profilo di prestazioni "Silenzioso" non fa quello che il nome suggerirebbe, ma riesce a ridurre il rumore di fondo, a scapito della potenza di calcolo.
Rumorosità
| Idle |
| 28 / 28 / 28 dB(A) |
| Sotto carico |
| 38.5 / 43.9 dB(A) |
 | ||
30 dB silenzioso 40 dB(A) udibile 50 dB(A) rumoroso |
||
min: | ||
| Razer Blade 15 OLED (Early 2022) GeForce RTX 3070 Ti Laptop GPU, i9-12900H, Samsung PM9A1 MZVL21T0HCLR | Asus ROG Zephyrus M16 GU603Z GeForce RTX 3070 Ti Laptop GPU, i9-12900H, Micron 3400 1TB MTFDKBA1T0TFH | Aorus 15 XE5 GeForce RTX 3070 Ti Laptop GPU, i7-12700H, Gigabyte AG470S1TB-SI B10 | Schenker XMG Fusion 15 (Mid 22) GeForce RTX 3070 Laptop GPU, i7-11800H, Samsung SSD 980 Pro 1TB MZ-V8P1T0BW | HP Omen 16-b1090ng GeForce RTX 3070 Ti Laptop GPU, i7-12700H, WDC PC SN810 1TB | Razer Blade 15 2022 GeForce RTX 3080 Ti Laptop GPU, i7-12800H, SSSTC CA6-8D1024 | |
|---|---|---|---|---|---|---|
| Noise | -10% | -6% | -5% | -16% | -4% | |
| off /ambiente * (dB) | 26 | 23 12% | 24 8% | 26 -0% | 26 -0% | 25.4 2% |
| Idle Minimum * (dB) | 28 | 23 18% | 26 7% | 26 7% | 30 -7% | 26.2 6% |
| Idle Average * (dB) | 28 | 24 14% | 28 -0% | 28 -0% | 31 -11% | 26.2 6% |
| Idle Maximum * (dB) | 28 | 47 -68% | 30 -7% | 31 -11% | 33 -18% | 28.4 -1% |
| Load Average * (dB) | 38.5 | 47.91 -24% | 48 -25% | 45 -17% | 49 -27% | 44.7 -16% |
| Load Maximum * (dB) | 43.9 | 50.25 -14% | 52 -18% | 48 -9% | 57 -30% | 51.9 -18% |
| Witcher 3 ultra * (dB) | 48.91 | 52 | 46 | 53 | 44.7 |
* ... Meglio usare valori piccoli
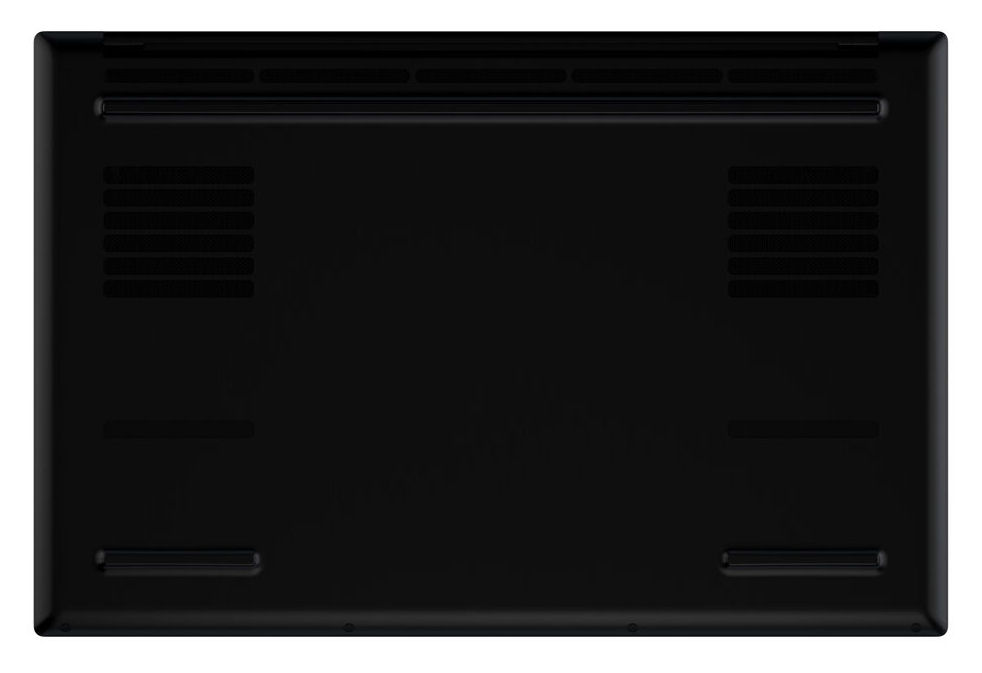
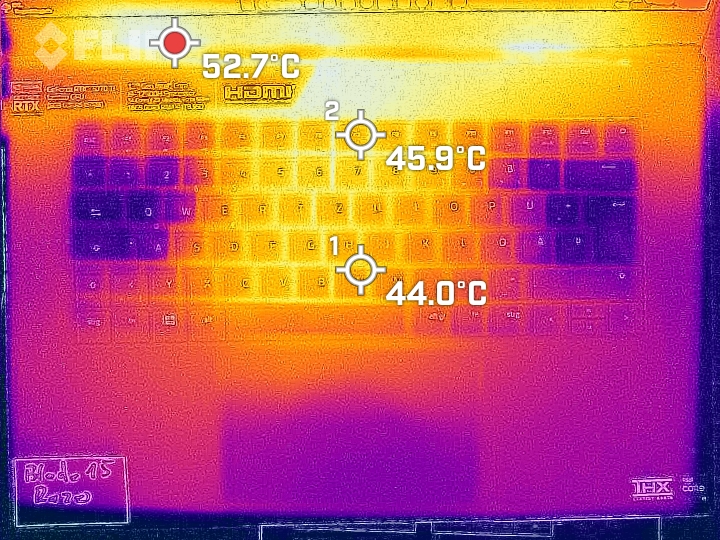
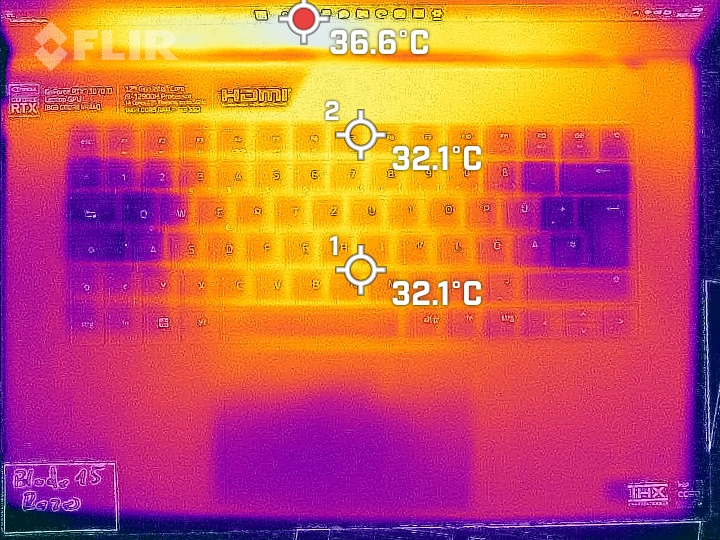
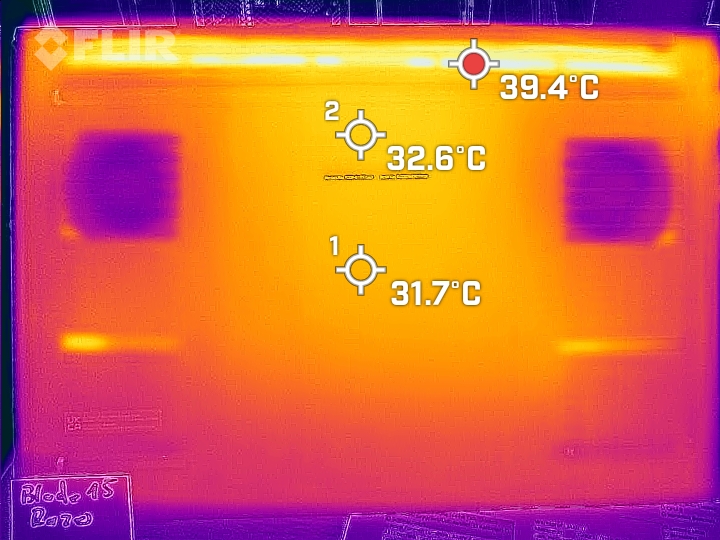
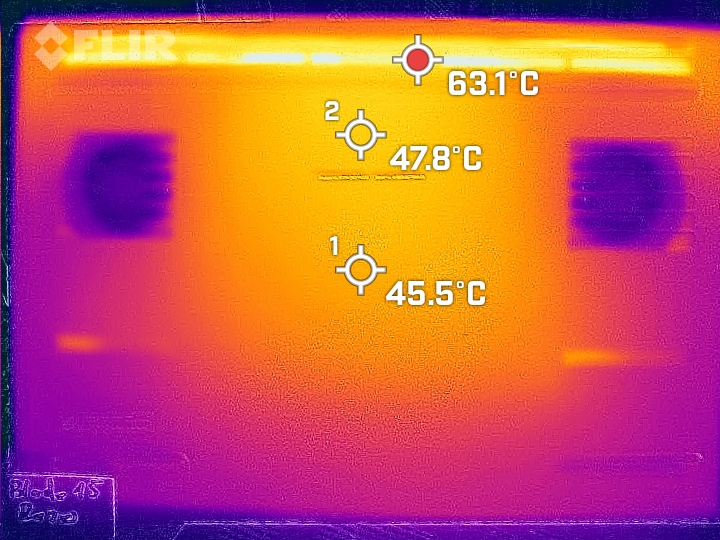
Temperatura
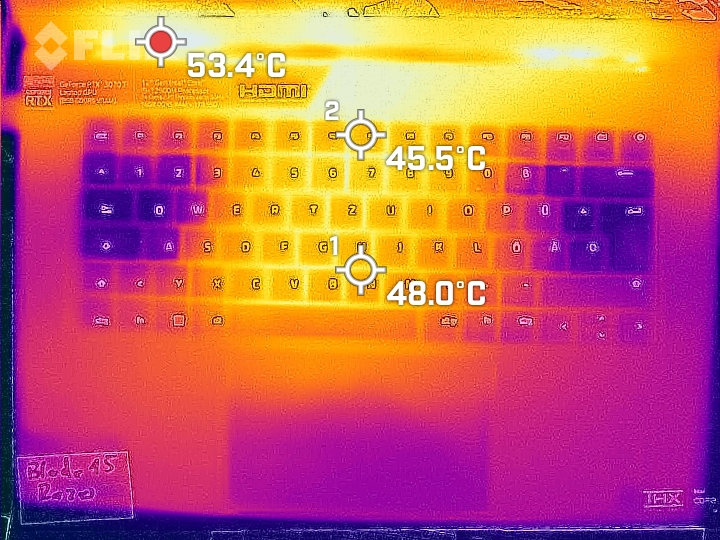
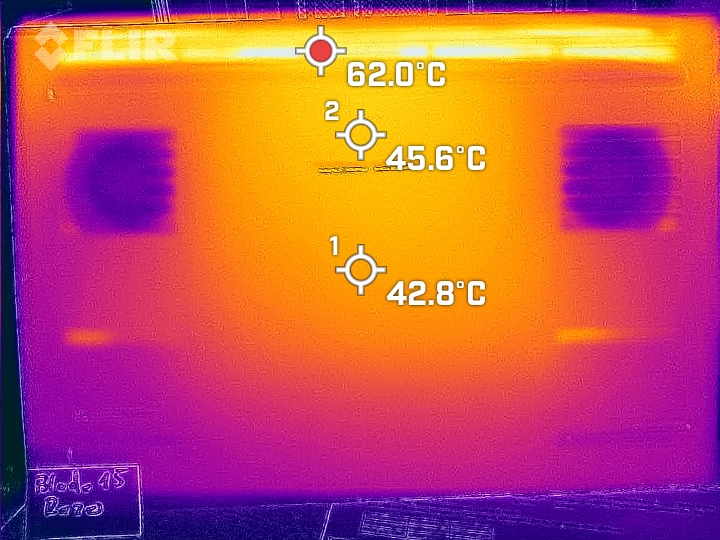
Nell'uso quotidiano (ufficio, internet) le temperature del case rimangono nella zona verde. Sotto carico (stress test, Witcher 3 test) il portatile si riscalda sensibilmente, ma non eccessivamente.
(-) La temperatura massima sul lato superiore è di 49.5 °C / 121 F, rispetto alla media di 40.4 °C / 105 F, che varia da 21.2 a 68.8 °C per questa classe Gaming.
(-) Il lato inferiore si riscalda fino ad un massimo di 47.5 °C / 118 F, rispetto alla media di 43.2 °C / 110 F
(+) In idle, la temperatura media del lato superiore è di 30 °C / 86 F, rispetto alla media deld ispositivo di 33.9 °C / 93 F.
(-) Riproducendo The Witcher 3, la temperatura media per il lato superiore e' di 40.3 °C / 105 F, rispetto alla media del dispositivo di 33.9 °C / 93 F.
(±) I poggiapolsi e il touchpad possono diventare molto caldi al tatto con un massimo di 38 °C / 100.4 F.
(-) La temperatura media della zona del palmo della mano di dispositivi simili e'stata di 28.8 °C / 83.8 F (-9.2 °C / -16.6 F).
| Razer Blade 15 OLED (Early 2022) Intel Core i9-12900H, NVIDIA GeForce RTX 3070 Ti Laptop GPU | Asus ROG Zephyrus M16 GU603Z Intel Core i9-12900H, NVIDIA GeForce RTX 3070 Ti Laptop GPU | Aorus 15 XE5 Intel Core i7-12700H, NVIDIA GeForce RTX 3070 Ti Laptop GPU | Schenker XMG Fusion 15 (Mid 22) Intel Core i7-11800H, NVIDIA GeForce RTX 3070 Laptop GPU | HP Omen 16-b1090ng Intel Core i7-12700H, NVIDIA GeForce RTX 3070 Ti Laptop GPU | Razer Blade 15 2022 Intel Core i7-12800H, NVIDIA GeForce RTX 3080 Ti Laptop GPU | |
|---|---|---|---|---|---|---|
| Heat | 2% | -12% | -15% | 9% | -6% | |
| Maximum Upper Side * (°C) | 49.5 | 52 -5% | 46 7% | 52 -5% | 41 17% | 50 -1% |
| Maximum Bottom * (°C) | 47.5 | 51 -7% | 57 -20% | 63 -33% | 62 -31% | 47 1% |
| Idle Upper Side * (°C) | 33.4 | 29 13% | 38 -14% | 37 -11% | 25 25% | 37.4 -12% |
| Idle Bottom * (°C) | 35 | 33 6% | 42 -20% | 38 -9% | 26 26% | 38.4 -10% |
* ... Meglio usare valori piccoli
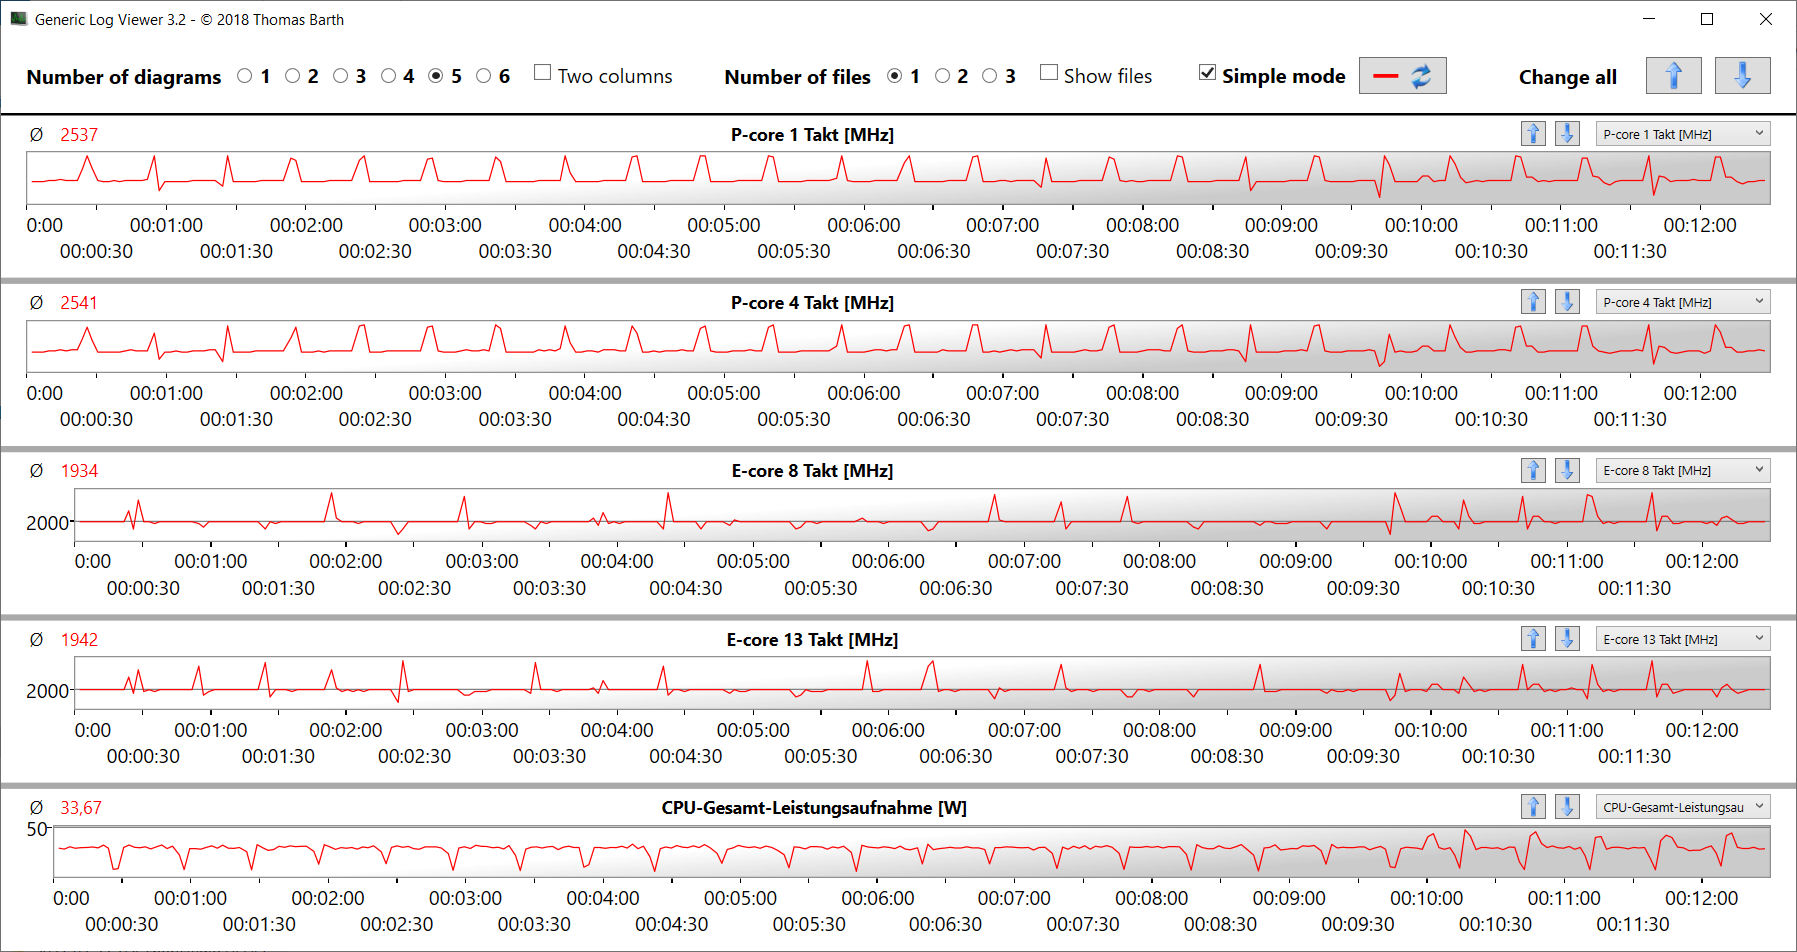
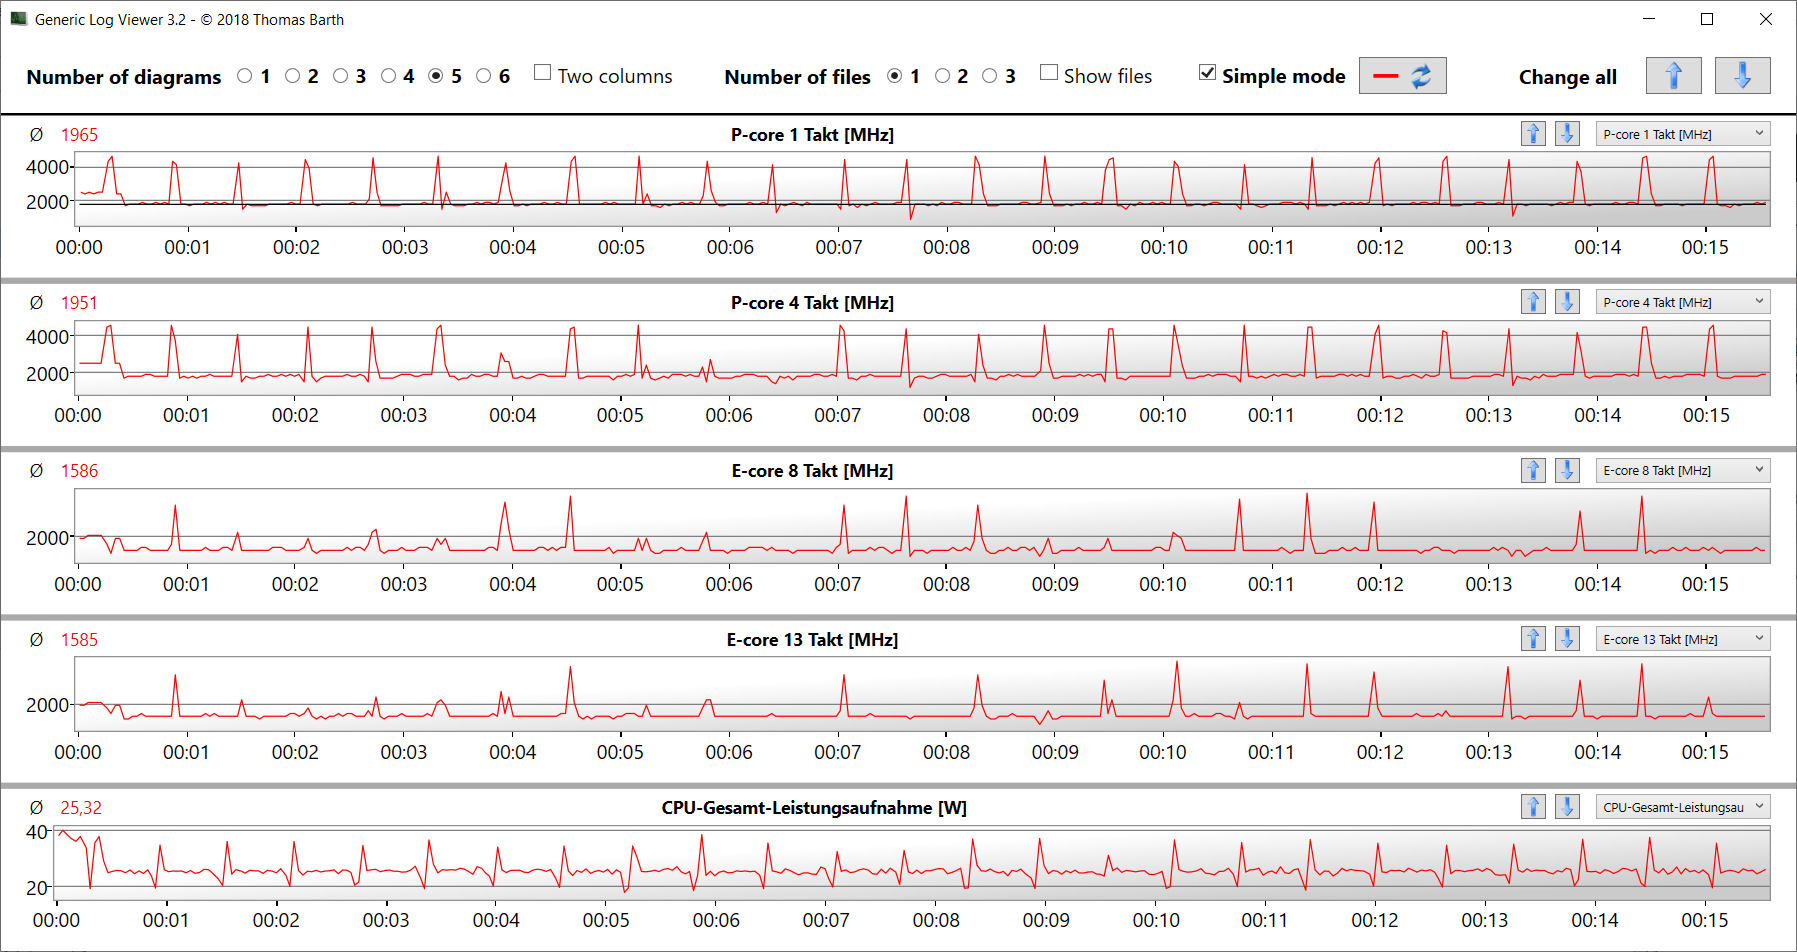
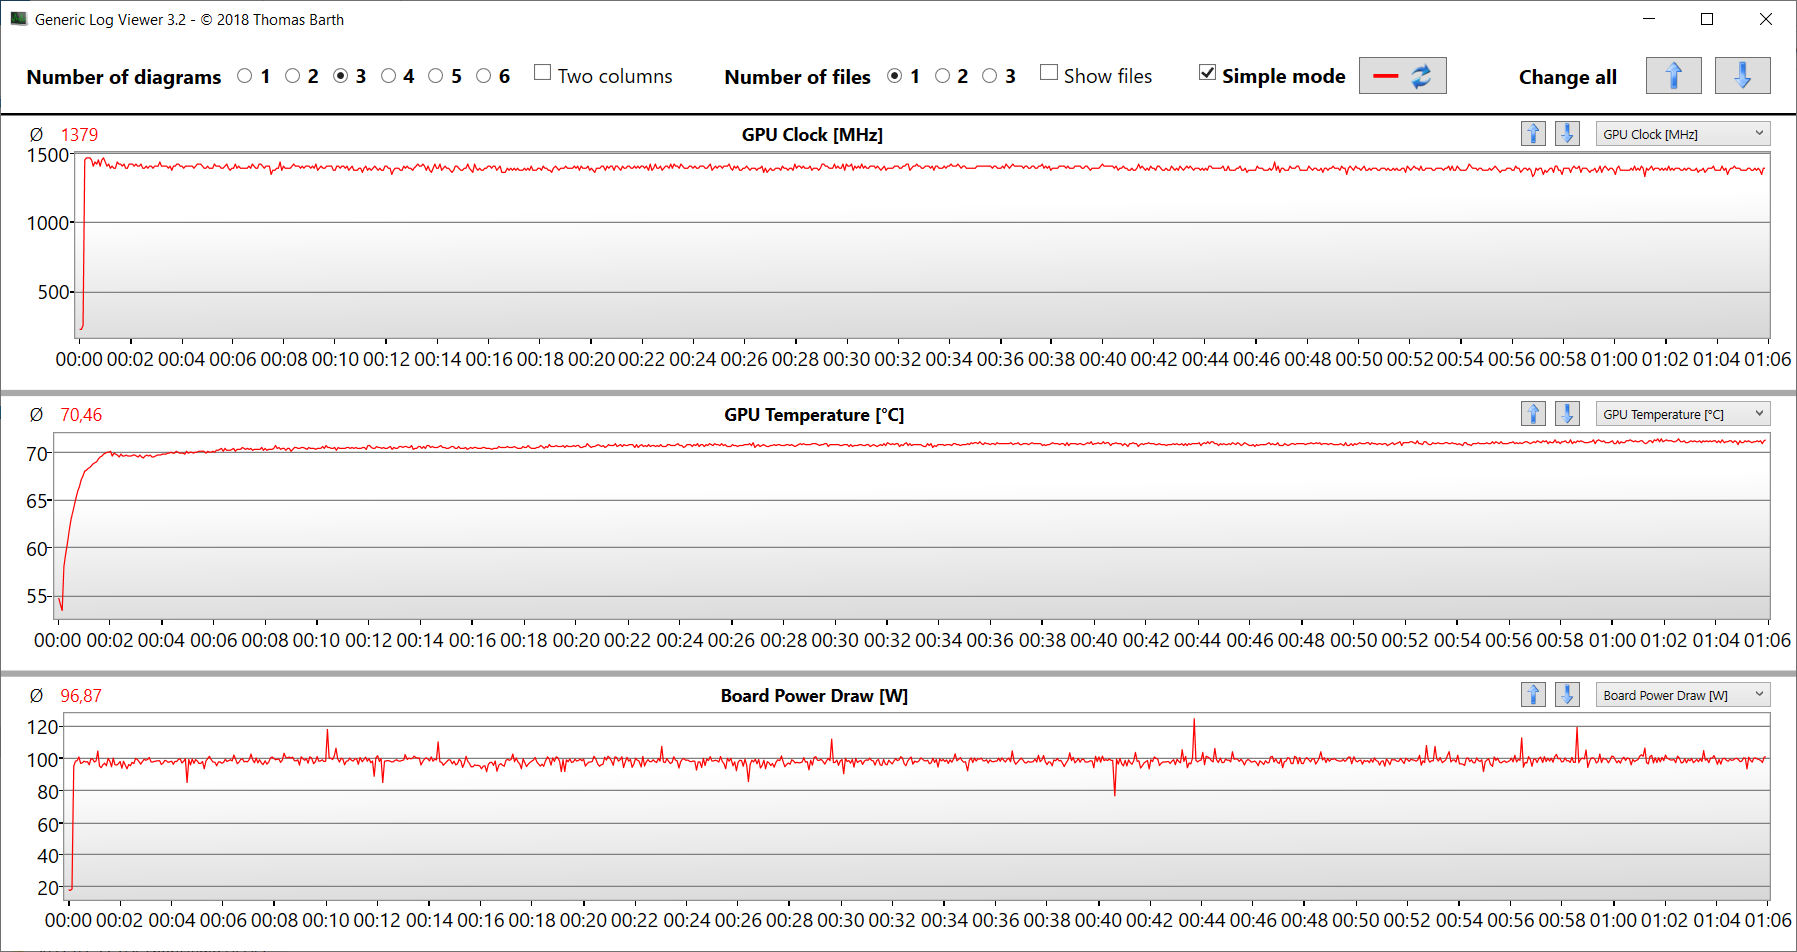
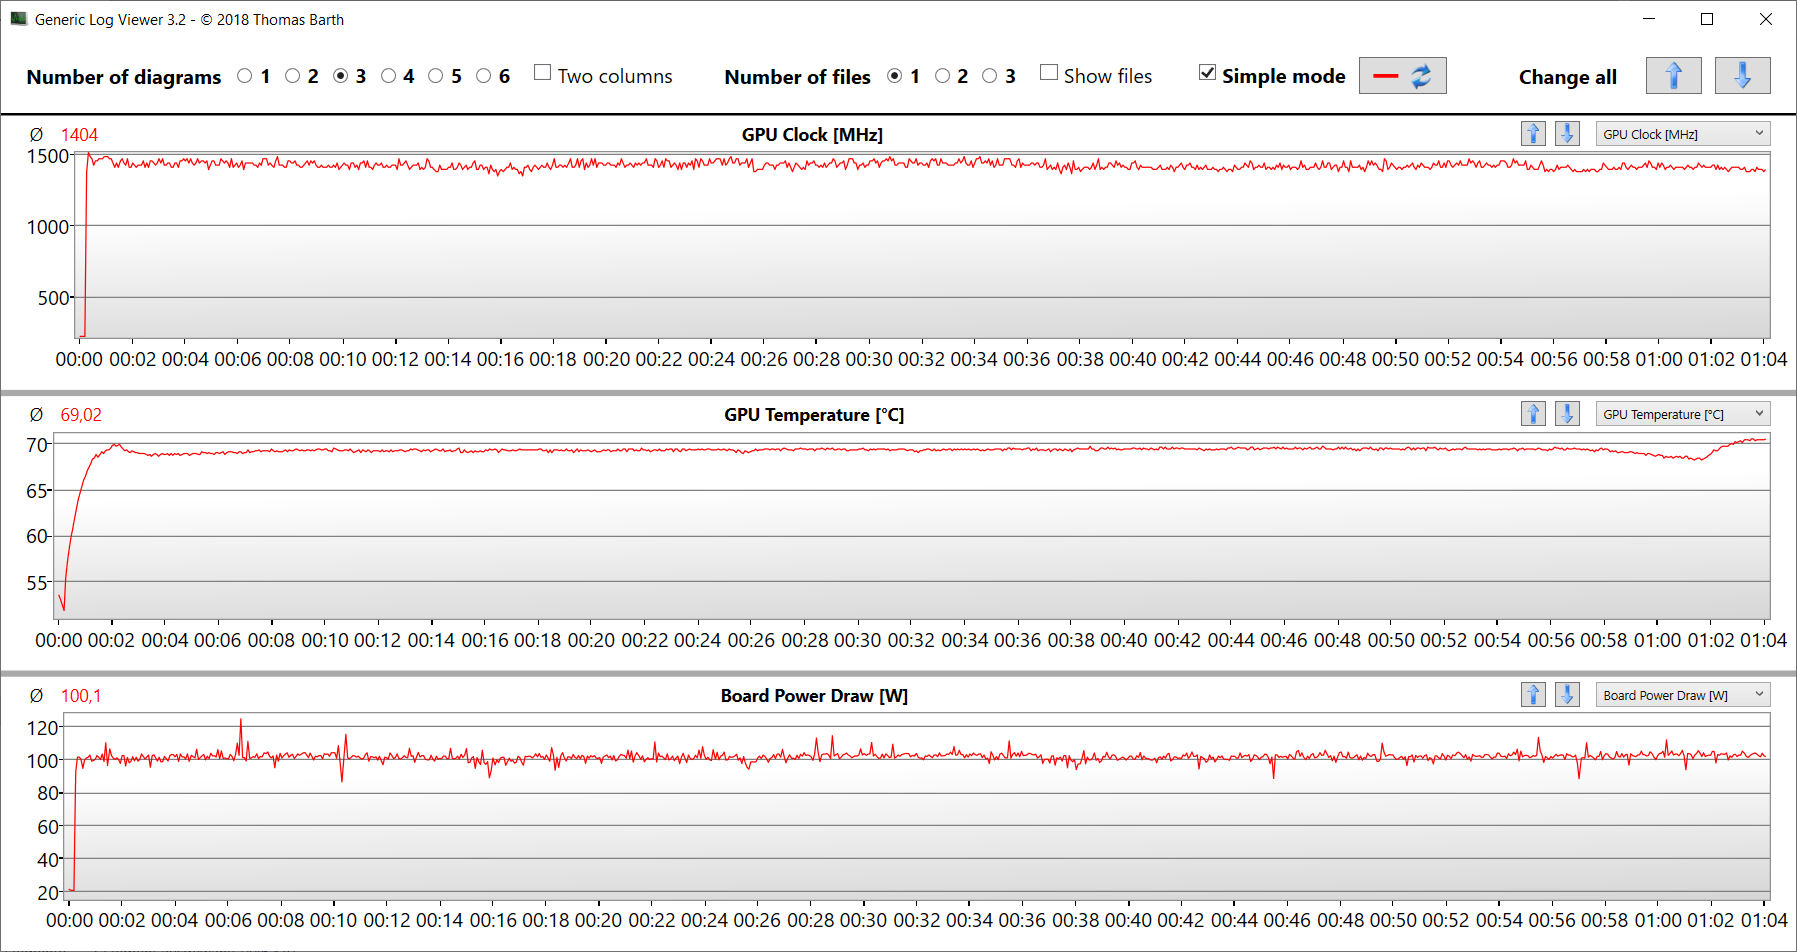
Test da sforzo
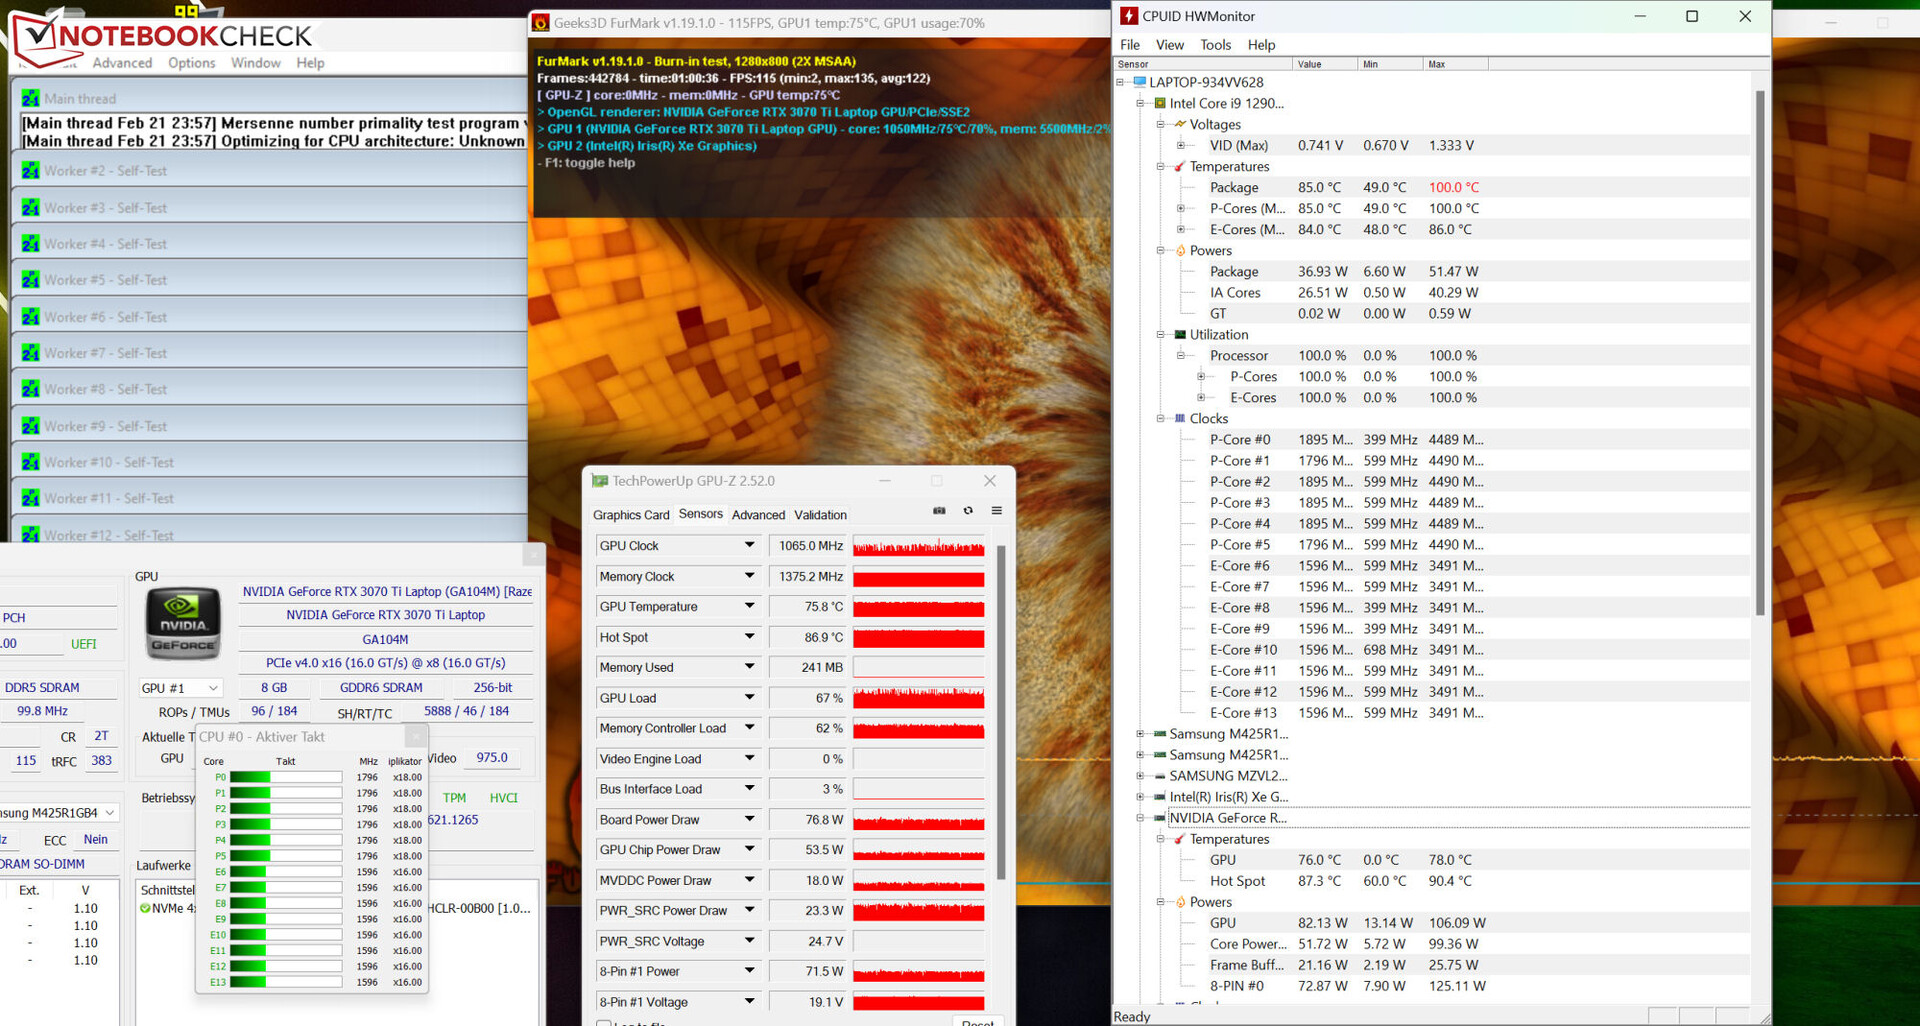
Lo stress test (Prime95 e Furmark in funzionamento continuo) rappresenta uno scenario estremo per analizzare la stabilità del sistema a pieno carico. Nel corso del test, la velocità di clock della CPU è scesa da un punto di partenza di 2,5 GHz (P-cores) e 2,1 GHz (E-cores), rispettivamente, a circa 1,7 GHz (P-cores) e 1,5 GHz (E-cores), rispettivamente. La velocità di clock della GPU oscilla tra 700 e 1.300 MHz.
Altoparlanti
Gli altoparlanti stereo producono un suono decente, ma privo di bassi.
Razer Blade 15 OLED (Early 2022) analisi audio
(+) | gli altoparlanti sono relativamente potenti (89.2 dB)
Bassi 100 - 315 Hz
(-) | quasi nessun basso - in media 24.8% inferiori alla media
(±) | la linearità dei bassi è media (12.7% delta rispetto alla precedente frequenza)
Medi 400 - 2000 Hz
(+) | medi bilanciati - solo only 3% rispetto alla media
(+) | medi lineari (4.3% delta rispetto alla precedente frequenza)
Alti 2 - 16 kHz
(+) | Alti bilanciati - appena 2.2% dalla media
(+) | alti lineari (4.1% delta rispetto alla precedente frequenza)
Nel complesso 100 - 16.000 Hz
(+) | suono nel complesso lineare (14.1% differenza dalla media)
Rispetto alla stessa classe
» 24% di tutti i dispositivi testati in questa classe è stato migliore, 8% simile, 68% peggiore
» Il migliore ha avuto un delta di 6%, medio di 18%, peggiore di 132%
Rispetto a tutti i dispositivi testati
» 17% di tutti i dispositivi testati in questa classe è stato migliore, 4% similare, 79% peggiore
» Il migliore ha avuto un delta di 4%, medio di 23%, peggiore di 134%
Asus ROG Zephyrus M16 GU603Z analisi audio
(+) | gli altoparlanti sono relativamente potenti (82.96 dB)
Bassi 100 - 315 Hz
(±) | bassi ridotti - in media 11.6% inferiori alla media
(±) | la linearità dei bassi è media (9.2% delta rispetto alla precedente frequenza)
Medi 400 - 2000 Hz
(+) | medi bilanciati - solo only 4.3% rispetto alla media
(+) | medi lineari (5.7% delta rispetto alla precedente frequenza)
Alti 2 - 16 kHz
(+) | Alti bilanciati - appena 1.6% dalla media
(+) | alti lineari (3.9% delta rispetto alla precedente frequenza)
Nel complesso 100 - 16.000 Hz
(+) | suono nel complesso lineare (10.1% differenza dalla media)
Rispetto alla stessa classe
» 5% di tutti i dispositivi testati in questa classe è stato migliore, 2% simile, 93% peggiore
» Il migliore ha avuto un delta di 6%, medio di 18%, peggiore di 132%
Rispetto a tutti i dispositivi testati
» 5% di tutti i dispositivi testati in questa classe è stato migliore, 2% similare, 94% peggiore
» Il migliore ha avuto un delta di 4%, medio di 23%, peggiore di 134%
Gestione dell'energia - Il Blade è molto affamato in caso di utilizzo inattivo
Consumo di energia
Nell'uso inattivo, il fabbisogno energetico (fino a 39 watt) è relativamente elevato. Questo sembra essere un problema generale riscontrato nei modelli Blade 2022, in cui ci siamo imbattuti in molte occasioni abbiamo riscontrato in molte occasioni. Sotto carico, il consumo è normale per questo tipo di hardware. Mentre il test di Witcher 3 si è svolto con un consumo energetico costante, i requisiti sono calati bruscamente durante lo stress test - la CPU è stata soffocata. L'alimentatore (230 watt) è adeguatamente dimensionato.
| Off / Standby | |
| Idle | |
| Sotto carico |
|
Leggenda:
min: | |
| Razer Blade 15 OLED (Early 2022) i9-12900H, GeForce RTX 3070 Ti Laptop GPU, Samsung PM9A1 MZVL21T0HCLR, OLED, 2560x1440, 15.6" | Asus ROG Zephyrus M16 GU603Z i9-12900H, GeForce RTX 3070 Ti Laptop GPU, Micron 3400 1TB MTFDKBA1T0TFH, IPS, 2560x1600, 16" | Aorus 15 XE5 i7-12700H, GeForce RTX 3070 Ti Laptop GPU, Gigabyte AG470S1TB-SI B10, IPS, 2560x1440, 15.6" | Schenker XMG Fusion 15 (Mid 22) i7-11800H, GeForce RTX 3070 Laptop GPU, Samsung SSD 980 Pro 1TB MZ-V8P1T0BW, IPS, 2560x1440, 15.6" | HP Omen 16-b1090ng i7-12700H, GeForce RTX 3070 Ti Laptop GPU, WDC PC SN810 1TB, IPS, 2560x1440, 16.1" | Razer Blade 15 2022 i7-12800H, GeForce RTX 3080 Ti Laptop GPU, SSSTC CA6-8D1024, IPS, 2560x1440, 15.6" | Media NVIDIA GeForce RTX 3070 Ti Laptop GPU | Media della classe Gaming | |
|---|---|---|---|---|---|---|---|---|
| Power Consumption | 26% | -18% | 24% | 29% | -8% | 18% | 20% | |
| Idle Minimum * (Watt) | 31.6 | 10.8 66% | 31 2% | 12 62% | 4 87% | 33.2 -5% | 14.2 ? 55% | 13.1 ? 59% |
| Idle Average * (Watt) | 33.3 | 17 49% | 35 -5% | 17 49% | 10 70% | 36.4 -9% | 19.9 ? 40% | 19 ? 43% |
| Idle Maximum * (Watt) | 38.6 | 17.8 54% | 46 -19% | 24 38% | 19 51% | 37.6 3% | 26.2 ? 32% | 24.6 ? 36% |
| Load Average * (Watt) | 149 | 116 22% | 120 19% | 106 29% | 114 23% | 116.7 22% | 125.8 ? 16% | 111.3 ? 25% |
| Witcher 3 ultra * (Watt) | 149.6 | 144 4% | 202 -35% | 159.9 -7% | 183.2 -22% | 172 -15% | ||
| Load Maximum * (Watt) | 160 | 220 -38% | 268 -68% | 208 -30% | 221 -38% | 228.6 -43% | 248 ? -55% | 260 ? -63% |
* ... Meglio usare valori piccoli
Power consumption Witcher 3 / Stress test
Power consumption with an external monitor
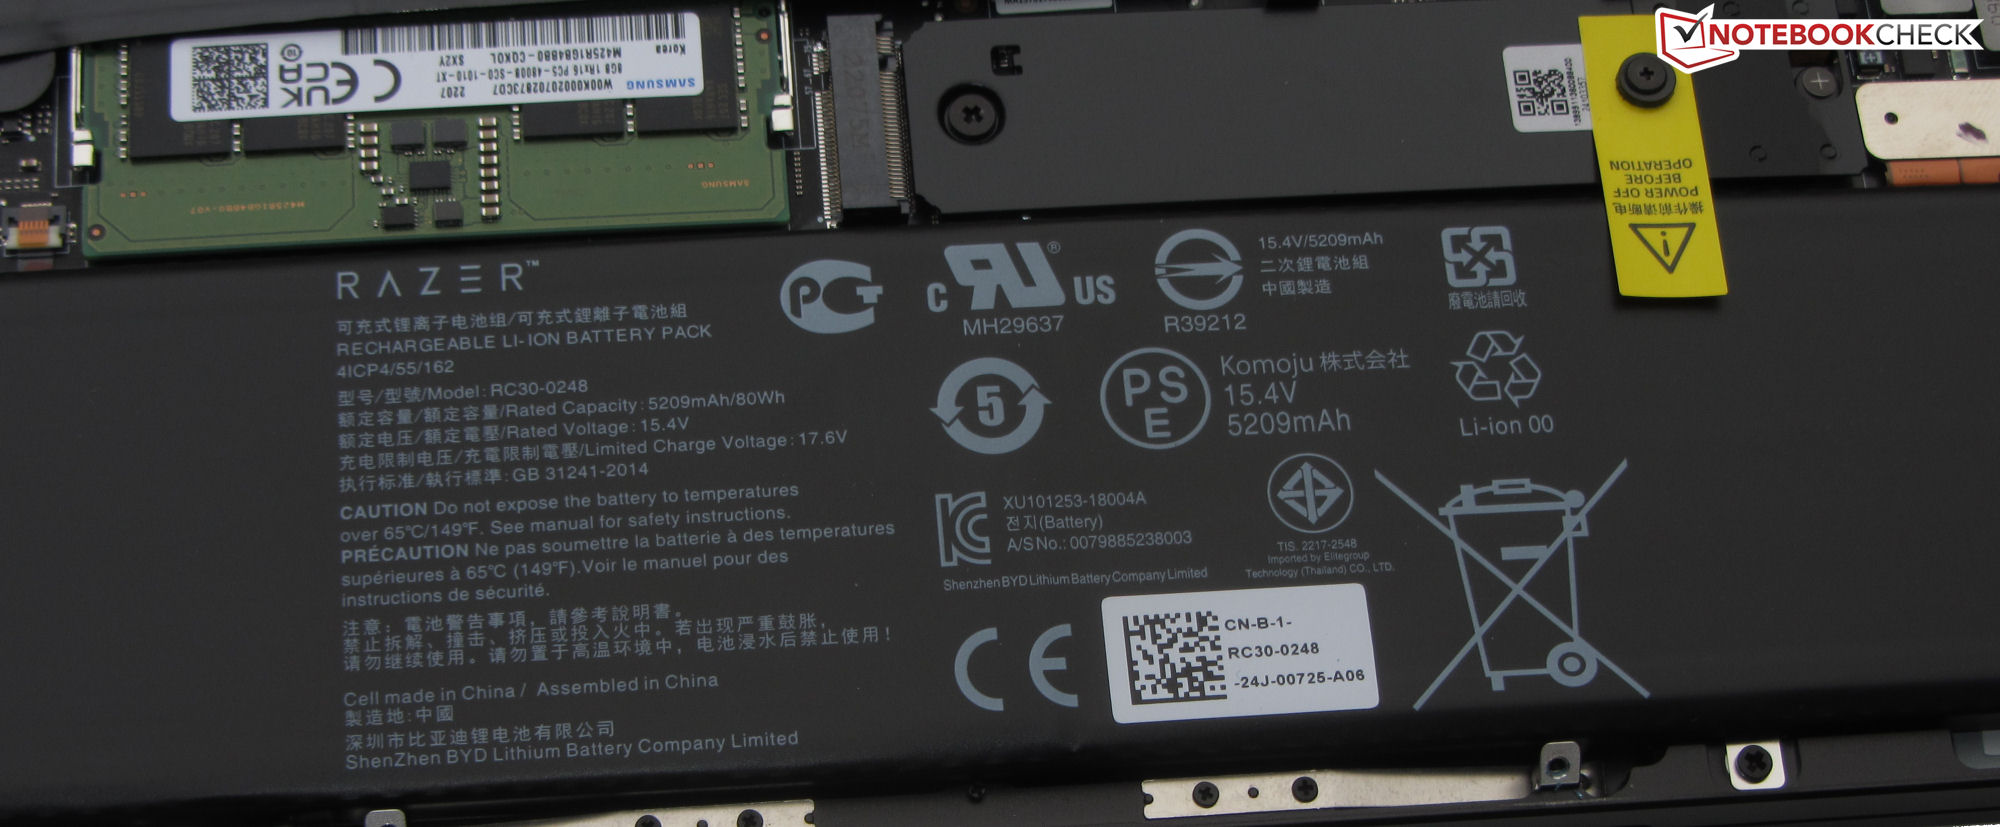
Durata della batteria
Nel test WiFi (apertura di siti web utilizzando uno script) e nel test video (cortometraggio Big Buck Bunny (codifica H.264, FHD) in loop), il dispositivo da 15 pollici ha raggiunto tempi di autonomia della batteria rispettivamente di 4,34 ore e 5,52 ore. Le funzioni di risparmio energetico del portatile sono state disattivate durante entrambi i test e la luminosità del display è stata impostata a 150 cd/m². Il test video è stato effettuato anche con il modulo radio spento.
Nel complesso, il Blade non è stato in grado di garantire un'autonomia impressionante, anche per un potente portatile QHD. In generale, la concorrenza offre una resistenza migliore, sia in termini assoluti che in termini di wattora calcolati.
| Razer Blade 15 OLED (Early 2022) i9-12900H, GeForce RTX 3070 Ti Laptop GPU, 80 Wh | Asus ROG Zephyrus M16 GU603Z i9-12900H, GeForce RTX 3070 Ti Laptop GPU, 90 Wh | Aorus 15 XE5 i7-12700H, GeForce RTX 3070 Ti Laptop GPU, 99 Wh | Schenker XMG Fusion 15 (Mid 22) i7-11800H, GeForce RTX 3070 Laptop GPU, 93.48 Wh | HP Omen 16-b1090ng i7-12700H, GeForce RTX 3070 Ti Laptop GPU, 83 Wh | Razer Blade 15 2022 i7-12800H, GeForce RTX 3080 Ti Laptop GPU, 80 Wh | Media della classe Gaming | |
|---|---|---|---|---|---|---|---|
| Autonomia della batteria | 17% | 23% | 51% | 21% | 7% | 21% | |
| Reader / Idle (h) | 6.7 | 10 49% | 15.5 131% | 10.1 51% | 7.84 ? 17% | ||
| H.264 (h) | 5.9 | 7.3 24% | 6.2 5% | 7.5 27% | 8.27 ? 40% | ||
| WiFi v1.3 (h) | 4.6 | 7.4 61% | 6.8 48% | 7.4 61% | 5.6 22% | 4.9 7% | 7.08 ? 54% |
| Load (h) | 2.1 | 1.4 -33% | 1.9 -10% | 1.8 -14% | 1.9 -10% | 1.496 ? -29% |
Pro
Contro
Verdetto: una centrale elettrica compatta

Le principali aree di applicazione del Blade 15 dovrebbero essere l'editing video, il rendering e i giochi. IlCore-i9 12900HcPU e GeForce RTX 3070 Ti(TGP: 110 watt) forniscono la potenza necessaria. Una veloce unità SSD PCIe-4 (1 TB) garantisce tempi di caricamento ridotti.
Il Blade 15 OLED (inizio 2022) è uno strumento potente per i giocatori e i creativi.
L'attenzione non è rivolta solo alle prestazioni elevate: I risultati massimi dei core di calcolo sono nella media se confrontati con i laptop precedentemente recensiti con 12900H o 3070 Ti. Mentre la produzione di calore è tipica per un portatile di questa potenza, le emissioni di rumore sono relativamente moderate. Non si può dire lo stesso del consumo di energia nell'uso inattivo: Il Blade 15 si concede una bella sorsata dalla bottiglia.
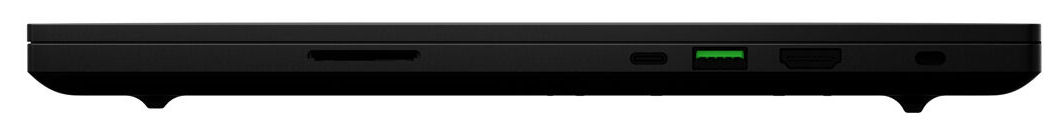
La durata reale della batteria, compresa tra le 4 e le 6 ore, non convince. A questo proposito, la concorrenza ha molto di più da offrire. Tuttavia, la batteria può essere ricaricata tramite un alimentatore universale USB-C (min. 65 watt, 20 V) ed entrambe le porte USB-C (2x Thunderbolt) supportano Power Delivery (e Displayport).
Nel complesso, il pannello OLED riflettente (QHD) è leggermente migliore del pannello LED convenzionale (QHD) presente nel modello Blade 2022 precedentemente recensito. Entrambi i display offrono una buona copertura dello spazio colore (sRGB: 100%) e una buona riproduzione dei colori. Il modello OLED è in vantaggio per quanto riguarda i livelli di nero, la luminosità e i tempi di risposta, mentre il modello LED guadagna punti grazie alla sua superficie opaca.
Una possibile alternativa a questo dispositivo potrebbe essere rappresentata dal modelloAsus ROG Zephyrus M16 GU603Z. Il processore è alla pari, ma il dispositivo guadagna punti grazie a un display più luminoso in formato 16:10 e a una durata della batteria notevolmente superiore. Un'alternativa economica potrebbe essere il modelloAorus 15 XE5. Nonostante il prezzo più basso di qualche centinaio di dollari, questo computer offre un po' più di potenza e una migliore durata della batteria rispetto al Blade.
Prezzo e disponibilità
Il Razer Blade 15 OLED (Early 22) può essere acquistato su Amazon per 1.967 dollari.
Razer Blade 15 OLED (Early 2022)
- 03/04/2023 v7 (old)
Sascha Mölck
Transparency
La selezione dei dispositivi da recensire viene effettuata dalla nostra redazione. Il campione di prova è stato fornito all'autore come prestito dal produttore o dal rivenditore ai fini di questa recensione. L'istituto di credito non ha avuto alcuna influenza su questa recensione, né il produttore ne ha ricevuto una copia prima della pubblicazione. Non vi era alcun obbligo di pubblicare questa recensione. In quanto società mediatica indipendente, Notebookcheck non è soggetta all'autorità di produttori, rivenditori o editori.
Ecco come Notebookcheck esegue i test
Ogni anno, Notebookcheck esamina in modo indipendente centinaia di laptop e smartphone utilizzando procedure standardizzate per garantire che tutti i risultati siano comparabili. Da circa 20 anni sviluppiamo continuamente i nostri metodi di prova e nel frattempo stabiliamo gli standard di settore. Nei nostri laboratori di prova, tecnici ed editori esperti utilizzano apparecchiature di misurazione di alta qualità. Questi test comportano un processo di validazione in più fasi. Il nostro complesso sistema di valutazione si basa su centinaia di misurazioni e parametri di riferimento ben fondati, che mantengono l'obiettività.Price comparison

