Recensione dello Schenker XMG Fusion 15 (Mid 22): Laptop RTX 3070 leggero con una buona autonomia
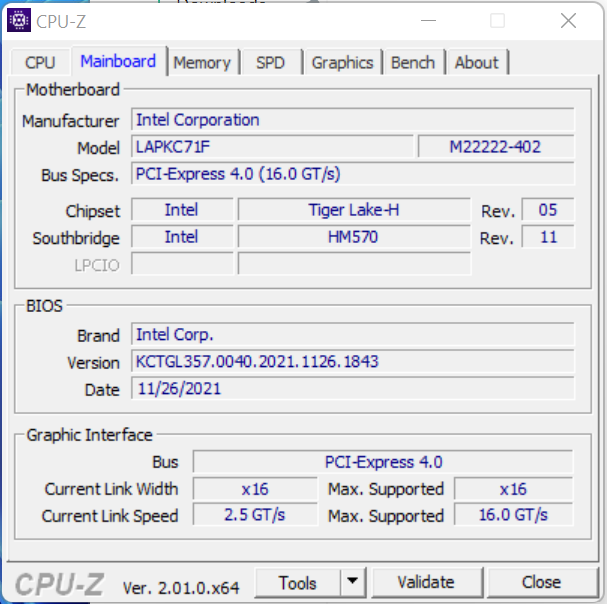
Lo Schenker XMG Fusion 15 è principalmente un portatile da gioco, ma è anche progettato per il settore creativo. Il dispositivo offre un compromesso tra prestazioni, dimensioni ridotte e portabilità: hardware di alto livello (Core i7-11800H,GeForce RTX 3070 Laptop) è abbinato a una batteria da 93 Wh e racchiuso in un case compatto. L'intero pacchetto pesa poco meno di 2 kg (~4,4 lb). Un barebone di Intel (NUC X15 Laptop Kit C71FBF) funge da base per il Fusion
I suoi concorrenti sono dispositivi altrettanto compatti e leggeri come il Razer Blade 15 modello base, ilMSI Delta 15e l'Asus TUF Dash F15 FX517ZR. Il gruppo più ampio di concorrenti comprende computer portatili come l' Acer Nitro 5 AN515-58e il HP Omen 16.
Potenziali concorrenti a confronto
Punteggio | Data | Modello | Peso | Altezza | Dimensione | Risoluzione | Prezzo |
|---|---|---|---|---|---|---|---|
| 87.4 % v7 (old) | 08/2022 | Schenker XMG Fusion 15 (Mid 22) i7-11800H, GeForce RTX 3070 Laptop GPU | 1.9 kg | 21.65 mm | 15.60" | 2560x1440 | |
| 85.8 % v7 (old) | 07/2022 | Asus TUF Dash F15 FX517ZR i7-12650H, GeForce RTX 3070 Laptop GPU | 2 kg | 20.7 mm | 15.60" | 2560x1440 | |
| 84 % v7 (old) | 06/2022 | Acer Nitro 5 AN515-58-72QR i7-12700H, GeForce RTX 3070 Ti Laptop GPU | 2.5 kg | 26.8 mm | 15.60" | 2560x1440 | |
| 85.5 % v7 (old) | 05/2022 | HP Omen 16-b1090ng i7-12700H, GeForce RTX 3070 Ti Laptop GPU | 2.3 kg | 23 mm | 16.10" | 2560x1440 | |
| 82.9 % v7 (old) | 10/2021 | MSI Delta 15 A5EFK R9 5900HX, Radeon RX 6700M | 2 kg | 19 mm | 15.60" | 1920x1080 | |
| 85.5 % v7 (old) | 03/2021 | Razer Blade 15 Base Edition 2021, i7-10750H RTX 3060 i7-10750H, GeForce RTX 3060 Laptop GPU | 2.1 kg | 19.9 mm | 15.60" | 1920x1080 |
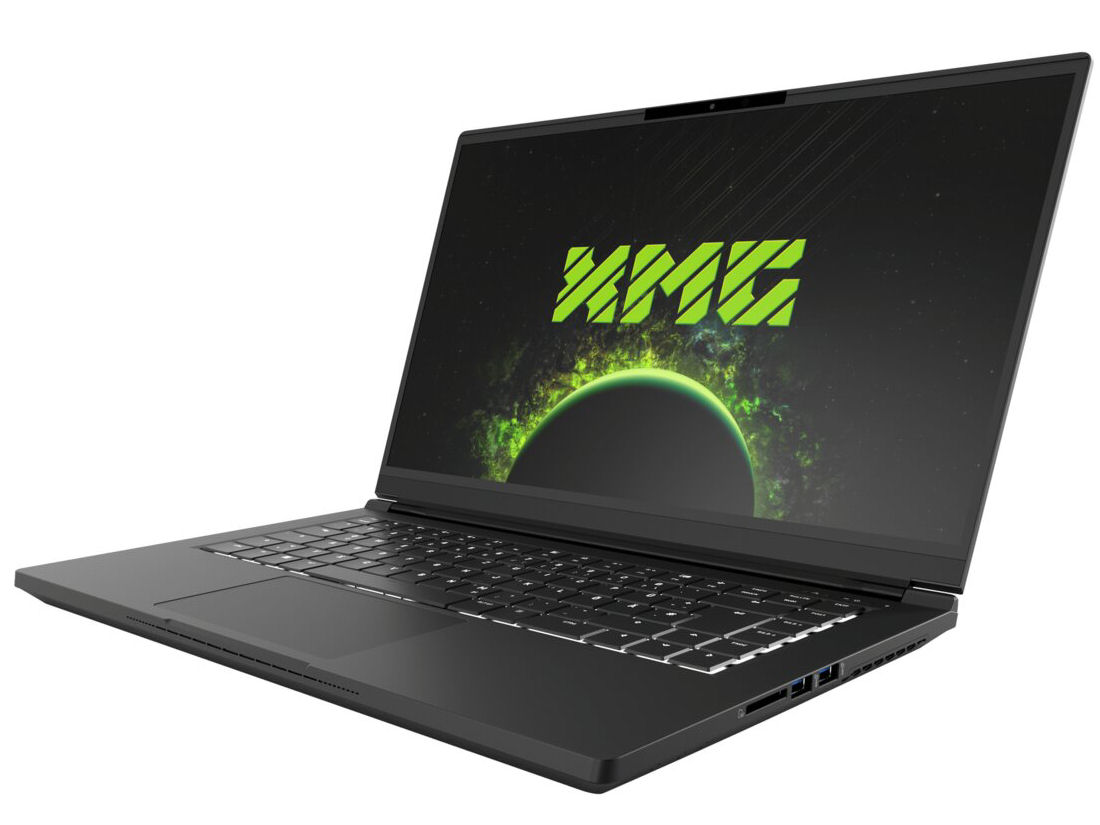
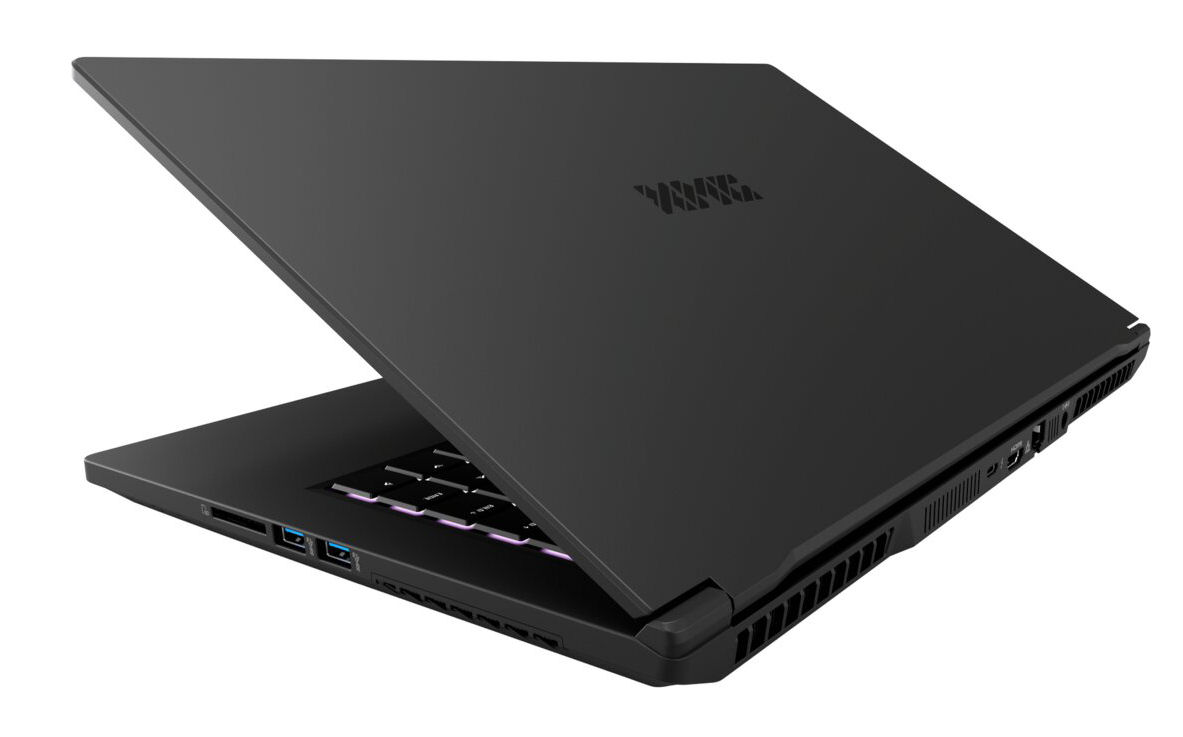
Custodia - Uno chassis in magnesio per il Fusion
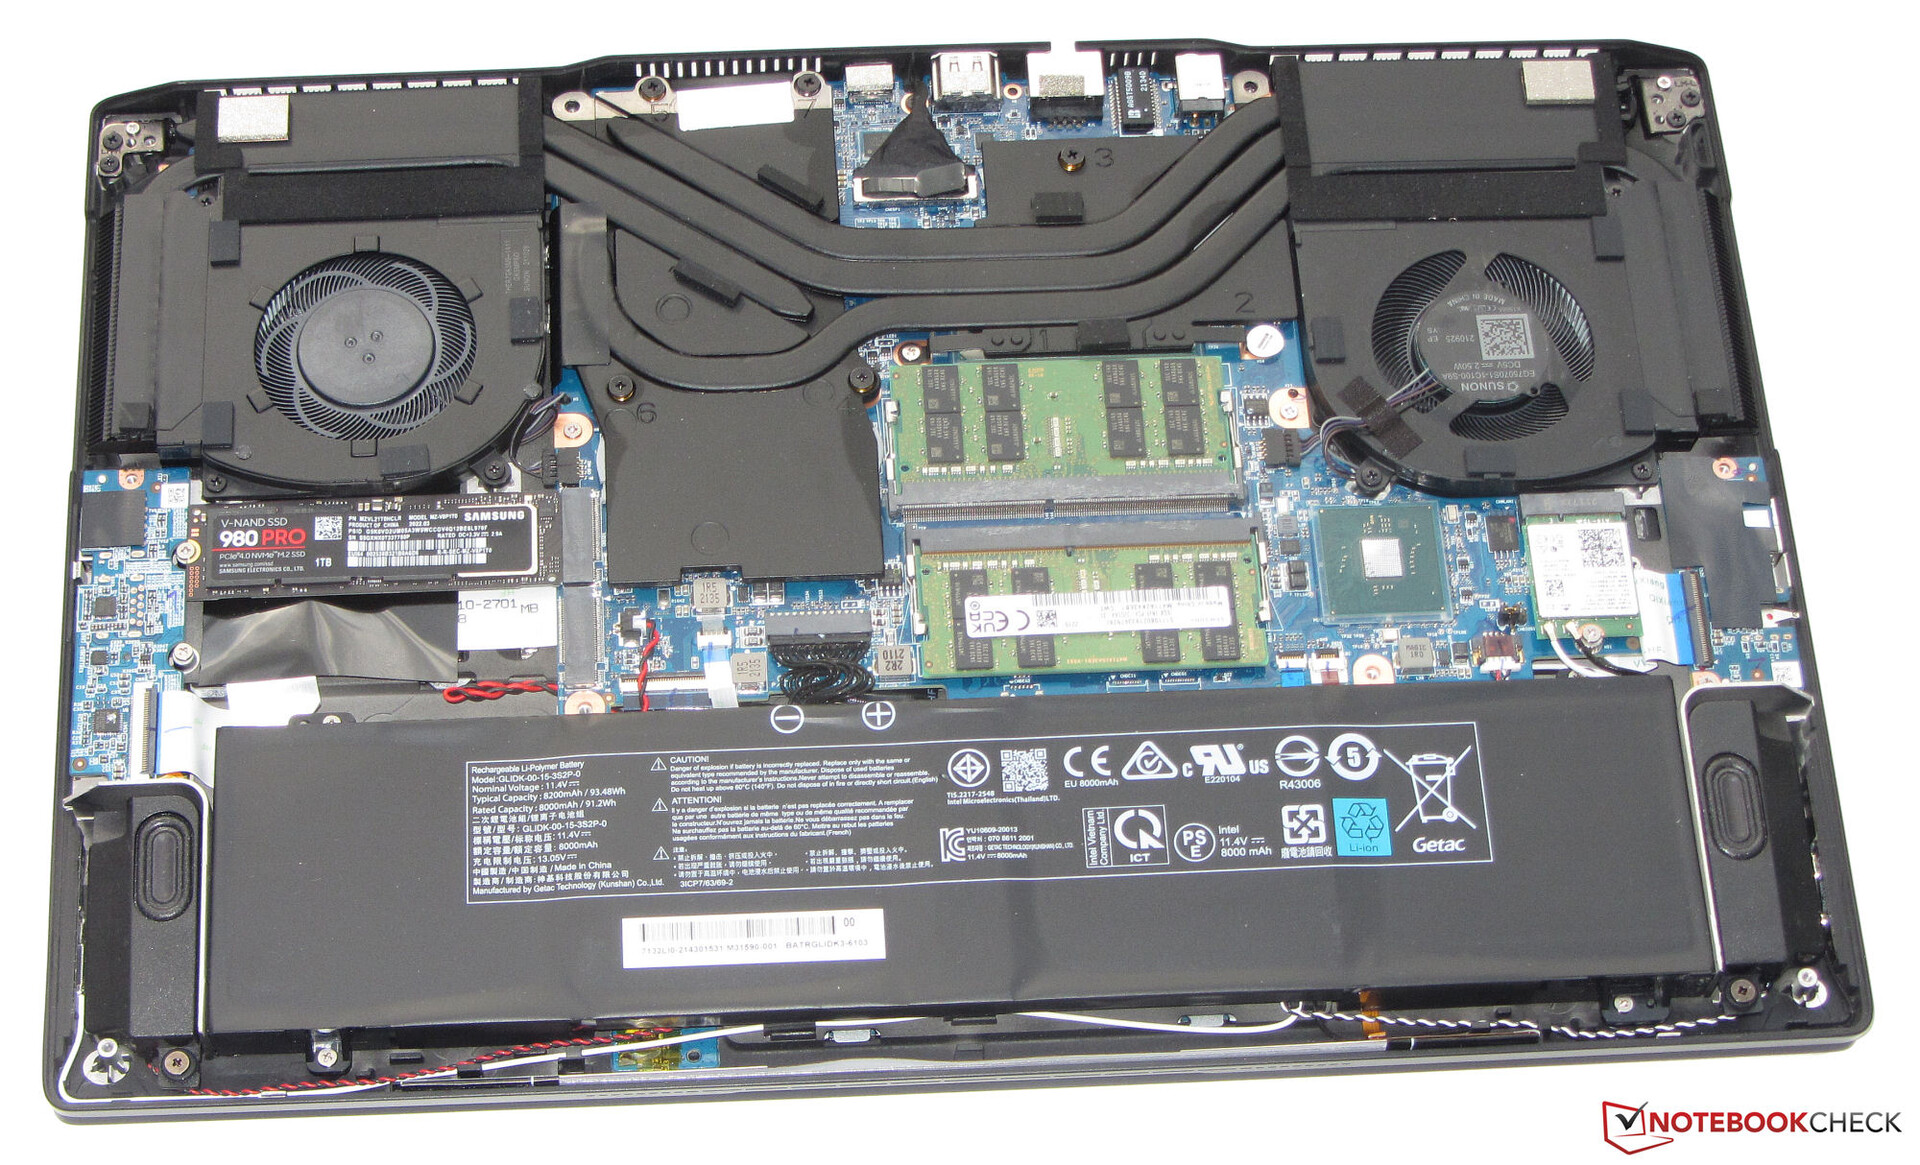
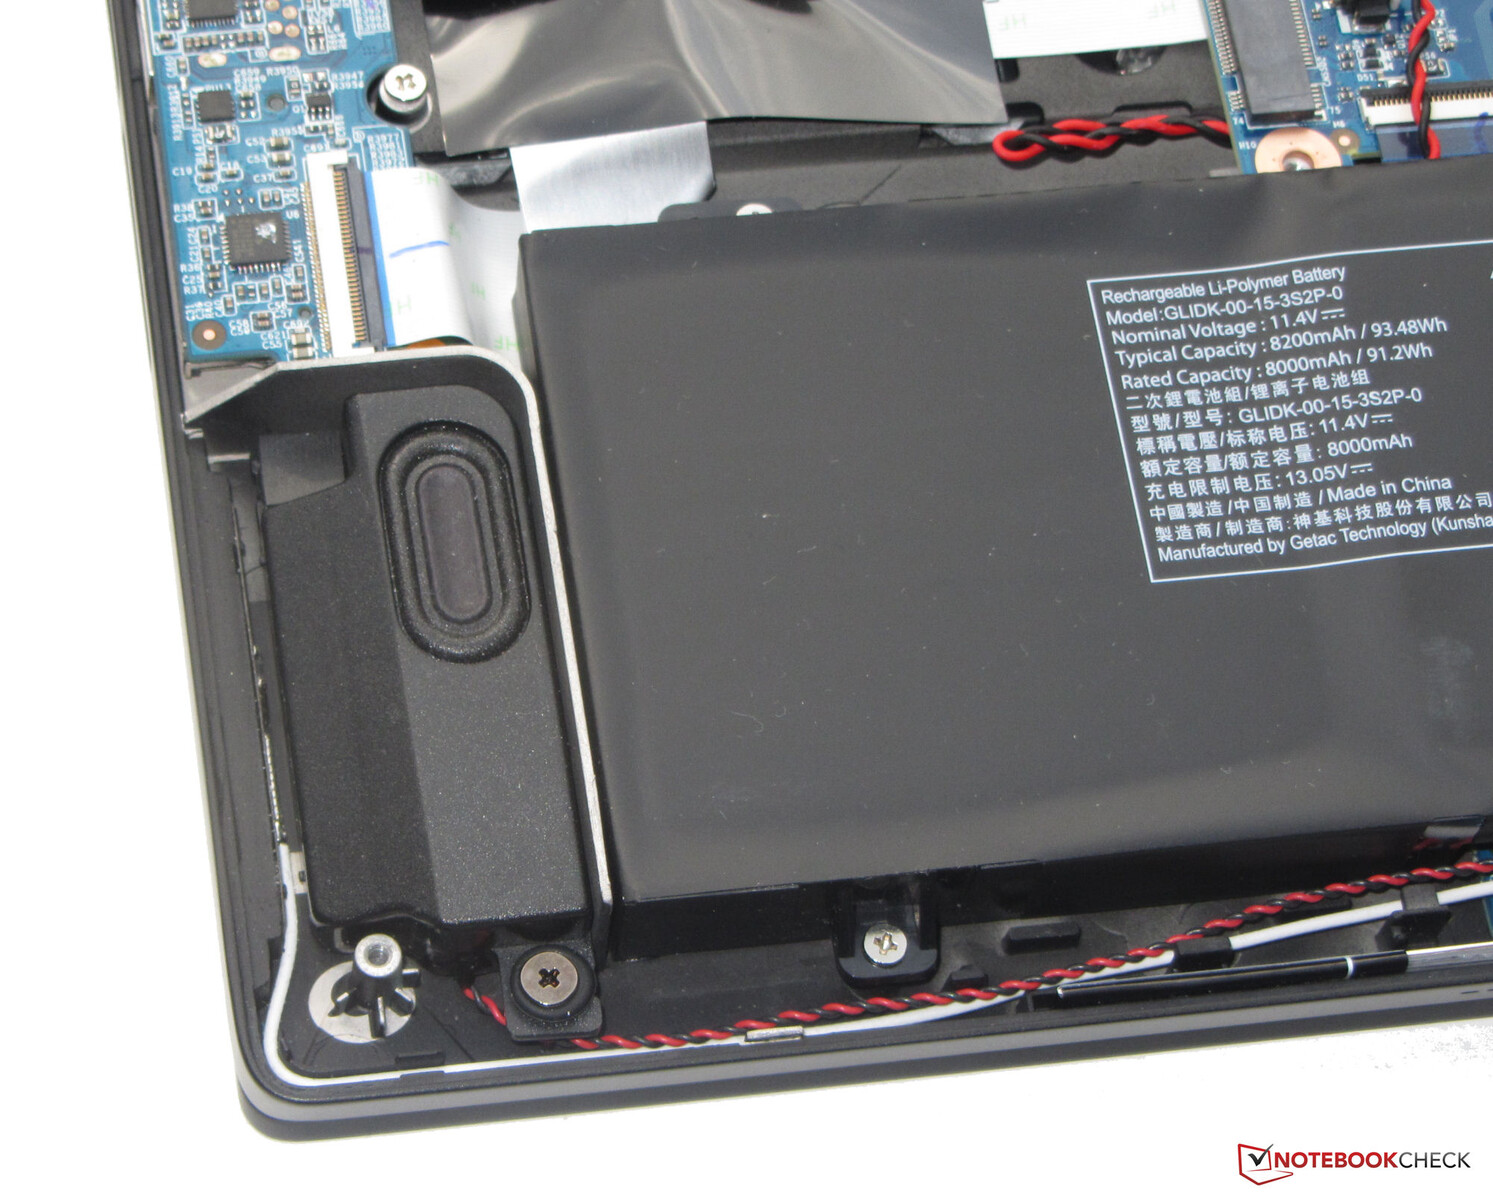
La cassa nera opaca è realizzata in lega di magnesio e offre un design elegante e senza fronzoli. Schenker ha optato per superfici lisce. Una striscia LED configurabile (RGB) sul lato del case rivolto verso l'utente fornisce un po' di colore in aggiunta all'illuminazione della tastiera. La batteria è integrata nel dispositivo (avvitata, non incollata). È possibile accedere all'interno dopo aver rimosso il coperchio inferiore.
Il portatile non presenta alcun difetto di fabbricazione. Le dimensioni dello spazio sono precise e non ci sono sporgenze di materiale. L'unità di base non può essere piegata, ma il coperchio sì. Le cerniere mantengono il coperchio saldamente in posizione e l'angolo di apertura massimo è di 180 gradi. È possibile aprire il coperchio con una sola mano.

Il Fusion non riesce ad eguagliare le dimensioni compatte del Blade 15ma ne riduce il peso di circa 200 grammi. Questo lo rende il dispositivo più leggero nel confronto
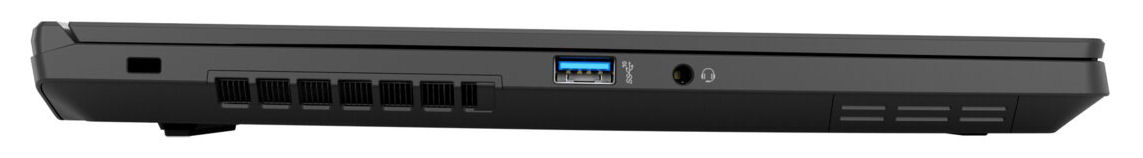
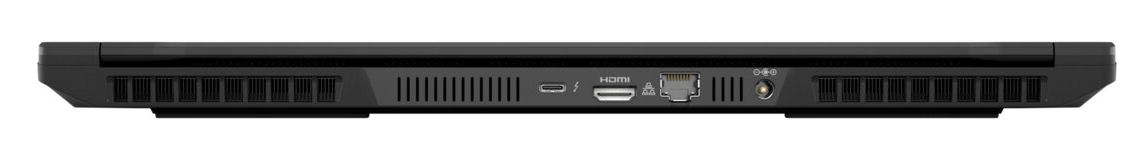
Connettività - XMG 15 dotato di Thunderbolt 4
Il Fusion dispone di tre porte USB-A (USB 3.2 Gen 2) e una porta USB-C (Thunderbolt 4). Quest'ultima supporta la porta DisplayPort tramite USB-C. Complessivamente, il portatile offre due uscite video (1x DP, 1x HDMI). Inoltre, sono presenti un jack audio combinato, una porta Gigabit Ethernet e uno slot per il blocco dei cavi.
Le porte sono distribuite su tre lati del portatile. Buone: Le uscite video, la porta Ethernet e la connessione di alimentazione si trovano sul retro del dispositivo. Pertanto, i cavi corrispondenti corrono verso la parte posteriore e non sono d'intralcio.
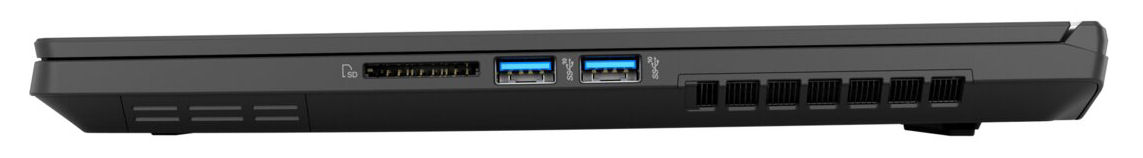
Lettore di schede SD
Con una velocità di trasferimento massima di 77 MB/s (trasferimento di 250 file immagine jpg di circa 5 MB ciascuno), il lettore di schede di memoria SD (scheda di riferimento: 128 GB AV PRO V60 microSD) presenta velocità medie
| SD Card Reader - average JPG Copy Test (av. of 3 runs) | |
| Media della classe Gaming (20.9 - 210, n=54, ultimi 2 anni) | |
| Schenker XMG Fusion 15 (Mid 22) (AV PRO microSD 128 GB V60) | |
| HP Omen 16-b1090ng (AV PRO microSD 128 GB V60) | |
Comunicazione
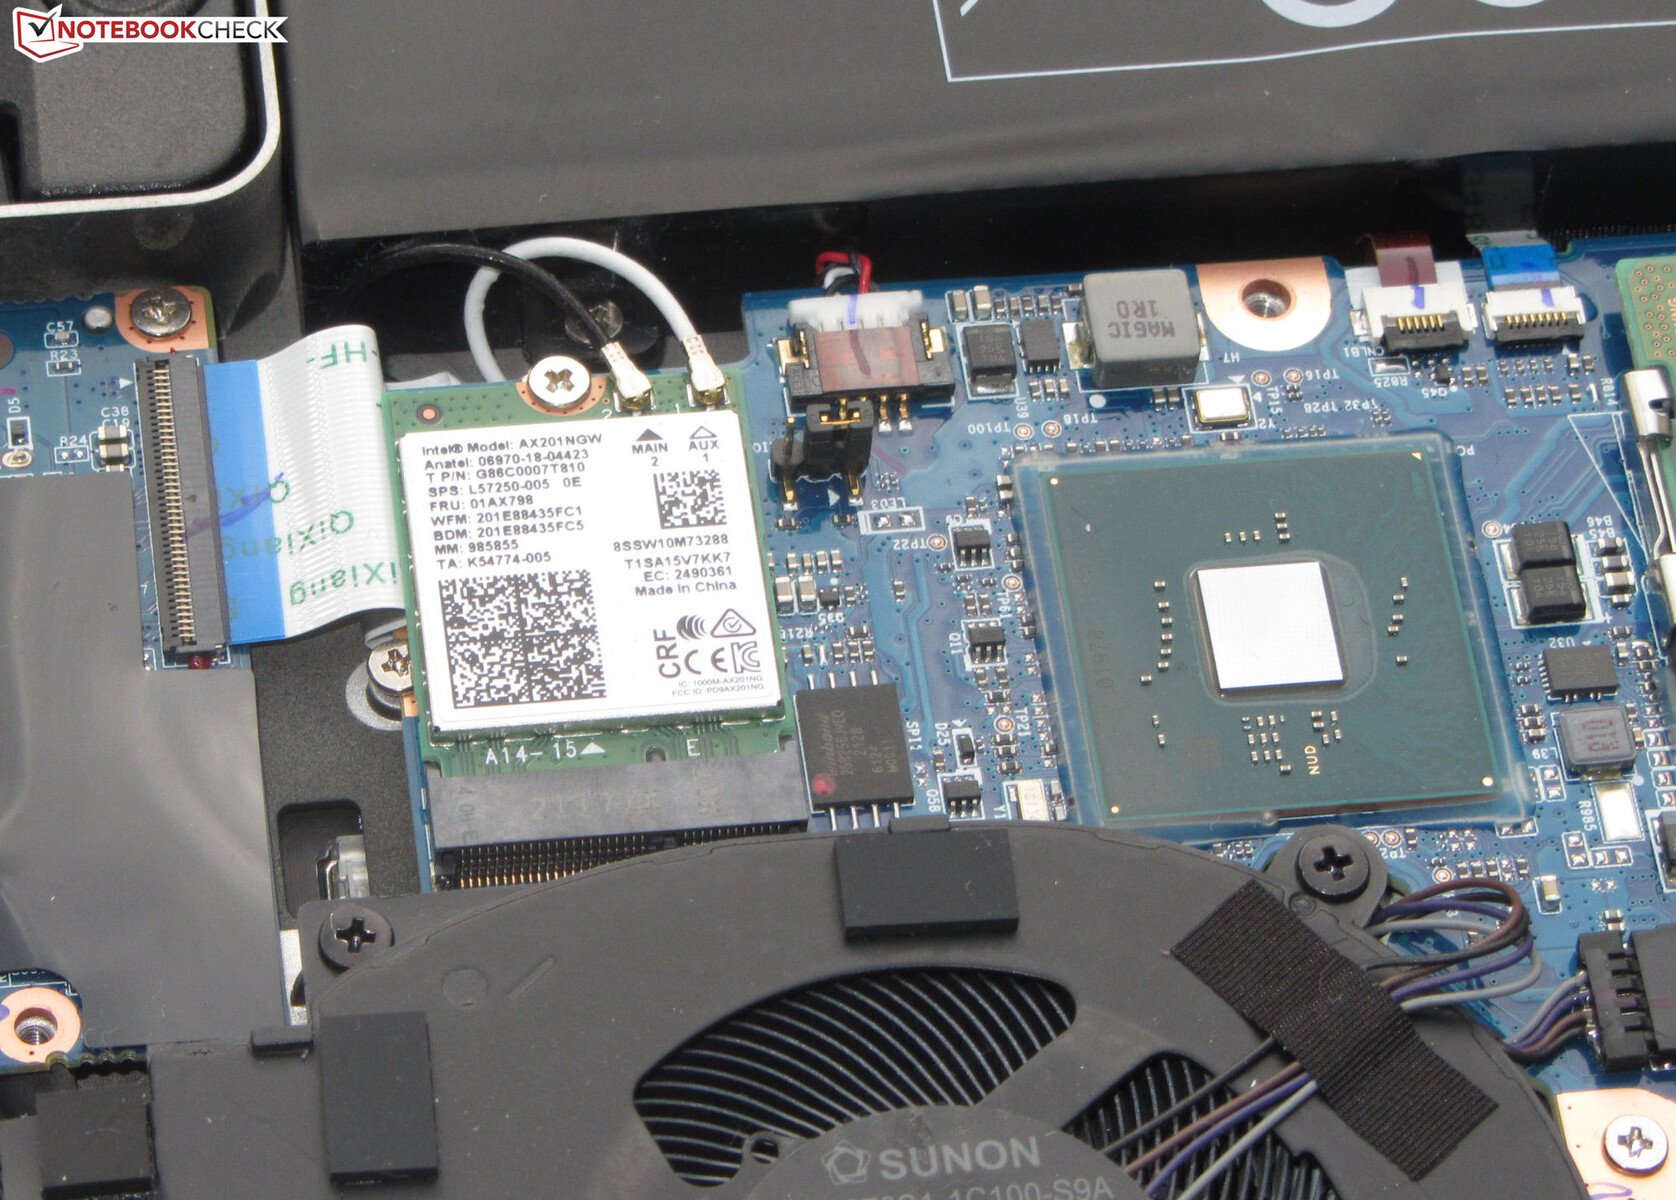
Le velocità di trasferimento Wi-Fi determinate in condizioni ottimali (nessun altro dispositivo Wi-Fi nelle vicinanze, breve distanza tra il portatile e il PC server) sono molto buone e sono in linea con le capacità del chip Wi-Fi (Intel AX201; 802.11ax). Un chip Gigabit Ethernet (Intel I225-V, 2,5 gigabit) gestisce le connessioni di rete cablate
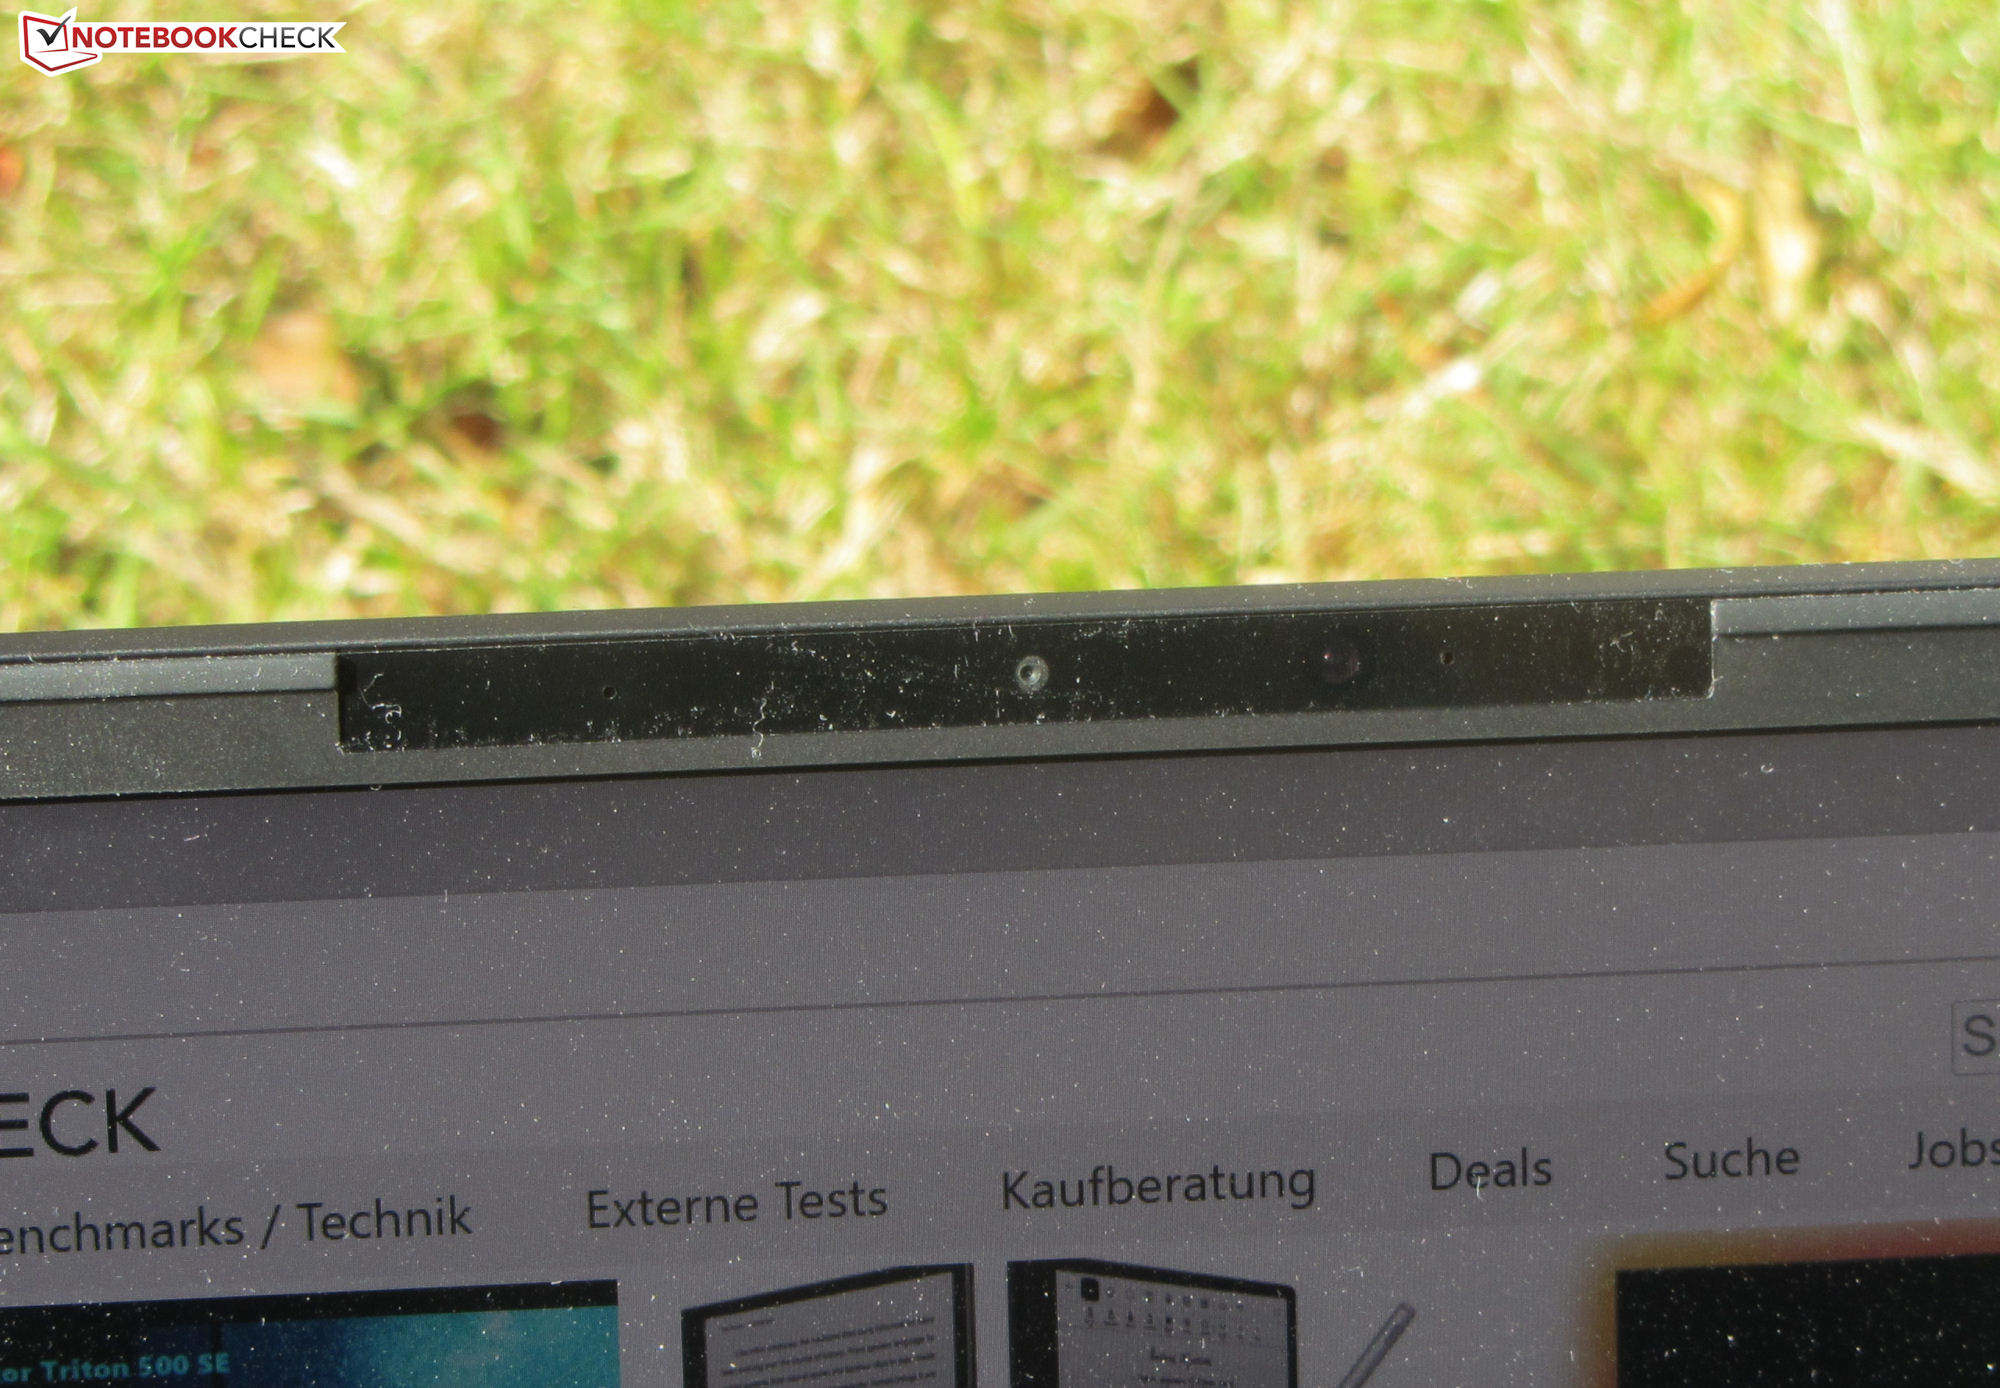
Webcam
La webcam (0,9 MP) produce immagini con una risoluzione massima di 1.280x720 pixel. Ci sono problemi con l'accuratezza dei colori: I colori si discostano dall'obiettivo. La fotocamera non ha un otturatore meccanico

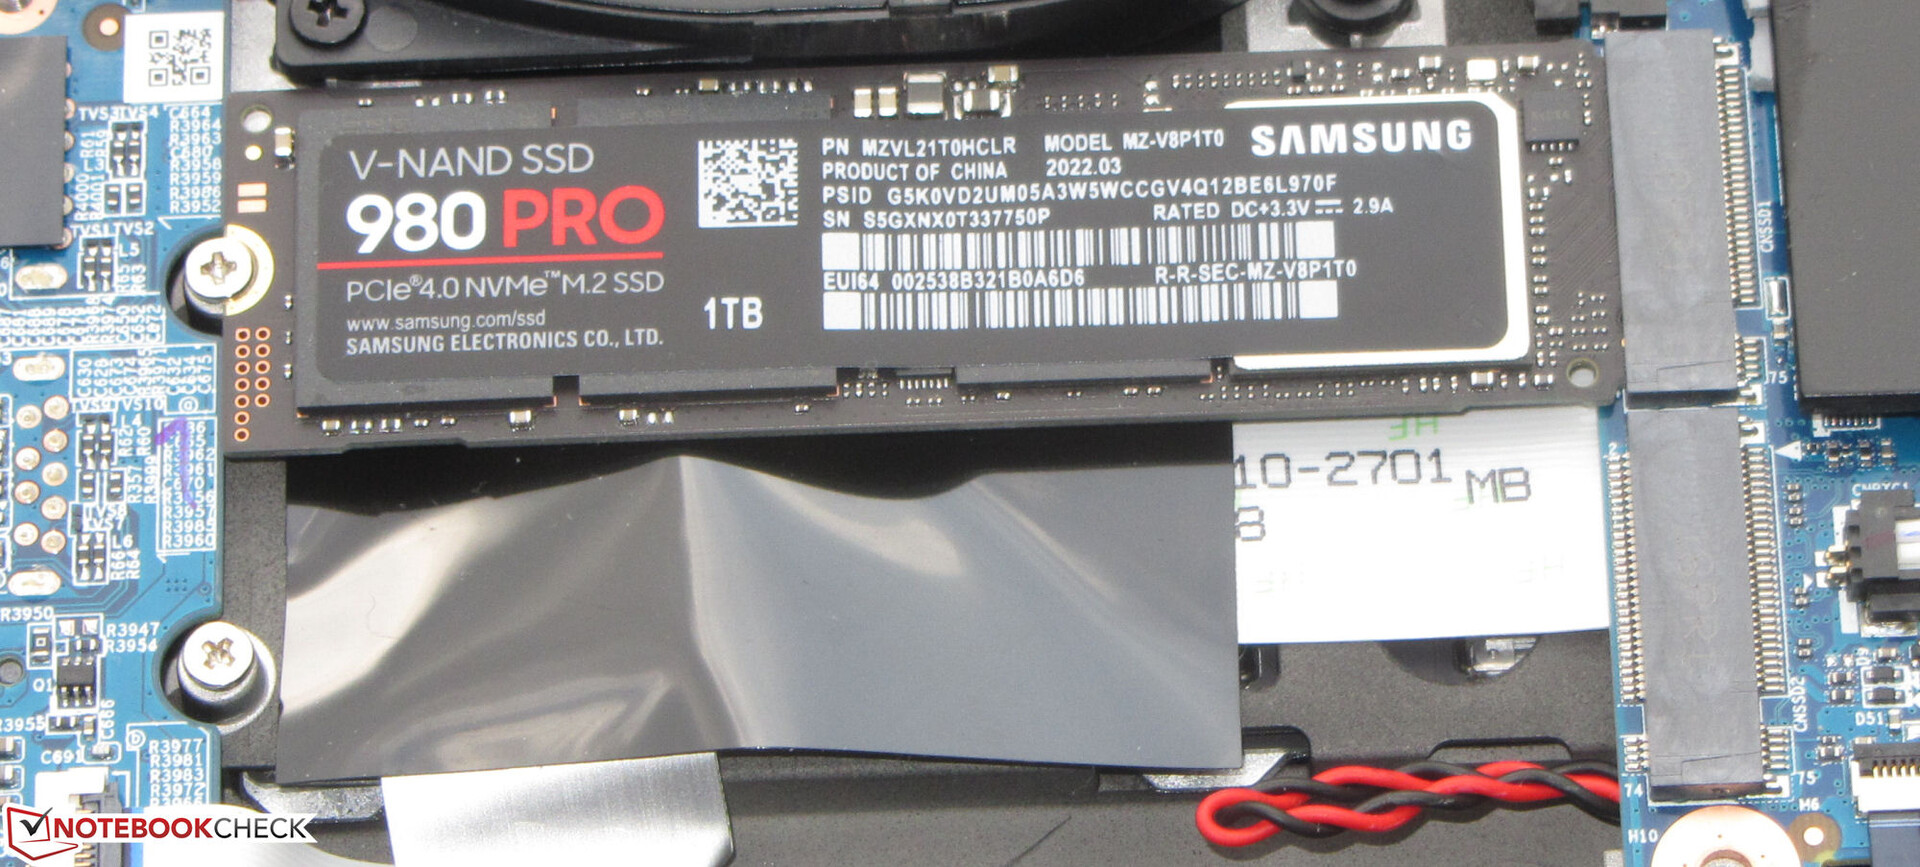
 GeForce RTX 3070 Laptop GPU, i7-11800H, Samsung SSD 980 Pro 1TB MZ-V8P1T0BW")
 GeForce RTX 3070 Laptop GPU, i7-11800H, Samsung SSD 980 Pro 1TB MZ-V8P1T0BW")
Accessori
Oltre alle informazioni sulla garanzia e al manuale d'uso stampato, il portatile viene fornito con una chiavetta USB (driver, istruzioni), adesivi e un tappetino per il mouse
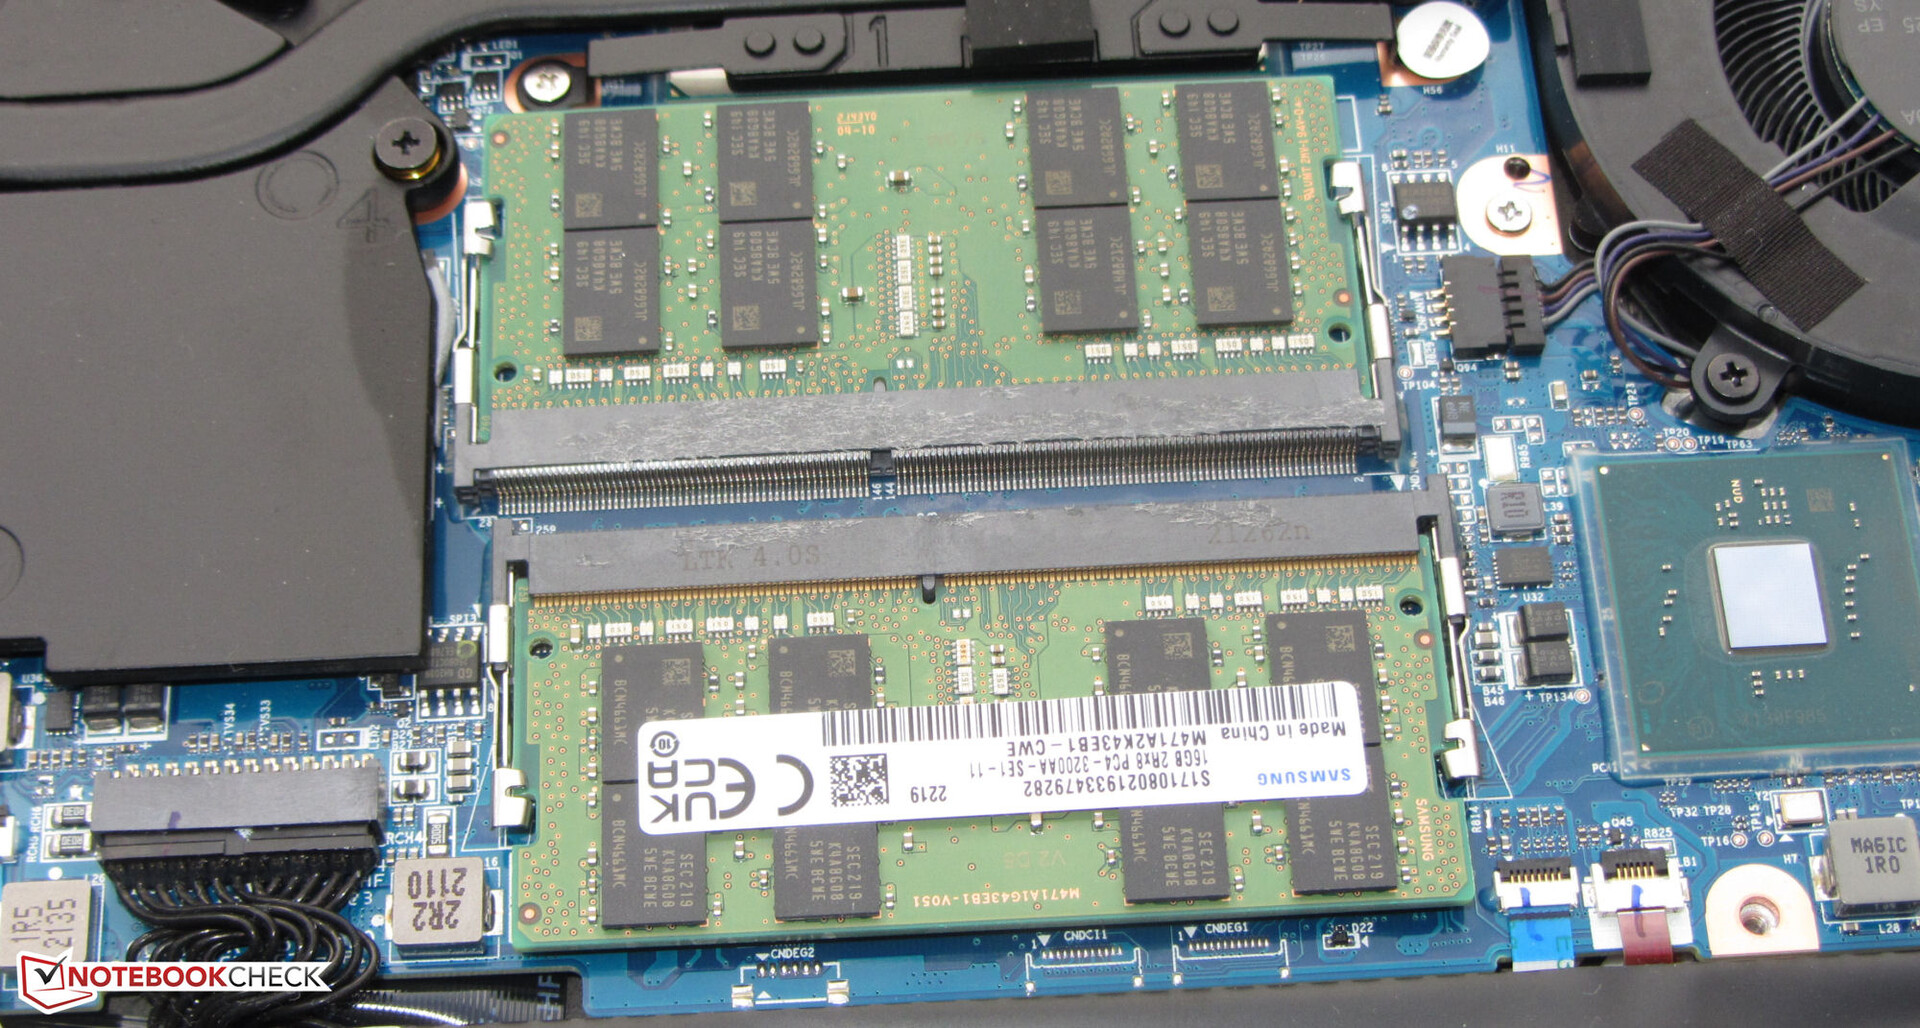
Manutenzione
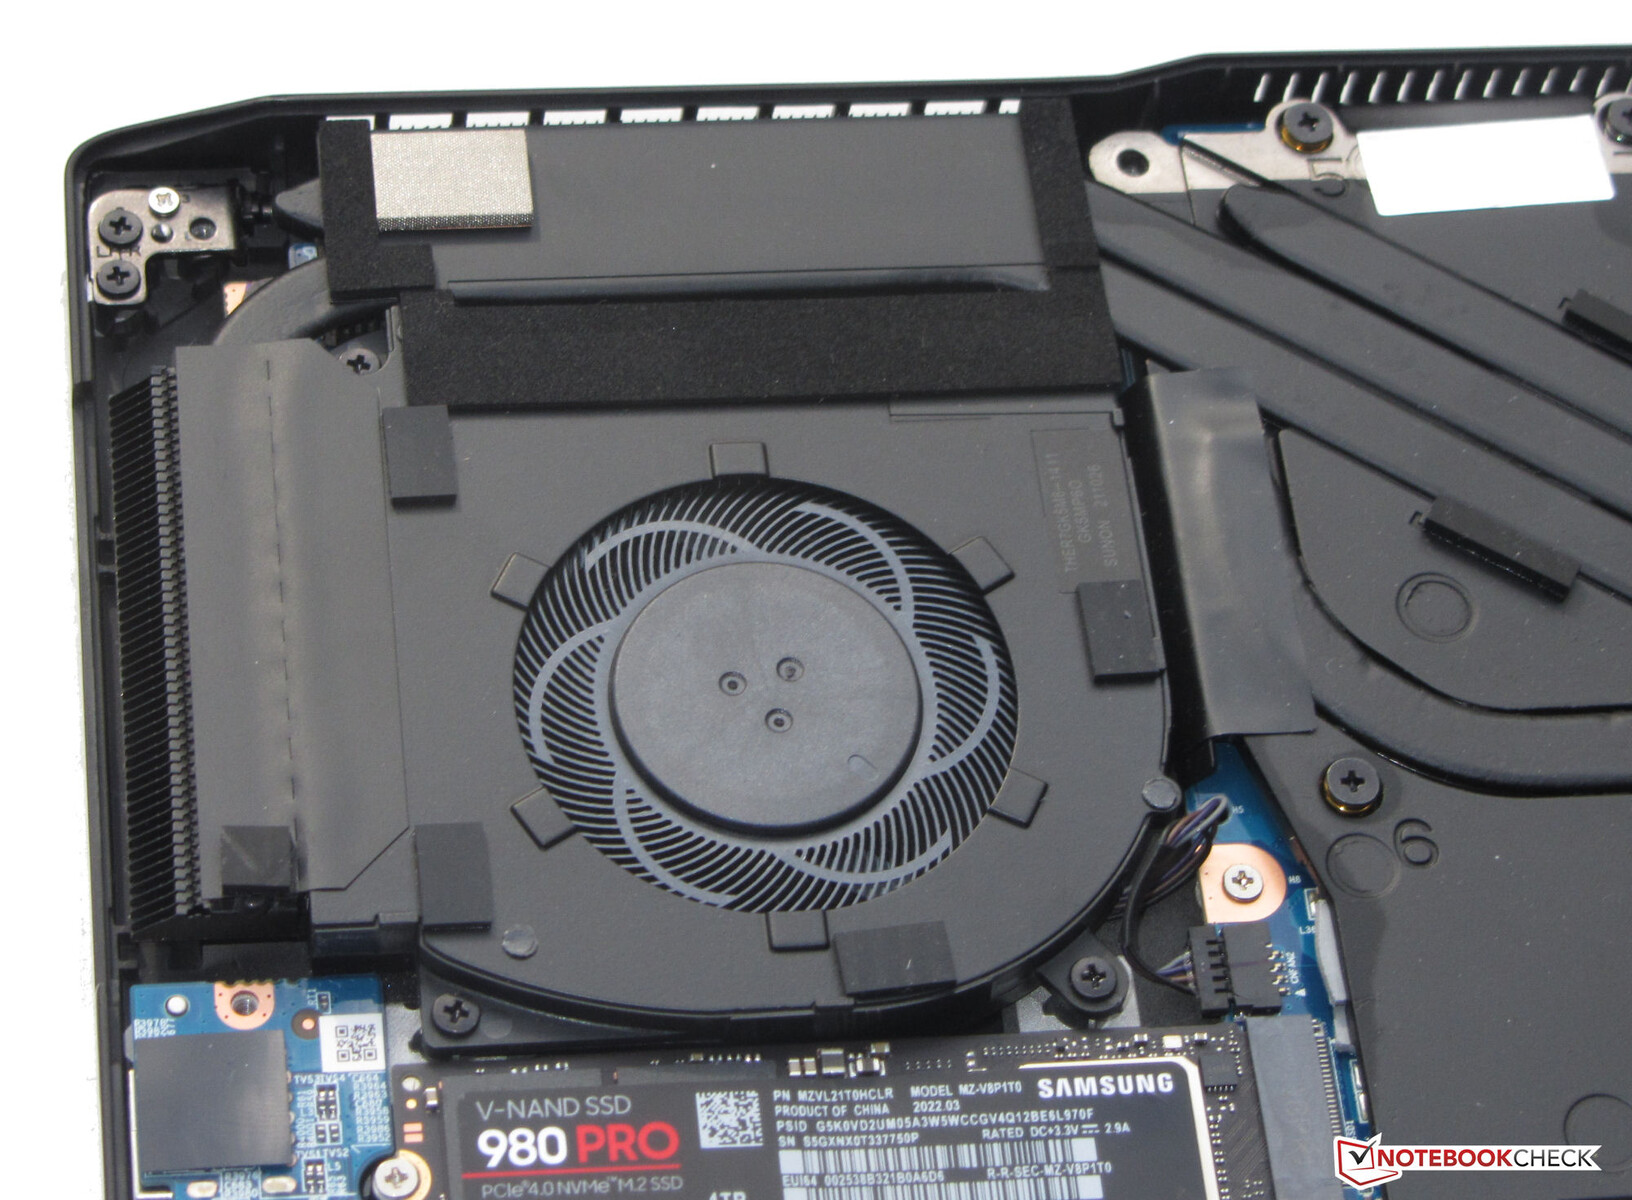
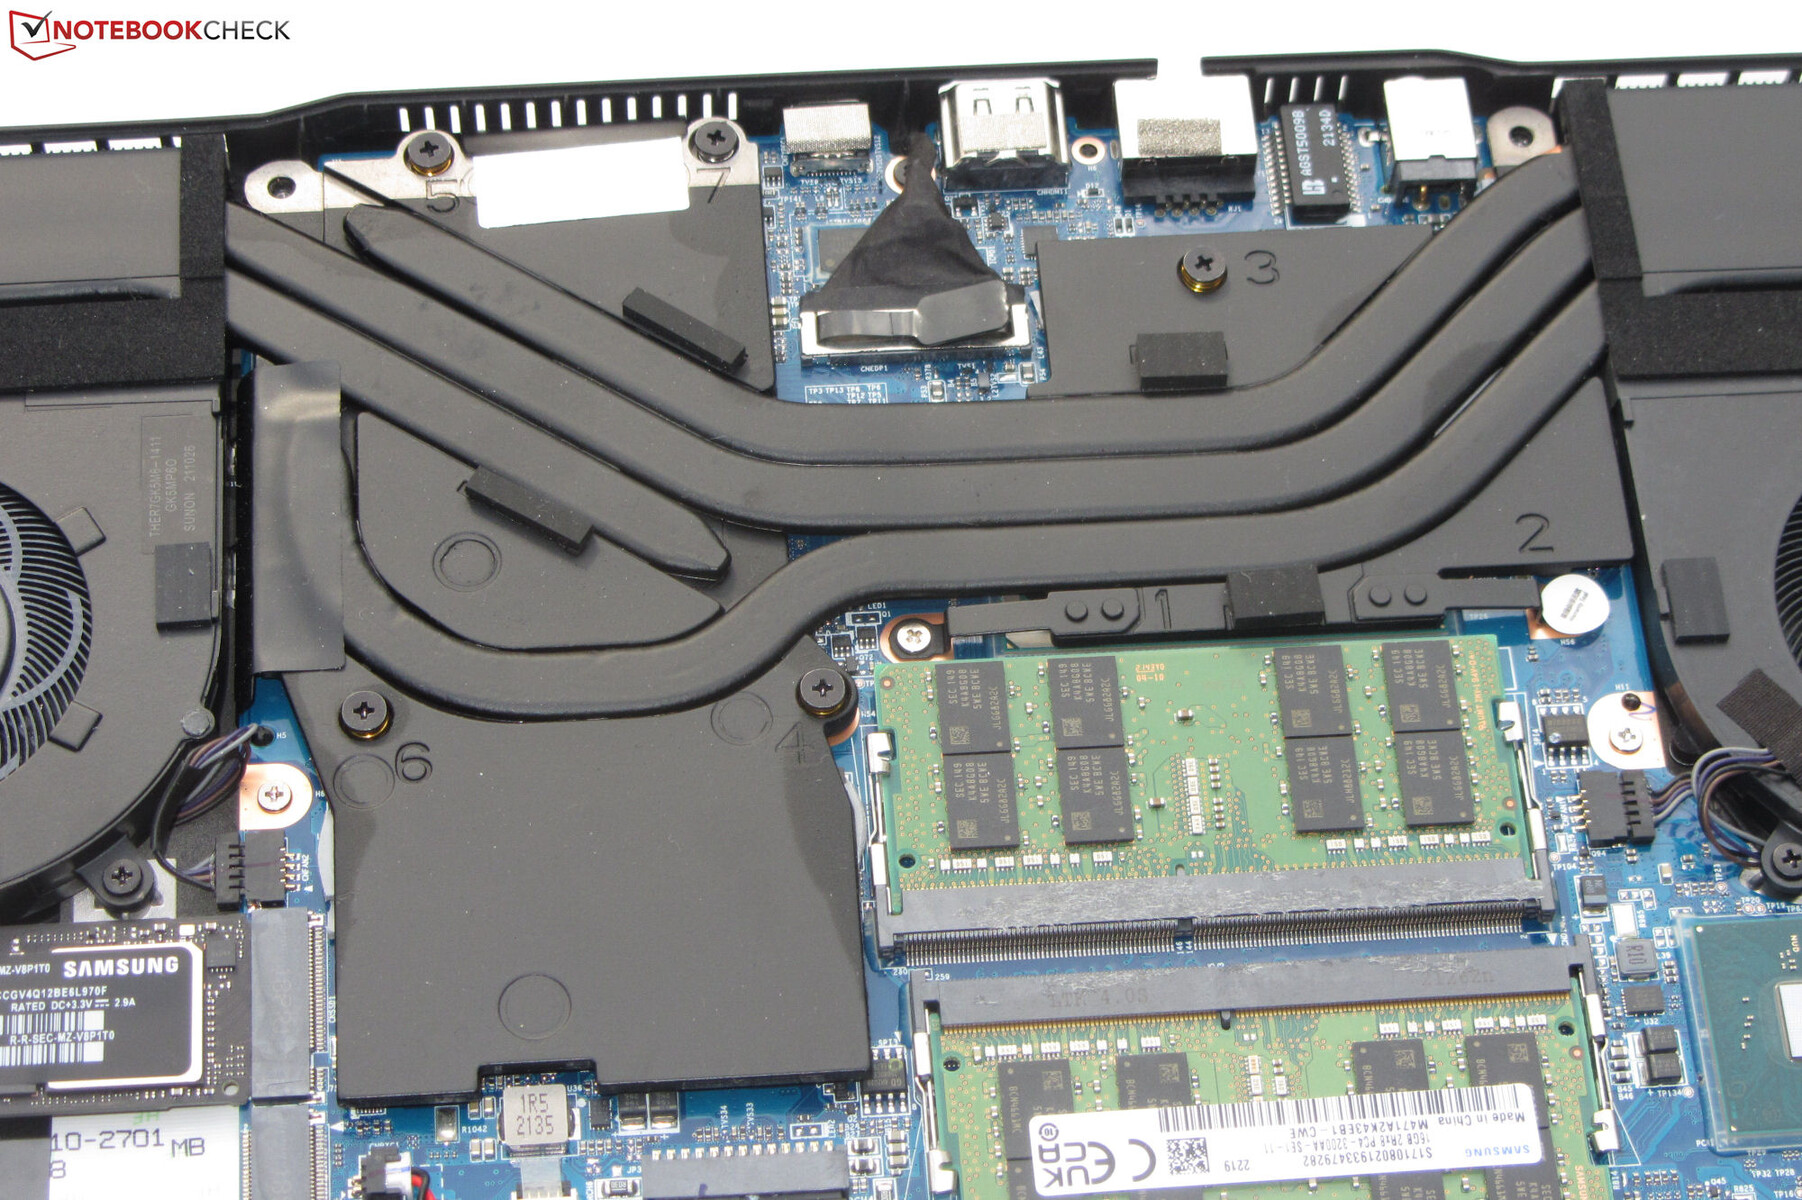
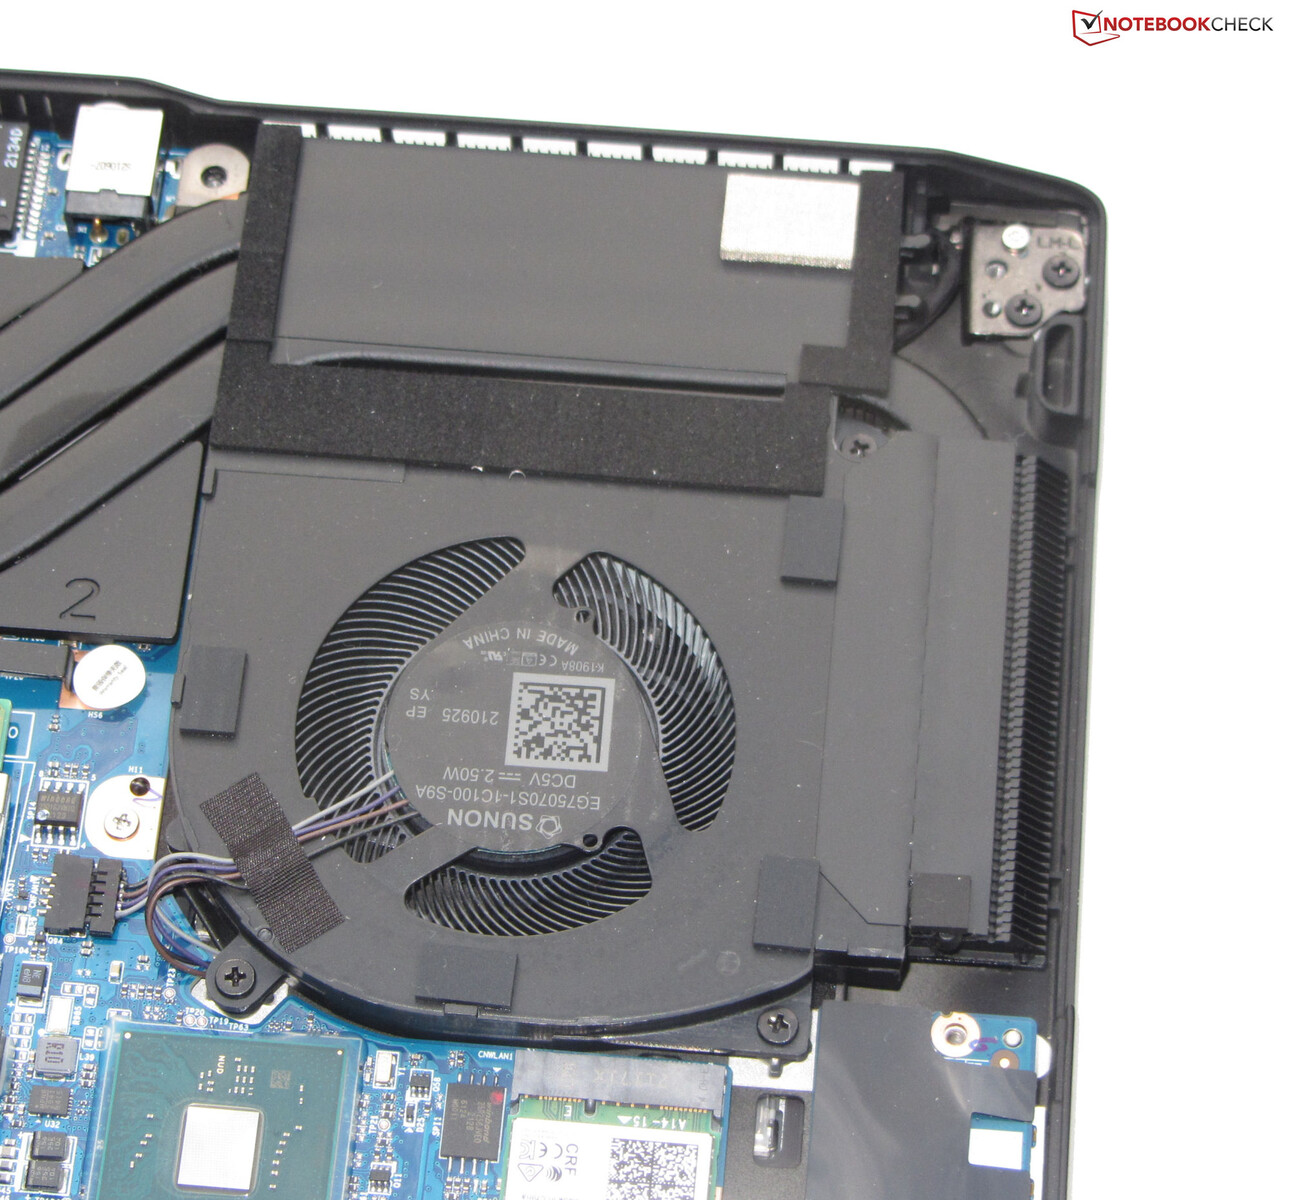
Le procedure di manutenzione e aggiornamento possono essere eseguite senza problemi. Dopo aver allentato tutte le viti sul fondo del dispositivo, il coperchio inferiore può essere rimosso abbastanza facilmente. È quindi possibile accedere agli slot della RAM (entrambi occupati), all'unità SSD (PCIe 4), al secondo slot M.2-2280 (PCIe 3/SATA), al modulo Wi-Fi, alle ventole, alla batteria del BIOS e alla batteria
Garanzia
La garanzia di base copre due anni, compreso il servizio di ritiro e 6 mesi di riparazione rapida (riparazione entro 48 ore). Una garanzia di 36 mesi costa tra i 100 e i 149 euro (~$99,53 e $148,30), a seconda del periodo di riparazione rapida selezionato
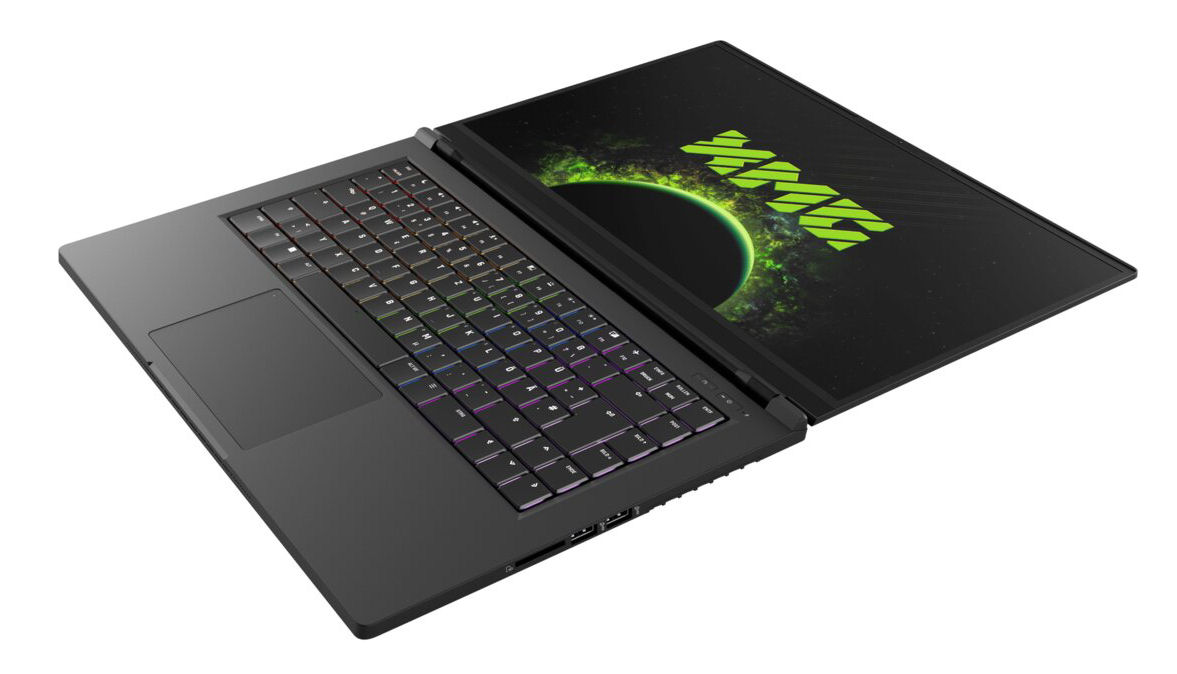
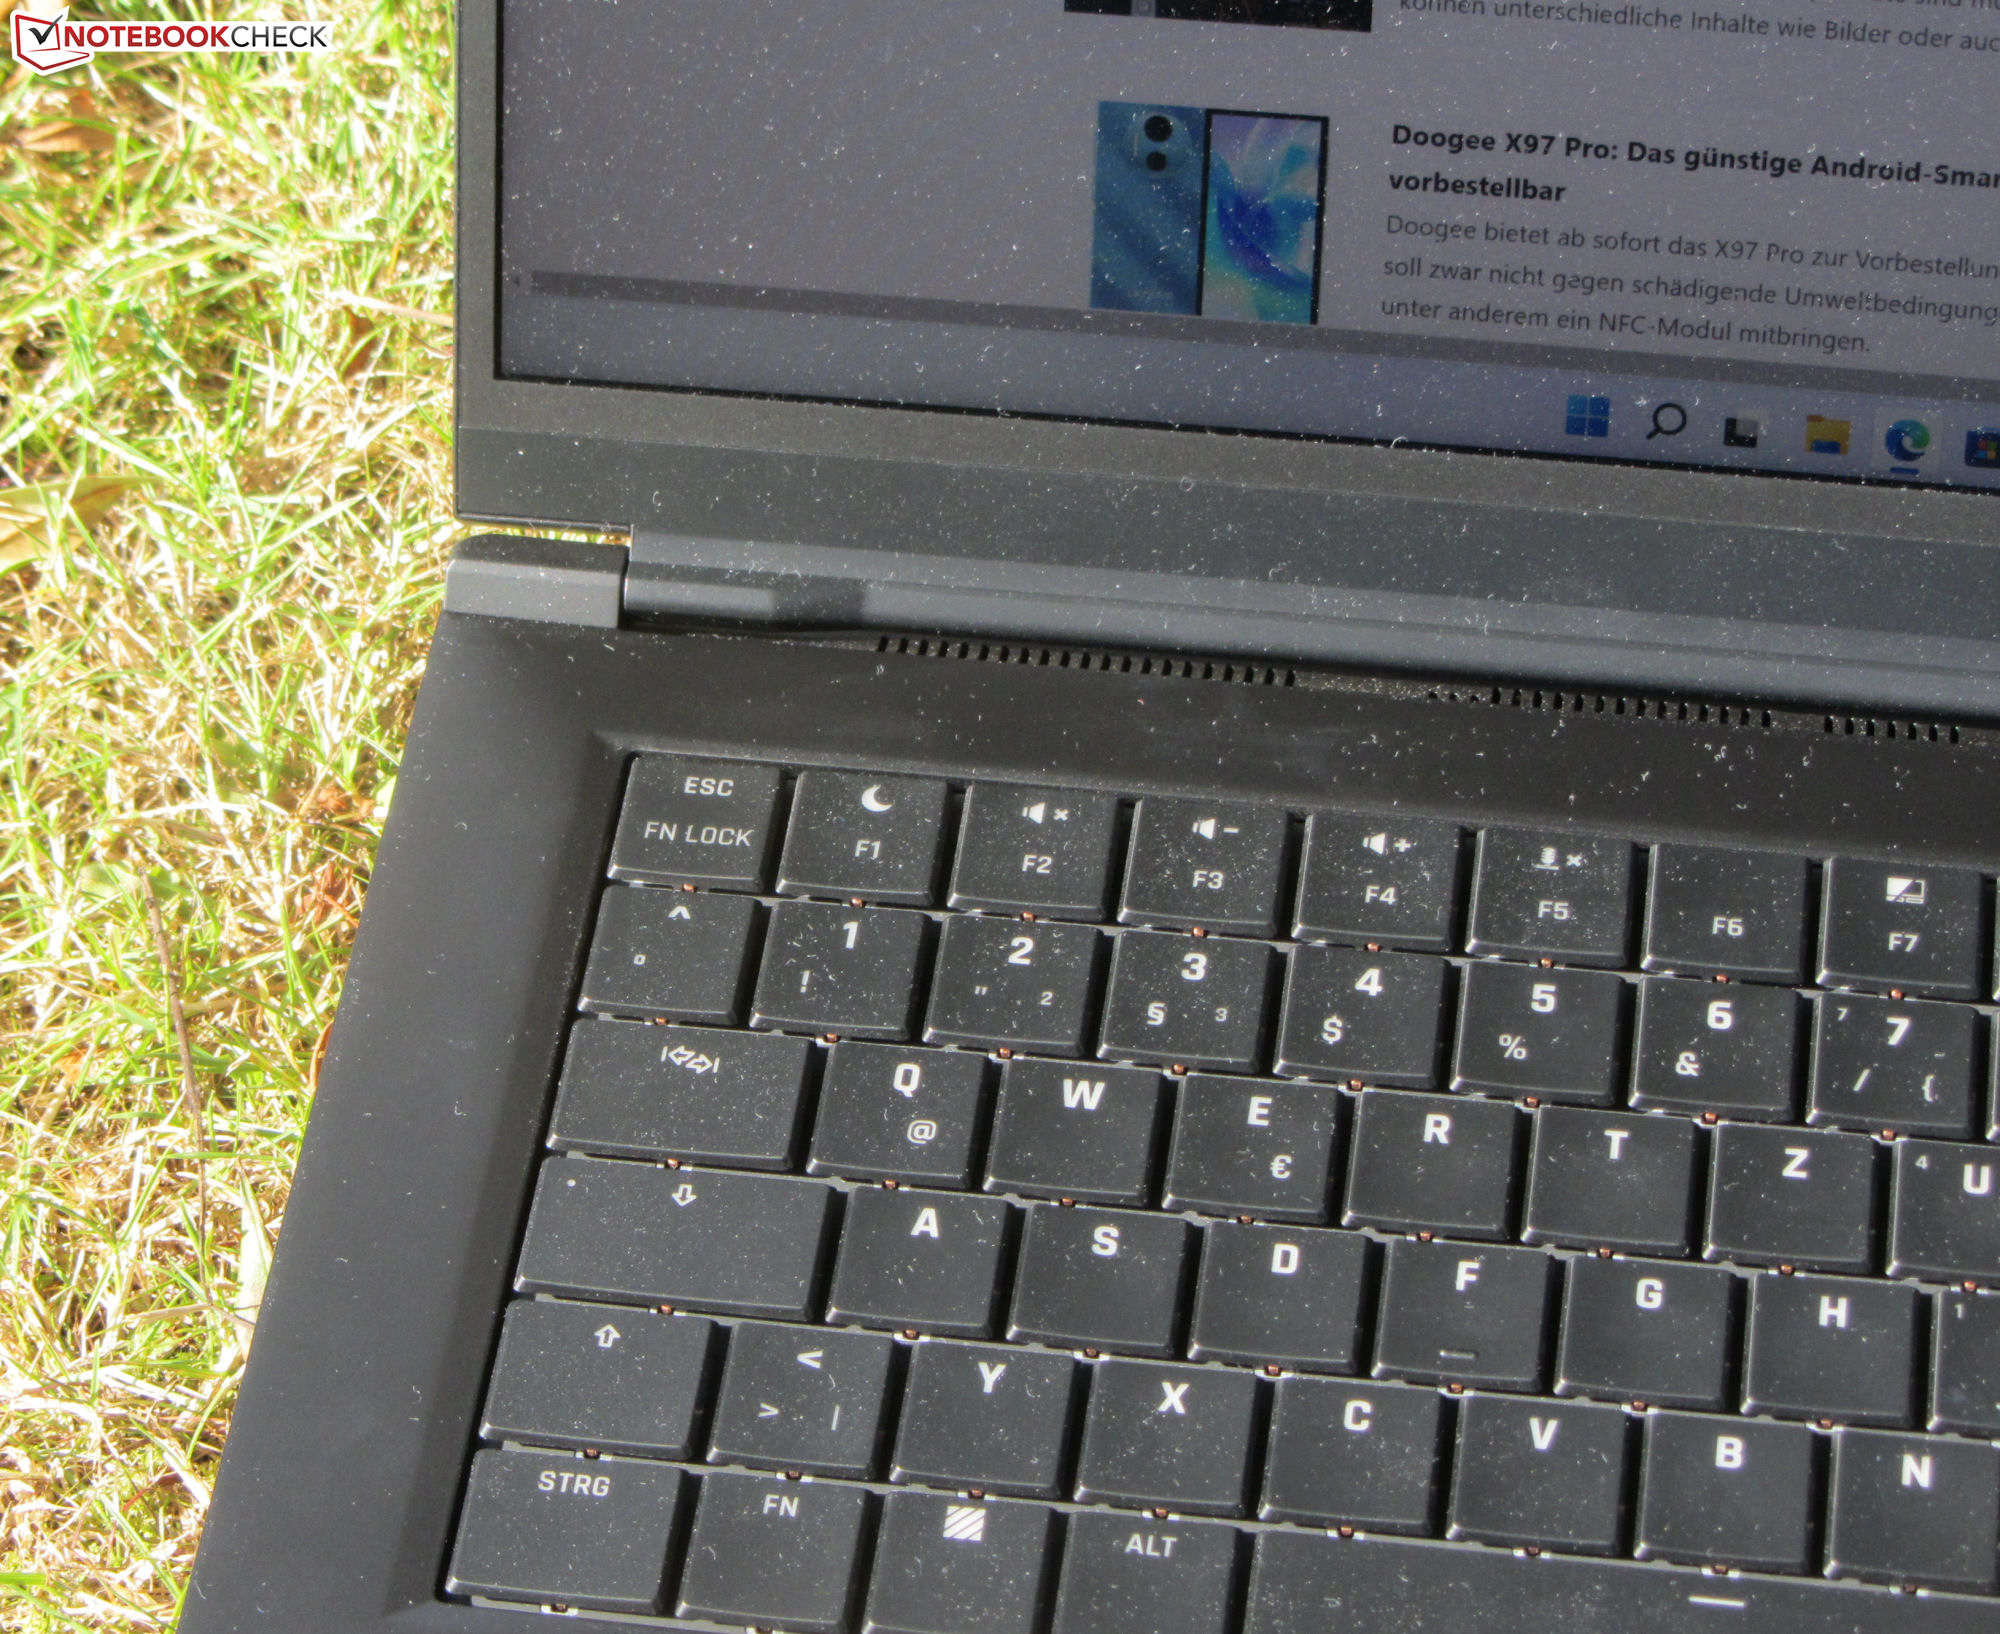
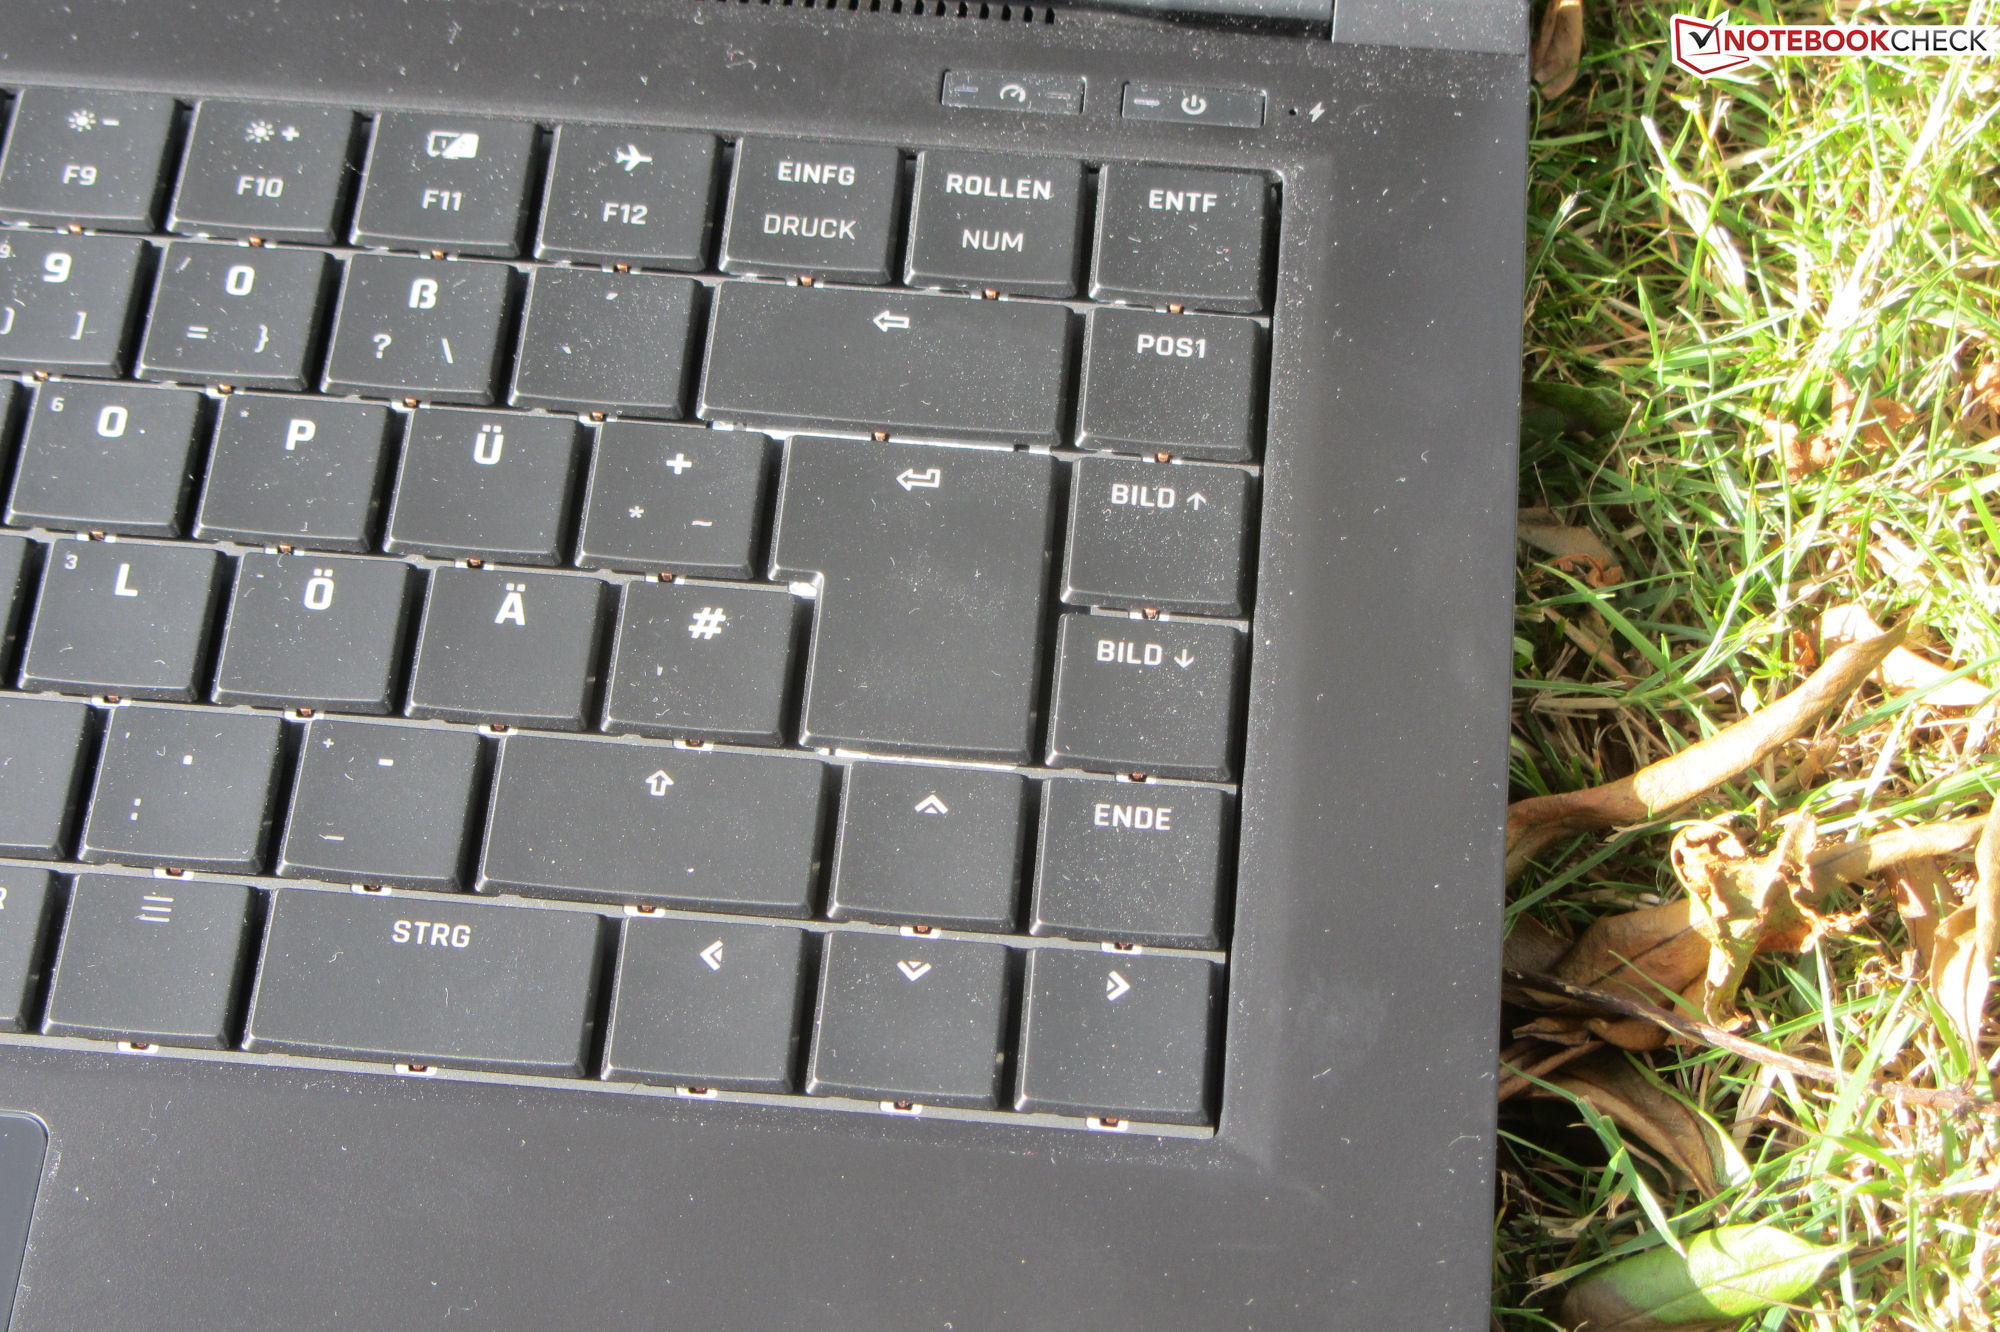
Dispositivi di input - Il portatile Schenker è dotato di una tastiera meccanica
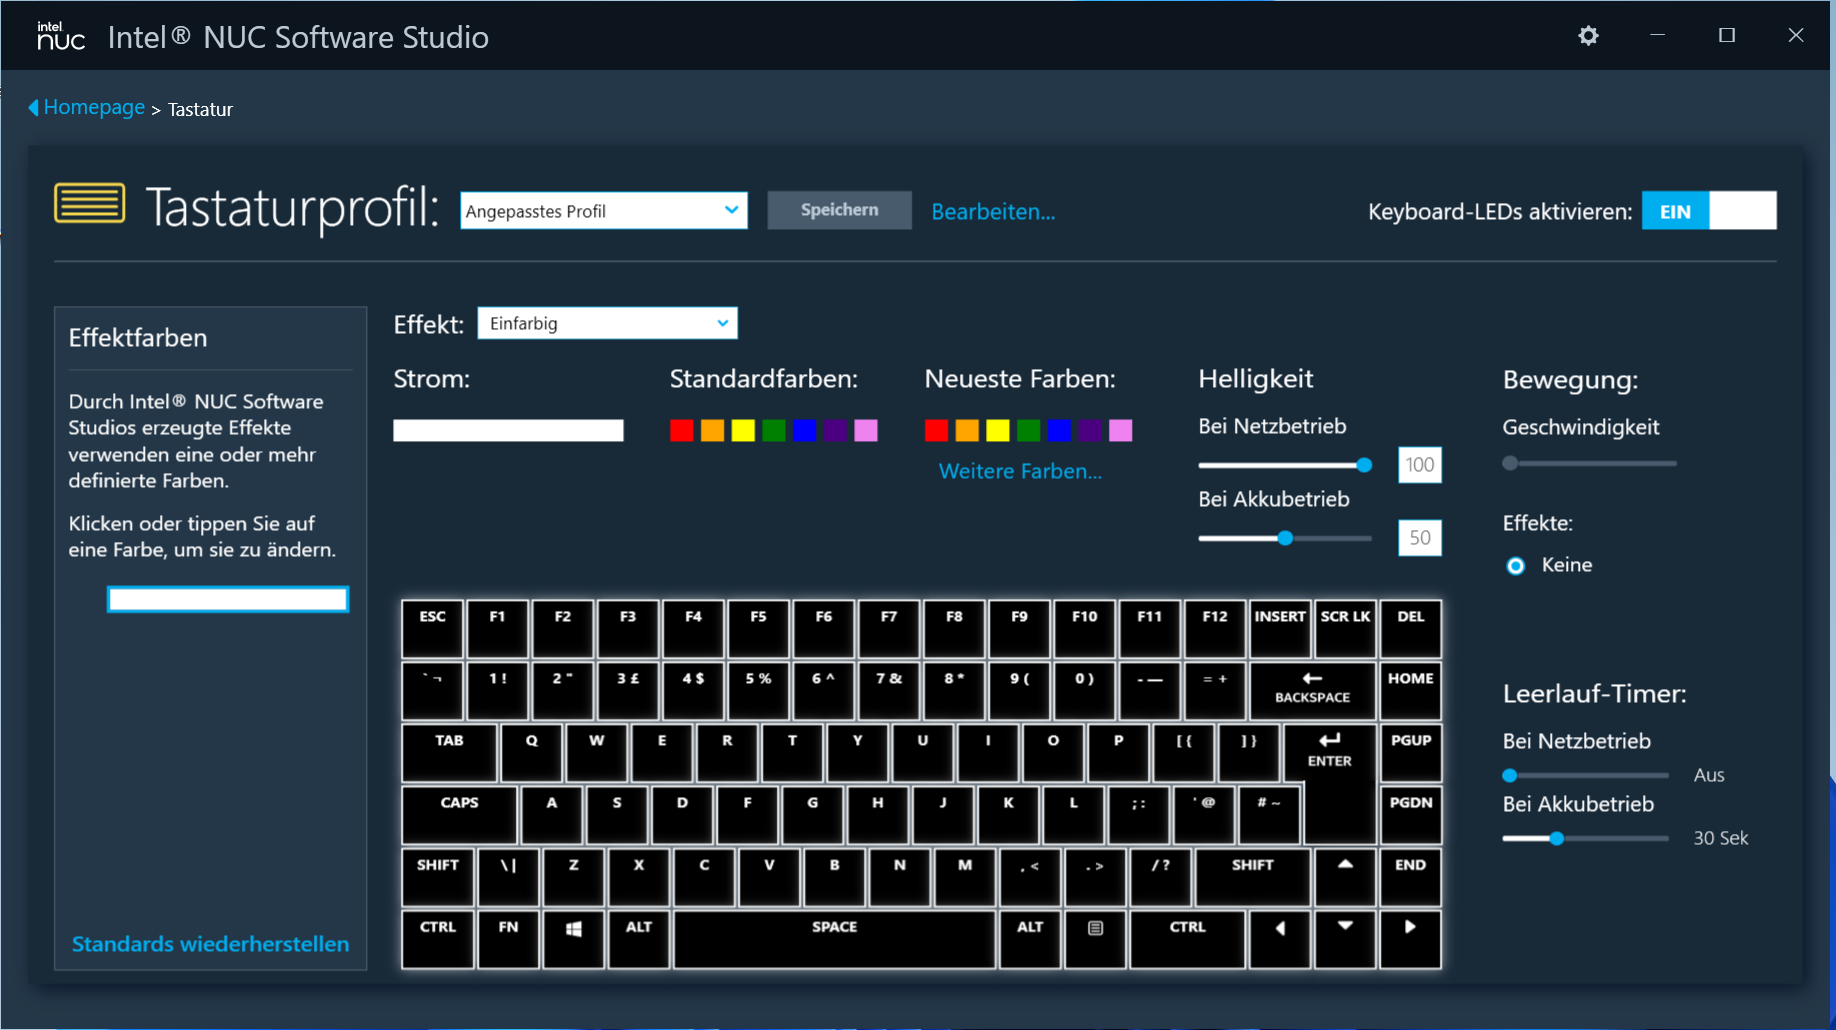
Tastiera
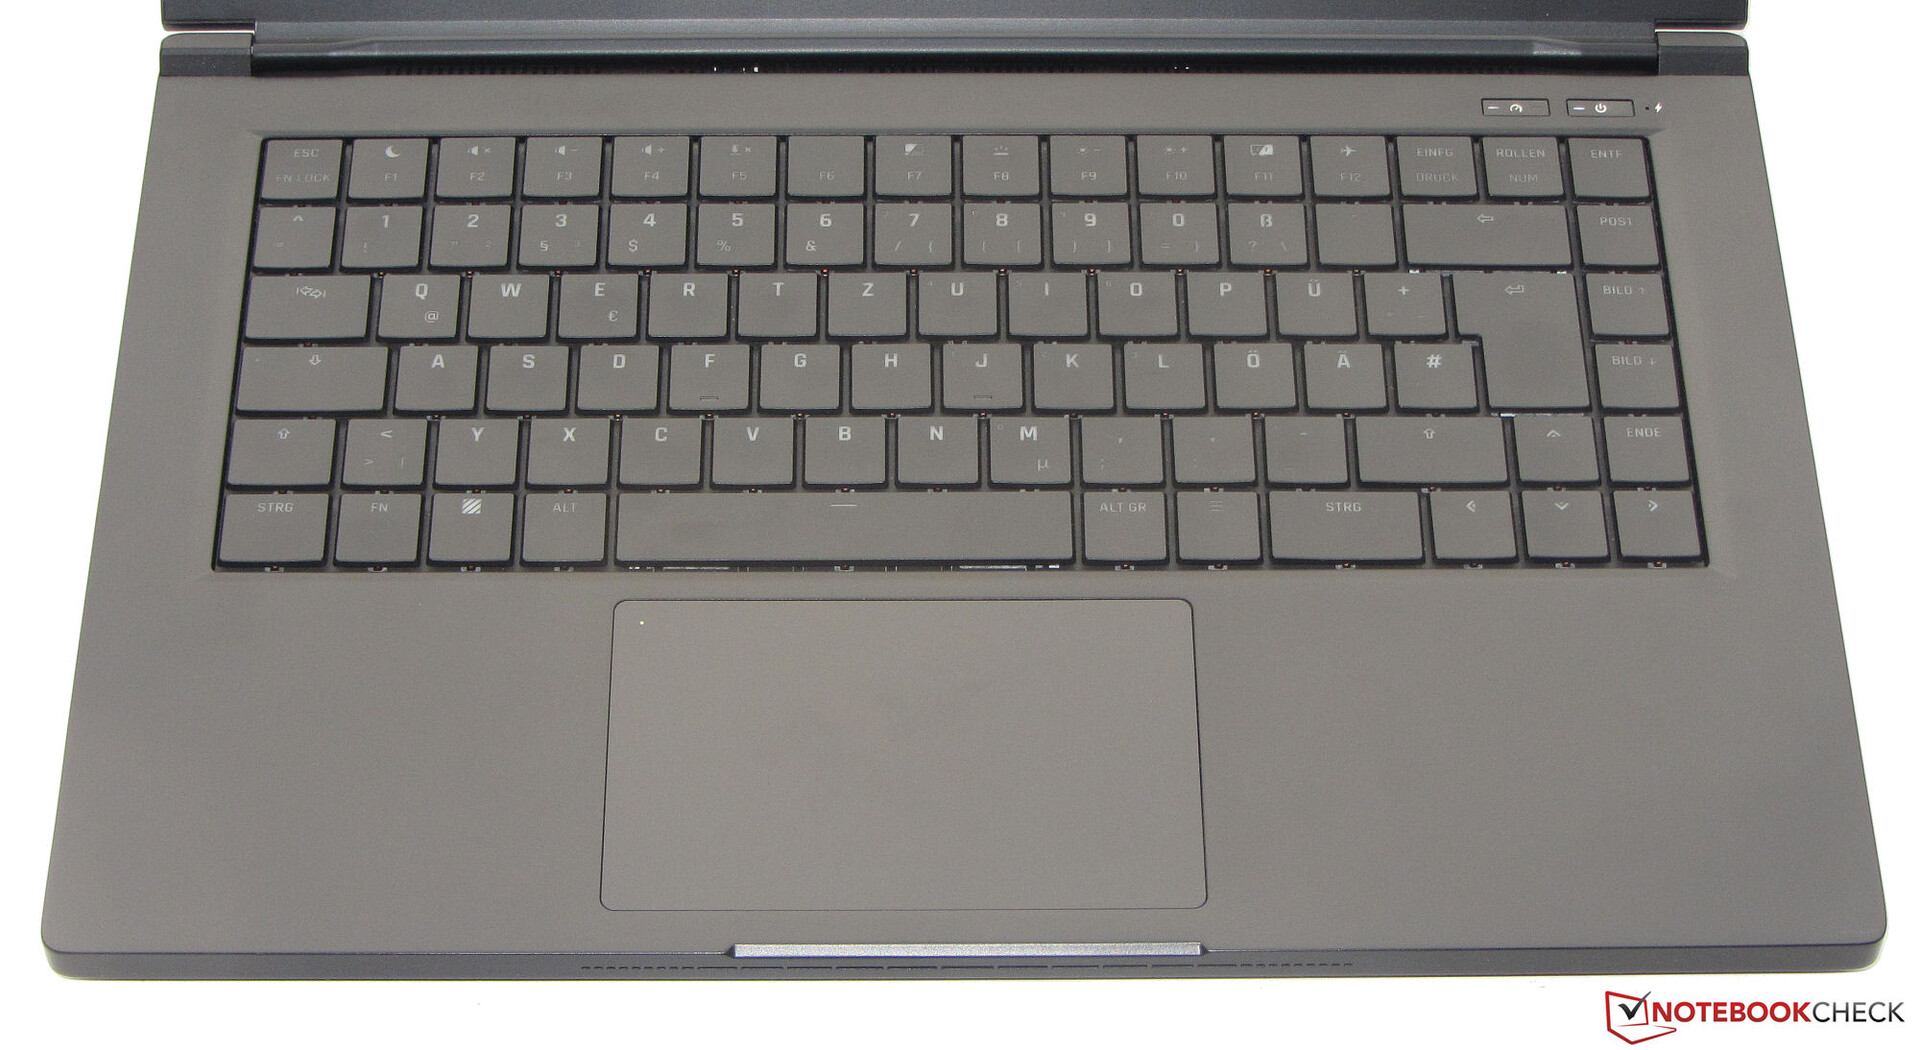
La tastiera meccanica (con illuminazione RGB a tasto singolo) è composta da tasti curvi e concavati. Offrono una corsa media e hanno un punto di pressione chiaramente udibile e percepibile. La tastiera non cede durante la digitazione. L'illuminazione a due livelli è controllata da un tasto funzione. Nel complesso, si tratta di una tastiera equilibrata e ben fatta
Touchpad
Un ClickPad multitouch (circa 11,7 x 7,2 cm) sostituisce il mouse. La sua superficie liscia consente alle dita di scivolare facilmente su di esso. Il pad ha una corsa breve e un chiaro punto di pressione. Toccando due volte l'angolo in alto a sinistra si accende/spegne il pad (indicato da un LED)
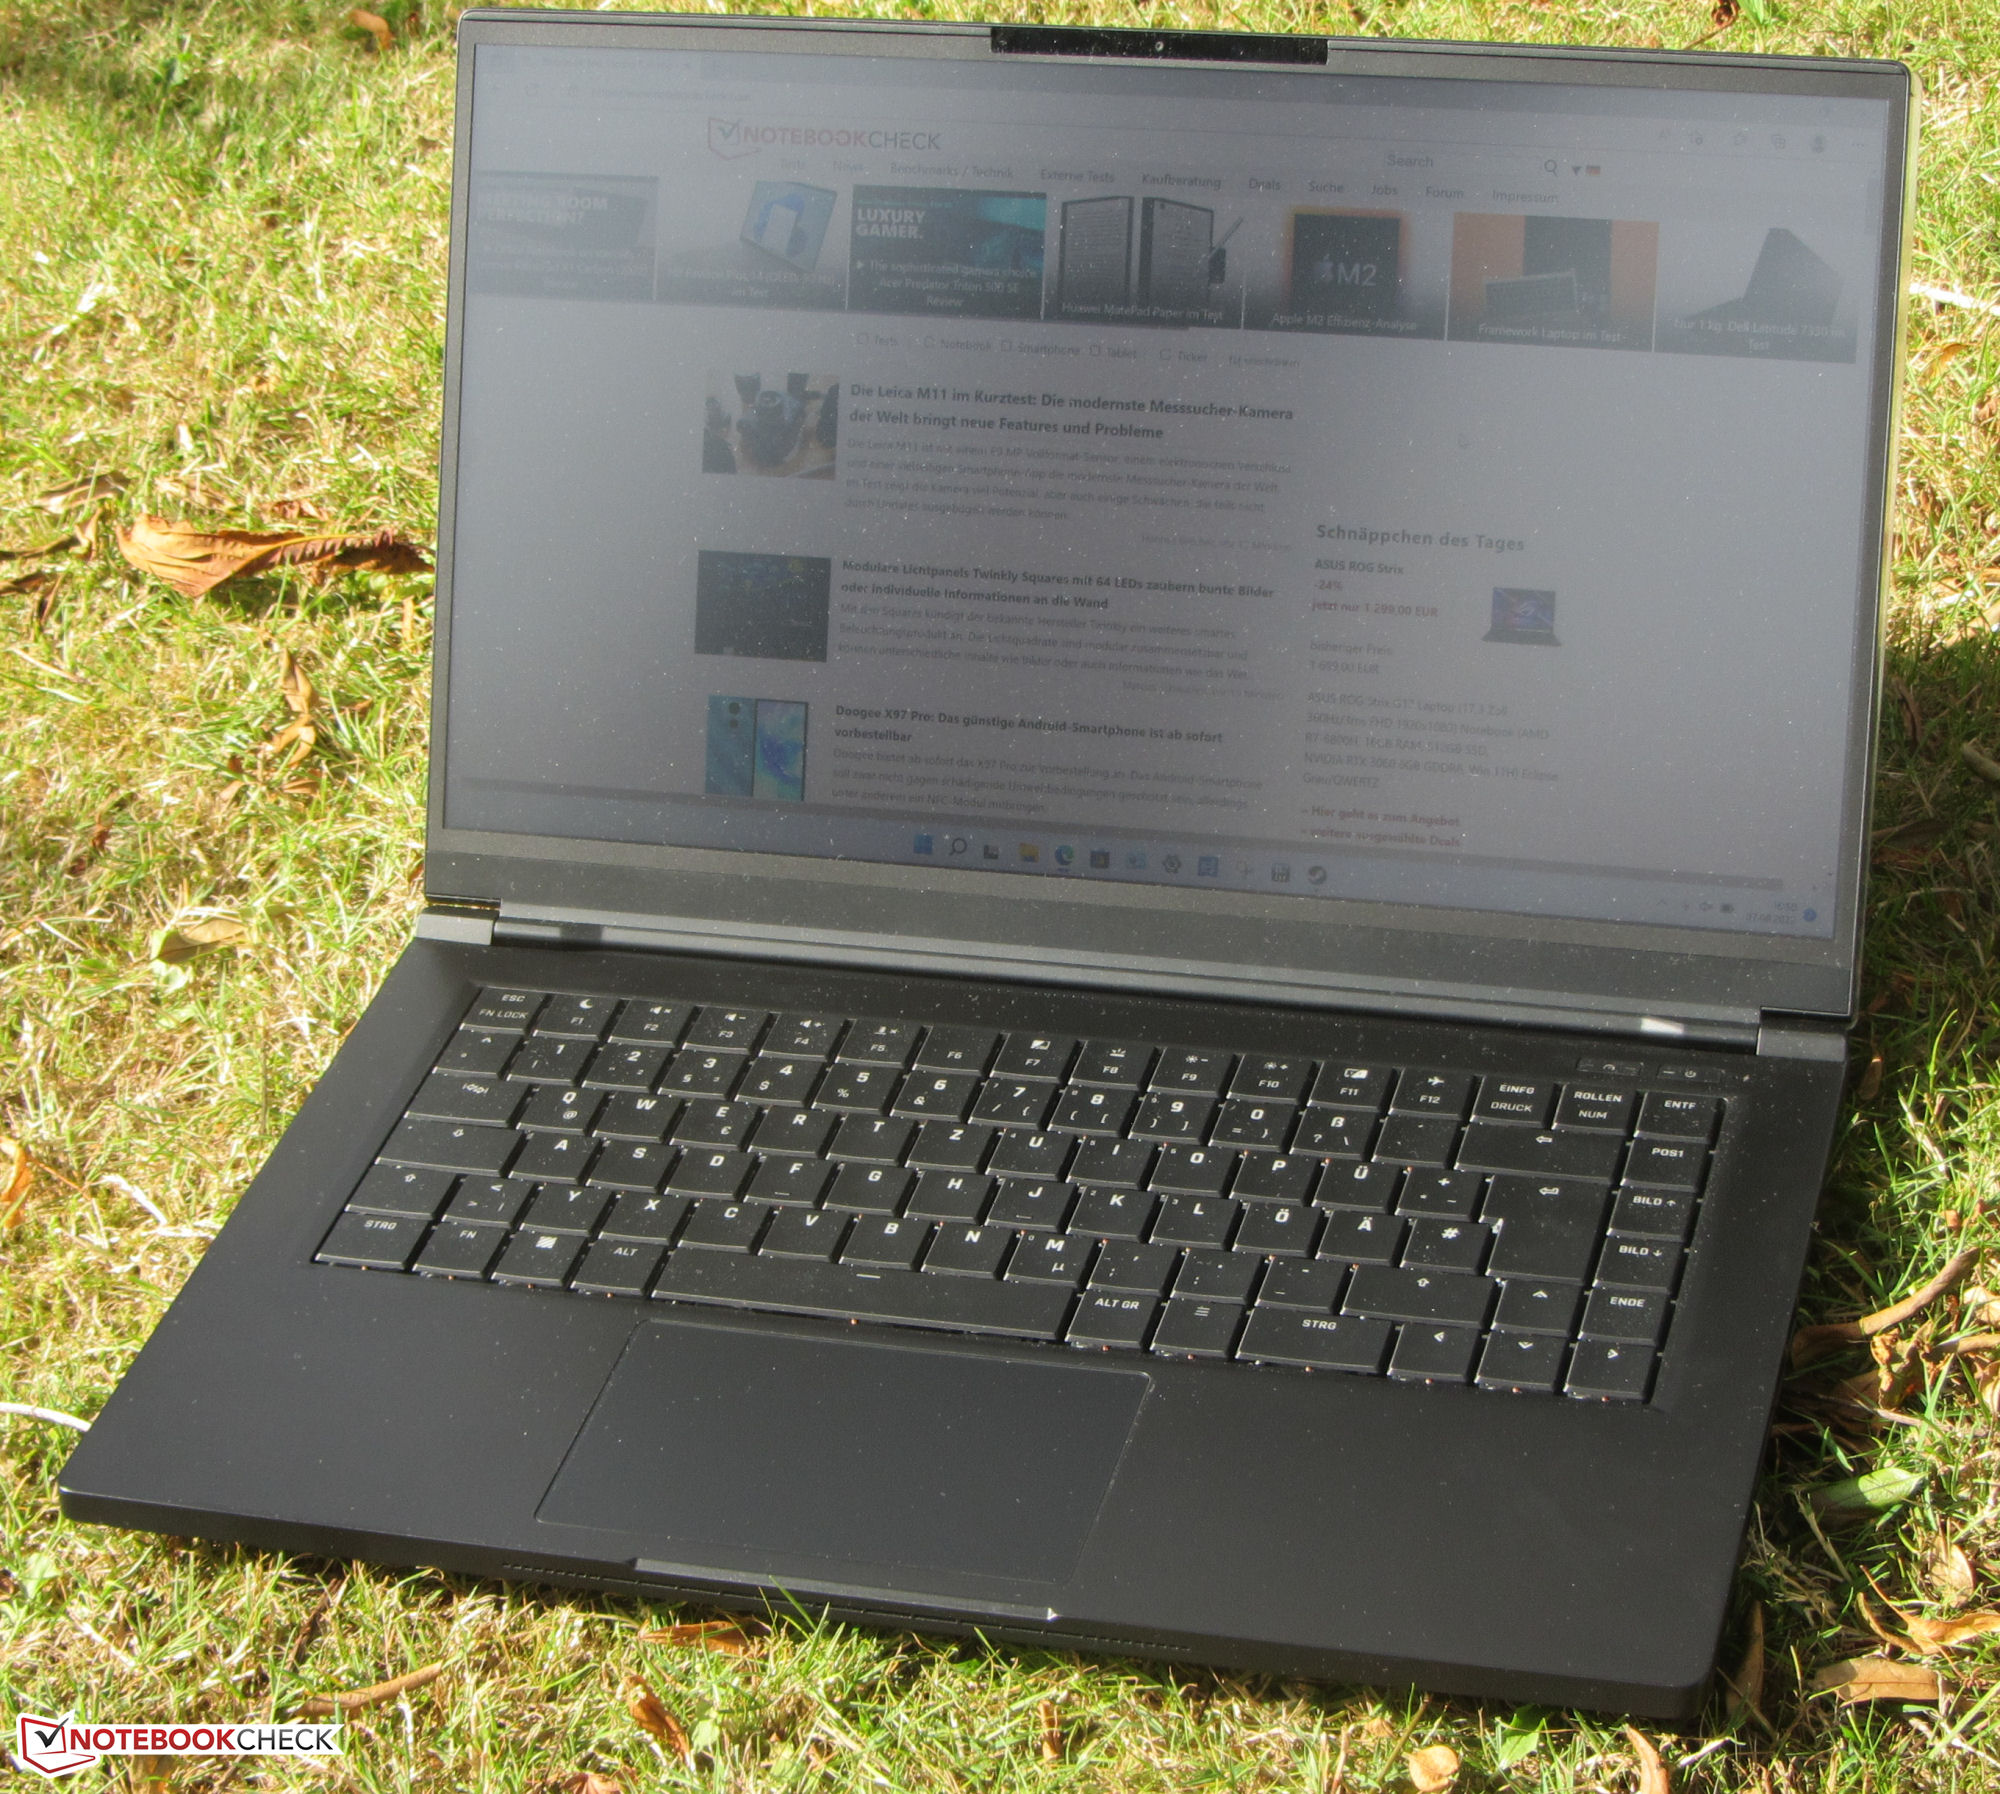
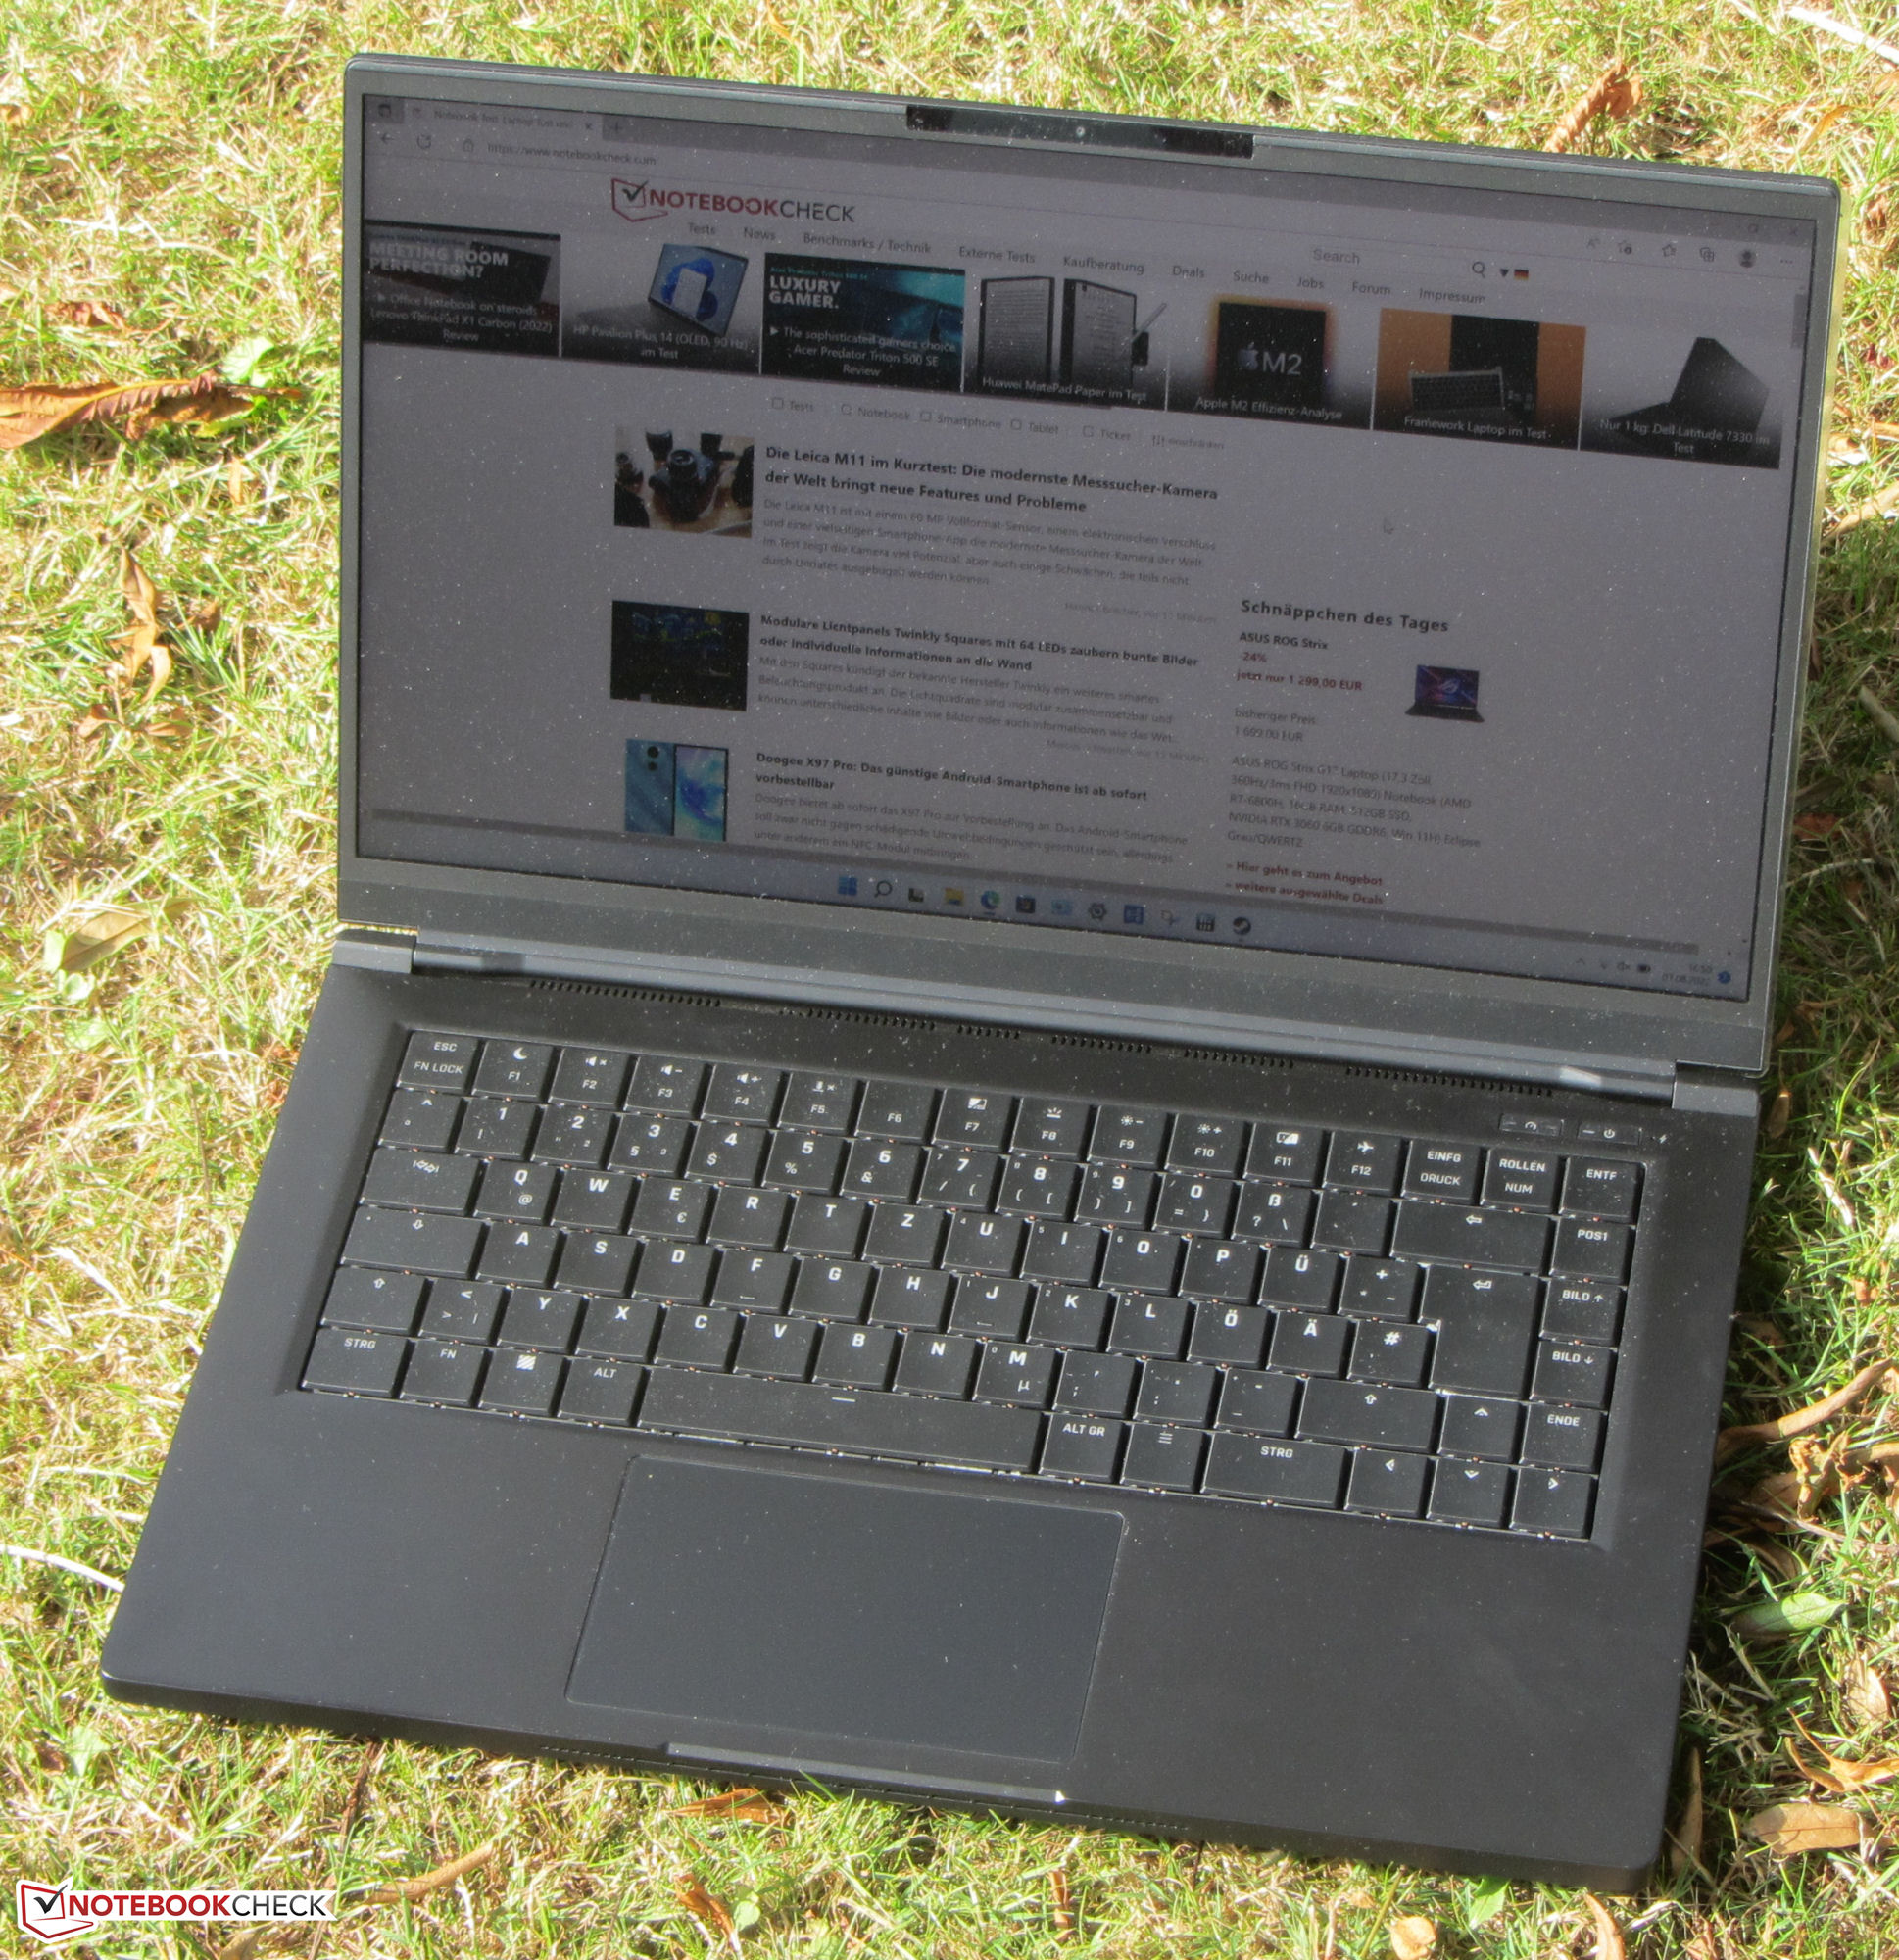
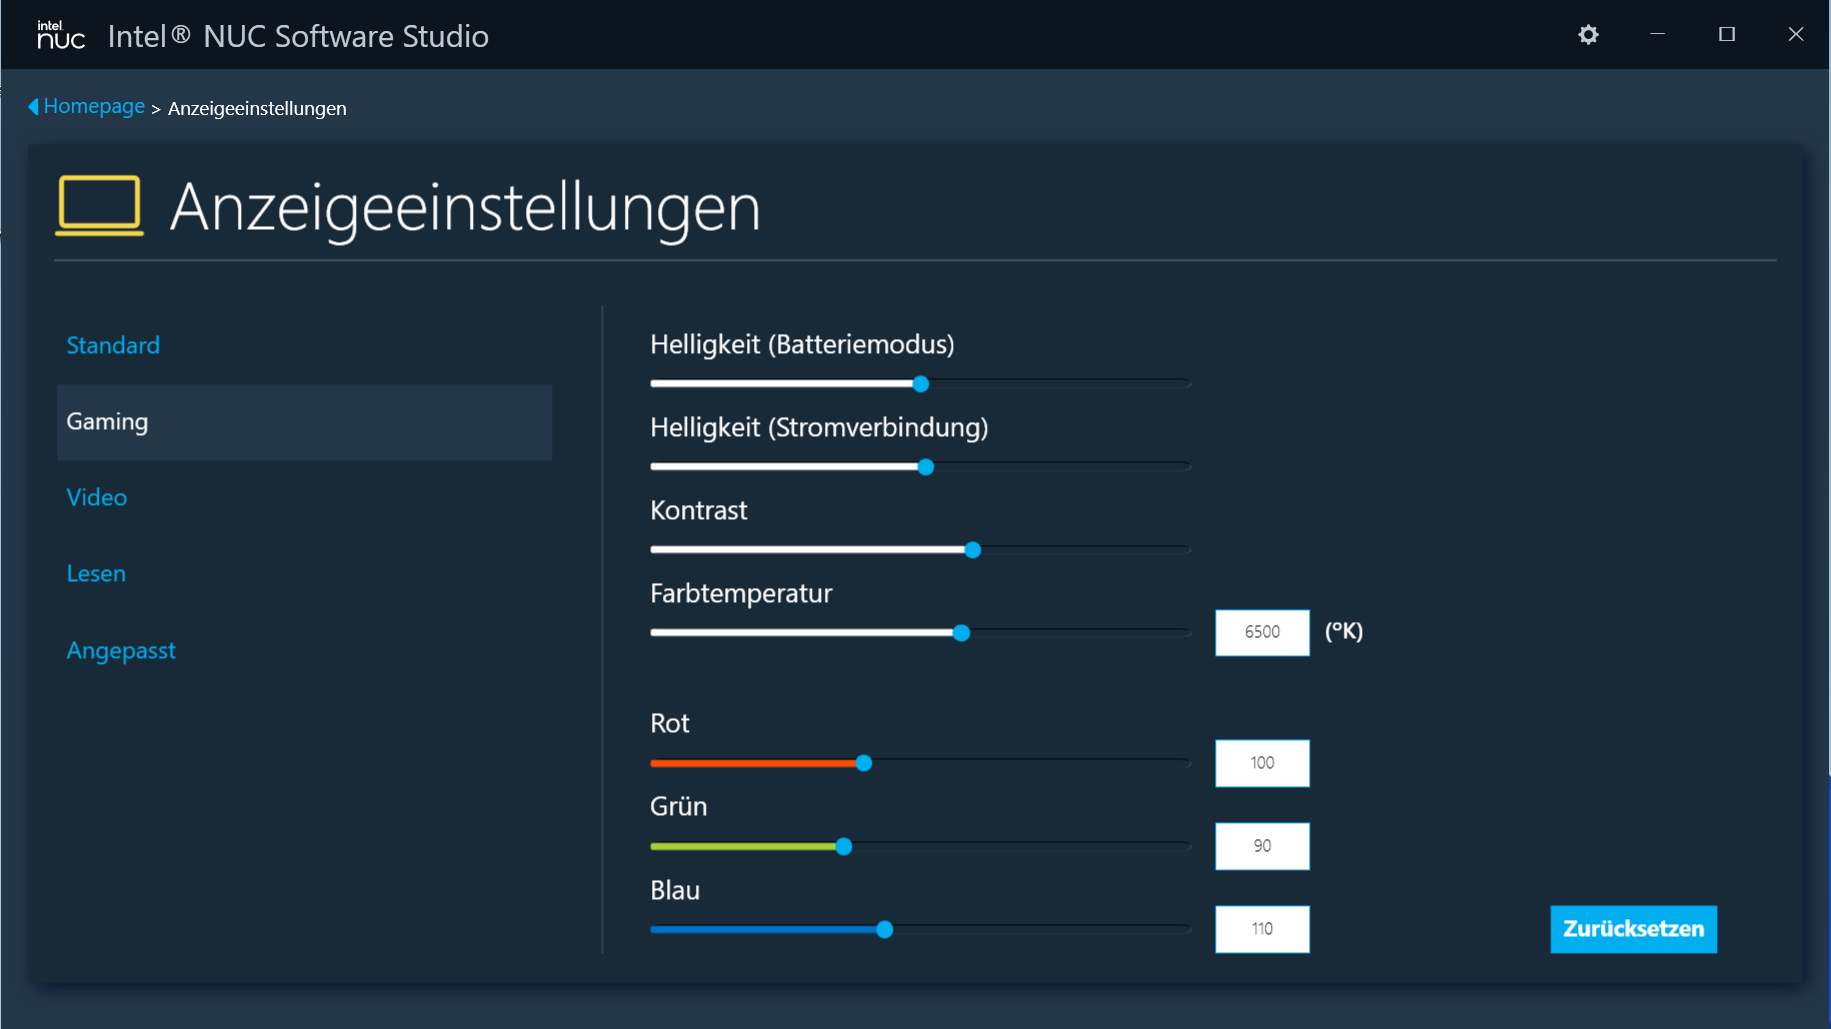
Display - IPS a bordo
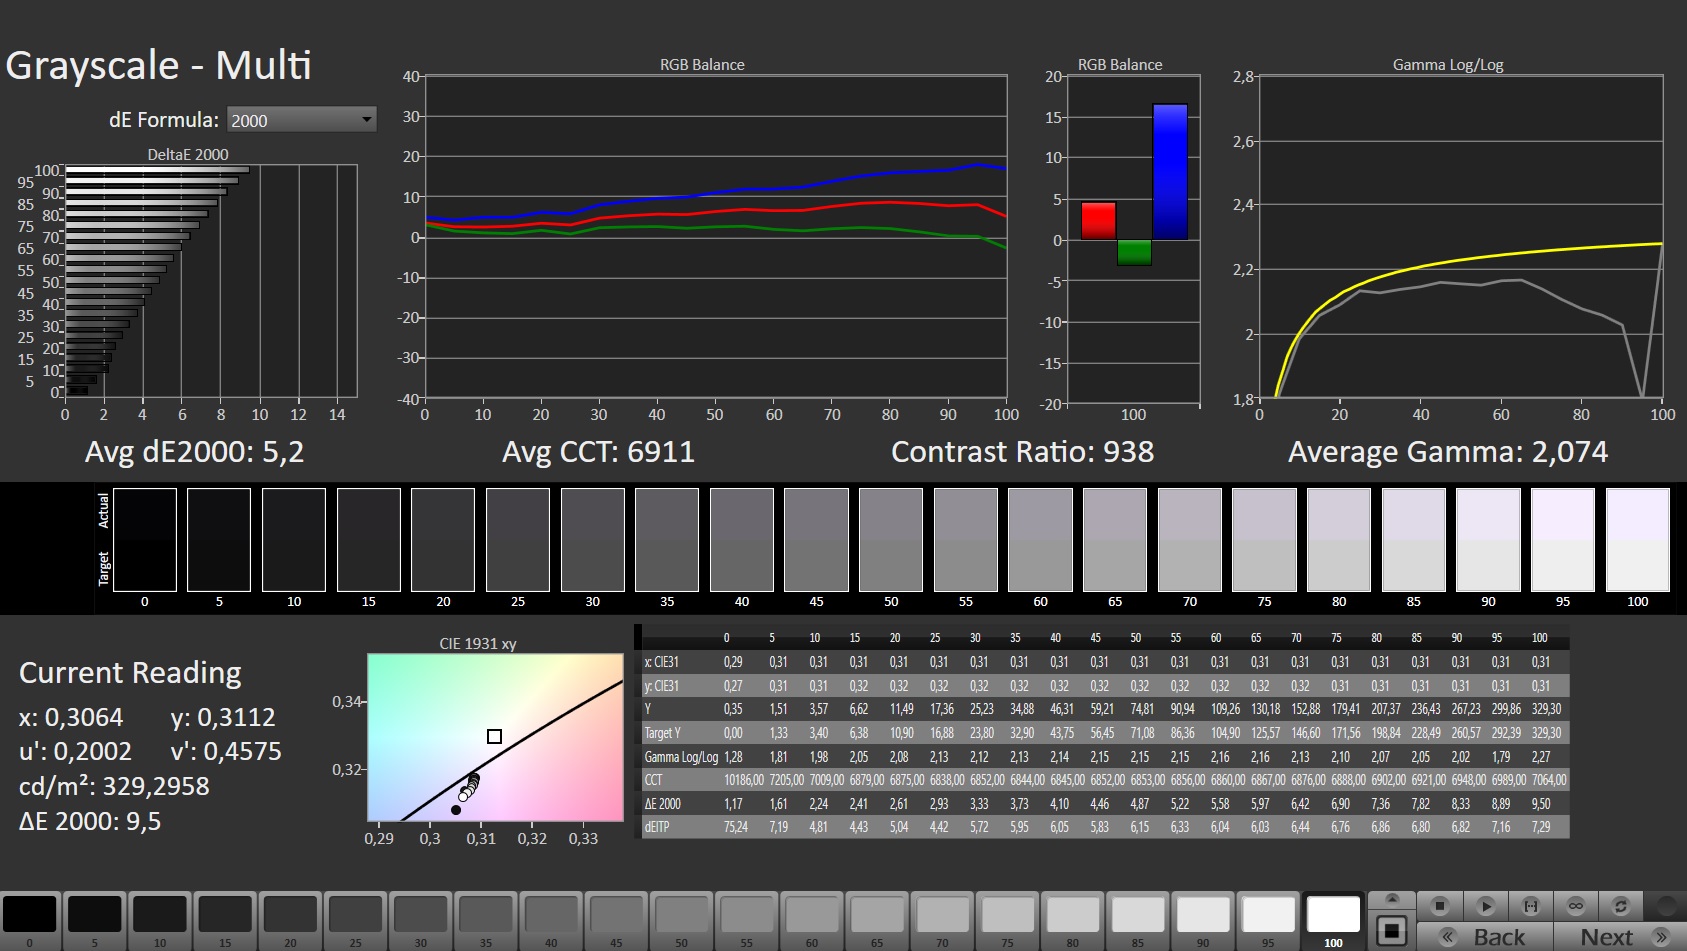
La luminosità (303,1 cd/m²) e il contrasto (988:1) del display opaco da 15,6 pollici (2.560x1.440 pixel) soddisfano appena i rispettivi obiettivi. Il pannello da 165 Hz ha tempi di risposta rapidi. Non è stato rilevato alcuno sfarfallio PWM

| |||||||||||||||||||||||||
Distribuzione della luminosità: 89 %
Al centro con la batteria: 326 cd/m²
Contrasto: 988:1 (Nero: 0.33 cd/m²)
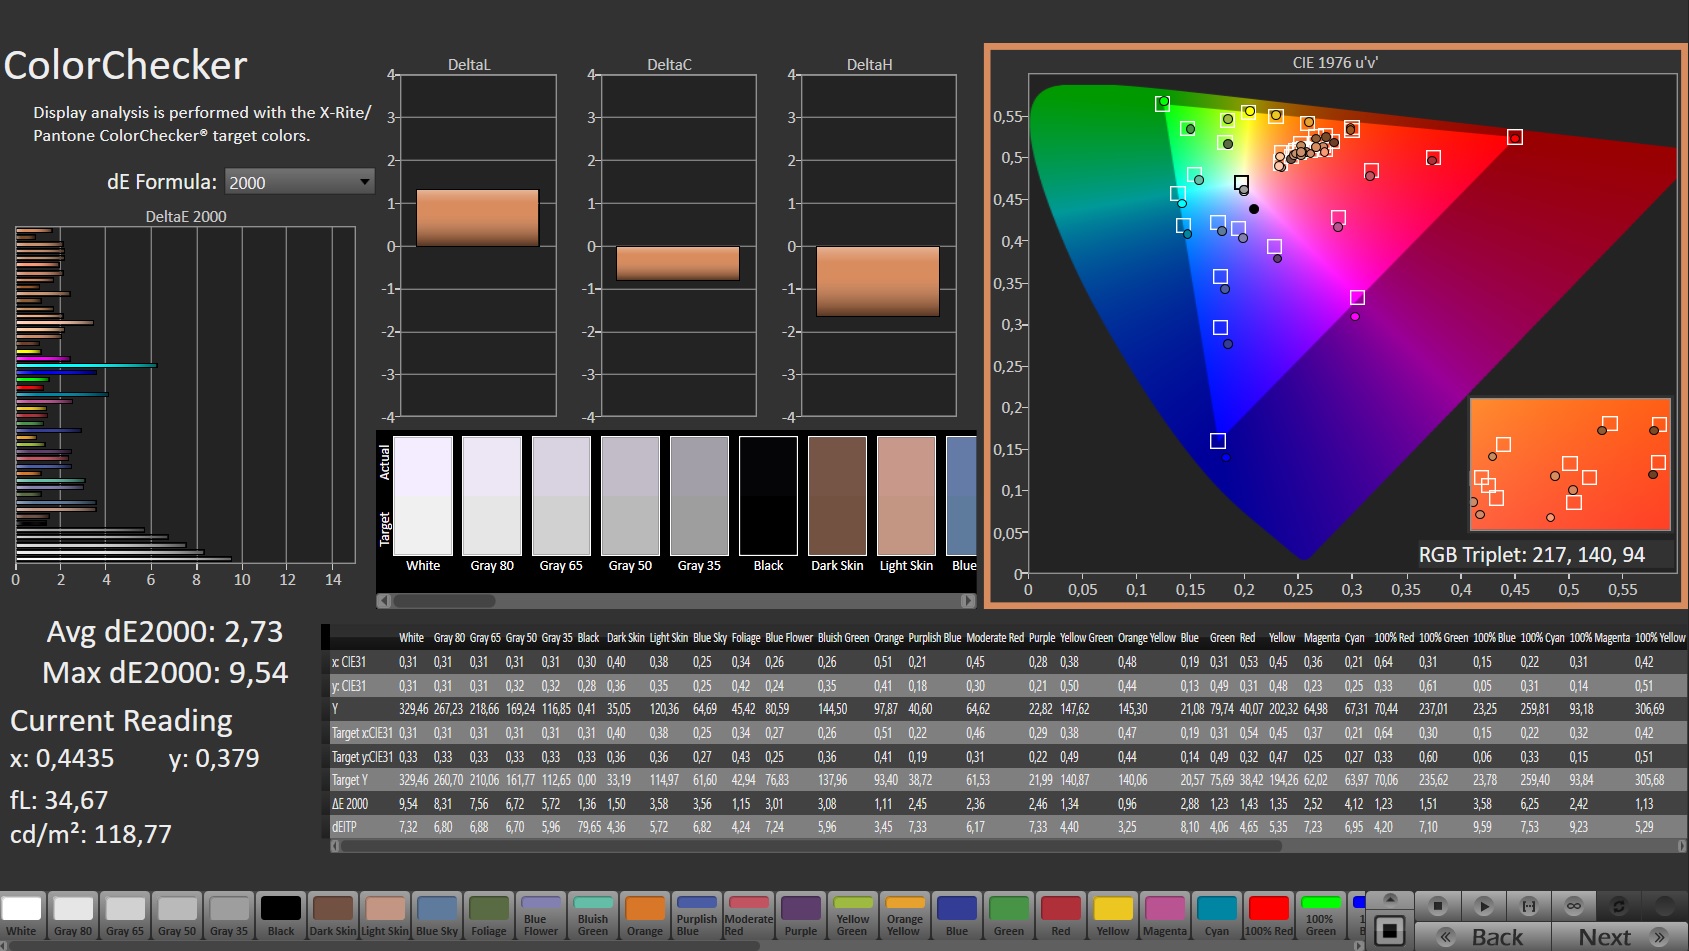
ΔE ColorChecker Calman: 2.73 | ∀{0.5-29.43 Ø4.71}
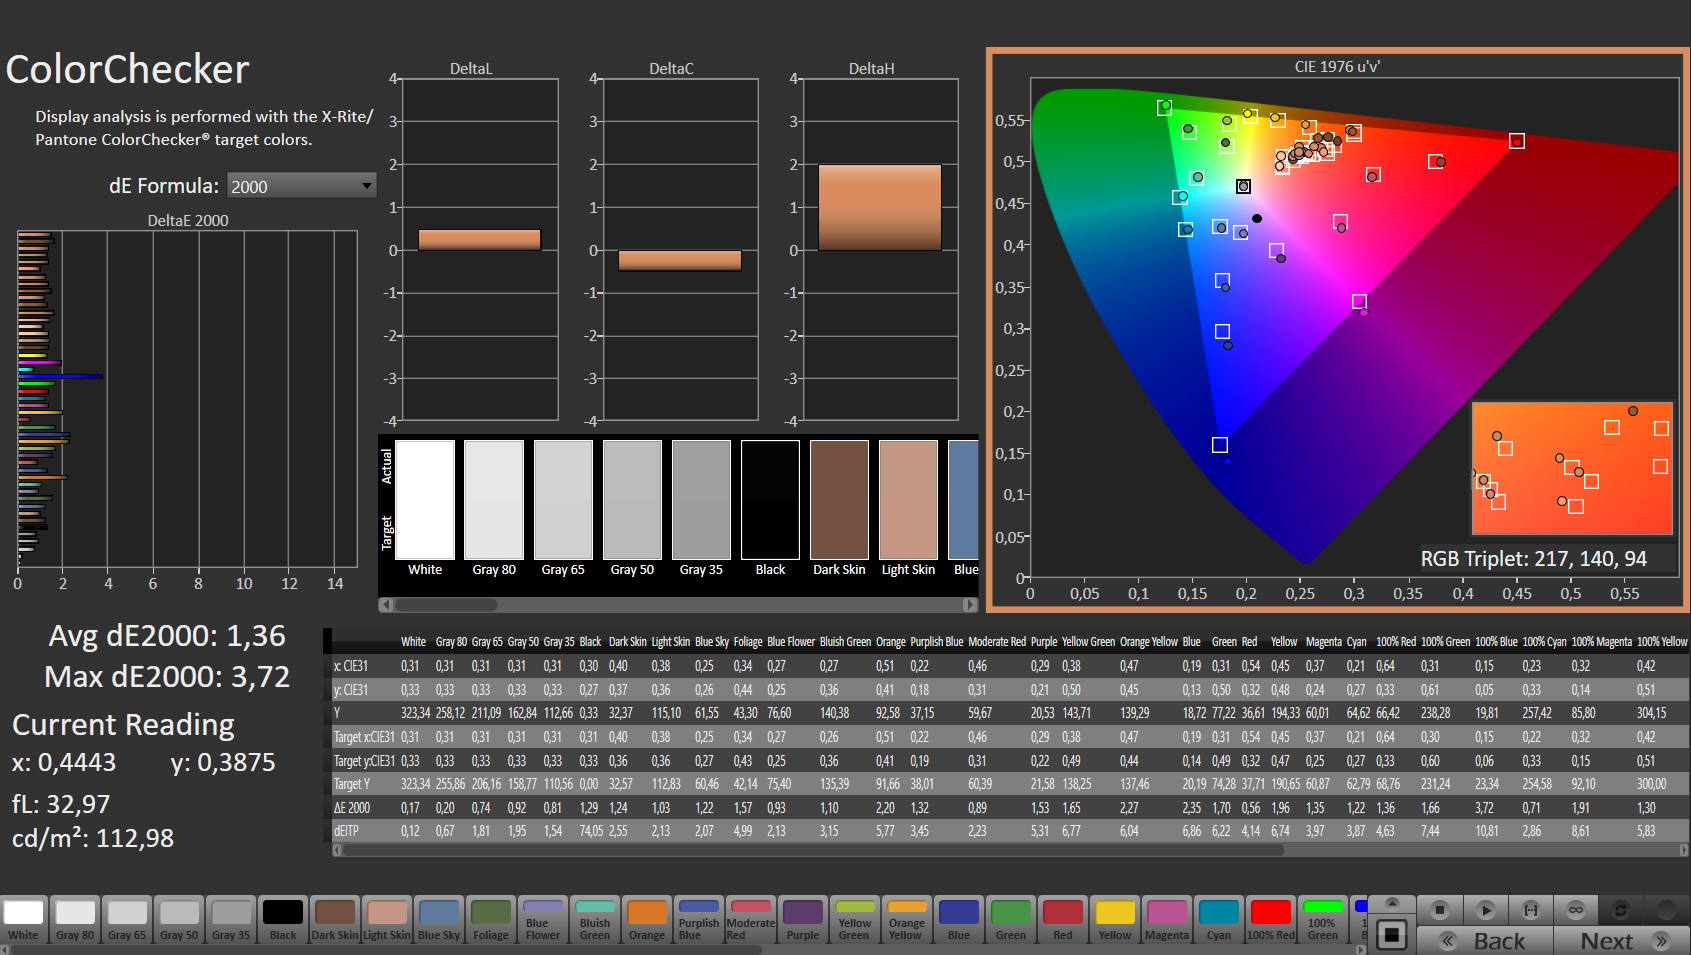
calibrated: 1.36
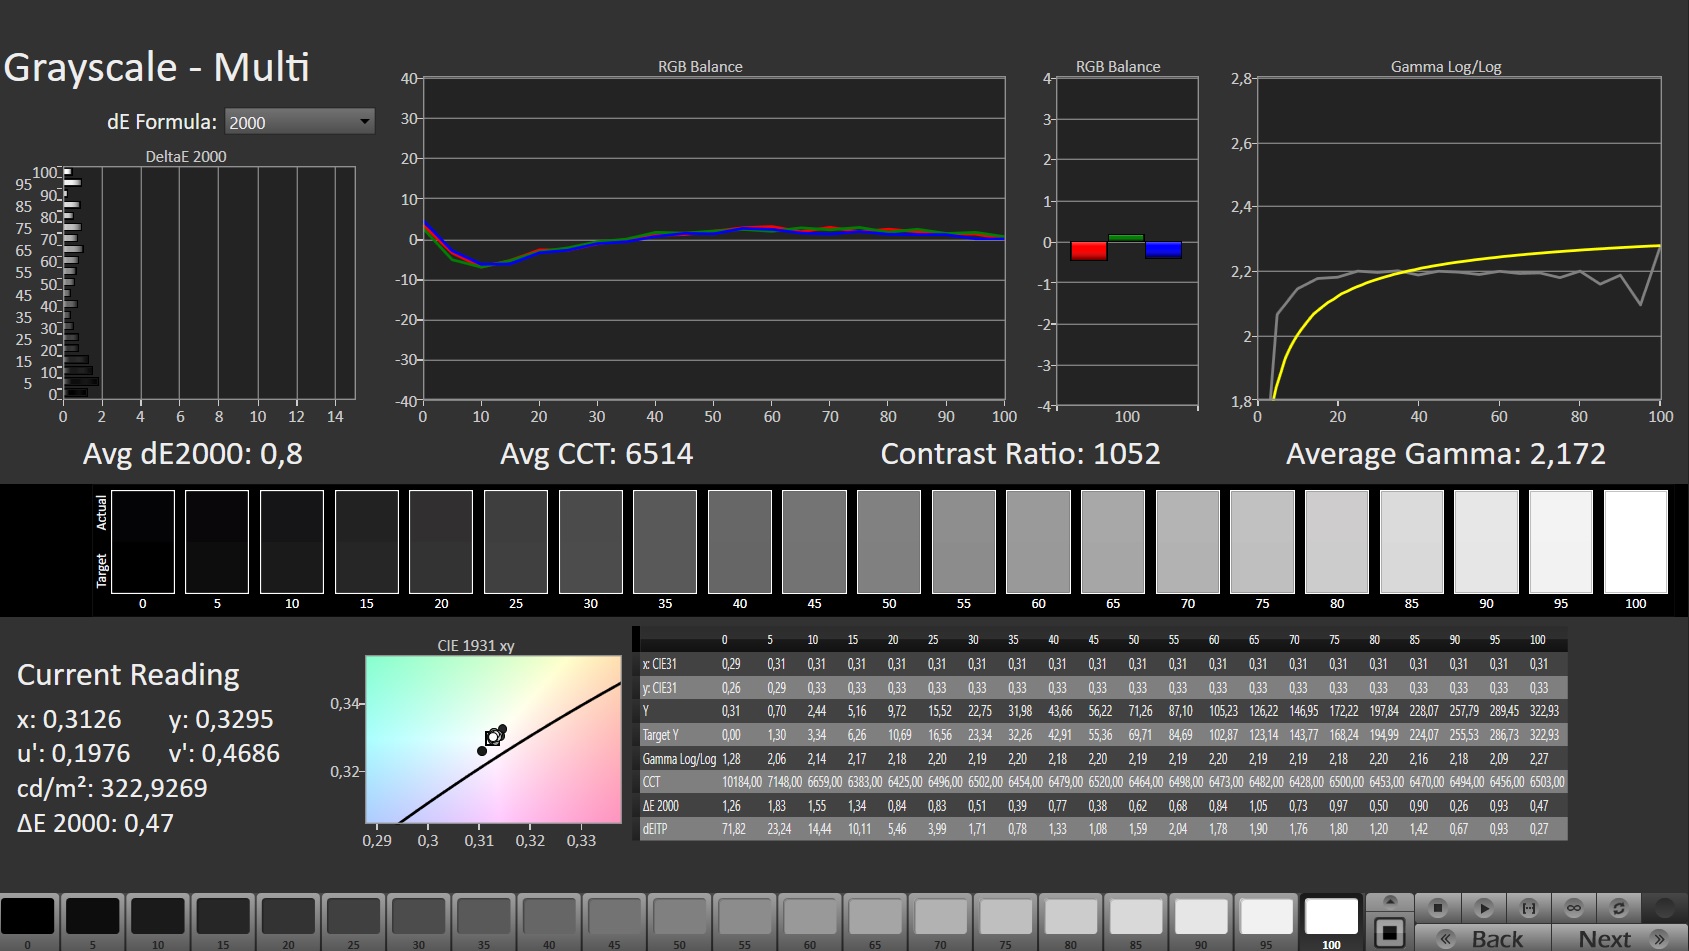
ΔE Greyscale Calman: 5.2 | ∀{0.09-98 Ø4.96}
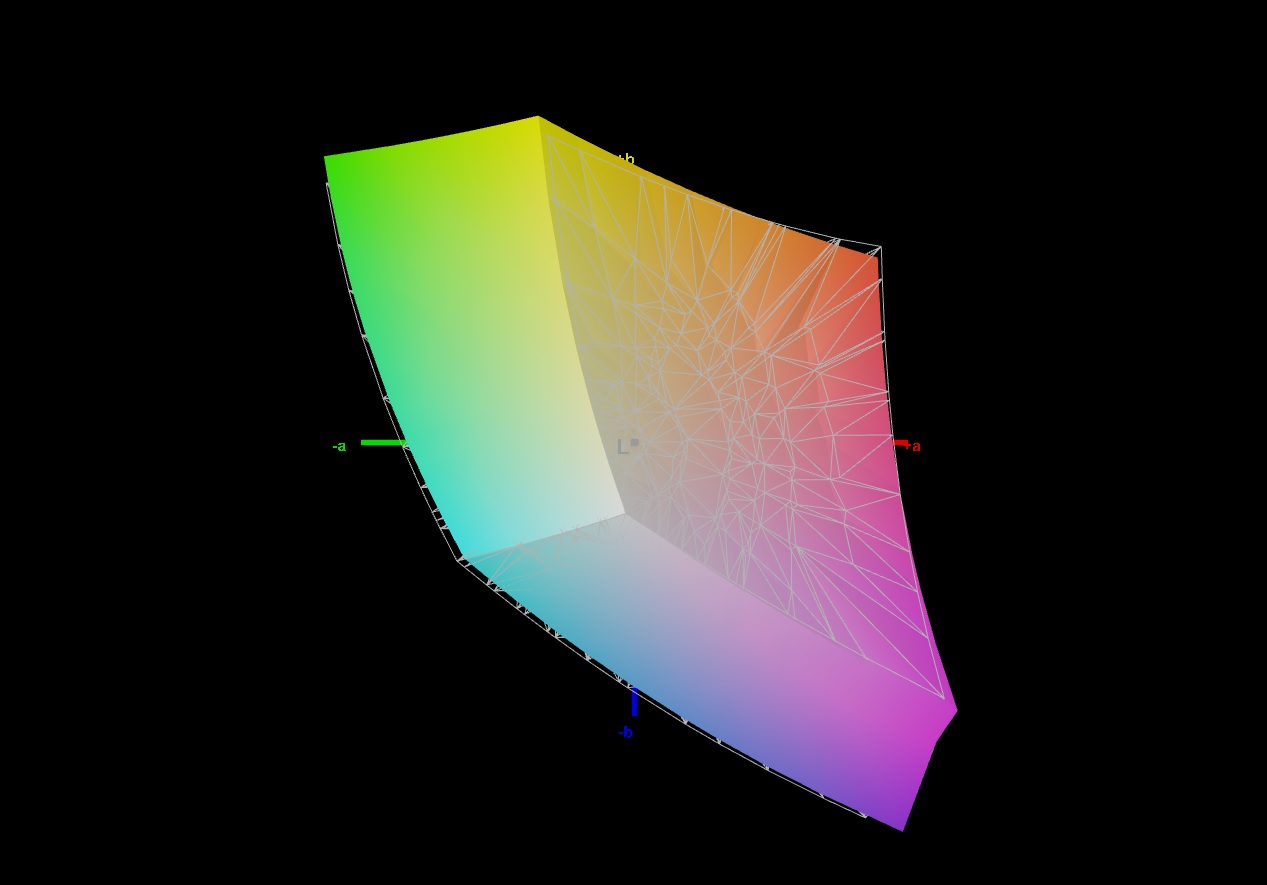
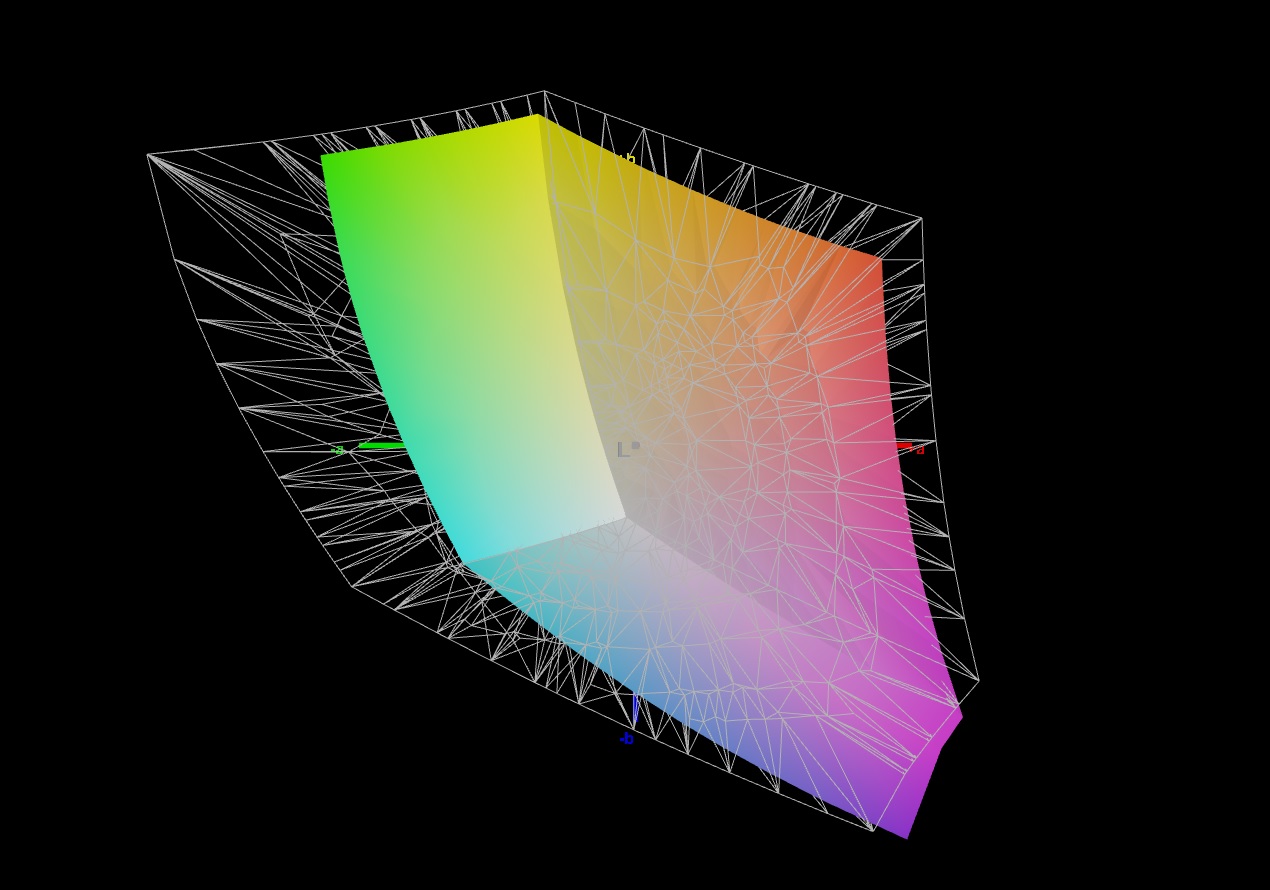
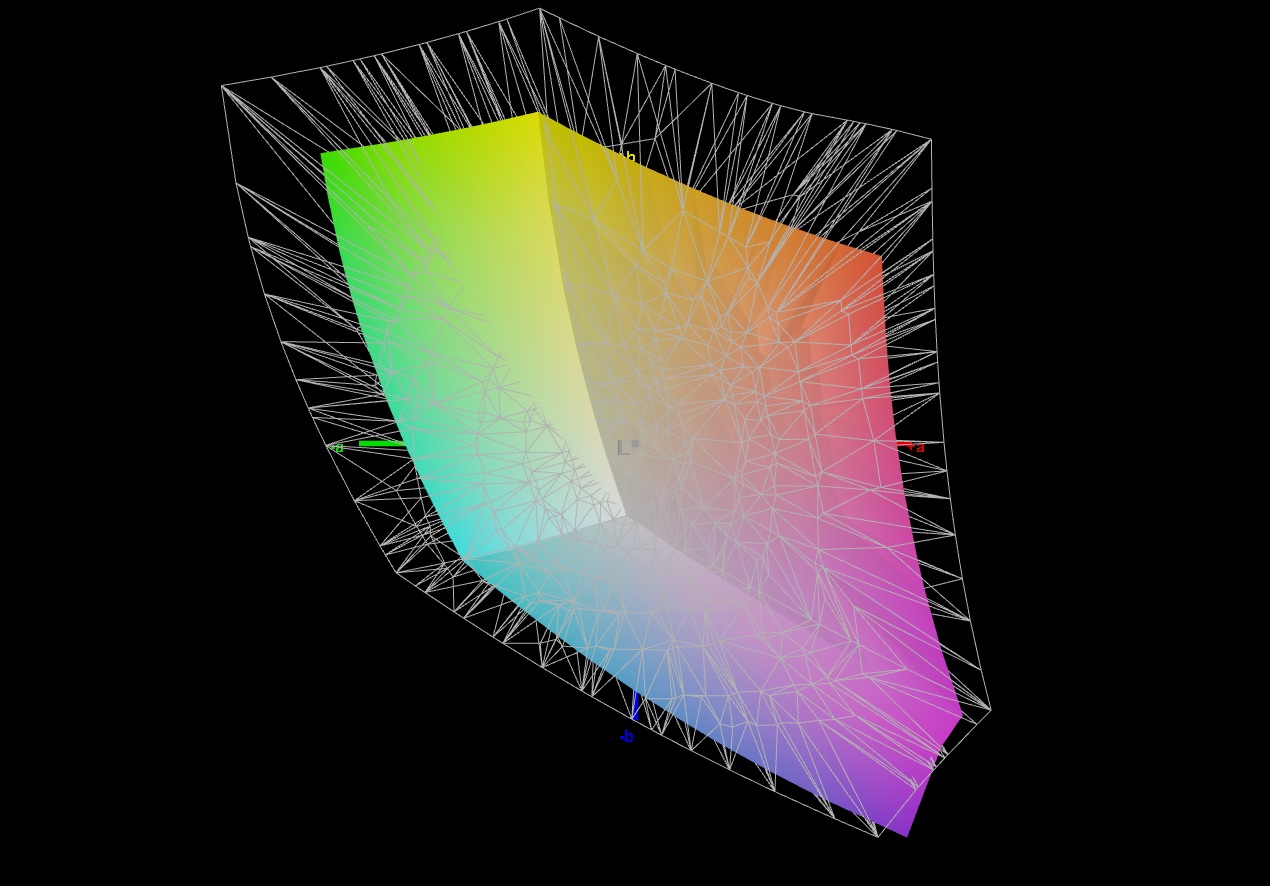
68.2% AdobeRGB 1998 (Argyll 3D)
96.7% sRGB (Argyll 3D)
67.3% Display P3 (Argyll 3D)
Gamma: 2.074
CCT: 6911 K
| Schenker XMG Fusion 15 (Mid 22) BOE CQ NE156QHM-NY2, IPS, 2560x1440, 15.6" | Asus TUF Dash F15 FX517ZR BOE CQ NE156QHM-NY1, IPS, 2560x1440, 15.6" | Acer Nitro 5 AN515-58-72QR Chi Mei N156KME-GNA, IPS, 2560x1440, 15.6" | HP Omen 16-b1090ng BOE09E5, IPS, 2560x1440, 16.1" | MSI Delta 15 A5EFK LQ156M1JW03 (SHP155D), IPS-Level, 1920x1080, 15.6" | Razer Blade 15 Base Edition 2021, i7-10750H RTX 3060 BOE NV156FHM-N4K, IPS, 1920x1080, 15.6" | |
|---|---|---|---|---|---|---|
| Display | 25% | 23% | 4% | -0% | -4% | |
| Display P3 Coverage (%) | 67.3 | 98.4 46% | 95.6 42% | 71 5% | 66.5 -1% | 64.3 -4% |
| sRGB Coverage (%) | 96.7 | 99.9 3% | 99.8 3% | 97.9 1% | 97.8 1% | 91.8 -5% |
| AdobeRGB 1998 Coverage (%) | 68.2 | 85.9 26% | 85.2 25% | 73.3 7% | 67.6 -1% | 65.5 -4% |
| Response Times | 9% | -41% | -30% | -30% | -10% | |
| Response Time Grey 50% / Grey 80% * (ms) | 11.6 ? | 5.6 ? 52% | 15.7 ? -35% | 14.5 ? -25% | 12.8 ? -10% | 8.8 ? 24% |
| Response Time Black / White * (ms) | 7 ? | 9.4 ? -34% | 10.2 ? -46% | 9.4 ? -34% | 10.4 ? -49% | 10 ? -43% |
| PWM Frequency (Hz) | 23580 ? | 1000 ? | ||||
| Screen | 20% | 8% | -5% | 1% | -12% | |
| Brightness middle (cd/m²) | 326 | 286 -12% | 332 2% | 335 3% | 291 -11% | 317.2 -3% |
| Brightness (cd/m²) | 303 | 266 -12% | 303 0% | 319 5% | 266 -12% | 306 1% |
| Brightness Distribution (%) | 89 | 87 -2% | 86 -3% | 90 1% | 88 -1% | 89 0% |
| Black Level * (cd/m²) | 0.33 | 0.25 24% | 0.29 12% | 0.28 15% | 0.36 -9% | 0.31 6% |
| Contrast (:1) | 988 | 1144 16% | 1145 16% | 1196 21% | 808 -18% | 1023 4% |
| Colorchecker dE 2000 * | 2.73 | 2.14 22% | 3.61 -32% | 4.38 -60% | 2.98 -9% | 4.37 -60% |
| Colorchecker dE 2000 max. * | 9.54 | 5.22 45% | 7.71 19% | 9.48 1% | 7.59 20% | 6.62 31% |
| Colorchecker dE 2000 calibrated * | 1.36 | 0.67 51% | 0.59 57% | 1.33 2% | 0.91 33% | 2.67 -96% |
| Greyscale dE 2000 * | 5.2 | 2.8 46% | 5.2 -0% | 7 -35% | 4.2 19% | 4.5 13% |
| Gamma | 2.074 106% | 2.23 99% | 2.155 102% | 2.103 105% | 2.293 96% | 2.4 92% |
| CCT | 6911 94% | 7092 92% | 6724 97% | 6244 104% | 7624 85% | 7418 88% |
| Color Space (Percent of AdobeRGB 1998) (%) | 59.2 | |||||
| Color Space (Percent of sRGB) (%) | 91.4 | |||||
| Media totale (Programma / Settaggio) | 18% /
19% | -3% /
4% | -10% /
-7% | -10% /
-3% | -9% /
-10% |
* ... Meglio usare valori piccoli
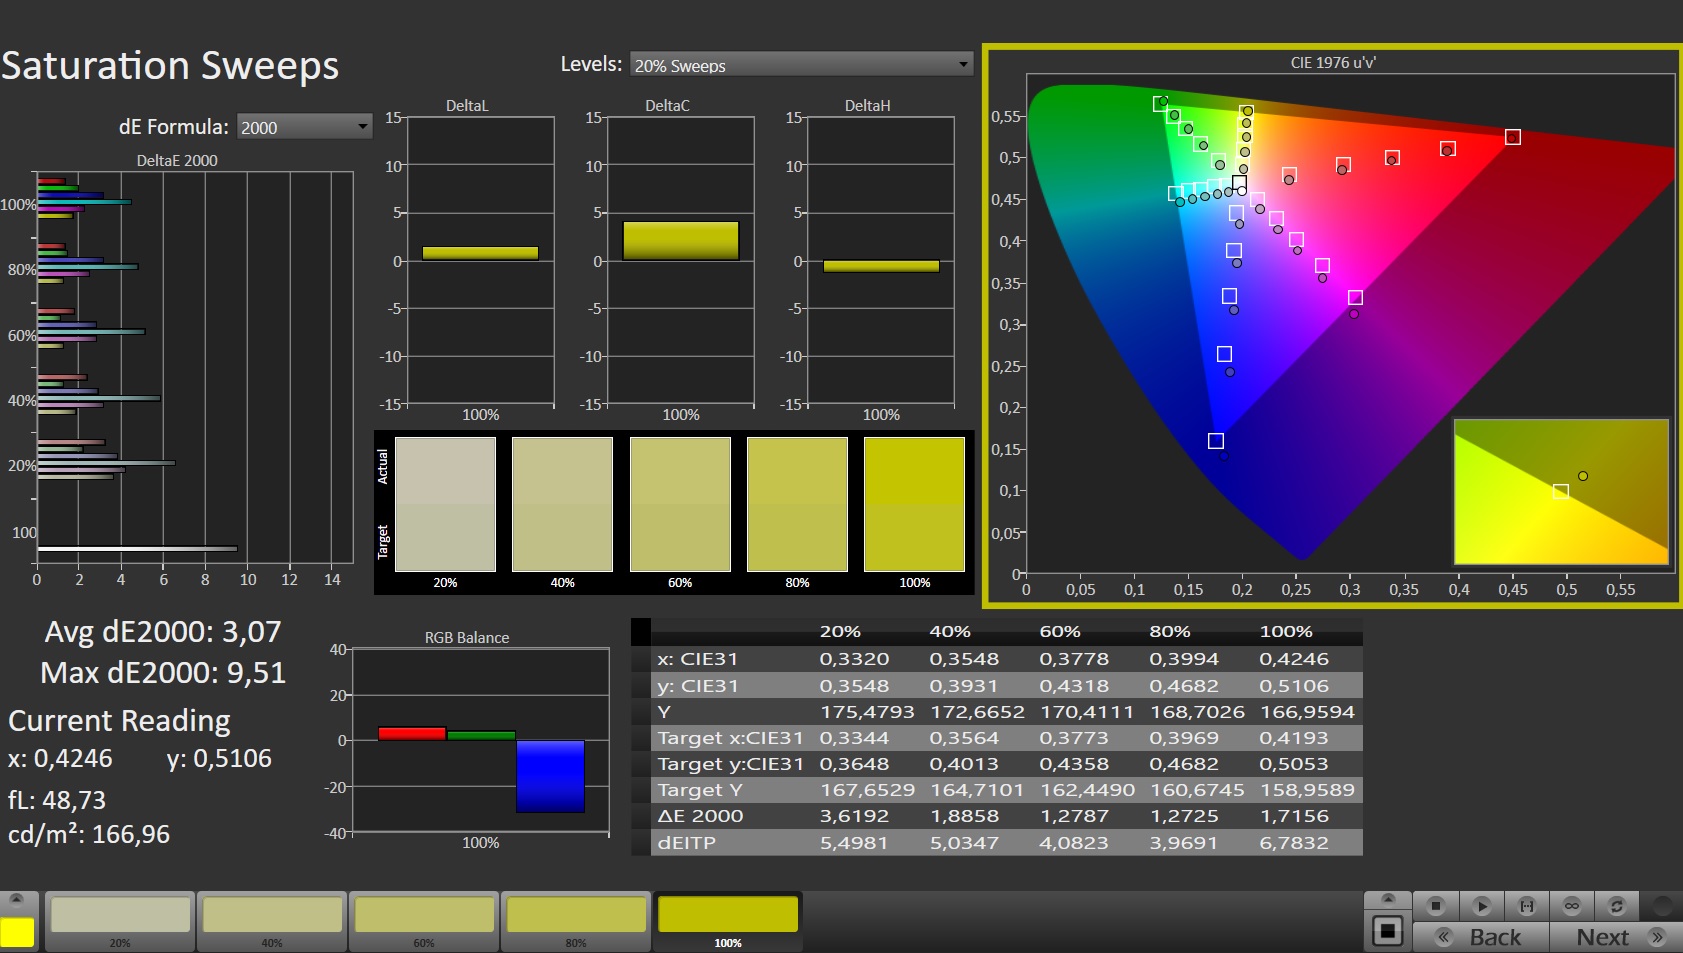
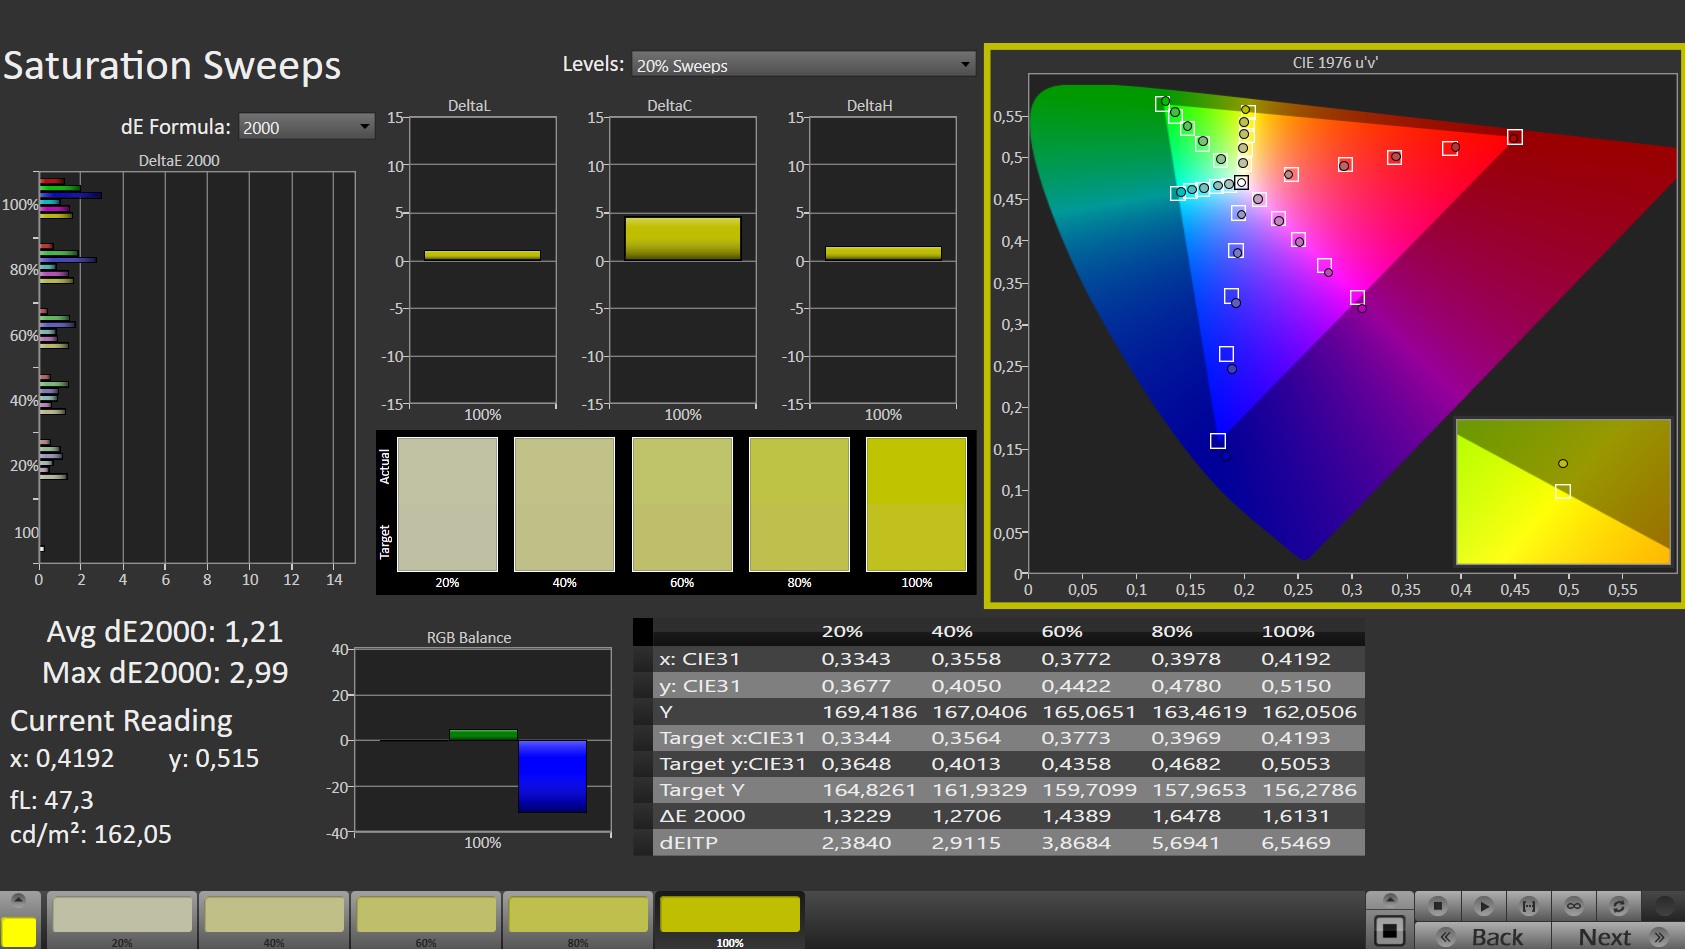
Fin dalla scatola il display riproduce bene i colori. La deviazione di 2,73 rientra nell'intervallo previsto (Delta E < 3) - questa piccola deviazione non è percepibile dagli spettatori. La calibrazione porta a dei miglioramenti: La deviazione del colore scende a 1,36 e la scala di grigi viene visualizzata in modo più equilibrato. Il display è in grado di riprodurre quasi completamente lo spazio colore sRGB (96,7%); gli spazi colore AdobeRGB e DCI-P3 sono riprodotti rispettivamente al 68% e al 67%
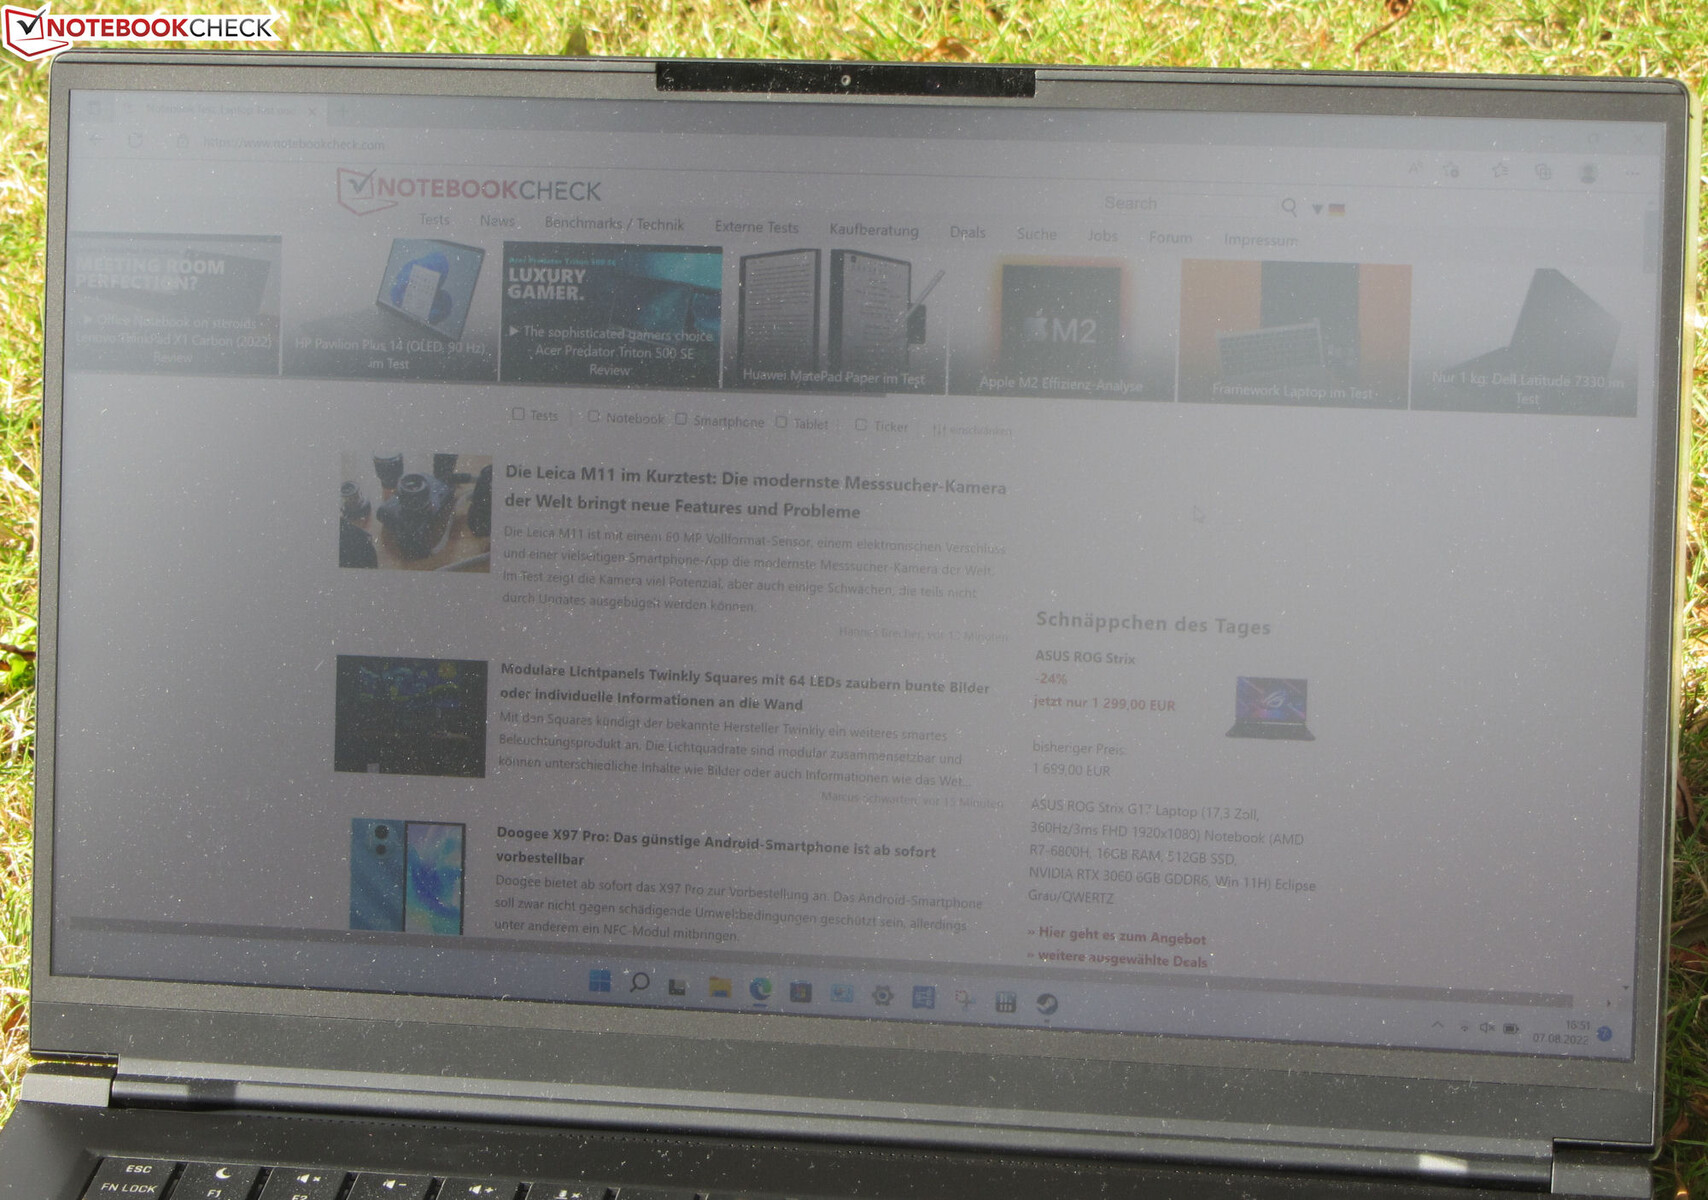
Il pannello IPS, stabile nell'angolo di visione, è leggibile da qualsiasi posizione. La leggibilità all'aperto è possibile quando il sole non splende troppo

Tempi di risposta del Display
| ↔ Tempi di risposta dal Nero al Bianco | ||
|---|---|---|
| 7 ms ... aumenta ↗ e diminuisce ↘ combinato | ↗ 3.3 ms Incremento | 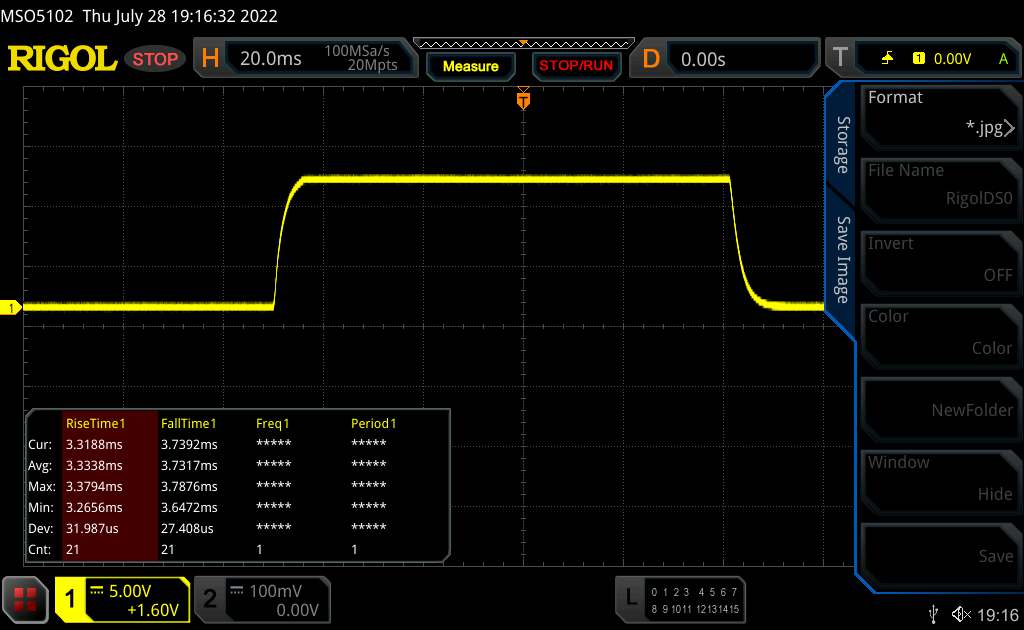 |
| ↘ 3.7 ms Calo | ||
| Lo schermo ha mostrato valori di risposta molto veloci nei nostri tests ed è molto adatto per i gaming veloce. In confronto, tutti i dispositivi di test variano da 0.1 (minimo) a 240 (massimo) ms. » 21 % di tutti i dispositivi è migliore. Questo significa che i tempi di risposta rilevati sono migliori rispettto alla media di tutti i dispositivi testati (19.8 ms). | ||
| ↔ Tempo di risposta dal 50% Grigio all'80% Grigio | ||
| 11.6 ms ... aumenta ↗ e diminuisce ↘ combinato | ↗ 5.6 ms Incremento | 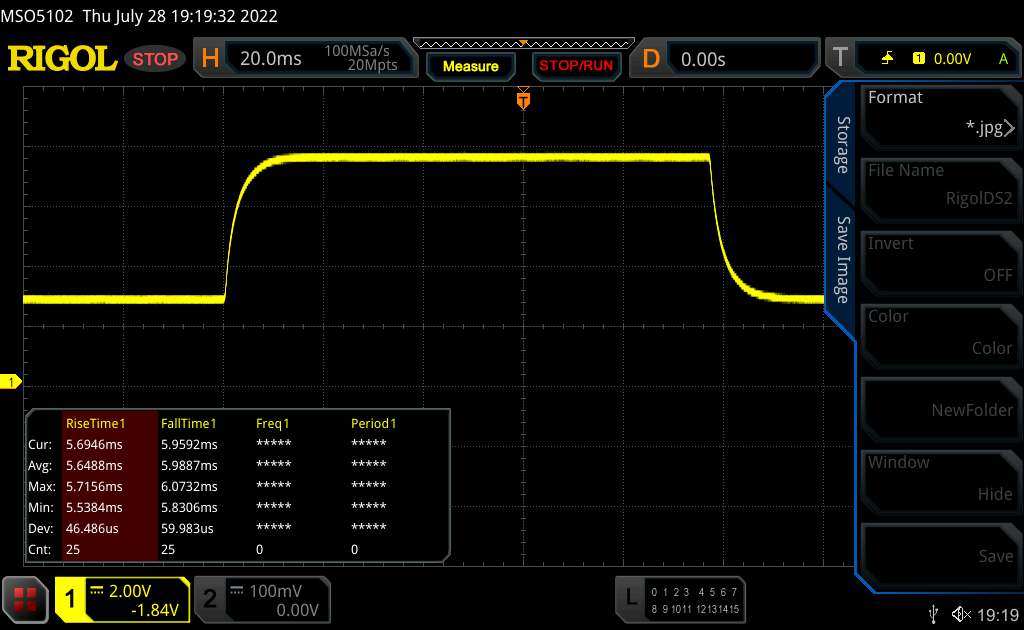 |
| ↘ 6 ms Calo | ||
| Lo schermo mostra buoni tempi di risposta durante i nostri tests, ma potrebbe essere troppo lento per i gamers competitivi. In confronto, tutti i dispositivi di test variano da 0.165 (minimo) a 636 (massimo) ms. » 25 % di tutti i dispositivi è migliore. Questo significa che i tempi di risposta rilevati sono migliori rispettto alla media di tutti i dispositivi testati (31 ms). | ||
Sfarfallio dello schermo / PWM (Pulse-Width Modulation)
| flickering dello schermo / PWM non rilevato | 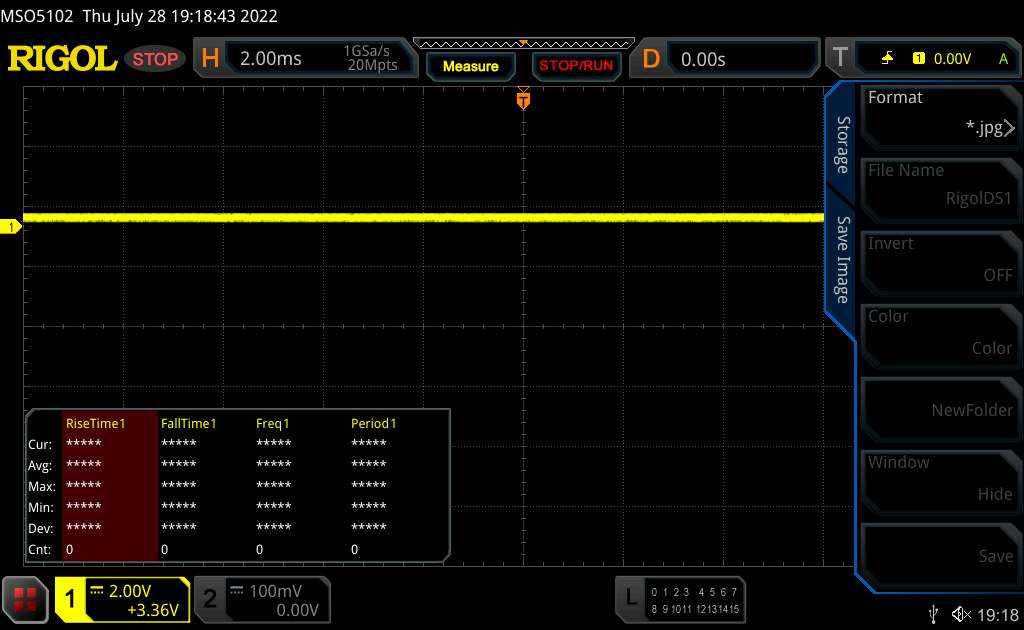 | ||
In confronto: 52 % di tutti i dispositivi testati non utilizza PWM per ridurre la luminosita' del display. Se è rilevato PWM, una media di 7757 (minimo: 5 - massimo: 343500) Hz è stata rilevata. | |||
Prestazioni - Tiger Lake incontra gli Ampere
Con l'XMG Fusion 15, Schenker ha in dotazione un potente computer portatile da 15,6 pollici, progettato per diversi ambiti applicativi
Condizioni di prova
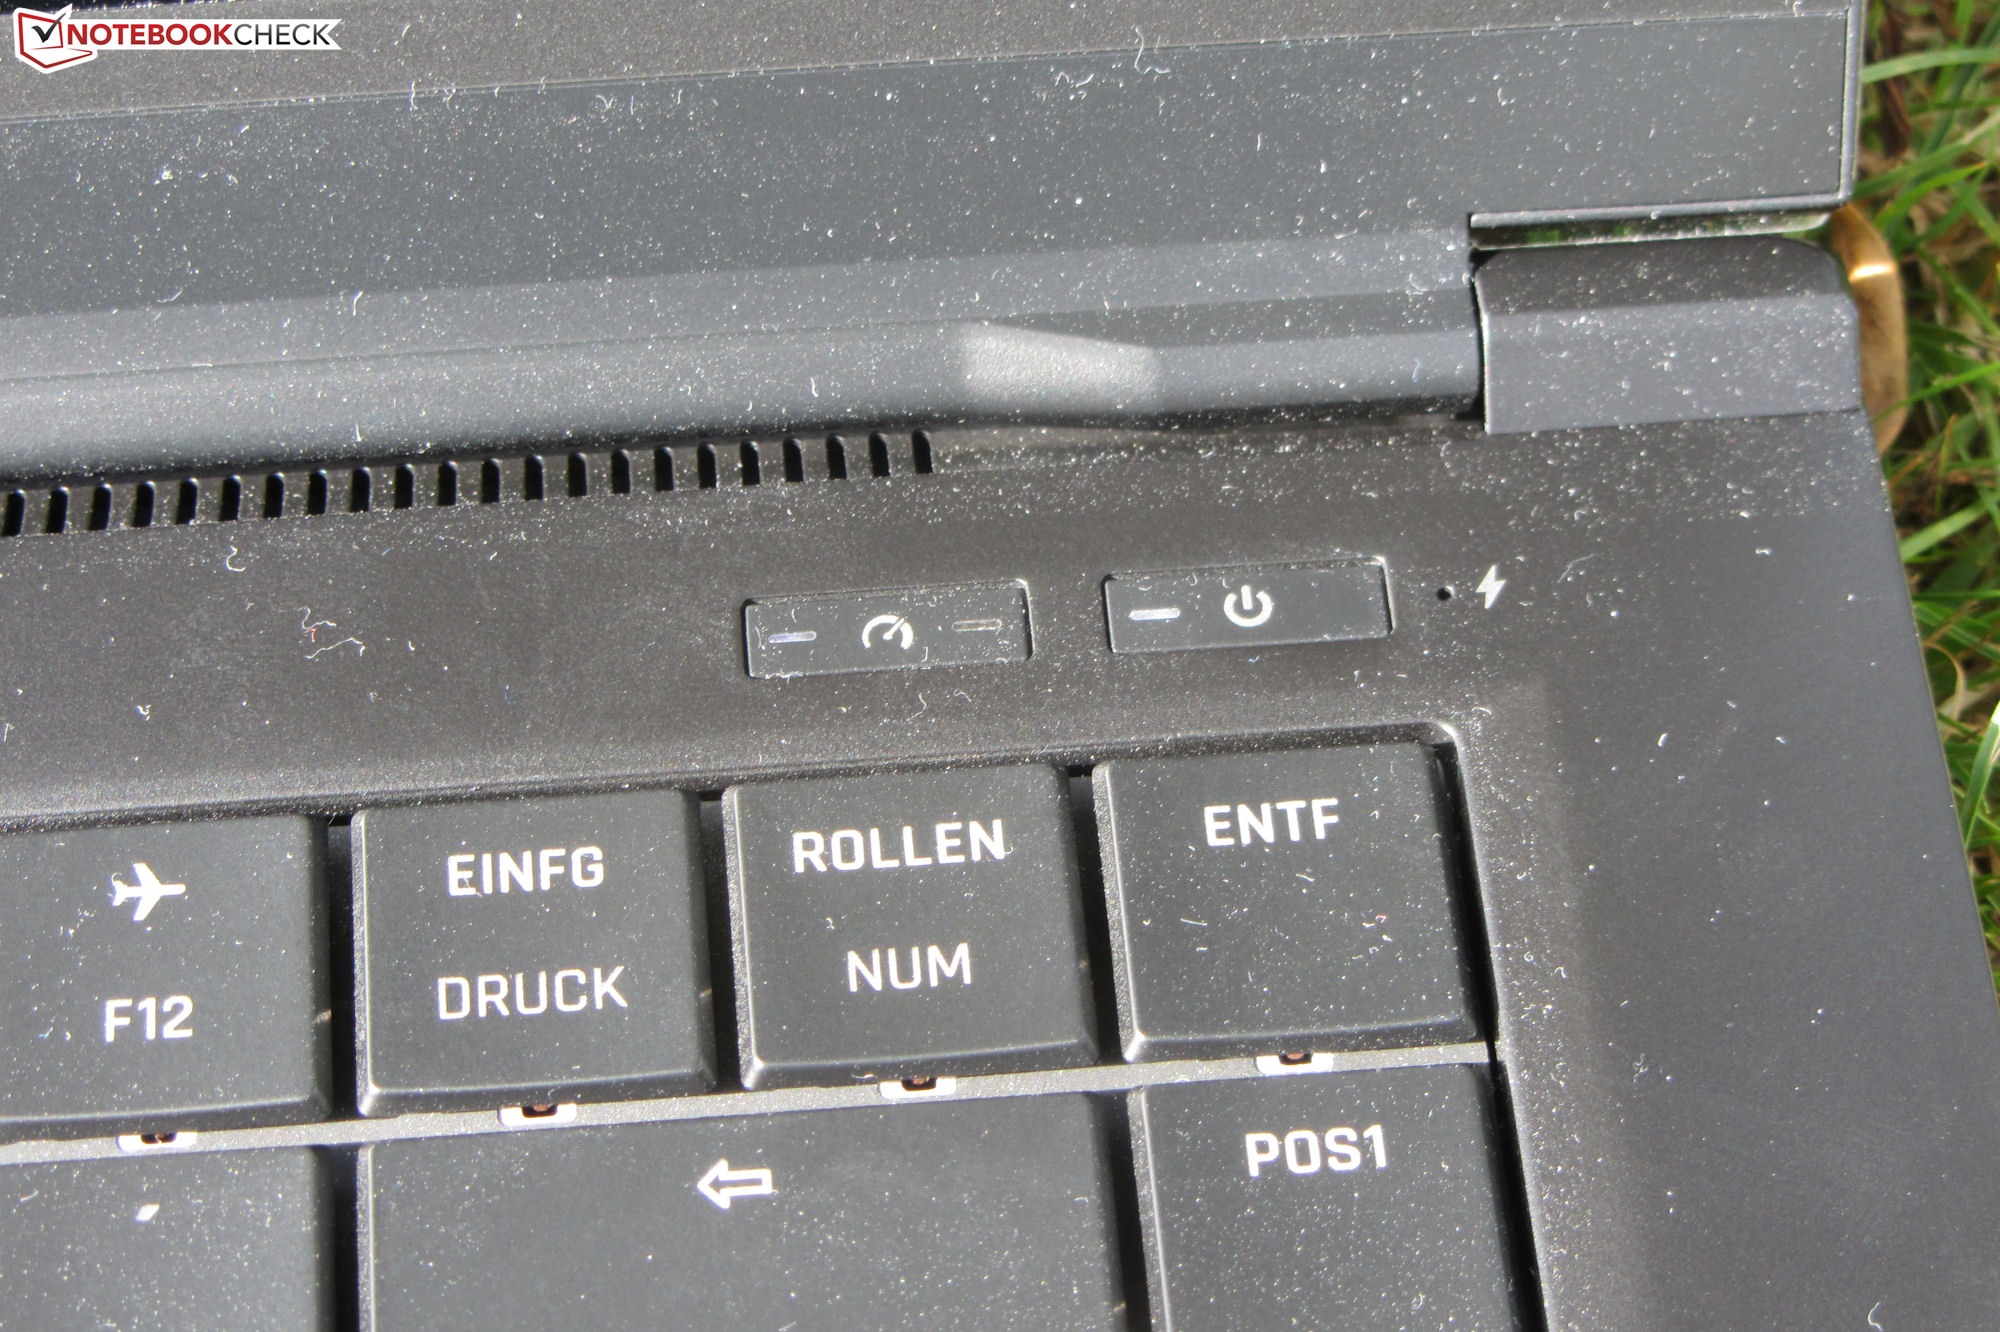
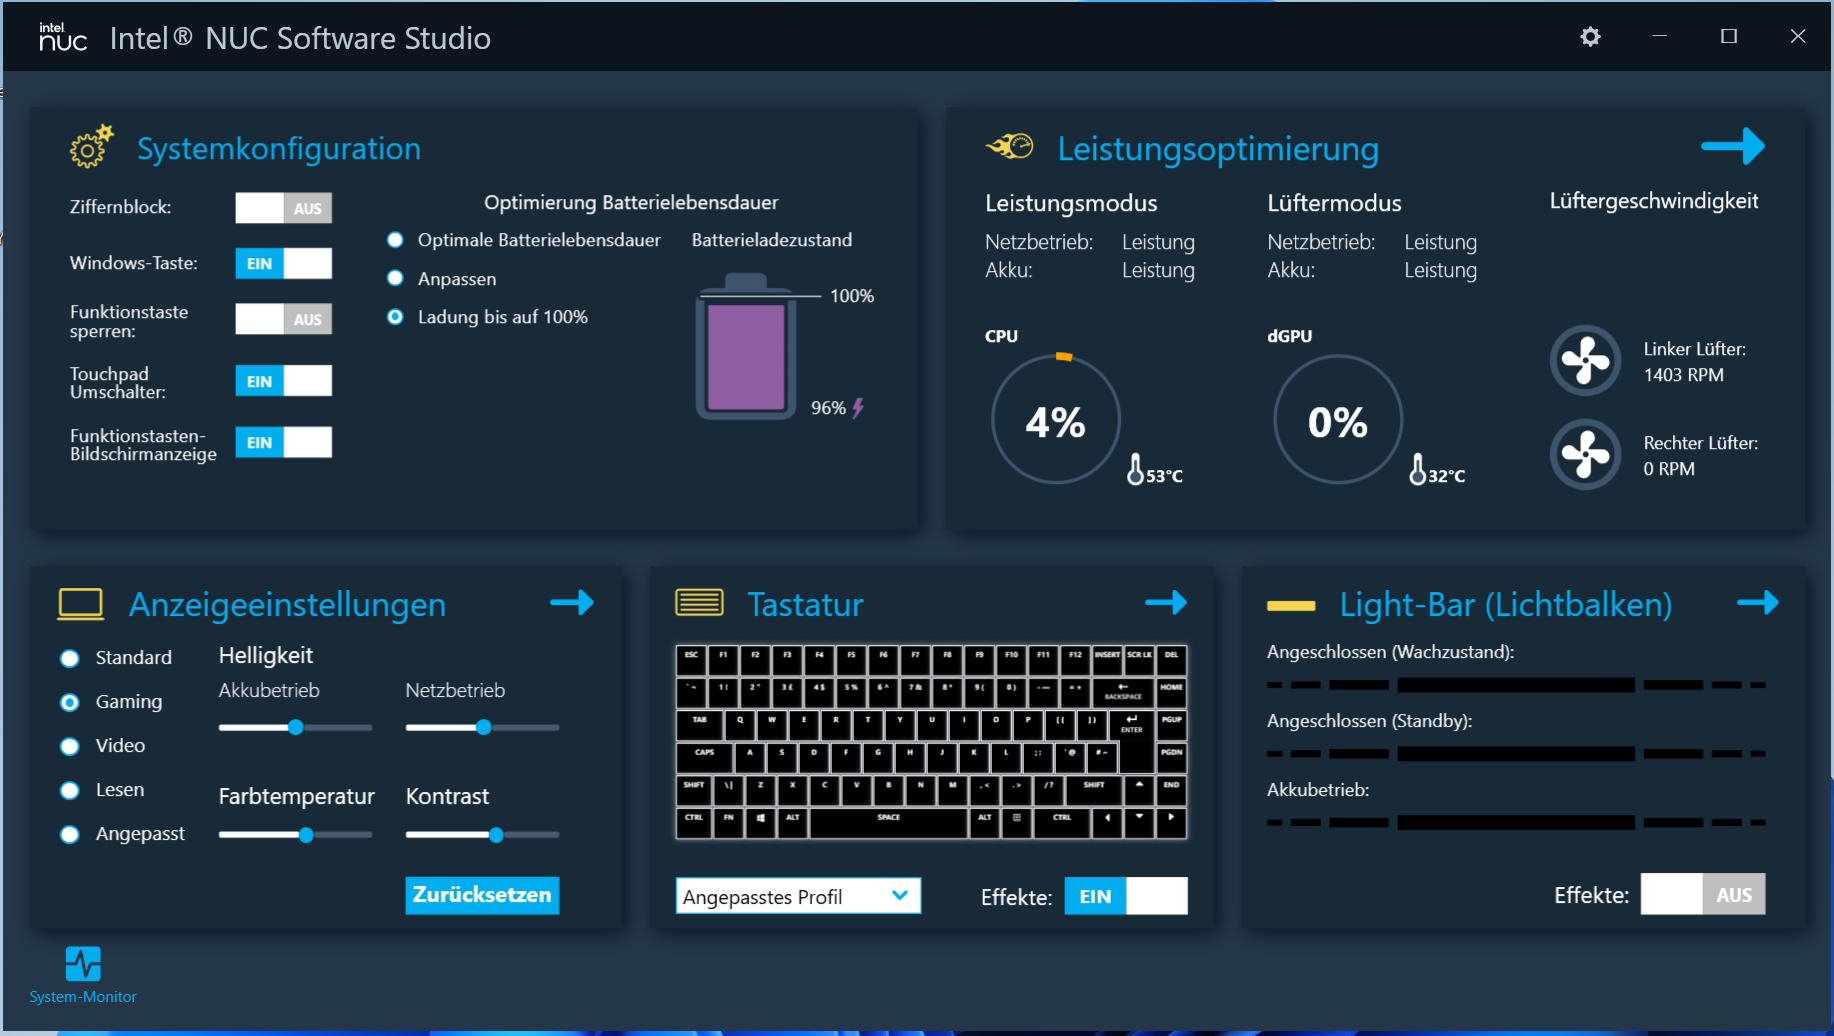
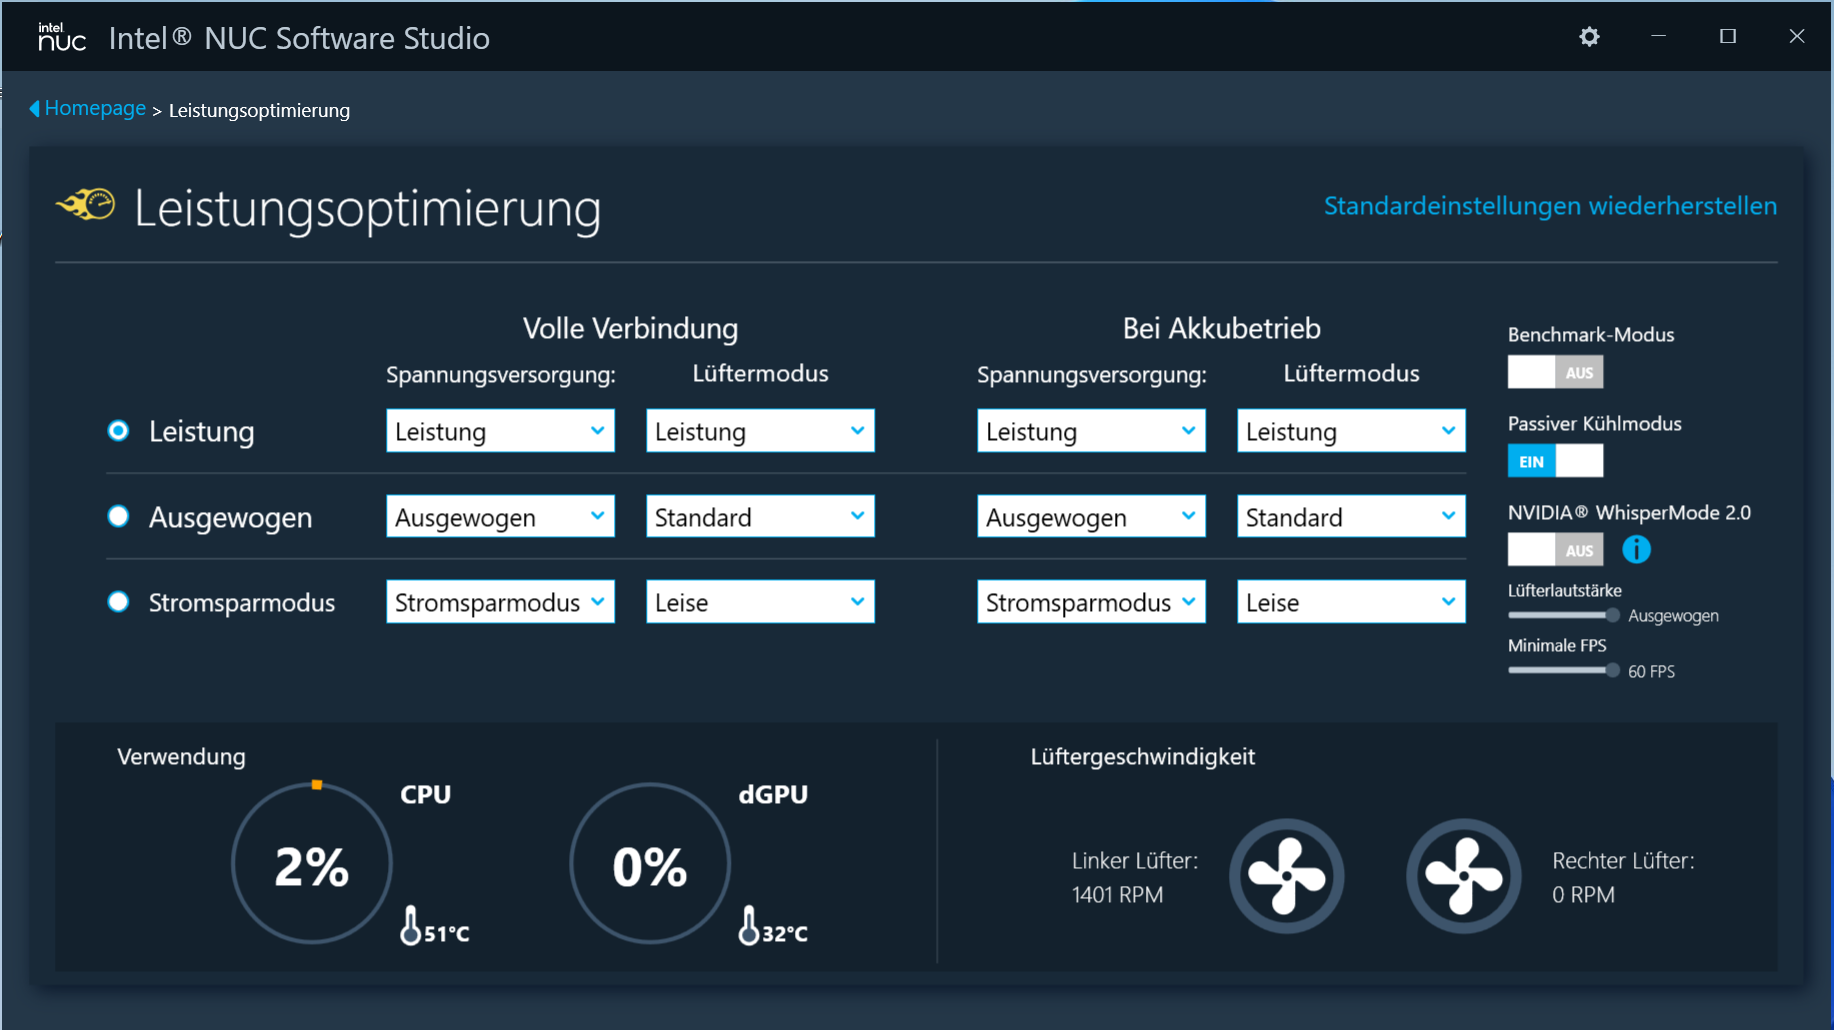
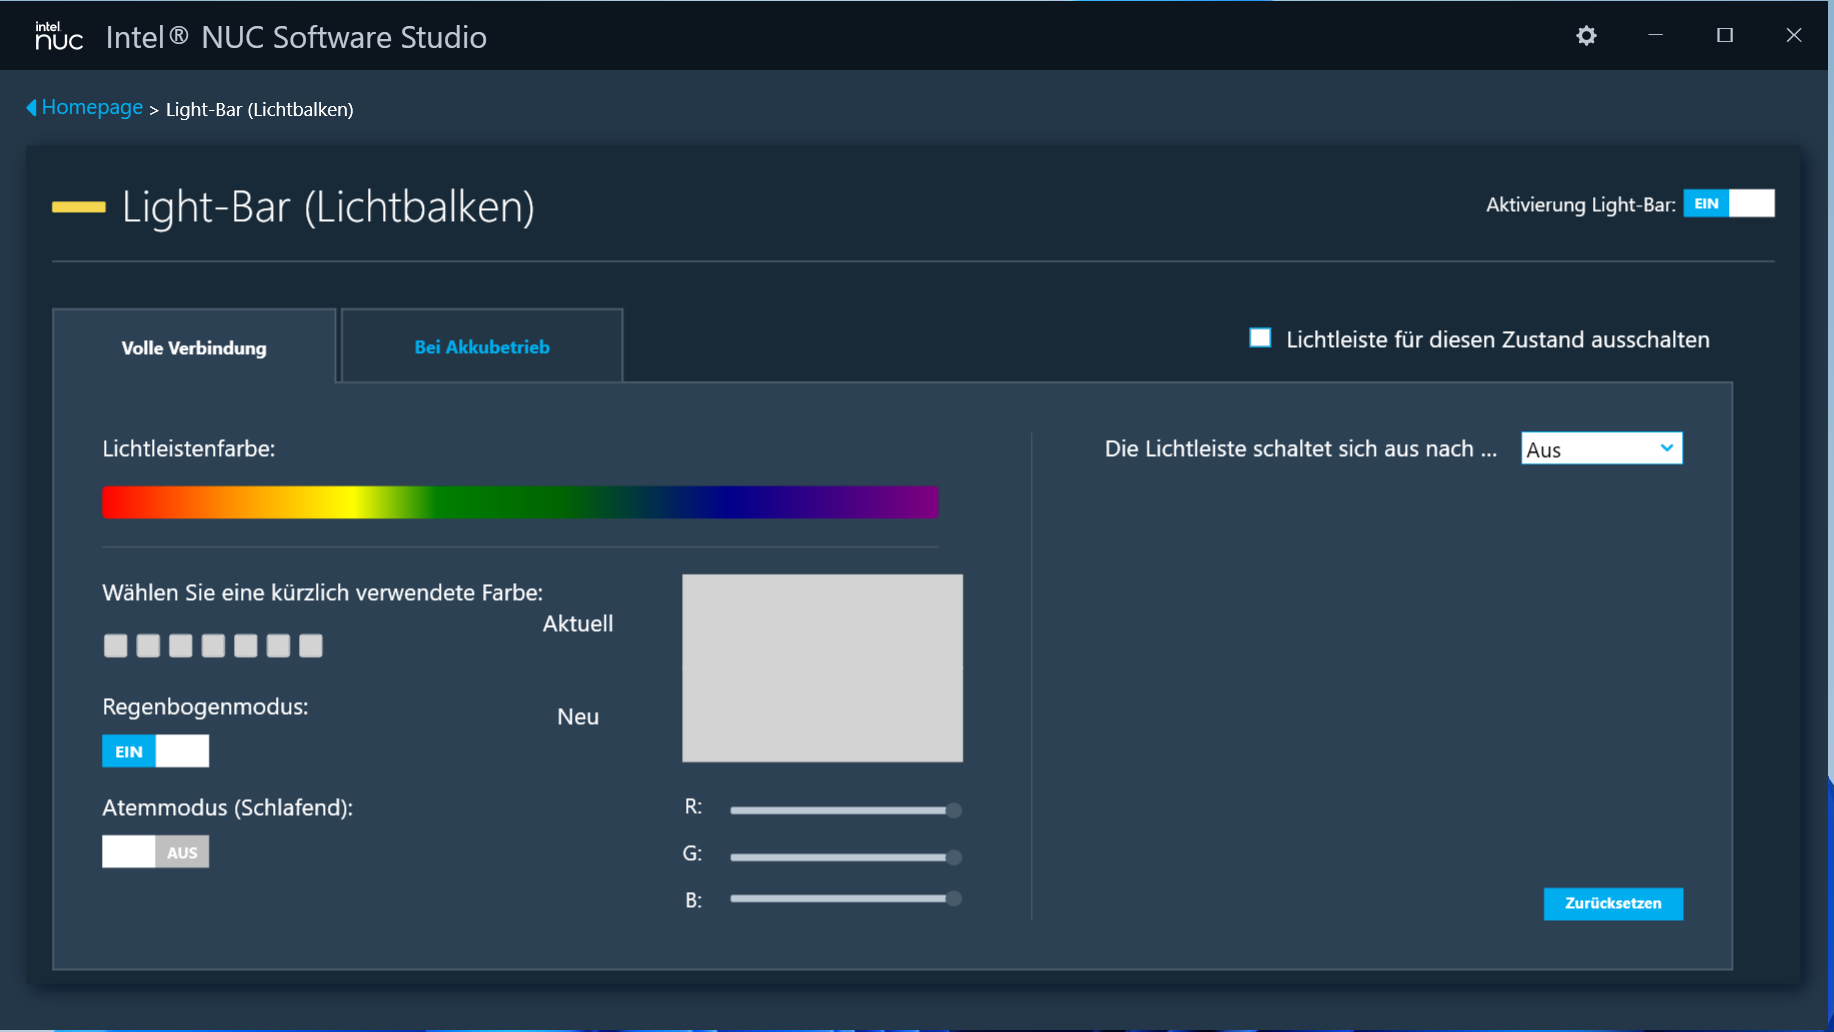
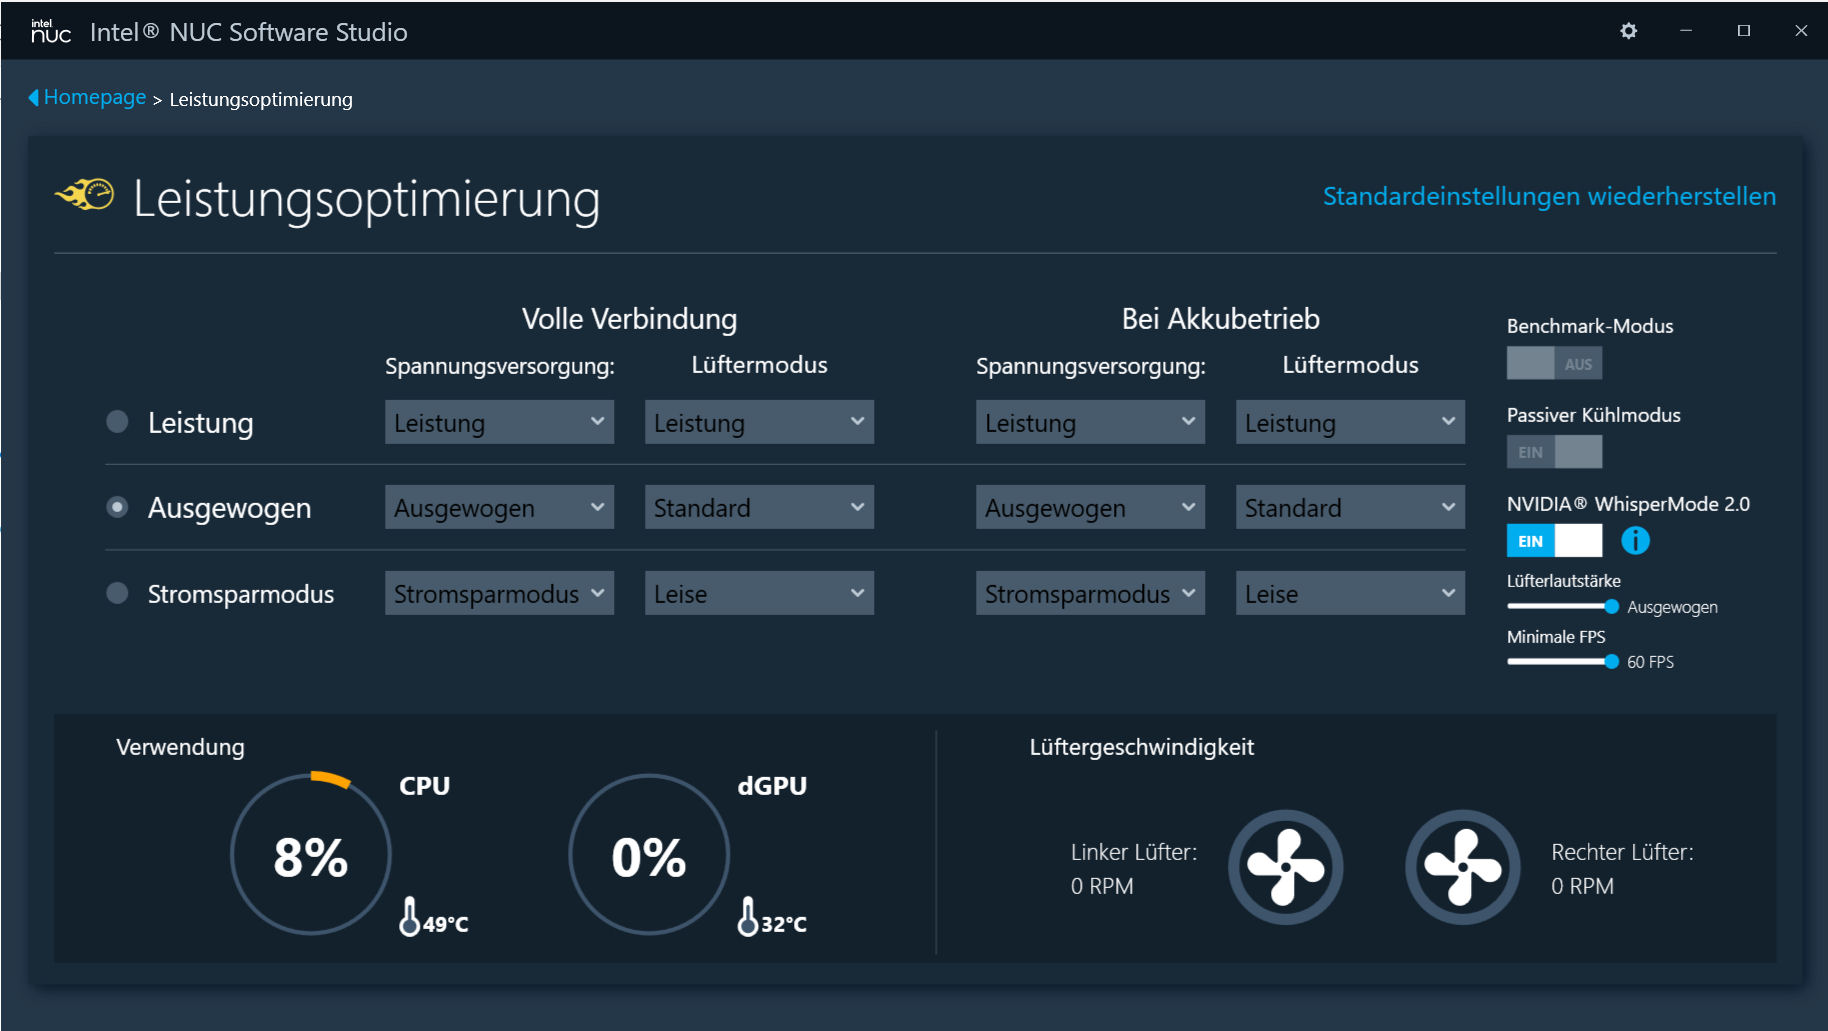
Il centro di controllo preinstallato del portatile (Intel NUC Software Studio) consente agli utenti di regolare le prestazioni, tra le altre cose. Sono disponibili tre profili di prestazioni, che possono essere alternati all'interno dell'applicazione o tramite un pulsante separato (accanto al pulsante di accensione). Un quarto profilo è disponibile all'interno del centro, attivabile solo con un clic del mouse: "Modalità Benchmark". Questo profilo consente di sfruttare al massimo le prestazioni dell'hardware integrato e di far lavorare le ventole alla massima potenza.
Il nostro test è stato eseguito utilizzando il profilo "Bilanciato" e la funzione attiva "Modalità di raffreddamento passivo". Queste sono le impostazioni predefinite. La modalità di raffreddamento passivo fa sì che le ventole si fermino non appena le temperature lo consentono. Altrimenti, la ventola funzionerebbe sempre a bassa velocità.
| Prestazioni | Bilanciato | Risparmio energetico | Modalità Benchmark | |
|---|---|---|---|---|
| Limite di potenza 1 | 65 W | 45 W | 30 W | 100 W |
| Limite di potenza 2 | 90 W | 65 W | 60 W | 110 W |
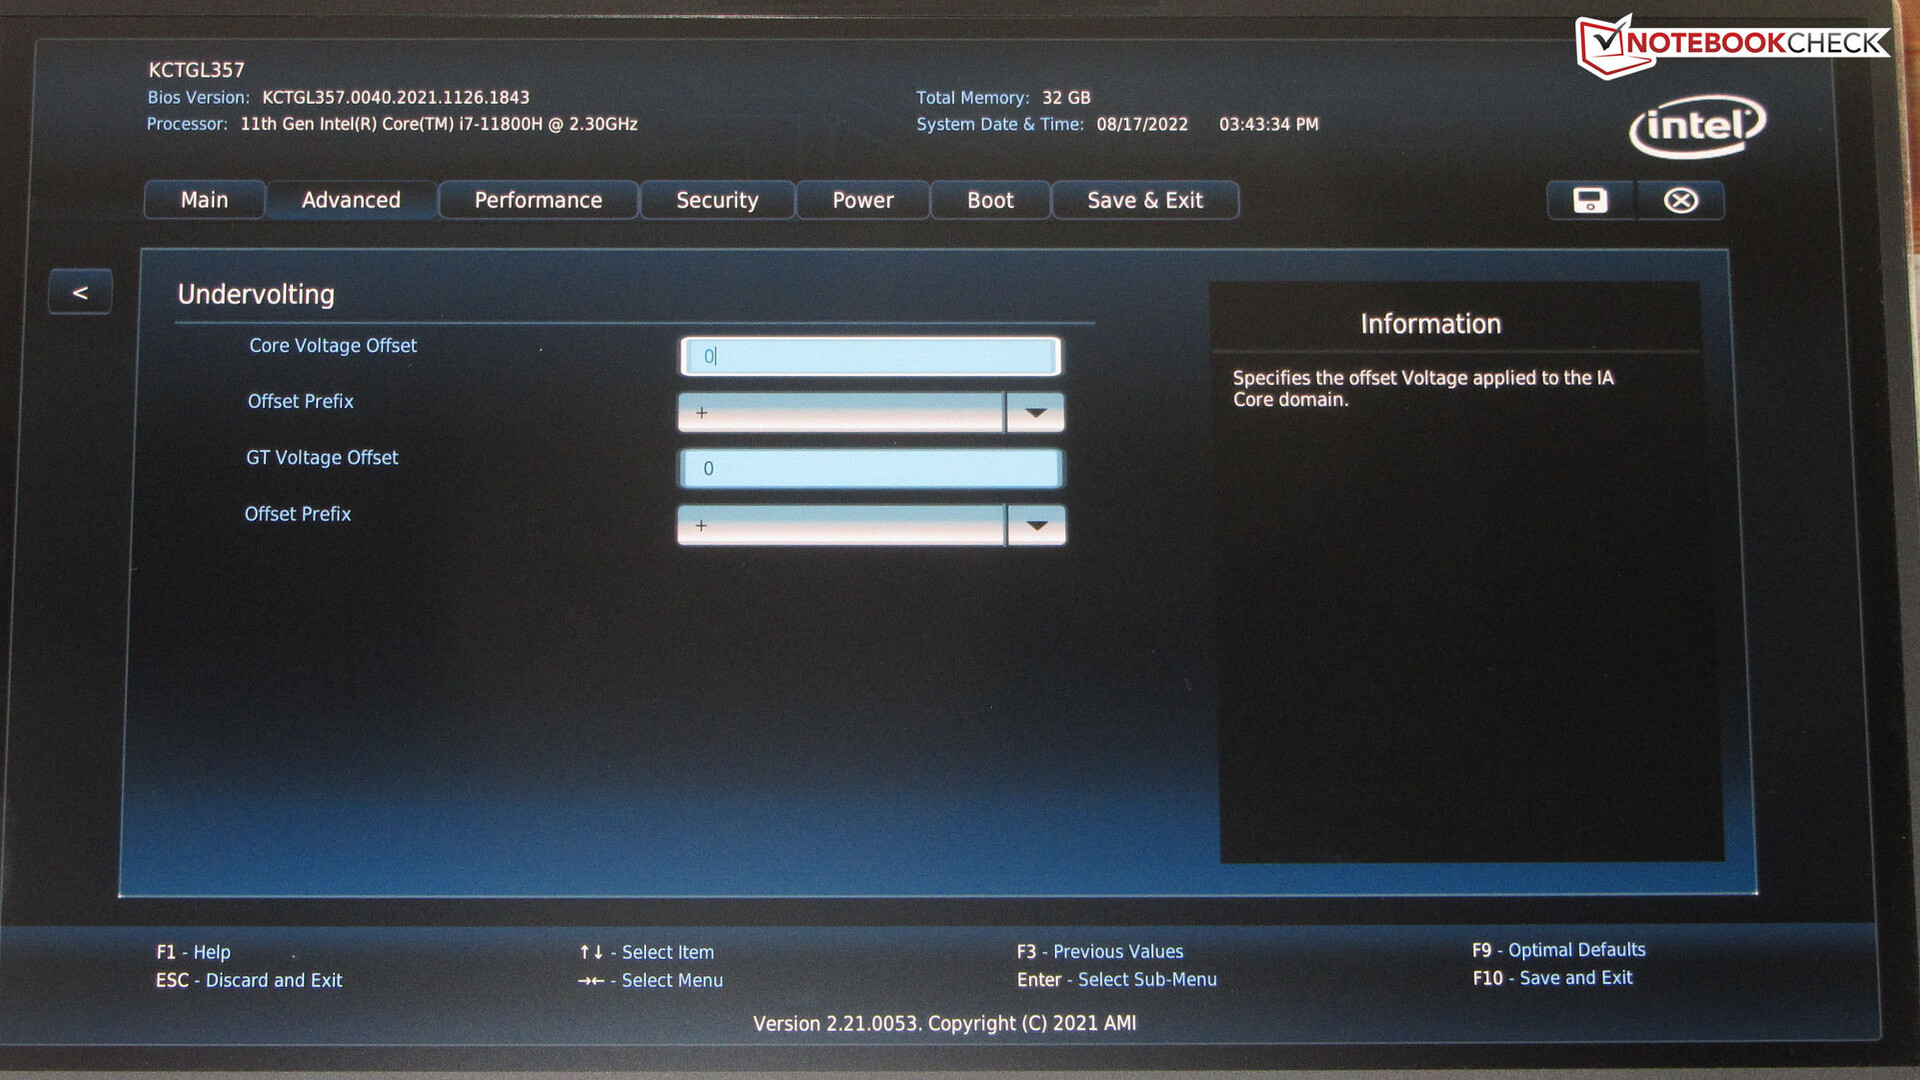
Undervolting tramite BIOS
Il processore e la iGPU possono funzionare con tensioni inferiori a quelle previste dal produttore (undervolting). Di conseguenza, il consumo energetico e lo sviluppo di calore diminuiscono. Ma attenzione: Un abbassamento eccessivo della tensione può portare a un sistema instabile o difettoso. In questo caso, è necessario tornare al livello di tensione precedente. L'undervolting viene effettuato a rischio e pericolo dell'utente
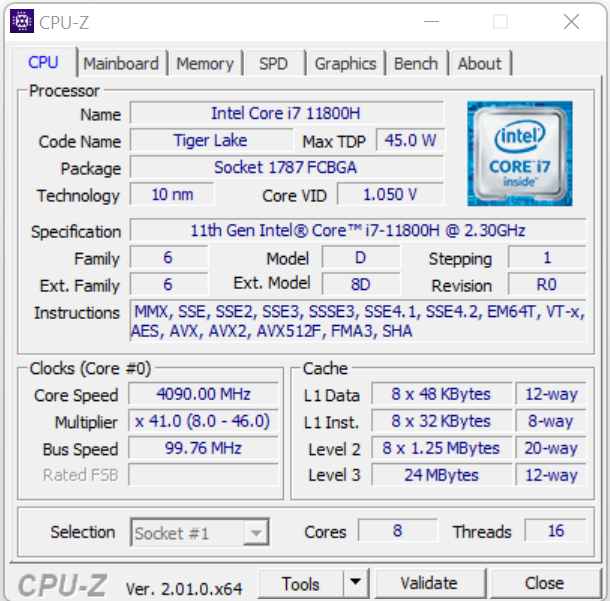
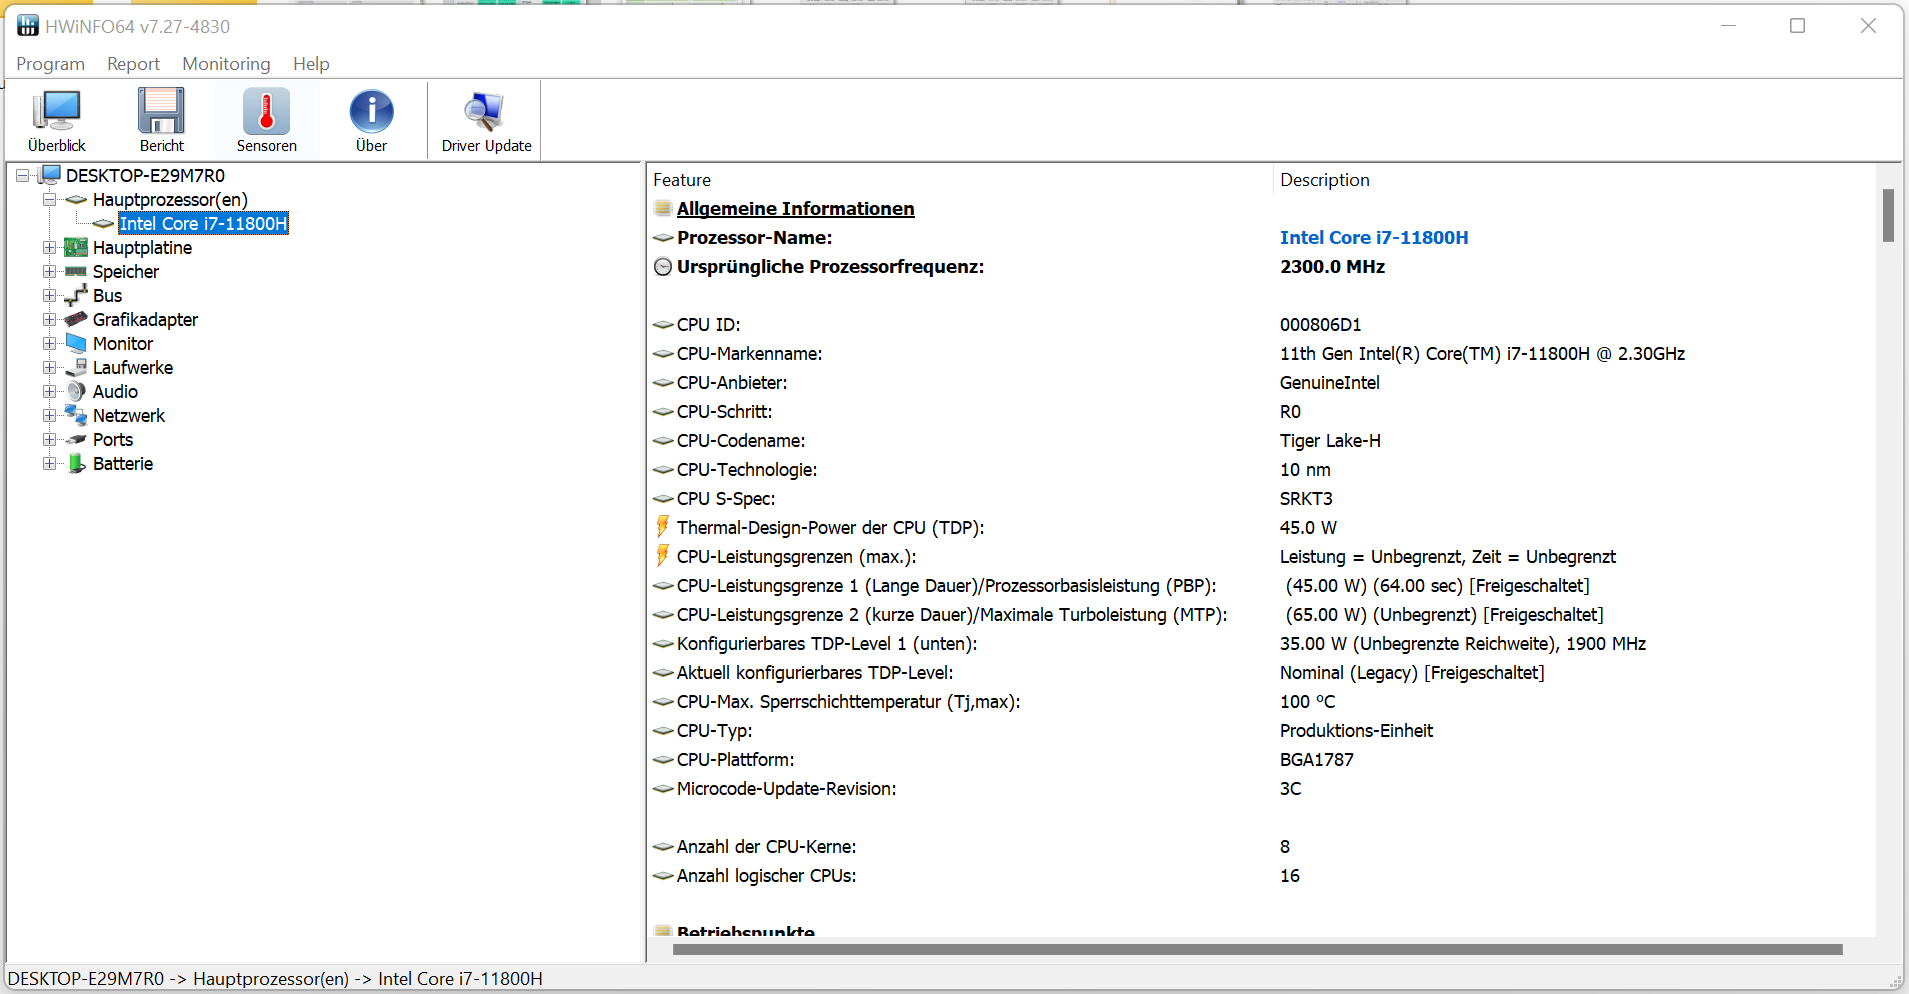
Processore
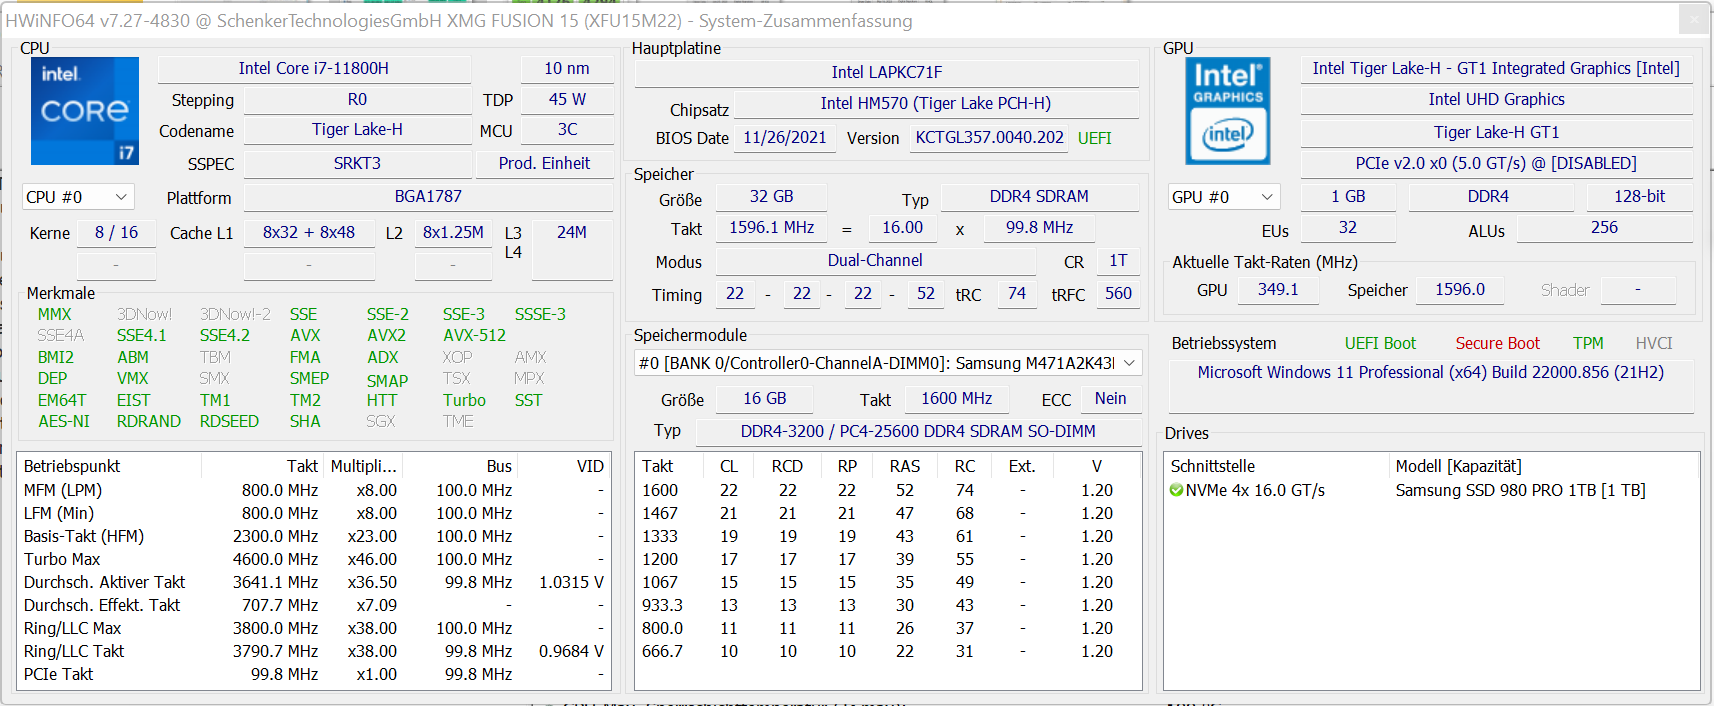
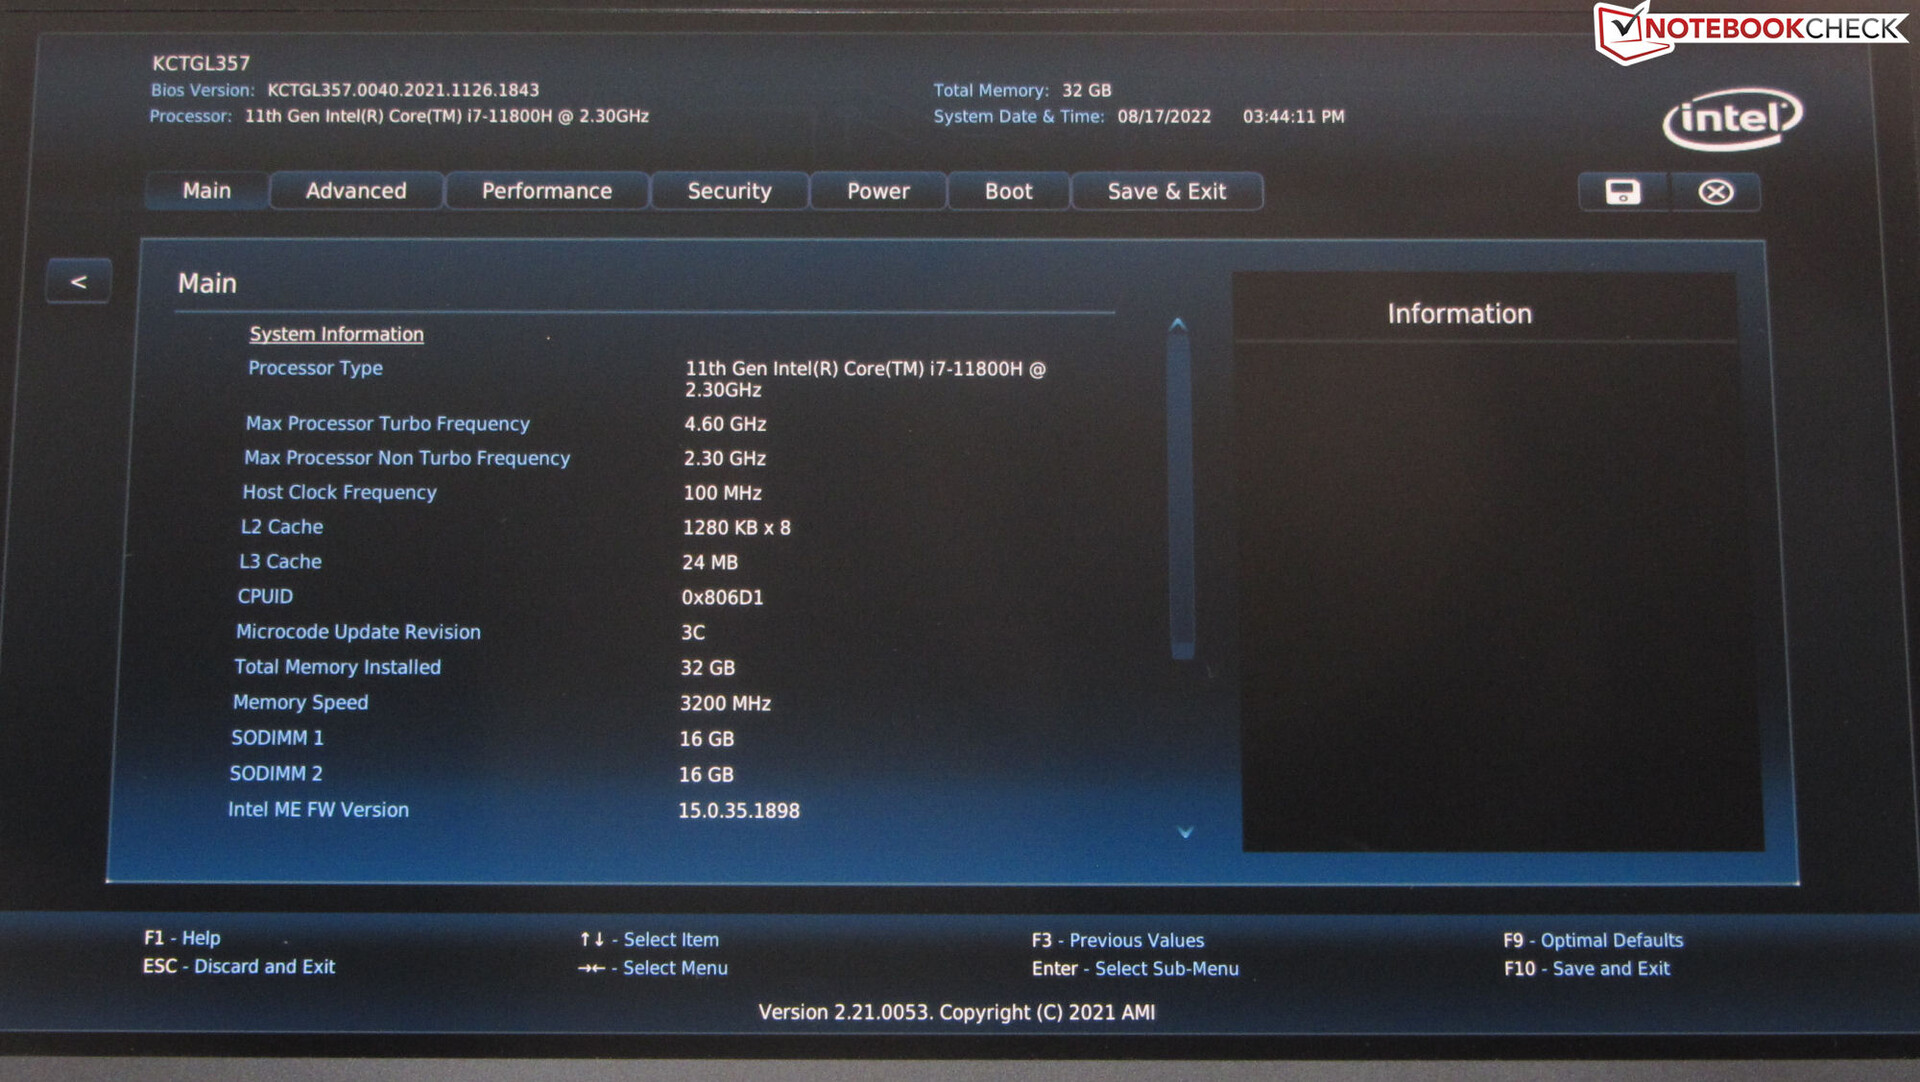
Il processore quad-core
Core-i7-11800H (Tiger Lake) funziona con una frequenza di clock di base di 2,3 GHz. L'aumento a 4,2 GHz (otto core) o a 4,6 GHz (un core) è possibile tramite Turbo. È supportato l'Hyper-Threading (due thread per core).
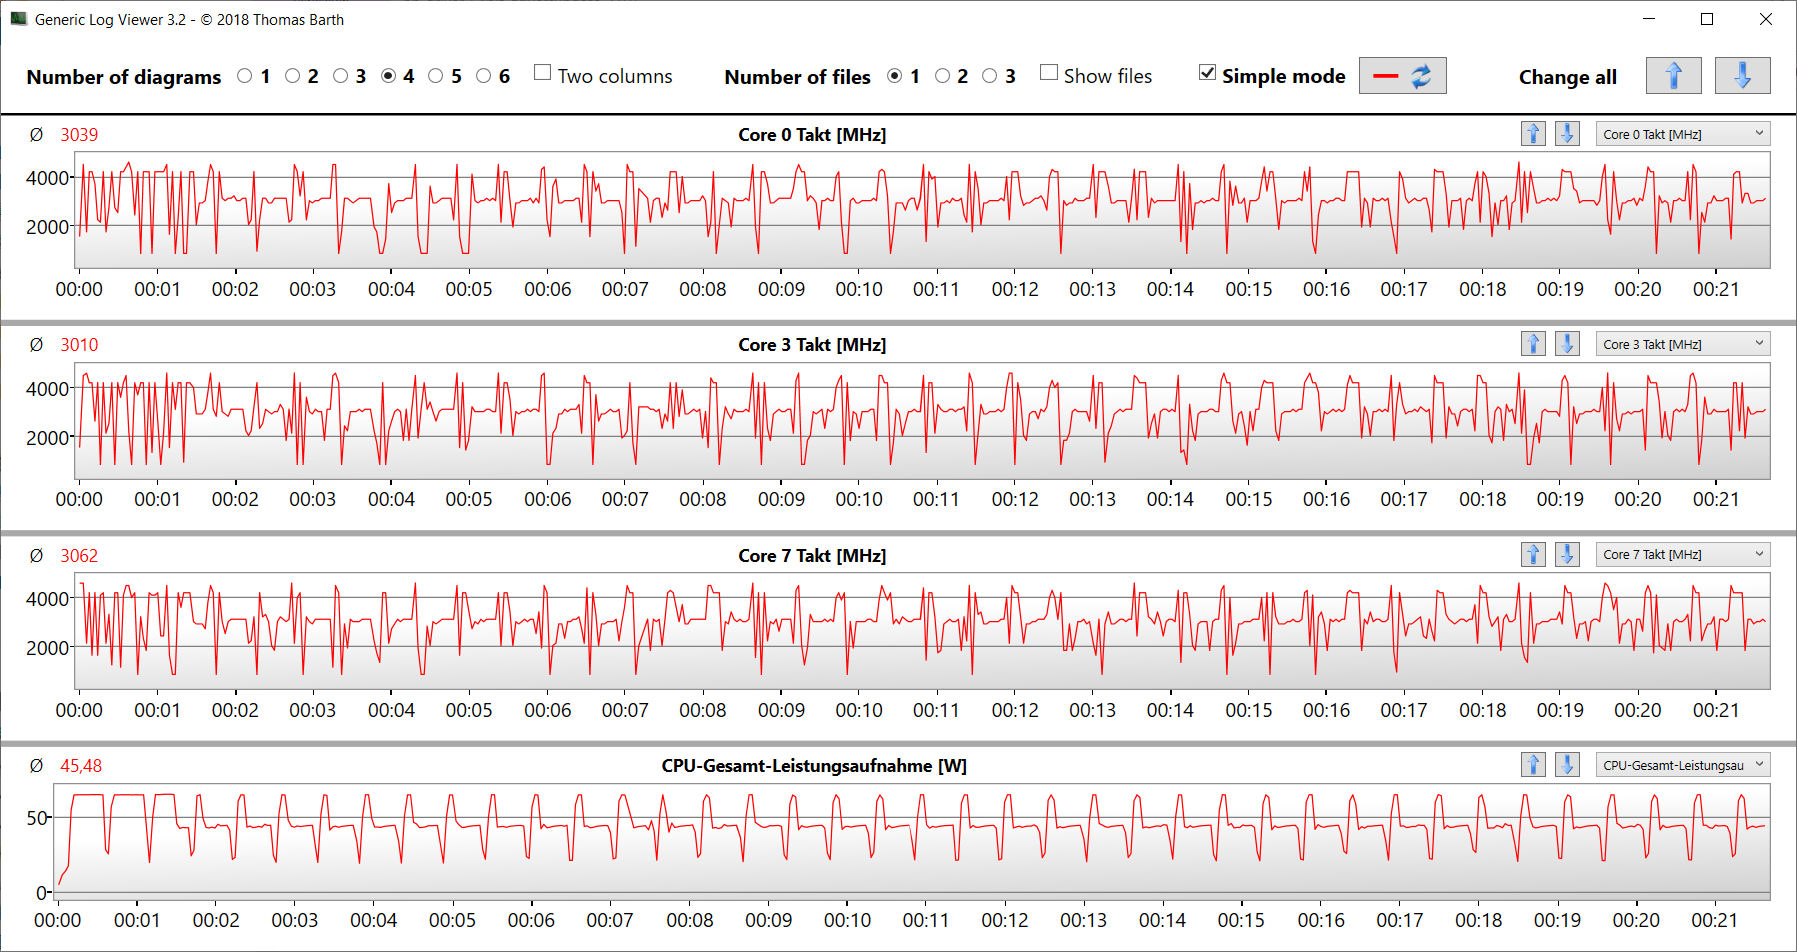
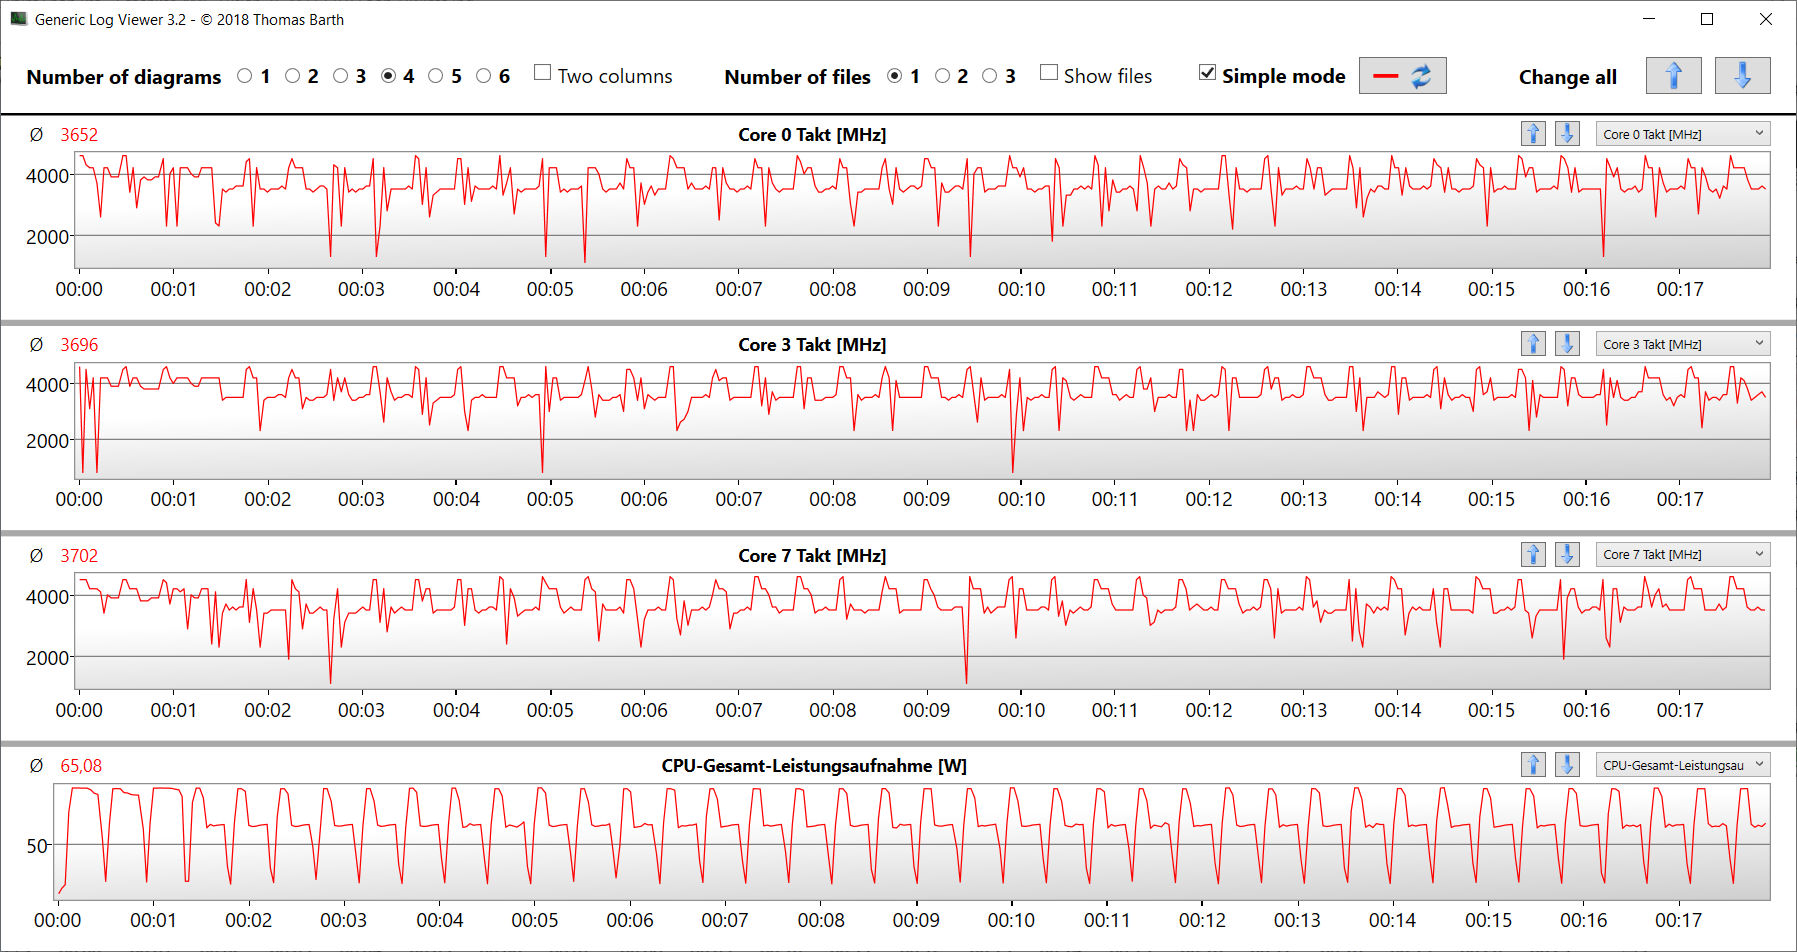
Il test multithread del benchmark Cinebench R15 viene elaborato a 1,3-4,2 GHz, mentre il test single-thread viene eseguito a 1,1-4,6 GHz. Le velocità di clock rimangono simili anche a batteria.

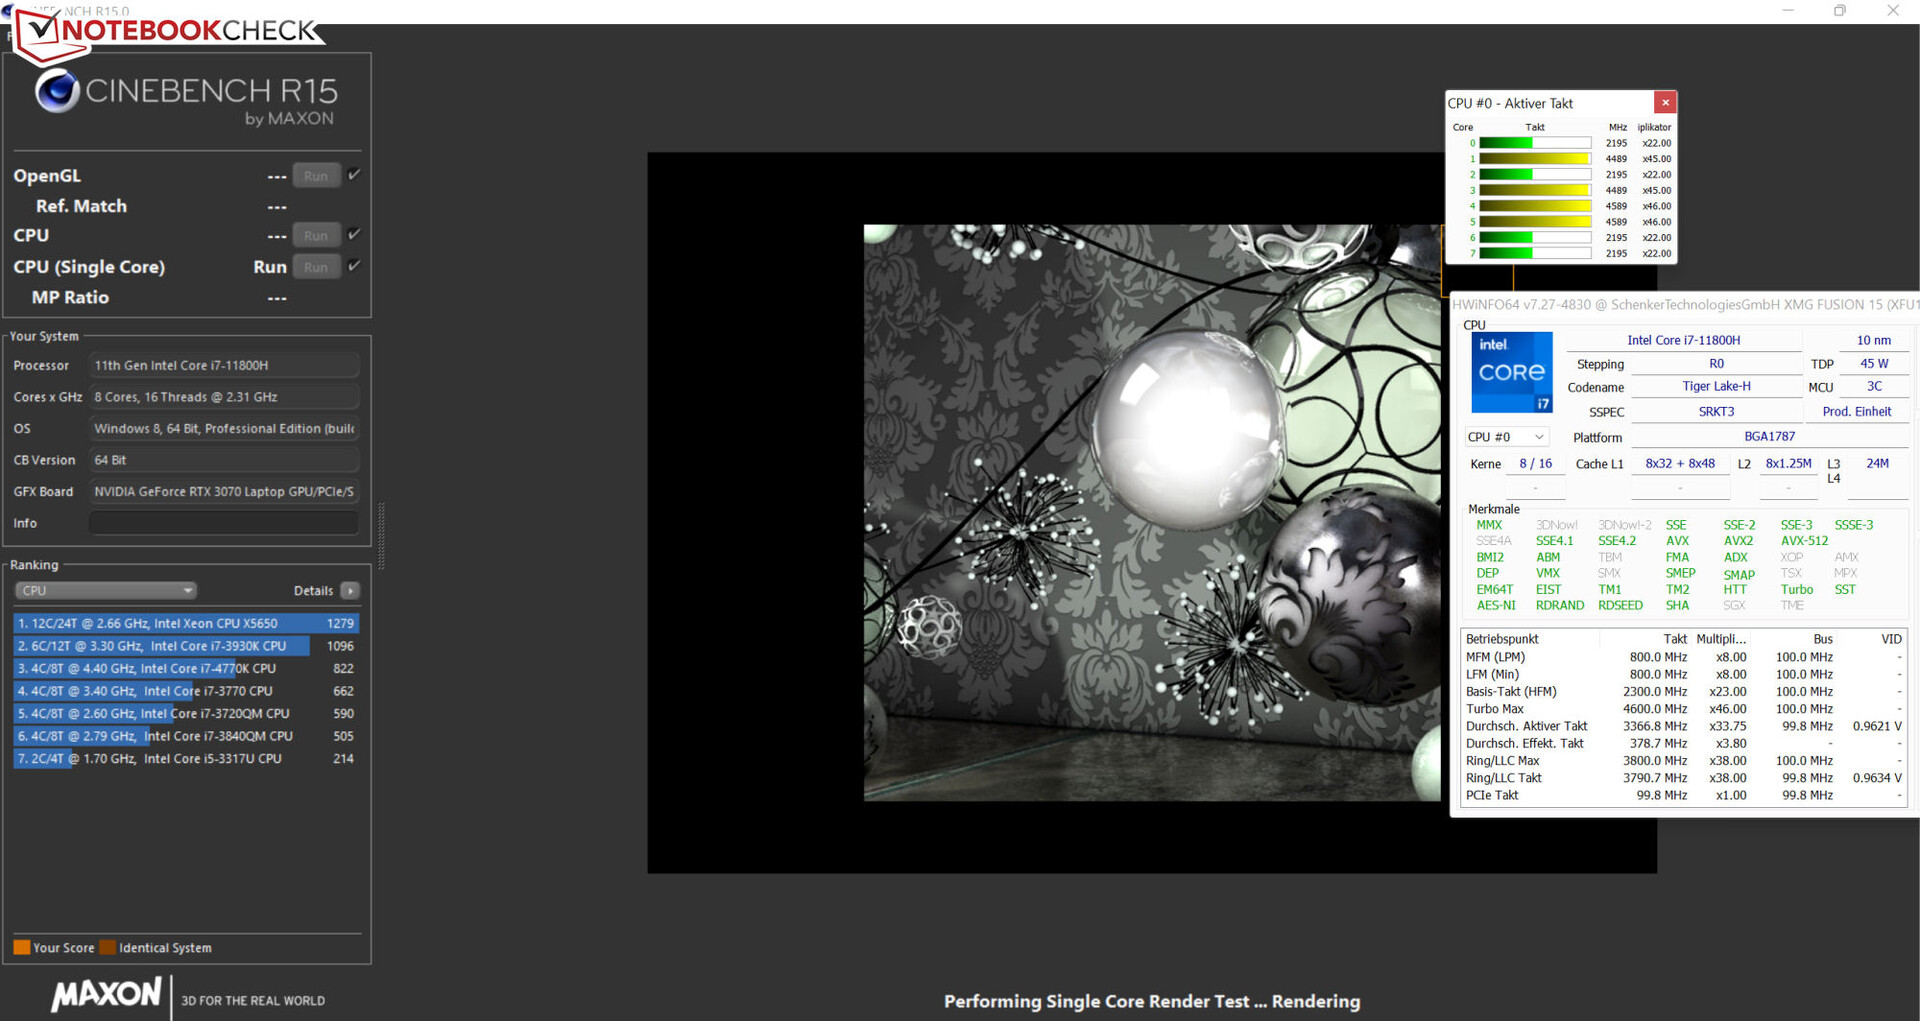
Verifichiamo se il Turbo della CPU viene utilizzato in modo costante quando è collegato, eseguendo il test multithread del benchmark Cinebench R15 per almeno 30 minuti. Il Turbo viene utilizzato in misura media. Il profilo "Benchmark Mode" sfrutta il Turbo della CPU quasi completamente.
Cinebench R15 Multi endurance test
| CPU Performance rating - Percent | |
| Media della classe Gaming | |
| HP Omen 16-b1090ng | |
| Acer Nitro 5 AN515-58-72QR | |
| Asus TUF Dash F15 FX517ZR | |
| Schenker XMG Fusion 15 (Mid 22) | |
| Schenker XMG Fusion 15 (Mid 22) | |
| MSI Delta 15 A5EFK | |
| Media Intel Core i7-11800H | |
| Schenker XMG Fusion 15 (Mid 22) | |
| Schenker XMG Fusion 15 (Mid 22) | |
| Razer Blade 15 Base Edition 2021, i7-10750H RTX 3060 | |
| Cinebench R23 | |
| Multi Core | |
| Media della classe Gaming (10488 - 42661, n=107, ultimi 2 anni) | |
| Acer Nitro 5 AN515-58-72QR | |
| HP Omen 16-b1090ng | |
| Asus TUF Dash F15 FX517ZR | |
| Schenker XMG Fusion 15 (Mid 22) (Benchmark-Modus) | |
| Schenker XMG Fusion 15 (Mid 22) (Leistung) | |
| MSI Delta 15 A5EFK | |
| Media Intel Core i7-11800H (6508 - 14088, n=48) | |
| Schenker XMG Fusion 15 (Mid 22) | |
| Schenker XMG Fusion 15 (Mid 22) (Stromsparmodus) | |
| Razer Blade 15 Base Edition 2021, i7-10750H RTX 3060 | |
| Single Core | |
| Media della classe Gaming (1166 - 2415, n=107, ultimi 2 anni) | |
| Acer Nitro 5 AN515-58-72QR | |
| Asus TUF Dash F15 FX517ZR | |
| HP Omen 16-b1090ng | |
| Schenker XMG Fusion 15 (Mid 22) | |
| Schenker XMG Fusion 15 (Mid 22) (Benchmark-Modus) | |
| Schenker XMG Fusion 15 (Mid 22) (Leistung) | |
| Media Intel Core i7-11800H (1386 - 1522, n=45) | |
| Schenker XMG Fusion 15 (Mid 22) (Stromsparmodus) | |
| MSI Delta 15 A5EFK | |
| Razer Blade 15 Base Edition 2021, i7-10750H RTX 3060 | |
| Cinebench R20 | |
| CPU (Multi Core) | |
| Media della classe Gaming (4029 - 16433, n=106, ultimi 2 anni) | |
| Acer Nitro 5 AN515-58-72QR | |
| HP Omen 16-b1090ng | |
| Asus TUF Dash F15 FX517ZR | |
| Schenker XMG Fusion 15 (Mid 22) (Benchmark-Modus) | |
| Schenker XMG Fusion 15 (Mid 22) (Leistung) | |
| MSI Delta 15 A5EFK | |
| Media Intel Core i7-11800H (2498 - 5408, n=50) | |
| Schenker XMG Fusion 15 (Mid 22) | |
| Schenker XMG Fusion 15 (Mid 22) (Stromsparmodus) | |
| Razer Blade 15 Base Edition 2021, i7-10750H RTX 3060 | |
| CPU (Single Core) | |
| Media della classe Gaming (442 - 913, n=106, ultimi 2 anni) | |
| Asus TUF Dash F15 FX517ZR | |
| HP Omen 16-b1090ng | |
| Acer Nitro 5 AN515-58-72QR | |
| Schenker XMG Fusion 15 (Mid 22) (Benchmark-Modus) | |
| Schenker XMG Fusion 15 (Mid 22) (Leistung) | |
| Schenker XMG Fusion 15 (Mid 22) | |
| MSI Delta 15 A5EFK | |
| Media Intel Core i7-11800H (520 - 586, n=47) | |
| Schenker XMG Fusion 15 (Mid 22) (Stromsparmodus) | |
| Razer Blade 15 Base Edition 2021, i7-10750H RTX 3060 | |
| Cinebench R15 | |
| CPU Multi 64Bit | |
| Media della classe Gaming (1578 - 6330, n=105, ultimi 2 anni) | |
| HP Omen 16-b1090ng | |
| Acer Nitro 5 AN515-58-72QR | |
| Asus TUF Dash F15 FX517ZR | |
| MSI Delta 15 A5EFK | |
| Schenker XMG Fusion 15 (Mid 22) (Benchmark-Modus) | |
| Schenker XMG Fusion 15 (Mid 22) (Leistung) | |
| Media Intel Core i7-11800H (1342 - 2173, n=50) | |
| Schenker XMG Fusion 15 (Mid 22) | |
| Schenker XMG Fusion 15 (Mid 22) (Stromsparmodus) | |
| Razer Blade 15 Base Edition 2021, i7-10750H RTX 3060 | |
| CPU Single 64Bit | |
| Media della classe Gaming (188.8 - 350, n=106, ultimi 2 anni) | |
| Acer Nitro 5 AN515-58-72QR | |
| HP Omen 16-b1090ng | |
| Asus TUF Dash F15 FX517ZR | |
| MSI Delta 15 A5EFK | |
| Schenker XMG Fusion 15 (Mid 22) | |
| Schenker XMG Fusion 15 (Mid 22) (Leistung) | |
| Schenker XMG Fusion 15 (Mid 22) (Benchmark-Modus) | |
| Media Intel Core i7-11800H (201 - 231, n=46) | |
| Schenker XMG Fusion 15 (Mid 22) (Stromsparmodus) | |
| Razer Blade 15 Base Edition 2021, i7-10750H RTX 3060 | |
| Blender - v2.79 BMW27 CPU | |
| Razer Blade 15 Base Edition 2021, i7-10750H RTX 3060 | |
| Schenker XMG Fusion 15 (Mid 22) (Stromsparmodus) | |
| Schenker XMG Fusion 15 (Mid 22) | |
| Media Intel Core i7-11800H (217 - 454, n=46) | |
| Schenker XMG Fusion 15 (Mid 22) (Leistung) | |
| MSI Delta 15 A5EFK | |
| Asus TUF Dash F15 FX517ZR | |
| Schenker XMG Fusion 15 (Mid 22) (Benchmark-Modus) | |
| Acer Nitro 5 AN515-58-72QR | |
| HP Omen 16-b1090ng | |
| Media della classe Gaming (79 - 330, n=104, ultimi 2 anni) | |
| 7-Zip 18.03 | |
| 7z b 4 | |
| Media della classe Gaming (33491 - 148086, n=105, ultimi 2 anni) | |
| HP Omen 16-b1090ng | |
| MSI Delta 15 A5EFK | |
| Asus TUF Dash F15 FX517ZR | |
| Acer Nitro 5 AN515-58-72QR | |
| Schenker XMG Fusion 15 (Mid 22) (Benchmark-Modus) | |
| Schenker XMG Fusion 15 (Mid 22) (Leistung) | |
| Media Intel Core i7-11800H (33718 - 56758, n=46) | |
| Schenker XMG Fusion 15 (Mid 22) | |
| Schenker XMG Fusion 15 (Mid 22) (Stromsparmodus) | |
| Razer Blade 15 Base Edition 2021, i7-10750H RTX 3060 | |
| 7z b 4 -mmt1 | |
| Media della classe Gaming (4199 - 7436, n=105, ultimi 2 anni) | |
| HP Omen 16-b1090ng | |
| Acer Nitro 5 AN515-58-72QR | |
| Asus TUF Dash F15 FX517ZR | |
| MSI Delta 15 A5EFK | |
| Schenker XMG Fusion 15 (Mid 22) (Benchmark-Modus) | |
| Schenker XMG Fusion 15 (Mid 22) | |
| Media Intel Core i7-11800H (5138 - 5732, n=46) | |
| Schenker XMG Fusion 15 (Mid 22) (Leistung) | |
| Schenker XMG Fusion 15 (Mid 22) (Stromsparmodus) | |
| Razer Blade 15 Base Edition 2021, i7-10750H RTX 3060 | |
| Geekbench 5.5 | |
| Multi-Core | |
| Media della classe Gaming (6460 - 28263, n=105, ultimi 2 anni) | |
| HP Omen 16-b1090ng | |
| Asus TUF Dash F15 FX517ZR | |
| Acer Nitro 5 AN515-58-72QR | |
| Schenker XMG Fusion 15 (Mid 22) (Benchmark-Modus) | |
| Schenker XMG Fusion 15 (Mid 22) (Leistung) | |
| MSI Delta 15 A5EFK | |
| Media Intel Core i7-11800H (4655 - 9851, n=40) | |
| Schenker XMG Fusion 15 (Mid 22) | |
| Schenker XMG Fusion 15 (Mid 22) (Stromsparmodus) | |
| Razer Blade 15 Base Edition 2021, i7-10750H RTX 3060 | |
| Single-Core | |
| Media della classe Gaming (986 - 2474, n=105, ultimi 2 anni) | |
| HP Omen 16-b1090ng | |
| Asus TUF Dash F15 FX517ZR | |
| Acer Nitro 5 AN515-58-72QR | |
| Schenker XMG Fusion 15 (Mid 22) (Benchmark-Modus) | |
| Schenker XMG Fusion 15 (Mid 22) (Leistung) | |
| Schenker XMG Fusion 15 (Mid 22) | |
| MSI Delta 15 A5EFK | |
| Media Intel Core i7-11800H (1429 - 1625, n=40) | |
| Schenker XMG Fusion 15 (Mid 22) (Stromsparmodus) | |
| Razer Blade 15 Base Edition 2021, i7-10750H RTX 3060 | |
| HWBOT x265 Benchmark v2.2 - 4k Preset | |
| Media della classe Gaming (11.5 - 44.4, n=105, ultimi 2 anni) | |
| HP Omen 16-b1090ng | |
| Acer Nitro 5 AN515-58-72QR | |
| Asus TUF Dash F15 FX517ZR | |
| Schenker XMG Fusion 15 (Mid 22) (Benchmark-Modus) | |
| Schenker XMG Fusion 15 (Mid 22) (Leistung) | |
| MSI Delta 15 A5EFK | |
| Media Intel Core i7-11800H (7.38 - 17.4, n=46) | |
| Schenker XMG Fusion 15 (Mid 22) | |
| Schenker XMG Fusion 15 (Mid 22) (Stromsparmodus) | |
| Razer Blade 15 Base Edition 2021, i7-10750H RTX 3060 | |
| LibreOffice - 20 Documents To PDF | |
| MSI Delta 15 A5EFK | |
| Media della classe Gaming (33.2 - 88.8, n=105, ultimi 2 anni) | |
| Razer Blade 15 Base Edition 2021, i7-10750H RTX 3060 | |
| Schenker XMG Fusion 15 (Mid 22) | |
| Media Intel Core i7-11800H (38.6 - 59.9, n=45) | |
| Schenker XMG Fusion 15 (Mid 22) (Stromsparmodus) | |
| Schenker XMG Fusion 15 (Mid 22) (Benchmark-Modus) | |
| Schenker XMG Fusion 15 (Mid 22) (Leistung) | |
| Acer Nitro 5 AN515-58-72QR | |
| HP Omen 16-b1090ng | |
| Asus TUF Dash F15 FX517ZR | |
| R Benchmark 2.5 - Overall mean | |
| Razer Blade 15 Base Edition 2021, i7-10750H RTX 3060 | |
| Schenker XMG Fusion 15 (Mid 22) (Stromsparmodus) | |
| Media Intel Core i7-11800H (0.548 - 0.615, n=46) | |
| Schenker XMG Fusion 15 (Mid 22) | |
| Schenker XMG Fusion 15 (Mid 22) (Leistung) | |
| Schenker XMG Fusion 15 (Mid 22) (Benchmark-Modus) | |
| MSI Delta 15 A5EFK | |
| Asus TUF Dash F15 FX517ZR | |
| Acer Nitro 5 AN515-58-72QR | |
| HP Omen 16-b1090ng | |
| Media della classe Gaming (0.3439 - 0.759, n=106, ultimi 2 anni) | |
* ... Meglio usare valori piccoli
AIDA64: FP32 Ray-Trace | FPU Julia | CPU SHA3 | CPU Queen | FPU SinJulia | FPU Mandel | CPU AES | CPU ZLib | FP64 Ray-Trace | CPU PhotoWorxx
| Performance rating | |
| Media della classe Gaming | |
| MSI Delta 15 A5EFK | |
| Schenker XMG Fusion 15 (Mid 22) | |
| Schenker XMG Fusion 15 (Mid 22) | |
| Schenker XMG Fusion 15 (Mid 22) | |
| Asus TUF Dash F15 FX517ZR | |
| Media Intel Core i7-11800H | |
| HP Omen 16-b1090ng | |
| Schenker XMG Fusion 15 (Mid 22) | |
| Acer Nitro 5 AN515-58-72QR | |
| AIDA64 / FP32 Ray-Trace | |
| Media della classe Gaming (10227 - 85542, n=105, ultimi 2 anni) | |
| Schenker XMG Fusion 15 (Mid 22) (v6.70.6000, Benchmark-Modus) | |
| Schenker XMG Fusion 15 (Mid 22) (v6.70.6000, Leistung) | |
| MSI Delta 15 A5EFK (v6.33.5700) | |
| Asus TUF Dash F15 FX517ZR (v6.70.6000) | |
| Media Intel Core i7-11800H (8772 - 15961, n=20) | |
| Schenker XMG Fusion 15 (Mid 22) (v6.70.6000) | |
| Schenker XMG Fusion 15 (Mid 22) (v6.70.6000, Stromsparmodus) | |
| Acer Nitro 5 AN515-58-72QR (v6.50.5800) | |
| HP Omen 16-b1090ng (v6.50.5800) | |
| AIDA64 / FPU Julia | |
| Media della classe Gaming (51376 - 238426, n=105, ultimi 2 anni) | |
| MSI Delta 15 A5EFK (v6.33.5700) | |
| Asus TUF Dash F15 FX517ZR (v6.70.6000) | |
| Schenker XMG Fusion 15 (Mid 22) (v6.70.6000, Benchmark-Modus) | |
| Schenker XMG Fusion 15 (Mid 22) (v6.70.6000) | |
| Schenker XMG Fusion 15 (Mid 22) (v6.70.6000, Leistung) | |
| Media Intel Core i7-11800H (39404 - 65636, n=20) | |
| Schenker XMG Fusion 15 (Mid 22) (v6.70.6000, Stromsparmodus) | |
| Acer Nitro 5 AN515-58-72QR (v6.50.5800) | |
| HP Omen 16-b1090ng (v6.50.5800) | |
| AIDA64 / CPU SHA3 | |
| Media della classe Gaming (2180 - 10115, n=105, ultimi 2 anni) | |
| Schenker XMG Fusion 15 (Mid 22) (v6.70.6000, Benchmark-Modus) | |
| Schenker XMG Fusion 15 (Mid 22) (v6.70.6000, Leistung) | |
| Schenker XMG Fusion 15 (Mid 22) (v6.70.6000) | |
| Media Intel Core i7-11800H (2599 - 4439, n=20) | |
| MSI Delta 15 A5EFK (v6.33.5700) | |
| Acer Nitro 5 AN515-58-72QR (v6.50.5800) | |
| Asus TUF Dash F15 FX517ZR (v6.70.6000) | |
| Schenker XMG Fusion 15 (Mid 22) (v6.70.6000, Stromsparmodus) | |
| HP Omen 16-b1090ng (v6.50.5800) | |
| AIDA64 / CPU Queen | |
| Media della classe Gaming (49785 - 173351, n=90, ultimi 2 anni) | |
| MSI Delta 15 A5EFK (v6.33.5700) | |
| HP Omen 16-b1090ng (v6.50.5800) | |
| Acer Nitro 5 AN515-58-72QR (v6.50.5800) | |
| Schenker XMG Fusion 15 (Mid 22) (v6.70.6000, Leistung) | |
| Schenker XMG Fusion 15 (Mid 22) (v6.70.6000, Benchmark-Modus) | |
| Media Intel Core i7-11800H (85233 - 91941, n=20) | |
| Asus TUF Dash F15 FX517ZR (v6.70.6000) | |
| Schenker XMG Fusion 15 (Mid 22) (v6.70.6000, Stromsparmodus) | |
| Schenker XMG Fusion 15 (Mid 22) | |
| AIDA64 / FPU SinJulia | |
| Media della classe Gaming (4424 - 33636, n=105, ultimi 2 anni) | |
| MSI Delta 15 A5EFK (v6.33.5700) | |
| Acer Nitro 5 AN515-58-72QR (v6.50.5800) | |
| Schenker XMG Fusion 15 (Mid 22) (v6.70.6000, Benchmark-Modus) | |
| Schenker XMG Fusion 15 (Mid 22) (v6.70.6000, Leistung) | |
| HP Omen 16-b1090ng (v6.50.5800) | |
| Media Intel Core i7-11800H (6420 - 9792, n=20) | |
| Schenker XMG Fusion 15 (Mid 22) (v6.70.6000) | |
| Asus TUF Dash F15 FX517ZR (v6.70.6000) | |
| Schenker XMG Fusion 15 (Mid 22) (v6.70.6000, Stromsparmodus) | |
| AIDA64 / FPU Mandel | |
| Media della classe Gaming (25115 - 128721, n=105, ultimi 2 anni) | |
| MSI Delta 15 A5EFK (v6.33.5700) | |
| Schenker XMG Fusion 15 (Mid 22) (v6.70.6000, Benchmark-Modus) | |
| Schenker XMG Fusion 15 (Mid 22) (v6.70.6000, Leistung) | |
| Schenker XMG Fusion 15 (Mid 22) (v6.70.6000) | |
| Media Intel Core i7-11800H (23365 - 39464, n=20) | |
| Asus TUF Dash F15 FX517ZR (v6.70.6000) | |
| Schenker XMG Fusion 15 (Mid 22) (v6.70.6000, Stromsparmodus) | |
| Acer Nitro 5 AN515-58-72QR | |
| HP Omen 16-b1090ng (v6.50.5800) | |
| AIDA64 / CPU AES | |
| Schenker XMG Fusion 15 (Mid 22) (v6.70.6000, Benchmark-Modus) | |
| Schenker XMG Fusion 15 (Mid 22) (v6.70.6000) | |
| Schenker XMG Fusion 15 (Mid 22) (v6.70.6000, Leistung) | |
| MSI Delta 15 A5EFK (v6.33.5700) | |
| Media Intel Core i7-11800H (74617 - 149388, n=20) | |
| Media della classe Gaming (39258 - 247074, n=105, ultimi 2 anni) | |
| Schenker XMG Fusion 15 (Mid 22) (v6.70.6000, Stromsparmodus) | |
| HP Omen 16-b1090ng (v6.50.5800) | |
| Asus TUF Dash F15 FX517ZR (v6.70.6000) | |
| Acer Nitro 5 AN515-58-72QR (v6.50.5800) | |
| AIDA64 / CPU ZLib | |
| Media della classe Gaming (574 - 2531, n=105, ultimi 2 anni) | |
| Acer Nitro 5 AN515-58-72QR (v6.50.5800) | |
| HP Omen 16-b1090ng (v6.50.5800) | |
| Asus TUF Dash F15 FX517ZR (v6.70.6000) | |
| MSI Delta 15 A5EFK (v6.33.5700) | |
| Schenker XMG Fusion 15 (Mid 22) (v6.70.6000, Benchmark-Modus) | |
| Schenker XMG Fusion 15 (Mid 22) (v6.70.6000, Leistung) | |
| Schenker XMG Fusion 15 (Mid 22) (v6.70.6000) | |
| Schenker XMG Fusion 15 (Mid 22) (v6.70.6000, Stromsparmodus) | |
| Media Intel Core i7-11800H (461 - 830, n=43) | |
| AIDA64 / FP64 Ray-Trace | |
| Media della classe Gaming (5509 - 45446, n=105, ultimi 2 anni) | |
| Schenker XMG Fusion 15 (Mid 22) (v6.70.6000, Benchmark-Modus) | |
| Schenker XMG Fusion 15 (Mid 22) (v6.70.6000, Leistung) | |
| MSI Delta 15 A5EFK (v6.33.5700) | |
| Asus TUF Dash F15 FX517ZR (v6.70.6000) | |
| Media Intel Core i7-11800H (4545 - 8717, n=21) | |
| Schenker XMG Fusion 15 (Mid 22) (v6.70.6000) | |
| Schenker XMG Fusion 15 (Mid 22) (v6.70.6000, Stromsparmodus) | |
| Acer Nitro 5 AN515-58-72QR (v6.50.5800) | |
| HP Omen 16-b1090ng (v6.50.5800) | |
| AIDA64 / CPU PhotoWorxx | |
| Media della classe Gaming (12271 - 89891, n=105, ultimi 2 anni) | |
| HP Omen 16-b1090ng (v6.50.5800) | |
| Asus TUF Dash F15 FX517ZR (v6.70.6000) | |
| Schenker XMG Fusion 15 (Mid 22) (v6.70.6000, Benchmark-Modus) | |
| Schenker XMG Fusion 15 (Mid 22) (v6.70.6000, Leistung) | |
| Schenker XMG Fusion 15 (Mid 22) (v6.70.6000) | |
| Schenker XMG Fusion 15 (Mid 22) (v6.70.6000, Stromsparmodus) | |
| Media Intel Core i7-11800H (11898 - 26757, n=21) | |
| Acer Nitro 5 AN515-58-72QR (v6.50.5800) | |
| MSI Delta 15 A5EFK (v6.33.5700) | |
Prestazioni del sistema
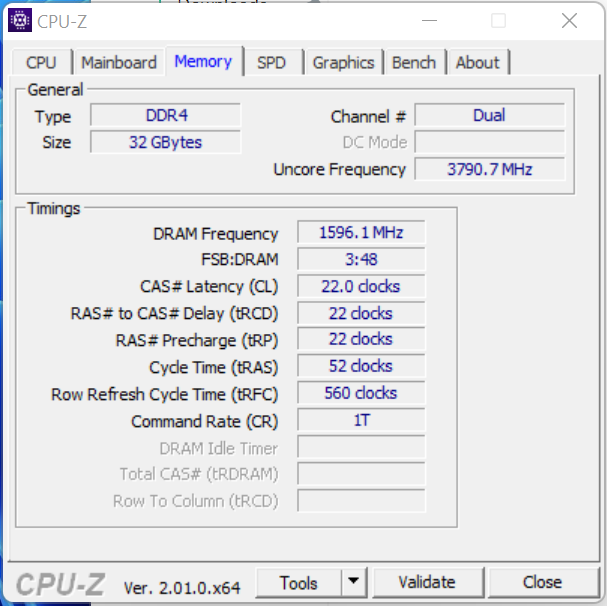
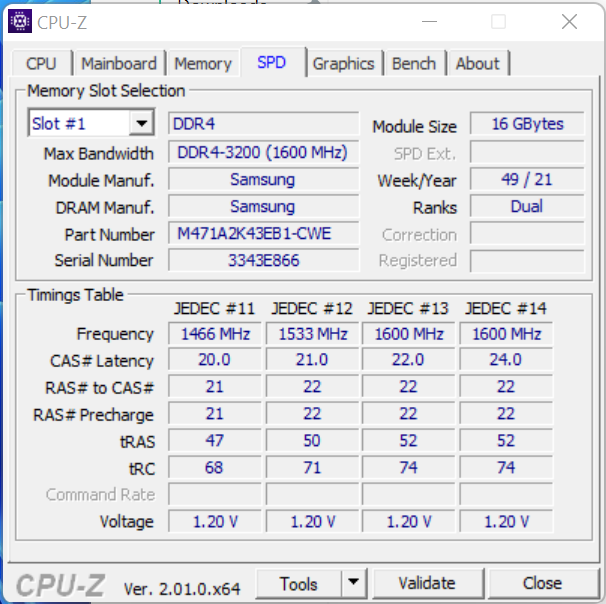
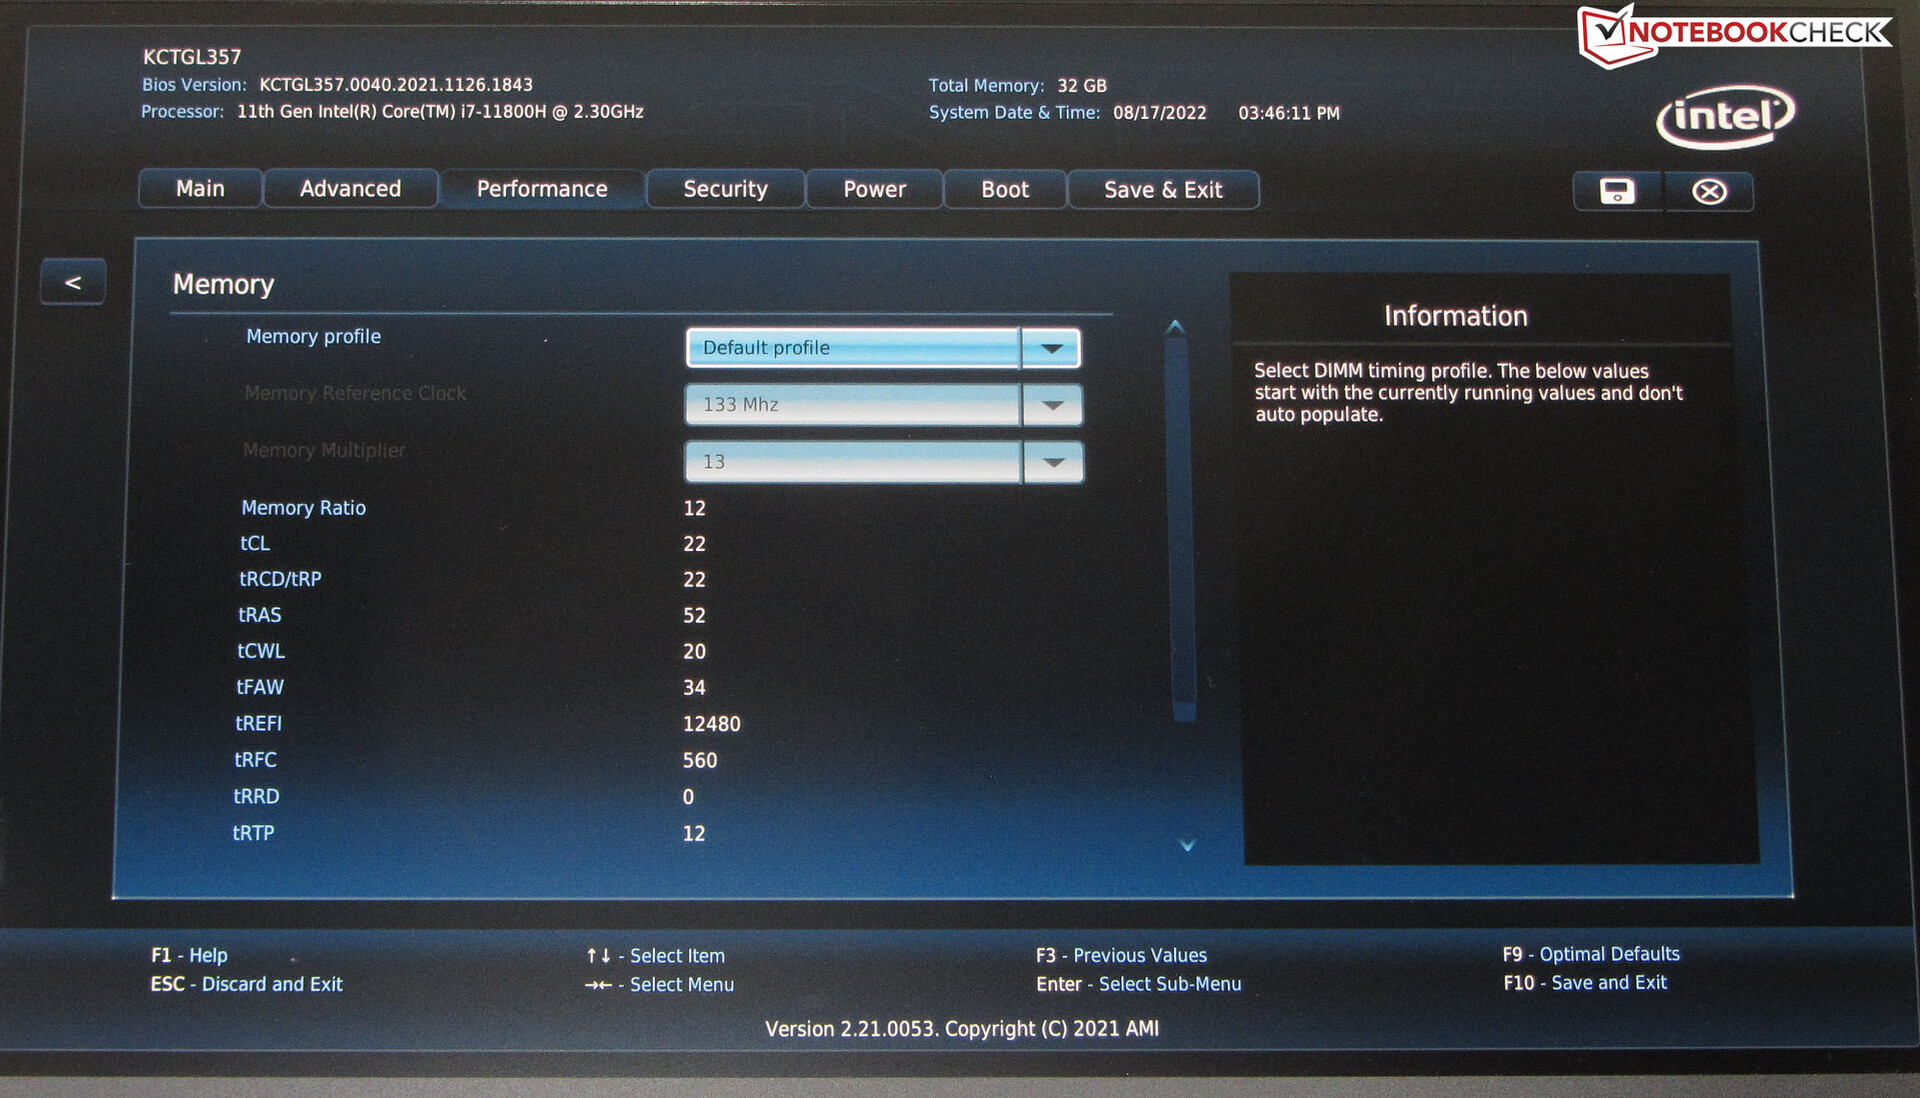
Il sistema, completo e fluido, offre una potenza di elaborazione sufficiente per applicazioni impegnative come il rendering e il gioco. I risultati di PCMark sono buoni. Le velocità di trasferimento della RAM sono a un livello normale per una memoria DDR4-3200
CrossMark: Overall | Productivity | Creativity | Responsiveness
| PCMark 10 / Score | |
| Media della classe Gaming (5828 - 12414, n=93, ultimi 2 anni) | |
| HP Omen 16-b1090ng | |
| MSI Delta 15 A5EFK | |
| Acer Nitro 5 AN515-58-72QR | |
| Media Intel Core i7-11800H, NVIDIA GeForce RTX 3070 Laptop GPU (6126 - 7311, n=11) | |
| Asus TUF Dash F15 FX517ZR | |
| Schenker XMG Fusion 15 (Mid 22) (Benchmark-Modus) | |
| Razer Blade 15 Base Edition 2021, i7-10750H RTX 3060 | |
| Schenker XMG Fusion 15 (Mid 22) | |
| PCMark 10 / Essentials | |
| Media della classe Gaming (8810 - 11935, n=97, ultimi 2 anni) | |
| MSI Delta 15 A5EFK | |
| HP Omen 16-b1090ng | |
| Razer Blade 15 Base Edition 2021, i7-10750H RTX 3060 | |
| Media Intel Core i7-11800H, NVIDIA GeForce RTX 3070 Laptop GPU (9248 - 10832, n=11) | |
| Asus TUF Dash F15 FX517ZR | |
| Acer Nitro 5 AN515-58-72QR | |
| Schenker XMG Fusion 15 (Mid 22) (Benchmark-Modus) | |
| Schenker XMG Fusion 15 (Mid 22) | |
| PCMark 10 / Productivity | |
| Media della classe Gaming (6845 - 25323, n=95, ultimi 2 anni) | |
| HP Omen 16-b1090ng | |
| Asus TUF Dash F15 FX517ZR | |
| MSI Delta 15 A5EFK | |
| Schenker XMG Fusion 15 (Mid 22) (Benchmark-Modus) | |
| Media Intel Core i7-11800H, NVIDIA GeForce RTX 3070 Laptop GPU (8571 - 9669, n=11) | |
| Acer Nitro 5 AN515-58-72QR | |
| Schenker XMG Fusion 15 (Mid 22) | |
| Razer Blade 15 Base Edition 2021, i7-10750H RTX 3060 | |
| PCMark 10 / Digital Content Creation | |
| Media della classe Gaming (7602 - 19954, n=95, ultimi 2 anni) | |
| HP Omen 16-b1090ng | |
| MSI Delta 15 A5EFK | |
| Acer Nitro 5 AN515-58-72QR | |
| Media Intel Core i7-11800H, NVIDIA GeForce RTX 3070 Laptop GPU (7627 - 10851, n=11) | |
| Asus TUF Dash F15 FX517ZR | |
| Razer Blade 15 Base Edition 2021, i7-10750H RTX 3060 | |
| Schenker XMG Fusion 15 (Mid 22) (Benchmark-Modus) | |
| Schenker XMG Fusion 15 (Mid 22) | |
| CrossMark / Overall | |
| Media della classe Gaming (1366 - 2409, n=94, ultimi 2 anni) | |
| Asus TUF Dash F15 FX517ZR | |
| Acer Nitro 5 AN515-58-72QR | |
| Schenker XMG Fusion 15 (Mid 22) | |
| Media Intel Core i7-11800H, NVIDIA GeForce RTX 3070 Laptop GPU (1569 - 1656, n=3) | |
| CrossMark / Productivity | |
| Media della classe Gaming (1386 - 2254, n=94, ultimi 2 anni) | |
| Acer Nitro 5 AN515-58-72QR | |
| Asus TUF Dash F15 FX517ZR | |
| Schenker XMG Fusion 15 (Mid 22) | |
| Media Intel Core i7-11800H, NVIDIA GeForce RTX 3070 Laptop GPU (1573 - 1640, n=3) | |
| CrossMark / Creativity | |
| Media della classe Gaming (1343 - 2786, n=94, ultimi 2 anni) | |
| Asus TUF Dash F15 FX517ZR | |
| Acer Nitro 5 AN515-58-72QR | |
| Schenker XMG Fusion 15 (Mid 22) | |
| Media Intel Core i7-11800H, NVIDIA GeForce RTX 3070 Laptop GPU (1613 - 1692, n=3) | |
| CrossMark / Responsiveness | |
| Media della classe Gaming (1226 - 2334, n=94, ultimi 2 anni) | |
| Acer Nitro 5 AN515-58-72QR | |
| Schenker XMG Fusion 15 (Mid 22) | |
| Asus TUF Dash F15 FX517ZR | |
| Media Intel Core i7-11800H, NVIDIA GeForce RTX 3070 Laptop GPU (1435 - 1600, n=3) | |
| PCMark 8 Home Score Accelerated v2 | 4521 punti | |
| PCMark 8 Creative Score Accelerated v2 | 6766 punti | |
| PCMark 8 Work Score Accelerated v2 | 5851 punti | |
| PCMark 10 Score | 6126 punti | |
Aiuto | ||
| AIDA64 / Memory Copy | |
| Media della classe Gaming (21750 - 129946, n=105, ultimi 2 anni) | |
| HP Omen 16-b1090ng | |
| Asus TUF Dash F15 FX517ZR | |
| Schenker XMG Fusion 15 (Mid 22) | |
| Acer Nitro 5 AN515-58-72QR | |
| Media Intel Core i7-11800H (24508 - 48144, n=21) | |
| MSI Delta 15 A5EFK | |
| AIDA64 / Memory Read | |
| Media della classe Gaming (22956 - 118858, n=105, ultimi 2 anni) | |
| HP Omen 16-b1090ng | |
| Asus TUF Dash F15 FX517ZR | |
| Schenker XMG Fusion 15 (Mid 22) | |
| MSI Delta 15 A5EFK | |
| Media Intel Core i7-11800H (25882 - 50365, n=20) | |
| Acer Nitro 5 AN515-58-72QR | |
| AIDA64 / Memory Write | |
| Media della classe Gaming (22297 - 135096, n=105, ultimi 2 anni) | |
| HP Omen 16-b1090ng | |
| Asus TUF Dash F15 FX517ZR | |
| Schenker XMG Fusion 15 (Mid 22) | |
| Acer Nitro 5 AN515-58-72QR | |
| MSI Delta 15 A5EFK | |
| Media Intel Core i7-11800H (22240 - 46214, n=20) | |
| AIDA64 / Memory Latency | |
| Media della classe Gaming (75.3 - 259, n=105, ultimi 2 anni) | |
| Asus TUF Dash F15 FX517ZR | |
| Schenker XMG Fusion 15 (Mid 22) | |
| HP Omen 16-b1090ng | |
| MSI Delta 15 A5EFK | |
| Media Intel Core i7-11800H (71.9 - 104.1, n=44) | |
| Acer Nitro 5 AN515-58-72QR | |
| Acer Nitro 5 AN515-58-72QR | |
* ... Meglio usare valori piccoli
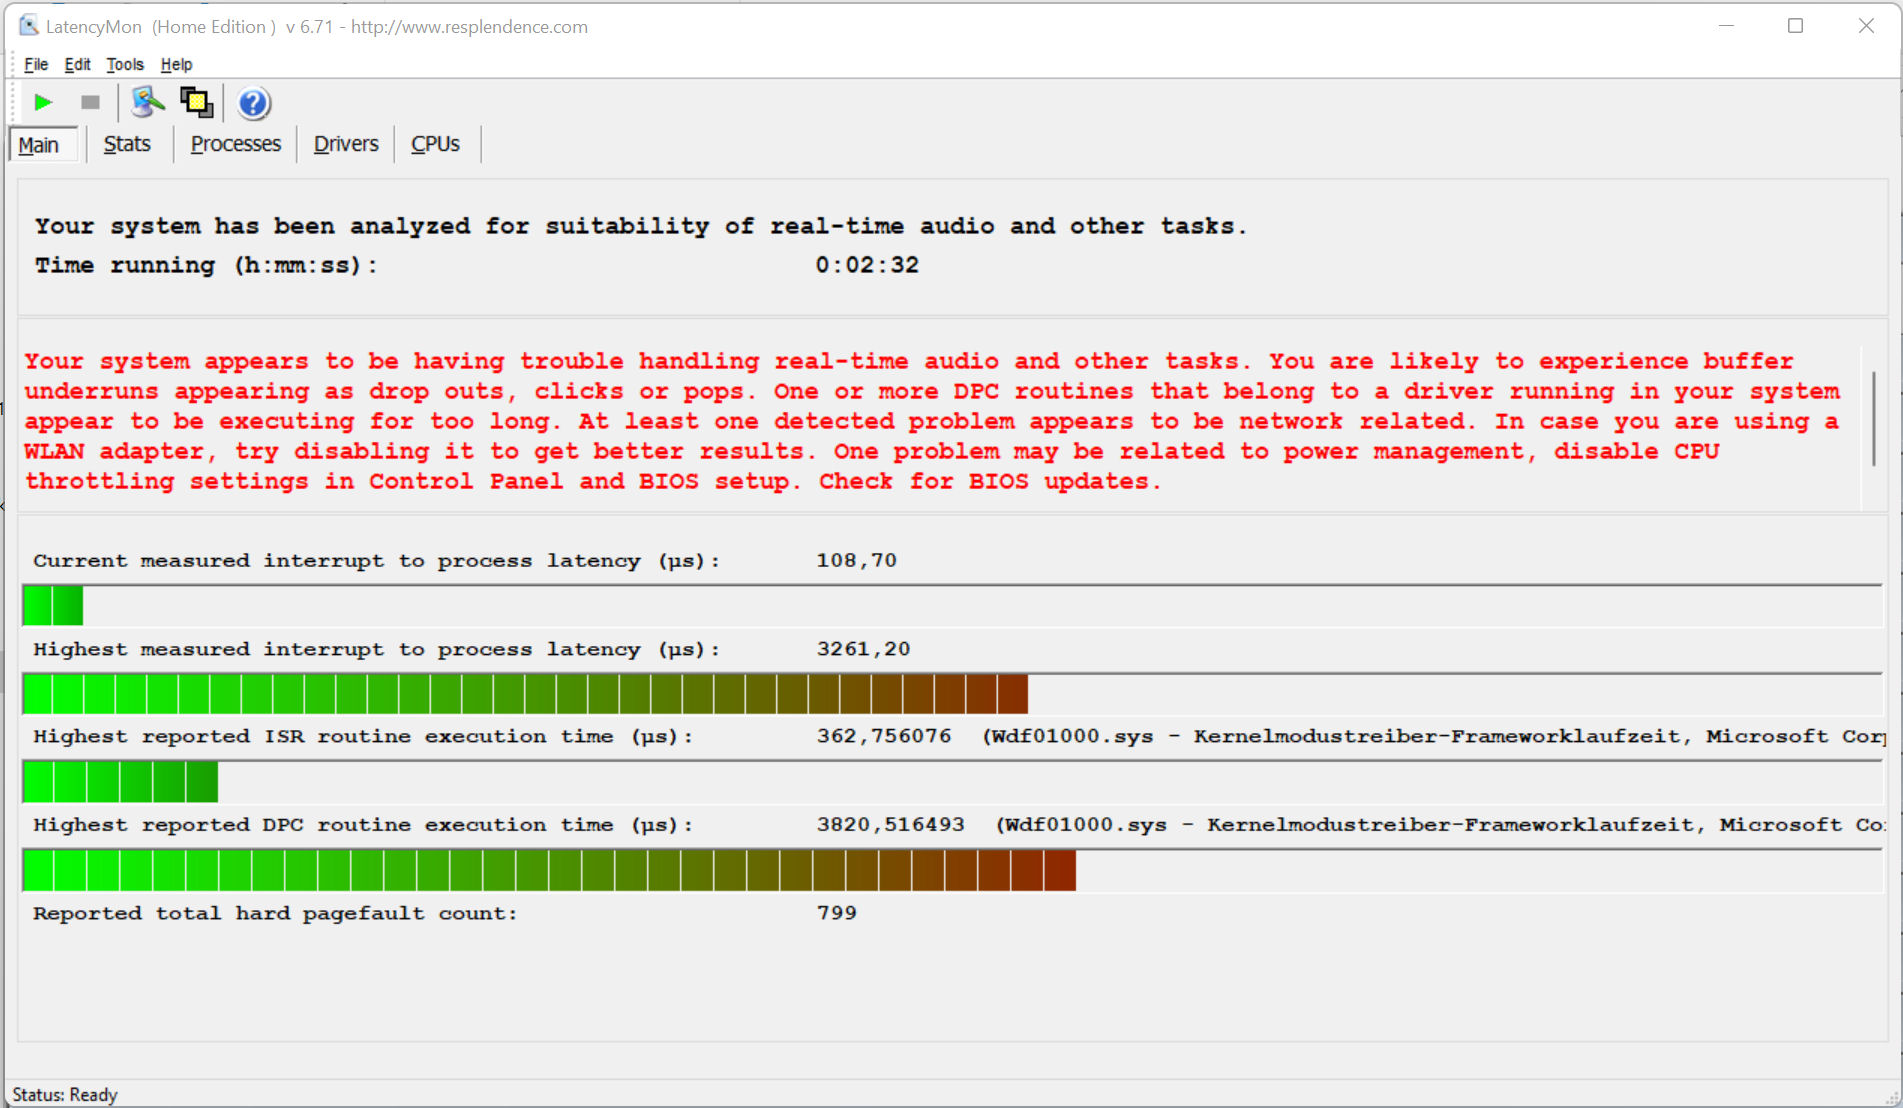
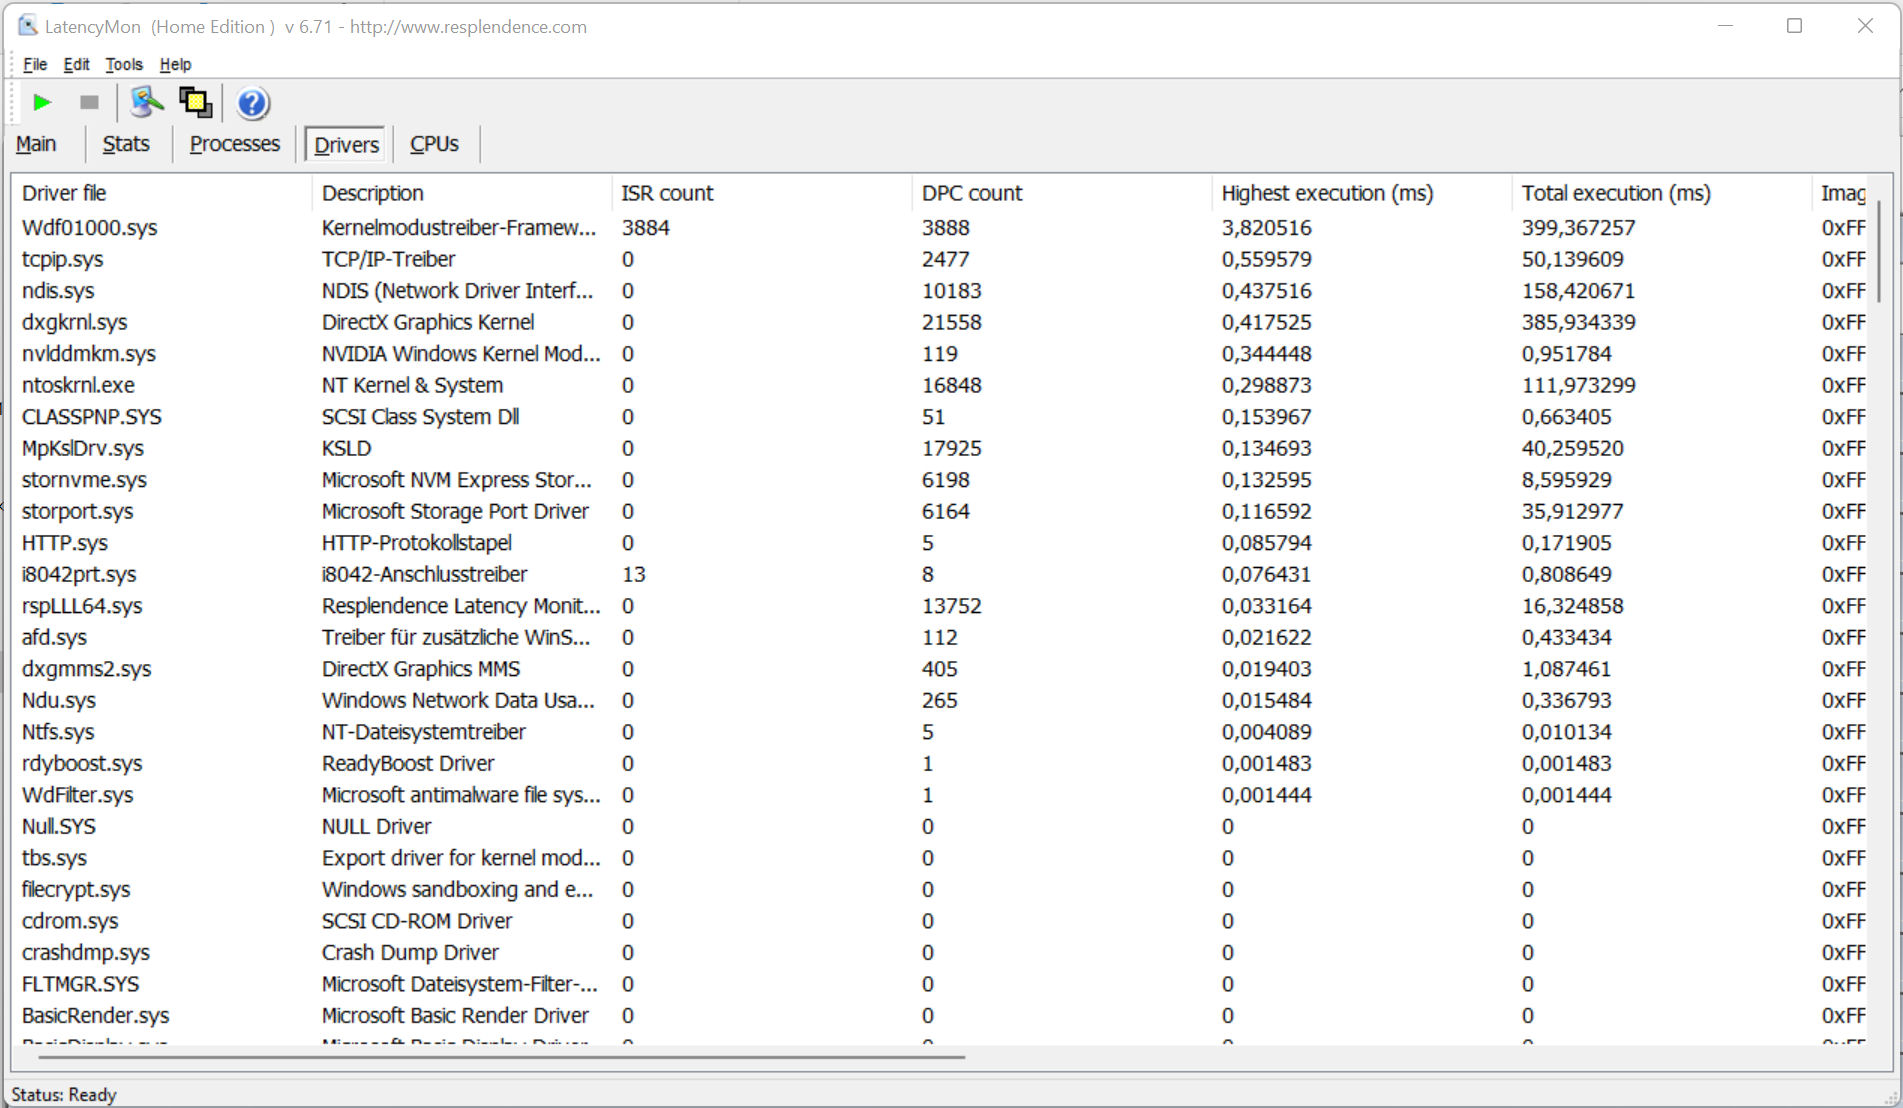
Latenze DPC
Il test standardizzato di monitoraggio della latenza (navigazione web, riproduzione video 4K, Prime95 ad alto carico) ha rivelato irregolarità con le latenze DPC. Il sistema non sembra essere adatto all'editing video e audio in tempo reale. I futuri aggiornamenti software potrebbero portare a miglioramenti o a un peggioramento delle prestazioni
| DPC Latencies / LatencyMon - interrupt to process latency (max), Web, Youtube, Prime95 | |
| Schenker XMG Fusion 15 (Mid 22) | |
| MSI Delta 15 A5EFK | |
| Acer Nitro 5 AN515-58-72QR | |
| HP Omen 16-b1090ng | |
| Razer Blade 15 Base Edition 2021, i7-10750H RTX 3060 | |
| Asus TUF Dash F15 FX517ZR | |
* ... Meglio usare valori piccoli
Immagazzinamento
Schenker ha dotato il portatile di un'unità SSD PCIe 4 (1 TB, M.2 2280) di Samsung che offre eccellenti velocità di trasferimento. Il portatile ha spazio per un totale di due SSD M.2-2280 (1x PCIe 4.0, 1x PCIe 3.0/SATA). È supportato il RAID 0/1

* ... Meglio usare valori piccoli
Continuous load read: DiskSpd Read Loop, Queue Depth 8
Scheda grafica
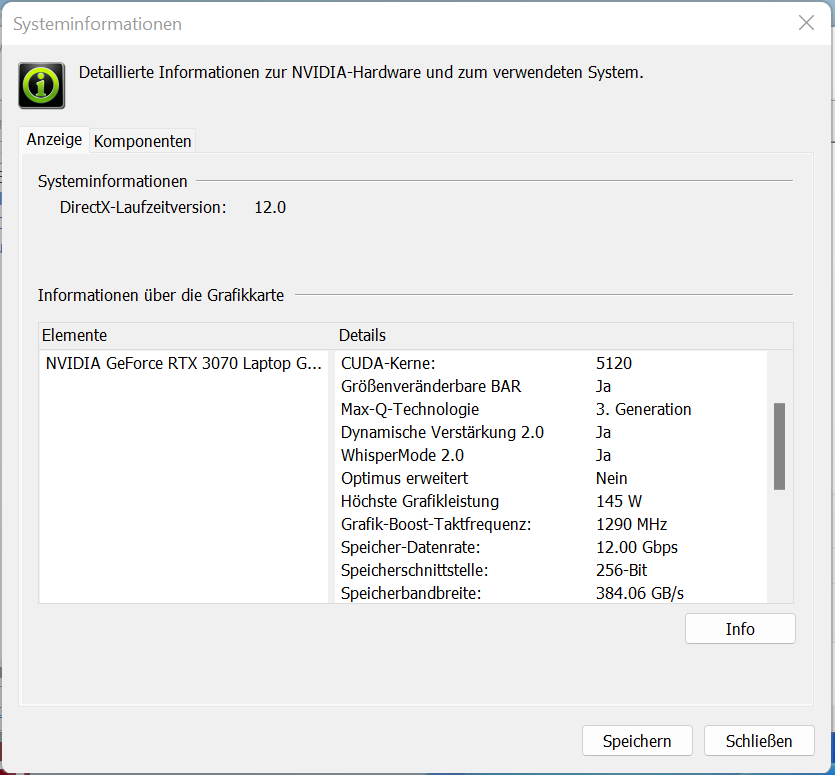
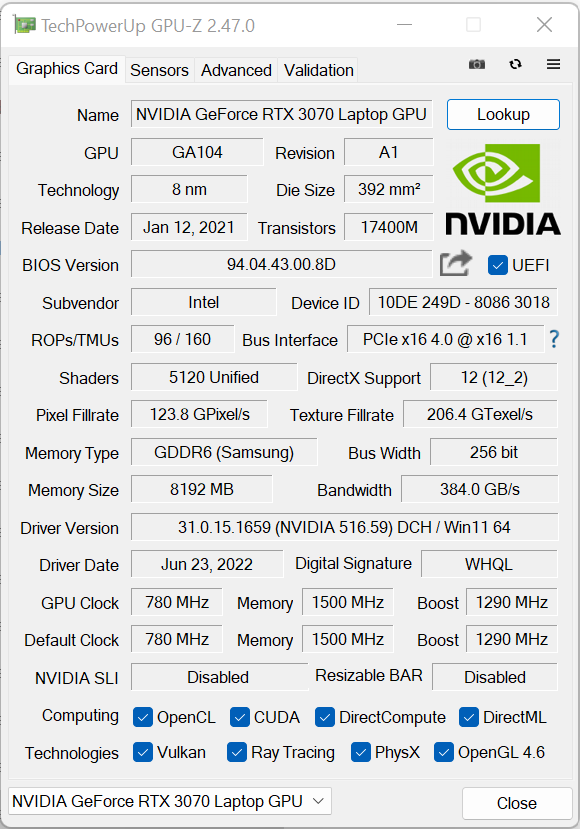
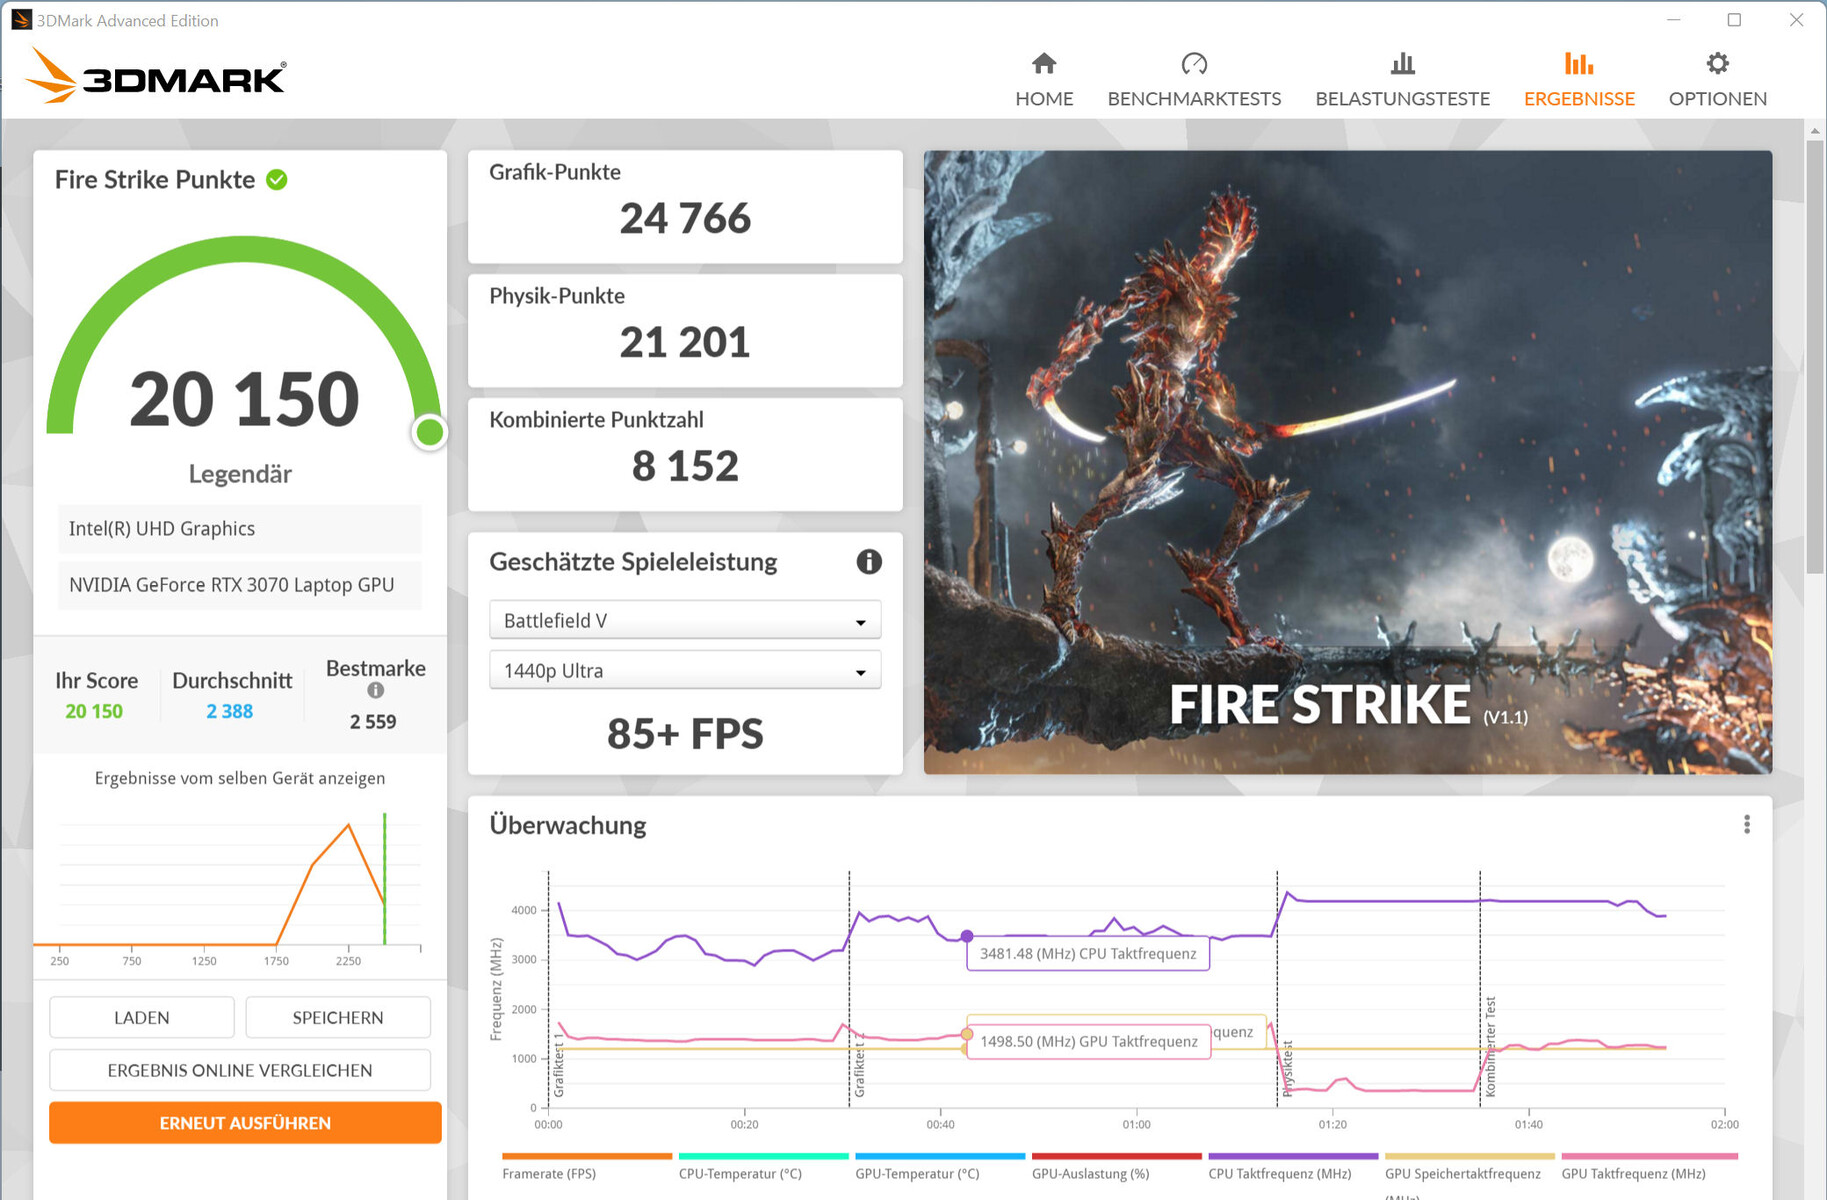
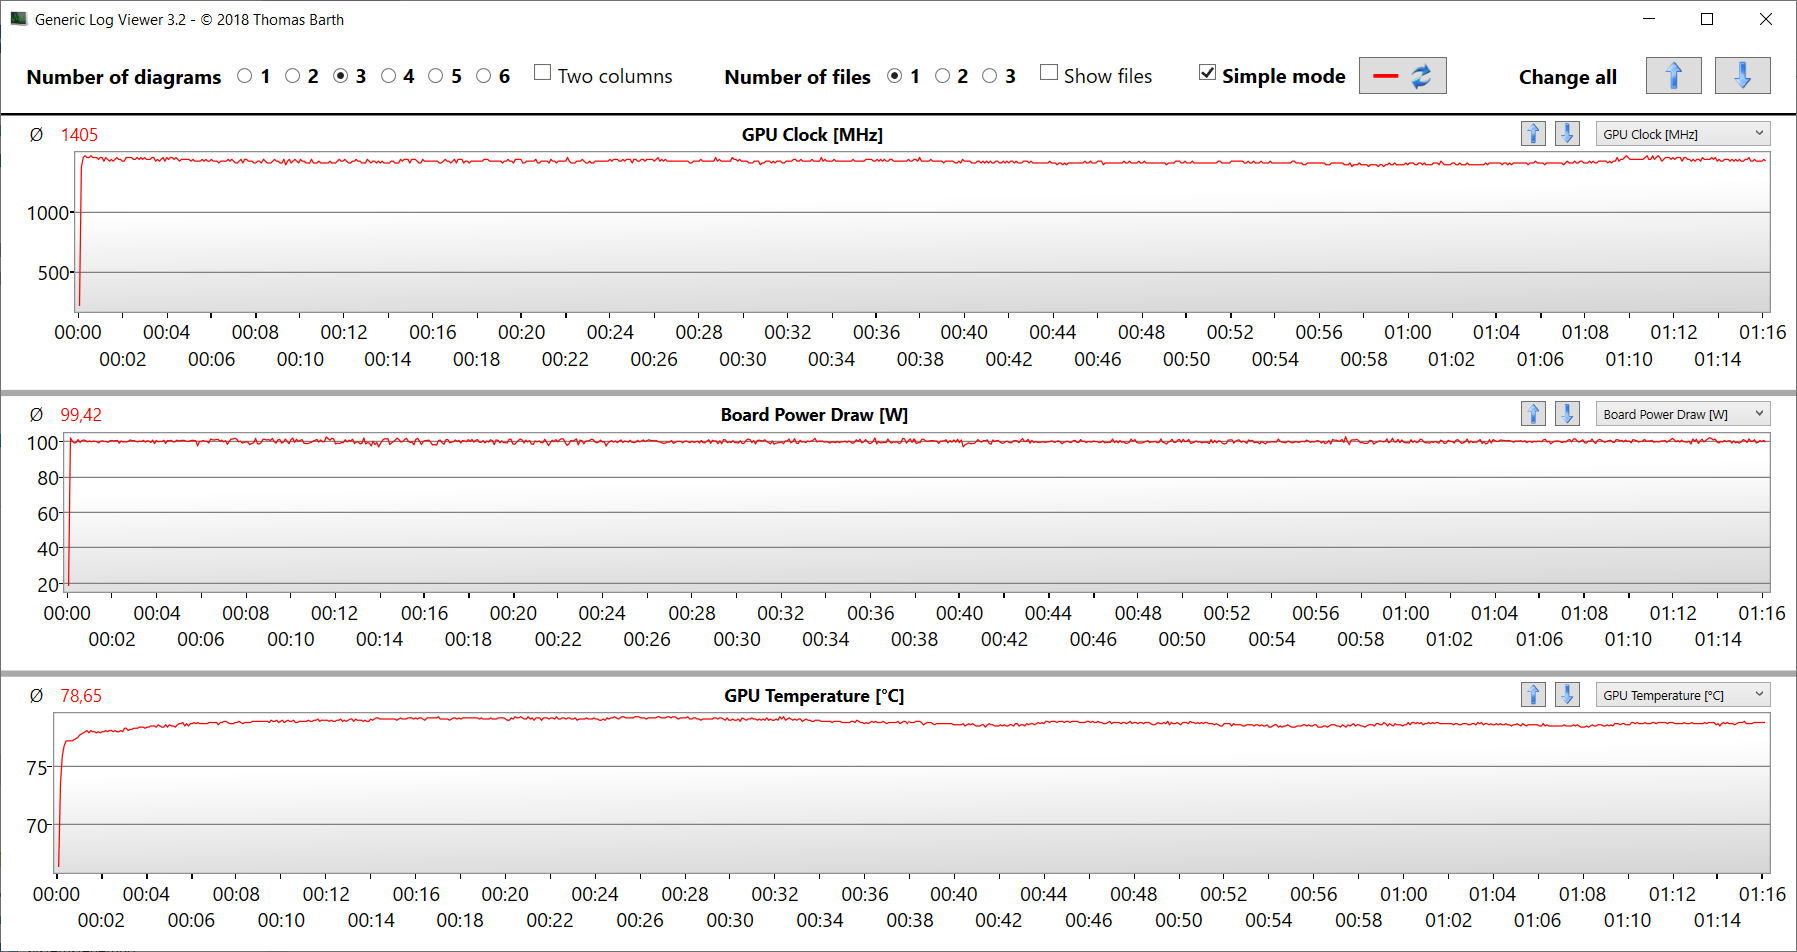
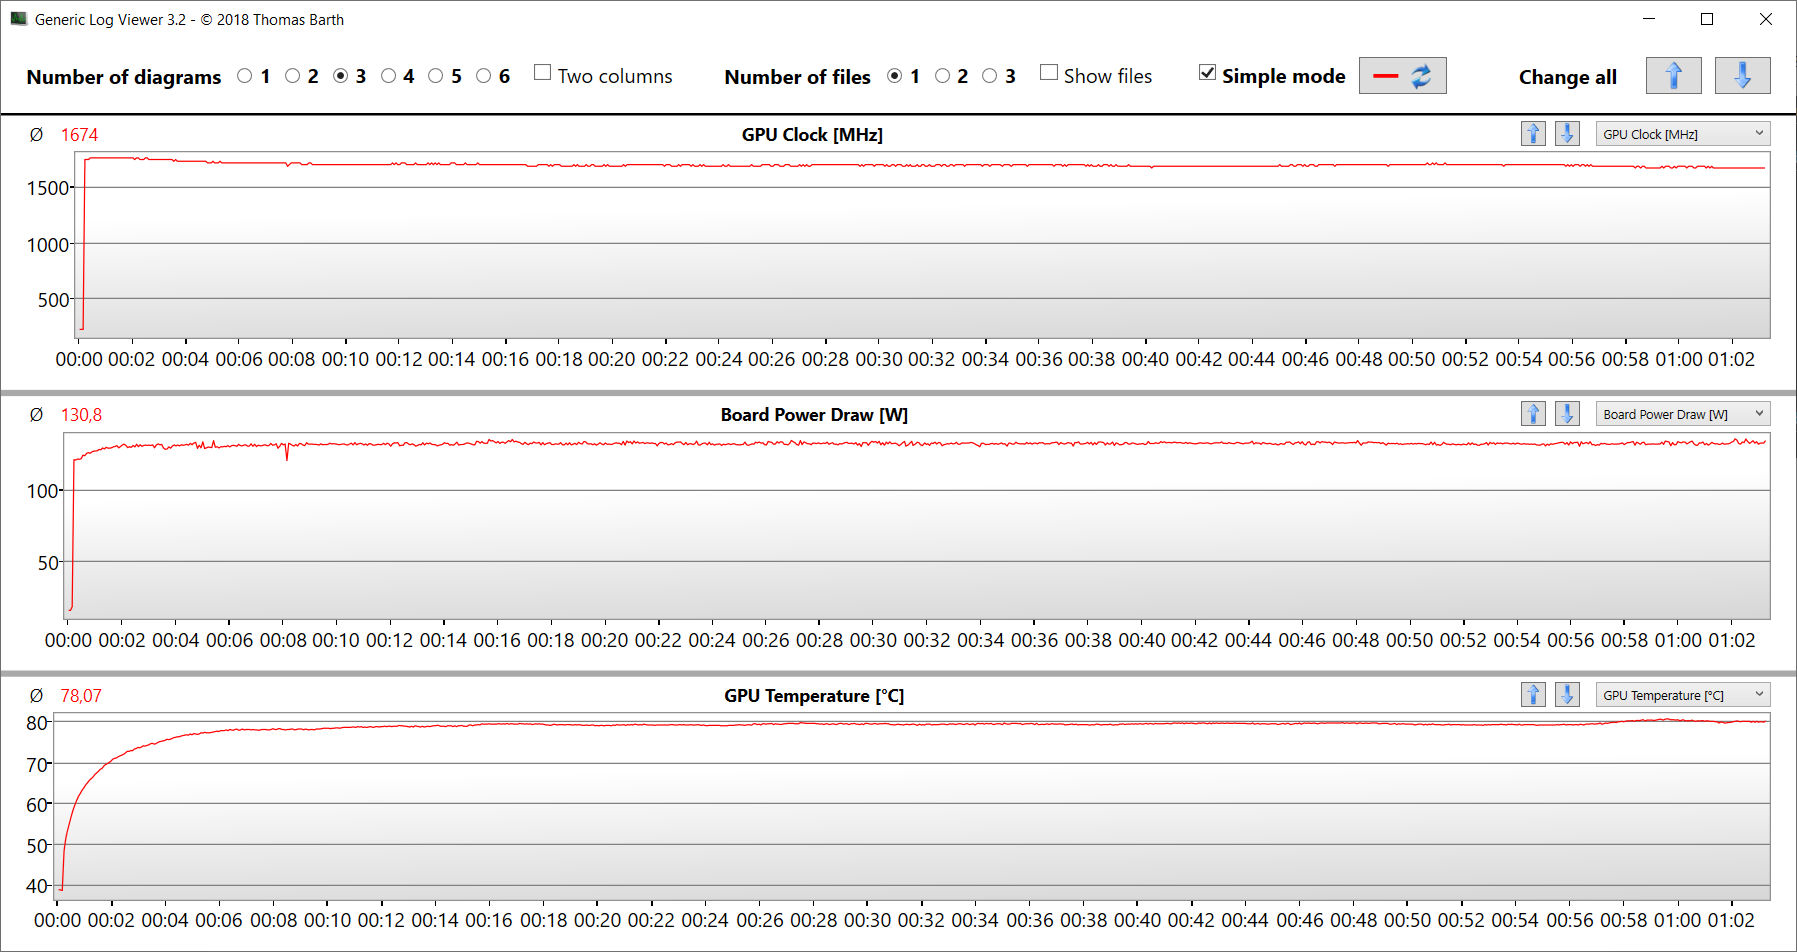
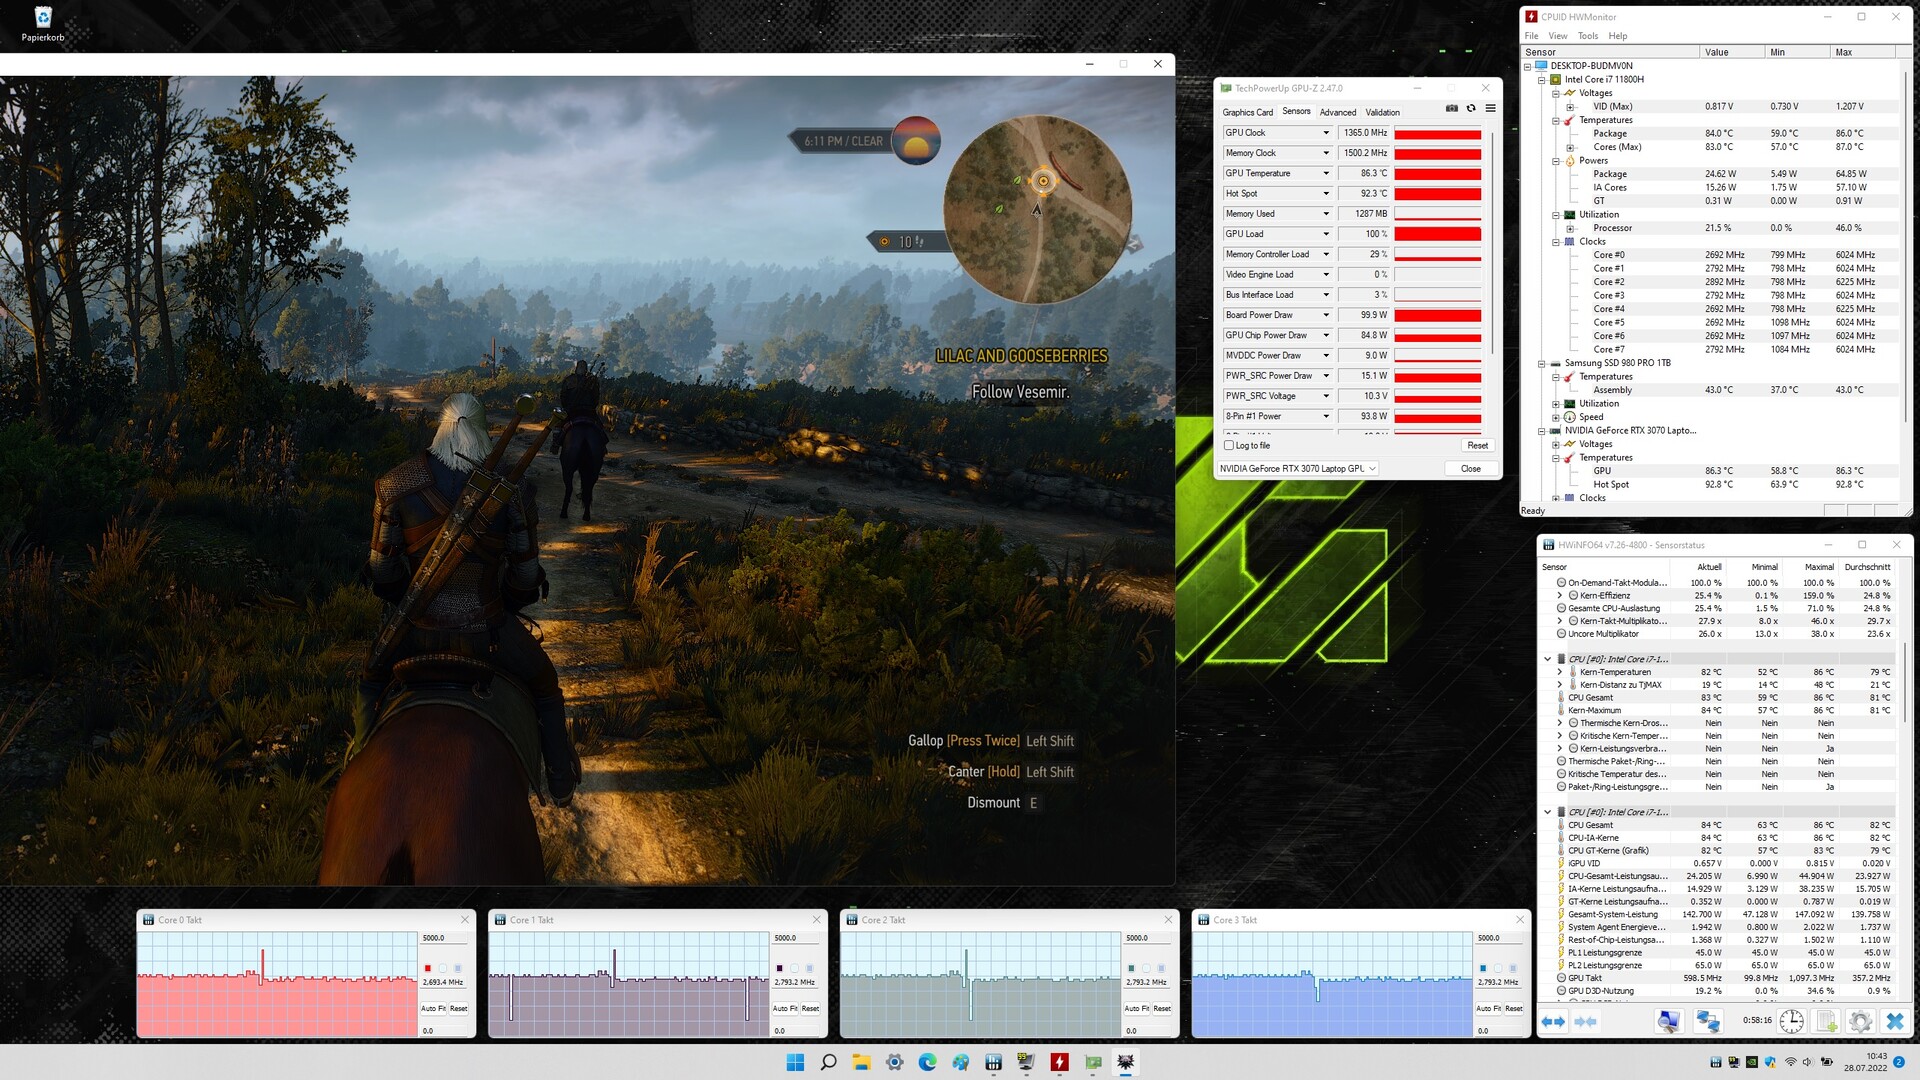
Le prestazioni effettive di una GPU RTX 3000 dipendono da alcuni fattori: Raffreddamento, configurazione della memoria e il TGP massimo scelto dal produttore del laptop entro i limiti definiti da Nvidia. Schenker fornisce il sistema integratoGeForce RTX 3070 integrata nel computer portatile Con un TGP massimo di 145 watt (125 watt + 20 watt di Dynamic Boost). Tuttavia, il Dynamic Boost viene utilizzato solo quando è attivo il profilo "Benchmark Mode". La GPU può accedere alla veloce memoria grafica GDDR6 (8.192 MB)
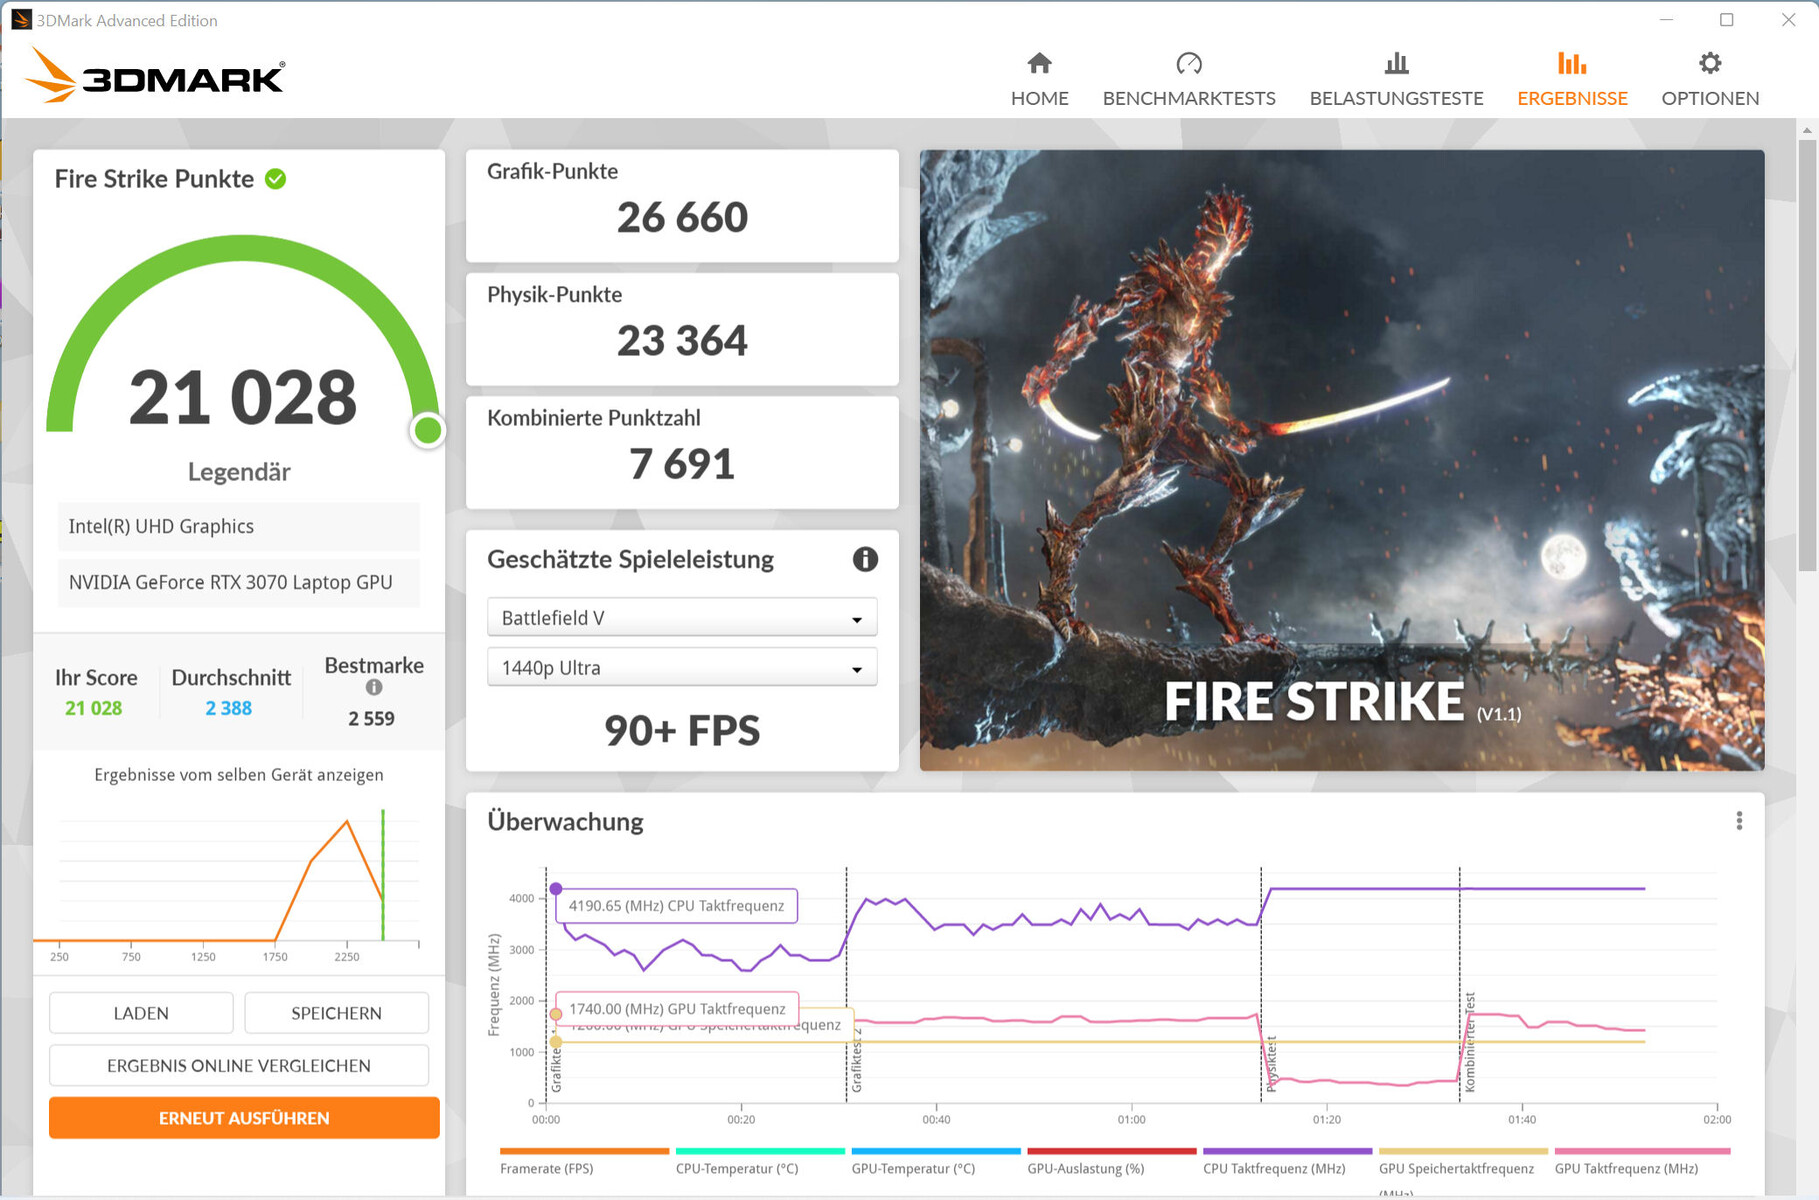
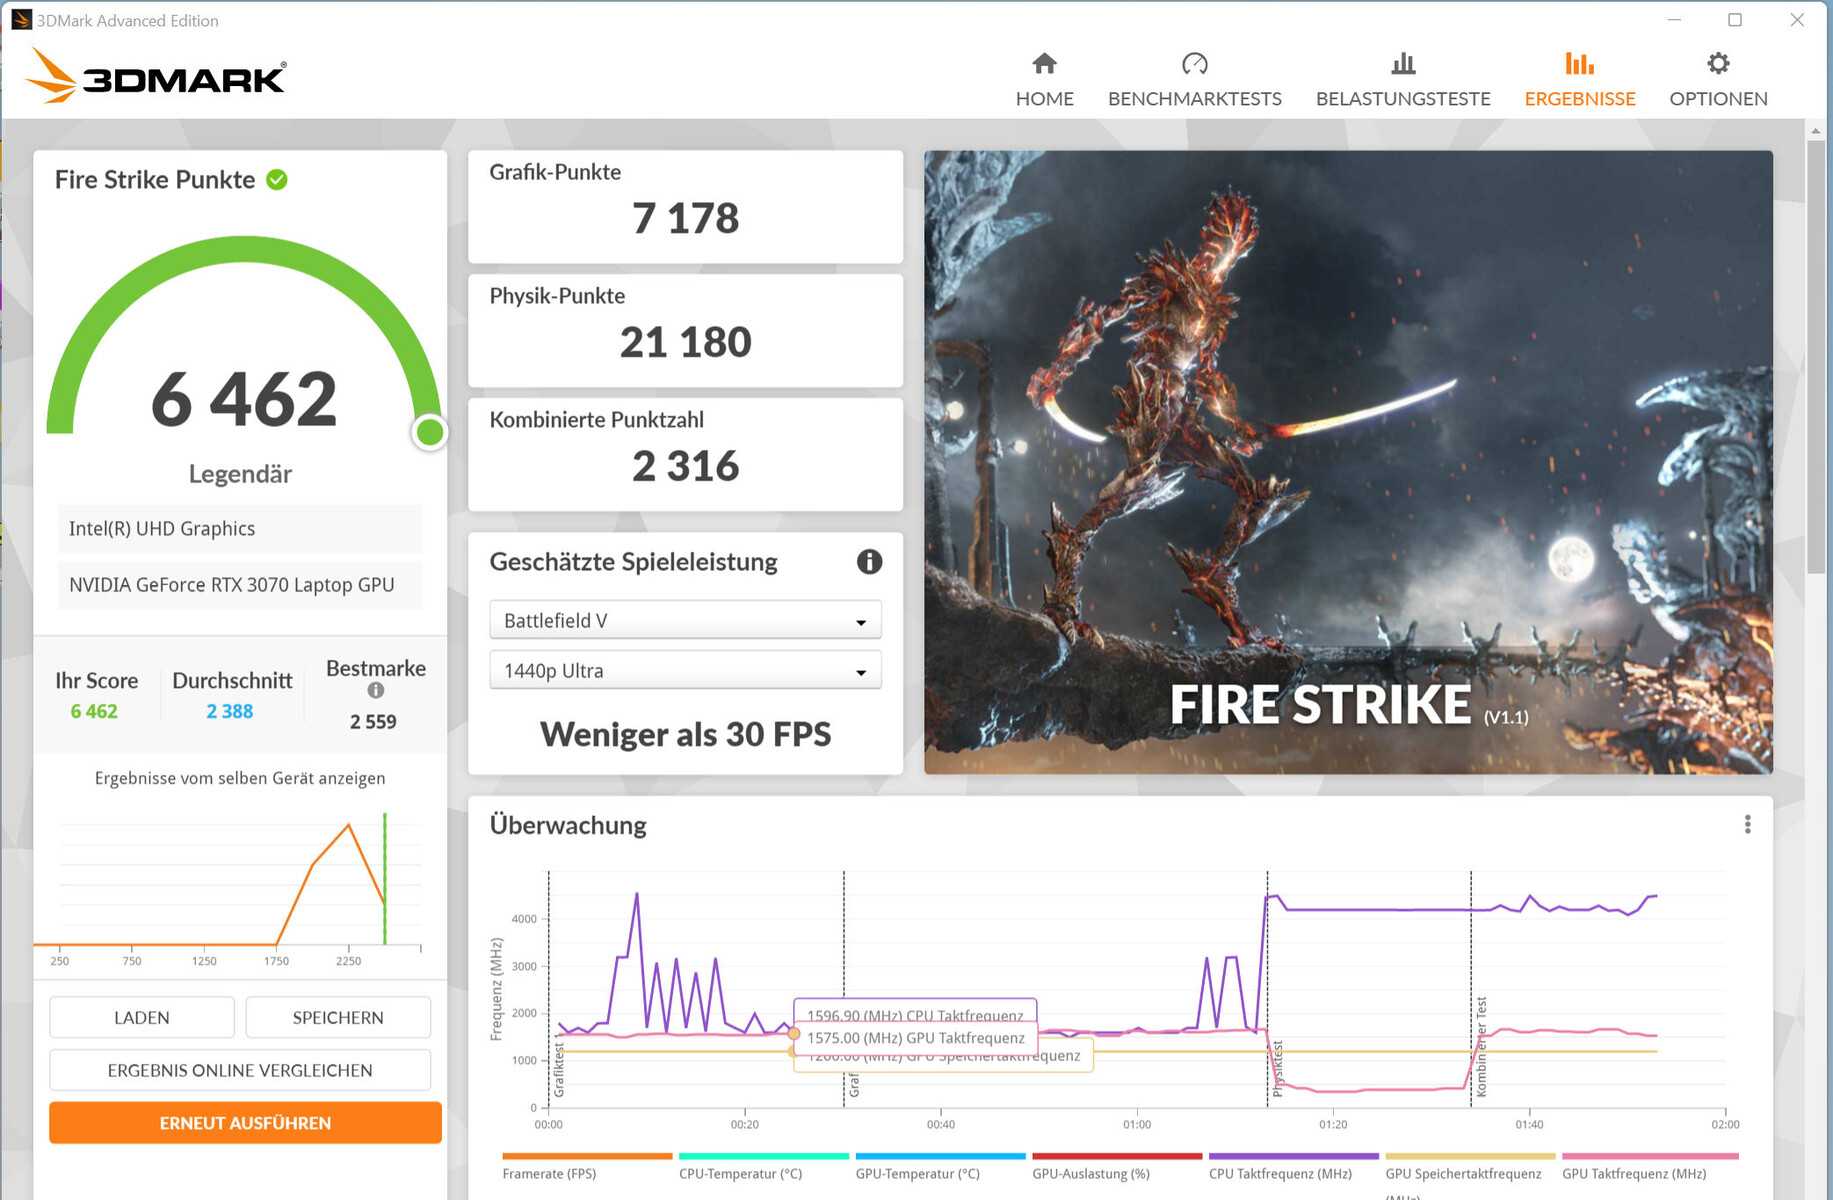
Il profilo "Balanced" porta a risultati di benchmark pari alla media precedentemente determinata per la RTX 3070. Il profilo "Benchmark Mode" permette di aumentare i tassi. Anche in questo caso, il TGP massimo (145 W) non viene utilizzato appieno, come dimostra il nostro test The Witcher 3. Tuttavia, viene utilizzata parte del Dynamic Boost
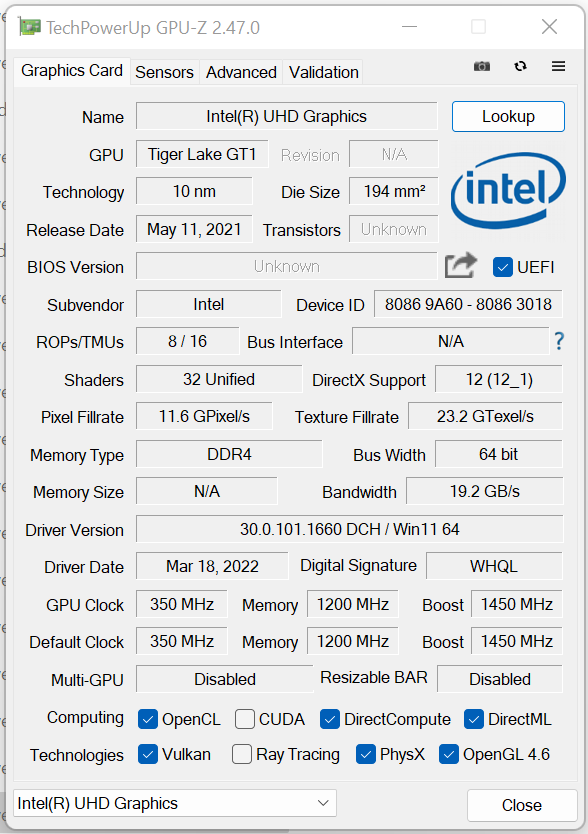
IlUHD Graphics Xe 32EUs integrato nel processore è attivo e il portatile funziona con la soluzione di commutazione grafica Optimus di Nvidia. Il Fusion non offre l'opzione di output diretto delle immagini tramite la GPU RTX 3070.

| 3DMark Performance rating - Percent | |
| Media della classe Gaming | |
| Schenker XMG Fusion 15 (Mid 22) | |
| Acer Nitro 5 AN515-58-72QR | |
| MSI Delta 15 A5EFK -1! | |
| Schenker XMG Fusion 15 (Mid 22) | |
| HP Omen 16-b1090ng | |
| Media NVIDIA GeForce RTX 3070 Laptop GPU | |
| Schenker XMG Fusion 15 (Mid 22) | |
| Asus TUF Dash F15 FX517ZR | |
| Razer Blade 15 Base Edition 2021, i7-10750H RTX 3060 | |
| Schenker XMG Fusion 15 (Mid 22) | |
| 3DMark 11 - 1280x720 Performance GPU | |
| Media della classe Gaming (21841 - 80022, n=104, ultimi 2 anni) | |
| Schenker XMG Fusion 15 (Mid 22) (Benchmark-Modus) | |
| Acer Nitro 5 AN515-58-72QR | |
| Schenker XMG Fusion 15 (Mid 22) (Leistung) | |
| HP Omen 16-b1090ng | |
| MSI Delta 15 A5EFK | |
| Media NVIDIA GeForce RTX 3070 Laptop GPU (12535 - 38275, n=54) | |
| Schenker XMG Fusion 15 (Mid 22) | |
| Asus TUF Dash F15 FX517ZR | |
| Razer Blade 15 Base Edition 2021, i7-10750H RTX 3060 | |
| Schenker XMG Fusion 15 (Mid 22) (Stromsparmodus) | |
| Geekbench 5.5 - OpenCL Score | |
| Media della classe Gaming (80702 - 277970, n=101, ultimi 2 anni) | |
| Acer Nitro 5 AN515-58-72QR | |
| Schenker XMG Apex 15 Max | |
| Schenker XMG Fusion 15 (Mid 22) (Benchmark-Modus) | |
| Schenker XMG Fusion 15 (Mid 22) (Leistung) | |
| Schenker XMG Fusion 15 (Mid 22) | |
| HP Omen 16-b1090ng | |
| Asus TUF Dash F15 FX517ZR | |
| Media NVIDIA GeForce RTX 3070 Laptop GPU (5732 - 125874, n=52) | |
| Razer Blade 15 Base Edition 2021, i7-10750H RTX 3060 | |
| MSI Delta 15 A5EFK | |
| Schenker XMG Fusion 15 (Mid 22) (Stromsparmodus) | |
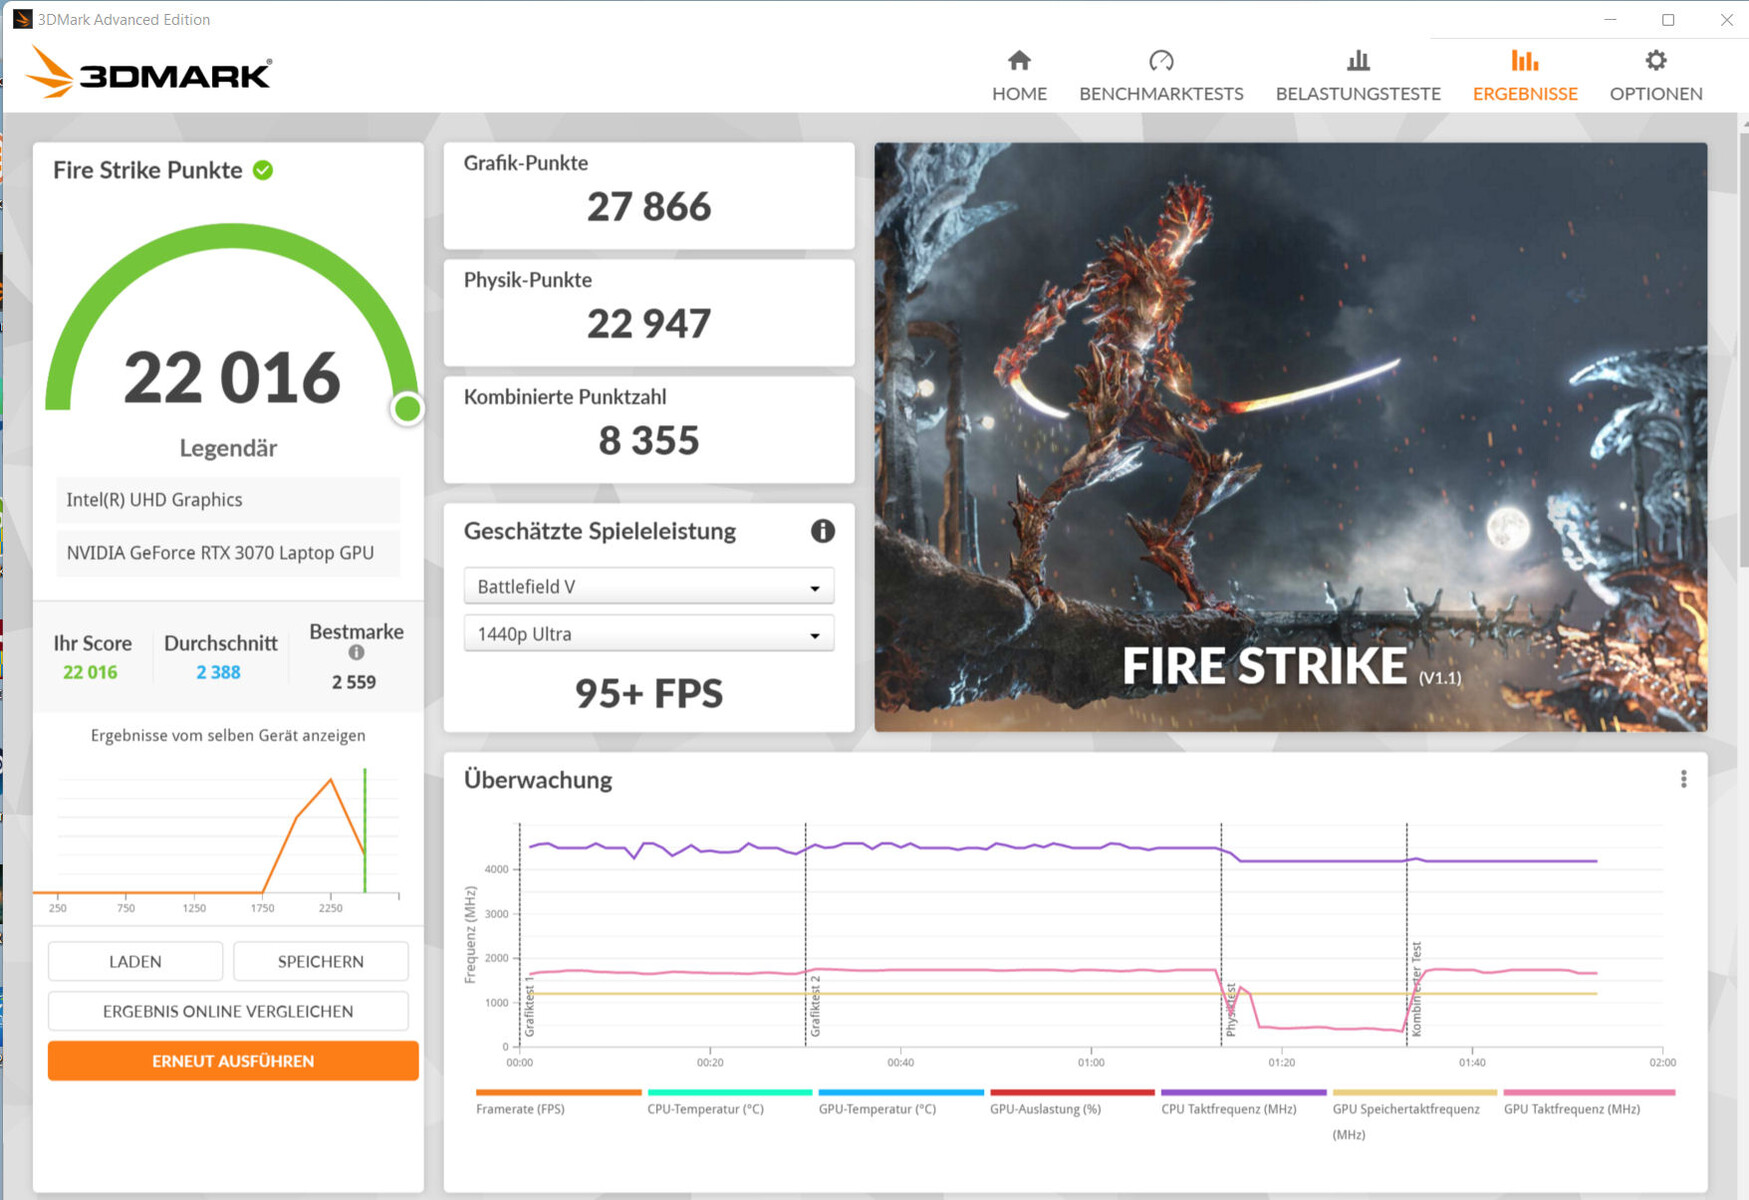
| 3DMark 11 Performance | 26211 punti | |
| 3DMark Cloud Gate Standard Score | 48271 punti | |
| 3DMark Fire Strike Score | 20150 punti | |
| 3DMark Time Spy Score | 9025 punti | |
Aiuto | ||
Prestazioni di gioco
L'hardware consente di giocare in QHD con impostazioni elevate o massime. È possibile utilizzare anche risoluzioni più elevate quando è collegato un display corrispondente, a volte con impostazioni ridotte. I frame rate sono in linea con la media della RTX 3070. Il profilo "Benchmark Mode" porta a un aumento dei frame rate
| The Witcher 3 - 1920x1080 Ultra Graphics & Postprocessing (HBAO+) | |
| Media della classe Gaming (104.7 - 240, n=7, ultimi 2 anni) | |
| Schenker XMG Fusion 15 (Mid 22) (Benchmark-Modus) | |
| Acer Nitro 5 AN515-58-72QR | |
| HP Omen 16-b1090ng | |
| MSI Delta 15 A5EFK | |
| Schenker XMG Fusion 15 (Mid 22) | |
| Media NVIDIA GeForce RTX 3070 Laptop GPU (34.9 - 109, n=52) | |
| Asus TUF Dash F15 FX517ZR | |
| Razer Blade 15 Base Edition 2021, i7-10750H RTX 3060 | |
| Dota 2 Reborn - 1920x1080 ultra (3/3) best looking | |
| Media della classe Gaming (84.8 - 248, n=107, ultimi 2 anni) | |
| HP Omen 16-b1090ng | |
| Acer Nitro 5 AN515-58-72QR | |
| Schenker XMG Fusion 15 (Mid 22) | |
| Schenker XMG Fusion 15 (Mid 22) (Benchmark-Modus) | |
| Razer Blade 15 Base Edition 2021, i7-10750H RTX 3060 | |
| Media NVIDIA GeForce RTX 3070 Laptop GPU (26.9 - 163.9, n=58) | |
| Schenker XMG Fusion 15 (Mid 22) (Leistung) | |
| MSI Delta 15 A5EFK | |
| Asus TUF Dash F15 FX517ZR | |
| Schenker XMG Fusion 15 (Mid 22) (Stromsparmodus) | |
| X-Plane 11.11 - 1920x1080 high (fps_test=3) | |
| HP Omen 16-b1090ng | |
| Asus TUF Dash F15 FX517ZR | |
| Media della classe Gaming (55.5 - 143.5, n=109, ultimi 2 anni) | |
| Acer Nitro 5 AN515-58-72QR | |
| Schenker XMG Fusion 15 (Mid 22) | |
| Media NVIDIA GeForce RTX 3070 Laptop GPU (12.4 - 118.8, n=61) | |
| Razer Blade 15 Base Edition 2021, i7-10750H RTX 3060 | |
| Schenker XMG Fusion 15 (Mid 22) (Benchmark-Modus) | |
| Schenker XMG Fusion 15 (Mid 22) (Leistung) | |
| Schenker XMG Fusion 15 (Mid 22) (Stromsparmodus) | |
| Final Fantasy XV Benchmark | |
| 1920x1080 High Quality | |
| Media della classe Gaming (41 - 215, n=95, ultimi 2 anni) | |
| Schenker XMG Fusion 15 (Mid 22) (1.3, Benchmark-Modus) | |
| HP Omen 16-b1090ng | |
| Schenker XMG Fusion 15 (Mid 22) (1.3, Leistung) | |
| Schenker XMG Fusion 15 (Mid 22) (1.3) | |
| Acer Nitro 5 AN515-58-72QR (1.3) | |
| Media NVIDIA GeForce RTX 3070 Laptop GPU (27.9 - 107, n=49) | |
| Asus TUF Dash F15 FX517ZR (1.3) | |
| MSI Delta 15 A5EFK | |
| Razer Blade 15 Base Edition 2021, i7-10750H RTX 3060 (1.3) | |
| Schenker XMG Fusion 15 (Mid 22) (1.3, Stromsparmodus) | |
| 2560x1440 High Quality | |
| Media della classe Gaming (32.5 - 184.3, n=87, ultimi 2 anni) | |
| Schenker XMG Fusion 15 (Mid 22) (1.3, Benchmark-Modus) | |
| Schenker XMG Fusion 15 (Mid 22) (1.3, Leistung) | |
| Schenker XMG Fusion 15 (Mid 22) (1.3) | |
| Acer Nitro 5 AN515-58-72QR (1.3) | |
| Media NVIDIA GeForce RTX 3070 Laptop GPU (19.8 - 79.9, n=25) | |
| Asus TUF Dash F15 FX517ZR (1.3) | |
| Schenker XMG Fusion 15 (Mid 22) (1.3, Stromsparmodus) | |
| GTA V | |
| 2560x1440 Highest AA:4xMSAA + FX AF:16x | |
| Media della classe Gaming (36.9 - 183.9, n=72, ultimi 2 anni) | |
| Schenker XMG Fusion 15 (Mid 22) (Benchmark-Modus) | |
| Schenker XMG Fusion 15 (Mid 22) (Leistung) | |
| Schenker XMG Fusion 15 (Mid 22) | |
| Media NVIDIA GeForce RTX 3070 Laptop GPU (70.8 - 97.1, n=19) | |
| Acer Nitro 5 AN515-58-72QR | |
| Asus TUF Dash F15 FX517ZR | |
| 1920x1080 Highest AA:4xMSAA + FX AF:16x | |
| Media della classe Gaming (48.3 - 186.9, n=94, ultimi 2 anni) | |
| HP Omen 16-b1090ng | |
| Schenker XMG Fusion 15 (Mid 22) (Benchmark-Modus) | |
| Asus TUF Dash F15 FX517ZR | |
| Schenker XMG Fusion 15 (Mid 22) (Leistung) | |
| Schenker XMG Fusion 15 (Mid 22) | |
| Acer Nitro 5 AN515-58-72QR | |
| Media NVIDIA GeForce RTX 3070 Laptop GPU (21.7 - 125.8, n=50) | |
| MSI Delta 15 A5EFK | |
| Razer Blade 15 Base Edition 2021, i7-10750H RTX 3060 | |
| Schenker XMG Fusion 15 (Mid 22) (Stromsparmodus) | |
| Strange Brigade | |
| 2560x1440 ultra AA:ultra AF:16 | |
| Media della classe Gaming (52.8 - 354, n=76, ultimi 2 anni) | |
| Acer Nitro 5 AN515-58-72QR (1.47.22.14 D3D12) | |
| Schenker XMG Fusion 15 (Mid 22) (1.47.22.14 D3D12, Benchmark-Modus) | |
| Schenker XMG Fusion 15 (Mid 22) (1.47.22.14 D3D12) | |
| Media NVIDIA GeForce RTX 3070 Laptop GPU (82.3 - 140.5, n=18) | |
| Asus TUF Dash F15 FX517ZR (1.47.22.14 D3D12) | |
| 1920x1080 ultra AA:ultra AF:16 | |
| Media della classe Gaming (76.3 - 458, n=87, ultimi 2 anni) | |
| Schenker XMG Fusion 15 (Mid 22) (1.47.22.14 D3D12, Benchmark-Modus) | |
| Acer Nitro 5 AN515-58-72QR (1.47.22.14 D3D12) | |
| Schenker XMG Fusion 15 (Mid 22) (1.47.22.14 D3D12, Leistung) | |
| MSI Delta 15 A5EFK (1.47.22.14 D3D12) | |
| Schenker XMG Fusion 15 (Mid 22) (1.47.22.14 D3D12) | |
| Media NVIDIA GeForce RTX 3070 Laptop GPU (36.2 - 194, n=46) | |
| Asus TUF Dash F15 FX517ZR (1.47.22.14 D3D12) | |
| HP Omen 16-b1090ng (1.47.22.14 D3D12) | |
| Razer Blade 15 Base Edition 2021, i7-10750H RTX 3060 (1.47.22.14 D3D12) | |
| Schenker XMG Fusion 15 (Mid 22) (1.47.22.14 D3D12, Stromsparmodus) | |
| F1 2021 | |
| 2560x1440 Ultra High Preset + Raytracing AA:T AF:16x | |
| Schenker XMG Fusion 15 (Mid 22) (874931, Benchmark-Modus) | |
| Schenker XMG Fusion 15 (Mid 22) (874931, Leistung) | |
| Media NVIDIA GeForce RTX 3070 Laptop GPU (67.1 - 90.2, n=11) | |
| Acer Nitro 5 AN515-58-72QR (874931) | |
| Schenker XMG Fusion 15 (Mid 22) (874931) | |
| Asus TUF Dash F15 FX517ZR (874931) | |
| 1920x1080 Ultra High Preset + Raytracing AA:T AF:16x | |
| Schenker XMG Fusion 15 (Mid 22) (874931, Benchmark-Modus) | |
| Schenker XMG Fusion 15 (Mid 22) (874931, Leistung) | |
| Acer Nitro 5 AN515-58-72QR (874931) | |
| Schenker XMG Fusion 15 (Mid 22) (874931) | |
| MSI Delta 15 A5EFK | |
| Media NVIDIA GeForce RTX 3070 Laptop GPU (33.1 - 123.1, n=23) | |
| Asus TUF Dash F15 FX517ZR (874931) | |
| Schenker XMG Fusion 15 (Mid 22) (874931, Stromsparmodus) | |
| Far Cry 5 | |
| 2560x1440 Ultra Preset AA:T | |
| Media della classe Gaming (93 - 149, n=5, ultimi 2 anni) | |
| Schenker XMG Fusion 15 (Mid 22) (Benchmark-Modus) | |
| Media NVIDIA GeForce RTX 3070 Laptop GPU (81 - 101, n=18) | |
| Schenker XMG Fusion 15 (Mid 22) | |
| Asus TUF Dash F15 FX517ZR | |
| Acer Nitro 5 AN515-58-72QR | |
| 1920x1080 Ultra Preset AA:T | |
| Media della classe Gaming (70 - 151, n=6, ultimi 2 anni) | |
| Schenker XMG Fusion 15 (Mid 22) (Benchmark-Modus) | |
| Schenker XMG Fusion 15 (Mid 22) | |
| Media NVIDIA GeForce RTX 3070 Laptop GPU (89 - 140, n=36) | |
| Asus TUF Dash F15 FX517ZR | |
| MSI Delta 15 A5EFK | |
| Acer Nitro 5 AN515-58-72QR | |
Per verificare se la frequenza dei fotogrammi rimane sostanzialmente costante per un periodo di tempo prolungato, abbiamo lasciato girare il gioco The Witcher 3 per circa 60 minuti alla risoluzione Full HD e con le impostazioni di qualità massime. Il personaggio non viene spostato. Non è stato riscontrato alcun calo di frame rate
The Witcher 3 FPS diagram
| basso | medio | alto | ultra | QHD | |
|---|---|---|---|---|---|
| GTA V (2015) | 183.5 | 177 | 168.5 | 100 | 83.4 |
| The Witcher 3 (2015) | 348 | 260 | 163.4 | 91.8 | |
| Dota 2 Reborn (2015) | 155.7 | 139.4 | 132.8 | 125.3 | |
| Final Fantasy XV Benchmark (2018) | 171.3 | 121.6 | 93.8 | 72.1 | |
| X-Plane 11.11 (2018) | 121.2 | 111 | 86.8 | ||
| Far Cry 5 (2018) | 152 | 122 | 115 | 109 | 89 |
| Strange Brigade (2018) | 389 | 232 | 188.8 | 165.6 | 124.1 |
| F1 2021 (2021) | 267 | 194.2 | 170.1 | 105 | 79.8 |
Emissioni - Il portatile Schenker genera molto calore
Emissioni acustiche
Le due ventole producono poco rumore nell'uso quotidiano (ufficio, Internet). Di tanto in tanto stanno anche ferme. A pieno carico il rumore si fa sentire, con livelli massimi di pressione sonora rispettivamente di 48 dB(A) (stress test) e 46 dB(A) (il nostro test The Witcher 3 ), ma non si tratta di un rumore eccessivo. La maggior parte dei concorrenti produce più rumore, con solo ilAsus TUF Dash F15 è circa alla pari
Lo sviluppo del rumore sotto carico può essere ridotto in due modi: Utilizzando il profilo "Modalità di risparmio energetico" o attivando il "WhisperMode 2.0" della GPU GeForce. Quest'ultimo può essere attivato nel Centro di controllo (nella sezione "Ottimizzazione delle prestazioni"). Incorpora il profilo "Modalità di risparmio energetico". La modalità WhisperMode dovrebbe ottenere il livello di rumore più basso possibile utilizzando livelli di frame rate sufficienti per un gioco per computer (almeno 30-60 fps). La GPU non deve lavorare alla massima potenza; produce meno calore e le ventole possono rallentare.
Una parola sul profilo "Modalità Benchmark": Le ventole funzionano continuamente alla massima velocità e sono - non sorprende - chiaramente udibili. Tutto questo si riflette in un sibilo costante. Le ventole del nostro esemplare in prova non emettono alcun rumore di fondo sgradevole.
Rumorosità
| Idle |
| 26 / 28 / 31 dB(A) |
| Sotto carico |
| 45 / 48 dB(A) |
 | ||
30 dB silenzioso 40 dB(A) udibile 50 dB(A) rumoroso |
||
min: | ||
| Schenker XMG Fusion 15 (Mid 22) i7-11800H, GeForce RTX 3070 Laptop GPU | Asus TUF Dash F15 FX517ZR i7-12650H, GeForce RTX 3070 Laptop GPU | Acer Nitro 5 AN515-58-72QR i7-12700H, GeForce RTX 3070 Ti Laptop GPU | HP Omen 16-b1090ng i7-12700H, GeForce RTX 3070 Ti Laptop GPU | MSI Delta 15 A5EFK R9 5900HX, Radeon RX 6700M | Razer Blade 15 Base Edition 2021, i7-10750H RTX 3060 i7-10750H, GeForce RTX 3060 Laptop GPU | |
|---|---|---|---|---|---|---|
| Noise | -4% | -6% | -11% | -6% | 5% | |
| off /ambiente * (dB) | 26 | 26 -0% | 26 -0% | 26 -0% | 25 4% | 25.3 3% |
| Idle Minimum * (dB) | 26 | 26 -0% | 26 -0% | 30 -15% | 25 4% | 25.4 2% |
| Idle Average * (dB) | 28 | 32 -14% | 29 -4% | 31 -11% | 30 -7% | 25.4 9% |
| Idle Maximum * (dB) | 31 | 33 -6% | 33 -6% | 33 -6% | 40 -29% | 25.4 18% |
| Load Average * (dB) | 45 | 48 -7% | 47 -4% | 49 -9% | 47 -4% | 42.5 6% |
| Witcher 3 ultra * (dB) | 46 | 47 -2% | 53 -15% | 53 -15% | 48 -4% | 42 9% |
| Load Maximum * (dB) | 48 | 49 -2% | 53 -10% | 57 -19% | 51 -6% | 52.2 -9% |
* ... Meglio usare valori piccoli
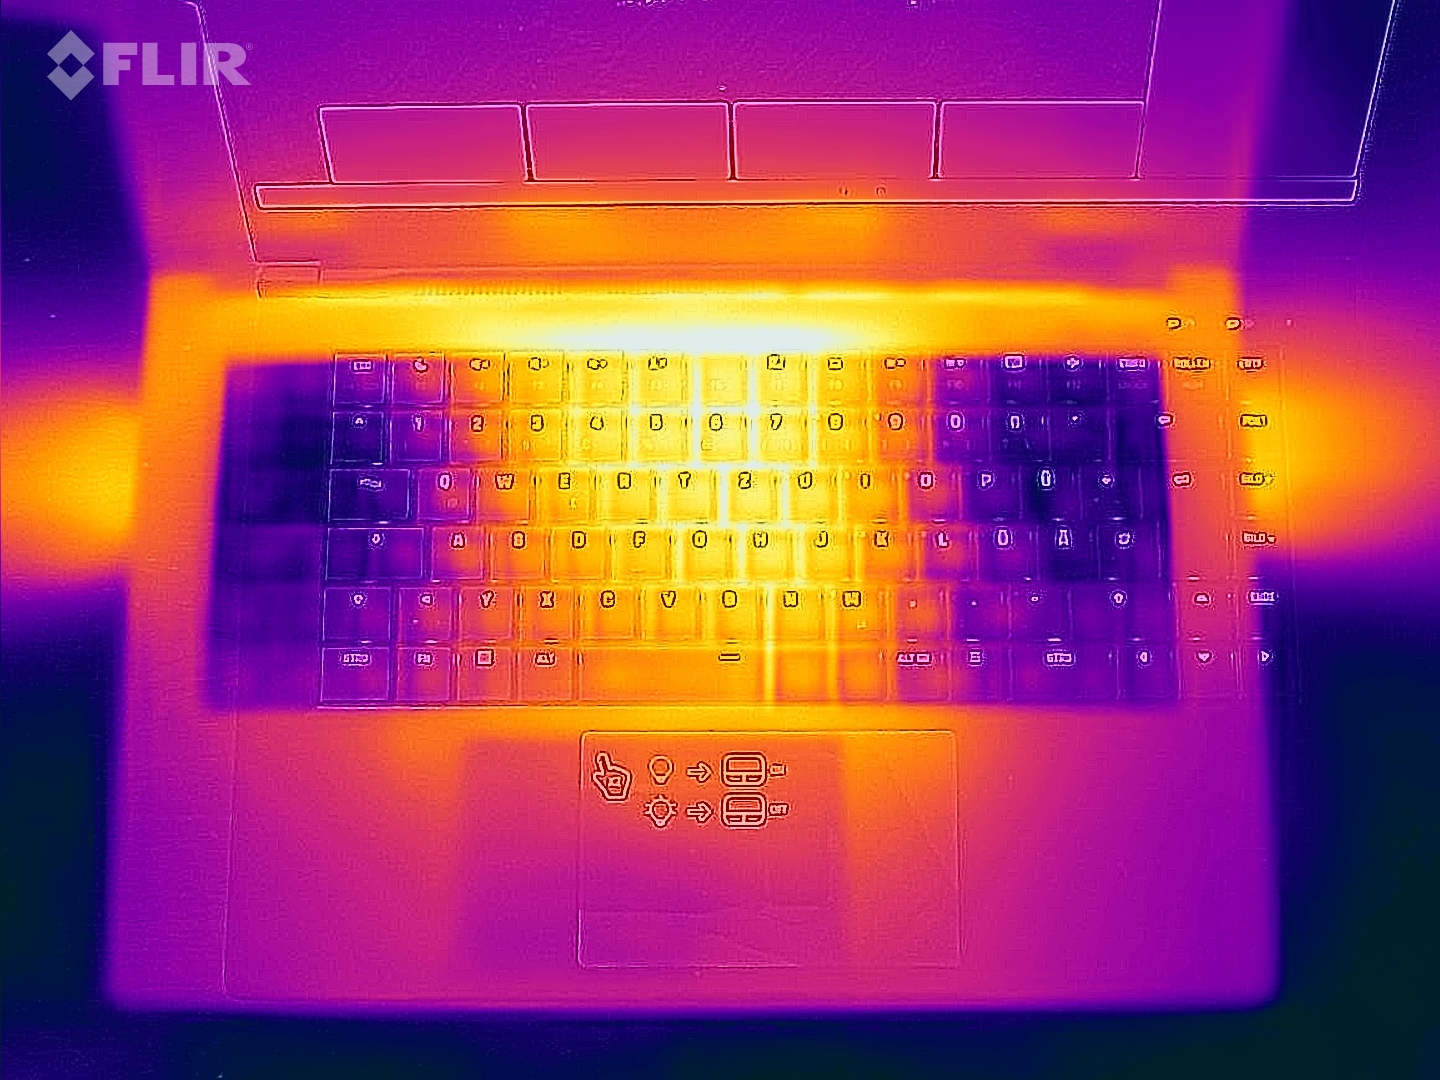
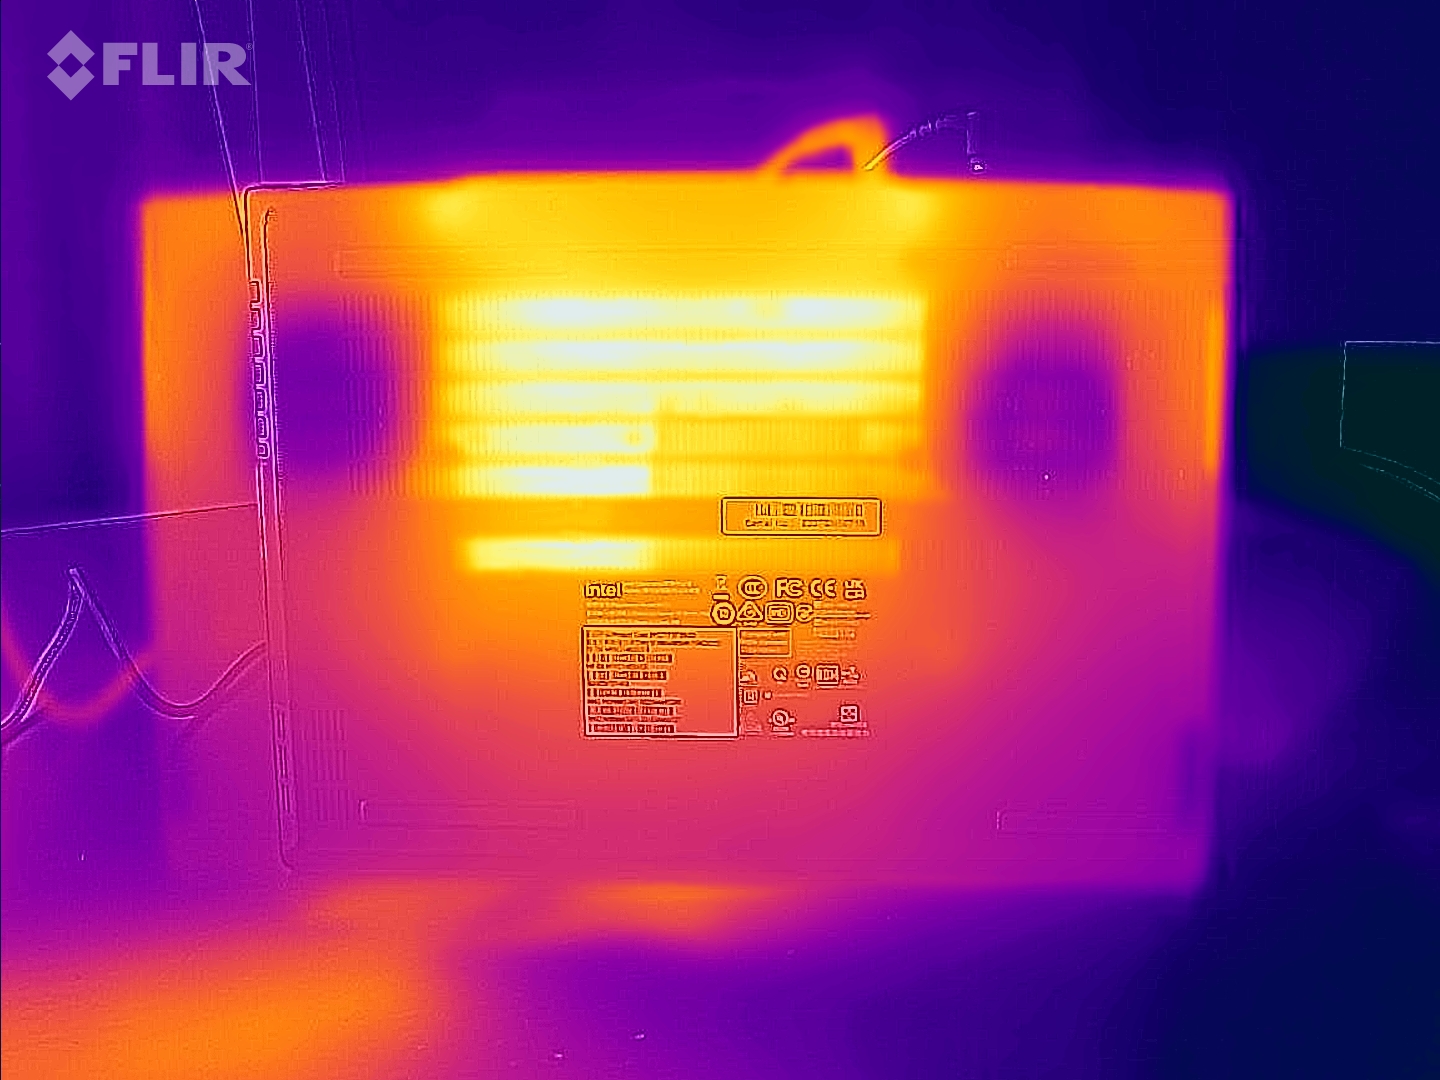
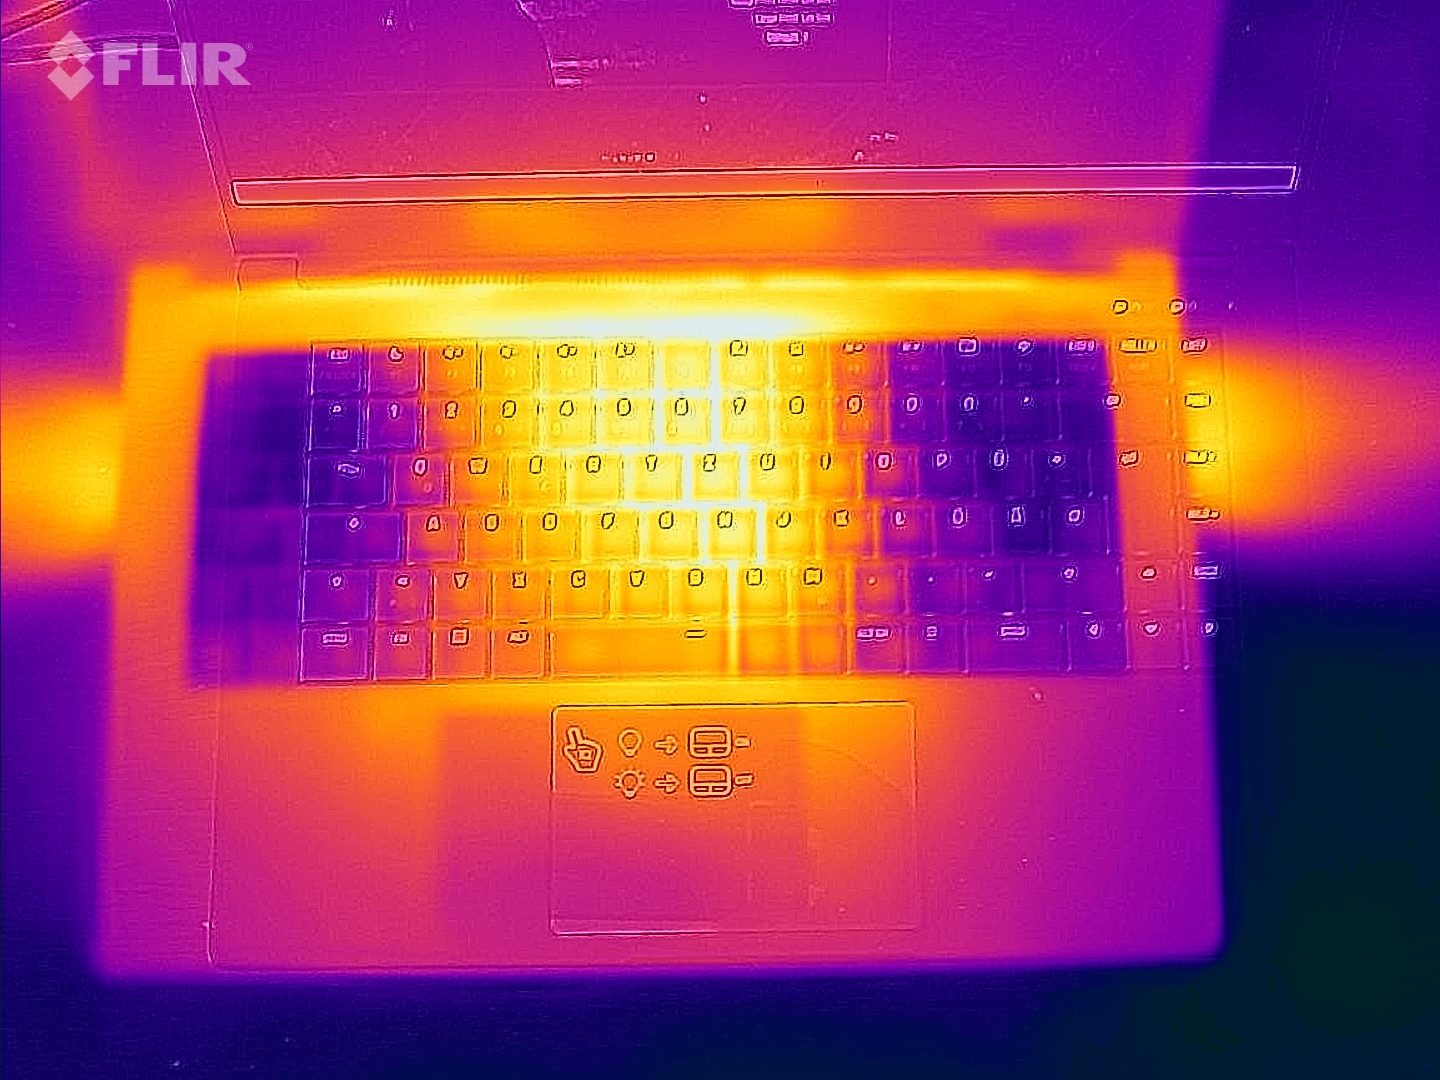
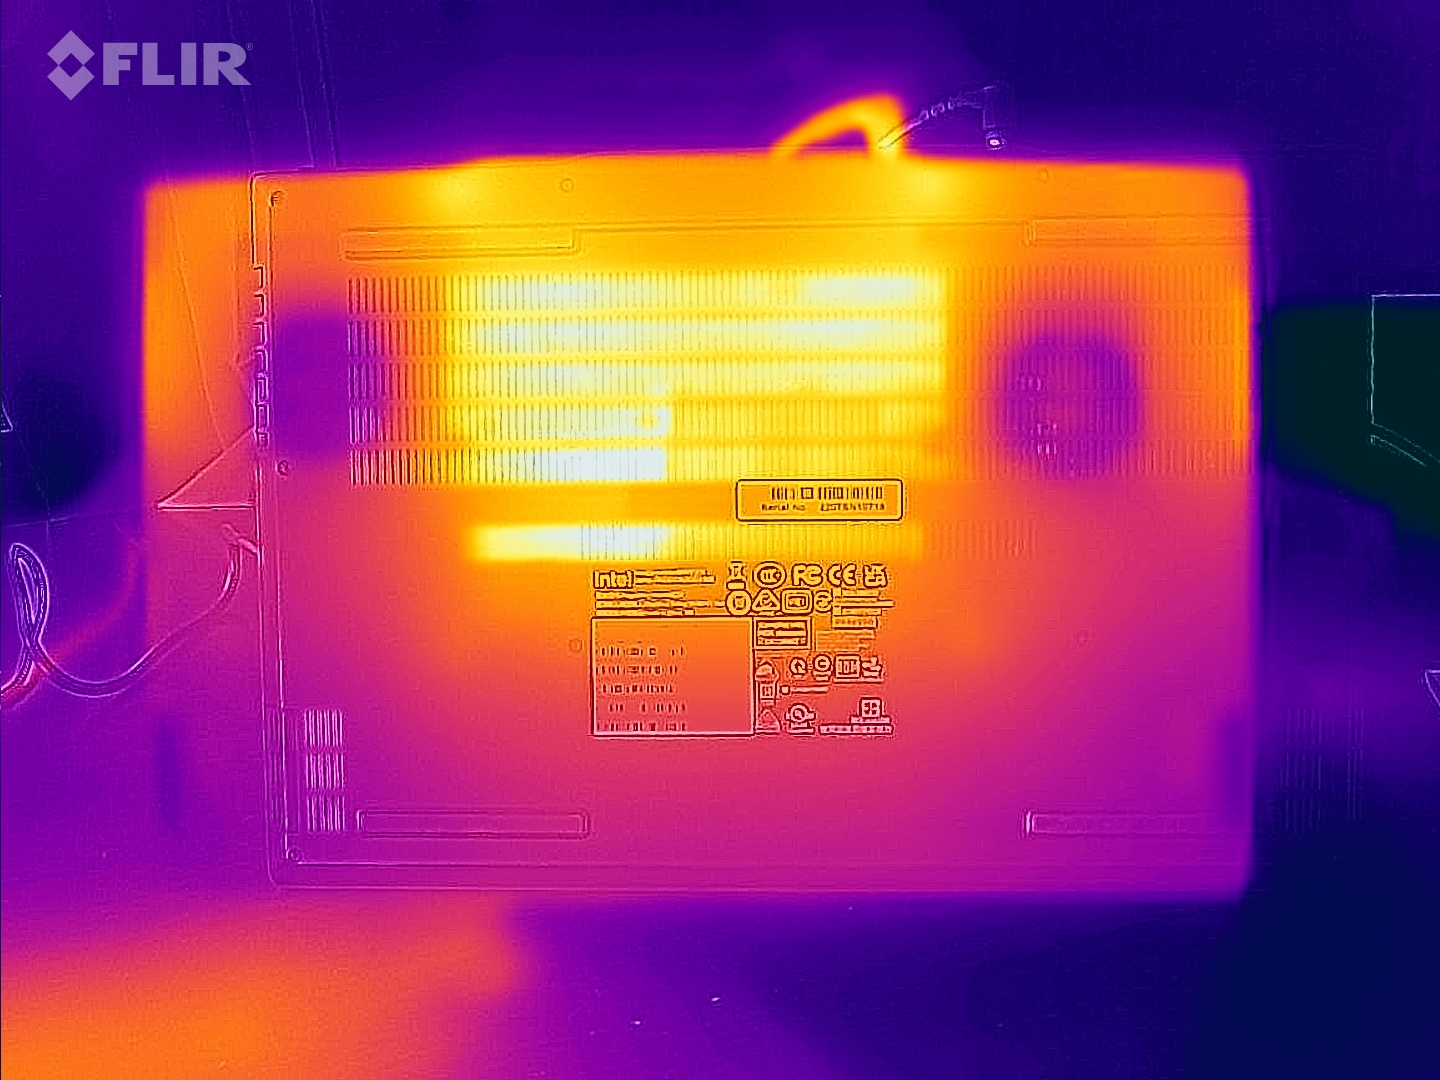
Temperatura
Nell'uso quotidiano (ufficio, Internet), le temperature del case rimangono in un range accettabile. Tuttavia, il portatile si riscalda notevolmente sotto carico (stress test, il nostro test The Witcher 3 ). In diversi punti di misurazione si registrano temperature appena superiori a 60 °C (~140 °F). Le temperature della CPU non destano preoccupazione
(-) La temperatura massima sul lato superiore è di 52 °C / 126 F, rispetto alla media di 40.4 °C / 105 F, che varia da 21.2 a 68.8 °C per questa classe Gaming.
(-) Il lato inferiore si riscalda fino ad un massimo di 63 °C / 145 F, rispetto alla media di 43.2 °C / 110 F
(±) In idle, la temperatura media del lato superiore è di 35.6 °C / 96 F, rispetto alla media deld ispositivo di 33.9 °C / 93 F.
(-) Riproducendo The Witcher 3, la temperatura media per il lato superiore e' di 48.8 °C / 120 F, rispetto alla media del dispositivo di 33.9 °C / 93 F.
(-) I poggiapolsi e il touchpad possono diventare molto caldi al tatto con un massimo di 46 °C / 114.8 F.
(-) La temperatura media della zona del palmo della mano di dispositivi simili e'stata di 28.8 °C / 83.8 F (-17.2 °C / -31 F).
| Schenker XMG Fusion 15 (Mid 22) Intel Core i7-11800H, NVIDIA GeForce RTX 3070 Laptop GPU | Asus TUF Dash F15 FX517ZR Intel Core i7-12650H, NVIDIA GeForce RTX 3070 Laptop GPU | Acer Nitro 5 AN515-58-72QR Intel Core i7-12700H, NVIDIA GeForce RTX 3070 Ti Laptop GPU | HP Omen 16-b1090ng Intel Core i7-12700H, NVIDIA GeForce RTX 3070 Ti Laptop GPU | MSI Delta 15 A5EFK AMD Ryzen 9 5900HX, AMD Radeon RX 6700M | Razer Blade 15 Base Edition 2021, i7-10750H RTX 3060 Intel Core i7-10750H, NVIDIA GeForce RTX 3060 Laptop GPU | |
|---|---|---|---|---|---|---|
| Heat | 8% | 12% | 22% | 14% | 12% | |
| Maximum Upper Side * (°C) | 52 | 52 -0% | 48 8% | 41 21% | 50 4% | 45.2 13% |
| Maximum Bottom * (°C) | 63 | 52 17% | 51 19% | 62 2% | 55 13% | 48 24% |
| Idle Upper Side * (°C) | 37 | 33 11% | 34 8% | 25 32% | 31 16% | 34.4 7% |
| Idle Bottom * (°C) | 38 | 36 5% | 33 13% | 26 32% | 30 21% | 37.2 2% |
* ... Meglio usare valori piccoli
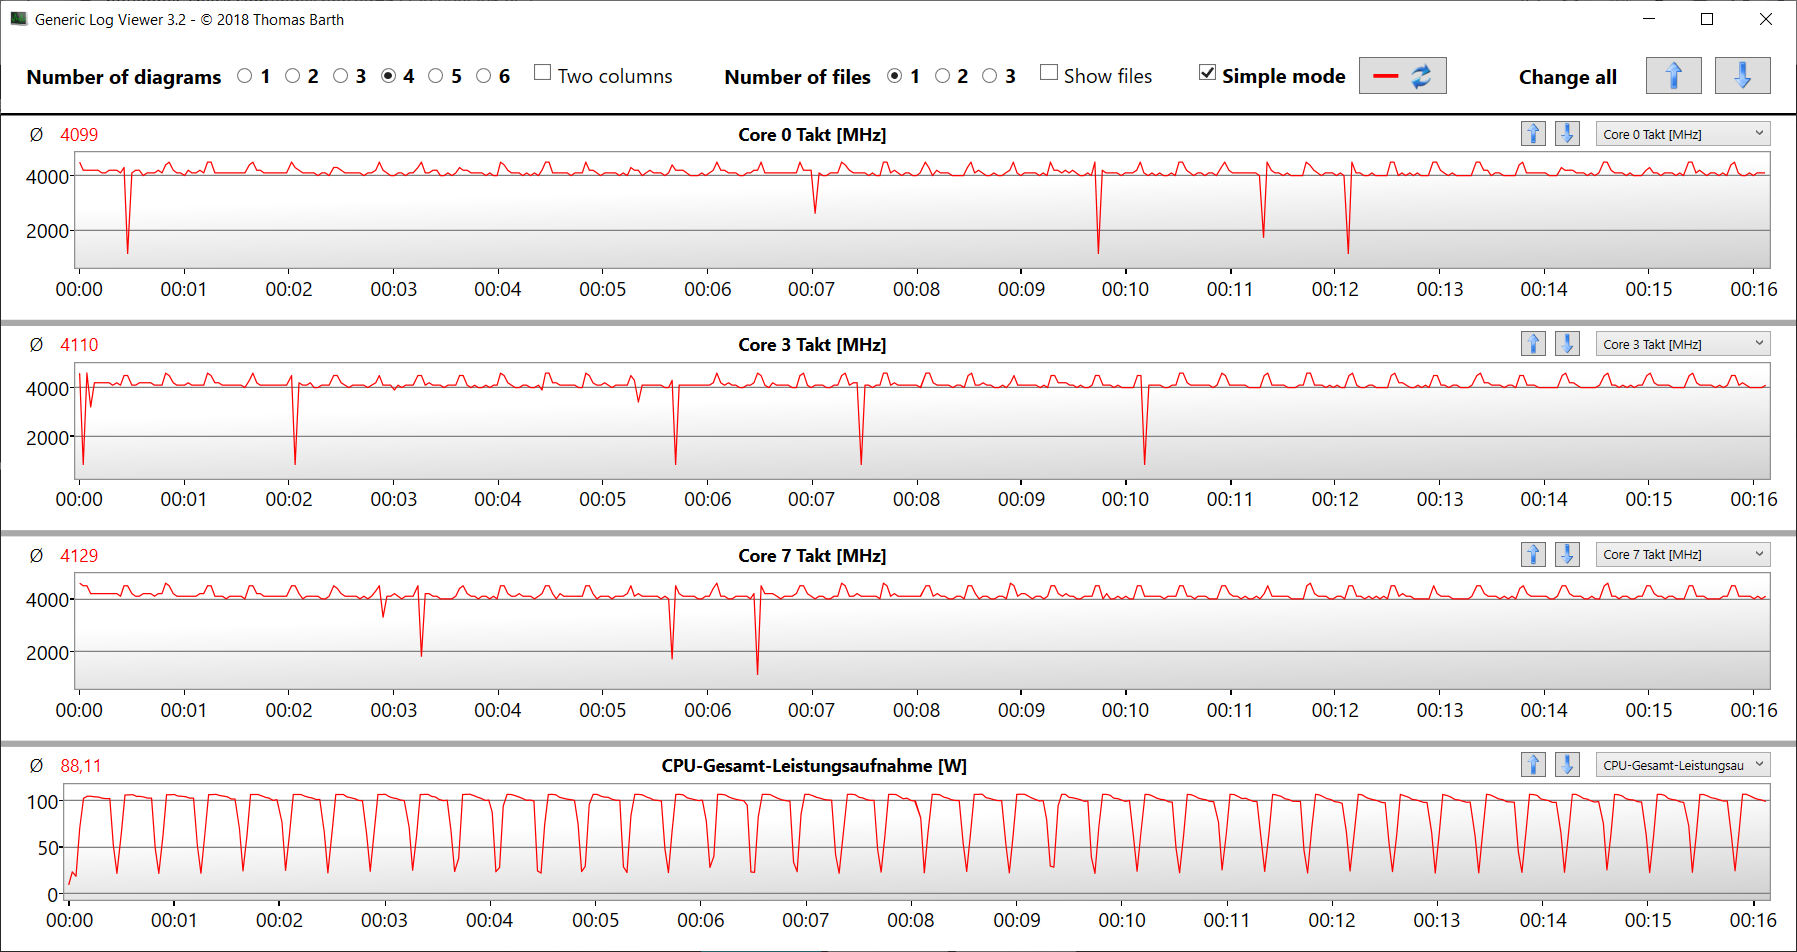
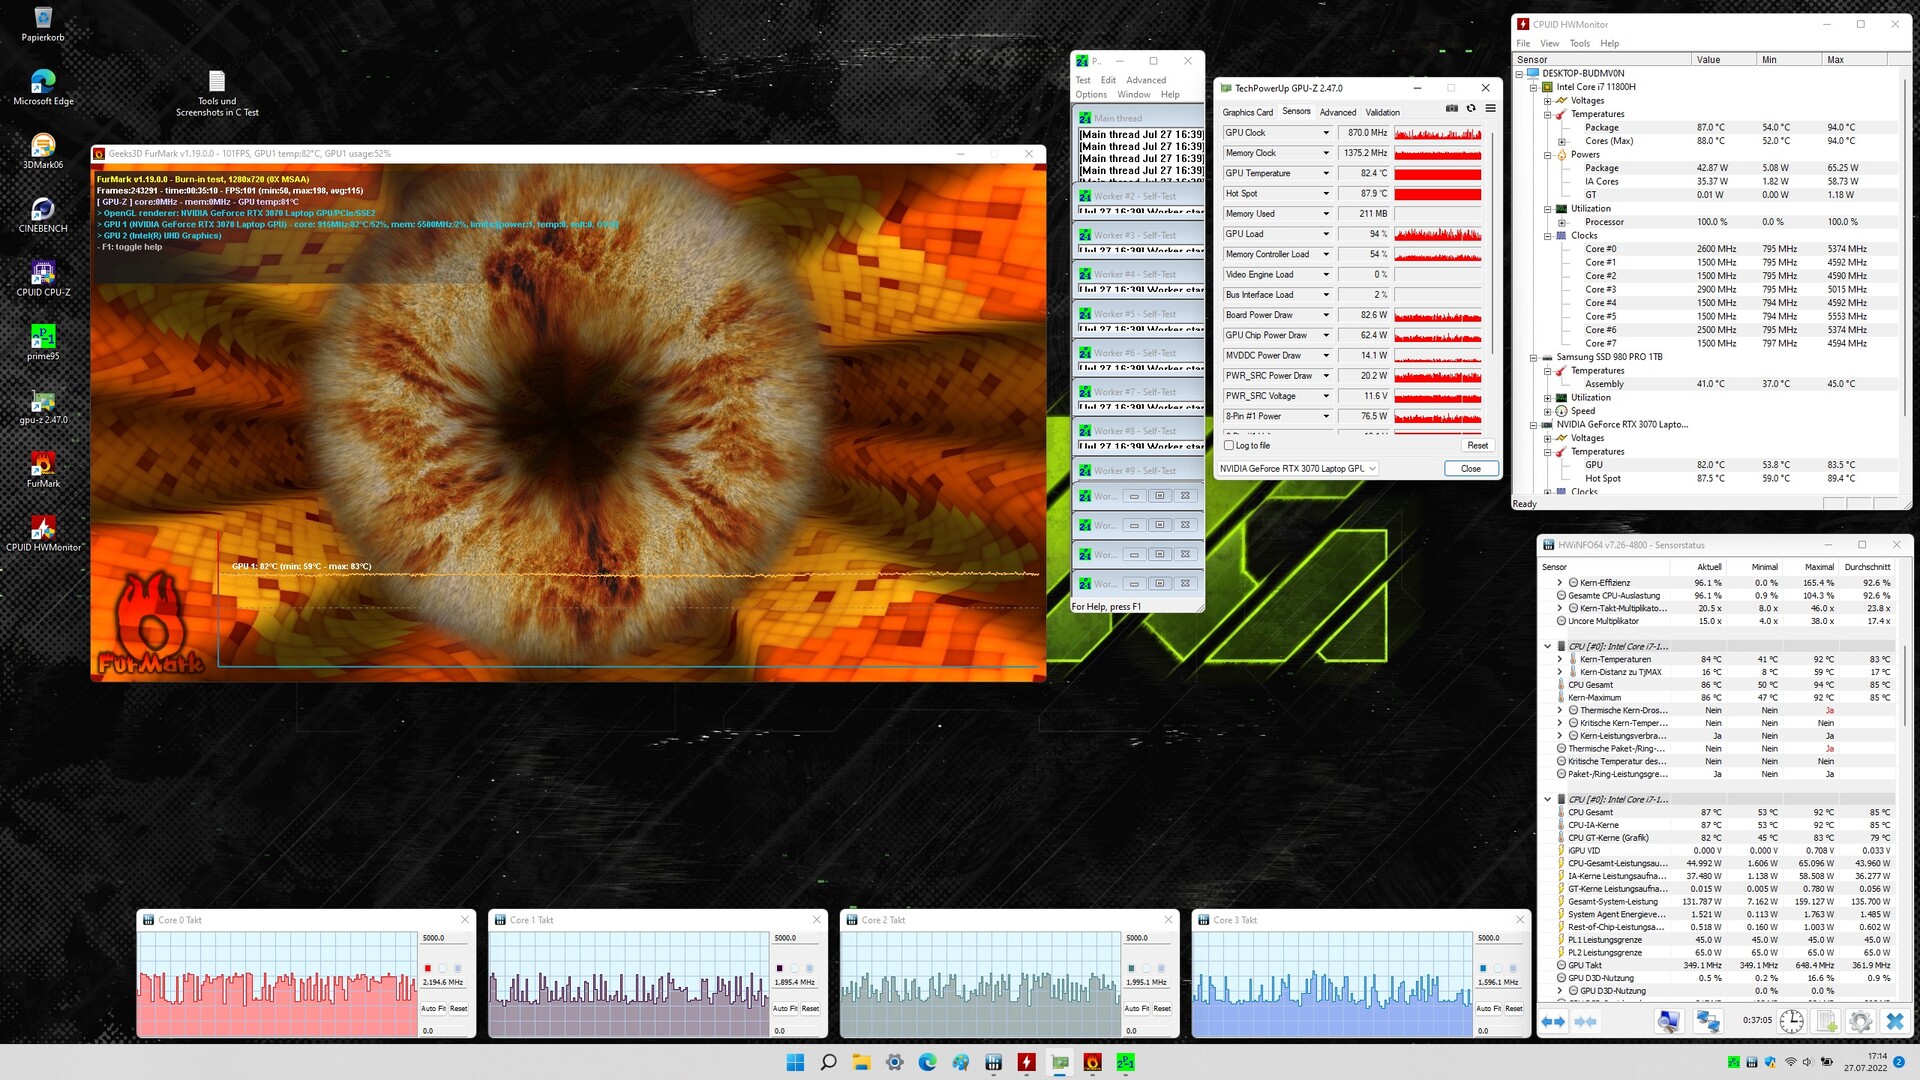
Test da sforzo
La CPU (da 1,8 a 4,2 GHz) e la GPU (da 1.000 a 1.700 MHz) iniziano lo stress test (Prime95 e FurMark durano almeno un'ora) con un alto livello di velocità operative fluttuanti. Man mano che il test procede, le velocità di clock diminuiscono. Lo stress test rappresenta uno scenario estremo. Questo test serve a verificare che il sistema rimanga stabile a pieno carico.
Altoparlanti
Gli altoparlanti stereo offrono un suono relativamente buono, ma i bassi sono quasi inesistenti. Si consiglia di utilizzare cuffie o altoparlanti esterni per un'esperienza sonora migliore
Schenker XMG Fusion 15 (Mid 22) analisi audio
(+) | gli altoparlanti sono relativamente potenti (82 dB)
Bassi 100 - 315 Hz
(-) | quasi nessun basso - in media 17.6% inferiori alla media
(±) | la linearità dei bassi è media (12.1% delta rispetto alla precedente frequenza)
Medi 400 - 2000 Hz
(+) | medi bilanciati - solo only 3% rispetto alla media
(+) | medi lineari (3.9% delta rispetto alla precedente frequenza)
Alti 2 - 16 kHz
(+) | Alti bilanciati - appena 2.8% dalla media
(+) | alti lineari (5.5% delta rispetto alla precedente frequenza)
Nel complesso 100 - 16.000 Hz
(+) | suono nel complesso lineare (13.3% differenza dalla media)
Rispetto alla stessa classe
» 19% di tutti i dispositivi testati in questa classe è stato migliore, 5% simile, 76% peggiore
» Il migliore ha avuto un delta di 6%, medio di 18%, peggiore di 132%
Rispetto a tutti i dispositivi testati
» 14% di tutti i dispositivi testati in questa classe è stato migliore, 3% similare, 83% peggiore
» Il migliore ha avuto un delta di 4%, medio di 23%, peggiore di 134%
Gestione dell'energia: il NUC offre una buona durata della batteria
Consumo di energia
Nel complesso, il consumo di energia si attesta su livelli normali per l'hardware installato. Il nostro test Witcher 3 e lo stress test comportano un consumo medio di 208 watt e fino a 160 watt, rispettivamente. Mentre il nostro test The Witcher 3 viene eseguito con un consumo energetico costante, la richiesta fluttua e diminuisce nel corso dello stress test. L'alimentatore in dotazione (230 watt) ha una capacità sufficiente
| Off / Standby | |
| Idle | |
| Sotto carico |
|
Leggenda:
min: | |
| Schenker XMG Fusion 15 (Mid 22) i7-11800H, GeForce RTX 3070 Laptop GPU | Asus TUF Dash F15 FX517ZR i7-12650H, GeForce RTX 3070 Laptop GPU | Acer Nitro 5 AN515-58-72QR i7-12700H, GeForce RTX 3070 Ti Laptop GPU | HP Omen 16-b1090ng i7-12700H, GeForce RTX 3070 Ti Laptop GPU | MSI Delta 15 A5EFK R9 5900HX, Radeon RX 6700M | Razer Blade 15 Base Edition 2021, i7-10750H RTX 3060 i7-10750H, GeForce RTX 3060 Laptop GPU | Media NVIDIA GeForce RTX 3070 Laptop GPU | Media della classe Gaming | |
|---|---|---|---|---|---|---|---|---|
| Power Consumption | 10% | 2% | 17% | -2% | 2% | -16% | -10% | |
| Idle Minimum * (Watt) | 12 | 10 17% | 7 42% | 4 67% | 10 17% | 11.7 2% | 15.6 ? -30% | 13 ? -8% |
| Idle Average * (Watt) | 17 | 14 18% | 15 12% | 10 41% | 18 -6% | 16 6% | 20.1 ? -18% | 19 ? -12% |
| Idle Maximum * (Watt) | 24 | 20 17% | 24 -0% | 19 21% | 25 -4% | 29.3 -22% | 29.4 ? -22% | 24.6 ? -3% |
| Load Average * (Watt) | 106 | 122 -15% | 124 -17% | 114 -8% | 101 5% | 95.6 10% | 110.8 ? -5% | 110.7 ? -4% |
| Witcher 3 ultra * (Watt) | 159.9 | 138.6 13% | 195.1 -22% | 183.2 -15% | 187 -17% | 141.3 12% | ||
| Load Maximum * (Watt) | 208 | 189 9% | 220 -6% | 221 -6% | 217 -4% | 197 5% | 214 ? -3% | 259 ? -25% |
* ... Meglio usare valori piccoli
Energy consumption during The Witcher 3 / Stress test
Energy consumption with an external monitor
Durata della batteria
Il portatile Schenker offre la migliore durata della batteria nel confronto, e non c'è da sorprendersi: Il portatile ha la capacità della batteria più elevata (93 Wh). Il portatile da 15,6 pollici ha raggiunto tempi di funzionamento di 7:26 ore e 7:28 ore rispettivamente nel nostro test Wi-Fi (accesso a siti web tramite script) e nel test video (cortometraggio Big Buck Bunny (codifica H.264, Full HD) eseguito in loop). Le funzioni di risparmio energetico del portatile sono disattivate durante entrambi i test e la luminosità del display è impostata a circa 150 cd/m². Inoltre, i moduli wireless sono disabilitati per il test video
| Schenker XMG Fusion 15 (Mid 22) i7-11800H, GeForce RTX 3070 Laptop GPU, 93.48 Wh | Asus TUF Dash F15 FX517ZR i7-12650H, GeForce RTX 3070 Laptop GPU, 76 Wh | Acer Nitro 5 AN515-58-72QR i7-12700H, GeForce RTX 3070 Ti Laptop GPU, 57.5 Wh | HP Omen 16-b1090ng i7-12700H, GeForce RTX 3070 Ti Laptop GPU, 83 Wh | MSI Delta 15 A5EFK R9 5900HX, Radeon RX 6700M, 82 Wh | Razer Blade 15 Base Edition 2021, i7-10750H RTX 3060 i7-10750H, GeForce RTX 3060 Laptop GPU, 65 Wh | Media della classe Gaming | |
|---|---|---|---|---|---|---|---|
| Autonomia della batteria | -8% | -45% | -18% | -11% | -34% | -14% | |
| Reader / Idle (h) | 15.5 | 10.8 -30% | 5.7 -63% | 10.1 -35% | 11.1 -28% | 7.8 -50% | 8.27 ? -47% |
| H.264 (h) | 7.5 | 5.8 -23% | 4.7 -37% | 8.32 ? 11% | |||
| WiFi v1.3 (h) | 7.4 | 7 -5% | 3.9 -47% | 5.6 -24% | 7.9 7% | 4.8 -35% | 7.11 ? -4% |
| Load (h) | 1.8 | 2.3 28% | 1.2 -33% | 1.9 6% | 1.6 -11% | 1.5 -17% | 1.502 ? -17% |
Pro
Contro
Verdetto - Compatto e potente
Rendering e giochi sono tra le competenze principali di questo portatile compatto e leggero. È possibile giocare in QHD con impostazioni elevate o massime. L'attenzione non è rivolta alle massime prestazioni, ma a un compromesso tra prestazioni e portabilità.
Con l'XMG Fusion 15 (Mid 22), Schenker offre un portatile da gioco compatto e completo. Tuttavia, non otterrà alcun punto in termini di stile.
Il Core i7-11800H e la GeForce RTX 3070 possono funzionare a velocità di clock costantemente elevate. A seconda delle impostazioni, le prestazioni della GPU sono pari o superiori alla media della RTX 3070. Il portatile si riscalda in modo significativo sotto carico e la rumorosità raggiunge il livello abituale della categoria. Il dispositivo può funzionare tranquillamente nell'uso quotidiano.
La batteria da 93 Wh garantisce un'autonomia pratica di circa 7:30 ore, una percentuale piuttosto buona. Peccato: la batteria non può essere ricaricata tramite la porta USB-C (Thunderbolt 4). Sarebbe stata una funzione molto utile, soprattutto per un dispositivo progettato per la mobilità. Tuttavia, la porta Thunderbolt 4 offre opzioni di espansione sotto forma di una soluzione docking o di una GPU esterna.
La tastiera meccanica (con retroilluminazione RGB a singolo tasto) ha lasciato una buona impressione e probabilmente sarà un criterio importante per molti potenziali acquirenti. Il display opaco QHD (15,6 pollici, IPS, 165 Hz) non soffre di grossi punti deboli, ma non è nemmeno un display di punta. Il pannello guadagna punti con una buona riproduzione dei colori, una discreta copertura dello spazio colore e tempi di risposta rapidi.
Un'alternativa al Fusion potrebbe essere il Asus TUF Dash F15 FX517ZR, anch'esso leggero e compatto. Il portatile offre una migliore copertura dello spazio colore, Adaptive Sync, una modalità dGPU e Power Delivery. Le prestazioni della GPU, tuttavia, sono leggermente inferiori a quelle del Fusion 15.
Prezzo e disponibilità
Lo Schenker XMG Fusion 15 (Mid 2022) può essere personalizzato nel negozio online di Schenker. La variante di configurazione che ci è stata fornita (Core i7-11800H, GeForce RTX 3070 Laptop, 32 GB di RAM, 1 TB SSD, display QHD) è disponibile per poco meno di 2.000 euro (~$1.991). I modelli entry-level sono disponibili a partire da circa 1.500 euro (~$1.493).
Suggerimento: Al momento in cui scriviamo, il negozio online offre uno sconto di 150 Euro (~$149) su ogni configurazione della Fusion. Lo sconto viene applicato nel carrello.
Schenker XMG Fusion 15 (Mid 22)
- 08/21/2022 v7 (old)
Sascha Mölck
Price comparison

