Recensione dell'XMG Apex 15 Max (Clevo NH57VR): Gaming Laptop con CPU desktop

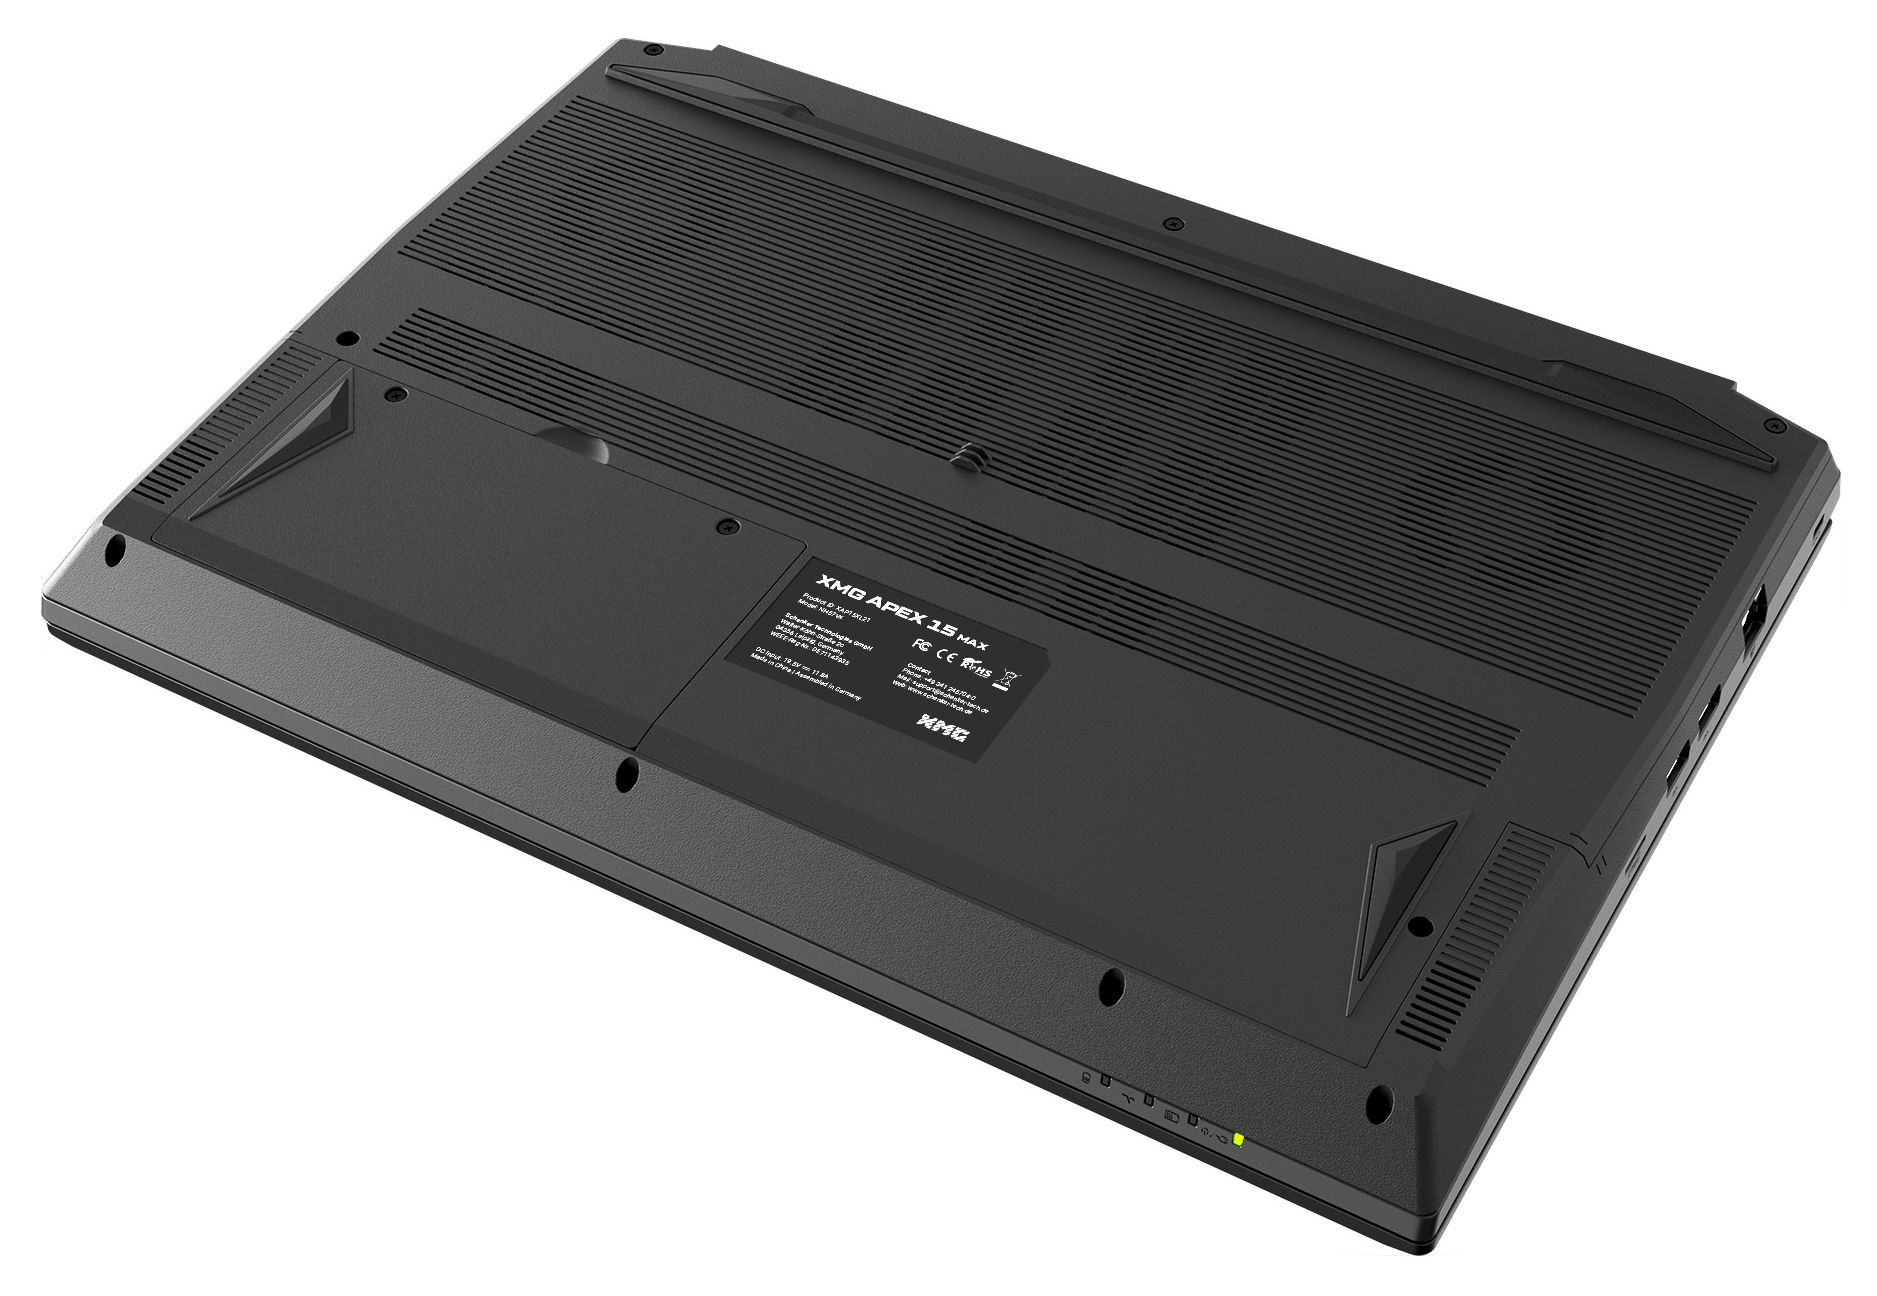
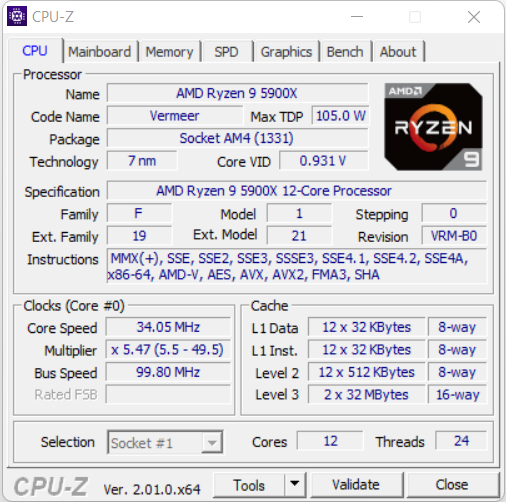
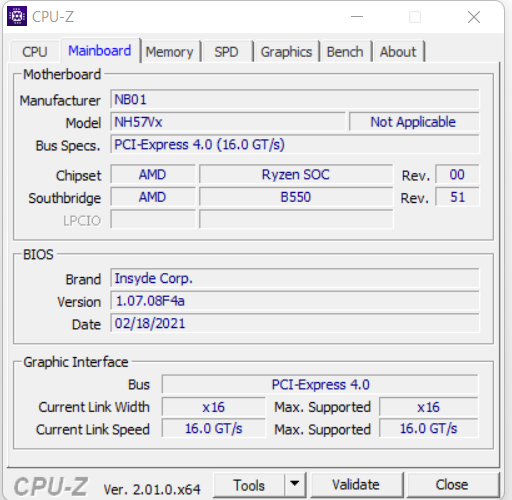
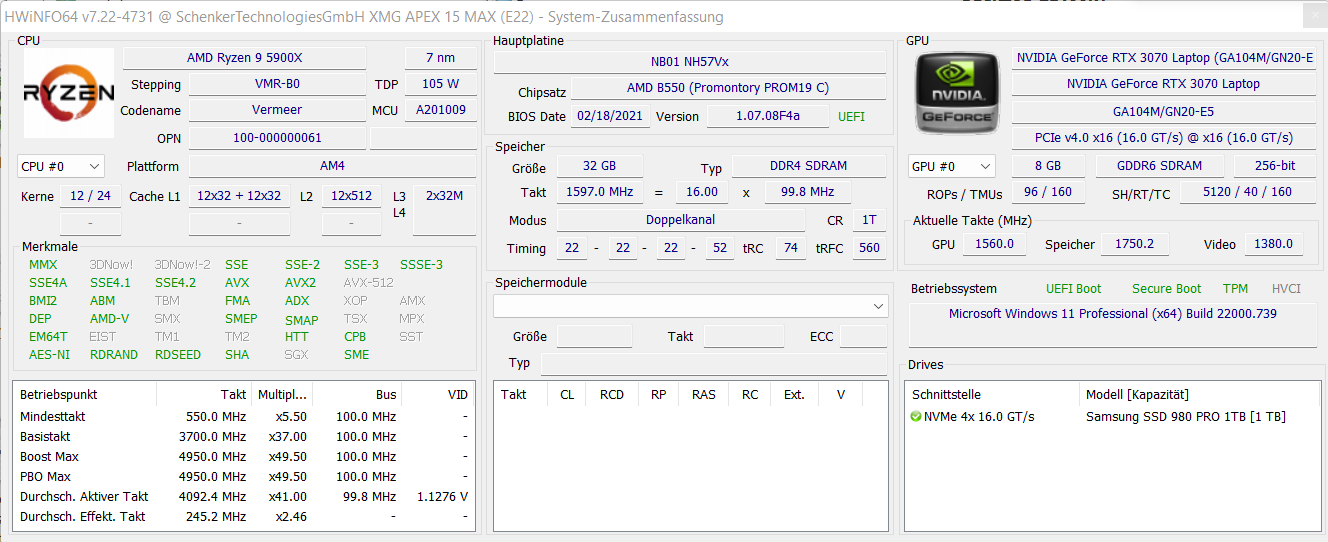
Sebbene lo Schenker XMG Apex 15 Max sia pubblicizzato principalmente come portatile da gioco, si rivolge anche all'area workstation e DTR. All'interno del Clevo Barebone (NH57VR) qui utilizzato sono presenti un processore sostituibile Ryzen 9-5900Xdesktop e una GeForce RTX 3070 per laptopgPU.
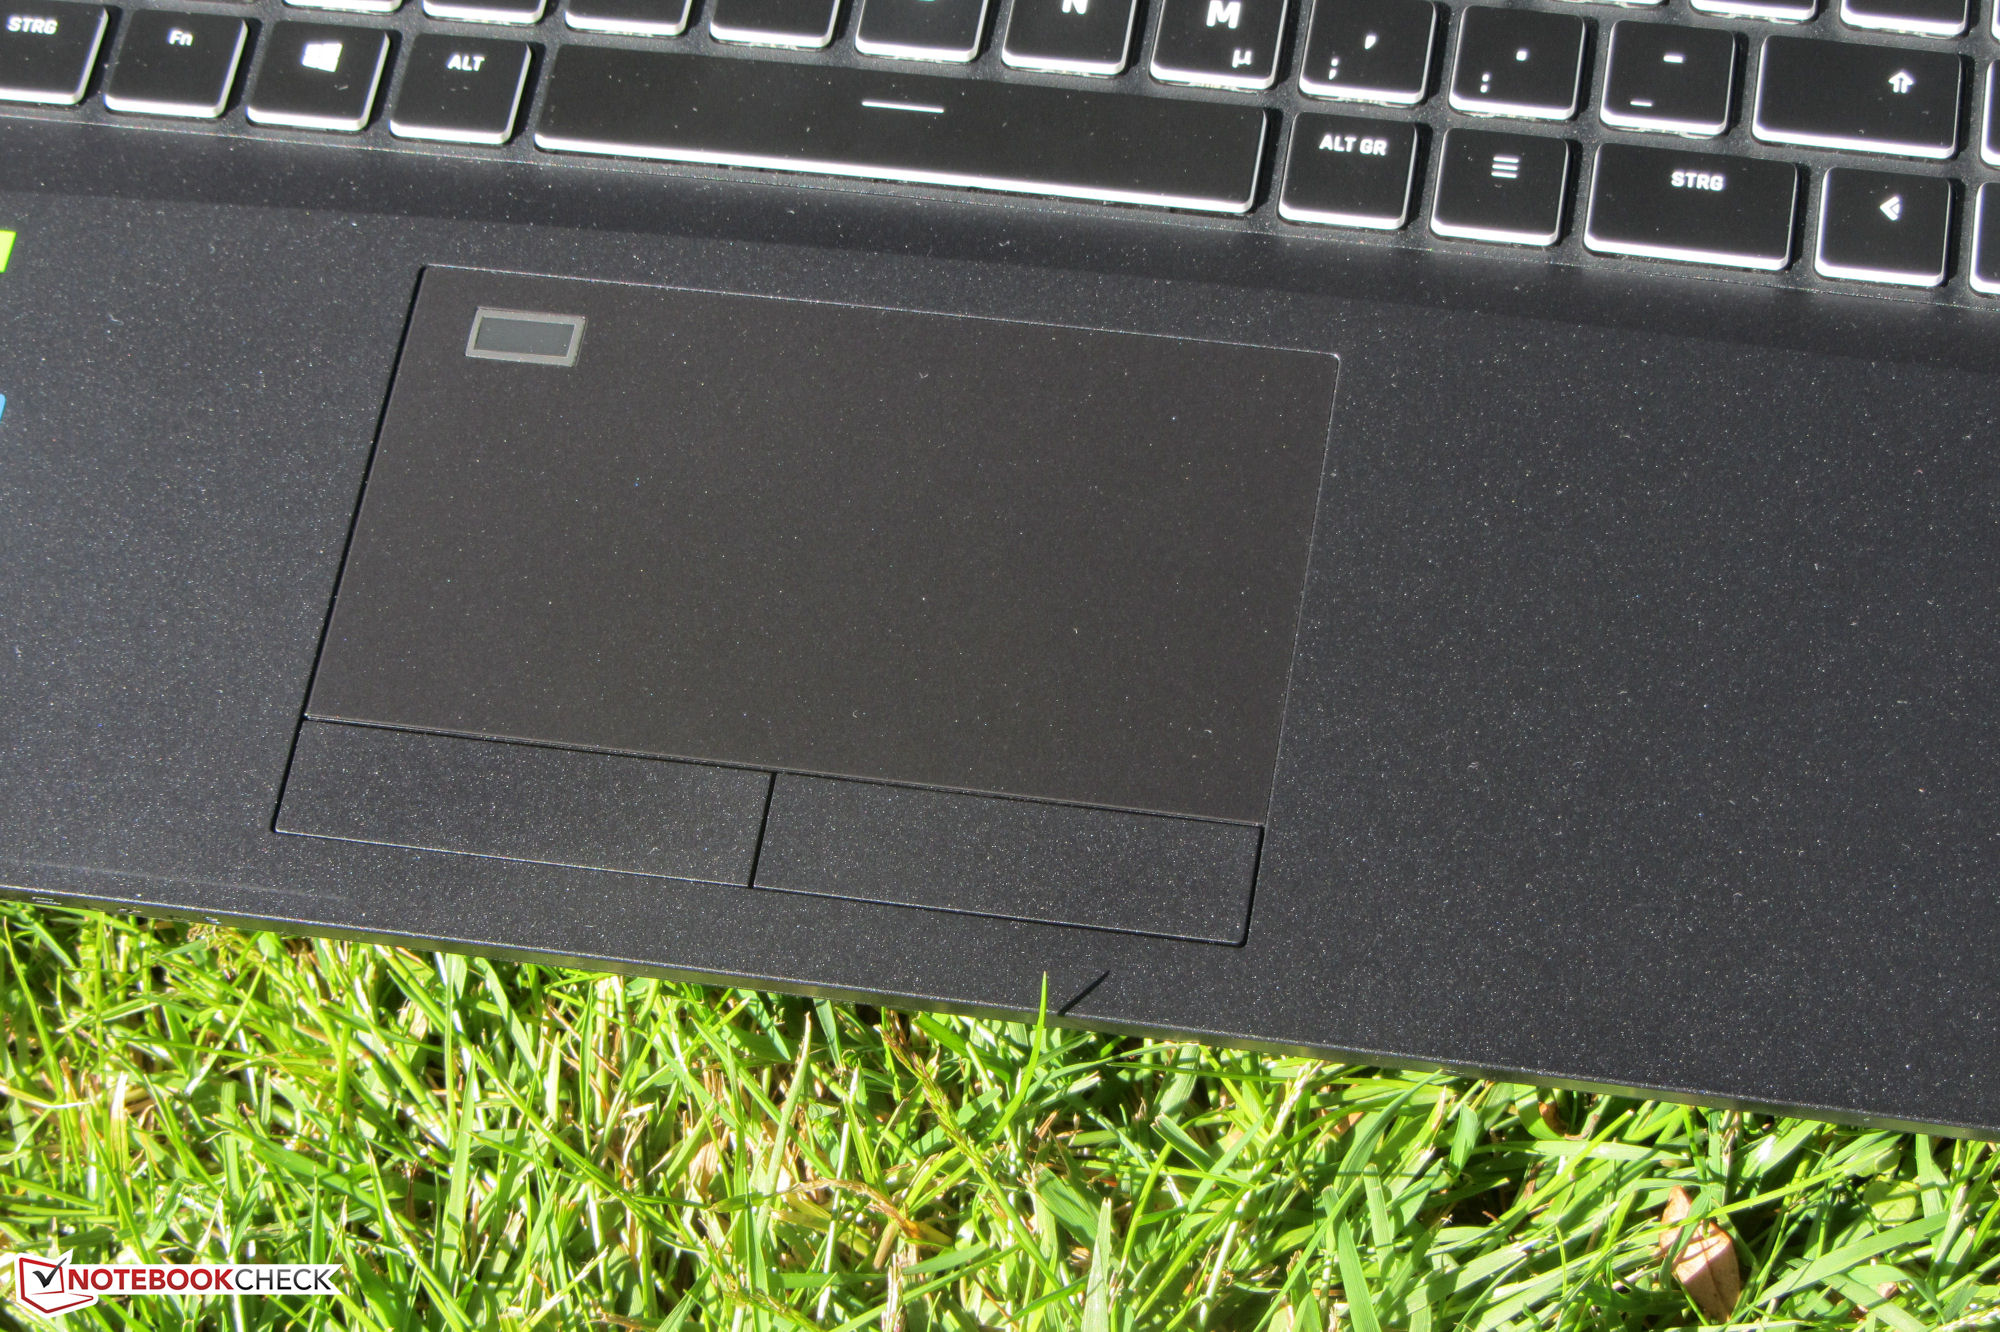
Si tratta del successore, dalla struttura identica, del modello Schenker XMG Apex 15 (2020). Pertanto, non parleremo di nuovo del case, dell'equipaggiamento, dei dispositivi di input e degli altoparlanti. Potete trovare le informazioni corrispondenti nella recensione del vecchio Apex 15.
Potenziali concorrenti a confronto
Punteggio | Data | Modello | Peso | Altezza | Dimensione | Risoluzione | Prezzo |
|---|---|---|---|---|---|---|---|
| 83.4 % v7 (old) | 06/2022 | Schenker XMG Apex 15 Max R9 5900X, GeForce RTX 3070 Laptop GPU | 2.6 kg | 32.5 mm | 15.60" | 1920x1080 | |
| 83 % v7 (old) | 01/2022 | Eurocom Nightsky ARX315 R9 5900X, GeForce RTX 3070 Laptop GPU | 2.6 kg | 32.5 mm | 15.60" | 1920x1080 | |
| 86.9 % v7 (old) | 03/2022 | MSI Vector GP66 12UGS i9-12900H, GeForce RTX 3070 Ti Laptop GPU | 2.3 kg | 23.4 mm | 15.60" | 1920x1080 | |
| 85.5 % v7 (old) | 05/2022 | HP Omen 16-b1090ng i7-12700H, GeForce RTX 3070 Ti Laptop GPU | 2.3 kg | 23 mm | 16.10" | 2560x1440 | |
| 84.1 % v7 (old) | 01/2022 | Gigabyte A5 X1 R9 5900HX, GeForce RTX 3070 Laptop GPU | 2.2 kg | 25.3 mm | 15.60" | 1920x1080 |

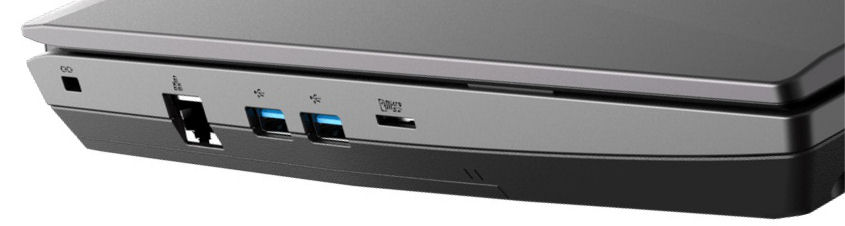
| SD Card Reader | |
| average JPG Copy Test (av. of 3 runs) | |
| Media della classe Gaming (20.9 - 210, n=54, ultimi 2 anni) | |
| Schenker XMG Apex 15 Max (AV PRO microSD 128 GB V60) | |
| Eurocom Nightsky ARX315 (AV Pro V60) | |
| HP Omen 16-b1090ng (AV PRO microSD 128 GB V60) | |
| maximum AS SSD Seq Read Test (1GB) | |
| Media della classe Gaming (25.5 - 261, n=51, ultimi 2 anni) | |
| Schenker XMG Apex 15 Max (AV PRO microSD 128 GB V60) | |
| Eurocom Nightsky ARX315 (AV Pro V60) | |


Display - IPS a 240 Hz
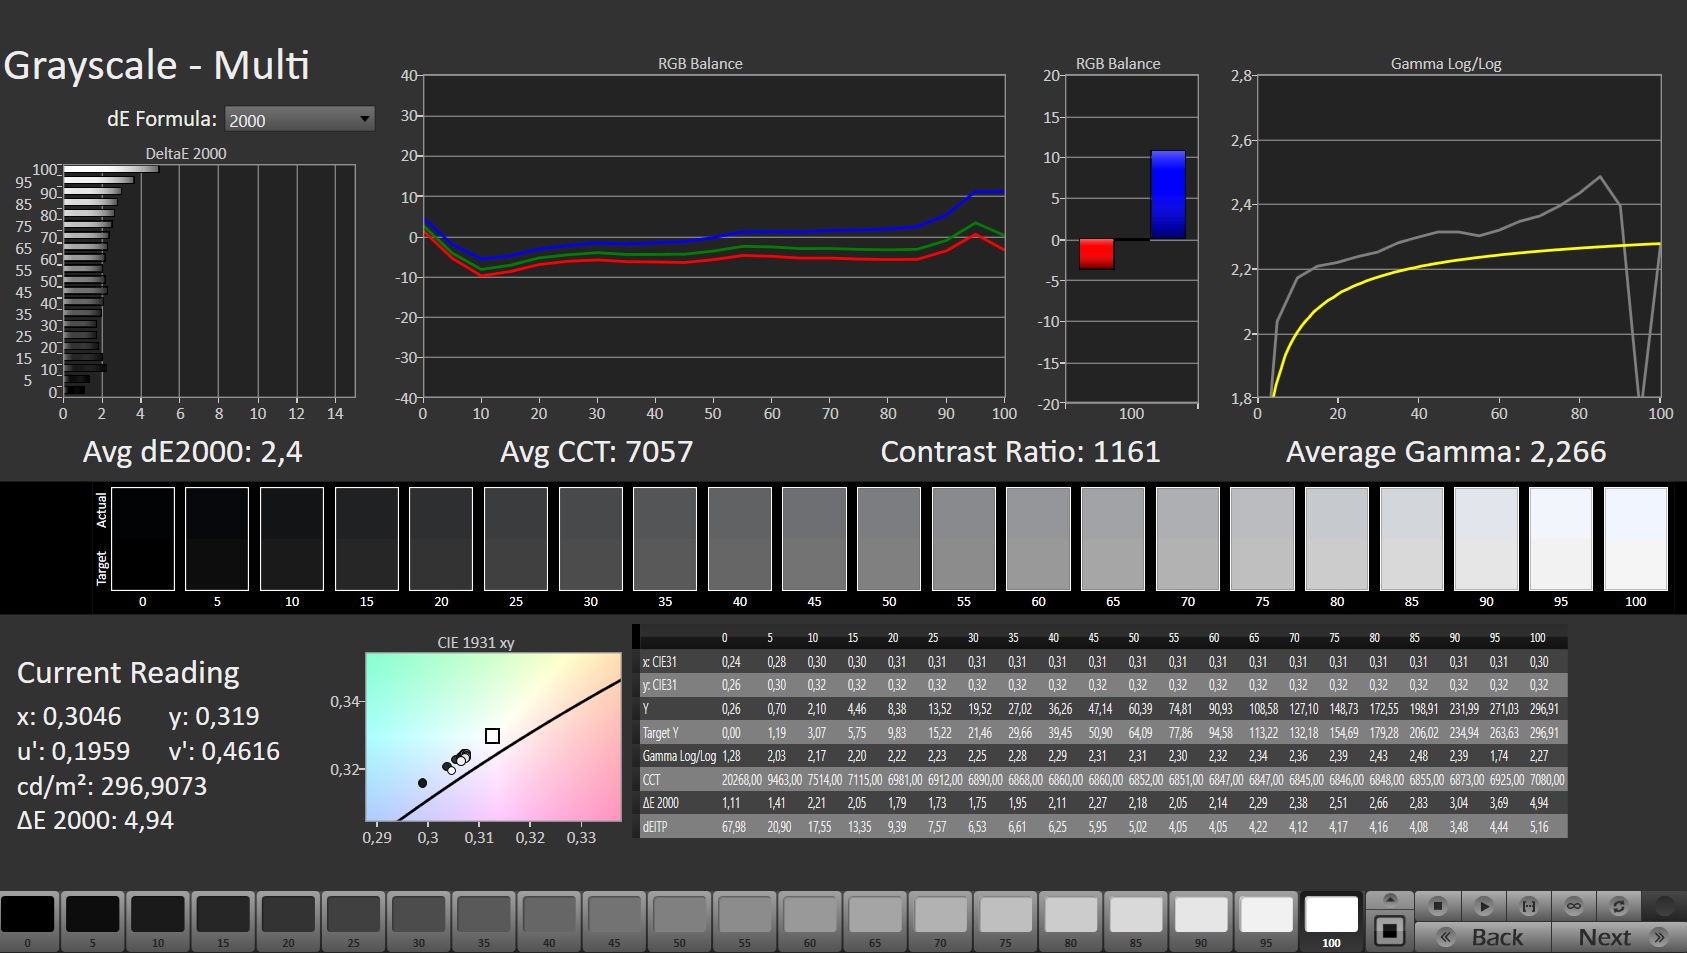
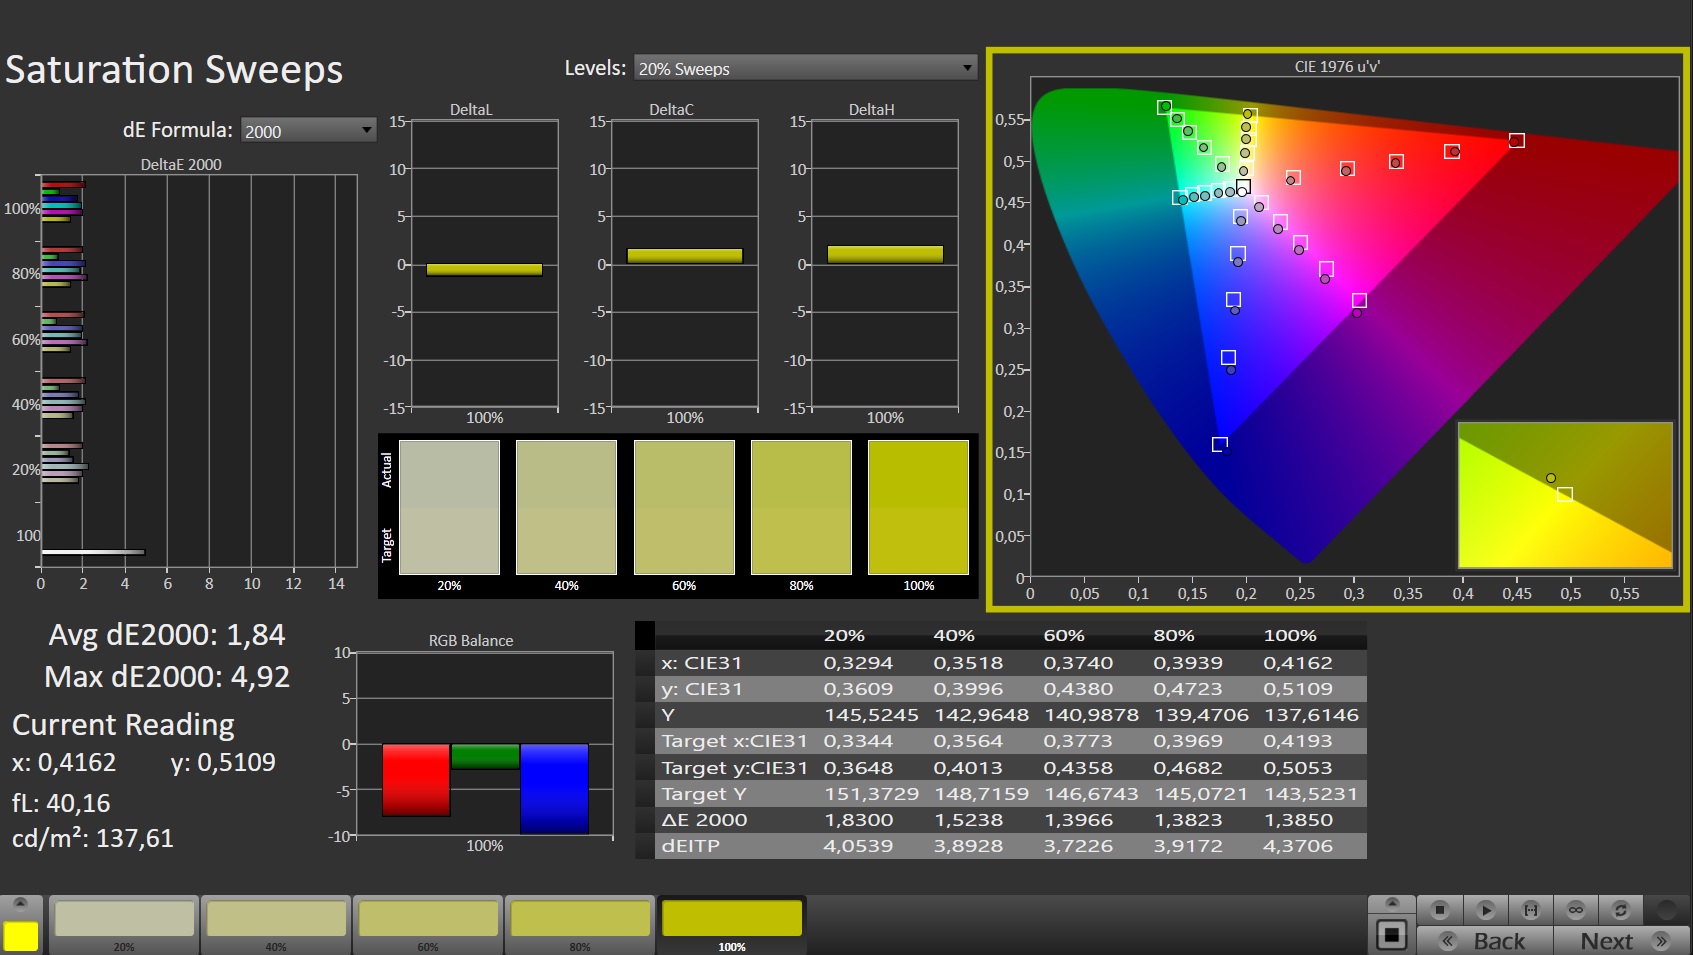
Mentre il contrasto (1096:1) del display opaco da 15,6 pollici (1920 x 1080 pixel) soddisfa i requisiti (> 1000:1), la luminosità (264,2 cd/m²) risulta troppo bassa. Consideriamo buoni i valori superiori a 300 cd/m². Il pannello a 240 Hz offre tempi di risposta brevi.
Gli strumenti di misurazione registrano uno sfarfallio ad alta frequenza (23.545 Hz) a livelli di luminosità pari o inferiori al 35%. Ciò significa che gli utenti sensibili dovrebbero essere risparmiati da mal di testa o problemi agli occhi.

| |||||||||||||||||||||||||
Distribuzione della luminosità: 86 %
Al centro con la batteria: 285 cd/m²
Contrasto: 1096:1 (Nero: 0.26 cd/m²)
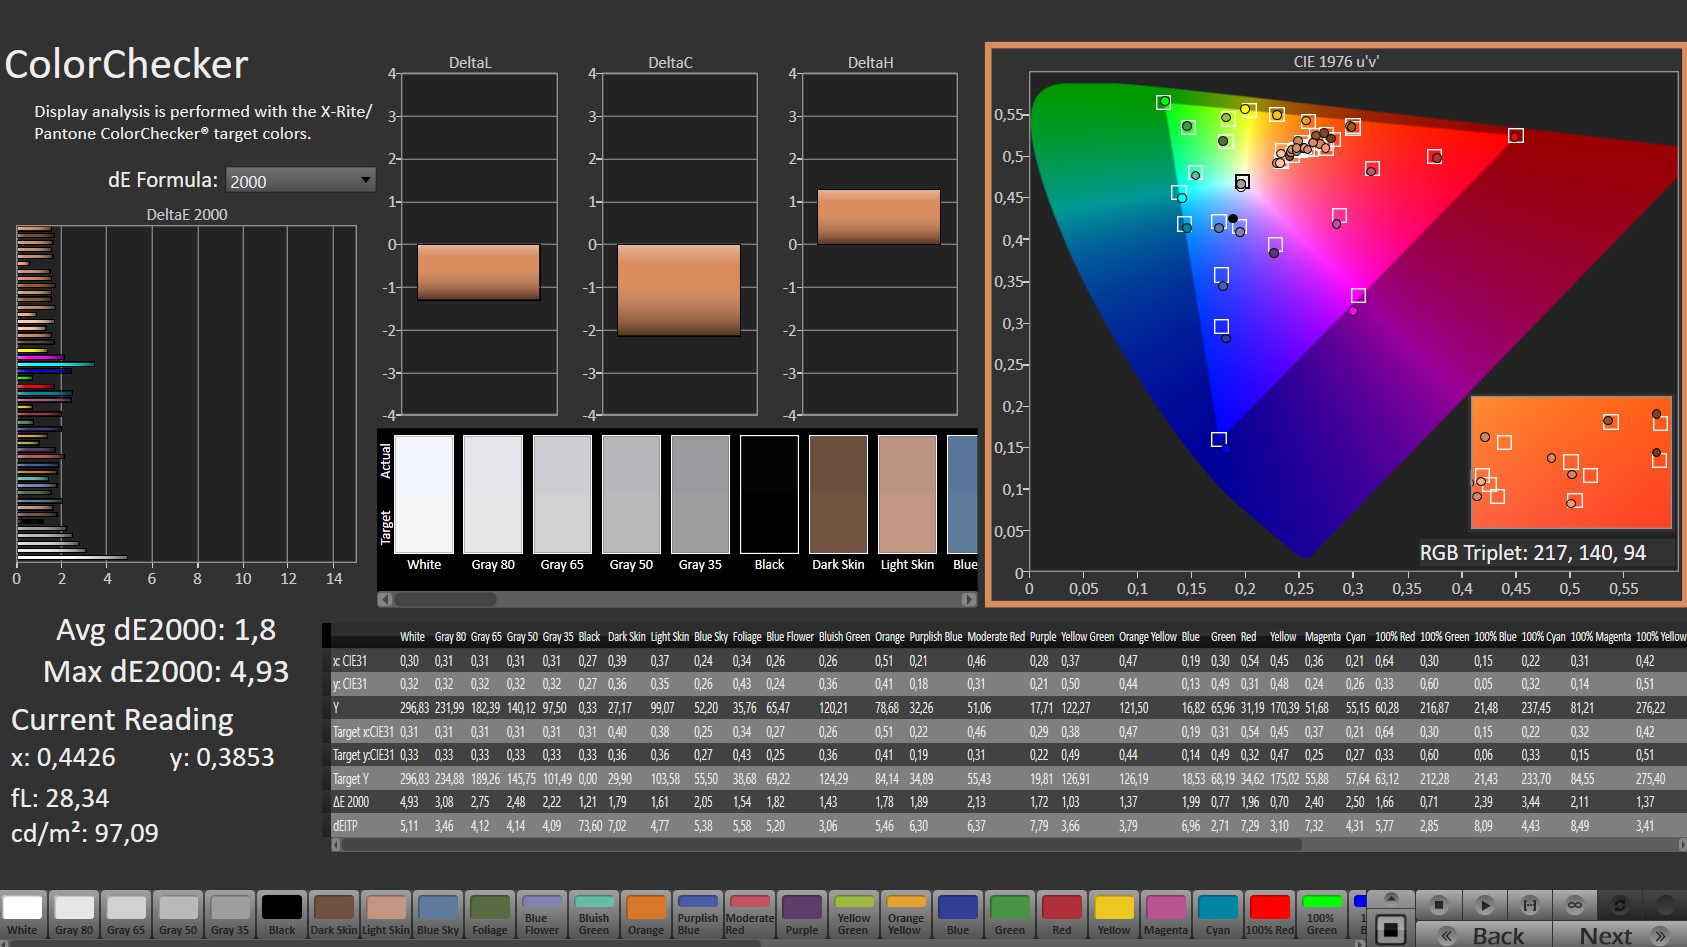
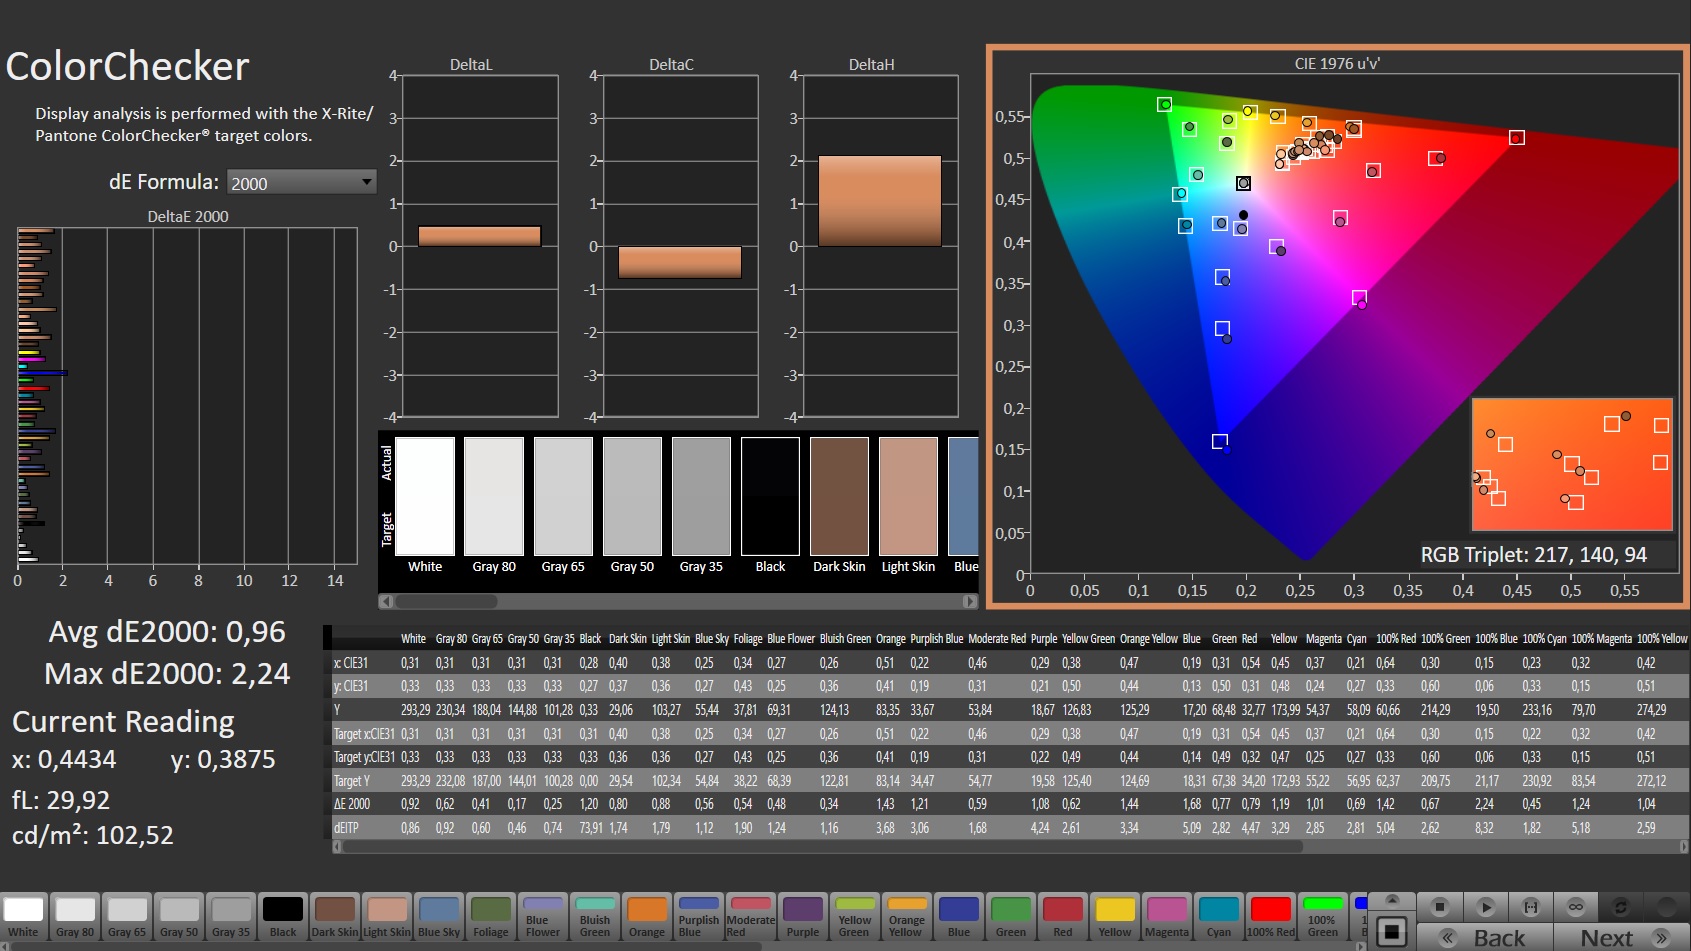
ΔE ColorChecker Calman: 1.8 | ∀{0.5-29.43 Ø4.71}
calibrated: 0.96
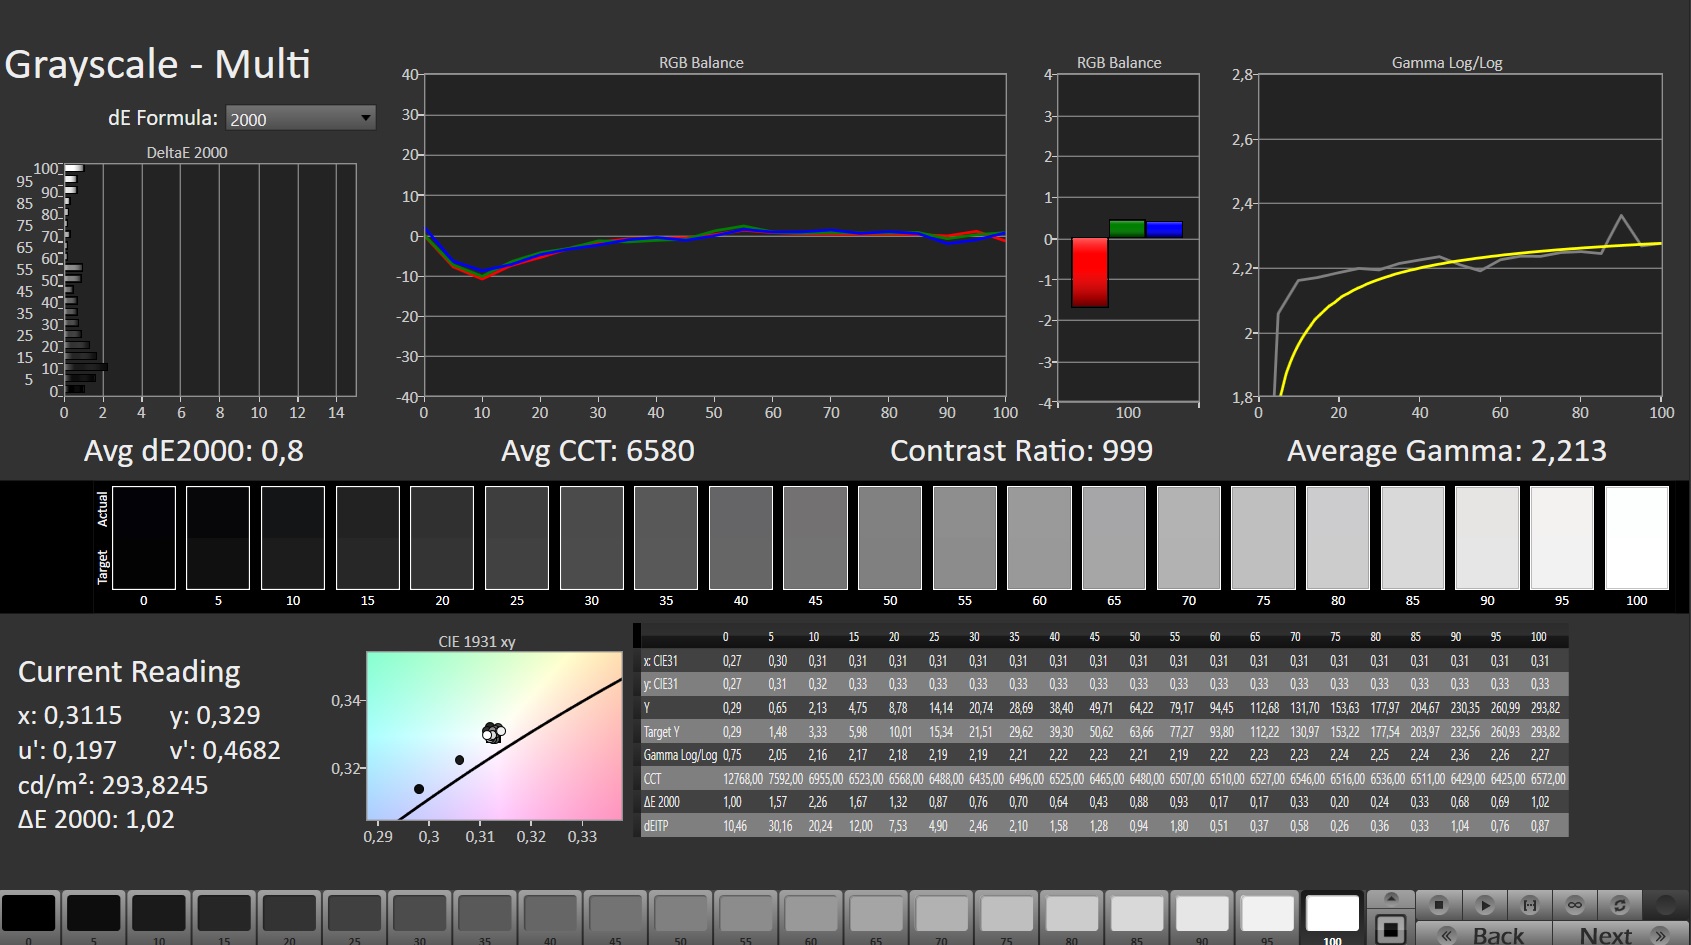
ΔE Greyscale Calman: 2.4 | ∀{0.09-98 Ø4.96}
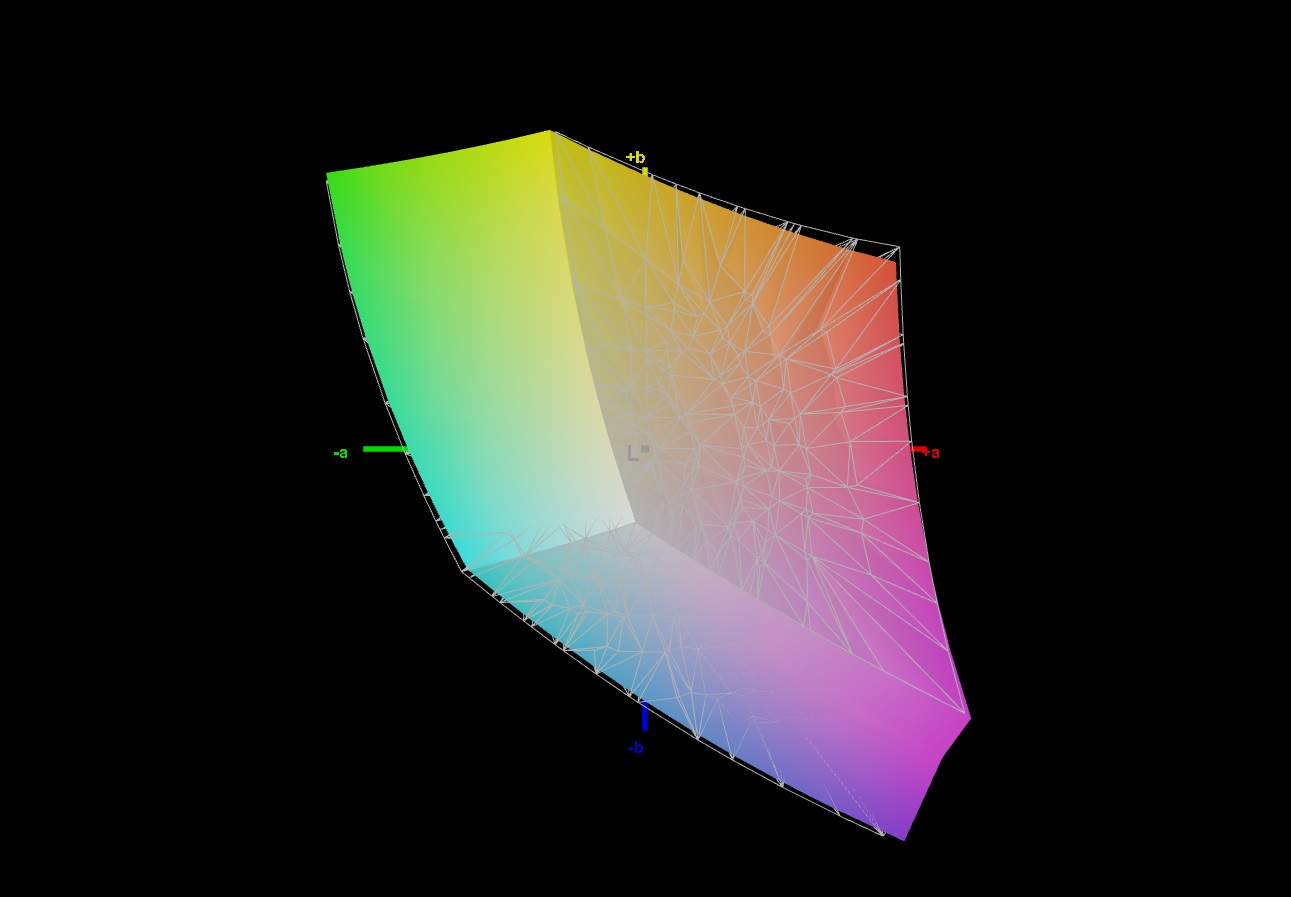
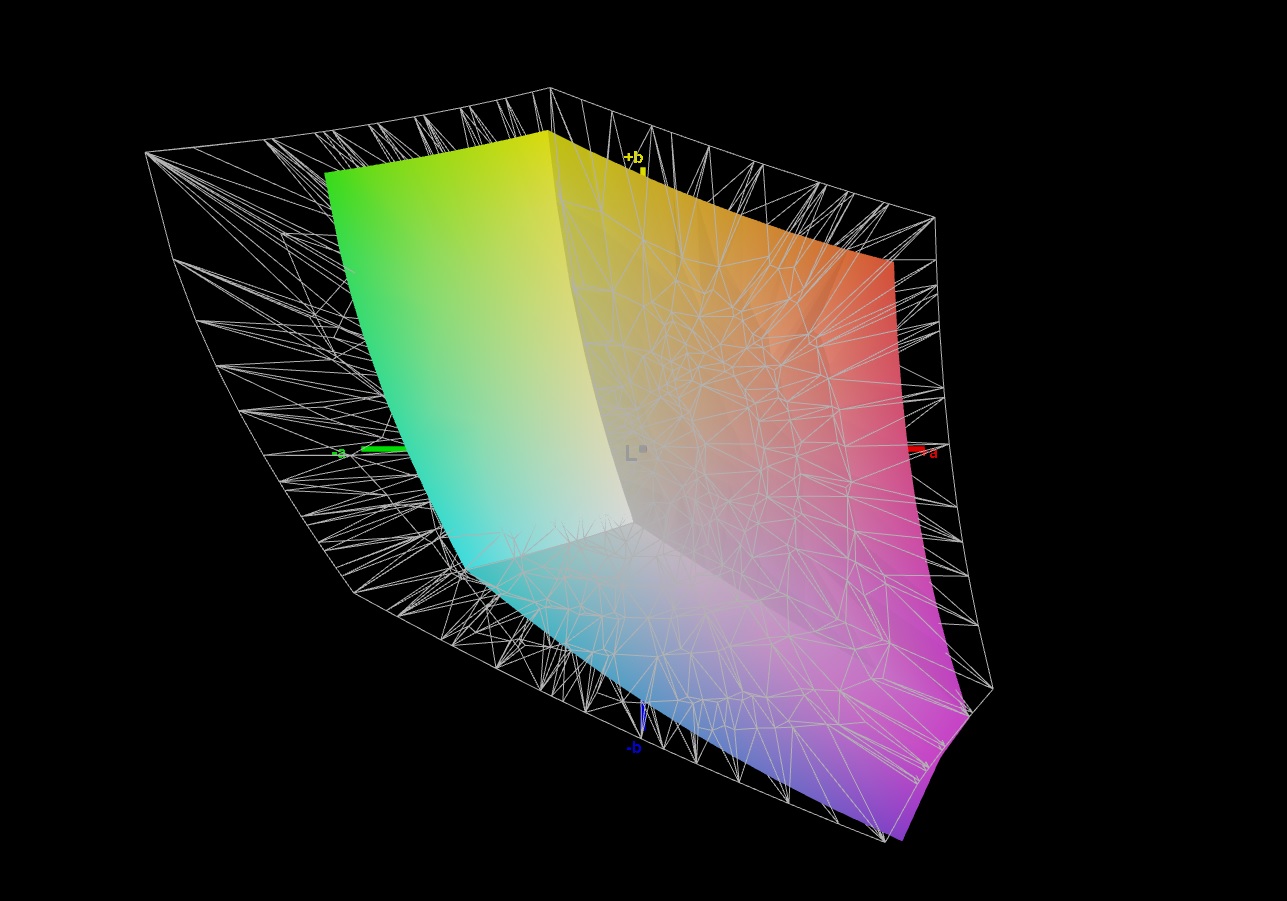
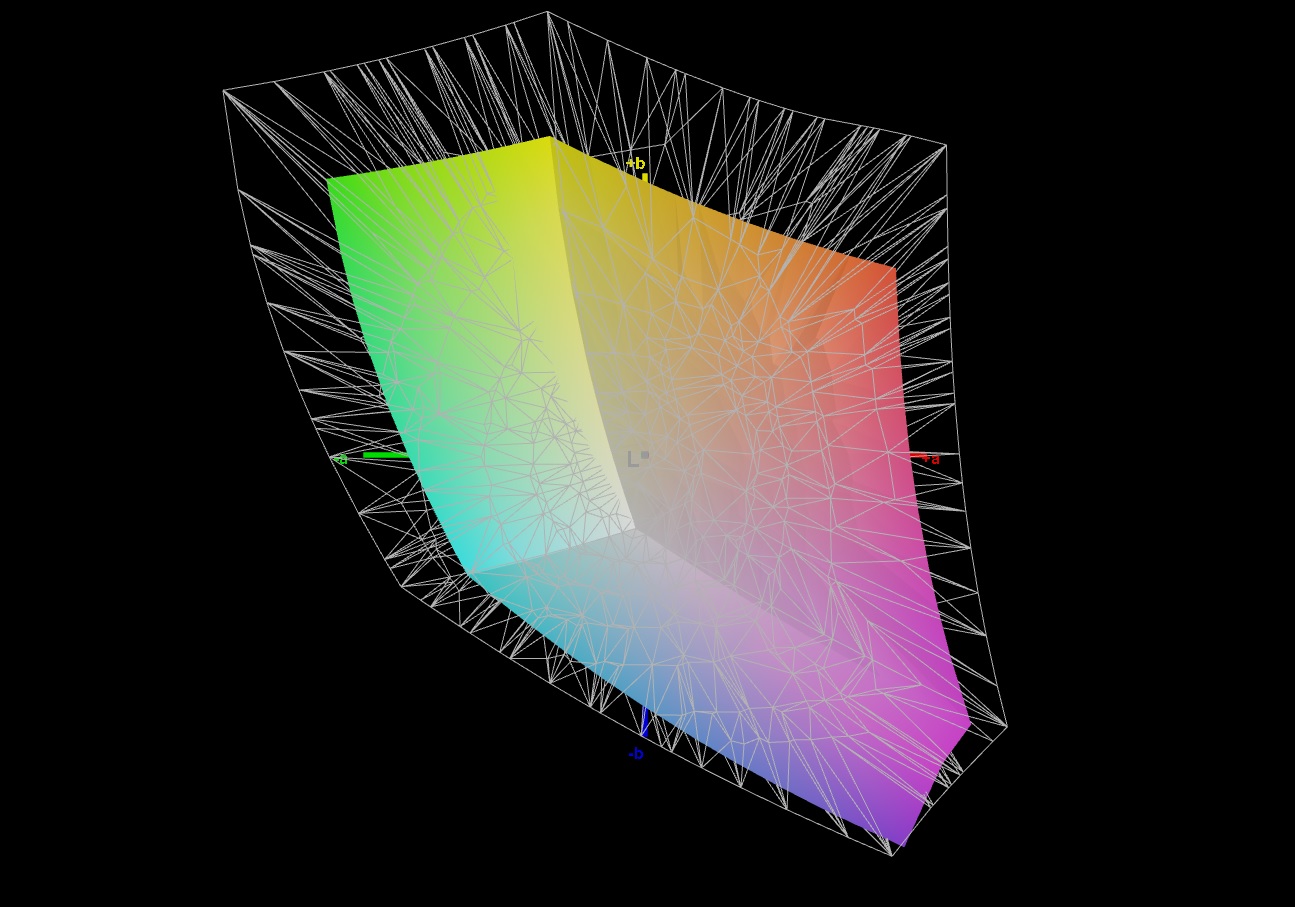
66.8% AdobeRGB 1998 (Argyll 3D)
97% sRGB (Argyll 3D)
65.4% Display P3 (Argyll 3D)
Gamma: 2.266
CCT: 7057 K
| Schenker XMG Apex 15 Max Sharp LQ156M1JW03, IPS, 1920x1080, 15.6" | Eurocom Nightsky ARX315 Sharp LQ156M1JW03, IPS, 1920x1080, 15.6" | MSI Vector GP66 12UGS BOE NE156FHM-NZ3, IPS, 1920x1080, 15.6" | HP Omen 16-b1090ng BOE09E5, IPS, 2560x1440, 16.1" | Schenker XMG Apex 15 NH57AF1 AU Optronics B156HAN (AUO80ED), IPS, 1920x1080, 15.6" | Gigabyte A5 X1 AU Optronics B156HAN12.0, IPS, 1920x1080, 15.6" | |
|---|---|---|---|---|---|---|
| Display | 6% | 6% | 7% | -1% | 5% | |
| Display P3 Coverage (%) | 65.4 | 67.9 4% | 70.1 7% | 71 9% | 67.3 3% | 69.6 6% |
| sRGB Coverage (%) | 97 | 99.7 3% | 99.5 3% | 97.9 1% | 91.3 -6% | 98.6 2% |
| AdobeRGB 1998 Coverage (%) | 66.8 | 73.7 10% | 72.1 8% | 73.3 10% | 66.8 0% | 70.8 6% |
| Response Times | -50% | 11% | -36% | -63% | 6% | |
| Response Time Grey 50% / Grey 80% * (ms) | 9.3 ? | 15.2 ? -63% | 5.8 ? 38% | 14.5 ? -56% | 17.6 ? -89% | 4.8 ? 48% |
| Response Time Black / White * (ms) | 8.2 ? | 11.2 ? -37% | 9.6 ? -17% | 9.4 ? -15% | 11.2 ? -37% | 11.2 ? -37% |
| PWM Frequency (Hz) | 23545 ? | 23150 ? | ||||
| Screen | -18% | -13% | -47% | -32% | -22% | |
| Brightness middle (cd/m²) | 285 | 312.8 10% | 353.1 24% | 335 18% | 317 11% | 335 18% |
| Brightness (cd/m²) | 264 | 294 11% | 325 23% | 319 21% | 316 20% | 325 23% |
| Brightness Distribution (%) | 86 | 90 5% | 85 -1% | 90 5% | 84 -2% | 90 5% |
| Black Level * (cd/m²) | 0.26 | 0.28 -8% | 0.38 -46% | 0.28 -8% | 0.28 -8% | 0.4 -54% |
| Contrast (:1) | 1096 | 1117 2% | 929 -15% | 1196 9% | 1132 3% | 838 -24% |
| Colorchecker dE 2000 * | 1.8 | 2.96 -64% | 2.24 -24% | 4.38 -143% | 3.52 -96% | 2.63 -46% |
| Colorchecker dE 2000 max. * | 4.93 | 6.23 -26% | 5 -1% | 9.48 -92% | 6.93 -41% | 7.71 -56% |
| Colorchecker dE 2000 calibrated * | 0.96 | 1.02 -6% | 1.33 -39% | 2.49 -159% | 0.97 -1% | |
| Greyscale dE 2000 * | 2.4 | 4.2 -75% | 4 -67% | 7 -192% | 2.81 -17% | 4 -67% |
| Gamma | 2.266 97% | 2.32 95% | 2.24 98% | 2.103 105% | 2.54 87% | 2.129 103% |
| CCT | 7057 92% | 7145 91% | 6864 95% | 6244 104% | 6877 95% | 7434 87% |
| Color Space (Percent of AdobeRGB 1998) (%) | 67 | |||||
| Color Space (Percent of sRGB) (%) | 91 | |||||
| Media totale (Programma / Settaggio) | -21% /
-18% | 1% /
-5% | -25% /
-34% | -32% /
-30% | -4% /
-13% |
* ... Meglio usare valori piccoli
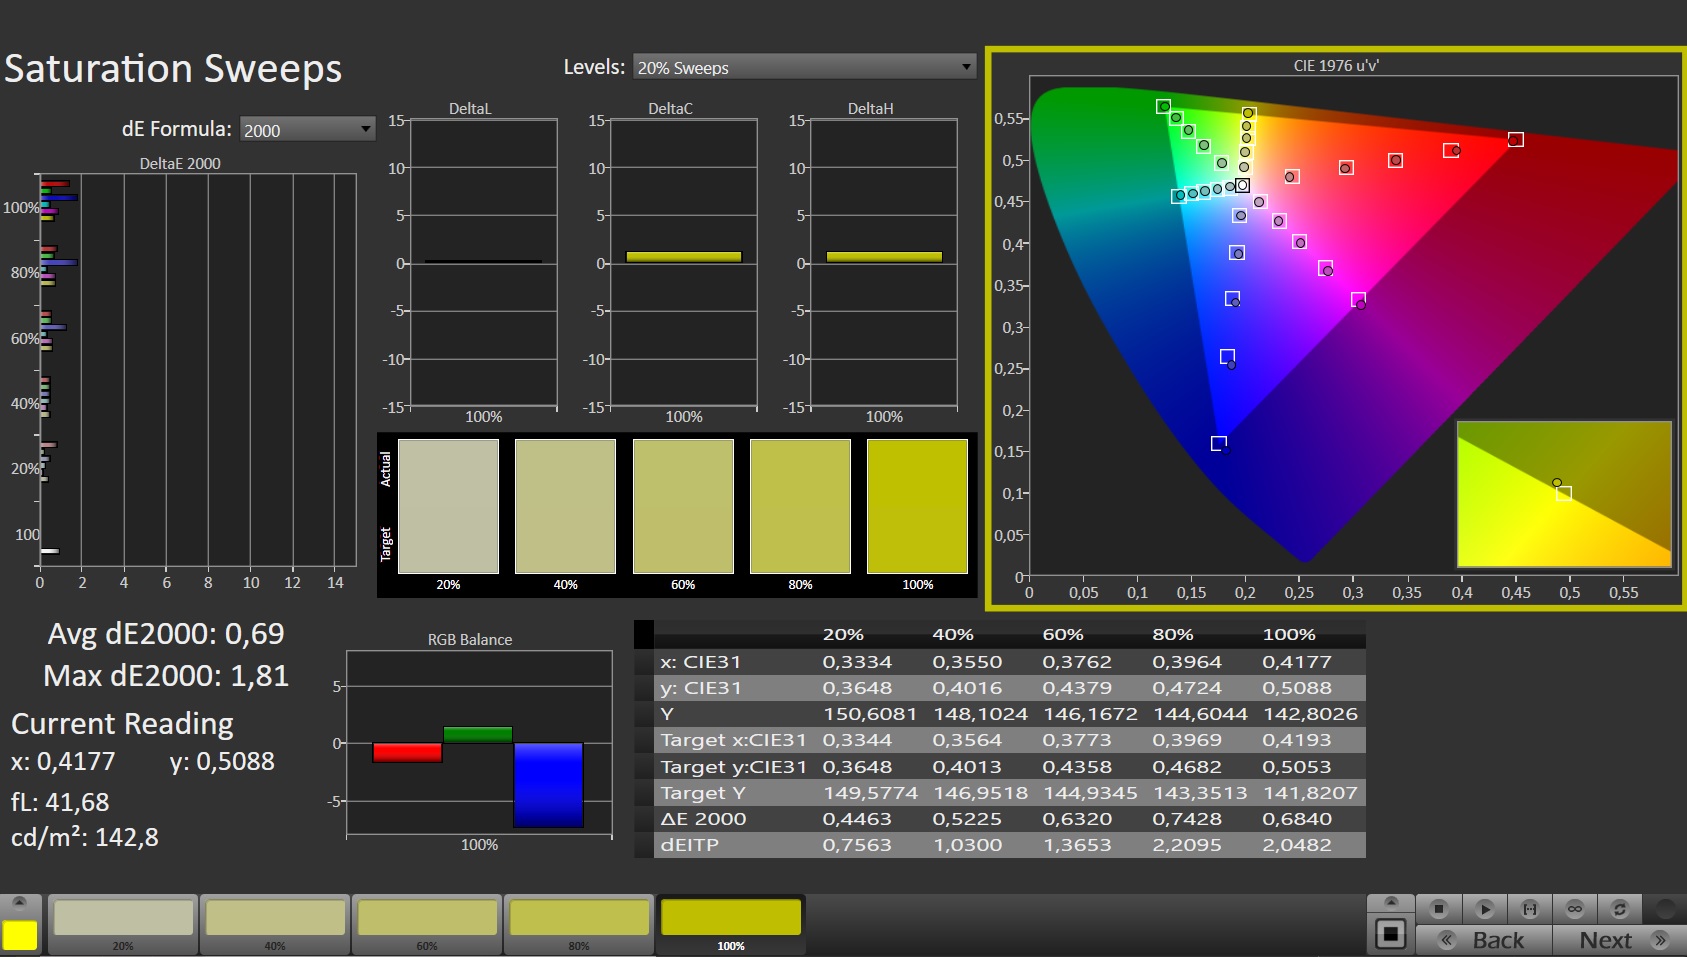
Il display mostra una buona riproduzione dei colori già in fase di consegna e le deviazioni cromatiche rimangono all'interno dell'intervallo previsto. Tuttavia, una calibrazione apporta ancora alcuni miglioramenti. Il display non è in grado di coprire gli spazi cromatici AdobeRGB (67%) e DCI-P3 (65%), ma viene visualizzato almeno il 97% dello spazio cromatico sRGB.
Tempi di risposta del Display
| ↔ Tempi di risposta dal Nero al Bianco | ||
|---|---|---|
| 8.2 ms ... aumenta ↗ e diminuisce ↘ combinato | ↗ 4.3 ms Incremento | 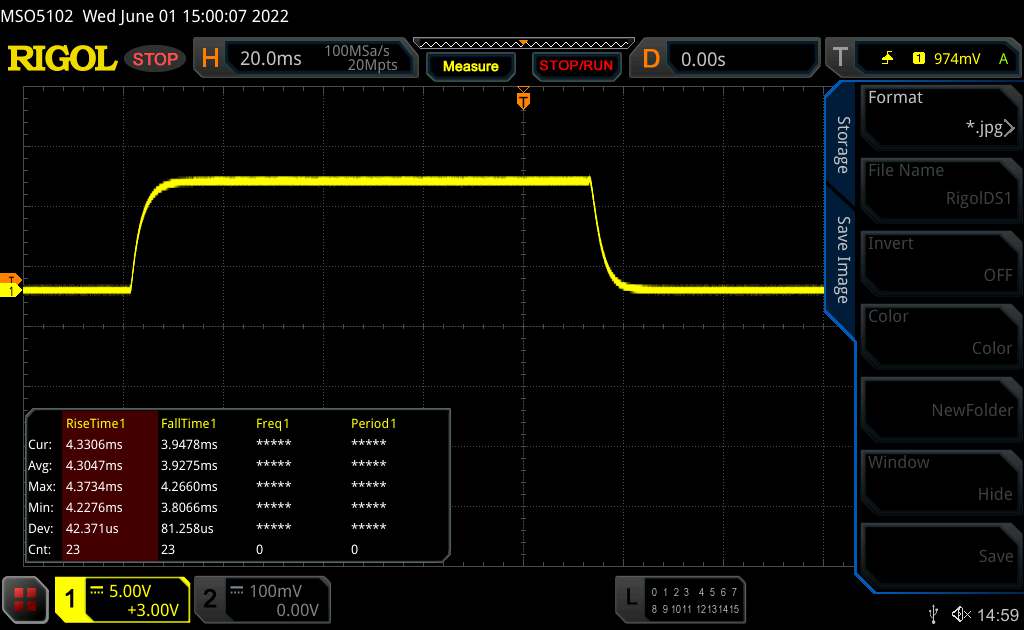 |
| ↘ 3.9 ms Calo | ||
| Lo schermo mostra veloci tempi di risposta durante i nostri tests e dovrebbe esere adatto al gaming In confronto, tutti i dispositivi di test variano da 0.1 (minimo) a 240 (massimo) ms. » 24 % di tutti i dispositivi è migliore. Questo significa che i tempi di risposta rilevati sono migliori rispettto alla media di tutti i dispositivi testati (19.8 ms). | ||
| ↔ Tempo di risposta dal 50% Grigio all'80% Grigio | ||
| 9.3 ms ... aumenta ↗ e diminuisce ↘ combinato | ↗ 4.5 ms Incremento | 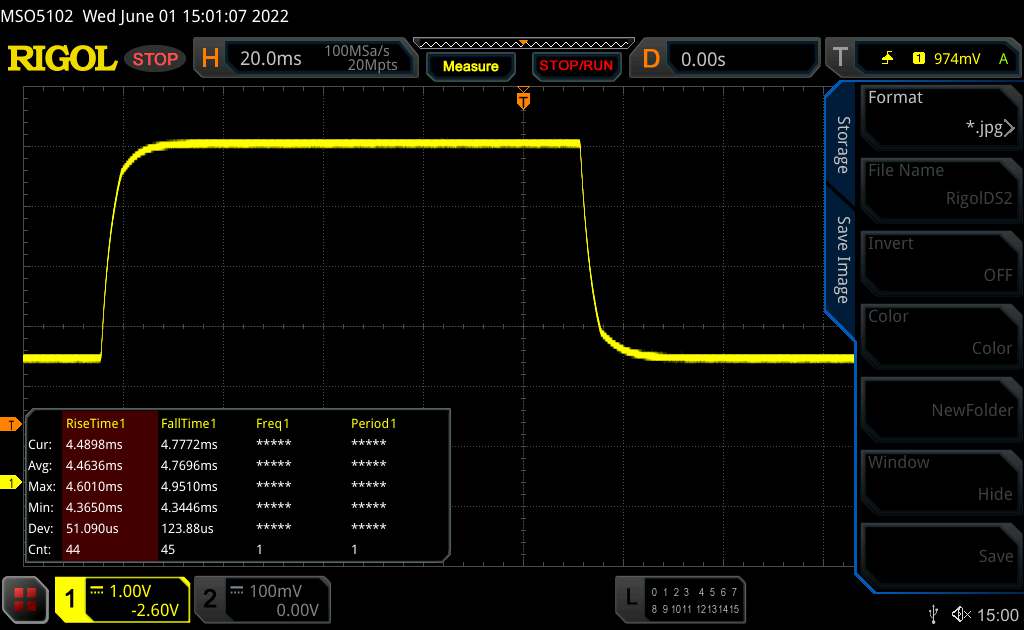 |
| ↘ 4.8 ms Calo | ||
| Lo schermo mostra veloci tempi di risposta durante i nostri tests e dovrebbe esere adatto al gaming In confronto, tutti i dispositivi di test variano da 0.165 (minimo) a 636 (massimo) ms. » 23 % di tutti i dispositivi è migliore. Questo significa che i tempi di risposta rilevati sono migliori rispettto alla media di tutti i dispositivi testati (31 ms). | ||
Sfarfallio dello schermo / PWM (Pulse-Width Modulation)
| flickering dello schermo / PWM rilevato | 23545 Hz | ≤ 35 % settaggio luminosita' | 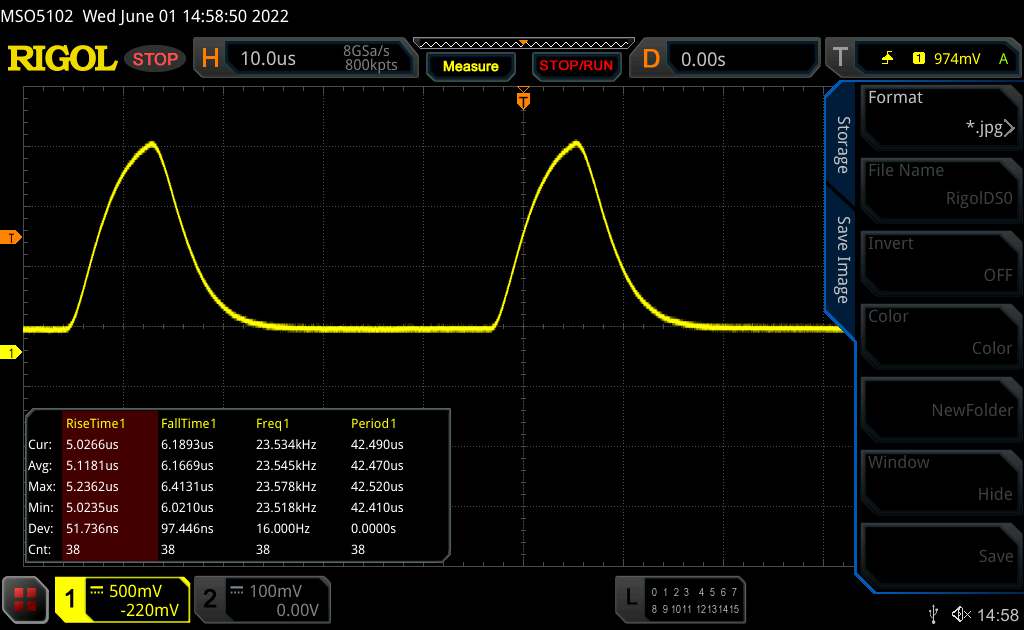 |
Il display sfarfalla a 23545 Hz (Probabilmente a causa dell'uso di PWM) Flickering rilevato ad una luminosita' di 35 % o inferiore. Non dovrebbe verificarsi flickering o PWM sopra questo valore di luminosita'. La frequenza di 23545 Hz è abbastanza alta, quindi la maggioranza degli utenti sensibili al PWM non dovrebbero notare alcun flickering. In confronto: 52 % di tutti i dispositivi testati non utilizza PWM per ridurre la luminosita' del display. Se è rilevato PWM, una media di 7747 (minimo: 5 - massimo: 343500) Hz è stata rilevata. | |||
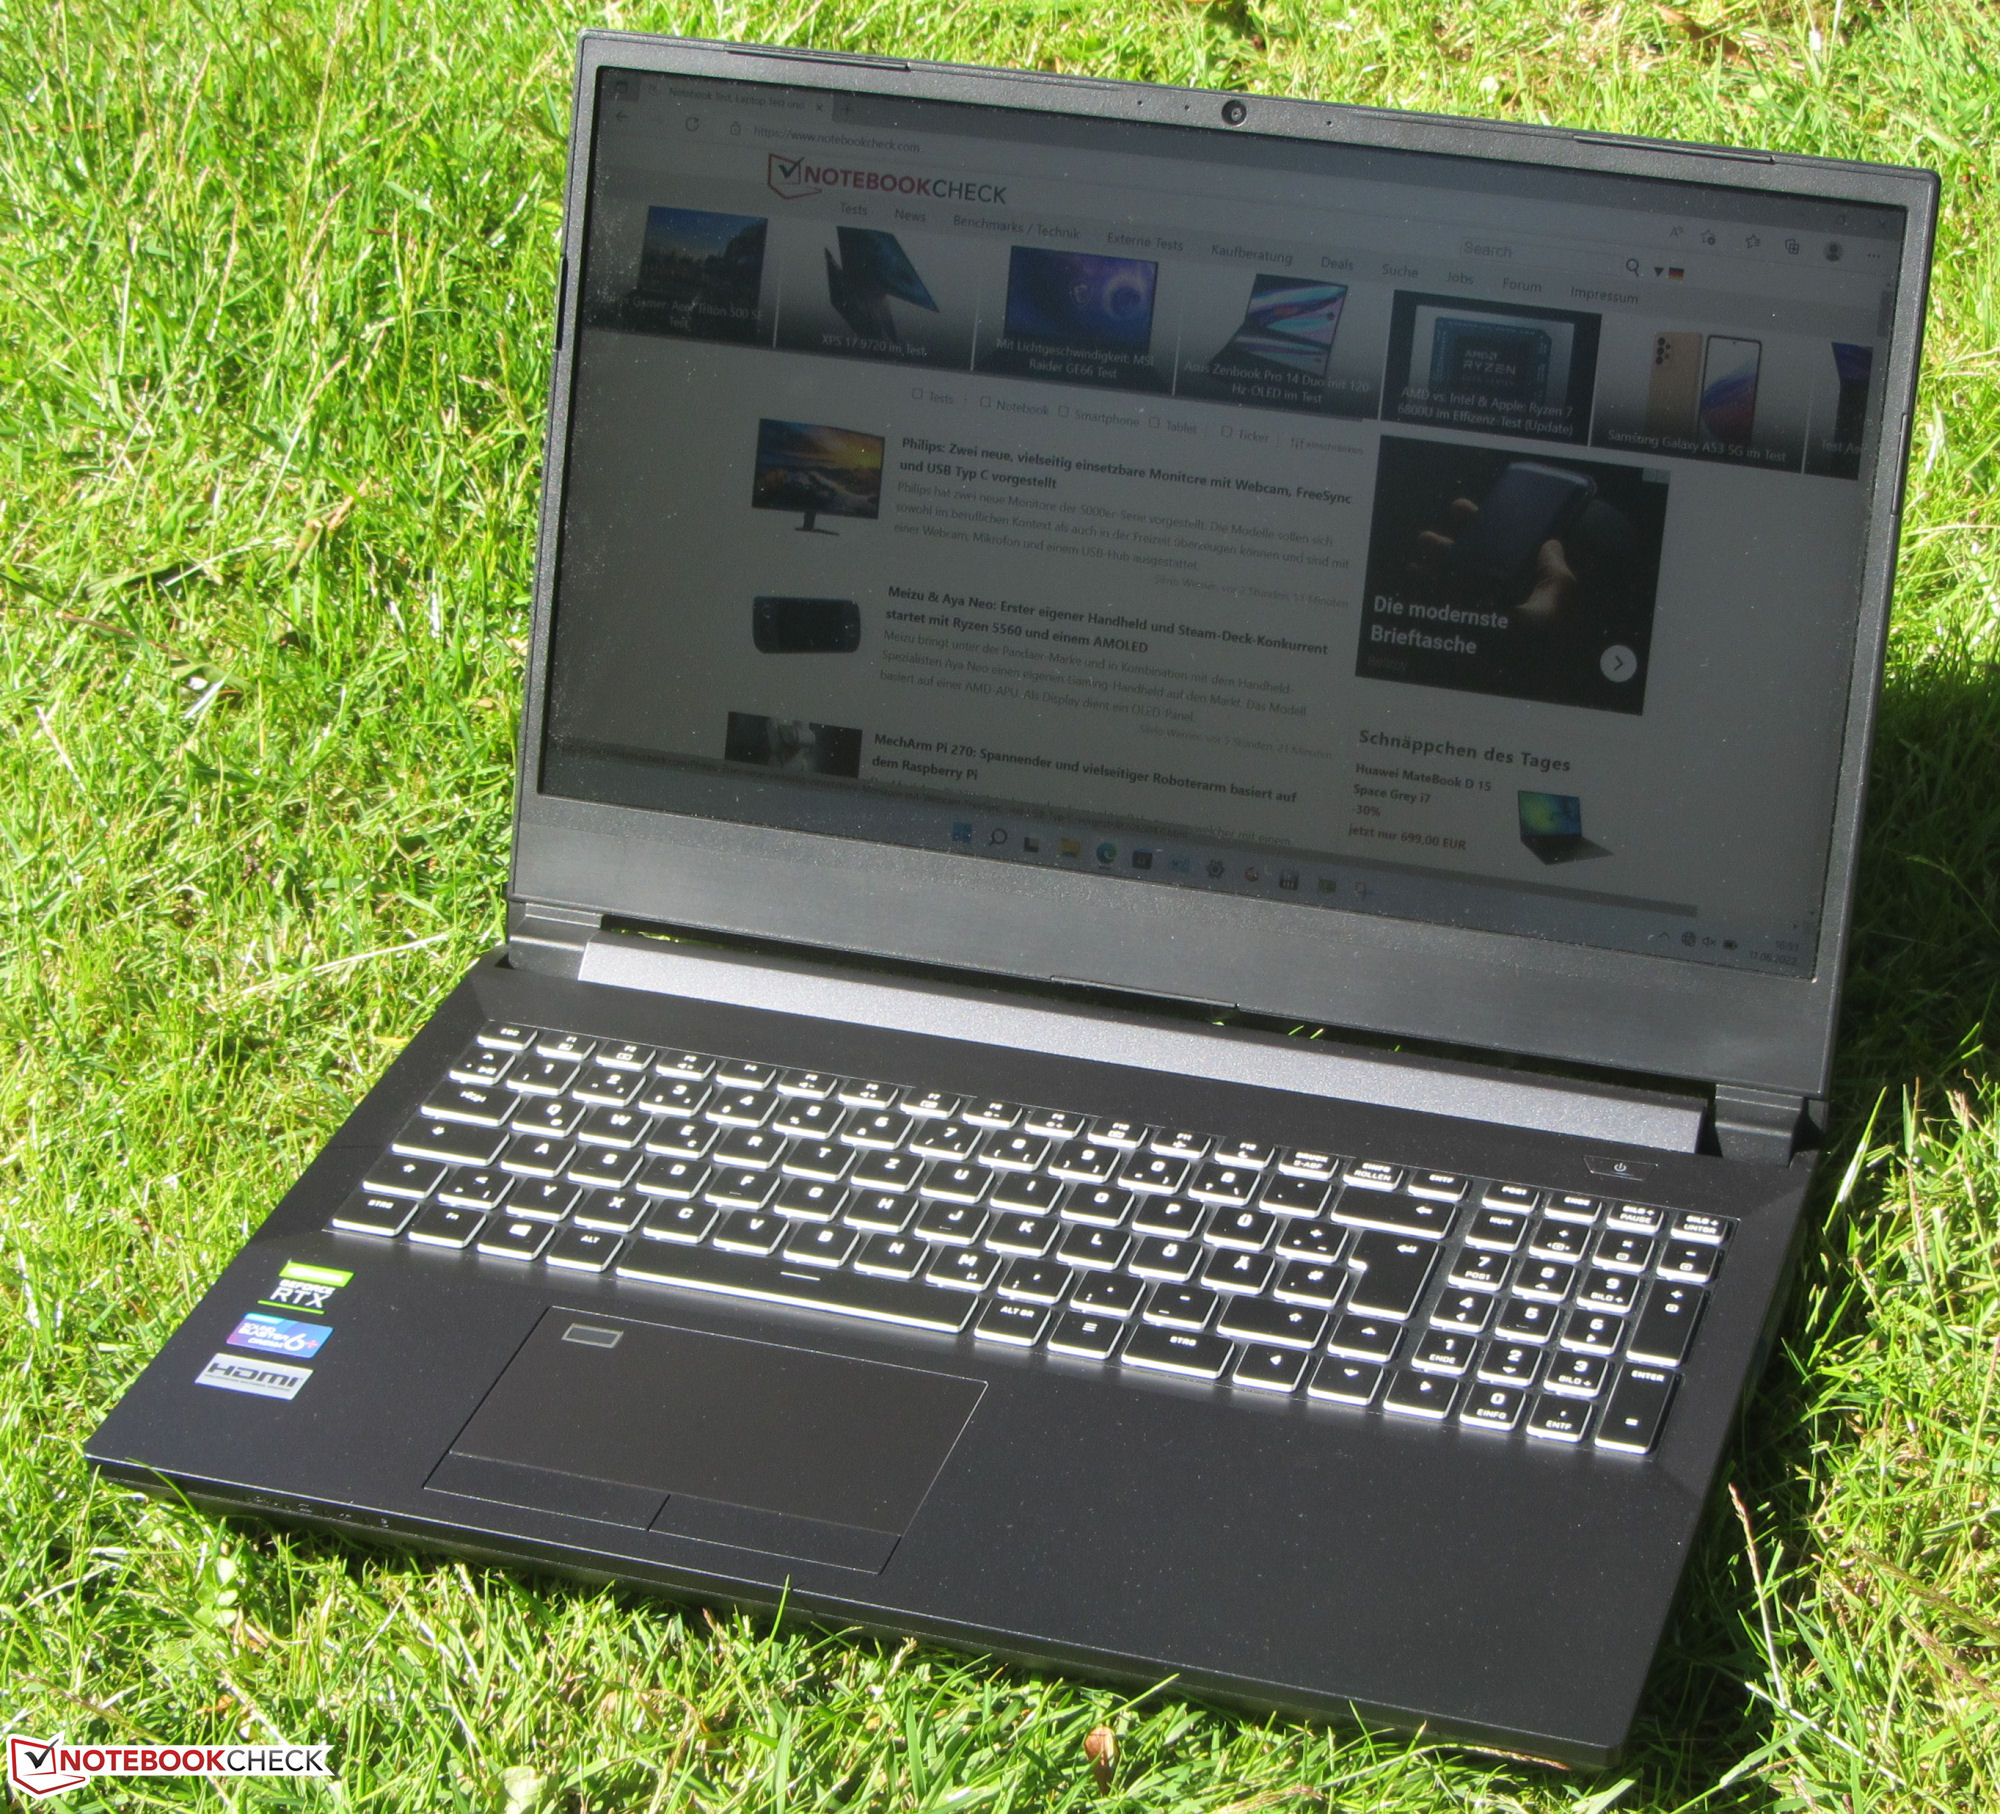
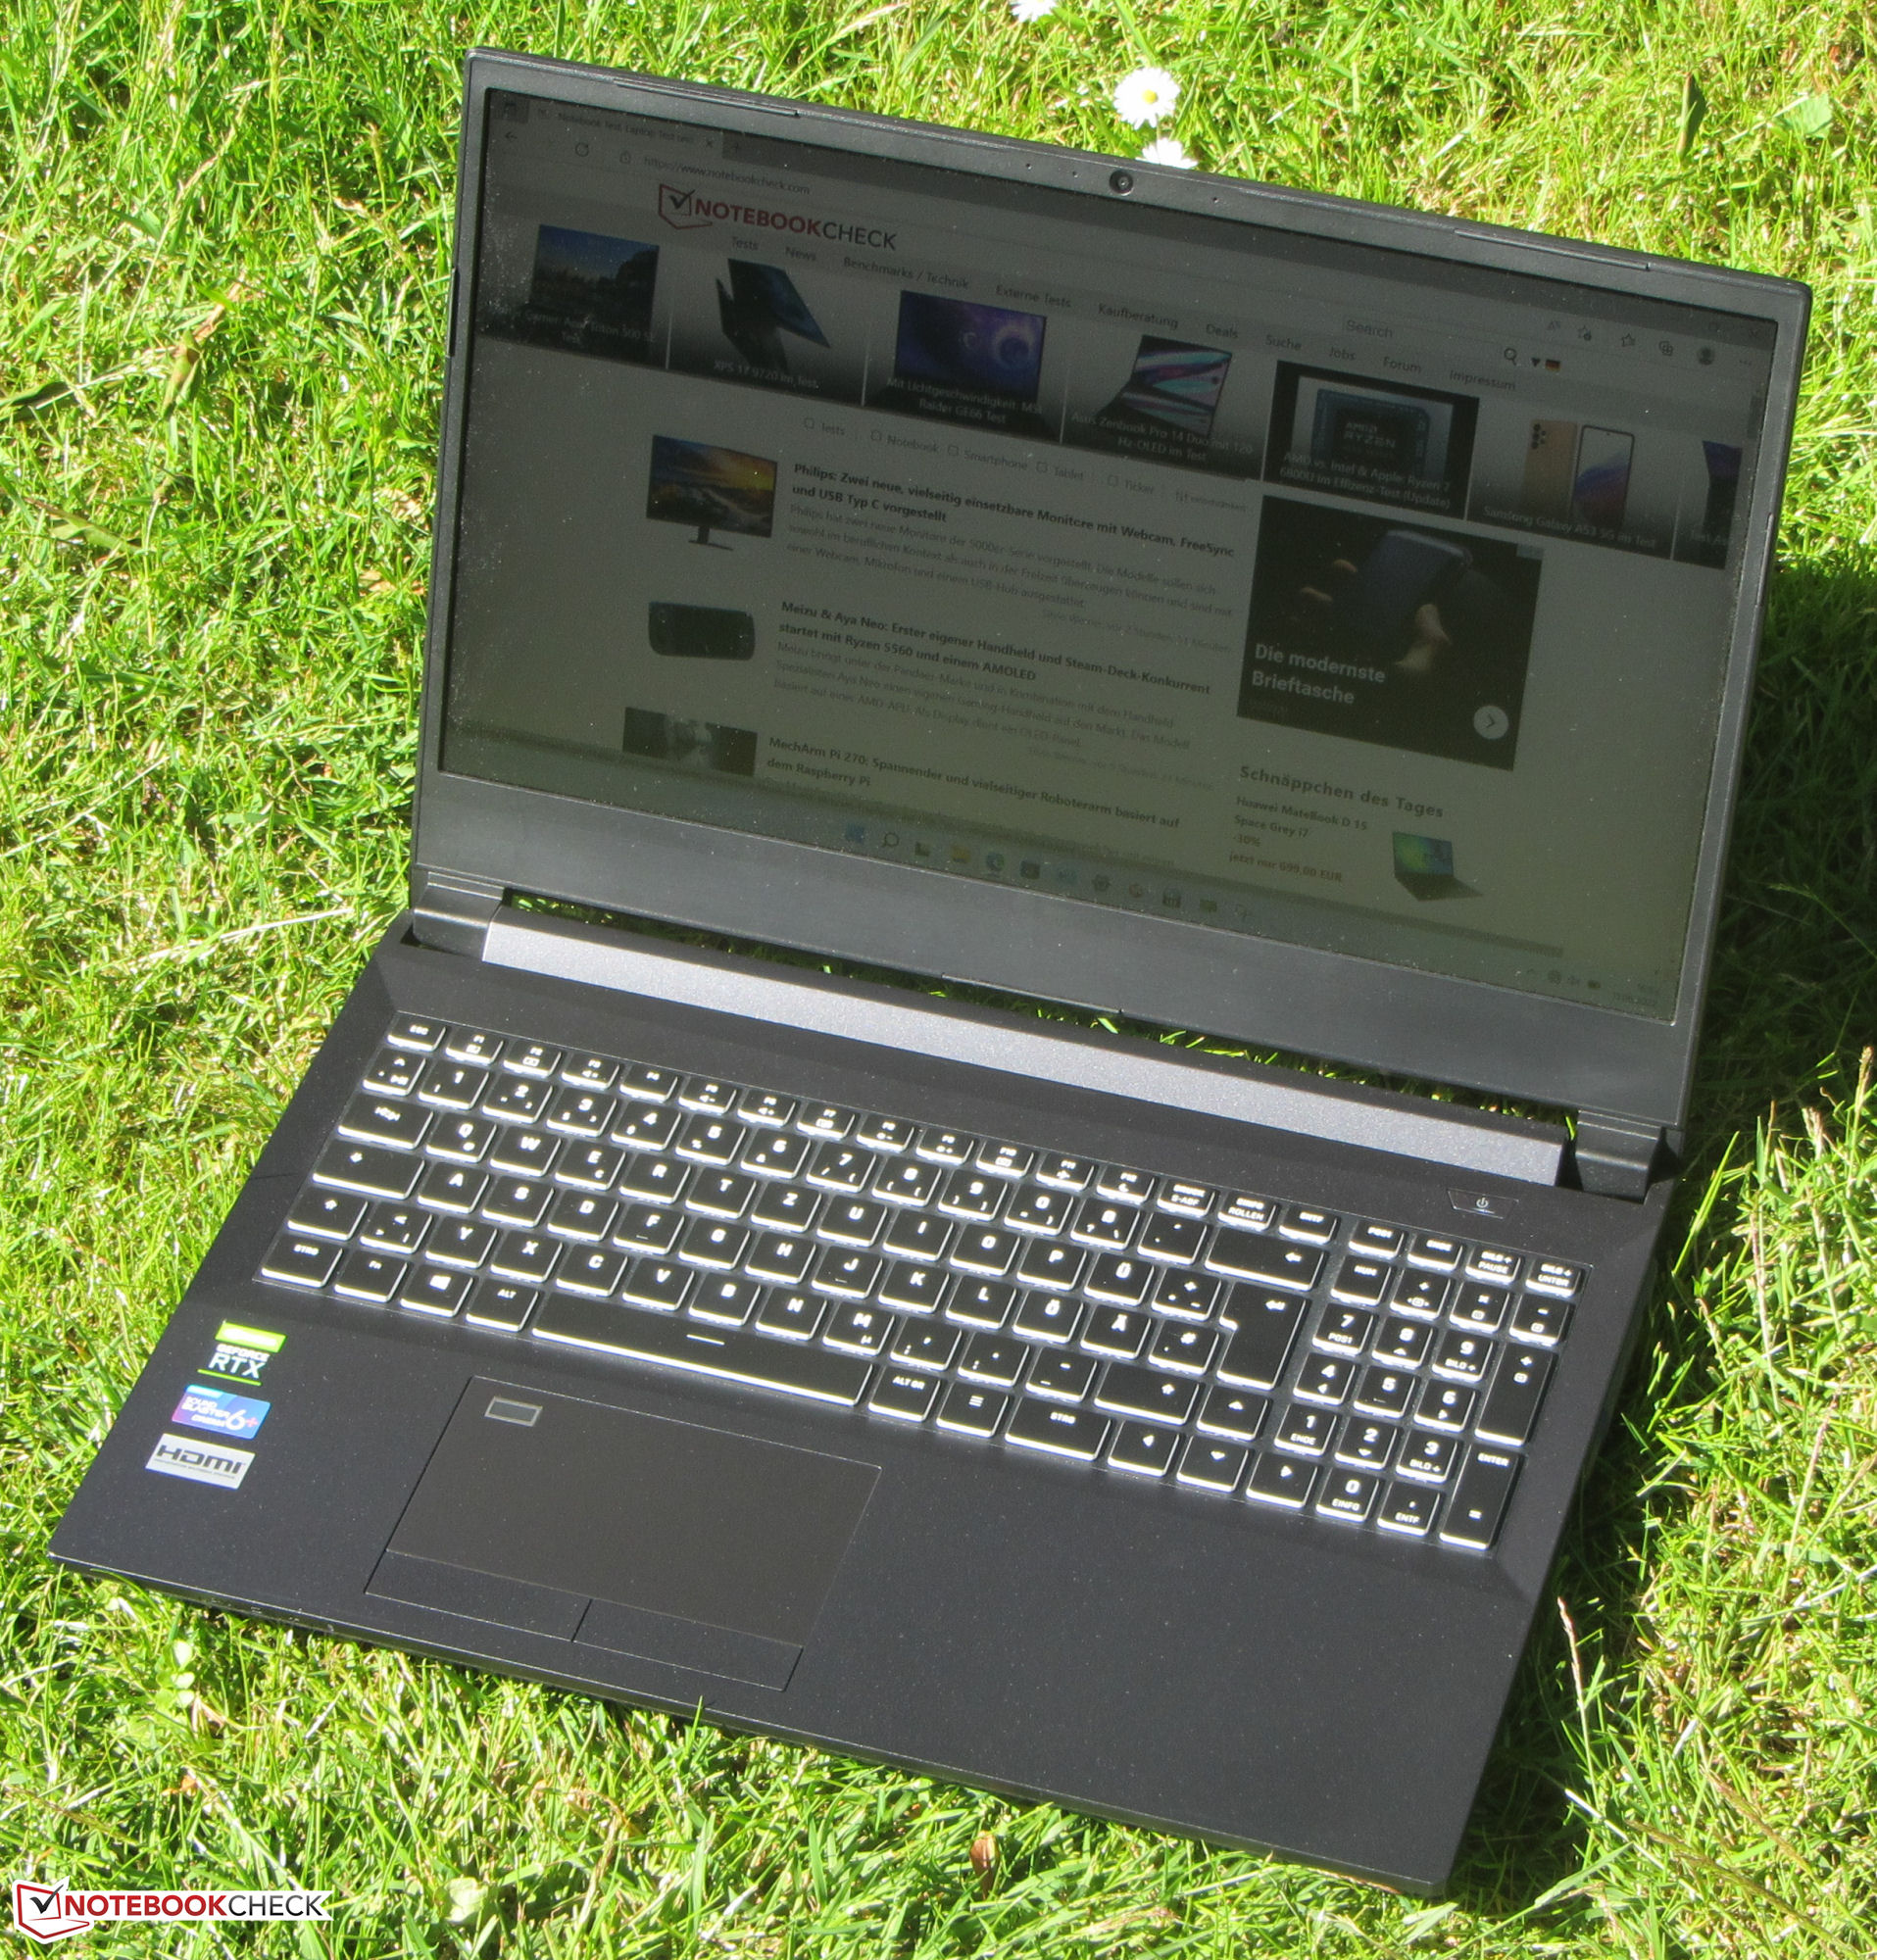
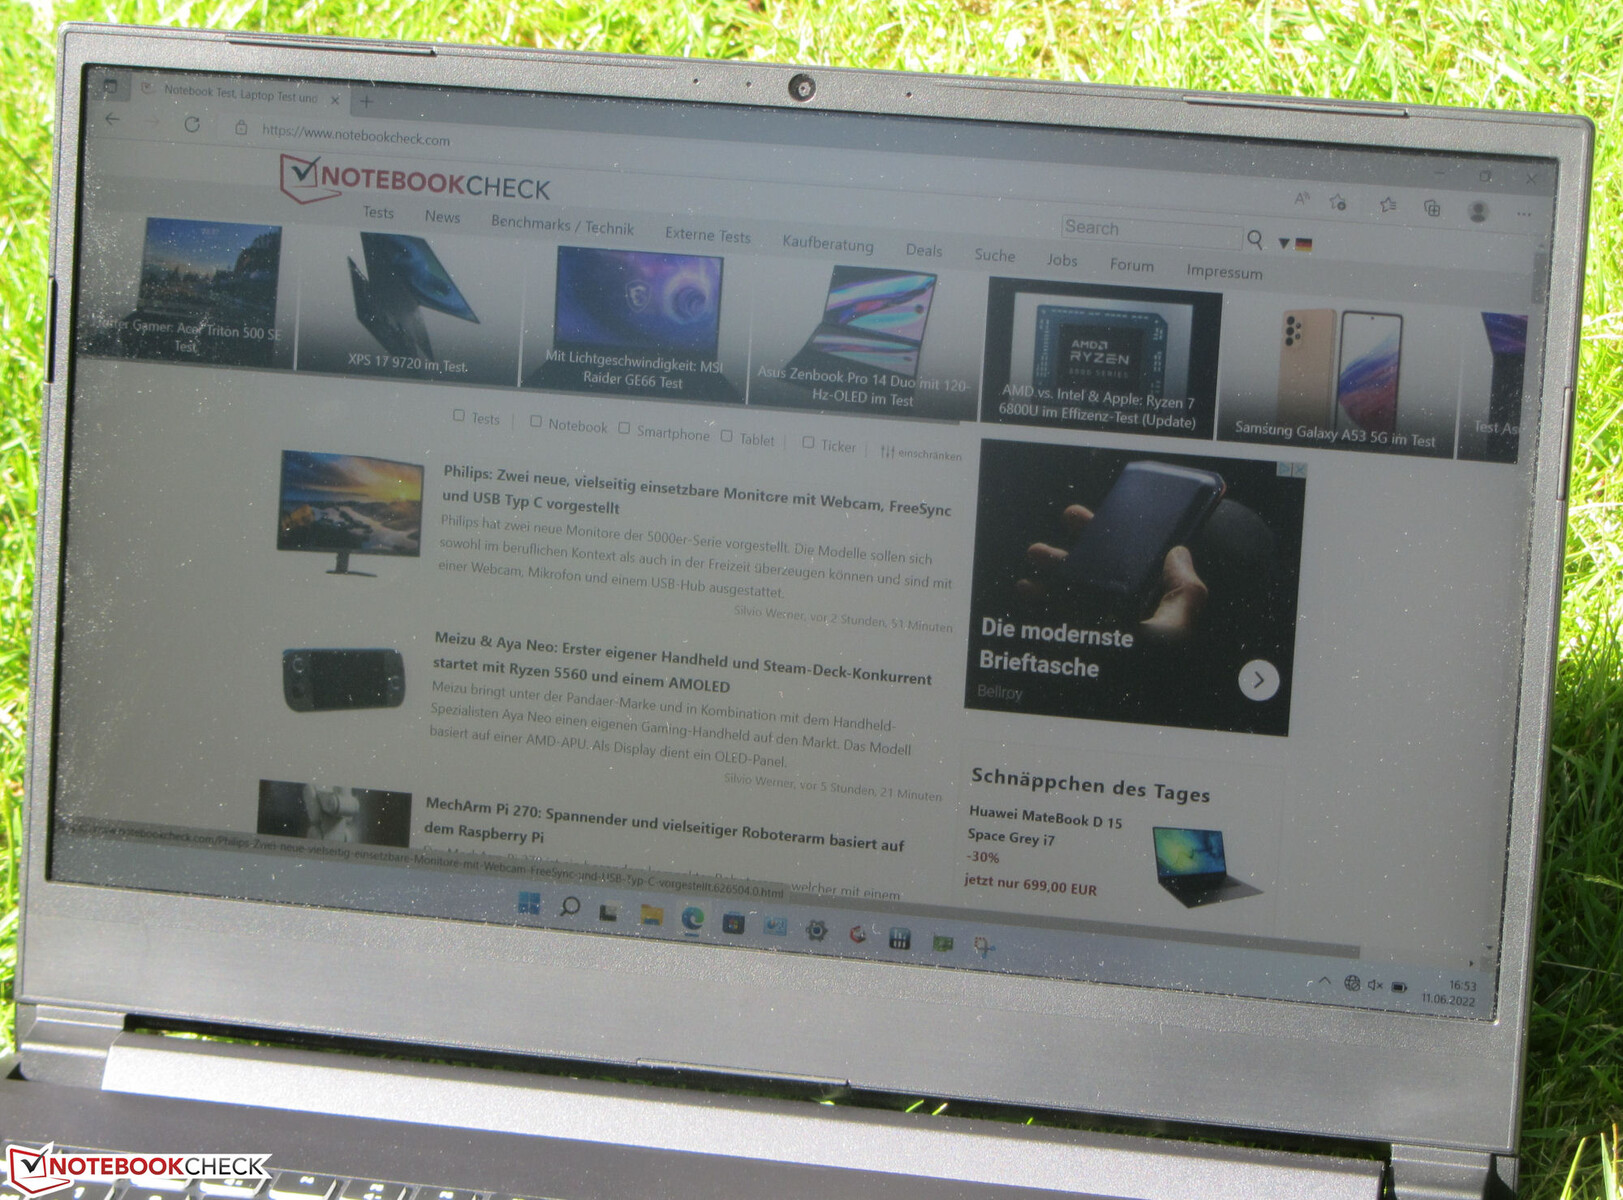
Il pannello IPS offre angoli di visualizzazione stabili e può essere letto da qualsiasi angolazione. All'aperto, i contenuti del display sono leggibili se il sole non è troppo forte.

Prestazioni - La CPU desktop dell'XMG Apex non sviluppa appieno il suo potenziale
Il potente laptop da 15,6 pollici fa un'ottima figura negli scenari applicativi che richiedono una grande potenza di calcolo, che si tratti di giochi, elaborazione video o rendering. Il portatile può essere configurato in modo personalizzato nel negozio online di Schenker (bestware.com).
Condizioni di prova
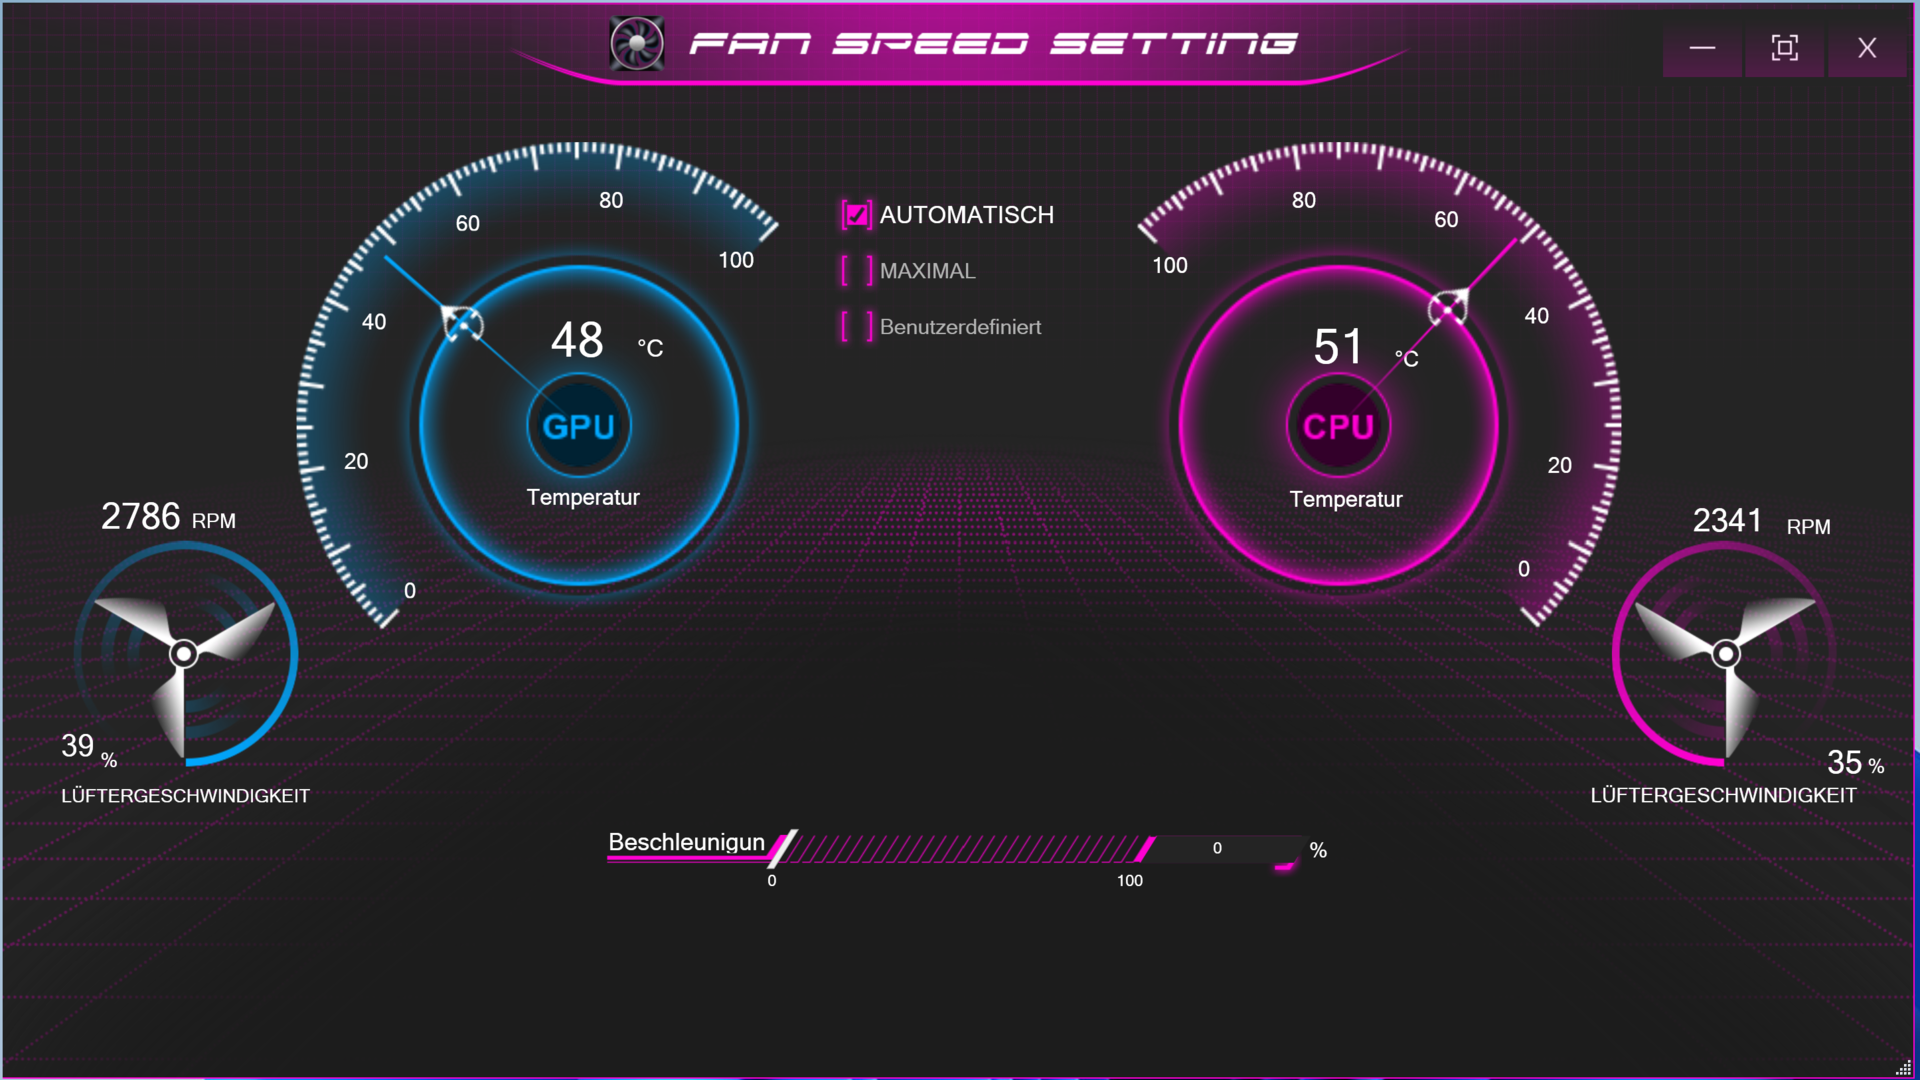
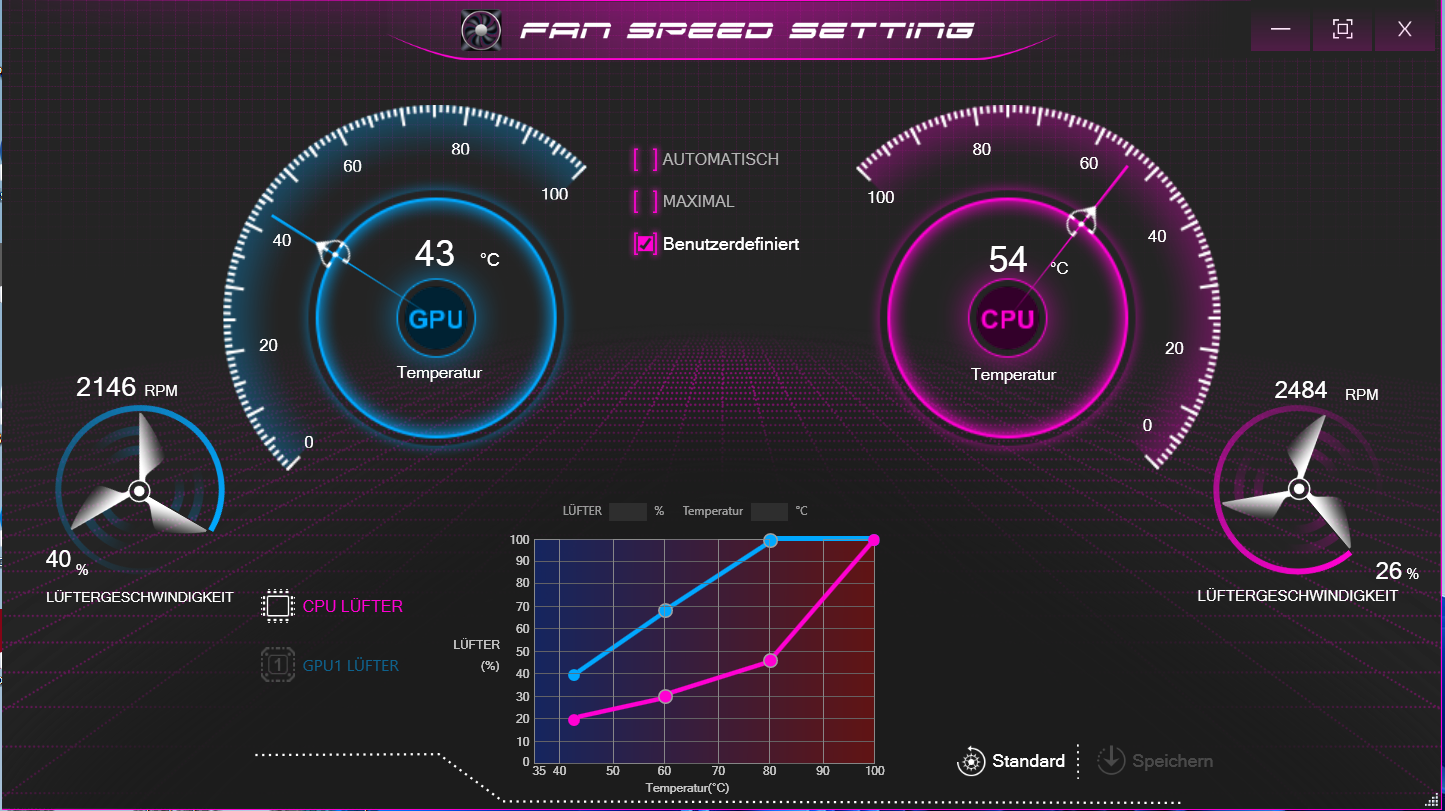
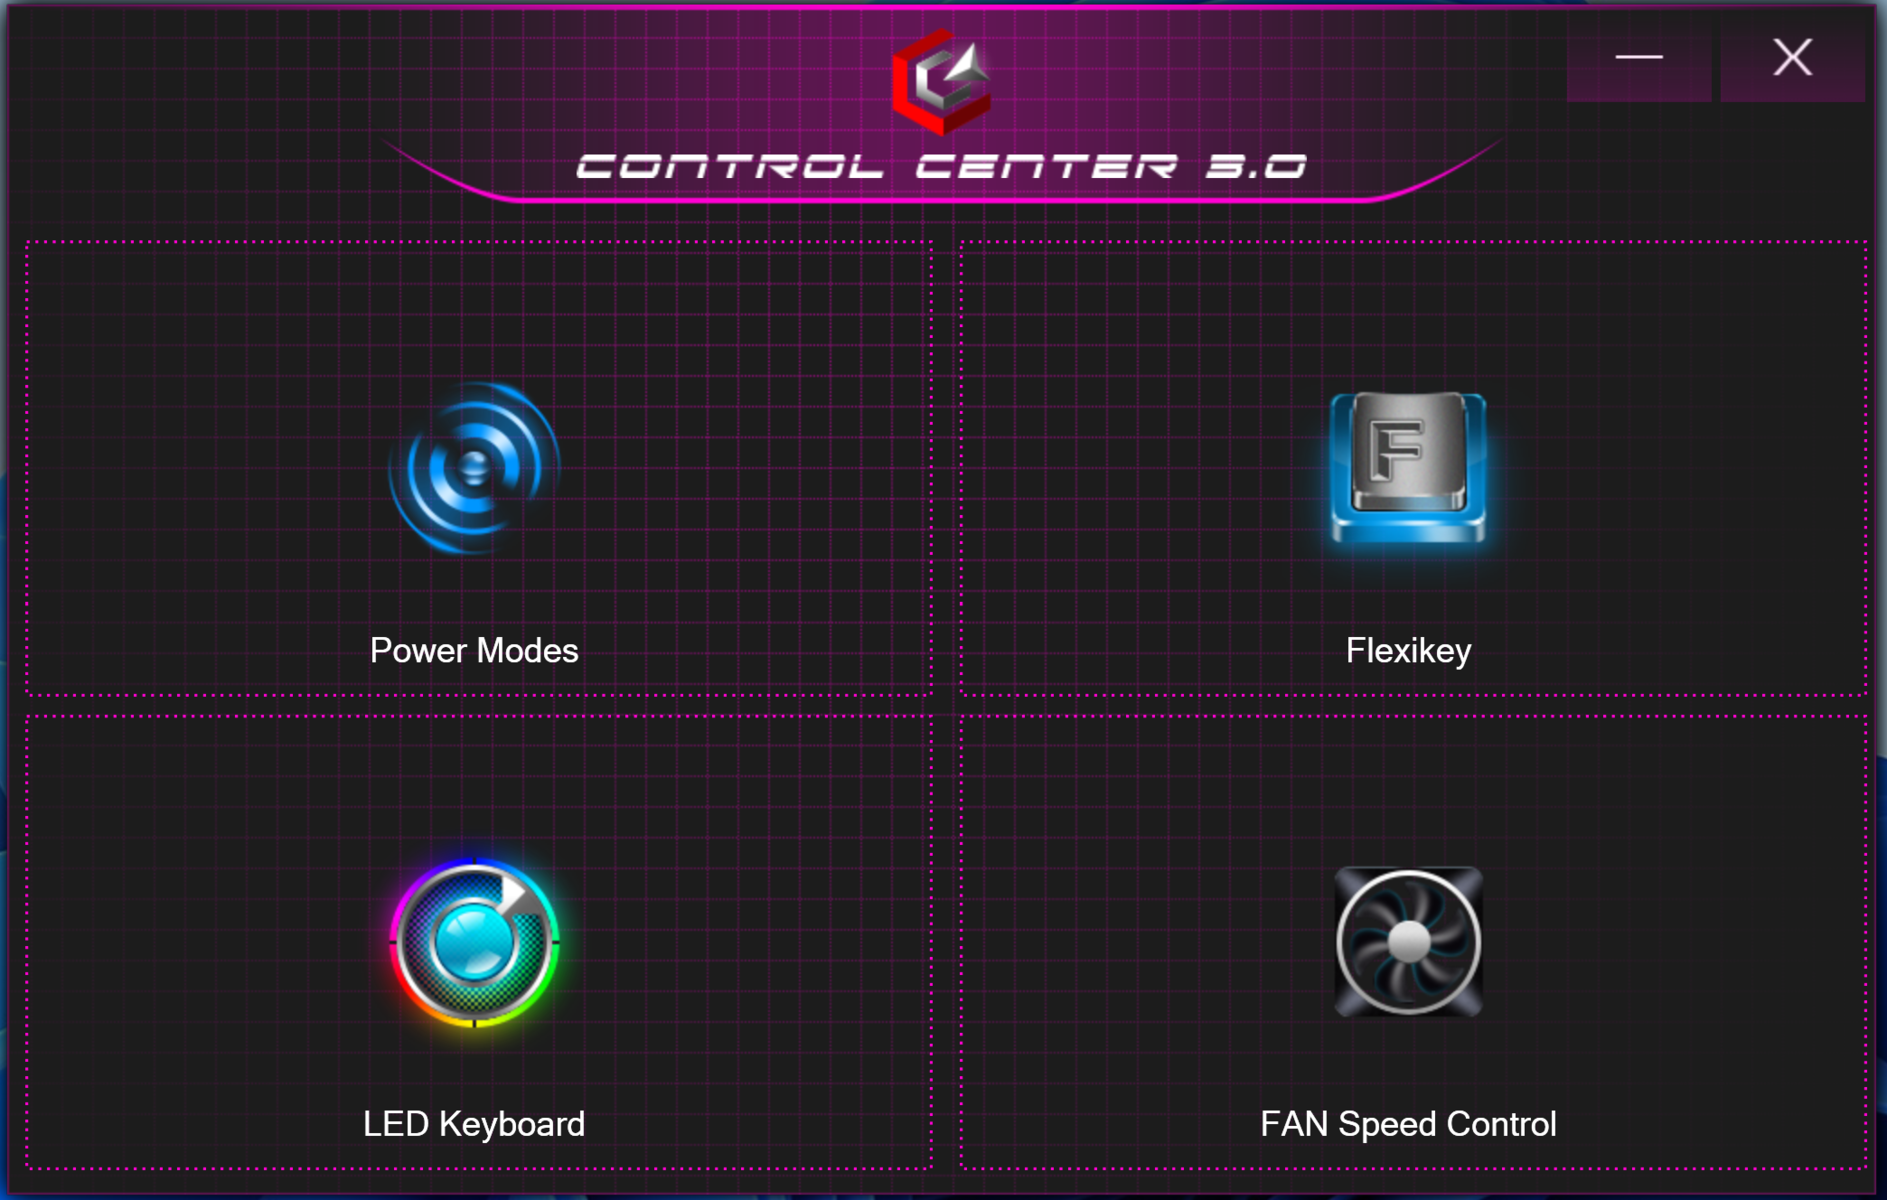
Tra le altre opzioni, il Centro di controllo preinstallato consente anche di selezionare un profilo di prestazioni (modalità Performance, modalità Intrattenimento, modalità Risparmio energetico, modalità Silenziosa). I benchmark e i test della batteria sono stati eseguiti utilizzando la modalità Intrattenimento che include il controllo automatico della ventola.

BIOS
Secondo Schenker, il BIOS dell'Apex 15 Max rappresenta uno sviluppo interno. In questo modo, l'azienda vuole garantire il funzionamento stabile delle CPU Ryzen 9 offerte in ogni momento. Possiamo confermarlo anche noi, almeno per la nostra unità di test.
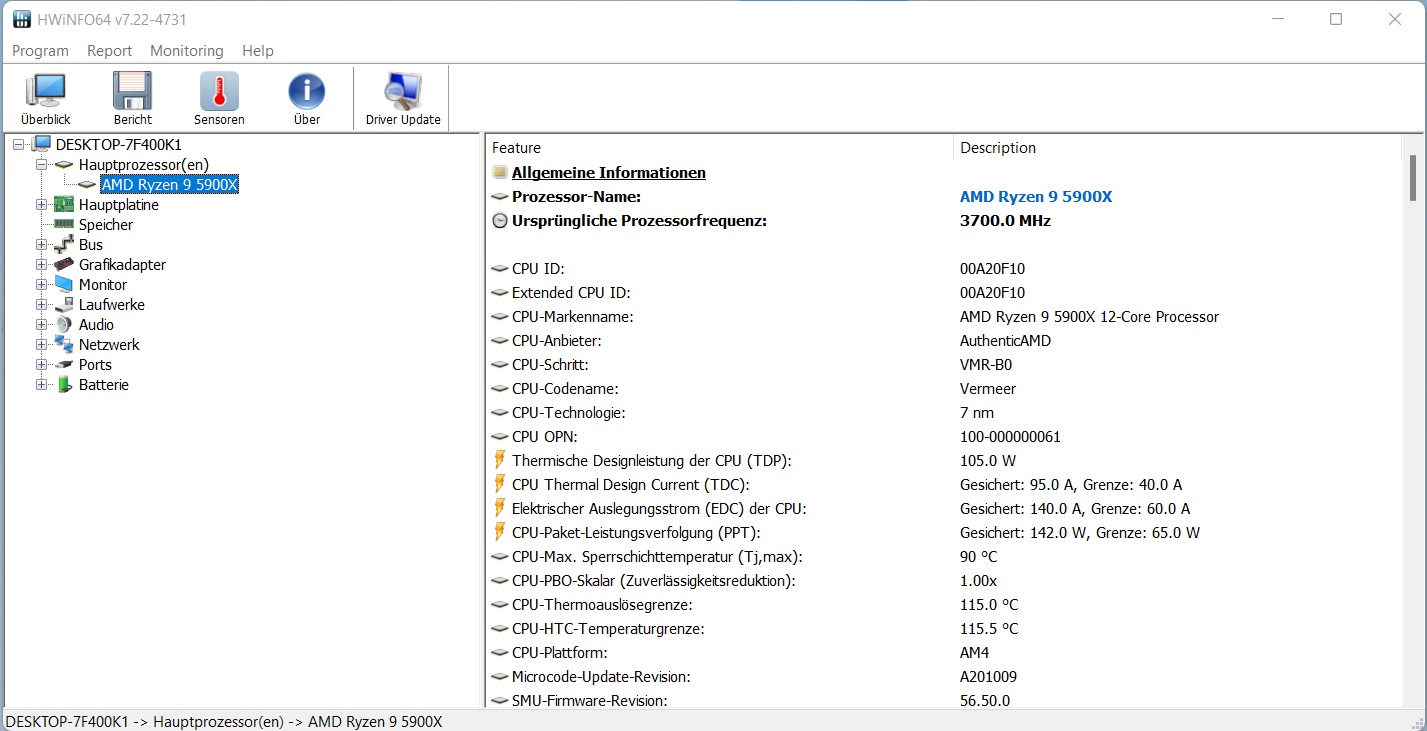
Processore
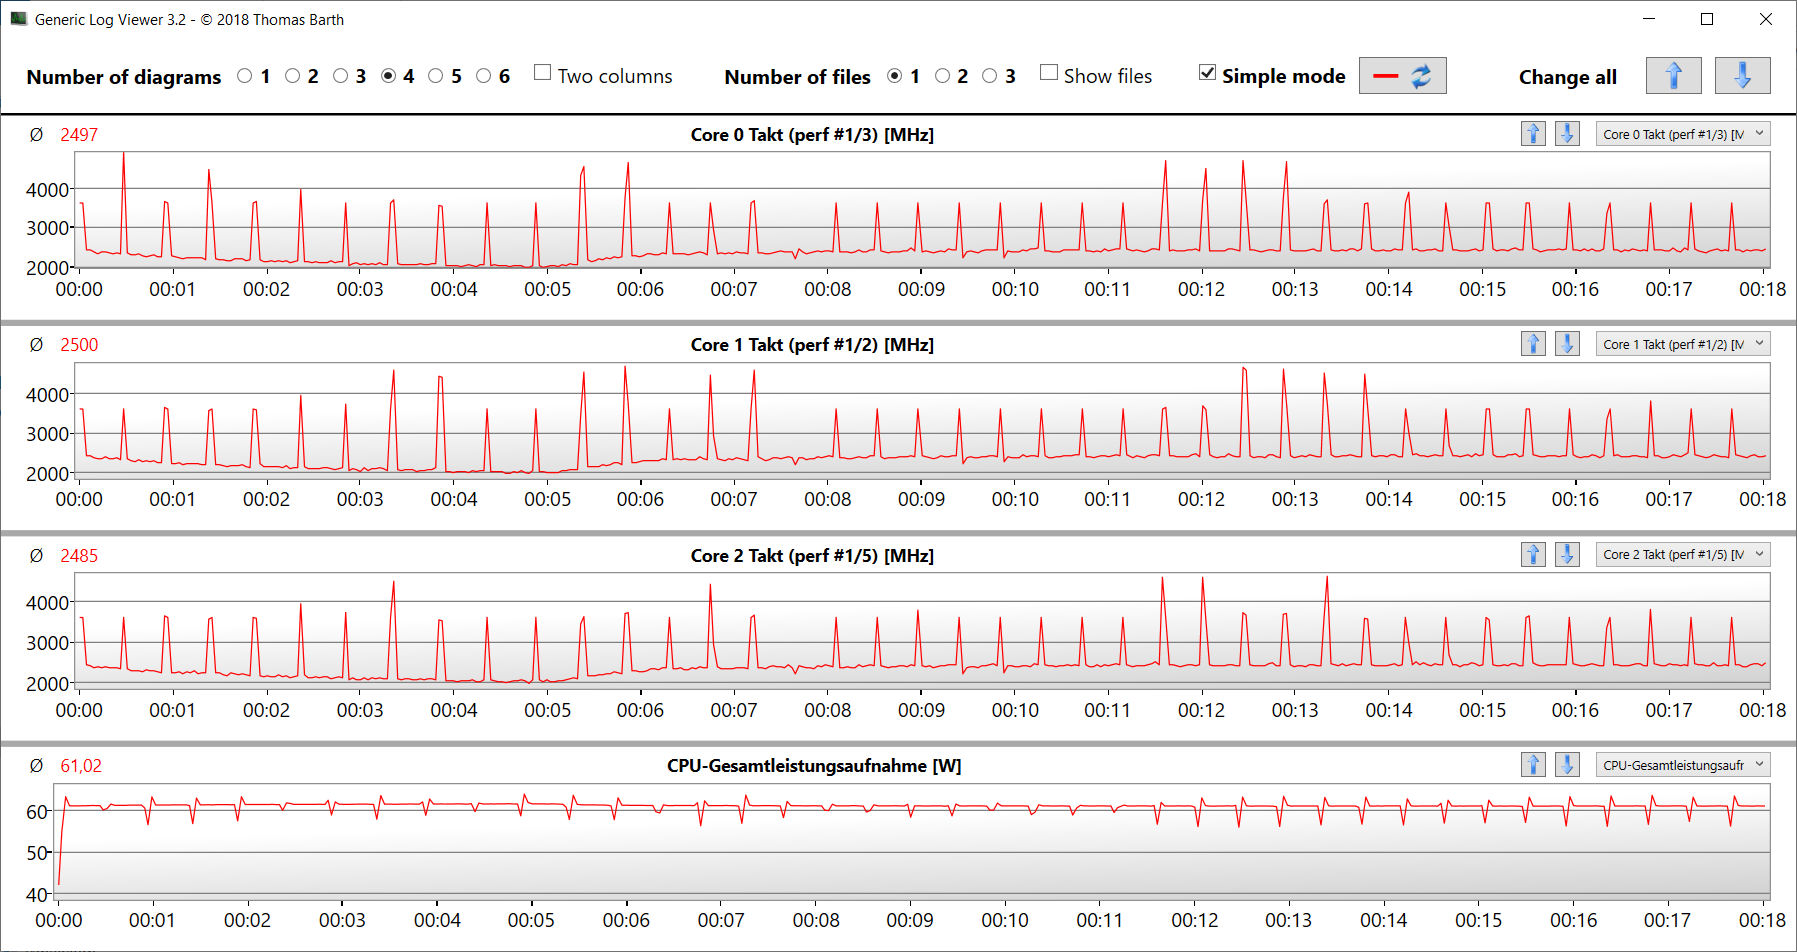
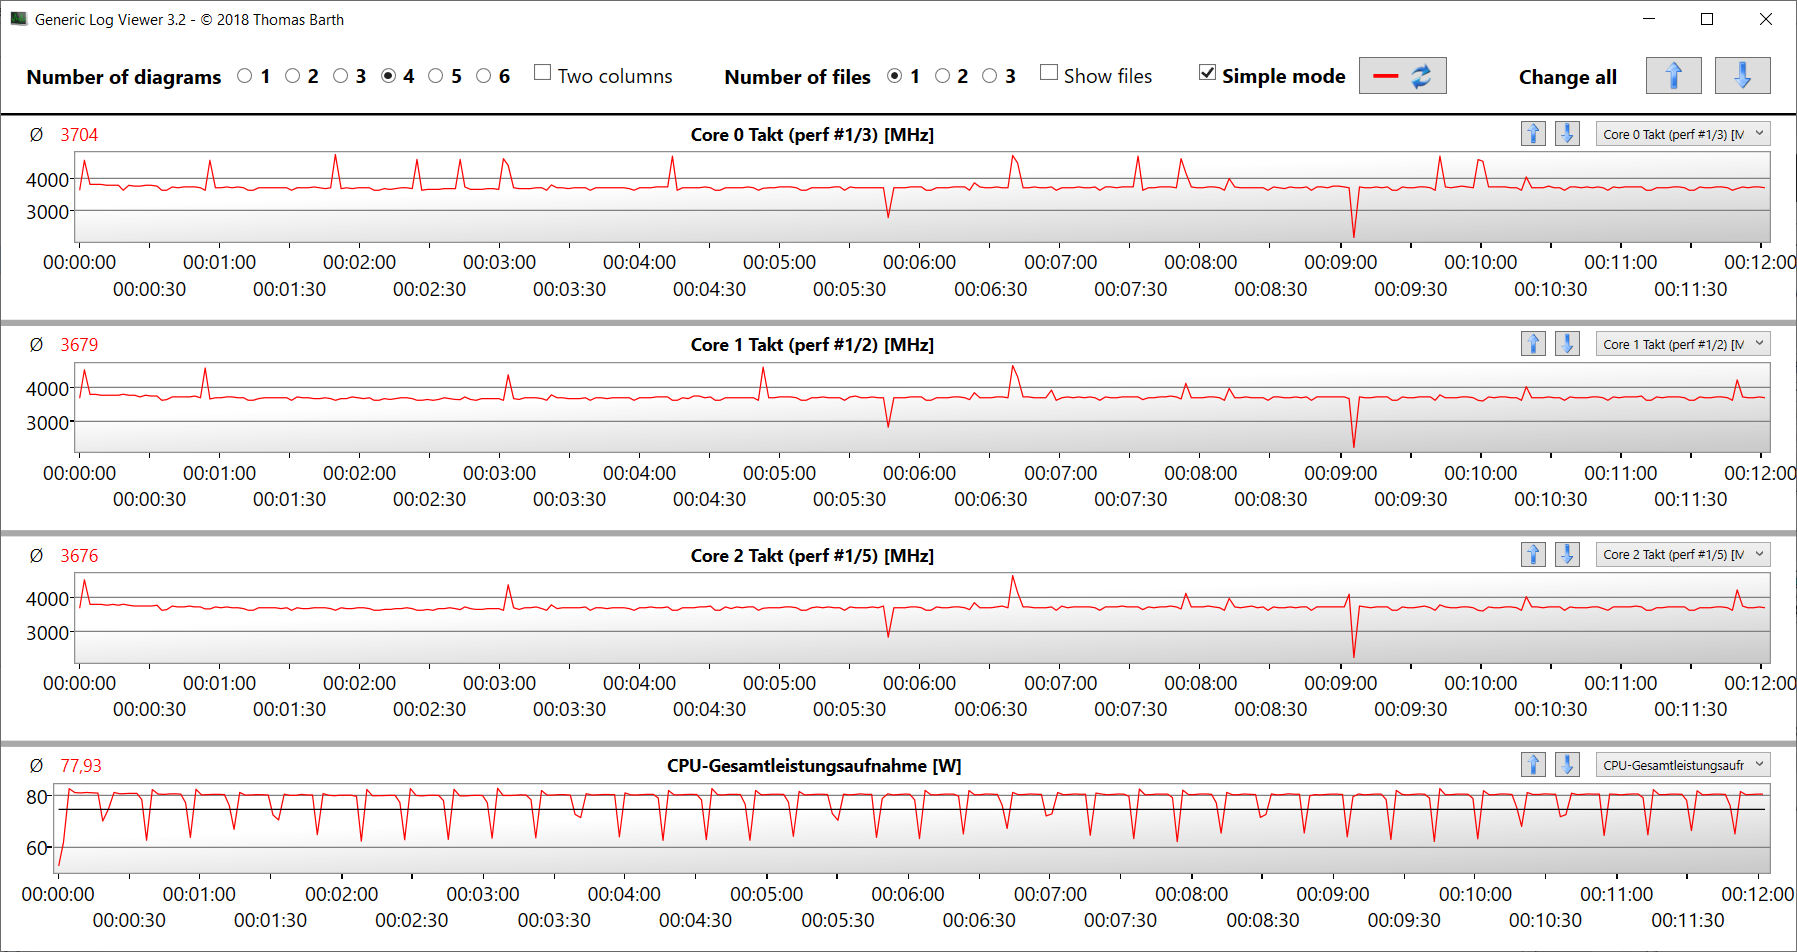
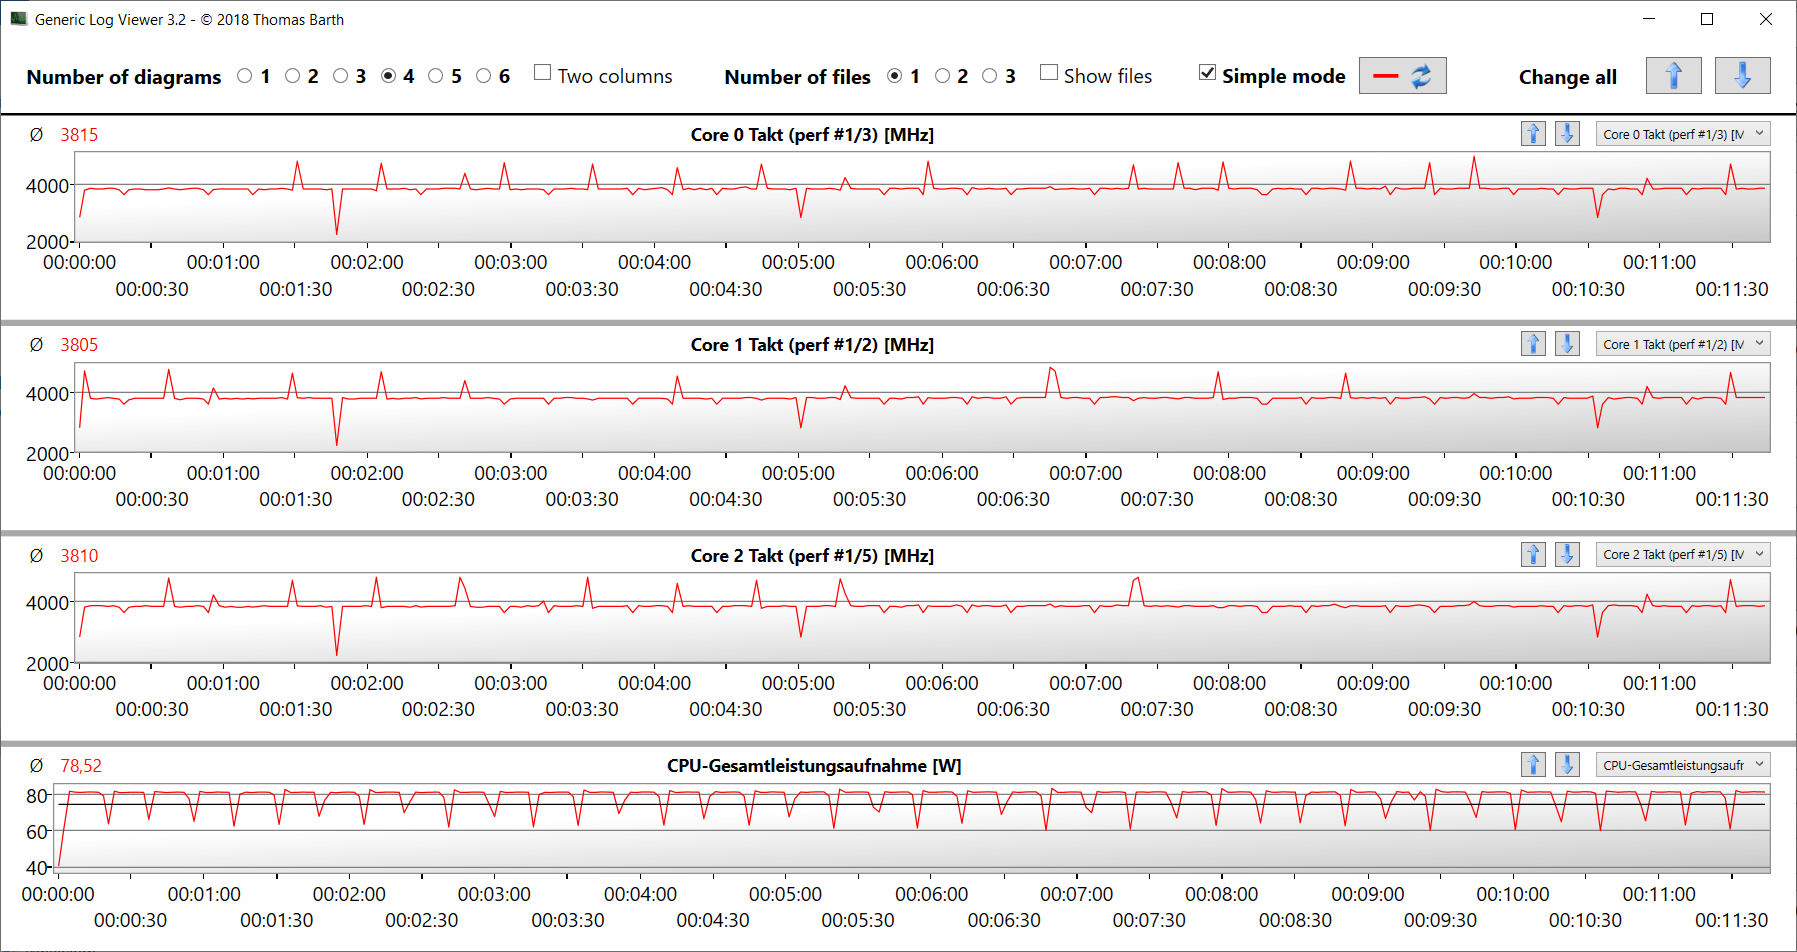
Il modello sostituibile Ryzen 9 5900Xa dodici core (Vermeer) funziona con una velocità di clock di base di 3,7 GHz. Tramite Turbo, questa può essere aumentata fino a 4,5 GHz (dodici core) e 4,8 GHz (singolo core). È supportato il multithreading simultaneo (con due thread per core). Le velocità di clock durante i benchmark di Cinebench R15 variano in modo significativo, a seconda del profilo energetico selezionato. In tutti i casi, la CPU è in grado di funzionare costantemente a una velocità di clock stabile, come dimostra il nostro test di loop CB15.
| Modalità Entertainment | Modalità Performance | Modalità Performance Max. Ventola | Modalità silenziosa | Modalità risparmio energetico | |
|---|---|---|---|---|---|
| Single Thread | Da 3,6 a 4,7 GHz | Da 3,4 a 4,8 GHz | Da 3,6 a 4,8 GHz | Da 600 MHz a 3,6 GHz | Da 550 a 650 MHz |
| Multi-Thread | 2,3 GHz | 3,8 GHz | 3,8 - 3,9 GHz | 550 MHz | 550 MHz |
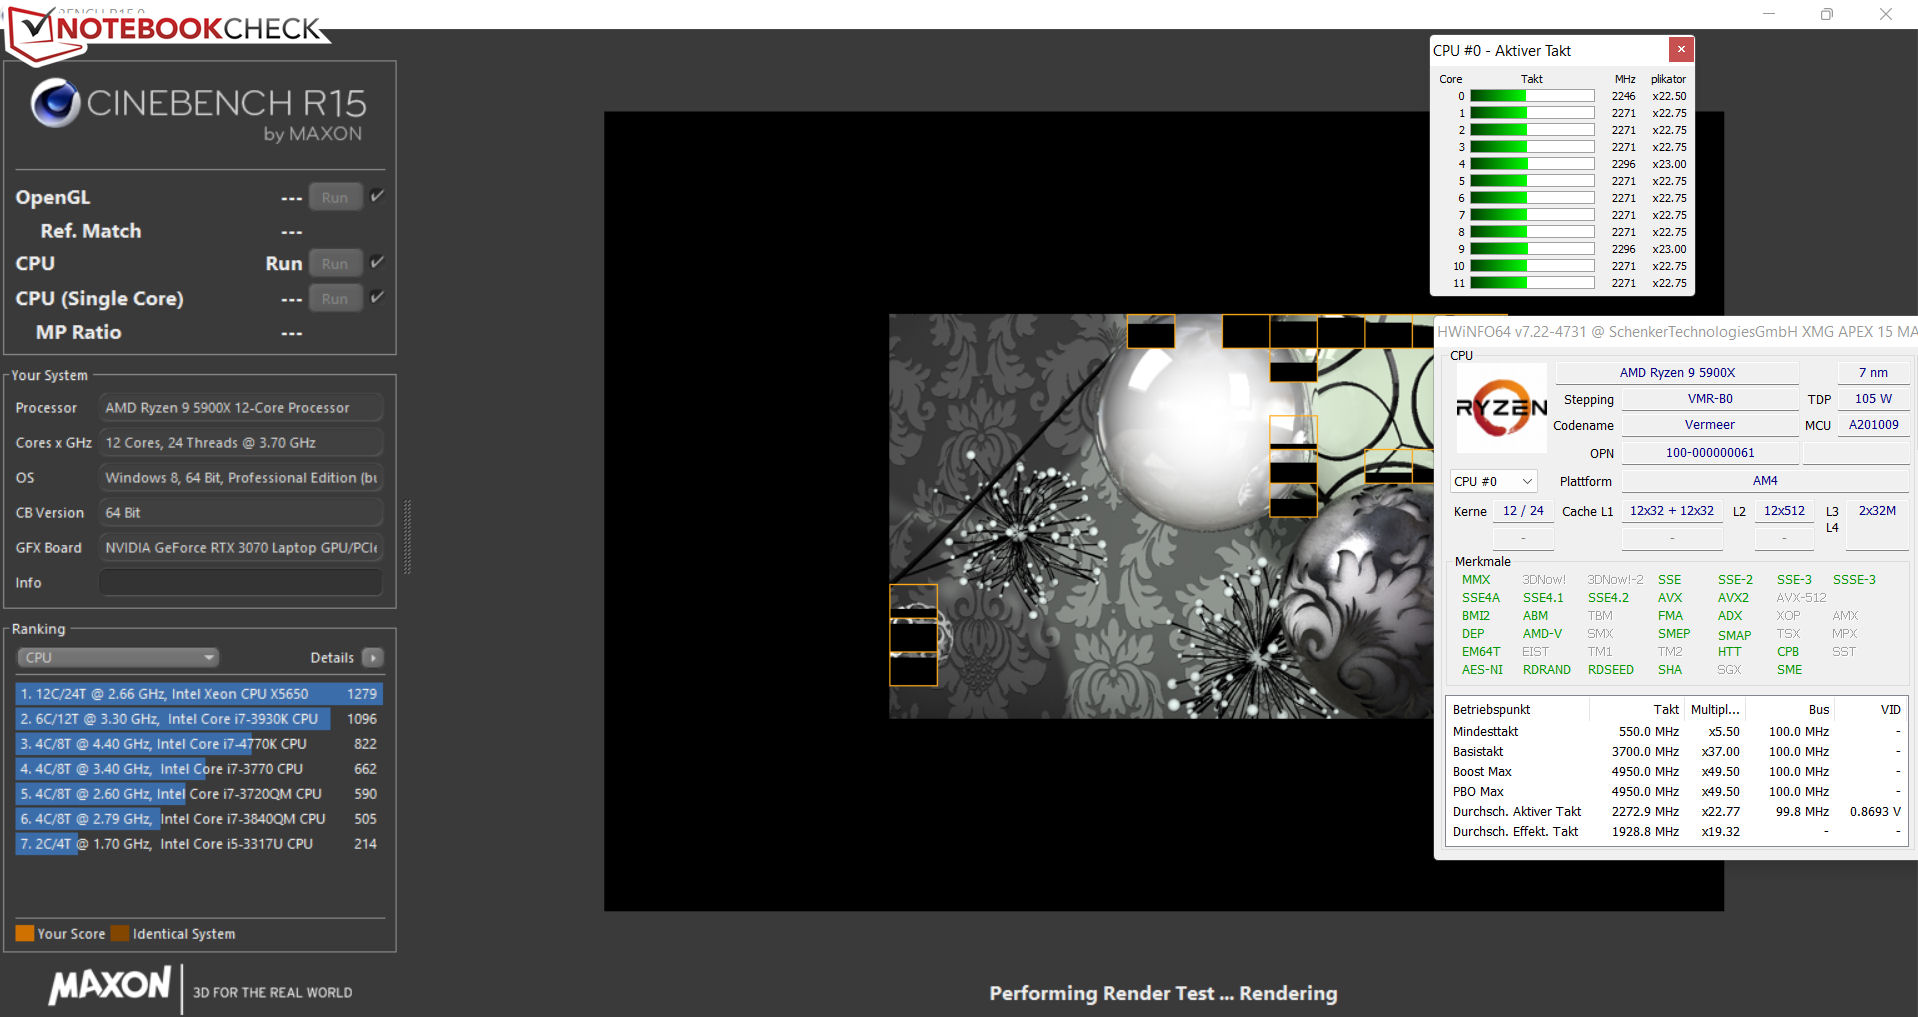
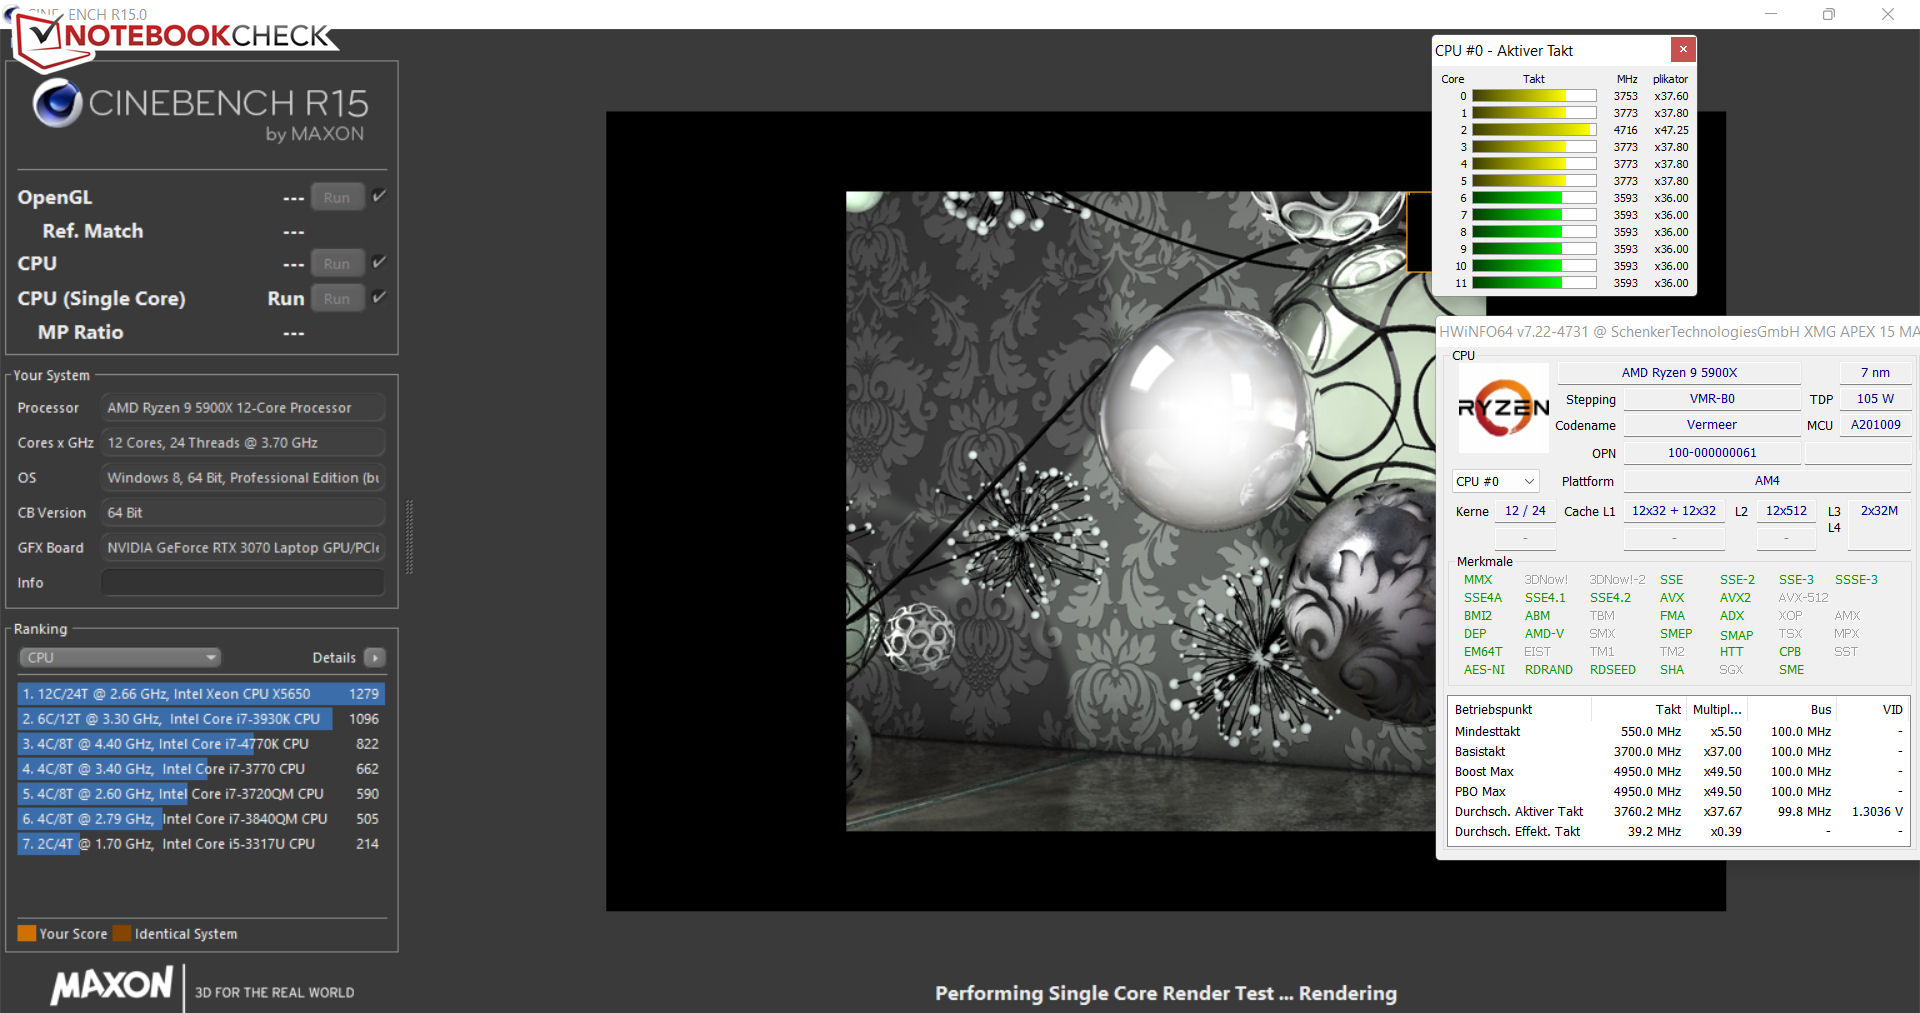
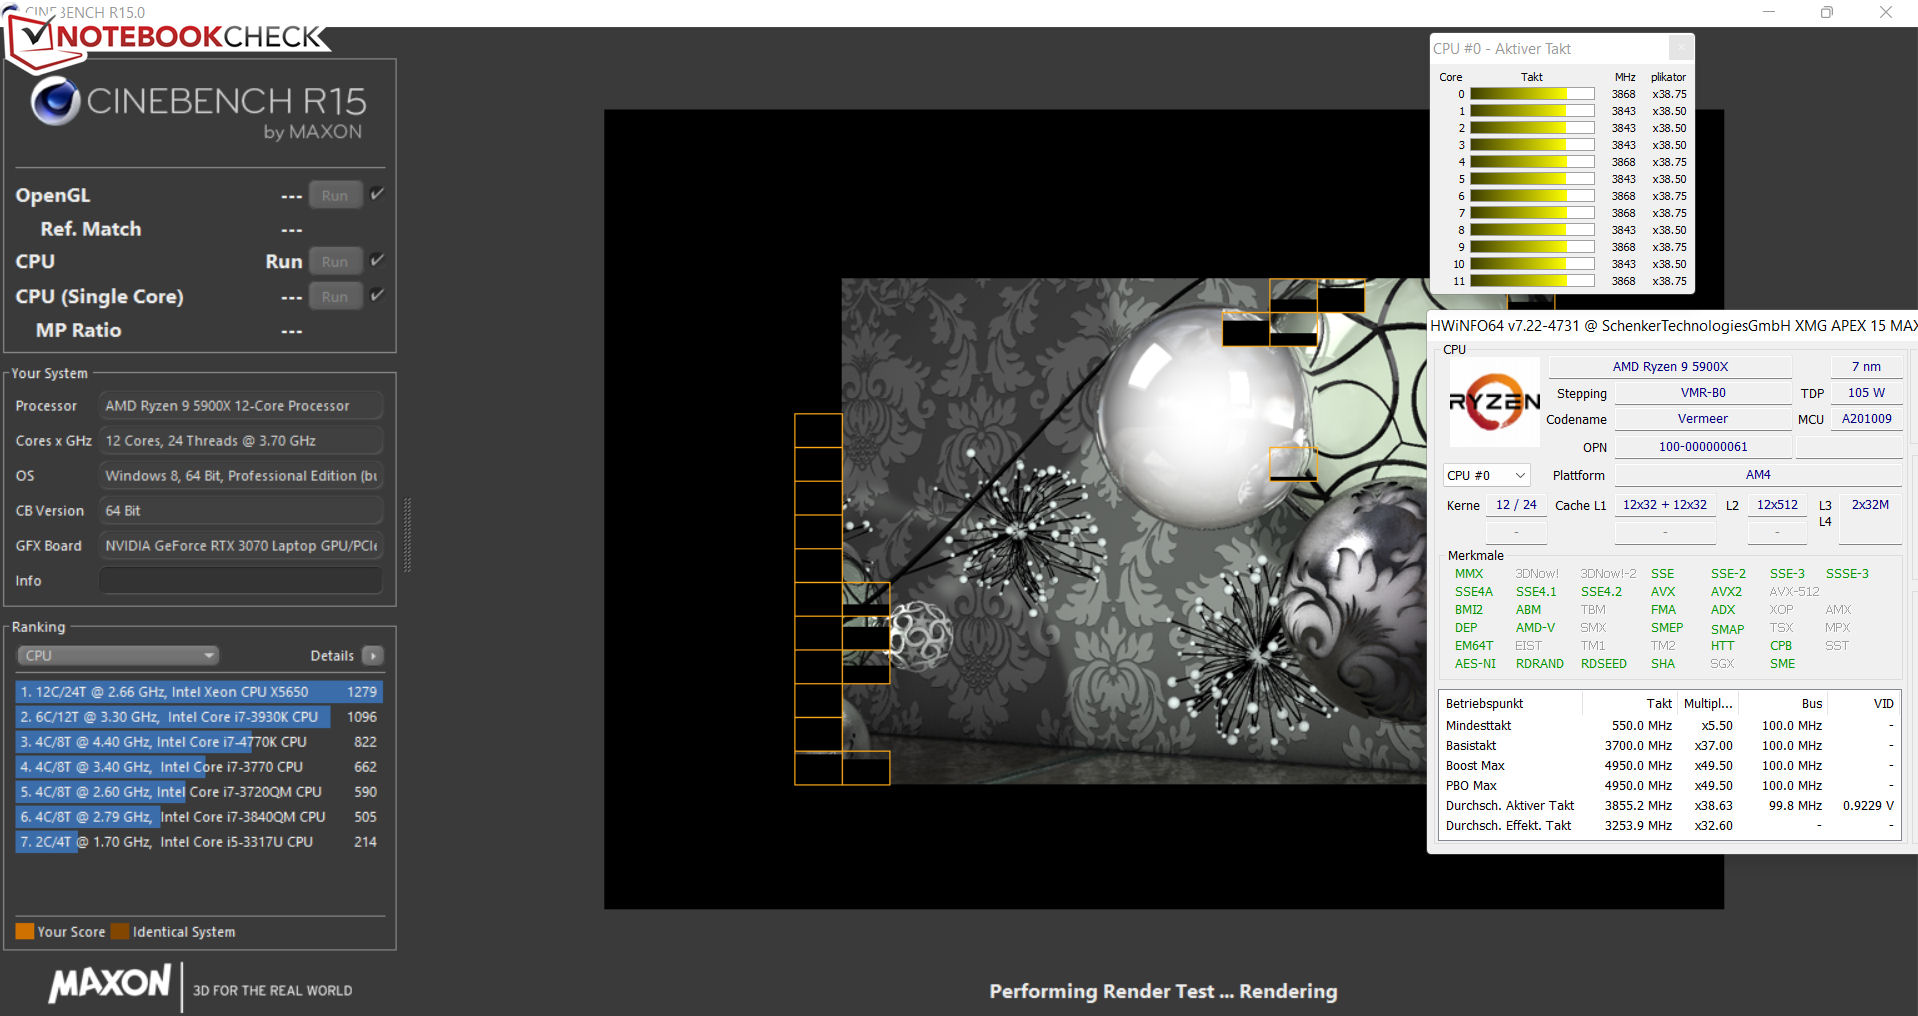
Nel funzionamento multi-thread, la CPU 5900X rimane significativamente al di sotto del suo pieno potenziale: raggiunge solo brevemente la velocità Turbo, se viene attivato il profilo Performance. Nel funzionamento a thread singolo, la distanza tra il desktop e il portatile si riduce (vedere il grafico di confronto). Le opzioni di raffreddamento di un portatile potrebbero semplicemente essere insufficienti, in generale, per far funzionare la CPU desktop alla massima potenza.
È curioso che, utilizzando le stesse impostazioni di prestazioni (modalità Performance, ventola massima), l'Apex si comporti molto meglio nel funzionamento multi-thread rispetto al modello identico Eurocom Nightsky ARX315, anch'esso dotato di una CPU Ryzen 9 5900X. Forse il BIOS Schenker ottimizzato e interno riesce a ottenere maggiori prestazioni dalla CPU.
Cinebench R15 Multi Constant Load Test
| CPU Performance rating - Percent | |
| Media della classe Gaming | |
| AMD Ryzen 9 5900X | |
| MSI Vector GP66 12UGS | |
| HP Omen 16-b1090ng | |
| Schenker XMG Apex 15 Max | |
| Schenker XMG Apex 15 Max | |
| Eurocom Nightsky ARX315 | |
| Schenker XMG Apex 15 NH57AF1 -2! | |
| Media AMD Ryzen 9 5900X | |
| Gigabyte A5 X1 | |
| Schenker XMG Apex 15 Max | |
| Schenker XMG Apex 15 Max | |
| Schenker XMG Apex 15 Max | |
| Cinebench R23 | |
| Multi Core | |
| Media della classe Gaming (10488 - 42661, n=107, ultimi 2 anni) | |
| AMD Ryzen 9 5900X | |
| MSI Vector GP66 12UGS | |
| Schenker XMG Apex 15 Max (Leistungsmodus, max. Fan) | |
| Schenker XMG Apex 15 Max (Leistungsmodus) | |
| HP Omen 16-b1090ng | |
| Gigabyte A5 X1 | |
| Eurocom Nightsky ARX315 | |
| Media AMD Ryzen 9 5900X (2435 - 20634, n=7) | |
| Schenker XMG Apex 15 Max | |
| Schenker XMG Apex 15 Max (Stromsparmodus) | |
| Schenker XMG Apex 15 Max (Lautlosmodus) | |
| Single Core | |
| Media della classe Gaming (1166 - 2415, n=107, ultimi 2 anni) | |
| MSI Vector GP66 12UGS | |
| HP Omen 16-b1090ng | |
| AMD Ryzen 9 5900X | |
| Eurocom Nightsky ARX315 | |
| Schenker XMG Apex 15 Max (Leistungsmodus) | |
| Schenker XMG Apex 15 Max (Leistungsmodus, max. Fan) | |
| Gigabyte A5 X1 | |
| Schenker XMG Apex 15 Max | |
| Media AMD Ryzen 9 5900X (527 - 1568, n=7) | |
| Schenker XMG Apex 15 Max (Lautlosmodus) | |
| Schenker XMG Apex 15 Max (Stromsparmodus) | |
| Cinebench R20 | |
| CPU (Multi Core) | |
| Media della classe Gaming (4029 - 16433, n=106, ultimi 2 anni) | |
| AMD Ryzen 9 5900X | |
| MSI Vector GP66 12UGS | |
| Schenker XMG Apex 15 Max (Leistungsmodus, max. Fan) | |
| Schenker XMG Apex 15 NH57AF1 | |
| Schenker XMG Apex 15 Max (Leistungsmodus) | |
| HP Omen 16-b1090ng | |
| Gigabyte A5 X1 | |
| Eurocom Nightsky ARX315 | |
| Media AMD Ryzen 9 5900X (930 - 8629, n=7) | |
| Schenker XMG Apex 15 Max | |
| Schenker XMG Apex 15 Max (Stromsparmodus) | |
| Schenker XMG Apex 15 Max (Lautlosmodus) | |
| CPU (Single Core) | |
| Media della classe Gaming (442 - 913, n=106, ultimi 2 anni) | |
| MSI Vector GP66 12UGS | |
| HP Omen 16-b1090ng | |
| AMD Ryzen 9 5900X | |
| Schenker XMG Apex 15 Max (Leistungsmodus) | |
| Eurocom Nightsky ARX315 | |
| Schenker XMG Apex 15 Max (Leistungsmodus, max. Fan) | |
| Gigabyte A5 X1 | |
| Schenker XMG Apex 15 Max | |
| Media AMD Ryzen 9 5900X (169 - 639, n=7) | |
| Schenker XMG Apex 15 NH57AF1 | |
| Schenker XMG Apex 15 Max (Lautlosmodus) | |
| Schenker XMG Apex 15 Max (Stromsparmodus) | |
| Cinebench R15 | |
| CPU Multi 64Bit | |
| Media della classe Gaming (1578 - 6330, n=105, ultimi 2 anni) | |
| AMD Ryzen 9 5900X | |
| HP Omen 16-b1090ng | |
| Schenker XMG Apex 15 NH57AF1 | |
| Schenker XMG Apex 15 Max (Leistungsmodus, max. Fan) | |
| Schenker XMG Apex 15 Max (Leistungsmodus) | |
| MSI Vector GP66 12UGS | |
| Eurocom Nightsky ARX315 | |
| Gigabyte A5 X1 | |
| Media AMD Ryzen 9 5900X (400 - 3717, n=7) | |
| Schenker XMG Apex 15 Max (Unterhaltungsmodus) | |
| Schenker XMG Apex 15 Max (Lautlosmodus) | |
| Schenker XMG Apex 15 Max (Stromsparmodus) | |
| CPU Single 64Bit | |
| Media della classe Gaming (188.8 - 350, n=106, ultimi 2 anni) | |
| MSI Vector GP66 12UGS | |
| AMD Ryzen 9 5900X | |
| HP Omen 16-b1090ng | |
| Schenker XMG Apex 15 Max (Leistungsmodus, max. Fan) | |
| Eurocom Nightsky ARX315 | |
| Schenker XMG Apex 15 Max (Leistungsmodus) | |
| Schenker XMG Apex 15 Max | |
| Gigabyte A5 X1 | |
| Media AMD Ryzen 9 5900X (79.2 - 271, n=7) | |
| Schenker XMG Apex 15 NH57AF1 | |
| Schenker XMG Apex 15 Max (Lautlosmodus) | |
| Schenker XMG Apex 15 Max (Stromsparmodus) | |
| Blender - v2.79 BMW27 CPU | |
| Schenker XMG Apex 15 Max (Stromsparmodus) | |
| Schenker XMG Apex 15 Max (Lautlosmodus) | |
| Schenker XMG Apex 15 Max | |
| Media AMD Ryzen 9 5900X (138 - 1259, n=25) | |
| Gigabyte A5 X1 | |
| Eurocom Nightsky ARX315 | |
| MSI Vector GP66 12UGS | |
| Schenker XMG Apex 15 Max (Leistungsmodus) | |
| Schenker XMG Apex 15 Max (Leistungsmodus, max. Fan) | |
| HP Omen 16-b1090ng | |
| Schenker XMG Apex 15 NH57AF1 | |
| Media della classe Gaming (79 - 330, n=104, ultimi 2 anni) | |
| AMD Ryzen 9 5900X | |
| 7-Zip 18.03 | |
| 7z b 4 | |
| AMD Ryzen 9 5900X | |
| Media della classe Gaming (33491 - 148086, n=105, ultimi 2 anni) | |
| Schenker XMG Apex 15 Max (Leistungsmodus, max. Fan) | |
| Schenker XMG Apex 15 Max (Leistungsmodus) | |
| Media AMD Ryzen 9 5900X (11386 - 103095, n=25) | |
| Eurocom Nightsky ARX315 | |
| Schenker XMG Apex 15 NH57AF1 | |
| HP Omen 16-b1090ng | |
| MSI Vector GP66 12UGS | |
| Schenker XMG Apex 15 Max | |
| Gigabyte A5 X1 | |
| Schenker XMG Apex 15 Max (Lautlosmodus) | |
| Schenker XMG Apex 15 Max (Stromsparmodus) | |
| 7z b 4 -mmt1 | |
| AMD Ryzen 9 5900X | |
| Schenker XMG Apex 15 Max (Leistungsmodus, max. Fan) | |
| Eurocom Nightsky ARX315 | |
| Media della classe Gaming (4199 - 7436, n=105, ultimi 2 anni) | |
| Schenker XMG Apex 15 Max | |
| Schenker XMG Apex 15 Max (Leistungsmodus) | |
| Media AMD Ryzen 9 5900X (2685 - 6930, n=25) | |
| MSI Vector GP66 12UGS | |
| HP Omen 16-b1090ng | |
| Gigabyte A5 X1 | |
| Schenker XMG Apex 15 Max (Lautlosmodus) | |
| Schenker XMG Apex 15 NH57AF1 | |
| Schenker XMG Apex 15 Max (Stromsparmodus) | |
| Geekbench 5.5 | |
| Multi-Core | |
| Media della classe Gaming (6460 - 28263, n=105, ultimi 2 anni) | |
| HP Omen 16-b1090ng | |
| AMD Ryzen 9 5900X | |
| MSI Vector GP66 12UGS | |
| Schenker XMG Apex 15 Max (Leistungsmodus, max. Fan) | |
| Schenker XMG Apex 15 Max (Leistungsmodus) | |
| Media AMD Ryzen 9 5900X (1946 - 15119, n=27) | |
| Schenker XMG Apex 15 NH57AF1 | |
| Eurocom Nightsky ARX315 | |
| Schenker XMG Apex 15 Max | |
| Gigabyte A5 X1 | |
| Schenker XMG Apex 15 Max (Lautlosmodus) | |
| Schenker XMG Apex 15 Max (Stromsparmodus) | |
| Single-Core | |
| Media della classe Gaming (986 - 2474, n=105, ultimi 2 anni) | |
| MSI Vector GP66 12UGS | |
| HP Omen 16-b1090ng | |
| AMD Ryzen 9 5900X | |
| Schenker XMG Apex 15 Max (Leistungsmodus) | |
| Schenker XMG Apex 15 Max (Leistungsmodus, max. Fan) | |
| Eurocom Nightsky ARX315 | |
| Schenker XMG Apex 15 Max | |
| Gigabyte A5 X1 | |
| Media AMD Ryzen 9 5900X (158 - 1737, n=27) | |
| Schenker XMG Apex 15 NH57AF1 | |
| Schenker XMG Apex 15 Max (Lautlosmodus) | |
| Schenker XMG Apex 15 Max (Stromsparmodus) | |
| HWBOT x265 Benchmark v2.2 - 4k Preset | |
| Media della classe Gaming (11.5 - 44.4, n=105, ultimi 2 anni) | |
| AMD Ryzen 9 5900X | |
| Media AMD Ryzen 9 5900X (3 - 27.4, n=24) | |
| Schenker XMG Apex 15 Max (Leistungsmodus, max. Fan) | |
| Schenker XMG Apex 15 Max (Leistungsmodus) | |
| HP Omen 16-b1090ng | |
| MSI Vector GP66 12UGS | |
| Schenker XMG Apex 15 NH57AF1 | |
| Eurocom Nightsky ARX315 | |
| Gigabyte A5 X1 | |
| Schenker XMG Apex 15 Max | |
| Schenker XMG Apex 15 Max (Lautlosmodus) | |
| Schenker XMG Apex 15 Max (Stromsparmodus) | |
| LibreOffice - 20 Documents To PDF | |
| Schenker XMG Apex 15 Max (Stromsparmodus) | |
| Schenker XMG Apex 15 Max (Lautlosmodus) | |
| Gigabyte A5 X1 | |
| Media AMD Ryzen 9 5900X (47.4 - 332, n=25) | |
| Schenker XMG Apex 15 NH57AF1 | |
| Schenker XMG Apex 15 Max | |
| Media della classe Gaming (33.2 - 88.8, n=105, ultimi 2 anni) | |
| Schenker XMG Apex 15 Max (Leistungsmodus) | |
| AMD Ryzen 9 5900X | |
| Schenker XMG Apex 15 Max (Leistungsmodus, max. Fan) | |
| Eurocom Nightsky ARX315 | |
| HP Omen 16-b1090ng | |
| MSI Vector GP66 12UGS | |
| R Benchmark 2.5 - Overall mean | |
| Schenker XMG Apex 15 Max (Stromsparmodus) | |
| Schenker XMG Apex 15 Max (Lautlosmodus) | |
| Media AMD Ryzen 9 5900X (0.4457 - 4.47, n=25) | |
| Schenker XMG Apex 15 NH57AF1 | |
| Schenker XMG Apex 15 Max | |
| Gigabyte A5 X1 | |
| Eurocom Nightsky ARX315 | |
| Schenker XMG Apex 15 Max (Leistungsmodus, max. Fan) | |
| Schenker XMG Apex 15 Max (Leistungsmodus) | |
| AMD Ryzen 9 5900X | |
| HP Omen 16-b1090ng | |
| Media della classe Gaming (0.3439 - 0.759, n=106, ultimi 2 anni) | |
| MSI Vector GP66 12UGS | |
* ... Meglio usare valori piccoli
AIDA64: FP32 Ray-Trace | FPU Julia | CPU SHA3 | CPU Queen | FPU SinJulia | FPU Mandel | CPU AES | CPU ZLib | FP64 Ray-Trace | CPU PhotoWorxx
| Performance rating | |
| Media della classe Gaming | |
| AMD Ryzen 9 5900X | |
| Schenker XMG Apex 15 Max | |
| Schenker XMG Apex 15 Max | |
| Media AMD Ryzen 9 5900X | |
| Schenker XMG Apex 15 NH57AF1 | |
| Eurocom Nightsky ARX315 | |
| Gigabyte A5 X1 | |
| Schenker XMG Apex 15 Max | |
| MSI Vector GP66 12UGS | |
| HP Omen 16-b1090ng | |
| Schenker XMG Apex 15 Max | |
| Schenker XMG Apex 15 Max | |
| AIDA64 / FP32 Ray-Trace | |
| Media della classe Gaming (10227 - 85542, n=105, ultimi 2 anni) | |
| AMD Ryzen 9 5900X (v6.25.5400) | |
| Media AMD Ryzen 9 5900X (3069 - 24659, n=15) | |
| Schenker XMG Apex 15 Max (v6.50.5800, Leistungsmodus, max. Fan) | |
| Schenker XMG Apex 15 NH57AF1 | |
| Schenker XMG Apex 15 Max (v6.50.5800, Leistungsmodus) | |
| Gigabyte A5 X1 (v6.50.5800) | |
| Eurocom Nightsky ARX315 (v6.50.5800) | |
| Schenker XMG Apex 15 Max (v6.50.5800) | |
| MSI Vector GP66 12UGS (v6.50.5800) | |
| HP Omen 16-b1090ng (v6.50.5800) | |
| Schenker XMG Apex 15 Max (v6.50.5800, Lautlosmodus) | |
| Schenker XMG Apex 15 Max (v6.50.5800, Stromsparmodus) | |
| AIDA64 / FPU Julia | |
| Media della classe Gaming (51376 - 238426, n=105, ultimi 2 anni) | |
| Schenker XMG Apex 15 Max (v6.50.5800, Leistungsmodus, max. Fan) | |
| AMD Ryzen 9 5900X (v6.25.5400) | |
| Schenker XMG Apex 15 Max (v6.50.5800, Leistungsmodus) | |
| Media AMD Ryzen 9 5900X (18567 - 155529, n=15) | |
| Schenker XMG Apex 15 NH57AF1 | |
| Gigabyte A5 X1 (v6.50.5800) | |
| Eurocom Nightsky ARX315 (v6.50.5800) | |
| Schenker XMG Apex 15 Max (v6.50.5800) | |
| MSI Vector GP66 12UGS (v6.50.5800) | |
| HP Omen 16-b1090ng (v6.50.5800) | |
| Schenker XMG Apex 15 Max (v6.50.5800, Stromsparmodus) | |
| Schenker XMG Apex 15 Max (v6.50.5800, Lautlosmodus) | |
| AIDA64 / CPU SHA3 | |
| Media della classe Gaming (2180 - 10115, n=105, ultimi 2 anni) | |
| Schenker XMG Apex 15 Max (v6.50.5800, Leistungsmodus, max. Fan) | |
| Schenker XMG Apex 15 Max (v6.50.5800, Leistungsmodus) | |
| Media AMD Ryzen 9 5900X (629 - 5329, n=15) | |
| AMD Ryzen 9 5900X (v6.25.5400) | |
| Gigabyte A5 X1 (v6.50.5800) | |
| Schenker XMG Apex 15 NH57AF1 | |
| Eurocom Nightsky ARX315 (v6.50.5800) | |
| MSI Vector GP66 12UGS (v6.50.5800) | |
| HP Omen 16-b1090ng (v6.50.5800) | |
| Schenker XMG Apex 15 Max | |
| Schenker XMG Apex 15 Max (v6.50.5800, Lautlosmodus) | |
| Schenker XMG Apex 15 Max (v6.50.5800, Stromsparmodus) | |
| AIDA64 / CPU Queen | |
| AMD Ryzen 9 5900X (v6.25.5400) | |
| Schenker XMG Apex 15 NH57AF1 | |
| Media della classe Gaming (49785 - 173351, n=90, ultimi 2 anni) | |
| Schenker XMG Apex 15 Max (v6.50.5800, Leistungsmodus, max. Fan) | |
| Eurocom Nightsky ARX315 (v6.50.5800) | |
| Media AMD Ryzen 9 5900X (15371 - 138889, n=15) | |
| Schenker XMG Apex 15 Max (v6.50.5800, Leistungsmodus) | |
| MSI Vector GP66 12UGS (v6.50.5800) | |
| Gigabyte A5 X1 (v6.50.5800) | |
| HP Omen 16-b1090ng (v6.50.5800) | |
| Schenker XMG Apex 15 Max (v6.50.5800) | |
| Schenker XMG Apex 15 Max (v6.50.5800, Lautlosmodus) | |
| Schenker XMG Apex 15 Max (v6.50.5800, Stromsparmodus) | |
| AIDA64 / FPU SinJulia | |
| Schenker XMG Apex 15 NH57AF1 | |
| AMD Ryzen 9 5900X (v6.25.5400) | |
| Eurocom Nightsky ARX315 (v6.50.5800) | |
| Schenker XMG Apex 15 Max (v6.50.5800, Leistungsmodus, max. Fan) | |
| Schenker XMG Apex 15 Max (v6.50.5800, Leistungsmodus) | |
| Media AMD Ryzen 9 5900X (2137 - 19465, n=15) | |
| Schenker XMG Apex 15 Max (v6.50.5800) | |
| Media della classe Gaming (4424 - 33636, n=105, ultimi 2 anni) | |
| Gigabyte A5 X1 (v6.50.5800) | |
| MSI Vector GP66 12UGS (v6.50.5800) | |
| HP Omen 16-b1090ng (v6.50.5800) | |
| Schenker XMG Apex 15 Max (v6.50.5800, Stromsparmodus) | |
| Schenker XMG Apex 15 Max (v6.50.5800, Lautlosmodus) | |
| AIDA64 / FPU Mandel | |
| Media della classe Gaming (25115 - 128721, n=105, ultimi 2 anni) | |
| Schenker XMG Apex 15 Max (v6.50.5800, Leistungsmodus, max. Fan) | |
| AMD Ryzen 9 5900X (v6.25.5400) | |
| Schenker XMG Apex 15 Max (v6.50.5800, Leistungsmodus) | |
| Media AMD Ryzen 9 5900X (10291 - 85469, n=15) | |
| Gigabyte A5 X1 (v6.50.5800) | |
| Schenker XMG Apex 15 NH57AF1 | |
| Eurocom Nightsky ARX315 (v6.50.5800) | |
| Schenker XMG Apex 15 Max | |
| MSI Vector GP66 12UGS (v6.50.5800) | |
| HP Omen 16-b1090ng (v6.50.5800) | |
| Schenker XMG Apex 15 Max (v6.50.5800, Lautlosmodus) | |
| Schenker XMG Apex 15 Max (v6.50.5800, Stromsparmodus) | |
| AIDA64 / CPU AES | |
| Schenker XMG Apex 15 Max (v6.50.5800, Leistungsmodus, max. Fan) | |
| Schenker XMG Apex 15 Max (v6.50.5800, Leistungsmodus) | |
| Media AMD Ryzen 9 5900X (24327 - 212390, n=15) | |
| Eurocom Nightsky ARX315 (v6.50.5800) | |
| Gigabyte A5 X1 (v6.50.5800) | |
| AMD Ryzen 9 5900X (v6.25.5400) | |
| Schenker XMG Apex 15 Max (v6.50.5800) | |
| Media della classe Gaming (39258 - 247074, n=105, ultimi 2 anni) | |
| Schenker XMG Apex 15 NH57AF1 | |
| MSI Vector GP66 12UGS (v6.50.5800) | |
| HP Omen 16-b1090ng (v6.50.5800) | |
| Schenker XMG Apex 15 Max (v6.50.5800, Stromsparmodus) | |
| Schenker XMG Apex 15 Max (v6.50.5800, Lautlosmodus) | |
| AIDA64 / CPU ZLib | |
| Media della classe Gaming (574 - 2531, n=105, ultimi 2 anni) | |
| AMD Ryzen 9 5900X (v6.25.5400) | |
| Schenker XMG Apex 15 NH57AF1 | |
| MSI Vector GP66 12UGS (v6.50.5800) | |
| Media AMD Ryzen 9 5900X (150.9 - 1345, n=15) | |
| Schenker XMG Apex 15 Max (v6.50.5800, Leistungsmodus, max. Fan) | |
| Schenker XMG Apex 15 Max (v6.50.5800, Leistungsmodus) | |
| HP Omen 16-b1090ng (v6.50.5800) | |
| Eurocom Nightsky ARX315 (v6.50.5800) | |
| Gigabyte A5 X1 (v6.50.5800) | |
| Schenker XMG Apex 15 Max (v6.50.5800) | |
| Schenker XMG Apex 15 Max (v6.50.5800, Stromsparmodus) | |
| Schenker XMG Apex 15 Max (v6.50.5800, Lautlosmodus) | |
| AIDA64 / FP64 Ray-Trace | |
| Media della classe Gaming (5509 - 45446, n=105, ultimi 2 anni) | |
| AMD Ryzen 9 5900X (v6.25.5400) | |
| Media AMD Ryzen 9 5900X (1518 - 13196, n=15) | |
| Schenker XMG Apex 15 Max (v6.50.5800, Leistungsmodus, max. Fan) | |
| Schenker XMG Apex 15 NH57AF1 | |
| Schenker XMG Apex 15 Max (v6.50.5800, Leistungsmodus) | |
| Gigabyte A5 X1 (v6.50.5800) | |
| Eurocom Nightsky ARX315 (v6.50.5800) | |
| Schenker XMG Apex 15 Max (v6.50.5800) | |
| MSI Vector GP66 12UGS (v6.50.5800) | |
| HP Omen 16-b1090ng (v6.50.5800) | |
| Schenker XMG Apex 15 Max (v6.50.5800, Stromsparmodus) | |
| Schenker XMG Apex 15 Max (v6.50.5800, Lautlosmodus) | |
| AIDA64 / CPU PhotoWorxx | |
| Media della classe Gaming (12271 - 89891, n=105, ultimi 2 anni) | |
| HP Omen 16-b1090ng (v6.50.5800) | |
| Schenker XMG Apex 15 Max (v6.50.5800, Leistungsmodus) | |
| Schenker XMG Apex 15 Max (v6.50.5800, Leistungsmodus, max. Fan) | |
| Schenker XMG Apex 15 Max (v6.50.5800) | |
| MSI Vector GP66 12UGS (v6.50.5800) | |
| Media AMD Ryzen 9 5900X (11451 - 32849, n=15) | |
| Eurocom Nightsky ARX315 (v6.50.5800) | |
| Schenker XMG Apex 15 NH57AF1 | |
| AMD Ryzen 9 5900X (v6.25.5400) | |
| Gigabyte A5 X1 (v6.50.5800) | |
| Schenker XMG Apex 15 Max (v6.50.5800, Stromsparmodus) | |
| Schenker XMG Apex 15 Max (v6.50.5800, Lautlosmodus) | |
Prestazioni del sistema
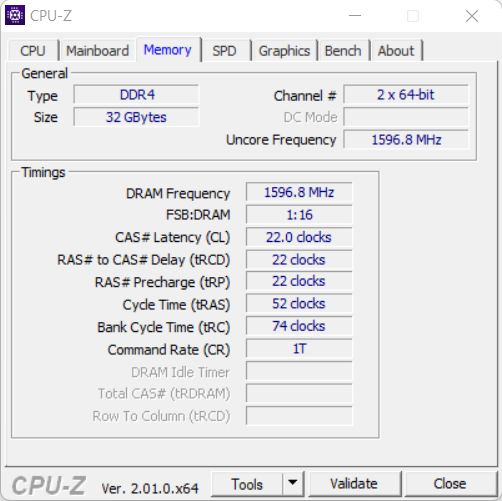
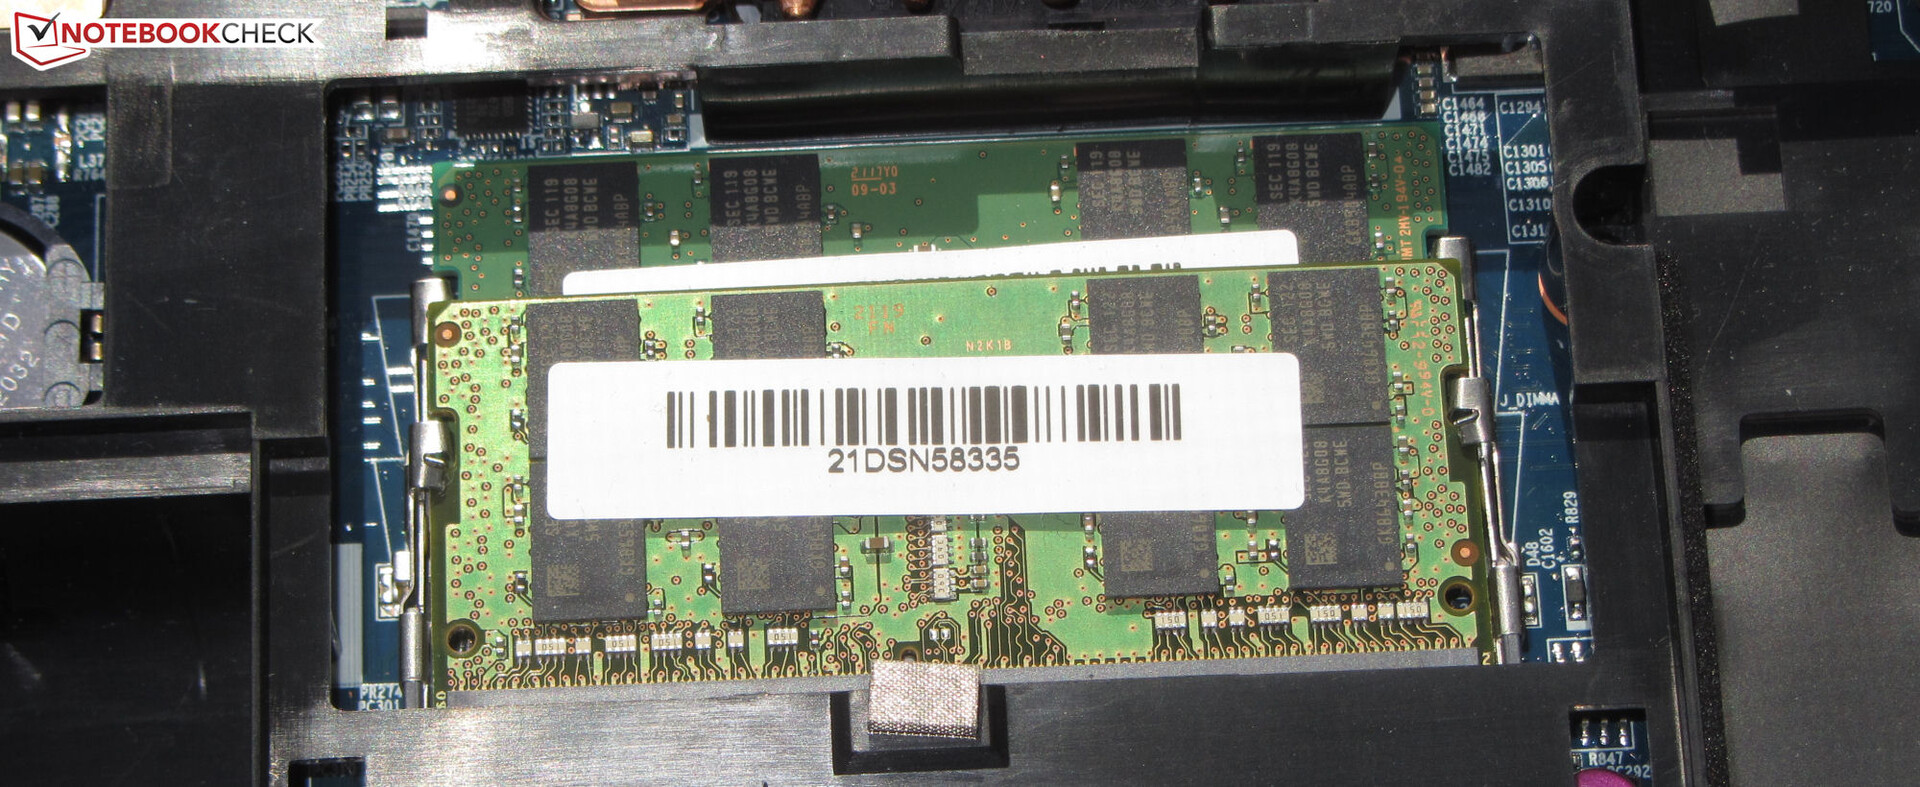
Il portatile è in grado di gestire senza problemi gli scenari applicativi che richiedono molte prestazioni, come confermano anche gli ottimi risultati di PC-Mark. Le velocità di trasferimento della memoria di lavoro integrata si attestano su livelli normali per una memoria DDR4 3200.
Finché si seleziona la modalità Performance o Entertainment, il sistema funziona in modo rapido e fluido. Se si utilizzano gli altri due profili, il sistema tende a soffrire di una certa lentezza, in quanto le prestazioni di calcolo vengono notevolmente rallentate.
CrossMark: Overall | Productivity | Creativity | Responsiveness
| PCMark 10 / Score | |
| Media della classe Gaming (5828 - 12414, n=93, ultimi 2 anni) | |
| MSI Vector GP66 12UGS | |
| Schenker XMG Apex 15 Max (Leistungsmodus) | |
| Media AMD Ryzen 9 5900X, NVIDIA GeForce RTX 3070 Laptop GPU (7087 - 7688, n=3) | |
| HP Omen 16-b1090ng | |
| Eurocom Nightsky ARX315 | |
| Schenker XMG Apex 15 Max | |
| Schenker XMG Apex 15 NH57AF1 | |
| Gigabyte A5 X1 | |
| PCMark 10 / Essentials | |
| MSI Vector GP66 12UGS | |
| Media della classe Gaming (8810 - 11935, n=97, ultimi 2 anni) | |
| Eurocom Nightsky ARX315 | |
| Schenker XMG Apex 15 NH57AF1 | |
| Media AMD Ryzen 9 5900X, NVIDIA GeForce RTX 3070 Laptop GPU (10286 - 10613, n=3) | |
| Schenker XMG Apex 15 Max (Leistungsmodus) | |
| Schenker XMG Apex 15 Max | |
| HP Omen 16-b1090ng | |
| Gigabyte A5 X1 | |
| PCMark 10 / Productivity | |
| Media della classe Gaming (6845 - 25323, n=95, ultimi 2 anni) | |
| MSI Vector GP66 12UGS | |
| Schenker XMG Apex 15 Max (Leistungsmodus) | |
| HP Omen 16-b1090ng | |
| Media AMD Ryzen 9 5900X, NVIDIA GeForce RTX 3070 Laptop GPU (9042 - 9959, n=3) | |
| Eurocom Nightsky ARX315 | |
| Gigabyte A5 X1 | |
| Schenker XMG Apex 15 Max | |
| Schenker XMG Apex 15 NH57AF1 | |
| PCMark 10 / Digital Content Creation | |
| Media della classe Gaming (7602 - 19954, n=95, ultimi 2 anni) | |
| MSI Vector GP66 12UGS | |
| Schenker XMG Apex 15 Max (Leistungsmodus) | |
| Media AMD Ryzen 9 5900X, NVIDIA GeForce RTX 3070 Laptop GPU (10387 - 11892, n=3) | |
| HP Omen 16-b1090ng | |
| Eurocom Nightsky ARX315 | |
| Schenker XMG Apex 15 Max | |
| Schenker XMG Apex 15 NH57AF1 | |
| Gigabyte A5 X1 | |
| CrossMark / Overall | |
| Media della classe Gaming (1366 - 2409, n=94, ultimi 2 anni) | |
| Schenker XMG Apex 15 Max | |
| Media AMD Ryzen 9 5900X, NVIDIA GeForce RTX 3070 Laptop GPU (n=1) | |
| CrossMark / Productivity | |
| Media della classe Gaming (1386 - 2254, n=94, ultimi 2 anni) | |
| Schenker XMG Apex 15 Max | |
| Media AMD Ryzen 9 5900X, NVIDIA GeForce RTX 3070 Laptop GPU (n=1) | |
| CrossMark / Creativity | |
| Media della classe Gaming (1343 - 2786, n=94, ultimi 2 anni) | |
| Schenker XMG Apex 15 Max | |
| Media AMD Ryzen 9 5900X, NVIDIA GeForce RTX 3070 Laptop GPU (n=1) | |
| CrossMark / Responsiveness | |
| Media della classe Gaming (1226 - 2334, n=94, ultimi 2 anni) | |
| Schenker XMG Apex 15 Max | |
| Media AMD Ryzen 9 5900X, NVIDIA GeForce RTX 3070 Laptop GPU (n=1) | |
| PCMark 8 Home Score Accelerated v2 | 5278 punti | |
| PCMark 8 Creative Score Accelerated v2 | 6049 punti | |
| PCMark 8 Work Score Accelerated v2 | 6196 punti | |
| PCMark 10 Score | 7087 punti | |
Aiuto | ||
| AIDA64 / Memory Copy | |
| Media della classe Gaming (21750 - 129946, n=105, ultimi 2 anni) | |
| HP Omen 16-b1090ng | |
| Media AMD Ryzen 9 5900X (31315 - 72008, n=15) | |
| Schenker XMG Apex 15 NH57AF1 | |
| Schenker XMG Apex 15 Max | |
| MSI Vector GP66 12UGS | |
| Gigabyte A5 X1 | |
| Eurocom Nightsky ARX315 | |
| AIDA64 / Memory Read | |
| Media della classe Gaming (22956 - 118858, n=105, ultimi 2 anni) | |
| HP Omen 16-b1090ng | |
| Media AMD Ryzen 9 5900X (32972 - 70692, n=15) | |
| MSI Vector GP66 12UGS | |
| Schenker XMG Apex 15 Max | |
| Schenker XMG Apex 15 NH57AF1 | |
| Gigabyte A5 X1 | |
| Eurocom Nightsky ARX315 | |
| AIDA64 / Memory Write | |
| Media della classe Gaming (22297 - 135096, n=105, ultimi 2 anni) | |
| HP Omen 16-b1090ng | |
| Media AMD Ryzen 9 5900X (21619 - 57070, n=15) | |
| Schenker XMG Apex 15 Max | |
| MSI Vector GP66 12UGS | |
| Schenker XMG Apex 15 NH57AF1 | |
| Eurocom Nightsky ARX315 | |
| Gigabyte A5 X1 | |
| AIDA64 / Memory Latency | |
| Media della classe Gaming (75.3 - 259, n=105, ultimi 2 anni) | |
| MSI Vector GP66 12UGS | |
| HP Omen 16-b1090ng | |
| Schenker XMG Apex 15 NH57AF1 | |
| Gigabyte A5 X1 | |
| Media AMD Ryzen 9 5900X (58.4 - 107.6, n=15) | |
| Schenker XMG Apex 15 Max | |
| Eurocom Nightsky ARX315 | |
* ... Meglio usare valori piccoli
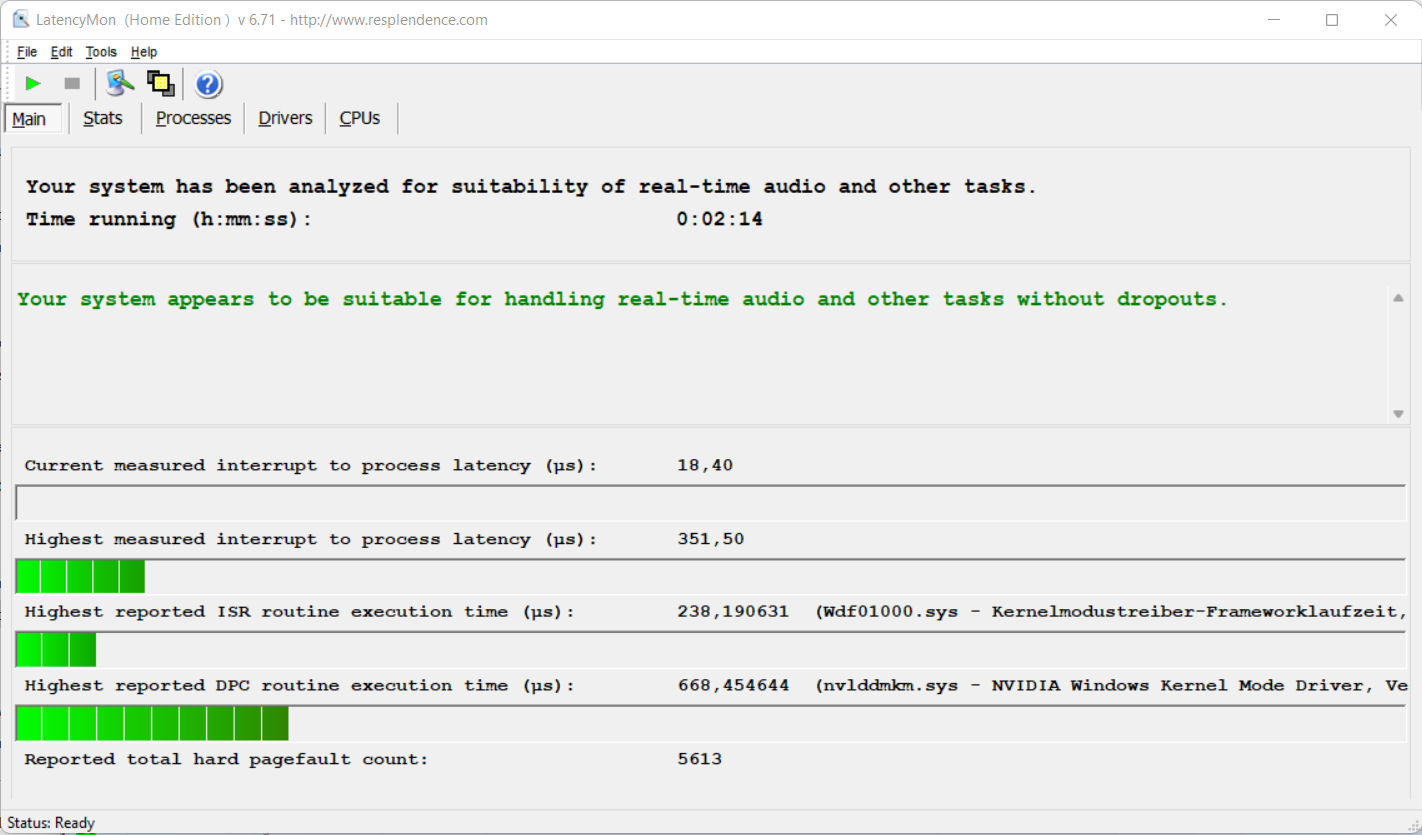
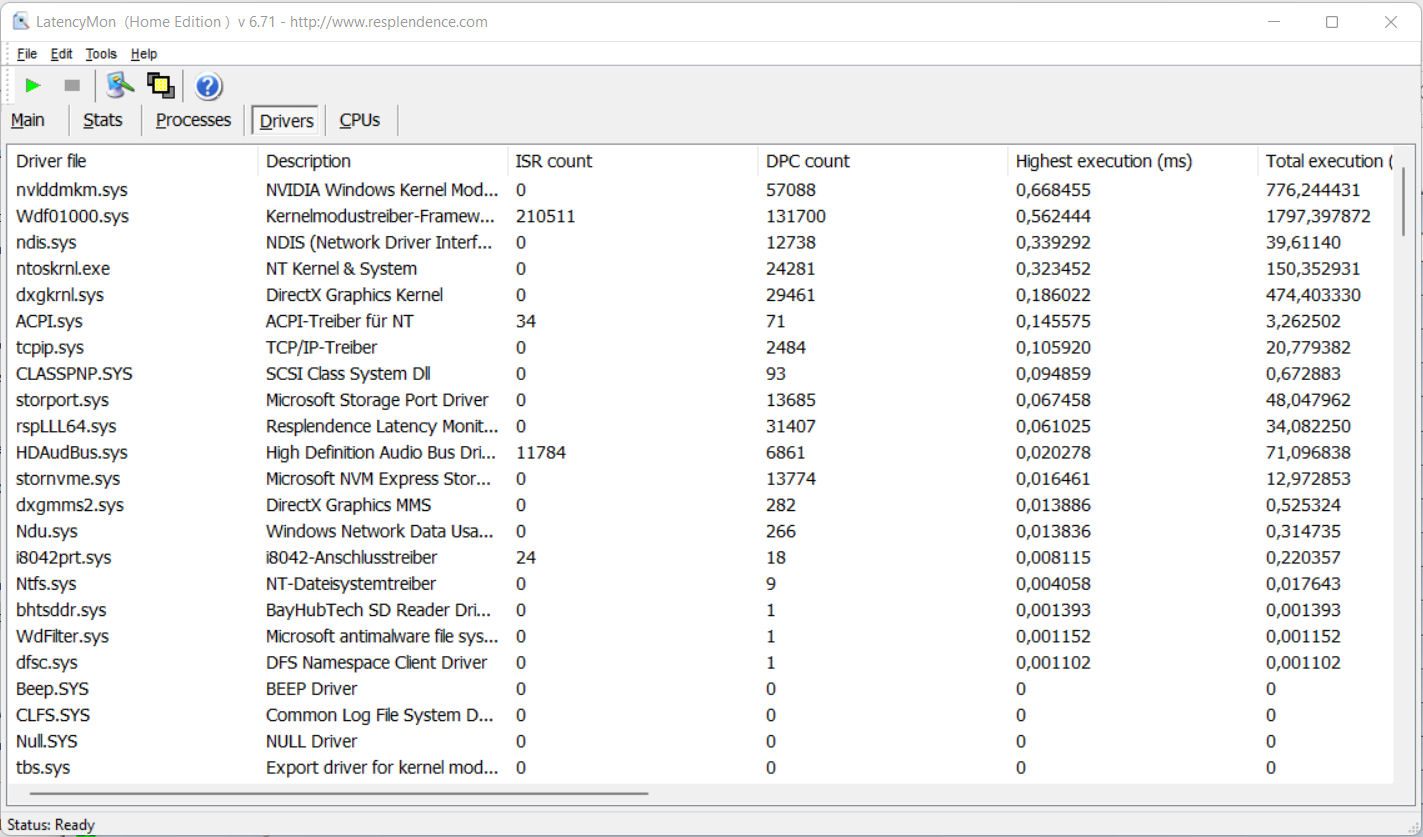
Latenze DPC
Il test standardizzato Latency Monitor (navigazione web, riproduzione video 4k, Prime95 high load) non rivela nulla di rilevante nelle latenze DPC. Il sistema sembra essere adatto all'elaborazione video e audio in tempo reale. I futuri aggiornamenti del software potrebbero apportare miglioramenti o addirittura peggiorare la situazione.
| DPC Latencies / LatencyMon - interrupt to process latency (max), Web, Youtube, Prime95 | |
| MSI Vector GP66 12UGS | |
| Schenker XMG Apex 15 NH57AF1 | |
| HP Omen 16-b1090ng | |
| Gigabyte A5 X1 | |
| Eurocom Nightsky ARX315 | |
| Schenker XMG Apex 15 Max | |
* ... Meglio usare valori piccoli
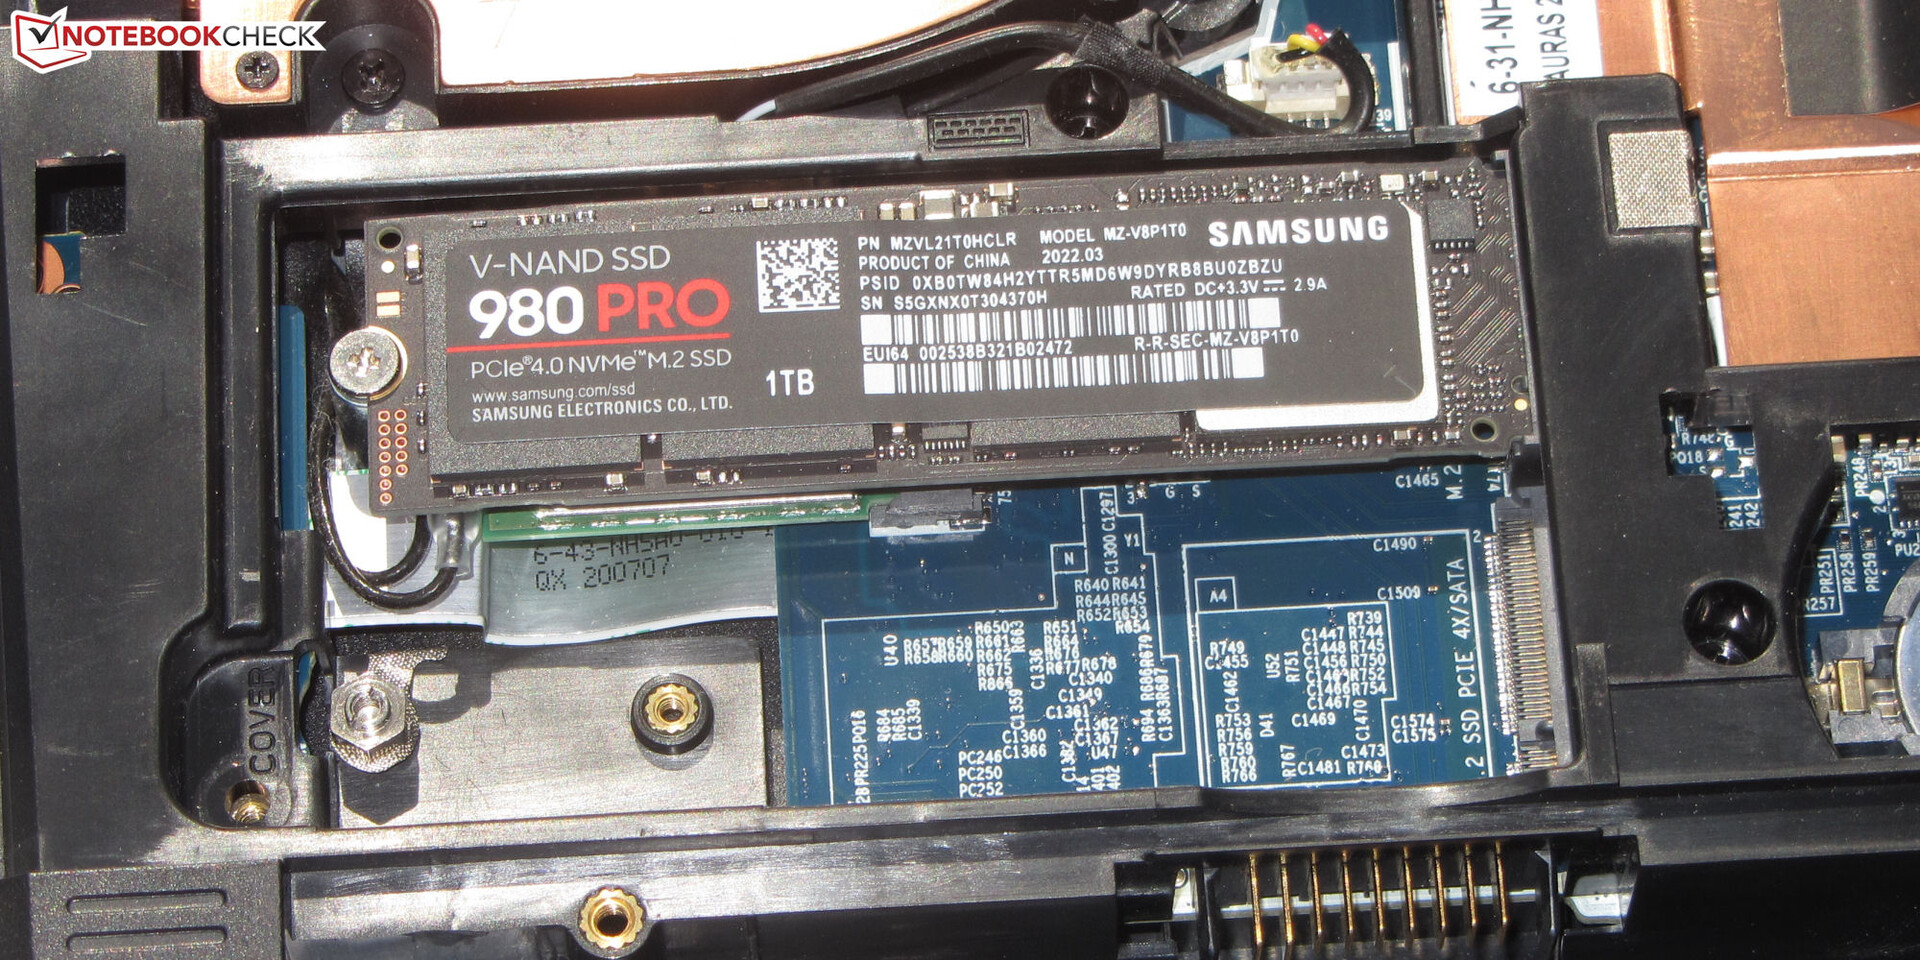
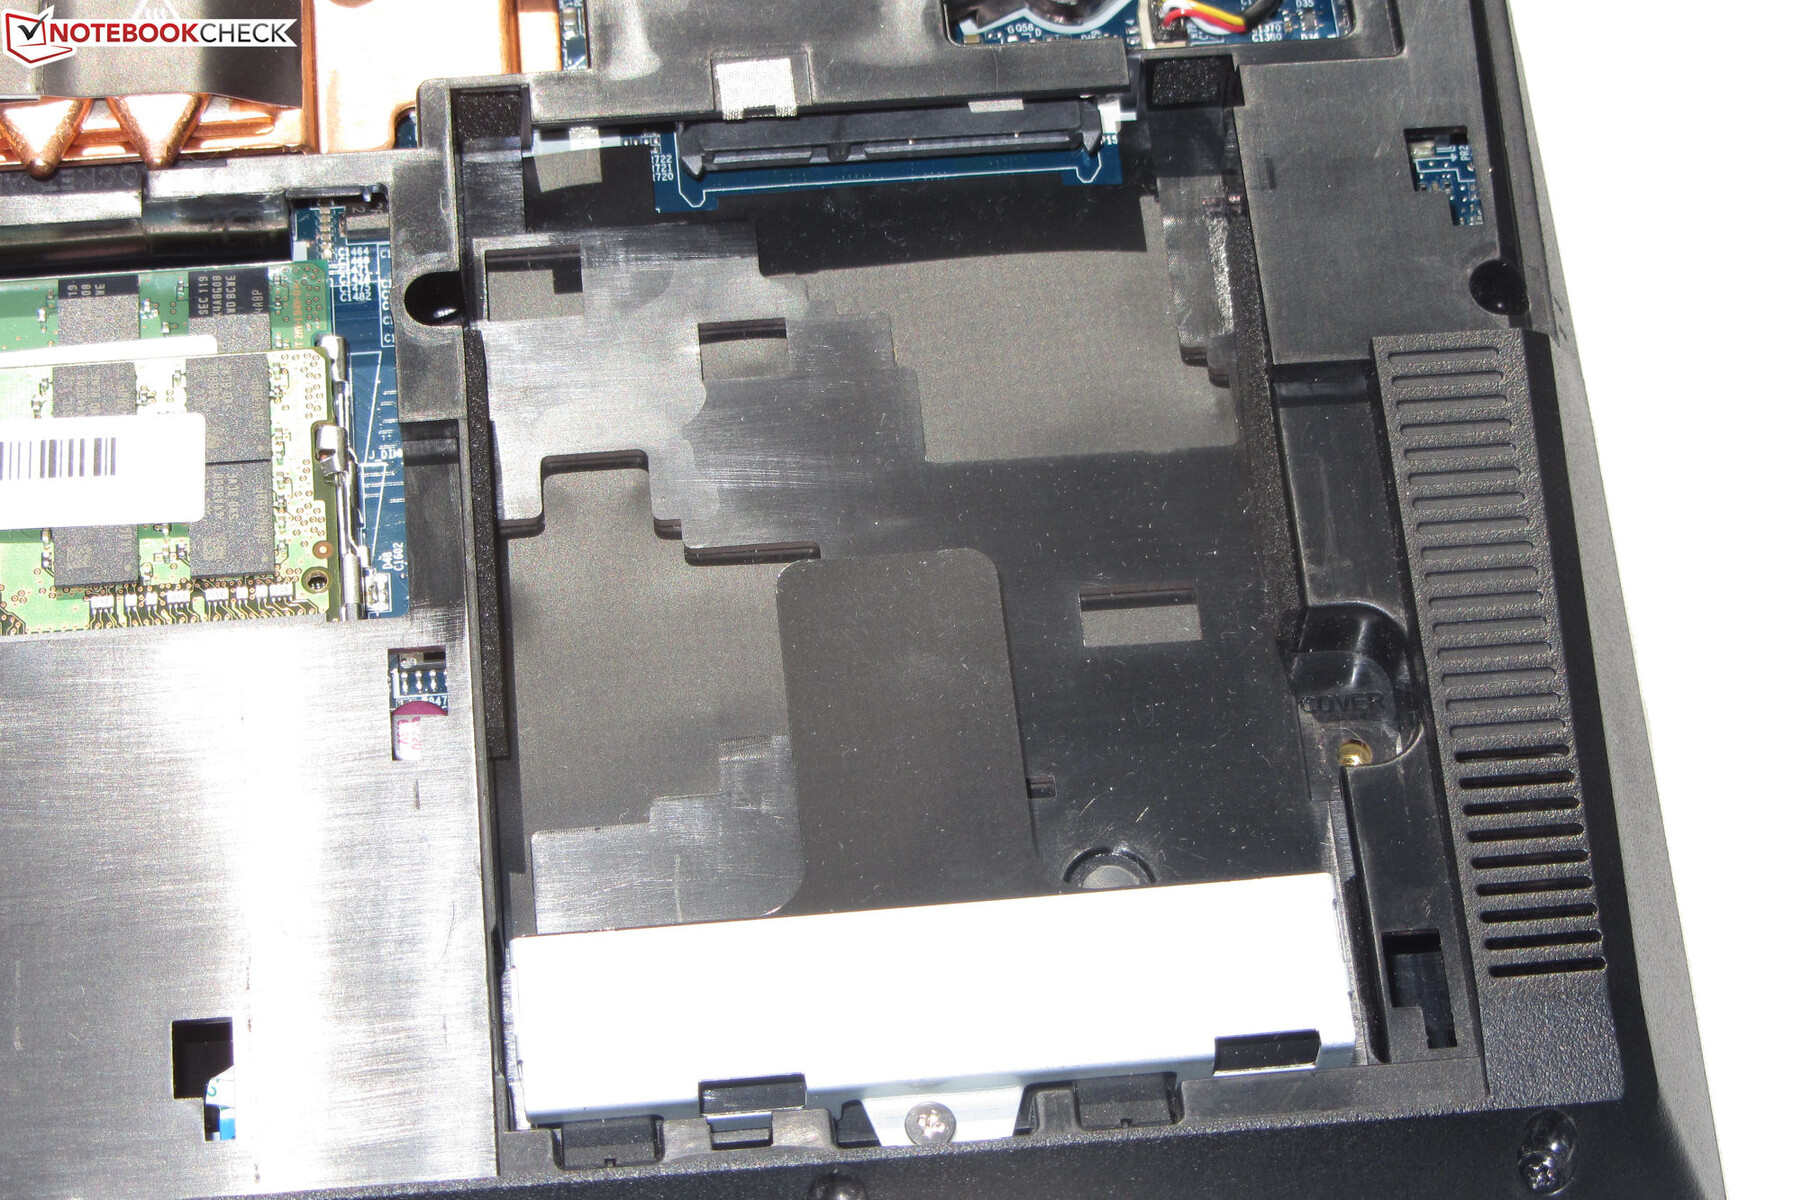
Soluzione di stoccaggio
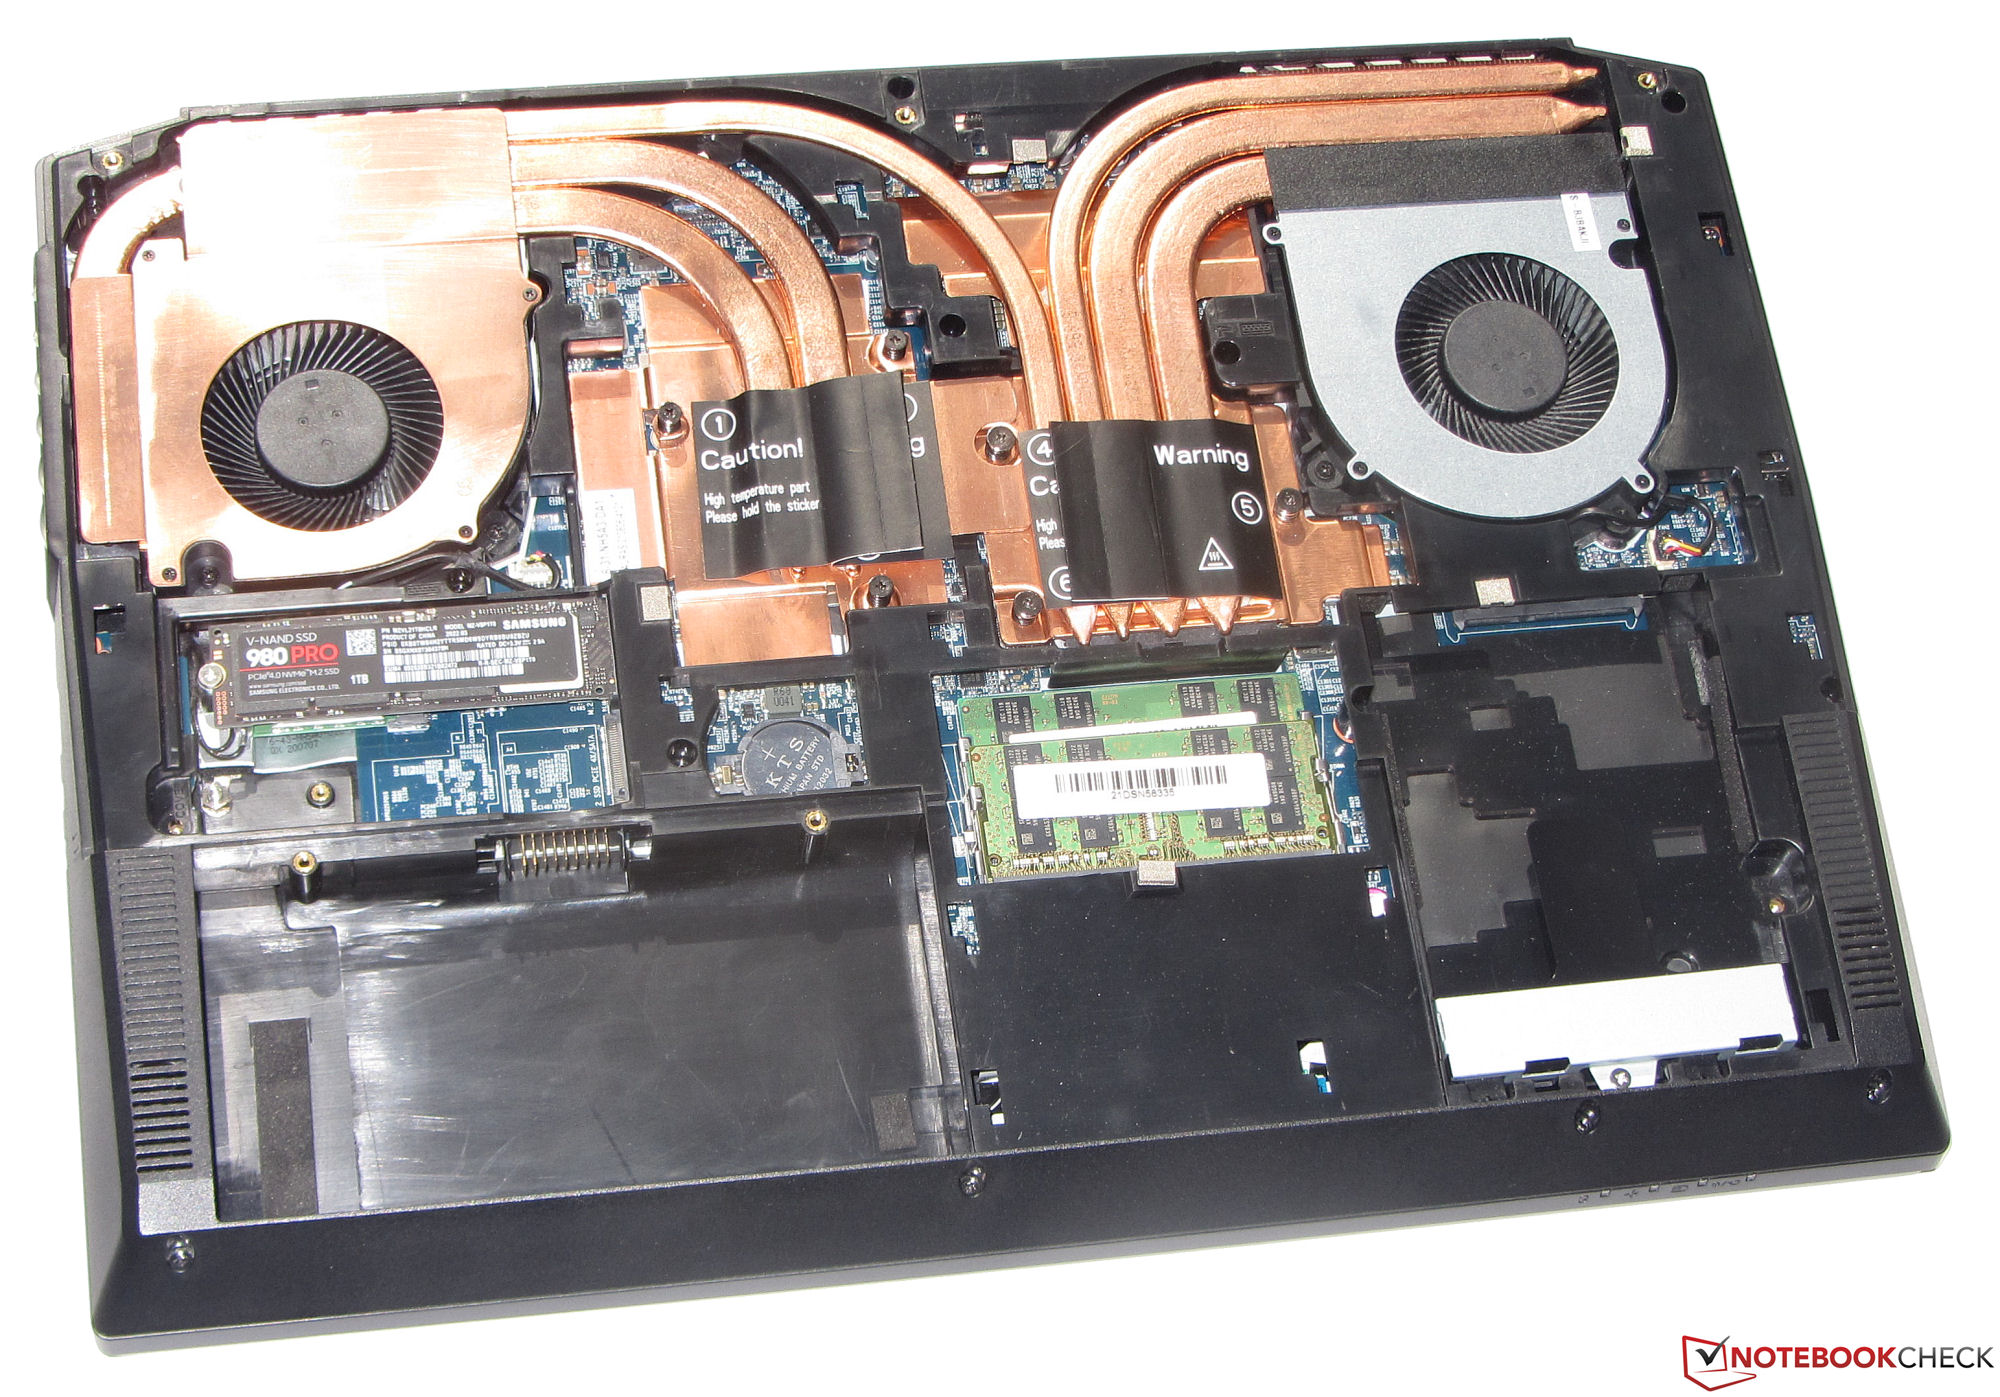
Come unità di sistema viene utilizzata un'unità SSD da 1 TB (PCIe 4, M.2-2280) di Samsung, che offre eccellenti velocità di trasferimento. Il portatile offre anche spazio aggiuntivo per una seconda unità SSD (PCIe 3) e un supporto di archiviazione da 2,5 pollici.

* ... Meglio usare valori piccoli
Constant Performance Reading: DiskSpd Read Loop, Queue Depth 8
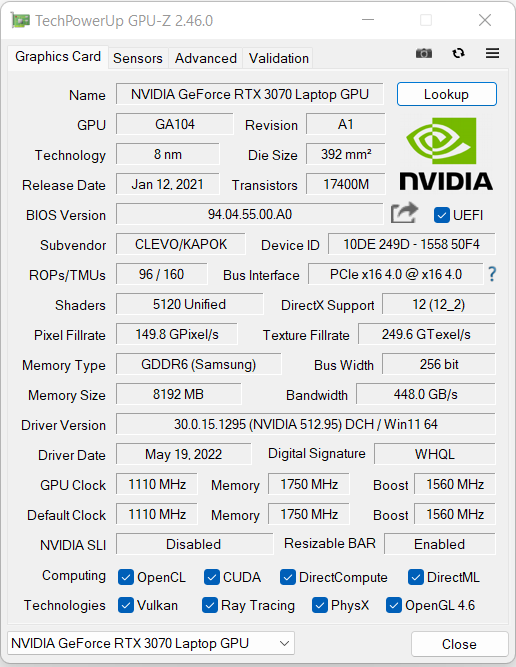
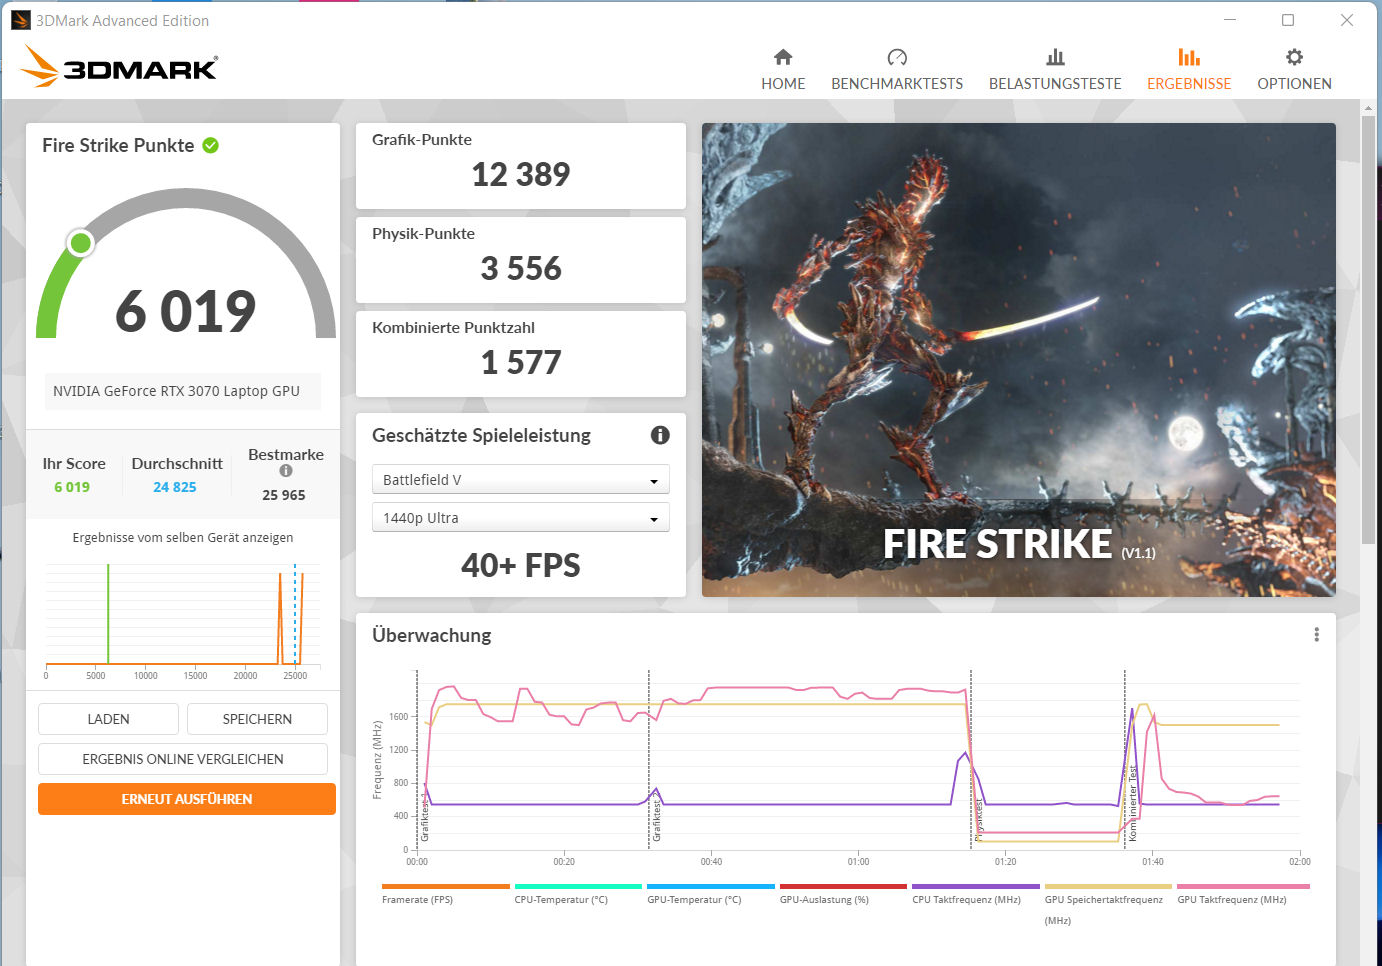
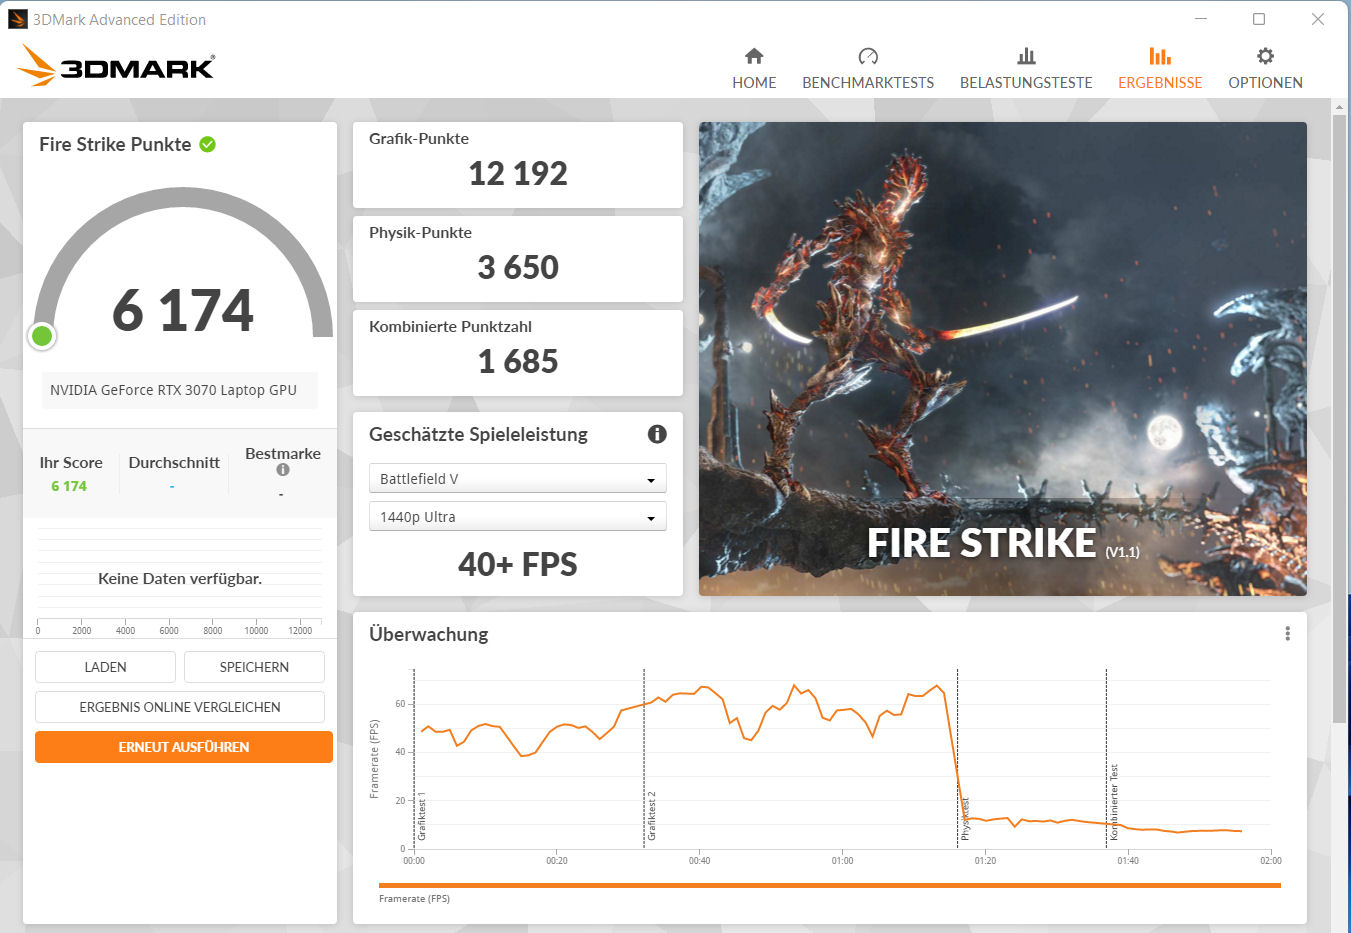
Scheda grafica
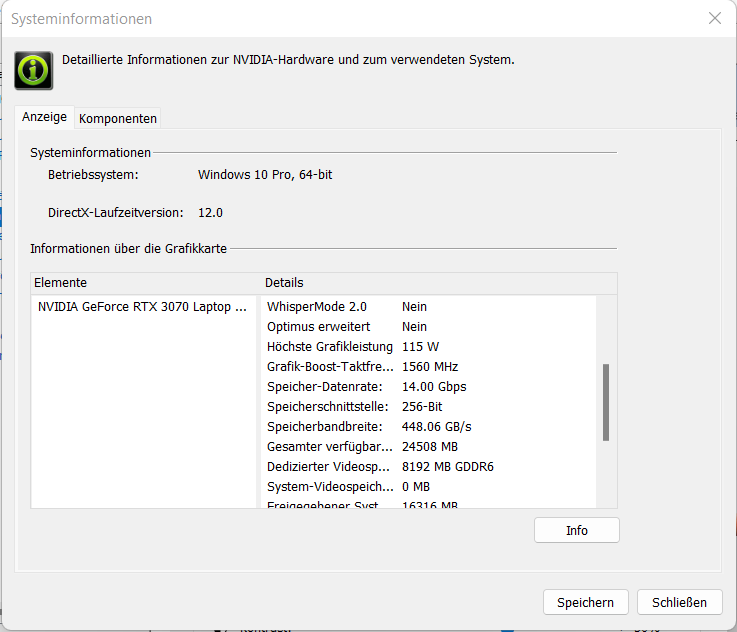
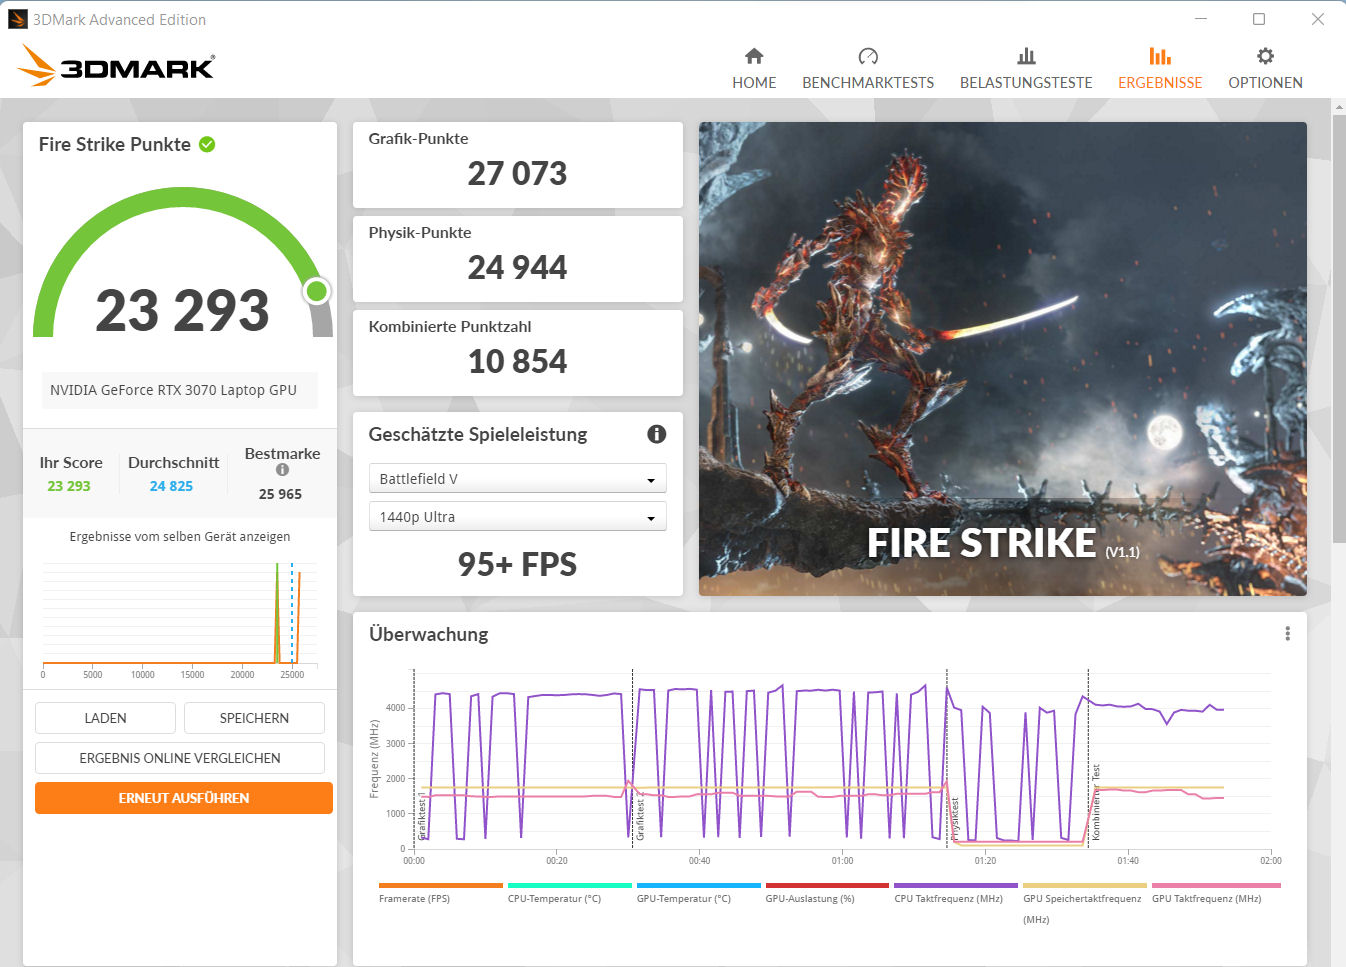
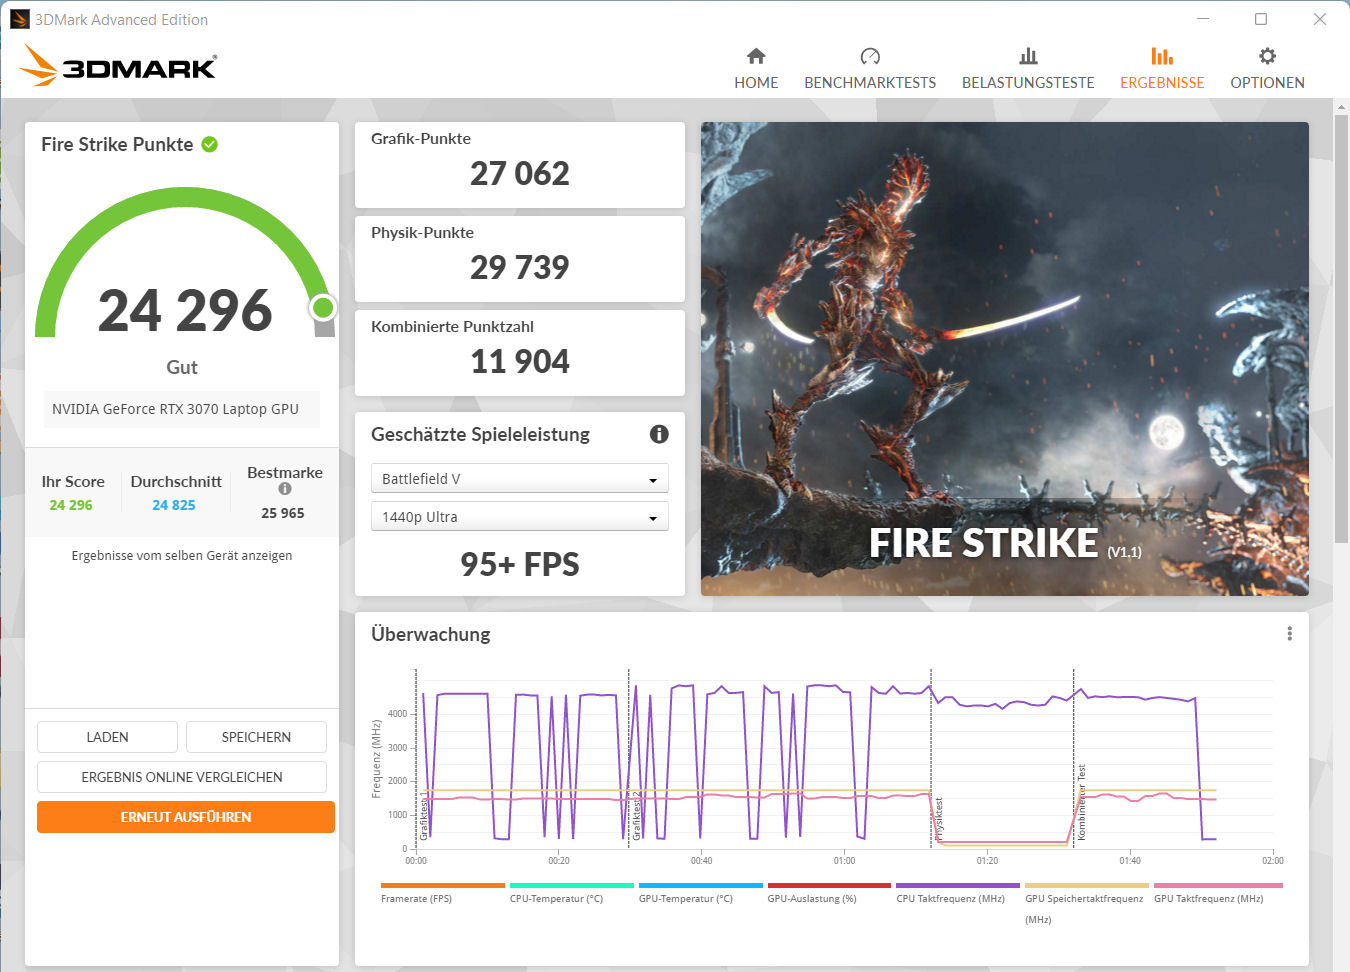
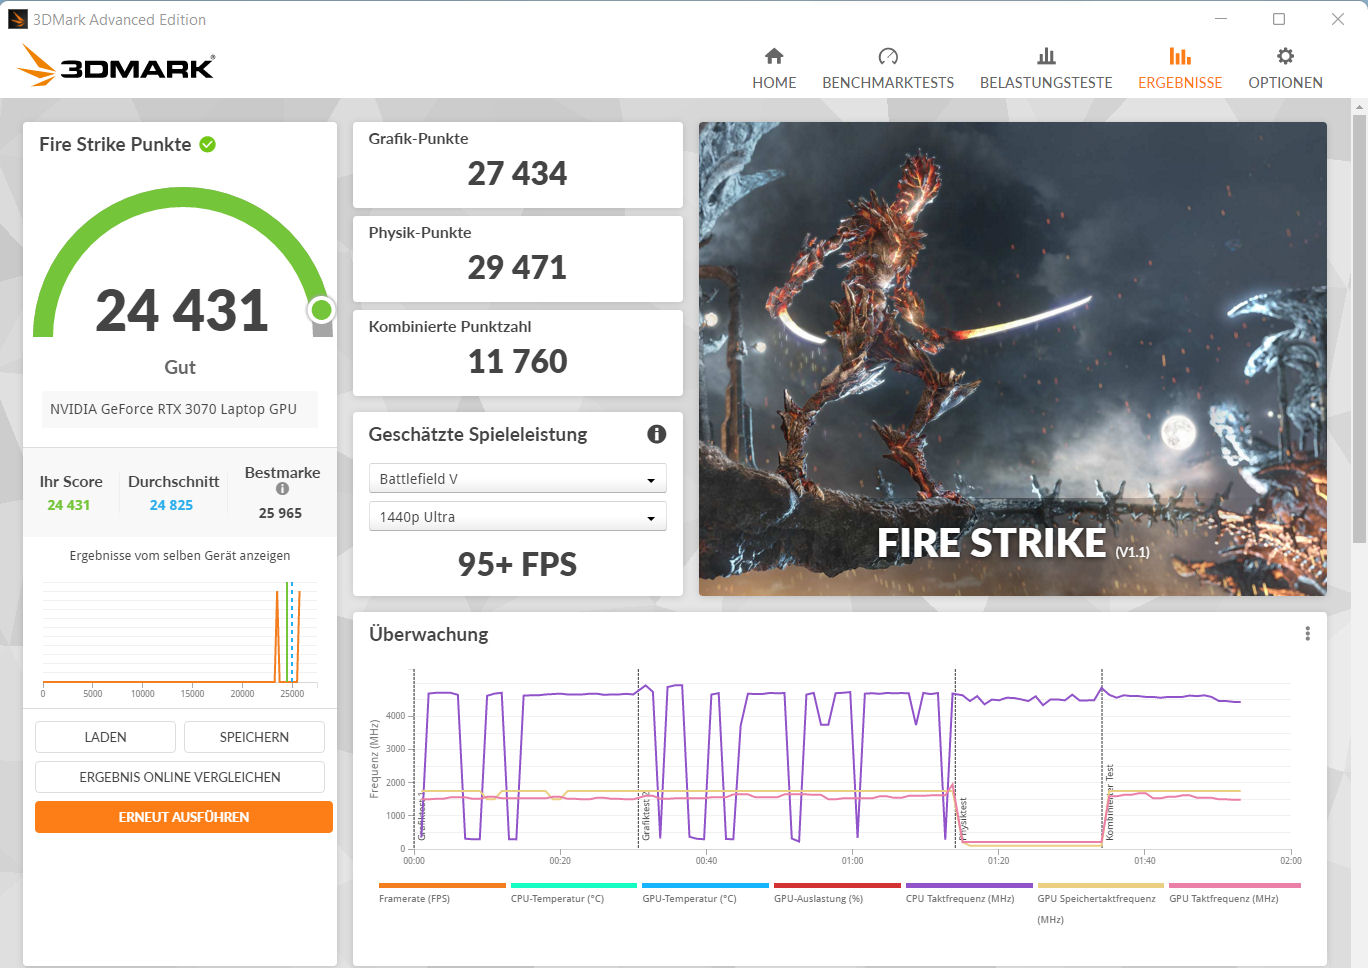
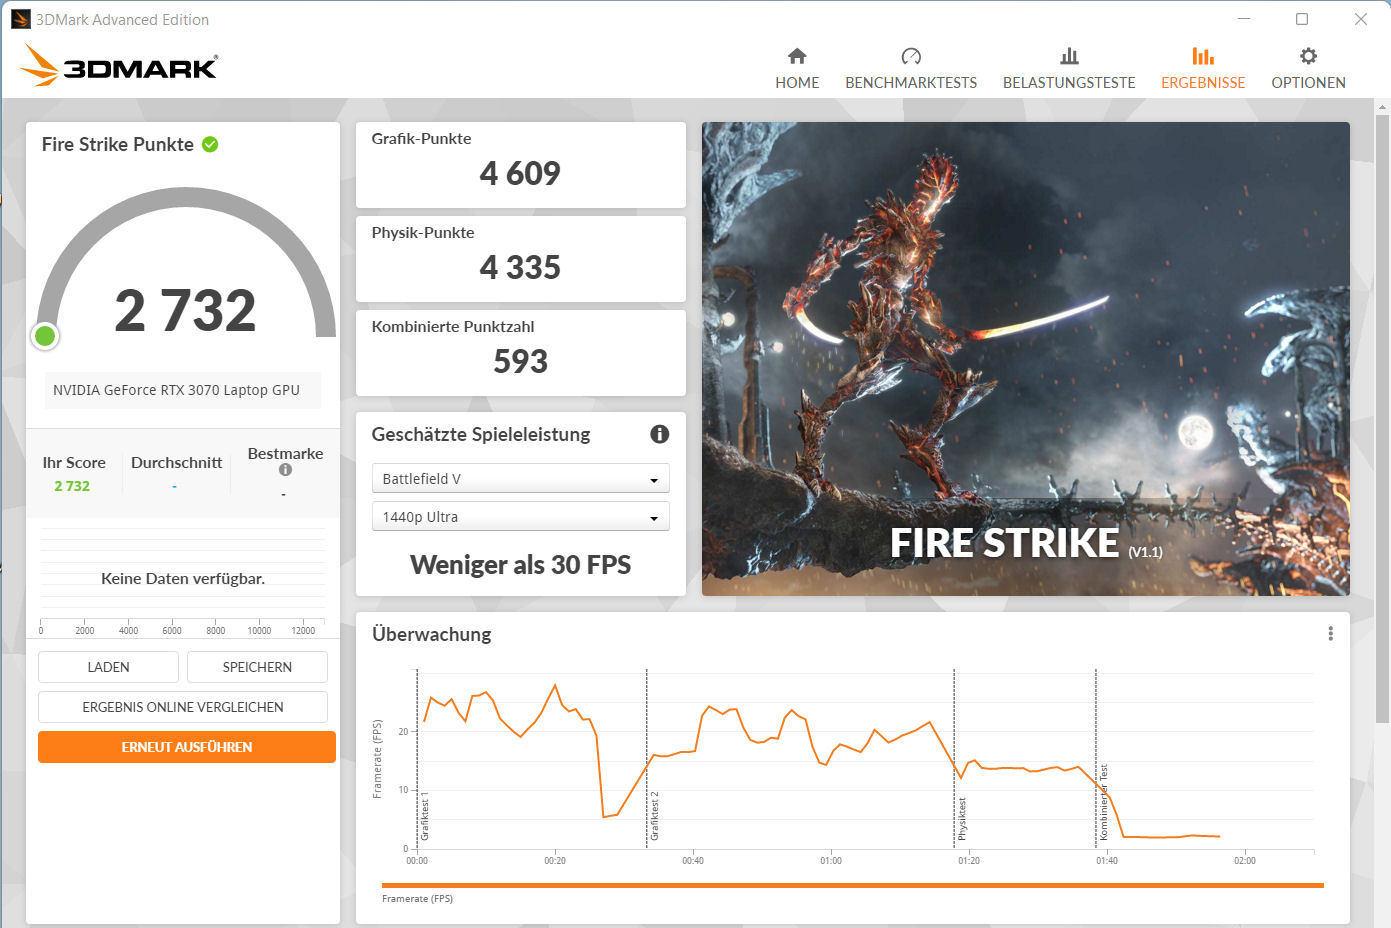
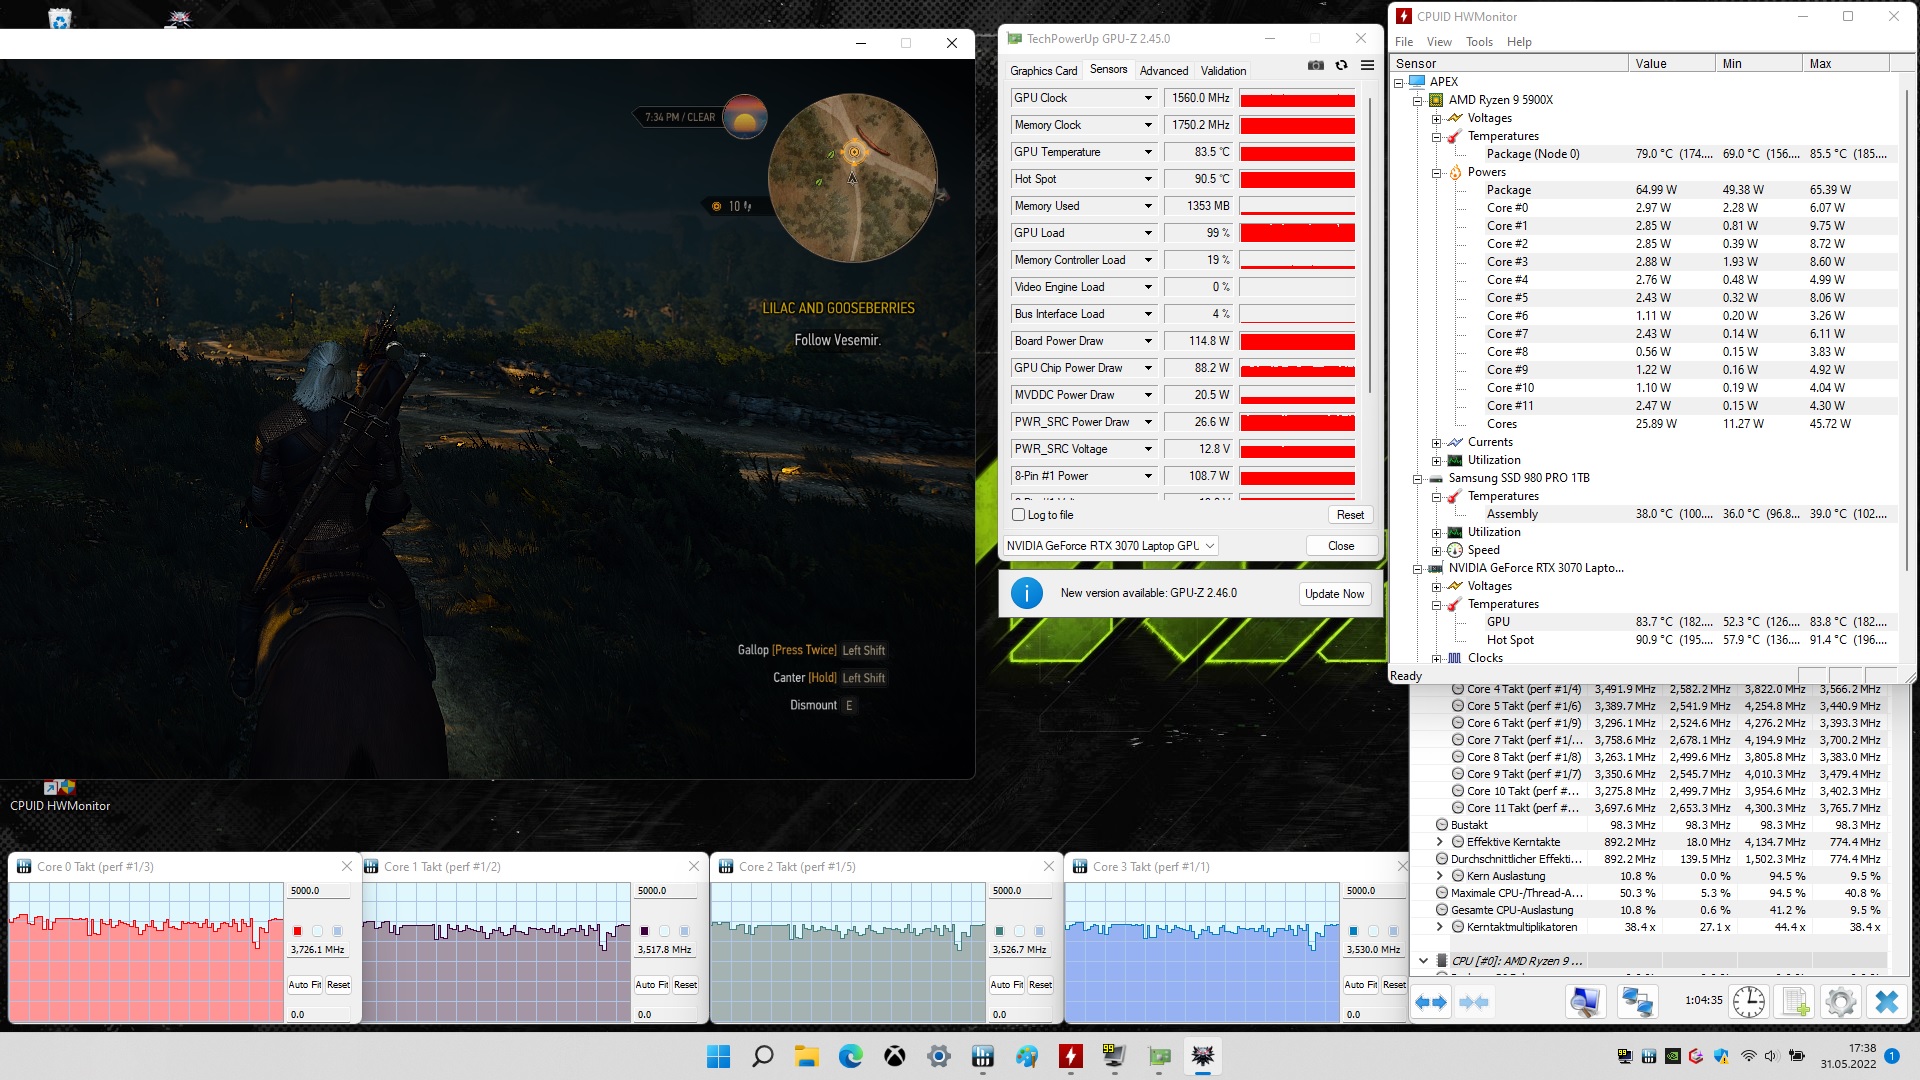
Le prestazioni effettive della GPU RTX 3000 dipendono da diversi fattori: il raffreddamento, l'attrezzatura di archiviazione e il TGP massimo scelto dal produttore del portatile entro i limiti definiti da Nvidia. Schenker ha scelto un TGP massimo di 115 watt per il computer portatile RTX 3070 integrato.GeForce RTX 3070 integrata nel portatilegPU. La GPU è in grado di utilizzare la veloce memoria grafica GDDR6 (8.192 MB).
I risultati del benchmark sono superiori alla media che abbiamo determinato per la RTX 3070 fino ad ora. Il TGP è pienamente utilizzato, come dimostra il nostro test The Witcher 3. Non c'è una GPU integrata a bordo e la RTX 3070 funziona in modo permanente.
| 3DMark Performance rating - Percent | |
| Media della classe Gaming | |
| Schenker XMG Apex 15 Max | |
| Schenker XMG Apex 15 Max | |
| MSI Vector GP66 12UGS -15! | |
| Media NVIDIA GeForce RTX 3070 Laptop GPU | |
| Gigabyte A5 X1 -16! | |
| Schenker XMG Apex 15 Max -15! | |
| HP Omen 16-b1090ng -15! | |
| Eurocom Nightsky ARX315 -15! | |
| Schenker XMG Apex 15 NH57AF1 -15! | |
| Schenker XMG Apex 15 Max -15! | |
| Schenker XMG Apex 15 Max -18! | |
| 3DMark 11 - 1280x720 Performance GPU | |
| Media della classe Gaming (21841 - 80022, n=104, ultimi 2 anni) | |
| MSI Vector GP66 12UGS | |
| Eurocom Nightsky ARX315 | |
| Gigabyte A5 X1 | |
| Schenker XMG Apex 15 Max (Leistungsmodus, max. Fan) | |
| Schenker XMG Apex 15 Max (Leistungsmodus) | |
| Schenker XMG Apex 15 Max | |
| HP Omen 16-b1090ng | |
| Media NVIDIA GeForce RTX 3070 Laptop GPU (12535 - 38275, n=54) | |
| Schenker XMG Apex 15 NH57AF1 | |
| Schenker XMG Apex 15 Max (Lautlosmodus) | |
| Schenker XMG Apex 15 Max (Stromsparmodus) | |
| 3DMark 11 Performance | 27648 punti | |
| 3DMark Cloud Gate Standard Score | 56629 punti | |
| 3DMark Fire Strike Score | 23293 punti | |
| 3DMark Time Spy Score | 9891 punti | |
Aiuto | ||
Prestazioni di gioco
L'hardware utilizzato è in grado di portare sullo schermo tutti i giochi attuali in modo fluido con risoluzione FHD e impostazioni massime. Risoluzioni più elevate con il collegamento del monitor esterno corrispondente potrebbero richiedere alcune impostazioni di qualità ridotte. I frame rate sono superiori alla media che abbiamo determinato per la RTX 3070 e rimangono costanti anche per un periodo di tempo più lungo, come dimostra il nostro test The Witcher 3 (FHD, impostazioni massime, durata 60 minuti). Il profilo Performance comporta un piccolo aumento dei frame rate nei giochi che richiedono molta CPU.
| The Witcher 3 - 1920x1080 Ultra Graphics & Postprocessing (HBAO+) | |
| Media della classe Gaming (104.7 - 240, n=6, ultimi 2 anni) | |
| MSI Vector GP66 12UGS | |
| Schenker XMG Apex 15 Max (Leistungsmodus, max. Fan) | |
| Schenker XMG Apex 15 Max | |
| Schenker XMG Apex 15 Max (Leistungsmodus) | |
| Gigabyte A5 X1 | |
| HP Omen 16-b1090ng | |
| Eurocom Nightsky ARX315 | |
| Media NVIDIA GeForce RTX 3070 Laptop GPU (34.9 - 109, n=52) | |
| Schenker XMG Apex 15 NH57AF1 | |
| Schenker XMG Apex 15 Max (Lautlosmodus) | |
| Schenker XMG Apex 15 Max (Stromsparmodus) | |
| Dota 2 Reborn - 1920x1080 ultra (3/3) best looking | |
| Schenker XMG Apex 15 Max (Leistungsmodus) | |
| Eurocom Nightsky ARX315 | |
| MSI Vector GP66 12UGS | |
| Schenker XMG Apex 15 Max (Leistungsmodus, max. Fan) | |
| Media della classe Gaming (84.8 - 248, n=107, ultimi 2 anni) | |
| Schenker XMG Apex 15 Max | |
| HP Omen 16-b1090ng | |
| Schenker XMG Apex 15 NH57AF1 | |
| Gigabyte A5 X1 | |
| Media NVIDIA GeForce RTX 3070 Laptop GPU (26.9 - 163.9, n=58) | |
| Schenker XMG Apex 15 Max (Lautlosmodus) | |
| Schenker XMG Apex 15 Max (Stromsparmodus) | |
| X-Plane 11.11 - 1920x1080 high (fps_test=3) | |
| Schenker XMG Apex 15 Max (Leistungsmodus) | |
| Schenker XMG Apex 15 Max (Leistungsmodus, max. Fan) | |
| HP Omen 16-b1090ng | |
| MSI Vector GP66 12UGS | |
| Schenker XMG Apex 15 Max | |
| Eurocom Nightsky ARX315 | |
| Media della classe Gaming (55.5 - 143.5, n=109, ultimi 2 anni) | |
| Schenker XMG Apex 15 NH57AF1 | |
| Media NVIDIA GeForce RTX 3070 Laptop GPU (12.4 - 118.8, n=61) | |
| Gigabyte A5 X1 | |
| Schenker XMG Apex 15 Max (Lautlosmodus) | |
| Schenker XMG Apex 15 Max (Stromsparmodus) | |
| Final Fantasy XV Benchmark - 1920x1080 High Quality | |
| Media della classe Gaming (41 - 215, n=95, ultimi 2 anni) | |
| MSI Vector GP66 12UGS (1.3) | |
| Eurocom Nightsky ARX315 (1.3) | |
| Schenker XMG Apex 15 Max (1.3, Leistungsmodus, max. Fan) | |
| Schenker XMG Apex 15 Max (1.3) | |
| Schenker XMG Apex 15 Max (1.3, Leistungsmodus) | |
| HP Omen 16-b1090ng | |
| Gigabyte A5 X1 (1.3) | |
| Media NVIDIA GeForce RTX 3070 Laptop GPU (27.9 - 107, n=49) | |
| Schenker XMG Apex 15 Max (1.3, Lautlosmodus) | |
| Schenker XMG Apex 15 Max (1.3, Stromsparmodus) | |
| GTA V - 1920x1080 Highest AA:4xMSAA + FX AF:16x | |
| Media della classe Gaming (48.3 - 186.9, n=93, ultimi 2 anni) | |
| Schenker XMG Apex 15 Max (Leistungsmodus) | |
| Schenker XMG Apex 15 Max (Leistungsmodus, max. Fan) | |
| Schenker XMG Apex 15 Max | |
| MSI Vector GP66 12UGS | |
| Eurocom Nightsky ARX315 | |
| HP Omen 16-b1090ng | |
| Gigabyte A5 X1 | |
| Media NVIDIA GeForce RTX 3070 Laptop GPU (21.7 - 125.8, n=50) | |
| Schenker XMG Apex 15 NH57AF1 | |
| Schenker XMG Apex 15 Max (Lautlosmodus) | |
| Schenker XMG Apex 15 Max (Stromsparmodus) | |
| Strange Brigade - 1920x1080 ultra AA:ultra AF:16 | |
| Media della classe Gaming (76.3 - 456, n=86, ultimi 2 anni) | |
| MSI Vector GP66 12UGS (1.47.22.14 D3D12) | |
| Eurocom Nightsky ARX315 (1.47.22.14 D3D12) | |
| Schenker XMG Apex 15 Max (1.47.22.14 D3D12, Leistungsmodus, max. Fan) | |
| Schenker XMG Apex 15 Max (1.47.22.14 D3D12) | |
| Schenker XMG Apex 15 Max (1.47.22.14 D3D12, Leistungsmodus) | |
| Gigabyte A5 X1 (1.47.22.14 D3D12) | |
| Media NVIDIA GeForce RTX 3070 Laptop GPU (36.2 - 194, n=46) | |
| HP Omen 16-b1090ng (1.47.22.14 D3D12) | |
| Schenker XMG Apex 15 Max (1.47.22.14 D3D12, Lautlosmodus) | |
| Schenker XMG Apex 15 Max (1.47.22.14 D3D12, Stromsparmodus) | |
| F1 2021 - 1920x1080 Ultra High Preset + Raytracing AA:T AF:16x | |
| Schenker XMG Apex 15 Max (874931) | |
| Schenker XMG Apex 15 Max (874931, Leistungsmodus) | |
| Schenker XMG Apex 15 Max (874931, Leistungsmodus, max. Fan) | |
| Gigabyte A5 X1 (831795) | |
| Media NVIDIA GeForce RTX 3070 Laptop GPU (33.1 - 123.1, n=23) | |
| Schenker XMG Apex 15 Max (874931, Lautlosmodus) | |
| Schenker XMG Apex 15 Max (874931, Stromsparmodus) | |
| Far Cry 5 - 1920x1080 Ultra Preset AA:T | |
| Schenker XMG Apex 15 Max (Leistungsmodus) | |
| MSI Vector GP66 12UGS | |
| Schenker XMG Apex 15 Max | |
| Eurocom Nightsky ARX315 | |
| Media della classe Gaming (70 - 151, n=6, ultimi 2 anni) | |
| Media NVIDIA GeForce RTX 3070 Laptop GPU (89 - 140, n=36) | |
| Gigabyte A5 X1 | |
The Witcher 3 FPS Chart

| basso | medio | alto | ultra | |
|---|---|---|---|---|
| GTA V (2015) | 186.4 | 183.4 | 181.4 | 123.6 |
| The Witcher 3 (2015) | 468 | 339 | 189.4 | 101.7 |
| Dota 2 Reborn (2015) | 196.2 | 173.3 | 165.1 | 150.9 |
| Final Fantasy XV Benchmark (2018) | 207 | 138.4 | 103.1 | |
| X-Plane 11.11 (2018) | 142.2 | 131.7 | 110.7 | |
| Far Cry 5 (2018) | 176 | 143 | 137 | 128 |
| Strange Brigade (2018) | 474 | 270 | 217 | 188.3 |
| F1 2021 (2021) | 460 | 324 | 256 | 122.8 |
| Forza Horizon 5 (2021) | 235 | 155 | 142 | 86 |
| Rainbow Six Extraction (2022) | 266 | 206 | 201 | 155 |
| Dying Light 2 (2022) | 111.6 | 88.8 | 75.3 | |
| GRID Legends (2022) | 197.6 | 169.2 | 153 | 124.2 |
| Ghostwire Tokyo (2022) | 164.5 | 162.5 | 160.4 | 159.3 |
| Tiny Tina's Wonderlands (2022) | 210.5 | 170.2 | 115.9 | 90.1 |
| The Quarry (2022) | 155.9 | 114.3 | 95.9 | 75.2 |
Emissioni - Il portatile Schenker fa molto rumore
Emissioni sonore
Nel funzionamento quotidiano con Office e Internet, le due ventole sono in gran parte attenuate, ma si sentono sempre. Non vengono mai spente. Sotto carico, diventano molto rumorose con livelli massimi di rumore fino a 52 dB(A) nel nostro test Witcher 3 ) e 56 dB(A) nello stress test. Per ottenere un livello di rumore più basso durante il funzionamento, è possibile selezionare la modalità Silent. Anche se il portatile funziona in modo più silenzioso, non è silenzioso e le prestazioni di calcolo sono notevolmente ridotte.
Rumorosità
| Idle |
| 30 / 33 / 34 dB(A) |
| Sotto carico |
| 52 / 56 dB(A) |
 | ||
30 dB silenzioso 40 dB(A) udibile 50 dB(A) rumoroso |
||
min: | ||
| Schenker XMG Apex 15 Max R9 5900X, GeForce RTX 3070 Laptop GPU | Eurocom Nightsky ARX315 R9 5900X, GeForce RTX 3070 Laptop GPU | MSI Vector GP66 12UGS i9-12900H, GeForce RTX 3070 Ti Laptop GPU | HP Omen 16-b1090ng i7-12700H, GeForce RTX 3070 Ti Laptop GPU | Schenker XMG Apex 15 NH57AF1 R9 3900, GeForce RTX 2070 Mobile | Gigabyte A5 X1 R9 5900HX, GeForce RTX 3070 Laptop GPU | |
|---|---|---|---|---|---|---|
| Noise | -0% | 14% | 2% | -14% | 1% | |
| off /ambiente * (dB) | 26 | 25.3 3% | 22.9 12% | 26 -0% | 30 -15% | 25 4% |
| Idle Minimum * (dB) | 30 | 25.9 14% | 23.4 22% | 30 -0% | 35 -17% | 27 10% |
| Idle Average * (dB) | 33 | 27.9 15% | 23.4 29% | 31 6% | 36 -9% | 29 12% |
| Idle Maximum * (dB) | 34 | 40.8 -20% | 27.4 19% | 33 3% | 39 -15% | 32 6% |
| Load Average * (dB) | 52 | 55.2 -6% | 36 31% | 49 6% | 59 -13% | 57 -10% |
| Witcher 3 ultra * (dB) | 52 | 52.4 -1% | 58.2 -12% | 53 -2% | 62 -19% | 56 -8% |
| Load Maximum * (dB) | 56 | 60.3 -8% | 58 -4% | 57 -2% | 63 -13% | 58 -4% |
* ... Meglio usare valori piccoli
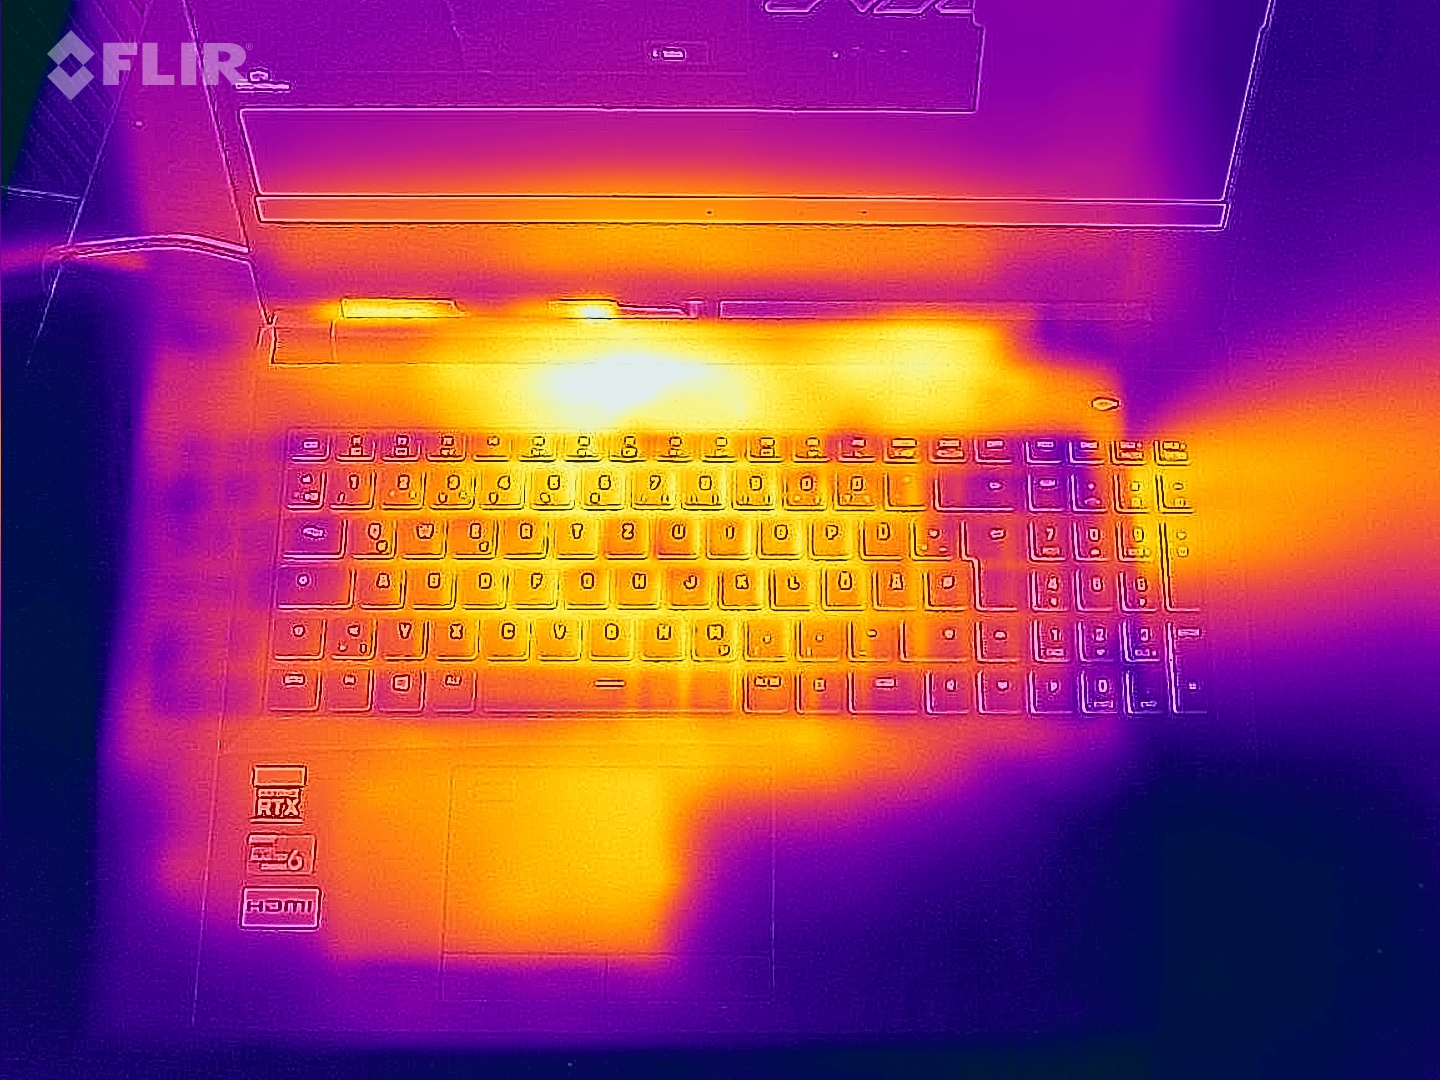
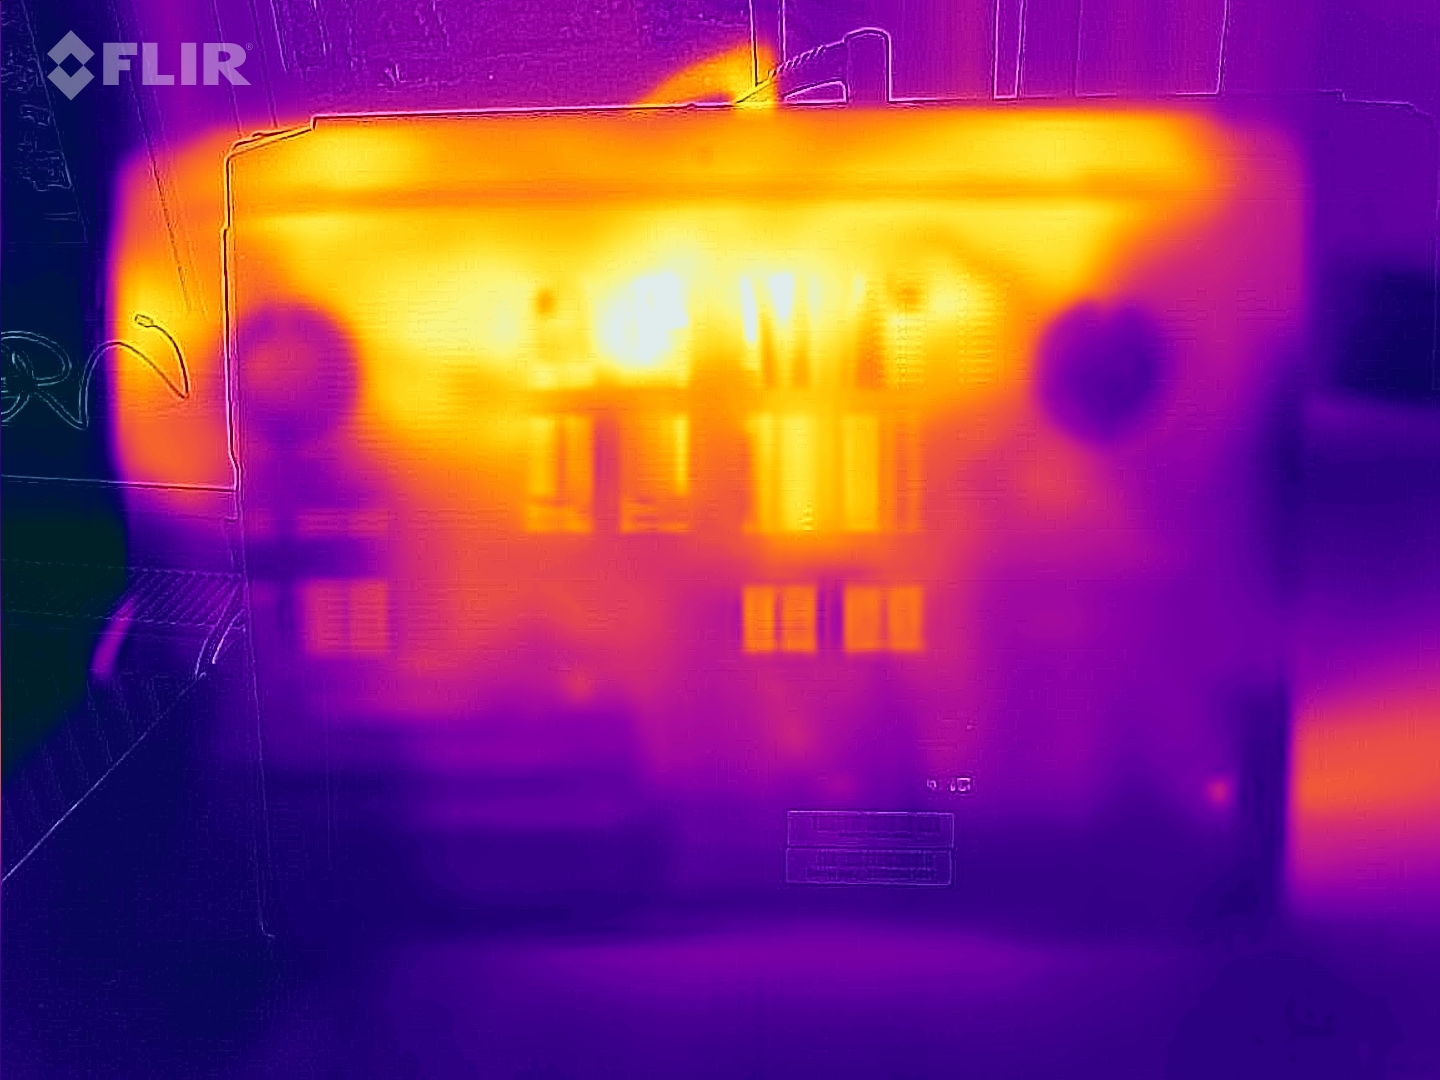
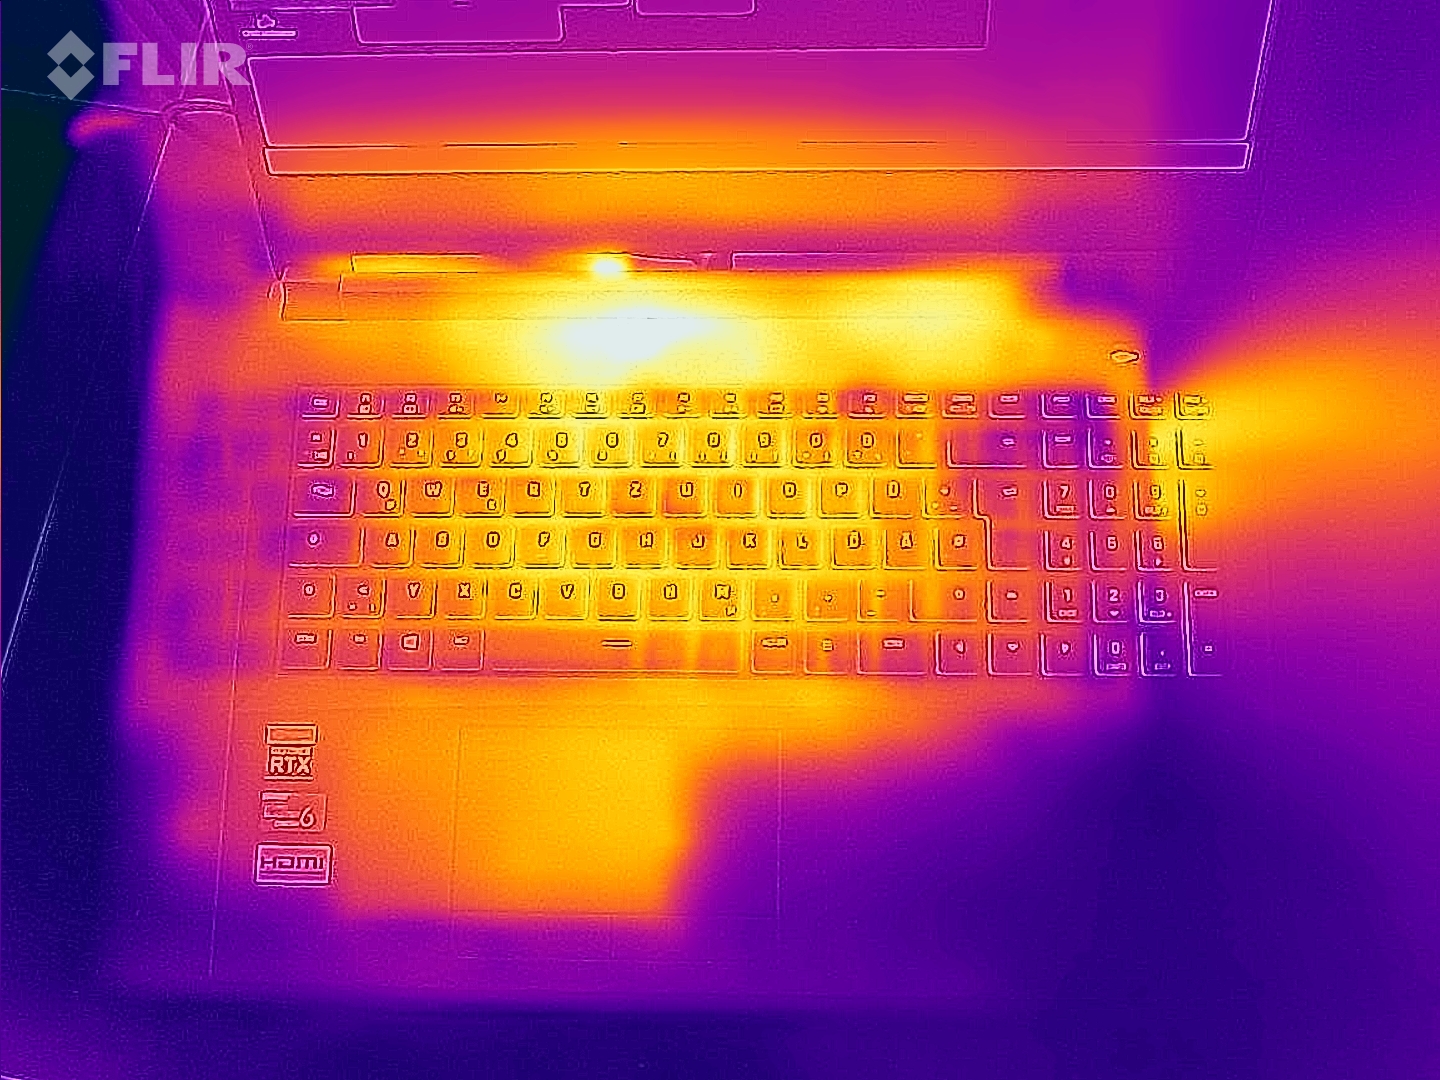
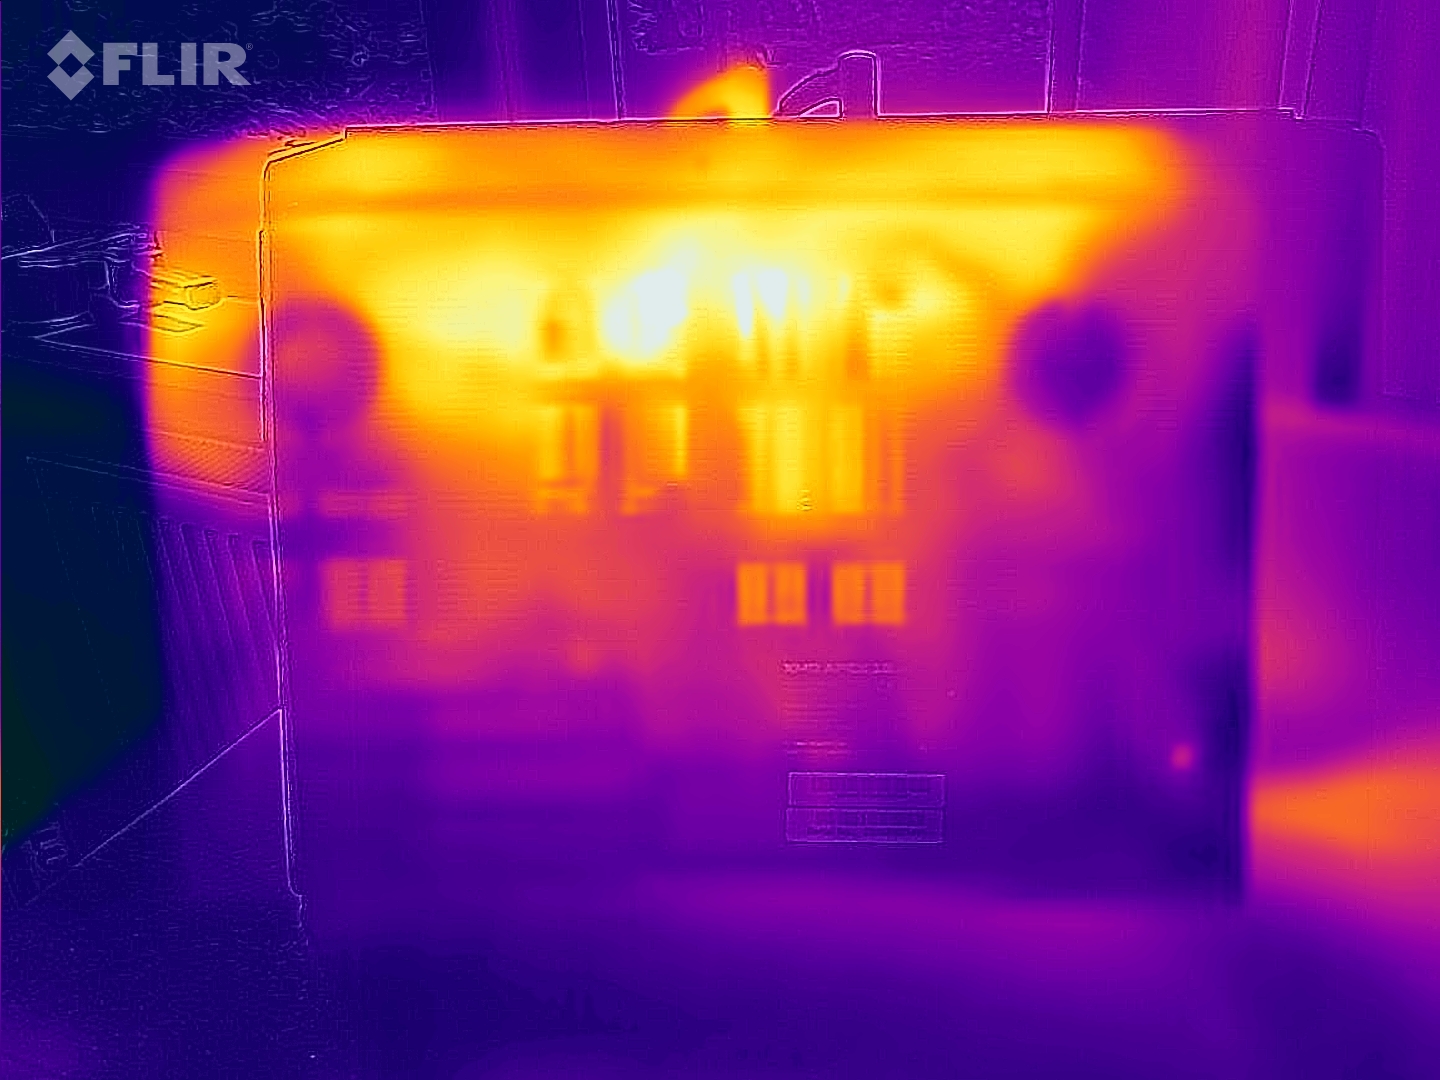
Temperature
Il portatile si scalda sensibilmente su tutto lo spettro di carico, ma non in modo estremo. Questo è il vantaggio delle ventole che girano forte. Le temperature della CPU non destano alcuna preoccupazione.
(-) La temperatura massima sul lato superiore è di 49 °C / 120 F, rispetto alla media di 40.4 °C / 105 F, che varia da 21.2 a 68.8 °C per questa classe Gaming.
(-) Il lato inferiore si riscalda fino ad un massimo di 54 °C / 129 F, rispetto alla media di 43.2 °C / 110 F
(±) In idle, la temperatura media del lato superiore è di 35.1 °C / 95 F, rispetto alla media deld ispositivo di 33.9 °C / 93 F.
(-) Riproducendo The Witcher 3, la temperatura media per il lato superiore e' di 39.8 °C / 104 F, rispetto alla media del dispositivo di 33.9 °C / 93 F.
(±) I poggiapolsi e il touchpad possono diventare molto caldi al tatto con un massimo di 39 °C / 102.2 F.
(-) La temperatura media della zona del palmo della mano di dispositivi simili e'stata di 28.8 °C / 83.8 F (-10.2 °C / -18.4 F).
| Schenker XMG Apex 15 Max R9 5900X, GeForce RTX 3070 Laptop GPU | Eurocom Nightsky ARX315 R9 5900X, GeForce RTX 3070 Laptop GPU | MSI Vector GP66 12UGS i9-12900H, GeForce RTX 3070 Ti Laptop GPU | HP Omen 16-b1090ng i7-12700H, GeForce RTX 3070 Ti Laptop GPU | Schenker XMG Apex 15 NH57AF1 R9 3900, GeForce RTX 2070 Mobile | Gigabyte A5 X1 R9 5900HX, GeForce RTX 3070 Laptop GPU | |
|---|---|---|---|---|---|---|
| Heat | 13% | 16% | 19% | 11% | 18% | |
| Maximum Upper Side * (°C) | 49 | 36.2 26% | 40.2 18% | 41 16% | 44 10% | 47 4% |
| Maximum Bottom * (°C) | 54 | 49.6 8% | 43.8 19% | 62 -15% | 48 11% | 51 6% |
| Idle Upper Side * (°C) | 38 | 32.6 14% | 34.8 8% | 25 34% | 33 13% | 27 29% |
| Idle Bottom * (°C) | 45 | 43.2 4% | 37 18% | 26 42% | 41 9% | 30 33% |
* ... Meglio usare valori piccoli
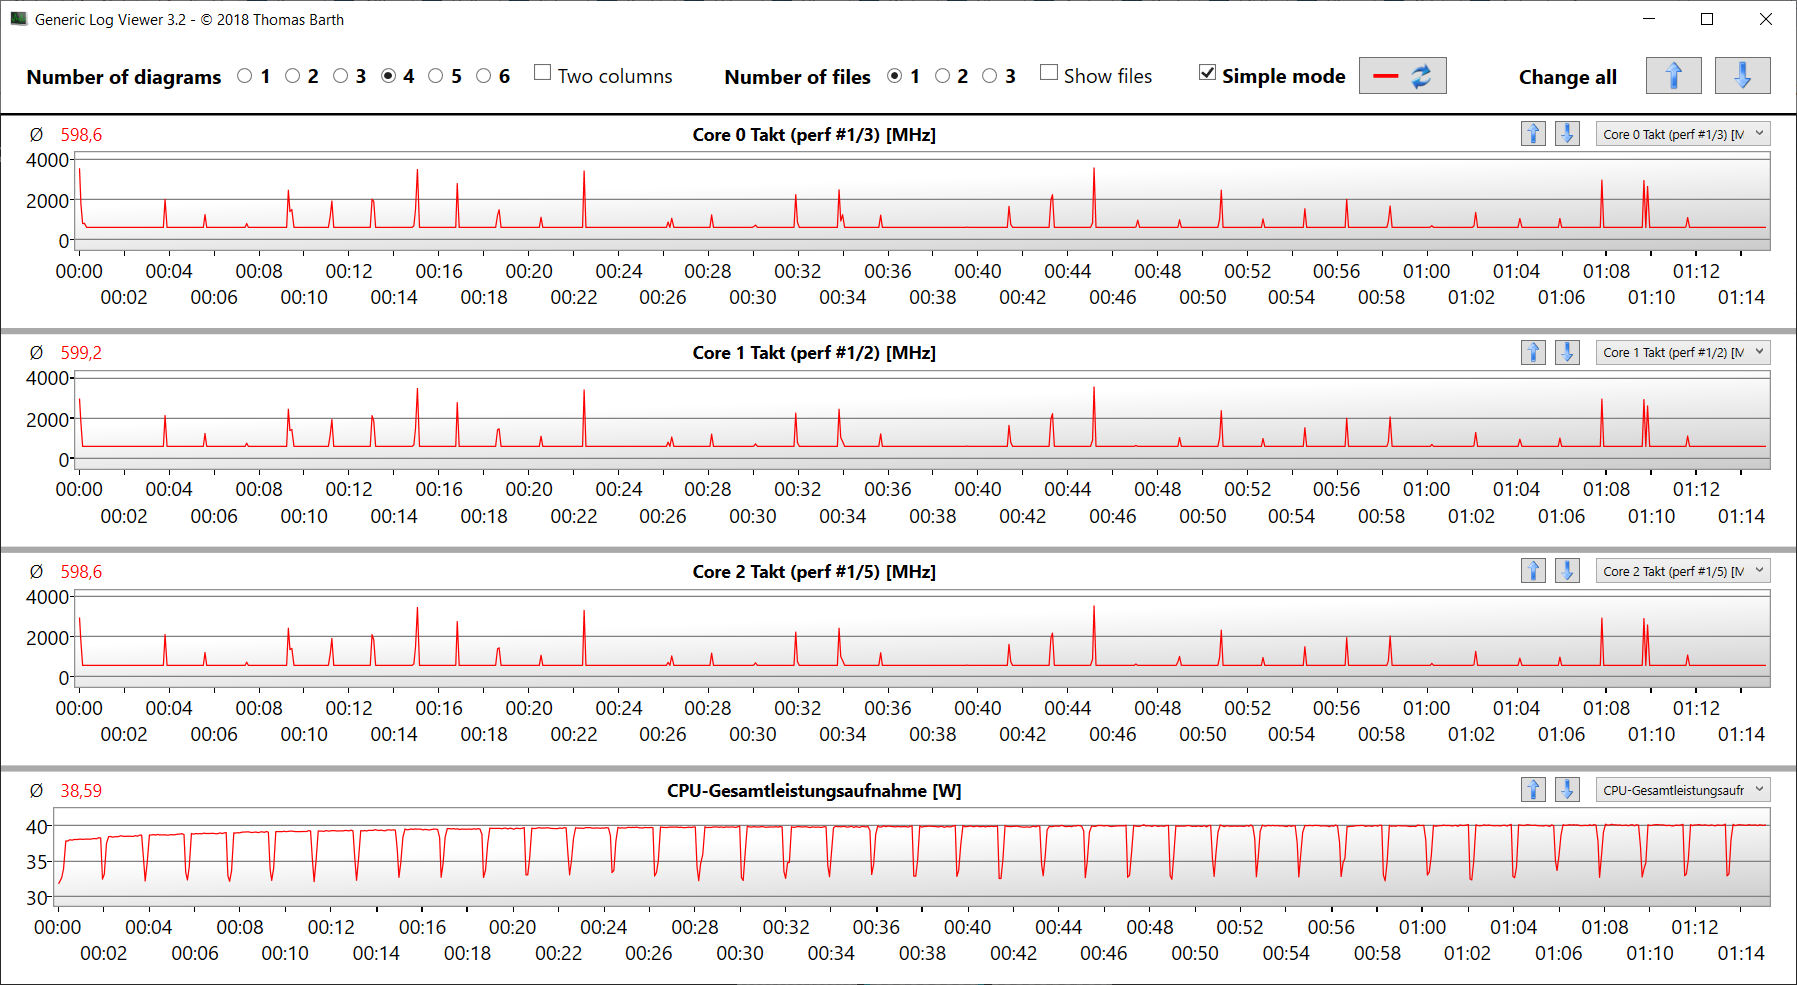
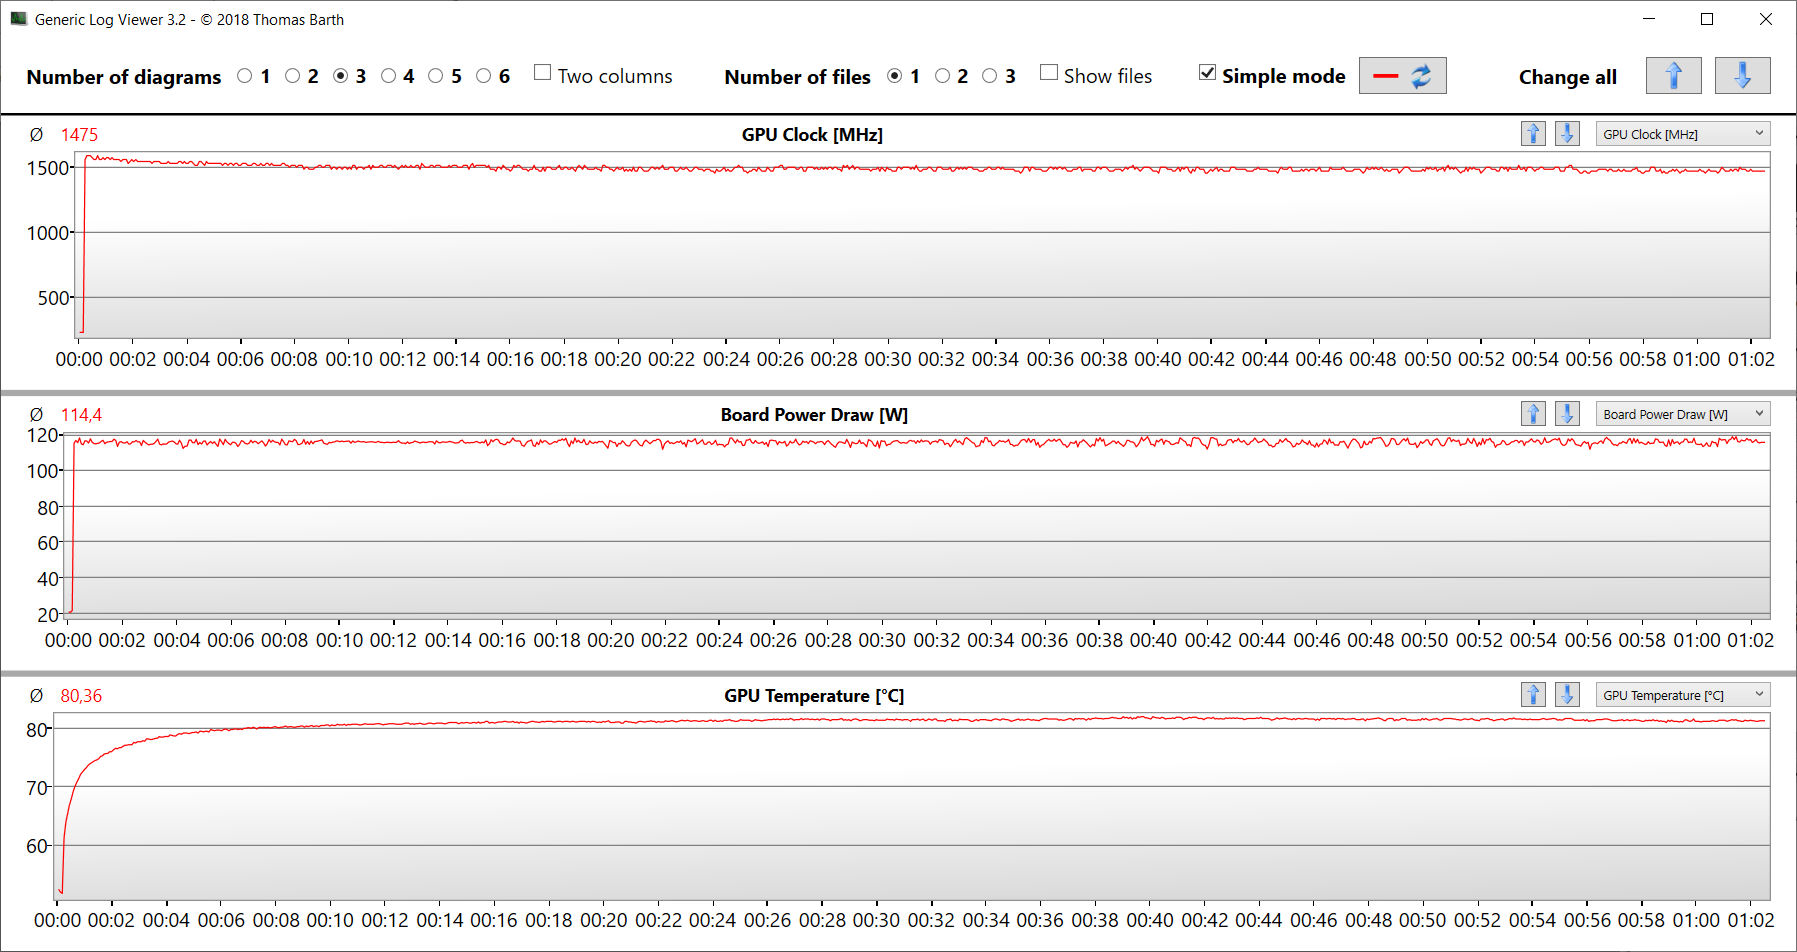
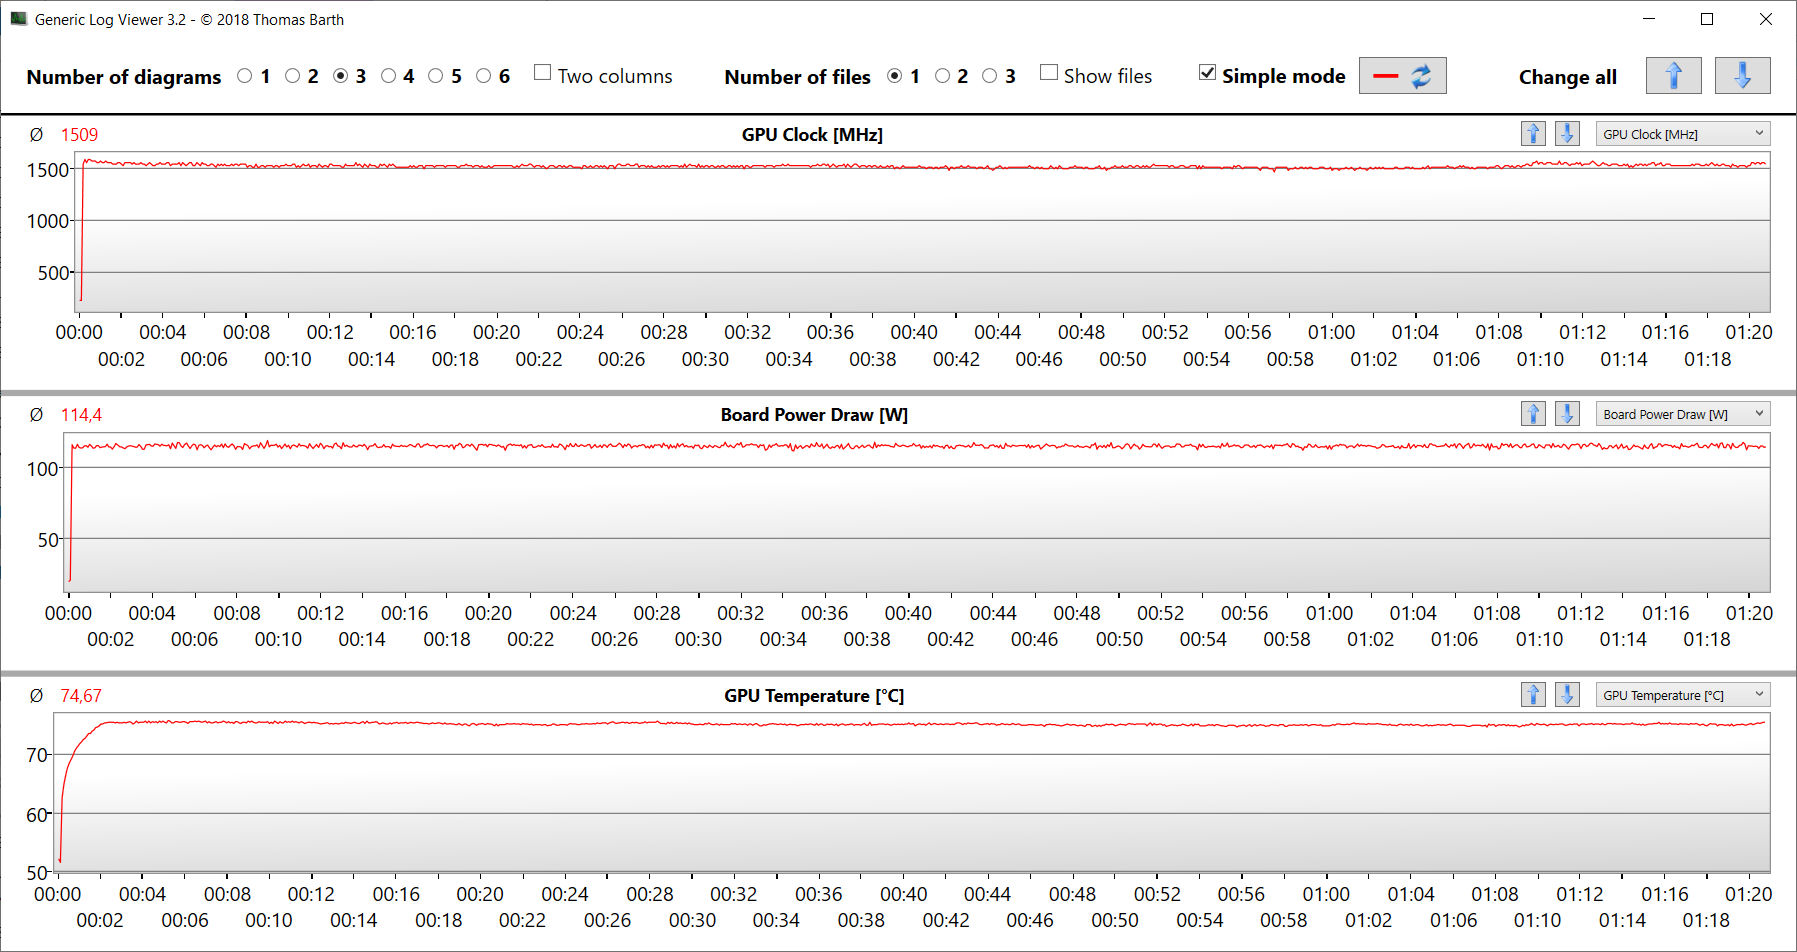
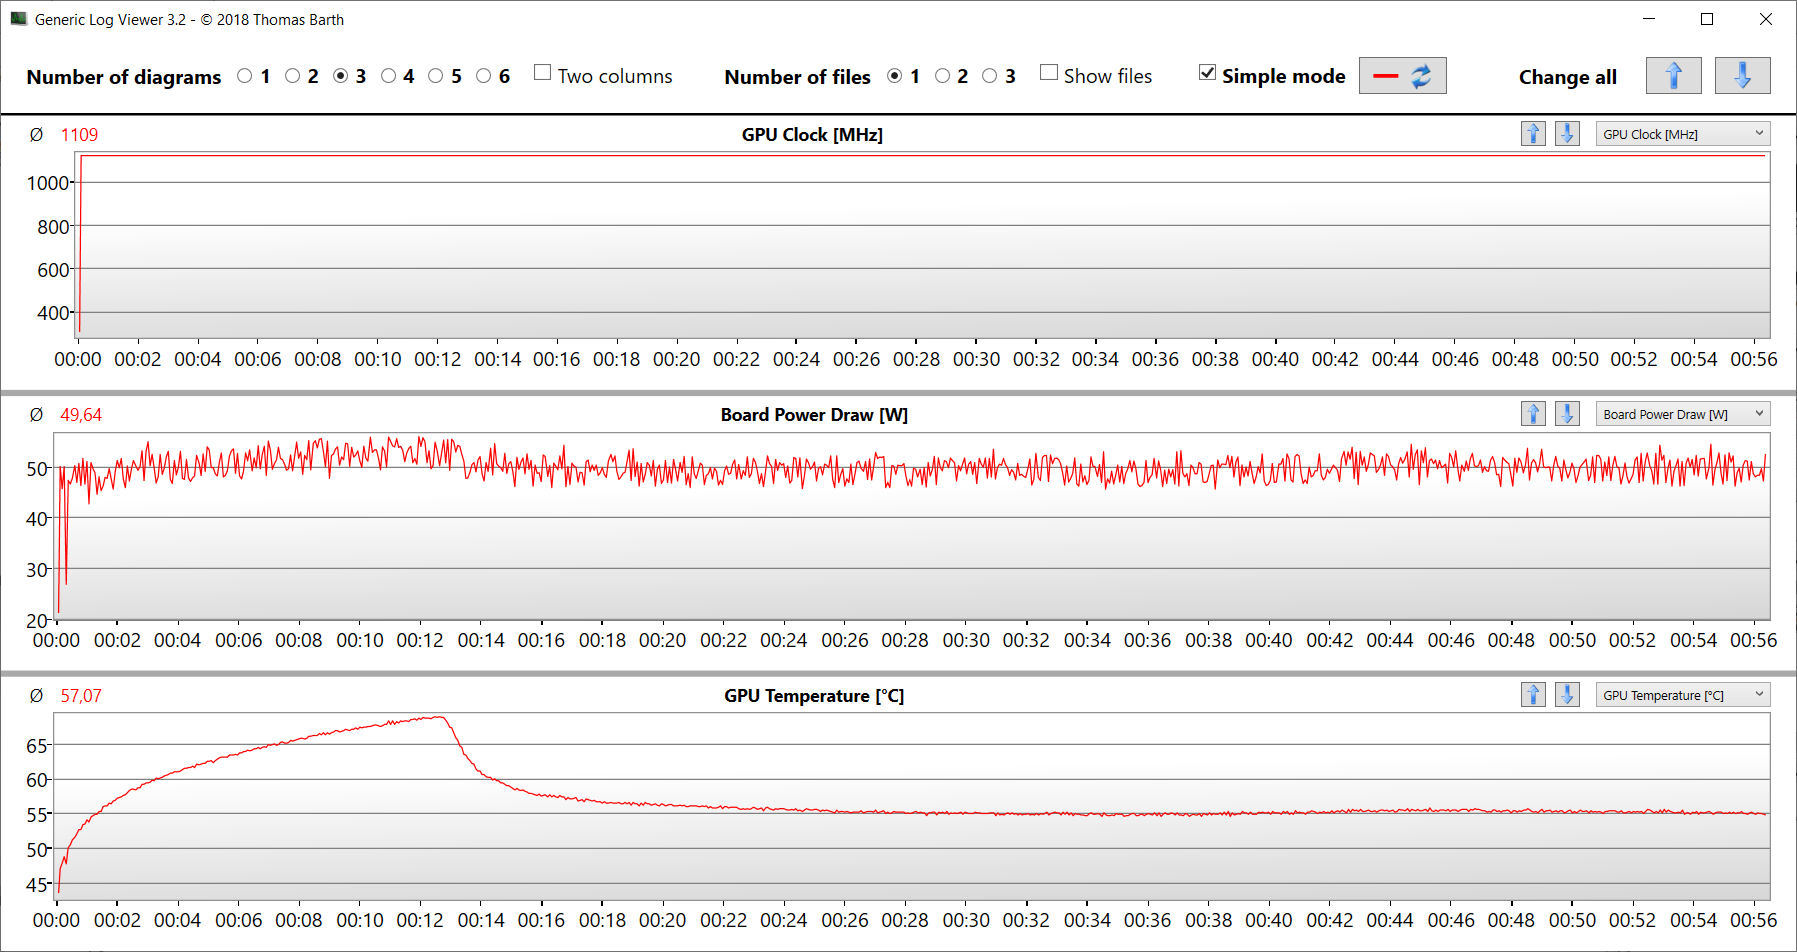
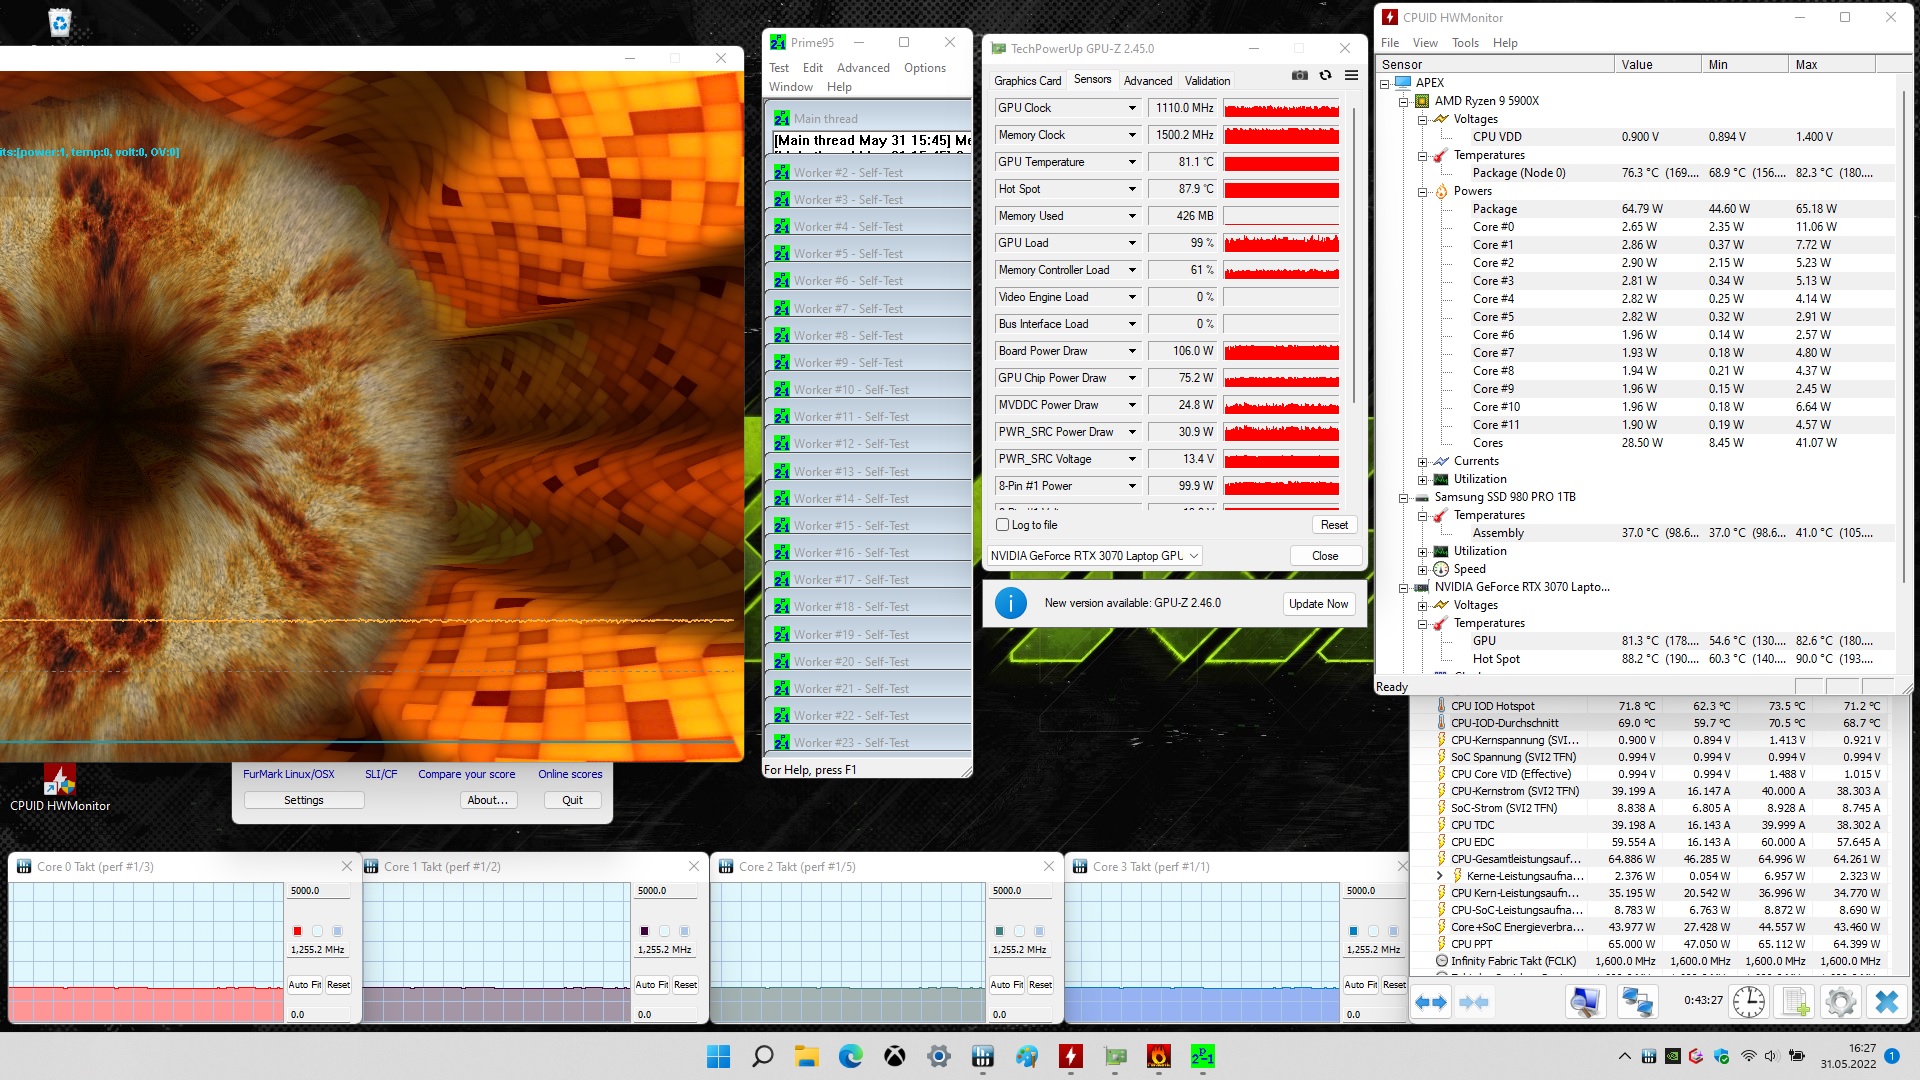
Stress test
La CPU esegue il nostro stress test con Prime95 e Furmark in funzione per almeno un'ora a una frequenza compresa tra 1,2 e 1,3 GHz, mentre il core grafico ha velocità comprese tra 1100 e 1200 MHz. Lo stress test rappresenta uno scenario estremo e viene utilizzato per valutare se il sistema rimane stabile a pieno carico.
Altoparlanti
Gli altoparlanti stereo producono un suono accettabile, ma i bassi sono quasi inesistenti.
Schenker XMG Apex 15 Max analisi audio
(±) | potenza degli altiparlanti media ma buona (79 dB)
Bassi 100 - 315 Hz
(-) | quasi nessun basso - in media 29.1% inferiori alla media
(±) | la linearità dei bassi è media (12.3% delta rispetto alla precedente frequenza)
Medi 400 - 2000 Hz
(+) | medi bilanciati - solo only 3% rispetto alla media
(+) | medi lineari (5.1% delta rispetto alla precedente frequenza)
Alti 2 - 16 kHz
(+) | Alti bilanciati - appena 2.8% dalla media
(+) | alti lineari (6.6% delta rispetto alla precedente frequenza)
Nel complesso 100 - 16.000 Hz
(±) | la linearità complessiva del suono è media (20.1% di differenza rispetto alla media
Rispetto alla stessa classe
» 71% di tutti i dispositivi testati in questa classe è stato migliore, 6% simile, 23% peggiore
» Il migliore ha avuto un delta di 6%, medio di 18%, peggiore di 132%
Rispetto a tutti i dispositivi testati
» 52% di tutti i dispositivi testati in questa classe è stato migliore, 8% similare, 40% peggiore
» Il migliore ha avuto un delta di 4%, medio di 23%, peggiore di 134%
MSI Vector GP66 12UGS analisi audio
(+) | gli altoparlanti sono relativamente potenti (86.4 dB)
Bassi 100 - 315 Hz
(-) | quasi nessun basso - in media 19.2% inferiori alla media
(±) | la linearità dei bassi è media (9.1% delta rispetto alla precedente frequenza)
Medi 400 - 2000 Hz
(±) | medi elevati - circa 6.5% superiore alla media
(+) | medi lineari (5.8% delta rispetto alla precedente frequenza)
Alti 2 - 16 kHz
(+) | Alti bilanciati - appena 3.7% dalla media
(+) | alti lineari (6.5% delta rispetto alla precedente frequenza)
Nel complesso 100 - 16.000 Hz
(±) | la linearità complessiva del suono è media (18.1% di differenza rispetto alla media
Rispetto alla stessa classe
» 57% di tutti i dispositivi testati in questa classe è stato migliore, 8% simile, 35% peggiore
» Il migliore ha avuto un delta di 6%, medio di 18%, peggiore di 132%
Rispetto a tutti i dispositivi testati
» 38% di tutti i dispositivi testati in questa classe è stato migliore, 8% similare, 54% peggiore
» Il migliore ha avuto un delta di 4%, medio di 23%, peggiore di 134%
Gestione dell'alimentazione - L'Apex Max è molto assetato di energia
Consumo di energia
Il consumo di energia durante il funzionamento in idle risulta molto elevato, con valori fino a 76 watt. Durante lo stress test e il test Witcher 3, il consumo aumenta fino a 233 watt o una media di 230 watt. Durante entrambi i test, il consumo energetico rimane costante. L'alimentatore ha una potenza nominale di 230 watt.
| Off / Standby | |
| Idle | |
| Sotto carico |
|
Leggenda:
min: | |
| Schenker XMG Apex 15 Max R9 5900X, GeForce RTX 3070 Laptop GPU | Eurocom Nightsky ARX315 R9 5900X, GeForce RTX 3070 Laptop GPU | MSI Vector GP66 12UGS i9-12900H, GeForce RTX 3070 Ti Laptop GPU | HP Omen 16-b1090ng i7-12700H, GeForce RTX 3070 Ti Laptop GPU | Schenker XMG Apex 15 NH57AF1 R9 3900, GeForce RTX 2070 Mobile | Gigabyte A5 X1 R9 5900HX, GeForce RTX 3070 Laptop GPU | Media della classe Gaming | |
|---|---|---|---|---|---|---|---|
| Power Consumption | -0% | 31% | 49% | 5% | 42% | 46% | |
| Idle Minimum * (Watt) | 64 | 55 14% | 17.5 73% | 4 94% | 55 14% | 10 84% | 13 ? 80% |
| Idle Average * (Watt) | 67 | 68.2 -2% | 20.1 70% | 10 85% | 59 12% | 12 82% | 18.7 ? 72% |
| Idle Maximum * (Watt) | 76 | 72.5 5% | 47.3 38% | 19 75% | 63 17% | 16 79% | 24.3 ? 68% |
| Load Average * (Watt) | 138 | 149.2 -8% | 107.3 22% | 114 17% | 141 -2% | 124 10% | 110.2 ? 20% |
| Witcher 3 ultra * (Watt) | 230 | 233 -1% | 225 2% | 183.2 20% | 238 -3% | 204 11% | |
| Load Maximum * (Watt) | 233 | 255.8 -10% | 277.7 -19% | 221 5% | 259 -11% | 272 -17% | 258 ? -11% |
* ... Meglio usare valori piccoli
Power Consumption The Witcher 3 / Stress Test
Power Consumption With External Monitor
Durata della batteria
L'elevato consumo energetico del portatile comporta una scarsa durata della batteria. Nel test WLAN con caricamento di siti web tramite script e nel test video con riproduzione in loop del cortometraggio Big Buck Bunny (codifica H.264, FHD), il portatile da 15,6 pollici dura rispettivamente 0:57 ore e 0:56 ore. Il profilo di risparmio energetico porta solo un piccolo miglioramento del tempo di esecuzione della WLAN a 1:14 h. La batteria serve più come backup di emergenza in questo caso.
| Schenker XMG Apex 15 Max R9 5900X, GeForce RTX 3070 Laptop GPU, 62 Wh | Eurocom Nightsky ARX315 R9 5900X, GeForce RTX 3070 Laptop GPU, 62 Wh | MSI Vector GP66 12UGS i9-12900H, GeForce RTX 3070 Ti Laptop GPU, 65 Wh | HP Omen 16-b1090ng i7-12700H, GeForce RTX 3070 Ti Laptop GPU, 83 Wh | Schenker XMG Apex 15 NH57AF1 R9 3900, GeForce RTX 2070 Mobile, 62 Wh | Gigabyte A5 X1 R9 5900HX, GeForce RTX 3070 Laptop GPU, 48.96 Wh | Media della classe Gaming | |
|---|---|---|---|---|---|---|---|
| Autonomia della batteria | 0% | 395% | 502% | -6% | 556% | 583% | |
| Reader / Idle (h) | 1 | 7.9 690% | 10.1 910% | 1.2 20% | 10.1 910% | 8.71 ? 771% | |
| H.264 (h) | 0.9 | 7.3 711% | 8.64 ? 860% | ||||
| WiFi v1.3 (h) | 1 | 1 0% | 5.7 470% | 5.6 460% | 1 0% | 6.4 540% | 7.11 ? 611% |
| Load (h) | 0.8 | 1 25% | 1.9 137% | 0.5 -37% | 1.3 63% | 1.502 ? 88% |
Pro
Contro
Verdetto - Un portatile da gioco per un gruppo limitato di utenti
Lo Schenker XMG Apex 15 Max deve essere visto come un ibrido tra un portatile da gioco, un portatile DTR e una workstation. Il portatile è progettato per essere in grado di produrre prestazioni elevate e costanti, e l'Apex non delude in questo senso. Il portatile è in grado di gestire senza problemi i giochi in FHD con le impostazioni massime.
Lo Schenker XMG Apex 15 Max offre molte prestazioni di calcolo, ma è anche molto assetato di energia.
D'altra parte, mentre il GeForce RTX 3070 Laptopfunziona costantemente alla massima velocità, la GPU permanente Ryzen 9 5900Xdesktop (socketed, sostituibile) raggiunge la sua velocità Turbo solo brevemente nel funzionamento multi-thread. Le opzioni di raffreddamento raggiungono i loro limiti.
Il portatile si scalda sensibilmente ma non diventa eccessivamente caldo. La rumorosità si attesta sui livelli consueti per la categoria, ovvero diventa molto forte. Questo è accompagnato da una pessima durata della batteria e da un'enorme fame di energia durante il funzionamento inattivo. Soprattutto quest'ultimo aspetto è difficile da spiegare al giorno d'oggi.
Nel nostro database non ci sono molti portatili con CPU desktop sostituibile e senza GPU integrata. Tra i portatili da gioco "normali", il modello MSI Vector GP66 12UGSè un'alternativa. Sebbene possa offrire prestazioni leggermente superiori a quelle dell'Apex, è anche in grado di garantire una durata della batteria significativamente maggiore.
Prezzo e disponibilità
Lo Schenker XMG Apex 15 Max (inizio 2022) può essere configurato individualmente nel negozio online Schenker. La configurazione di equipaggiamento che ci è stata fornita è disponibile per quasi 2300 Euro (~$2433), mentre i modelli base sono disponibili a partire da circa 1400 Euro (~$1481).
Schenker XMG Apex 15 Max
- 06/22/2022 v7 (old)
Sascha Mölck
Price comparison

