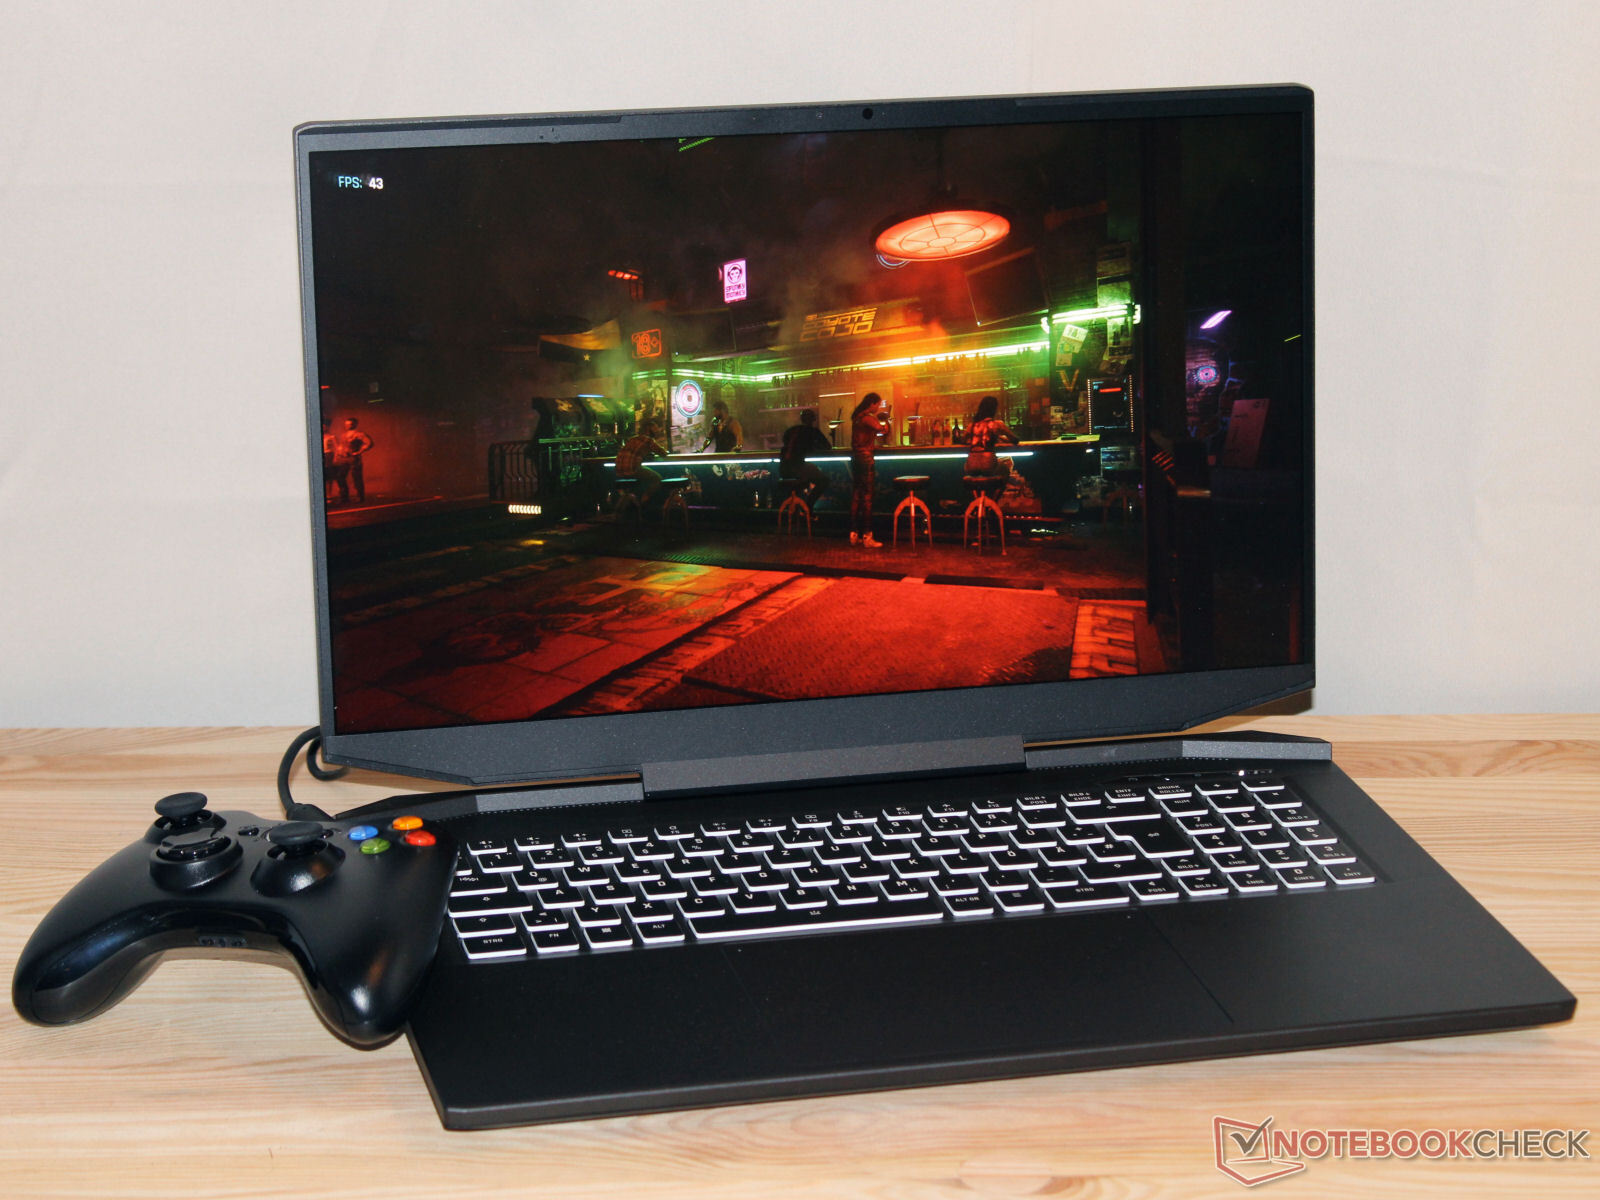
Recensione dell'XMG Apex 17 (late 23): un portatile gaming QHD con RTX 4060
L'XMG Apex 17 (late 23) è un portatile da gioco QHD di fascia media basato su un barebone TongFang (GM7XG0) ed è disponibile in questa variante a poco meno di 1.800 euro. Il pacchetto è composto da un Ryzen 7 7840HS, GeForce RTX 4060 (in alternativa: RTX 4050), 32 GB di RAM e un'unità SSD da 1 TB. La concorrenza è rappresentata dal modelloAcer Nitro 17 AN17-51, l'Alienware m16 R1, ilLenovo Legion Pro 5 16IRX8, ilMSI Katana 17 B13VFKe ilMedion Erazer Defender P40.
Potenziali concorrenti a confronto
Punteggio | Data | Modello | Peso | Altezza | Dimensione | Risoluzione | Prezzo |
|---|---|---|---|---|---|---|---|
| 87.1 % v7 (old) | 10/2023 | Schenker XMG Apex 17 (Late 23) R7 7840HS, GeForce RTX 4060 Laptop GPU | 2.5 kg | 24.9 mm | 17.30" | 2560x1440 | |
| 88.3 % v7 (old) | 09/2023 | Alienware m16 R1 Intel i7-13700HX, GeForce RTX 4060 Laptop GPU | 3 kg | 25.4 mm | 16.00" | 2560x1600 | |
| 87.9 % v7 (old) | 05/2023 | Lenovo Legion Pro 5 16IRX8 i7-13700HX, GeForce RTX 4060 Laptop GPU | 2.5 kg | 26.8 mm | 16.00" | 2560x1600 | |
| 87.2 % v7 (old) | 07/2023 | Acer Nitro 17 AN17-51-71ER i7-13700H, GeForce RTX 4060 Laptop GPU | 3 kg | 30.3 mm | 17.30" | 2560x1440 | |
| 84.6 % v7 (old) | 05/2023 | Medion Erazer Defender P40 i7-13700HX, GeForce RTX 4060 Laptop GPU | 2.9 kg | 33 mm | 17.30" | 2560x1440 | |
| 82.1 % v7 (old) | 02/2023 | MSI Katana 17 B13VFK i7-13620H, GeForce RTX 4060 Laptop GPU | 2.8 kg | 25.2 mm | 17.30" | 1920x1080 |
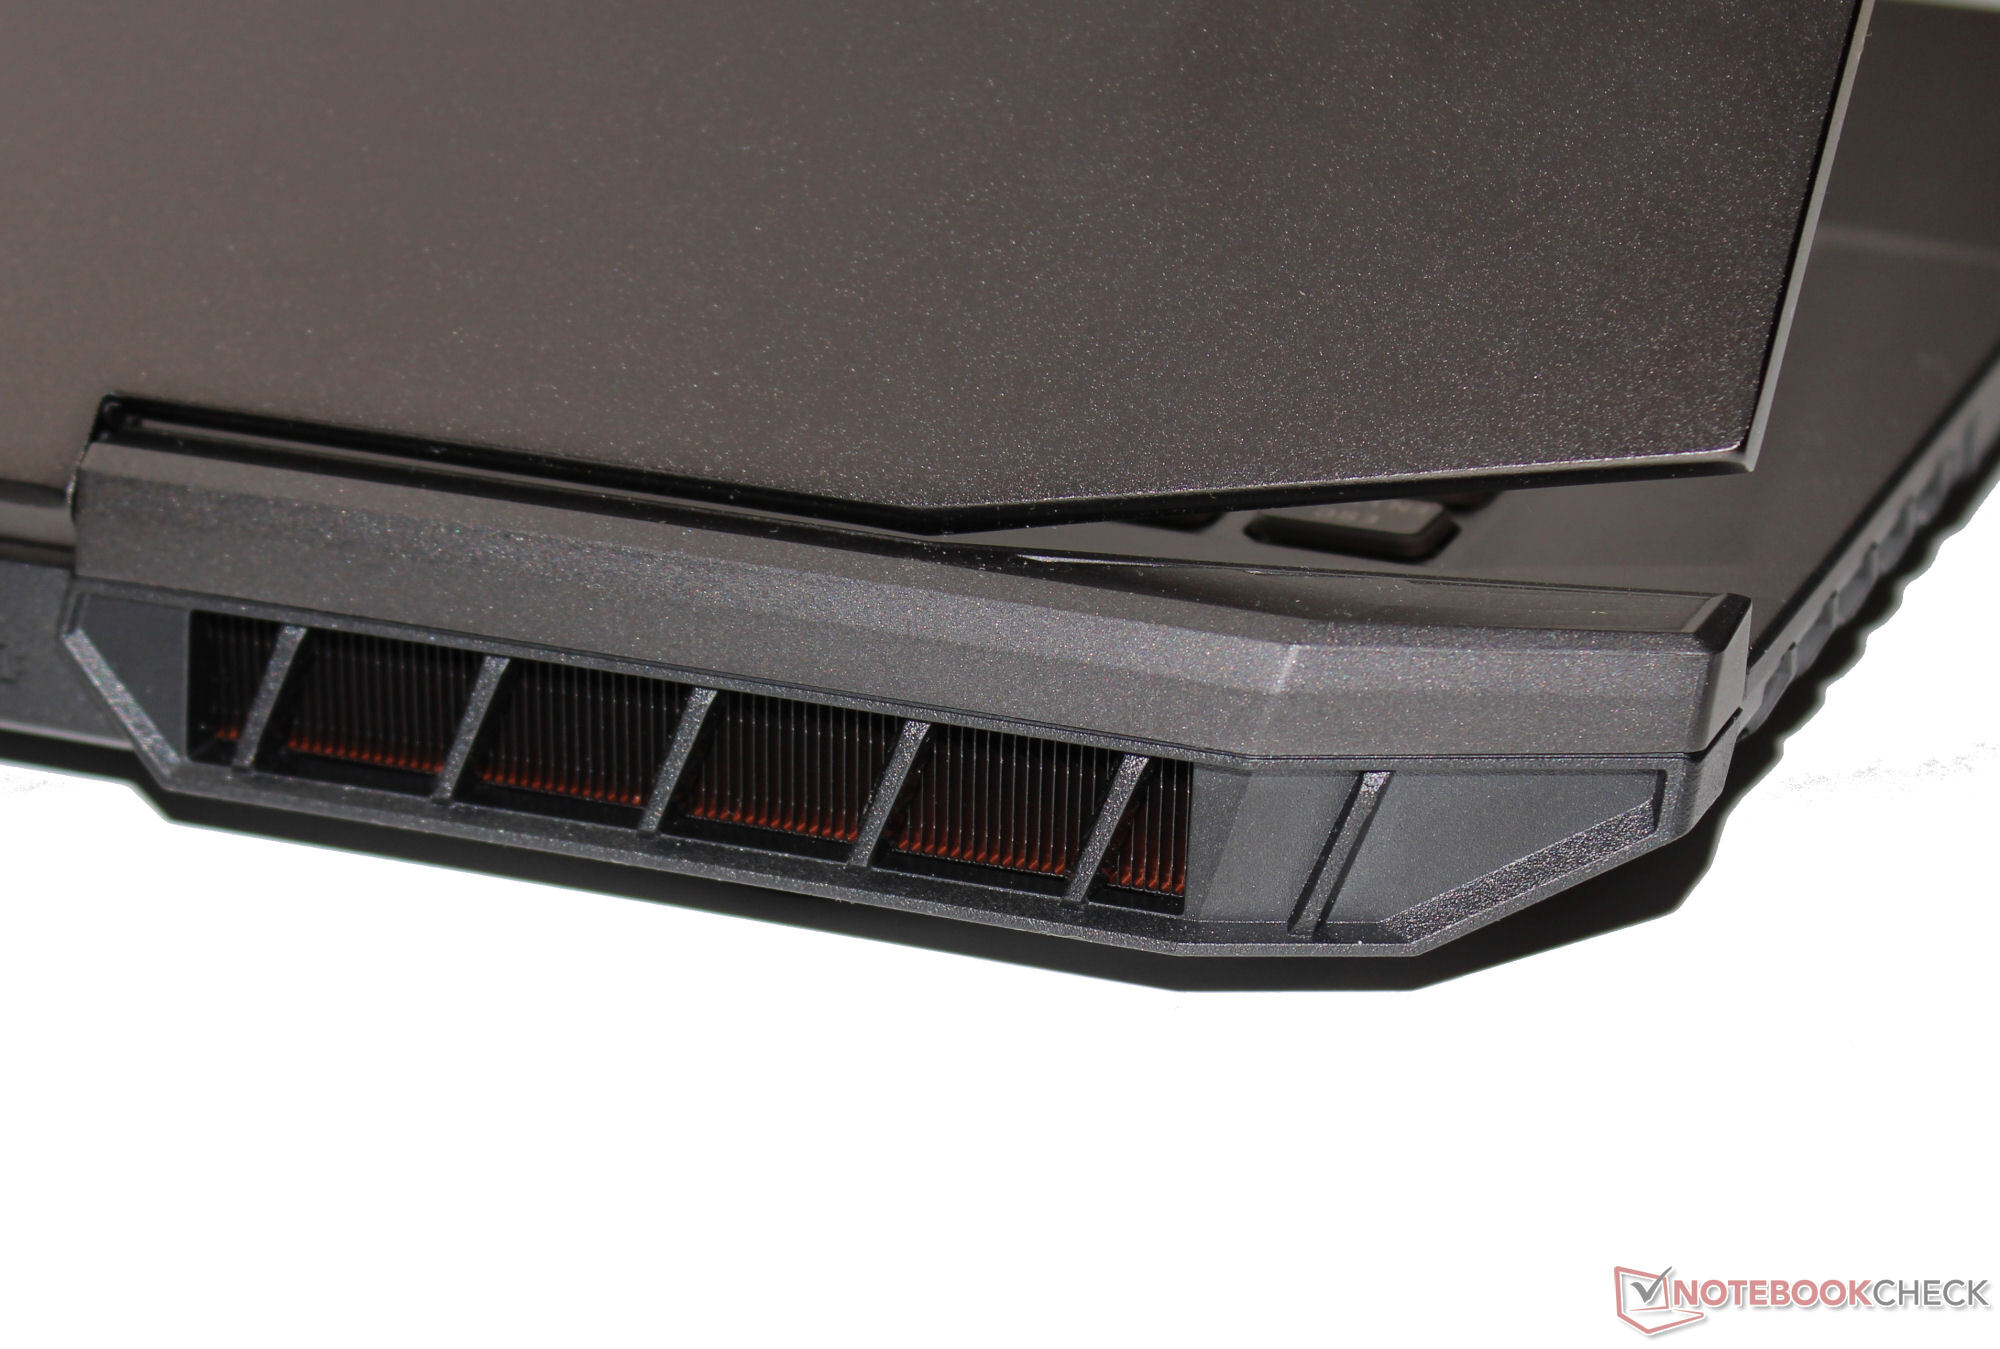
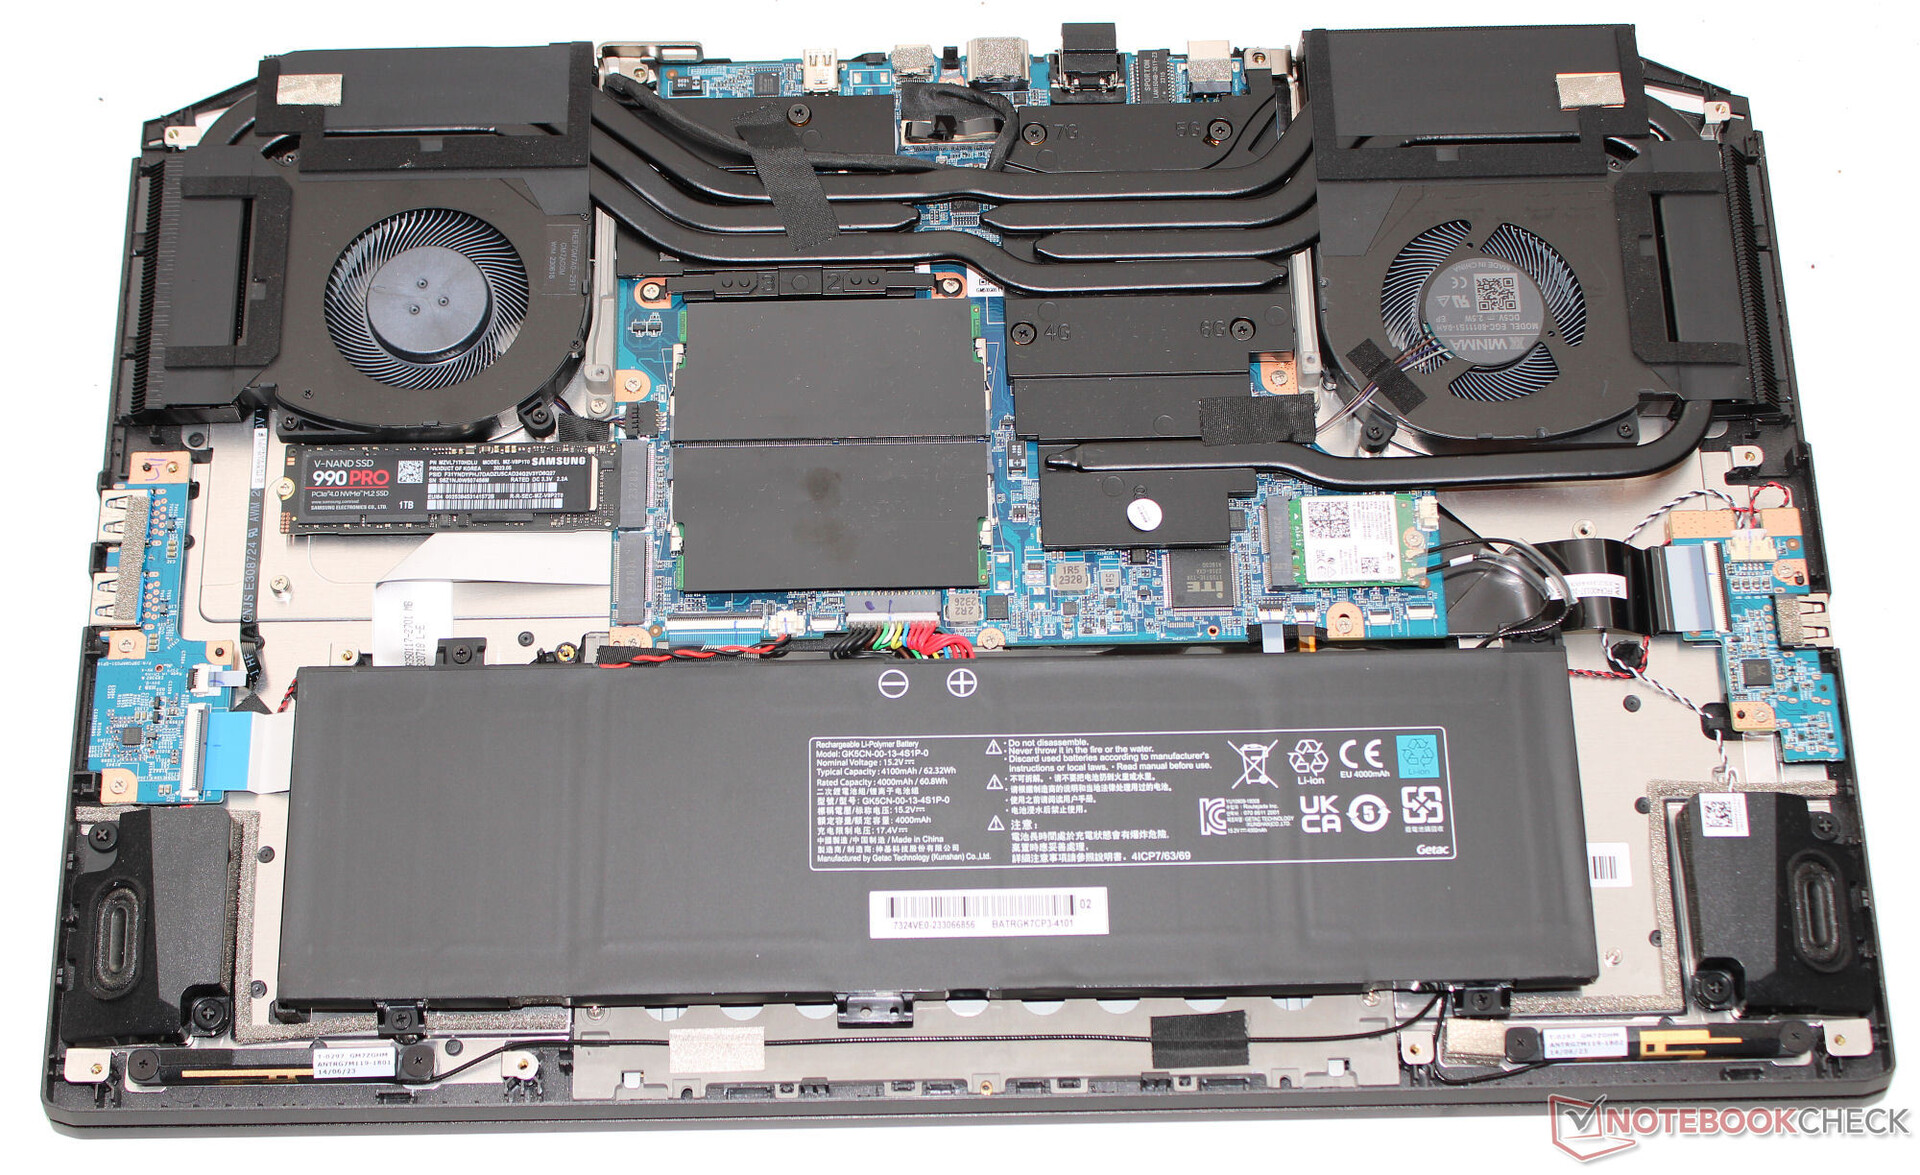
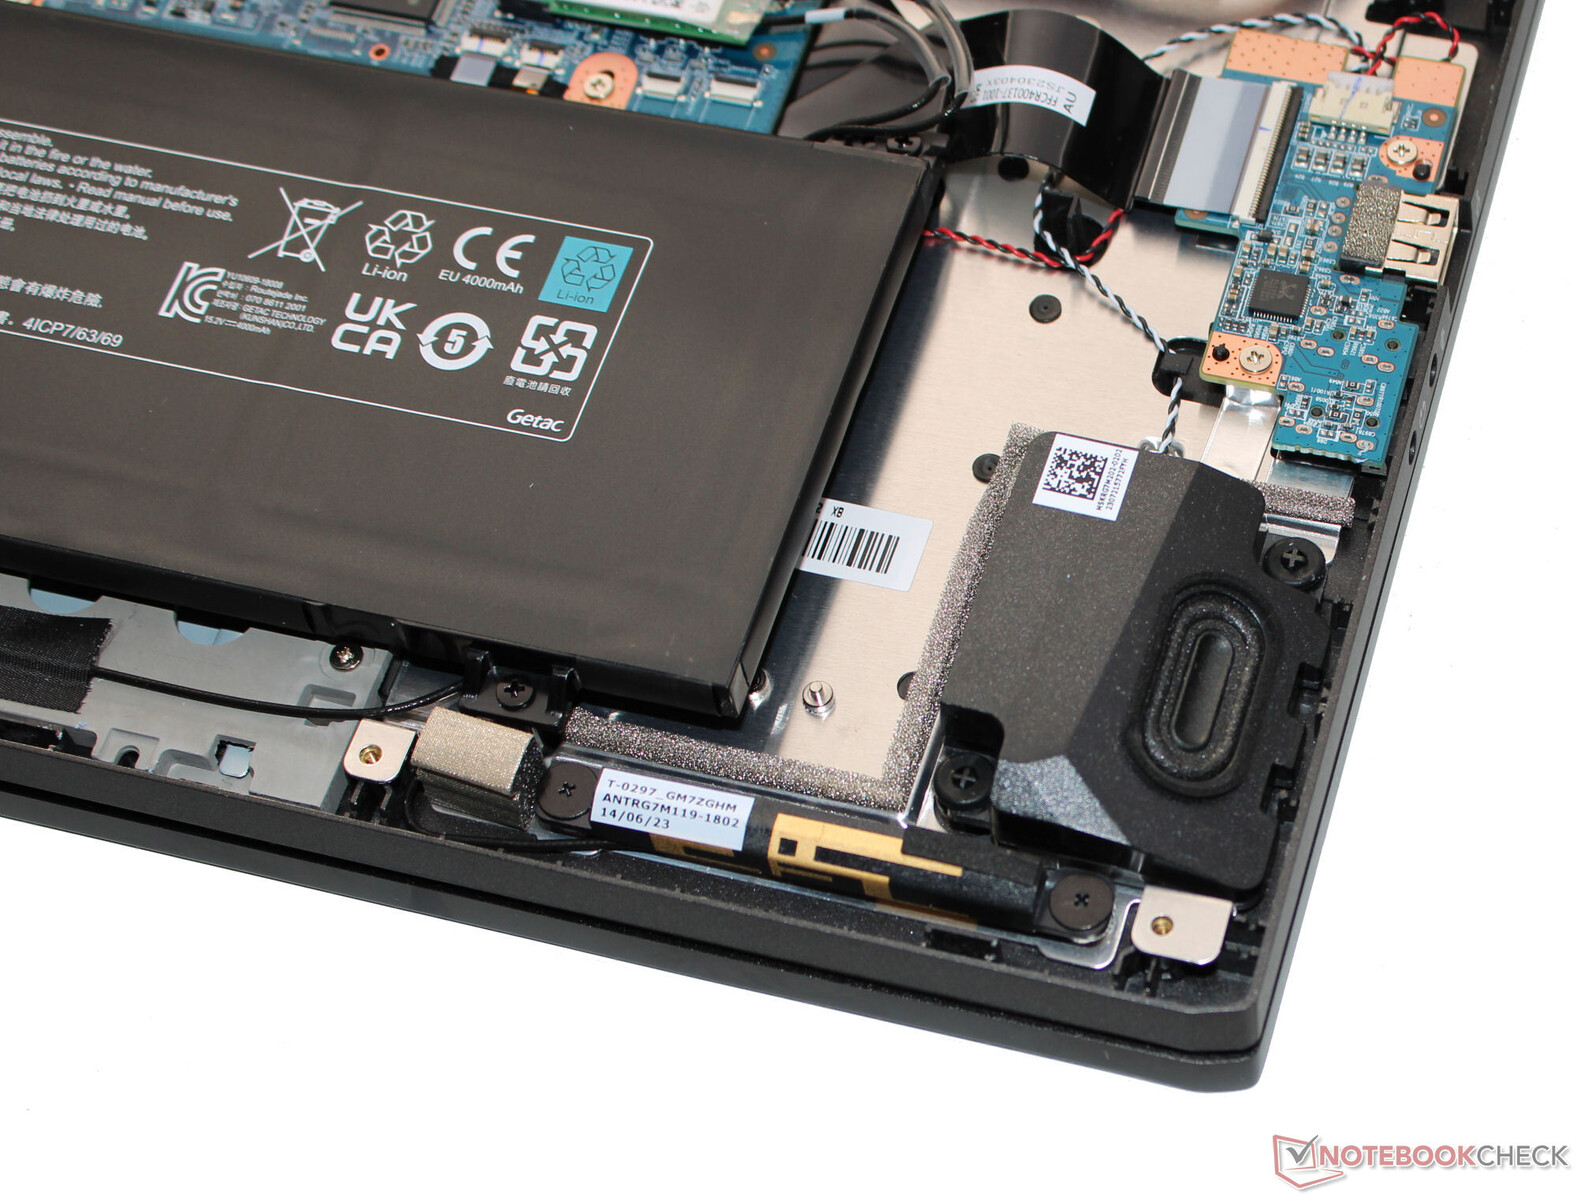
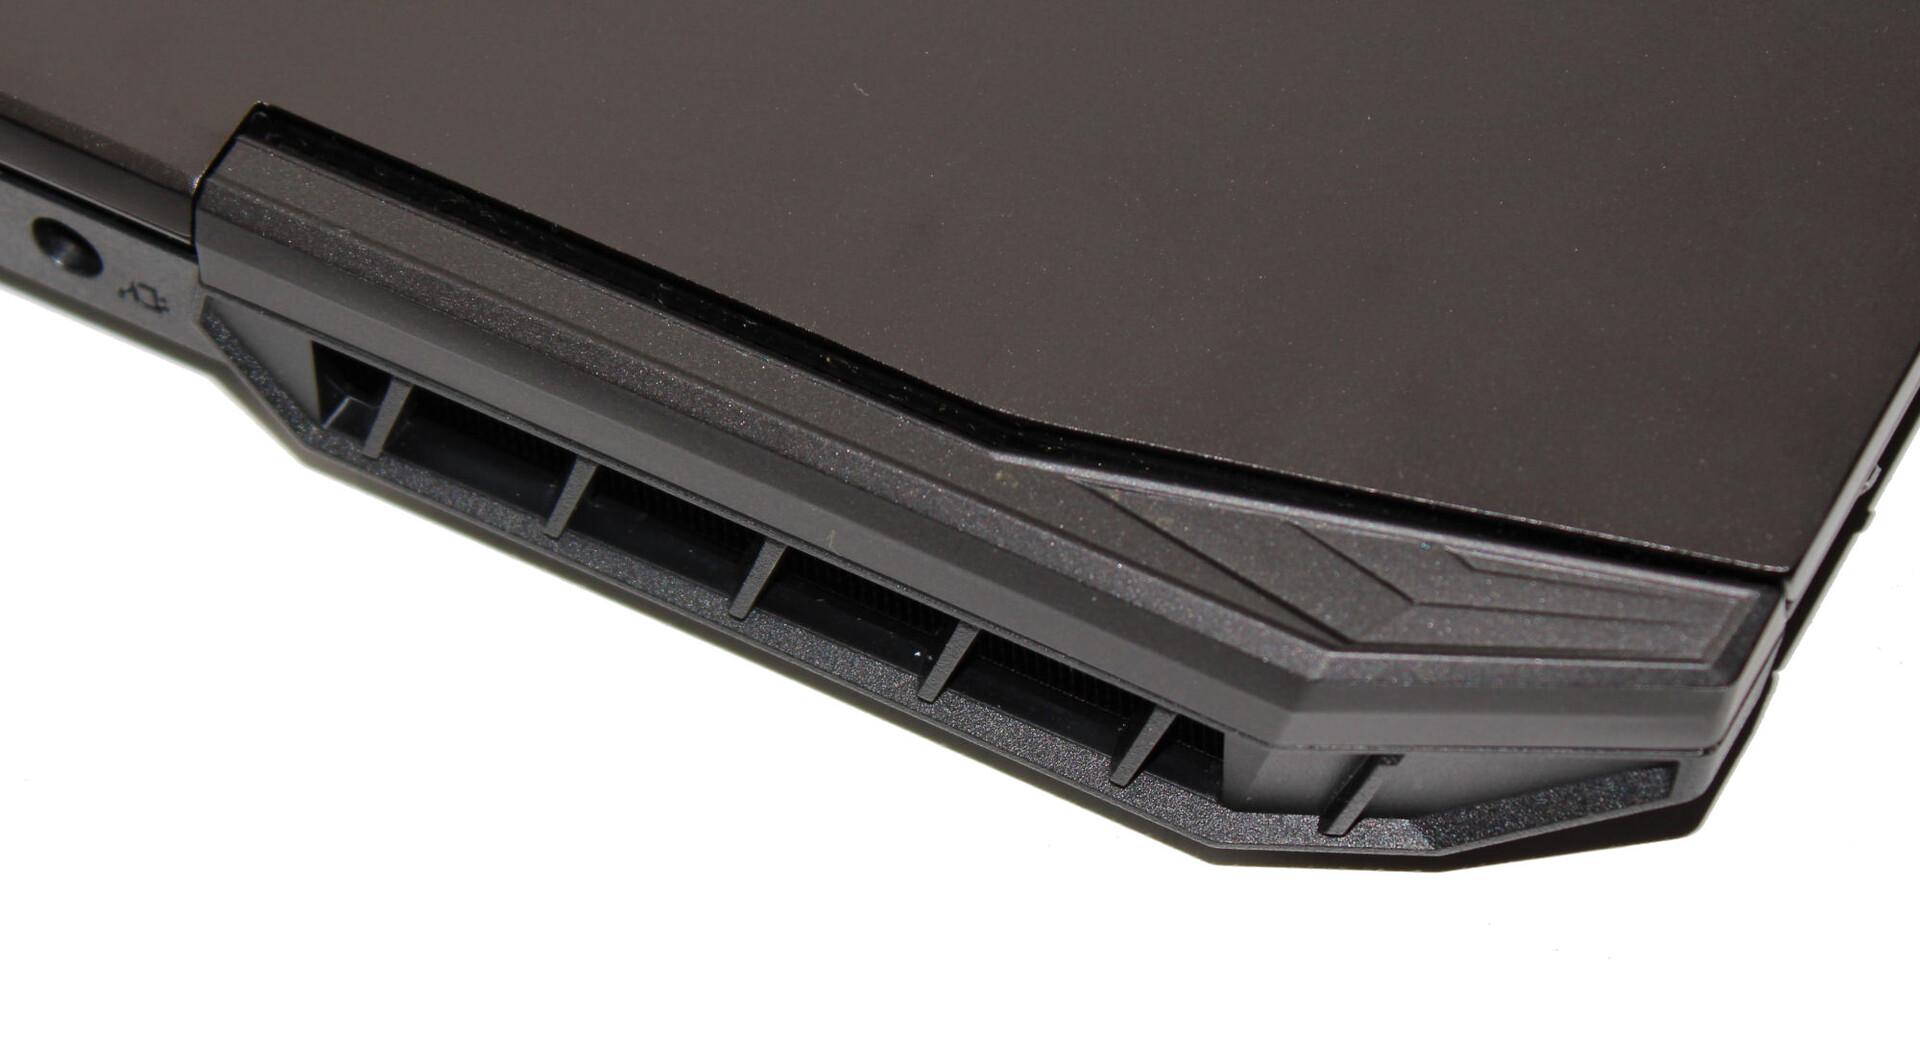
Cassa - La parte posteriore della cassa è in alluminio
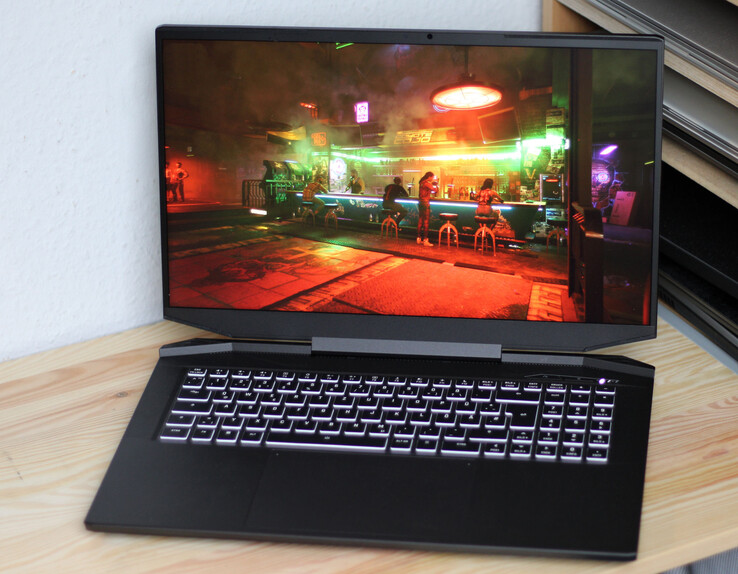
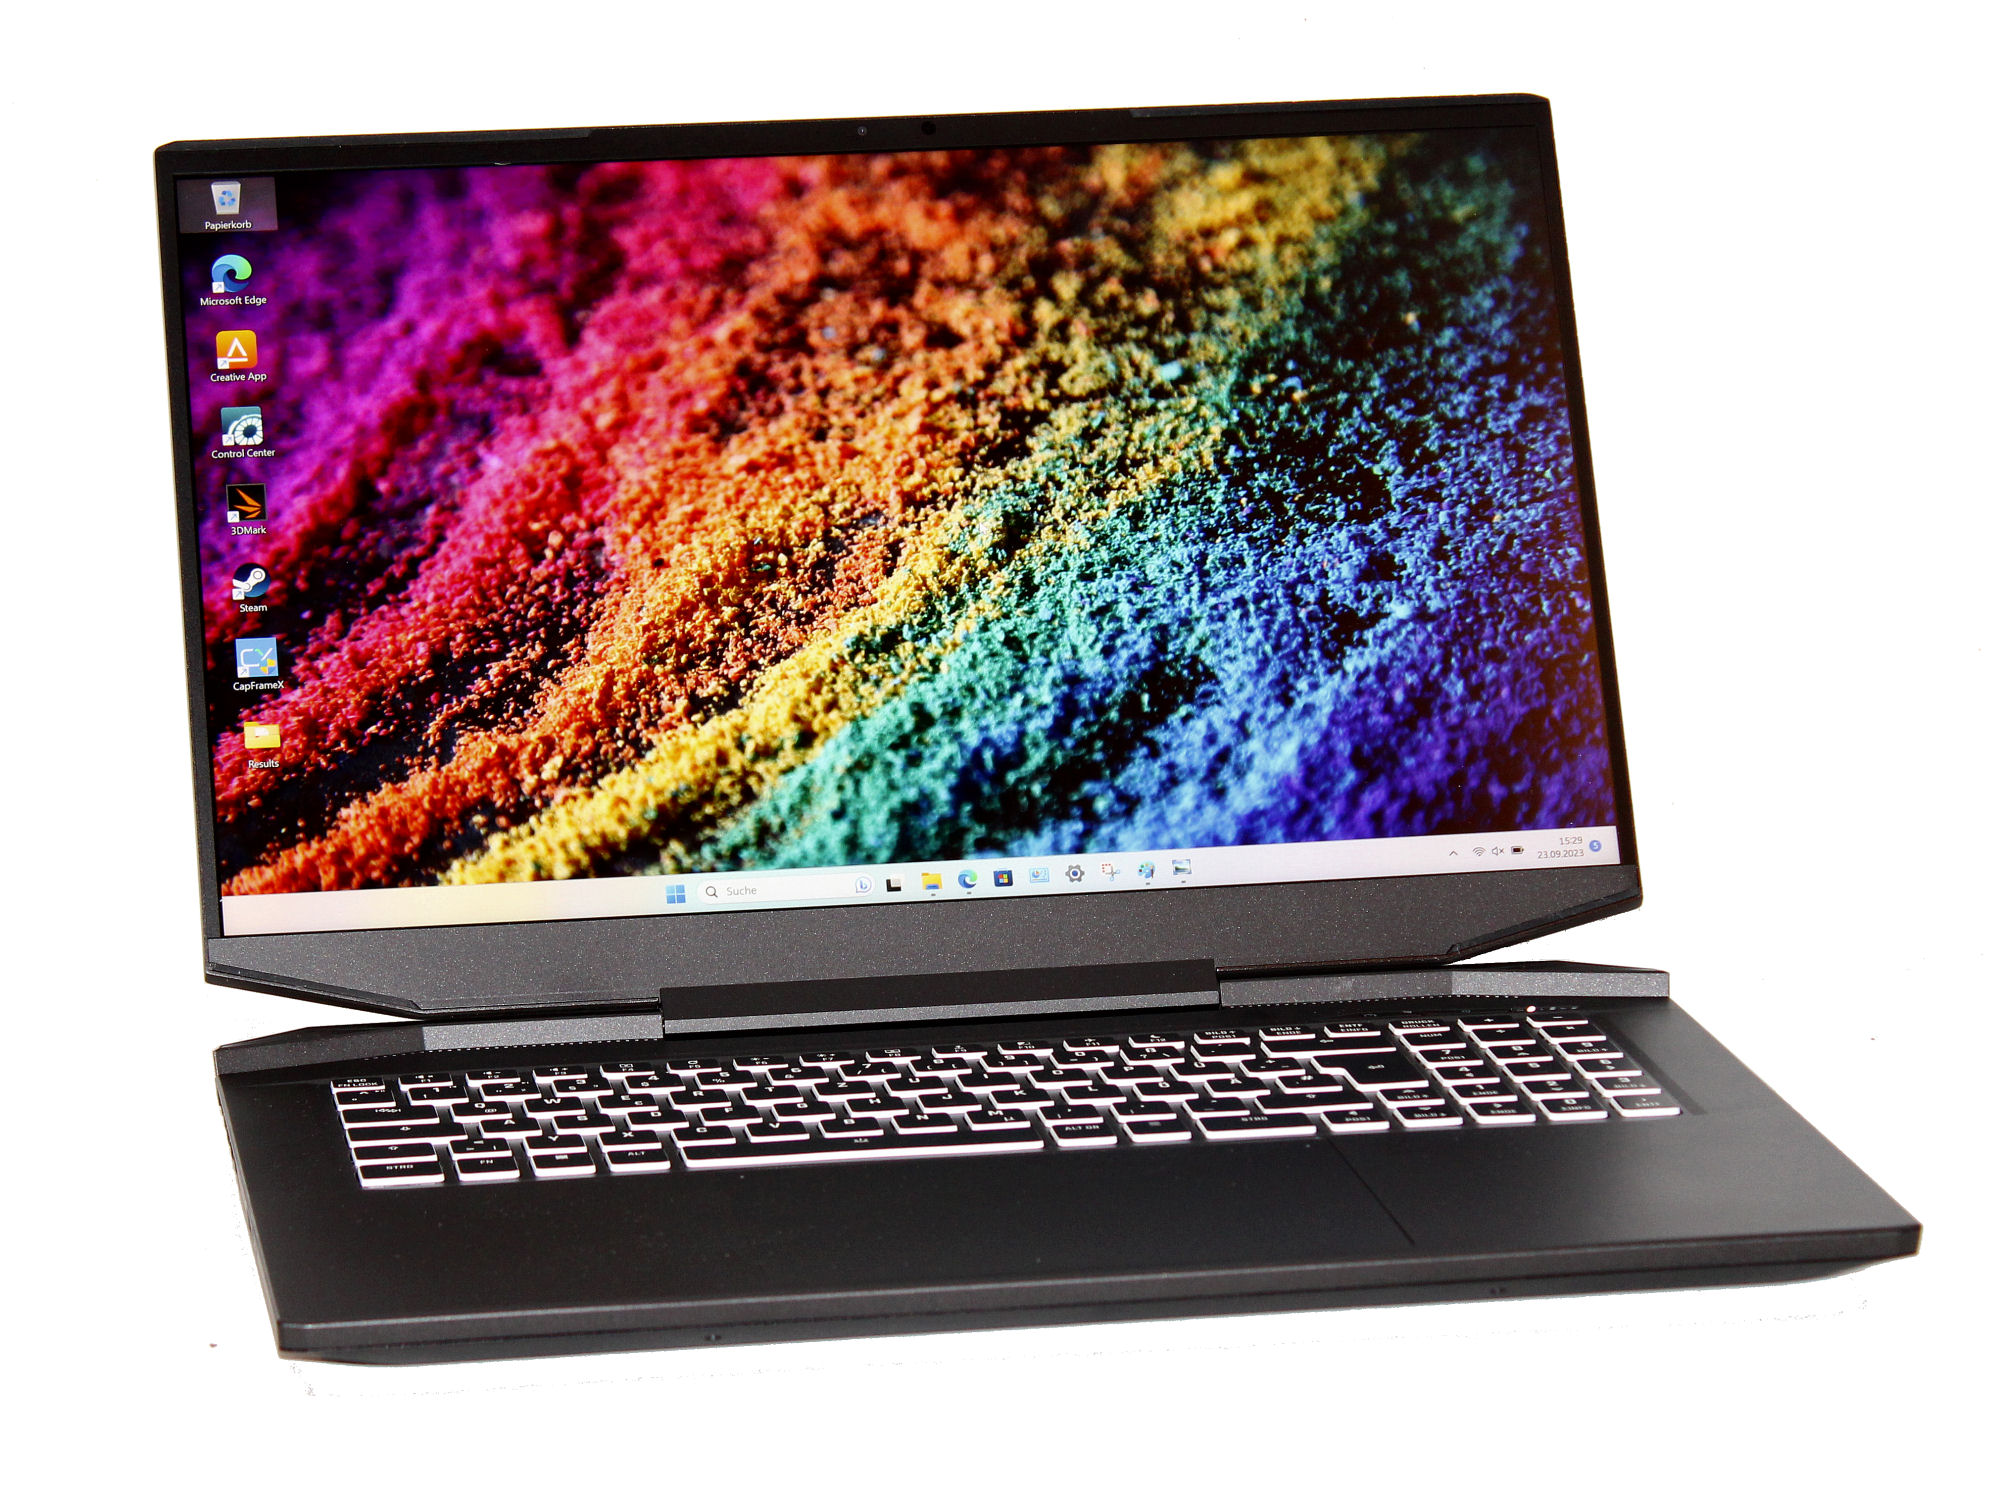
Il case nero opaco presenta superfici lisce (ad eccezione dell'unità di base) e nessun elemento di design appariscente. Non sono presenti elementi luminosi a LED, ad eccezione dell'illuminazione dei tasti. Schenker ha optato per un mix di materiali: La parte posteriore del coperchio in alluminio è completata da componenti in plastica. Dopo aver smontato l'unità di base, la batteria (avvitata, non incollata) e la solita ferramenta sono tutte esposte.
I difetti di fabbricazione non si notano e le dimensioni della fessura sono buone. Il coperchio e la base possono essere leggermente ruotati, ma tutto rientra in un range accettabile. Qualsiasi pressione esercitata sul coperchio non provoca distorsioni dell'immagine. Le cerniere mantengono il coperchio saldamente in posizione, ma oscillano un po'. L'angolo di apertura massimo è di 140 gradi. È possibile aprire il portatile con una sola mano.
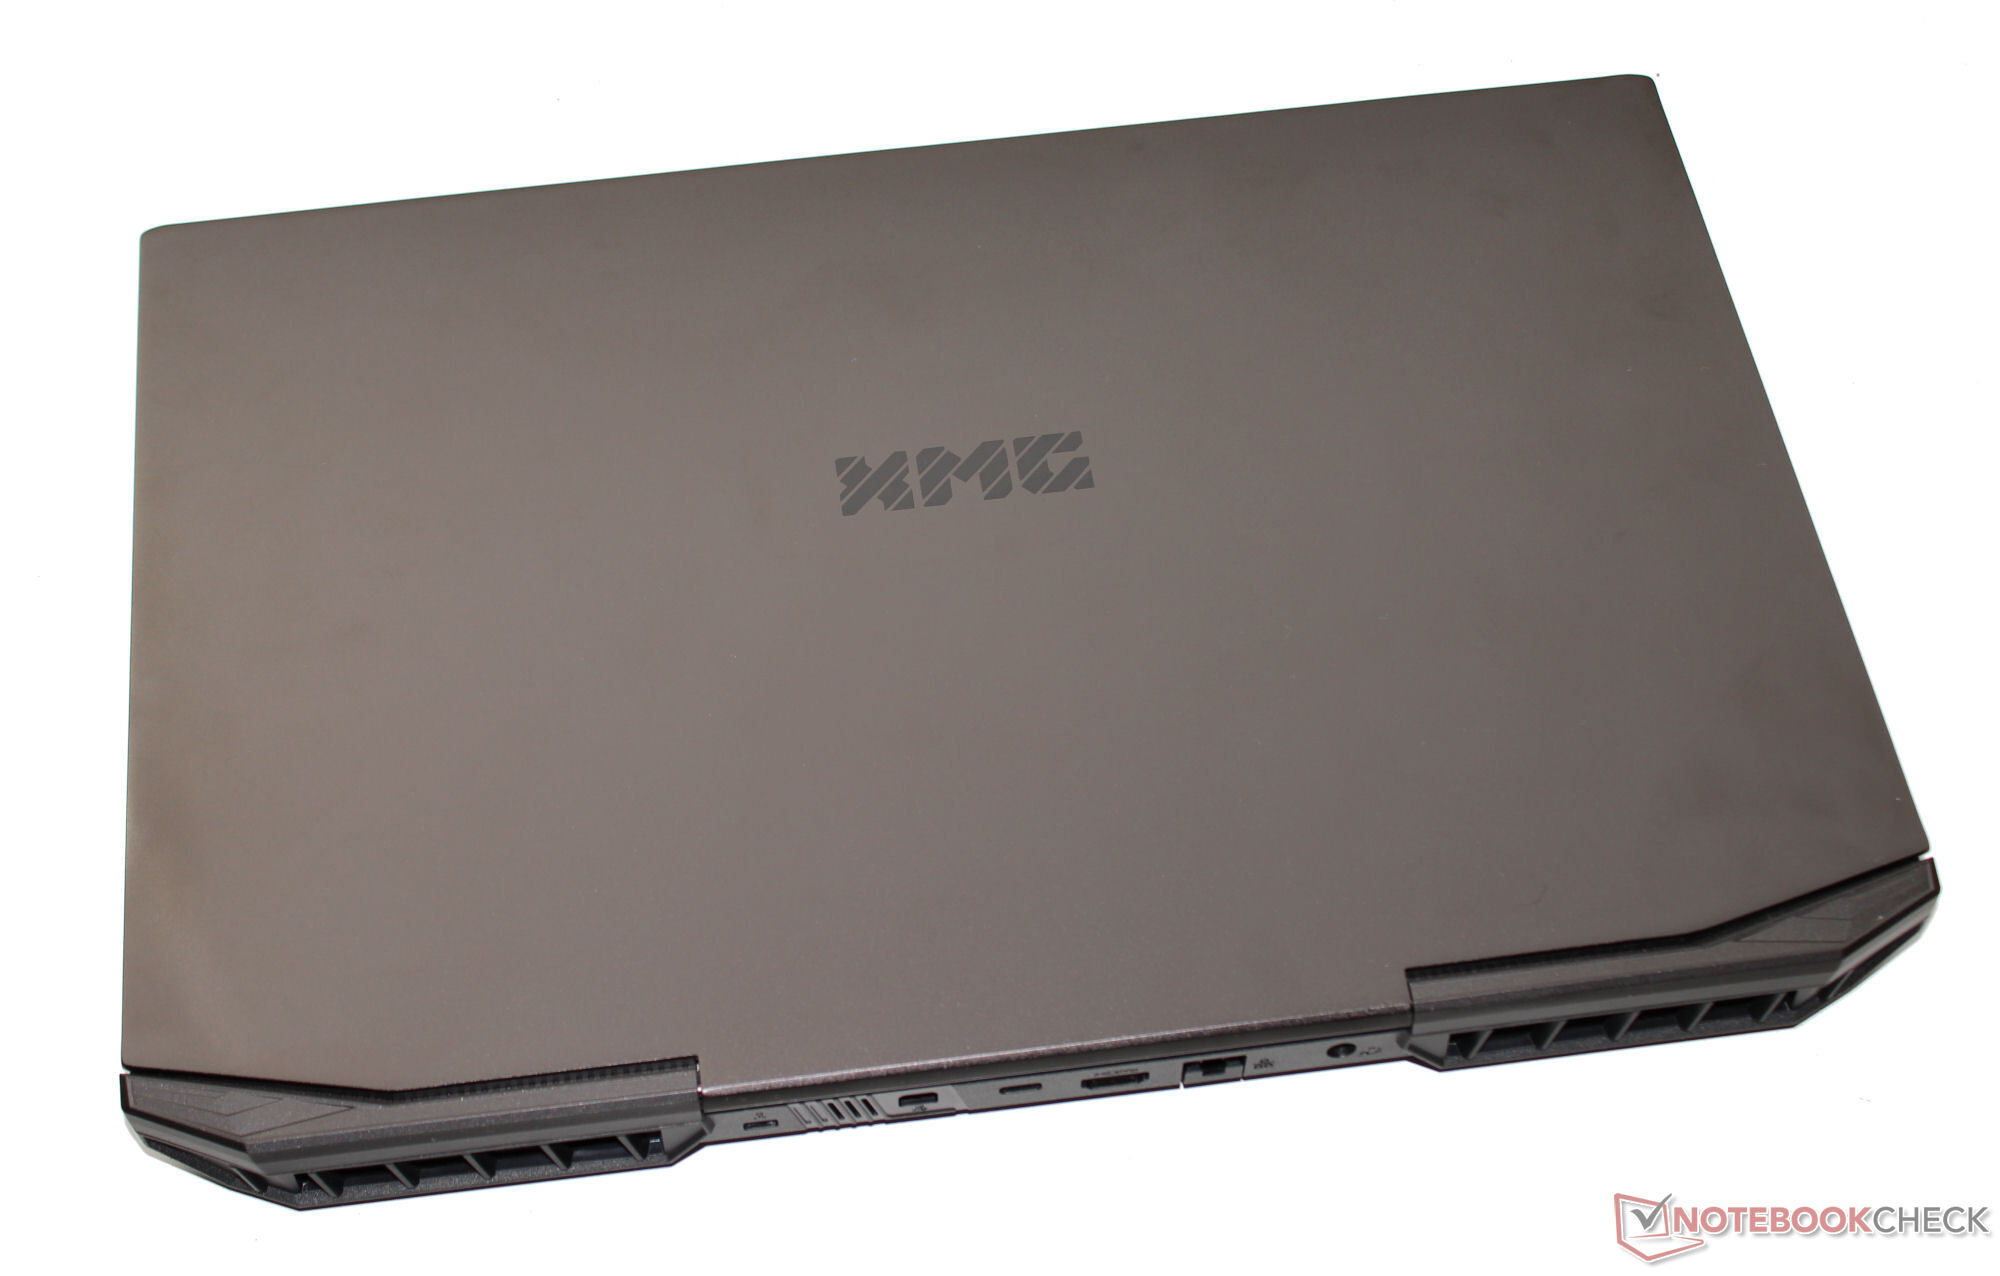
Il computer XMG è il più leggero e compatto tra i portatili da 17,3 pollici della concorrenza. Con un peso di circa 2,5 kg, rientra generalmente tra i rappresentanti più leggeri del suo genere.
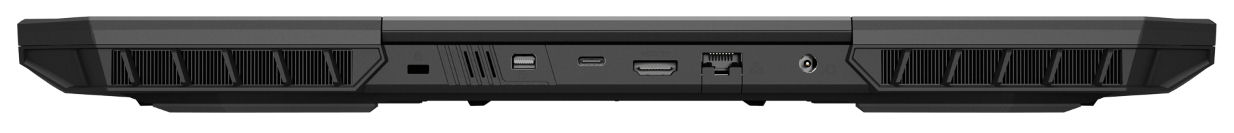
Caratteristiche - Il portatile XMG viene fornito senza Thunderbolt
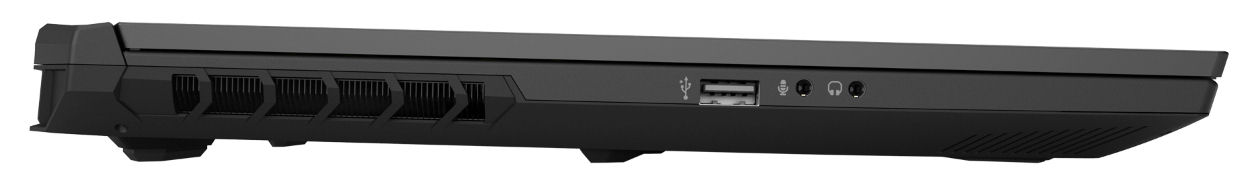
L'Apex dispone di tre porte USB-A (1x USB 2.0, 2x USB 3.2 Gen 1) e una porta USB-C (USB 3.2 Gen 2). Quest'ultima non è in grado di emettere un segnale Displayport e non offre il supporto Power Delivery. Due uscite video (HDMI 2.1, DP 1.4a), jack audio e una porta Gigabit Ethernet completano la dotazione.
Le uscite video, il connettore di alimentazione e la porta LAN si trovano sul retro del dispositivo. I cavi corrispondenti passano sul retro e quindi non intralciano il passaggio.

Lettore di schede SD
Con una velocità massima di trasferimento di 35 MB/s (trasferimento di 250 file di immagini jpg di circa 5 MB ciascuno) e di 36 MB/s (copia di grandi blocchi di dati), il lettore di schede di memoria (scheda di riferimento: AV PRO microSD 128 GB V60) appartiene ai modelli lenti. A questo proposito, la concorrenza offre di più.
| SD Card Reader | |
| average JPG Copy Test (av. of 3 runs) | |
| Alienware m16 R1 Intel (AV PRO microSD 128 GB V60) | |
| Media della classe Gaming (20.9 - 210, n=54, ultimi 2 anni) | |
| Medion Erazer Defender P40 (AV PRO microSD 128 GB V60) | |
| Acer Nitro 17 AN17-51-71ER | |
| Schenker XMG Apex 17 (Late 23) (AV PRO microSD 128 GB V60) | |
| maximum AS SSD Seq Read Test (1GB) | |
| Alienware m16 R1 Intel (AV PRO microSD 128 GB V60) | |
| Media della classe Gaming (25.5 - 261, n=51, ultimi 2 anni) | |
| Medion Erazer Defender P40 (AV PRO microSD 128 GB V60) | |
| Acer Nitro 17 AN17-51-71ER | |
| Schenker XMG Apex 17 (Late 23) (AV PRO microSD 128 GB V60) | |
Comunicazione
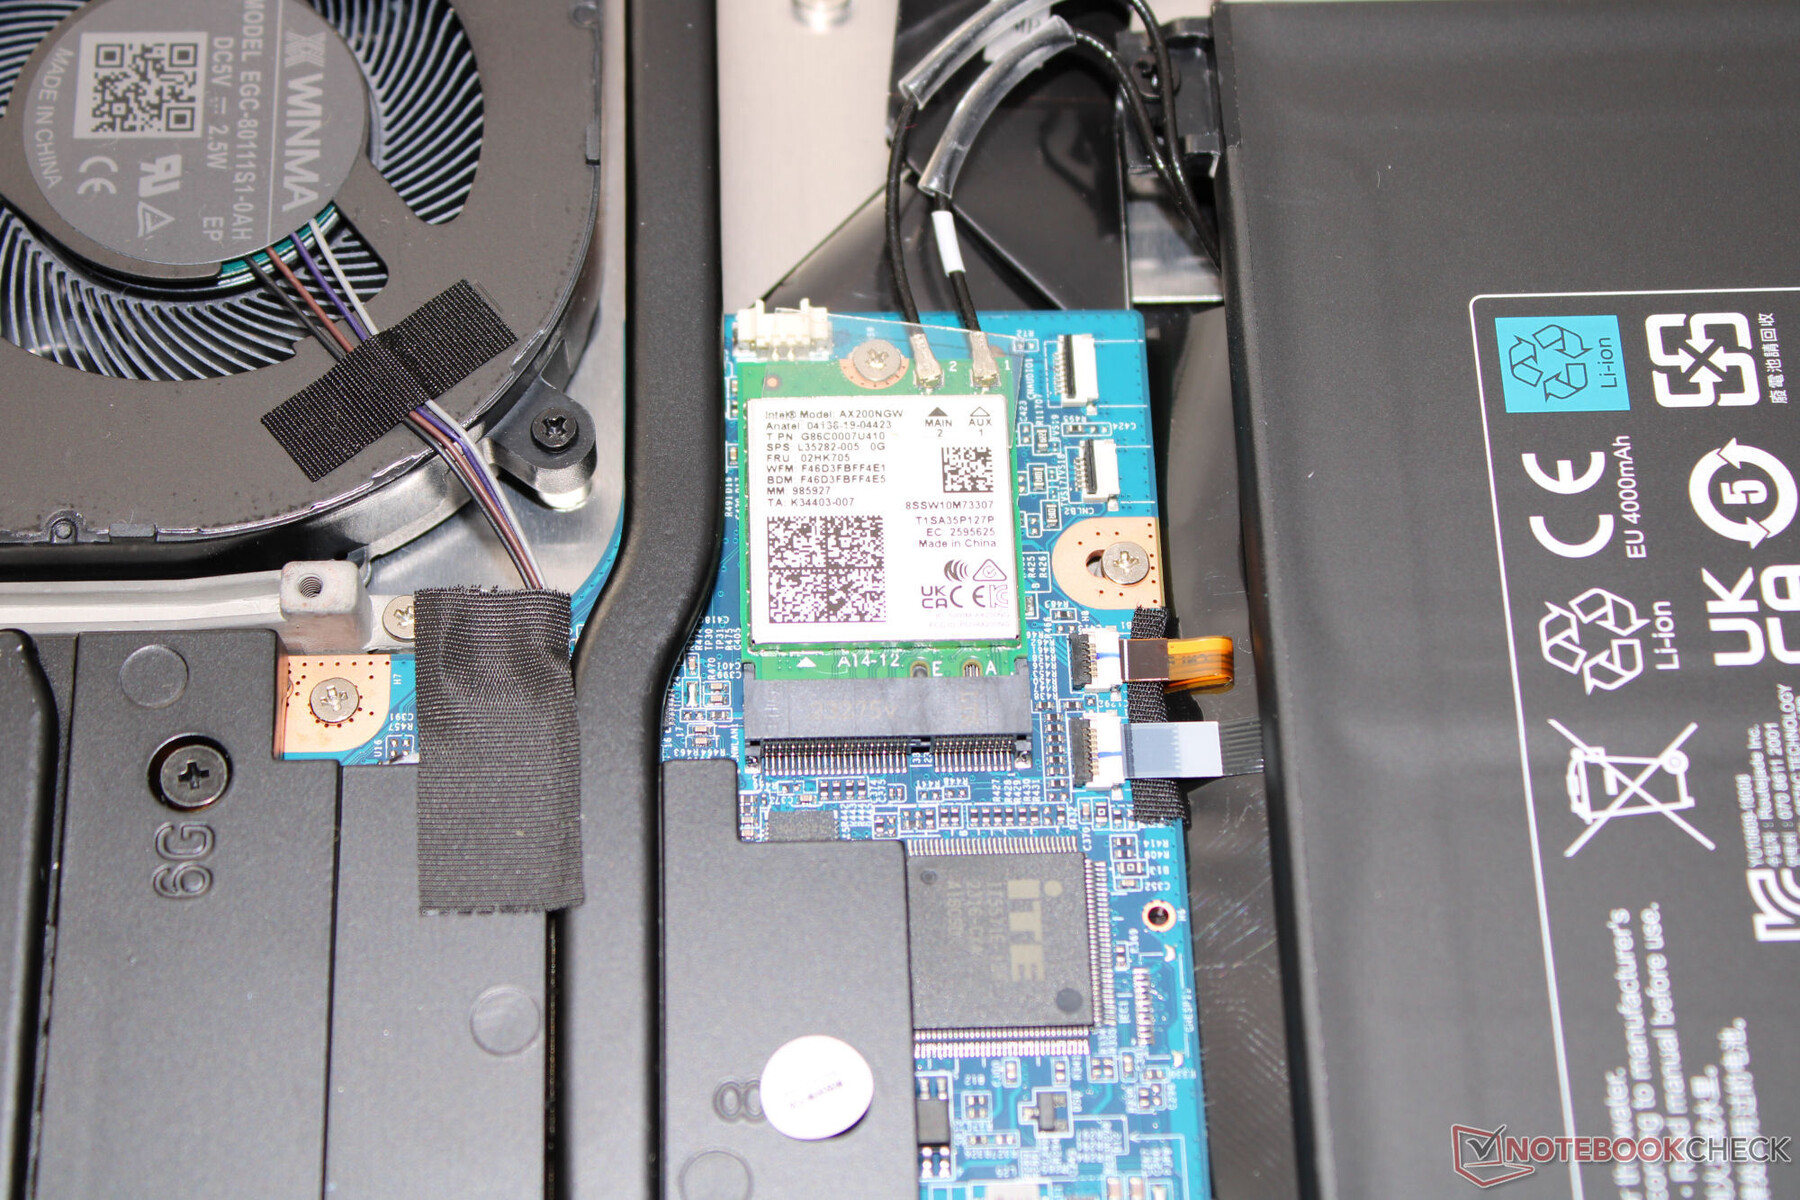
In condizioni ottimali (assenza di dispositivi Wi-Fi nelle vicinanze, breve distanza tra il portatile e il PC server) è possibile raggiungere velocità di trasmissione dati Wi-Fi da buone a ottime. Il portatile Schenker utilizza un chip Wi-Fi 6E (Intel AX200). Un controller Realtek (RTL8168/8111; 1 GBit/s) si occupa delle connessioni cablate.
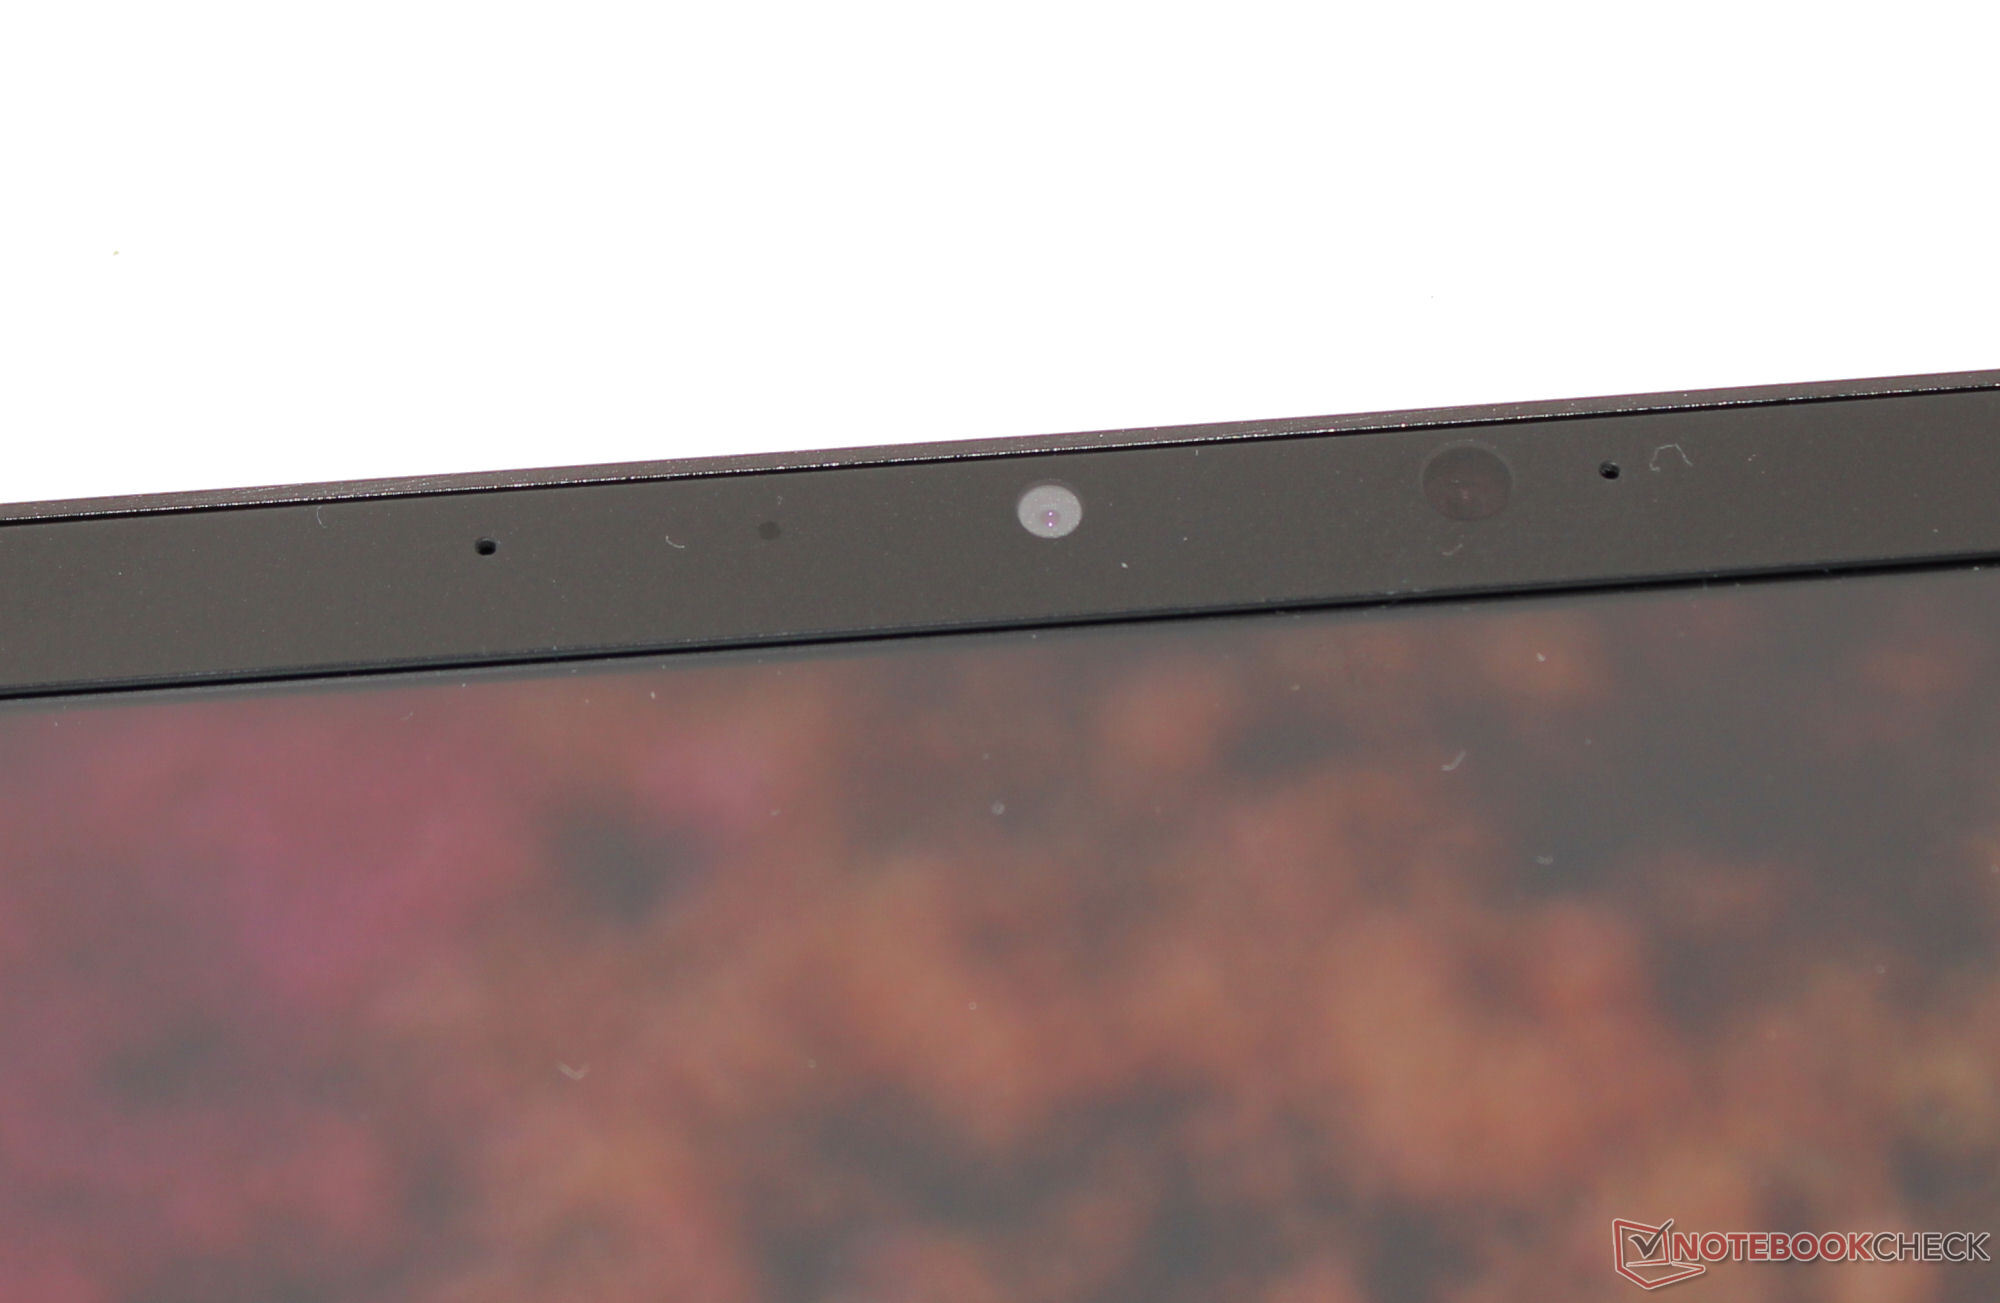
Webcam
Dal punto di vista qualitativo, la webcam (2,1 MP, max. 1.920 x 1.080 pixel) offre prestazioni standard. Una deviazione del colore di circa 8,7 (obiettivo: DeltaE < 3) è abbastanza decente. La fotocamera non offre un otturatore meccanico.

 GeForce RTX 4060 Laptop GPU, R7 7840HS, Samsung 990 Pro 1 TB")
 GeForce RTX 4060 Laptop GPU, R7 7840HS, Samsung 990 Pro 1 TB")
Accessori
Oltre ai soliti documenti, il portatile viene fornito con una chiavetta USB (driver, software), un portachiavi con apribottiglie e un grande mousepad.
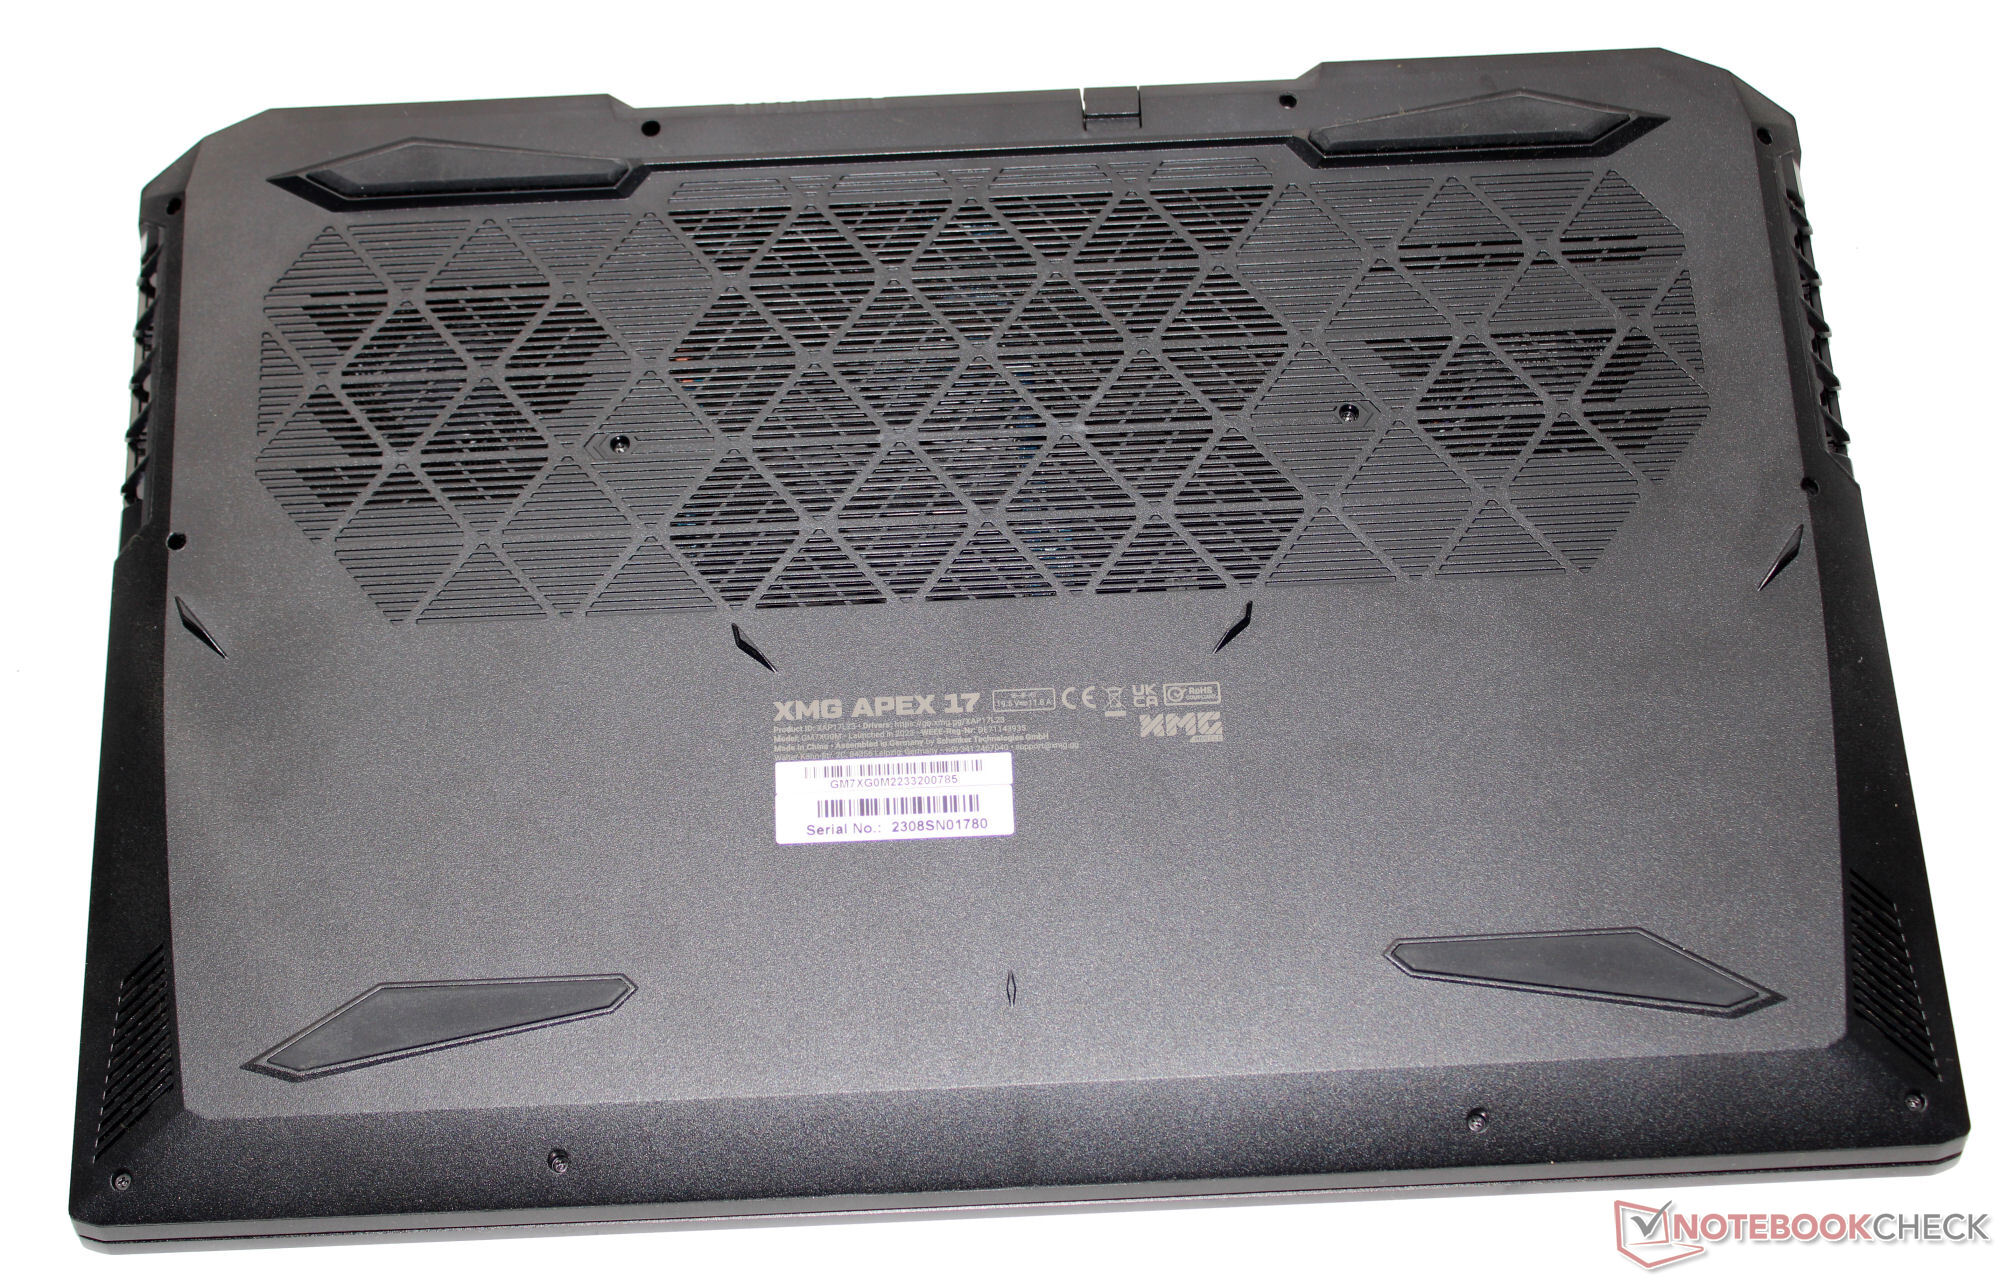
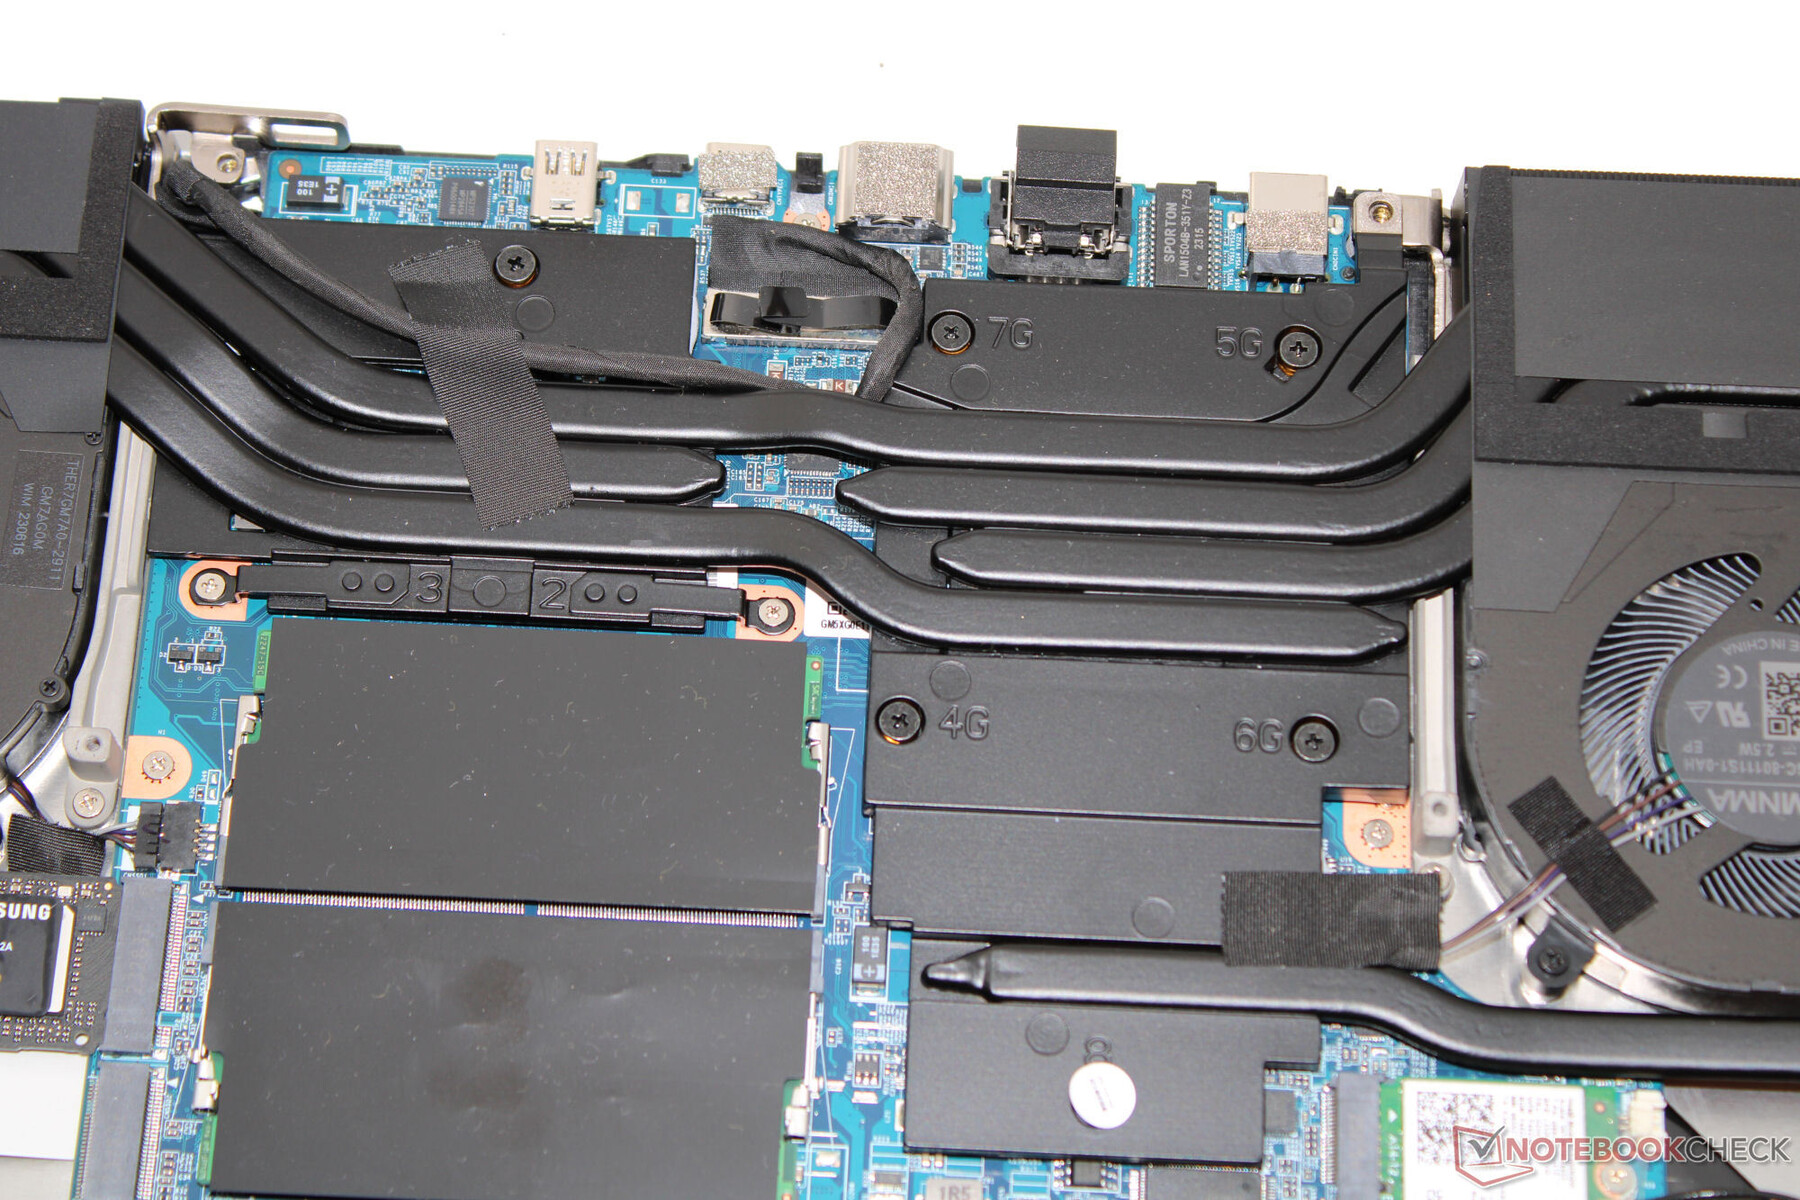
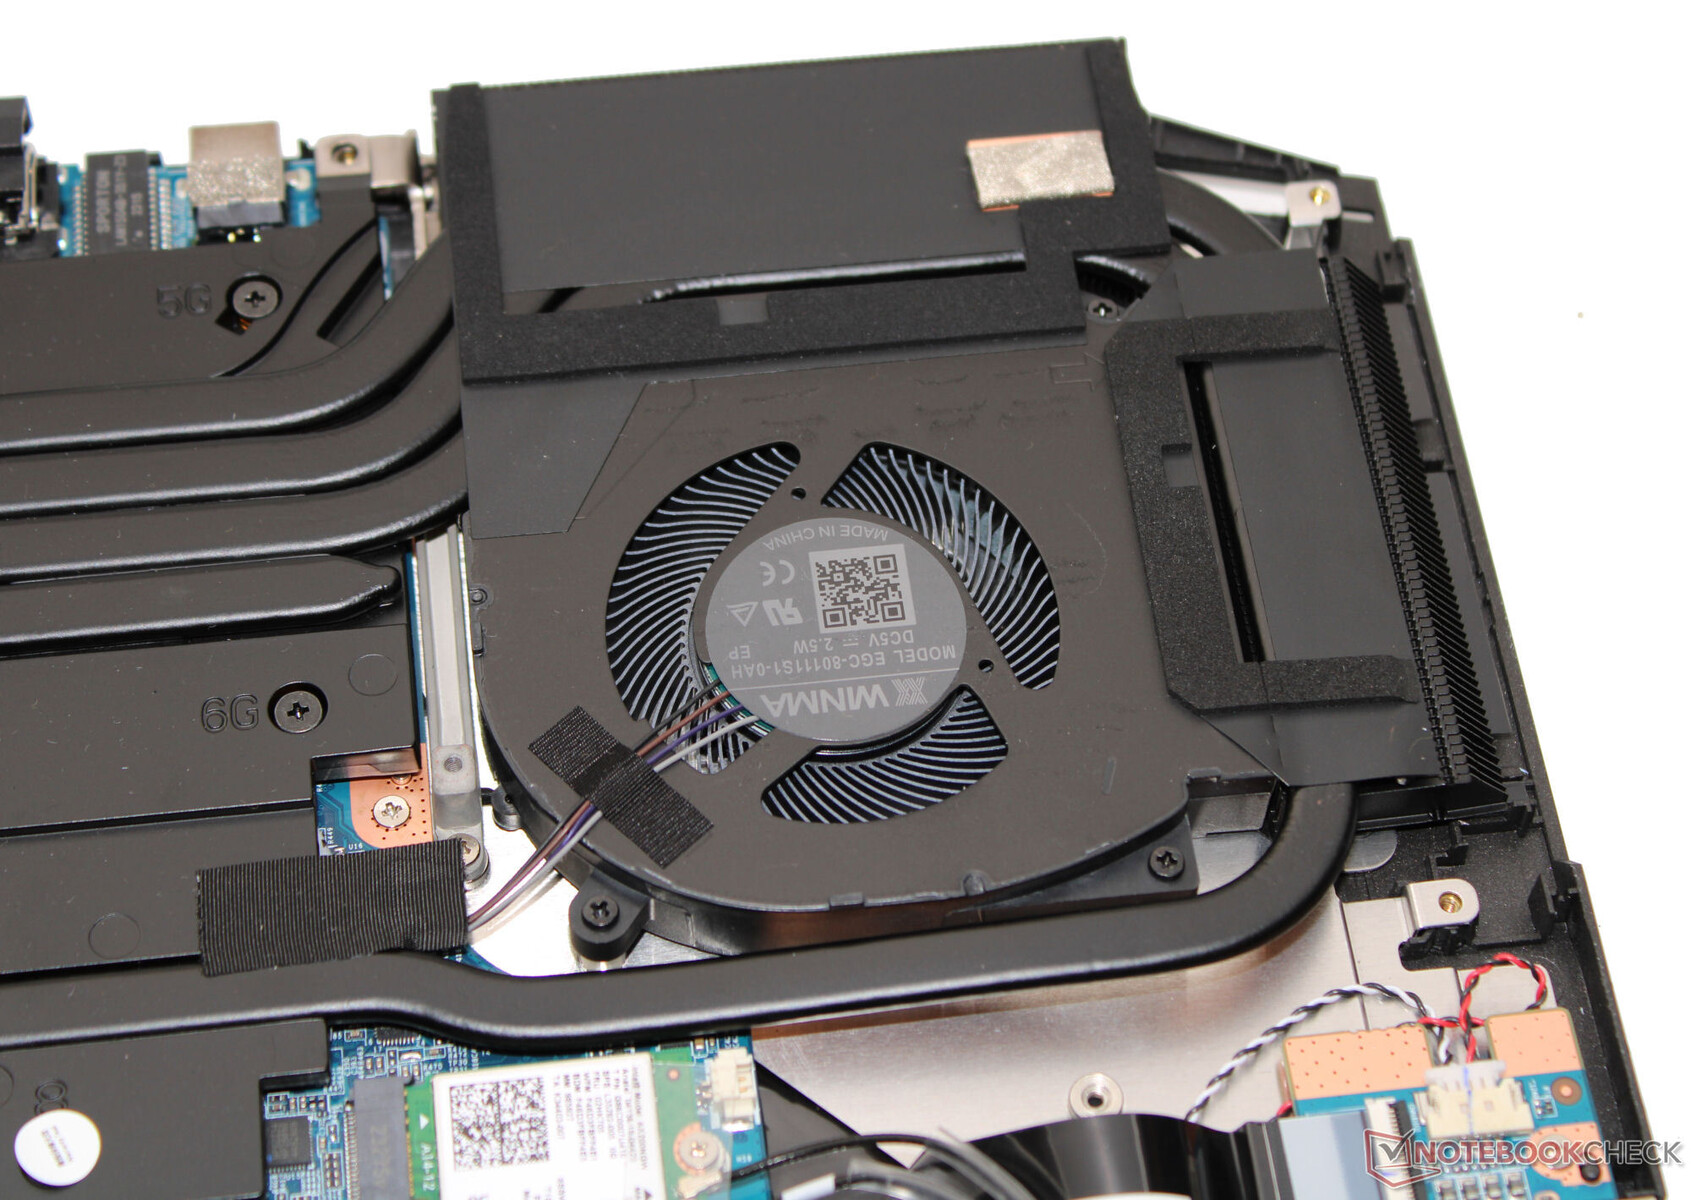
Manutenzione
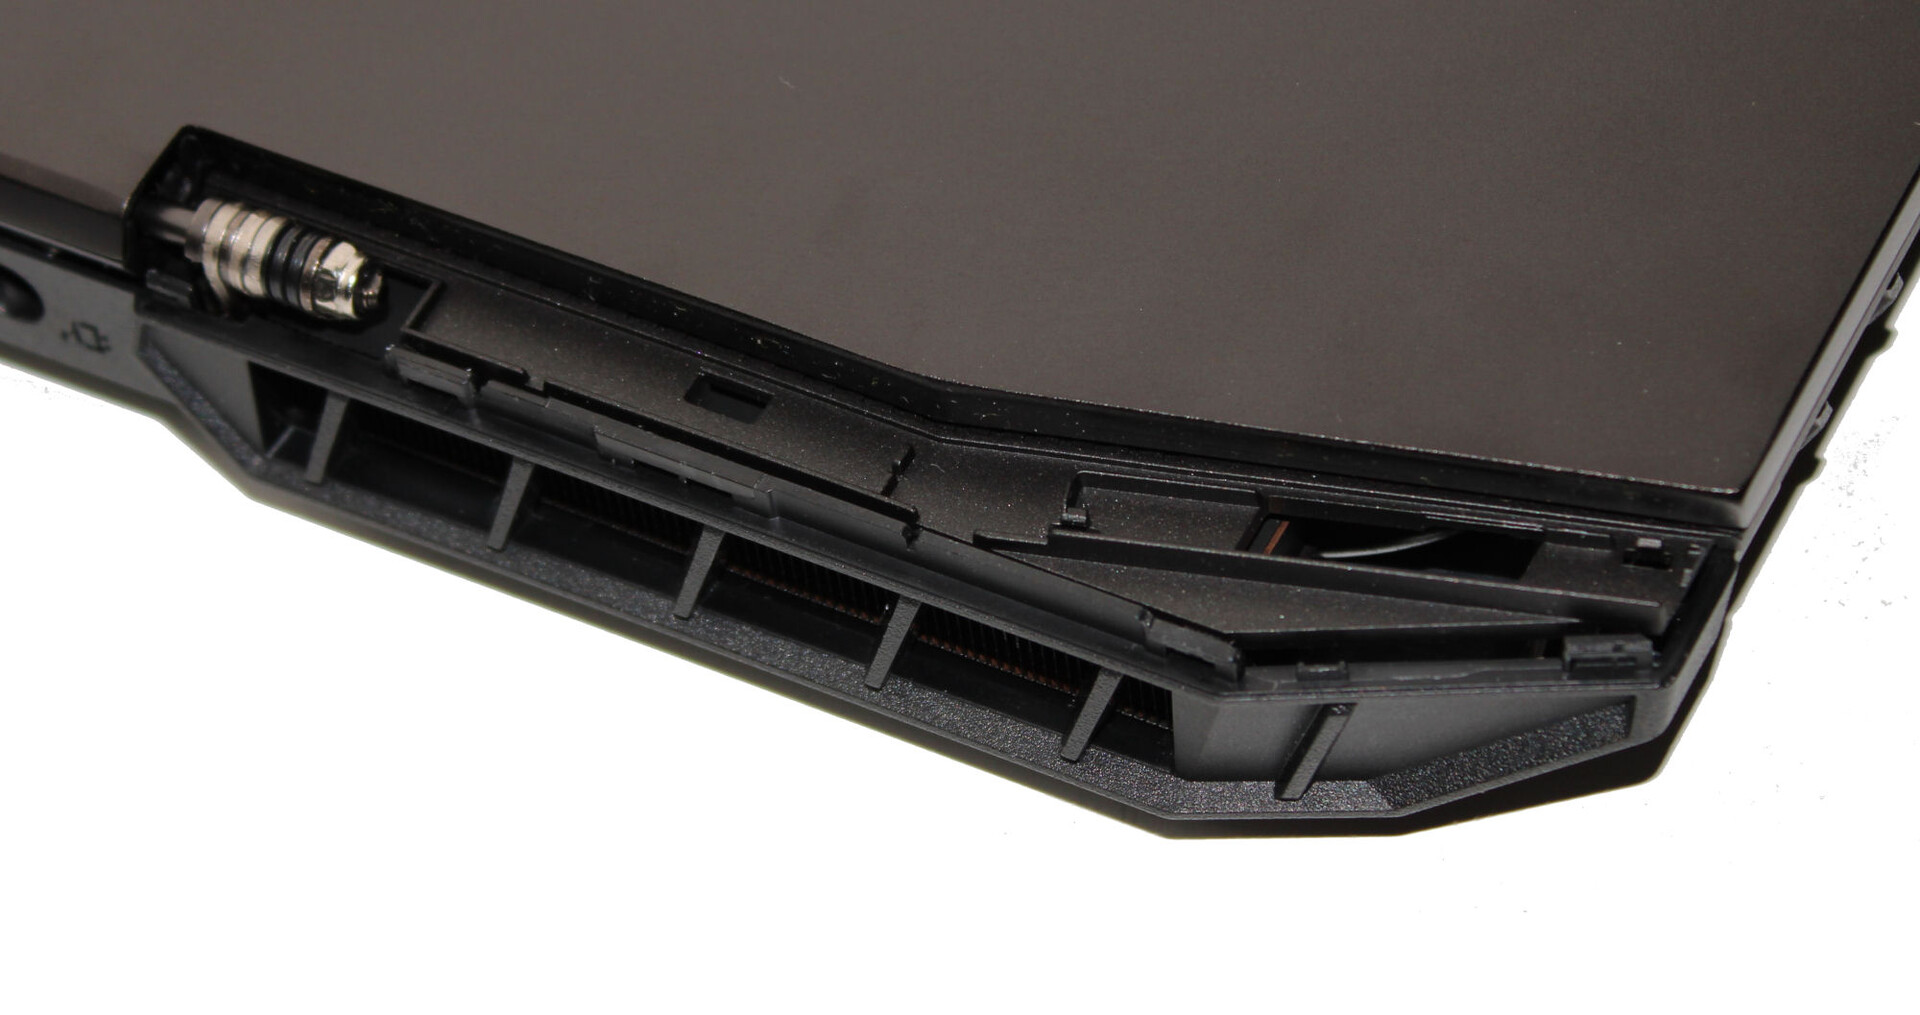
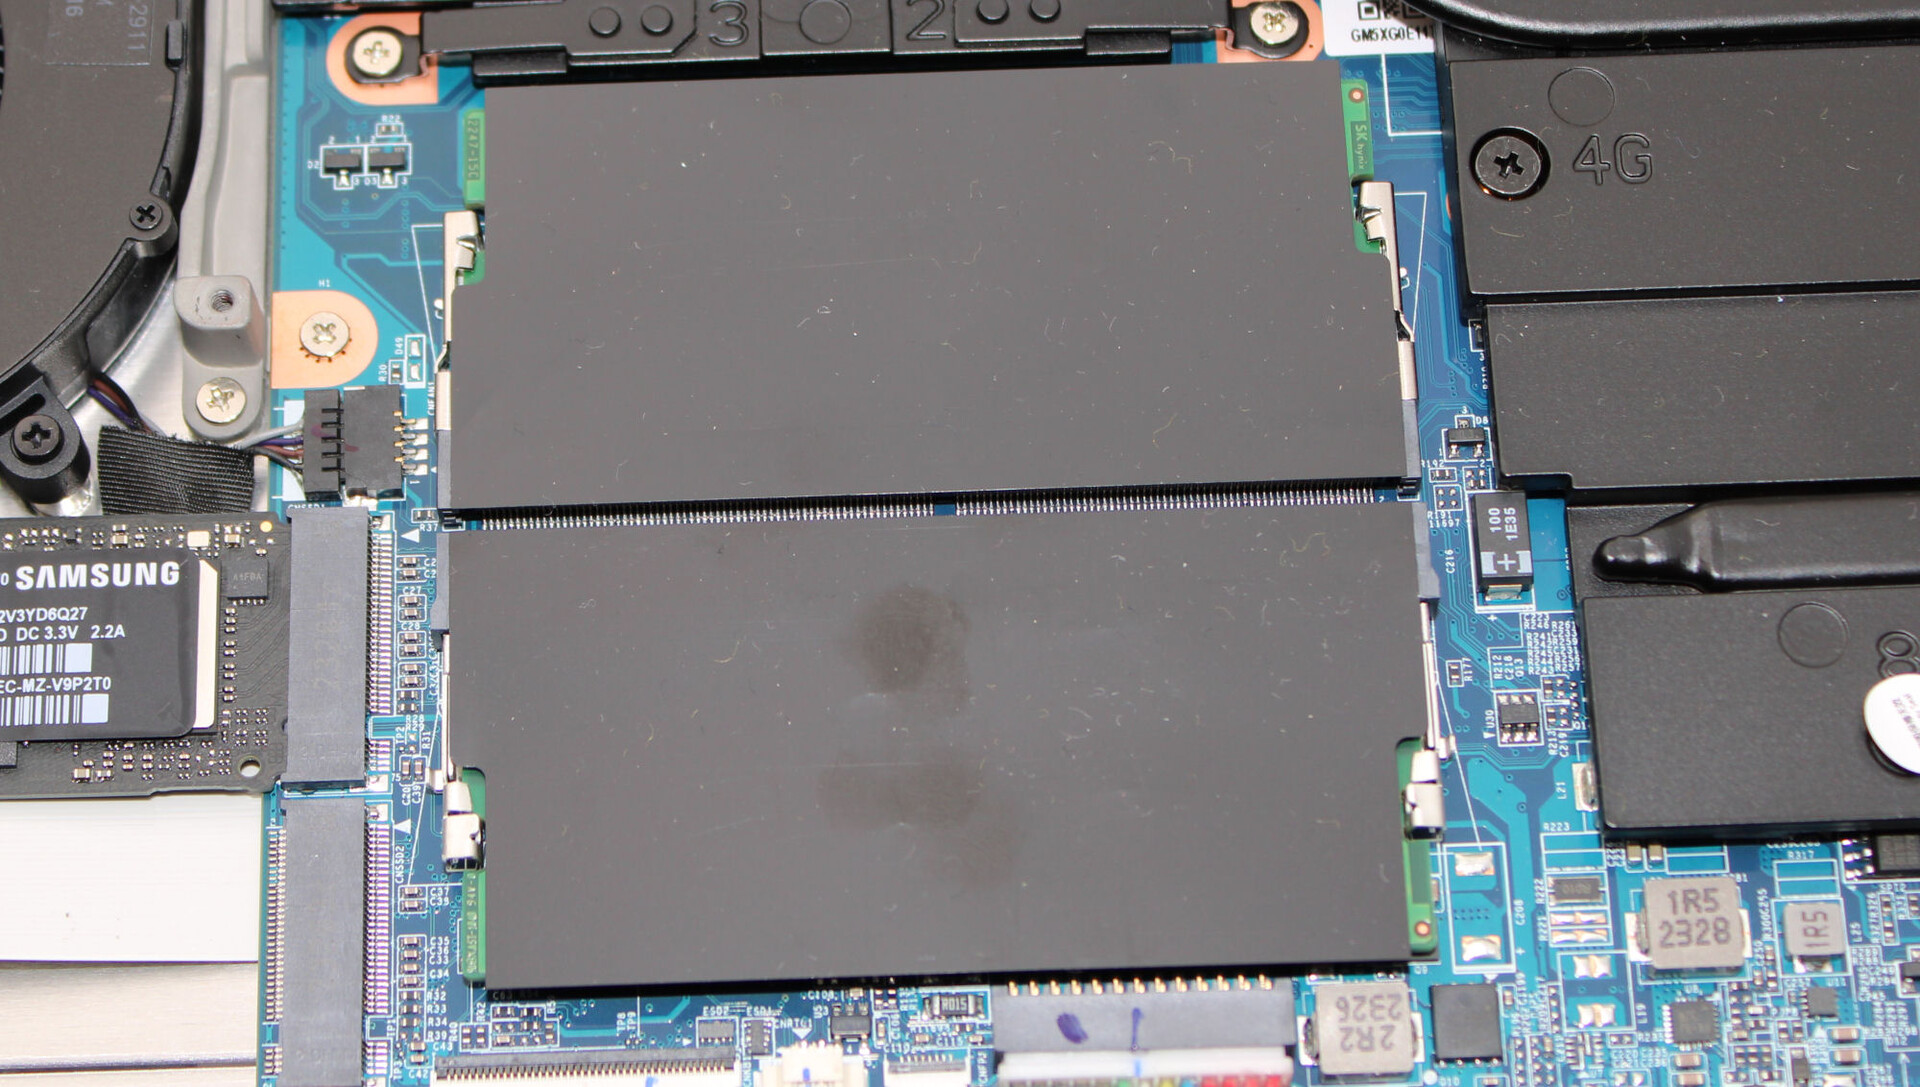
Dopo aver smontato la piastra di base, la ferramenta diventa accessibile. Il primo passo di questo viaggio è rappresentato dalla rimozione dei coperchi delle cerniere (sopra le prese d'aria). Queste sono solo incastrate e non avvitate. Successivamente, la rimozione di tutte le viti sul fondo del dispositivo consente di separare la scocca di base dal resto del dispositivo utilizzando una spatola sottile o un plettro. In questo modo è possibile accedere ai banchi di memoria (entrambi occupati), all'unità SSD (PCIe 4, M.2 2280), al secondo slot SSD (PCIe 4, M.2 2280), al modulo Wi-Fi, alla batteria del BIOS, alle ventole e alla batteria.
Garanzia
La garanzia di base ha una durata di due anni e comprende un servizio di ritiro e sei mesi di riparazione rapida (riparazione entro 48 ore). In Germania, il prezzo richiesto per una garanzia di 36 mesi va da 80 a 119 euro, a seconda del periodo di riparazione rapida selezionato.
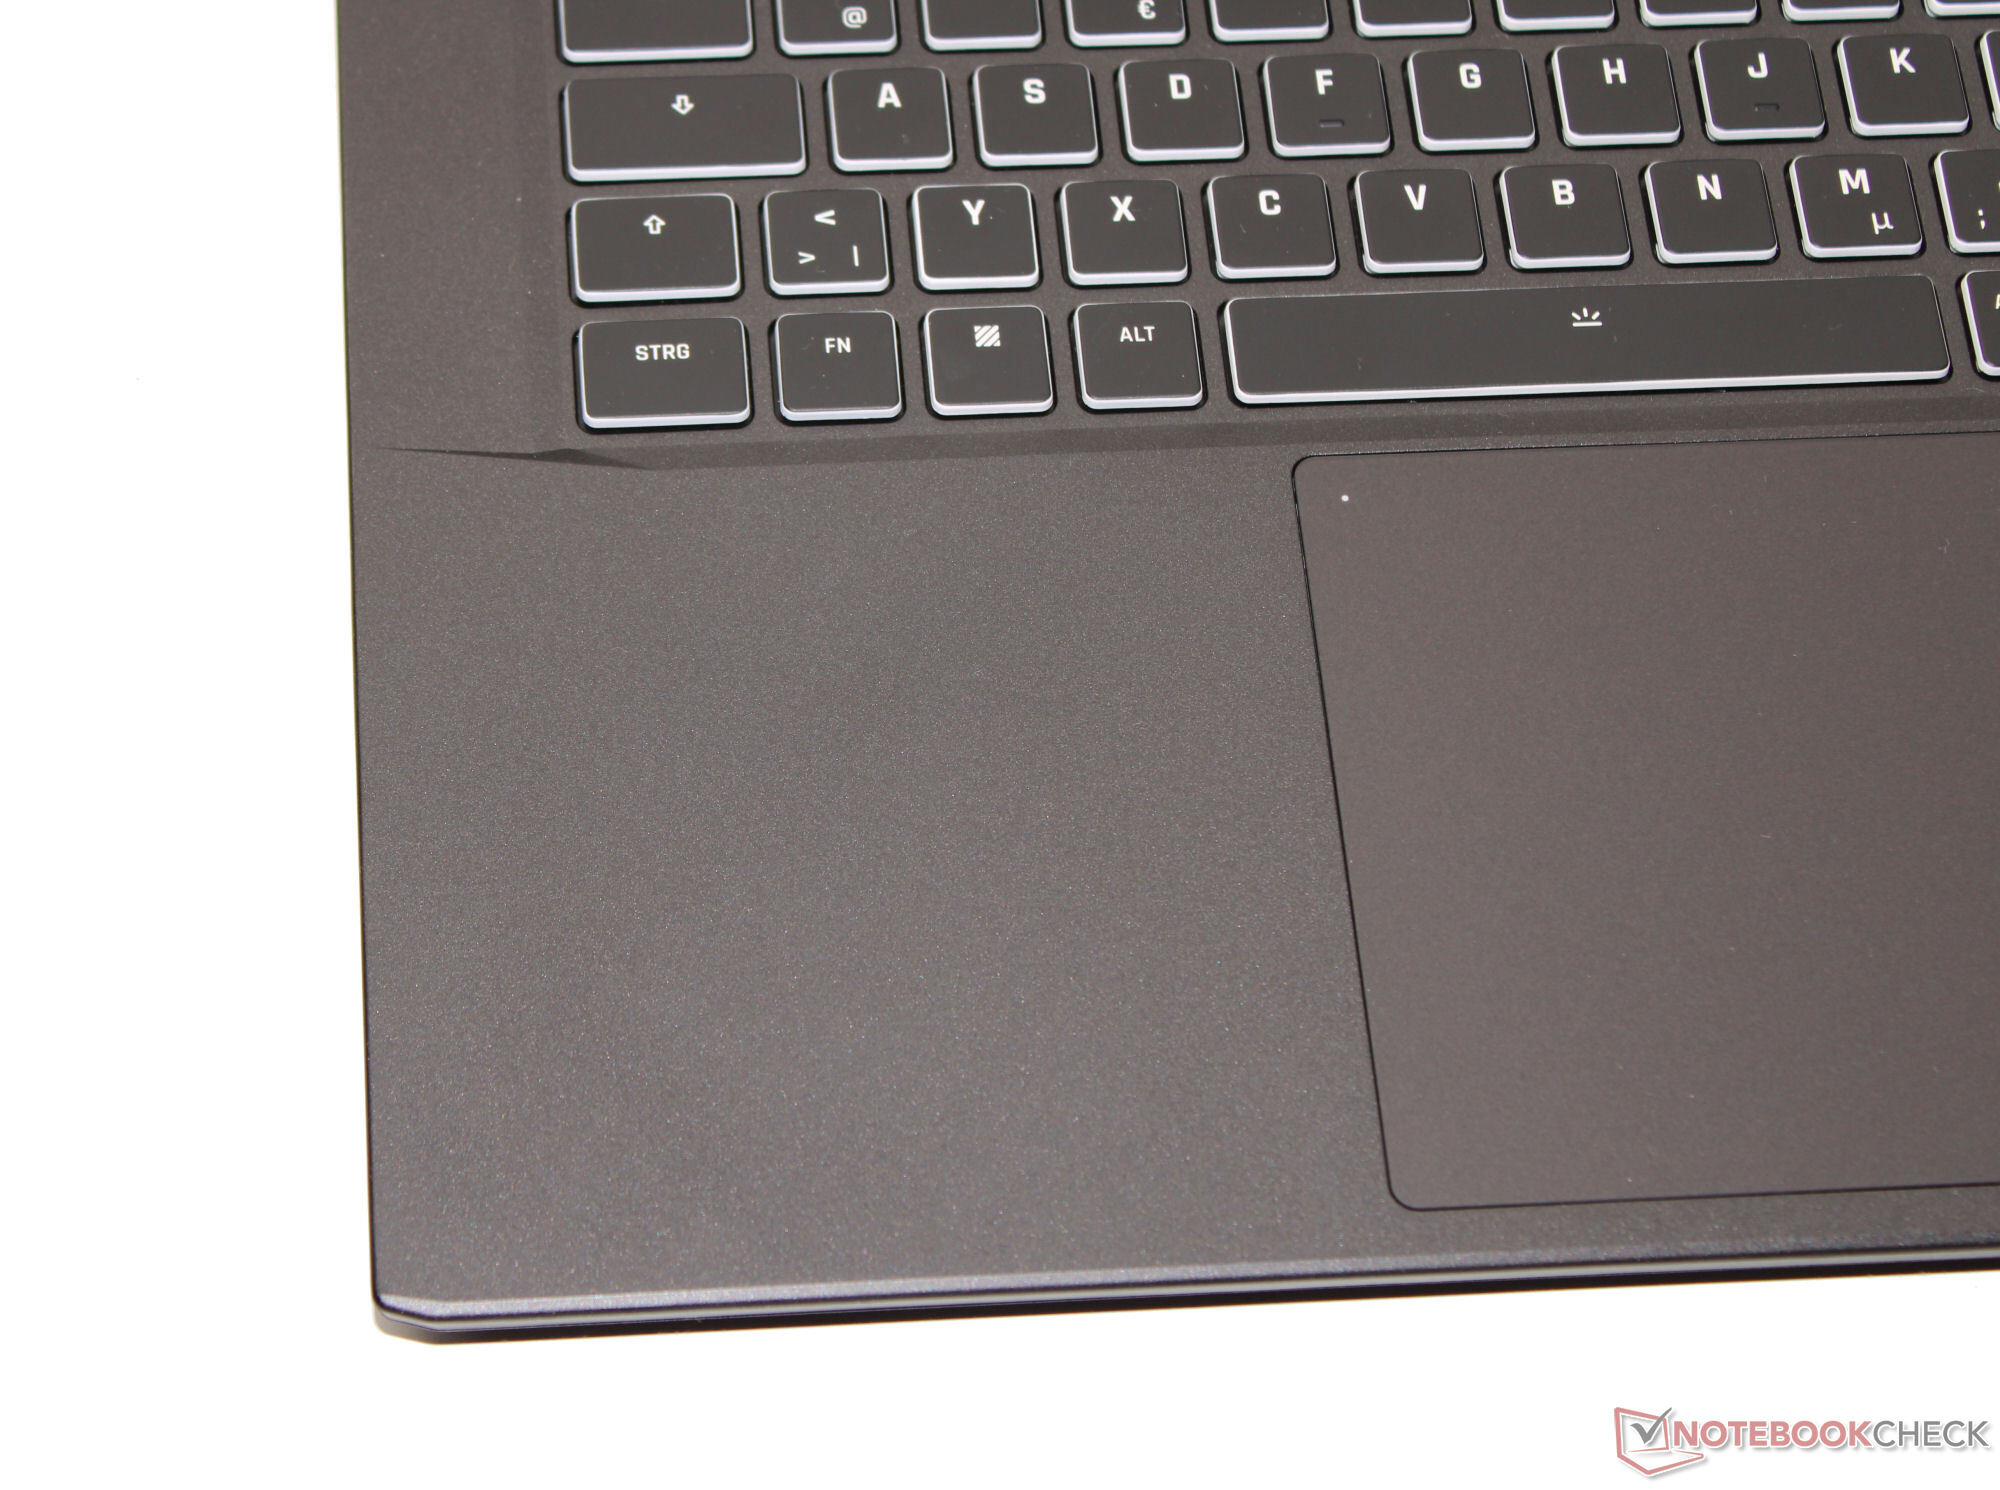
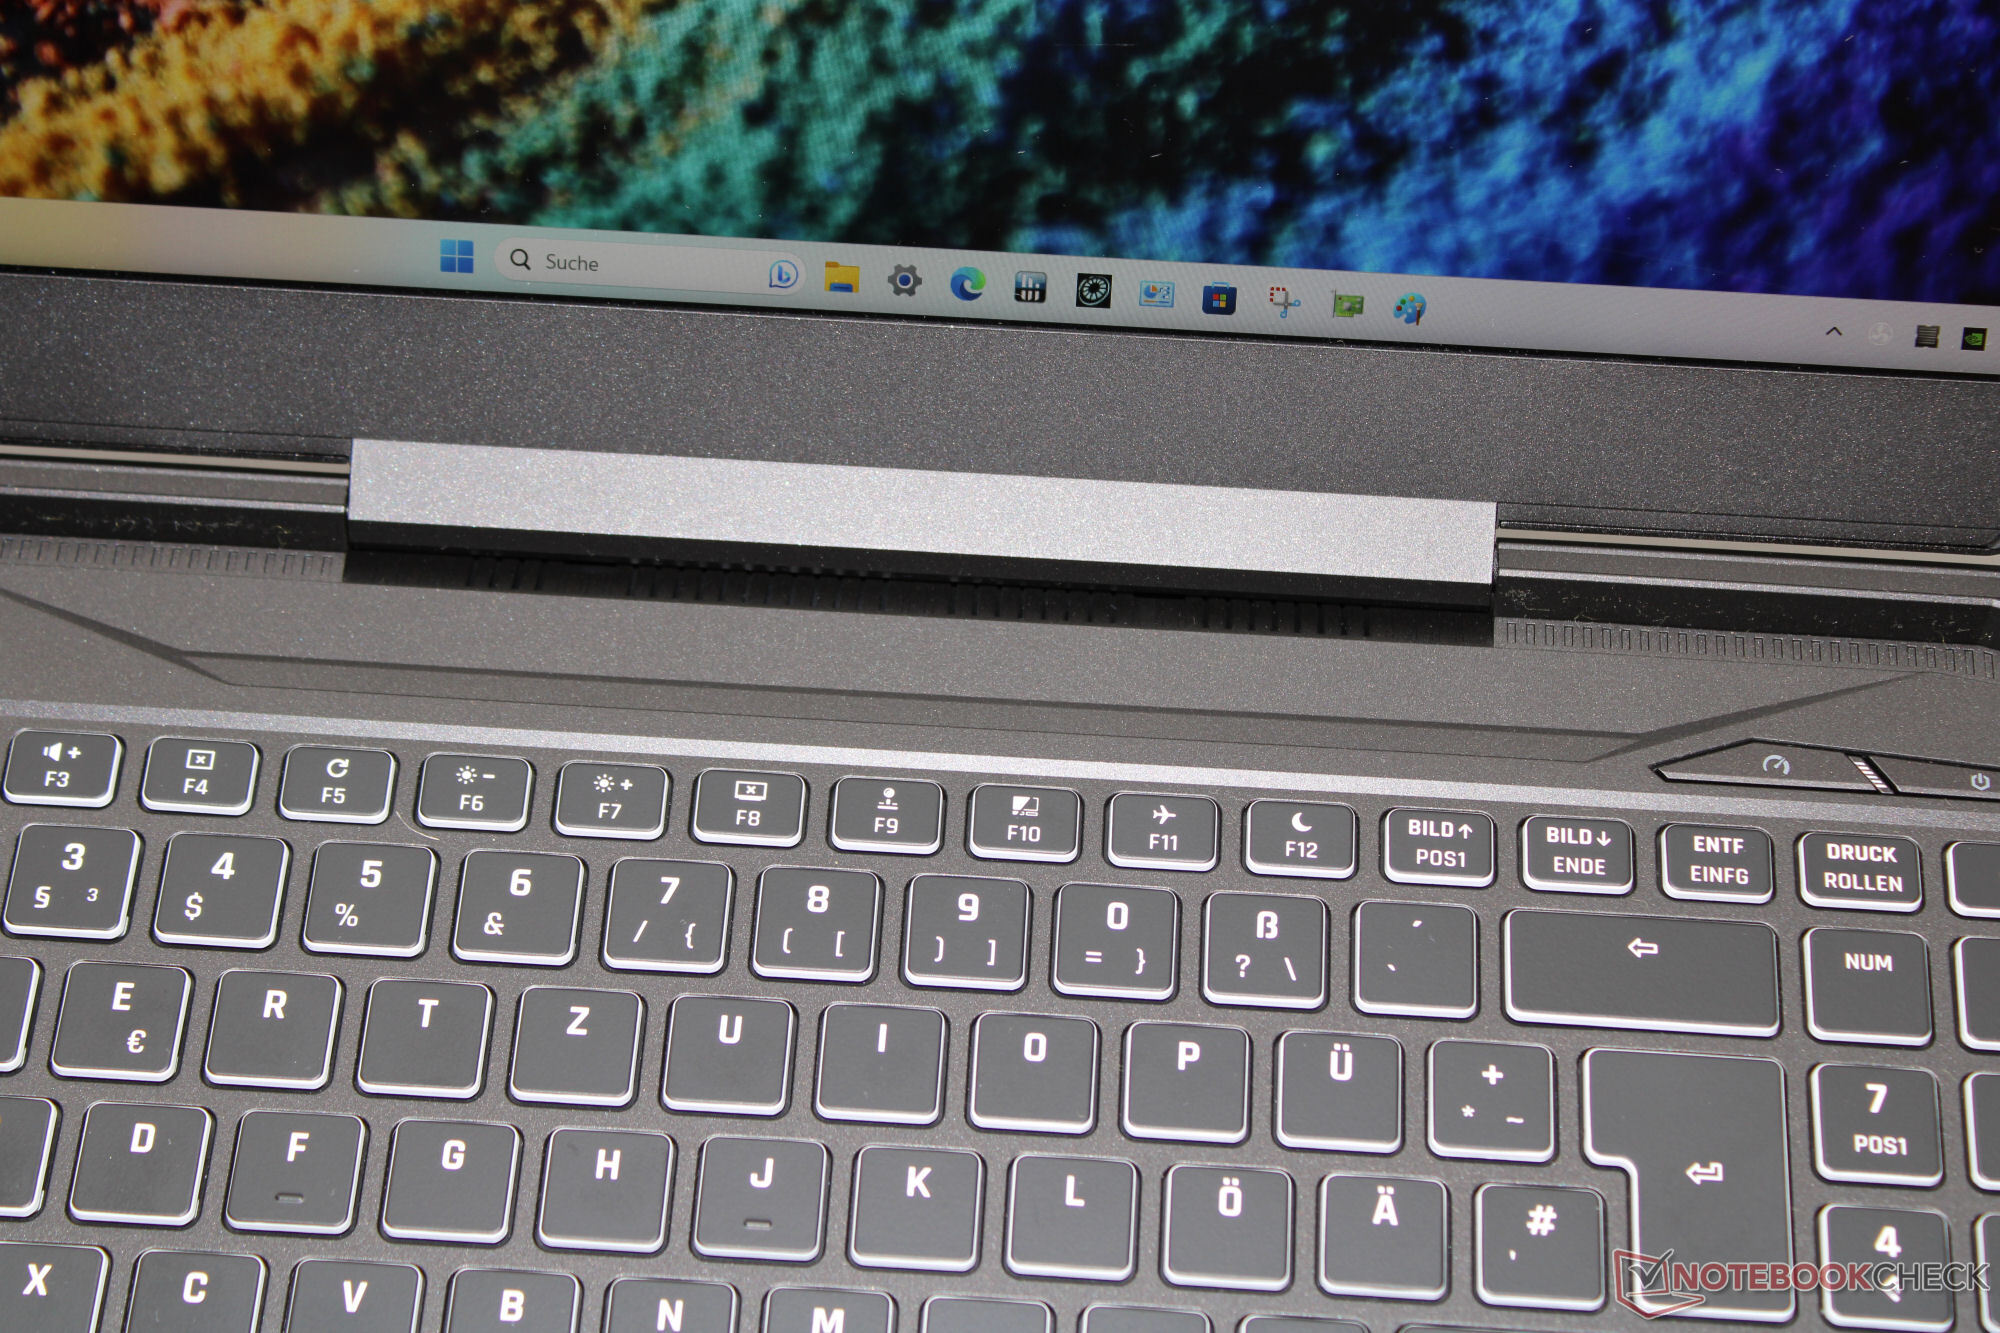
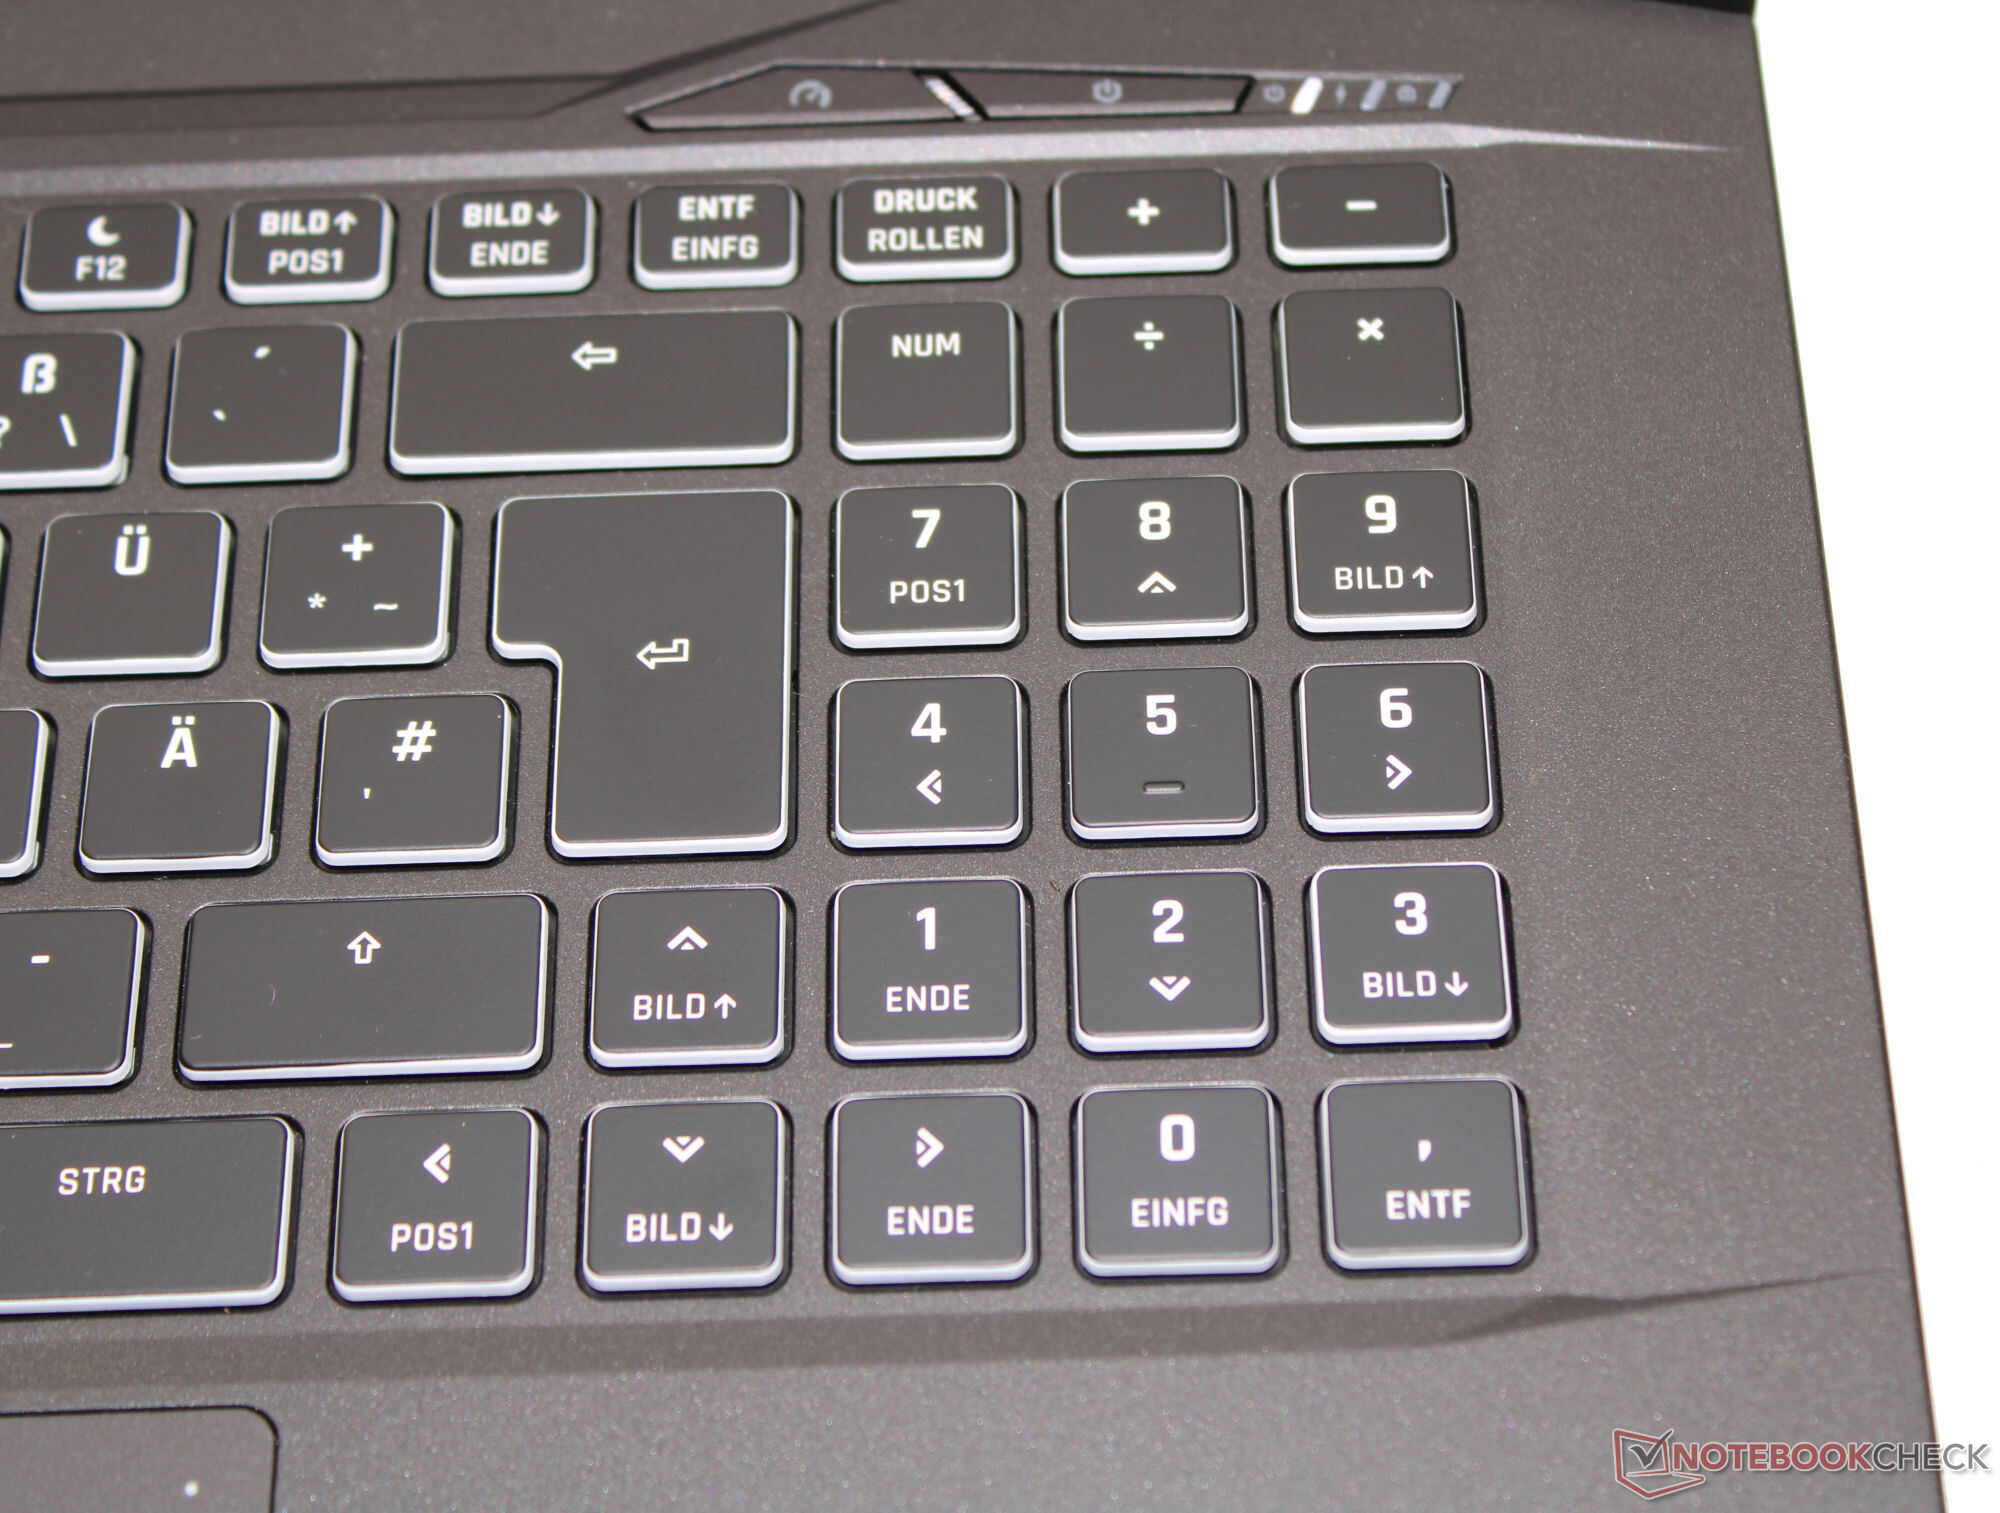
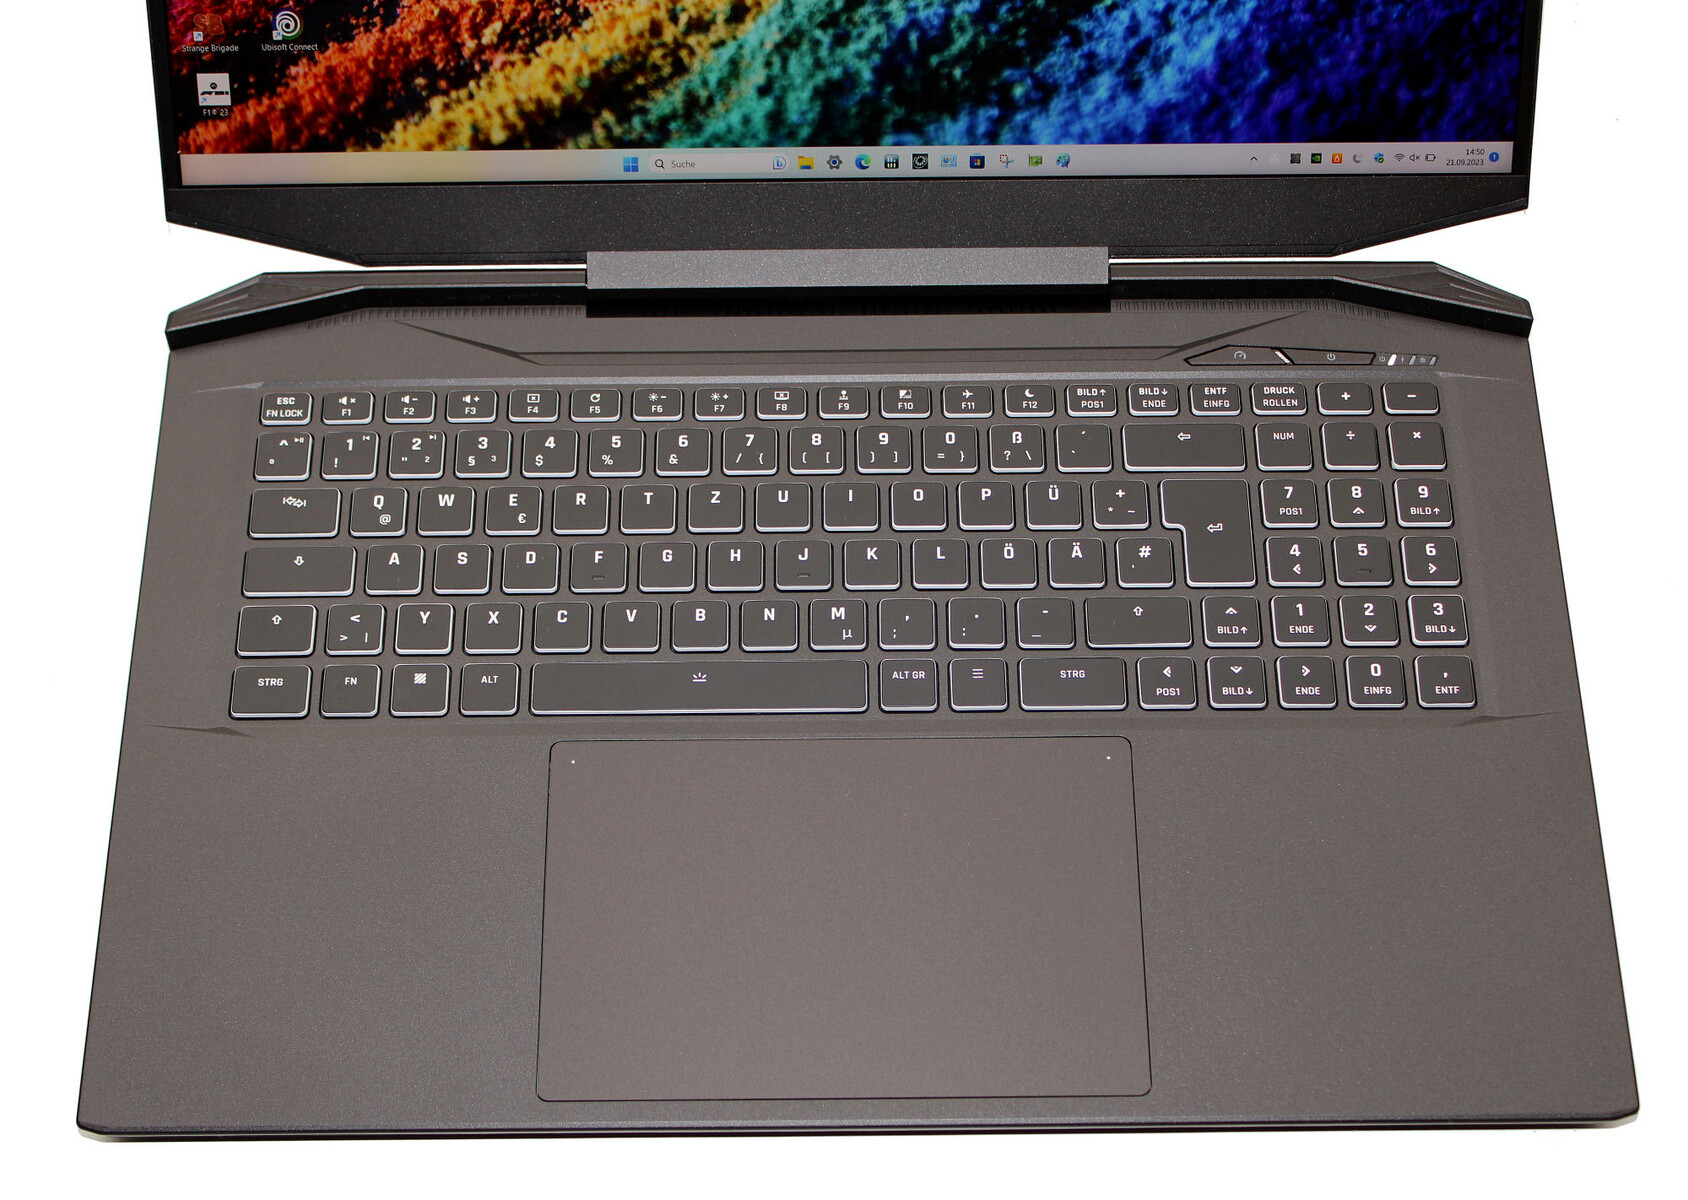
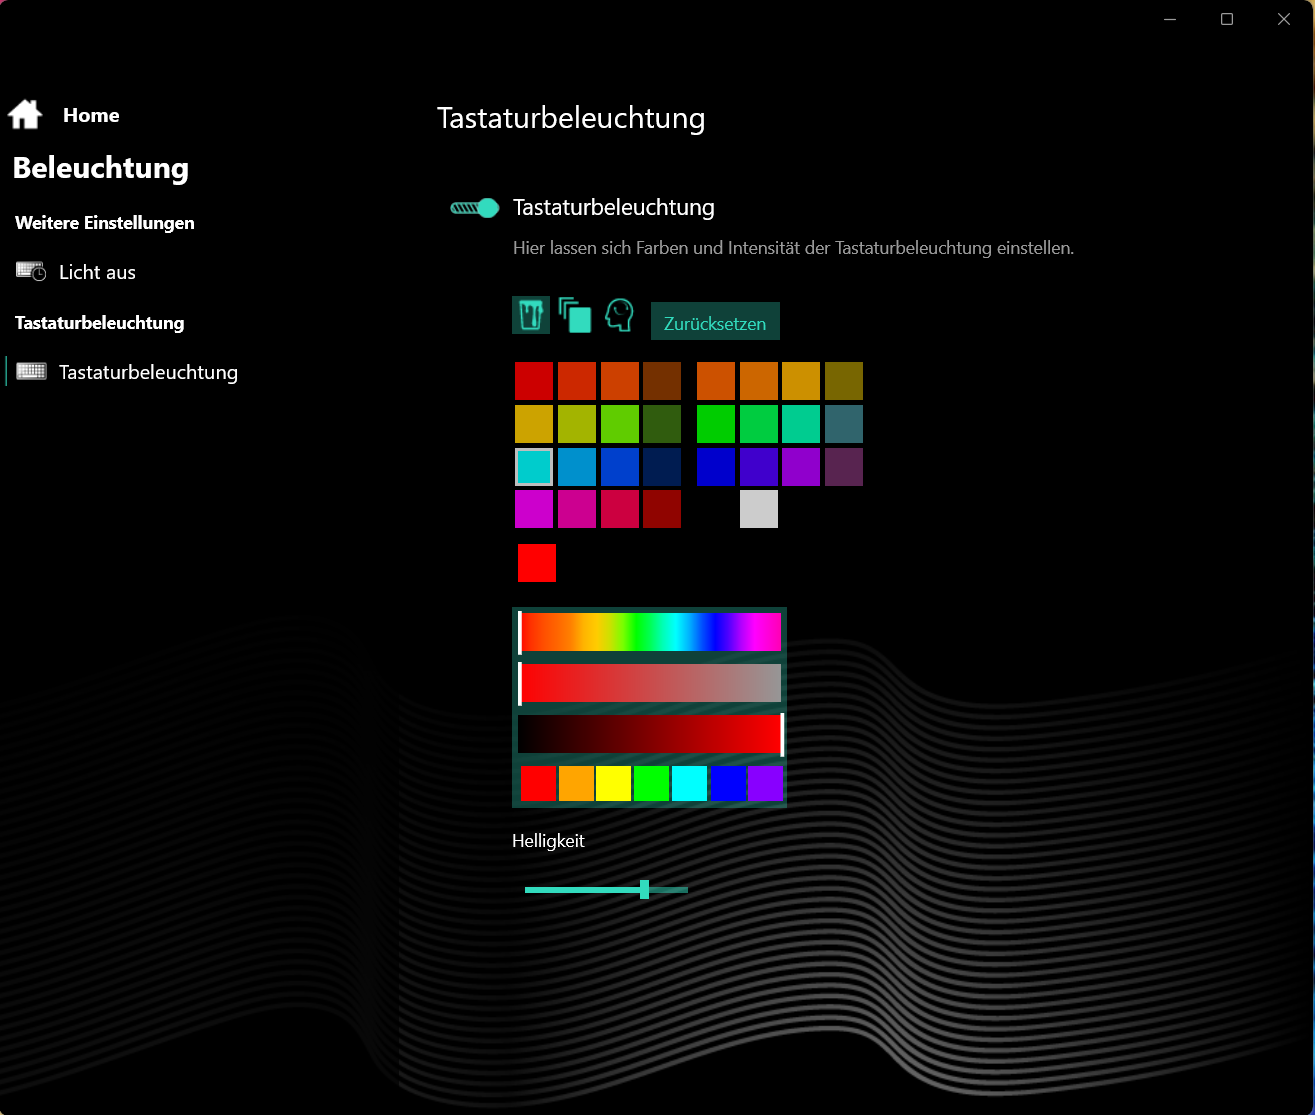
Dispositivi di input - L'Apex 17 è dotato di illuminazione dei tasti RGB
Tastiera
I tasti piatti e lisci della tastiera chiclet retroilluminata (RGB) hanno una corsa media, un punto di pressione ben definito e una buona resistenza. Durante la digitazione, la tastiera non cede. Nel complesso, si tratta di una tastiera adatta all'uso quotidiano.
Touchpad
Il Clickpad (circa 15,4 x 10 cm) è un sostituto del mouse, con una corsa breve e un chiaro punto di pressione. Toccando il LED nell'angolo in alto a sinistra si spegne o accende l'intero pad. Toccando il LED nell'angolo superiore destro si spegne o si accende il lato destro del pad.
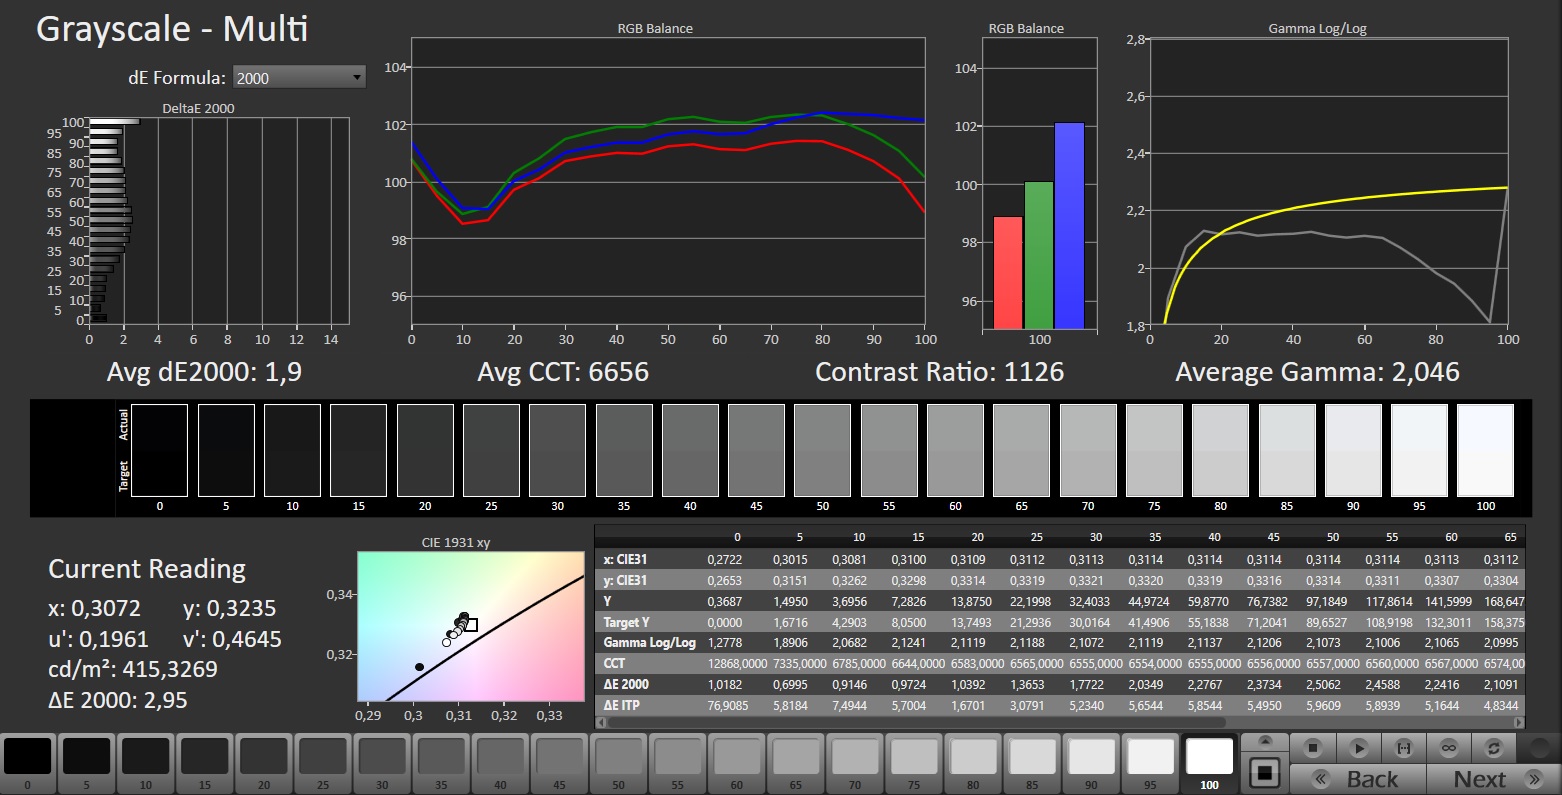
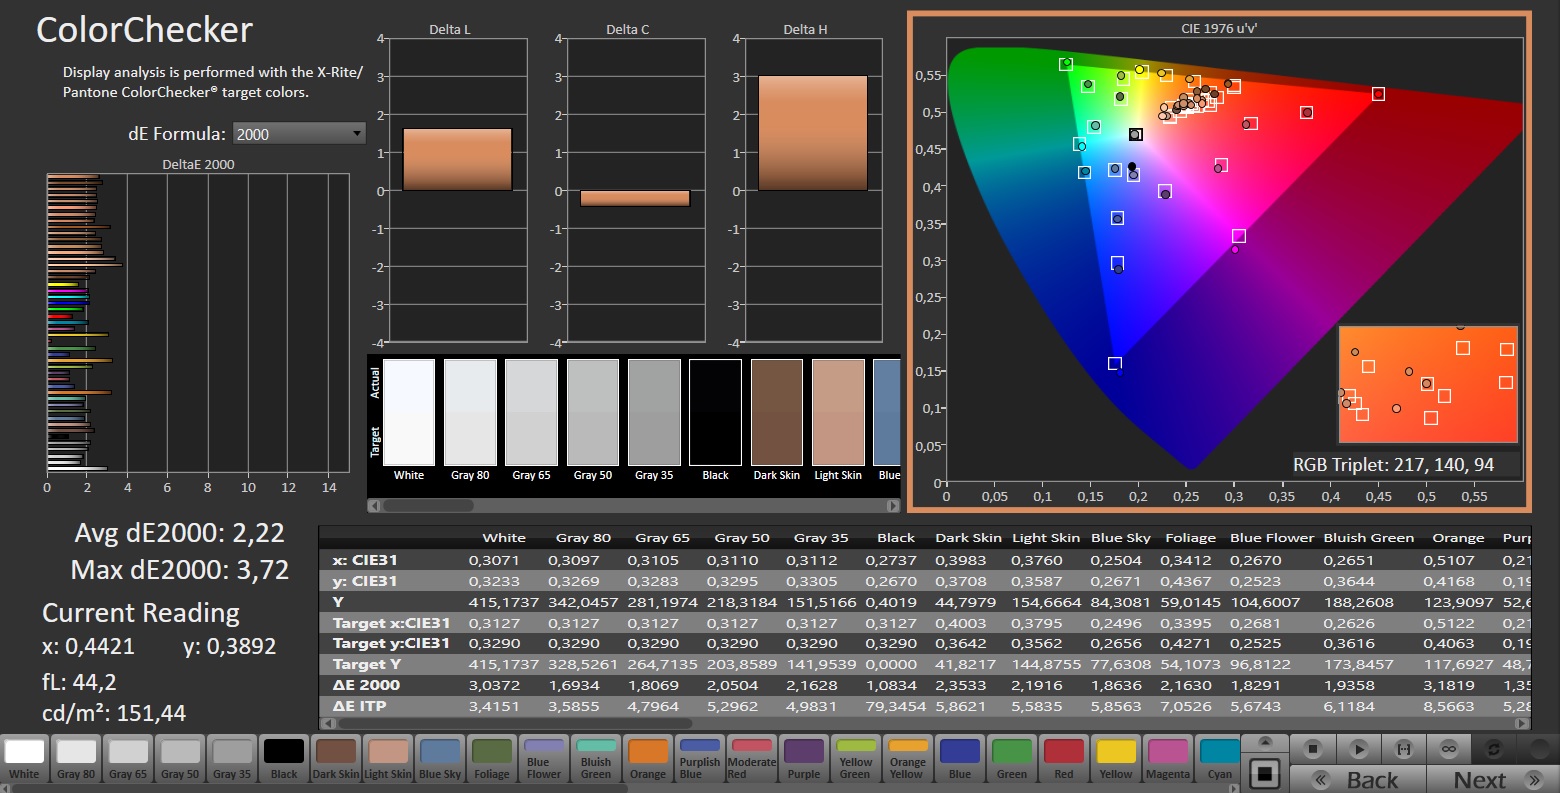
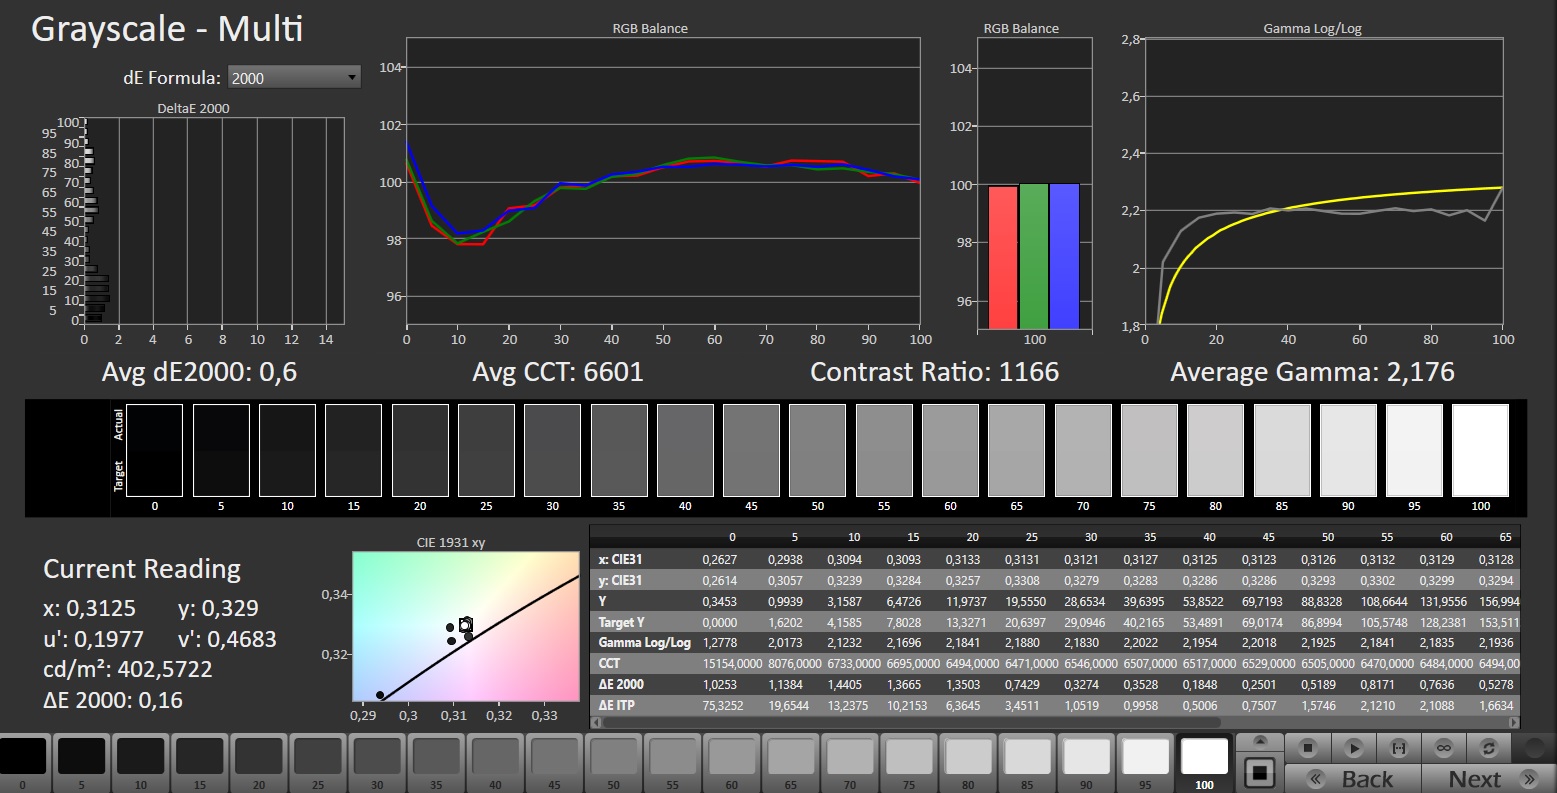
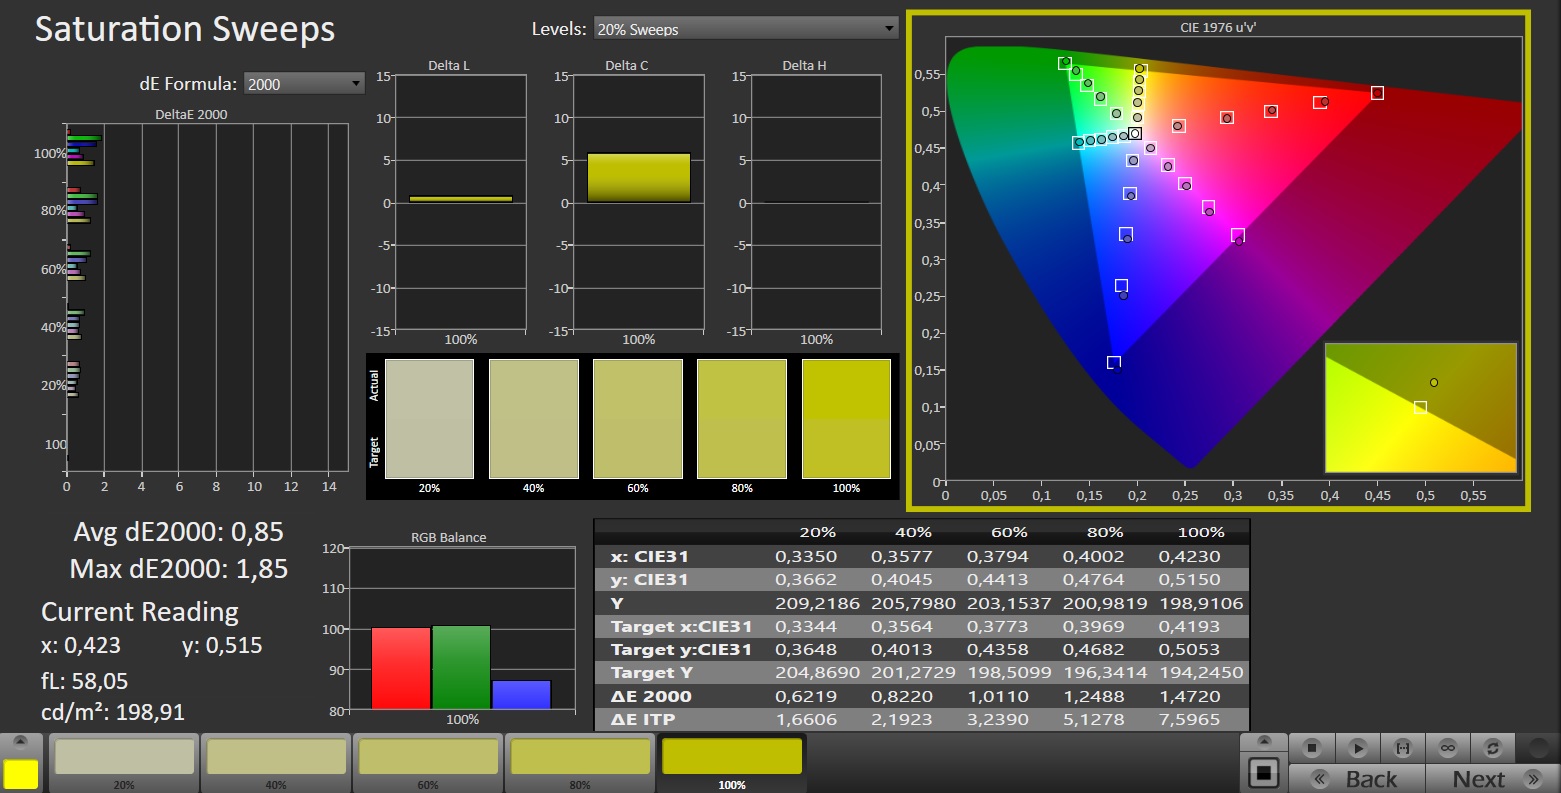
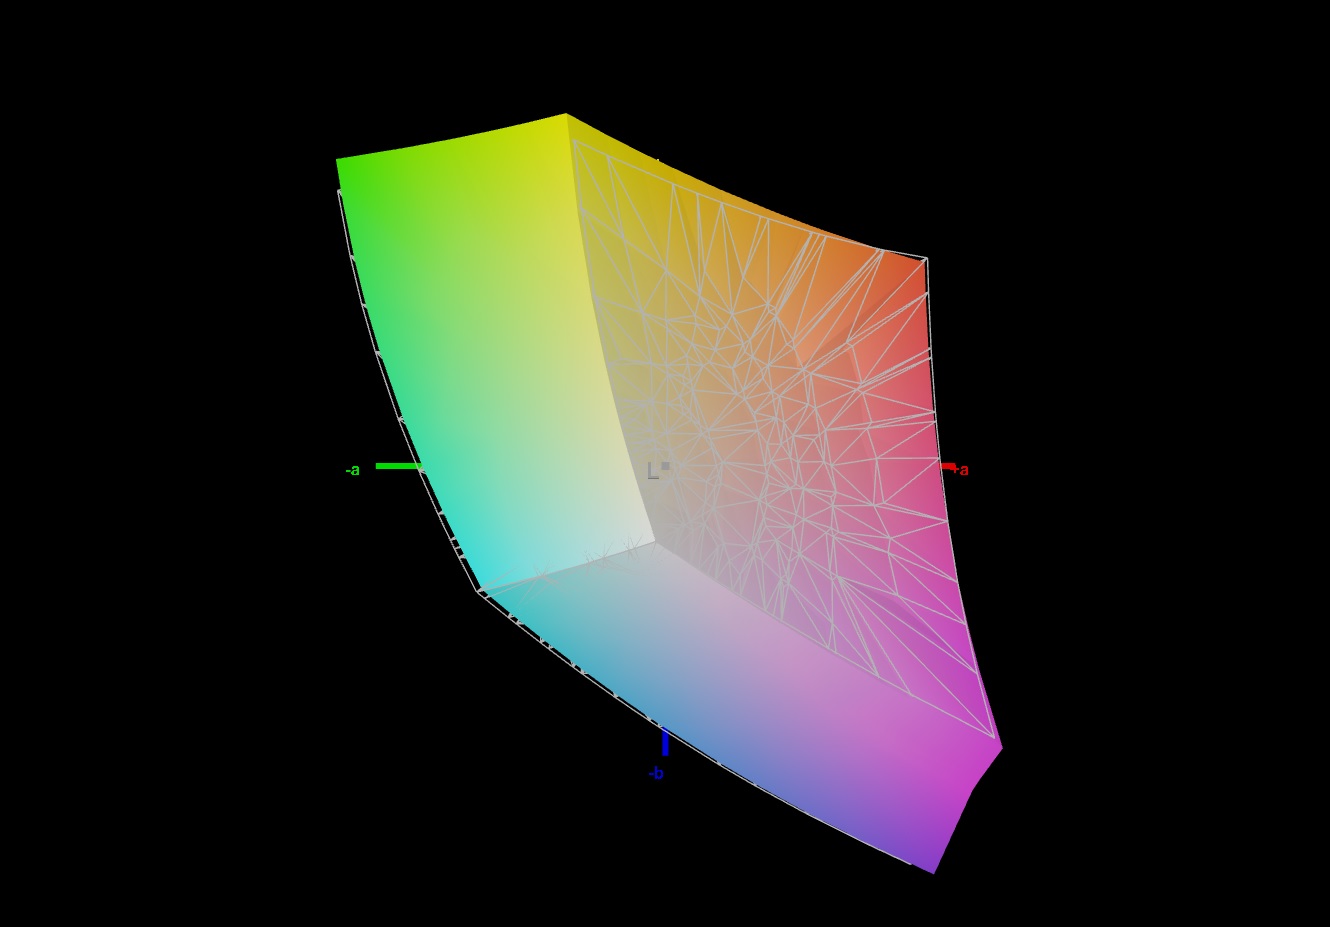
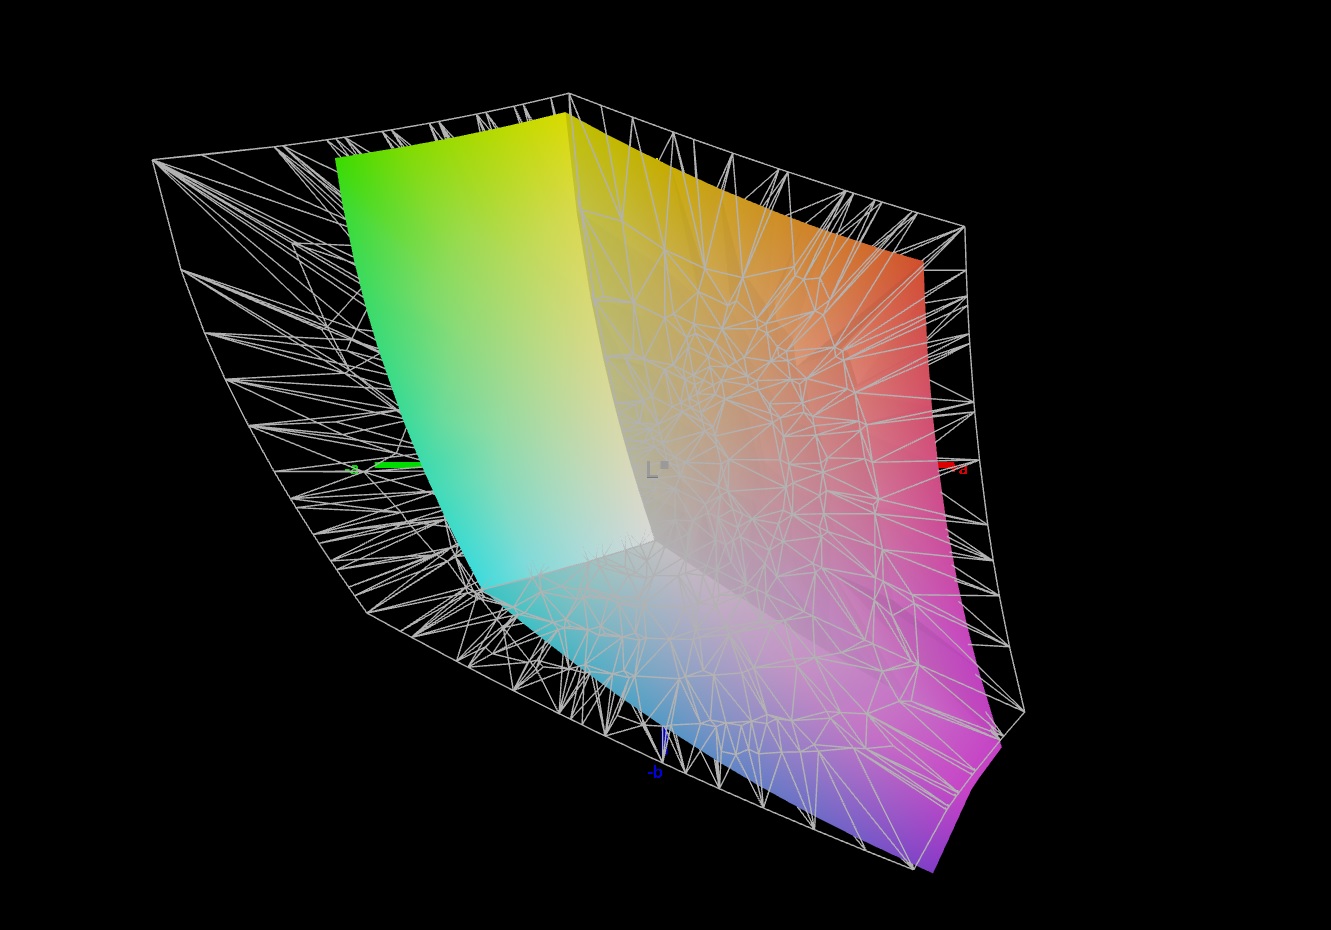
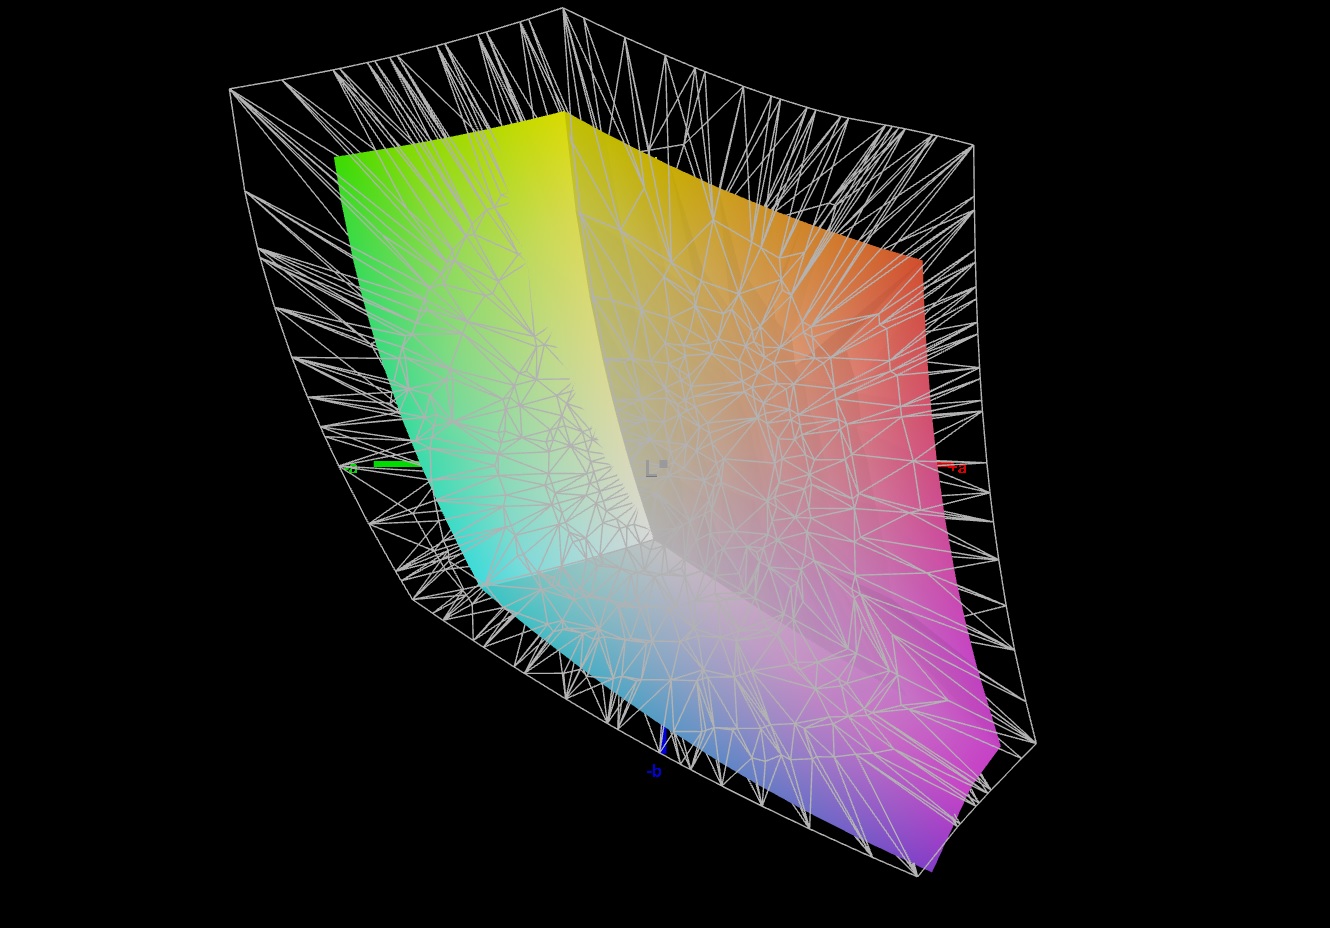
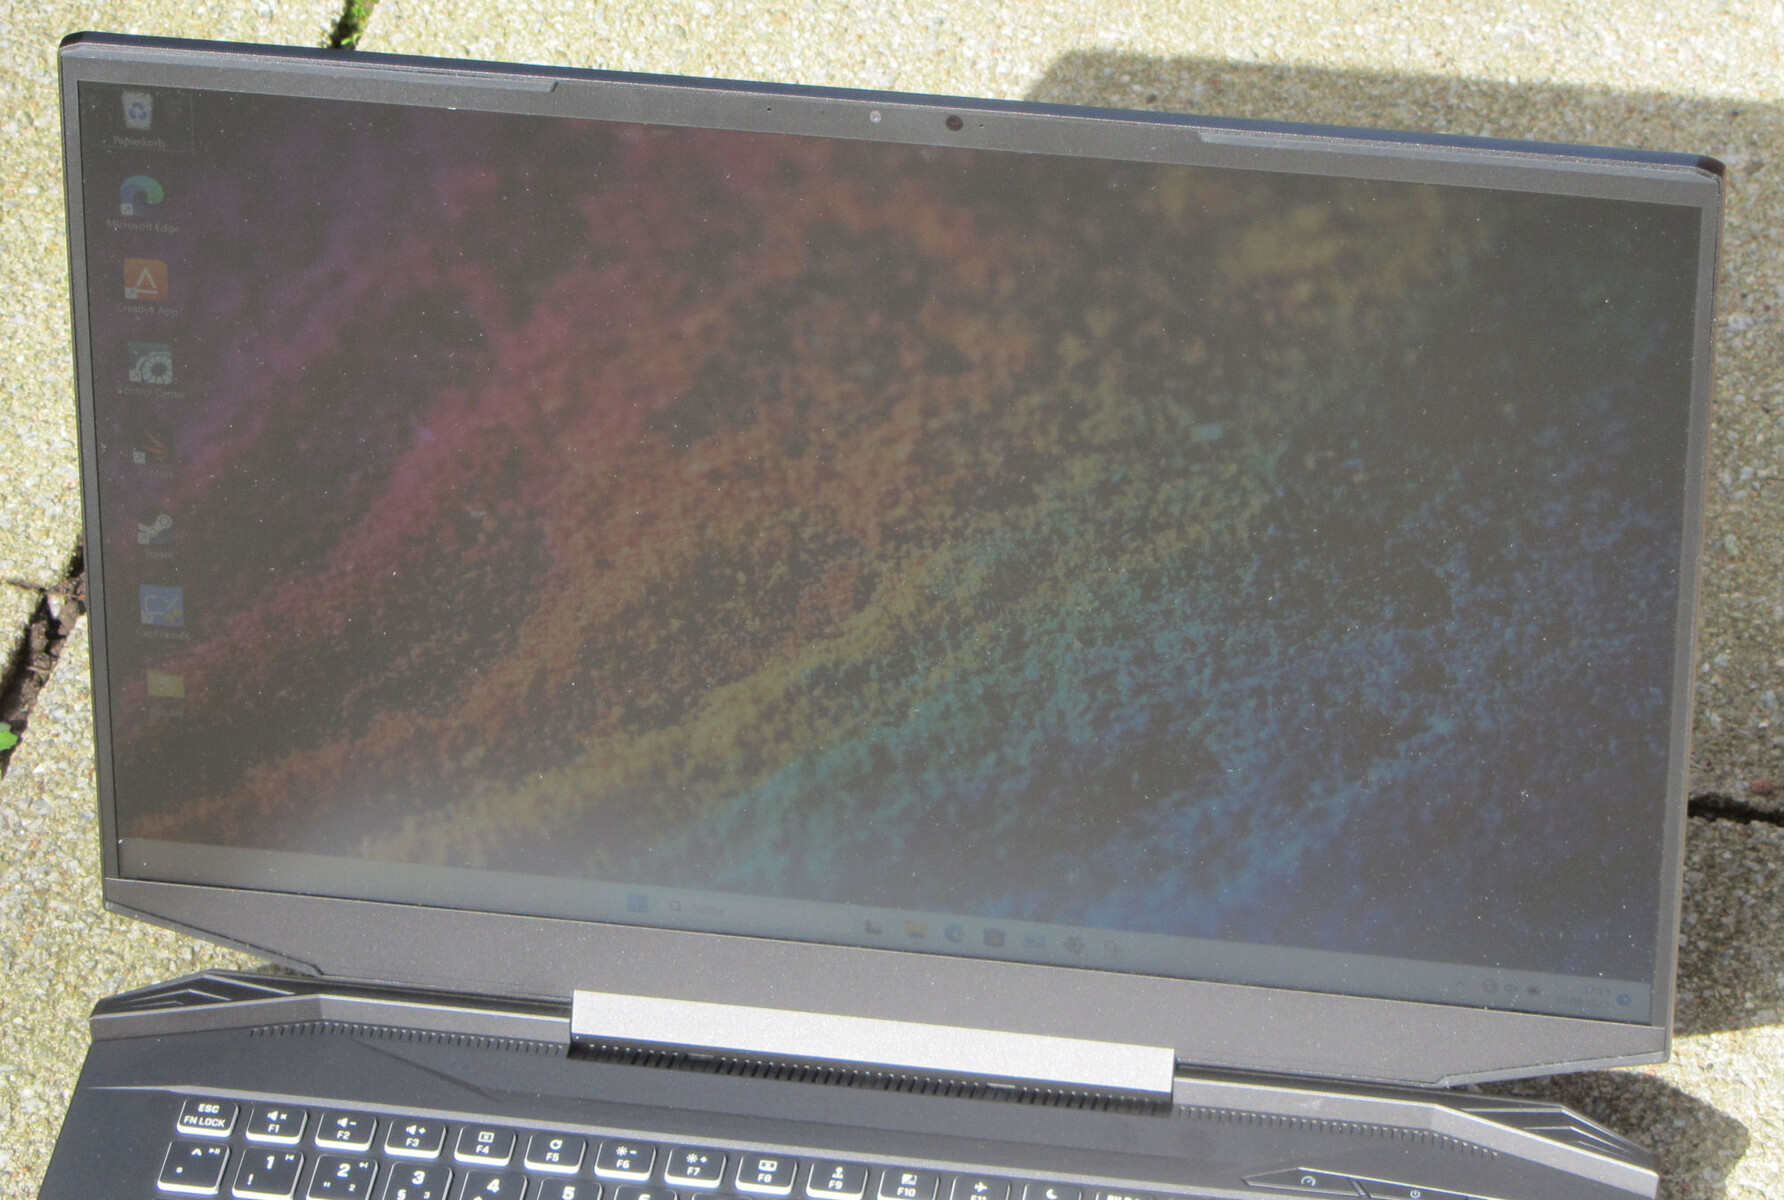
Display - Un pannello QHD con copertura sRGB
Il pannello reattivo, con rapporto di aspetto 16:9 e 240 Hz, non presenta sfarfallii PWM, indipendentemente dall'impostazione della luminosità. La luminosità e il contrasto dello schermo opaco da 17,3 pollici (2.560 x 1.440 pixel) raggiungono i rispettivi obiettivi (> 300 cd/m² e 1.000:1).
Oltre al display QHD del dispositivo in esame, Schenker offre l'Apex 17 con un pannello alternativo FHD (1.920 x 1.080 pixel, 144 Hz, IPS).
| |||||||||||||||||||||||||
Distribuzione della luminosità: 90 %
Al centro con la batteria: 403 cd/m²
Contrasto: 1089:1 (Nero: 0.37 cd/m²)
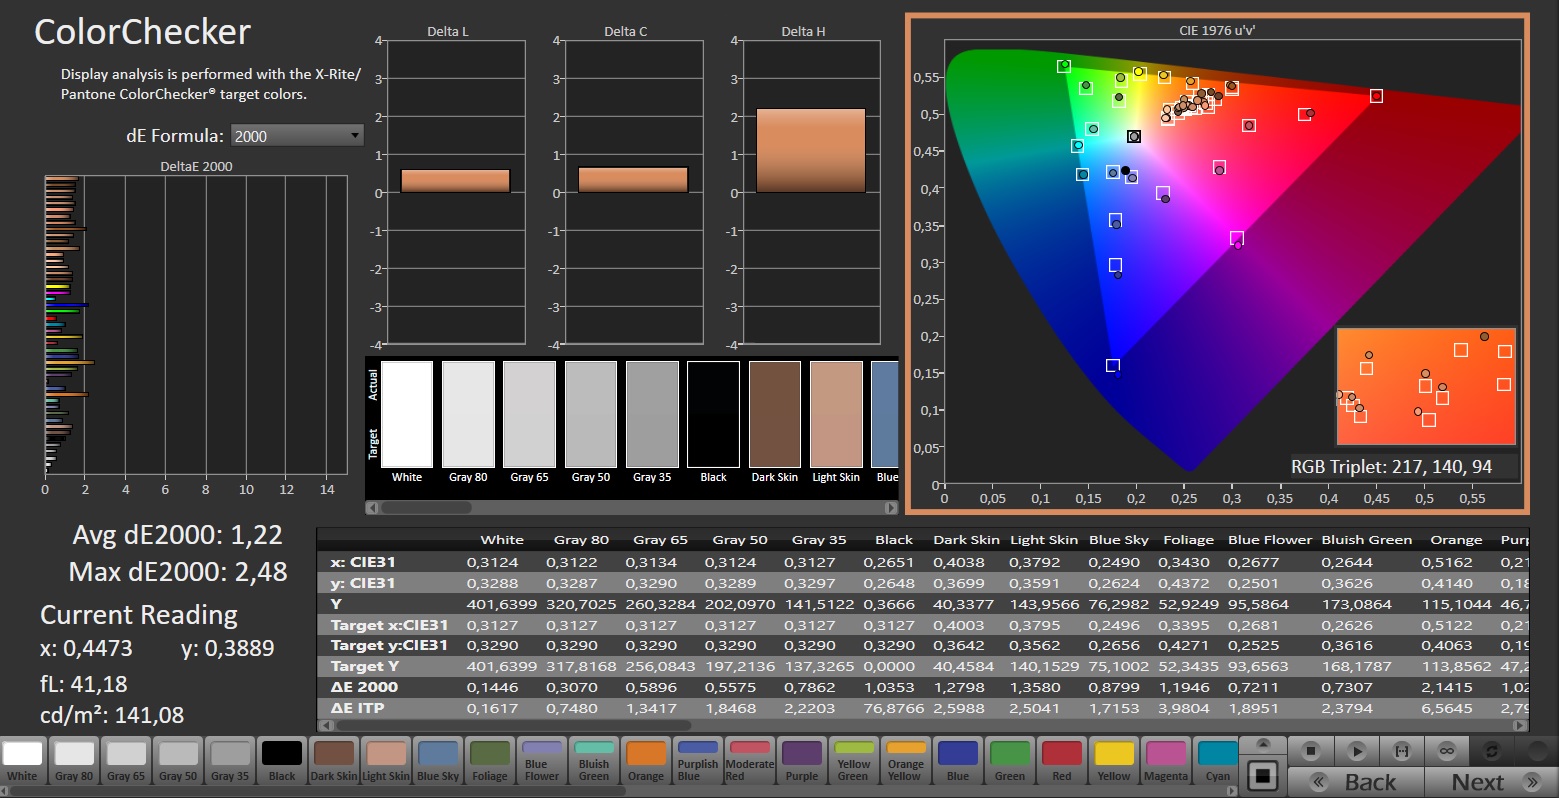
ΔE ColorChecker Calman: 2.22 | ∀{0.5-29.43 Ø4.71}
calibrated: 1.22
ΔE Greyscale Calman: 1.9 | ∀{0.09-98 Ø4.96}
69.5% AdobeRGB 1998 (Argyll 3D)
97.7% sRGB (Argyll 3D)
68.1% Display P3 (Argyll 3D)
Gamma: 2.046
CCT: 6656 K
| Schenker XMG Apex 17 (Late 23) BOE CQ NE173QHM-NZ3, IPS, 2560x1440, 17.3" | Alienware m16 R1 Intel BOE NE16NYB, IPS, 2560x1600, 16" | Lenovo Legion Pro 5 16IRX8 AU Optronics B160QAN03.1, IPS, 2560x1600, 16" | Acer Nitro 17 AN17-51-71ER BOE0B7C NE173QHM-NY6, , 2560x1440, 17.3" | Medion Erazer Defender P40 BOE CQ NE173QHM-NZ3, IPS, 2560x1440, 17.3" | MSI Katana 17 B13VFK B173HAN04.9, IPS LED, 1920x1080, 17.3" | |
|---|---|---|---|---|---|---|
| Display | -0% | 4% | 23% | 0% | -39% | |
| Display P3 Coverage (%) | 68.1 | 67.7 -1% | 71.2 5% | 98.3 44% | 68.3 0% | 40.8 -40% |
| sRGB Coverage (%) | 97.7 | 97.2 -1% | 98.8 1% | 100 2% | 98.1 0% | 61 -38% |
| AdobeRGB 1998 Coverage (%) | 69.5 | 70 1% | 73.3 5% | 85.7 23% | 69.8 0% | 42.2 -39% |
| Response Times | 39% | -20% | -6% | -9% | -187% | |
| Response Time Grey 50% / Grey 80% * (ms) | 13.5 ? | 4 ? 70% | 14.5 ? -7% | 14.8 ? -10% | 14.6 ? -8% | 33 ? -144% |
| Response Time Black / White * (ms) | 7.9 ? | 7.3 ? 8% | 10.4 ? -32% | 8 ? -1% | 8.7 ? -10% | 26 ? -229% |
| PWM Frequency (Hz) | ||||||
| Screen | -12% | 11% | -57% | 11% | -90% | |
| Brightness middle (cd/m²) | 403 | 306 -24% | 405.7 1% | 361 -10% | 364 -10% | 267 -34% |
| Brightness (cd/m²) | 381 | 302 -21% | 368 -3% | 326 -14% | 343 -10% | 256 -33% |
| Brightness Distribution (%) | 90 | 89 -1% | 87 -3% | 87 -3% | 86 -4% | 93 3% |
| Black Level * (cd/m²) | 0.37 | 0.3 19% | 0.38 -3% | 0.6 -62% | 0.28 24% | 0.21 43% |
| Contrast (:1) | 1089 | 1020 -6% | 1068 -2% | 602 -45% | 1300 19% | 1271 17% |
| Colorchecker dE 2000 * | 2.22 | 2.57 -16% | 1.65 26% | 3.83 -73% | 1.67 25% | 4.7 -112% |
| Colorchecker dE 2000 max. * | 3.76 | 4.26 -13% | 4.2 -12% | 5.71 -52% | 2.78 26% | 20.4 -443% |
| Colorchecker dE 2000 calibrated * | 1.22 | 0.85 30% | 0.53 57% | 3.48 -185% | 1.14 7% | 4.5 -269% |
| Greyscale dE 2000 * | 1.9 | 3.3 -74% | 1.2 37% | 3.29 -73% | 1.4 26% | 1.5 21% |
| Gamma | 2.046 108% | 1.997 110% | 2.3 96% | 2.29 96% | 2.091 105% | 2.12 104% |
| CCT | 6656 98% | 6895 94% | 6453 101% | 6679 97% | 6568 99% | 6552 99% |
| Media totale (Programma / Settaggio) | 9% /
-2% | -2% /
5% | -13% /
-33% | 1% /
6% | -105% /
-93% |
* ... Meglio usare valori piccoli
Il display dimostra una buona riproduzione dei colori. Con una deviazione di circa 2,2, viene raggiunto il valore target (DeltaE < 3). Una calibrazione riduce la deviazione a 1,2 e garantisce scale di grigio bilanciate. Il pannello copre quasi interamente lo spazio colore sRGB, ma non gli spazi colore AdobeRGB e DCI P3. La maggior parte dei display dei dispositivi concorrenti presenta un quadro simile. Solo ilNitro 17copre lo spazio colore P3.

Tempi di risposta del Display
| ↔ Tempi di risposta dal Nero al Bianco | ||
|---|---|---|
| 7.9 ms ... aumenta ↗ e diminuisce ↘ combinato | ↗ 3 ms Incremento | 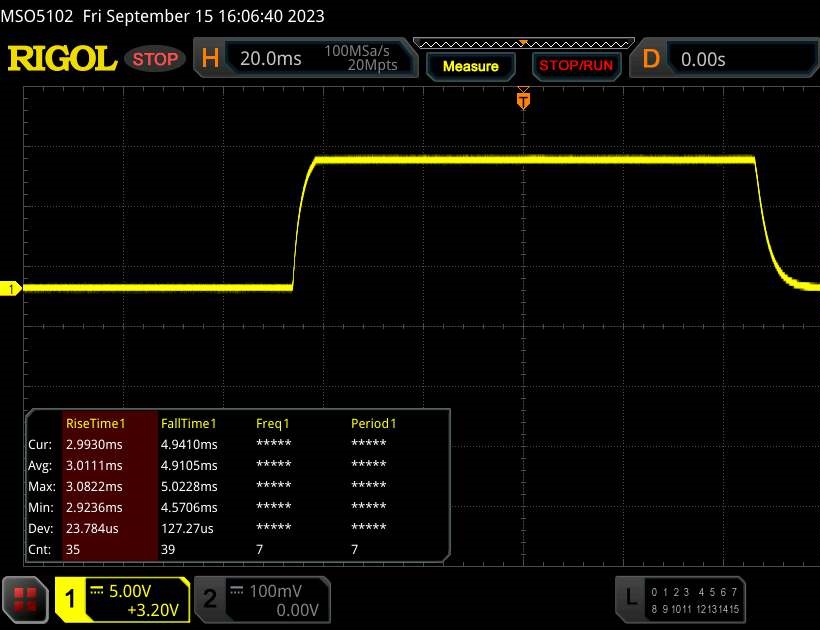 |
| ↘ 4.9 ms Calo | ||
| Lo schermo ha mostrato valori di risposta molto veloci nei nostri tests ed è molto adatto per i gaming veloce. In confronto, tutti i dispositivi di test variano da 0.1 (minimo) a 240 (massimo) ms. » 22 % di tutti i dispositivi è migliore. Questo significa che i tempi di risposta rilevati sono migliori rispettto alla media di tutti i dispositivi testati (19.8 ms). | ||
| ↔ Tempo di risposta dal 50% Grigio all'80% Grigio | ||
| 13.5 ms ... aumenta ↗ e diminuisce ↘ combinato | ↗ 6.4 ms Incremento | 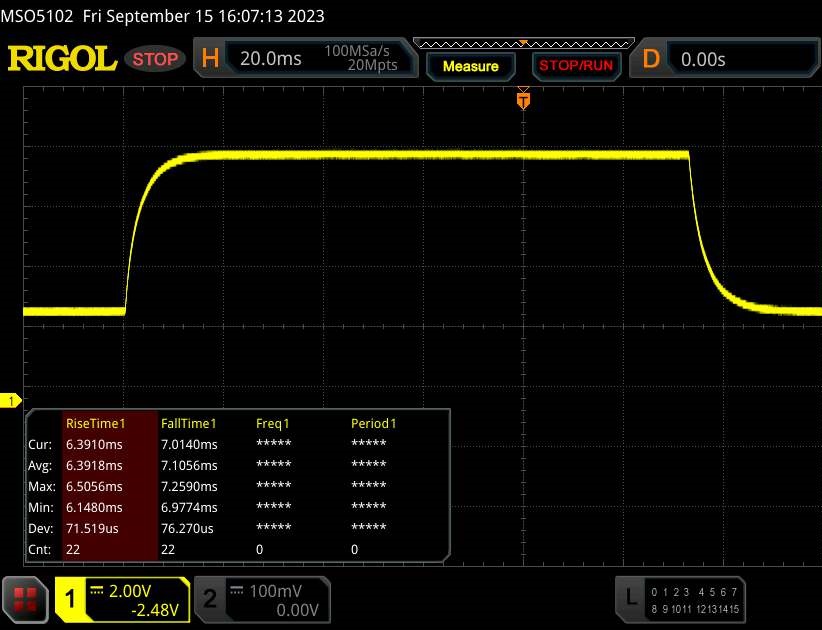 |
| ↘ 7.1 ms Calo | ||
| Lo schermo mostra buoni tempi di risposta durante i nostri tests, ma potrebbe essere troppo lento per i gamers competitivi. In confronto, tutti i dispositivi di test variano da 0.165 (minimo) a 636 (massimo) ms. » 27 % di tutti i dispositivi è migliore. Questo significa che i tempi di risposta rilevati sono migliori rispettto alla media di tutti i dispositivi testati (31 ms). | ||
Sfarfallio dello schermo / PWM (Pulse-Width Modulation)
| flickering dello schermo / PWM non rilevato | 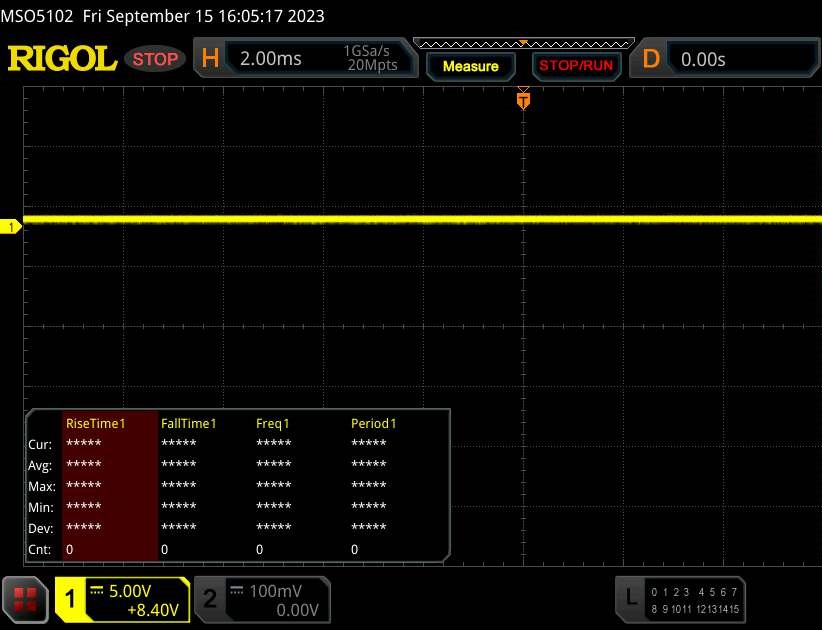 | ||
In confronto: 52 % di tutti i dispositivi testati non utilizza PWM per ridurre la luminosita' del display. Se è rilevato PWM, una media di 7757 (minimo: 5 - massimo: 343500) Hz è stata rilevata. | |||
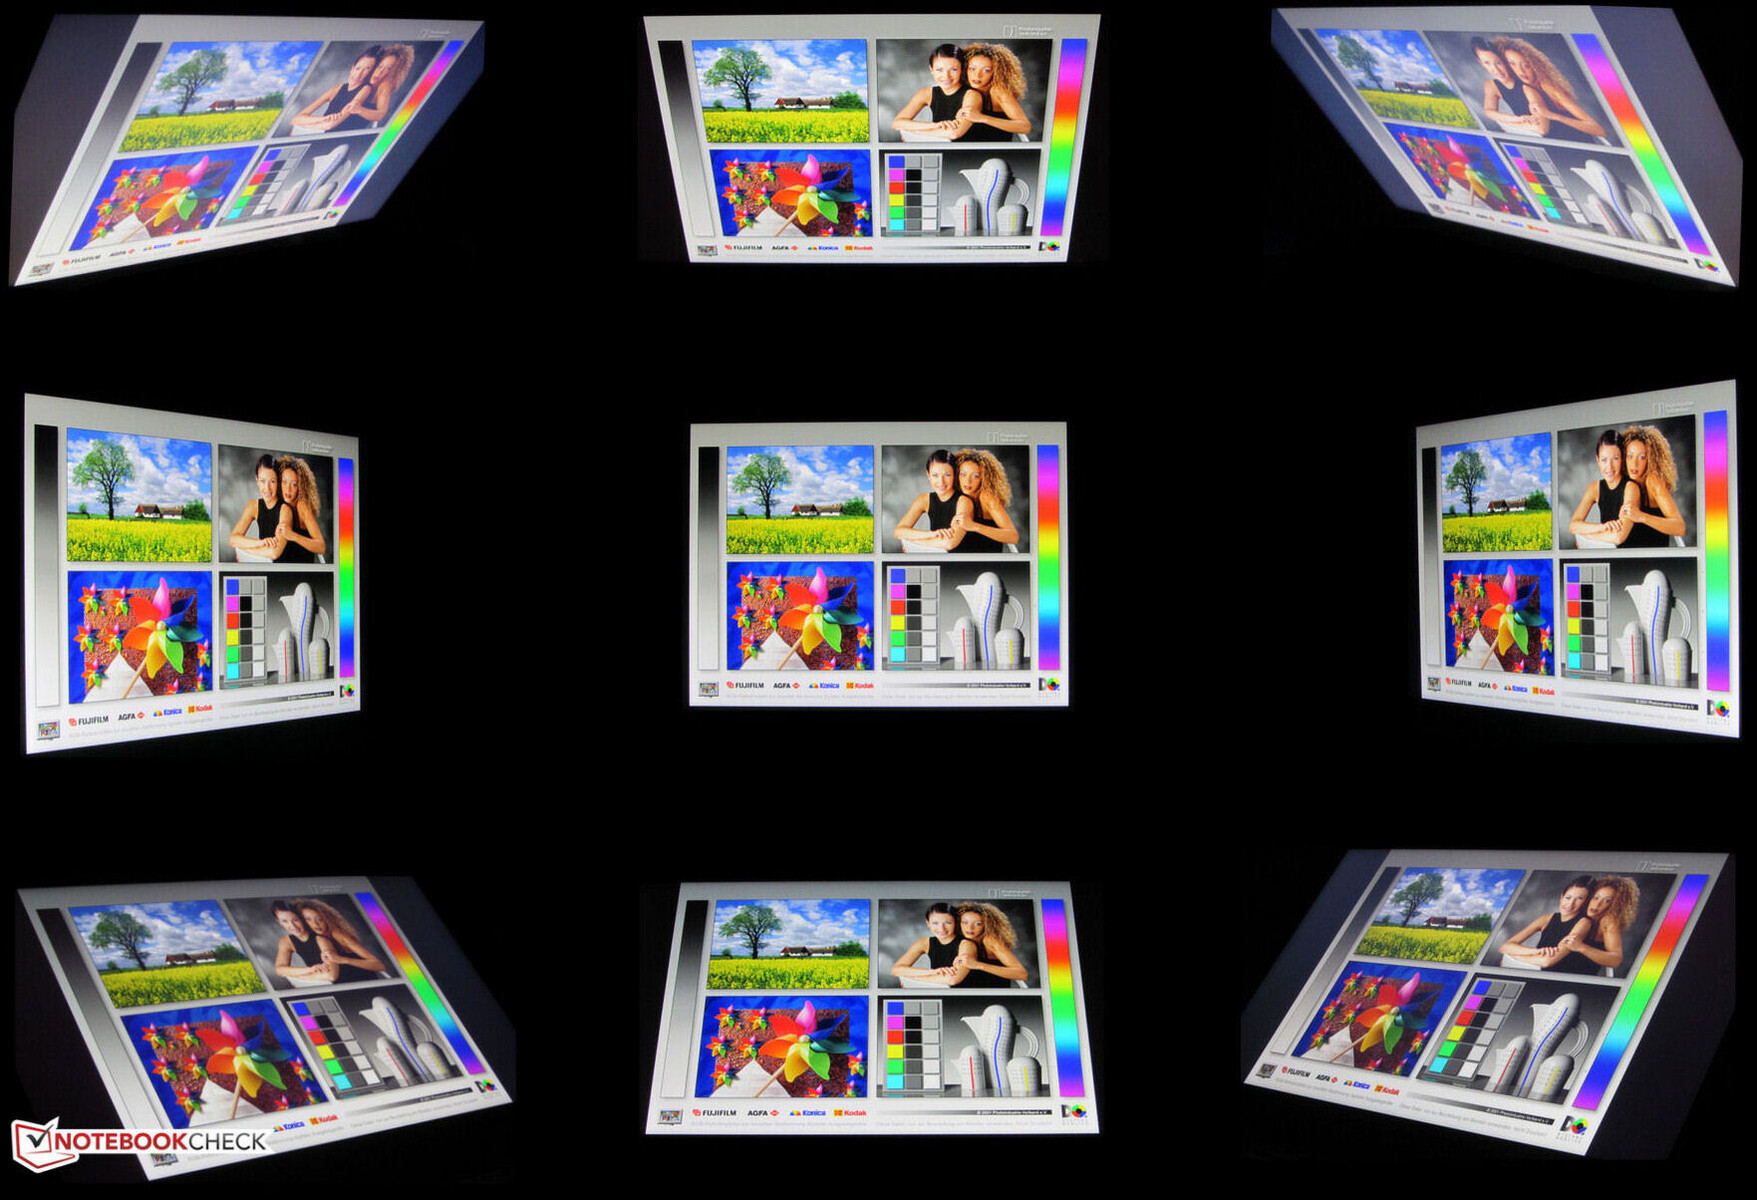
Il pannello IPS ha una buona stabilità dell'angolo di visione ed è leggibile da ogni posizione. All'aperto, lo schermo è leggibile se la luce del sole non è troppo intensa.
Performance - Phoenix e Ada Lovelace alimentano il portatile Schenker
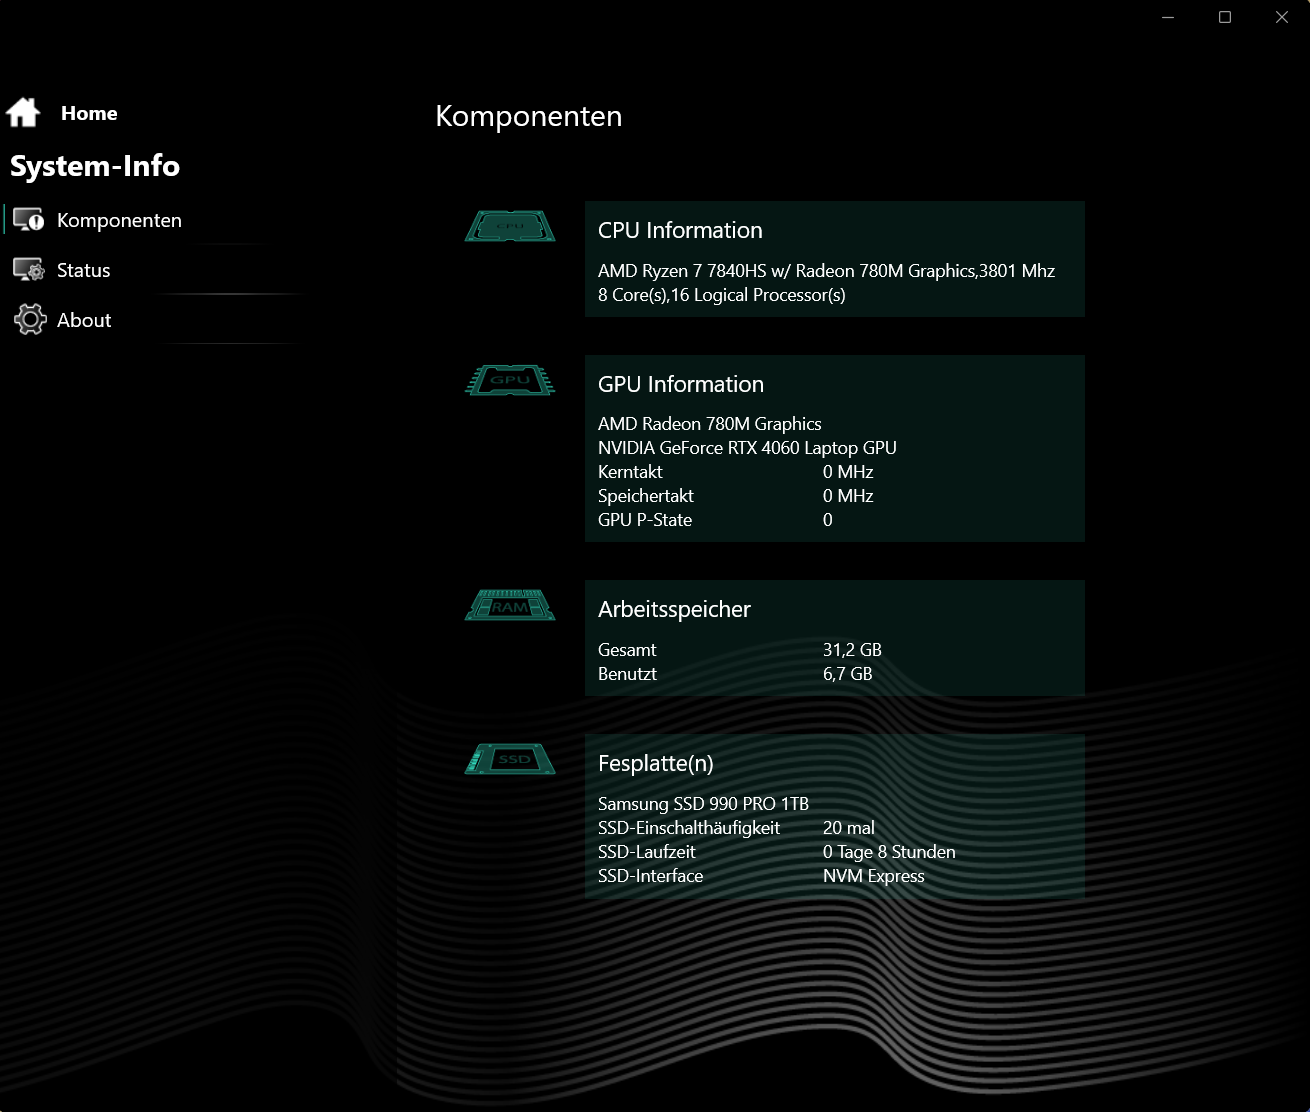
Schenker Apex 17 è un portatile da gioco QHD di fascia media la cui potenza di calcolo è fornita da Phoenix e Ada Lovelace. Il portatile può essere configurato su misura e acquistato su Bestware.com. Il nostro dispositivo in prova può essere acquistato a 1.750 euro, con prezzi a partire da circa 1.200 euro.
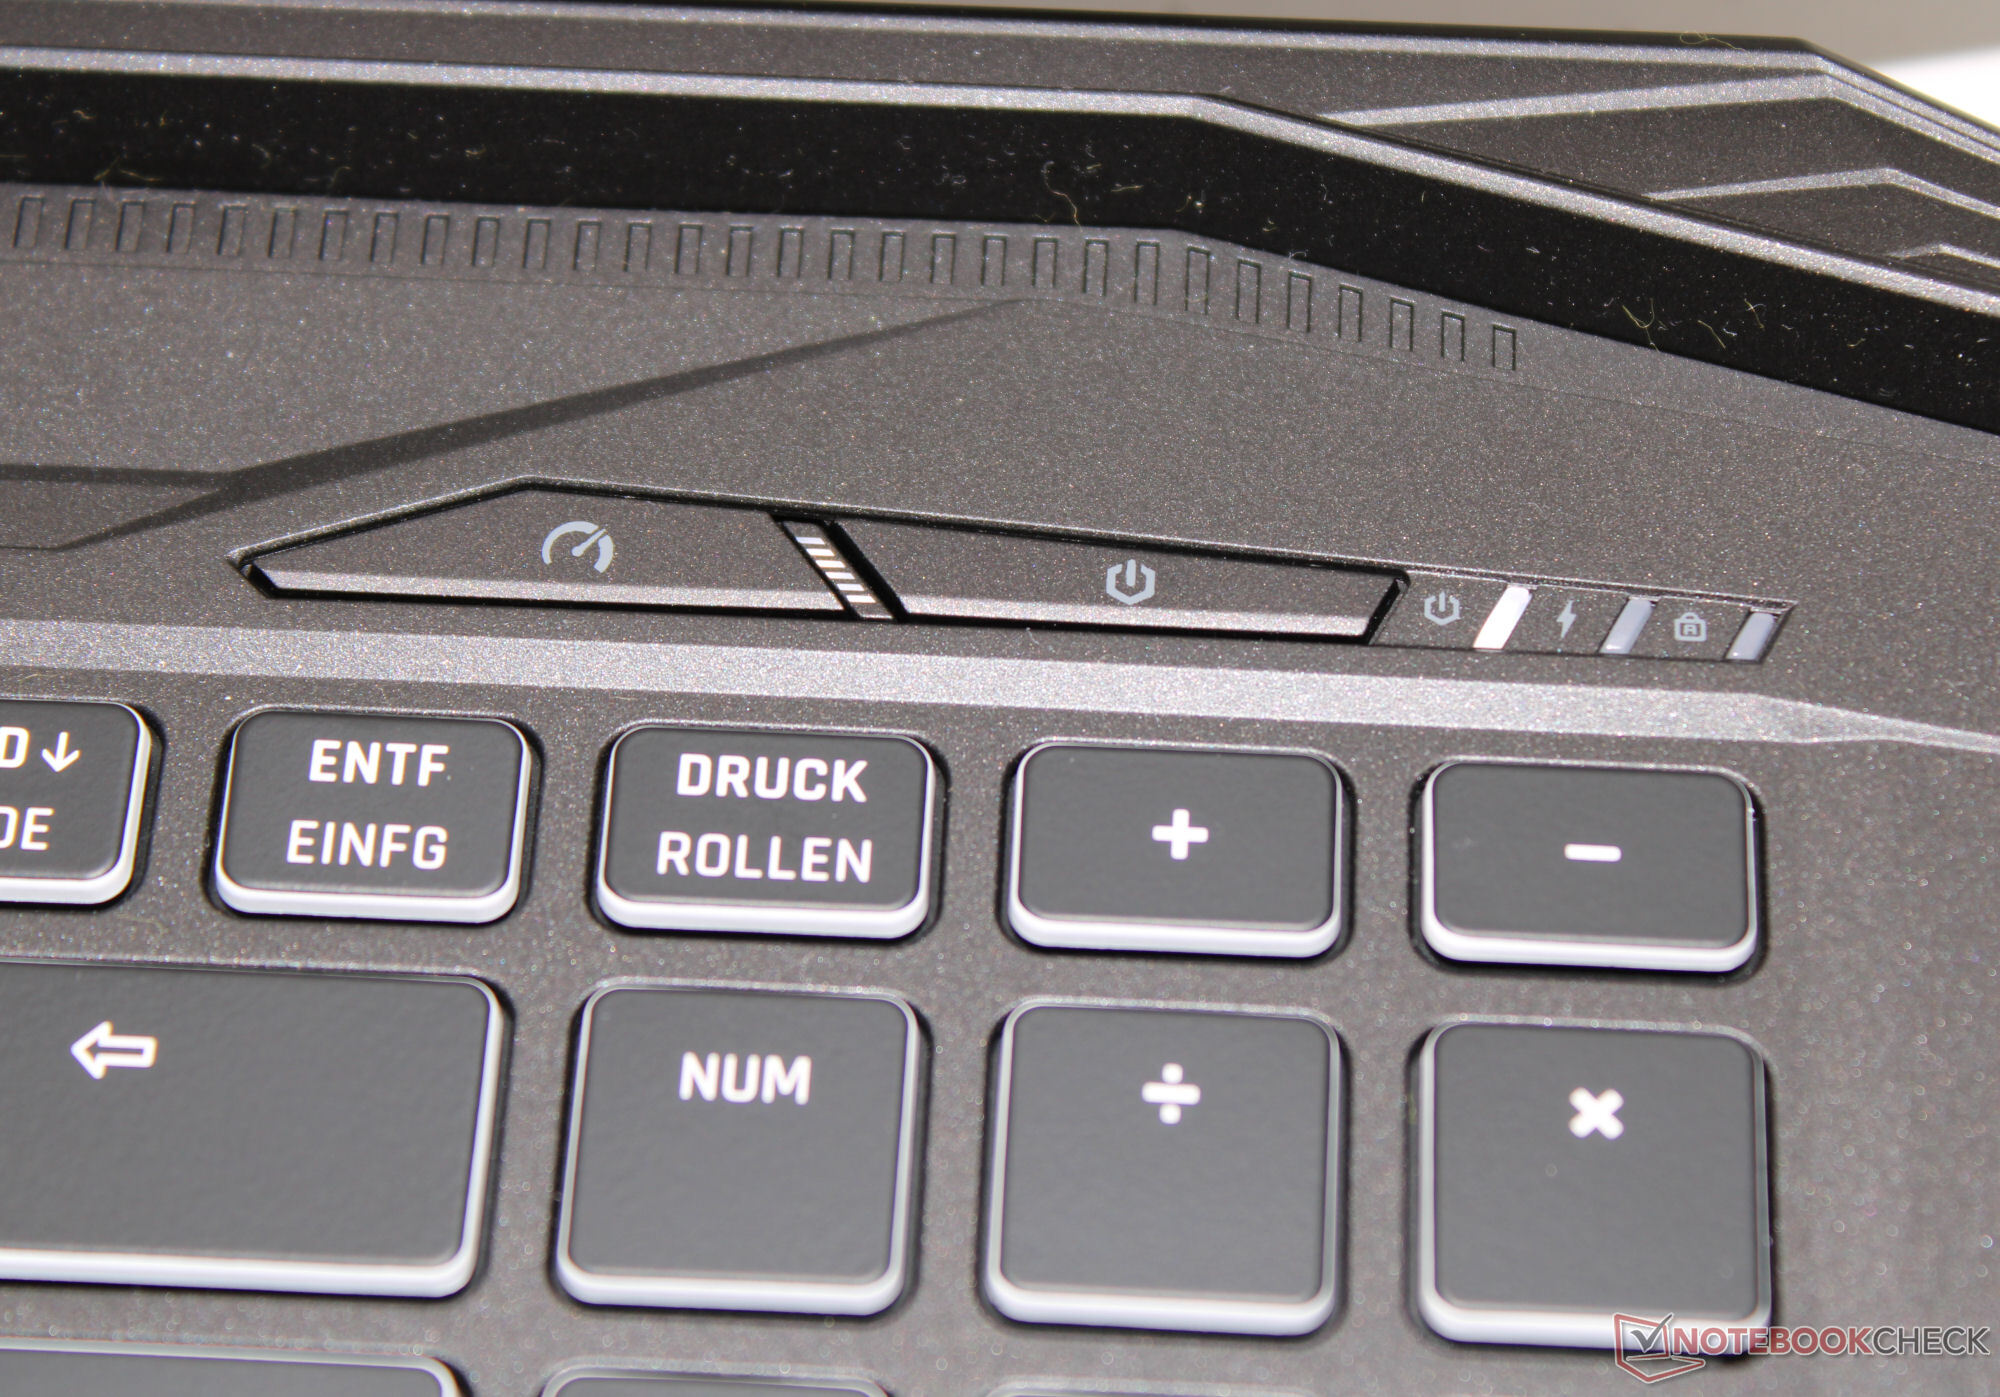
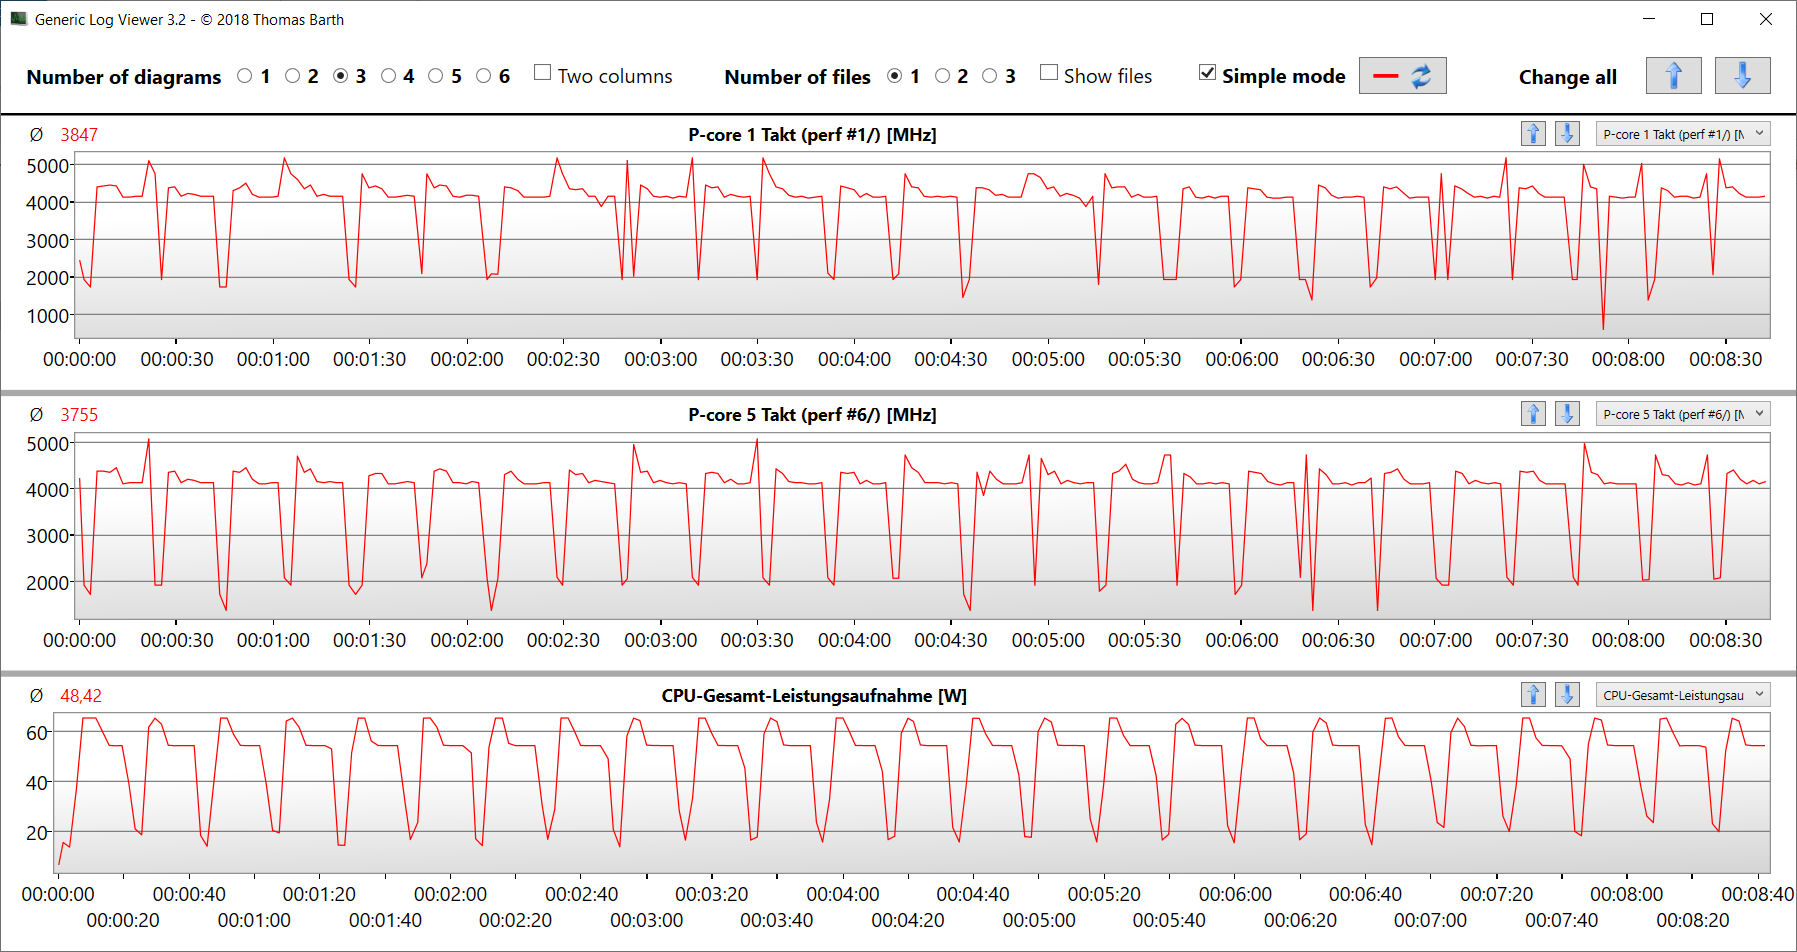
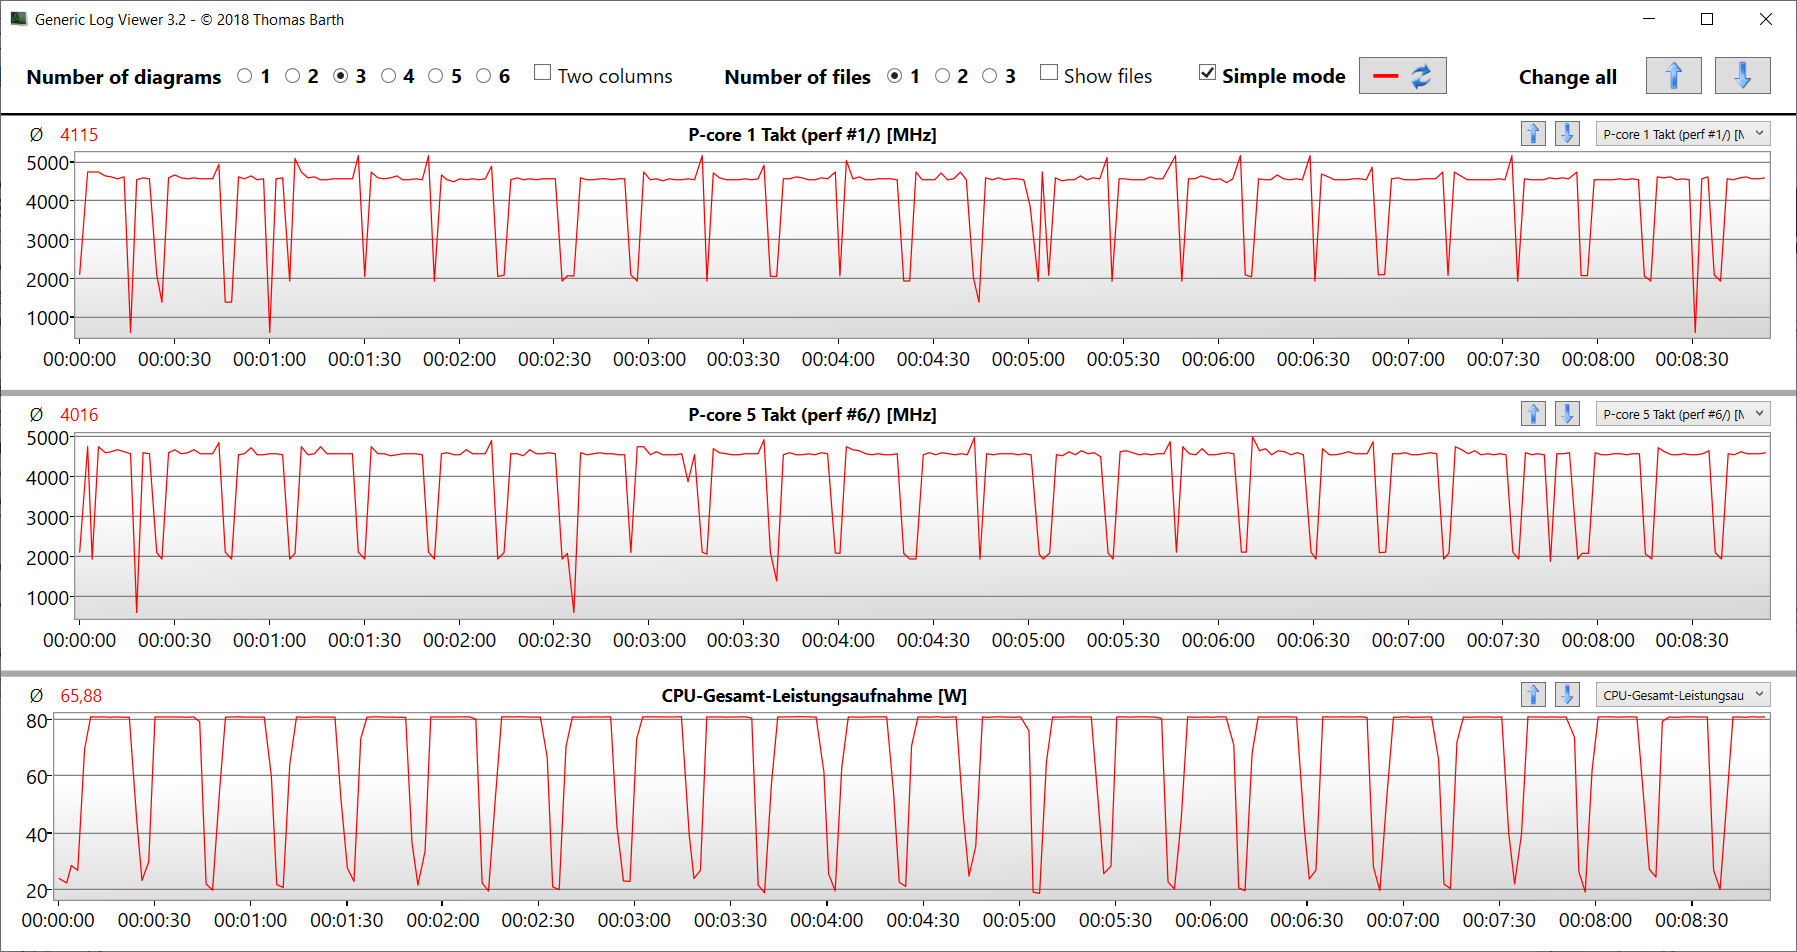
Condizioni di prova
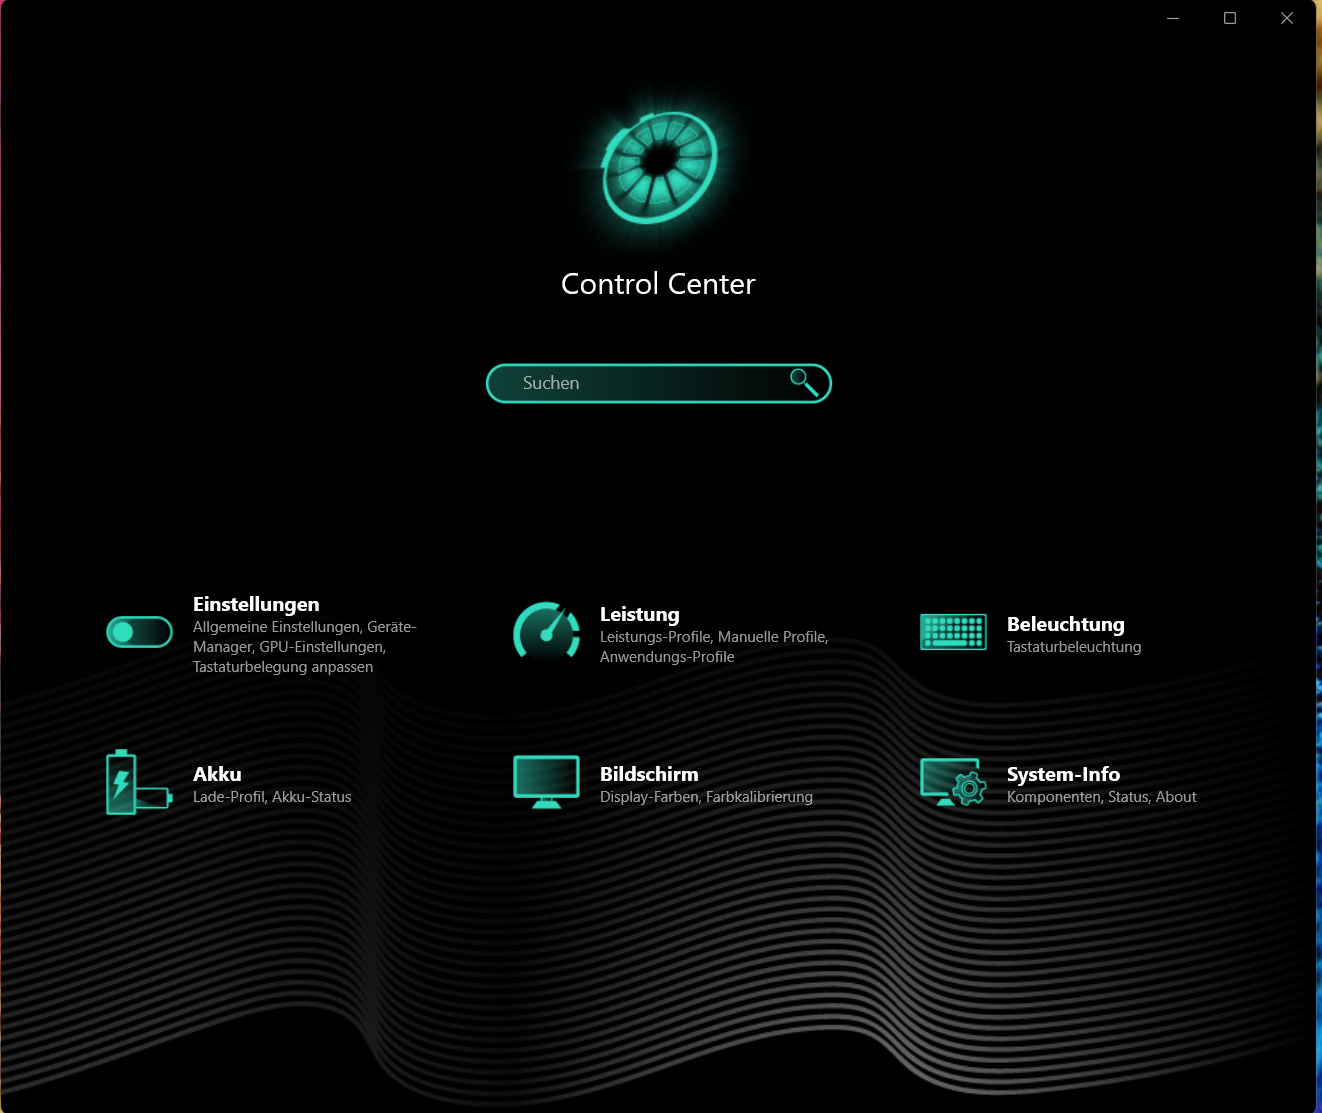
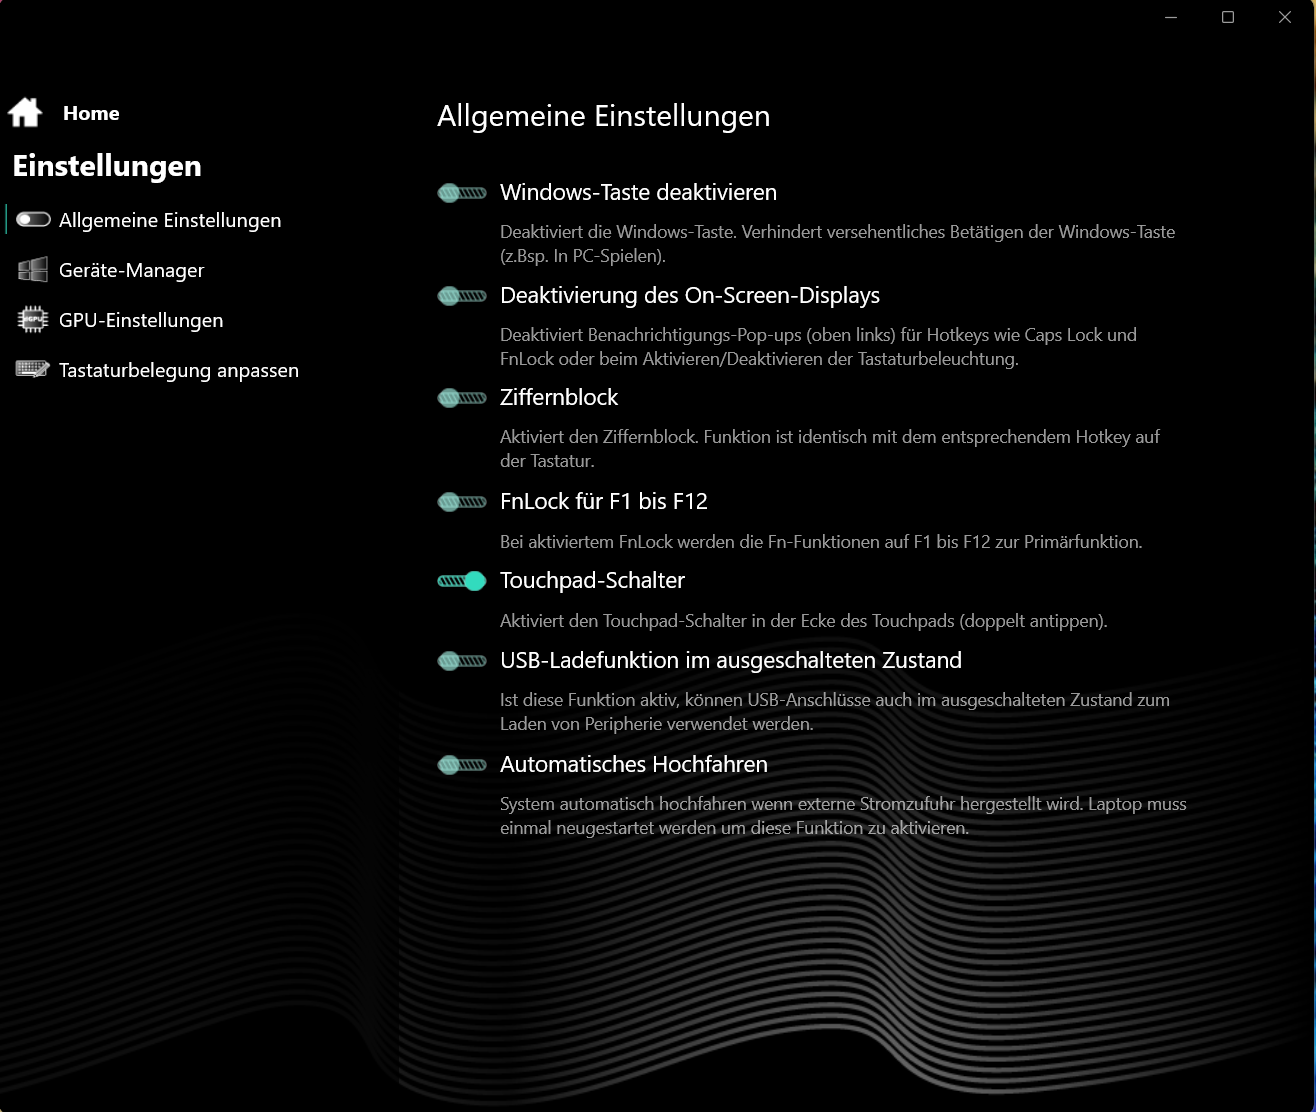
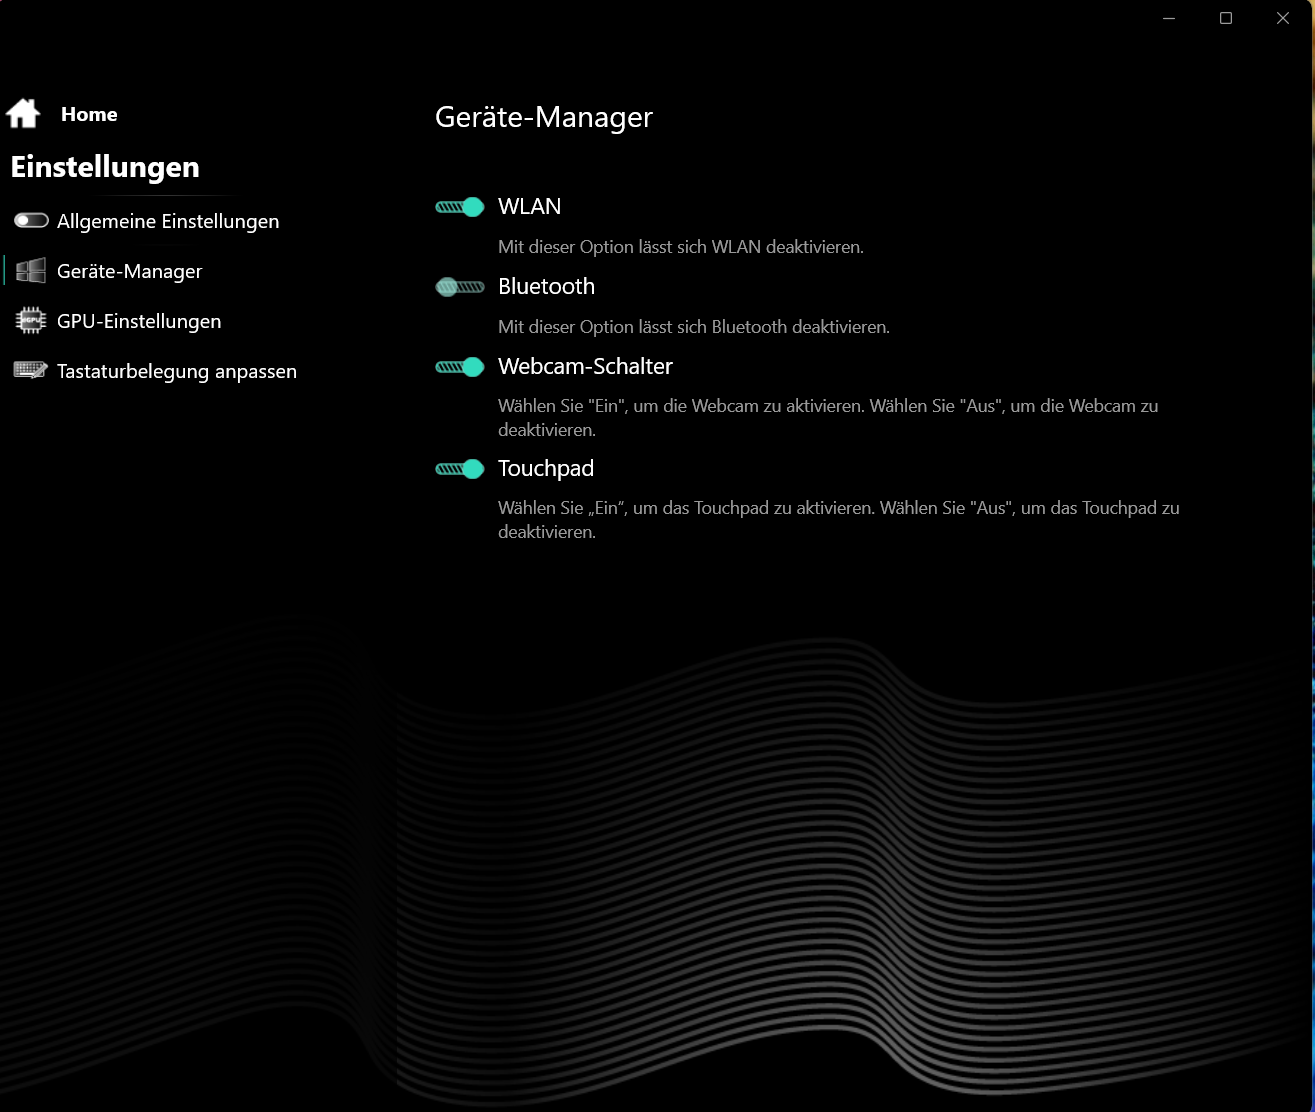
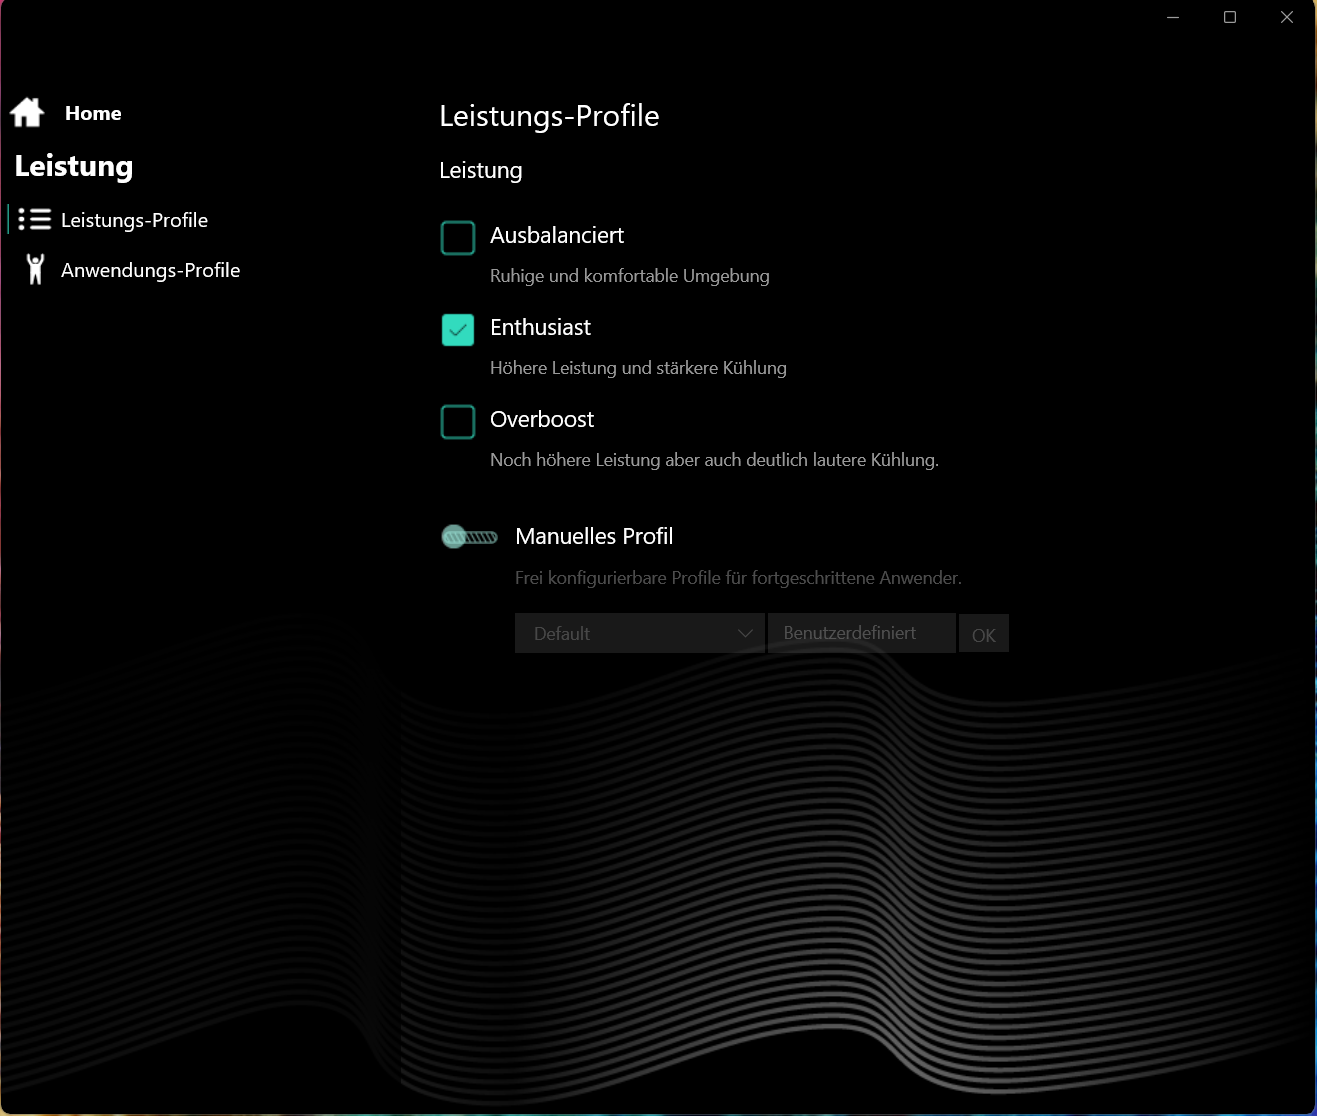
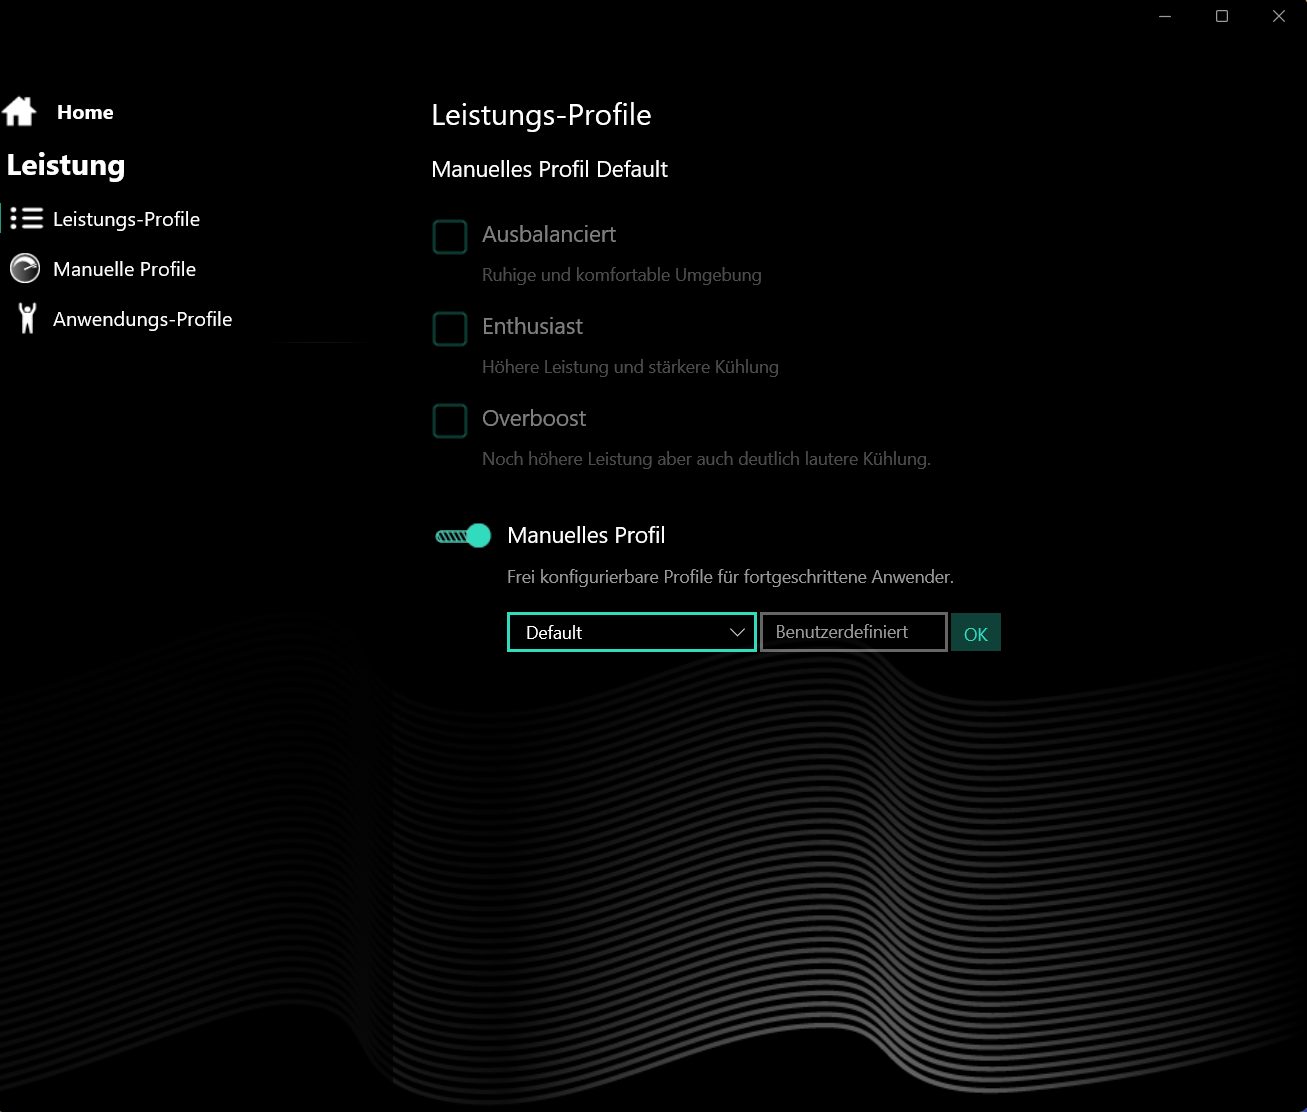
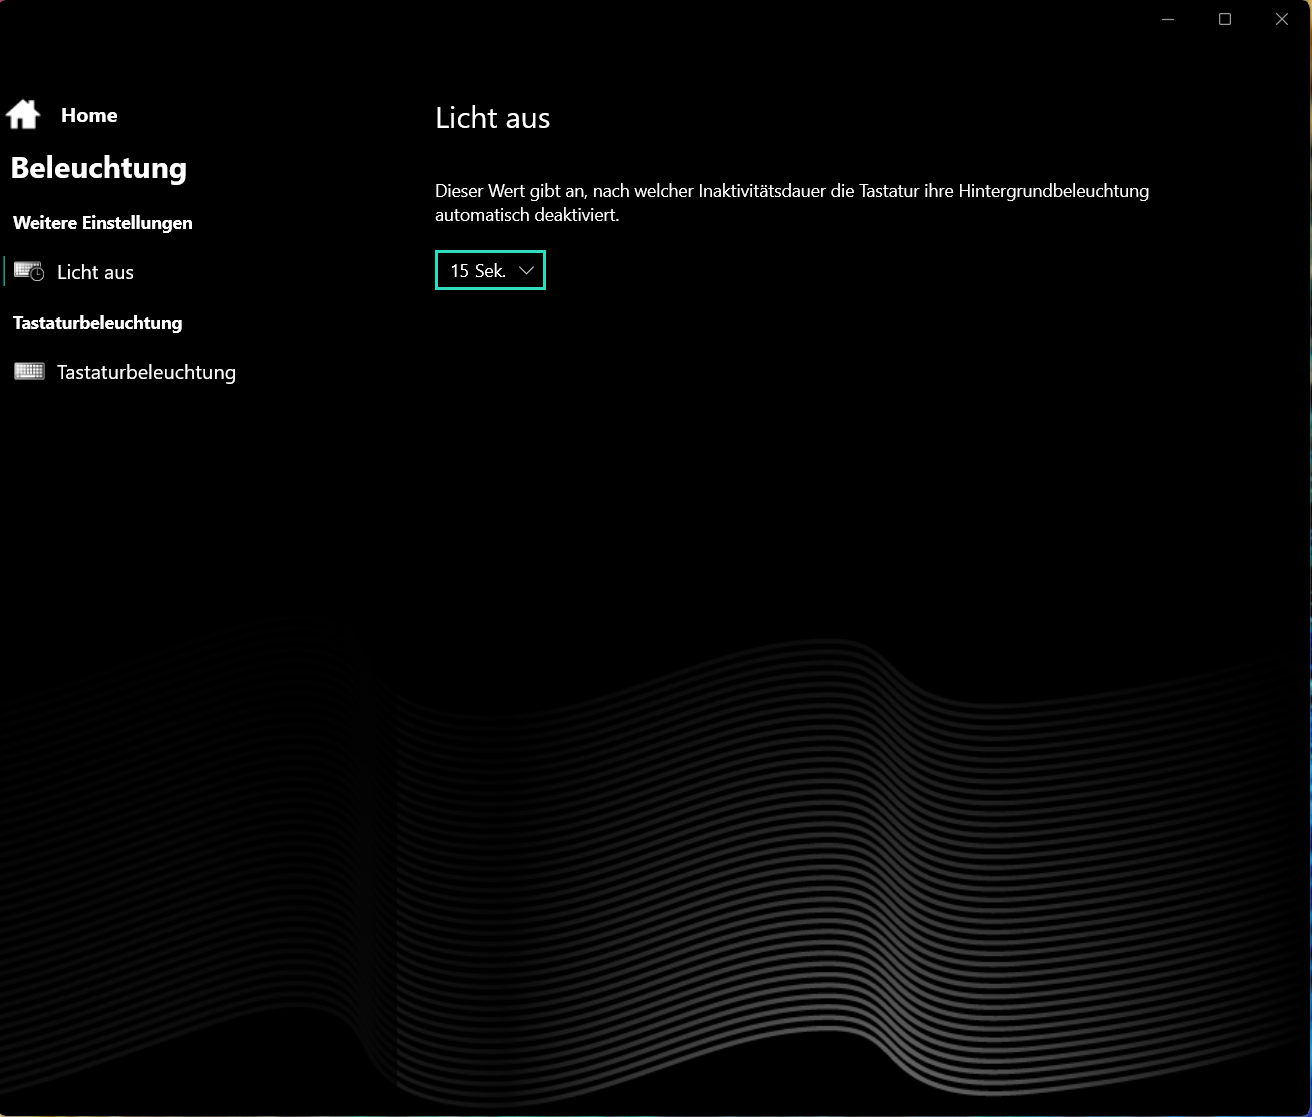
L'Apex offre tre modalità di prestazioni specifiche del produttore (vedi tabella) che possono essere alternate tramite un tasto separato (accanto al pulsante di accensione). Un LED di stato indica quale modalità è attiva. Abbiamo utilizzato le modalità "enthusiast" (benchmark) e "balanced" (test della batteria). Optimus era attivo.
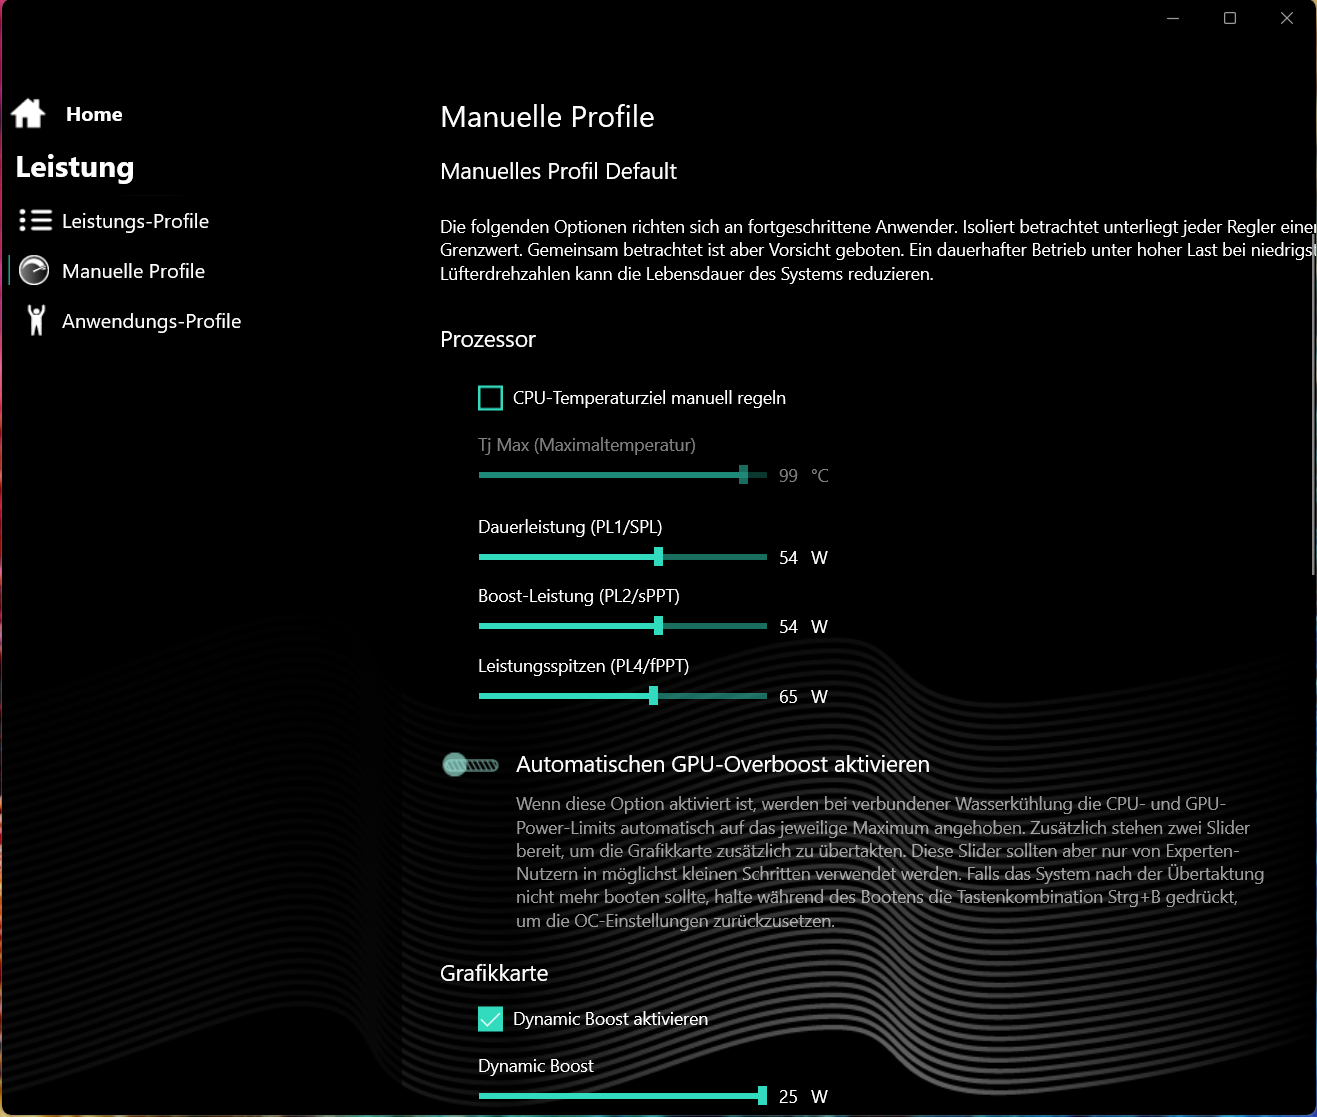
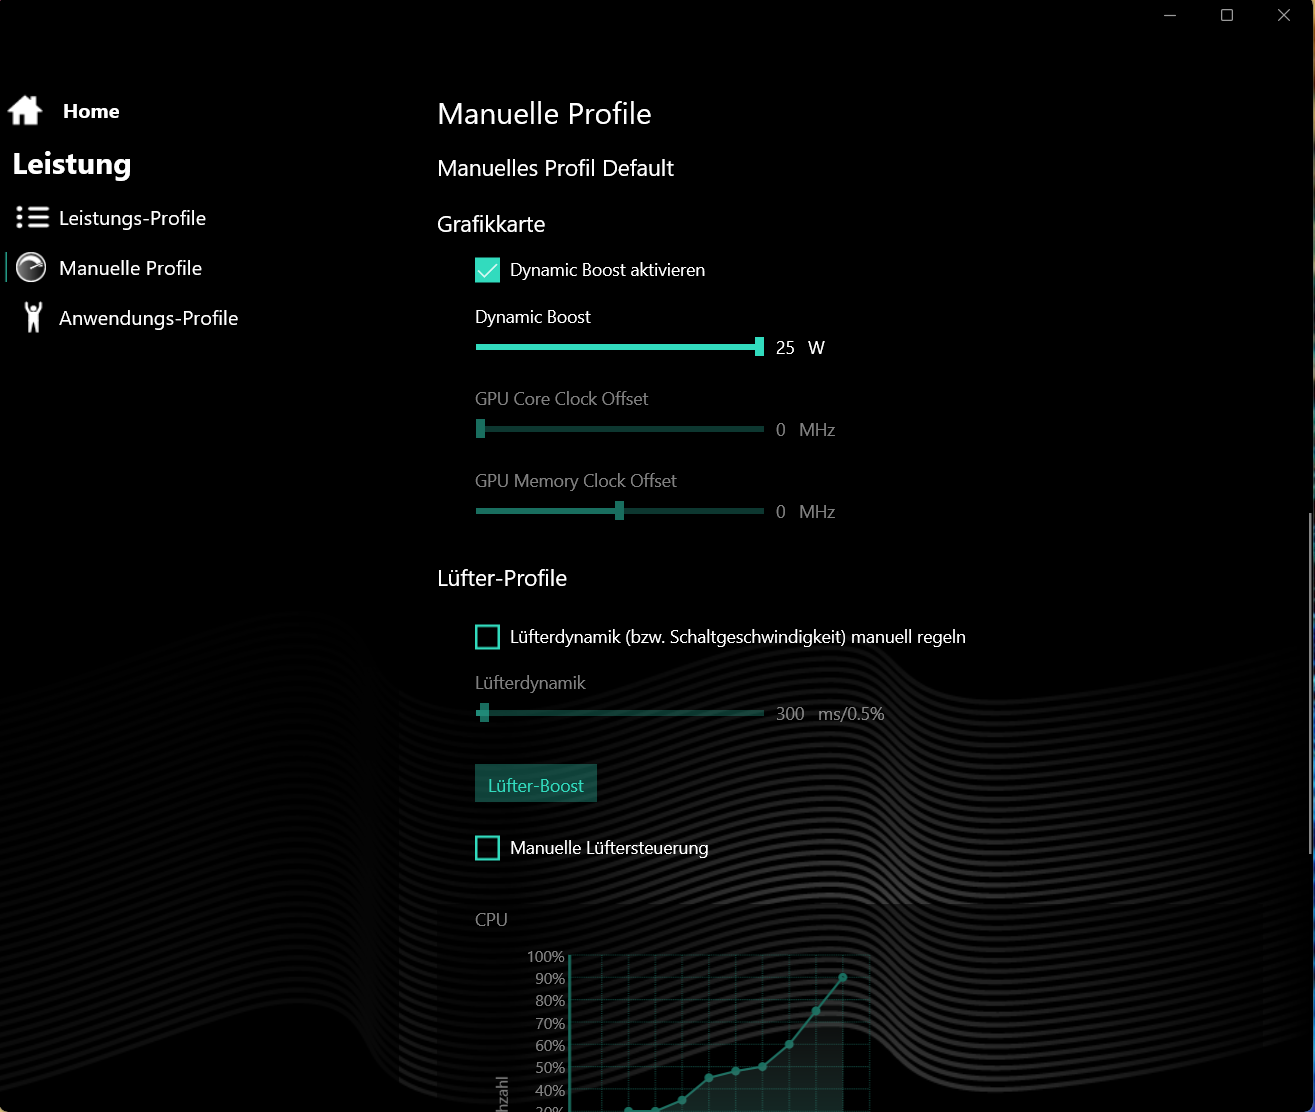
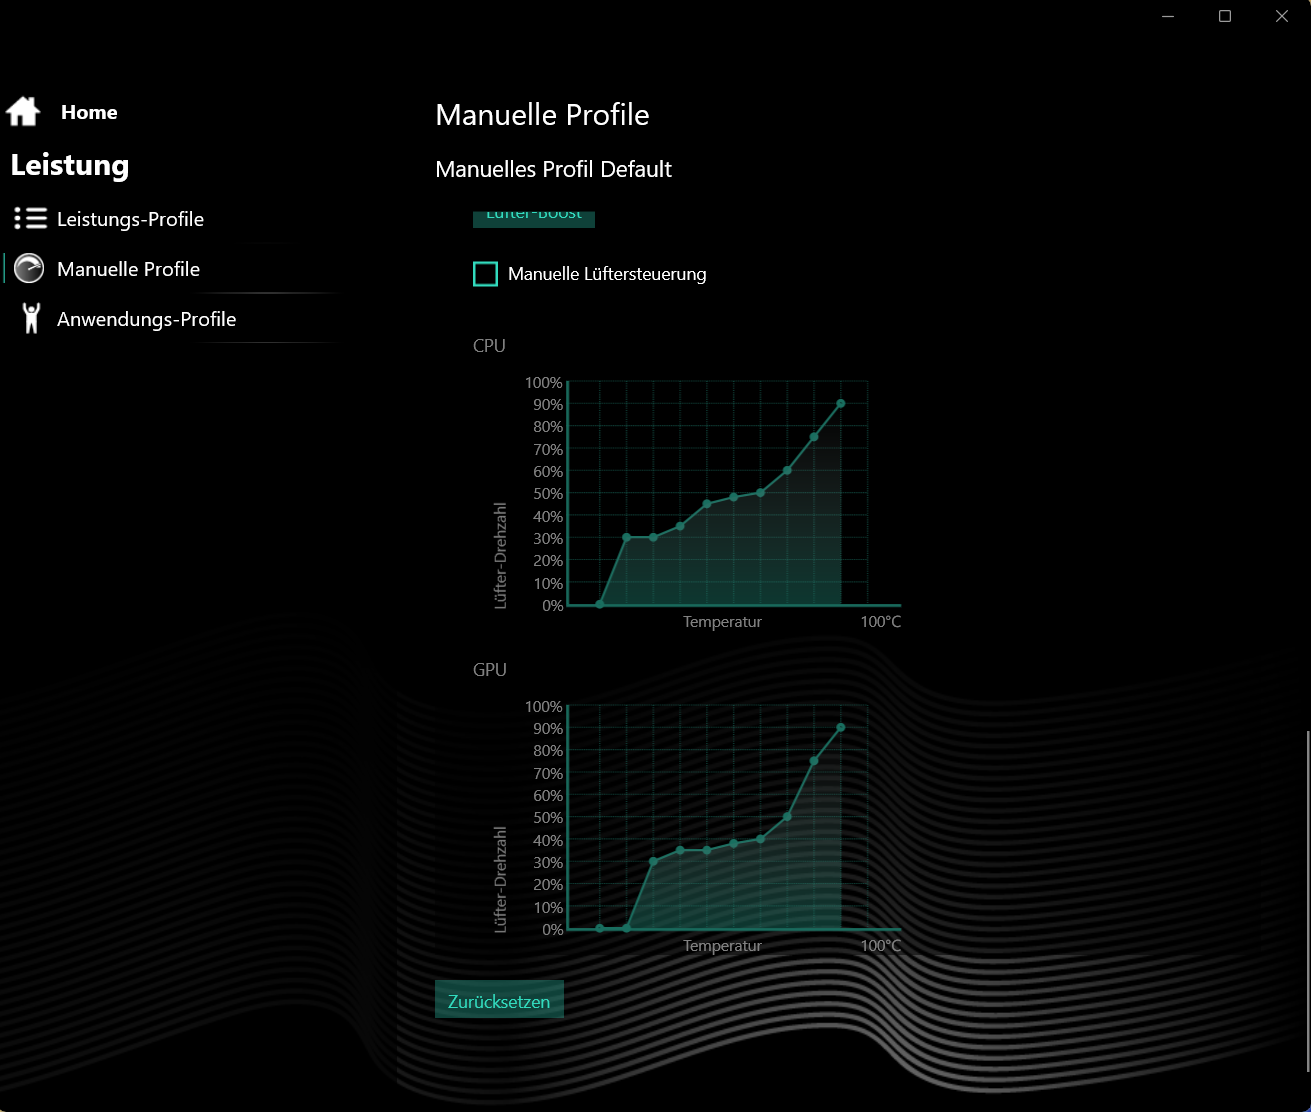
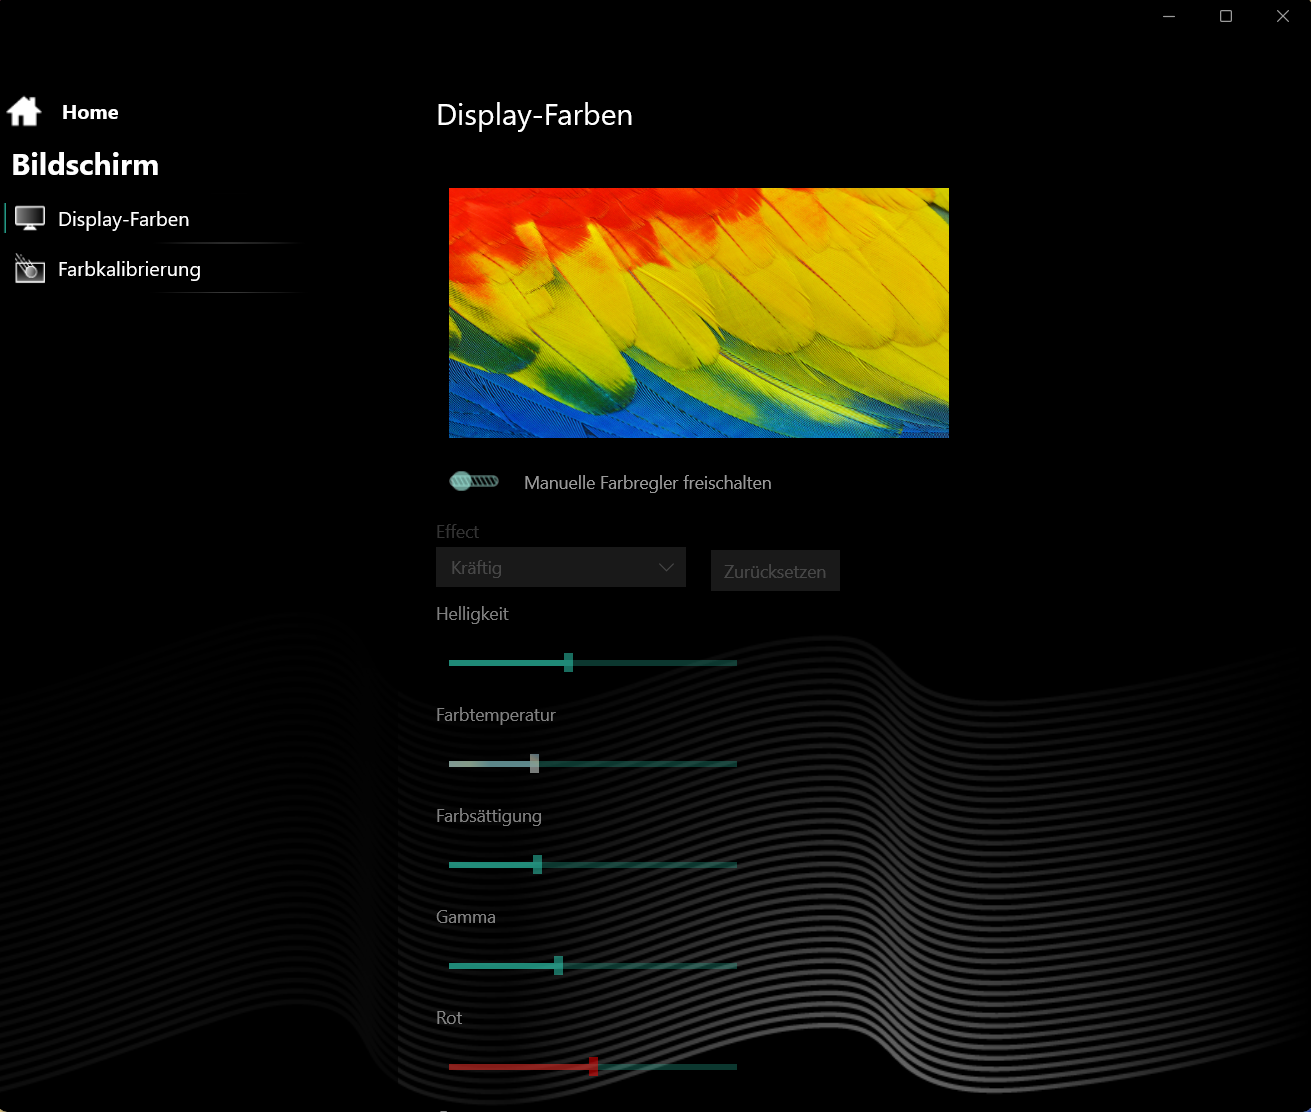
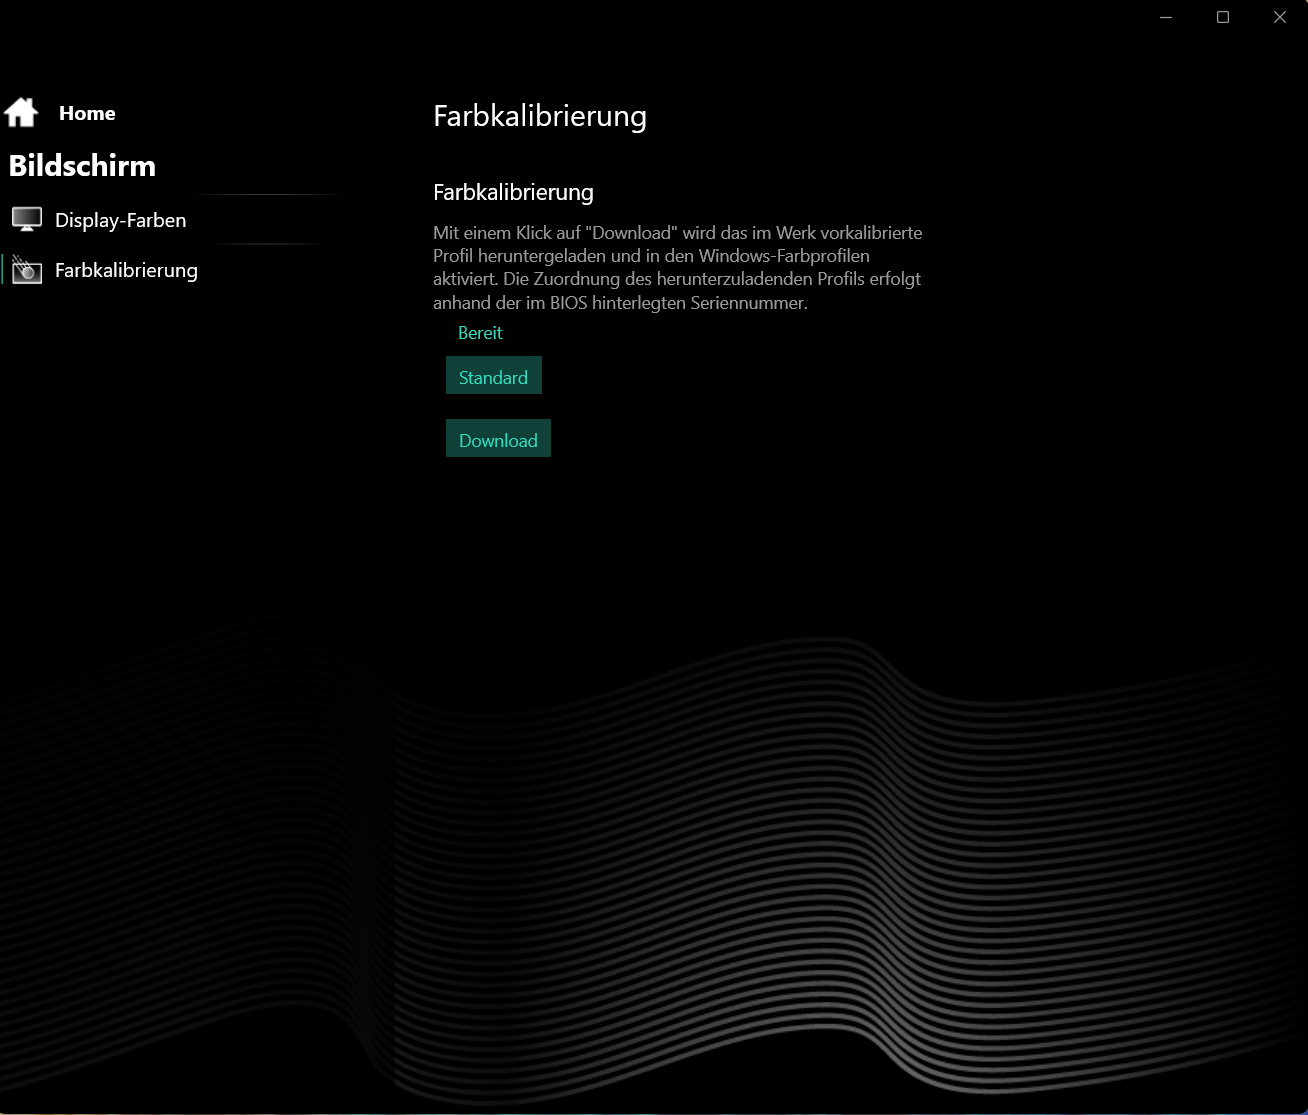
Il Centro di Controllo preinstallato consente di creare profili individuali: In questo modo è possibile regolare, ad esempio, i limiti di potenza della CPU, il TGP della GPU e/o il controllo della ventola.
| Enthusiast | Overboost | Bilanciato | |
|---|---|---|---|
| Limite di potenza 1 (HWInfo) | 54 watt | 80 watt | 35 watt |
| Limite di potenza 2 (HWInfo) | 65 watt | 80 watt | 65 watt |
| Rumore (Witcher 3) | ~50 dB(A) | ~54 dB(A) | ~34 dB(A) |
| Prestazioni (Witcher 3) | ~102 fps | ~105 fps | ~60 fps |
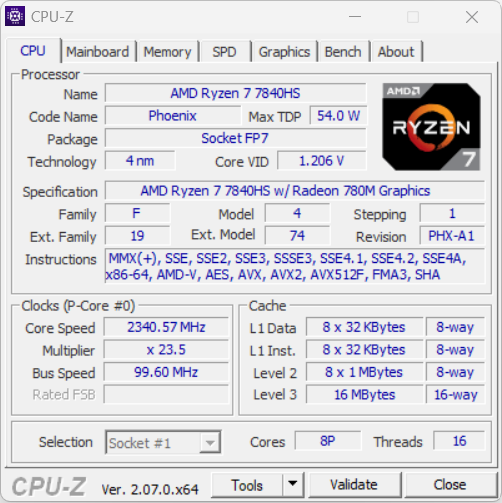
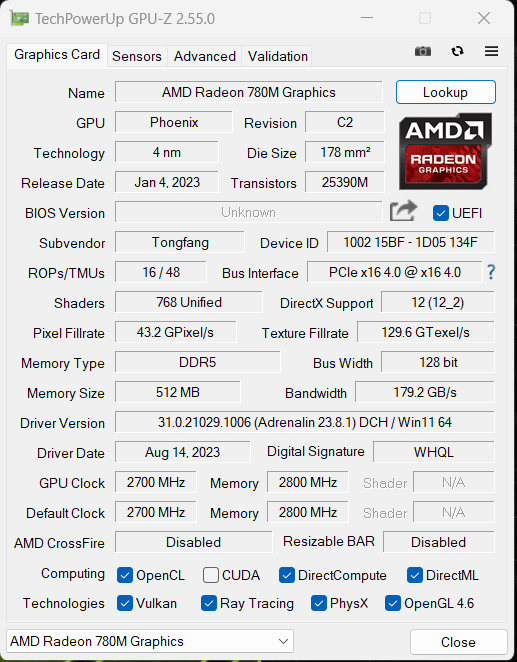
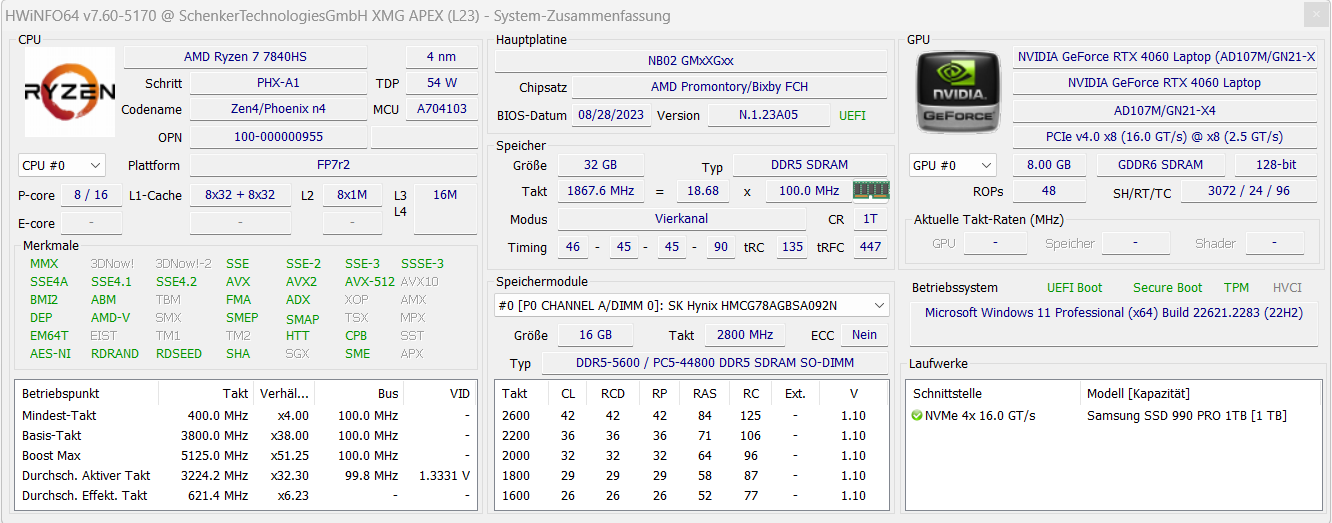
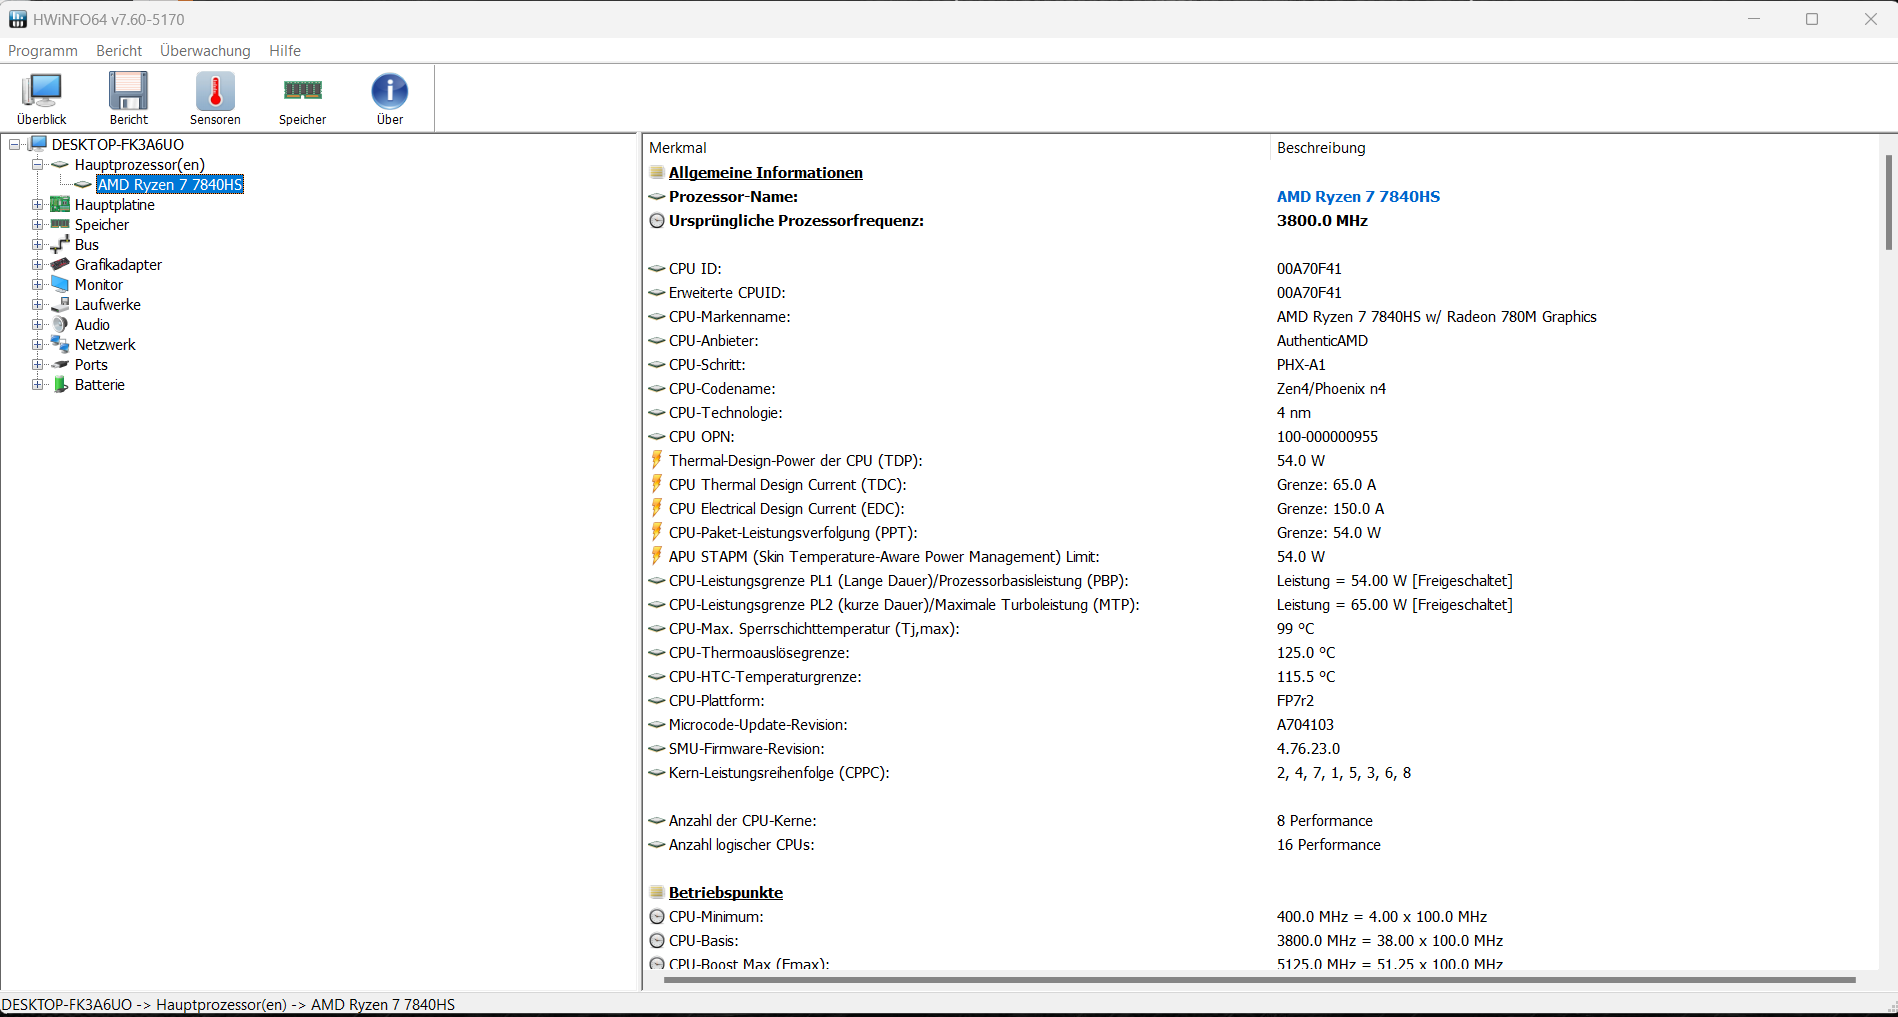
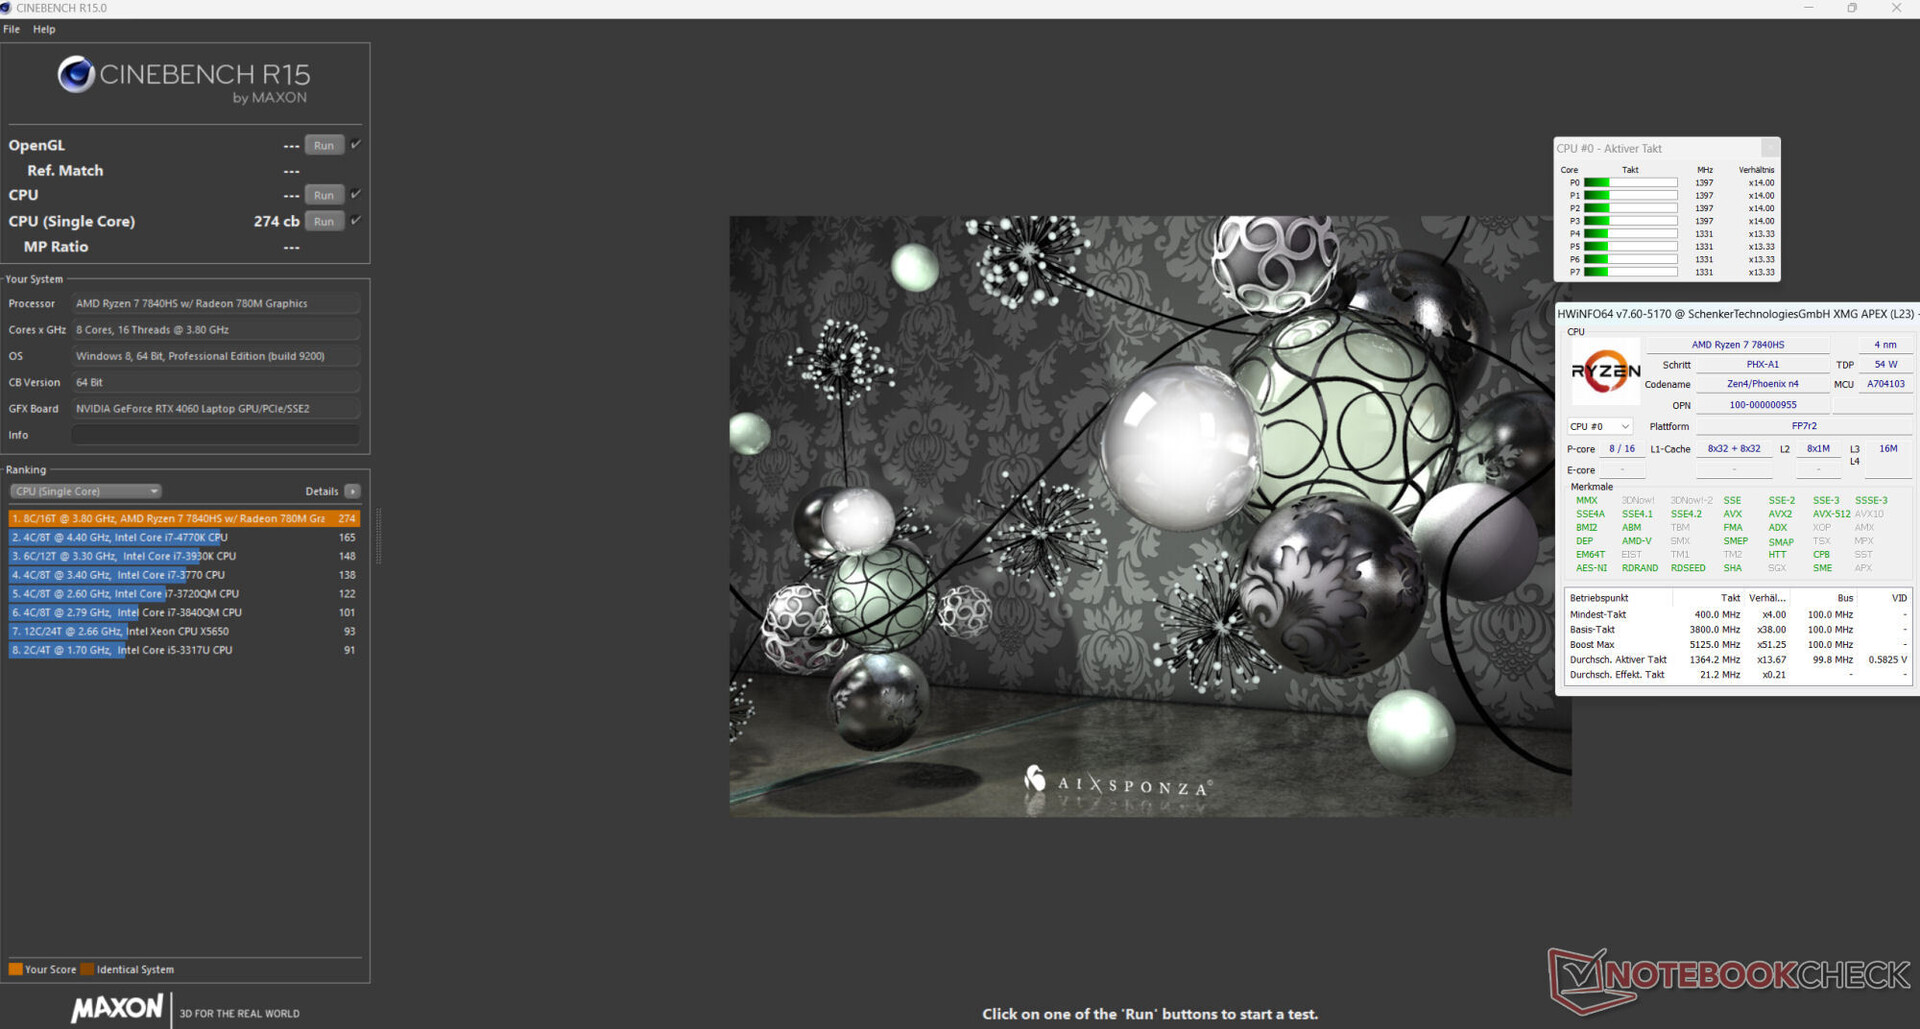
Processore
IlRyzen 7 7840HS(Phoenix, Zen 4) offre 8 core CPU con un totale di 16 thread a una velocità di clock massima di 5,1 GHz (un core). La CPU riconosce il carico multi-thread continuo (ciclo CB15) con una velocità turbo costantemente elevata, indipendentemente dalla modalità di prestazioni selezionata.
Nel funzionamento a rete, i risultati dei benchmark si aggirano intorno alla media della CPU. In modalità batteria, le prestazioni single-thread più rilevanti (216 punti) diminuiscono in misura minore rispetto alle prestazioni multi-thread (1.715 punti).
Nota: informazioni più dettagliate sull'architettura Zen 4 sono disponibili in questo articolo di analisi Analisi di AMD Ryzen 9 7940HS - Zen4 Phoenix è idealmente efficiente quanto Apple .
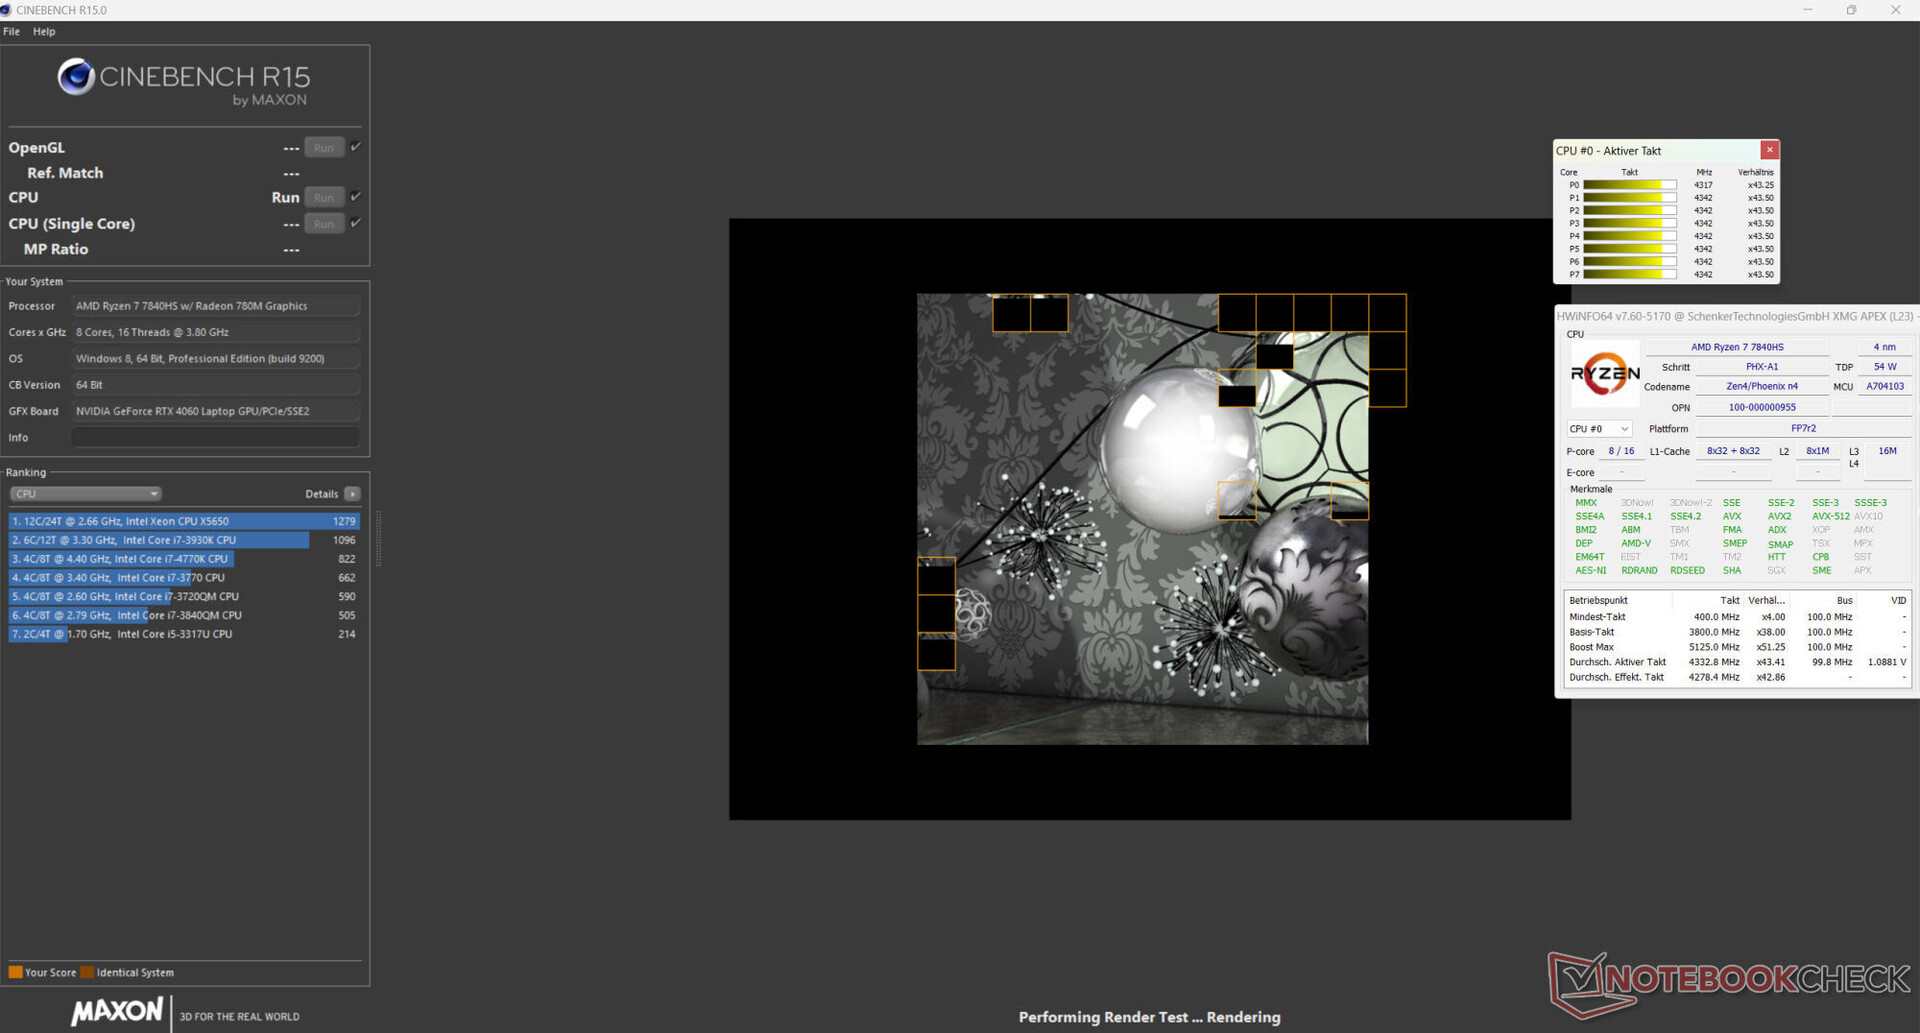
Cinebench R15 Multi Continuous Test
* ... Meglio usare valori piccoli
AIDA64: FP32 Ray-Trace | FPU Julia | CPU SHA3 | CPU Queen | FPU SinJulia | FPU Mandel | CPU AES | CPU ZLib | FP64 Ray-Trace | CPU PhotoWorxx
| Performance rating | |
| Media della classe Gaming | |
| Schenker XMG Apex 17 (Late 23) | |
| Media AMD Ryzen 7 7840HS | |
| Alienware m16 R1 Intel | |
| Lenovo Legion Pro 5 16IRX8 | |
| Acer Nitro 17 AN17-51-71ER | |
| Medion Erazer Defender P40 | |
| MSI Katana 17 B13VFK | |
| AIDA64 / FP32 Ray-Trace | |
| Media della classe Gaming (10227 - 85542, n=105, ultimi 2 anni) | |
| Media AMD Ryzen 7 7840HS (22845 - 28921, n=21) | |
| Schenker XMG Apex 17 (Late 23) | |
| Lenovo Legion Pro 5 16IRX8 | |
| Alienware m16 R1 Intel | |
| Acer Nitro 17 AN17-51-71ER | |
| Medion Erazer Defender P40 | |
| MSI Katana 17 B13VFK | |
| AIDA64 / FPU Julia | |
| Media della classe Gaming (51376 - 238426, n=105, ultimi 2 anni) | |
| Media AMD Ryzen 7 7840HS (97164 - 123167, n=21) | |
| Schenker XMG Apex 17 (Late 23) | |
| Lenovo Legion Pro 5 16IRX8 | |
| Alienware m16 R1 Intel | |
| Acer Nitro 17 AN17-51-71ER | |
| Medion Erazer Defender P40 | |
| MSI Katana 17 B13VFK | |
| AIDA64 / CPU SHA3 | |
| Media della classe Gaming (2180 - 10115, n=105, ultimi 2 anni) | |
| Alienware m16 R1 Intel | |
| Media AMD Ryzen 7 7840HS (4293 - 5155, n=21) | |
| Lenovo Legion Pro 5 16IRX8 | |
| Schenker XMG Apex 17 (Late 23) | |
| Acer Nitro 17 AN17-51-71ER | |
| Medion Erazer Defender P40 | |
| MSI Katana 17 B13VFK | |
| AIDA64 / CPU Queen | |
| Media della classe Gaming (49785 - 173351, n=90, ultimi 2 anni) | |
| Media AMD Ryzen 7 7840HS (102271 - 125820, n=21) | |
| Schenker XMG Apex 17 (Late 23) | |
| Alienware m16 R1 Intel | |
| Lenovo Legion Pro 5 16IRX8 | |
| Medion Erazer Defender P40 | |
| Acer Nitro 17 AN17-51-71ER | |
| MSI Katana 17 B13VFK | |
| AIDA64 / FPU SinJulia | |
| Media AMD Ryzen 7 7840HS (13767 - 15525, n=21) | |
| Schenker XMG Apex 17 (Late 23) | |
| Media della classe Gaming (4424 - 33636, n=105, ultimi 2 anni) | |
| Alienware m16 R1 Intel | |
| Lenovo Legion Pro 5 16IRX8 | |
| Acer Nitro 17 AN17-51-71ER | |
| Medion Erazer Defender P40 | |
| MSI Katana 17 B13VFK | |
| AIDA64 / FPU Mandel | |
| Media della classe Gaming (25115 - 128721, n=105, ultimi 2 anni) | |
| Media AMD Ryzen 7 7840HS (52084 - 65812, n=21) | |
| Schenker XMG Apex 17 (Late 23) | |
| Lenovo Legion Pro 5 16IRX8 | |
| Alienware m16 R1 Intel | |
| Acer Nitro 17 AN17-51-71ER | |
| Medion Erazer Defender P40 | |
| MSI Katana 17 B13VFK | |
| AIDA64 / CPU AES | |
| Alienware m16 R1 Intel | |
| Schenker XMG Apex 17 (Late 23) | |
| Acer Nitro 17 AN17-51-71ER | |
| Media AMD Ryzen 7 7840HS (67389 - 177158, n=21) | |
| Media della classe Gaming (39258 - 247074, n=105, ultimi 2 anni) | |
| Lenovo Legion Pro 5 16IRX8 | |
| Medion Erazer Defender P40 | |
| MSI Katana 17 B13VFK | |
| AIDA64 / CPU ZLib | |
| Media della classe Gaming (574 - 2531, n=105, ultimi 2 anni) | |
| Alienware m16 R1 Intel | |
| Lenovo Legion Pro 5 16IRX8 | |
| Acer Nitro 17 AN17-51-71ER | |
| Media AMD Ryzen 7 7840HS (944 - 1123, n=21) | |
| Schenker XMG Apex 17 (Late 23) | |
| Medion Erazer Defender P40 | |
| MSI Katana 17 B13VFK | |
| AIDA64 / FP64 Ray-Trace | |
| Media della classe Gaming (5509 - 45446, n=105, ultimi 2 anni) | |
| Media AMD Ryzen 7 7840HS (12248 - 15599, n=21) | |
| Schenker XMG Apex 17 (Late 23) | |
| Lenovo Legion Pro 5 16IRX8 | |
| Alienware m16 R1 Intel | |
| Acer Nitro 17 AN17-51-71ER | |
| Medion Erazer Defender P40 | |
| MSI Katana 17 B13VFK | |
| AIDA64 / CPU PhotoWorxx | |
| Media della classe Gaming (12271 - 89891, n=105, ultimi 2 anni) | |
| Acer Nitro 17 AN17-51-71ER | |
| Media AMD Ryzen 7 7840HS (17615 - 41516, n=21) | |
| Lenovo Legion Pro 5 16IRX8 | |
| Schenker XMG Apex 17 (Late 23) | |
| Medion Erazer Defender P40 | |
| Alienware m16 R1 Intel | |
| MSI Katana 17 B13VFK | |
Prestazioni del sistema
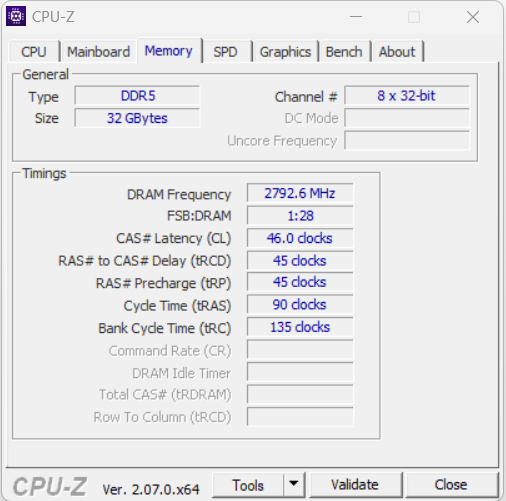
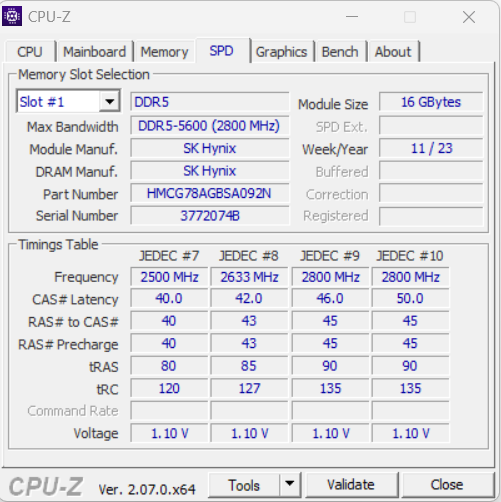
Il sistema, che funziona in modo fluido, è stato progettato per gestire scenari d'uso ad alte prestazioni come il rendering e il gioco - i buoni risultati di PC Mark lo confermano. Le velocità di trasferimento della RAM sono nella norma per una RAM DDR5 5600.
CrossMark: Overall | Productivity | Creativity | Responsiveness
| PCMark 10 / Score | |
| Media della classe Gaming (5828 - 12414, n=93, ultimi 2 anni) | |
| Schenker XMG Apex 17 (Late 23) | |
| Media AMD Ryzen 7 7840HS, NVIDIA GeForce RTX 4060 Laptop GPU (7502 - 7946, n=4) | |
| Lenovo Legion Pro 5 16IRX8 | |
| Alienware m16 R1 Intel | |
| MSI Katana 17 B13VFK | |
| Acer Nitro 17 AN17-51-71ER | |
| Medion Erazer Defender P40 | |
| PCMark 10 / Essentials | |
| Lenovo Legion Pro 5 16IRX8 | |
| Media AMD Ryzen 7 7840HS, NVIDIA GeForce RTX 4060 Laptop GPU (10441 - 11169, n=4) | |
| MSI Katana 17 B13VFK | |
| Alienware m16 R1 Intel | |
| Schenker XMG Apex 17 (Late 23) | |
| Media della classe Gaming (8810 - 11935, n=97, ultimi 2 anni) | |
| Acer Nitro 17 AN17-51-71ER | |
| Medion Erazer Defender P40 | |
| PCMark 10 / Productivity | |
| Media della classe Gaming (6845 - 25323, n=95, ultimi 2 anni) | |
| Schenker XMG Apex 17 (Late 23) | |
| Media AMD Ryzen 7 7840HS, NVIDIA GeForce RTX 4060 Laptop GPU (9575 - 10273, n=4) | |
| Medion Erazer Defender P40 | |
| Alienware m16 R1 Intel | |
| MSI Katana 17 B13VFK | |
| Lenovo Legion Pro 5 16IRX8 | |
| Acer Nitro 17 AN17-51-71ER | |
| PCMark 10 / Digital Content Creation | |
| Media della classe Gaming (7602 - 19954, n=95, ultimi 2 anni) | |
| Lenovo Legion Pro 5 16IRX8 | |
| Schenker XMG Apex 17 (Late 23) | |
| Media AMD Ryzen 7 7840HS, NVIDIA GeForce RTX 4060 Laptop GPU (11464 - 12418, n=4) | |
| Acer Nitro 17 AN17-51-71ER | |
| Alienware m16 R1 Intel | |
| MSI Katana 17 B13VFK | |
| Medion Erazer Defender P40 | |
| CrossMark / Overall | |
| Alienware m16 R1 Intel | |
| Media della classe Gaming (1366 - 2409, n=94, ultimi 2 anni) | |
| MSI Katana 17 B13VFK | |
| Media AMD Ryzen 7 7840HS, NVIDIA GeForce RTX 4060 Laptop GPU (1800 - 1866, n=3) | |
| Schenker XMG Apex 17 (Late 23) | |
| Medion Erazer Defender P40 | |
| Lenovo Legion Pro 5 16IRX8 | |
| Acer Nitro 17 AN17-51-71ER | |
| CrossMark / Productivity | |
| Alienware m16 R1 Intel | |
| Media della classe Gaming (1386 - 2254, n=94, ultimi 2 anni) | |
| Media AMD Ryzen 7 7840HS, NVIDIA GeForce RTX 4060 Laptop GPU (1743 - 1821, n=3) | |
| MSI Katana 17 B13VFK | |
| Schenker XMG Apex 17 (Late 23) | |
| Medion Erazer Defender P40 | |
| Lenovo Legion Pro 5 16IRX8 | |
| Acer Nitro 17 AN17-51-71ER | |
| CrossMark / Creativity | |
| Media della classe Gaming (1343 - 2786, n=94, ultimi 2 anni) | |
| Alienware m16 R1 Intel | |
| MSI Katana 17 B13VFK | |
| Medion Erazer Defender P40 | |
| Media AMD Ryzen 7 7840HS, NVIDIA GeForce RTX 4060 Laptop GPU (1908 - 1966, n=3) | |
| Schenker XMG Apex 17 (Late 23) | |
| Lenovo Legion Pro 5 16IRX8 | |
| Acer Nitro 17 AN17-51-71ER | |
| CrossMark / Responsiveness | |
| Alienware m16 R1 Intel | |
| MSI Katana 17 B13VFK | |
| Media della classe Gaming (1226 - 2334, n=94, ultimi 2 anni) | |
| Schenker XMG Apex 17 (Late 23) | |
| Lenovo Legion Pro 5 16IRX8 | |
| Media AMD Ryzen 7 7840HS, NVIDIA GeForce RTX 4060 Laptop GPU (1522 - 1776, n=3) | |
| Acer Nitro 17 AN17-51-71ER | |
| Medion Erazer Defender P40 | |
| PCMark 10 Score | 7854 punti | |
Aiuto | ||
| AIDA64 / Memory Copy | |
| Media della classe Gaming (21750 - 129946, n=105, ultimi 2 anni) | |
| Schenker XMG Apex 17 (Late 23) | |
| Media AMD Ryzen 7 7840HS (30937 - 72158, n=21) | |
| Lenovo Legion Pro 5 16IRX8 | |
| Acer Nitro 17 AN17-51-71ER | |
| Medion Erazer Defender P40 | |
| Alienware m16 R1 Intel | |
| MSI Katana 17 B13VFK | |
| AIDA64 / Memory Read | |
| Media della classe Gaming (22956 - 118858, n=105, ultimi 2 anni) | |
| Lenovo Legion Pro 5 16IRX8 | |
| Medion Erazer Defender P40 | |
| Alienware m16 R1 Intel | |
| Acer Nitro 17 AN17-51-71ER | |
| Schenker XMG Apex 17 (Late 23) | |
| MSI Katana 17 B13VFK | |
| Media AMD Ryzen 7 7840HS (30497 - 62147, n=21) | |
| AIDA64 / Memory Write | |
| Schenker XMG Apex 17 (Late 23) | |
| Media AMD Ryzen 7 7840HS (34590 - 93323, n=21) | |
| Media della classe Gaming (22297 - 135096, n=105, ultimi 2 anni) | |
| Lenovo Legion Pro 5 16IRX8 | |
| Acer Nitro 17 AN17-51-71ER | |
| Alienware m16 R1 Intel | |
| Medion Erazer Defender P40 | |
| MSI Katana 17 B13VFK | |
| AIDA64 / Memory Latency | |
| Acer Nitro 17 AN17-51-71ER | |
| Media della classe Gaming (75.3 - 259, n=105, ultimi 2 anni) | |
| MSI Katana 17 B13VFK | |
| Medion Erazer Defender P40 | |
| Media AMD Ryzen 7 7840HS (85.1 - 112, n=21) | |
| Alienware m16 R1 Intel | |
| Schenker XMG Apex 17 (Late 23) | |
| Lenovo Legion Pro 5 16IRX8 | |
* ... Meglio usare valori piccoli
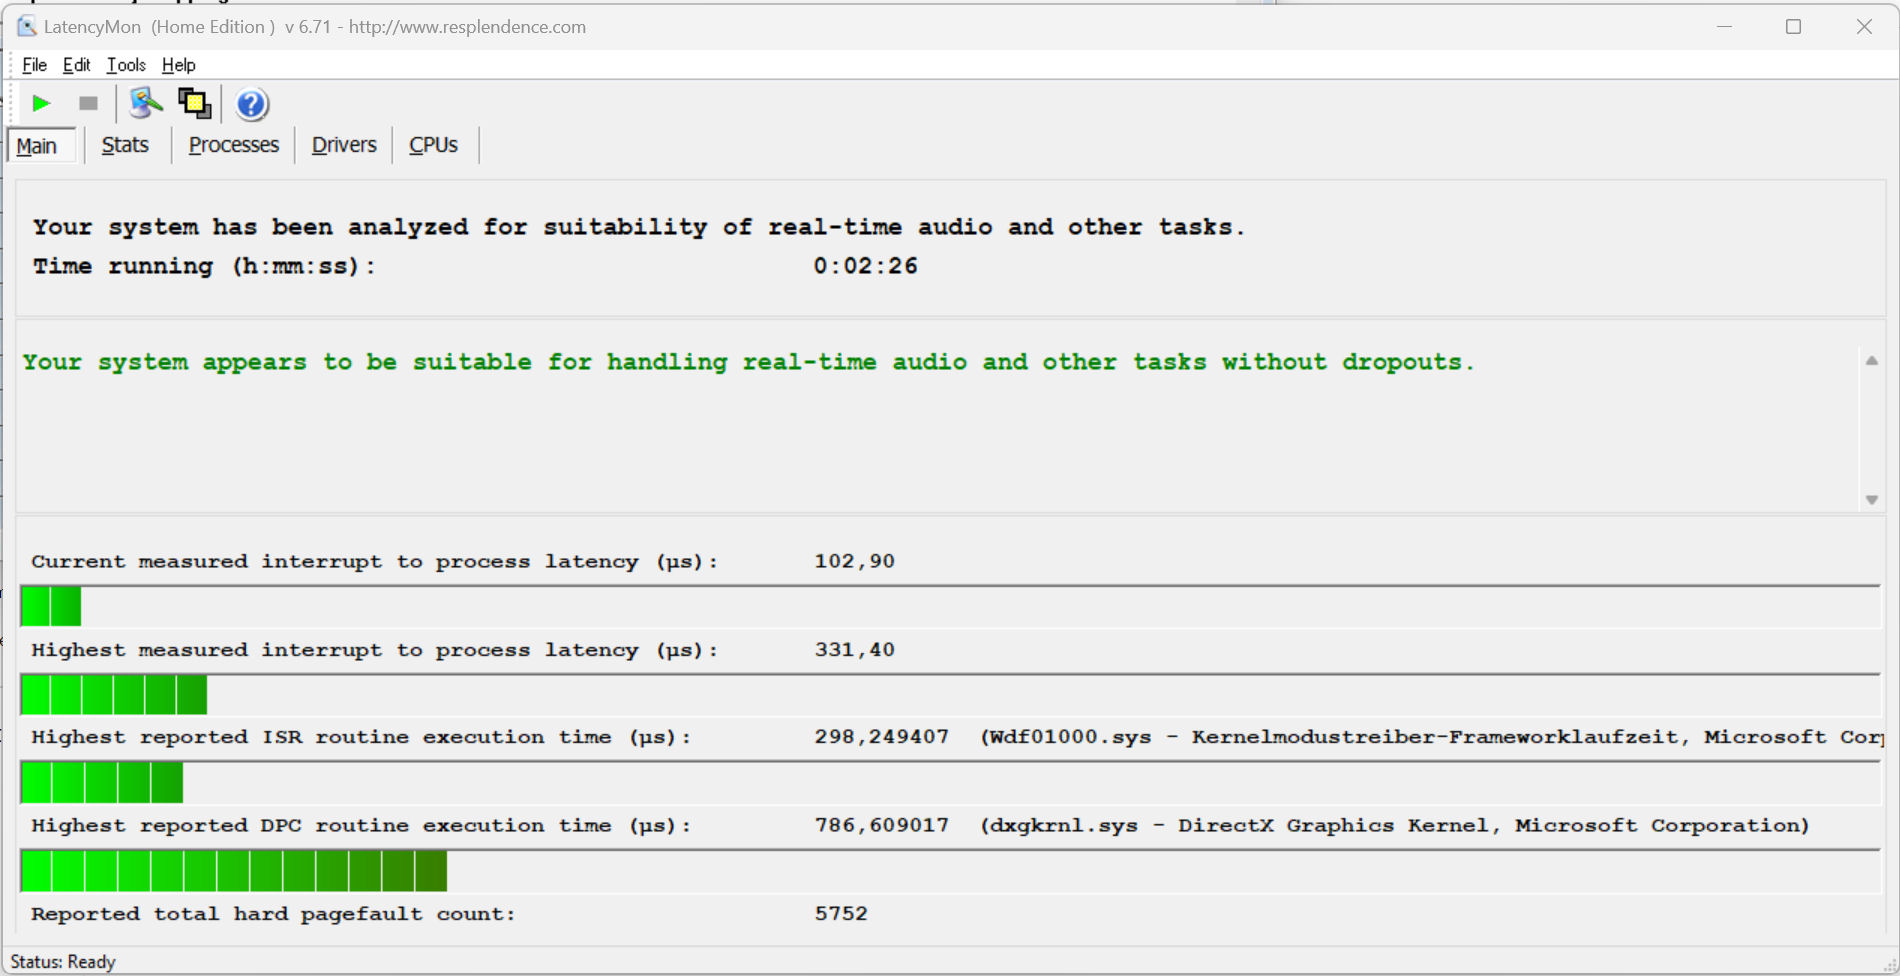
Latenze DPC
Il test standardizzato Latency Monitor (navigazione in Internet, riproduzione di video 4k, Prime95 ad alto carico) non ha rivelato alcuna anomalia. Il sistema sembra essere adatto all'editing video e audio in tempo reale. I futuri aggiornamenti software potrebbero migliorare o peggiorare queste prestazioni.

| DPC Latencies / LatencyMon - interrupt to process latency (max), Web, Youtube, Prime95 | |
| Medion Erazer Defender P40 | |
| Alienware m16 R1 Intel | |
| MSI Katana 17 B13VFK | |
| Acer Nitro 17 AN17-51-71ER | |
| Lenovo Legion Pro 5 16IRX8 | |
| Schenker XMG Apex 17 (Late 23) | |
* ... Meglio usare valori piccoli
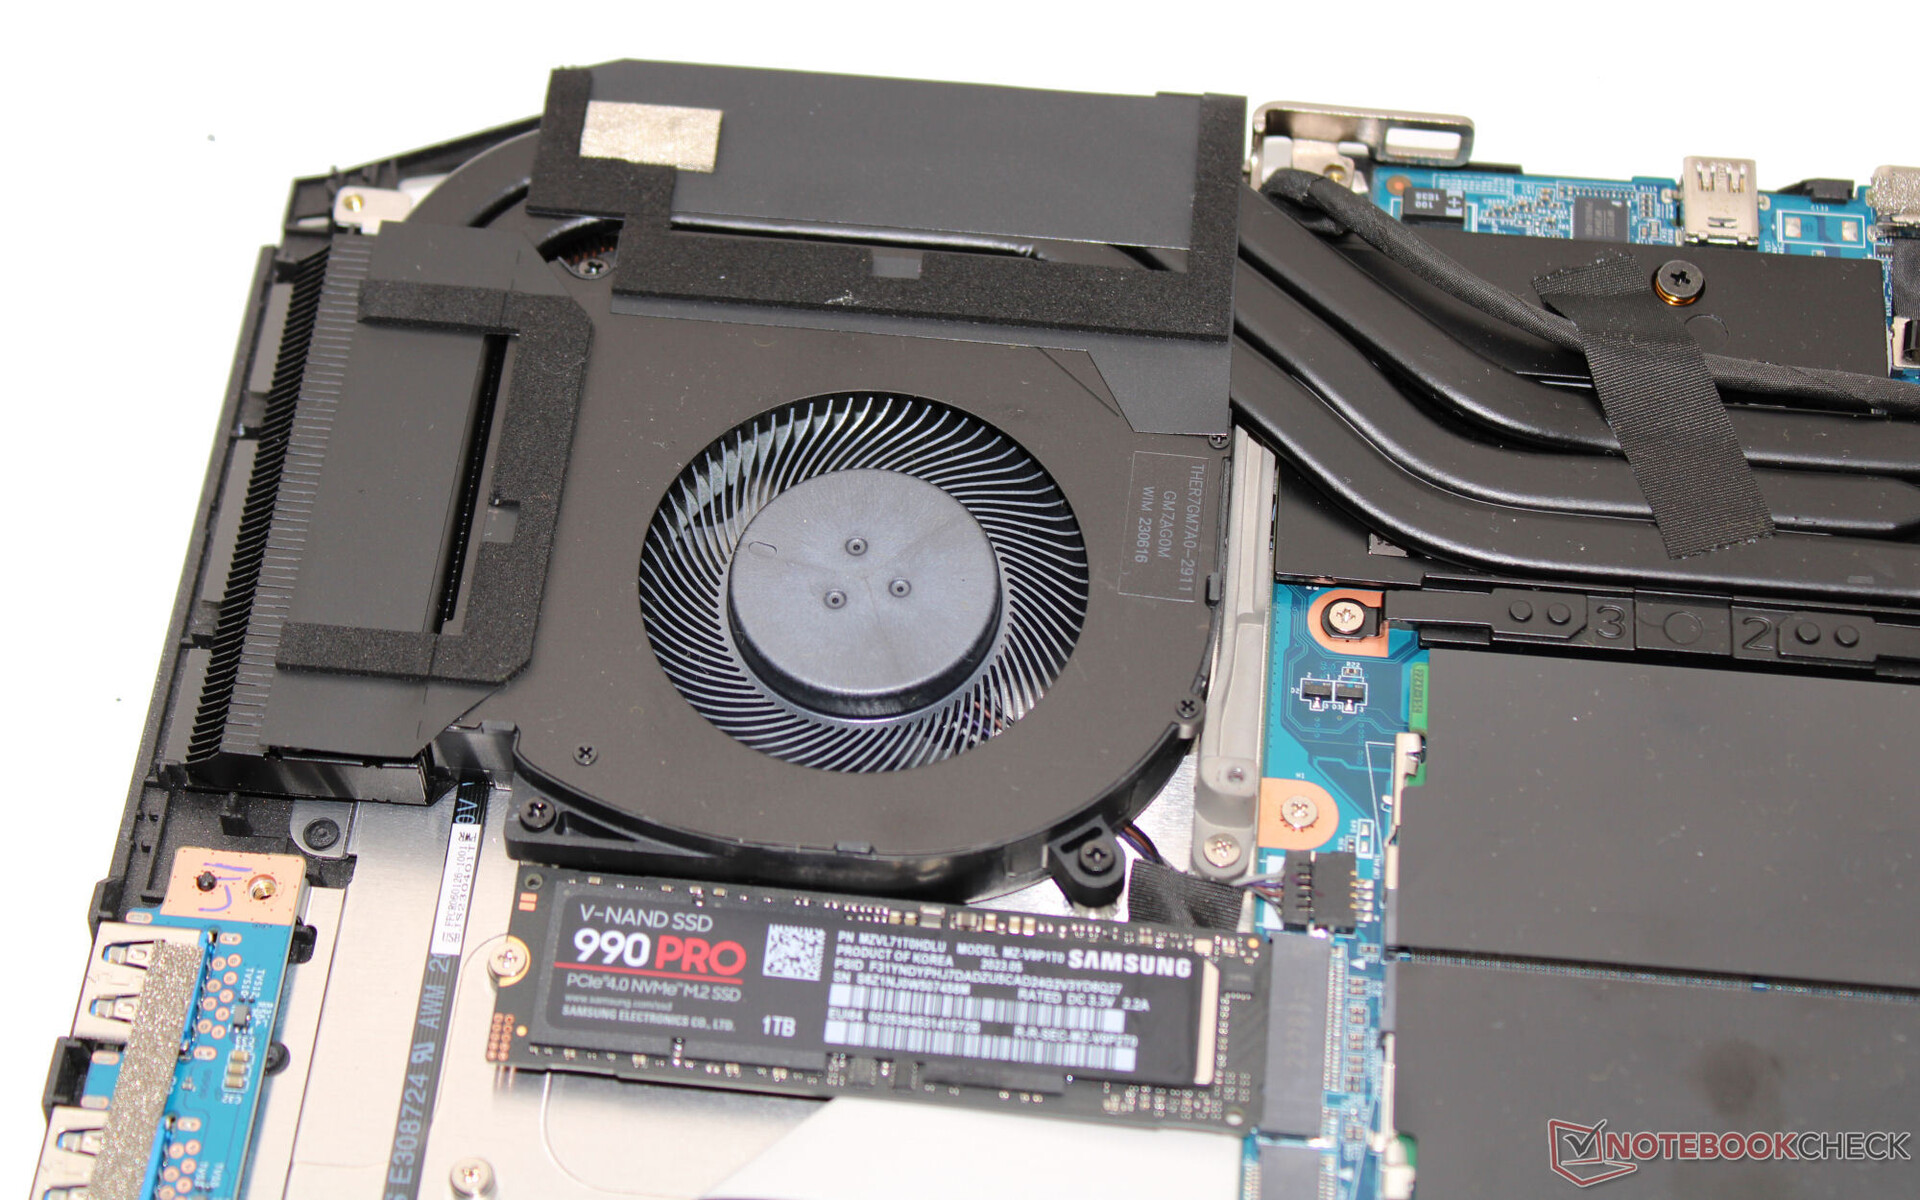
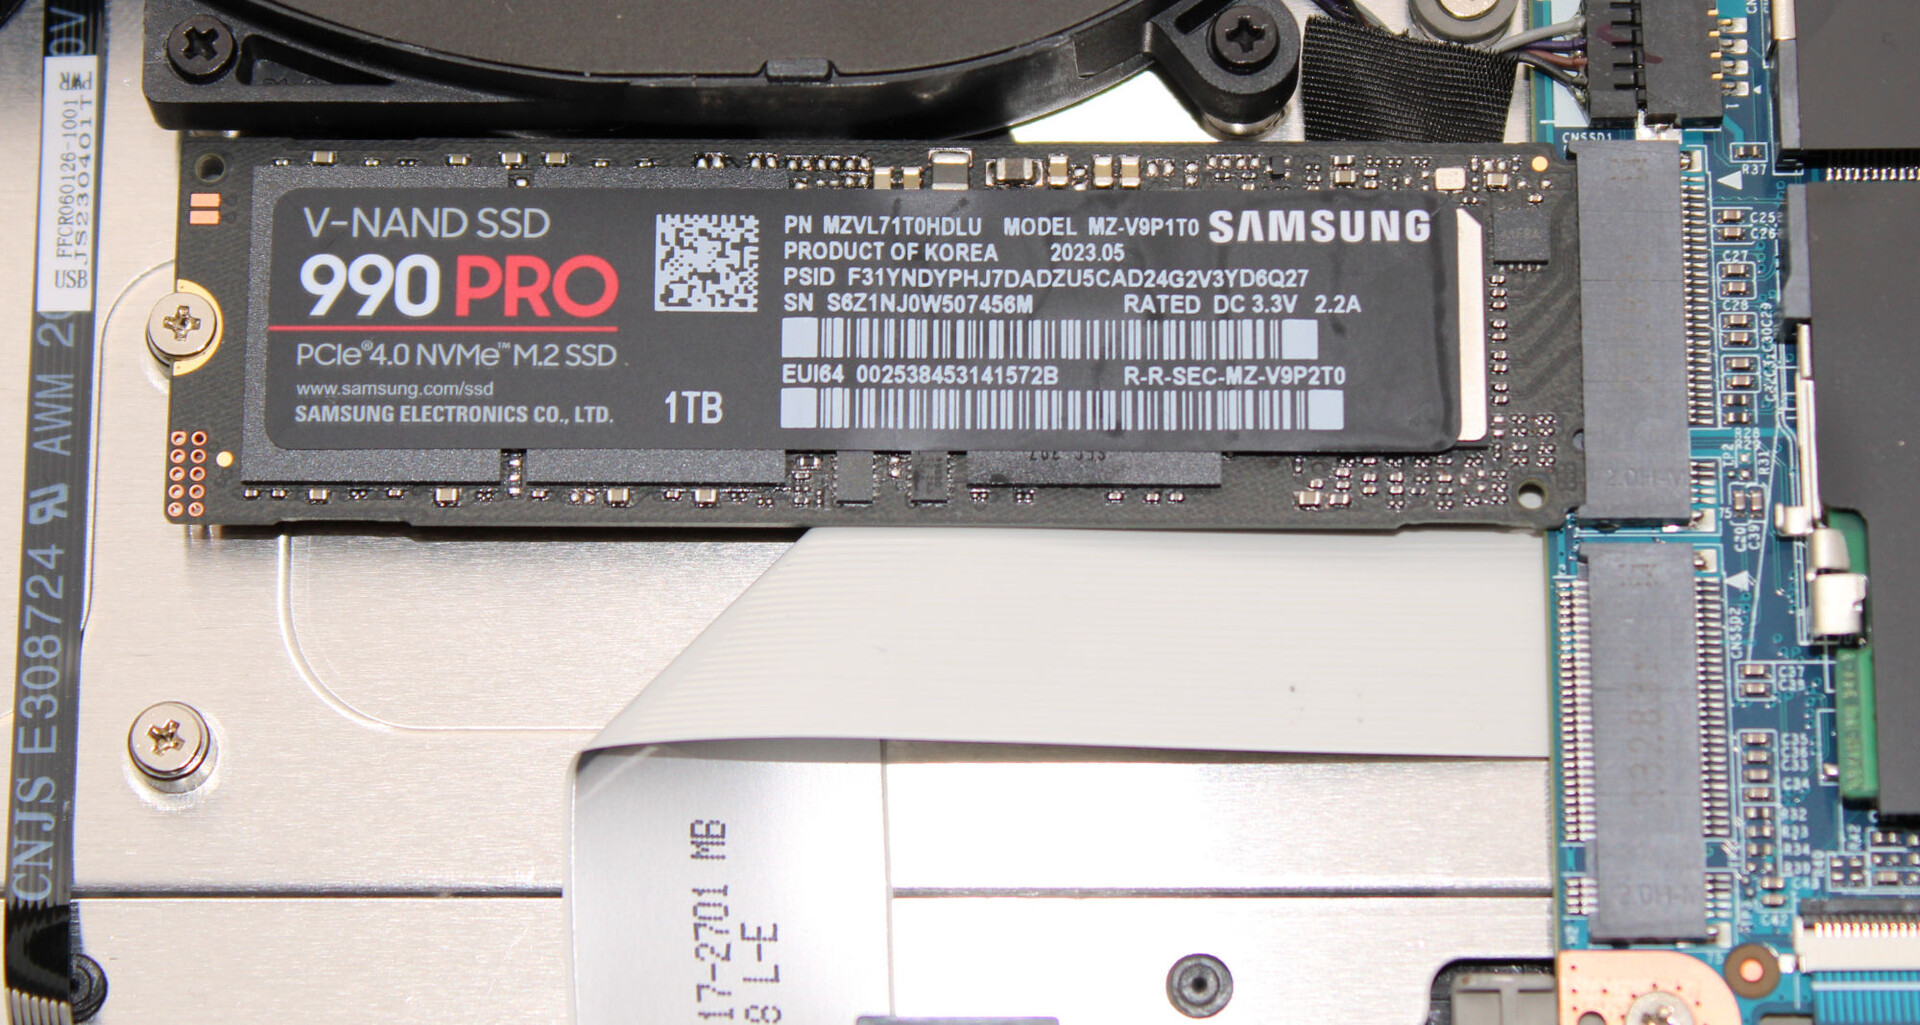
Memoria di massa
L'Apex può ospitare un totale di due unità SSD PCIe 4 in formato M.2 2280. È supportato il RAID-0/1. Il dispositivo di prova che ci è stato fornito ha a bordo un'unità SSD Samsung da 1 TB (PCIe 4, M.2 2280) che offre eccellenti velocità di trasferimento. Positivo: Non si è verificato il throttling dovuto al calore.

* ... Meglio usare valori piccoli
Continuous Performance Read: DiskSpd Read Loop, Queue Depth 8
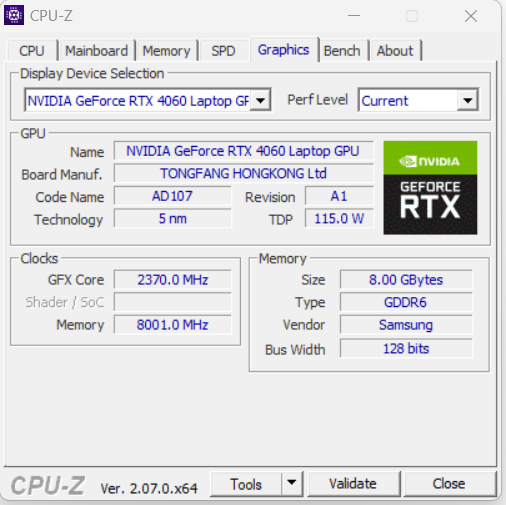
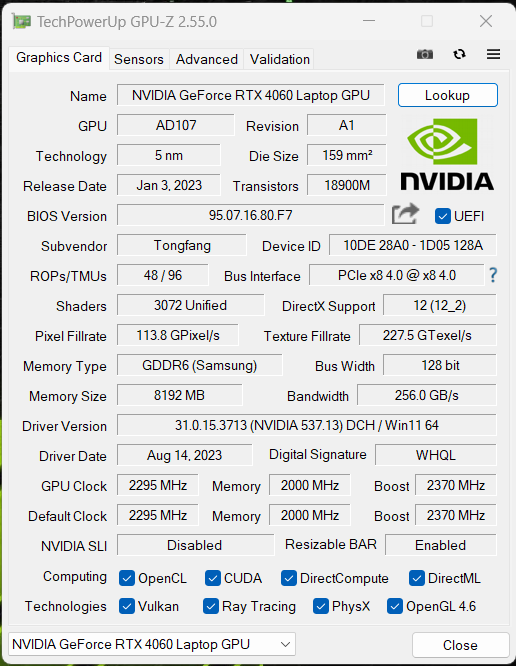
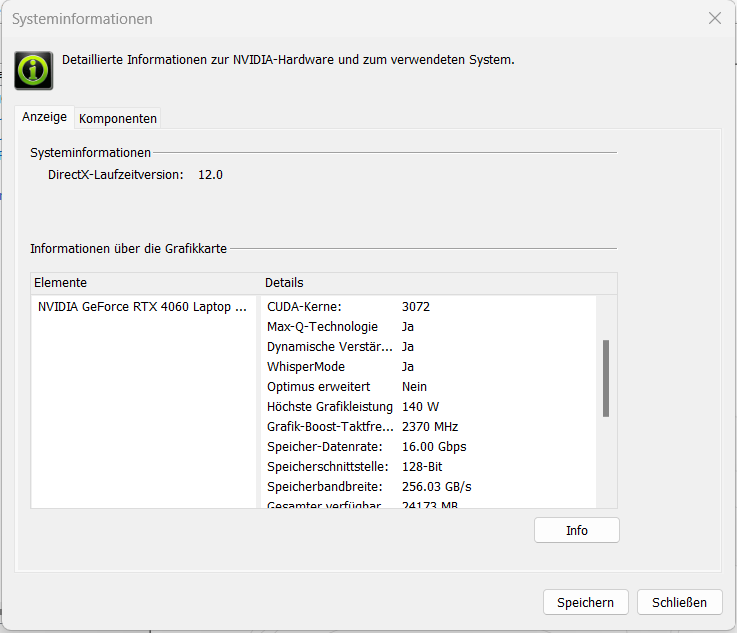
Scheda grafica
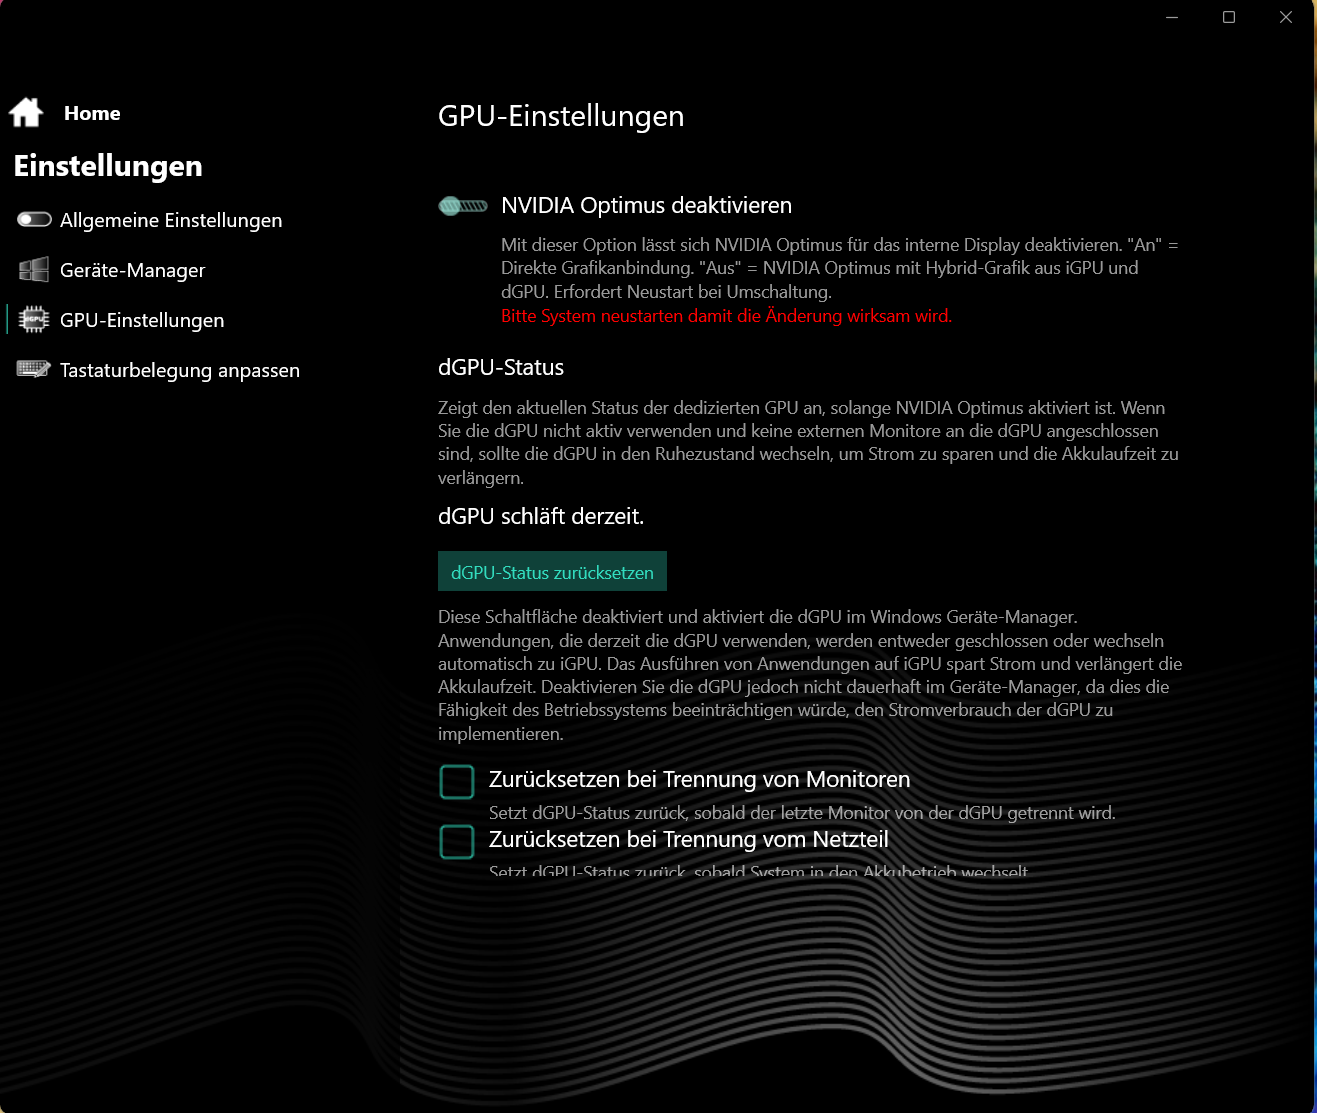
LaGeForce RTX 4060 offre 3.072 shader, un bus largo 128 bit e una veloce RAM GDDR6 (8.192 MB). Schenker ha impostato il TGP massimo a un valore di 140 watt (115 watt + 25 watt di boost dinamico) - di più non è possibile. Secondo il test di Witcher 3, il TGP non è al massimo.
I risultati del benchmark sono superiori alla media della precedente RTX 4060. La modalità dGPU non comporta alcun aumento delle prestazioni. Il passaggio tra dGPU e Optimus richiede un riavvio - Advanced Optimus non è supportato.
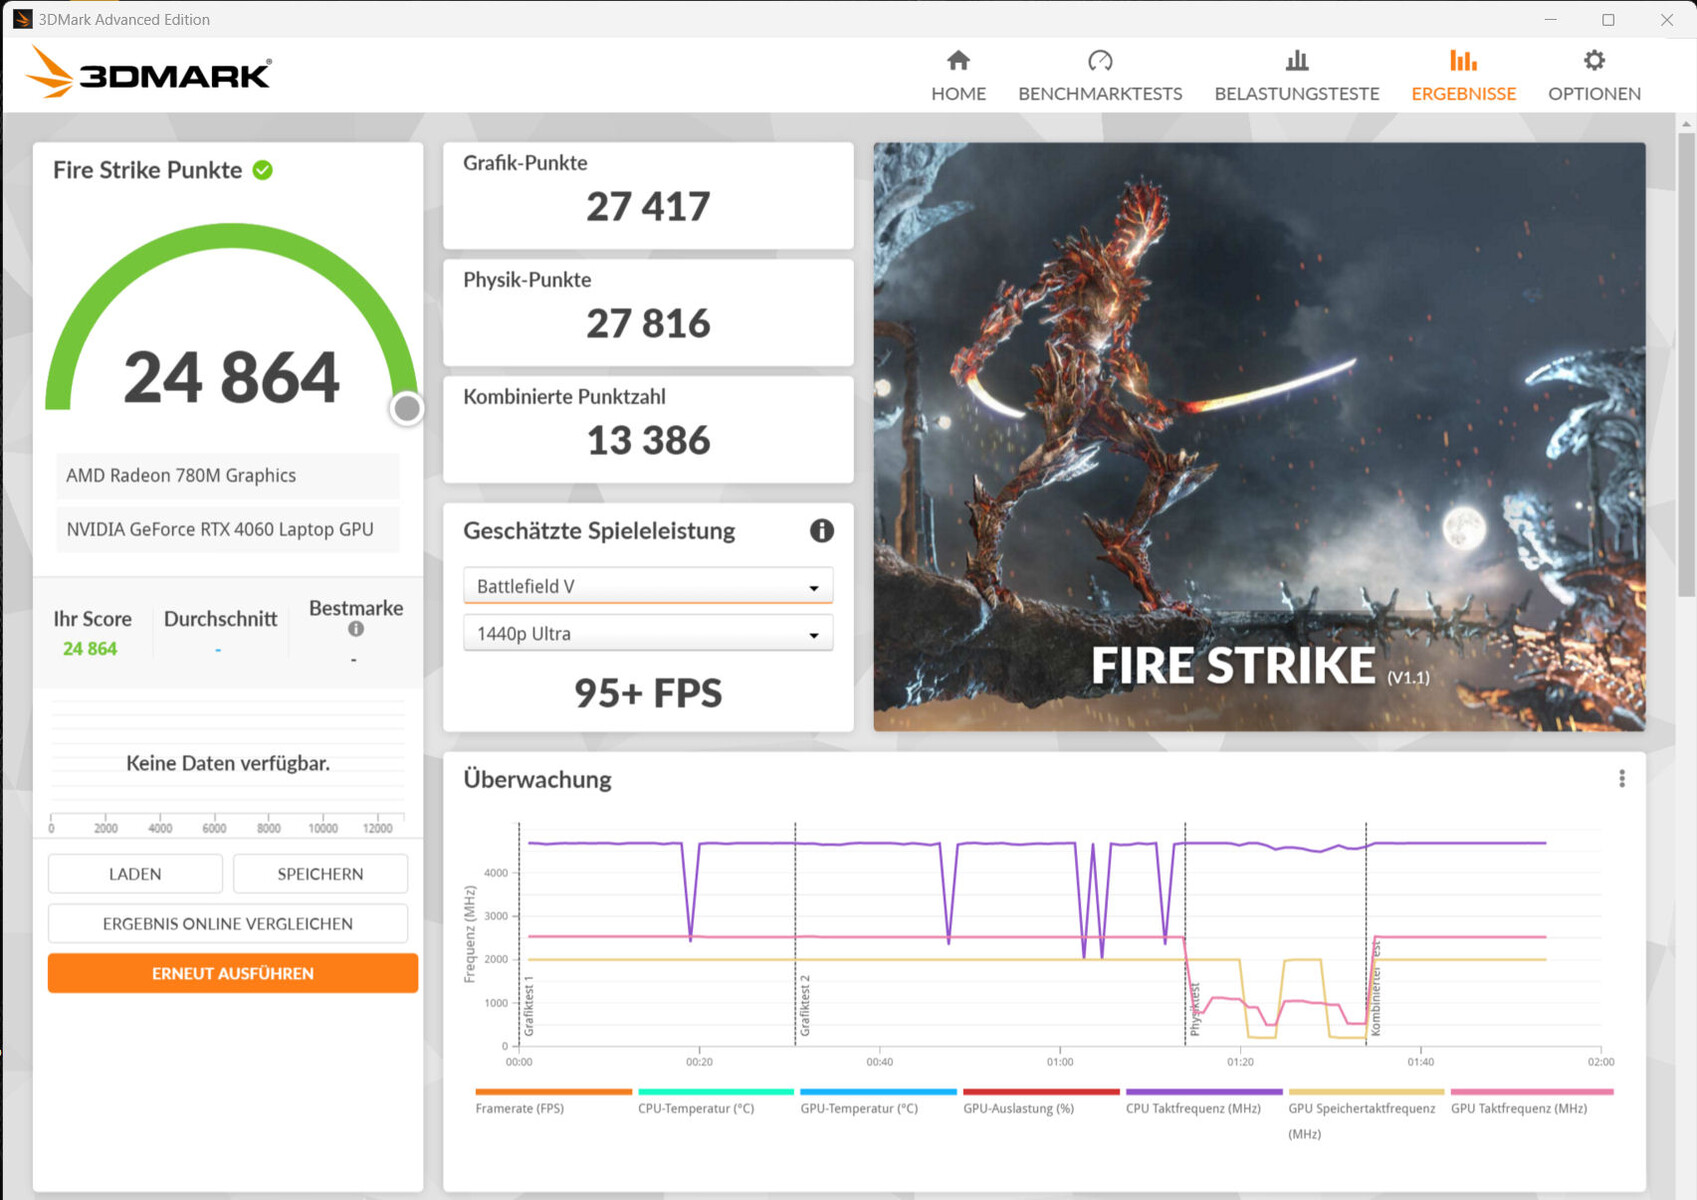
| 3DMark 06 Standard Score | 49011 punti | |
| 3DMark 11 Performance | 32639 punti | |
| 3DMark Cloud Gate Standard Score | 64881 punti | |
| 3DMark Fire Strike Score | 24864 punti | |
| 3DMark Time Spy Score | 10640 punti | |
Aiuto | ||
* ... Meglio usare valori piccoli
Prestazioni di gioco
Il computer Schenker è progettato per i giochi in QHD con impostazioni elevate o massime. Risoluzioni più elevate sono utilizzabili con impostazioni talvolta ridotte se collegate a un monitor appropriato. È possibile ottenere frame rate tipici della media RTX 4060. In generale, la modalità dGP non comporta un aumento delle prestazioni. Solo nel gioco "X Plane 11" è stato registrato un aumento del frame rate del 10-20%.
| The Witcher 3 - 1920x1080 Ultra Graphics & Postprocessing (HBAO+) | |
| Media della classe Gaming (104.7 - 240, n=7, ultimi 2 anni) | |
| Lenovo Legion Pro 5 16IRX8 | |
| Alienware m16 R1 Intel | |
| Acer Nitro 17 AN17-51-71ER | |
| MSI Katana 17 B13VFK | |
| Schenker XMG Apex 17 (Late 23) | |
| Medion Erazer Defender P40 | |
| Media NVIDIA GeForce RTX 4060 Laptop GPU (77 - 159.7, n=42) | |
| Cyberpunk 2077 1.6 - 1920x1080 Ultra Preset | |
| Lenovo Legion Pro 5 16IRX8 | |
| Alienware m16 R1 Intel | |
| Schenker XMG Apex 17 (Late 23) | |
| Acer Nitro 17 AN17-51-71ER | |
| Media NVIDIA GeForce RTX 4060 Laptop GPU (57.9 - 93.2, n=18) | |
| MSI Katana 17 B13VFK | |
| Ratchet & Clank Rift Apart | |
| 1920x1080 Very High Preset AA:T | |
| Alienware m16 R1 Intel | |
| Schenker XMG Apex 17 (Late 23) | |
| Media NVIDIA GeForce RTX 4060 Laptop GPU (51.6 - 54.8, n=4) | |
| 2560x1440 Very High Preset AA:T | |
| Alienware m16 R1 Intel | |
| Media NVIDIA GeForce RTX 4060 Laptop GPU (45.6 - 46.6, n=3) | |
| Schenker XMG Apex 17 (Late 23) | |
| 1920x1080 Very High Preset + Very High Raytracing AA:T | |
| Alienware m16 R1 Intel | |
| Media NVIDIA GeForce RTX 4060 Laptop GPU (39.1 - 44.5, n=3) | |
| Schenker XMG Apex 17 (Late 23) | |
| Atlas Fallen | |
| 1920x1080 High Preset | |
| Schenker XMG Apex 17 (Late 23) | |
| Alienware m16 R1 Intel | |
| Media NVIDIA GeForce RTX 4060 Laptop GPU (88.8 - 133.3, n=3) | |
| 2560x1440 Very High Preset | |
| Alienware m16 R1 Intel | |
| Schenker XMG Apex 17 (Late 23) | |
| Media NVIDIA GeForce RTX 4060 Laptop GPU (75 - 79.2, n=3) | |
| Immortals of Aveum | |
| 1920x1080 Ultra AF:16x | |
| Alienware m16 R1 Intel | |
| Schenker XMG Apex 17 (Late 23) | |
| Media NVIDIA GeForce RTX 4060 Laptop GPU (33 - 48.9, n=4) | |
| 2560x1440 Ultra AF:16x | |
| Alienware m16 R1 Intel | |
| Schenker XMG Apex 17 (Late 23) | |
| Media NVIDIA GeForce RTX 4060 Laptop GPU (20.5 - 32.8, n=4) | |
| Armored Core 6 | |
| 1920x1080 Maximum Preset | |
| Schenker XMG Apex 17 (Late 23) | |
| Media NVIDIA GeForce RTX 4060 Laptop GPU (95.6 - 100.8, n=3) | |
| Media della classe Gaming (n=1ultimi 2 anni) | |
| 2560x1440 Maximum Preset | |
| Schenker XMG Apex 17 (Late 23) | |
| Media NVIDIA GeForce RTX 4060 Laptop GPU (73.2 - 74.6, n=3) | |
| Media della classe Gaming (n=1ultimi 2 anni) | |
| Starfield | |
| 1920x1080 Ultra Preset | |
| Media della classe Gaming (n=1ultimi 2 anni) | |
| Media NVIDIA GeForce RTX 4060 Laptop GPU (39.7 - 41, n=3) | |
| Schenker XMG Apex 17 (Late 23) | |
| 2560x1440 Ultra Preset | |
| Media della classe Gaming (n=1ultimi 2 anni) | |
| Schenker XMG Apex 17 (Late 23) | |
| Media NVIDIA GeForce RTX 4060 Laptop GPU (32.5 - 32.6, n=2) | |
| Lies of P | |
| 1920x1080 Best Preset | |
| Schenker XMG Apex 17 (Late 23) | |
| Media NVIDIA GeForce RTX 4060 Laptop GPU (106.2 - 126.6, n=3) | |
| 2560x1440 Best Preset | |
| Schenker XMG Apex 17 (Late 23) | |
| Media NVIDIA GeForce RTX 4060 Laptop GPU (83.6 - 85.6, n=2) | |
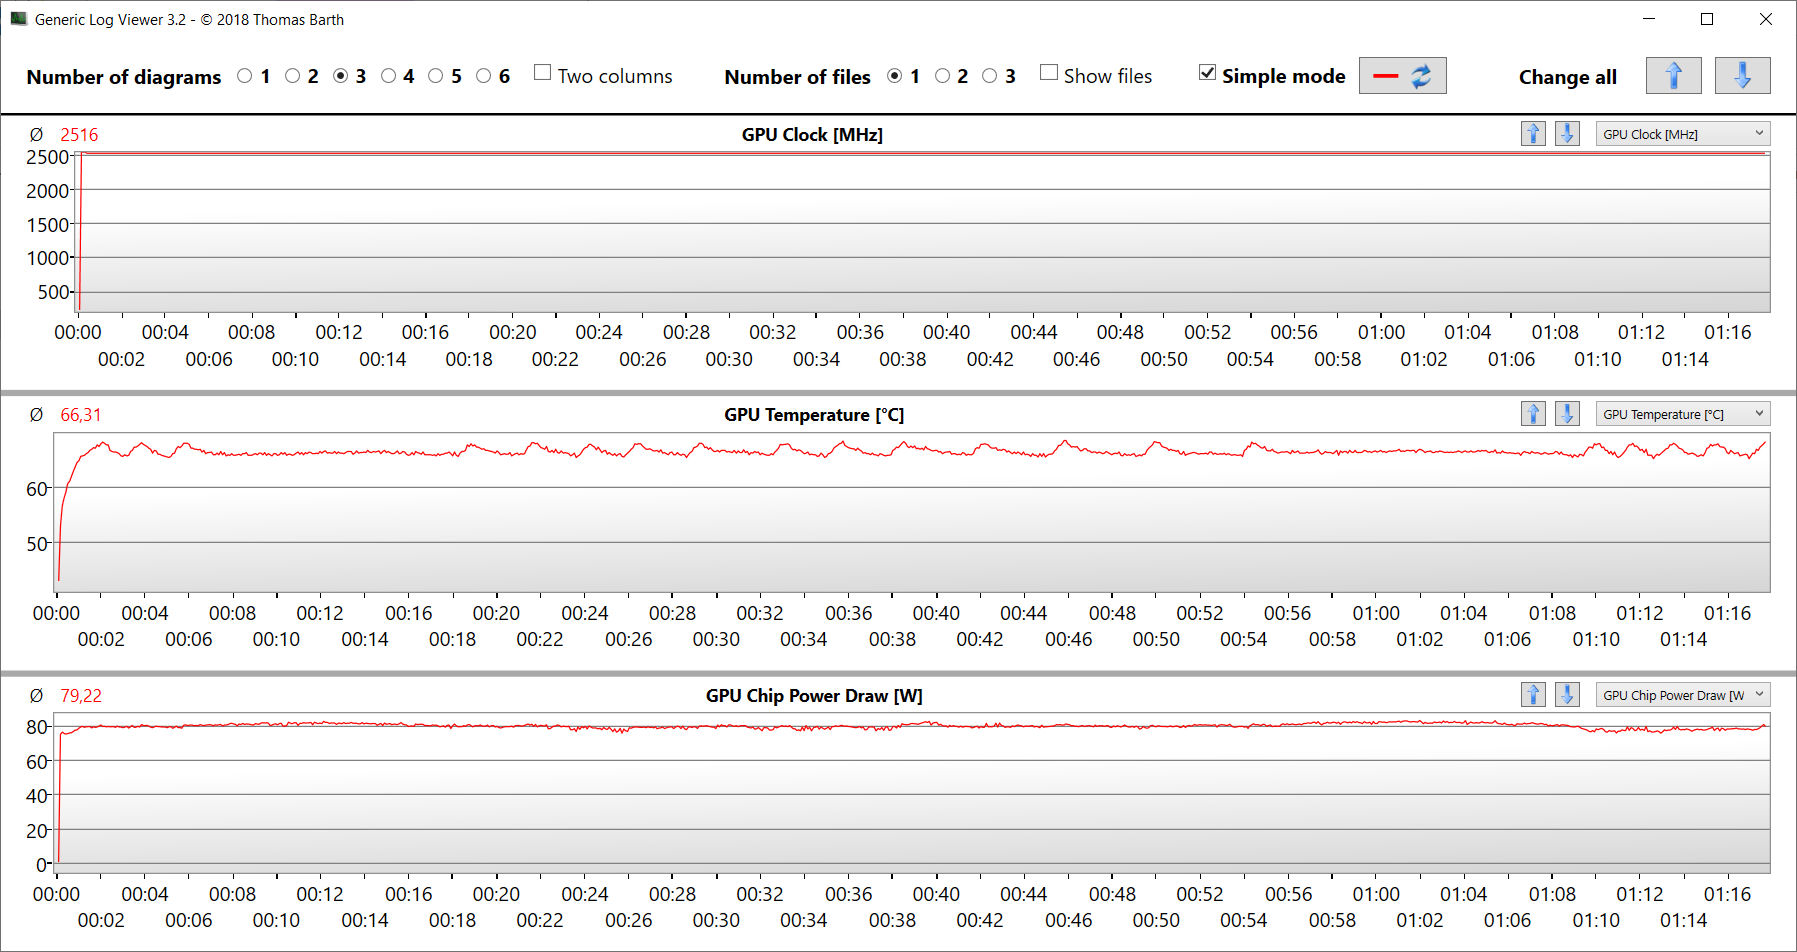
Per verificare se la frequenza dei fotogrammi è rimasta costante per un periodo di tempo più lungo, abbiamo eseguito il gioco "The Witcher 3" per circa 60 minuti alla risoluzione Full HD e con le impostazioni di qualità massime. Il personaggio del gioco non è stato spostato. Non abbiamo notato alcun calo della frequenza dei fotogrammi.
Witcher 3 FPS diagram

| basso | medio | alto | ultra | QHD | |
|---|---|---|---|---|---|
| The Witcher 3 (2015) | 401.8 | 316.1 | 198.2 | 103.4 | 76.3 |
| Dota 2 Reborn (2015) | 169.4 | 154.1 | 147.6 | 139.8 | |
| Final Fantasy XV Benchmark (2018) | 223 | 148.4 | 103.4 | 76.8 | |
| X-Plane 11.11 (2018) | 127.3 | 110.9 | 88.2 | ||
| Far Cry 5 (2018) | 163 | 145 | 139 | 130 | 106 |
| Strange Brigade (2018) | 399 | 279 | 221 | 190.1 | 126.9 |
| Gears Tactics (2020) | 320.2 | 255 | 180.5 | 125.9 | 85.8 |
| GRID Legends (2022) | 152.8 | 141.6 | 132.4 | 120.6 | 103.2 |
| Cyberpunk 2077 1.6 (2022) | 129.9 | 101 | 87.5 | 79.8 | 49.1 |
| Spider-Man Miles Morales (2022) | 123.7 | 115.9 | 110.3 | 103.8 | 77.8 |
| F1 23 (2023) | 249 | 244 | 186.2 | 60.1 | 37.8 |
| Ratchet & Clank Rift Apart (2023) | 85.4 | 74.7 | 60.6 | 54.6 | 45.6 |
| Atlas Fallen (2023) | 146 | 143.2 | 133.3 | 112.6 | 79.1 |
| Immortals of Aveum (2023) | 65.7 | 53.1 | 44 | 30.2 | |
| Armored Core 6 (2023) | 111.1 | 108.7 | 109.4 | 100.8 | 74.6 |
| Starfield (2023) | 70.3 | 62.5 | 47.1 | 39.7 | 32.6 |
| The Crew Motorfest (2023) | 60 | 60 | 60 | 60 | 54 |
| Lies of P (2023) | 186.6 | 163.8 | 141.9 | 126.6 | 85.6 |
Emissioni - Il portatile da gioco può funzionare in modo silenzioso
Emissioni acustiche
In generale, consideriamo l'Apex con livelli di rumorosità da bassi a moderati. Nell'uso quotidiano (ufficio, internet, banche...) le ventole spesso girano lentamente o addirittura rimangono ferme. Anche sotto carico medio il livello di rumorosità è basso. La situazione è diversa nel settore dei giochi: I livelli di pressione sonora possono raggiungere i 54 dB(A) ("overboost"). In modalità "enthusiast", con 50 dB(A), i livelli di rumore possono essere definiti piuttosto bassi. La modalità "balanced" è notevolmente più silenziosa: tuttavia, un livello di 34 dB(A) comporta una significativa perdita di prestazioni della GPU.
Le ventole emettono principalmente un rumore sonoro. I fastidiosi rumori di fondo sono impercettibili.
Rumorosità
| Idle |
| 25 / 29 / 33 dB(A) |
| Sotto carico |
| 37 / 54 dB(A) |
 | ||
30 dB silenzioso 40 dB(A) udibile 50 dB(A) rumoroso |
||
min: | ||
| Schenker XMG Apex 17 (Late 23) R7 7840HS, GeForce RTX 4060 Laptop GPU | Alienware m16 R1 Intel i7-13700HX, GeForce RTX 4060 Laptop GPU | Lenovo Legion Pro 5 16IRX8 i7-13700HX, GeForce RTX 4060 Laptop GPU | Acer Nitro 17 AN17-51-71ER i7-13700H, GeForce RTX 4060 Laptop GPU | Medion Erazer Defender P40 i7-13700HX, GeForce RTX 4060 Laptop GPU | MSI Katana 17 B13VFK i7-13620H, GeForce RTX 4060 Laptop GPU | |
|---|---|---|---|---|---|---|
| Noise | -2% | 9% | 2% | -10% | -8% | |
| off /ambiente * (dB) | 24 | 25 -4% | 23 4% | 24 -0% | 25 -4% | 24.5 -2% |
| Idle Minimum * (dB) | 25 | 25 -0% | 23.1 8% | 24 4% | 26 -4% | 24.5 2% |
| Idle Average * (dB) | 29 | 26 10% | 23.1 20% | 24 17% | 27 7% | 24.5 16% |
| Idle Maximum * (dB) | 33 | 27 18% | 26.6 19% | 32.32 2% | 32 3% | 40 -21% |
| Load Average * (dB) | 37 | 52 -41% | 34.7 6% | 35.18 5% | 53 -43% | 48.3 -31% |
| Witcher 3 ultra * (dB) | 50 | 51 -2% | 47.6 5% | 54.78 -10% | 56 -12% | 56 -12% |
| Load Maximum * (dB) | 54 | 53 2% | 54.8 -1% | 54.78 -1% | 64 -19% | 59.1 -9% |
* ... Meglio usare valori piccoli
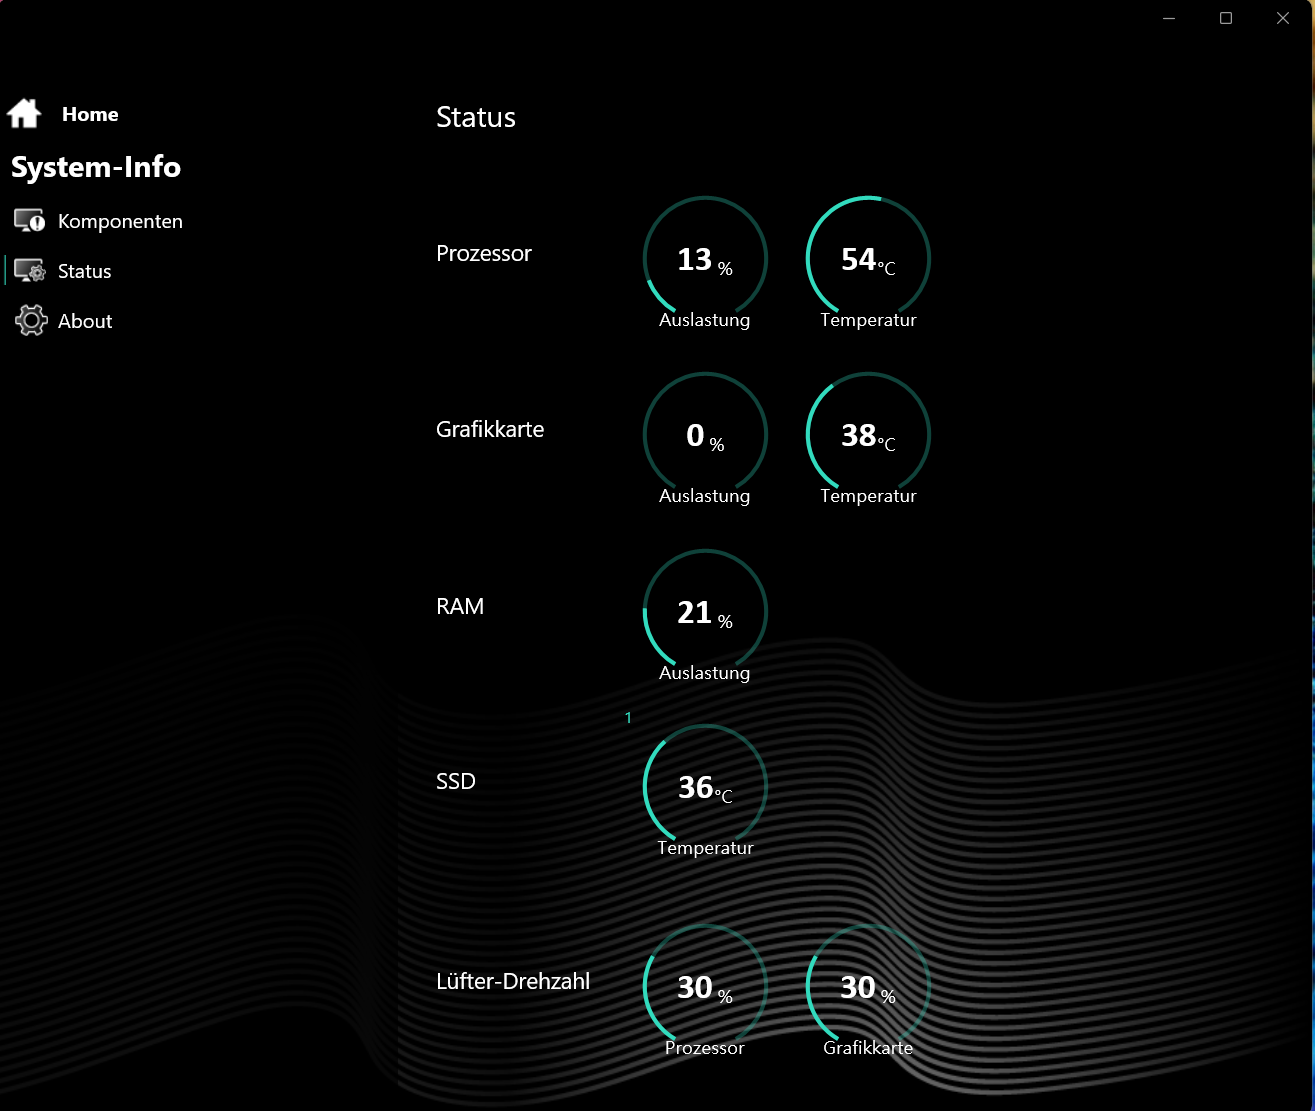
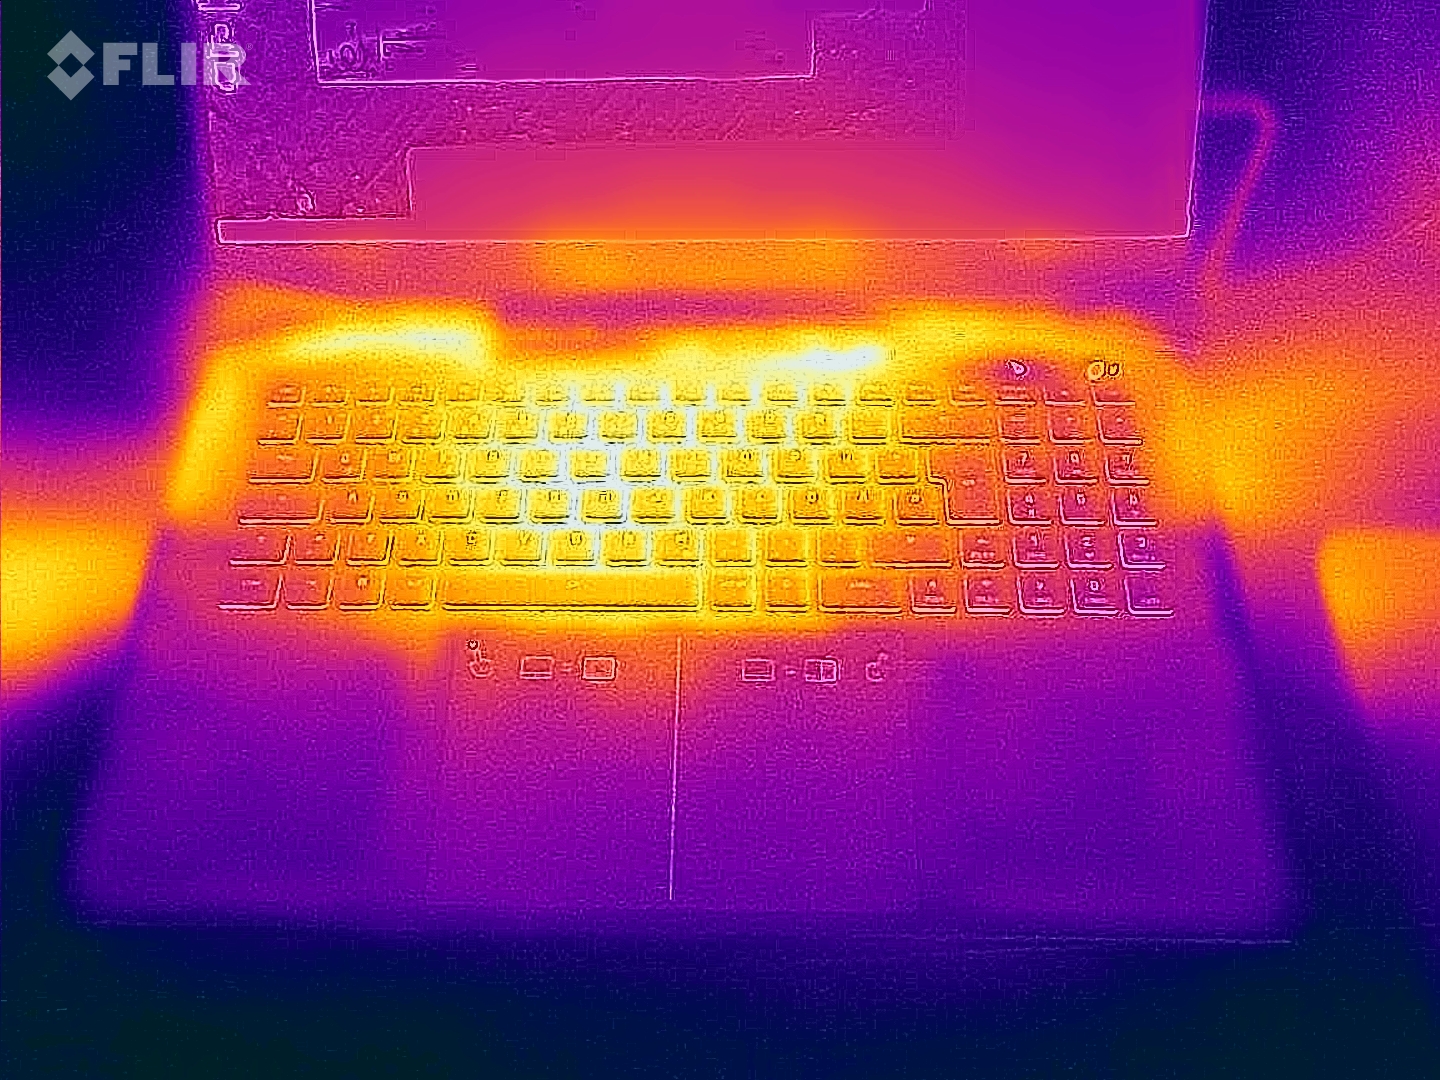
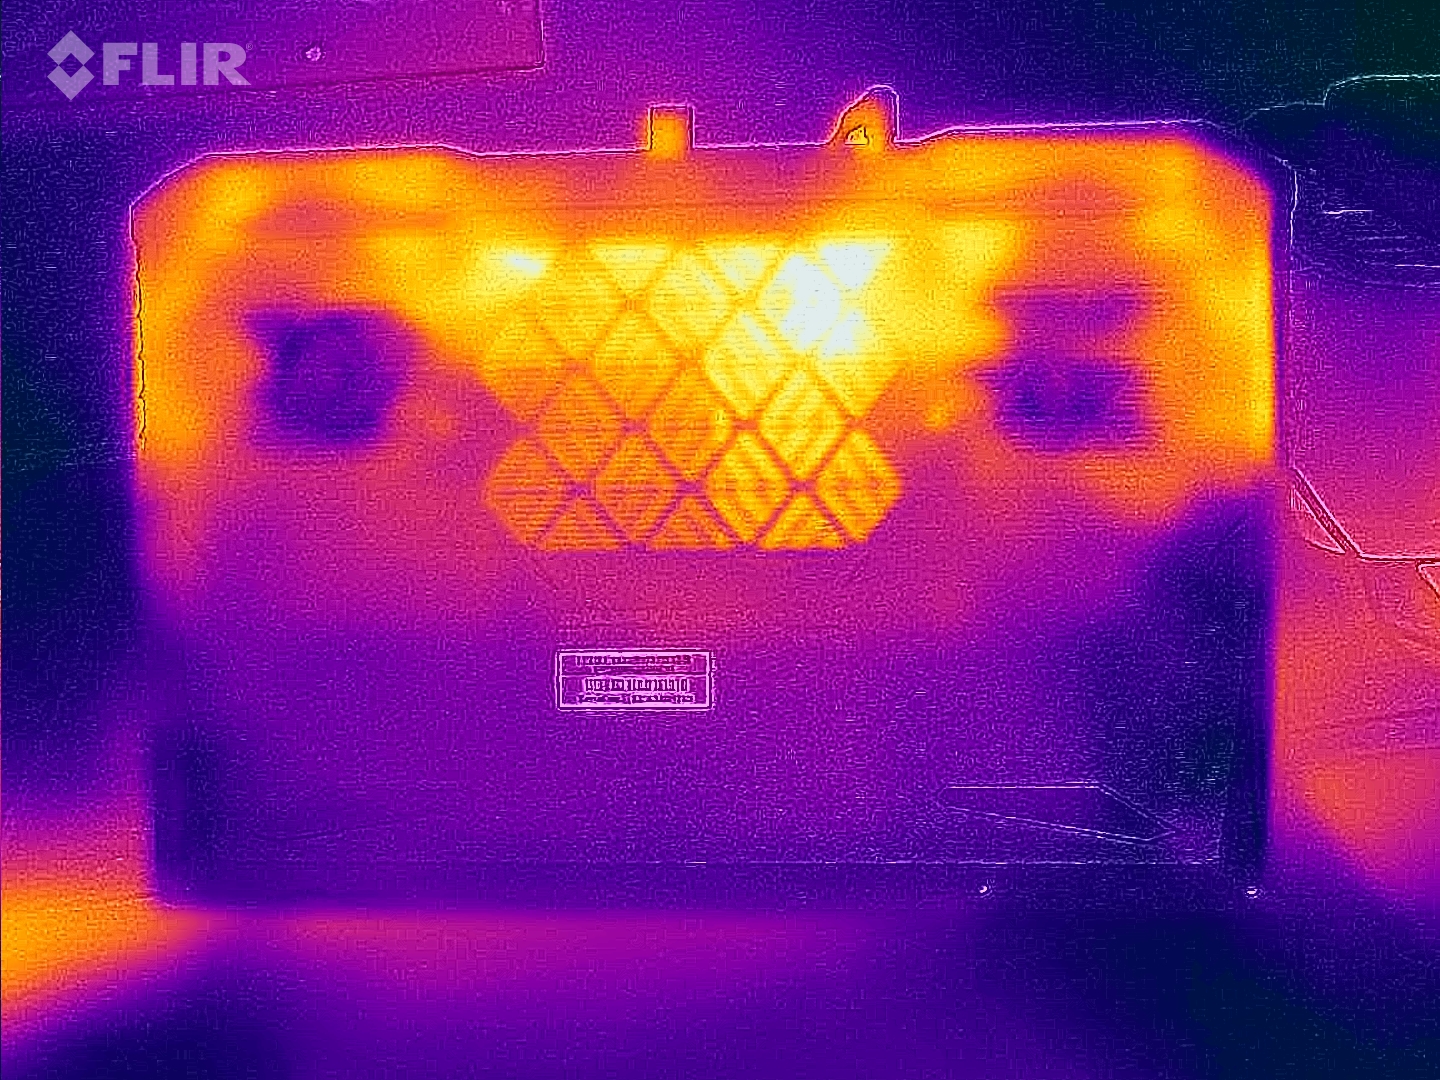
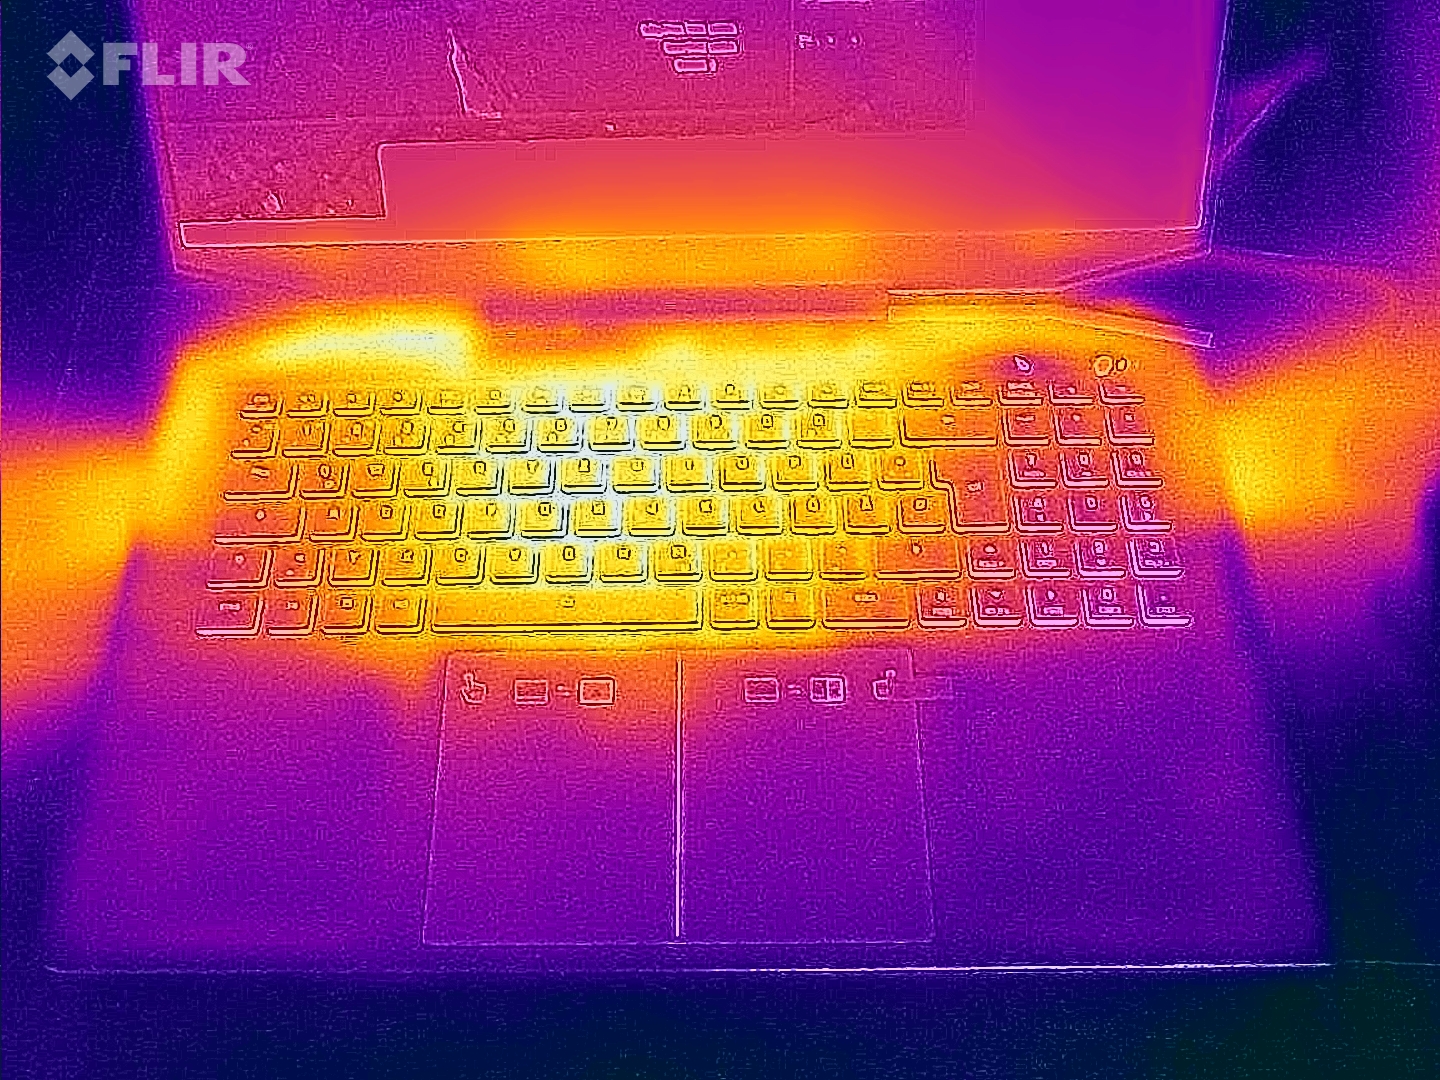
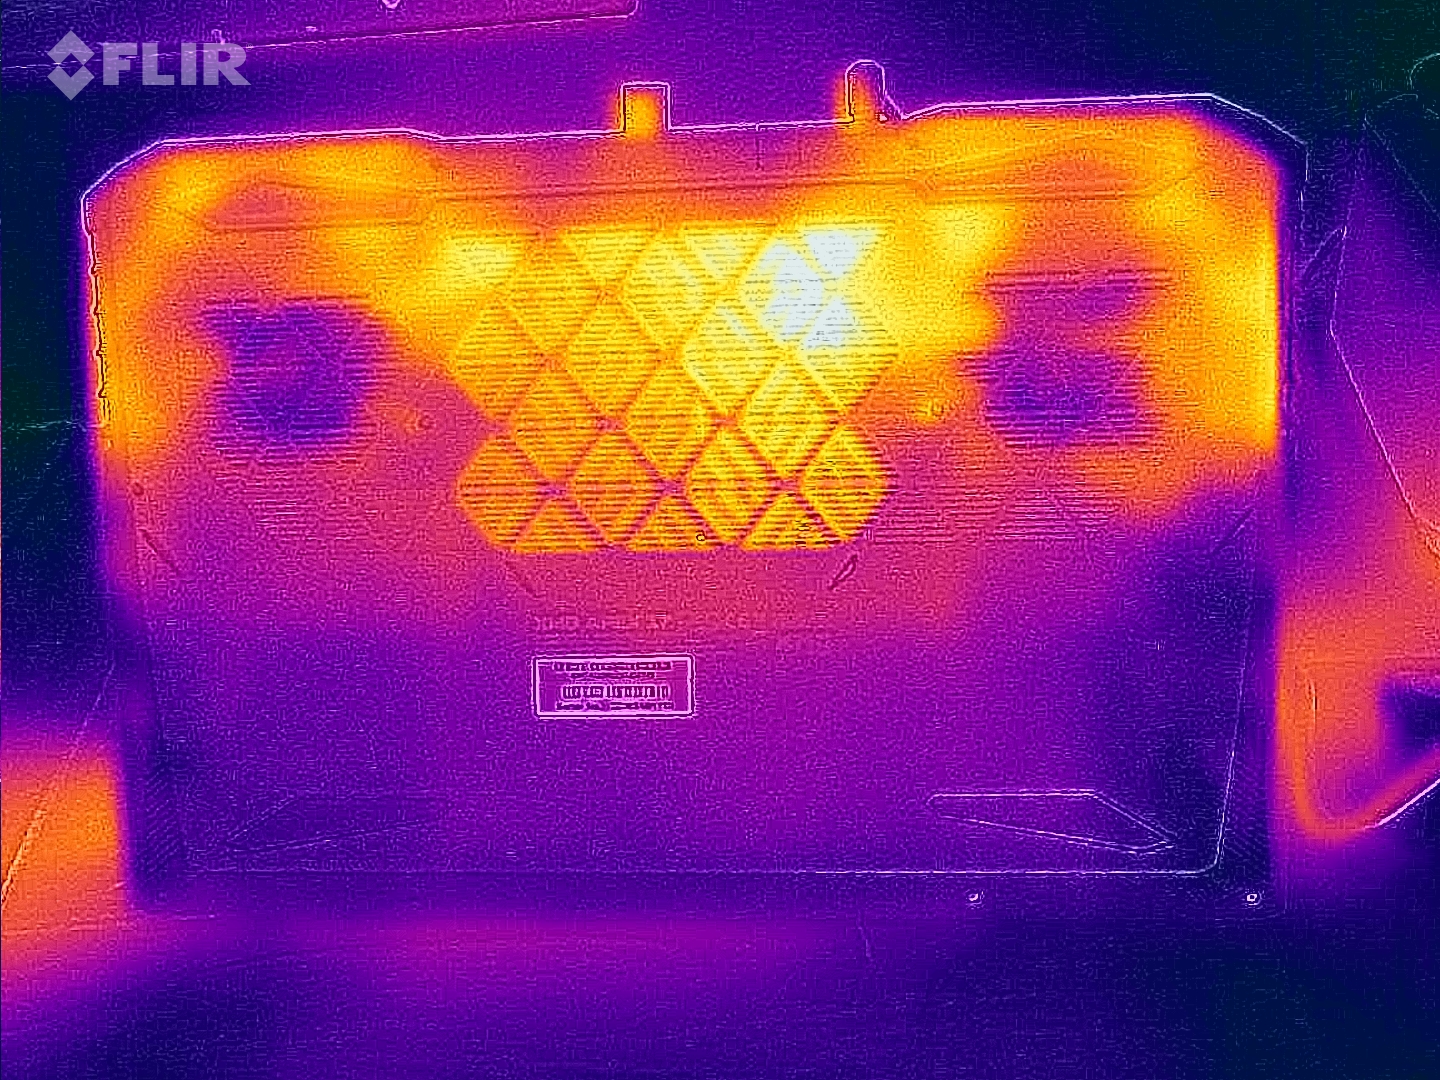
Temperatura
Lo stress test e il test Witcher 3 hanno causato un notevole riscaldamento del portatile in alcuni punti. Tuttavia, tutto è ancora in dimensioni accettabili. Nell'uso quotidiano (ufficio, internet) le temperature del case rimangono nella zona verde.
(-) La temperatura massima sul lato superiore è di 51 °C / 124 F, rispetto alla media di 40.4 °C / 105 F, che varia da 21.2 a 68.8 °C per questa classe Gaming.
(-) Il lato inferiore si riscalda fino ad un massimo di 54 °C / 129 F, rispetto alla media di 43.2 °C / 110 F
(+) In idle, la temperatura media del lato superiore è di 30.3 °C / 87 F, rispetto alla media deld ispositivo di 33.9 °C / 93 F.
(-) Riproducendo The Witcher 3, la temperatura media per il lato superiore e' di 38.2 °C / 101 F, rispetto alla media del dispositivo di 33.9 °C / 93 F.
(+) I poggiapolsi e il touchpad sono piu' freddi della temperatura della pelle con un massimo di 31 °C / 87.8 F e sono quindi freddi al tatto.
(-) La temperatura media della zona del palmo della mano di dispositivi simili e'stata di 28.8 °C / 83.8 F (-2.2 °C / -4 F).
| Schenker XMG Apex 17 (Late 23) AMD Ryzen 7 7840HS, NVIDIA GeForce RTX 4060 Laptop GPU | Alienware m16 R1 Intel Intel Core i7-13700HX, NVIDIA GeForce RTX 4060 Laptop GPU | Lenovo Legion Pro 5 16IRX8 Intel Core i7-13700HX, NVIDIA GeForce RTX 4060 Laptop GPU | Acer Nitro 17 AN17-51-71ER Intel Core i7-13700H, NVIDIA GeForce RTX 4060 Laptop GPU | Medion Erazer Defender P40 Intel Core i7-13700HX, NVIDIA GeForce RTX 4060 Laptop GPU | MSI Katana 17 B13VFK Intel Core i7-13620H, NVIDIA GeForce RTX 4060 Laptop GPU | |
|---|---|---|---|---|---|---|
| Heat | -5% | 8% | 4% | 16% | 9% | |
| Maximum Upper Side * (°C) | 51 | 49 4% | 42.8 16% | 46 10% | 42 18% | 41.6 18% |
| Maximum Bottom * (°C) | 54 | 48 11% | 50 7% | 51 6% | 45 17% | 43.1 20% |
| Idle Upper Side * (°C) | 33 | 40 -21% | 29.6 10% | 34 -3% | 28 15% | 32 3% |
| Idle Bottom * (°C) | 34 | 39 -15% | 34 -0% | 33 3% | 30 12% | 35.8 -5% |
* ... Meglio usare valori piccoli
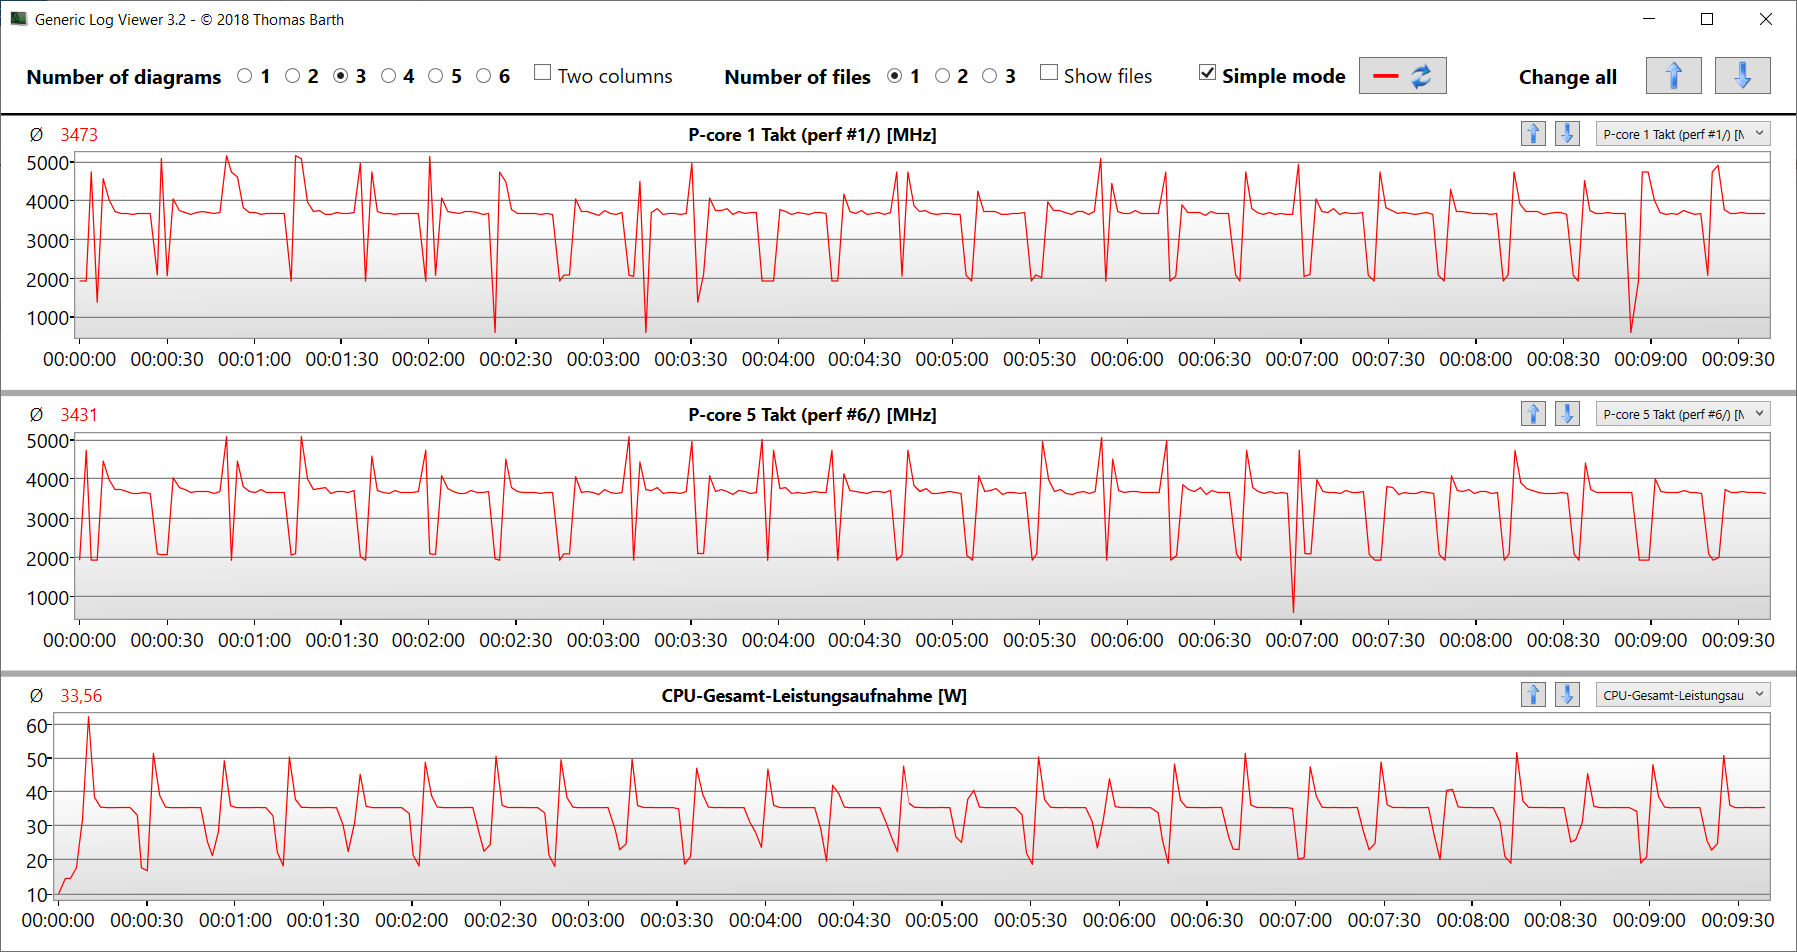
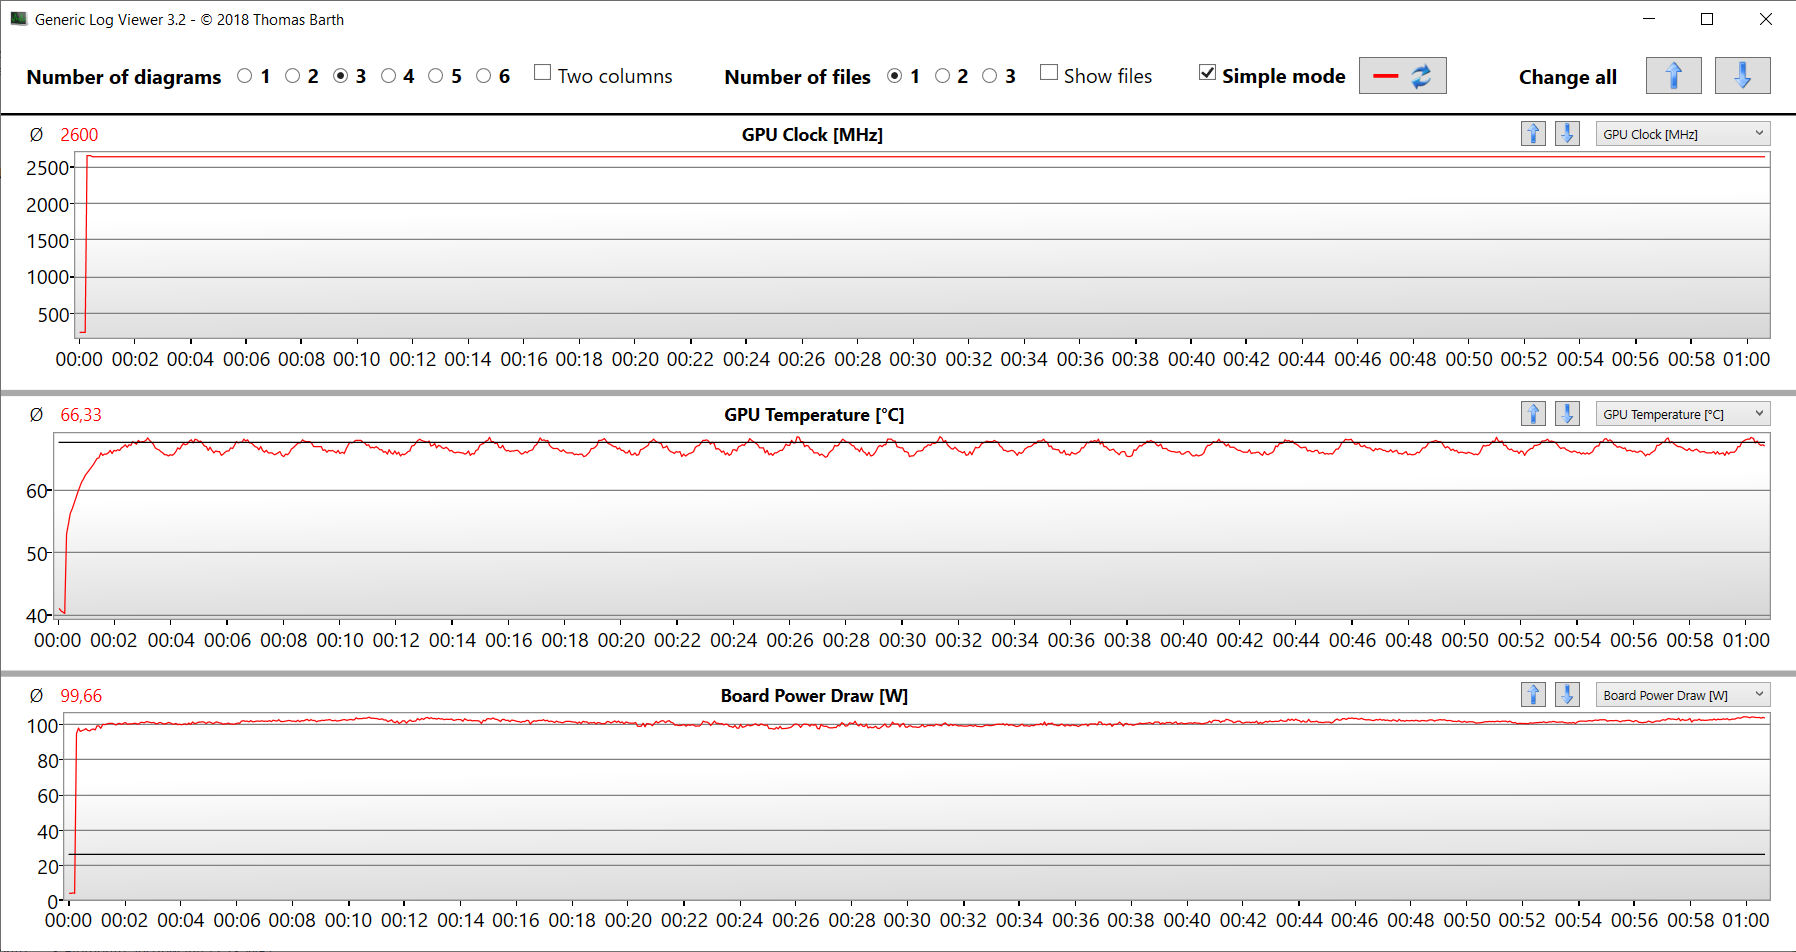
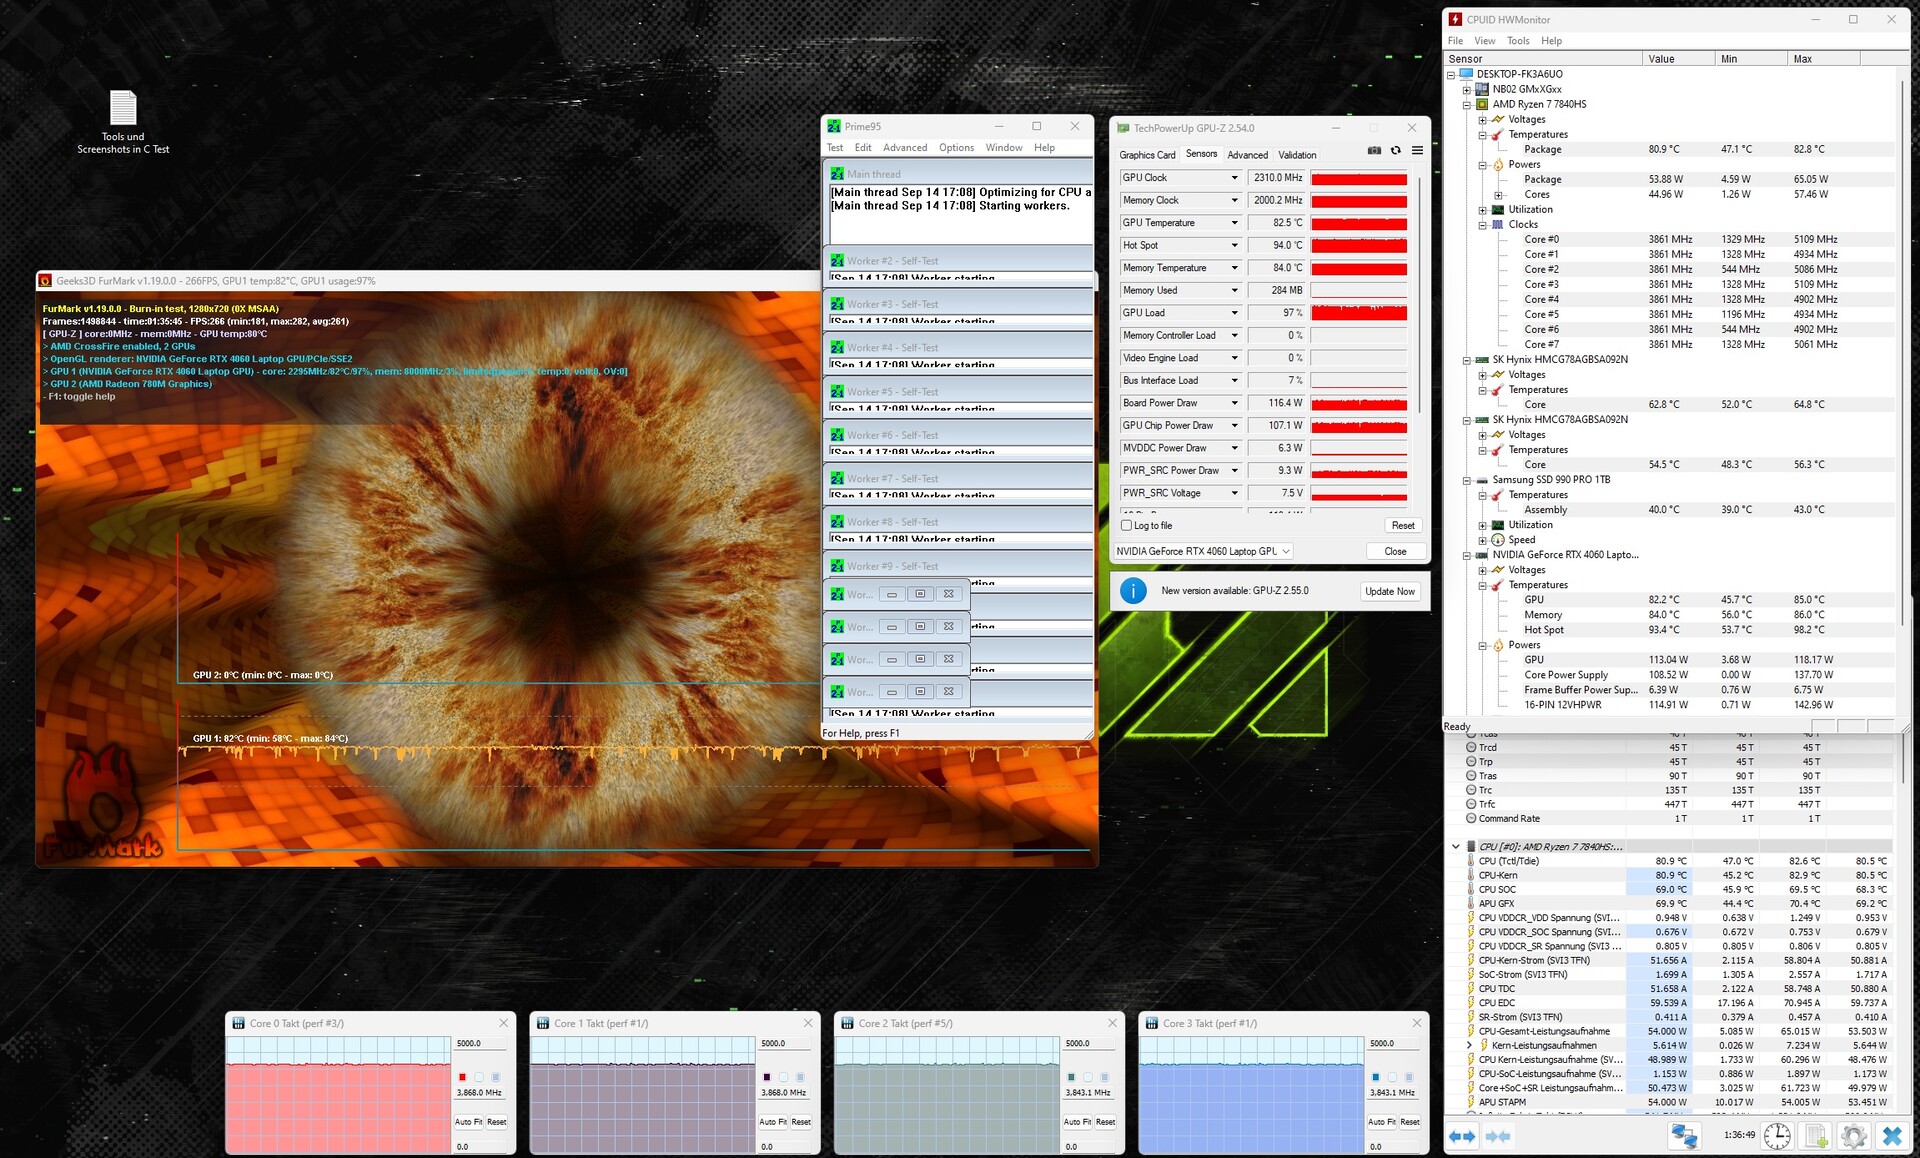
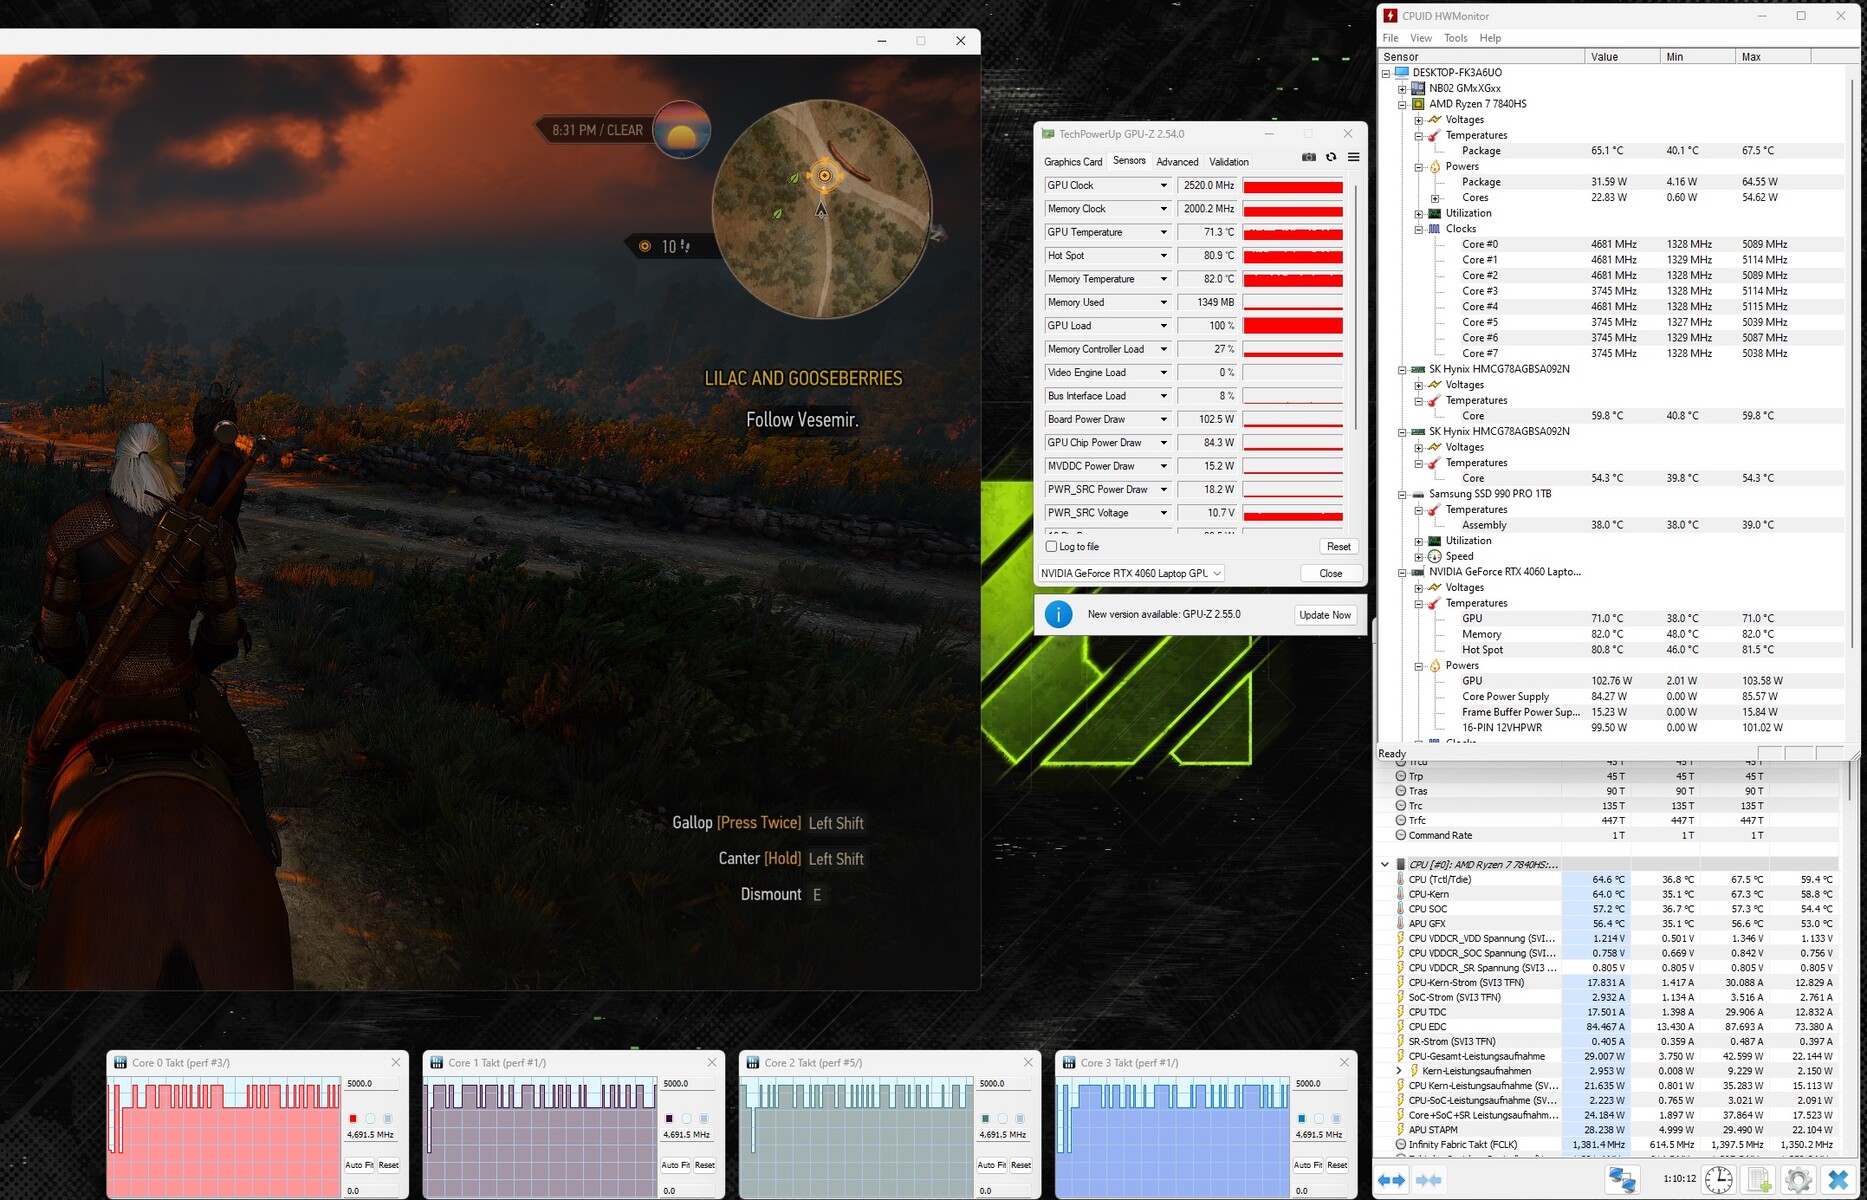
Test da sforzo
Lo stress test (Prime95 e Furmark in funzionamento continuo) rappresenta uno scenario estremo che ci permette di verificare la stabilità del sistema a pieno carico. La CPU ha funzionato per tutta la durata del test con velocità di clock comprese tra 3,8 e 3,9 GHz e i core grafici hanno funzionato da 2,2 a 2,4 GHz.
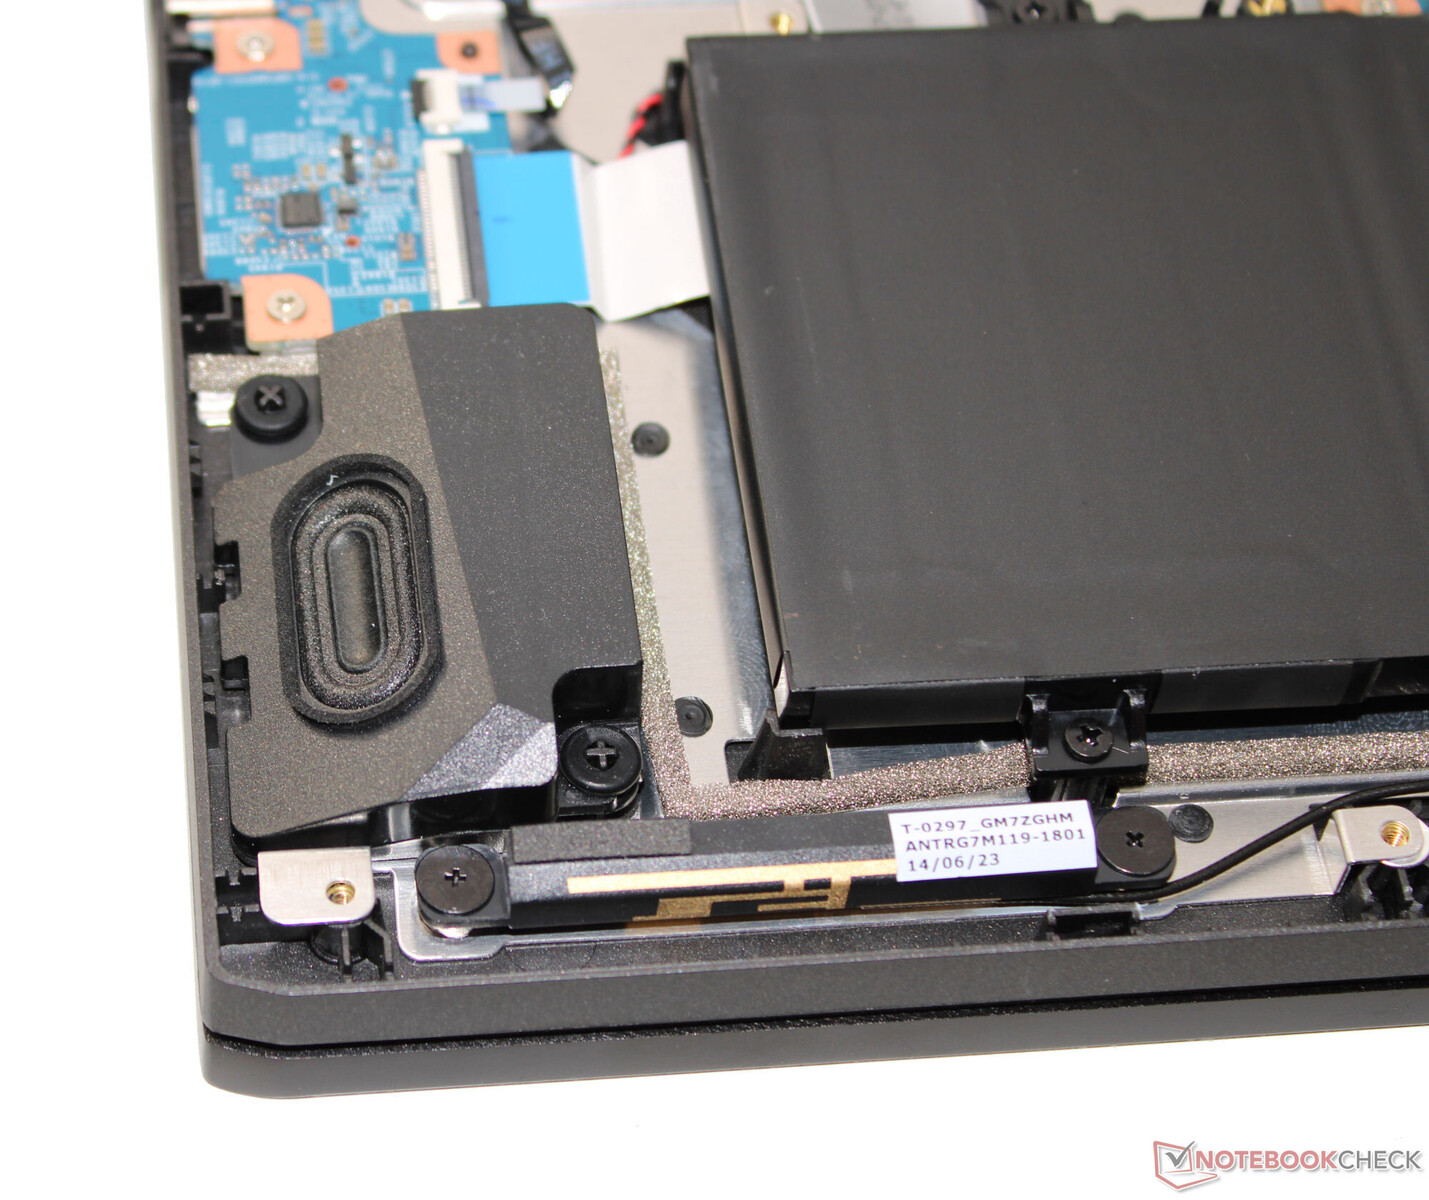
Altoparlanti
Gli altoparlanti stereo producono un suono decente, ma mancano di bassi. Per un'esperienza sonora migliore, si consiglia l'uso di cuffie o altoparlanti esterni.
Schenker XMG Apex 17 (Late 23) analisi audio
(±) | potenza degli altiparlanti media ma buona (80 dB)
Bassi 100 - 315 Hz
(-) | quasi nessun basso - in media 29% inferiori alla media
(±) | la linearità dei bassi è media (10.4% delta rispetto alla precedente frequenza)
Medi 400 - 2000 Hz
(+) | medi bilanciati - solo only 2.7% rispetto alla media
(+) | medi lineari (4.7% delta rispetto alla precedente frequenza)
Alti 2 - 16 kHz
(+) | Alti bilanciati - appena 2.1% dalla media
(+) | alti lineari (4.9% delta rispetto alla precedente frequenza)
Nel complesso 100 - 16.000 Hz
(±) | la linearità complessiva del suono è media (18.3% di differenza rispetto alla media
Rispetto alla stessa classe
» 58% di tutti i dispositivi testati in questa classe è stato migliore, 9% simile, 33% peggiore
» Il migliore ha avuto un delta di 6%, medio di 18%, peggiore di 132%
Rispetto a tutti i dispositivi testati
» 40% di tutti i dispositivi testati in questa classe è stato migliore, 8% similare, 52% peggiore
» Il migliore ha avuto un delta di 4%, medio di 23%, peggiore di 134%
Alienware m16 R1 Intel analisi audio
(+) | gli altoparlanti sono relativamente potenti (87 dB)
Bassi 100 - 315 Hz
(-) | quasi nessun basso - in media 24% inferiori alla media
(±) | la linearità dei bassi è media (13.5% delta rispetto alla precedente frequenza)
Medi 400 - 2000 Hz
(+) | medi bilanciati - solo only 1.4% rispetto alla media
(+) | medi lineari (3.3% delta rispetto alla precedente frequenza)
Alti 2 - 16 kHz
(+) | Alti bilanciati - appena 3.5% dalla media
(+) | alti lineari (4.6% delta rispetto alla precedente frequenza)
Nel complesso 100 - 16.000 Hz
(+) | suono nel complesso lineare (13.4% differenza dalla media)
Rispetto alla stessa classe
» 19% di tutti i dispositivi testati in questa classe è stato migliore, 7% simile, 74% peggiore
» Il migliore ha avuto un delta di 6%, medio di 18%, peggiore di 132%
Rispetto a tutti i dispositivi testati
» 14% di tutti i dispositivi testati in questa classe è stato migliore, 4% similare, 82% peggiore
» Il migliore ha avuto un delta di 4%, medio di 23%, peggiore di 134%
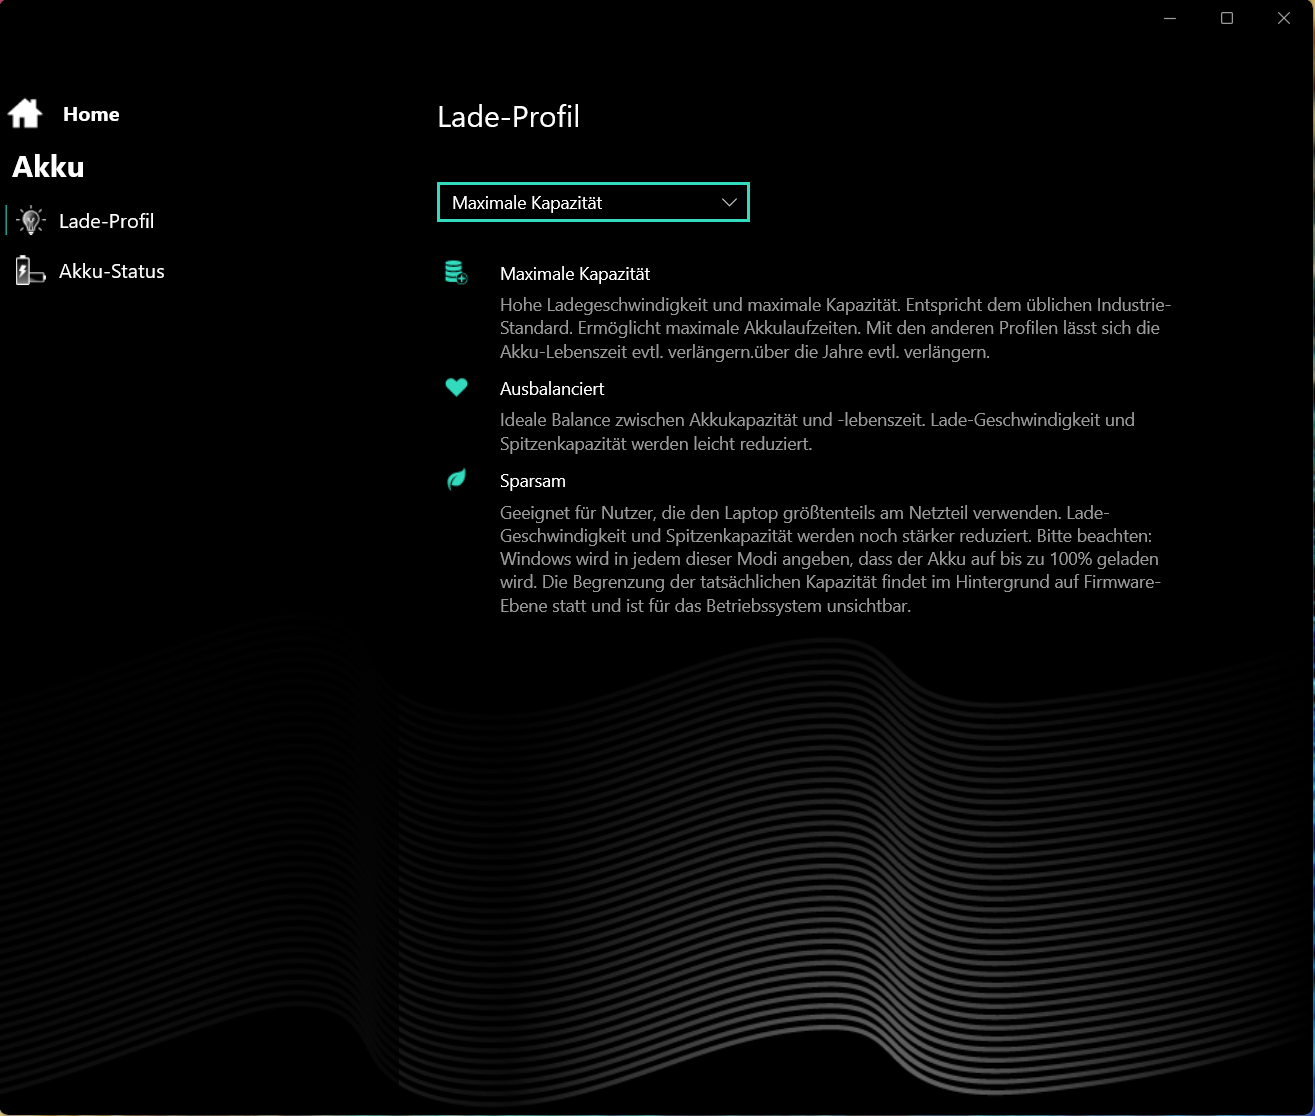
Gestione dell'energia - Lo Schenker XMG offre una discreta durata della batteria
Consumo di energia
Degno di lode: Tra i dispositivi di confronto, l'Apex 17 è il portatile più economico. Nel complesso, i concorrenti hanno requisiti energetici molto più elevati. Lo stress test e Witcher 3 sono stati eseguiti con un consumo energetico costante. L'alimentatore (230 watt) è di dimensioni adeguate.
| Off / Standby | |
| Idle | |
| Sotto carico |
|
Leggenda:
min: | |
| Schenker XMG Apex 17 (Late 23) R7 7840HS, GeForce RTX 4060 Laptop GPU | Alienware m16 R1 Intel i7-13700HX, GeForce RTX 4060 Laptop GPU | Lenovo Legion Pro 5 16IRX8 i7-13700HX, GeForce RTX 4060 Laptop GPU | Acer Nitro 17 AN17-51-71ER i7-13700H, GeForce RTX 4060 Laptop GPU | Medion Erazer Defender P40 i7-13700HX, GeForce RTX 4060 Laptop GPU | MSI Katana 17 B13VFK i7-13620H, GeForce RTX 4060 Laptop GPU | Media NVIDIA GeForce RTX 4060 Laptop GPU | Media della classe Gaming | |
|---|---|---|---|---|---|---|---|---|
| Power Consumption | -38% | -90% | -8% | -20% | -16% | -28% | -52% | |
| Idle Minimum * (Watt) | 9 | 10 -11% | 24.5 -172% | 8.3 8% | 8 11% | 12.2 -36% | 11.5 ? -28% | 13 ? -44% |
| Idle Average * (Watt) | 12 | 14 -17% | 29.2 -143% | 13.5 -13% | 12 -0% | 14.9 -24% | 16 ? -33% | 19 ? -58% |
| Idle Maximum * (Watt) | 14 | 21 -50% | 34.3 -145% | 14.8 -6% | 18 -29% | 15.8 -13% | 20.3 ? -45% | 24.6 ? -76% |
| Load Average * (Watt) | 67 | 119 -78% | 98.7 -47% | 77 -15% | 101 -51% | 85.22 -27% | 92.9 ? -39% | 110.7 ? -65% |
| Witcher 3 ultra * (Watt) | 147.6 | 186.7 -26% | 178.6 -21% | 154 -4% | 180.8 -22% | 151.1 -2% | ||
| Load Maximum * (Watt) | 223 | 323 -45% | 249.6 -12% | 263 -18% | 284 -27% | 212.8 5% | 210 ? 6% | 259 ? -16% |
* ... Meglio usare valori piccoli
Power consumption Witcher 3 / stress test
Power consumption with an external monitor
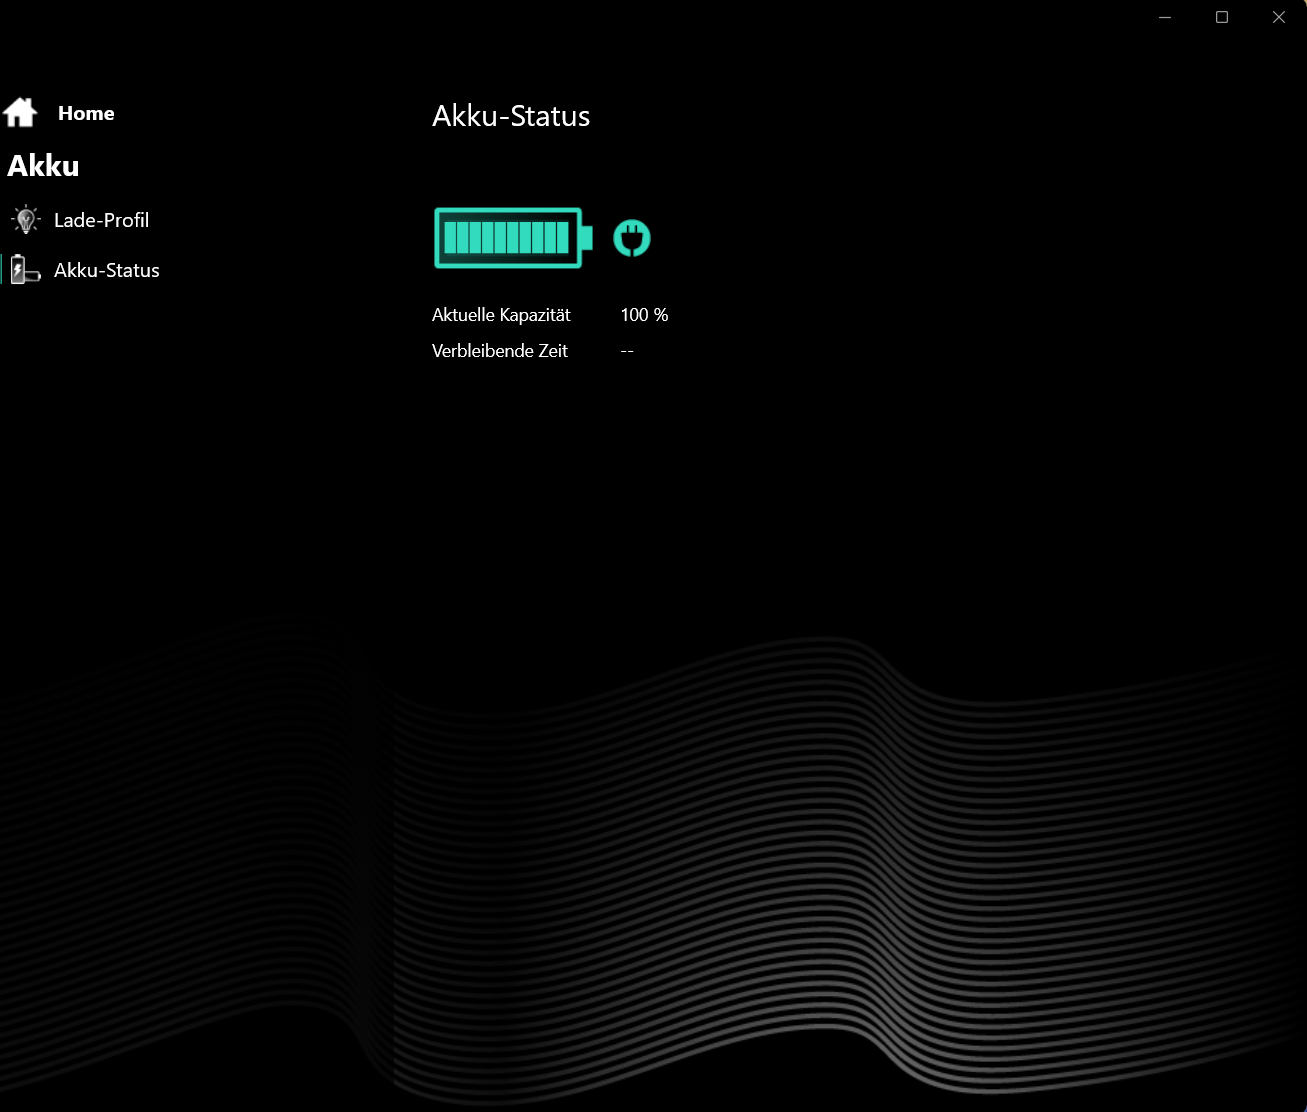
Durata della batteria
Nel test Wi-Fi (utilizzando uno script per caricare siti web) e nel test video (cortometraggio Big Buck Bunny (codifica H.264, FHD), il dispositivo da 17,3 pollici ha raggiunto tempi di esecuzione rispettivamente di 5,06 e 6,51 ore. Durante i test, le funzioni di risparmio energetico del portatile sono state disattivate e la luminosità del display è stata impostata a circa 150 cd/m². Inoltre, il test video è stato eseguito con i moduli radio spenti.
Sebbene l'Apex abbia una capacità della batteria relativamente bassa, riesce a garantire tempi di esecuzione di tutto rispetto. Il computer si lascia alle spalle alcuni dei concorrenti con batterie più grandi.
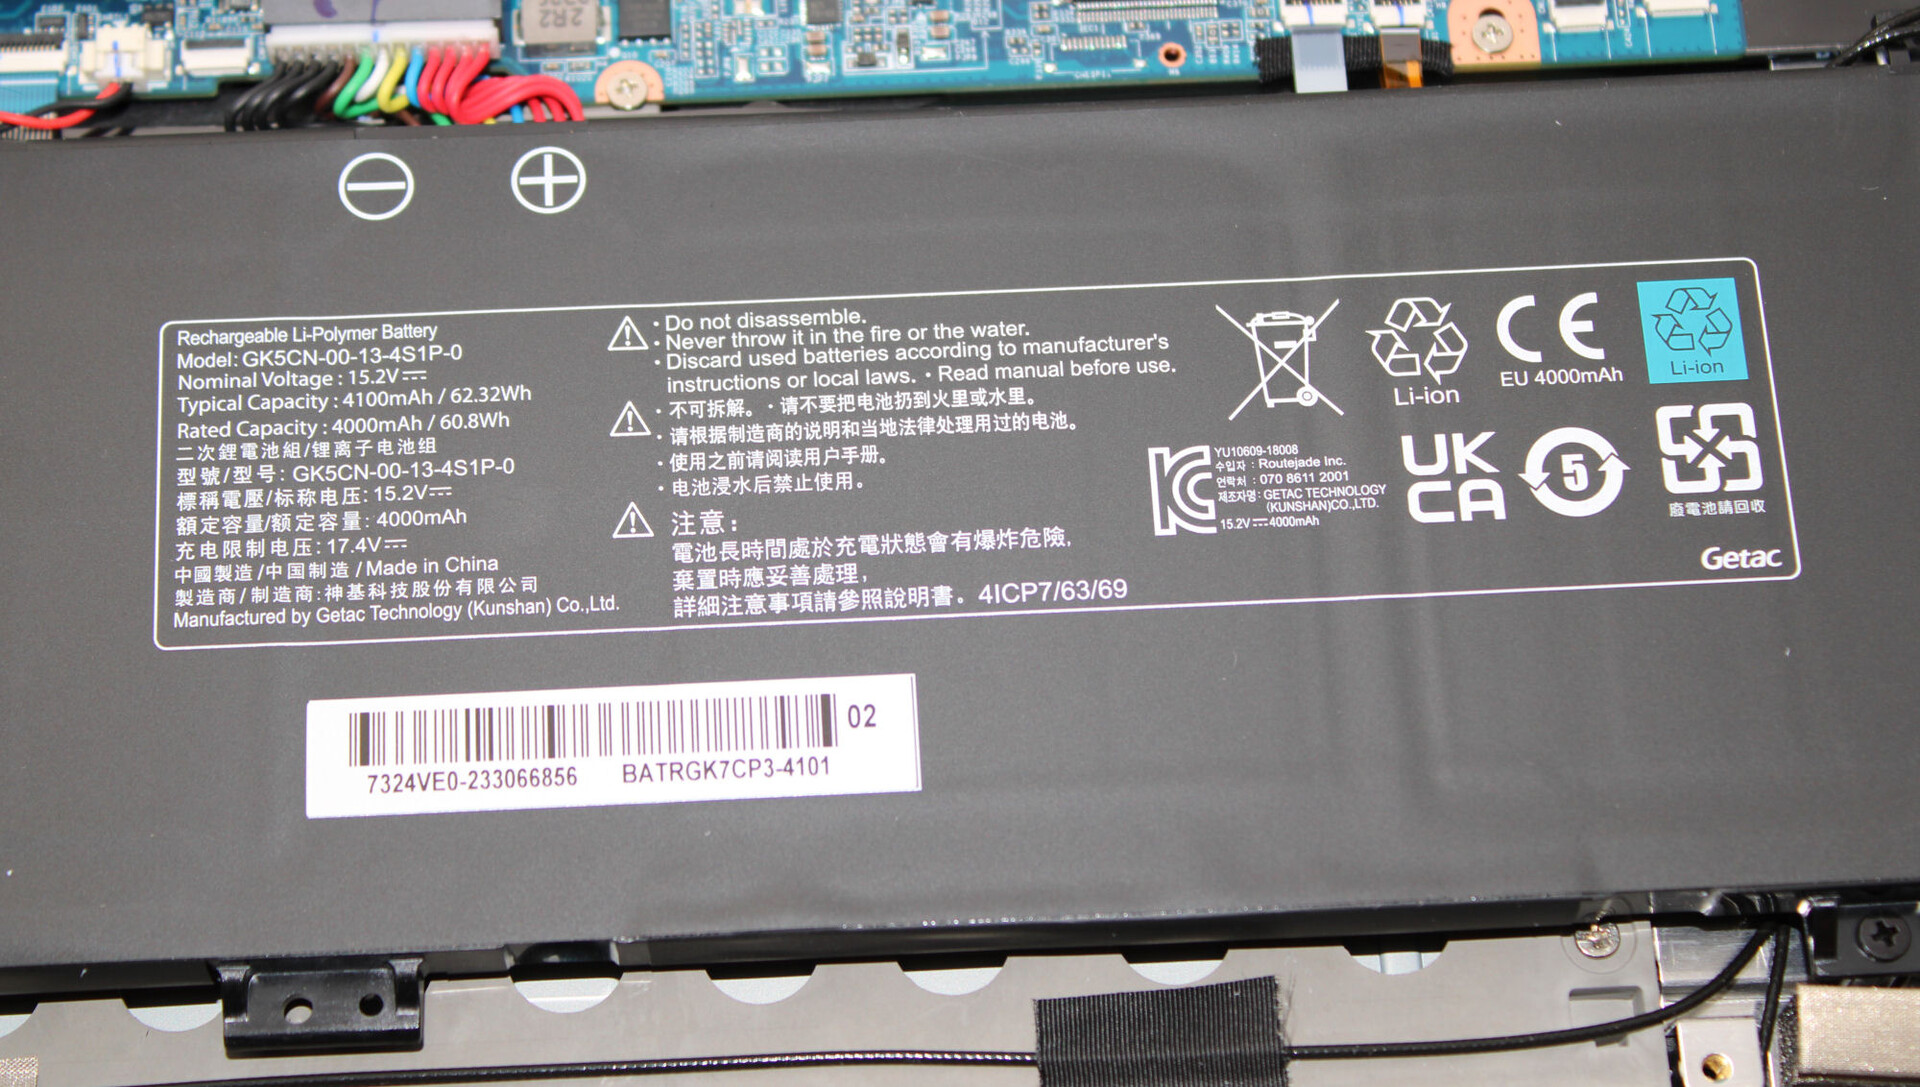
| Schenker XMG Apex 17 (Late 23) R7 7840HS, GeForce RTX 4060 Laptop GPU, 62.32 Wh | Alienware m16 R1 Intel i7-13700HX, GeForce RTX 4060 Laptop GPU, 86 Wh | Lenovo Legion Pro 5 16IRX8 i7-13700HX, GeForce RTX 4060 Laptop GPU, 80 Wh | Acer Nitro 17 AN17-51-71ER i7-13700H, GeForce RTX 4060 Laptop GPU, 90 Wh | Medion Erazer Defender P40 i7-13700HX, GeForce RTX 4060 Laptop GPU, 73 Wh | MSI Katana 17 B13VFK i7-13620H, GeForce RTX 4060 Laptop GPU, 53.5 Wh | Media della classe Gaming | |
|---|---|---|---|---|---|---|---|
| Autonomia della batteria | -20% | -34% | 31% | -0% | -40% | 15% | |
| Reader / Idle (h) | 7.8 | 6.4 -18% | 6.7 -14% | 8.8 13% | 8.27 ? 6% | ||
| H.264 (h) | 6.9 | 5.6 -19% | 6.9 0% | 5.7 -17% | 8.32 ? 21% | ||
| WiFi v1.3 (h) | 5.1 | 4.8 -6% | 3.4 -33% | 8.2 61% | 6.2 22% | 2.9 -43% | 7.11 ? 39% |
| Load (h) | 1.6 | 1 -37% | 0.7 -56% | 1.3 -19% | 1 -37% | 1.502 ? -6% | |
| Witcher 3 ultra (h) | 2.5 |
Pro
Contro
Verdetto - Una macchina da gioco modesta e di fascia media
Das Apex 17 svolge senza problemi i compiti previsti (giochi in QHD, rendering, editing video) - Il processore Ryzen 74040 è il più potente dei modelli.Ryzen 7 7840HSe GeForce RTX 4060 lo rendono possibile. Entrambi i chip possono funzionare a velocità di clock costantemente elevate.
Con l'XMG Apex 17 (late 23), Schenker ha realizzato un computer portatile QHD di fascia media, ben rifinito.
Il computer non produce molto rumore nell'uso quotidiano, ma quando si gioca è possibile trovare un compromesso tra prestazioni e rumore selezionando il profilo appropriato. L'autonomia reale della batteria di circa 5-7 ore, misurata in base alla capacità della batteria, è perfettamente accettabile. La batteria non può essere caricata tramite la porta USB-C (USB 3.2 Gen 2).
Il portatile offre spazio per due SSD PCIe 4 (M.2 2280). È supportato il RAID 0/1. Il negozio online di Schenker consente di selezionare l'SSD o gli SSD preferiti. Il dispositivo in prova è dotato di una velocissima SSD PCIe 4 (1 TB). Nel complesso, il display QHD installato (17,3 pollici, 2.560 x 1.440 pixel, sRGB, IPS, 240 Hz) ha fatto una buona impressione. In alternativa, è disponibile un pannello FHD più economico.
IlMedion Erazer Defender P40 è un'alternativa con prestazioni e specifiche paragonabili. A differenza dell'Apex, il P40 ha una porta Thunderbolt 4 a bordo.
Notebookcheck.com pubblicherà presto una recensione del modello gemello da 15,6 pollici, l'XMG Apex 15 (fine 23) in una variante con Ryzen 7 7840HS e GeForce RTX 4050.
Prezzo e disponibilità
Una variante simile al nostro dispositivo di recensione (16 anziché 32 GB di RAM) è disponibile a 1.739 euro presso Notebooksbilliger.de. Offrono anche un modello entry-level più economico con GeForce RTX 4050 a 1.399 euro. In alternativa, è possibile configurare il proprio dispositivo nel negozio online di Schenker.
Schenker XMG Apex 17 (Late 23)
- 10/04/2023 v7 (old)
Sascha Mölck
Transparency
La selezione dei dispositivi da recensire viene effettuata dalla nostra redazione. Il campione di prova è stato fornito all'autore come prestito dal produttore o dal rivenditore ai fini di questa recensione. L'istituto di credito non ha avuto alcuna influenza su questa recensione, né il produttore ne ha ricevuto una copia prima della pubblicazione. Non vi era alcun obbligo di pubblicare questa recensione. In quanto società mediatica indipendente, Notebookcheck non è soggetta all'autorità di produttori, rivenditori o editori.
Ecco come Notebookcheck esegue i test
Ogni anno, Notebookcheck esamina in modo indipendente centinaia di laptop e smartphone utilizzando procedure standardizzate per garantire che tutti i risultati siano comparabili. Da circa 20 anni sviluppiamo continuamente i nostri metodi di prova e nel frattempo stabiliamo gli standard di settore. Nei nostri laboratori di prova, tecnici ed editori esperti utilizzano apparecchiature di misurazione di alta qualità. Questi test comportano un processo di validazione in più fasi. Il nostro complesso sistema di valutazione si basa su centinaia di misurazioni e parametri di riferimento ben fondati, che mantengono l'obiettività.Price comparison

