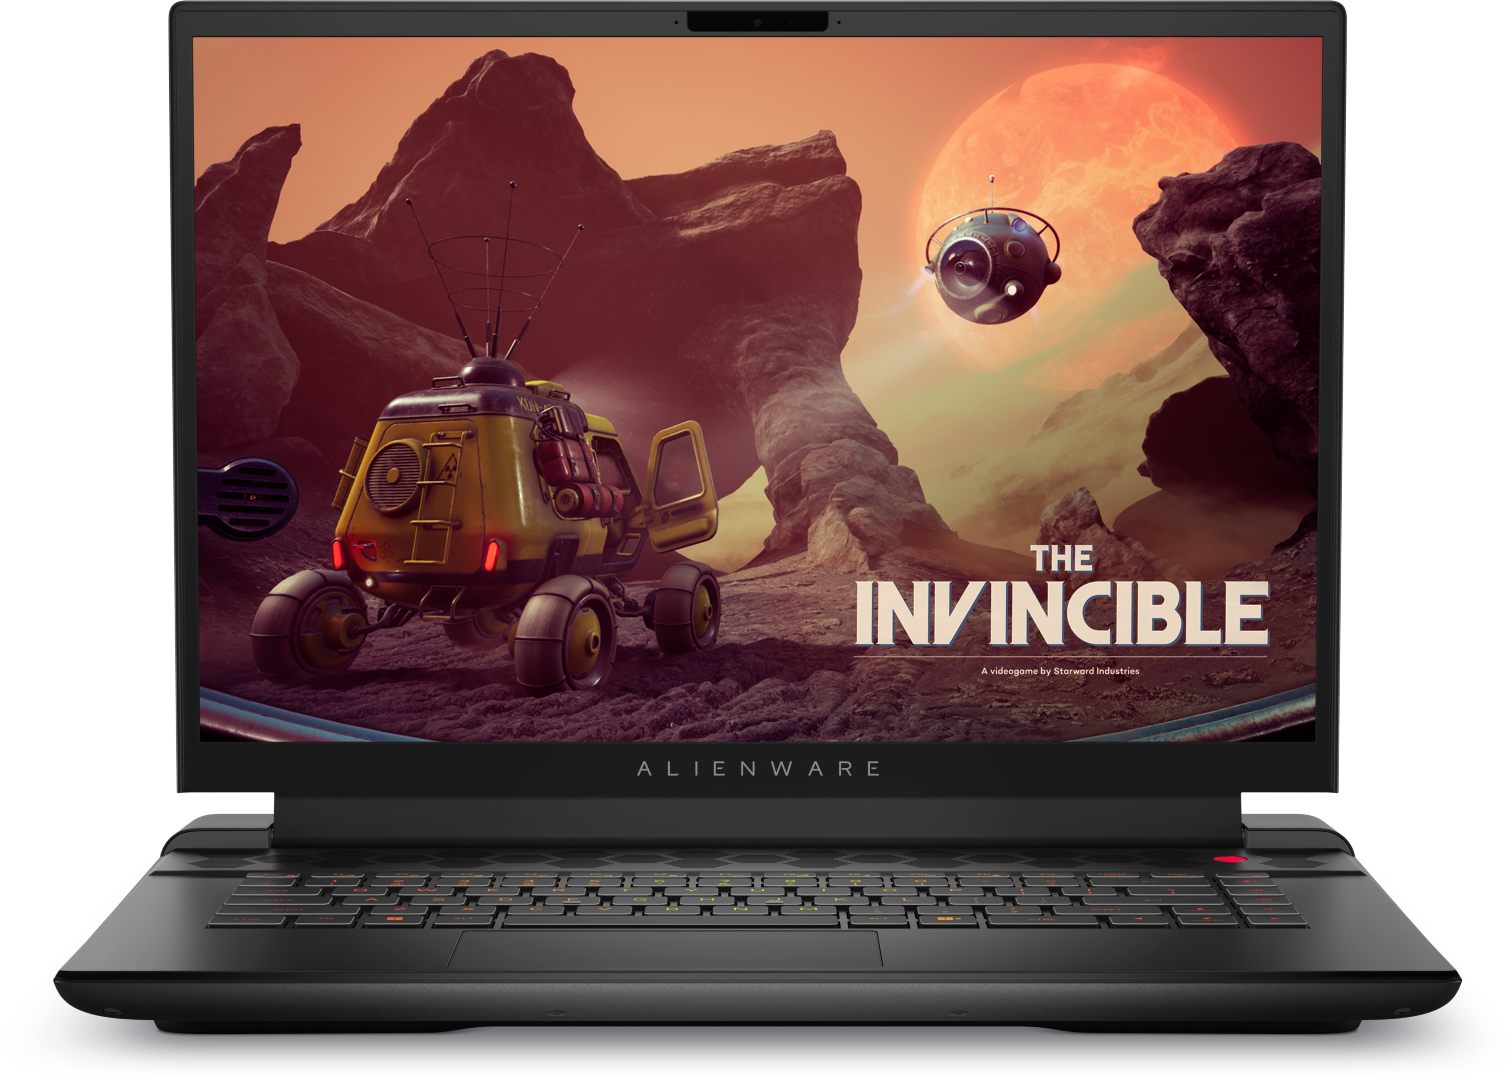
Recensione dell'Alienware m16 R1: Macchina gaming QHD con RTX 4060 e Thunderbolt 4
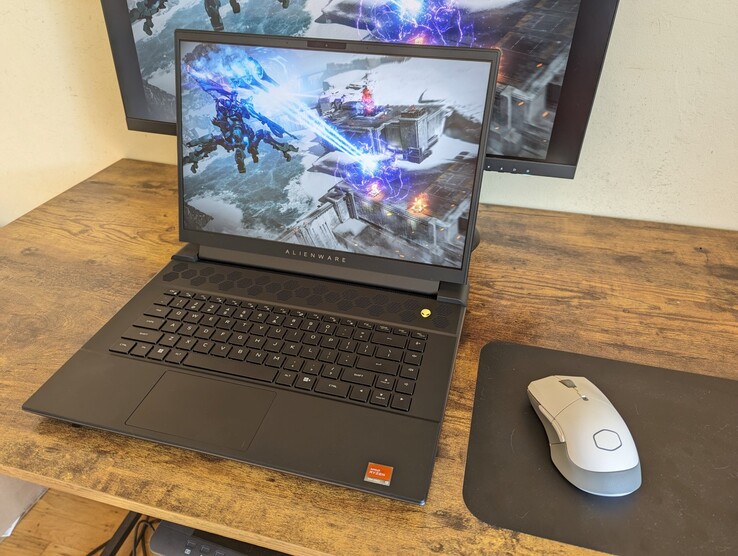
Gioco, rendering e creazione di contenuti saranno probabilmente le principali aree di applicazione dell'Alienware m16 R1. Raptor Lake e Ada Lovelace forniscono la potenza di calcolo necessaria. La nostra variante è un modello entry-level della serie m16-R1; di recente abbiamo avuto un modellomodello gemello della fascia superiore della scala di prestazioni. I dispositivi concorrenti includono il Acer Predator Helios 16 PH16-71, il Medion Erazer Defender P40, il Lenovo Legion Pro 5 16IRX8, il XMG Pro 15 (E23) e ilAorus 15 BSF.
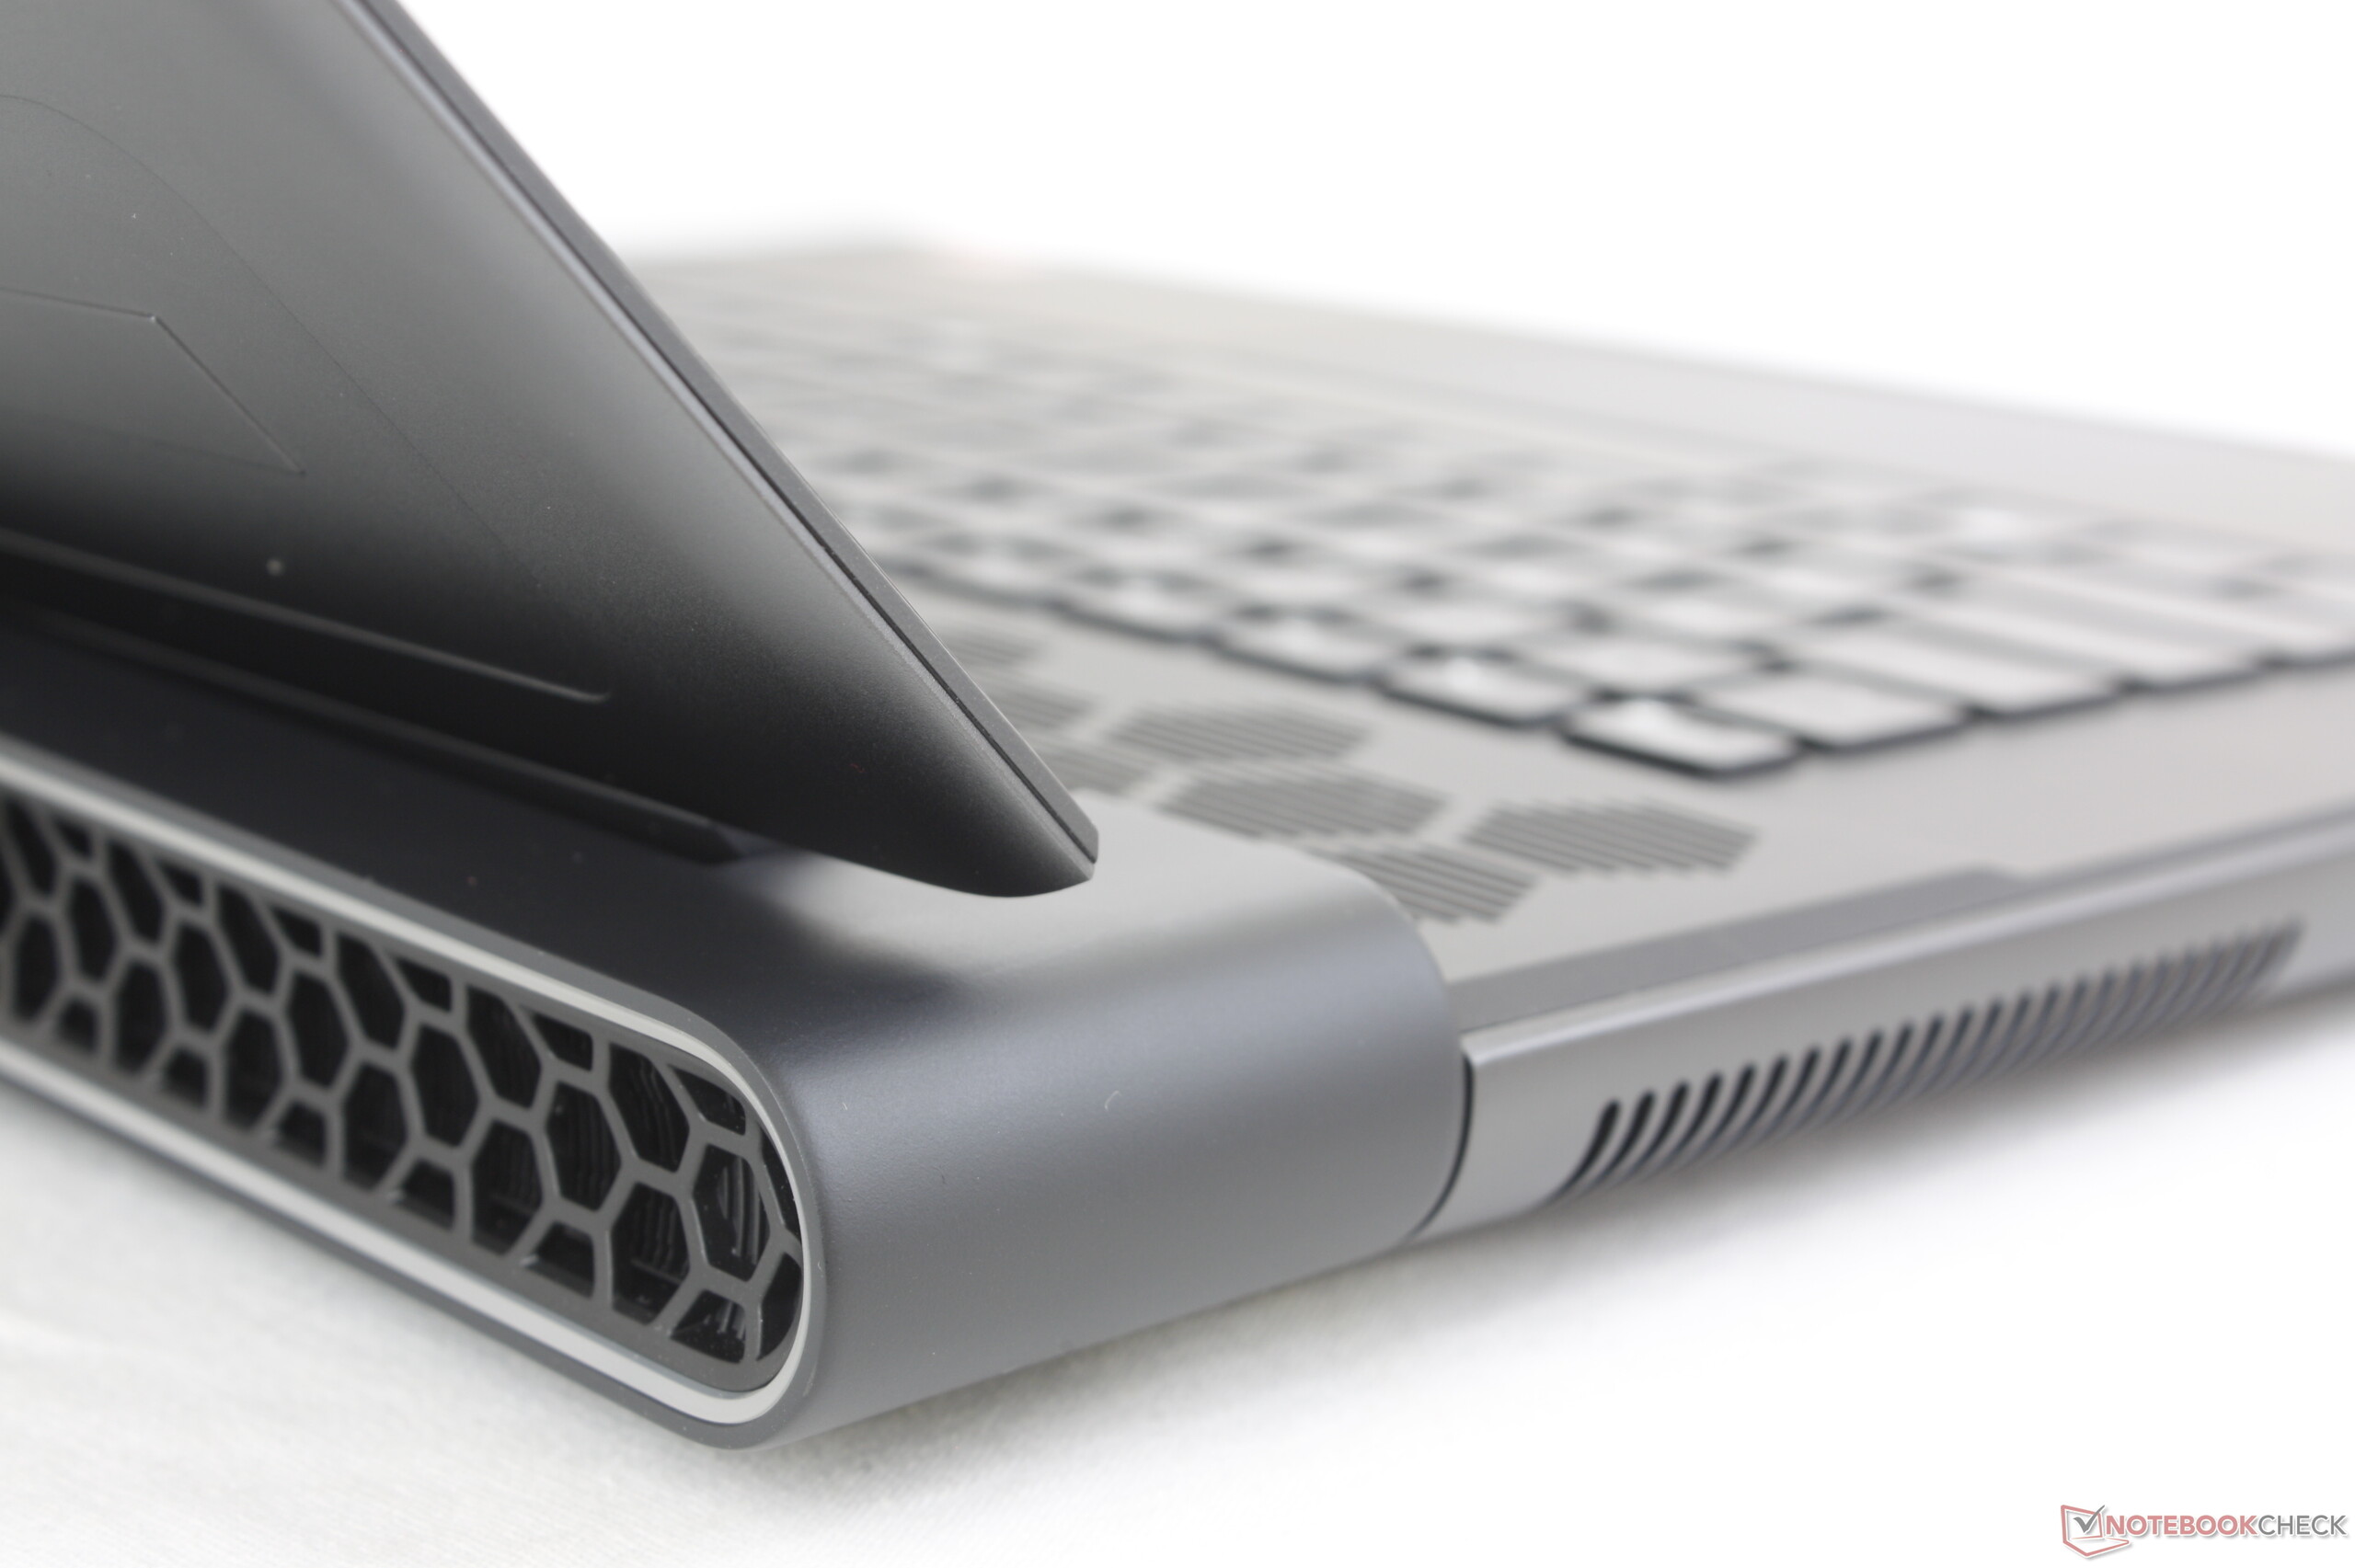
Informazioni sul case, sull'equipaggiamento e sui dispositivi di input sono disponibili nellala nostra recensione del modello gemello quasi identico.
Potenziali concorrenti a confronto
Punteggio | Data | Modello | Peso | Altezza | Dimensione | Risoluzione | Prezzo |
|---|---|---|---|---|---|---|---|
| 88.3 % v7 (old) | 09/2023 | Alienware m16 R1 Intel i7-13700HX, GeForce RTX 4060 Laptop GPU | 3 kg | 25.4 mm | 16.00" | 2560x1600 | |
| 89.5 % v7 (old) | 07/2023 | Acer Predator Helios 16 PH16-71-731Q i7-13700HX, GeForce RTX 4060 Laptop GPU | 2.6 kg | 26.9 mm | 16.00" | 2560x1600 | |
| 84.6 % v7 (old) | 05/2023 | Medion Erazer Defender P40 i7-13700HX, GeForce RTX 4060 Laptop GPU | 2.9 kg | 33 mm | 17.30" | 2560x1440 | |
| 87.9 % v7 (old) | 05/2023 | Lenovo Legion Pro 5 16IRX8 i7-13700HX, GeForce RTX 4060 Laptop GPU | 2.5 kg | 26.8 mm | 16.00" | 2560x1600 | |
| 86.2 % v7 (old) | 07/2023 | Schenker XMG Pro 15 (E23) i9-13900HX, GeForce RTX 4060 Laptop GPU | 2.4 kg | 24.9 mm | 15.60" | 2560x1440 | |
| 85.7 % v7 (old) | 08/2023 | Aorus 15 BSF i7-13700H, GeForce RTX 4070 Laptop GPU | 2.4 kg | 20.9 mm | 15.60" | 2560x1440 |
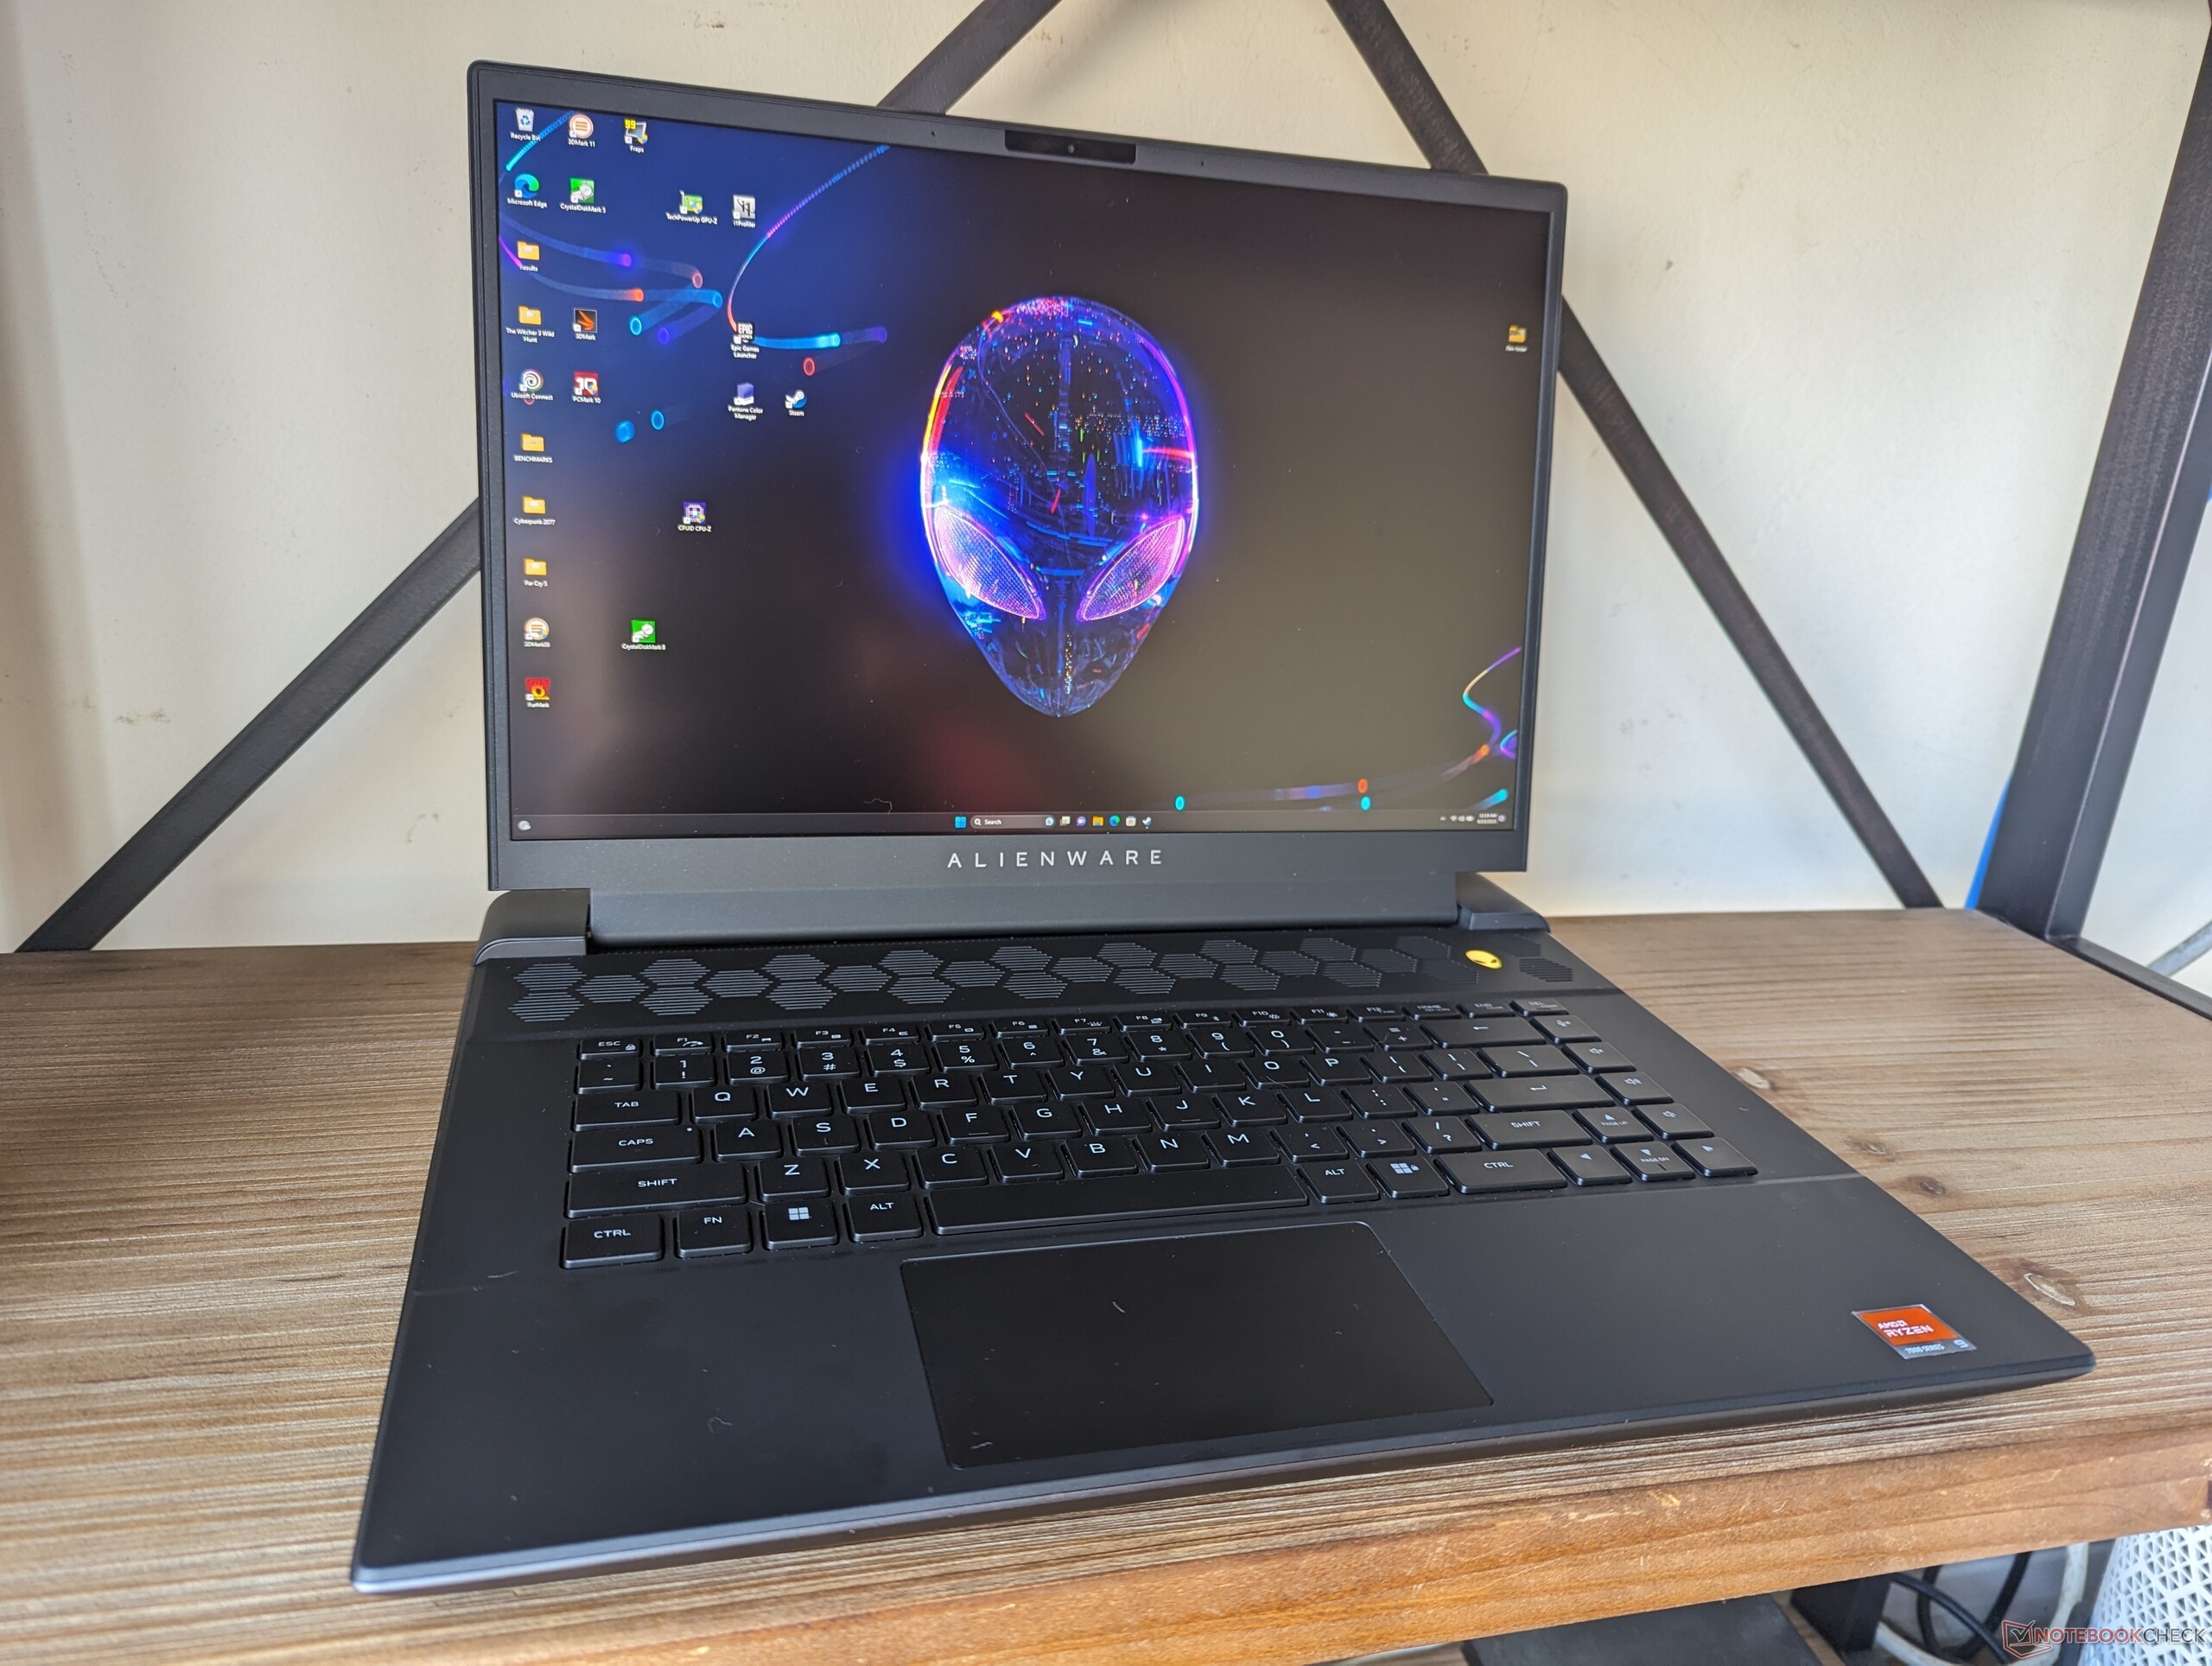
Apparecchiature e dispositivi di input - Differenze rispetto al modello AMD
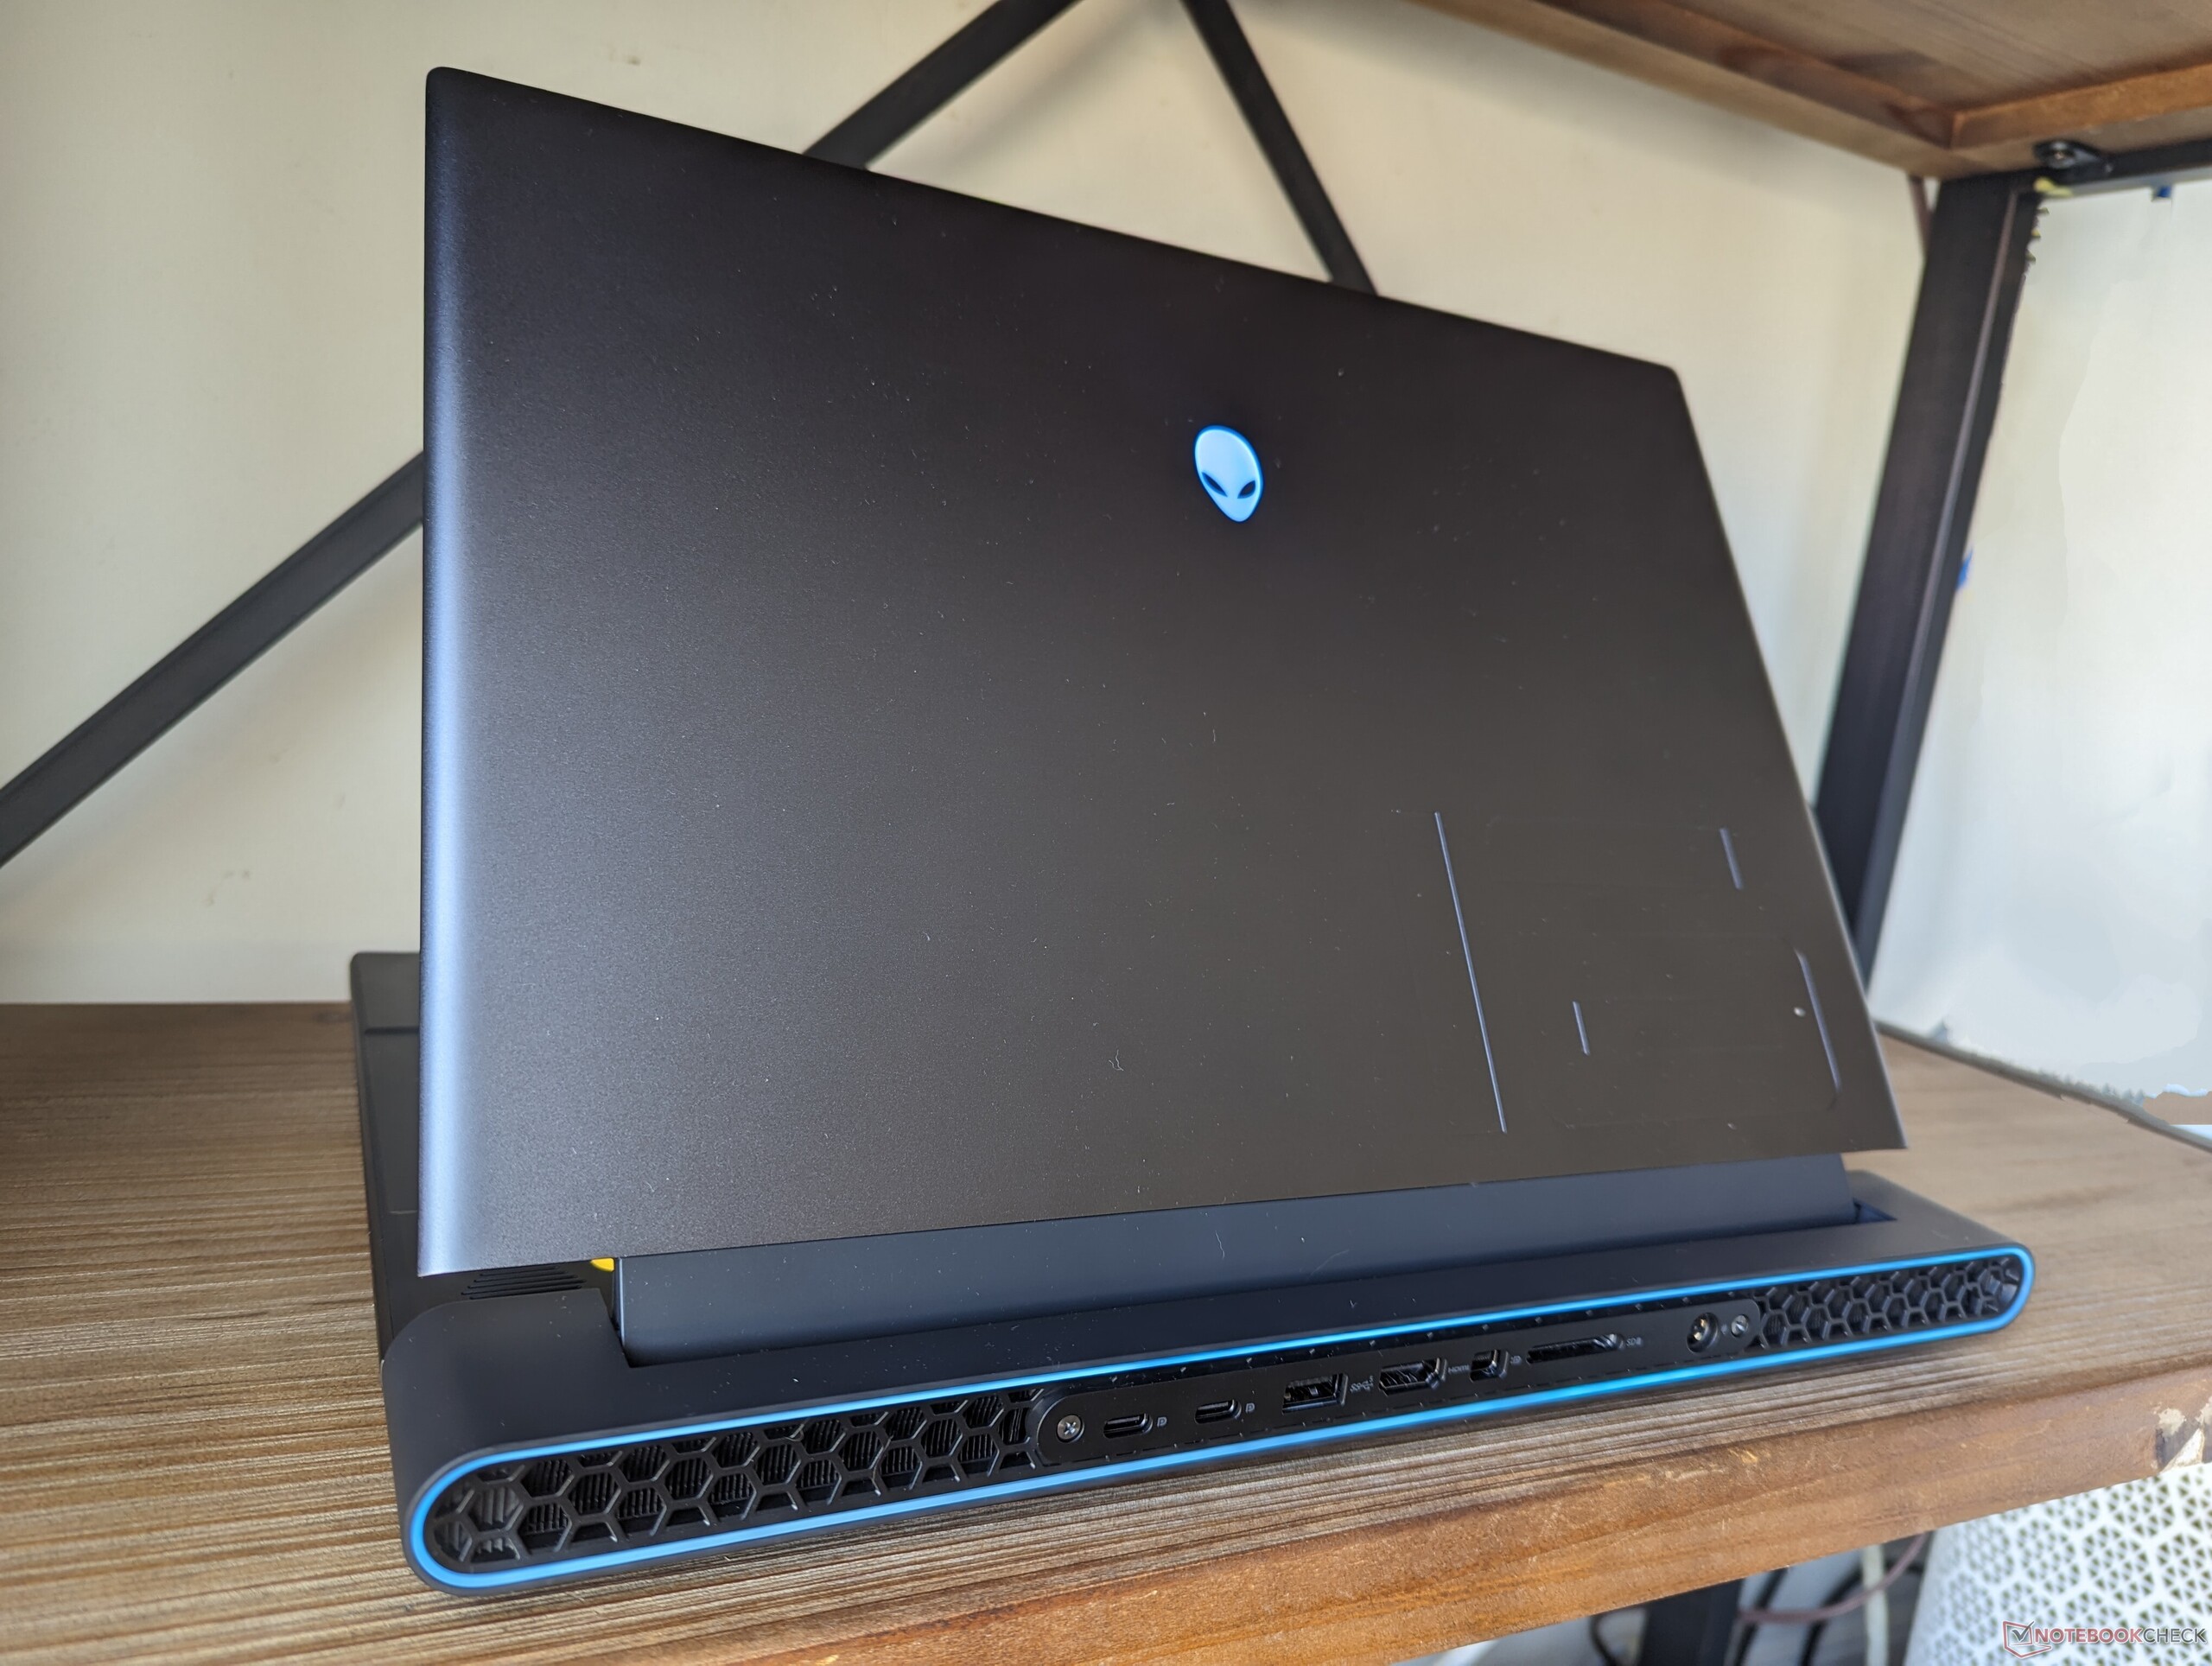
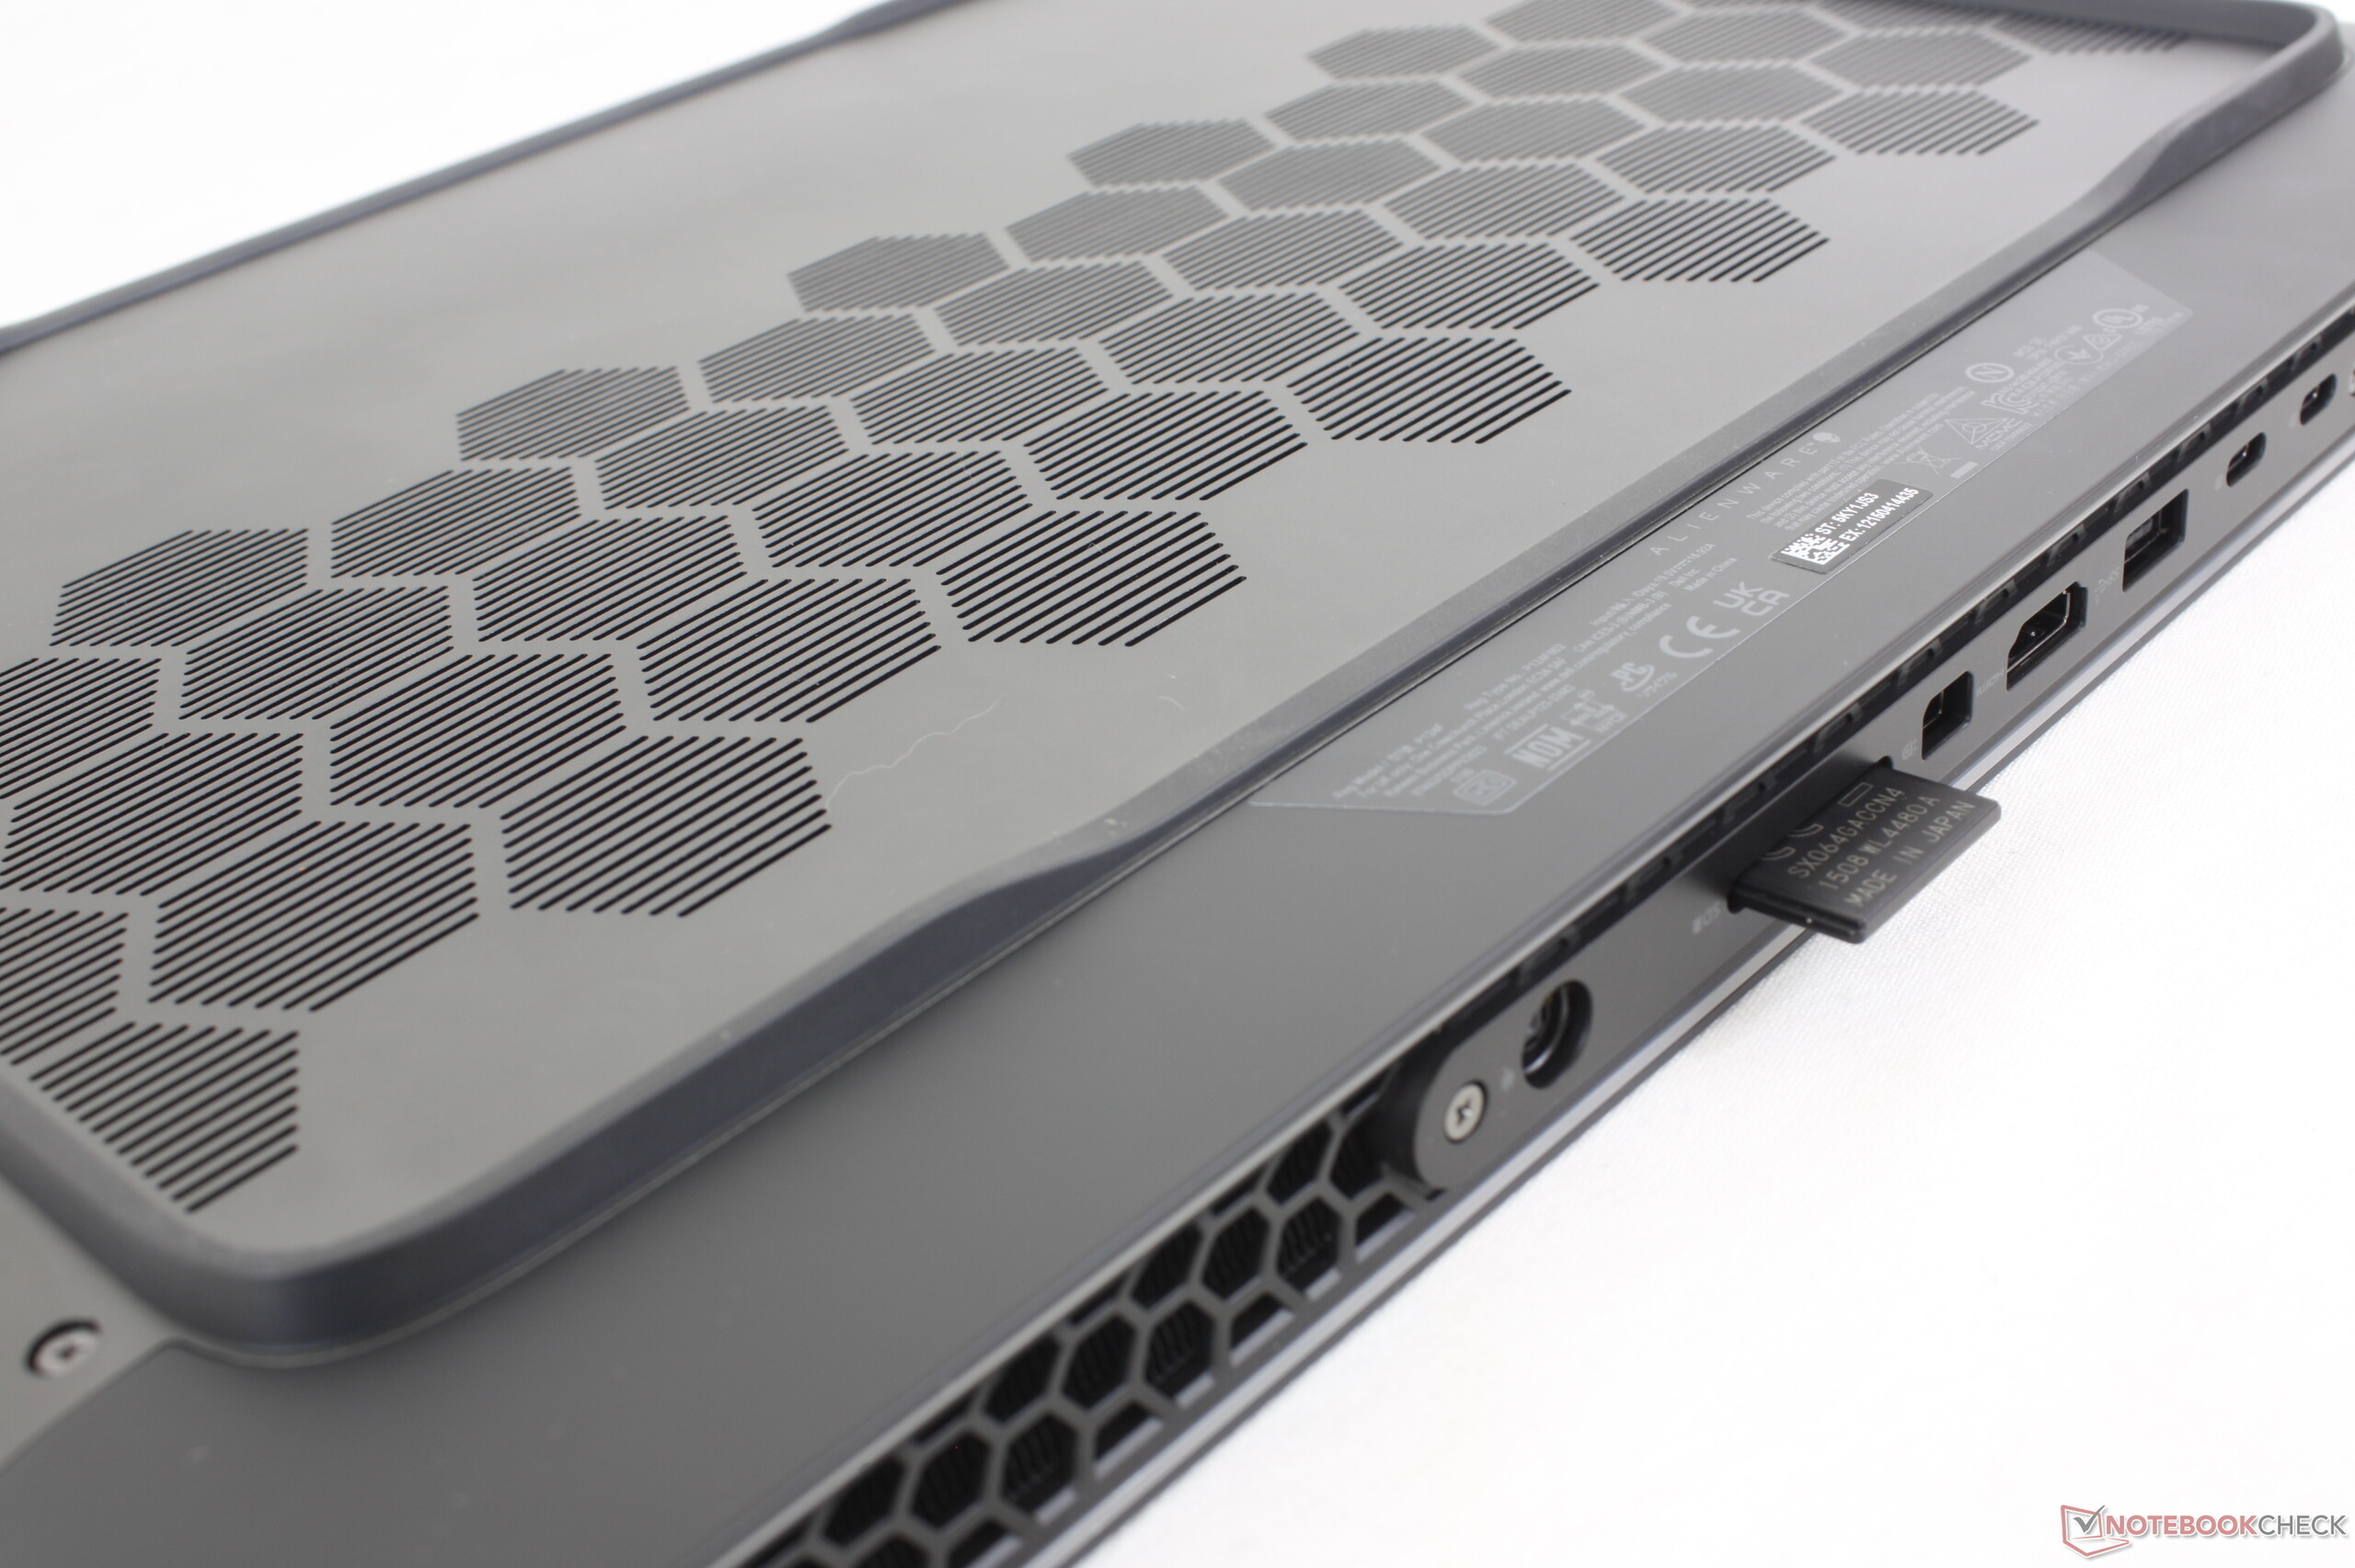
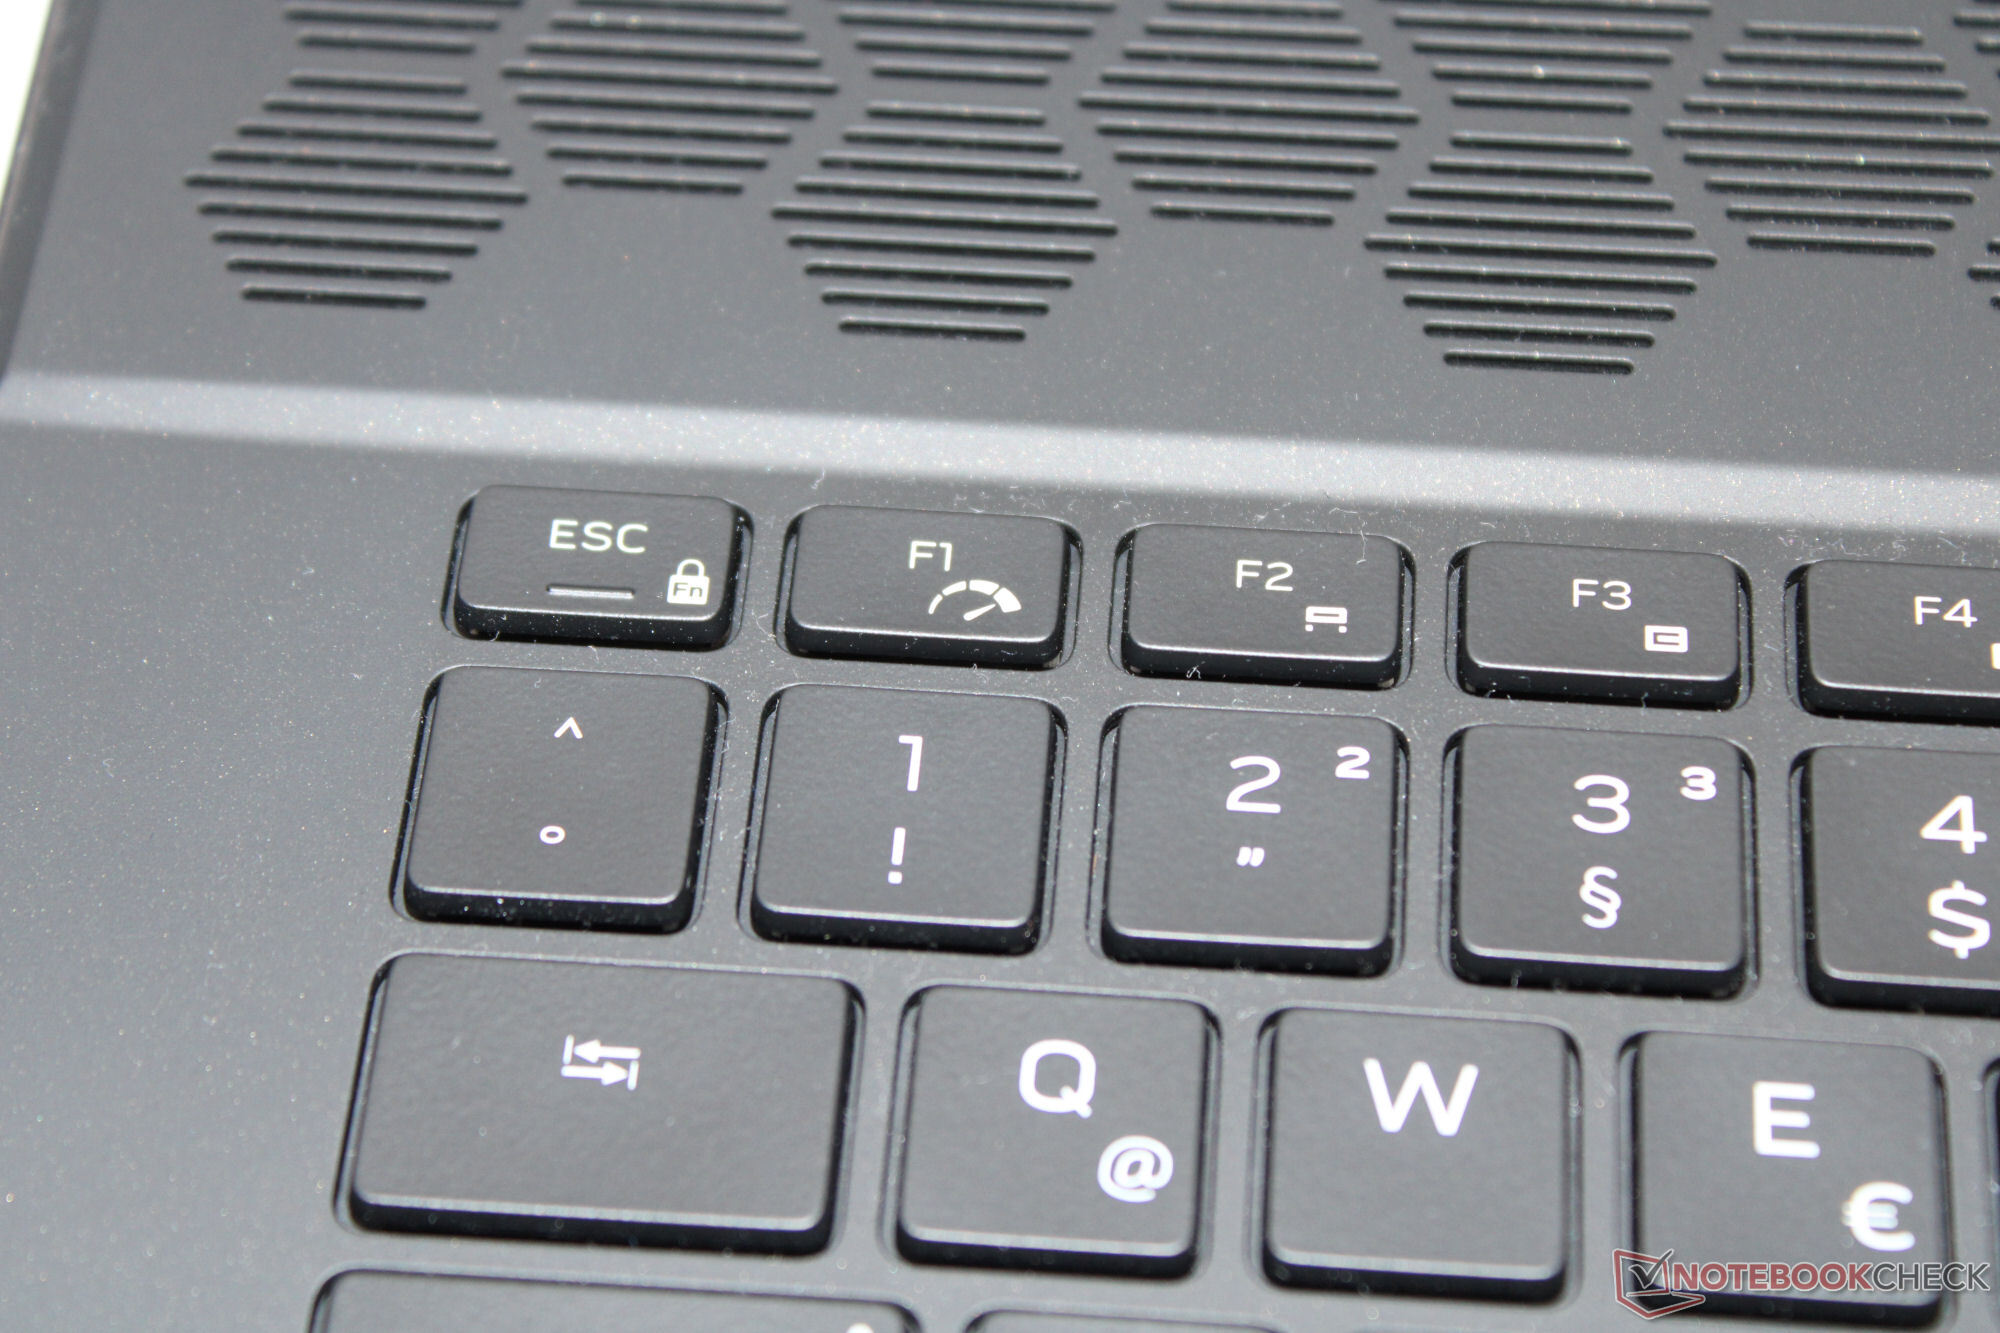
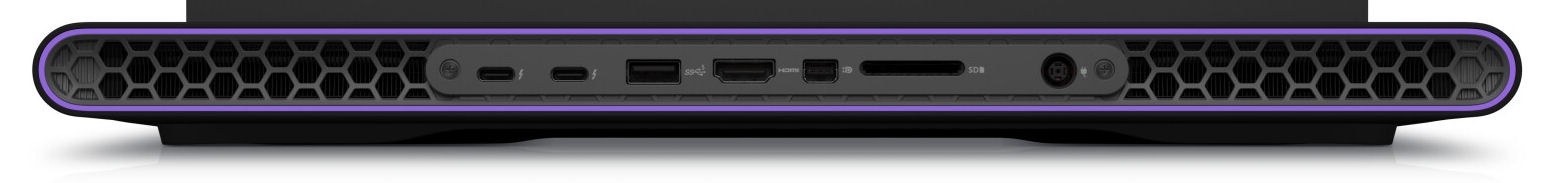
- Le due porte USB-C dei modelli m16 basati su Intel supportano Thunderbolt 4 (AMD: solo USB 3.2 Gen 2), inclusa DisplayPort e Power Delivery. Ma attenzione: non è possibile alimentare il notebook o caricare la batteria tramite USB-C. Le porte USB-C possono solo fornire energia. Le porte USB-C possono solo fornire energia.
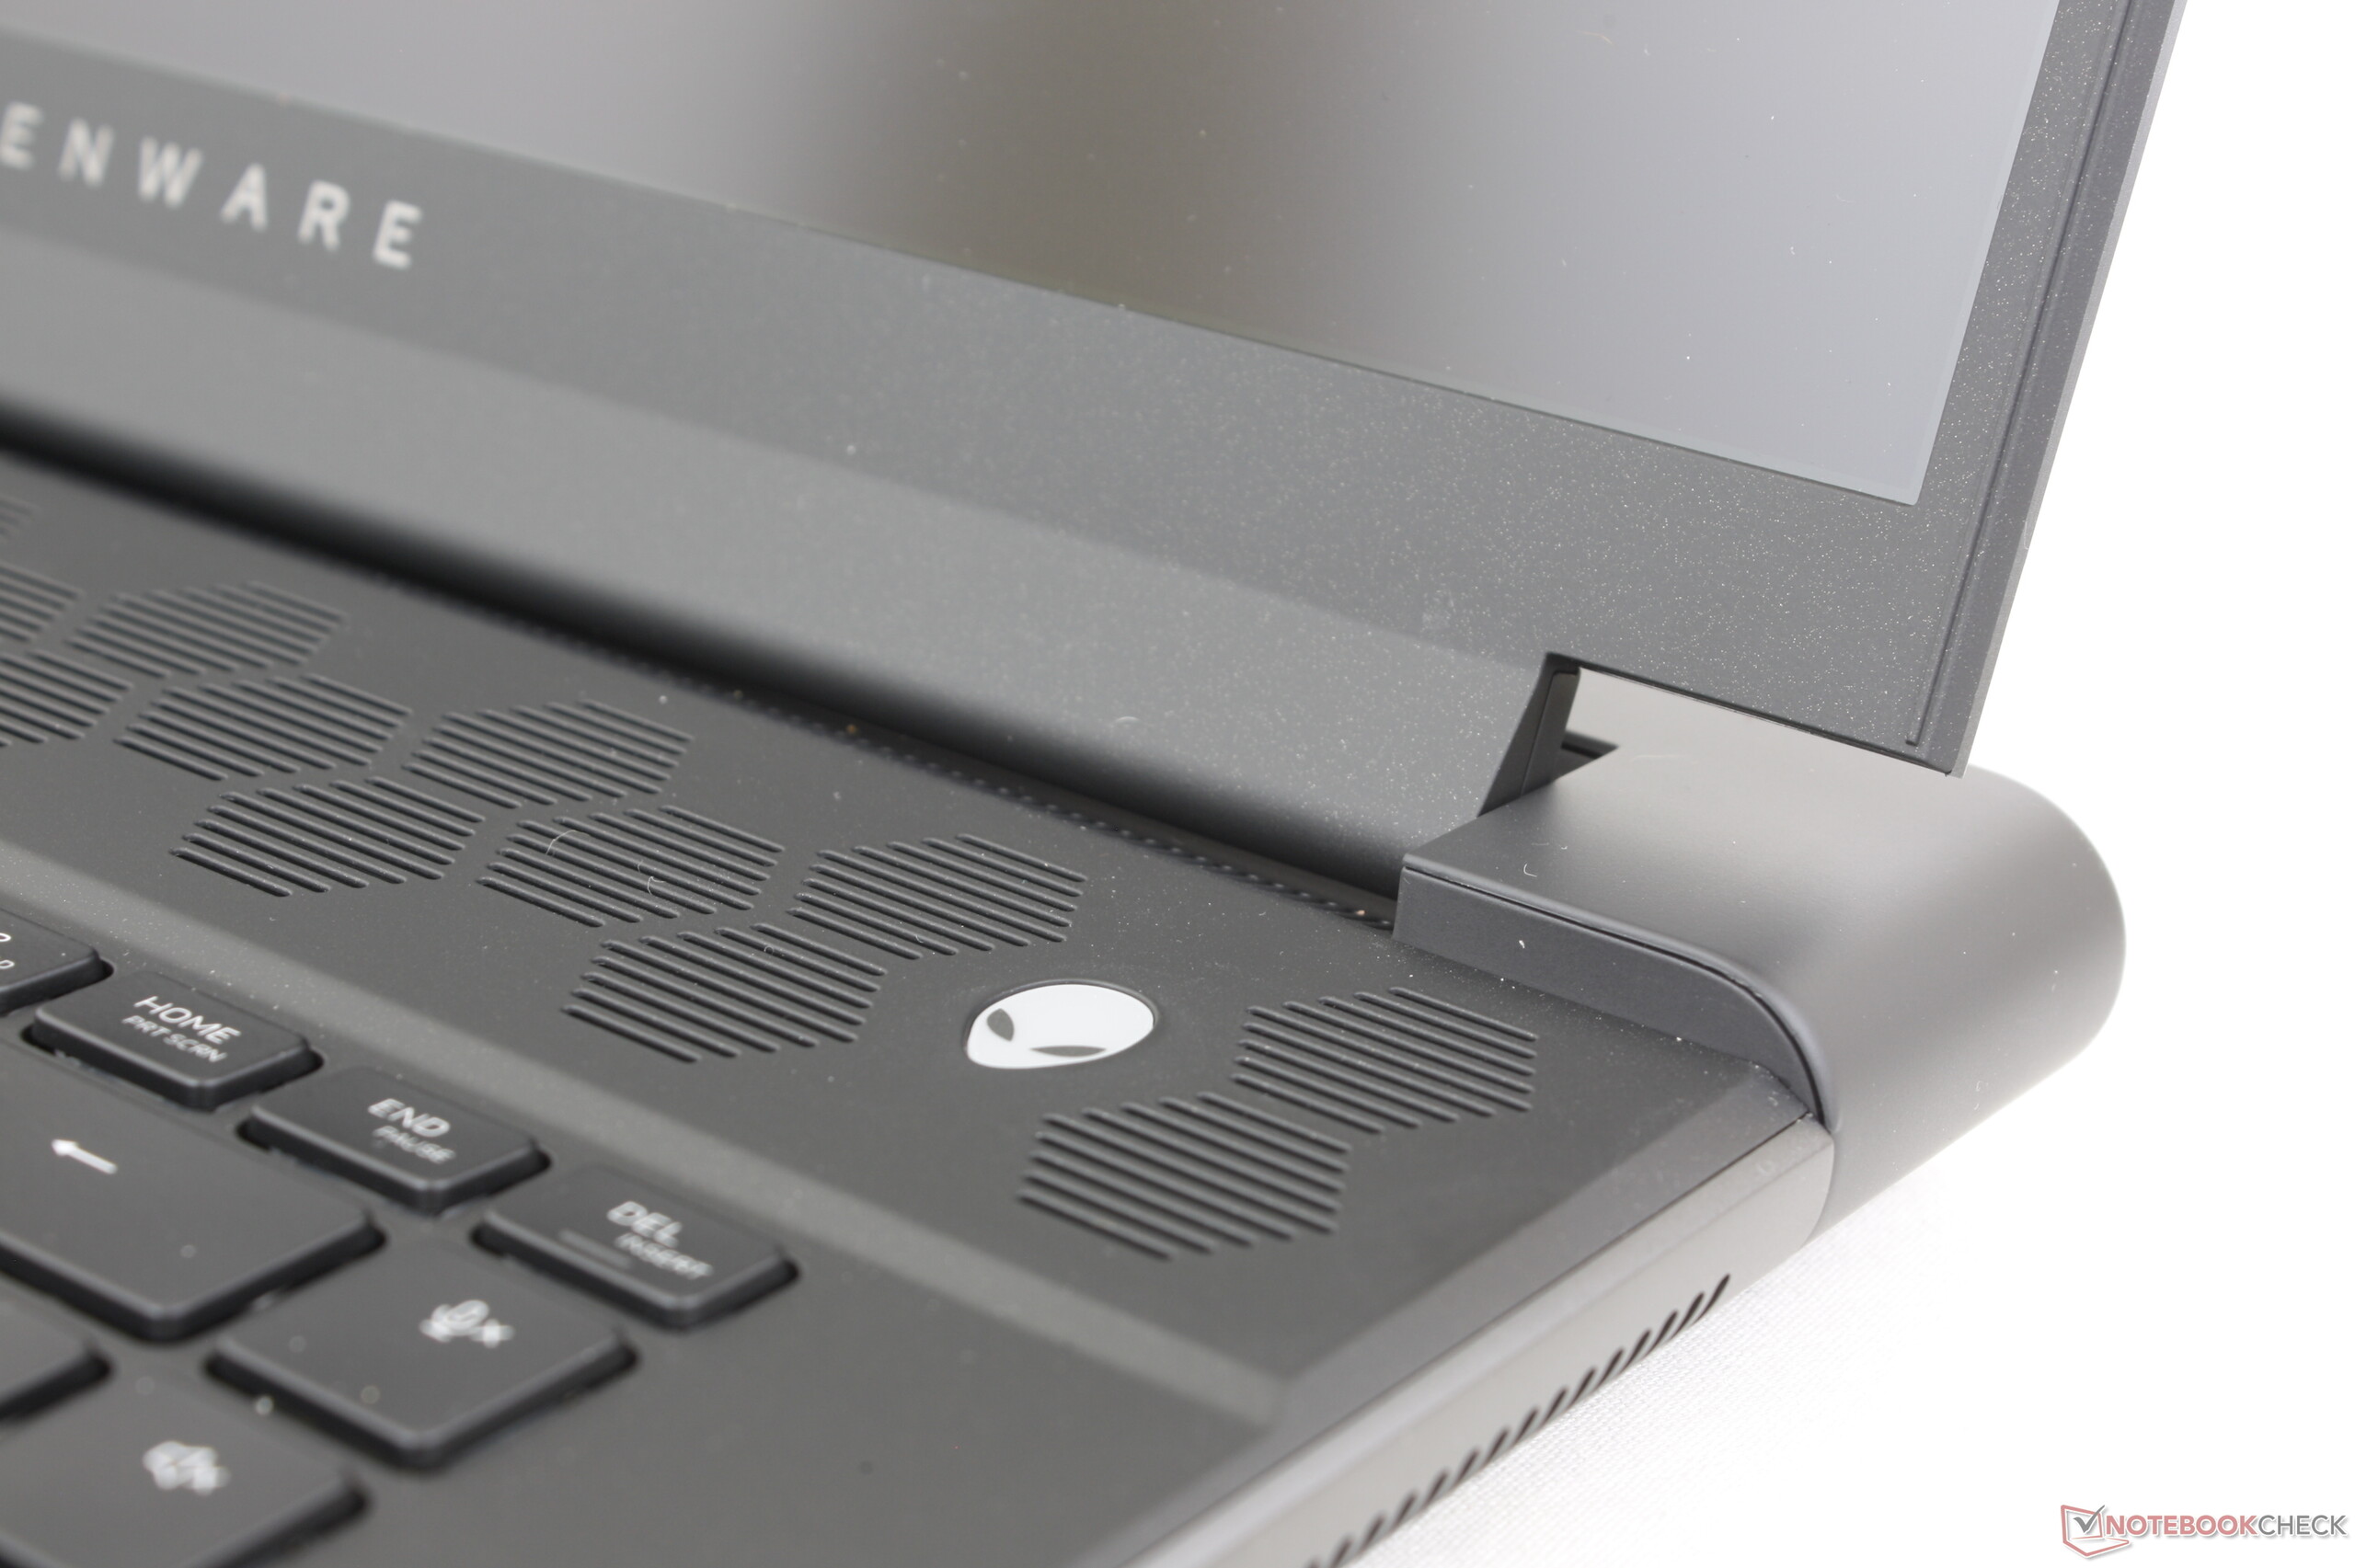
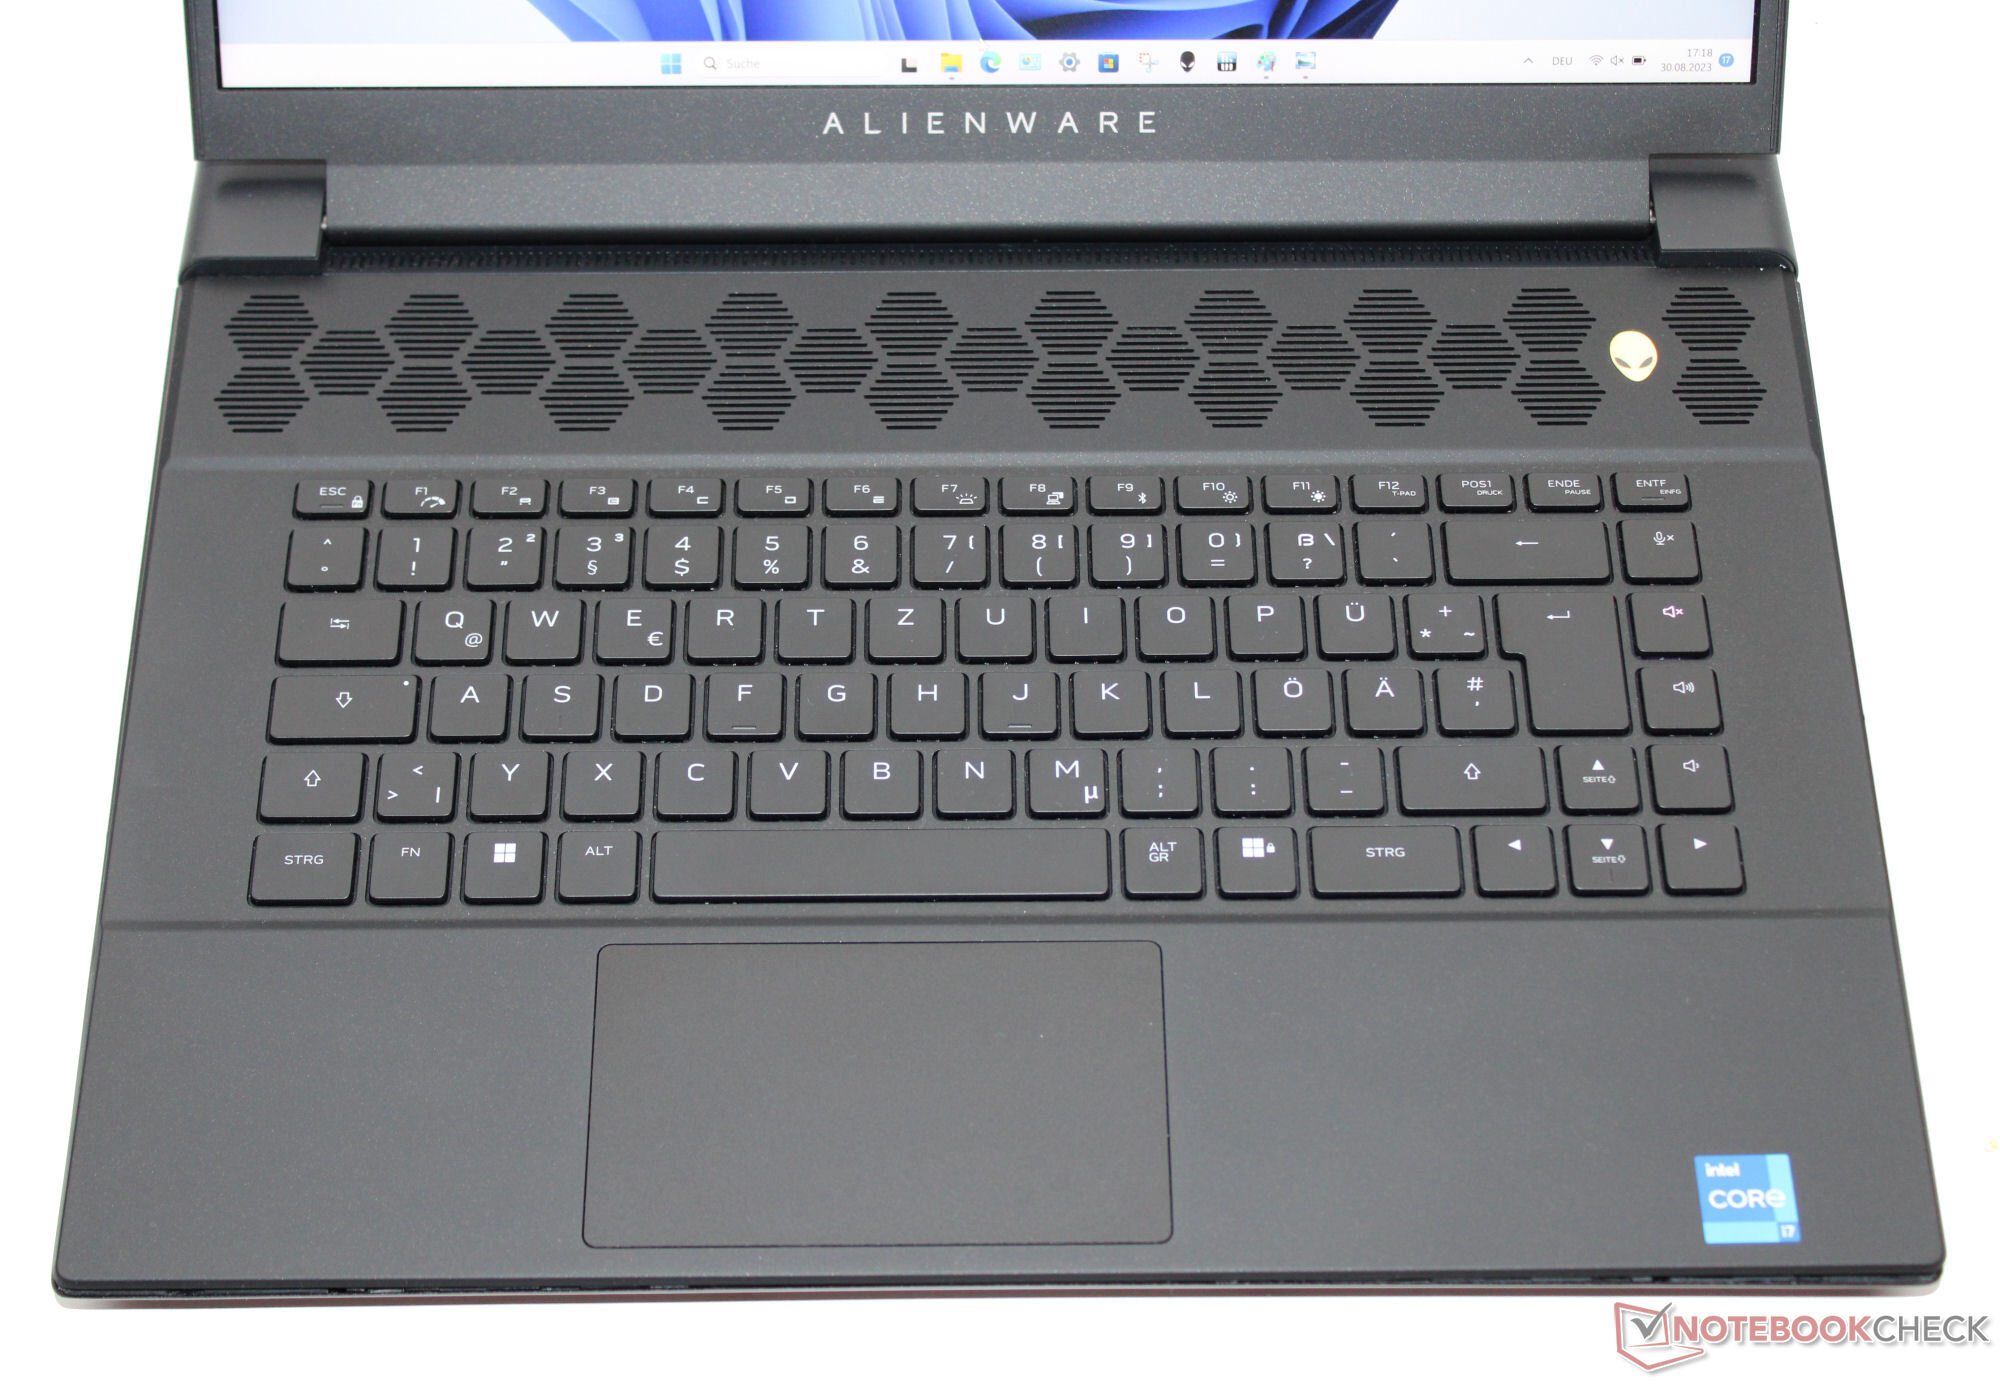
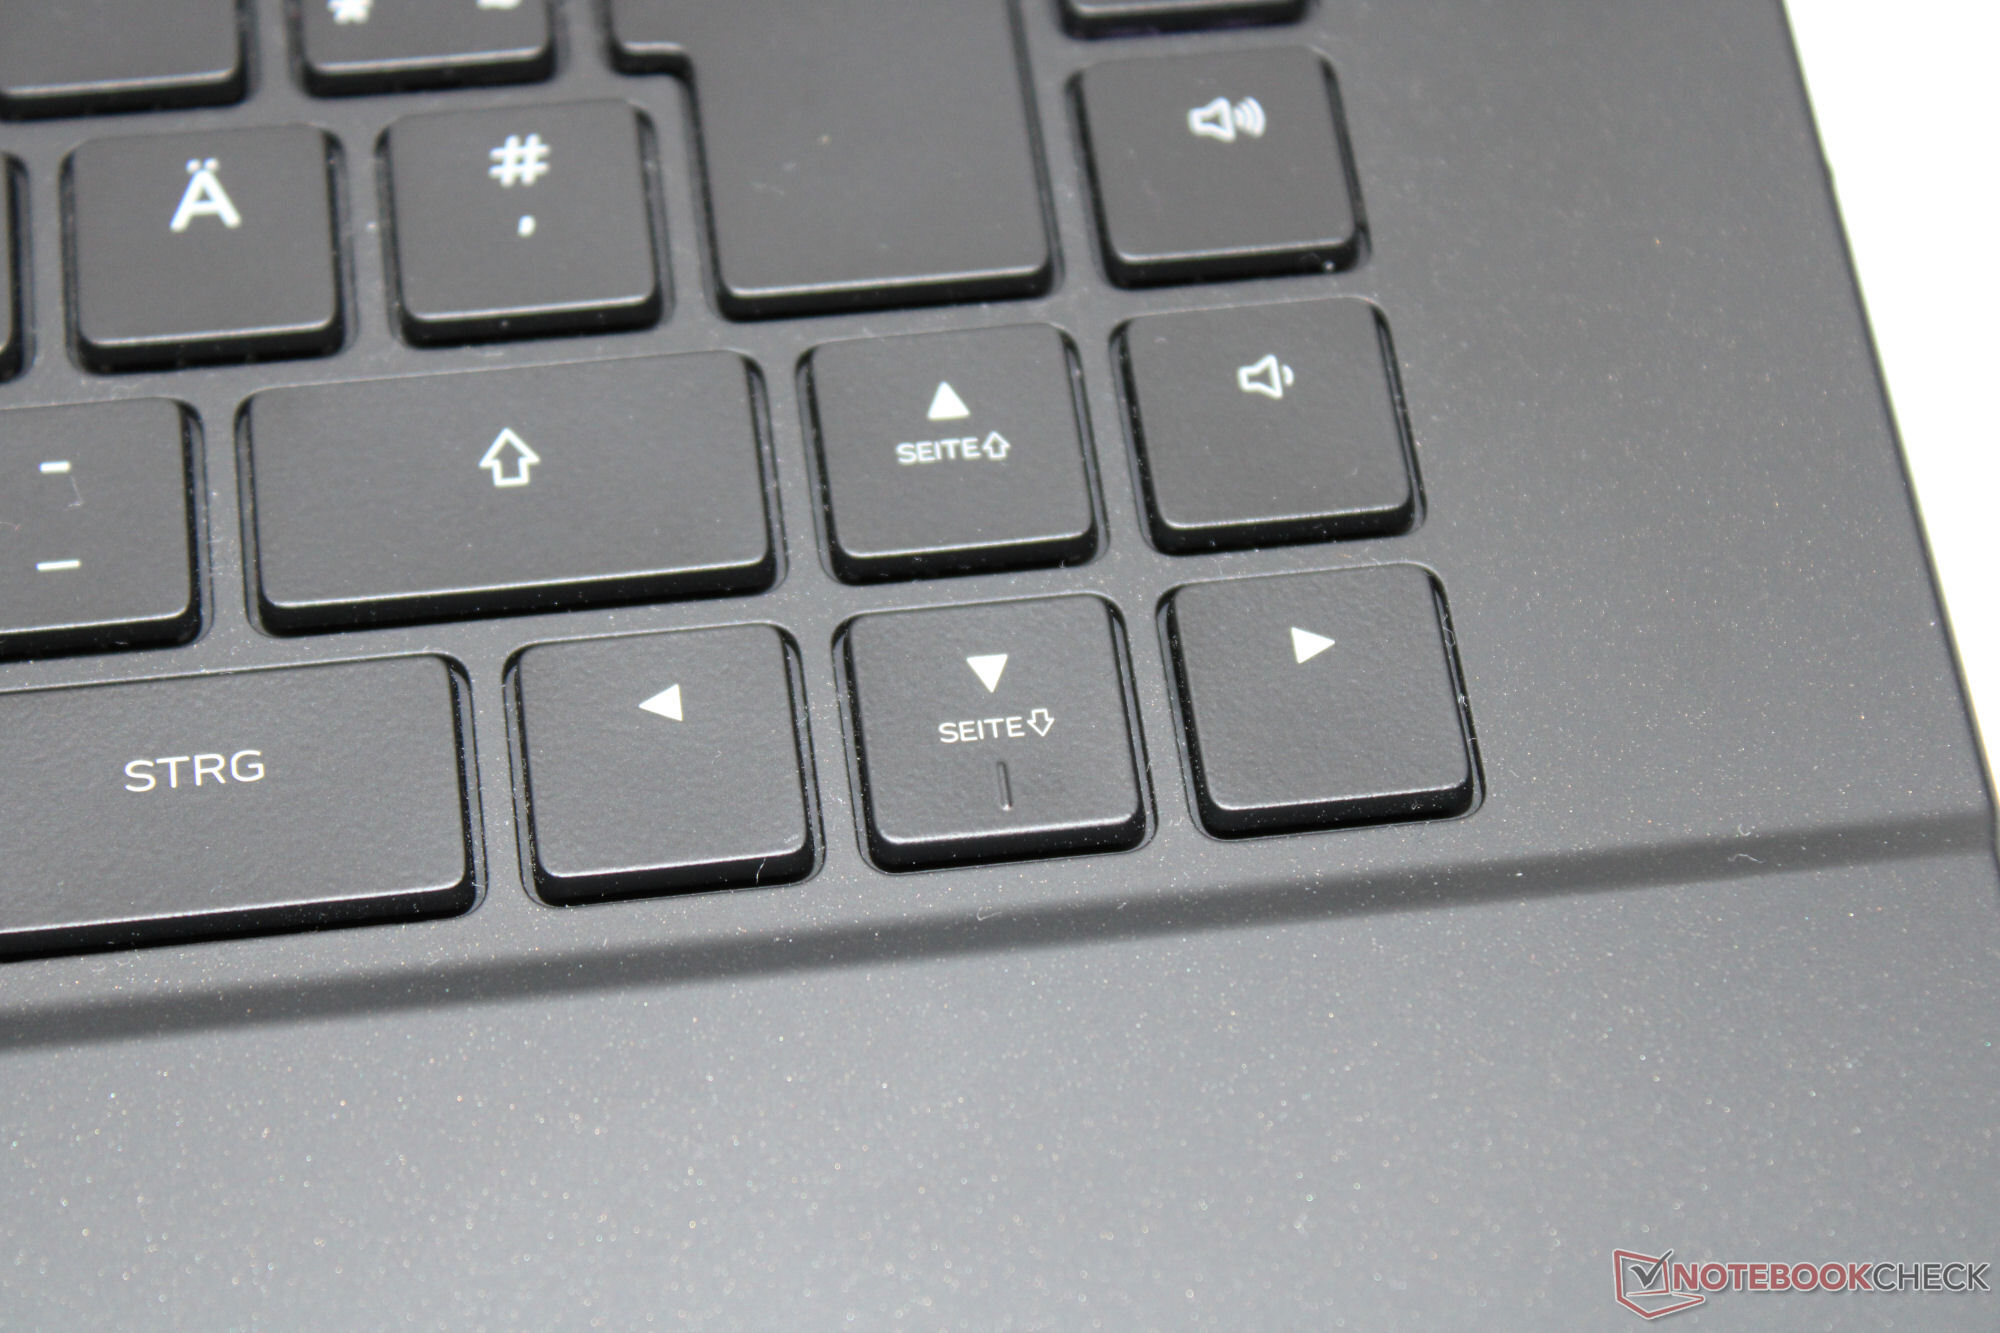
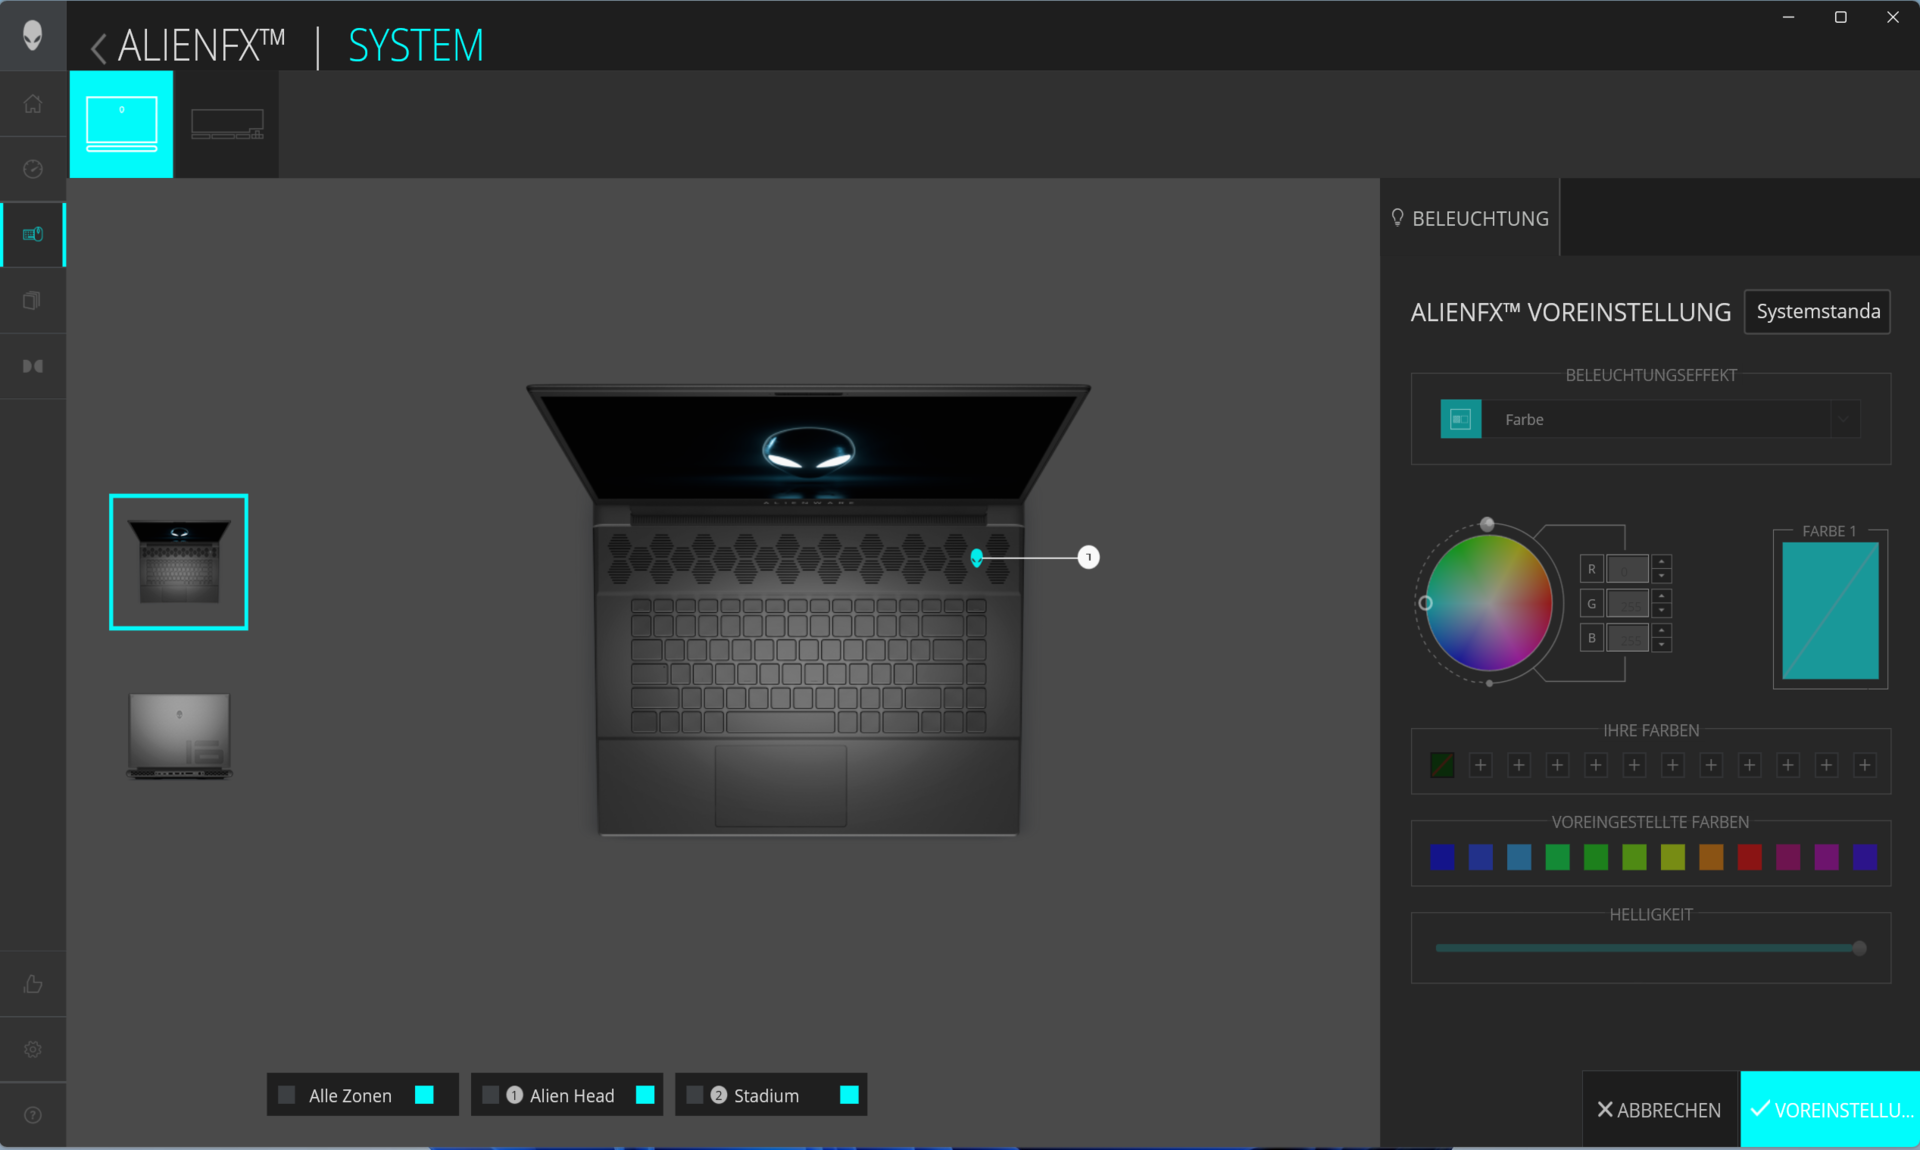
- Al posto della tastiera meccanica (CherryMX) del modellomodello gemelloil nostro dispositivo di prova ha una tastiera a membrana. I suoi tasti offrono una corsa media, un punto di pressione molto chiaro e una resistenza molto salda. È inoltre possibile l'illuminazione individuale dei tasti (RGB).
| SD Card Reader | |
| average JPG Copy Test (av. of 3 runs) | |
| Alienware m16 R1 AMD (Toshiba Exceria Pro SDXC 64 GB UHS-II) | |
| Alienware m16 R1 Intel (AV PRO microSD 128 GB V60) | |
| Media della classe Gaming (20.9 - 210, n=54, ultimi 2 anni) | |
| Medion Erazer Defender P40 (AV PRO microSD 128 GB V60) | |
| Schenker XMG Pro 15 (E23) | |
| Acer Predator Helios 16 PH16-71-731Q | |
| maximum AS SSD Seq Read Test (1GB) | |
| Alienware m16 R1 AMD (Toshiba Exceria Pro SDXC 64 GB UHS-II) | |
| Alienware m16 R1 Intel (AV PRO microSD 128 GB V60) | |
| Media della classe Gaming (25.5 - 261, n=51, ultimi 2 anni) | |
| Medion Erazer Defender P40 (AV PRO microSD 128 GB V60) | |
| Schenker XMG Pro 15 (E23) | |
| Acer Predator Helios 16 PH16-71-731Q | |


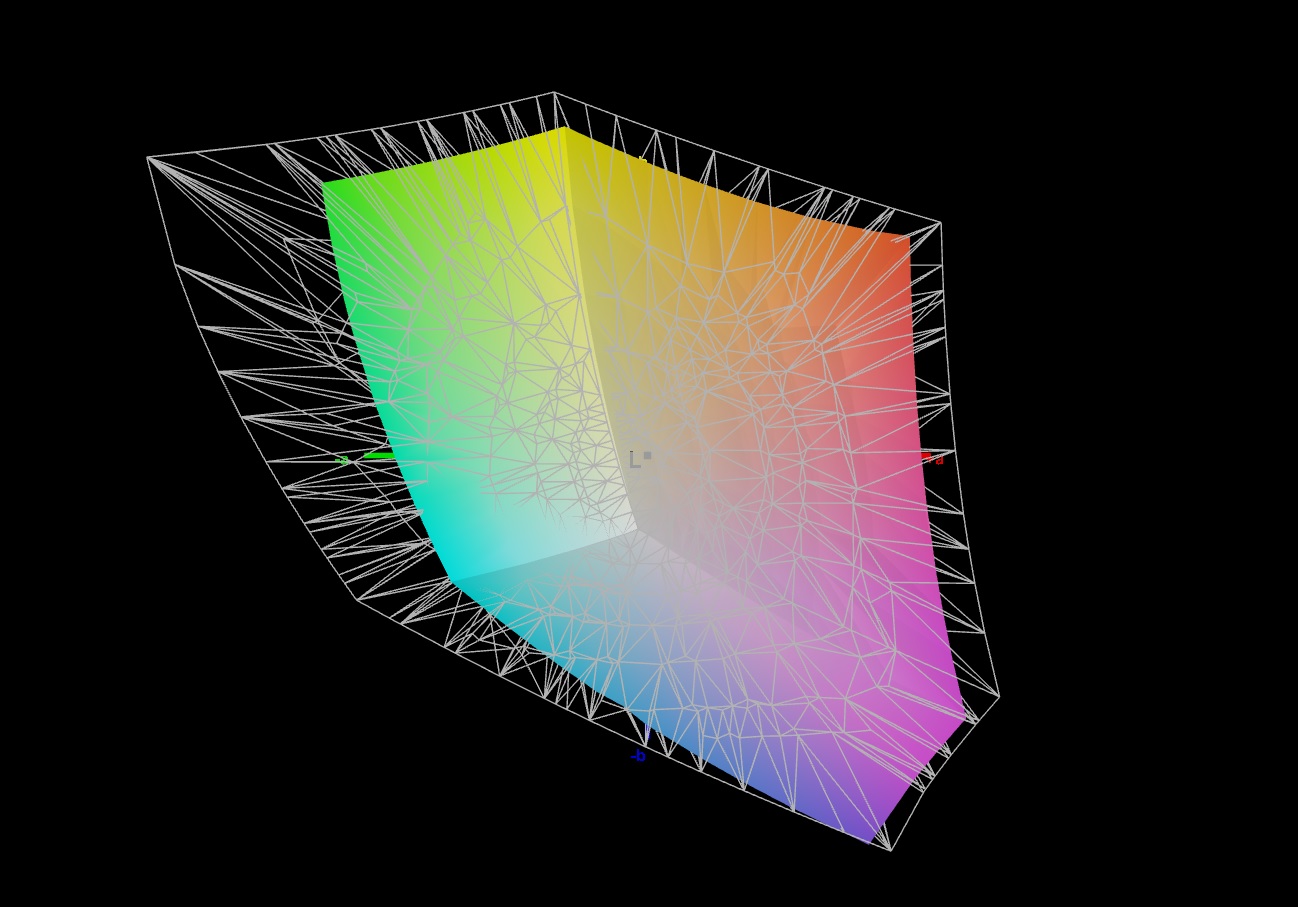
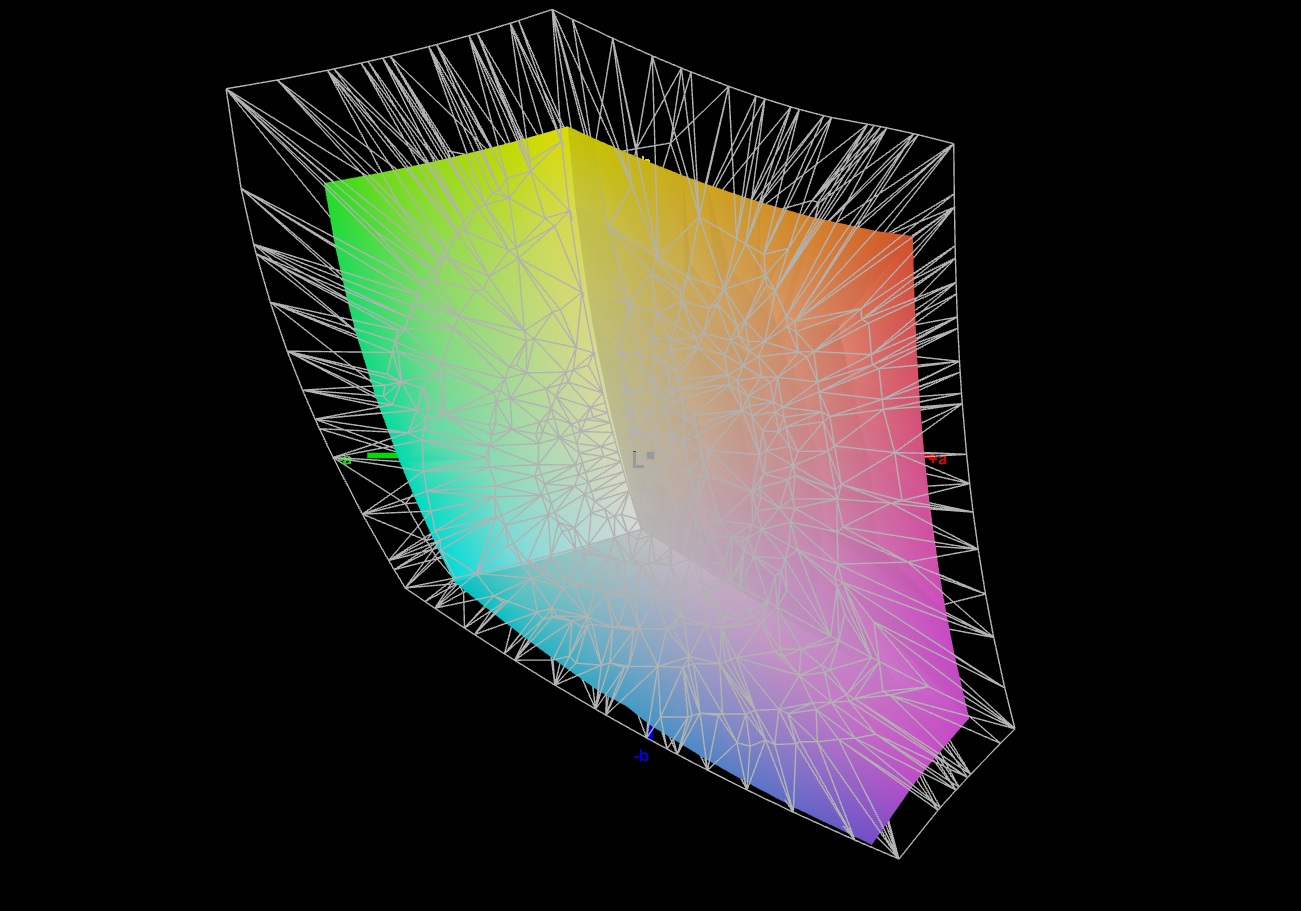
Display - QHD+ con copertura sRGB
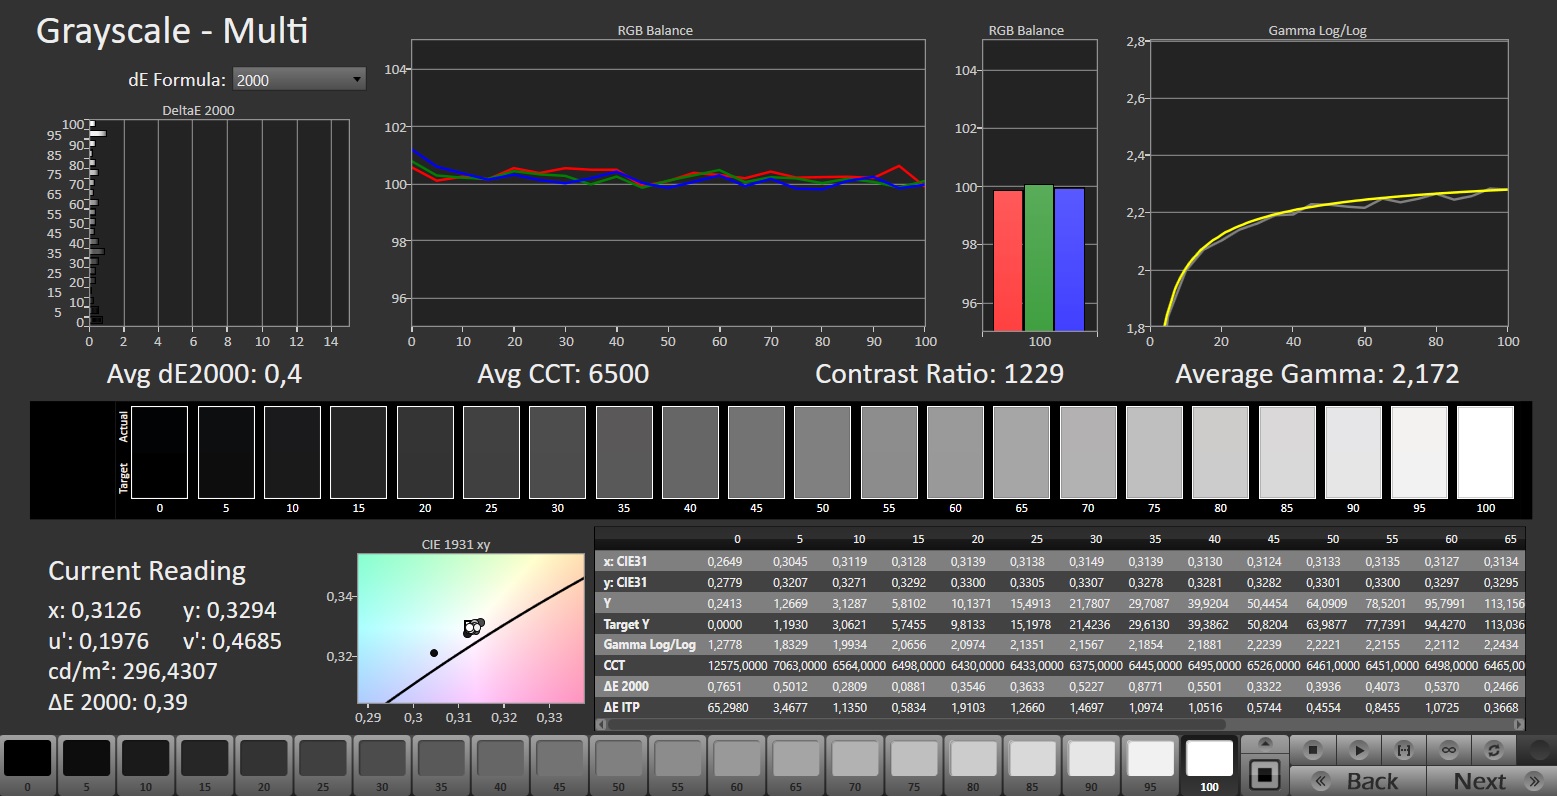
Il lato positivo dello schermo opaco da 16 pollici (2560x1600, IPS) in formato 16:10 è l'assenza di sfarfallio PWM, il supporto G-Sync (solo per i modelli Intel m16) e i brevi tempi di risposta. La luminosità e il contrasto del pannello a 165 Hz raggiungono i rispettivi obiettivi (> 300 cd/m² o 1000:1).
In alternativa, sono disponibili altri due display (1x QHD+, 1x FHD+) che offrono frequenze di aggiornamento più elevate e una maggiore copertura dello spazio colore. non sono disponibili opzioni 4k, OLED o mini-LED.
| |||||||||||||||||||||||||
Distribuzione della luminosità: 89 %
Al centro con la batteria: 306 cd/m²
Contrasto: 1020:1 (Nero: 0.3 cd/m²)
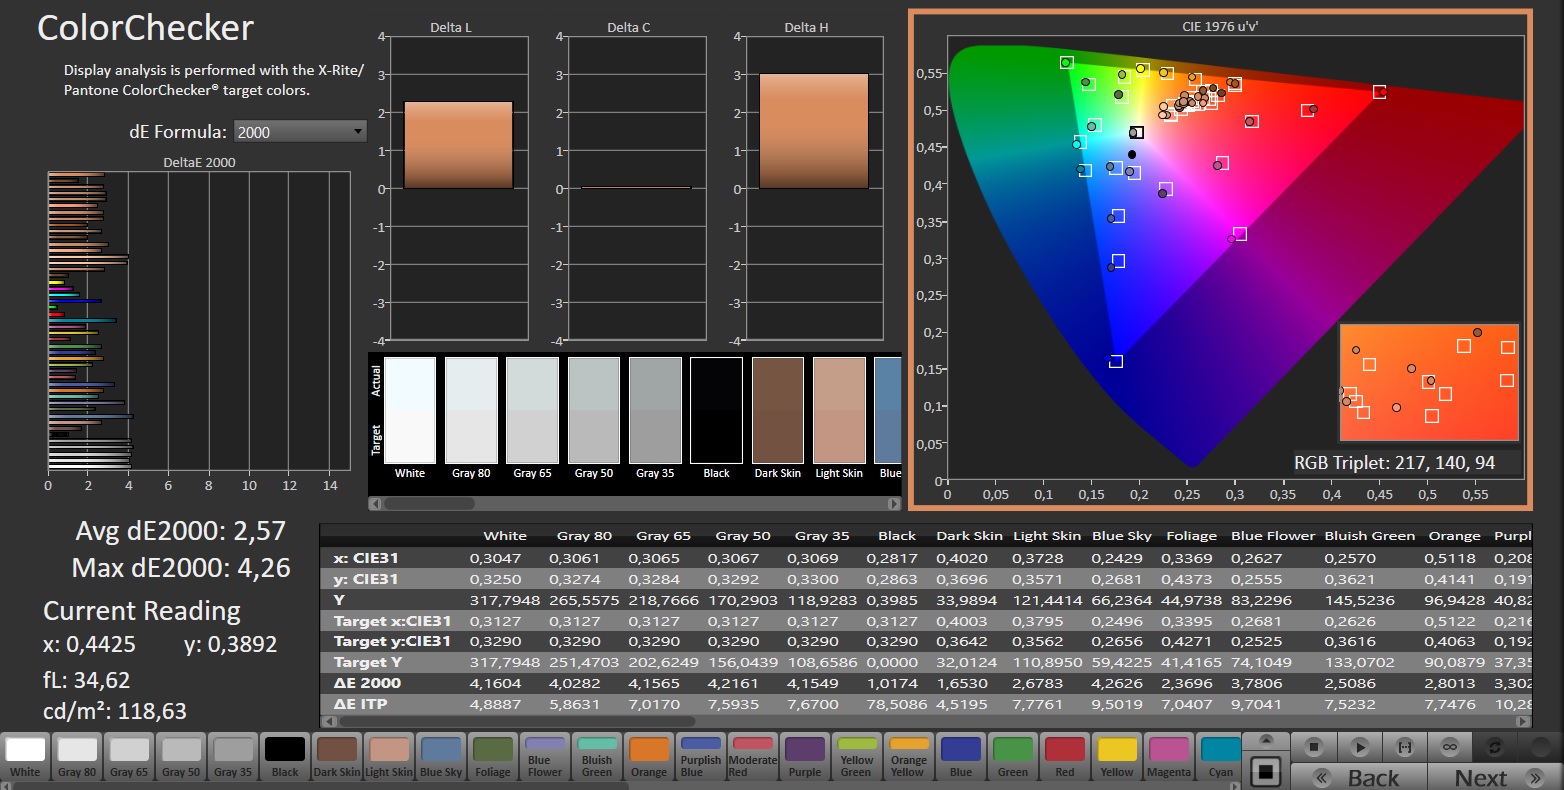
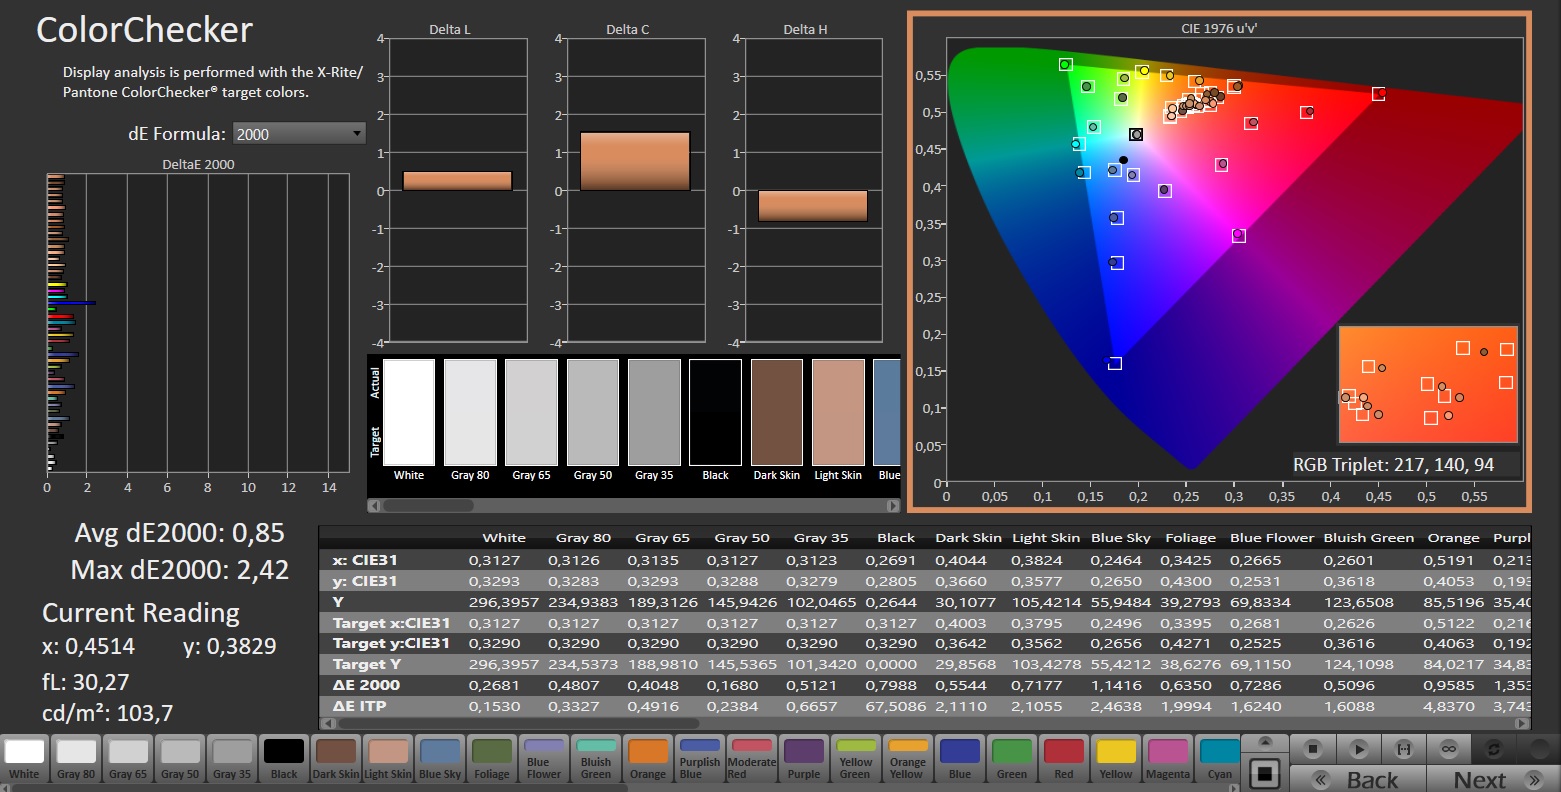
ΔE ColorChecker Calman: 2.57 | ∀{0.5-29.43 Ø4.71}
calibrated: 0.85
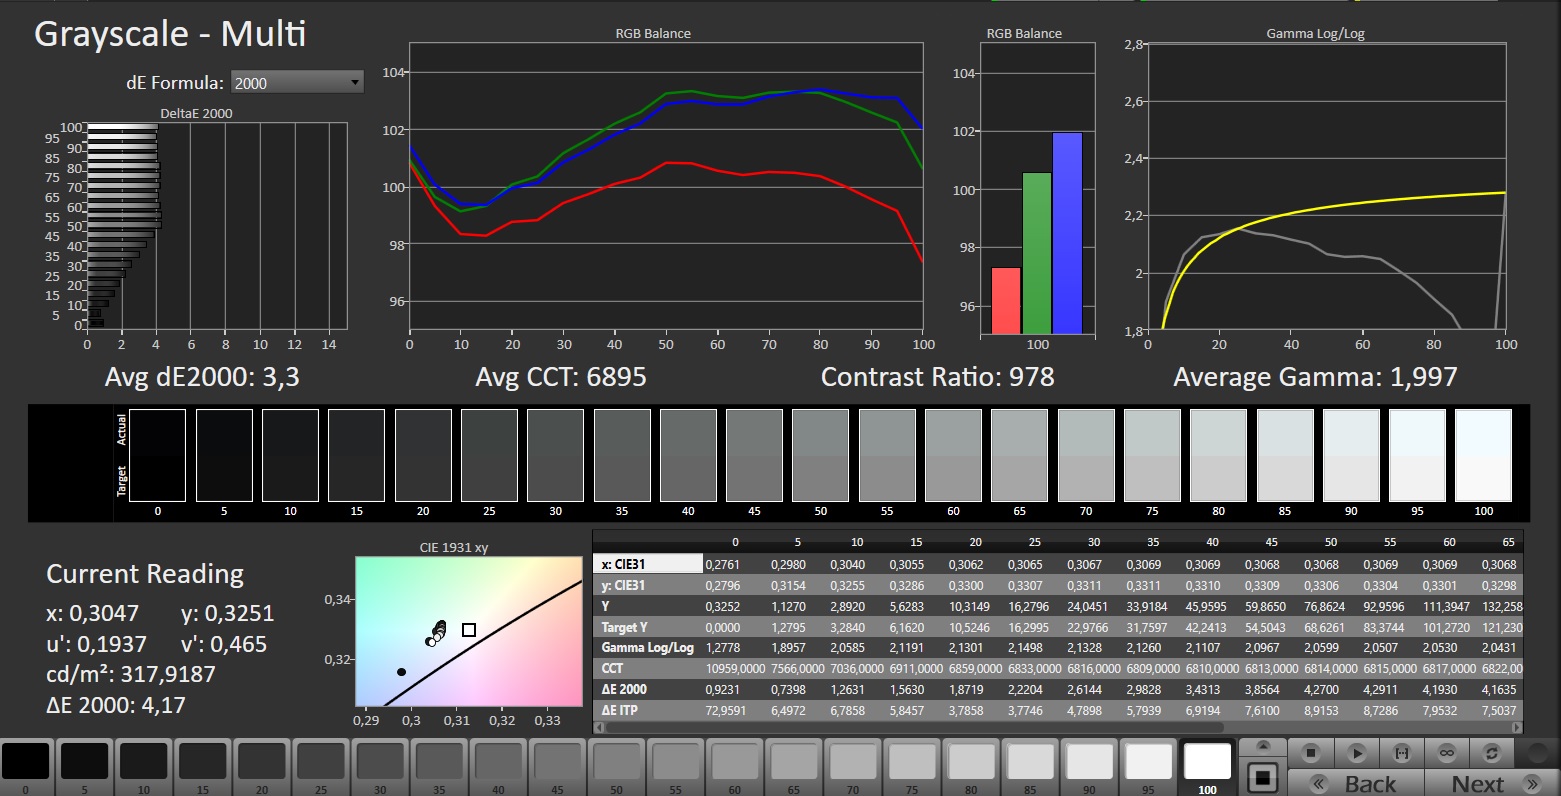
ΔE Greyscale Calman: 3.3 | ∀{0.09-98 Ø4.96}
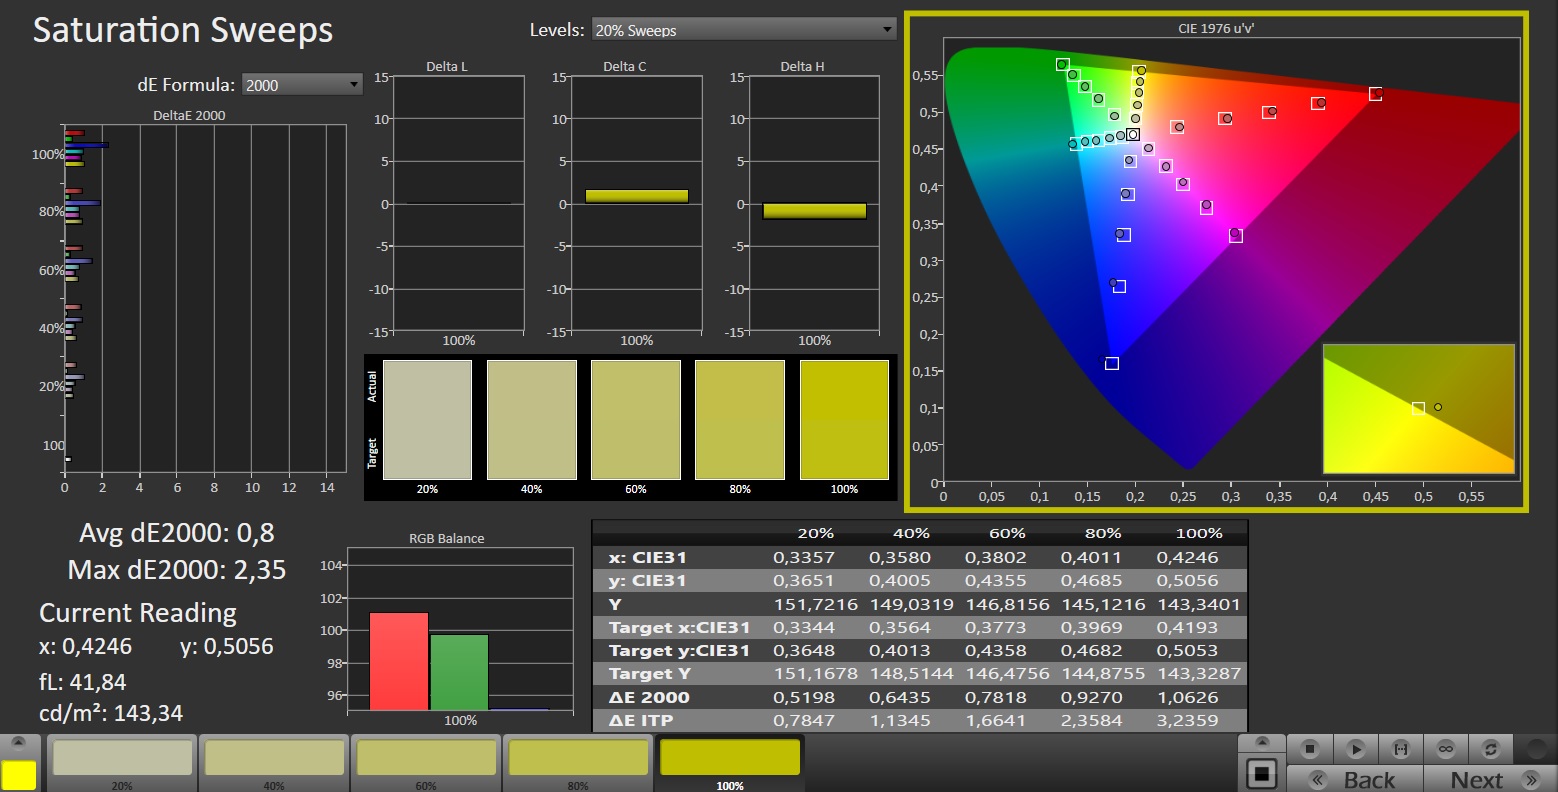
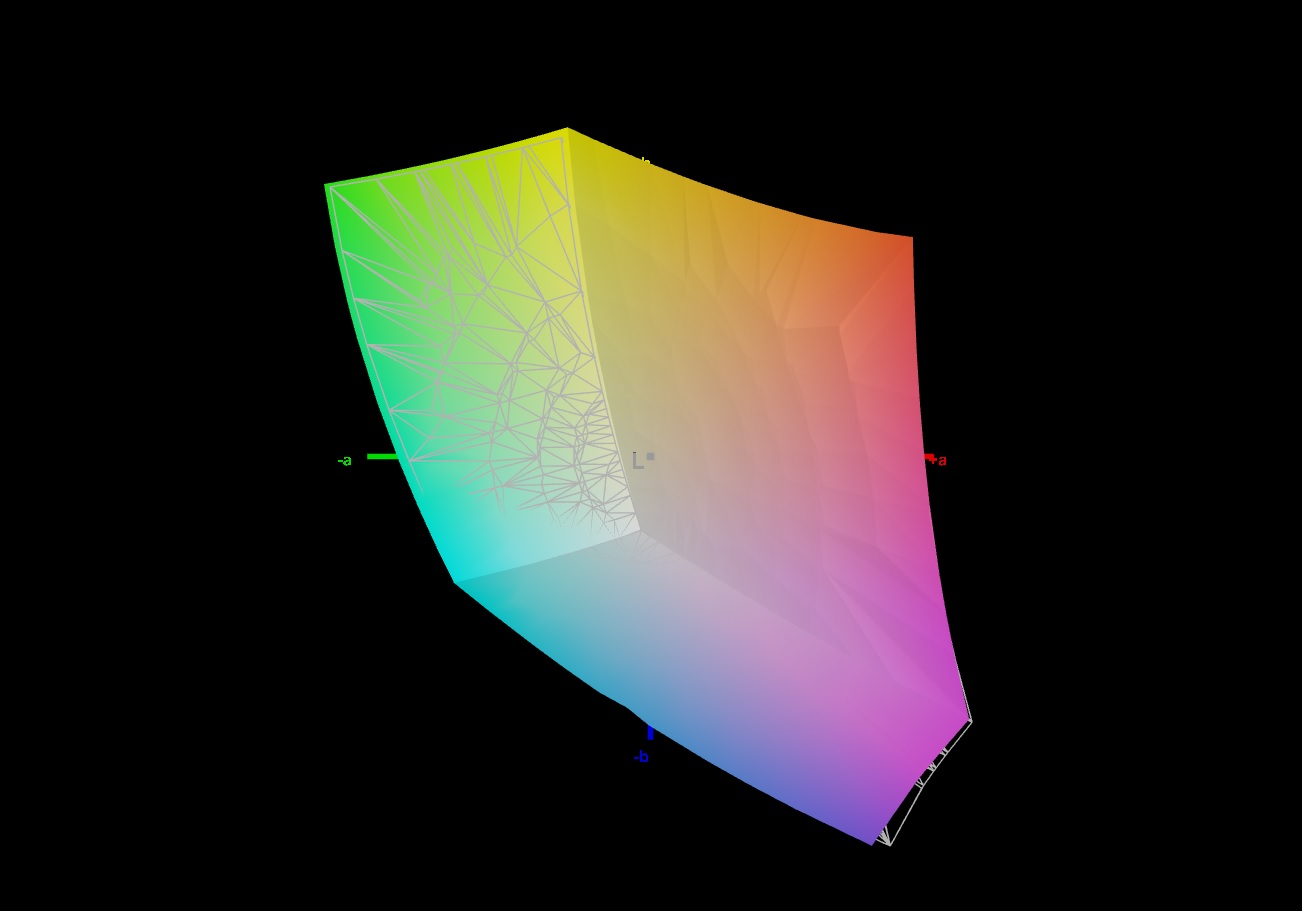
70% AdobeRGB 1998 (Argyll 3D)
97.2% sRGB (Argyll 3D)
67.7% Display P3 (Argyll 3D)
Gamma: 1.997
CCT: 6895 K
| Alienware m16 R1 Intel BOE NE16NYB, IPS, 2560x1600, 16" | Acer Predator Helios 16 PH16-71-731Q BOE NE160QDM-NZ2, IPS-LED, 2560x1600, 16" | Medion Erazer Defender P40 BOE CQ NE173QHM-NZ3, IPS, 2560x1440, 17.3" | Lenovo Legion Pro 5 16IRX8 AU Optronics B160QAN03.1, IPS, 2560x1600, 16" | Schenker XMG Pro 15 (E23) BOE0AD1, IPS, 2560x1440, 15.6" | Aorus 15 BSF Sharp LQ156T1JW05, IPS, 2560x1440, 15.6" | Alienware m16 R1 AMD BOE NE16NZ4, IPS, 2560x1600, 16" | |
|---|---|---|---|---|---|---|---|
| Display | 22% | 1% | 4% | 23% | 23% | 25% | |
| Display P3 Coverage (%) | 67.7 | 97.1 43% | 68.3 1% | 71.2 5% | 97.8 44% | 98.2 45% | 98.6 46% |
| sRGB Coverage (%) | 97.2 | 100 3% | 98.1 1% | 98.8 2% | 99.9 3% | 99.9 3% | 99.9 3% |
| AdobeRGB 1998 Coverage (%) | 70 | 84.7 21% | 69.8 0% | 73.3 5% | 85.4 22% | 85.7 22% | 88.9 27% |
| Response Times | -114% | -142% | -153% | -141% | -90% | -25% | |
| Response Time Grey 50% / Grey 80% * (ms) | 4 ? | 13.6 ? -240% | 14.6 ? -265% | 14.5 ? -263% | 14 ? -250% | 11.3 ? -183% | 5.1 ? -27% |
| Response Time Black / White * (ms) | 7.3 ? | 6.4 ? 12% | 8.7 ? -19% | 10.4 ? -42% | 9.6 ? -32% | 7 ? 4% | 9 ? -23% |
| PWM Frequency (Hz) | |||||||
| Screen | 14% | 18% | 19% | -15% | -24% | -34% | |
| Brightness middle (cd/m²) | 306 | 511 67% | 364 19% | 405.7 33% | 322 5% | 299 -2% | 329 8% |
| Brightness (cd/m²) | 302 | 498 65% | 343 14% | 368 22% | 301 0% | 282 -7% | 317 5% |
| Brightness Distribution (%) | 89 | 94 6% | 86 -3% | 87 -2% | 85 -4% | 82 -8% | 89 0% |
| Black Level * (cd/m²) | 0.3 | 0.36 -20% | 0.28 7% | 0.38 -27% | 0.36 -20% | 0.31 -3% | 0.32 -7% |
| Contrast (:1) | 1020 | 1419 39% | 1300 27% | 1068 5% | 894 -12% | 965 -5% | 1028 1% |
| Colorchecker dE 2000 * | 2.57 | 1.76 32% | 1.67 35% | 1.65 36% | 1.98 23% | 2.24 13% | 3.71 -44% |
| Colorchecker dE 2000 max. * | 4.26 | 3.7 13% | 2.78 35% | 4.2 1% | 5.24 -23% | 4.29 -1% | 7.23 -70% |
| Colorchecker dE 2000 calibrated * | 0.85 | 1.56 -84% | 1.14 -34% | 0.53 38% | 1.98 -133% | 2.62 -208% | 2.82 -232% |
| Greyscale dE 2000 * | 3.3 | 3 9% | 1.4 58% | 1.2 64% | 2.44 26% | 3 9% | 2.2 33% |
| Gamma | 1.997 110% | 2.33 94% | 2.091 105% | 2.3 96% | 2.42 91% | 2.086 105% | 2.3 96% |
| CCT | 6895 94% | 6341 103% | 6568 99% | 6453 101% | 6984 93% | 6289 103% | 6270 104% |
| Media totale (Programma / Settaggio) | -26% /
-2% | -41% /
-9% | -43% /
-9% | -44% /
-25% | -30% /
-23% | -11% /
-20% |
* ... Meglio usare valori piccoli
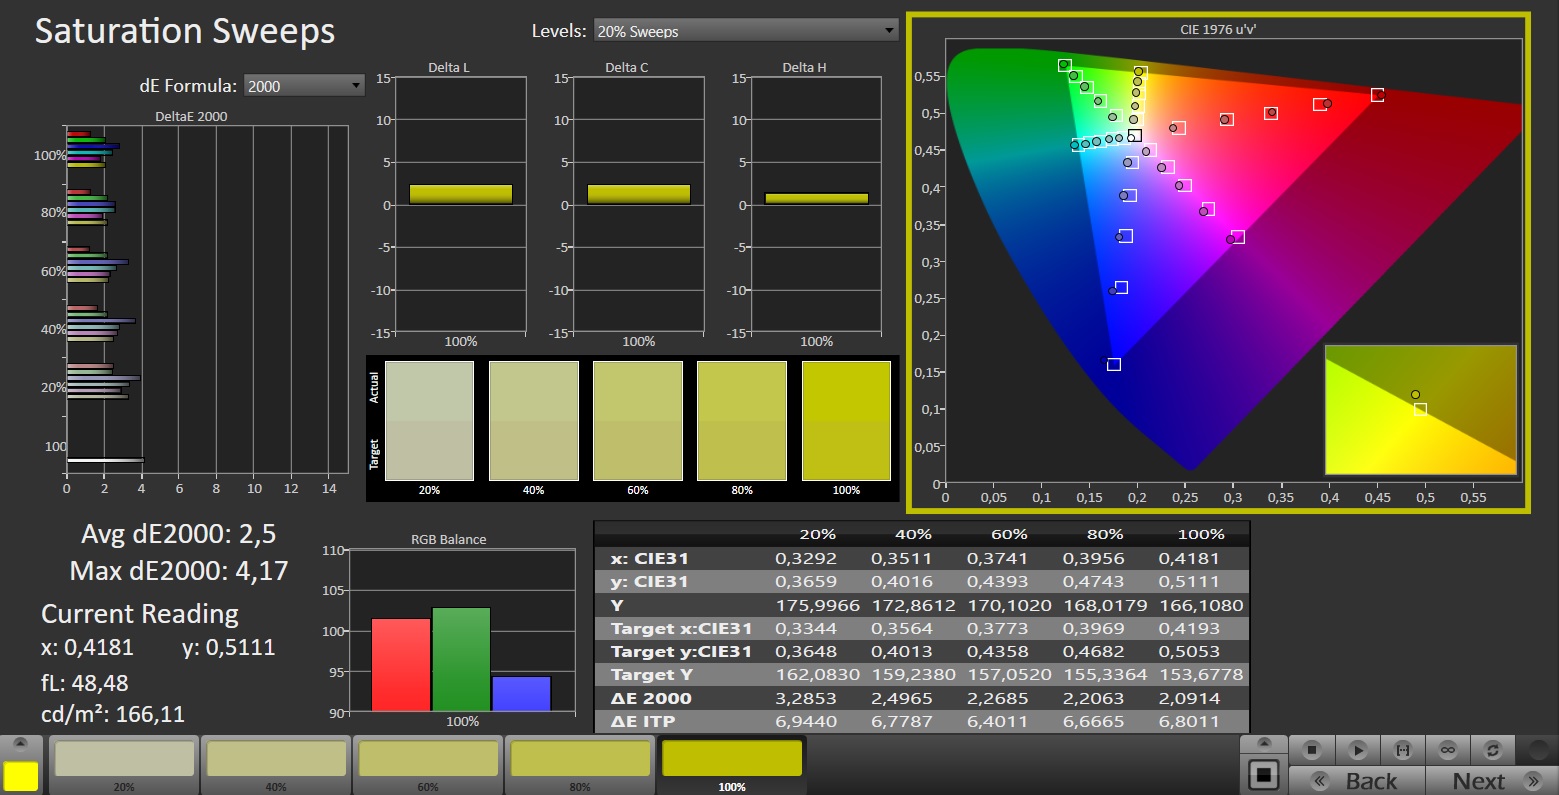
Lo schermo mostra una buona rappresentazione dei colori: l'obiettivo (DeltaE < 3) è raggiunto con una deviazione di circa 2,6. La calibrazione riduce ulteriormente questa deviazione a 0,85 e garantisce livelli di grigio più equilibrati. Il pannello è in grado di riprodurre completamente lo spazio colore sRGB, ma non gli spazi colore AdobeRGB e DCI P3. D'altra parte, lo spazio P3 può essere riprodotto sugli schermi alternativi.
Tempi di risposta del Display
| ↔ Tempi di risposta dal Nero al Bianco | ||
|---|---|---|
| 7.3 ms ... aumenta ↗ e diminuisce ↘ combinato | ↗ 3.6 ms Incremento | 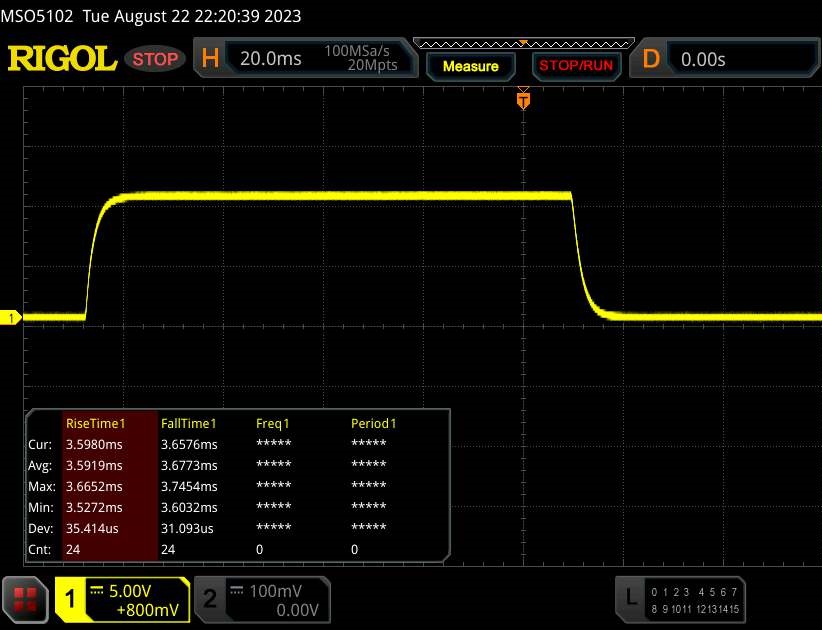 |
| ↘ 3.7 ms Calo | ||
| Lo schermo ha mostrato valori di risposta molto veloci nei nostri tests ed è molto adatto per i gaming veloce. In confronto, tutti i dispositivi di test variano da 0.1 (minimo) a 240 (massimo) ms. » 22 % di tutti i dispositivi è migliore. Questo significa che i tempi di risposta rilevati sono migliori rispettto alla media di tutti i dispositivi testati (19.8 ms). | ||
| ↔ Tempo di risposta dal 50% Grigio all'80% Grigio | ||
| 4 ms ... aumenta ↗ e diminuisce ↘ combinato | ↗ 1.7 ms Incremento | 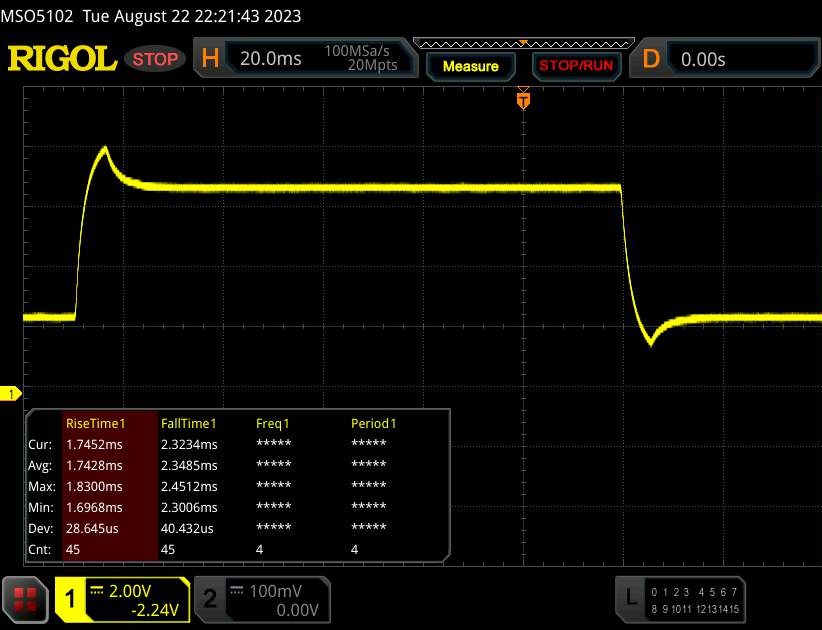 |
| ↘ 2.3 ms Calo | ||
| Lo schermo ha mostrato valori di risposta molto veloci nei nostri tests ed è molto adatto per i gaming veloce. In confronto, tutti i dispositivi di test variano da 0.165 (minimo) a 636 (massimo) ms. » 15 % di tutti i dispositivi è migliore. Questo significa che i tempi di risposta rilevati sono migliori rispettto alla media di tutti i dispositivi testati (31 ms). | ||
Sfarfallio dello schermo / PWM (Pulse-Width Modulation)
| flickering dello schermo / PWM non rilevato |  | ||
In confronto: 52 % di tutti i dispositivi testati non utilizza PWM per ridurre la luminosita' del display. Se è rilevato PWM, una media di 7757 (minimo: 5 - massimo: 343500) Hz è stata rilevata. | |||
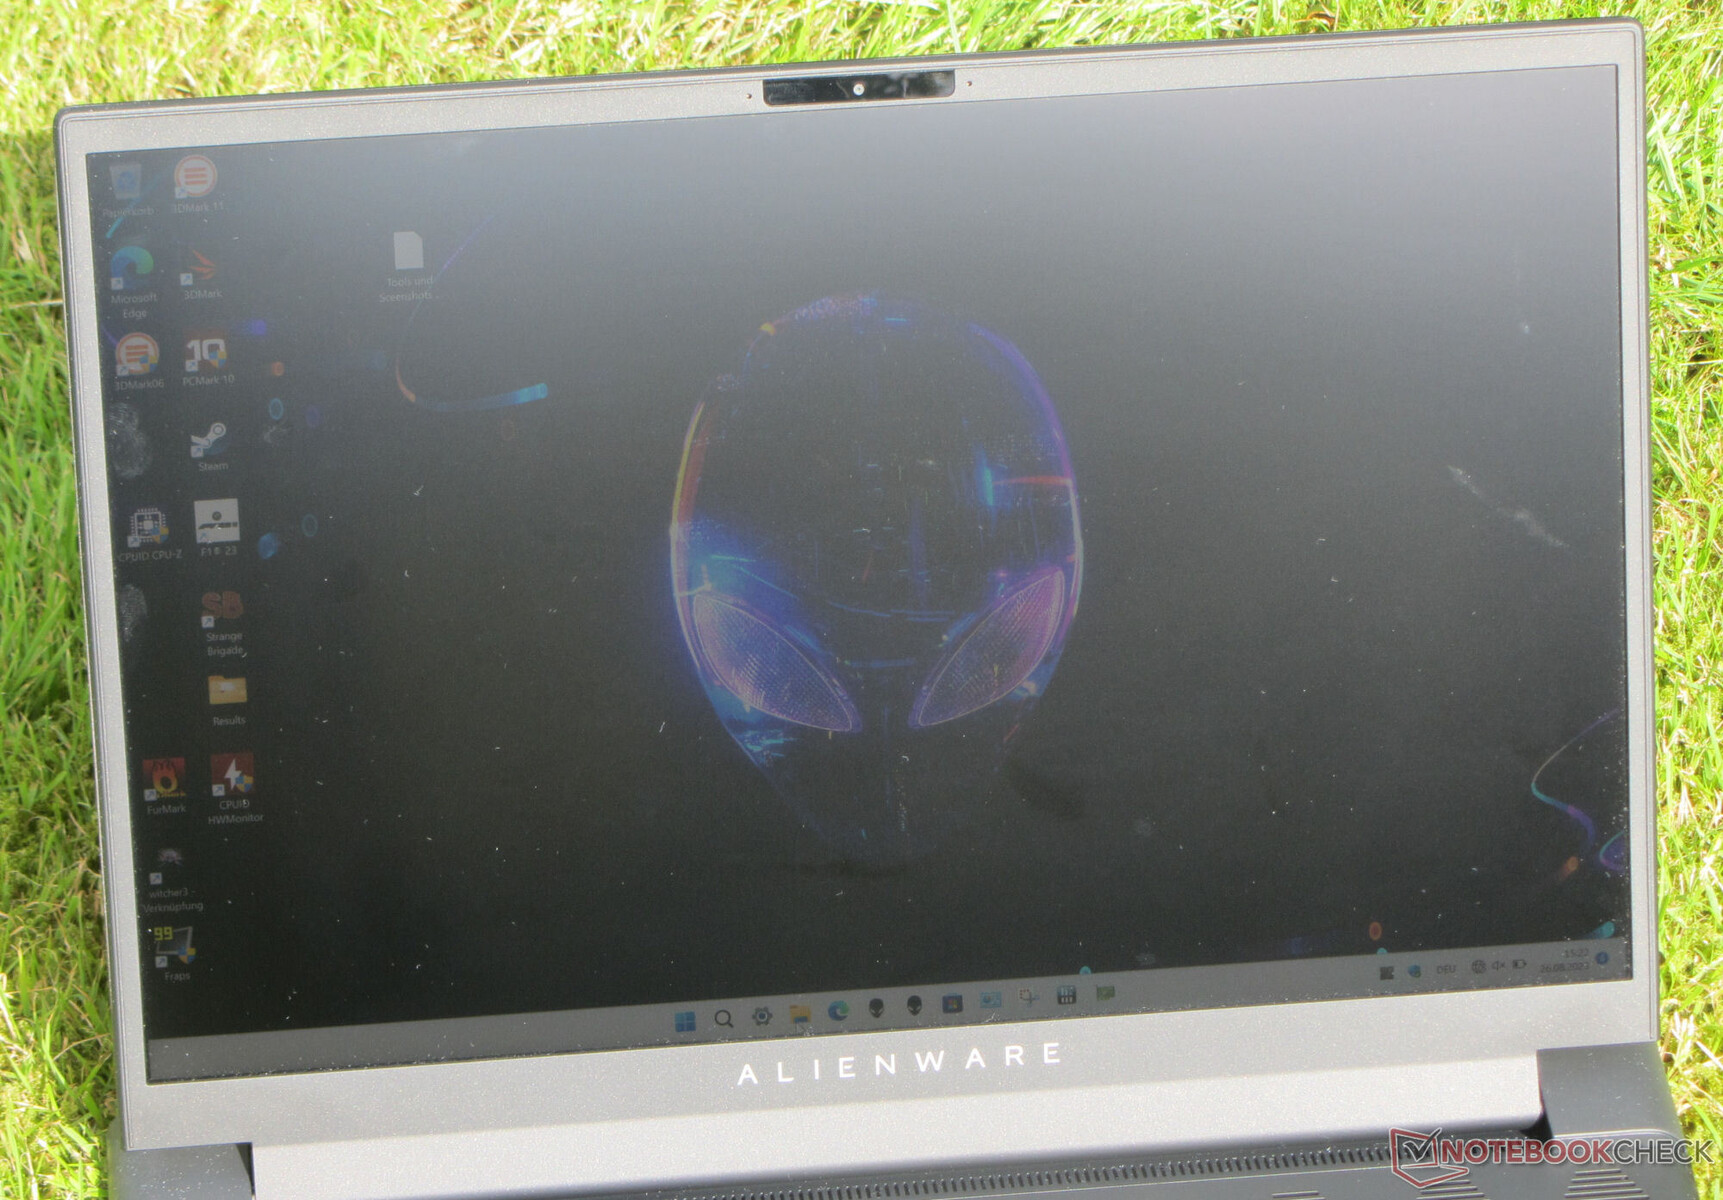
Il pannello IPS, stabile nell'angolo di visione, può essere letto da qualsiasi posizione. All'aperto, la lettura dello schermo è possibile solo se il sole non è troppo forte.

Prestazioni - Il notebook Alienware offre elevate prestazioni di sistema
All'interno della linea Alienware m16 R1, le GPU Ada Lovelace (RTX 4060, 4070, 4080) sono abbinati a CPU di Intel o AMD. Ci sono due eccezioni: alcuni modelli AMD possono essere ordinati solo con una Radeon RX 7600M XT e alcuni modelli Intel con una GeForce RTX 4090. Il nostro dispositivo m16 basato su Intel è disponibile a circa 1.900 euro, il che lo rende attualmente uno dei rappresentanti più economici della serie.
Condizioni di test
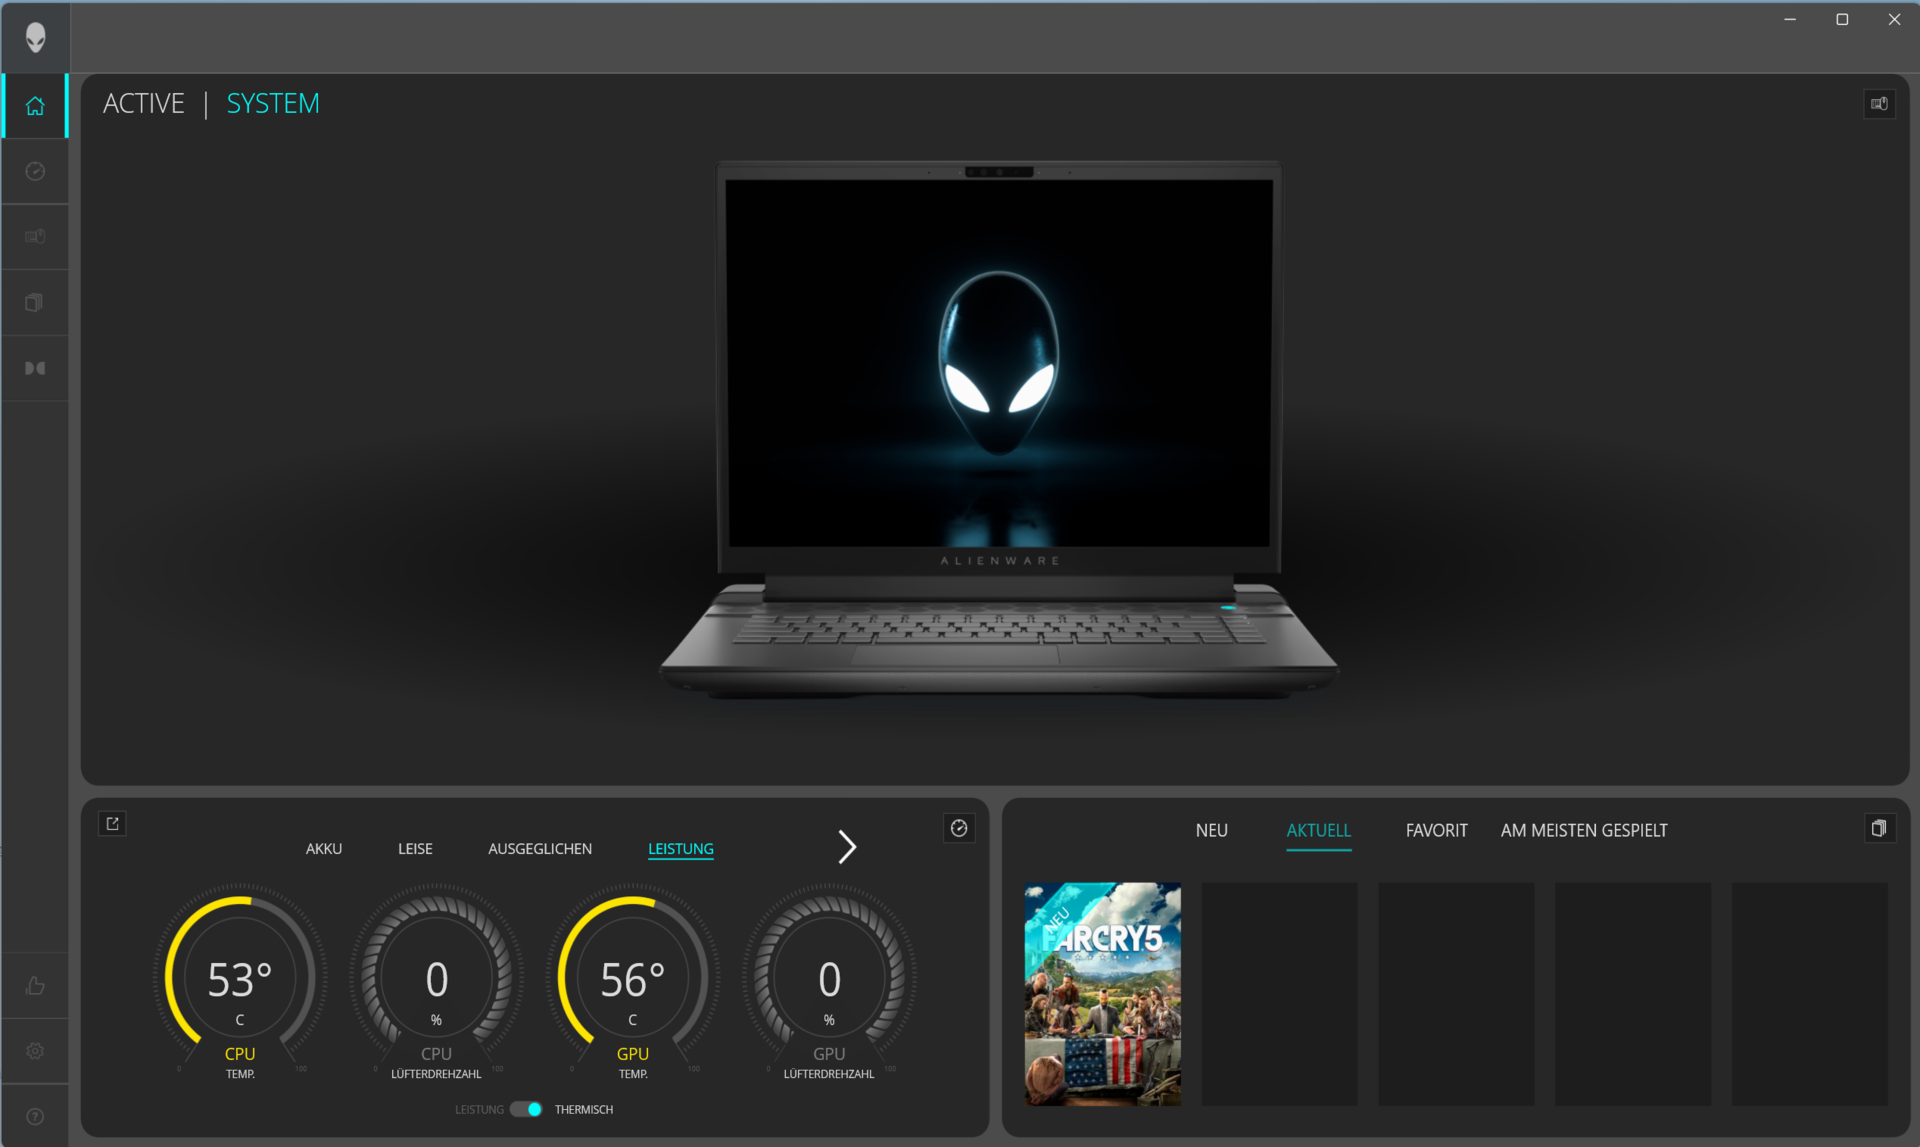
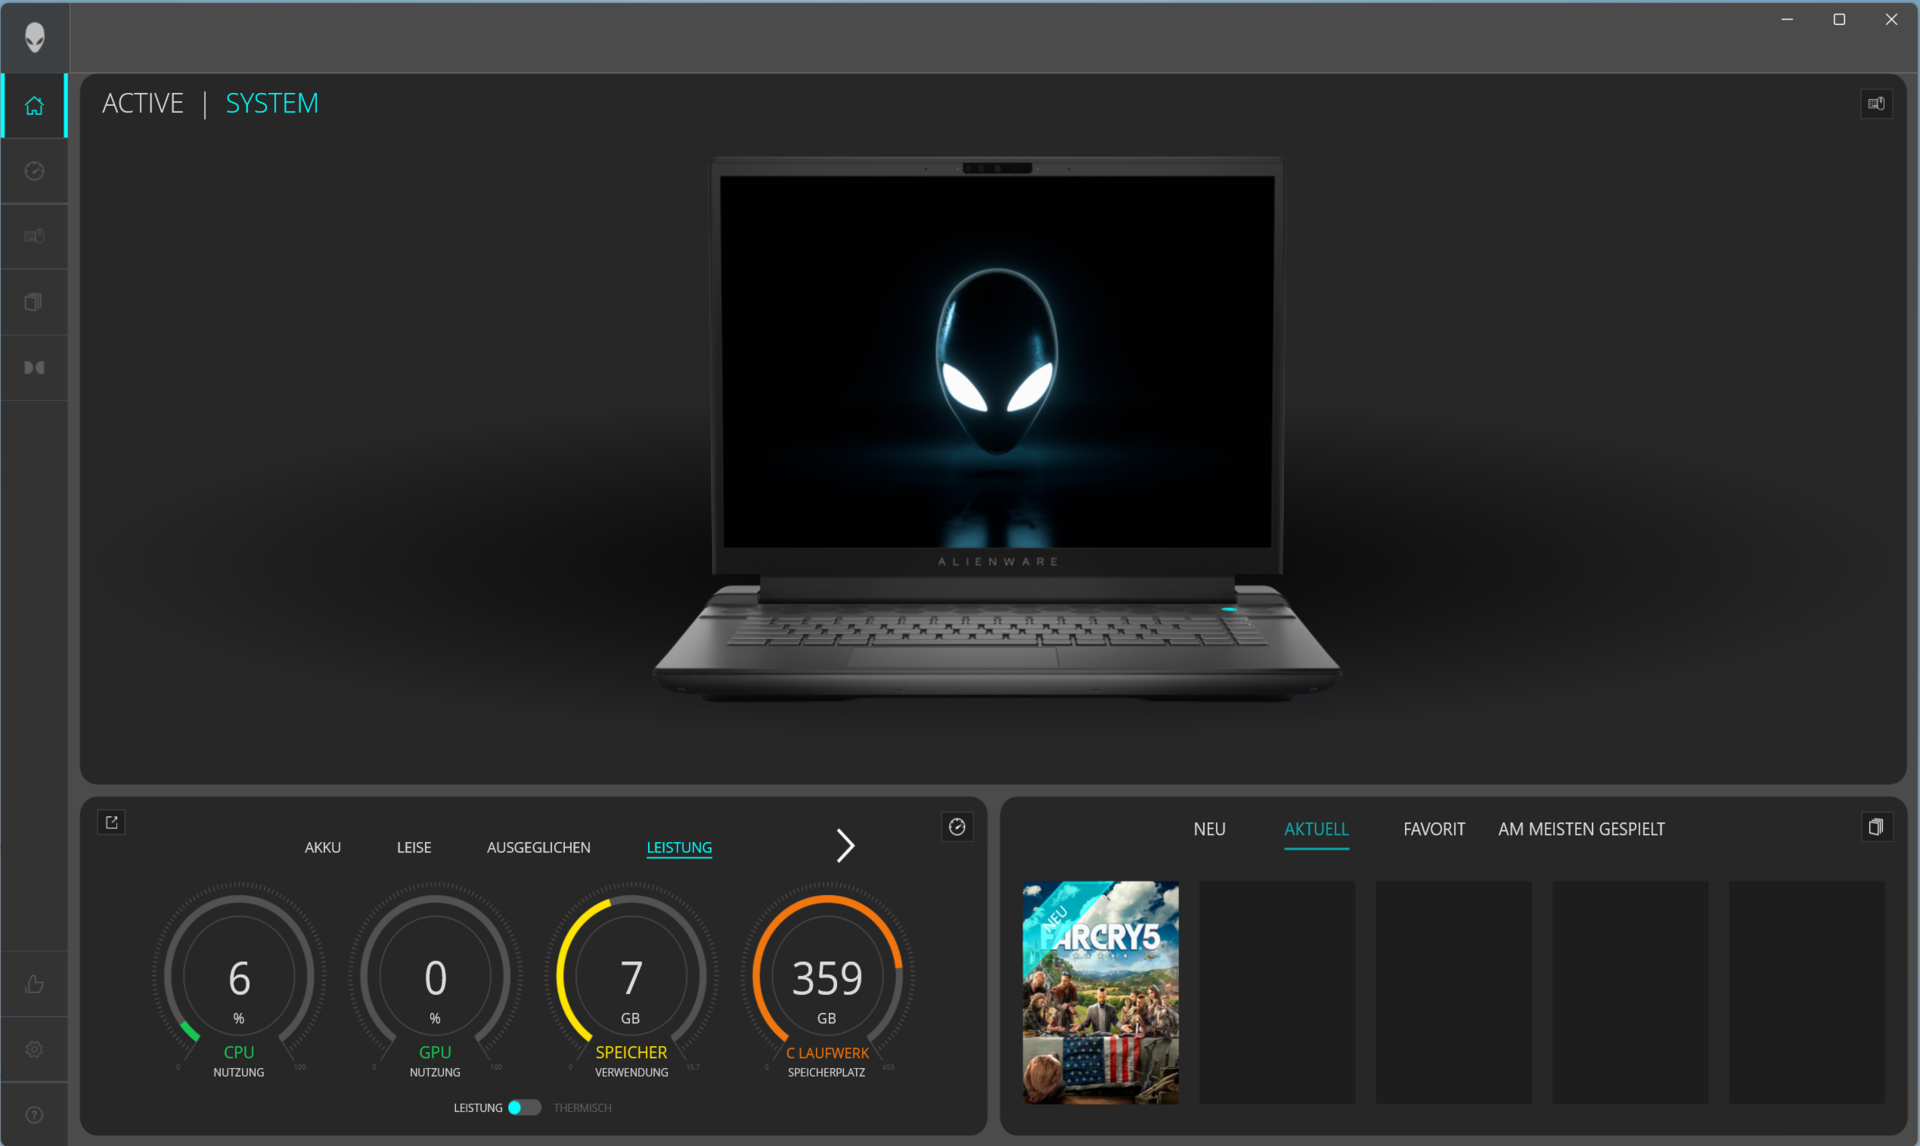
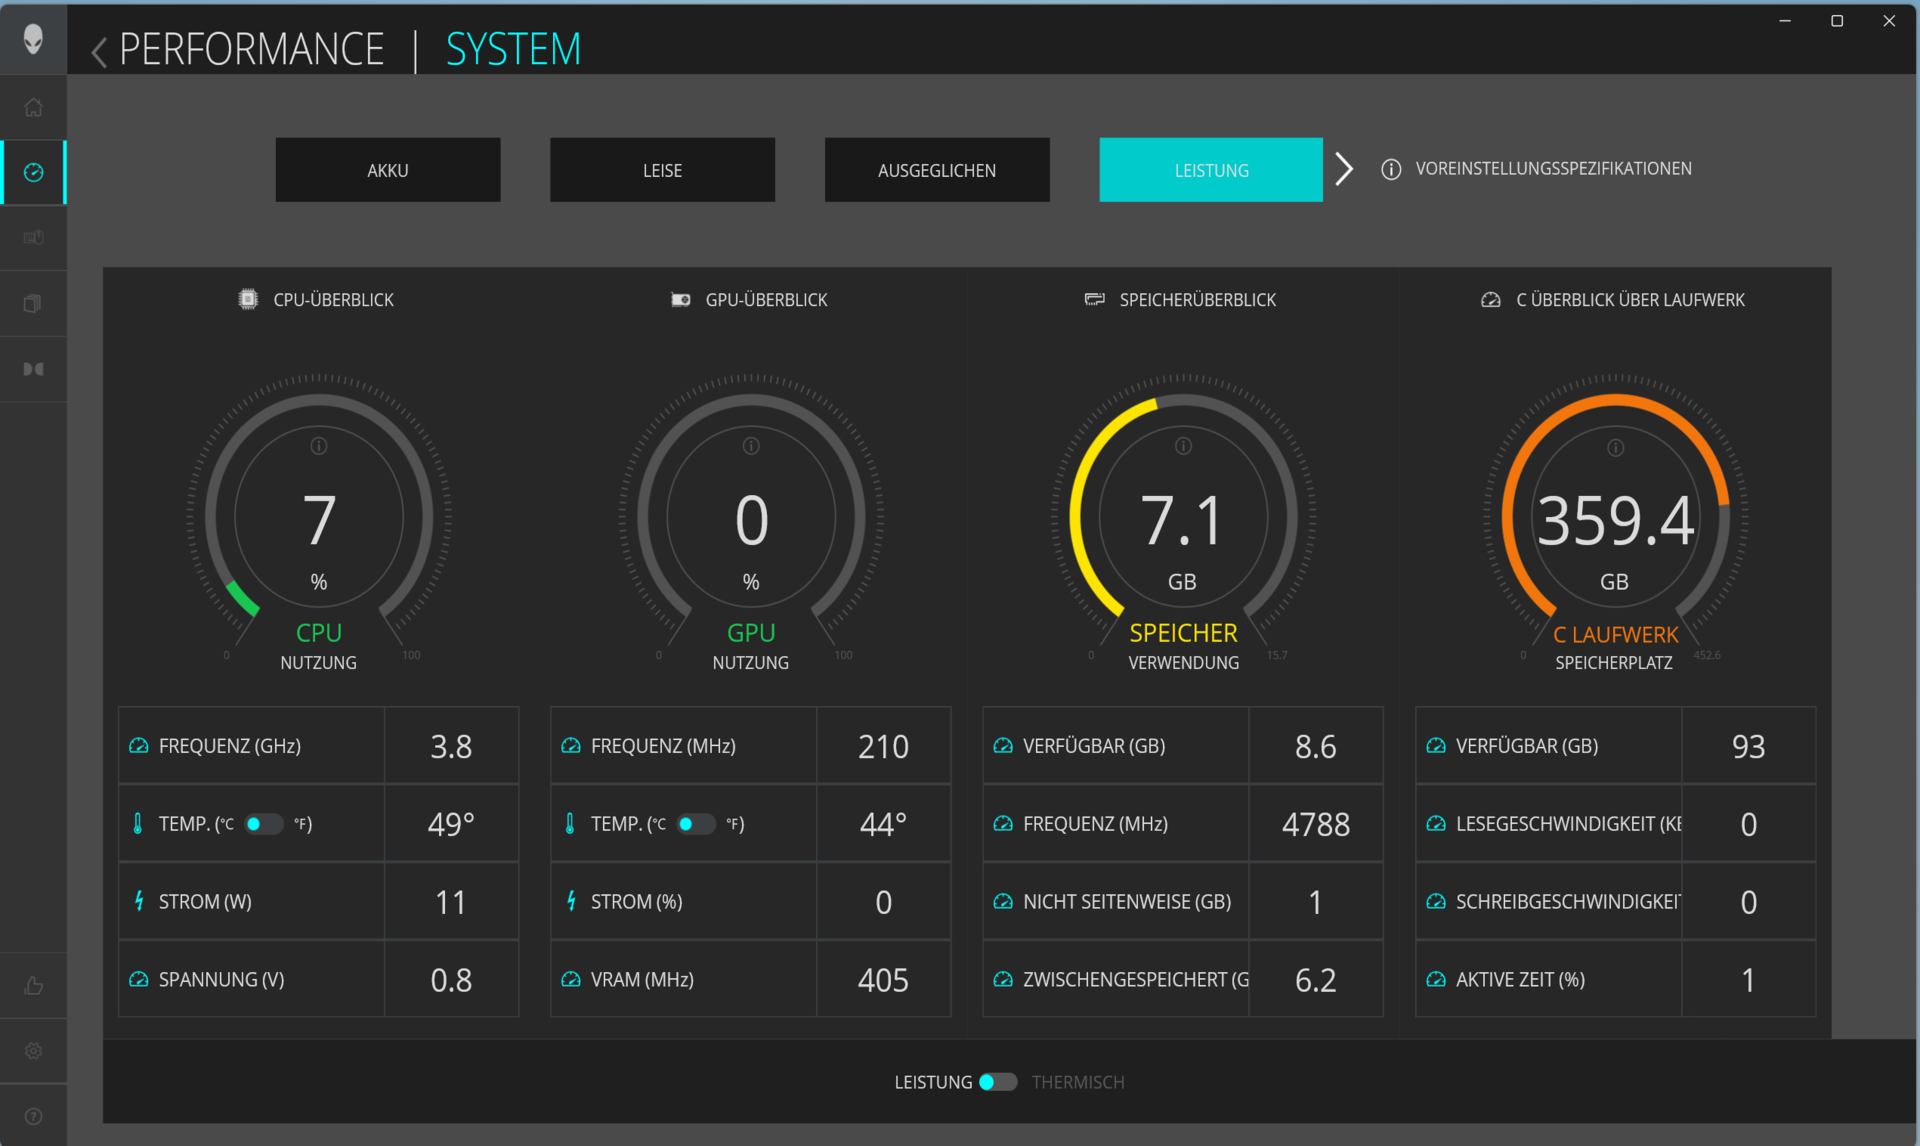
Gli utenti possono scegliere tra cinque modalità di prestazioni specifiche del produttore tramite l'Alienware Command Center (centro di controllo del portatile). Una modalità ad alte prestazioni (prestazioni massime, ventole completamente attive) può essere attivata tramite il tasto "F1". Nei nostri test sono state utilizzate le modalità "Performance" (benchmark) e "Balanced" (test della batteria).
Nota: il modello Recensione del portatile Alienware m16 R1: Debutto delle prestazioni dell'AMD Ryzen 9 7845HX è stato testato con il profilo "Overdrive" e la modalità dGPU attiva. Pertanto, i risultati dei benchmark non sono sempre direttamente confrontabili.
| Prestazioni | Overdrive | Bilanciato | Silenzioso | Batteria | |
|---|---|---|---|---|---|
| Limite di potenza 1 (HWInfo) | 157 watt | 165 watt | 157 watt | 50 watt | 55 watt |
| Limite di potenza 2 (HWInfo) | 157 watt | 165 watt | 157 watt | 157 watt | 157 watt |
| Prestazioni (Witcher 3) | 104fps | 104fps | 103fps | 102fps | 103fps |
| Rumore (Witcher 3) | 51dB(A) | 58dB(A) | 49dB(A) | 43dB(A) | 47dB(A) |

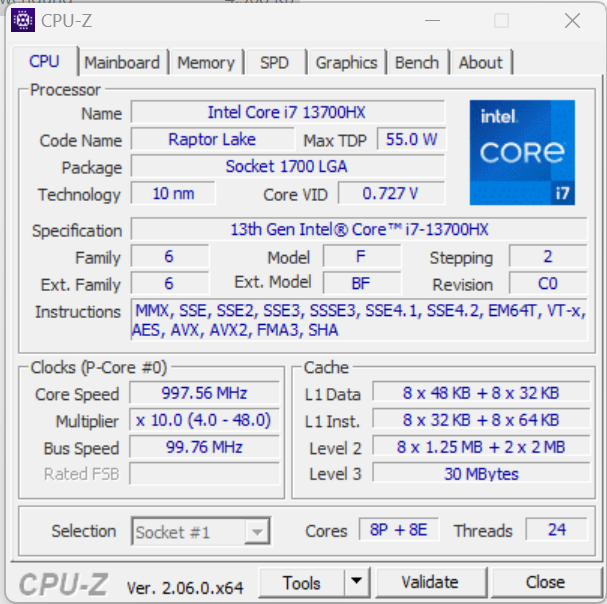
Processore
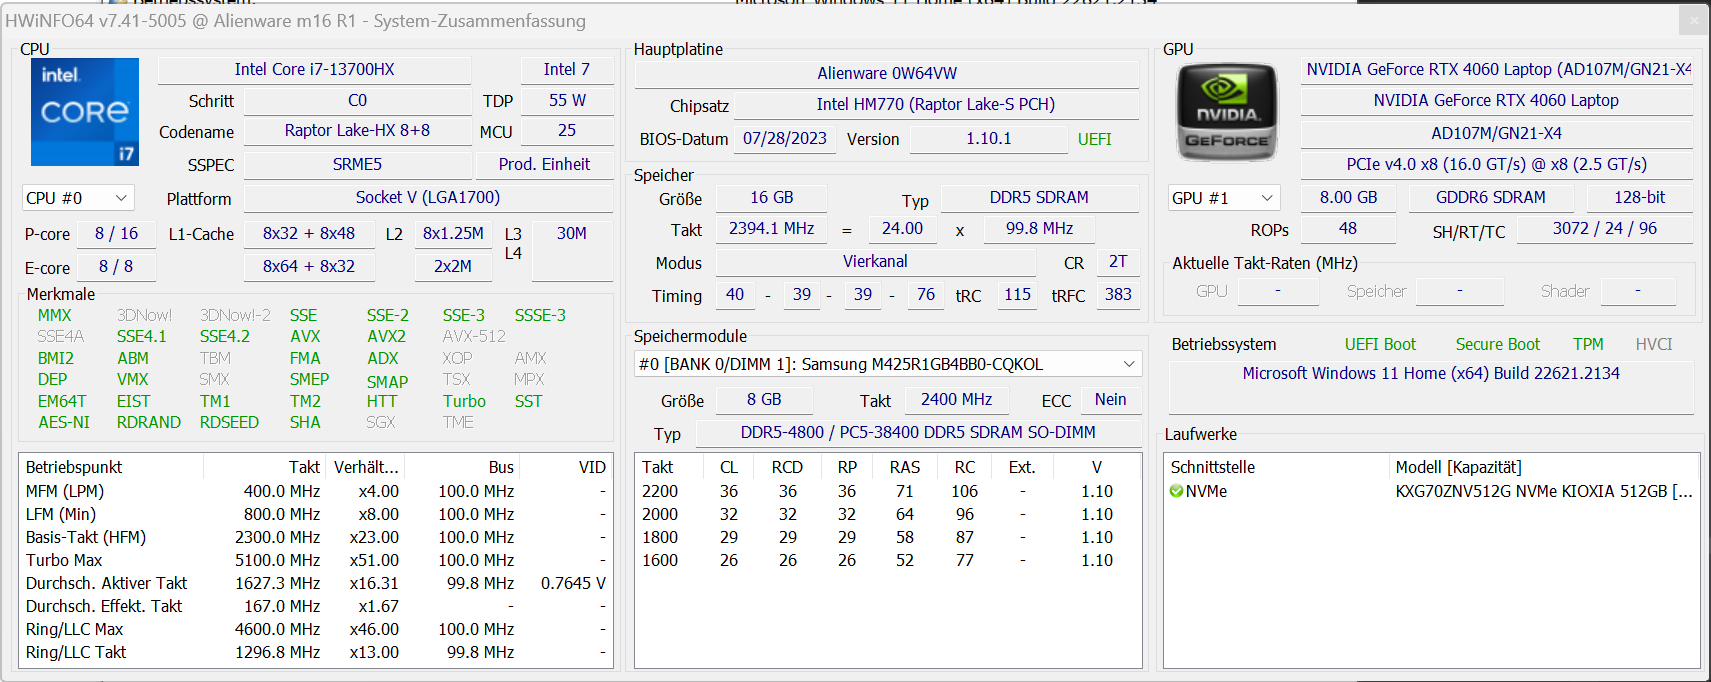
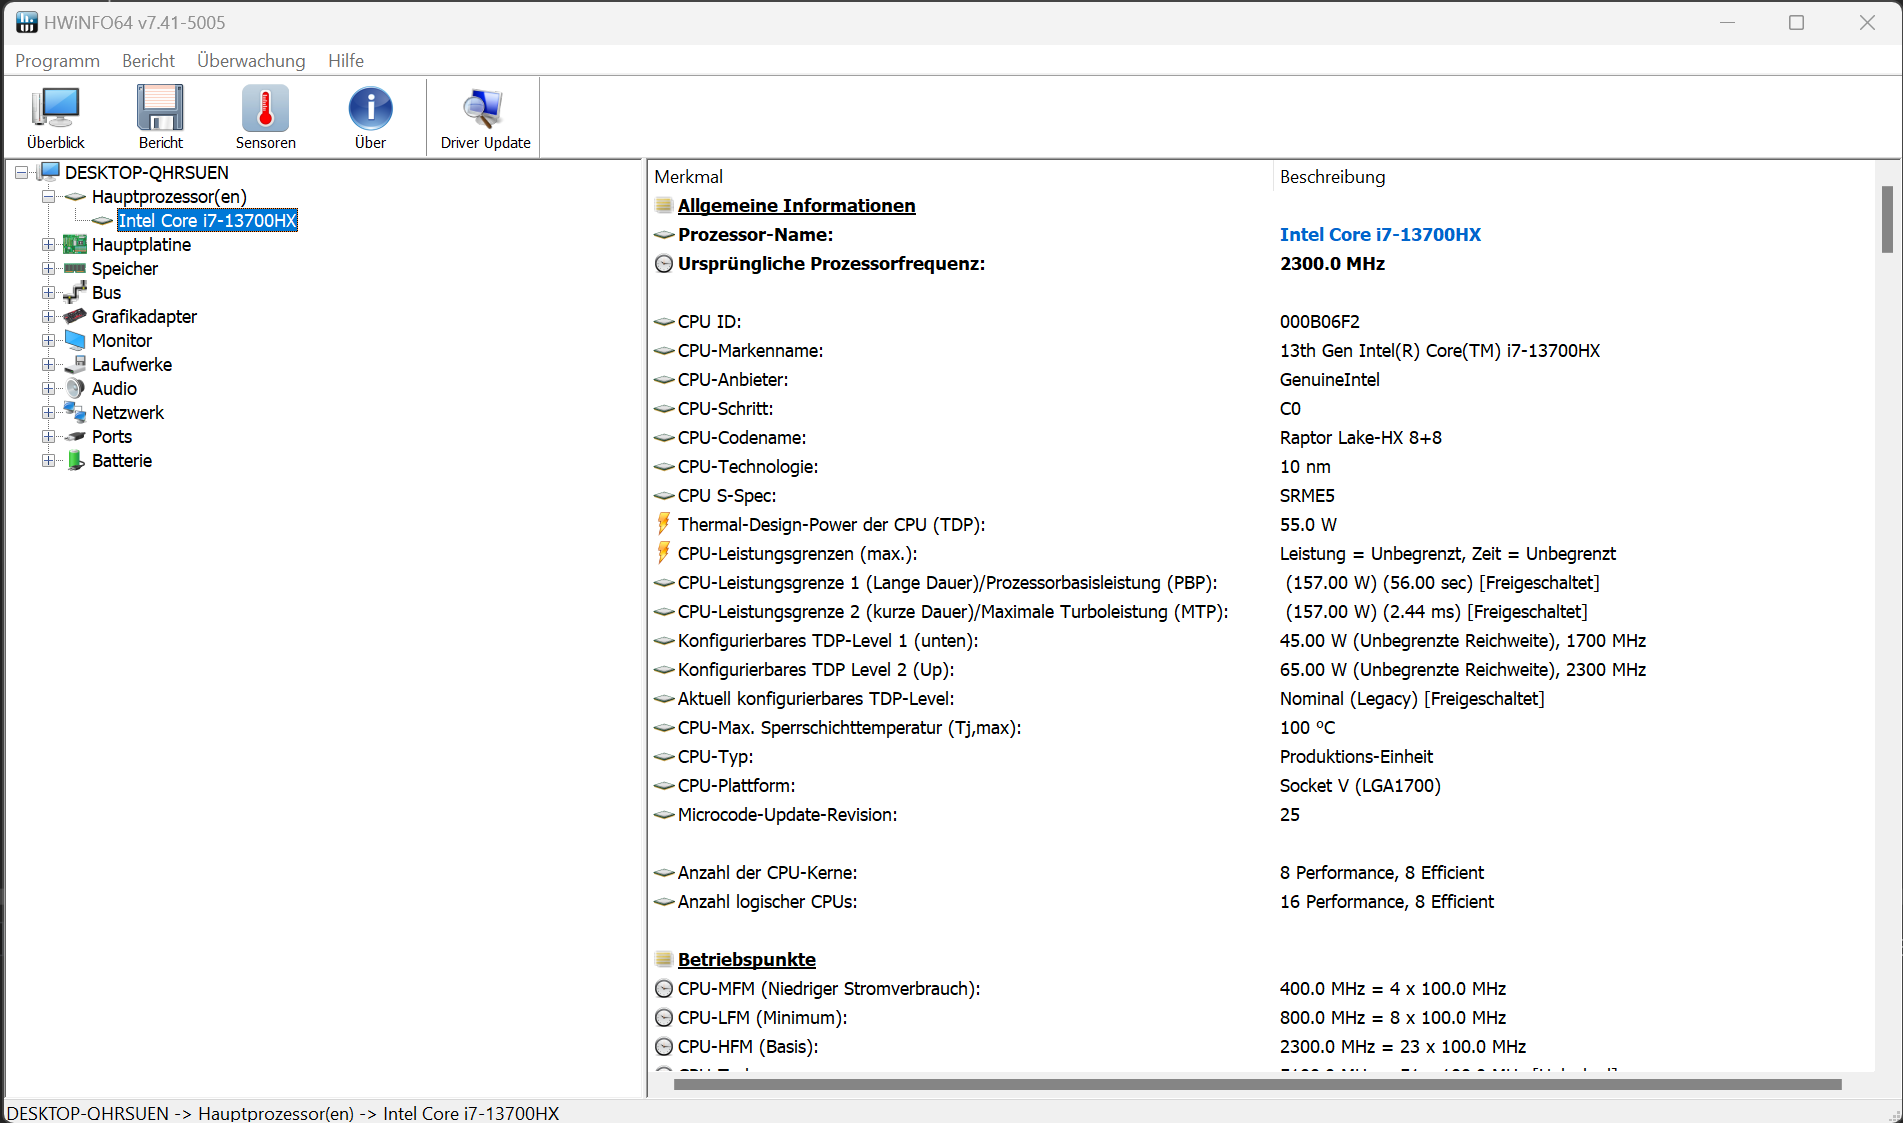
Il Core-i7-13700HX (Raptor Lake) è composto da otto core di efficienza (senza hyperthreading, da 1,5 a 3,7 GHz) e otto core di prestazioni (hyperthreading, da 2,1 a 5 GHz). In totale ci sono 24 core logici della CPU.
I risultati del benchmark sono superiori alla media della CPU nel funzionamento a rete. In modalità batteria, le prestazioni single-thread più rilevanti (160 punti) diminuiscono in modo simile alle prestazioni multi-thread (2.134 punti).
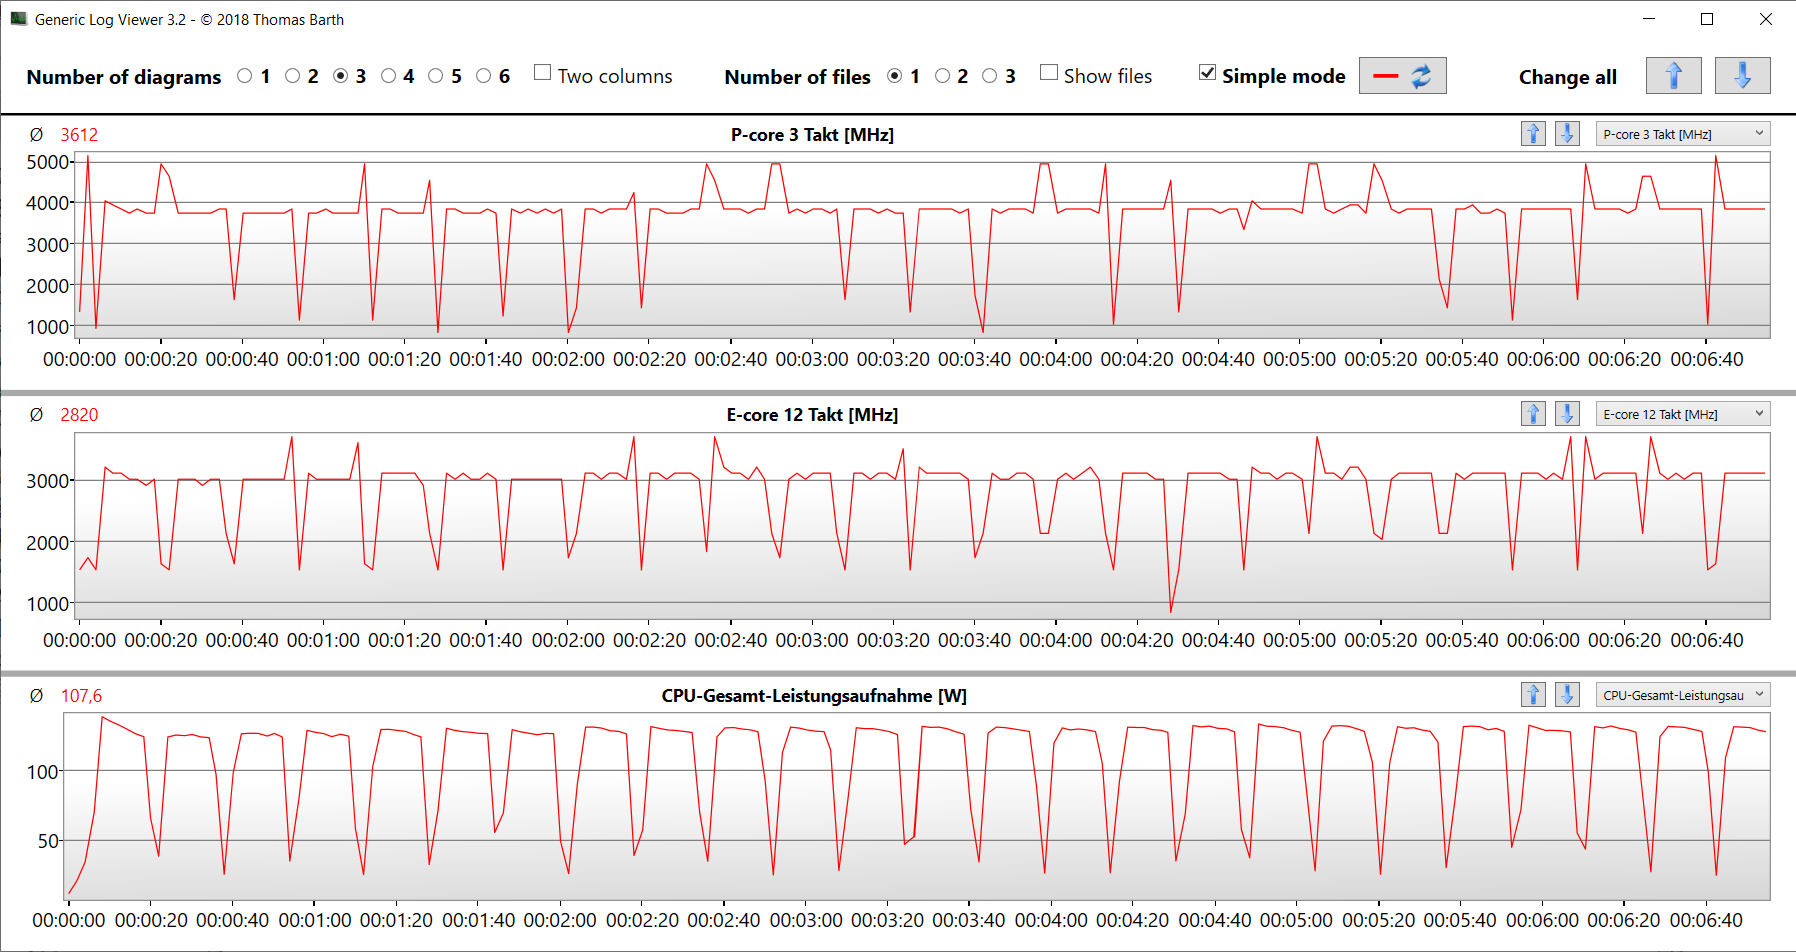
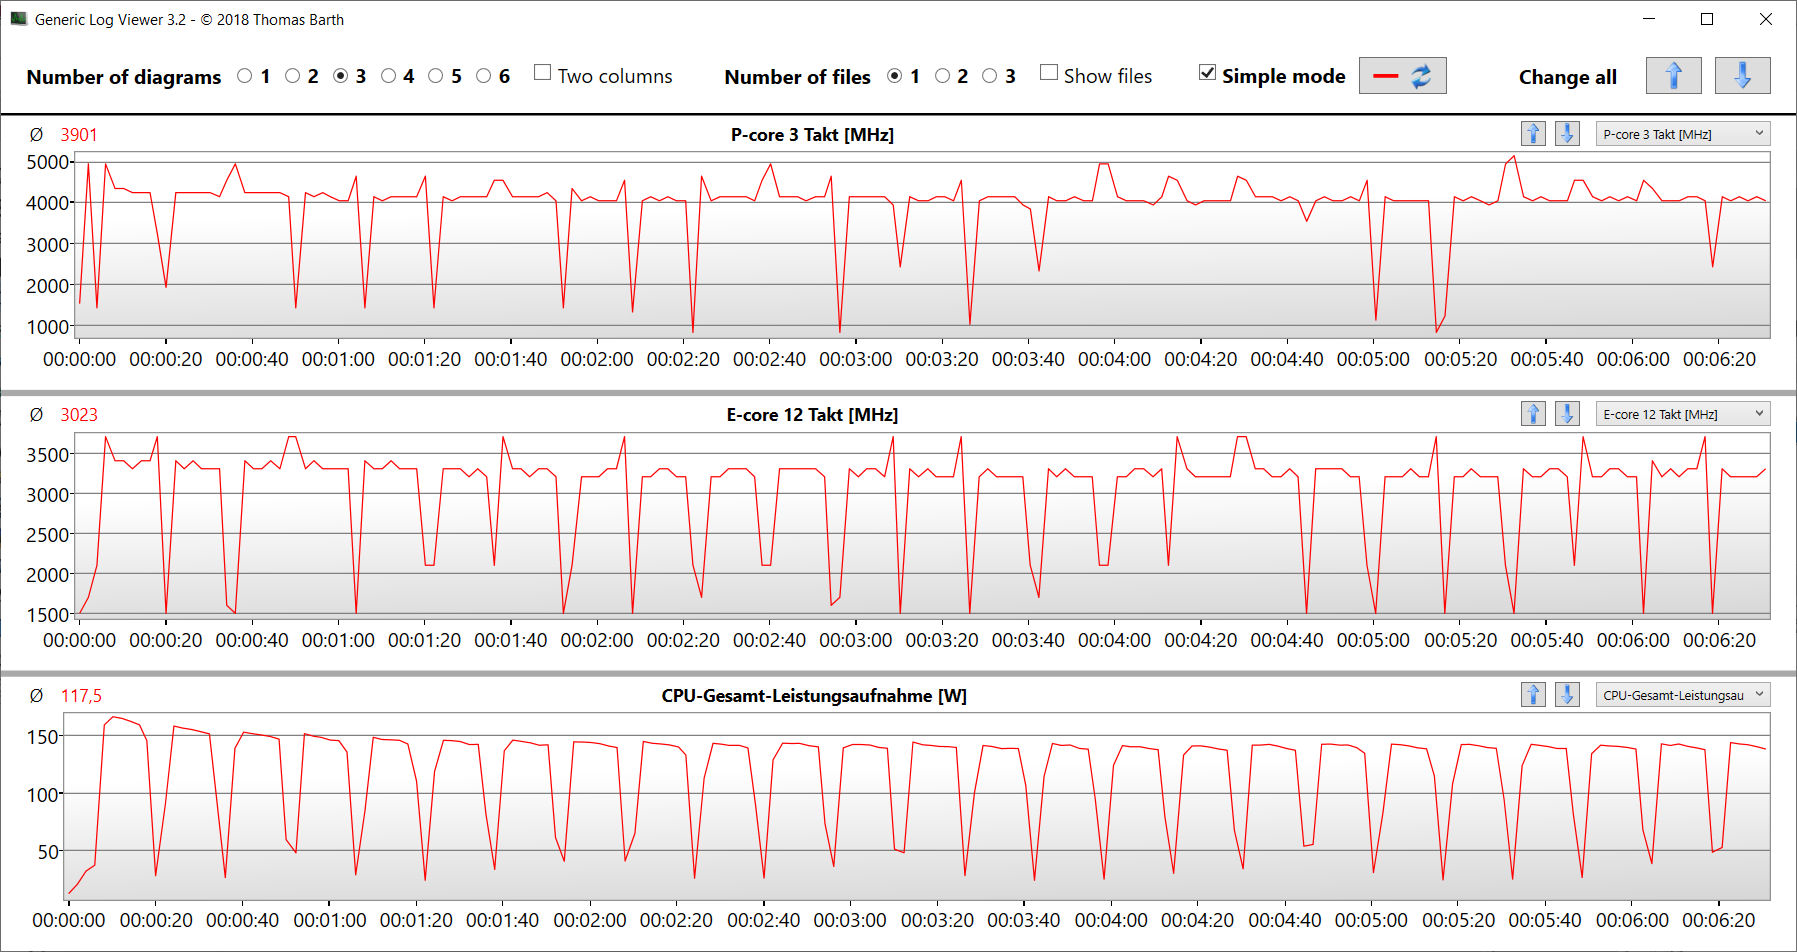
Il test in loop CB15 conferma che il turbo della CPU può essere mantenuto in modo permanente. Tuttavia, la velocità di clock cala leggermente dopo la prima esecuzione, indipendentemente dal profilo utilizzato. "Overdrive" garantisce il massimo livello di prestazioni complessive.
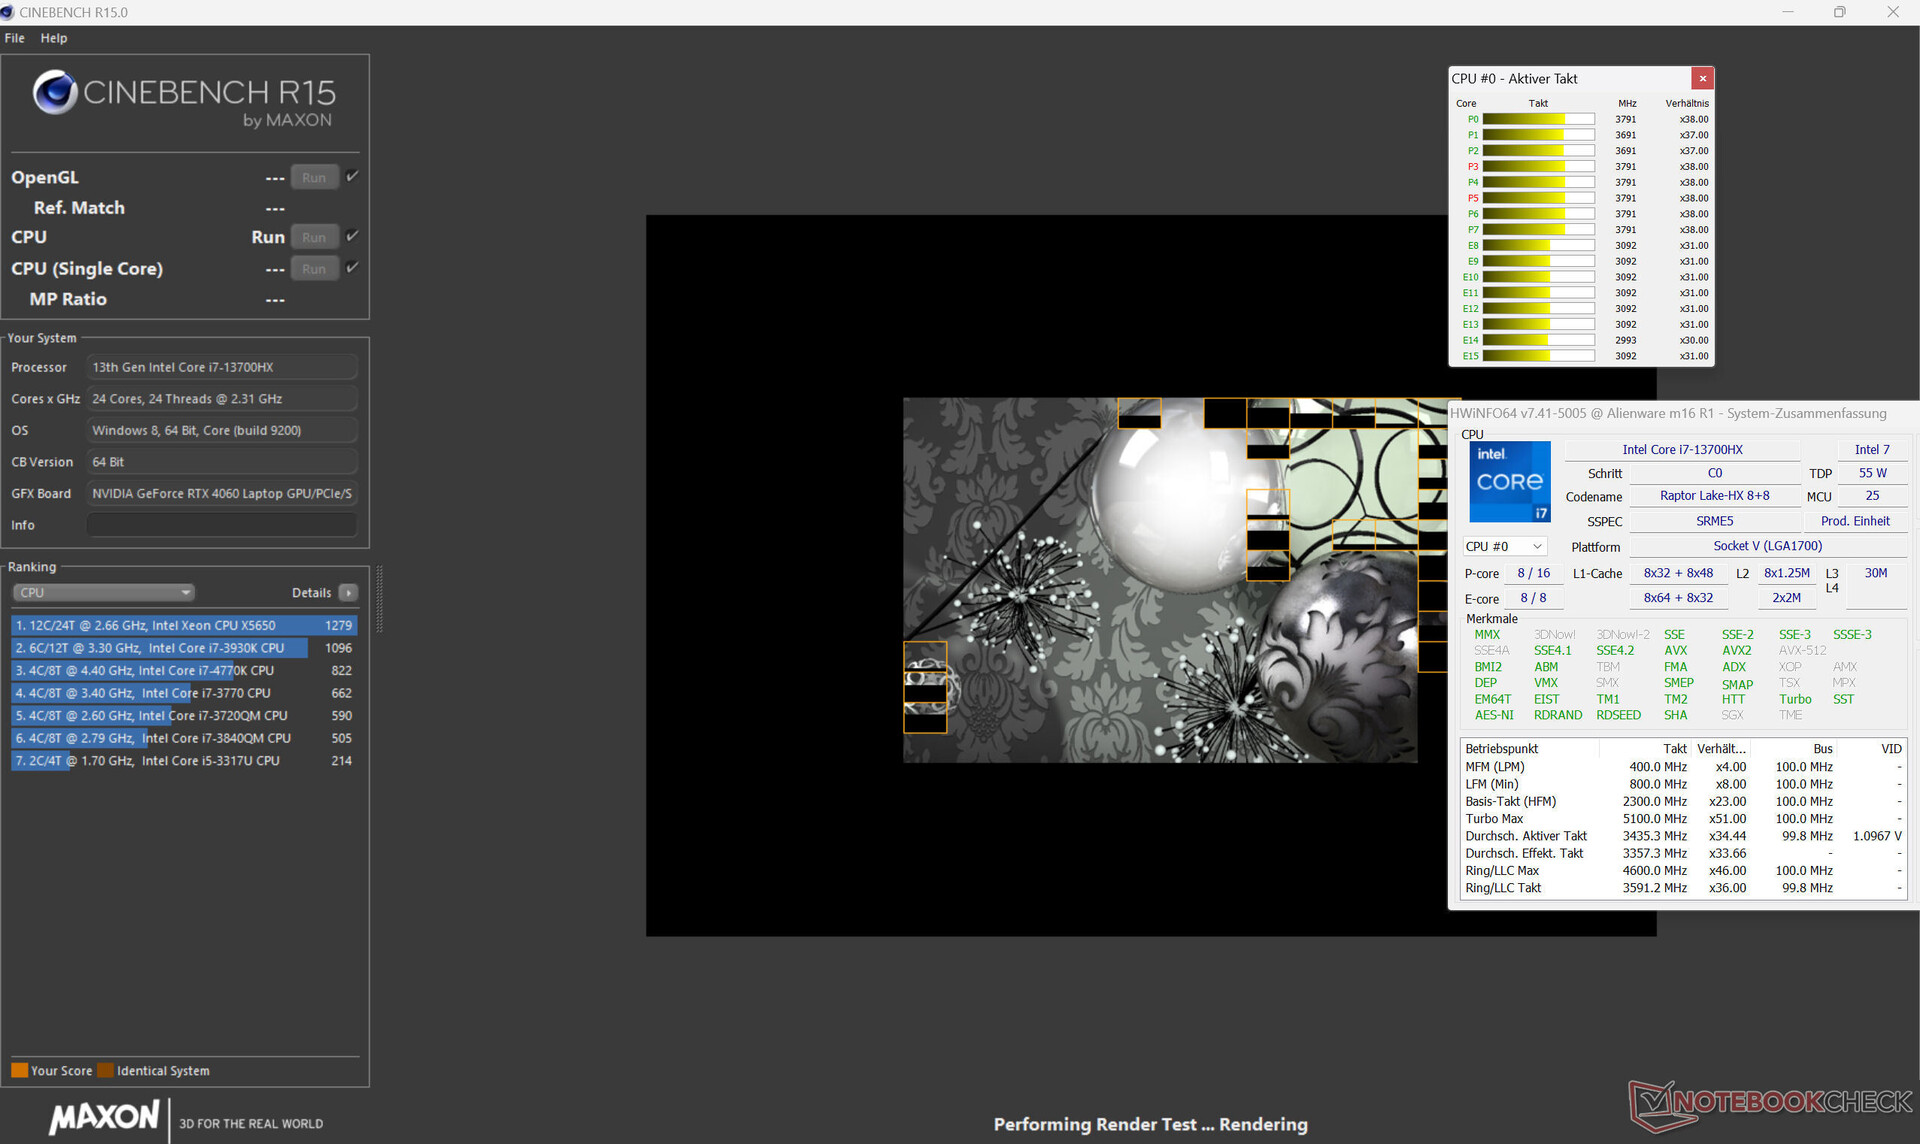
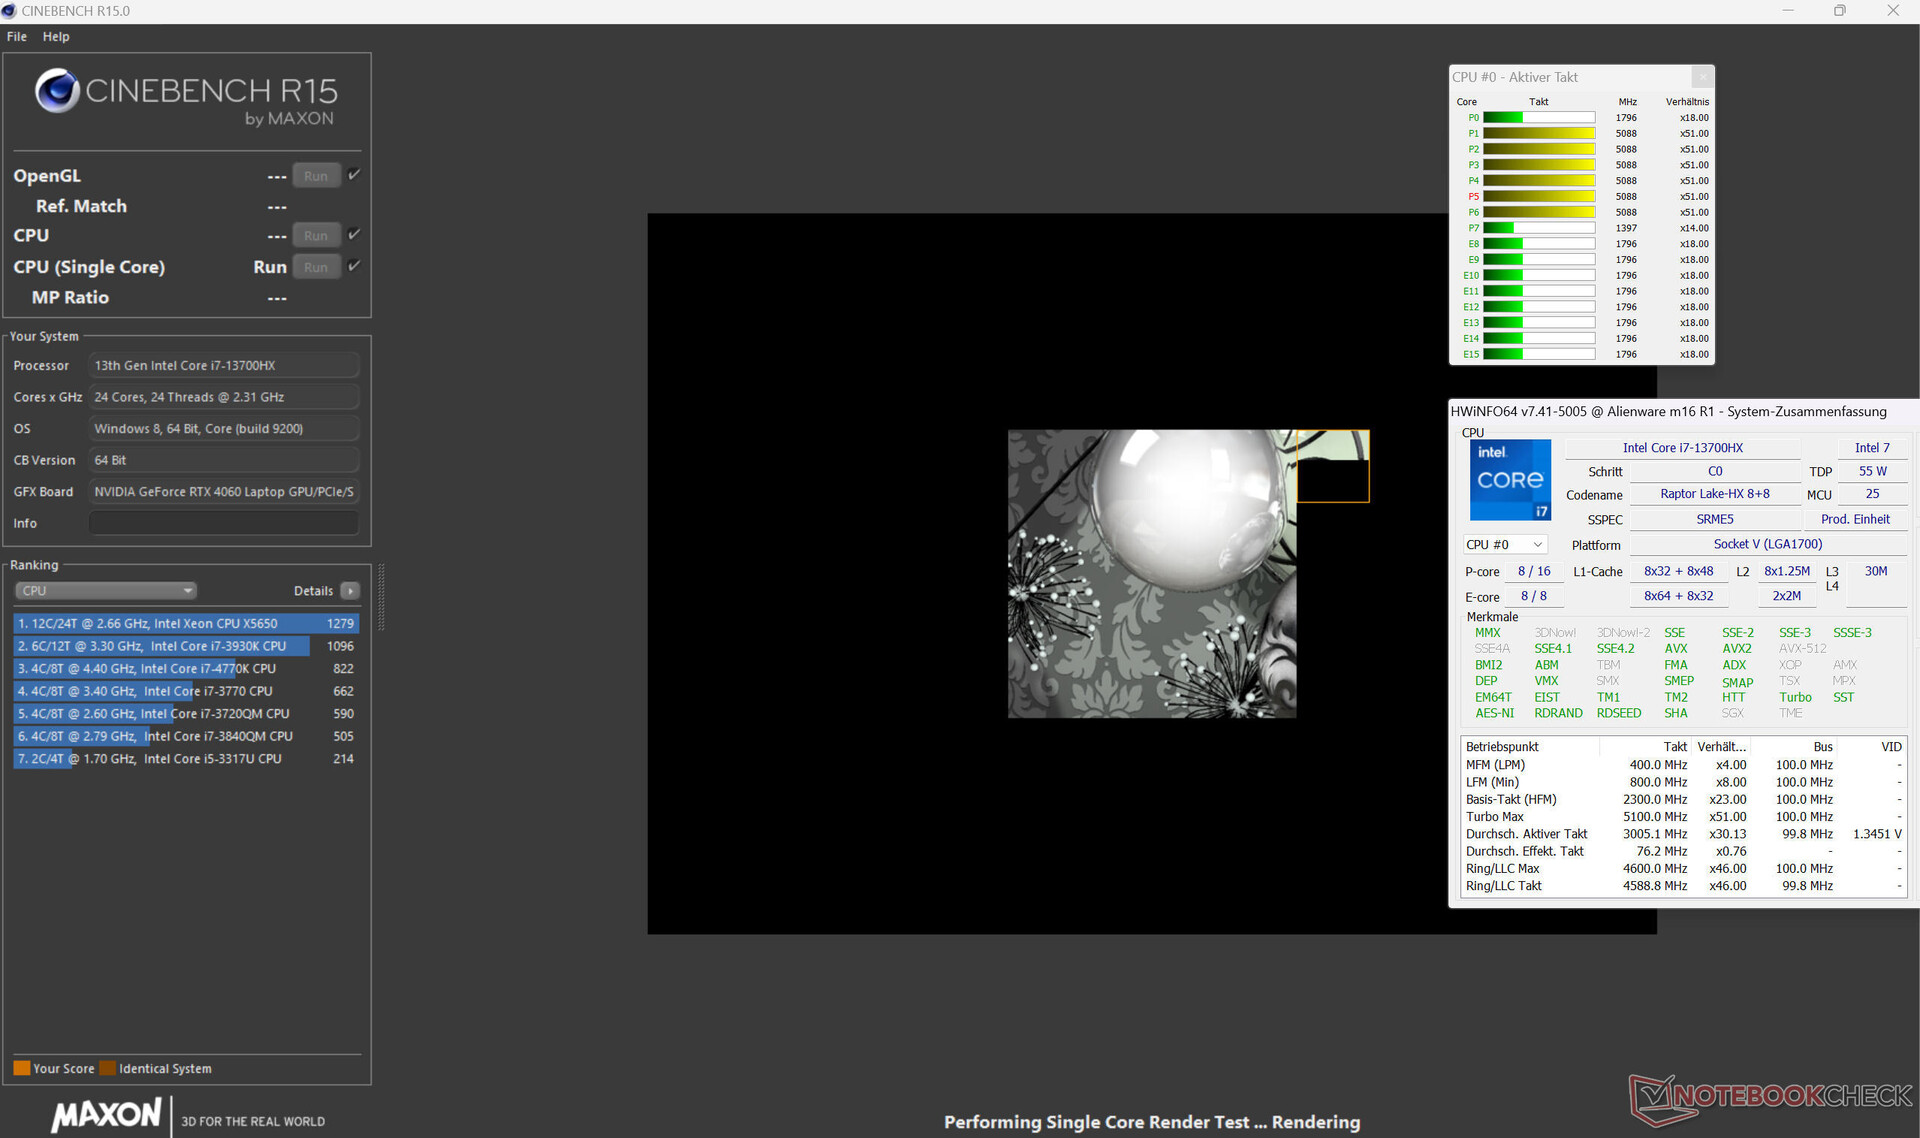
Cinebench R15 Multi Sustained Load
* ... Meglio usare valori piccoli
AIDA64: FP32 Ray-Trace | FPU Julia | CPU SHA3 | CPU Queen | FPU SinJulia | FPU Mandel | CPU AES | CPU ZLib | FP64 Ray-Trace | CPU PhotoWorxx
| Performance rating | |
| Alienware m16 R1 AMD | |
| Media della classe Gaming | |
| Alienware m16 R1 Intel | |
| Acer Predator Helios 16 PH16-71-731Q | |
| Schenker XMG Pro 15 (E23) | |
| Lenovo Legion Pro 5 16IRX8 | |
| Media Intel Core i7-13700HX | |
| Medion Erazer Defender P40 | |
| Aorus 15 BSF | |
| AIDA64 / FP32 Ray-Trace | |
| Alienware m16 R1 AMD | |
| Media della classe Gaming (10227 - 85542, n=105, ultimi 2 anni) | |
| Lenovo Legion Pro 5 16IRX8 | |
| Alienware m16 R1 Intel | |
| Acer Predator Helios 16 PH16-71-731Q | |
| Media Intel Core i7-13700HX (14261 - 21999, n=11) | |
| Schenker XMG Pro 15 (E23) | |
| Medion Erazer Defender P40 | |
| Aorus 15 BSF | |
| AIDA64 / FPU Julia | |
| Alienware m16 R1 AMD | |
| Media della classe Gaming (51376 - 238426, n=105, ultimi 2 anni) | |
| Lenovo Legion Pro 5 16IRX8 | |
| Alienware m16 R1 Intel | |
| Acer Predator Helios 16 PH16-71-731Q | |
| Media Intel Core i7-13700HX (74636 - 109364, n=11) | |
| Schenker XMG Pro 15 (E23) | |
| Medion Erazer Defender P40 | |
| Aorus 15 BSF | |
| AIDA64 / CPU SHA3 | |
| Alienware m16 R1 AMD | |
| Media della classe Gaming (2180 - 10115, n=105, ultimi 2 anni) | |
| Alienware m16 R1 Intel | |
| Schenker XMG Pro 15 (E23) | |
| Lenovo Legion Pro 5 16IRX8 | |
| Acer Predator Helios 16 PH16-71-731Q | |
| Media Intel Core i7-13700HX (3359 - 5053, n=11) | |
| Medion Erazer Defender P40 | |
| Aorus 15 BSF | |
| AIDA64 / CPU Queen | |
| Alienware m16 R1 AMD | |
| Schenker XMG Pro 15 (E23) | |
| Media della classe Gaming (49785 - 173351, n=90, ultimi 2 anni) | |
| Alienware m16 R1 Intel | |
| Acer Predator Helios 16 PH16-71-731Q | |
| Lenovo Legion Pro 5 16IRX8 | |
| Medion Erazer Defender P40 | |
| Media Intel Core i7-13700HX (86532 - 114717, n=11) | |
| Aorus 15 BSF | |
| AIDA64 / FPU SinJulia | |
| Alienware m16 R1 AMD | |
| Media della classe Gaming (4424 - 33636, n=105, ultimi 2 anni) | |
| Alienware m16 R1 Intel | |
| Lenovo Legion Pro 5 16IRX8 | |
| Acer Predator Helios 16 PH16-71-731Q | |
| Schenker XMG Pro 15 (E23) | |
| Media Intel Core i7-13700HX (9290 - 13519, n=11) | |
| Medion Erazer Defender P40 | |
| Aorus 15 BSF | |
| AIDA64 / FPU Mandel | |
| Alienware m16 R1 AMD | |
| Media della classe Gaming (25115 - 128721, n=105, ultimi 2 anni) | |
| Lenovo Legion Pro 5 16IRX8 | |
| Alienware m16 R1 Intel | |
| Acer Predator Helios 16 PH16-71-731Q | |
| Media Intel Core i7-13700HX (35751 - 53484, n=11) | |
| Schenker XMG Pro 15 (E23) | |
| Medion Erazer Defender P40 | |
| Aorus 15 BSF | |
| AIDA64 / CPU AES | |
| Alienware m16 R1 Intel | |
| Acer Predator Helios 16 PH16-71-731Q | |
| Aorus 15 BSF | |
| Media Intel Core i7-13700HX (67846 - 182575, n=11) | |
| Alienware m16 R1 AMD | |
| Media della classe Gaming (39258 - 247074, n=105, ultimi 2 anni) | |
| Lenovo Legion Pro 5 16IRX8 | |
| Schenker XMG Pro 15 (E23) | |
| Medion Erazer Defender P40 | |
| AIDA64 / CPU ZLib | |
| Alienware m16 R1 AMD | |
| Media della classe Gaming (574 - 2531, n=105, ultimi 2 anni) | |
| Acer Predator Helios 16 PH16-71-731Q | |
| Schenker XMG Pro 15 (E23) | |
| Alienware m16 R1 Intel | |
| Lenovo Legion Pro 5 16IRX8 | |
| Media Intel Core i7-13700HX (981 - 1451, n=11) | |
| Medion Erazer Defender P40 | |
| Aorus 15 BSF | |
| AIDA64 / FP64 Ray-Trace | |
| Alienware m16 R1 AMD | |
| Media della classe Gaming (5509 - 45446, n=105, ultimi 2 anni) | |
| Lenovo Legion Pro 5 16IRX8 | |
| Alienware m16 R1 Intel | |
| Acer Predator Helios 16 PH16-71-731Q | |
| Media Intel Core i7-13700HX (7728 - 11837, n=11) | |
| Schenker XMG Pro 15 (E23) | |
| Medion Erazer Defender P40 | |
| Aorus 15 BSF | |
| AIDA64 / CPU PhotoWorxx | |
| Schenker XMG Pro 15 (E23) | |
| Media della classe Gaming (12271 - 89891, n=105, ultimi 2 anni) | |
| Aorus 15 BSF | |
| Lenovo Legion Pro 5 16IRX8 | |
| Medion Erazer Defender P40 | |
| Alienware m16 R1 Intel | |
| Acer Predator Helios 16 PH16-71-731Q | |
| Media Intel Core i7-13700HX (19678 - 42415, n=11) | |
| Alienware m16 R1 AMD | |
Prestazioni del sistema
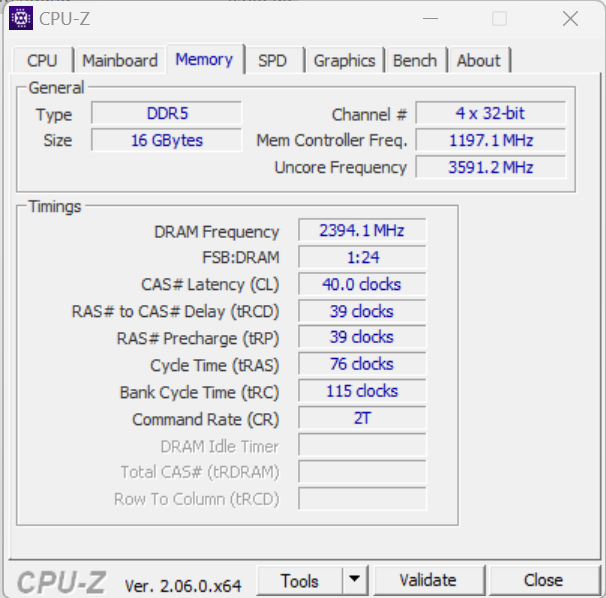
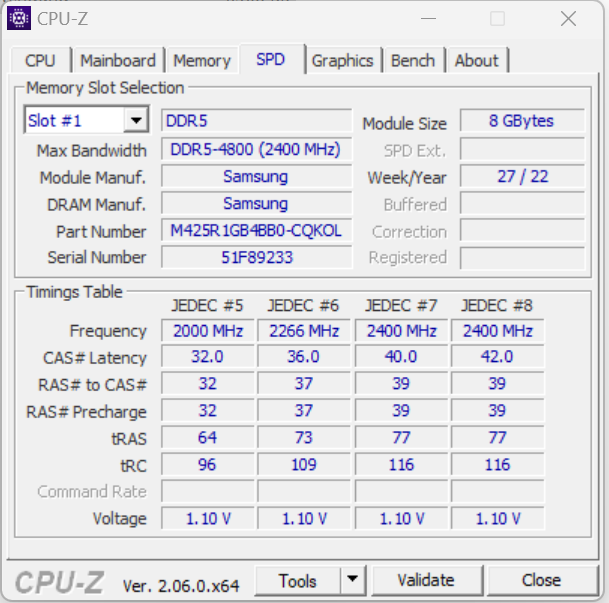
Il sistema funziona senza problemi e non manca di potenza di calcolo. Il portatile gestisce senza problemi rendering, editing video e giochi. La velocità di trasferimento della RAM è nella norma per una memoria DDR5-4800.
CrossMark: Overall | Productivity | Creativity | Responsiveness
| PCMark 10 / Score | |
| Alienware m16 R1 AMD | |
| Media della classe Gaming (5828 - 12414, n=93, ultimi 2 anni) | |
| Acer Predator Helios 16 PH16-71-731Q | |
| Lenovo Legion Pro 5 16IRX8 | |
| Schenker XMG Pro 15 (E23) | |
| Media Intel Core i7-13700HX, NVIDIA GeForce RTX 4060 Laptop GPU (6909 - 7743, n=5) | |
| Aorus 15 BSF | |
| Alienware m16 R1 Intel | |
| Medion Erazer Defender P40 | |
| PCMark 10 / Essentials | |
| Alienware m16 R1 AMD | |
| Schenker XMG Pro 15 (E23) | |
| Acer Predator Helios 16 PH16-71-731Q | |
| Lenovo Legion Pro 5 16IRX8 | |
| Aorus 15 BSF | |
| Alienware m16 R1 Intel | |
| Media della classe Gaming (8810 - 11935, n=97, ultimi 2 anni) | |
| Media Intel Core i7-13700HX, NVIDIA GeForce RTX 4060 Laptop GPU (9760 - 11313, n=5) | |
| Medion Erazer Defender P40 | |
| PCMark 10 / Productivity | |
| Media della classe Gaming (6845 - 25323, n=95, ultimi 2 anni) | |
| Acer Predator Helios 16 PH16-71-731Q | |
| Schenker XMG Pro 15 (E23) | |
| Alienware m16 R1 AMD | |
| Medion Erazer Defender P40 | |
| Media Intel Core i7-13700HX, NVIDIA GeForce RTX 4060 Laptop GPU (9131 - 11018, n=5) | |
| Alienware m16 R1 Intel | |
| Lenovo Legion Pro 5 16IRX8 | |
| Aorus 15 BSF | |
| PCMark 10 / Digital Content Creation | |
| Alienware m16 R1 AMD | |
| Media della classe Gaming (7602 - 19954, n=95, ultimi 2 anni) | |
| Lenovo Legion Pro 5 16IRX8 | |
| Media Intel Core i7-13700HX, NVIDIA GeForce RTX 4060 Laptop GPU (9393 - 12434, n=5) | |
| Aorus 15 BSF | |
| Acer Predator Helios 16 PH16-71-731Q | |
| Alienware m16 R1 Intel | |
| Schenker XMG Pro 15 (E23) | |
| Medion Erazer Defender P40 | |
| CrossMark / Overall | |
| Acer Predator Helios 16 PH16-71-731Q | |
| Aorus 15 BSF | |
| Alienware m16 R1 Intel | |
| Alienware m16 R1 AMD | |
| Media della classe Gaming (1366 - 2409, n=94, ultimi 2 anni) | |
| Schenker XMG Pro 15 (E23) | |
| Media Intel Core i7-13700HX, NVIDIA GeForce RTX 4060 Laptop GPU (1663 - 2105, n=5) | |
| Medion Erazer Defender P40 | |
| Lenovo Legion Pro 5 16IRX8 | |
| CrossMark / Productivity | |
| Aorus 15 BSF | |
| Acer Predator Helios 16 PH16-71-731Q | |
| Alienware m16 R1 Intel | |
| Alienware m16 R1 AMD | |
| Media della classe Gaming (1386 - 2254, n=94, ultimi 2 anni) | |
| Schenker XMG Pro 15 (E23) | |
| Media Intel Core i7-13700HX, NVIDIA GeForce RTX 4060 Laptop GPU (1618 - 1989, n=5) | |
| Medion Erazer Defender P40 | |
| Lenovo Legion Pro 5 16IRX8 | |
| CrossMark / Creativity | |
| Acer Predator Helios 16 PH16-71-731Q | |
| Media della classe Gaming (1343 - 2786, n=94, ultimi 2 anni) | |
| Alienware m16 R1 Intel | |
| Schenker XMG Pro 15 (E23) | |
| Alienware m16 R1 AMD | |
| Aorus 15 BSF | |
| Media Intel Core i7-13700HX, NVIDIA GeForce RTX 4060 Laptop GPU (1710 - 2274, n=5) | |
| Medion Erazer Defender P40 | |
| Lenovo Legion Pro 5 16IRX8 | |
| CrossMark / Responsiveness | |
| Aorus 15 BSF | |
| Acer Predator Helios 16 PH16-71-731Q | |
| Alienware m16 R1 Intel | |
| Schenker XMG Pro 15 (E23) | |
| Alienware m16 R1 AMD | |
| Media della classe Gaming (1226 - 2334, n=94, ultimi 2 anni) | |
| Media Intel Core i7-13700HX, NVIDIA GeForce RTX 4060 Laptop GPU (1269 - 1983, n=5) | |
| Lenovo Legion Pro 5 16IRX8 | |
| Medion Erazer Defender P40 | |
| PCMark 10 Score | 7224 punti | |
Aiuto | ||
| AIDA64 / Memory Copy | |
| Schenker XMG Pro 15 (E23) | |
| Media della classe Gaming (21750 - 129946, n=105, ultimi 2 anni) | |
| Aorus 15 BSF | |
| Lenovo Legion Pro 5 16IRX8 | |
| Medion Erazer Defender P40 | |
| Alienware m16 R1 Intel | |
| Acer Predator Helios 16 PH16-71-731Q | |
| Media Intel Core i7-13700HX (36125 - 63990, n=11) | |
| Alienware m16 R1 AMD | |
| AIDA64 / Memory Read | |
| Schenker XMG Pro 15 (E23) | |
| Media della classe Gaming (22956 - 118858, n=105, ultimi 2 anni) | |
| Aorus 15 BSF | |
| Lenovo Legion Pro 5 16IRX8 | |
| Medion Erazer Defender P40 | |
| Alienware m16 R1 Intel | |
| Acer Predator Helios 16 PH16-71-731Q | |
| Media Intel Core i7-13700HX (36510 - 69729, n=11) | |
| Alienware m16 R1 AMD | |
| AIDA64 / Memory Write | |
| Aorus 15 BSF | |
| Acer Predator Helios 16 PH16-71-731Q | |
| Media della classe Gaming (22297 - 135096, n=105, ultimi 2 anni) | |
| Schenker XMG Pro 15 (E23) | |
| Lenovo Legion Pro 5 16IRX8 | |
| Media Intel Core i7-13700HX (33598 - 85675, n=11) | |
| Alienware m16 R1 Intel | |
| Medion Erazer Defender P40 | |
| Alienware m16 R1 AMD | |
| AIDA64 / Memory Latency | |
| Media della classe Gaming (75.3 - 259, n=105, ultimi 2 anni) | |
| Medion Erazer Defender P40 | |
| Aorus 15 BSF | |
| Alienware m16 R1 AMD | |
| Alienware m16 R1 Intel | |
| Media Intel Core i7-13700HX (81.5 - 97.9, n=11) | |
| Acer Predator Helios 16 PH16-71-731Q | |
| Schenker XMG Pro 15 (E23) | |
| Lenovo Legion Pro 5 16IRX8 | |
* ... Meglio usare valori piccoli
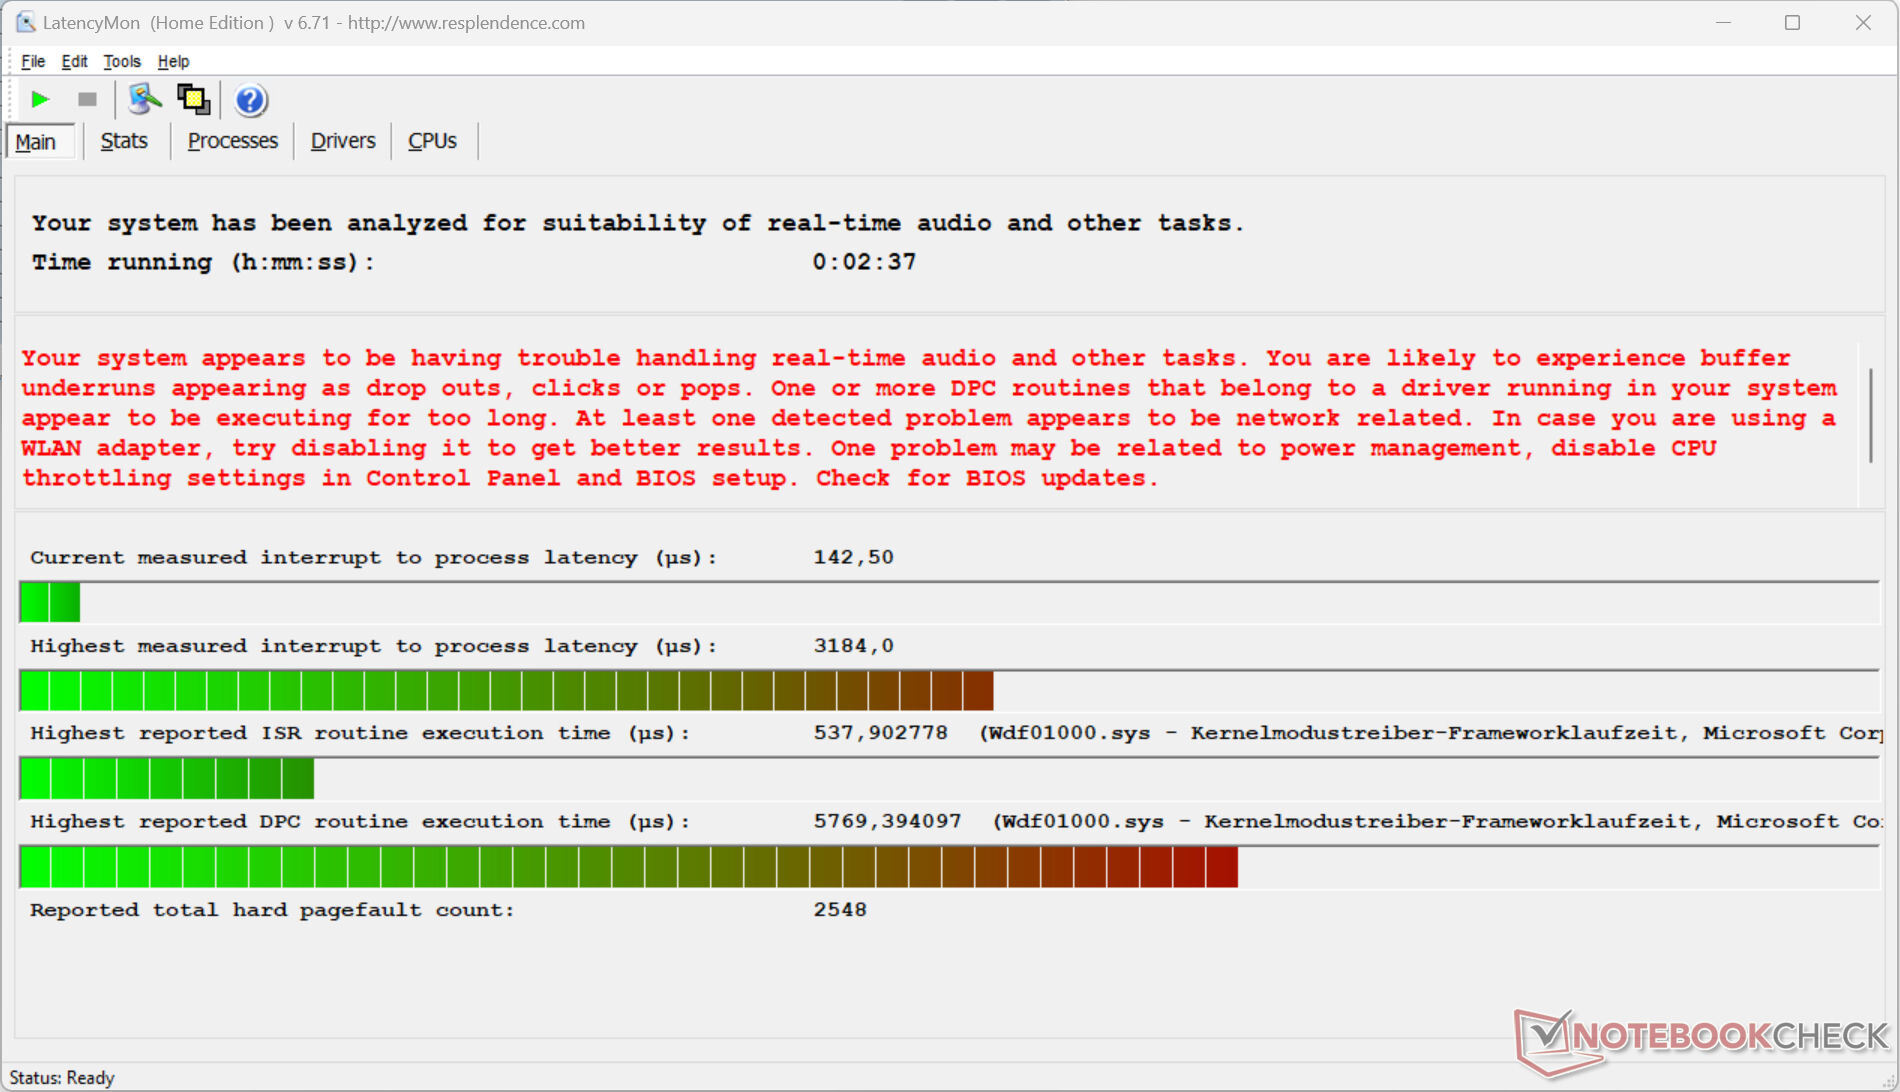
Latenza DPC
Il test standardizzato di monitoraggio della latenza (navigazione web, riproduzione di video 4k, Prime95 ad alto carico) ha rivelato anomalie. Il sistema non sembra adatto all'editing video e audio in tempo reale. I futuri aggiornamenti del software potrebbero portare a un miglioramento o a un ulteriore degrado.
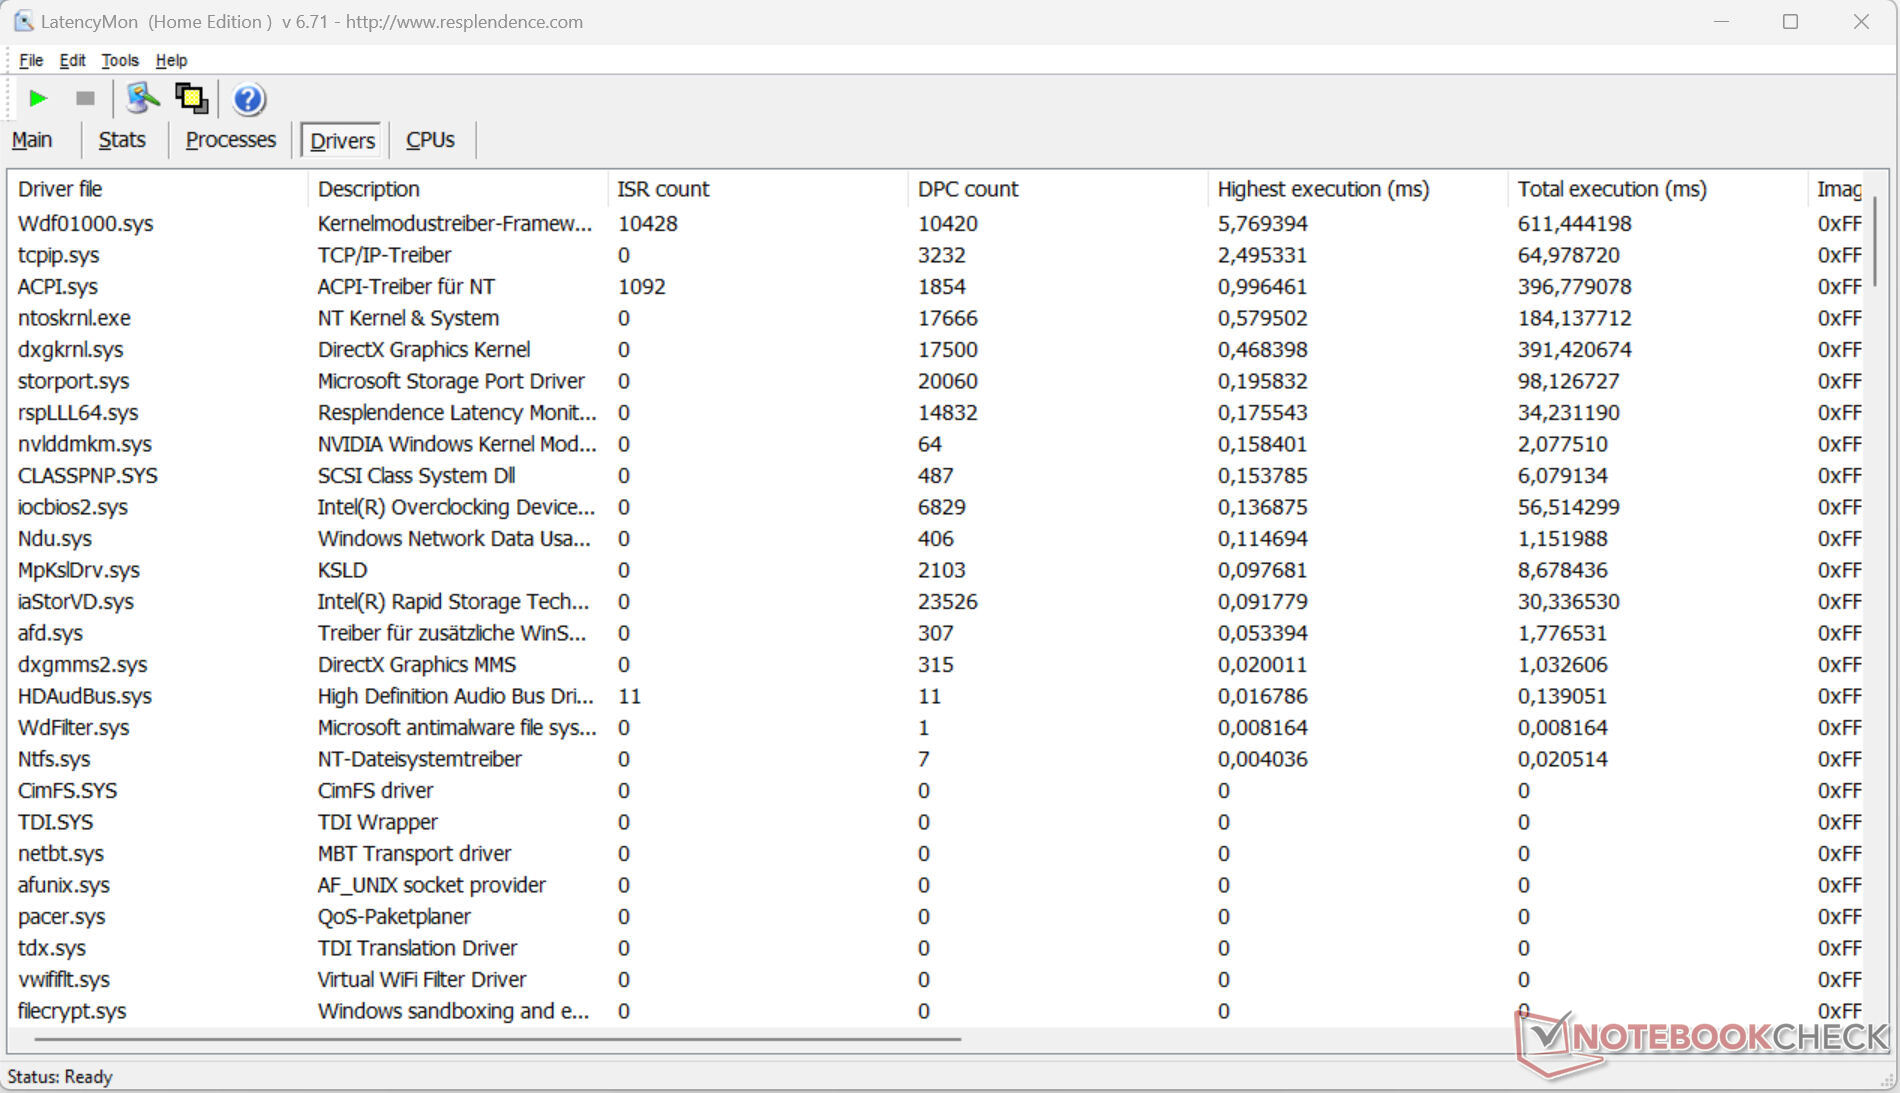
| DPC Latencies / LatencyMon - interrupt to process latency (max), Web, Youtube, Prime95 | |
| Medion Erazer Defender P40 | |
| Alienware m16 R1 Intel | |
| Alienware m16 R1 AMD | |
| Aorus 15 BSF | |
| Acer Predator Helios 16 PH16-71-731Q | |
| Schenker XMG Pro 15 (E23) | |
| Lenovo Legion Pro 5 16IRX8 | |
* ... Meglio usare valori piccoli
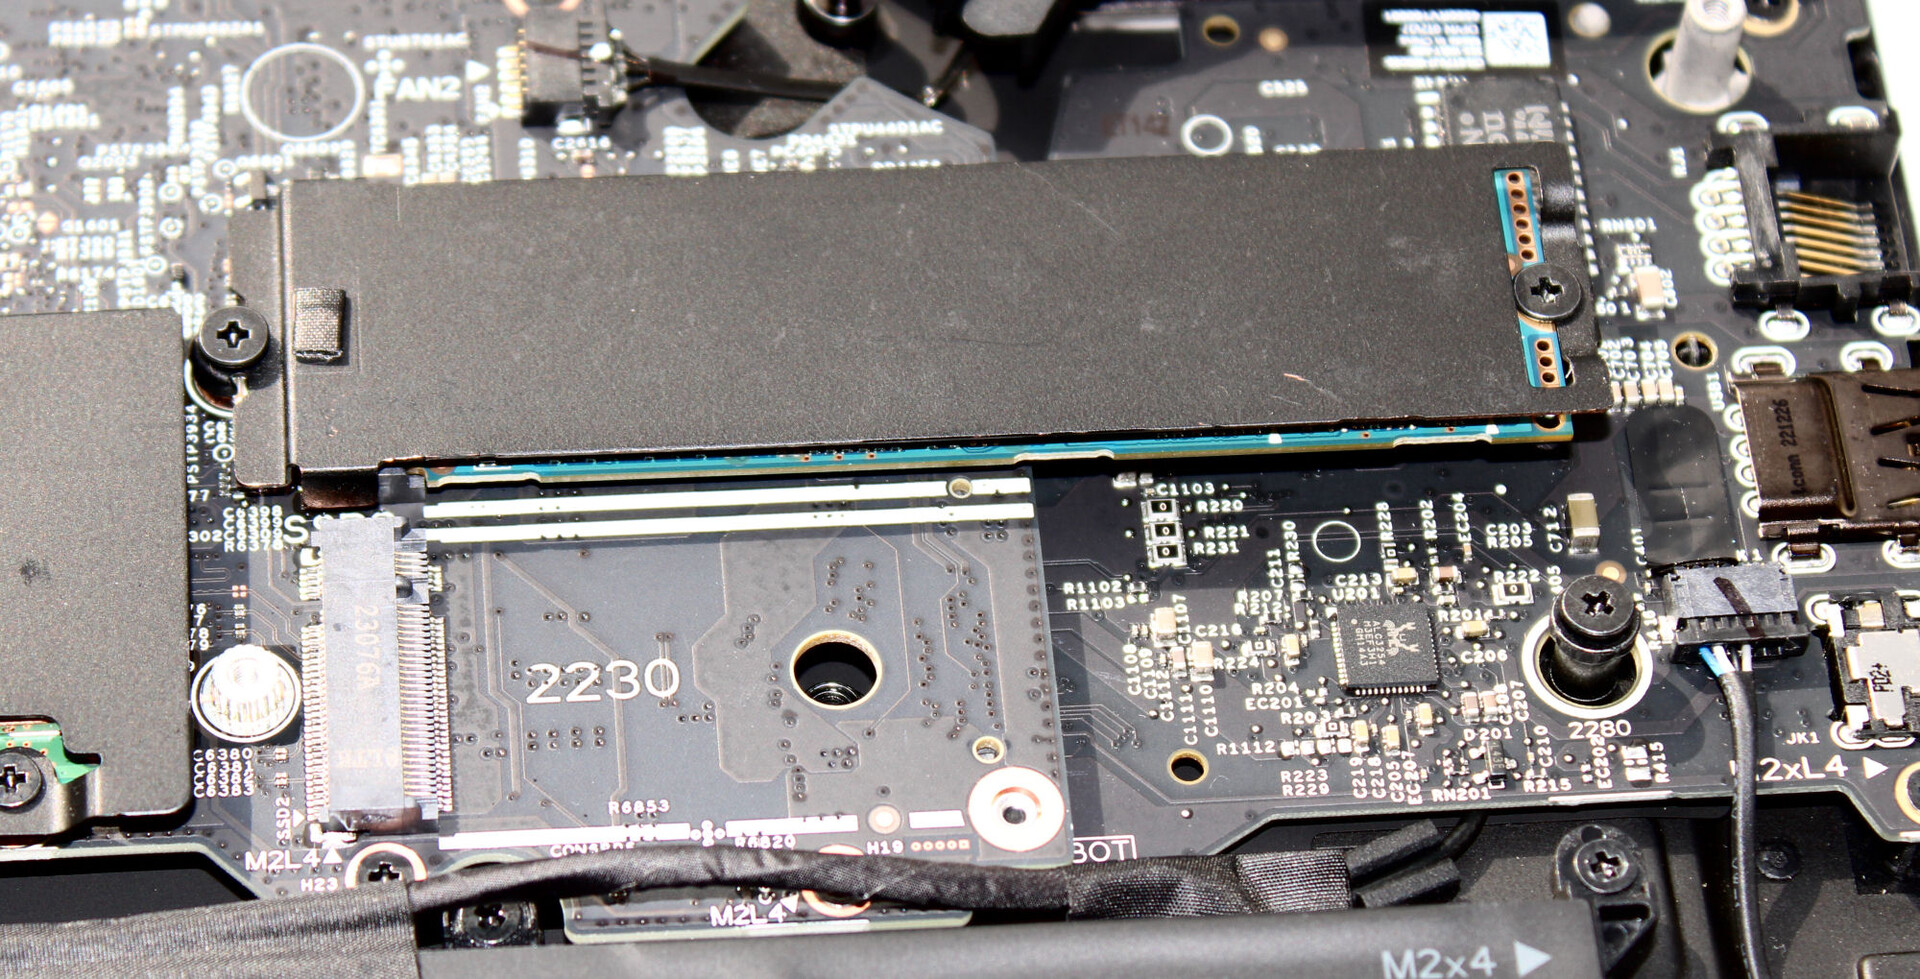
Dispositivi di archiviazione
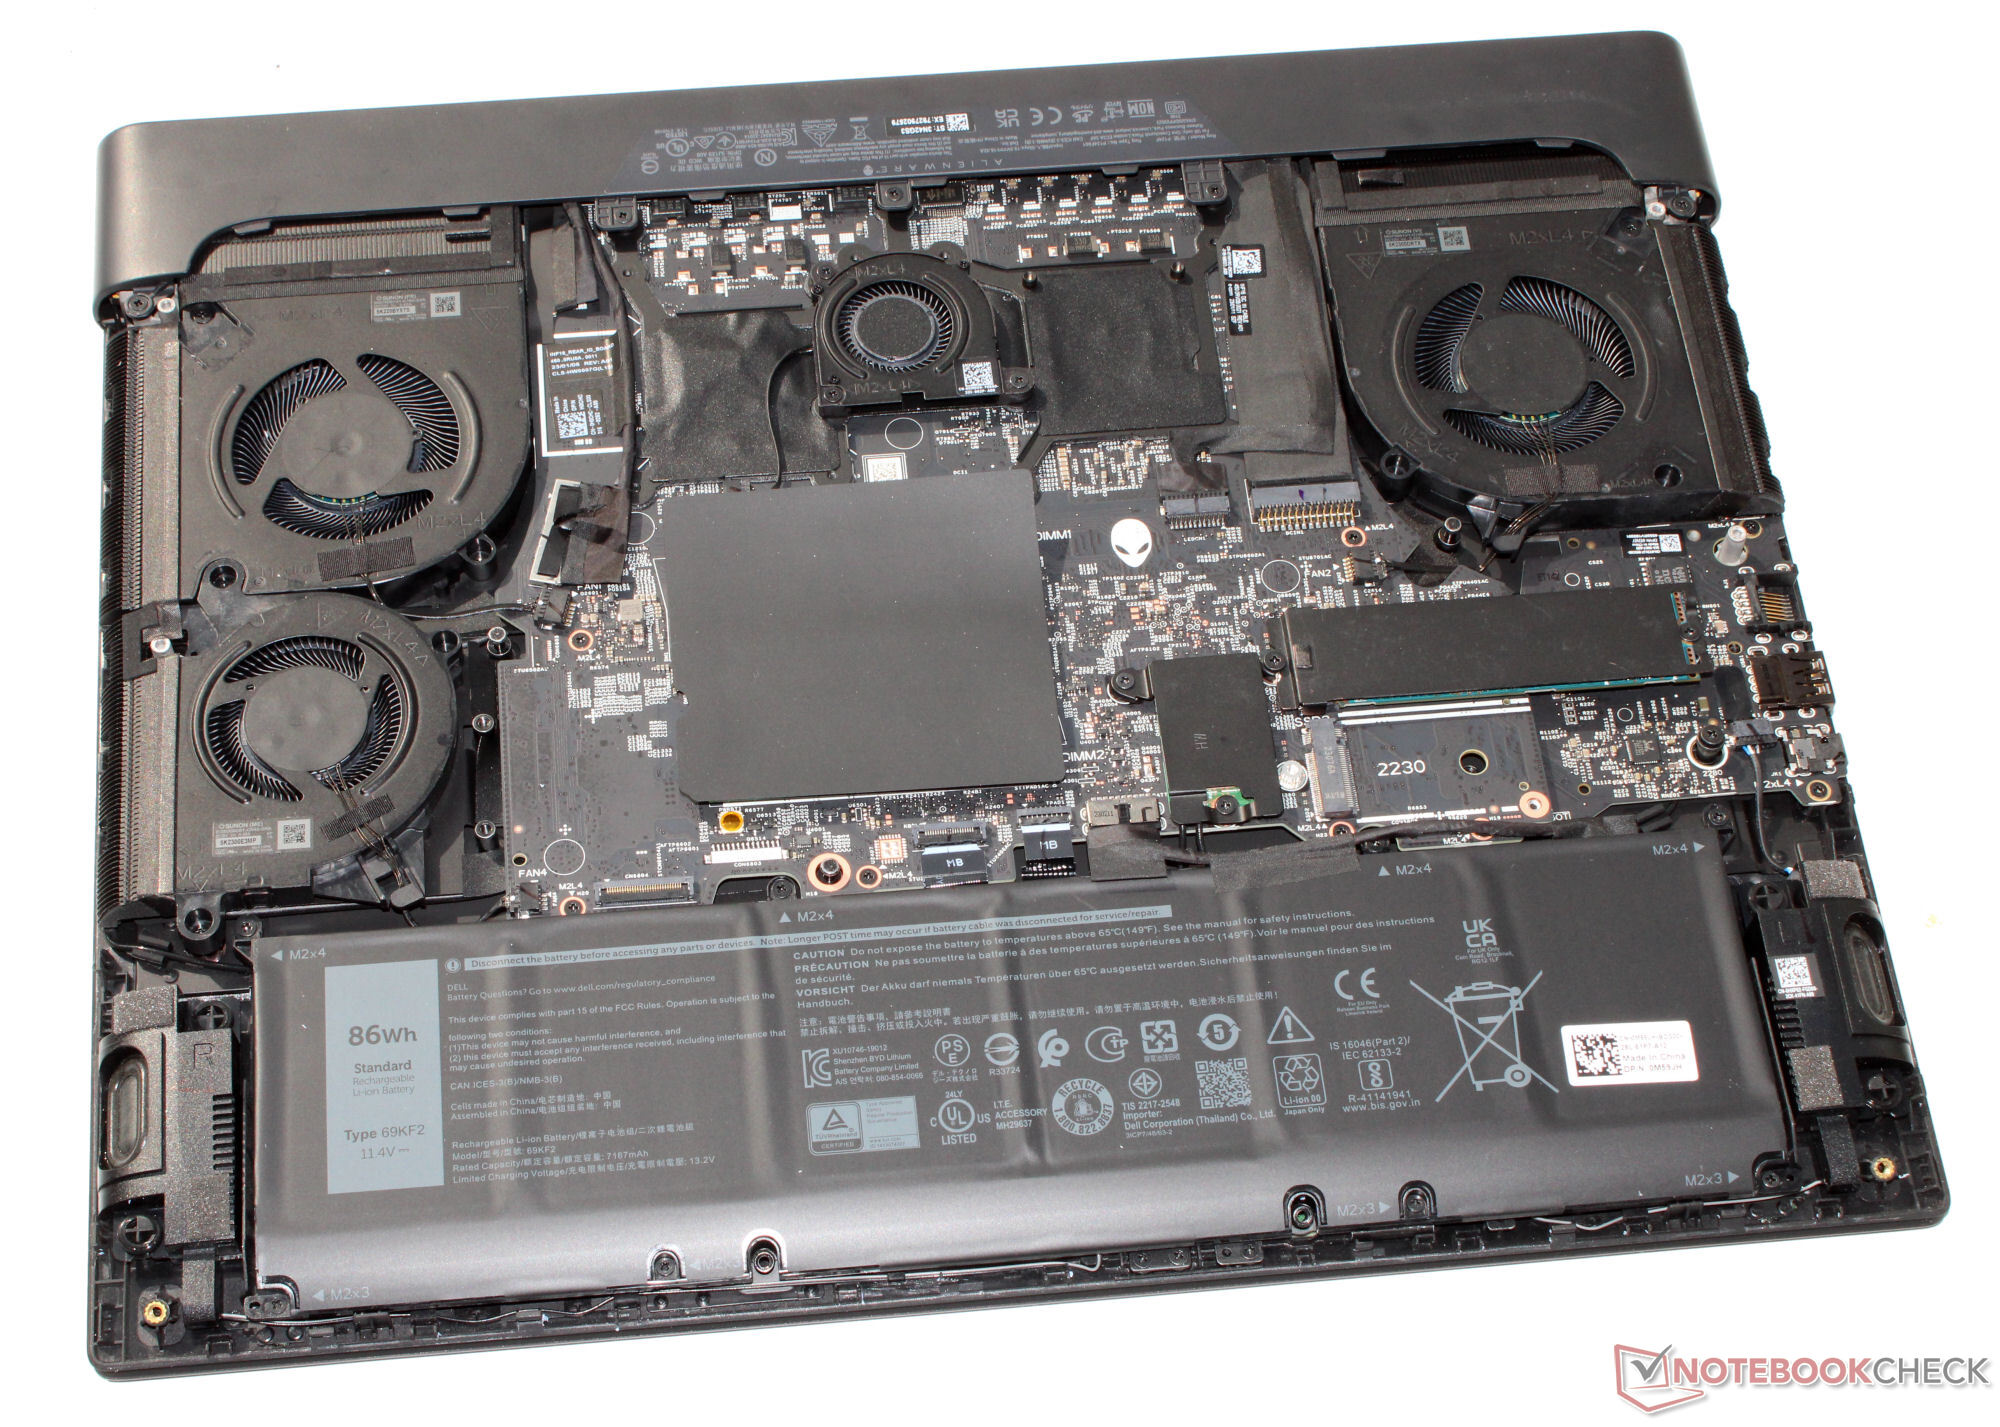
Un'unità SSD da 512 GB (PCIe 4, M.2 2280) di Kioxia funge da unità di sistema. Offre una buona velocità di trasferimento dati, ma non è uno dei modelli di SSD migliori. Non si è verificato il throttlig indotto dalle temperature. Il notebook ha spazio per un altro PCIe-4-SSD (M.2 2230 o M.2 2280). Altre configurazioni dell'm16 possono ospitare fino a quattro SSD.

* ... Meglio usare valori piccoli
Sustained Read Performance: DiskSpd Read Loop, Queue Depth 8
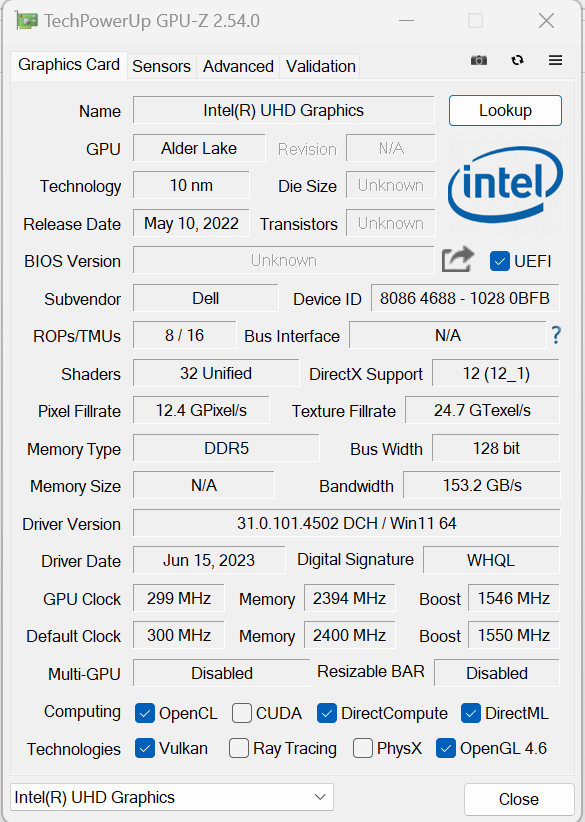
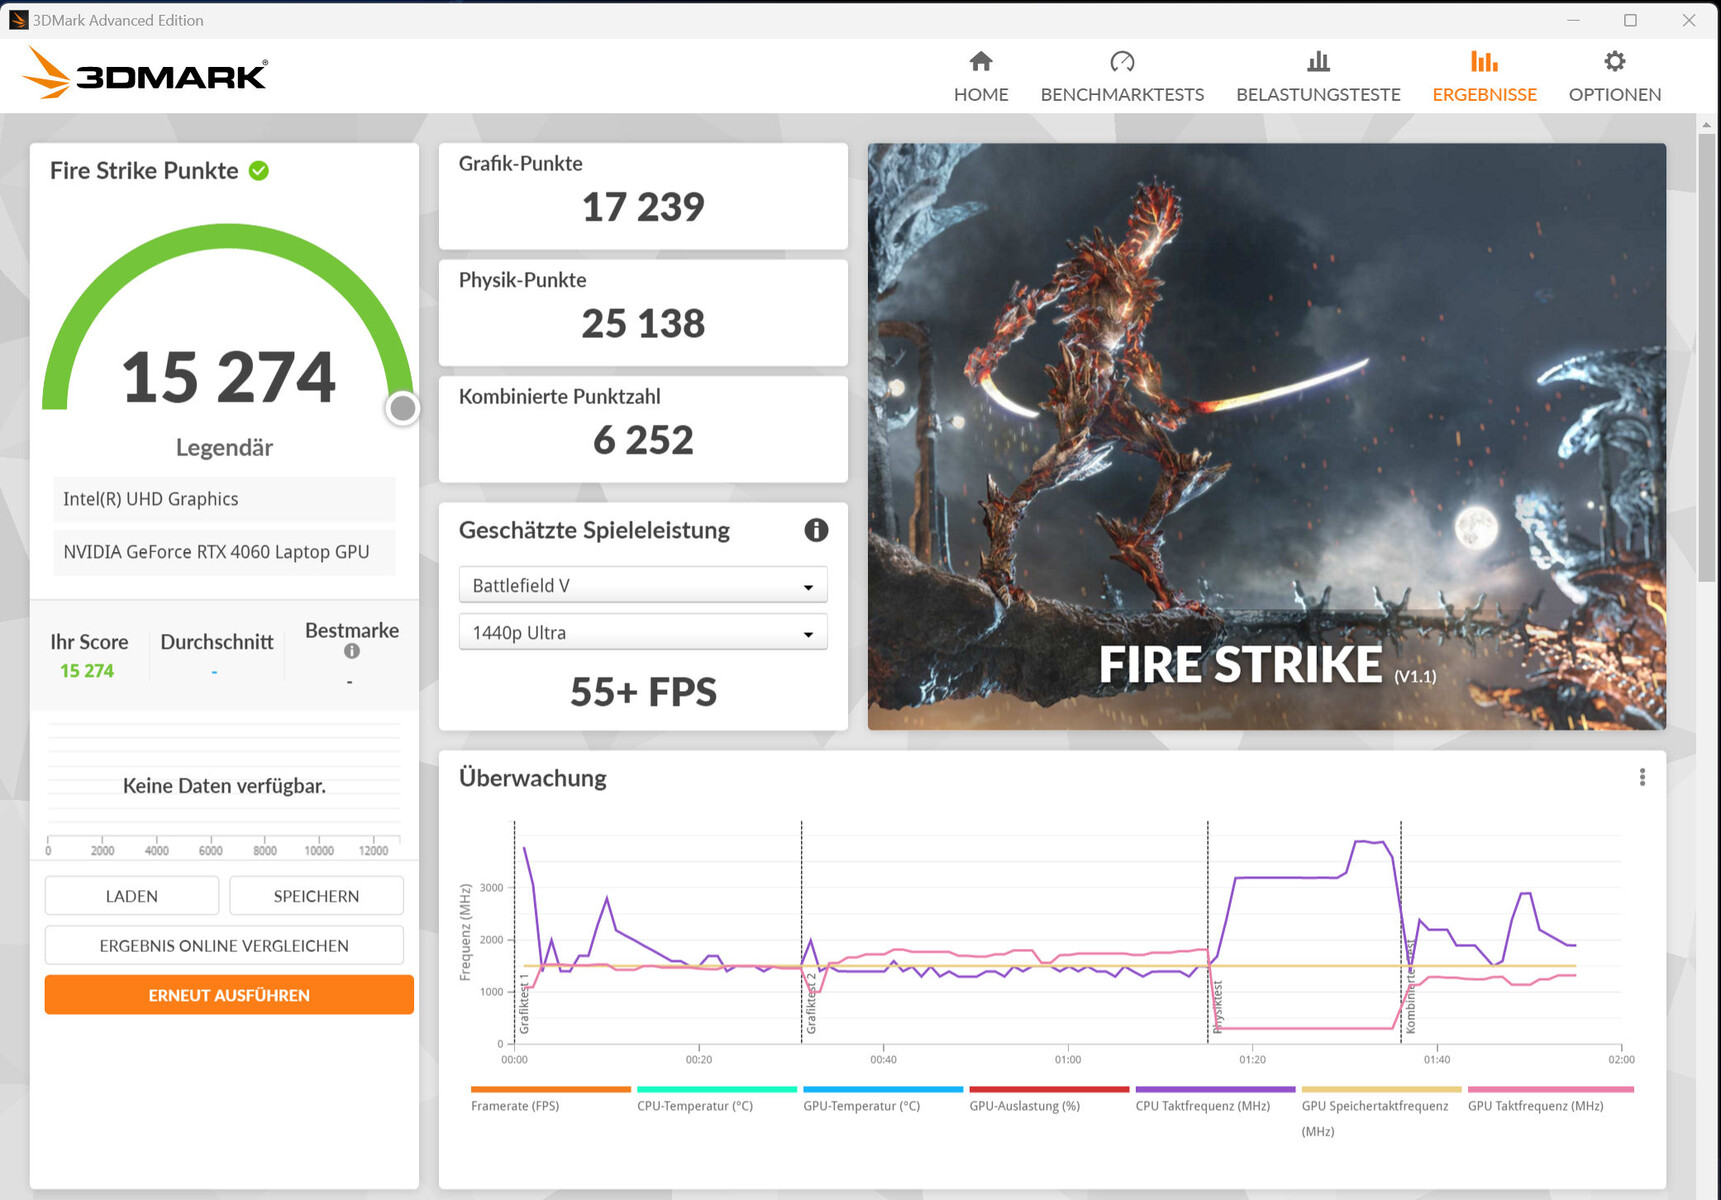
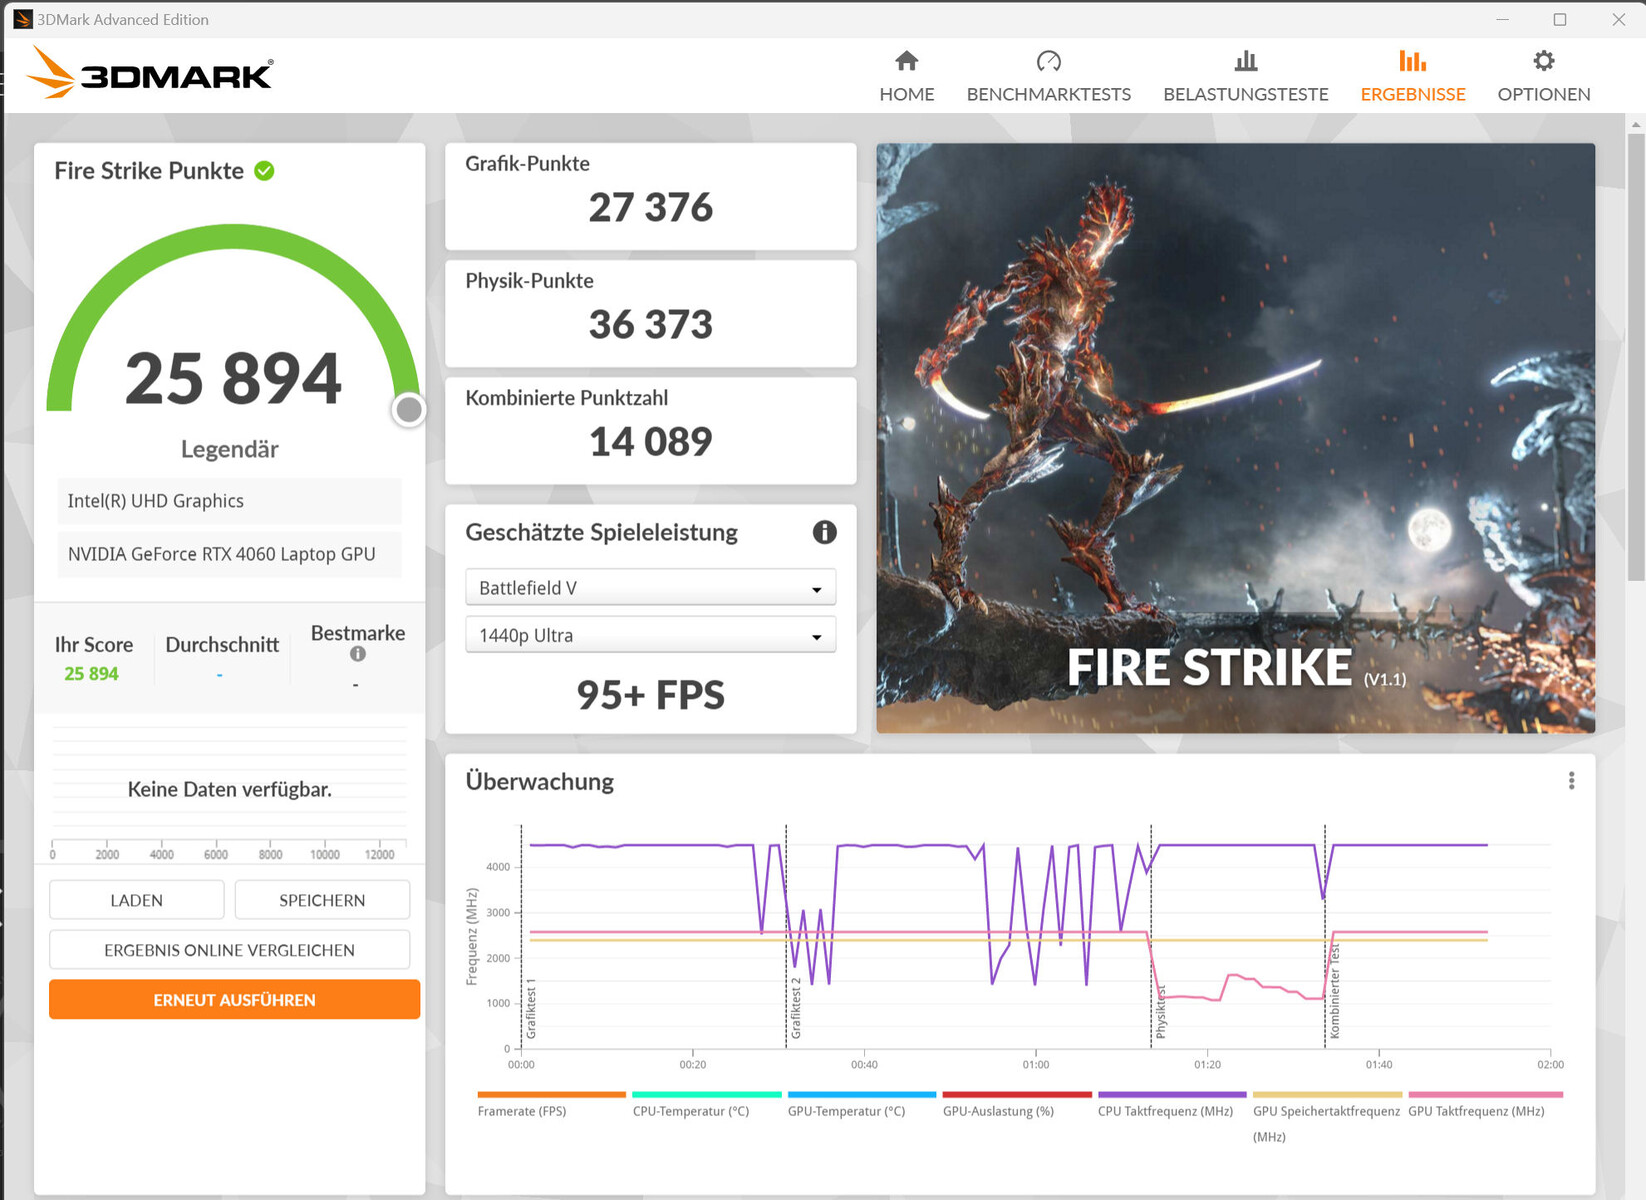
Scheda grafica
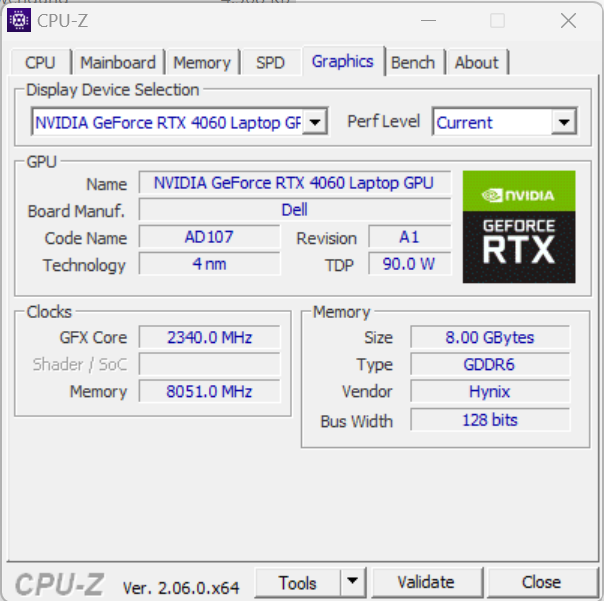
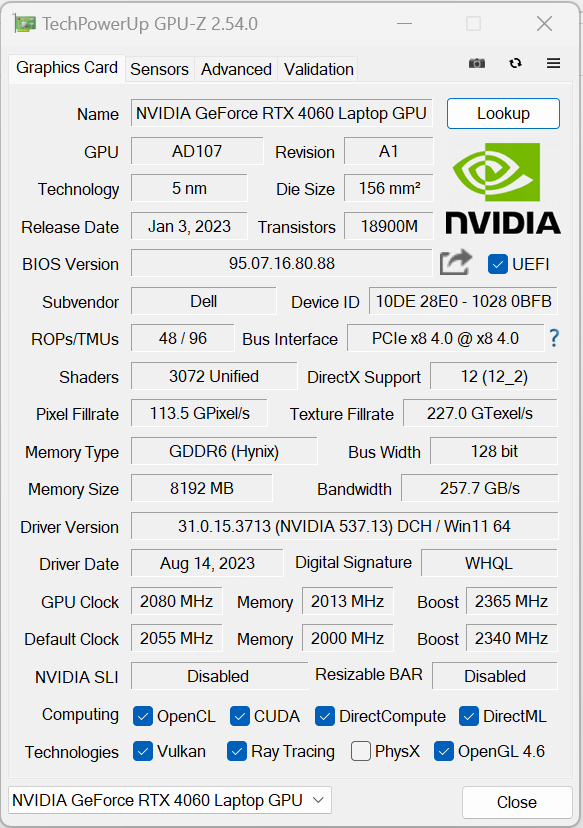
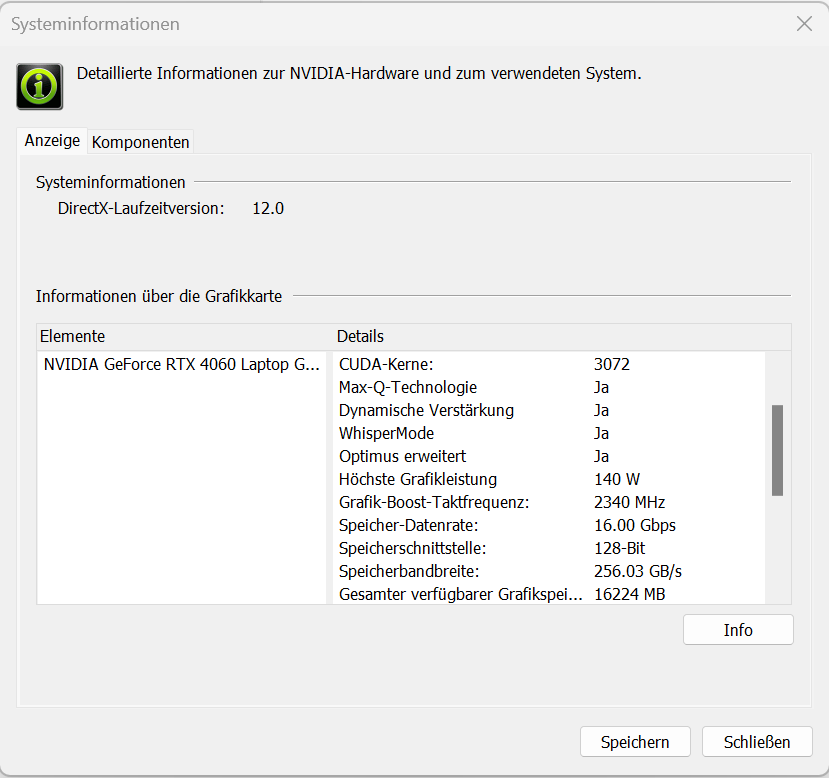
La GeForce RTX 4060offre 3072 shader, un bus largo 128 bit e una memoria GDDR6 veloce (8.192 MB). Dell consente un TGP massimo di 140 watt (115 watt + 25 watt di Dynamic Boost) - di più non è possibile. Secondo il test di Witcher 3, il TGP non viene utilizzato completamente. I risultati del benchmark sono superiori alla media della precedente RTX 4060 e sono tra i migliori valori registrati finora con questa GPU. Il passaggio da dGPU a Optimus non richiede un riavvio - Optimus avanzato è supportato.

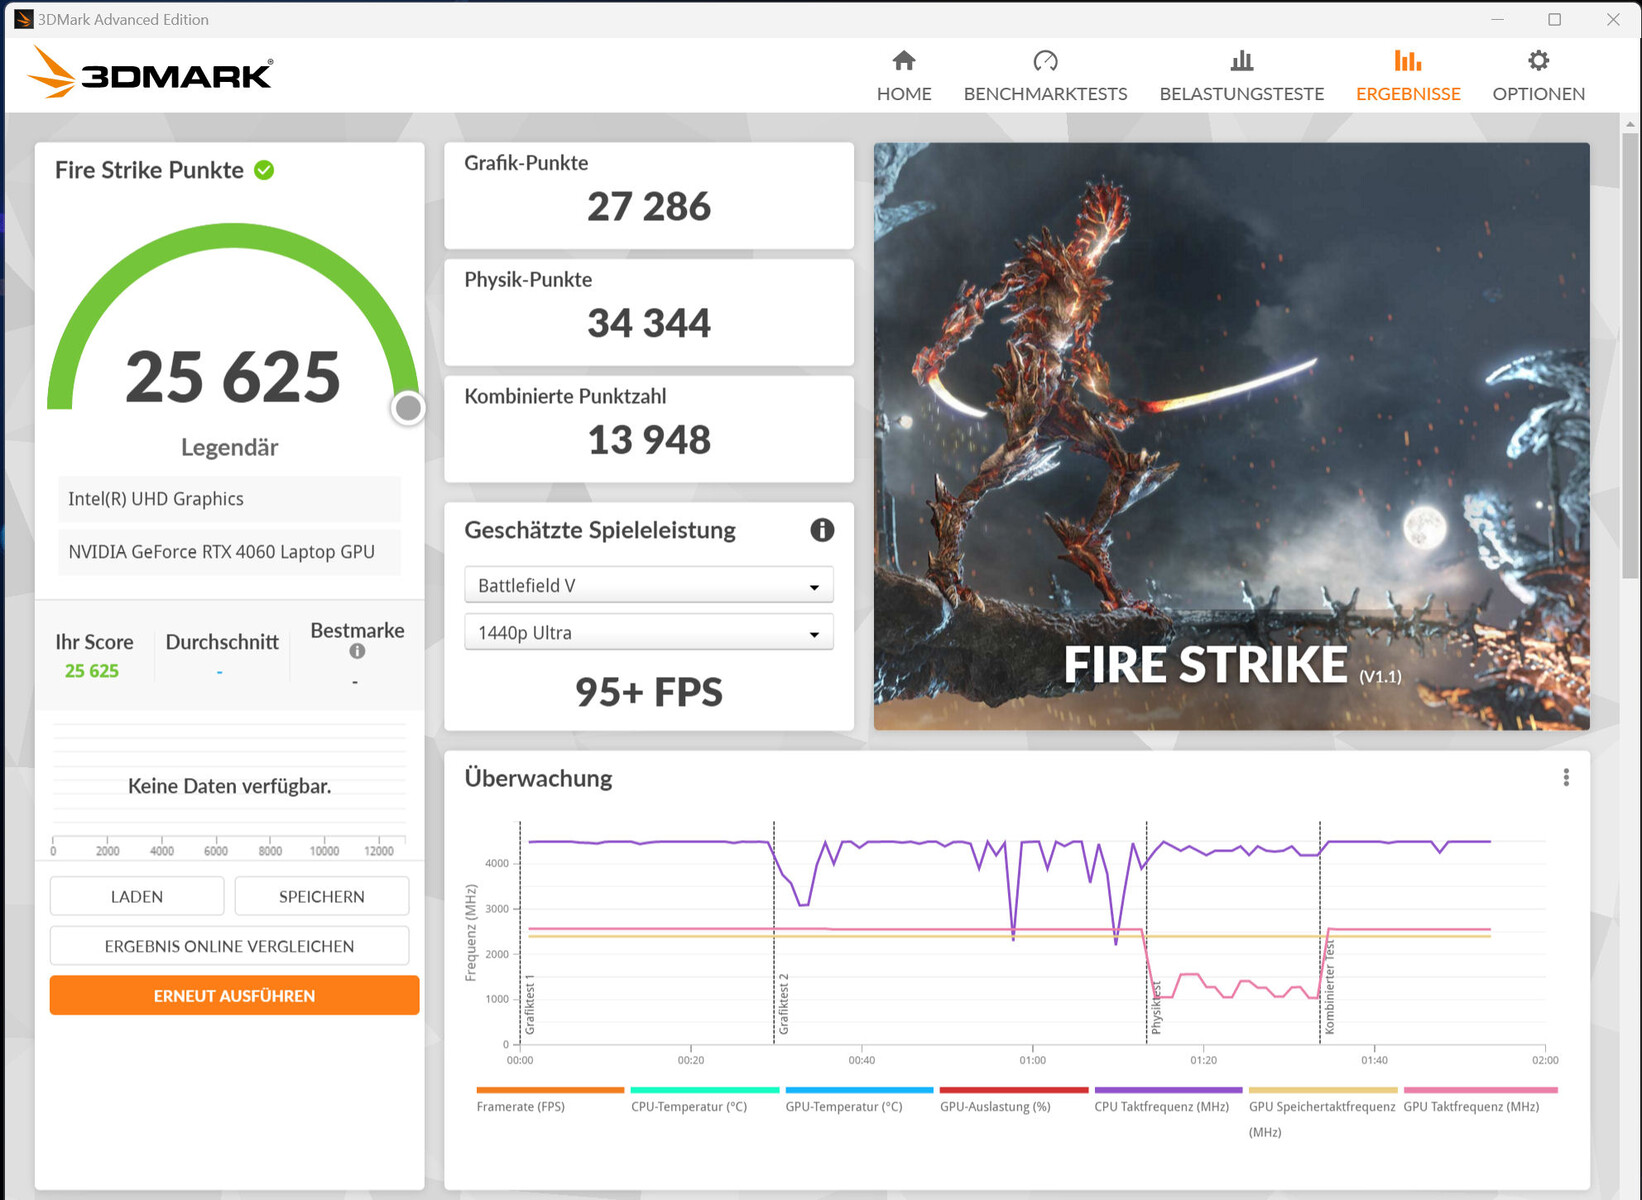
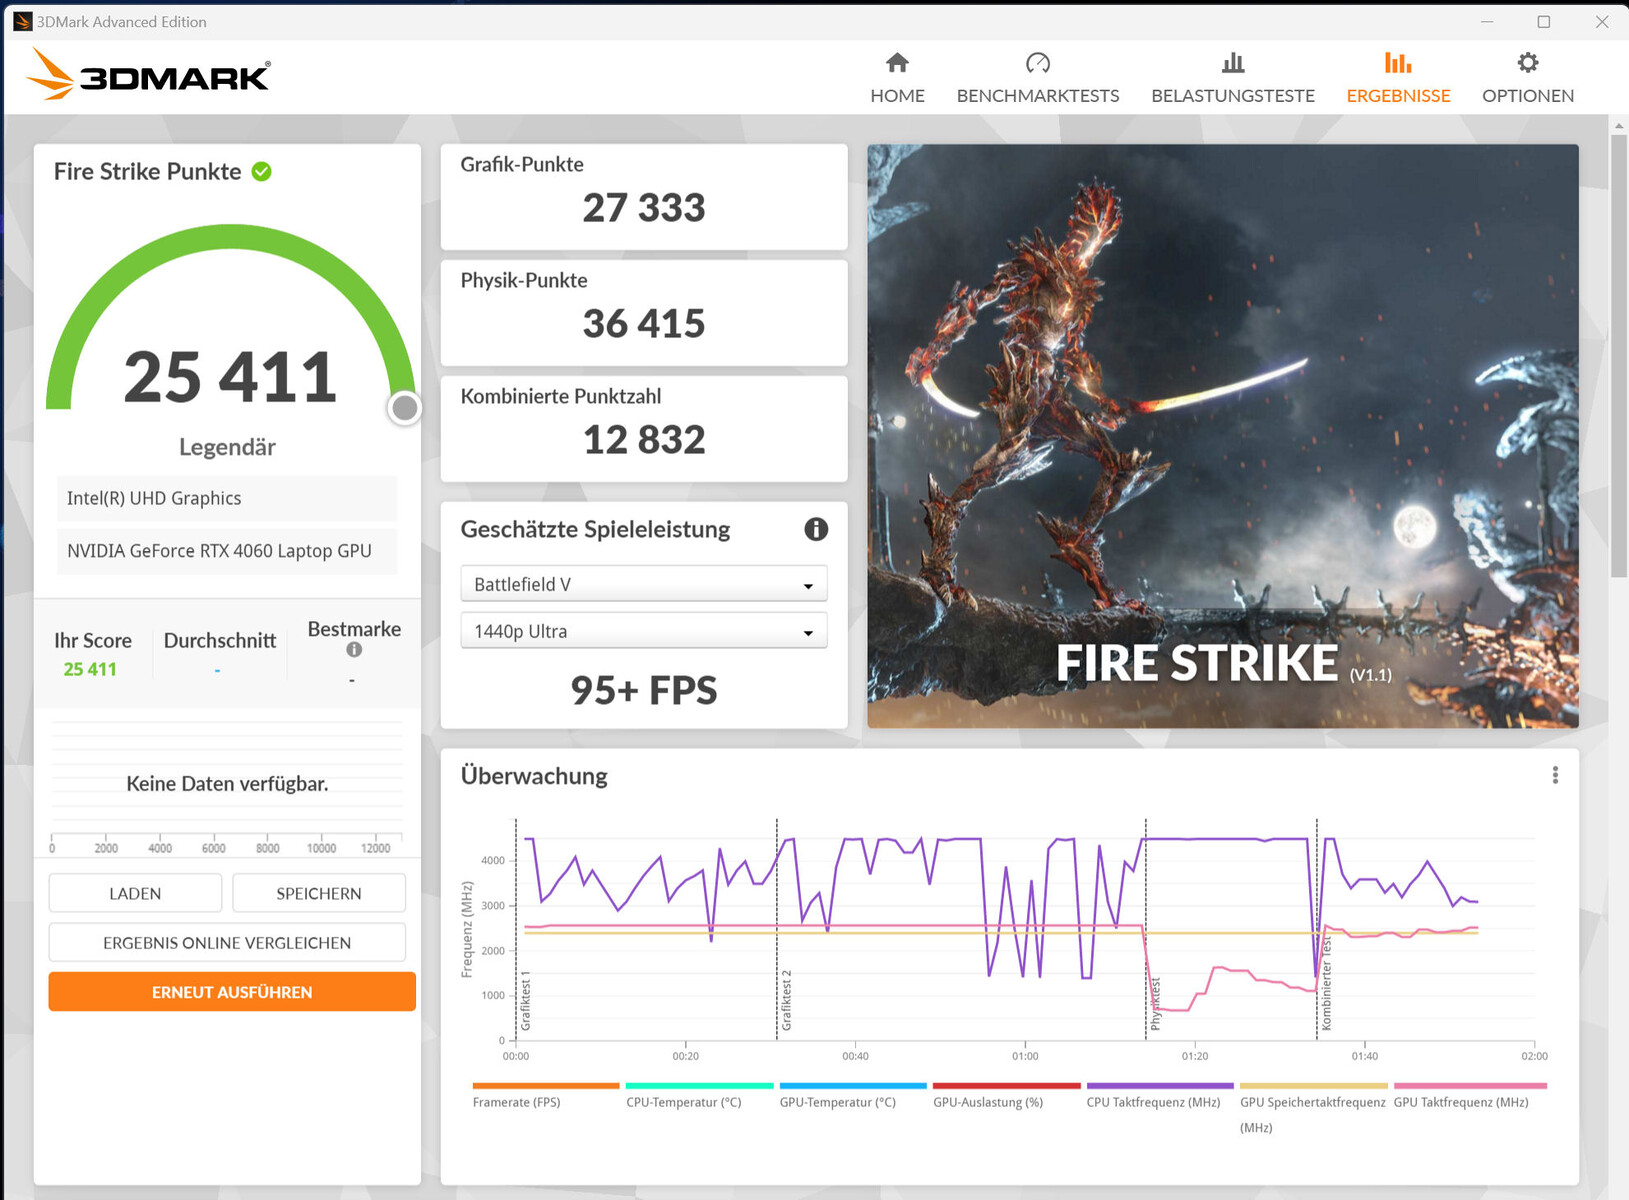
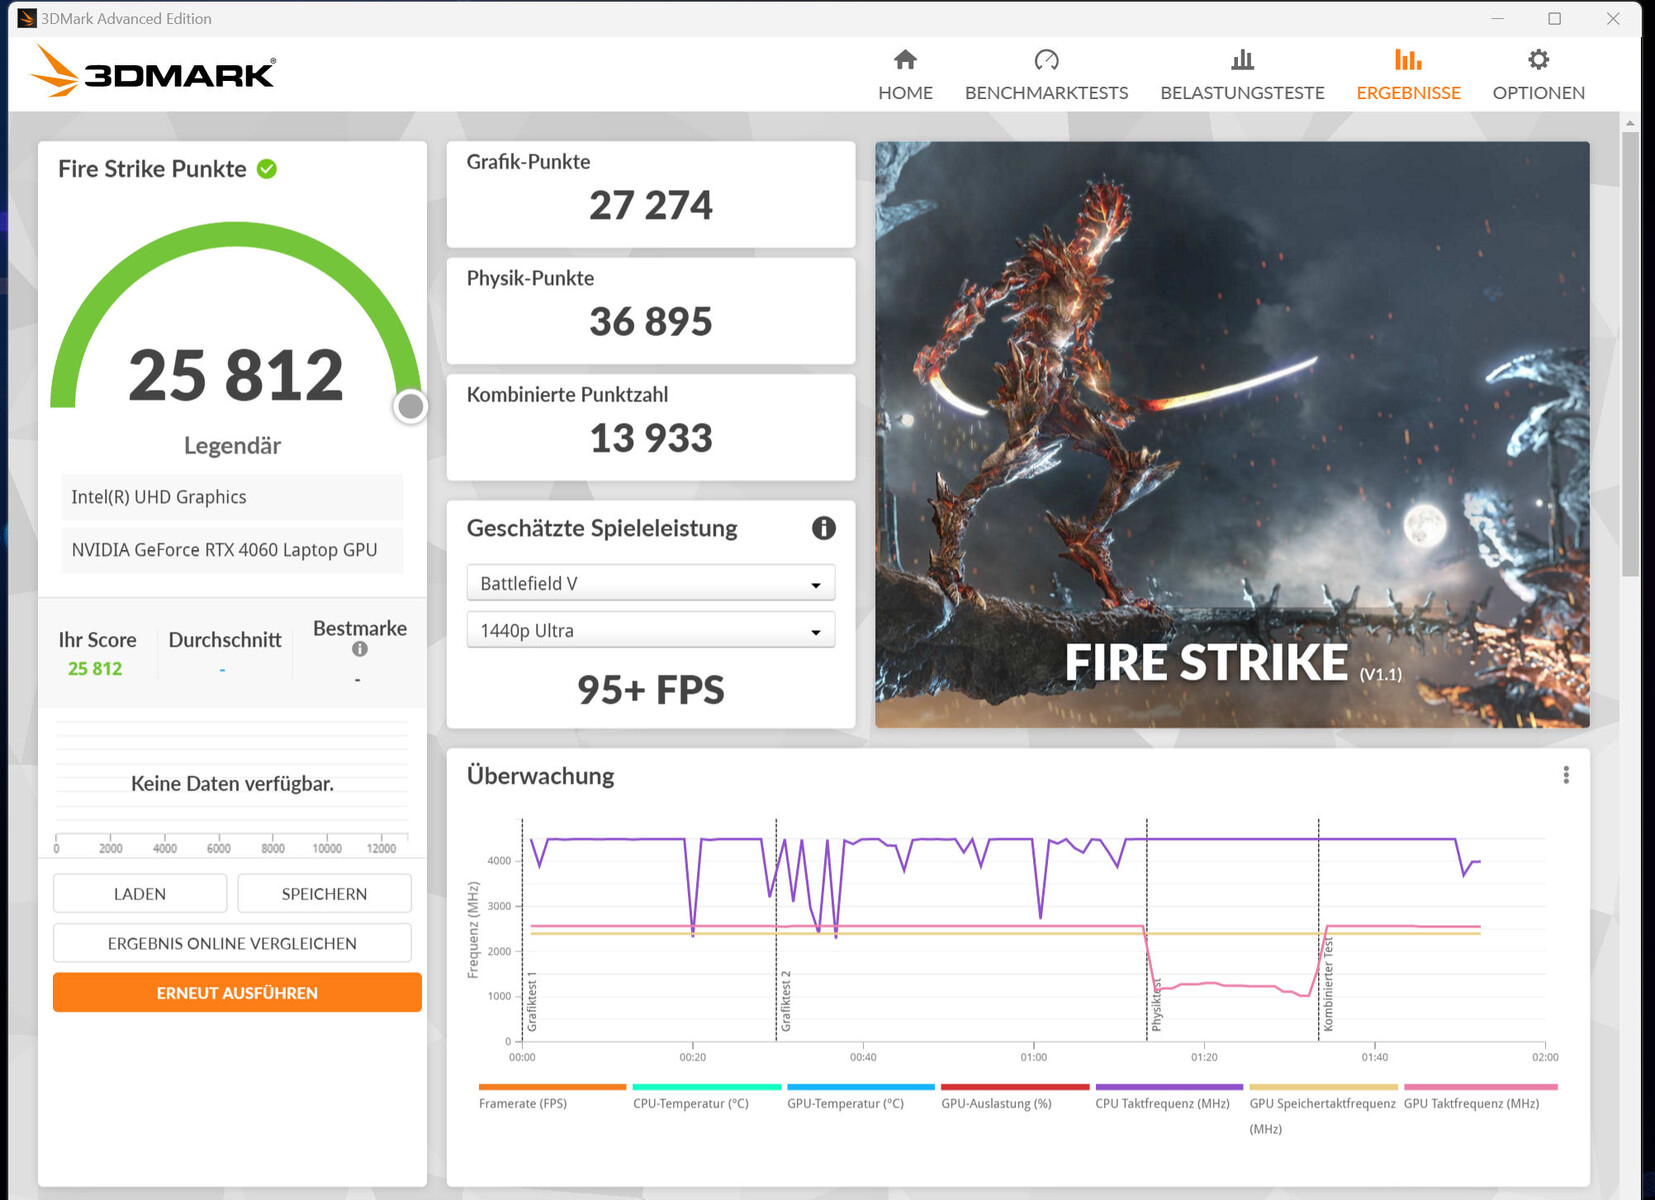
| 3DMark 06 Standard Score | 55811 punti | |
| 3DMark 11 Performance | 33427 punti | |
| 3DMark Cloud Gate Standard Score | 67224 punti | |
| 3DMark Fire Strike Score | 25869 punti | |
| 3DMark Time Spy Score | 11090 punti | |
Aiuto | ||
* ... Meglio usare valori piccoli
Prestazioni di gioco
L'm16 è progettato per i giochi QHD+ con impostazioni elevate o massime. Risoluzioni più elevate sono possibili se si collega uno schermo corrispondente - con impostazioni parzialmente ridotte. Si ottengono frame rate superiori alla media RTX 4060.
| The Witcher 3 - 1920x1080 Ultra Graphics & Postprocessing (HBAO+) | |
| Media della classe Gaming (104.7 - 240, n=7, ultimi 2 anni) | |
| Alienware m16 R1 AMD | |
| Schenker XMG Pro 15 (E23) | |
| Aorus 15 BSF | |
| Lenovo Legion Pro 5 16IRX8 | |
| Alienware m16 R1 Intel | |
| Medion Erazer Defender P40 | |
| Acer Predator Helios 16 PH16-71-731Q | |
| Media NVIDIA GeForce RTX 4060 Laptop GPU (77 - 159.7, n=42) | |
| Atlas Fallen - 1920x1080 Very High Preset | |
| Alienware m16 R1 Intel | |
| Media NVIDIA GeForce RTX 4060 Laptop GPU (88.2 - 114.4, n=3) | |
| Ratchet & Clank Rift Apart | |
| 1920x1080 Very High Preset AA:T | |
| Aorus 15 BSF | |
| Alienware m16 R1 Intel | |
| Media NVIDIA GeForce RTX 4060 Laptop GPU (51.6 - 54.8, n=4) | |
| 1920x1080 Very High Preset + Very High Raytracing AA:T | |
| Aorus 15 BSF | |
| Alienware m16 R1 Intel | |
| Media NVIDIA GeForce RTX 4060 Laptop GPU (39.1 - 44.5, n=3) | |
| Immortals of Aveum - 1920x1080 Ultra AF:16x | |
| Alienware m16 R1 Intel | |
| Media NVIDIA GeForce RTX 4060 Laptop GPU (33 - 48.9, n=4) | |
| The Callisto Protocol | |
| 1920x1080 Ultra Preset (without FSR Upscaling) | |
| Aorus 15 BSF | |
| Alienware m16 R1 Intel | |
| Media NVIDIA GeForce RTX 4060 Laptop GPU (54.4 - 81.1, n=3) | |
| 1920x1080 Ultra Preset (without FSR Upscaling) + Full Ray-Tracing | |
| Aorus 15 BSF | |
| Alienware m16 R1 Intel | |
| Media NVIDIA GeForce RTX 4060 Laptop GPU (38.6 - 69.8, n=2) | |
| Star Wars Jedi Survivor | |
| 1920x1080 Epic Preset | |
| Alienware m16 R1 Intel | |
| Medion Erazer Defender P40 | |
| Media NVIDIA GeForce RTX 4060 Laptop GPU (45.5 - 66.7, n=10) | |
| 1920x1080 Epic Preset + Ray Tracing | |
| Alienware m16 R1 Intel | |
| Media NVIDIA GeForce RTX 4060 Laptop GPU (47 - 52.8, n=4) | |
| Medion Erazer Defender P40 | |
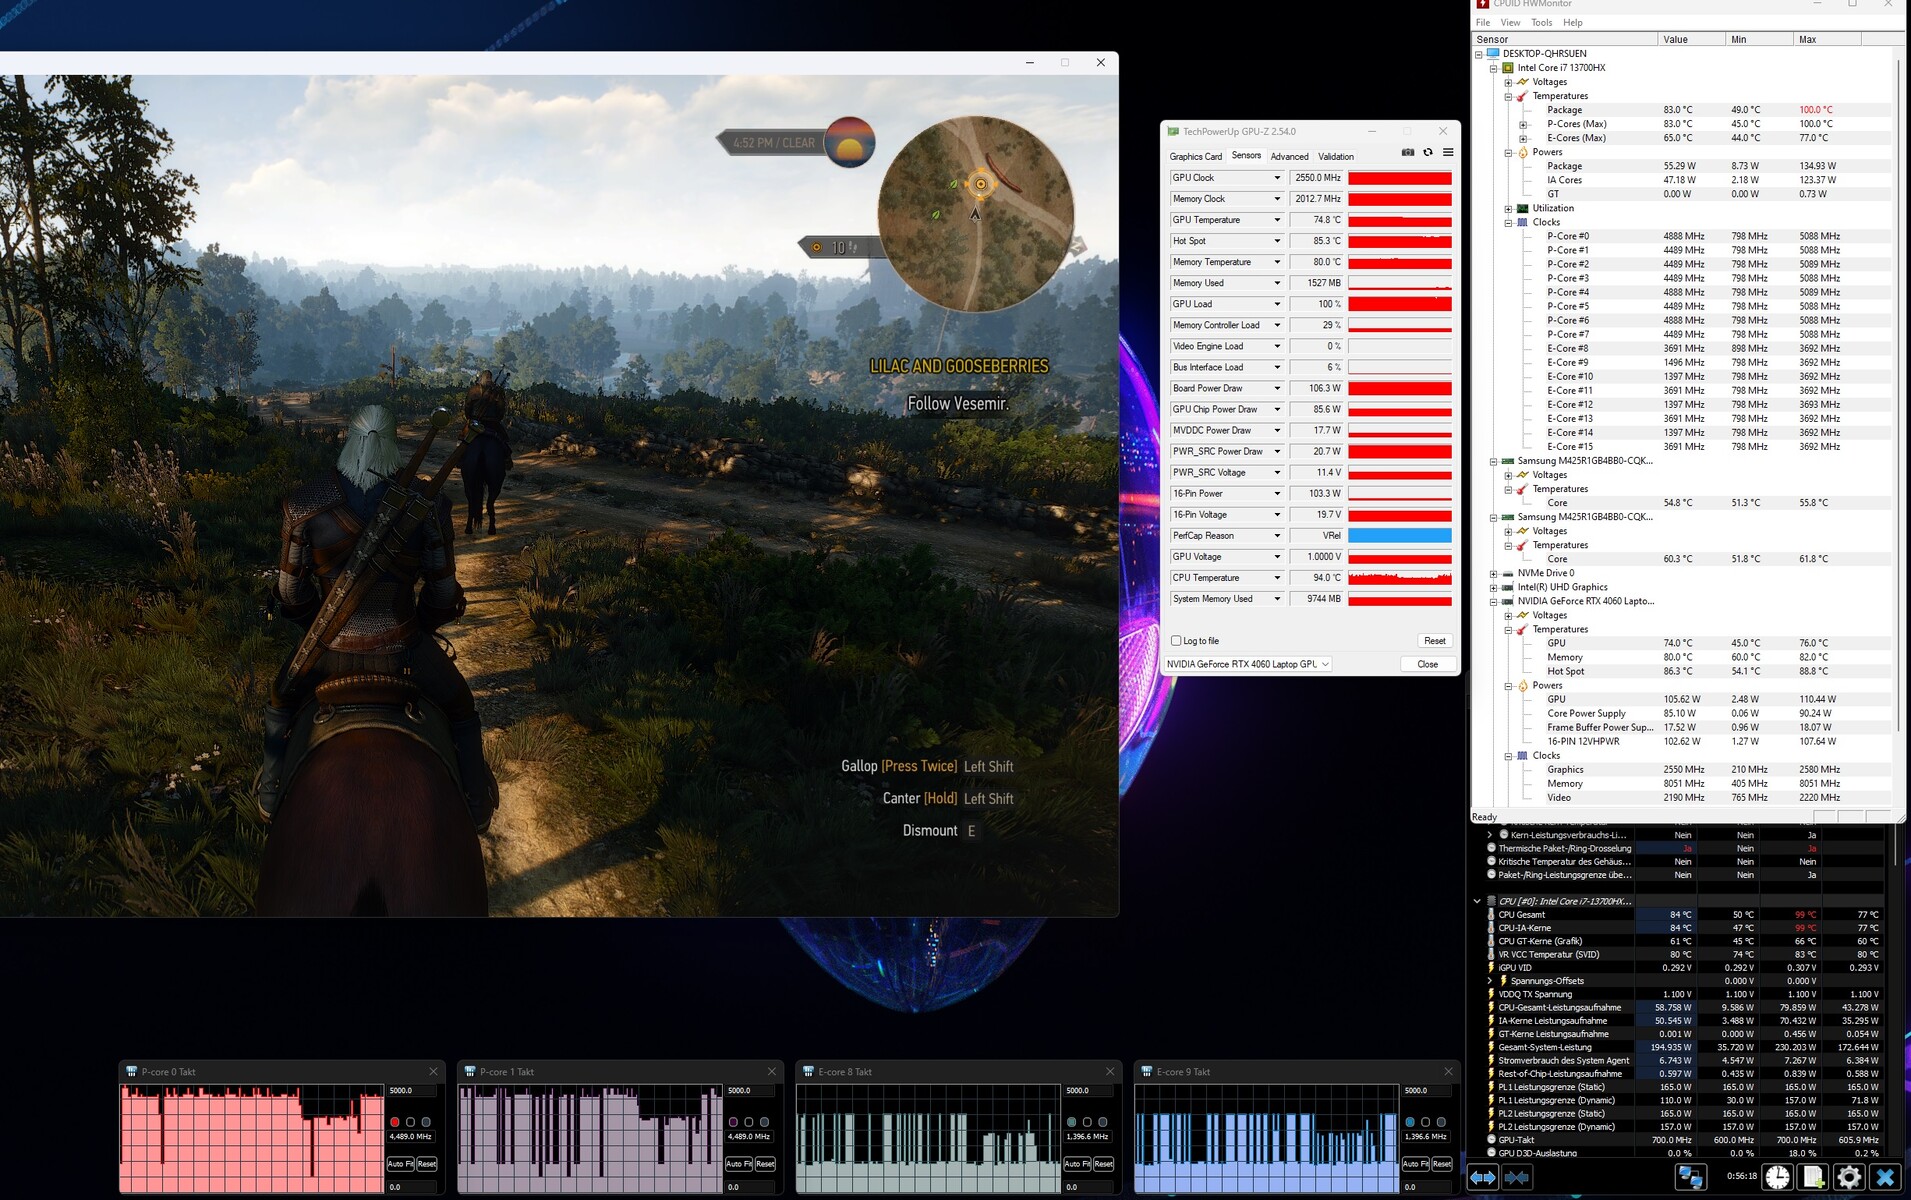
Per verificare se la frequenza dei fotogrammi rimane sostanzialmente costante per lunghi periodi di tempo, "The Witcher 3" viene eseguito per circa 60 minuti con una risoluzione Full HD e con le impostazioni di qualità massime. Il personaggio del gioco non viene spostato. Non è stato osservato un calo della frequenza dei fotogrammi.
Witcher 3 FPS-Diagramm
| basso | medio | alto | ultra | QHD | |
|---|---|---|---|---|---|
| The Witcher 3 (2015) | 497 | 340.9 | 206.2 | 106.5 | 78.8 |
| Dota 2 Reborn (2015) | 189.5 | 169.6 | 165.8 | 153.2 | |
| Final Fantasy XV Benchmark (2018) | 232 | 150.8 | 104.7 | 77.1 | |
| X-Plane 11.11 (2018) | 170.4 | 156.7 | 120.4 | ||
| Far Cry 5 (2018) | 199 | 163 | 155 | 146 | 107 |
| Strange Brigade (2018) | 580 | 283 | 223 | 190.3 | 128.5 |
| Cyberpunk 2077 1.6 (2022) | 134.6 | 104.5 | 89.3 | 82.1 | 49.9 |
| The Callisto Protocol (2022) | 165.4 | 135.4 | 128 | 81.1 | 62.8 |
| Star Wars Jedi Survivor (2023) | 86 | 75.8 | 70.9 | 66.7 | 41.7 |
| F1 23 (2023) | 291 | 272 | 187.6 | 119.9 | 38.9 |
| Ratchet & Clank Rift Apart (2023) | 86 | 74.7 | 60.6 | 54.8 | 46.6 |
| Atlas Fallen (2023) | 145.9 | 137.5 | 132.1 | 114.4 | 79.2 |
| Immortals of Aveum (2023) | 61.6 | 54.6 | 48.9 | 32.8 |
Emissioni - Il portatile Dell può produrre molto rumore
Rumore
Il livello di pressione sonora può salire fino a 58 dB(A) ("Overdrive") in modalità gioco. la modalità "Performance" si comporta meglio con 51 dB(A). La preferita tra le modalità è il profilo "Silenzioso": un livello di 43 dB(A) viene fornito al costo di prestazioni di gioco leggermente ridotte.
Quando è inattivo e nell'uso quotidiano (ufficio, internet), le quattro ventole spesso rimangono ferme e regna il silenzio.
Rumorosità
| Idle |
| 25 / 26 / 27 dB(A) |
| Sotto carico |
| 52 / 53 dB(A) |
 | ||
30 dB silenzioso 40 dB(A) udibile 50 dB(A) rumoroso |
||
min: | ||
| Alienware m16 R1 Intel GeForce RTX 4060 Laptop GPU, i7-13700HX, Kioxia KXG70ZNV512G | Acer Predator Helios 16 PH16-71-731Q GeForce RTX 4060 Laptop GPU, i7-13700HX, Micron 3400 1TB MTFDKBA1T0TFH | Medion Erazer Defender P40 GeForce RTX 4060 Laptop GPU, i7-13700HX, Phison PS5021-E21 1TB | Lenovo Legion Pro 5 16IRX8 GeForce RTX 4060 Laptop GPU, i7-13700HX, SK hynix PC801 HFS512GEJ9X115N | Schenker XMG Pro 15 (E23) GeForce RTX 4060 Laptop GPU, i9-13900HX, Crucial P5 Plus 1TB CT1000P5PSSD8 | Aorus 15 BSF GeForce RTX 4070 Laptop GPU, i7-13700H, Gigabyte AG470S1TB-SI B10 | Alienware m16 R1 AMD GeForce RTX 4080 Laptop GPU, R9 7845HX, Kioxia XG8 KXG80ZNV1T02 | |
|---|---|---|---|---|---|---|---|
| Noise | 5% | -9% | 9% | 3% | -10% | 4% | |
| off /ambiente * (dB) | 25 | 24 4% | 25 -0% | 23 8% | 24 4% | 24 4% | 22.9 8% |
| Idle Minimum * (dB) | 25 | 24 4% | 26 -4% | 23.1 8% | 24 4% | 25 -0% | 22.9 8% |
| Idle Average * (dB) | 26 | 24 8% | 27 -4% | 23.1 11% | 24 8% | 31 -19% | 29.7 -14% |
| Idle Maximum * (dB) | 27 | 32.32 -20% | 32 -19% | 26.6 1% | 24 11% | 37 -37% | 29.7 -10% |
| Load Average * (dB) | 52 | 36.66 29% | 53 -2% | 34.7 33% | 53.65 -3% | 51 2% | 29.8 43% |
| Witcher 3 ultra * (dB) | 51 | 49.06 4% | 56 -10% | 47.6 7% | 53.53 -5% | 54.7 -7% | |
| Load Maximum * (dB) | 53 | 49.49 7% | 64 -21% | 54.8 -3% | 53.65 -1% | 57 -8% | 54.7 -3% |
* ... Meglio usare valori piccoli
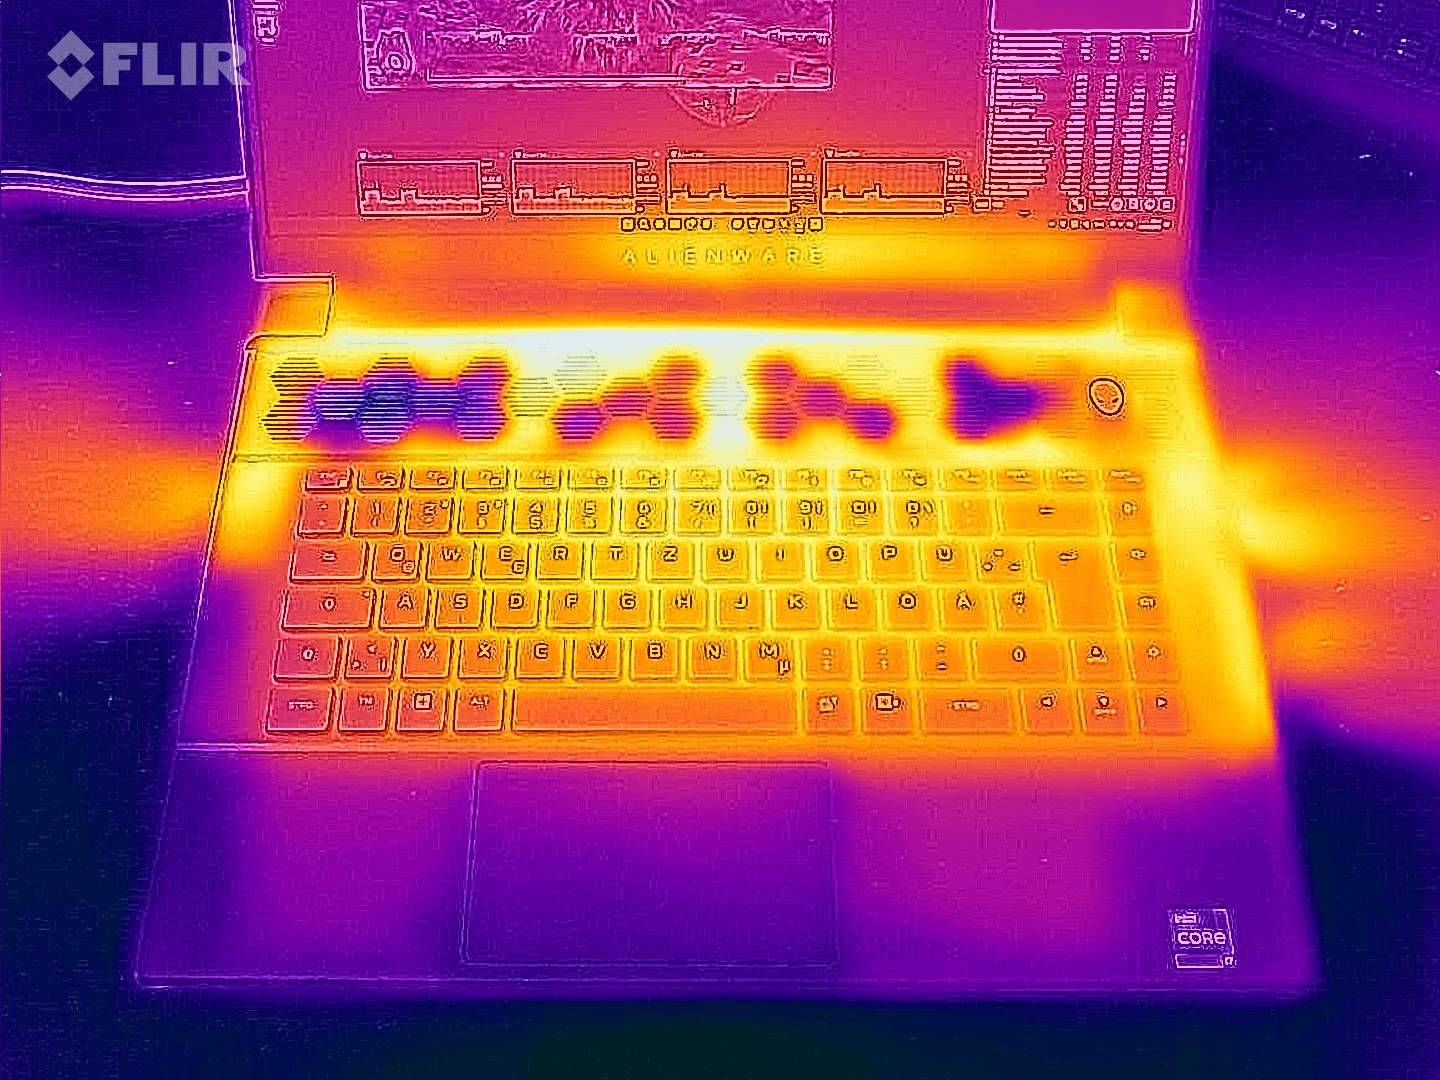
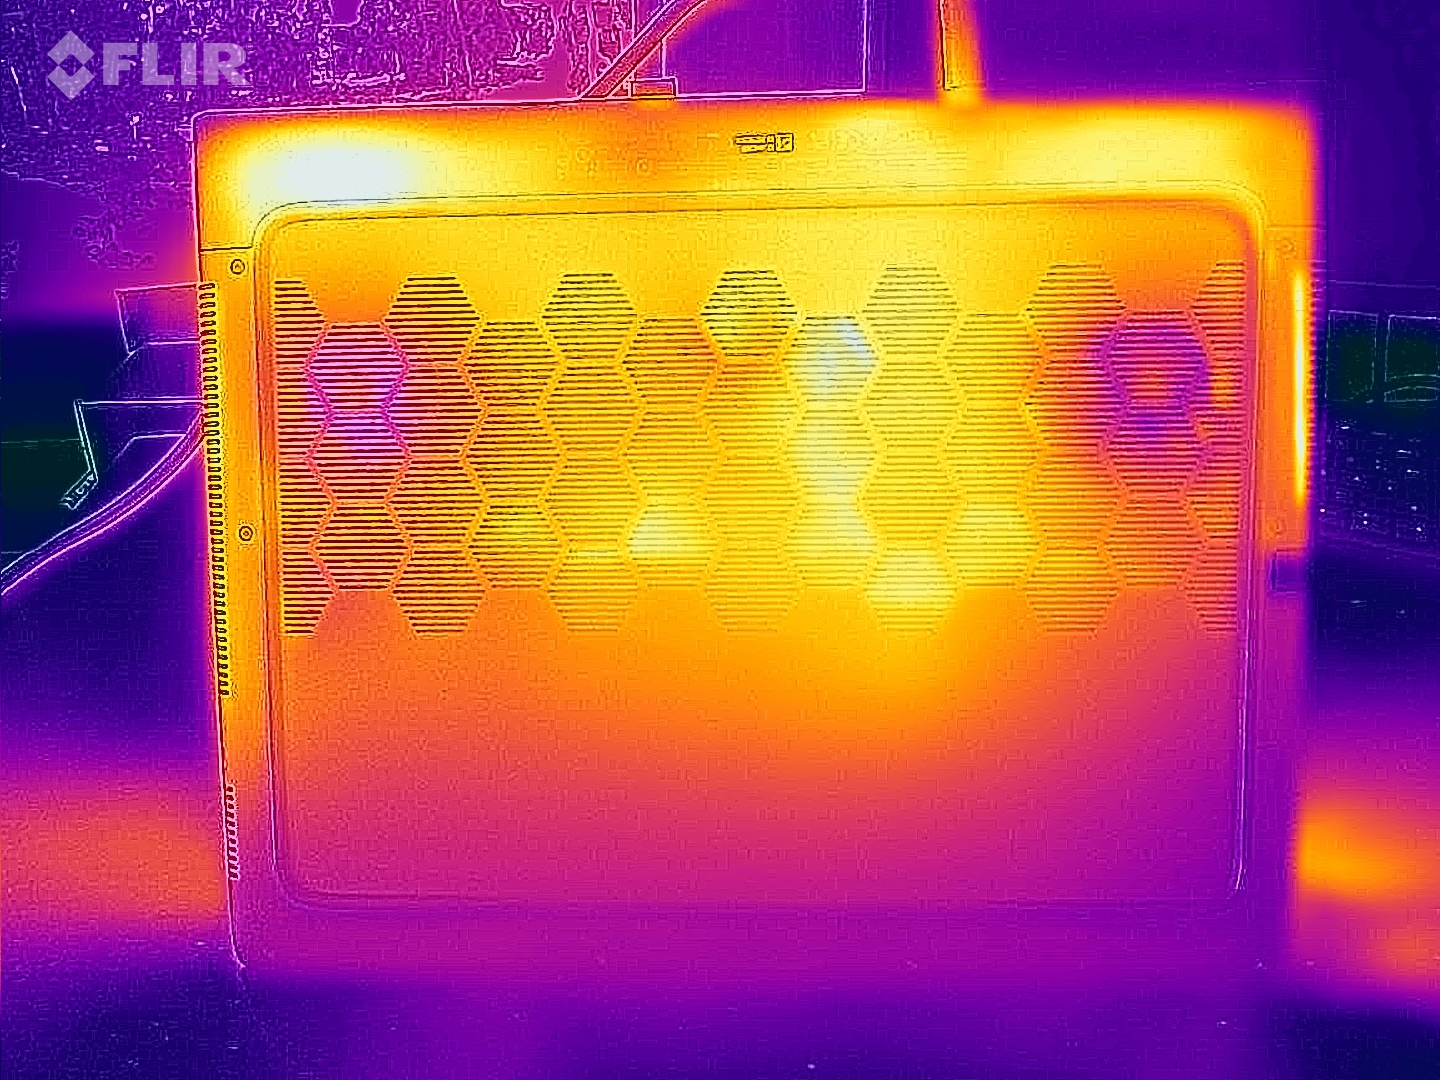
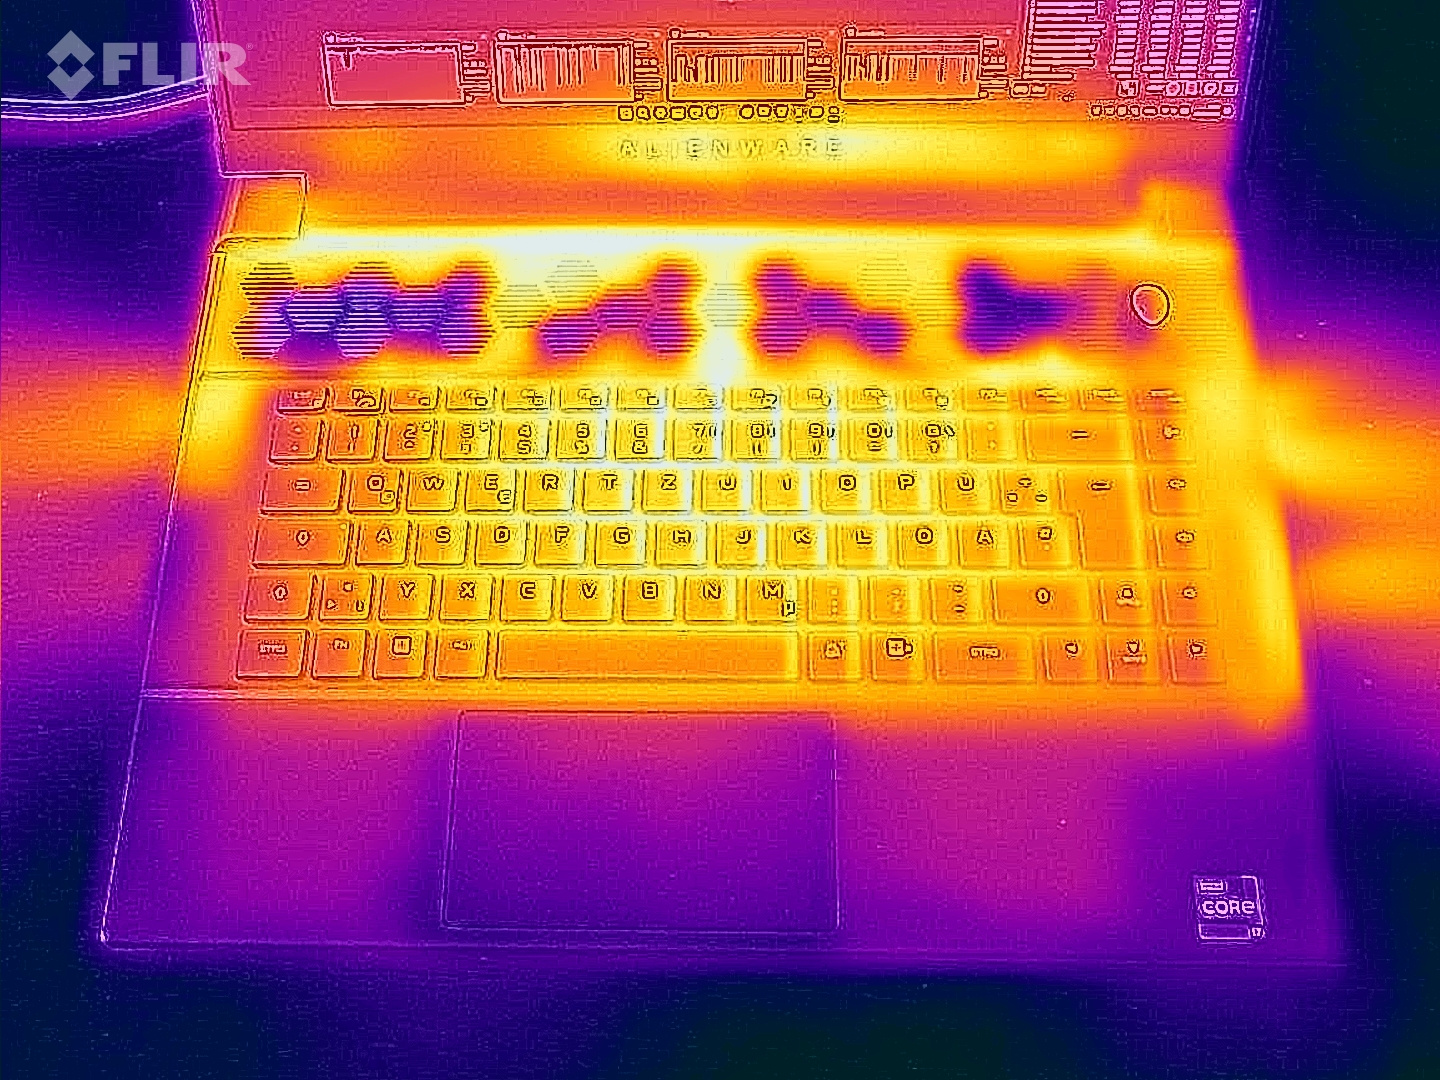
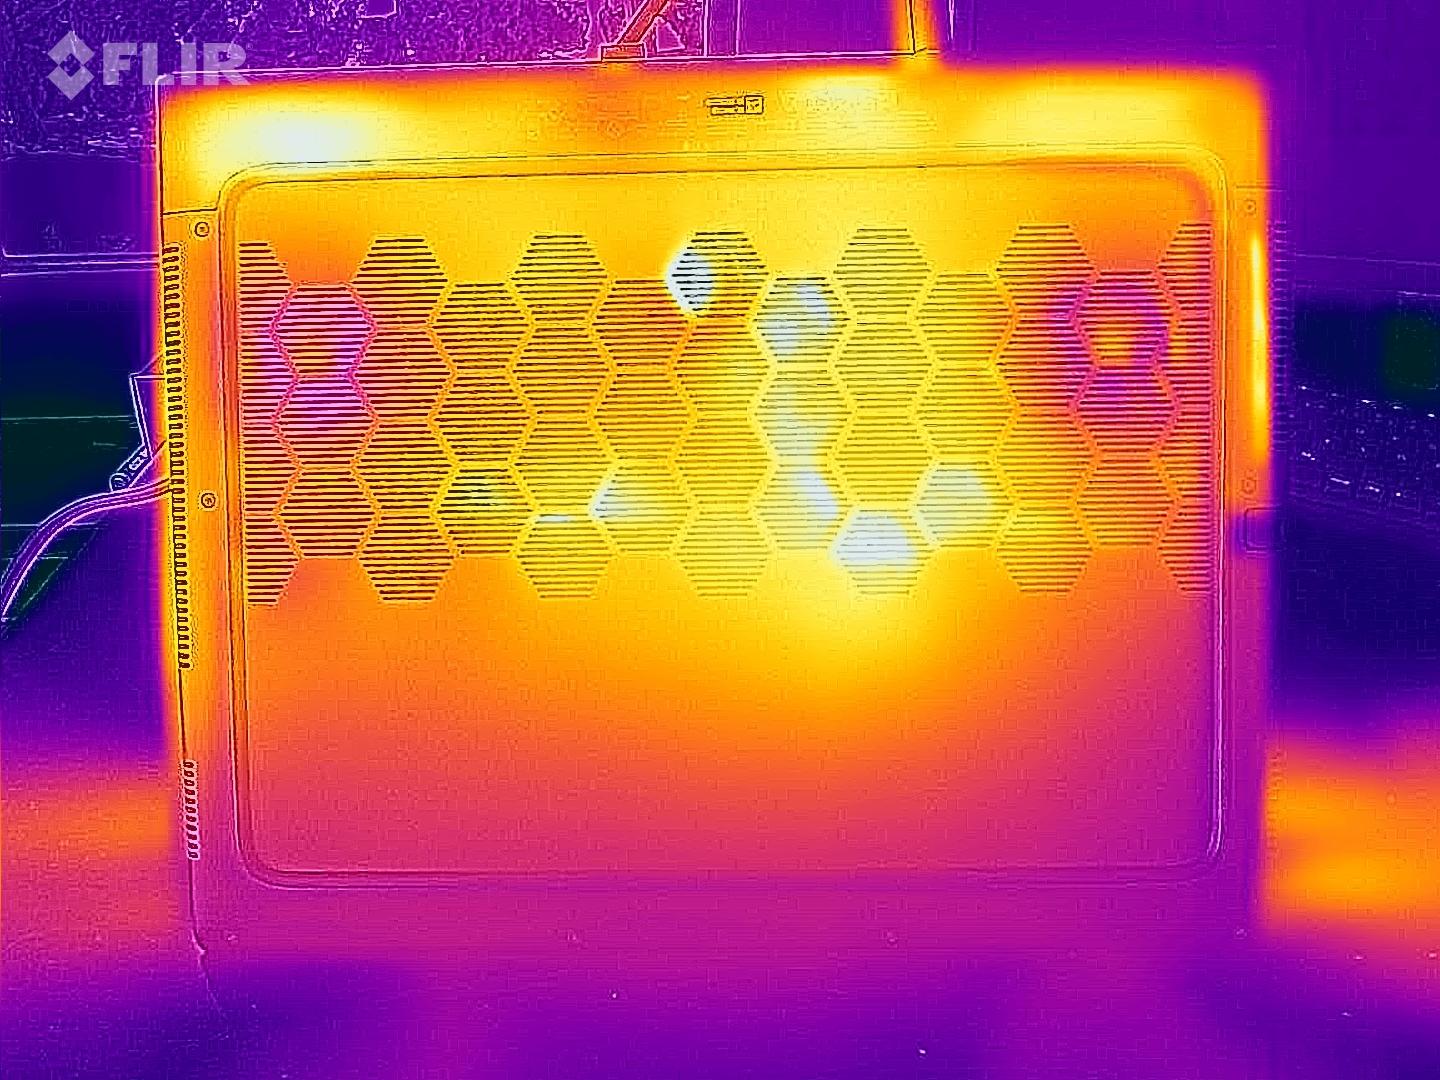
Temperatura
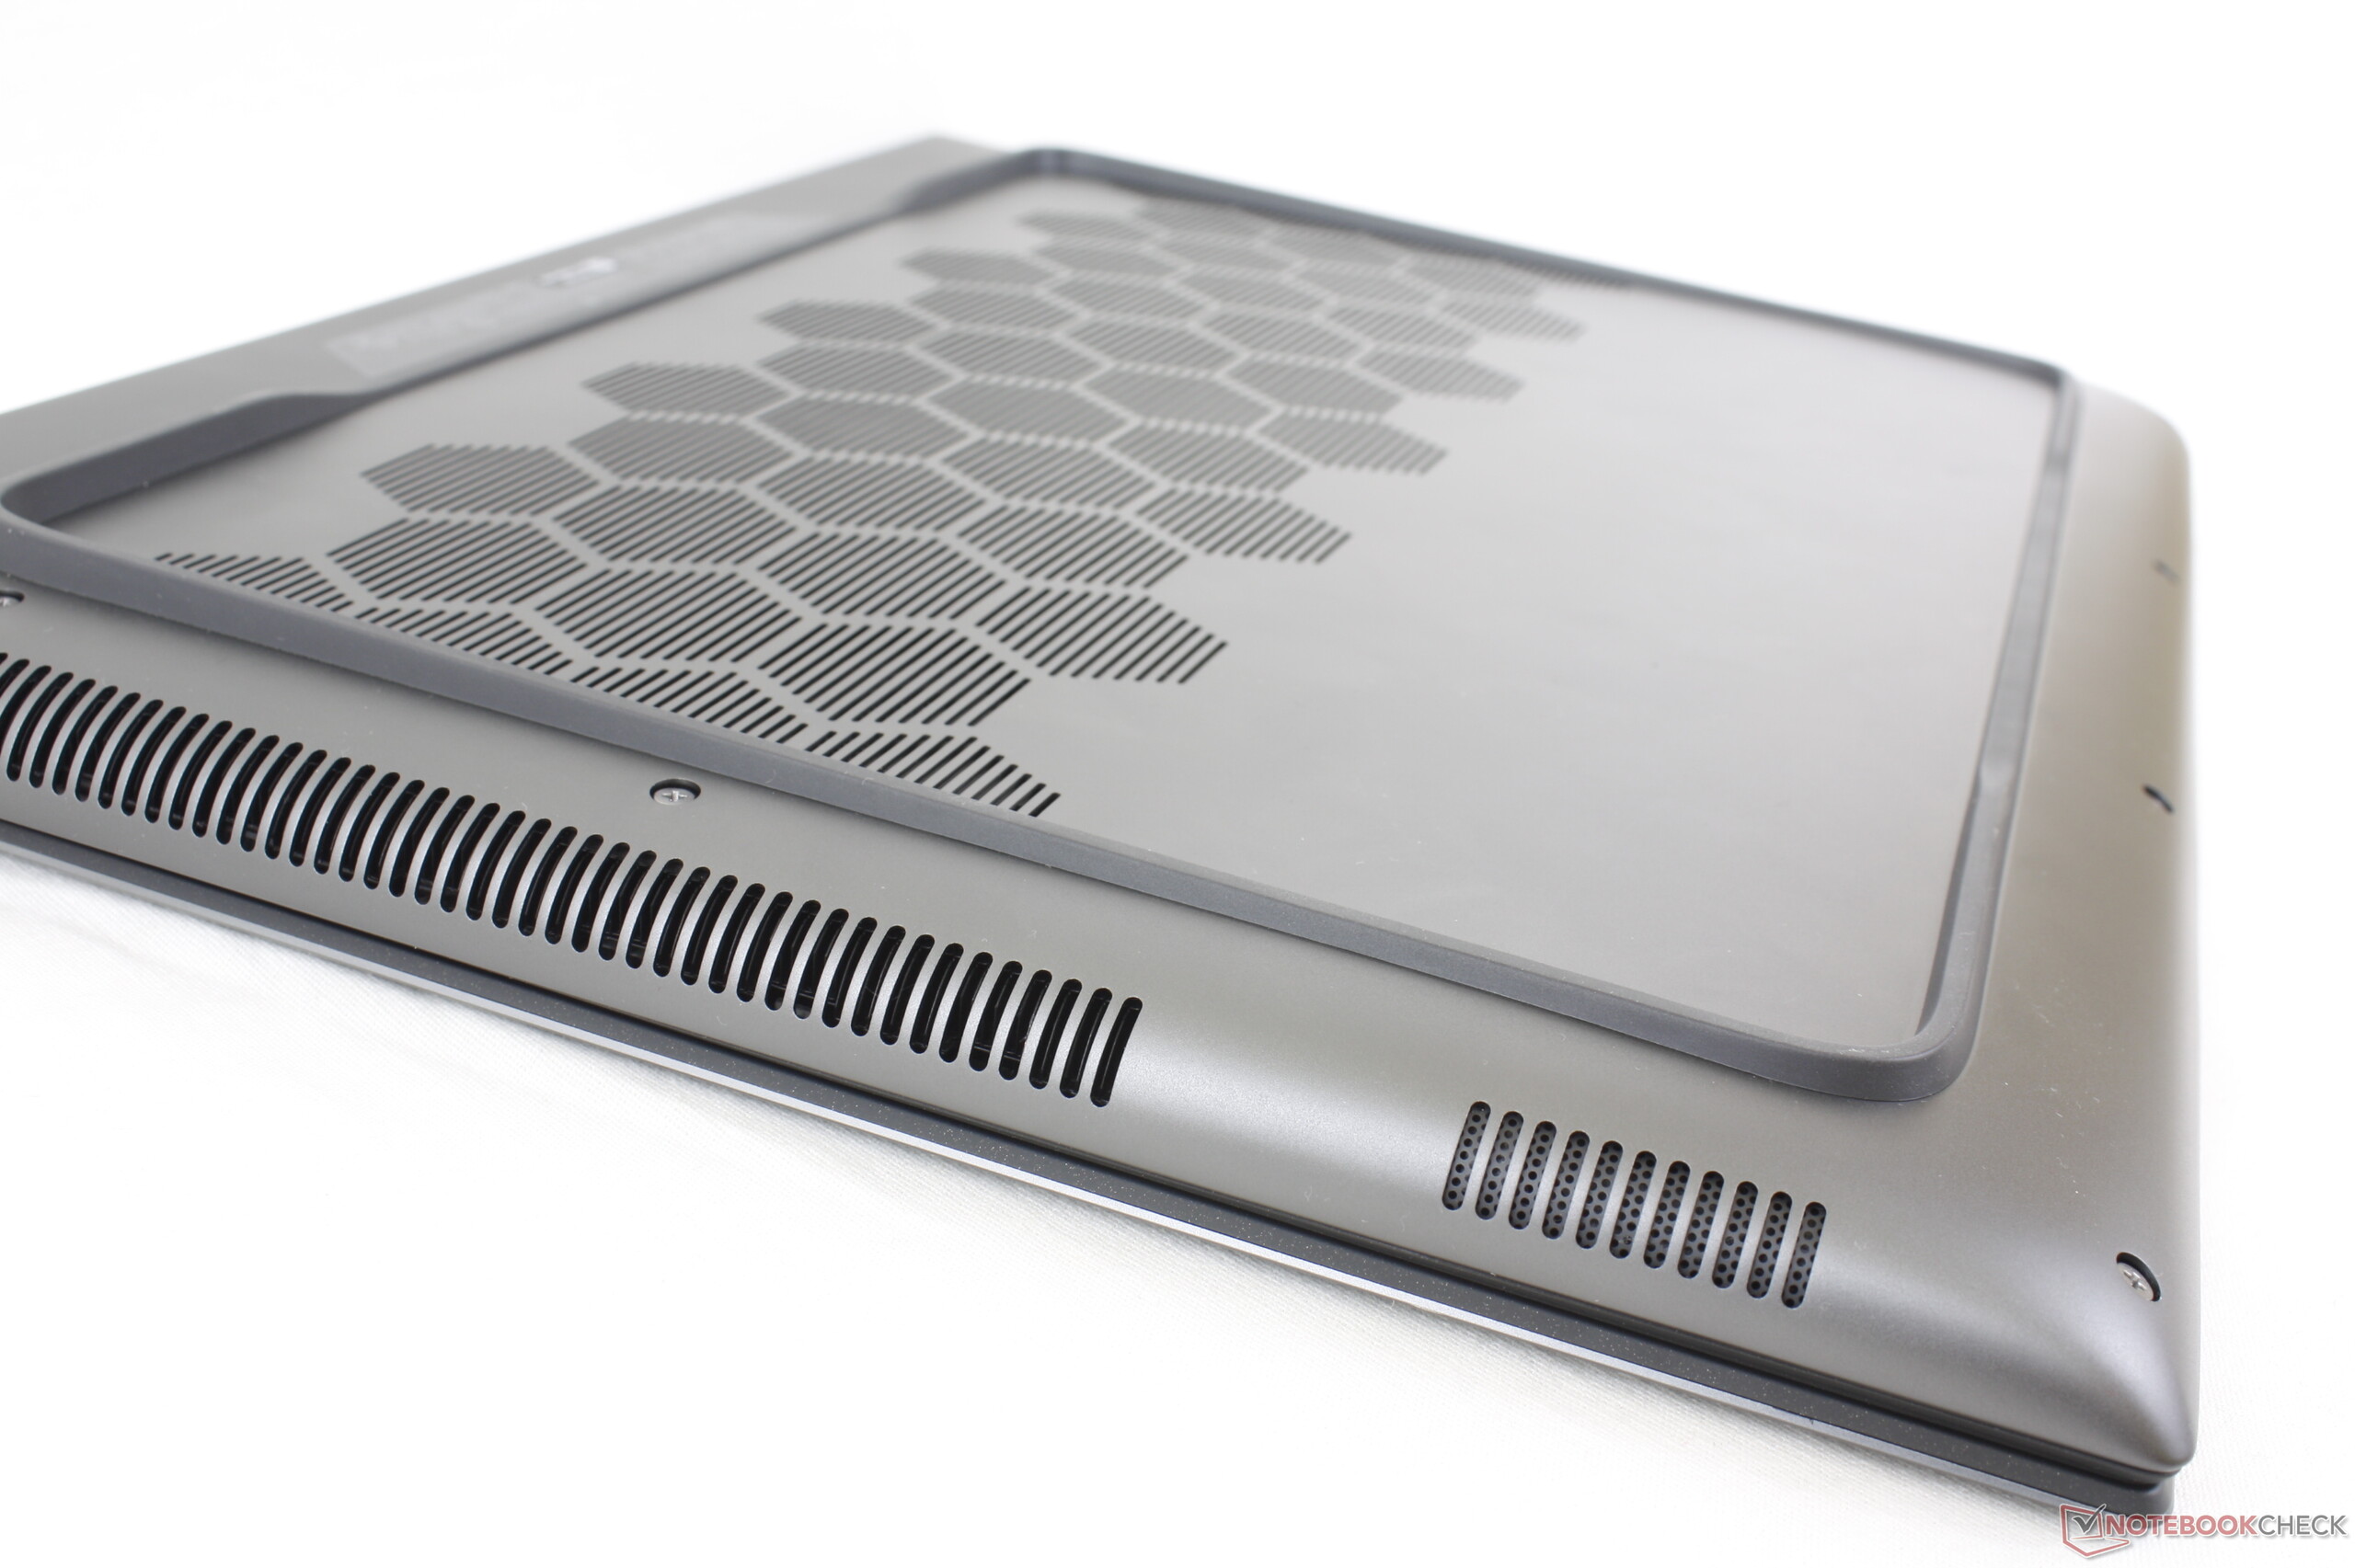
Gli stress test e Witcher 3 causano un notevole riscaldamento del notebook, ma tutto rimane entro limiti accettabili. Nell'uso quotidiano (ufficio, internet), le temperature del case rimangono sostanzialmente nella zona verde, ma sono troppo elevate rispetto a quelle di altri portatili.
Il portatile si riscalda di più sotto carico rispetto alla sua controparte AMD dotata di hardware più potente. Quest'ultimo beneficia di un'APU più parsimoniosa.
(-) La temperatura massima sul lato superiore è di 49 °C / 120 F, rispetto alla media di 40.4 °C / 105 F, che varia da 21.2 a 68.8 °C per questa classe Gaming.
(-) Il lato inferiore si riscalda fino ad un massimo di 48 °C / 118 F, rispetto alla media di 43.2 °C / 110 F
(±) In idle, la temperatura media del lato superiore è di 37 °C / 99 F, rispetto alla media deld ispositivo di 33.9 °C / 93 F.
(-) Riproducendo The Witcher 3, la temperatura media per il lato superiore e' di 46 °C / 115 F, rispetto alla media del dispositivo di 33.9 °C / 93 F.
(-) I poggiapolsi e il touchpad possono diventare molto caldi al tatto con un massimo di 44 °C / 111.2 F.
(-) La temperatura media della zona del palmo della mano di dispositivi simili e'stata di 28.8 °C / 83.8 F (-15.2 °C / -27.4 F).
| Alienware m16 R1 Intel Intel Core i7-13700HX, NVIDIA GeForce RTX 4060 Laptop GPU | Acer Predator Helios 16 PH16-71-731Q Intel Core i7-13700HX, NVIDIA GeForce RTX 4060 Laptop GPU | Medion Erazer Defender P40 Intel Core i7-13700HX, NVIDIA GeForce RTX 4060 Laptop GPU | Lenovo Legion Pro 5 16IRX8 Intel Core i7-13700HX, NVIDIA GeForce RTX 4060 Laptop GPU | Schenker XMG Pro 15 (E23) Intel Core i9-13900HX, NVIDIA GeForce RTX 4060 Laptop GPU | Aorus 15 BSF Intel Core i7-13700H, NVIDIA GeForce RTX 4070 Laptop GPU | Alienware m16 R1 AMD AMD Ryzen 9 7845HX, NVIDIA GeForce RTX 4080 Laptop GPU | |
|---|---|---|---|---|---|---|---|
| Heat | -2% | 18% | 12% | 7% | 4% | 9% | |
| Maximum Upper Side * (°C) | 49 | 41 16% | 42 14% | 42.8 13% | 50 -2% | 48 2% | 48 2% |
| Maximum Bottom * (°C) | 48 | 66 -38% | 45 6% | 50 -4% | 50 -4% | 47 2% | 39 19% |
| Idle Upper Side * (°C) | 40 | 36 10% | 28 30% | 29.6 26% | 33 17% | 39 2% | 37 7% |
| Idle Bottom * (°C) | 39 | 37 5% | 30 23% | 34 13% | 32 18% | 35 10% | 36.2 7% |
* ... Meglio usare valori piccoli
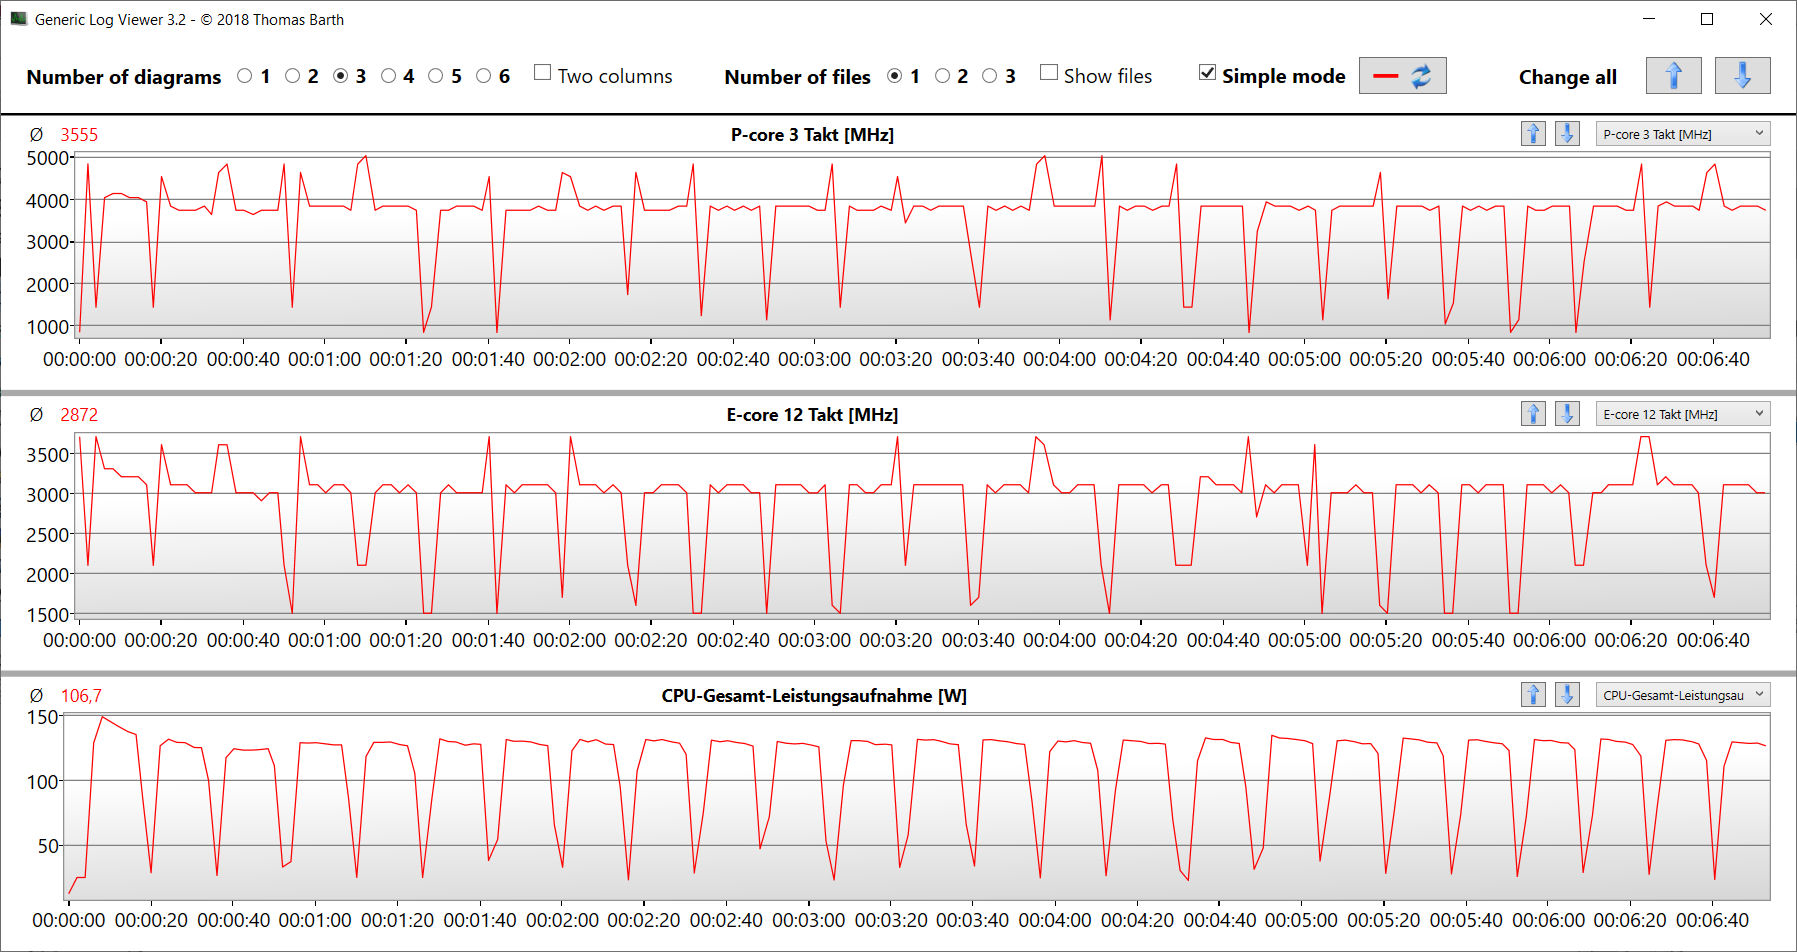
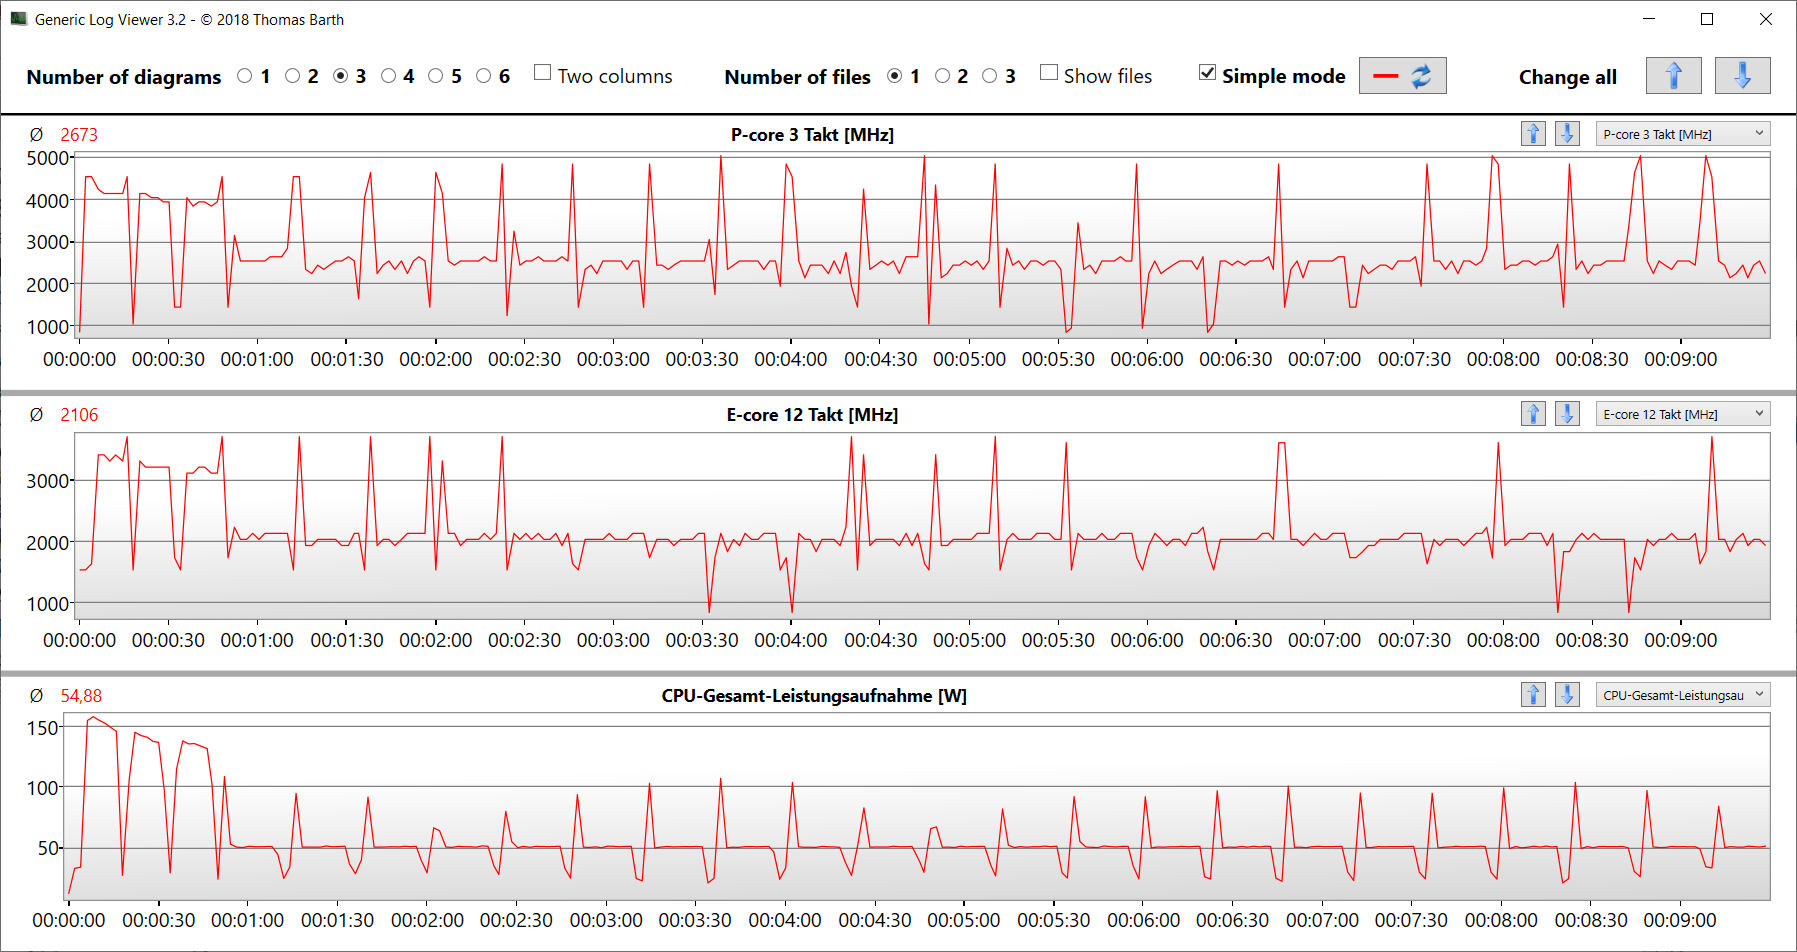
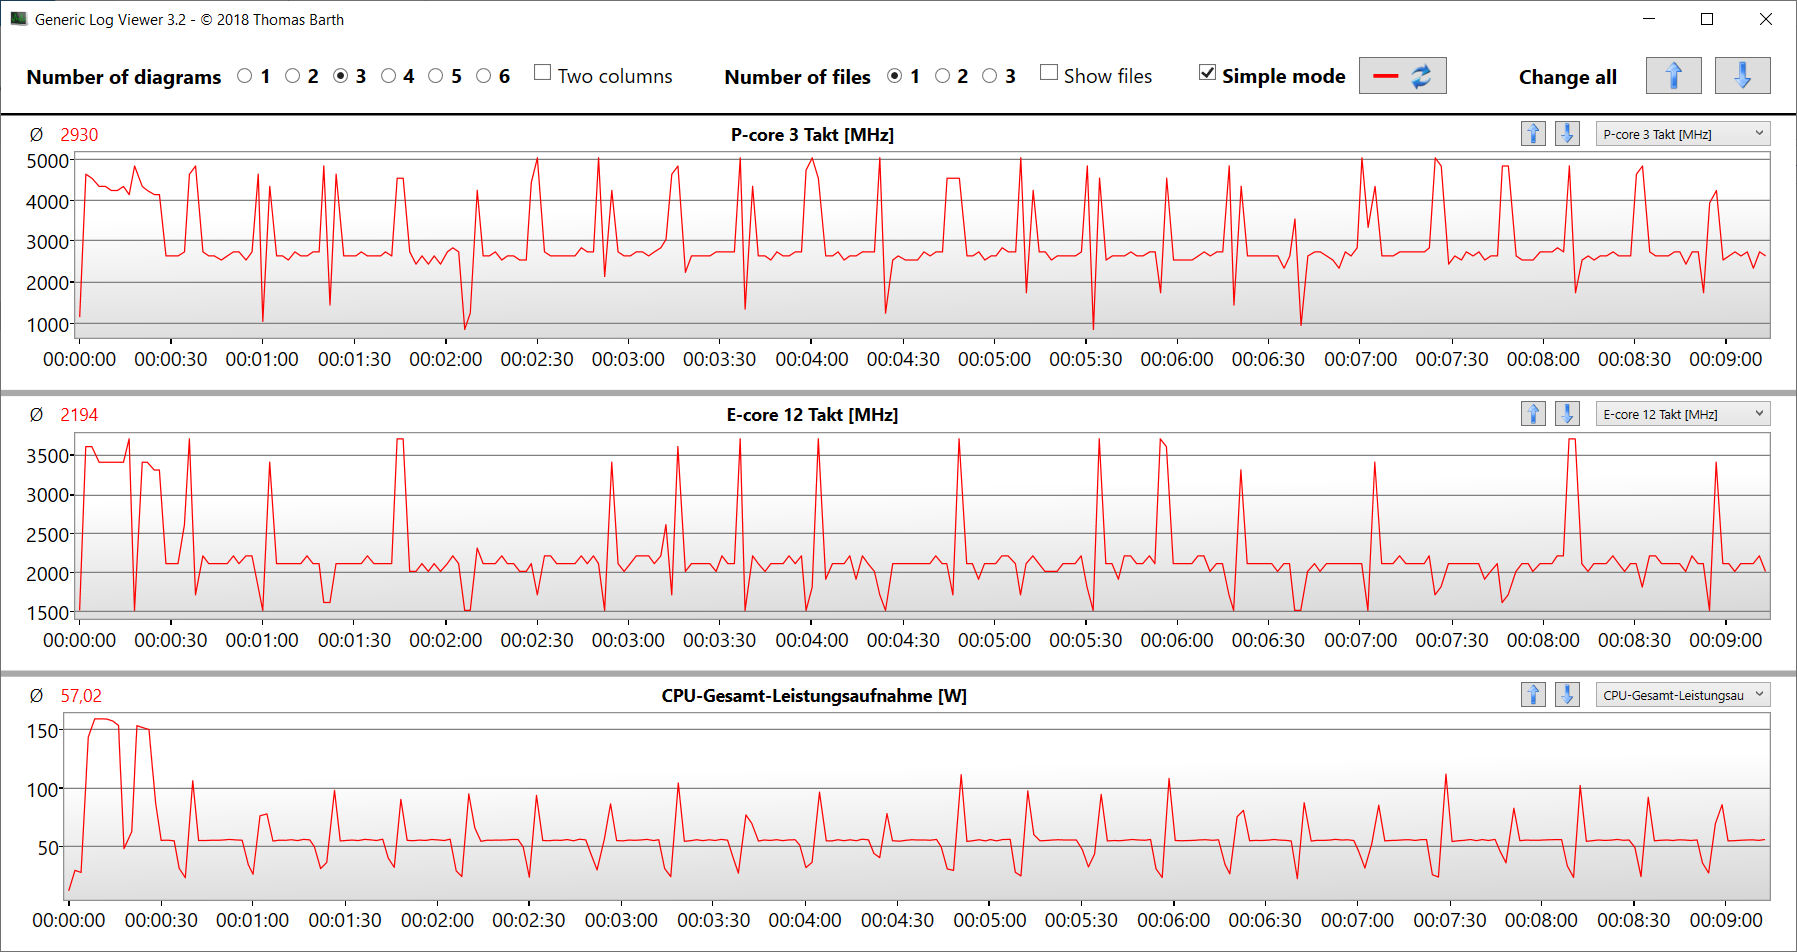
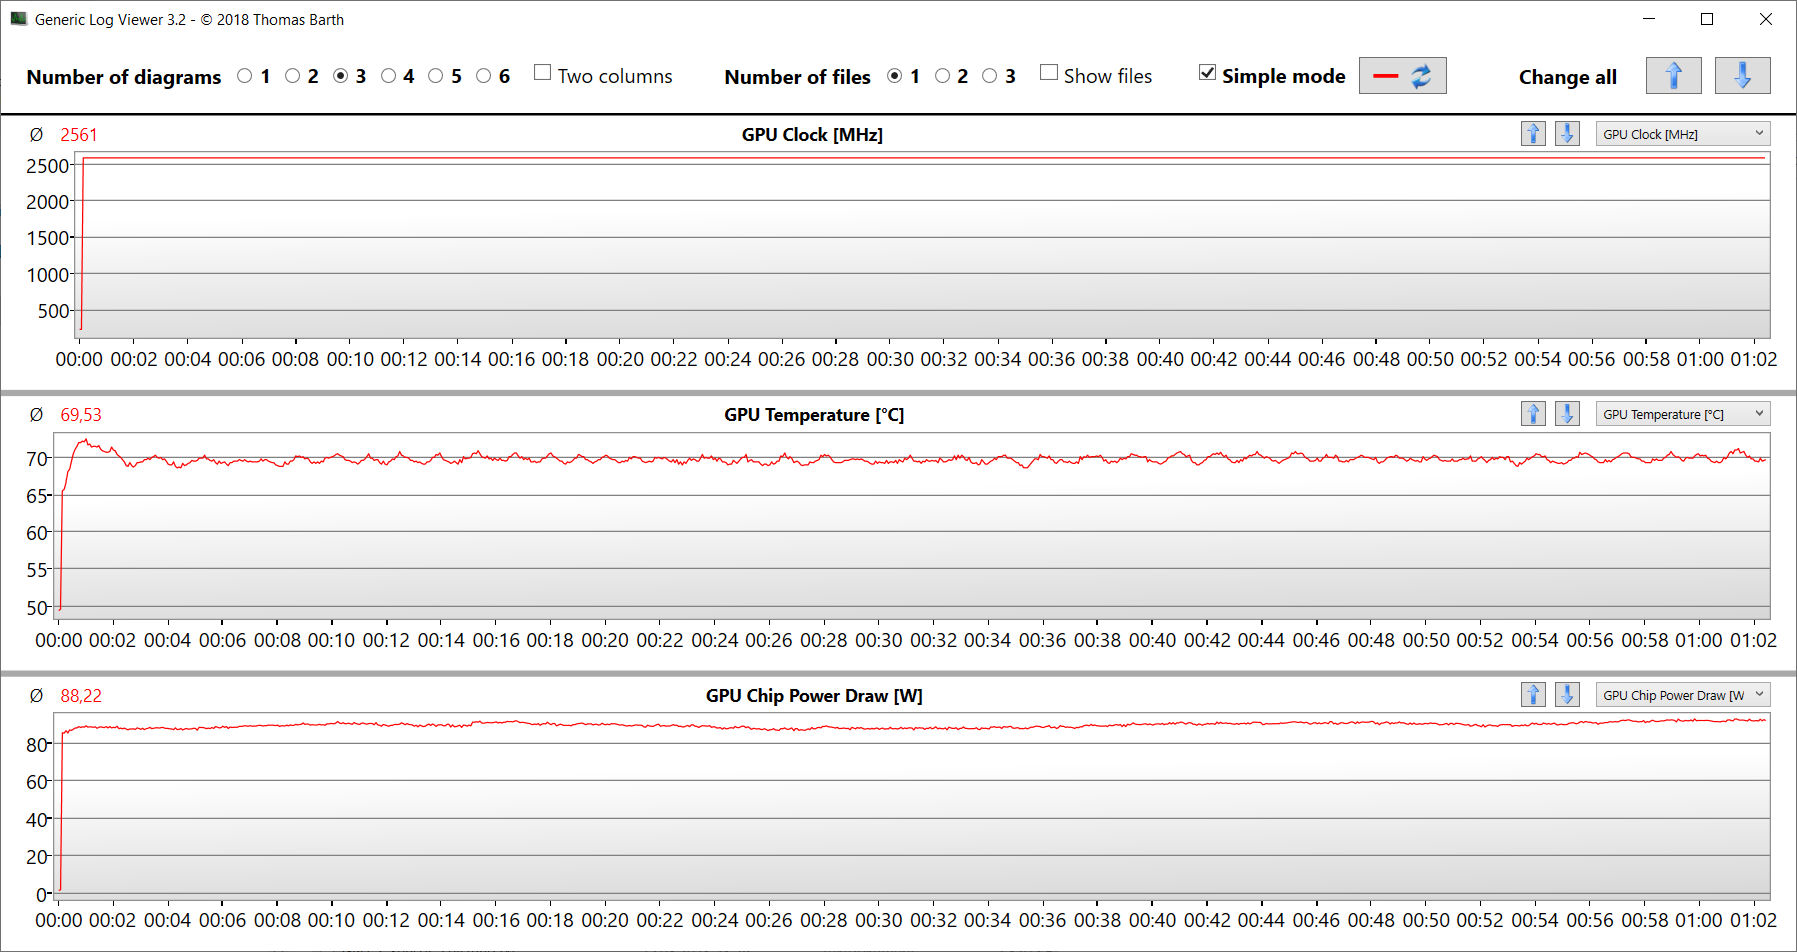
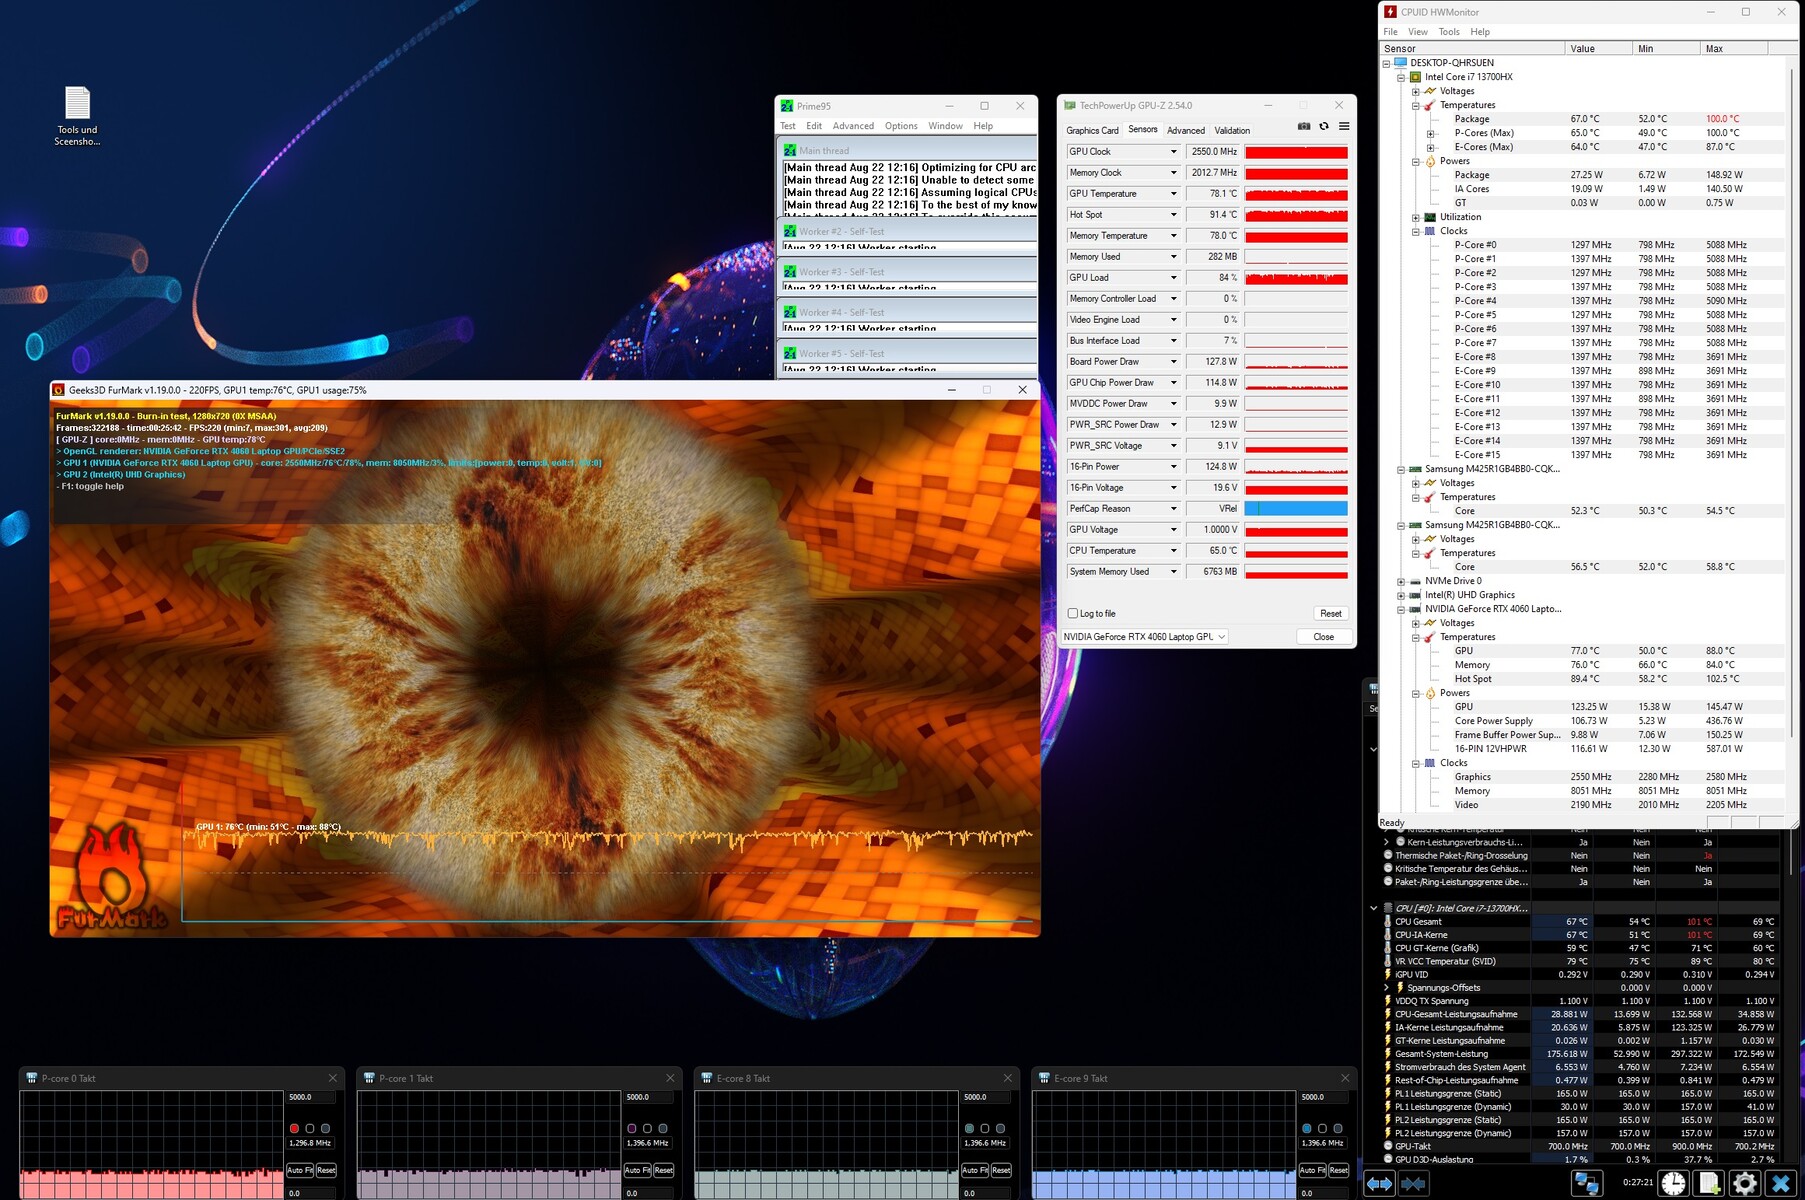
Test di stress
Lo stress test (Prime95 e Furmark in funzionamento continuo) rappresenta uno scenario estremo per verificare la stabilità del sistema a pieno carico. La CPU (P: 4,2 GHz, E: 3,4 GHz) inizia il test con velocità di clock elevate. Man mano che il test procede, il clock diminuisce leggermente fino a scendere improvvisamente a valori inferiori al clock di base dopo circa 30 minuti. La GPU lavora costantemente alla massima potenza.
Altoparlanti
Gli altoparlanti stereo producono un suono decente, ma i bassi sono quasi inesistenti. Per una migliore esperienza sonora si consiglia di utilizzare cuffie o altoparlanti esterni.
Alienware m16 R1 Intel analisi audio
(+) | gli altoparlanti sono relativamente potenti (87 dB)
Bassi 100 - 315 Hz
(-) | quasi nessun basso - in media 24% inferiori alla media
(±) | la linearità dei bassi è media (13.5% delta rispetto alla precedente frequenza)
Medi 400 - 2000 Hz
(+) | medi bilanciati - solo only 1.4% rispetto alla media
(+) | medi lineari (3.3% delta rispetto alla precedente frequenza)
Alti 2 - 16 kHz
(+) | Alti bilanciati - appena 3.5% dalla media
(+) | alti lineari (4.6% delta rispetto alla precedente frequenza)
Nel complesso 100 - 16.000 Hz
(+) | suono nel complesso lineare (13.4% differenza dalla media)
Rispetto alla stessa classe
» 19% di tutti i dispositivi testati in questa classe è stato migliore, 7% simile, 74% peggiore
» Il migliore ha avuto un delta di 6%, medio di 18%, peggiore di 132%
Rispetto a tutti i dispositivi testati
» 14% di tutti i dispositivi testati in questa classe è stato migliore, 4% similare, 82% peggiore
» Il migliore ha avuto un delta di 4%, medio di 23%, peggiore di 134%
Acer Predator Helios 16 PH16-71-731Q analisi audio
(±) | potenza degli altiparlanti media ma buona (76.12 dB)
Bassi 100 - 315 Hz
(-) | quasi nessun basso - in media 15% inferiori alla media
(-) | bassi non lineari (15% delta rispetto alla precedente frequenza)
Medi 400 - 2000 Hz
(+) | medi bilanciati - solo only 2.5% rispetto alla media
(+) | medi lineari (5.9% delta rispetto alla precedente frequenza)
Alti 2 - 16 kHz
(+) | Alti bilanciati - appena 2.9% dalla media
(±) | la linearità degli alti è media (8.4% delta rispetto alla precedente frequenza)
Nel complesso 100 - 16.000 Hz
(+) | suono nel complesso lineare (13.6% differenza dalla media)
Rispetto alla stessa classe
» 20% di tutti i dispositivi testati in questa classe è stato migliore, 7% simile, 73% peggiore
» Il migliore ha avuto un delta di 6%, medio di 18%, peggiore di 132%
Rispetto a tutti i dispositivi testati
» 15% di tutti i dispositivi testati in questa classe è stato migliore, 4% similare, 82% peggiore
» Il migliore ha avuto un delta di 4%, medio di 23%, peggiore di 134%
Gestione dell'alimentazione - L'm16 offre tempi di funzionamento ridotti
Consumo di energia
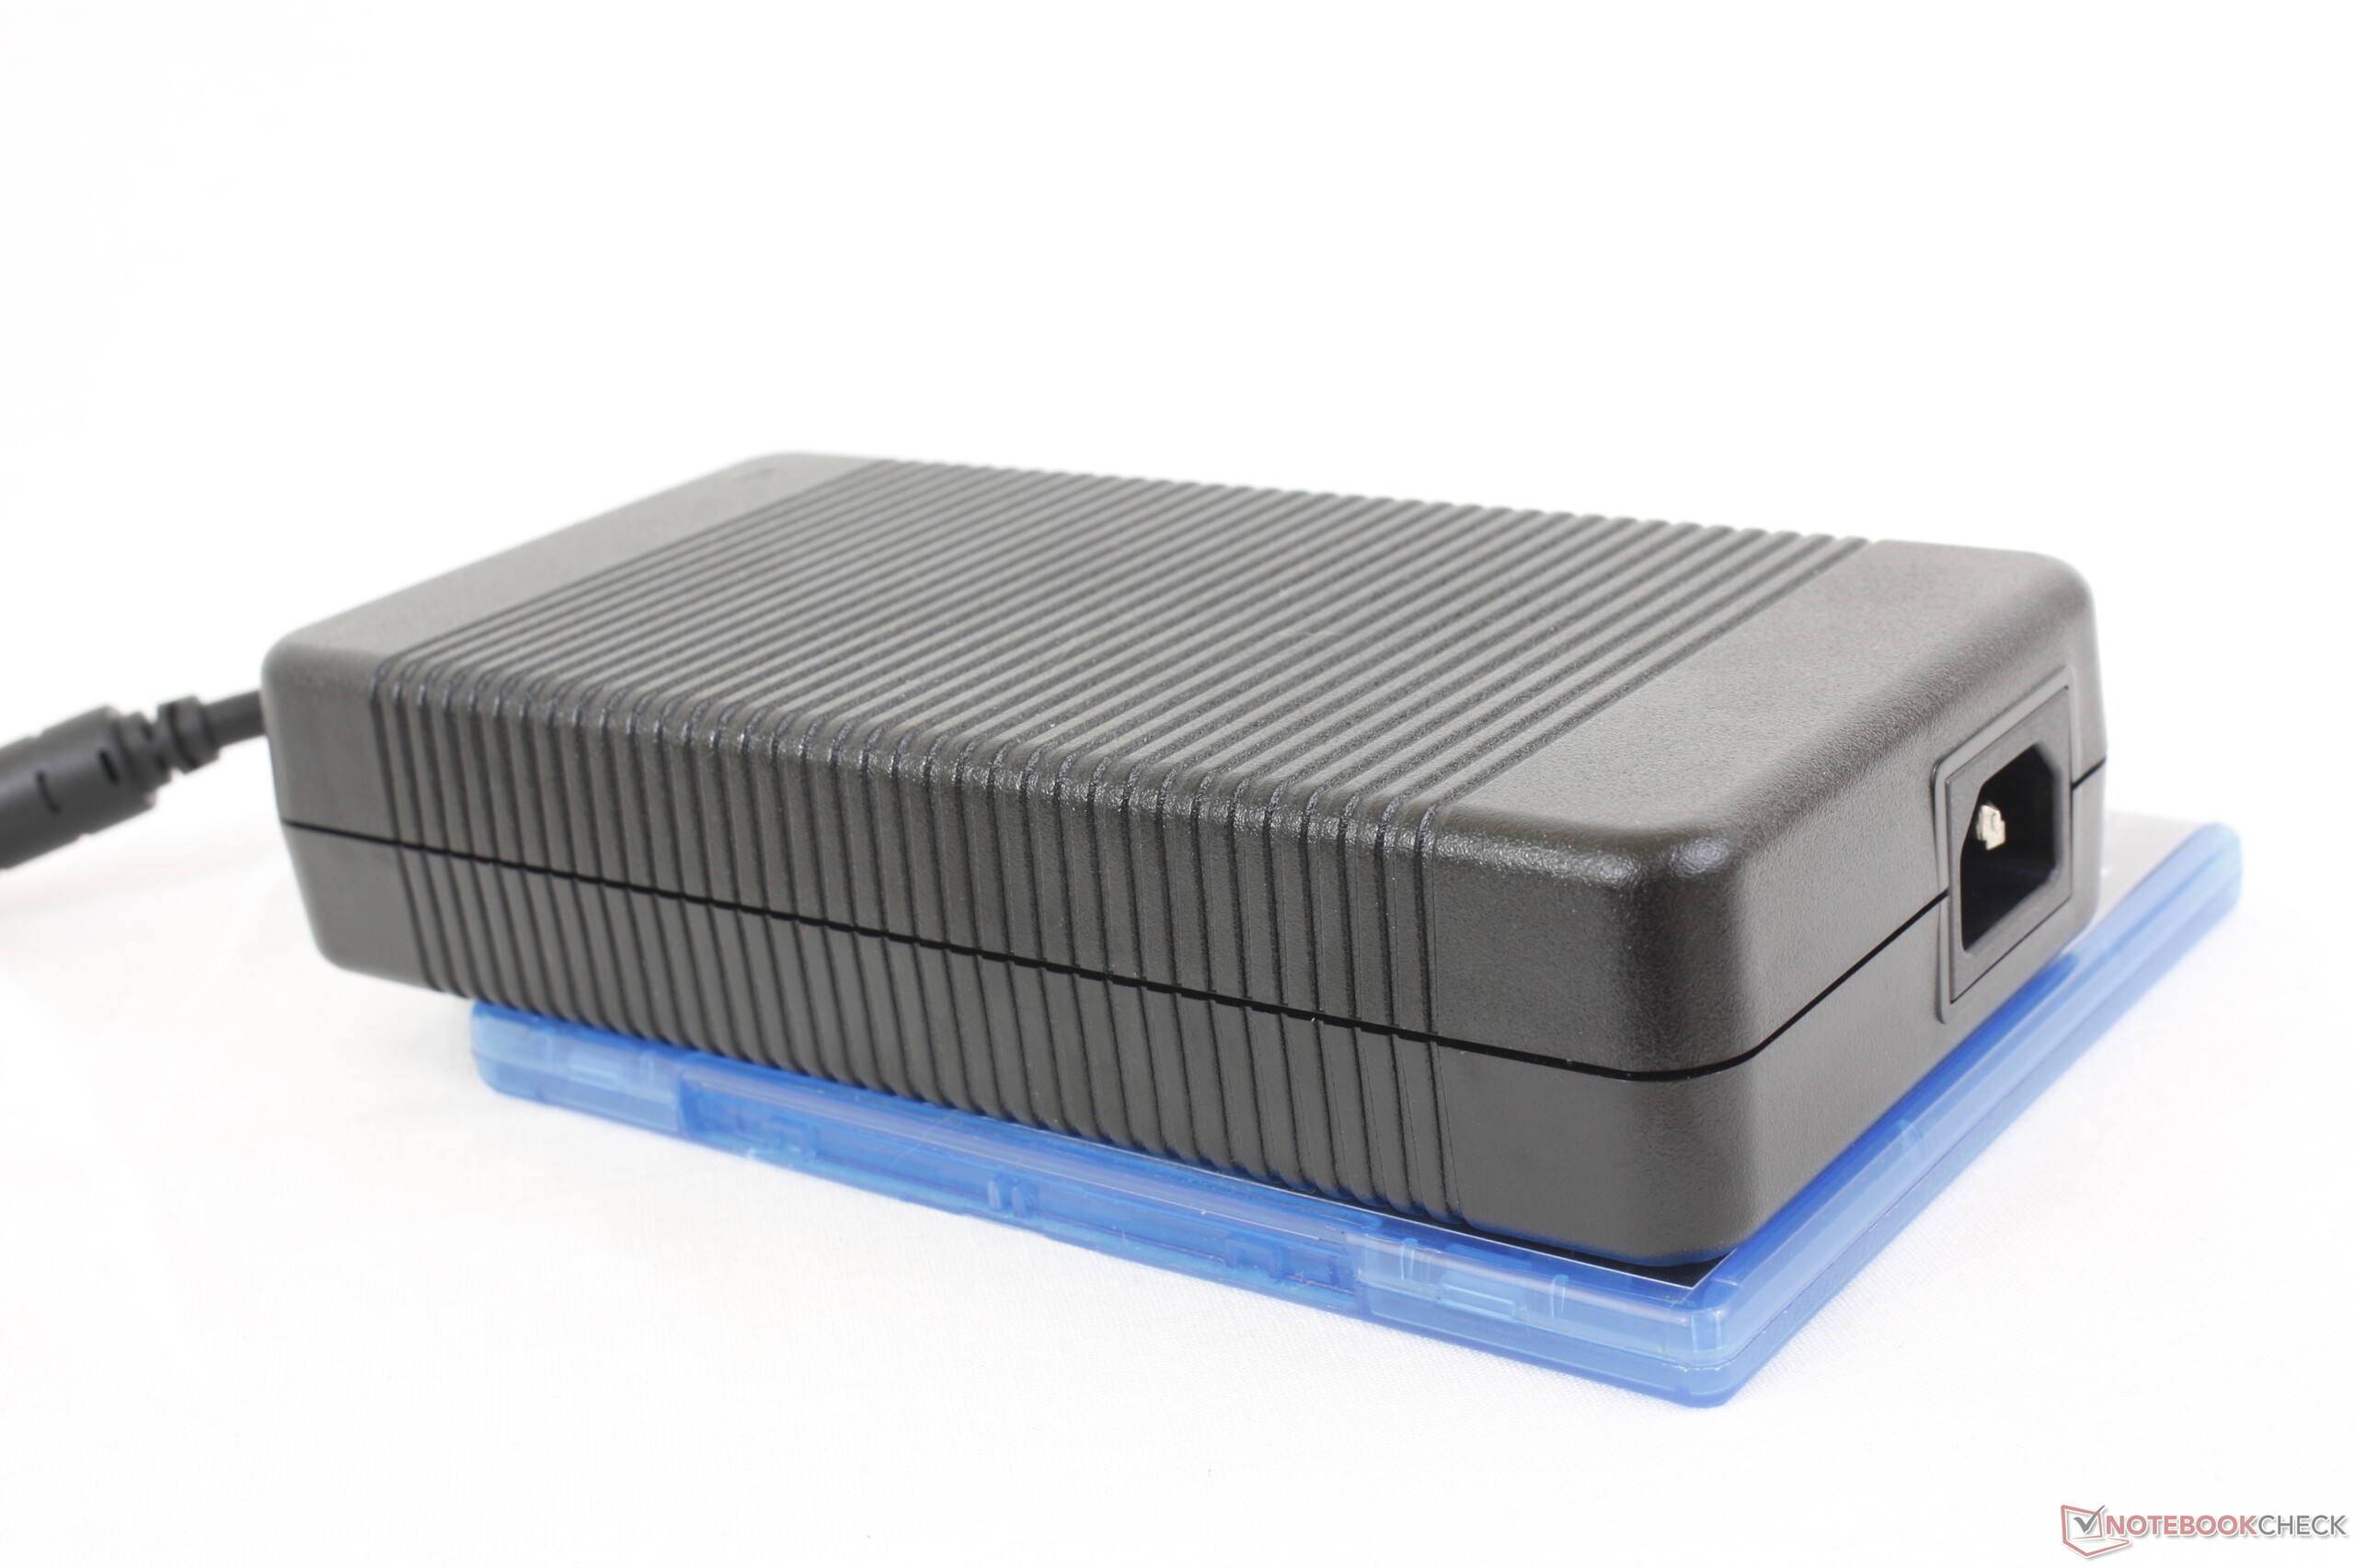
L'm16 non presenta anomalie in termini di consumo energetico: i valori sono nella norma per l'hardware installato. Il test Witcher 3 viene eseguito con un consumo energetico costante. Durante lo stress test, la richiesta diminuisce significativamente nel tempo. L'alimentatore (330 watt) è quindi sufficientemente dimensionato.
| Off / Standby | |
| Idle | |
| Sotto carico |
|
Leggenda:
min: | |
| Alienware m16 R1 Intel i7-13700HX, GeForce RTX 4060 Laptop GPU | Acer Predator Helios 16 PH16-71-731Q i7-13700HX, GeForce RTX 4060 Laptop GPU | Medion Erazer Defender P40 i7-13700HX, GeForce RTX 4060 Laptop GPU | Lenovo Legion Pro 5 16IRX8 i7-13700HX, GeForce RTX 4060 Laptop GPU | Schenker XMG Pro 15 (E23) i9-13900HX, GeForce RTX 4060 Laptop GPU | Aorus 15 BSF i7-13700H, GeForce RTX 4070 Laptop GPU | Alienware m16 R1 AMD R9 7845HX, GeForce RTX 4080 Laptop GPU | Media NVIDIA GeForce RTX 4060 Laptop GPU | Media della classe Gaming | |
|---|---|---|---|---|---|---|---|---|---|
| Power Consumption | -12% | 13% | -46% | -62% | 17% | -133% | 6% | -11% | |
| Idle Minimum * (Watt) | 10 | 15.9 -59% | 8 20% | 24.5 -145% | 21.6 -116% | 7 30% | 39 -290% | 11.5 ? -15% | 13 ? -30% |
| Idle Average * (Watt) | 14 | 20.5 -46% | 12 14% | 29.2 -109% | 29 -107% | 12 14% | 44.6 -219% | 16 ? -14% | 18.7 ? -34% |
| Idle Maximum * (Watt) | 21 | 20.9 -0% | 18 14% | 34.3 -63% | 42.7 -103% | 20 5% | 68.1 -224% | 20.3 ? 3% | 24.3 ? -16% |
| Load Average * (Watt) | 119 | 106 11% | 101 15% | 98.7 17% | 190 -60% | 94 21% | 129.8 -9% | 92.9 ? 22% | 110.2 ? 7% |
| Witcher 3 ultra * (Watt) | 186.7 | 175 6% | 180.8 3% | 178.6 4% | 189 -1% | 175.8 6% | 285 -53% | ||
| Load Maximum * (Watt) | 323 | 276 15% | 284 12% | 249.6 23% | 269 17% | 247 24% | 327.3 -1% | 210 ? 35% | 258 ? 20% |
* ... Meglio usare valori piccoli
Power consumption Witcher 3 / Stress test
Power consumption with an external monitor
Durata della batteria
Il 16 pollici ha raggiunto tempi di esecuzione di 4:46 ore e 5:36 ore rispettivamente nel test WLAN (caricamento di siti web tramite uno script) e nel test video (cortometraggio Big Buck Bunny, codifica H.264, FHD, in loop). Durante entrambi i test, le funzioni di risparmio energetico del notebook sono state disattivate e la luminosità del display è stata impostata a circa 150 cd/m². Anche i moduli wireless sono stati disattivati per il test video.
Nel complesso, l'm16 offre tempi di esecuzione miseri. Alcuni concorrenti offrono prestazioni molto migliori. Il vantaggio rispetto aModello gemello di AMDè probabilmente dovuto alla modalità dGPU attiva di quest'ultimo.
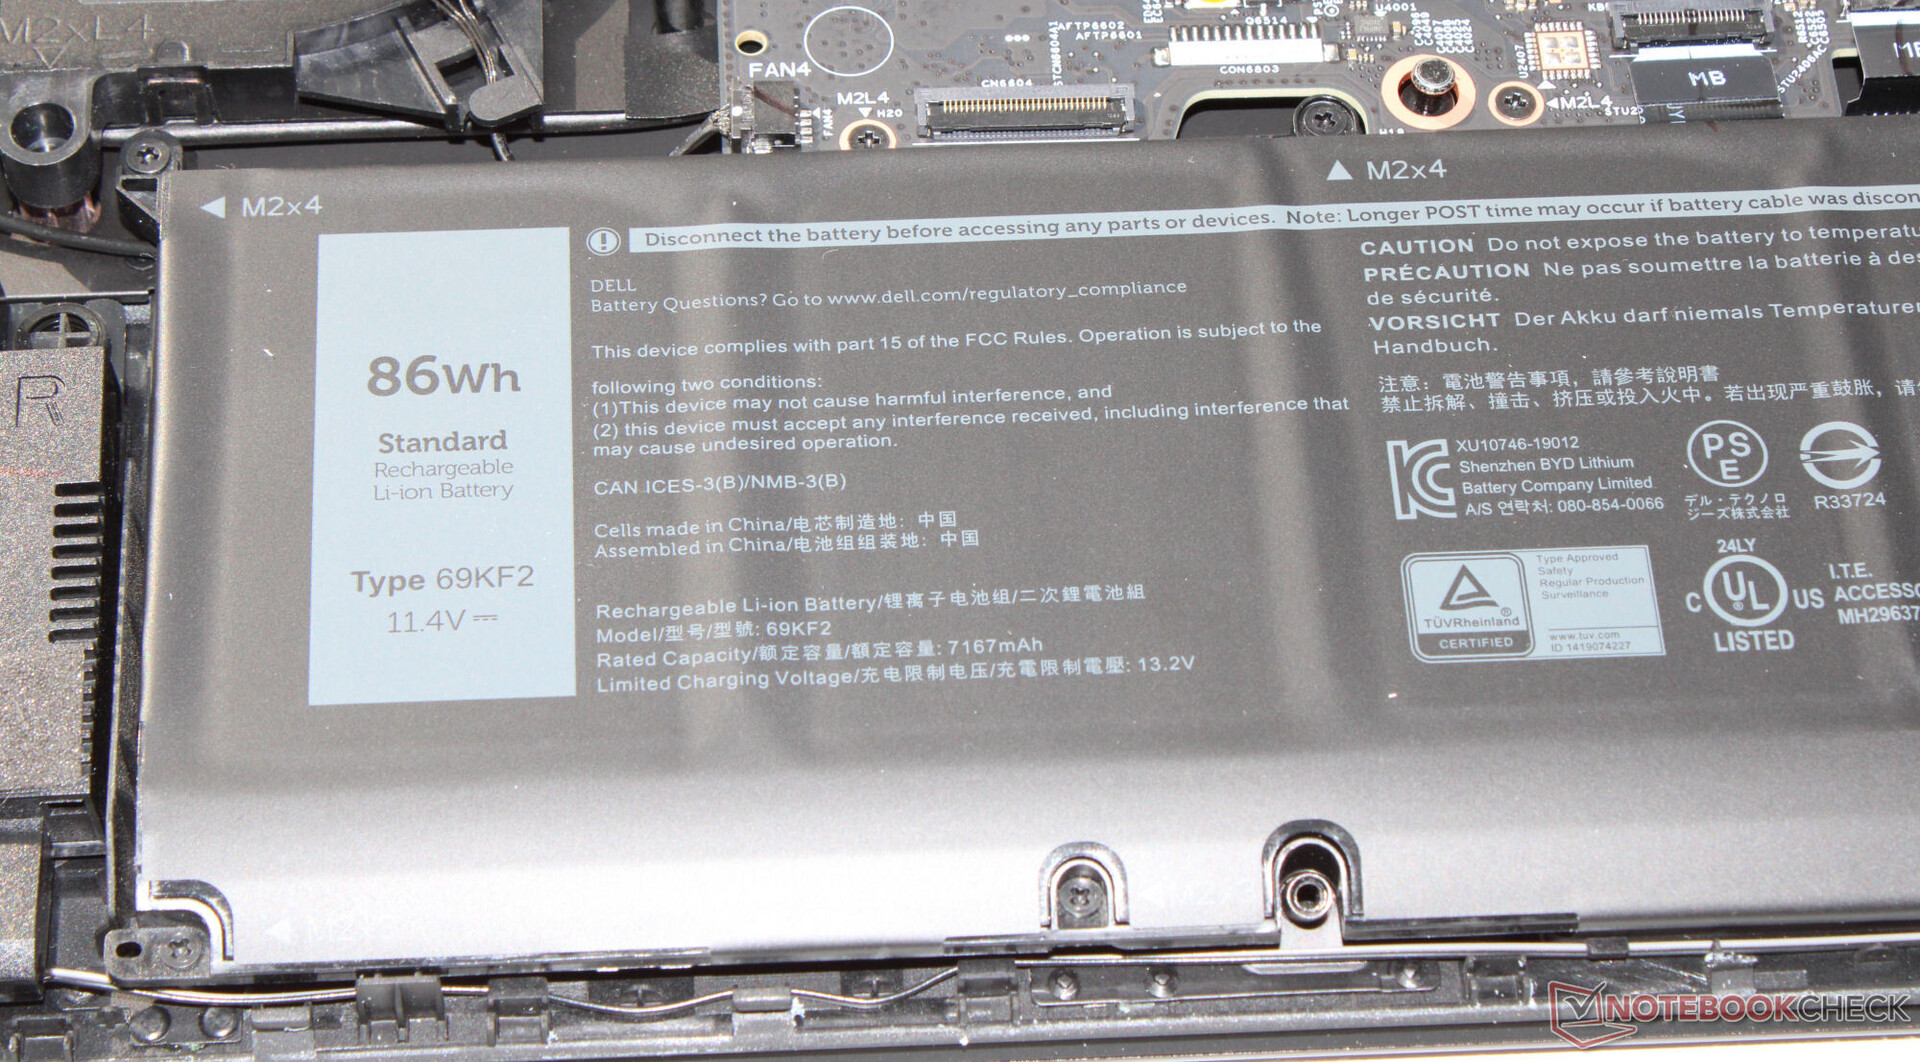
| Alienware m16 R1 Intel i7-13700HX, GeForce RTX 4060 Laptop GPU, 86 Wh | Acer Predator Helios 16 PH16-71-731Q i7-13700HX, GeForce RTX 4060 Laptop GPU, 90 Wh | Medion Erazer Defender P40 i7-13700HX, GeForce RTX 4060 Laptop GPU, 73 Wh | Lenovo Legion Pro 5 16IRX8 i7-13700HX, GeForce RTX 4060 Laptop GPU, 80 Wh | Schenker XMG Pro 15 (E23) i9-13900HX, GeForce RTX 4060 Laptop GPU, 80 Wh | Aorus 15 BSF i7-13700H, GeForce RTX 4070 Laptop GPU, 99 Wh | Alienware m16 R1 AMD R9 7845HX, GeForce RTX 4080 Laptop GPU, 86 Wh | Media della classe Gaming | |
|---|---|---|---|---|---|---|---|---|
| Autonomia della batteria | 18% | 25% | -18% | 55% | 92% | -27% | 44% | |
| Reader / Idle (h) | 6.4 | 8.8 38% | 6.7 5% | 10.9 70% | 4 -37% | 8.16 ? 27% | ||
| H.264 (h) | 5.6 | 4.8 -14% | 5.7 2% | 9 61% | 8.32 ? 49% | |||
| WiFi v1.3 (h) | 4.8 | 5.6 17% | 6.2 29% | 3.4 -29% | 5.7 19% | 10.3 115% | 3.7 -23% | 7.11 ? 48% |
| Load (h) | 1 | 1.5 50% | 1.3 30% | 0.7 -30% | 1.9 90% | 2.2 120% | 0.8 -20% | 1.502 ? 50% |
| Witcher 3 ultra (h) | 1.5 |
Pro
Contro
Verdetto - Macchina da gioco potente
La nostra variante dell'Alienware m16 R1 - il modello entry-level della serie - è progettata per il gioco e il rendering QHD+. Il Core i7-13700HX e la GeForce RTX 4060 forniscono la potenza necessaria. Entrambi i componenti lavorano a velocità di clock per lo più elevate ed è possibile un compromesso accettabile tra prestazioni e rumore.
Dell offre un potente notebook da gioco QHD+ con l'Alienware m16 R1. Solo le caratteristiche secondarie meritano una critica.
Il pannello IPS (16 pollici, 2560x1600, sRGB, G-Sync) ha fatto una buona impressione nel complesso. In alternativa, è possibile scegliere altri due pannelli con frequenze di aggiornamento più elevate e una maggiore copertura dello spazio colore (DCI-P3). L'offerta del disco rigido (512 GB) è piuttosto esigua; 1 TB o 2 TB sarebbero più adatti al prezzo di 1900 euro. Anche l'autonomia della batteria è piuttosto mediocre.
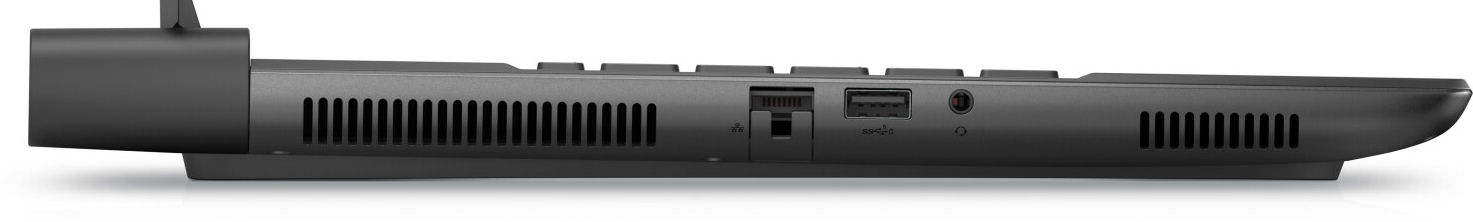
Due porte Thunderbolt 4 (Power Delivery, Displayport) garantiscono numerose opzioni di espansione (GPU esterna, docking). L'alimentazione del notebook tramite USB C non è possibile; le porte USB C si limitano a fornire l'alimentazione.
Un'alternativa è il Acer Predator Helios 16 PH16-71. Offre più o meno la stessa configurazione hardware, ma più spazio sul disco rigido (1 TB). Inoltre, ha un display più luminoso.
Prezzo e disponibilità
Una configurazione simile alla nostra variante dell'Alienware m16 R1, ma con un disco rigido da 1 TB, è disponibile negli Stati Uniti tramite Best Buy al prezzo di 1.999,99 dollari.
I prezzi sono aggiornati al 05.09.2023 e sono soggetti a modifiche.
Alienware m16 R1 Intel
- 09/04/2023 v7 (old)
Sascha Mölck
Transparency
La selezione dei dispositivi da recensire viene effettuata dalla nostra redazione. Il campione di prova è stato fornito all'autore come prestito dal produttore o dal rivenditore ai fini di questa recensione. L'istituto di credito non ha avuto alcuna influenza su questa recensione, né il produttore ne ha ricevuto una copia prima della pubblicazione. Non vi era alcun obbligo di pubblicare questa recensione. In quanto società mediatica indipendente, Notebookcheck non è soggetta all'autorità di produttori, rivenditori o editori.
Ecco come Notebookcheck esegue i test
Ogni anno, Notebookcheck esamina in modo indipendente centinaia di laptop e smartphone utilizzando procedure standardizzate per garantire che tutti i risultati siano comparabili. Da circa 20 anni sviluppiamo continuamente i nostri metodi di prova e nel frattempo stabiliamo gli standard di settore. Nei nostri laboratori di prova, tecnici ed editori esperti utilizzano apparecchiature di misurazione di alta qualità. Questi test comportano un processo di validazione in più fasi. Il nostro complesso sistema di valutazione si basa su centinaia di misurazioni e parametri di riferimento ben fondati, che mantengono l'obiettività.Price comparison

