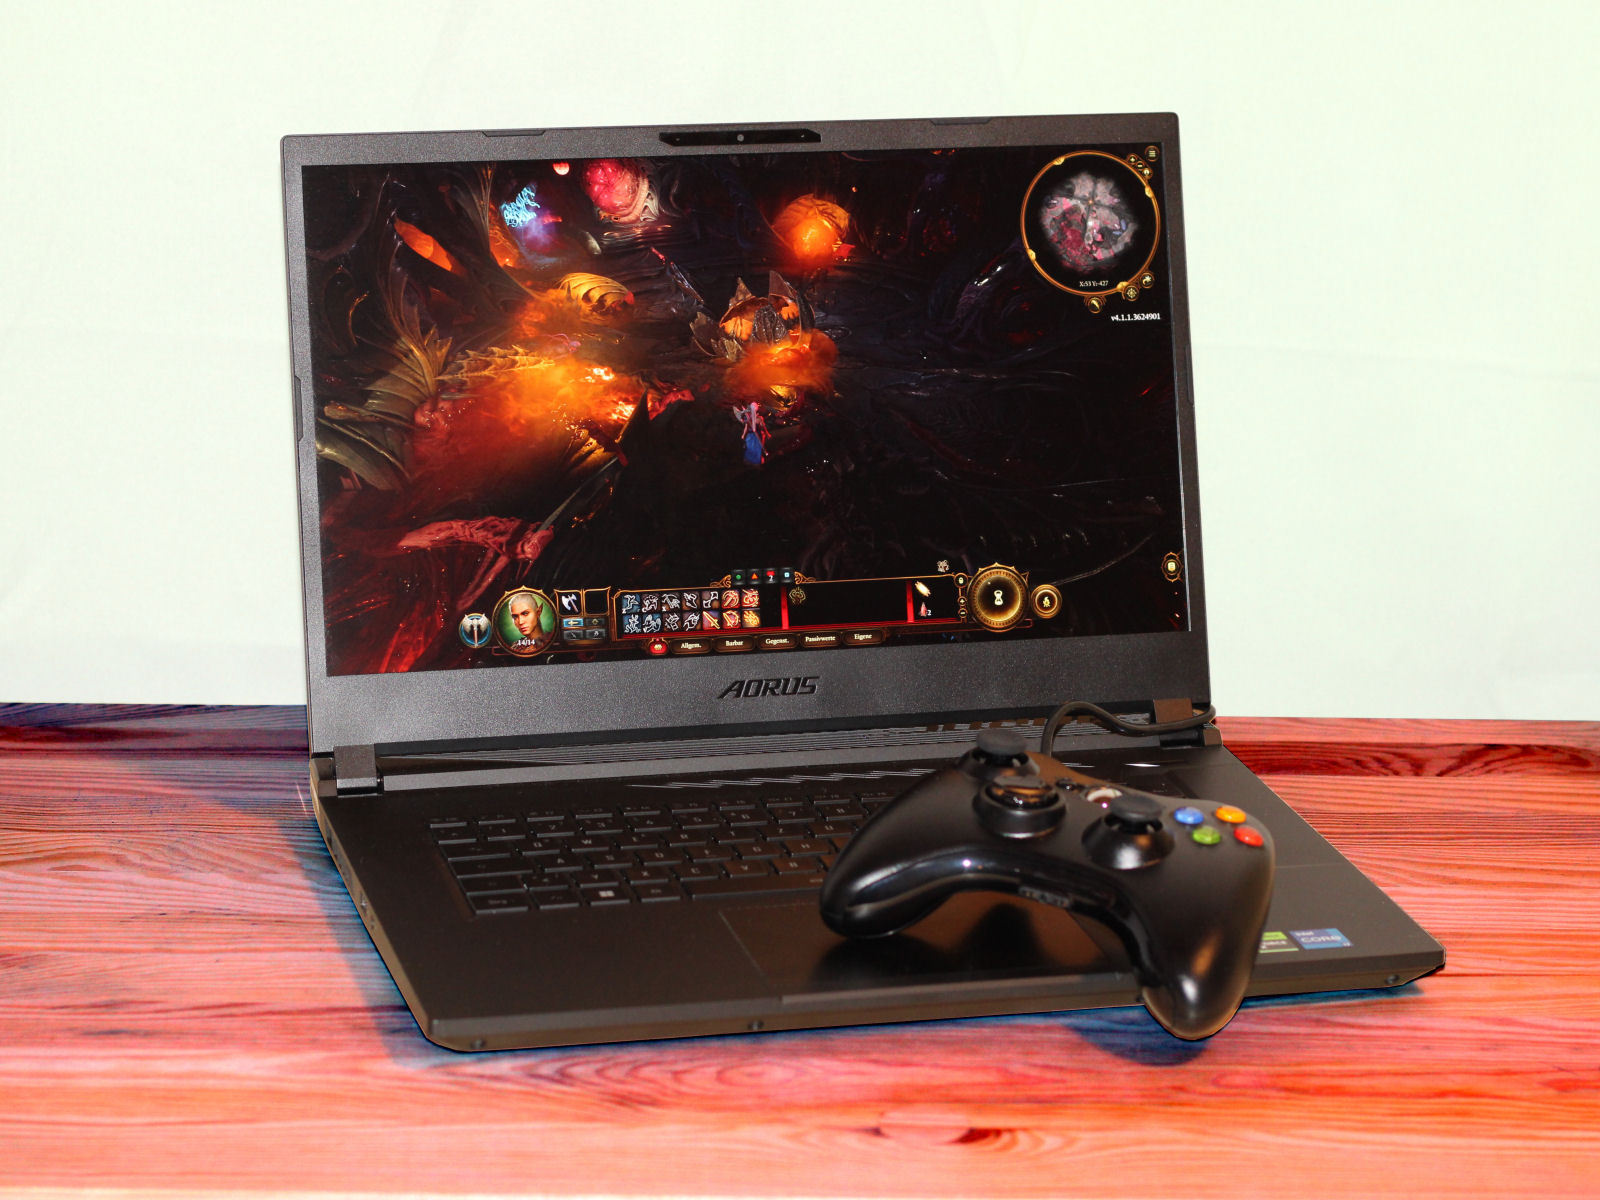
Recensione dell'Aorus 15 BSF: gaming laptop QHD con RTX 4070 e ottima autonomia
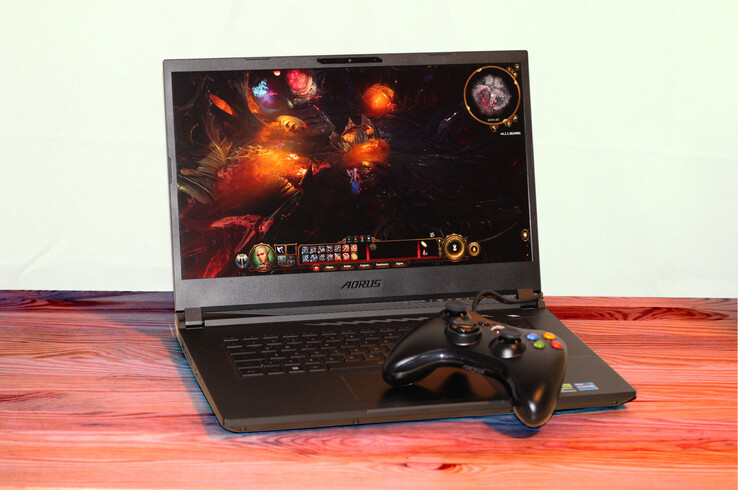
L'Aorus 15 BSF di Gigabyte è un portatile da gioco da 15,6 pollici di fascia media che si affida a un hardware aggiornato: Raptor Lake, Ada Lovelace, DDR5, PCIe 4. Il pacchetto complessivo è disponibile a circa 1.700 dollari. I concorrenti includono il modelloHP Omen Transcend 16, MSI Pulse 17 B13VGK, Lenovo Legion Slim 7i 16 Gen 8, Acer Nitro 16 AN16-41e ilAsus TUF Gaming A16 FA617XS.
Potenziali concorrenti a confronto
Punteggio | Data | Modello | Peso | Altezza | Dimensione | Risoluzione | Prezzo |
|---|---|---|---|---|---|---|---|
| 85.7 % v7 (old) | 08/2023 | Aorus 15 BSF i7-13700H, GeForce RTX 4070 Laptop GPU | 2.4 kg | 20.9 mm | 15.60" | 2560x1440 | |
| 87.9 % v7 (old) | 08/2023 | HP Omen Transcend 16 i9-13900HX, GeForce RTX 4070 Laptop GPU | 2.3 kg | 19.8 mm | 16.00" | 2560x1600 | |
| 86.3 % v7 (old) | 07/2023 | MSI Pulse 17 B13VGK i7-13700H, GeForce RTX 4070 Laptop GPU | 2.7 kg | 27.2 mm | 17.30" | 1920x1080 | |
| 90 % v7 (old) | 07/2023 | Lenovo Legion Slim 7i 16 Gen 8 i9-13900H, GeForce RTX 4070 Laptop GPU | 2.1 kg | 19.9 mm | 16.00" | 2560x1600 | |
| 88.1 % v7 (old) | 06/2023 | Acer Nitro 16 AN16-41 R7 7735HS, GeForce RTX 4070 Laptop GPU | 2.7 kg | 27.9 mm | 16.00" | 2560x1600 | |
| 86.9 % v7 (old) | 06/2023 | Asus TUF Gaming A16 FA617XS R9 7940HS, Radeon RX 7600S | 2.2 kg | 22.1 mm | 16.00" | 1920x1200 |
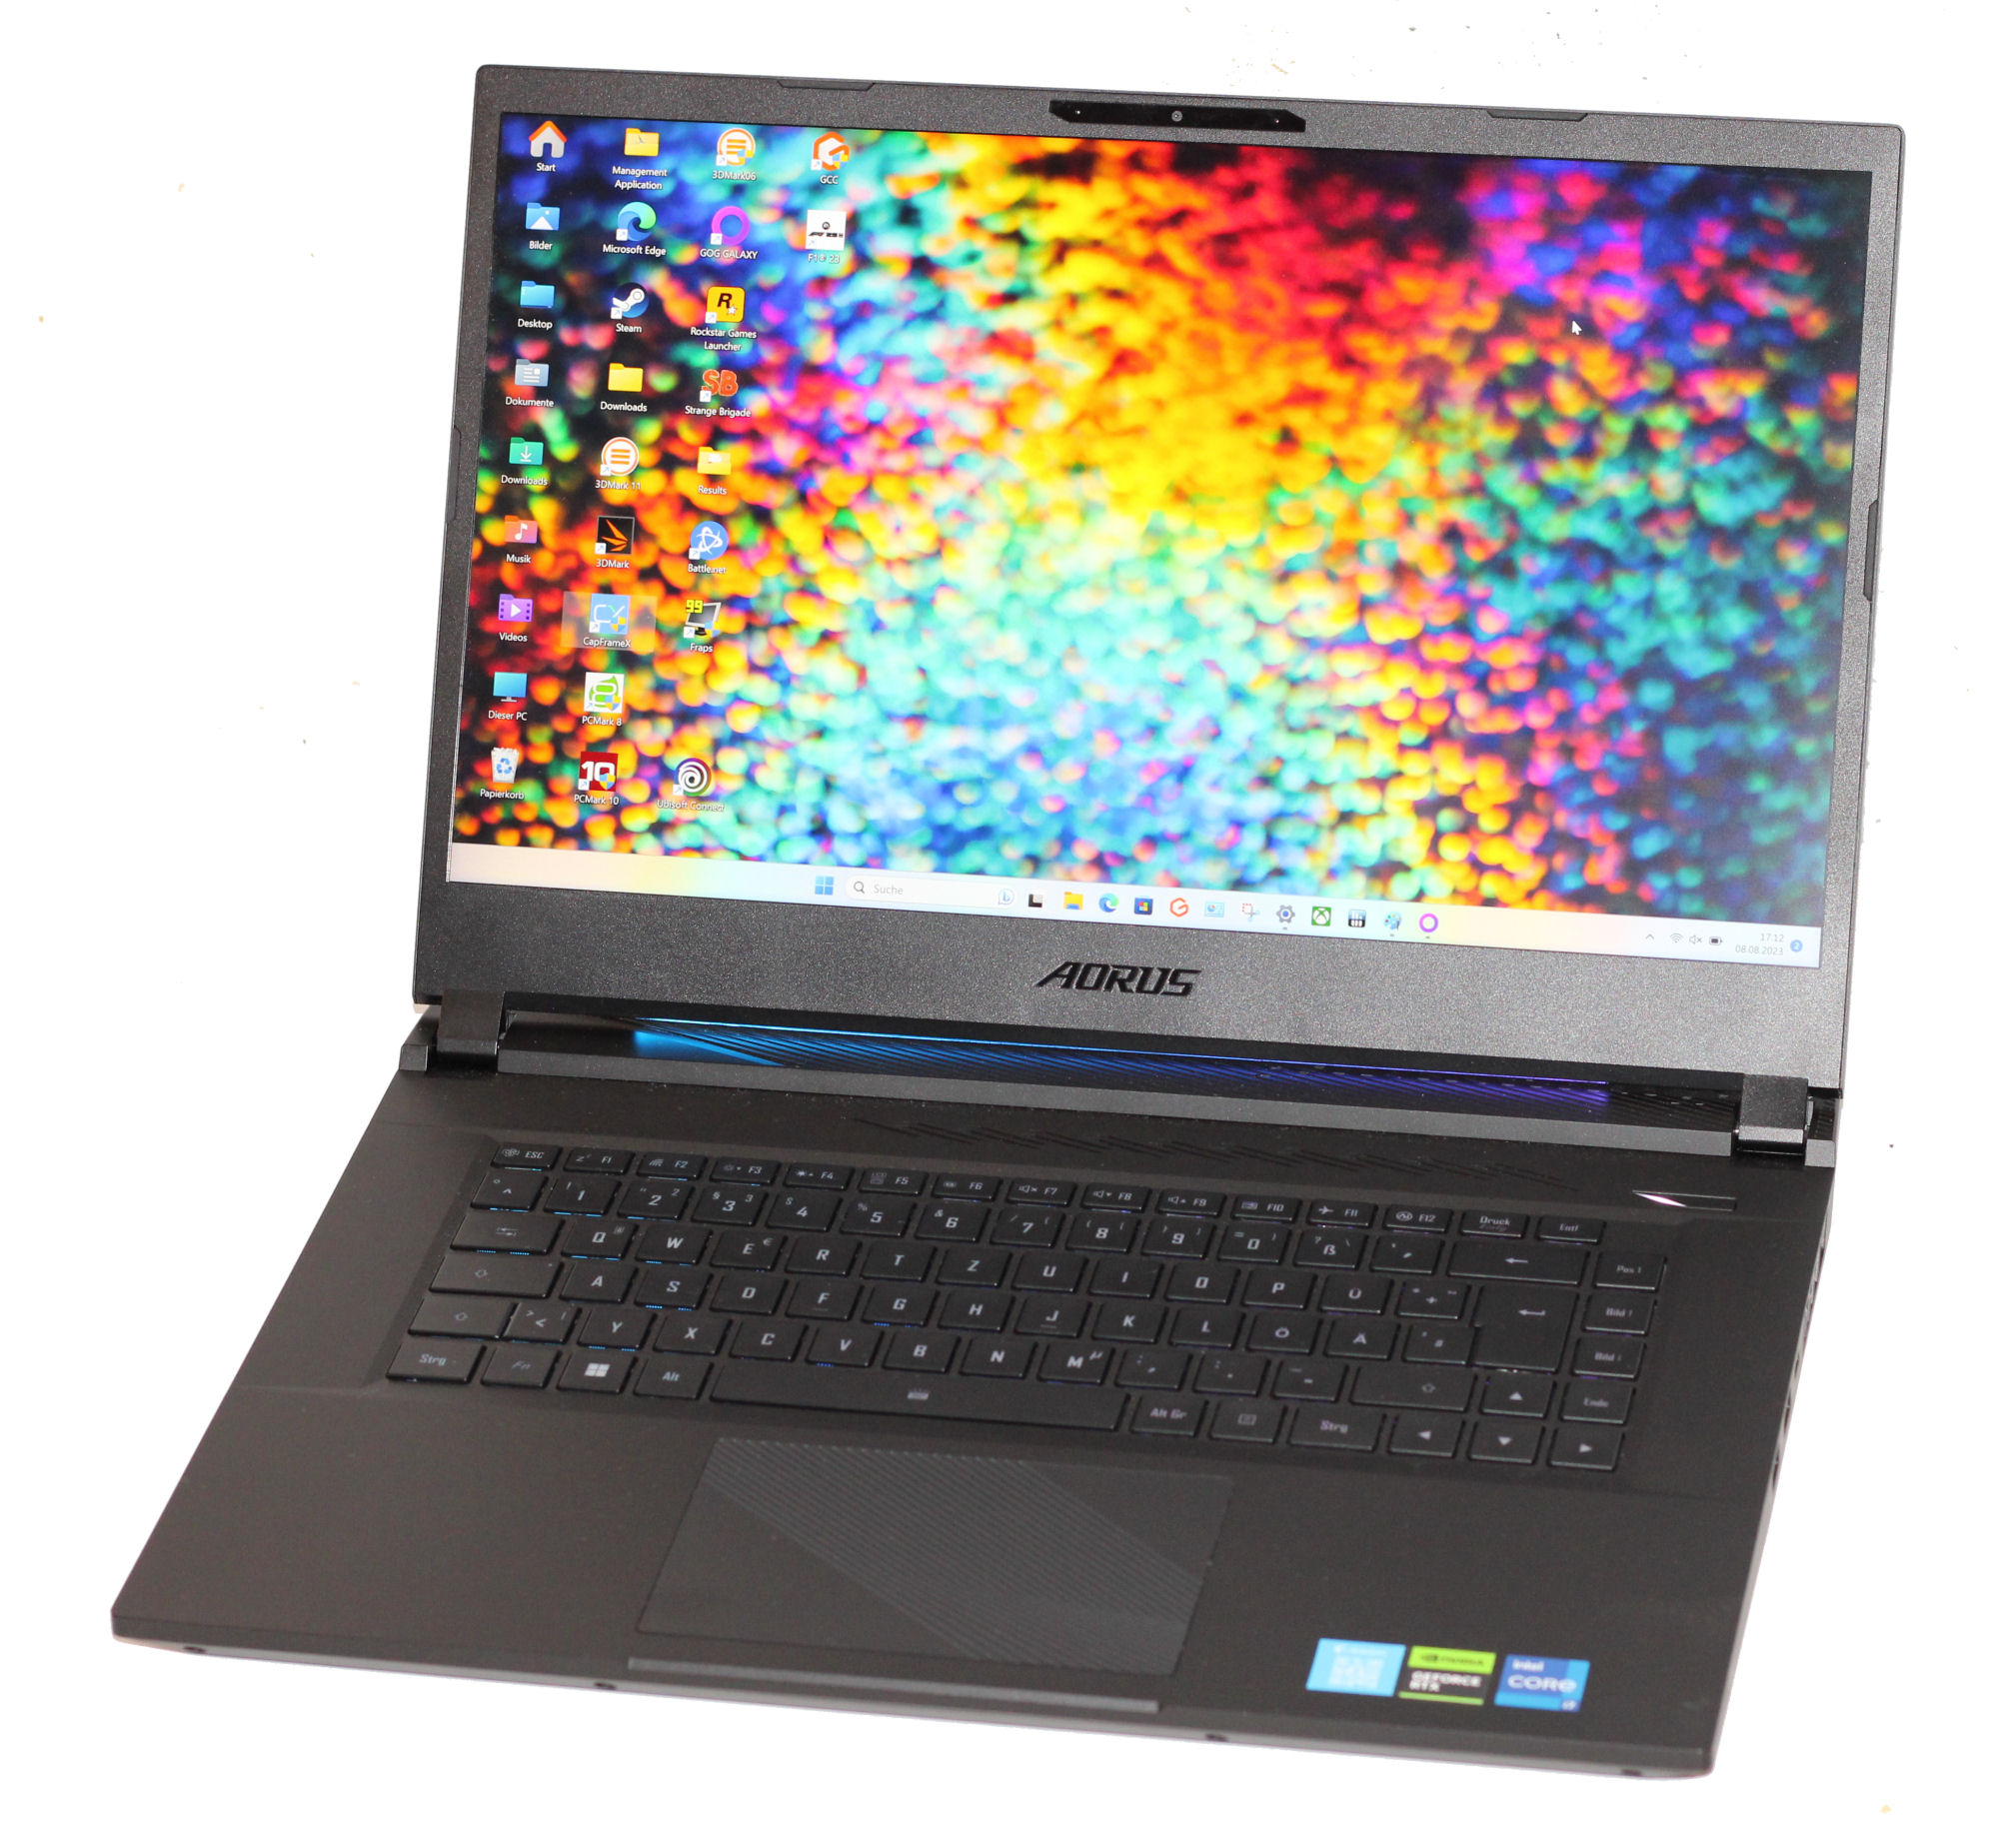
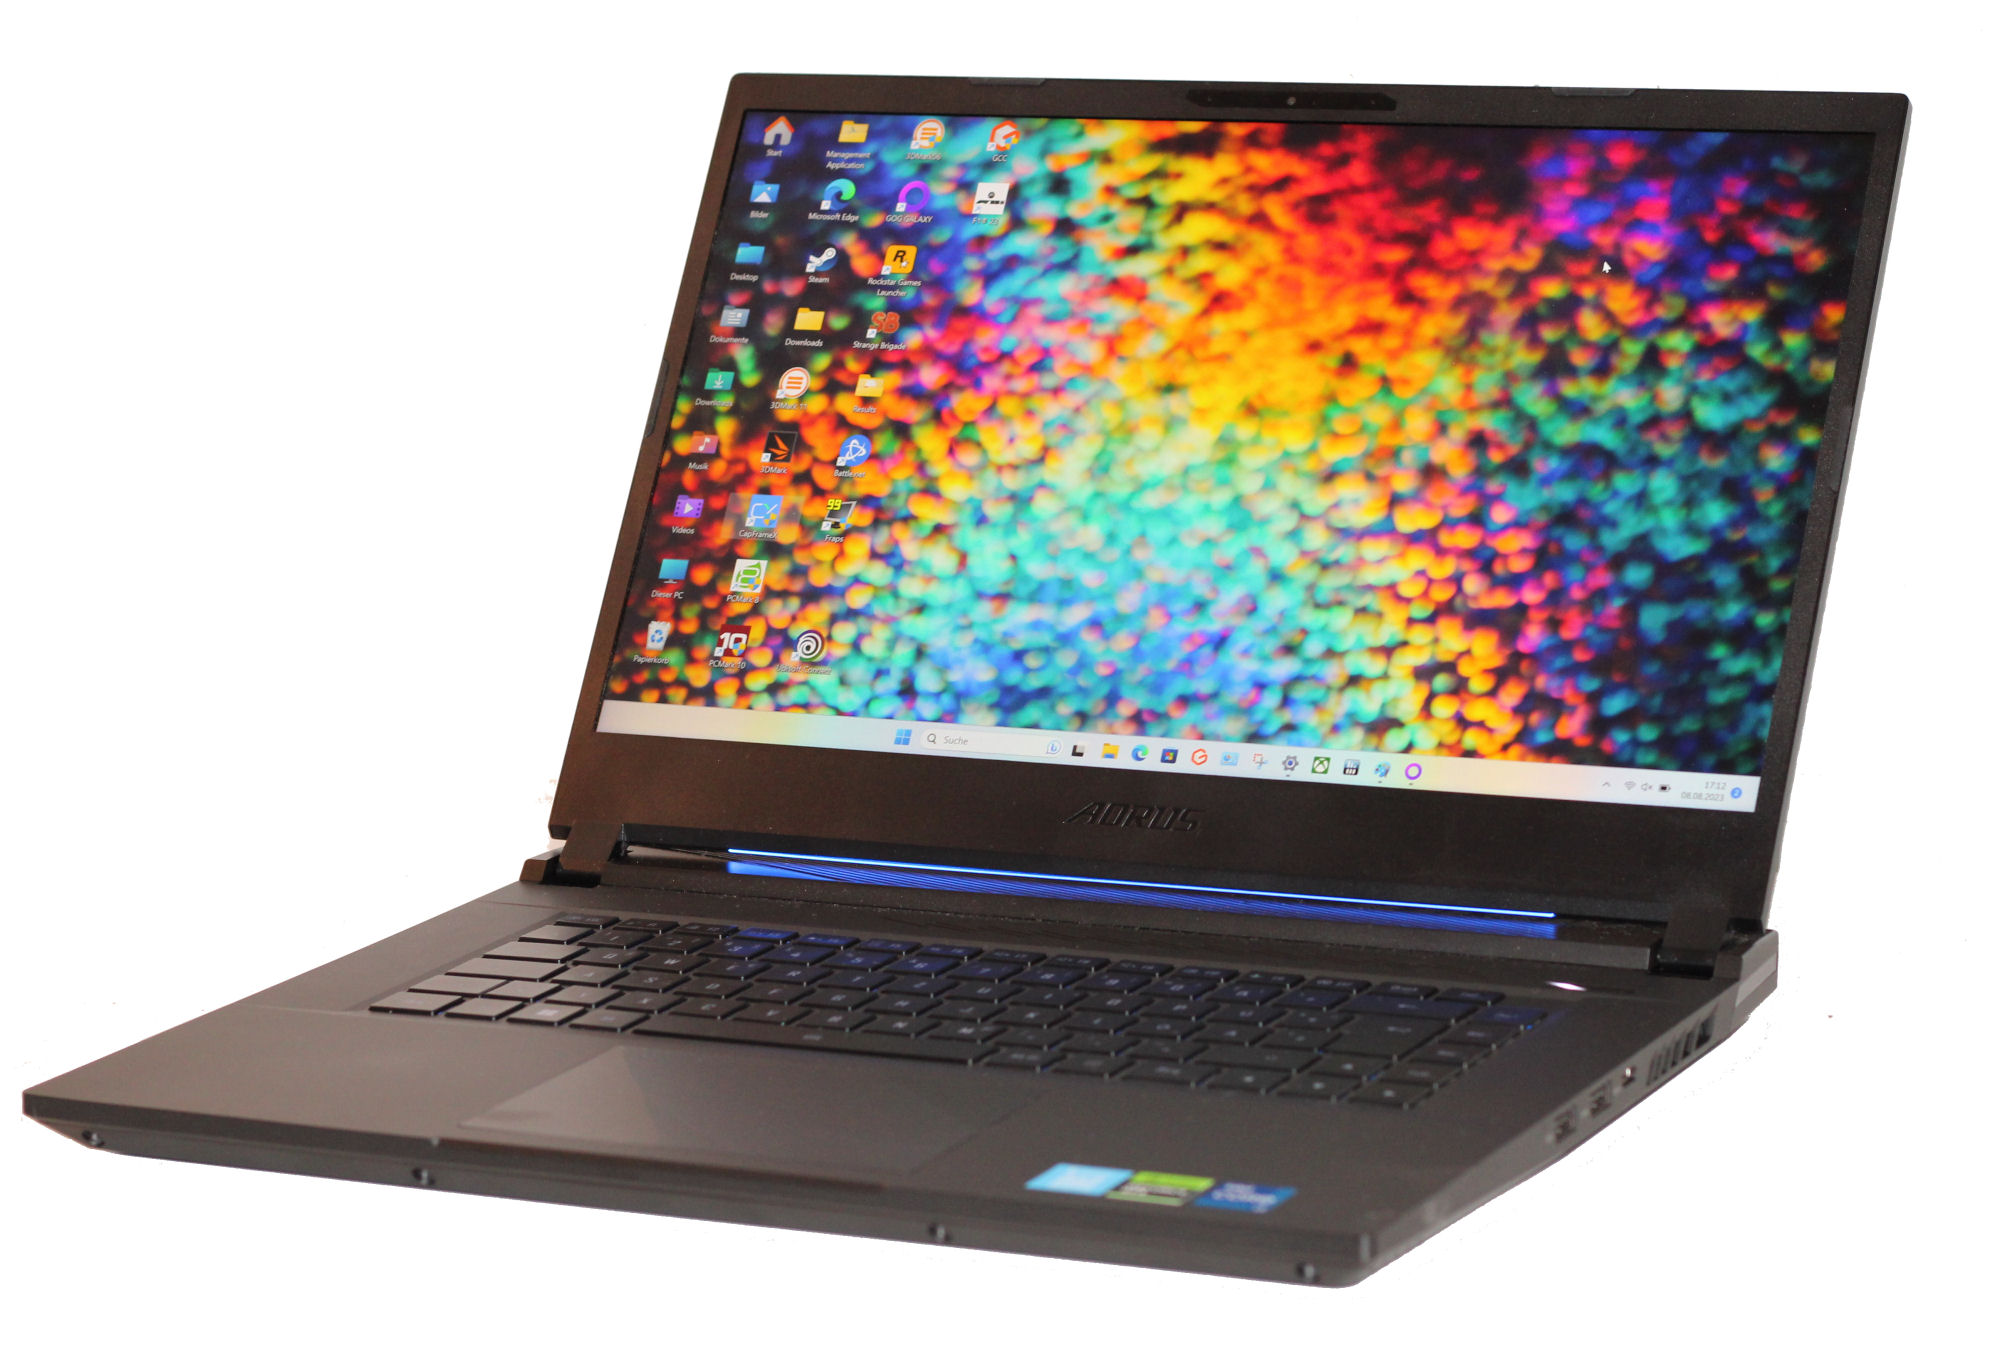
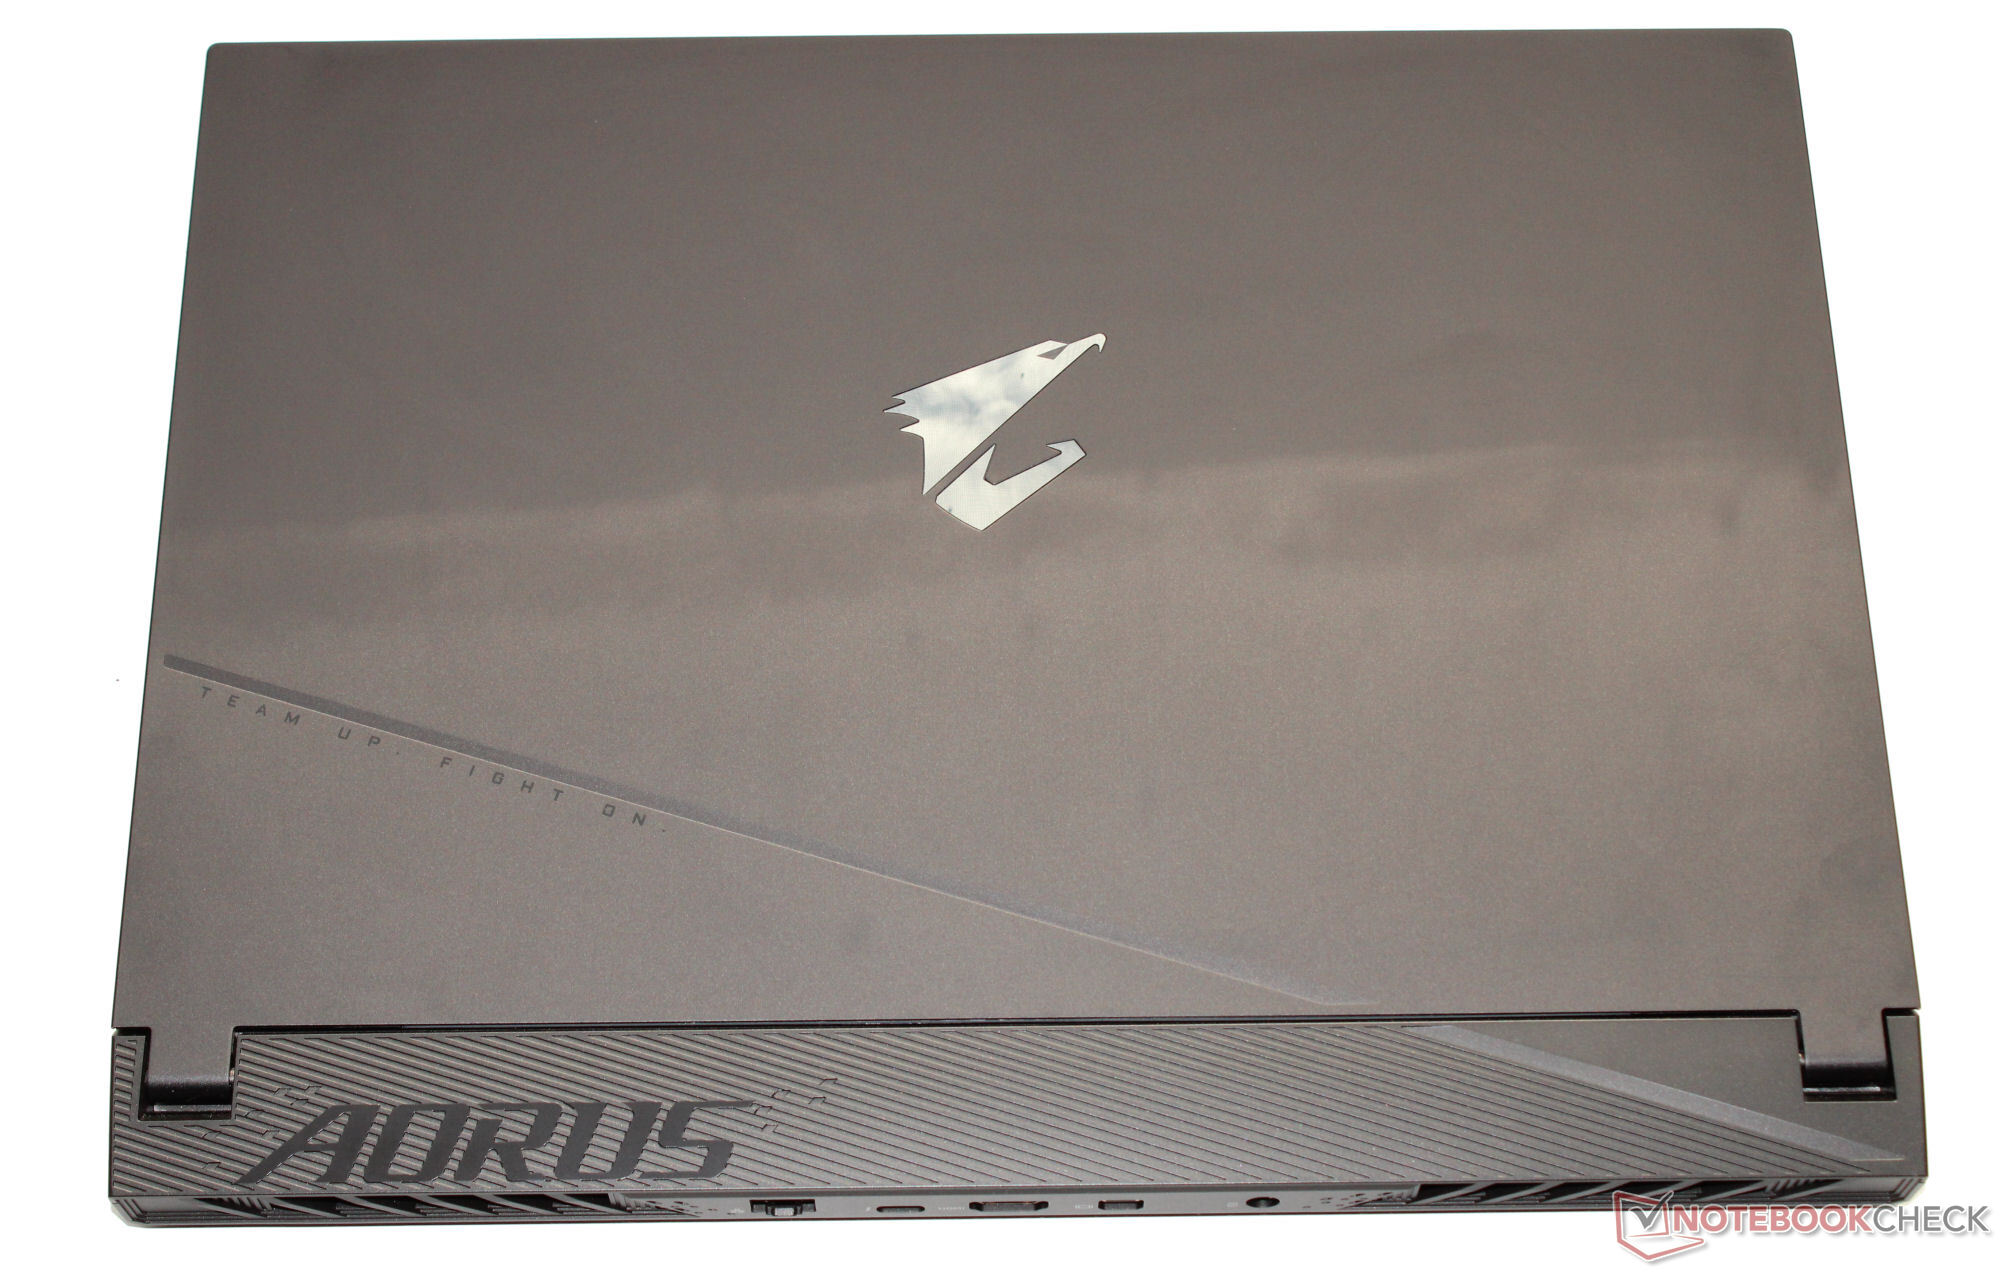
Case - Gigabyte ha alloggiato la tecnologia all'interno di un case in metallo
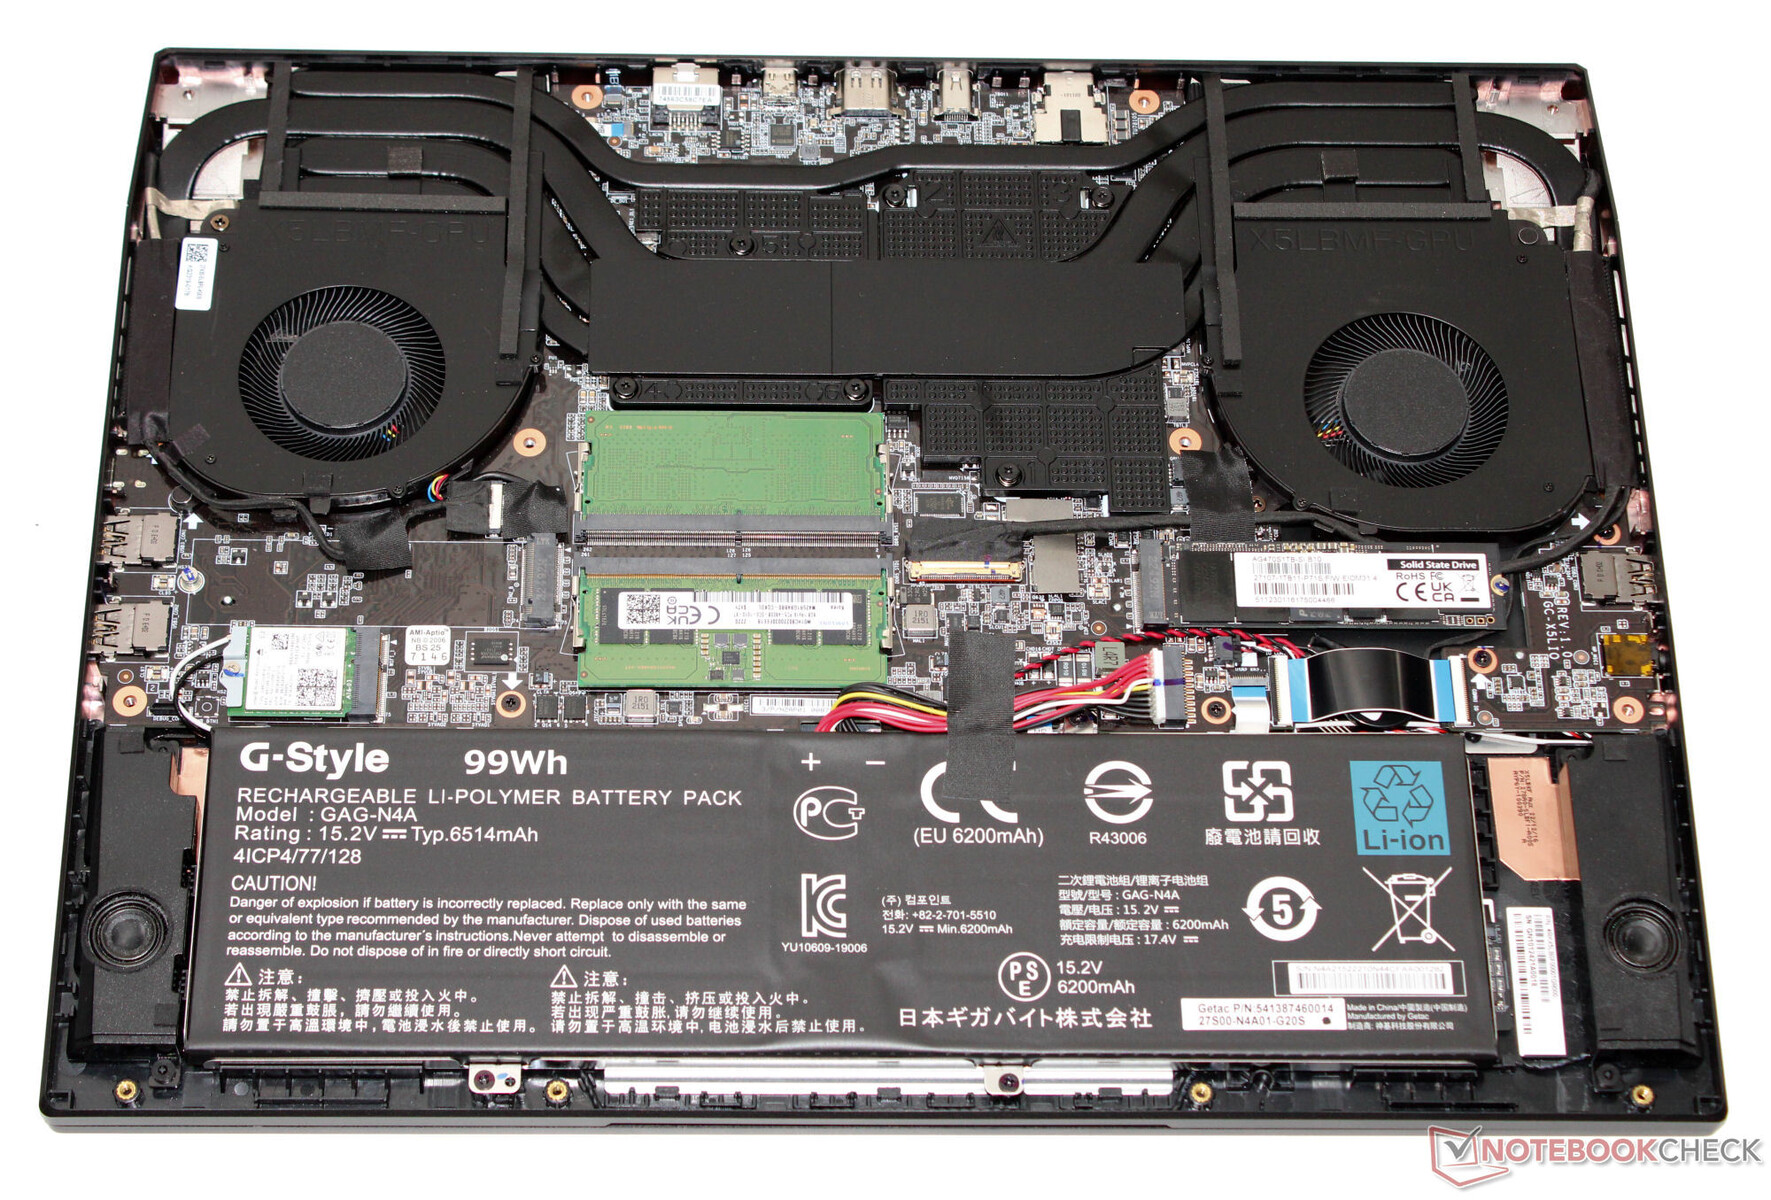
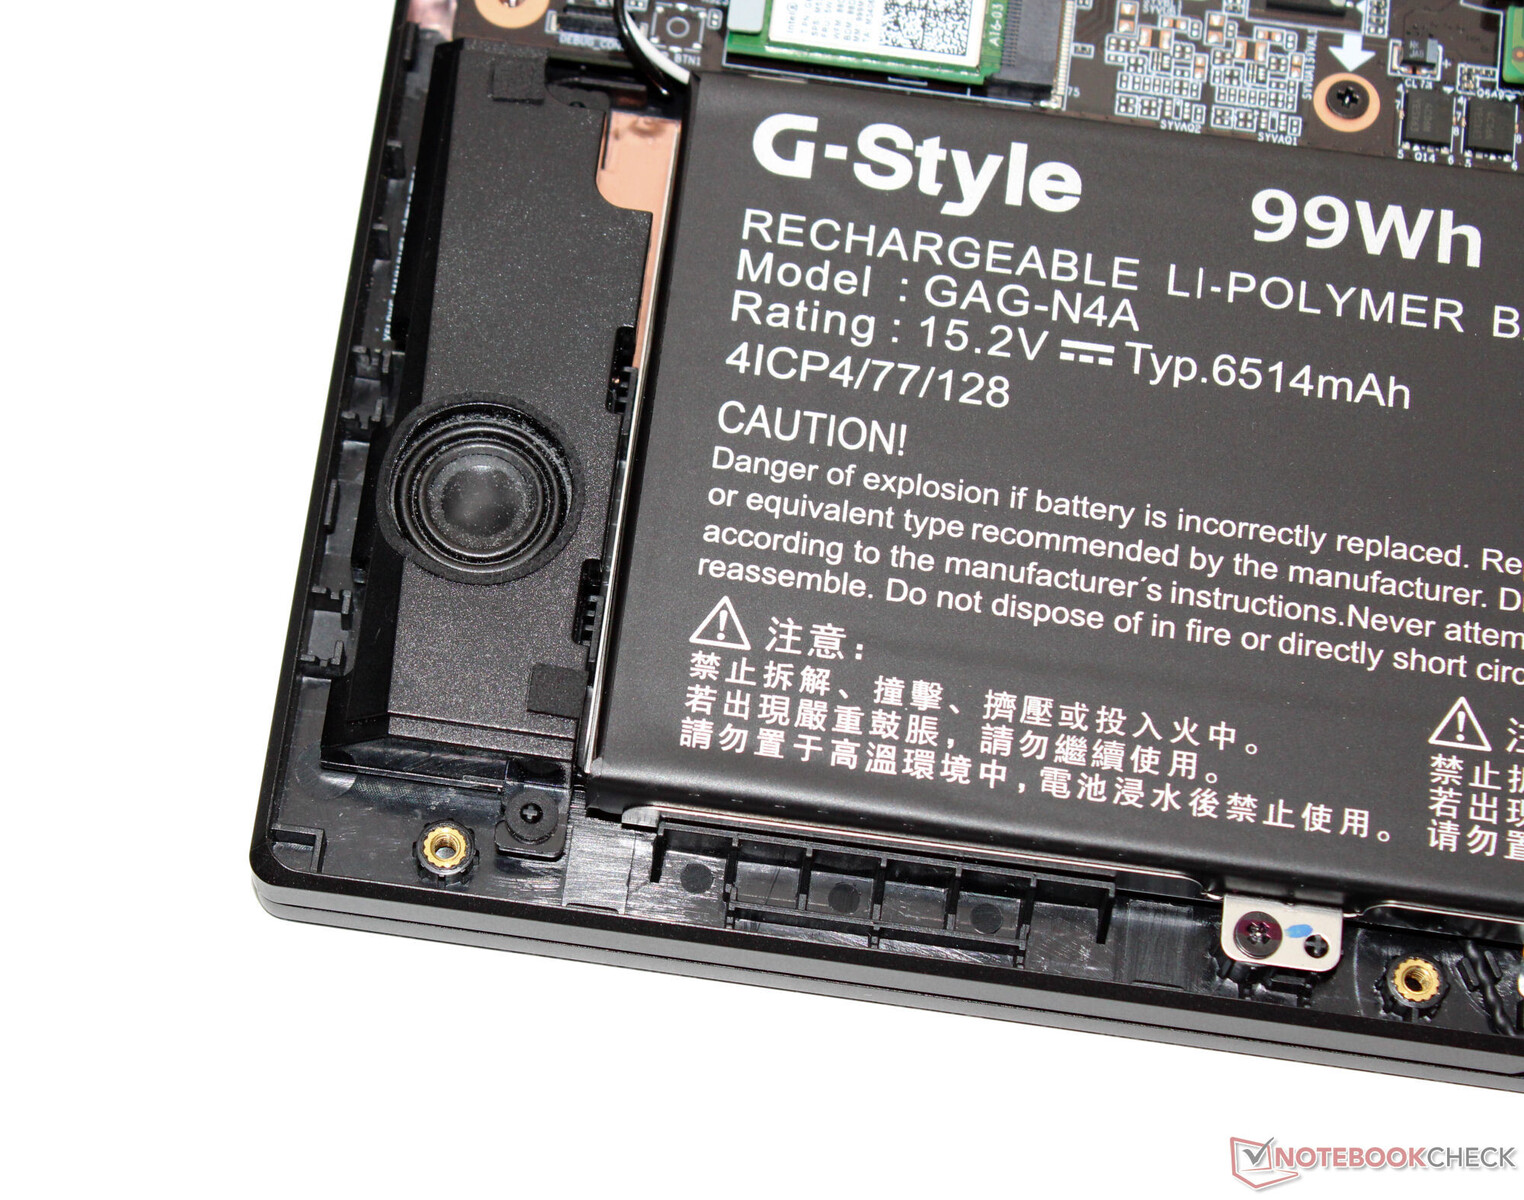
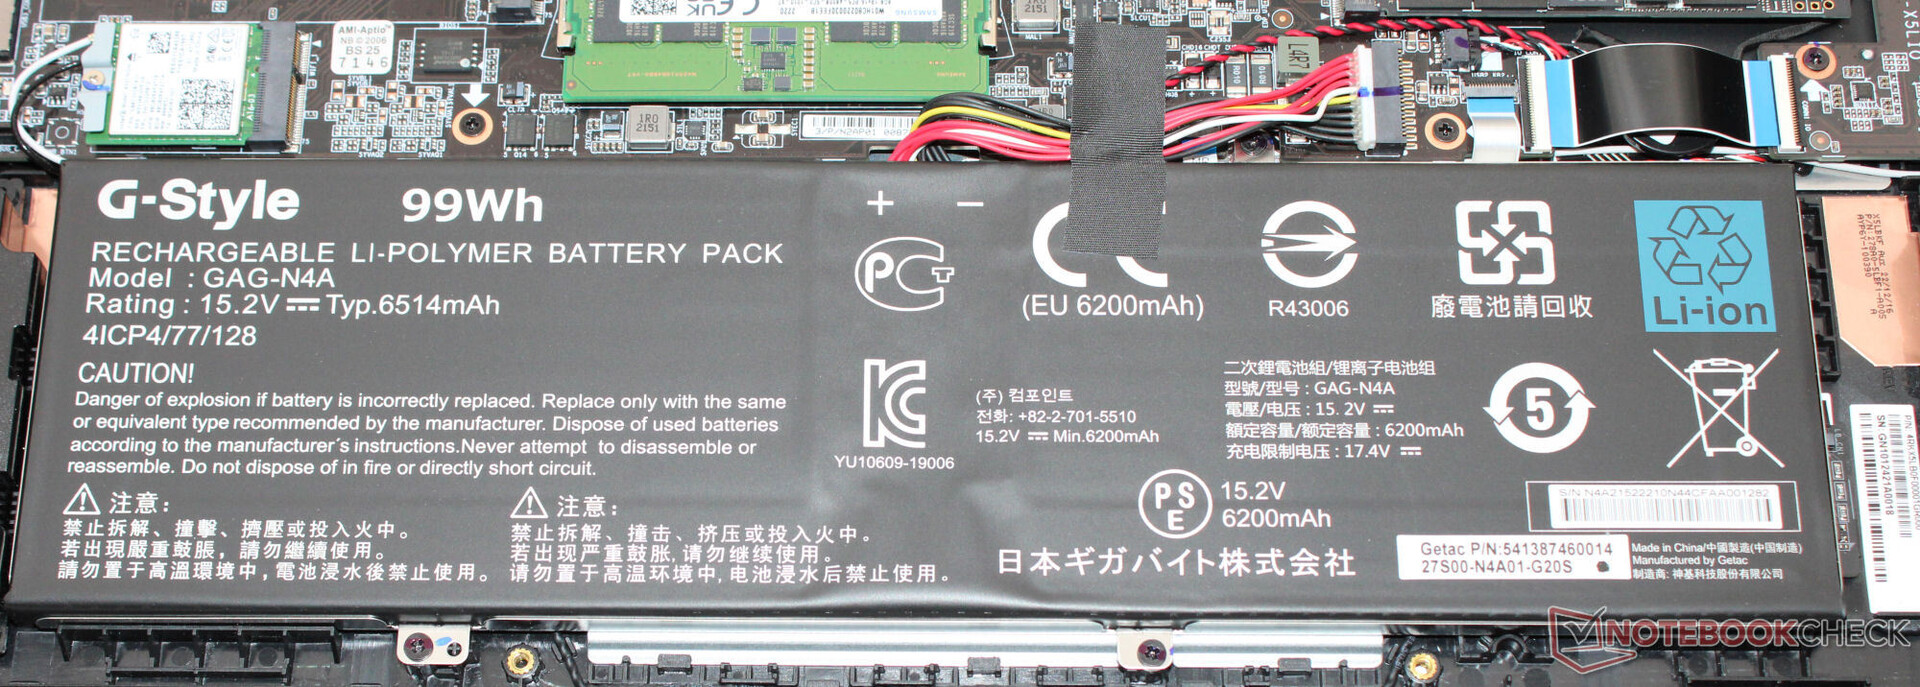
Gigabyte ha scelto un case in metallo nero con superfici lisce e opache. Il portatile non presenta caratteristiche di design estroverse. Una striscia LED attaccata alla parte inferiore del coperchio (quando il portatile è aperto) dà un po' di colore al dispositivo, insieme alla tastiera illuminata. La batteria (avvitata, non incollata) e il resto dei componenti interni del portatile sono accessibili dopo aver rimosso la parte inferiore del case.
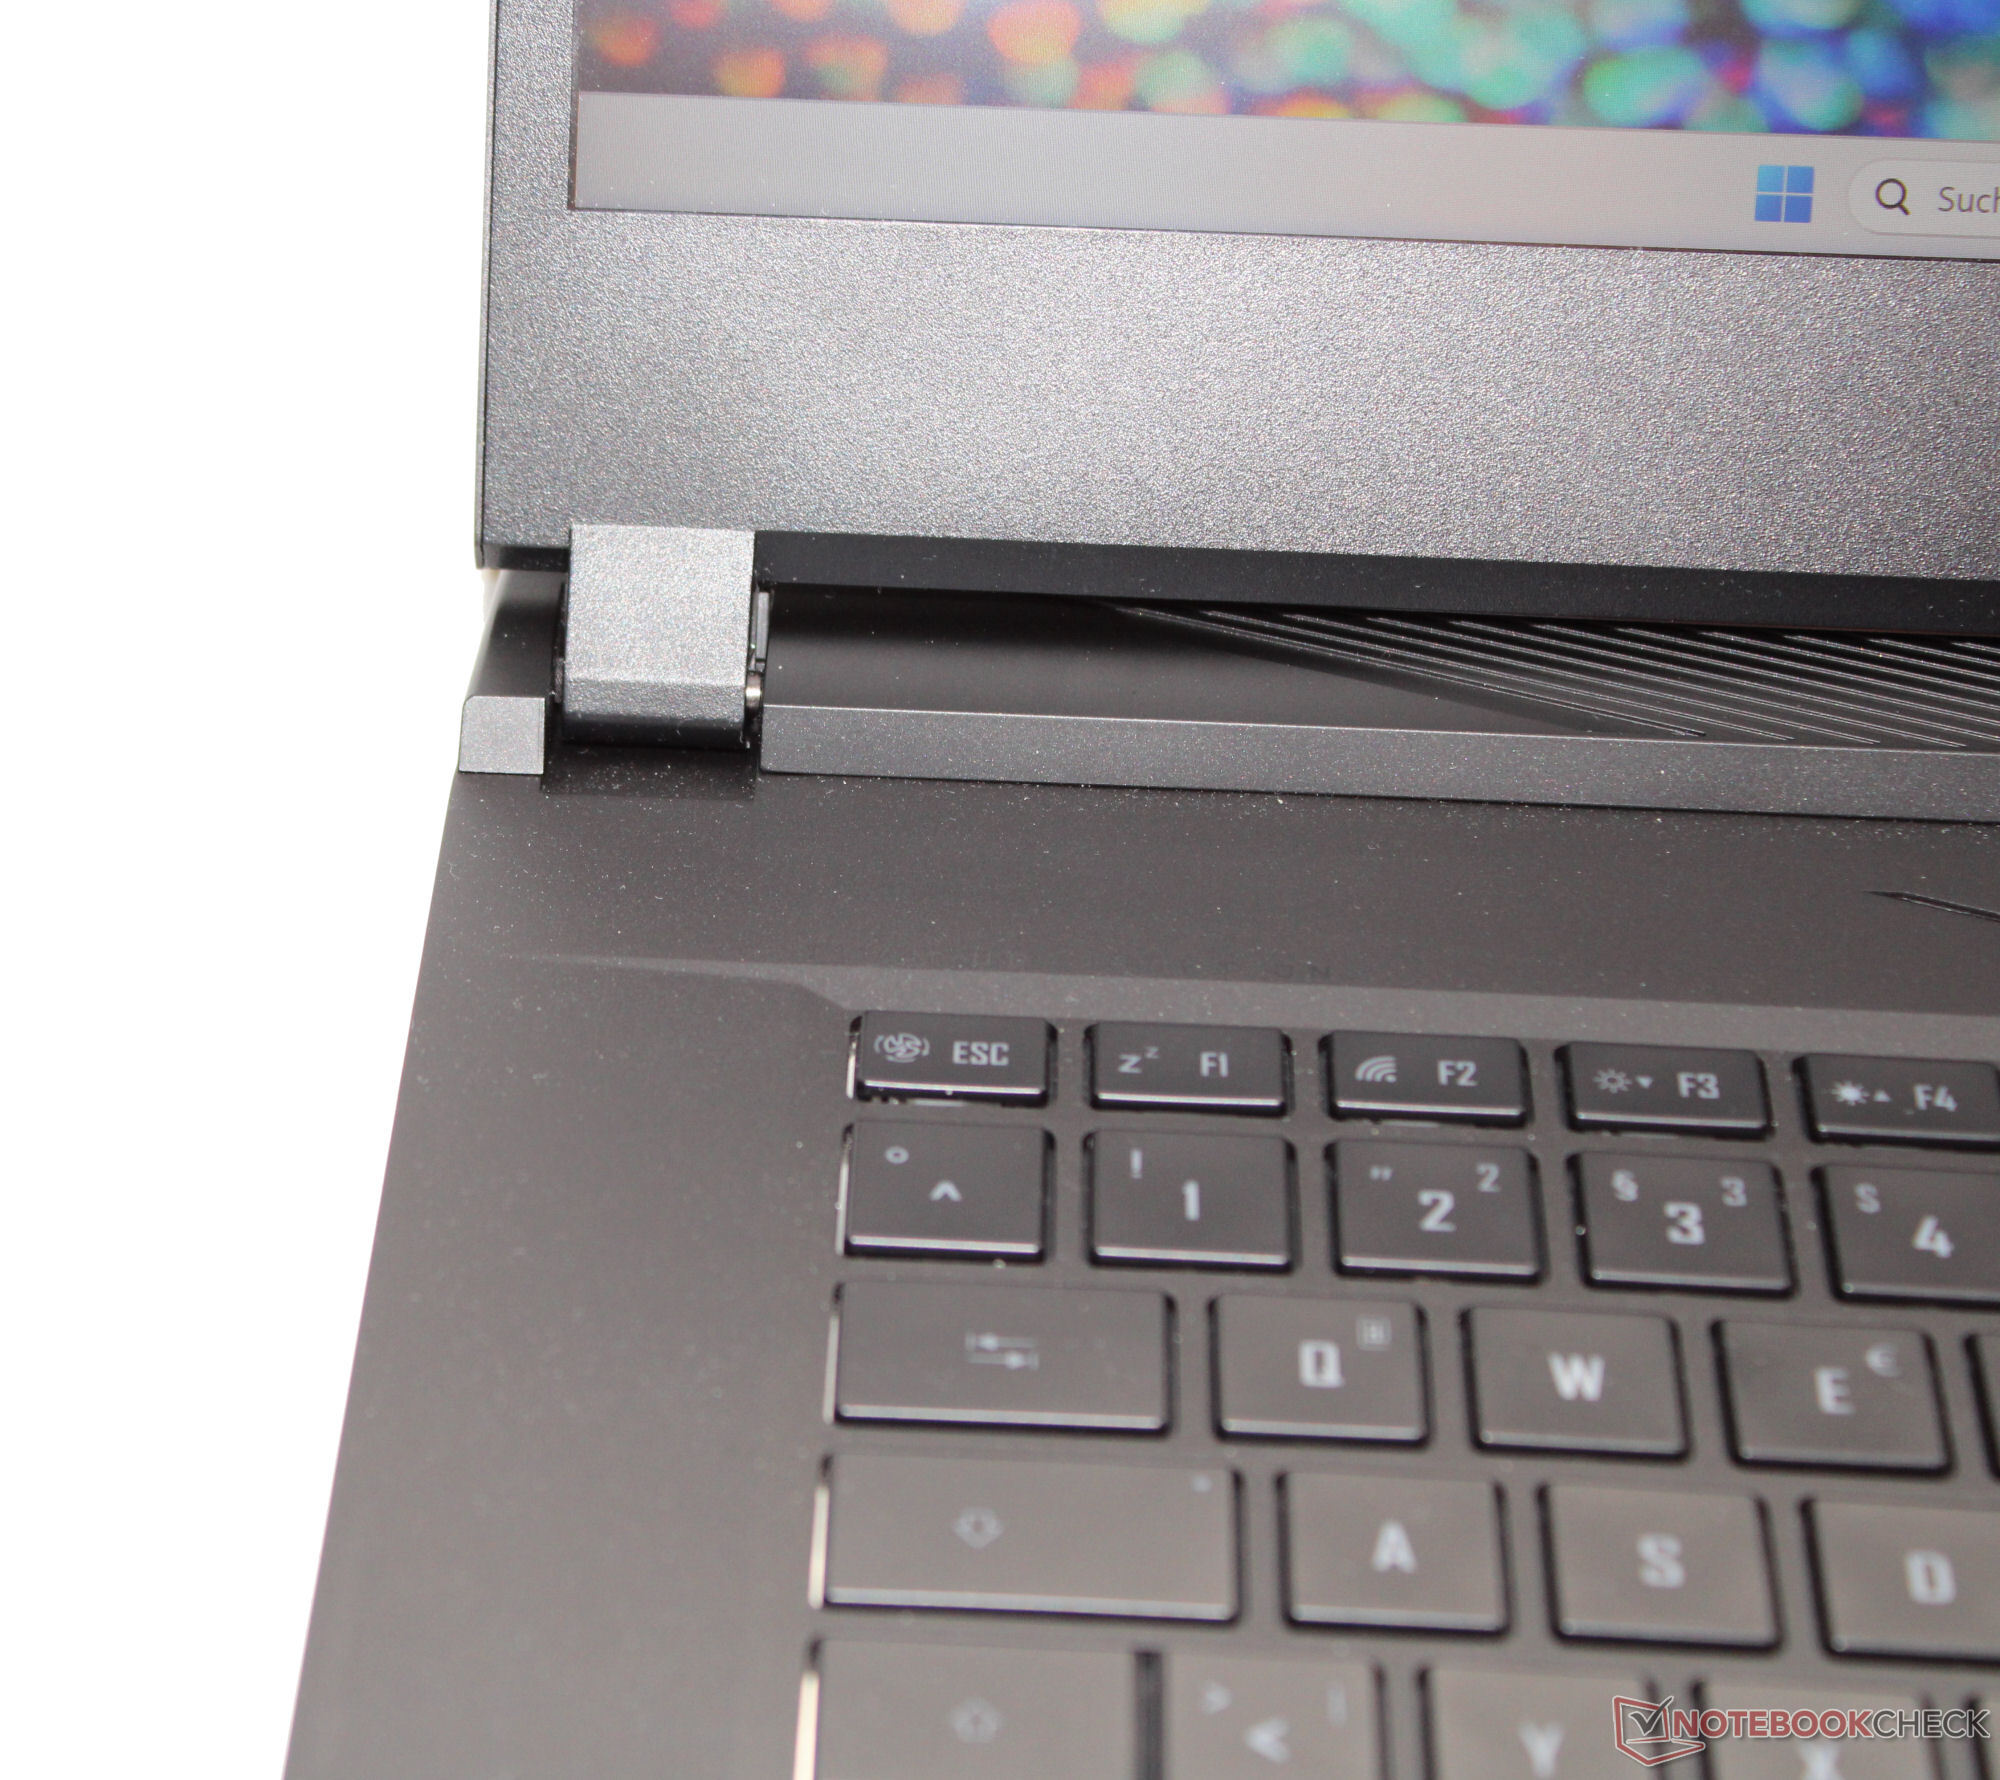
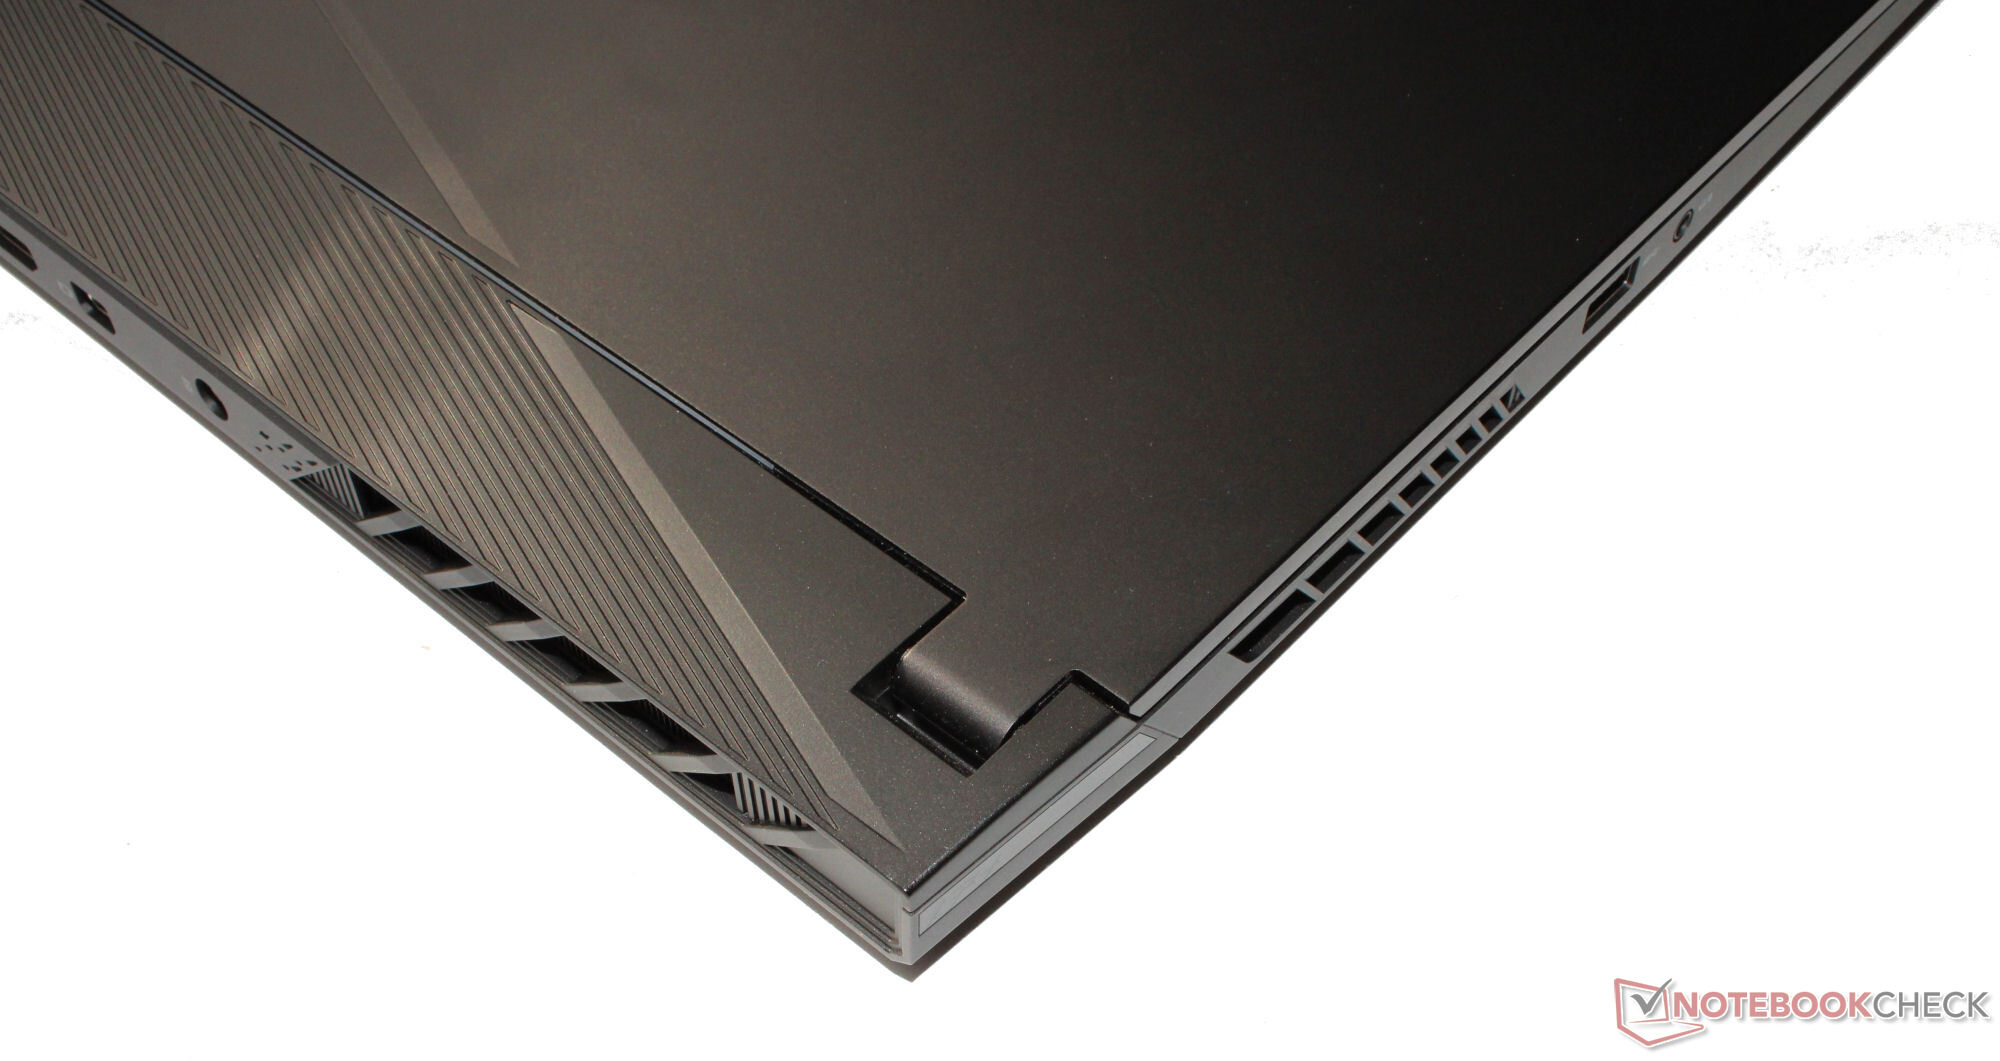
Il portatile non sembra avere alcun difetto di progettazione o costruzione. Tutti gli spazi sono allineati e non si notano eccessi di materiale. L'unità di base può essere ruotata solo leggermente, il coperchio ancora di più. Anche se: Premendo il retro non si ottiene alcun cambiamento nell'immagine. Le cerniere tengono il coperchio saldamente in posizione e l'angolo di apertura massimo è di circa 130 gradi. È possibile aprire il dispositivo con una sola mano.
Nell'ambito del confronto, l'Aorus 15 è uno dei portatili più grandi in termini di ingombro. Il suo peso è nella media.
Connettività - Thunderbolt 4 inclusa
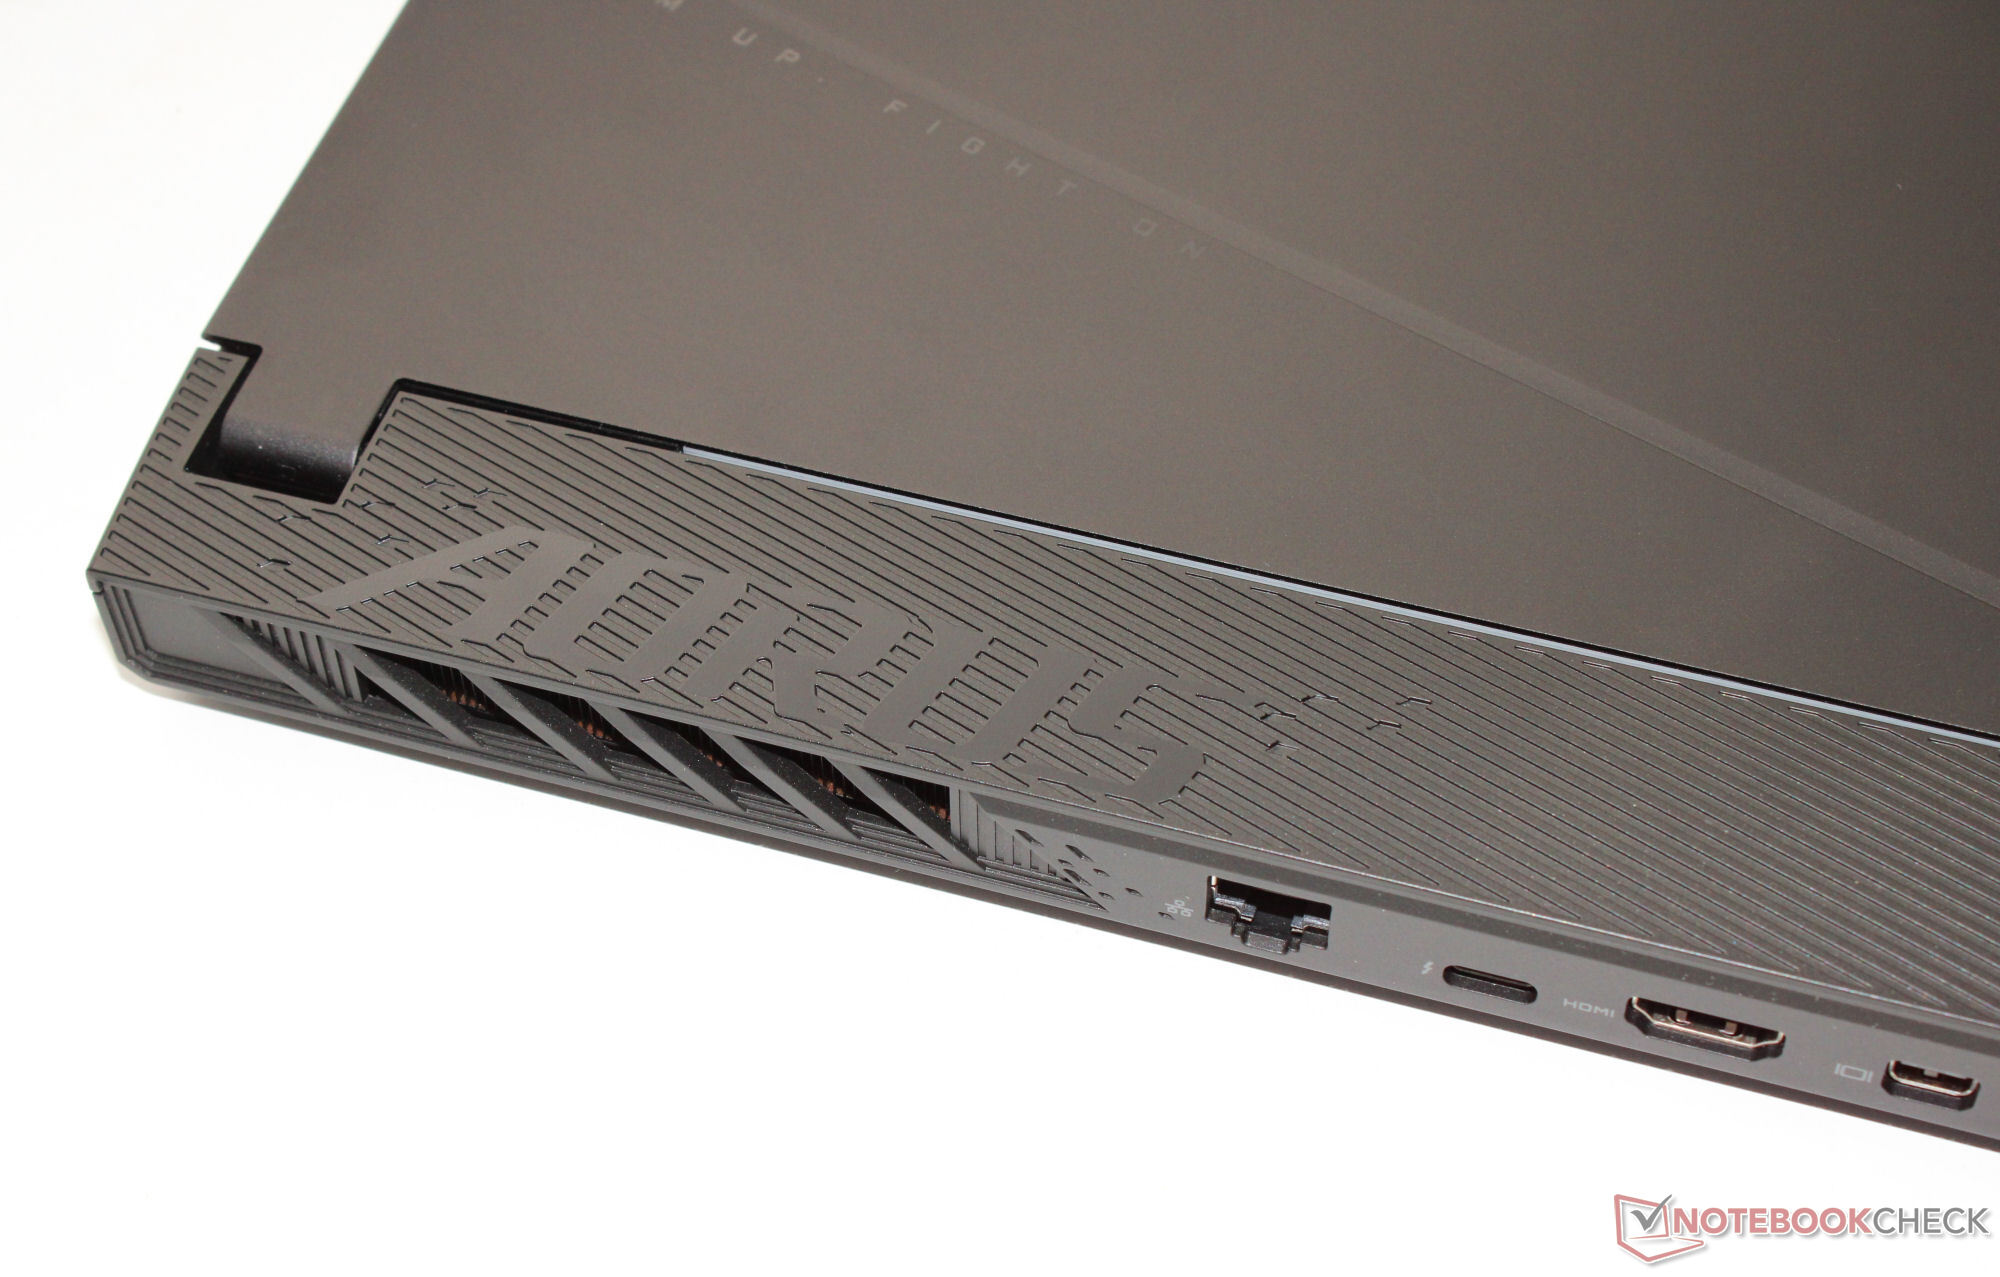
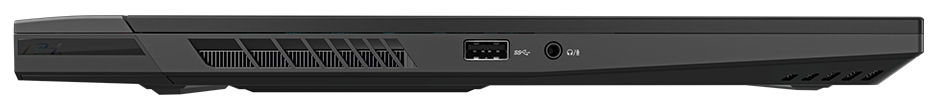
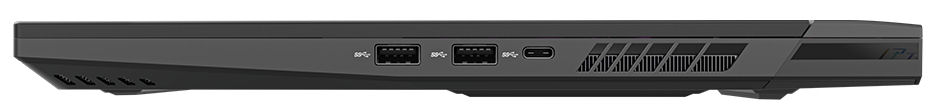
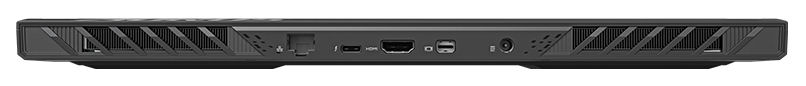
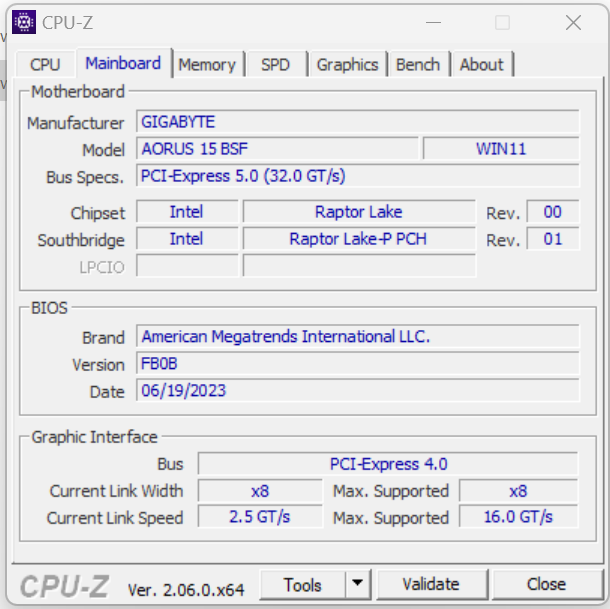
L'Aorus dispone di tre porte USB-A (2x USB 3.2 Gen 2, 1x USB 3.2 Gen 1) e due connessioni USB-C (1x Thunderbolt 4, 1x USB 3.2 Gen 2). La porta TB4 supporta Power Delivery ma non può emettere un segnale DisplayPort. Questo significa che ha un totale di due uscite video, ovvero una porta HDMI (2.1) e una Mini DisplayPort dedicata (1.4). Il portatile non dispone di un lettore di schede SD.
Le uscite video, la connessione di alimentazione e la porta Gigabit Ethernet sono tutte situate sul retro del dispositivo, il che significa che i cavi passano tutti sul retro e probabilmente non saranno d'intralcio.
Comunicazione
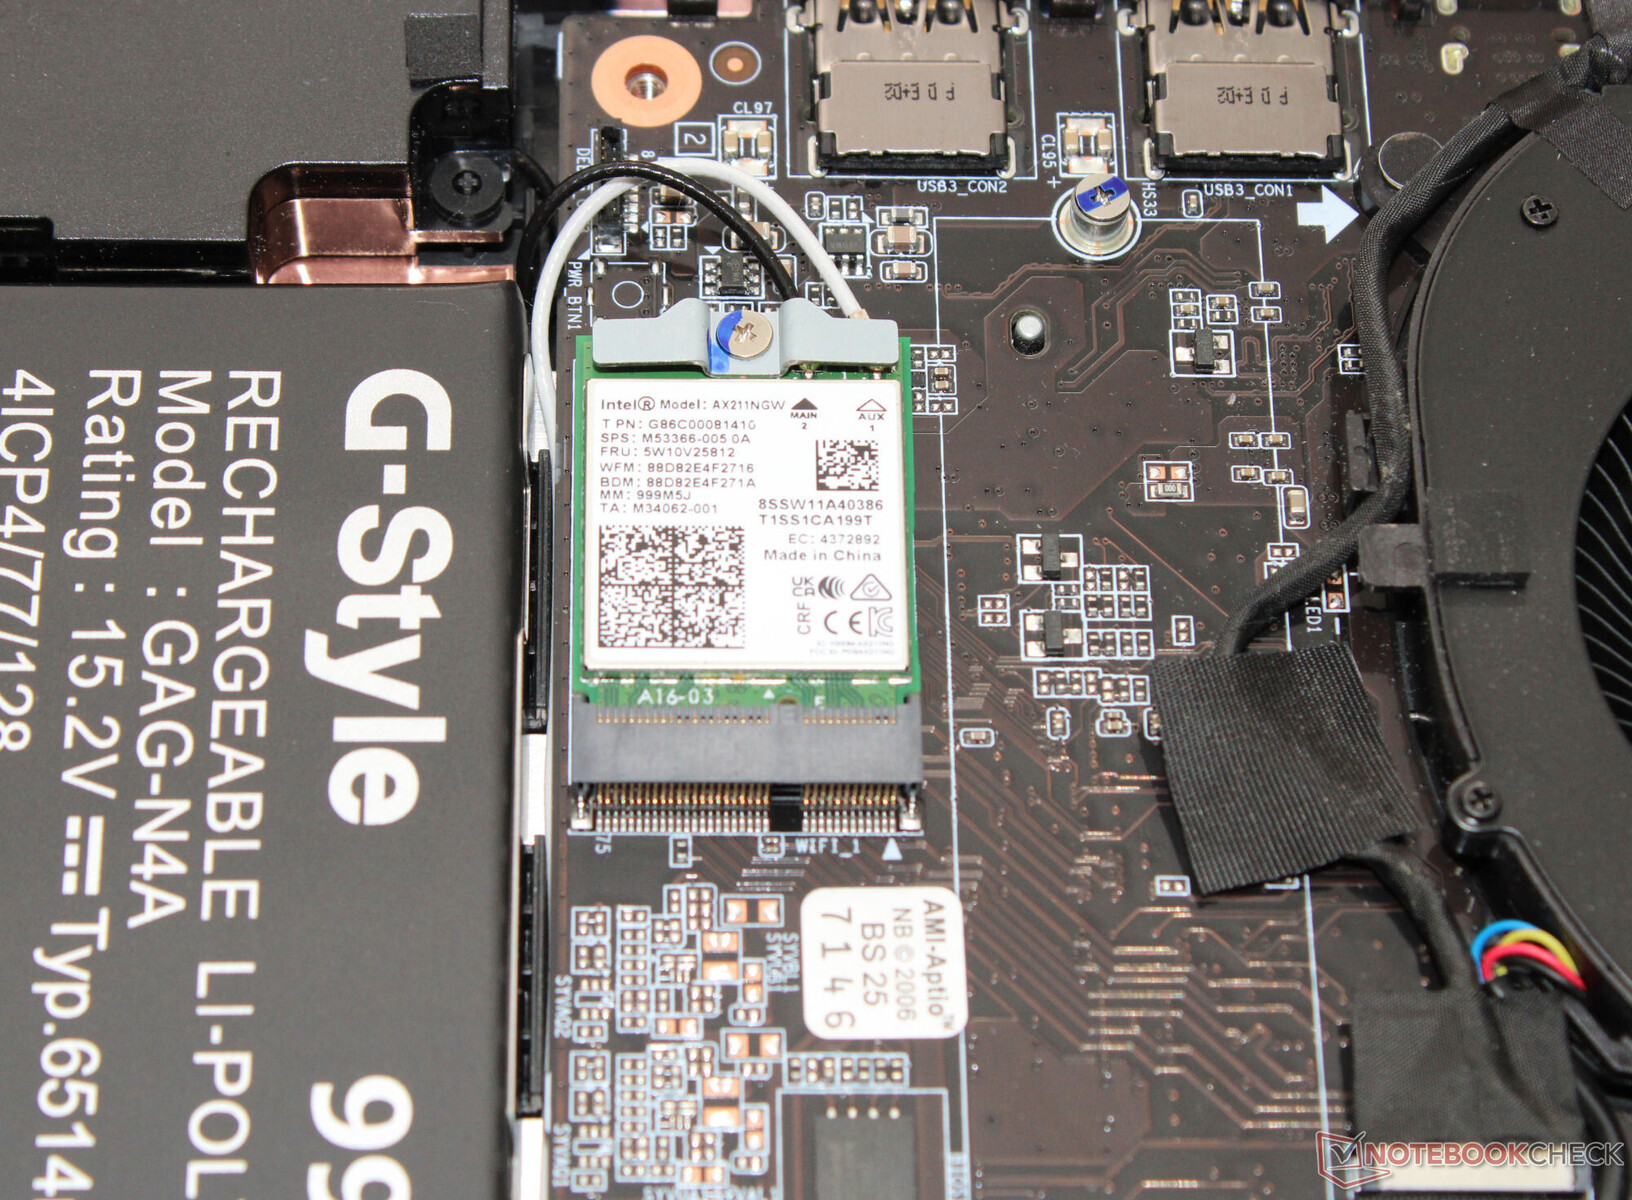
In condizioni ideali (assenza di dispositivi WLAN nelle vicinanze, breve distanza tra il portatile e il PC server), il portatile raggiunge velocità di trasmissione dati WiFi eccellenti. Il dispositivo utilizza un chip WiFi 6E (Intel AX211). Le connessioni cablate sono gestite da un controller (RTL8125; 2,5 GBit) di Realtek.
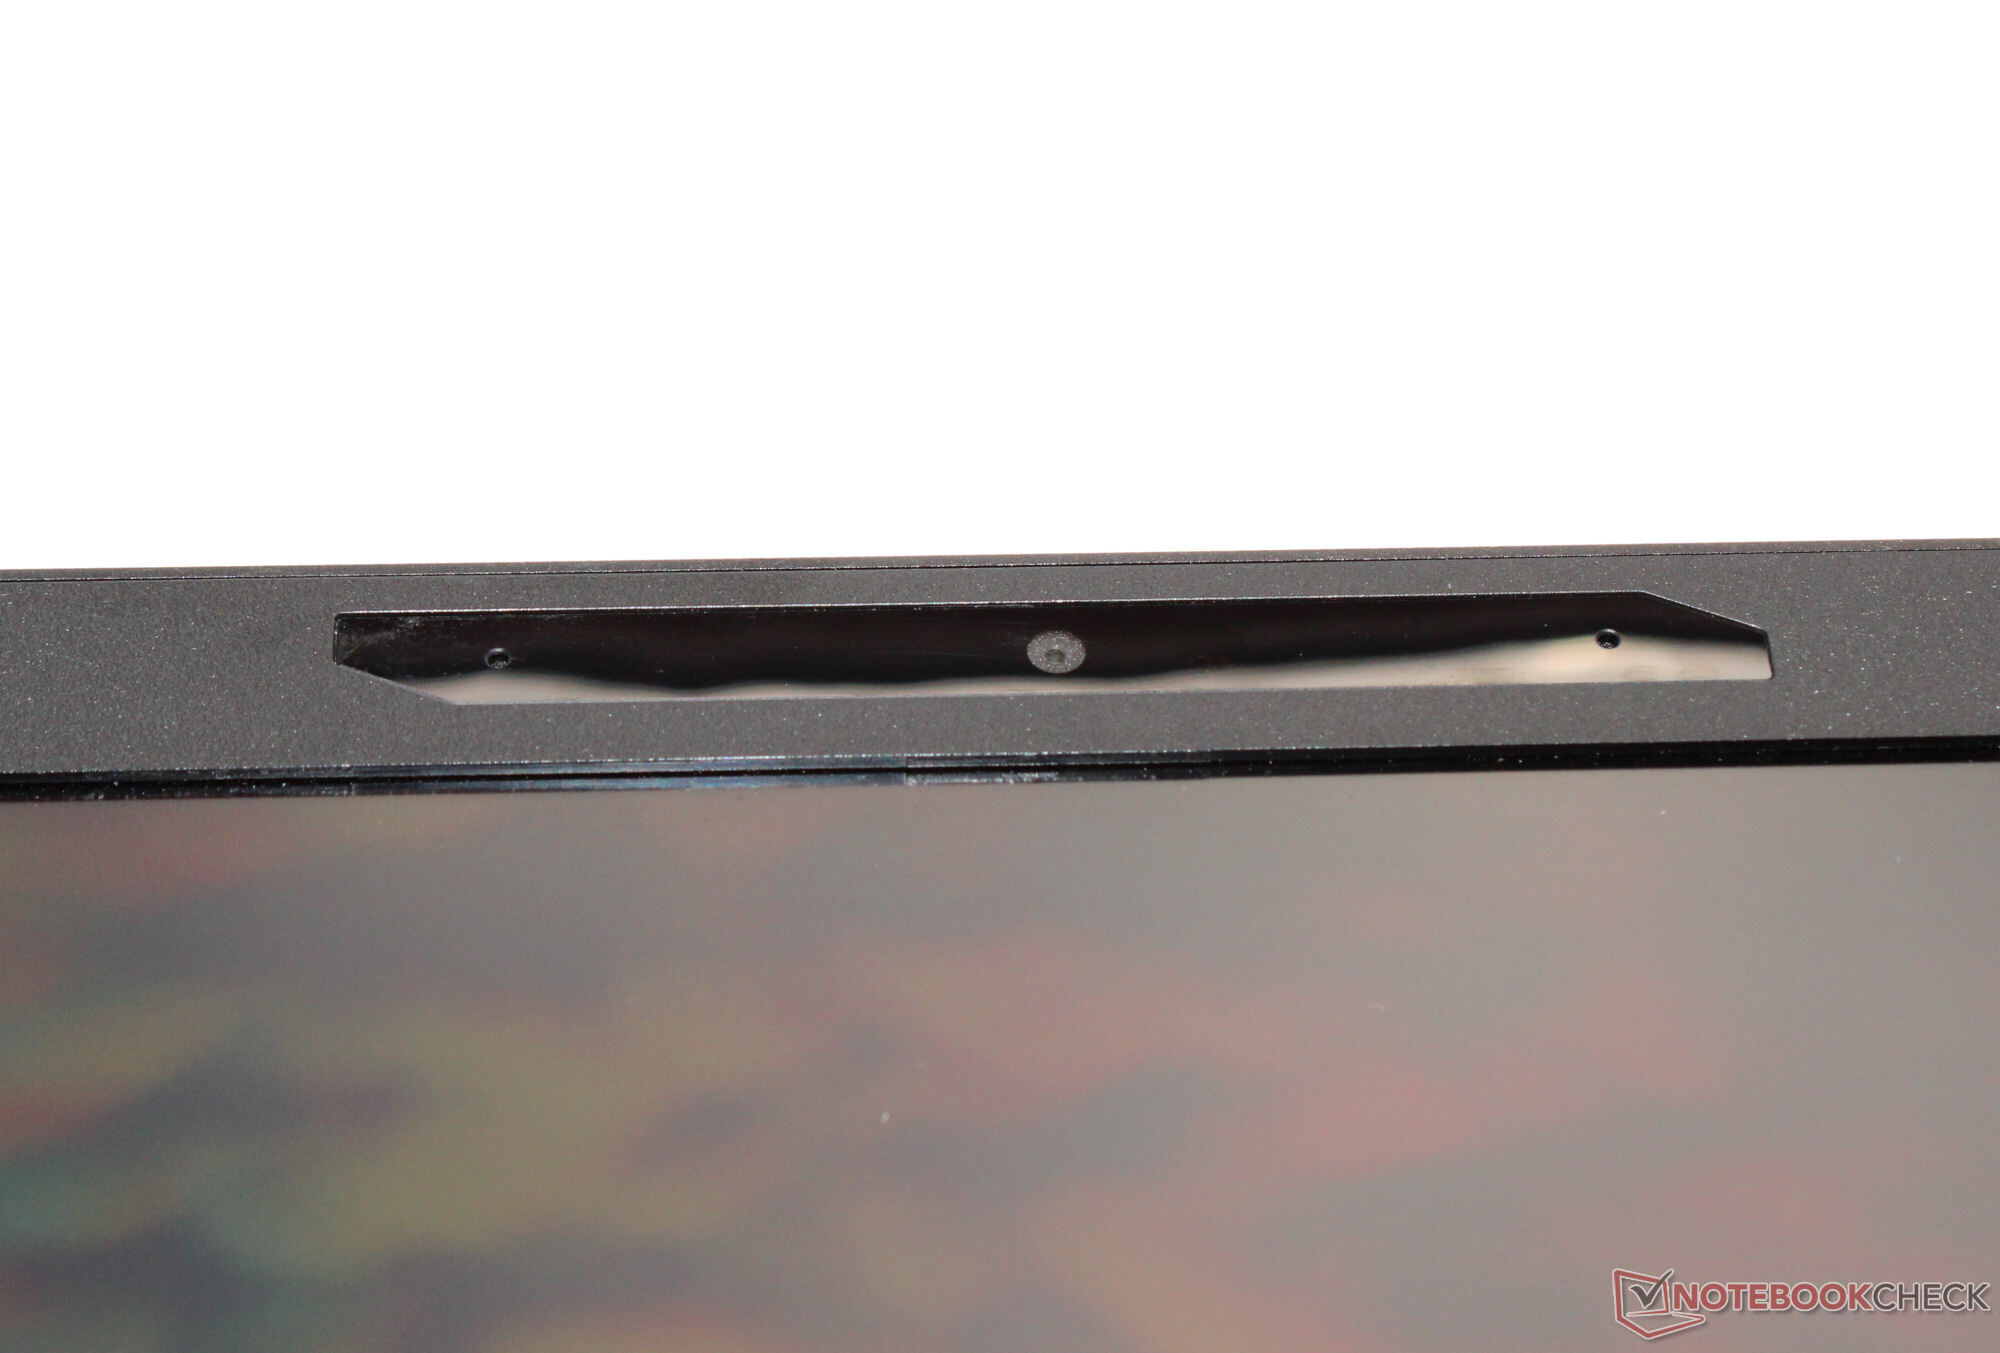
Webcam
La qualità della webcam (2,1 MP, max. 1.920 x 1.080 pixel) non è diversa da quella della concorrenza. Non dispone di una copertura meccanica.


Accessori
A parte i soliti documenti (guida rapida e informazioni sulla garanzia), il portatile non viene fornito con alcun accessorio aggiuntivo.
Manutenzione
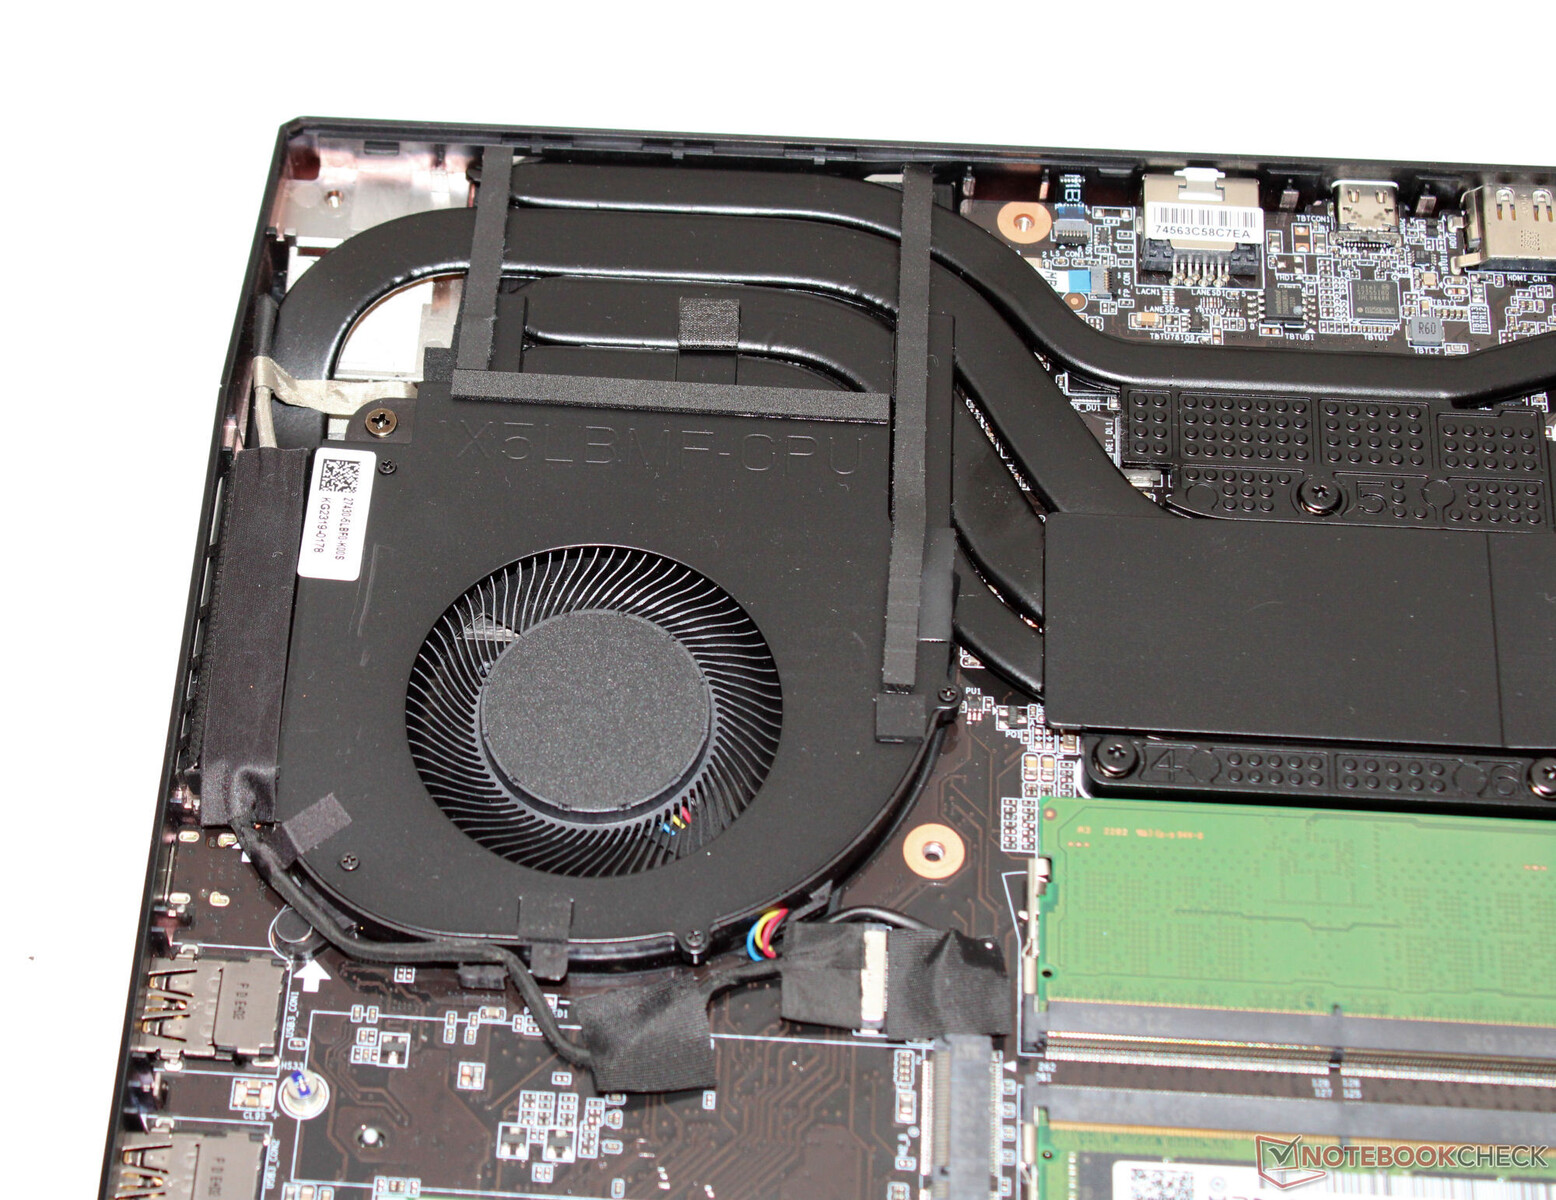
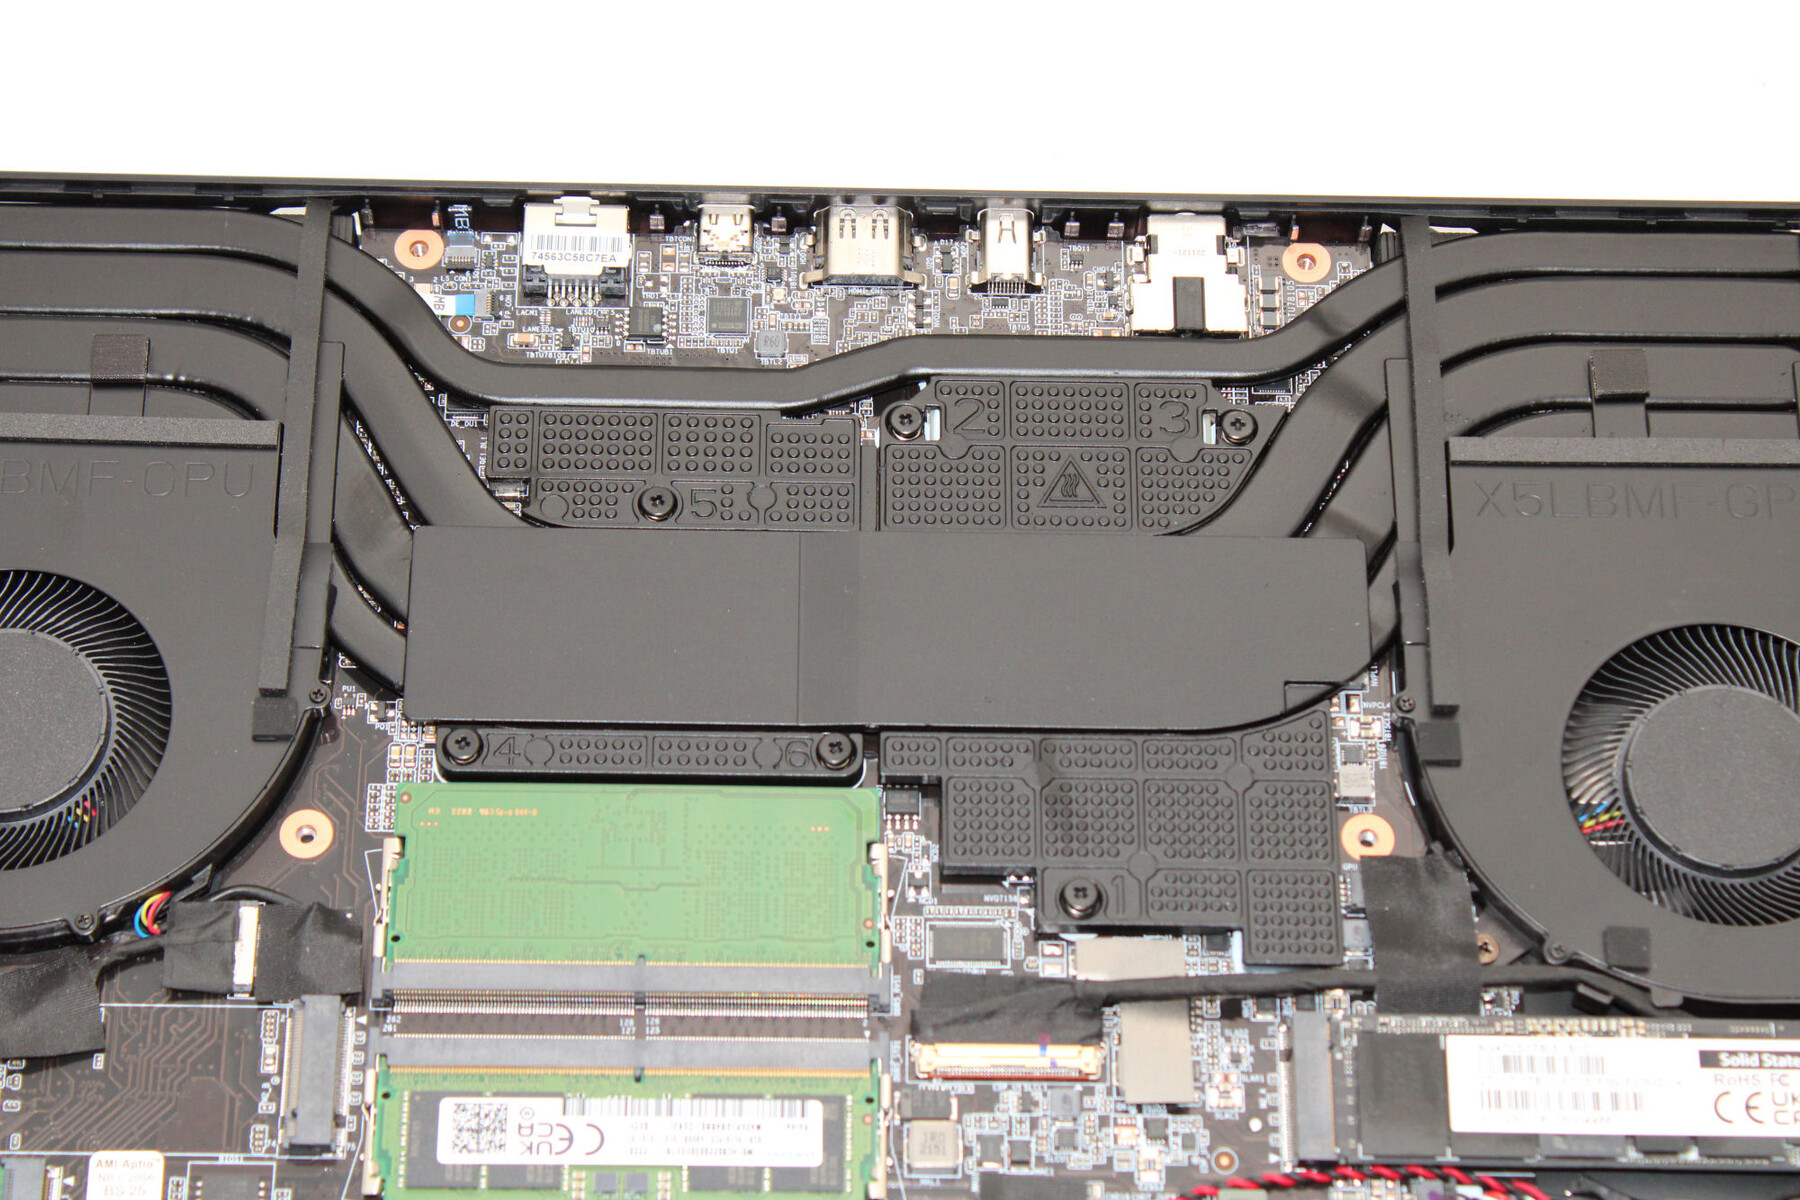
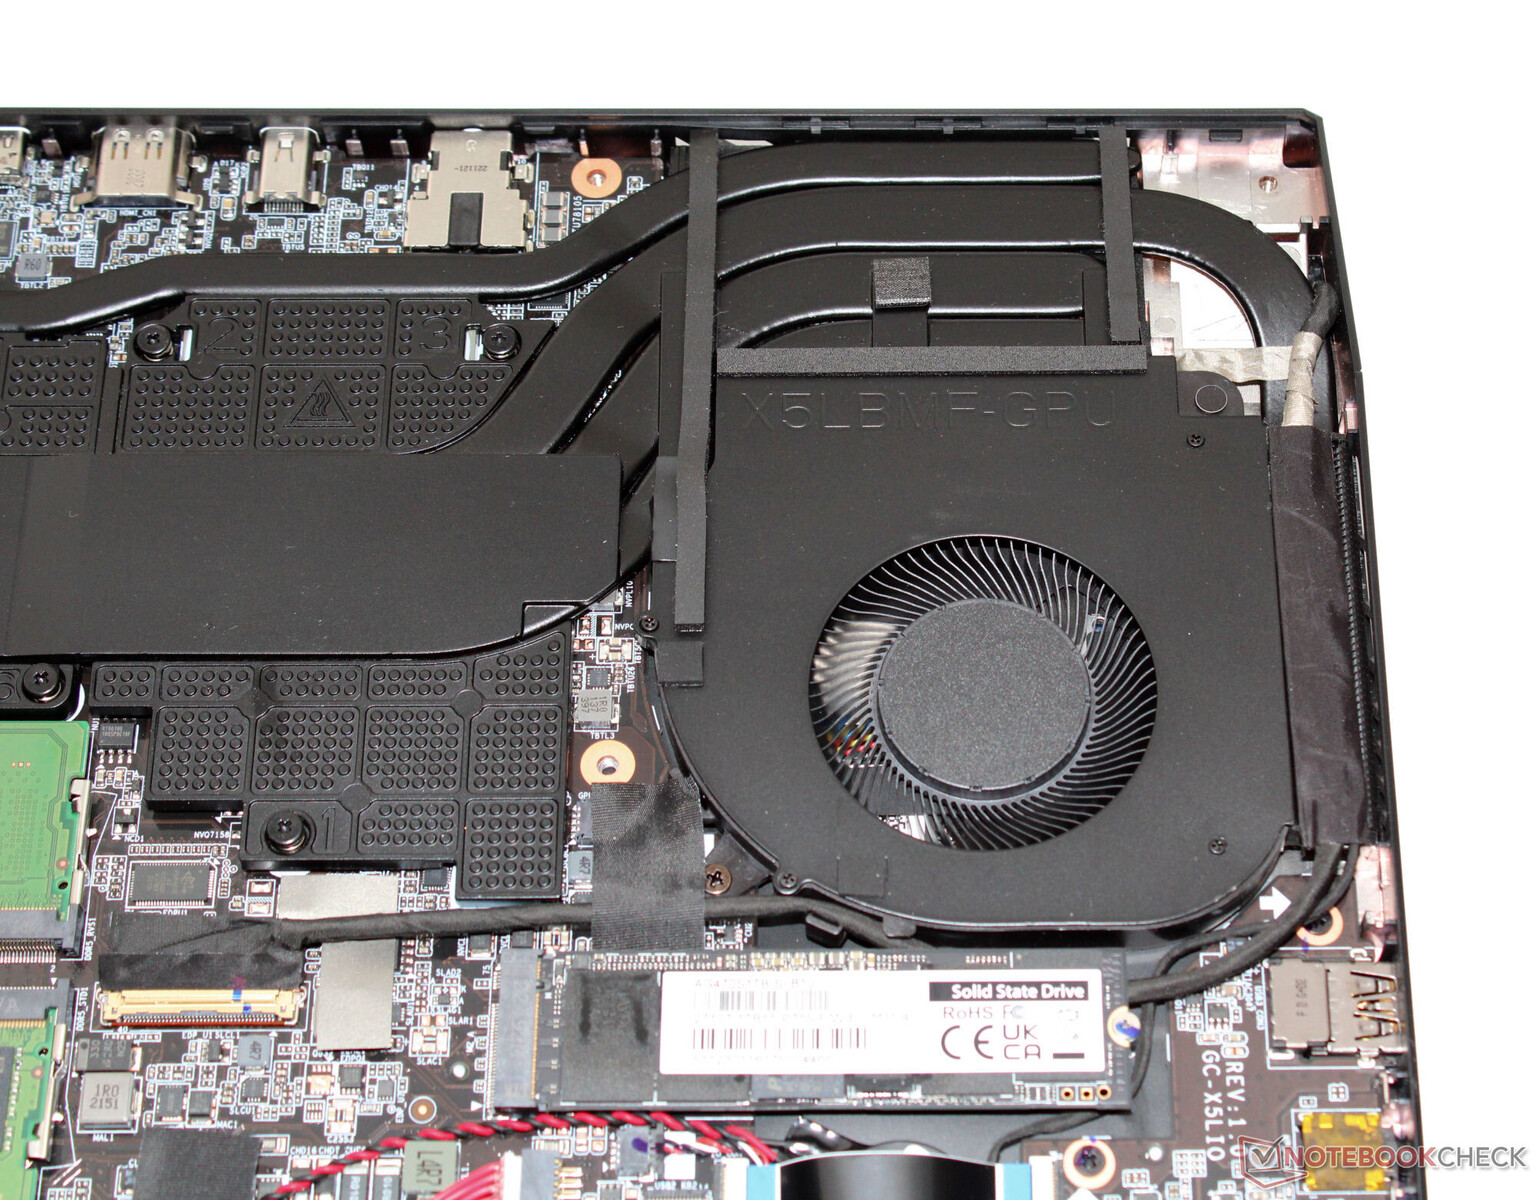
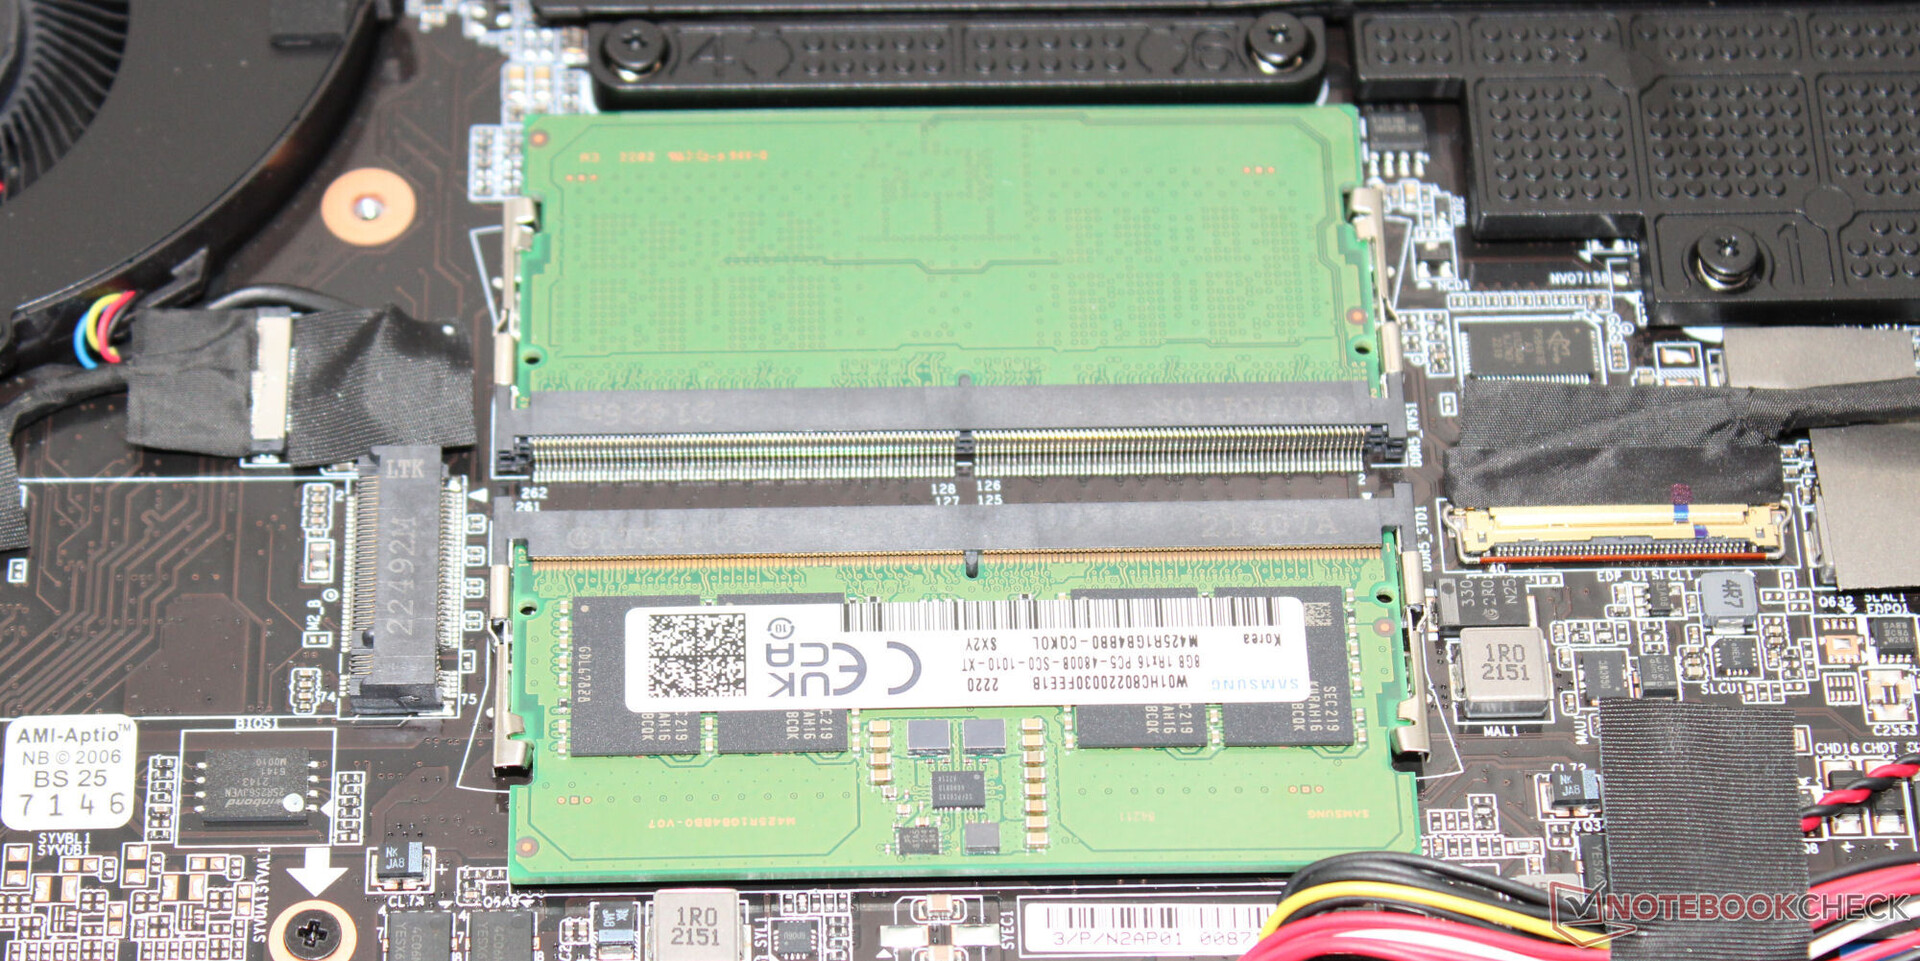
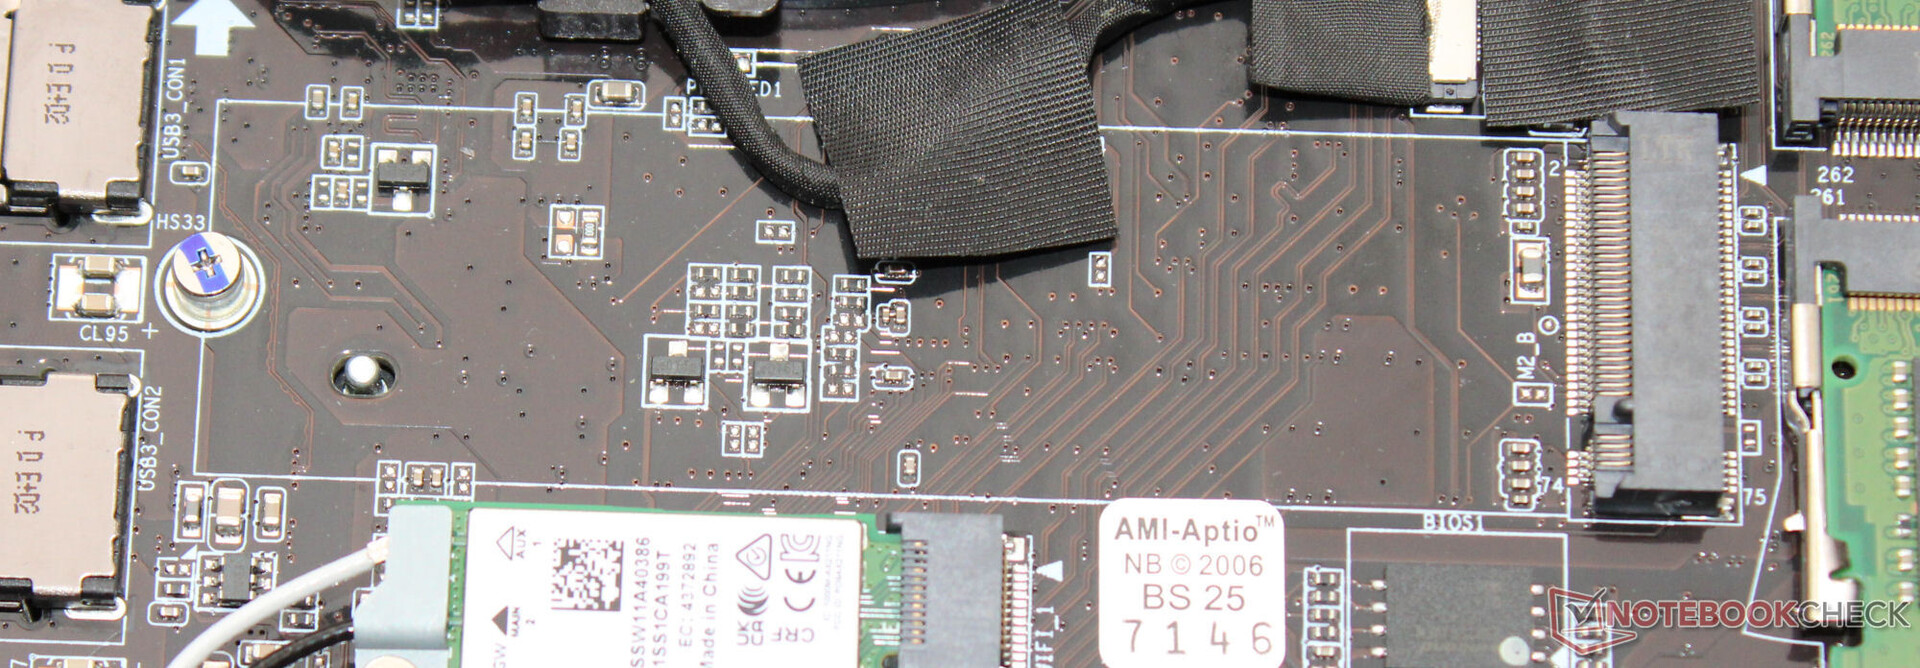
Dopo aver rimosso tutte le viti sul fondo del dispositivo, è possibile rimuovere la sezione inferiore del case con l'aiuto di una spatola o di un plettro. Successivamente, è possibile accedere agli slot della RAM (entrambi occupati), all'unità SSD (PCIe 4, M.2 2280), al secondo slot M.2 2280 (PCIe 4, M.2 2280), alla batteria del BIOS, al modulo WLAN, alle ventole, agli altoparlanti e alla batteria.
Garanzia
Il portatile Gigabyte da 15,6 pollici viene fornito con una garanzia di un anno. Non è possibile estenderla.
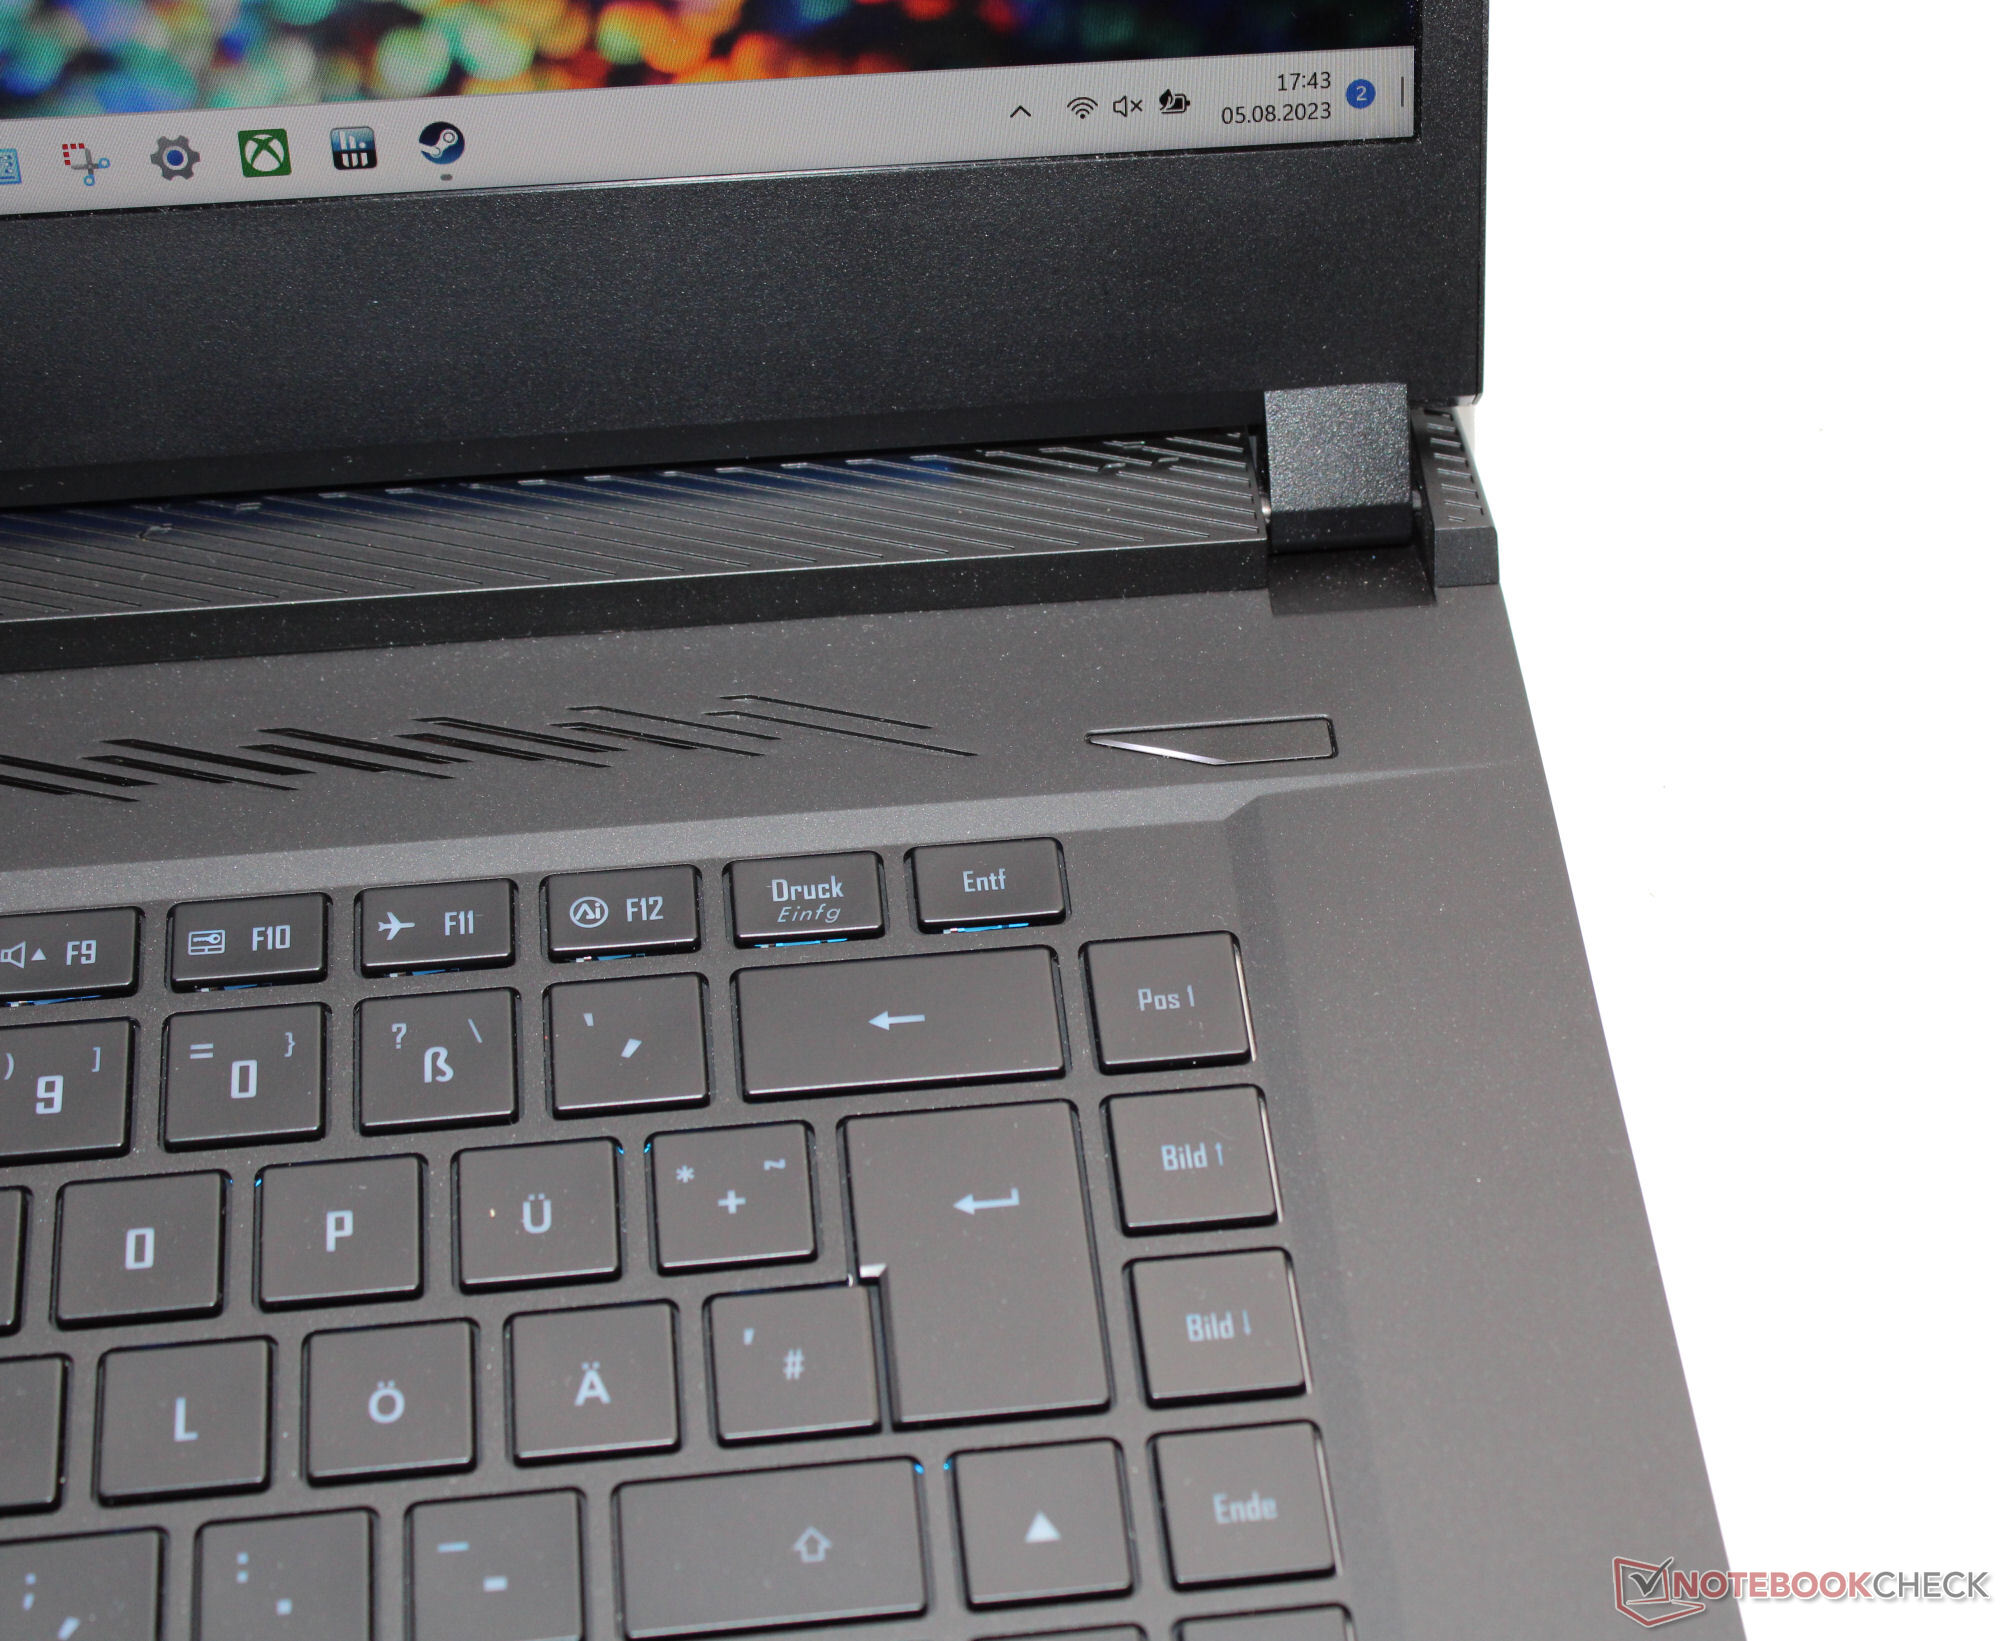
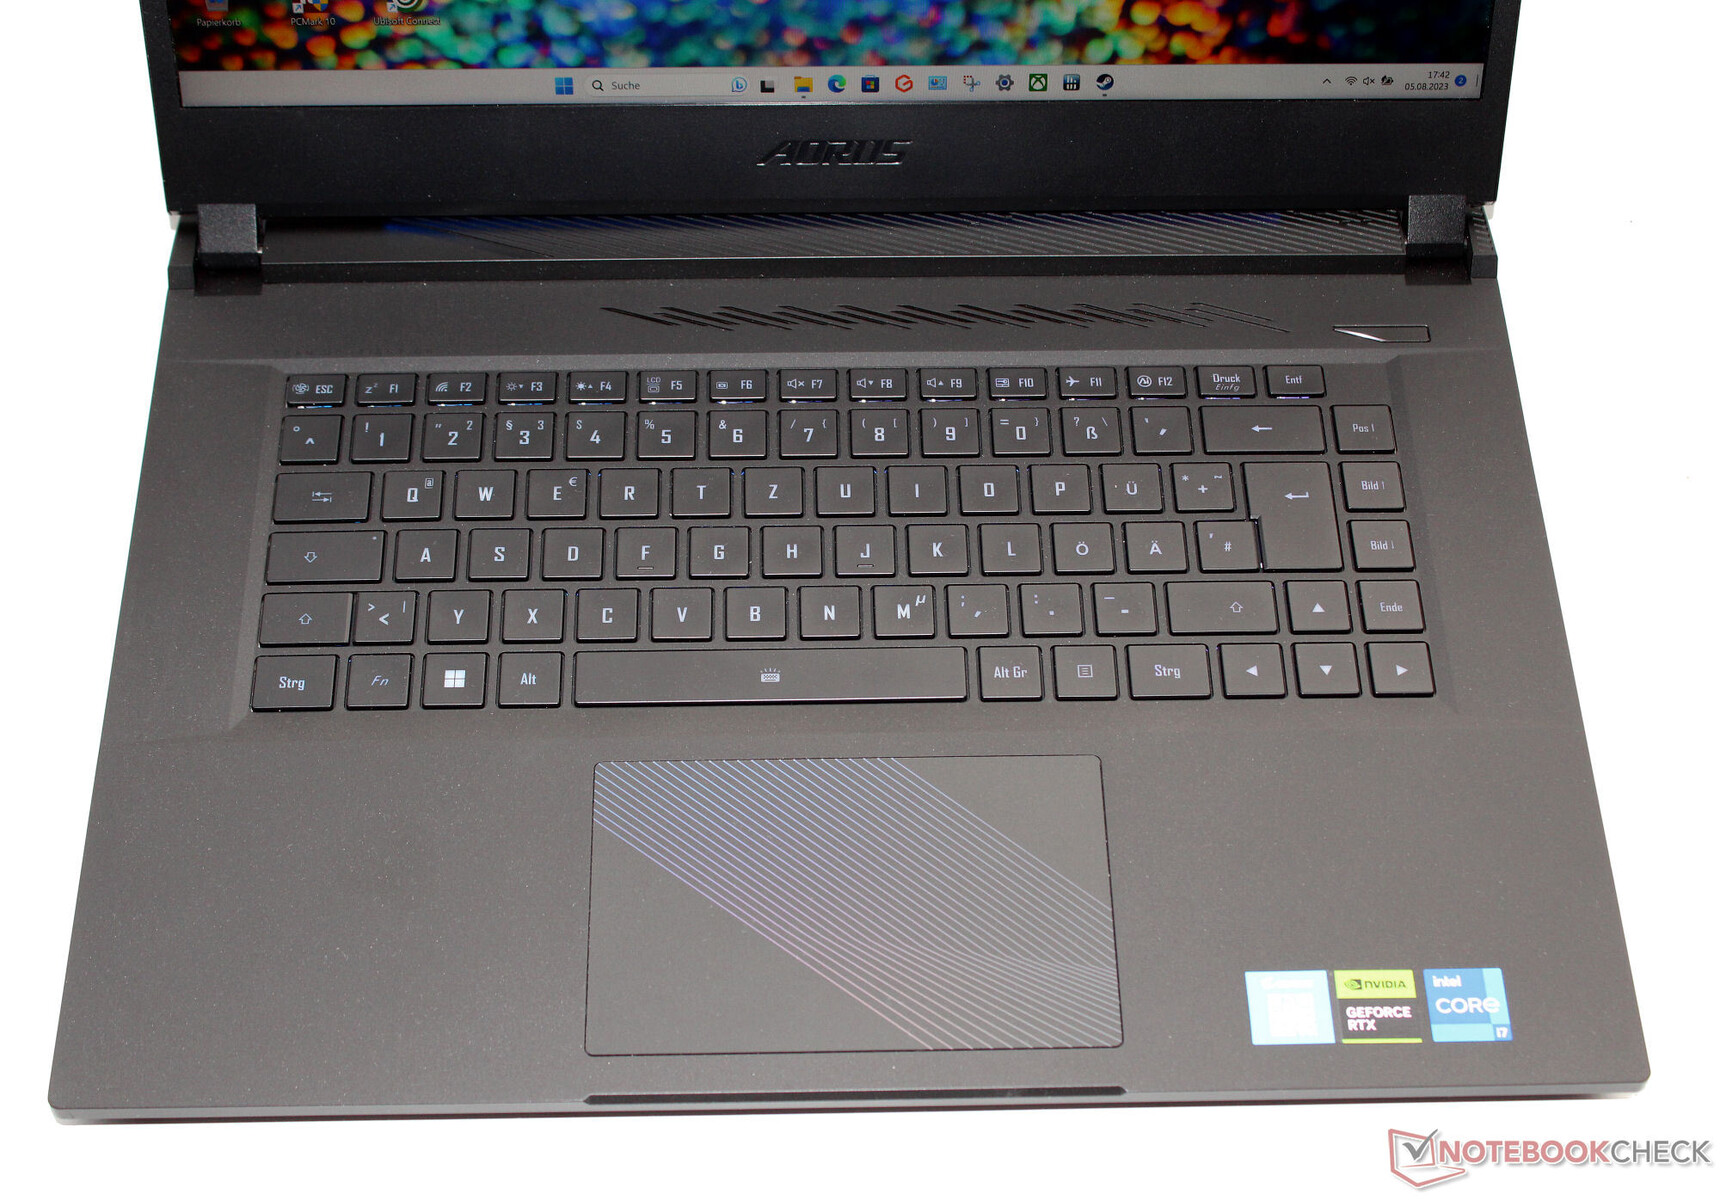
Dispositivi di input - Il portatile da gioco con illuminazione RGB
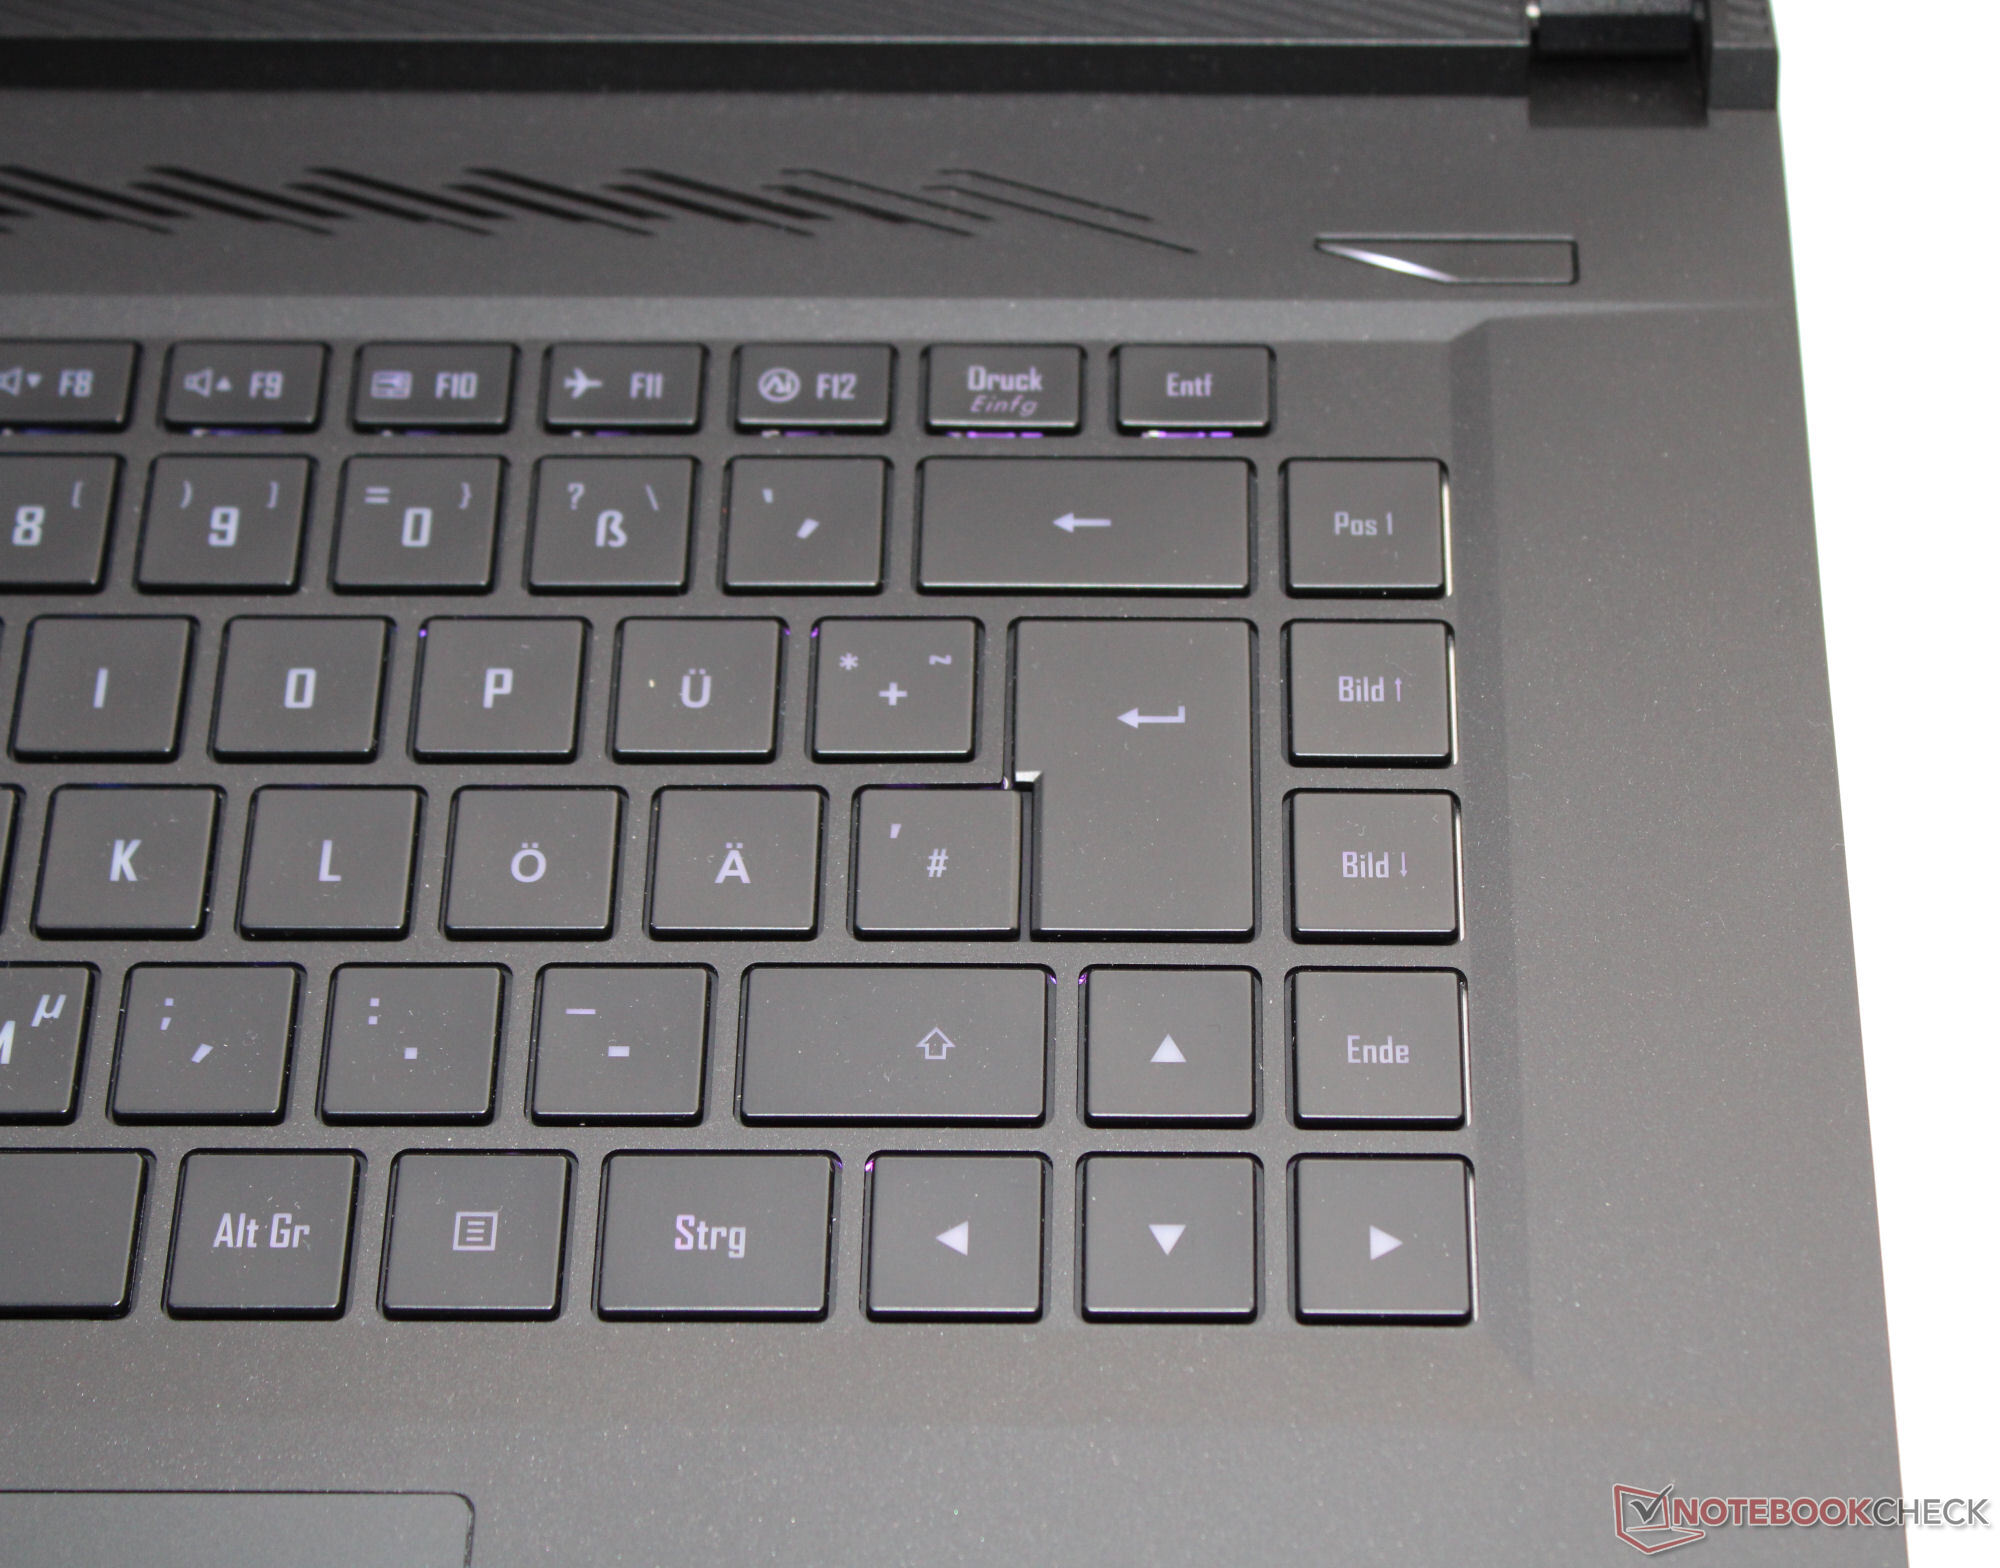
Tastiera
I tasti lisci della tastiera chiclet illuminata hanno un'inclinazione media e un punto di pressione chiaro. La resistenza dei tasti è buona: durante la digitazione hanno un piccolo cedimento, ma non dovrebbe essere troppo fastidioso. Positivo: Tutti e quattro i tasti freccia sono di dimensioni regolari. Nel complesso, si tratta di una buona tastiera per l'uso quotidiano.
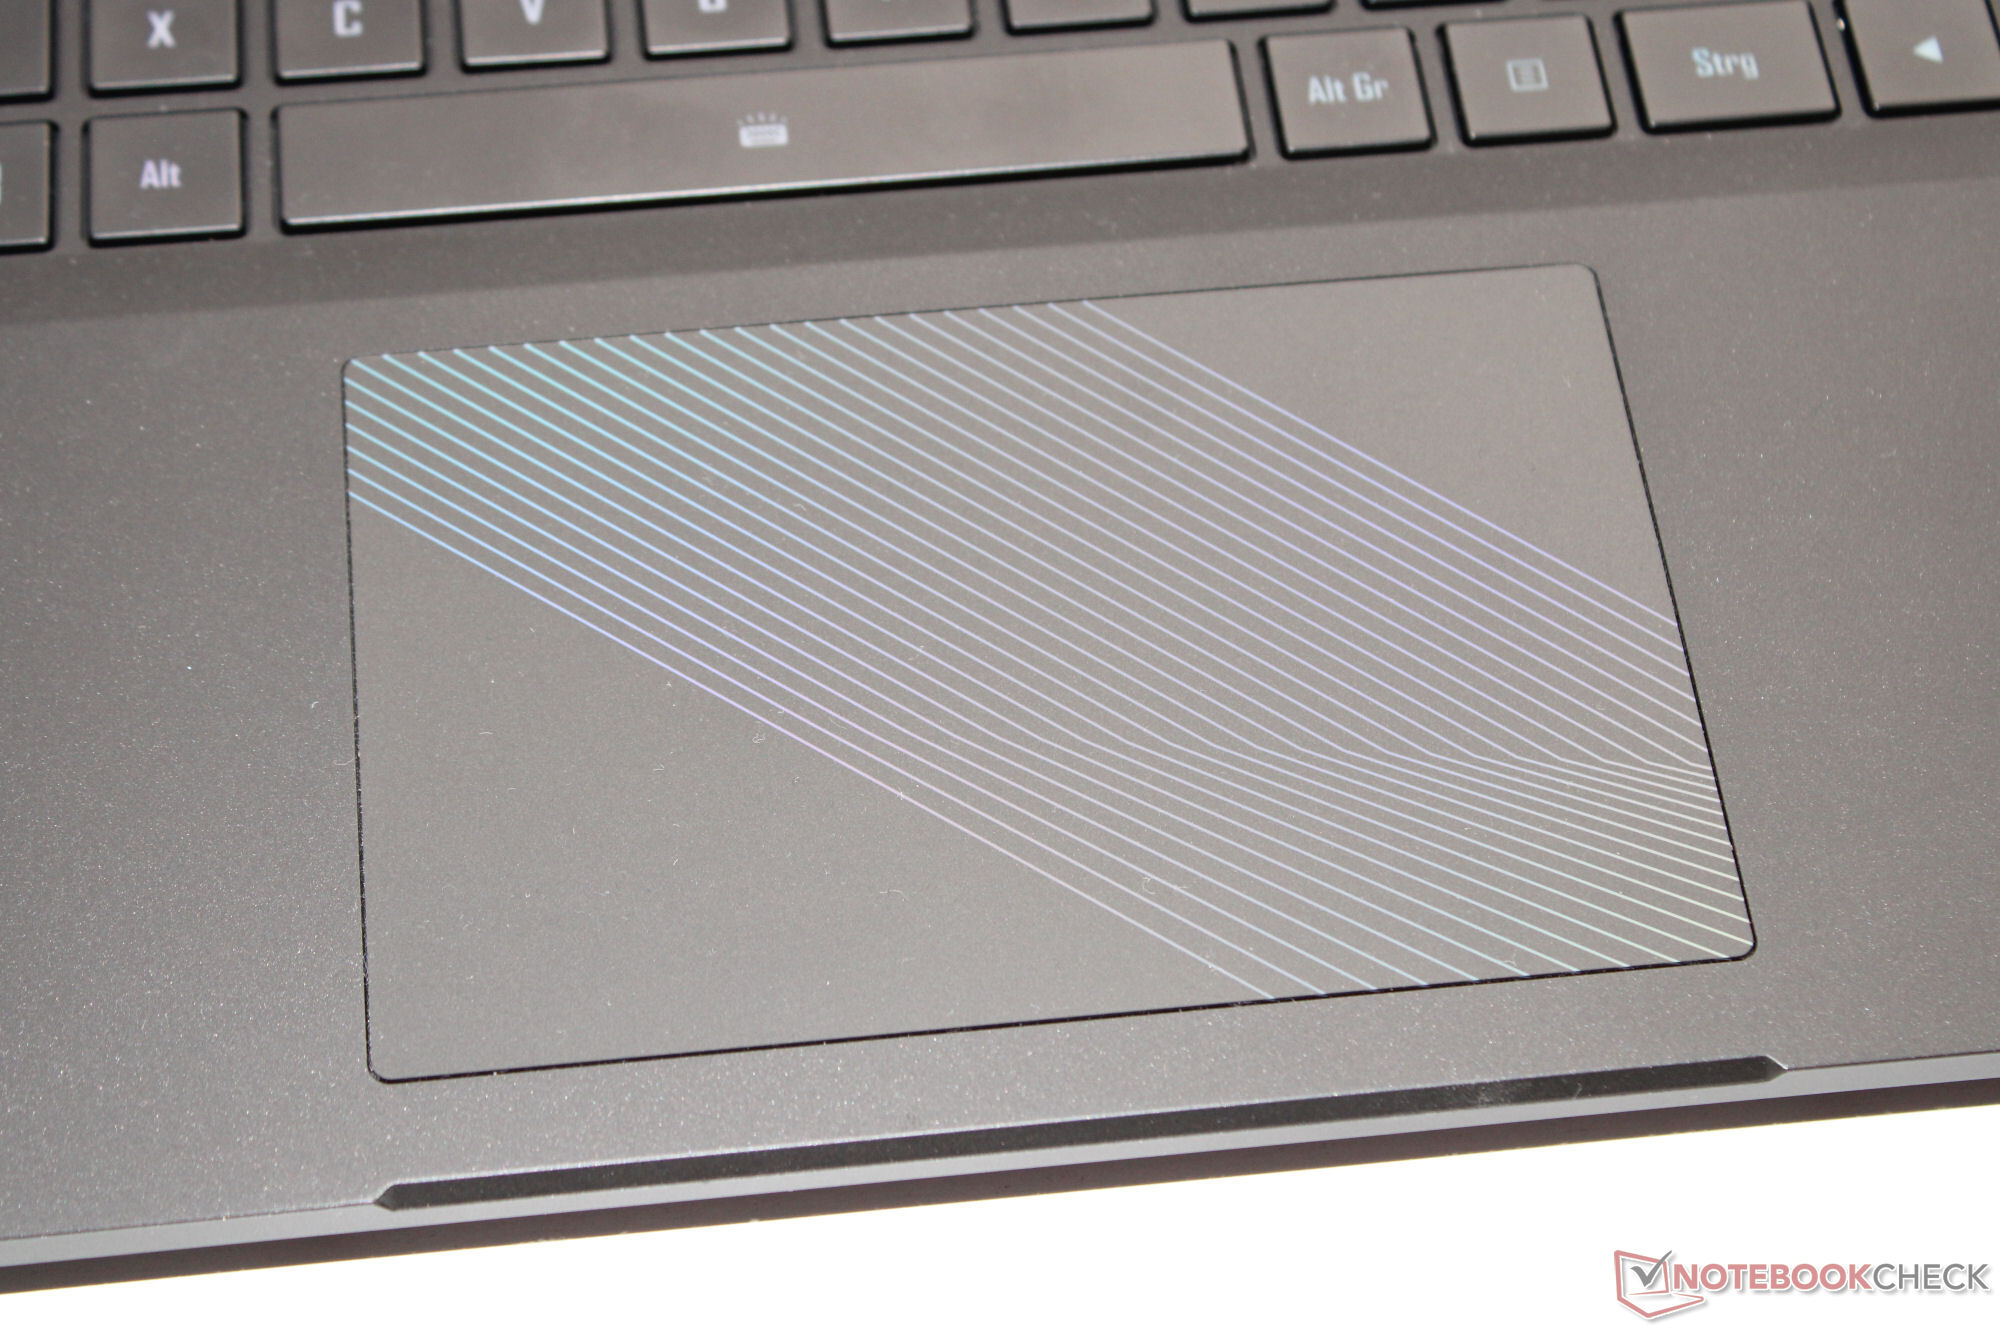
Touchpad
Un click pad (12,1 x 7,6 cm) sostituisce il mouse e le dita scivolano piacevolmente sulla sua superficie liscia. Ha un'alzata breve e un chiaro punto di pressione.
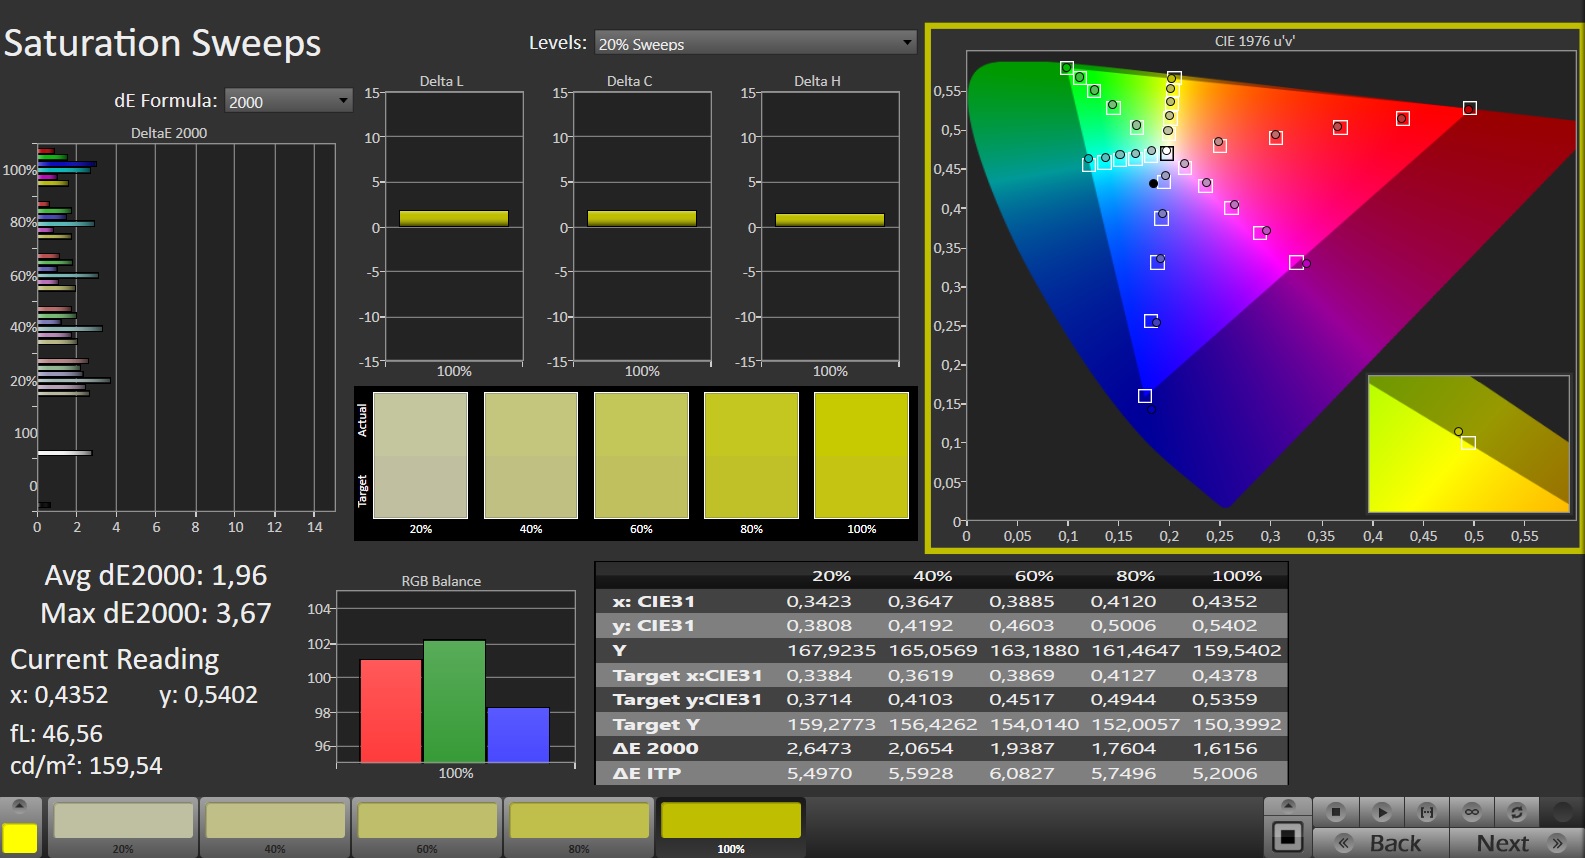
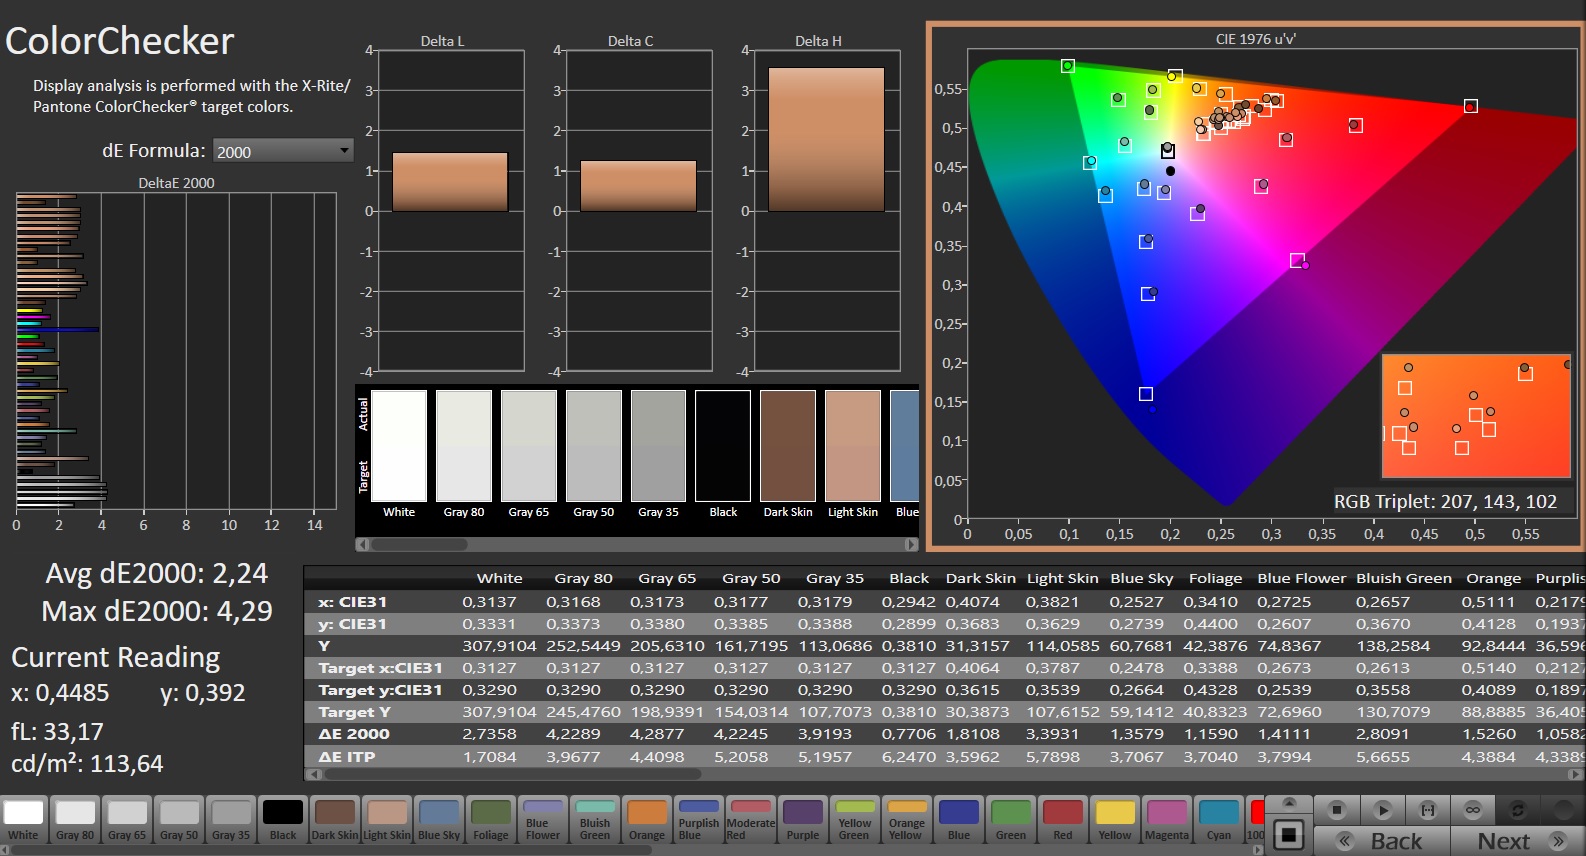
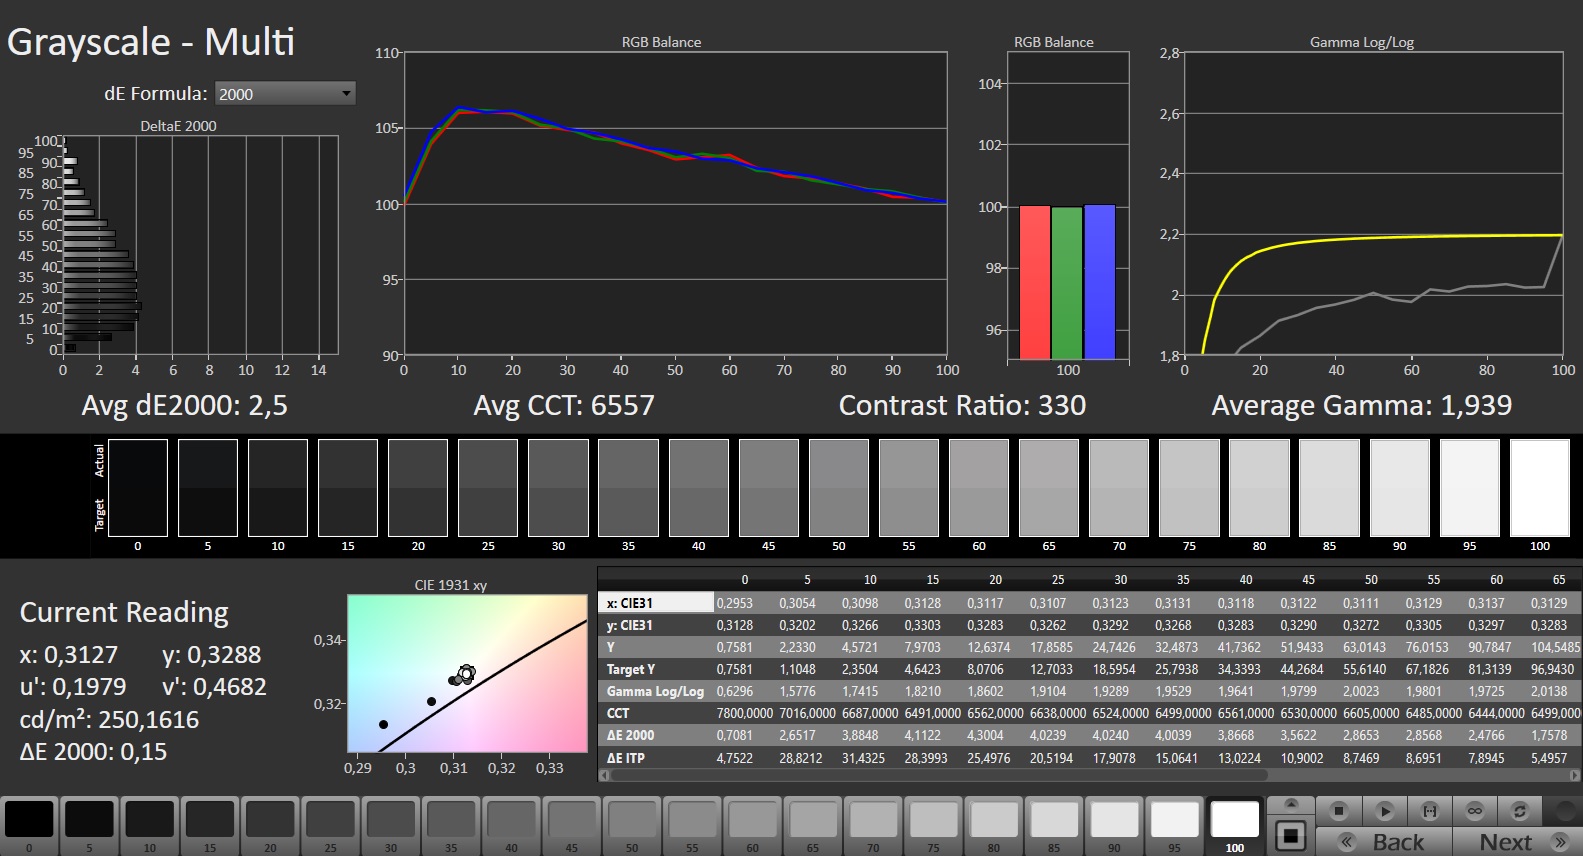
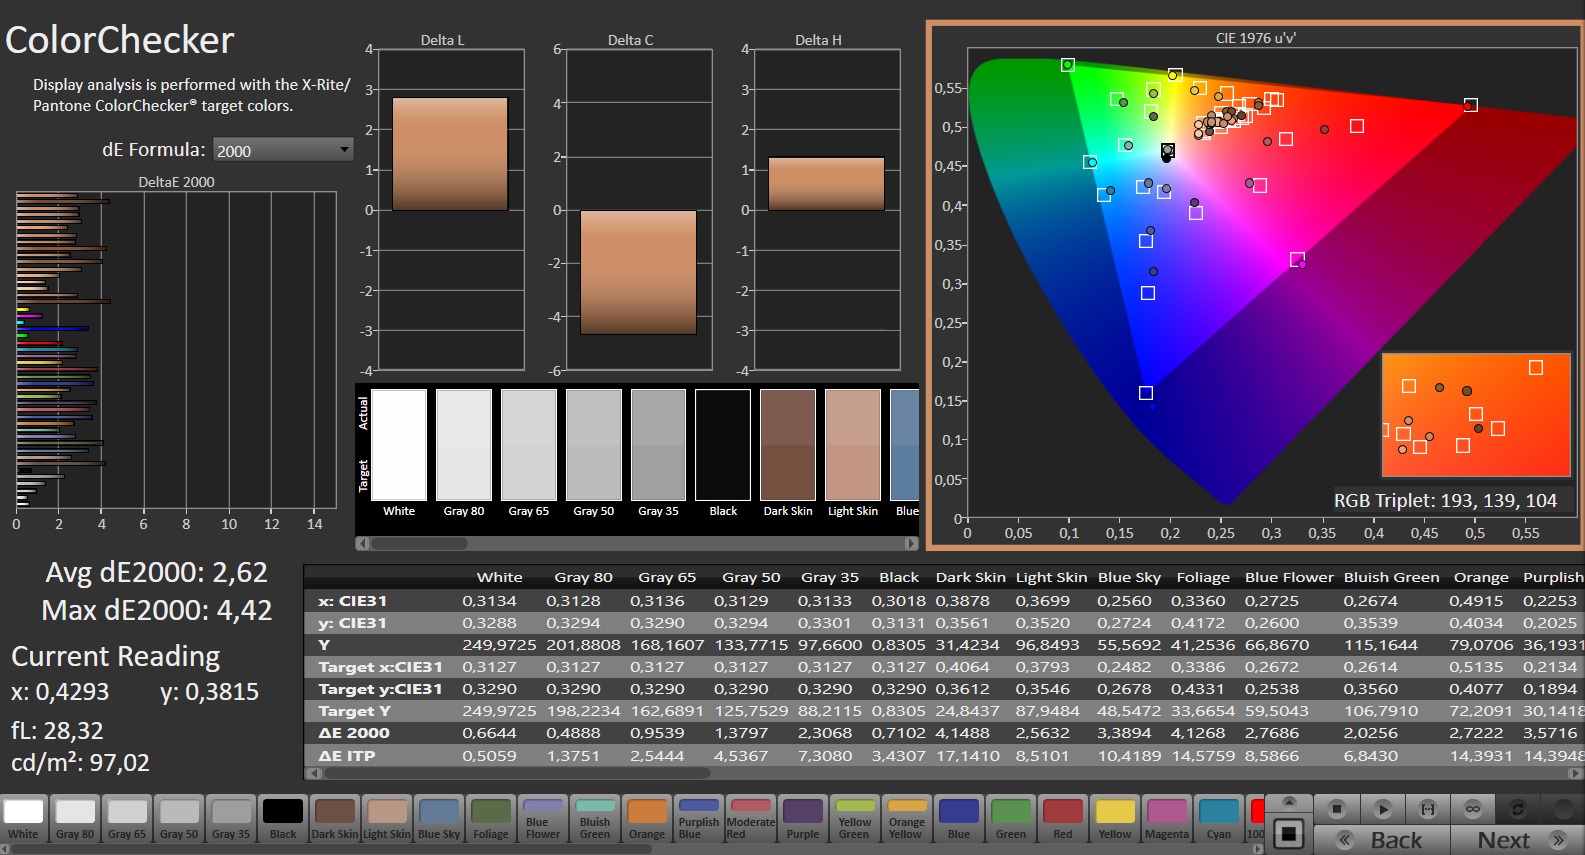
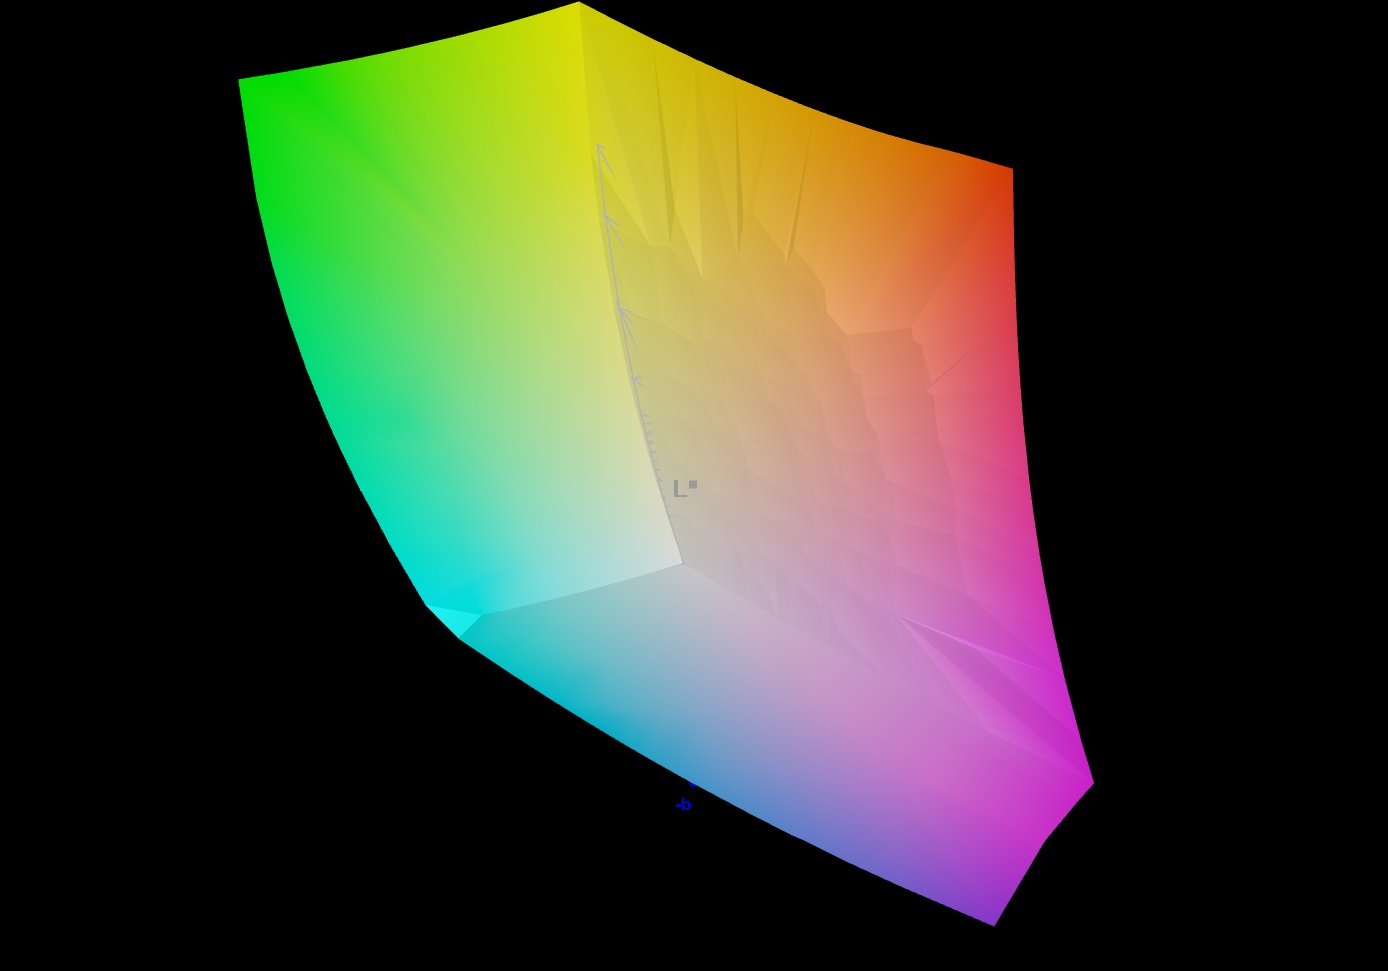
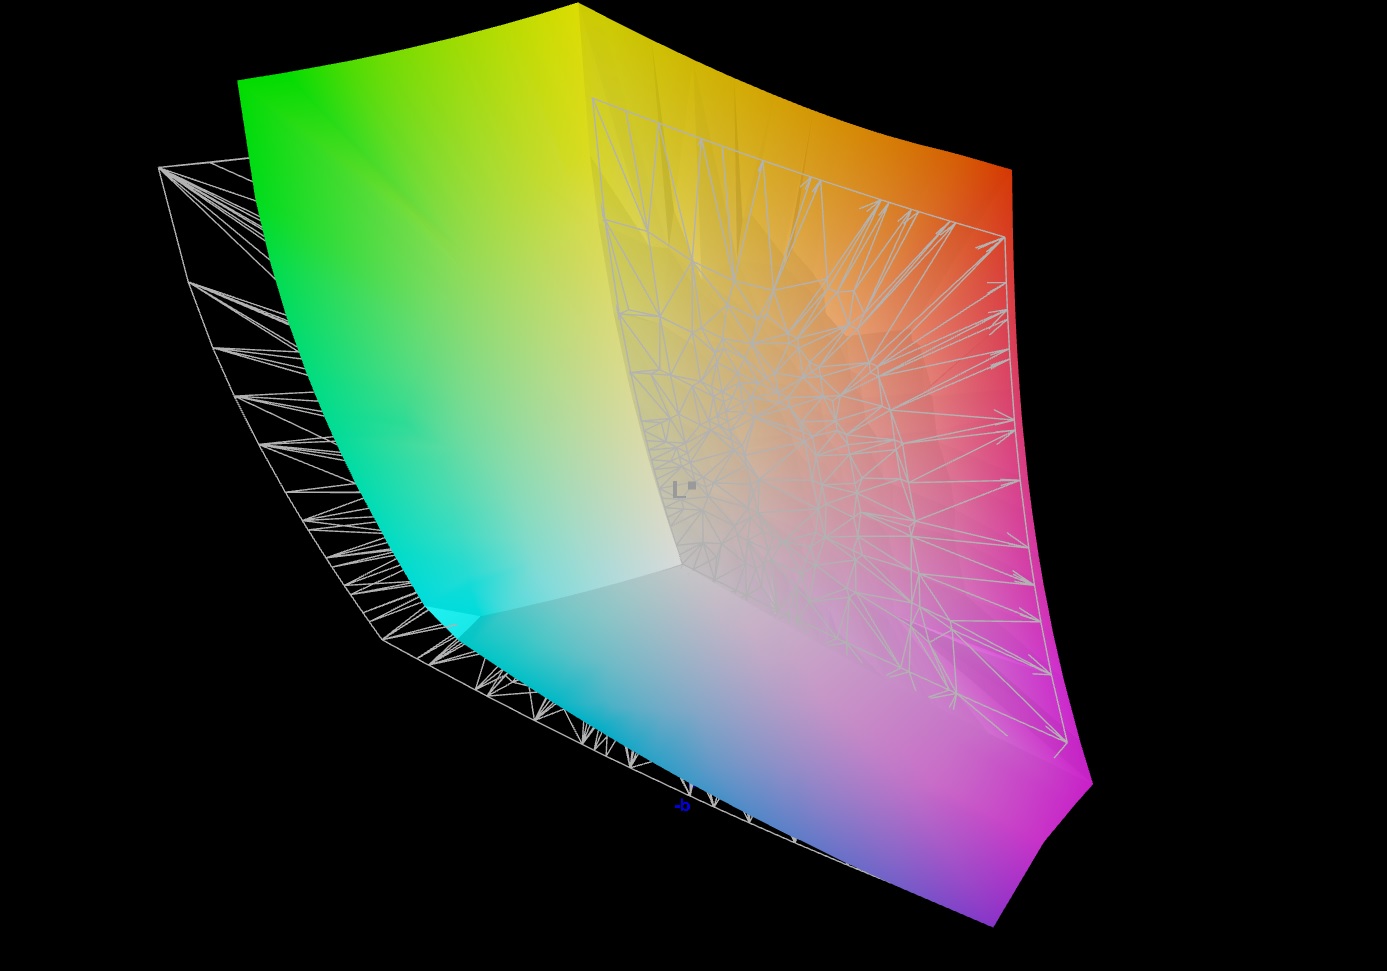
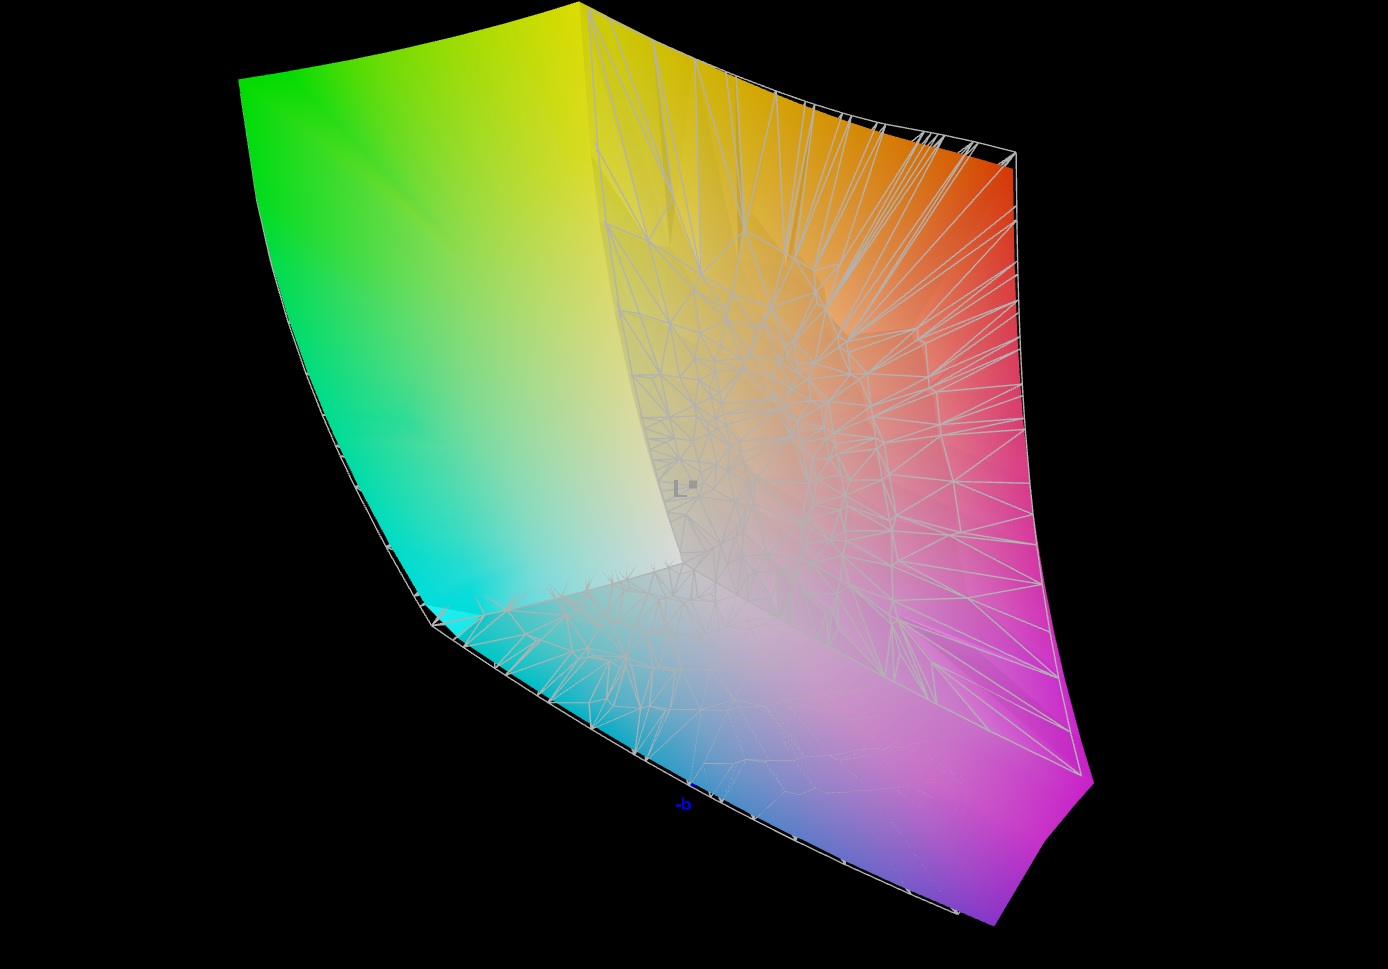
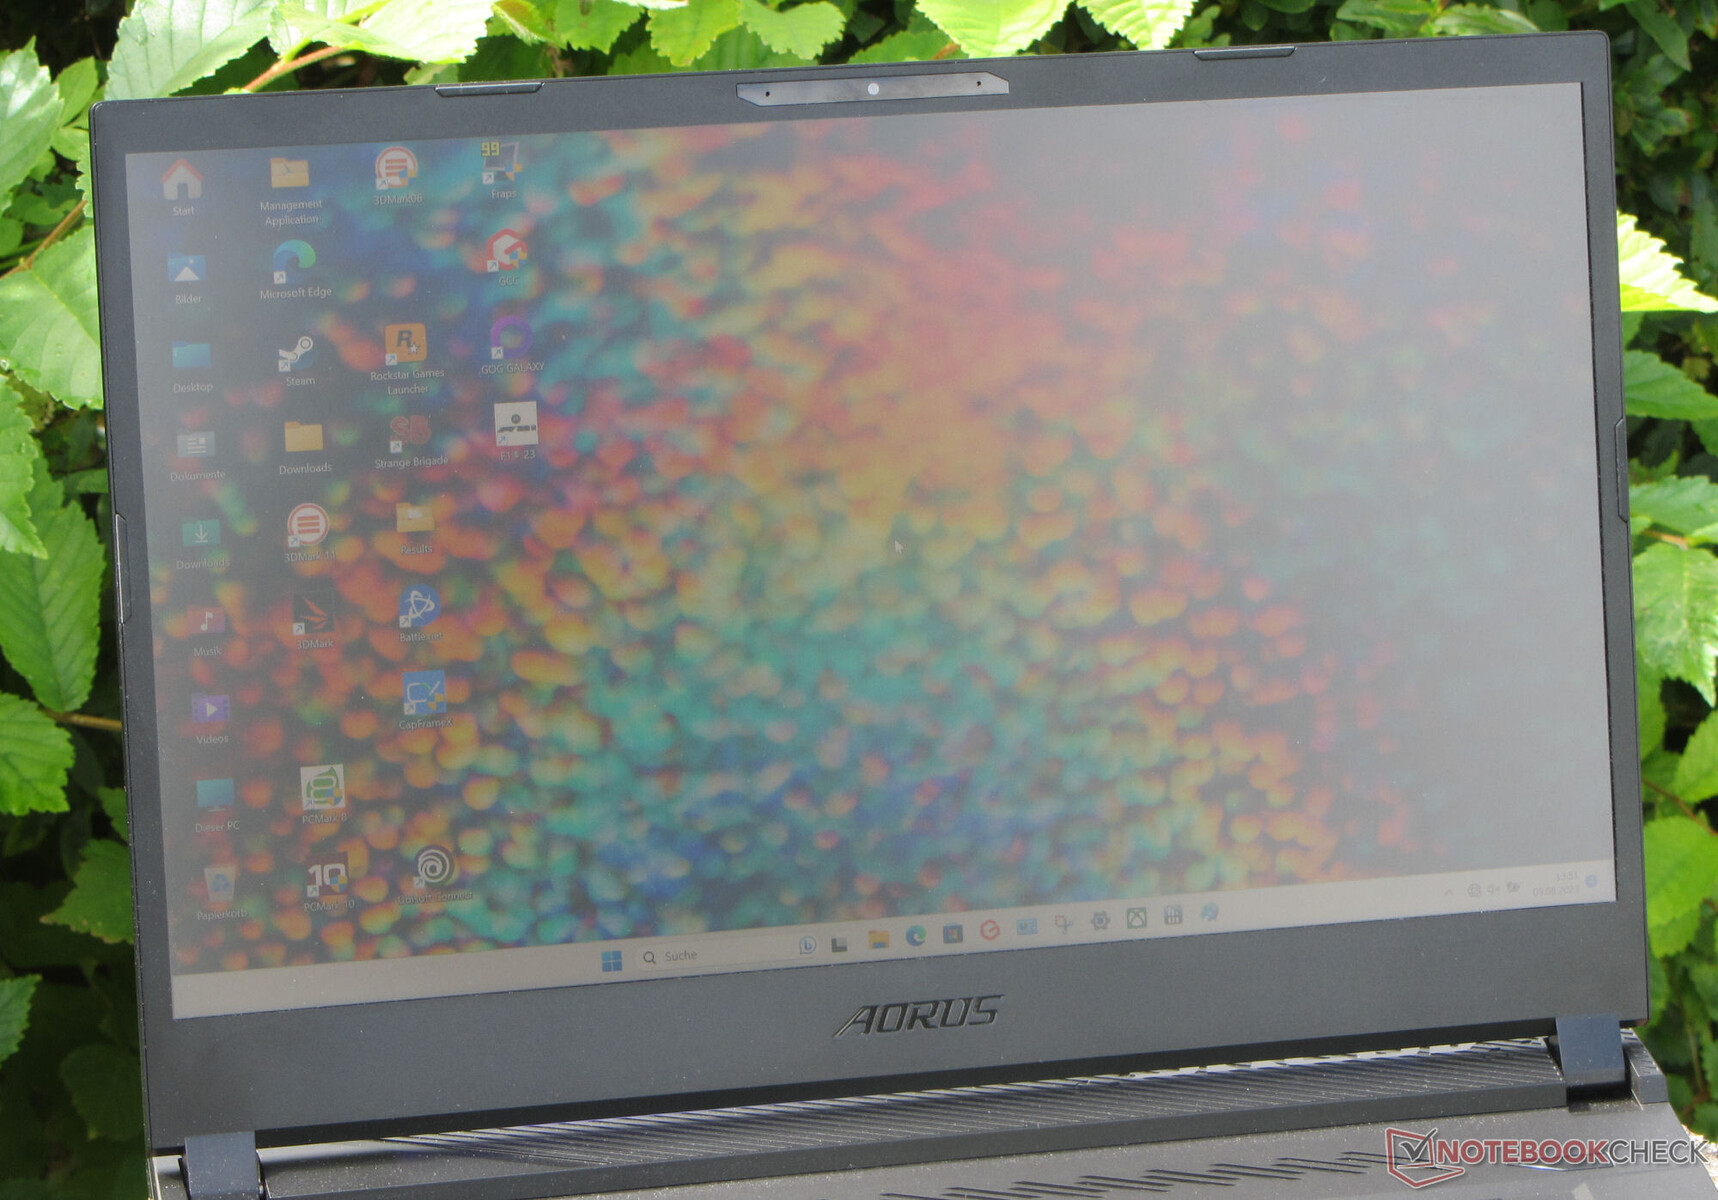
Display - Un pannello QHD con copertura DCI-P3
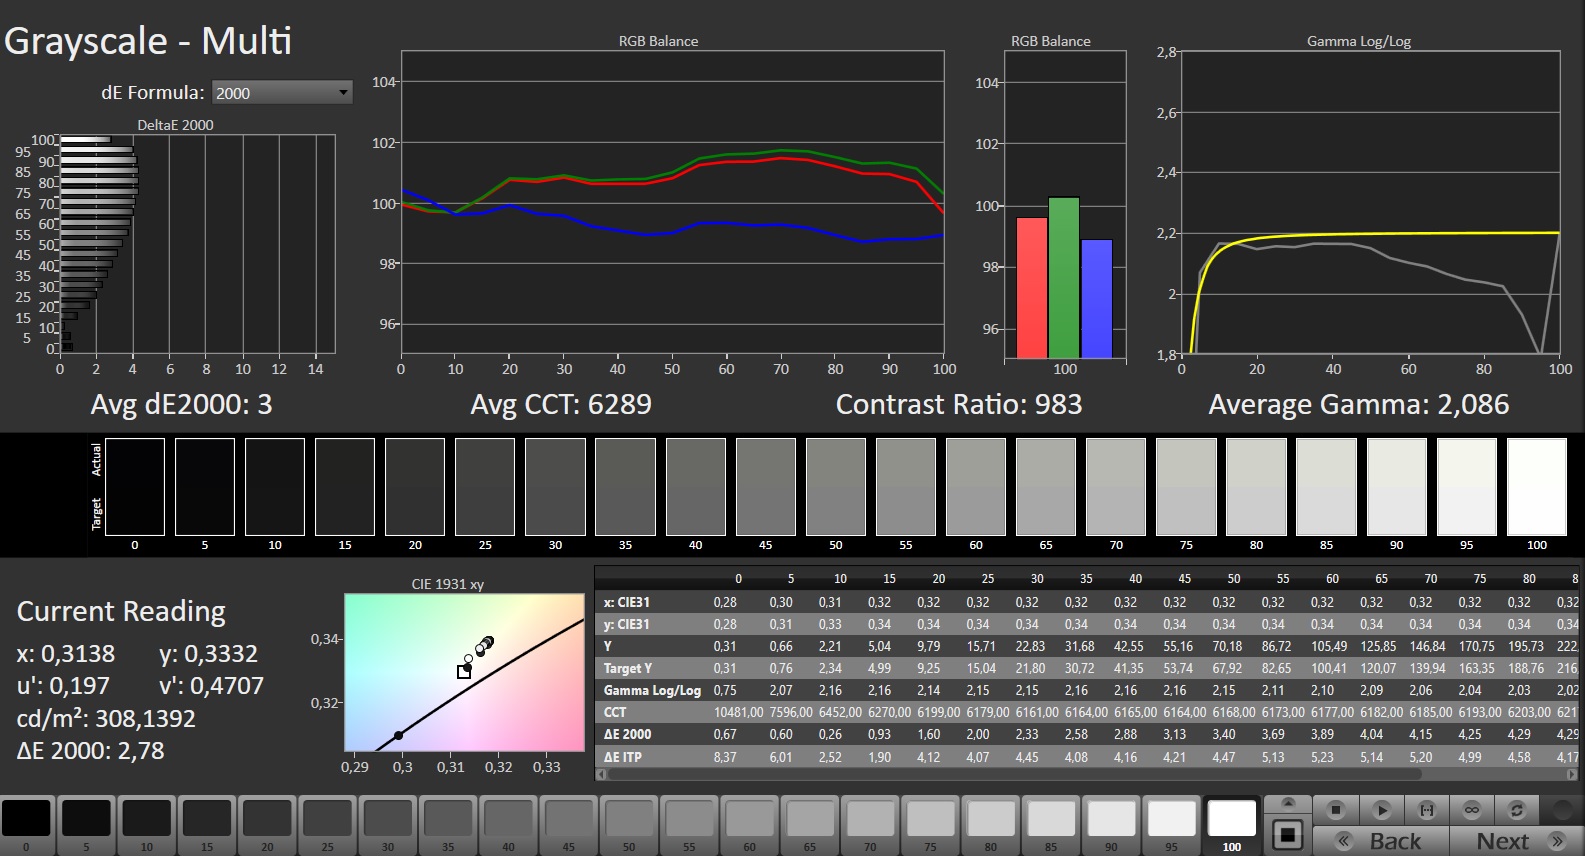
Lo schermo a 165 Hz a reazione rapida guadagna punti grazie alla superficie opaca e all'assenza di sfarfallio PWM. Il display da 15,6 pollici (2.560 x 1.440 pixel, IPS), con un rapporto di 16:9, ha raggiunto livelli di luminosità e contrasto che non hanno raggiunto i rispettivi obiettivi (> 300 cd/m² e 1.000:1).
| |||||||||||||||||||||||||
Distribuzione della luminosità: 82 %
Al centro con la batteria: 299 cd/m²
Contrasto: 965:1 (Nero: 0.31 cd/m²)
ΔE ColorChecker Calman: 2.24 | ∀{0.5-29.43 Ø4.71}
calibrated: 2.62
ΔE Greyscale Calman: 3 | ∀{0.09-98 Ø4.96}
85.7% AdobeRGB 1998 (Argyll 3D)
99.9% sRGB (Argyll 3D)
98.2% Display P3 (Argyll 3D)
Gamma: 2.086
CCT: 6289 K
| Aorus 15 BSF Sharp LQ156T1JW05, IPS, 2560x1440, 15.6" | HP Omen Transcend 16 AUOA3A6, Mini-LED, 2560x1600, 16" | MSI Pulse 17 B13VGK AU Optronics B173HAN04.9, IPS, 1920x1080, 17.3" | Lenovo Legion Slim 7i 16 Gen 8 CSOT T3 MNG007DA2-3, IPS, 2560x1600, 16" | Acer Nitro 16 AN16-41 BOE CQ NE16QDM-NY1, IPS, 2560x1600, 16" | Asus TUF Gaming A16 FA617XS BOE NE160WUM-NX2, IPS, 1920x1200, 16" | |
|---|---|---|---|---|---|---|
| Display | 1% | -52% | -15% | -17% | -17% | |
| Display P3 Coverage (%) | 98.2 | 99.2 1% | 38.4 -61% | 70.4 -28% | 67.9 -31% | 69.3 -29% |
| sRGB Coverage (%) | 99.9 | 100 0% | 57.5 -42% | 99.4 -1% | 99.1 -1% | 97.3 -3% |
| AdobeRGB 1998 Coverage (%) | 85.7 | 87.6 2% | 39.7 -54% | 72.5 -15% | 69.9 -18% | 70.7 -18% |
| Response Times | -219% | -207% | -17% | 16% | -41% | |
| Response Time Grey 50% / Grey 80% * (ms) | 11.3 ? | 26.4 ? -134% | 31.2 ? -176% | 12 ? -6% | 11 ? 3% | 15.6 ? -38% |
| Response Time Black / White * (ms) | 7 ? | 28.2 ? -303% | 23.6 ? -237% | 8.9 ? -27% | 5 ? 29% | 10 ? -43% |
| PWM Frequency (Hz) | 3506 ? | |||||
| Screen | 234% | -42% | 22% | 25% | 23% | |
| Brightness middle (cd/m²) | 299 | 791.1 165% | 254 -15% | 474.6 59% | 520 74% | 301 1% |
| Brightness (cd/m²) | 282 | 800 184% | 250 -11% | 445 58% | 494 75% | 294 4% |
| Brightness Distribution (%) | 82 | 95 16% | 91 11% | 86 5% | 91 11% | 94 15% |
| Black Level * (cd/m²) | 0.31 | 0.04 87% | 0.14 55% | 0.39 -26% | 0.39 -26% | 0.21 32% |
| Contrast (:1) | 965 | 19778 1950% | 1814 88% | 1217 26% | 1333 38% | 1433 48% |
| Colorchecker dE 2000 * | 2.24 | 4.37 -95% | 4.52 -102% | 2.12 5% | 1.94 13% | 1.79 20% |
| Colorchecker dE 2000 max. * | 4.29 | 10.39 -142% | 21.22 -395% | 4.73 -10% | 5.62 -31% | 3.48 19% |
| Colorchecker dE 2000 calibrated * | 2.62 | 1.04 60% | 4.52 -73% | 0.57 78% | 0.74 72% | 1.2 54% |
| Greyscale dE 2000 * | 3 | 6.5 -117% | 1 67% | 2.8 7% | 2.94 2% | 2.5 17% |
| Gamma | 2.086 105% | 2.28 96% | 2.44 90% | 2.22 99% | 2.37 93% | 2.265 97% |
| CCT | 6289 103% | 6000 108% | 6502 100% | 6542 99% | 6443 101% | 6157 106% |
| Media totale (Programma / Settaggio) | 5% /
120% | -100% /
-68% | -3% /
9% | 8% /
15% | -12% /
6% |
* ... Meglio usare valori piccoli
Il display ha mostrato una buona rappresentazione dei colori già nello stato in cui è stato consegnato: Con una deviazione di 2,24, l'obiettivo è stato raggiunto (DeltaE < 3). La calibrazione non ha portato ad alcuna differenza evidente. L'accuratezza del colore è presente: Il pannello è in grado di rappresentare completamente gli spazi colore sRGB e DCI-P3 e l'86% dello spazio Adobe RGB.

Tempi di risposta del Display
| ↔ Tempi di risposta dal Nero al Bianco | ||
|---|---|---|
| 7 ms ... aumenta ↗ e diminuisce ↘ combinato | ↗ 3.4 ms Incremento | 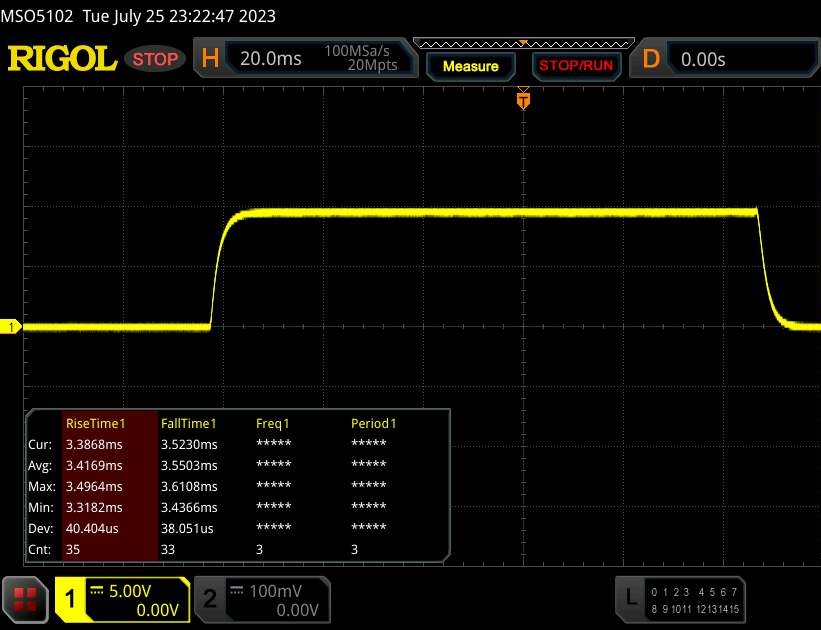 |
| ↘ 3.6 ms Calo | ||
| Lo schermo ha mostrato valori di risposta molto veloci nei nostri tests ed è molto adatto per i gaming veloce. In confronto, tutti i dispositivi di test variano da 0.1 (minimo) a 240 (massimo) ms. » 21 % di tutti i dispositivi è migliore. Questo significa che i tempi di risposta rilevati sono migliori rispettto alla media di tutti i dispositivi testati (19.8 ms). | ||
| ↔ Tempo di risposta dal 50% Grigio all'80% Grigio | ||
| 11.3 ms ... aumenta ↗ e diminuisce ↘ combinato | ↗ 5.2 ms Incremento | 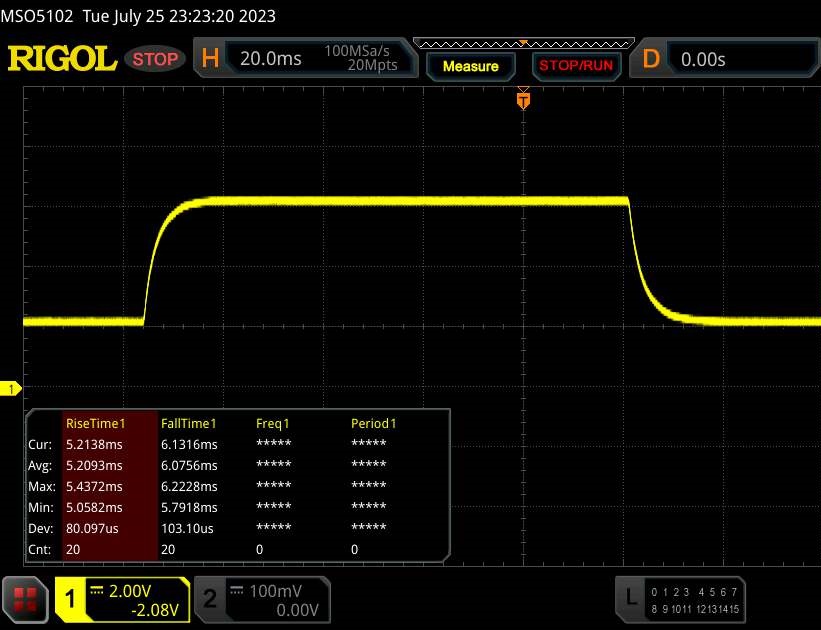 |
| ↘ 6.1 ms Calo | ||
| Lo schermo mostra buoni tempi di risposta durante i nostri tests, ma potrebbe essere troppo lento per i gamers competitivi. In confronto, tutti i dispositivi di test variano da 0.165 (minimo) a 636 (massimo) ms. » 25 % di tutti i dispositivi è migliore. Questo significa che i tempi di risposta rilevati sono migliori rispettto alla media di tutti i dispositivi testati (31 ms). | ||
Sfarfallio dello schermo / PWM (Pulse-Width Modulation)
| flickering dello schermo / PWM non rilevato | 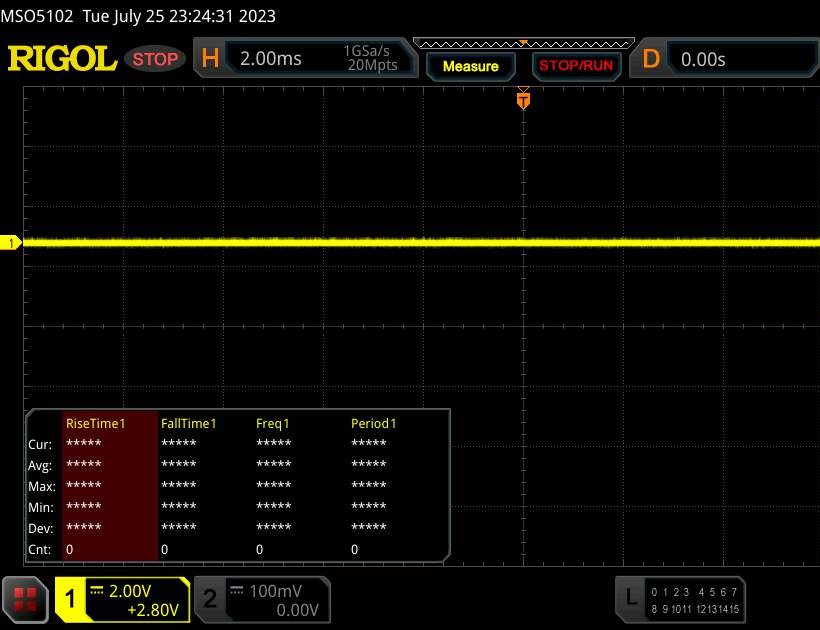 | ||
In confronto: 52 % di tutti i dispositivi testati non utilizza PWM per ridurre la luminosita' del display. Se è rilevato PWM, una media di 7747 (minimo: 5 - massimo: 343500) Hz è stata rilevata. | |||
Il pannello IPS, stabile nell'angolo di visione, può essere letto da qualsiasi posizione. All'esterno, è possibile leggere dallo schermo se il sole non splende troppo forte.

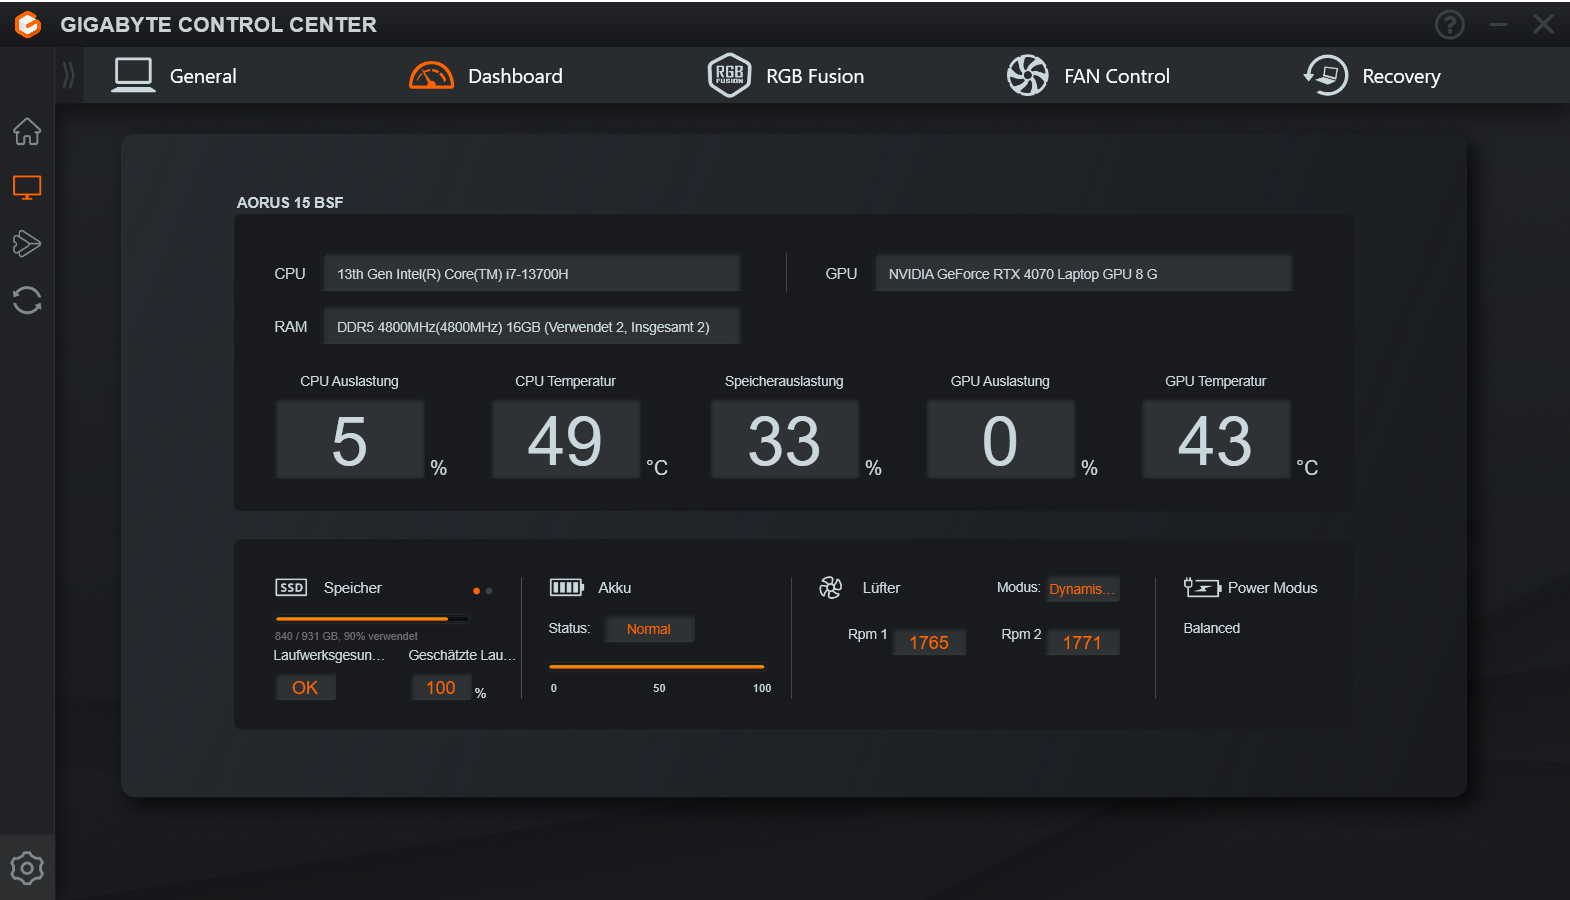
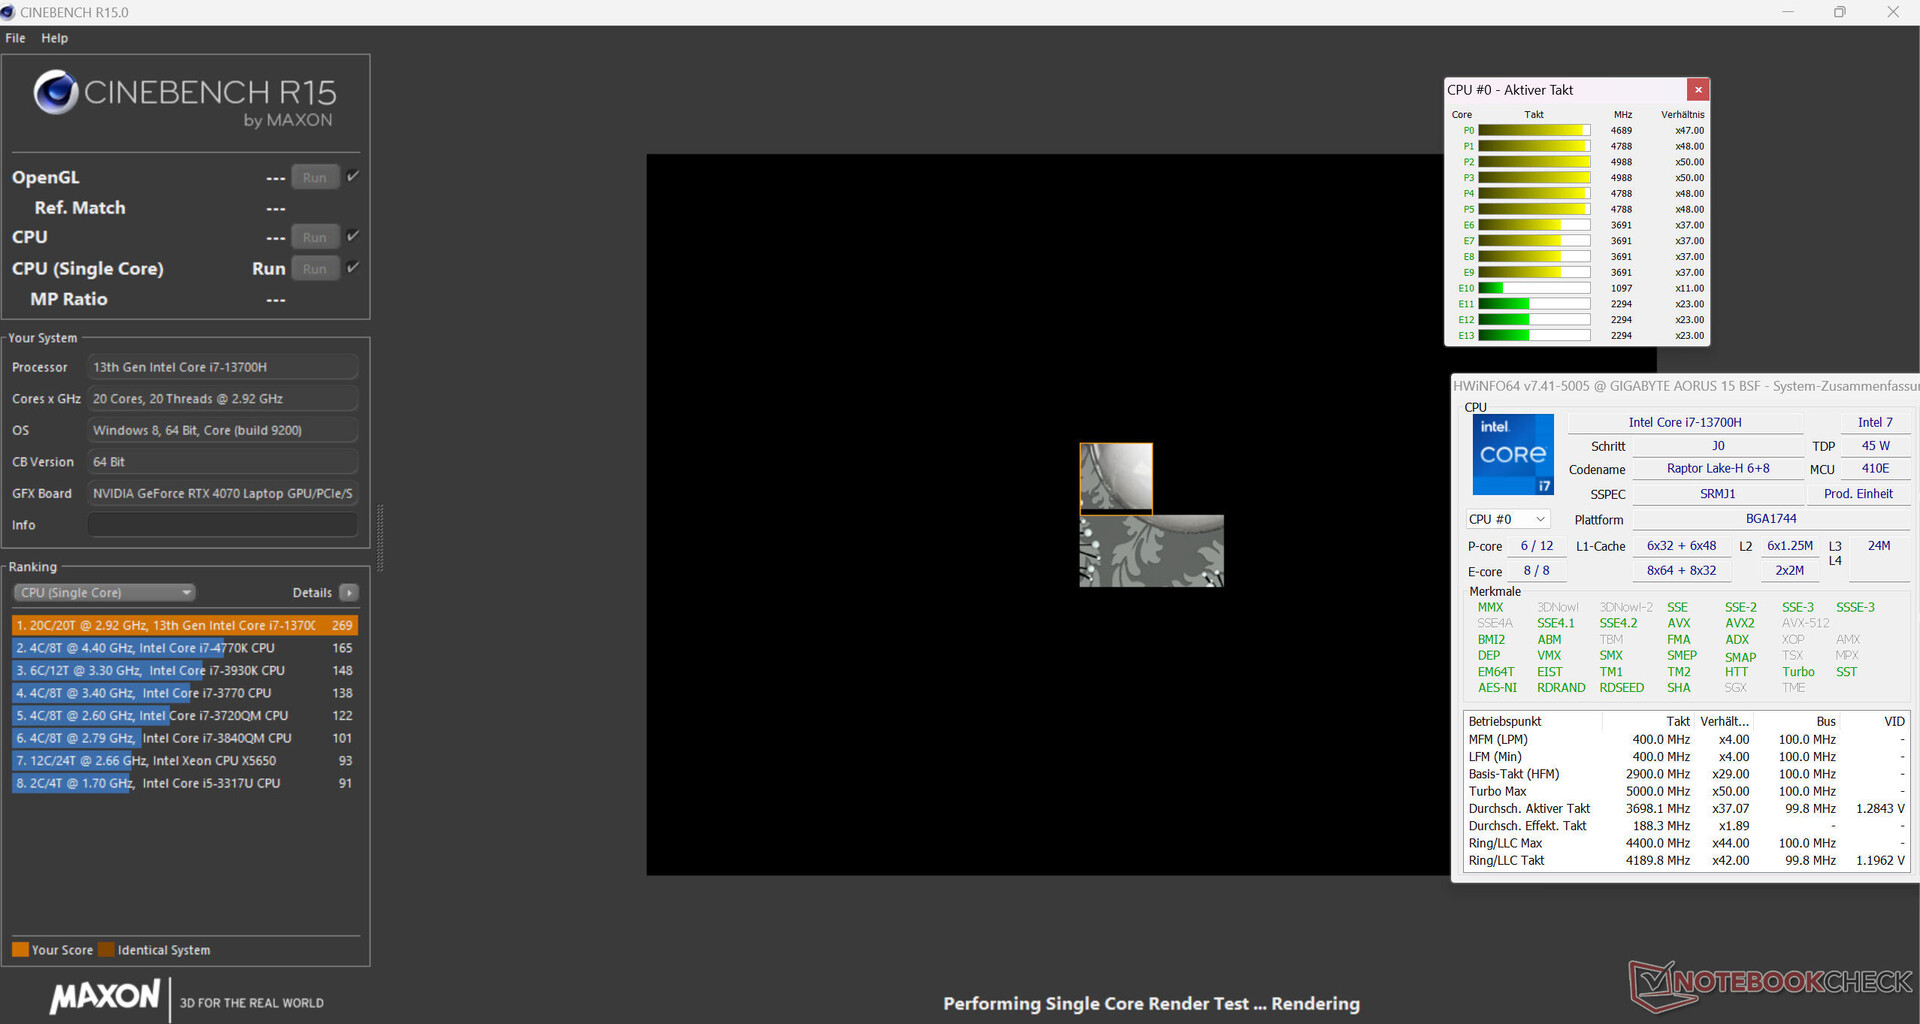
Prestazioni - Raptor Lake e Ada Lovelace alimentano il computer Gigabyte
L'Aorus 15 BSF è uno dei più potenti portatili da gioco di fascia media e può essere utilizzato in diversi campi. Le prestazioni necessarie sono fornite da Raptor Lake e Ada Lovelace. Questo dispositivo può essere acquistato a circa 1.700 dollari.
Condizioni di test
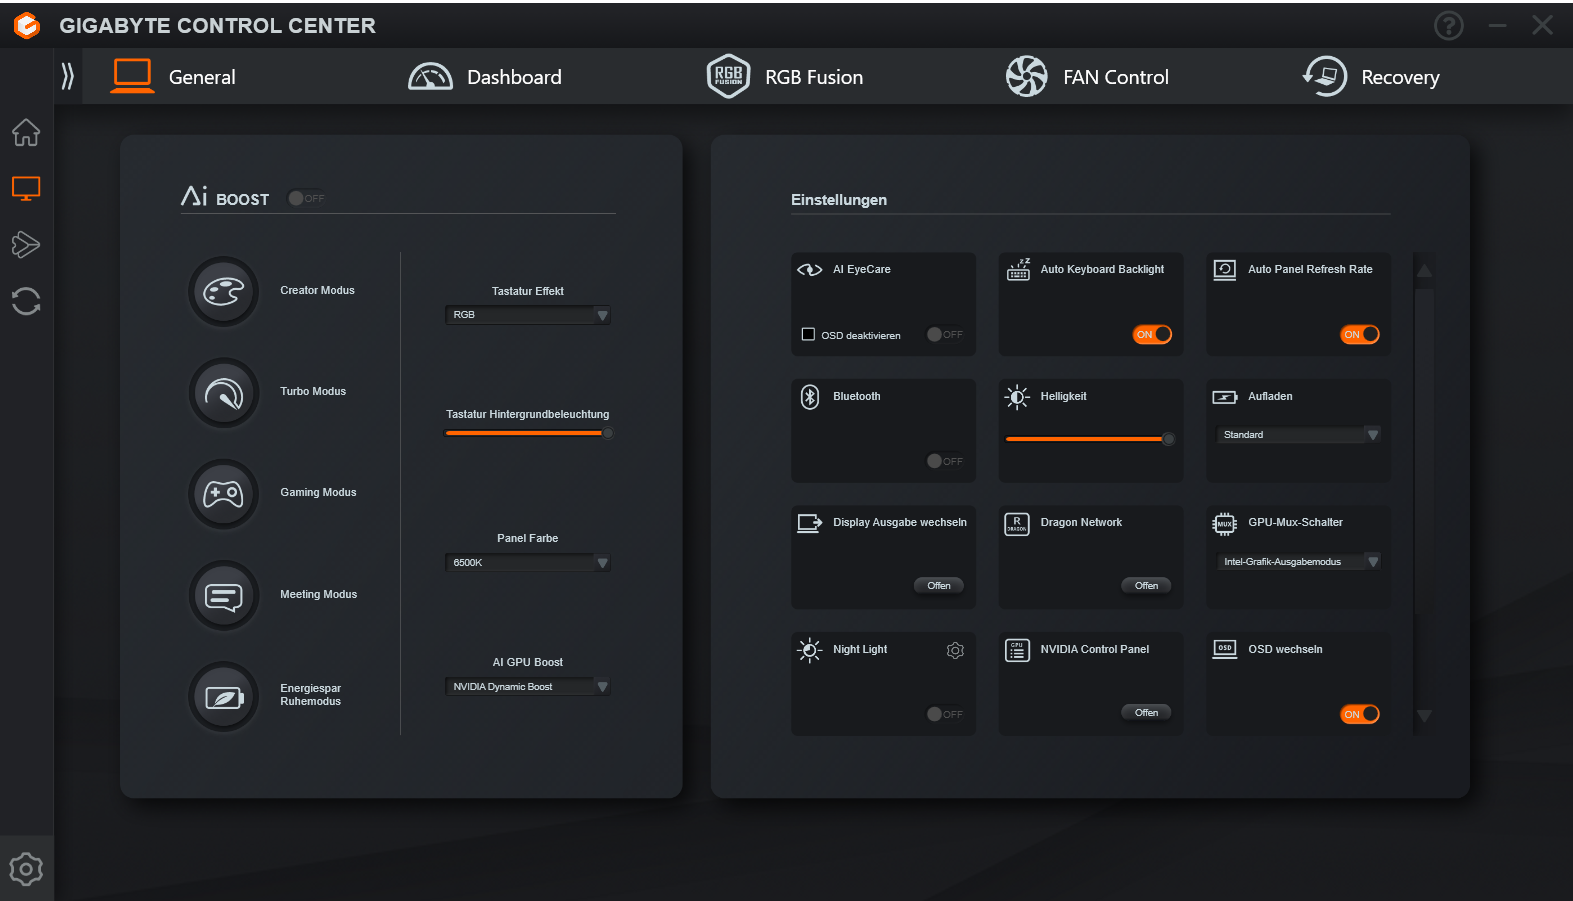
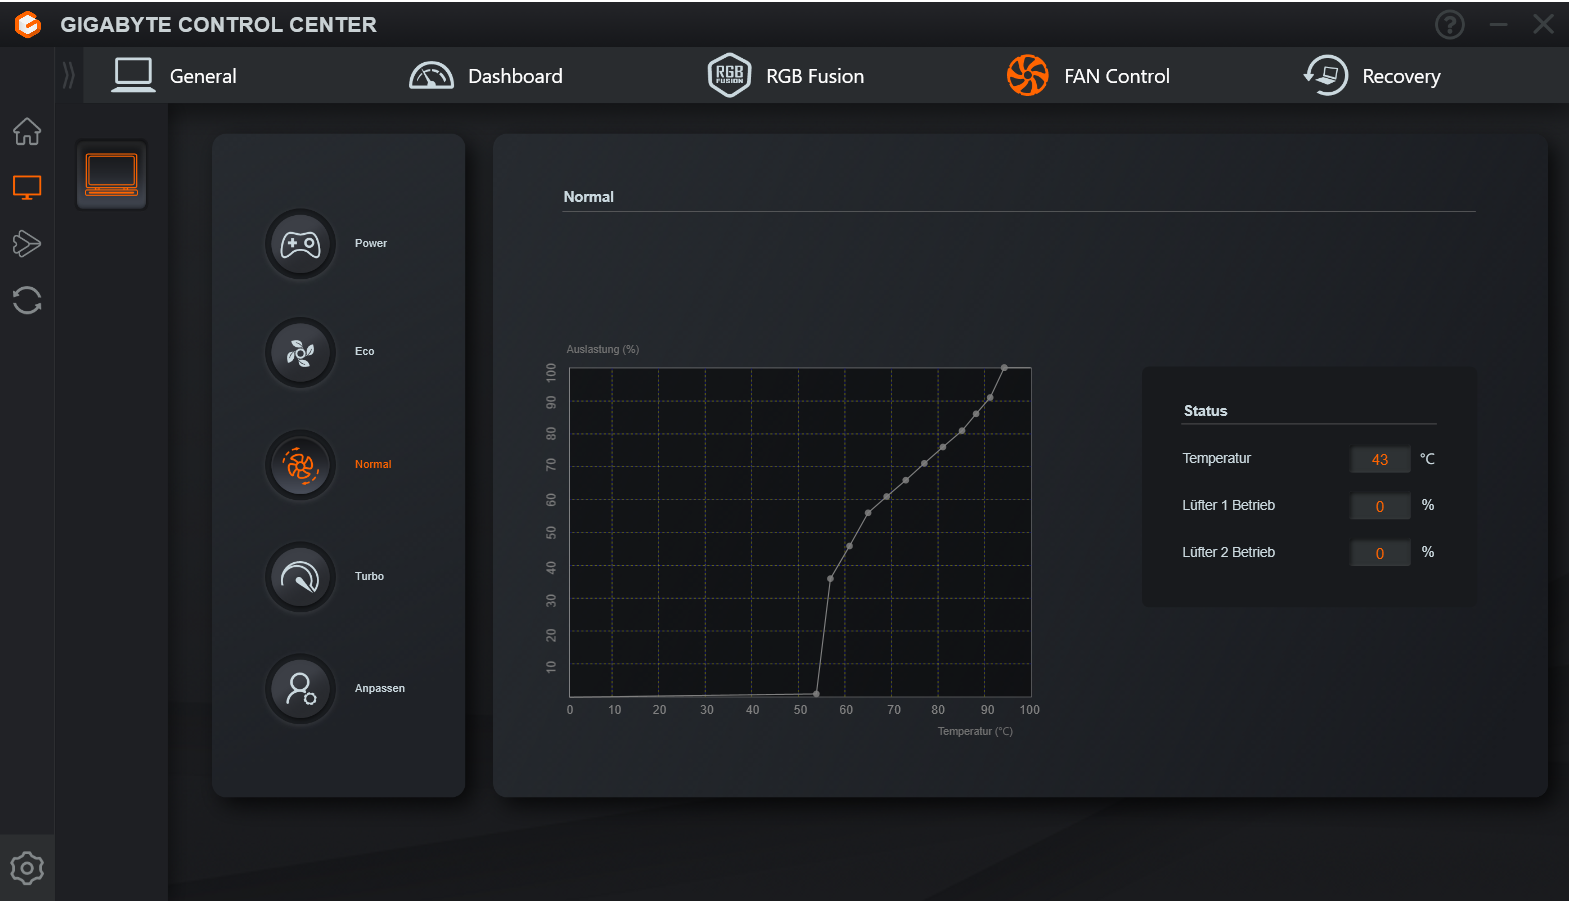
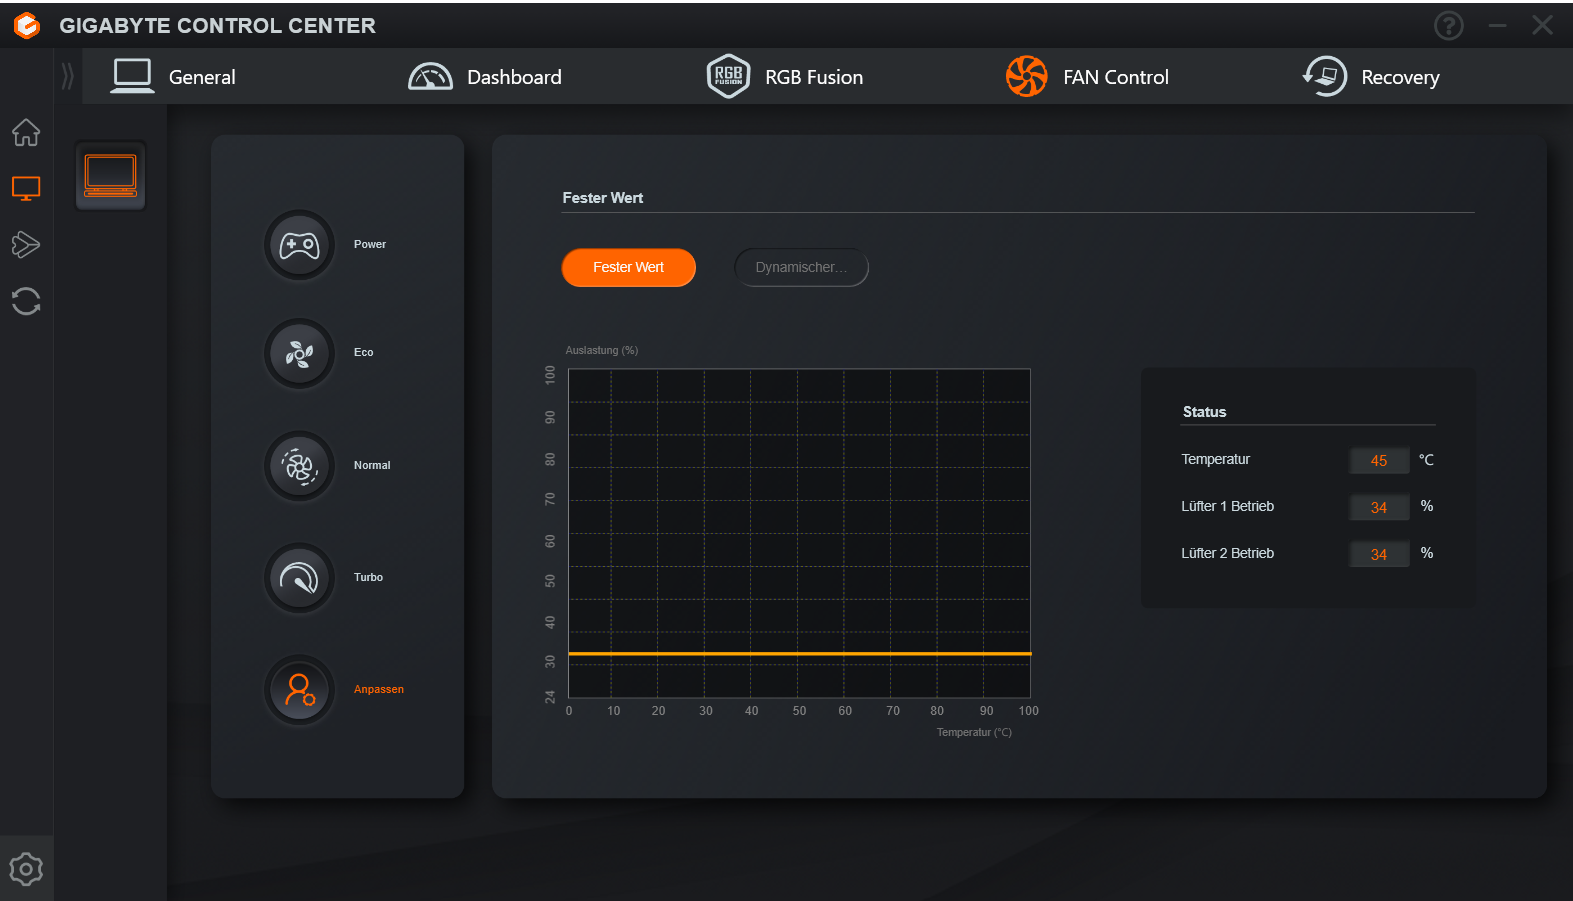
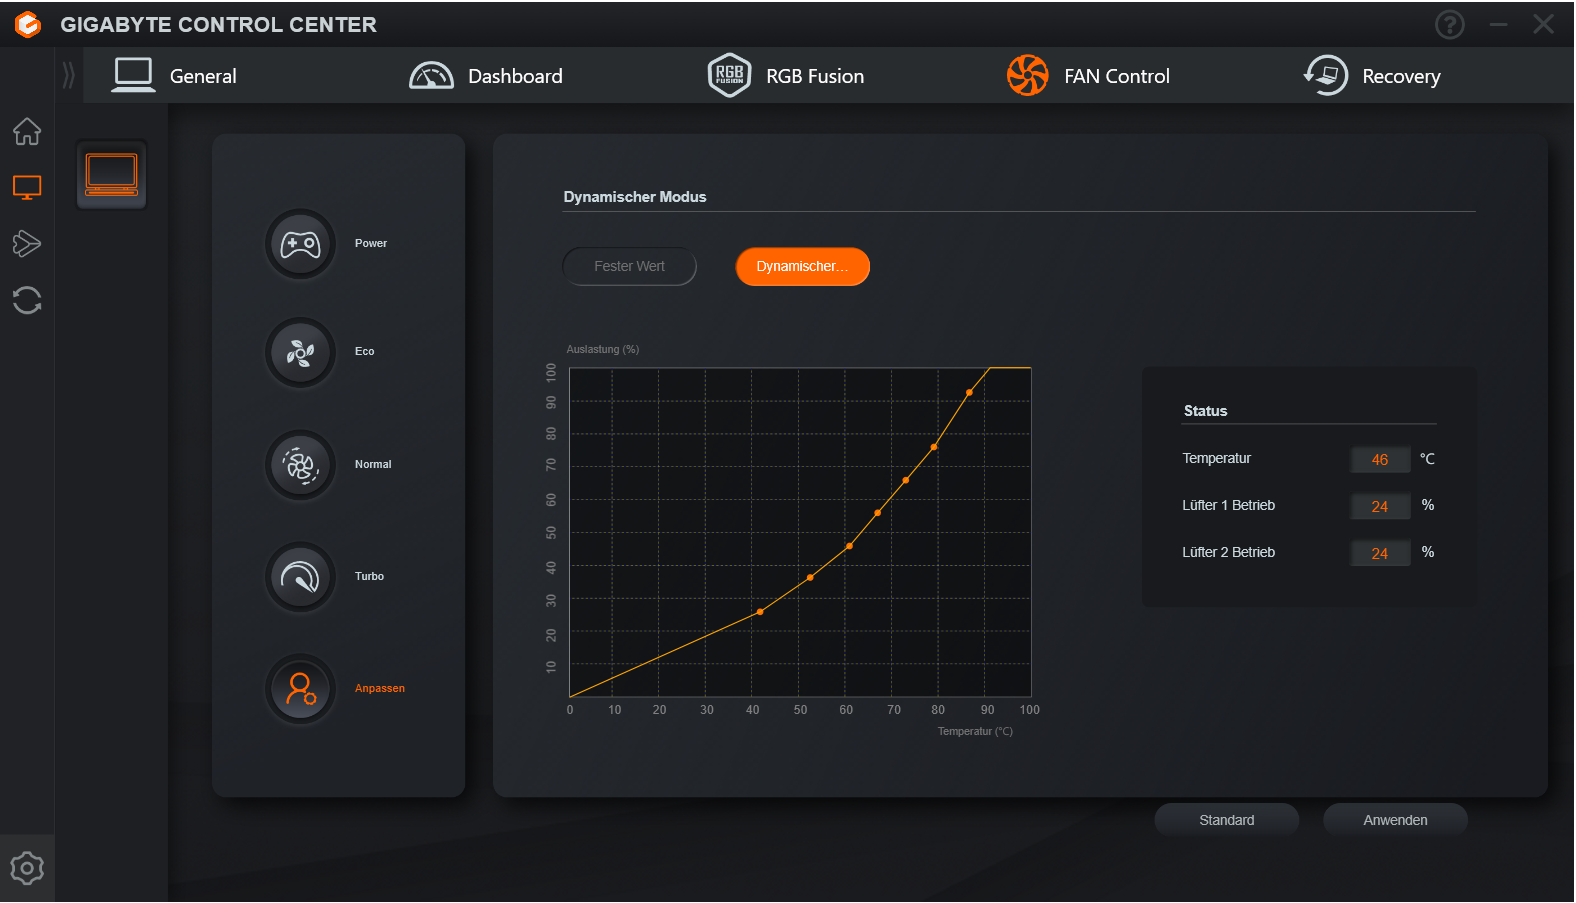
Il centro di controllo del computer (Gigabyte Control Center) offre una funzione AI Boost di livello superiore che abbiamo utilizzato in aggiunta alle tipiche modalità di prestazioni (vedere tabella). Successivamente, il Control Center ha selezionato il profilo appropriato: "Gaming Mode" e "Creator Mode" per i benchmark, "Energy Saving Sleep Mode" per i test della batteria.
| AI Boost | Creator | Turbo | Gaming | Meeting | Risparmio energetico Modalità Sleep | |
|---|---|---|---|---|---|---|
| Limite di potenza 1 (HWInfo) | 55-70 watt | 70 watt | 70 watt | 55 watt | 27 watt | 27 watt |
| Limite di potenza 2 (HWInfo) | 115 watt | 115 watt | 115 watt | 115 watt | 45 watt | 45 watt |
| Rumore (Witcher 3) | 53 dB(A) | 52 dB(A) | 55 dB(A) | 53 dB(A) | 46 dB(A) | 46 dB(A) |
| Prestazioni (Witcher 3) | 118 fps | 118 fps | 118 fps | 118 fps | 118 fps | 118 fps |
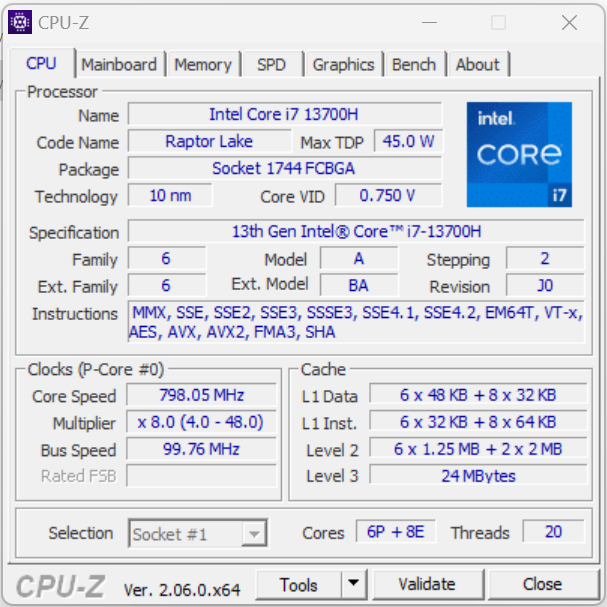
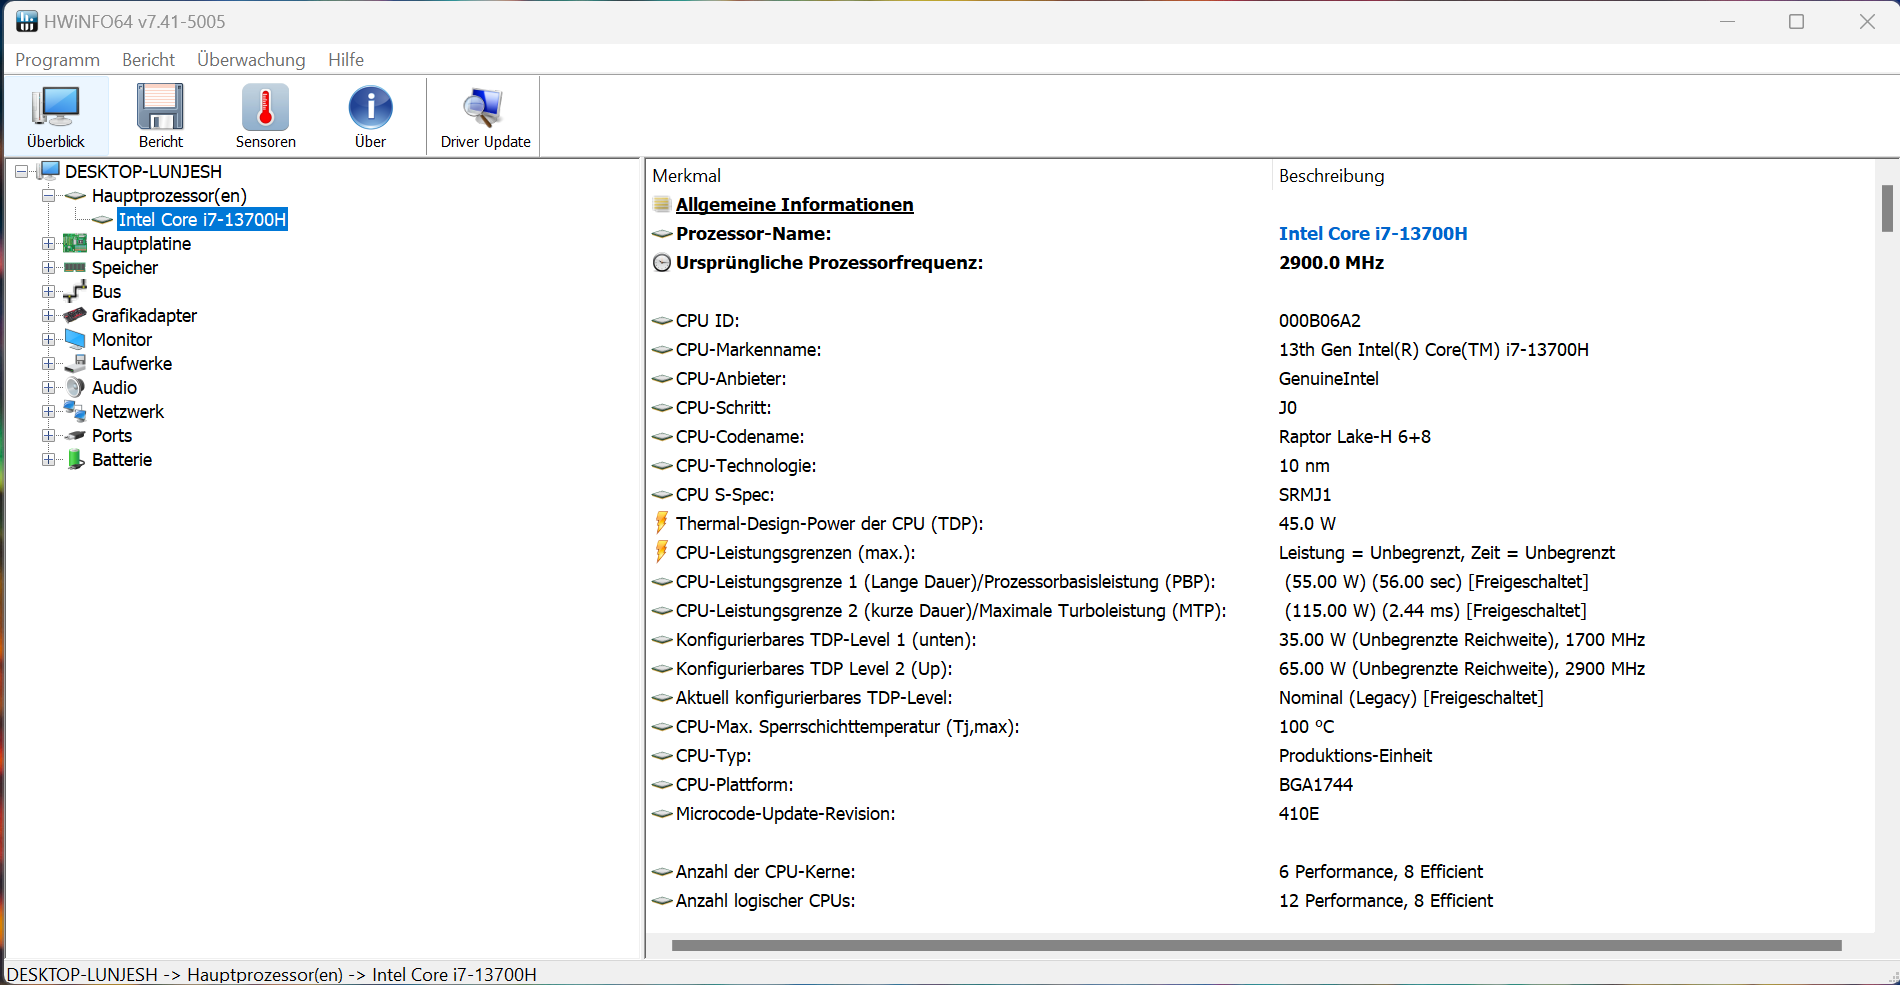
Processore
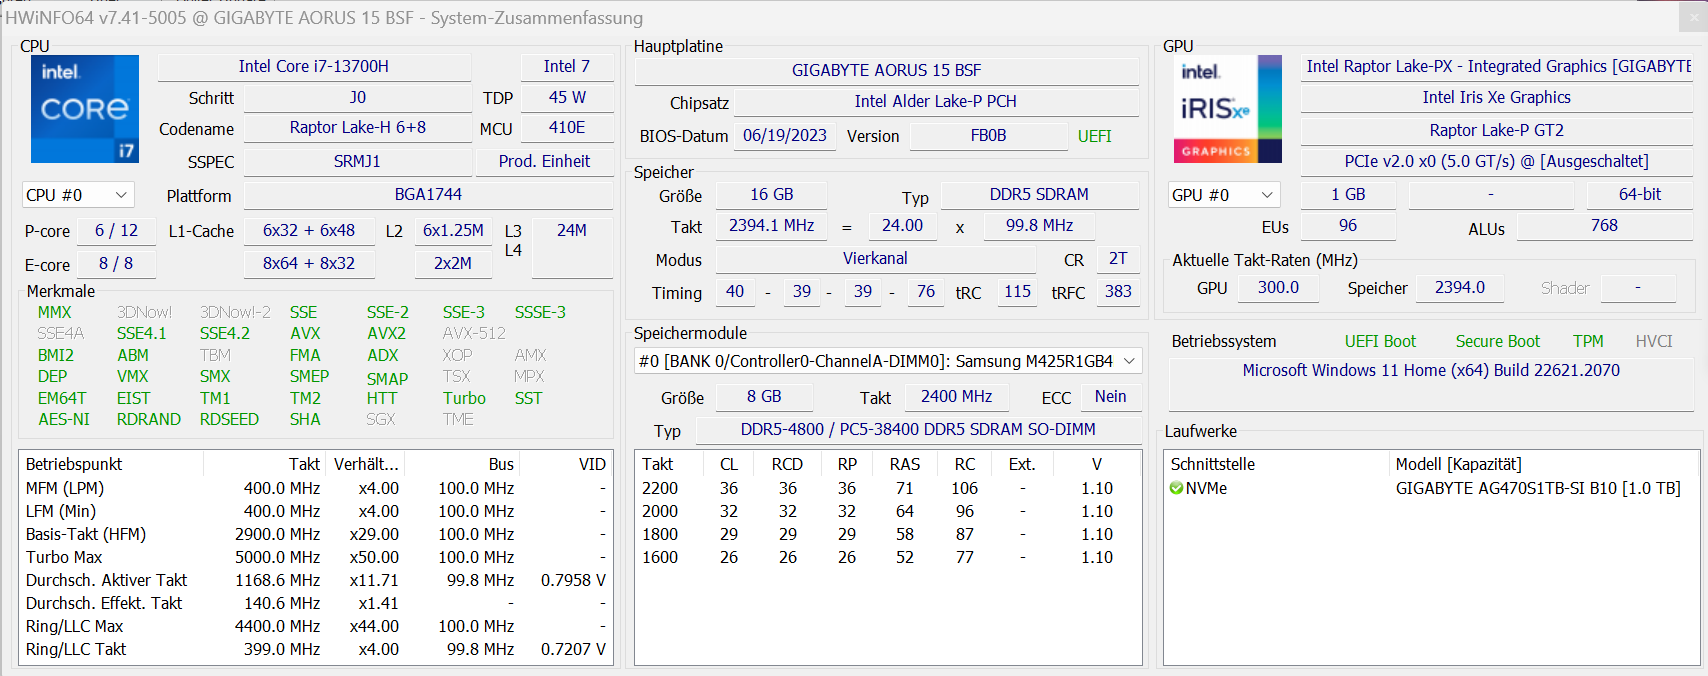
IlCore-i7-13700H(Raptor Lake) è composto da otto core di efficienza (senza hyper threading, 1,8 - 3,7 GHz) e sei core di prestazioni (hyper threading, 2,4 - 5 GHz). In totale, si tratta di 20 core logici della CPU.
I risultati dei benchmark del portatile quando è collegato all'alimentazione sono stati superiori alla media della CPU. Nell'uso a batteria, le prestazioni single-thread più rilevanti (163 punti) sono diminuite in misura simile alle prestazioni multi-thread (1.614 punti).
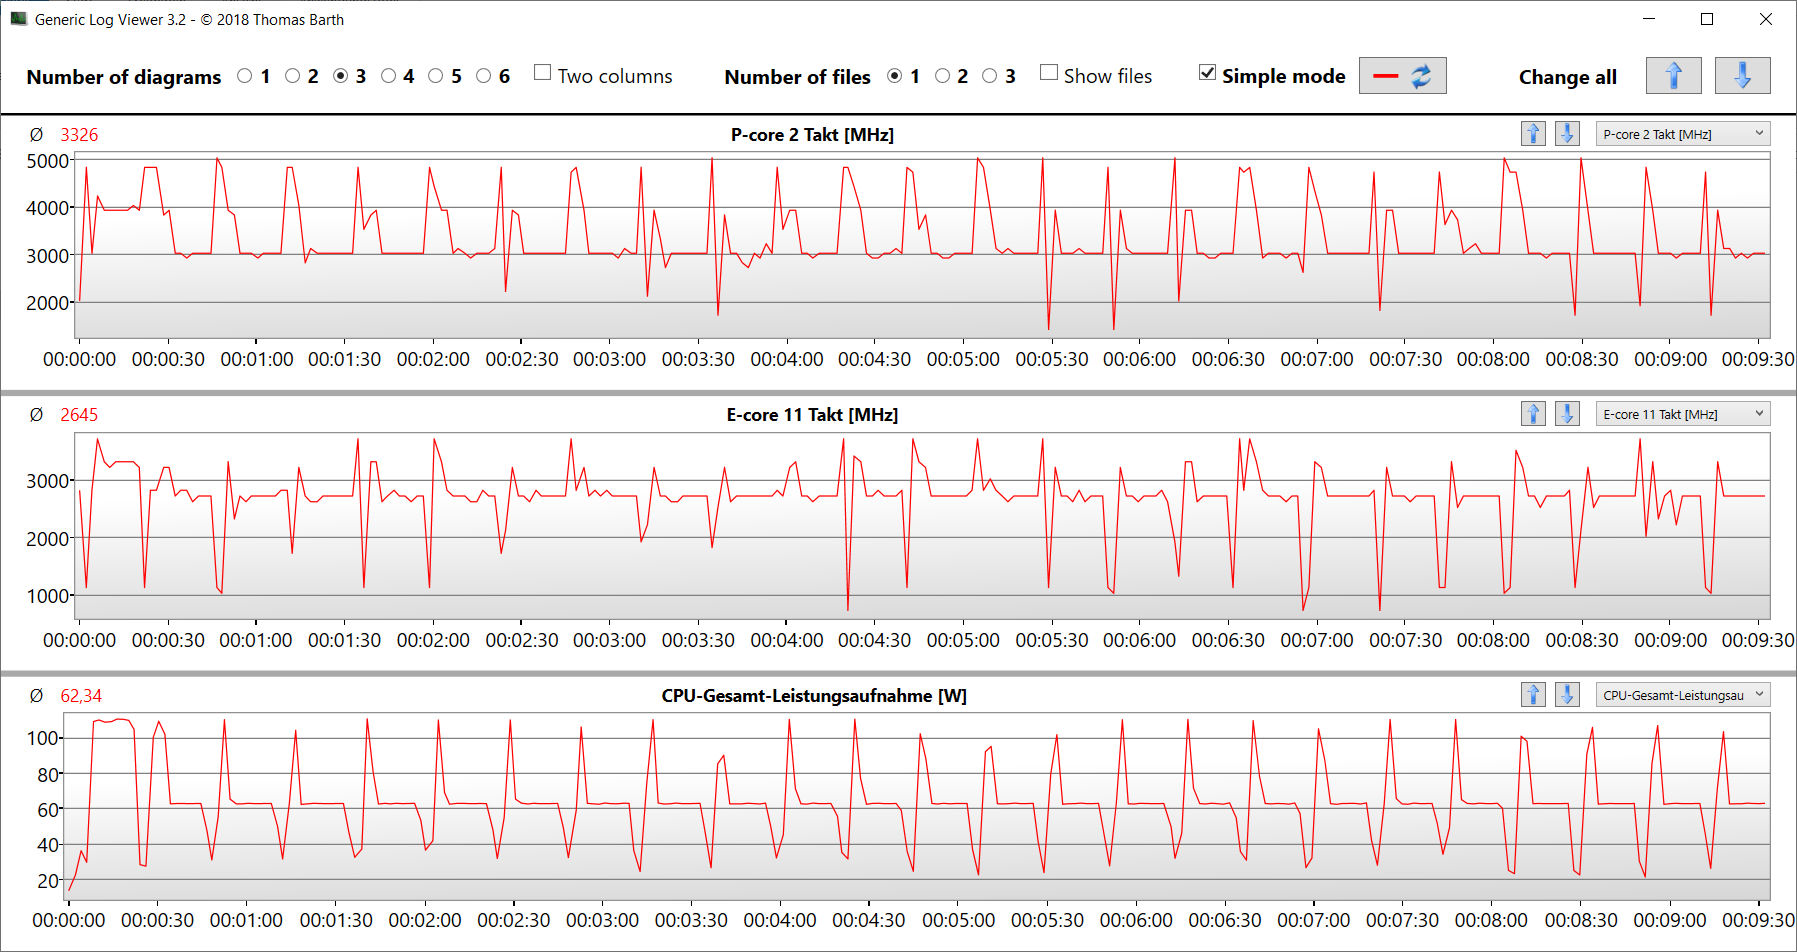
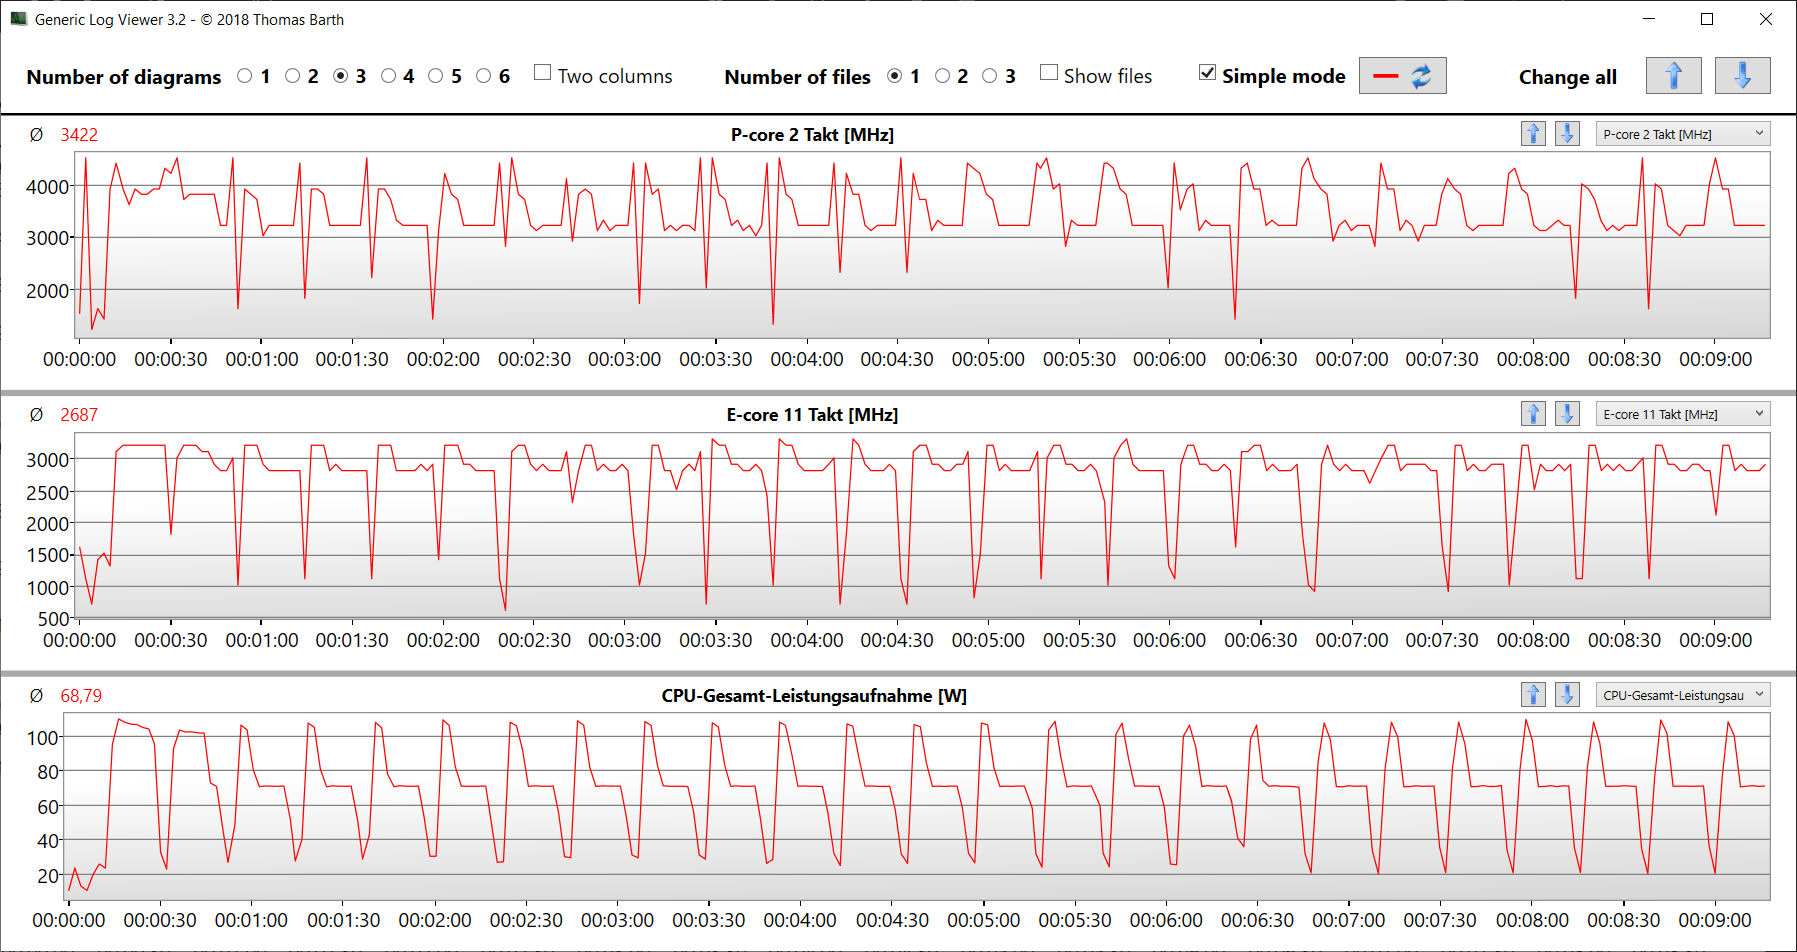
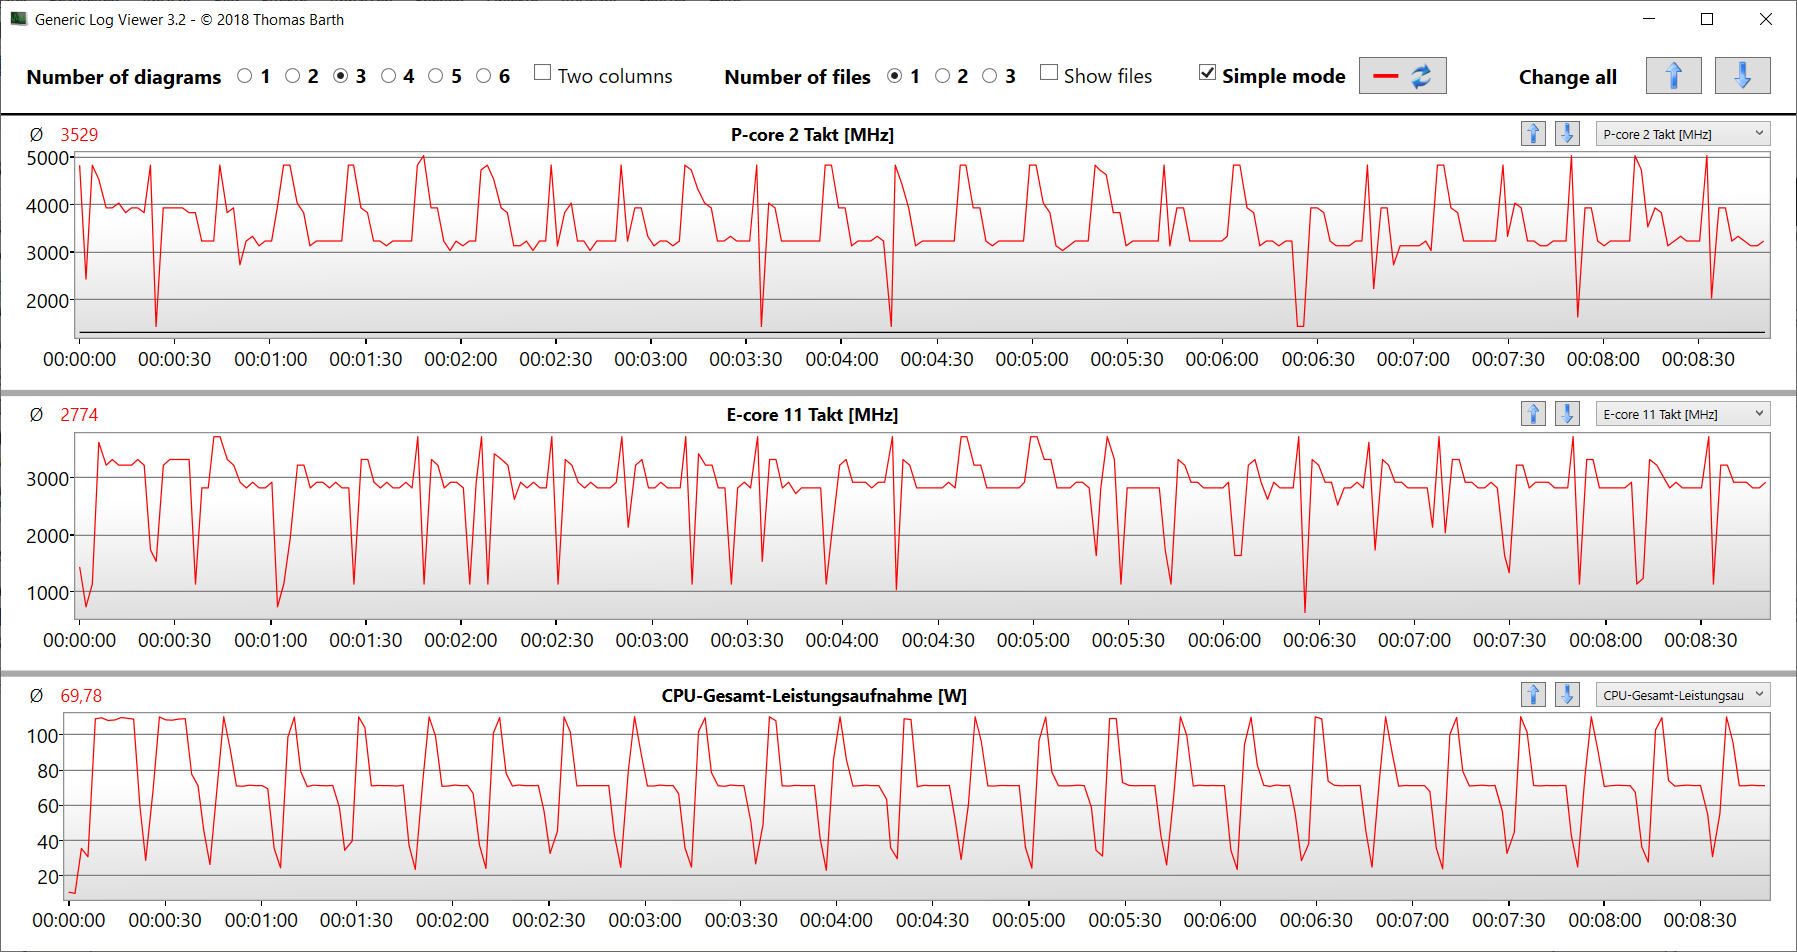
Il test in loop CB15 ha confermato che il turbo della CPU è utilizzato in modo permanente. anche se la velocità di clock è scesa un po' dopo la prima esecuzione, indipendentemente dal profilo utilizzato. il profilo "Turbo" ha influito sul livello di prestazioni complessivamente più elevato.
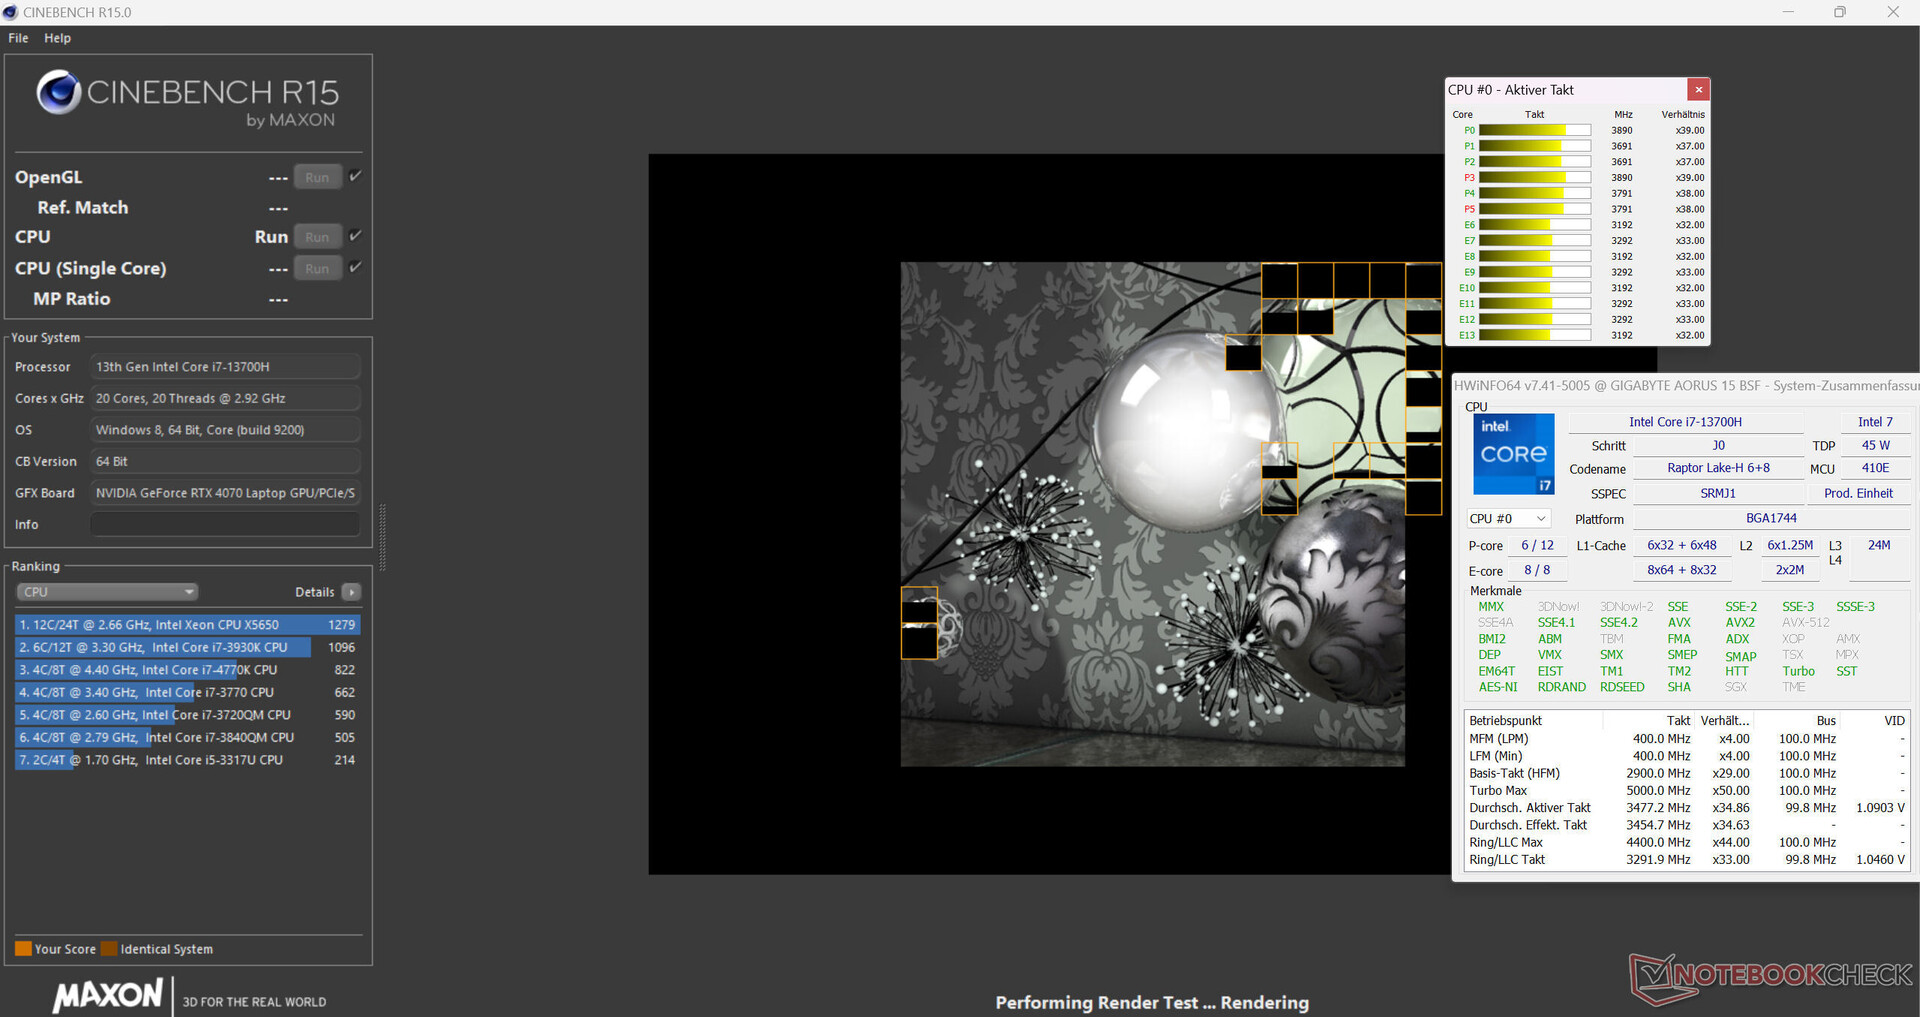
Cinebench R15 Multi continuous test
* ... Meglio usare valori piccoli
AIDA64: FP32 Ray-Trace | FPU Julia | CPU SHA3 | CPU Queen | FPU SinJulia | FPU Mandel | CPU AES | CPU ZLib | FP64 Ray-Trace | CPU PhotoWorxx
| Performance rating | |
| Media della classe Gaming | |
| HP Omen Transcend 16 | |
| Asus TUF Gaming A16 FA617XS | |
| MSI Pulse 17 B13VGK | |
| Lenovo Legion Slim 7i 16 Gen 8 | |
| Acer Nitro 16 AN16-41 | |
| Aorus 15 BSF | |
| Media Intel Core i7-13700H | |
| AIDA64 / FP32 Ray-Trace | |
| Media della classe Gaming (10227 - 85542, n=105, ultimi 2 anni) | |
| Asus TUF Gaming A16 FA617XS | |
| HP Omen Transcend 16 | |
| MSI Pulse 17 B13VGK | |
| Lenovo Legion Slim 7i 16 Gen 8 | |
| Acer Nitro 16 AN16-41 | |
| Media Intel Core i7-13700H (4986 - 18908, n=29) | |
| Aorus 15 BSF | |
| AIDA64 / FPU Julia | |
| Media della classe Gaming (51376 - 238426, n=105, ultimi 2 anni) | |
| Asus TUF Gaming A16 FA617XS | |
| HP Omen Transcend 16 | |
| Acer Nitro 16 AN16-41 | |
| MSI Pulse 17 B13VGK | |
| Lenovo Legion Slim 7i 16 Gen 8 | |
| Media Intel Core i7-13700H (25360 - 92359, n=29) | |
| Aorus 15 BSF | |
| AIDA64 / CPU SHA3 | |
| Media della classe Gaming (2180 - 10115, n=105, ultimi 2 anni) | |
| HP Omen Transcend 16 | |
| Asus TUF Gaming A16 FA617XS | |
| MSI Pulse 17 B13VGK | |
| Lenovo Legion Slim 7i 16 Gen 8 | |
| Acer Nitro 16 AN16-41 | |
| Aorus 15 BSF | |
| Media Intel Core i7-13700H (1339 - 4224, n=29) | |
| AIDA64 / CPU Queen | |
| HP Omen Transcend 16 | |
| Asus TUF Gaming A16 FA617XS | |
| Lenovo Legion Slim 7i 16 Gen 8 | |
| Media della classe Gaming (49785 - 173351, n=90, ultimi 2 anni) | |
| Acer Nitro 16 AN16-41 | |
| Aorus 15 BSF | |
| MSI Pulse 17 B13VGK | |
| Media Intel Core i7-13700H (59324 - 107159, n=29) | |
| AIDA64 / FPU SinJulia | |
| Asus TUF Gaming A16 FA617XS | |
| Media della classe Gaming (4424 - 33636, n=105, ultimi 2 anni) | |
| HP Omen Transcend 16 | |
| Acer Nitro 16 AN16-41 | |
| Lenovo Legion Slim 7i 16 Gen 8 | |
| MSI Pulse 17 B13VGK | |
| Aorus 15 BSF | |
| Media Intel Core i7-13700H (4800 - 11050, n=29) | |
| AIDA64 / FPU Mandel | |
| Media della classe Gaming (25115 - 128721, n=105, ultimi 2 anni) | |
| Asus TUF Gaming A16 FA617XS | |
| HP Omen Transcend 16 | |
| Acer Nitro 16 AN16-41 | |
| MSI Pulse 17 B13VGK | |
| Lenovo Legion Slim 7i 16 Gen 8 | |
| Media Intel Core i7-13700H (12321 - 45118, n=29) | |
| Aorus 15 BSF | |
| AIDA64 / CPU AES | |
| Aorus 15 BSF | |
| HP Omen Transcend 16 | |
| Media della classe Gaming (39258 - 247074, n=105, ultimi 2 anni) | |
| Asus TUF Gaming A16 FA617XS | |
| MSI Pulse 17 B13VGK | |
| Lenovo Legion Slim 7i 16 Gen 8 | |
| Media Intel Core i7-13700H (28769 - 151254, n=29) | |
| Acer Nitro 16 AN16-41 | |
| AIDA64 / CPU ZLib | |
| HP Omen Transcend 16 | |
| Media della classe Gaming (574 - 2531, n=105, ultimi 2 anni) | |
| Lenovo Legion Slim 7i 16 Gen 8 | |
| MSI Pulse 17 B13VGK | |
| Asus TUF Gaming A16 FA617XS | |
| Media Intel Core i7-13700H (389 - 1215, n=29) | |
| Aorus 15 BSF | |
| Acer Nitro 16 AN16-41 | |
| AIDA64 / FP64 Ray-Trace | |
| Media della classe Gaming (5509 - 45446, n=105, ultimi 2 anni) | |
| Asus TUF Gaming A16 FA617XS | |
| HP Omen Transcend 16 | |
| MSI Pulse 17 B13VGK | |
| Lenovo Legion Slim 7i 16 Gen 8 | |
| Acer Nitro 16 AN16-41 | |
| Media Intel Core i7-13700H (2540 - 10135, n=29) | |
| Aorus 15 BSF | |
| AIDA64 / CPU PhotoWorxx | |
| HP Omen Transcend 16 | |
| Media della classe Gaming (12271 - 89891, n=105, ultimi 2 anni) | |
| Media Intel Core i7-13700H (12872 - 52727, n=29) | |
| MSI Pulse 17 B13VGK | |
| Aorus 15 BSF | |
| Asus TUF Gaming A16 FA617XS | |
| Acer Nitro 16 AN16-41 | |
| Lenovo Legion Slim 7i 16 Gen 8 | |
Prestazioni del sistema
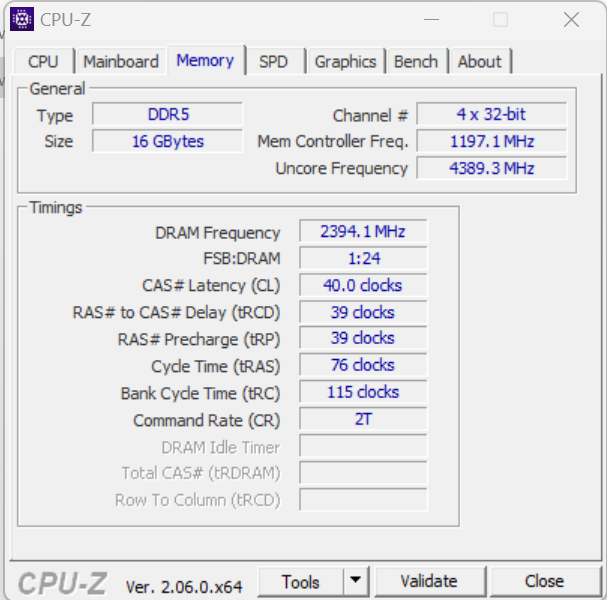
Il sistema fluido non manca di prestazioni di calcolo. Il rendering e i giochi non sono un problema per il portatile. La velocità di trasferimento della RAM si attesta su un livello medio per una RAM DDR5 4800.
CrossMark: Overall | Productivity | Creativity | Responsiveness
| PCMark 10 / Score | |
| Lenovo Legion Slim 7i 16 Gen 8 | |
| Media della classe Gaming (5828 - 12414, n=93, ultimi 2 anni) | |
| HP Omen Transcend 16 | |
| Asus TUF Gaming A16 FA617XS | |
| MSI Pulse 17 B13VGK | |
| Media Intel Core i7-13700H, NVIDIA GeForce RTX 4070 Laptop GPU (7158 - 7956, n=8) | |
| Aorus 15 BSF | |
| Acer Nitro 16 AN16-41 | |
| PCMark 10 / Essentials | |
| Lenovo Legion Slim 7i 16 Gen 8 | |
| HP Omen Transcend 16 | |
| Asus TUF Gaming A16 FA617XS | |
| Aorus 15 BSF | |
| Media Intel Core i7-13700H, NVIDIA GeForce RTX 4070 Laptop GPU (10252 - 11449, n=8) | |
| Media della classe Gaming (8810 - 11935, n=97, ultimi 2 anni) | |
| Acer Nitro 16 AN16-41 | |
| MSI Pulse 17 B13VGK | |
| PCMark 10 / Productivity | |
| Media della classe Gaming (6845 - 25323, n=95, ultimi 2 anni) | |
| Lenovo Legion Slim 7i 16 Gen 8 | |
| MSI Pulse 17 B13VGK | |
| Asus TUF Gaming A16 FA617XS | |
| HP Omen Transcend 16 | |
| Media Intel Core i7-13700H, NVIDIA GeForce RTX 4070 Laptop GPU (8501 - 10769, n=8) | |
| Acer Nitro 16 AN16-41 | |
| Aorus 15 BSF | |
| PCMark 10 / Digital Content Creation | |
| Media della classe Gaming (7602 - 19954, n=95, ultimi 2 anni) | |
| Lenovo Legion Slim 7i 16 Gen 8 | |
| HP Omen Transcend 16 | |
| Asus TUF Gaming A16 FA617XS | |
| MSI Pulse 17 B13VGK | |
| Media Intel Core i7-13700H, NVIDIA GeForce RTX 4070 Laptop GPU (10358 - 12908, n=8) | |
| Aorus 15 BSF | |
| Acer Nitro 16 AN16-41 | |
| CrossMark / Overall | |
| Aorus 15 BSF | |
| Media della classe Gaming (1366 - 2409, n=94, ultimi 2 anni) | |
| Lenovo Legion Slim 7i 16 Gen 8 | |
| HP Omen Transcend 16 | |
| MSI Pulse 17 B13VGK | |
| Media Intel Core i7-13700H, NVIDIA GeForce RTX 4070 Laptop GPU (1768 - 2073, n=6) | |
| Asus TUF Gaming A16 FA617XS | |
| Acer Nitro 16 AN16-41 | |
| CrossMark / Productivity | |
| Aorus 15 BSF | |
| Lenovo Legion Slim 7i 16 Gen 8 | |
| Media della classe Gaming (1386 - 2254, n=94, ultimi 2 anni) | |
| HP Omen Transcend 16 | |
| MSI Pulse 17 B13VGK | |
| Media Intel Core i7-13700H, NVIDIA GeForce RTX 4070 Laptop GPU (1645 - 2006, n=6) | |
| Asus TUF Gaming A16 FA617XS | |
| Acer Nitro 16 AN16-41 | |
| CrossMark / Creativity | |
| HP Omen Transcend 16 | |
| Media della classe Gaming (1343 - 2786, n=94, ultimi 2 anni) | |
| Aorus 15 BSF | |
| Lenovo Legion Slim 7i 16 Gen 8 | |
| MSI Pulse 17 B13VGK | |
| Media Intel Core i7-13700H, NVIDIA GeForce RTX 4070 Laptop GPU (1936 - 2137, n=6) | |
| Asus TUF Gaming A16 FA617XS | |
| Acer Nitro 16 AN16-41 | |
| CrossMark / Responsiveness | |
| Aorus 15 BSF | |
| Lenovo Legion Slim 7i 16 Gen 8 | |
| MSI Pulse 17 B13VGK | |
| Media Intel Core i7-13700H, NVIDIA GeForce RTX 4070 Laptop GPU (1451 - 2202, n=6) | |
| Media della classe Gaming (1226 - 2334, n=94, ultimi 2 anni) | |
| HP Omen Transcend 16 | |
| Asus TUF Gaming A16 FA617XS | |
| Acer Nitro 16 AN16-41 | |
| PCMark 10 Score | 7309 punti | |
Aiuto | ||
| AIDA64 / Memory Copy | |
| HP Omen Transcend 16 | |
| Media della classe Gaming (21750 - 129946, n=105, ultimi 2 anni) | |
| Media Intel Core i7-13700H (24334 - 78081, n=29) | |
| MSI Pulse 17 B13VGK | |
| Aorus 15 BSF | |
| Asus TUF Gaming A16 FA617XS | |
| Acer Nitro 16 AN16-41 | |
| Lenovo Legion Slim 7i 16 Gen 8 | |
| AIDA64 / Memory Read | |
| HP Omen Transcend 16 | |
| Media della classe Gaming (22956 - 118858, n=105, ultimi 2 anni) | |
| MSI Pulse 17 B13VGK | |
| Aorus 15 BSF | |
| Media Intel Core i7-13700H (23681 - 79656, n=29) | |
| Asus TUF Gaming A16 FA617XS | |
| Acer Nitro 16 AN16-41 | |
| Lenovo Legion Slim 7i 16 Gen 8 | |
| AIDA64 / Memory Write | |
| Aorus 15 BSF | |
| Media della classe Gaming (22297 - 135096, n=105, ultimi 2 anni) | |
| HP Omen Transcend 16 | |
| Asus TUF Gaming A16 FA617XS | |
| Media Intel Core i7-13700H (22986 - 99898, n=29) | |
| MSI Pulse 17 B13VGK | |
| Acer Nitro 16 AN16-41 | |
| Lenovo Legion Slim 7i 16 Gen 8 | |
| AIDA64 / Memory Latency | |
| Media della classe Gaming (75.3 - 259, n=105, ultimi 2 anni) | |
| MSI Pulse 17 B13VGK | |
| Media Intel Core i7-13700H (82.4 - 136.8, n=29) | |
| Acer Nitro 16 AN16-41 | |
| Aorus 15 BSF | |
| Asus TUF Gaming A16 FA617XS | |
| HP Omen Transcend 16 | |
| Lenovo Legion Slim 7i 16 Gen 8 | |
* ... Meglio usare valori piccoli
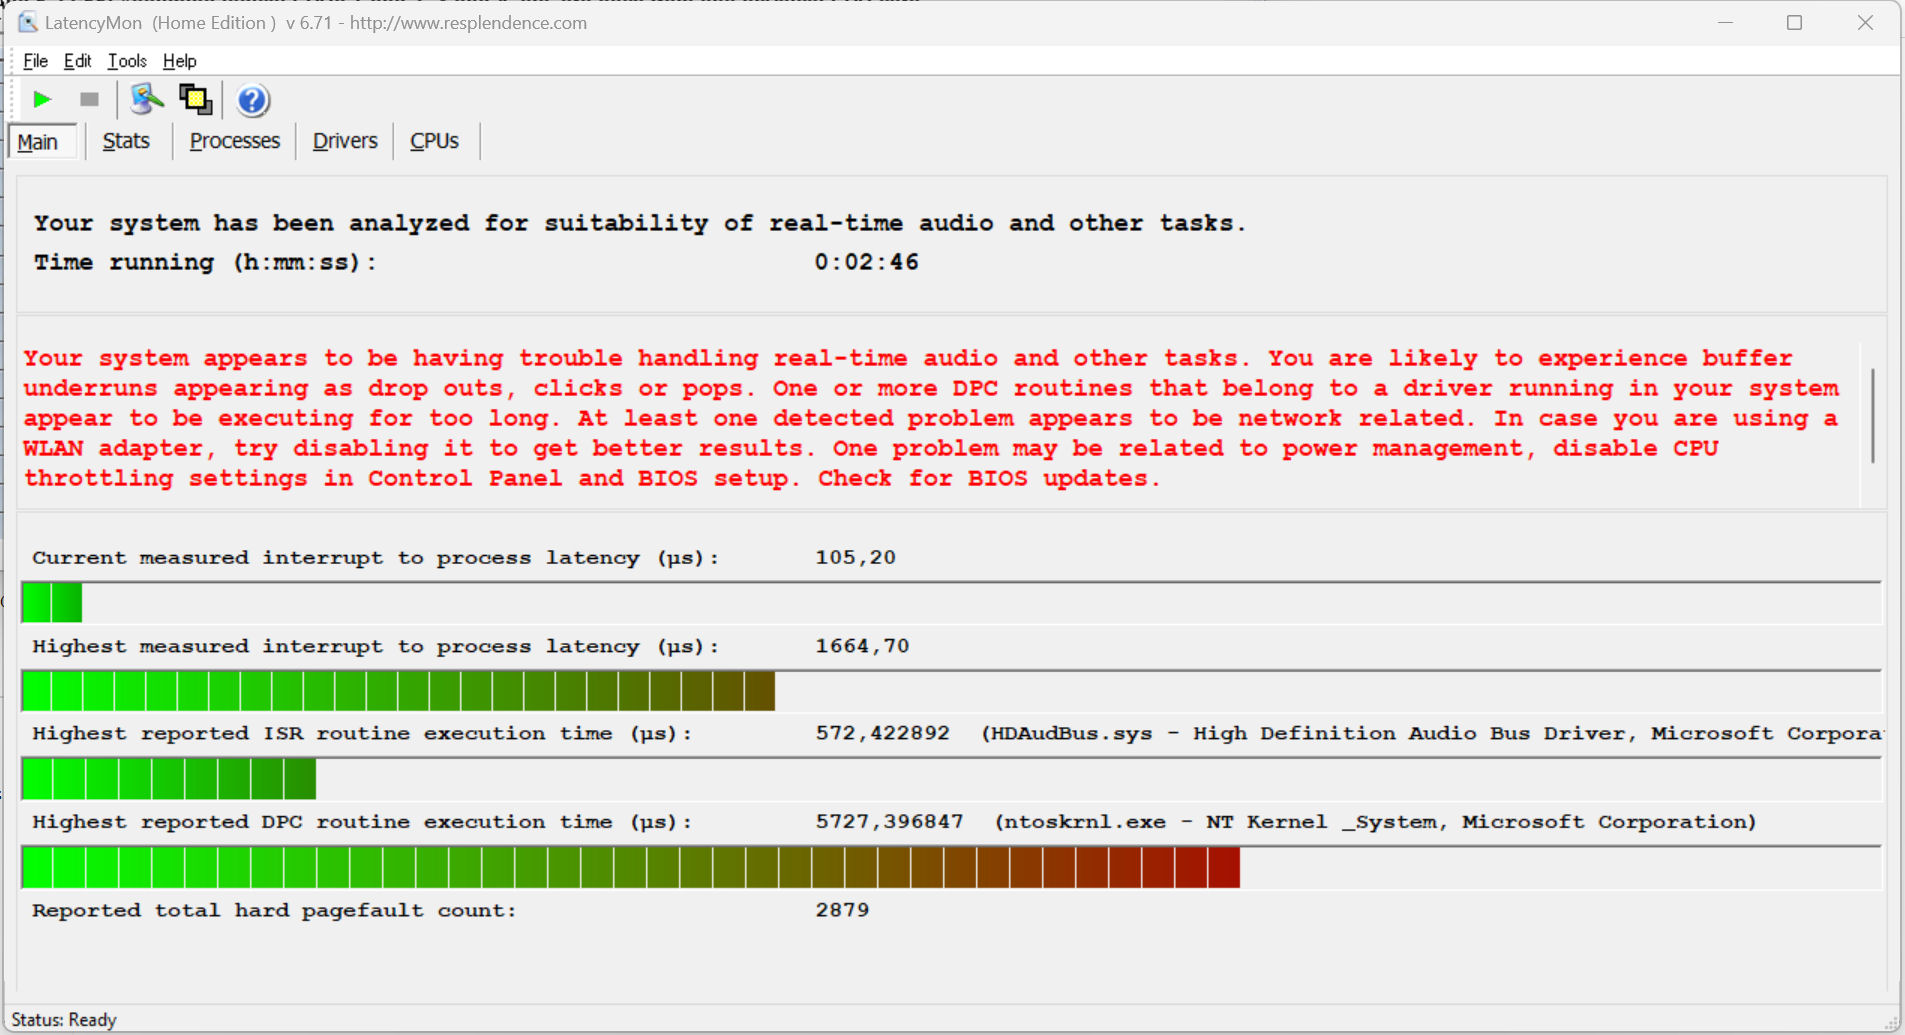
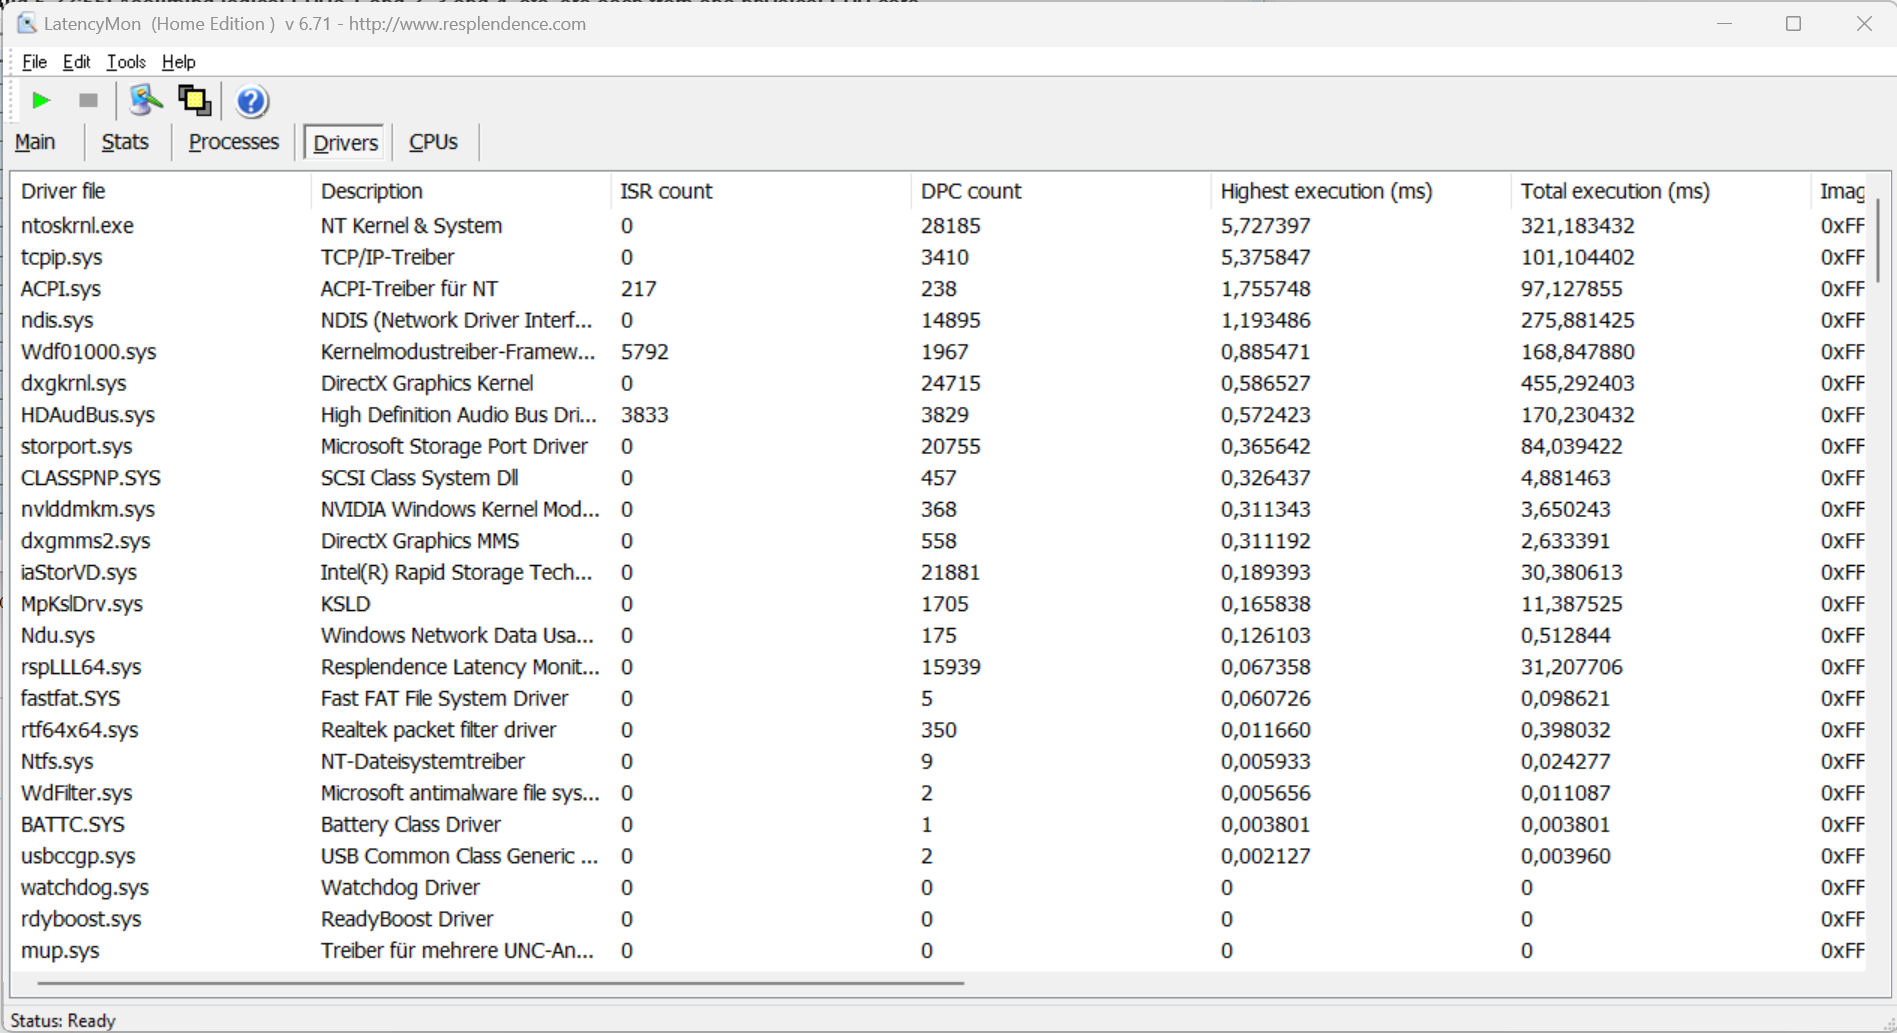
Latenza DPC
Il test standardizzato di monitoraggio della latenza (navigazione web, riproduzione video 4k, Prime95 ad alto carico) ha rivelato alcune anomalie. Il sistema non sembra essere adatto all'editing video e audio in tempo reale. I futuri aggiornamenti del software potrebbero portare a miglioramenti o addirittura a peggioramenti.
| DPC Latencies / LatencyMon - interrupt to process latency (max), Web, Youtube, Prime95 | |
| Lenovo Legion Slim 7i 16 Gen 8 | |
| Aorus 15 BSF | |
| HP Omen Transcend 16 | |
| Acer Nitro 16 AN16-41 | |
| Asus TUF Gaming A16 FA617XS | |
| MSI Pulse 17 B13VGK | |
* ... Meglio usare valori piccoli
Dispositivi di archiviazione
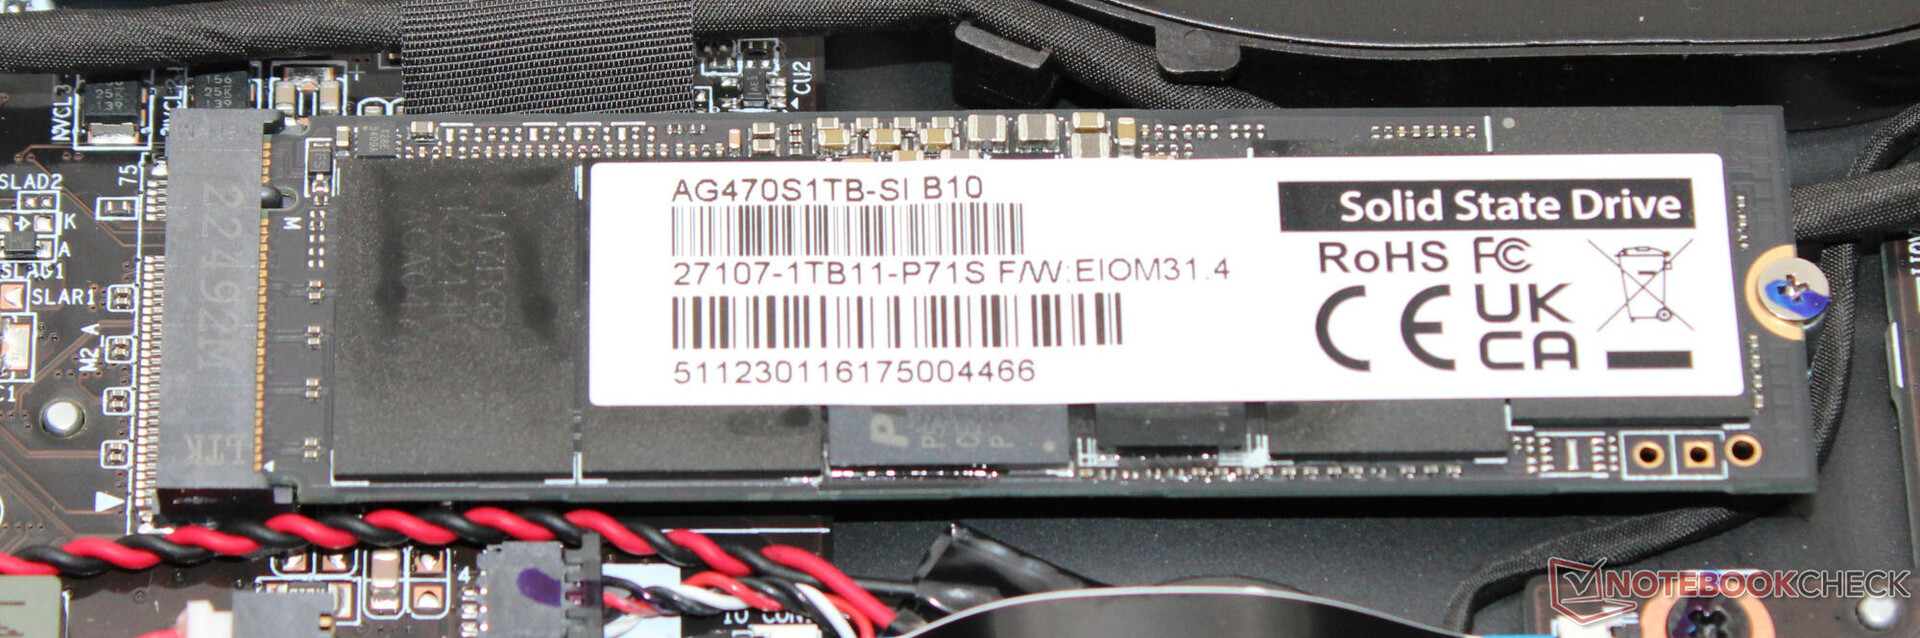
Il portatile è dotato di un'unità SSD da 1 TB (PCIe 4, M.2 2280) di Gigabyte che ha mostrato ottime velocità di trasferimento dati. Positivo: Non abbiamo notato alcun throttling legato alla temperatura. Il dispositivo ha spazio per un'altra unità SSD.

* ... Meglio usare valori piccoli
Reading continuous performance: DiskSpd Read Loop, Queue Depth 8
Scheda grafica
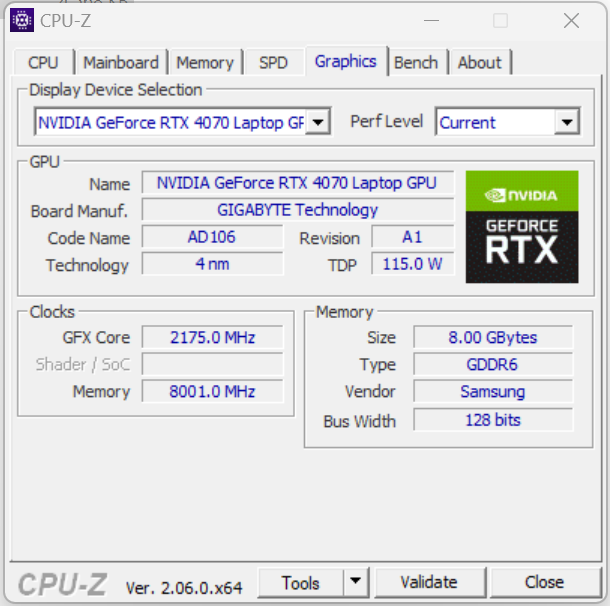
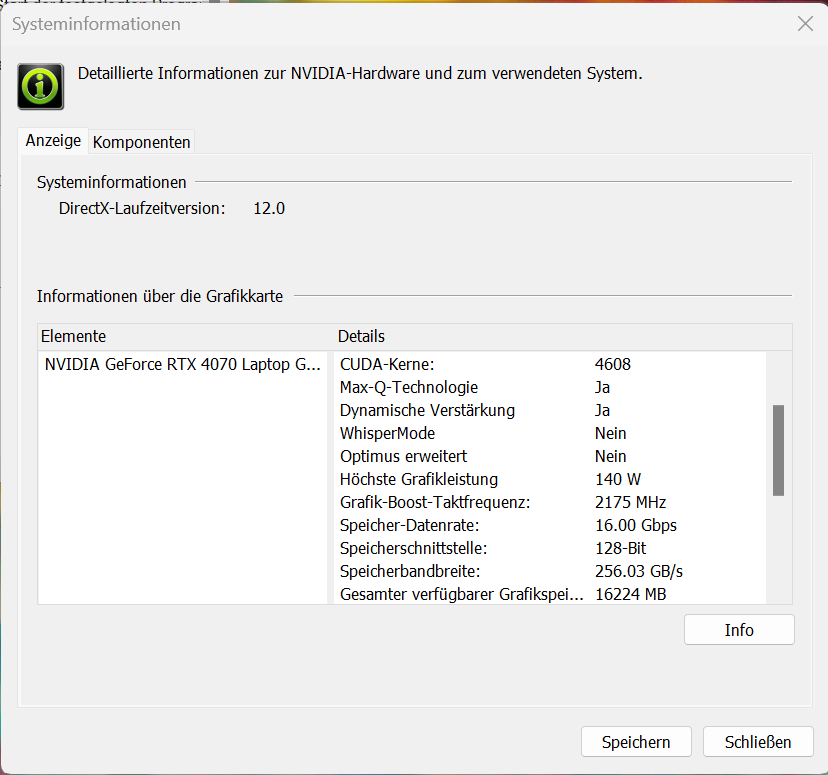
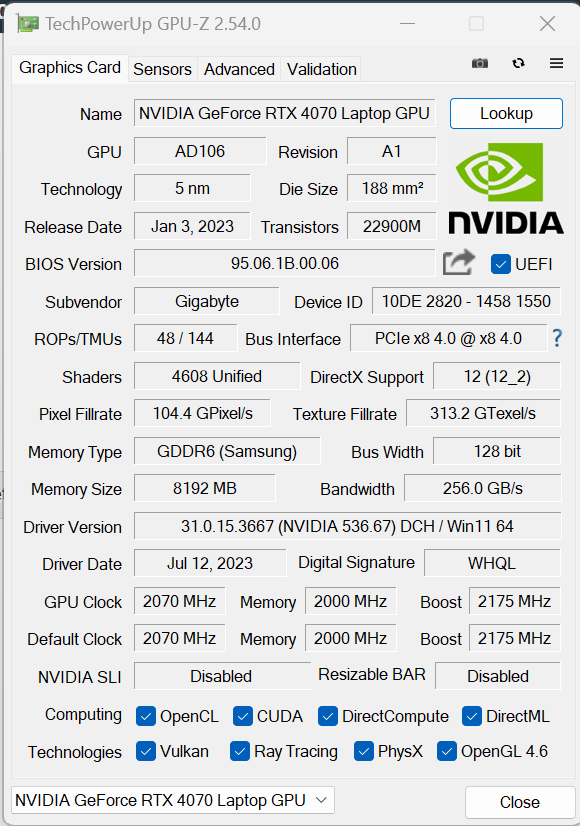
LaGeForce RTX 4070dispone di 4.608 shader, memoria GDDR6 veloce (anche se solo 8.192 MB) e un bus largo 128 bit. Gigabyte le ha assegnato un TGP massimo di 140 watt (115 watt + 25 watt) - di più non è possibile. Secondo il Witcher 3 test, il TGP completo non viene sfruttato.
I risultati dei benchmark sono stati superiori alla media della precedente RTX 4070. L'utilizzo della modalità dGPU non ha portato ad alcun miglioramento. Il passaggio dalla modalità Optimus ("modalità di uscita grafica Intel") alla modalità dGPU ("modalità di uscita grafica Nvidia") può essere effettuato tramite il Centro di controllo (generale -> interruttore GPU MUX). È sempre necessario riavviare il portatile. Gigabyte si affida a un interruttore MUX - Advanced Optimus non è supportato.

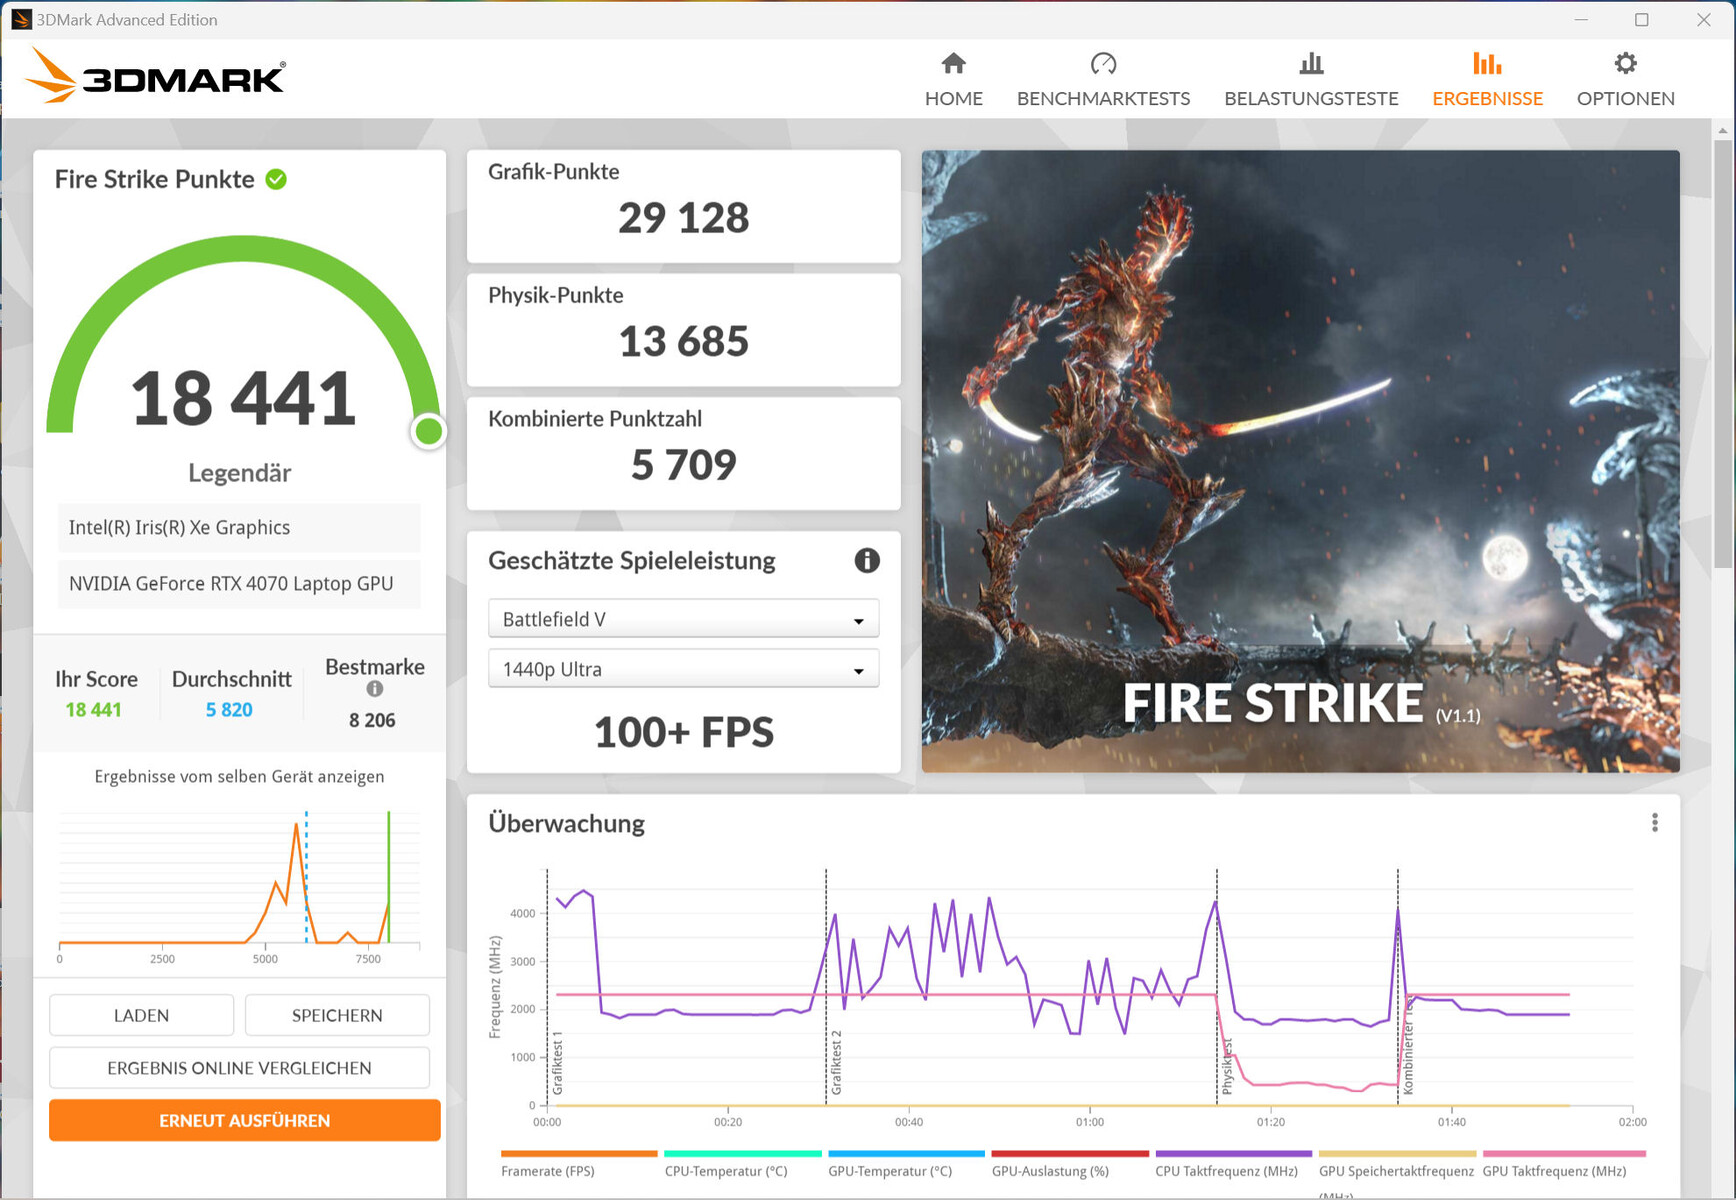
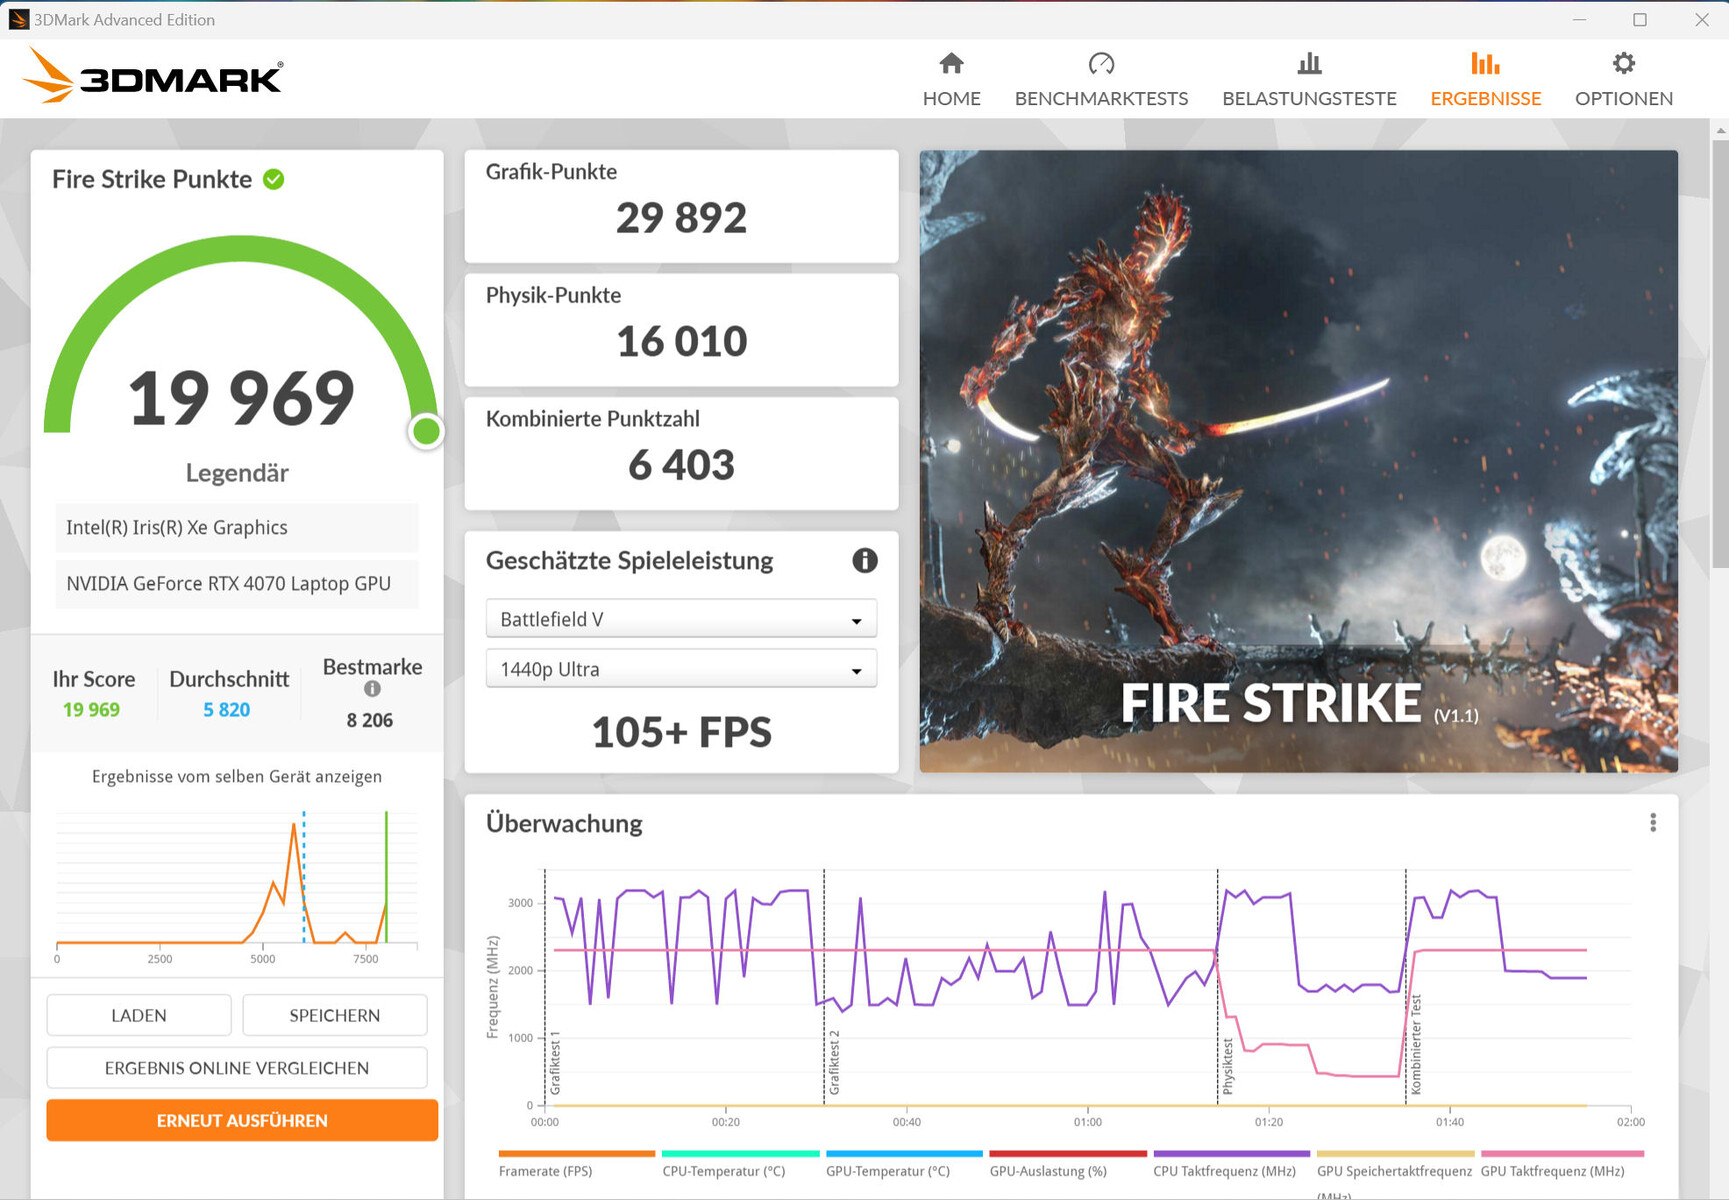
| 3DMark 06 Standard Score | 55084 punti | |
| 3DMark 11 Performance | 33789 punti | |
| 3DMark Cloud Gate Standard Score | 57822 punti | |
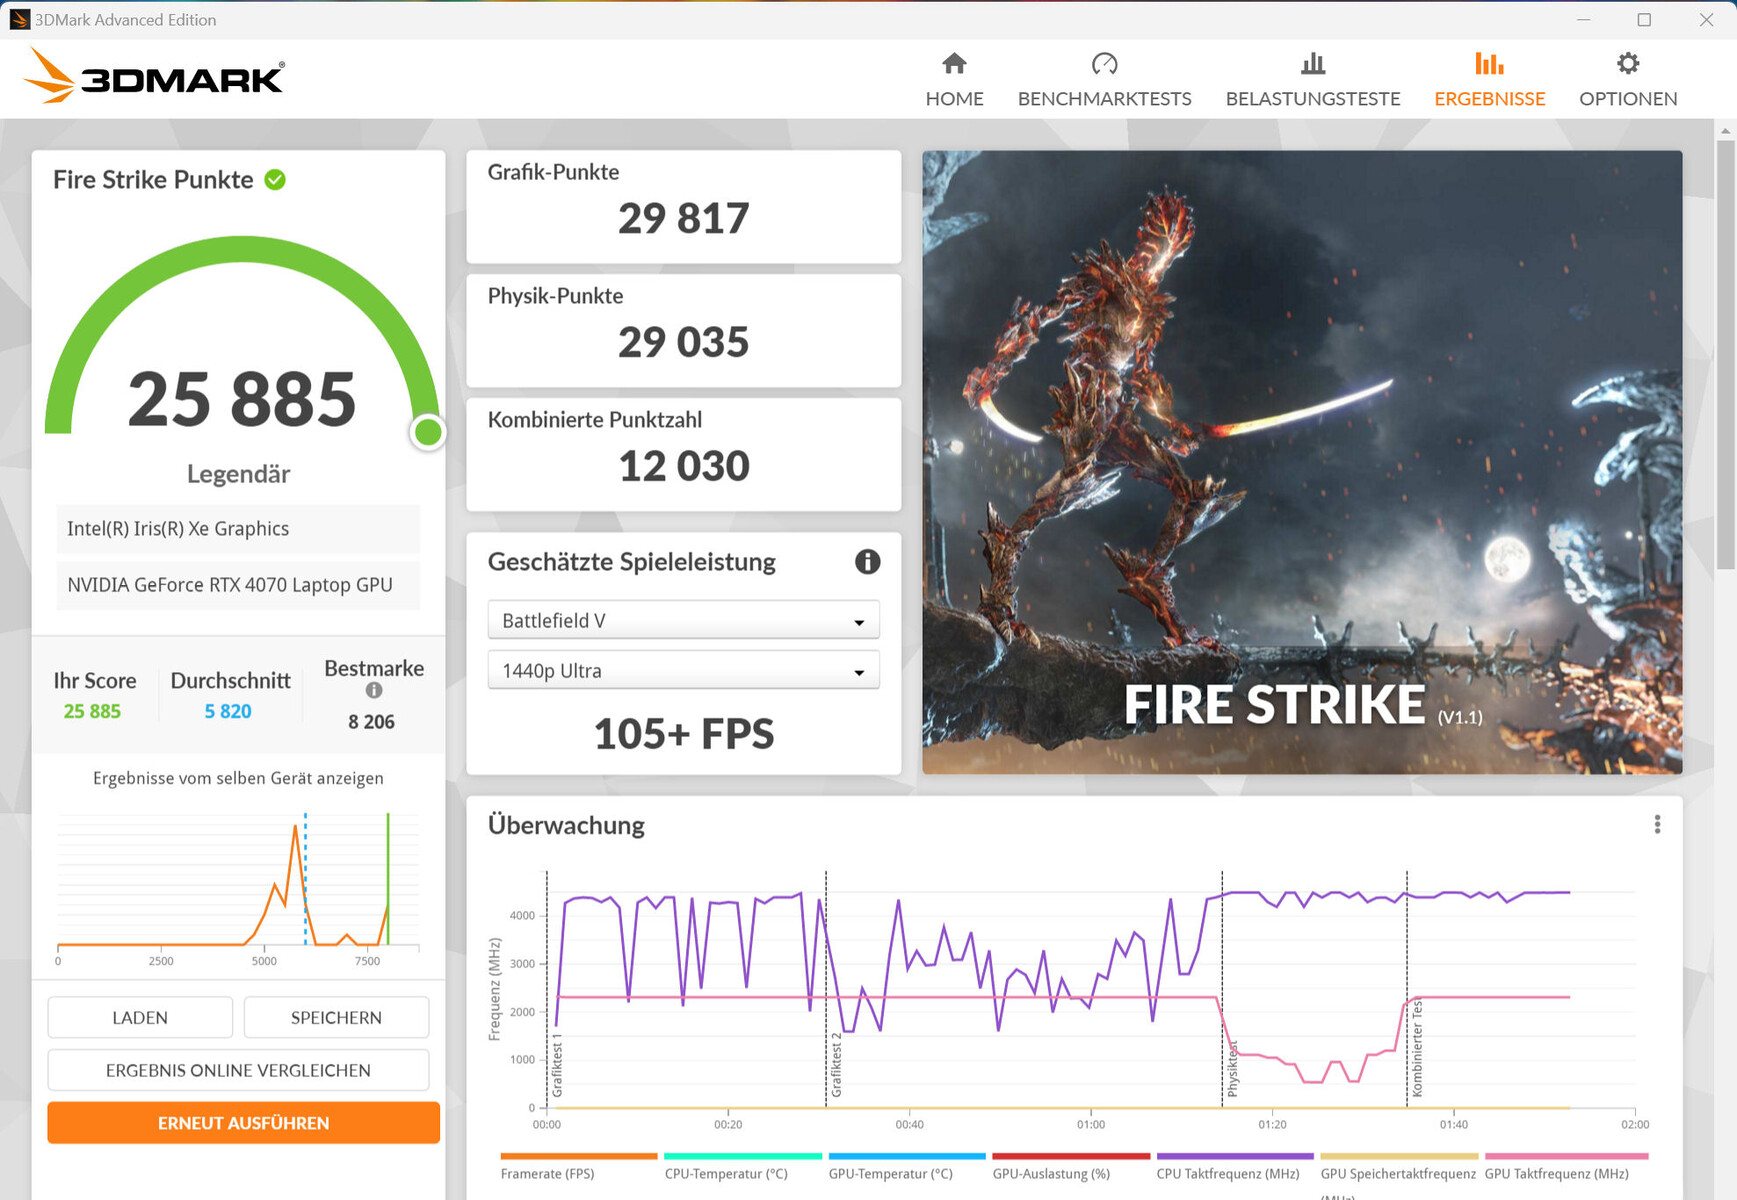
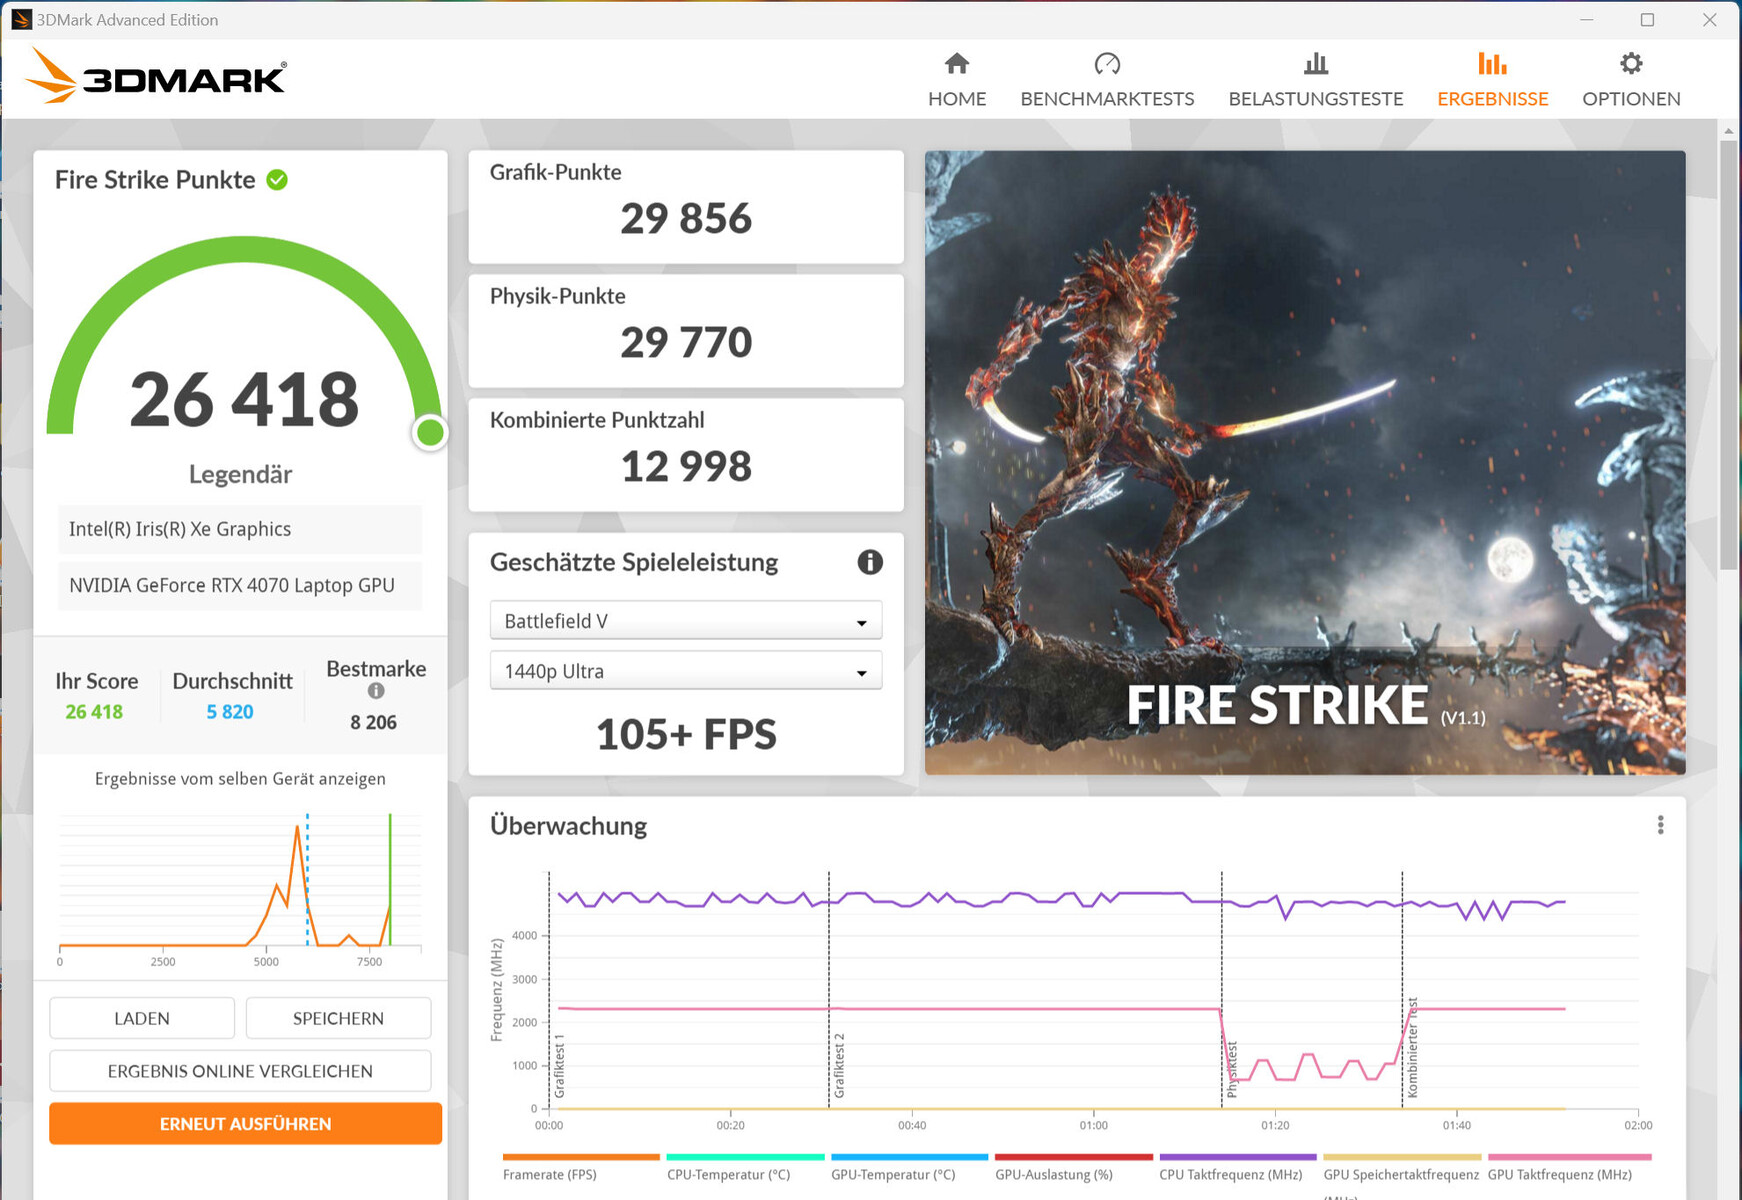
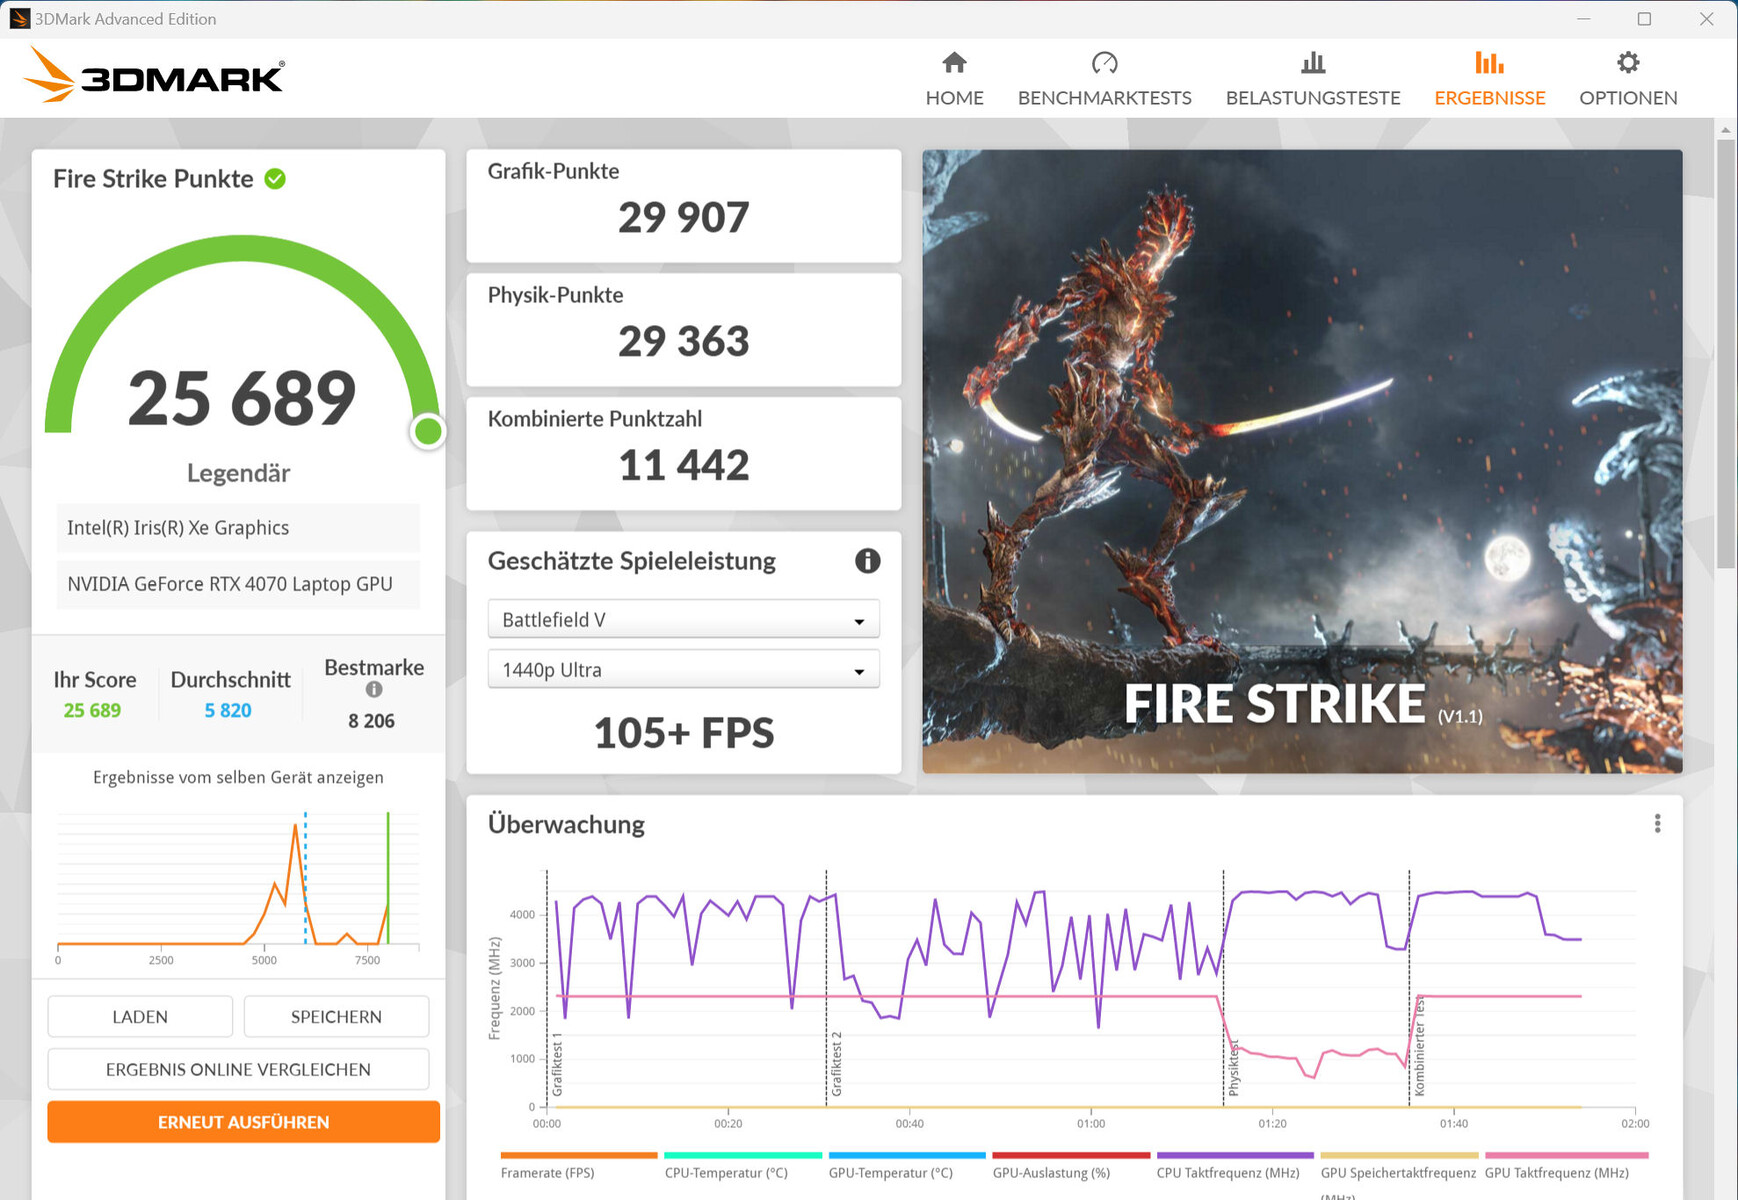
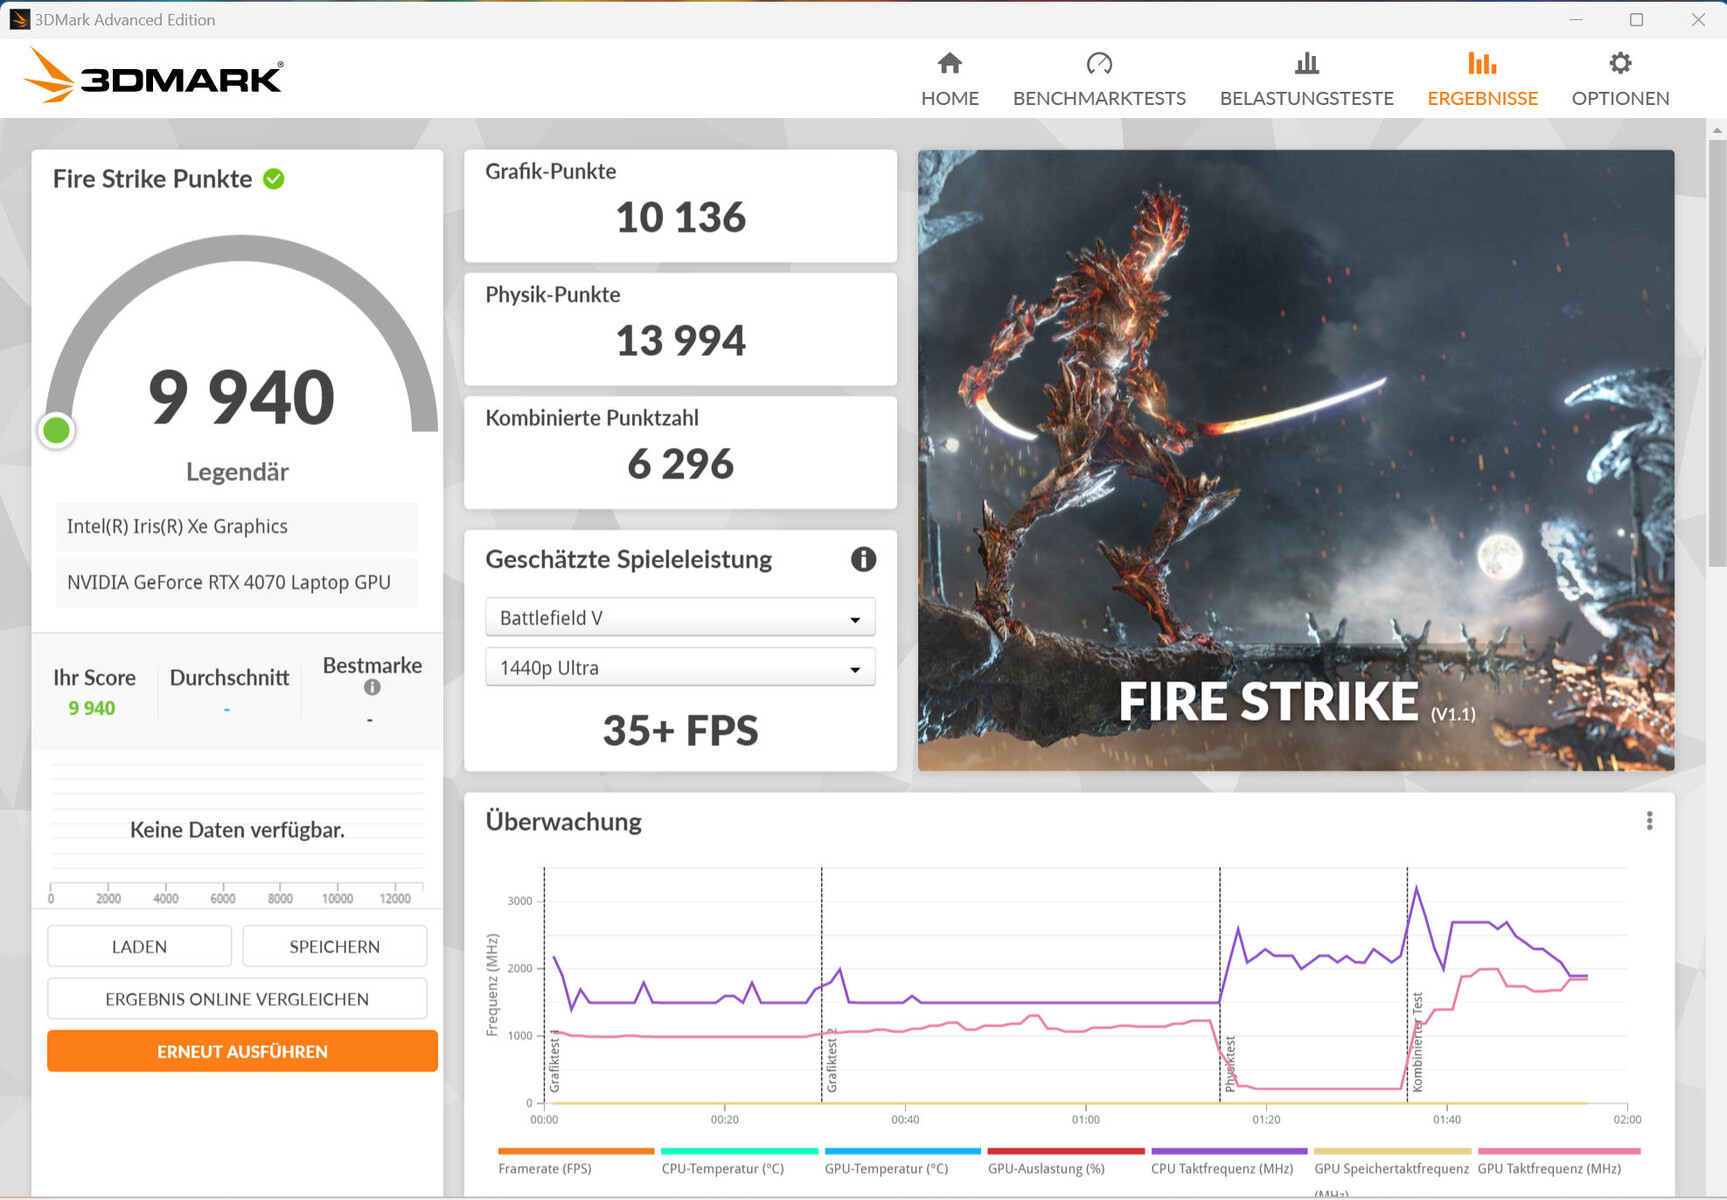
| 3DMark Fire Strike Score | 26593 punti | |
| 3DMark Time Spy Score | 12234 punti | |
Aiuto | ||
| Geekbench 6.7 - GPU OpenCL | |
| Media della classe Gaming (67235 - 253130, n=103, ultimi 2 anni) | |
| Aorus 15 BSF | |
| MSI Pulse 17 B13VGK | |
| Media NVIDIA GeForce RTX 4070 Laptop GPU (85488 - 129836, n=45) | |
* ... Meglio usare valori piccoli
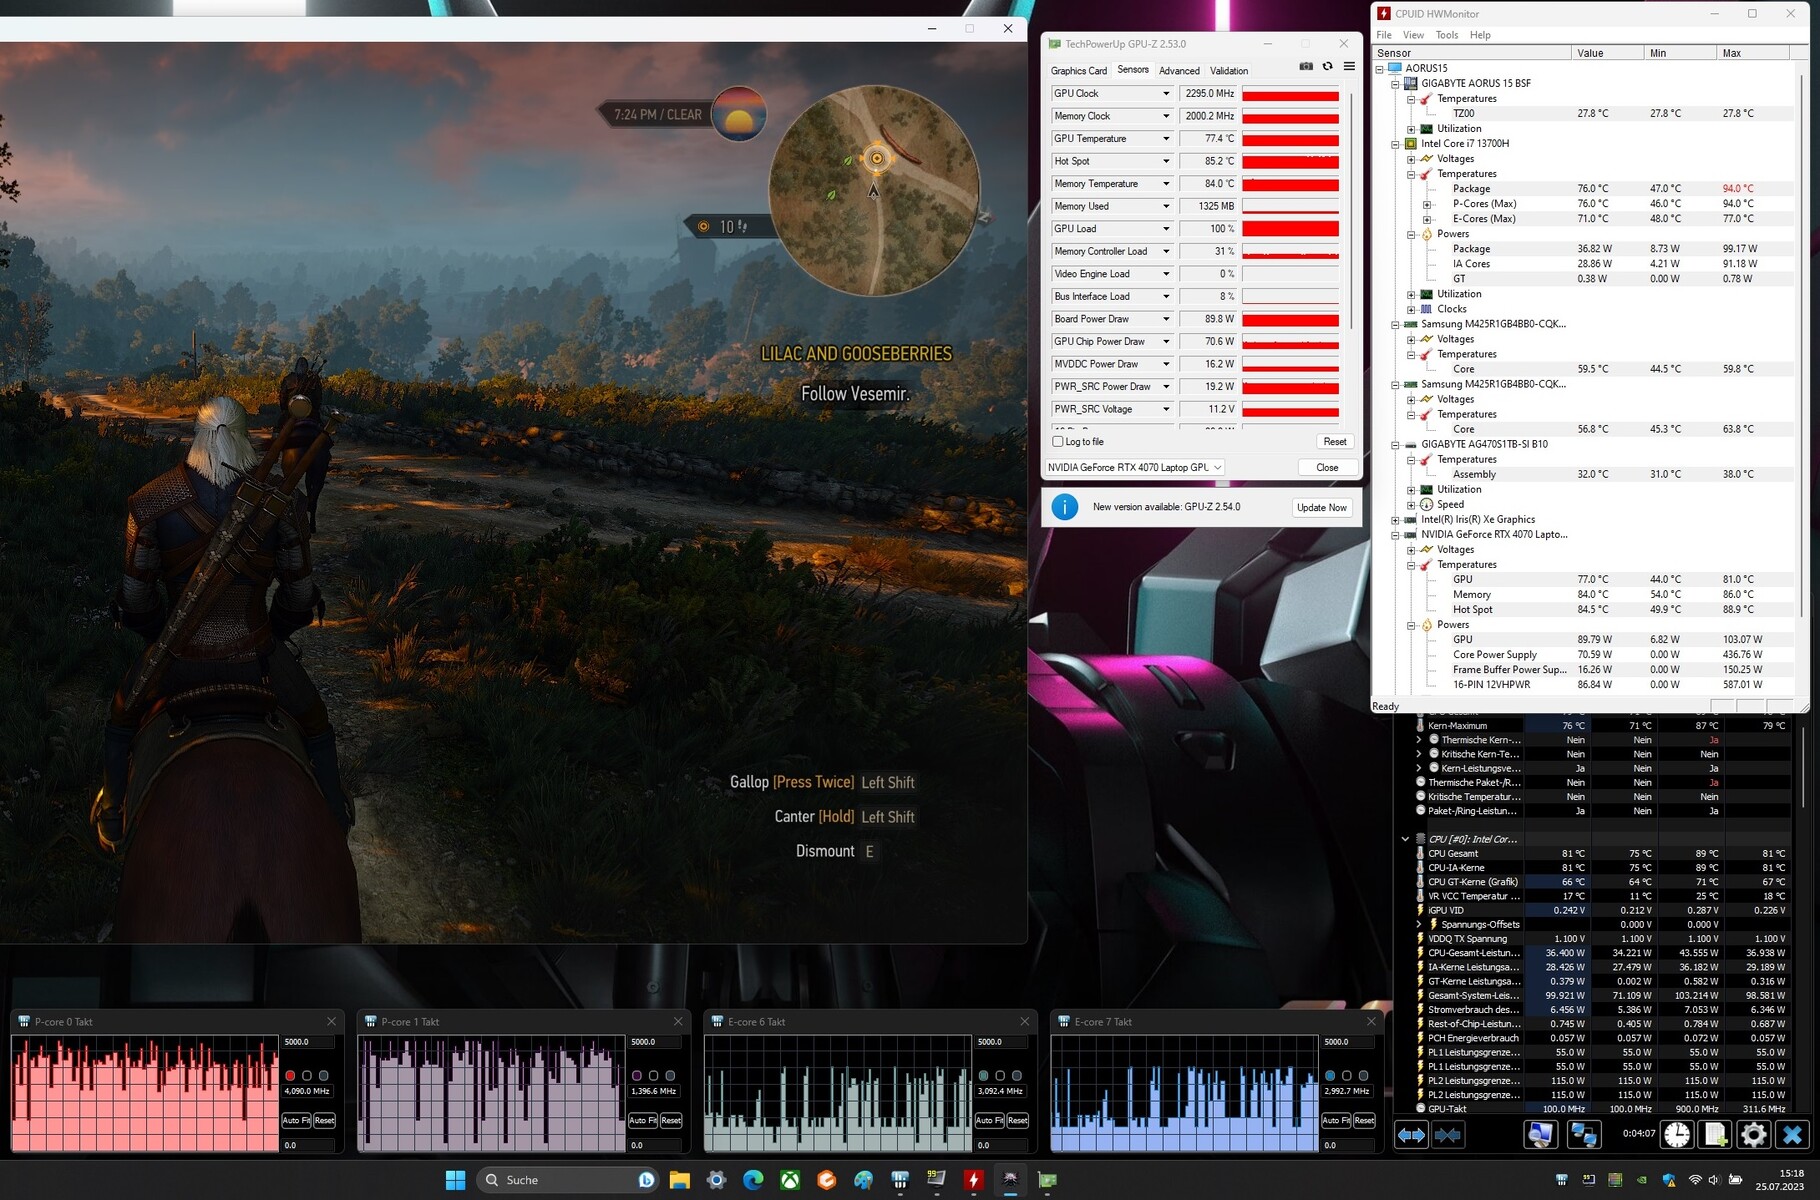
Prestazioni di gioco
Il portatile è destinato ai giochi in QHD con impostazioni elevate o massime. Risoluzioni più elevate possono essere utilizzate in combinazione con un monitor adeguato, a volte con impostazioni ridotte. I frame rate dei giochi che abbiamo testato erano superiori alla media determinata della RTX 4070. L'uso della modalità dGPU non ha portato a prestazioni superiori.
L'uso della modalità Meeting consente di giocare con emissioni di rumore inferiori: Mentre le prestazioni della GPU rimangono allo stesso livello, quelle della CPU diminuiscono a causa della riduzione del limite di potenza. Potrebbe quindi essere necessario ridurre le impostazioni.
| The Witcher 3 - 1920x1080 Ultra Graphics & Postprocessing (HBAO+) | |
| Media della classe Gaming (104.7 - 240, n=6, ultimi 2 anni) | |
| Lenovo Legion Slim 7i 16 Gen 8 | |
| Aorus 15 BSF | |
| Acer Nitro 16 AN16-41 | |
| Media NVIDIA GeForce RTX 4070 Laptop GPU (69.8 - 133.7, n=57) | |
| HP Omen Transcend 16 | |
| MSI Pulse 17 B13VGK | |
| Asus TUF Gaming A16 FA617XS | |
| Final Fantasy XV Benchmark - 1920x1080 High Quality | |
| Media della classe Gaming (41 - 215, n=95, ultimi 2 anni) | |
| Lenovo Legion Slim 7i 16 Gen 8 | |
| Aorus 15 BSF | |
| MSI Pulse 17 B13VGK | |
| Media NVIDIA GeForce RTX 4070 Laptop GPU (41 - 131.9, n=65) | |
| Acer Nitro 16 AN16-41 | |
| Asus TUF Gaming A16 FA617XS | |
| Cyberpunk 2077 1.6 | |
| 1920x1080 Ultra Preset | |
| Lenovo Legion Slim 7i 16 Gen 8 | |
| Aorus 15 BSF | |
| HP Omen Transcend 16 | |
| Acer Nitro 16 AN16-41 | |
| Media NVIDIA GeForce RTX 4070 Laptop GPU (48 - 110, n=24) | |
| 2560x1440 Ultra Preset | |
| HP Omen Transcend 16 | |
| Lenovo Legion Slim 7i 16 Gen 8 | |
| Acer Nitro 16 AN16-41 | |
| Aorus 15 BSF | |
| Media NVIDIA GeForce RTX 4070 Laptop GPU (30 - 63.9, n=24) | |
| 1920x1080 Ray Tracing Ultra Preset (DLSS off) | |
| Media NVIDIA GeForce RTX 4070 Laptop GPU (36.2 - 65, n=5) | |
| Aorus 15 BSF | |
| The Callisto Protocol | |
| 1920x1080 Ultra Preset (without FSR Upscaling) | |
| Aorus 15 BSF | |
| Acer Nitro 16 AN16-41 | |
| Media NVIDIA GeForce RTX 4070 Laptop GPU (78.9 - 88, n=4) | |
| 2560x1440 Ultra Preset (without FSR Upscaling) | |
| Aorus 15 BSF | |
| Acer Nitro 16 AN16-41 | |
| Media NVIDIA GeForce RTX 4070 Laptop GPU (58.4 - 68.3, n=4) | |
| 1920x1080 Ultra Preset (without FSR Upscaling) + Full Ray-Tracing | |
| Aorus 15 BSF | |
| Media NVIDIA GeForce RTX 4070 Laptop GPU (50.8 - 70, n=4) | |
| Acer Nitro 16 AN16-41 | |
| Returnal | |
| 1920x1080 Epic Preset | |
| Aorus 15 BSF | |
| HP Omen Transcend 16 | |
| Media NVIDIA GeForce RTX 4070 Laptop GPU (54 - 90, n=12) | |
| Asus TUF Gaming A16 FA617XS | |
| Lenovo Legion Slim 7i 16 Gen 8 | |
| 2560x1440 Epic Preset | |
| Aorus 15 BSF | |
| HP Omen Transcend 16 | |
| Media NVIDIA GeForce RTX 4070 Laptop GPU (39 - 66, n=12) | |
| Lenovo Legion Slim 7i 16 Gen 8 | |
| 1920x1080 Epic Preset + Epic Ray-Tracing | |
| Aorus 15 BSF | |
| Media NVIDIA GeForce RTX 4070 Laptop GPU (71 - 75, n=5) | |
| Asus TUF Gaming A16 FA617XS | |
| Baldur's Gate 3 | |
| 1920x1080 Ultra Preset AA:T | |
| Media della classe Gaming (59.4 - 246, n=103, ultimi 2 anni) | |
| Media NVIDIA GeForce RTX 4070 Laptop GPU (66.7 - 128.5, n=30) | |
| Aorus 15 BSF | |
| 2560x1440 Ultra Preset AA:T | |
| Media della classe Gaming (60 - 175.5, n=84, ultimi 2 anni) | |
| Media NVIDIA GeForce RTX 4070 Laptop GPU (54.4 - 89.6, n=25) | |
| Aorus 15 BSF | |
| Ratchet & Clank Rift Apart | |
| 1920x1080 Very High Preset AA:T | |
| Aorus 15 BSF | |
| Media NVIDIA GeForce RTX 4070 Laptop GPU (52.3 - 58.1, n=4) | |
| 2560x1440 Very High Preset AA:T | |
| Media NVIDIA GeForce RTX 4070 Laptop GPU (48.7 - 49.1, n=3) | |
| Aorus 15 BSF | |
| 1920x1080 Very High Preset + Very High Raytracing AA:T | |
| Media NVIDIA GeForce RTX 4070 Laptop GPU (43.4 - 44.8, n=2) | |
| Aorus 15 BSF | |
Per verificare se la frequenza dei fotogrammi rimane stabile per un periodo di tempo più lungo, abbiamo lasciato girare il gioco The Witcher 3 per circa 60 minuti in risoluzione Full HD e utilizzando le impostazioni di qualità massime. Non abbiamo mosso il personaggio. Non abbiamo notato cali di frame rate.
Witcher 3 FPS diagram
| basso | medio | alto | ultra | QHD | |
|---|---|---|---|---|---|
| The Witcher 3 (2015) | 432.4 | 371.8 | 230.9 | 117 | |
| Dota 2 Reborn (2015) | 186.9 | 167.6 | 162.4 | 149.9 | |
| Final Fantasy XV Benchmark (2018) | 213 | 163.9 | 115.4 | 84.4 | |
| X-Plane 11.11 (2018) | 160 | 142.1 | 113.4 | ||
| Far Cry 5 (2018) | 178 | 156 | 149 | 140 | 117 |
| Strange Brigade (2018) | 485 | 295 | 231 | 202 | 133.6 |
| Cyberpunk 2077 1.6 (2022) | 135.4 | 113.8 | 96.7 | 90 | 53.4 |
| The Callisto Protocol (2022) | 162.8 | 142.2 | 136 | 88 | 68.3 |
| Returnal (2023) | 117 | 114 | 104 | 87 | 64 |
| F1 23 (2023) | 248 | 255 | 209 | 71.7 | 46.3 |
| Ratchet & Clank Rift Apart (2023) | 90.4 | 78.8 | 62.3 | 57.1 | 48.8 |
| Baldur's Gate 3 (2023) | 137.1 | 114.2 | 91.4 | 88.5 | 60.2 |
Emissioni - Il portatile Aorus può essere piuttosto rumoroso
Emissioni acustiche
Durante il gioco, le emissioni acustiche salgono fino a 55 dB(A) ("Turbo"). Quando abbiamo utilizzato la modalità "AI Boost", abbiamo misurato 53 dB(A). La modalità Meeting offre una combinazione più equilibrata di prestazioni, emissioni e consumo energetico.
In modalità idle e nell'uso quotidiano (ufficio, internet), le due ventole generalmente non fanno troppo rumore - a volte non girano affatto. Questo non significa che siano sempre silenziose: abbiamo misurato fino a 37 dB(A).
Rumorosità
| Idle |
| 25 / 31 / 37 dB(A) |
| Sotto carico |
| 51 / 57 dB(A) |
 | ||
30 dB silenzioso 40 dB(A) udibile 50 dB(A) rumoroso |
||
min: | ||
| Aorus 15 BSF i7-13700H, GeForce RTX 4070 Laptop GPU | HP Omen Transcend 16 i9-13900HX, GeForce RTX 4070 Laptop GPU | MSI Pulse 17 B13VGK i7-13700H, GeForce RTX 4070 Laptop GPU | Lenovo Legion Slim 7i 16 Gen 8 i9-13900H, GeForce RTX 4070 Laptop GPU | Acer Nitro 16 AN16-41 R7 7735HS, GeForce RTX 4070 Laptop GPU | Asus TUF Gaming A16 FA617XS R9 7940HS, Radeon RX 7600S | |
|---|---|---|---|---|---|---|
| Noise | 5% | 19% | 20% | 10% | 10% | |
| off /ambiente * (dB) | 24 | 22.9 5% | 24 -0% | 22.8 5% | 25.7 -7% | 25 -4% |
| Idle Minimum * (dB) | 25 | 29.1 -16% | 24 4% | 23.6 6% | 25.7 -3% | 25 -0% |
| Idle Average * (dB) | 31 | 29.1 6% | 24 23% | 23.6 24% | 25.7 17% | 26 16% |
| Idle Maximum * (dB) | 37 | 29.1 21% | 24 35% | 25.7 31% | 26.3 29% | 28 24% |
| Load Average * (dB) | 51 | 45.7 10% | 32.49 36% | 27.6 46% | 33.9 34% | 43 16% |
| Load Maximum * (dB) | 57 | 54.3 5% | 46.51 18% | 54.4 5% | 62 -9% | 53 7% |
| Witcher 3 ultra * (dB) | 54.3 | 46.51 | 54.4 | 51 |
* ... Meglio usare valori piccoli
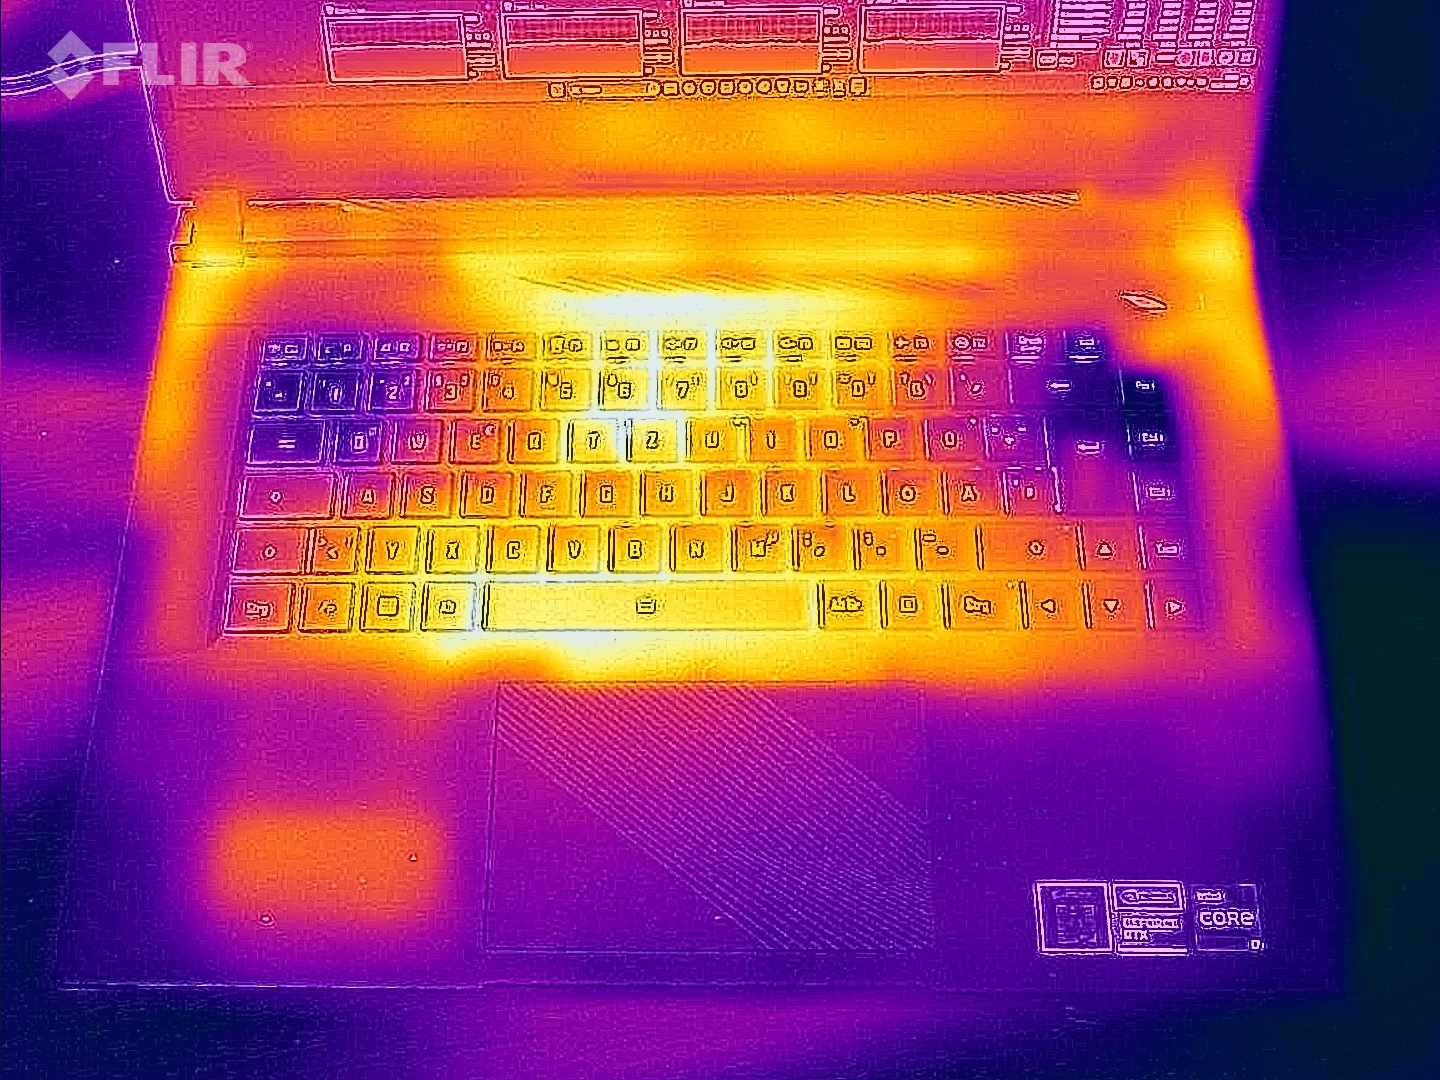
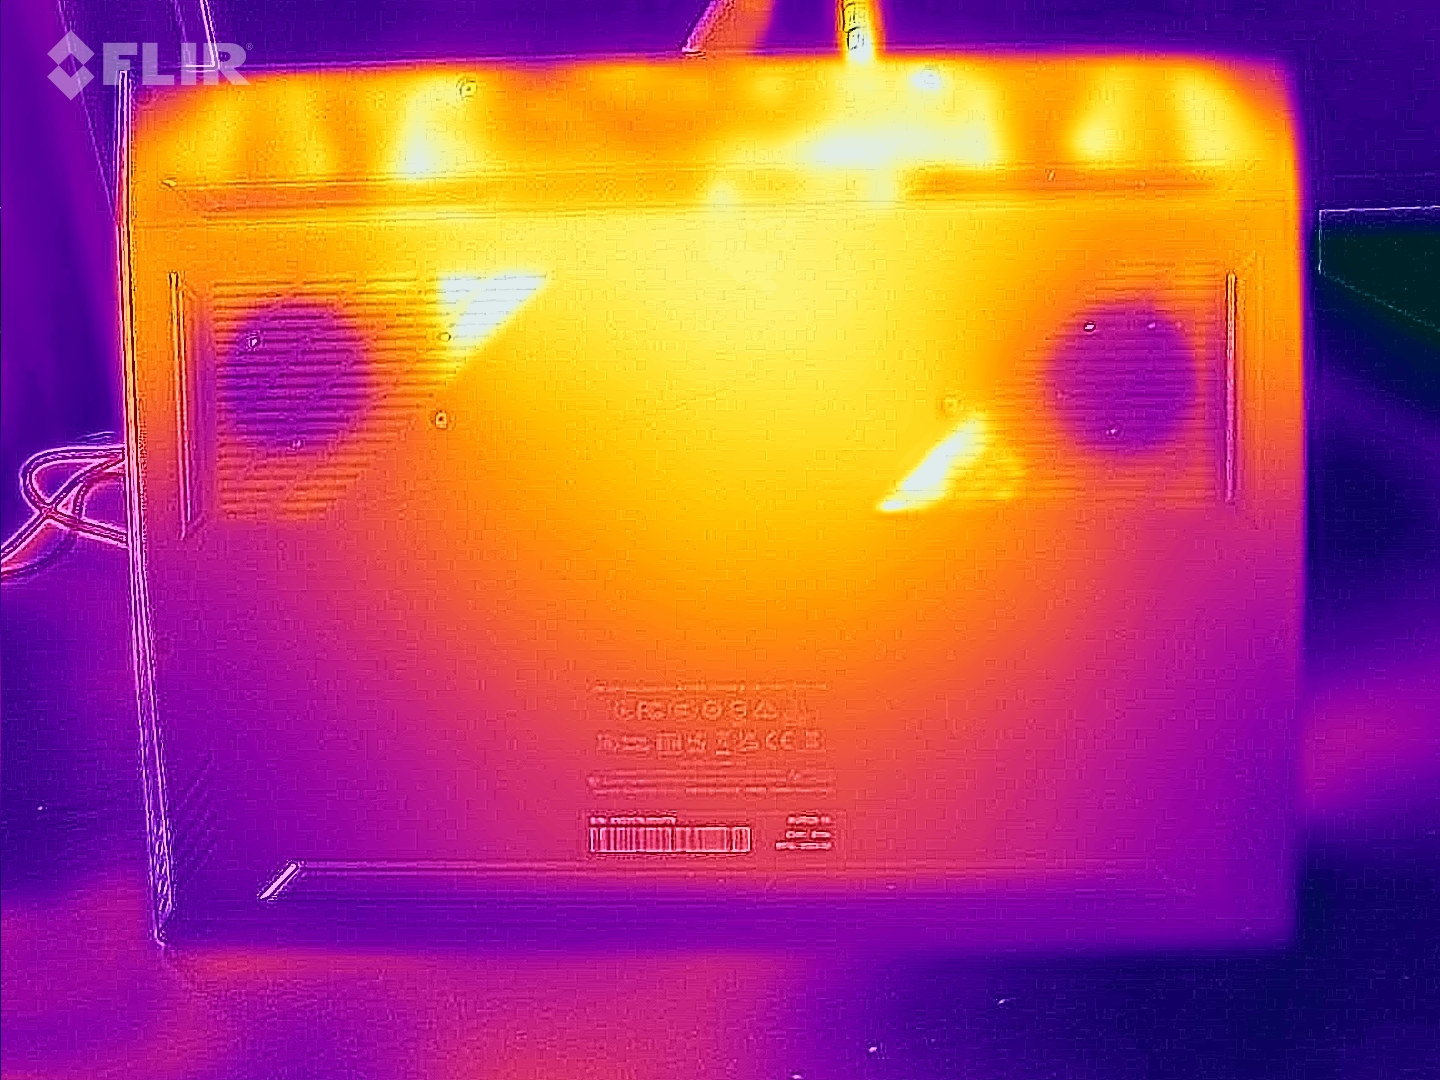
Temperatura
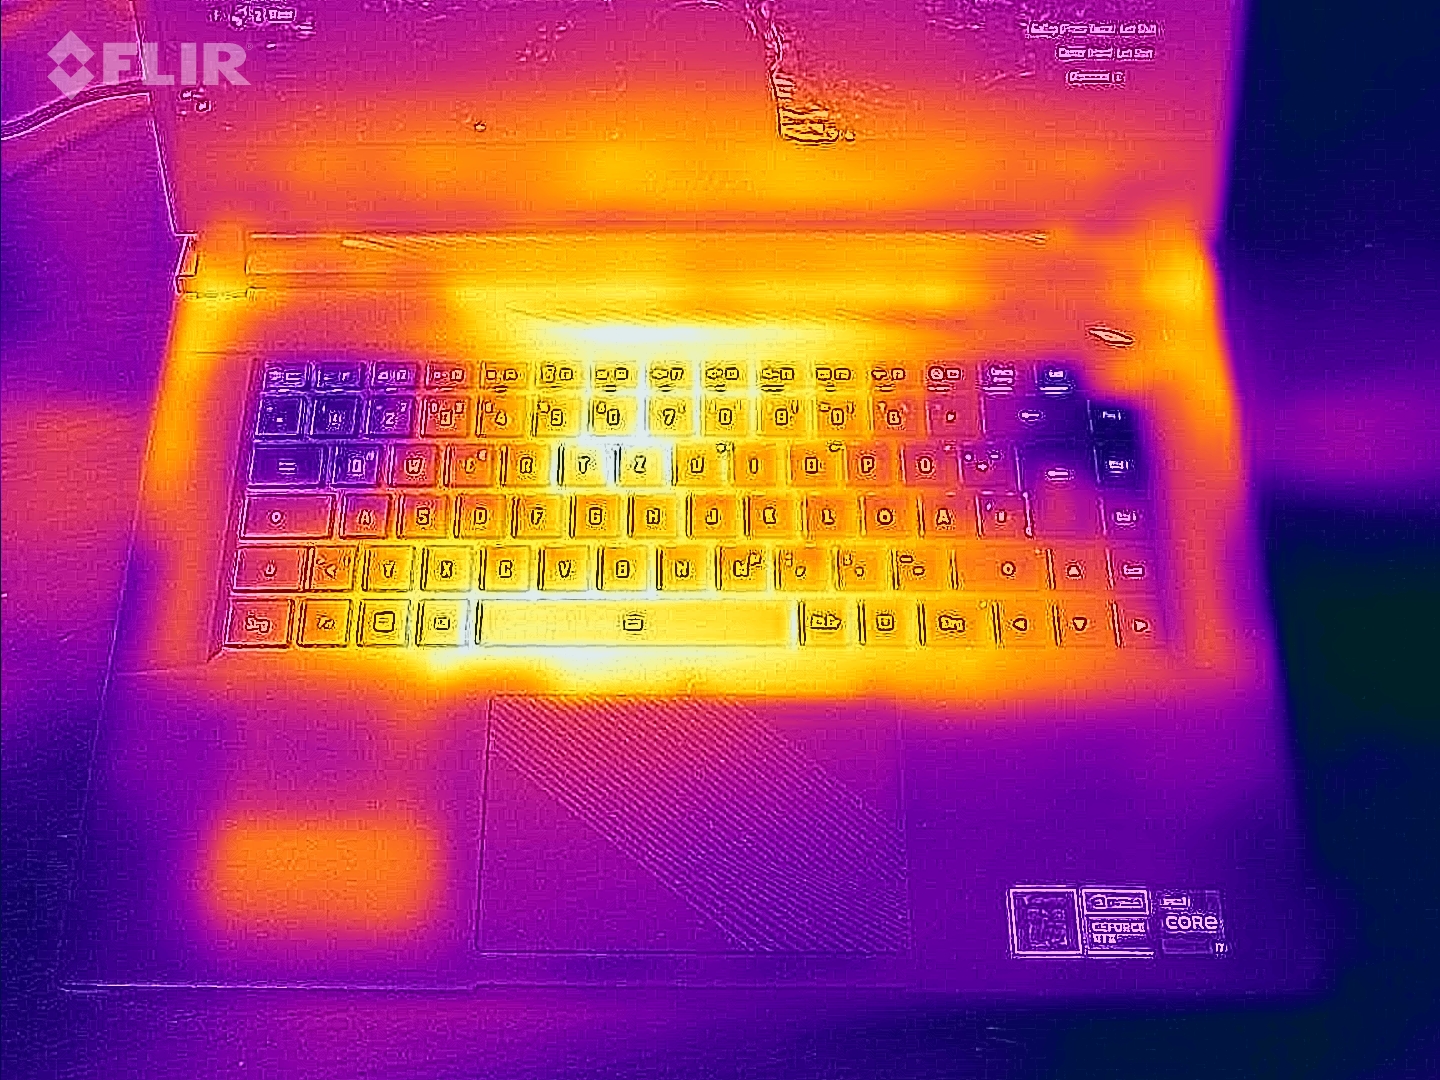
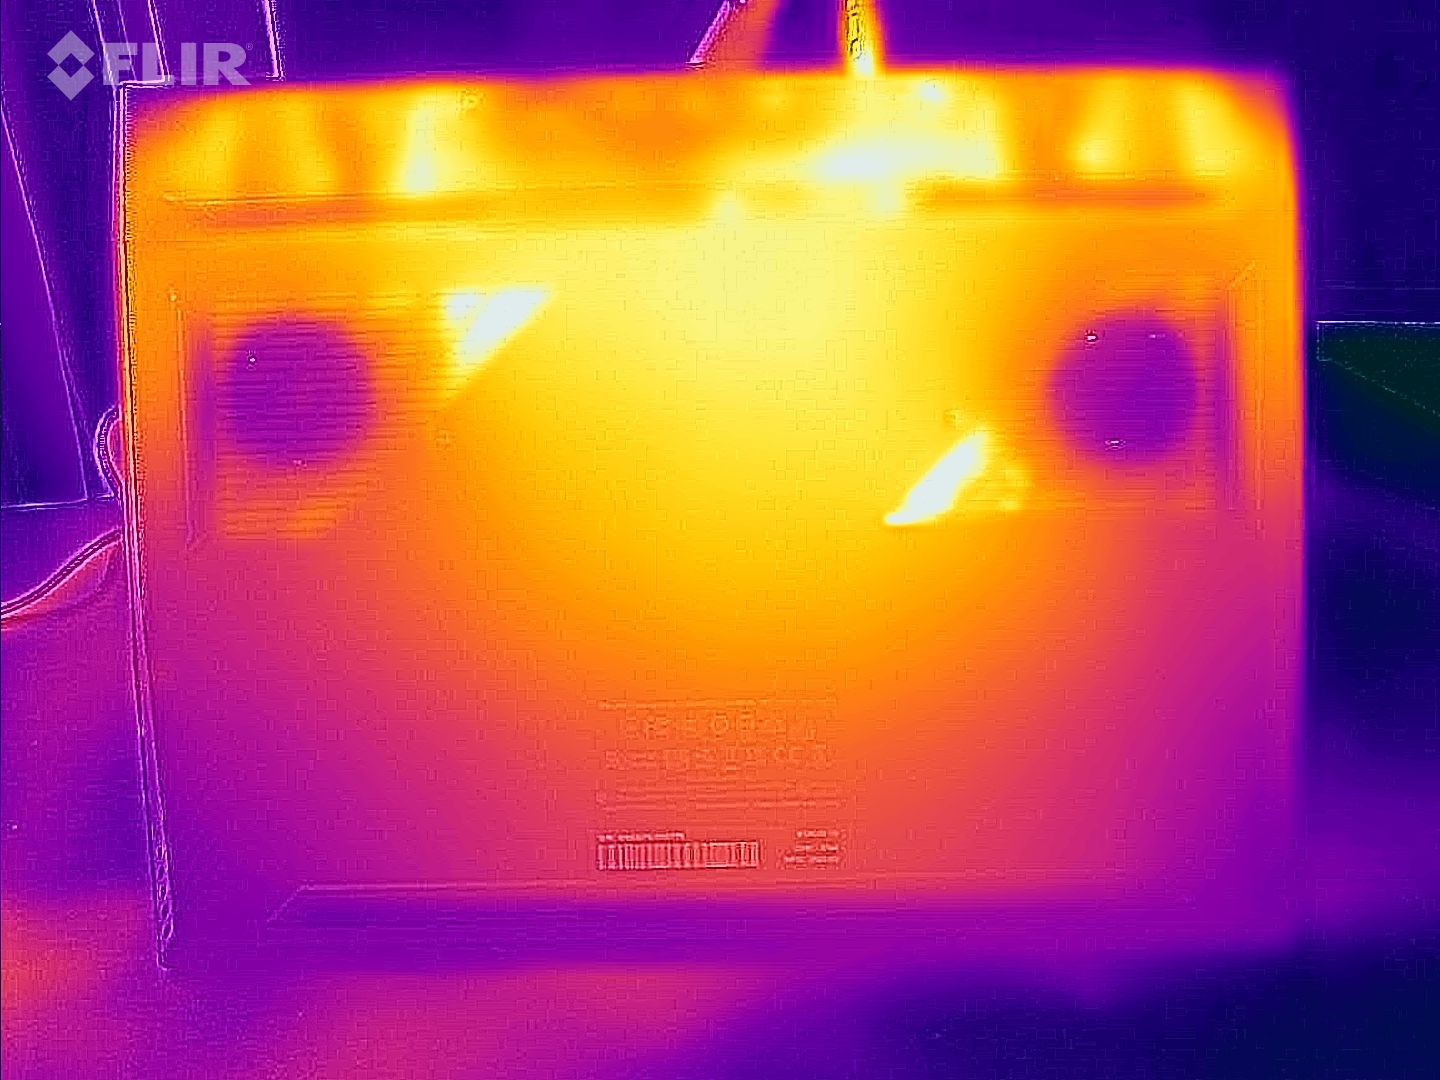
Il nostro stress test e il test Witcher 3 hanno fatto sì che il portatile si riscaldasse in modo evidente, ma non eccessivo. Nell'uso quotidiano (ufficio, internet), le temperature del case rimangono generalmente all'interno dell'area verde - rispetto a computer portatili simili, sono un po' alte.
(-) La temperatura massima sul lato superiore è di 48 °C / 118 F, rispetto alla media di 40.4 °C / 105 F, che varia da 21.2 a 68.8 °C per questa classe Gaming.
(-) Il lato inferiore si riscalda fino ad un massimo di 47 °C / 117 F, rispetto alla media di 43.2 °C / 110 F
(±) In idle, la temperatura media del lato superiore è di 35.6 °C / 96 F, rispetto alla media deld ispositivo di 33.9 °C / 93 F.
(-) Riproducendo The Witcher 3, la temperatura media per il lato superiore e' di 41.9 °C / 107 F, rispetto alla media del dispositivo di 33.9 °C / 93 F.
(-) I poggiapolsi e il touchpad possono diventare molto caldi al tatto con un massimo di 42 °C / 107.6 F.
(-) La temperatura media della zona del palmo della mano di dispositivi simili e'stata di 28.8 °C / 83.8 F (-13.2 °C / -23.8 F).
| Aorus 15 BSF Intel Core i7-13700H, NVIDIA GeForce RTX 4070 Laptop GPU | HP Omen Transcend 16 Intel Core i9-13900HX, NVIDIA GeForce RTX 4070 Laptop GPU | MSI Pulse 17 B13VGK Intel Core i7-13700H, NVIDIA GeForce RTX 4070 Laptop GPU | Lenovo Legion Slim 7i 16 Gen 8 Intel Core i9-13900H, NVIDIA GeForce RTX 4070 Laptop GPU | Acer Nitro 16 AN16-41 AMD Ryzen 7 7735HS, NVIDIA GeForce RTX 4070 Laptop GPU | Asus TUF Gaming A16 FA617XS AMD Ryzen 9 7940HS, AMD Radeon RX 7600S | |
|---|---|---|---|---|---|---|
| Heat | 7% | 6% | 8% | 6% | 6% | |
| Maximum Upper Side * (°C) | 48 | 47.4 1% | 48 -0% | 49.8 -4% | 41.5 14% | 53 -10% |
| Maximum Bottom * (°C) | 47 | 54.4 -16% | 50 -6% | 48.8 -4% | 51.8 -10% | 48 -2% |
| Idle Upper Side * (°C) | 39 | 28.4 27% | 30 23% | 29.4 25% | 31.6 19% | 30 23% |
| Idle Bottom * (°C) | 35 | 29.2 17% | 33 6% | 30 14% | 34.5 1% | 30 14% |
* ... Meglio usare valori piccoli
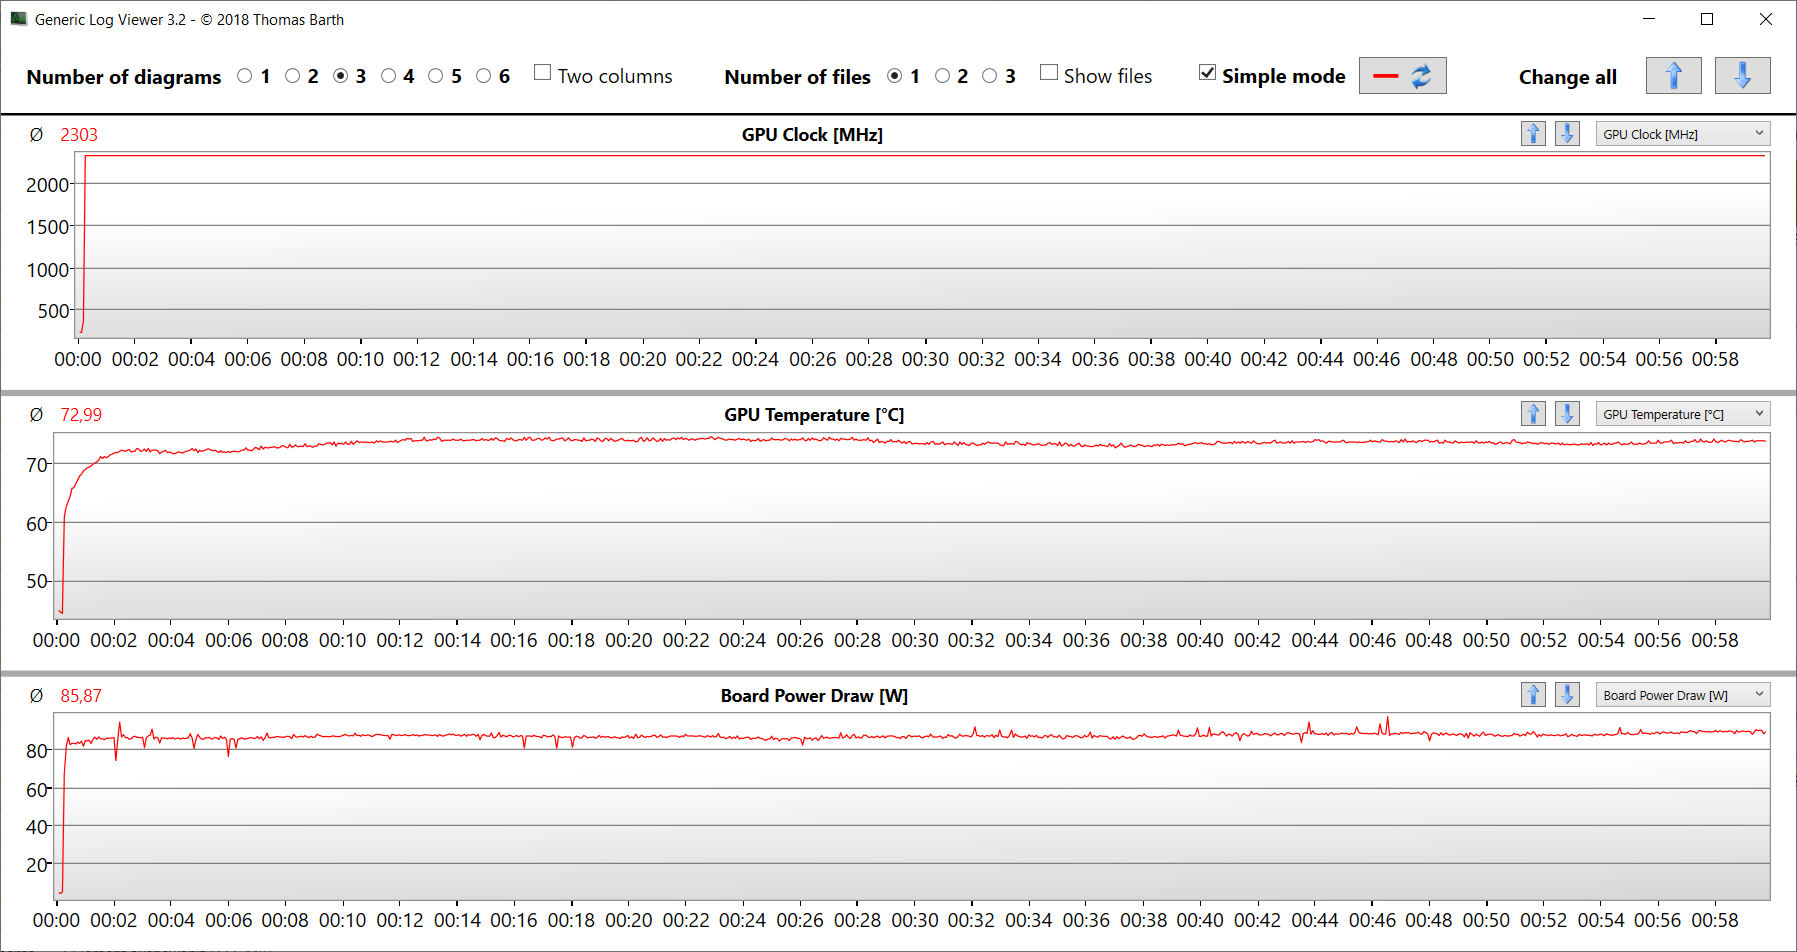
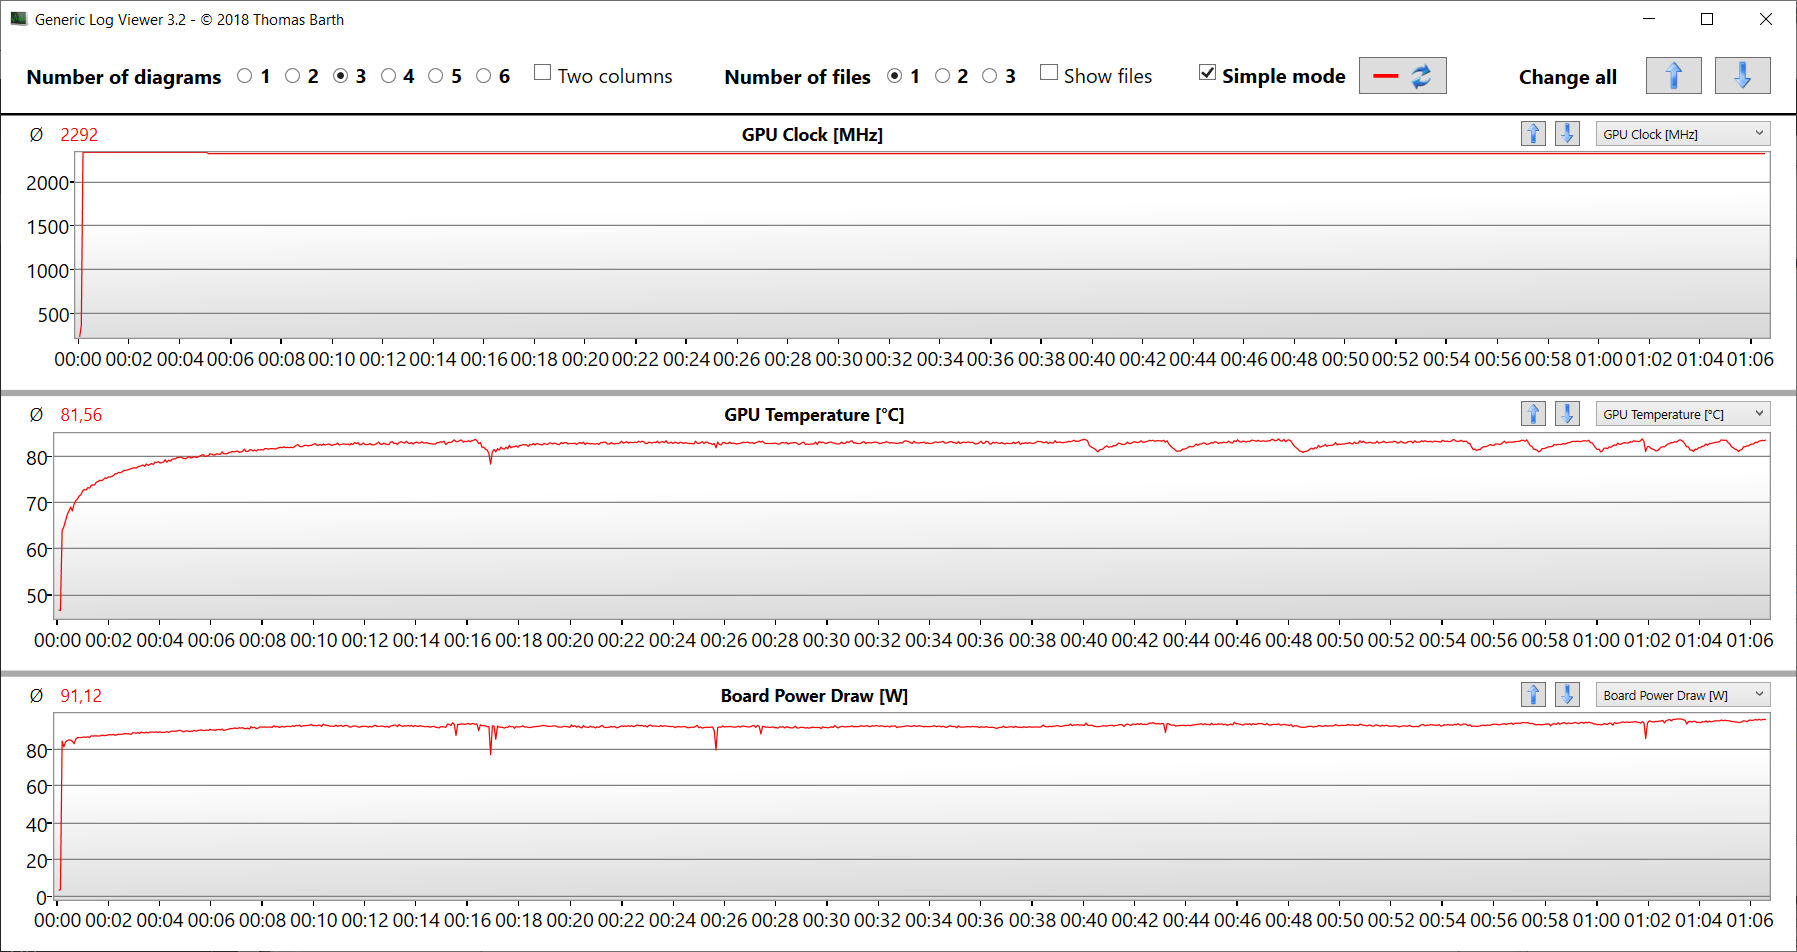
Test da sforzo
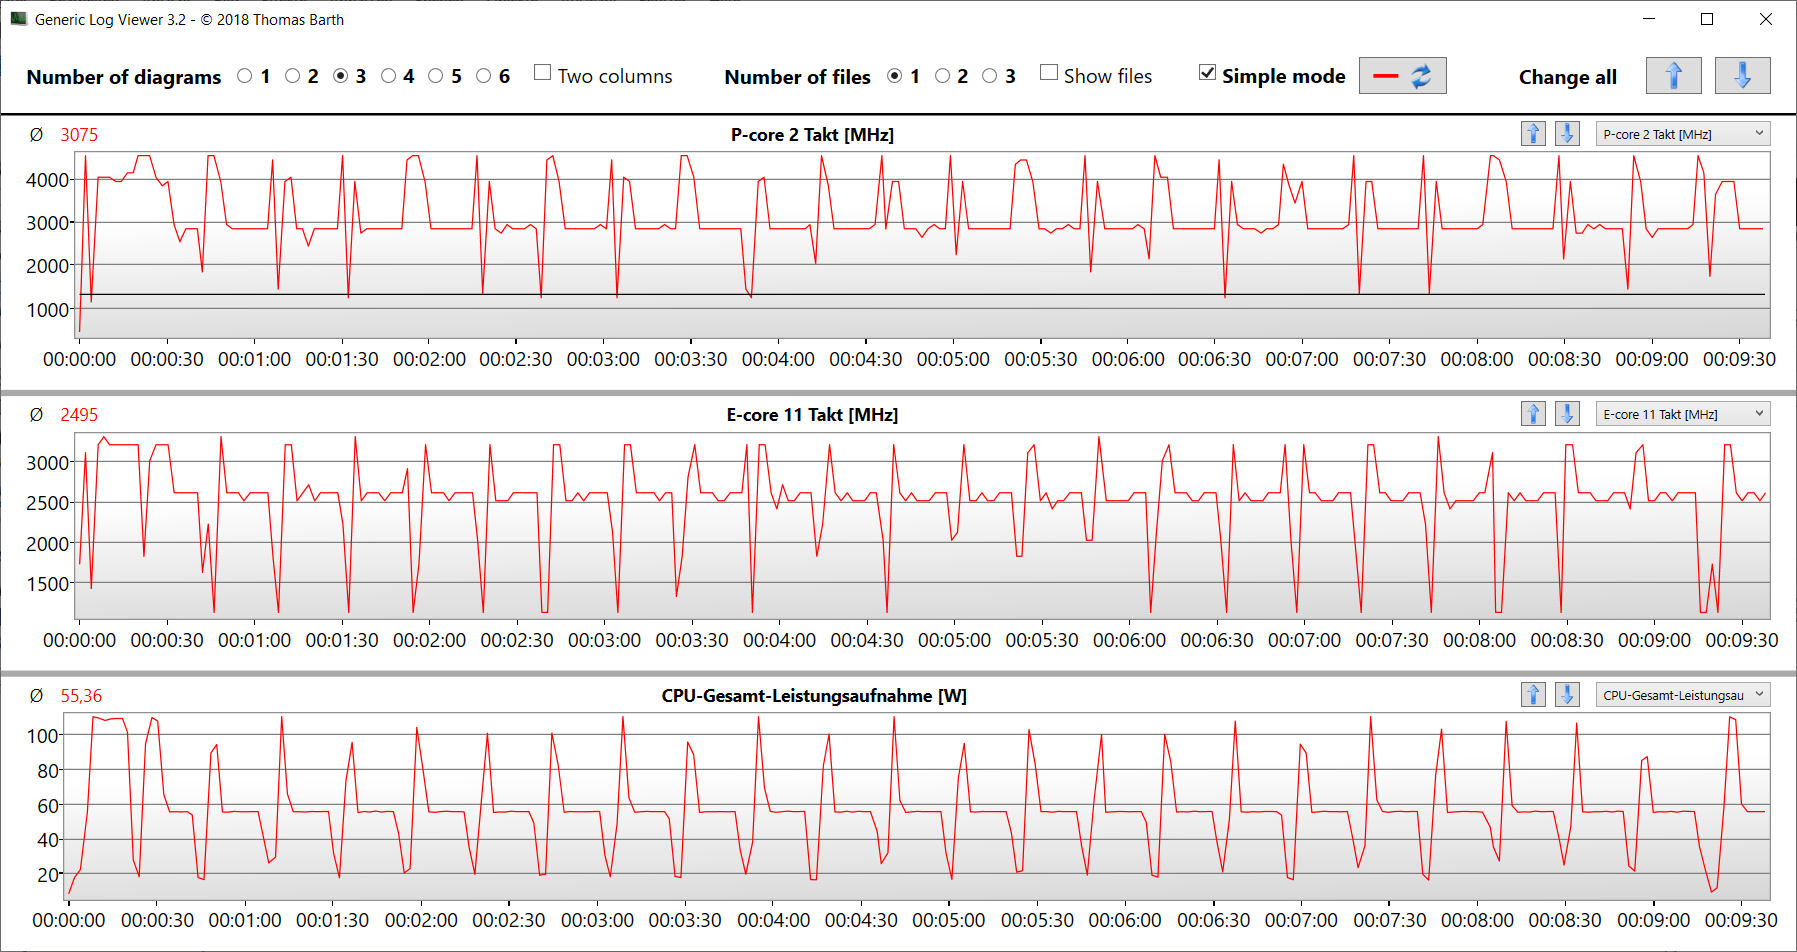
Lo stress test (Prime95 e Furmark in uso continuo) crea uno scenario estremo per verificare la stabilità del sistema a pieno carico. La CPU (P: 2,7 - 2,8 GHz, E: 2,5 GHz) ha iniziato il test con velocità di clock medie. Dopo poco tempo, il clock è sceso a circa 2,6-2,7 GHz (core P) e 2,1-2,2 GHz (core E). Il clock della GPU è sceso da 2,3 GHz a 2,1 GHz.
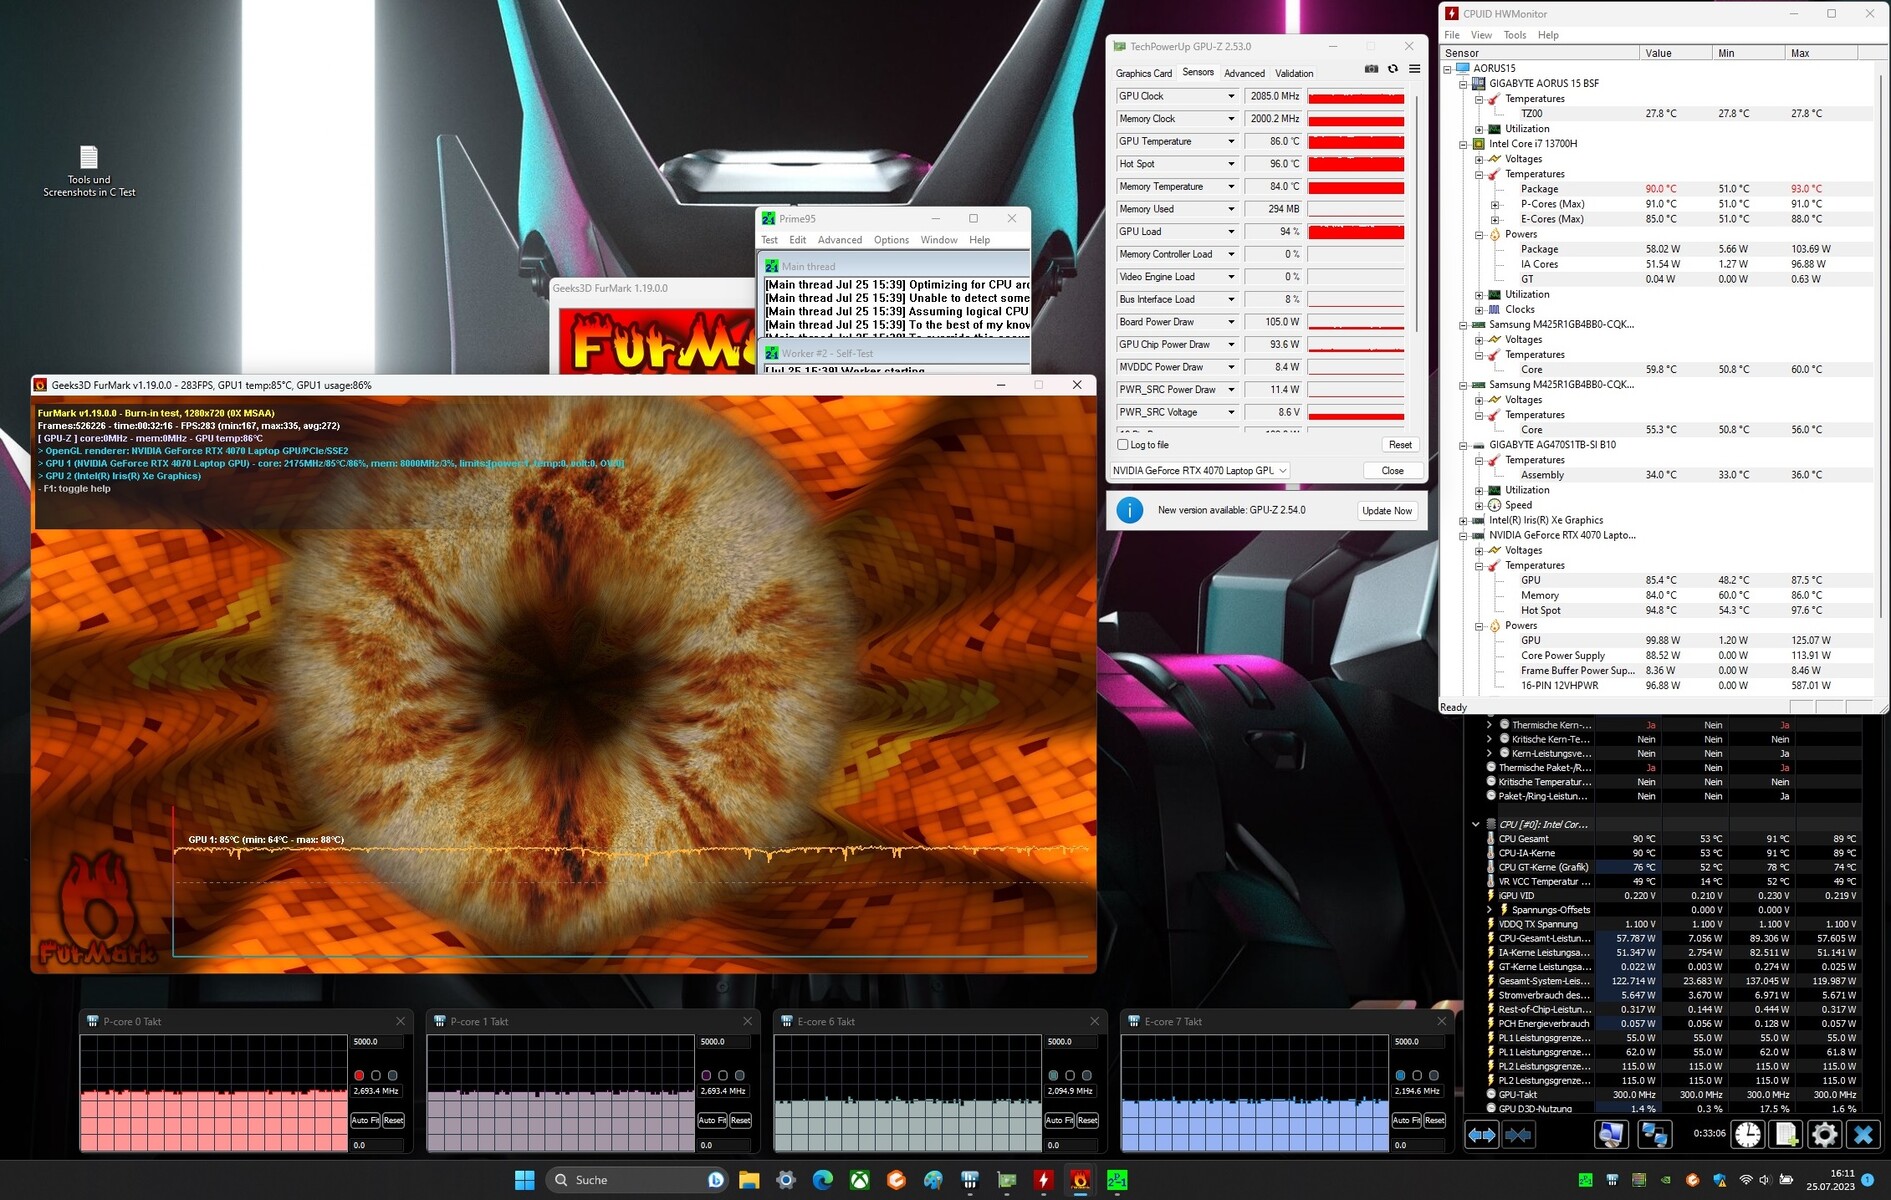
Altoparlanti
Gli altoparlanti stereo producono un suono decente, ma i bassi sono quasi inesistenti. Per un'esperienza sonora migliore, si consiglia di utilizzare cuffie o altoparlanti esterni.
Aorus 15 BSF analisi audio
(+) | gli altoparlanti sono relativamente potenti (83 dB)
Bassi 100 - 315 Hz
(-) | quasi nessun basso - in media 27.1% inferiori alla media
(-) | bassi non lineari (16% delta rispetto alla precedente frequenza)
Medi 400 - 2000 Hz
(+) | medi bilanciati - solo only 4.2% rispetto alla media
(+) | medi lineari (3.6% delta rispetto alla precedente frequenza)
Alti 2 - 16 kHz
(+) | Alti bilanciati - appena 2.8% dalla media
(+) | alti lineari (6.8% delta rispetto alla precedente frequenza)
Nel complesso 100 - 16.000 Hz
(±) | la linearità complessiva del suono è media (17.3% di differenza rispetto alla media
Rispetto alla stessa classe
» 47% di tutti i dispositivi testati in questa classe è stato migliore, 12% simile, 41% peggiore
» Il migliore ha avuto un delta di 6%, medio di 18%, peggiore di 132%
Rispetto a tutti i dispositivi testati
» 32% di tutti i dispositivi testati in questa classe è stato migliore, 8% similare, 59% peggiore
» Il migliore ha avuto un delta di 4%, medio di 23%, peggiore di 134%
Acer Nitro 16 AN16-41 analisi audio
(+) | gli altoparlanti sono relativamente potenti (83.9 dB)
Bassi 100 - 315 Hz
(-) | quasi nessun basso - in media 33.5% inferiori alla media
(±) | la linearità dei bassi è media (13.2% delta rispetto alla precedente frequenza)
Medi 400 - 2000 Hz
(+) | medi bilanciati - solo only 2.4% rispetto alla media
(+) | medi lineari (4.9% delta rispetto alla precedente frequenza)
Alti 2 - 16 kHz
(+) | Alti bilanciati - appena 3.6% dalla media
(+) | alti lineari (4.2% delta rispetto alla precedente frequenza)
Nel complesso 100 - 16.000 Hz
(±) | la linearità complessiva del suono è media (19.6% di differenza rispetto alla media
Rispetto alla stessa classe
» 68% di tutti i dispositivi testati in questa classe è stato migliore, 6% simile, 25% peggiore
» Il migliore ha avuto un delta di 6%, medio di 18%, peggiore di 132%
Rispetto a tutti i dispositivi testati
» 49% di tutti i dispositivi testati in questa classe è stato migliore, 7% similare, 44% peggiore
» Il migliore ha avuto un delta di 4%, medio di 23%, peggiore di 134%
Gestione dell'energia: il computer Gigabyte non manca di resistenza
Consumo di energia
Il portatile Gigabyte non ha evidenziato alcun problema in termini di consumo energetico. I tassi sono nella norma per l'hardware installato. Il test e lo stress test sono stati eseguiti con un consumo energetico relativamente costante Witcher 3 test e lo stress test sono stati eseguiti con un consumo energetico relativamente costante. L'alimentatore (240 watt) è sufficientemente dimensionato.
| Off / Standby | |
| Idle | |
| Sotto carico |
|
Leggenda:
min: | |
| Aorus 15 BSF i7-13700H, GeForce RTX 4070 Laptop GPU | HP Omen Transcend 16 i9-13900HX, GeForce RTX 4070 Laptop GPU | MSI Pulse 17 B13VGK i7-13700H, GeForce RTX 4070 Laptop GPU | Lenovo Legion Slim 7i 16 Gen 8 i9-13900H, GeForce RTX 4070 Laptop GPU | Acer Nitro 16 AN16-41 R7 7735HS, GeForce RTX 4070 Laptop GPU | Asus TUF Gaming A16 FA617XS R9 7940HS, Radeon RX 7600S | Media della classe Gaming | |
|---|---|---|---|---|---|---|---|
| Power Consumption | -85% | 15% | -74% | -19% | 15% | -37% | |
| Idle Minimum * (Watt) | 7 | 19.2 -174% | 9 -29% | 22 -214% | 11.6 -66% | 7 -0% | 13 ? -86% |
| Idle Average * (Watt) | 12 | 22.7 -89% | 10.2 15% | 29 -142% | 15.6 -30% | 10 17% | 18.7 ? -56% |
| Idle Maximum * (Watt) | 20 | 55.4 -177% | 10.8 46% | 39.5 -98% | 16.5 17% | 15 25% | 24.3 ? -22% |
| Load Average * (Watt) | 94 | 128.4 -37% | 72 23% | 98.7 -5% | 155 -65% | 86 9% | 110.2 ? -17% |
| Witcher 3 ultra * (Watt) | 175.8 | 206 -17% | 130 26% | 171.8 2% | 154.8 12% | 160.6 9% | |
| Load Maximum * (Watt) | 247 | 292 -18% | 221 11% | 213.2 14% | 205 17% | 172 30% | 258 ? -4% |
* ... Meglio usare valori piccoli
Power consumption Witcher 3 / stress test
Power consumption with external monitor
Durata della batteria
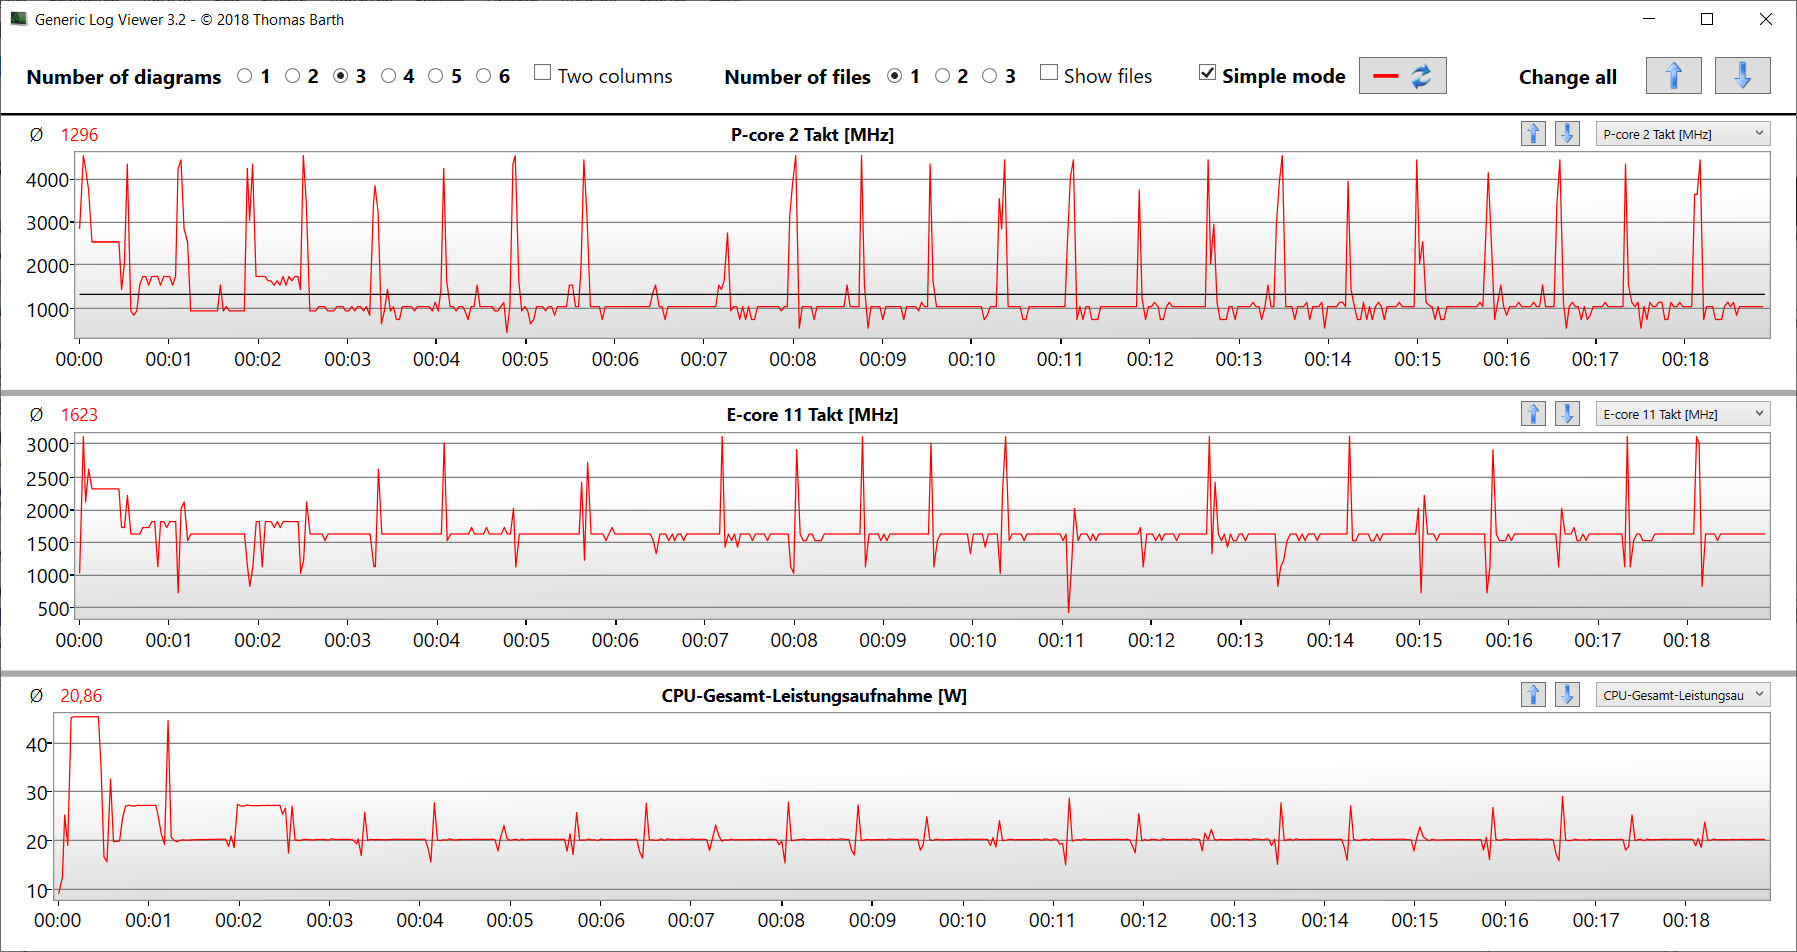
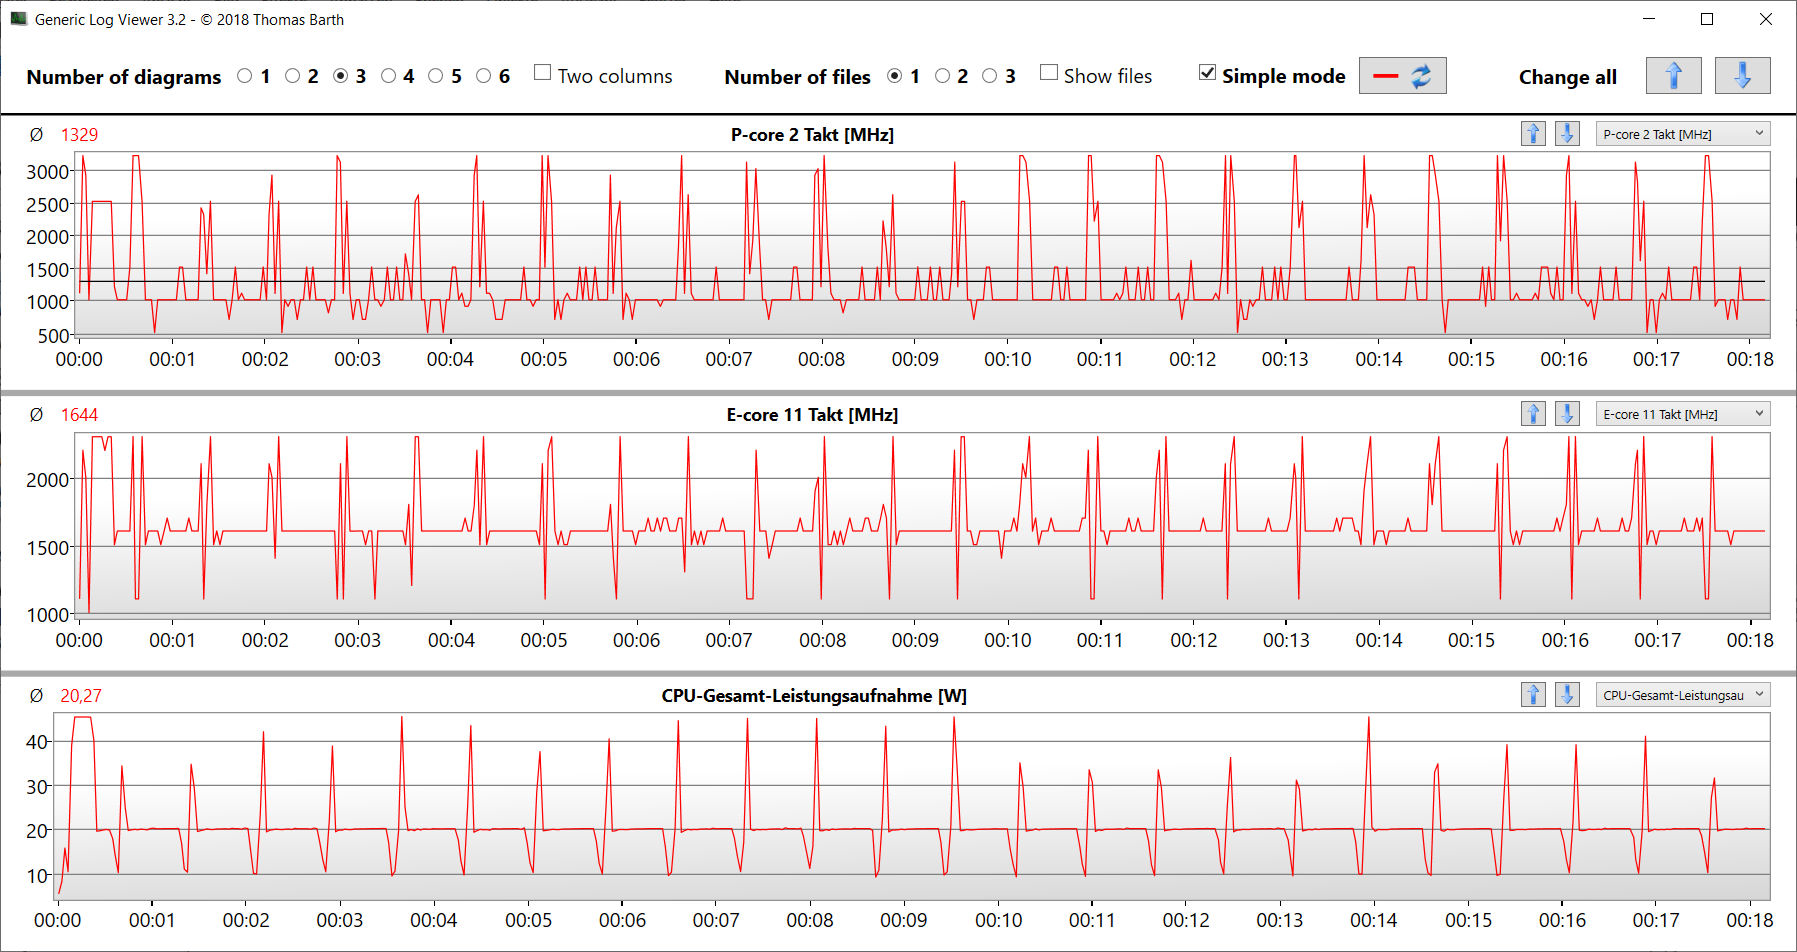
Il dispositivo da 15,6 pollici ha raggiunto tempi di esecuzione di 10:19 ore e 9:01 ore rispettivamente nel test WLAN (richiamo di siti web tramite uno script) e nel test video (breve film Big Buck Bunny (codifica H.264, FHD) in loop). Durante entrambi i test, le funzioni di risparmio energetico del portatile erano disattivate e la luminosità del display era impostata a circa 150 cd/m². Anche i moduli wireless sono stati disattivati per il test video.
Il dispositivo ha garantito ottimi tempi di esecuzione. Molti dei concorrenti sono arrivati molto indietro rispetto all'Aorus 15, nonostante la capacità della batteria sia simile. Il portatile Aorus non è riuscito ad avvicinarsi all'Asus TUF Gaming A16.Asus TUF Gaming A16dell'Asus TUF Gaming A16. Il computer Asus trae vantaggio dalla sua APU AMD più parsimoniosa.
| Aorus 15 BSF i7-13700H, GeForce RTX 4070 Laptop GPU, 99 Wh | HP Omen Transcend 16 i9-13900HX, GeForce RTX 4070 Laptop GPU, 97 Wh | MSI Pulse 17 B13VGK i7-13700H, GeForce RTX 4070 Laptop GPU, 90 Wh | Lenovo Legion Slim 7i 16 Gen 8 i9-13900H, GeForce RTX 4070 Laptop GPU, 99.9 Wh | Acer Nitro 16 AN16-41 R7 7735HS, GeForce RTX 4070 Laptop GPU, 90 Wh | Asus TUF Gaming A16 FA617XS R9 7940HS, Radeon RX 7600S, 90 Wh | Media della classe Gaming | |
|---|---|---|---|---|---|---|---|
| Autonomia della batteria | -49% | -7% | -56% | -2% | 21% | -22% | |
| Reader / Idle (h) | 10.9 | 6.3 -42% | 5.1 -53% | 12.2 12% | 20.3 86% | 8.71 ? -20% | |
| H.264 (h) | 9 | 10.2 13% | 12.4 38% | 8.64 ? -4% | |||
| WiFi v1.3 (h) | 10.3 | 4.2 -59% | 9 -13% | 4.4 -57% | 9 -13% | 12.4 20% | 7.11 ? -31% |
| Load (h) | 2.2 | 1.2 -45% | 2.2 0% | 0.9 -59% | 1.8 -18% | 0.9 -59% | 1.502 ? -32% |
Pro
Contro
Verdetto - Il portatile da gioco con risoluzione QHD vale i soldi spesi
L'Aorus 15 è fatto per i giochi in QHD (con impostazioni elevate o massime), ma è ottimo anche in altri campi di utilizzo (editing video, rendering). Il suoCore i7-13700HeGeForce RTX 4070forniscono le prestazioni necessarie. Entrambi i chip funzionano con una frequenza di clock costantemente elevata. Un veloce SSD PCIe 4 (1 TB) fornisce lo spazio di archiviazione necessario e garantisce tempi di caricamento ridotti.
L'Aorus 15 BSF di Gigabyte è un portatile da gioco di fascia media ottimo e completo.
Le emissioni di rumore e calore sono ai livelli previsti per questa fascia di prezzo. La riduzione delle emissioni acustiche potrebbe essere ottenuta a scapito di alcune prestazioni del portatile. Il pannello IPS opaco (15,6 pollici, 2.560 x 1.440 pixel, 165 Hz, DCI P3) fa generalmente una buona impressione. Tuttavia, la luminosità e il contrasto potrebbero essere leggermente migliori.
La ricarica completa della batteria (99 Wh) porta a un'autonomia pratica di circa 9-10 ore, un risultato molto buono. Positivo: La batteria può essere caricata tramite un cavo USB-C (min 65 watt, 20 V) - la sua porta USB-C (Thunderbolt 4) supporta Power Delivery. Ciò significa che l'ingombrante connettore di alimentazione proprietario (240 watt) non deve essere sempre trasportato con il dispositivo.
Un'alternativa a questo portatile potrebbe essere ilAsus TUF Gaming A16 FA617XSche offre migliori prestazioni della CPU, un display 16:10 e tempi di esecuzione ancora più lunghi. In termini di prestazioni grafiche, è un po' in svantaggio rispetto all'Aorus 15.
Prezzo e disponibilità
La versione dell'Aorus 15 BSF che abbiamo testato è disponibile su Amazon al prezzo di 1.699 dollari.
Aorus 15 BSF
- 08/12/2023 v7 (old)
Sascha Mölck
Transparency
La selezione dei dispositivi da recensire viene effettuata dalla nostra redazione. Il campione di prova è stato fornito all'autore come prestito dal produttore o dal rivenditore ai fini di questa recensione. L'istituto di credito non ha avuto alcuna influenza su questa recensione, né il produttore ne ha ricevuto una copia prima della pubblicazione. Non vi era alcun obbligo di pubblicare questa recensione. In quanto società mediatica indipendente, Notebookcheck non è soggetta all'autorità di produttori, rivenditori o editori.
Ecco come Notebookcheck esegue i test
Ogni anno, Notebookcheck esamina in modo indipendente centinaia di laptop e smartphone utilizzando procedure standardizzate per garantire che tutti i risultati siano comparabili. Da circa 20 anni sviluppiamo continuamente i nostri metodi di prova e nel frattempo stabiliamo gli standard di settore. Nei nostri laboratori di prova, tecnici ed editori esperti utilizzano apparecchiature di misurazione di alta qualità. Questi test comportano un processo di validazione in più fasi. Il nostro complesso sistema di valutazione si basa su centinaia di misurazioni e parametri di riferimento ben fondati, che mantengono l'obiettività.Price comparison

