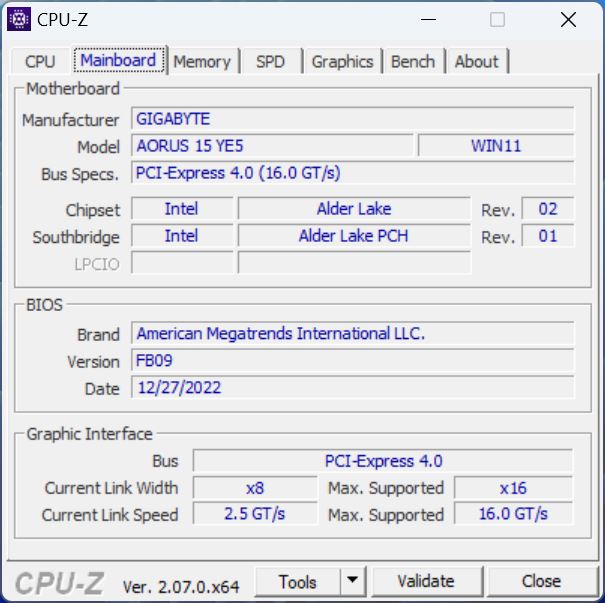
Recensione dell'Aorus 15 YE5: Il portatile gaming di fascia alta per i risparmiatori
Già solo per il suo prezzo contenuto, l'Aorus 15 YE è un portatile da gioco interessante. Dall'esterno, appare moderno e sottile - il pacchetto economico include persino Thunderbolt 4 e DDR5. All'interno, invece, è installato un hardware (forte) di ultima generazione, ovvero un Core i5-12500H e il precedente modello di punta di Nvidia RTX 3080 Ti. Tutto questo rende l'Aorus 15 YE5 uno dei portatili da gioco più forti che si possano trovare a 1.500 dollari.
Nonostante la CPU e la GPU appartengano alla generazione precedente, l'Aorus deve difendersi dai concorrenti attuali per dimostrare se è in grado di tenere il passo e se riesce effettivamente a offrire un buon rapporto qualità-prezzo. Successivamente, lo confronteremo con gli attuali computer portatili con RTX 4060 o RTX 4070, come Aorus 15 BSF (RTX 4070), Captiva Advanced Gaming I74-121 (RTX 4060), HP Victus 16 (RTX 4070), HP Omen 16 (RTX 4080) e il molto più costoso Dell XPS 15 9530 (RTX 4070).
Potenziali concorrenti a confronto
Punteggio | Data | Modello | Peso | Altezza | Dimensione | Risoluzione | Prezzo |
|---|---|---|---|---|---|---|---|
| 86.6 % v7 (old) | 12/2023 | Aorus 15 YE5-54DEB34SH i5-12500H, GeForce RTX 3080 Ti Laptop GPU | 2.3 kg | 27 mm | 15.60" | 2560x1440 | |
| 85.7 % v7 (old) | 08/2023 | Aorus 15 BSF i7-13700H, GeForce RTX 4070 Laptop GPU | 2.4 kg | 20.9 mm | 15.60" | 2560x1440 | |
| 85.7 % v7 (old) | 09/2023 | Captiva Advanced Gaming I74-121 i5-13500H, GeForce RTX 4060 Laptop GPU | 2.3 kg | 29 mm | 15.60" | 1920x1080 | |
| 85.1 % v7 (old) | 09/2023 | HP Victus 16-r0077ng i7-13700H, GeForce RTX 4070 Laptop GPU | 2.4 kg | 24 mm | 16.10" | 1920x1080 | |
| 90.3 % v7 (old) | 04/2023 | Dell XPS 15 9530 RTX 4070 i7-13700H, GeForce RTX 4070 Laptop GPU | 1.9 kg | 18 mm | 15.60" | 3456x2160 | |
| 87.4 % v7 (old) | 07/2023 | HP Omen 16-wf000 i7-13700HX, GeForce RTX 4080 Laptop GPU | 2.4 kg | 23.6 mm | 16.10" | 2560x1440 |
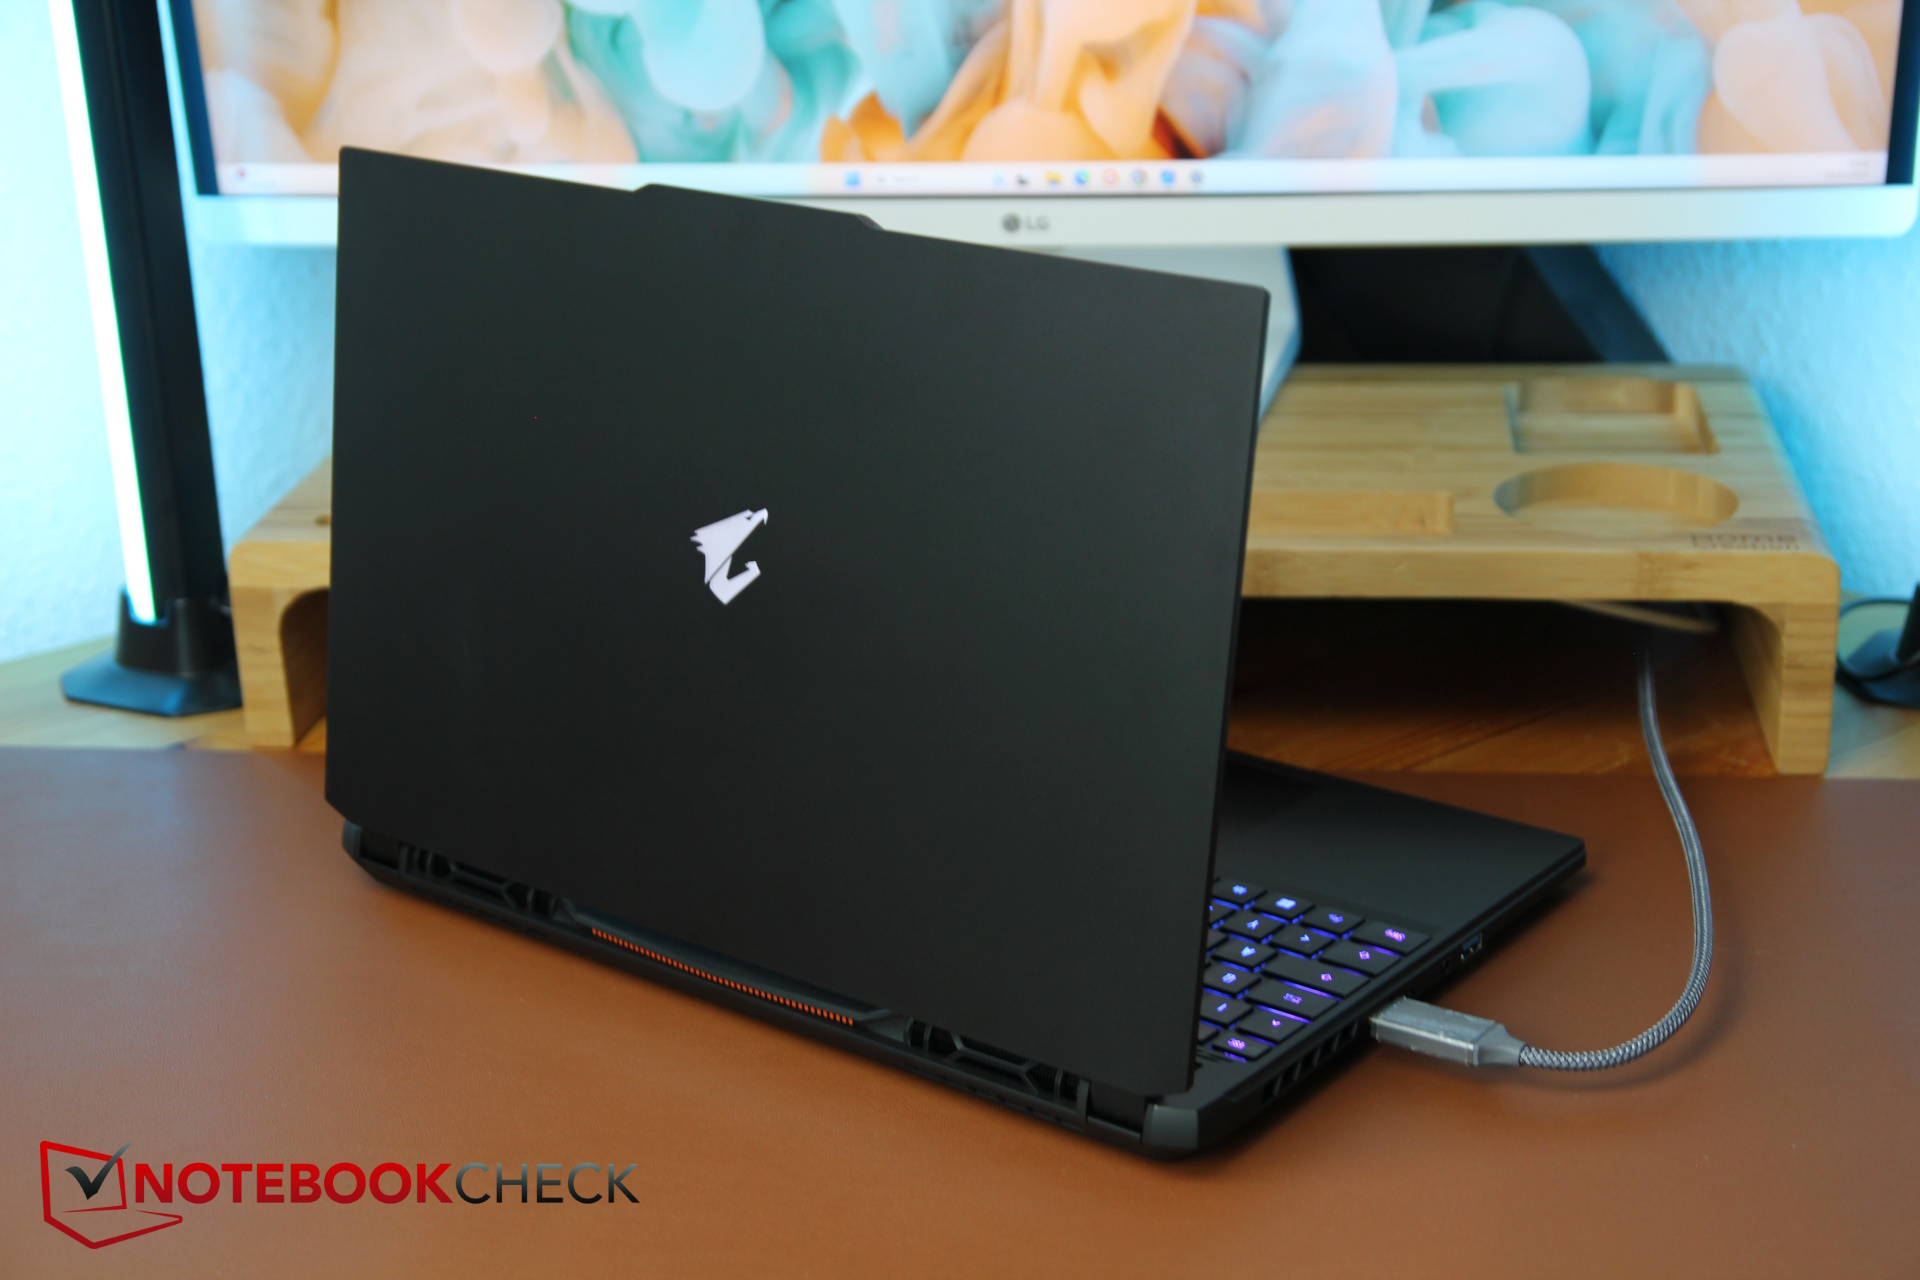
Custodia e connettività: Moderno, ma ridotto al minimo
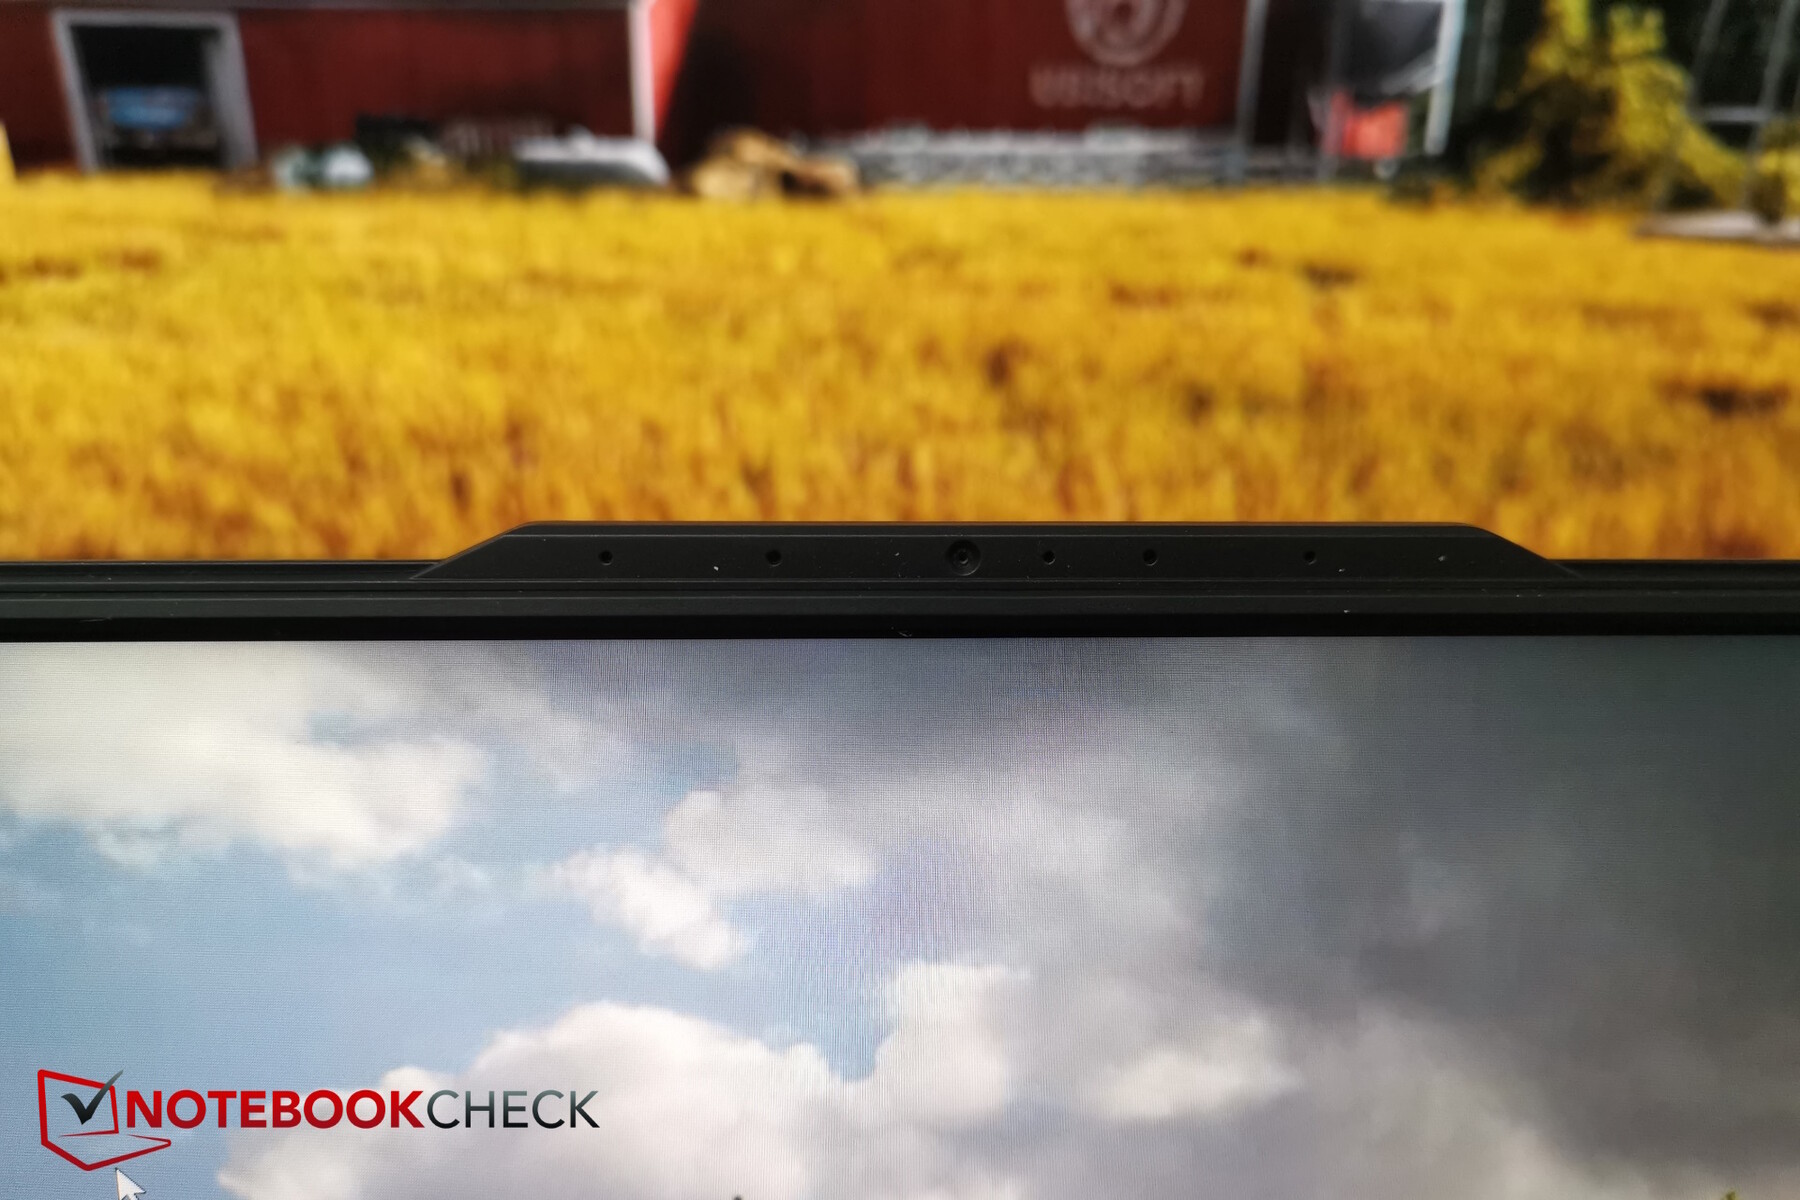
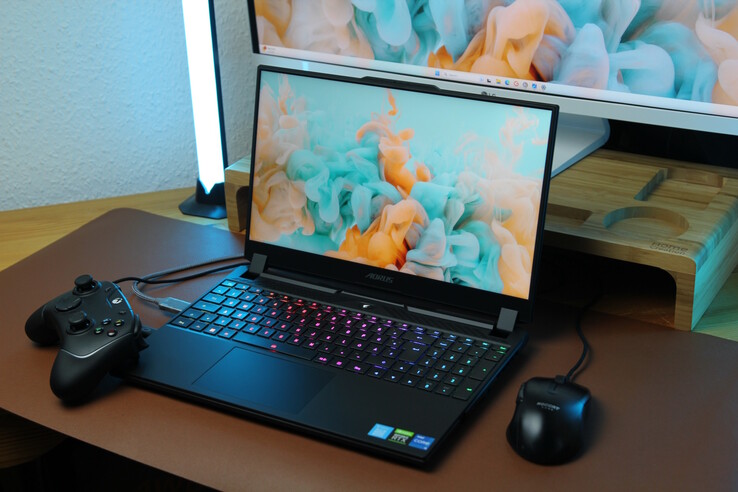
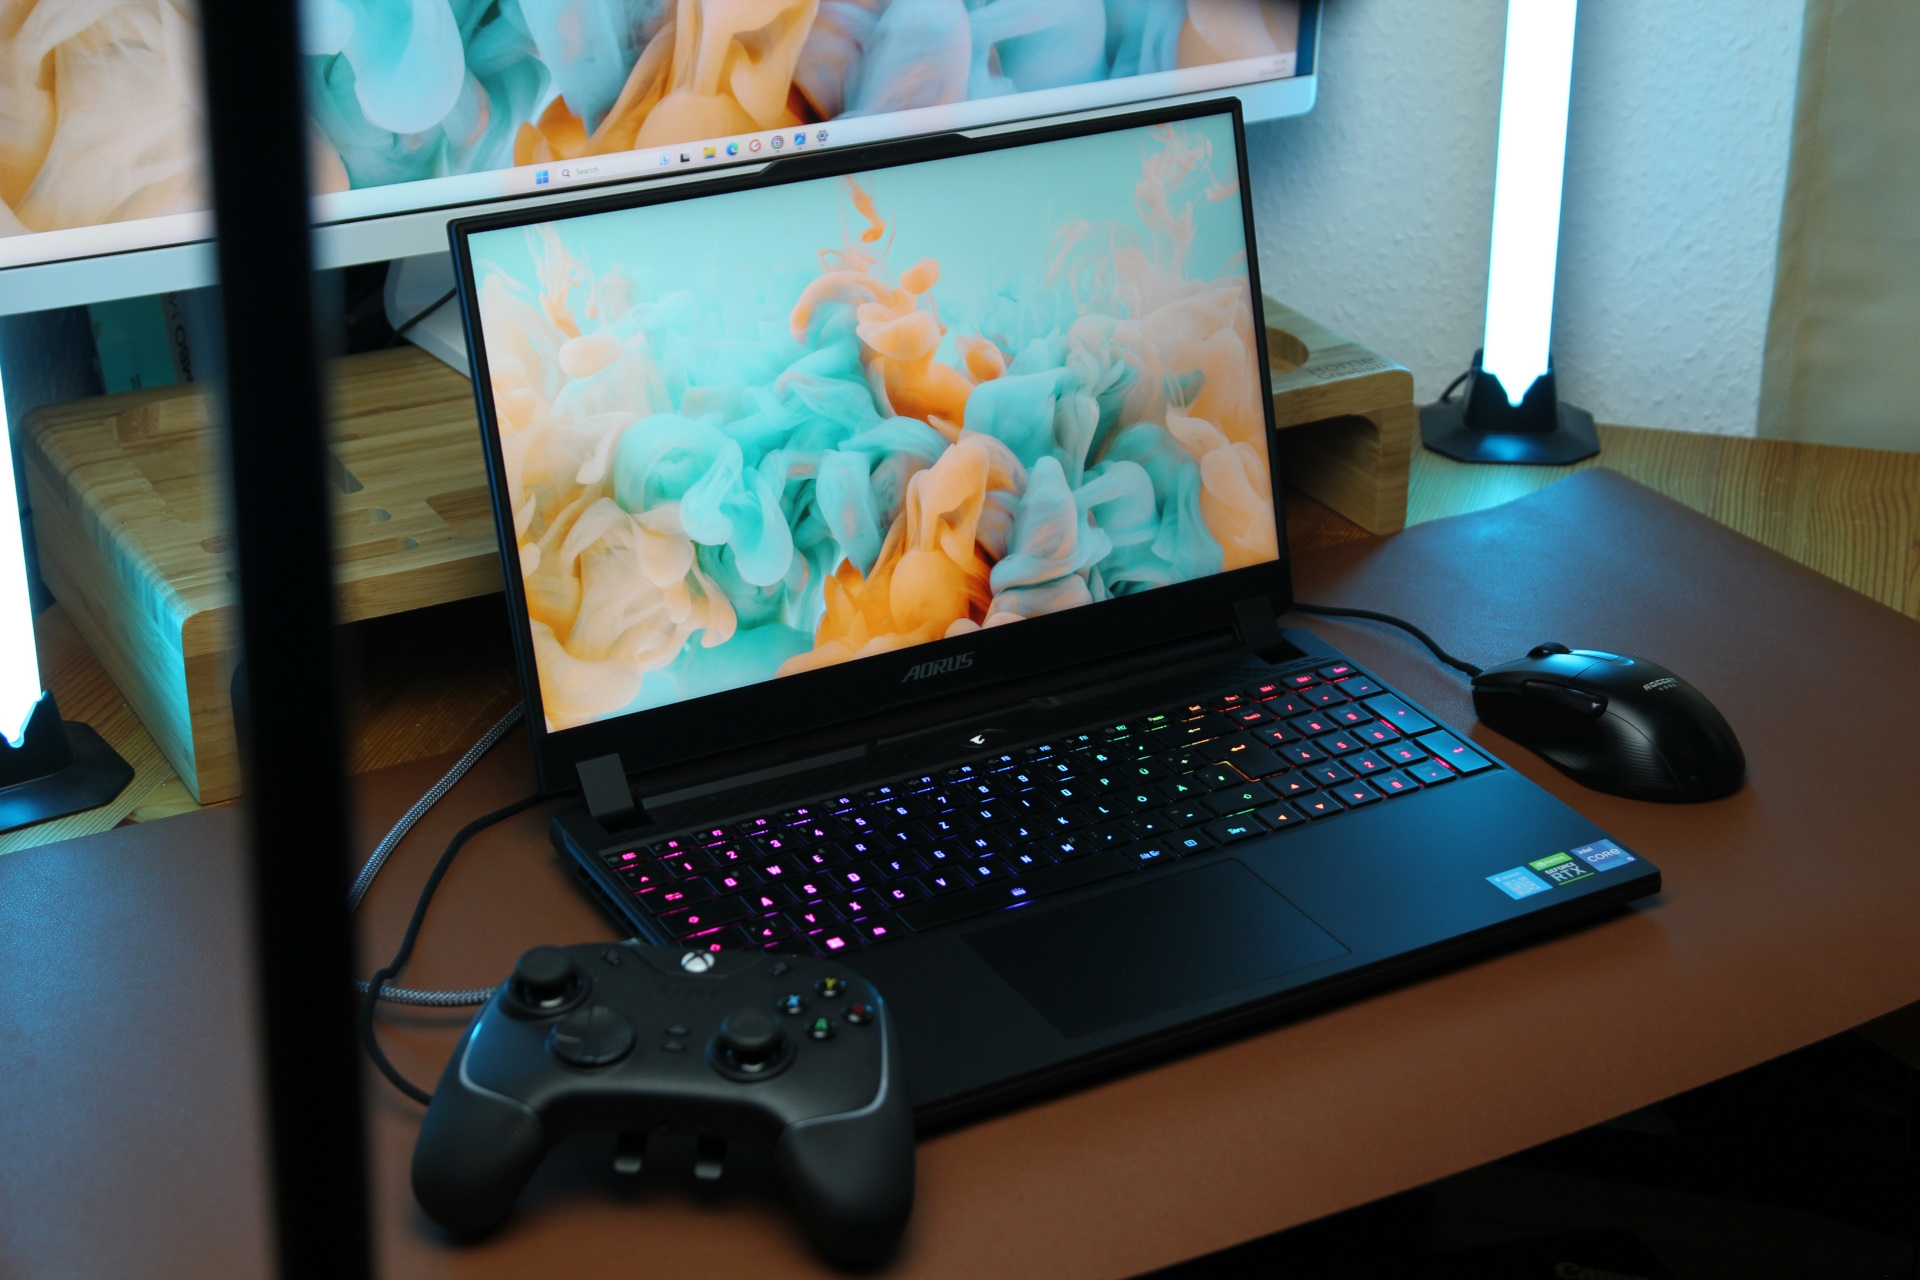
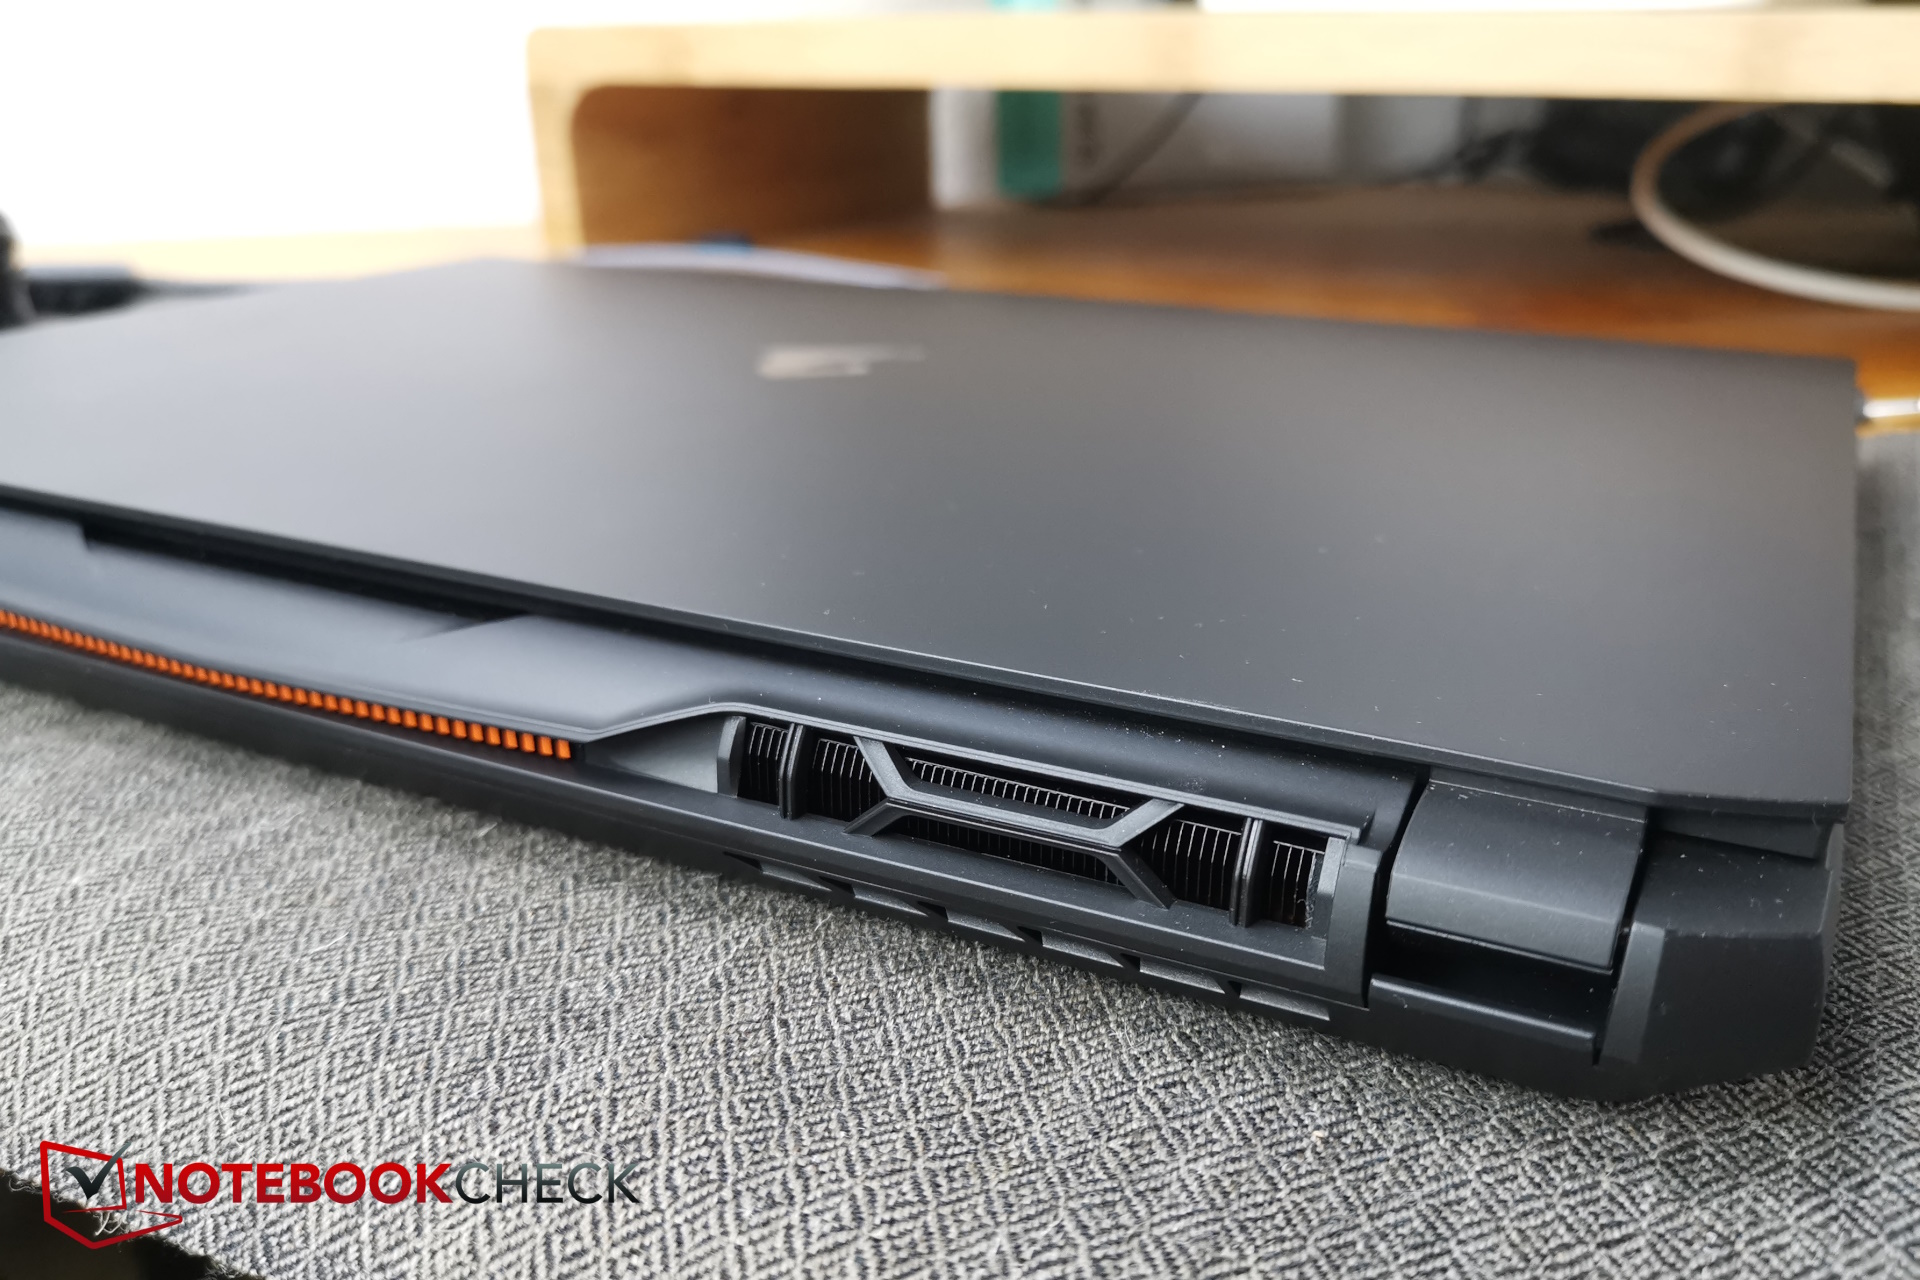
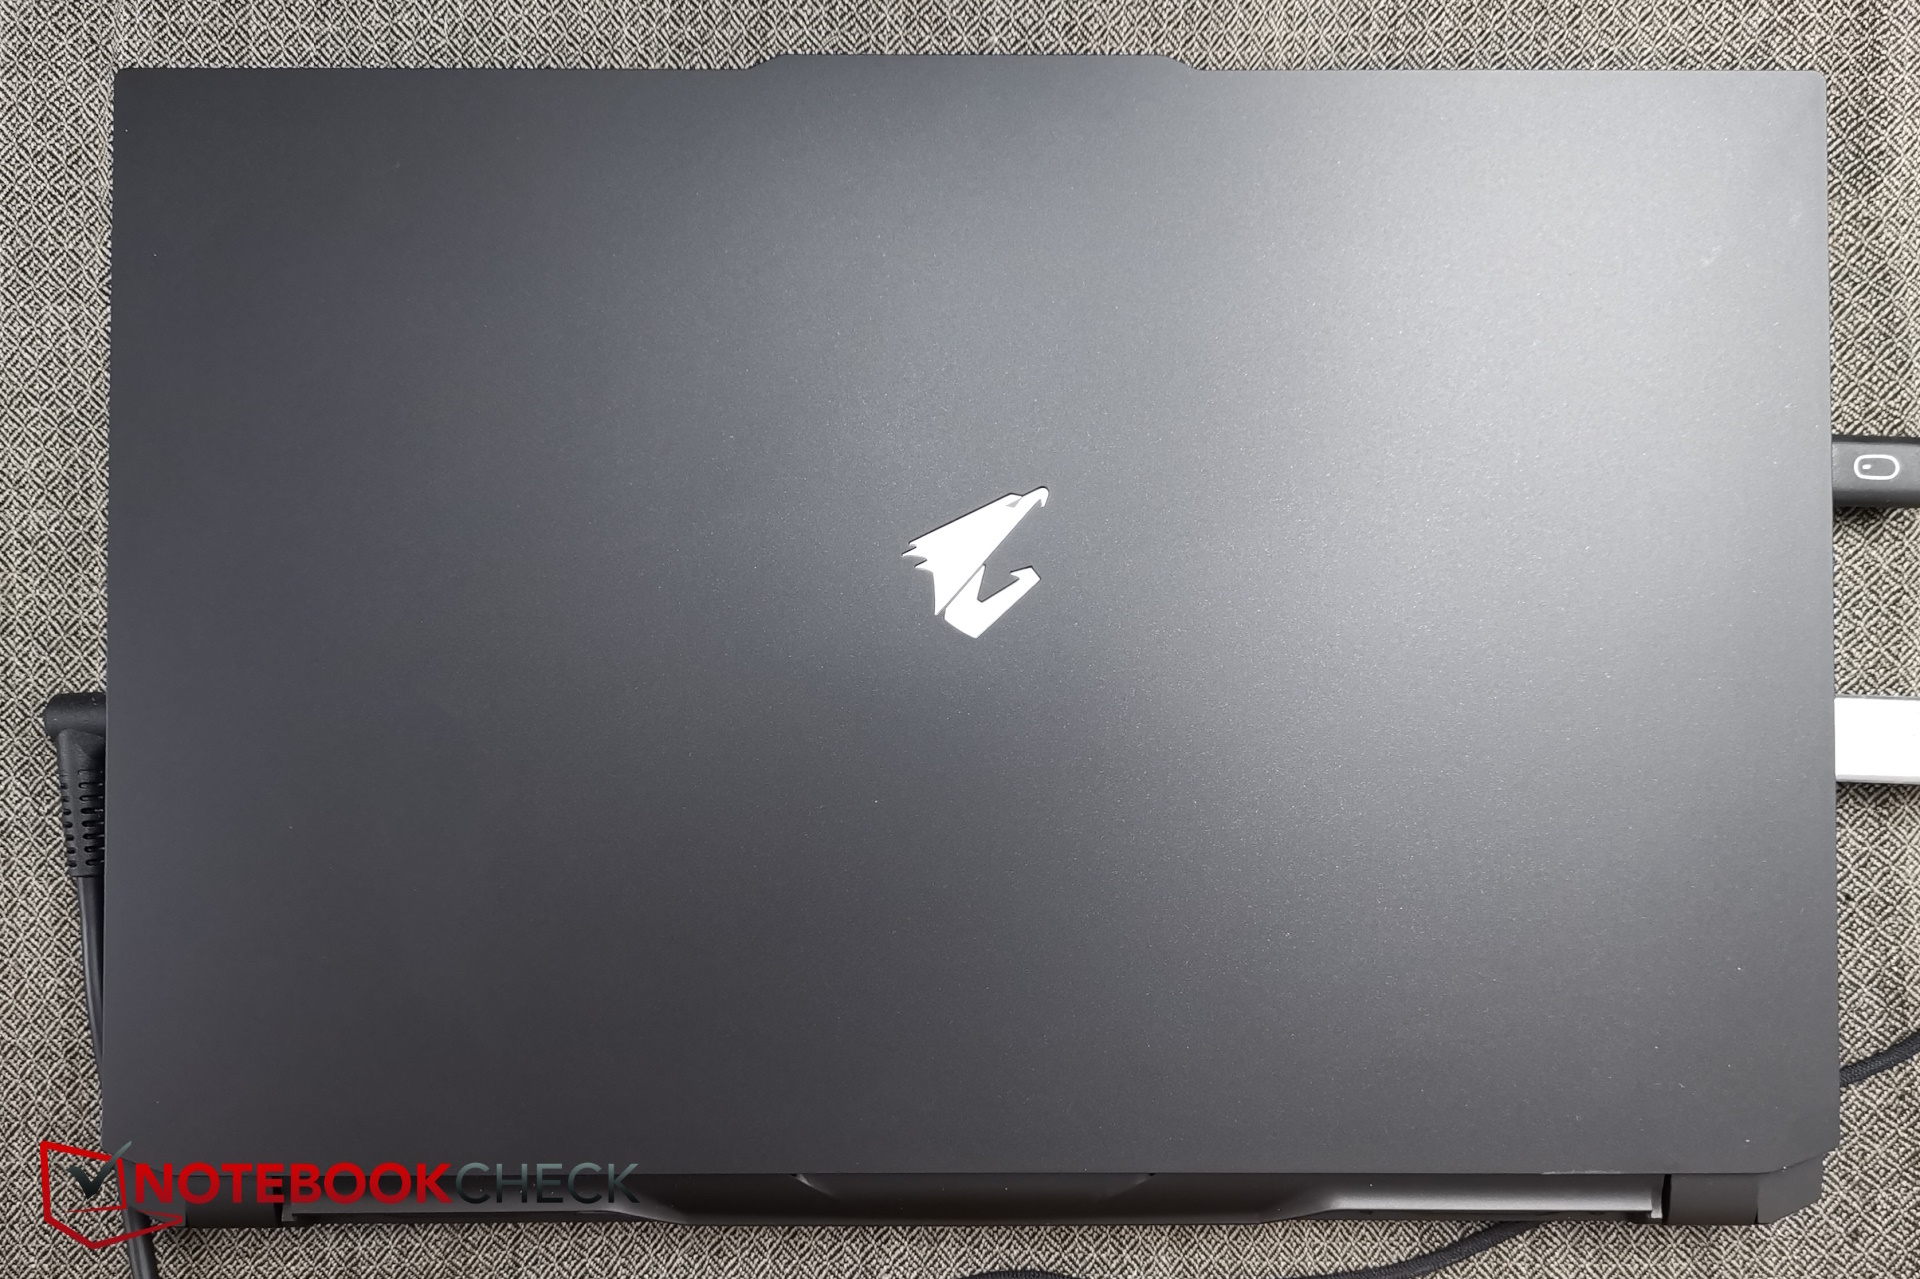
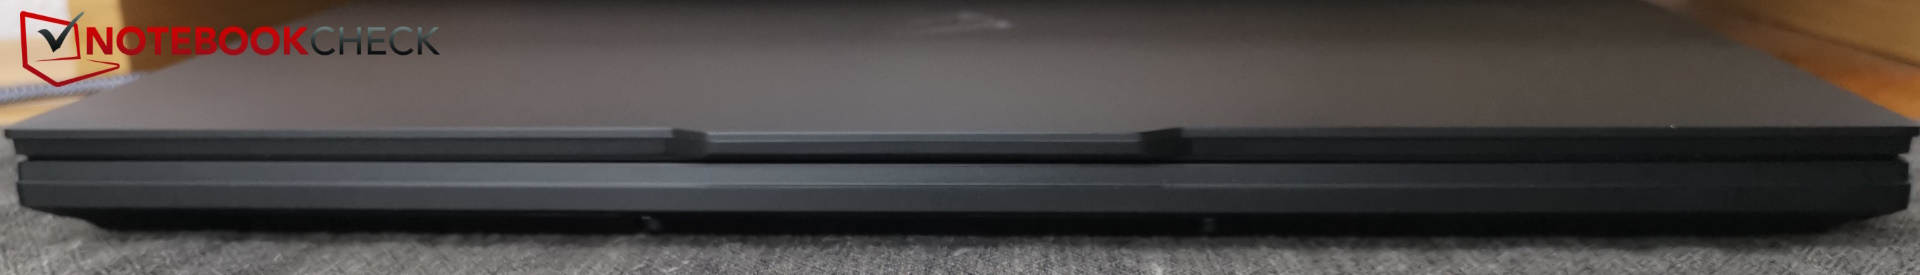
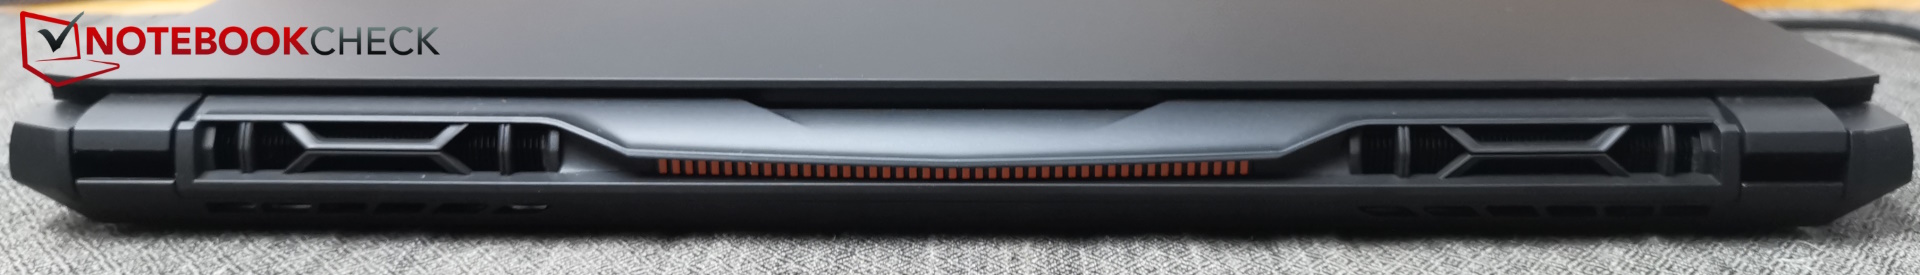
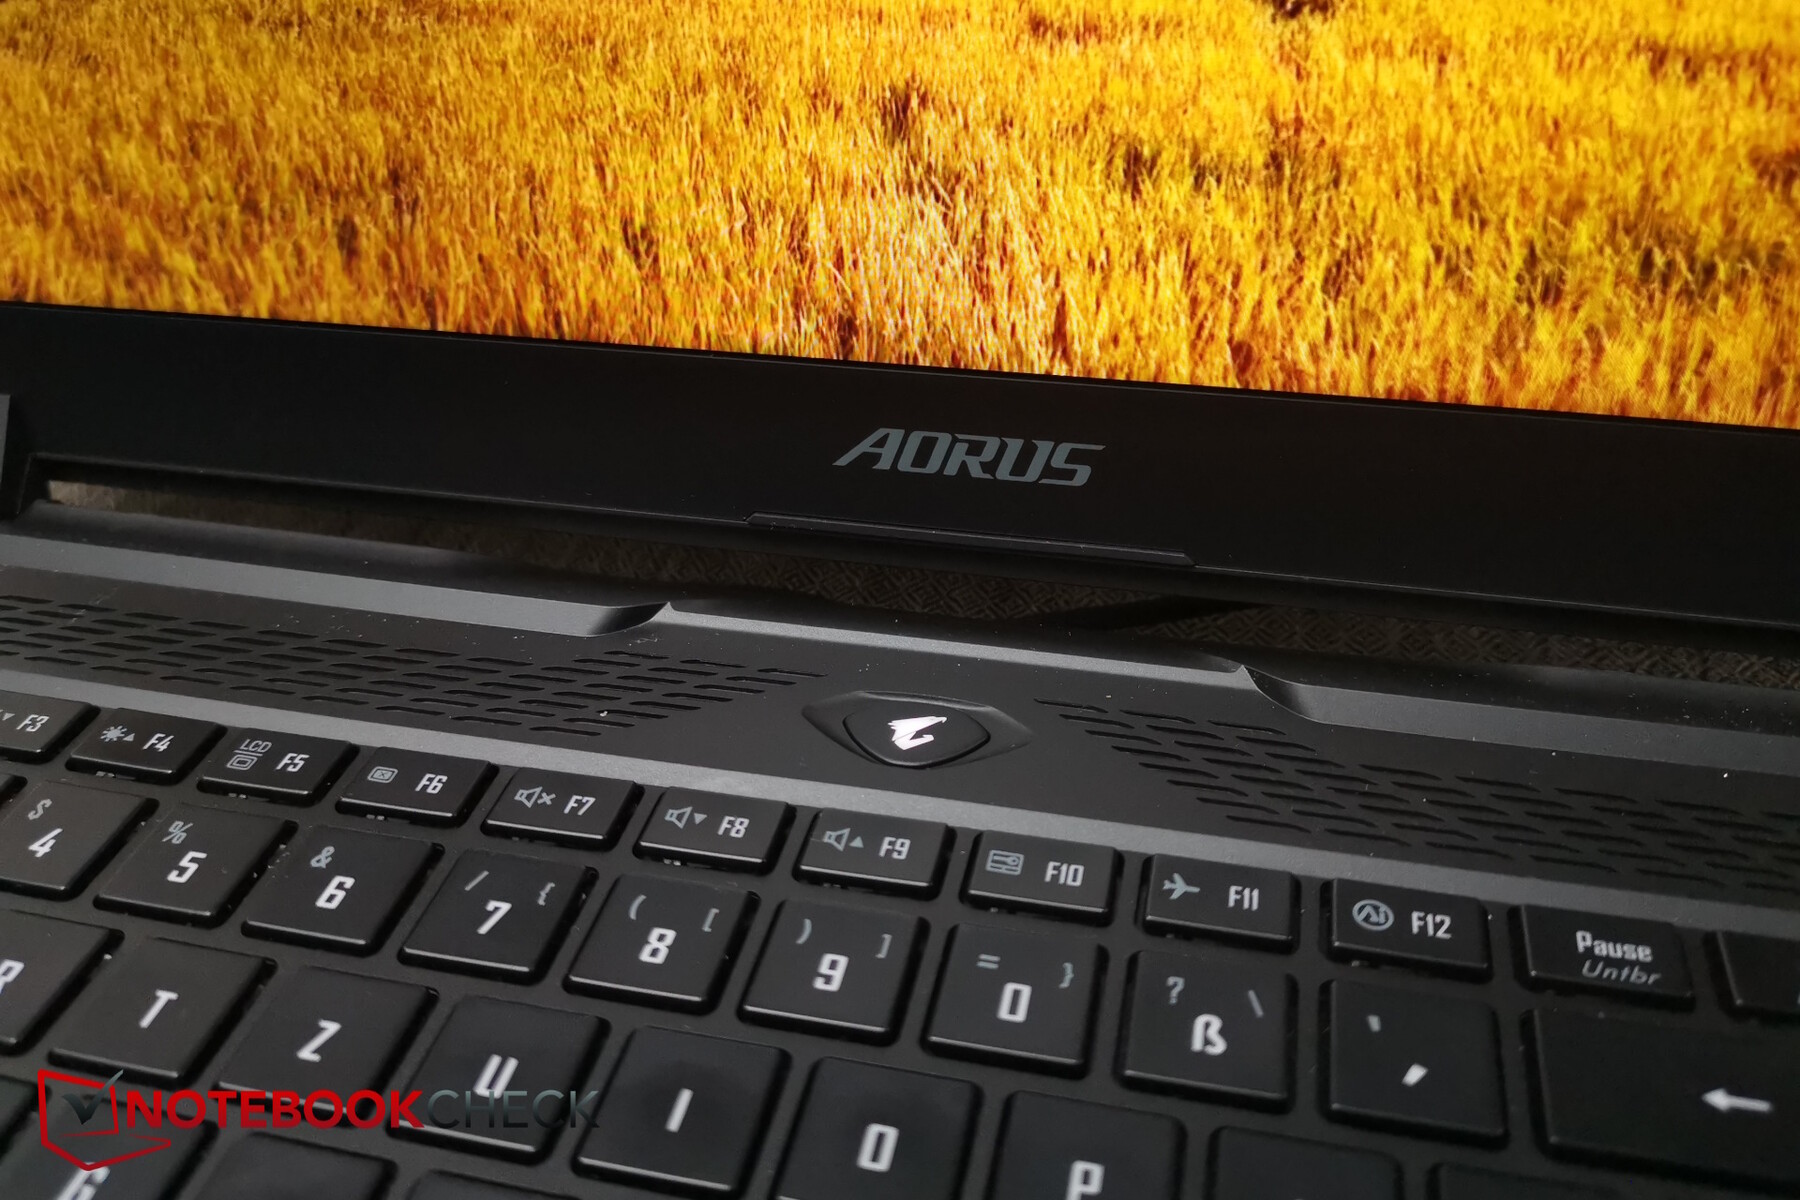
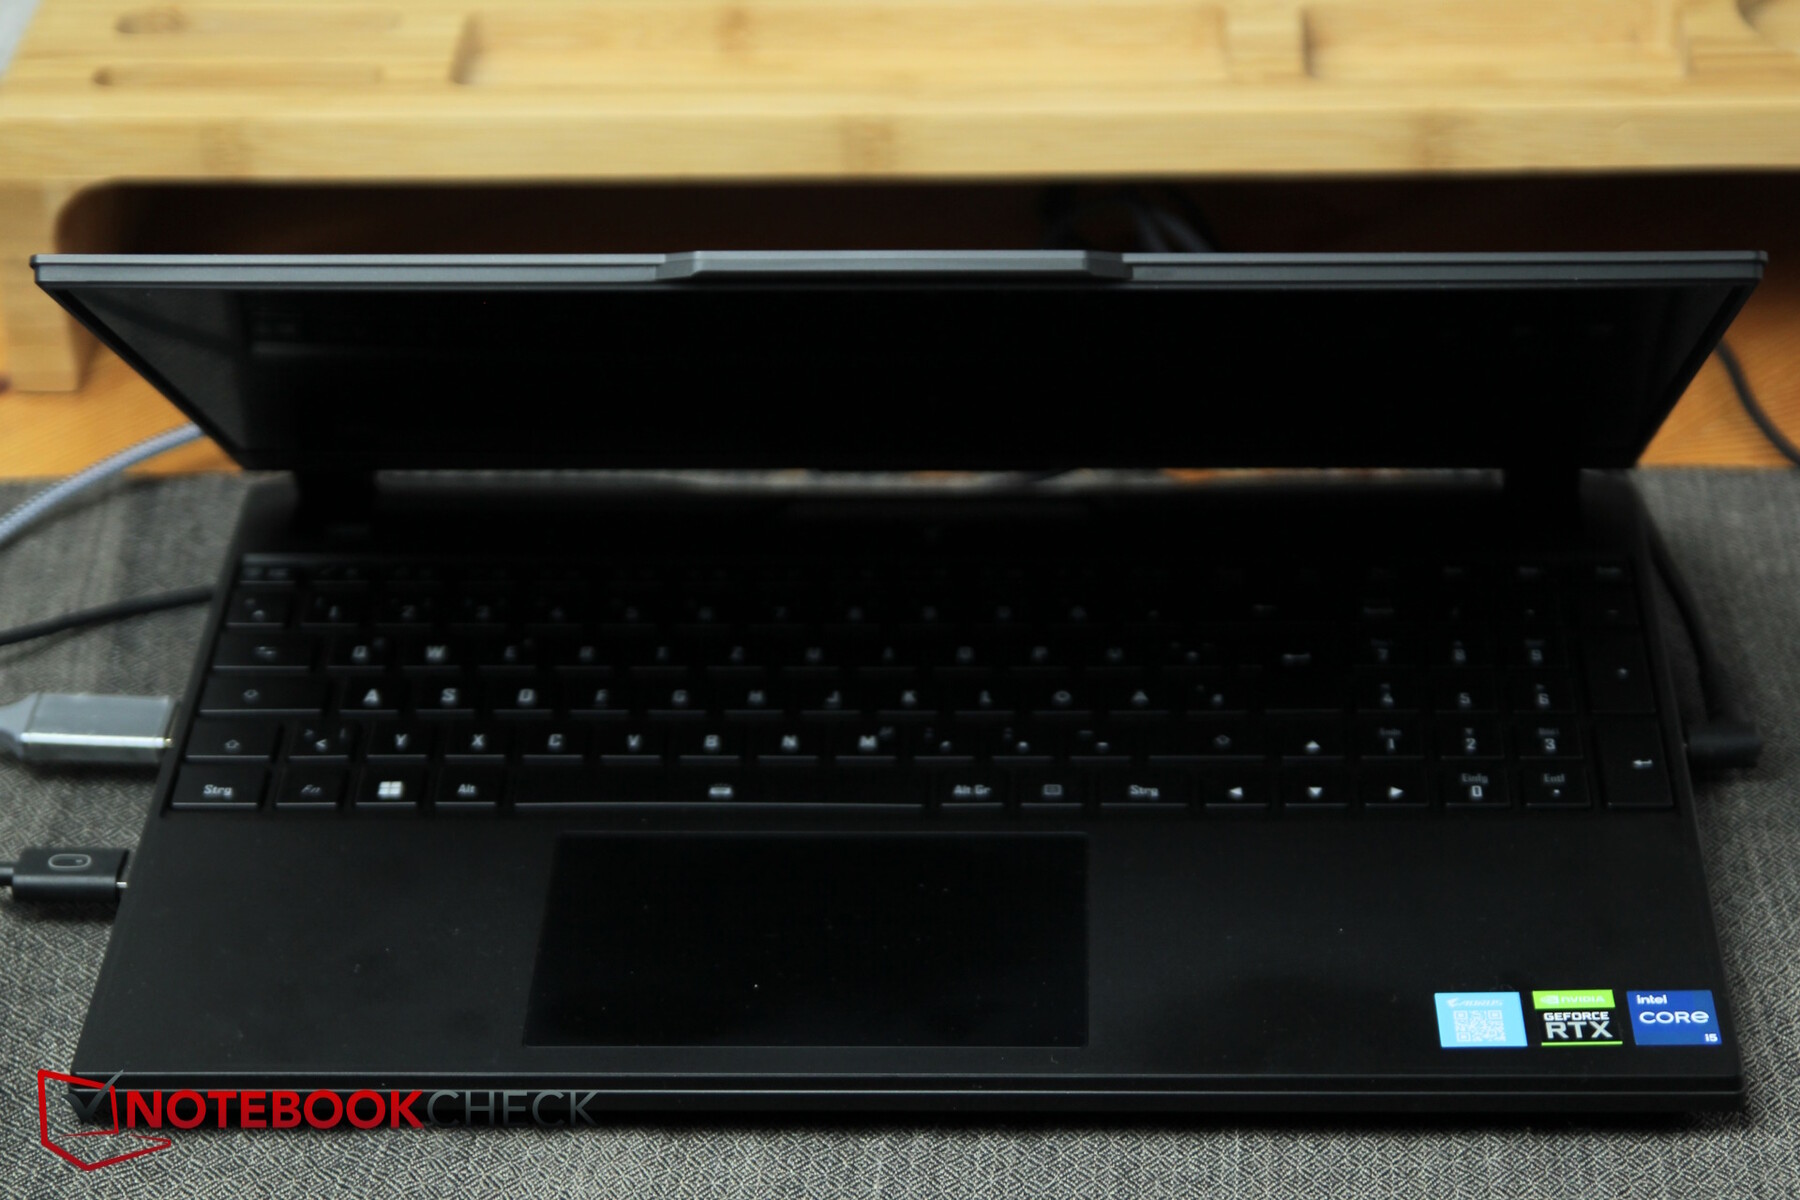
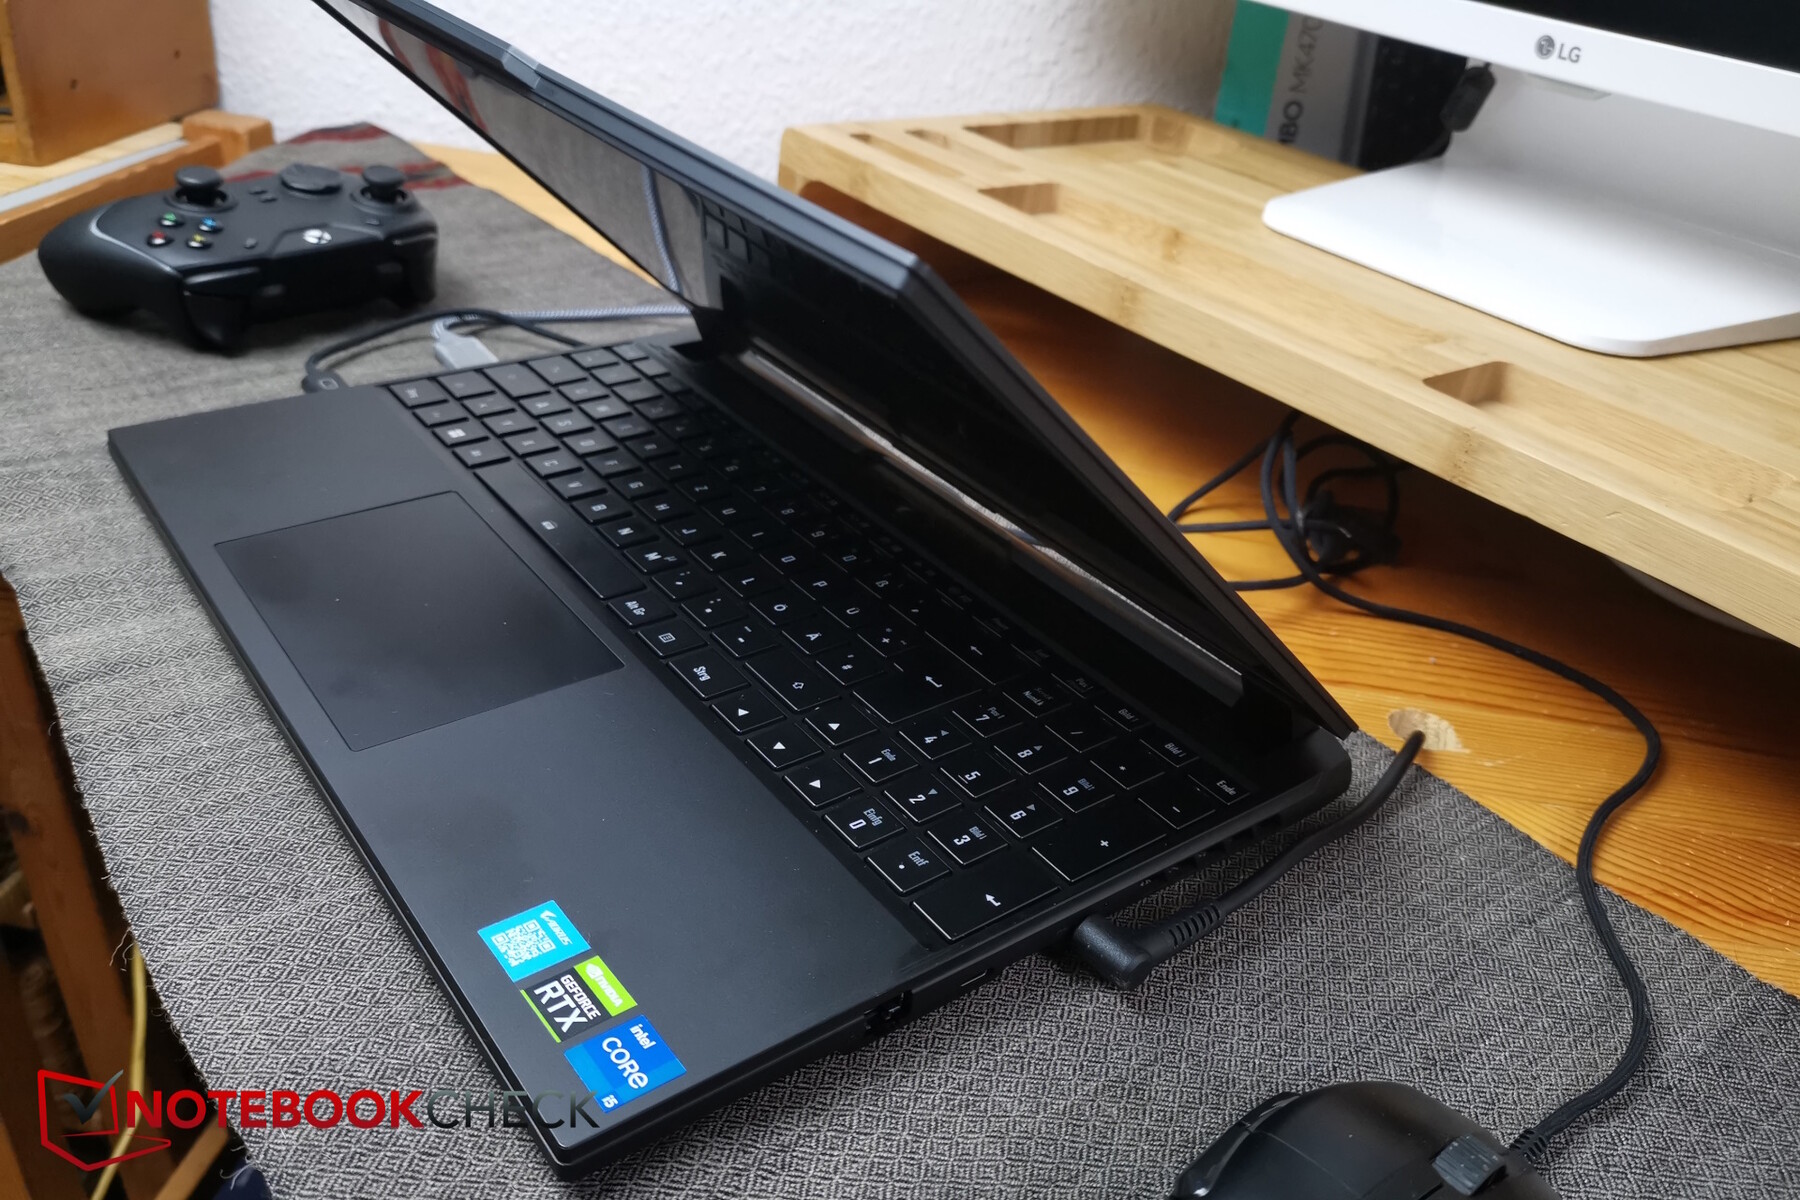
Visivamente, l'Aorus ha un aspetto moderno e attraente. Questo grazie al suo design nero opaco e sottile, anche se in realtà il portatile non è così sottile (fino a 27 mm). Allo stesso tempo, è elegante pur rimanendo unico, ad esempio grazie alla struttura lungo la griglia della ventola posteriore e alle piccole colorazioni arancioni che vi compaiono, o ai bordi smussati appositamente progettati. Il logo Aorus in argento attira l'attenzione sulla parte superiore del dispositivo. Il coperchio presenta una piccola tacca lungo il bordo superiore anteriore, che ospita la webcam e gli altoparlanti - in più, offre un'ottima presa quando si apre il portatile con una sola mano.
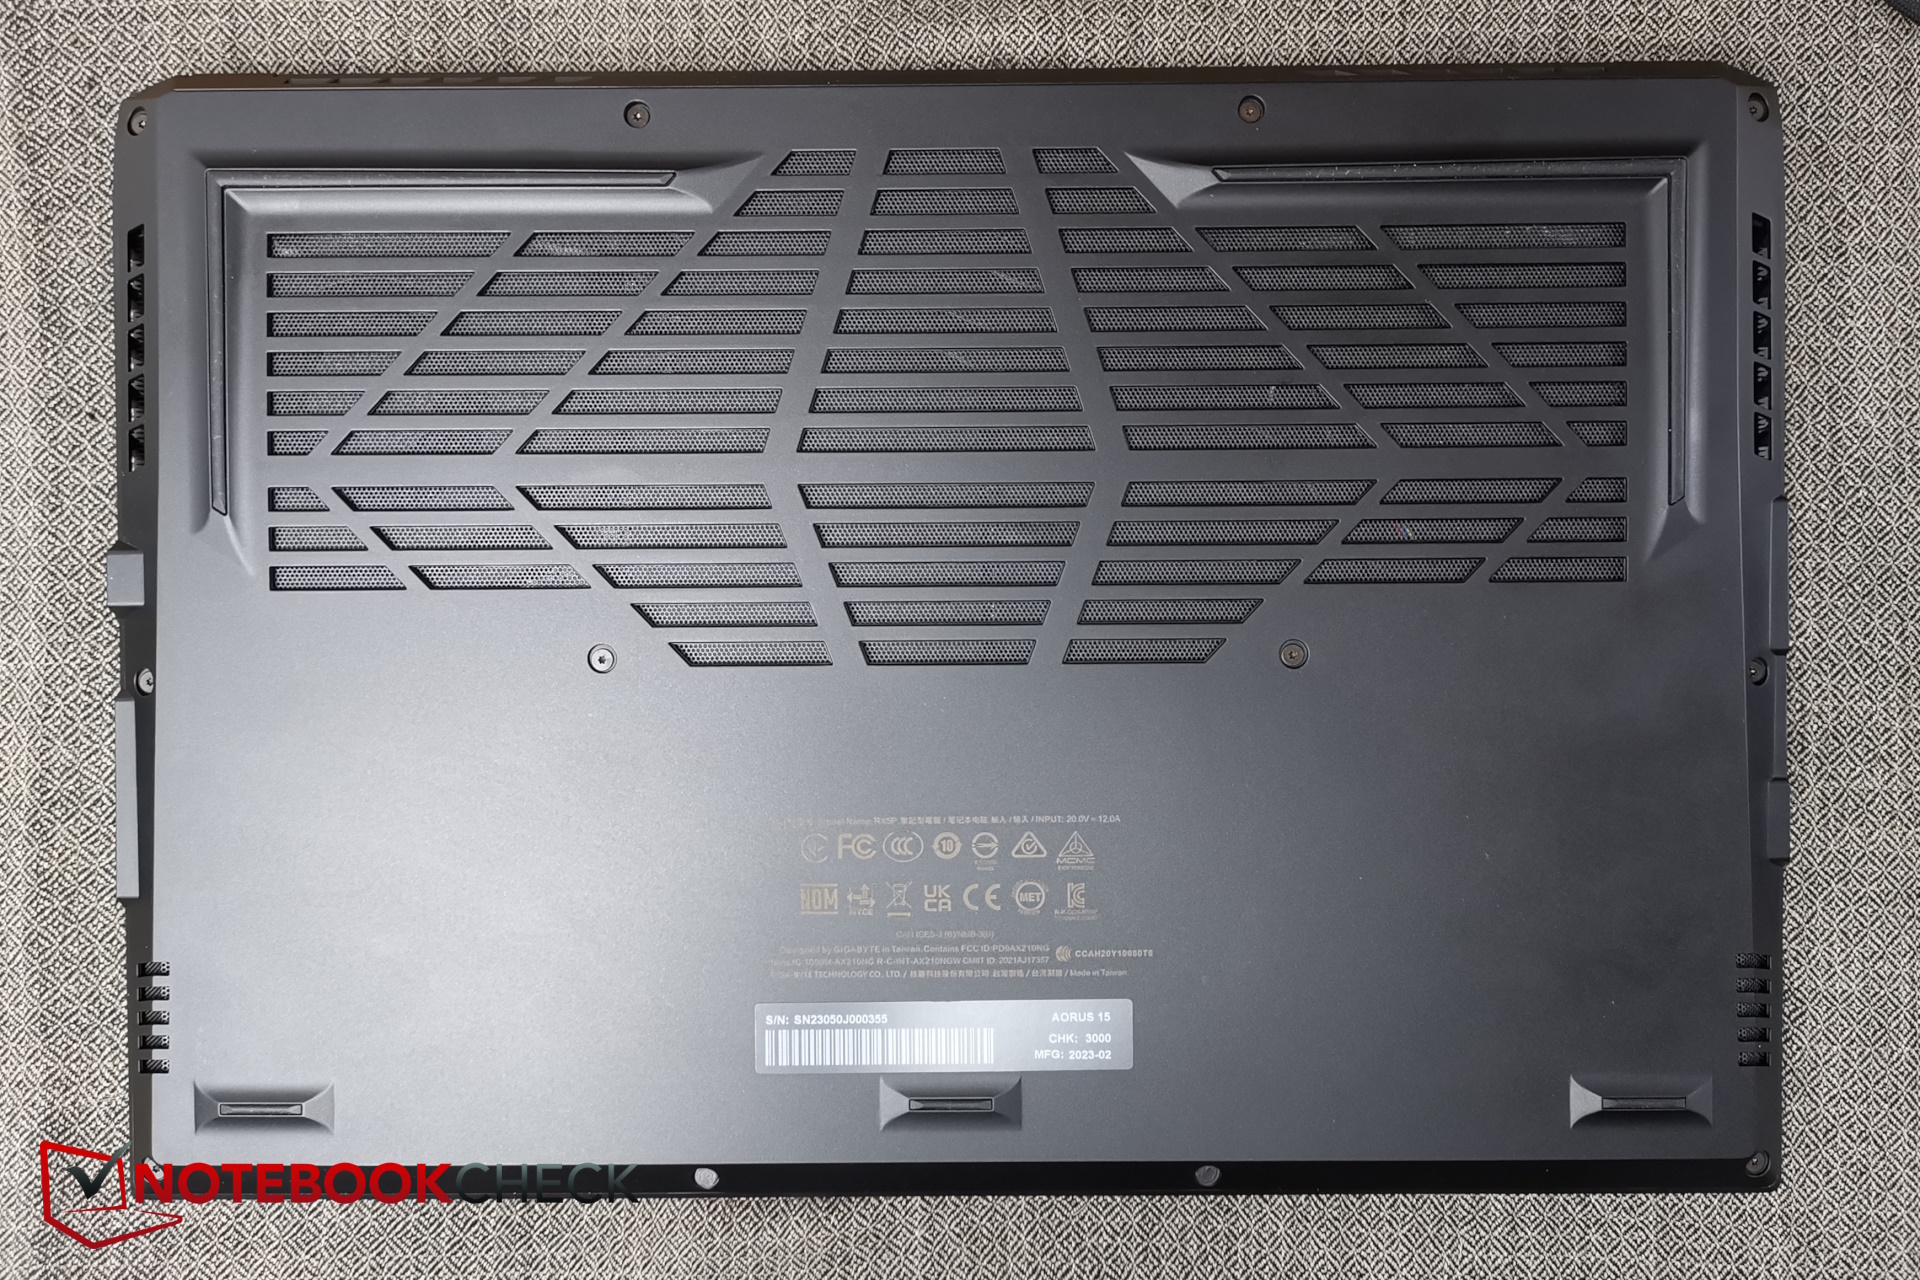
Tutti i lati del case sono realizzati in plastica liscia. L'aspetto è ottimo, ma non è altrettanto resistente alle torsioni rispetto ad altri concorrenti. La tastiera non ha alcun cedimento quando si digita, il che significa che la sua stabilità è complessivamente buona.
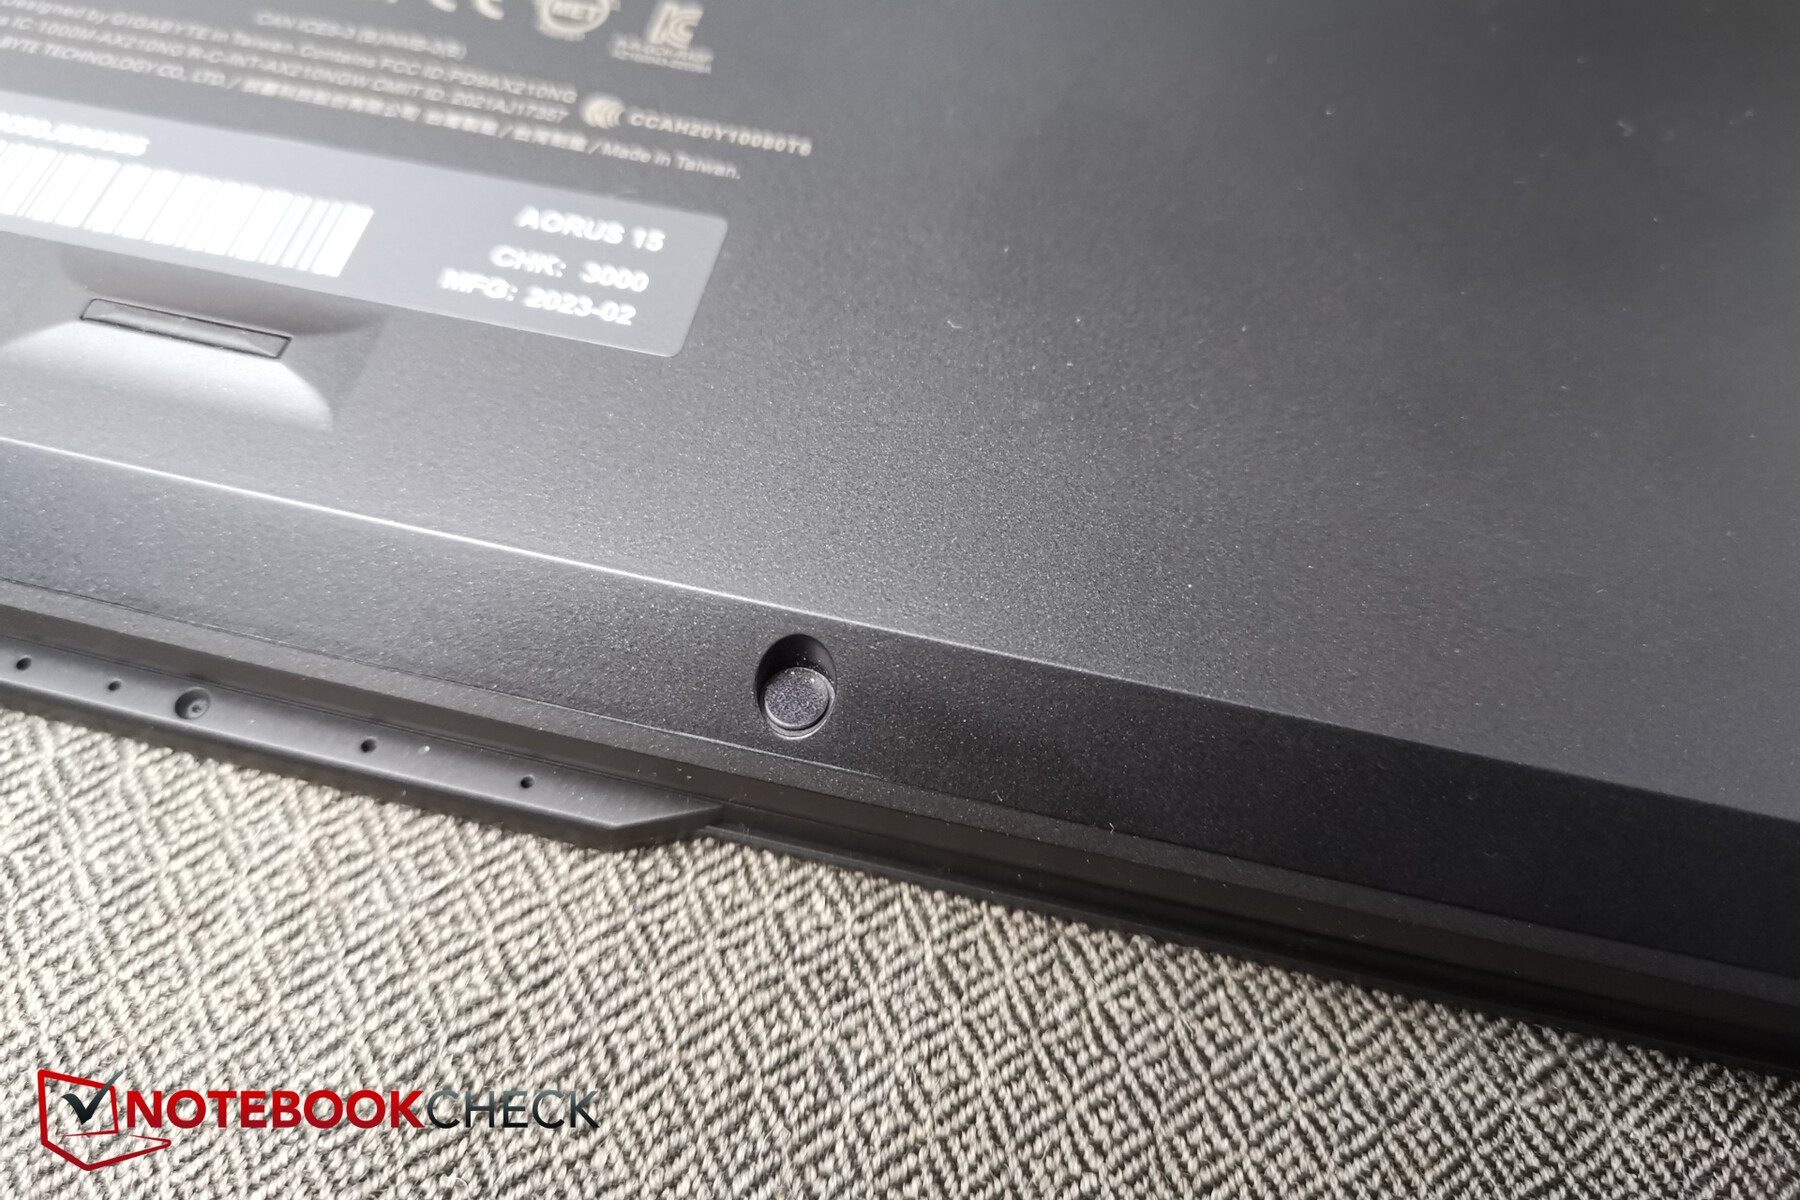
Non abbiamo aperto l'Aorus, poiché le due viti Torx sono coperte da un adesivo e non volevamo danneggiarle nell'interesse della nostra Cyberport in prestito.
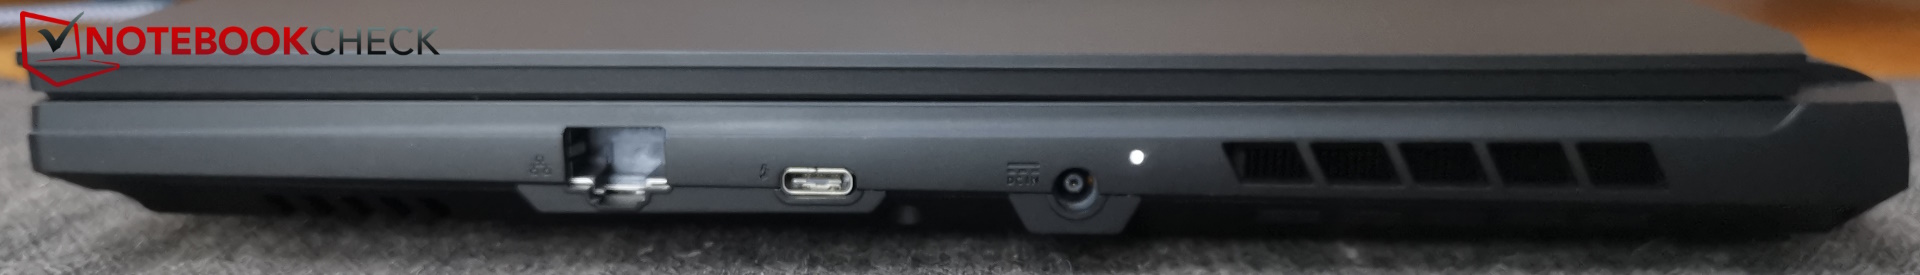
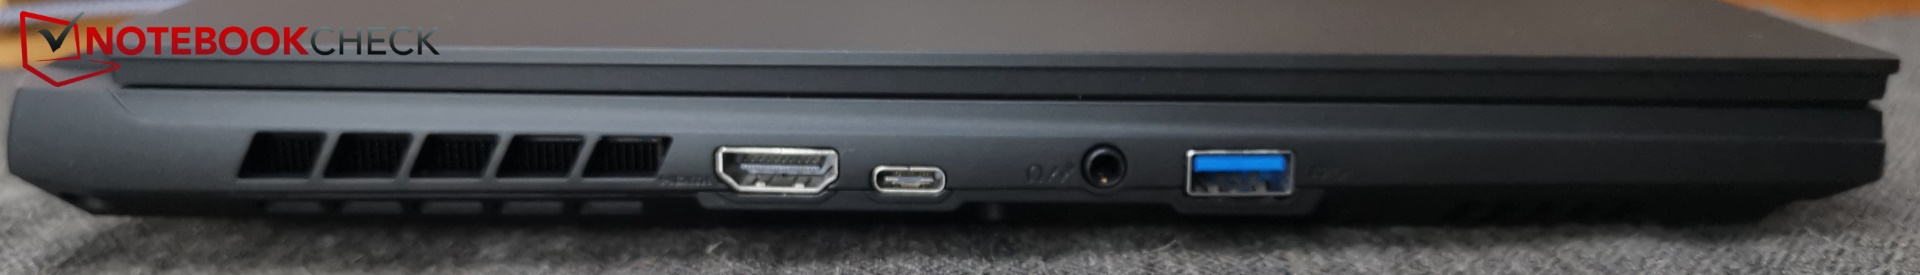
Connettività
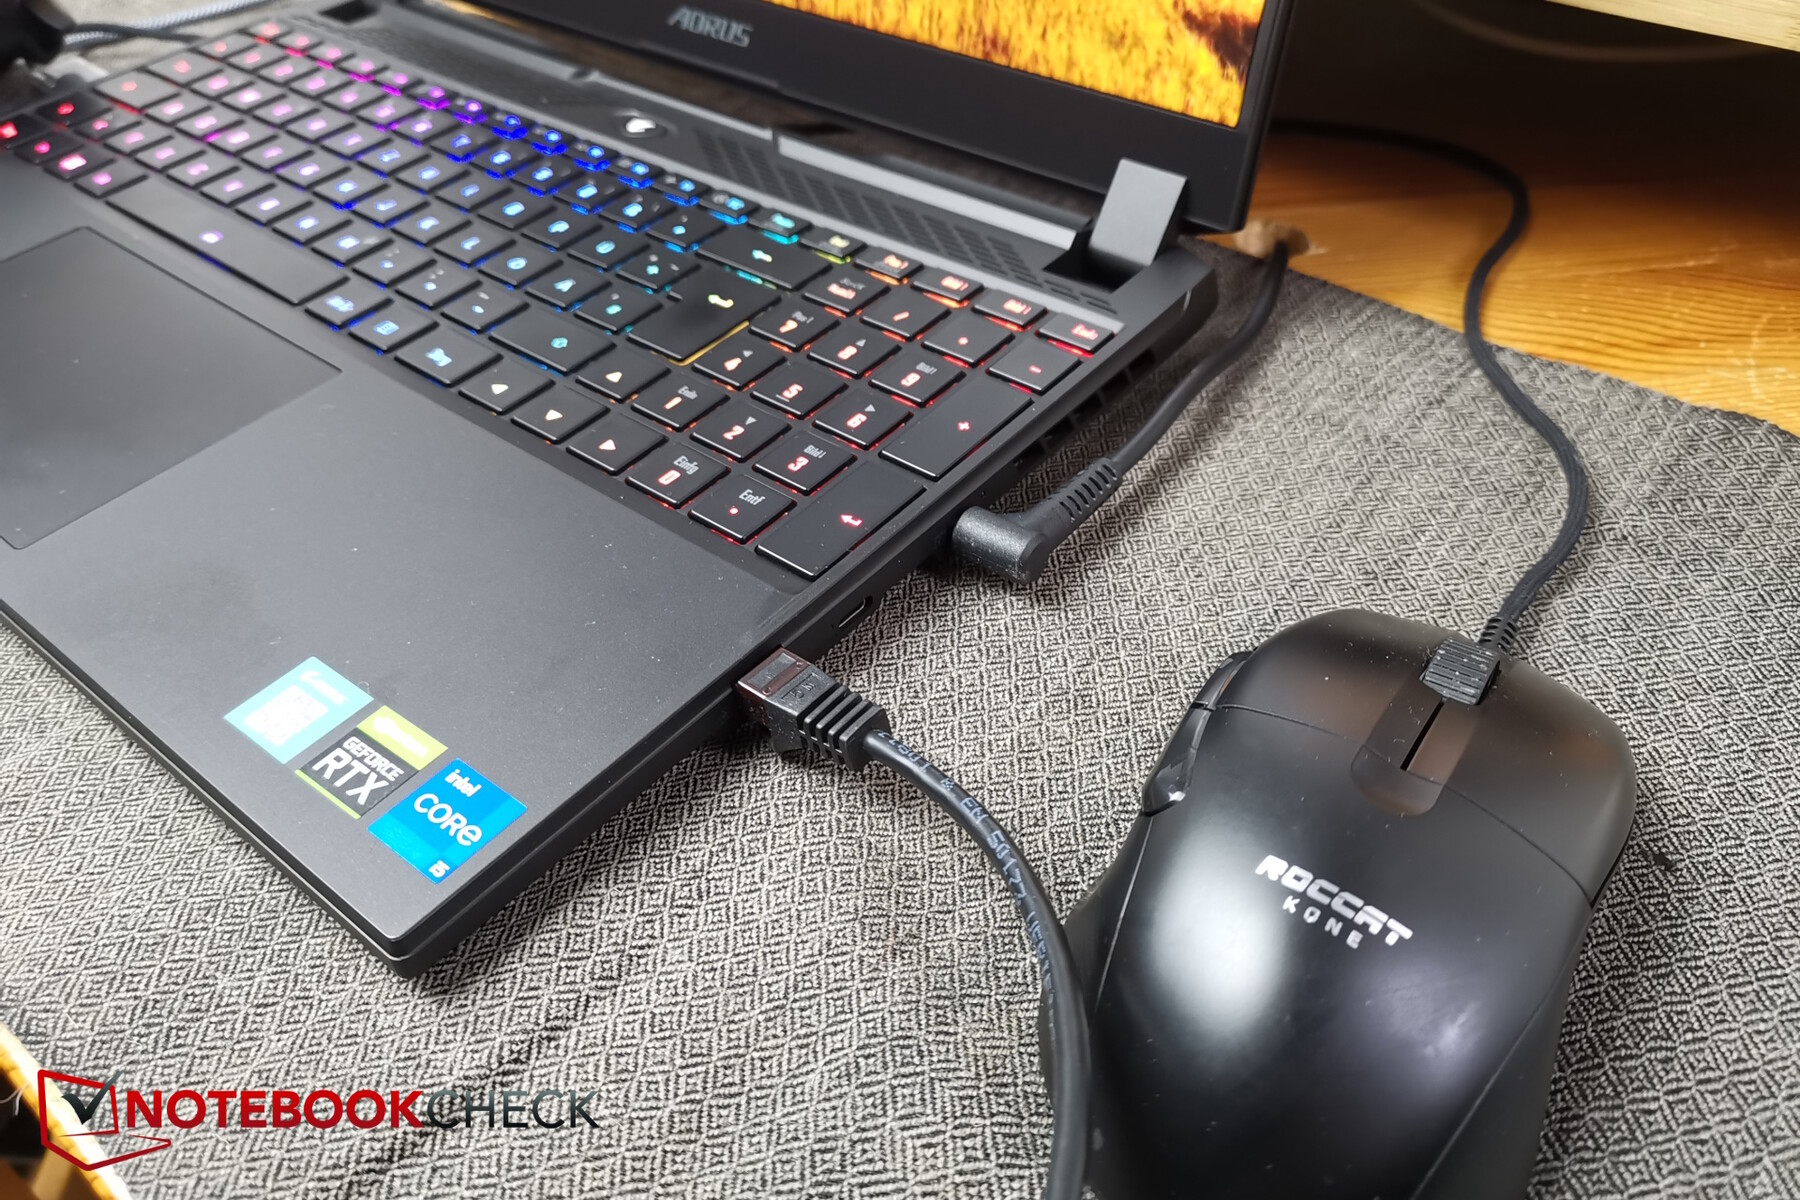
Le opzioni di connettività del portatile Aorus sono moderne, ma anche ridotte al minimo. Delle tre porte USB, solo una è di tipo-A, il che non è sufficiente. A sua volta, una delle due porte Type-C è dotata di supporto Thunderbolt 4. Oltre alla quarta connessione USB, il dispositivo manca anche di un lettore di schede SD, di un lucchetto Kensington e di una DisplayPort dedicata (2x disponibile tramite USB-C).
Nonostante le poche porte, non sono disposte molto bene: la porta RJ45 per i cavi LAN rigidi è posizionata a destra e verso la parte anteriore. Lo spazio sul retro dell'Aorus, come al solito, non è utilizzato. Ospita solo le uscite della ventola.
WiFi e webcam
Le sue velocità di trasmissione WLAN sono tra le più alte nel campo di confronto, sia nelle reti a 6 GHz (WiFi 6E) che in quelle a 5 GHz.
Purtroppo, la webcam del dispositivo è ancora di ultima generazione: Ha solo una risoluzione di 720p, le sue deviazioni di colore sono piuttosto elevate e non c'è un otturatore nel Centro di Controllo.


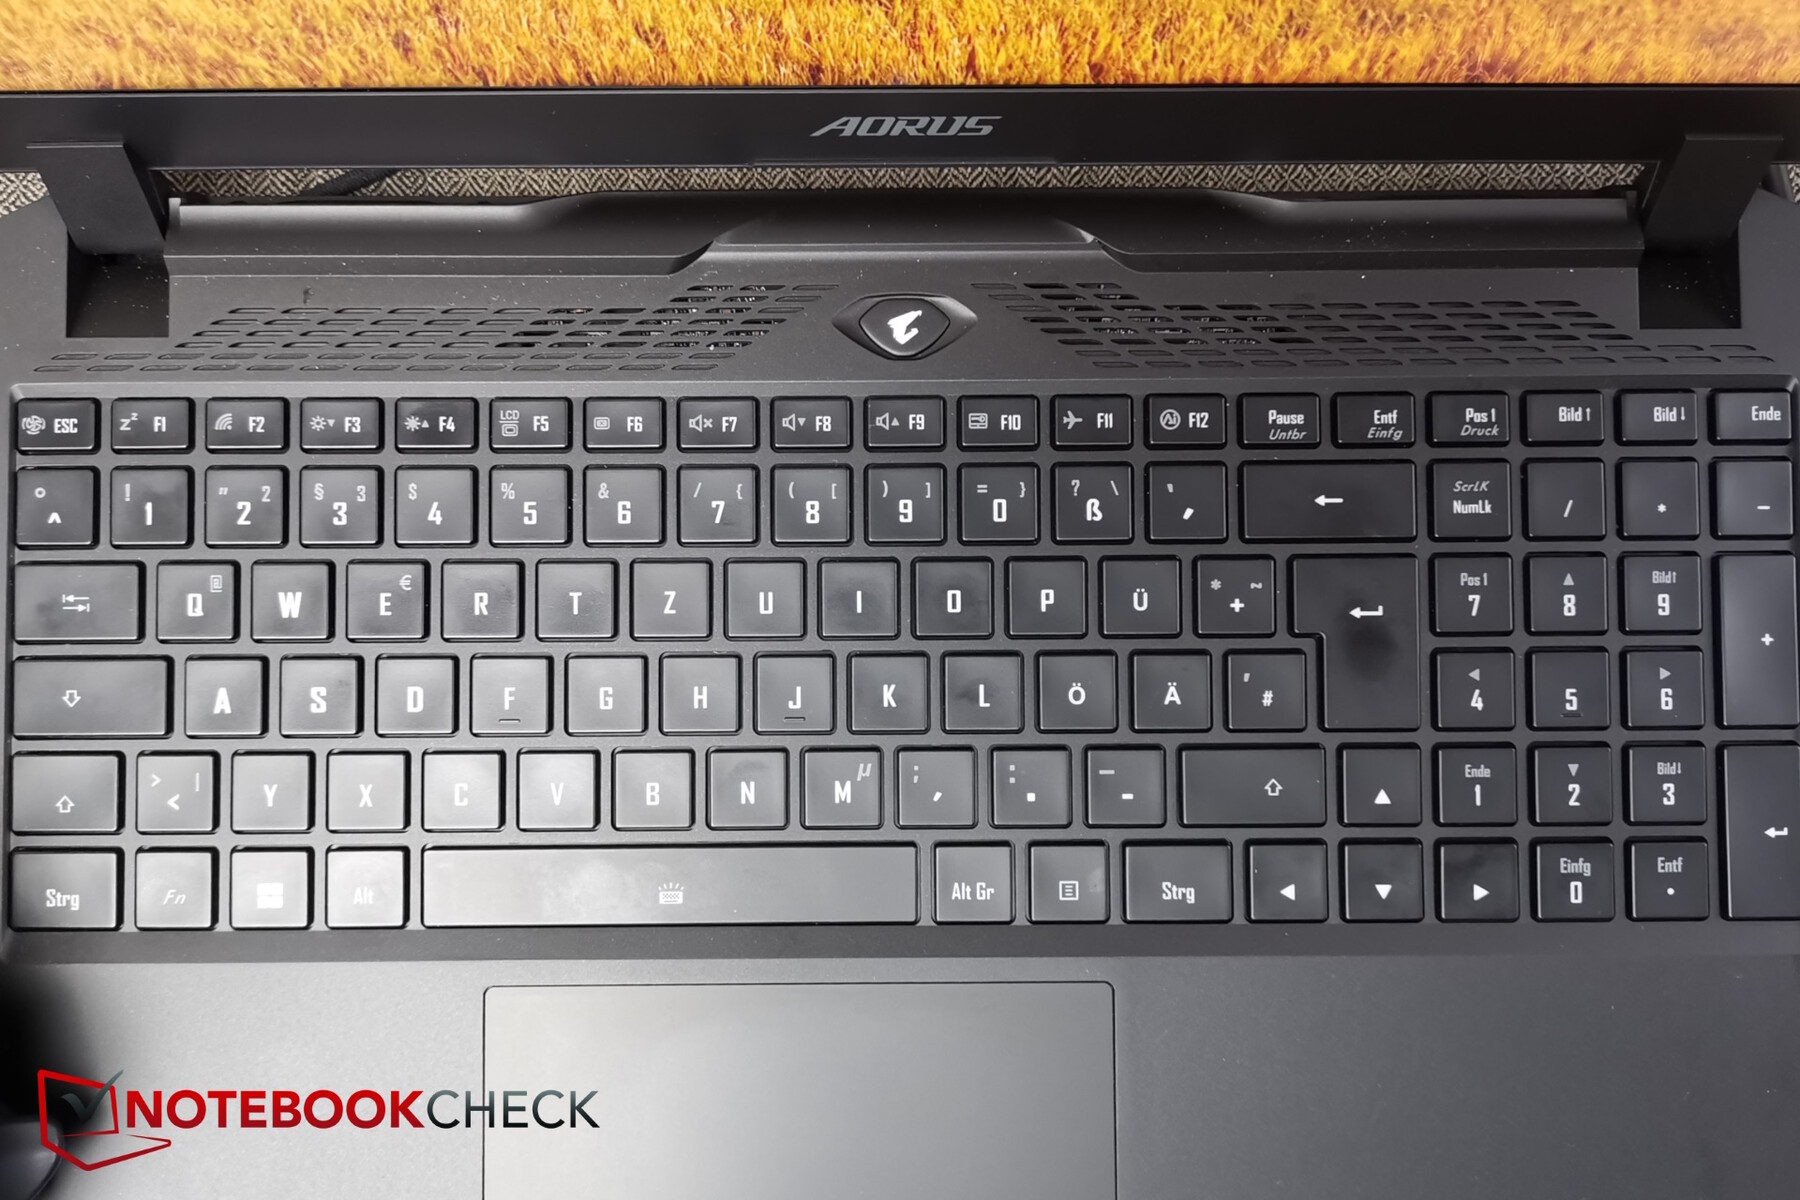
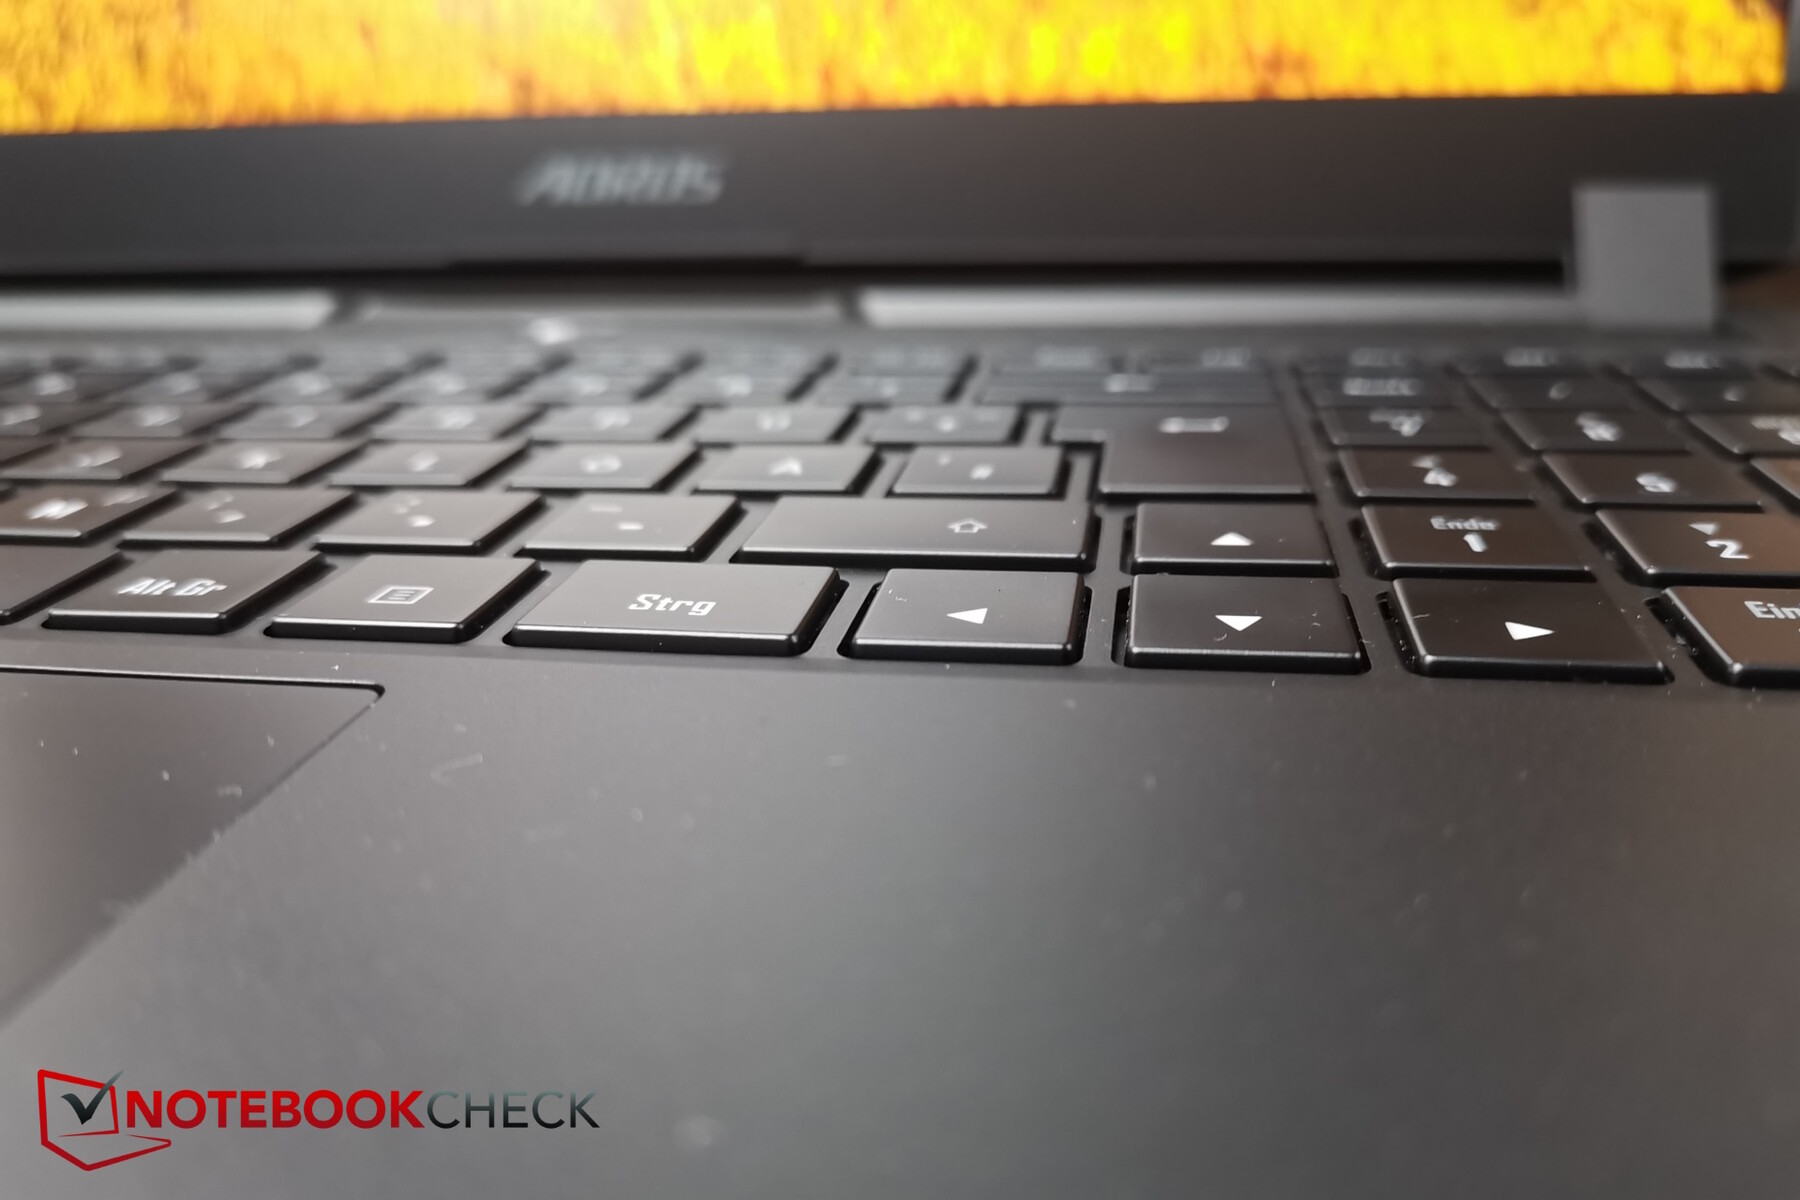
Dispositivi di input - Etichettatura dei tasti speciali più che solida, ma scura
Il layout dei tasti è molto ordinato - la tastiera è leggermente ribassata nella base del portatile. Anche i tasti freccia sono di dimensioni normali e c'è un tastierino numerico direttamente a destra.
I tasti hanno solo un'inclinazione medio-bassa, ma sono comunque sorprendentemente comodi durante la digitazione, grazie anche a un discreto feedback. I rumori durante la digitazione sono sul lato più silenzioso, quindi sono adatti anche ad ambienti poco rumorosi.
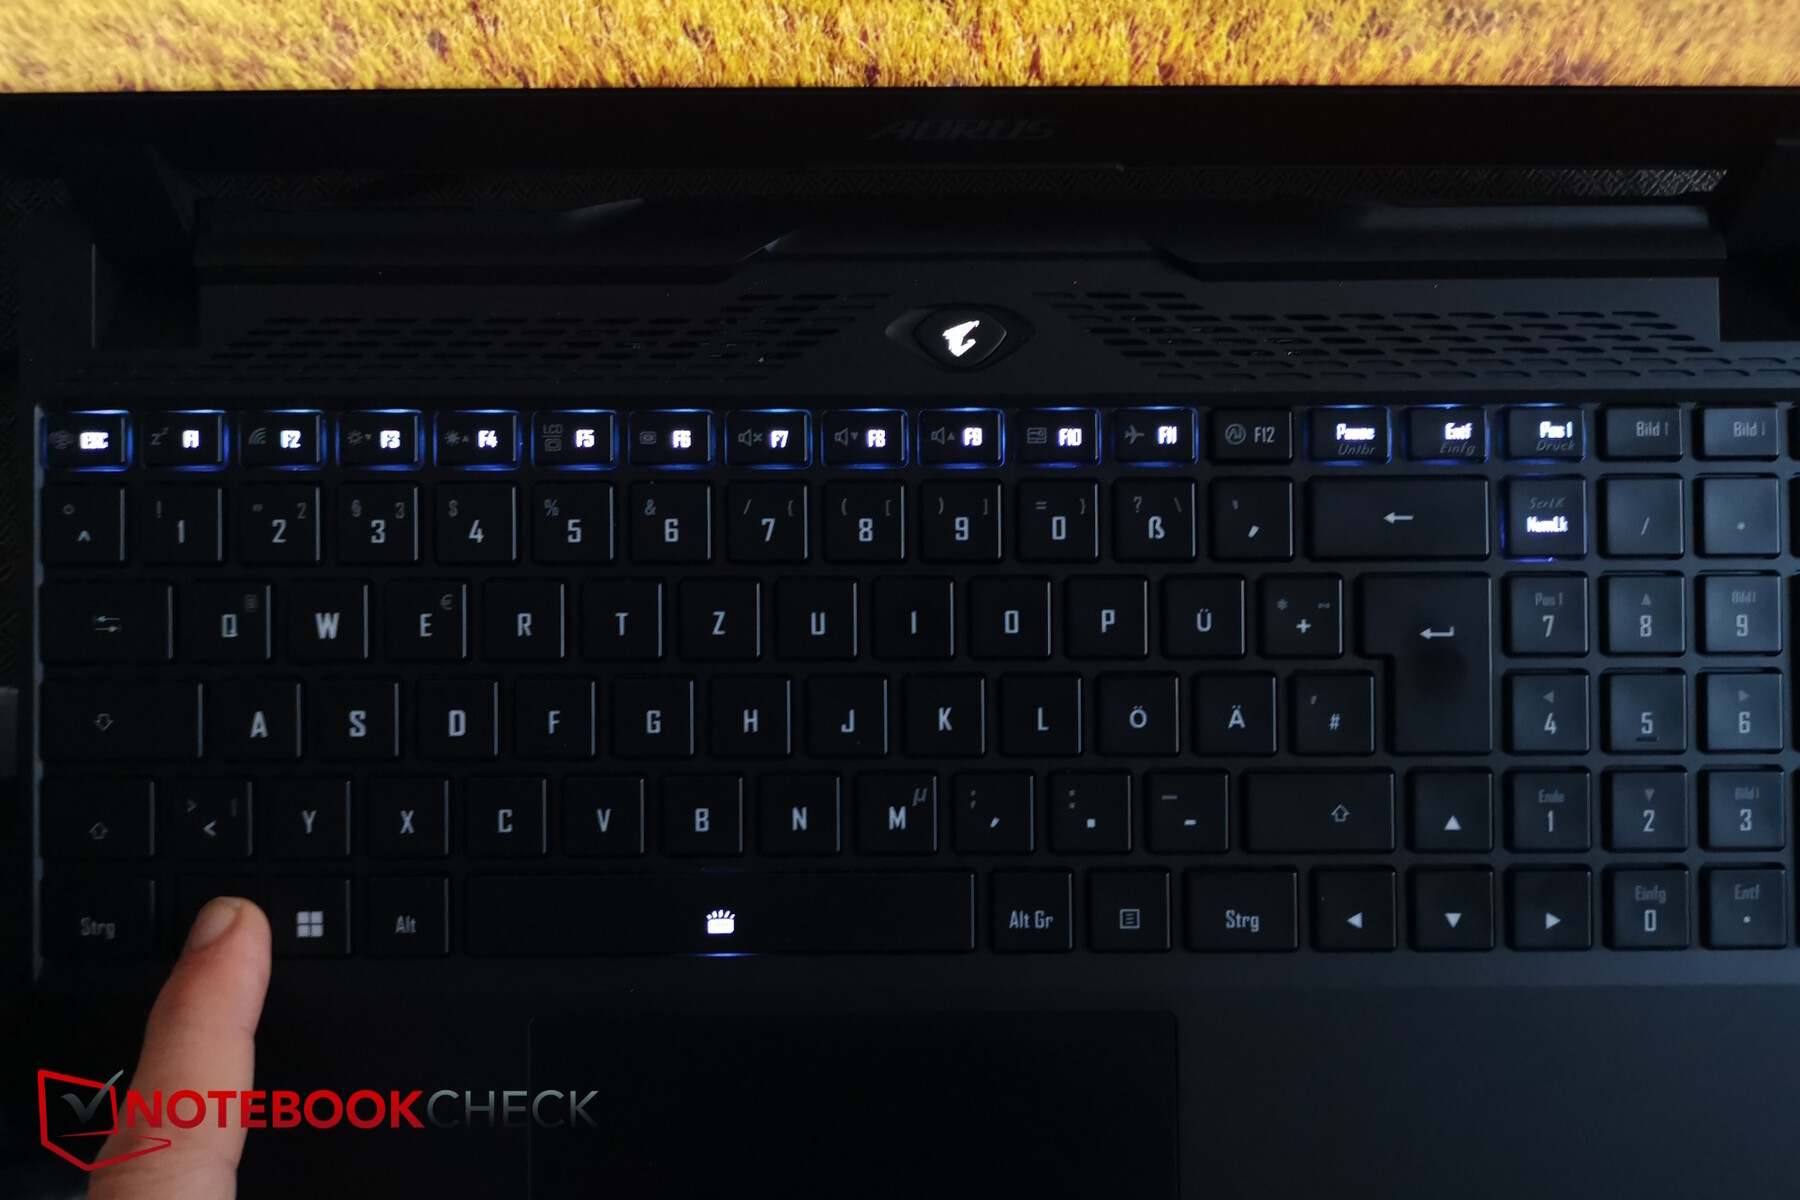
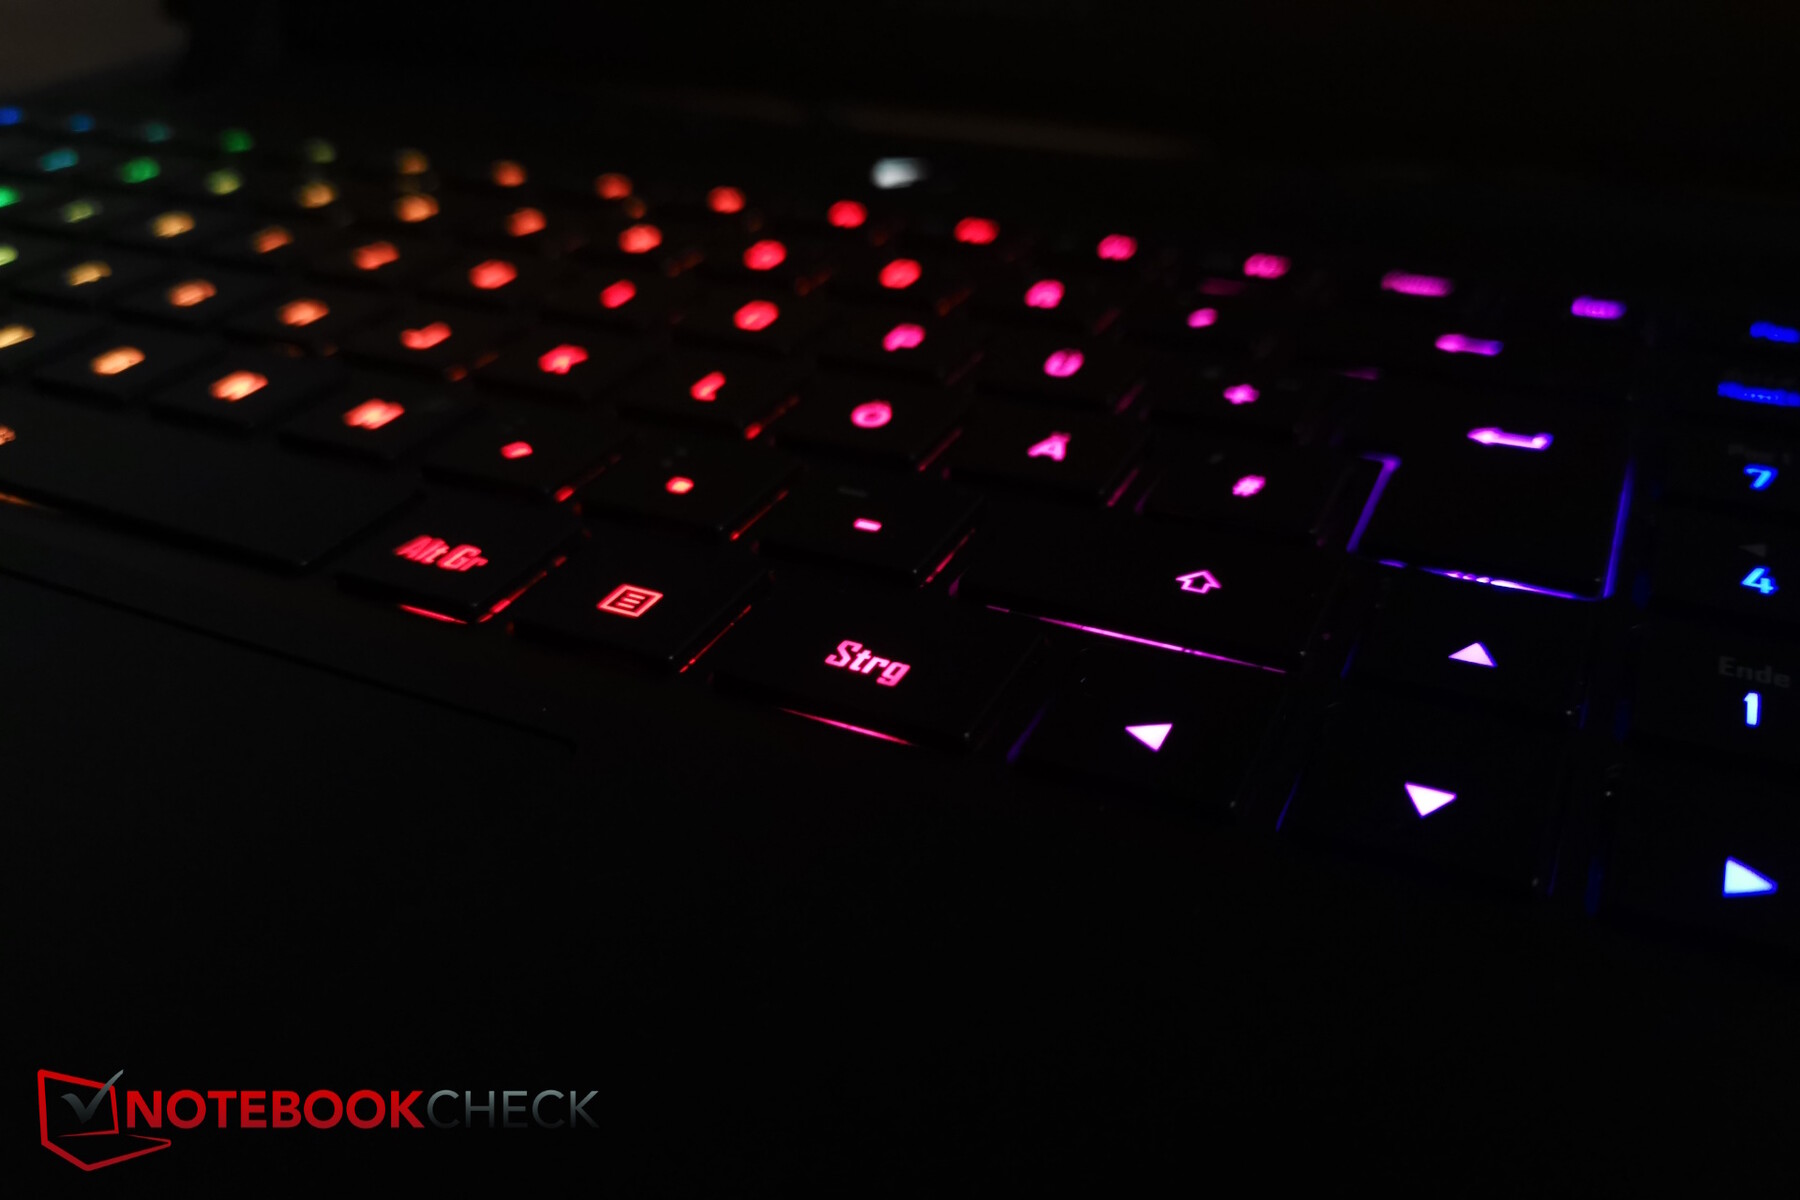
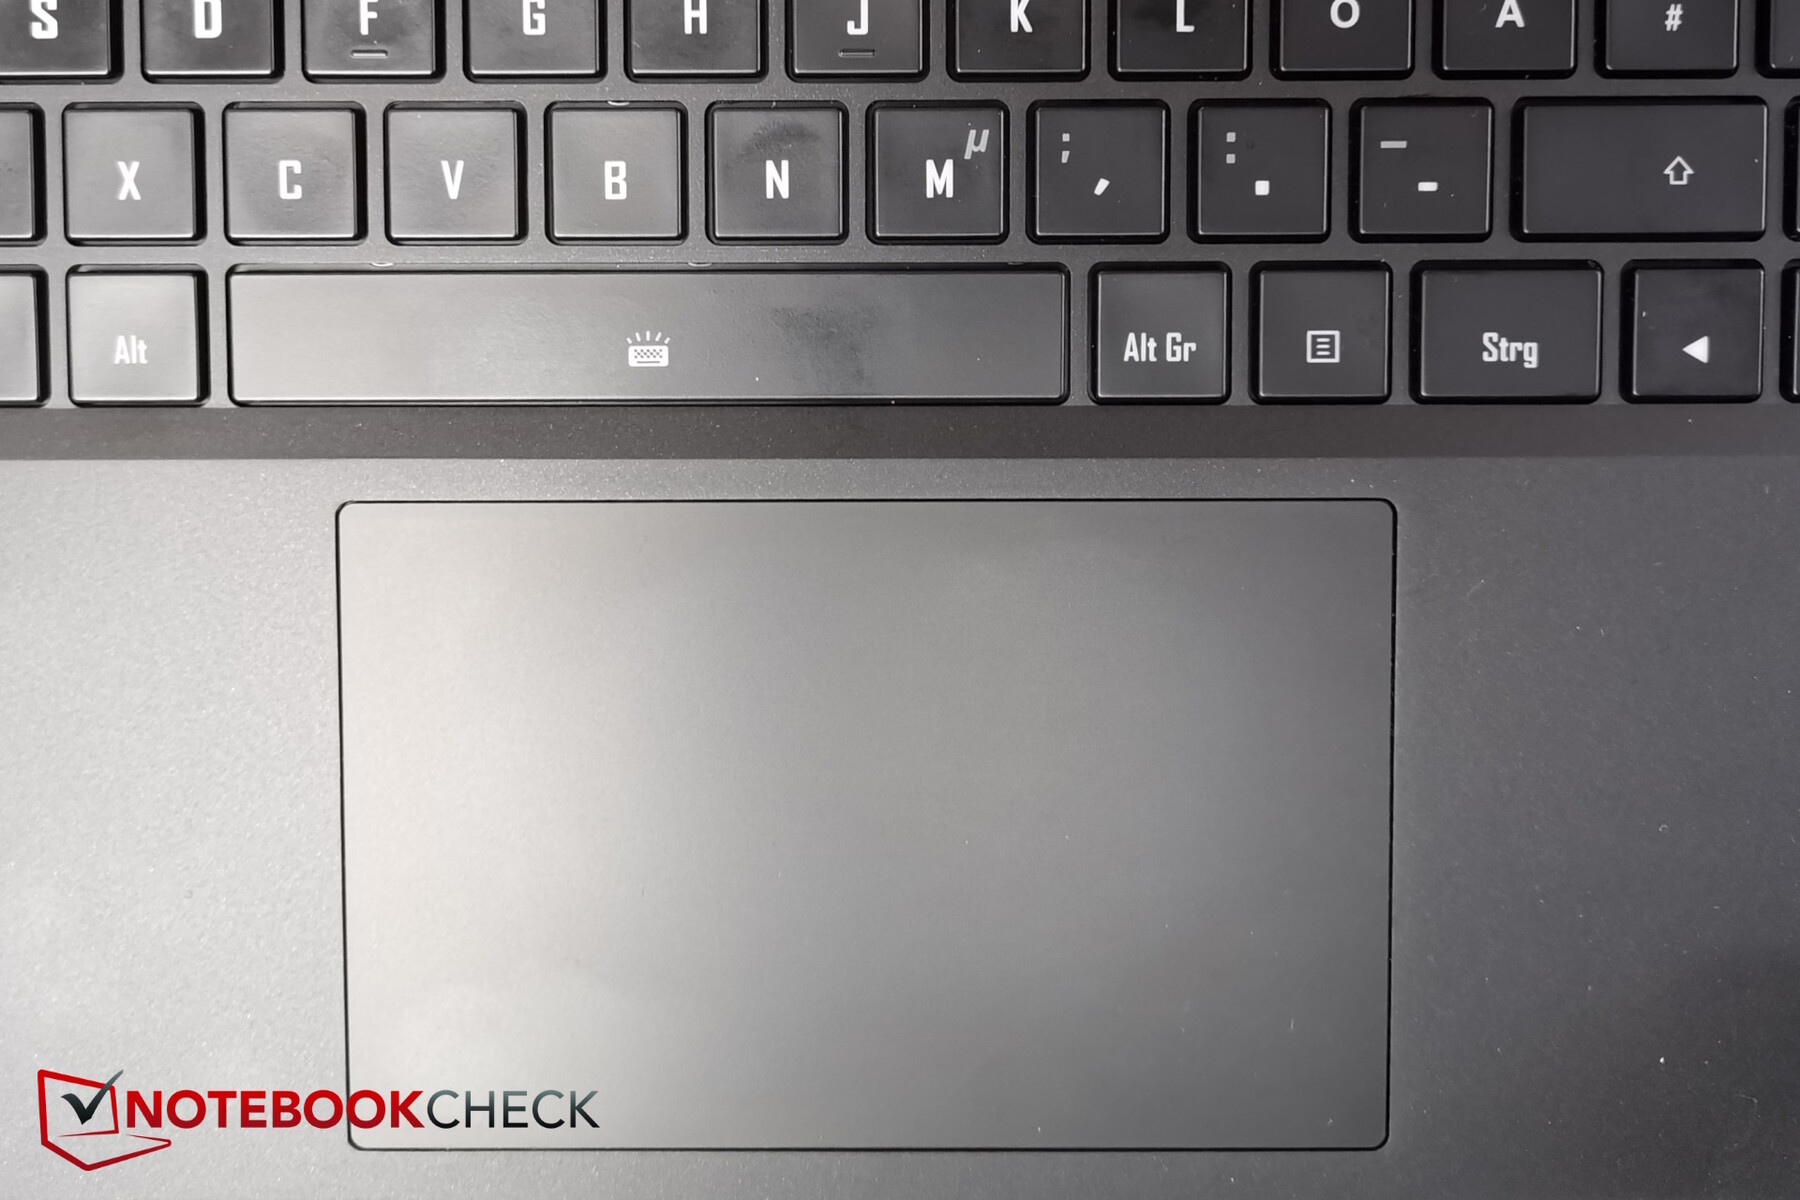
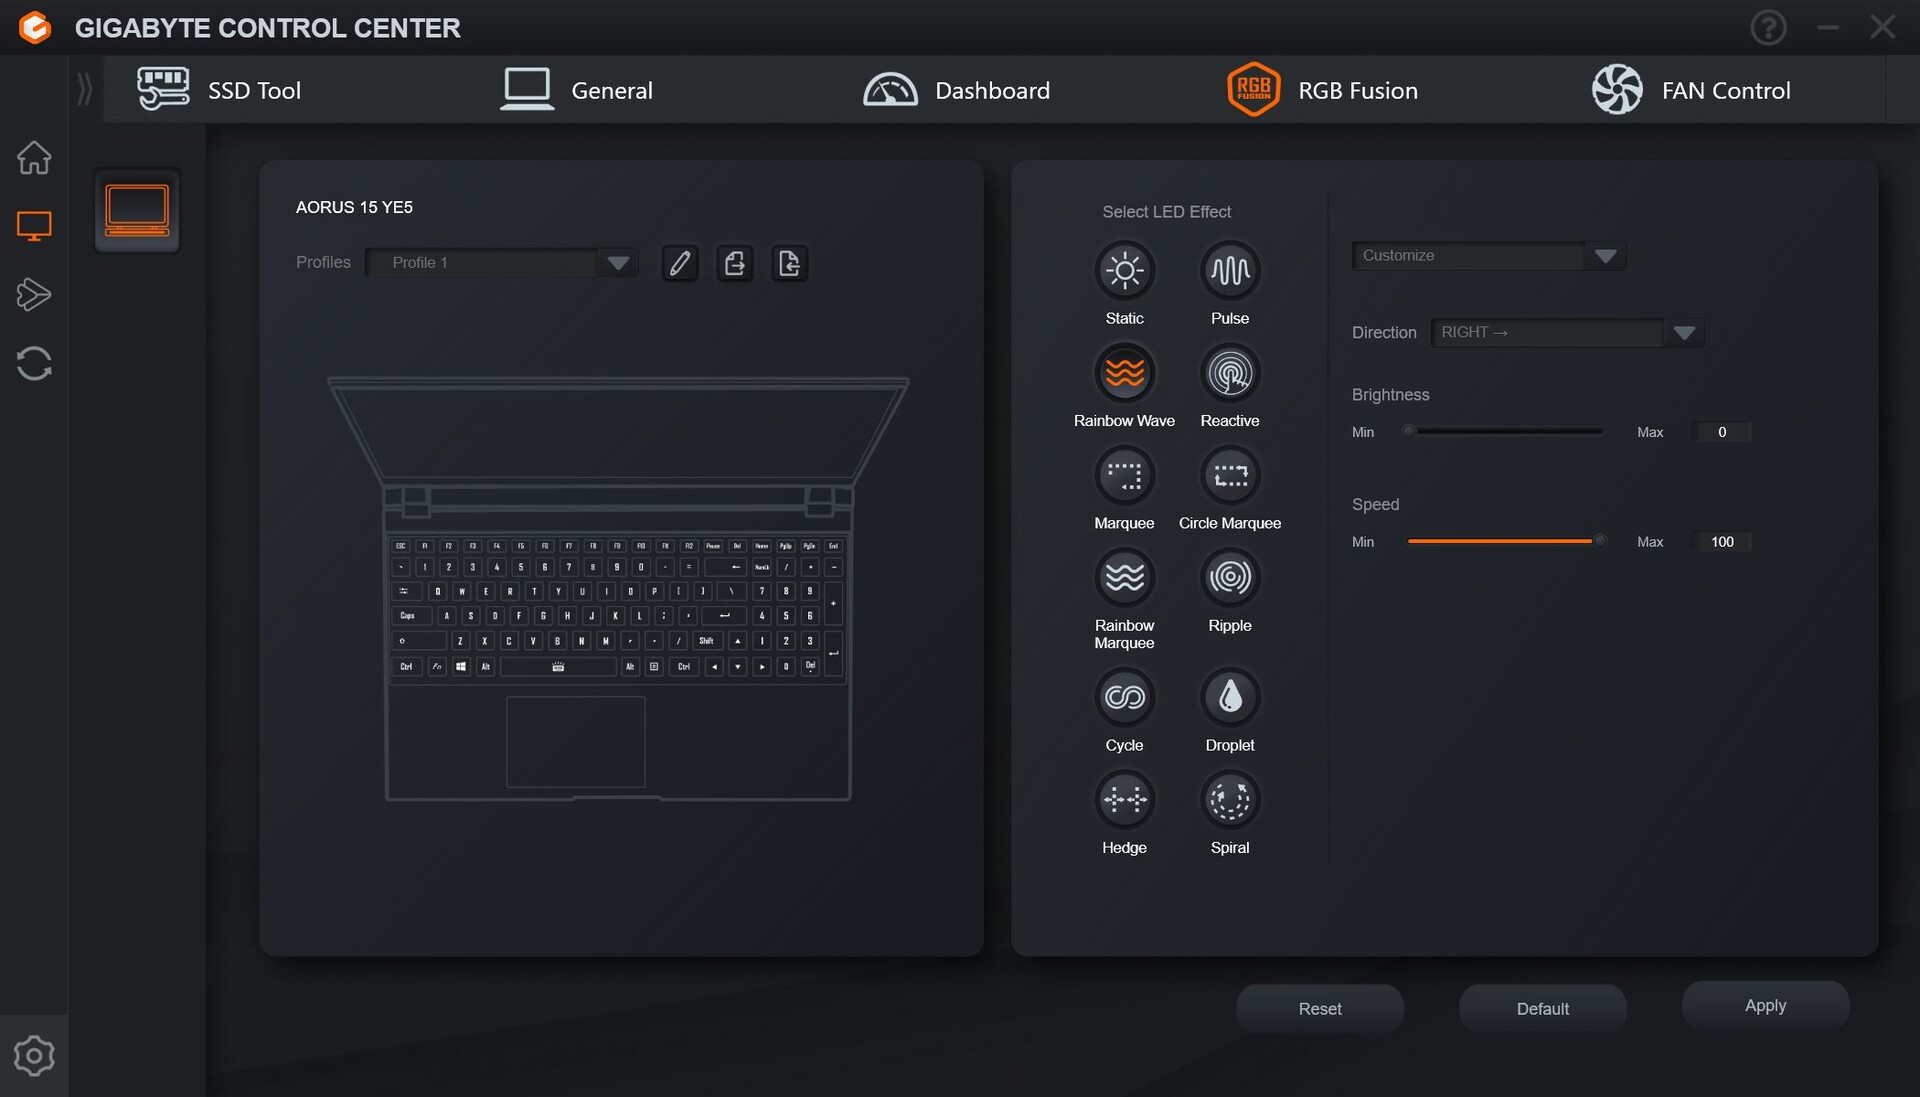
La retroilluminazione dei tasti è in grado di produrre vari effetti RGB, ma non può essere impostata individualmente per ciascun tasto - anche se questi possono illuminarsi di colori diversi per determinati effetti (Rain Drop). Pratico: se preme il tasto fn, si illuminano tutti i tasti che possono essere combinati con fn per creare funzioni speciali. Tuttavia, solo le etichette dei tasti normali sono illuminate (ad esempio "F7"), ma non la loro funzione speciale ("mute"), per cui la funzione speciale di un tasto F non è riconoscibile in ambienti bui.
Il touchpad sufficientemente grande (21,1 x 7,6 cm) è piacevole e scorrevole, anche se le mani non sono completamente asciutte. I pulsanti di clic integrati richiedono una forza abbastanza elevata, il che significa che il punto di pressione è chiaro. I rumori di clic sono moderati.
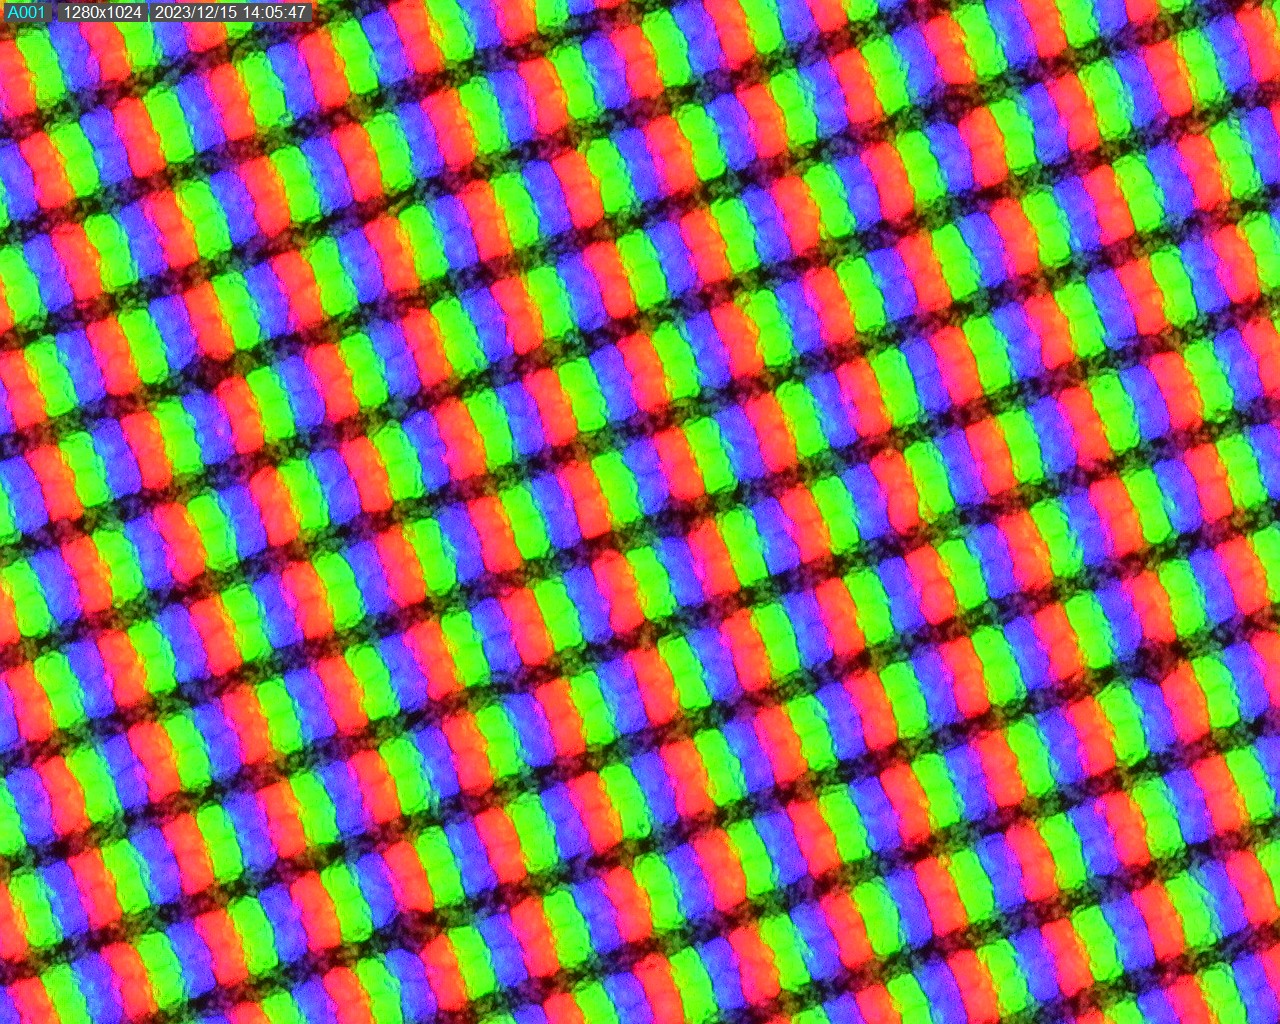
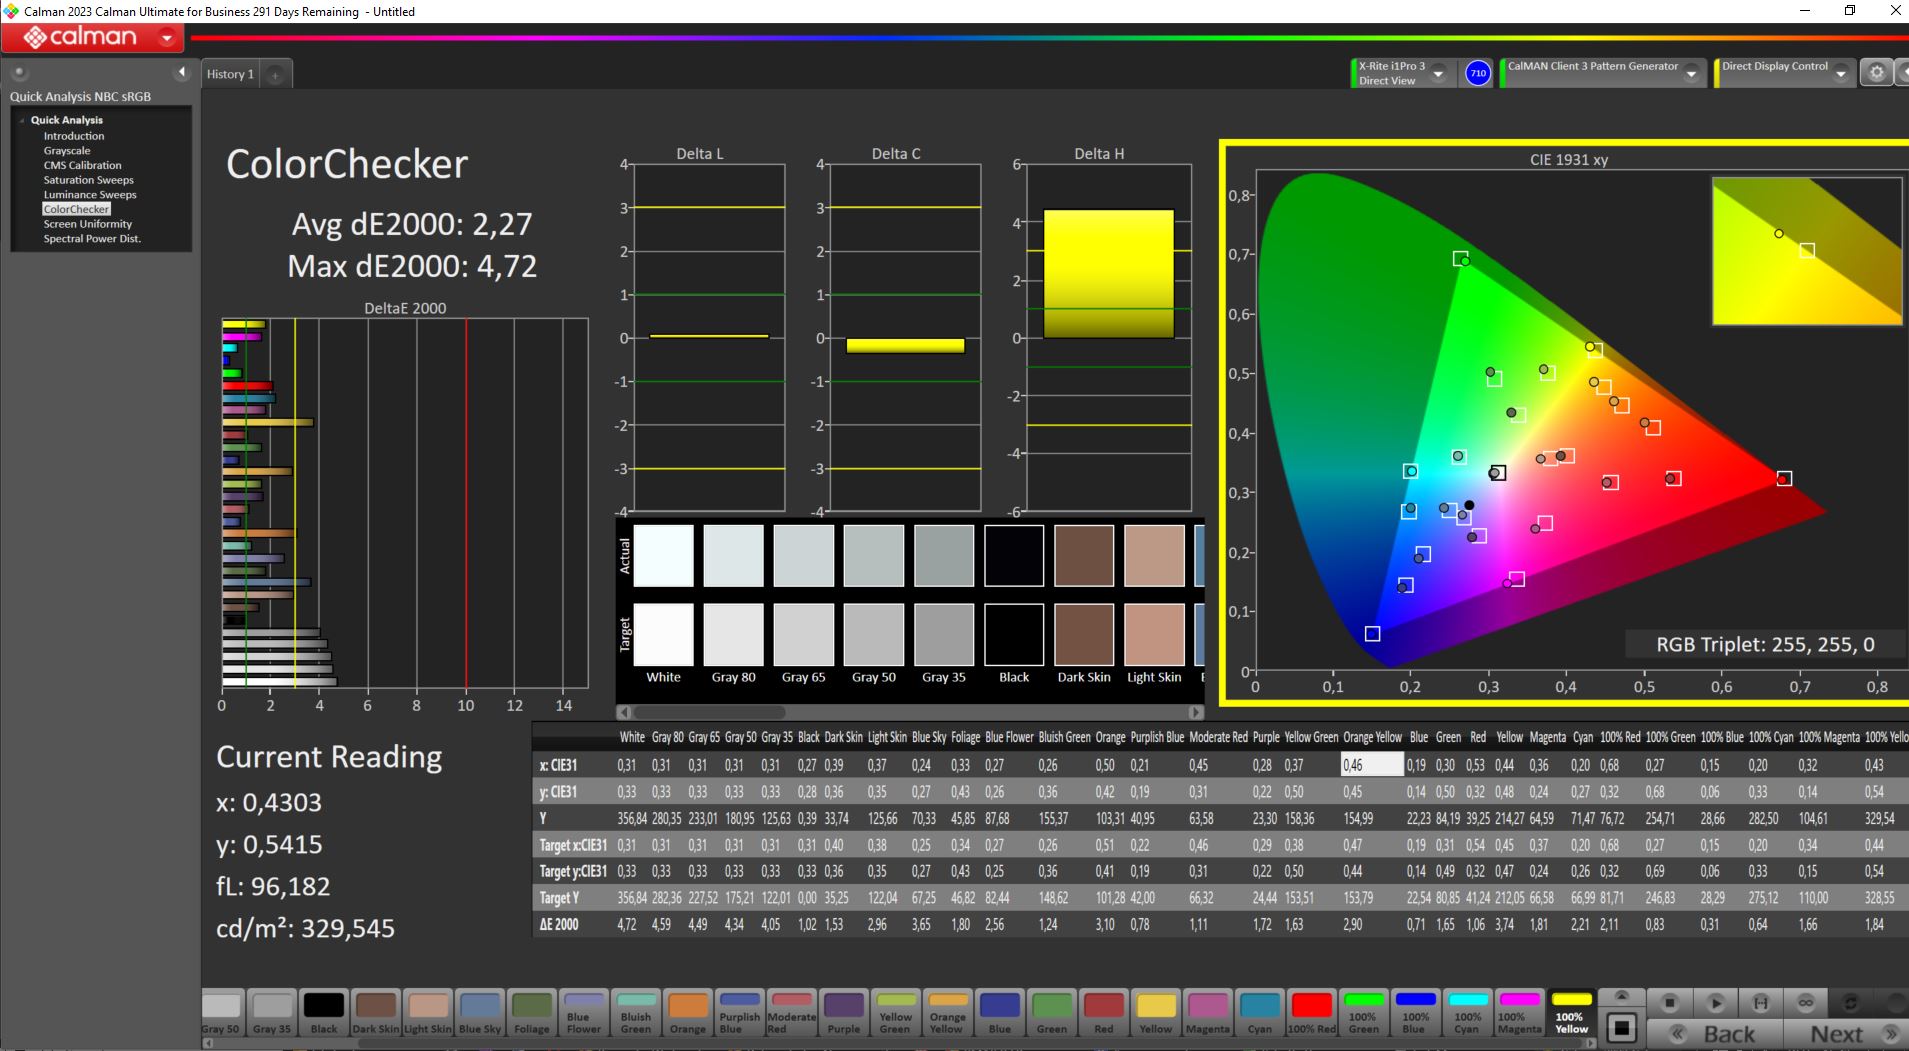
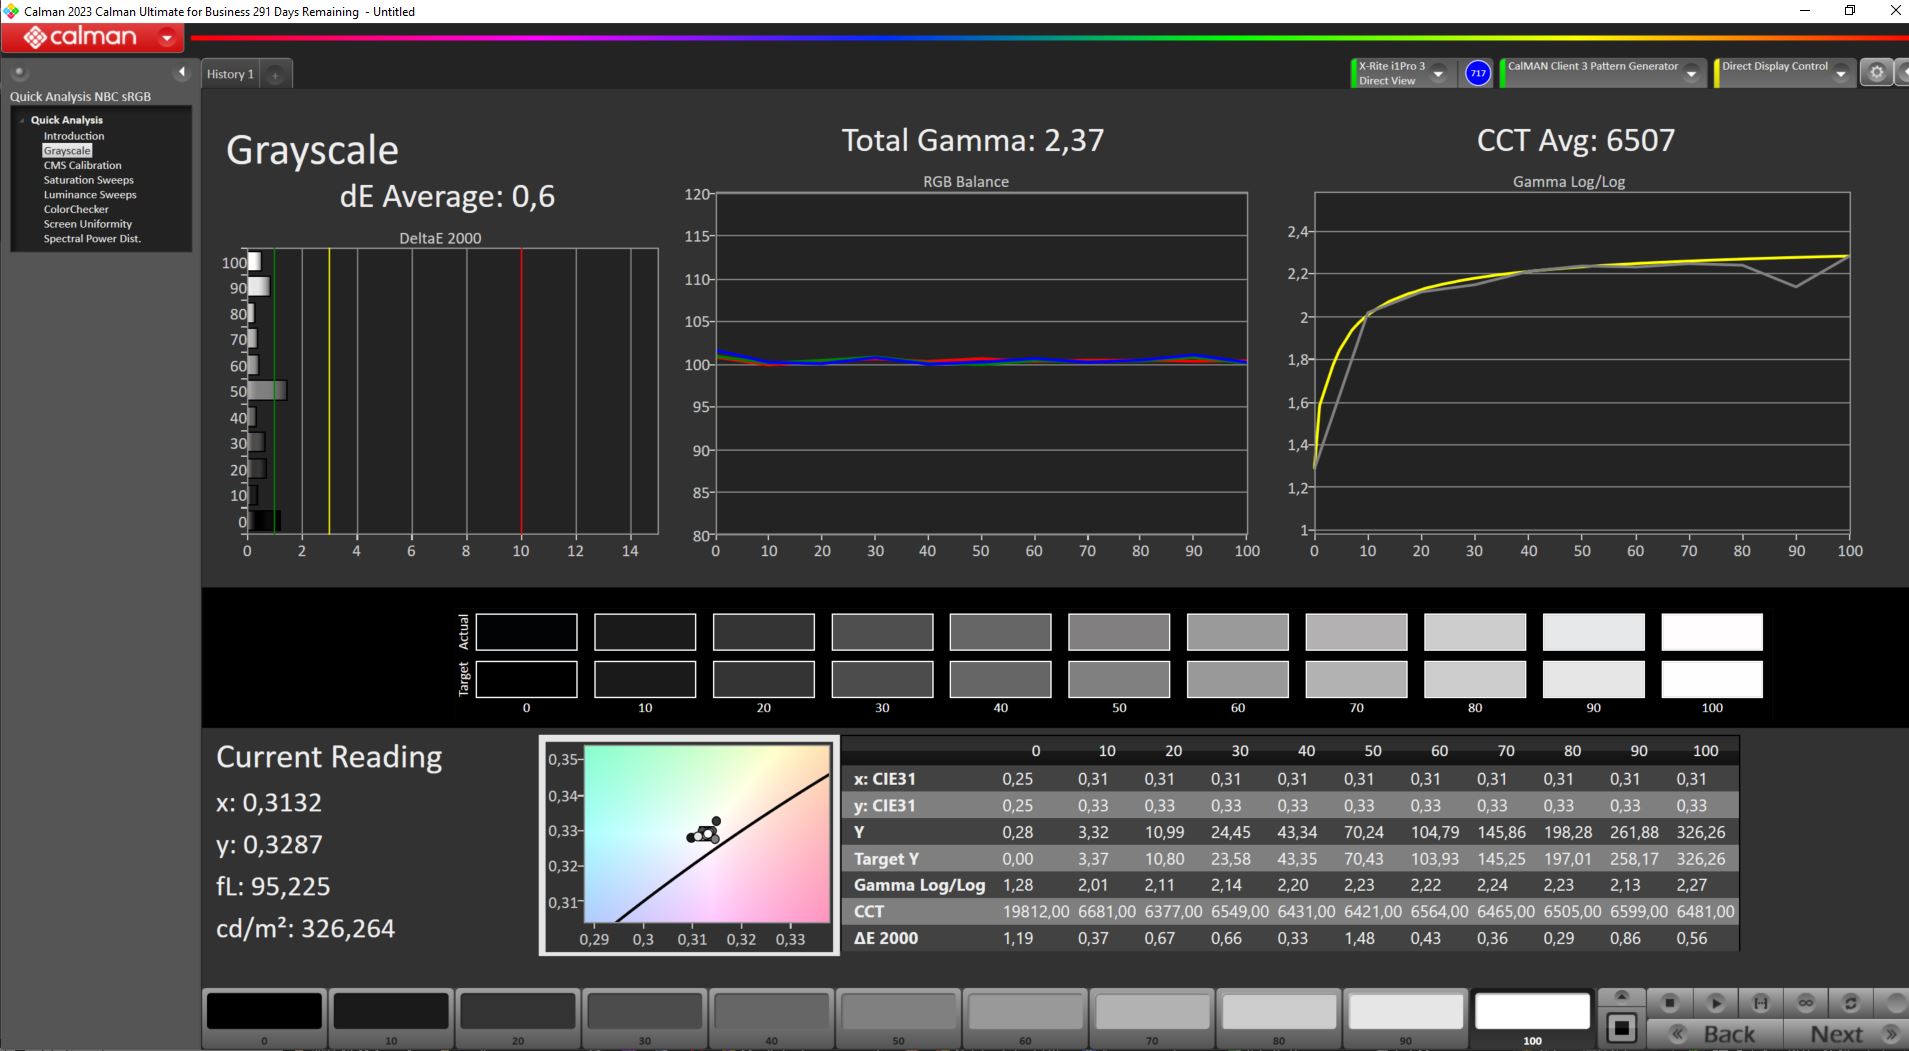
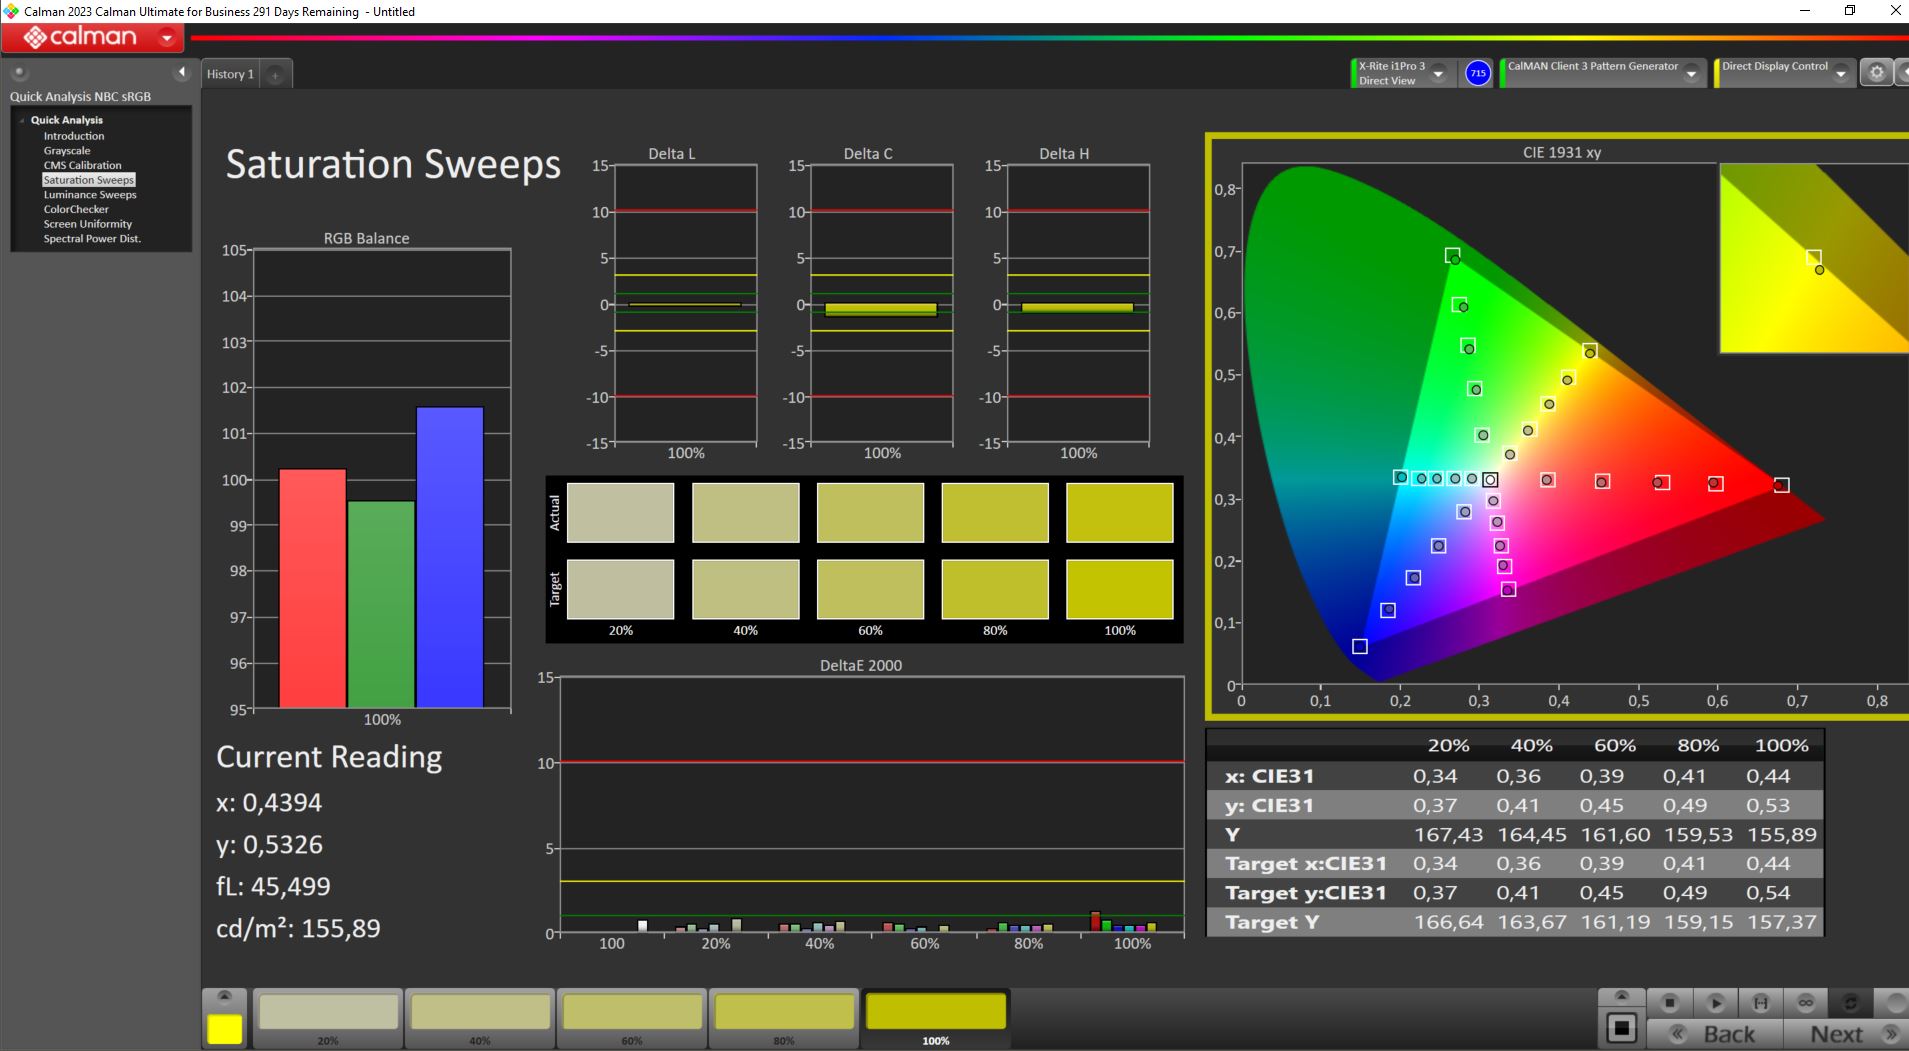
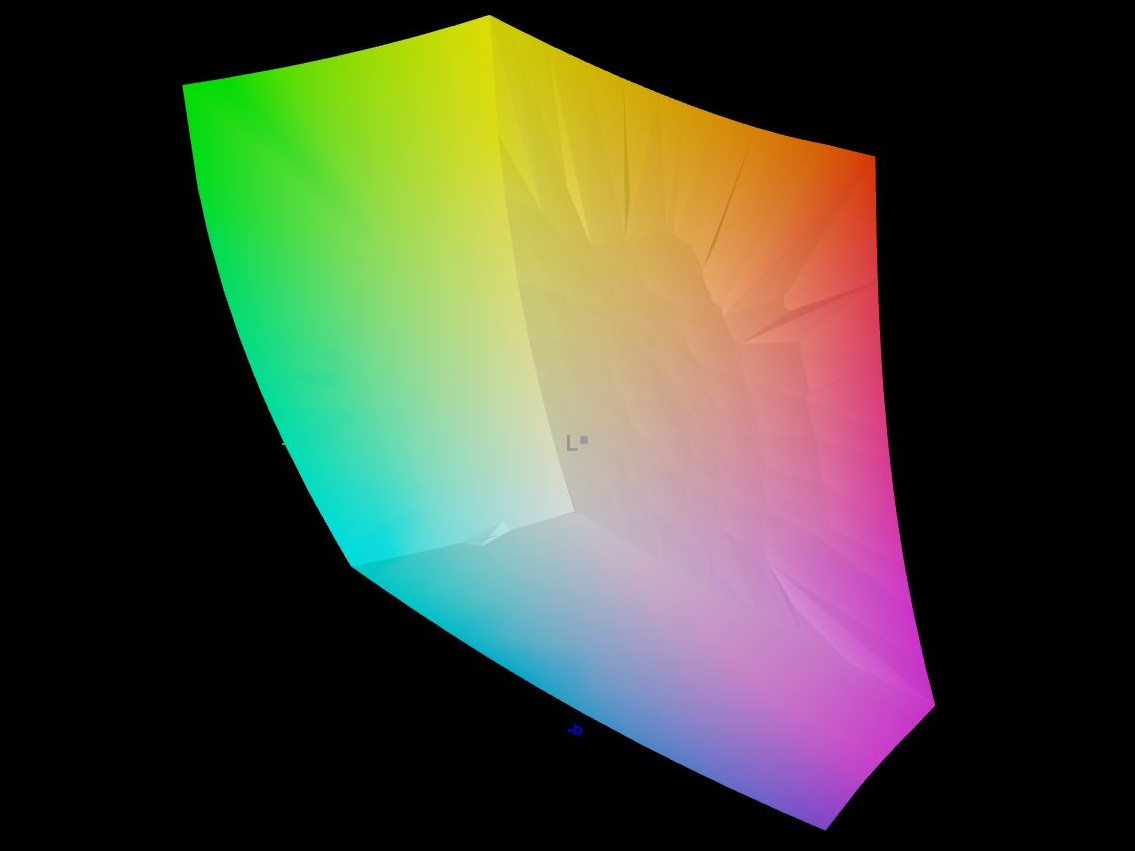
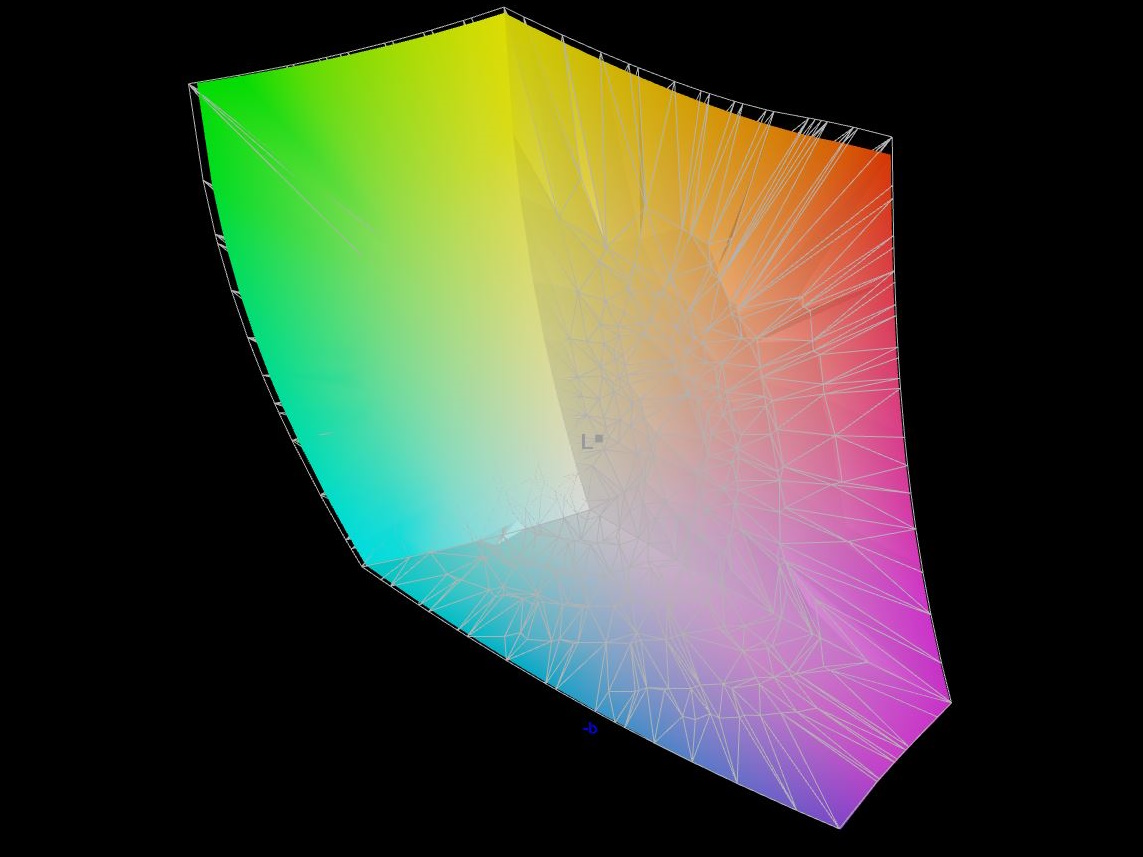
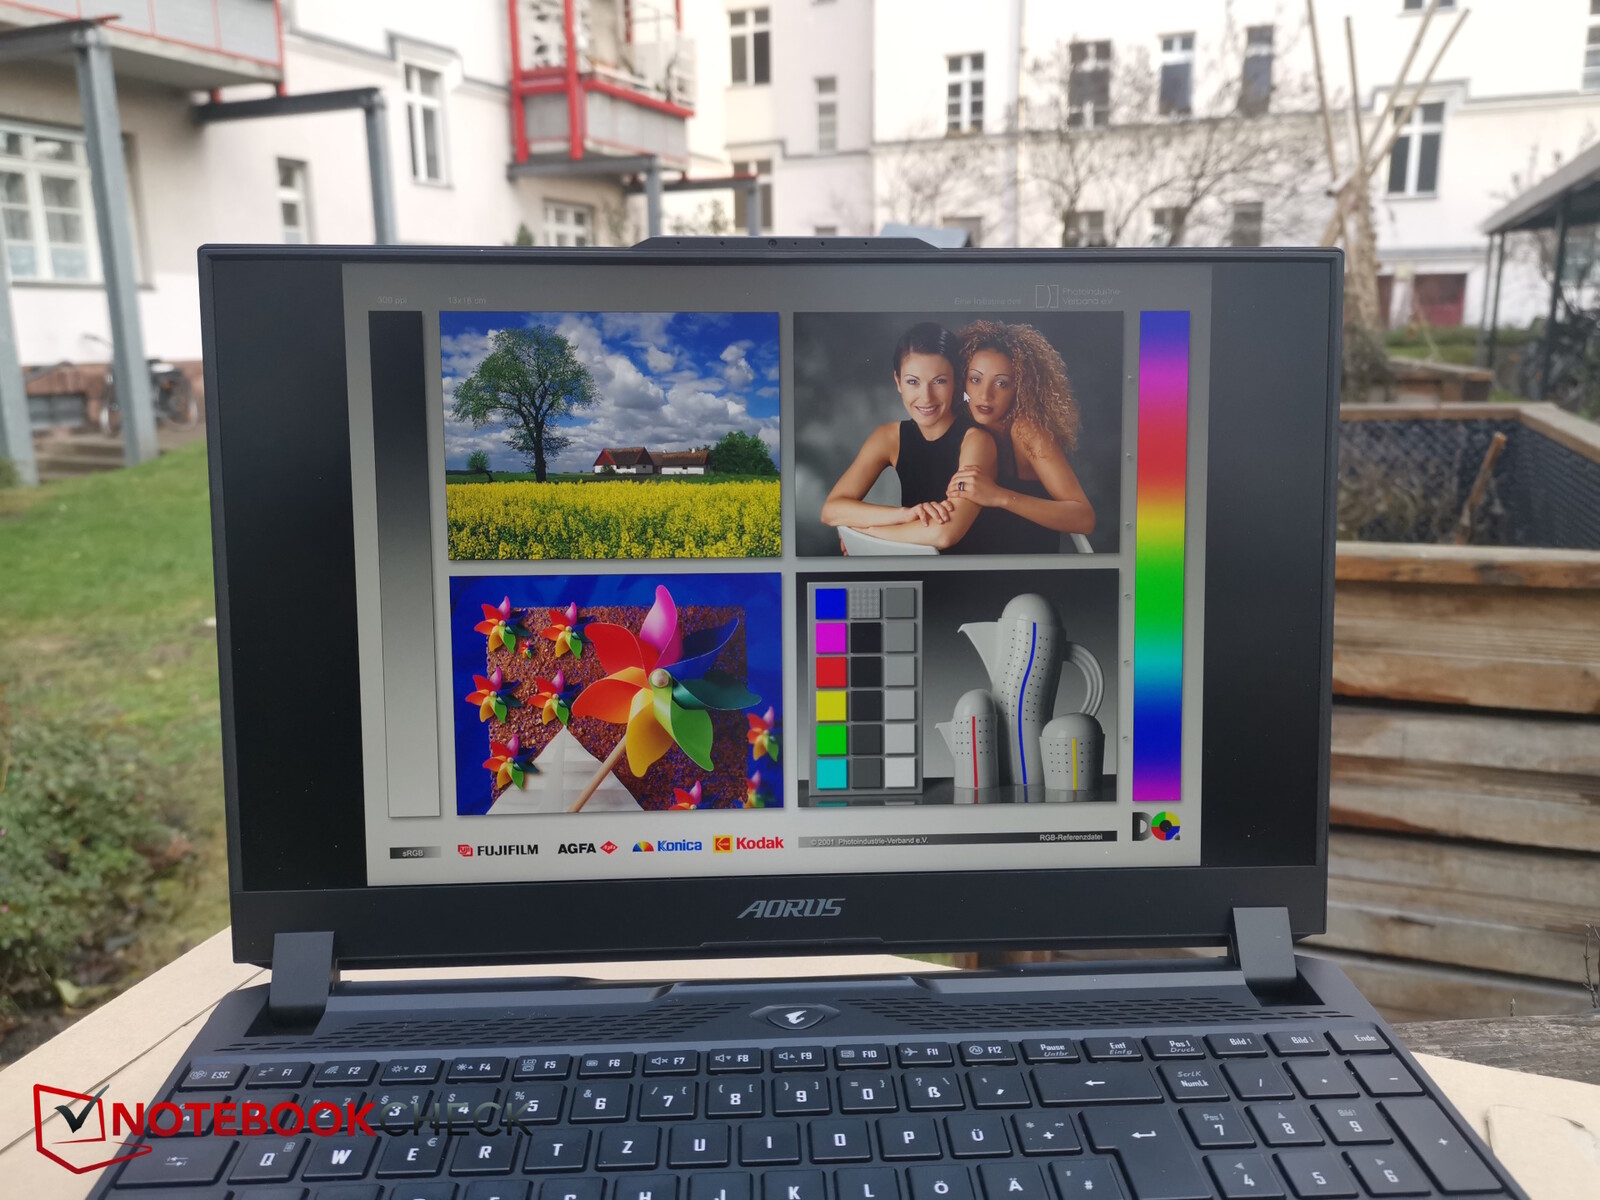
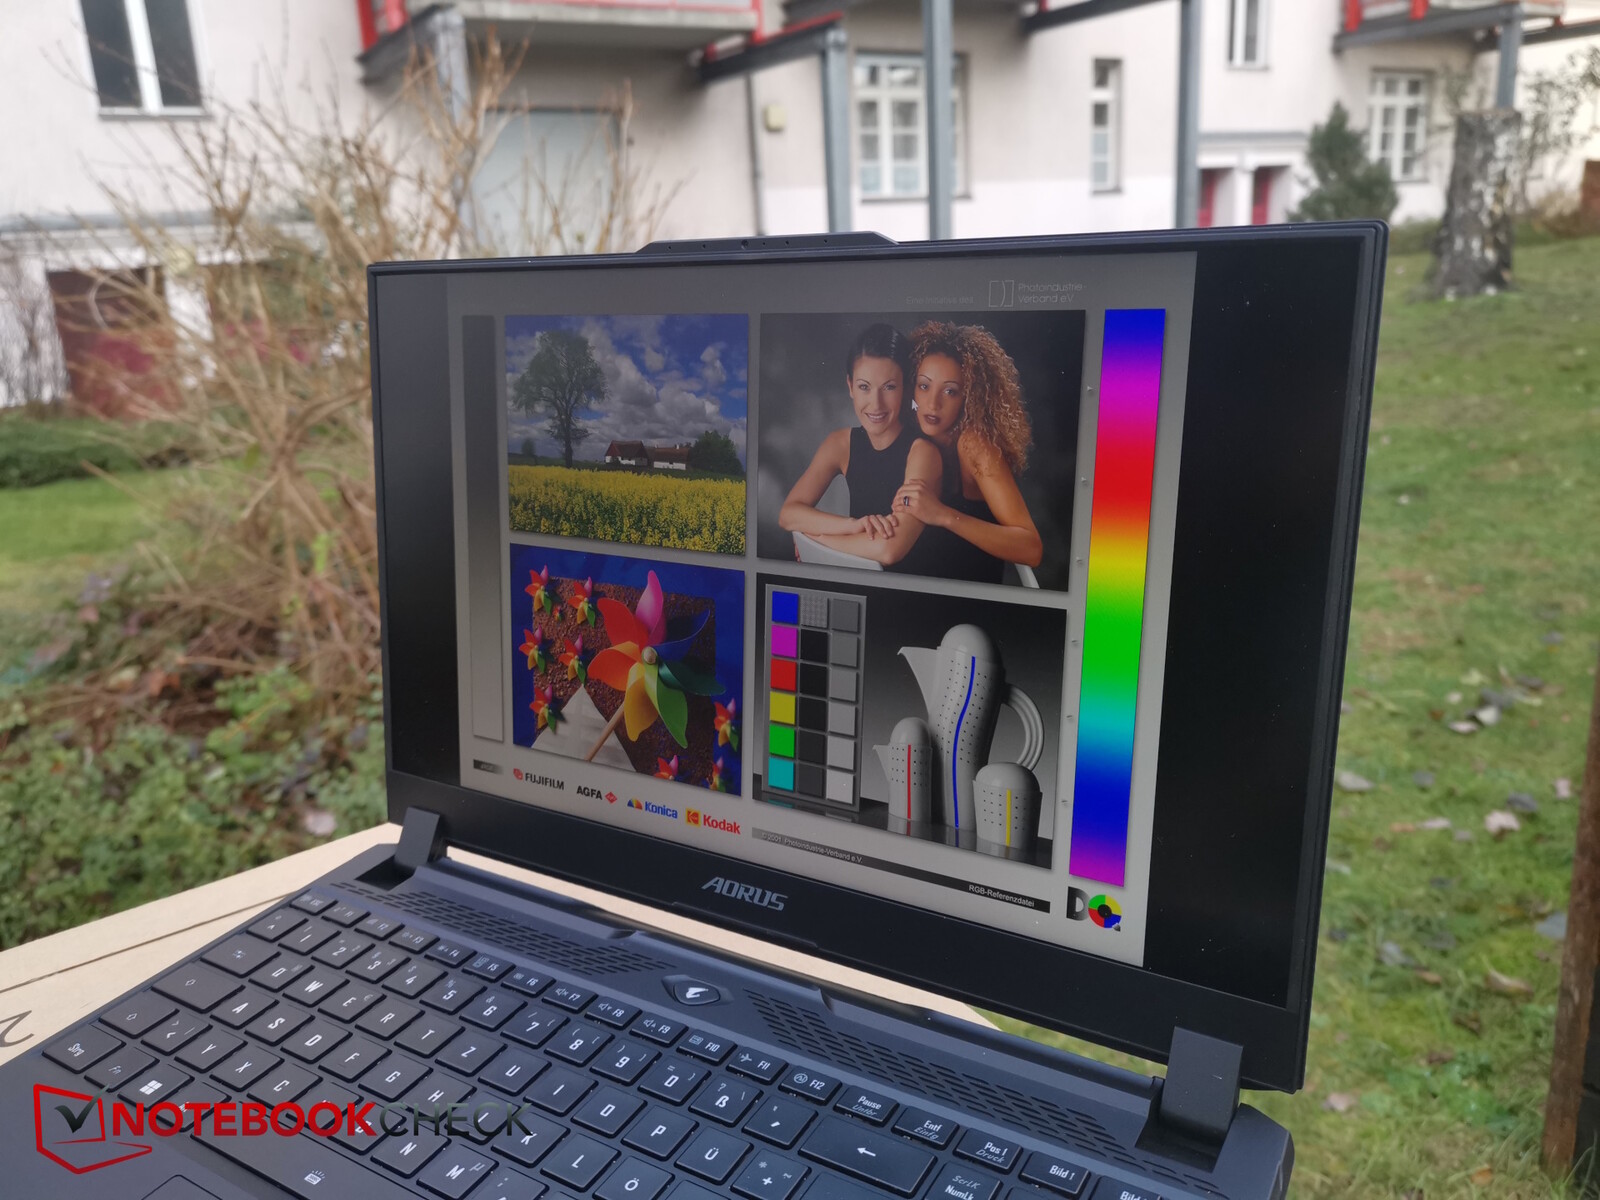
Display - 1.440p con buona precisione del colore
Il display WQHD opaco del laptop Aorus è realizzato da Chi Mei ed è già stato utilizzato nel modello Asus ROG Zephyrus G15 nel 2021. È stato un successo, quindi non sembra superato nemmeno nel 2023. La risoluzione di 2.560 x 1.440 pixel è impressionante, così come la frequenza di aggiornamento di 165 Hz, i tempi di risposta relativamente rapidi e la copertura dello spazio colore (100% sRGB, 97% Display P3). La luminosità e il contrasto dello schermo, invece, sono nella media. In alternativa, esiste anche un modello Full HD con una frequenza di aggiornamento di 360 Hz.
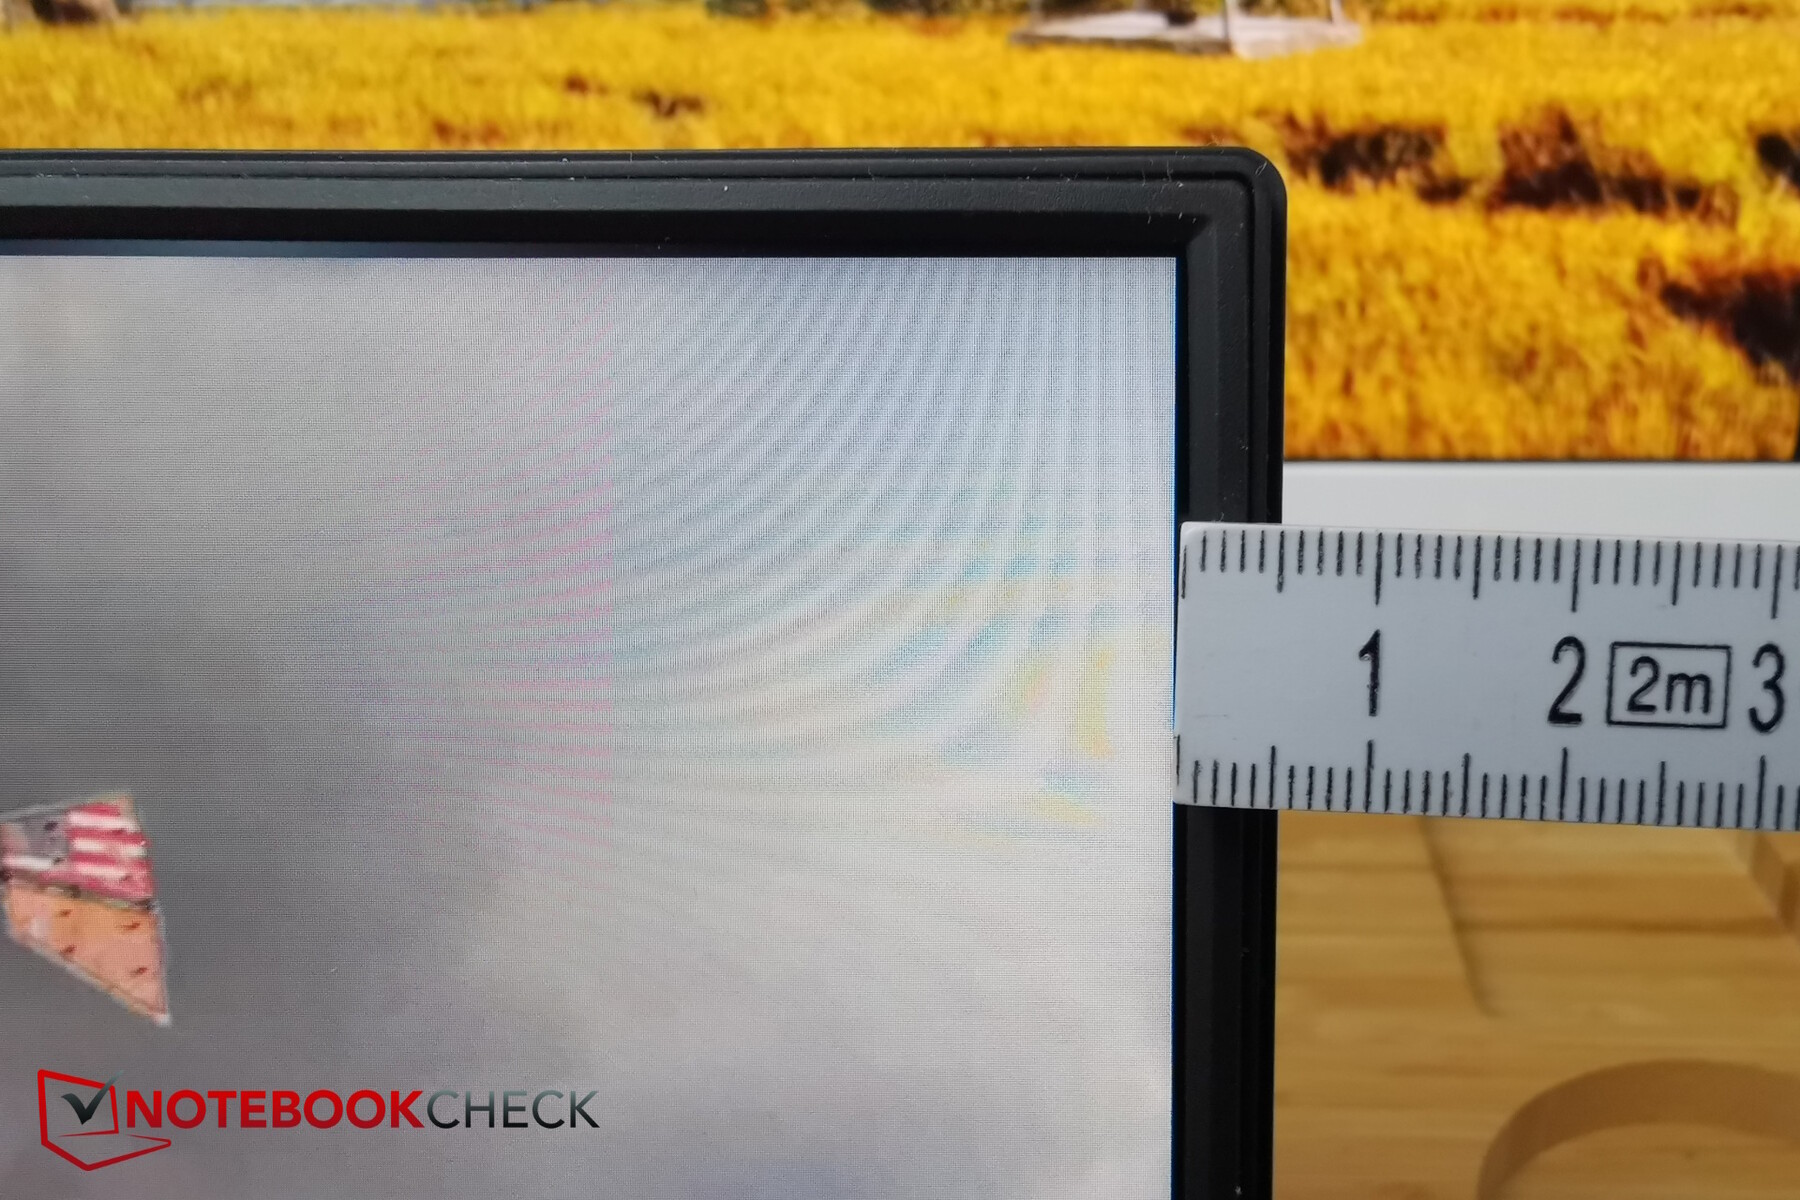
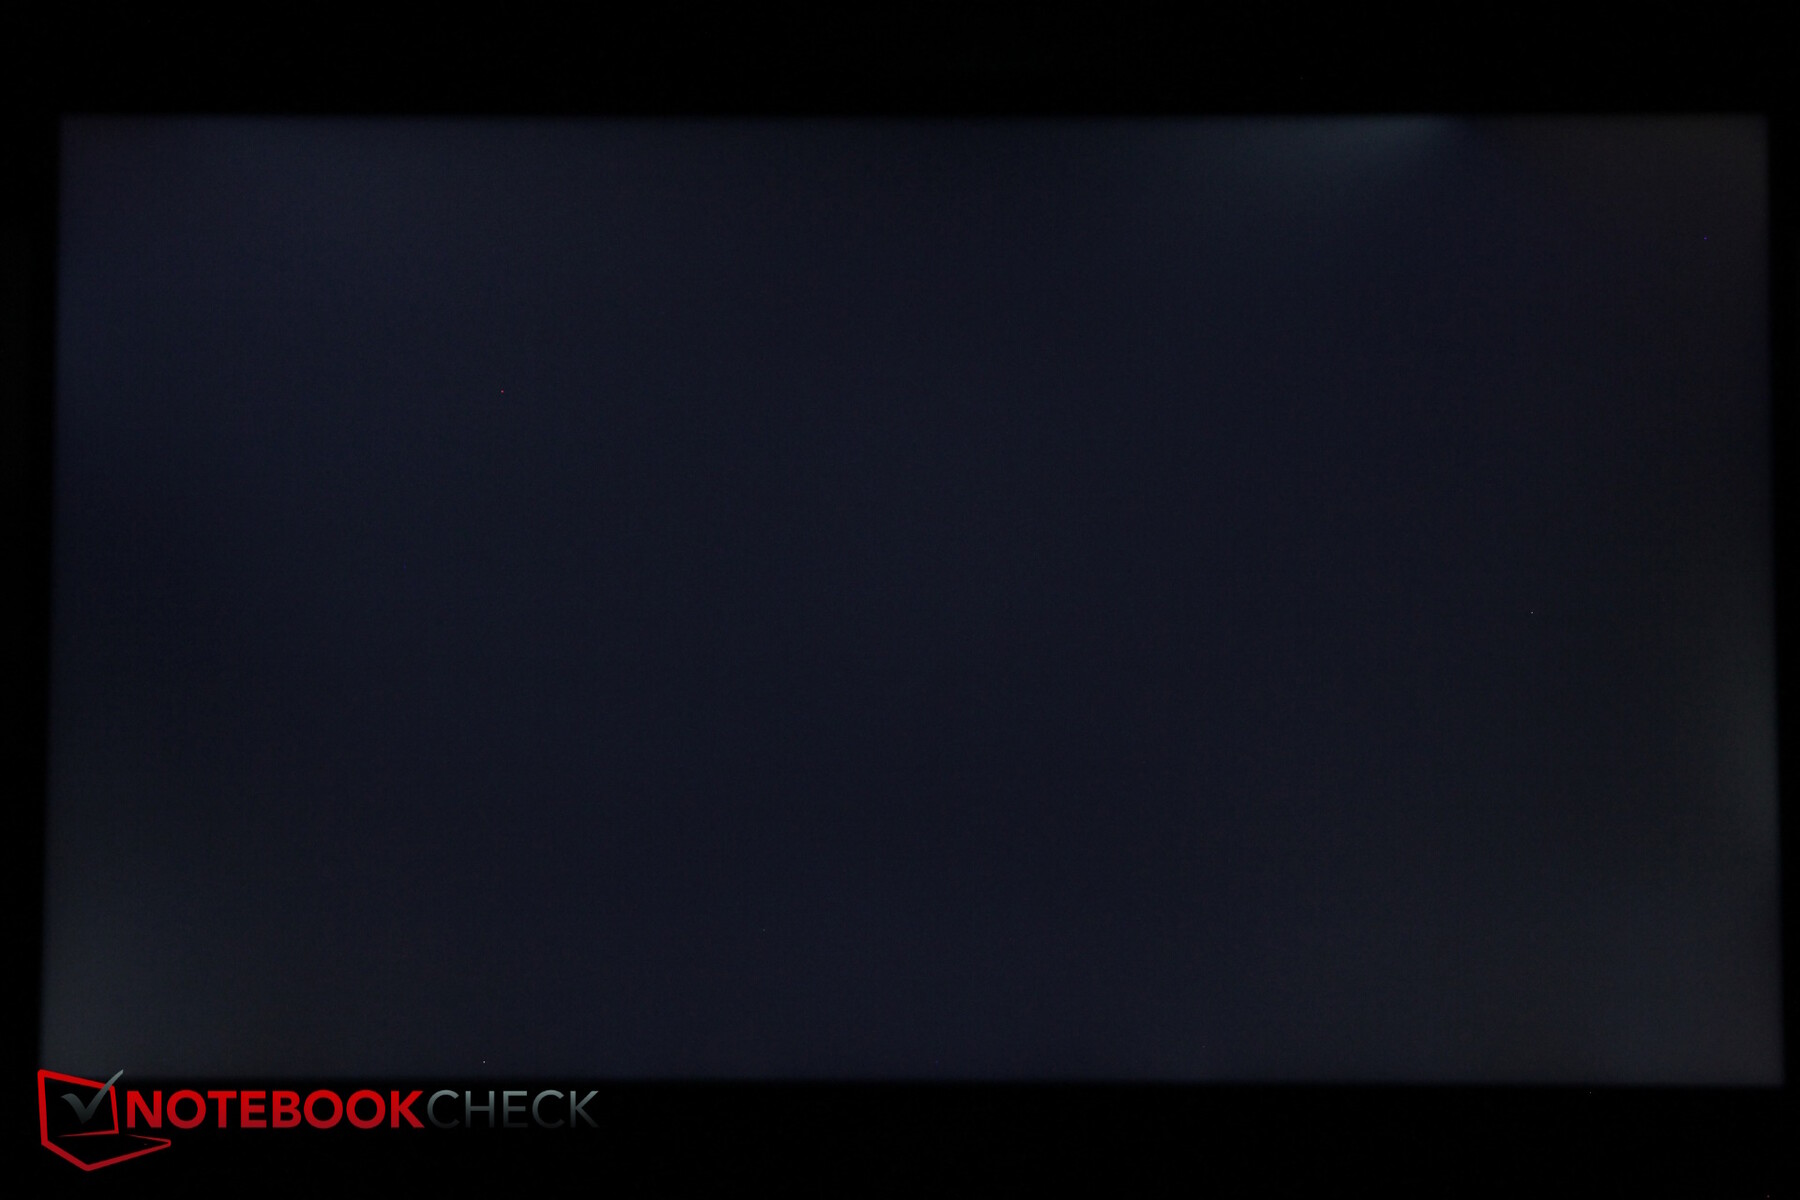
Meno bene è il sanguinamento della retroilluminazione molto visibile nell'angolo inferiore sinistro e lungo il bordo superiore destro. Tuttavia, il PWM non viene utilizzato per il controllo della luminosità. I suoi tempi di risposta sono mediocri, nella migliore delle ipotesi.
| |||||||||||||||||||||||||
Distribuzione della luminosità: 81 %
Al centro con la batteria: 350 cd/m²
Contrasto: 939:1 (Nero: 0.38 cd/m²)
ΔE ColorChecker Calman: 2.27 | ∀{0.5-29.43 Ø4.71}
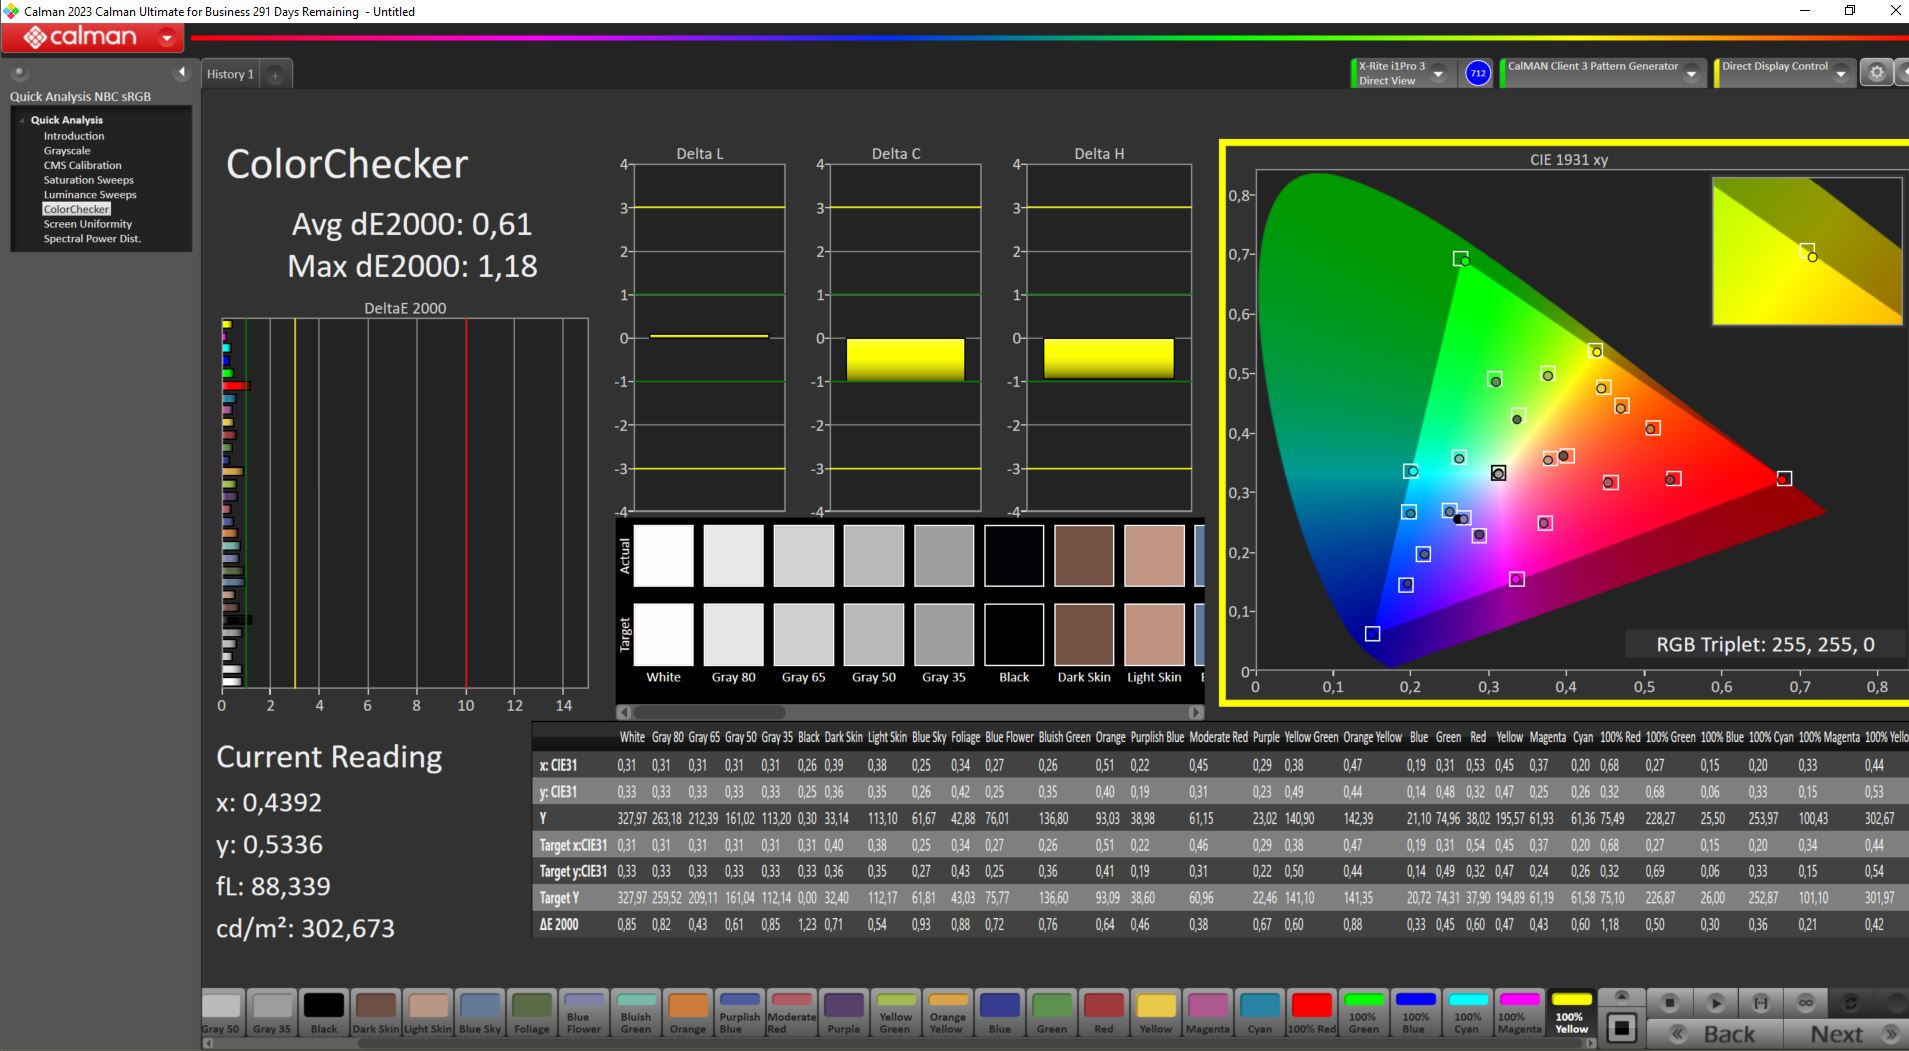
calibrated: 0.61
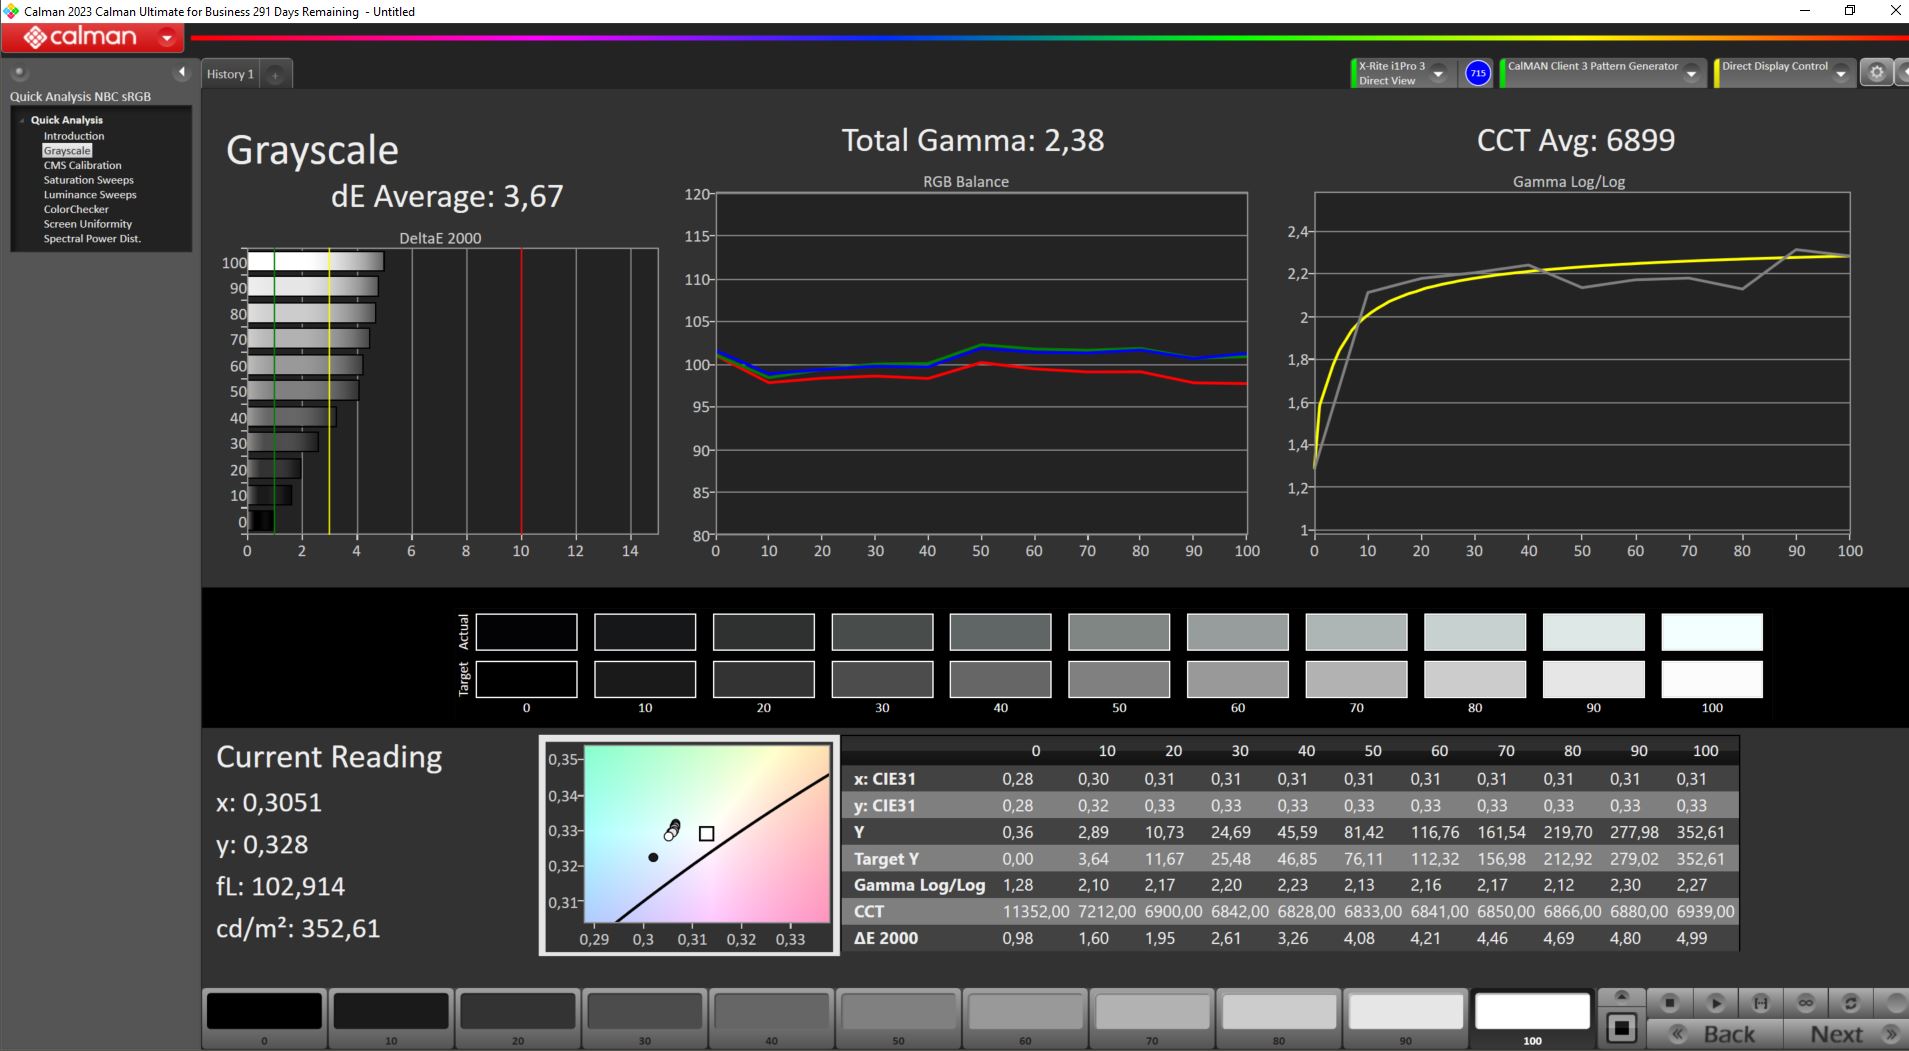
ΔE Greyscale Calman: 3.67 | ∀{0.09-98 Ø4.96}
85.9% AdobeRGB 1998 (Argyll 3D)
100% sRGB (Argyll 3D)
97.7% Display P3 (Argyll 3D)
Gamma: 2.38
CCT: 7899 K
| Aorus 15 YE5-54DEB34SH Chi Mei CMN1540 (CMN N156KME-GNA), IPS, 2560x1440, 15.6" | Aorus 15 BSF Sharp LQ156T1JW05, IPS, 2560x1440, 15.6" | Captiva Advanced Gaming I74-121 BOE08B3, IPS, 1920x1080, 15.6" | HP Victus 16-r0077ng CMN162D, IPS, 1920x1080, 16.1" | Dell XPS 15 9530 RTX 4070 Samsung 156XG01, OLED, 3456x2160, 15.6" | HP Omen 16-wf000 BOE0B7D, IPS, 2560x1440, 16.1" | |
|---|---|---|---|---|---|---|
| Display | 0% | -21% | -18% | 6% | -16% | |
| Display P3 Coverage (%) | 97.7 | 98.2 1% | 64 -34% | 66.7 -32% | 99.8 2% | 69 -29% |
| sRGB Coverage (%) | 100 | 99.9 0% | 93.2 -7% | 98 -2% | 100 0% | 99.2 -1% |
| AdobeRGB 1998 Coverage (%) | 85.9 | 85.7 0% | 66 -23% | 69 -20% | 98.4 15% | 71.2 -17% |
| Response Times | 40% | 55% | 30% | 87% | 47% | |
| Response Time Grey 50% / Grey 80% * (ms) | 18.9 ? | 11.3 ? 40% | 5 ? 74% | 13.3 ? 30% | 1.68 ? 91% | 4.6 ? 76% |
| Response Time Black / White * (ms) | 11.7 ? | 7 ? 40% | 7.55 ? 35% | 8.2 ? 30% | 1.94 ? 83% | 9.7 ? 17% |
| PWM Frequency (Hz) | 239 | |||||
| Screen | -34% | -28% | 15% | -36% | 7% | |
| Brightness middle (cd/m²) | 357 | 299 -16% | 346 -3% | 308 -14% | 389.5 9% | 310.9 -13% |
| Brightness (cd/m²) | 322 | 282 -12% | 324 1% | 285 -11% | 392 22% | 296 -8% |
| Brightness Distribution (%) | 81 | 82 1% | 90 11% | 85 5% | 98 21% | 91 12% |
| Black Level * (cd/m²) | 0.38 | 0.31 18% | 0.35 8% | 0.25 34% | 0.35 8% | |
| Contrast (:1) | 939 | 965 3% | 989 5% | 1232 31% | 888 -5% | |
| Colorchecker dE 2000 * | 2.27 | 2.24 1% | 4.12 -81% | 1.3 43% | 4.95 -118% | 2.18 4% |
| Colorchecker dE 2000 max. * | 4.72 | 4.29 9% | 7.78 -65% | 2.76 42% | 8.65 -83% | 3.58 24% |
| Colorchecker dE 2000 calibrated * | 0.61 | 2.62 -330% | 1.22 -100% | 0.92 -51% | 1.53 -151% | 0.52 15% |
| Greyscale dE 2000 * | 3.67 | 3 18% | 4.81 -31% | 1.7 54% | 2 46% | 2.8 24% |
| Gamma | 2.38 92% | 2.086 105% | 2.31 95% | 2.167 102% | 2.27 97% | 2.18 101% |
| CCT | 7899 82% | 6289 103% | 7633 85% | 6767 96% | 6265 104% | 6002 108% |
| Media totale (Programma / Settaggio) | 2% /
-16% | 2% /
-15% | 9% /
10% | 19% /
-5% | 13% /
8% |
* ... Meglio usare valori piccoli
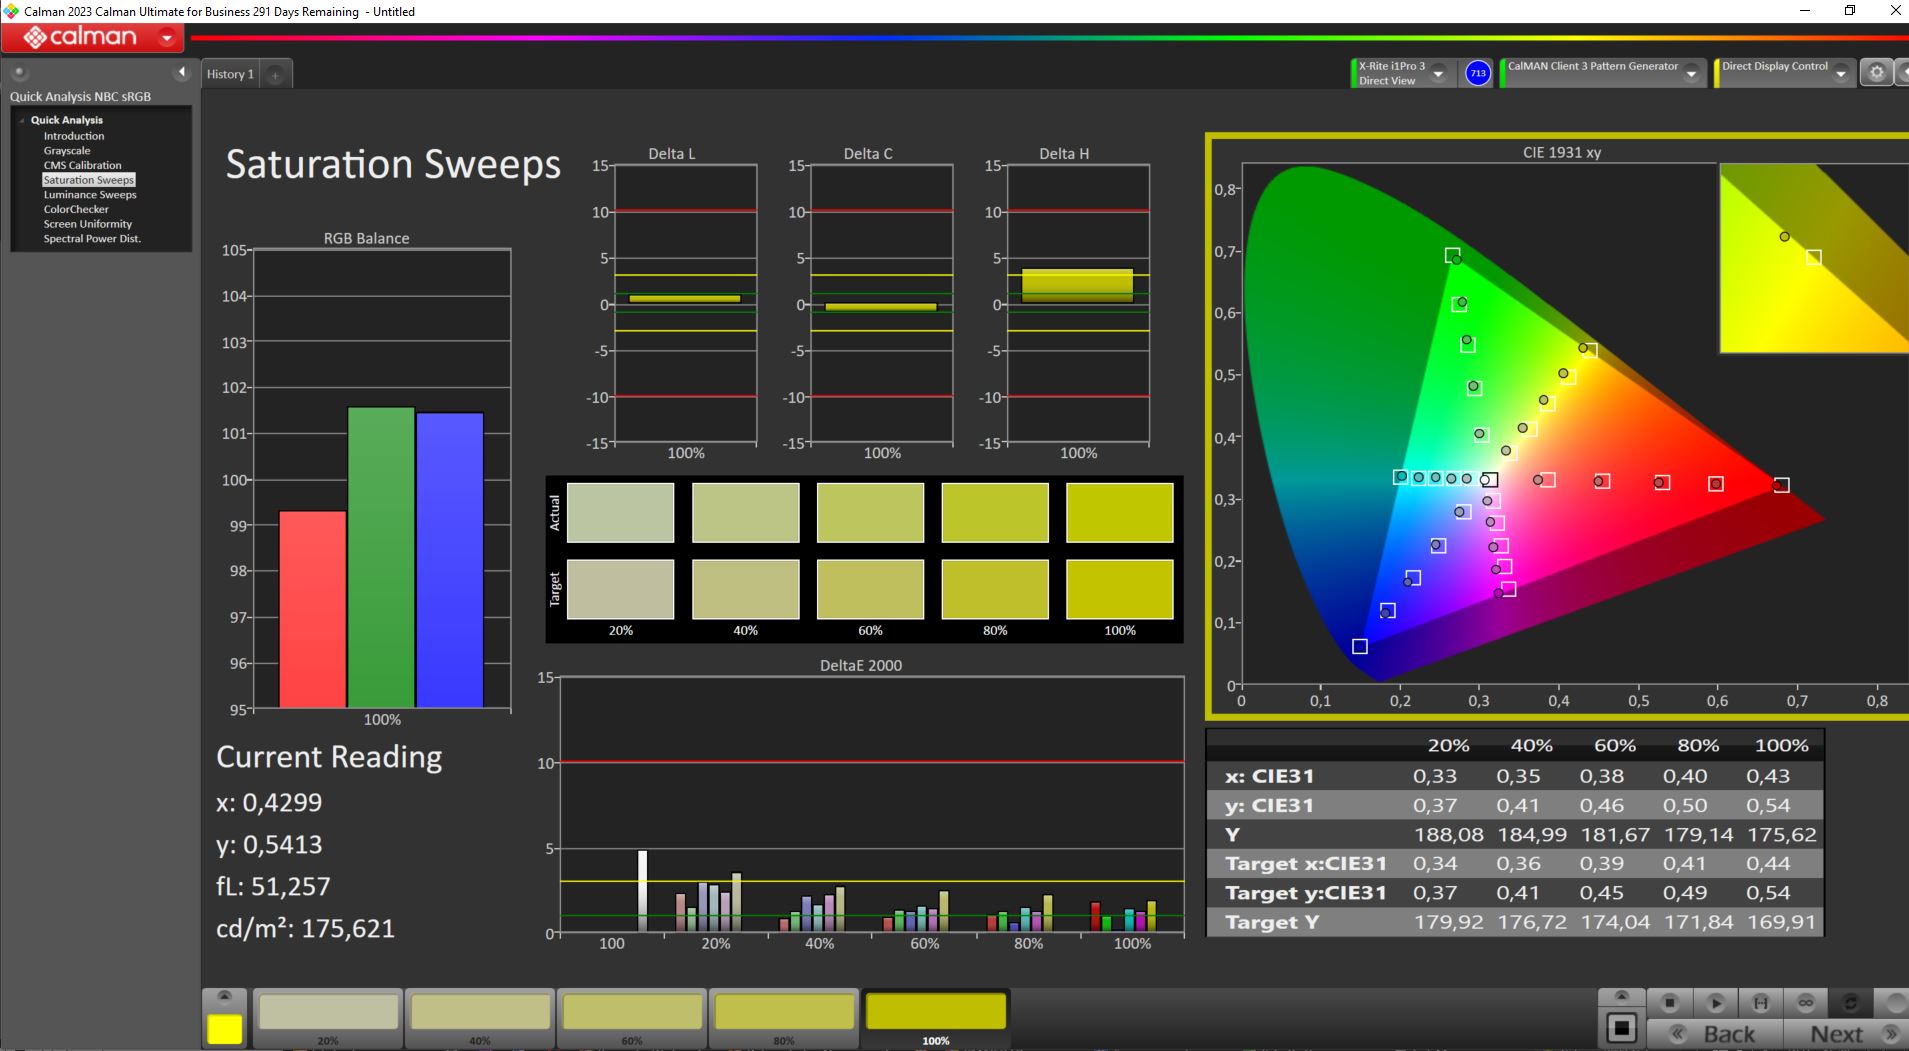
Ex funziona, il display non viene fornito calibrato in modo ottimale, ma la nostra calibrazione con il dispositivo di misurazione X-Rite Fab e il software Calman riduce il valore DeltaE (significativo per le deviazioni (di colore)) a molto meno di 1 - sia per la scala di grigi che per i colori. Insieme alla buona copertura dello spazio colore (vedere l'ultima fila di immagini qui sotto), il display è adatto anche all'editing semi-professionale di immagini e video.

Tempi di risposta del Display
| ↔ Tempi di risposta dal Nero al Bianco | ||
|---|---|---|
| 11.7 ms ... aumenta ↗ e diminuisce ↘ combinato | ↗ 7.2 ms Incremento | 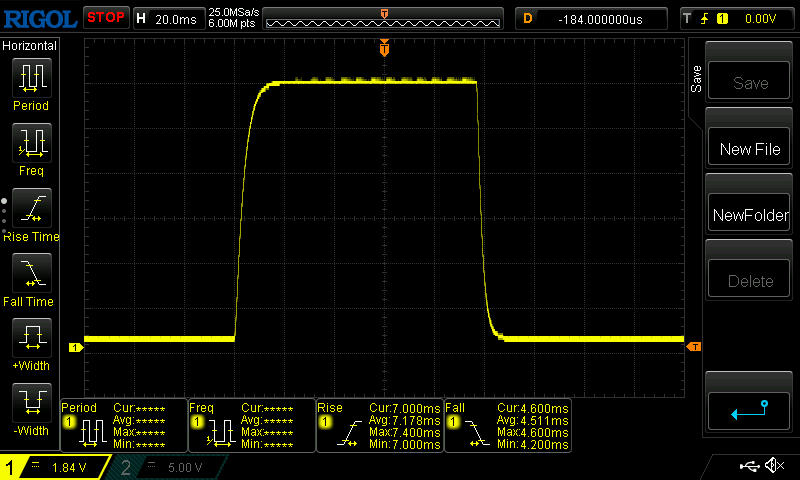 |
| ↘ 4.5 ms Calo | ||
| Lo schermo mostra buoni tempi di risposta durante i nostri tests, ma potrebbe essere troppo lento per i gamers competitivi. In confronto, tutti i dispositivi di test variano da 0.1 (minimo) a 240 (massimo) ms. » 32 % di tutti i dispositivi è migliore. Questo significa che i tempi di risposta rilevati sono migliori rispettto alla media di tutti i dispositivi testati (19.8 ms). | ||
| ↔ Tempo di risposta dal 50% Grigio all'80% Grigio | ||
| 18.9 ms ... aumenta ↗ e diminuisce ↘ combinato | ↗ 9.4 ms Incremento | 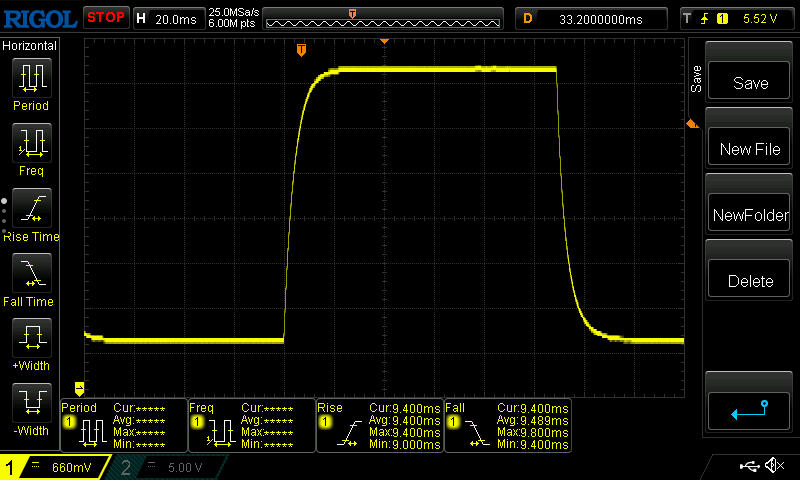 |
| ↘ 9.5 ms Calo | ||
| Lo schermo mostra buoni tempi di risposta durante i nostri tests, ma potrebbe essere troppo lento per i gamers competitivi. In confronto, tutti i dispositivi di test variano da 0.165 (minimo) a 636 (massimo) ms. » 33 % di tutti i dispositivi è migliore. Questo significa che i tempi di risposta rilevati sono migliori rispettto alla media di tutti i dispositivi testati (31 ms). | ||
Sfarfallio dello schermo / PWM (Pulse-Width Modulation)
| flickering dello schermo / PWM non rilevato |  | ||
In confronto: 52 % di tutti i dispositivi testati non utilizza PWM per ridurre la luminosita' del display. Se è rilevato PWM, una media di 7757 (minimo: 5 - massimo: 343500) Hz è stata rilevata. | |||
Grazie alla luminosità accettabile di oltre 300 nit e alla sua superficie opaca, il contenuto dello schermo del portatile è ancora facile da vedere in ambienti ombreggiati.

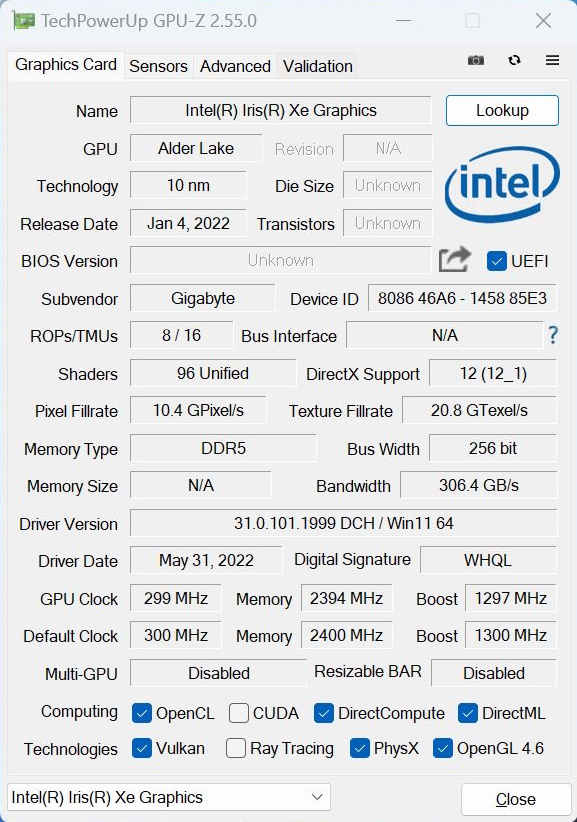
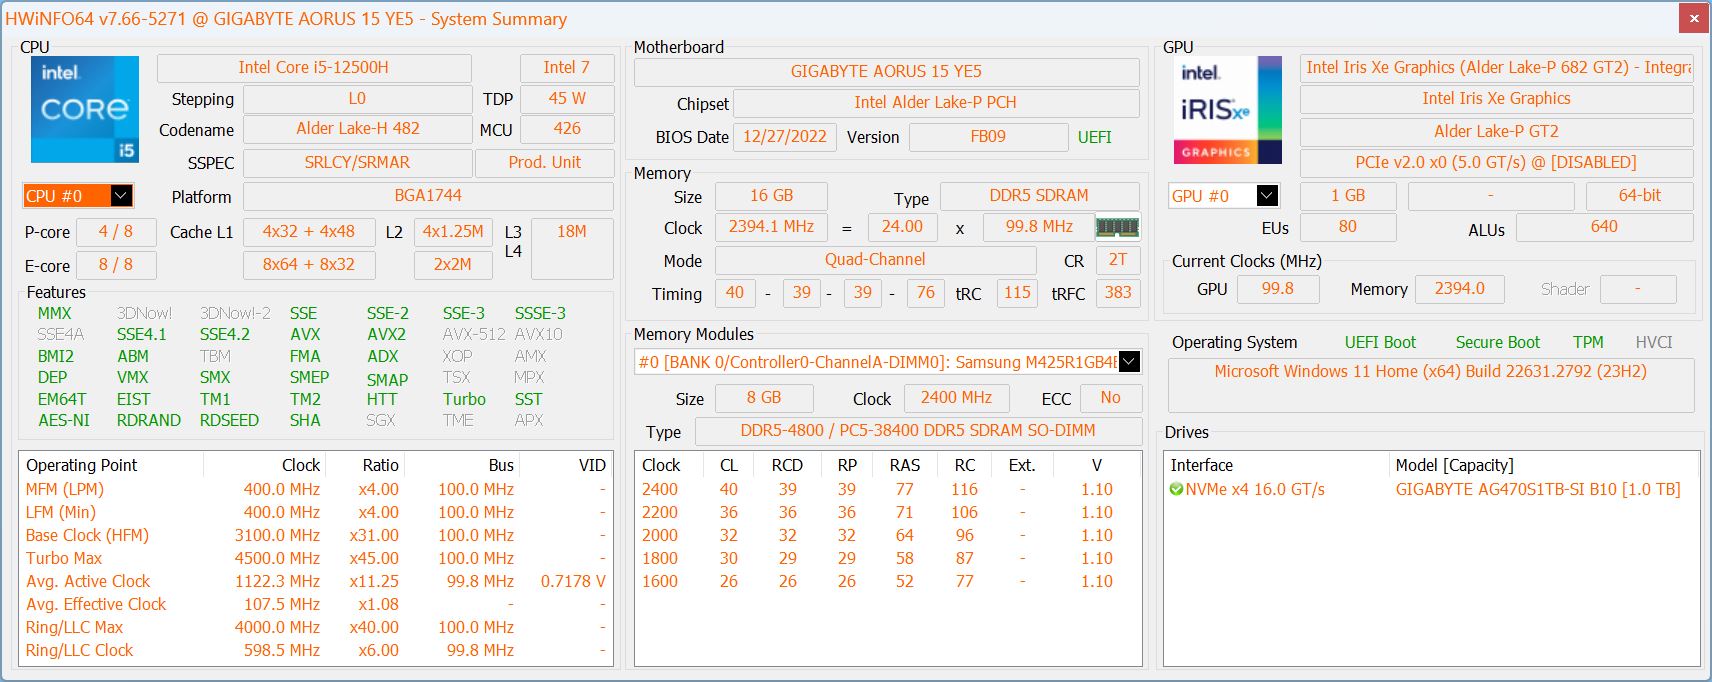
Prestazioni - La scorsa generazione è ancora all'altezza
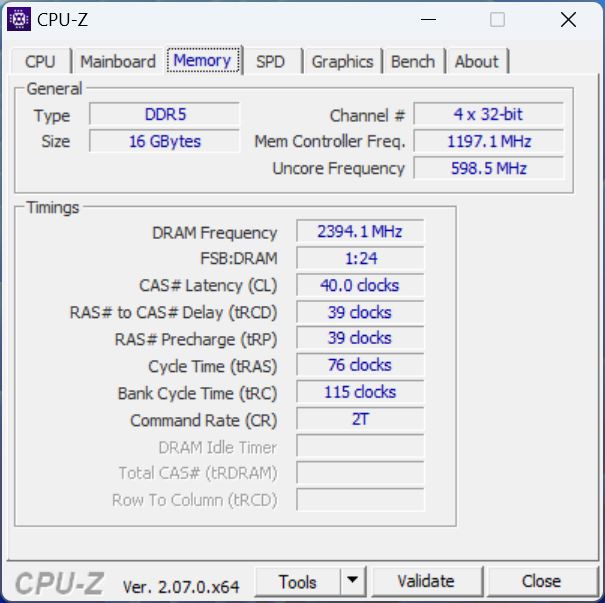
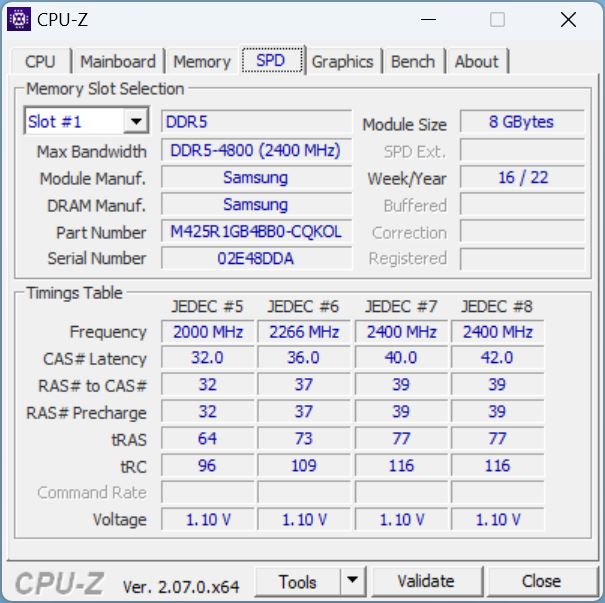
La CPU e la GPU di ultima generazione alimentano il sistema. Il vecchio Core i5-12500H ha accesso a 16 GB di moderna RAM DDR5 4800 e a un SSD NVMe da 1 TB di Gigabyte. Insieme alla sua RTX 3080 Tiaorus 15 YE5 può essere sicuramente classificato come un gamer di fascia alta, nonostante la CPU di ultima generazione e di fascia media.
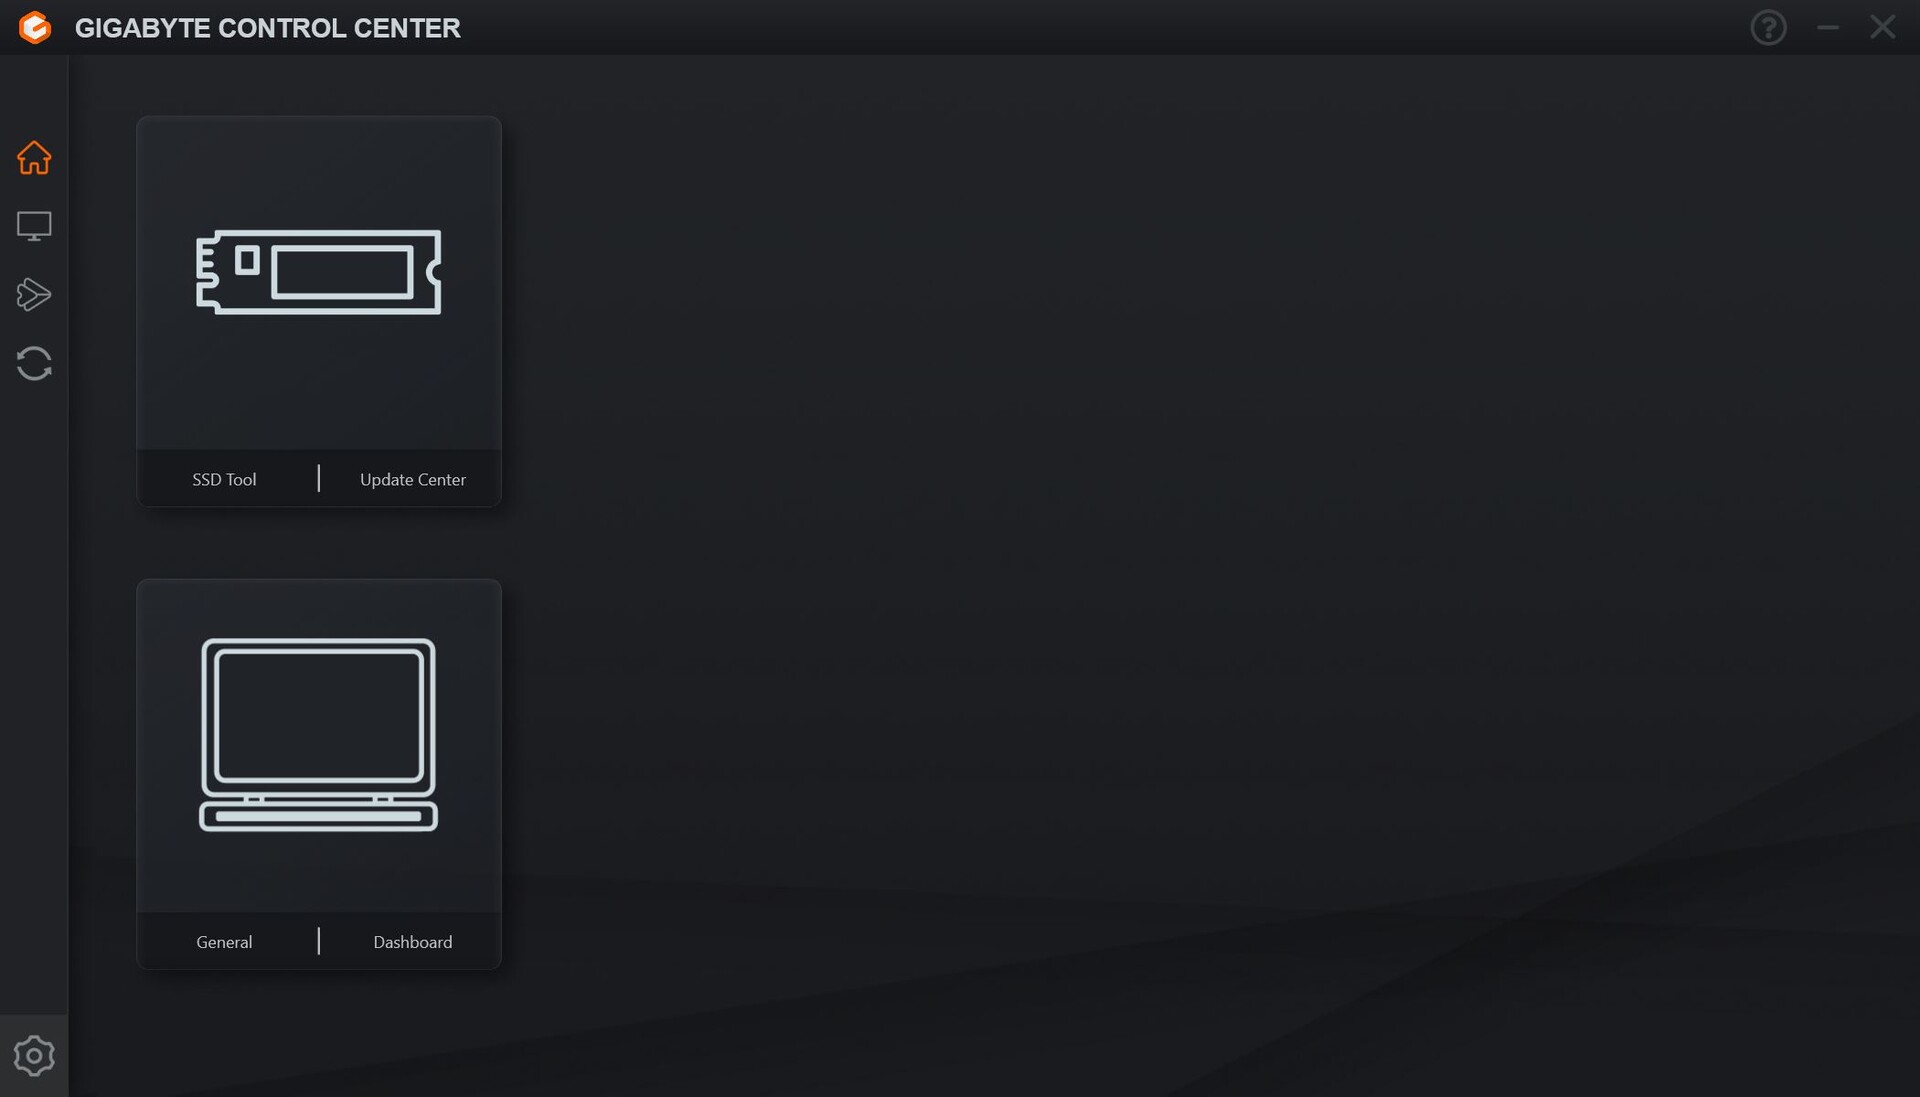
Condizioni di test
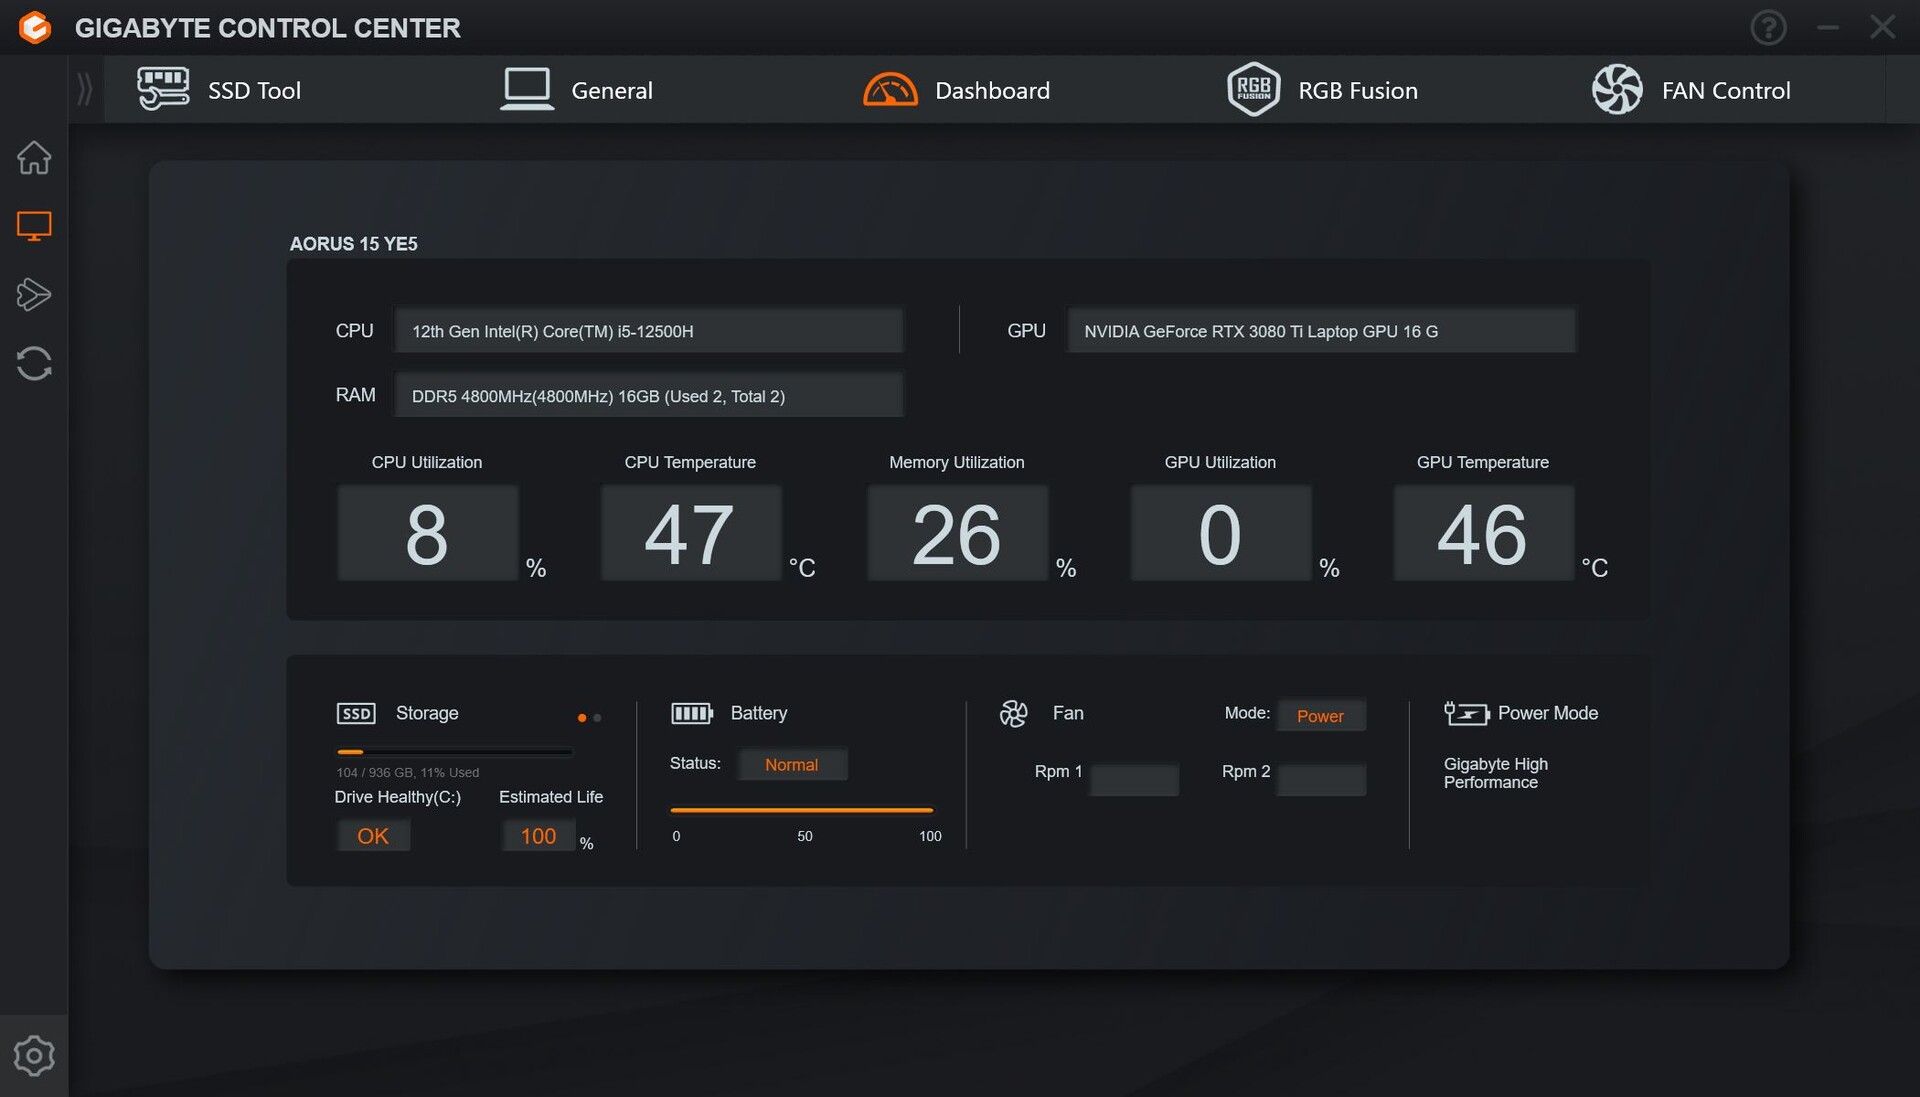
Ex funziona, il portatile non è stato preinstallato con un Control Center - dovrebbe o può essere scaricato dal sito web di supporto Gigabyte https://www.gigabyte.com/de/Laptop/AORUS-15--Intel-12th-Gen/support#support-dl-utility se necessario.
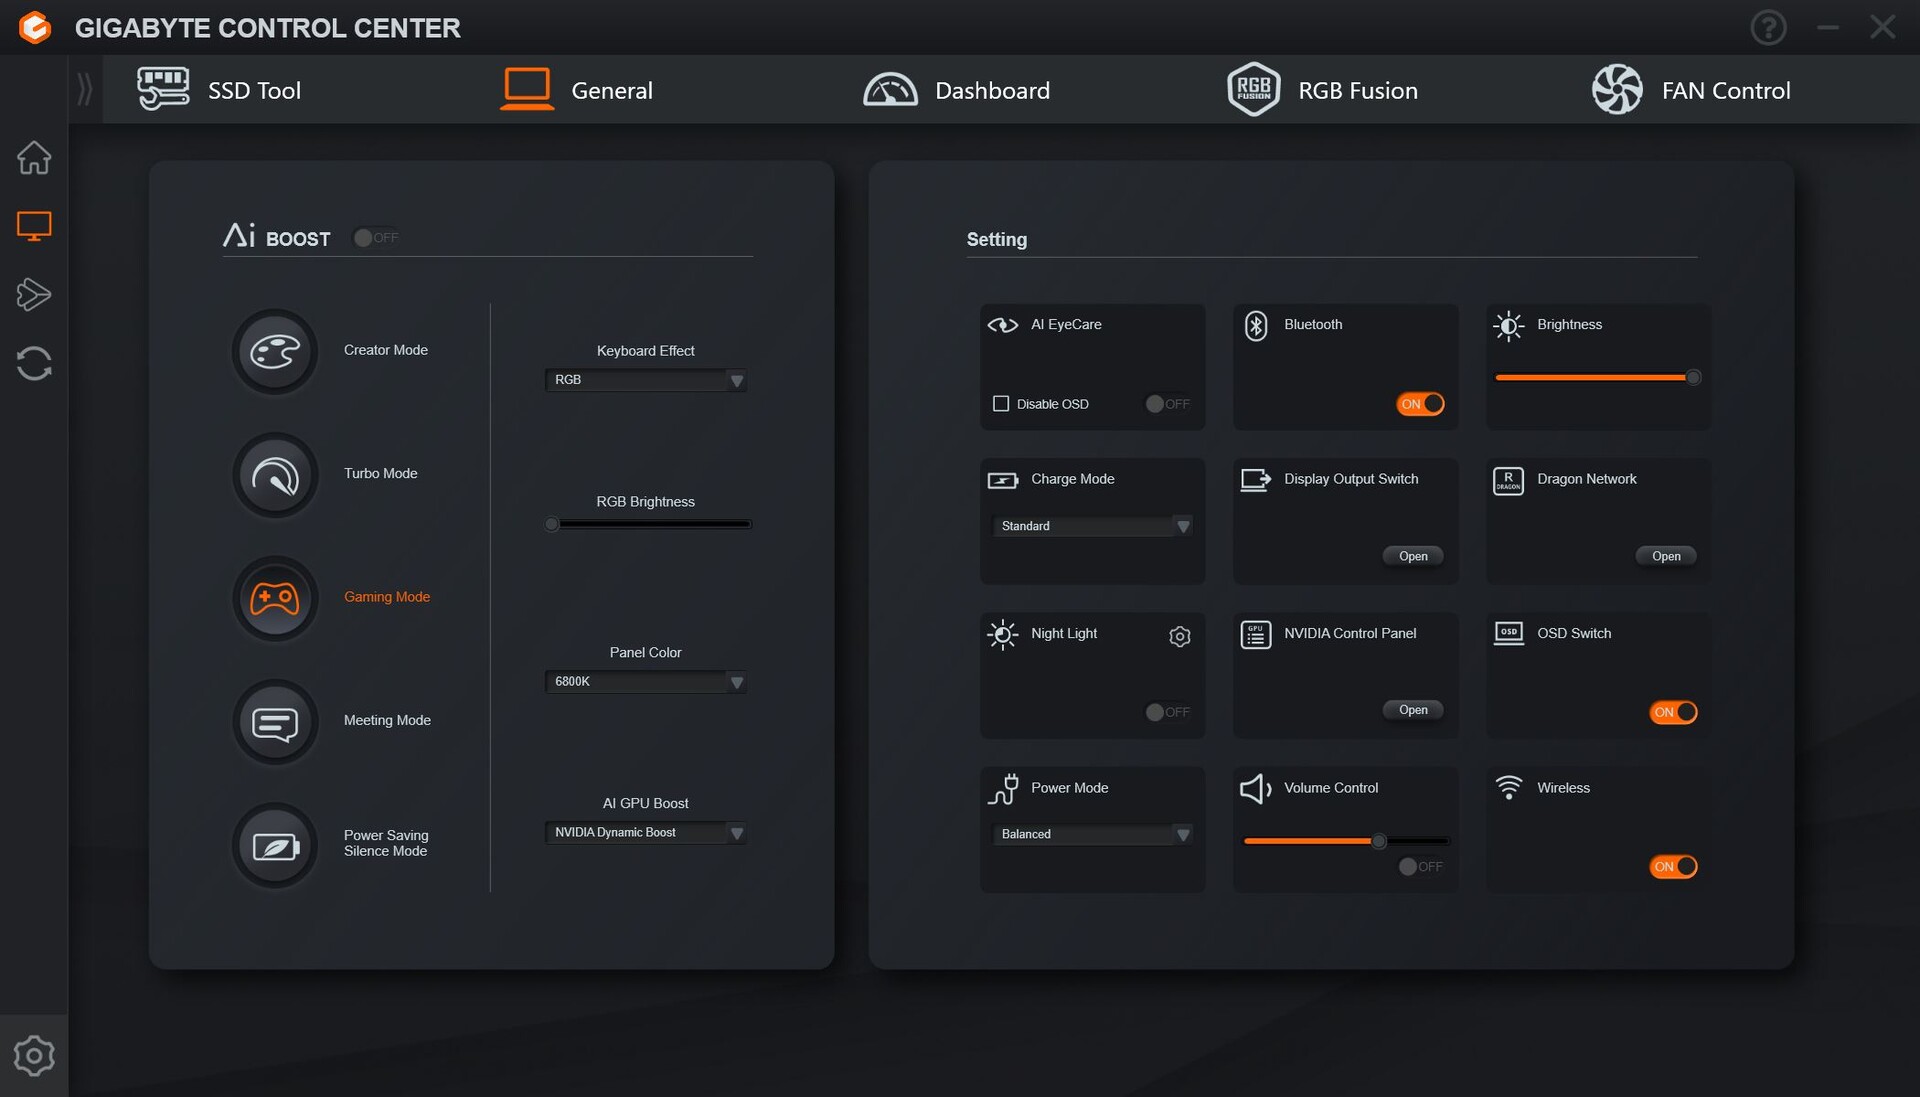
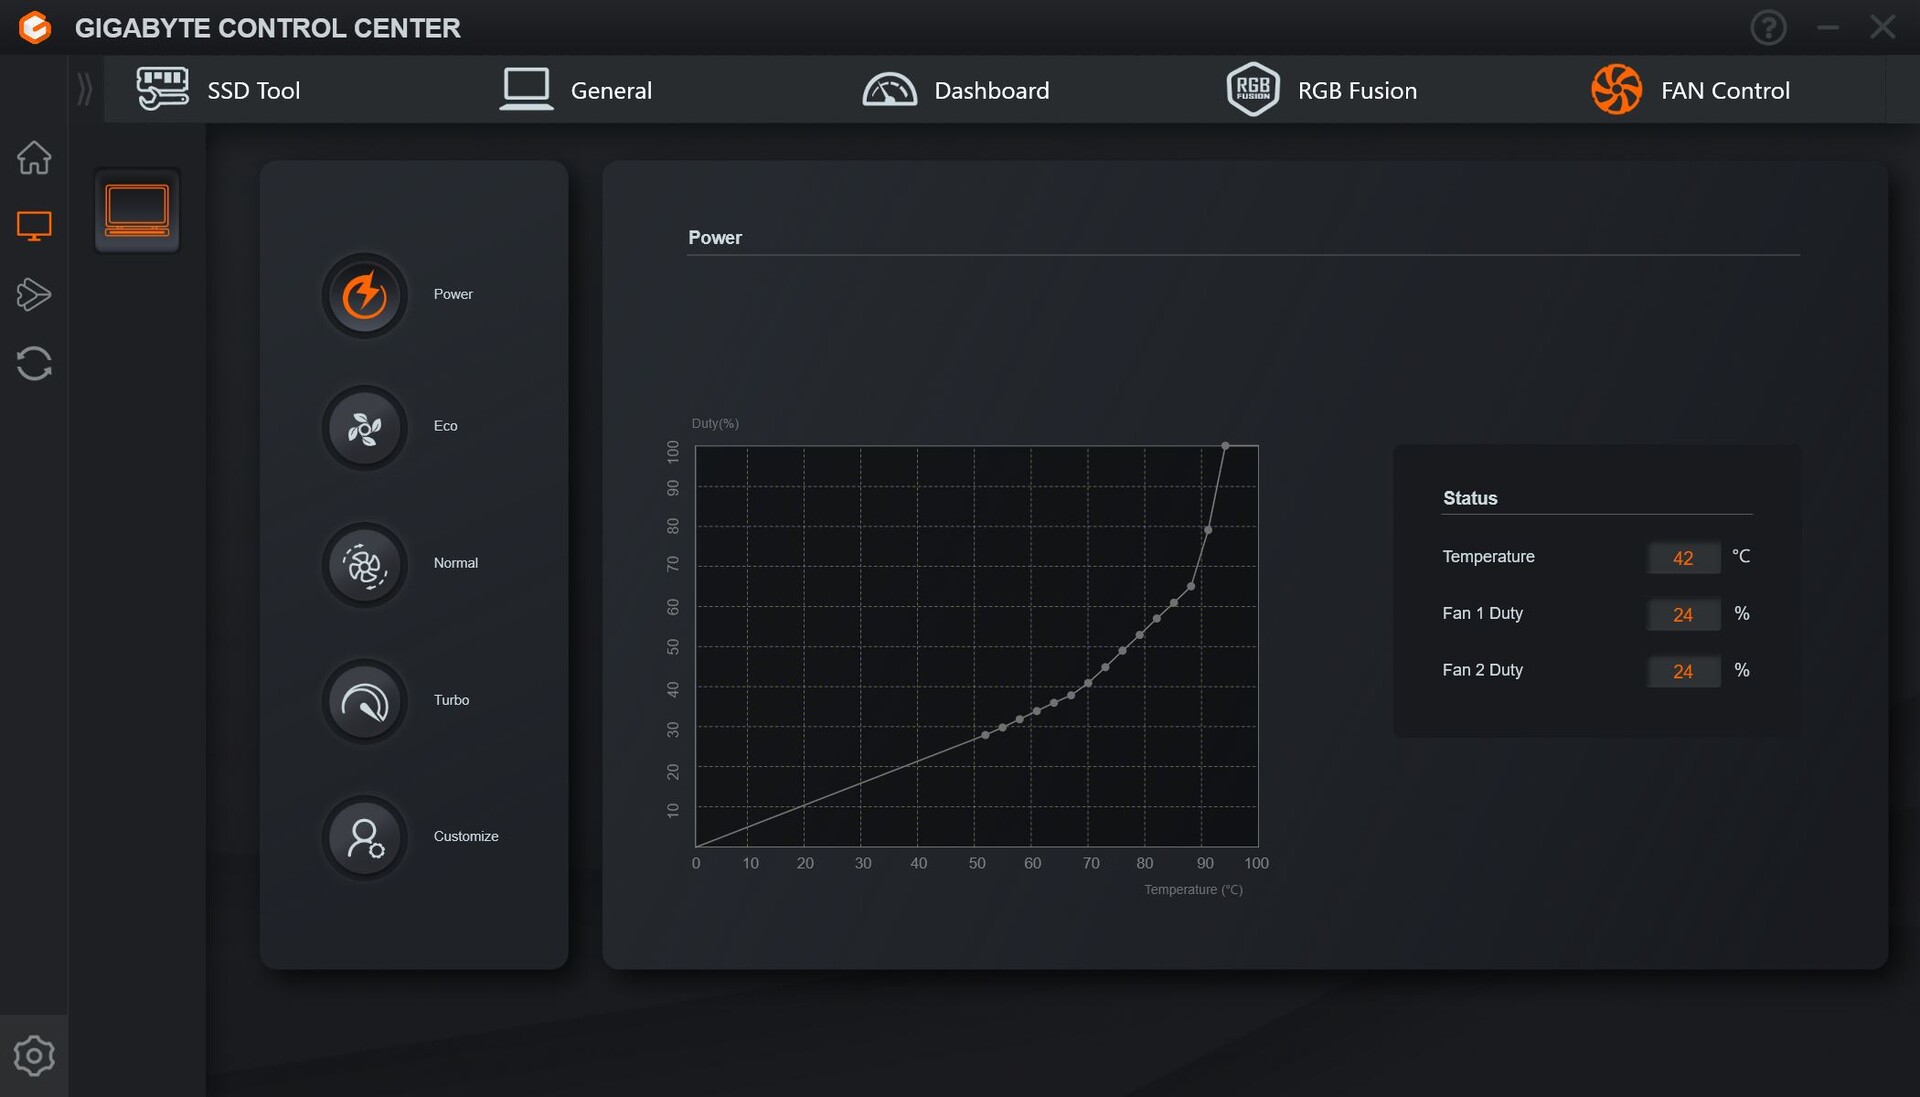
Il Control Center di Gigabyte contiene molte impostazioni importanti che controllano le prestazioni, la retroilluminazione della tastiera e l'SSD. Il menu potrebbe essere strutturato un po' meglio, in quanto la schermata iniziale non sembra mostrare alcuna informazione utile - si suppone che prima si debba selezionare il portatile stesso o l'SSD per avere maggiori informazioni. Tuttavia, è possibile fare la stessa cosa nei menu pertinenti, motivo per cui la schermata iniziale in particolare sembra insensata. Ci mancava anche l'opzione per cambiare GPU.
Per il resto, ci sono modalità di prestazione e curve della ventola, una modalità di prestazione regolabile separatamente e varie altre opzioni. Abbiamo usato la modalità gaming per i nostri benchmark. Quando si utilizza la modalità turbo, ancora più potente, le ventole funzionano sempre alla massima velocità.
Una parola sulla modalità standby: Con Aorus (incluso il modello Aorus 15G), sembra che sia comune che il portatile passi in standby non appena si chiude leggermente il coperchio del portatile. Questo è estremamente fastidioso, ad esempio, se si utilizza un monitor esterno e si desidera piegare leggermente in avanti il coperchio del portatile. Tuttavia, il sistema si spegne a circa 40-45 gradi, il che è davvero troppo presto e dà sui nervi. Un laptop dovrebbe spegnersi solo quando è effettivamente chiuso e non a metà strada.
Processore
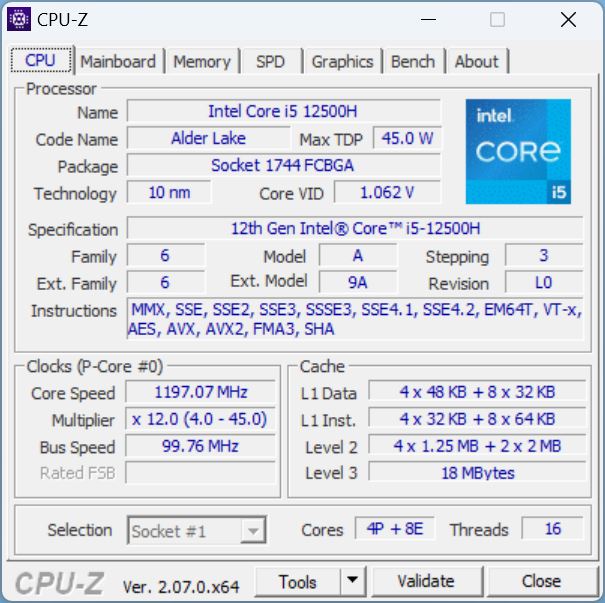
Il portatile è dotato di una CPU Alder Lake - il Core i5-12500H - con 4 core P e 8 core E. Questo aggiunge 8 core e 16 thread in totale. La vecchia CPU di fascia media superiore ha fatto risparmiare il produttore.
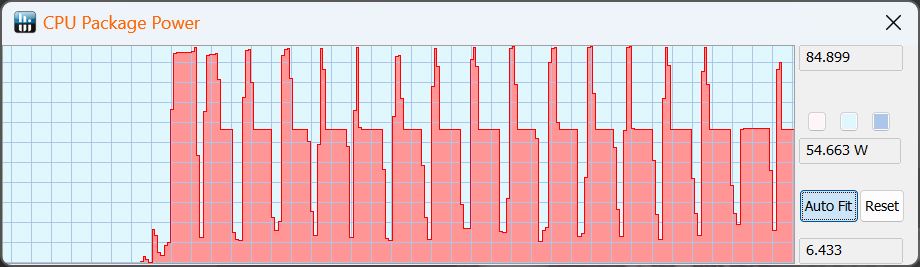
Durante il Loop Cinebench R15, le sue prestazioni sono calate un po' nei primi due test, poi sono rimaste stabili.
Durante tutti i test della CPU, è emerso chiaramente che la Gen 13 offre un vantaggio significativo (ma non enorme) in termini di velocità rispetto alla Gen 12.
La Captiva con un i5-13500H ha ottenuto un vantaggio di circa il 13%. Gli altri concorrenti con il migliore i7-13700H variavano da un basso 8 percento in più (HP Victus) a un notevole 22% in più (Aorus 15 BSF).
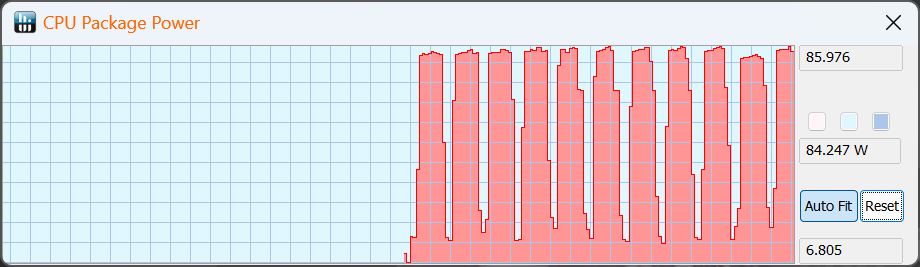
| Cinebench R15 | Punteggio multi-thread (1a esecuzione) | Consumo di energia della CPU in Watt |
|---|---|---|
| AI Boost | 2.277 | 85 |
| Turbo | 2.283 | 85 |
| Gaming | 2.283 | 85, scende a 55 |
| Creatore | 2.239 | 85 |
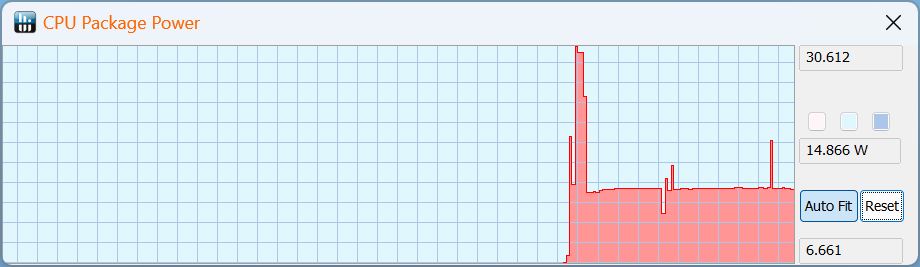
| Riunione | 836 | 30, scende rapidamente al 15 |
| Risparmio energetico | 724 | 30, scende al 15 |
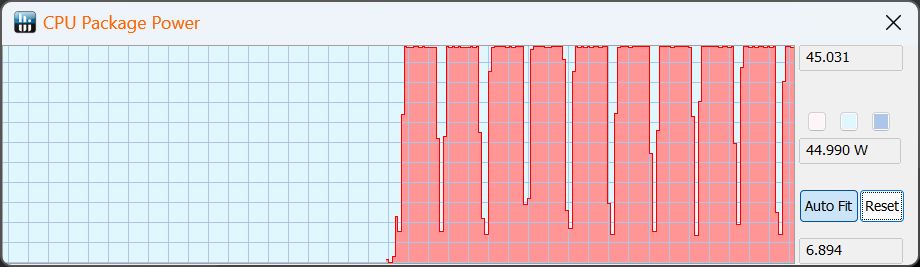
| Batteria | 1.670 | 45 |
Cinebench R15 Multi continuous test
Cinebench R23: Multi Core | Single Core
Cinebench R20: CPU (Multi Core) | CPU (Single Core)
Cinebench R15: CPU Multi 64Bit | CPU Single 64Bit
Blender: v2.79 BMW27 CPU
7-Zip 18.03: 7z b 4 | 7z b 4 -mmt1
Geekbench 5.5: Multi-Core | Single-Core
HWBOT x265 Benchmark v2.2: 4k Preset
LibreOffice : 20 Documents To PDF
R Benchmark 2.5: Overall mean
| CPU Performance rating | |
| Media della classe Gaming | |
| HP Omen 16-wf000 -1! | |
| Aorus 15 BSF | |
| Dell XPS 15 9530 RTX 4070 | |
| Captiva Advanced Gaming I74-121 | |
| HP Victus 16-r0077ng | |
| Aorus 15 YE5-54DEB34SH | |
| Media Intel Core i5-12500H | |
| Cinebench R23 / Multi Core | |
| Media della classe Gaming (10488 - 42661, n=107, ultimi 2 anni) | |
| HP Omen 16-wf000 | |
| Aorus 15 BSF | |
| Captiva Advanced Gaming I74-121 | |
| Dell XPS 15 9530 RTX 4070 | |
| HP Victus 16-r0077ng | |
| Aorus 15 YE5-54DEB34SH | |
| Media Intel Core i5-12500H (11330 - 14686, n=9) | |
| Cinebench R23 / Single Core | |
| Media della classe Gaming (1166 - 2415, n=107, ultimi 2 anni) | |
| Aorus 15 BSF | |
| HP Omen 16-wf000 | |
| Dell XPS 15 9530 RTX 4070 | |
| Captiva Advanced Gaming I74-121 | |
| Aorus 15 YE5-54DEB34SH | |
| HP Victus 16-r0077ng | |
| Media Intel Core i5-12500H (1558 - 1701, n=9) | |
| Cinebench R20 / CPU (Multi Core) | |
| Media della classe Gaming (4029 - 16433, n=106, ultimi 2 anni) | |
| HP Omen 16-wf000 | |
| Aorus 15 BSF | |
| Captiva Advanced Gaming I74-121 | |
| Dell XPS 15 9530 RTX 4070 | |
| HP Victus 16-r0077ng | |
| Media Intel Core i5-12500H (4687 - 5640, n=9) | |
| Aorus 15 YE5-54DEB34SH | |
| Cinebench R20 / CPU (Single Core) | |
| Media della classe Gaming (442 - 913, n=106, ultimi 2 anni) | |
| Aorus 15 BSF | |
| HP Omen 16-wf000 | |
| Dell XPS 15 9530 RTX 4070 | |
| Captiva Advanced Gaming I74-121 | |
| Aorus 15 YE5-54DEB34SH | |
| HP Victus 16-r0077ng | |
| Media Intel Core i5-12500H (602 - 656, n=9) | |
| Cinebench R15 / CPU Multi 64Bit | |
| Media della classe Gaming (1578 - 6330, n=105, ultimi 2 anni) | |
| HP Omen 16-wf000 | |
| Aorus 15 BSF | |
| Dell XPS 15 9530 RTX 4070 | |
| Captiva Advanced Gaming I74-121 | |
| HP Victus 16-r0077ng | |
| Aorus 15 YE5-54DEB34SH | |
| Media Intel Core i5-12500H (1970 - 2283, n=10) | |
| Cinebench R15 / CPU Single 64Bit | |
| Media della classe Gaming (188.8 - 350, n=106, ultimi 2 anni) | |
| Aorus 15 BSF | |
| Dell XPS 15 9530 RTX 4070 | |
| HP Omen 16-wf000 | |
| Captiva Advanced Gaming I74-121 | |
| Aorus 15 YE5-54DEB34SH | |
| HP Victus 16-r0077ng | |
| Media Intel Core i5-12500H (220 - 250, n=9) | |
| Blender / v2.79 BMW27 CPU | |
| Aorus 15 YE5-54DEB34SH | |
| Media Intel Core i5-12500H (223 - 288, n=9) | |
| Aorus 15 BSF | |
| Dell XPS 15 9530 RTX 4070 | |
| HP Victus 16-r0077ng | |
| Captiva Advanced Gaming I74-121 | |
| Media della classe Gaming (79 - 330, n=104, ultimi 2 anni) | |
| 7-Zip 18.03 / 7z b 4 | |
| Media della classe Gaming (33491 - 148086, n=105, ultimi 2 anni) | |
| HP Omen 16-wf000 | |
| HP Victus 16-r0077ng | |
| Aorus 15 BSF | |
| Dell XPS 15 9530 RTX 4070 | |
| Captiva Advanced Gaming I74-121 | |
| Aorus 15 YE5-54DEB34SH | |
| Media Intel Core i5-12500H (44105 - 54380, n=9) | |
| 7-Zip 18.03 / 7z b 4 -mmt1 | |
| Media della classe Gaming (4199 - 7436, n=105, ultimi 2 anni) | |
| Aorus 15 BSF | |
| Dell XPS 15 9530 RTX 4070 | |
| HP Omen 16-wf000 | |
| Captiva Advanced Gaming I74-121 | |
| HP Victus 16-r0077ng | |
| Aorus 15 YE5-54DEB34SH | |
| Media Intel Core i5-12500H (5151 - 5563, n=9) | |
| Geekbench 5.5 / Multi-Core | |
| Media della classe Gaming (6460 - 28263, n=105, ultimi 2 anni) | |
| HP Omen 16-wf000 | |
| Aorus 15 BSF | |
| Dell XPS 15 9530 RTX 4070 | |
| HP Victus 16-r0077ng | |
| Aorus 15 YE5-54DEB34SH | |
| Captiva Advanced Gaming I74-121 | |
| Media Intel Core i5-12500H (7962 - 10828, n=9) | |
| Geekbench 5.5 / Single-Core | |
| Media della classe Gaming (986 - 2474, n=105, ultimi 2 anni) | |
| Dell XPS 15 9530 RTX 4070 | |
| HP Omen 16-wf000 | |
| Aorus 15 BSF | |
| Captiva Advanced Gaming I74-121 | |
| HP Victus 16-r0077ng | |
| Aorus 15 YE5-54DEB34SH | |
| Media Intel Core i5-12500H (1471 - 1693, n=9) | |
| HWBOT x265 Benchmark v2.2 / 4k Preset | |
| Media della classe Gaming (11.5 - 44.4, n=105, ultimi 2 anni) | |
| HP Omen 16-wf000 | |
| Captiva Advanced Gaming I74-121 | |
| Dell XPS 15 9530 RTX 4070 | |
| HP Victus 16-r0077ng | |
| Aorus 15 BSF | |
| Aorus 15 YE5-54DEB34SH | |
| Media Intel Core i5-12500H (12 - 16.6, n=9) | |
| LibreOffice / 20 Documents To PDF | |
| HP Victus 16-r0077ng | |
| Aorus 15 YE5-54DEB34SH | |
| Captiva Advanced Gaming I74-121 | |
| Media della classe Gaming (33.2 - 88.8, n=105, ultimi 2 anni) | |
| Media Intel Core i5-12500H (40.1 - 58.5, n=9) | |
| Aorus 15 BSF | |
| HP Omen 16-wf000 | |
| Dell XPS 15 9530 RTX 4070 | |
| R Benchmark 2.5 / Overall mean | |
| Aorus 15 YE5-54DEB34SH | |
| Media Intel Core i5-12500H (0.4748 - 0.535, n=9) | |
| HP Victus 16-r0077ng | |
| Captiva Advanced Gaming I74-121 | |
| HP Omen 16-wf000 | |
| Aorus 15 BSF | |
| Dell XPS 15 9530 RTX 4070 | |
| Media della classe Gaming (0.3439 - 0.759, n=106, ultimi 2 anni) | |
* ... Meglio usare valori piccoli
AIDA64: FP32 Ray-Trace | FPU Julia | CPU SHA3 | CPU Queen | FPU SinJulia | FPU Mandel | CPU AES | CPU ZLib | FP64 Ray-Trace | CPU PhotoWorxx
| Performance rating | |
| Media della classe Gaming | |
| Aorus 15 BSF | |
| Captiva Advanced Gaming I74-121 | |
| Dell XPS 15 9530 RTX 4070 | |
| HP Victus 16-r0077ng | |
| Aorus 15 YE5-54DEB34SH | |
| Media Intel Core i5-12500H | |
| AIDA64 / FP32 Ray-Trace | |
| Media della classe Gaming (10227 - 85542, n=105, ultimi 2 anni) | |
| Captiva Advanced Gaming I74-121 | |
| HP Victus 16-r0077ng | |
| Dell XPS 15 9530 RTX 4070 | |
| Aorus 15 BSF | |
| Aorus 15 YE5-54DEB34SH | |
| Media Intel Core i5-12500H (6851 - 13947, n=9) | |
| AIDA64 / FPU Julia | |
| Media della classe Gaming (51376 - 238426, n=105, ultimi 2 anni) | |
| Captiva Advanced Gaming I74-121 | |
| HP Victus 16-r0077ng | |
| Aorus 15 BSF | |
| Dell XPS 15 9530 RTX 4070 | |
| Aorus 15 YE5-54DEB34SH | |
| Media Intel Core i5-12500H (29874 - 68178, n=9) | |
| AIDA64 / CPU SHA3 | |
| Media della classe Gaming (2180 - 10115, n=105, ultimi 2 anni) | |
| Captiva Advanced Gaming I74-121 | |
| HP Victus 16-r0077ng | |
| Aorus 15 BSF | |
| Dell XPS 15 9530 RTX 4070 | |
| Aorus 15 YE5-54DEB34SH | |
| Media Intel Core i5-12500H (2287 - 3337, n=9) | |
| AIDA64 / CPU Queen | |
| Media della classe Gaming (49785 - 173351, n=90, ultimi 2 anni) | |
| Aorus 15 BSF | |
| Dell XPS 15 9530 RTX 4070 | |
| HP Victus 16-r0077ng | |
| Captiva Advanced Gaming I74-121 | |
| Aorus 15 YE5-54DEB34SH | |
| Media Intel Core i5-12500H (77935 - 80703, n=9) | |
| AIDA64 / FPU SinJulia | |
| Media della classe Gaming (4424 - 33636, n=105, ultimi 2 anni) | |
| Aorus 15 BSF | |
| Dell XPS 15 9530 RTX 4070 | |
| HP Victus 16-r0077ng | |
| Captiva Advanced Gaming I74-121 | |
| Aorus 15 YE5-54DEB34SH | |
| Media Intel Core i5-12500H (6590 - 7431, n=9) | |
| AIDA64 / FPU Mandel | |
| Media della classe Gaming (25115 - 128721, n=105, ultimi 2 anni) | |
| Captiva Advanced Gaming I74-121 | |
| HP Victus 16-r0077ng | |
| Dell XPS 15 9530 RTX 4070 | |
| Aorus 15 BSF | |
| Aorus 15 YE5-54DEB34SH | |
| Media Intel Core i5-12500H (18252 - 34041, n=9) | |
| AIDA64 / CPU AES | |
| Captiva Advanced Gaming I74-121 | |
| Aorus 15 BSF | |
| Aorus 15 YE5-54DEB34SH | |
| Media della classe Gaming (39258 - 247074, n=105, ultimi 2 anni) | |
| Media Intel Core i5-12500H (50298 - 111567, n=9) | |
| HP Victus 16-r0077ng | |
| Dell XPS 15 9530 RTX 4070 | |
| AIDA64 / CPU ZLib | |
| Media della classe Gaming (574 - 2531, n=105, ultimi 2 anni) | |
| Captiva Advanced Gaming I74-121 | |
| HP Victus 16-r0077ng | |
| Aorus 15 YE5-54DEB34SH | |
| Dell XPS 15 9530 RTX 4070 | |
| Aorus 15 BSF | |
| Media Intel Core i5-12500H (746 - 924, n=9) | |
| AIDA64 / FP64 Ray-Trace | |
| Media della classe Gaming (5509 - 45446, n=105, ultimi 2 anni) | |
| Captiva Advanced Gaming I74-121 | |
| HP Victus 16-r0077ng | |
| Dell XPS 15 9530 RTX 4070 | |
| Aorus 15 BSF | |
| Aorus 15 YE5-54DEB34SH | |
| Media Intel Core i5-12500H (3848 - 7405, n=9) | |
| AIDA64 / CPU PhotoWorxx | |
| Media della classe Gaming (12271 - 89891, n=105, ultimi 2 anni) | |
| Dell XPS 15 9530 RTX 4070 | |
| HP Victus 16-r0077ng | |
| Aorus 15 BSF | |
| Aorus 15 YE5-54DEB34SH | |
| Media Intel Core i5-12500H (13686 - 43813, n=9) | |
| Captiva Advanced Gaming I74-121 | |
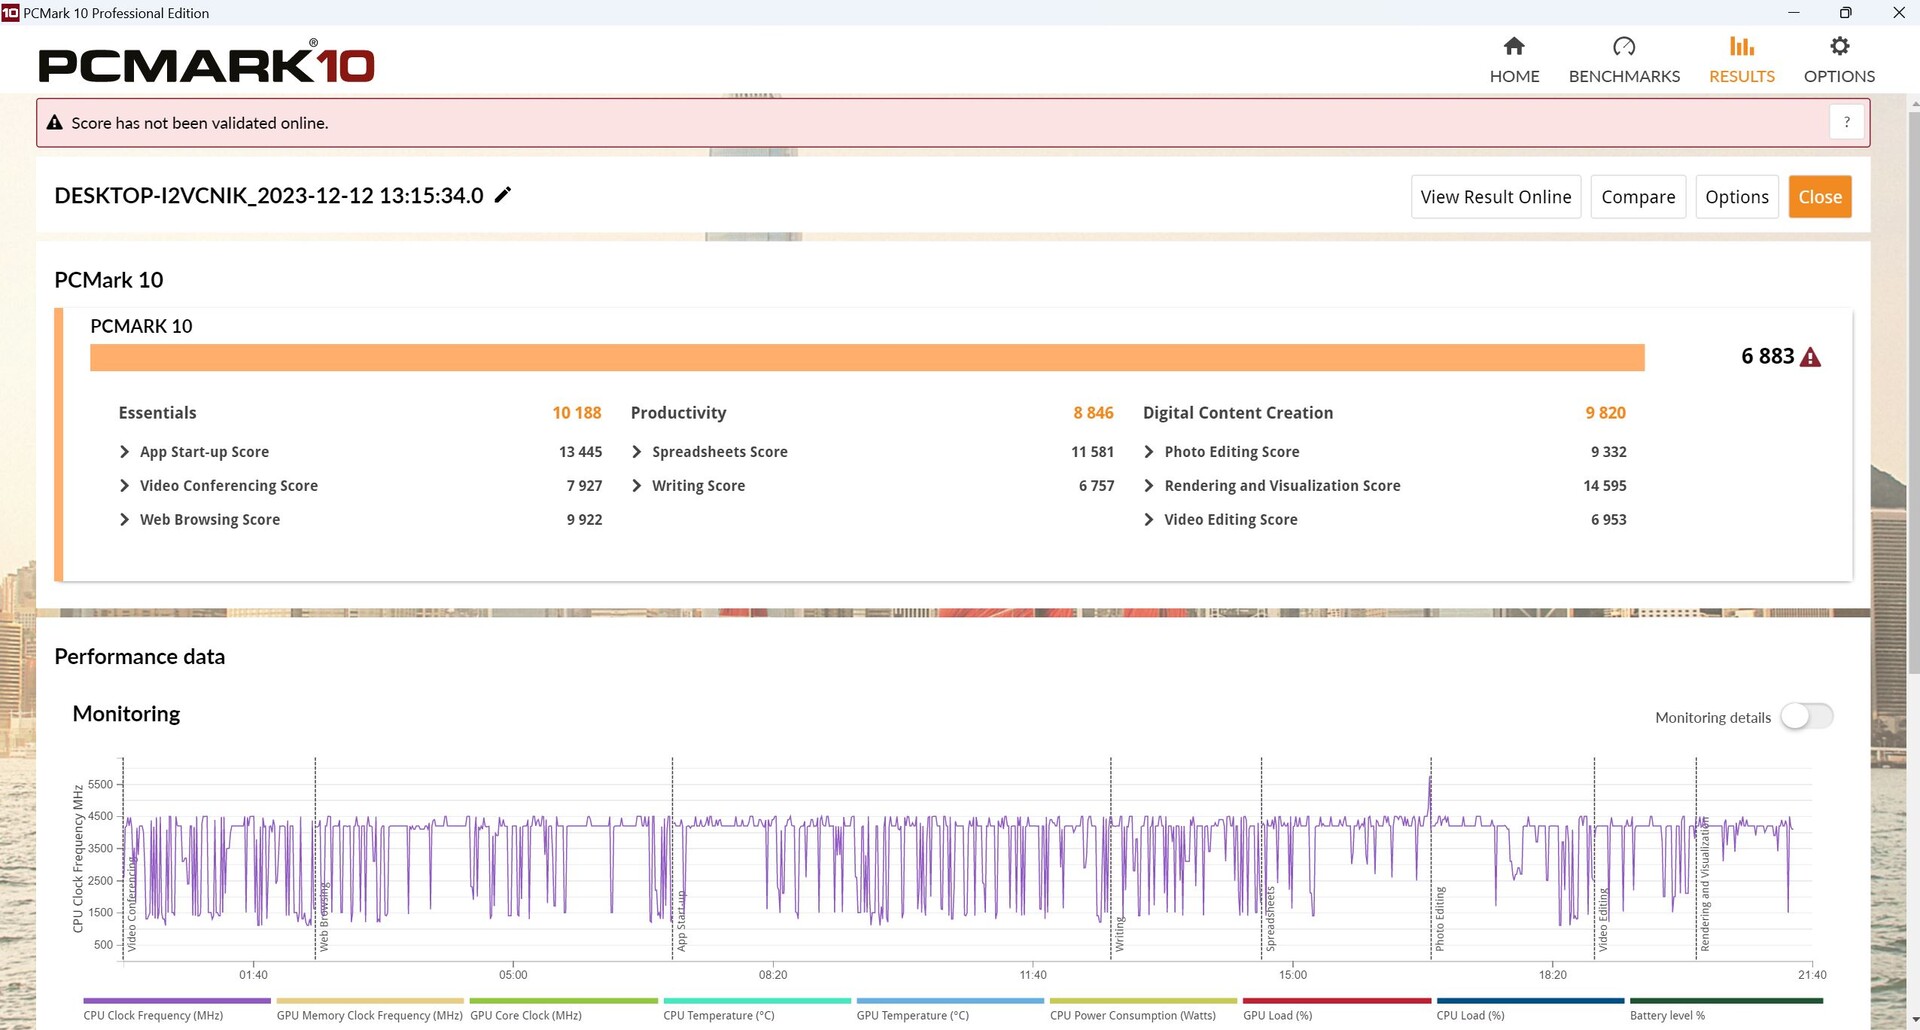
Prestazioni del sistema
Durante PCMark 10, il Captiva con la CPU successiva ha ottenuto un vantaggio di circa il 7 percento, mentre entrambi i dispositivi hanno fatto lo stesso durante CrossMark.
CrossMark: Overall | Productivity | Creativity | Responsiveness
WebXPRT 3: Overall
WebXPRT 4: Overall
Mozilla Kraken 1.1: Total
| PCMark 10 / Score | |
| Media della classe Gaming (5828 - 12414, n=93, ultimi 2 anni) | |
| HP Omen 16-wf000 | |
| Captiva Advanced Gaming I74-121 | |
| Aorus 15 BSF | |
| Dell XPS 15 9530 RTX 4070 | |
| HP Victus 16-r0077ng | |
| Aorus 15 YE5-54DEB34SH | |
| Media Intel Core i5-12500H, NVIDIA GeForce RTX 3080 Ti Laptop GPU (n=1) | |
| PCMark 10 / Essentials | |
| Captiva Advanced Gaming I74-121 | |
| Dell XPS 15 9530 RTX 4070 | |
| Aorus 15 BSF | |
| HP Victus 16-r0077ng | |
| Media della classe Gaming (8810 - 11935, n=97, ultimi 2 anni) | |
| HP Omen 16-wf000 | |
| Aorus 15 YE5-54DEB34SH | |
| Media Intel Core i5-12500H, NVIDIA GeForce RTX 3080 Ti Laptop GPU (n=1) | |
| PCMark 10 / Productivity | |
| Media della classe Gaming (6845 - 25323, n=95, ultimi 2 anni) | |
| HP Omen 16-wf000 | |
| Captiva Advanced Gaming I74-121 | |
| Aorus 15 BSF | |
| HP Victus 16-r0077ng | |
| Aorus 15 YE5-54DEB34SH | |
| Media Intel Core i5-12500H, NVIDIA GeForce RTX 3080 Ti Laptop GPU (n=1) | |
| Dell XPS 15 9530 RTX 4070 | |
| PCMark 10 / Digital Content Creation | |
| Media della classe Gaming (7602 - 19954, n=95, ultimi 2 anni) | |
| HP Omen 16-wf000 | |
| Aorus 15 BSF | |
| Dell XPS 15 9530 RTX 4070 | |
| Captiva Advanced Gaming I74-121 | |
| HP Victus 16-r0077ng | |
| Aorus 15 YE5-54DEB34SH | |
| Media Intel Core i5-12500H, NVIDIA GeForce RTX 3080 Ti Laptop GPU (n=1) | |
| CrossMark / Overall | |
| Aorus 15 BSF | |
| Media della classe Gaming (1366 - 2409, n=94, ultimi 2 anni) | |
| Dell XPS 15 9530 RTX 4070 | |
| HP Omen 16-wf000 | |
| Captiva Advanced Gaming I74-121 | |
| Aorus 15 YE5-54DEB34SH | |
| Media Intel Core i5-12500H, NVIDIA GeForce RTX 3080 Ti Laptop GPU (n=1) | |
| CrossMark / Productivity | |
| Aorus 15 BSF | |
| Media della classe Gaming (1386 - 2254, n=94, ultimi 2 anni) | |
| Dell XPS 15 9530 RTX 4070 | |
| Captiva Advanced Gaming I74-121 | |
| Aorus 15 YE5-54DEB34SH | |
| Media Intel Core i5-12500H, NVIDIA GeForce RTX 3080 Ti Laptop GPU (n=1) | |
| HP Omen 16-wf000 | |
| CrossMark / Creativity | |
| Media della classe Gaming (1343 - 2786, n=94, ultimi 2 anni) | |
| Dell XPS 15 9530 RTX 4070 | |
| Aorus 15 BSF | |
| HP Omen 16-wf000 | |
| Aorus 15 YE5-54DEB34SH | |
| Media Intel Core i5-12500H, NVIDIA GeForce RTX 3080 Ti Laptop GPU (n=1) | |
| Captiva Advanced Gaming I74-121 | |
| CrossMark / Responsiveness | |
| Aorus 15 BSF | |
| Media della classe Gaming (1226 - 2334, n=94, ultimi 2 anni) | |
| Dell XPS 15 9530 RTX 4070 | |
| Captiva Advanced Gaming I74-121 | |
| Aorus 15 YE5-54DEB34SH | |
| Media Intel Core i5-12500H, NVIDIA GeForce RTX 3080 Ti Laptop GPU (n=1) | |
| HP Omen 16-wf000 | |
| WebXPRT 3 / Overall | |
| Dell XPS 15 9530 RTX 4070 | |
| Media della classe Gaming (220 - 532, n=98, ultimi 2 anni) | |
| Aorus 15 BSF | |
| HP Omen 16-wf000 | |
| HP Victus 16-r0077ng | |
| HP Victus 16-r0077ng | |
| Captiva Advanced Gaming I74-121 | |
| Captiva Advanced Gaming I74-121 | |
| Aorus 15 YE5-54DEB34SH | |
| Media Intel Core i5-12500H, NVIDIA GeForce RTX 3080 Ti Laptop GPU (n=1) | |
| WebXPRT 4 / Overall | |
| Media della classe Gaming (165 - 354, n=98, ultimi 2 anni) | |
| Dell XPS 15 9530 RTX 4070 | |
| Aorus 15 BSF | |
| HP Omen 16-wf000 | |
| HP Victus 16-r0077ng | |
| HP Victus 16-r0077ng | |
| Aorus 15 YE5-54DEB34SH | |
| Media Intel Core i5-12500H, NVIDIA GeForce RTX 3080 Ti Laptop GPU (n=1) | |
| Captiva Advanced Gaming I74-121 | |
| Captiva Advanced Gaming I74-121 | |
| Mozilla Kraken 1.1 / Total | |
| Aorus 15 YE5-54DEB34SH | |
| Media Intel Core i5-12500H, NVIDIA GeForce RTX 3080 Ti Laptop GPU (n=1) | |
| HP Victus 16-r0077ng | |
| HP Victus 16-r0077ng | |
| Captiva Advanced Gaming I74-121 | |
| Captiva Advanced Gaming I74-121 | |
| HP Omen 16-wf000 | |
| Dell XPS 15 9530 RTX 4070 | |
| Aorus 15 BSF | |
| Media della classe Gaming (391 - 590, n=100, ultimi 2 anni) | |
* ... Meglio usare valori piccoli
| PCMark 10 Score | 6883 punti | |
Aiuto | ||
| AIDA64 / Memory Copy | |
| Media della classe Gaming (21750 - 129946, n=105, ultimi 2 anni) | |
| Dell XPS 15 9530 RTX 4070 | |
| HP Victus 16-r0077ng | |
| Aorus 15 BSF | |
| Aorus 15 YE5-54DEB34SH | |
| Media Intel Core i5-12500H (23850 - 66598, n=9) | |
| Captiva Advanced Gaming I74-121 | |
| AIDA64 / Memory Read | |
| Media della classe Gaming (22956 - 118858, n=105, ultimi 2 anni) | |
| Dell XPS 15 9530 RTX 4070 | |
| HP Victus 16-r0077ng | |
| Aorus 15 BSF | |
| Aorus 15 YE5-54DEB34SH | |
| Media Intel Core i5-12500H (24879 - 68013, n=9) | |
| Captiva Advanced Gaming I74-121 | |
| AIDA64 / Memory Write | |
| Aorus 15 BSF | |
| Media della classe Gaming (22297 - 135096, n=105, ultimi 2 anni) | |
| Dell XPS 15 9530 RTX 4070 | |
| HP Victus 16-r0077ng | |
| Aorus 15 YE5-54DEB34SH | |
| Media Intel Core i5-12500H (23543 - 58797, n=9) | |
| Captiva Advanced Gaming I74-121 | |
| AIDA64 / Memory Latency | |
| Media della classe Gaming (75.3 - 259, n=105, ultimi 2 anni) | |
| Aorus 15 YE5-54DEB34SH | |
| Media Intel Core i5-12500H (83.8 - 114.7, n=9) | |
| HP Victus 16-r0077ng | |
| Aorus 15 BSF | |
| Dell XPS 15 9530 RTX 4070 | |
| Captiva Advanced Gaming I74-121 | |
* ... Meglio usare valori piccoli
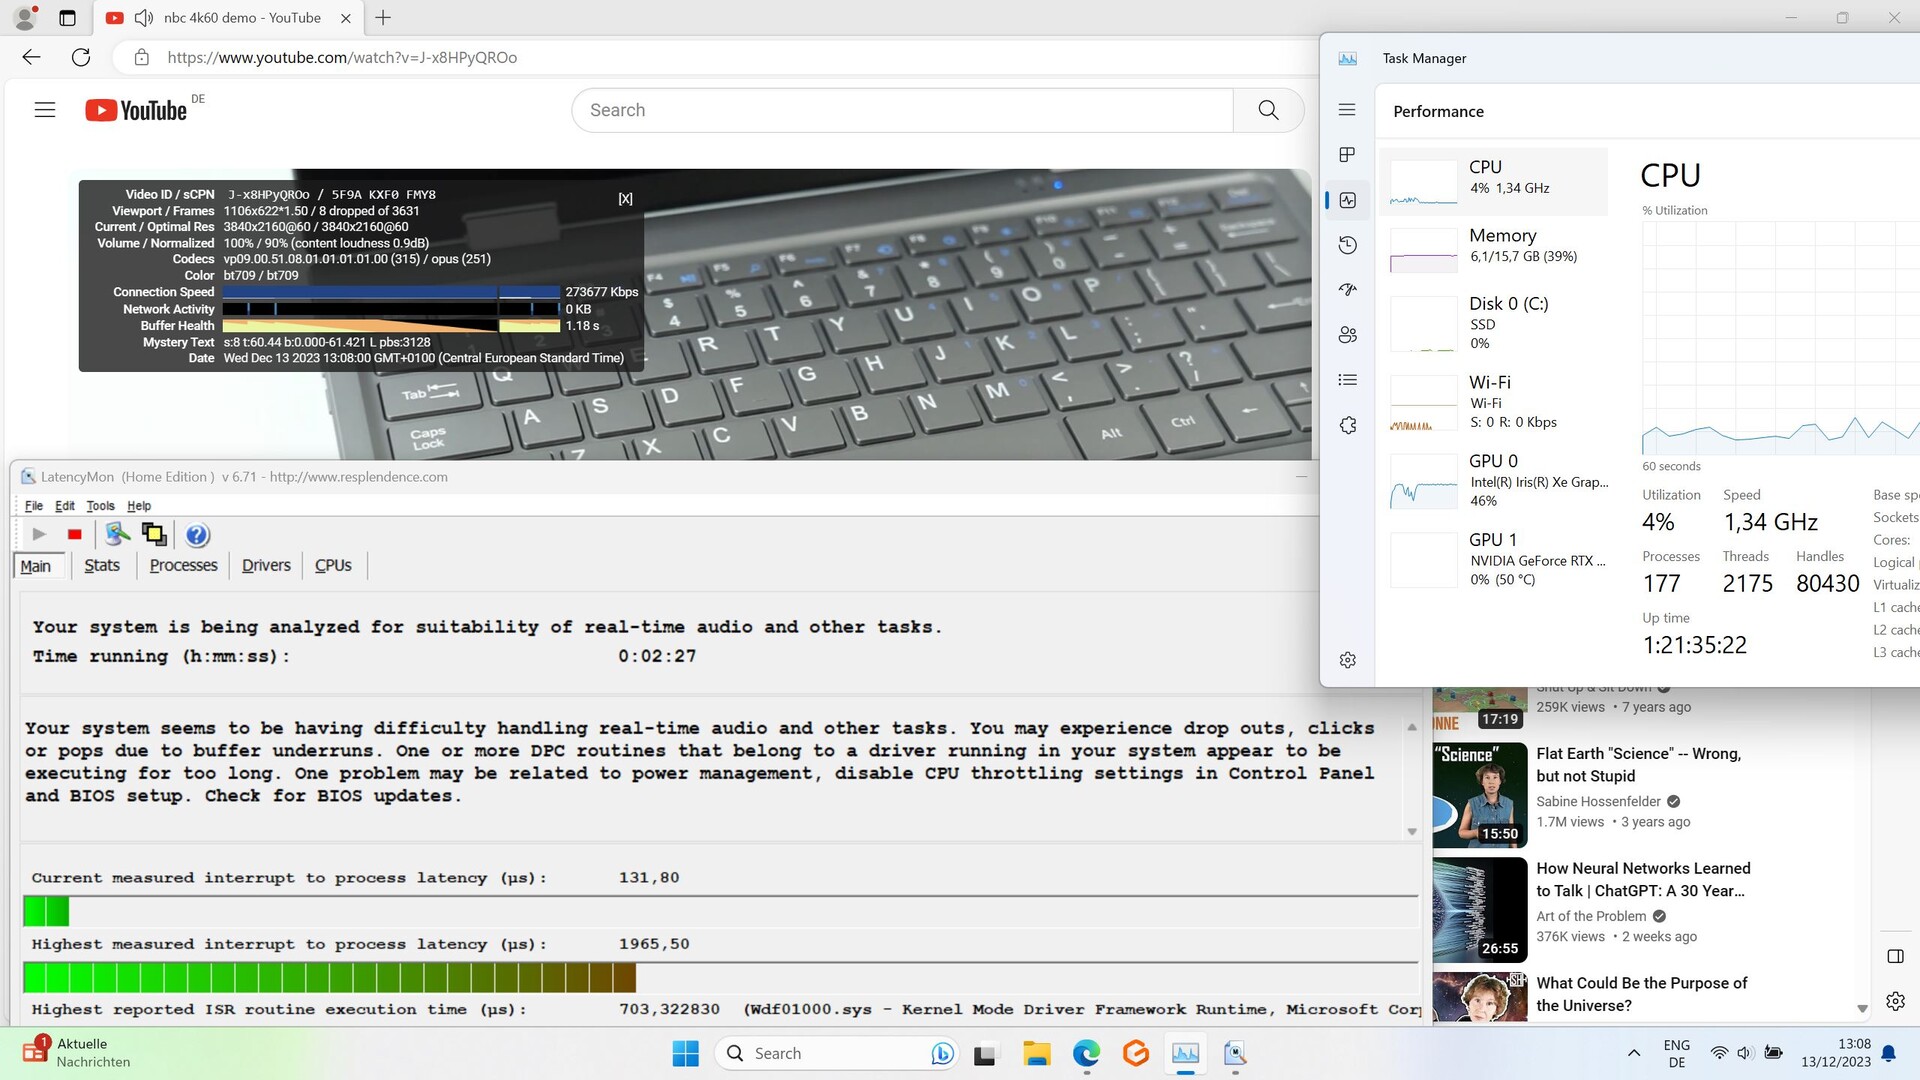
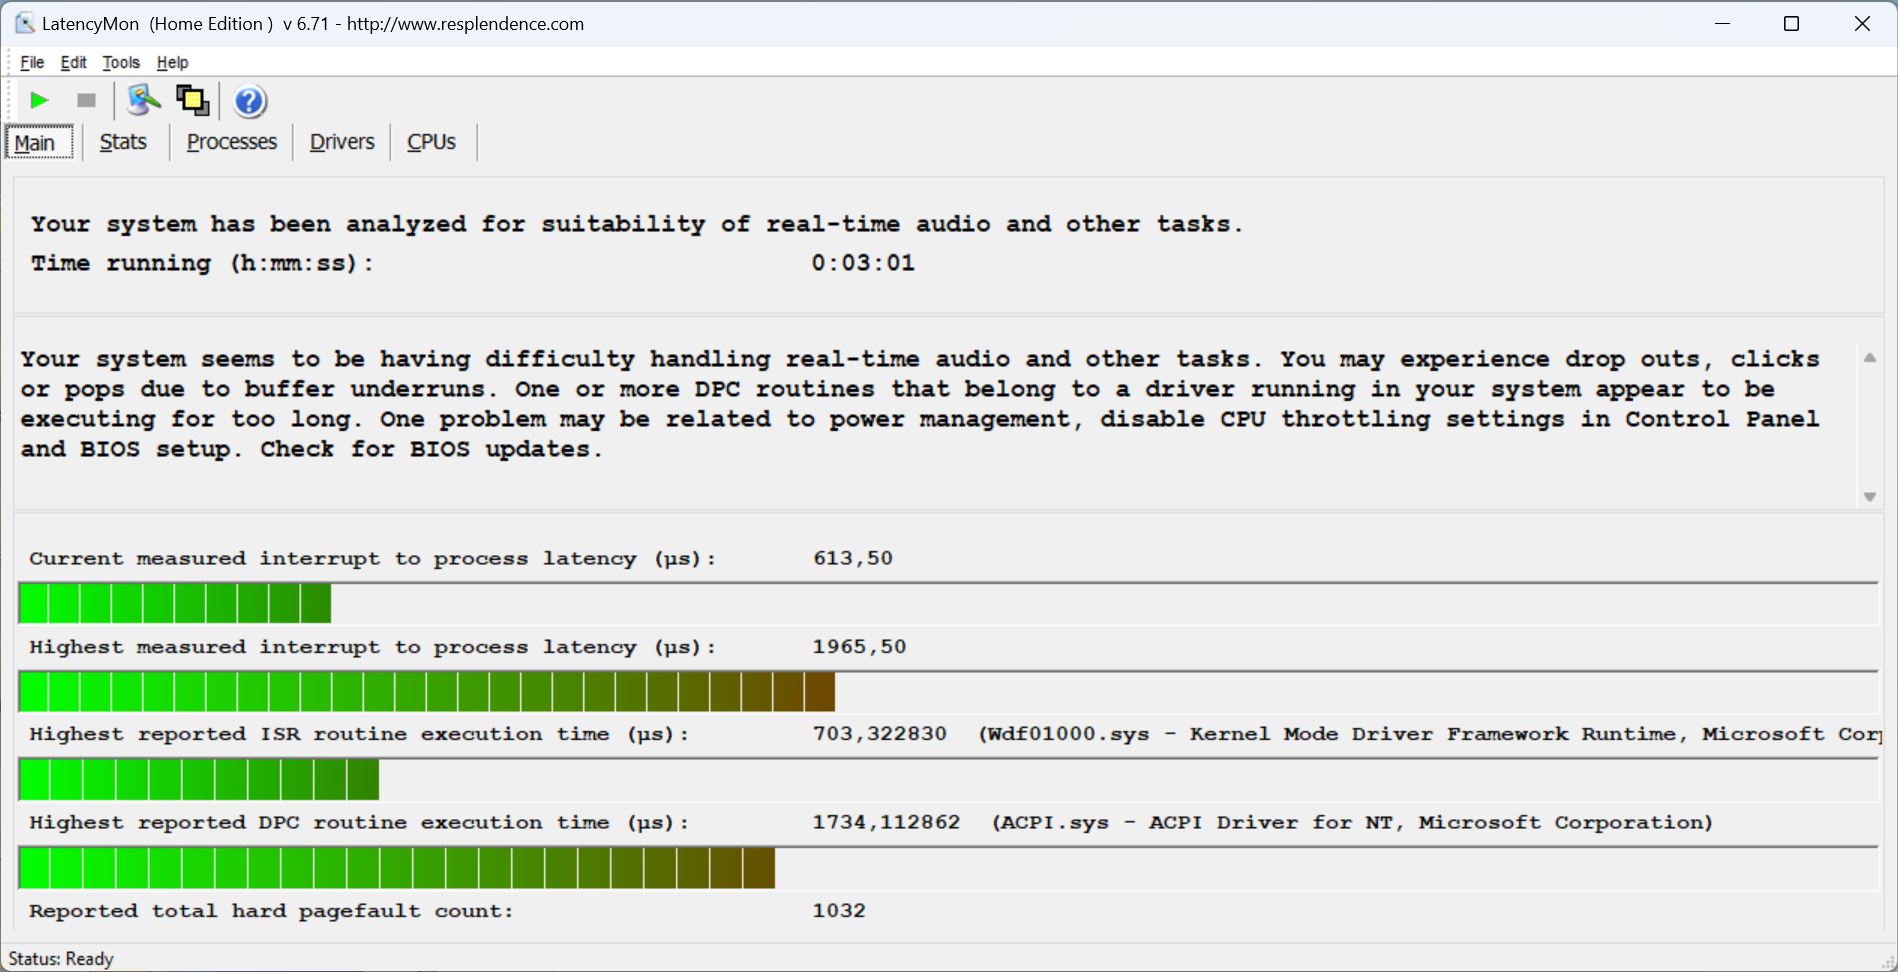
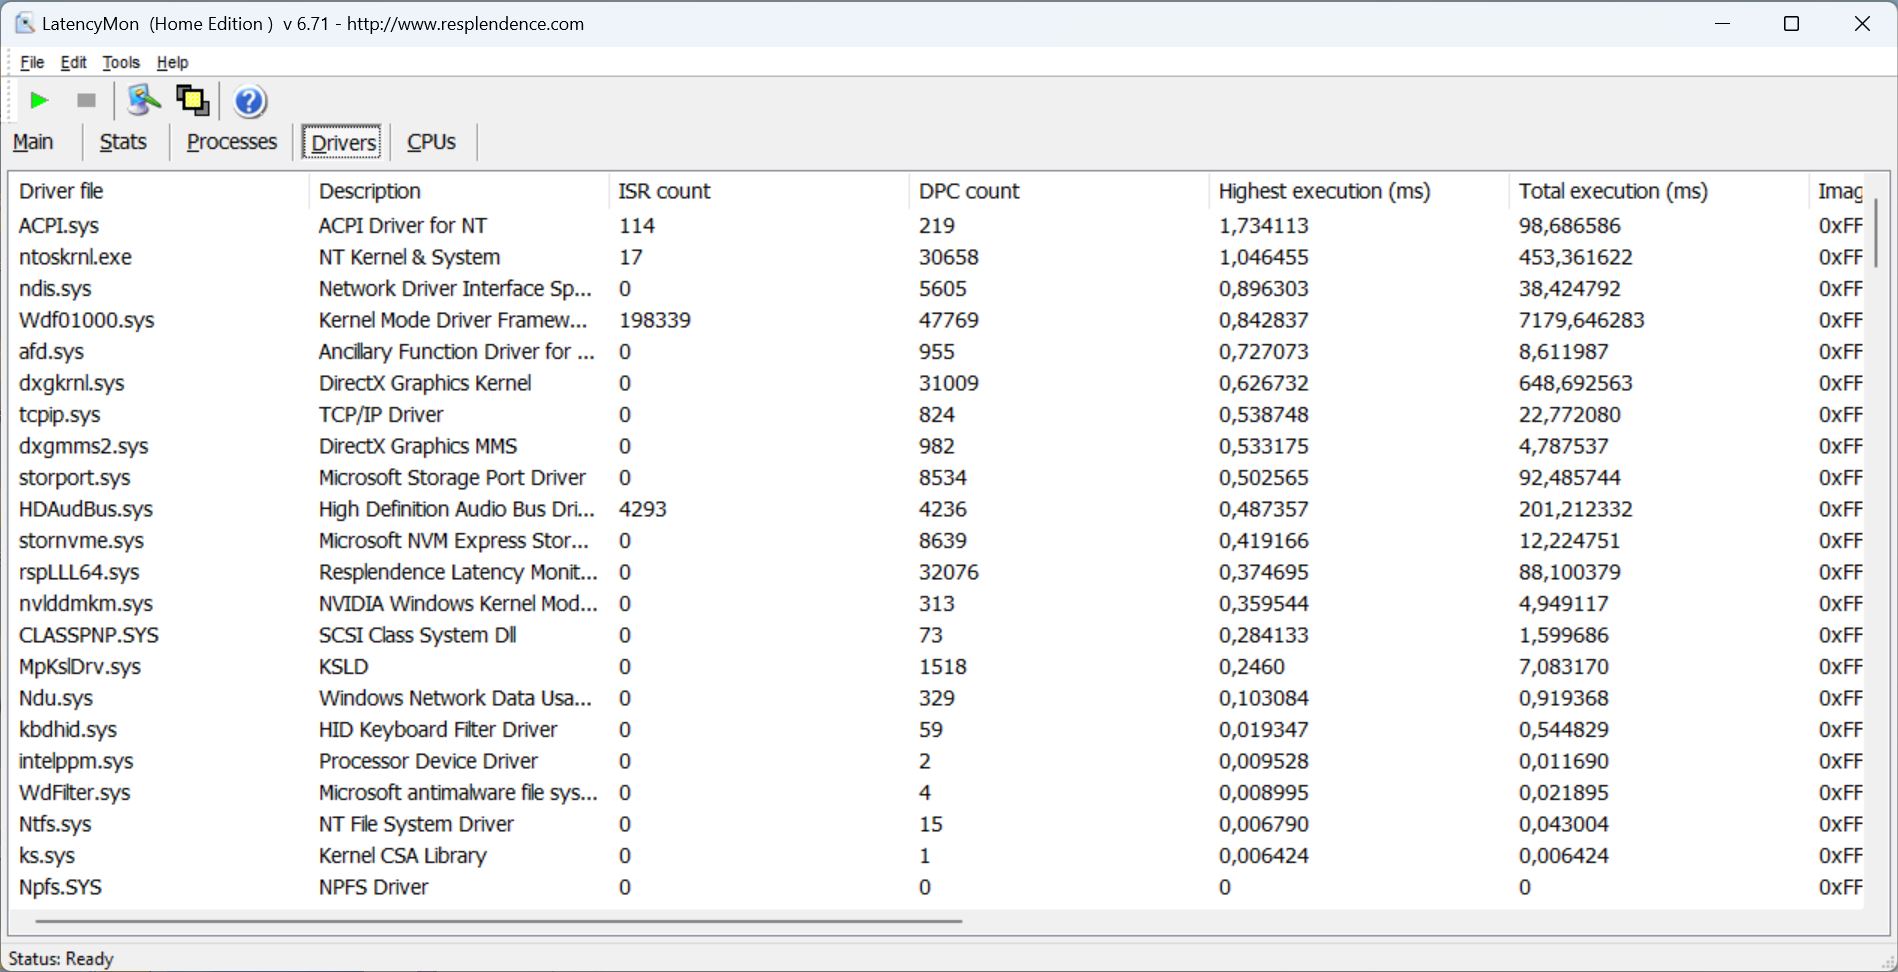
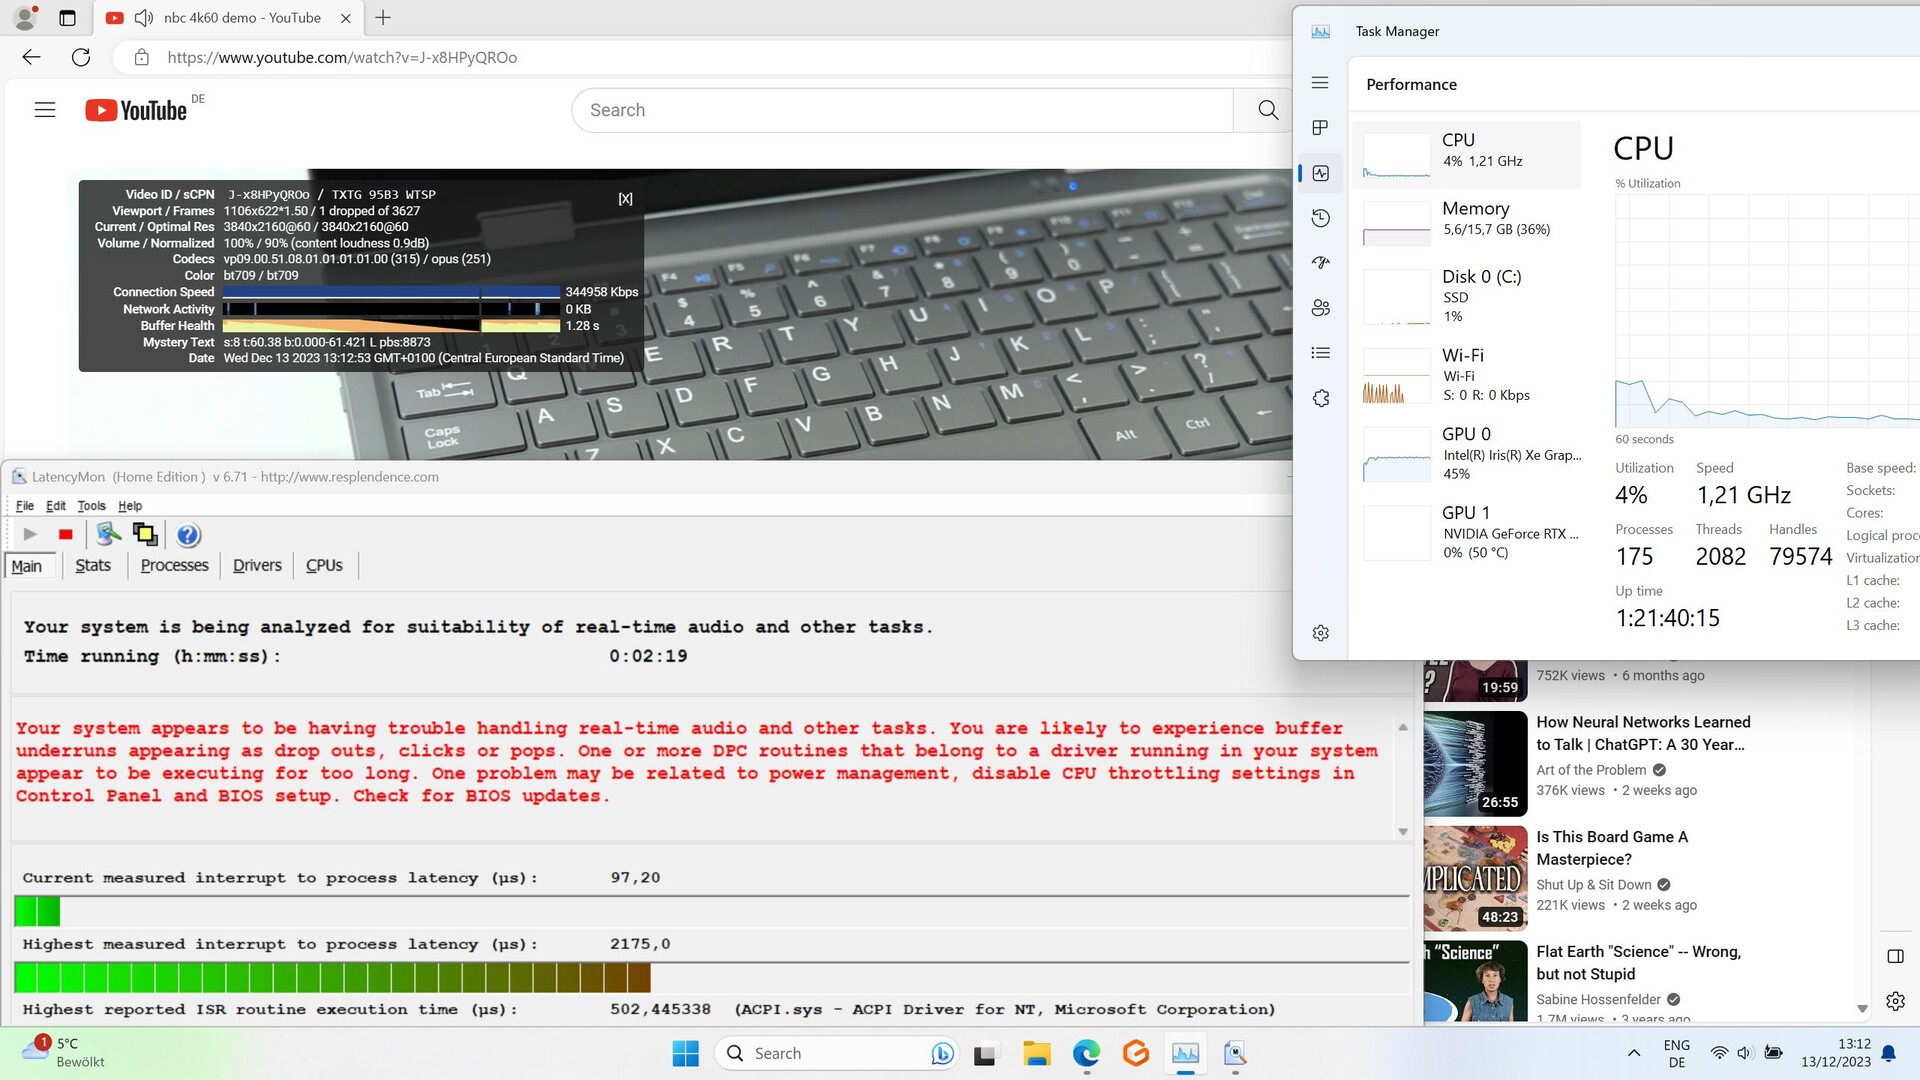
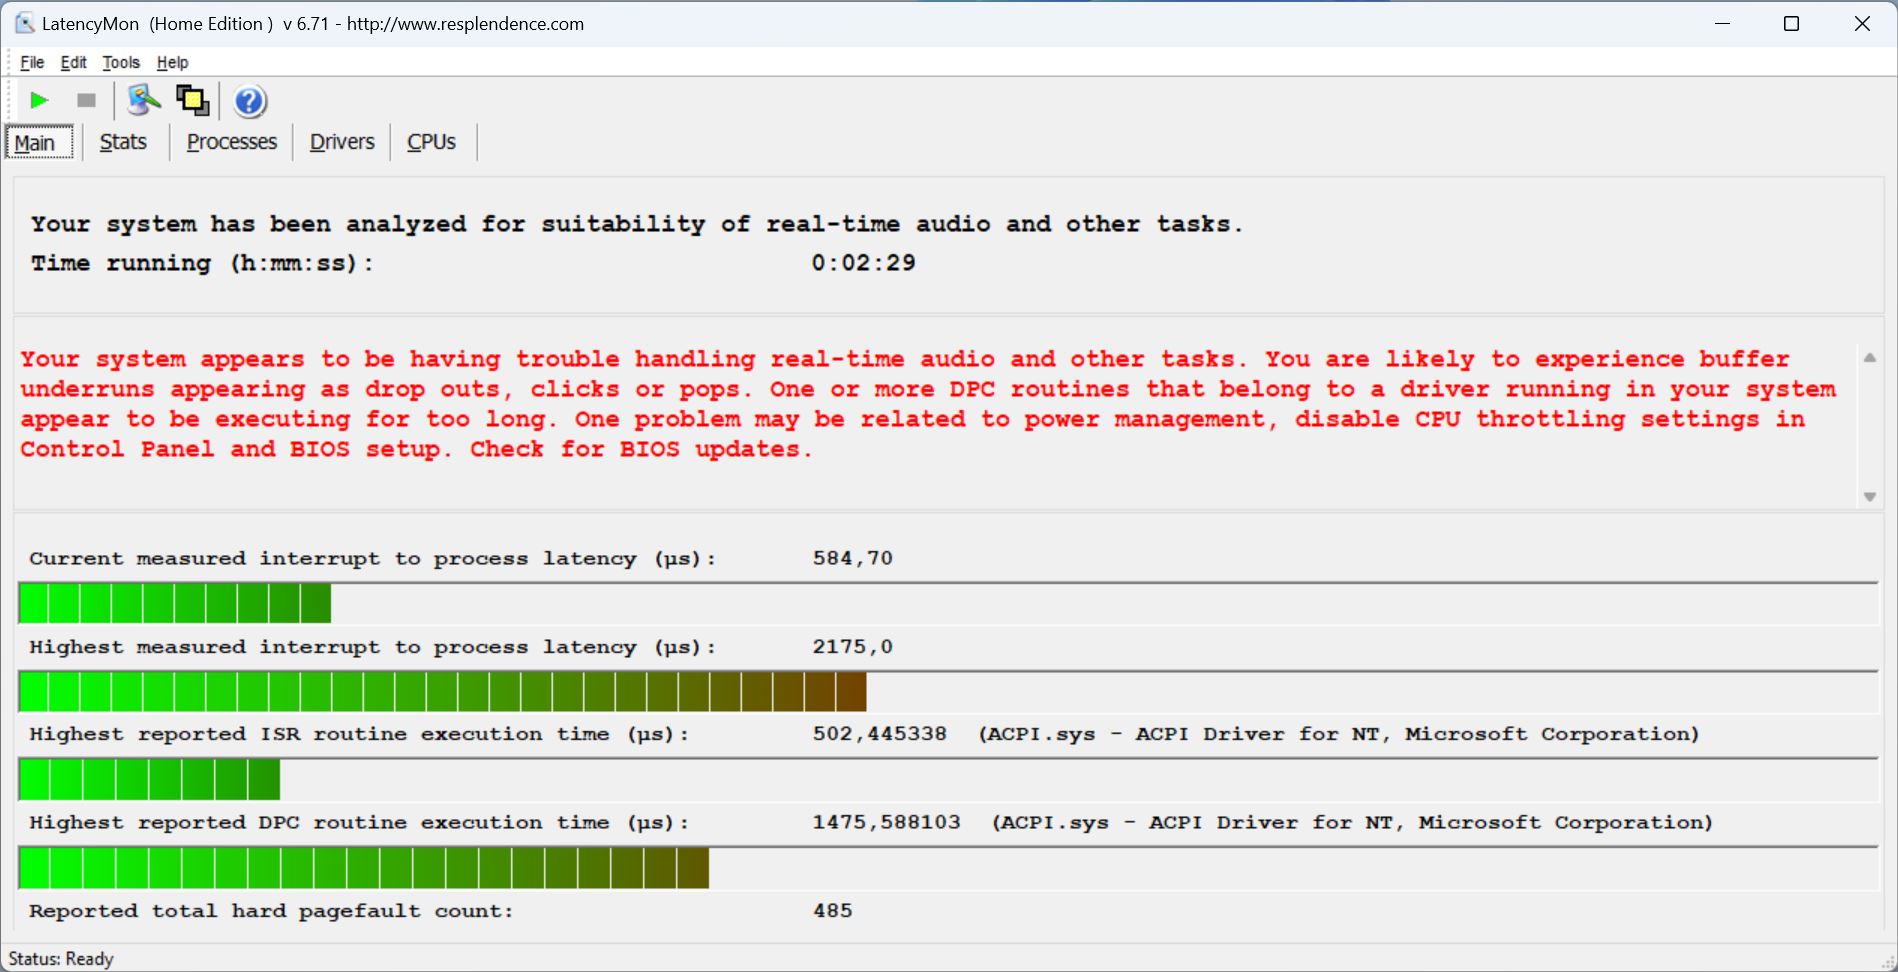
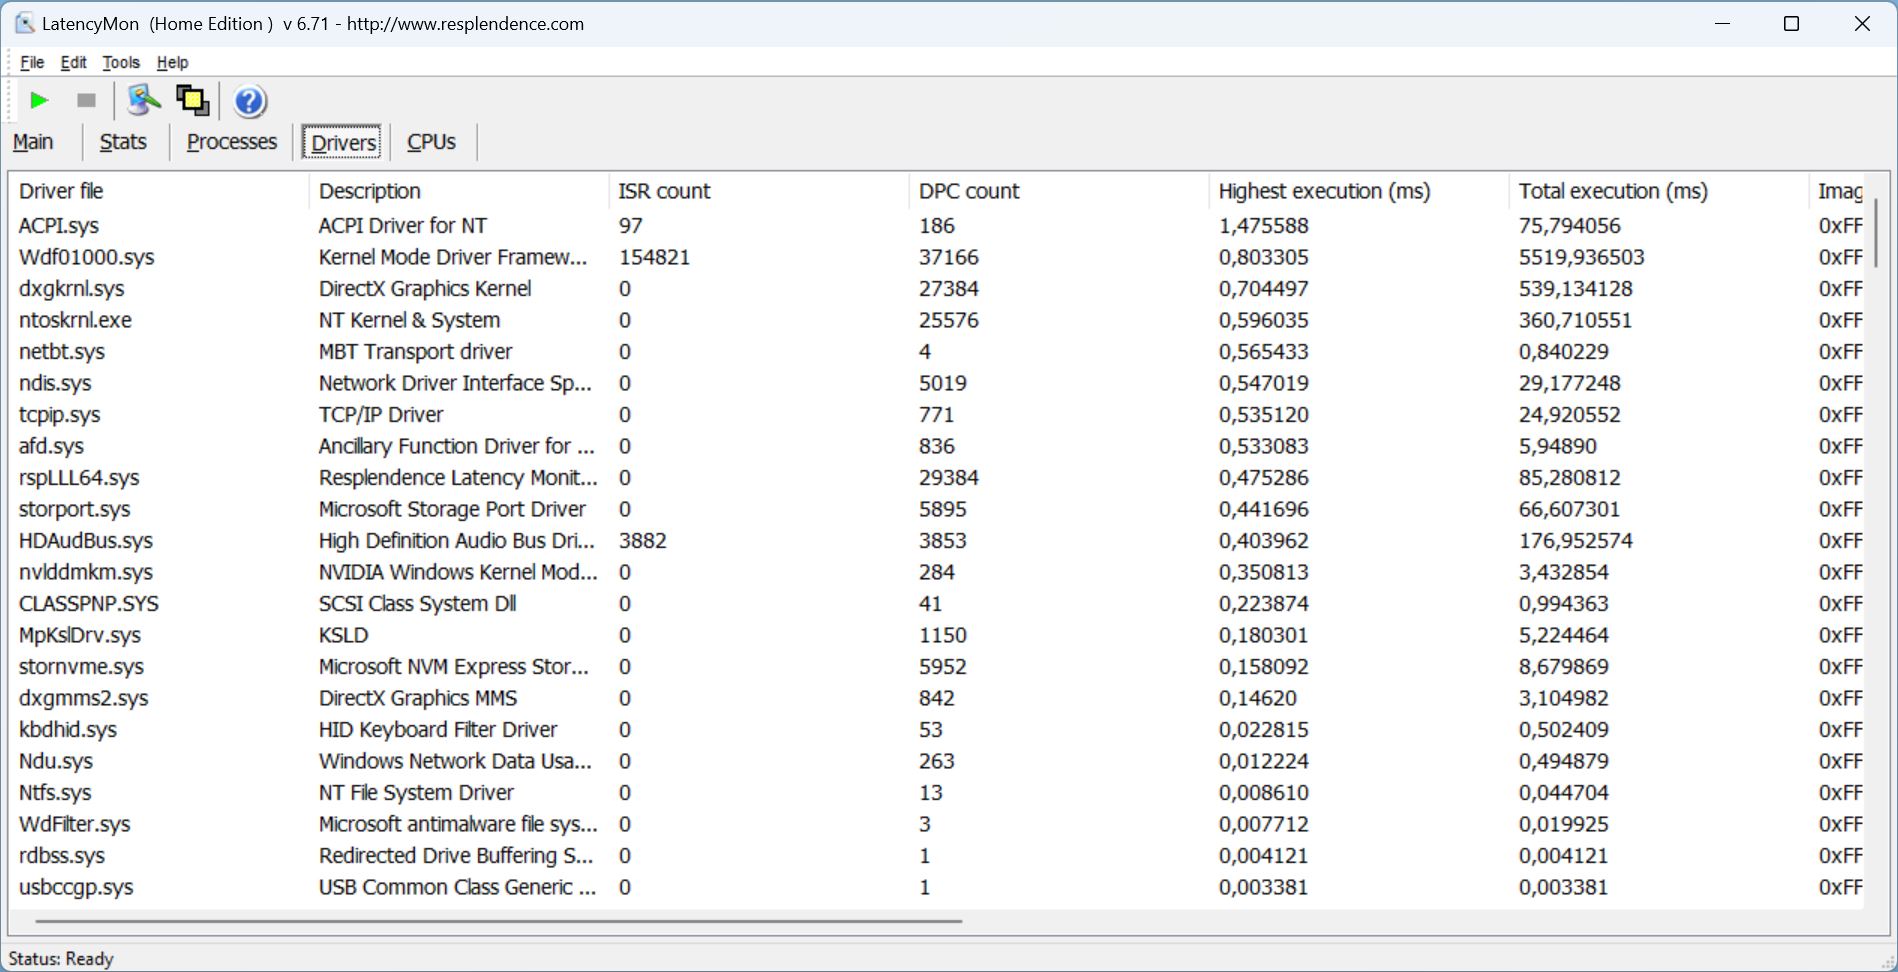
Latenza DPC
Poiché il Centro di Controllo non offre una modalità bilanciata, abbiamo testato il portatile utilizzando le modalità meeting e creator. La prima ha mostrato alcuni problemi di latenza quando si aprivano più schede del browser - questi sono diventati ancora più elevati durante il video YouTube a 4K/60-fps, con la conseguente perdita di otto fotogrammi.
Se pensa che questo possa cambiare utilizzando la più potente modalità creatore, purtroppo si sbaglia. Abbiamo già notato un aumento delle latenze all'apertura del browser. D'altra parte, il video è stato eseguito con una sola caduta di fotogrammi.
| DPC Latencies / LatencyMon - interrupt to process latency (max), Web, Youtube, Prime95 | |
| HP Omen 16-wf000 | |
| Aorus 15 YE5-54DEB34SH | |
| HP Victus 16-r0077ng | |
| Aorus 15 BSF | |
| Dell XPS 15 9530 RTX 4070 | |
| Captiva Advanced Gaming I74-121 | |
* ... Meglio usare valori piccoli
Dispositivi di archiviazione
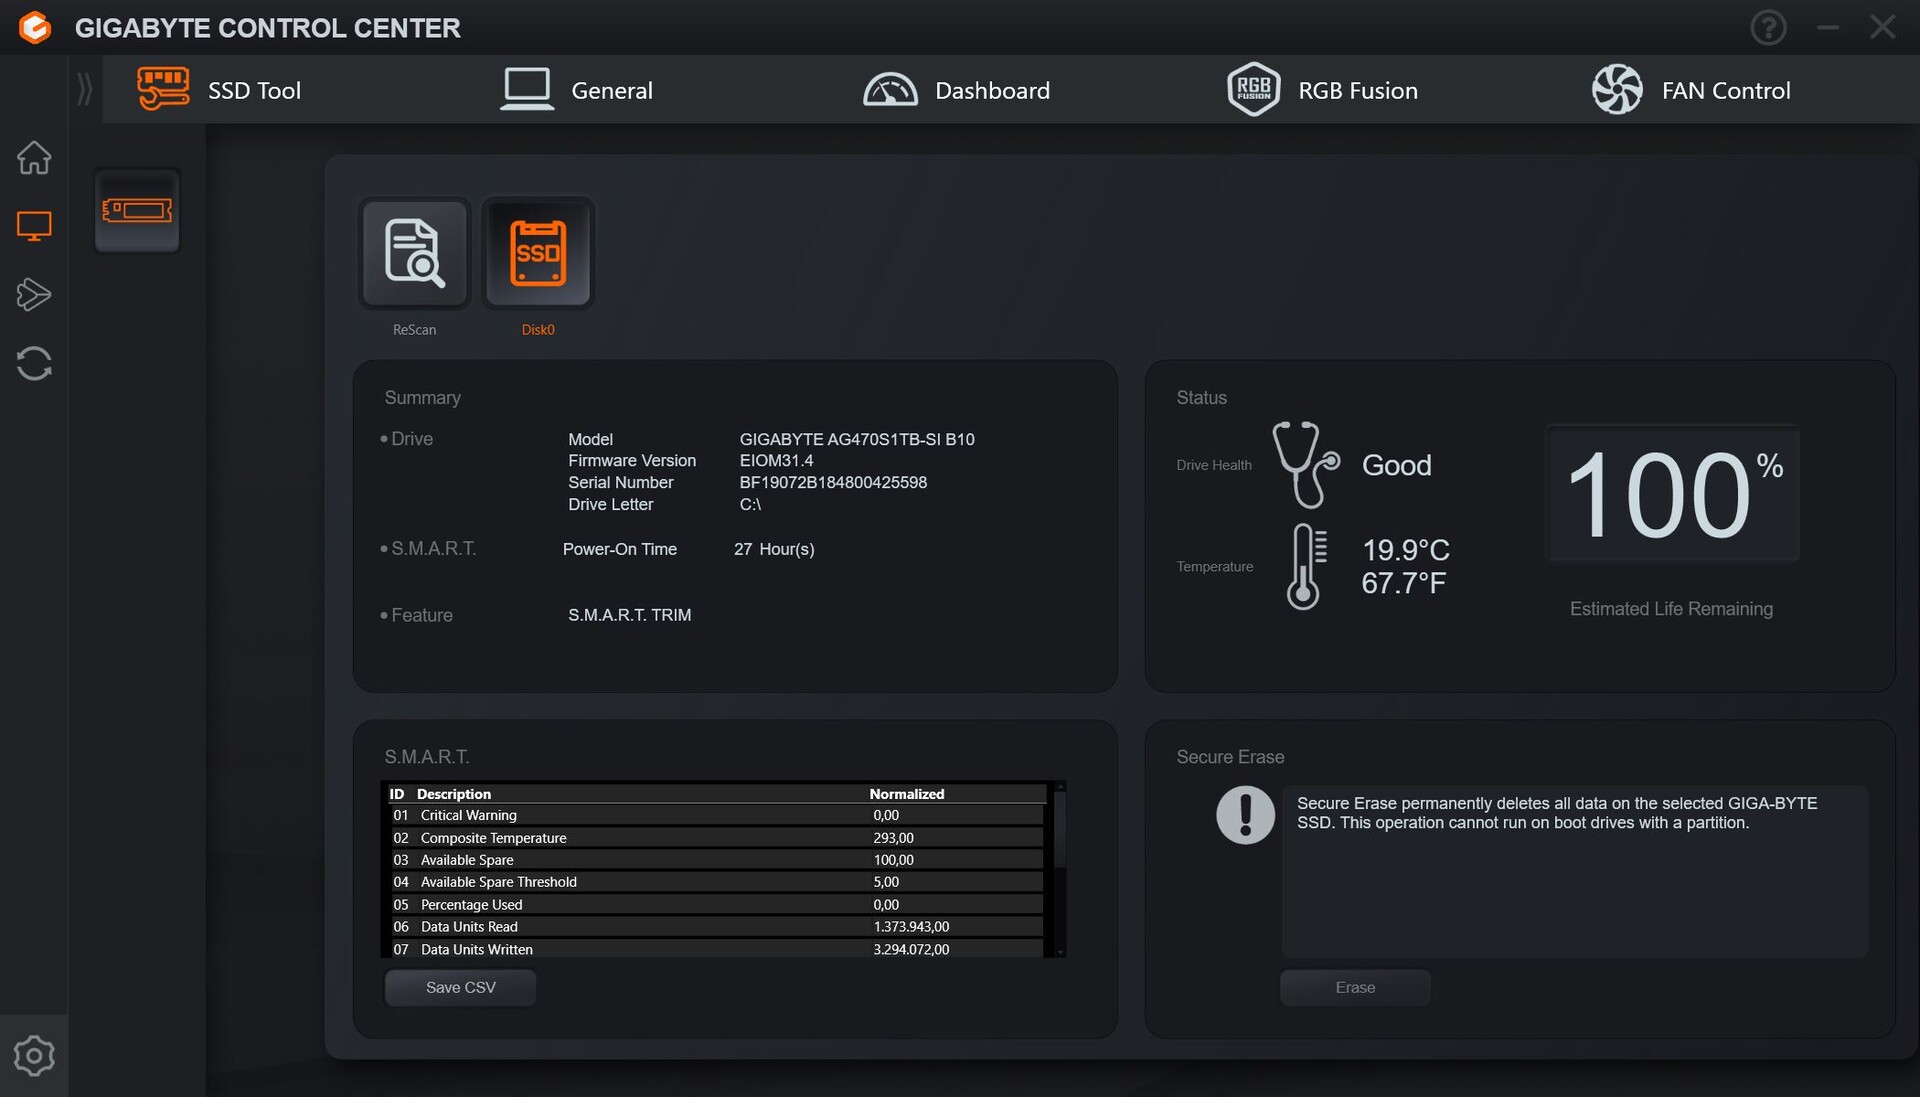
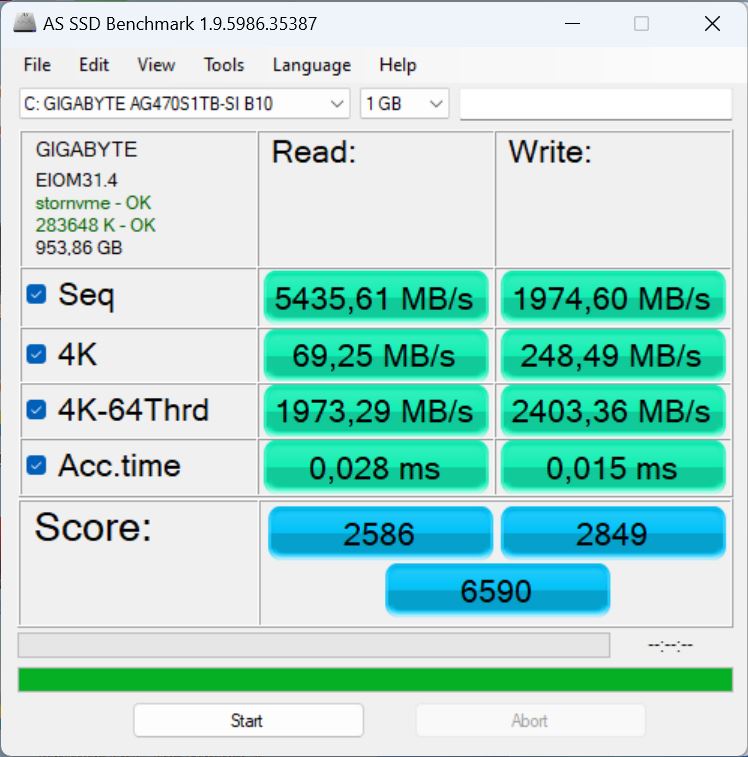
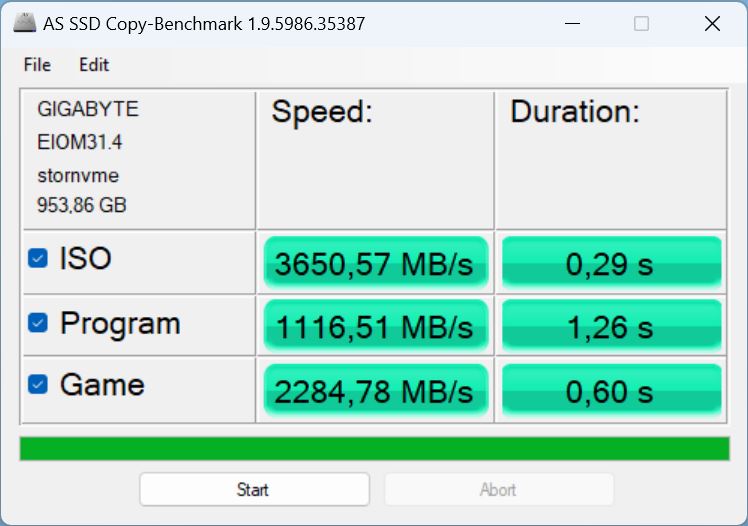
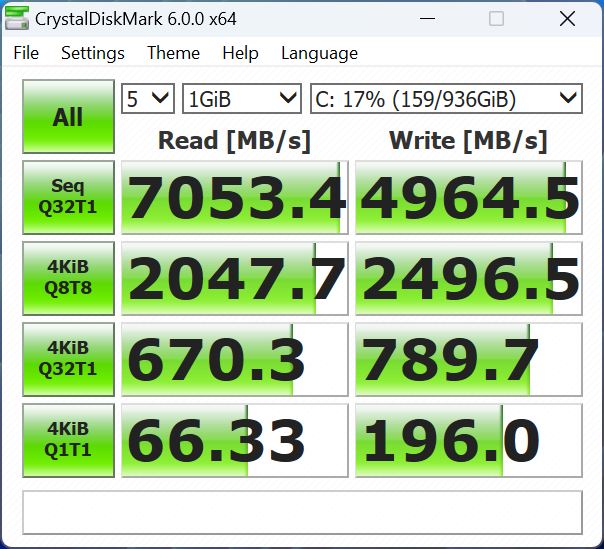
L'unità Gigabyte AG470S1TB-SI B10 installata con 1 TB di memoria è un veloce SSD PCIe Gen 4 NVMe di fascia alta. Nella nostra Elenco dei migliori SSDoccupa attualmente la posizione 3, che è eccellente.
All'interno di Aorus 15 YE5, potrebbe non essere in grado di sfruttare appieno il suo potenziale (arrivando al 12% di ritardo rispetto al modello di riferimento), tuttavia è ancora più veloce delle SSD della concorrenza. L'unica eccezione è rappresentata dall'Aorus 15 di attuale generazione. Utilizza lo stesso SSD, ma è più veloce del 28 percento. Nonostante ciò, le prestazioni del nostro campione di prova sono ancora ottime e, soprattutto, sono rimaste costanti e non hanno mostrato problemi di throttling durante l'uso continuo.

* ... Meglio usare valori piccoli
Reading continuous performance: DiskSpd Read Loop, Queue Depth 8
Scheda grafica
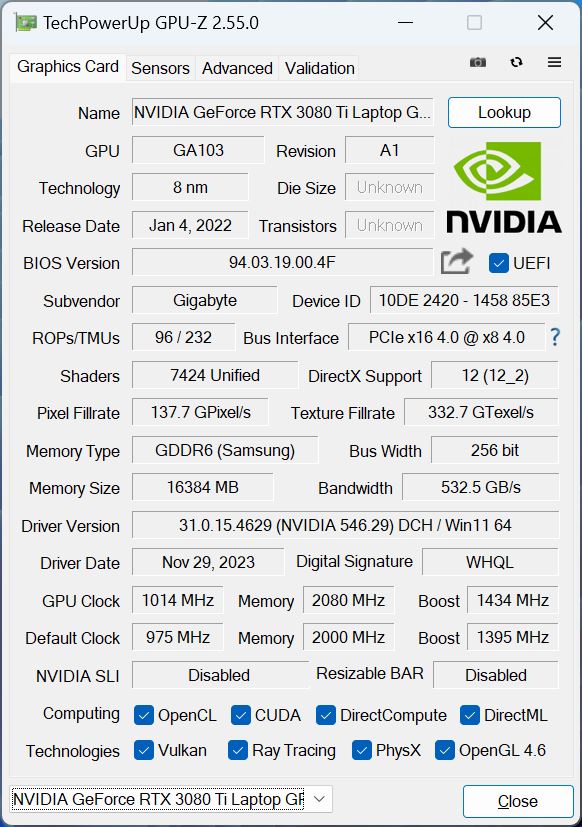
Il precedente modello di punta Geforce RTX 3080 Ti con 16 GB di RAM è responsabile dei calcoli 3D come scheda grafica del portatile. Tuttavia, le vengono assegnati solo 130 watt su un massimo possibile di 165 watt. Il potente chip Ampere non è efficiente come l'attuale architettura Ada Lovelace e probabilmente genererà più calore.
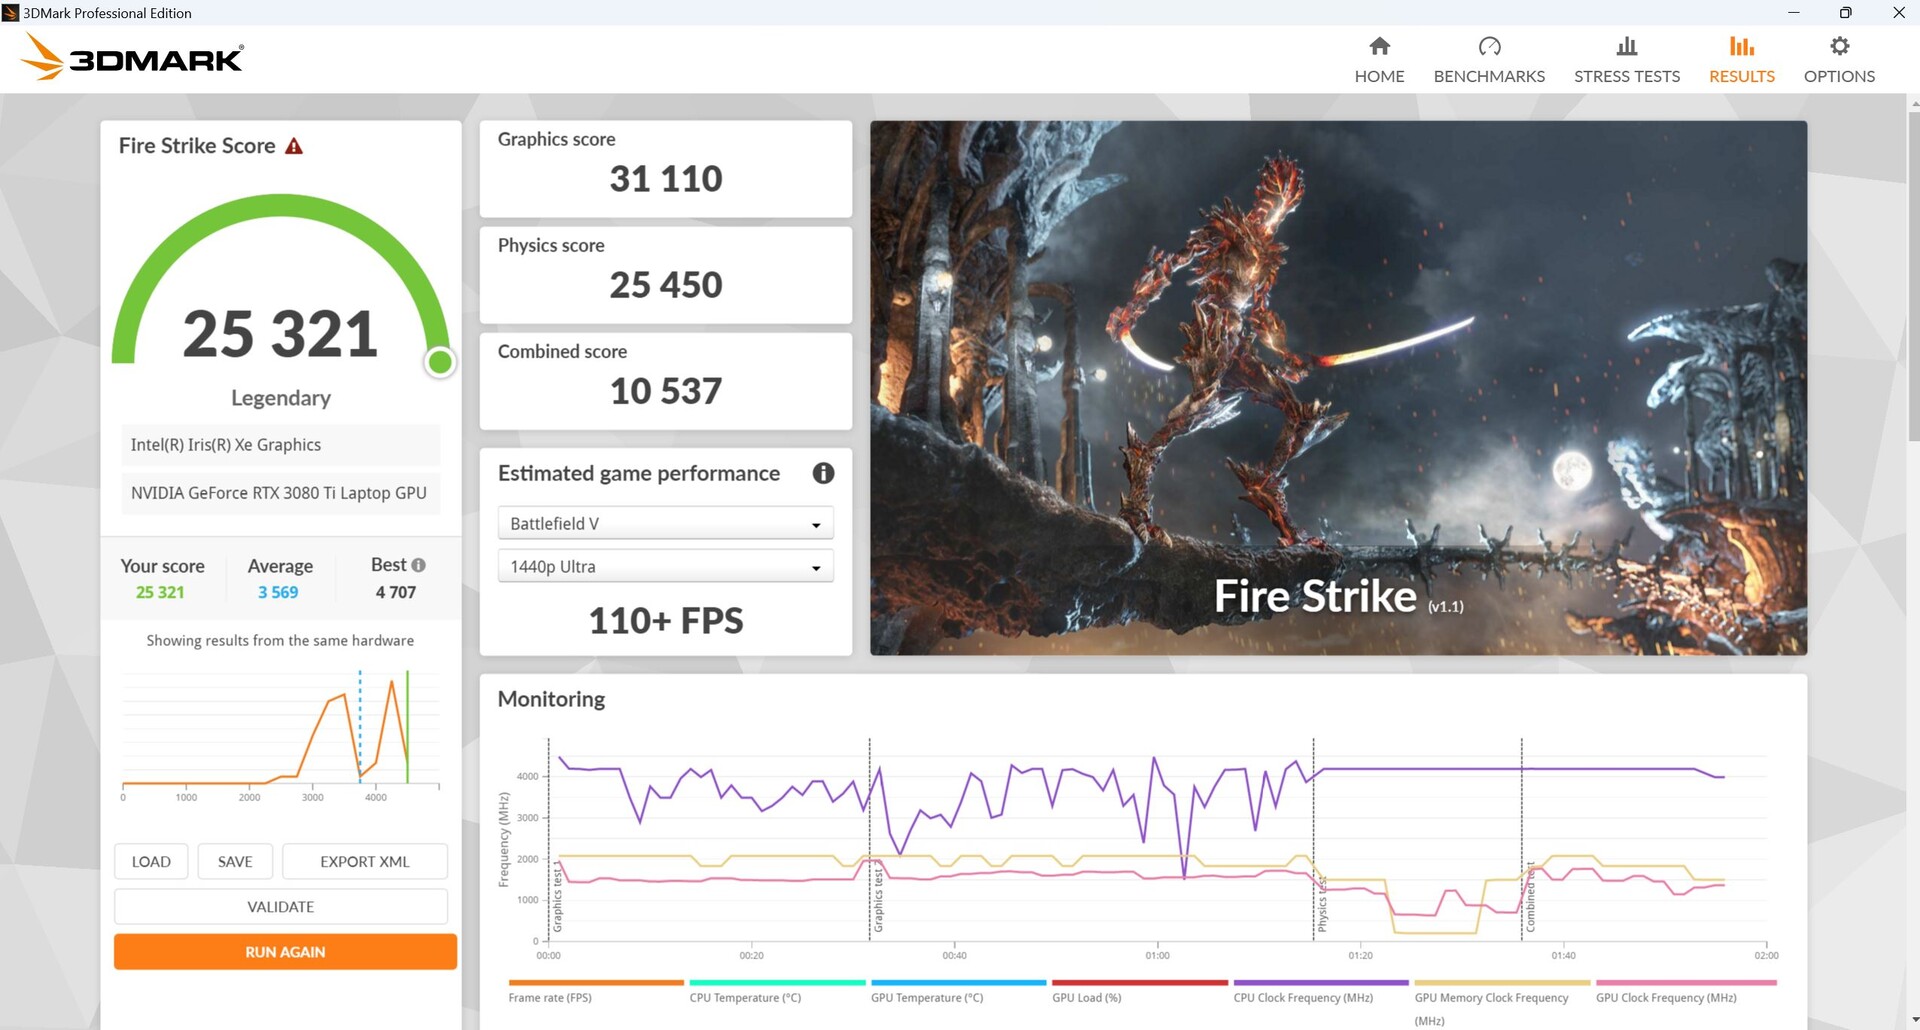
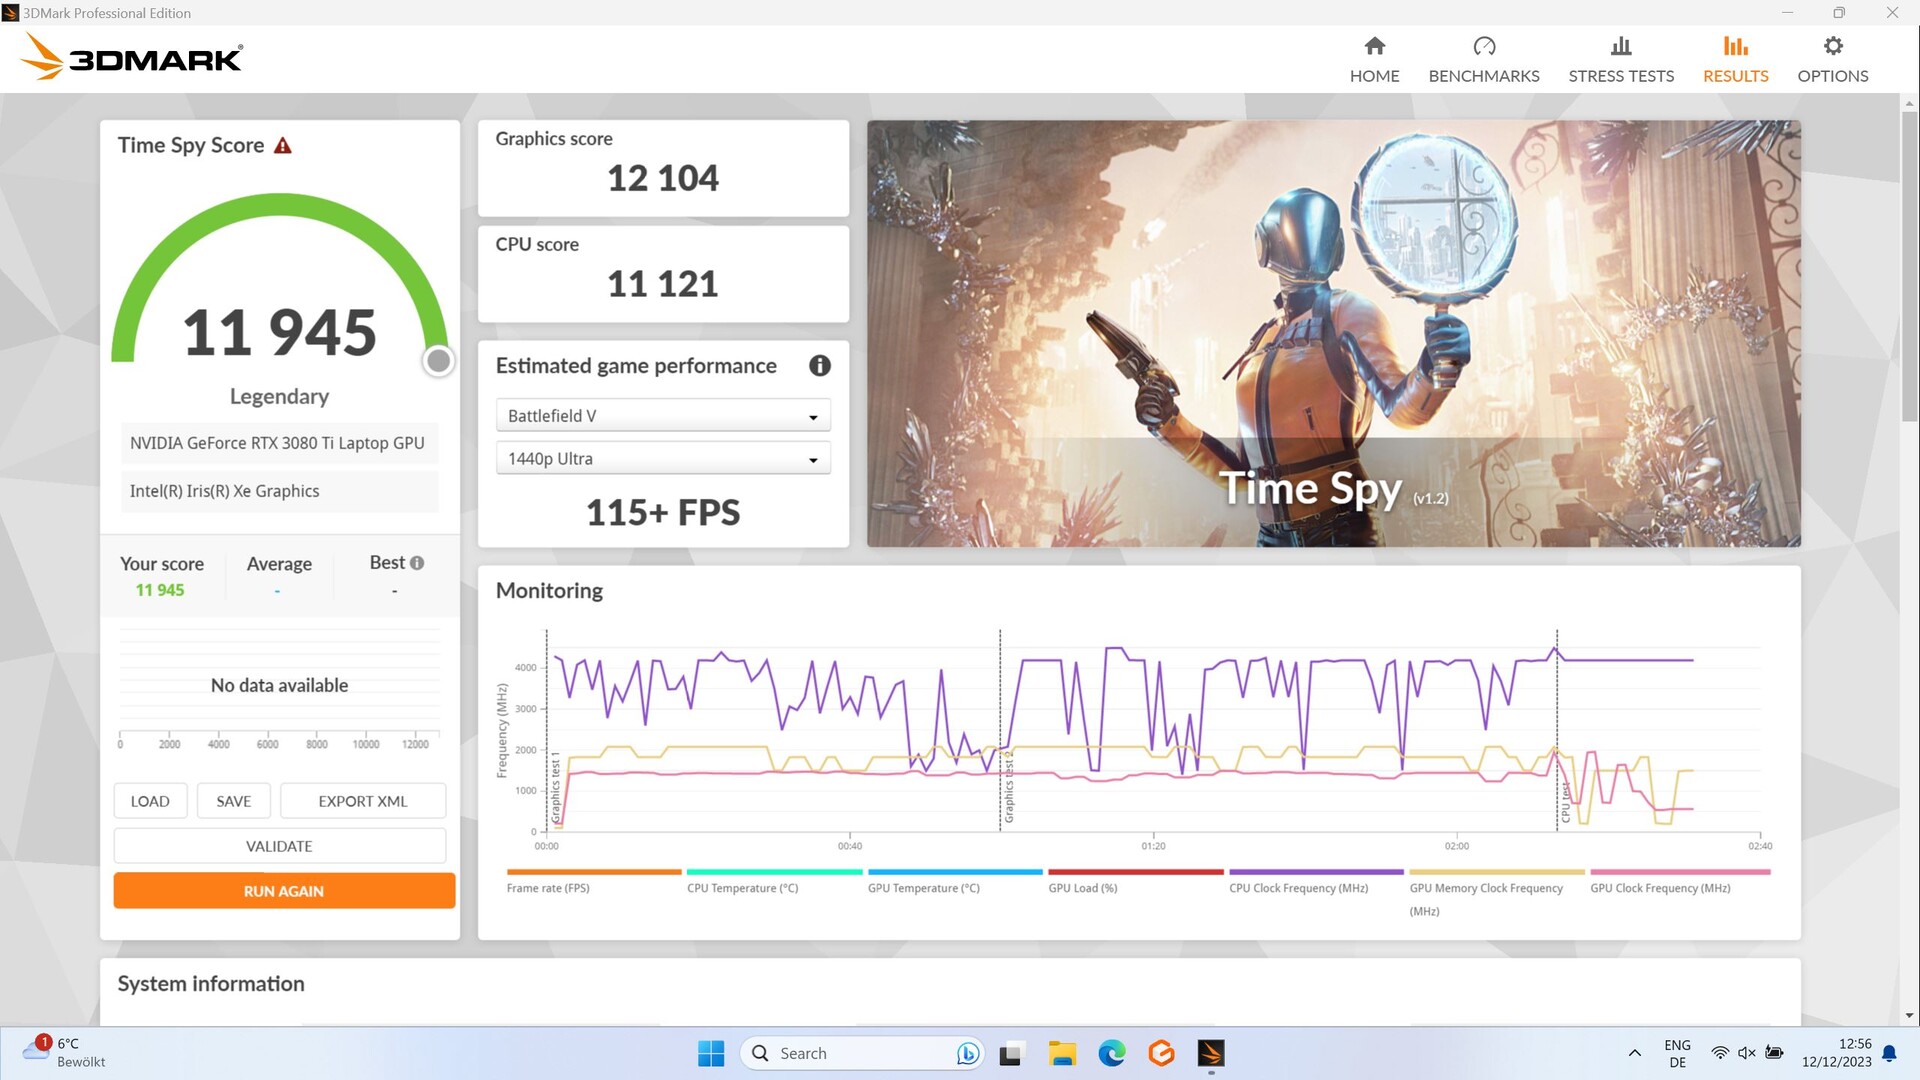
Durante i benchmark sintetici 3DMark, il nostro Aorus ha superato la concorrenza current-gen con una RTX 4060 e una RTX 4070. La nostra RTX 3080 Ti è risultata superiore in quasi tutti i test, anche se solo di qualche punto percentuale. Tuttavia, i divari tra loro sono piuttosto piccoli, ma costanti in tutti i test.
In modalità batteria, le sue prestazioni in Fire Strike sono scese da 31.110 a soli 6.921 punti, un calo di ben il 78%!
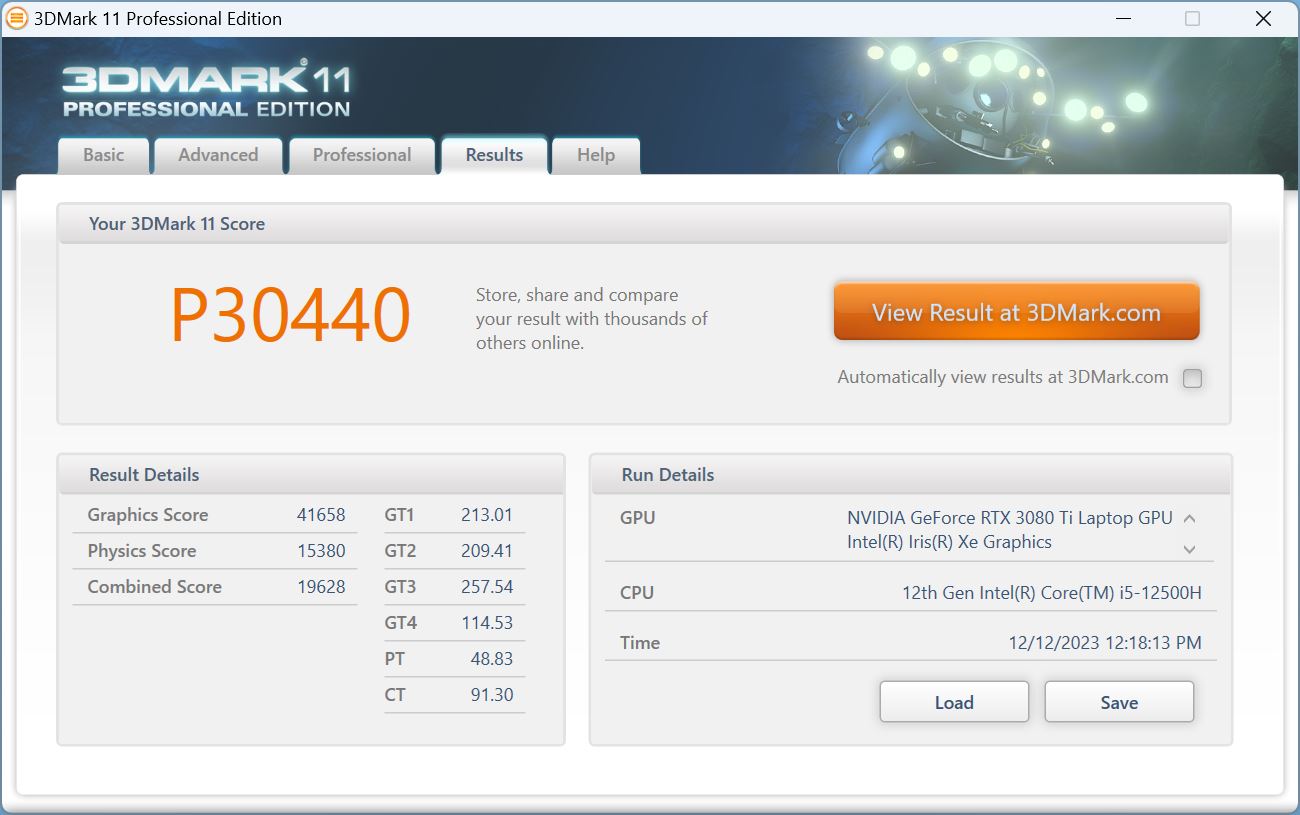
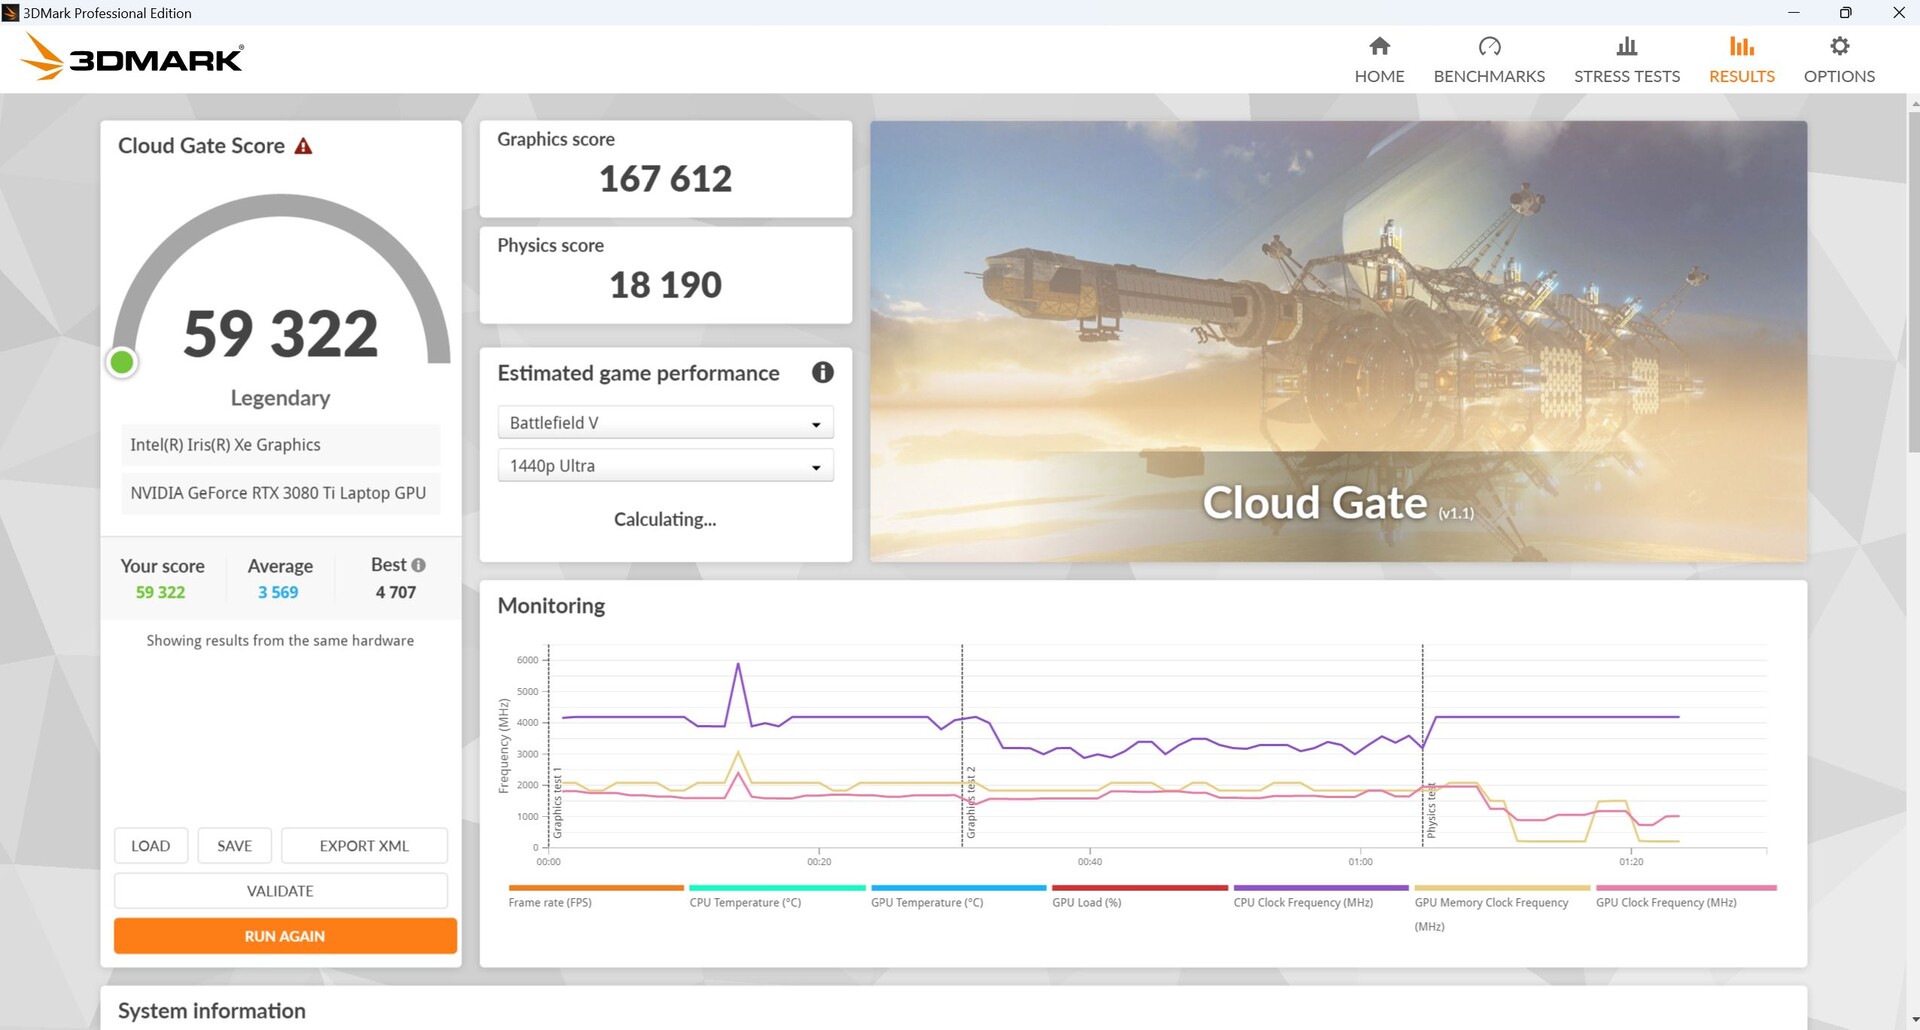
| 3DMark 11 Performance | 30440 punti | |
| 3DMark Cloud Gate Standard Score | 59322 punti | |
| 3DMark Fire Strike Score | 25321 punti | |
| 3DMark Time Spy Score | 11945 punti | |
Aiuto | ||
* ... Meglio usare valori piccoli
Gioco d'azzardo
Durante i giochi, il nostro Aorus si è trovato testa a testa con l'Aorus di aorus di nuova generazione con una RTX 4070 ed è persino riuscito a batterlo con uno stretto margine. Anche tutti gli altri concorrenti con RTX 4070 sono stati battuti di poco. L'Omen 16 con RTX 4070 Omen 16 con RTX 4080 è rimasto irraggiungibile al vertice ed è stato circa il 18% più veloce del nostro Aorus secondo classificato in tutti i test di gioco. Nei giochi incentrati sulla CPU, le sue prestazioni sono rimaste indietro rispetto alla concorrenza a causa del suo mediocre i5-12500H.
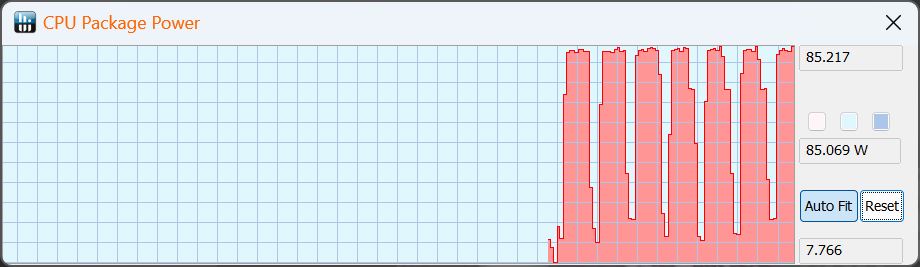
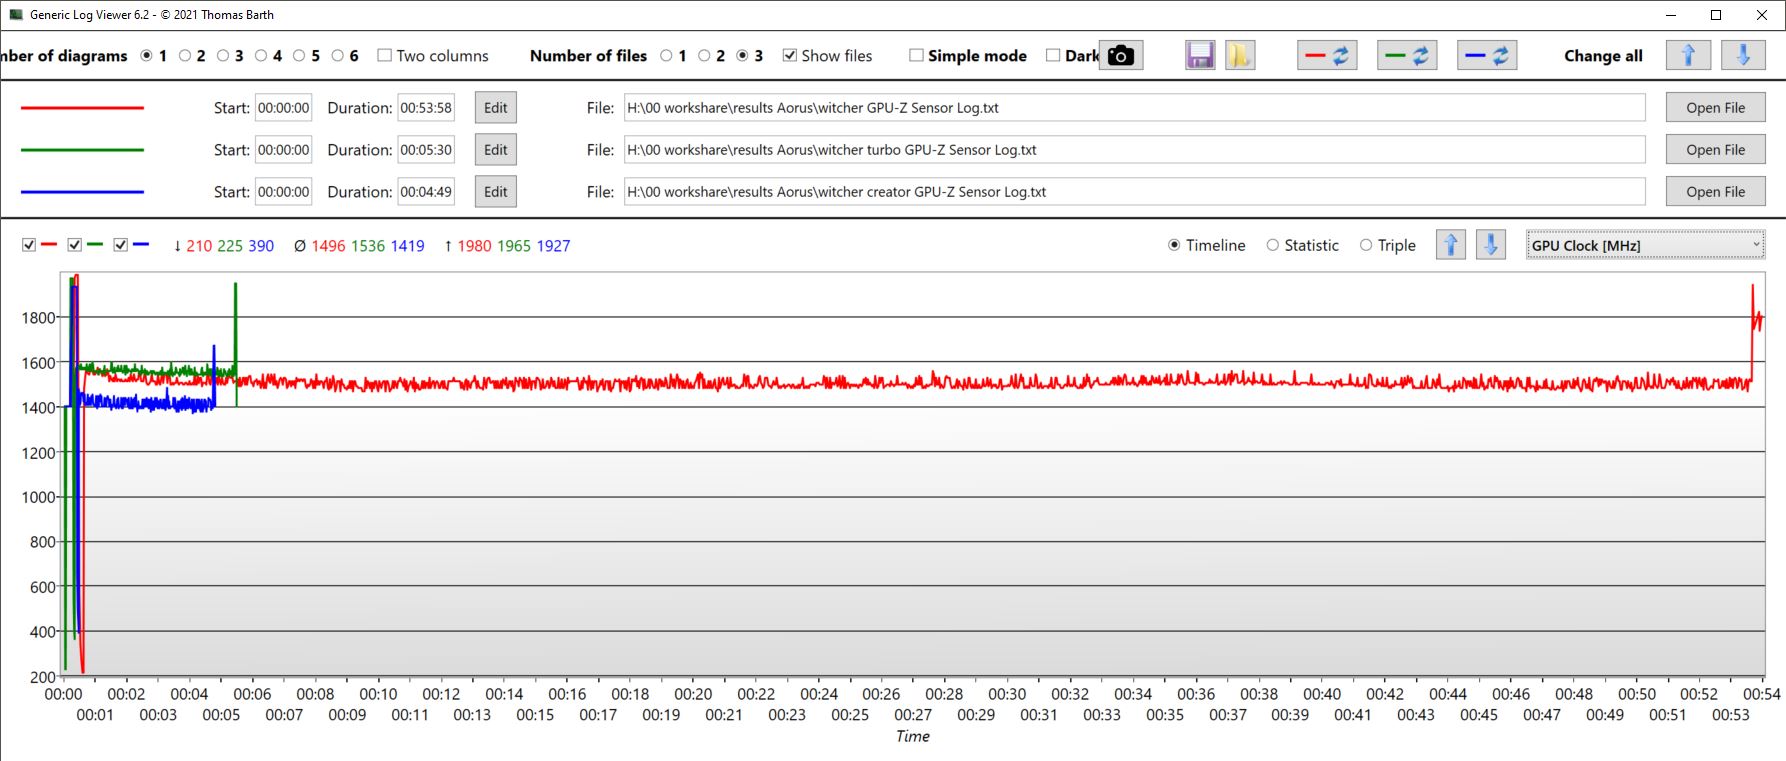
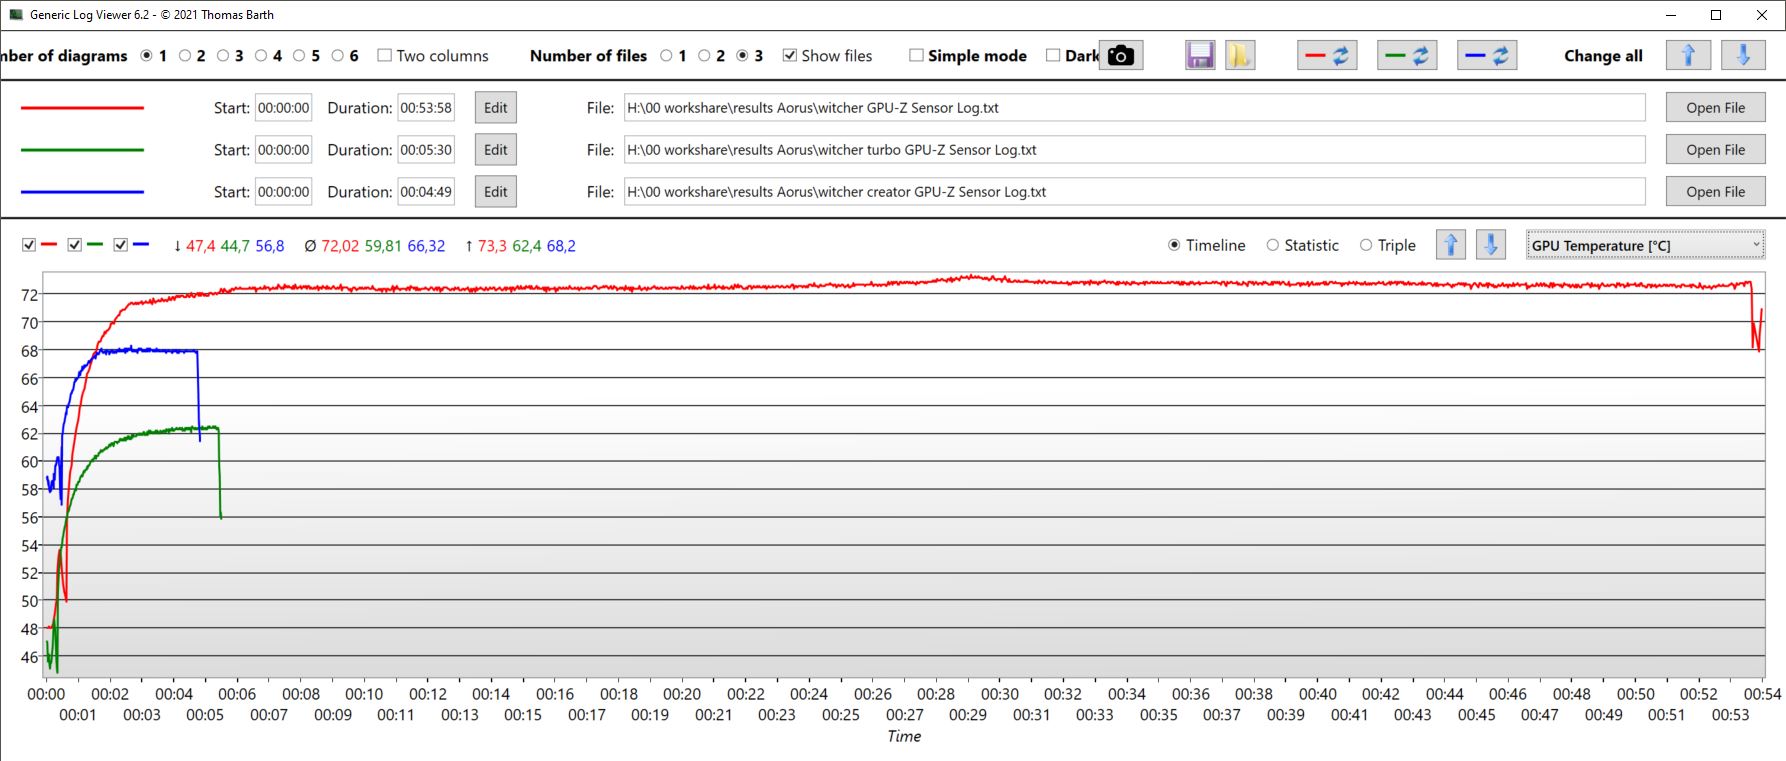
Confrontando le modalità, si nota che turbo, AI e gaming hanno fornito tutte praticamente le stesse prestazioni della GPU in The Witcher 3. L'unica differenza è che la GPU è rimasta significativamente più fredda in modalità turbo, ma questa modalità era anche significativamente più rumorosa.
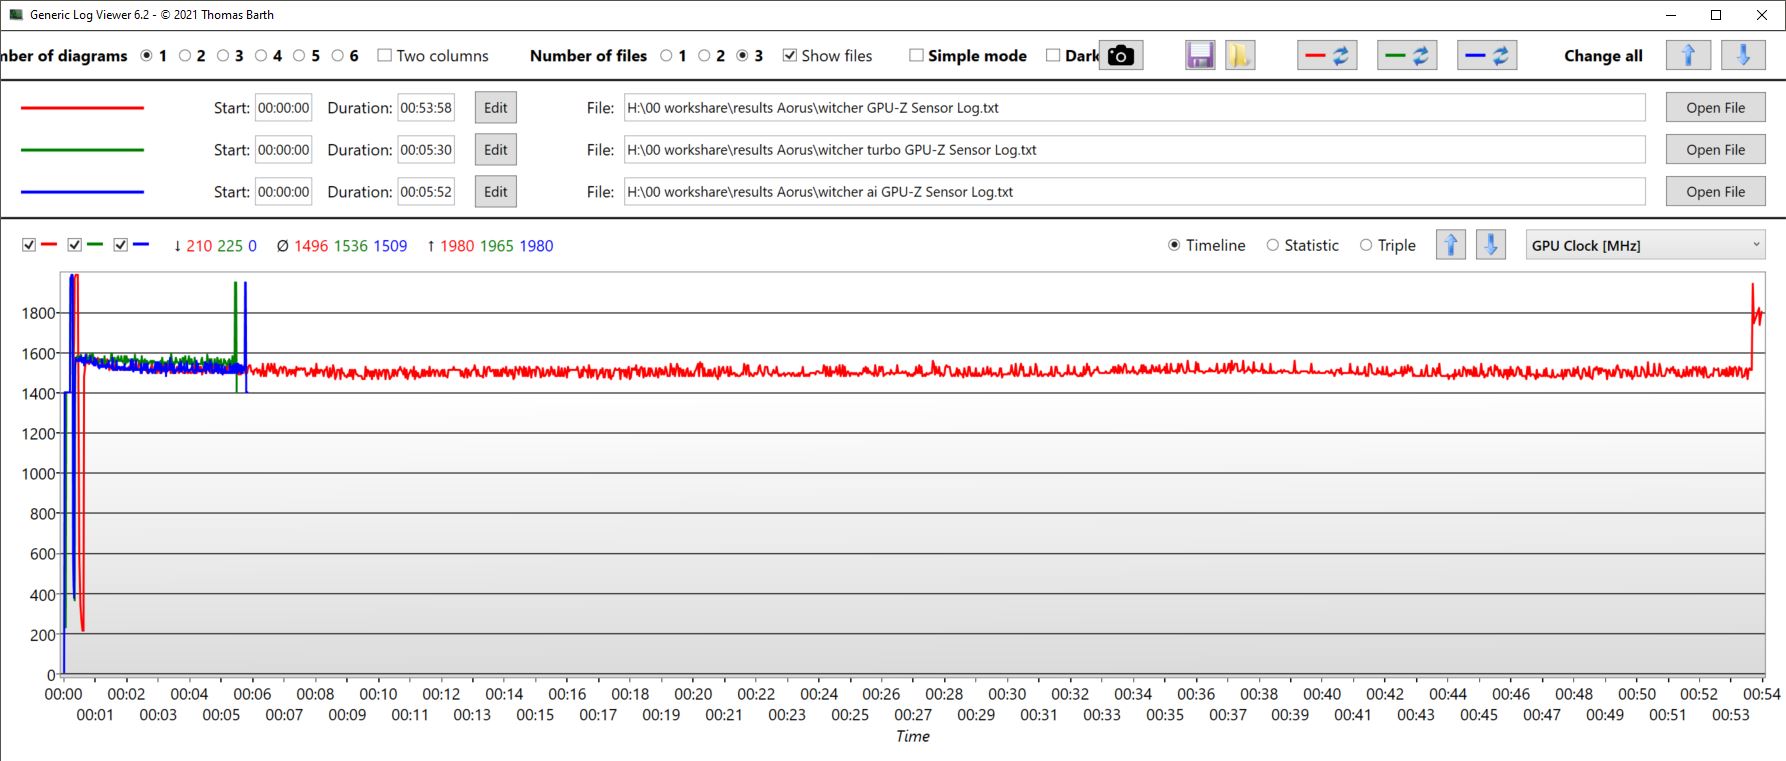
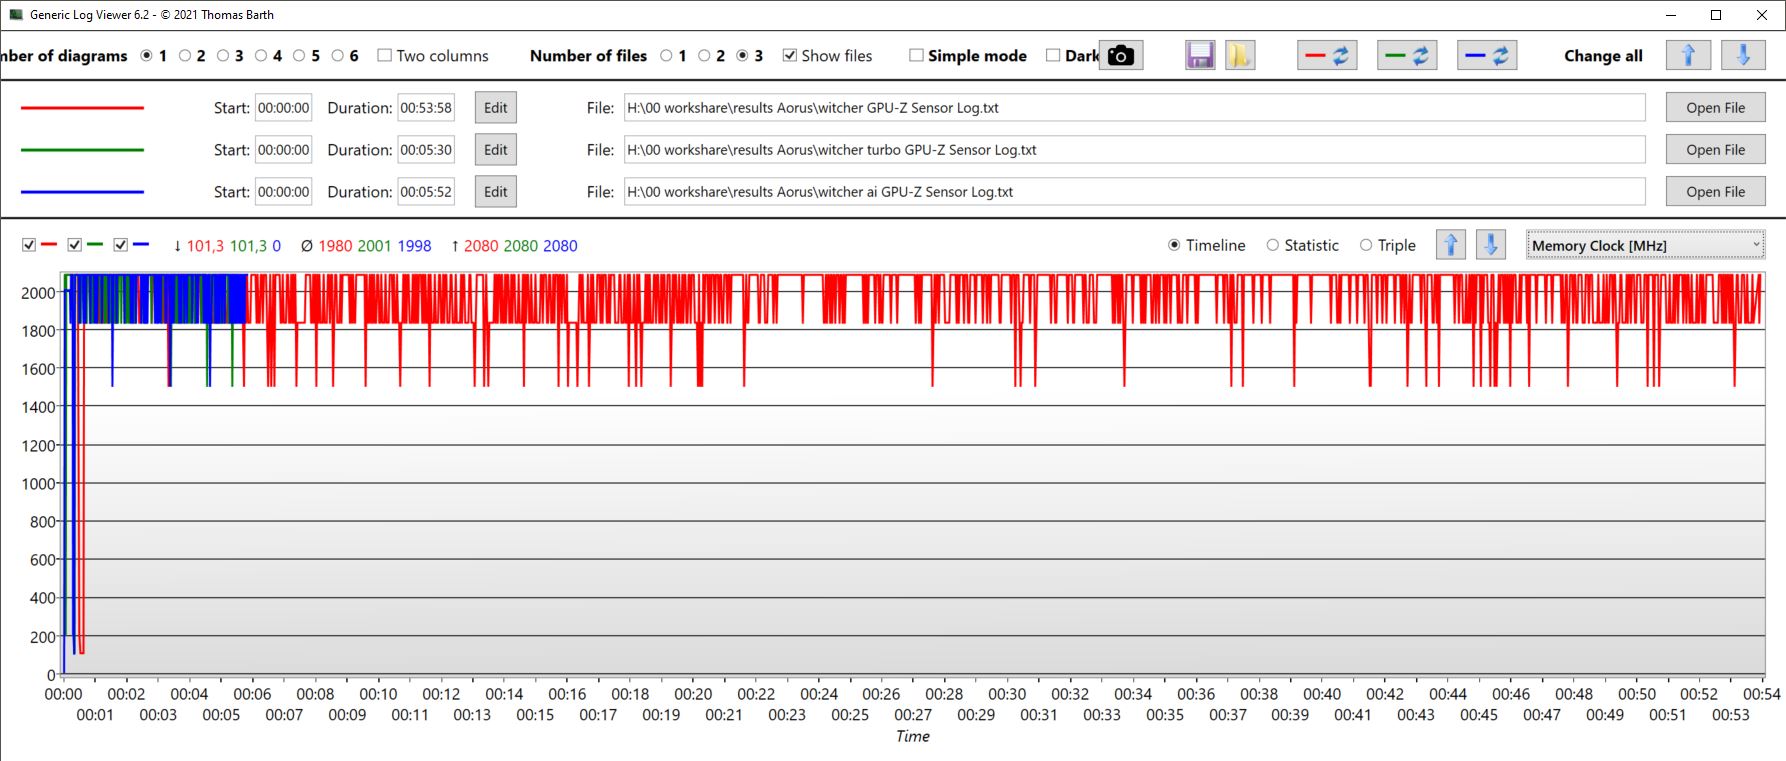
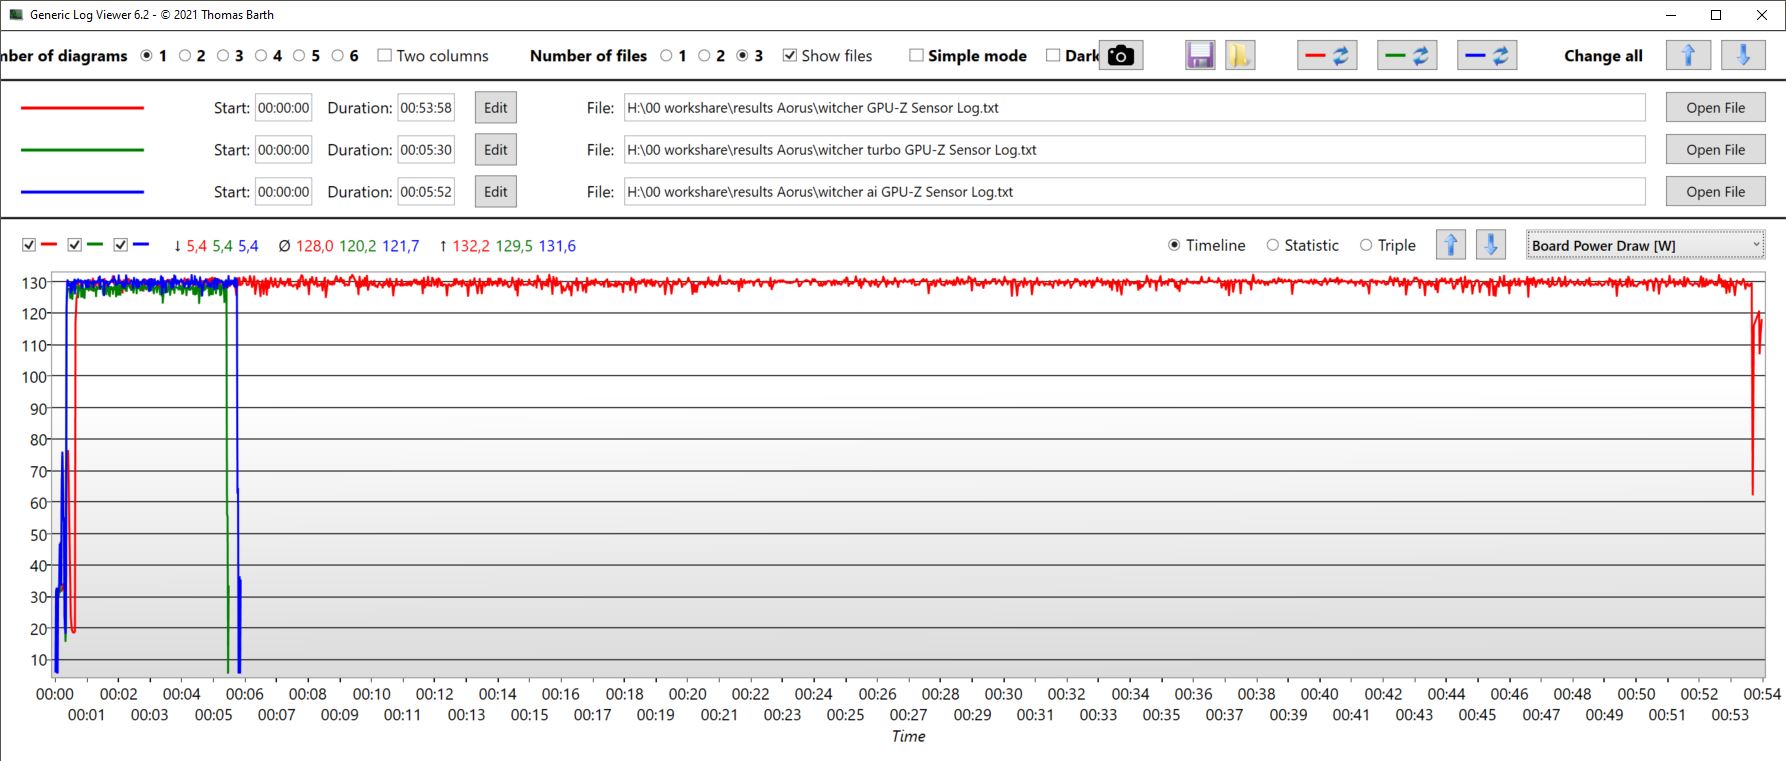
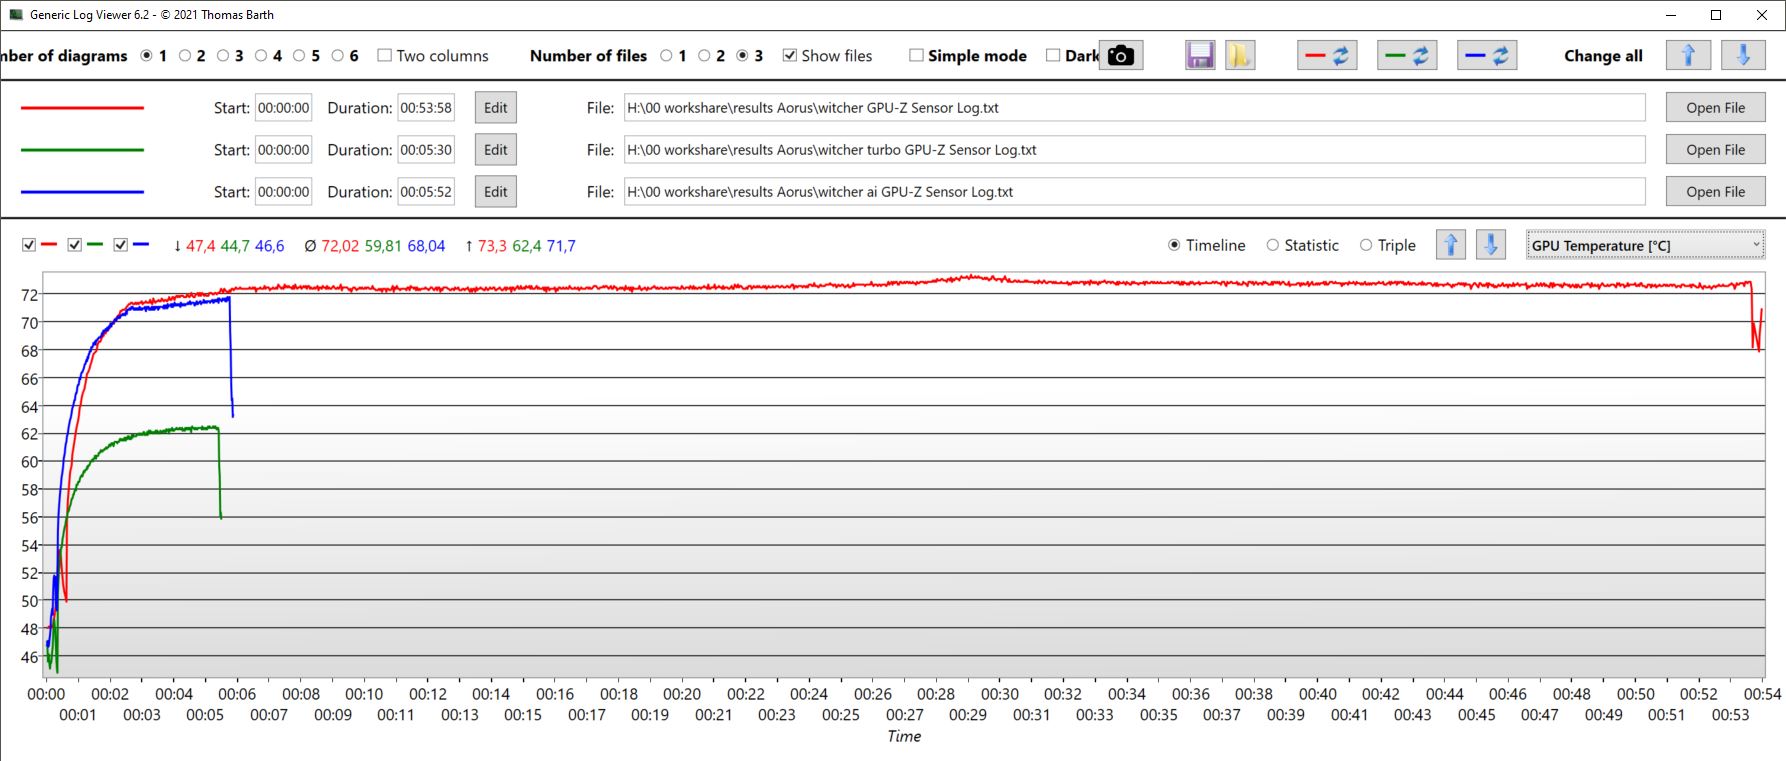
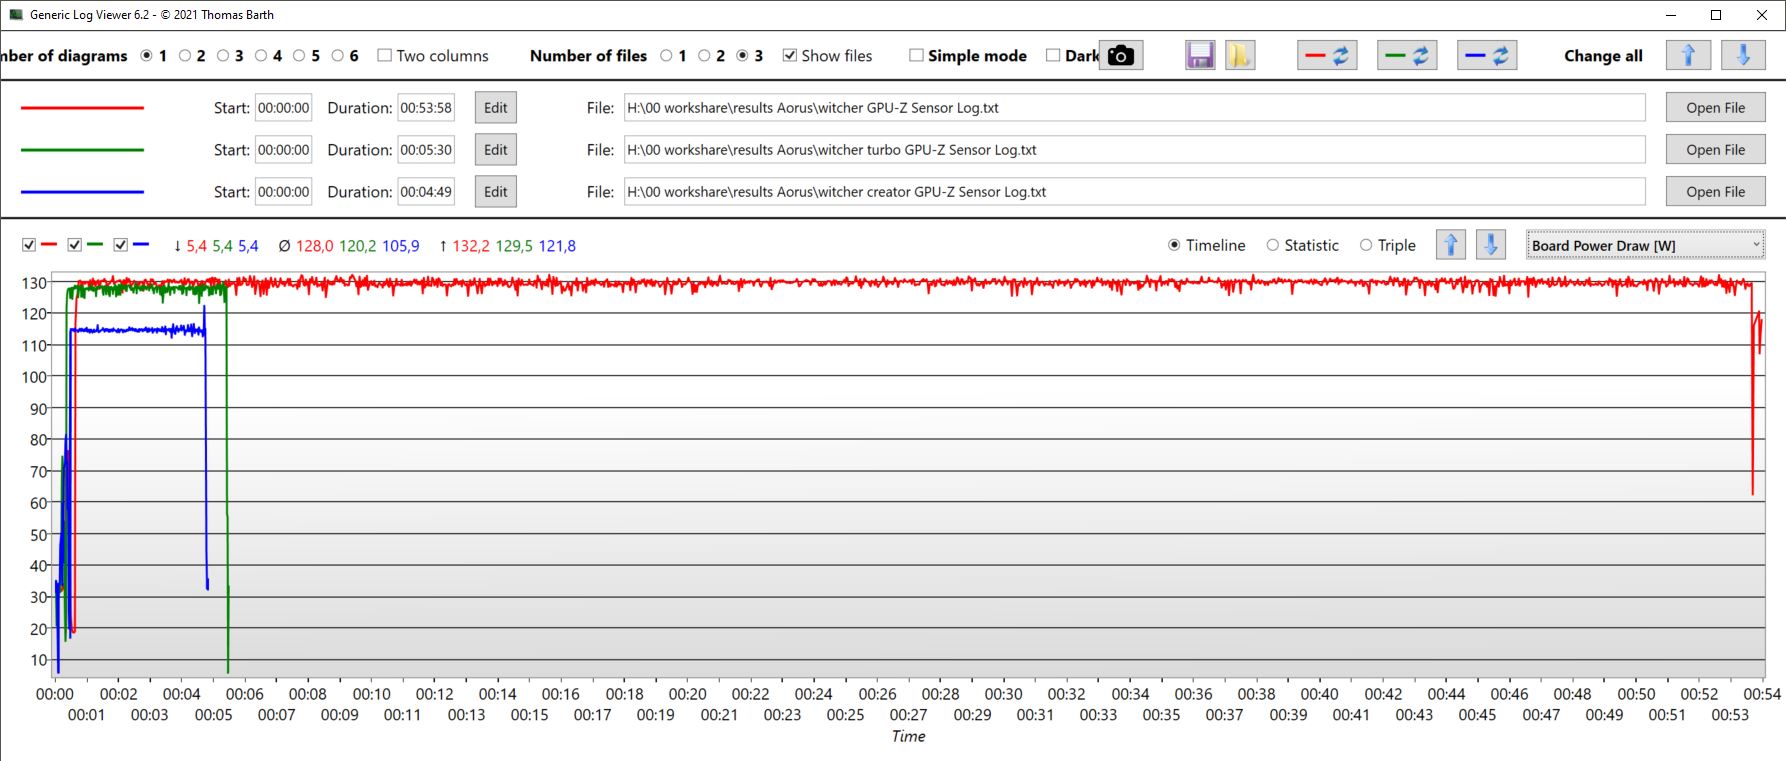
La modalità Creator (curva blu questa volta) si è comportata leggermente peggio, non ha assorbito tanta energia ed è rimasta leggermente più fredda. Nella sezione sulle emissioni di rumore, abbiamo elencato le modalità e il loro effetto sugli FPS e sulle emissioni di rumore durante l'esecuzione di The Witcher 3.
| Performance rating - Percent | |
| Media della classe Gaming | |
| HP Omen 16-wf000 | |
| Aorus 15 YE5-54DEB34SH -1! | |
| Aorus 15 BSF -1! | |
| Captiva Advanced Gaming I74-121 | |
| HP Victus 16-r0077ng | |
| Dell XPS 15 9530 RTX 4070 | |
| The Witcher 3 - 1920x1080 Ultra Graphics & Postprocessing (HBAO+) | |
| Media della classe Gaming (104.7 - 240, n=7, ultimi 2 anni) | |
| HP Omen 16-wf000 | |
| Aorus 15 YE5-54DEB34SH | |
| Aorus 15 BSF | |
| HP Victus 16-r0077ng | |
| Captiva Advanced Gaming I74-121 | |
| Dell XPS 15 9530 RTX 4070 | |
| GTA V - 1920x1080 Highest AA:4xMSAA + FX AF:16x | |
| Media della classe Gaming (48.3 - 186.9, n=94, ultimi 2 anni) | |
| Aorus 15 YE5-54DEB34SH | |
| Captiva Advanced Gaming I74-121 | |
| HP Omen 16-wf000 | |
| HP Victus 16-r0077ng | |
| Dell XPS 15 9530 RTX 4070 | |
| Final Fantasy XV Benchmark - 1920x1080 High Quality | |
| HP Omen 16-wf000 | |
| Media della classe Gaming (41 - 215, n=95, ultimi 2 anni) | |
| Aorus 15 YE5-54DEB34SH | |
| Aorus 15 BSF | |
| HP Victus 16-r0077ng | |
| Captiva Advanced Gaming I74-121 | |
| Dell XPS 15 9530 RTX 4070 | |
| Strange Brigade - 1920x1080 ultra AA:ultra AF:16 | |
| HP Omen 16-wf000 | |
| Media della classe Gaming (76.3 - 458, n=87, ultimi 2 anni) | |
| Aorus 15 BSF | |
| HP Victus 16-r0077ng | |
| Captiva Advanced Gaming I74-121 | |
| Dell XPS 15 9530 RTX 4070 | |
| Dota 2 Reborn - 1920x1080 ultra (3/3) best looking | |
| HP Omen 16-wf000 | |
| Media della classe Gaming (84.8 - 248, n=107, ultimi 2 anni) | |
| Aorus 15 BSF | |
| Captiva Advanced Gaming I74-121 | |
| Aorus 15 YE5-54DEB34SH | |
| Dell XPS 15 9530 RTX 4070 | |
| HP Victus 16-r0077ng | |
| X-Plane 11.11 - 1920x1080 high (fps_test=3) | |
| HP Omen 16-wf000 | |
| Aorus 15 BSF | |
| Captiva Advanced Gaming I74-121 | |
| Media della classe Gaming (55.5 - 143.5, n=109, ultimi 2 anni) | |
| HP Victus 16-r0077ng | |
| Aorus 15 YE5-54DEB34SH | |
| Dell XPS 15 9530 RTX 4070 | |
Witcher 3 FPS diagram
| basso | medio | alto | ultra | QHD | 4K | |
|---|---|---|---|---|---|---|
| GTA V (2015) | 184.4 | 180.8 | 176 | 118 | ||
| The Witcher 3 (2015) | 385 | 306 | 222 | 120 | 86 | |
| Dota 2 Reborn (2015) | 167.6 | 154.1 | 146.4 | 138.9 | 140.1 | |
| Final Fantasy XV Benchmark (2018) | 206 | 151.7 | 119.2 | 92.2 | ||
| X-Plane 11.11 (2018) | 134.1 | 121.3 | 94.9 | 85.4 | ||
| Far Cry 5 (2018) | 165 | 137 | 131 | 124 | 116 |
Emissioni e potenza - Meglio di quanto possa far pensare la RTX 3080 Ti
Emissioni di rumore
In modalità turbo, le ventole sono sempre vicine al loro limite, ossia da 52 a 55 dB. Nelle altre modalità, le ventole funzionano in modo più situazionale. La tabella seguente elenca i livelli di emissione sonora delle diverse modalità dopo circa 10 minuti di gioco di The Witcher 3. In generale, le sue emissioni possono essere descritte come moderate in relazione alle sue prestazioni e possono essere regolate in modo molto variabile grazie alle numerose modalità. Sia la Captiva e il HP Victus hanno prestazioni peggiori nelle applicazioni 3D, ma sono ugualmente rumorosi; il Captiva è ancora più rumoroso.
In modalità gioco, le ventole sono attive anche quando il portatile è al minimo, anche se in modo silenzioso. Di solito sono silenziose in modalità riunione o Risparmio energetico. Durante lo scenario di carico medio simulato (3DMark06) con la modalità di gioco selezionata, le emissioni acustiche aumentano gradualmente fino a 43 dB. In modalità Risparmio energetico, lo stesso test si è svolto a soli 27 dB.
| Modalità di prestazioni/Witcher 3 | Frequenza massima dei fotogrammi | Frequenza media dei fotogrammi | Emissioni di rumore in dB | Consumo in Watt |
|---|---|---|---|---|
| Turbo | 124 | 118 | 52,68 | 199 |
| AI | 122 | 116 | 44,78 | 197 |
| Gioco | 125 | 116 | 46,77 | 196 |
| Creatore | 115 | 110 | 44,78 | 185 |
| Riunione | 111 | 105 | 36,53 | 163 |
| Risparmio energetico | 115 | 106 | 36,53 | 162 |
Rumorosità
| Idle |
| 23 / 23 / 26.42 dB(A) |
| Sotto carico |
| 43.5 / 50.21 dB(A) |
 | ||
30 dB silenzioso 40 dB(A) udibile 50 dB(A) rumoroso |
||
min: | ||
| Aorus 15 YE5-54DEB34SH GeForce RTX 3080 Ti Laptop GPU, i5-12500H, Gigabyte AG470S1TB-SI B10 | Aorus 15 BSF GeForce RTX 4070 Laptop GPU, i7-13700H, Gigabyte AG470S1TB-SI B10 | Captiva Advanced Gaming I74-121 GeForce RTX 4060 Laptop GPU, i5-13500H, Samsung SSD 980 1TB MZ-V8V1T0BW | HP Victus 16-r0077ng GeForce RTX 4070 Laptop GPU, i7-13700H, Kioxia XG8 KXG80ZNV1T02 | Dell XPS 15 9530 RTX 4070 GeForce RTX 4070 Laptop GPU, i7-13700H, SK hynix PC801 HFS001TEJ9X101N | HP Omen 16-wf000 GeForce RTX 4080 Laptop GPU, i7-13700HX, SK hynix PC801 HFS002TEJ9X101N | |
|---|---|---|---|---|---|---|
| Noise | -20% | -3% | -9% | 10% | -13% | |
| off /ambiente * (dB) | 23 | 24 -4% | 23 -0% | 25 -9% | 23.1 -0% | 23 -0% |
| Idle Minimum * (dB) | 23 | 25 -9% | 23 -0% | 28 -22% | 23.1 -0% | 29.6 -29% |
| Idle Average * (dB) | 23 | 31 -35% | 25.67 -12% | 29 -26% | 23.1 -0% | 29.8 -30% |
| Idle Maximum * (dB) | 26.42 | 37 -40% | 25.67 3% | 30 -14% | 24.2 8% | 30.4 -15% |
| Load Average * (dB) | 43.5 | 51 -17% | 38.52 11% | 43 1% | 27.1 38% | 33.8 22% |
| Witcher 3 ultra * (dB) | 46.77 | 54.17 -16% | 46 2% | 40.1 14% | 57 -22% | |
| Load Maximum * (dB) | 50.21 | 57 -14% | 54.17 -8% | 48 4% | 44.6 11% | 58.3 -16% |
* ... Meglio usare valori piccoli
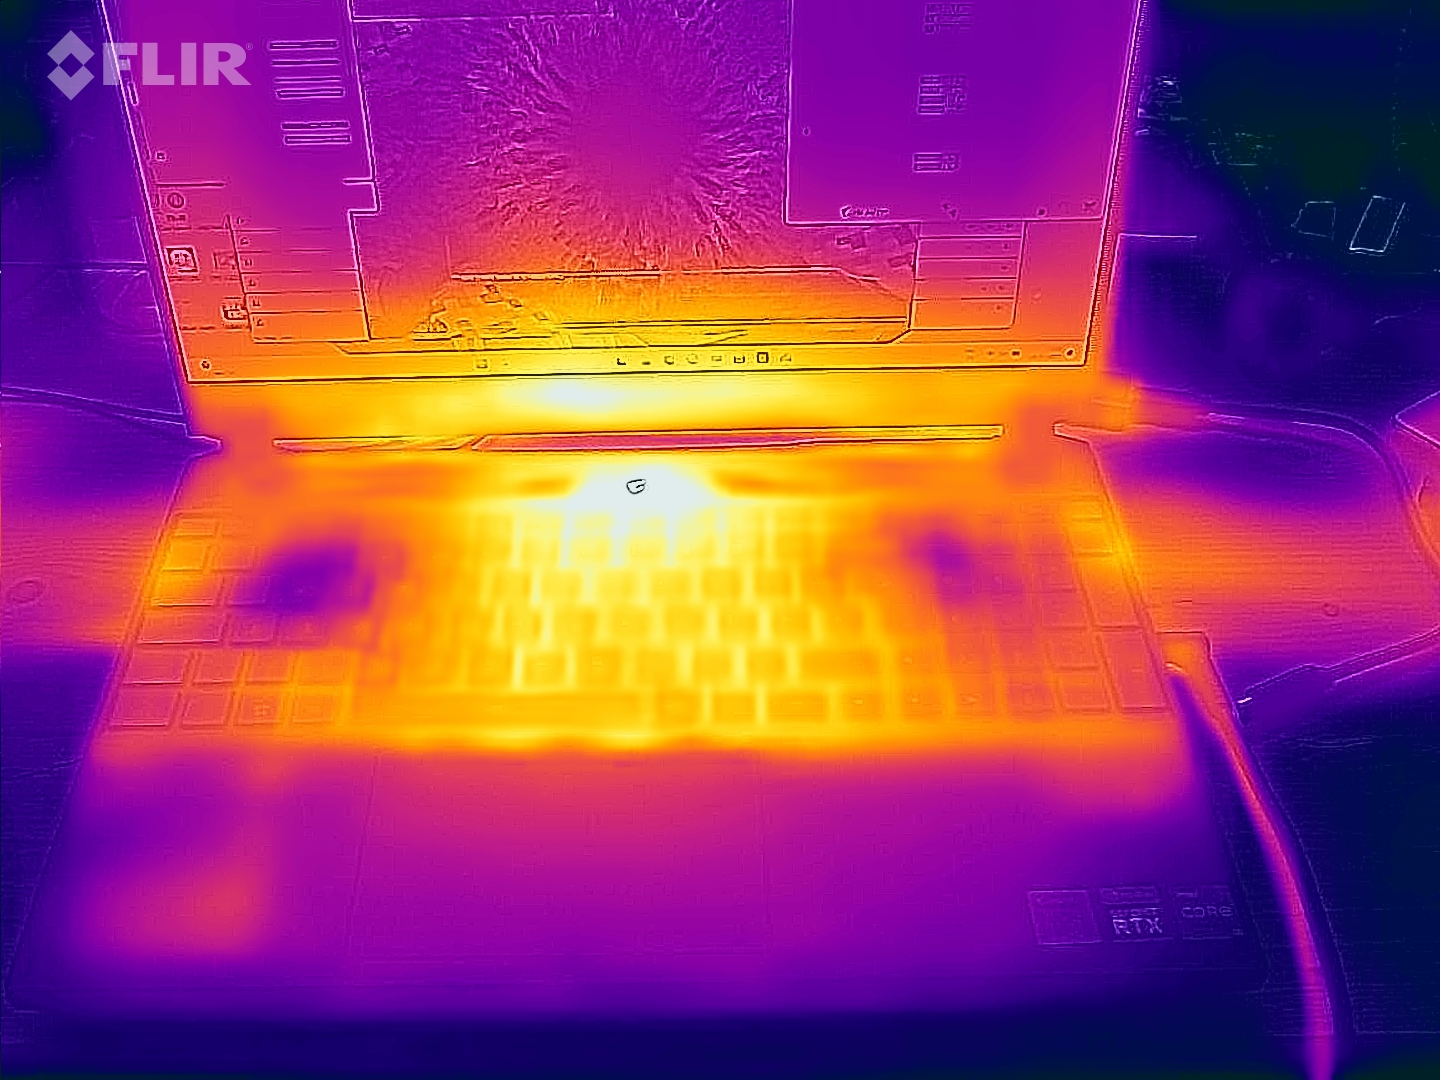
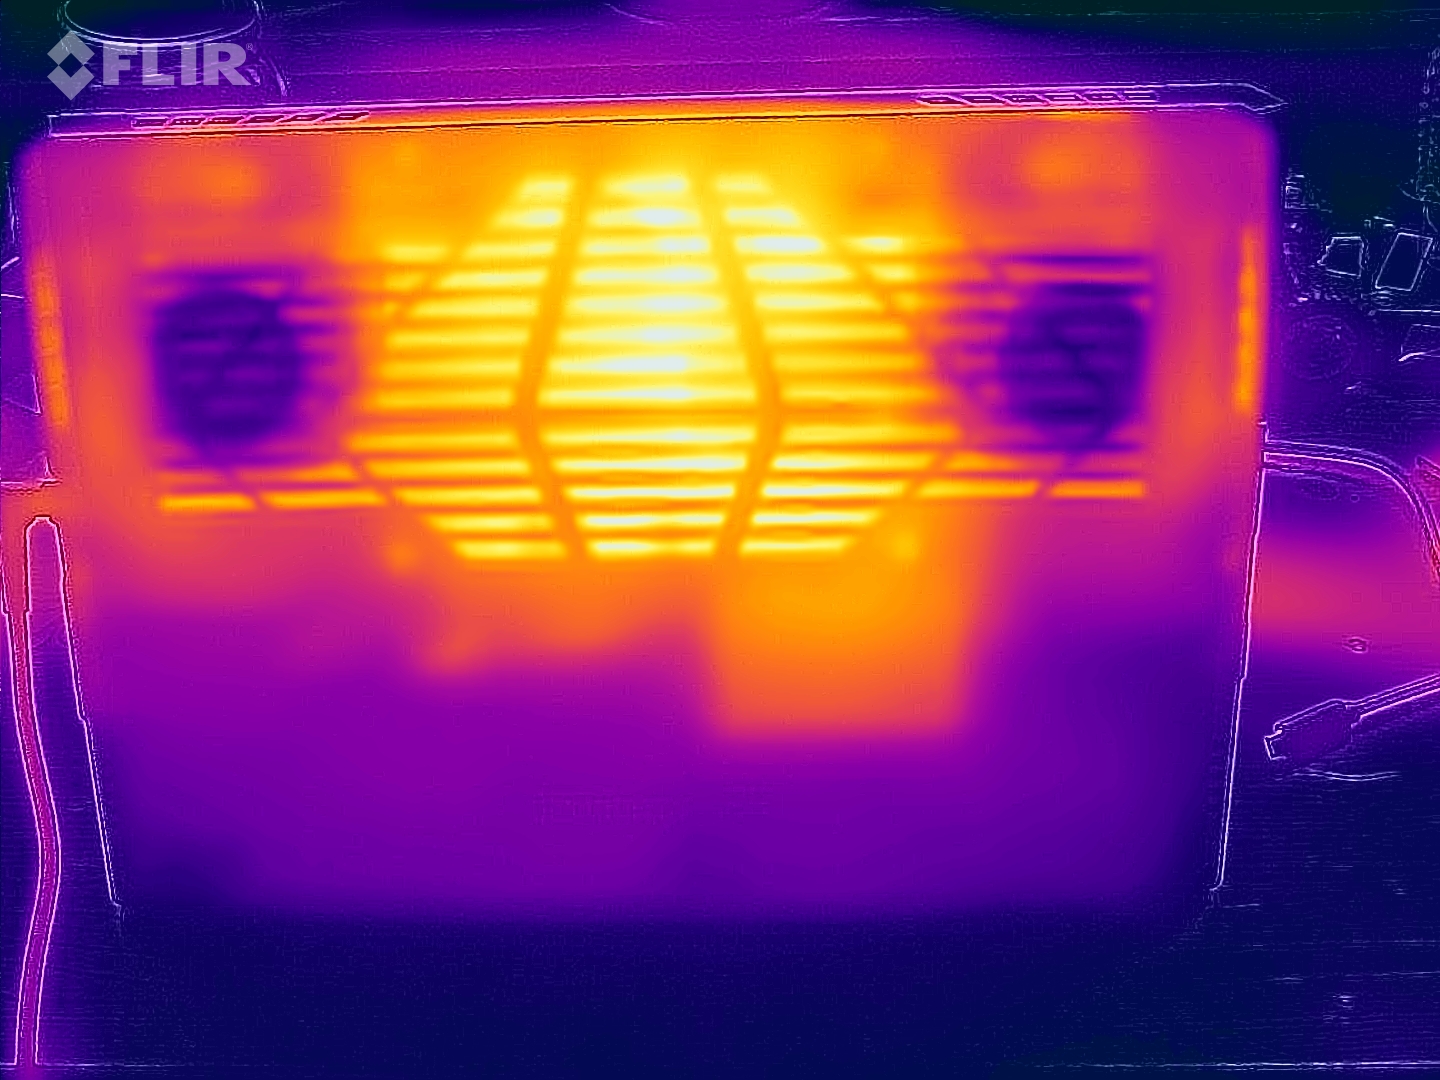
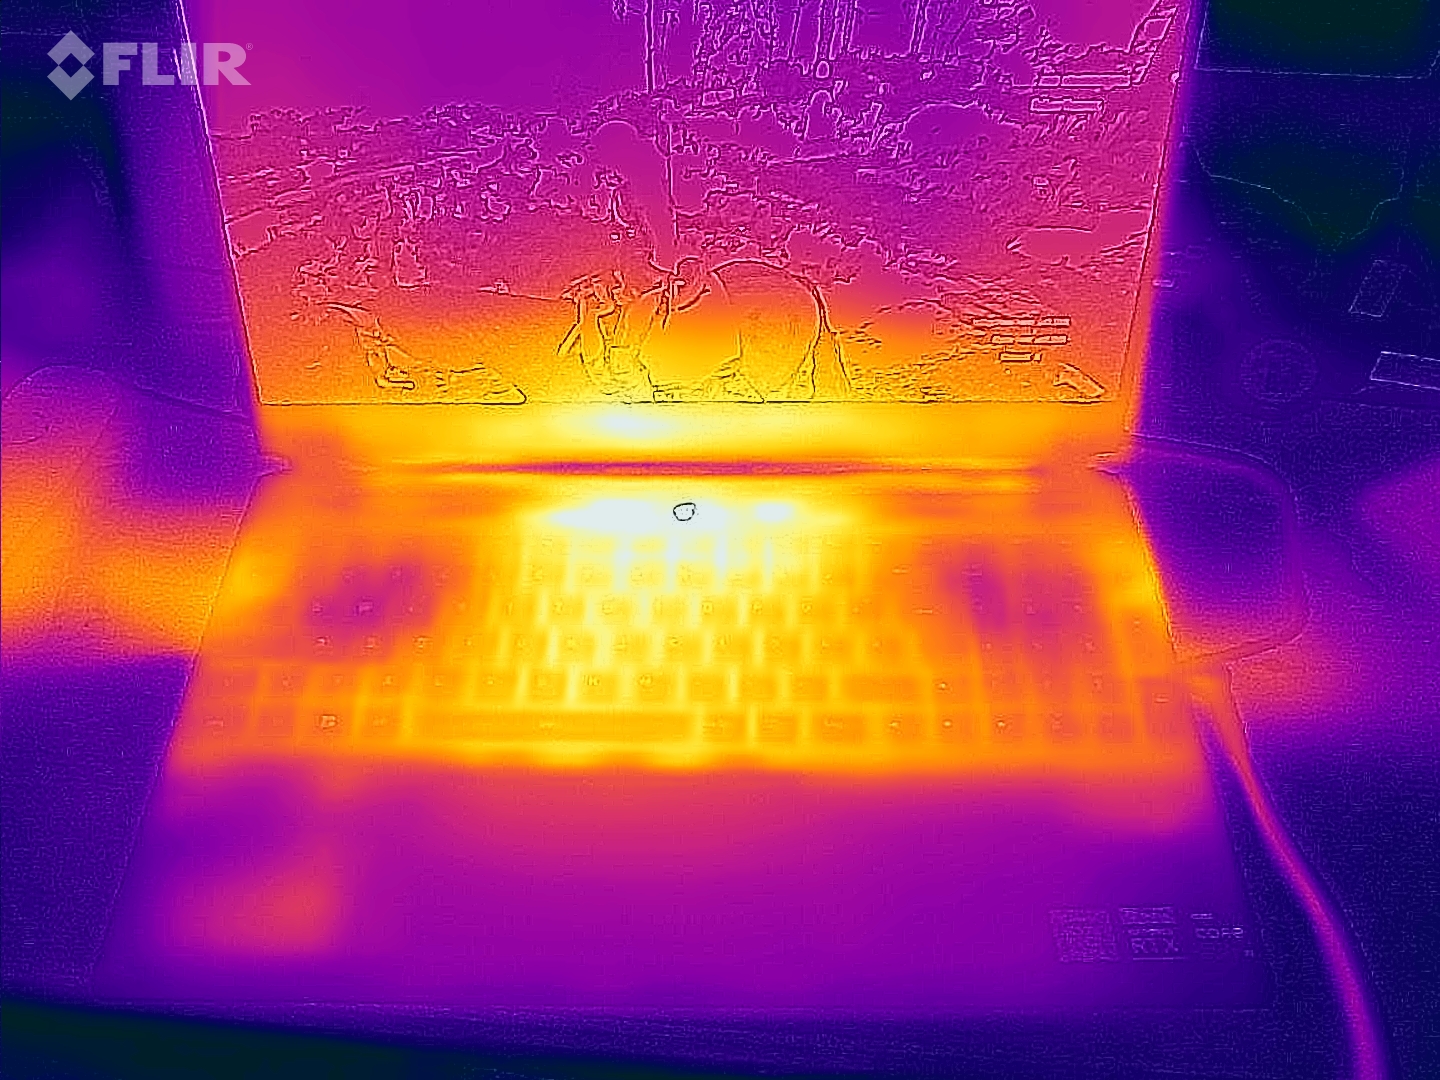
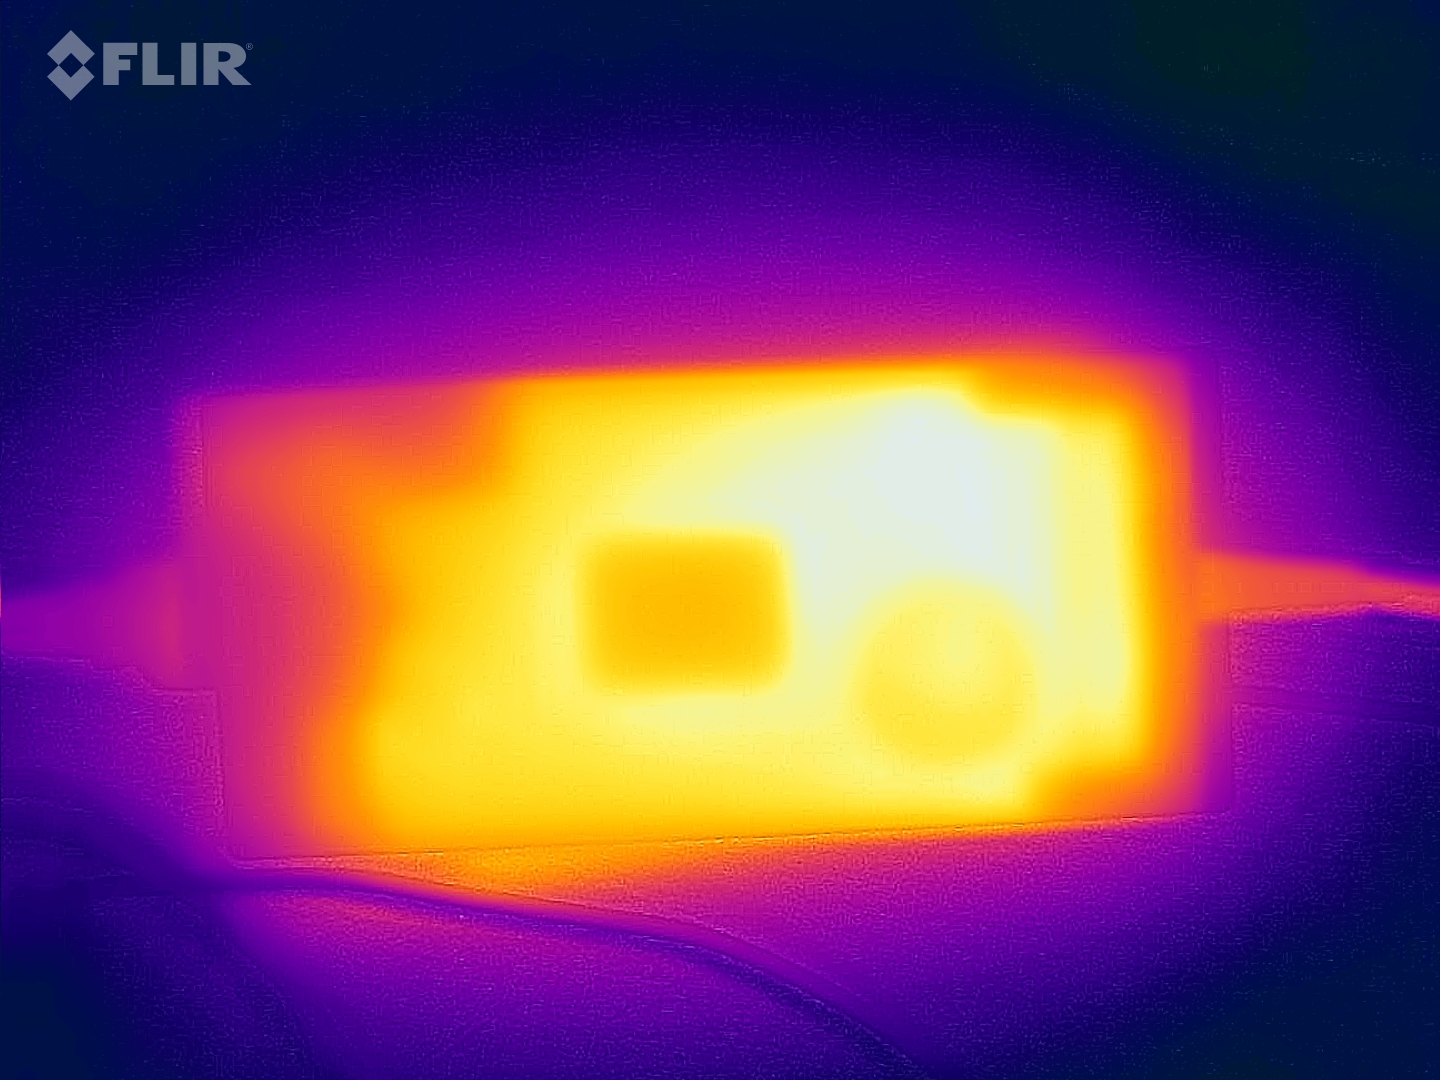
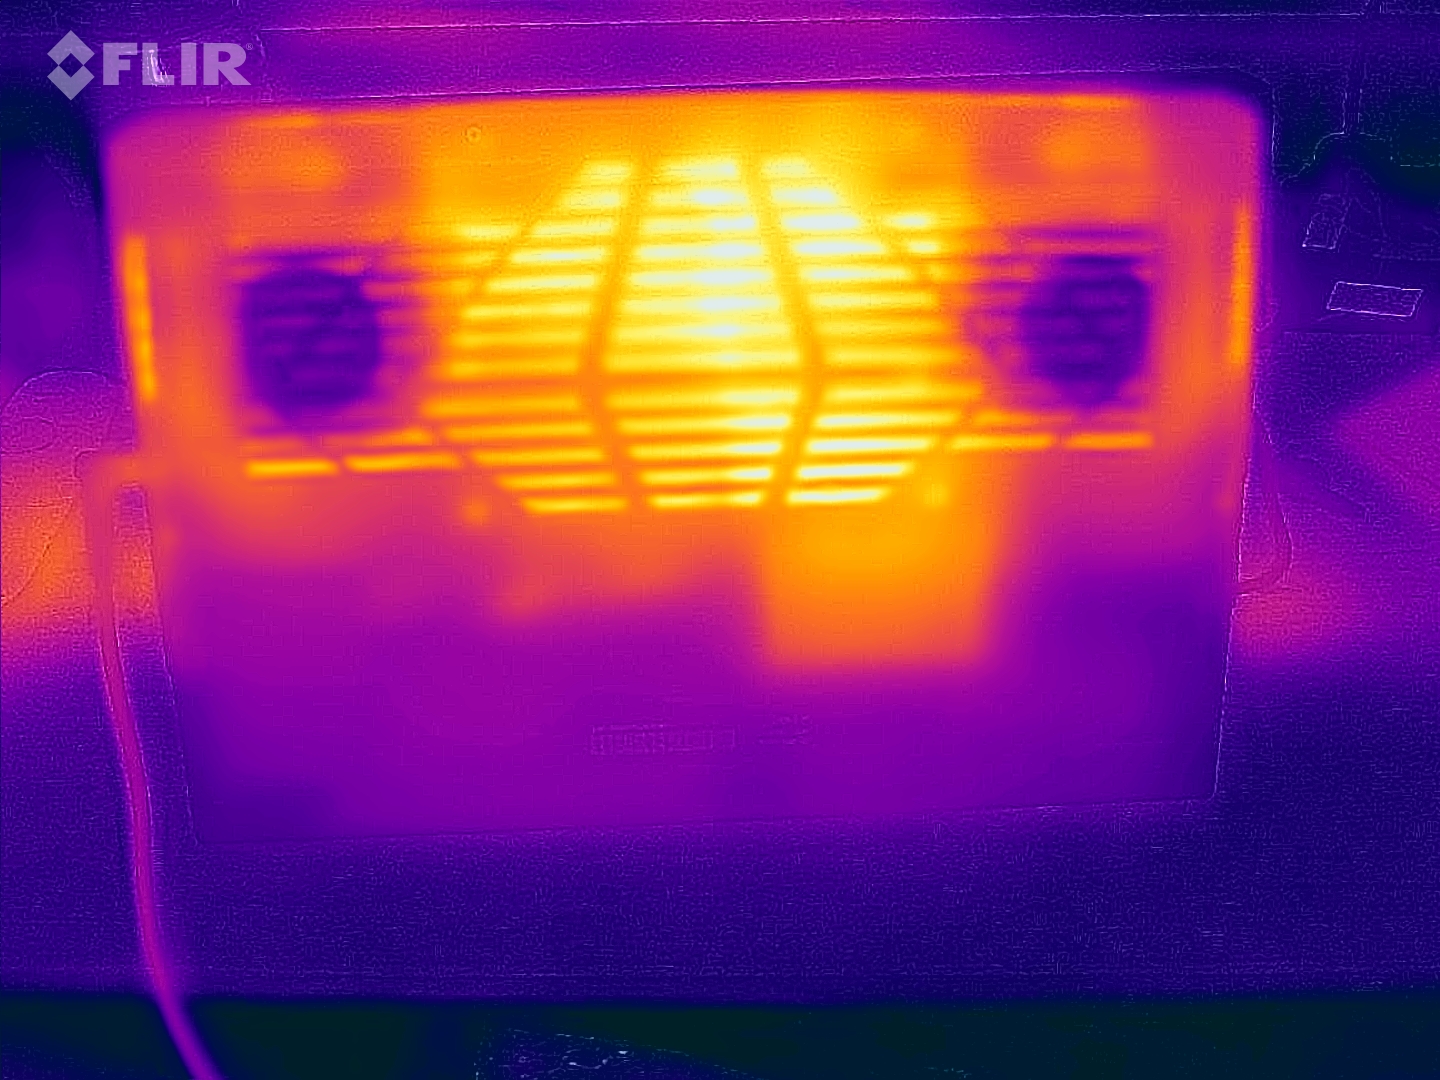
Temperatura
Si scalda sotto carico elevato, soprattutto nella parte inferiore al centro del dispositivo, verso il display. Tuttavia, con un massimo di 50 °C, la sua temperatura rientra nell'intervallo dei tipici computer portatili da gioco. Anche la parte superiore rimane sorprendentemente fresca, con un massimo di 43 °C. In modalità turbo, le temperature sono ancora più basse.
(±) La temperatura massima sul lato superiore è di 43 °C / 109 F, rispetto alla media di 40.4 °C / 105 F, che varia da 21.2 a 68.8 °C per questa classe Gaming.
(-) Il lato inferiore si riscalda fino ad un massimo di 50 °C / 122 F, rispetto alla media di 43.2 °C / 110 F
(+) In idle, la temperatura media del lato superiore è di 27.3 °C / 81 F, rispetto alla media deld ispositivo di 33.9 °C / 93 F.
(+) Riproducendo The Witcher 3, la temperatura media per il lato superiore e' di 29.7 °C / 85 F, rispetto alla media del dispositivo di 33.9 °C / 93 F.
(+) I poggiapolsi e il touchpad sono piu' freddi della temperatura della pelle con un massimo di 26 °C / 78.8 F e sono quindi freddi al tatto.
(+) La temperatura media della zona del palmo della mano di dispositivi simili e'stata di 28.8 °C / 83.8 F (+2.8 °C / 5 F).
| Aorus 15 YE5-54DEB34SH Intel Core i5-12500H, NVIDIA GeForce RTX 3080 Ti Laptop GPU | Aorus 15 BSF Intel Core i7-13700H, NVIDIA GeForce RTX 4070 Laptop GPU | Captiva Advanced Gaming I74-121 Intel Core i5-13500H, NVIDIA GeForce RTX 4060 Laptop GPU | HP Victus 16-r0077ng Intel Core i7-13700H, NVIDIA GeForce RTX 4070 Laptop GPU | Dell XPS 15 9530 RTX 4070 Intel Core i7-13700H, NVIDIA GeForce RTX 4070 Laptop GPU | HP Omen 16-wf000 Intel Core i7-13700HX, NVIDIA GeForce RTX 4080 Laptop GPU | |
|---|---|---|---|---|---|---|
| Heat | -8% | 4% | -8% | 1% | 5% | |
| Maximum Upper Side * (°C) | 43 | 48 -12% | 41 5% | 51 -19% | 45.6 -6% | 45 -5% |
| Maximum Bottom * (°C) | 50 | 47 6% | 42 16% | 54 -8% | 42 16% | 48.8 2% |
| Idle Upper Side * (°C) | 33 | 39 -18% | 32 3% | 37 -12% | 34.4 -4% | 29.2 12% |
| Idle Bottom * (°C) | 32 | 35 -9% | 35 -9% | 29 9% | 33.2 -4% | 28.8 10% |
* ... Meglio usare valori piccoli
Altoparlanti
Un aspetto positivo è il volume decente dei diffusori. Tuttavia, i bassi sono quasi assenti e anche i medi e gli alti non sono particolarmente equilibrati.
Per collegare dispositivi audio esterni è disponibile un jack combinato da 3,5 mm per microfono e cuffie.
Aorus 15 YE5-54DEB34SH analisi audio
(+) | gli altoparlanti sono relativamente potenti (84.15 dB)
Bassi 100 - 315 Hz
(-) | quasi nessun basso - in media 27.1% inferiori alla media
(±) | la linearità dei bassi è media (12.4% delta rispetto alla precedente frequenza)
Medi 400 - 2000 Hz
(±) | medi elevati - circa 6.2% superiore alla media
(±) | linearità dei medi adeguata (7.7% delta rispetto alla precedente frequenza)
Alti 2 - 16 kHz
(±) | alti elevati - circa 7.4% superiori alla media
(±) | la linearità degli alti è media (7.5% delta rispetto alla precedente frequenza)
Nel complesso 100 - 16.000 Hz
(±) | la linearità complessiva del suono è media (22.5% di differenza rispetto alla media
Rispetto alla stessa classe
» 81% di tutti i dispositivi testati in questa classe è stato migliore, 5% simile, 14% peggiore
» Il migliore ha avuto un delta di 6%, medio di 18%, peggiore di 132%
Rispetto a tutti i dispositivi testati
» 66% di tutti i dispositivi testati in questa classe è stato migliore, 6% similare, 28% peggiore
» Il migliore ha avuto un delta di 4%, medio di 23%, peggiore di 134%
Apple MacBook Pro 16 2021 M1 Pro analisi audio
(+) | gli altoparlanti sono relativamente potenti (84.7 dB)
Bassi 100 - 315 Hz
(+) | bassi buoni - solo 3.8% dalla media
(+) | bassi in lineaa (5.2% delta rispetto alla precedente frequenza)
Medi 400 - 2000 Hz
(+) | medi bilanciati - solo only 1.3% rispetto alla media
(+) | medi lineari (2.1% delta rispetto alla precedente frequenza)
Alti 2 - 16 kHz
(+) | Alti bilanciati - appena 1.9% dalla media
(+) | alti lineari (2.7% delta rispetto alla precedente frequenza)
Nel complesso 100 - 16.000 Hz
(+) | suono nel complesso lineare (4.6% differenza dalla media)
Rispetto alla stessa classe
» 0% di tutti i dispositivi testati in questa classe è stato migliore, 0% simile, 100% peggiore
» Il migliore ha avuto un delta di 5%, medio di 17%, peggiore di 45%
Rispetto a tutti i dispositivi testati
» 0% di tutti i dispositivi testati in questa classe è stato migliore, 0% similare, 100% peggiore
» Il migliore ha avuto un delta di 4%, medio di 23%, peggiore di 134%
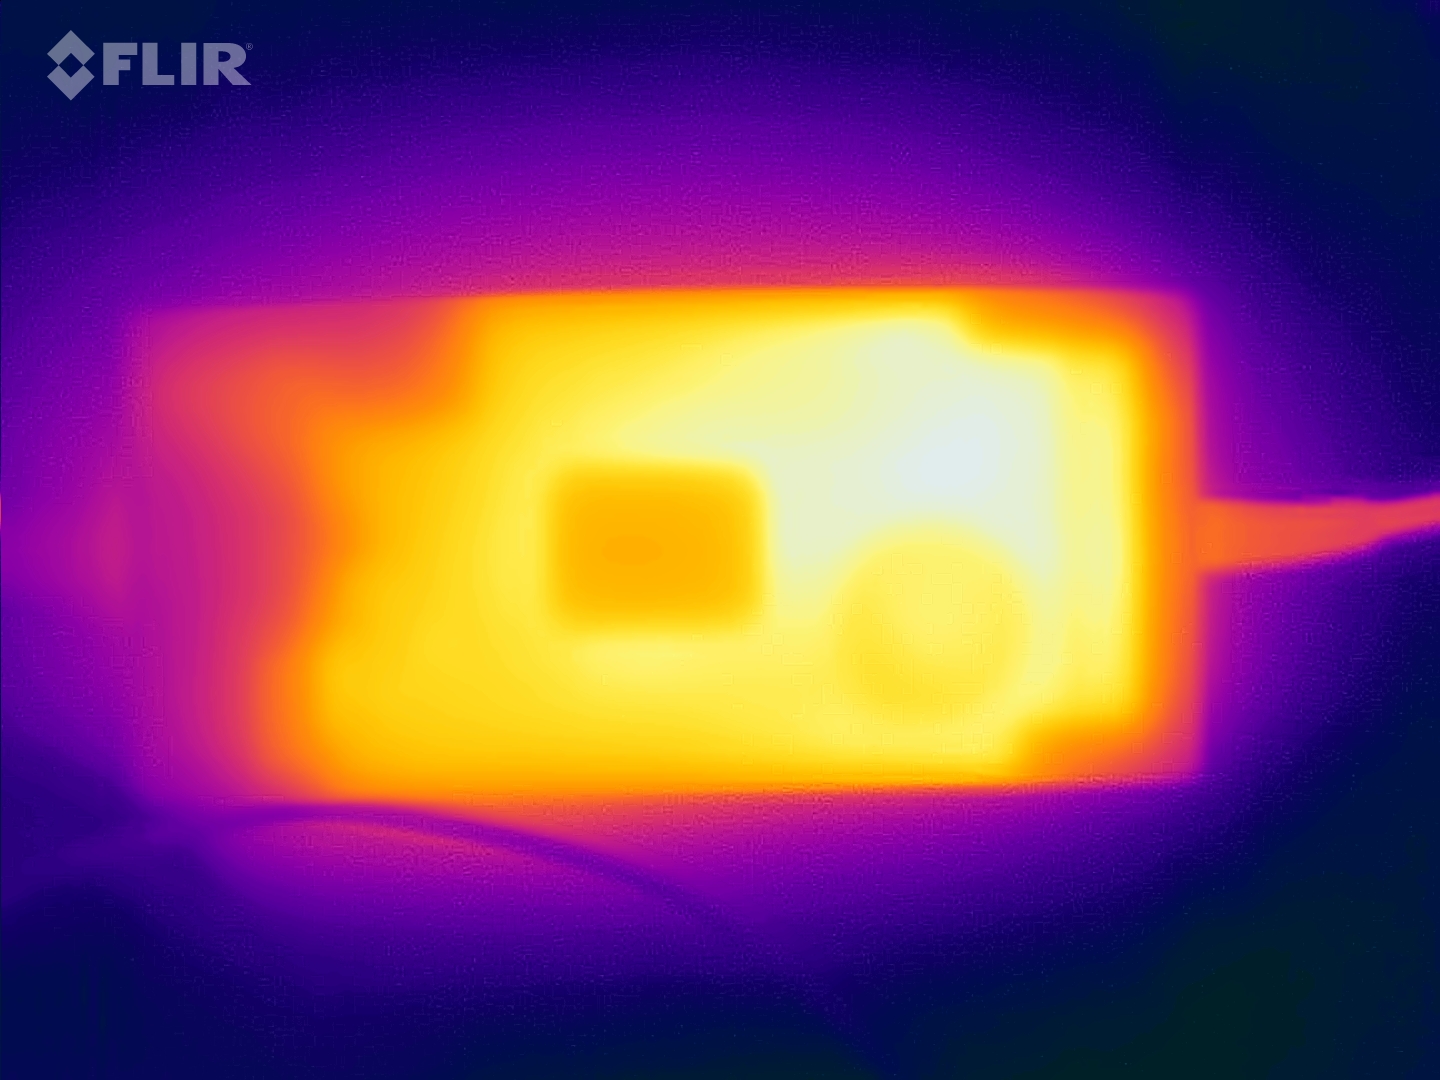
Consumo di energia
Ok, la RTX 3080 Ti non è esattamente frugale - tecnicamente, l'attuale generazione di CPU/GPU dovrebbe essere ormai più efficiente.
Per consumare "poco" quanto la Captiva quando si gioca a The Witcher 3, ad esempio, è necessario impostare il nostro Aorus in modalità riunione o Risparmio energetico. Tuttavia, anche le frequenze di aggiornamento nel gioco si attestano su un livello un po' sorprendente (vedere la tabella nella sezione emissioni acustiche).
Soprattutto, spiccano negativamente i 150 watt che abbiamo misurato nel nostro test 3DMark06 (carico medio); al contrario, il Captiva consuma solo 85 watt. In generale, anche in idle, ci si deve aspettare un consumo leggermente superiore, ma questo viene messo in prospettiva quando si gioca.
Abbiamo misurato un valore massimo e temporaneo di 204 watt, che l'alimentatore da 240 watt di Delta può gestire senza problemi.
| Off / Standby | |
| Idle | |
| Sotto carico |
|
Leggenda:
min: | |
| Aorus 15 YE5-54DEB34SH GeForce RTX 3080 Ti Laptop GPU, i5-12500H, Gigabyte AG470S1TB-SI B10 | Aorus 15 BSF GeForce RTX 4070 Laptop GPU, i7-13700H, Gigabyte AG470S1TB-SI B10 | Captiva Advanced Gaming I74-121 GeForce RTX 4060 Laptop GPU, i5-13500H, Samsung SSD 980 1TB MZ-V8V1T0BW | HP Victus 16-r0077ng GeForce RTX 4070 Laptop GPU, i7-13700H, Kioxia XG8 KXG80ZNV1T02 | Dell XPS 15 9530 RTX 4070 GeForce RTX 4070 Laptop GPU, i7-13700H, SK hynix PC801 HFS001TEJ9X101N | HP Omen 16-wf000 GeForce RTX 4080 Laptop GPU, i7-13700HX, SK hynix PC801 HFS002TEJ9X101N | |
|---|---|---|---|---|---|---|
| Power Consumption | 10% | 15% | 23% | 23% | -24% | |
| Idle 150cd/m2 * (Watt) | 16 | 12.4 22% | 18 -13% | 12.8 20% | 20.1 -26% | 23.2 -45% |
| 3DMark06 Return To Proxycon * (Watt) | 150 | 85 43% | ||||
| Witcher 3 ultra * (Watt) | 196 | 175.8 10% | 164 16% | 141.8 28% | 95.4 51% | 214 -9% |
| 1280x720 Prime95 28.10 and Furmark 1.25 * (Watt) | 204 | 210 -3% | 179 12% | 164.1 20% | 117.2 43% | 240 -18% |
* ... Meglio usare valori piccoli
Power consumption Witcher 3 / stress test
Power consumption with external monitor
Tempi di esecuzione
L'Aorus delude in termini di autonomia, presumibilmente a causa dell'aumento del consumo in idle. Gigabyte ha installato una generosa batteria da 99-Wh, ma i tempi di esecuzione sono rimasti allo stesso livello di quelli di Captiva Captiva con una batteria da 53 Wh! L'Aorus BSF di generazione attuale con un i7-13700H e una RTX 4070 è durato il 65% in più con la sua batteria da 99-Wh, e quasi il doppio nel test WLAN! Ha resistito per oltre 10 ore, mentre il nostro Aorus è durato meno di 5,5 ore.
| Aorus 15 YE5-54DEB34SH i5-12500H, GeForce RTX 3080 Ti Laptop GPU, 99 Wh | Aorus 15 BSF i7-13700H, GeForce RTX 4070 Laptop GPU, 99 Wh | Captiva Advanced Gaming I74-121 i5-13500H, GeForce RTX 4060 Laptop GPU, 53 Wh | HP Victus 16-r0077ng i7-13700H, GeForce RTX 4070 Laptop GPU, 83 Wh | Dell XPS 15 9530 RTX 4070 i7-13700H, GeForce RTX 4070 Laptop GPU, 86 Wh | HP Omen 16-wf000 i7-13700HX, GeForce RTX 4080 Laptop GPU, 83 Wh | Media della classe Gaming | |
|---|---|---|---|---|---|---|---|
| Autonomia della batteria | 64% | -5% | 34% | 20% | -20% | 26% | |
| H.264 (h) | 5.3 | 9 70% | 4.9 -8% | 8.32 ? 57% | |||
| WiFi v1.3 (h) | 5.3 | 10.3 94% | 5.3 0% | 7.1 34% | 8 51% | 5.1 -4% | 7.11 ? 34% |
| Load (h) | 1.7 | 2.2 29% | 1.6 -6% | 1.5 -12% | 1.1 -35% | 1.502 ? -12% | |
| Reader / Idle (h) | 10.9 | 11.5 | 5.5 | 8.27 ? |
Pro
Contro
Verdetto - Decisamente competitivo!


La combinazione di una CPU Gen-12 e di una RTX 3080 Ti non è affatto un ricordo del passato, soprattutto per quanto riguarda le prestazioni (3D). L'Aorus 15 YE5 è in grado di battere la maggior parte degli altri portatili da gioco con una RTX 4070, il che lo rende degno di essere preso in considerazione, soprattutto per quanto riguarda il suo prezzo basso. Nonostante ciò, l'Aorus non ha rinunciato a caratteristiche moderne come Thunderbolt 4, un SSD veloce o un design completo come molti dei suoi concorrenti.
La sua scarsa efficienza non è più del tutto aggiornata, il che si riflette soprattutto nei tempi di esecuzione deludenti del portatile, nonostante la batteria di grandi dimensioni. La sua vecchia webcam da 720p potrebbe non essere un no-go assoluto, tuttavia, per i giocatori, questo è un chiaro svantaggio. Una caratteristica fastidiosa, tipica di Aorus, è che il dispositivo passa in standby molto rapidamente non appena si chiude il display di 45 gradi.
L'Aorus 15 YE5 offre prestazioni di gioco molto forti a un prezzo basso - senza sembrare economico, come fanno altri concorrenti più costosi. La sua GPU di ultima generazione è particolarmente impressionante quando si tratta di prestazioni 3D, mentre l'efficienza e i tempi di esecuzione sono carenti.
Sono disponibili alcune alternative di prezzo simile, come MSI Katana con RTX 4070. Tuttavia, l'Aorus dovrebbe essere leggermente più veloce in molti giochi. Inoltre, la Katana non è dotata di Thunderbolt 4 e non ha una sensazione di alta qualità. A sua volta, MSI beneficia di tempi di esecuzione più lunghi. Il HP Victus 16 si comporta in modo simile - costa anche un po' di più, ma non è così veloce o di alta qualità come l'Aorus. Attualmente dovrà spendere circa 300 dollari in più per acquistare l'Aorus di ultima generazione.
Prezzo e disponibilità
L'Aorus 15 YE5 è attualmente in vendita al prezzo di circa 1.500 dollari. Al momento della scrittura, non siamo riusciti a trovarlo in vendita presso nessun rivenditore online negli Stati Uniti.
Aorus 15 YE5-54DEB34SH
- 12/15/2023 v7 (old)
Christian Hintze
Transparency
La selezione dei dispositivi da recensire viene effettuata dalla nostra redazione. Il campione di prova è stato fornito all'autore come prestito dal produttore o dal rivenditore ai fini di questa recensione. L'istituto di credito non ha avuto alcuna influenza su questa recensione, né il produttore ne ha ricevuto una copia prima della pubblicazione. Non vi era alcun obbligo di pubblicare questa recensione. In quanto società mediatica indipendente, Notebookcheck non è soggetta all'autorità di produttori, rivenditori o editori.
Ecco come Notebookcheck esegue i test
Ogni anno, Notebookcheck esamina in modo indipendente centinaia di laptop e smartphone utilizzando procedure standardizzate per garantire che tutti i risultati siano comparabili. Da circa 20 anni sviluppiamo continuamente i nostri metodi di prova e nel frattempo stabiliamo gli standard di settore. Nei nostri laboratori di prova, tecnici ed editori esperti utilizzano apparecchiature di misurazione di alta qualità. Questi test comportano un processo di validazione in più fasi. Il nostro complesso sistema di valutazione si basa su centinaia di misurazioni e parametri di riferimento ben fondati, che mantengono l'obiettività.Price comparison

