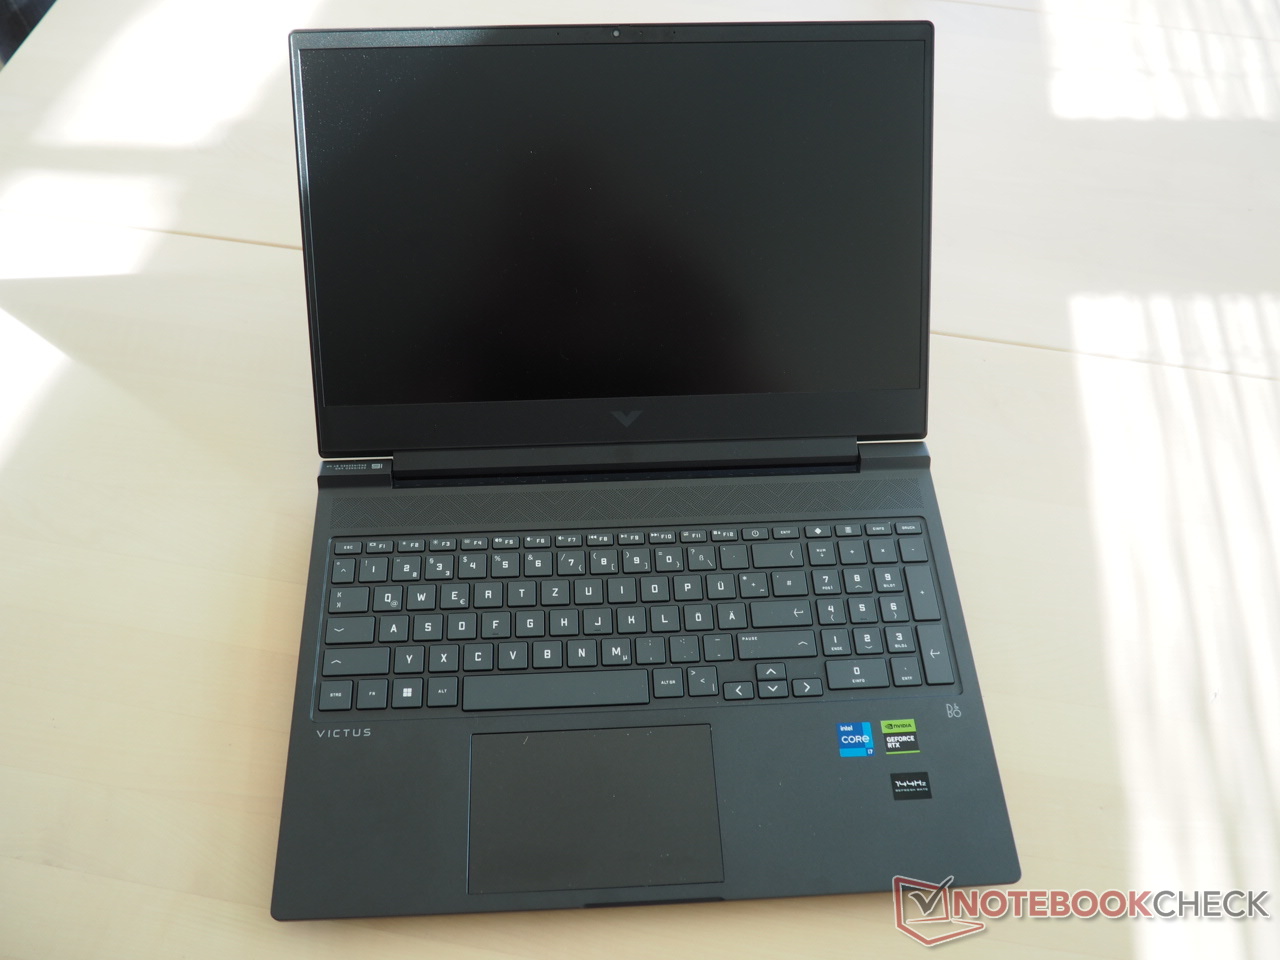
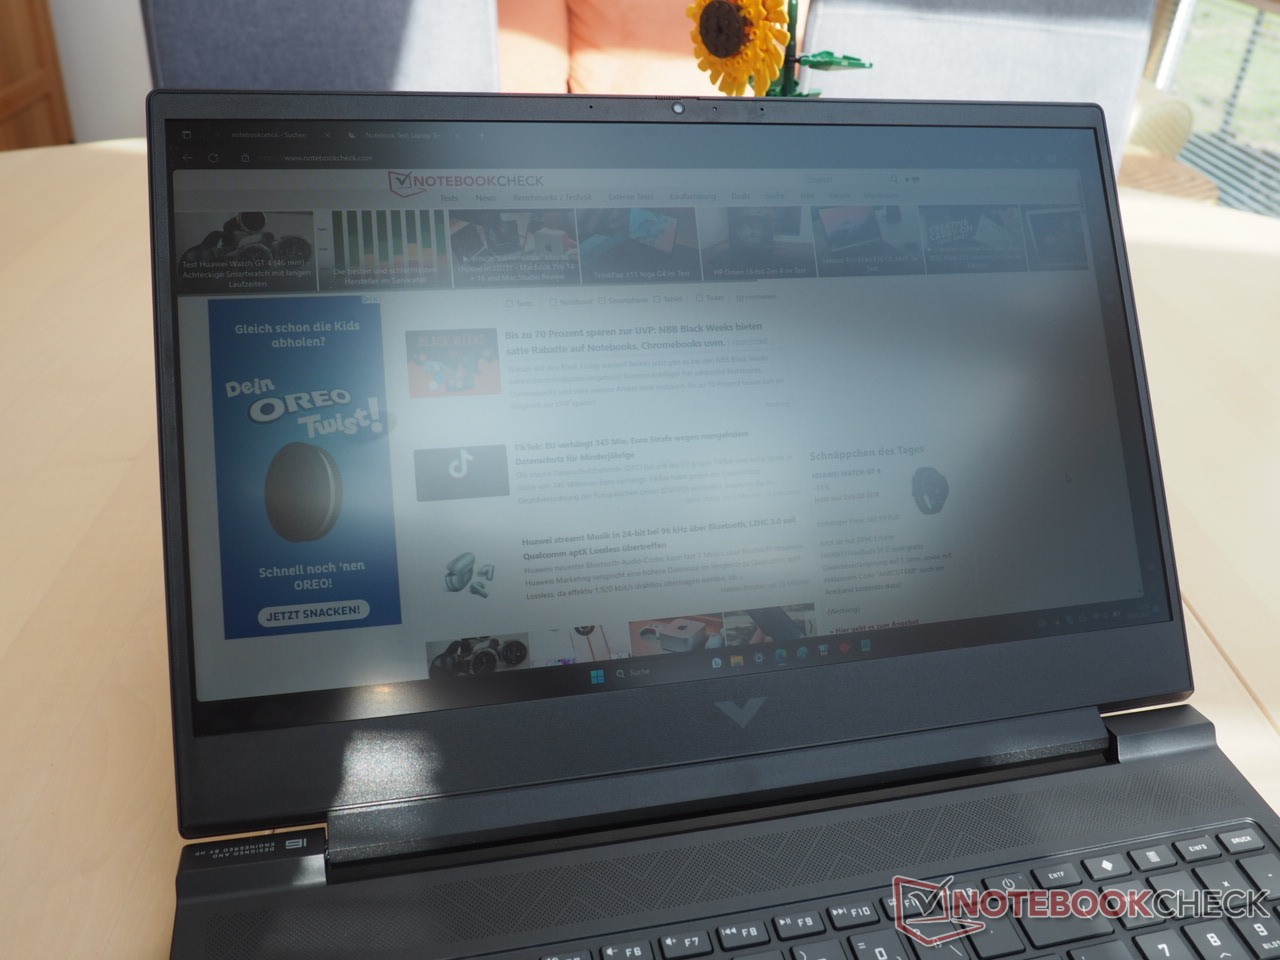
Recensione del portatile HP Victus 16: gamer Full HD con RTX 4070

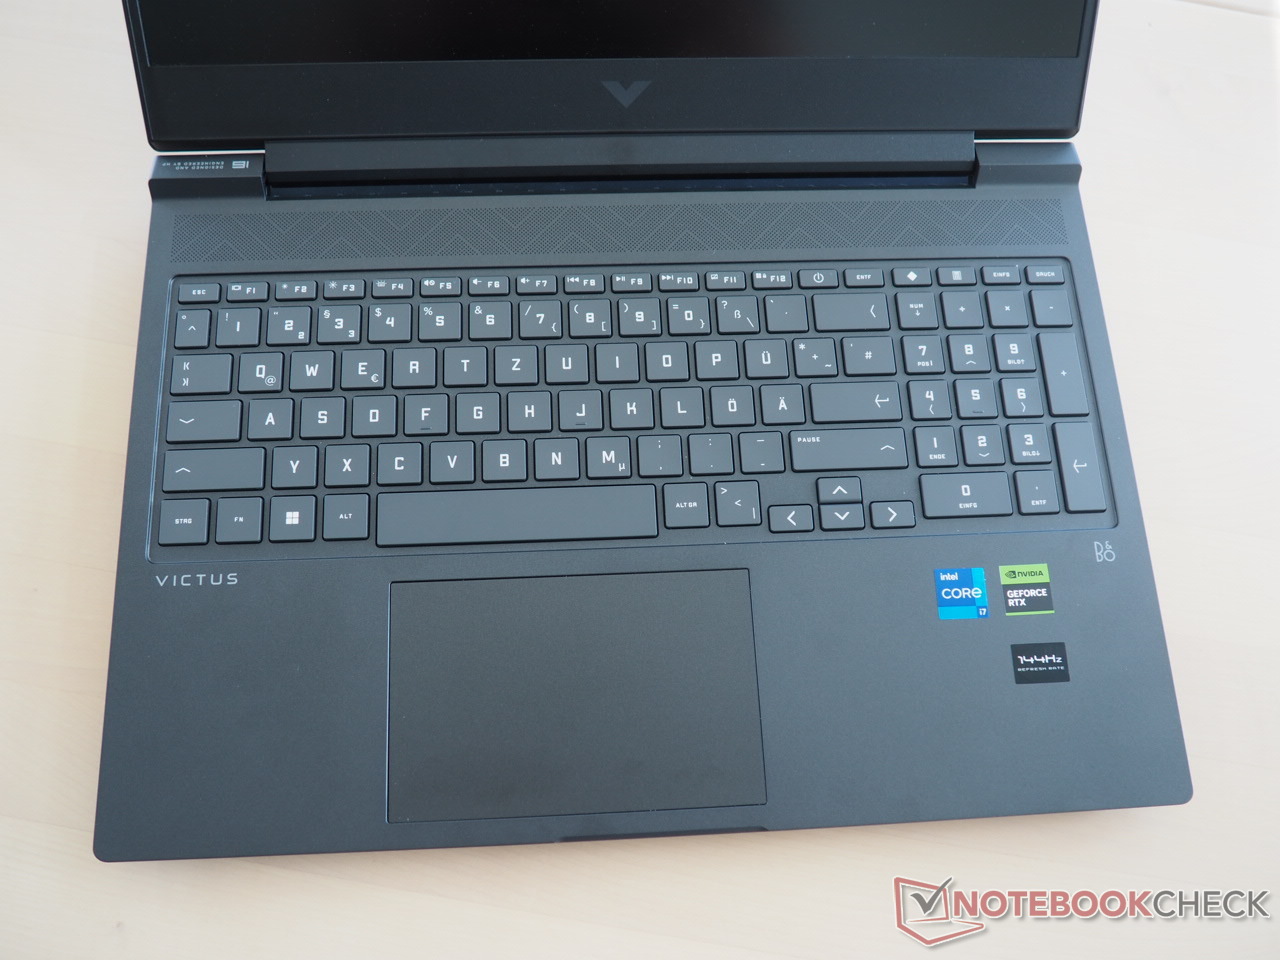
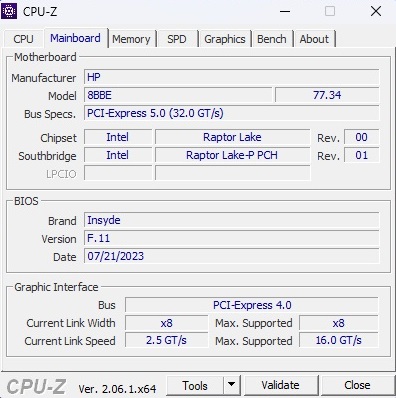
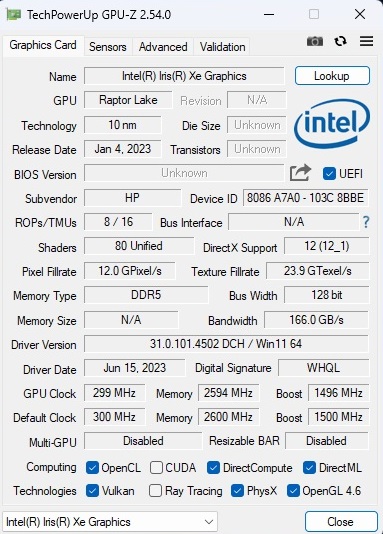
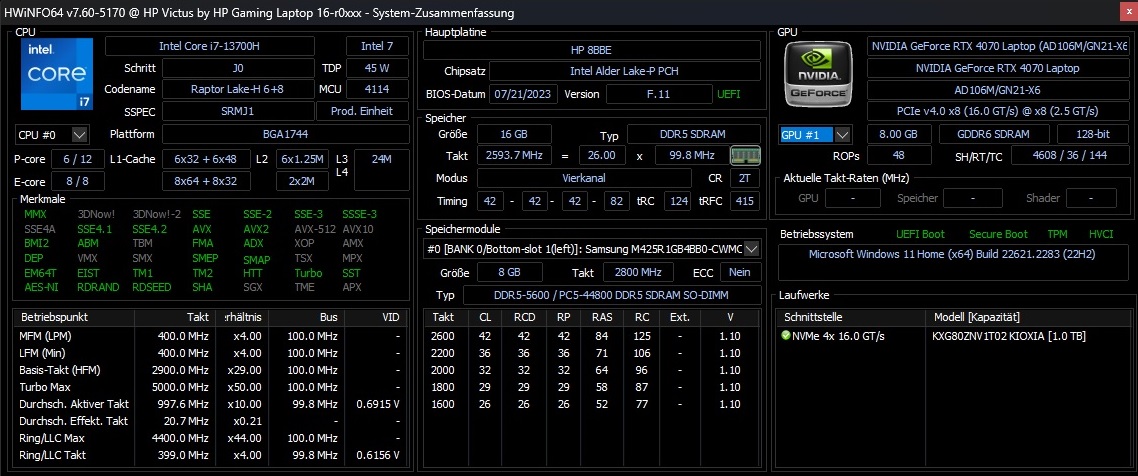
Come la serie Omen, anche il Victus è disponibile in diverse configurazioni hardware. La nostra unità di prova, con il suo Core i7-13700H e GeForce RTX 4070appartiene all'estremità superiore della scala di prestazioni. 16 GB di RAM DDR5-5600 e un'unità SSD M.2 NVMe da 1 TB sono anch'essi solidi per il 2023. Il display è un pannello IPS opaco in formato 16:9 a 1.920 x 1.080 e 144 Hz. Costo dell'intero pacchetto: almeno 1.439,99 dollari al momento.
Tra i concorrenti del Victus 16 ci sono altri gamer da 16 pollici, anch'essi dotati di una GeForce RTX 4070, come ilLenovo Legion Pro 5 16ARX8, il Acer Nitro 16 AN16-41, il Gigabyte Aero 16 OLED BSF e il MSI Stealth 16 Studio A13VGalcuni di questi utilizzano un processore AMD e appaiono tutti nelle tabelle seguenti come dispositivi di confronto.
Potenziali concorrenti a confronto
Punteggio | Data | Modello | Peso | Altezza | Dimensione | Risoluzione | Prezzo |
|---|---|---|---|---|---|---|---|
| 85.1 % v7 (old) | 09/2023 | HP Victus 16-r0077ng i7-13700H, GeForce RTX 4070 Laptop GPU | 2.4 kg | 24 mm | 16.10" | 1920x1080 | |
| 86.6 % v7 (old) | 09/2023 | HP Omen 16-xf0376ng R7 7840HS, GeForce RTX 4070 Laptop GPU | 2.4 kg | 23.5 mm | 16.10" | 1920x1080 | |
| 88.4 % v7 (old) | 05/2023 | Lenovo Legion Pro 5 16ARX8 R7 7745HX, GeForce RTX 4070 Laptop GPU | 2.5 kg | 26.8 mm | 16.00" | 2560x1600 | |
| 88.1 % v7 (old) | 06/2023 | Acer Nitro 16 AN16-41 R7 7735HS, GeForce RTX 4070 Laptop GPU | 2.7 kg | 27.9 mm | 16.00" | 2560x1600 | |
| 86.2 % v7 (old) | 03/2023 | Gigabyte AERO 16 OLED BSF i9-13900H, GeForce RTX 4070 Laptop GPU | 2.1 kg | 18 mm | 16.00" | 3840x2400 | |
| 88.8 % v7 (old) | 07/2023 | MSI Stealth 16 Studio A13VG i7-13700H, GeForce RTX 4070 Laptop GPU | 2 kg | 19.95 mm | 16.00" | 2560x1600 |
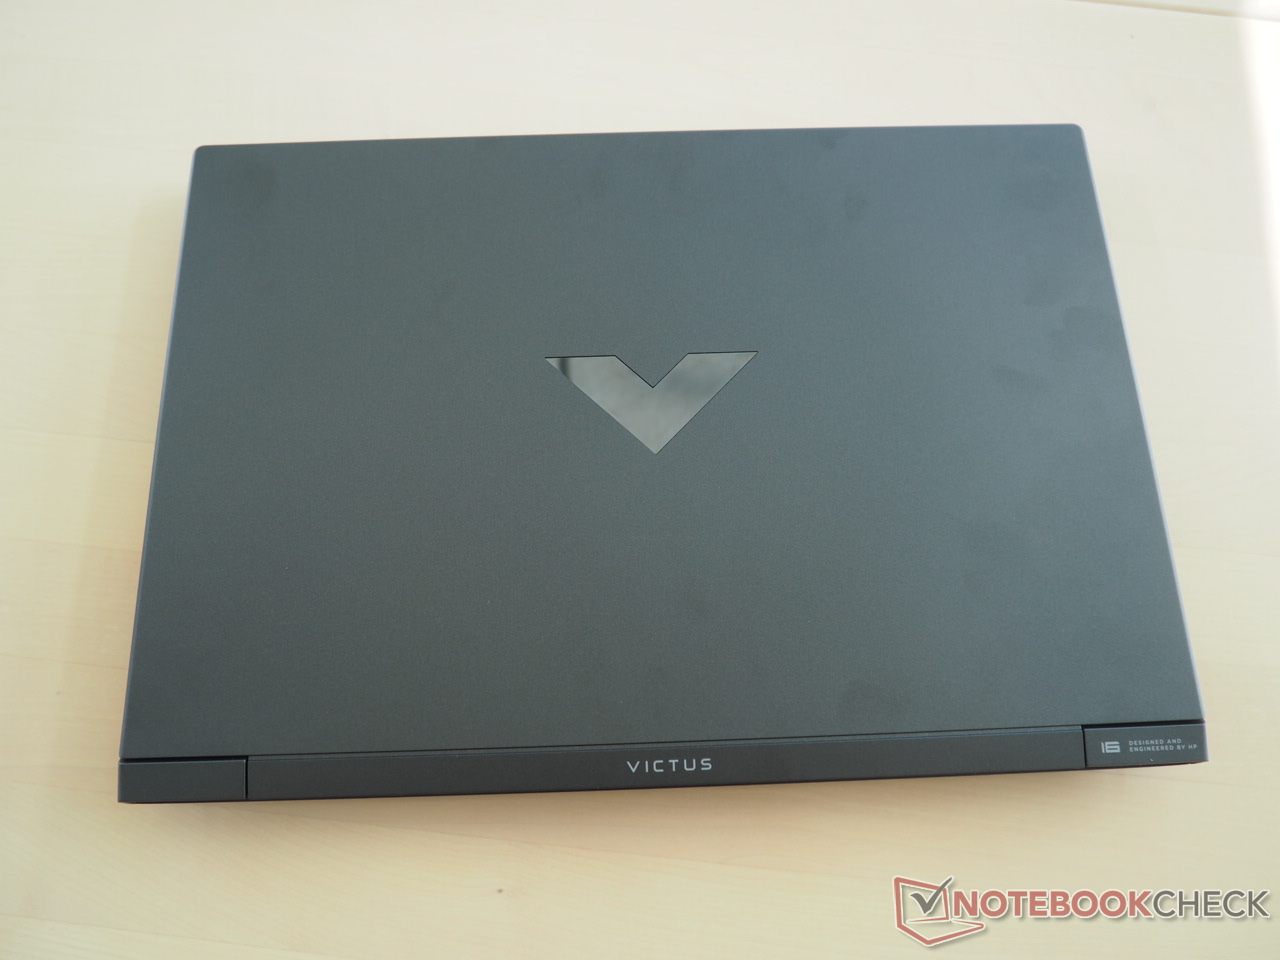
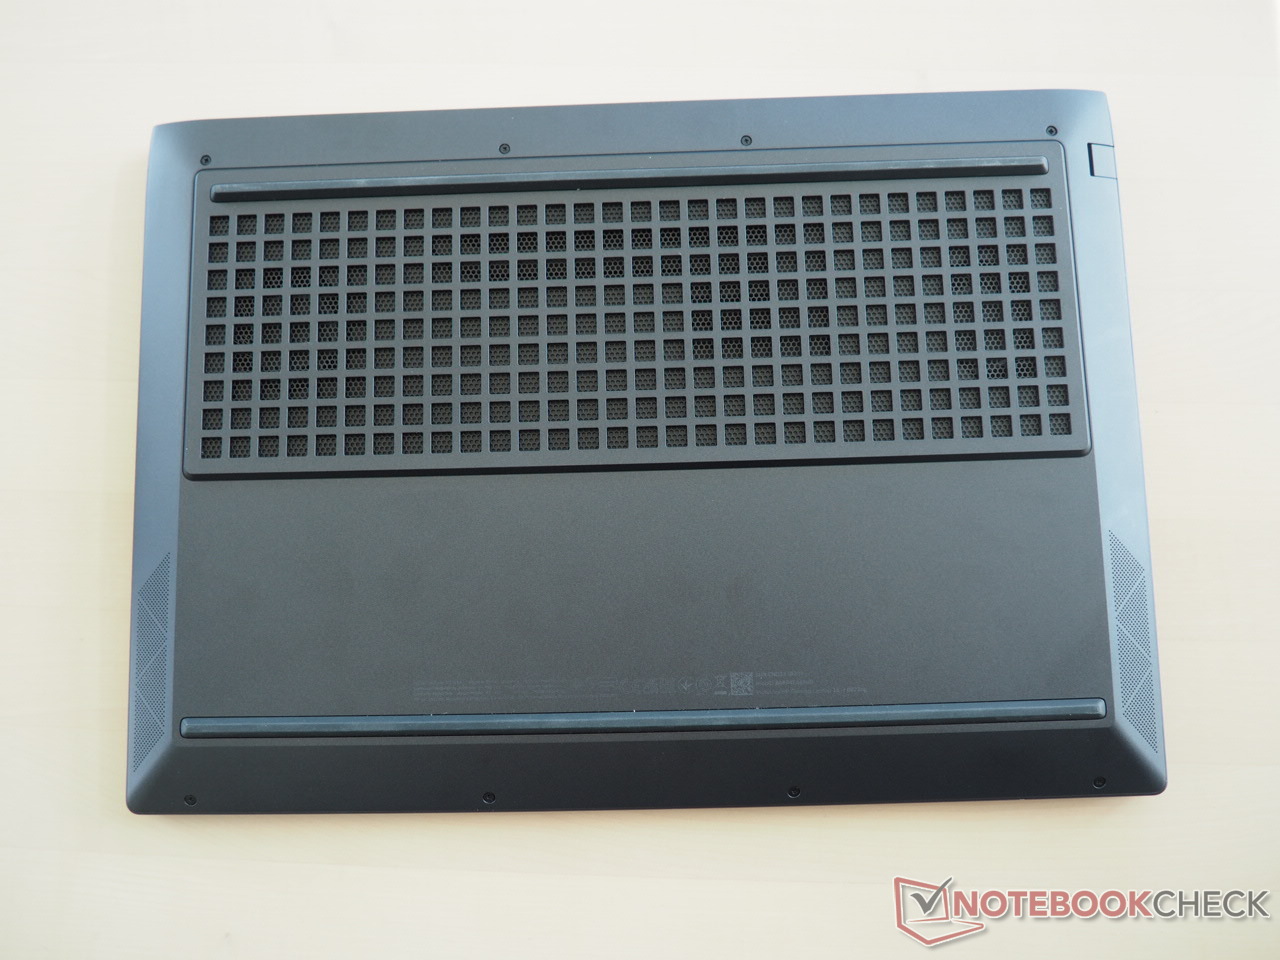
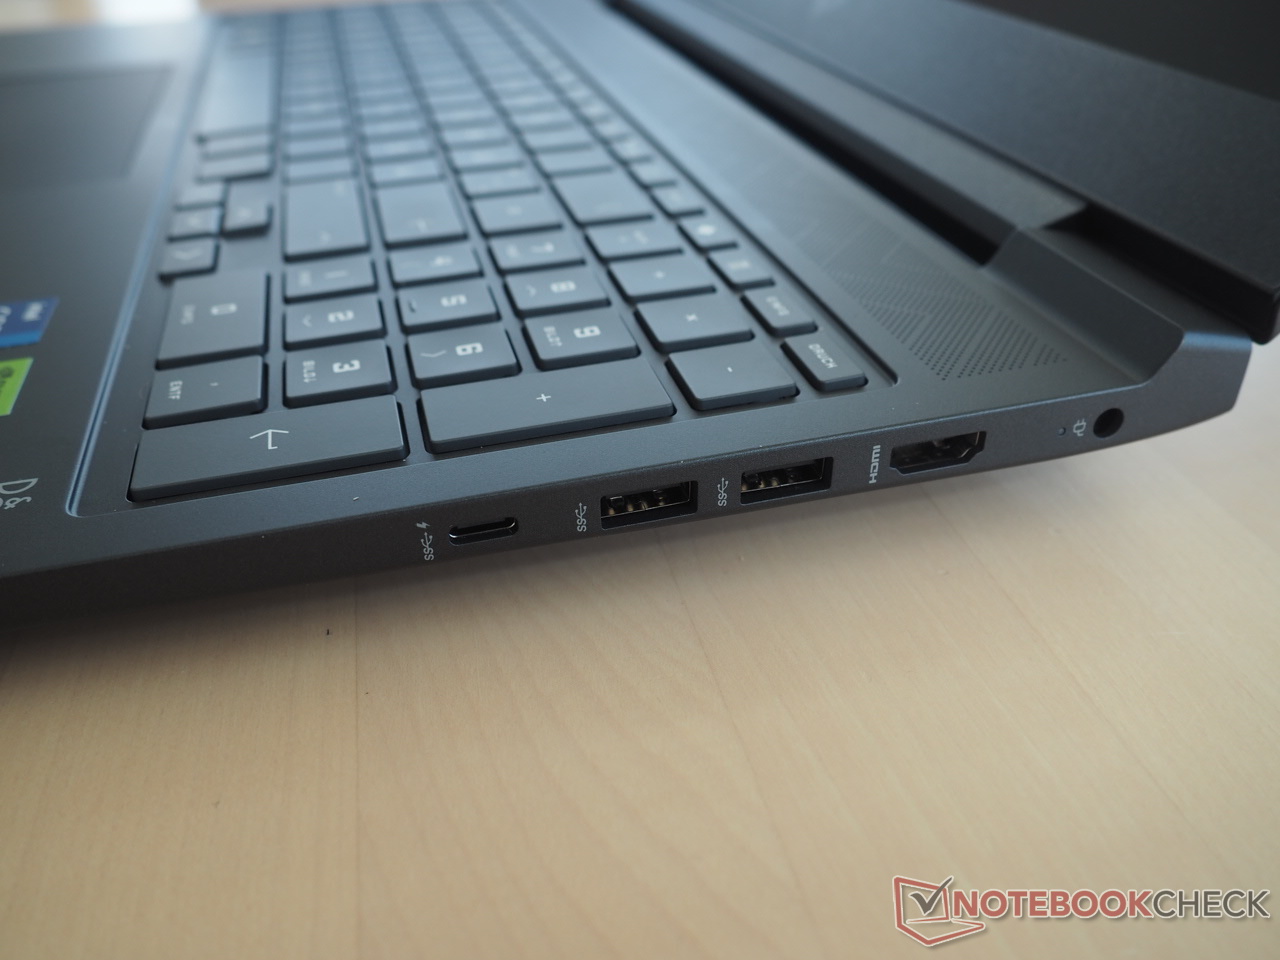
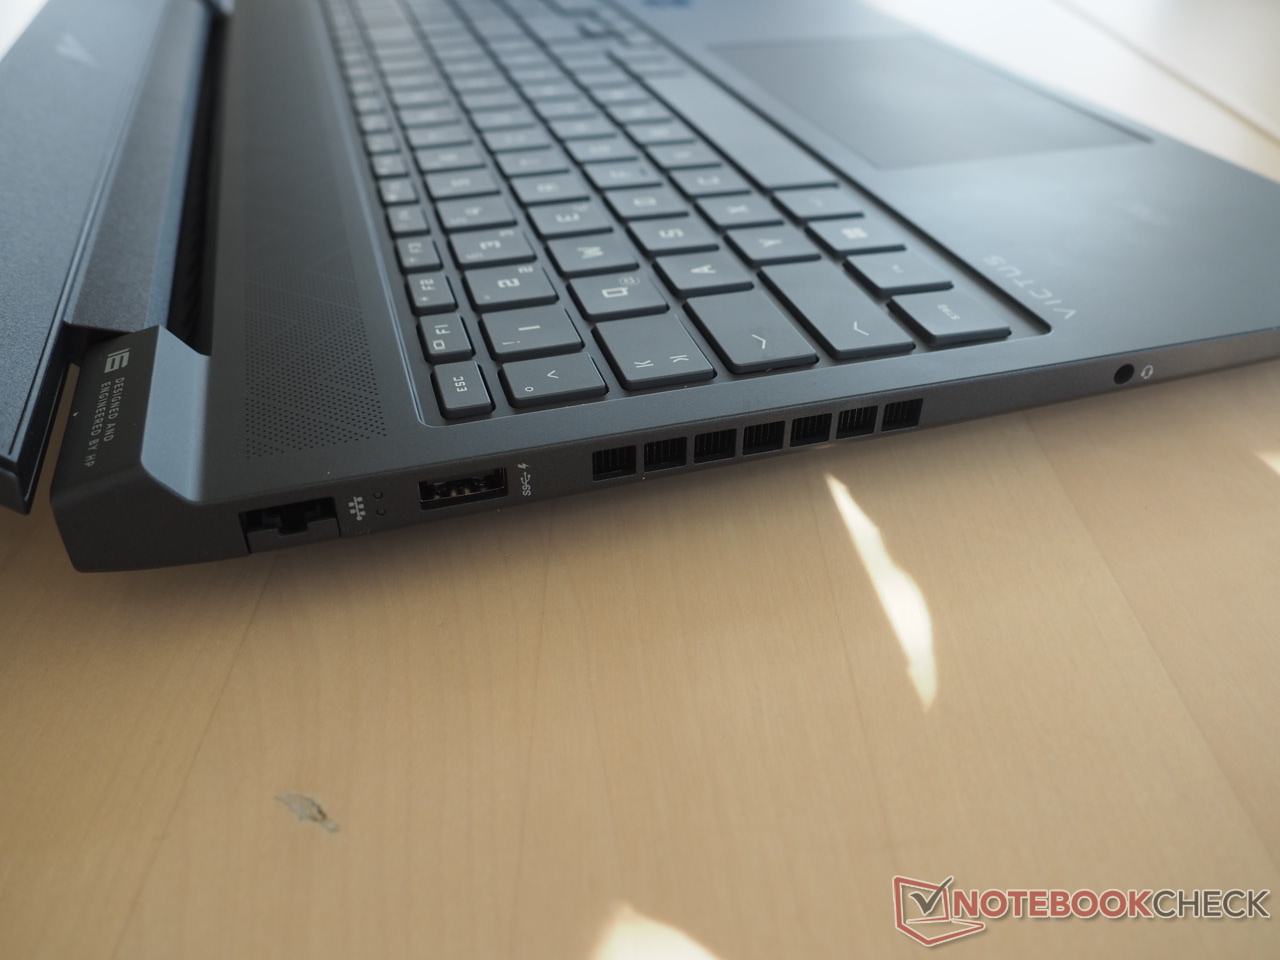
Poiché lo chassis è identico a quello della versione statunitense recentemente recensita con un Core i5-13500HX e una GeForce RTX 4050,in questa recensione non ci soffermiamo sui dettagli del telaio, delle apparecchiature e dei dispositivi di input. Potete trovare tutte le informazioni pertinenti nella recensione corrispondente qui.
Comunicazione
Webcam


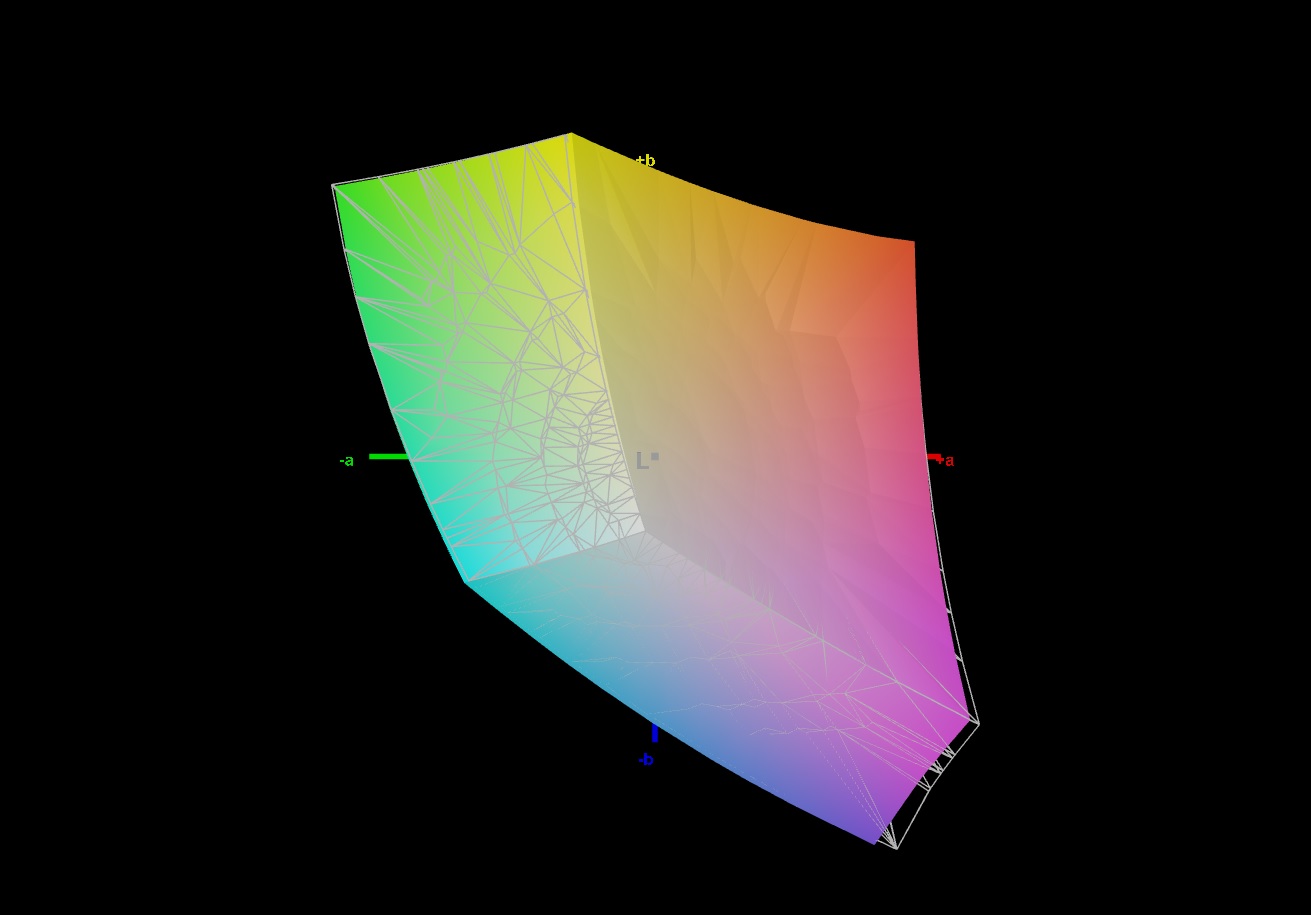
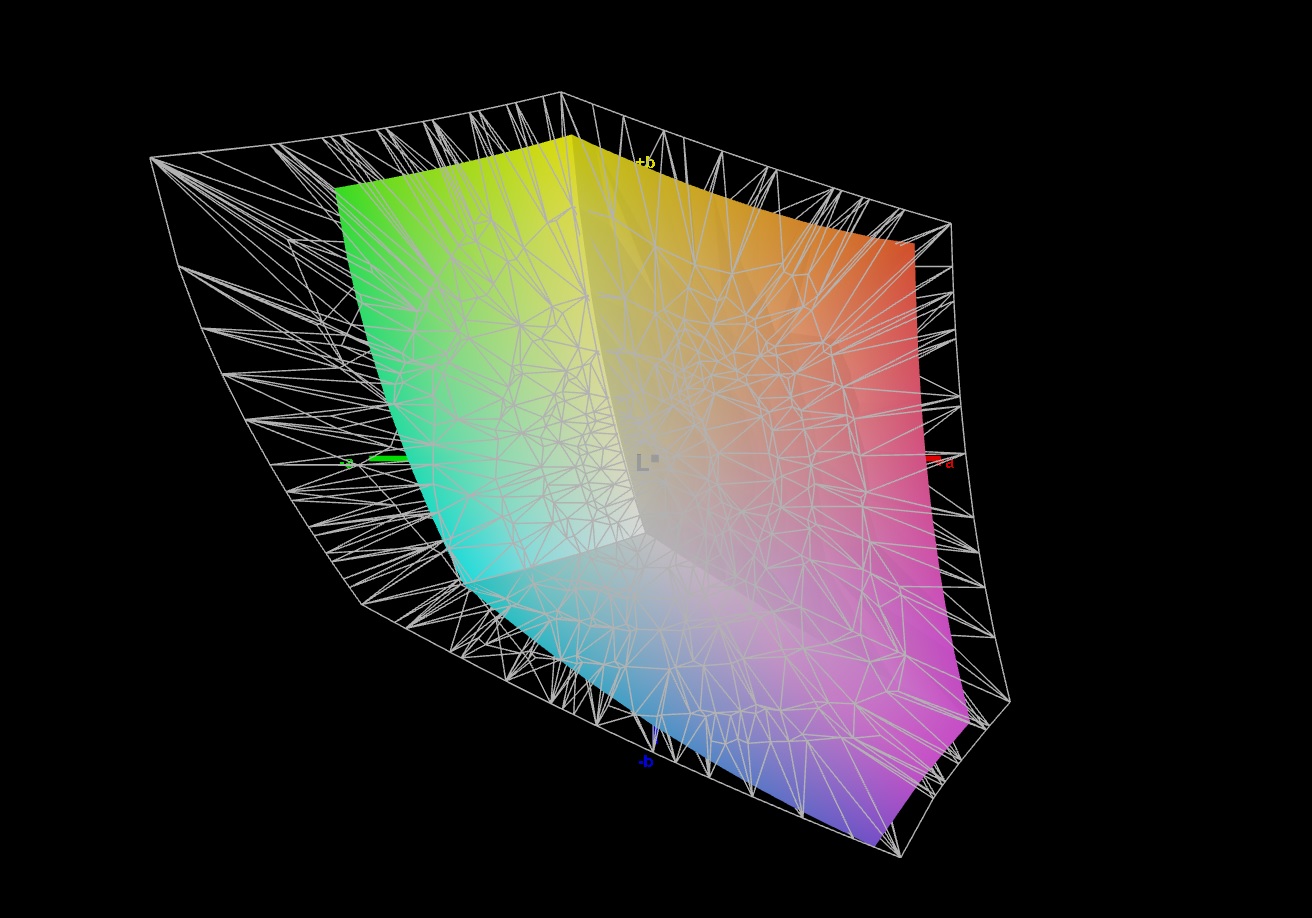
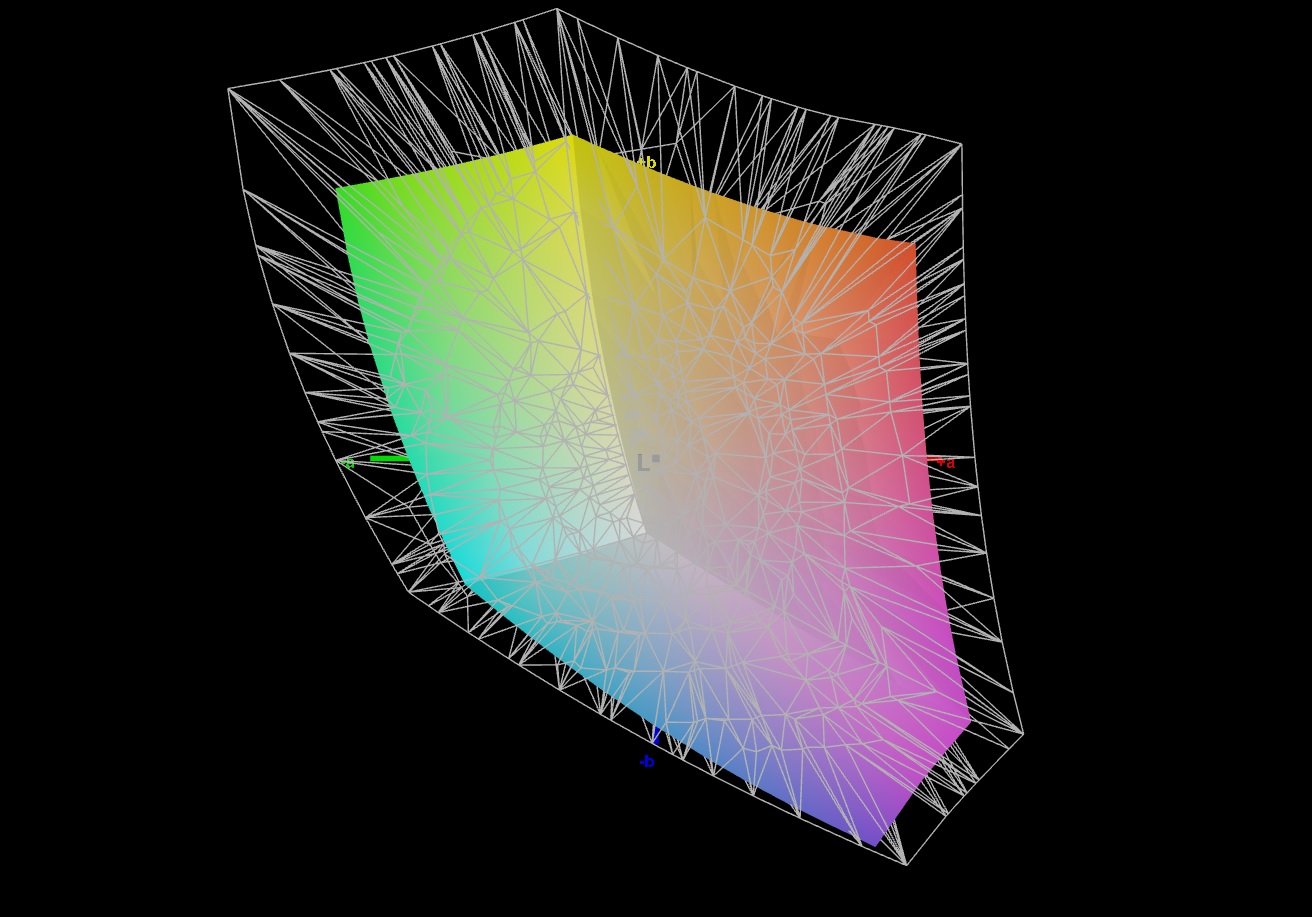
Display
Sebbene le denominazioni dei pannelli siano molto simili, la versione RTX 4070 ha un display Full HD leggermente diverso rispetto alla variante RTX 4050, anche se i risultati non differiscono quasi per niente.
| |||||||||||||||||||||||||
Distribuzione della luminosità: 85 %
Al centro con la batteria: 308 cd/m²
Contrasto: 1232:1 (Nero: 0.25 cd/m²)
ΔE ColorChecker Calman: 1.3 | ∀{0.5-29.43 Ø4.71}
calibrated: 0.92
ΔE Greyscale Calman: 1.7 | ∀{0.09-98 Ø4.96}
69% AdobeRGB 1998 (Argyll 3D)
98% sRGB (Argyll 3D)
66.7% Display P3 (Argyll 3D)
Gamma: 2.167
CCT: 6767 K
| HP Victus 16-r0077ng CMN162D, IPS, 1920x1080, 16.1" | HP Omen 16-xf0376ng BOE0B81, IPS, 1920x1080, 16.1" | Lenovo Legion Pro 5 16ARX8 CSOT T3 MNG007DA1-Q, IPS, 2560x1600, 16" | Acer Nitro 16 AN16-41 BOE CQ NE16QDM-NY1, IPS, 2560x1600, 16" | Gigabyte AERO 16 OLED BSF Samsung SDC4191 (ATNA60YV09-0, OLED, 3840x2400, 16" | MSI Stealth 16 Studio A13VG AUO26A9, IPS, 2560x1600, 16" | |
|---|---|---|---|---|---|---|
| Display | 5% | 4% | 1% | 31% | 23% | |
| Display P3 Coverage (%) | 66.7 | 72.1 8% | 70.4 6% | 67.9 2% | 99.9 50% | 96.4 45% |
| sRGB Coverage (%) | 98 | 99.6 2% | 99.6 2% | 99.1 1% | 100 2% | 99.7 2% |
| AdobeRGB 1998 Coverage (%) | 69 | 72.3 5% | 72.6 5% | 69.9 1% | 96.4 40% | 84.8 23% |
| Response Times | 10% | 18% | 28% | 81% | 50% | |
| Response Time Grey 50% / Grey 80% * (ms) | 13.3 ? | 12.3 ? 8% | 7 ? 47% | 11 ? 17% | 2 ? 85% | 4.4 ? 67% |
| Response Time Black / White * (ms) | 8.2 ? | 7.2 ? 12% | 9.1 ? -11% | 5 ? 39% | 1.98 ? 76% | 5.6 ? 32% |
| PWM Frequency (Hz) | 60 | |||||
| Screen | -68% | 11% | -12% | 101% | -73% | |
| Brightness middle (cd/m²) | 308 | 350 14% | 355.3 15% | 520 69% | 389.97 27% | 424 38% |
| Brightness (cd/m²) | 285 | 338 19% | 340 19% | 494 73% | 395 39% | 411 44% |
| Brightness Distribution (%) | 85 | 91 7% | 91 7% | 91 7% | 97 14% | 88 4% |
| Black Level * (cd/m²) | 0.25 | 0.35 -40% | 0.32 -28% | 0.39 -56% | 0.03 88% | 0.37 -48% |
| Contrast (:1) | 1232 | 1000 -19% | 1110 -10% | 1333 8% | 12999 955% | 1146 -7% |
| Colorchecker dE 2000 * | 1.3 | 3.29 -153% | 1.13 13% | 1.94 -49% | 2 -54% | 3.04 -134% |
| Colorchecker dE 2000 max. * | 2.76 | 8.47 -207% | 2.78 -1% | 5.62 -104% | 4.1 -49% | 7.5 -172% |
| Colorchecker dE 2000 calibrated * | 0.92 | 2.23 -142% | 0.32 65% | 0.74 20% | 1.68 -83% | 3.04 -230% |
| Greyscale dE 2000 * | 1.7 | 3.2 -88% | 1.4 18% | 2.94 -73% | 2.23 -31% | 4.34 -155% |
| Gamma | 2.167 102% | 2.131 103% | 2.24 98% | 2.37 93% | 2.41 91% | 2.32 95% |
| CCT | 6767 96% | 6317 103% | 6372 102% | 6443 101% | 6323 103% | 6952 93% |
| Media totale (Programma / Settaggio) | -18% /
-41% | 11% /
11% | 6% /
-3% | 71% /
83% | 0% /
-35% |
* ... Meglio usare valori piccoli
Con una luminosità media di 285 cd/m², il Victus 16 non è purtroppo tra i modelli più luminosi. Sebbene questo valore possa essere sufficiente per la maggior parte degli ambienti interni, all'aperto si raggiungono rapidamente i limiti di leggibilità e riconoscibilità. Grazie al valore relativamente buono del nero, pari a 0,25 cd/m² per gli standard IPS, il display raggiunge comunque un solido contrasto di circa 1200:1.
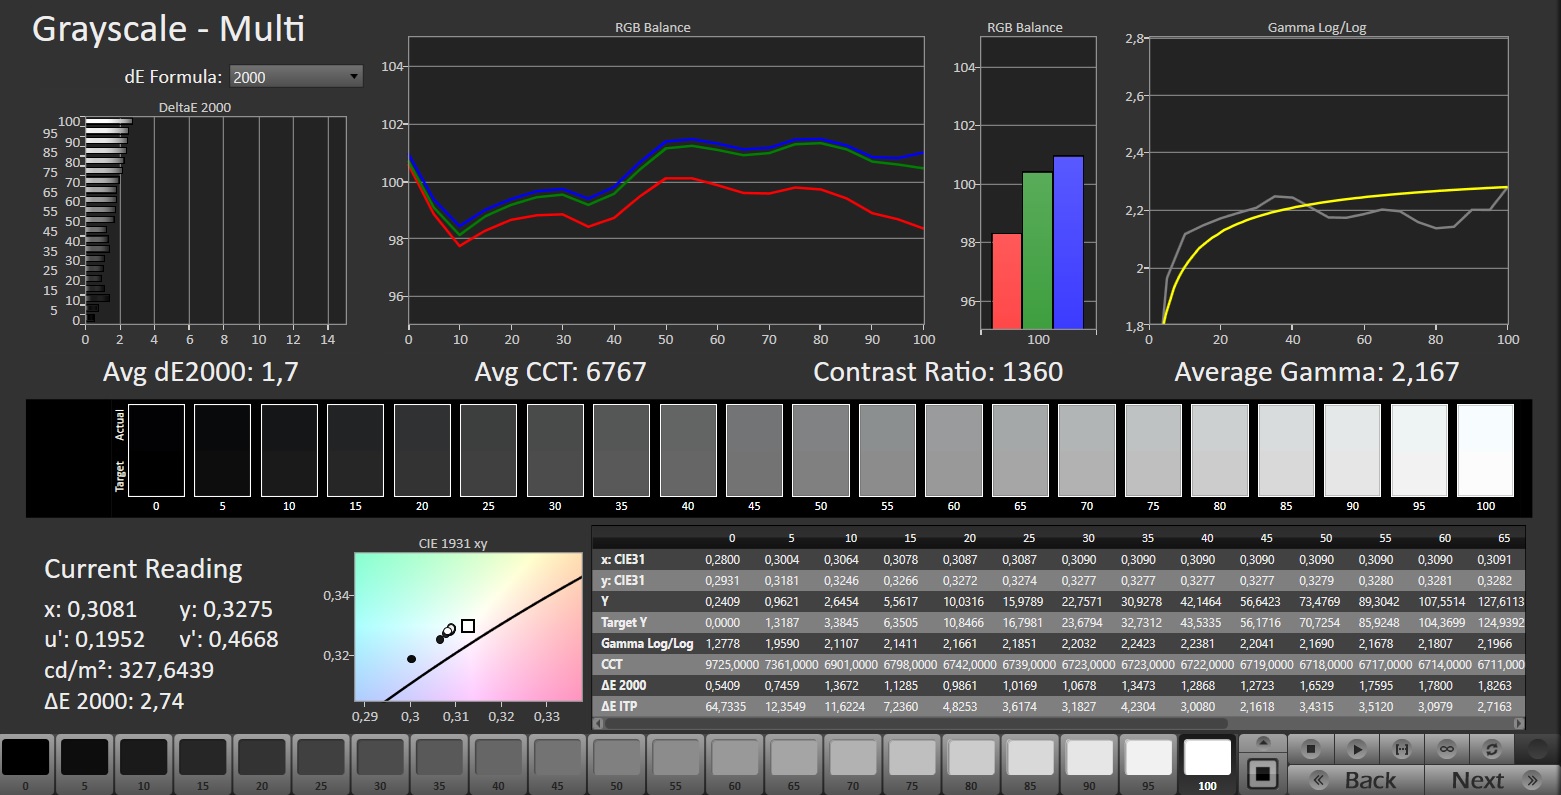
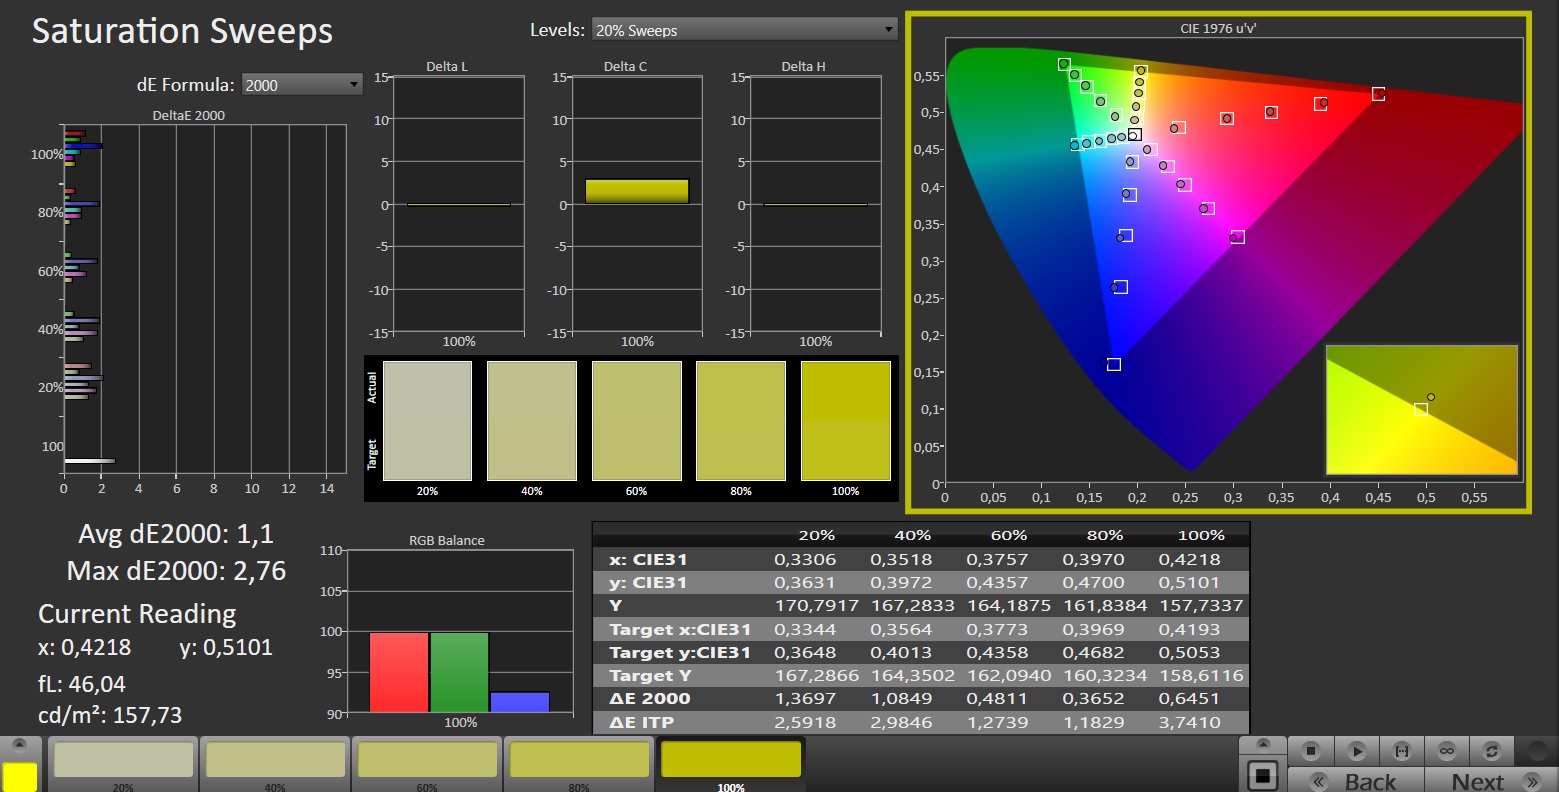
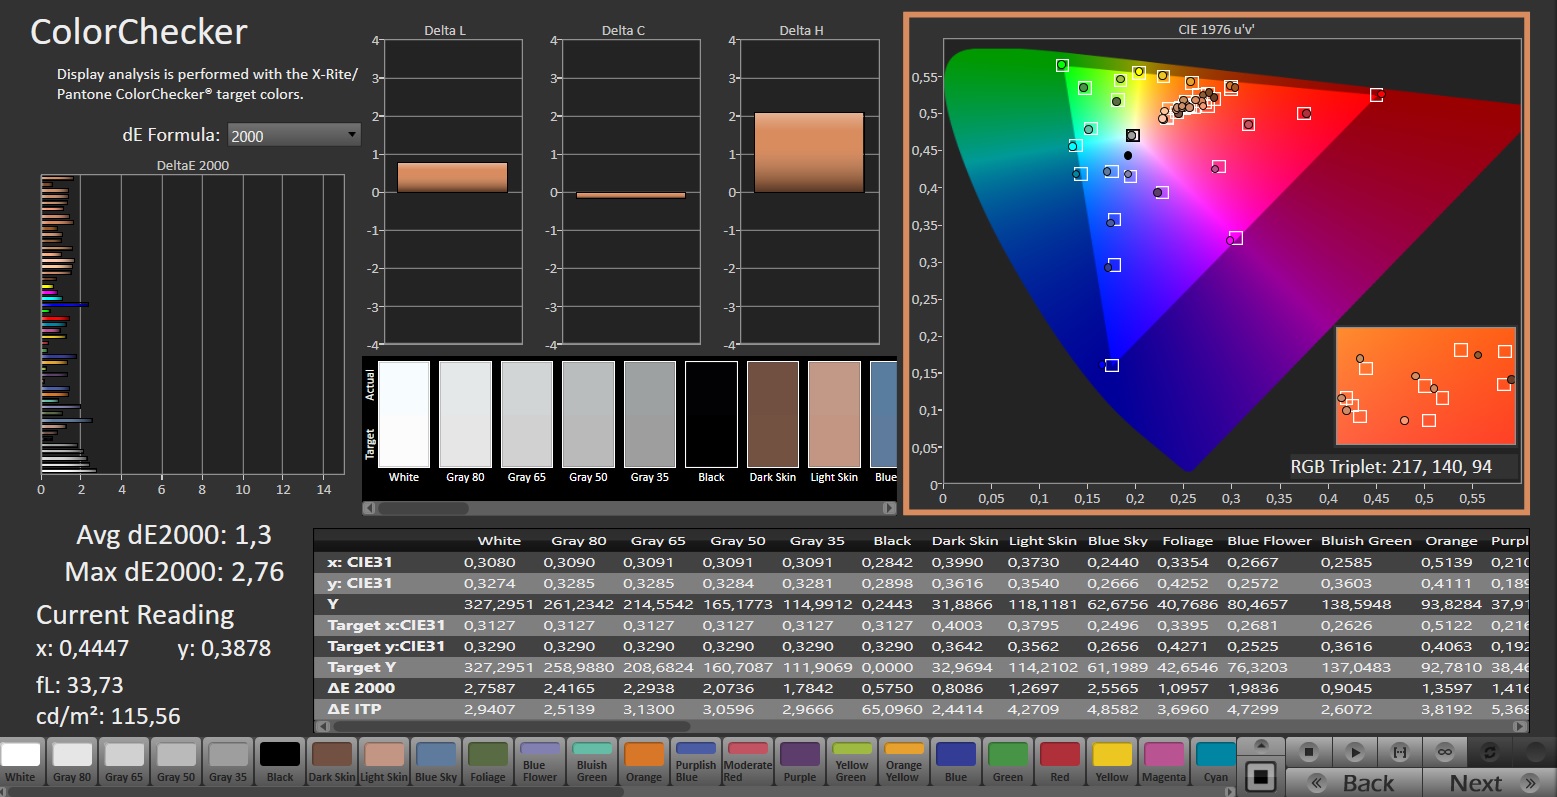
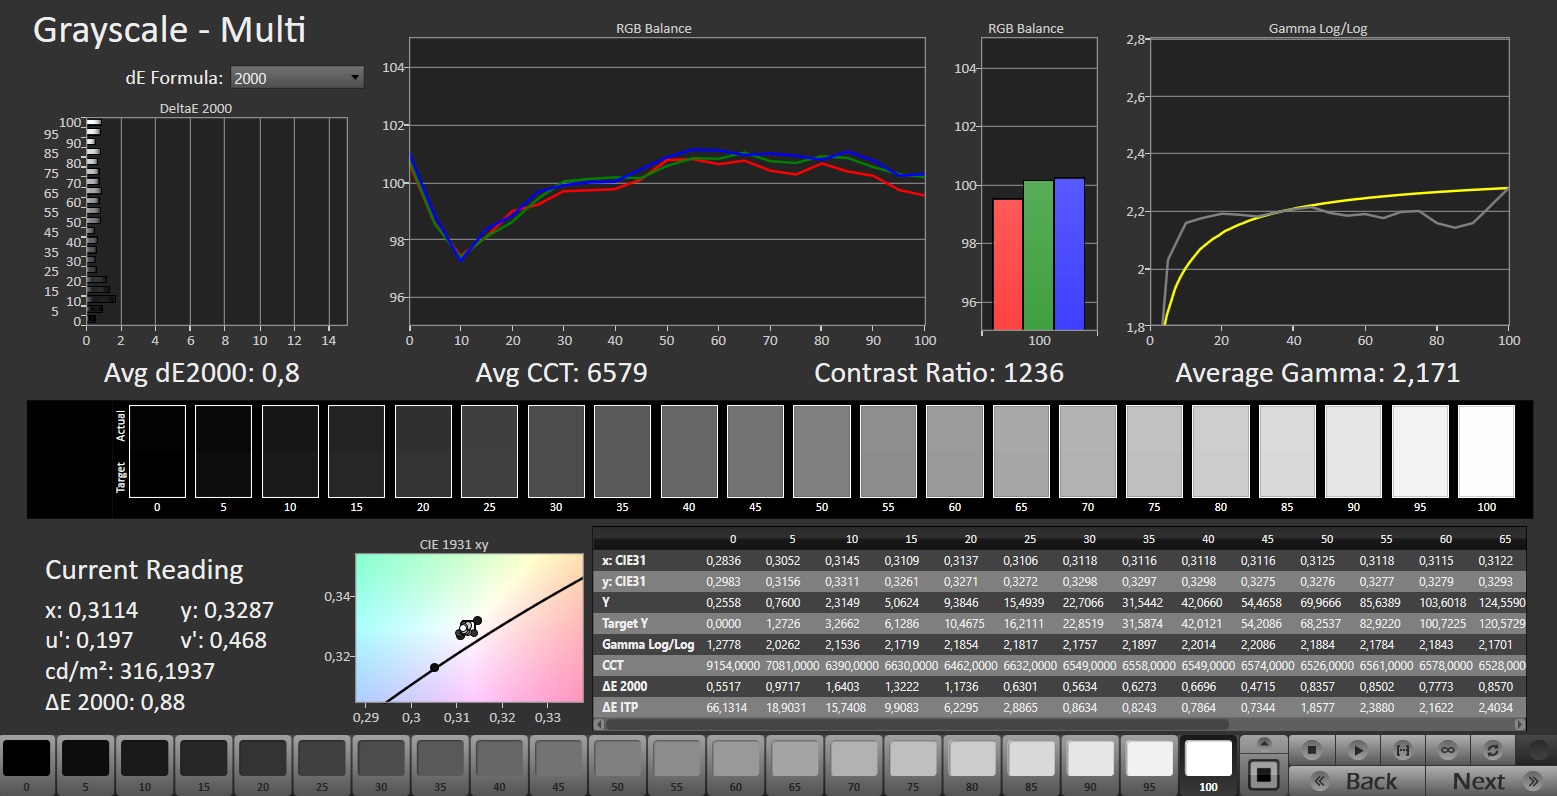
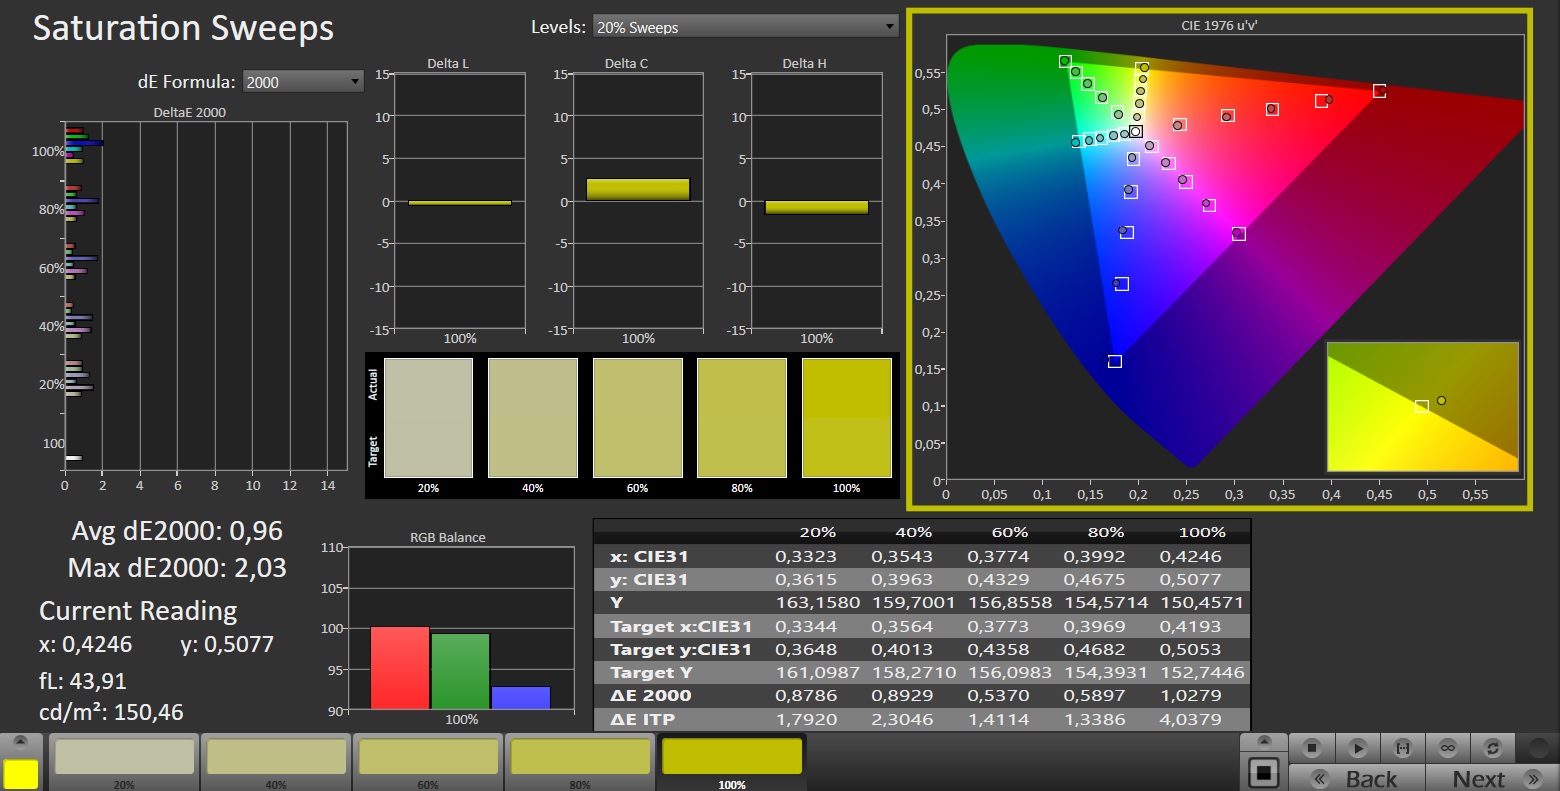
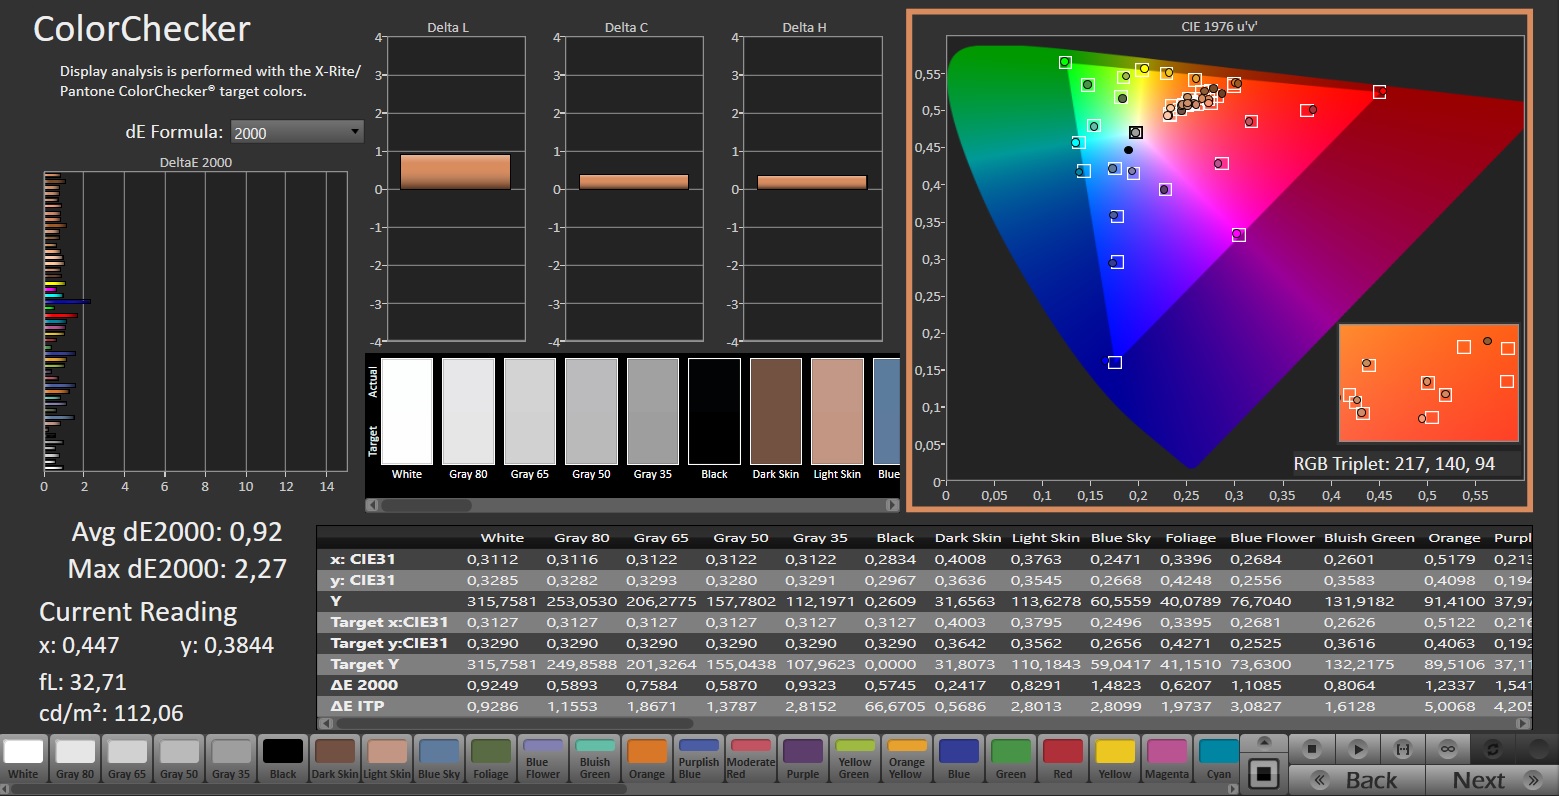
Anche lo spazio colore non dà adito a critiche, in quanto sRGB ha una copertura di quasi il 100%. anche il 69% di AdobeRGB e il 67% di DCI-P3 sono accettabili per un notebook da gioco. Il Victus 16 merita un elogio particolare per l'accuratezza del colore: anche in fase di consegna, i valori sono nell'intervallo ideale (vedere gli screenshot di Calman).
Gli angoli di visualizzazione sono al livello tipico (buono) degli IPS. Il nostro dispositivo di prova non ha mostrato alcun segno di sfarfallio dello schermo o di emorragia dello schermo. Anche i tempi di risposta sono stati discreti e dovrebbero soddisfare le esigenze della maggior parte degli utenti.
Tempi di risposta del Display
| ↔ Tempi di risposta dal Nero al Bianco | ||
|---|---|---|
| 8.2 ms ... aumenta ↗ e diminuisce ↘ combinato | ↗ 4.5 ms Incremento | 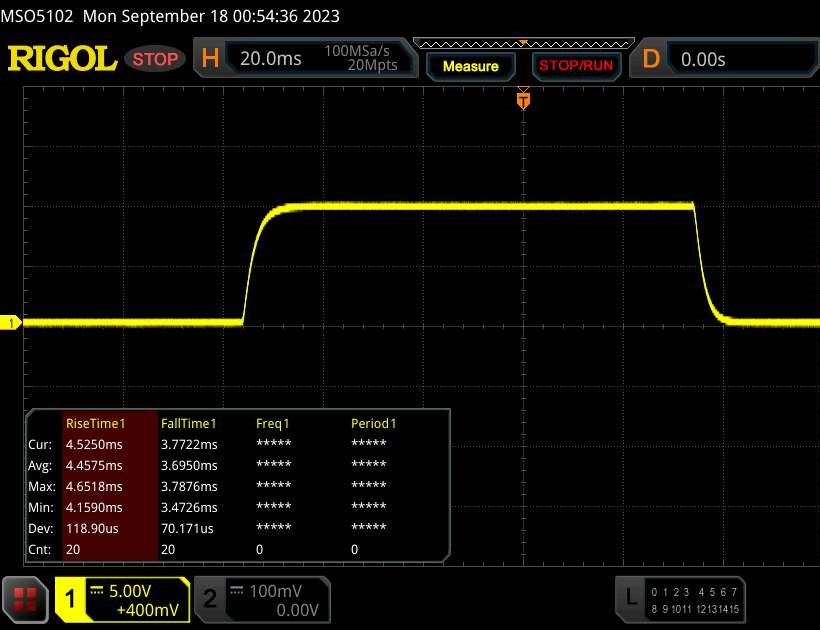 |
| ↘ 3.7 ms Calo | ||
| Lo schermo mostra veloci tempi di risposta durante i nostri tests e dovrebbe esere adatto al gaming In confronto, tutti i dispositivi di test variano da 0.1 (minimo) a 240 (massimo) ms. » 24 % di tutti i dispositivi è migliore. Questo significa che i tempi di risposta rilevati sono migliori rispettto alla media di tutti i dispositivi testati (19.8 ms). | ||
| ↔ Tempo di risposta dal 50% Grigio all'80% Grigio | ||
| 13.3 ms ... aumenta ↗ e diminuisce ↘ combinato | ↗ 6 ms Incremento | 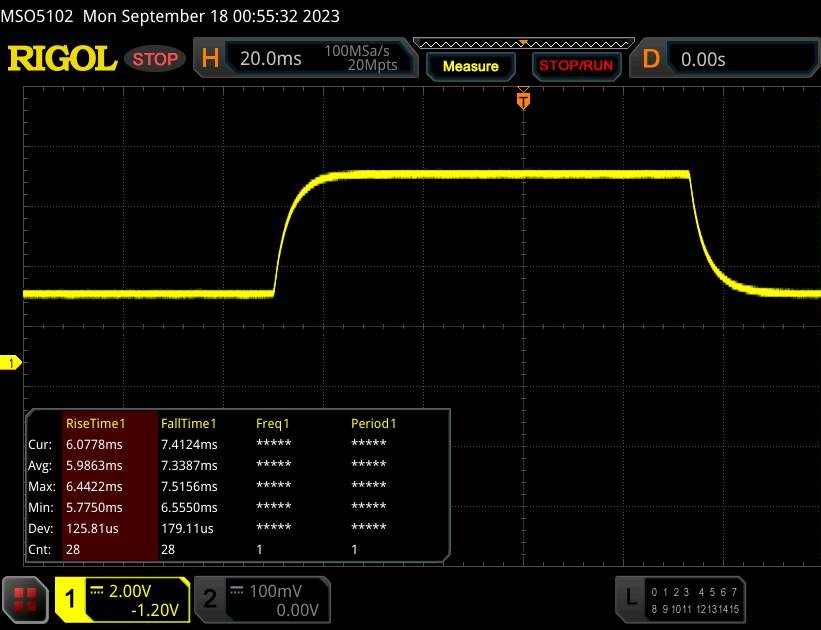 |
| ↘ 7.3 ms Calo | ||
| Lo schermo mostra buoni tempi di risposta durante i nostri tests, ma potrebbe essere troppo lento per i gamers competitivi. In confronto, tutti i dispositivi di test variano da 0.165 (minimo) a 636 (massimo) ms. » 27 % di tutti i dispositivi è migliore. Questo significa che i tempi di risposta rilevati sono migliori rispettto alla media di tutti i dispositivi testati (31 ms). | ||
Sfarfallio dello schermo / PWM (Pulse-Width Modulation)
| flickering dello schermo / PWM non rilevato | 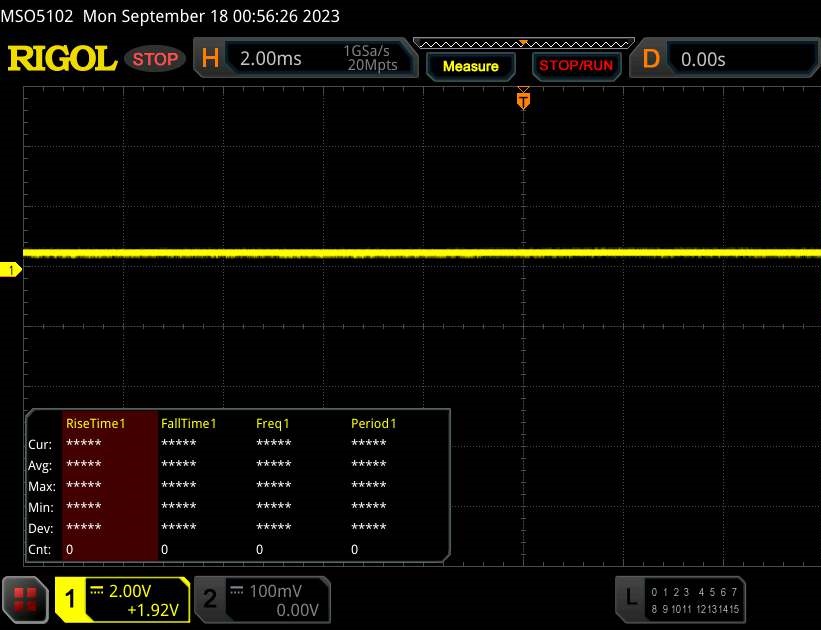 | ||
In confronto: 52 % di tutti i dispositivi testati non utilizza PWM per ridurre la luminosita' del display. Se è rilevato PWM, una media di 7751 (minimo: 5 - massimo: 343500) Hz è stata rilevata. | |||
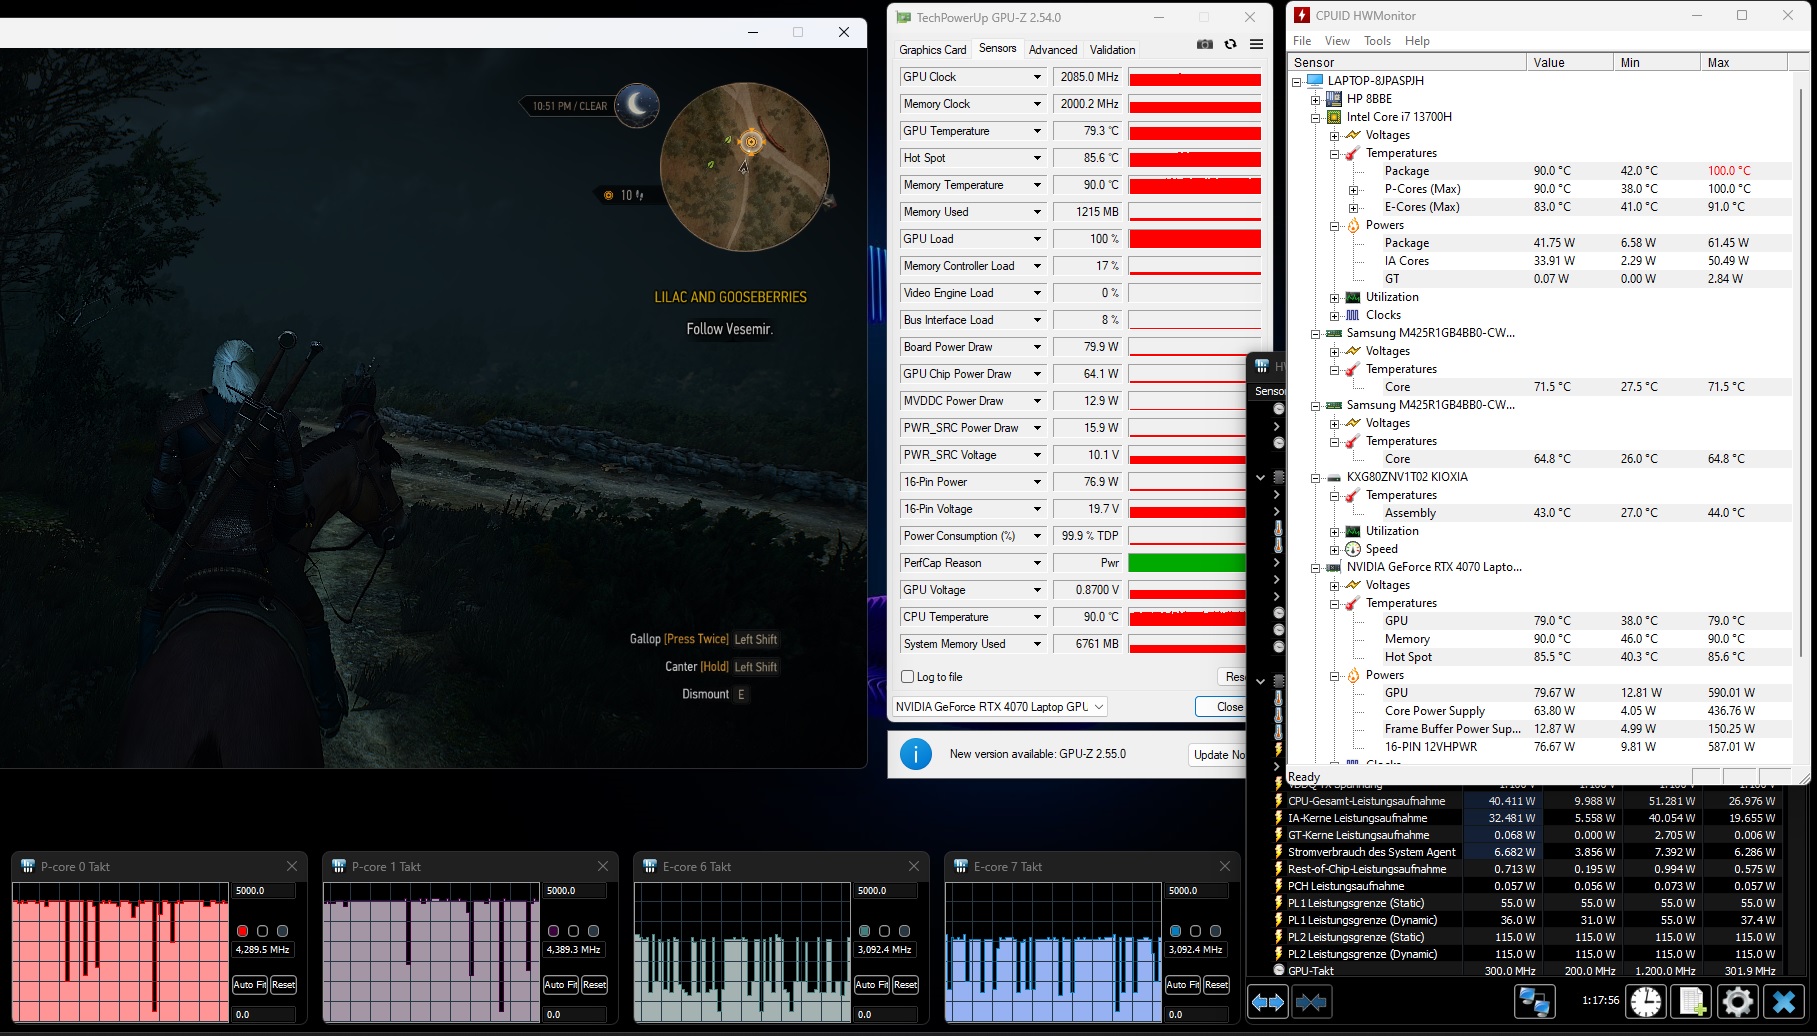
Prestazioni
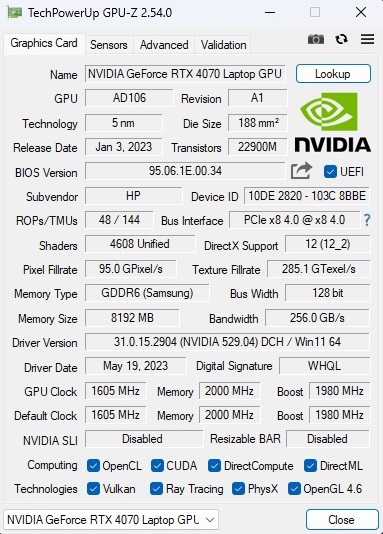
In termini di hardware, il Victus 16 si colloca tra la fascia media e quella alta. Mentre il processore Intel dovrebbe avere riserve più che sufficienti per i prossimi anni, la RTX 4070 di GeForce potrebbe avere problemi a causa della sua scarsa dimensione di VRAM (8 GB GDDR6 non sono più abbastanza aggiornati o a prova di futuro).
Condizioni di test
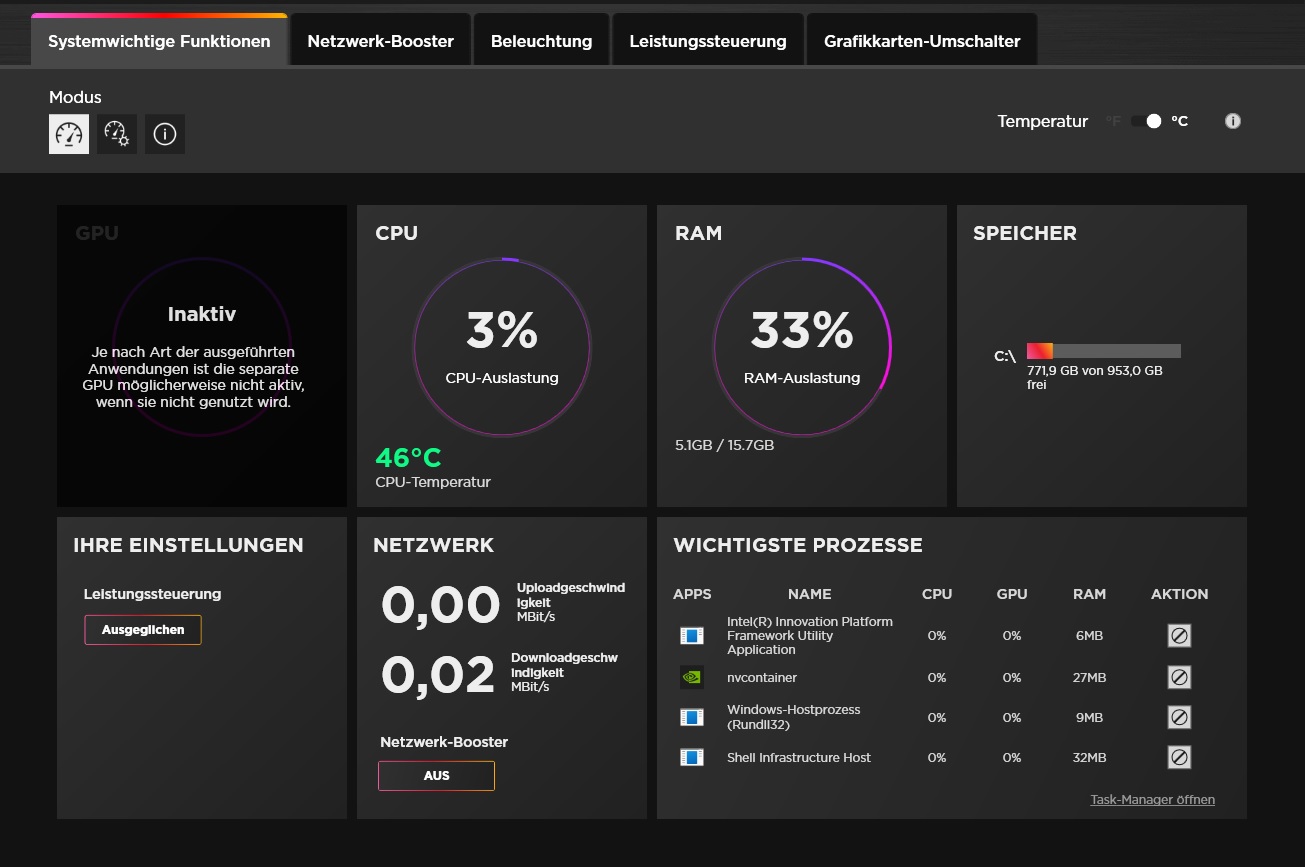
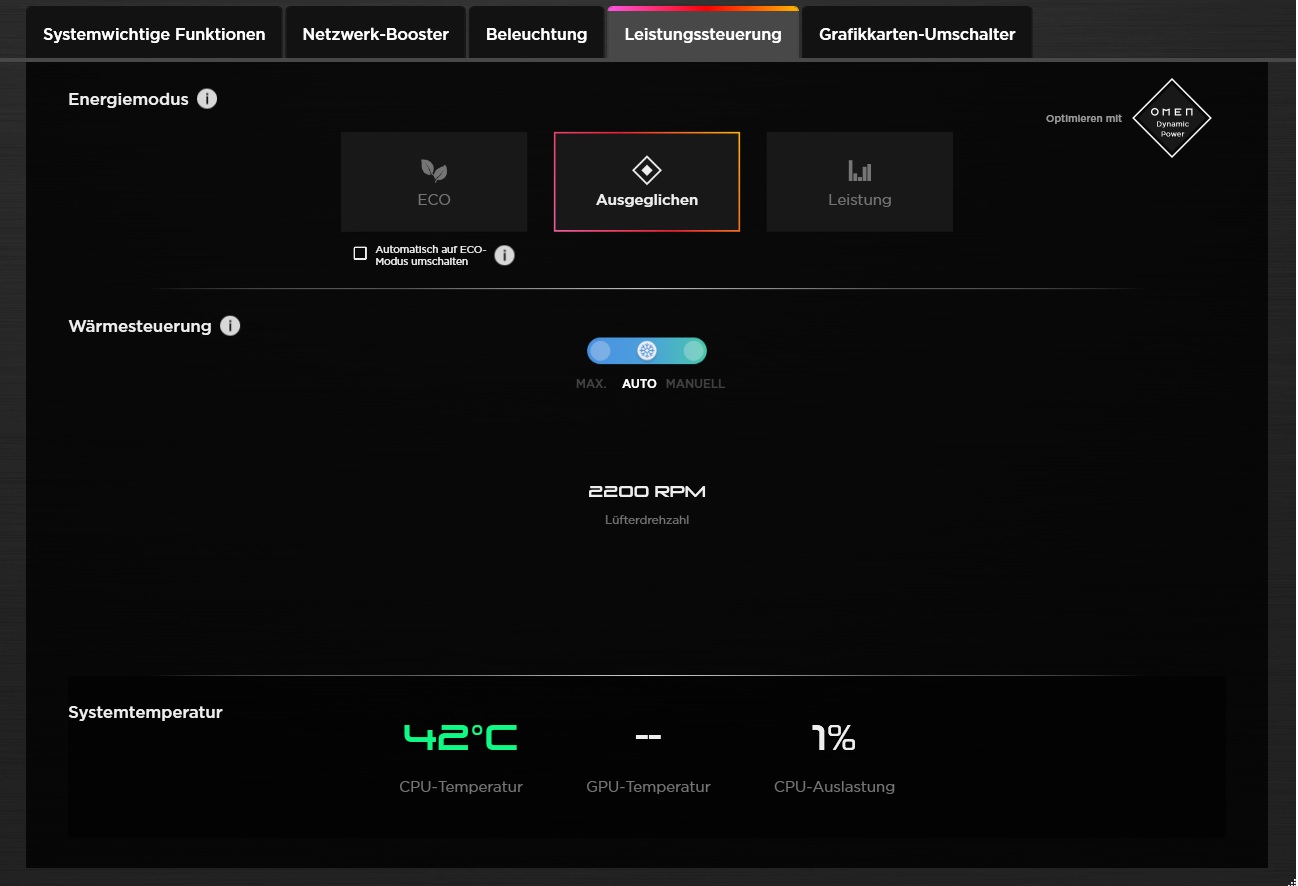
Nell'Omen Gaming Hub preinstallato, gli utenti possono, tra le altre cose, regolare il controllo delle prestazioni (schermata #4). Poiché le prestazioni 3D non aumentano quasi mai in modalità Performance , ma il rumore aumenta in modo significativo, abbiamo effettuato tutte le misurazioni in modalità Balanced . La modalità Eco è solo parzialmente all'altezza del suo nome: il frame rate e il livello di rumore gravitano verso la modalità intermedia.
| Witcher 3 (FHD/Ultra) | Eco | Bilanciato | Prestazioni |
|---|---|---|---|
| Frame rate | ~110 fps | ~114 fps | ~118 fps |
| Rumore | ~46 dB(A) | ~46 dB(A) | ~56 dB(A) |
Processore
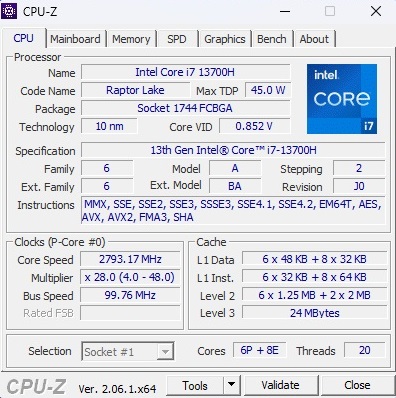
Il Core i7-13700H di Intel è attualmente presente in un gran numero di notebook da gioco. Il modello a 10 nm della generazione Raptor Lake offre 6 core di prestazioni con hyper-threading e 8 core di efficienza senza HT, con un massimo di 20 thread paralleli
Nel corso del benchmark, il Core i7-13700H del Victus 16 offre prestazioni leggermente inferiori alla media se si confrontano i risultati con la media precedente. Almeno bisogna dare credito ad HP per il fatto che le prestazioni rimangono abbastanza stabili per lunghi periodi di tempo. Non ci sono state grandi fluttuazioni o cali nel nostro ciclo Cinebench.
Cinebench R15 Multi Sustained Load
* ... Meglio usare valori piccoli
AIDA64: FP32 Ray-Trace | FPU Julia | CPU SHA3 | CPU Queen | FPU SinJulia | FPU Mandel | CPU AES | CPU ZLib | FP64 Ray-Trace | CPU PhotoWorxx
| Performance rating | |
| Media della classe Gaming | |
| Lenovo Legion Pro 5 16ARX8 | |
| HP Omen 16-xf0376ng | |
| Gigabyte AERO 16 OLED BSF | |
| MSI Stealth 16 Studio A13VG | |
| Acer Nitro 16 AN16-41 | |
| HP Victus 16-r0077ng | |
| Media Intel Core i7-13700H | |
| AIDA64 / FP32 Ray-Trace | |
| Media della classe Gaming (10227 - 85542, n=106, ultimi 2 anni) | |
| Lenovo Legion Pro 5 16ARX8 | |
| HP Omen 16-xf0376ng | |
| Gigabyte AERO 16 OLED BSF | |
| MSI Stealth 16 Studio A13VG | |
| Acer Nitro 16 AN16-41 | |
| HP Victus 16-r0077ng | |
| Media Intel Core i7-13700H (4986 - 18908, n=29) | |
| AIDA64 / FPU Julia | |
| Media della classe Gaming (51376 - 372155, n=106, ultimi 2 anni) | |
| Lenovo Legion Pro 5 16ARX8 | |
| HP Omen 16-xf0376ng | |
| Acer Nitro 16 AN16-41 | |
| Gigabyte AERO 16 OLED BSF | |
| MSI Stealth 16 Studio A13VG | |
| HP Victus 16-r0077ng | |
| Media Intel Core i7-13700H (25360 - 92359, n=29) | |
| AIDA64 / CPU SHA3 | |
| Media della classe Gaming (2180 - 10115, n=106, ultimi 2 anni) | |
| Lenovo Legion Pro 5 16ARX8 | |
| HP Omen 16-xf0376ng | |
| Gigabyte AERO 16 OLED BSF | |
| MSI Stealth 16 Studio A13VG | |
| Acer Nitro 16 AN16-41 | |
| HP Victus 16-r0077ng | |
| Media Intel Core i7-13700H (1339 - 4224, n=29) | |
| AIDA64 / CPU Queen | |
| Lenovo Legion Pro 5 16ARX8 | |
| HP Omen 16-xf0376ng | |
| Media della classe Gaming (49785 - 173351, n=90, ultimi 2 anni) | |
| Acer Nitro 16 AN16-41 | |
| MSI Stealth 16 Studio A13VG | |
| Media Intel Core i7-13700H (59324 - 107159, n=29) | |
| Gigabyte AERO 16 OLED BSF | |
| HP Victus 16-r0077ng | |
| AIDA64 / FPU SinJulia | |
| Lenovo Legion Pro 5 16ARX8 | |
| HP Omen 16-xf0376ng | |
| Media della classe Gaming (4424 - 33636, n=106, ultimi 2 anni) | |
| Acer Nitro 16 AN16-41 | |
| MSI Stealth 16 Studio A13VG | |
| Gigabyte AERO 16 OLED BSF | |
| Media Intel Core i7-13700H (4800 - 11050, n=29) | |
| HP Victus 16-r0077ng | |
| AIDA64 / FPU Mandel | |
| Media della classe Gaming (25115 - 196829, n=106, ultimi 2 anni) | |
| Lenovo Legion Pro 5 16ARX8 | |
| HP Omen 16-xf0376ng | |
| Acer Nitro 16 AN16-41 | |
| Gigabyte AERO 16 OLED BSF | |
| MSI Stealth 16 Studio A13VG | |
| HP Victus 16-r0077ng | |
| Media Intel Core i7-13700H (12321 - 45118, n=29) | |
| AIDA64 / CPU AES | |
| Gigabyte AERO 16 OLED BSF | |
| Media della classe Gaming (39258 - 247074, n=106, ultimi 2 anni) | |
| MSI Stealth 16 Studio A13VG | |
| Media Intel Core i7-13700H (28769 - 151254, n=29) | |
| Lenovo Legion Pro 5 16ARX8 | |
| HP Omen 16-xf0376ng | |
| HP Victus 16-r0077ng | |
| Acer Nitro 16 AN16-41 | |
| AIDA64 / CPU ZLib | |
| Media della classe Gaming (574 - 2531, n=106, ultimi 2 anni) | |
| Gigabyte AERO 16 OLED BSF | |
| Lenovo Legion Pro 5 16ARX8 | |
| HP Omen 16-xf0376ng | |
| MSI Stealth 16 Studio A13VG | |
| HP Victus 16-r0077ng | |
| Media Intel Core i7-13700H (389 - 1215, n=29) | |
| Acer Nitro 16 AN16-41 | |
| AIDA64 / FP64 Ray-Trace | |
| Media della classe Gaming (5509 - 45446, n=106, ultimi 2 anni) | |
| Lenovo Legion Pro 5 16ARX8 | |
| HP Omen 16-xf0376ng | |
| Gigabyte AERO 16 OLED BSF | |
| MSI Stealth 16 Studio A13VG | |
| Acer Nitro 16 AN16-41 | |
| HP Victus 16-r0077ng | |
| Media Intel Core i7-13700H (2540 - 10135, n=29) | |
| AIDA64 / CPU PhotoWorxx | |
| MSI Stealth 16 Studio A13VG | |
| Media della classe Gaming (12271 - 89891, n=106, ultimi 2 anni) | |
| Gigabyte AERO 16 OLED BSF | |
| Media Intel Core i7-13700H (12872 - 52727, n=29) | |
| HP Victus 16-r0077ng | |
| HP Omen 16-xf0376ng | |
| Lenovo Legion Pro 5 16ARX8 | |
| Acer Nitro 16 AN16-41 | |
Prestazioni del sistema
Poiché l'SSD non è altrettanto veloce, il Victus 16 si piazza all'ultimo posto nei benchmark di sistema. Tuttavia, 7.158 punti in PCMark 10 sono ancora un buon risultato complessivo.
CrossMark: Overall | Productivity | Creativity | Responsiveness
| PCMark 10 / Score | |
| Media della classe Gaming (5828 - 12414, n=94, ultimi 2 anni) | |
| Lenovo Legion Pro 5 16ARX8 | |
| HP Omen 16-xf0376ng | |
| Gigabyte AERO 16 OLED BSF | |
| Media Intel Core i7-13700H, NVIDIA GeForce RTX 4070 Laptop GPU (7158 - 7956, n=8) | |
| MSI Stealth 16 Studio A13VG | |
| Acer Nitro 16 AN16-41 | |
| HP Victus 16-r0077ng | |
| PCMark 10 / Essentials | |
| Gigabyte AERO 16 OLED BSF | |
| HP Omen 16-xf0376ng | |
| Lenovo Legion Pro 5 16ARX8 | |
| HP Victus 16-r0077ng | |
| Media Intel Core i7-13700H, NVIDIA GeForce RTX 4070 Laptop GPU (10252 - 11449, n=8) | |
| Media della classe Gaming (8810 - 11935, n=98, ultimi 2 anni) | |
| Acer Nitro 16 AN16-41 | |
| MSI Stealth 16 Studio A13VG | |
| PCMark 10 / Productivity | |
| Media della classe Gaming (6845 - 25323, n=96, ultimi 2 anni) | |
| Lenovo Legion Pro 5 16ARX8 | |
| HP Omen 16-xf0376ng | |
| Media Intel Core i7-13700H, NVIDIA GeForce RTX 4070 Laptop GPU (8501 - 10769, n=8) | |
| MSI Stealth 16 Studio A13VG | |
| Gigabyte AERO 16 OLED BSF | |
| Acer Nitro 16 AN16-41 | |
| HP Victus 16-r0077ng | |
| PCMark 10 / Digital Content Creation | |
| Media della classe Gaming (7602 - 19954, n=96, ultimi 2 anni) | |
| Gigabyte AERO 16 OLED BSF | |
| Lenovo Legion Pro 5 16ARX8 | |
| HP Omen 16-xf0376ng | |
| Media Intel Core i7-13700H, NVIDIA GeForce RTX 4070 Laptop GPU (10358 - 12908, n=8) | |
| MSI Stealth 16 Studio A13VG | |
| Acer Nitro 16 AN16-41 | |
| HP Victus 16-r0077ng | |
| CrossMark / Overall | |
| Lenovo Legion Pro 5 16ARX8 | |
| Media della classe Gaming (1366 - 2409, n=95, ultimi 2 anni) | |
| Media Intel Core i7-13700H, NVIDIA GeForce RTX 4070 Laptop GPU (1768 - 2073, n=6) | |
| Gigabyte AERO 16 OLED BSF | |
| MSI Stealth 16 Studio A13VG | |
| Acer Nitro 16 AN16-41 | |
| CrossMark / Productivity | |
| Lenovo Legion Pro 5 16ARX8 | |
| Media della classe Gaming (1386 - 2254, n=95, ultimi 2 anni) | |
| Media Intel Core i7-13700H, NVIDIA GeForce RTX 4070 Laptop GPU (1645 - 2006, n=6) | |
| Gigabyte AERO 16 OLED BSF | |
| MSI Stealth 16 Studio A13VG | |
| Acer Nitro 16 AN16-41 | |
| CrossMark / Creativity | |
| Media della classe Gaming (1343 - 2786, n=95, ultimi 2 anni) | |
| Lenovo Legion Pro 5 16ARX8 | |
| Media Intel Core i7-13700H, NVIDIA GeForce RTX 4070 Laptop GPU (1936 - 2137, n=6) | |
| Gigabyte AERO 16 OLED BSF | |
| MSI Stealth 16 Studio A13VG | |
| Acer Nitro 16 AN16-41 | |
| CrossMark / Responsiveness | |
| Gigabyte AERO 16 OLED BSF | |
| Lenovo Legion Pro 5 16ARX8 | |
| Media Intel Core i7-13700H, NVIDIA GeForce RTX 4070 Laptop GPU (1451 - 2202, n=6) | |
| Media della classe Gaming (1226 - 2334, n=95, ultimi 2 anni) | |
| MSI Stealth 16 Studio A13VG | |
| Acer Nitro 16 AN16-41 | |
| PCMark 10 Score | 7158 punti | |
Aiuto | ||
| AIDA64 / Memory Copy | |
| Media della classe Gaming (21750 - 129946, n=106, ultimi 2 anni) | |
| MSI Stealth 16 Studio A13VG | |
| Gigabyte AERO 16 OLED BSF | |
| HP Omen 16-xf0376ng | |
| Media Intel Core i7-13700H (24334 - 78081, n=29) | |
| HP Victus 16-r0077ng | |
| Lenovo Legion Pro 5 16ARX8 | |
| Acer Nitro 16 AN16-41 | |
| AIDA64 / Memory Read | |
| Media della classe Gaming (22956 - 118858, n=106, ultimi 2 anni) | |
| MSI Stealth 16 Studio A13VG | |
| HP Victus 16-r0077ng | |
| Gigabyte AERO 16 OLED BSF | |
| Media Intel Core i7-13700H (23681 - 79656, n=29) | |
| HP Omen 16-xf0376ng | |
| Lenovo Legion Pro 5 16ARX8 | |
| Acer Nitro 16 AN16-41 | |
| AIDA64 / Memory Write | |
| HP Omen 16-xf0376ng | |
| Media della classe Gaming (22297 - 135096, n=106, ultimi 2 anni) | |
| MSI Stealth 16 Studio A13VG | |
| Gigabyte AERO 16 OLED BSF | |
| Media Intel Core i7-13700H (22986 - 99898, n=29) | |
| HP Victus 16-r0077ng | |
| Acer Nitro 16 AN16-41 | |
| Lenovo Legion Pro 5 16ARX8 | |
| AIDA64 / Memory Latency | |
| Media della classe Gaming (75.3 - 259, n=106, ultimi 2 anni) | |
| Gigabyte AERO 16 OLED BSF | |
| HP Victus 16-r0077ng | |
| Media Intel Core i7-13700H (82.4 - 136.8, n=29) | |
| Acer Nitro 16 AN16-41 | |
| HP Omen 16-xf0376ng | |
| MSI Stealth 16 Studio A13VG | |
| Lenovo Legion Pro 5 16ARX8 | |
* ... Meglio usare valori piccoli
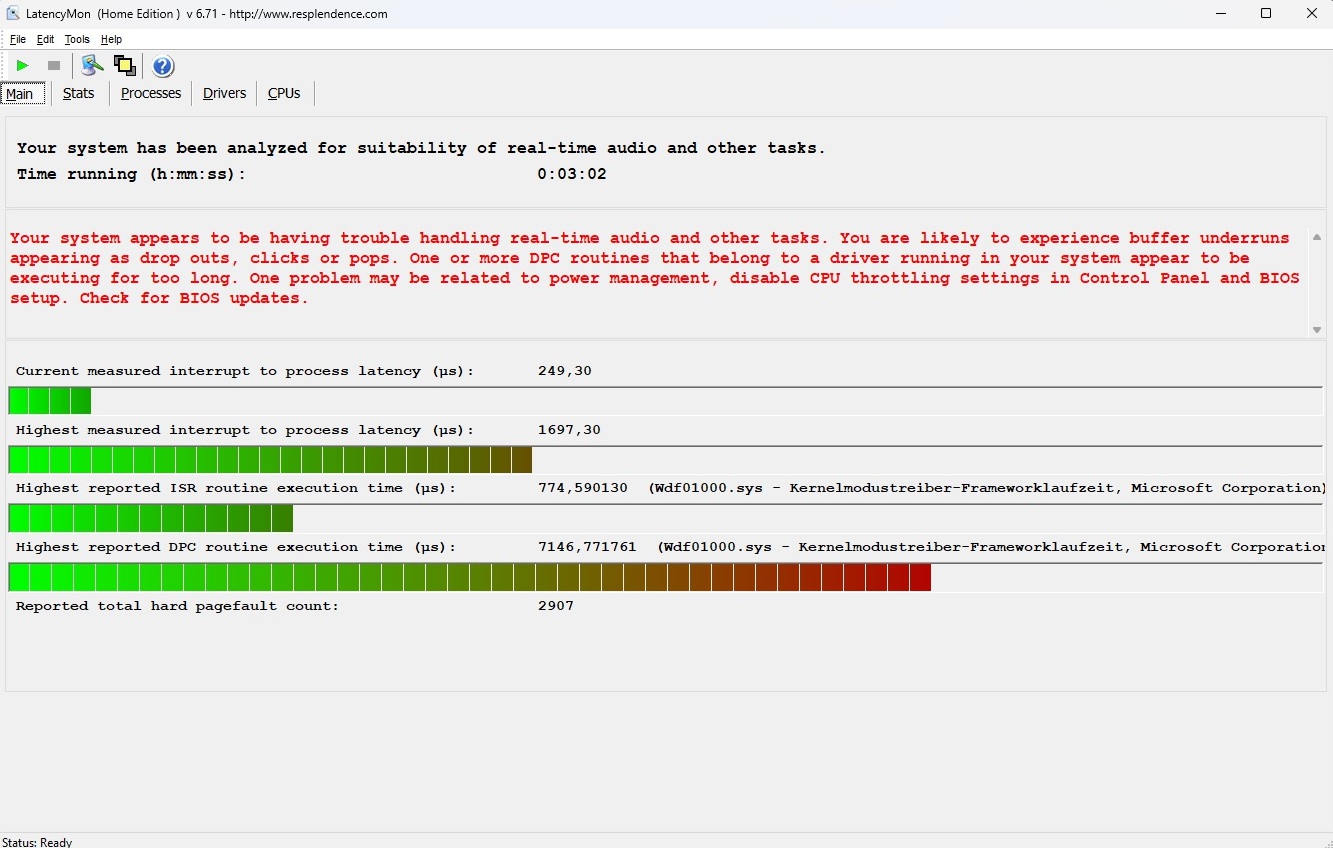
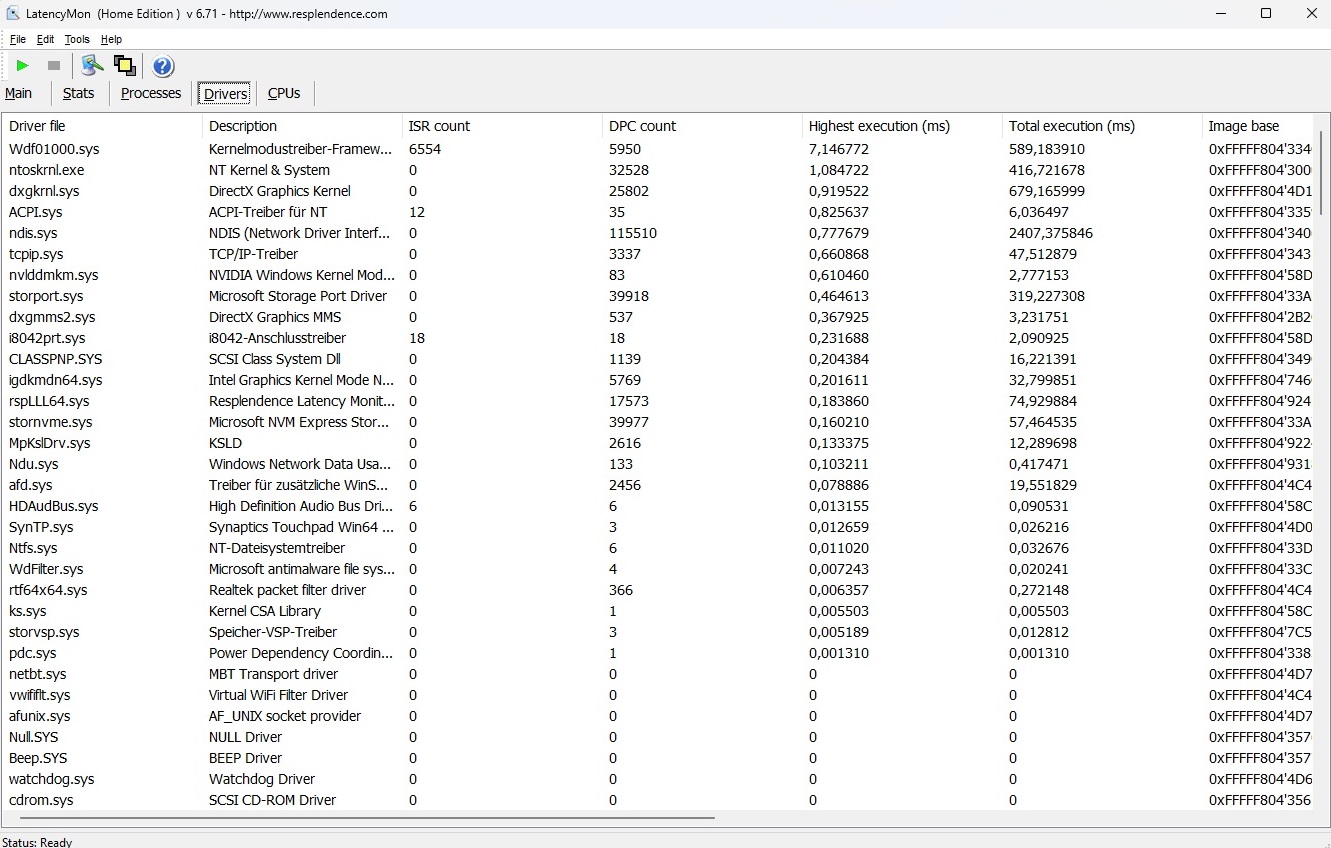
Latenza DPC
Come numerosi altri concorrenti, anche il Victus 16 si dimostra debole quando si tratta di latenza. Secondo lo strumento LatencyMon, gli utenti possono incontrare problemi con le attività sensibili alla latenza, come l'editing audio e video in tempo reale.
| DPC Latencies / LatencyMon - interrupt to process latency (max), Web, Youtube, Prime95 | |
| MSI Stealth 16 Studio A13VG | |
| HP Omen 16-xf0376ng | |
| HP Victus 16-r0077ng | |
| Acer Nitro 16 AN16-41 | |
| Gigabyte AERO 16 OLED BSF | |
| Lenovo Legion Pro 5 16ARX8 | |
* ... Meglio usare valori piccoli
Dispositivi di archiviazione
Complessivamente, le prestazioni dell'SSD sono leggermente inferiori a quelle dell'Omen 16 nonostante la maggiore capacità (1.000 GB contro 512 GB), che di per sé non riesce a tenere il passo con la concorrenza. Il nostro ciclo DiskSpd mostra anche che l'SSD Kioxia installato nel Victus 16 perde velocità dopo un po' di tempo sotto carico, come si può notare in altri portatili.

* ... Meglio usare valori piccoli
Sustained Read Performance: DiskSpd Read Loop, Queue Depth 8
Scheda grafica
Poiché Nvidia è stata piuttosto parsimoniosa in termini di espansione della memoria (quantità di VRAM, interfaccia) - come già accennato - la GeForce RTX 4070 è molto indietro rispetto allaRTX 4080 e RTX 4090se si confrontano le prestazioni con quelle di altri notebook RTX 4070, il Victus 16 non è male. Nei benchmark grafici sintetici, il modello da 16 pollici è costretto a cedere la sconfitta alla concorrenza, ma la precedente media della RTX 4070 viene comunque mantenuta, soprattutto perché HP non si limita al TGP massimo possibile di 140 watt, ma lo fissa solo a 120 watt.
| 3DMark 11 Performance | 33616 punti | |
| 3DMark Ice Storm Standard Score | 159379 punti | |
| 3DMark Cloud Gate Standard Score | 65316 punti | |
| 3DMark Fire Strike Score | 26013 punti | |
| 3DMark Time Spy Score | 11427 punti | |
Aiuto | ||
* ... Meglio usare valori piccoli
Prestazioni di gioco
Nei test di gioco pratici, anche le prestazioni 3D gravitano verso la media della RTX 4070. Con la risoluzione nativa Full HD, il Victus 16 è in grado di eseguire senza problemi quasi tutti i giochi attuali, anche con le impostazioni massime. Solo i titoli molto impegnativi o scarsamente ottimizzati, come ad esempio Immortali di Aveum o Starfieldnon riescono a raggiungere più di 60 FPS.
| The Witcher 3 - 1920x1080 Ultra Graphics & Postprocessing (HBAO+) | |
| Media della classe Gaming (104.7 - 240, n=7, ultimi 2 anni) | |
| Lenovo Legion Pro 5 16ARX8 | |
| MSI Stealth 16 Studio A13VG | |
| Gigabyte AERO 16 OLED BSF | |
| HP Victus 16-r0077ng | |
| Acer Nitro 16 AN16-41 | |
| Media NVIDIA GeForce RTX 4070 Laptop GPU (69.8 - 133.7, n=57) | |
| HP Omen 16-xf0376ng | |
| Immortals of Aveum - 1920x1080 Ultra AF:16x | |
| Media NVIDIA GeForce RTX 4070 Laptop GPU (46.1 - 49.9, n=4) | |
| HP Omen 16-xf0376ng | |
| HP Victus 16-r0077ng | |
| Atlas Fallen - 1920x1080 Very High Preset | |
| HP Omen 16-xf0376ng | |
| Media NVIDIA GeForce RTX 4070 Laptop GPU (105.3 - 111.1, n=4) | |
| HP Victus 16-r0077ng | |
| Armored Core 6 - 1920x1080 Maximum Preset | |
| HP Omen 16-xf0376ng | |
| Media NVIDIA GeForce RTX 4070 Laptop GPU (87.2 - 107, n=4) | |
| HP Victus 16-r0077ng | |
| Media della classe Gaming (n=1ultimi 2 anni) | |
| Atomic Heart - 1920x1080 Atomic Preset | |
| Acer Nitro 16 AN16-41 | |
| Media NVIDIA GeForce RTX 4070 Laptop GPU (70.4 - 79, n=4) | |
| HP Victus 16-r0077ng | |
| High On Life - 1920x1080 Very High Preset | |
| MSI Stealth 16 Studio A13VG | |
| Media NVIDIA GeForce RTX 4070 Laptop GPU (101.9 - 114, n=4) | |
| HP Victus 16-r0077ng | |
| Company of Heroes 3 - 1920x1080 Maximum Settings | |
| MSI Stealth 16 Studio A13VG | |
| Media NVIDIA GeForce RTX 4070 Laptop GPU (134 - 157.5, n=5) | |
| HP Victus 16-r0077ng | |
| Resident Evil 4 Remake - 1920x1080 Max Preset | |
| MSI Stealth 16 Studio A13VG | |
| Media NVIDIA GeForce RTX 4070 Laptop GPU (74.8 - 86.7, n=4) | |
| Acer Nitro 16 AN16-41 | |
| HP Victus 16-r0077ng | |
| Sons of the Forest - 1920x1080 Ultra Preset AA:T | |
| HP Victus 16-r0077ng | |
| HP Omen 16-xf0376ng | |
| Media NVIDIA GeForce RTX 4070 Laptop GPU (71.1 - 87.5, n=4) | |
| Baldur's Gate 3 - 1920x1080 Ultra Preset AA:T | |
| Media della classe Gaming (59.4 - 246, n=104, ultimi 2 anni) | |
| Media NVIDIA GeForce RTX 4070 Laptop GPU (66.7 - 128.5, n=30) | |
| HP Victus 16-r0077ng | |
| Ratchet & Clank Rift Apart - 1920x1080 Very High Preset AA:T | |
| Media NVIDIA GeForce RTX 4070 Laptop GPU (52.3 - 58.1, n=4) | |
| HP Victus 16-r0077ng | |
Nei nostri 60 minuti Witcher 3non si sono verificate anomalie come cadute di frame. Le prestazioni sono leggermente diminuite con il passare del tempo, ma sono rimaste abbastanza stabili.
Witcher 3 FPS chart
| basso | medio | alto | ultra | |
|---|---|---|---|---|
| GTA V (2015) | 180.9 | 175.7 | 112.8 | |
| The Witcher 3 (2015) | 114 | |||
| Dota 2 Reborn (2015) | 173.9 | 147.9 | 139.3 | 131.6 |
| Final Fantasy XV Benchmark (2018) | 145 | 109.3 | ||
| X-Plane 11.11 (2018) | 136 | 118.3 | 95.4 | |
| Strange Brigade (2018) | 224 | 192.4 | 192 | |
| High On Life (2023) | 166.2 | 126.7 | 101.9 | |
| Atomic Heart (2023) | 131.7 | 86.2 | 70.4 | |
| Company of Heroes 3 (2023) | 174 | 135 | 134 | |
| Sons of the Forest (2023) | 92.1 | 88.5 | 87.5 | |
| Resident Evil 4 Remake (2023) | 108.3 | 105.5 | 74.8 | |
| Ratchet & Clank Rift Apart (2023) | 72.5 | 58 | 52.3 | |
| Atlas Fallen (2023) | 133.8 | 126.7 | 106.6 | |
| Immortals of Aveum (2023) | 56 | 46.1 | ||
| Armored Core 6 (2023) | 102.5 | 101.9 | 97 | |
| Starfield (2023) | 62.3 | 51.2 | 46.6 | |
| The Crew Motorfest (2023) | 60 | 60 | 60 | |
| Baldur's Gate 3 (2023) | 115.2 | 99.1 | 95.4 |
Emissioni
Rumore
Se si utilizza la modalità Balanced , il Victus 16 non è troppo rumoroso. Circa 46 dB(A) in Witcher 3 è un livello chiaramente udibile, ma non estremo (in modalità Performance diventa un fastidioso 56 dB). In situazioni di inattività e in attività innocue come l'ufficio, i video e la navigazione web, le ventole di solito girano a 28-30 dB(A), un valore superiore a quello della concorrenza. HP ha margini di miglioramento in questo senso.
Rumorosità
| Idle |
| 28 / 29 / 30 dB(A) |
| Sotto carico |
| 43 / 48 dB(A) |
 | ||
30 dB silenzioso 40 dB(A) udibile 50 dB(A) rumoroso |
||
min: | ||
| HP Victus 16-r0077ng i7-13700H, GeForce RTX 4070 Laptop GPU | HP Omen 16-xf0376ng R7 7840HS, GeForce RTX 4070 Laptop GPU | Lenovo Legion Pro 5 16ARX8 R7 7745HX, GeForce RTX 4070 Laptop GPU | Acer Nitro 16 AN16-41 R7 7735HS, GeForce RTX 4070 Laptop GPU | Gigabyte AERO 16 OLED BSF i9-13900H, GeForce RTX 4070 Laptop GPU | MSI Stealth 16 Studio A13VG i7-13700H, GeForce RTX 4070 Laptop GPU | |
|---|---|---|---|---|---|---|
| Noise | 2% | 10% | 3% | -3% | 10% | |
| off /ambiente * (dB) | 25 | 24 4% | 23.2 7% | 25.7 -3% | 23 8% | 24 4% |
| Idle Minimum * (dB) | 28 | 25 11% | 23.2 17% | 25.7 8% | 23 18% | 24 14% |
| Idle Average * (dB) | 29 | 29 -0% | 23.2 20% | 25.7 11% | 23 21% | 24 17% |
| Idle Maximum * (dB) | 30 | 32 -7% | 26.2 13% | 26.3 12% | 33.64 -12% | 24 20% |
| Load Average * (dB) | 43 | 44 -2% | 31.4 27% | 33.9 21% | 51.49 -20% | 34.81 19% |
| Witcher 3 ultra * (dB) | 46 | 44 4% | 48.4 -5% | 55.27 -20% | 44.05 4% | |
| Load Maximum * (dB) | 48 | 46 4% | 53.8 -12% | 62 -29% | 55.24 -15% | 51.57 -7% |
* ... Meglio usare valori piccoli
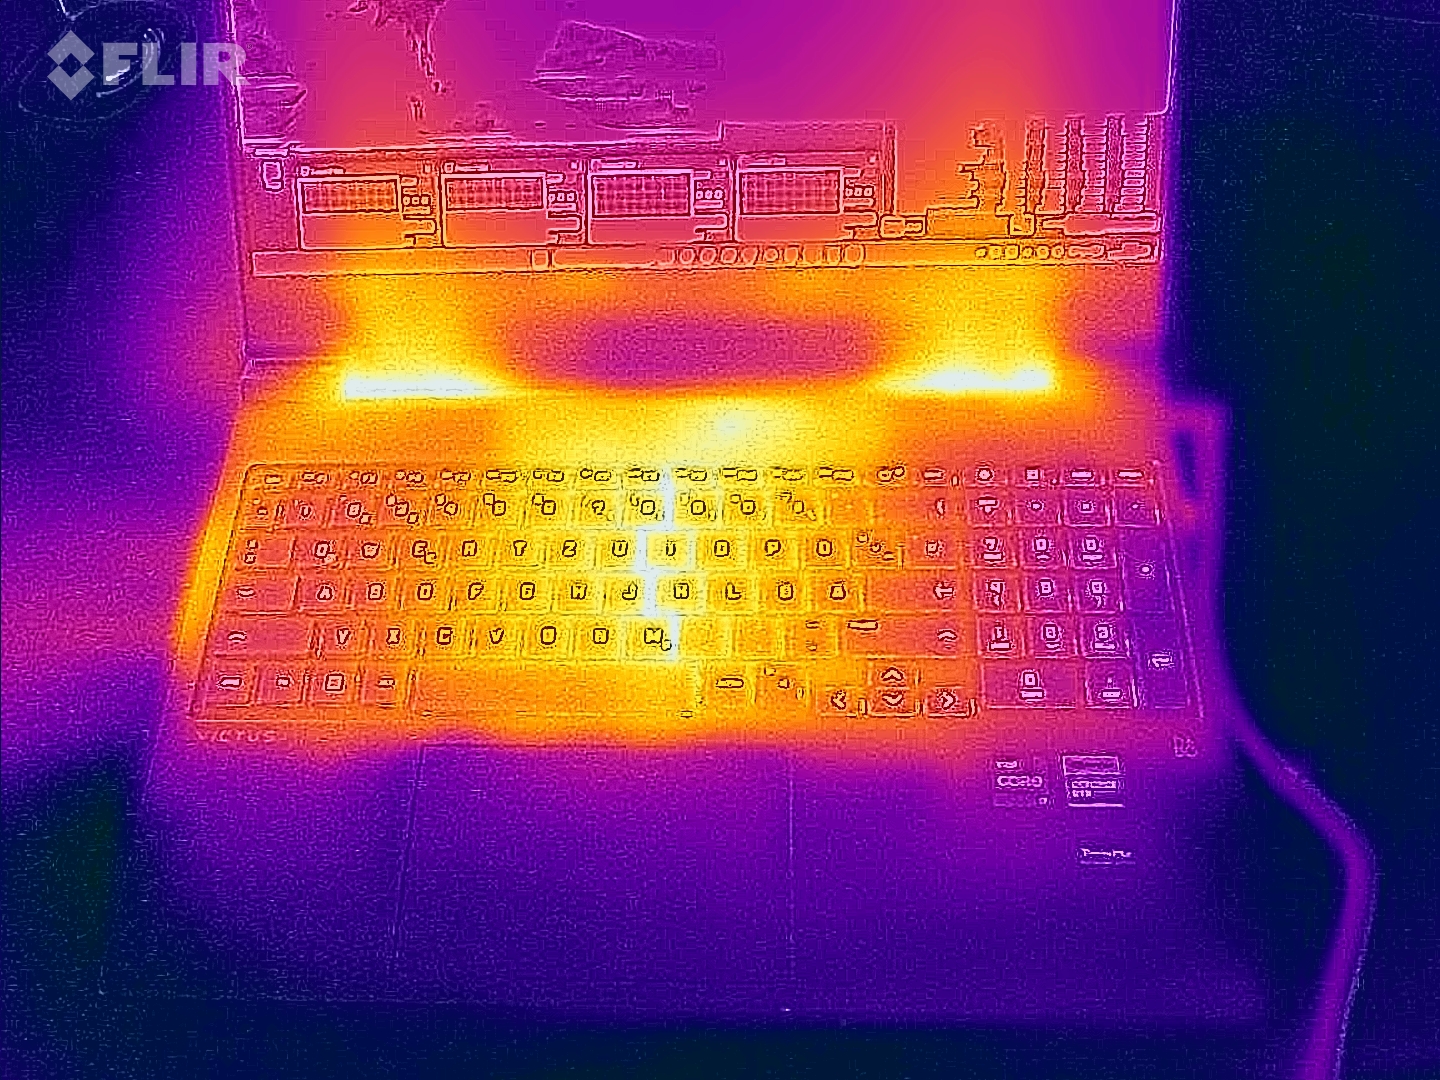
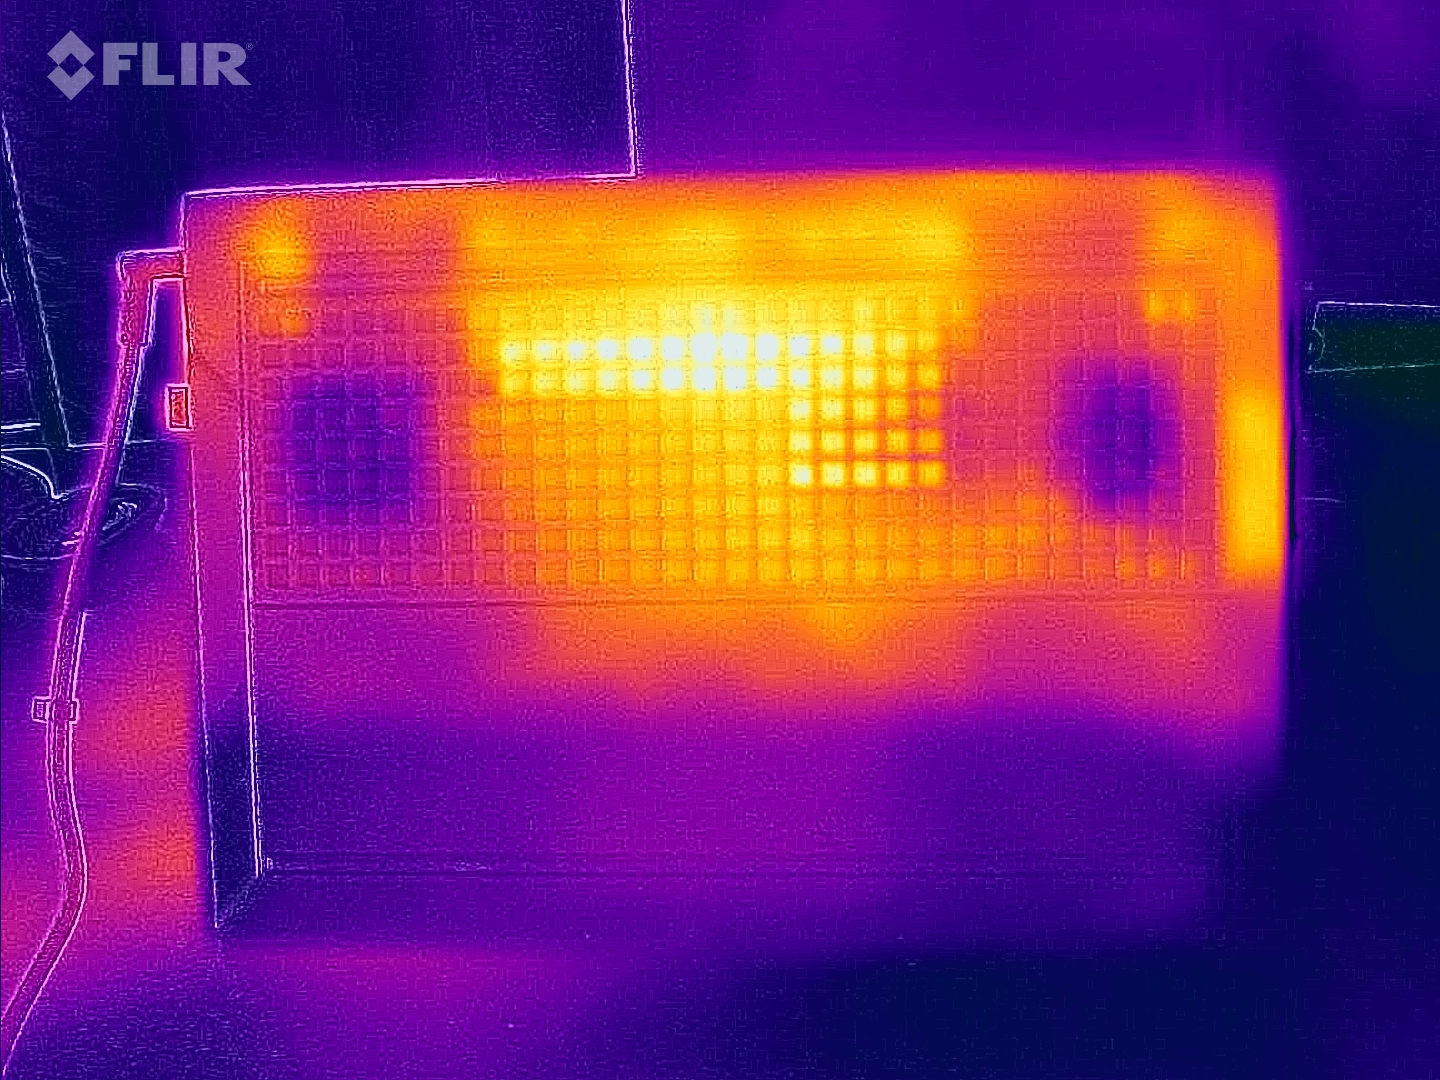
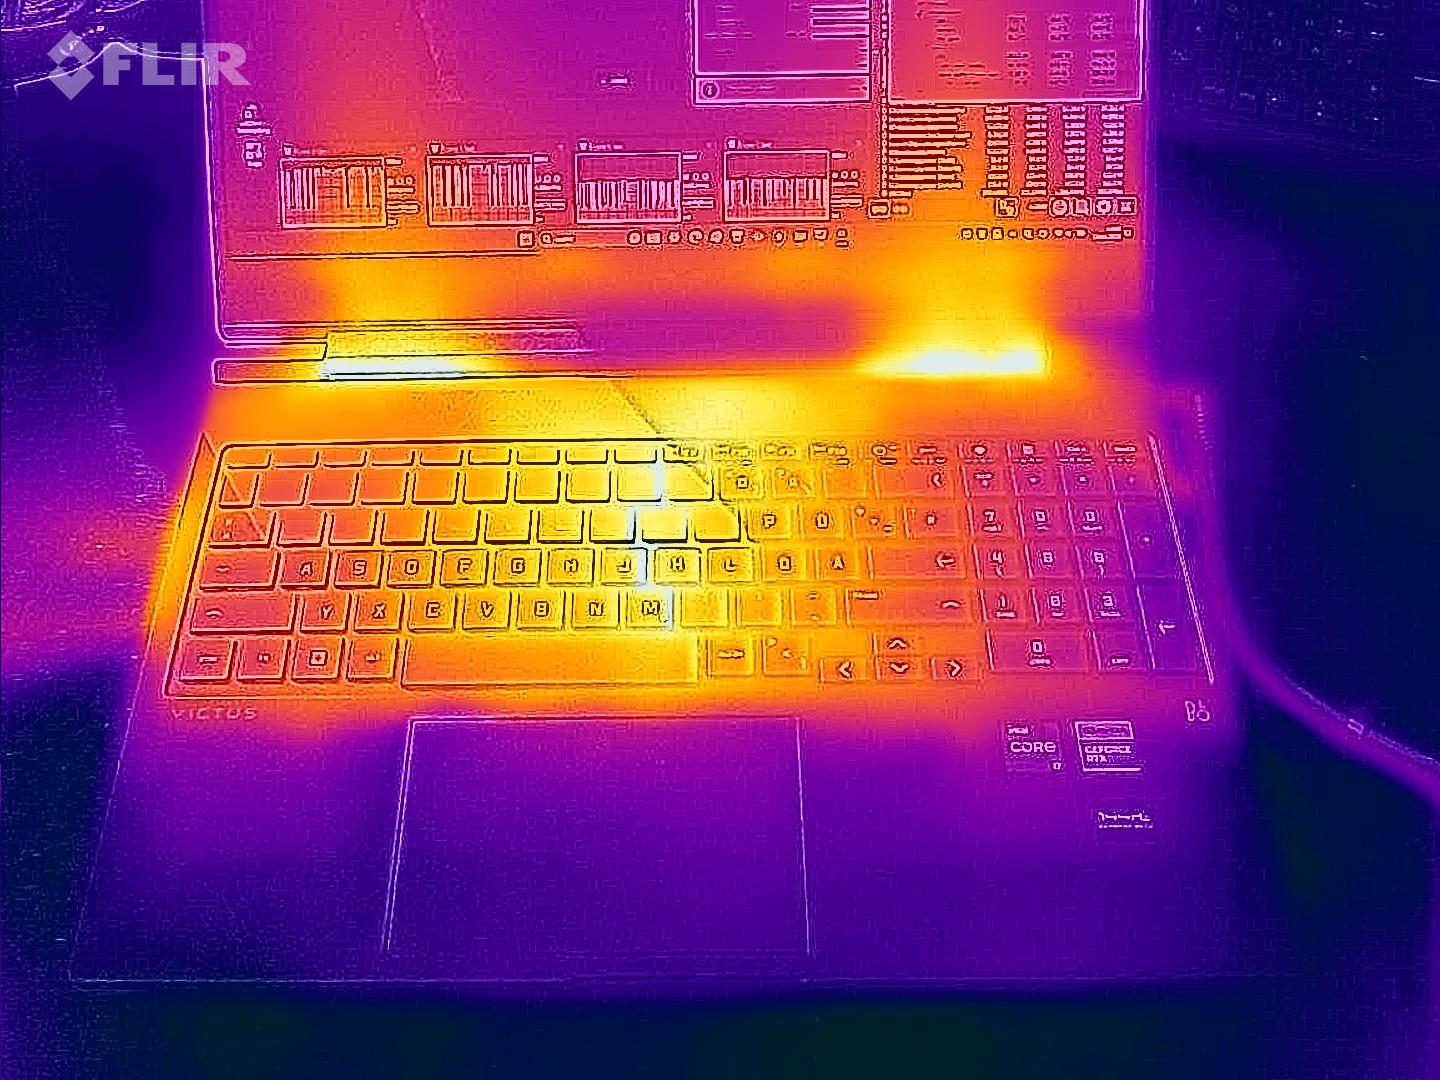
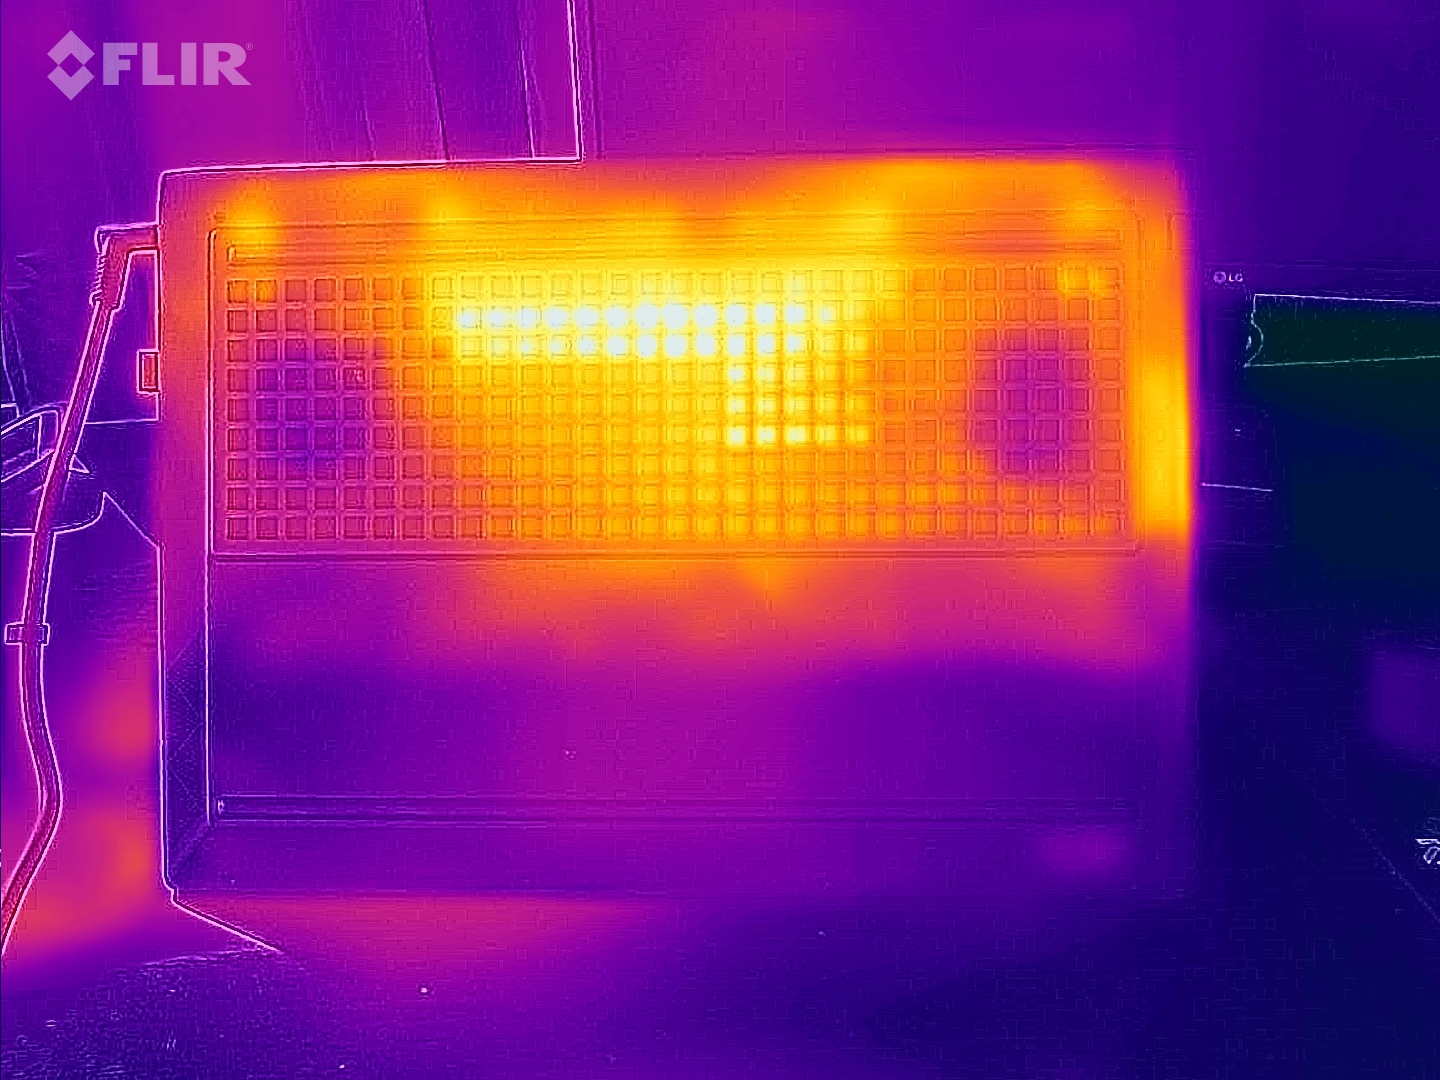
Temperatura
Anche le temperature sono leggermente più alte rispetto alla maggior parte dei dispositivi di confronto, sia in modalità idle che sotto carico. Dopo un'ora di Witcher 3, la parte superiore dello chassis ha raggiunto i 52 °C e la parte inferiore del case i 54 °C, il che depone a sfavore delle sessioni di gioco sulle gambe. Almeno l'area del palmo della mano rimane sempre in una zona confortevole, con un massimo di 33 °C.
(-) La temperatura massima sul lato superiore è di 51 °C / 124 F, rispetto alla media di 40.4 °C / 105 F, che varia da 21.2 a 68.8 °C per questa classe Gaming.
(-) Il lato inferiore si riscalda fino ad un massimo di 54 °C / 129 F, rispetto alla media di 43.2 °C / 110 F
(+) In idle, la temperatura media del lato superiore è di 29.8 °C / 86 F, rispetto alla media deld ispositivo di 33.9 °C / 93 F.
(-) Riproducendo The Witcher 3, la temperatura media per il lato superiore e' di 41.6 °C / 107 F, rispetto alla media del dispositivo di 33.9 °C / 93 F.
(+) I poggiapolsi e il touchpad raggiungono la temperatura massima della pelle (33 °C / 91.4 F) e quindi non sono caldi.
(-) La temperatura media della zona del palmo della mano di dispositivi simili e'stata di 28.8 °C / 83.8 F (-4.2 °C / -7.6 F).
| HP Victus 16-r0077ng i7-13700H, GeForce RTX 4070 Laptop GPU | HP Omen 16-xf0376ng R7 7840HS, GeForce RTX 4070 Laptop GPU | Lenovo Legion Pro 5 16ARX8 R7 7745HX, GeForce RTX 4070 Laptop GPU | Acer Nitro 16 AN16-41 R7 7735HS, GeForce RTX 4070 Laptop GPU | Gigabyte AERO 16 OLED BSF i9-13900H, GeForce RTX 4070 Laptop GPU | MSI Stealth 16 Studio A13VG i7-13700H, GeForce RTX 4070 Laptop GPU | |
|---|---|---|---|---|---|---|
| Heat | 2% | 15% | 5% | 23% | -16% | |
| Maximum Upper Side * (°C) | 51 | 49 4% | 41.8 18% | 41.5 19% | 41 20% | 60 -18% |
| Maximum Bottom * (°C) | 54 | 57 -6% | 41.4 23% | 51.8 4% | 47 13% | 61 -13% |
| Idle Upper Side * (°C) | 37 | 31 16% | 29 22% | 31.6 15% | 23 38% | 38.2 -3% |
| Idle Bottom * (°C) | 29 | 31 -7% | 30.4 -5% | 34.5 -19% | 23 21% | 37.7 -30% |
* ... Meglio usare valori piccoli
Stress test
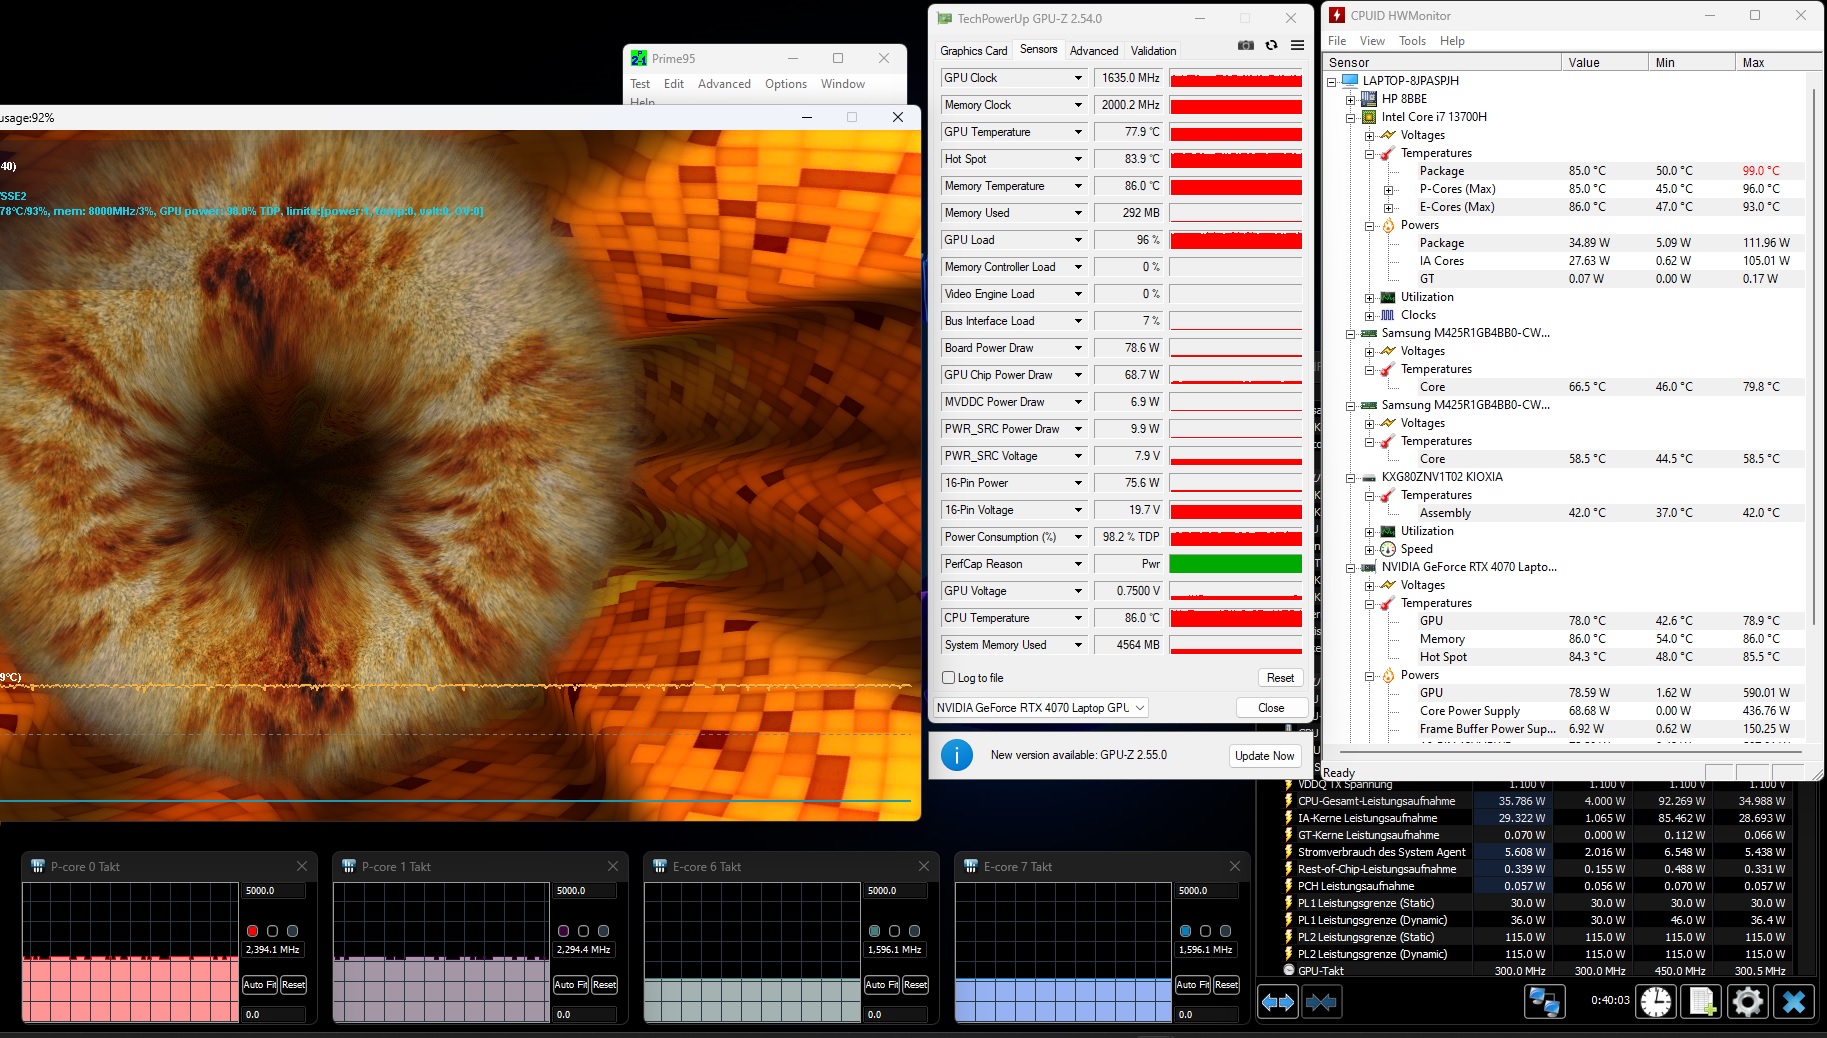
Il sistema di raffreddamento ci lascia con sentimenti contrastanti. Sebbene il Core i7-13700H operi solo al suo clock di base o leggermente al di sotto di esso a pieno carico, la CPU si riscalda abbastanza, intorno agli 85 °C. La situazione della scheda grafica è un po' più tranquilla. Poco meno di 78 °C e una frequenza di clock di 1.635 MHz dopo 60 minuti di Furmark e Prime95 sono un risultato solido.
Altoparlanti
HP Victus 16-r0077ng analisi audio
(±) | potenza degli altiparlanti media ma buona (77 dB)
Bassi 100 - 315 Hz
(-) | quasi nessun basso - in media 21.1% inferiori alla media
(±) | la linearità dei bassi è media (13.6% delta rispetto alla precedente frequenza)
Medi 400 - 2000 Hz
(+) | medi bilanciati - solo only 1.3% rispetto alla media
(+) | medi lineari (2.7% delta rispetto alla precedente frequenza)
Alti 2 - 16 kHz
(+) | Alti bilanciati - appena 2.8% dalla media
(+) | alti lineari (5.3% delta rispetto alla precedente frequenza)
Nel complesso 100 - 16.000 Hz
(±) | la linearità complessiva del suono è media (15.8% di differenza rispetto alla media
Rispetto alla stessa classe
» 37% di tutti i dispositivi testati in questa classe è stato migliore, 7% simile, 56% peggiore
» Il migliore ha avuto un delta di 6%, medio di 18%, peggiore di 132%
Rispetto a tutti i dispositivi testati
» 24% di tutti i dispositivi testati in questa classe è stato migliore, 5% similare, 70% peggiore
» Il migliore ha avuto un delta di 4%, medio di 23%, peggiore di 134%
HP Omen 16-xf0376ng analisi audio
(±) | potenza degli altiparlanti media ma buona (81 dB)
Bassi 100 - 315 Hz
(±) | bassi ridotti - in media 14.9% inferiori alla media
(±) | la linearità dei bassi è media (13.6% delta rispetto alla precedente frequenza)
Medi 400 - 2000 Hz
(±) | medi elevati - circa 5.2% superiore alla media
(+) | medi lineari (4.7% delta rispetto alla precedente frequenza)
Alti 2 - 16 kHz
(+) | Alti bilanciati - appena 3.7% dalla media
(+) | alti lineari (6.6% delta rispetto alla precedente frequenza)
Nel complesso 100 - 16.000 Hz
(+) | suono nel complesso lineare (14.6% differenza dalla media)
Rispetto alla stessa classe
» 28% di tutti i dispositivi testati in questa classe è stato migliore, 7% simile, 65% peggiore
» Il migliore ha avuto un delta di 6%, medio di 18%, peggiore di 132%
Rispetto a tutti i dispositivi testati
» 19% di tutti i dispositivi testati in questa classe è stato migliore, 4% similare, 77% peggiore
» Il migliore ha avuto un delta di 4%, medio di 23%, peggiore di 134%
Gestione dell'energia
Consumo di energia
Il Victus 16 si distingue dalla concorrenza in termini di consumo energetico. Un consumo medio in idle di 13 watt e un consumo di gioco di 142 watt sono inferiori alla maggior parte dei dispositivi di confronto. L'alimentatore da 230 watt in dotazione è quindi perfettamente adeguato.
| Off / Standby | |
| Idle | |
| Sotto carico |
|
Leggenda:
min: | |
| HP Victus 16-r0077ng i7-13700H, GeForce RTX 4070 Laptop GPU | HP Omen 16-xf0376ng R7 7840HS, GeForce RTX 4070 Laptop GPU | Lenovo Legion Pro 5 16ARX8 R7 7745HX, GeForce RTX 4070 Laptop GPU | Acer Nitro 16 AN16-41 R7 7735HS, GeForce RTX 4070 Laptop GPU | Gigabyte AERO 16 OLED BSF i9-13900H, GeForce RTX 4070 Laptop GPU | MSI Stealth 16 Studio A13VG i7-13700H, GeForce RTX 4070 Laptop GPU | Media della classe Gaming | |
|---|---|---|---|---|---|---|---|
| Power Consumption | 3% | -24% | -20% | -10% | -10% | -32% | |
| Idle Minimum * (Watt) | 8 | 9 -13% | 8.1 -1% | 11.6 -45% | 11.8 -48% | 11 -38% | 13 ? -63% |
| Idle Average * (Watt) | 13 | 14 -8% | 15.9 -22% | 15.6 -20% | 16.1 -24% | 18 -38% | 19 ? -46% |
| Idle Maximum * (Watt) | 22 | 20 9% | 37.2 -69% | 16.5 25% | 17 23% | 19 14% | 24.6 ? -12% |
| Load Average * (Watt) | 86 | 84 2% | 90.9 -6% | 155 -80% | 100.6 -17% | 91 -6% | 110.7 ? -29% |
| Witcher 3 ultra * (Watt) | 141.8 | 140.9 1% | 189.6 -34% | 154.8 -9% | 158 -11% | 130 8% | |
| Load Maximum * (Watt) | 233 | 176 24% | 263.5 -13% | 205 12% | 192 18% | 228 2% | 259 ? -11% |
* ... Meglio usare valori piccoli
Power consumption Witcher 3 / Stress test
Power consumption with an external monitor
Durata della batteria
Con la commutazione grafica attiva, il Victus 16 dura relativamente a lungo senza presa di corrente per un notebook da gioco. Nel test pratico WLAN (luminosità impostata a 150 cd/m²), il dispositivo da 16 pollici è durato 426 minuti, quasi 1,5 ore in più rispetto all'analogo Omen 16, anche se alcuni concorrenti hanno tempi di funzionamento ancora più lunghi grazie a batterie più grandi (il Victus 16 offre 83 Wh).
| HP Victus 16-r0077ng i7-13700H, GeForce RTX 4070 Laptop GPU, 83 Wh | HP Omen 16-xf0376ng R7 7840HS, GeForce RTX 4070 Laptop GPU, 83 Wh | Lenovo Legion Pro 5 16ARX8 R7 7745HX, GeForce RTX 4070 Laptop GPU, 80 Wh | Acer Nitro 16 AN16-41 R7 7735HS, GeForce RTX 4070 Laptop GPU, 90 Wh | Gigabyte AERO 16 OLED BSF i9-13900H, GeForce RTX 4070 Laptop GPU, 88 Wh | MSI Stealth 16 Studio A13VG i7-13700H, GeForce RTX 4070 Laptop GPU, 99.9 Wh | Media della classe Gaming | |
|---|---|---|---|---|---|---|---|
| Autonomia della batteria | -20% | -44% | 27% | 6% | 10% | 0% | |
| WiFi v1.3 (h) | 7.1 | 5.7 -20% | 4 -44% | 9 27% | 7.5 6% | 7.8 10% | 7.11 ? 0% |
| Reader / Idle (h) | 6.5 | 12.2 | 11 | 8.27 ? | |||
| Load (h) | 1 | 1.8 | 2.1 | 2.4 | 1.502 ? | ||
| H.264 (h) | 10.2 | 7.4 | 7.7 | 8.32 ? |
Pro
Contro
Il verdetto
Se HP non avesse scelto la strada dei prezzi ragionevoli, il Victus 16-r0077ng avrebbe avuto vita difficile contro la concorrenza. Il Gigabyte Aero 16, il Lenovo Legion Pro 5, il Acer Nitro 16 e il MSI Stealth 16 Studio hanno tutti una valutazione complessiva migliore, anche se alcuni di loro costano molto di più.
Per un prezzo di partenza di circa 949,99 dollari, il Victus 16 fa una figura relativamente buona.
Sebbene lo chassis in plastica non abbia un aspetto particolarmente pregiato e debba fare a meno di Thunderbolt 4, si distingue per un design di classe e dispositivi di input utilizzabili. La maggior parte degli acquirenti dovrebbe essere soddisfatta anche del display Full HD accurato nei colori (144 Hz), anche se la luminosità è piuttosto scarsa. Le prestazioni del Core i7-13700H e GeForce RTX 4070 soddisfano generalmente le aspettative, mentre i valori di emissione sono un po' contrastanti. In modalità Balanced , che raccomandiamo per l'uso quotidiano, il 16 pollici non è troppo rumoroso, ma piuttosto caldo.
Nel complesso, i giocatori attenti al prezzo non possono sbagliare. Tuttavia, coloro che attribuiscono maggiore valore alla qualità in singole aree o che desiderano risultati migliori, dovrebbero preferibilmente acquistare uno dei dispositivi della concorrenza.
Prezzo e disponibilità
L'equivalente statunitense della nostra configurazione Victus 16 (Core i7-13700H, GeForce RTX 4070 e display a 144 Hz) è disponibile sul webstore HP a 1.439,99 dollari.
I prezzi sono aggiornati al 26.09.2023 e sono soggetti a modifiche.
HP Victus 16-r0077ng
- 09/25/2023 v7 (old)
Florian Glaser
Transparency
La selezione dei dispositivi da recensire viene effettuata dalla nostra redazione. Il campione di prova è stato fornito all'autore come prestito dal produttore o dal rivenditore ai fini di questa recensione. L'istituto di credito non ha avuto alcuna influenza su questa recensione, né il produttore ne ha ricevuto una copia prima della pubblicazione. Non vi era alcun obbligo di pubblicare questa recensione. In quanto società mediatica indipendente, Notebookcheck non è soggetta all'autorità di produttori, rivenditori o editori.
Ecco come Notebookcheck esegue i test
Ogni anno, Notebookcheck esamina in modo indipendente centinaia di laptop e smartphone utilizzando procedure standardizzate per garantire che tutti i risultati siano comparabili. Da circa 20 anni sviluppiamo continuamente i nostri metodi di prova e nel frattempo stabiliamo gli standard di settore. Nei nostri laboratori di prova, tecnici ed editori esperti utilizzano apparecchiature di misurazione di alta qualità. Questi test comportano un processo di validazione in più fasi. Il nostro complesso sistema di valutazione si basa su centinaia di misurazioni e parametri di riferimento ben fondati, che mantengono l'obiettività.Price comparison

