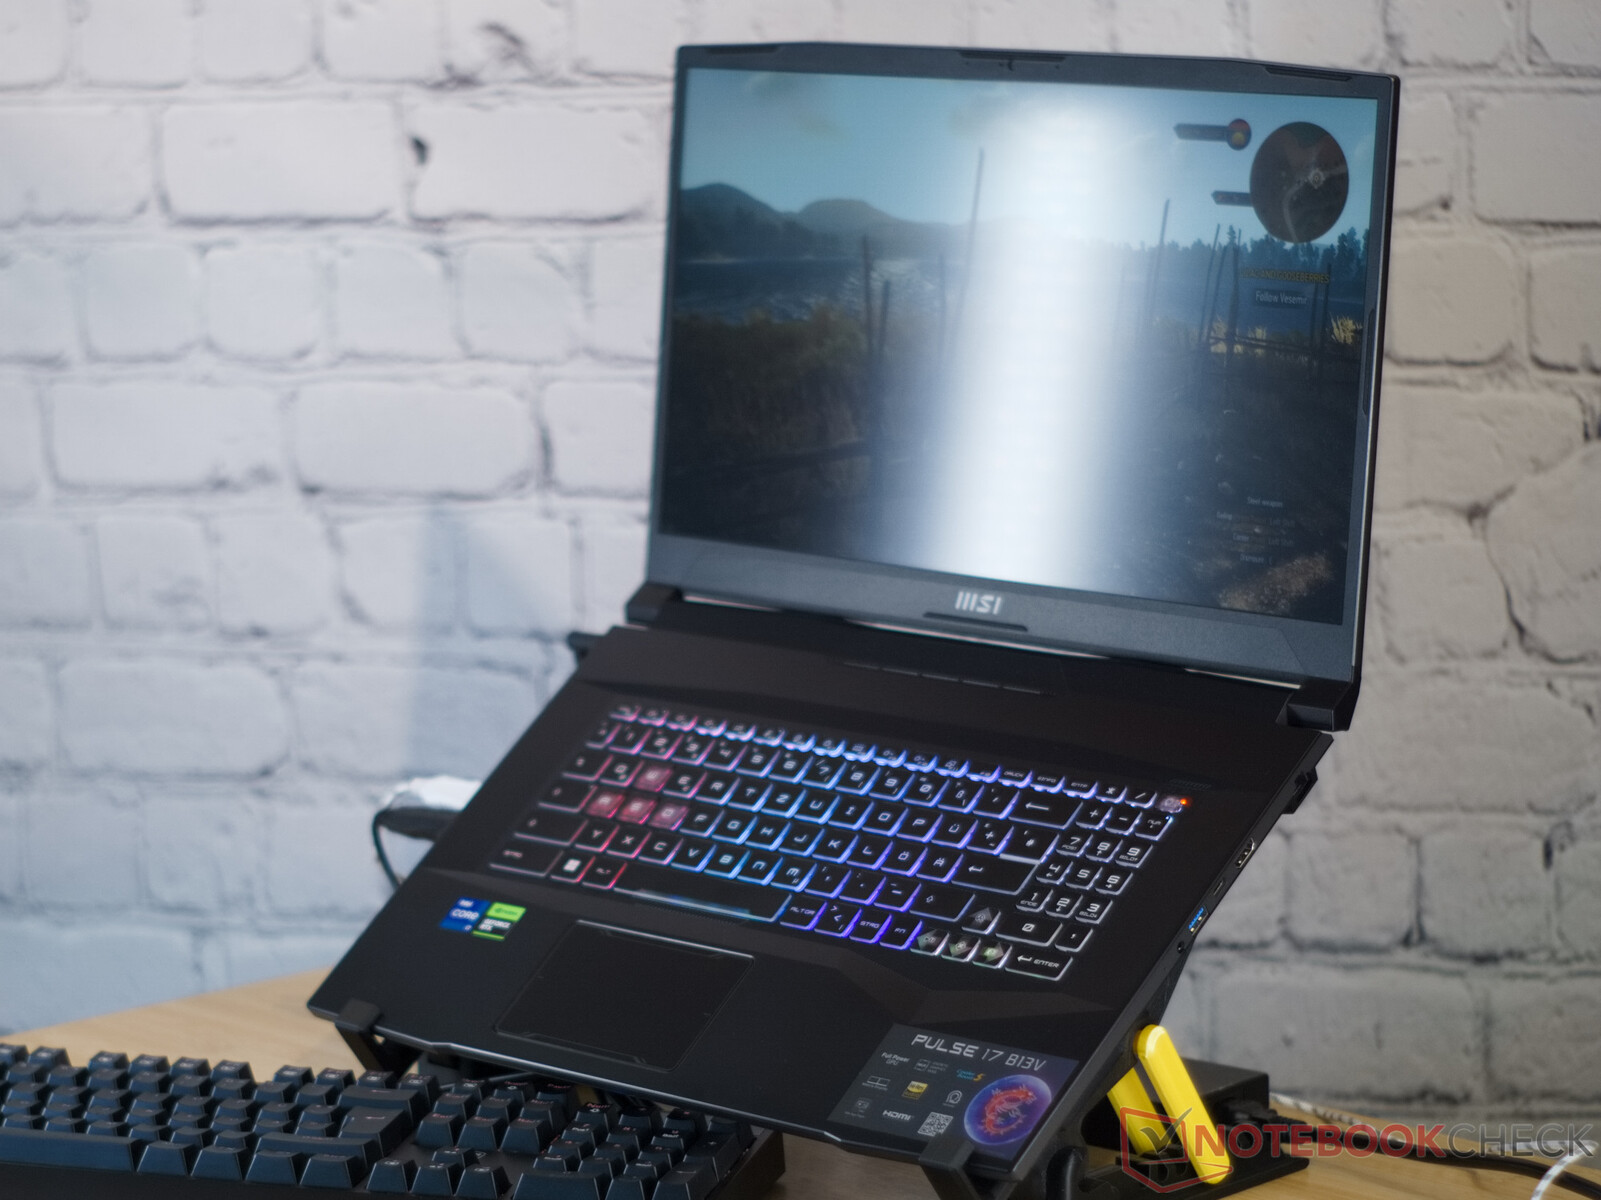
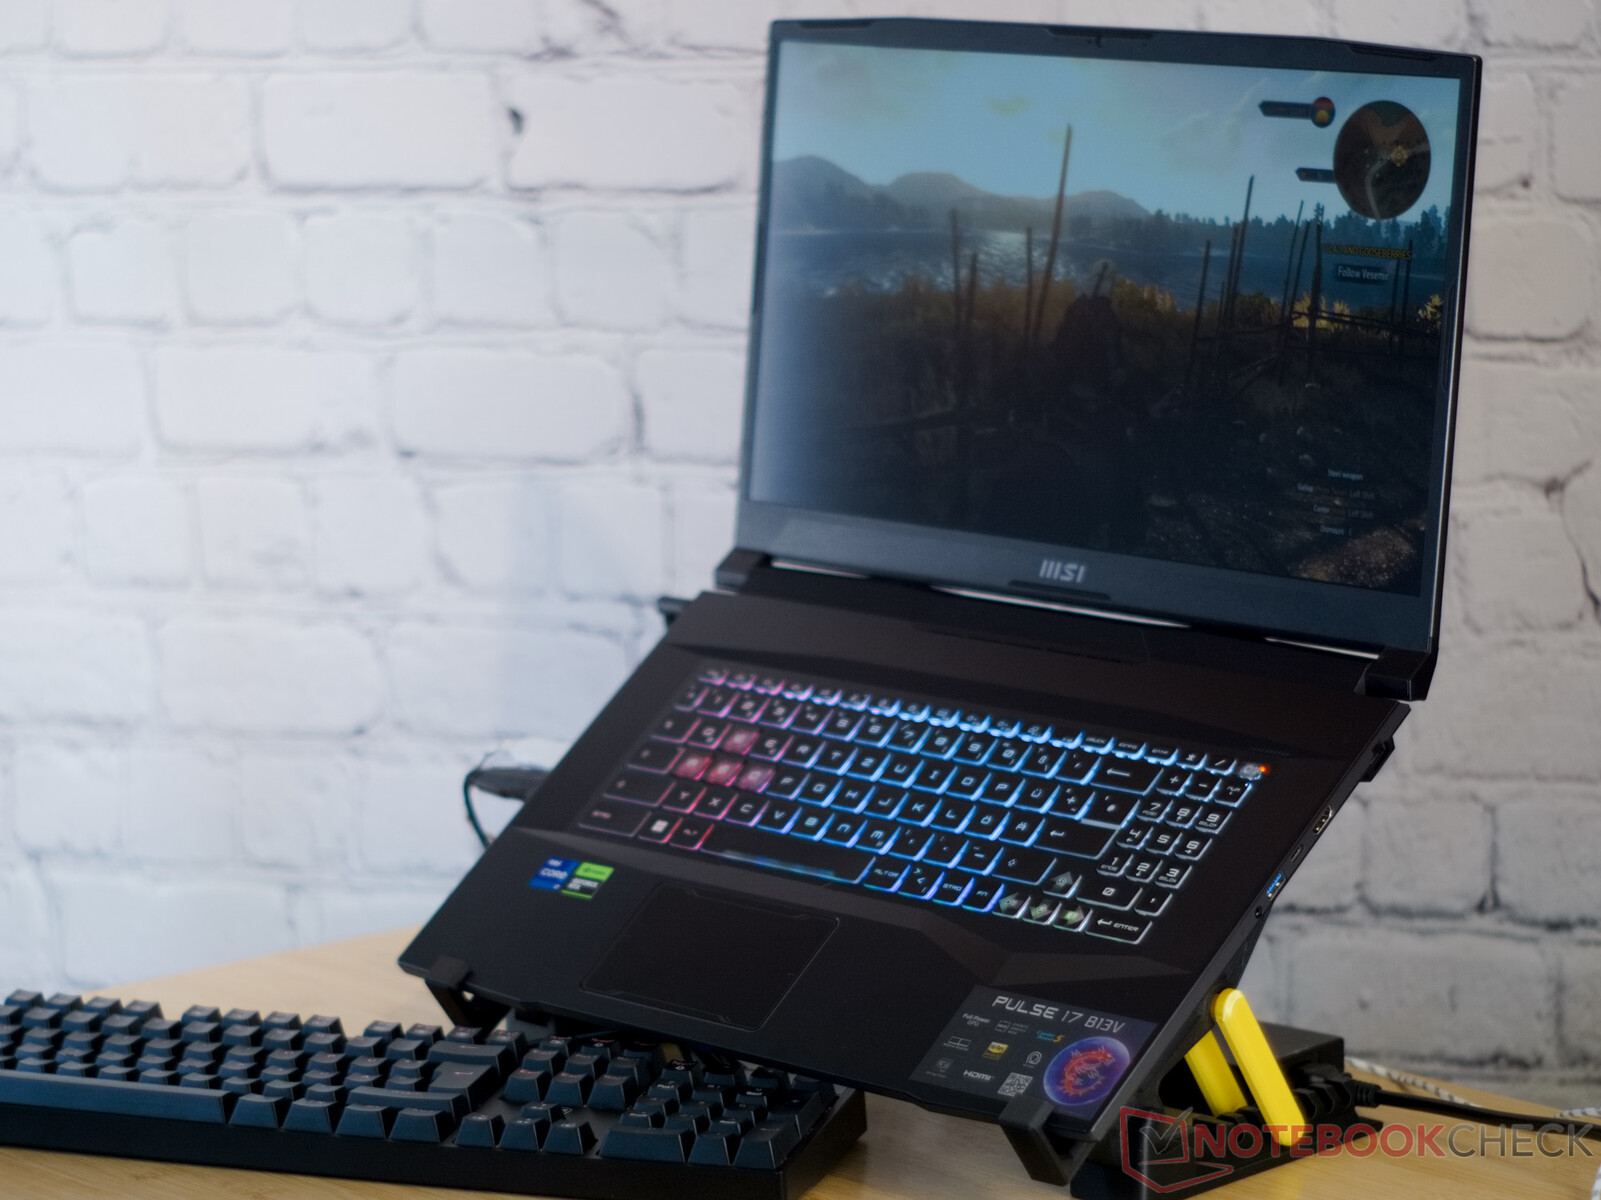
Recensione del portatile gaming MSI Pulse 17 B13V: Con ali silenziose
Con l'MSI Pulse 17, il Red Dragon presenta un portatile da gioco il cui aspetto esteriore ricorda un po' la fantascienza. Questa impressione deriva dal coperchio del display in alluminio anodizzato, dai numerosi bordi e angoli e persino dalla griglia a nido d'ape sul fondo del portatile da 17 pollici. Ma all'interno del portatile girano componenti attuali e la nostra unità di prova è dotata di un processore Intel Core i7-13700He Nvidia GeForce RTX 4070. Quando abbiamo testato il predecessore all'inizio dell'annole prestazioni del portatile erano convincenti. Ma abbiamo anche notato che il Pulse GL76 non dispone di G-Sync, MUX, Advanced Optimus e supporto Thunderbolt. Anche il livello di rumorosità delle ventole del portatile da gioco era motivo di lamentele.
MSI ha ora rielaborato il portatile in modo significativo, introducendo molti miglioramenti, oltre al nuovo design, alle generazioni di chip e al nome criptico. Grazie a ciò, il potente dispositivo sale in modo significativo nelle nostre valutazioni. Confrontiamo il portatile con l'Asus ROG Strix G17 G17 Asus ROG Strix G17 G713PI, ilMSI Katana 17 B13VFKe lo Schenker XMG Focus 17 (E23).
Potenziali concorrenti a confronto
Punteggio | Data | Modello | Peso | Altezza | Dimensione | Risoluzione | Prezzo |
|---|---|---|---|---|---|---|---|
| 86.3 % v7 (old) | 07/2023 | MSI Pulse 17 B13VGK i7-13700H, GeForce RTX 4070 Laptop GPU | 2.7 kg | 27.2 mm | 17.30" | 1920x1080 | |
| 83.2 % v7 (old) | 01/2023 | MSI Pulse GL76 12UGK i7-12700H, GeForce RTX 3070 Laptop GPU | 2.6 kg | 24.2 mm | 17.30" | 1920x1080 | |
| 82.1 % v7 (old) | 02/2023 | MSI Katana 17 B13VFK i7-13620H, GeForce RTX 4060 Laptop GPU | 2.8 kg | 25.2 mm | 17.30" | 1920x1080 | |
| 87.2 % v7 (old) | 07/2023 | Acer Nitro 17 AN17-51-71ER i7-13700H, GeForce RTX 4060 Laptop GPU | 3 kg | 30.3 mm | 17.30" | 2560x1440 | |
| 85.9 % v7 (old) | 06/2023 | Schenker XMG Focus 17 (E23) i9-13900HX, GeForce RTX 4070 Laptop GPU | 2.9 kg | 29.3 mm | 17.30" | 2560x1440 | |
| 88.4 % v7 (old) | 04/2023 | Asus ROG Strix G17 G713PI R9 7945HX, GeForce RTX 4070 Laptop GPU | 2.8 kg | 30.7 mm | 17.30" | 2560x1440 |
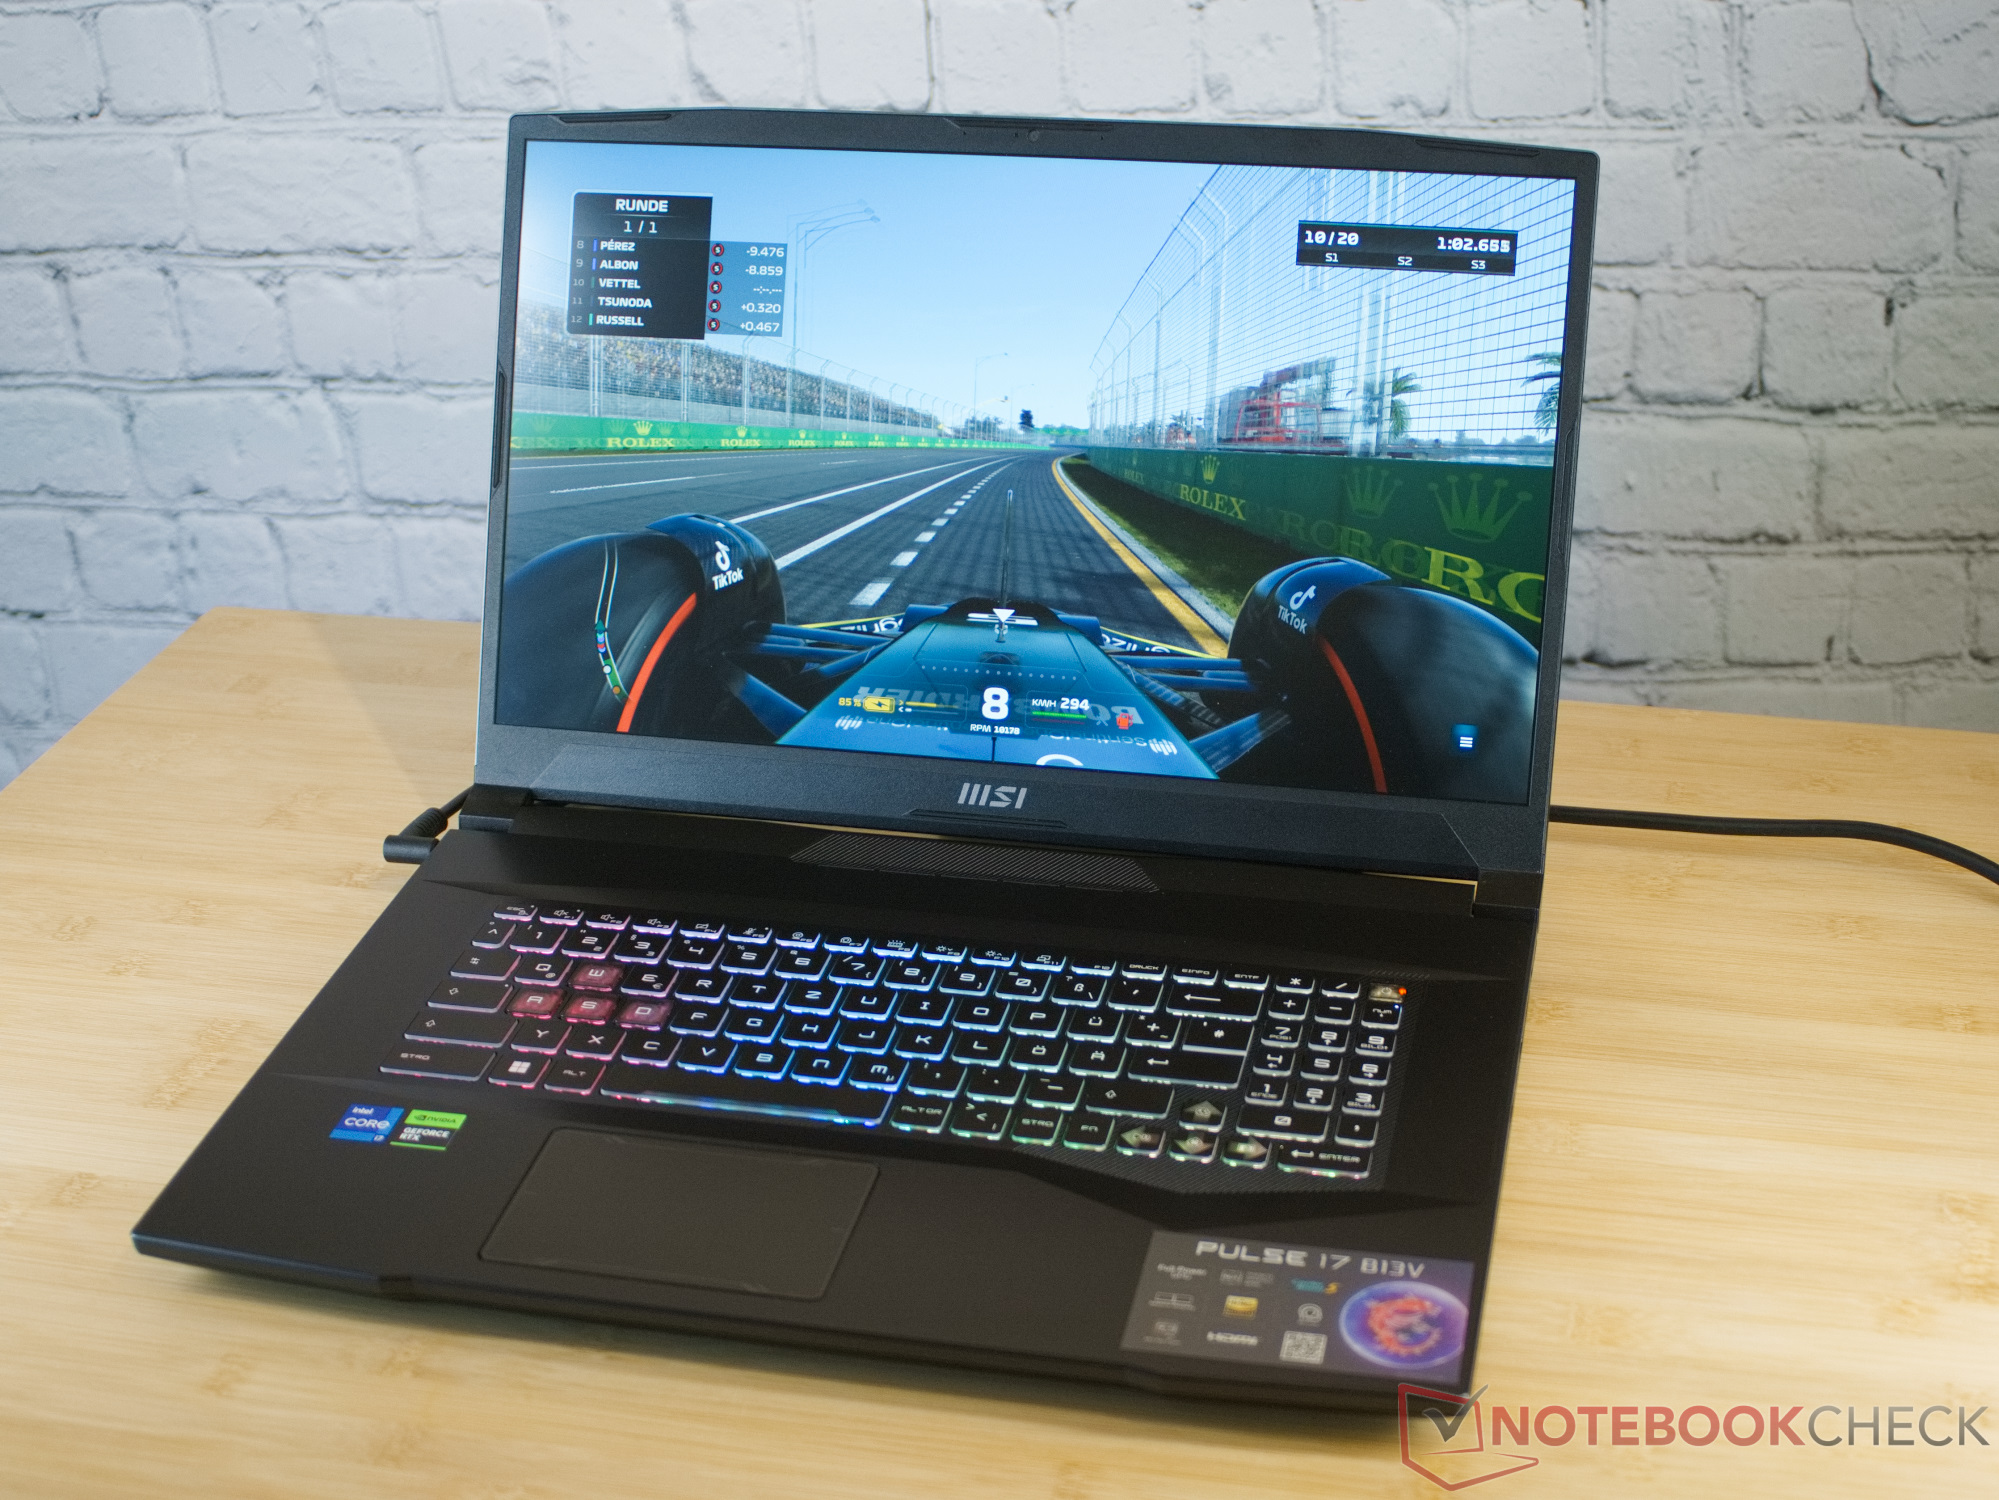
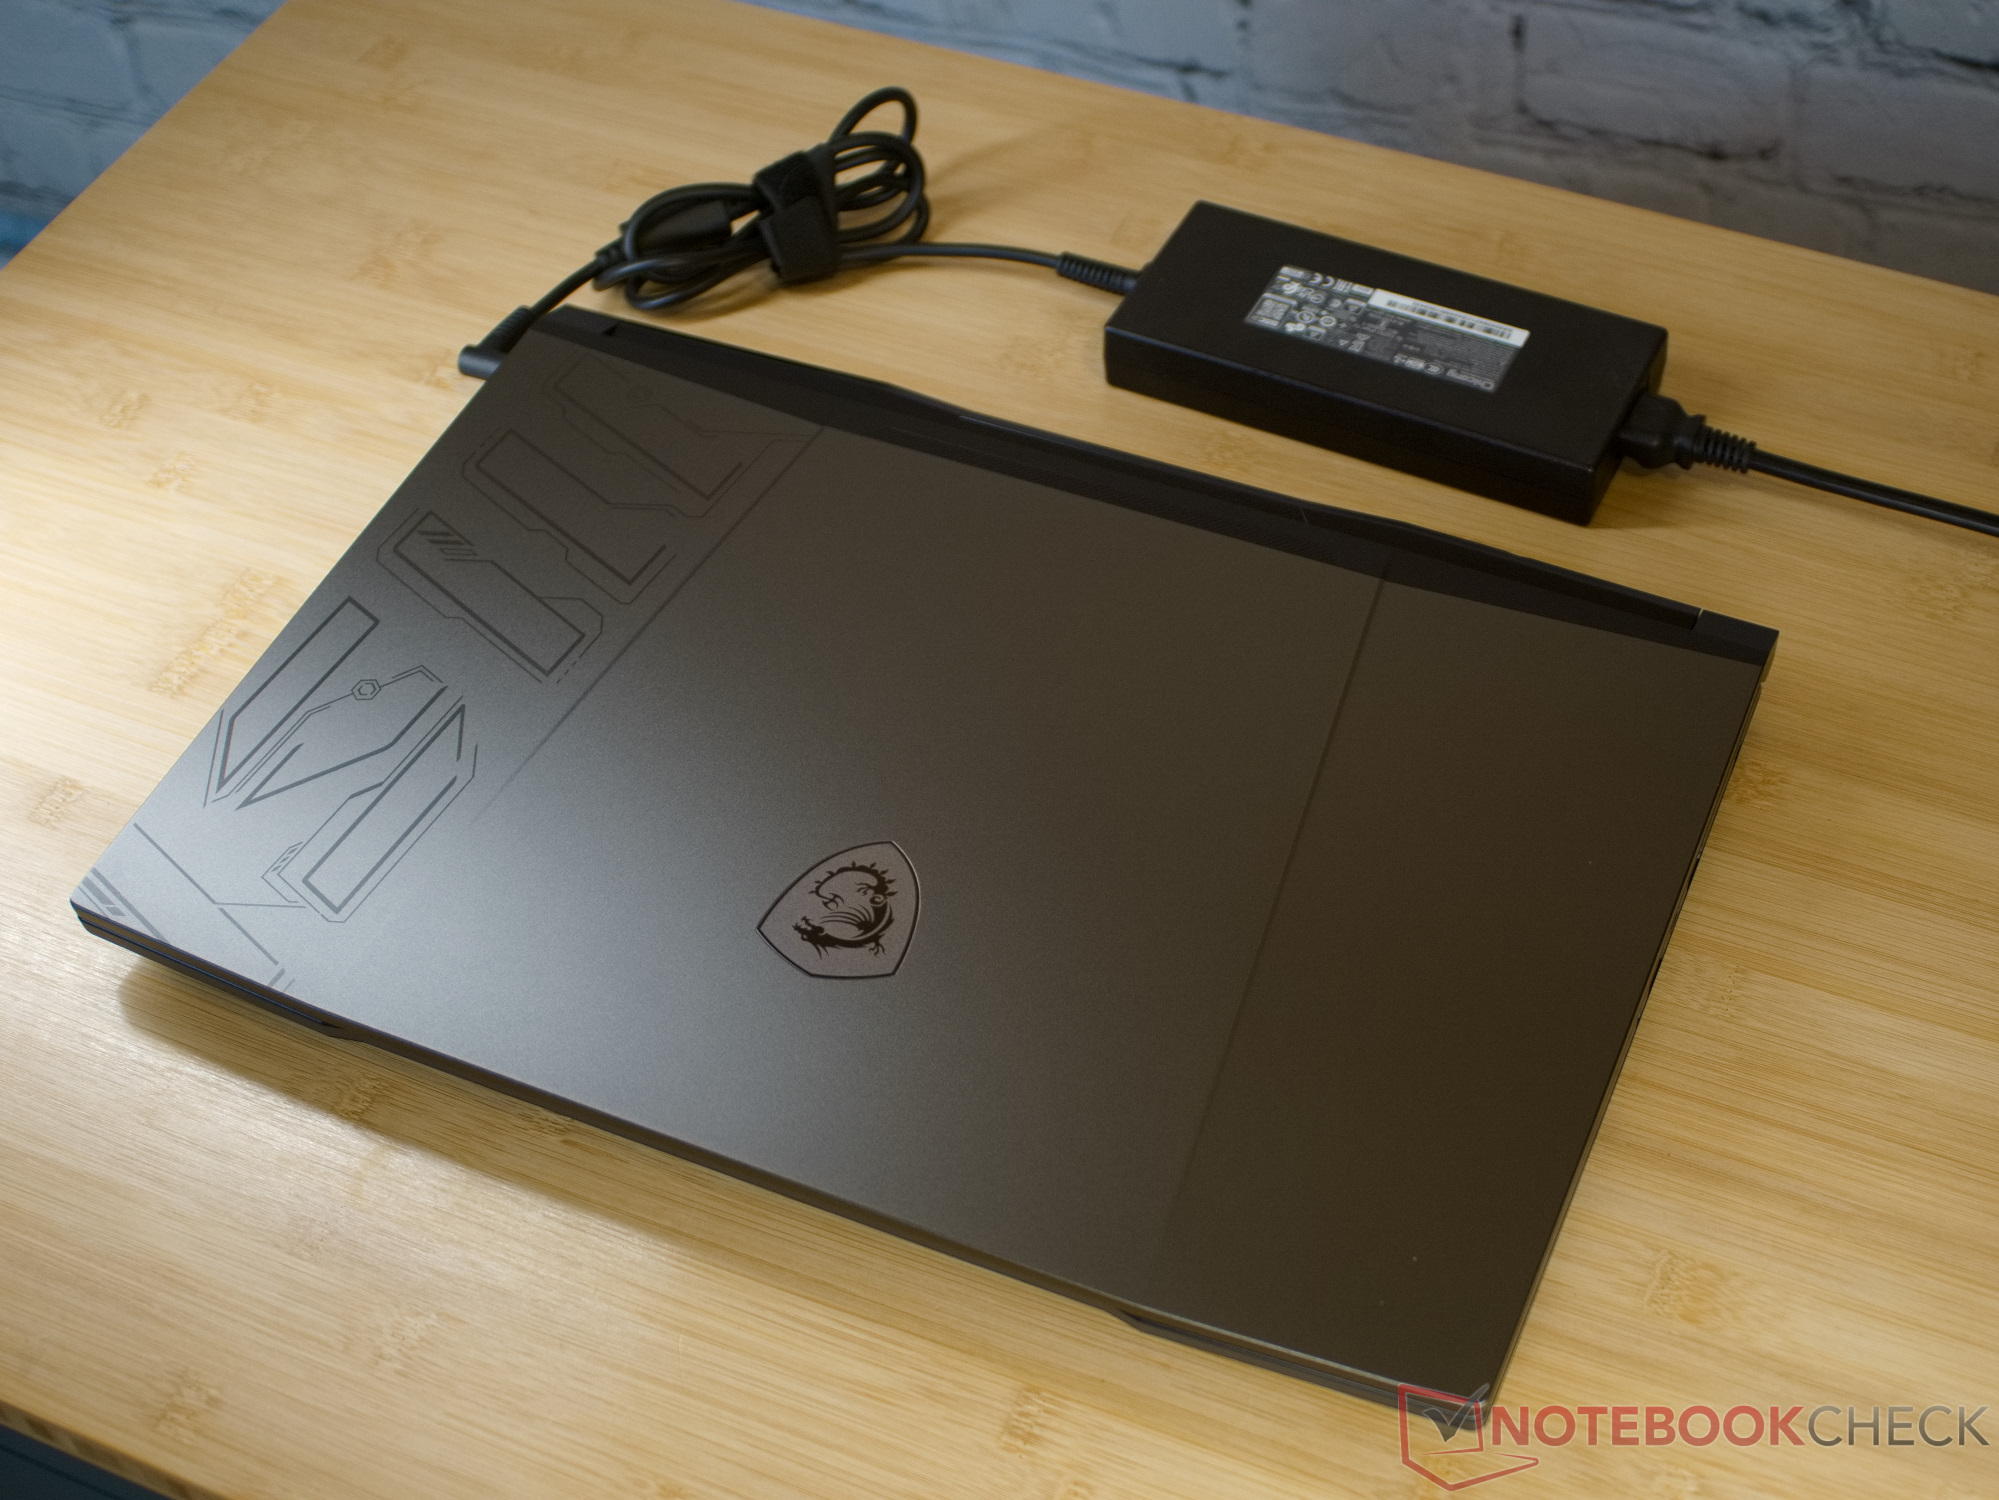
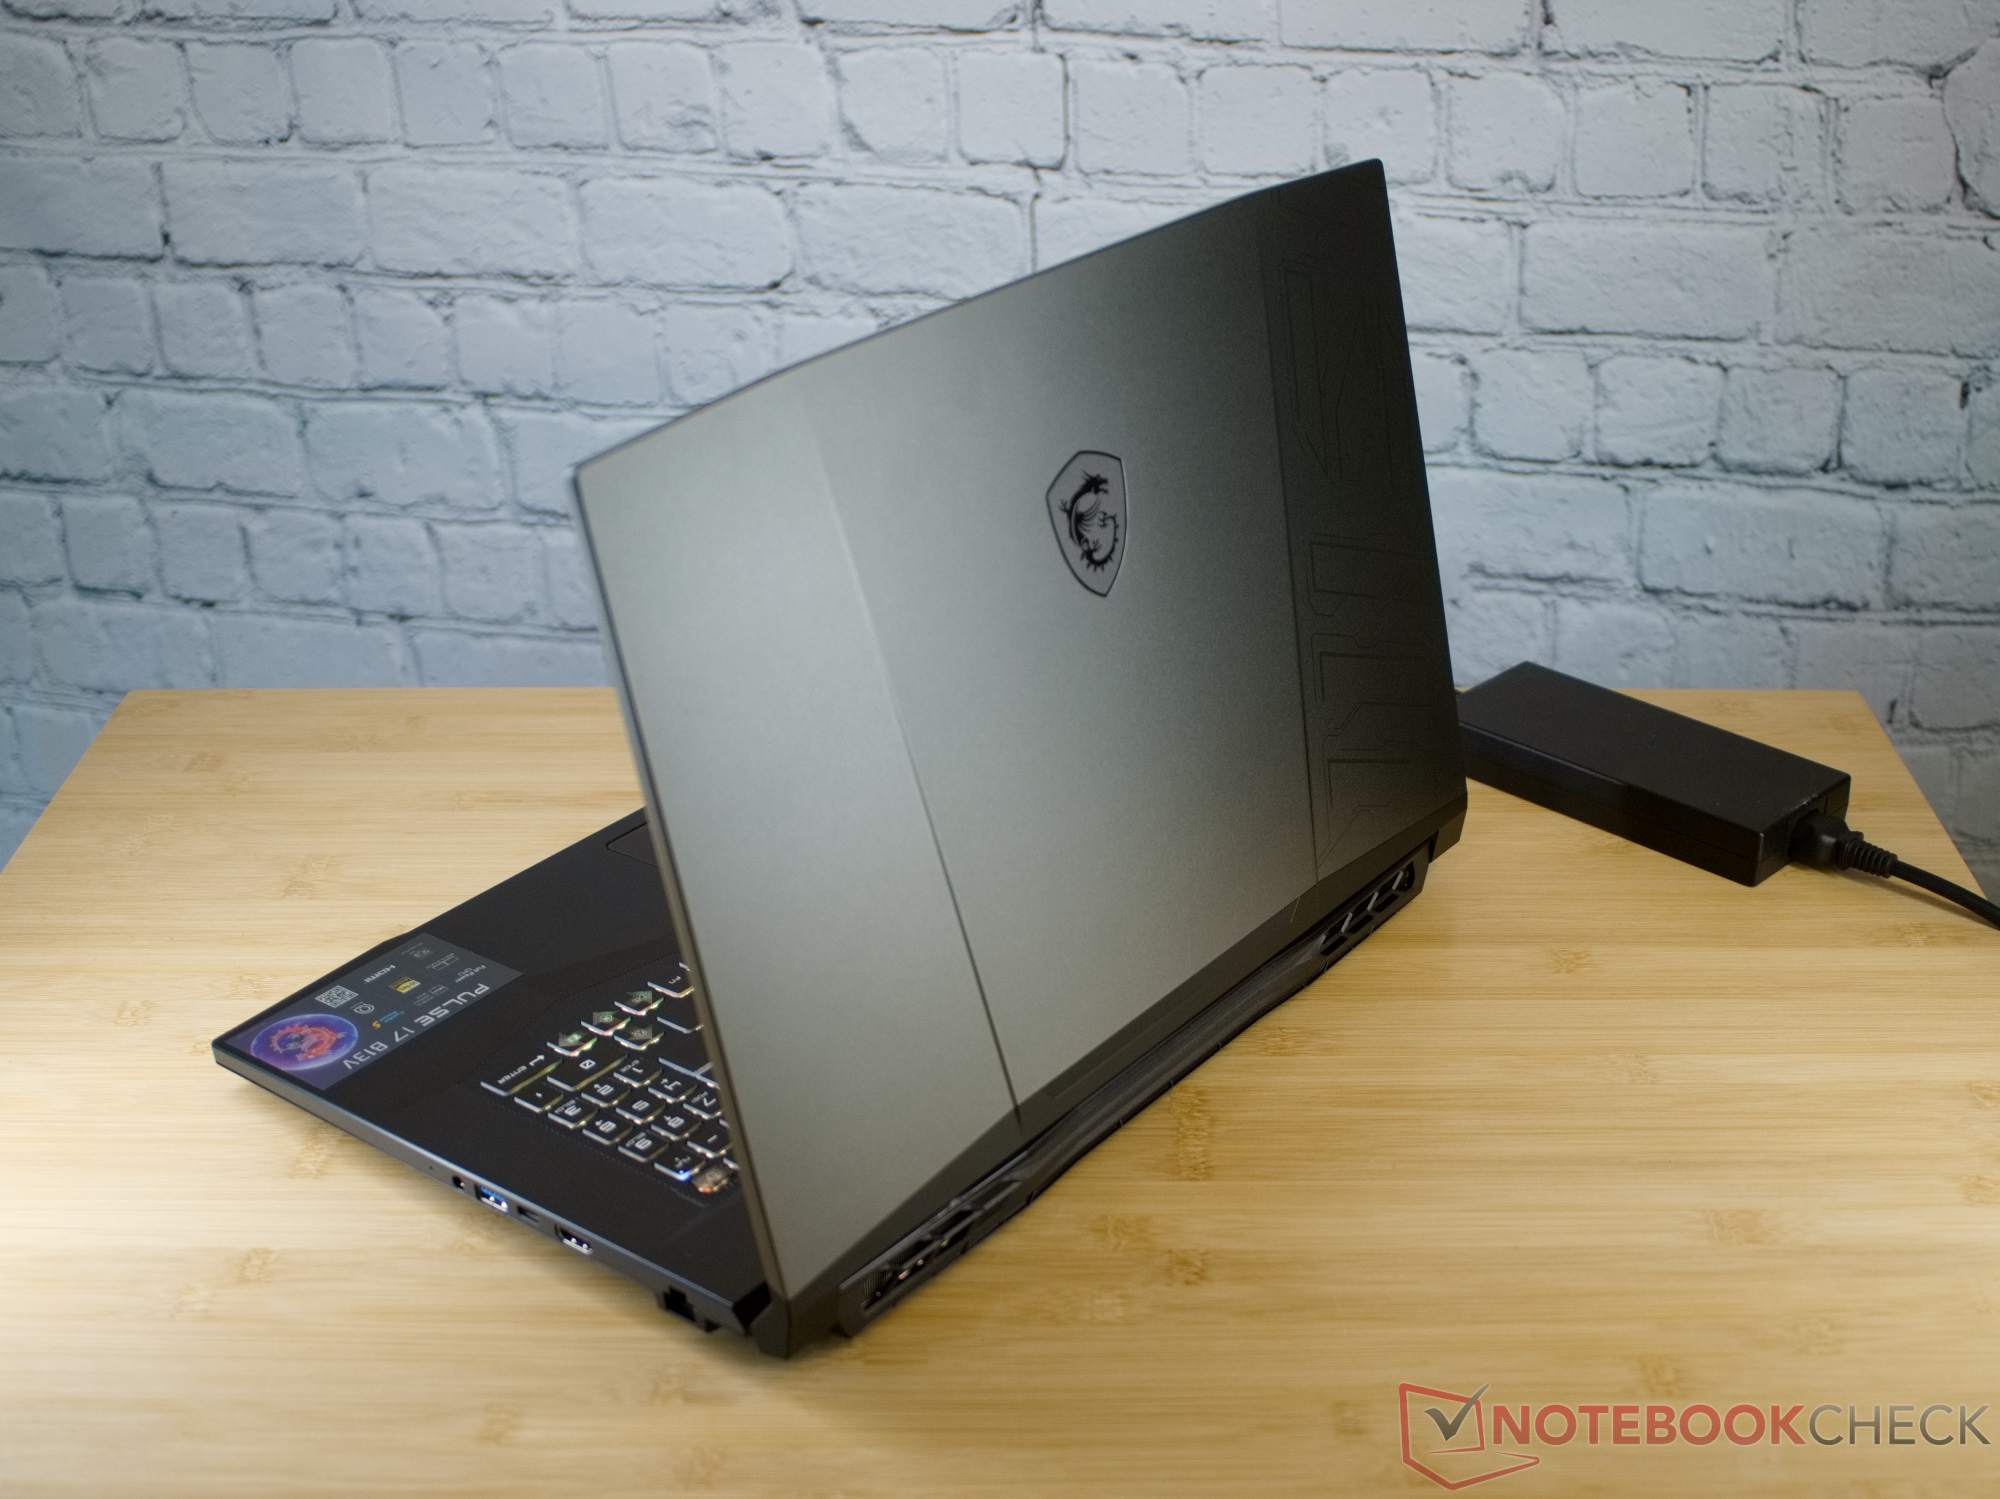
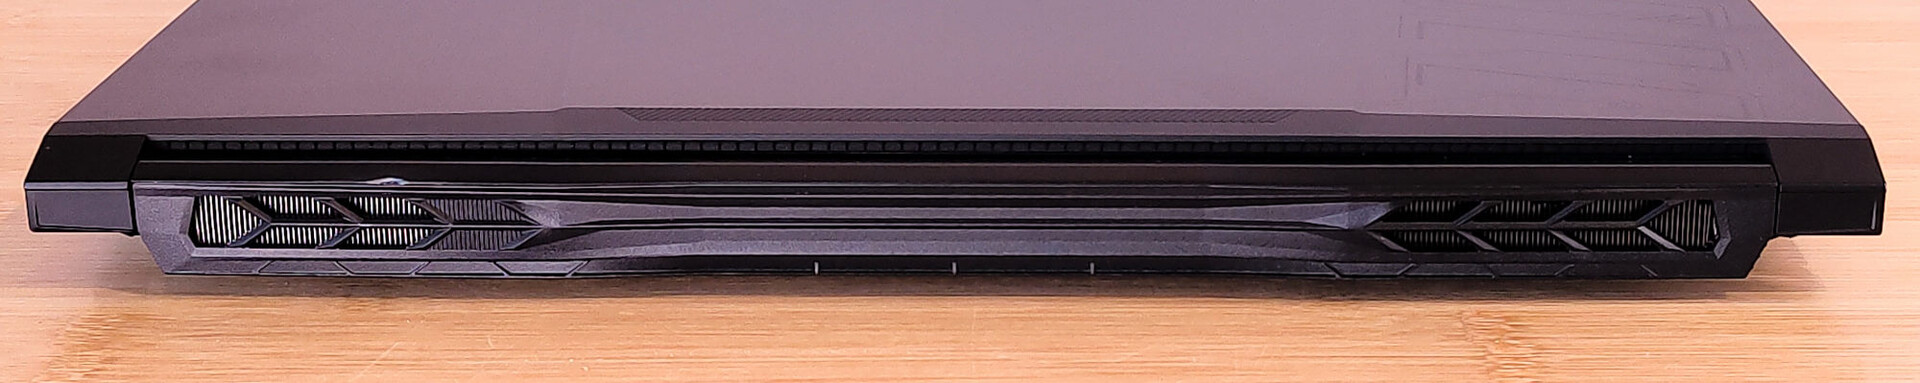
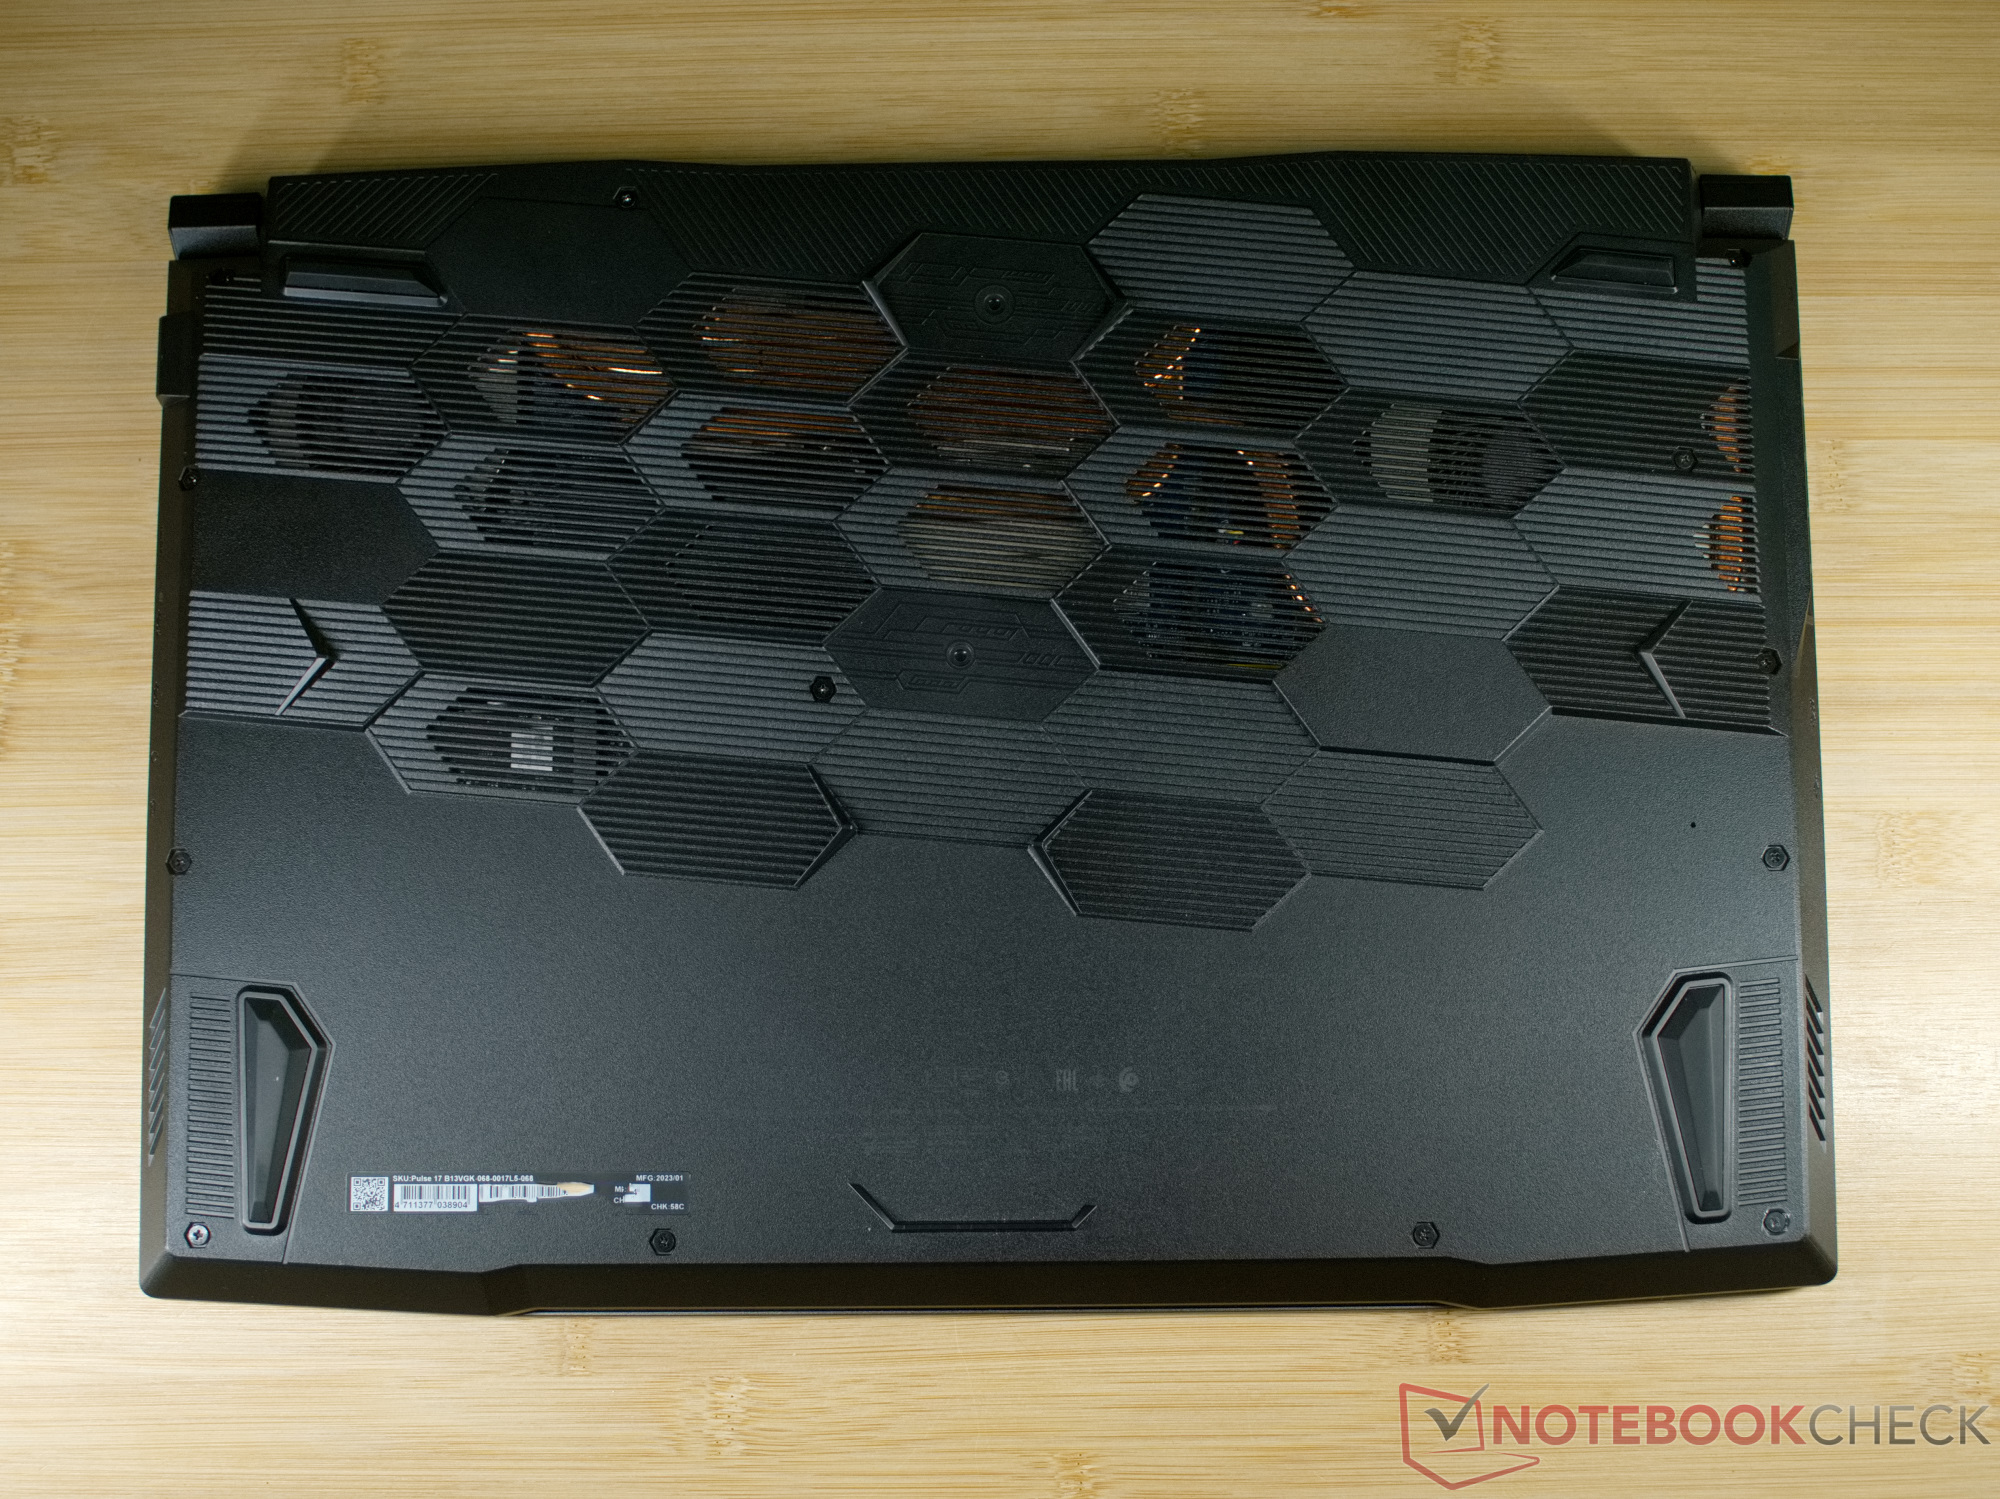
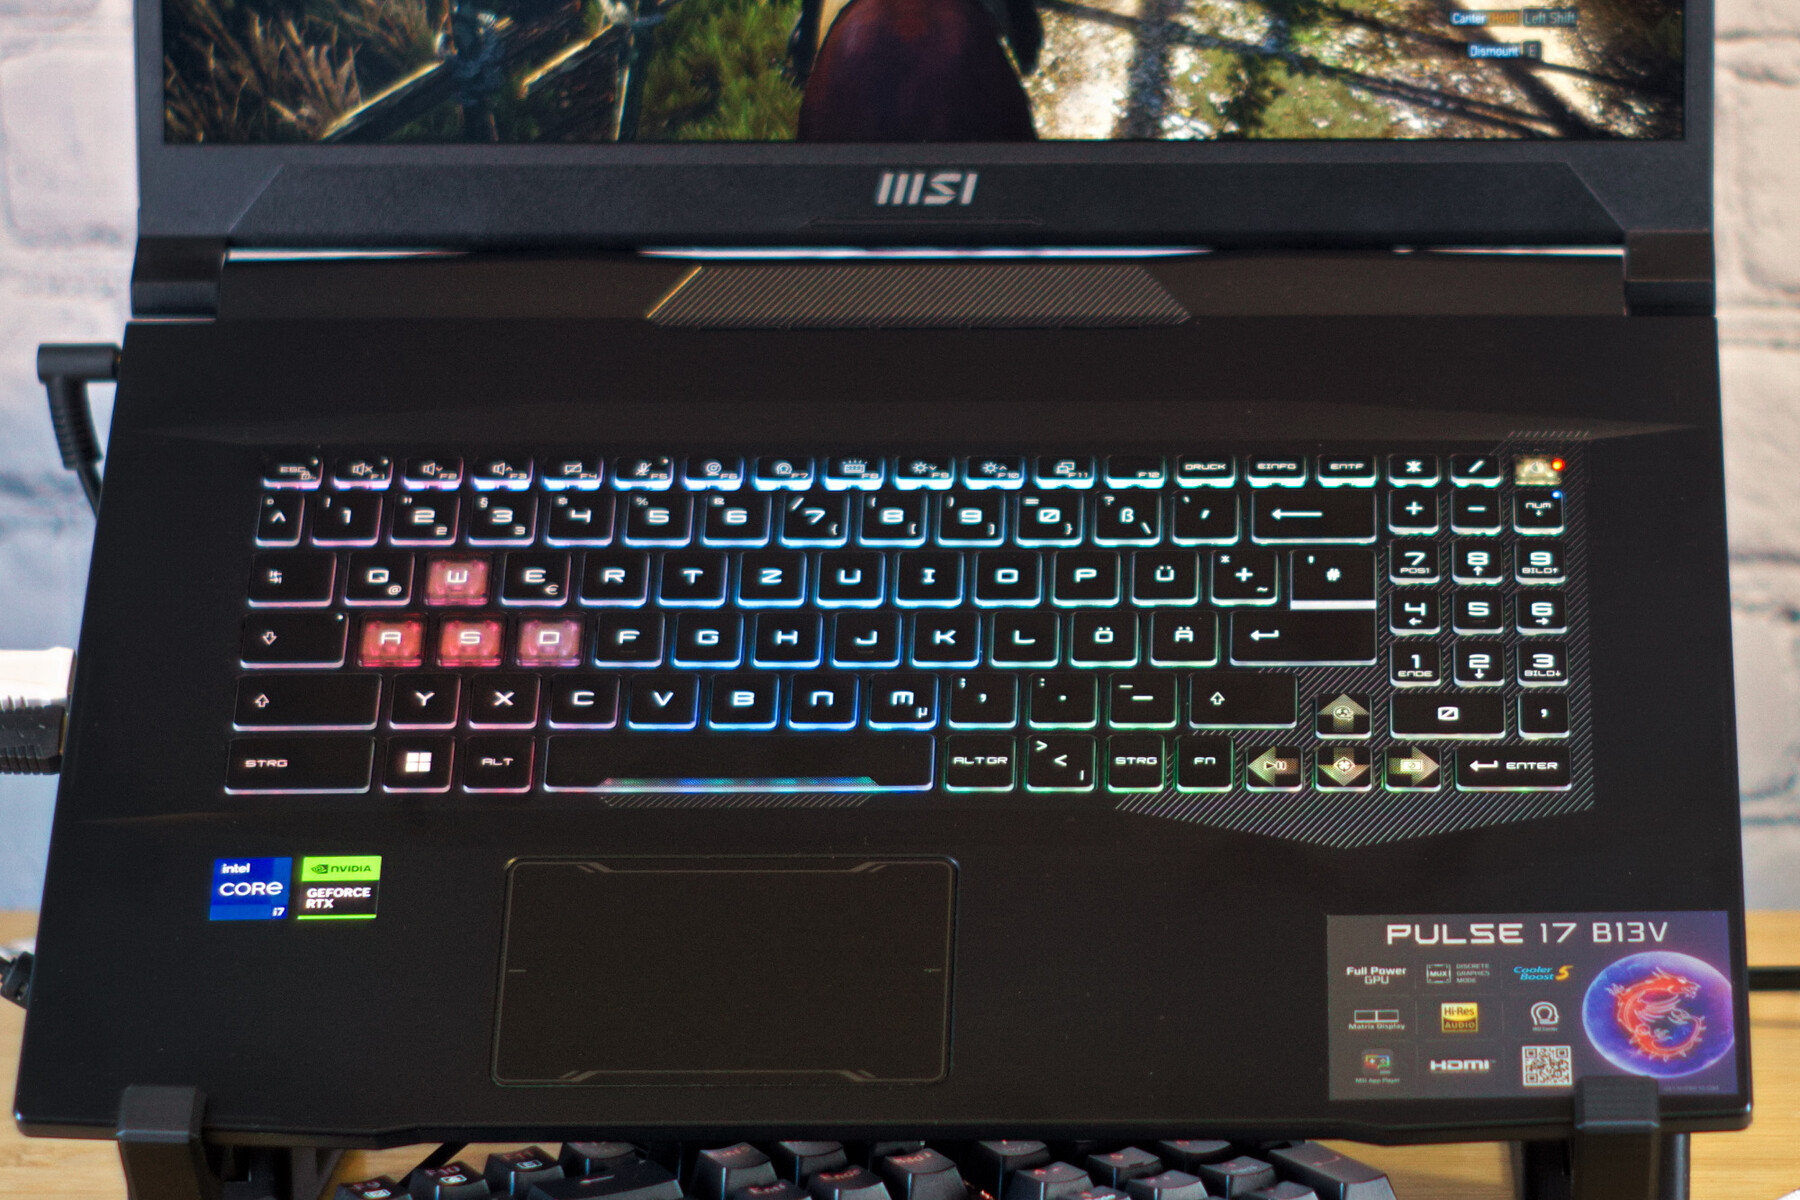
Custodia - Coperchio espositivo in alluminio dall'aspetto fantascientifico
Quasi tutti gli attuali portatili da gioco di MSI sono progettati con un concetto simile. MSI utilizza sempre le linee aggressive del coperchio del display, le cerniere spigolose e il motivo a nido d'ape sul fondo del case. Nel Pulse 17, il coperchio del display in alluminio è ornato da alcuni bordi che danno un ulteriore tocco fantascientifico al portatile. Sotto il coperchio, il tema futuristico continua con MSI che aggiunge anche qui molti elementi di design.
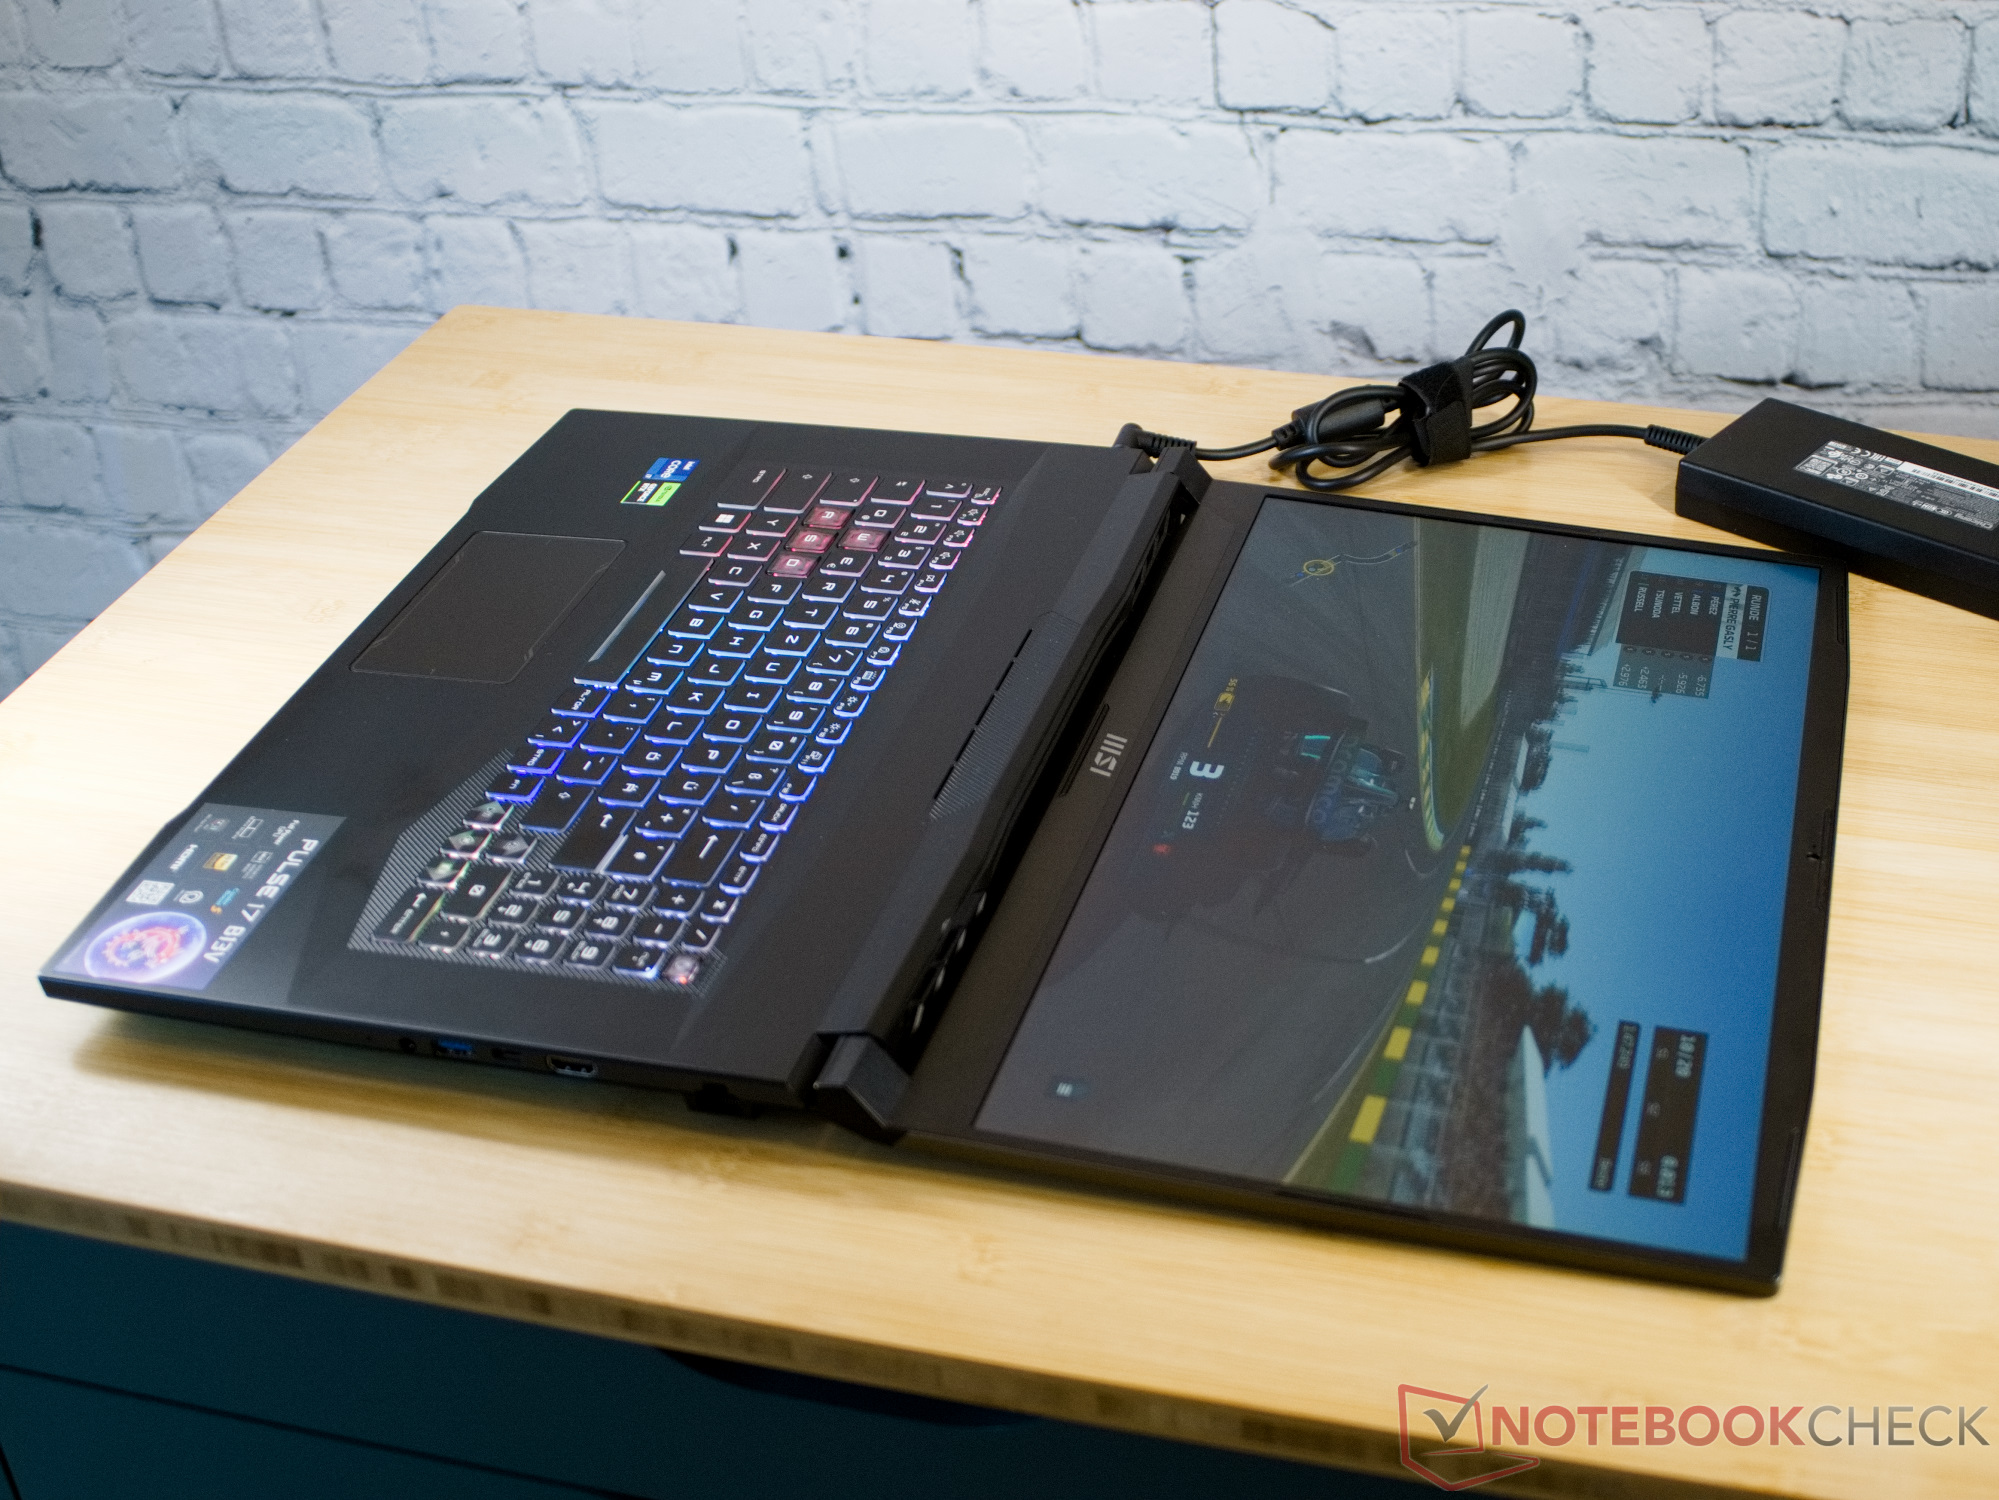
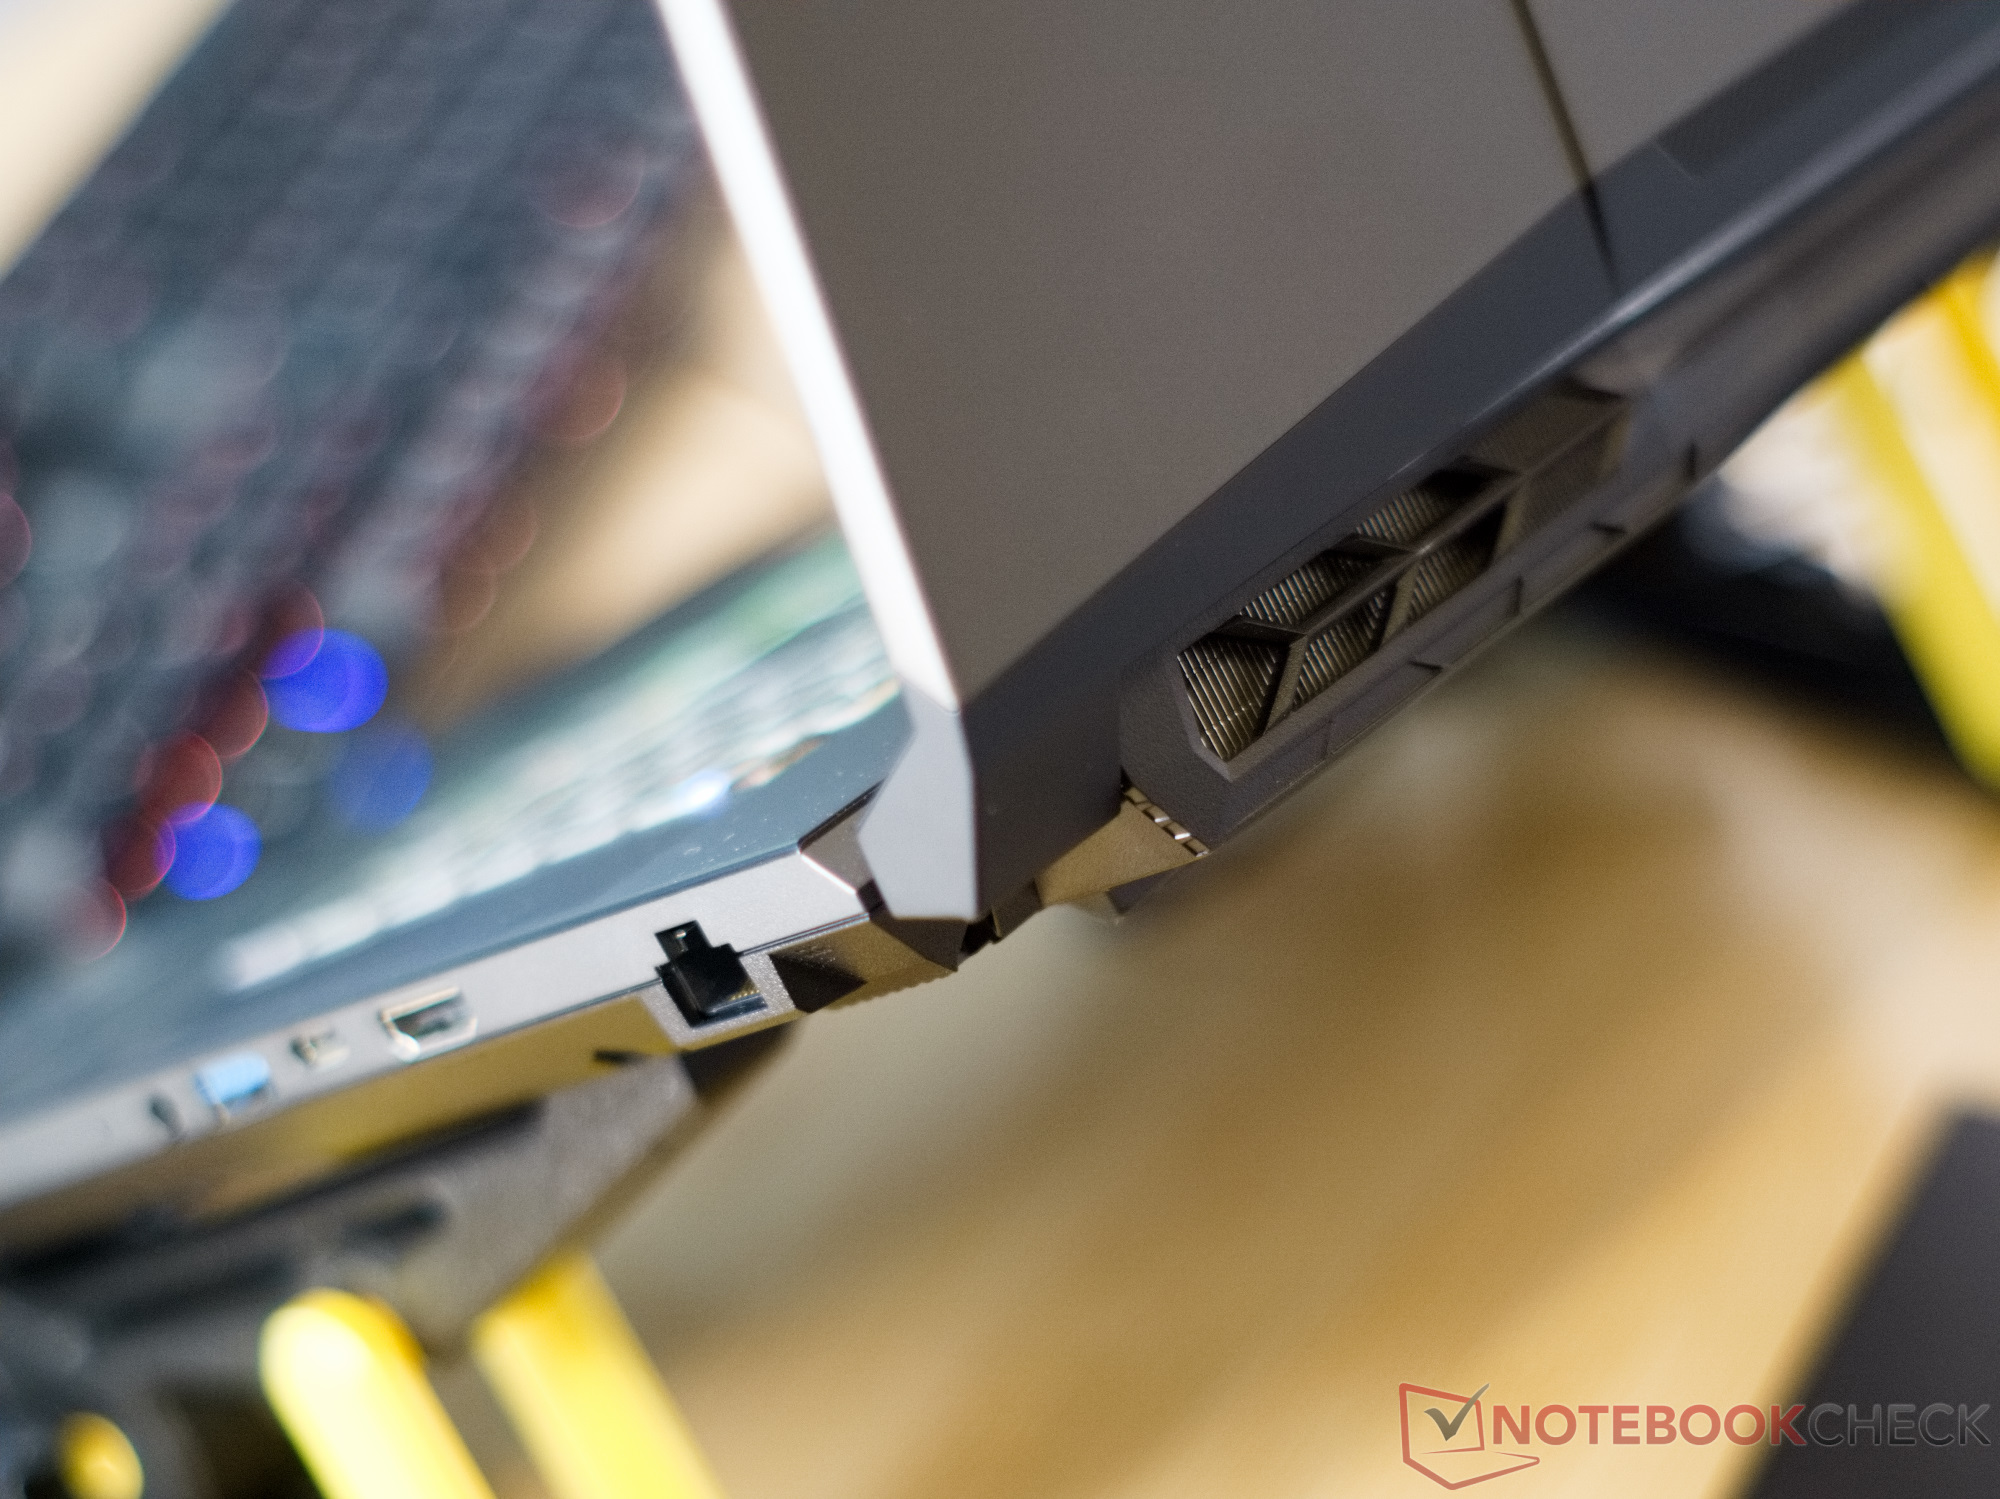
Allo stesso tempo, il case dell'MSI Pulse 17 è abbastanza robusto, ma le grandi dimensioni del portatile significano anche che è ancora possibile deformare o premere leggermente gli elementi in plastica. Tuttavia, il Pulse 17 si presenta come un dispositivo complessivamente solido. L'ampio display può essere aperto di 180° ed è in grado di mantenere la posizione fino a un certo punto. Le cerniere sono quasi troppo facili da muovere, e alcune leggere vibrazioni o colpetti sul display lo spostano già un po'.
Con un peso di 2,7 kg (~6 lb), l'MSI Pulse 17 è il più leggero tra i suoi concorrenti di dimensioni simili. Solo il modello precedente pesa meno. A parte questo, gli attuali portatili da gioco nel nostro confronto differiscono abbastanza poco in termini di riempimento della borsa.
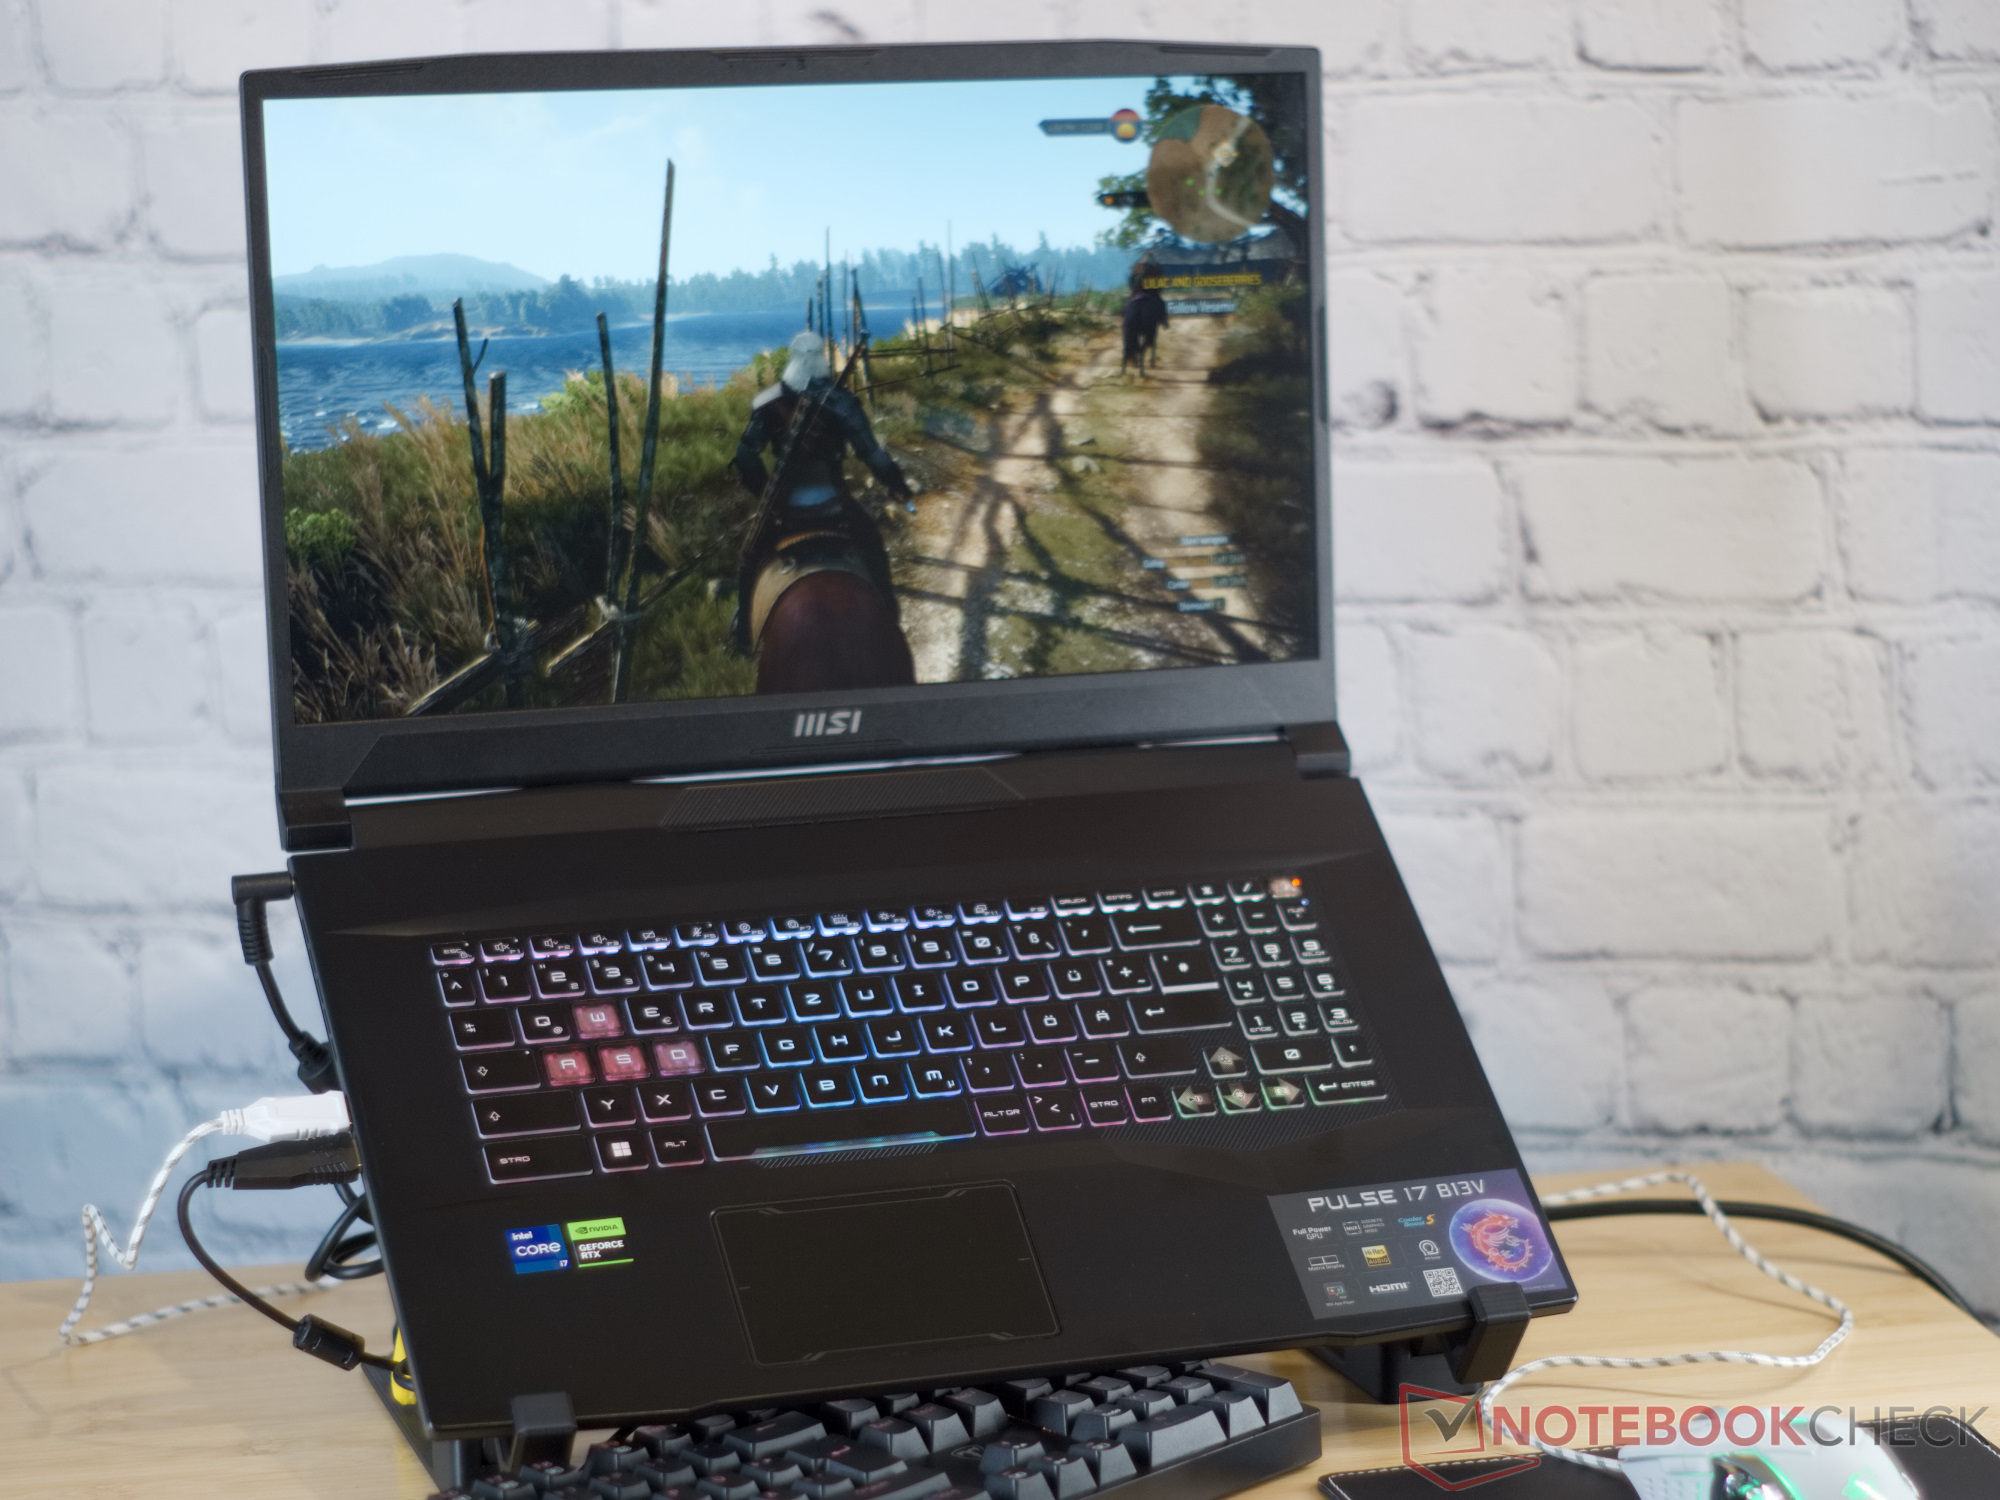
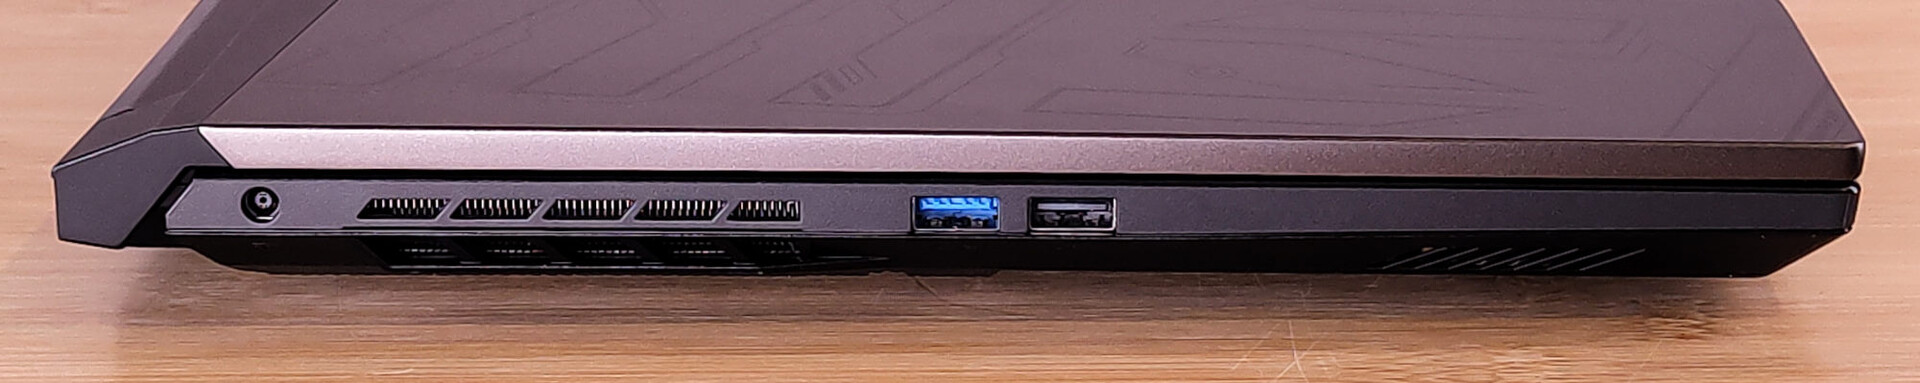
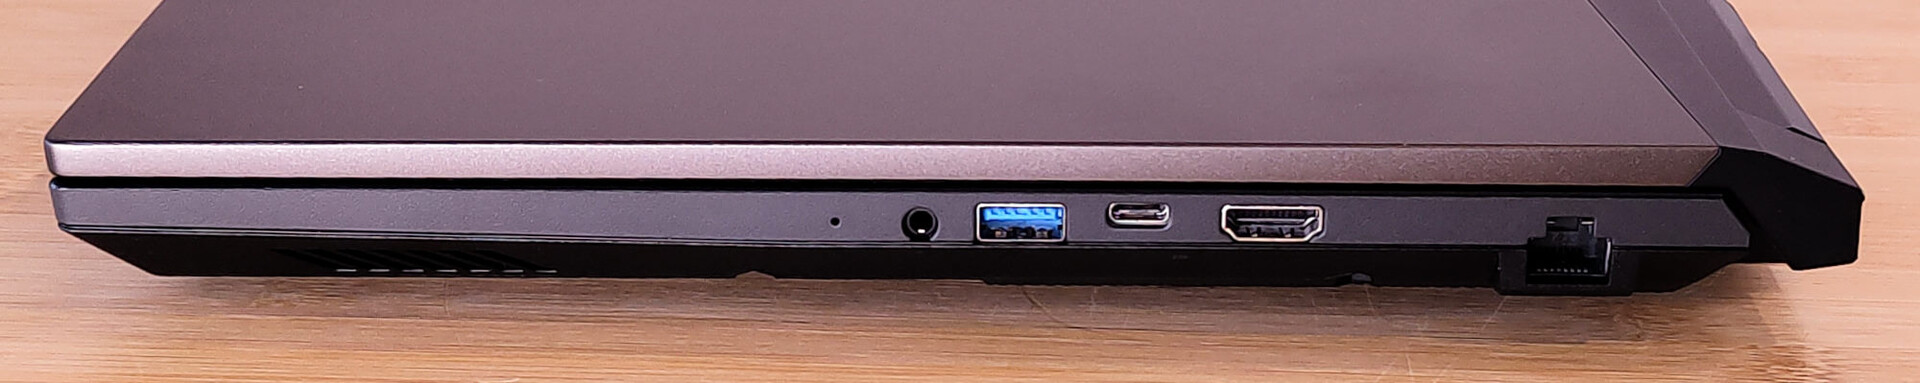
Dotazione - Niente Thunderbolt e solo USB 3.2 Gen 1
Il fatto che il Pulse offra due connessioni USB su ciascun lato è un design intelligente, che consente agli utenti mancini e destrorsi di tenere i cavi fuori dai piedi. Una delle porte USB sul lato destro è una connessione USB-C, ma purtroppo supporta solo il trasferimento dati e la DisplayPort.
Comunicazione
Con Gigabit LAN e WiFi 6 del modulo Intel AX201, il Pulse 17 non è molto aggiornato in termini di tecnologia di rete. D'altra parte, la nostra unità di test dimostra che è possibile raggiungere velocità di trasferimento elevate e stabili anche con la rete a 5 GHz.
Webcam
Anche la webcam dell'MSI Pulse 17 è tutt'altro che moderna. Offre una risoluzione HD e produce immagini piuttosto sfocate con forti deviazioni cromatiche ai bordi contrastanti.


Accessori
A parte la solita documentazione, un adesivo con il drago rosso e il caricabatterie per il portatile, non troviamo altri accessori nella confezione.
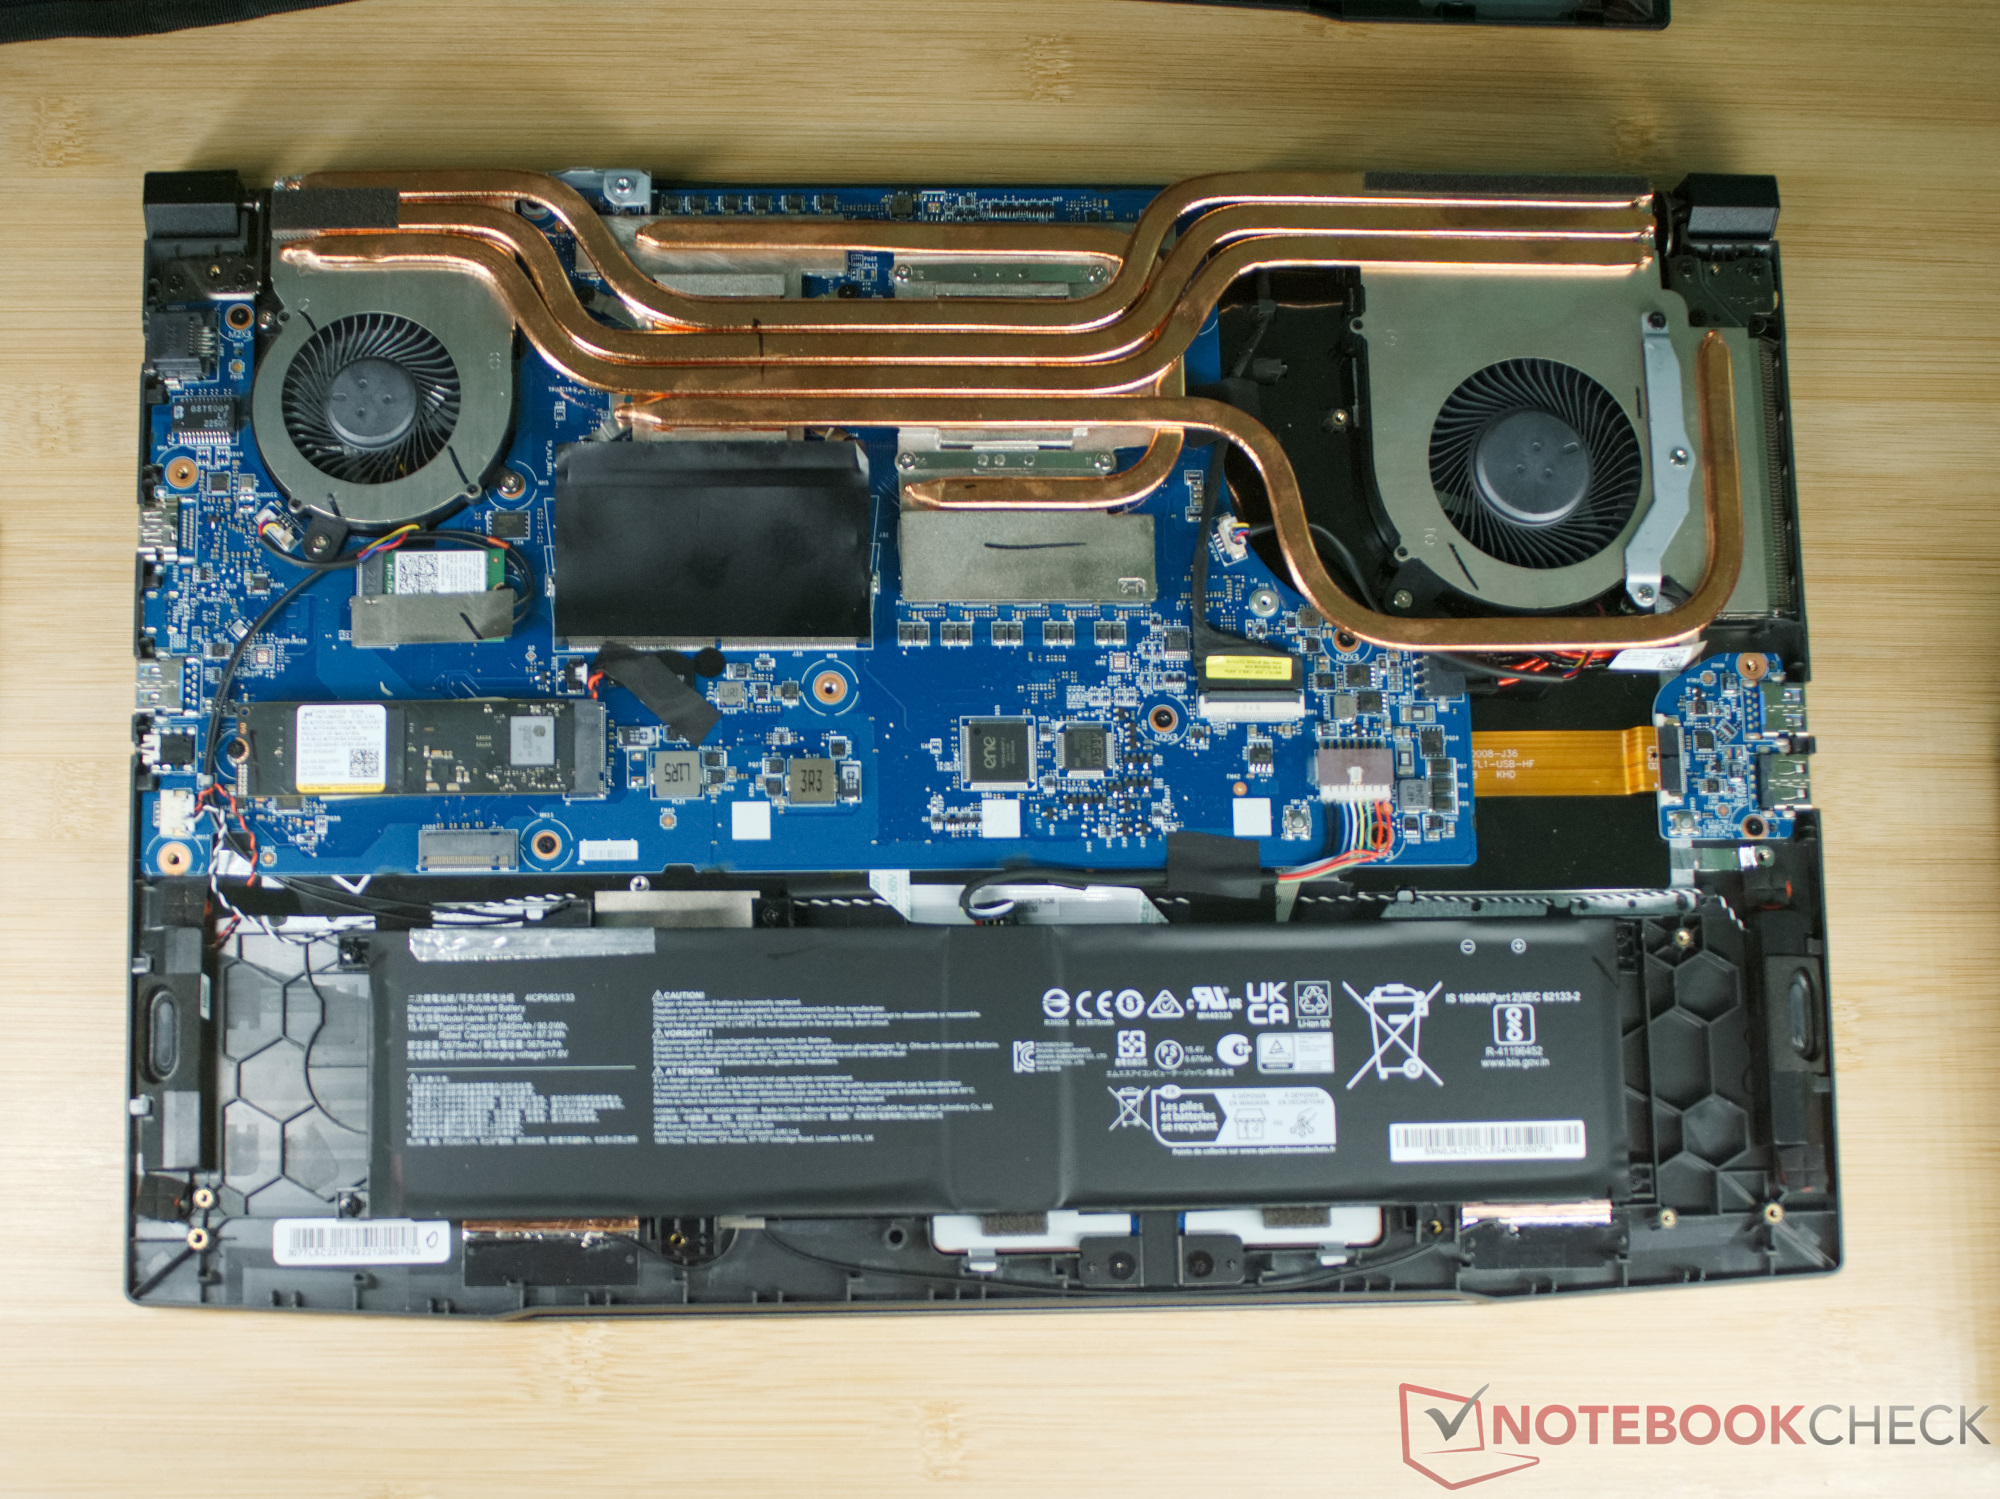
Manutenzione
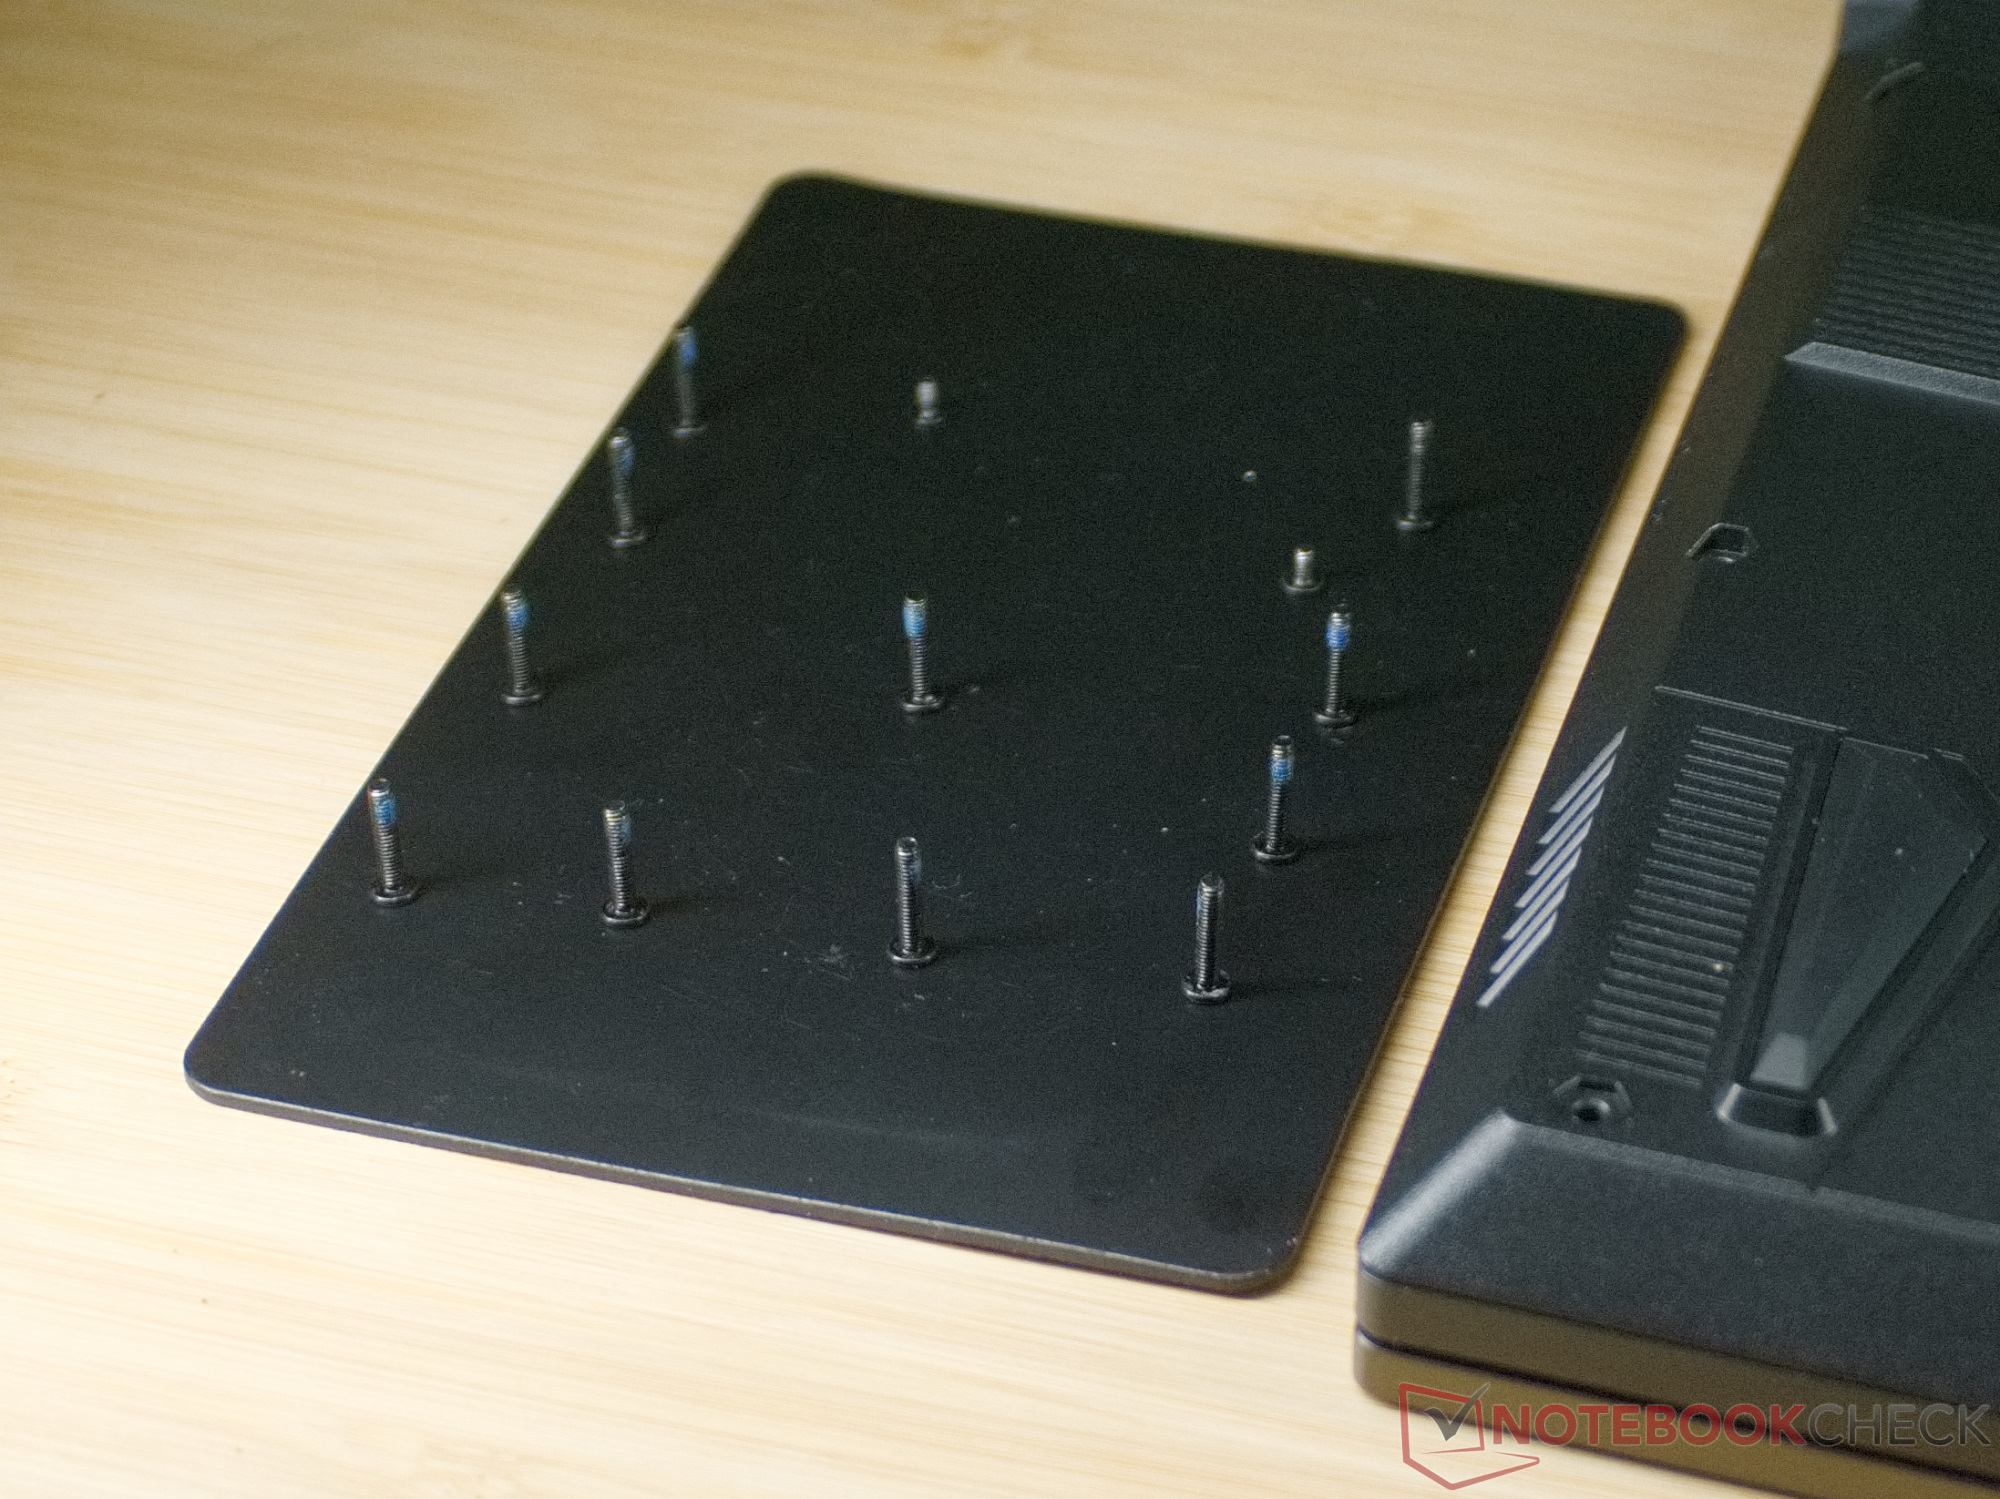
Una delle 13 viti Phillips PH0 che tengono il fondo del case è protetta da un sigillo adesivo nella nostra unità di prova. Anche se MSI sottolinea più volte che questo non è rilevante per la garanzia, alcuni venditori potrebbero protestare se il sigillo è rotto in un caso di garanzia.
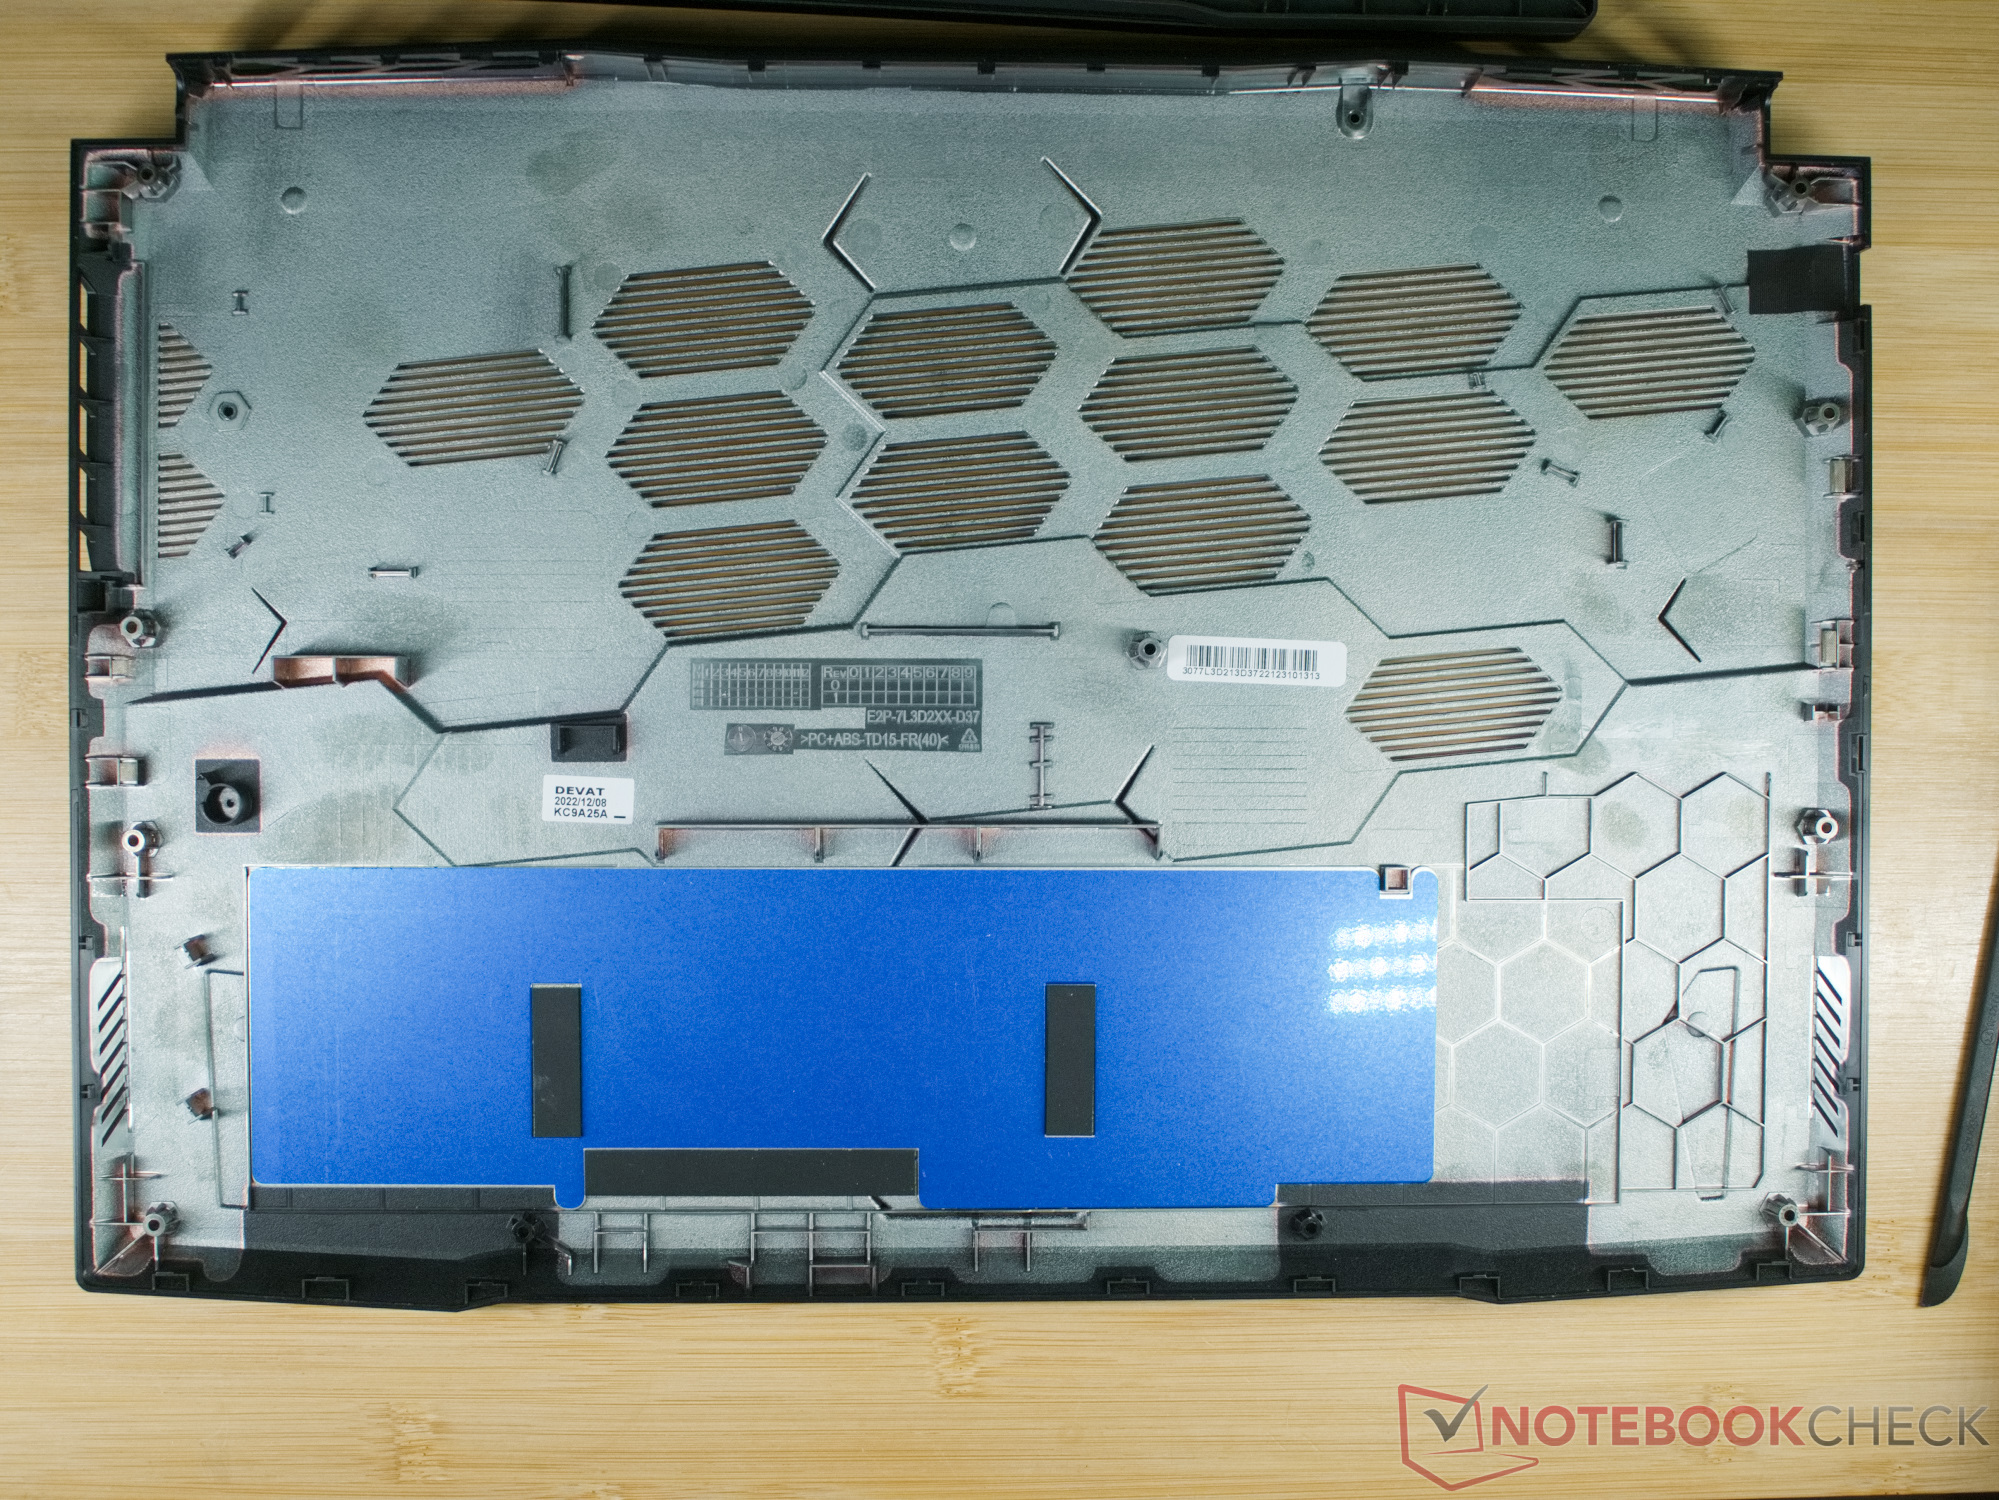
Quando si rimuovono le 13 viti, si dovrebbe anche segnare la loro posizione, poiché due delle viti sono significativamente più corte. Anche il coperchio inferiore è fissato da diverse clip, ma queste possono essere aperte facilmente con uno strumento di plastica per fare leva, consentendo poi di sollevare il coperchio inferiore.
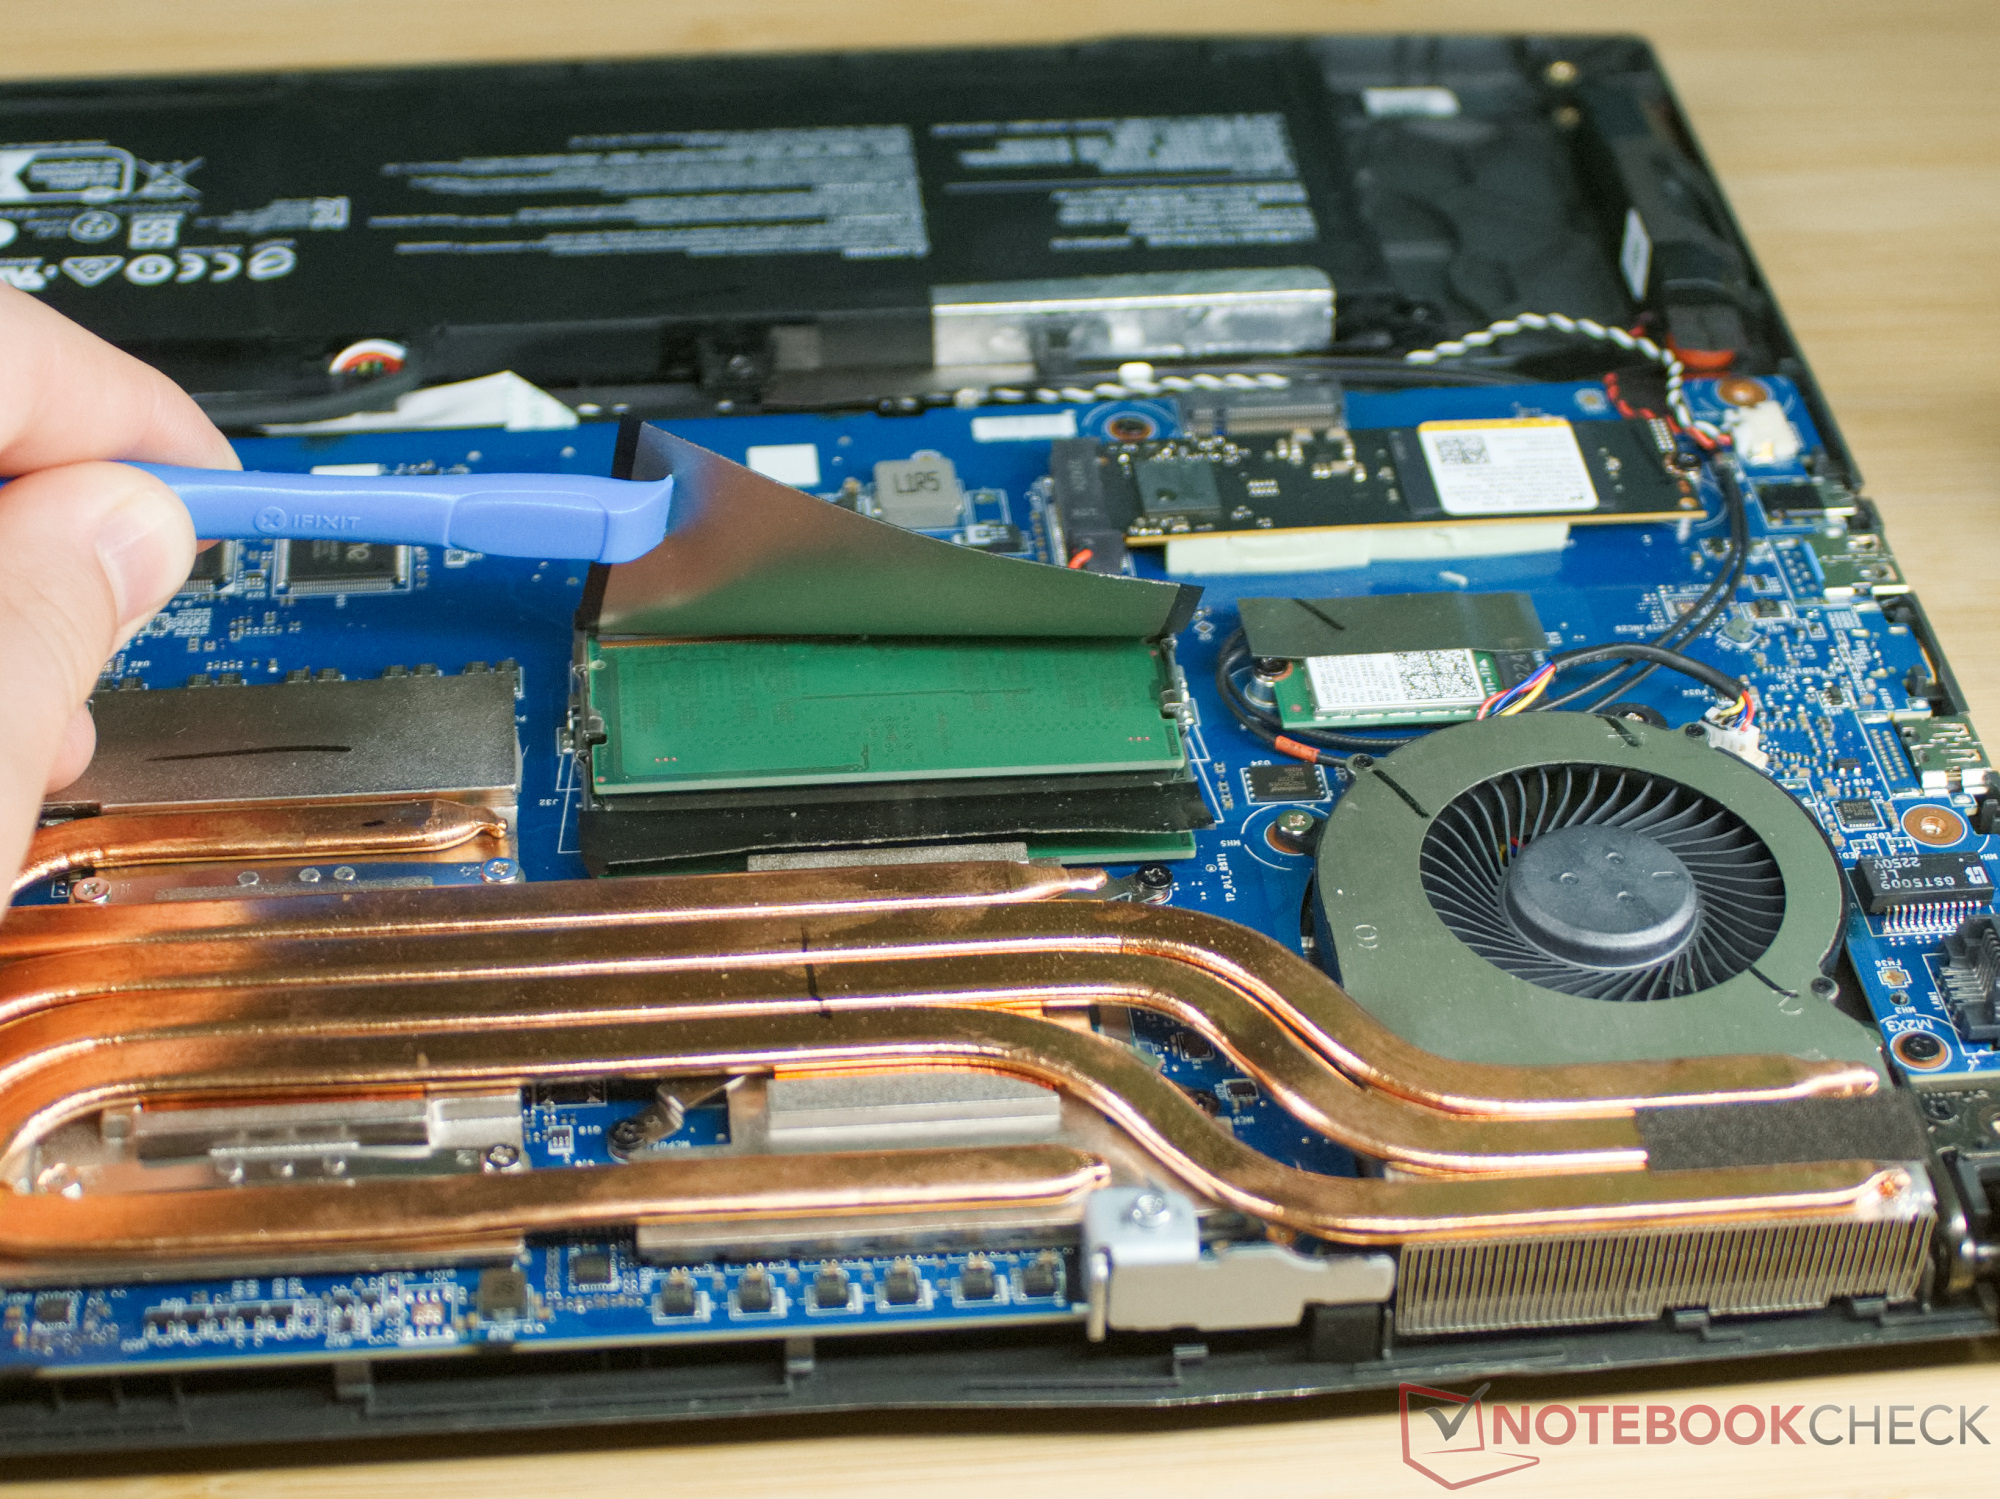
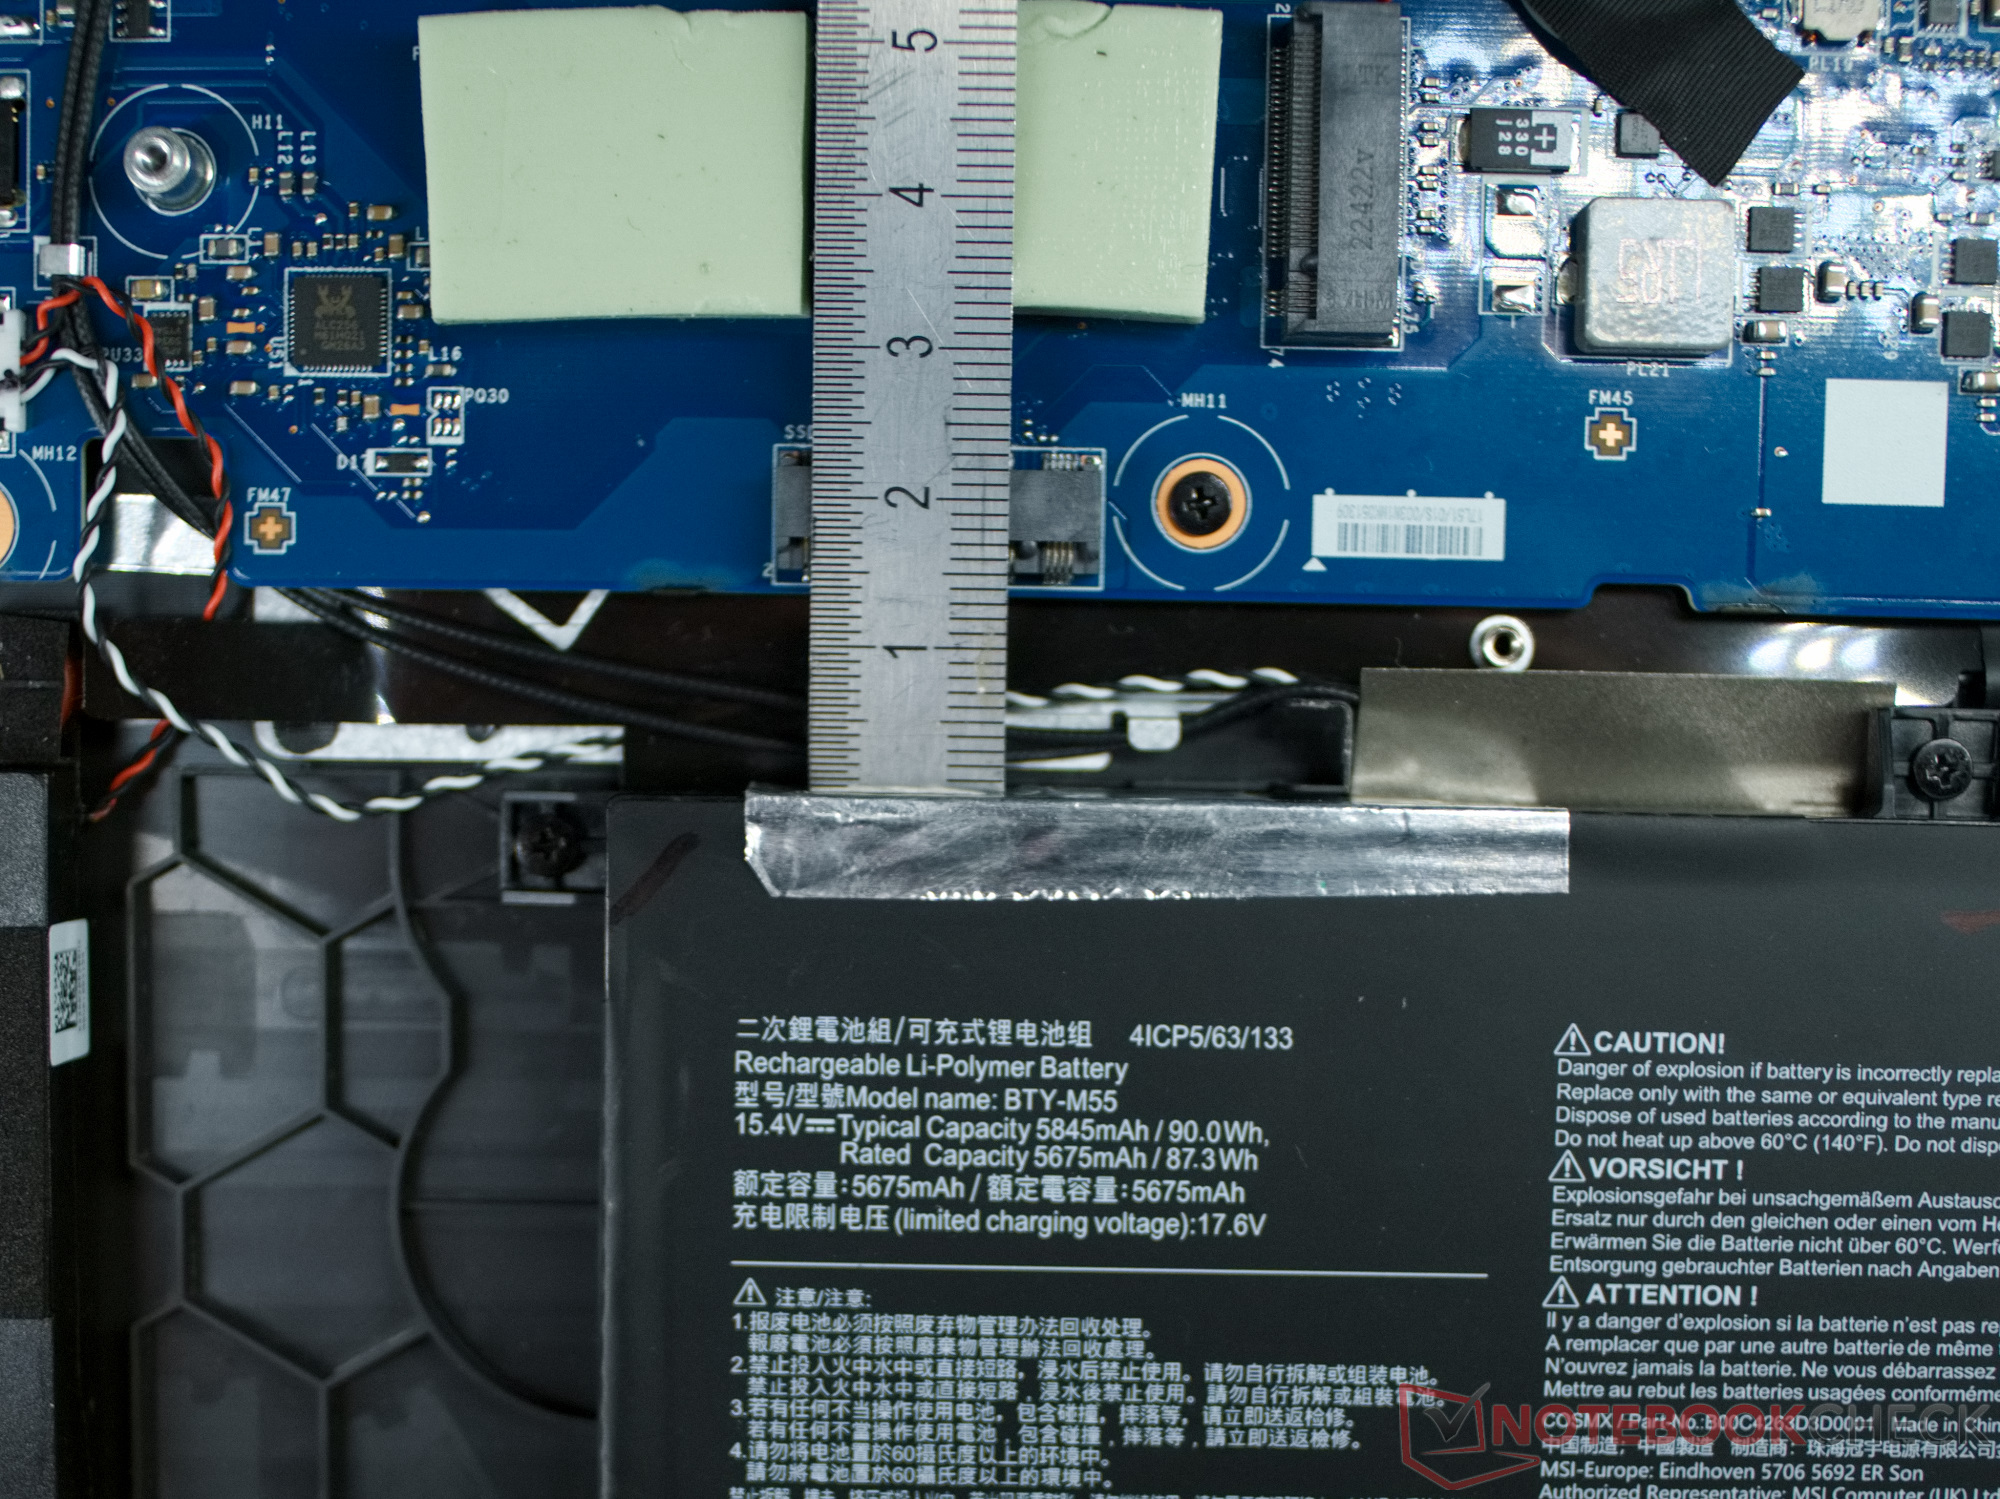
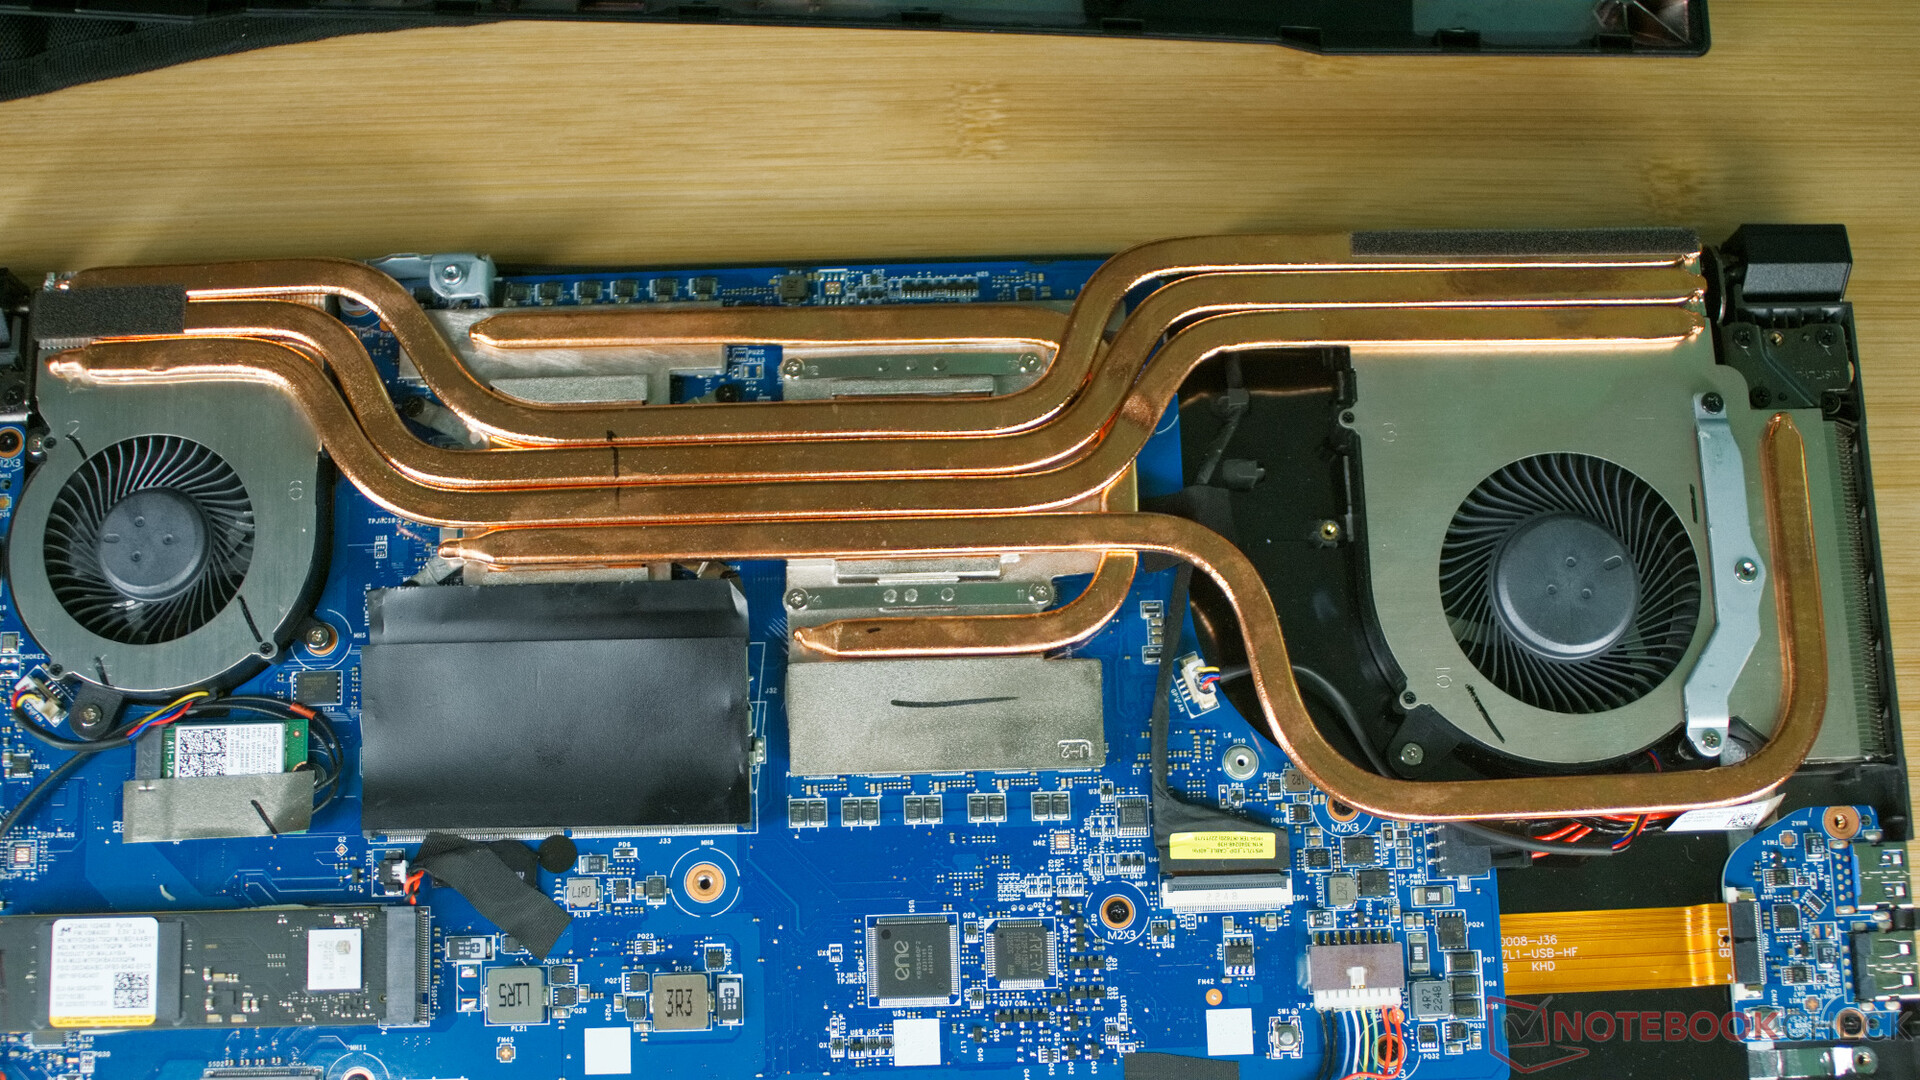
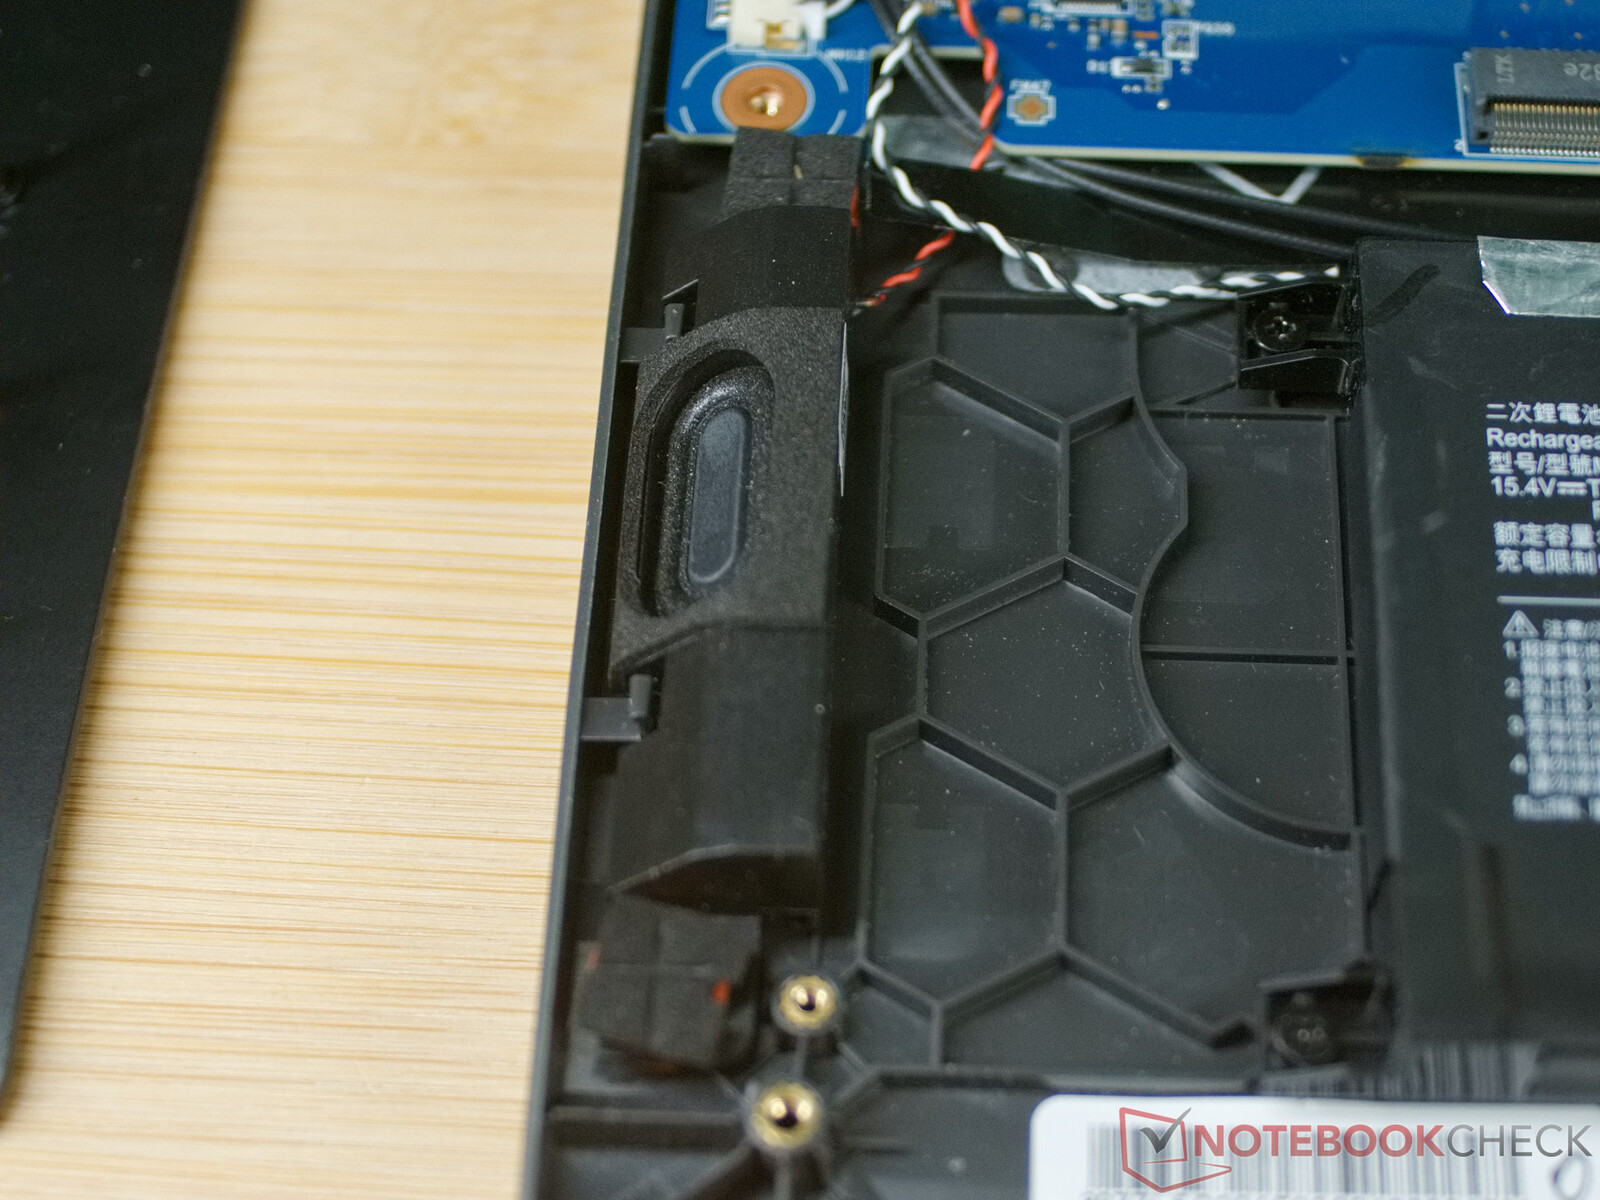
All'interno del portatile troviamo una struttura abbastanza modulare, in modo da poter sostituire rapidamente la RAM, l'SSD NVMe e la WLAN/Modul. Anche la batteria, gli altoparlanti e la scheda con le due connessioni USB possono essere sostituiti facilmente. Tuttavia, chi desidera rimuovere regolarmente la polvere tra le ventole e le alette di raffreddamento deve rimuovere l'intero sistema di raffreddamento per poterlo fare.
Il portatile offre anche un secondo slot M.2 PCIe, ma purtroppo è bloccato dalla batteria. Quindi è possibile installare una seconda unità SSD solo con una soluzione che utilizza adattatori e cavi.
Garanzia
MSI offre una garanzia di 24 mesi agli acquirenti europei.
Input Devices - Four RGB zones and a small touchpad in the MSI Pulse
Tastiera
Il Control Center di MSI consente di controllare l'illuminazione di sfondo RGB della tastiera MSI Pluse 17. Il produttore consente anche di utilizzare software di terze parti per modificare i colori e gli effetti delle quattro zone della tastiera. Il produttore consente anche di utilizzare software di terze parti per modificare i colori e gli effetti nelle quattro zone di illuminazione della tastiera. I tasti trasparenti W, A, S e D sono particolarmente evidenziati. La tastiera offre un buon feedback aptico e una corsa dei tasti di circa 1,2 mm (~0,05 in).
Touchpad
Il touchpad del Pulse 17 è relativamente piccolo, ma questo significa anche che non intralcia i palmi delle mani quando si gioca. Con la sua superficie liscia, i tasti nitidi e l'elevata precisione, funziona bene in generale.
Display - Meno del 60% di copertura sRGB
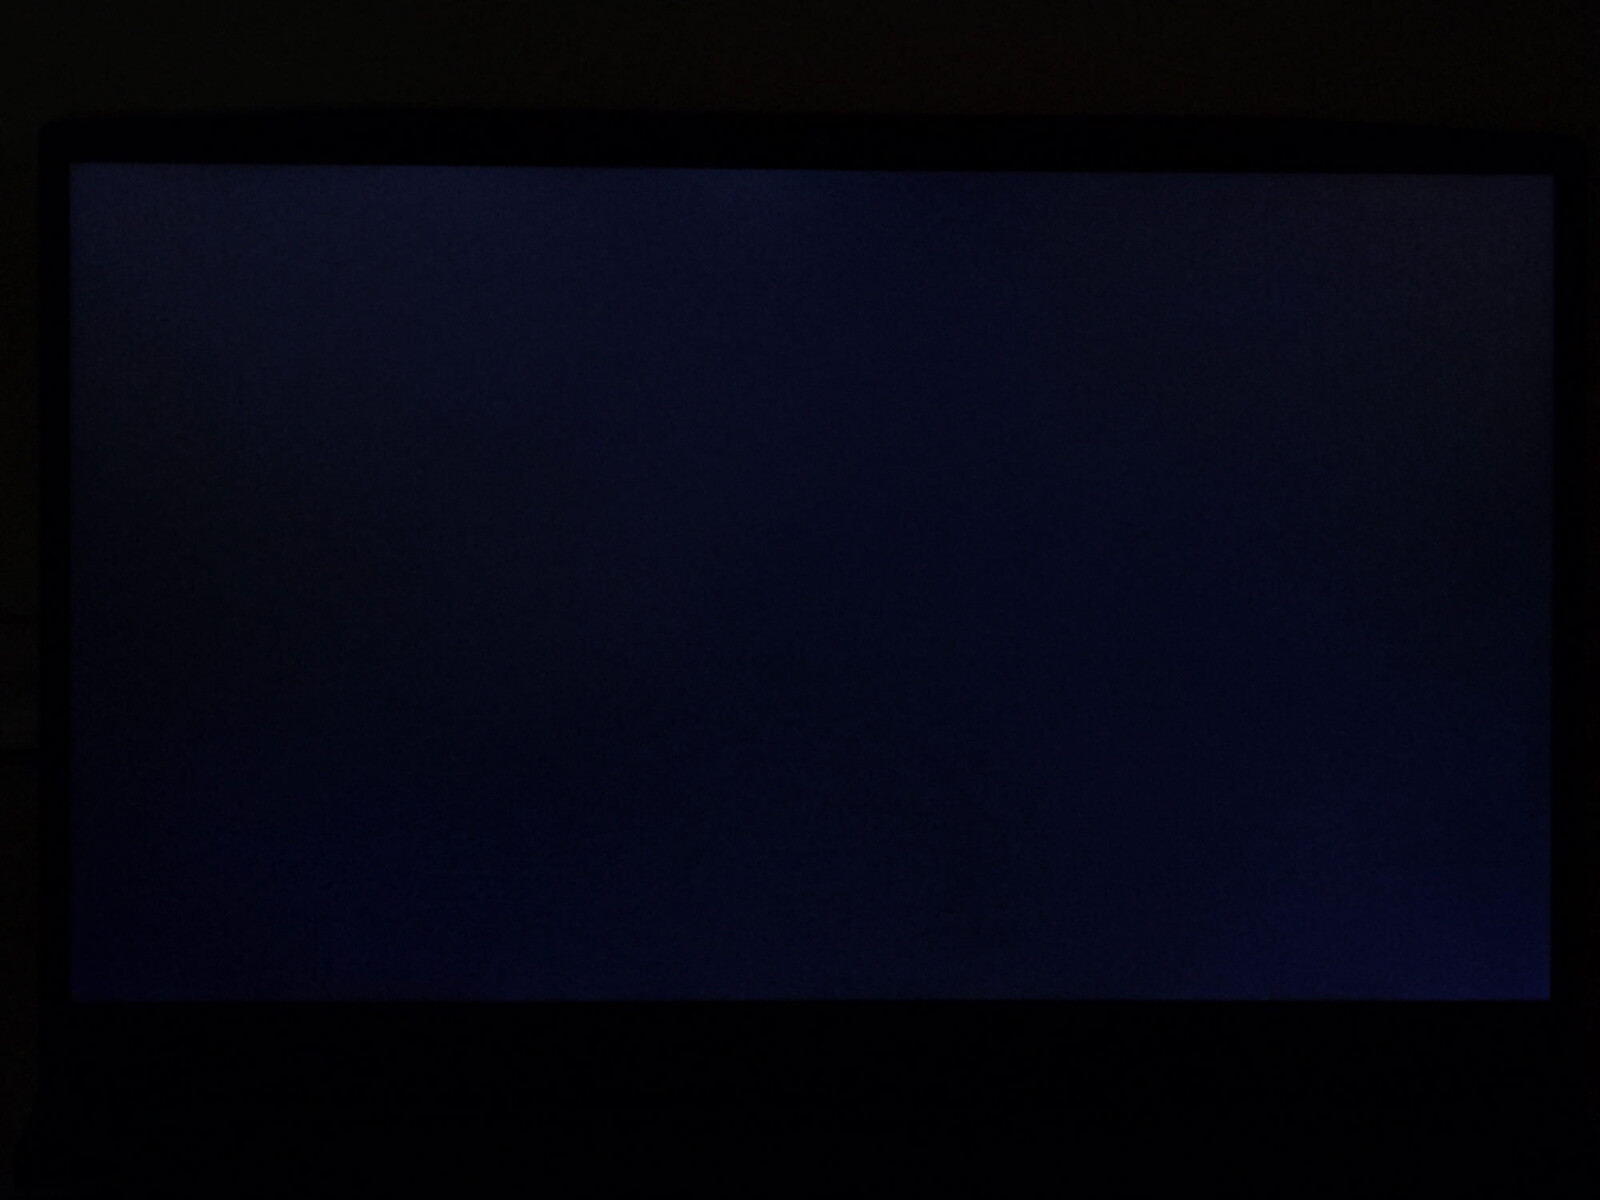
In un portatile da gioco, il display deve essere molto reattivo, coprire completamente lo spazio colore sRGB e offrire un contrasto elevato. Di queste caratteristiche, solo l'elevato rapporto di contrasto è un punto di forza del display dell'MSI Pulse. Anche se il display opaco non è particolarmente luminoso con una luminosità media di 250 cd/m², il basso valore del nero garantisce un elevato rapporto di contrasto. La distribuzione della luminosità non è particolarmente uniforme, ma almeno non si notano aloni di luce visibili.
Ciò significa che il display del Pulse 17 è significativamente peggiore rispetto a quello del Pulse GL76 Pulse GL76. I tempi di risposta sono quasi raddoppiati, diventando a volte quasi 6 volte più lenti, e il numero di colori visualizzabili è stato ridotto a quasi la metà. MSI ha quindi effettuato un significativo downgrade del display.
| |||||||||||||||||||||||||
Distribuzione della luminosità: 91 %
Al centro con la batteria: 253 cd/m²
Contrasto: 1814:1 (Nero: 0.14 cd/m²)
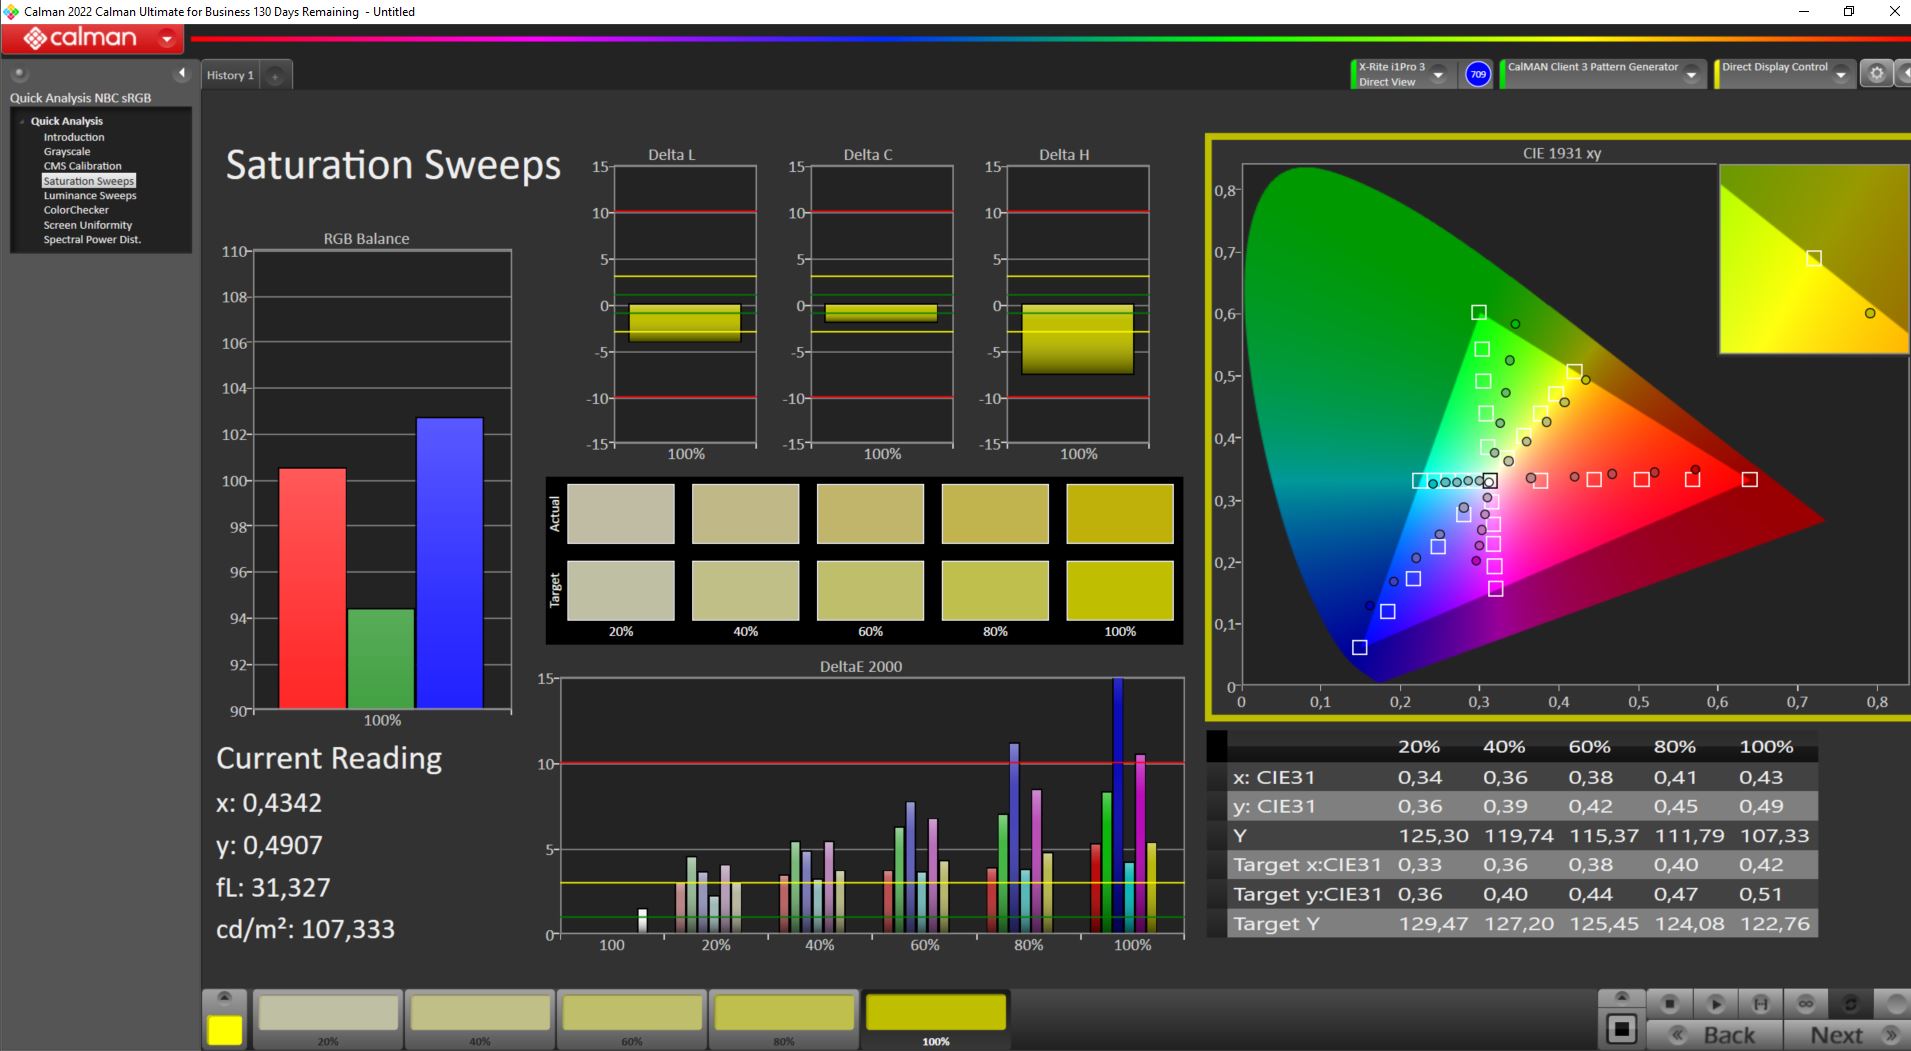
ΔE ColorChecker Calman: 4.52 | ∀{0.5-29.43 Ø4.71}
calibrated: 4.52
ΔE Greyscale Calman: 1 | ∀{0.09-98 Ø4.96}
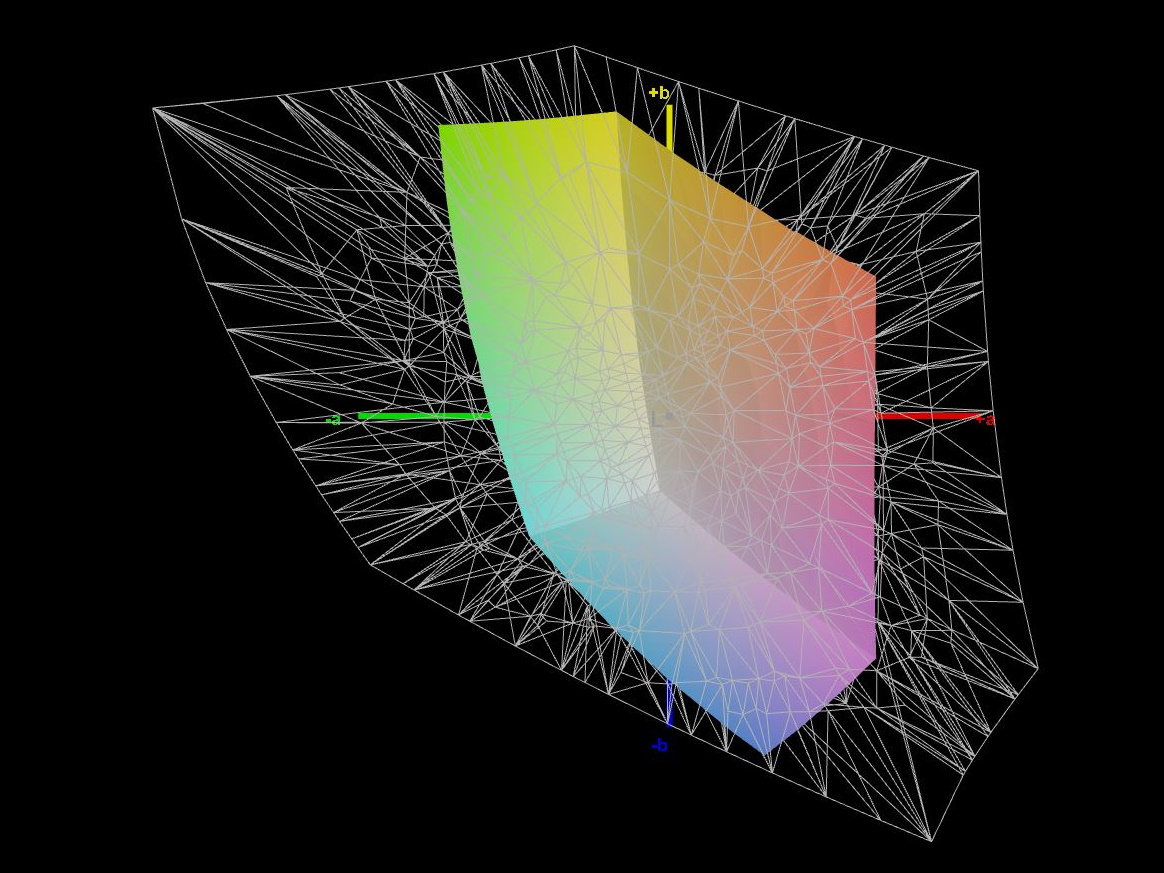
39.7% AdobeRGB 1998 (Argyll 3D)
57.5% sRGB (Argyll 3D)
38.4% Display P3 (Argyll 3D)
Gamma: 2.44
CCT: 6502 K
| MSI Pulse 17 B13VGK AU Optronics B173HAN04.9, IPS, 1920x1080, 17.3" | MSI Pulse GL76 12UGK Sharp LQ173M1JW08, IPS, 1920x1080, 17.3" | MSI Katana 17 B13VFK B173HAN04.9, IPS LED, 1920x1080, 17.3" | Acer Nitro 17 AN17-51-71ER BOE0B7C NE173QHM-NY6, , 2560x1440, 17.3" | Schenker XMG Focus 17 (E23) BOE09F9 NE173QHM-NZ1, IPS, 2560x1440, 17.3" | Asus ROG Strix G17 G713PI BOE0B69, IPS, 2560x1440, 17.3" | |
|---|---|---|---|---|---|---|
| Display | 82% | 6% | 115% | 113% | 115% | |
| Display P3 Coverage (%) | 38.4 | 71.9 87% | 40.8 6% | 98.3 156% | 96.6 152% | 98.3 156% |
| sRGB Coverage (%) | 57.5 | 99.9 74% | 61 6% | 100 74% | 99.9 74% | 100 74% |
| AdobeRGB 1998 Coverage (%) | 39.7 | 73.7 86% | 42.2 6% | 85.7 116% | 84.5 113% | 85.9 116% |
| Response Times | 69% | -8% | 60% | 51% | 74% | |
| Response Time Grey 50% / Grey 80% * (ms) | 31.2 ? | 4.6 ? 85% | 33 ? -6% | 14.8 ? 53% | 16.4 ? 47% | 5.3 ? 83% |
| Response Time Black / White * (ms) | 23.6 ? | 11.2 ? 53% | 26 ? -10% | 8 ? 66% | 10.8 ? 54% | 8.6 ? 64% |
| PWM Frequency (Hz) | ||||||
| Screen | -55% | -13% | -50% | -10% | 2% | |
| Brightness middle (cd/m²) | 254 | 337.7 33% | 267 5% | 361 42% | 349 37% | 327 29% |
| Brightness (cd/m²) | 250 | 331 32% | 256 2% | 326 30% | 318 27% | 320 28% |
| Brightness Distribution (%) | 91 | 82 -10% | 93 2% | 87 -4% | 82 -10% | 89 -2% |
| Black Level * (cd/m²) | 0.14 | 0.31 -121% | 0.21 -50% | 0.6 -329% | 0.56 -300% | 0.38 -171% |
| Contrast (:1) | 1814 | 1089 -40% | 1271 -30% | 602 -67% | 623 -66% | 861 -53% |
| Colorchecker dE 2000 * | 4.52 | 4.12 9% | 4.7 -4% | 3.83 15% | 1.08 76% | 1.01 78% |
| Colorchecker dE 2000 max. * | 21.22 | 8.89 58% | 20.4 4% | 5.71 73% | 3.05 86% | 4.01 81% |
| Colorchecker dE 2000 calibrated * | 4.52 | 0.98 78% | 4.5 -0% | 3.48 23% | 1.08 76% | 0.41 91% |
| Greyscale dE 2000 * | 1 | 6.3 -530% | 1.5 -50% | 3.29 -229% | 1.14 -14% | 1.6 -60% |
| Gamma | 2.44 90% | 2.48 89% | 2.12 104% | 2.29 96% | 2.41 91% | 2.168 101% |
| CCT | 6502 100% | 6542 99% | 6552 99% | 6679 97% | 6687 97% | 6659 98% |
| Media totale (Programma / Settaggio) | 32% /
-8% | -5% /
-9% | 42% /
1% | 51% /
25% | 64% /
37% |
* ... Meglio usare valori piccoli
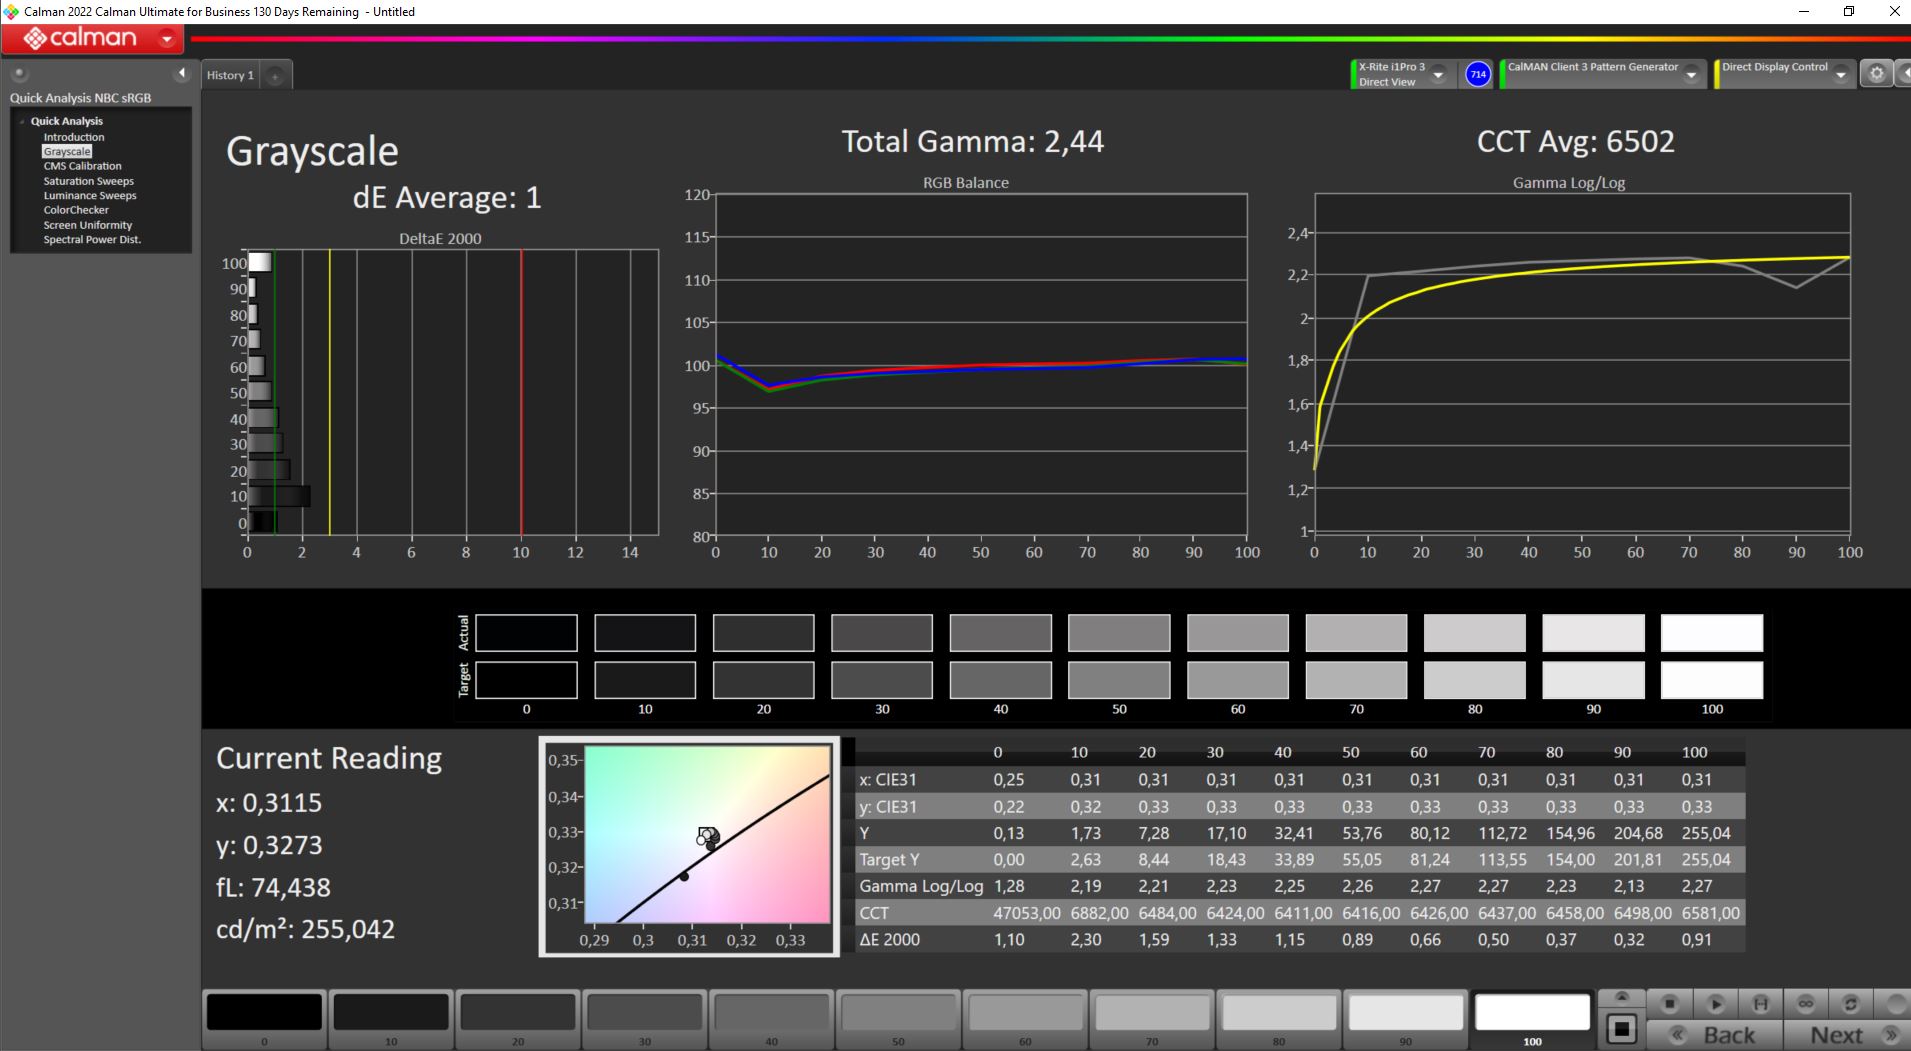
Gli spazi colore AdobeRGB e DisplayP3 sono coperti solo per meno del 40% e persino sRGB non è coperto al 60% dal Pulse 17.
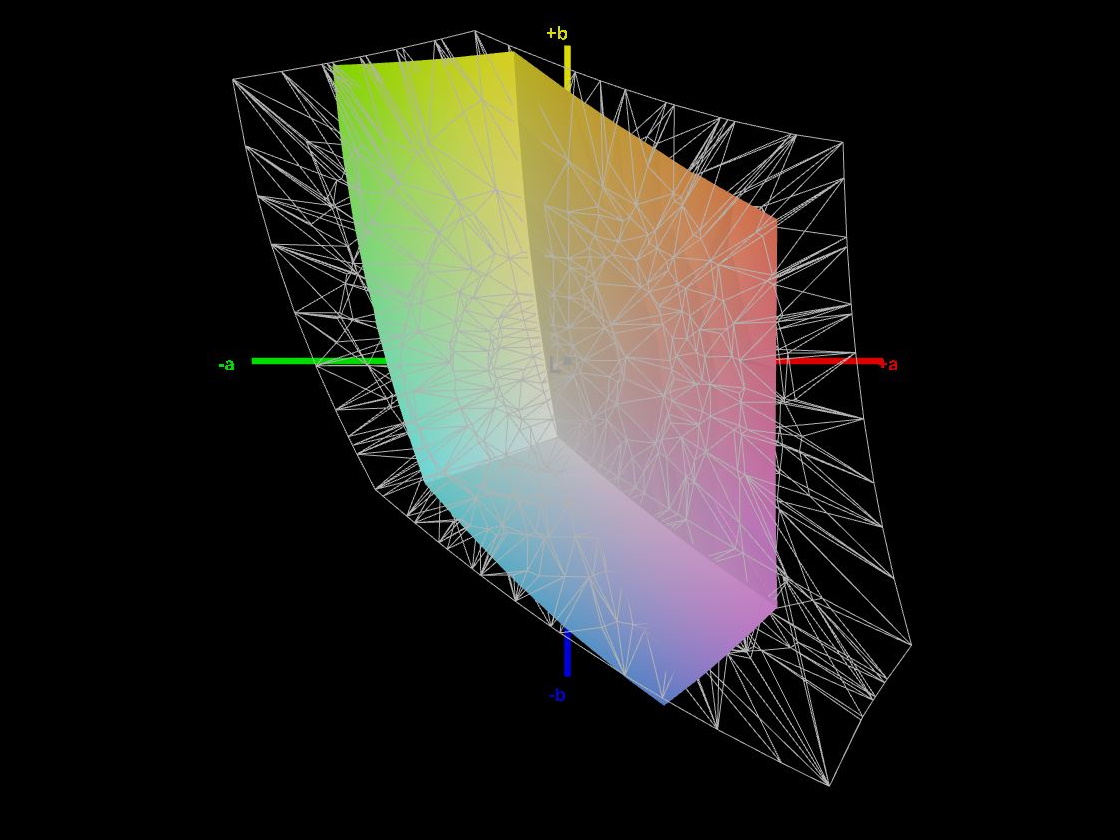
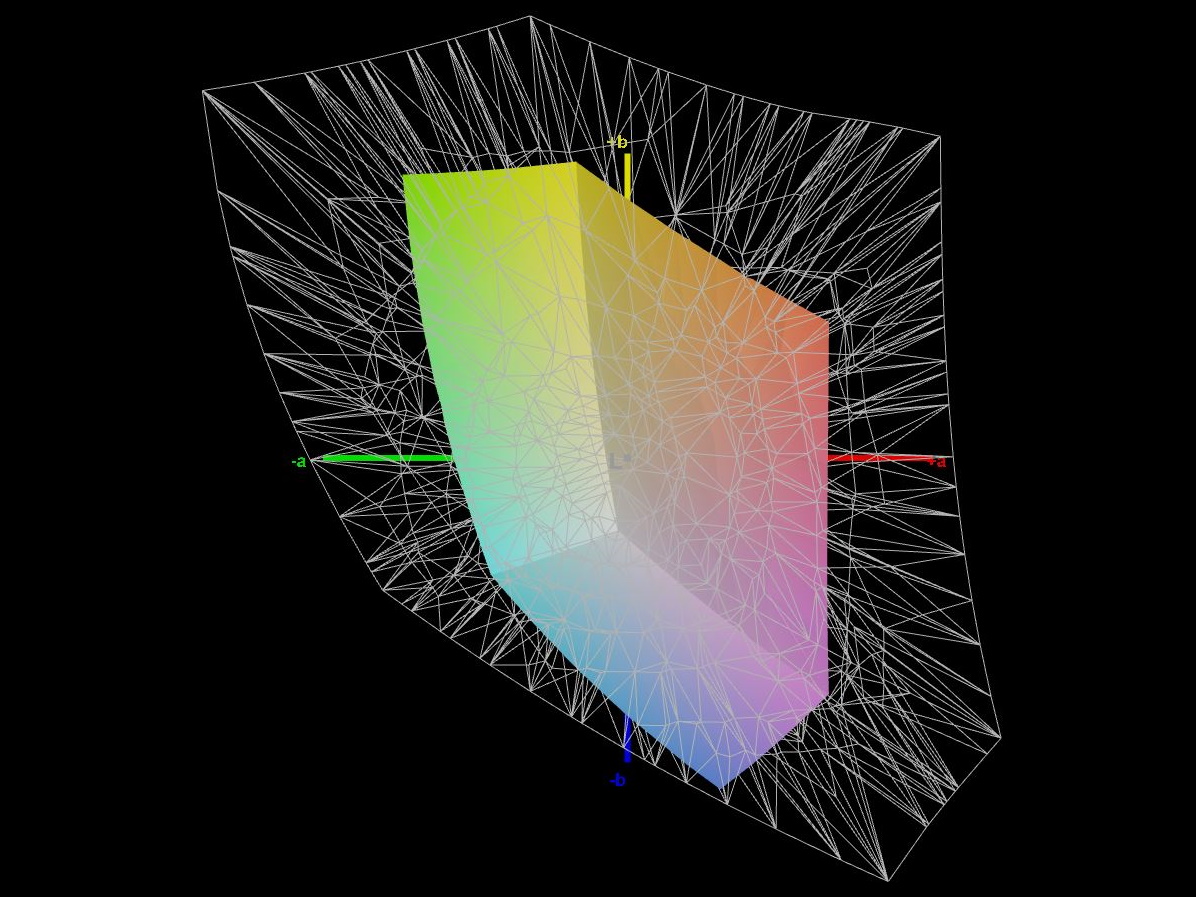
Almeno il test Calman mostra un buon risultato nella visualizzazione della scala di grigi. Tuttavia, la valutazione dell'accuratezza della riproduzione dei colori con il Calman ColorChecker rivela chiaramente i limiti del display. Con solo il 60% dello spazio colore sRGB, il display manca chiaramente di gran parte dei colori, finendo per allontanarsi dalla scala cromatica nei colori rosso, verde e blu. Il risultato è una deviazione massima del colore pari a ΔΕ 21,22. Si tratta di una deviazione massima molto elevata, che non viene raggiunta da nessuno degli altri portatili di confronto. Tuttavia, il display se la cava leggermente meglio nelle deviazioni medie del colore. Tuttavia, un'ulteriore calibrazione non cambia il risultato, per cui anche l' MSI Katanafinisce per avere deviazioni cromatiche inferiori utilizzando il nostro profilo ICC.
Tempi di risposta del Display
| ↔ Tempi di risposta dal Nero al Bianco | ||
|---|---|---|
| 23.6 ms ... aumenta ↗ e diminuisce ↘ combinato | ↗ 12.2 ms Incremento | 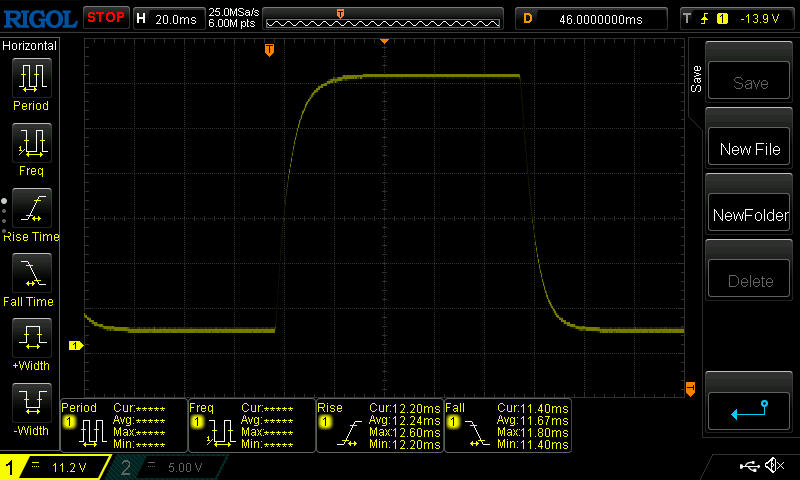 |
| ↘ 11.4 ms Calo | ||
| Lo schermo mostra buoni tempi di risposta durante i nostri tests, ma potrebbe essere troppo lento per i gamers competitivi. In confronto, tutti i dispositivi di test variano da 0.1 (minimo) a 240 (massimo) ms. » 54 % di tutti i dispositivi è migliore. Questo significa che i tempi di risposta rilevati sono peggiori rispetto alla media di tutti i dispositivi testati (19.8 ms). | ||
| ↔ Tempo di risposta dal 50% Grigio all'80% Grigio | ||
| 31.2 ms ... aumenta ↗ e diminuisce ↘ combinato | ↗ 14.2 ms Incremento | 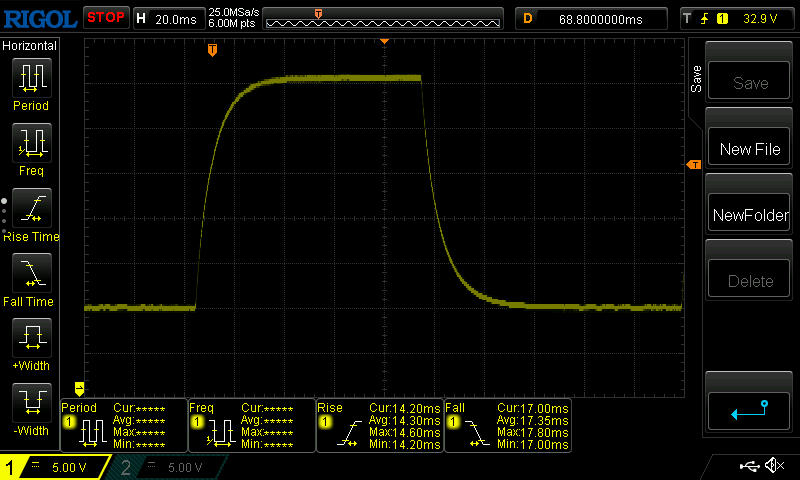 |
| ↘ 17 ms Calo | ||
| Lo schermo mostra tempi di risposta lenti nei nostri tests e sarà insoddisfacente per i gamers. In confronto, tutti i dispositivi di test variano da 0.165 (minimo) a 636 (massimo) ms. » 42 % di tutti i dispositivi è migliore. Questo significa che i tempi di risposta rilevati sono simili alla media di tutti i dispositivi testati (31 ms). | ||
Sfarfallio dello schermo / PWM (Pulse-Width Modulation)
| flickering dello schermo / PWM non rilevato | 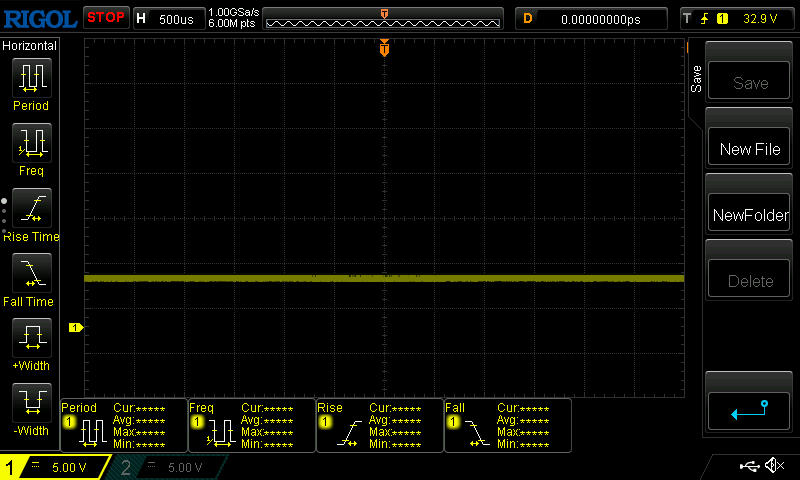 | ||
In confronto: 52 % di tutti i dispositivi testati non utilizza PWM per ridurre la luminosita' del display. Se è rilevato PWM, una media di 7747 (minimo: 5 - massimo: 343500) Hz è stata rilevata. | |||
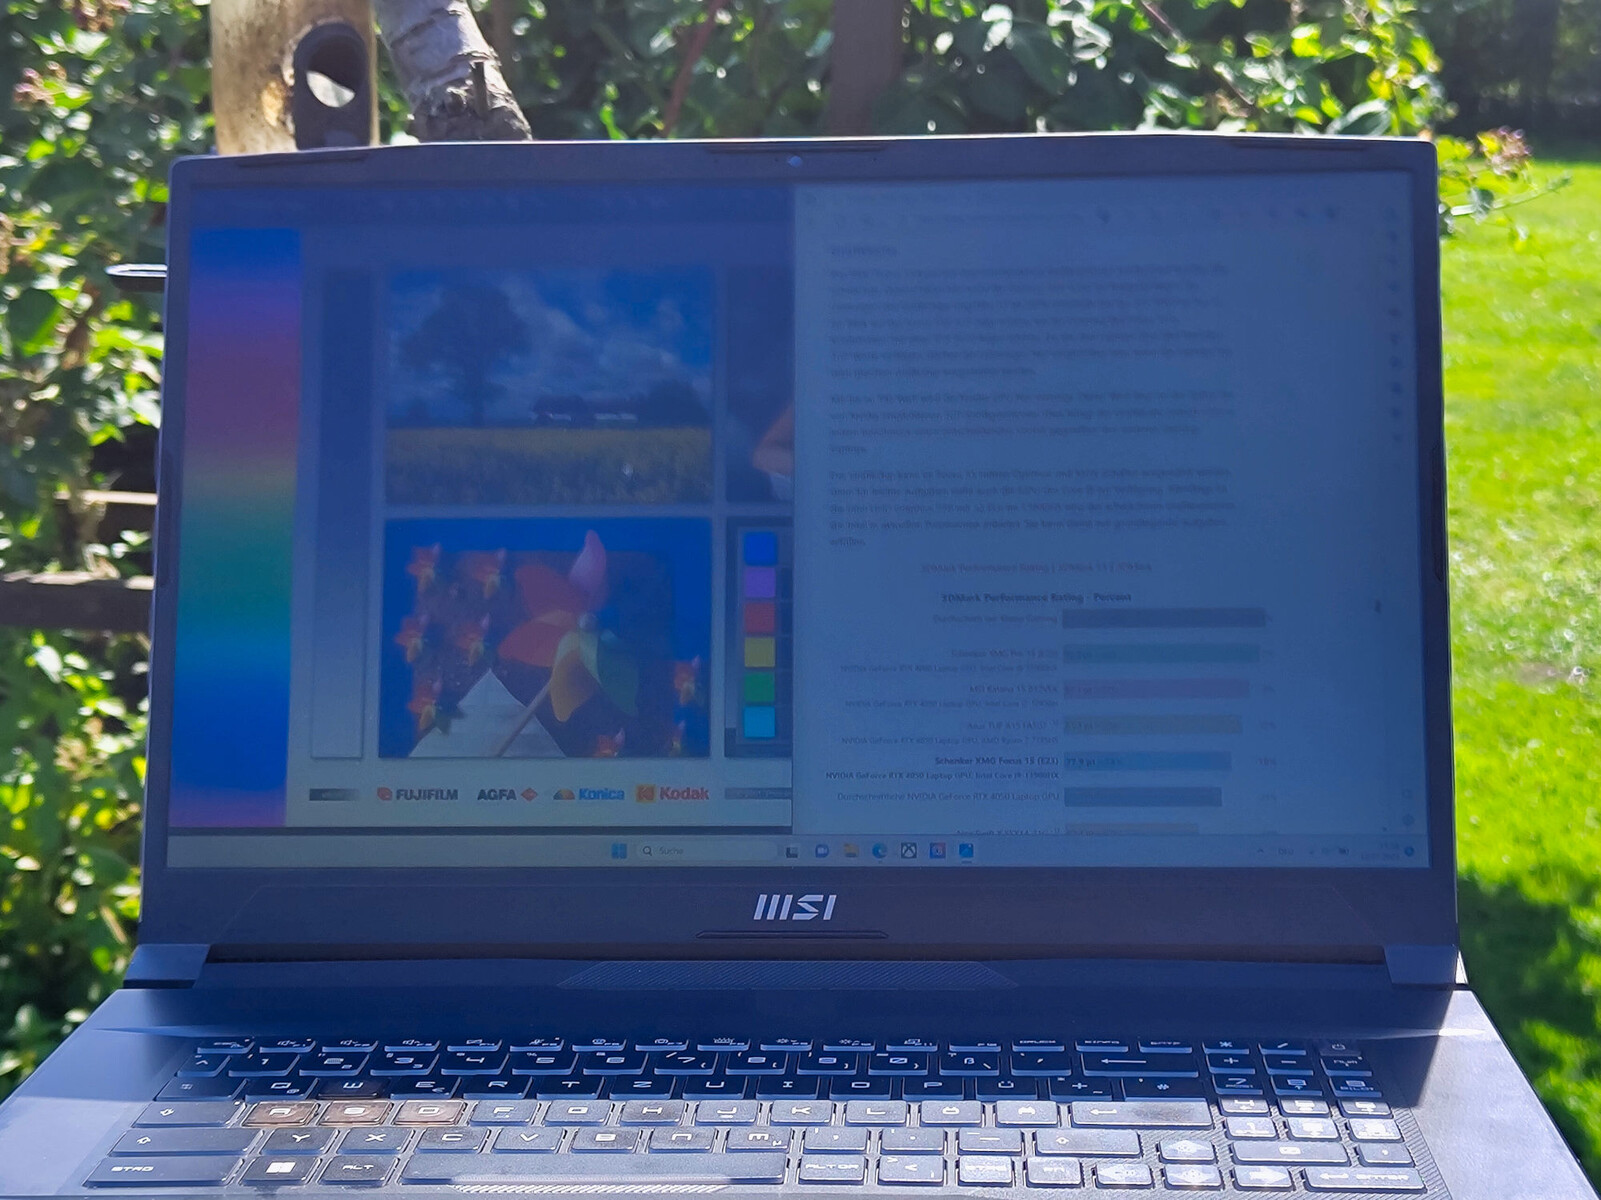
Gli angoli di visualizzazione del pannello Pulse 17 IPS sono abbastanza stabili in termini di riproduzione dei colori, ma perdono significativamente in luminosità con l'aumentare dell'angolo. Quando lo si usa all'aperto, il portatile è convincente solo in misura limitata, poiché il display non è abbastanza luminoso da essere visibile in piena luce solare. Anche con l'illuminazione del nostro studio, diventa subito chiaro che il display è piuttosto scuro, con la superficie opaca che mostra ancora una quantità relativamente elevata di riflessi.

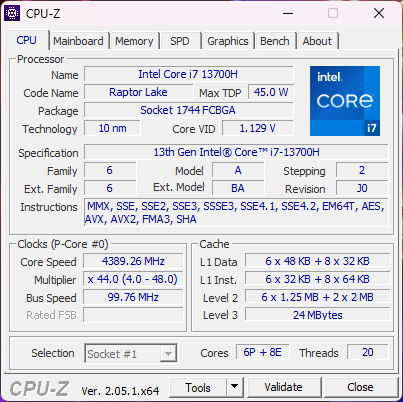
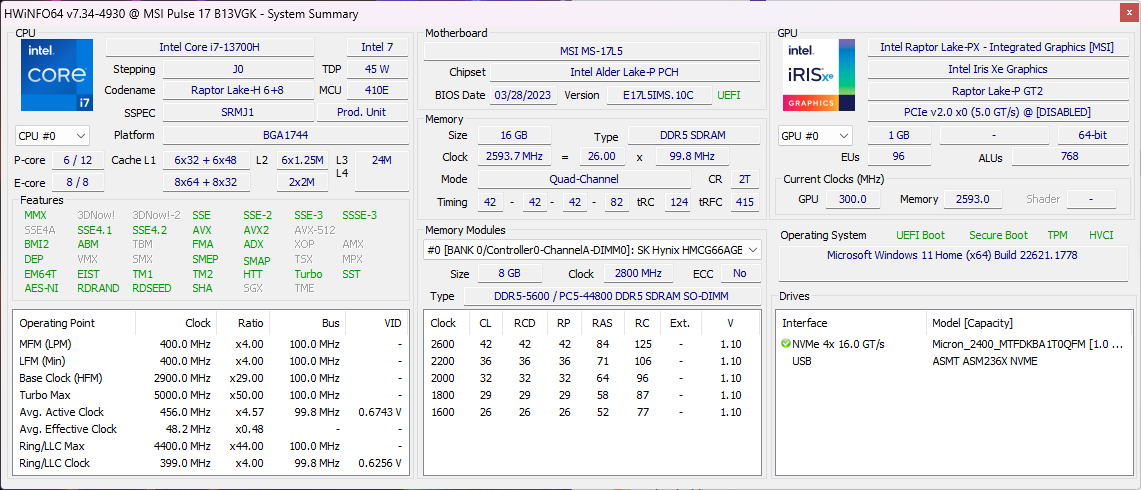
Prestazioni - Intel Core i7-13700H molto potente
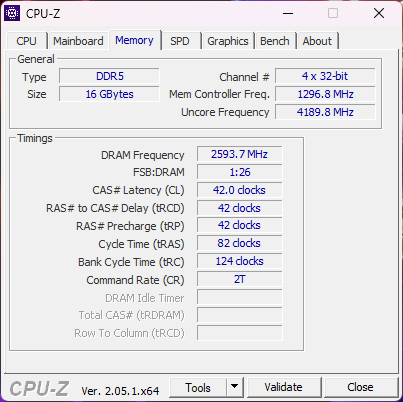
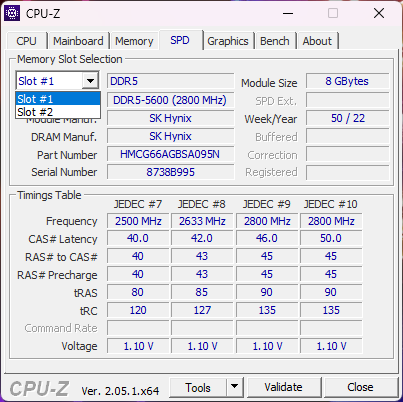
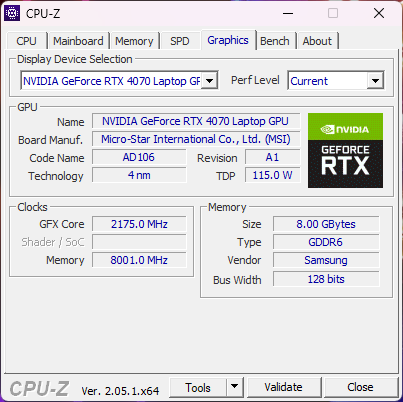
L'MSI Pulse 17 B13V è disponibile in due configurazioni di equipaggiamento che differiscono solo per la GPU. Mentre la nostra unità di test utilizza unaNvidia GeForce RTX 4070l'altra configurazione è dotata di una RTX 4060. Come processore, il Intel Core i7-13700Hviene utilizzato. È accompagnato da 16 GB di RAM DDR5-5200 e da un'unità SSD con capacità di 1 TB. Con una configurazione hardware così potente, la nostra unità di prova è adatta a giocare a risoluzioni superiori al Full HD.
Controllo dell'alimentazione e condizioni di test
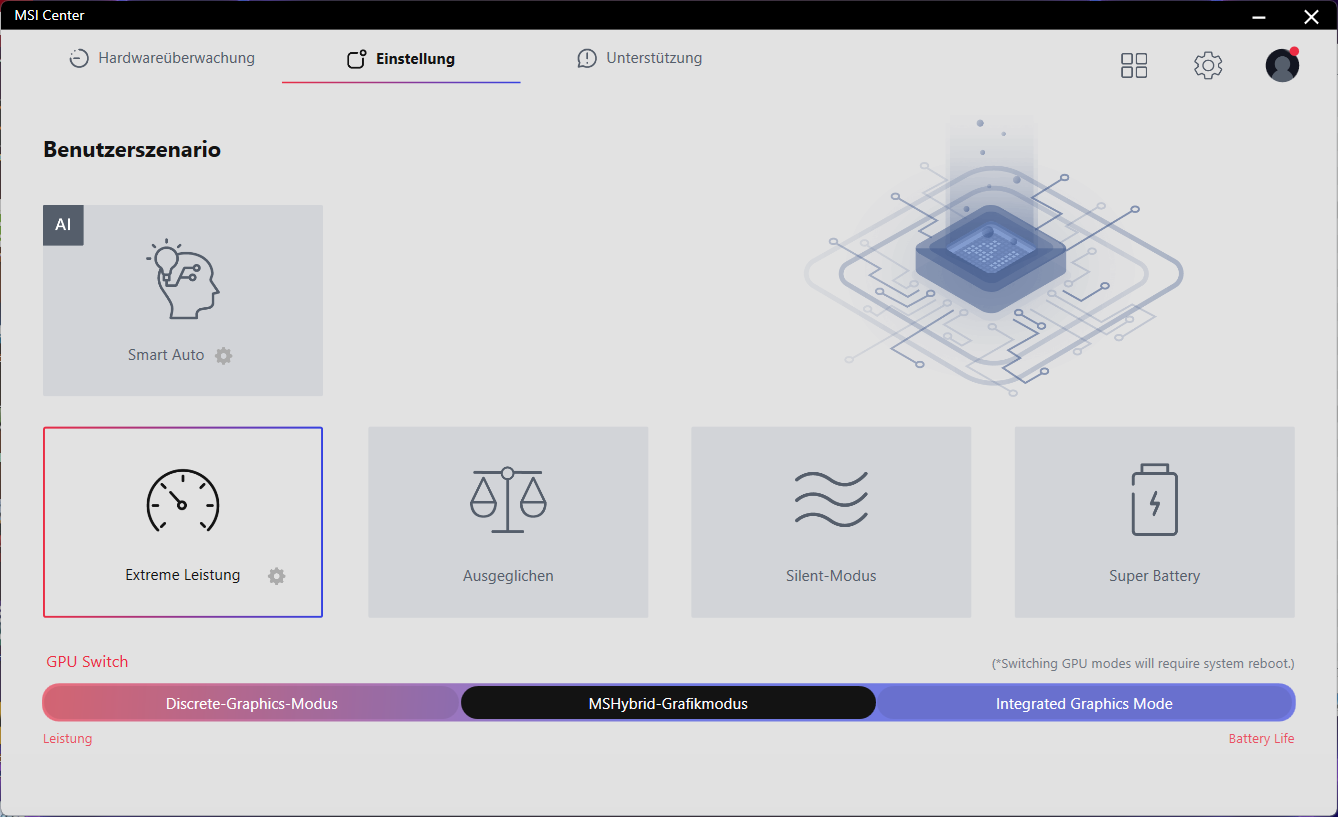
MSI offre tre profili di prestazioni e una modalità di risparmio della batteria nel Pulse 17. Inoltre, è possibile utilizzare la modalità AI di MSI. Quando la CPU funziona da sola, è in grado di utilizzare un PL1 di 90 watt in modalità Extreme Performance, con un potente boost di prestazioni (PL2) di 140 watt. In modalità Balanced, PL1 e PL2 sono rispettivamente di 70 e 120 watt. La modalità Quiet Operation, in cui le ventole non sono udibili, funziona a 30 watt senza boost.
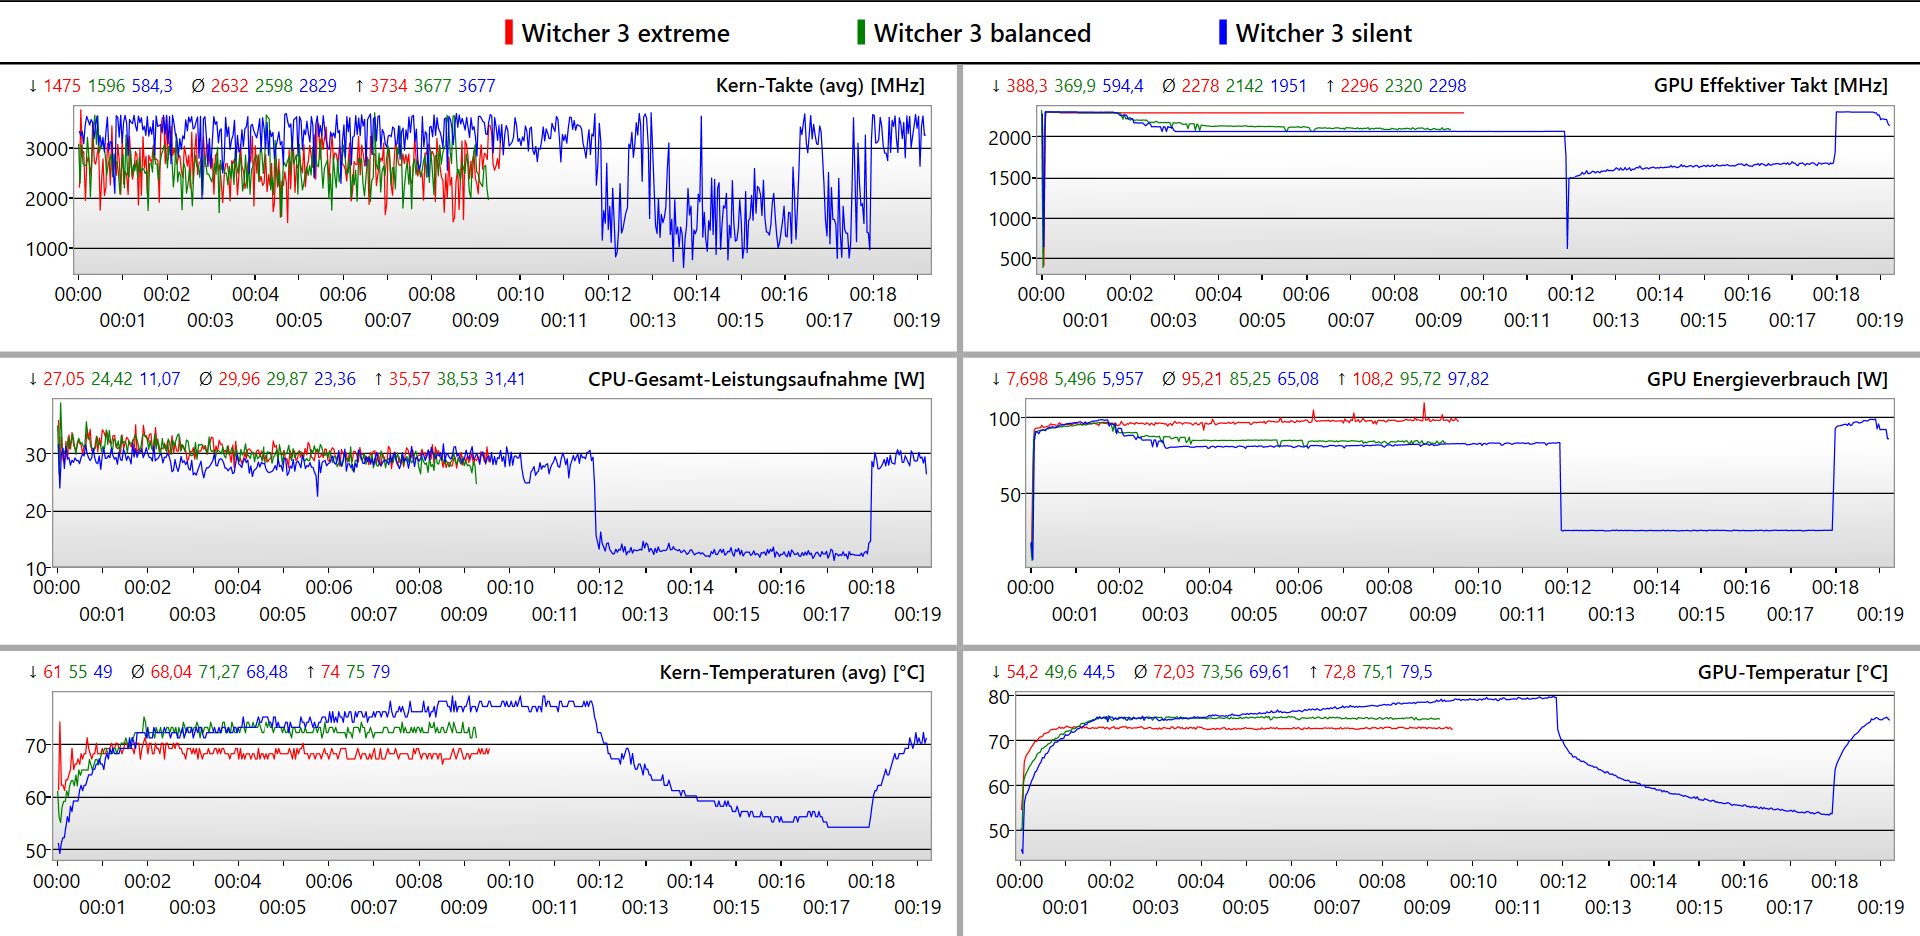
Ma ciò che è più interessante per un portatile da gioco sono le prestazioni durante il gioco. In tutte e tre le modalità di prestazioni, nei primi 10 minuti del nostro test non ci sono differenze. Solo le temperature raggiungono valori diversi. Le modalità Performance e Balanced garantiscono temperature costanti per CPU e GPU. In modalità Quiet Operation, le temperature salgono a tal punto da strozzare le prestazioni, calando significativamente dopo circa 10 minuti.
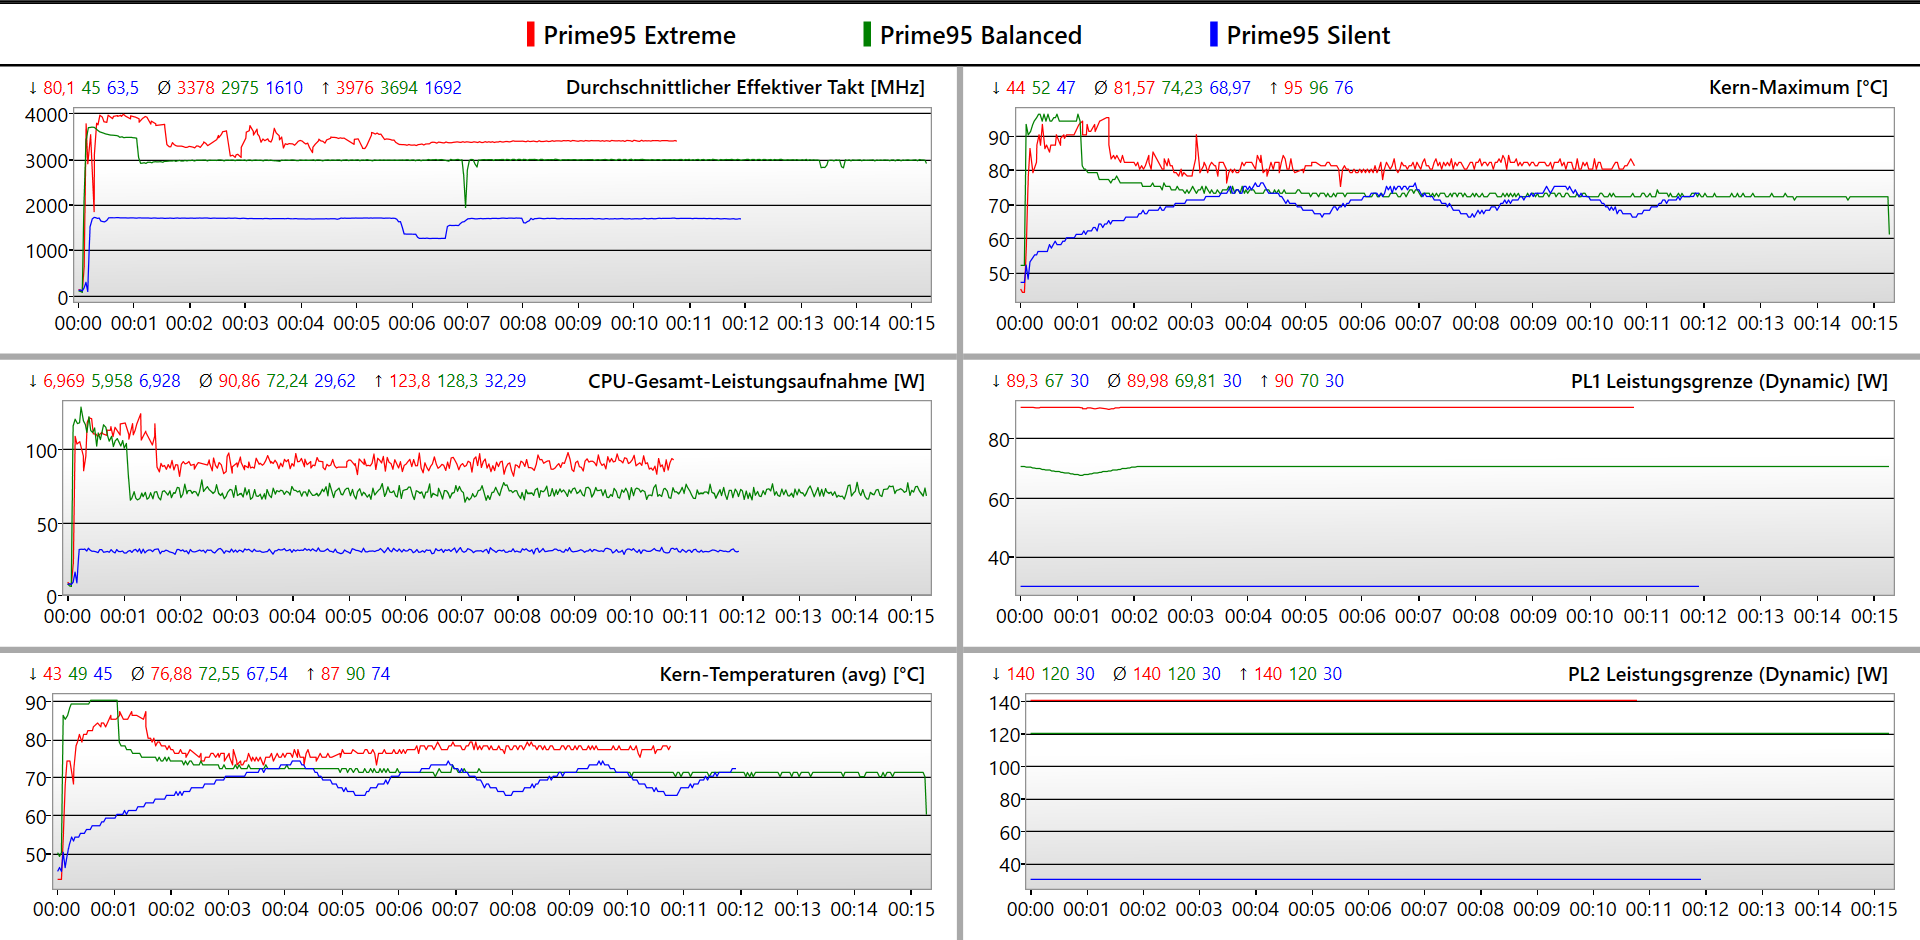
Abbiamo quindi deciso di eseguire tutti i benchmark generici in modalità Performance e i benchmark di gioco in modalità Balanced. In tutti i giochi testati, abbiamo eseguito anche un ulteriore benchmark con le impostazioni di qualità più elevate in modalità Prestazioni. Le frequenze dei fotogrammi ottenute differiscono di meno di un punto percentuale. Ciò significa che la modalità Performance non consente di ottenere alcun vantaggio in termini di FPS durante i giochi.
Processore
Con sei core P e otto core E, il processore Intel Core i7-13700H del Pulse 17 è in grado di gestire 20 thread. Il processore è dotato di una potenza relativamente elevata e in questo modo riesce a posizionarsi appena davanti agli altri dispositivi di confronto con il Core i7. Tuttavia, ilXMG Focus 17con unCore i9e l' Asus ROG Strix G17con unRyzen 9 superano in modo significativo i processori i7.
Cinebench R15 Multi Constant Load Test
Cinebench R23: Multi Core | Single Core
Cinebench R20: CPU (Multi Core) | CPU (Single Core)
Cinebench R15: CPU Multi 64Bit | CPU Single 64Bit
Blender: v2.79 BMW27 CPU
7-Zip 18.03: 7z b 4 | 7z b 4 -mmt1
Geekbench 5.5: Multi-Core | Single-Core
HWBOT x265 Benchmark v2.2: 4k Preset
LibreOffice : 20 Documents To PDF
R Benchmark 2.5: Overall mean
| CPU Performance rating | |
| Asus ROG Strix G17 G713PI | |
| Schenker XMG Focus 17 (E23) | |
| Media della classe Gaming | |
| MSI Pulse 17 B13VGK | |
| MSI Pulse GL76 12UGK | |
| Media Intel Core i7-13700H | |
| MSI Katana 17 B13VFK | |
| Acer Nitro 17 AN17-51-71ER | |
| Cinebench R23 / Multi Core | |
| Asus ROG Strix G17 G713PI | |
| Schenker XMG Focus 17 (E23) | |
| Media della classe Gaming (10488 - 42661, n=107, ultimi 2 anni) | |
| Acer Nitro 17 AN17-51-71ER | |
| MSI Pulse 17 B13VGK | |
| MSI Pulse GL76 12UGK | |
| MSI Katana 17 B13VFK | |
| Media Intel Core i7-13700H (5890 - 20034, n=29) | |
| Cinebench R23 / Single Core | |
| Media della classe Gaming (1166 - 2415, n=107, ultimi 2 anni) | |
| Schenker XMG Focus 17 (E23) | |
| Asus ROG Strix G17 G713PI | |
| MSI Katana 17 B13VFK | |
| Media Intel Core i7-13700H (1323 - 1914, n=29) | |
| MSI Pulse GL76 12UGK | |
| MSI Pulse 17 B13VGK | |
| Acer Nitro 17 AN17-51-71ER | |
| Cinebench R20 / CPU (Multi Core) | |
| Media della classe Gaming (4029 - 16433, n=106, ultimi 2 anni) | |
| Schenker XMG Focus 17 (E23) | |
| Asus ROG Strix G17 G713PI | |
| MSI Pulse 17 B13VGK | |
| Acer Nitro 17 AN17-51-71ER | |
| MSI Pulse GL76 12UGK | |
| MSI Katana 17 B13VFK | |
| Media Intel Core i7-13700H (2322 - 7674, n=29) | |
| Cinebench R20 / CPU (Single Core) | |
| Media della classe Gaming (442 - 913, n=106, ultimi 2 anni) | |
| Schenker XMG Focus 17 (E23) | |
| Asus ROG Strix G17 G713PI | |
| Media Intel Core i7-13700H (508 - 741, n=29) | |
| MSI Katana 17 B13VFK | |
| MSI Pulse GL76 12UGK | |
| MSI Pulse 17 B13VGK | |
| Acer Nitro 17 AN17-51-71ER | |
| Cinebench R15 / CPU Multi 64Bit | |
| Asus ROG Strix G17 G713PI | |
| Schenker XMG Focus 17 (E23) | |
| Media della classe Gaming (1578 - 6330, n=105, ultimi 2 anni) | |
| Acer Nitro 17 AN17-51-71ER | |
| MSI Pulse 17 B13VGK | |
| MSI Pulse GL76 12UGK | |
| Media Intel Core i7-13700H (905 - 2982, n=29) | |
| MSI Katana 17 B13VFK | |
| Cinebench R15 / CPU Single 64Bit | |
| Media della classe Gaming (188.8 - 350, n=106, ultimi 2 anni) | |
| Asus ROG Strix G17 G713PI | |
| Schenker XMG Focus 17 (E23) | |
| Media Intel Core i7-13700H (213 - 278, n=29) | |
| MSI Katana 17 B13VFK | |
| MSI Pulse GL76 12UGK | |
| MSI Pulse 17 B13VGK | |
| Acer Nitro 17 AN17-51-71ER | |
| Blender / v2.79 BMW27 CPU | |
| Media Intel Core i7-13700H (169 - 555, n=29) | |
| MSI Katana 17 B13VFK | |
| MSI Pulse GL76 12UGK | |
| Acer Nitro 17 AN17-51-71ER | |
| MSI Pulse 17 B13VGK | |
| Media della classe Gaming (79 - 330, n=104, ultimi 2 anni) | |
| Schenker XMG Focus 17 (E23) | |
| Asus ROG Strix G17 G713PI | |
| 7-Zip 18.03 / 7z b 4 | |
| Asus ROG Strix G17 G713PI | |
| Schenker XMG Focus 17 (E23) | |
| Media della classe Gaming (33491 - 148086, n=105, ultimi 2 anni) | |
| MSI Pulse 17 B13VGK | |
| Acer Nitro 17 AN17-51-71ER | |
| MSI Pulse GL76 12UGK | |
| MSI Katana 17 B13VFK | |
| Media Intel Core i7-13700H (27322 - 76344, n=29) | |
| 7-Zip 18.03 / 7z b 4 -mmt1 | |
| Asus ROG Strix G17 G713PI | |
| Schenker XMG Focus 17 (E23) | |
| Media della classe Gaming (4199 - 7436, n=105, ultimi 2 anni) | |
| Media Intel Core i7-13700H (4825 - 6238, n=29) | |
| MSI Katana 17 B13VFK | |
| MSI Pulse GL76 12UGK | |
| MSI Pulse 17 B13VGK | |
| Acer Nitro 17 AN17-51-71ER | |
| Geekbench 5.5 / Multi-Core | |
| Asus ROG Strix G17 G713PI | |
| Schenker XMG Focus 17 (E23) | |
| Media della classe Gaming (6460 - 28263, n=105, ultimi 2 anni) | |
| MSI Pulse 17 B13VGK | |
| Acer Nitro 17 AN17-51-71ER | |
| MSI Pulse GL76 12UGK | |
| Media Intel Core i7-13700H (6165 - 14215, n=29) | |
| MSI Katana 17 B13VFK | |
| Geekbench 5.5 / Single-Core | |
| Media della classe Gaming (986 - 2474, n=105, ultimi 2 anni) | |
| Asus ROG Strix G17 G713PI | |
| Schenker XMG Focus 17 (E23) | |
| Media Intel Core i7-13700H (1362 - 1919, n=29) | |
| MSI Katana 17 B13VFK | |
| MSI Pulse 17 B13VGK | |
| MSI Pulse GL76 12UGK | |
| Acer Nitro 17 AN17-51-71ER | |
| HWBOT x265 Benchmark v2.2 / 4k Preset | |
| Asus ROG Strix G17 G713PI | |
| Media della classe Gaming (11.5 - 44.4, n=105, ultimi 2 anni) | |
| Schenker XMG Focus 17 (E23) | |
| MSI Pulse 17 B13VGK | |
| Acer Nitro 17 AN17-51-71ER | |
| MSI Pulse GL76 12UGK | |
| MSI Katana 17 B13VFK | |
| Media Intel Core i7-13700H (6.72 - 21.2, n=29) | |
| LibreOffice / 20 Documents To PDF | |
| MSI Pulse 17 B13VGK | |
| MSI Katana 17 B13VFK | |
| Acer Nitro 17 AN17-51-71ER | |
| Schenker XMG Focus 17 (E23) | |
| Media della classe Gaming (33.2 - 88.8, n=105, ultimi 2 anni) | |
| Media Intel Core i7-13700H (31.3 - 62.4, n=29) | |
| MSI Pulse GL76 12UGK | |
| Asus ROG Strix G17 G713PI | |
| R Benchmark 2.5 / Overall mean | |
| Acer Nitro 17 AN17-51-71ER | |
| MSI Pulse 17 B13VGK | |
| MSI Pulse GL76 12UGK | |
| Media Intel Core i7-13700H (0.4308 - 0.607, n=29) | |
| MSI Katana 17 B13VFK | |
| Media della classe Gaming (0.3439 - 0.759, n=106, ultimi 2 anni) | |
| Schenker XMG Focus 17 (E23) | |
| Asus ROG Strix G17 G713PI | |
* ... Meglio usare valori piccoli
AIDA64: FP32 Ray-Trace | FPU Julia | CPU SHA3 | CPU Queen | FPU SinJulia | FPU Mandel | CPU AES | CPU ZLib | FP64 Ray-Trace | CPU PhotoWorxx
| Performance rating | |
| Asus ROG Strix G17 G713PI | |
| Media della classe Gaming | |
| Schenker XMG Focus 17 (E23) | |
| Acer Nitro 17 AN17-51-71ER | |
| MSI Pulse 17 B13VGK | |
| MSI Pulse GL76 12UGK | |
| Media Intel Core i7-13700H | |
| MSI Katana 17 B13VFK | |
| AIDA64 / FP32 Ray-Trace | |
| Asus ROG Strix G17 G713PI | |
| Media della classe Gaming (10227 - 85542, n=105, ultimi 2 anni) | |
| Schenker XMG Focus 17 (E23) | |
| MSI Pulse 17 B13VGK | |
| Acer Nitro 17 AN17-51-71ER | |
| MSI Pulse GL76 12UGK | |
| Media Intel Core i7-13700H (4986 - 18908, n=29) | |
| MSI Katana 17 B13VFK | |
| AIDA64 / FPU Julia | |
| Asus ROG Strix G17 G713PI | |
| Media della classe Gaming (51376 - 238426, n=105, ultimi 2 anni) | |
| Schenker XMG Focus 17 (E23) | |
| MSI Pulse 17 B13VGK | |
| Acer Nitro 17 AN17-51-71ER | |
| MSI Pulse GL76 12UGK | |
| Media Intel Core i7-13700H (25360 - 92359, n=29) | |
| MSI Katana 17 B13VFK | |
| AIDA64 / CPU SHA3 | |
| Asus ROG Strix G17 G713PI | |
| Media della classe Gaming (2180 - 10115, n=105, ultimi 2 anni) | |
| Schenker XMG Focus 17 (E23) | |
| Acer Nitro 17 AN17-51-71ER | |
| MSI Pulse 17 B13VGK | |
| MSI Pulse GL76 12UGK | |
| Media Intel Core i7-13700H (1339 - 4224, n=29) | |
| MSI Katana 17 B13VFK | |
| AIDA64 / CPU Queen | |
| Asus ROG Strix G17 G713PI | |
| Schenker XMG Focus 17 (E23) | |
| Media della classe Gaming (49785 - 173351, n=90, ultimi 2 anni) | |
| MSI Pulse GL76 12UGK | |
| Acer Nitro 17 AN17-51-71ER | |
| MSI Pulse 17 B13VGK | |
| Media Intel Core i7-13700H (59324 - 107159, n=29) | |
| MSI Katana 17 B13VFK | |
| AIDA64 / FPU SinJulia | |
| Asus ROG Strix G17 G713PI | |
| Media della classe Gaming (4424 - 33636, n=105, ultimi 2 anni) | |
| Schenker XMG Focus 17 (E23) | |
| MSI Pulse 17 B13VGK | |
| Acer Nitro 17 AN17-51-71ER | |
| MSI Pulse GL76 12UGK | |
| Media Intel Core i7-13700H (4800 - 11050, n=29) | |
| MSI Katana 17 B13VFK | |
| AIDA64 / FPU Mandel | |
| Asus ROG Strix G17 G713PI | |
| Media della classe Gaming (25115 - 128721, n=105, ultimi 2 anni) | |
| Schenker XMG Focus 17 (E23) | |
| MSI Pulse 17 B13VGK | |
| Acer Nitro 17 AN17-51-71ER | |
| MSI Pulse GL76 12UGK | |
| Media Intel Core i7-13700H (12321 - 45118, n=29) | |
| MSI Katana 17 B13VFK | |
| AIDA64 / CPU AES | |
| Asus ROG Strix G17 G713PI | |
| Acer Nitro 17 AN17-51-71ER | |
| MSI Pulse GL76 12UGK | |
| Media della classe Gaming (39258 - 247074, n=105, ultimi 2 anni) | |
| Schenker XMG Focus 17 (E23) | |
| MSI Pulse 17 B13VGK | |
| Media Intel Core i7-13700H (28769 - 151254, n=29) | |
| MSI Katana 17 B13VFK | |
| AIDA64 / CPU ZLib | |
| Asus ROG Strix G17 G713PI | |
| Schenker XMG Focus 17 (E23) | |
| Media della classe Gaming (574 - 2531, n=105, ultimi 2 anni) | |
| Acer Nitro 17 AN17-51-71ER | |
| MSI Pulse 17 B13VGK | |
| MSI Pulse GL76 12UGK | |
| Media Intel Core i7-13700H (389 - 1215, n=29) | |
| MSI Katana 17 B13VFK | |
| AIDA64 / FP64 Ray-Trace | |
| Asus ROG Strix G17 G713PI | |
| Media della classe Gaming (5509 - 45446, n=105, ultimi 2 anni) | |
| Schenker XMG Focus 17 (E23) | |
| MSI Pulse 17 B13VGK | |
| Acer Nitro 17 AN17-51-71ER | |
| MSI Pulse GL76 12UGK | |
| Media Intel Core i7-13700H (2540 - 10135, n=29) | |
| MSI Katana 17 B13VFK | |
| AIDA64 / CPU PhotoWorxx | |
| Schenker XMG Focus 17 (E23) | |
| Media della classe Gaming (12271 - 89891, n=105, ultimi 2 anni) | |
| Media Intel Core i7-13700H (12872 - 52727, n=29) | |
| MSI Pulse 17 B13VGK | |
| Acer Nitro 17 AN17-51-71ER | |
| MSI Katana 17 B13VFK | |
| Asus ROG Strix G17 G713PI | |
| MSI Pulse GL76 12UGK | |
Prestazioni del sistema
Abbiamo eseguito due volte il benchmark PCMark 10 delle prestazioni del sistema, poiché nella prima esecuzione l'MSI Pulse è rimasto molto indietro rispetto ai potenti risultati che il processore era in grado di mostrare nei benchmark precedenti. Con soli 6844 punti, avrebbe raggiunto solo l'ultimo posto tra i nostri dispositivi di confronto. Tuttavia, alcuni aggiornamenti successivi tramite Windows Update, il quadro cambia drasticamente.
Il portatile da gioco si posiziona ora appena davanti ai dispositivi di confronto. L'unico chiaro errore si verifica nella sezione Essentials del benchmark. Sospettiamo che la colpa sia dell'SSD relativamente lento della nostra unità di test, poiché la sezione Essentials pone particolare enfasi sui tempi di accesso di dati e programmi.
Il CrossMark, che si basa sulla CPU, presenta un quadro simile, con i dispositivi di confronto dotati di Core i9e Ryzen 9sono in grado di posizionarsi significativamente in testa.
CrossMark: Overall | Productivity | Creativity | Responsiveness
| PCMark 10 / Score | |
| Media della classe Gaming (5828 - 12414, n=93, ultimi 2 anni) | |
| MSI Pulse 17 B13VGK | |
| MSI Pulse GL76 12UGK | |
| Asus ROG Strix G17 G713PI | |
| Media Intel Core i7-13700H, NVIDIA GeForce RTX 4070 Laptop GPU (7158 - 7956, n=8) | |
| MSI Katana 17 B13VFK | |
| Acer Nitro 17 AN17-51-71ER | |
| Schenker XMG Focus 17 (E23) | |
| PCMark 10 / Essentials | |
| Asus ROG Strix G17 G713PI | |
| MSI Pulse GL76 12UGK | |
| MSI Katana 17 B13VFK | |
| Media Intel Core i7-13700H, NVIDIA GeForce RTX 4070 Laptop GPU (10252 - 11449, n=8) | |
| Media della classe Gaming (8810 - 11935, n=97, ultimi 2 anni) | |
| MSI Pulse 17 B13VGK | |
| Acer Nitro 17 AN17-51-71ER | |
| Schenker XMG Focus 17 (E23) | |
| PCMark 10 / Productivity | |
| Media della classe Gaming (6845 - 25323, n=95, ultimi 2 anni) | |
| Asus ROG Strix G17 G713PI | |
| MSI Pulse 17 B13VGK | |
| MSI Pulse GL76 12UGK | |
| Schenker XMG Focus 17 (E23) | |
| Media Intel Core i7-13700H, NVIDIA GeForce RTX 4070 Laptop GPU (8501 - 10769, n=8) | |
| MSI Katana 17 B13VFK | |
| Acer Nitro 17 AN17-51-71ER | |
| PCMark 10 / Digital Content Creation | |
| Media della classe Gaming (7602 - 19954, n=95, ultimi 2 anni) | |
| Acer Nitro 17 AN17-51-71ER | |
| MSI Pulse 17 B13VGK | |
| MSI Pulse GL76 12UGK | |
| Media Intel Core i7-13700H, NVIDIA GeForce RTX 4070 Laptop GPU (10358 - 12908, n=8) | |
| MSI Katana 17 B13VFK | |
| Schenker XMG Focus 17 (E23) | |
| Asus ROG Strix G17 G713PI | |
| CrossMark / Overall | |
| Asus ROG Strix G17 G713PI | |
| Schenker XMG Focus 17 (E23) | |
| Media della classe Gaming (1366 - 2409, n=94, ultimi 2 anni) | |
| MSI Pulse 17 B13VGK | |
| Media Intel Core i7-13700H, NVIDIA GeForce RTX 4070 Laptop GPU (1768 - 2073, n=6) | |
| MSI Katana 17 B13VFK | |
| MSI Pulse GL76 12UGK | |
| Acer Nitro 17 AN17-51-71ER | |
| CrossMark / Productivity | |
| Asus ROG Strix G17 G713PI | |
| Schenker XMG Focus 17 (E23) | |
| Media della classe Gaming (1386 - 2254, n=94, ultimi 2 anni) | |
| MSI Pulse 17 B13VGK | |
| Media Intel Core i7-13700H, NVIDIA GeForce RTX 4070 Laptop GPU (1645 - 2006, n=6) | |
| MSI Pulse GL76 12UGK | |
| MSI Katana 17 B13VFK | |
| Acer Nitro 17 AN17-51-71ER | |
| CrossMark / Creativity | |
| Asus ROG Strix G17 G713PI | |
| Schenker XMG Focus 17 (E23) | |
| Media della classe Gaming (1343 - 2786, n=94, ultimi 2 anni) | |
| MSI Pulse 17 B13VGK | |
| Media Intel Core i7-13700H, NVIDIA GeForce RTX 4070 Laptop GPU (1936 - 2137, n=6) | |
| MSI Katana 17 B13VFK | |
| MSI Pulse GL76 12UGK | |
| Acer Nitro 17 AN17-51-71ER | |
| CrossMark / Responsiveness | |
| MSI Pulse GL76 12UGK | |
| MSI Pulse 17 B13VGK | |
| Schenker XMG Focus 17 (E23) | |
| Media Intel Core i7-13700H, NVIDIA GeForce RTX 4070 Laptop GPU (1451 - 2202, n=6) | |
| MSI Katana 17 B13VFK | |
| Media della classe Gaming (1226 - 2334, n=94, ultimi 2 anni) | |
| Asus ROG Strix G17 G713PI | |
| Acer Nitro 17 AN17-51-71ER | |
| PCMark 10 Score | 7796 punti | |
Aiuto | ||
| AIDA64 / Memory Copy | |
| Schenker XMG Focus 17 (E23) | |
| Media della classe Gaming (21750 - 129946, n=105, ultimi 2 anni) | |
| Media Intel Core i7-13700H (24334 - 78081, n=29) | |
| MSI Pulse 17 B13VGK | |
| Acer Nitro 17 AN17-51-71ER | |
| MSI Katana 17 B13VFK | |
| Asus ROG Strix G17 G713PI | |
| MSI Pulse GL76 12UGK | |
| AIDA64 / Memory Read | |
| Schenker XMG Focus 17 (E23) | |
| Media della classe Gaming (22956 - 118858, n=105, ultimi 2 anni) | |
| MSI Pulse 17 B13VGK | |
| Acer Nitro 17 AN17-51-71ER | |
| Media Intel Core i7-13700H (23681 - 79656, n=29) | |
| MSI Katana 17 B13VFK | |
| Asus ROG Strix G17 G713PI | |
| MSI Pulse GL76 12UGK | |
| AIDA64 / Memory Write | |
| Media della classe Gaming (22297 - 135096, n=105, ultimi 2 anni) | |
| Schenker XMG Focus 17 (E23) | |
| Media Intel Core i7-13700H (22986 - 99898, n=29) | |
| Acer Nitro 17 AN17-51-71ER | |
| MSI Pulse 17 B13VGK | |
| Asus ROG Strix G17 G713PI | |
| MSI Katana 17 B13VFK | |
| MSI Pulse GL76 12UGK | |
| AIDA64 / Memory Latency | |
| Acer Nitro 17 AN17-51-71ER | |
| Media della classe Gaming (75.3 - 259, n=105, ultimi 2 anni) | |
| MSI Katana 17 B13VFK | |
| MSI Pulse 17 B13VGK | |
| Media Intel Core i7-13700H (82.4 - 136.8, n=29) | |
| MSI Pulse GL76 12UGK | |
| Schenker XMG Focus 17 (E23) | |
| Asus ROG Strix G17 G713PI | |
* ... Meglio usare valori piccoli
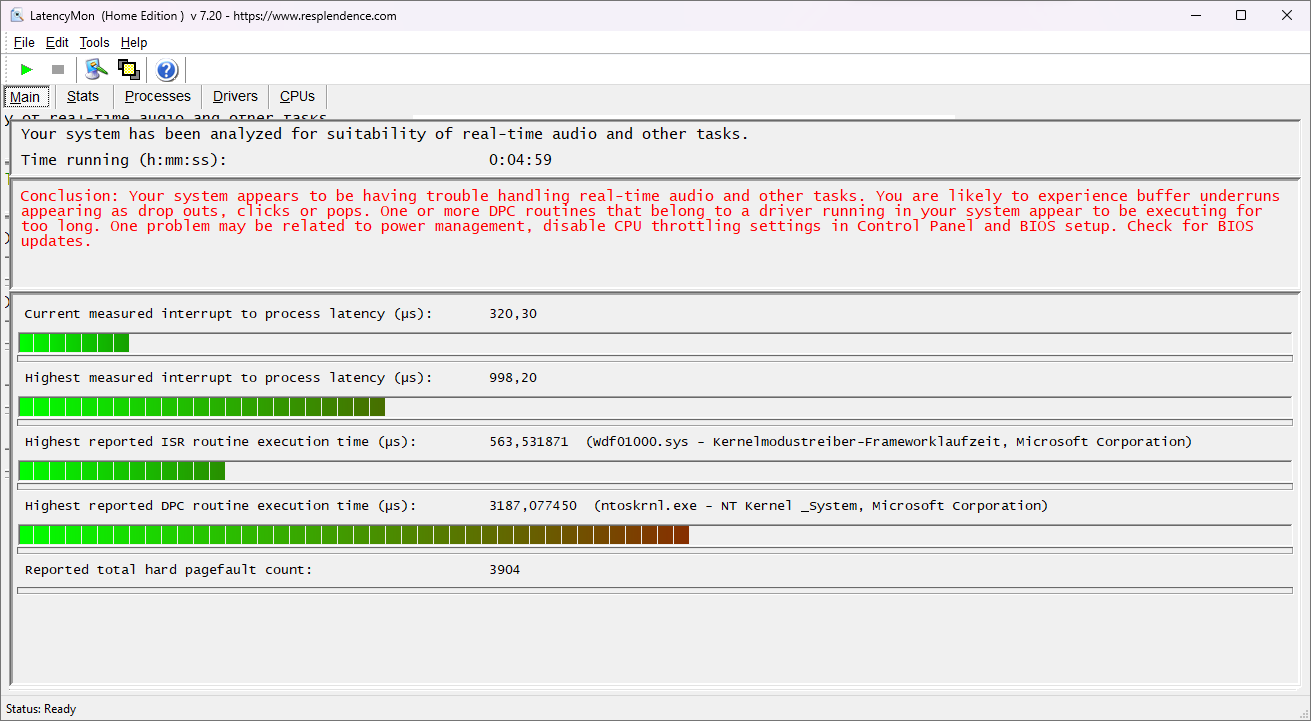
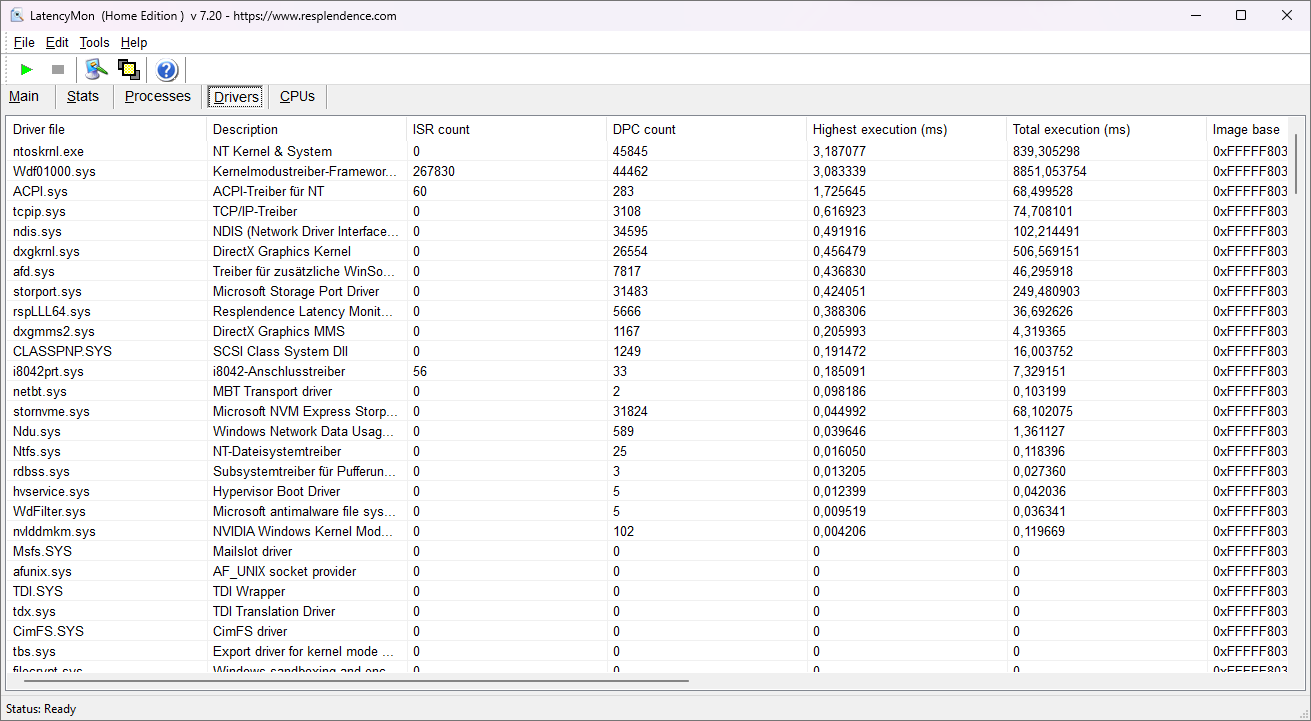
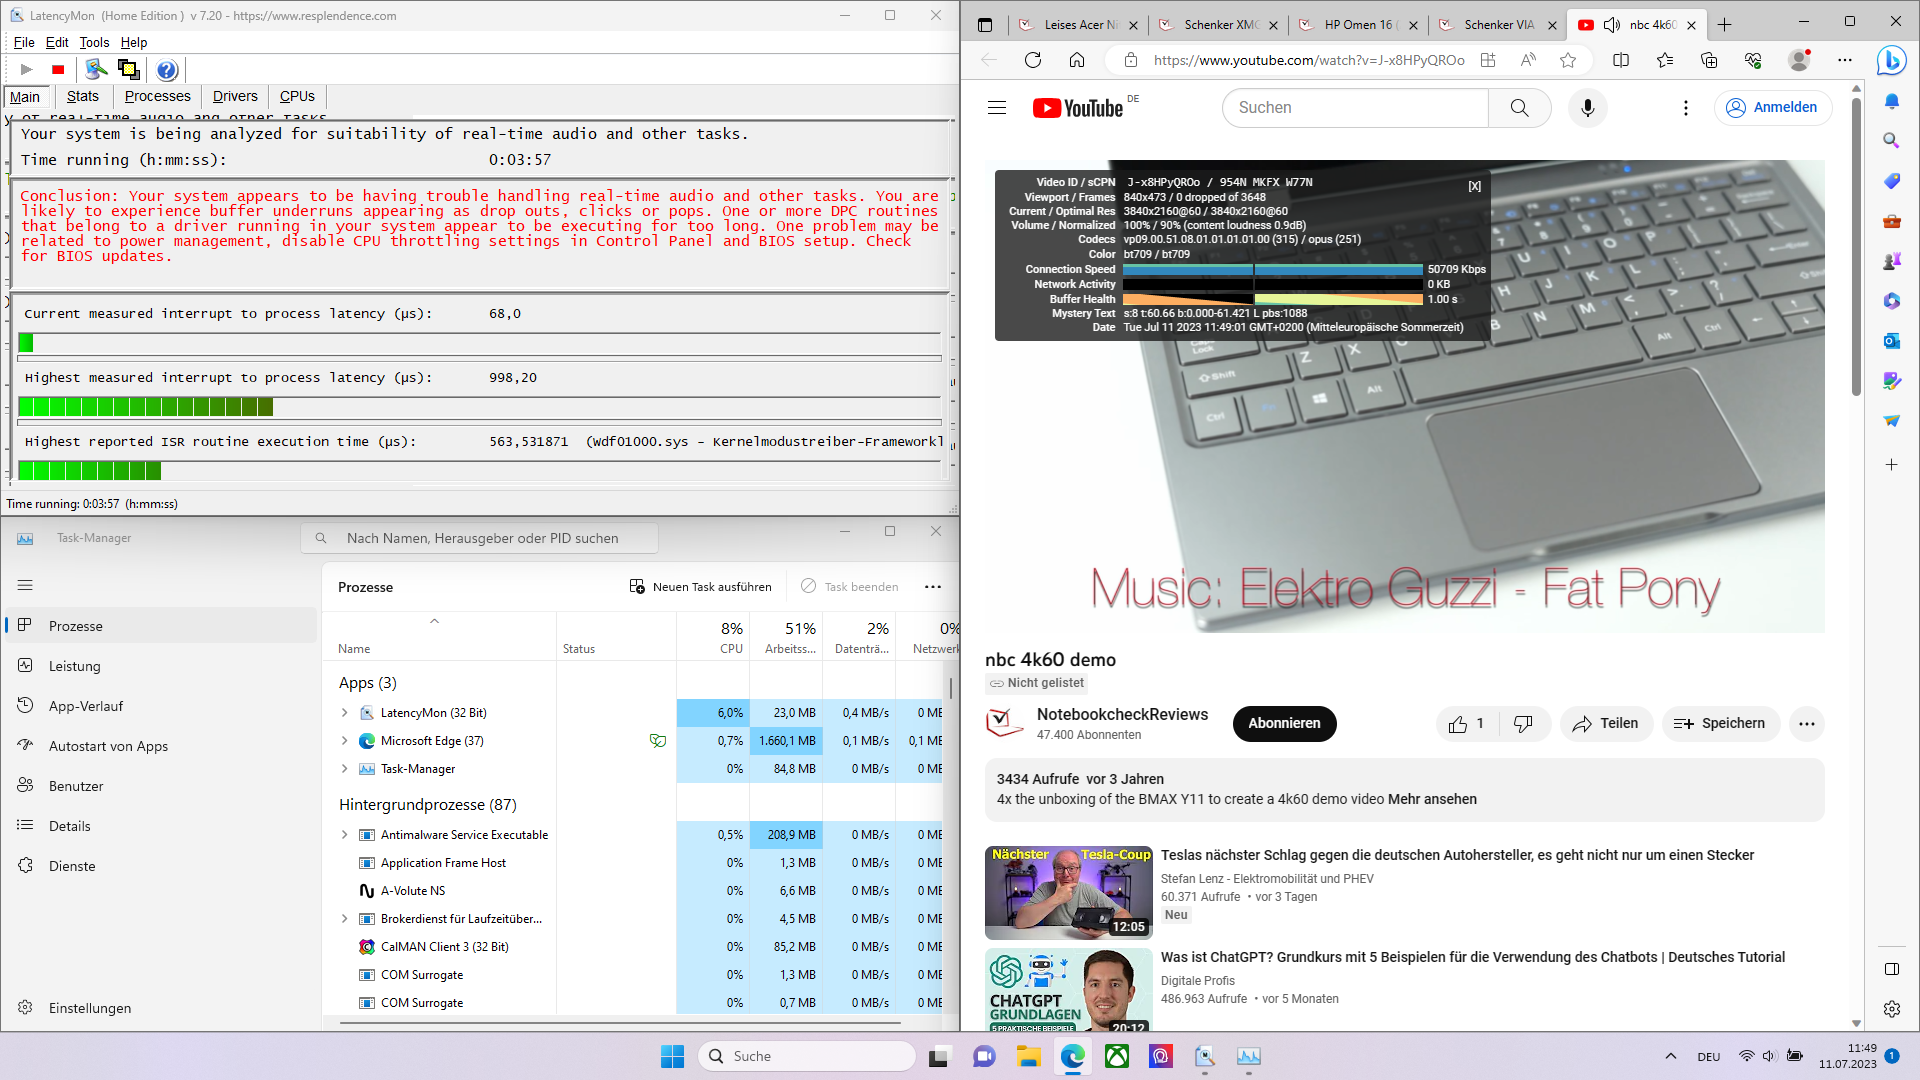
Latenze DPC
Nelle latenze DPC, LatencyMon determina che il portatile da gioco con gli aggiornamenti disponibili al momento del test non è adatto all'elaborazione in tempo reale dell'audio. Il problema sembra risiedere nel kernel di Windows.
| DPC Latencies / LatencyMon - interrupt to process latency (max), Web, Youtube, Prime95 | |
| MSI Katana 17 B13VFK | |
| Asus ROG Strix G17 G713PI | |
| Acer Nitro 17 AN17-51-71ER | |
| MSI Pulse 17 B13VGK | |
| Schenker XMG Focus 17 (E23) | |
| MSI Pulse GL76 12UGK | |
* ... Meglio usare valori piccoli
Soluzione di stoccaggio
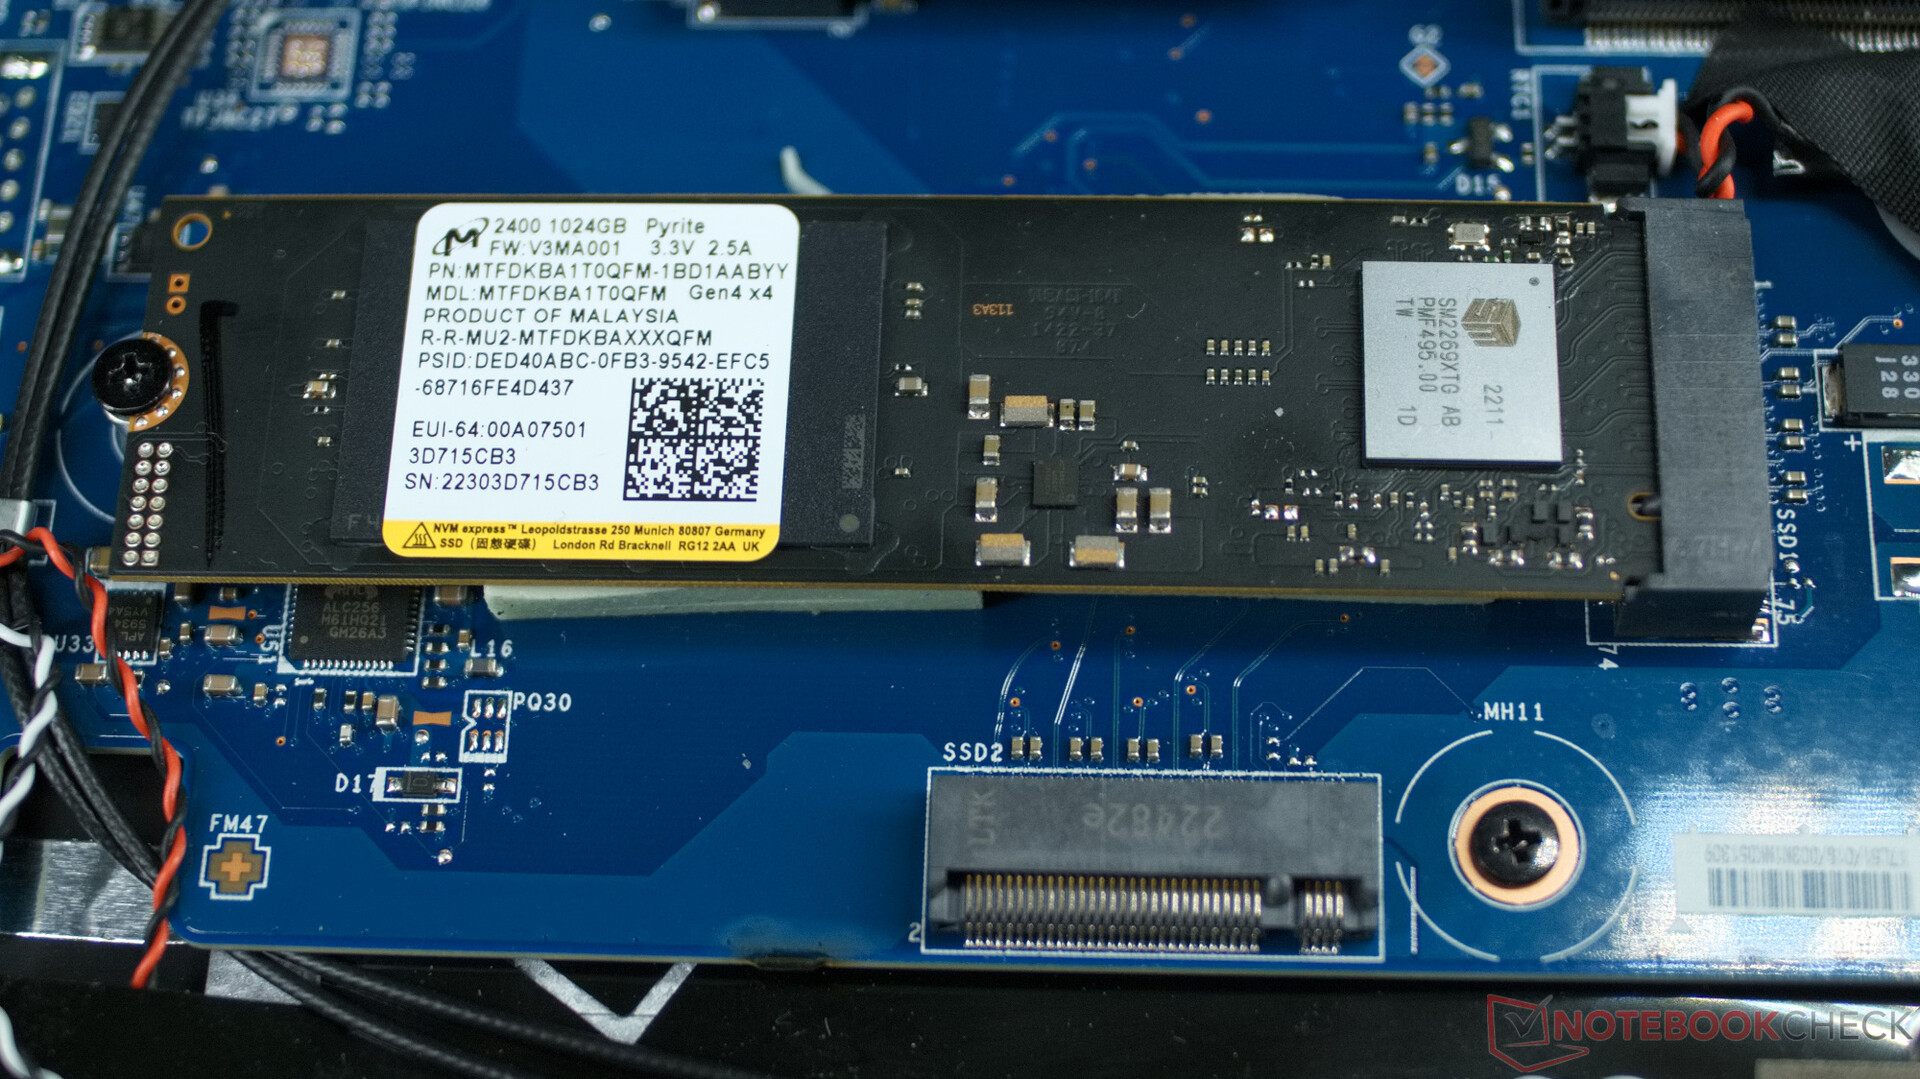
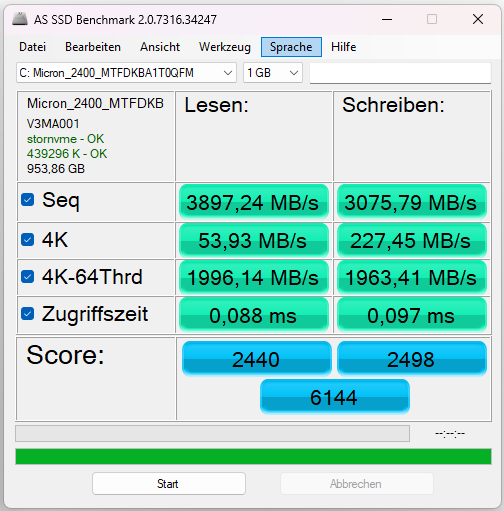
IlSSD Micron 2400 NVMe nella nostra unità di test offre una capacità di 1 Terabyte. La sua velocità è nella media dei portatili da gioco e può essere mantenuta costantemente nell'MSI Pulse 17 anche per lunghi periodi di tempo senza problemi.

* ... Meglio usare valori piccoli
Constant Read Performance: DiskSpd Read Loop, Queue Depth 8
Scheda grafica
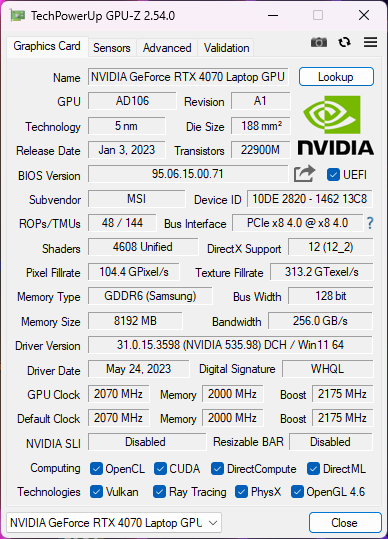
LaNvidia RTX 4070è in grado di funzionare costantemente a una potenza compresa tra 100 e 140 watt nell'MSI Pulse 17 senza che le temperature del chip diventino troppo elevate. Grazie a ciò, il chip grafico offre prestazioni relativamente elevate nei benchmark 3DMark. Ciò significa che i giochi in Full HD e un po' di raytracing non dovrebbero creare problemi alla scheda grafica, che riesce anche a gestire rapidamente applicazioni pratiche come il rendering di grafica 3D in programmi come Blender.
| 3DMark 11 Performance | 34584 punti | |
| 3DMark Cloud Gate Standard Score | 70329 punti | |
| 3DMark Fire Strike Score | 27138 punti | |
| 3DMark Time Spy Score | 12235 punti | |
Aiuto | ||
| Geekbench 6.7 - GPU OpenCL | |
| Media della classe Gaming (67235 - 253130, n=103, ultimi 2 anni) | |
| MSI Pulse 17 B13VGK | |
| Media NVIDIA GeForce RTX 4070 Laptop GPU (85488 - 129836, n=45) | |
* ... Meglio usare valori piccoli
Prestazioni di gioco
IlSchenker XMG Focus 17e Asus ROG Strix G17hanno un leggero vantaggio rispetto al Pulse 17 di MSI. Entrambi i portatili offrono semplicemente un processore più veloce, il che si riflette chiaramente nei frame rate dei giochi più pesanti per la CPU, come Dota 2 Reborn. Tuttavia, il Pulse 17 dimostra anche che è possibile giocare in Full HD e non solo, con impostazioni di alta qualità e persino con il raytracing, senza scendere sotto i 60 fotogrammi al secondo. Allo stesso tempo, il portatile rimane significativamente più silenzioso rispetto agli altri concorrenti, ed è possibile giocare senza alcun calo di prestazioni in modalità Bilanciata con un livello di rumore di soli 42 dB(A) (misurato da una distanza di 15 cm, ~6 in).
| Performance rating - Percent | |
| Media della classe Gaming | |
| Asus ROG Strix G17 G713PI | |
| Schenker XMG Focus 17 (E23) | |
| MSI Katana 17 B13VFK | |
| MSI Pulse 17 B13VGK | |
| Acer Nitro 17 AN17-51-71ER | |
| MSI Pulse GL76 12UGK | |
| The Witcher 3 - 1920x1080 Ultra Graphics & Postprocessing (HBAO+) | |
| Media della classe Gaming (104.7 - 240, n=6, ultimi 2 anni) | |
| Asus ROG Strix G17 G713PI | |
| Schenker XMG Focus 17 (E23) | |
| MSI Pulse 17 B13VGK | |
| Acer Nitro 17 AN17-51-71ER | |
| MSI Katana 17 B13VFK | |
| MSI Pulse GL76 12UGK | |
| GTA V - 1920x1080 Highest AA:4xMSAA + FX AF:16x | |
| Media della classe Gaming (48.3 - 186.9, n=93, ultimi 2 anni) | |
| Schenker XMG Focus 17 (E23) | |
| MSI Pulse 17 B13VGK | |
| Acer Nitro 17 AN17-51-71ER | |
| Asus ROG Strix G17 G713PI | |
| MSI Katana 17 B13VFK | |
| MSI Pulse GL76 12UGK | |
| Final Fantasy XV Benchmark - 1920x1080 High Quality | |
| Media della classe Gaming (41 - 215, n=95, ultimi 2 anni) | |
| Schenker XMG Focus 17 (E23) | |
| Asus ROG Strix G17 G713PI | |
| MSI Pulse 17 B13VGK | |
| Acer Nitro 17 AN17-51-71ER | |
| MSI Katana 17 B13VFK | |
| MSI Pulse GL76 12UGK | |
| Strange Brigade - 1920x1080 ultra AA:ultra AF:16 | |
| Media della classe Gaming (76.3 - 456, n=86, ultimi 2 anni) | |
| Schenker XMG Focus 17 (E23) | |
| Asus ROG Strix G17 G713PI | |
| MSI Pulse 17 B13VGK | |
| Acer Nitro 17 AN17-51-71ER | |
| MSI Katana 17 B13VFK | |
| MSI Pulse GL76 12UGK | |
| Dota 2 Reborn - 1920x1080 ultra (3/3) best looking | |
| Schenker XMG Focus 17 (E23) | |
| Asus ROG Strix G17 G713PI | |
| MSI Katana 17 B13VFK | |
| Media della classe Gaming (84.8 - 248, n=107, ultimi 2 anni) | |
| MSI Pulse 17 B13VGK | |
| Acer Nitro 17 AN17-51-71ER | |
| MSI Pulse GL76 12UGK | |
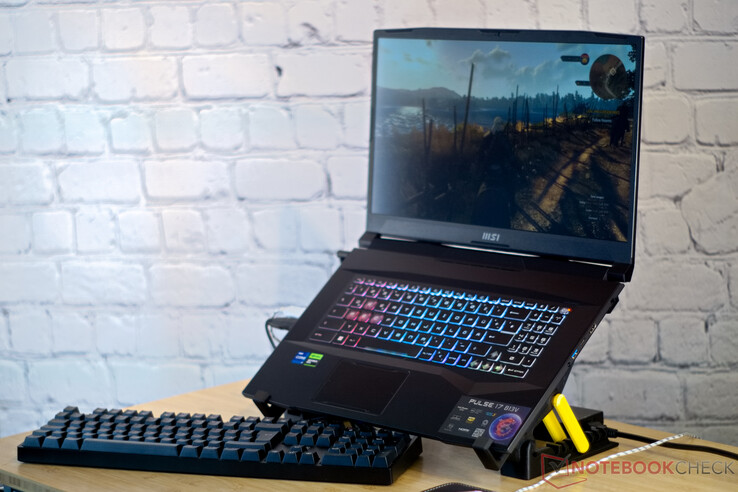
Nel test di un'ora con The Witcher 3, viene mostrata la tipica gamma di FPS nel ritmo diurno e notturno del gioco. Non si notano valori anomali significativi.
The Witcher 3 FPS Chart
| basso | medio | alto | ultra | QHD | 4K | |
|---|---|---|---|---|---|---|
| GTA V (2015) | 184.8 | 182.2 | 176.9 | 116.4 | ||
| The Witcher 3 (2015) | 106.9 | |||||
| Dota 2 Reborn (2015) | 174 | 158 | 146.3 | 138.5 | 132.4 | |
| Final Fantasy XV Benchmark (2018) | 150.5 | 111.9 | 86.2 | 47.5 | ||
| X-Plane 11.11 (2018) | 147.6 | 130.8 | 102 | 102.2 | ||
| Far Cry 5 (2018) | 163 | 154 | 145 | |||
| Strange Brigade (2018) | 468 | 295 | 233 | 202 | ||
| F1 22 (2022) | 239 | 228 | 186.7 | 71 | ||
| F1 23 (2023) | 248 | 251 | 199.2 | 100 |
Emissioni - Ventilatori silenziosi
Emissioni sonore
L'MSI Pulse 17 è estremamente silenzioso per un portatile da gioco. Abbiamo misurato un livello di rumore massimo di soli 46,5 dB(A) sotto carico in modalità Performance, e in modalità Balanced è addirittura inferiore di 4 dB(A). Le ventole sono inoltre udibili con un certo ritardo sotto carico. Ad esempio, si attivano solo poco prima della fine del benchmark nella nostra misurazione con PCMark 06 sotto carico medio.
Rumorosità
| Idle |
| 24 / 24 / 24 dB(A) |
| Sotto carico |
| 32.49 / 46.51 dB(A) |
 | ||
30 dB silenzioso 40 dB(A) udibile 50 dB(A) rumoroso |
||
min: | ||
| MSI Pulse 17 B13VGK GeForce RTX 4070 Laptop GPU, i7-13700H, Micron 2400 MTFDKBA1T0QFM | MSI Pulse GL76 12UGK GeForce RTX 3070 Laptop GPU, i7-12700H, Micron 3400 1TB MTFDKBA1T0TFH | MSI Katana 17 B13VFK GeForce RTX 4060 Laptop GPU, i7-13620H, Micron 2400 MTFDKBA1T0QFM | Acer Nitro 17 AN17-51-71ER GeForce RTX 4060 Laptop GPU, i7-13700H, Samsung PM9A1 MZVL21T0HCLR | Schenker XMG Focus 17 (E23) GeForce RTX 4070 Laptop GPU, i9-13900HX, Crucial P5 Plus 1TB CT1000P5PSSD8 | Asus ROG Strix G17 G713PI GeForce RTX 4070 Laptop GPU, R9 7945HX, WD PC SN560 SDDPNQE-1T00 | |
|---|---|---|---|---|---|---|
| Noise | -13% | -24% | -11% | -19% | -14% | |
| off /ambiente * (dB) | 24 | 24.1 -0% | 24.5 -2% | 24 -0% | 24 -0% | 25 -4% |
| Idle Minimum * (dB) | 24 | 26.9 -12% | 24.5 -2% | 24 -0% | 24 -0% | 26 -8% |
| Idle Average * (dB) | 24 | 26.9 -12% | 24.5 -2% | 24 -0% | 24 -0% | 29 -21% |
| Idle Maximum * (dB) | 24 | 27 -13% | 40 -67% | 32.32 -35% | 26.47 -10% | 30 -25% |
| Load Average * (dB) | 32.49 | 43.8 -35% | 48.3 -49% | 35.18 -8% | 55.72 -71% | 46 -42% |
| Witcher 3 ultra * (dB) | 46.51 | 44.7 4% | 56 -20% | 54.78 -18% | 57.94 -25% | 46 1% |
| Load Maximum * (dB) | 46.51 | 58.3 -25% | 59.1 -27% | 54.78 -18% | 57.94 -25% | 47 -1% |
* ... Meglio usare valori piccoli
Temperature
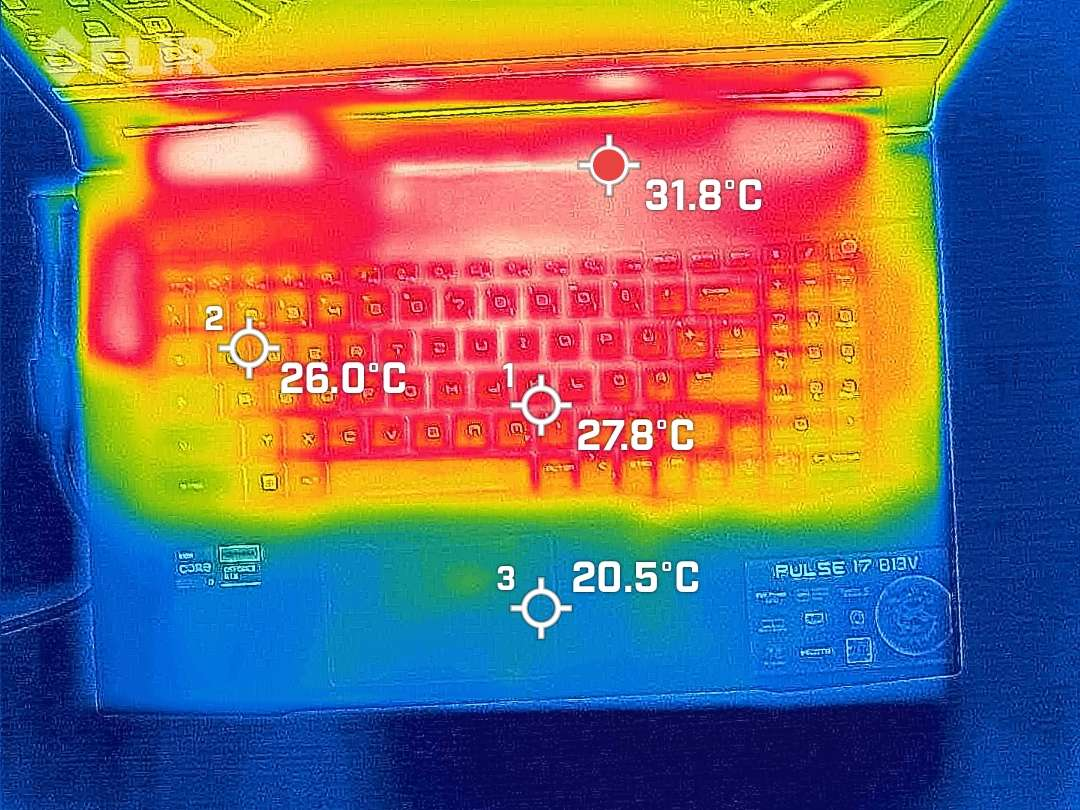
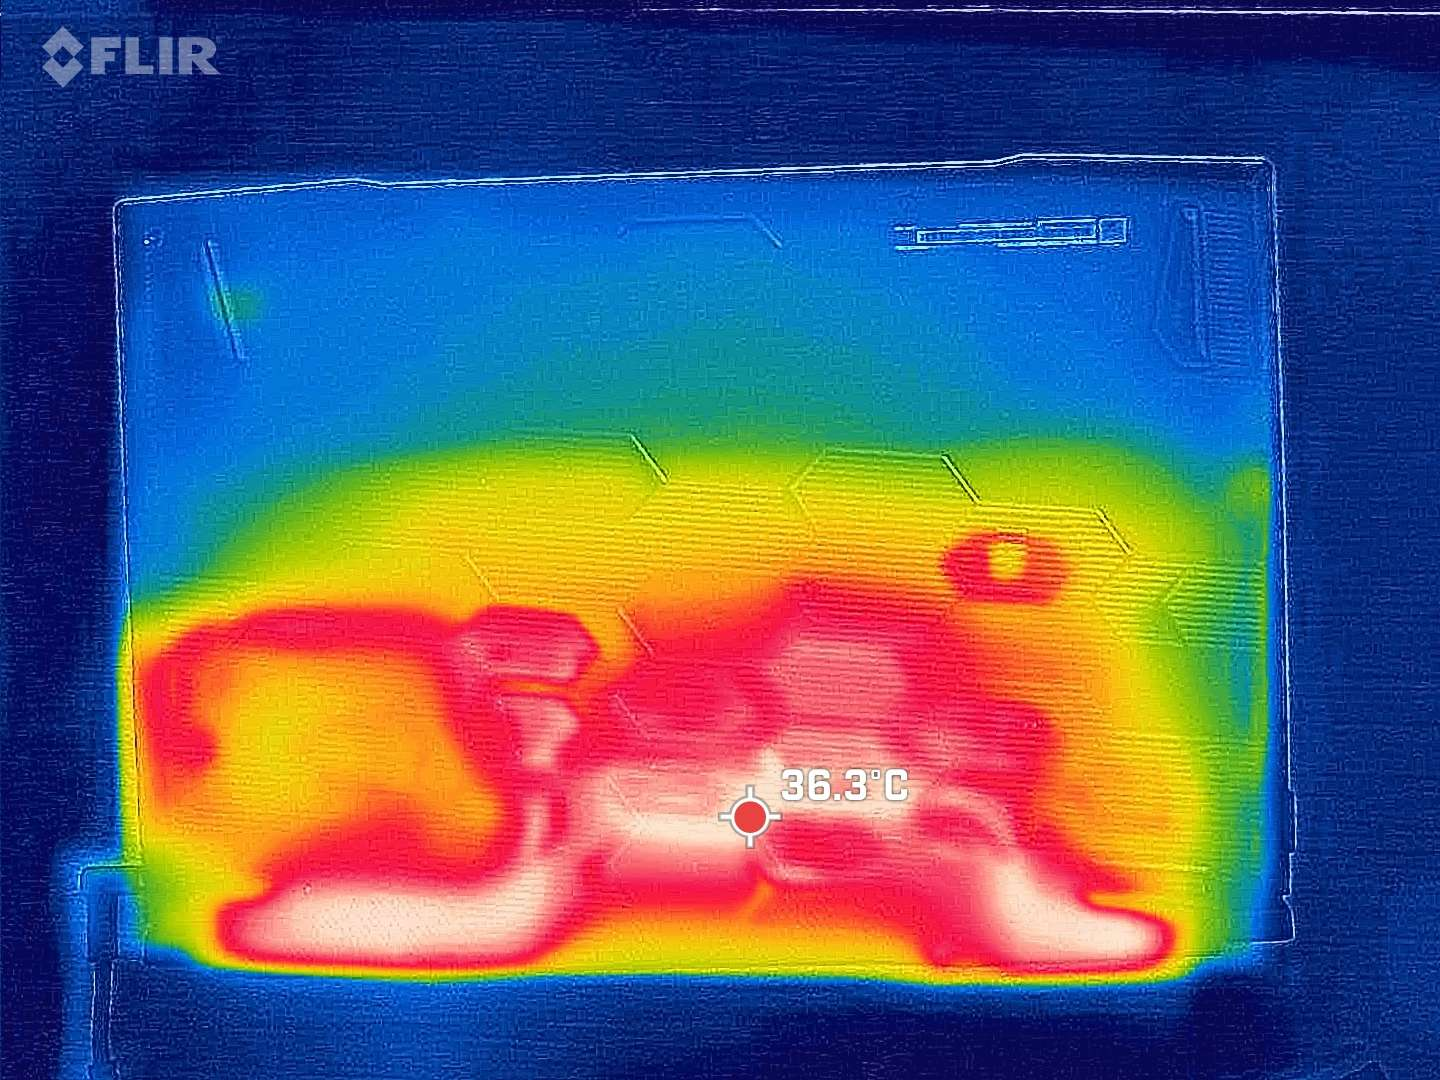
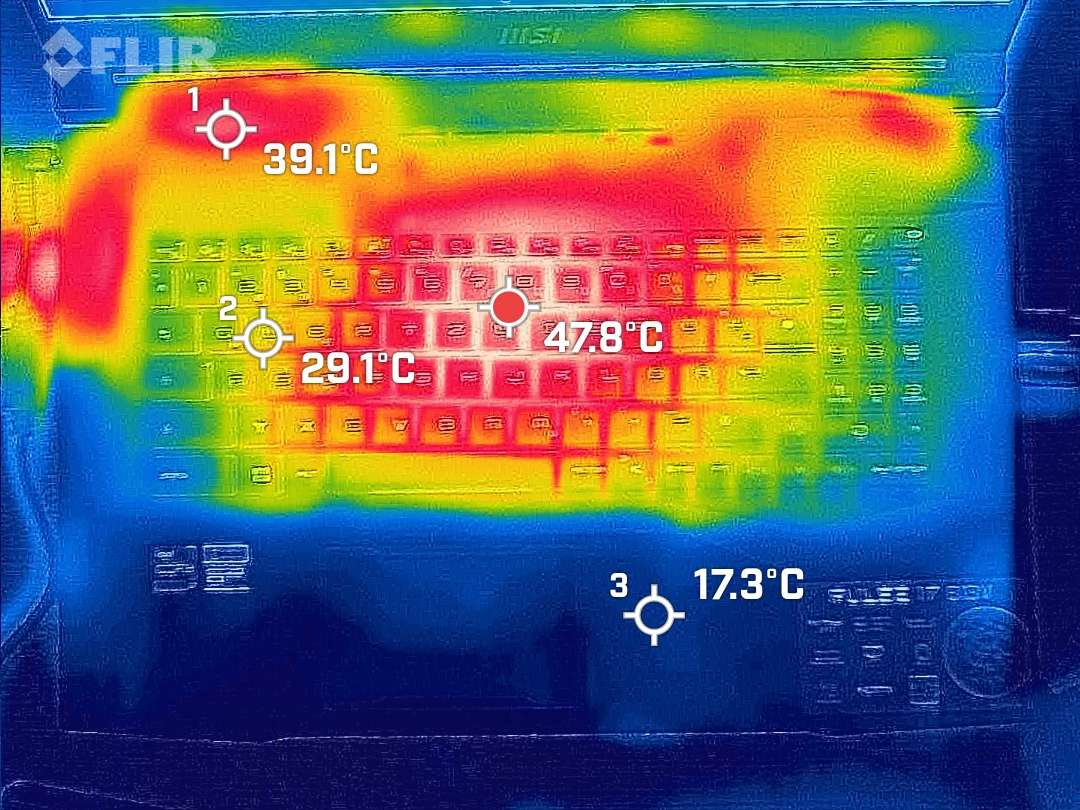
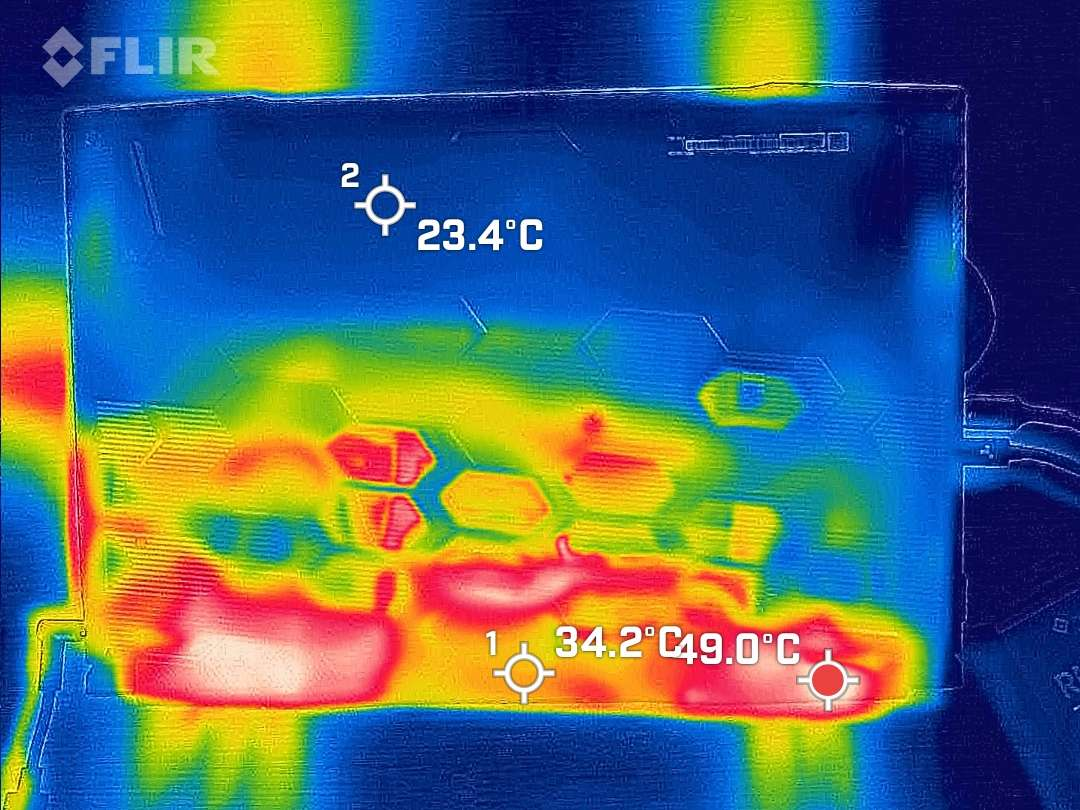
Nel nostro test, le temperature superficiali dei palmari rimangono costantemente fresche e appena superiori alla temperatura ambiente. La temperatura massima del dispositivo è di 48 °C (118 °F) ed è distribuita su ampie aree sul bordo posteriore sopra e sotto il sistema di raffreddamento, nonché al centro della tastiera. Tuttavia, le temperature rimangono all'interno di intervalli tollerabili nelle aree importanti per il gioco e nella parte inferiore del portatile da gioco ad alte prestazioni.
(-) La temperatura massima sul lato superiore è di 48 °C / 118 F, rispetto alla media di 40.4 °C / 105 F, che varia da 21.2 a 68.8 °C per questa classe Gaming.
(-) Il lato inferiore si riscalda fino ad un massimo di 50 °C / 122 F, rispetto alla media di 43.2 °C / 110 F
(+) In idle, la temperatura media del lato superiore è di 27.8 °C / 82 F, rispetto alla media deld ispositivo di 33.9 °C / 93 F.
(±) Riproducendo The Witcher 3, la temperatura media per il lato superiore e' di 37 °C / 99 F, rispetto alla media del dispositivo di 33.9 °C / 93 F.
(+) I poggiapolsi e il touchpad sono piu' freddi della temperatura della pelle con un massimo di 24 °C / 75.2 F e sono quindi freddi al tatto.
(+) La temperatura media della zona del palmo della mano di dispositivi simili e'stata di 28.8 °C / 83.8 F (+4.8 °C / 8.6 F).
| MSI Pulse 17 B13VGK Intel Core i7-13700H, NVIDIA GeForce RTX 4070 Laptop GPU | |
|---|---|
| Heat | |
| Maximum Upper Side * (°C) | 48 |
| Maximum Bottom * (°C) | 50 |
| Idle Upper Side * (°C) | 30 |
| Idle Bottom * (°C) | 33 |
* ... Meglio usare valori piccoli
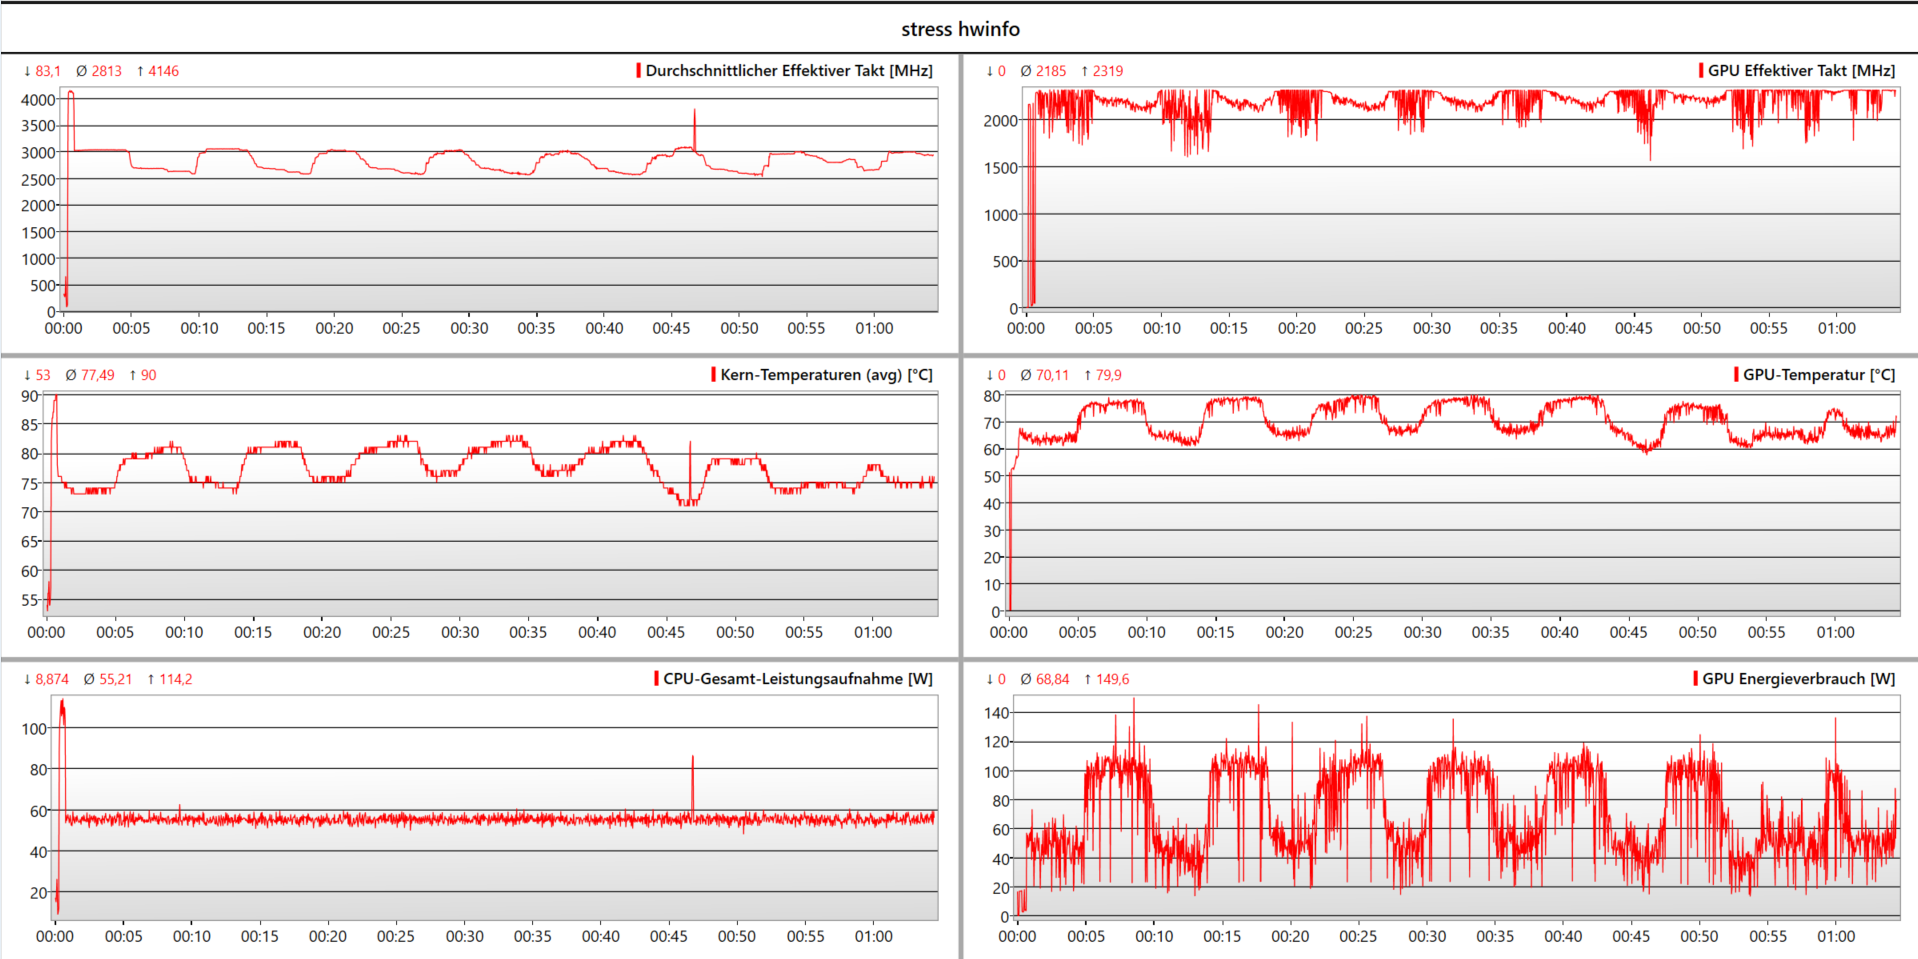
Stress test
Abbiamo eseguito il test di stress sul quasi nuovo MSI Pulse 17. A quanto pare, la temperatura target della GPU è di circa 80 °C (176 °F). Non appena viene raggiunto questo valore, le prestazioni vengono rallentate fino a quando la GPU non si è raffreddata un po'. Questo provoca alcune oscillazioni nel nostro log dello stress test con Prime95 e Furmark. Dopo la breve fase di boost, il Core i7 funziona costantemente a circa 55 watt. La RTX 4070 deve ripetutamente scendere da 110 watt a 50 watt. Nelle parti successive del nostro test dell'MSI Pulse 17, il controllo dell'alimentazione del portatile si è stabilizzato in modo significativo, per cui possiamo ipotizzare un certo effetto di apprendimento.
Altoparlanti
I medi troppo enfatizzati rendono il suono dell'MSI Pulse 17 un po' metallico. Tuttavia, con una potenza massima di 85 dB(A), i piccoli altoparlanti sono relativamente forti e riescono facilmente a coprire le silenziose ventole di questo portatile da gioco. Chi non gradisce gli altoparlanti può collegare dispositivi esterni tramite Bluetooth o la porta audio da 3,5 mm.
MSI Pulse 17 B13VGK analisi audio
(+) | gli altoparlanti sono relativamente potenti (85.01 dB)
Bassi 100 - 315 Hz
(±) | bassi ridotti - in media 13.2% inferiori alla media
(±) | la linearità dei bassi è media (12.3% delta rispetto alla precedente frequenza)
Medi 400 - 2000 Hz
(±) | medi elevati - circa 9.4% superiore alla media
(+) | medi lineari (5.7% delta rispetto alla precedente frequenza)
Alti 2 - 16 kHz
(+) | Alti bilanciati - appena 2.9% dalla media
(+) | alti lineari (6.7% delta rispetto alla precedente frequenza)
Nel complesso 100 - 16.000 Hz
(±) | la linearità complessiva del suono è media (15.8% di differenza rispetto alla media
Rispetto alla stessa classe
» 37% di tutti i dispositivi testati in questa classe è stato migliore, 7% simile, 56% peggiore
» Il migliore ha avuto un delta di 6%, medio di 18%, peggiore di 132%
Rispetto a tutti i dispositivi testati
» 24% di tutti i dispositivi testati in questa classe è stato migliore, 5% similare, 70% peggiore
» Il migliore ha avuto un delta di 4%, medio di 23%, peggiore di 134%
Apple MacBook Pro 16 2021 M1 Pro analisi audio
(+) | gli altoparlanti sono relativamente potenti (84.7 dB)
Bassi 100 - 315 Hz
(+) | bassi buoni - solo 3.8% dalla media
(+) | bassi in lineaa (5.2% delta rispetto alla precedente frequenza)
Medi 400 - 2000 Hz
(+) | medi bilanciati - solo only 1.3% rispetto alla media
(+) | medi lineari (2.1% delta rispetto alla precedente frequenza)
Alti 2 - 16 kHz
(+) | Alti bilanciati - appena 1.9% dalla media
(+) | alti lineari (2.7% delta rispetto alla precedente frequenza)
Nel complesso 100 - 16.000 Hz
(+) | suono nel complesso lineare (4.6% differenza dalla media)
Rispetto alla stessa classe
» 0% di tutti i dispositivi testati in questa classe è stato migliore, 0% simile, 100% peggiore
» Il migliore ha avuto un delta di 5%, medio di 17%, peggiore di 45%
Rispetto a tutti i dispositivi testati
» 0% di tutti i dispositivi testati in questa classe è stato migliore, 0% similare, 100% peggiore
» Il migliore ha avuto un delta di 4%, medio di 23%, peggiore di 134%
Gestione dell'alimentazione - La batteria da 90 Wh garantisce una lunga autonomia
Consumo di energia
Mentre il consumo massimo di energia del Pulse 17 sotto carico è abbastanza tipico per la categoria dei portatili, durante il funzionamento inattivo e anche sotto carichi moderati, la nostra unità di test è insolitamente efficiente per un portatile da gioco.
| Off / Standby | |
| Idle | |
| Sotto carico |
|
Leggenda:
min: | |
| MSI Pulse 17 B13VGK i7-13700H, GeForce RTX 4070 Laptop GPU, Micron 2400 MTFDKBA1T0QFM, IPS, 1920x1080, 17.3" | MSI Pulse GL76 12UGK i7-12700H, GeForce RTX 3070 Laptop GPU, Micron 3400 1TB MTFDKBA1T0TFH, IPS, 1920x1080, 17.3" | MSI Katana 17 B13VFK i7-13620H, GeForce RTX 4060 Laptop GPU, Micron 2400 MTFDKBA1T0QFM, IPS LED, 1920x1080, 17.3" | Acer Nitro 17 AN17-51-71ER i7-13700H, GeForce RTX 4060 Laptop GPU, Samsung PM9A1 MZVL21T0HCLR, , 2560x1440, 17.3" | Schenker XMG Focus 17 (E23) i9-13900HX, GeForce RTX 4070 Laptop GPU, Crucial P5 Plus 1TB CT1000P5PSSD8, IPS, 2560x1440, 17.3" | Asus ROG Strix G17 G713PI R9 7945HX, GeForce RTX 4070 Laptop GPU, WD PC SN560 SDDPNQE-1T00, IPS, 2560x1440, 17.3" | Media NVIDIA GeForce RTX 4070 Laptop GPU | Media della classe Gaming | |
|---|---|---|---|---|---|---|---|---|
| Power Consumption | -45% | -26% | -18% | -97% | -75% | -58% | -64% | |
| Idle Minimum * (Watt) | 9 | 12.4 -38% | 12.2 -36% | 8.3 8% | 17 -89% | 15 -67% | 13.2 ? -47% | 13 ? -44% |
| Idle Average * (Watt) | 10.2 | 13.1 -28% | 14.9 -46% | 13.5 -32% | 18 -76% | 20 -96% | 18.2 ? -78% | 18.7 ? -83% |
| Idle Maximum * (Watt) | 10.8 | 25.3 -134% | 15.8 -46% | 14.8 -37% | 25.8 -139% | 29 -169% | 24.6 ? -128% | 24.3 ? -125% |
| Load Average * (Watt) | 72 | 105.4 -46% | 85.22 -18% | 77 -7% | 178 -147% | 121 -68% | 97 ? -35% | 110.2 ? -53% |
| Witcher 3 ultra * (Watt) | 130 | 150 -15% | 151.1 -16% | 154 -18% | 265 -104% | 179.8 -38% | ||
| Load Maximum * (Watt) | 221 | 240.5 -9% | 212.8 4% | 263 -19% | 275 -24% | 246 -11% | 221 ? -0% | 258 ? -17% |
* ... Meglio usare valori piccoli
Power Consumption The Witcher 3 / Stress Test
Power Consumption With External Monitor
Durata della batteria
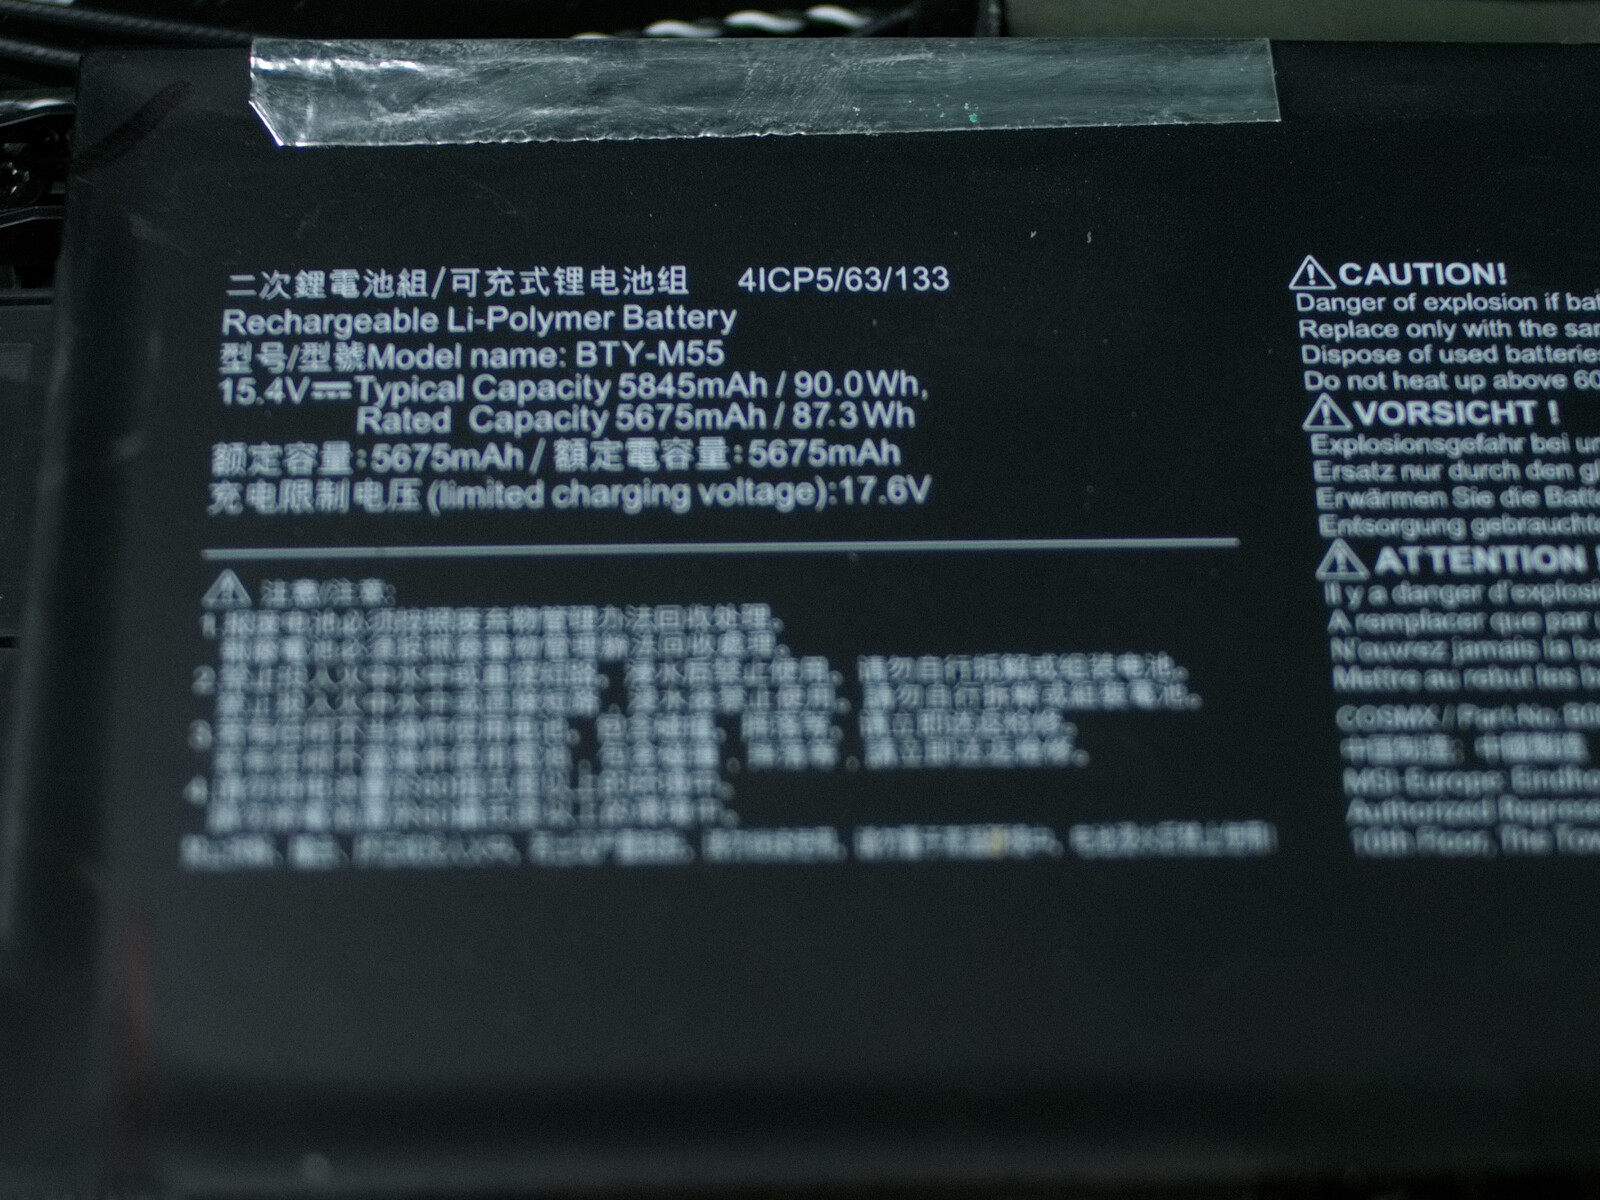
In linea con le nostre misurazioni del consumo energetico, non sorprende che il portatile da gioco duri a lungo con la sua batteria da 90 W nel nostro test di navigazione web WiFi, raggiungendo quasi le 9 ore. Anche sotto carico, la batteria dura ben 2 ore.
| MSI Pulse 17 B13VGK i7-13700H, GeForce RTX 4070 Laptop GPU, 90 Wh | MSI Pulse GL76 12UGK i7-12700H, GeForce RTX 3070 Laptop GPU, 90 Wh | MSI Katana 17 B13VFK i7-13620H, GeForce RTX 4060 Laptop GPU, 53.5 Wh | Acer Nitro 17 AN17-51-71ER i7-13700H, GeForce RTX 4060 Laptop GPU, 90 Wh | Schenker XMG Focus 17 (E23) i9-13900HX, GeForce RTX 4070 Laptop GPU, 73 Wh | Asus ROG Strix G17 G713PI R9 7945HX, GeForce RTX 4070 Laptop GPU, 90 Wh | Media della classe Gaming | |
|---|---|---|---|---|---|---|---|
| Autonomia della batteria | -20% | -62% | -9% | -57% | -54% | -27% | |
| WiFi v1.3 (h) | 9 | 5.9 -34% | 2.9 -68% | 8.2 -9% | 3.9 -57% | 4.3 -52% | 7.11 ? -21% |
| Load (h) | 2.2 | 2.1 -5% | 1 -55% | 1 -55% | 1.502 ? -32% | ||
| Reader / Idle (h) | 7.3 | 8.71 ? | |||||
| H.264 (h) | 6.9 | 3.1 | 2.8 | 8.64 ? | |||
| Witcher 3 ultra (h) | 2.5 | 1 | 1.1 |
Pro
Contro
Verdetto - Più steam punk che fantascienza
Sul lato positivo dell'MSI Pulse 17, ci sono diversi punti di forza che parlano a favore del portatile, con una prestazione ottimale del Core i7e Nvidia GeForce RTX 4070 soprattutto. Per ottenere questo risultato, il Pulse non ha nemmeno bisogno di ventole pulsanti e il portatile è particolarmente silenzioso per la sua classe di prestazioni. Altri punti positivi del portatile da gioco sono una tastiera decente e un buon posizionamento delle connessioni esterne. Anche l'autonomia della batteria è eccellente per un portatile da gioco.
Il Pulse 17 è un portatile da gioco in grado di offrire prestazioni potenti a un basso livello di rumorosità. D'altra parte, il dispositivo non è ancora arrivato all'anno 2023 in molti altri aspetti.
Sfortunatamente, il portatile presenta anche alcuni pesanti svantaggi. A parte l'MSI Katana 17, nessun altro portatile da gioco nel nostro confronto ha un display così scadente. Anche la dotazione di connessioni, con porte USB 2.0 e USB 3.2 Gen 1 lente e LAN da 1 GBit/s, e la mancanza di Wi-Fi a 6 GHz non presentano il portatile da gioco come un dispositivo di fascia alta. Ma ciò che è davvero fastidioso è la porta M.2 NVMe bloccata, poiché il produttore avrebbe potuto evitarla in due modi. In primo luogo, la scheda madre e il case avrebbero lasciato spazio sufficiente per spostare il modulo leggermente a sinistra per dare spazio alla batteria. In secondo luogo, le corsie PCIe inutilmente sprecate avrebbero potuto essere investite in una porta Thunderbolt.
Sebbene rispetto al predecessore, il modello attuale offra ora il supporto G-Sync, MUX e Advanced Optimus, manca ancora la Thunderbolt. Inoltre, il display del predecessore era significativamente migliore secondo le nostre misurazioni.
Con prezzi di vendita a partire da 2.150 Euro (~$2.415) al momento del nostro test, ci sono molti portatili (in parte anche significativamente più convenienti) come alternative alla nostra unità di prova. Il prezzo pagato dal produttore per l'Asus ROG Stix G17 Asus ROG Strix G17 G713PI: portatile gaming che convince nel test con il nuovo Ryzen 9 è allo stesso livello di quello del dispositivo MSI di molti venditori. Anche se con il portatile di Asus bisogna scendere a compromessi per quanto riguarda la durata della batteria, per il resto il Pulse 17 e il ROG Strix G17 sono abbastanza simili in tutte le aree delle prestazioni. D'altra parte, il display e la dotazione di connessione del ROG Strix sono significativamente migliori.
Prezzo e disponibilità
L'MSI Pulse 17 B13VGK è disponibile solo presso alcuni venditori negli Stati Uniti, come Newegg per ~$1963mentre altri venditori lo offrono in UK, Australiao Canadaper esempio.
MSI Pulse 17 B13VGK
- 07/16/2023 v7 (old)
Marc Herter
Transparency
La selezione dei dispositivi da recensire viene effettuata dalla nostra redazione. Il campione di prova è stato fornito all'autore come prestito dal produttore o dal rivenditore ai fini di questa recensione. L'istituto di credito non ha avuto alcuna influenza su questa recensione, né il produttore ne ha ricevuto una copia prima della pubblicazione. Non vi era alcun obbligo di pubblicare questa recensione. In quanto società mediatica indipendente, Notebookcheck non è soggetta all'autorità di produttori, rivenditori o editori.
Ecco come Notebookcheck esegue i test
Ogni anno, Notebookcheck esamina in modo indipendente centinaia di laptop e smartphone utilizzando procedure standardizzate per garantire che tutti i risultati siano comparabili. Da circa 20 anni sviluppiamo continuamente i nostri metodi di prova e nel frattempo stabiliamo gli standard di settore. Nei nostri laboratori di prova, tecnici ed editori esperti utilizzano apparecchiature di misurazione di alta qualità. Questi test comportano un processo di validazione in più fasi. Il nostro complesso sistema di valutazione si basa su centinaia di misurazioni e parametri di riferimento ben fondati, che mantengono l'obiettività.Price comparison

