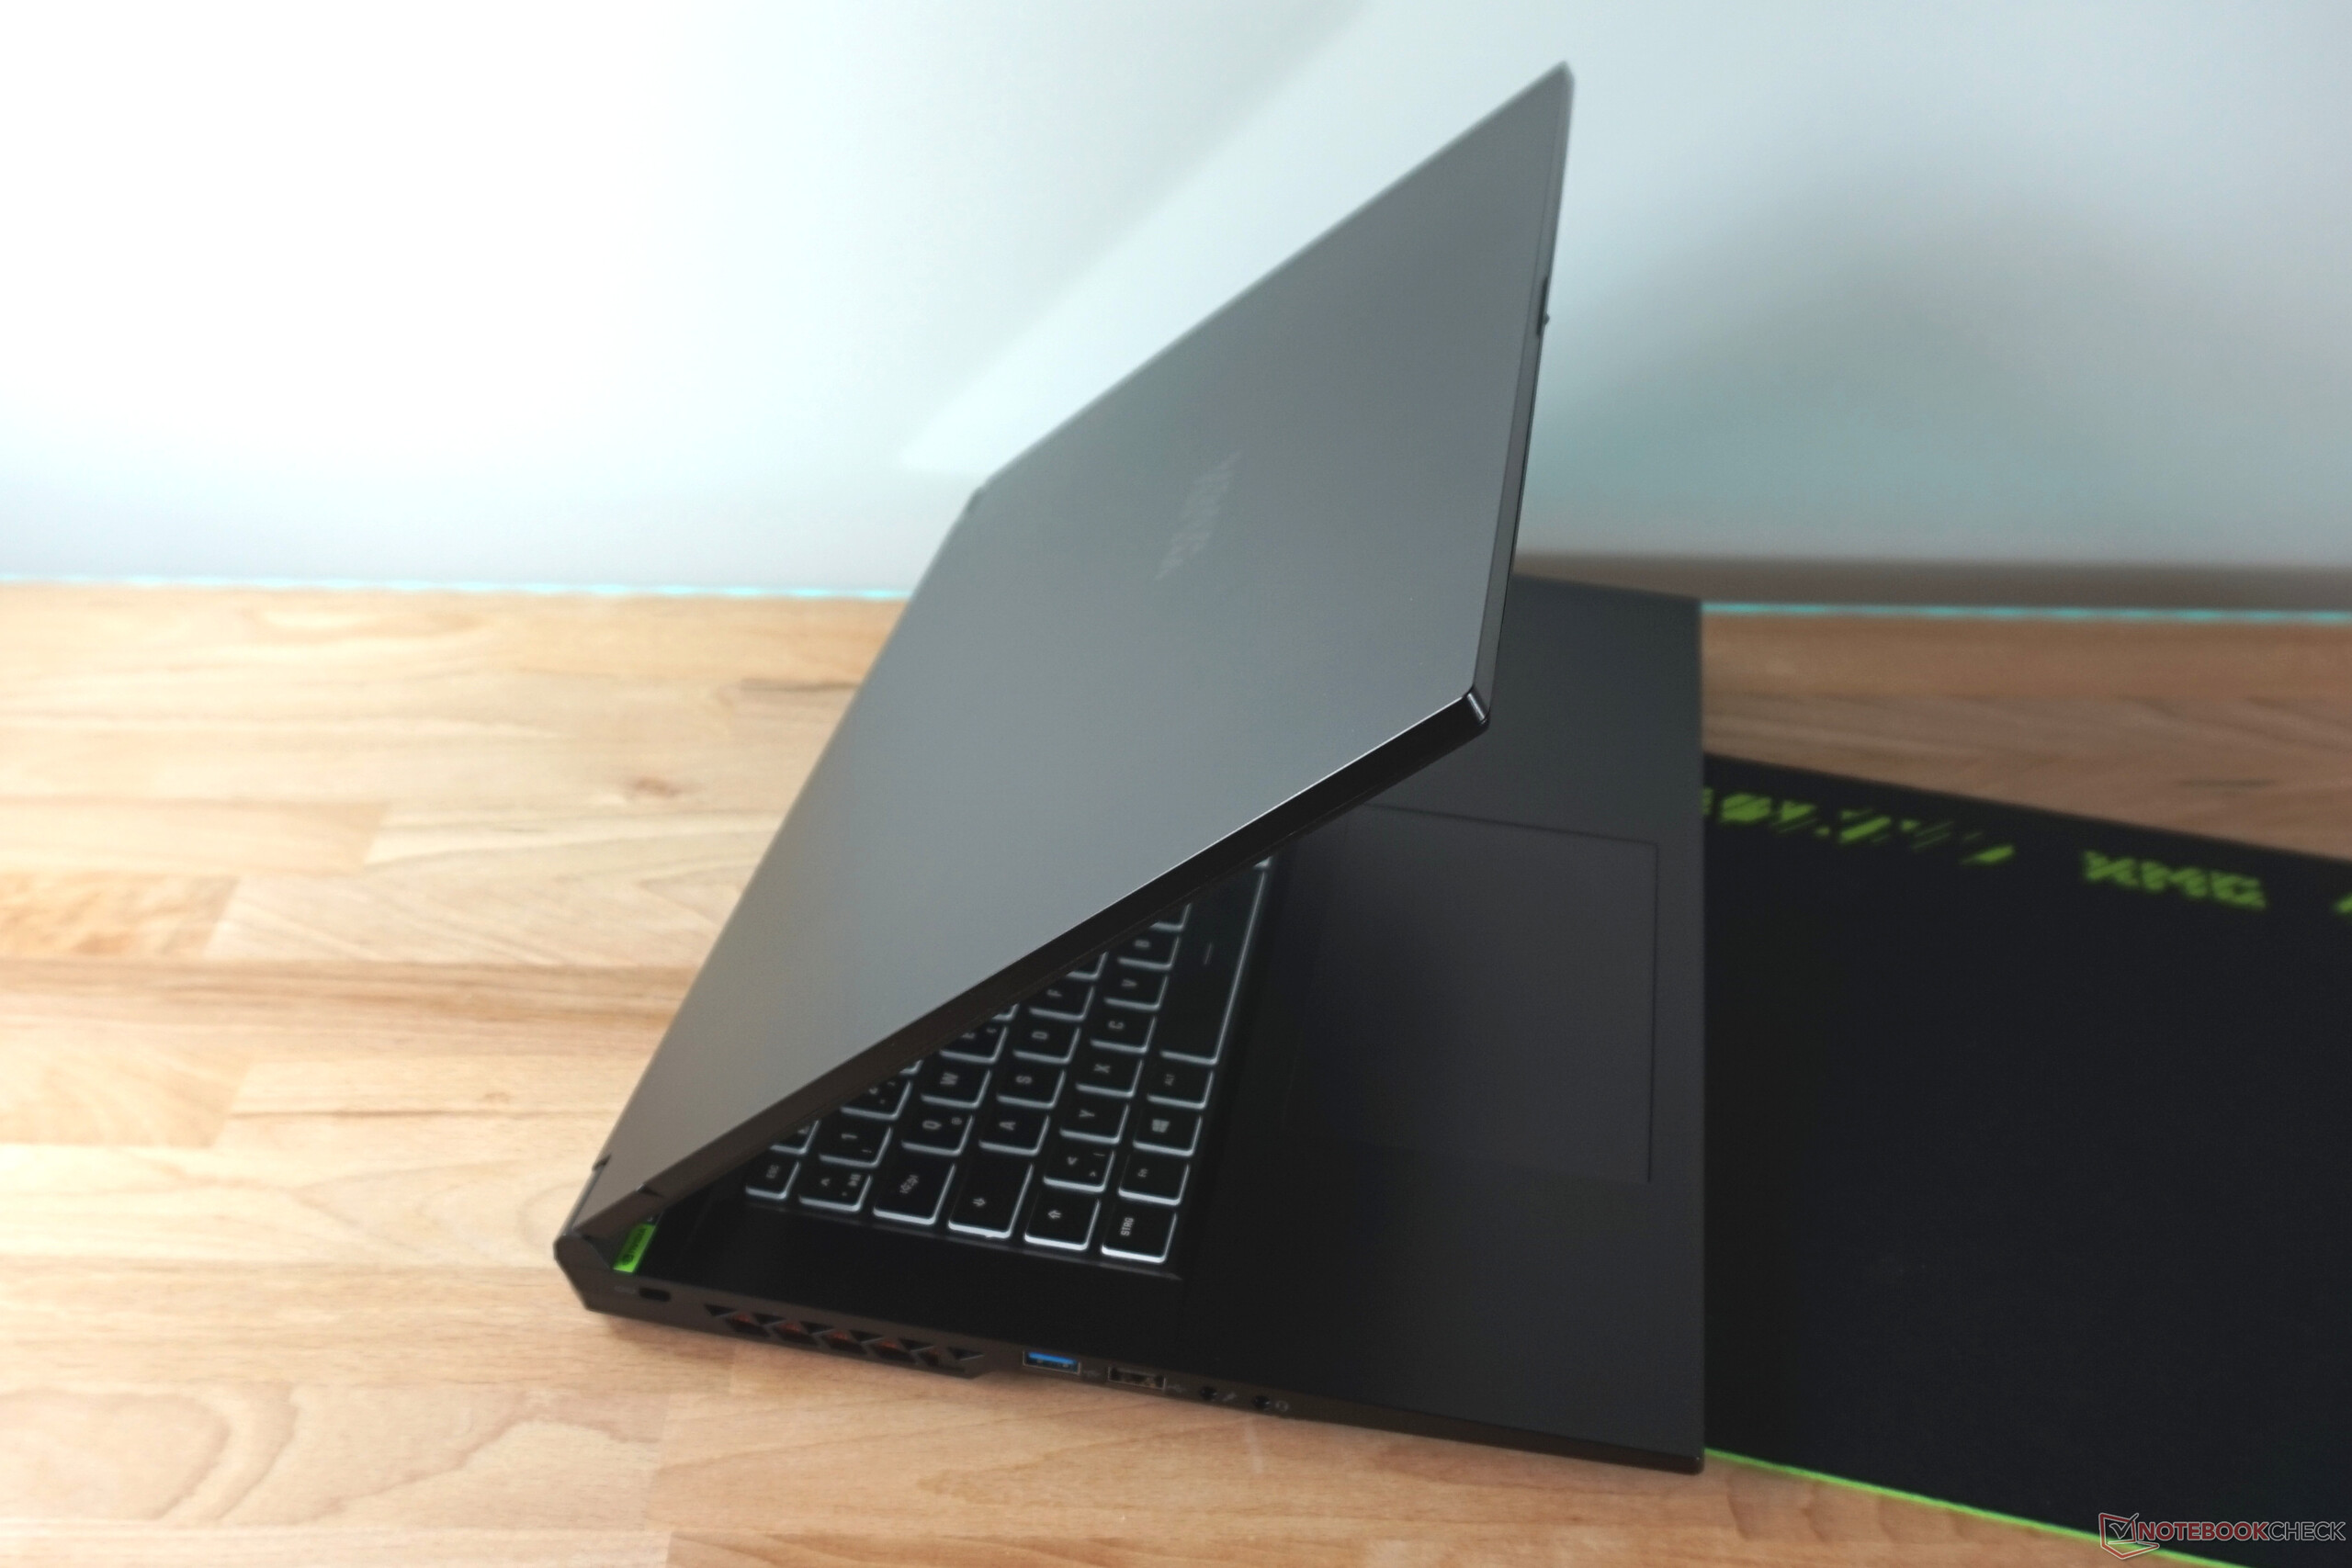
Recensione dello Schenker XMG Focus 17 (E23): un portatile gaming con RTX 4070 che non lesina sulle prestazioni
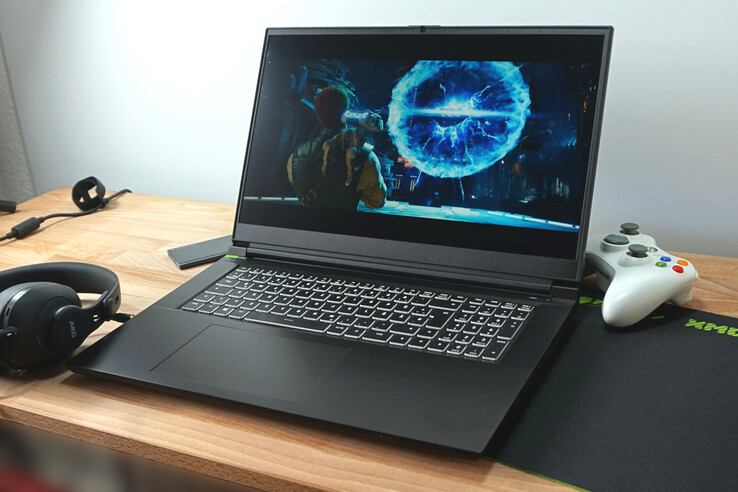
Il notebook da gioco Schenker XMG Focus 17 E23 (barebone: NP70SNE-G) si concentra sull'essenziale. Con l'eccezionale processore i9 e, opzionalmente, unaRTX 4050, 4060o 4070le prestazioni sono sufficienti per i giochi. Il display offre anche 240 Hz e una quantità sufficiente di pixel.
Tuttavia, non ci sono extra straordinari, caratteristiche speciali o il miglior design. Il case è cambiato rispetto alla nostra ultima recensione dell' XMG Focus 17 (Clevo NP70HK)del 2021, per cui in questo articolo si possono trovare informazioni più dettagliate sul case, sulla costruzione e sull'equipaggiamento. A parte le prestazioni di gioco, il portatile è anche piuttosto modesto. In compenso, rimane ben al di sotto dei 2.000 euro (a seconda della configurazione) e non è molto più costoso nella configurazione top che abbiamo testato.
I rivali come il Medion Erazer Major X20 o il Lenovo Legion Pro 5 seguono percorsi simili e utilizzano hardware comparabile. Tuttavia, non riescono a salvare con la stessa costanza del portatile di Schenker, come dimostra il nostro test dettagliato.
Potenziali concorrenti a confronto
Punteggio | Data | Modello | Peso | Altezza | Dimensione | Risoluzione | Prezzo |
|---|---|---|---|---|---|---|---|
| 85.9 % v7 (old) | 06/2023 | Schenker XMG Focus 17 (E23) i9-13900HX, GeForce RTX 4070 Laptop GPU | 2.9 kg | 29.3 mm | 17.30" | 2560x1440 | |
| 88.4 % v7 (old) | 05/2023 | Lenovo Legion Pro 5 16ARX8 R7 7745HX, GeForce RTX 4070 Laptop GPU | 2.5 kg | 26.8 mm | 16.00" | 2560x1600 | |
| 89 % v7 (old) | 04/2023 | Medion Erazer Major X20 i9-13900HX, GeForce RTX 4070 Laptop GPU | 2.4 kg | 29 mm | 16.00" | 2560x1600 | |
| 87.6 % v7 (old) | 09/2022 | Schenker XMG Neo 17 M22 R9 6900HX, GeForce RTX 3080 Ti Laptop GPU | 2.8 kg | 27 mm | 17.00" | 2560x1600 | |
| 85.4 % v7 (old) | 03/2023 | HP Omen 17-ck2097ng i9-13900HX, GeForce RTX 4080 Laptop GPU | 2.8 kg | 27 mm | 17.30" | 2560x1440 | |
| 84.6 % v7 (old) | 05/2023 | Medion Erazer Defender P40 i7-13700HX, GeForce RTX 4060 Laptop GPU | 2.9 kg | 33 mm | 17.30" | 2560x1440 |
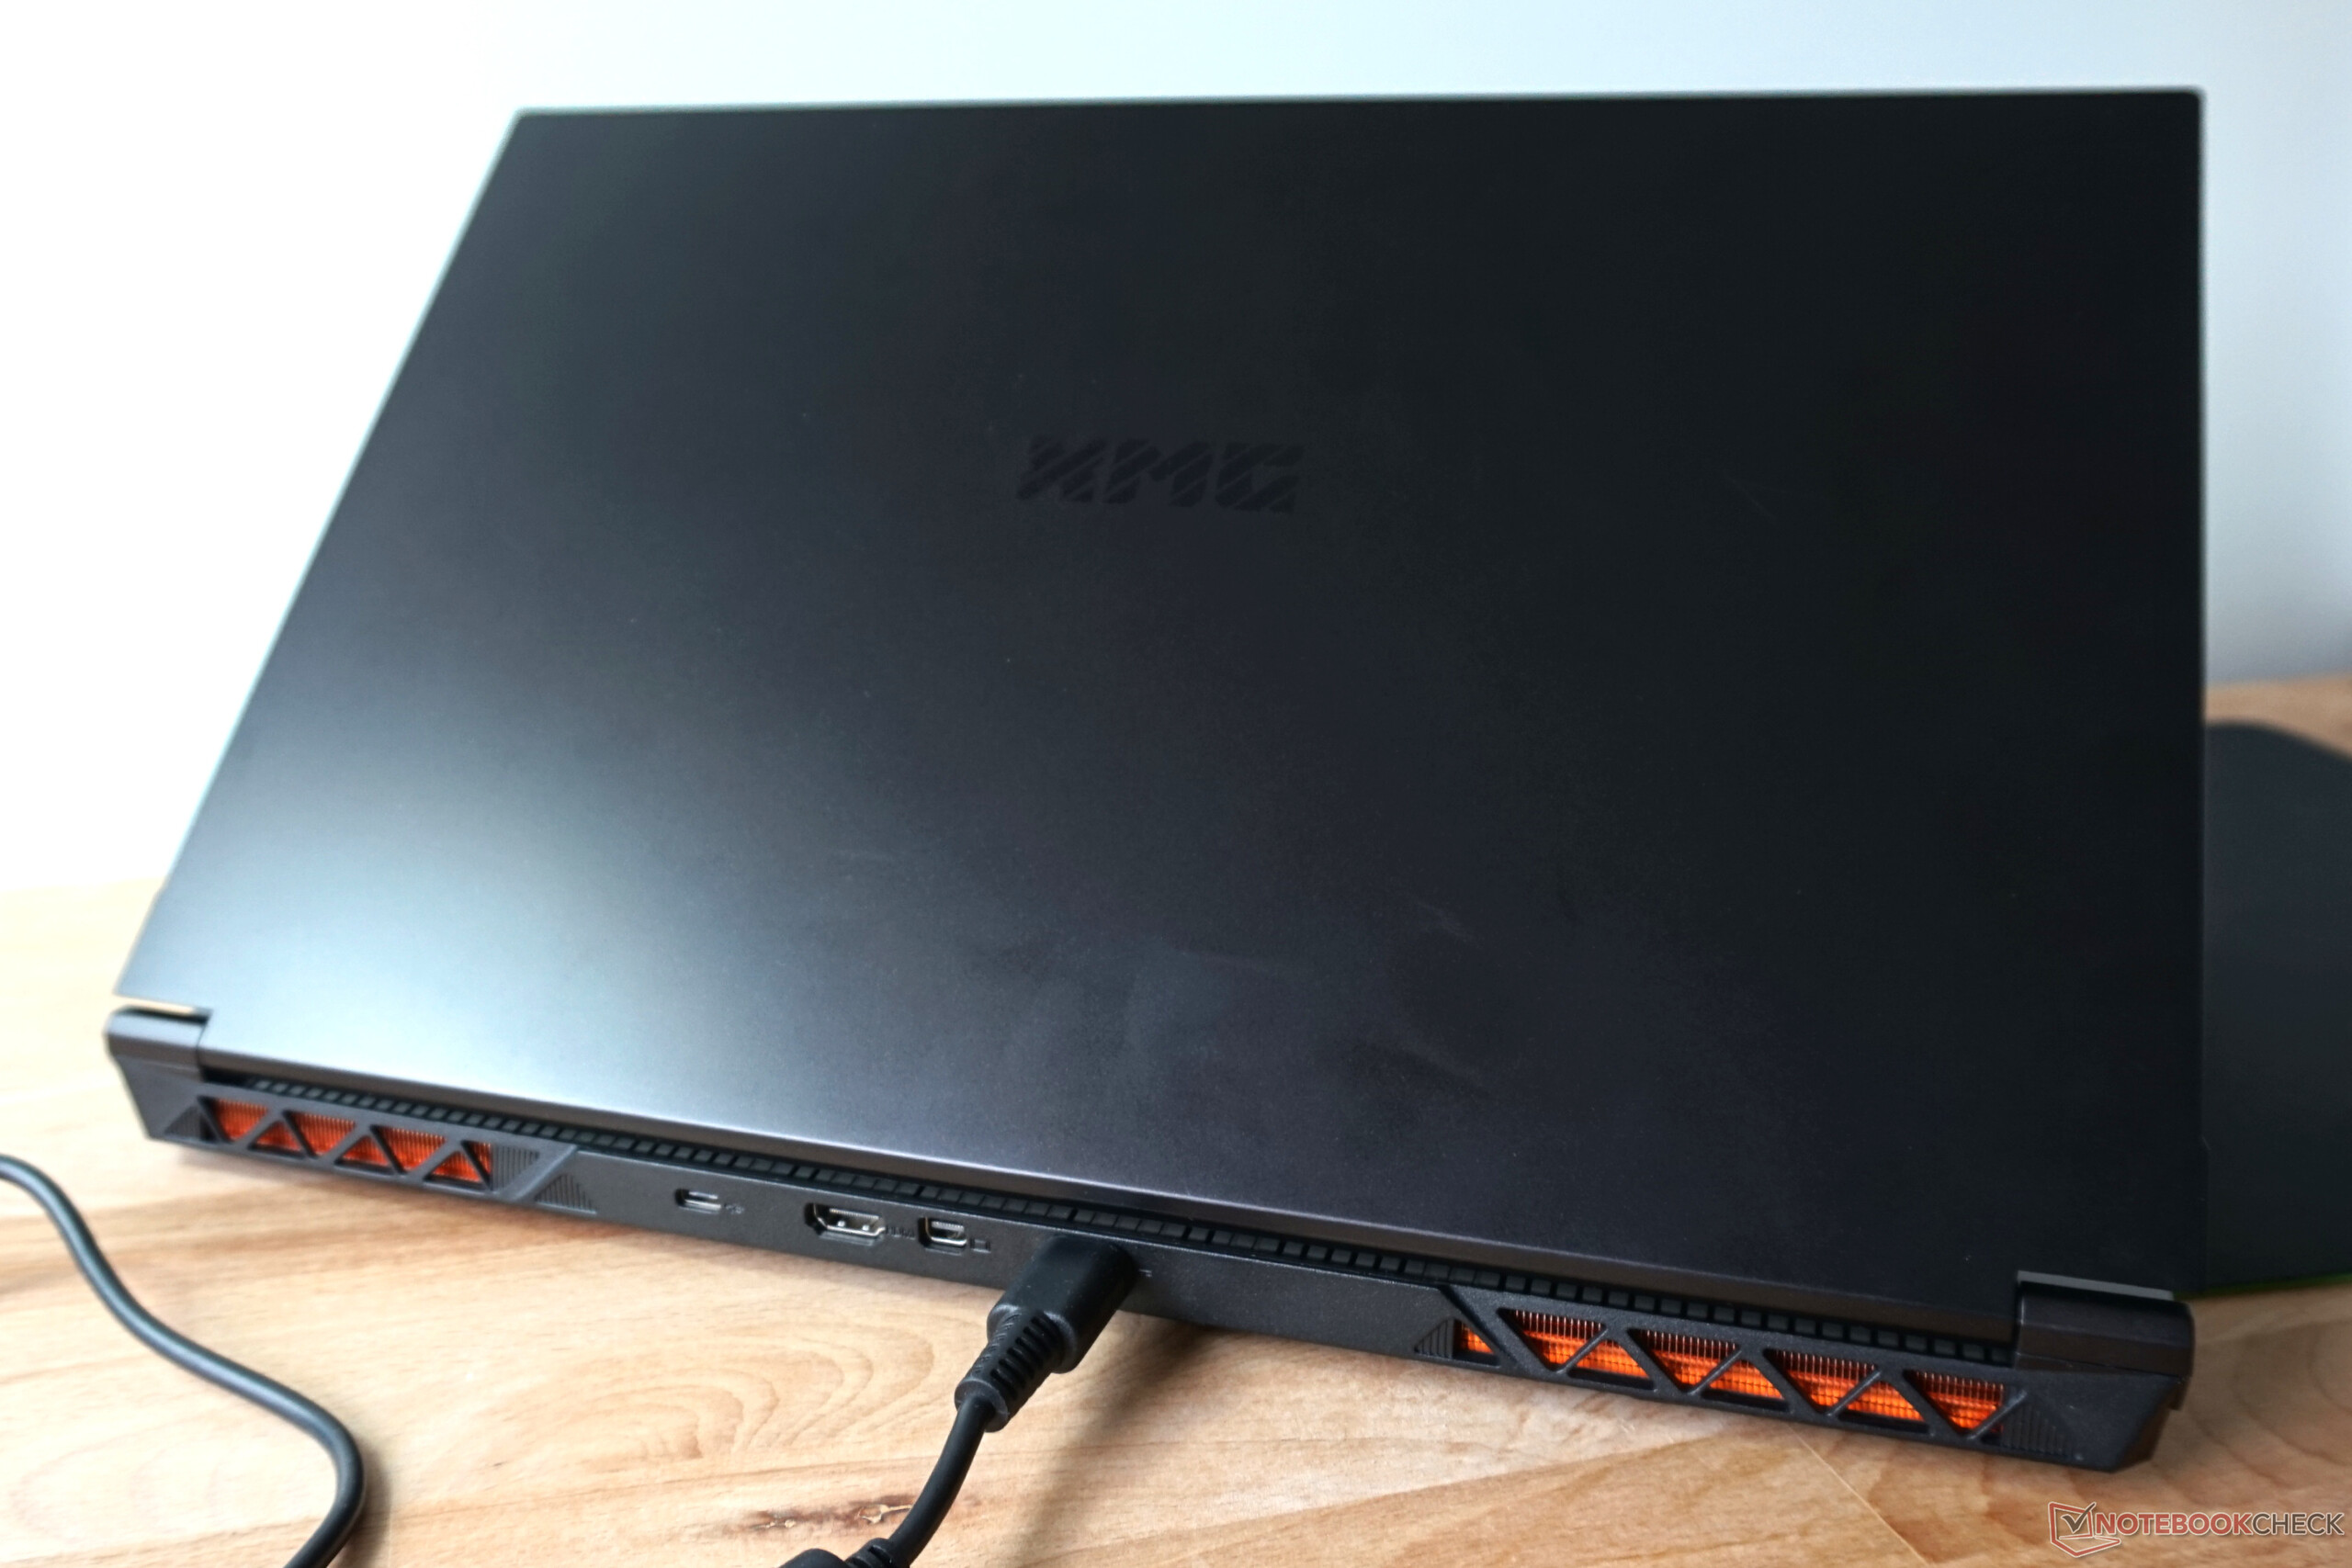
Apparecchiature - Tutto da TB4 a USB 2.0
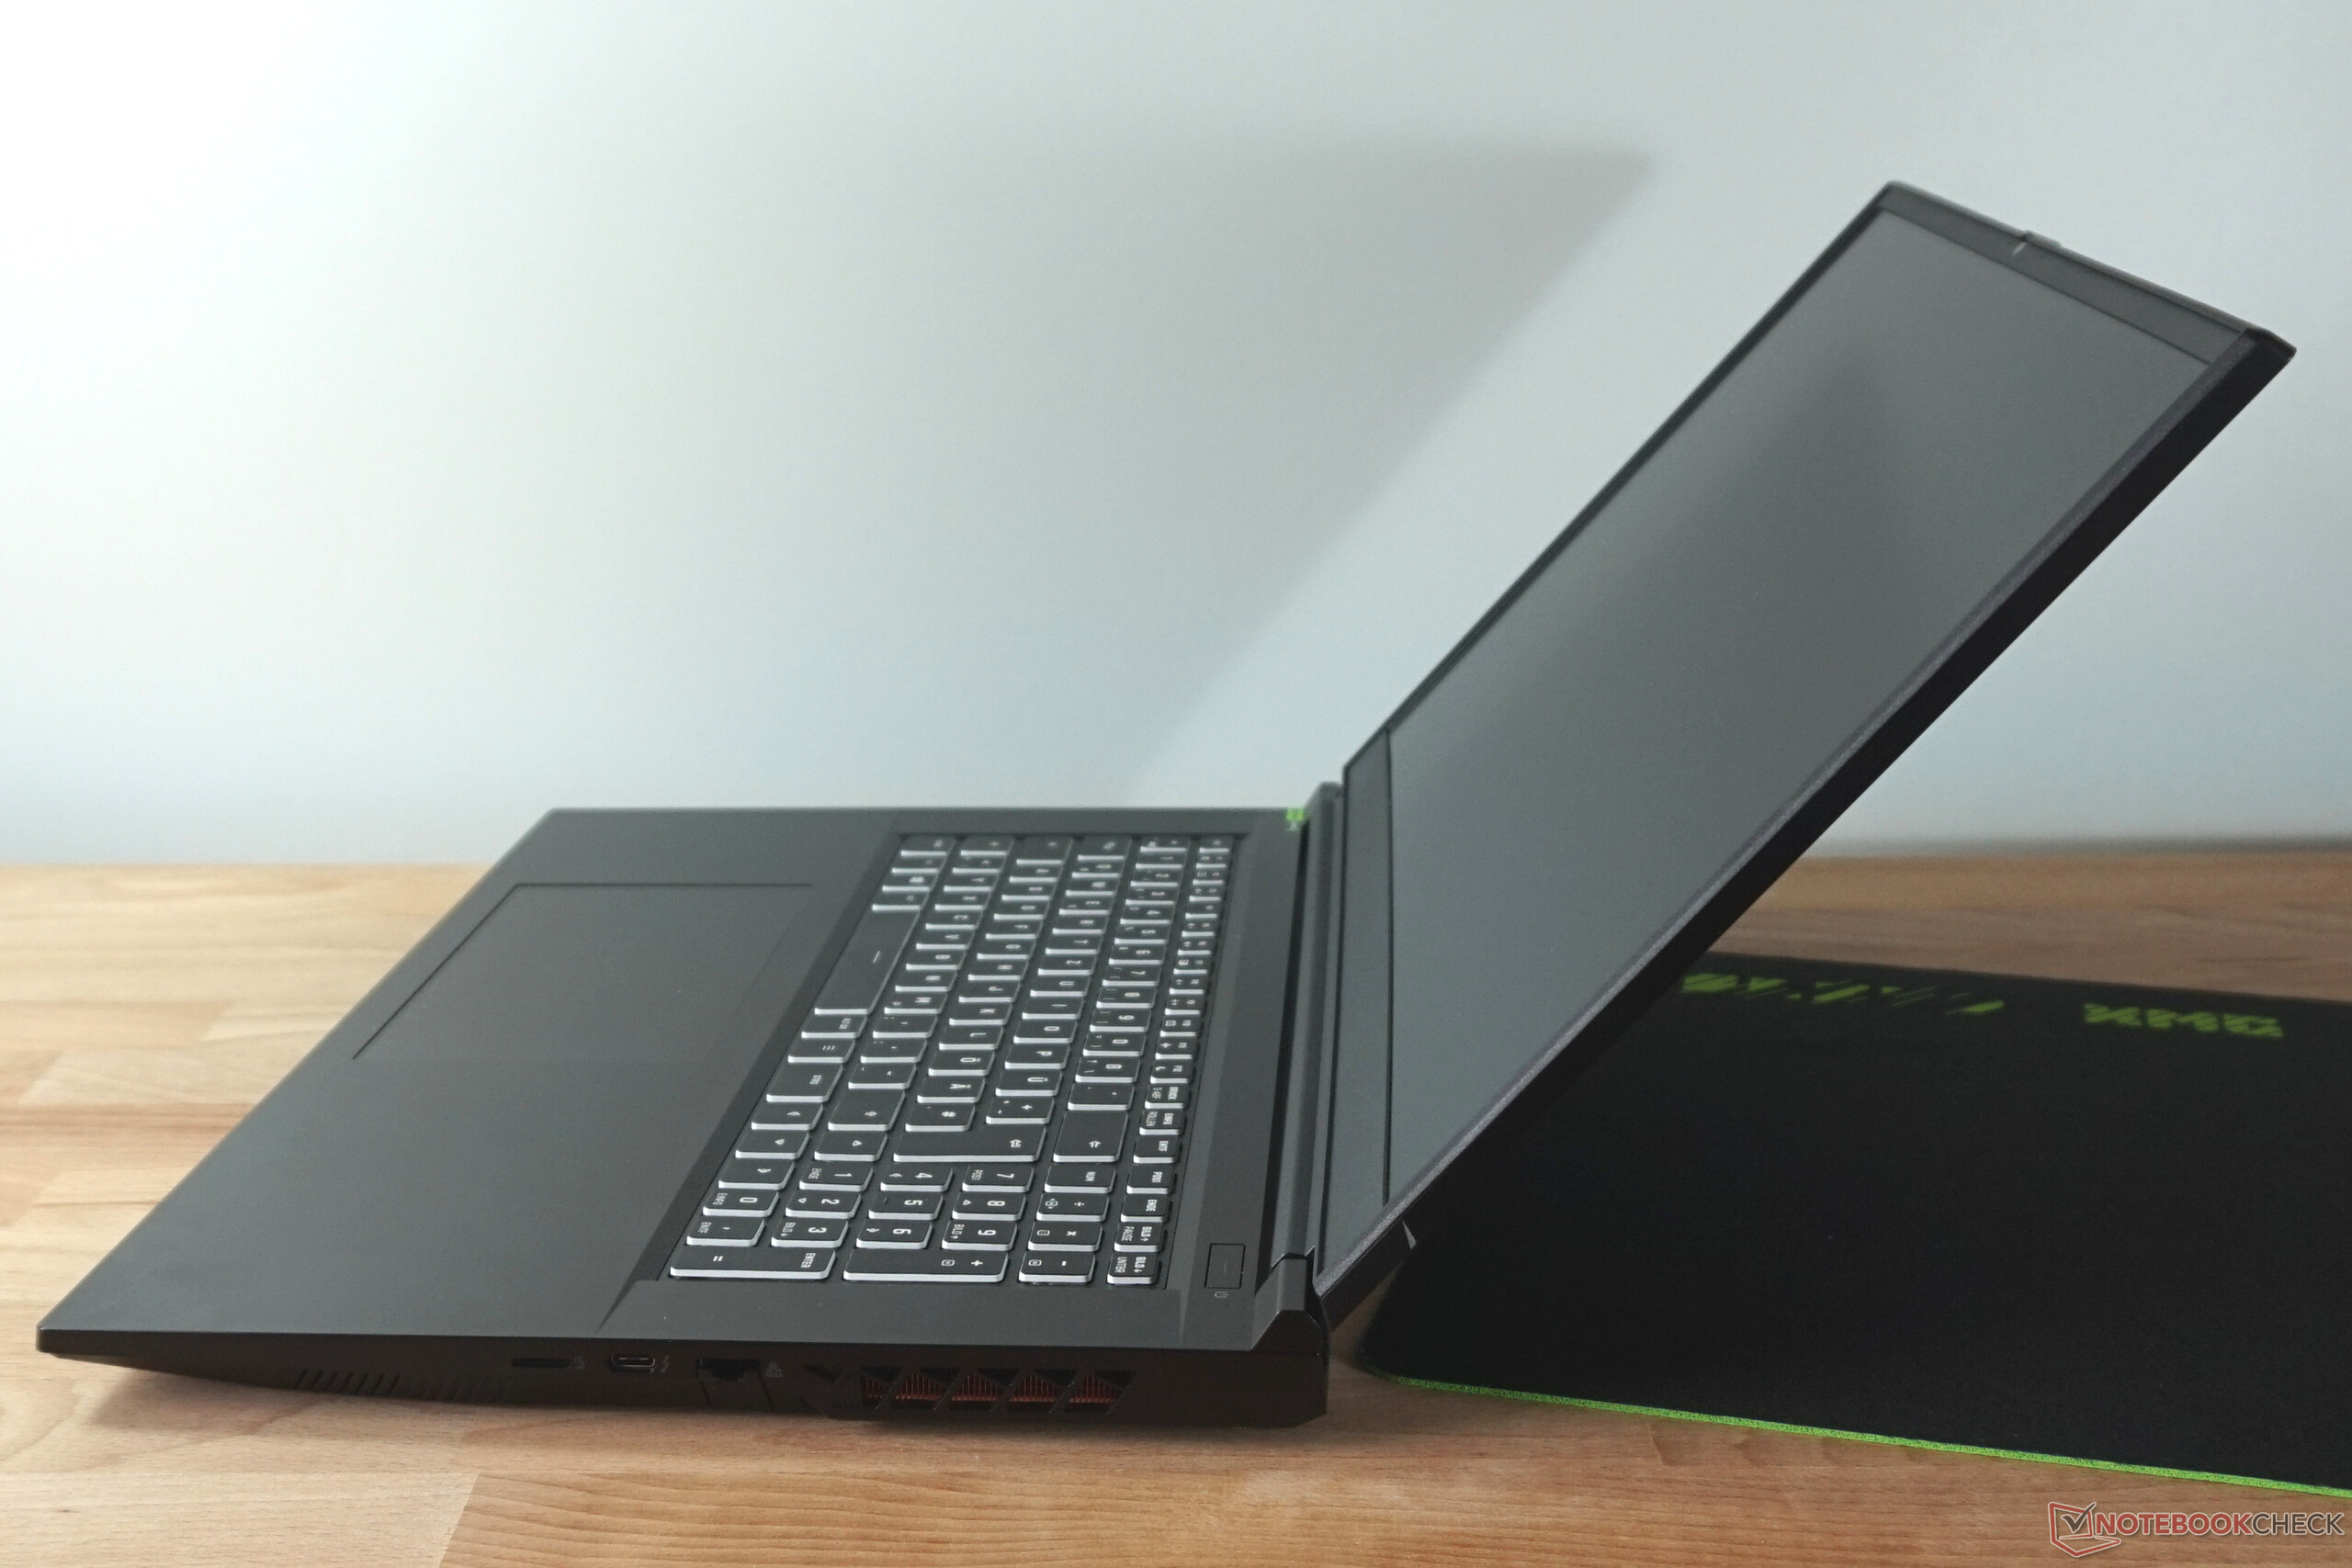
Rispetto al predecessore, ci sono molte somiglianze nelle porte, ma fortunatamente qualche aggiornamento. È ancora presente una porta USB 2.0, che dovrebbe essere sufficiente per un mouse o una stampante. Anche la porta Mini-DP è stata mantenuta.
Il semplice connettore USB-C è stato spostato sul retro e offre velocità fino a 10 Gbit/s, ma non sono supportati né PD né DP. Thunderbolt 4 è a destra, ma purtroppo non c'è più la porta USB-A. Inoltre, lo slot per schede si è ridotto a microSD nella versione attuale, il che limita notevolmente la versatilità.


Lettore di schede SD
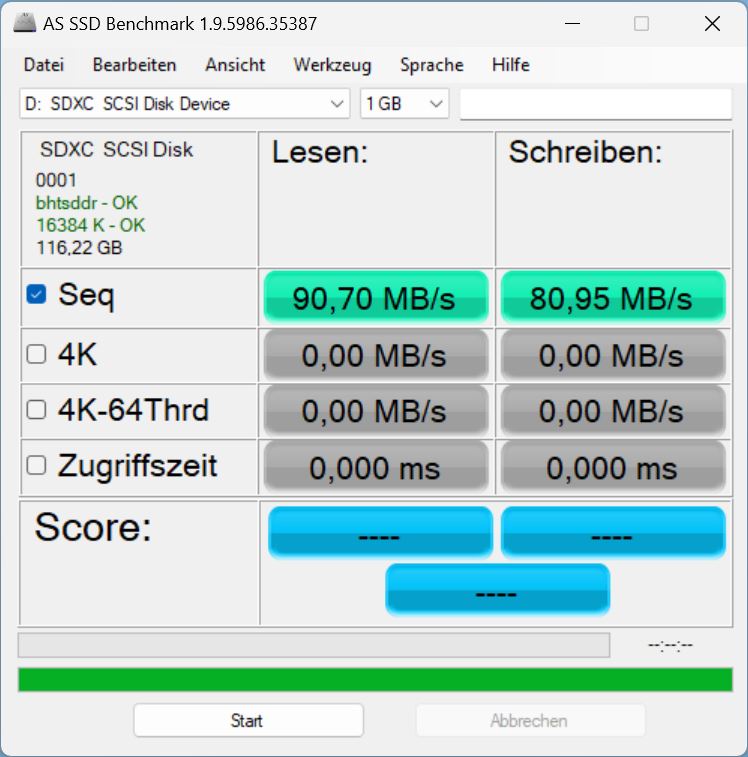
Le nostre misurazioni con la scheda microSD AV PRO V60 128 GB di riferimento non sono del tutto nella media, ma in parte sono un po' migliori rispetto alla concorrenza. È sufficiente per copiare qualche migliaio di immagini in pochi minuti.
| SD Card Reader | |
| average JPG Copy Test (av. of 3 runs) | |
| Media della classe Gaming (20.9 - 210, n=54, ultimi 2 anni) | |
| Medion Erazer Defender P40 (AV PRO microSD 128 GB V60) | |
| Schenker XMG Focus 17 (E23) | |
| Medion Erazer Major X20 (AV PRO microSD 128 GB V60) | |
| HP Omen 17-ck2097ng (AV PRO microSD 128 GB V60) | |
| Schenker XMG Neo 17 M22 (AV PRO microSD 128 GB V60) | |
| maximum AS SSD Seq Read Test (1GB) | |
| Media della classe Gaming (25.5 - 261, n=51, ultimi 2 anni) | |
| Medion Erazer Defender P40 (AV PRO microSD 128 GB V60) | |
| Schenker XMG Focus 17 (E23) | |
| Medion Erazer Major X20 (AV PRO microSD 128 GB V60) | |
| HP Omen 17-ck2097ng (AV PRO microSD 128 GB V60) | |
Comunicazione
Il modulo WLAN Intel AX211 soddisfa le aspettative. Tuttavia, nelle nostre misurazioni i tassi medi tipici sono stati raggiunti solo in una rete a 6 GHz e persino leggermente superati. La leggera debolezza a 5 GHz si spiega molto probabilmente con le interferenze delle reti wireless vicine, che naturalmente non abbiamo potuto disattivare durante il test.

 GeForce RTX 4070 Laptop GPU, i9-13900HX, Crucial P5 Plus 1TB CT1000P5PSSD8")
 GeForce RTX 4070 Laptop GPU, i9-13900HX, Crucial P5 Plus 1TB CT1000P5PSSD8")
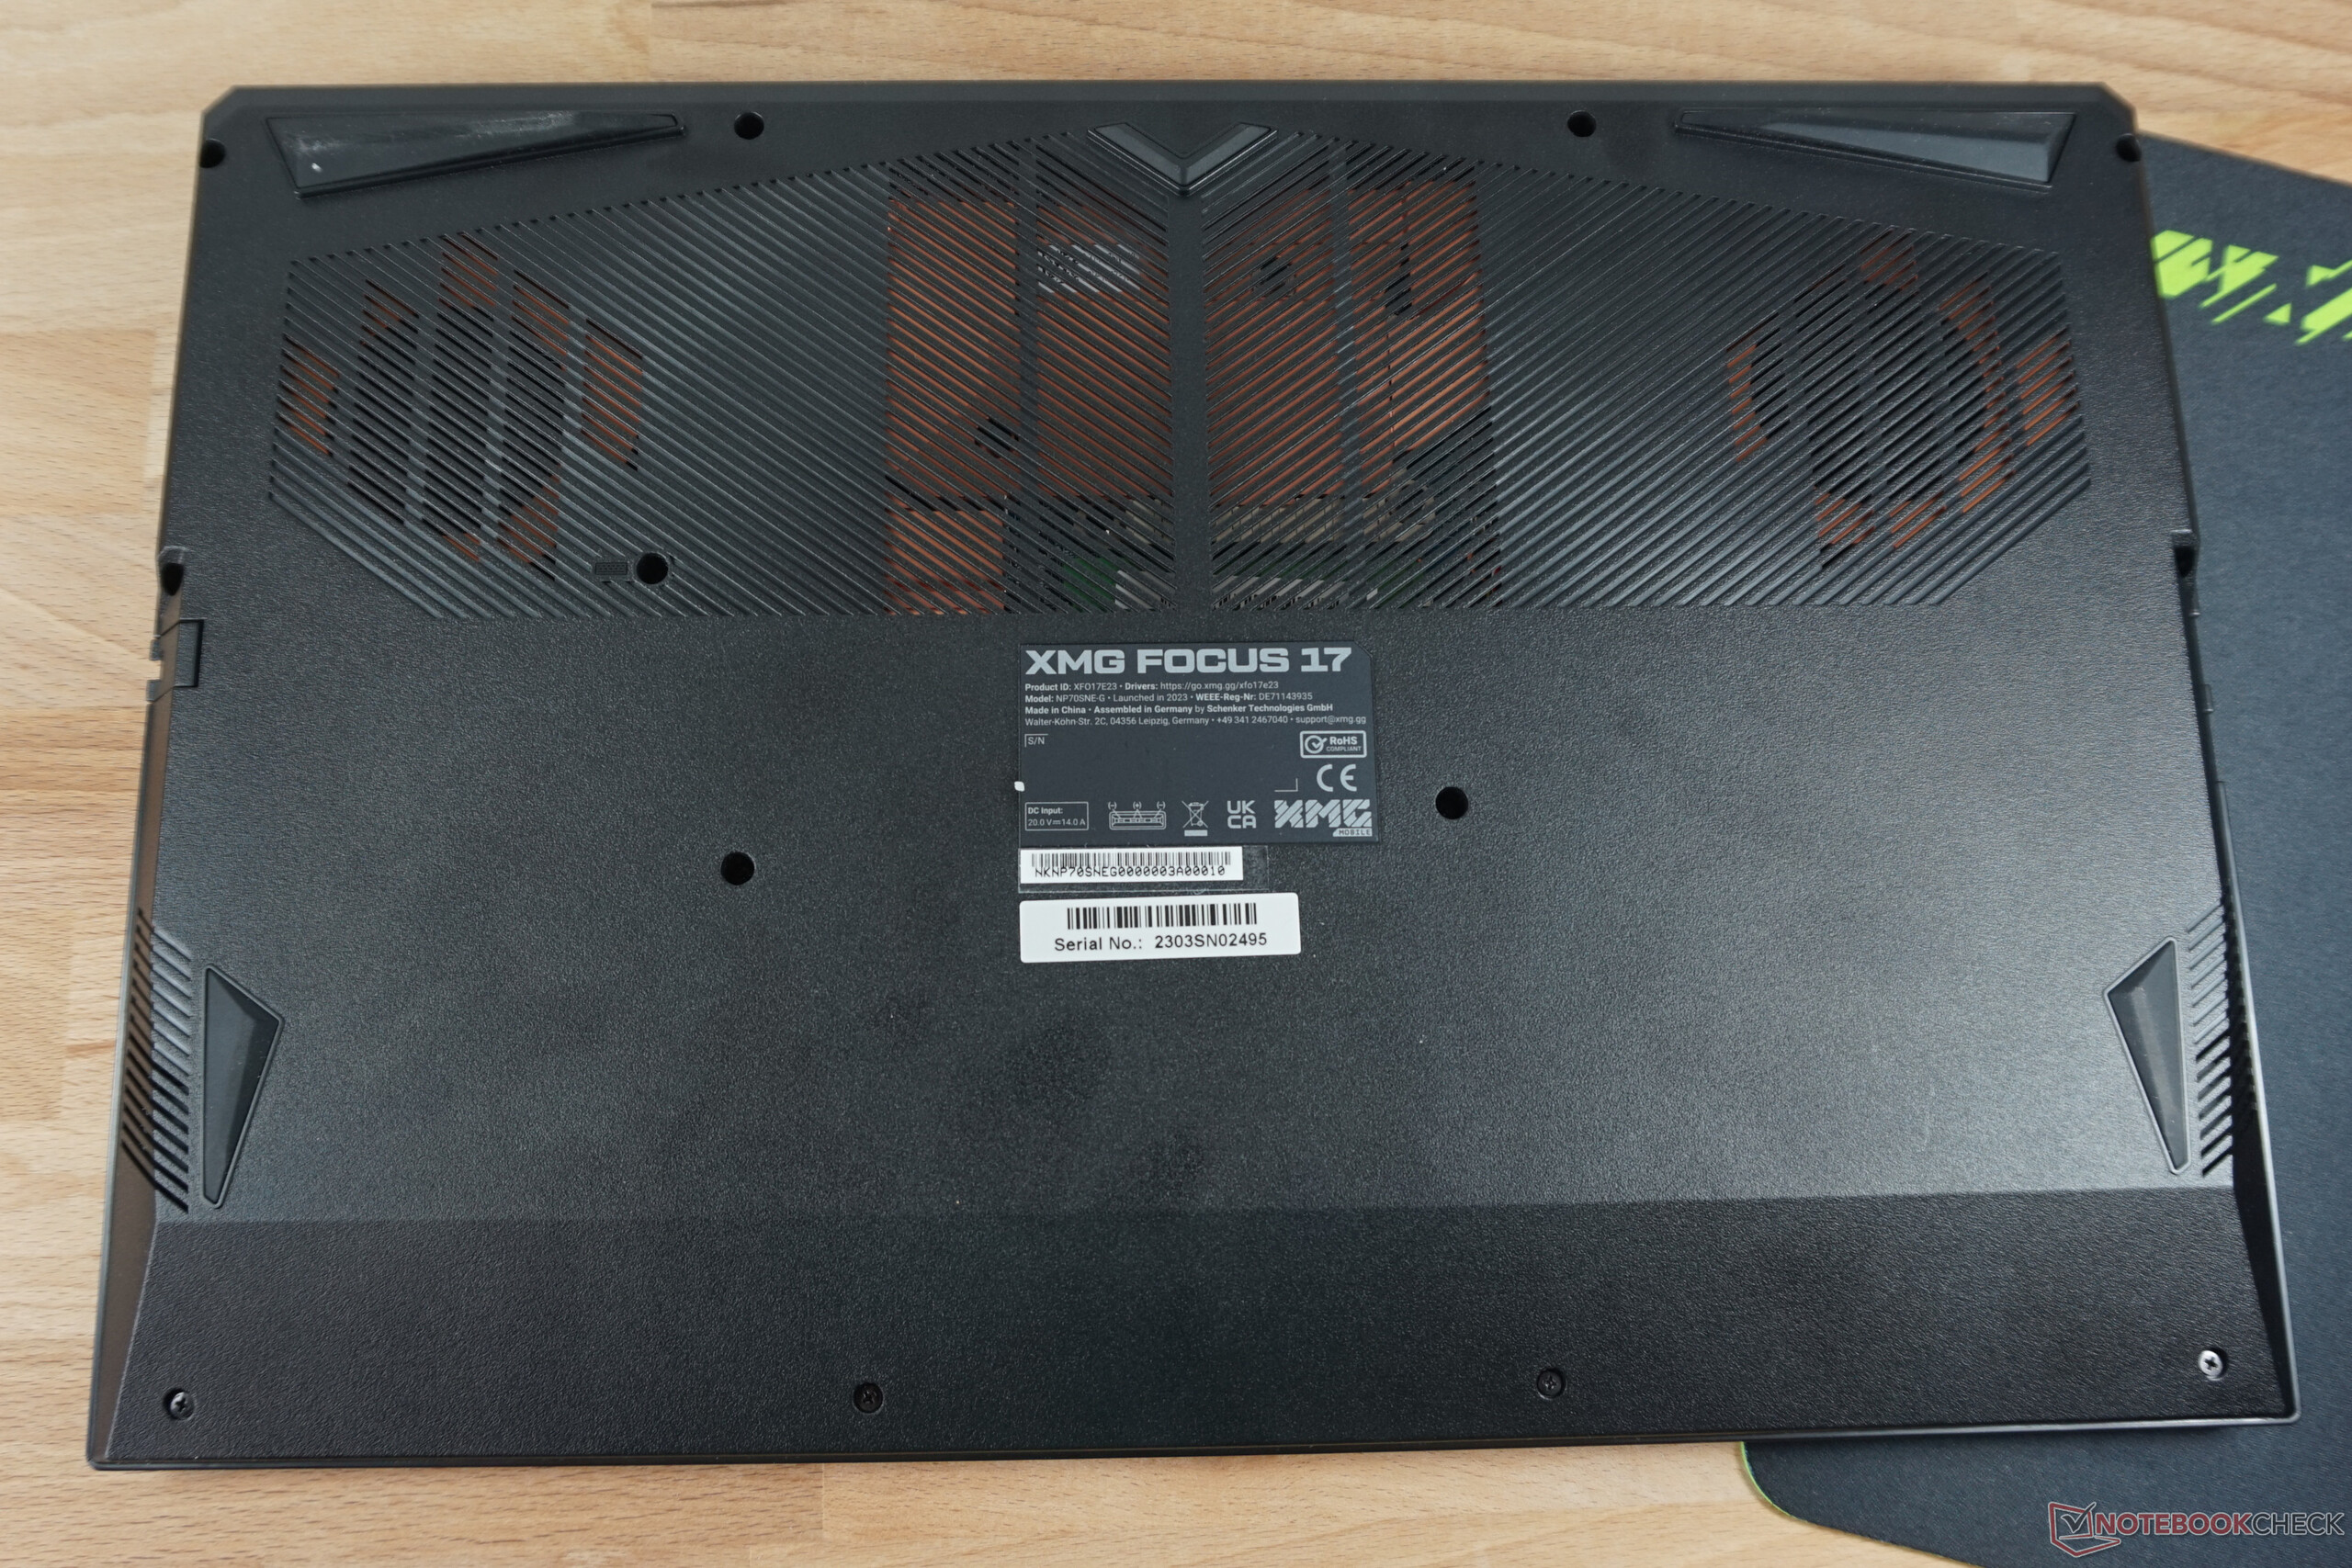
Manutenzione
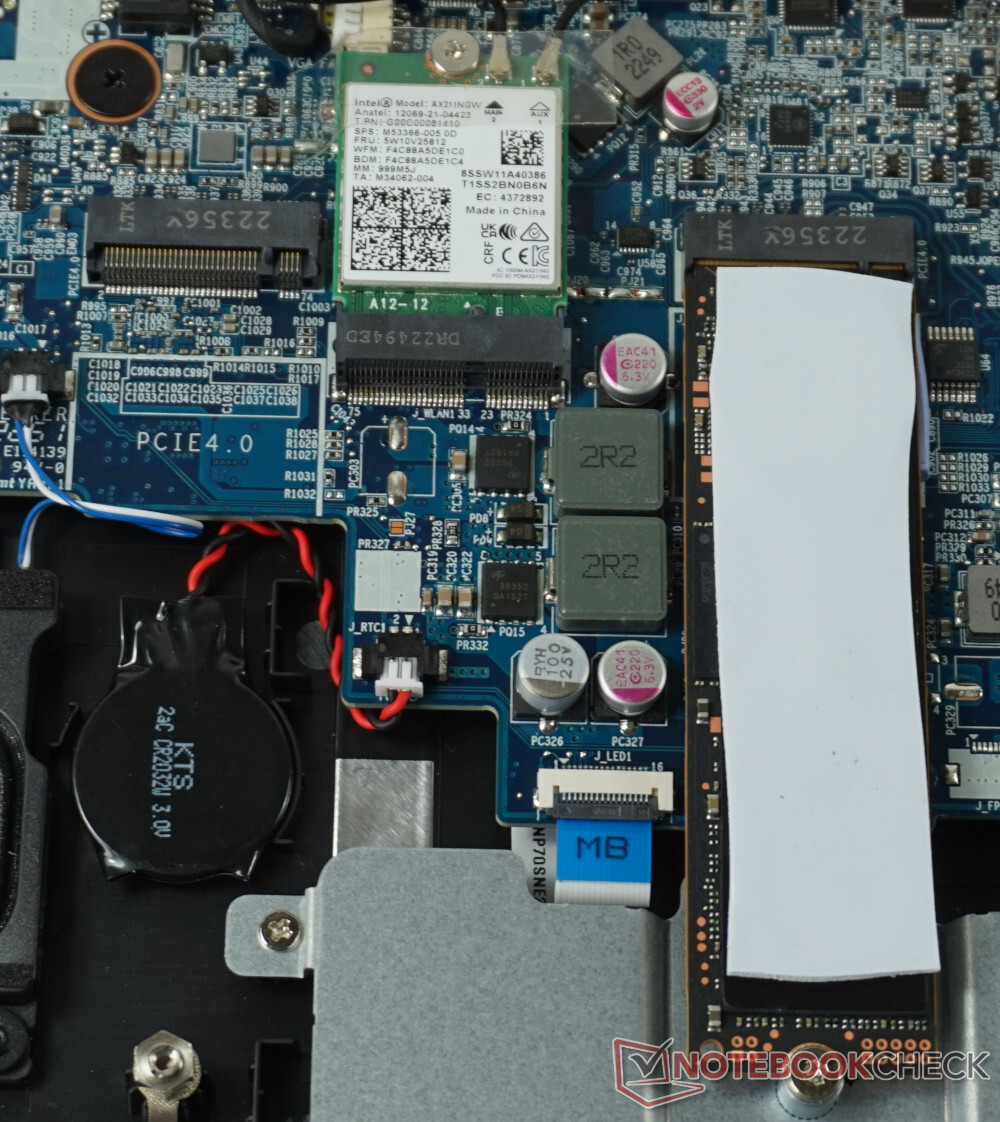
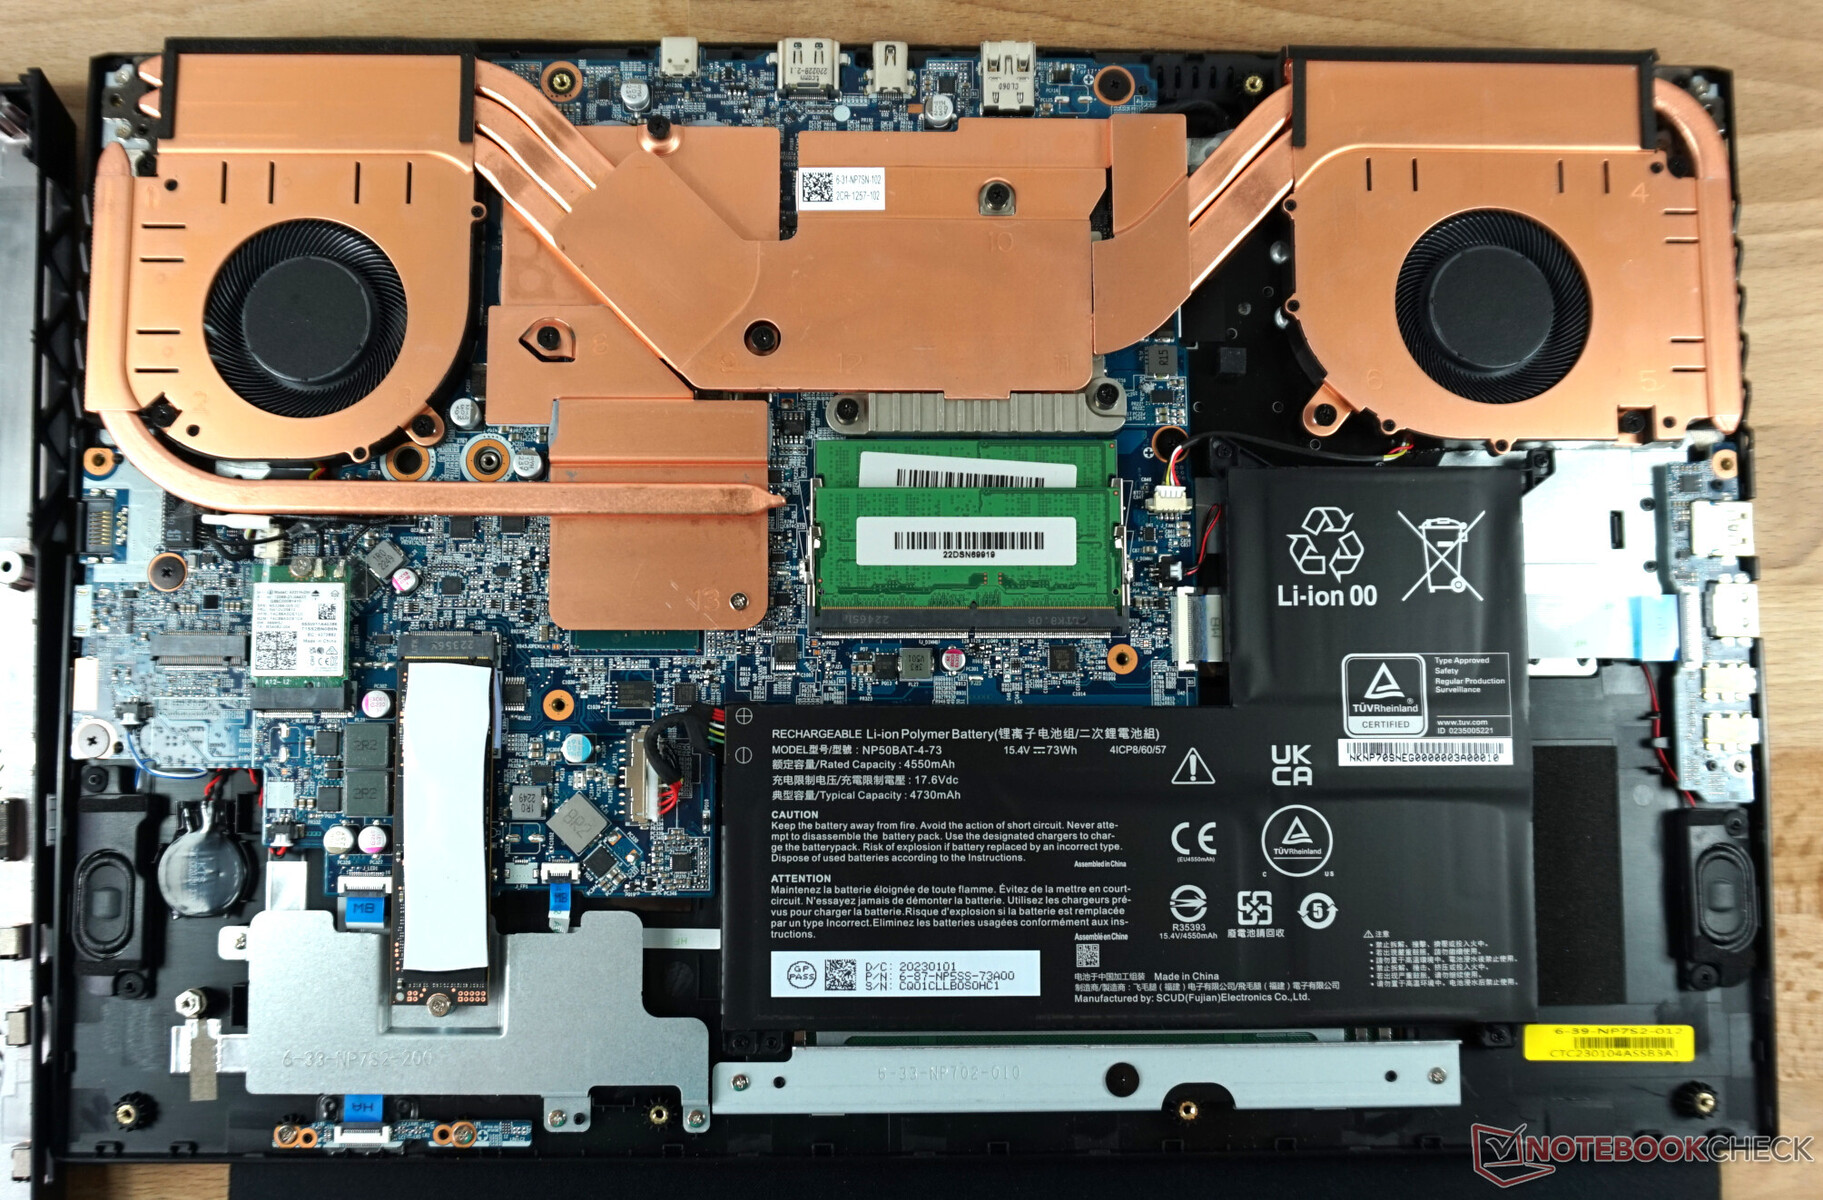
Modifiche sostanziali in vista della XMG Focus 17 del 2021 sono state apportate all'interno. Tutti gli elementi di raffreddamento sono ora in rame e l'aria può uscire da entrambi i lati. L'obsoleta porta SATA per un SSD da 2,5 pollici è scomparsa. Al suo posto c'è un secondo slot per un'unità SSD M.2 NVMe.
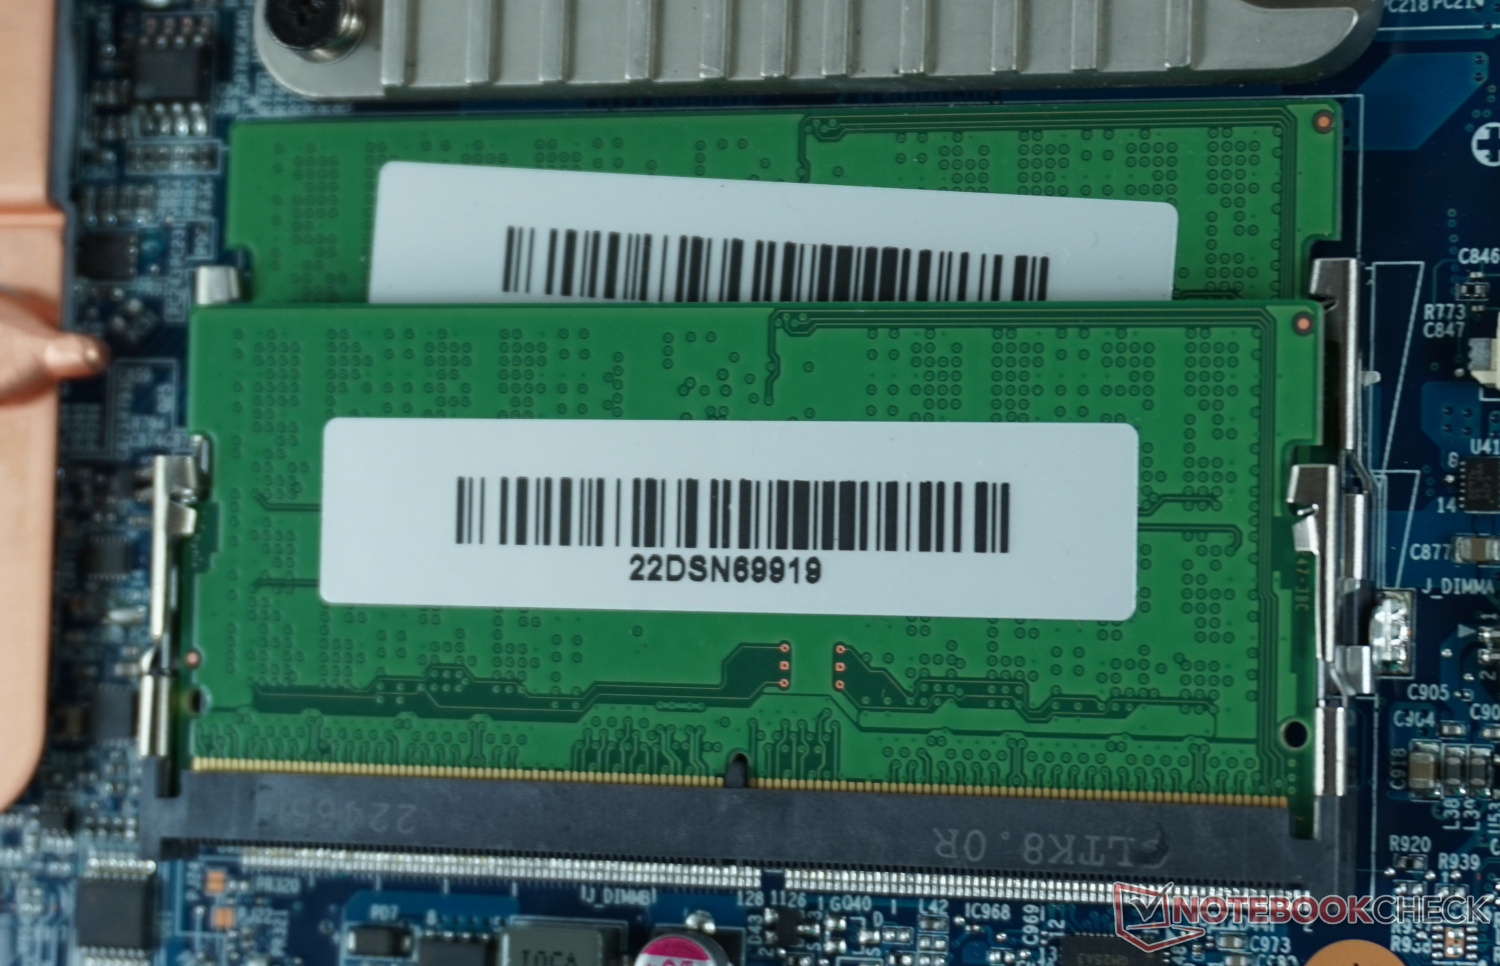
Come ci si aspetta da Schenker, l'accesso ai componenti è semplice. Dopo aver allentato dodici viti identiche, il fondo può essere estratto con poco sforzo partendo dal raffreddamento posteriore. RAM, SSD, modulo WLAN e batteria sono facilmente accessibili e sostituibili.
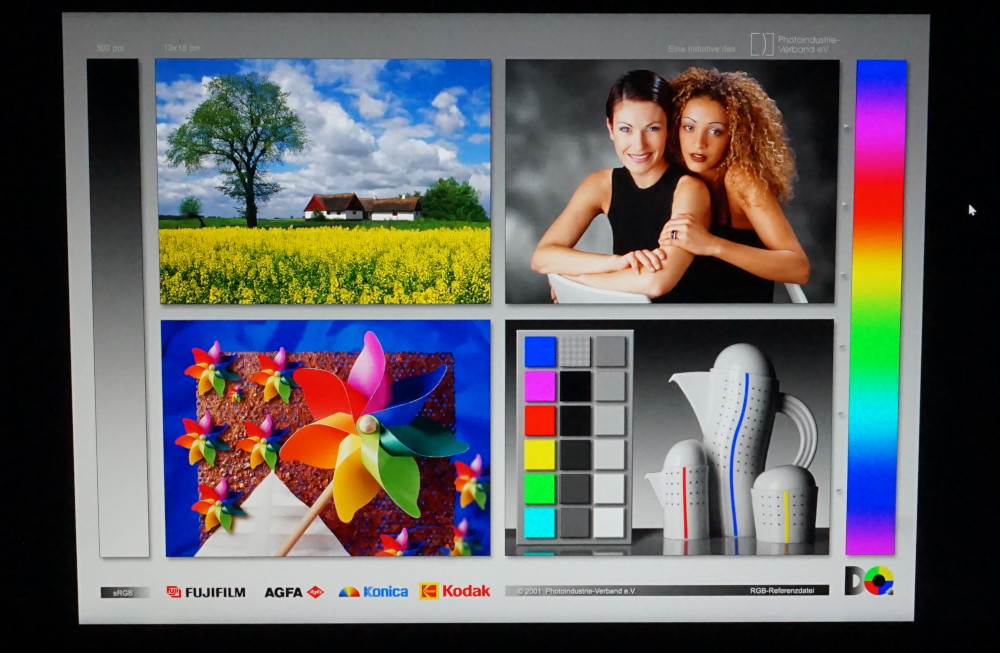
Display - Colori intensi, contrasti scarsi sul notebook da gioco XMG

Il pannello IPS opaco dell'XMG Focus 17 soddisfa le aspettative di un notebook da gioco solido ma non eccezionale. La risoluzione QHD si fa notare sull'ampia diagonale di 17,3 pollici; inoltre, la frequenza di aggiornamento di 240 Hz garantisce basse latenze anche quando il frame rate non viene raggiunto nei giochi.
Non del tutto convincenti sono i tempi di risposta, non ottimali con oltre 10 ms, ma accettabili. Lo scarso livello del nero impedisce un contrasto migliore. Una foschia grigia è visibile nelle scene molto scure con un'illuminazione minima nella stanza. Con un rapporto di 623:1 da noi misurato, il contrasto qui è solo poco meno della metà del valore del Medion Erazer Defender P40 o HP Omen 17-ck. Anche il bleeding dello schermo è chiaramente visibile.
L'illuminazione potrebbe essere un po' più uniforme e la luminosità di 320 cd/m² un po' più alta. Pertanto, le prestazioni del display sono inferiori alla media rispetto a molti modelli di prezzo simile.
| |||||||||||||||||||||||||
Distribuzione della luminosità: 82 %
Al centro con la batteria: 349 cd/m²
Contrasto: 623:1 (Nero: 0.56 cd/m²)
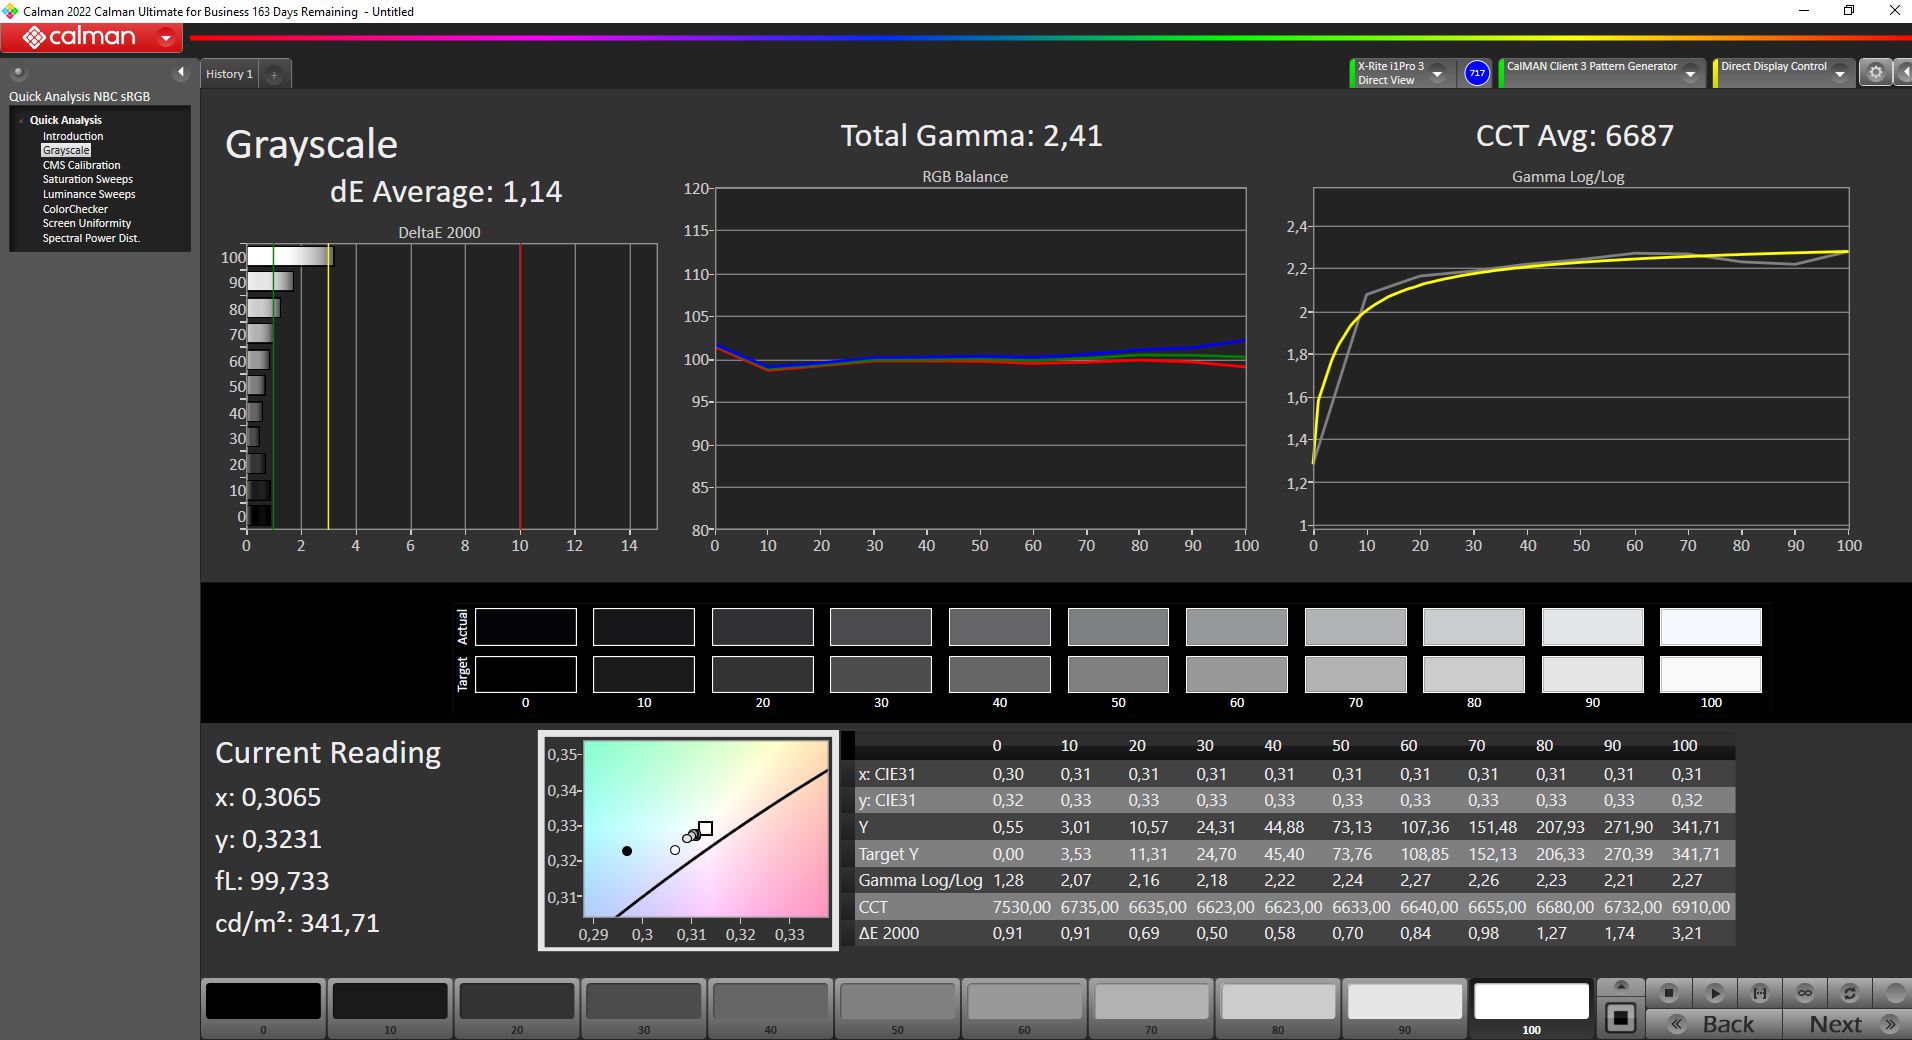
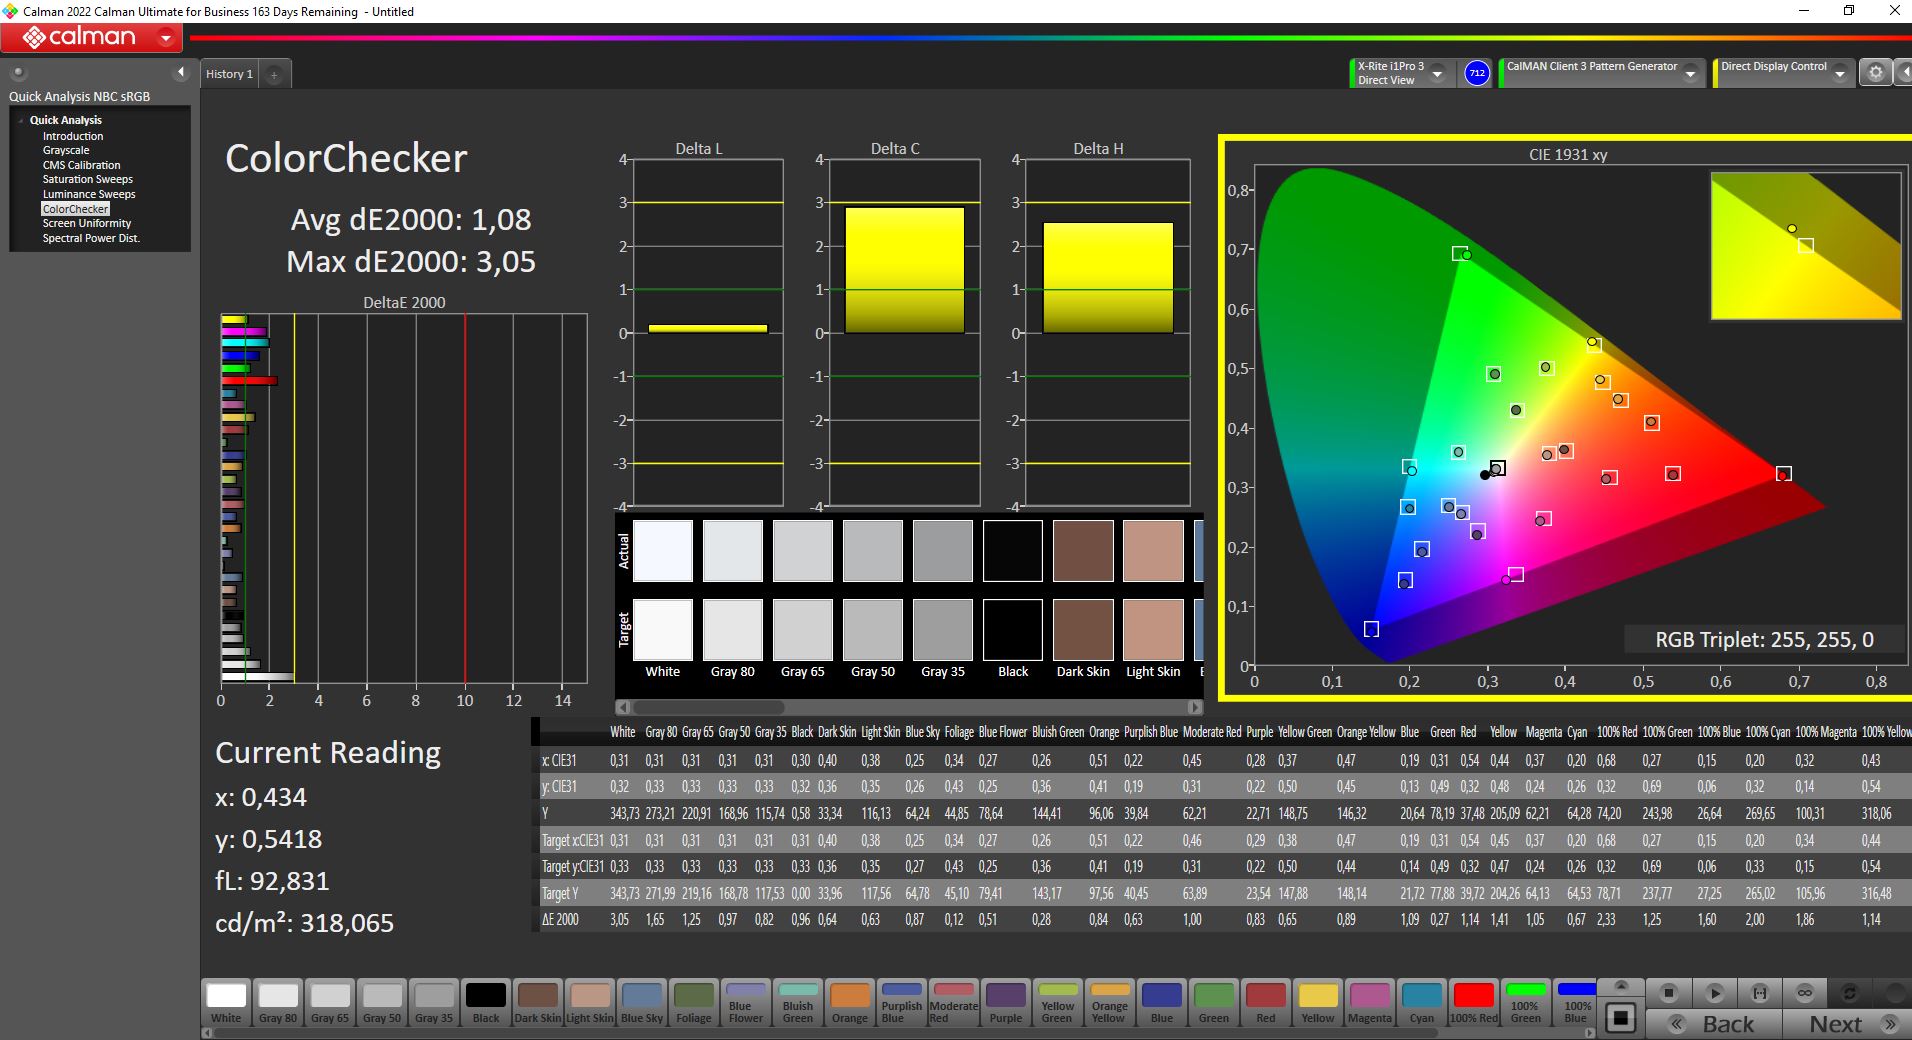
ΔE ColorChecker Calman: 1.08 | ∀{0.5-29.43 Ø4.71}
calibrated: 1.08
ΔE Greyscale Calman: 1.14 | ∀{0.09-98 Ø4.96}
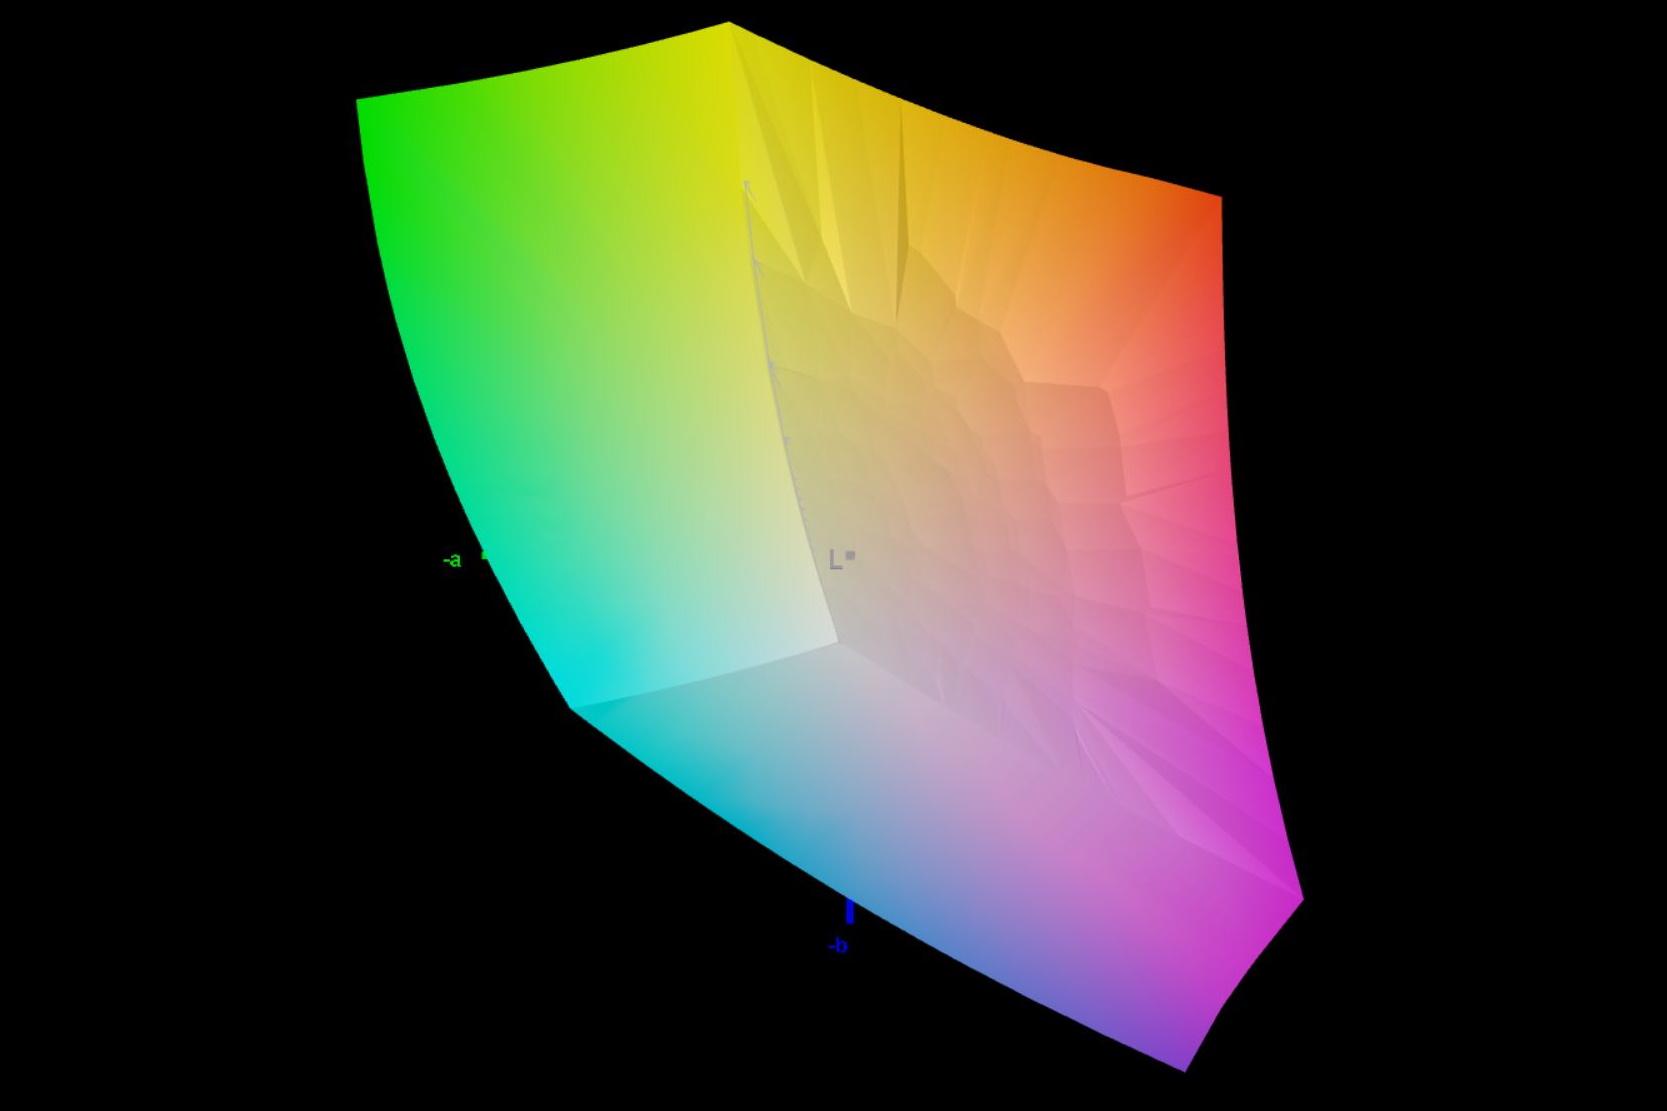
84.5% AdobeRGB 1998 (Argyll 3D)
99.9% sRGB (Argyll 3D)
96.6% Display P3 (Argyll 3D)
Gamma: 2.41
CCT: 6687 K
| Schenker XMG Focus 17 (E23) BOE09F9 NE173QHM-NZ1, IPS, 2560x1440, 17.3" | Lenovo Legion Pro 5 16ARX8 CSOT T3 MNG007DA1-Q, IPS, 2560x1600, 16" | Medion Erazer Major X20 BOE CQ NE160QDM-NZ1, IPS, 2560x1600, 16" | Schenker XMG Neo 17 M22 BOE0A99, IPS, 2560x1600, 17" | HP Omen 17-ck2097ng BOE BOE09BF, IPS, 2560x1440, 17.3" | Medion Erazer Defender P40 BOE CQ NE173QHM-NZ3, IPS, 2560x1440, 17.3" | |
|---|---|---|---|---|---|---|
| Display | -14% | -15% | -16% | -17% | -16% | |
| Display P3 Coverage (%) | 96.6 | 70.4 -27% | 69.4 -28% | 69 -29% | 67.4 -30% | 68.3 -29% |
| sRGB Coverage (%) | 99.9 | 99.6 0% | 98 -2% | 99.8 0% | 97.6 -2% | 98.1 -2% |
| AdobeRGB 1998 Coverage (%) | 84.5 | 72.6 -14% | 70.9 -16% | 69.6 -18% | 69.6 -18% | 69.8 -17% |
| Response Times | 37% | 26% | 39% | 12% | 15% | |
| Response Time Grey 50% / Grey 80% * (ms) | 16.4 ? | 7 ? 57% | 13.1 ? 20% | 10.8 ? 34% | 15.6 ? 5% | 14.6 ? 11% |
| Response Time Black / White * (ms) | 10.8 ? | 9.1 ? 16% | 7.3 ? 32% | 6.1 ? 44% | 8.9 ? 18% | 8.7 ? 19% |
| PWM Frequency (Hz) | ||||||
| Screen | 21% | -23% | 9% | -7% | 11% | |
| Brightness middle (cd/m²) | 349 | 355.3 2% | 374 7% | 415 19% | 371 6% | 364 4% |
| Brightness (cd/m²) | 318 | 340 7% | 357 12% | 399 25% | 350 10% | 343 8% |
| Brightness Distribution (%) | 82 | 91 11% | 92 12% | 90 10% | 90 10% | 86 5% |
| Black Level * (cd/m²) | 0.56 | 0.32 43% | 0.33 41% | 0.43 23% | 0.32 43% | 0.28 50% |
| Contrast (:1) | 623 | 1110 78% | 1133 82% | 965 55% | 1159 86% | 1300 109% |
| Colorchecker dE 2000 * | 1.08 | 1.13 -5% | 2.43 -125% | 1.44 -33% | 1.74 -61% | 1.67 -55% |
| Colorchecker dE 2000 max. * | 3.05 | 2.78 9% | 3.97 -30% | 2.33 24% | 3.59 -18% | 2.78 9% |
| Colorchecker dE 2000 calibrated * | 1.08 | 0.32 70% | 1.4 -30% | 0.89 18% | 1.01 6% | 1.14 -6% |
| Greyscale dE 2000 * | 1.14 | 1.4 -23% | 3.1 -172% | 1.8 -58% | 2.8 -146% | 1.4 -23% |
| Gamma | 2.41 91% | 2.24 98% | 2.191 100% | 2.132 103% | 2.19 100% | 2.091 105% |
| CCT | 6687 97% | 6372 102% | 6194 105% | 6327 103% | 6474 100% | 6568 99% |
| Media totale (Programma / Settaggio) | 15% /
16% | -4% /
-14% | 11% /
8% | -4% /
-7% | 3% /
6% |
* ... Meglio usare valori piccoli
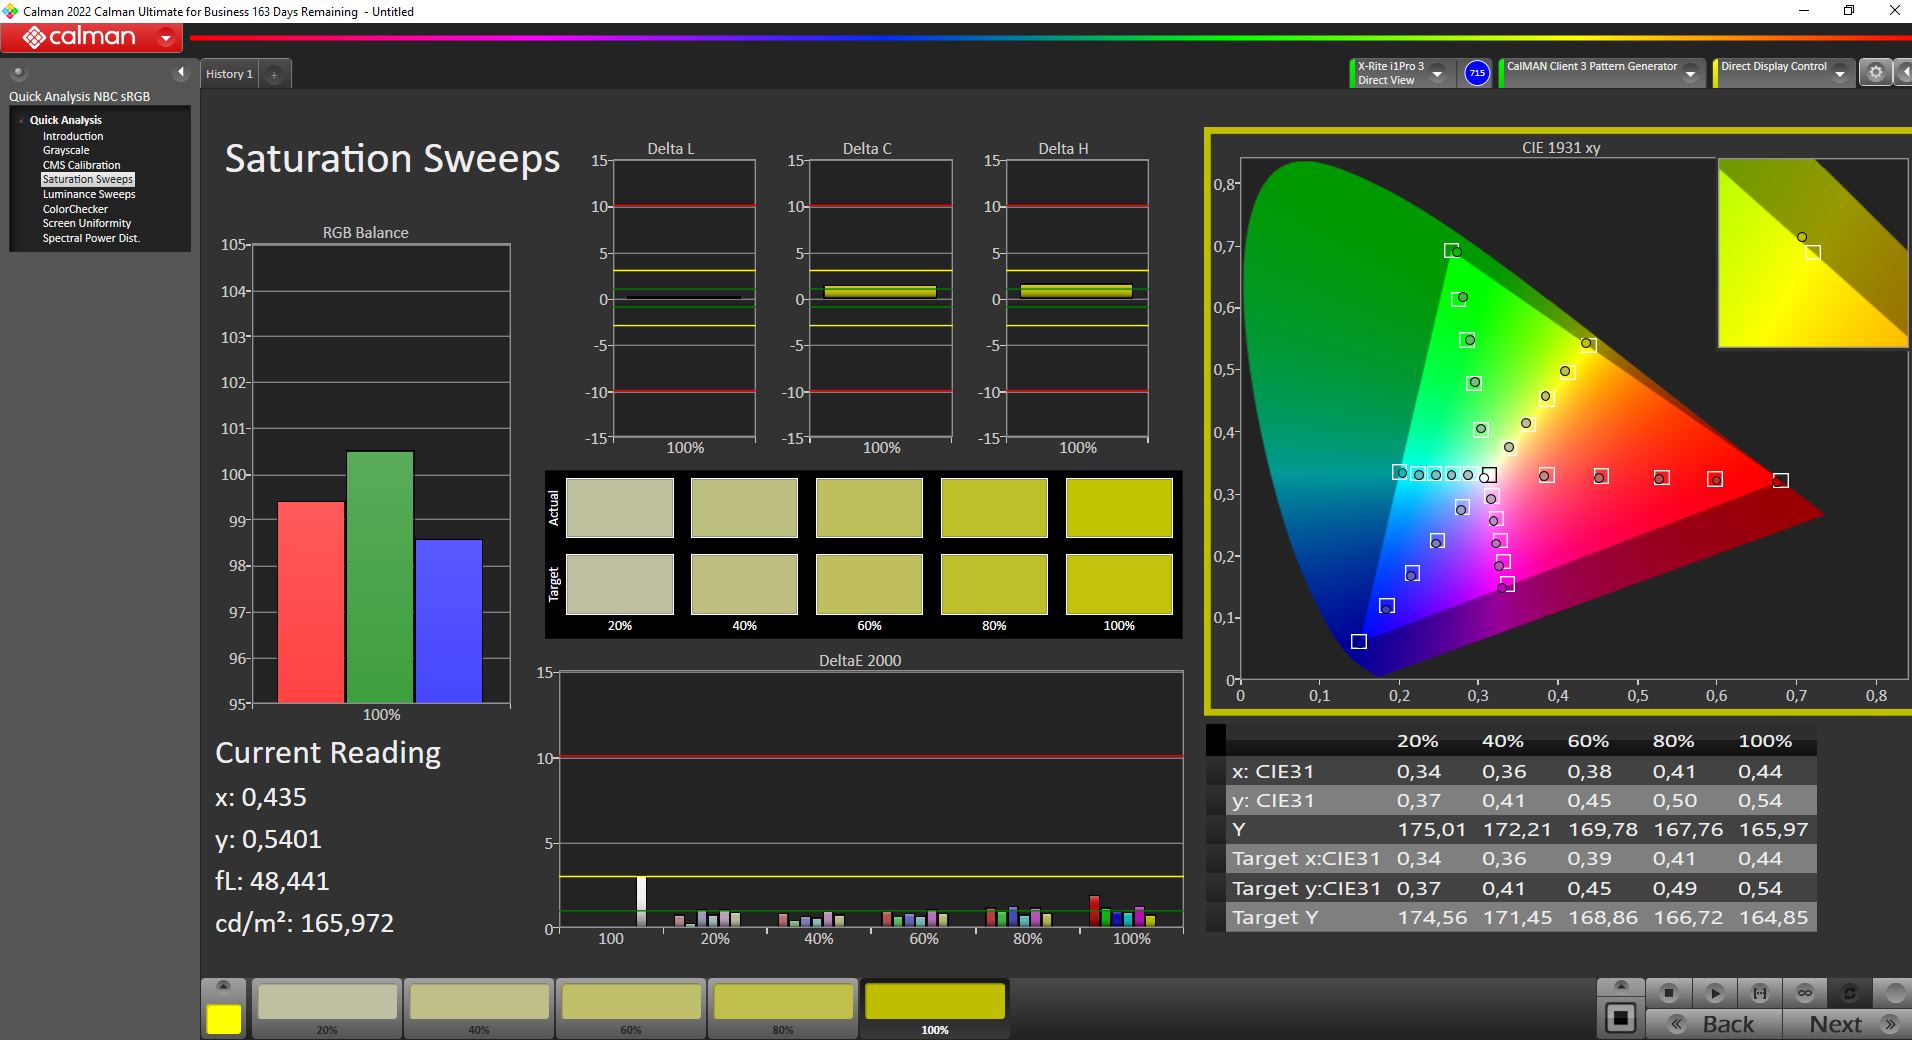
La riproduzione dei colori è molto buona. Lo spazio colore sRGB, utilizzato per i giochi e per la maggior parte delle applicazioni non professionali, è praticamente completamente coperto. Anche il DCI-P3 può essere rappresentato in larga misura. Pertanto, la riproduzione dei colori è superiore alla media.
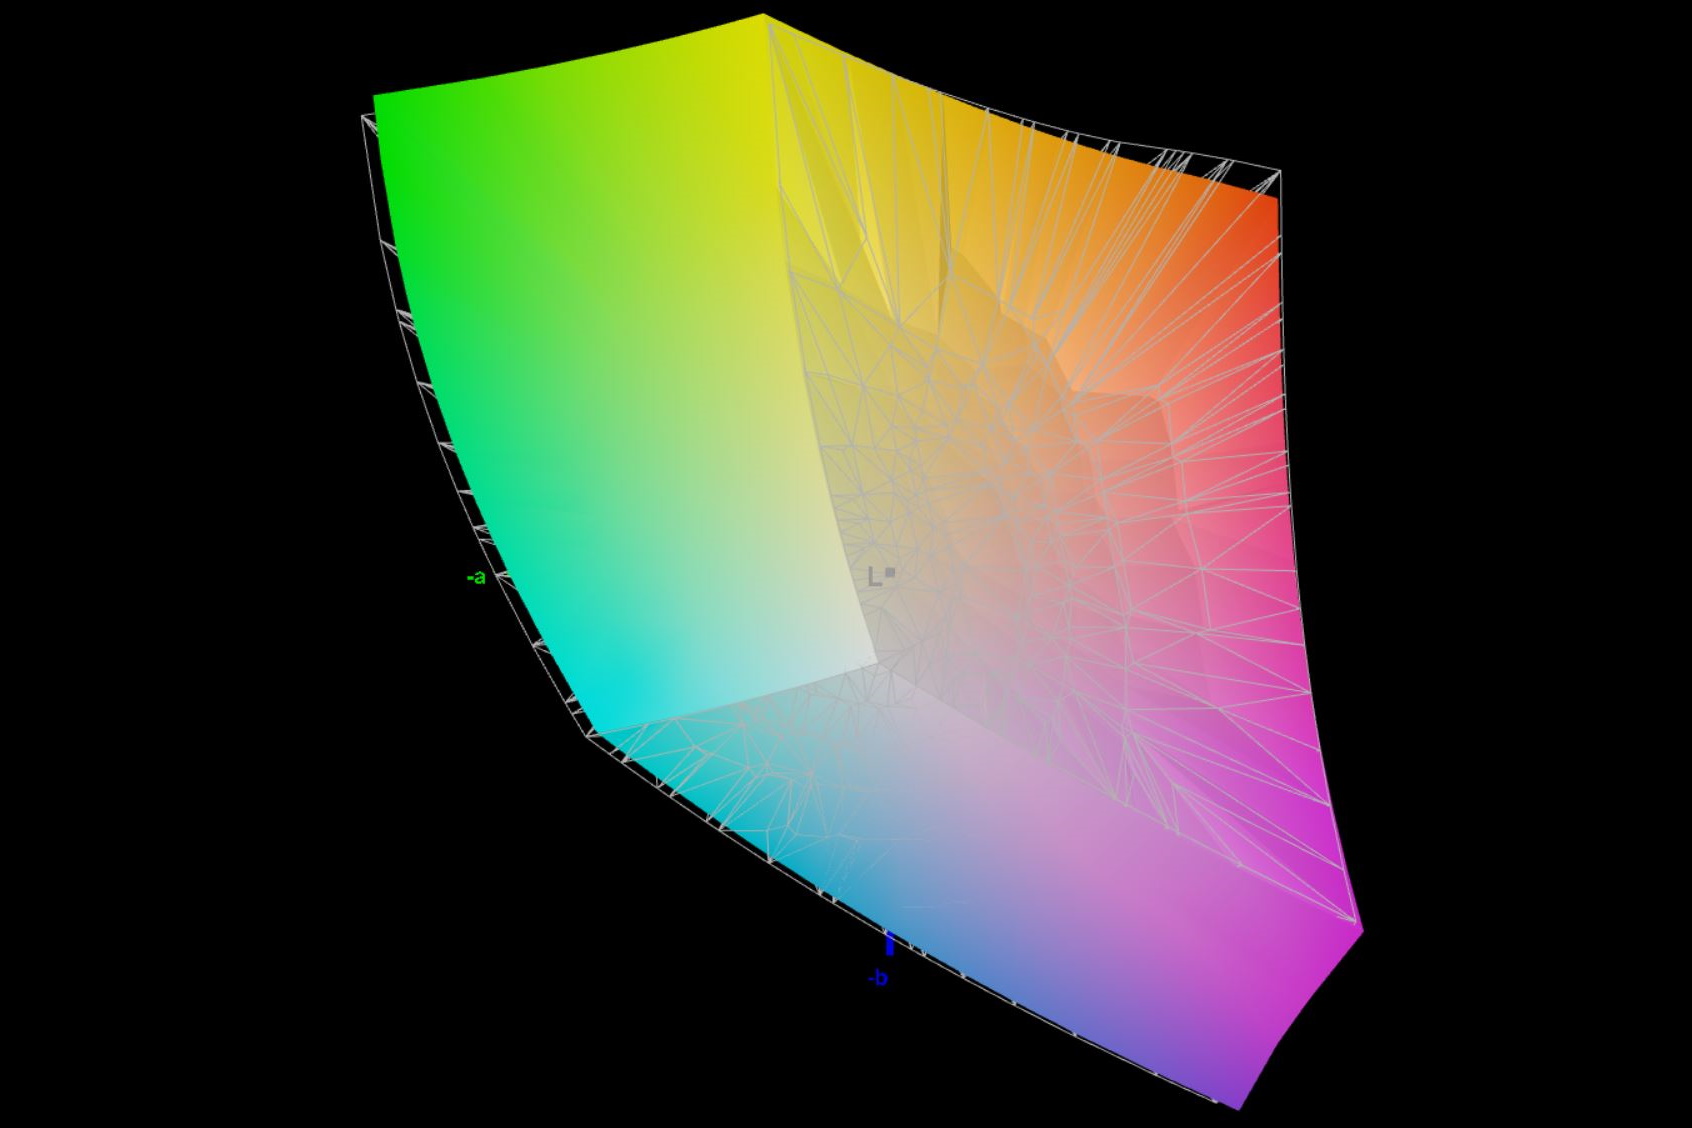
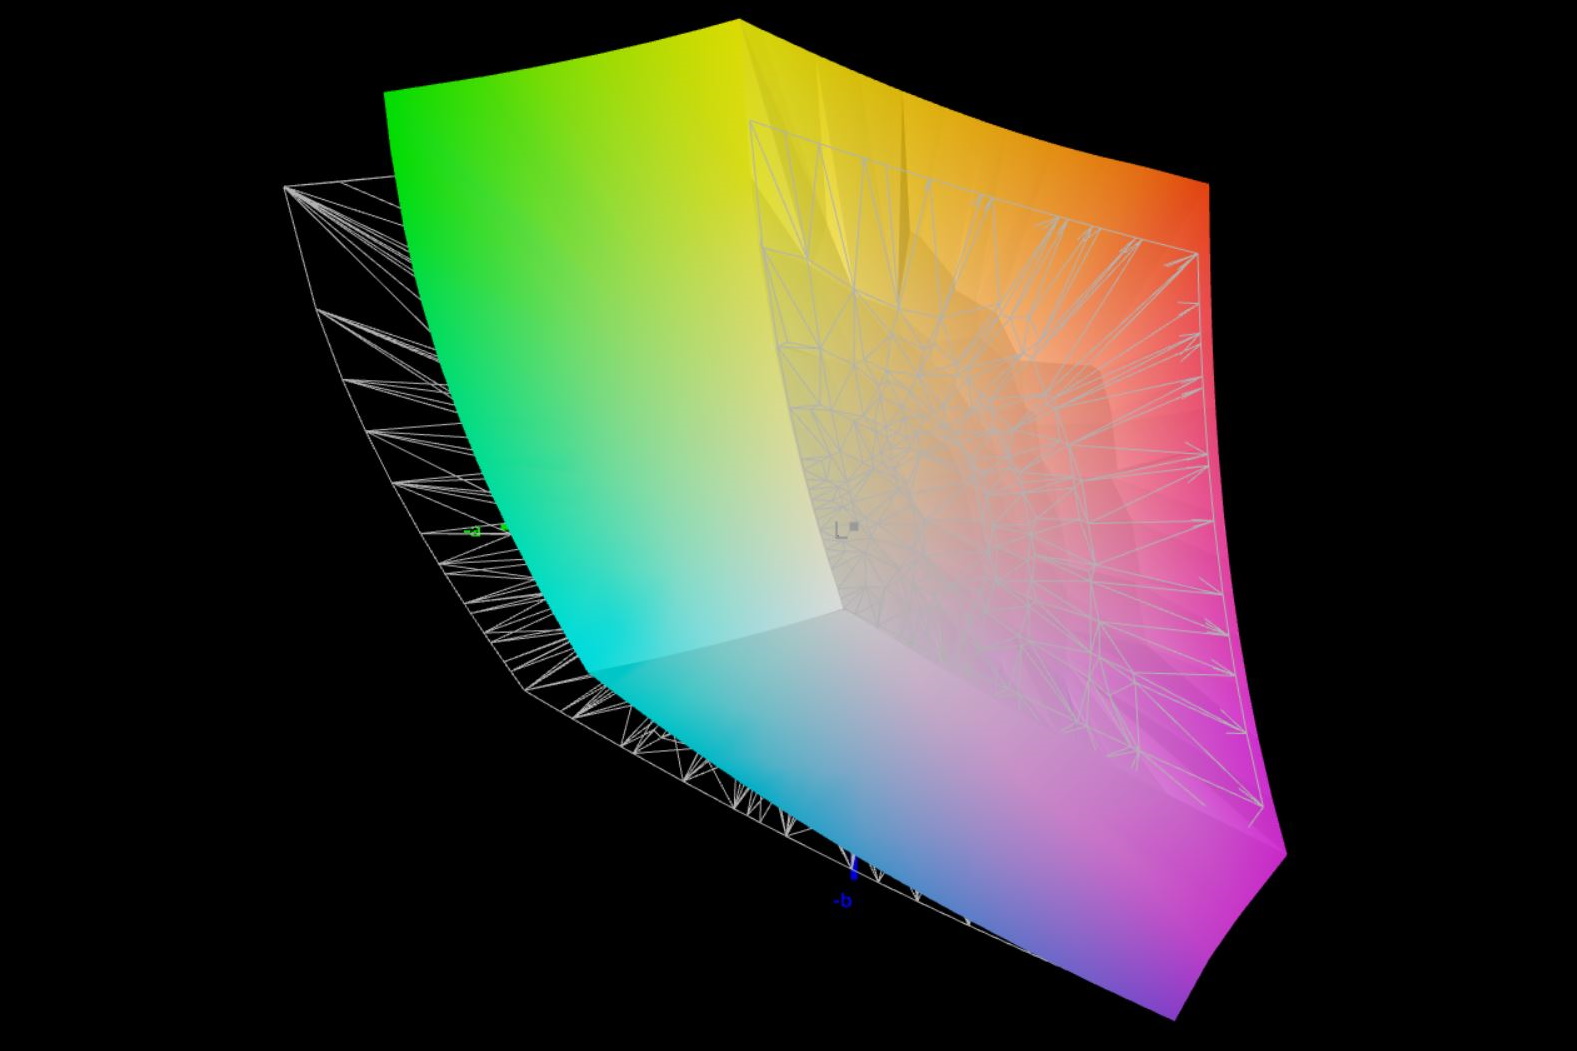
Le basse deviazioni di colore misurate senza una precedente calibrazione sono notevoli. Anche il DeltaE massimo determinato, appena inferiore a 3, significa che non è possibile rilevare differenze a occhio nudo. Pertanto, non è necessario regolare il display in seguito per ottenere una visualizzazione ottimale.
Tempi di risposta del Display
| ↔ Tempi di risposta dal Nero al Bianco | ||
|---|---|---|
| 10.8 ms ... aumenta ↗ e diminuisce ↘ combinato | ↗ 4.6 ms Incremento | 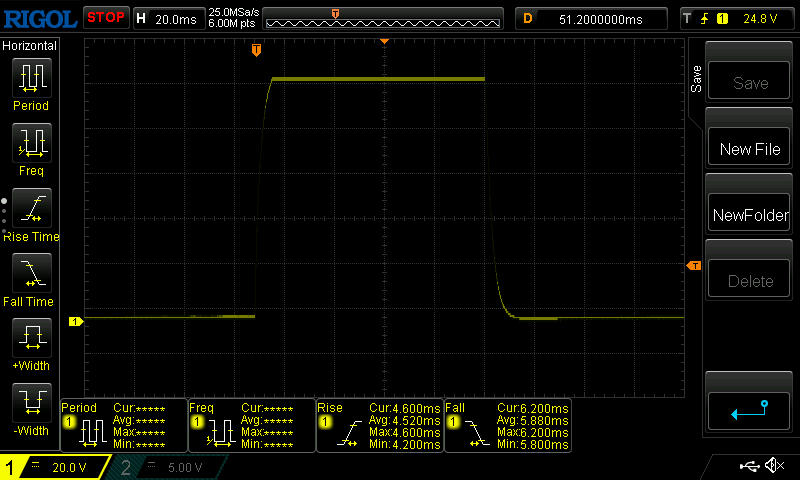 |
| ↘ 6.2 ms Calo | ||
| Lo schermo mostra buoni tempi di risposta durante i nostri tests, ma potrebbe essere troppo lento per i gamers competitivi. In confronto, tutti i dispositivi di test variano da 0.1 (minimo) a 240 (massimo) ms. » 29 % di tutti i dispositivi è migliore. Questo significa che i tempi di risposta rilevati sono migliori rispettto alla media di tutti i dispositivi testati (19.8 ms). | ||
| ↔ Tempo di risposta dal 50% Grigio all'80% Grigio | ||
| 16.4 ms ... aumenta ↗ e diminuisce ↘ combinato | ↗ 7.4 ms Incremento | 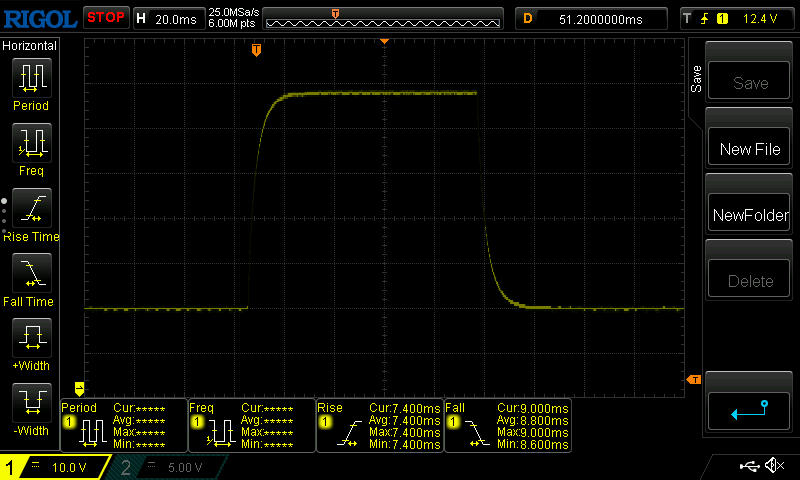 |
| ↘ 9 ms Calo | ||
| Lo schermo mostra buoni tempi di risposta durante i nostri tests, ma potrebbe essere troppo lento per i gamers competitivi. In confronto, tutti i dispositivi di test variano da 0.165 (minimo) a 636 (massimo) ms. » 31 % di tutti i dispositivi è migliore. Questo significa che i tempi di risposta rilevati sono migliori rispettto alla media di tutti i dispositivi testati (31 ms). | ||
Sfarfallio dello schermo / PWM (Pulse-Width Modulation)
| flickering dello schermo / PWM non rilevato | 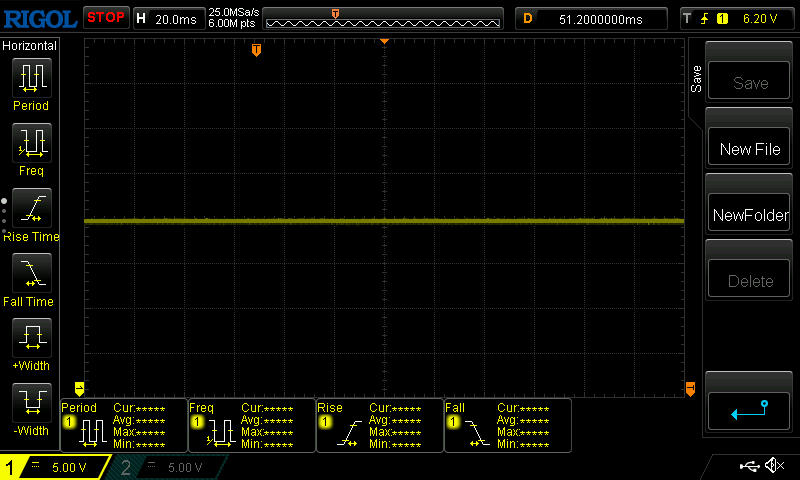 | ||
In confronto: 52 % di tutti i dispositivi testati non utilizza PWM per ridurre la luminosita' del display. Se è rilevato PWM, una media di 7757 (minimo: 5 - massimo: 343500) Hz è stata rilevata. | |||
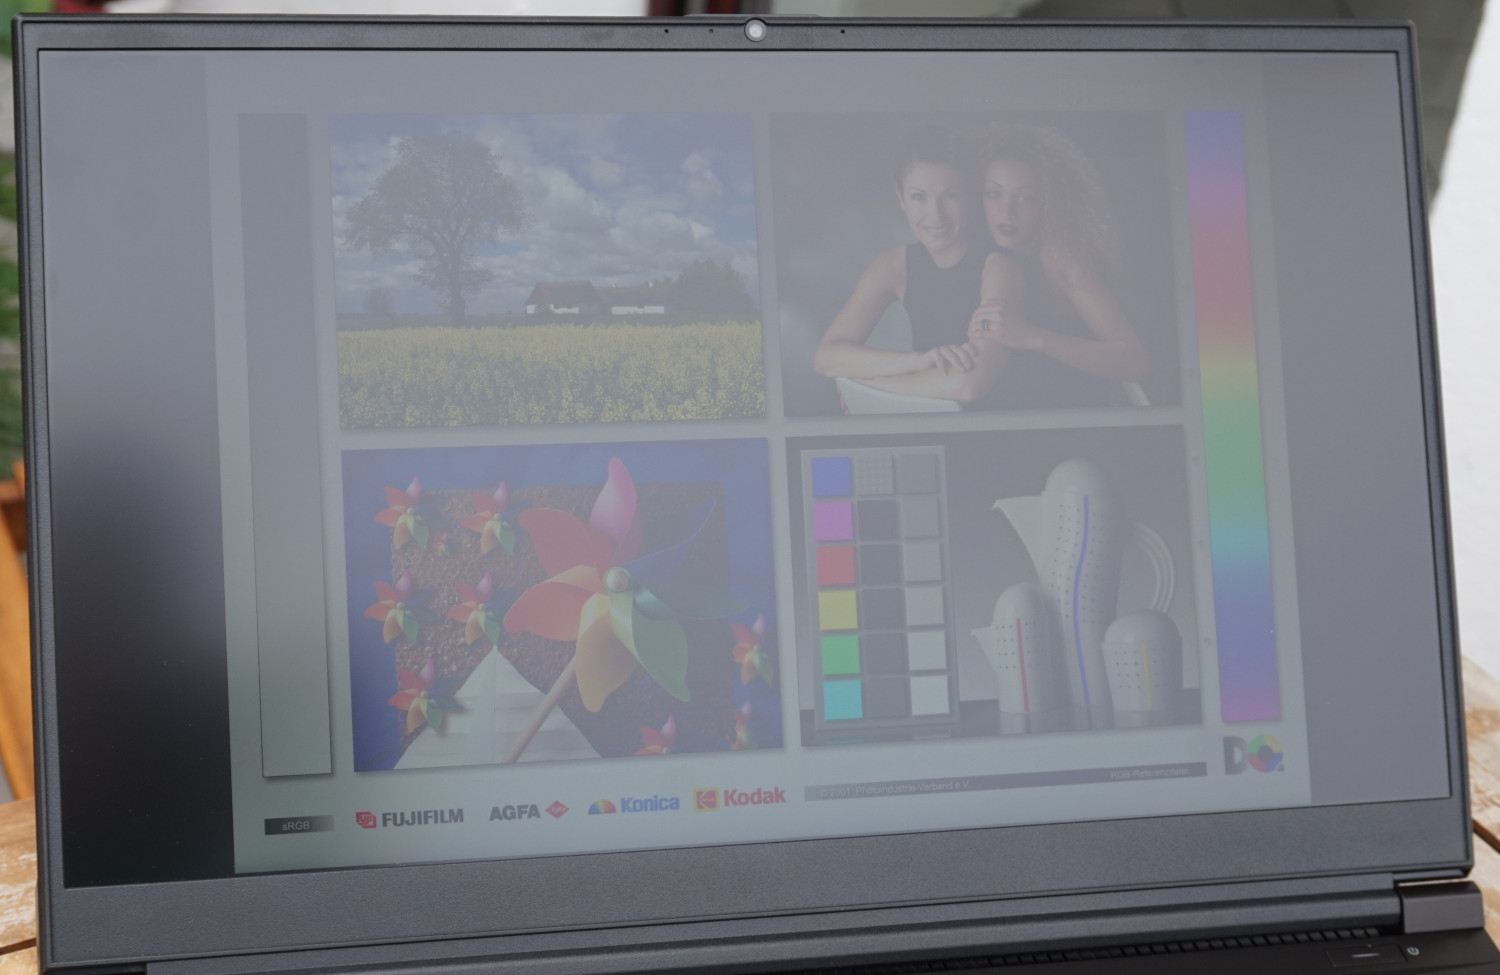
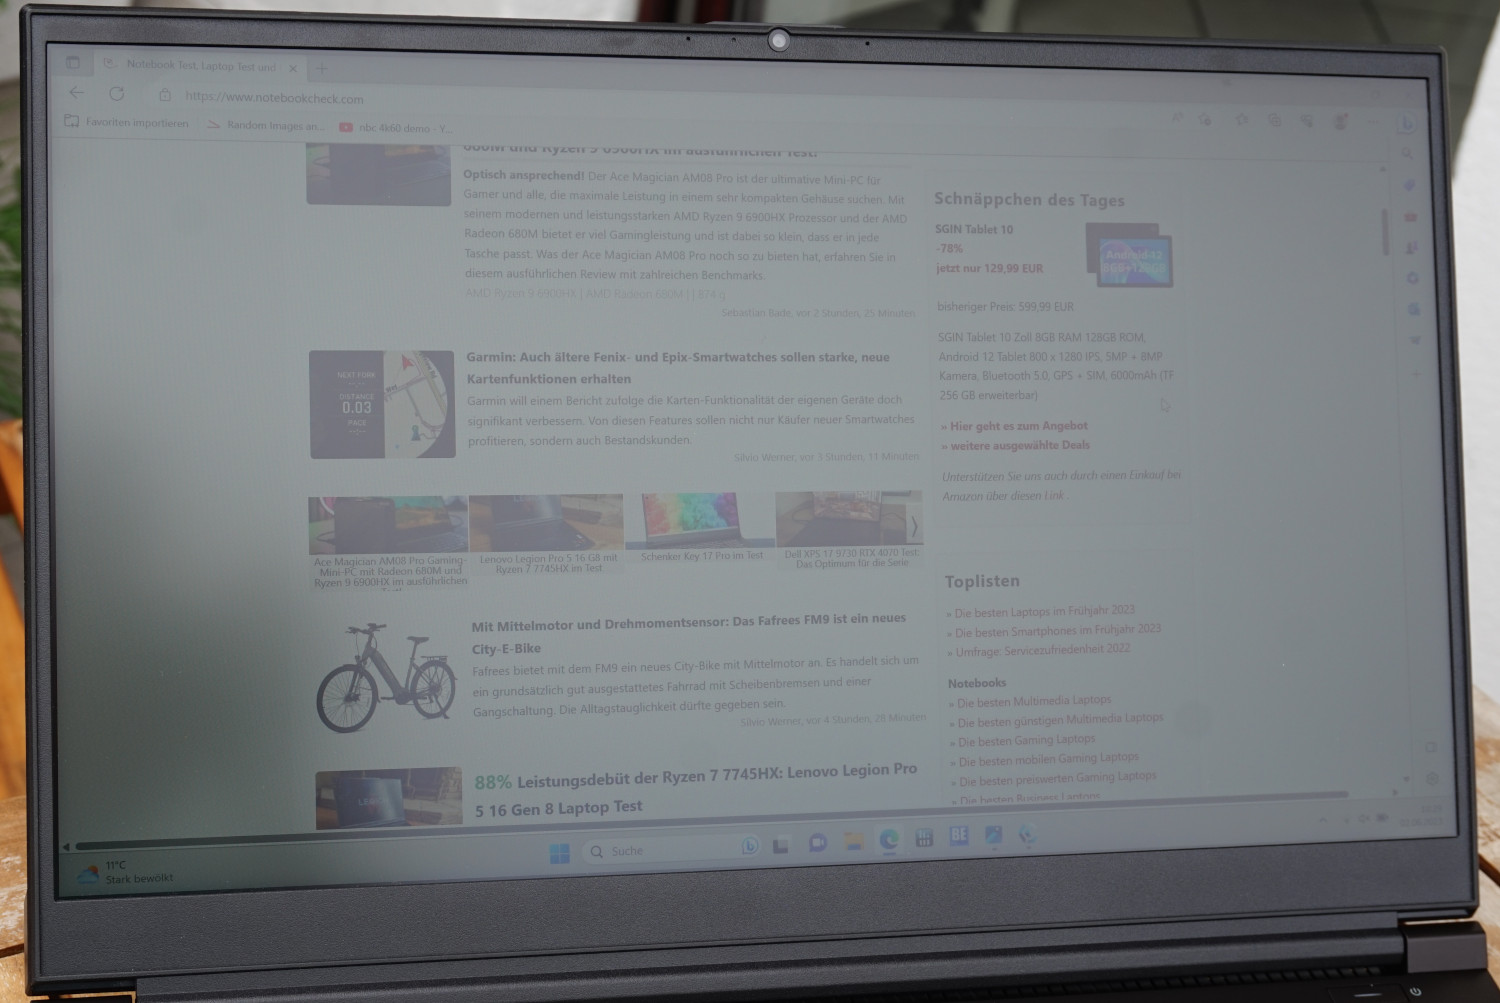
Con soli 350 cd/m², la visibilità all'aperto ne risente in modo significativo. I colori possono comunque essere riconosciuti bene in un luogo ombreggiato. Tuttavia, se sullo schermo cade un po' di luce in più, i testi possono al massimo essere riconosciuti sufficientemente bene. Questo vale anche in una giornata nuvolosa.
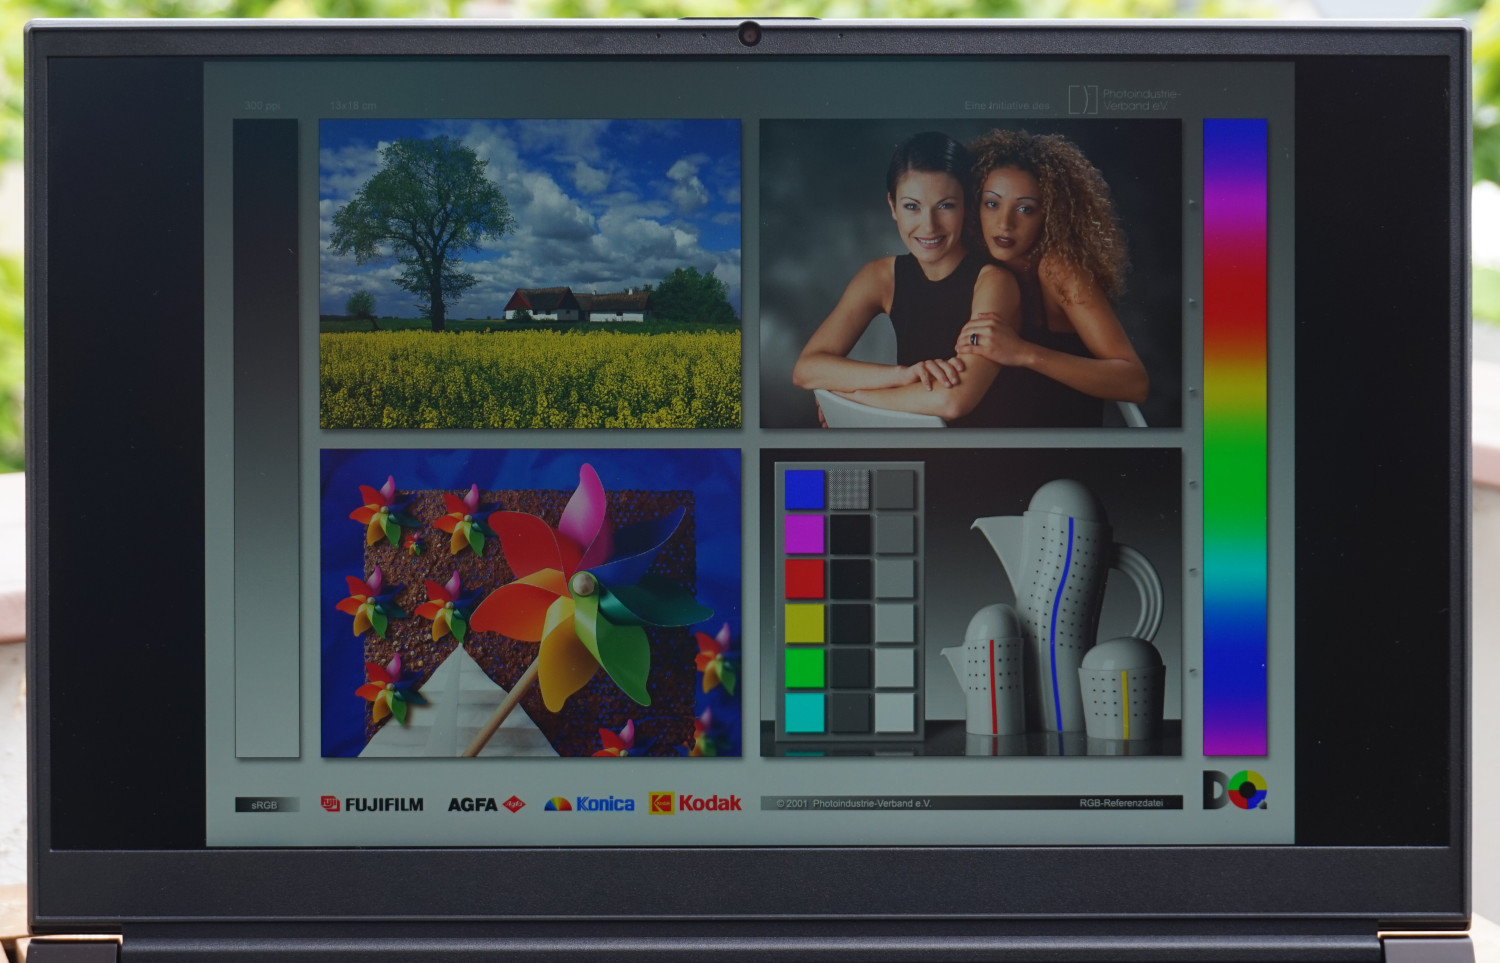
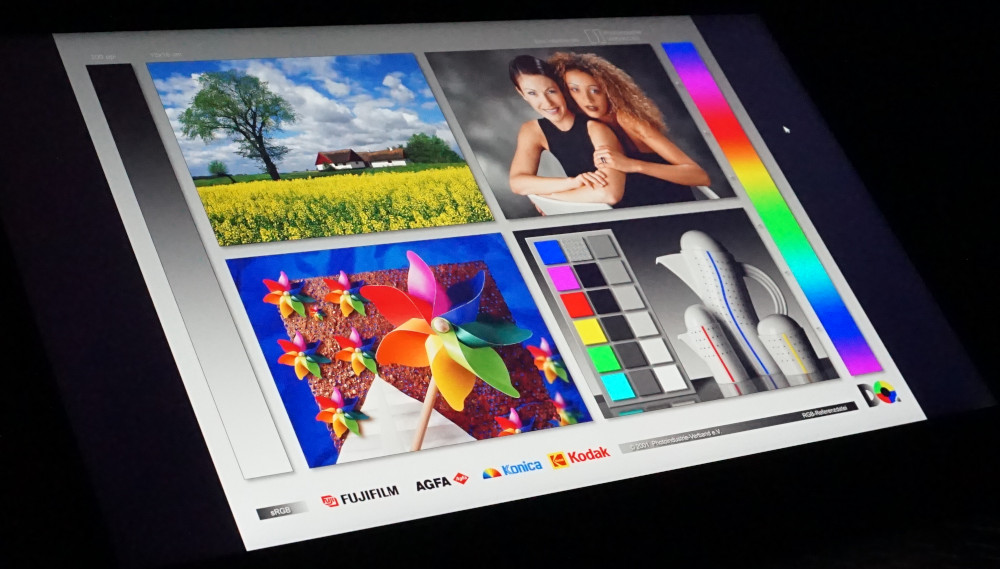
La riproduzione dei colori da diverse direzioni di visione è prevedibilmente buona. Il pannello IPS non rivela alcuna variazione di colore e anche la luminosità rimane pressoché costante, anche da un angolo acuto.

Prestazioni - Gioco solido con il Focus 17
Soprattutto la forte Nvidia Geforce RTX 4070 determina le possibilità di applicazione del Focus 17 E23. La GPU offre molte prestazioni abbinate a una VRAM sufficiente per i titoli attuali che possono essere giocati principalmente alla risoluzione QHD nativa e con quasi tutti i dettagli. Questo dovrebbe valere anche per i giochi in arrivo nel prossimo futuro.
Allo stesso tempo, è garantita una buona velocità di lavoro grazie al processore Intel Core i9-13900HX. Le applicazioni complesse possono essere elaborate rapidamente. Il multitasking non rappresenta un problema, nemmeno in misura elevata. Tuttavia, le prestazioni della CPU sono al massimo secondarie in un notebook da gioco.
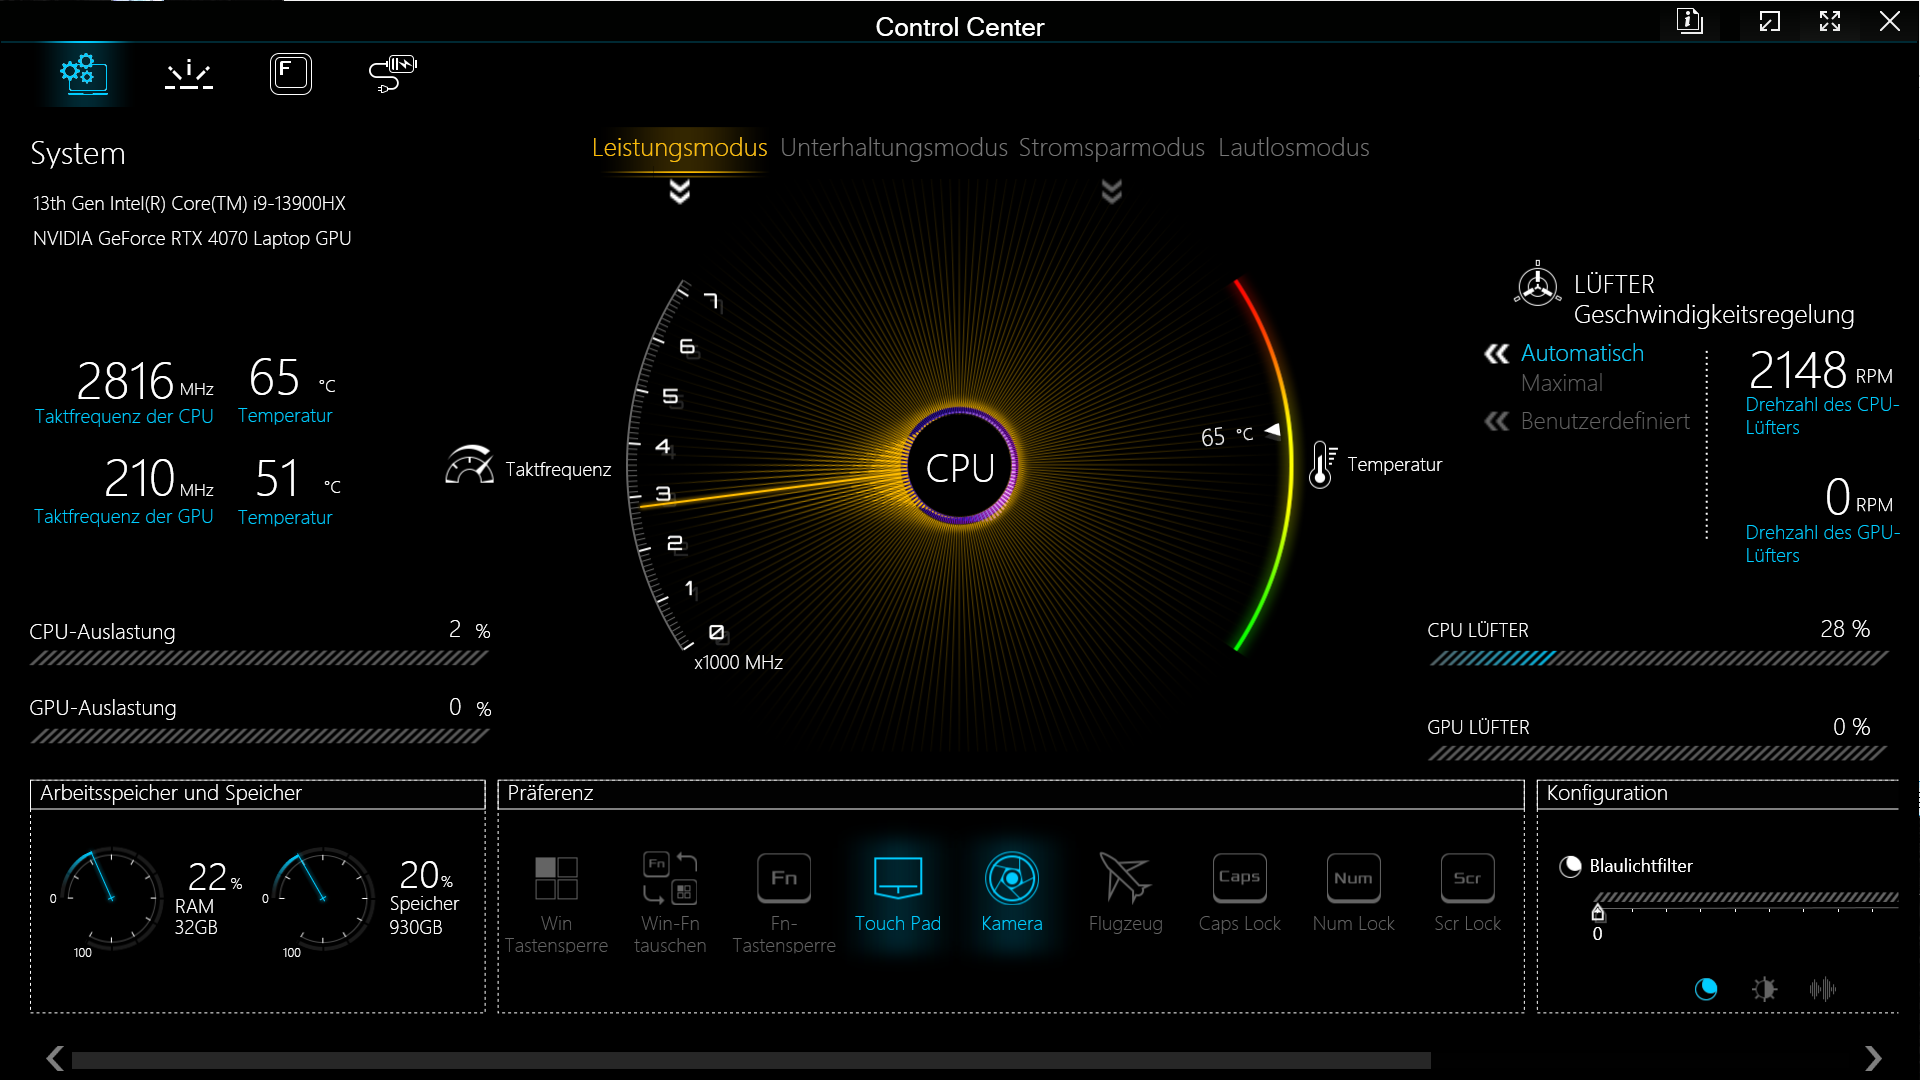
Condizioni di prova
Nel ControlCenter preinstallato è possibile selezionare quattro modalità di prestazioni predefinite. Per i nostri test e benchmark abbiamo sempre utilizzato la modalità "Performance", che garantisce la massima velocità delle ventole e la massima alimentazione di GPU e CPU.
I valori sono minimamente inferiori in "Modalità Intrattenimento". Solo le prestazioni della CPU sono leggermente ridotte, quindi è difficile aspettarsi effetti significativi sui giochi. la "Modalità silenziosa", invece, limita notevolmente le prestazioni del sistema, ma lo sviluppo del rumore si attenua sullo sfondo, anche se non scompare completamente. I giochi meno impegnativi rimangono giocabili anche in questa modalità. Tra gli altri, Witcher 3 raggiunge più di 60 fps con le impostazioni più alte e in Full HD.
La "modalità di risparmio energetico" disabilita completamente il chip grafico dedicato ed è, allo stato attuale delle cose, obbligatoria per ottenere tempi di autonomia della batteria semi-accettabili, almeno sul sistema che abbiamo testato.
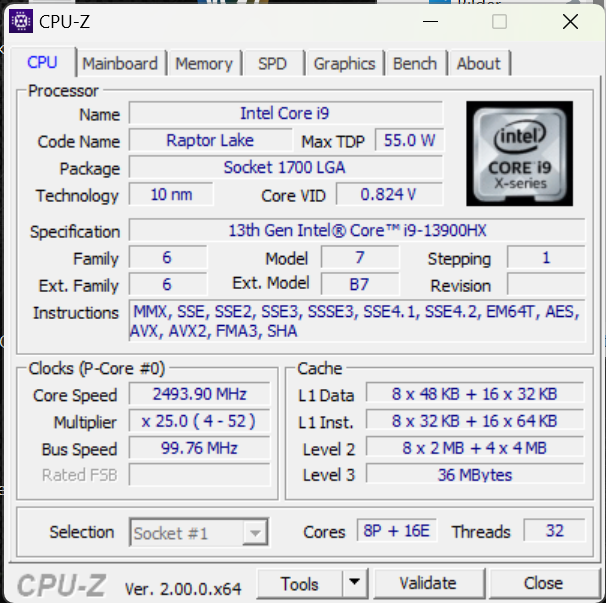
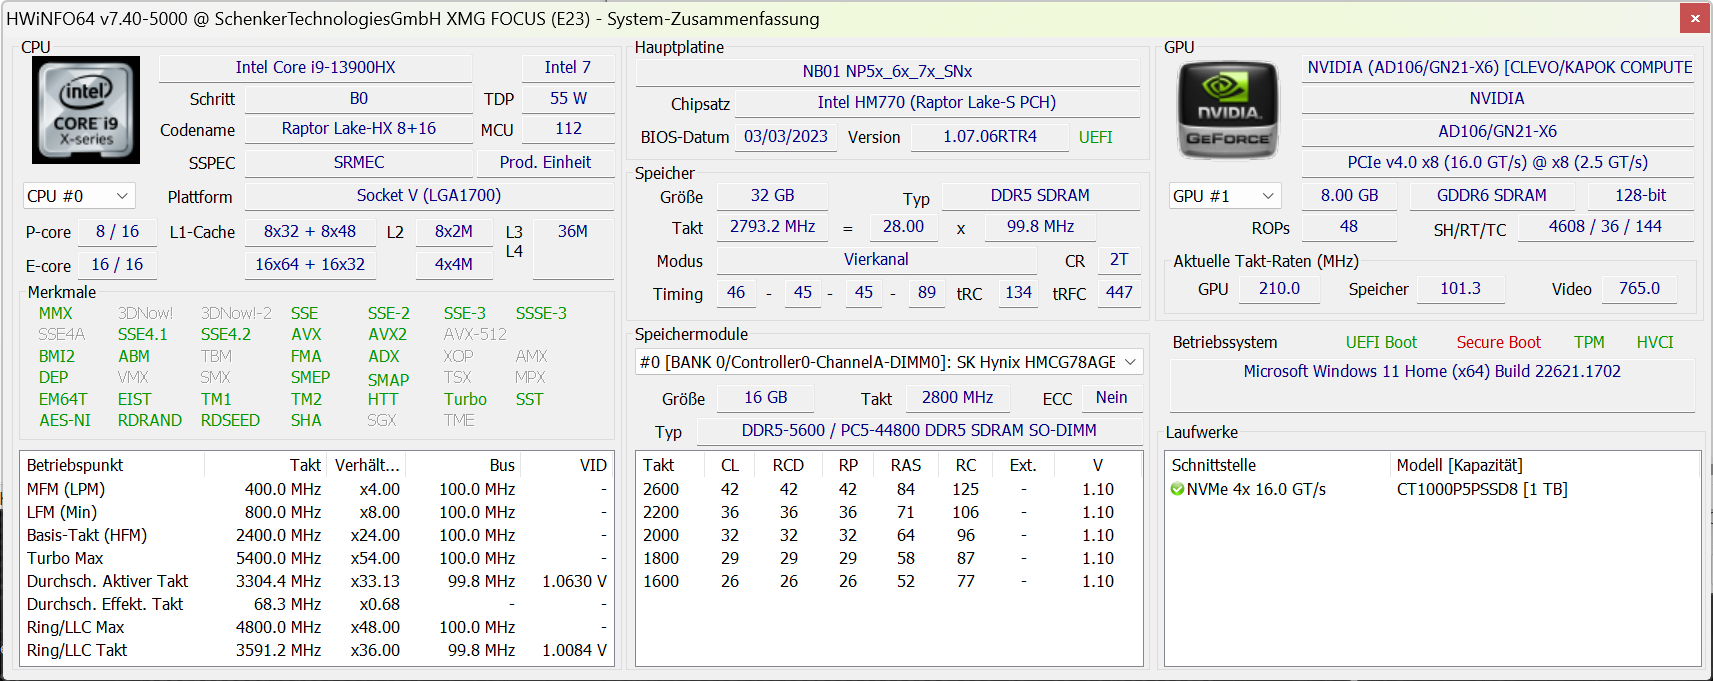
Processore
Un totale di 32 thread e 36 MB di cache di livello 3, oltre alla frequenza di clock massima di 5,4 GHz, lo indicano: Il Intel Core i9-13900HX è attualmente una delle migliori CPU mobili. Viene utilizzato in modo ottimale per il multitasking e per le applicazioni ad alta intensità di calcolo e lascia il predecessore Intel Core i9-12900HX o un AMD Ryzen 7 7745HX dietro.
Nell'XMG Focus 17, la CPU riceve fino a 162 W per frazioni di secondo. Almeno 135 W possono essere alimentati per mezzo minuto. Purtroppo, il raffreddamento non è in grado di gestire l'elevato sviluppo di calore. Nel Medion Erazer Major X20, lo stesso processore rimane stabile al massimo delle prestazioni. Nel Focus 17, le prestazioni scendono di oltre il 20% nel test Cinebench R15. Tuttavia, l'i9 dell'Omen 17-ck2097ng di HP perde addirittura il 30%, quindi il comportamento complessivo sembra accettabile.
Il fatto che il processore sia in qualche modo sovradimensionato diventa evidente quando guardiamo la "Modalità Intrattenimento". Anche in questo caso la ventola rimane rumorosa, sebbene l'alimentatore sia stato abbassato da 135 W a 55 W. Allo stesso tempo, non rileviamo una grave riduzione delle prestazioni, soprattutto nei giochi. Questo perché la CPU può funzionare in modo sufficientemente stabile con questo consumo energetico solo nel lungo periodo. Di conseguenza, la modalità di risparmio energetico ha effetto solo durante i carichi a breve termine.
Sono concessi solo 15 W nelle modalità silenziosa e di risparmio energetico e 30 W per brevi periodi.
Ulteriori misurazioni, dati di confronto e informazioni sono disponibili nel nostro Elenco dei benchmark delle CPU.
Cinebench R15 Multi loop
Cinebench R23: Multi Core | Single Core
Cinebench R20: CPU (Multi Core) | CPU (Single Core)
Cinebench R15: CPU Multi 64Bit | CPU Single 64Bit
Blender: v2.79 BMW27 CPU
7-Zip 18.03: 7z b 4 | 7z b 4 -mmt1
Geekbench 5.5: Multi-Core | Single-Core
HWBOT x265 Benchmark v2.2: 4k Preset
LibreOffice : 20 Documents To PDF
R Benchmark 2.5: Overall mean
| CPU Performance rating | |
| Media Intel Core i9-13900HX | |
| Medion Erazer Major X20 | |
| HP Omen 17-ck2097ng | |
| Schenker XMG Focus 17 (E23) | |
| Media della classe Gaming | |
| MSI Titan GT77 12UHS | |
| Lenovo Legion Pro 5 16ARX8 | |
| Medion Erazer Defender P40 | |
| Schenker XMG Neo 17 M22 | |
| Cinebench R23 / Multi Core | |
| Media Intel Core i9-13900HX (24270 - 32623, n=23) | |
| Medion Erazer Major X20 | |
| Schenker XMG Focus 17 (E23) | |
| HP Omen 17-ck2097ng | |
| Media della classe Gaming (10488 - 42661, n=107, ultimi 2 anni) | |
| MSI Titan GT77 12UHS | |
| Medion Erazer Defender P40 | |
| Lenovo Legion Pro 5 16ARX8 | |
| Schenker XMG Neo 17 M22 | |
| Cinebench R23 / Single Core | |
| HP Omen 17-ck2097ng | |
| Media Intel Core i9-13900HX (1867 - 2105, n=20) | |
| Medion Erazer Major X20 | |
| Media della classe Gaming (1166 - 2415, n=107, ultimi 2 anni) | |
| Schenker XMG Focus 17 (E23) | |
| MSI Titan GT77 12UHS | |
| Lenovo Legion Pro 5 16ARX8 | |
| Medion Erazer Defender P40 | |
| Schenker XMG Neo 17 M22 | |
| Cinebench R20 / CPU (Multi Core) | |
| Media Intel Core i9-13900HX (9152 - 12541, n=21) | |
| Medion Erazer Major X20 | |
| Media della classe Gaming (4029 - 16433, n=106, ultimi 2 anni) | |
| Schenker XMG Focus 17 (E23) | |
| HP Omen 17-ck2097ng | |
| MSI Titan GT77 12UHS | |
| Medion Erazer Defender P40 | |
| Lenovo Legion Pro 5 16ARX8 | |
| Schenker XMG Neo 17 M22 | |
| Cinebench R20 / CPU (Single Core) | |
| HP Omen 17-ck2097ng | |
| Media Intel Core i9-13900HX (722 - 810, n=21) | |
| Media della classe Gaming (442 - 913, n=106, ultimi 2 anni) | |
| Medion Erazer Major X20 | |
| Schenker XMG Focus 17 (E23) | |
| MSI Titan GT77 12UHS | |
| Lenovo Legion Pro 5 16ARX8 | |
| Medion Erazer Defender P40 | |
| Schenker XMG Neo 17 M22 | |
| Cinebench R15 / CPU Multi 64Bit | |
| Media Intel Core i9-13900HX (3913 - 4970, n=22) | |
| Schenker XMG Focus 17 (E23) | |
| Medion Erazer Major X20 | |
| HP Omen 17-ck2097ng | |
| Media della classe Gaming (1578 - 6330, n=105, ultimi 2 anni) | |
| MSI Titan GT77 12UHS | |
| Medion Erazer Defender P40 | |
| Lenovo Legion Pro 5 16ARX8 | |
| Schenker XMG Neo 17 M22 | |
| Cinebench R15 / CPU Single 64Bit | |
| HP Omen 17-ck2097ng | |
| Medion Erazer Major X20 | |
| Media della classe Gaming (188.8 - 350, n=106, ultimi 2 anni) | |
| Lenovo Legion Pro 5 16ARX8 | |
| Media Intel Core i9-13900HX (247 - 304, n=22) | |
| Schenker XMG Focus 17 (E23) | |
| MSI Titan GT77 12UHS | |
| Schenker XMG Neo 17 M22 | |
| Medion Erazer Defender P40 | |
| Blender / v2.79 BMW27 CPU | |
| Schenker XMG Neo 17 M22 | |
| Medion Erazer Defender P40 | |
| Lenovo Legion Pro 5 16ARX8 | |
| HP Omen 17-ck2097ng | |
| Media della classe Gaming (79 - 330, n=104, ultimi 2 anni) | |
| MSI Titan GT77 12UHS | |
| Schenker XMG Focus 17 (E23) | |
| Media Intel Core i9-13900HX (101 - 153, n=22) | |
| Medion Erazer Major X20 | |
| 7-Zip 18.03 / 7z b 4 | |
| Medion Erazer Major X20 | |
| Media Intel Core i9-13900HX (90675 - 127283, n=21) | |
| Schenker XMG Focus 17 (E23) | |
| HP Omen 17-ck2097ng | |
| Media della classe Gaming (33491 - 148086, n=105, ultimi 2 anni) | |
| MSI Titan GT77 12UHS | |
| Lenovo Legion Pro 5 16ARX8 | |
| Medion Erazer Defender P40 | |
| Schenker XMG Neo 17 M22 | |
| 7-Zip 18.03 / 7z b 4 -mmt1 | |
| Lenovo Legion Pro 5 16ARX8 | |
| HP Omen 17-ck2097ng | |
| Medion Erazer Major X20 | |
| Media Intel Core i9-13900HX (6340 - 7177, n=21) | |
| Schenker XMG Focus 17 (E23) | |
| Media della classe Gaming (4199 - 7436, n=105, ultimi 2 anni) | |
| MSI Titan GT77 12UHS | |
| Schenker XMG Neo 17 M22 | |
| Medion Erazer Defender P40 | |
| Geekbench 5.5 / Multi-Core | |
| HP Omen 17-ck2097ng | |
| Media Intel Core i9-13900HX (17614 - 21075, n=22) | |
| Medion Erazer Major X20 | |
| Schenker XMG Focus 17 (E23) | |
| Media della classe Gaming (6460 - 28263, n=105, ultimi 2 anni) | |
| MSI Titan GT77 12UHS | |
| Medion Erazer Defender P40 | |
| Lenovo Legion Pro 5 16ARX8 | |
| Schenker XMG Neo 17 M22 | |
| Geekbench 5.5 / Single-Core | |
| HP Omen 17-ck2097ng | |
| Media della classe Gaming (986 - 2474, n=105, ultimi 2 anni) | |
| Lenovo Legion Pro 5 16ARX8 | |
| Medion Erazer Major X20 | |
| Media Intel Core i9-13900HX (1345 - 2093, n=22) | |
| Schenker XMG Focus 17 (E23) | |
| MSI Titan GT77 12UHS | |
| Medion Erazer Defender P40 | |
| Schenker XMG Neo 17 M22 | |
| HWBOT x265 Benchmark v2.2 / 4k Preset | |
| Media Intel Core i9-13900HX (23.5 - 34.4, n=22) | |
| Medion Erazer Major X20 | |
| Media della classe Gaming (11.5 - 44.4, n=105, ultimi 2 anni) | |
| Schenker XMG Focus 17 (E23) | |
| MSI Titan GT77 12UHS | |
| HP Omen 17-ck2097ng | |
| Lenovo Legion Pro 5 16ARX8 | |
| Medion Erazer Defender P40 | |
| Schenker XMG Neo 17 M22 | |
| LibreOffice / 20 Documents To PDF | |
| Schenker XMG Neo 17 M22 | |
| Schenker XMG Focus 17 (E23) | |
| Medion Erazer Defender P40 | |
| Media della classe Gaming (33.2 - 88.8, n=105, ultimi 2 anni) | |
| HP Omen 17-ck2097ng | |
| Media Intel Core i9-13900HX (32.8 - 51.1, n=21) | |
| Medion Erazer Major X20 | |
| MSI Titan GT77 12UHS | |
| Lenovo Legion Pro 5 16ARX8 | |
| R Benchmark 2.5 / Overall mean | |
| Medion Erazer Defender P40 | |
| Schenker XMG Neo 17 M22 | |
| Media della classe Gaming (0.3439 - 0.759, n=106, ultimi 2 anni) | |
| Schenker XMG Focus 17 (E23) | |
| Lenovo Legion Pro 5 16ARX8 | |
| MSI Titan GT77 12UHS | |
| Media Intel Core i9-13900HX (0.375 - 0.4564, n=22) | |
| Medion Erazer Major X20 | |
| HP Omen 17-ck2097ng | |
* ... Meglio usare valori piccoli
AIDA64: FP32 Ray-Trace | FPU Julia | CPU SHA3 | CPU Queen | FPU SinJulia | FPU Mandel | CPU AES | CPU ZLib | FP64 Ray-Trace | CPU PhotoWorxx
| Performance rating | |
| Media della classe Gaming | |
| Media Intel Core i9-13900HX | |
| Medion Erazer Major X20 | |
| Schenker XMG Focus 17 (E23) | |
| Lenovo Legion Pro 5 16ARX8 | |
| HP Omen 17-ck2097ng | |
| Schenker XMG Neo 17 M22 | |
| Medion Erazer Defender P40 | |
| AIDA64 / FP32 Ray-Trace | |
| Media della classe Gaming (10227 - 85542, n=105, ultimi 2 anni) | |
| Lenovo Legion Pro 5 16ARX8 | |
| Medion Erazer Major X20 | |
| Media Intel Core i9-13900HX (17589 - 27615, n=22) | |
| Schenker XMG Focus 17 (E23) | |
| HP Omen 17-ck2097ng | |
| Schenker XMG Neo 17 M22 | |
| Medion Erazer Defender P40 | |
| AIDA64 / FPU Julia | |
| Media della classe Gaming (51376 - 238426, n=105, ultimi 2 anni) | |
| Medion Erazer Major X20 | |
| Media Intel Core i9-13900HX (88686 - 137015, n=22) | |
| Lenovo Legion Pro 5 16ARX8 | |
| Schenker XMG Focus 17 (E23) | |
| Schenker XMG Neo 17 M22 | |
| HP Omen 17-ck2097ng | |
| Medion Erazer Defender P40 | |
| AIDA64 / CPU SHA3 | |
| Media della classe Gaming (2180 - 10115, n=105, ultimi 2 anni) | |
| Medion Erazer Major X20 | |
| Media Intel Core i9-13900HX (4362 - 7029, n=22) | |
| Schenker XMG Focus 17 (E23) | |
| Lenovo Legion Pro 5 16ARX8 | |
| HP Omen 17-ck2097ng | |
| Schenker XMG Neo 17 M22 | |
| Medion Erazer Defender P40 | |
| AIDA64 / CPU Queen | |
| Schenker XMG Focus 17 (E23) | |
| HP Omen 17-ck2097ng | |
| Medion Erazer Major X20 | |
| Media Intel Core i9-13900HX (125644 - 141385, n=22) | |
| Lenovo Legion Pro 5 16ARX8 | |
| Media della classe Gaming (49785 - 173351, n=90, ultimi 2 anni) | |
| Medion Erazer Defender P40 | |
| Schenker XMG Neo 17 M22 | |
| AIDA64 / FPU SinJulia | |
| Lenovo Legion Pro 5 16ARX8 | |
| Medion Erazer Major X20 | |
| Media Intel Core i9-13900HX (12334 - 17179, n=22) | |
| Media della classe Gaming (4424 - 33636, n=105, ultimi 2 anni) | |
| Schenker XMG Focus 17 (E23) | |
| Schenker XMG Neo 17 M22 | |
| HP Omen 17-ck2097ng | |
| Medion Erazer Defender P40 | |
| AIDA64 / FPU Mandel | |
| Media della classe Gaming (25115 - 128721, n=105, ultimi 2 anni) | |
| Lenovo Legion Pro 5 16ARX8 | |
| Medion Erazer Major X20 | |
| Media Intel Core i9-13900HX (43850 - 69202, n=22) | |
| Schenker XMG Neo 17 M22 | |
| Schenker XMG Focus 17 (E23) | |
| HP Omen 17-ck2097ng | |
| Medion Erazer Defender P40 | |
| AIDA64 / CPU AES | |
| Media Intel Core i9-13900HX (89413 - 237881, n=22) | |
| Schenker XMG Neo 17 M22 | |
| Medion Erazer Major X20 | |
| Media della classe Gaming (39258 - 247074, n=105, ultimi 2 anni) | |
| Schenker XMG Focus 17 (E23) | |
| HP Omen 17-ck2097ng | |
| Medion Erazer Defender P40 | |
| Lenovo Legion Pro 5 16ARX8 | |
| AIDA64 / CPU ZLib | |
| Medion Erazer Major X20 | |
| Media Intel Core i9-13900HX (1284 - 1958, n=22) | |
| Schenker XMG Focus 17 (E23) | |
| Media della classe Gaming (574 - 2531, n=105, ultimi 2 anni) | |
| HP Omen 17-ck2097ng | |
| Lenovo Legion Pro 5 16ARX8 | |
| Medion Erazer Defender P40 | |
| Schenker XMG Neo 17 M22 | |
| AIDA64 / FP64 Ray-Trace | |
| Media della classe Gaming (5509 - 45446, n=105, ultimi 2 anni) | |
| Lenovo Legion Pro 5 16ARX8 | |
| Medion Erazer Major X20 | |
| Media Intel Core i9-13900HX (9481 - 15279, n=22) | |
| Schenker XMG Focus 17 (E23) | |
| HP Omen 17-ck2097ng | |
| Schenker XMG Neo 17 M22 | |
| Medion Erazer Defender P40 | |
| AIDA64 / CPU PhotoWorxx | |
| HP Omen 17-ck2097ng | |
| Schenker XMG Focus 17 (E23) | |
| Media Intel Core i9-13900HX (42994 - 51994, n=22) | |
| Media della classe Gaming (12271 - 89891, n=105, ultimi 2 anni) | |
| Medion Erazer Major X20 | |
| Medion Erazer Defender P40 | |
| Schenker XMG Neo 17 M22 | |
| Lenovo Legion Pro 5 16ARX8 | |
Prestazioni del sistema
Molti core del processore, molta RAM ad accesso rapido e un'unità SSD veloce guidano il sistema in ogni situazione. Anche un gioco in pausa in background rallenta solo un po'. Dal multitasking estensivo con software di editing video aperti alle innumerevoli schede del browser, quasi nulla causa a Focus 17 seri problemi.
Sebbene sia relativamente indietro rispetto ai rivali con hardware simile, raggiunge comunque una valutazione più che solida che promette prestazioni più che sufficienti per le attività più impegnative.
CrossMark: Overall | Productivity | Creativity | Responsiveness
| PCMark 10 / Score | |
| Media della classe Gaming (5828 - 12414, n=93, ultimi 2 anni) | |
| Lenovo Legion Pro 5 16ARX8 | |
| HP Omen 17-ck2097ng | |
| Medion Erazer Major X20 | |
| Media Intel Core i9-13900HX, NVIDIA GeForce RTX 4070 Laptop GPU (6956 - 8153, n=3) | |
| Schenker XMG Neo 17 M22 | |
| Schenker XMG Focus 17 (E23) | |
| Medion Erazer Defender P40 | |
| PCMark 10 / Essentials | |
| HP Omen 17-ck2097ng | |
| Medion Erazer Major X20 | |
| Lenovo Legion Pro 5 16ARX8 | |
| Media Intel Core i9-13900HX, NVIDIA GeForce RTX 4070 Laptop GPU (9865 - 11653, n=3) | |
| Media della classe Gaming (8810 - 11935, n=97, ultimi 2 anni) | |
| Schenker XMG Focus 17 (E23) | |
| Medion Erazer Defender P40 | |
| Schenker XMG Neo 17 M22 | |
| PCMark 10 / Productivity | |
| Media della classe Gaming (6845 - 25323, n=95, ultimi 2 anni) | |
| Lenovo Legion Pro 5 16ARX8 | |
| HP Omen 17-ck2097ng | |
| Medion Erazer Major X20 | |
| Medion Erazer Defender P40 | |
| Media Intel Core i9-13900HX, NVIDIA GeForce RTX 4070 Laptop GPU (9470 - 9850, n=3) | |
| Schenker XMG Neo 17 M22 | |
| Schenker XMG Focus 17 (E23) | |
| PCMark 10 / Digital Content Creation | |
| Media della classe Gaming (7602 - 19954, n=95, ultimi 2 anni) | |
| Lenovo Legion Pro 5 16ARX8 | |
| Media Intel Core i9-13900HX, NVIDIA GeForce RTX 4070 Laptop GPU (9776 - 13370, n=3) | |
| Medion Erazer Major X20 | |
| HP Omen 17-ck2097ng | |
| Schenker XMG Neo 17 M22 | |
| Schenker XMG Focus 17 (E23) | |
| Medion Erazer Defender P40 | |
| CrossMark / Overall | |
| Schenker XMG Focus 17 (E23) | |
| Lenovo Legion Pro 5 16ARX8 | |
| HP Omen 17-ck2097ng | |
| Media della classe Gaming (1366 - 2409, n=94, ultimi 2 anni) | |
| Media Intel Core i9-13900HX, NVIDIA GeForce RTX 4070 Laptop GPU (1842 - 2029, n=3) | |
| Medion Erazer Major X20 | |
| Medion Erazer Defender P40 | |
| Schenker XMG Neo 17 M22 | |
| CrossMark / Productivity | |
| Lenovo Legion Pro 5 16ARX8 | |
| Schenker XMG Focus 17 (E23) | |
| Media della classe Gaming (1386 - 2254, n=94, ultimi 2 anni) | |
| HP Omen 17-ck2097ng | |
| Media Intel Core i9-13900HX, NVIDIA GeForce RTX 4070 Laptop GPU (1700 - 1872, n=3) | |
| Medion Erazer Major X20 | |
| Schenker XMG Neo 17 M22 | |
| Medion Erazer Defender P40 | |
| CrossMark / Creativity | |
| Schenker XMG Focus 17 (E23) | |
| Media della classe Gaming (1343 - 2786, n=94, ultimi 2 anni) | |
| HP Omen 17-ck2097ng | |
| Media Intel Core i9-13900HX, NVIDIA GeForce RTX 4070 Laptop GPU (2088 - 2316, n=3) | |
| Lenovo Legion Pro 5 16ARX8 | |
| Medion Erazer Major X20 | |
| Medion Erazer Defender P40 | |
| Schenker XMG Neo 17 M22 | |
| CrossMark / Responsiveness | |
| HP Omen 17-ck2097ng | |
| Lenovo Legion Pro 5 16ARX8 | |
| Schenker XMG Focus 17 (E23) | |
| Media della classe Gaming (1226 - 2334, n=94, ultimi 2 anni) | |
| Media Intel Core i9-13900HX, NVIDIA GeForce RTX 4070 Laptop GPU (1557 - 1752, n=3) | |
| Medion Erazer Major X20 | |
| Medion Erazer Defender P40 | |
| Schenker XMG Neo 17 M22 | |
| PCMark 10 Score | 6956 punti | |
Aiuto | ||
| AIDA64 / Memory Copy | |
| HP Omen 17-ck2097ng | |
| Schenker XMG Focus 17 (E23) | |
| Media Intel Core i9-13900HX (67716 - 79193, n=22) | |
| Media della classe Gaming (21750 - 129946, n=105, ultimi 2 anni) | |
| Medion Erazer Major X20 | |
| Medion Erazer Defender P40 | |
| Schenker XMG Neo 17 M22 | |
| Lenovo Legion Pro 5 16ARX8 | |
| AIDA64 / Memory Read | |
| HP Omen 17-ck2097ng | |
| Schenker XMG Focus 17 (E23) | |
| Media Intel Core i9-13900HX (73998 - 88462, n=22) | |
| Media della classe Gaming (22956 - 118858, n=105, ultimi 2 anni) | |
| Medion Erazer Major X20 | |
| Medion Erazer Defender P40 | |
| Schenker XMG Neo 17 M22 | |
| Lenovo Legion Pro 5 16ARX8 | |
| AIDA64 / Memory Write | |
| HP Omen 17-ck2097ng | |
| Media della classe Gaming (22297 - 135096, n=105, ultimi 2 anni) | |
| Schenker XMG Focus 17 (E23) | |
| Media Intel Core i9-13900HX (65472 - 77045, n=22) | |
| Medion Erazer Major X20 | |
| Medion Erazer Defender P40 | |
| Schenker XMG Neo 17 M22 | |
| Lenovo Legion Pro 5 16ARX8 | |
| AIDA64 / Memory Latency | |
| Media della classe Gaming (75.3 - 259, n=105, ultimi 2 anni) | |
| Medion Erazer Defender P40 | |
| Schenker XMG Focus 17 (E23) | |
| Schenker XMG Neo 17 M22 | |
| Medion Erazer Major X20 | |
| Lenovo Legion Pro 5 16ARX8 | |
| Media Intel Core i9-13900HX (75.3 - 91.1, n=22) | |
| HP Omen 17-ck2097ng | |
* ... Meglio usare valori piccoli
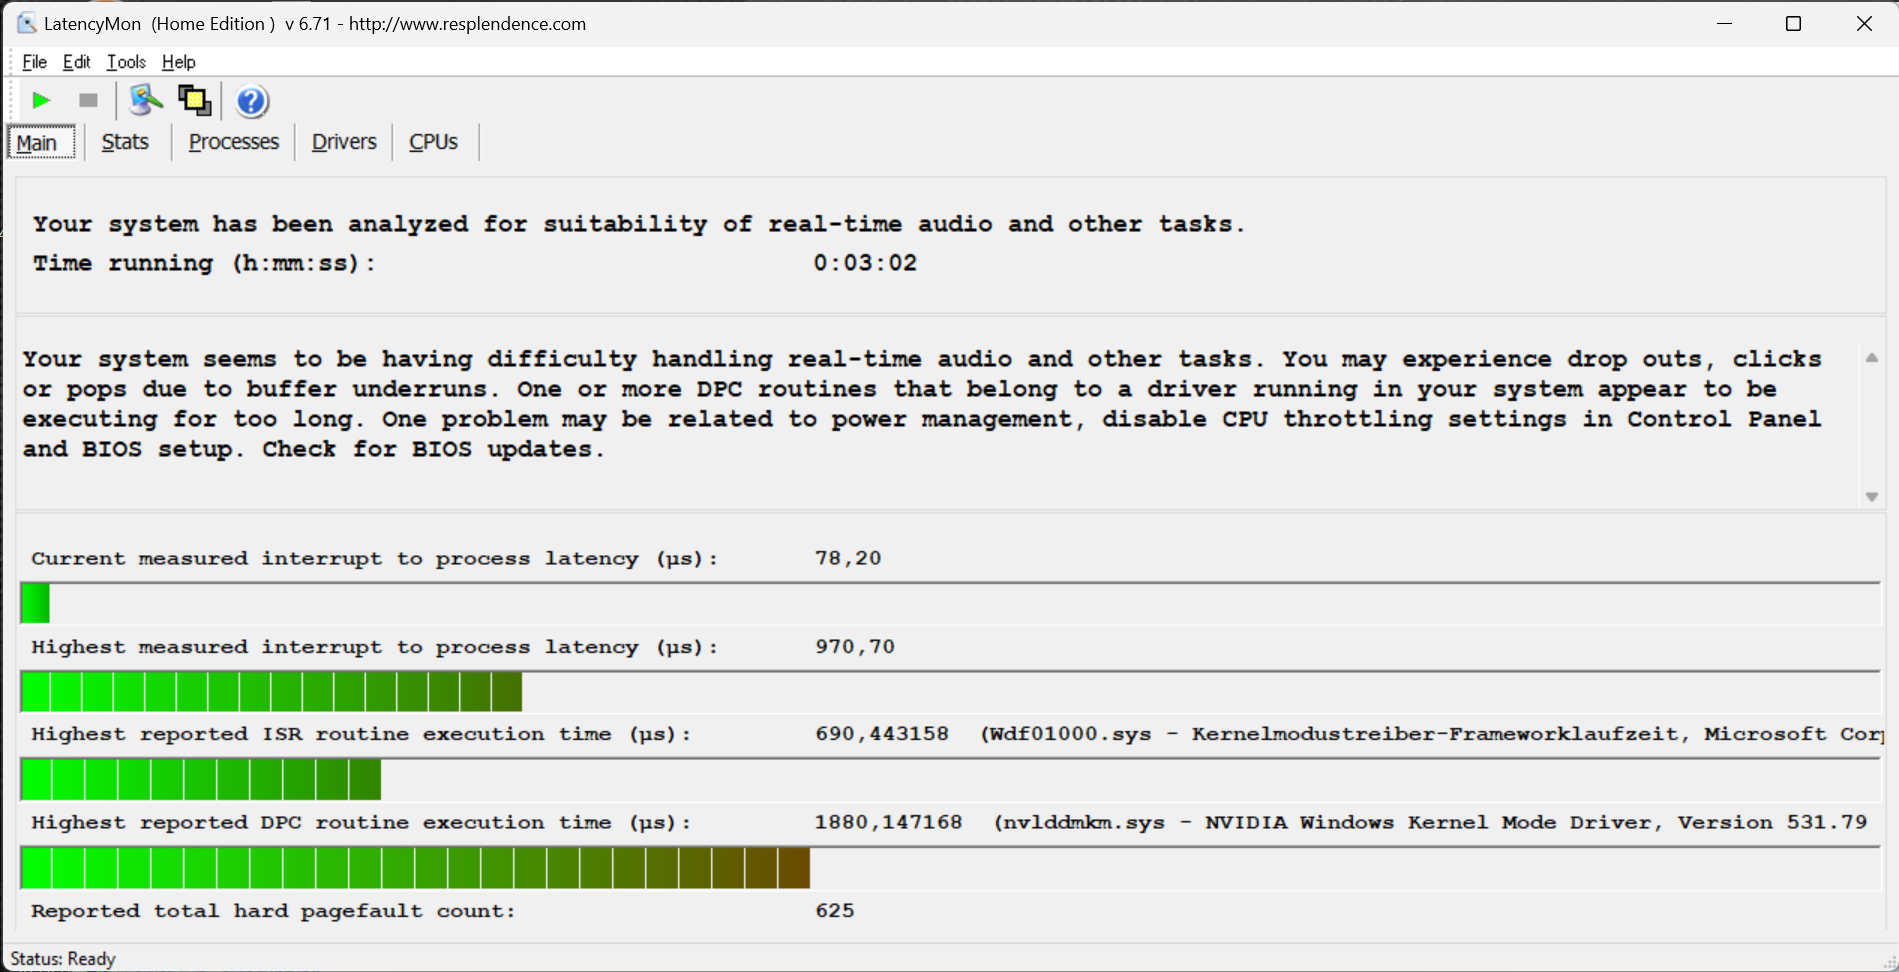
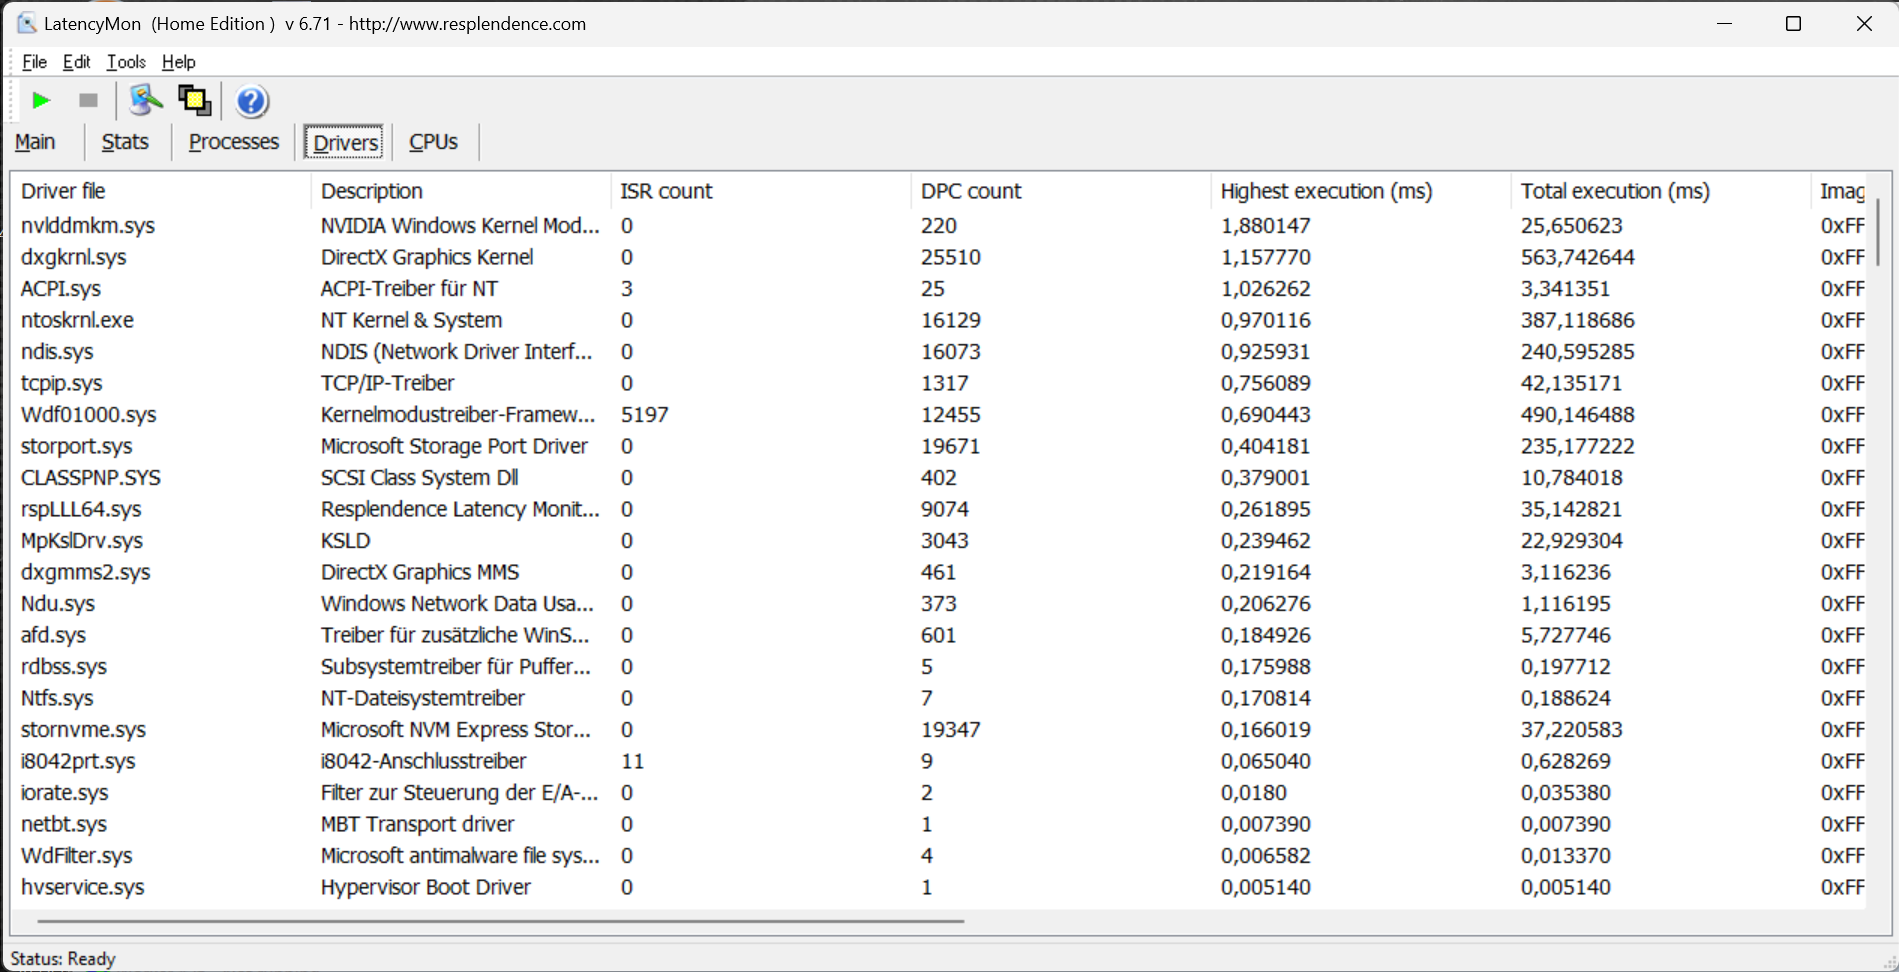
Latenze DPC
Altri notebook da gioco con la stessa CPU hanno prestazioni molto peggiori rispetto all'XMG Focus 17. Non raggiunge un risultato ottimale, ma dovrebbe funzionare in modo soddisfacente nella maggior parte dei compiti in cui è necessario un processo fluido. Non raggiunge un risultato ottimale, ma dovrebbe funzionare in modo soddisfacente nella maggior parte delle attività in cui è necessario un processo fluido. Può fare anche meglio, ma per la maggior parte degli utenti dovrebbe essere un aspetto secondario.
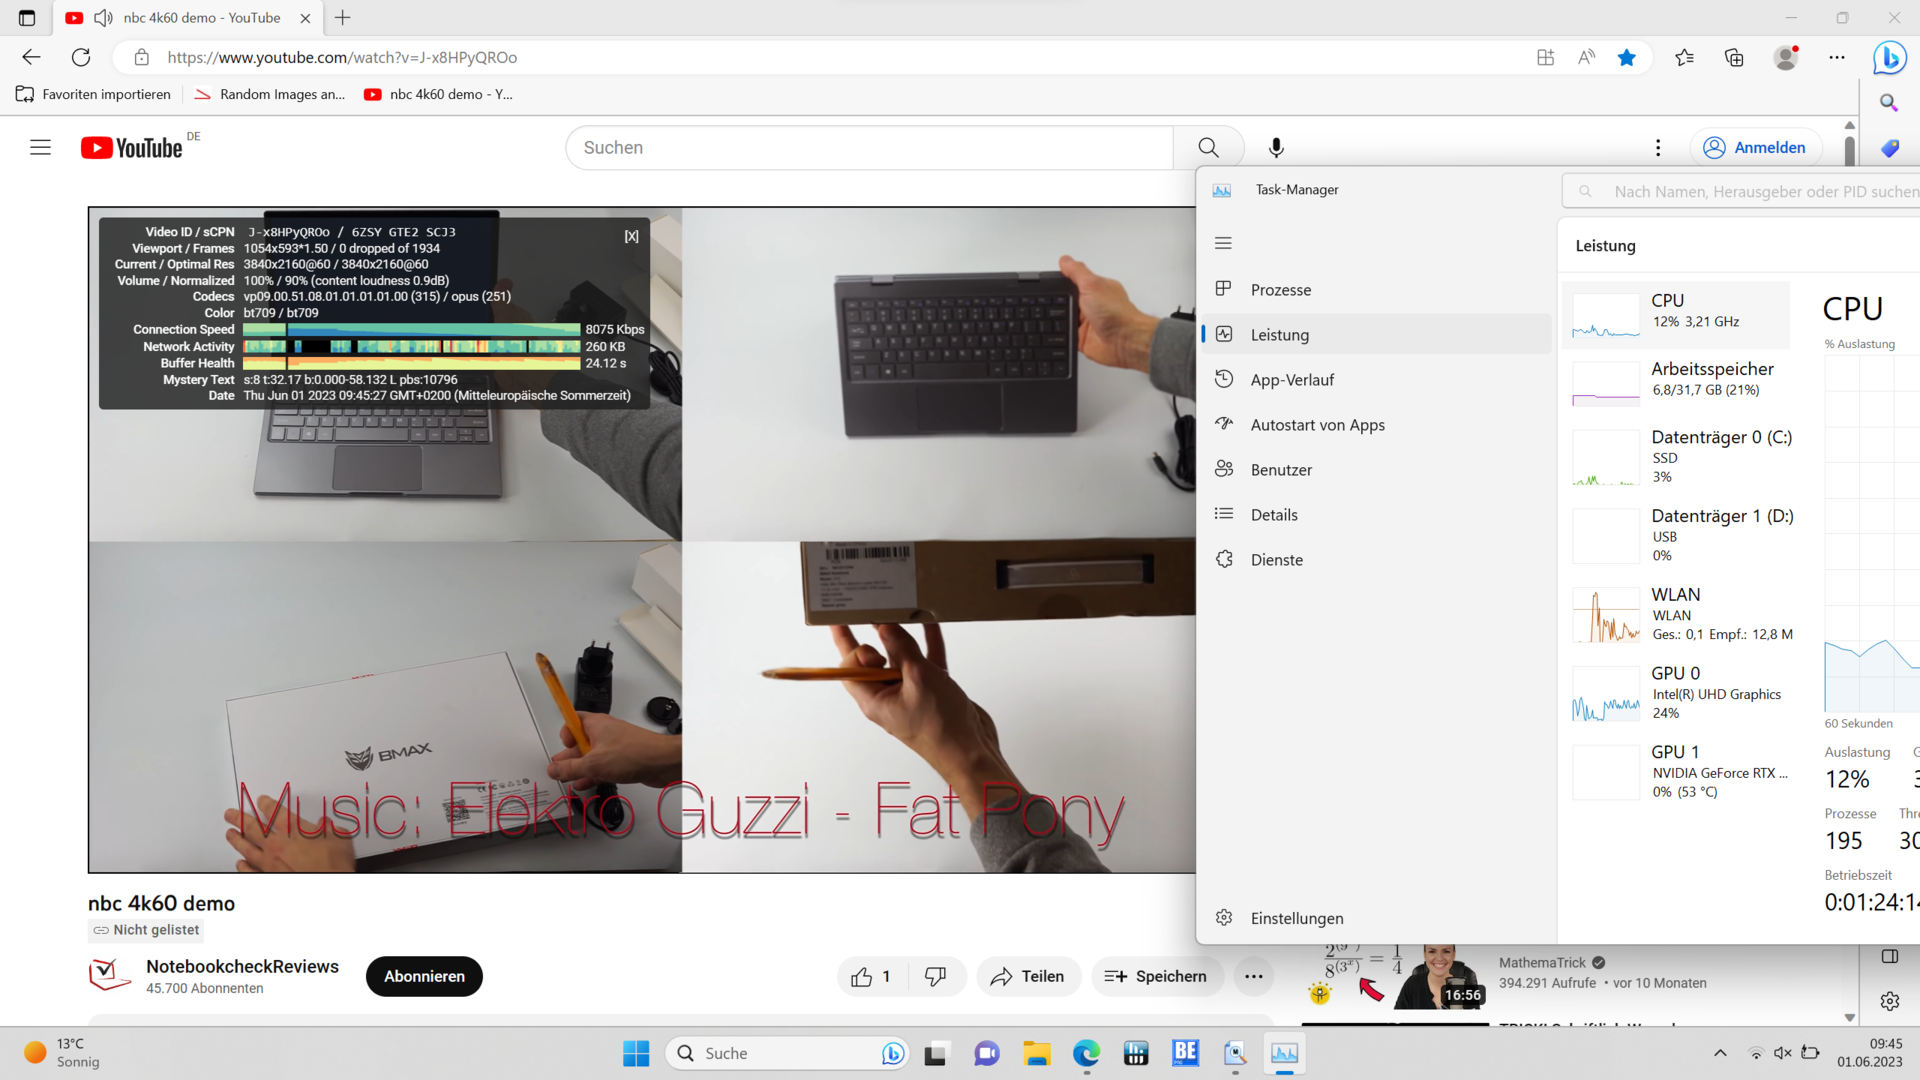
Le maggiori difficoltà sono causate dal driver della scheda grafica di Nvidia, che si spera possa essere migliorato con un aggiornamento in futuro. Lodevole, ma non certo la norma, è anche la riproduzione fluida dei video in 4K senza cadute di fotogrammi. Pertanto, l'attuale build e l'equipaggiamento dei driver sembrano armonizzarsi.
| DPC Latencies / LatencyMon - interrupt to process latency (max), Web, Youtube, Prime95 | |
| Schenker XMG Neo 17 M22 | |
| Medion Erazer Defender P40 | |
| HP Omen 17-ck2097ng | |
| Medion Erazer Major X20 | |
| Schenker XMG Focus 17 (E23) | |
| Lenovo Legion Pro 5 16ARX8 | |
* ... Meglio usare valori piccoli
Memoria di massa
L'SSD M.2 Crucial P5 Plus installato non è un modello premium. Tuttavia, raggiunge buone velocità di trasferimento tramite PCIe 4.0 e rimane molto stabile nei test a lungo termine, grazie al raffreddamento aggiuntivo nella piastra di base del portatile da gioco.
Pertanto, la memoria di massa non presenta ostruzioni o ritardi durante il caricamento, l'esecuzione di programmi e così via.

* ... Meglio usare valori piccoli
Continuous reading: DiskSpd Read Loop, Queue Depth 8
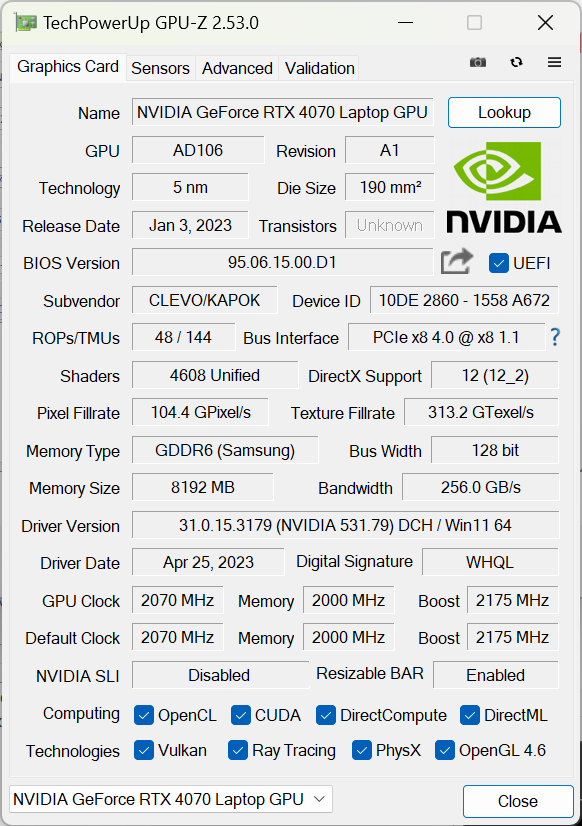
Scheda grafica
Solo poche GPU sono più veloci della Nvidia GeForce RTX 4070, che può a buon diritto classificarsi nella fascia media superiore. Offre 4.608 shader, 144 core tensoriali per Nvidia DLSS e 36 core di ray-tracing. Questo è sufficiente per le attività più impegnative e per i giochi complessi al massimo livello di dettaglio. Solo la VRAM è un po' limitata, con 8 GB. Tuttavia, questo dovrebbe causare problemi solo quando è collegato un monitor 4K. Nei singoli test casuali con la risoluzione QHD nativa dello schermo, non sono mai stati occupati più di 7 GB nei giochi attuali
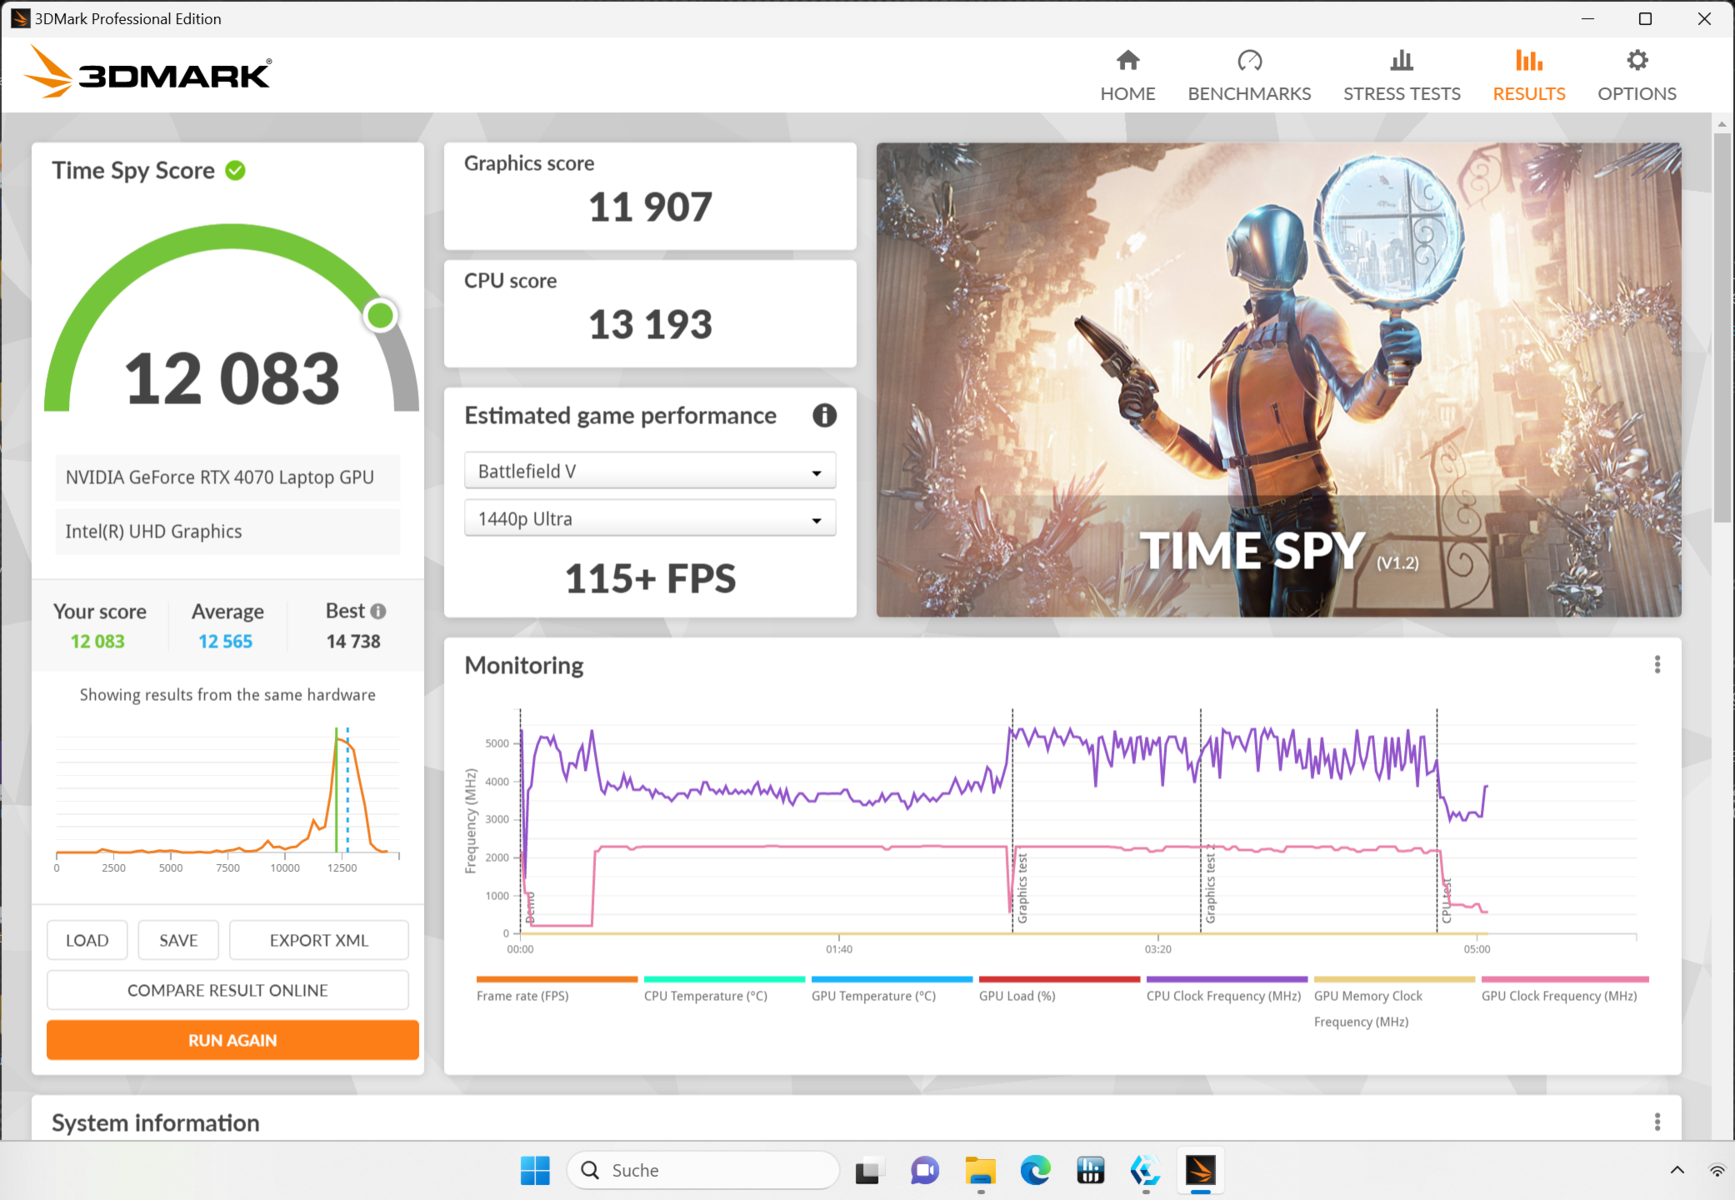
Nel Focus 17 E23, il chip grafico può consumare un massimo di 140 W, con 25 W deviati dal processore come boost dinamico. Questo corrisponde alle impostazioni tipiche della RTX 4070 in un portatile da gioco. Tuttavia, i benchmark sintetici che abbiamo eseguito sono un po' al di sotto delle aspettative perché l'elevato consumo energetico non può essere mantenuto nel tempo.
Nei punteggi 3DMark e nei giochi, il Focus 17 è sempre in ritardo rispetto a un Medion Erazer Major X20 quasi identico o al Lenovo Legion Pro 5 con una CPU diversa. A quanto pare, il grande i9-13900HX con i relativi requisiti di raffreddamento ostacola piuttosto che aiutare nelle applicazioni grafiche. Oltre al Legion Pro, si può citare come esempio l'Asus ROG Strix G18 con RTX 4070 ma il più piccolo i7-13650HX che raggiunge all'incirca le stesse prestazioni.
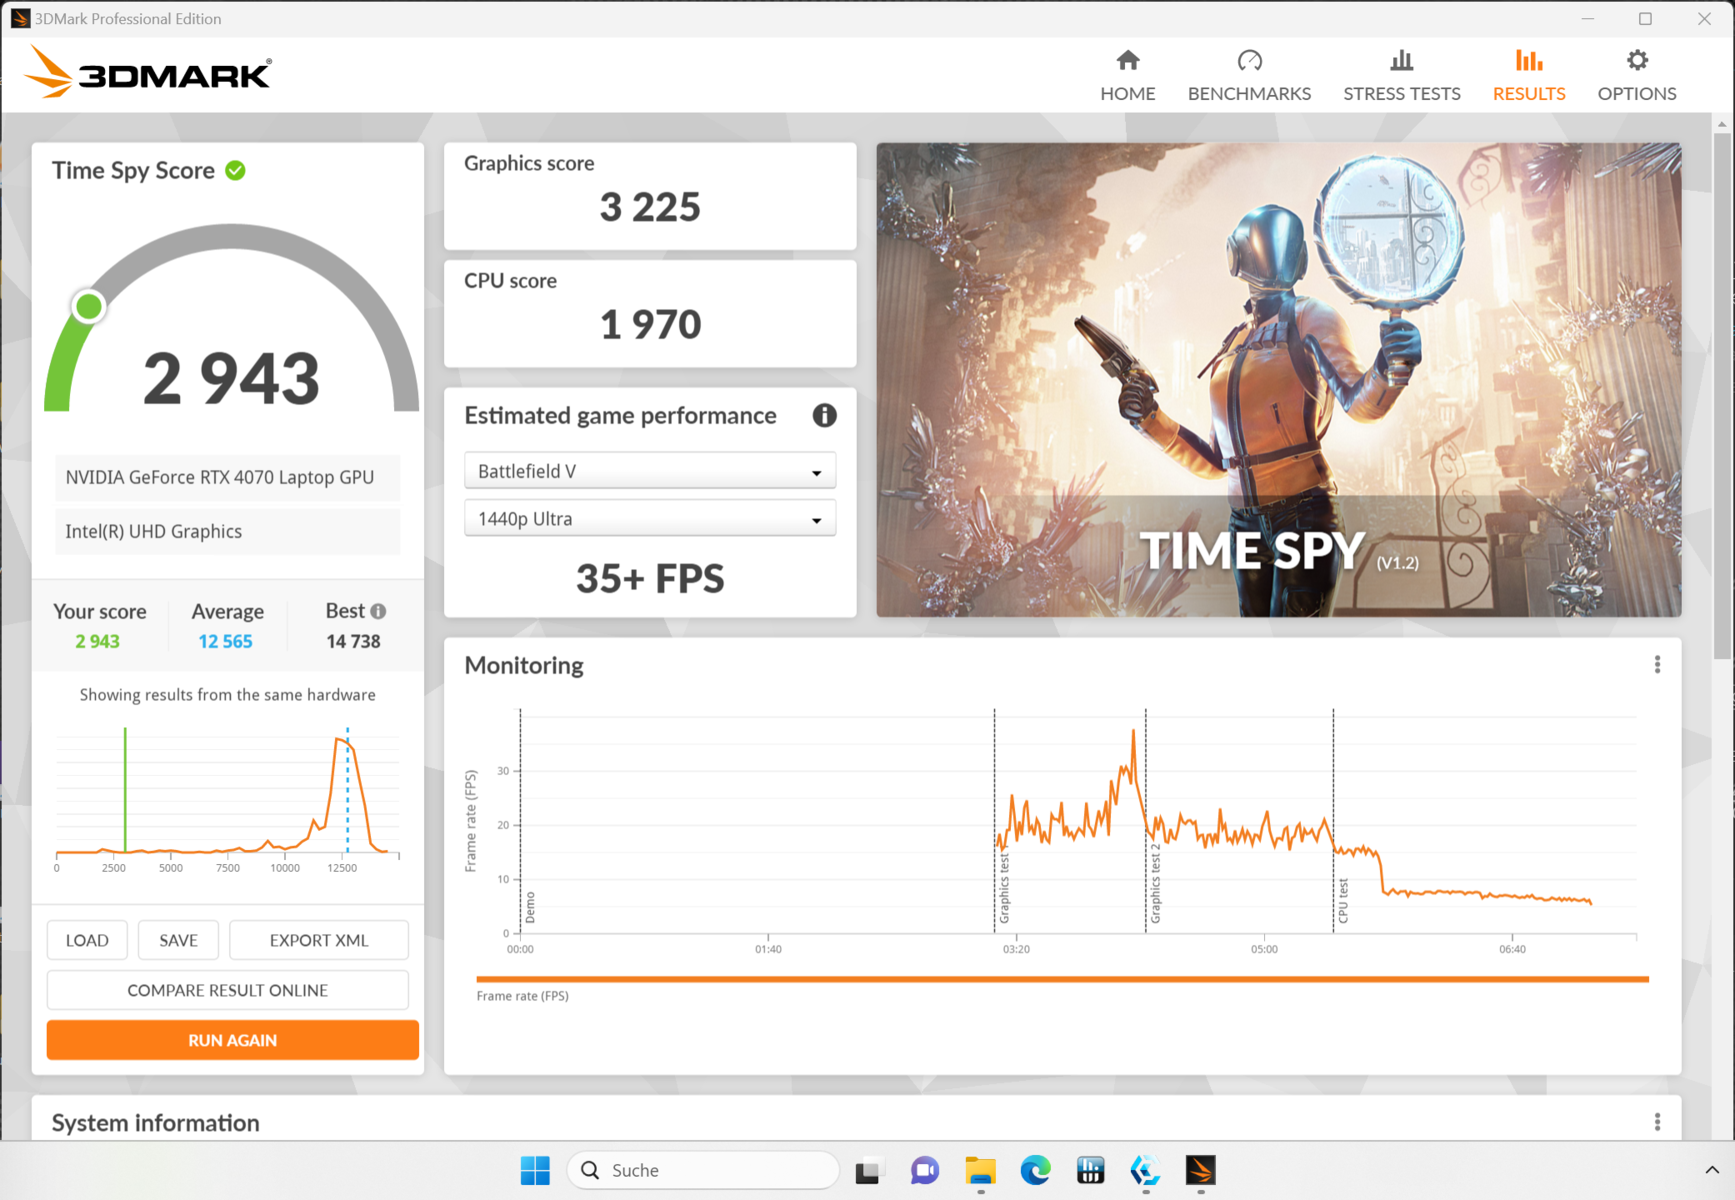
Inoltre, le modalità di prestazione non sembrano ancora mature. Confrontando i risultati del benchmark Time Spy, le prestazioni e le modalità di intrattenimento sono quasi alla pari. Anche nei singoli giochi che abbiamo testato, il divario negli FPS misurati è stato minimo. La modalità silenziosa, che almeno funziona in modo molto silenzioso, invece, cala in modo troppo significativo. I 2.943 punti raggiunti sono stati ottenuti anche dalla AMD Radeon 780M, un chip grafico integrato
Altri benchmark e dati sulle prestazioni sono disponibili nel nostro elenco di benchmark delle GPU Mobile Graphics Cards - Benchmark List .
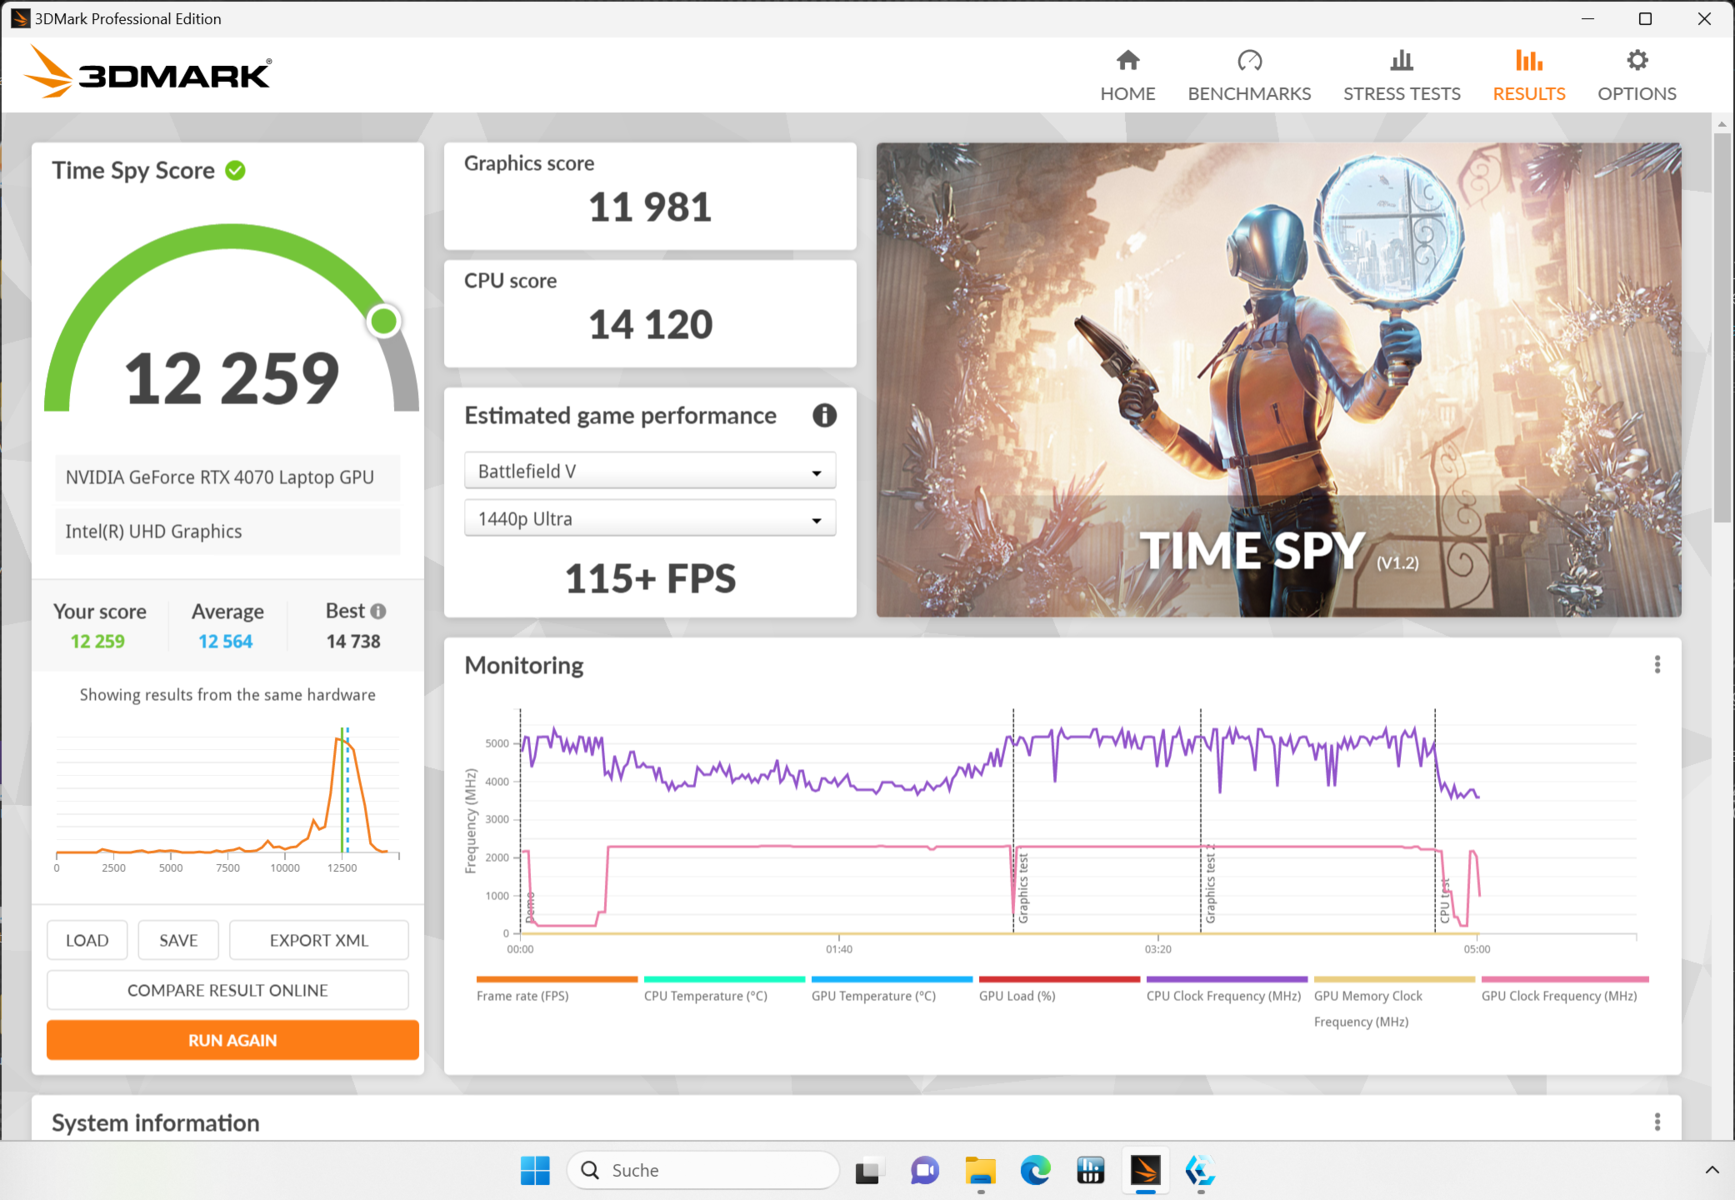
| 3DMark 11 Performance | 33424 punti | |
| 3DMark Cloud Gate Standard Score | 58621 punti | |
| 3DMark Fire Strike Score | 25541 punti | |
| 3DMark Time Spy Score | 12339 punti | |
Aiuto | ||
* ... Meglio usare valori piccoli
Prestazioni di gioco
Tutti i giochi che abbiamo testato raggiungono frame rate almeno soddisfacenti. I tassi sono inferiori a 60 fps solo nei giochi attuali e piuttosto impegnativi al massimo livello di dettaglio e alla risoluzione QHD. Pertanto, l'hardware dovrebbe essere sufficiente per i giochi futuri per un bel po'. La maggior parte dei giochi è giocabile con 100 fps o più quando si rinuncia a qualche dettaglio e si utilizza la risoluzione Full HD
L'XMG Focus 17 si posiziona tra i nostri rivali selezionati con GPU identiche nei giochi per i quali sono disponibili i tassi di confronto. È anche più o meno alla pari con una MSI Titan GT77 Recensione del portatile MSI Titan GT77 12UHS: Il figlio di Alder Lake-HX con prestazioni senza ostacoli di classe desktop con RTX 3080 Ti, che costava circa il doppio quando è stata presentata l'anno scorso. I notebook da gioco con la GPU precedente RTX 3070 possono essere superati di oltre il 10% a seconda del modello.
Poiché la CPU è meno sollecitata nei giochi rispetto a molti altri benchmark, il raffreddamento un po' debole non ha molta importanza. Solo la GPU deve dissipare molto calore, mentre le prestazioni del processore possono essere limitate senza perdite significative di frame rate. Pertanto, il notebook XMG non mostra alcuna debolezza nei giochi, anche se qualche punto percentuale in più a pieno carico sembra realistico.
Tra l'altro, i 140 W massimi che la GPU può consumare non vengono quasi mai raggiunti. Siamo riusciti a provocare un singolo picco di misurazione di 143 W in uno scenario speciale del nostro stress test. Per il resto, il consumo medio di energia nei giochi è di 100 W, che è ancora una volta ben al di sotto dei 115 W che il chip grafico dovrebbe consumare anche senza un boost dinamico.
Tutto indica che il sistema di raffreddamento non riesce a dissipare il calore residuo abbastanza velocemente. Schenker XMG ha spesso dimostrato che una ventola per notebook è in grado di gestire il consumo massimo di energia del chip grafico in modo permanente - si veda ad esempio l'XMG Neo 16 E23 XMG Neo 16 E23.
| Star Wars Jedi Survivor | |
| 1920x1080 Epic Preset | |
| Lenovo Legion Pro 5 16ARX8 | |
| Schenker XMG Focus 17 (E23) | |
| Media NVIDIA GeForce RTX 4070 Laptop GPU (61.5 - 80.1, n=8) | |
| Medion Erazer Defender P40 | |
| 2560x1440 Epic Preset | |
| Lenovo Legion Pro 5 16ARX8 | |
| Media NVIDIA GeForce RTX 4070 Laptop GPU (39.5 - 51.1, n=8) | |
| Schenker XMG Focus 17 (E23) | |
| Medion Erazer Defender P40 | |
Il test di resistenza con Witcher 3 non riserva sorprese. Questo è da intendersi come completamente positivo. Non si osservano cali di prestazioni o throttling costante. Le tipiche fluttuazioni possono essere spiegate dal cambiamento dell'ora del giorno nel gioco. Di conseguenza, non si dovrebbero osservare cali di frame rate in altri giochi nel corso del tempo.
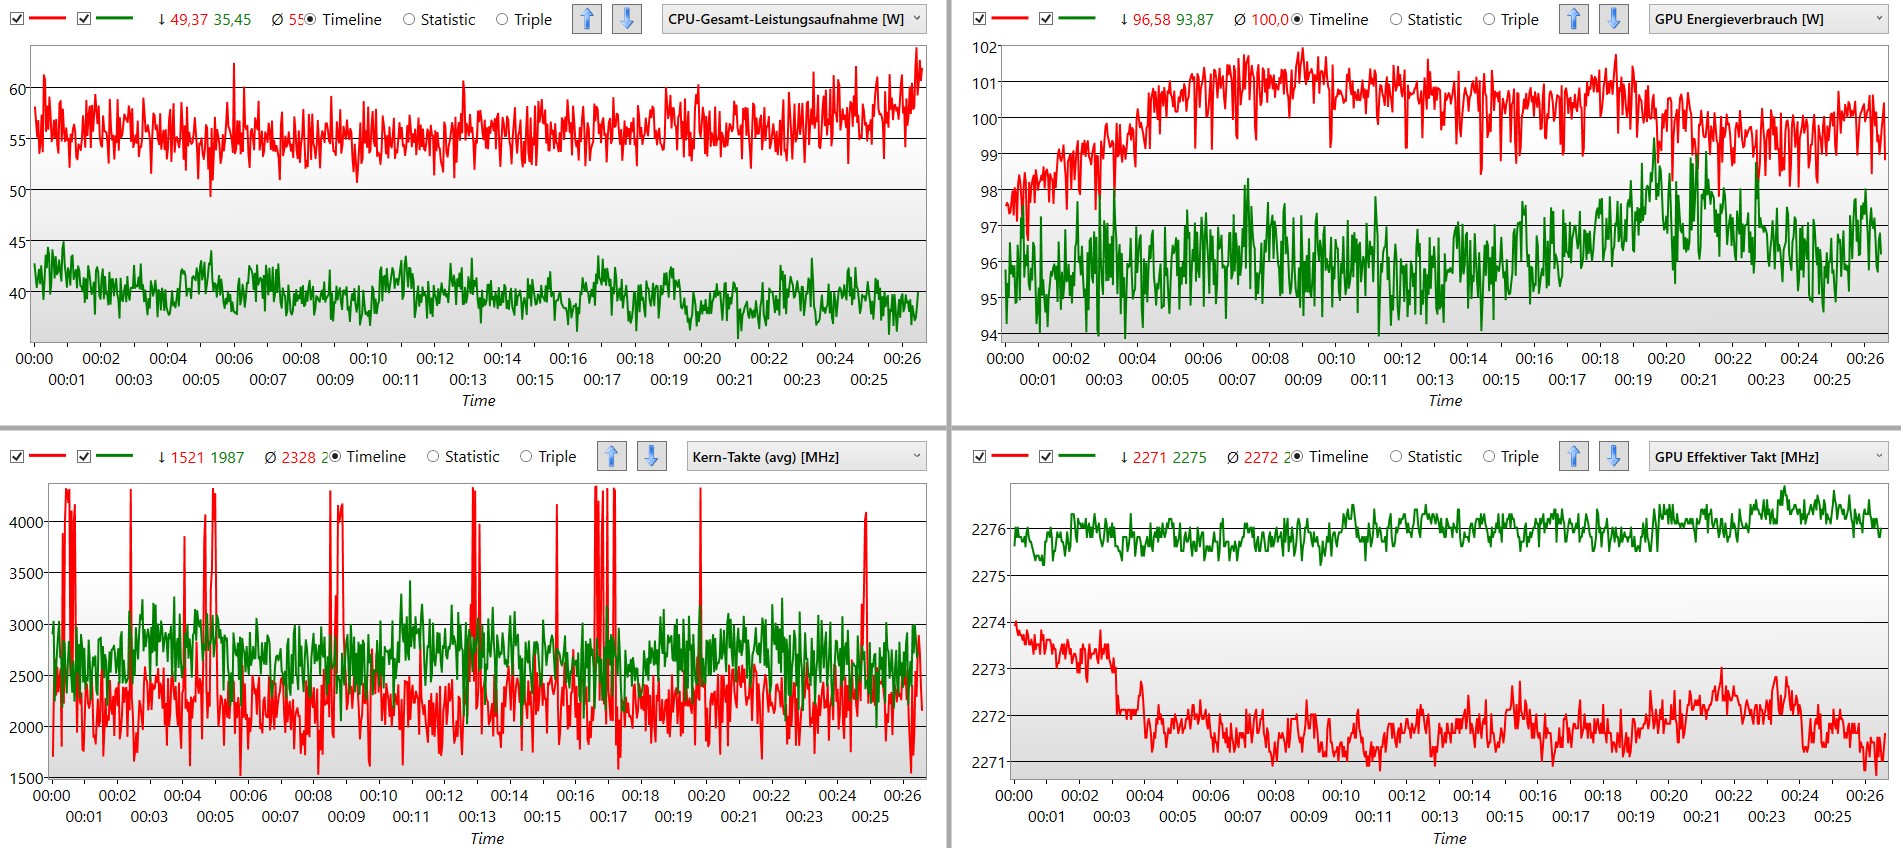
Nel test di resistenza del gioco, abbiamo potuto verificare ancora una volta il comportamento delle modalità intrattenimento e prestazioni. In modalità intrattenimento, il sistema richiede quasi 20 W in meno, mentre la GPU ha una frequenza di clock più alta rispetto alla modalità prestazioni. Il comportamento della CPU sembra più regolare e di solito anche la frequenza di clock (verde) è leggermente superiore rispetto alla modalità prestazioni. Con un consumo energetico inferiore e uno sviluppo del rumore leggermente più basso, misuriamo anche lo stesso frame rate.
Witcher 3 FPS chart
| basso | medio | alto | ultra | QHD | |
|---|---|---|---|---|---|
| GTA V (2015) | 180.8 | 117.4 | 88.5 | ||
| The Witcher 3 (2015) | 226 | 115 | |||
| Dota 2 Reborn (2015) | 177.3 | 164.5 | |||
| Final Fantasy XV Benchmark (2018) | 114.8 | 81.3 | |||
| X-Plane 11.11 (2018) | 123 | ||||
| Far Cry 5 (2018) | 145 | 136 | 112 | ||
| Strange Brigade (2018) | 247 | 211 | 135.2 | ||
| Cyberpunk 2077 1.6 (2022) | 100.7 | 102.3 | 63.9 | ||
| F1 22 (2022) | 211 | 77.8 | 49 | ||
| Hogwarts Legacy (2023) | 86 | 71 | 50 | ||
| Star Wars Jedi Survivor (2023) | 79 | 73 | 45 |
Emissioni - La Focus 17 può essere silenziosa
Emissioni acustiche
Il Focus 17 è uno dei rappresentanti più rumorosi della sua categoria. È chiaramente udibile con circa 58 dB, anche attraverso una porta chiusa. Tuttavia, ilMedion Erazer Defender P40 dimostra di poter essere ancora più rumoroso. Nonostante il chip grafico più piccolo, raggiunge chiaramente oltre 60 dB.
L'aumento della ventola durante il normale utilizzo del portatile, lontano dal carico permanente, è evidente. Il raffreddamento si avvia senza un motivo apparente. Pochi secondi dopo, la velocità si riduce nuovamente. D'altra parte, la velocità rimane costante durante il gioco, quindi è udibile un rumore permanente, ma senza fastidiosi cambiamenti di velocità.
Abbiamo misurato alcuni decibel in meno a Witcher 3 in modalità intrattenimento, il che è abbastanza percettibile. Tra l'altro, gli fps rimangono costanti. In "modalità silenziosa", sono misurabili 15 dB in meno, pari a un terzo del volume originale. Il notebook è quindi udibile, ma non disturba nemmeno in un ambiente silenzioso. Il frame rate è ancora di poco inferiore alla metà a Witcher 3. Il gioco è ancora giocabile a 60 fps con le impostazioni di dettaglio più elevate, il che è probabilmente vero per molti titoli non troppo impegnativi o un po' datati, che sono quindi giocabili anche silenziosi come un sussurro.
Rumorosità
| Idle |
| 24 / 24 / 26.47 dB(A) |
| Sotto carico |
| 55.72 / 57.94 dB(A) |
 | ||
30 dB silenzioso 40 dB(A) udibile 50 dB(A) rumoroso |
||
min: | ||
| Schenker XMG Focus 17 (E23) GeForce RTX 4070 Laptop GPU, i9-13900HX, Crucial P5 Plus 1TB CT1000P5PSSD8 | Lenovo Legion Pro 5 16ARX8 GeForce RTX 4070 Laptop GPU, R7 7745HX, Samsung PM9A1 MZVL21T0HCLR | Medion Erazer Major X20 GeForce RTX 4070 Laptop GPU, i9-13900HX, Phison E18-1TB-PHISON-SSD-B47R | Schenker XMG Neo 17 M22 GeForce RTX 3080 Ti Laptop GPU, R9 6900HX, Samsung SSD 980 Pro 1TB MZ-V8P1T0BW | HP Omen 17-ck2097ng GeForce RTX 4080 Laptop GPU, i9-13900HX, SK hynix PC801 HFS001TEJ9X101N | Medion Erazer Defender P40 GeForce RTX 4060 Laptop GPU, i7-13700HX, Phison PS5021-E21 1TB | |
|---|---|---|---|---|---|---|
| Noise | 11% | -3% | -8% | -5% | -7% | |
| off /ambiente * (dB) | 24 | 23.2 3% | 24 -0% | 26 -8% | 24 -0% | 25 -4% |
| Idle Minimum * (dB) | 24 | 23.2 3% | 25 -4% | 26 -8% | 31 -29% | 26 -8% |
| Idle Average * (dB) | 24 | 23.2 3% | 29 -21% | 29 -21% | 32 -33% | 27 -13% |
| Idle Maximum * (dB) | 26.47 | 26.2 1% | 31 -17% | 40 -51% | 33 -25% | 32 -21% |
| Load Average * (dB) | 55.72 | 31.4 44% | 50 10% | 47 16% | 45 19% | 53 5% |
| Witcher 3 ultra * (dB) | 57.94 | 48.4 16% | 53 9% | 52 10% | 45 22% | 56 3% |
| Load Maximum * (dB) | 57.94 | 53.8 7% | 57 2% | 54 7% | 50 14% | 64 -10% |
* ... Meglio usare valori piccoli
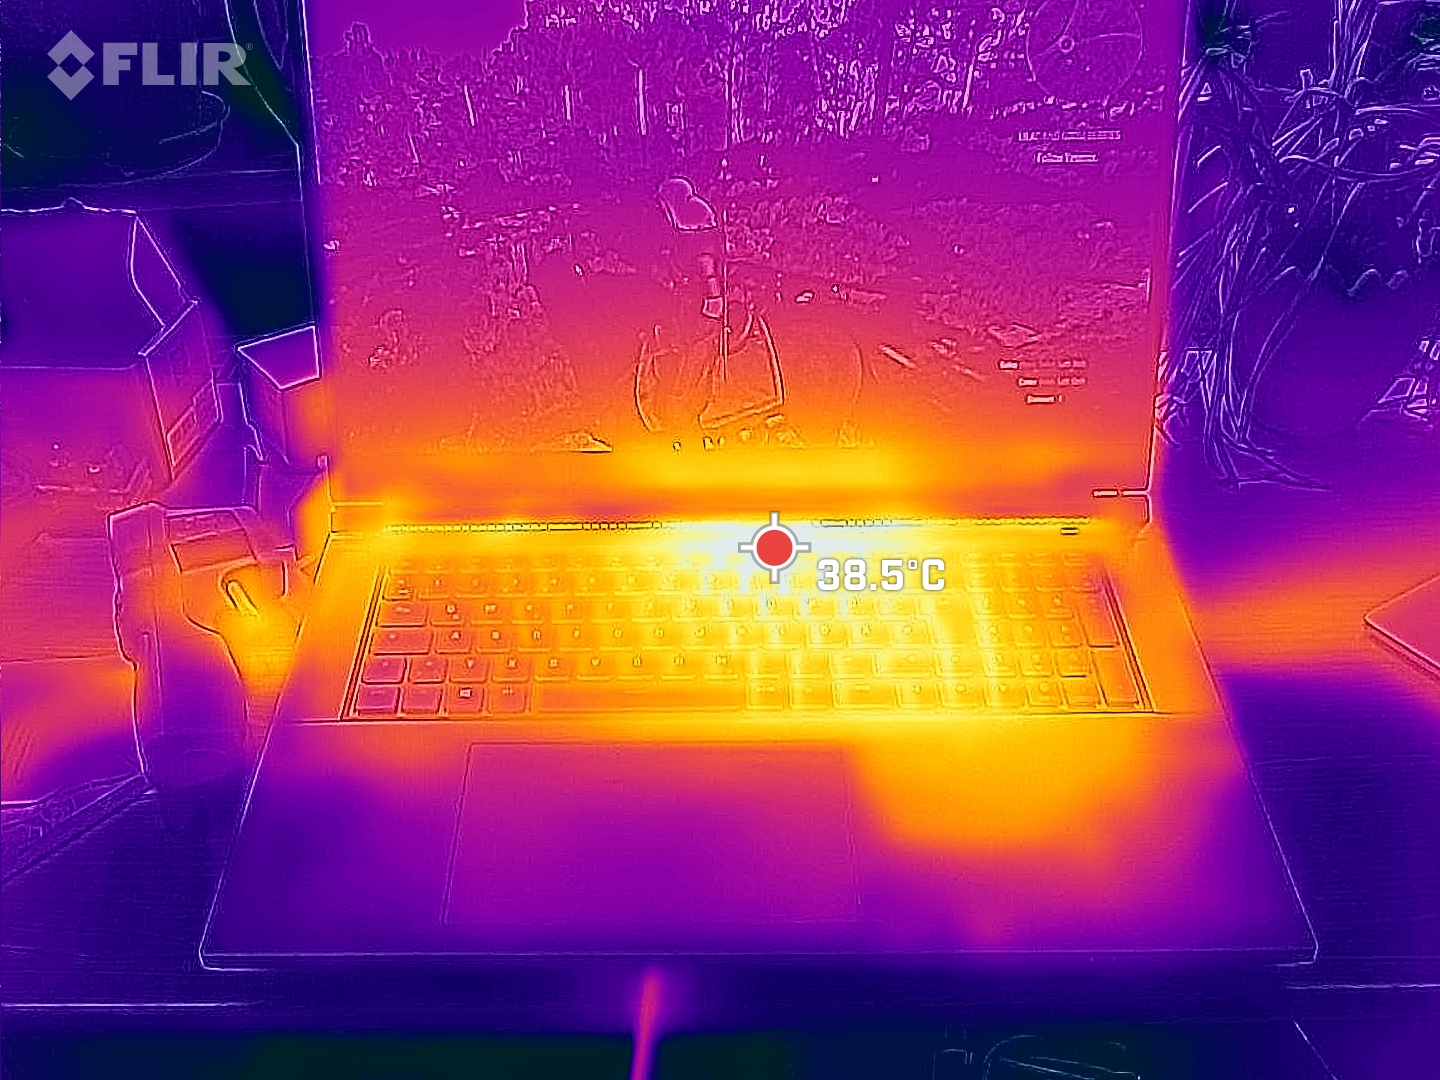
Temperatura
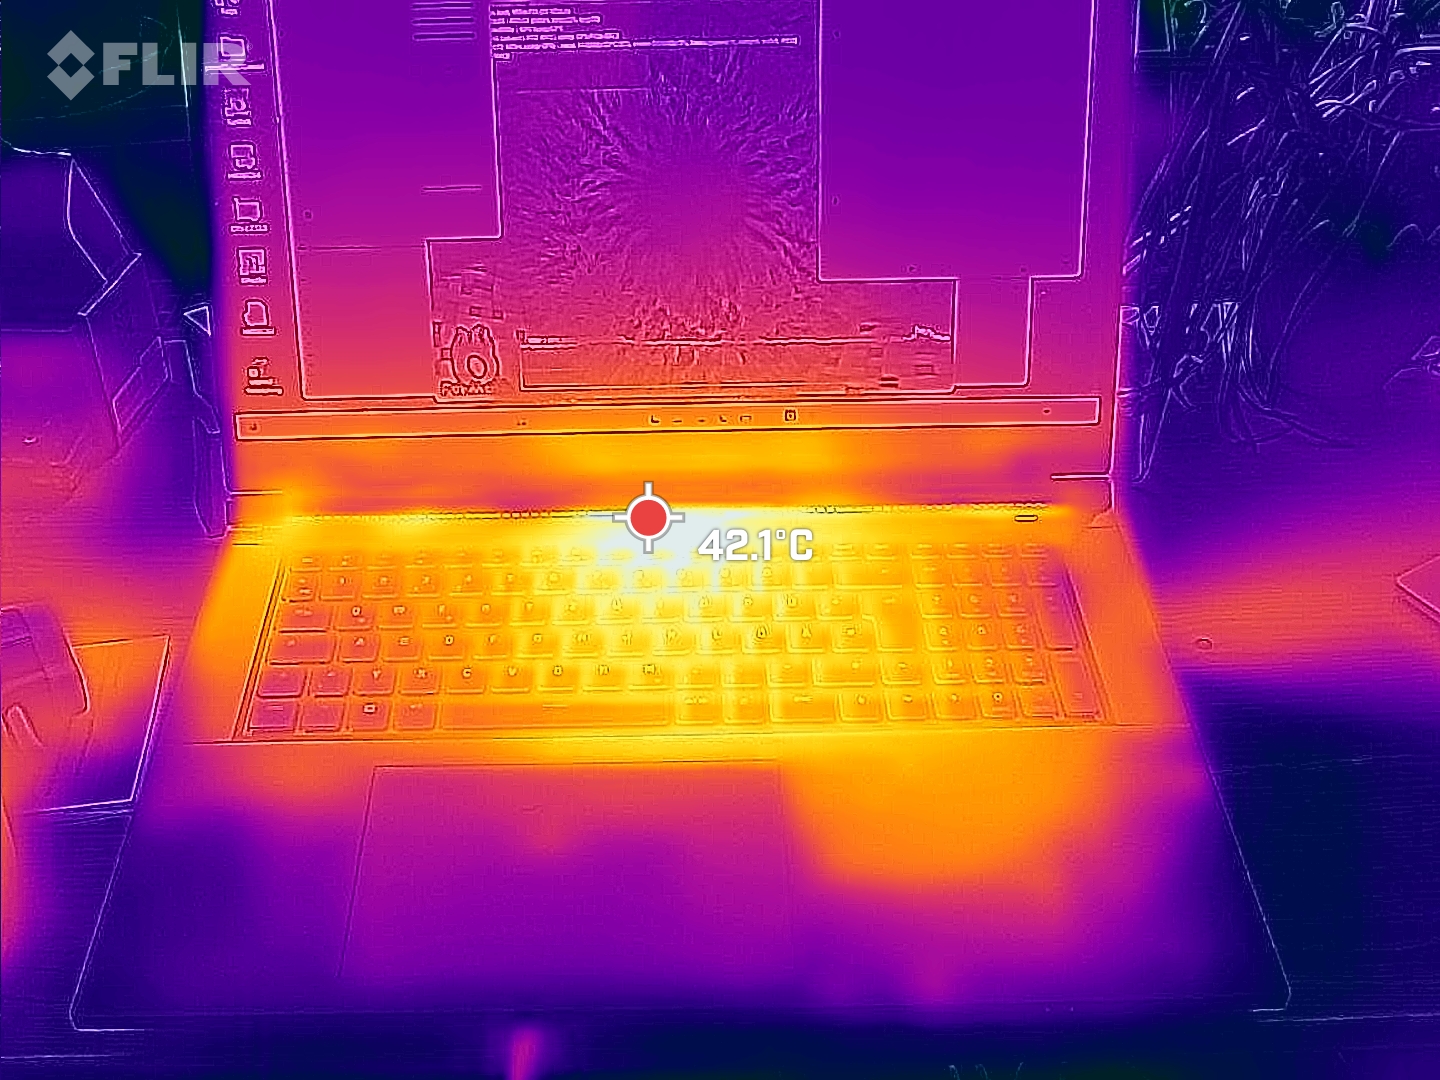
I poggiapolsi sono caldi, ma non caldi (abbiamo misurato un massimo di 36 °C). Tuttavia, la temperatura è già di 42 °C nell'area dei tasti, mentre è ancora di 40 °C sulla destra del centro. A sinistra, il portatile da gioco rimane un po' più fresco. Questo può essere fastidioso, soprattutto nelle giornate calde in cui si scrive e si gioca.
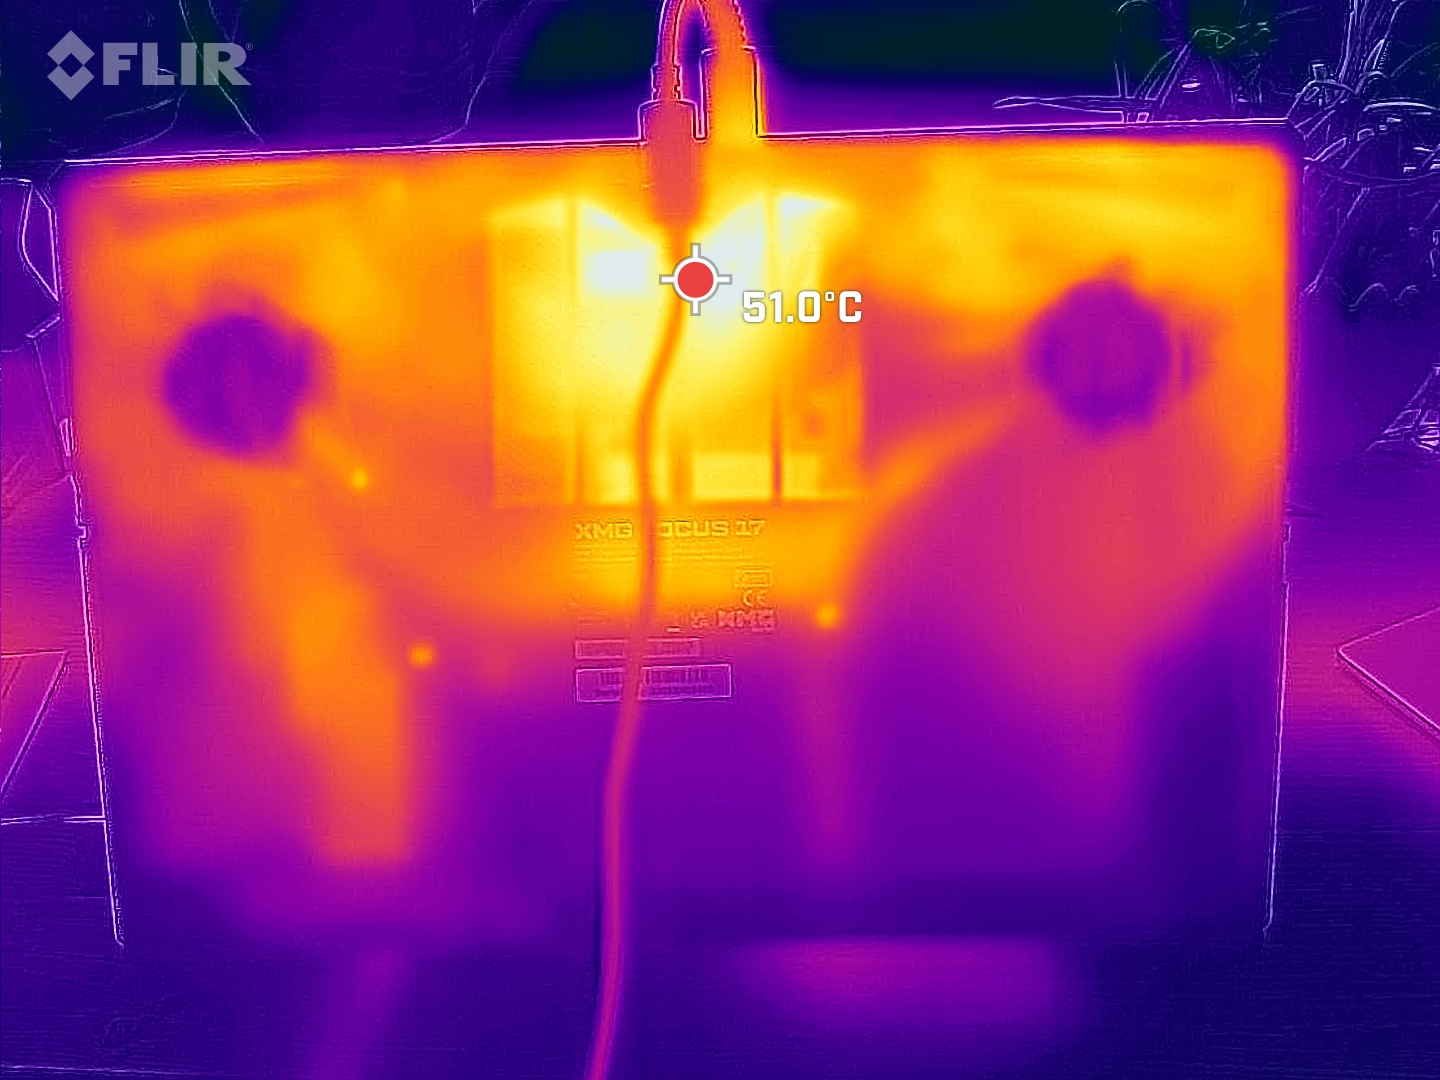
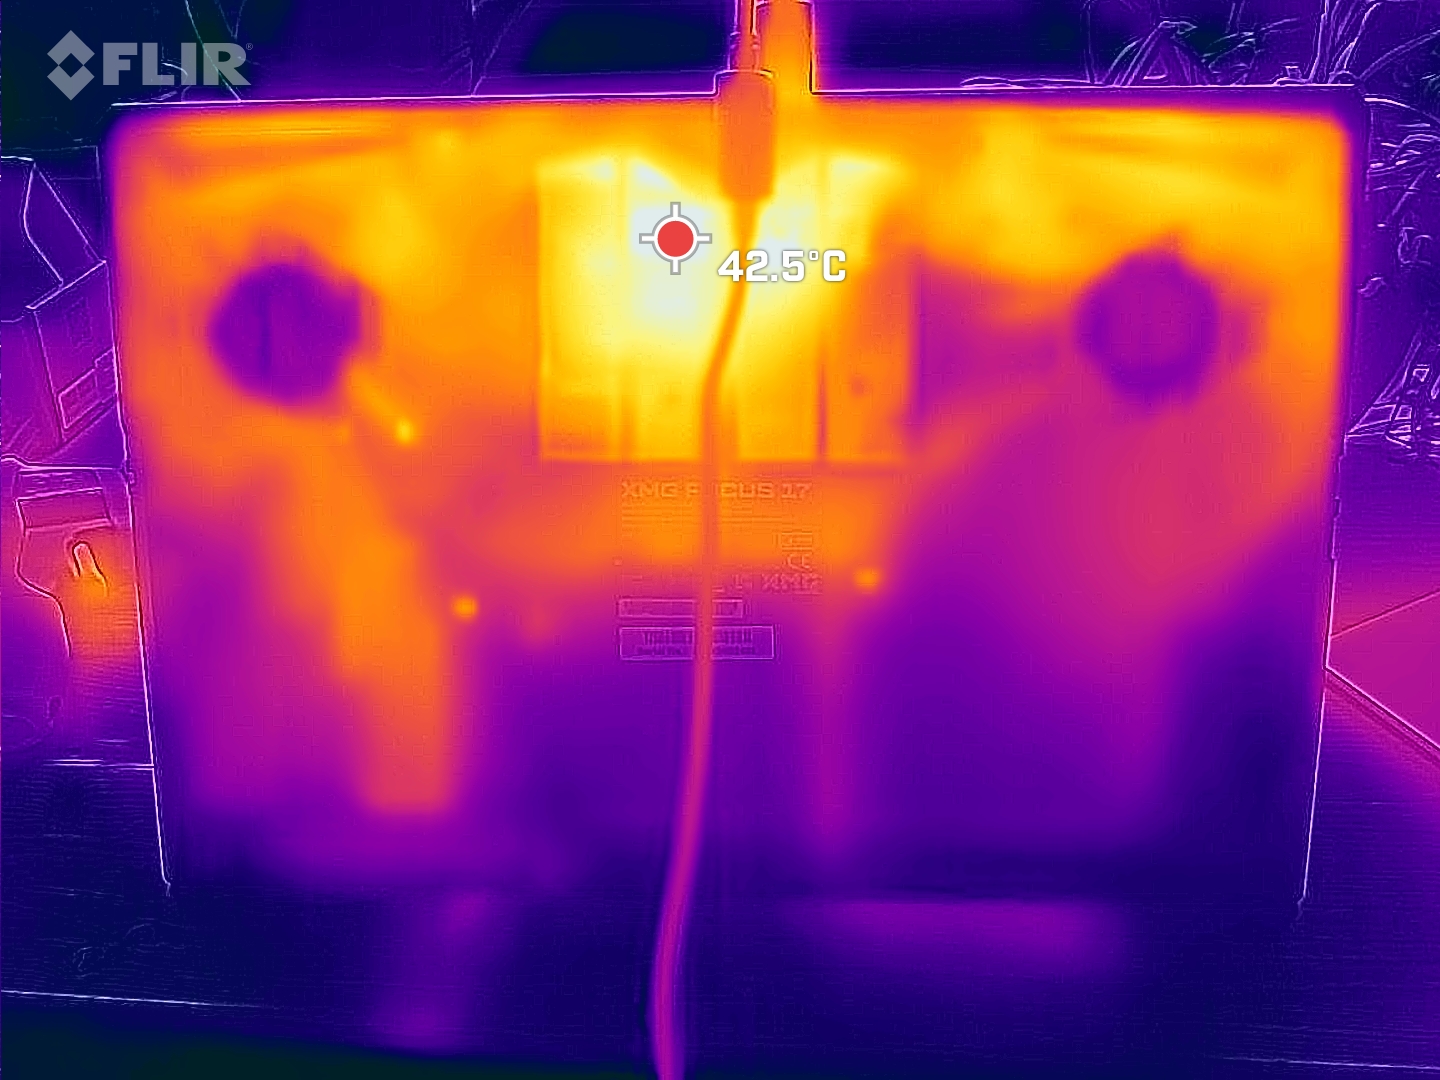
La parte inferiore si scalda anche senza un carico significativo, quindi l'XMG Focus 17 E23 dovrebbe essere utilizzato solo su una superficie piana e dura.
(-) La temperatura massima sul lato superiore è di 50 °C / 122 F, rispetto alla media di 40.4 °C / 105 F, che varia da 21.2 a 68.8 °C per questa classe Gaming.
(-) Il lato inferiore si riscalda fino ad un massimo di 56 °C / 133 F, rispetto alla media di 43.2 °C / 110 F
(+) In idle, la temperatura media del lato superiore è di 30.9 °C / 88 F, rispetto alla media deld ispositivo di 33.9 °C / 93 F.
(±) Riproducendo The Witcher 3, la temperatura media per il lato superiore e' di 36.8 °C / 98 F, rispetto alla media del dispositivo di 33.9 °C / 93 F.
(±) I poggiapolsi e il touchpad possono diventare molto caldi al tatto con un massimo di 37 °C / 98.6 F.
(-) La temperatura media della zona del palmo della mano di dispositivi simili e'stata di 28.8 °C / 83.8 F (-8.2 °C / -14.8 F).
| Schenker XMG Focus 17 (E23) Intel Core i9-13900HX, NVIDIA GeForce RTX 4070 Laptop GPU | Lenovo Legion Pro 5 16ARX8 AMD Ryzen 7 7745HX, NVIDIA GeForce RTX 4070 Laptop GPU | Medion Erazer Major X20 Intel Core i9-13900HX, NVIDIA GeForce RTX 4070 Laptop GPU | Schenker XMG Neo 17 M22 AMD Ryzen 9 6900HX, NVIDIA GeForce RTX 3080 Ti Laptop GPU | HP Omen 17-ck2097ng Intel Core i9-13900HX, NVIDIA GeForce RTX 4080 Laptop GPU | Medion Erazer Defender P40 Intel Core i7-13700HX, NVIDIA GeForce RTX 4060 Laptop GPU | |
|---|---|---|---|---|---|---|
| Heat | 20% | 4% | 9% | 23% | 19% | |
| Maximum Upper Side * (°C) | 50 | 41.8 16% | 46 8% | 49 2% | 41 18% | 42 16% |
| Maximum Bottom * (°C) | 56 | 41.4 26% | 49 12% | 52 7% | 51 9% | 45 20% |
| Idle Upper Side * (°C) | 37 | 29 22% | 37 -0% | 30 19% | 24 35% | 28 24% |
| Idle Bottom * (°C) | 36 | 30.4 16% | 38 -6% | 33 8% | 25 31% | 30 17% |
* ... Meglio usare valori piccoli
Test da sforzo
Nel nostro test di stress con Prime95 e Furmark, la CPU raggiunge temperature superiori ai 95 °C. La GPU invece non viene sfruttata appieno e oscilla tra i 60 e i 75 °C. L'alimentazione è limitata in questa situazione estrema e si aggira intorno ai 200 W per la GPU e la CPU insieme, mentre teoricamente sarebbero possibili 240 W. Inoltre, questa situazione dura solo pochi secondi prima che l'alimentazione e la velocità di clock si riducano significativamente.
Il raffreddamento non è in grado di mantenere costantemente le prestazioni massime, come ad esempio nel caso dell'XMG Neo 16 E23 XMG Neo 16 E23 è il caso.

Altoparlante
La riproduzione del suono è sufficientemente potente per un notebook. Non c'è nulla di cui lamentarsi, soprattutto per quanto riguarda le basse frequenze e gli alti. Il parlato e gli effetti tipici dei giochi d'azione sono riprodotti bene.
Nella musica o anche nei film, si sente la mancanza di qualità del suono e la mancanza di medi inferiori e bassi superiori, che si nota chiaramente nelle nostre misurazioni. Per questi compiti, non c'è quasi modo di evitare l'uso di altoparlanti esterni o cuffie.
Schenker XMG Focus 17 (E23) analisi audio
(±) | potenza degli altiparlanti media ma buona (78.08 dB)
Bassi 100 - 315 Hz
(-) | quasi nessun basso - in media 33.5% inferiori alla media
(+) | bassi in lineaa (6.1% delta rispetto alla precedente frequenza)
Medi 400 - 2000 Hz
(±) | medi ridotti - circa 7.2% inferiori alla media
(±) | linearità dei medi adeguata (9.5% delta rispetto alla precedente frequenza)
Alti 2 - 16 kHz
(+) | Alti bilanciati - appena 4.4% dalla media
(+) | alti lineari (5.2% delta rispetto alla precedente frequenza)
Nel complesso 100 - 16.000 Hz
(±) | la linearità complessiva del suono è media (26.9% di differenza rispetto alla media
Rispetto alla stessa classe
» 93% di tutti i dispositivi testati in questa classe è stato migliore, 2% simile, 5% peggiore
» Il migliore ha avuto un delta di 6%, medio di 18%, peggiore di 132%
Rispetto a tutti i dispositivi testati
» 82% di tutti i dispositivi testati in questa classe è stato migliore, 4% similare, 14% peggiore
» Il migliore ha avuto un delta di 4%, medio di 23%, peggiore di 134%
Apple MacBook Pro 16 2021 M1 Pro analisi audio
(+) | gli altoparlanti sono relativamente potenti (84.7 dB)
Bassi 100 - 315 Hz
(+) | bassi buoni - solo 3.8% dalla media
(+) | bassi in lineaa (5.2% delta rispetto alla precedente frequenza)
Medi 400 - 2000 Hz
(+) | medi bilanciati - solo only 1.3% rispetto alla media
(+) | medi lineari (2.1% delta rispetto alla precedente frequenza)
Alti 2 - 16 kHz
(+) | Alti bilanciati - appena 1.9% dalla media
(+) | alti lineari (2.7% delta rispetto alla precedente frequenza)
Nel complesso 100 - 16.000 Hz
(+) | suono nel complesso lineare (4.6% differenza dalla media)
Rispetto alla stessa classe
» 0% di tutti i dispositivi testati in questa classe è stato migliore, 0% simile, 100% peggiore
» Il migliore ha avuto un delta di 5%, medio di 17%, peggiore di 45%
Rispetto a tutti i dispositivi testati
» 0% di tutti i dispositivi testati in questa classe è stato migliore, 0% similare, 100% peggiore
» Il migliore ha avuto un delta di 4%, medio di 23%, peggiore di 134%
Gestione dell'alimentazione - La CPU di un notebook per videogiochi è molto affamata
Consumo di energia
Il consumo energetico è chiaramente troppo elevato quando non ci sono processi in esecuzione. Soprattutto i rivali con processori AMD, come l' XMG Neo 17 M22 se la cavano con meno della metà della potenza.
Anche il Focus 17 non è parsimonioso sotto carico. Ha bisogno di un terzo di energia in più per lo stesso frame rate in Witcher 3 rispetto al Lenovo Pro 5 Lenovo Legion Pro 5. Questo non è efficiente e spiega in gran parte perché Legion è solo la metà più rumoroso.
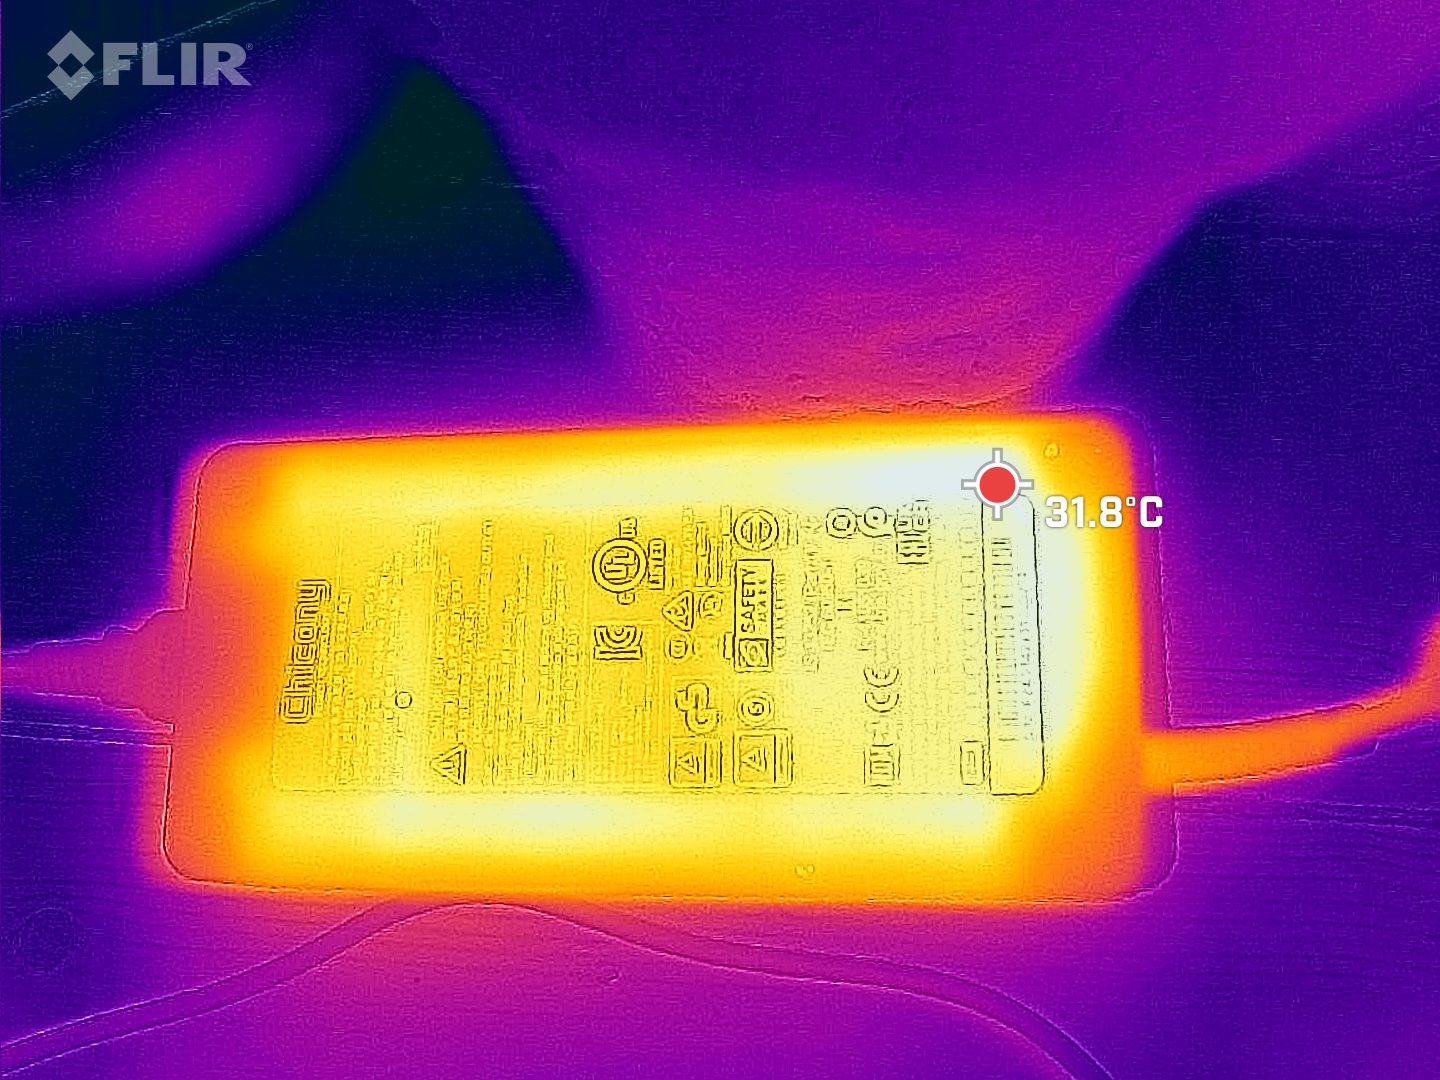
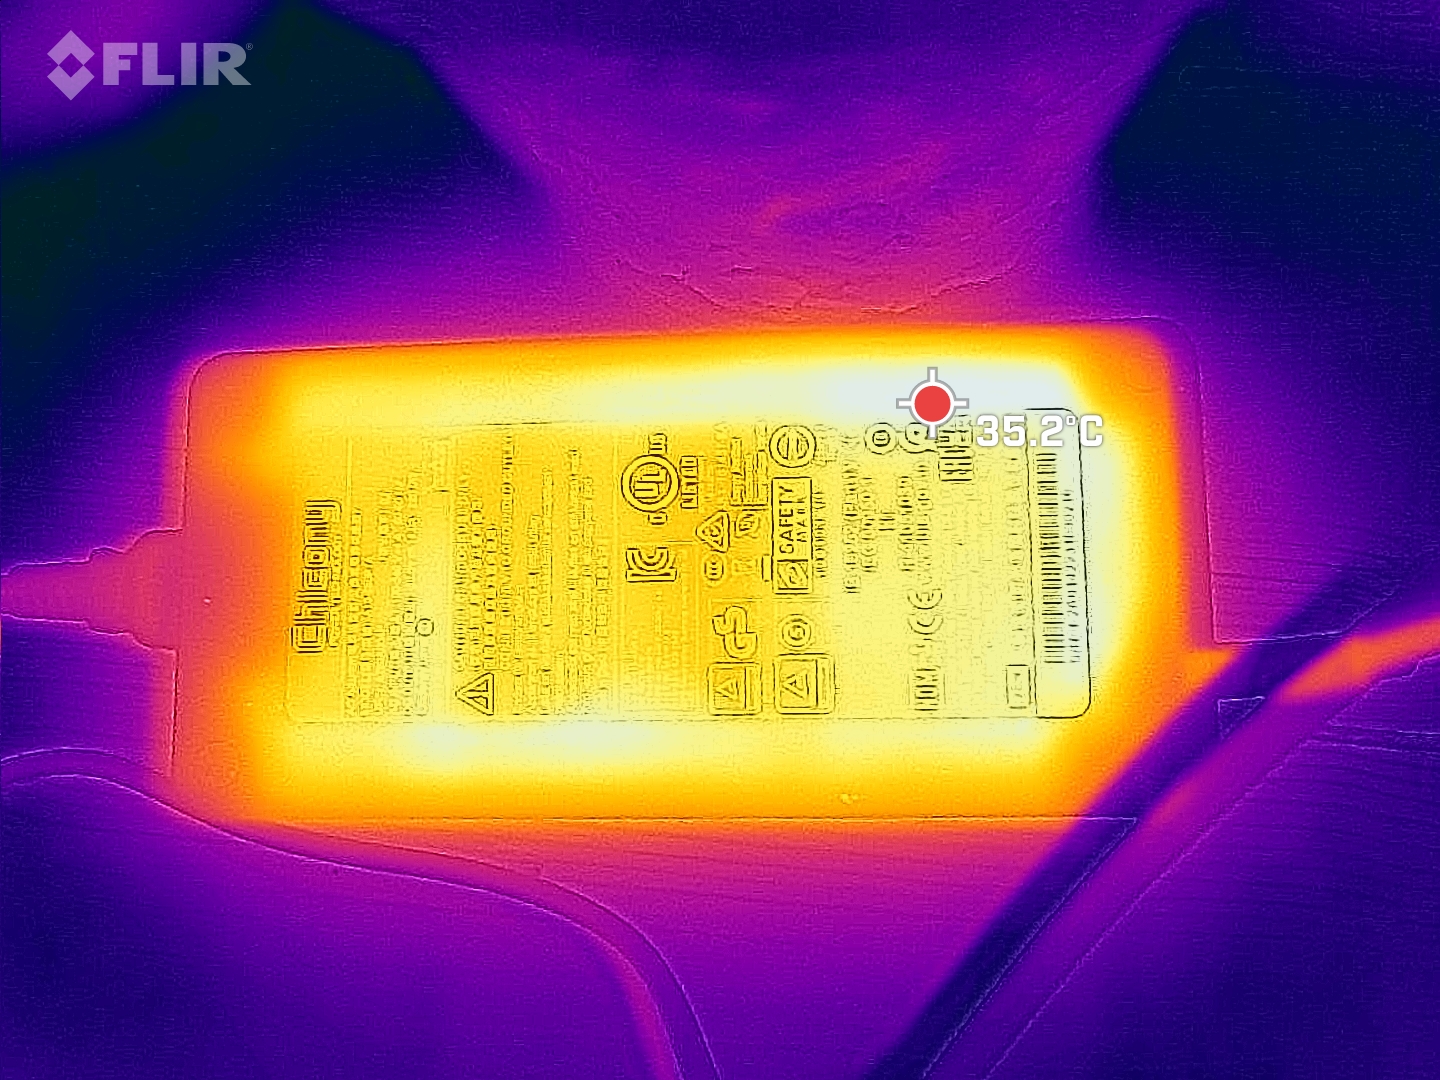
L'alimentatore da 280 watt è almeno sufficientemente grande, non è mai sovraccarico e dovrebbe sempre fornire energia sufficiente per caricare la batteria.
| Off / Standby | |
| Idle | |
| Sotto carico |
|
Leggenda:
min: | |
| Schenker XMG Focus 17 (E23) i9-13900HX, GeForce RTX 4070 Laptop GPU, Crucial P5 Plus 1TB CT1000P5PSSD8, IPS, 2560x1440, 17.3" | Lenovo Legion Pro 5 16ARX8 R7 7745HX, GeForce RTX 4070 Laptop GPU, Samsung PM9A1 MZVL21T0HCLR, IPS, 2560x1600, 16" | Schenker XMG Neo 17 M22 R9 6900HX, GeForce RTX 3080 Ti Laptop GPU, Samsung SSD 980 Pro 1TB MZ-V8P1T0BW, IPS, 2560x1600, 17" | HP Omen 17-ck2097ng i9-13900HX, GeForce RTX 4080 Laptop GPU, SK hynix PC801 HFS001TEJ9X101N, IPS, 2560x1440, 17.3" | Medion Erazer Defender P40 i7-13700HX, GeForce RTX 4060 Laptop GPU, Phison PS5021-E21 1TB, IPS, 2560x1440, 17.3" | MSI Titan GT77 12UHS i9-12900HX, GeForce RTX 3080 Ti Laptop GPU, Samsung PM9A1 MZVL21T0HCLR, IPS-Level, 1920x1080, 17.3" | Media NVIDIA GeForce RTX 4070 Laptop GPU | Media della classe Gaming | |
|---|---|---|---|---|---|---|---|---|
| Power Consumption | 17% | 31% | 5% | 31% | -29% | 18% | 14% | |
| Idle Minimum * (Watt) | 17 | 8.1 52% | 7 59% | 16 6% | 8 53% | 30.21 -78% | 13.2 ? 22% | 13 ? 24% |
| Idle Average * (Watt) | 18 | 15.9 12% | 11 39% | 20 -11% | 12 33% | 32.42 -80% | 18.2 ? -1% | 18.7 ? -4% |
| Idle Maximum * (Watt) | 25.8 | 37.2 -44% | 17 34% | 26 -1% | 18 30% | 33.7 -31% | 24.6 ? 5% | 24.3 ? 6% |
| Load Average * (Watt) | 178 | 90.9 49% | 92 48% | 135 24% | 101 43% | 125.09 30% | 97 ? 46% | 110.2 ? 38% |
| Witcher 3 ultra * (Watt) | 265 | 189.6 28% | 221 17% | 215 19% | 180.8 32% | 256 3% | ||
| Load Maximum * (Watt) | 275 | 263.5 4% | 306 -11% | 299 -9% | 284 -3% | 321.88 -17% | 221 ? 20% | 258 ? 6% |
* ... Meglio usare valori piccoli
Power consumption Witcher 3 / Stress test
Power consumption external monitor
Durata della batteria
L'elevato consumo energetico in assenza di carico è accompagnato da una scarsa autonomia della batteria. Anche in modalità di risparmio energetico non si raggiungono le 4 ore. Altri 20 minuti si ottengono in modalità silenziosa, cosa che non ci si poteva aspettare in considerazione della dGPU attivata. Se si stacca la spina in modalità prestazioni e Advanced Optimus è attivo, l'autonomia non raggiunge nemmeno le 2 ore nel nostro test WLAN con chiamate Internet alternate.
XMG ha riferito a questo proposito che la modalità di risparmio energetico non funziona attualmente come desiderato. Possiamo confermarlo alla luce dei risultati dei nostri test. Un aggiornamento dovrebbe sicuramente porre rimedio alla situazione.
| Schenker XMG Focus 17 (E23) i9-13900HX, GeForce RTX 4070 Laptop GPU, 73 Wh | Lenovo Legion Pro 5 16ARX8 R7 7745HX, GeForce RTX 4070 Laptop GPU, 80 Wh | Medion Erazer Major X20 i9-13900HX, GeForce RTX 4070 Laptop GPU, 62.3 Wh | Schenker XMG Neo 17 M22 R9 6900HX, GeForce RTX 3080 Ti Laptop GPU, 99 Wh | HP Omen 17-ck2097ng i9-13900HX, GeForce RTX 4080 Laptop GPU, 83 Wh | Medion Erazer Defender P40 i7-13700HX, GeForce RTX 4060 Laptop GPU, 73 Wh | Media della classe Gaming | |
|---|---|---|---|---|---|---|---|
| Autonomia della batteria | 3% | 18% | 122% | 6% | 72% | 125% | |
| H.264 (h) | 3.1 | 4.2 35% | 6.6 113% | 3.7 19% | 5.7 84% | 8.32 ? 168% | |
| WiFi v1.3 (h) | 3.9 | 4 3% | 3.9 0% | 9 131% | 3.6 -8% | 6.2 59% | 7.11 ? 82% |
| Witcher 3 ultra (h) | 1 |
Pro
Contro
Verdetto - Il migliore per i giochi, con alcuni svantaggi
Non ci sono dubbi sulle prestazioni del sistema. Il Focus 17 si colloca tra i concorrenti altrettanto forti. Solo il raffreddamento non del tutto convincente impedisce un punteggio migliore. Non sembra essere regolato in modo preciso per l'Intel Core i9 in particolare. Tuttavia, probabilmente nessun gioco attuale è troppo impegnativo per la risoluzione QHD dello schermo preciso nei colori.
Concentrazione sulle prestazioni di gioco: Il Focus 17 E23 è dotato di un hardware robusto, ma con un equipaggiamento inferiore alla media.
Se il portatile non deve essere in grado di fare di più, l'XMG Focus si concentra sulle prestazioni di gioco, come già previsto dal nome. Per il resto, la valutazione risulta piuttosto debole rispetto alla concorrenza (quasi universalmente più costosa).
La tastiera offre solo poche impostazioni di colore, sempre per tutti i tasti. Come nel predecessore, il touchpad non convince, ma difficilmente verrà utilizzato per i giochi. La durata della batteria è troppo breve e accettabile solo a metà in modalità di risparmio energetico. Gli altoparlanti hanno un suono mediocre. Inoltre, la ventilazione è più rumorosa della media, mentre i componenti consumano troppa energia per le prestazioni accertate. Inoltre, l'USB 2.0 non sembra più al passo con i tempi e la porta Mini-DisplayPort si trova, ad esempio, sulle cuffie VR, ma l'USB-C con supporto DP sarebbe più variabile.
In compenso, il prezzo è altrettanto interessante. Il rapporto prezzo-prestazioni è buono. Se Schenker riuscirà anche a regolare le modalità di prestazione apparentemente incompiute tramite un aggiornamento software, alcuni difetti come la breve durata della batteria o il cattivo comportamento della ventola potrebbero essere mitigati in modo significativo.
Maggiori prestazioni da componenti simili sono disponibili, ad esempio, con il modello XMG Neo 16 E23 (dotato di RTX 4090). Approssimativamente altrettanto veloce e più silenzioso dell'XMG Focus 17 è il Lenovo Legion Pro 5 16 Gen8. Tuttavia, entrambi i portatili da gioco sono notevolmente più costosi a fronte di una dotazione complessivamente migliore.
Prezzo e disponibilità
Schenker XMG Focus 17 (E23)
- 06/04/2023 v7 (old)
Mario Petzold
Transparency
La selezione dei dispositivi da recensire viene effettuata dalla nostra redazione. Il campione di prova è stato fornito all'autore come prestito dal produttore o dal rivenditore ai fini di questa recensione. L'istituto di credito non ha avuto alcuna influenza su questa recensione, né il produttore ne ha ricevuto una copia prima della pubblicazione. Non vi era alcun obbligo di pubblicare questa recensione. In quanto società mediatica indipendente, Notebookcheck non è soggetta all'autorità di produttori, rivenditori o editori.
Ecco come Notebookcheck esegue i test
Ogni anno, Notebookcheck esamina in modo indipendente centinaia di laptop e smartphone utilizzando procedure standardizzate per garantire che tutti i risultati siano comparabili. Da circa 20 anni sviluppiamo continuamente i nostri metodi di prova e nel frattempo stabiliamo gli standard di settore. Nei nostri laboratori di prova, tecnici ed editori esperti utilizzano apparecchiature di misurazione di alta qualità. Questi test comportano un processo di validazione in più fasi. Il nostro complesso sistema di valutazione si basa su centinaia di misurazioni e parametri di riferimento ben fondati, che mantengono l'obiettività.Price comparison
