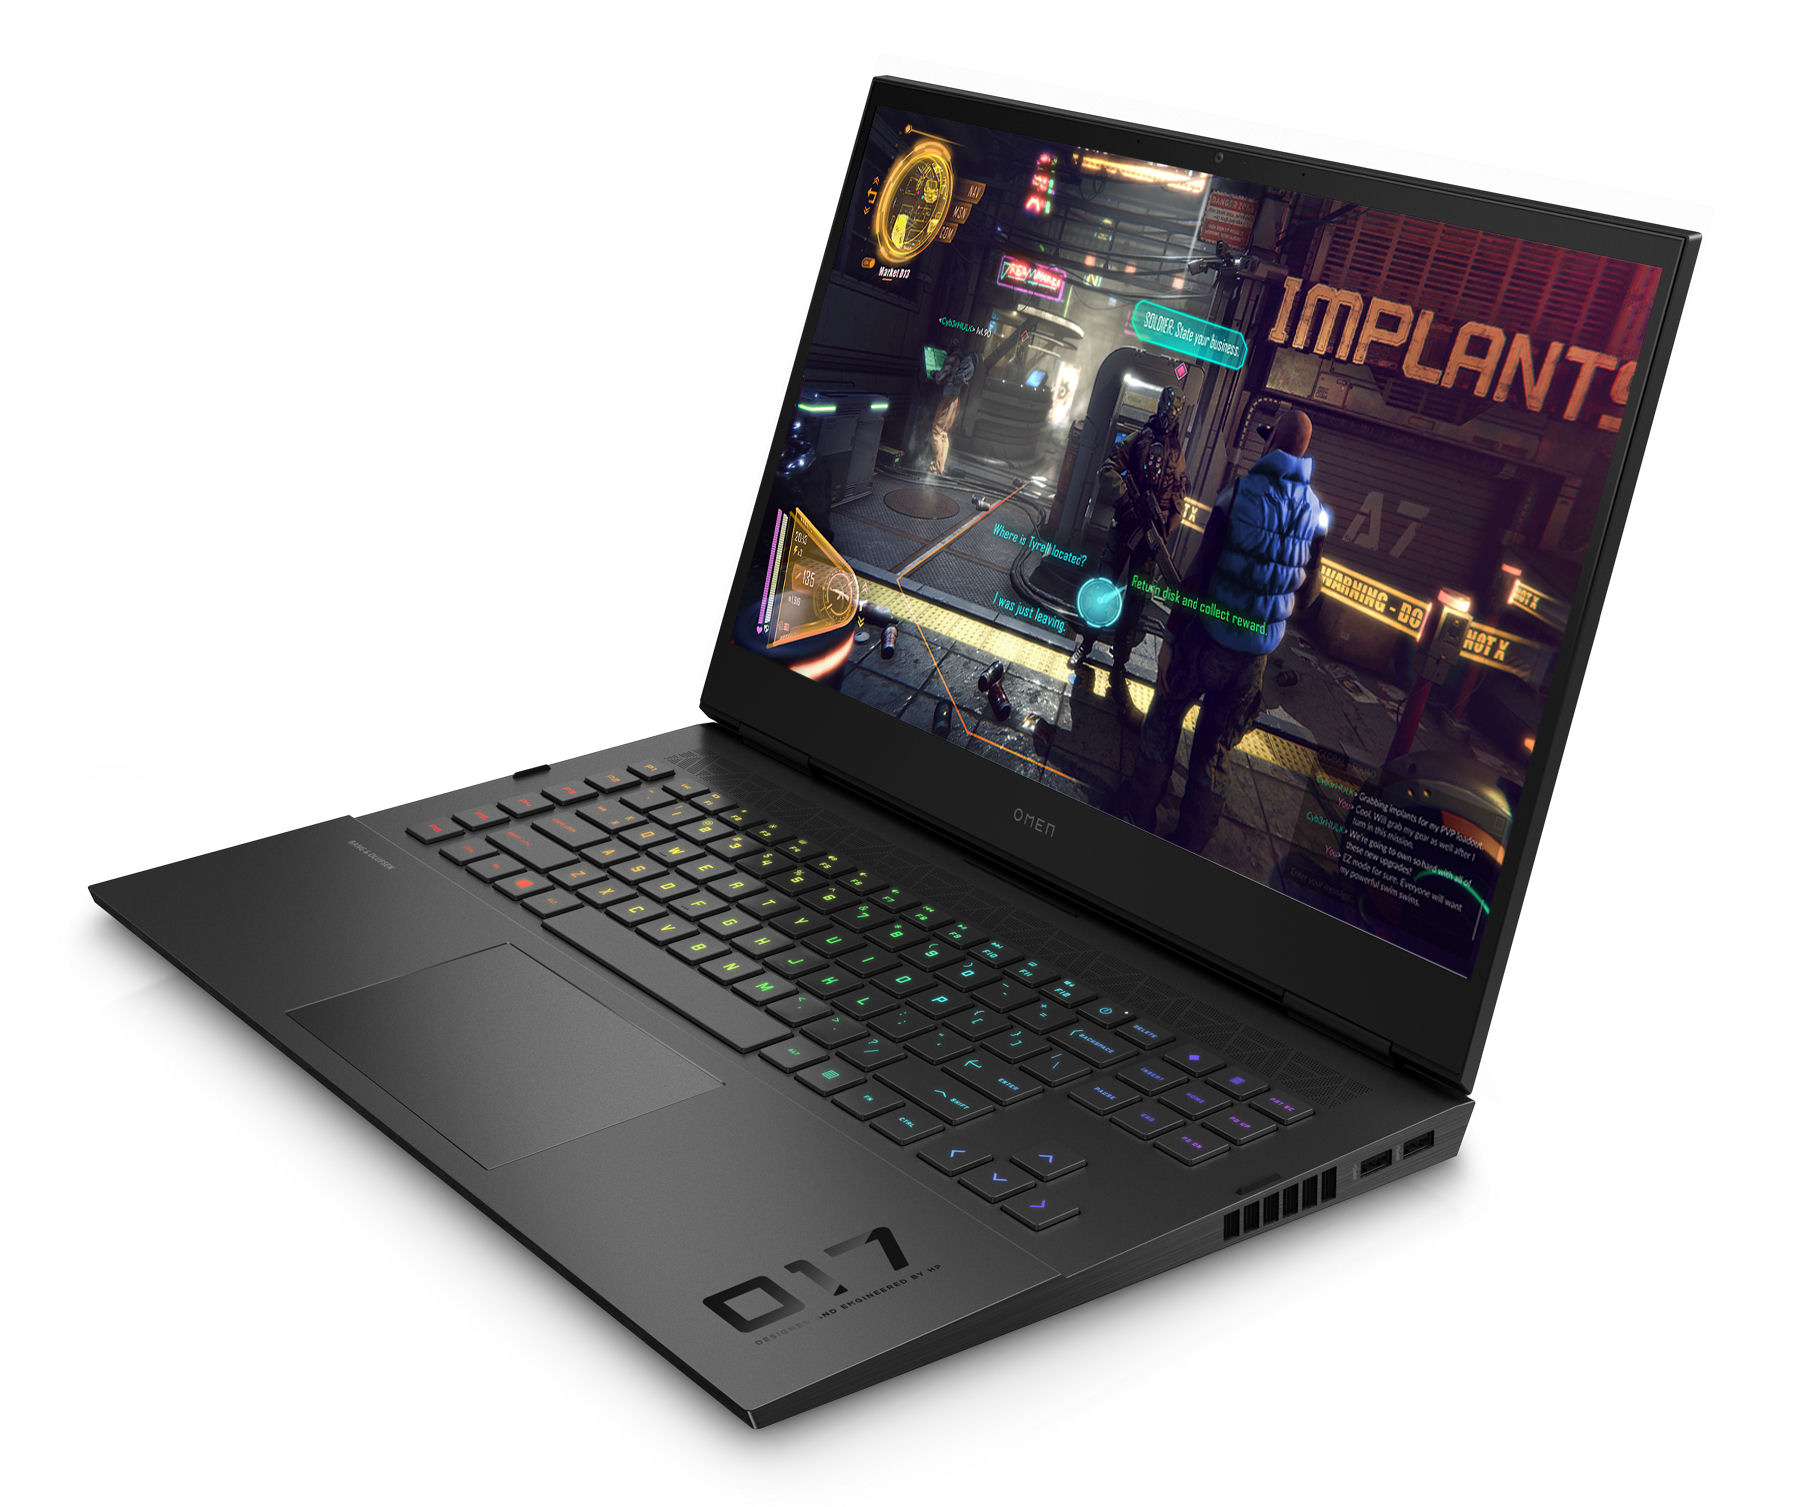
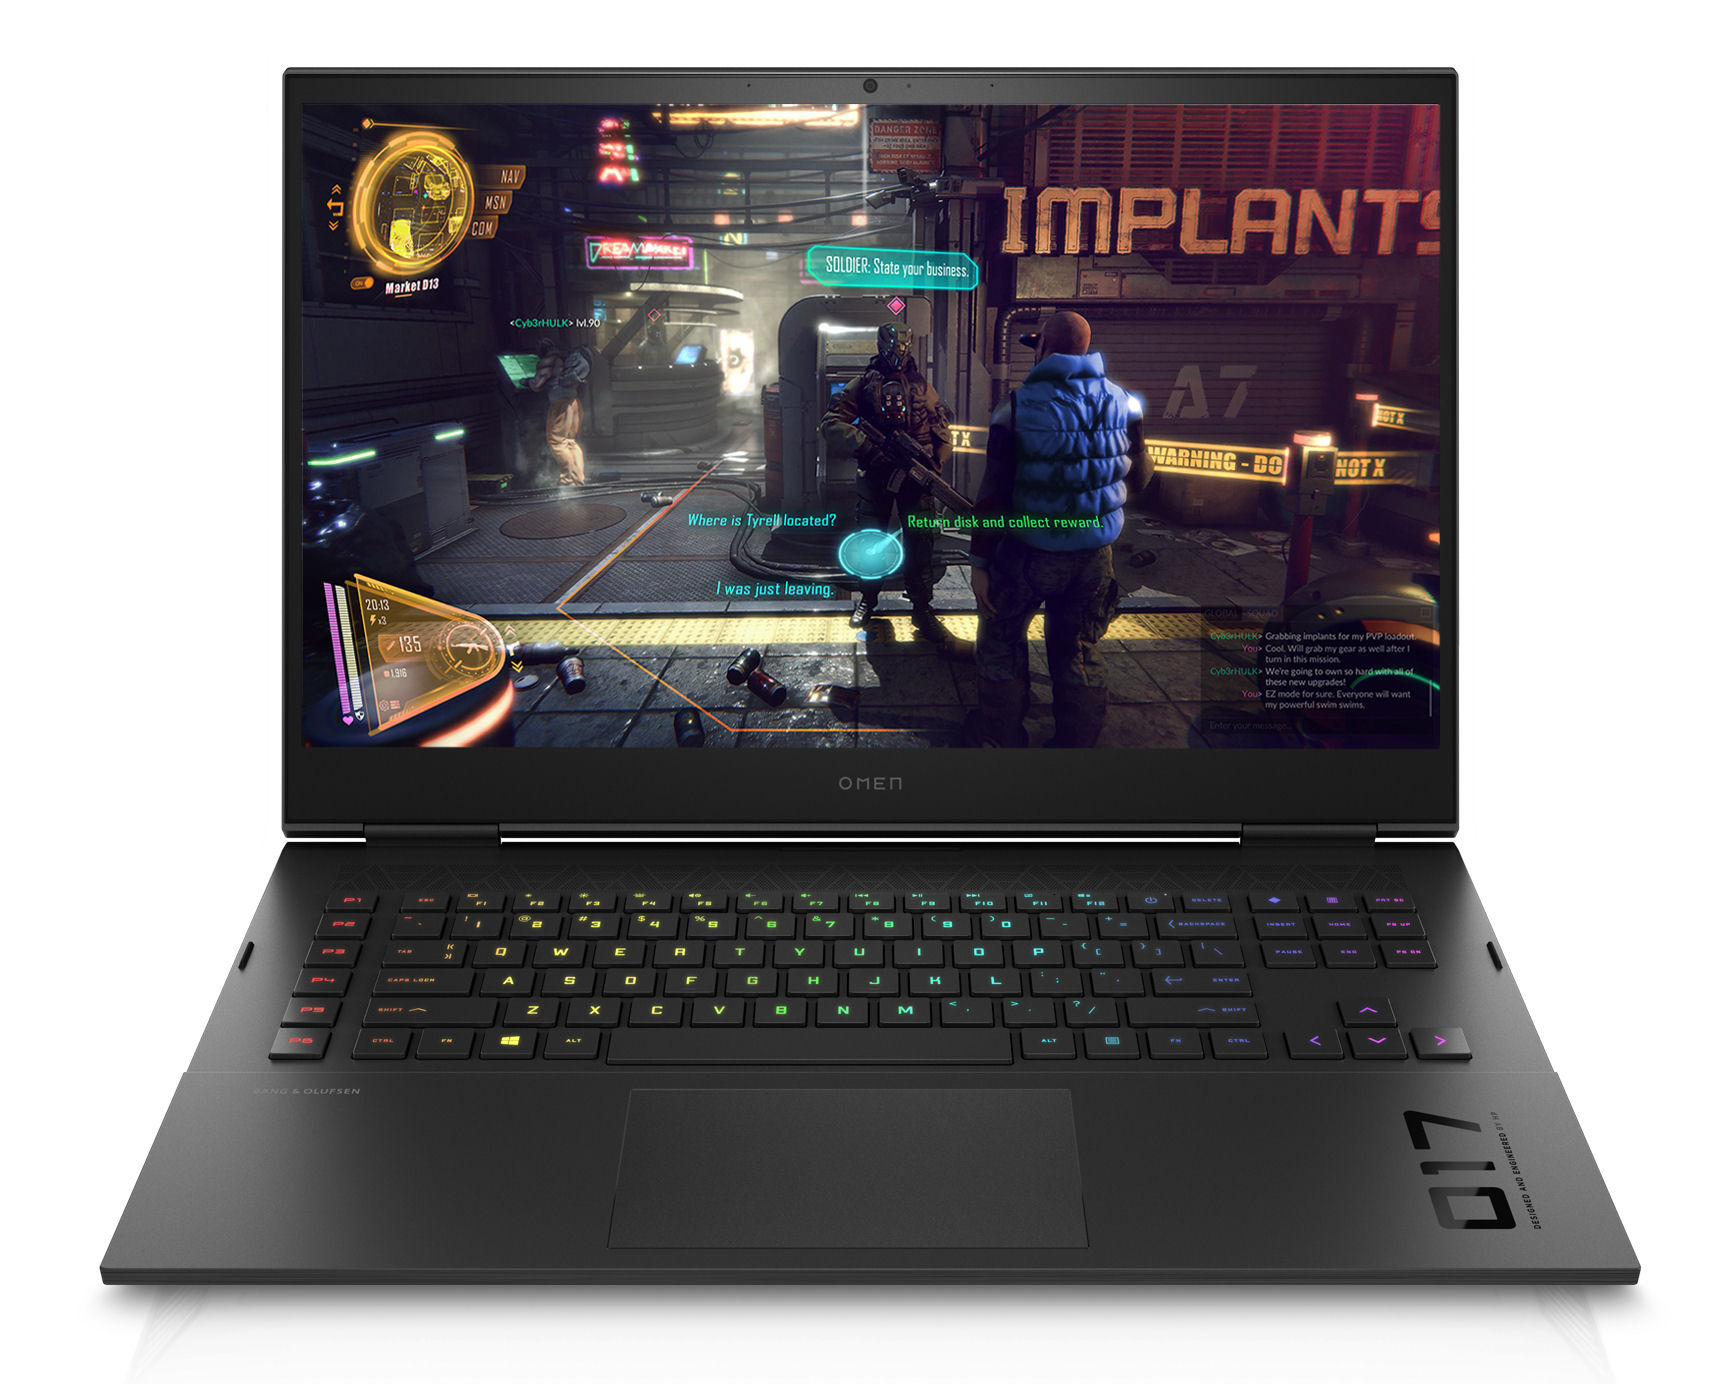
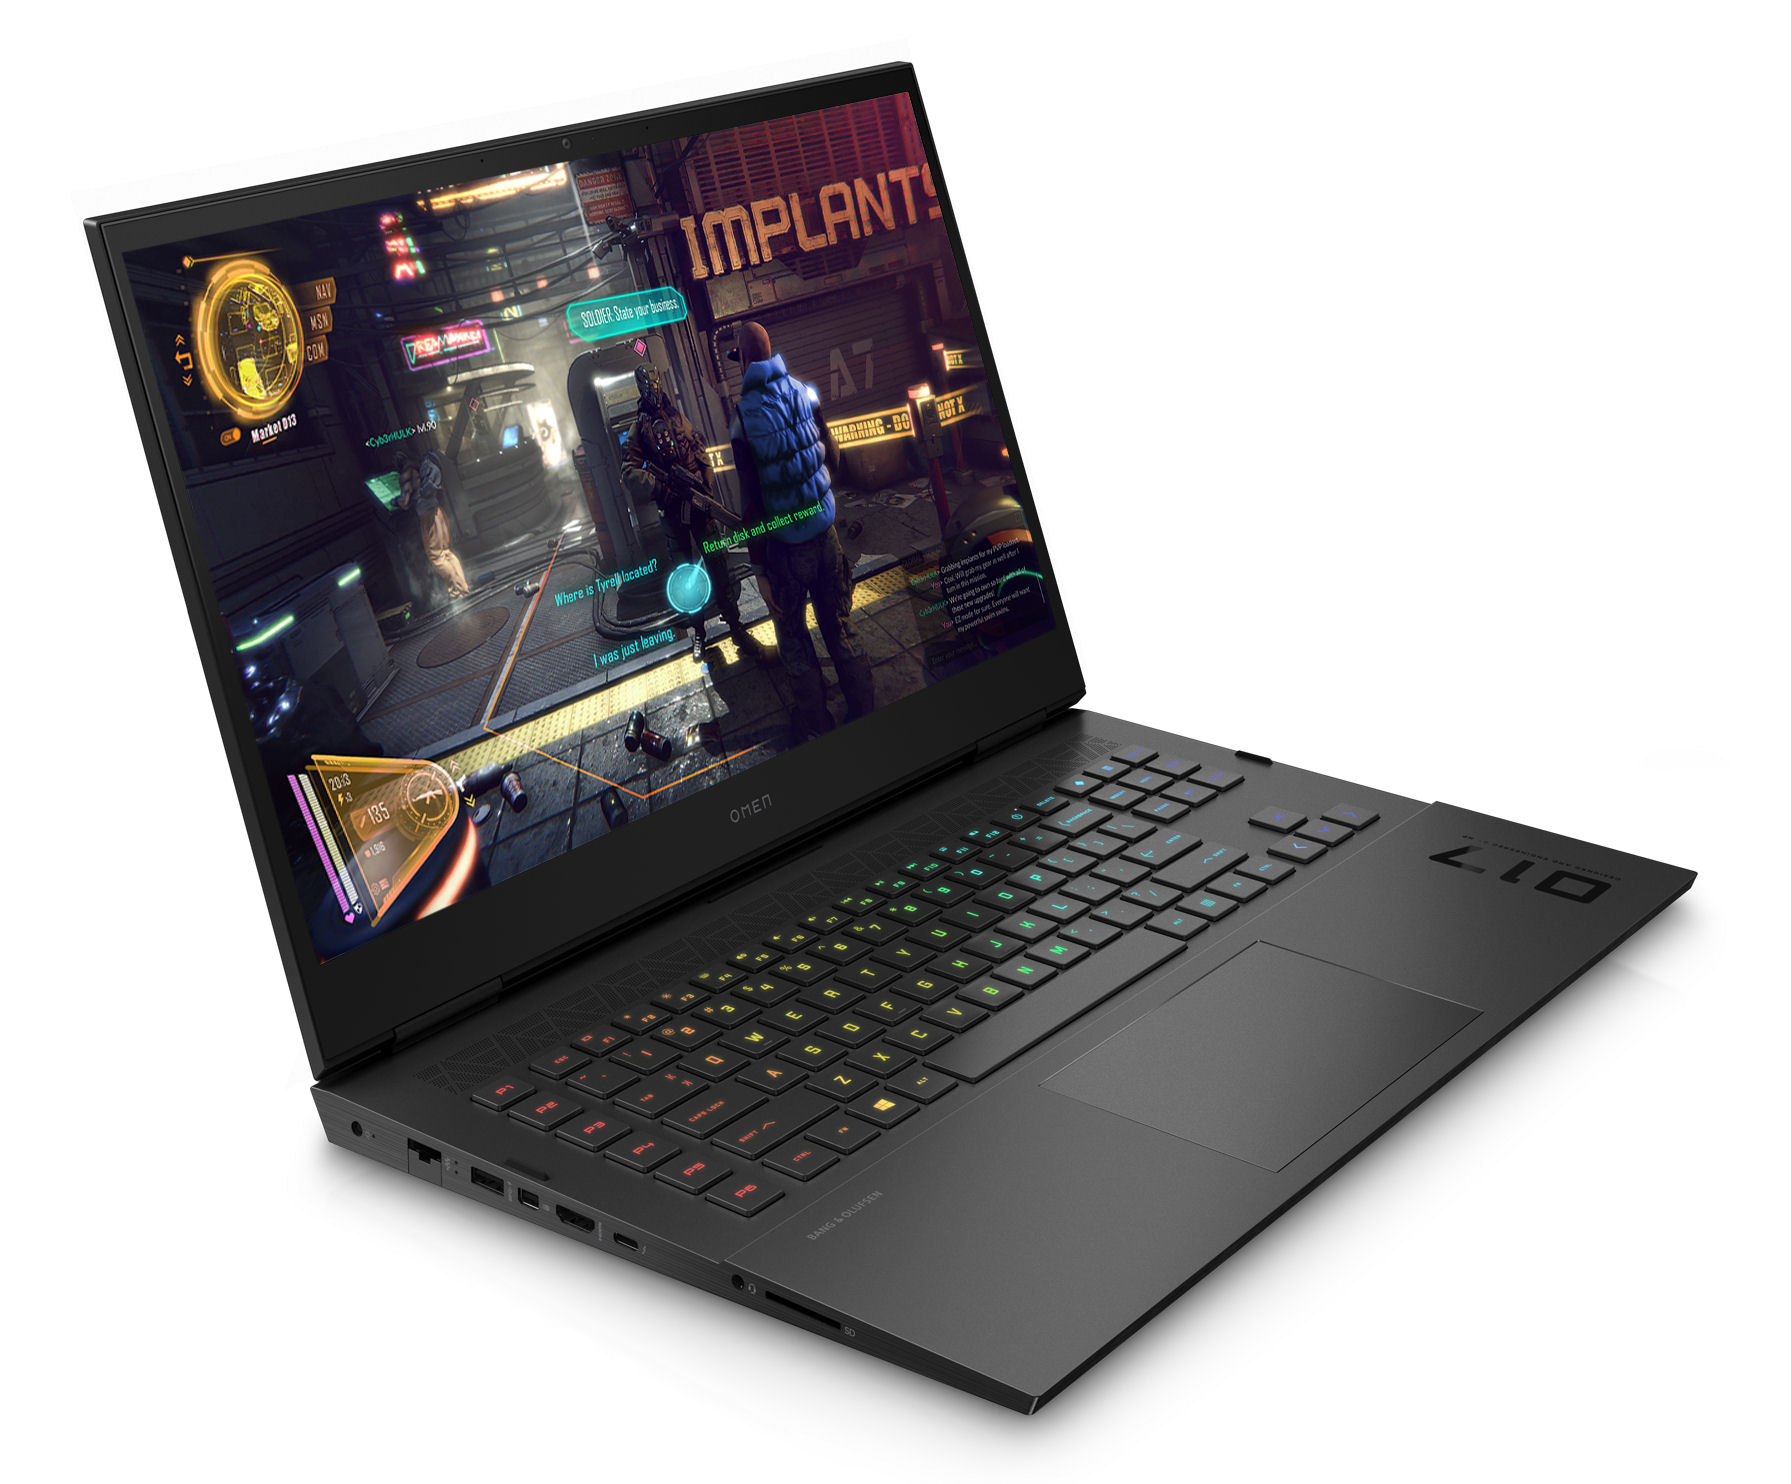
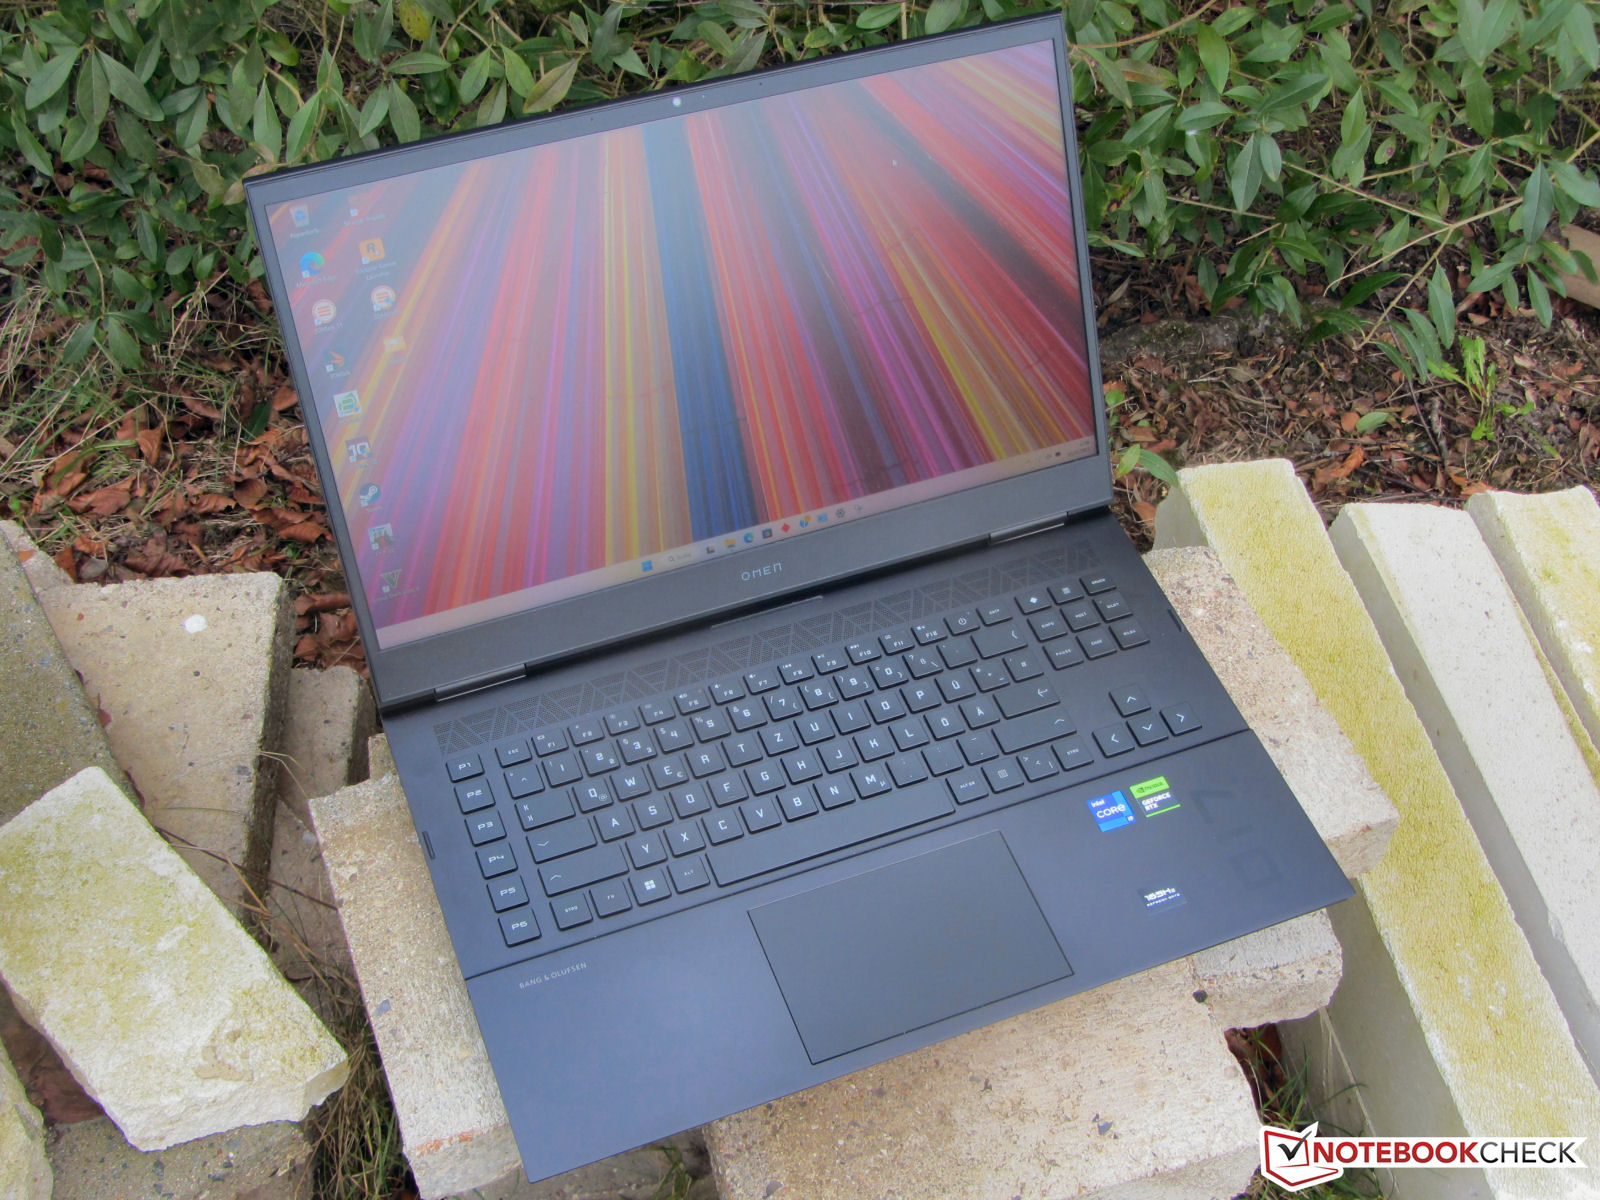
Recensione dell'HP Omen 17 (2023): un portatile gaming che utilizza la RTX 4080

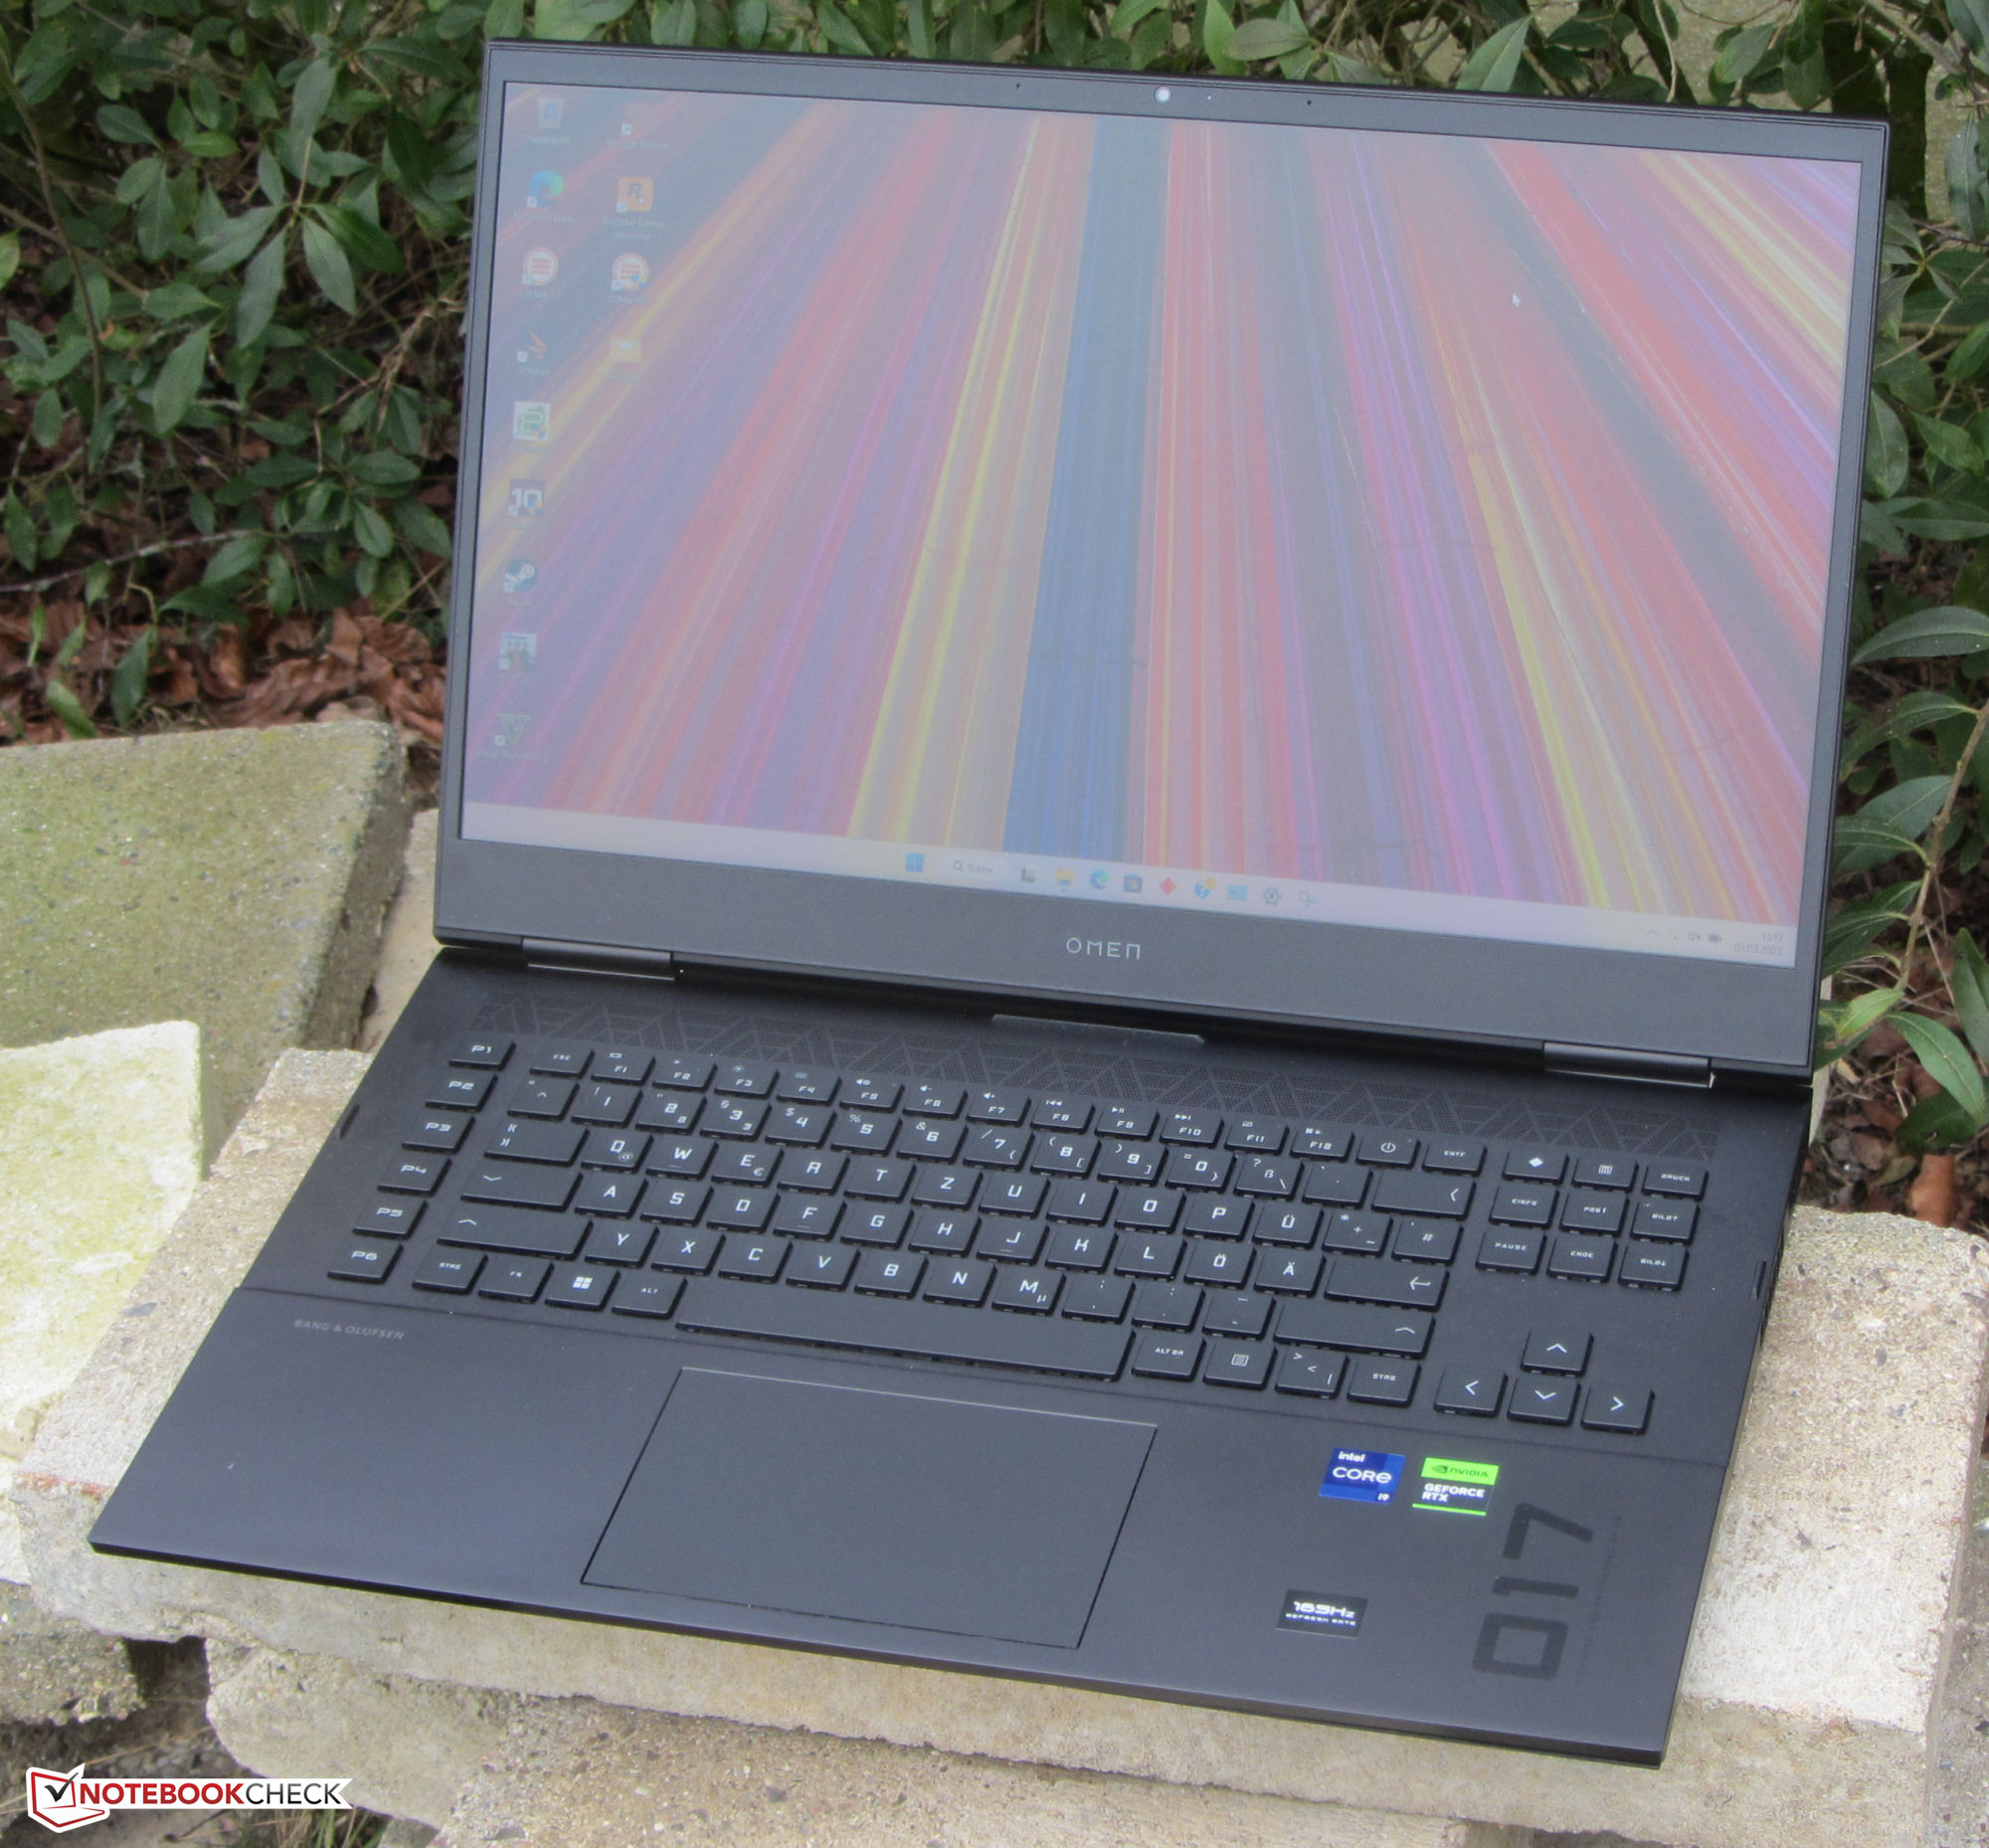
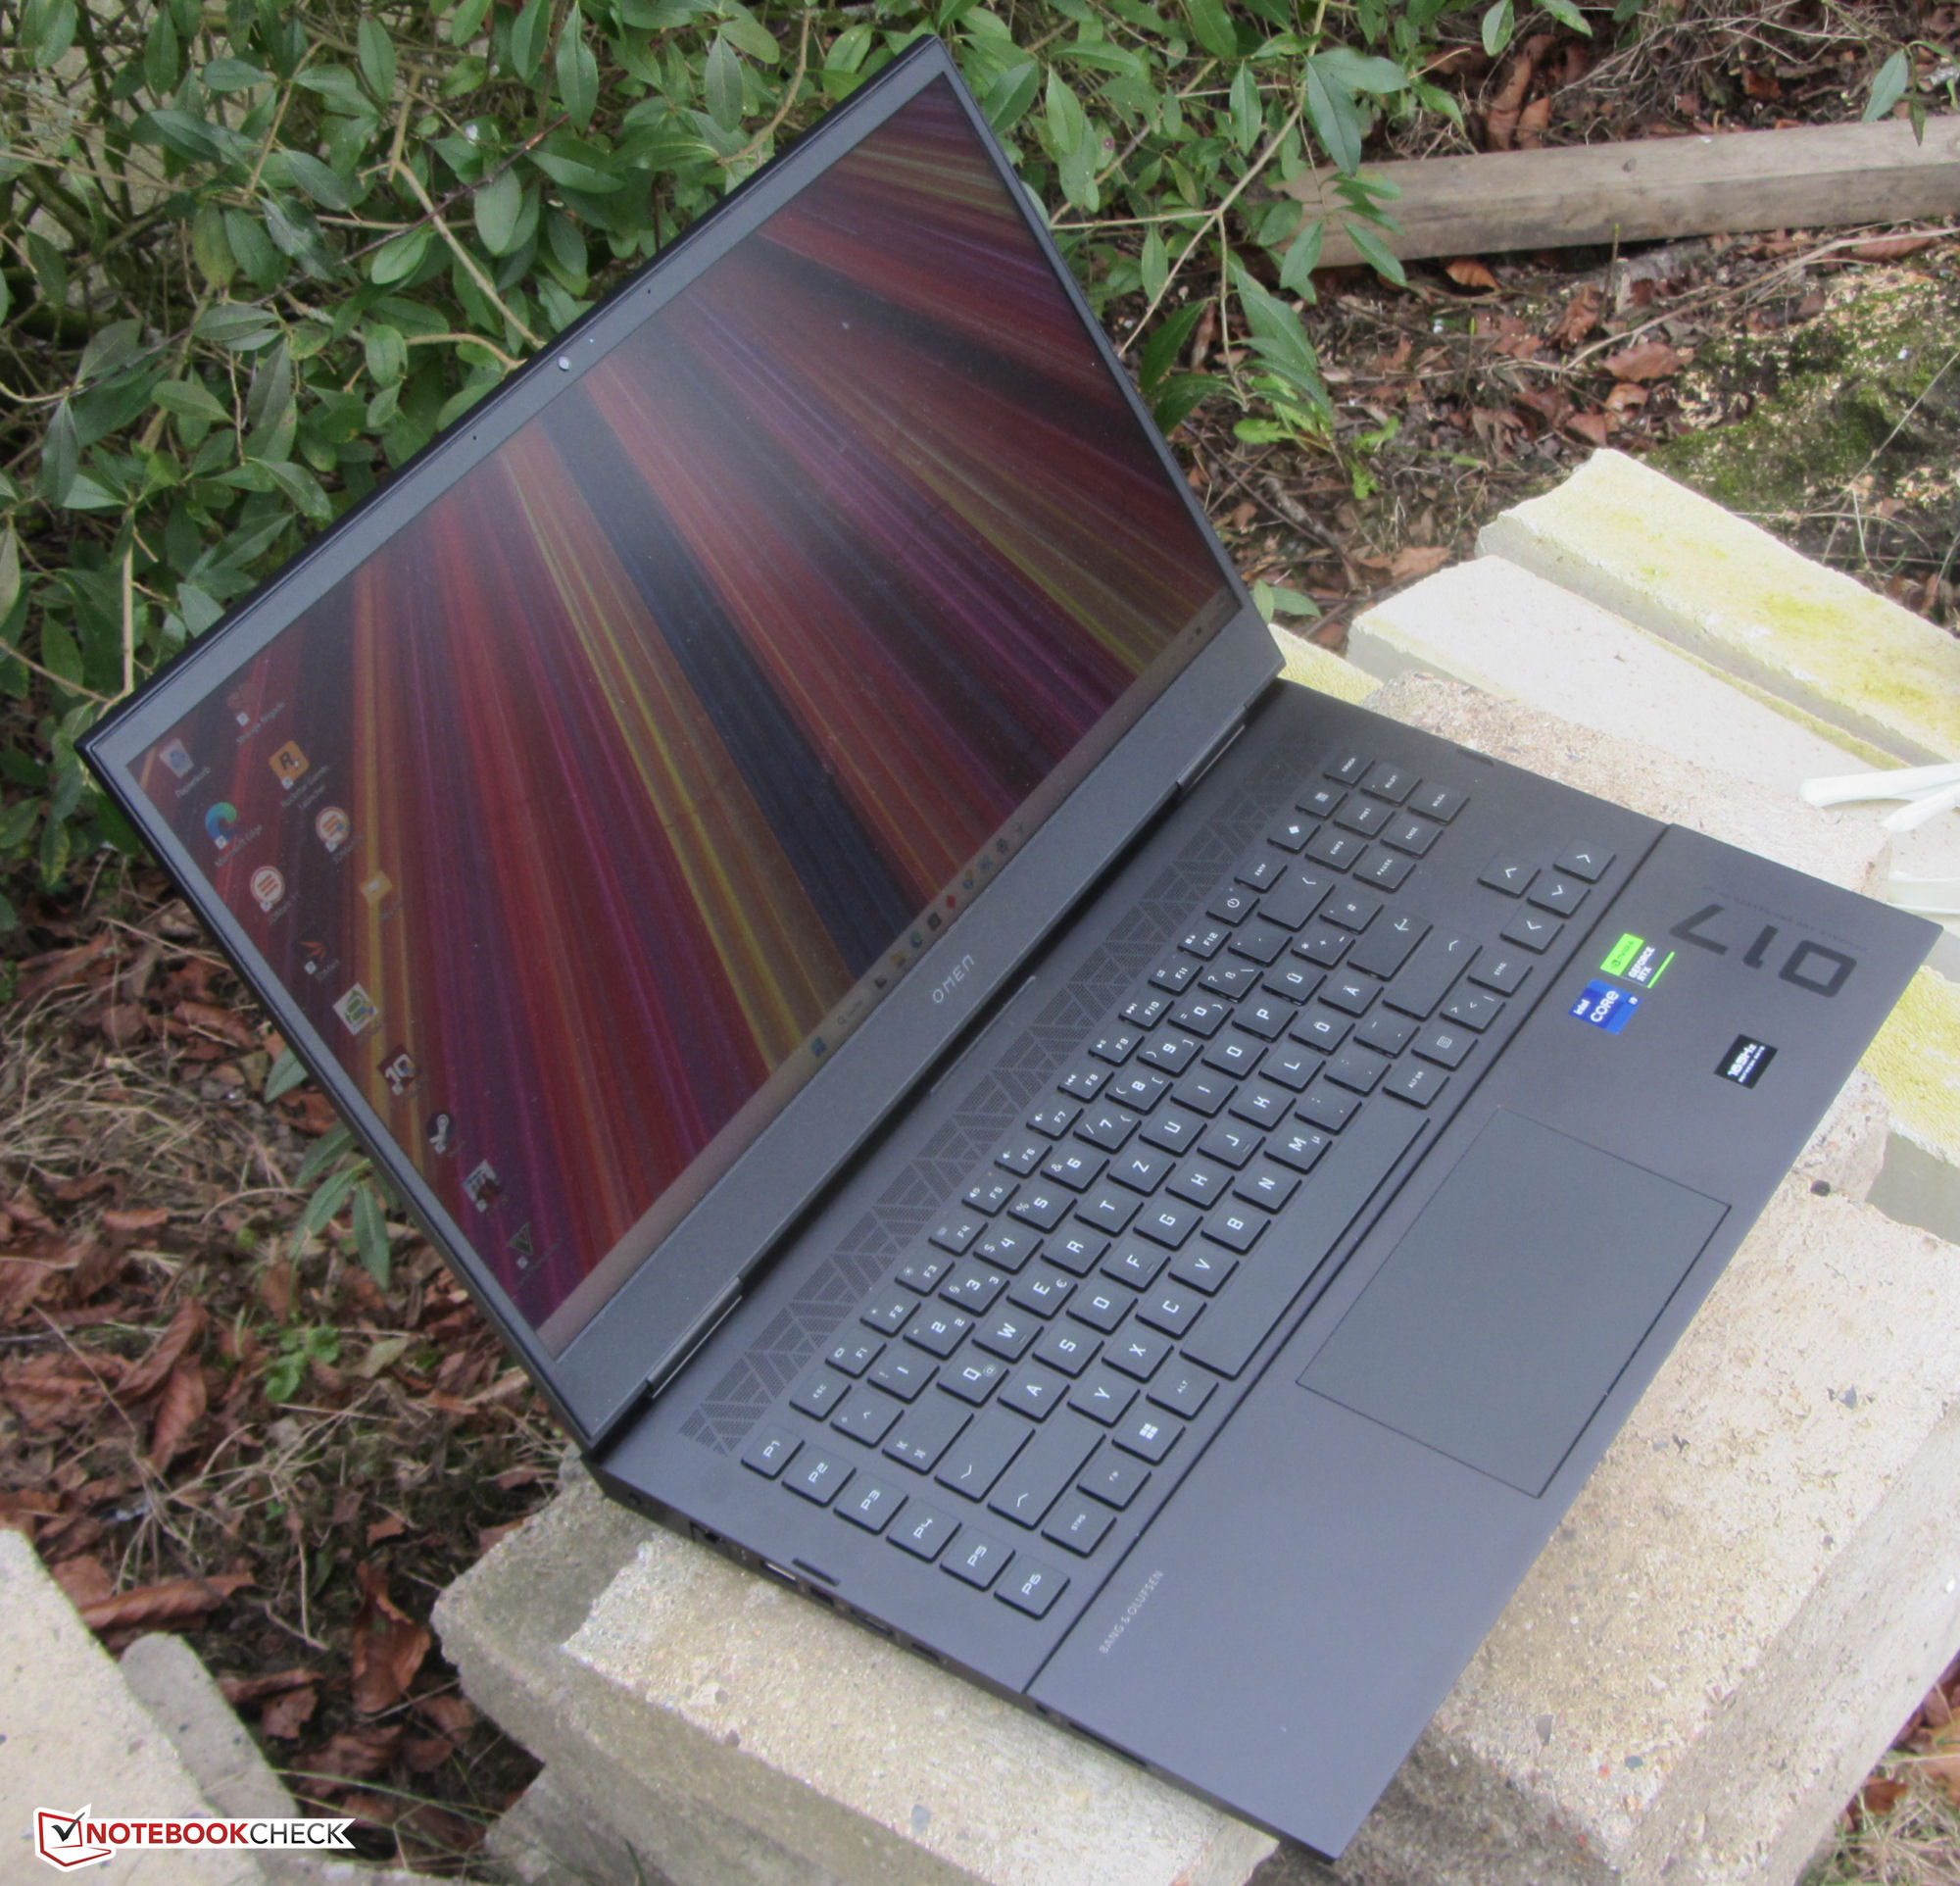
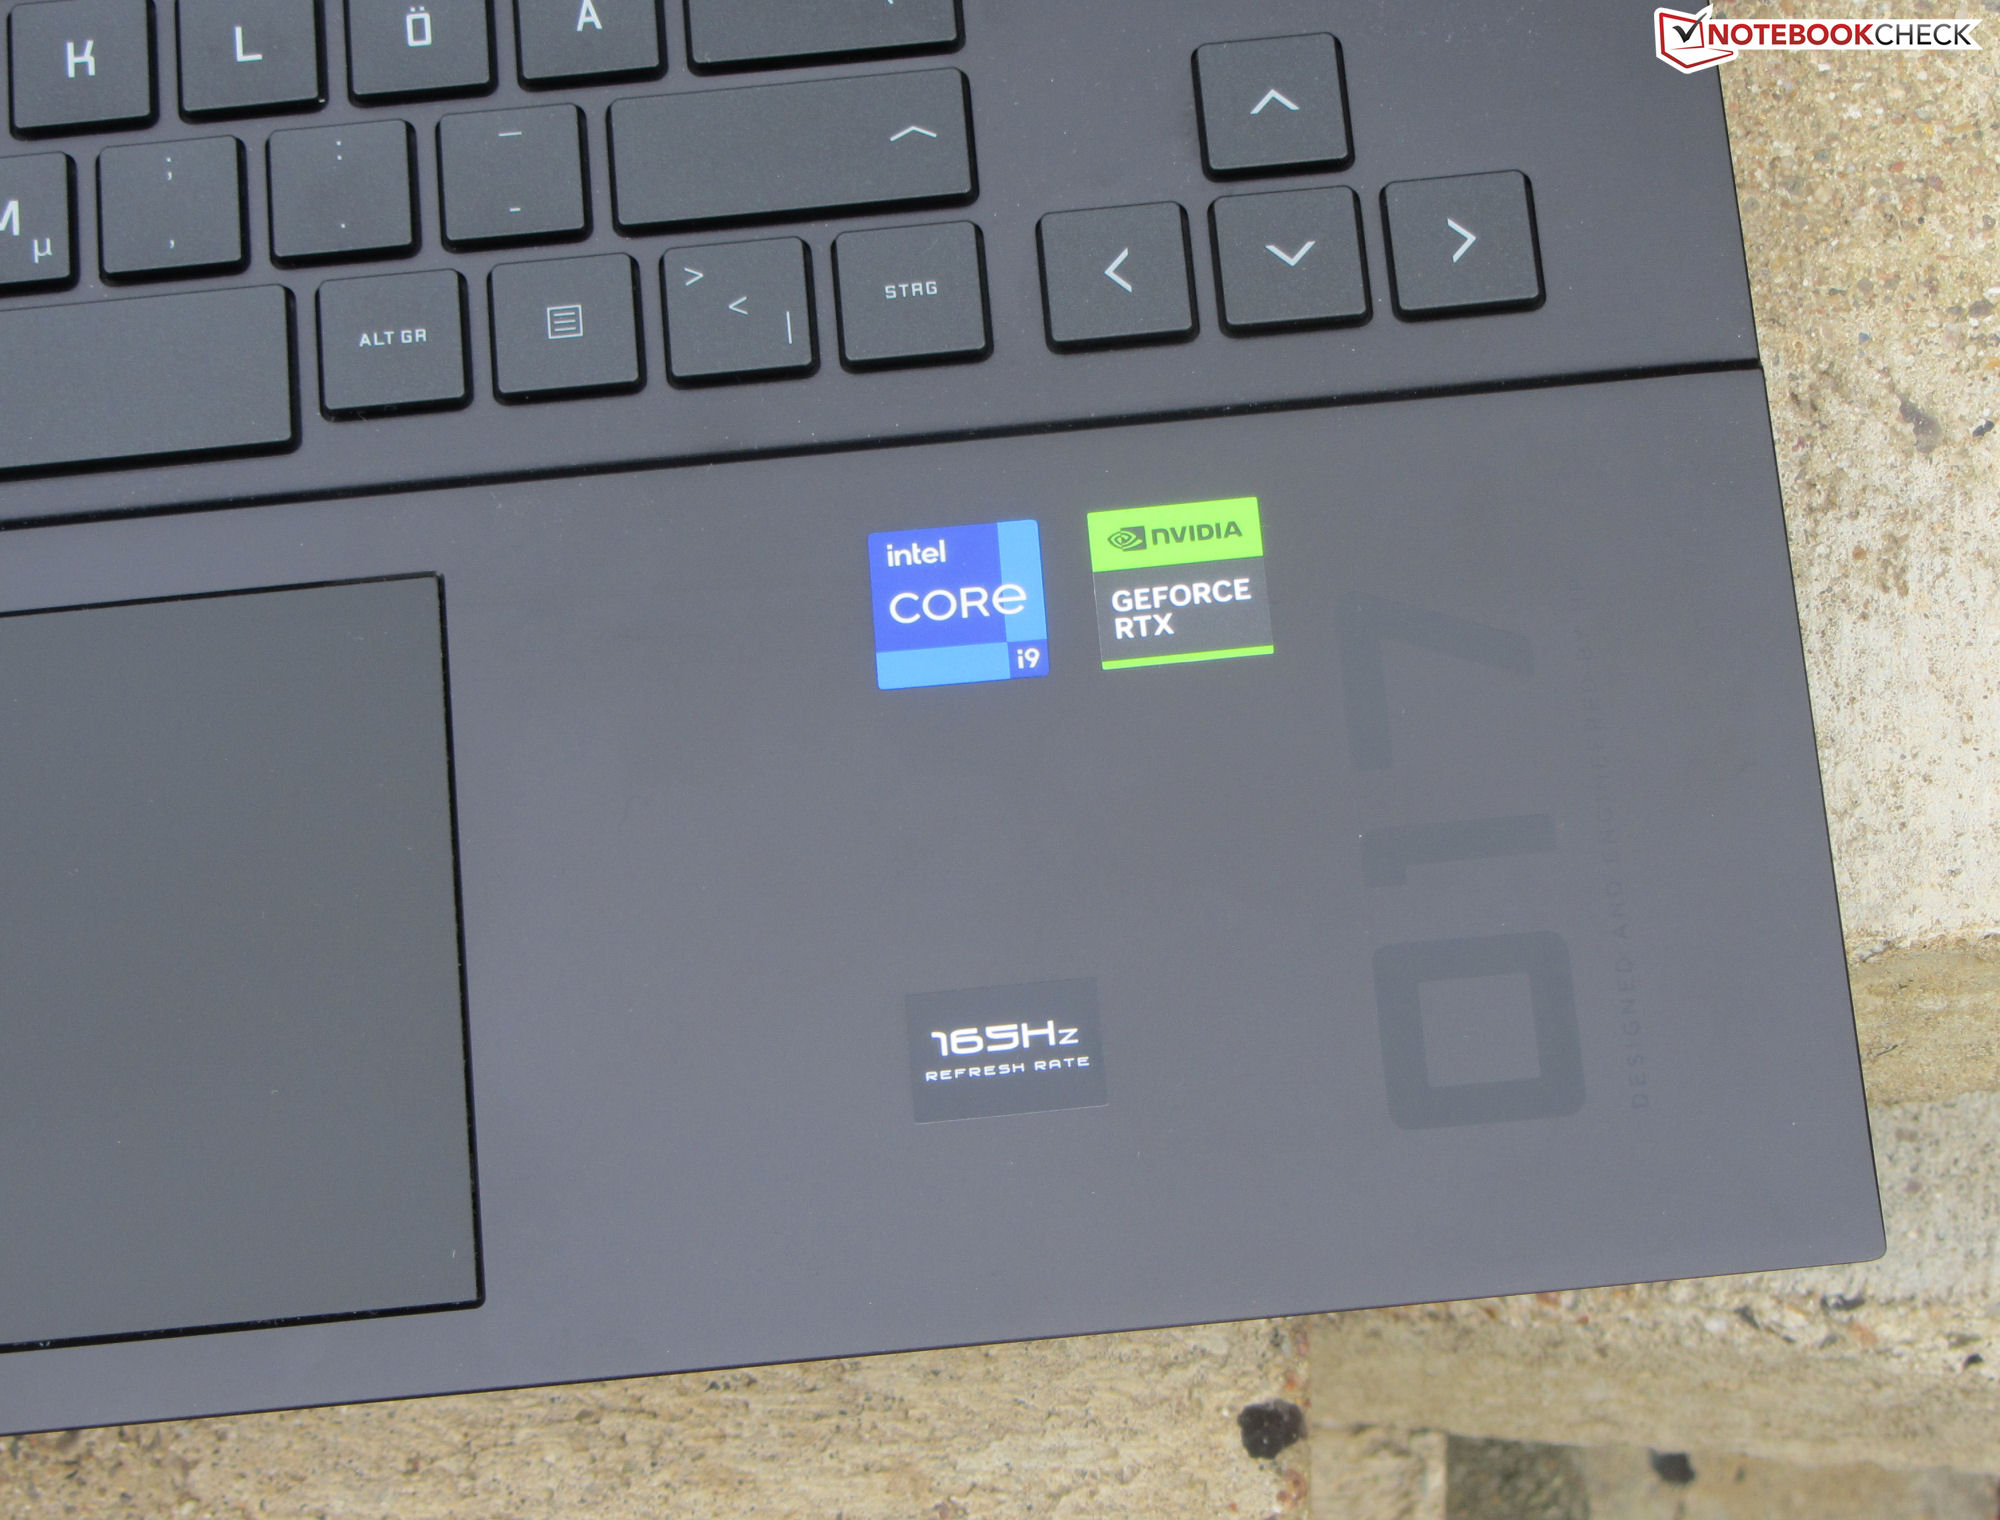
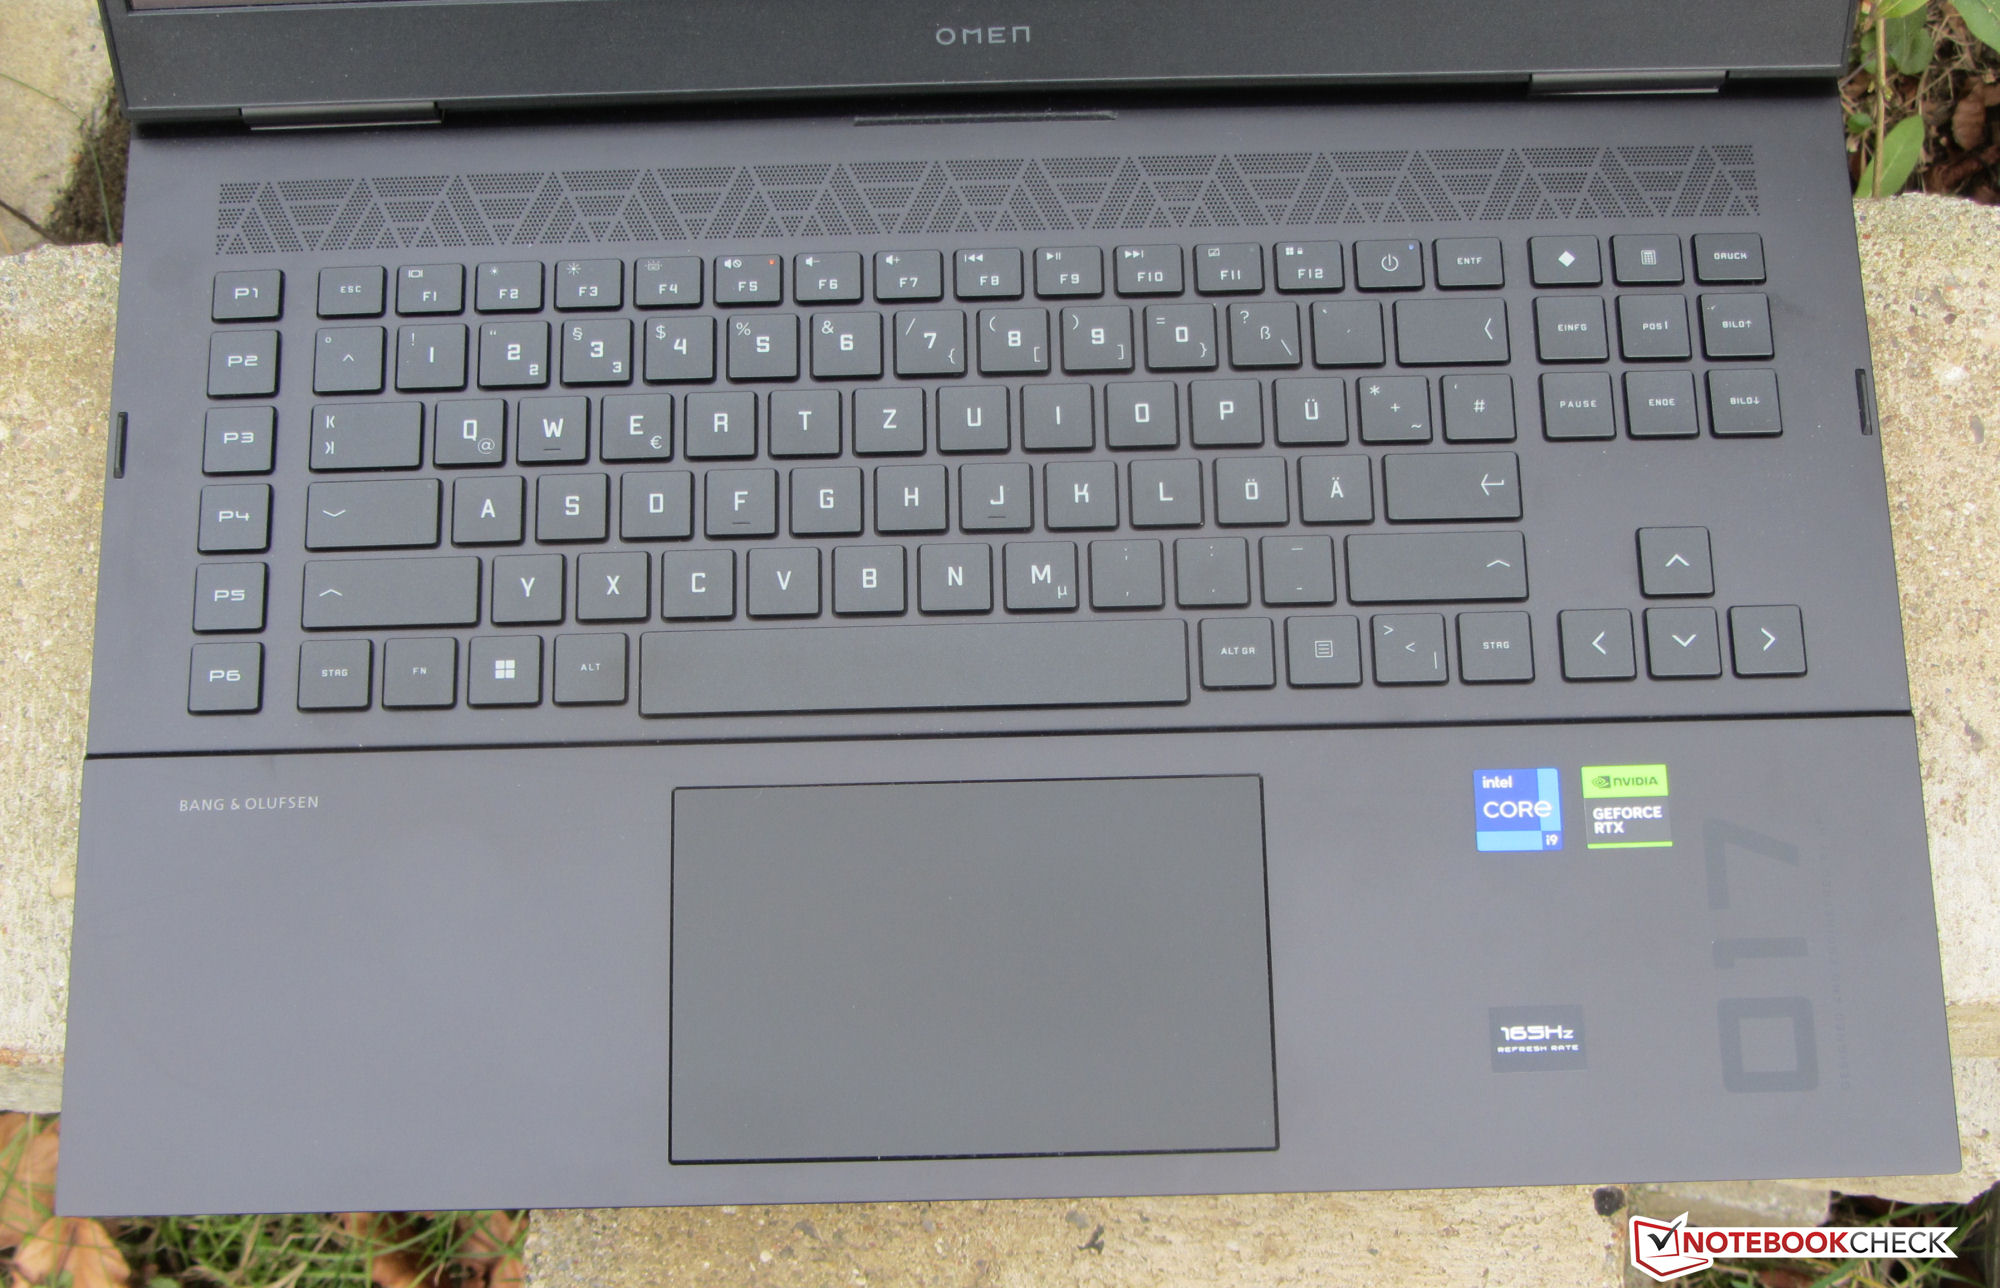
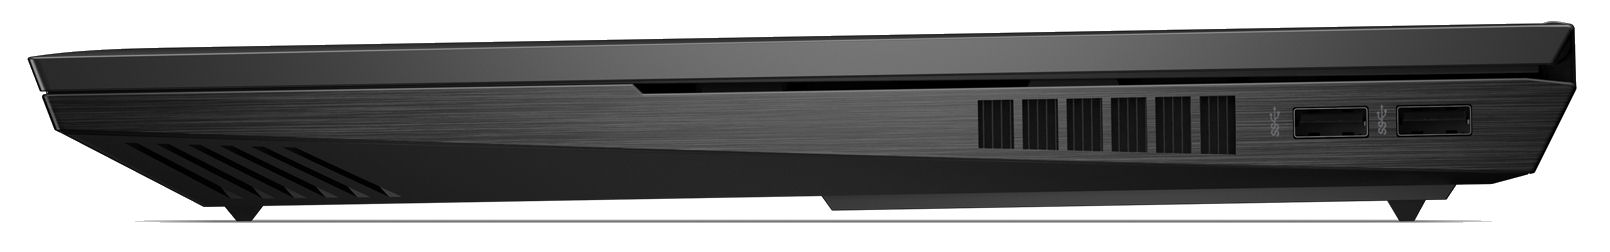
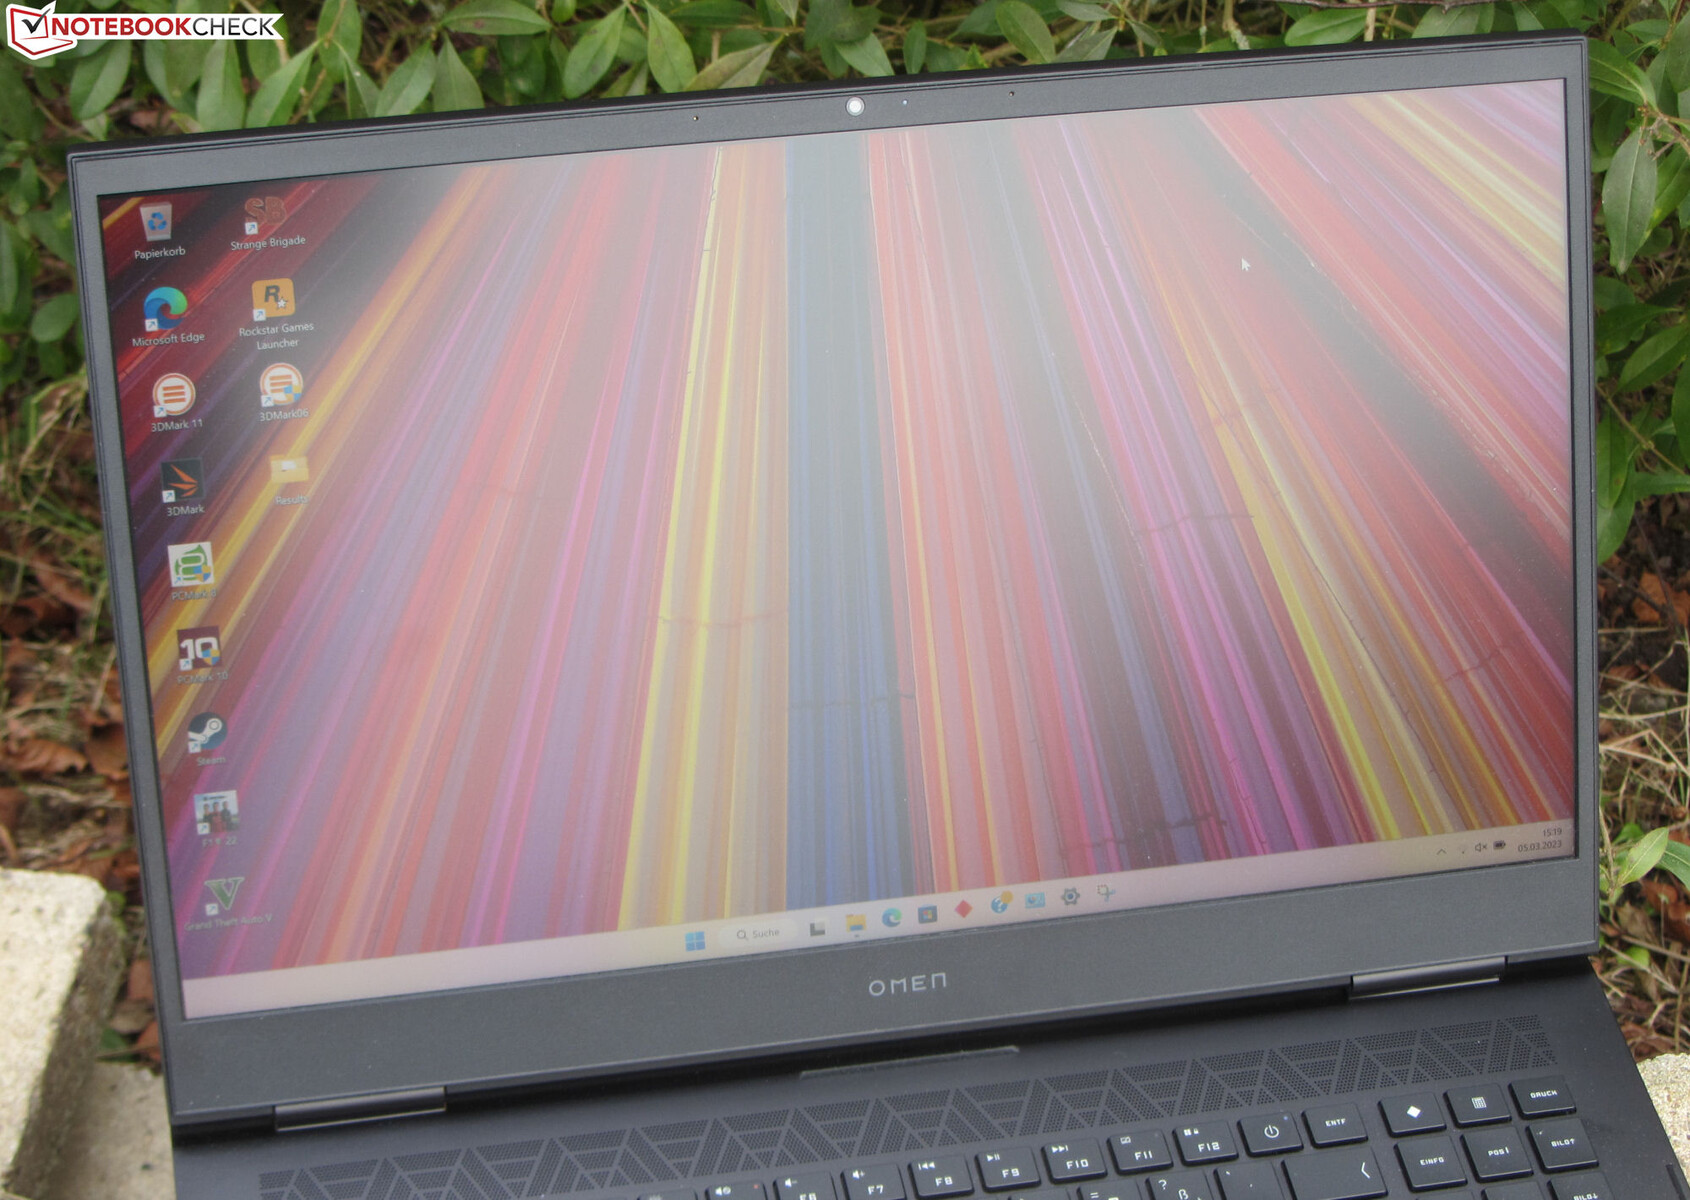
Il modello 2023 dell'Omen 17, che è un portatile da gioco di fascia alta, utilizza lo stesso case che già conosciamo del predecessore ma include hardware attuale: Il portatile è gestito da chip Raptor Lake e Ada Lovelace. HP combina un Core i9 con una GPU RTX 4080, chiedendo quasi 3.300 euro (3.582 dollari) per l'intero pacchetto. Tra i concorrenti ci sono laptop come l' Alienware m17 R5, ilRazer Blade 16 (inizio 2023), ilAsus ROG Strix G16 G614JZe il Lenovo Legion Pro 7 16IRX8H.
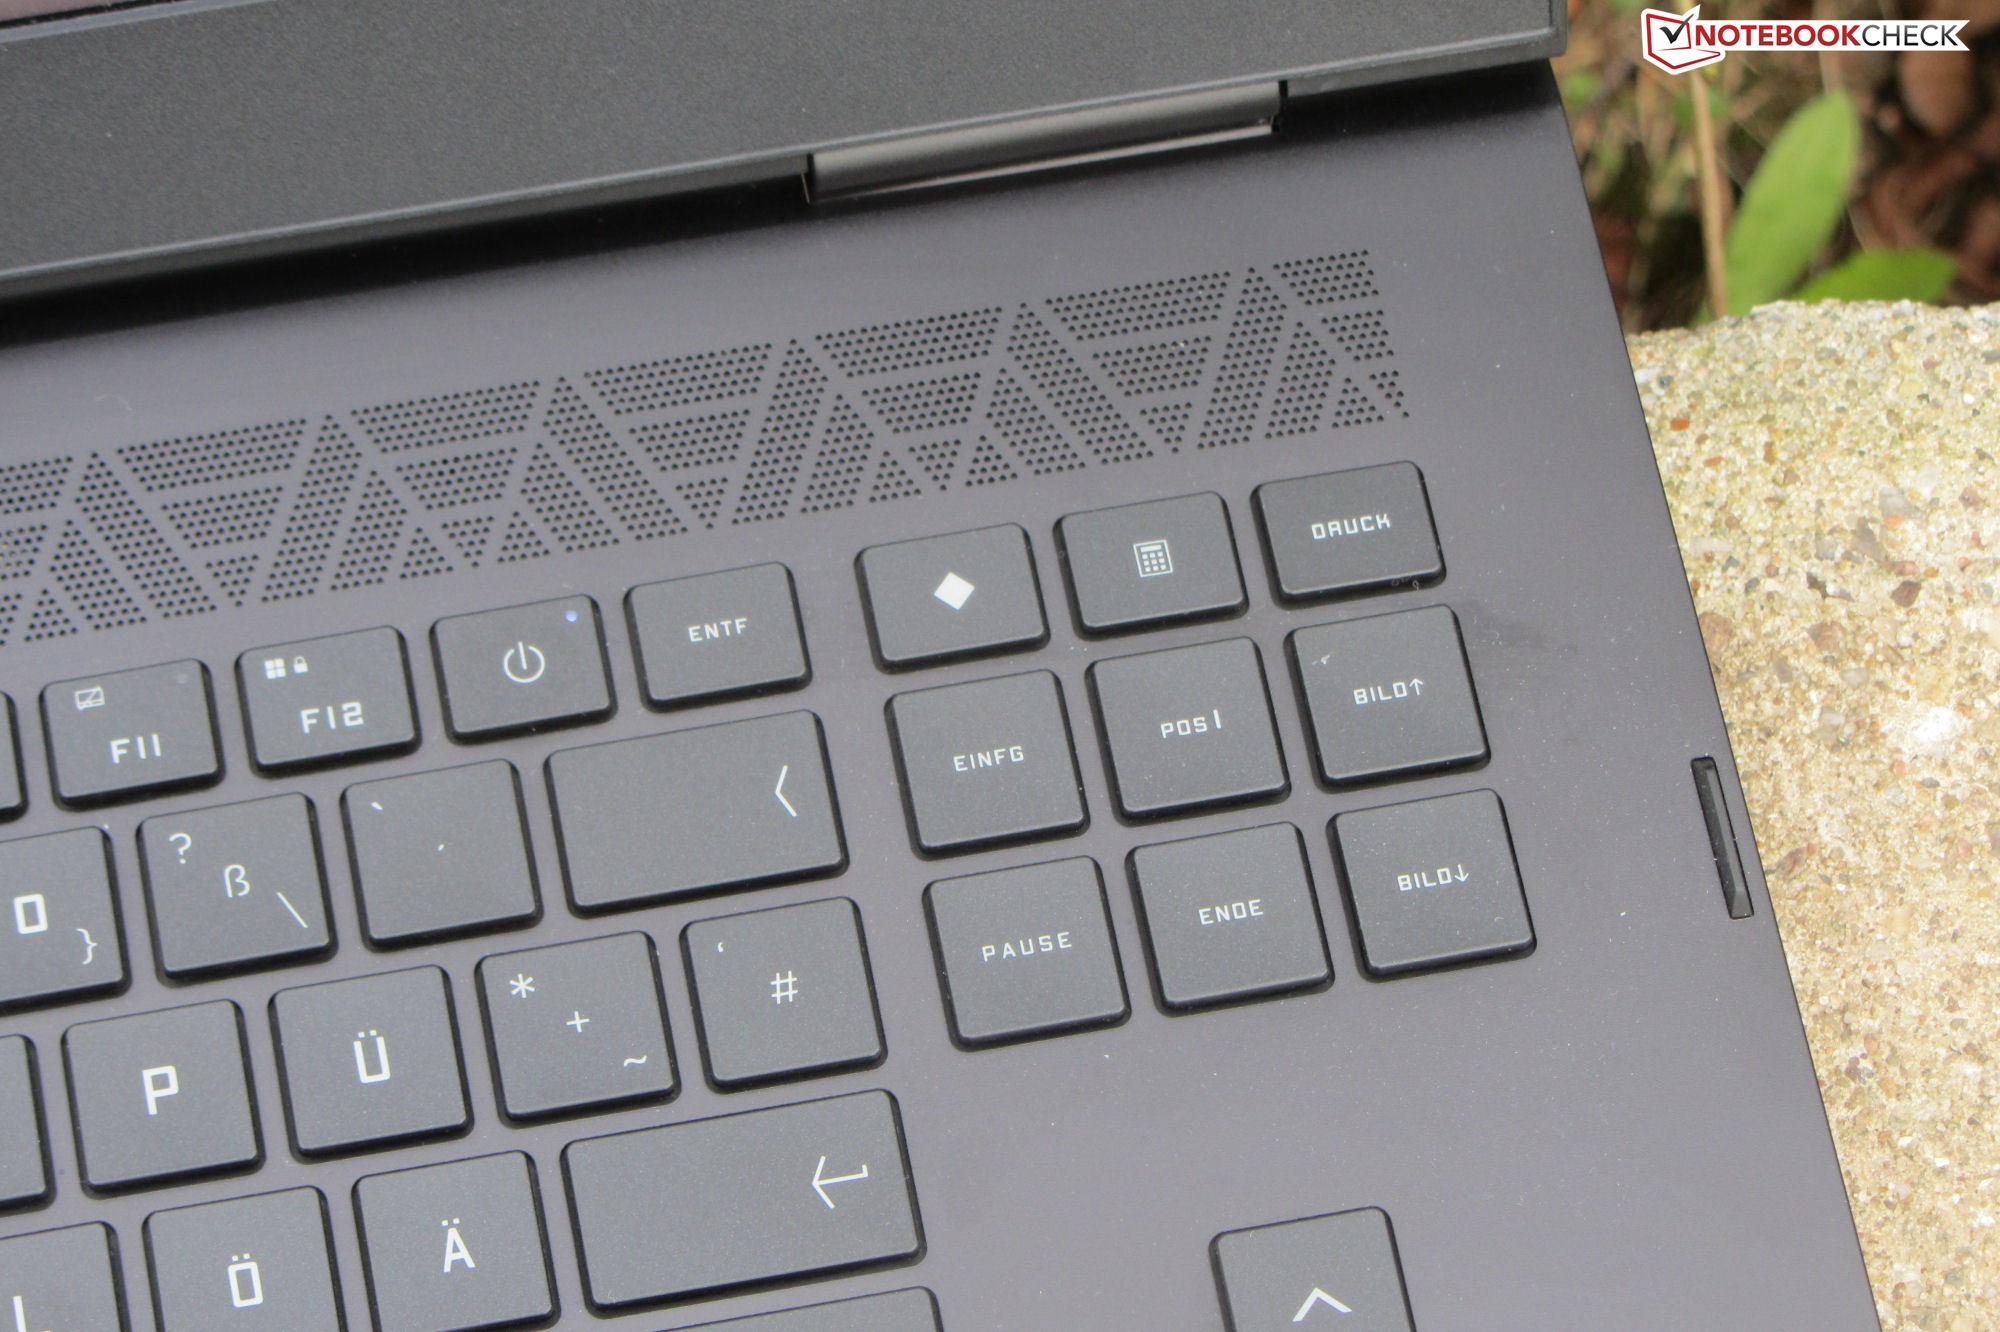
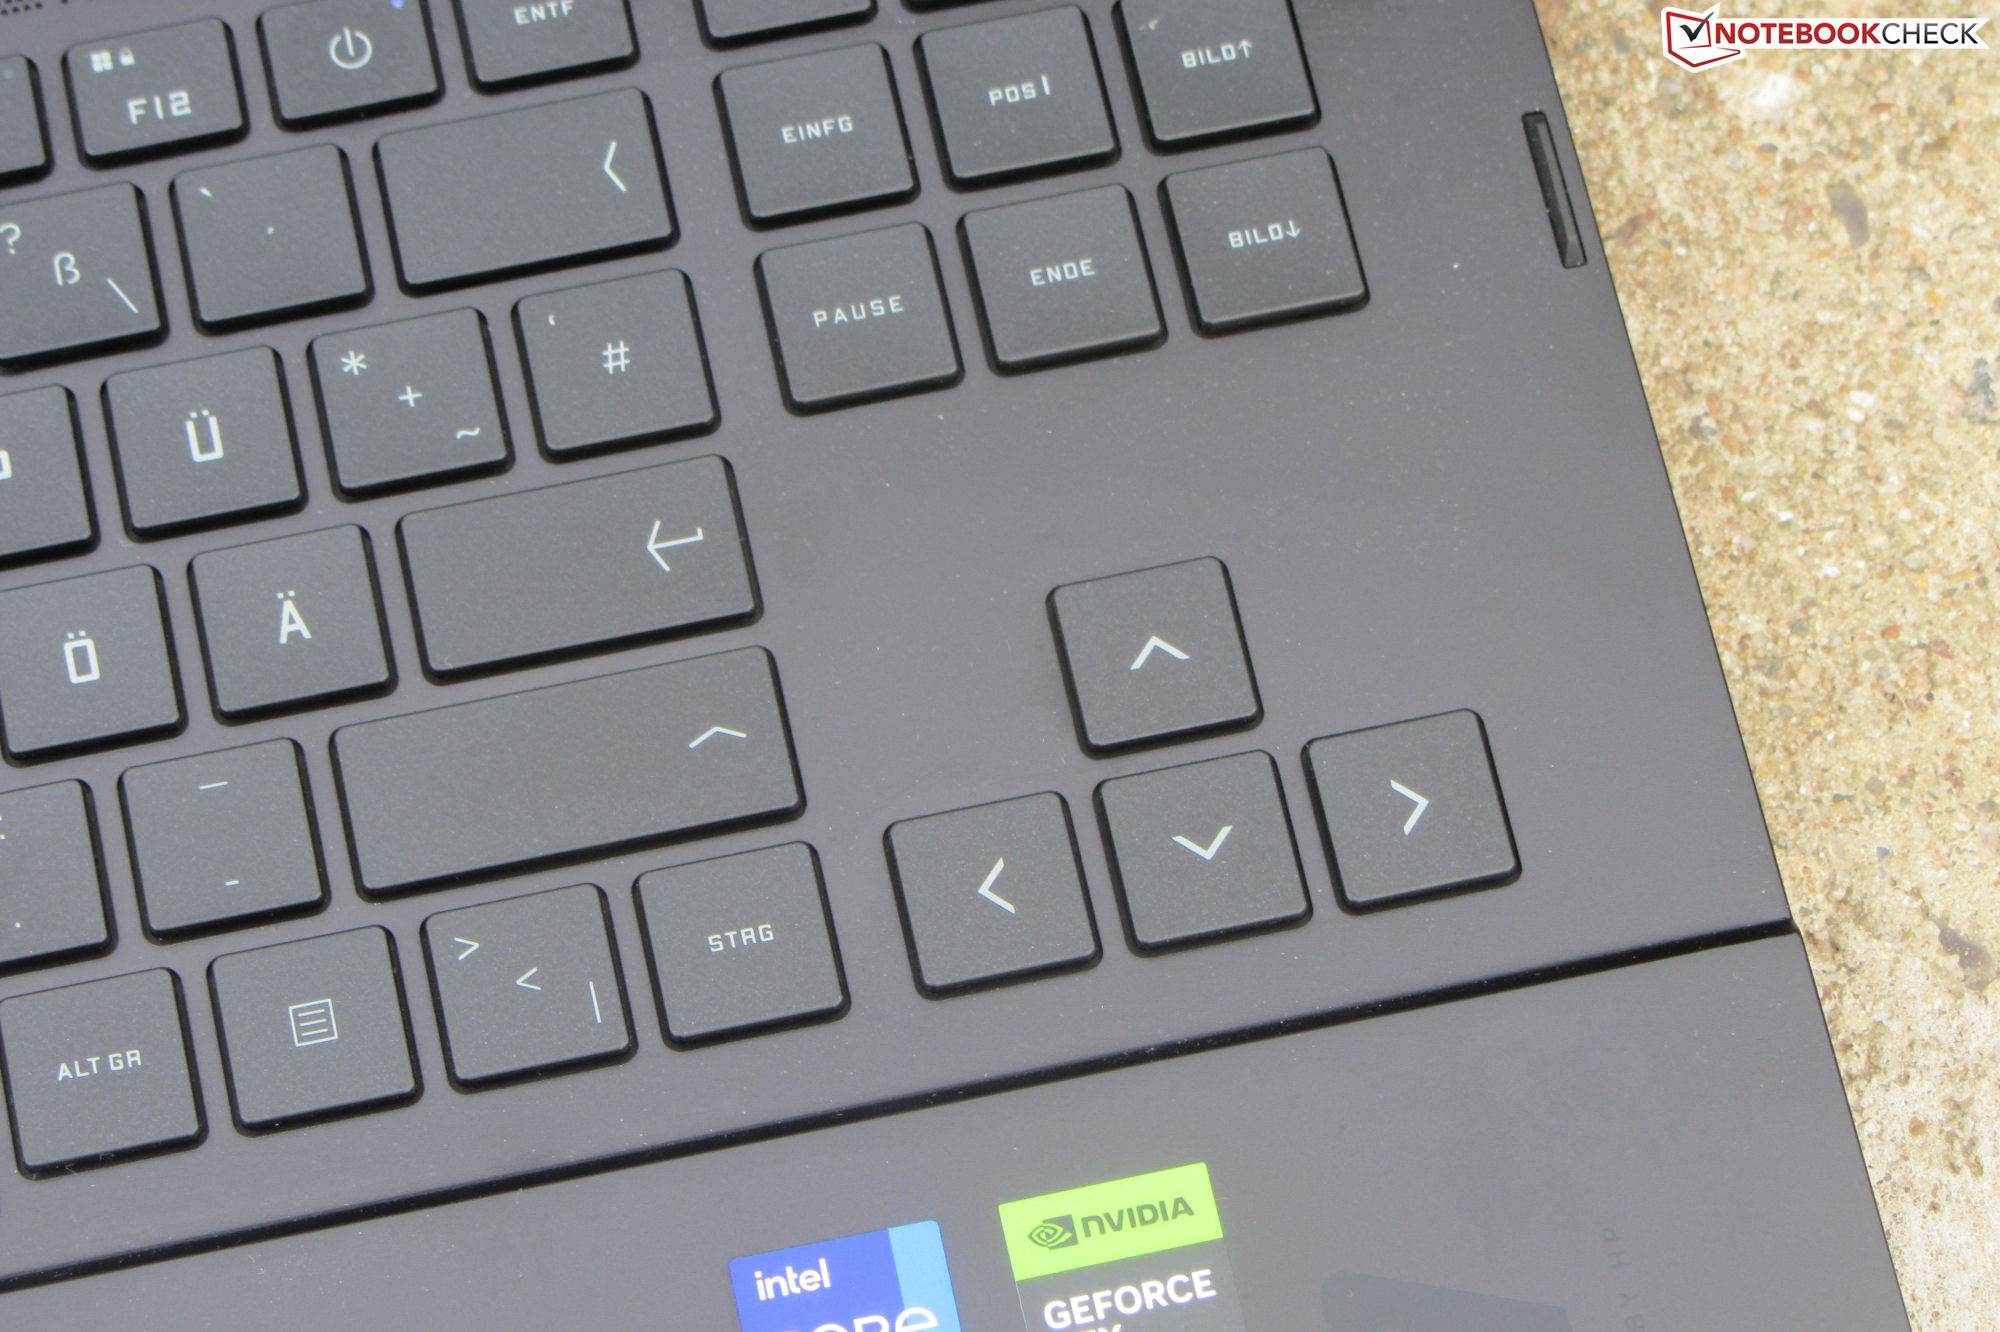
Potete trovare informazioni sul case, sulla dotazione, sui dispositivi di input e sugli altoparlanti nella nostra recensione del modello precedenteche è identico sotto questi aspetti.
Potenziali concorrenti a confronto
Punteggio | Data | Modello | Peso | Altezza | Dimensione | Risoluzione | Prezzo |
|---|---|---|---|---|---|---|---|
| 85.4 % v7 (old) | 03/2023 | HP Omen 17-ck2097ng i9-13900HX, GeForce RTX 4080 Laptop GPU | 2.8 kg | 27 mm | 17.30" | 2560x1440 | |
| 86.1 % v7 (old) | 01/2023 | Alienware m17 R5 (R9 6900HX, RX 6850M XT) R9 6900HX, Radeon RX 6850M XT | 3.4 kg | 26.7 mm | 17.00" | 3840x2160 | |
| 91.2 % v7 (old) | 02/2023 | Razer Blade 16 Early 2023 i9-13950HX, GeForce RTX 4080 Laptop GPU | 2.4 kg | 21.99 mm | 16.00" | 2560x1600 | |
| 89.4 % v7 (old) | 02/2023 | Lenovo Legion Pro 7 16IRX8H i9-13900HX, GeForce RTX 4080 Laptop GPU | 2.7 kg | 26 mm | 16.00" | 2560x1600 | |
| 88.4 % v7 (old) | 03/2023 | Asus ROG Strix G16 G614JZ i9-13980HX, GeForce RTX 4080 Laptop GPU | 2.4 kg | 30.4 mm | 16.00" | 2560x1600 |
| SD Card Reader | |
| average JPG Copy Test (av. of 3 runs) | |
| Media della classe Gaming (20.9 - 210, n=54, ultimi 2 anni) | |
| Razer Blade 16 Early 2023 (AV PRO microSD 128 GB V60) | |
| HP Omen 17-ck2097ng (AV PRO microSD 128 GB V60) | |
| maximum AS SSD Seq Read Test (1GB) | |
| Razer Blade 16 Early 2023 (AV PRO microSD 128 GB V60) | |
| Media della classe Gaming (25.5 - 261, n=51, ultimi 2 anni) | |
| HP Omen 17-ck2097ng (AV PRO microSD 128 GB V60) | |


Display - QHD con copertura sRGB
Mentre a questo punto molti concorrenti preferiscono utilizzare display 16:10, HP rimane fedele al formato 16:9 nell'Omen. Un aspetto positivo è che il pannello reattivo a 165 Hz non mostra alcuno sfarfallio PWM a qualsiasi livello di luminosità.
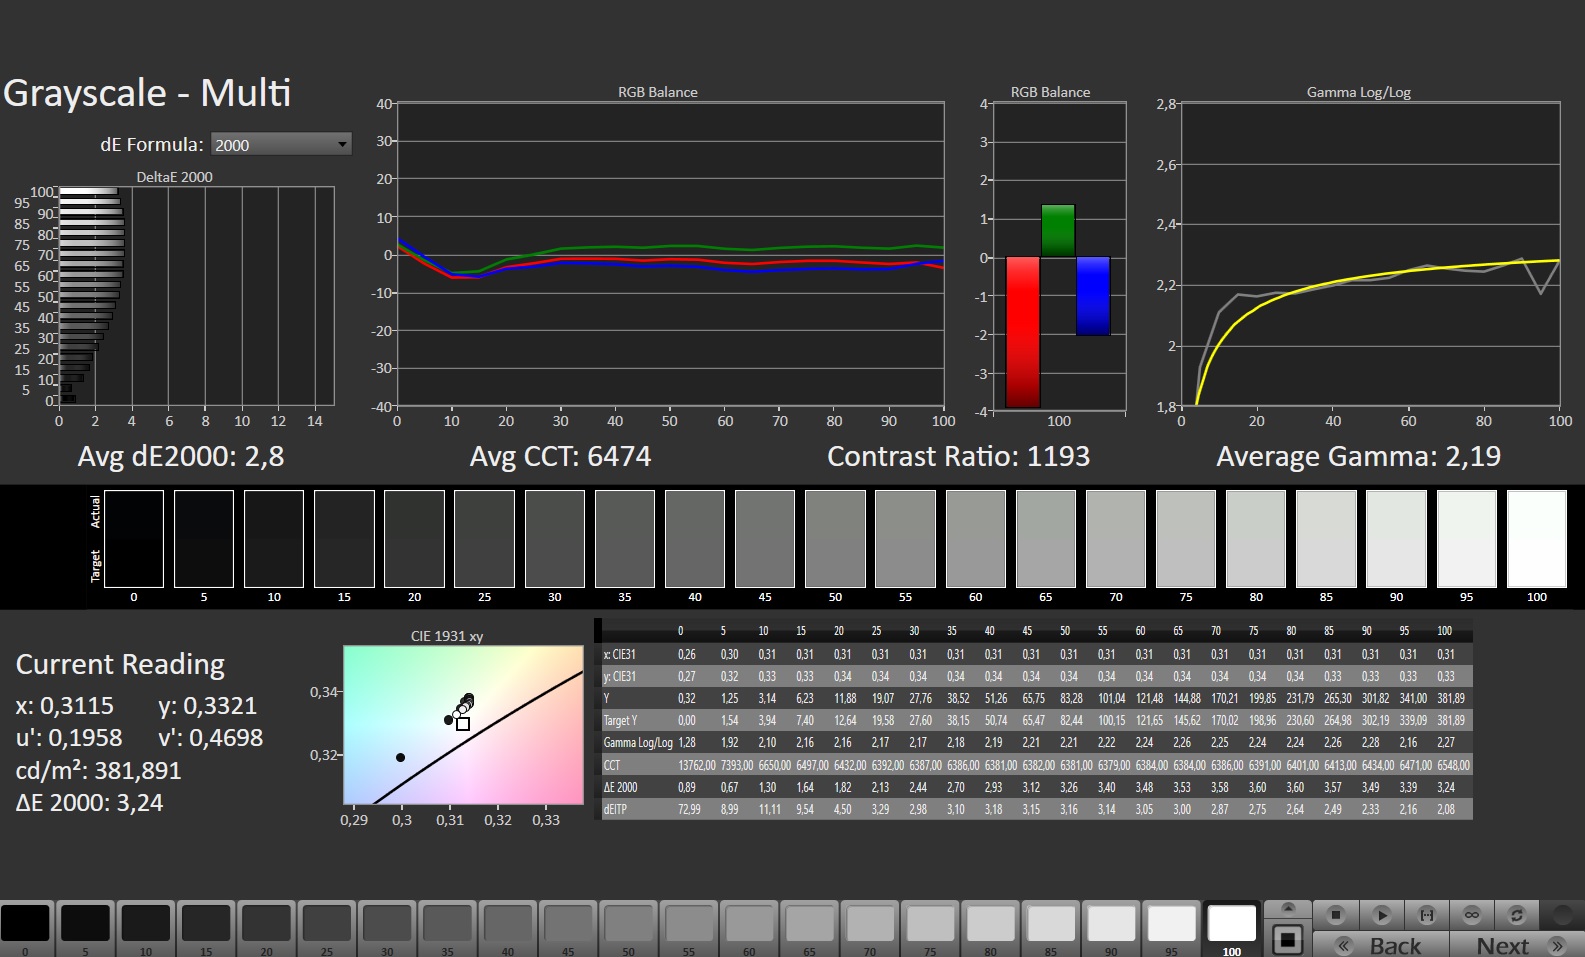
La luminosità e il contrasto del display opaco da 17,3 pollici (2.560 x 1.440 pixel) soddisfano i requisiti (> 300 cd/m² e 1.000:1). Tuttavia, il display Omen offre la luminosità più bassa tra i display dei nostri concorrenti. Il Legion 7 Pro ha il pannello più luminoso.
| |||||||||||||||||||||||||
Distribuzione della luminosità: 90 %
Al centro con la batteria: 371 cd/m²
Contrasto: 1159:1 (Nero: 0.32 cd/m²)
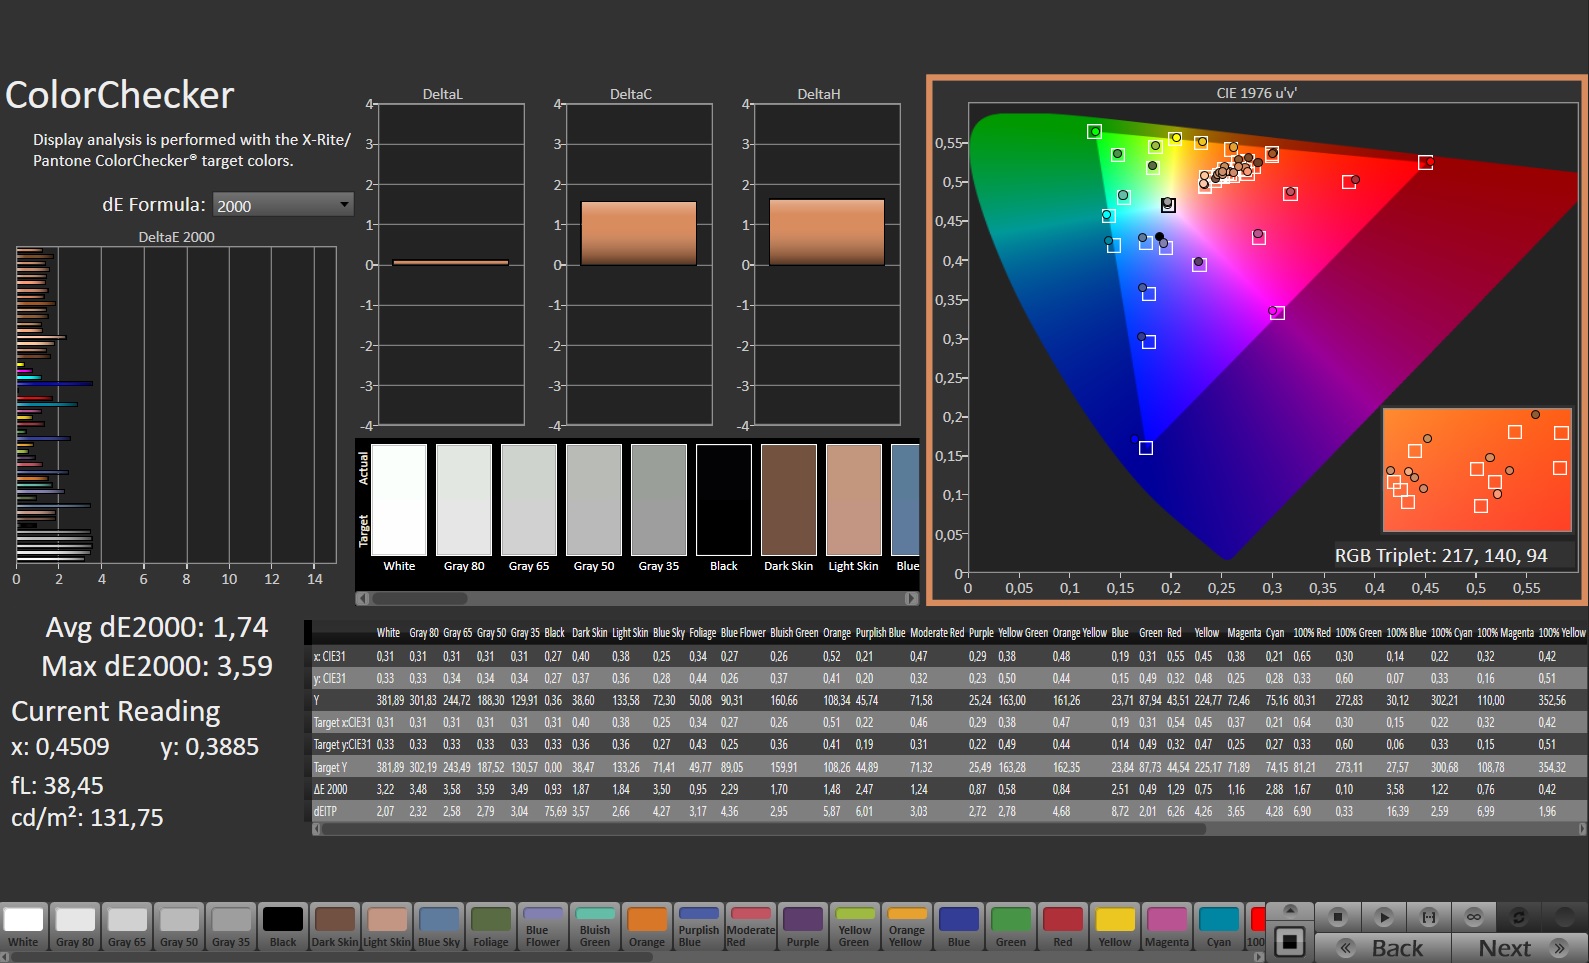
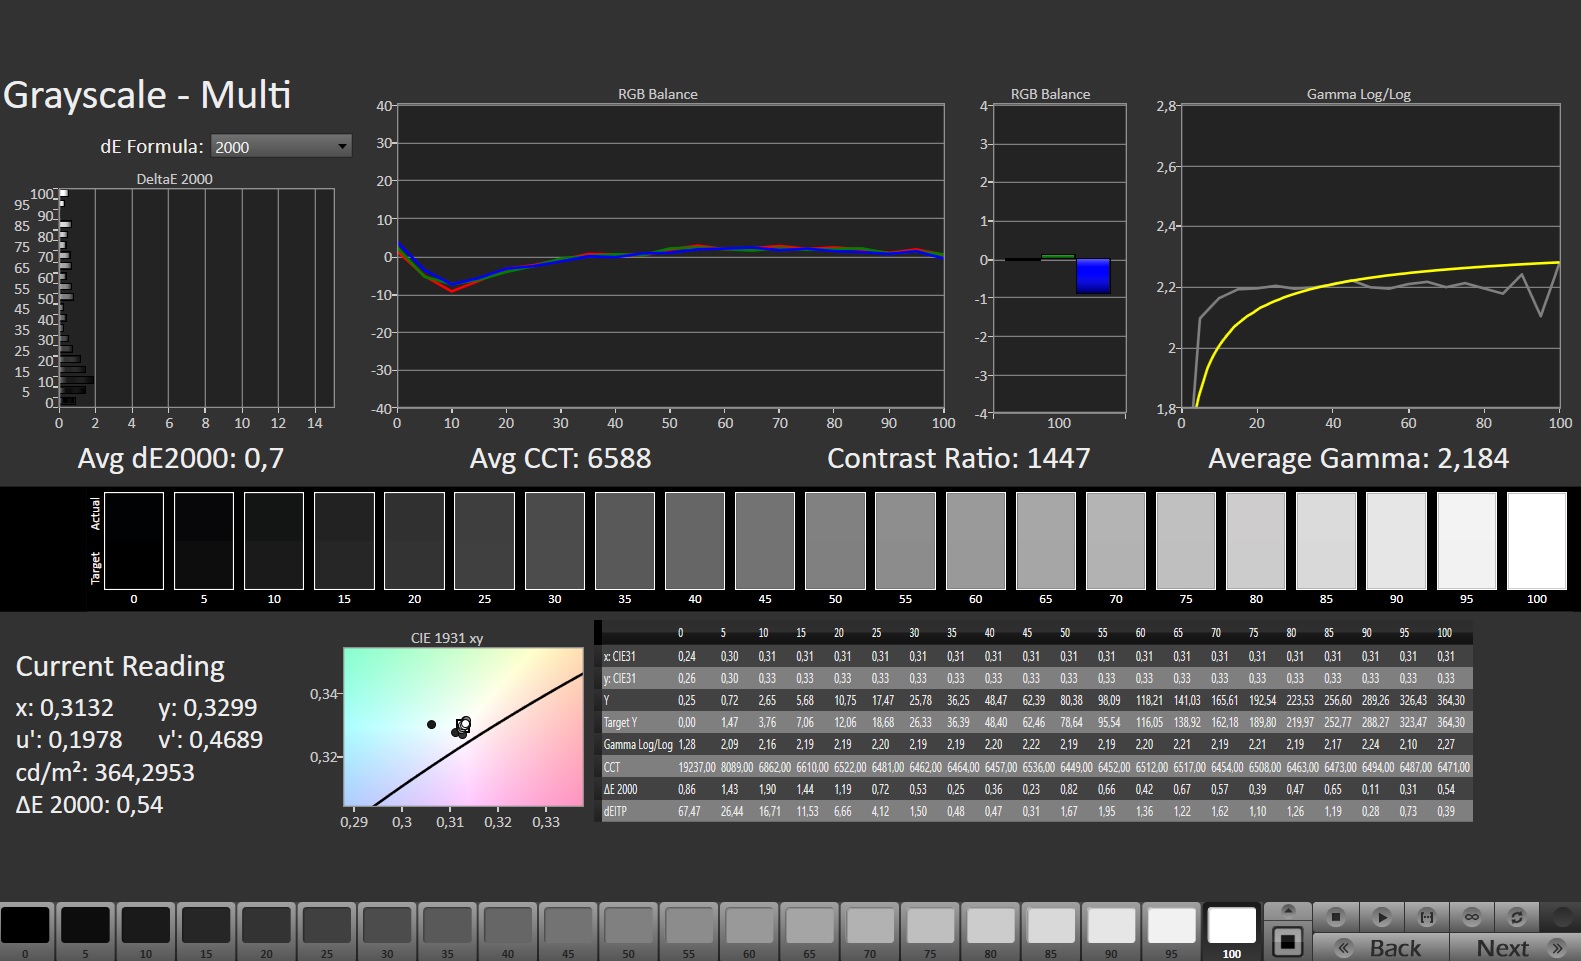
ΔE ColorChecker Calman: 1.74 | ∀{0.5-29.43 Ø4.71}
calibrated: 1.01
ΔE Greyscale Calman: 2.8 | ∀{0.09-98 Ø4.96}
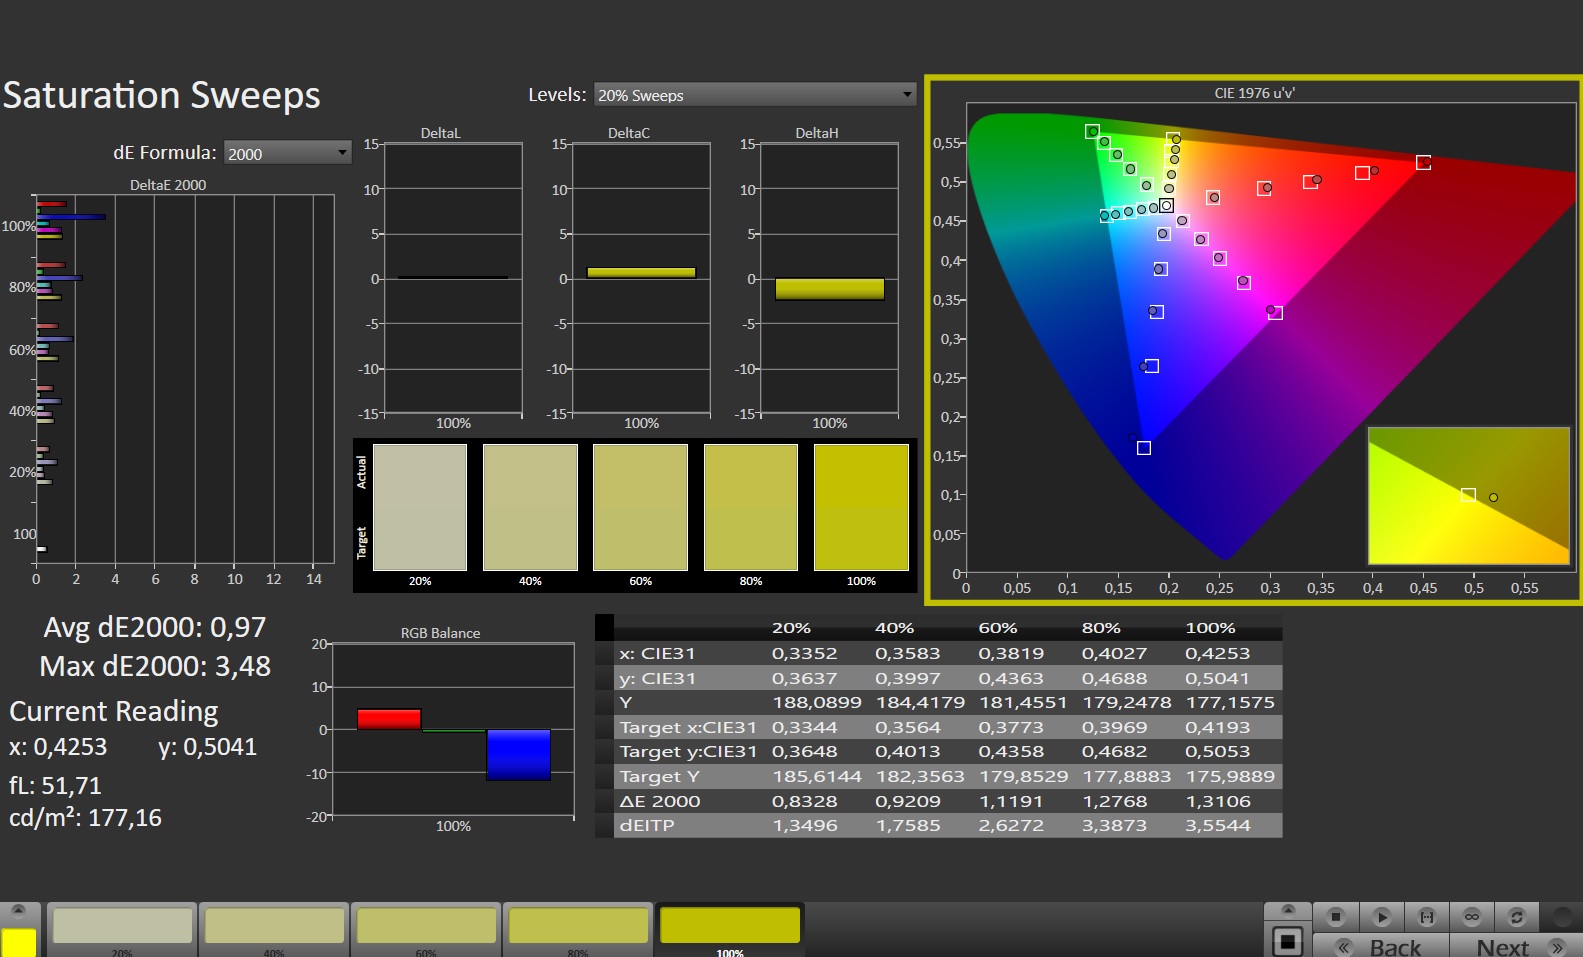
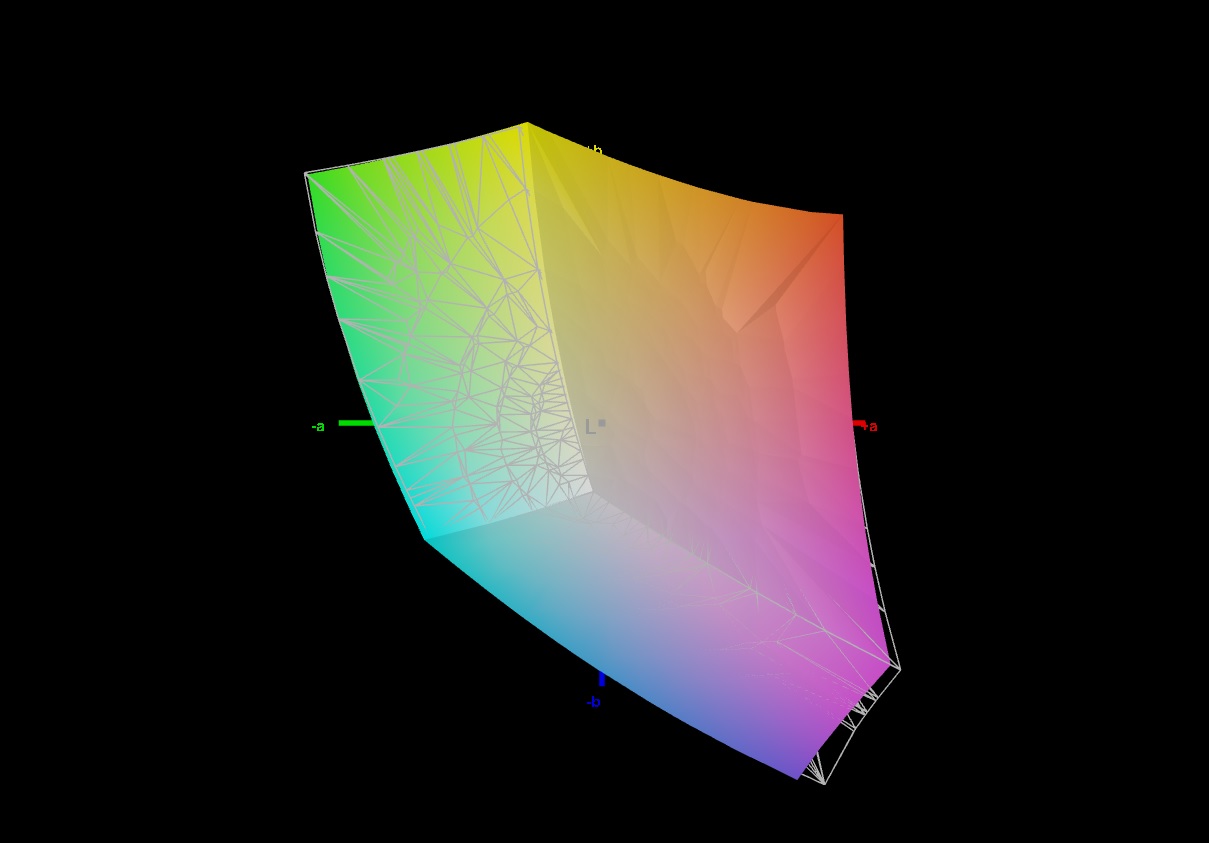
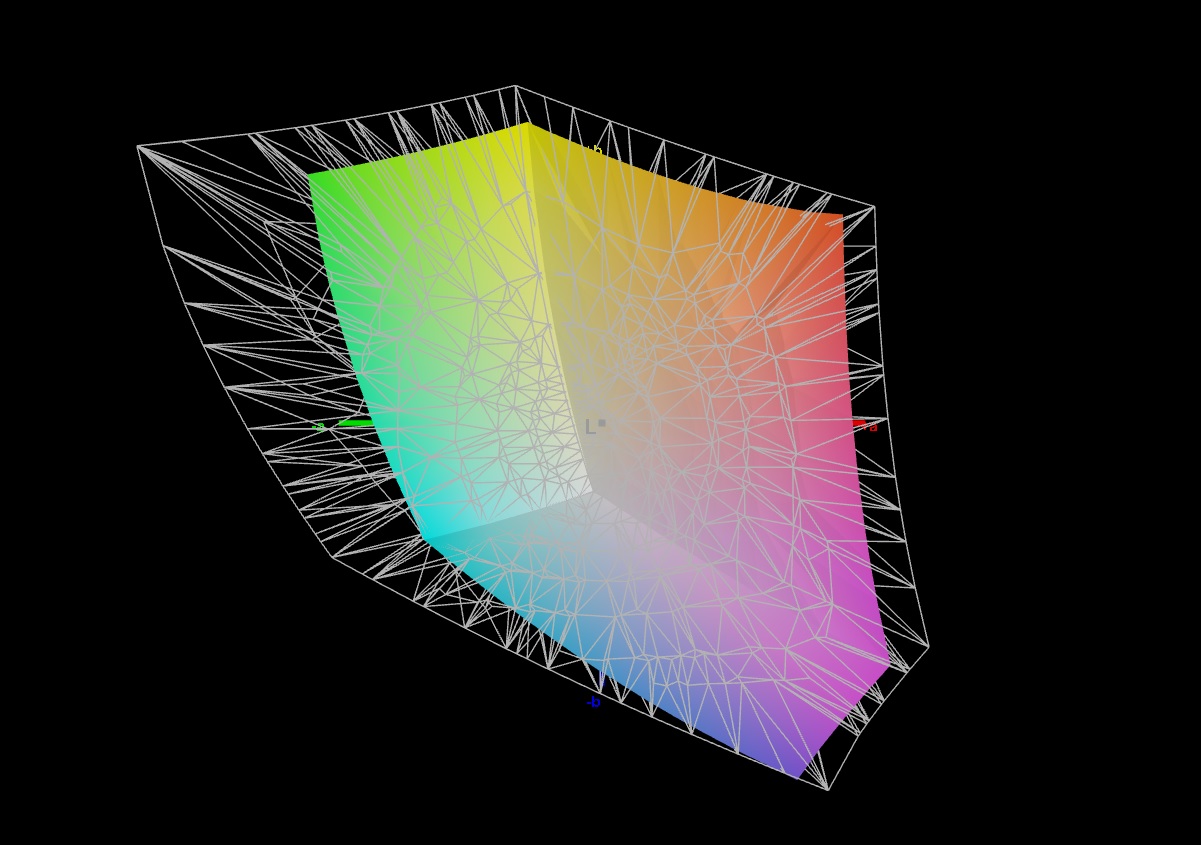
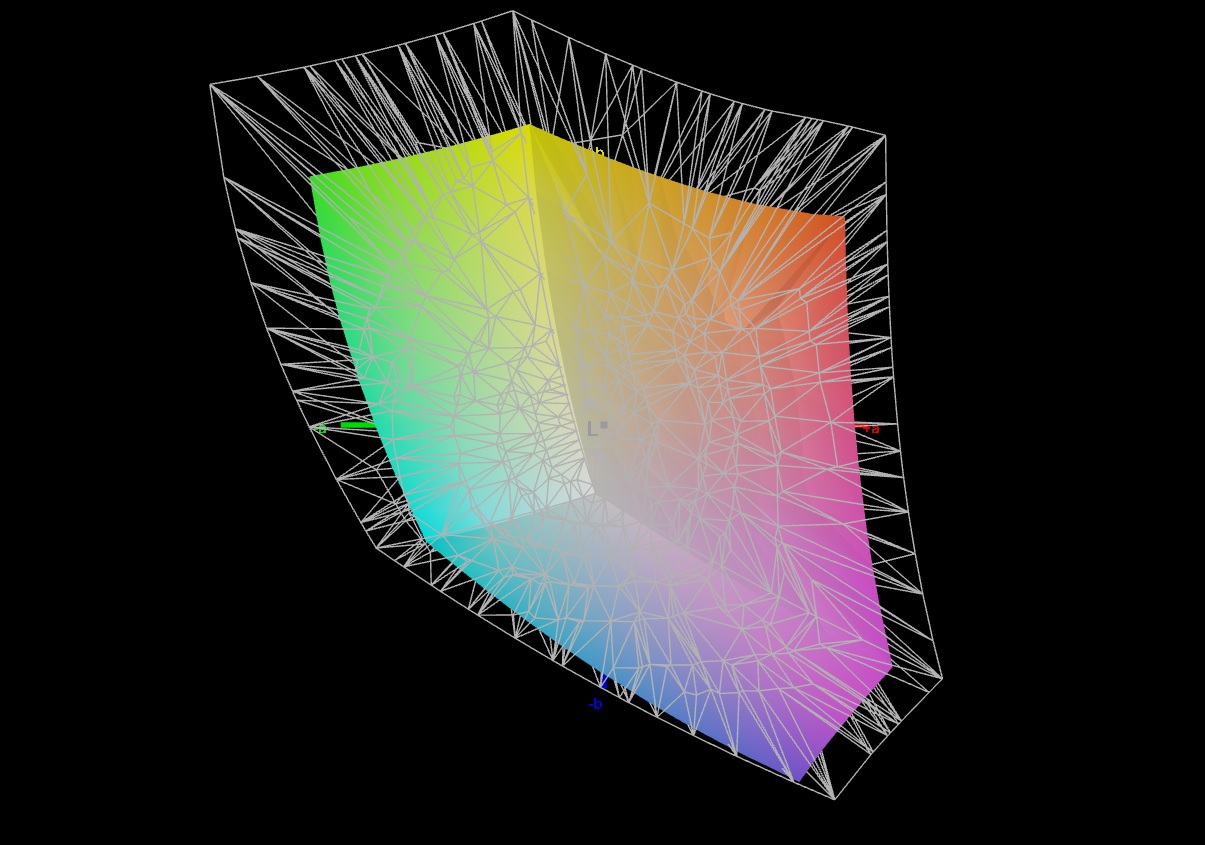
69.6% AdobeRGB 1998 (Argyll 3D)
97.6% sRGB (Argyll 3D)
67.4% Display P3 (Argyll 3D)
Gamma: 2.19
CCT: 6474 K
| HP Omen 17-ck2097ng BOE BOE09BF, IPS, 2560x1440, 17.3" | Alienware m17 R5 (R9 6900HX, RX 6850M XT) AU Optronics AUODBA3, IPS, 3840x2160, 17" | Razer Blade 16 Early 2023 CSOT T3 MNG007DA4-1, IPS, 2560x1600, 16" | Lenovo Legion Pro 7 16IRX8H MNG007DA2-3 (CSO1628), IPS, 2560x1600, 16" | Asus ROG Strix G16 G614JZ TL160ADMP03-0, IPS, 2560x1600, 16" | HP Omen 17-ck1075ng BOE09EE, IPS, 1920x1080, 17.3" | |
|---|---|---|---|---|---|---|
| Display | 24% | 26% | 2% | 23% | -11% | |
| Display P3 Coverage (%) | 67.4 | 97.2 44% | 98.5 46% | 69.1 3% | 97 44% | 59.03 -12% |
| sRGB Coverage (%) | 97.6 | 99.6 2% | 100 2% | 99.7 2% | 99.9 2% | 87.46 -10% |
| AdobeRGB 1998 Coverage (%) | 69.6 | 88.4 27% | 89.7 29% | 71.2 2% | 84.9 22% | 61.04 -12% |
| Response Times | -18% | 12% | 28% | 47% | -1% | |
| Response Time Grey 50% / Grey 80% * (ms) | 15.6 ? | 16.4 ? -5% | 6.6 ? 58% | 12.3 ? 21% | 5.1 ? 67% | 14 ? 10% |
| Response Time Black / White * (ms) | 8.9 ? | 11.6 ? -30% | 12 ? -35% | 5.9 ? 34% | 6.6 ? 26% | 10 ? -12% |
| PWM Frequency (Hz) | 100 ? | |||||
| Screen | -88% | -12% | 25% | 3% | -15% | |
| Brightness middle (cd/m²) | 371 | 484 30% | 456.8 23% | 511 38% | 470 27% | 321 -13% |
| Brightness (cd/m²) | 350 | 449 28% | 437 25% | 469 34% | 459 31% | 302 -14% |
| Brightness Distribution (%) | 90 | 87 -3% | 83 -8% | 86 -4% | 93 3% | 84 -7% |
| Black Level * (cd/m²) | 0.32 | 0.55 -72% | 0.35 -9% | 0.4 -25% | 0.42 -31% | 0.41 -28% |
| Contrast (:1) | 1159 | 880 -24% | 1305 13% | 1278 10% | 1119 -3% | 783 -32% |
| Colorchecker dE 2000 * | 1.74 | 4.8 -176% | 3.7 -113% | 0.95 45% | 1.86 -7% | 1.62 7% |
| Colorchecker dE 2000 max. * | 3.59 | 7.48 -108% | 6.42 -79% | 2.07 42% | 3.87 -8% | 4.08 -14% |
| Colorchecker dE 2000 calibrated * | 1.01 | 4.74 -369% | 0.66 35% | 0.91 10% | 0.93 8% | 1.93 -91% |
| Greyscale dE 2000 * | 2.8 | 5.5 -96% | 2.6 7% | 0.6 79% | 2.7 4% | 1.24 56% |
| Gamma | 2.19 100% | 2.42 91% | 2.3 96% | 2.176 101% | 2.246 98% | 2.41 91% |
| CCT | 6474 100% | 6148 106% | 6108 106% | 6545 99% | 6711 97% | 6261 104% |
| Media totale (Programma / Settaggio) | -27% /
-54% | 9% /
-0% | 18% /
21% | 24% /
13% | -9% /
-12% |
* ... Meglio usare valori piccoli
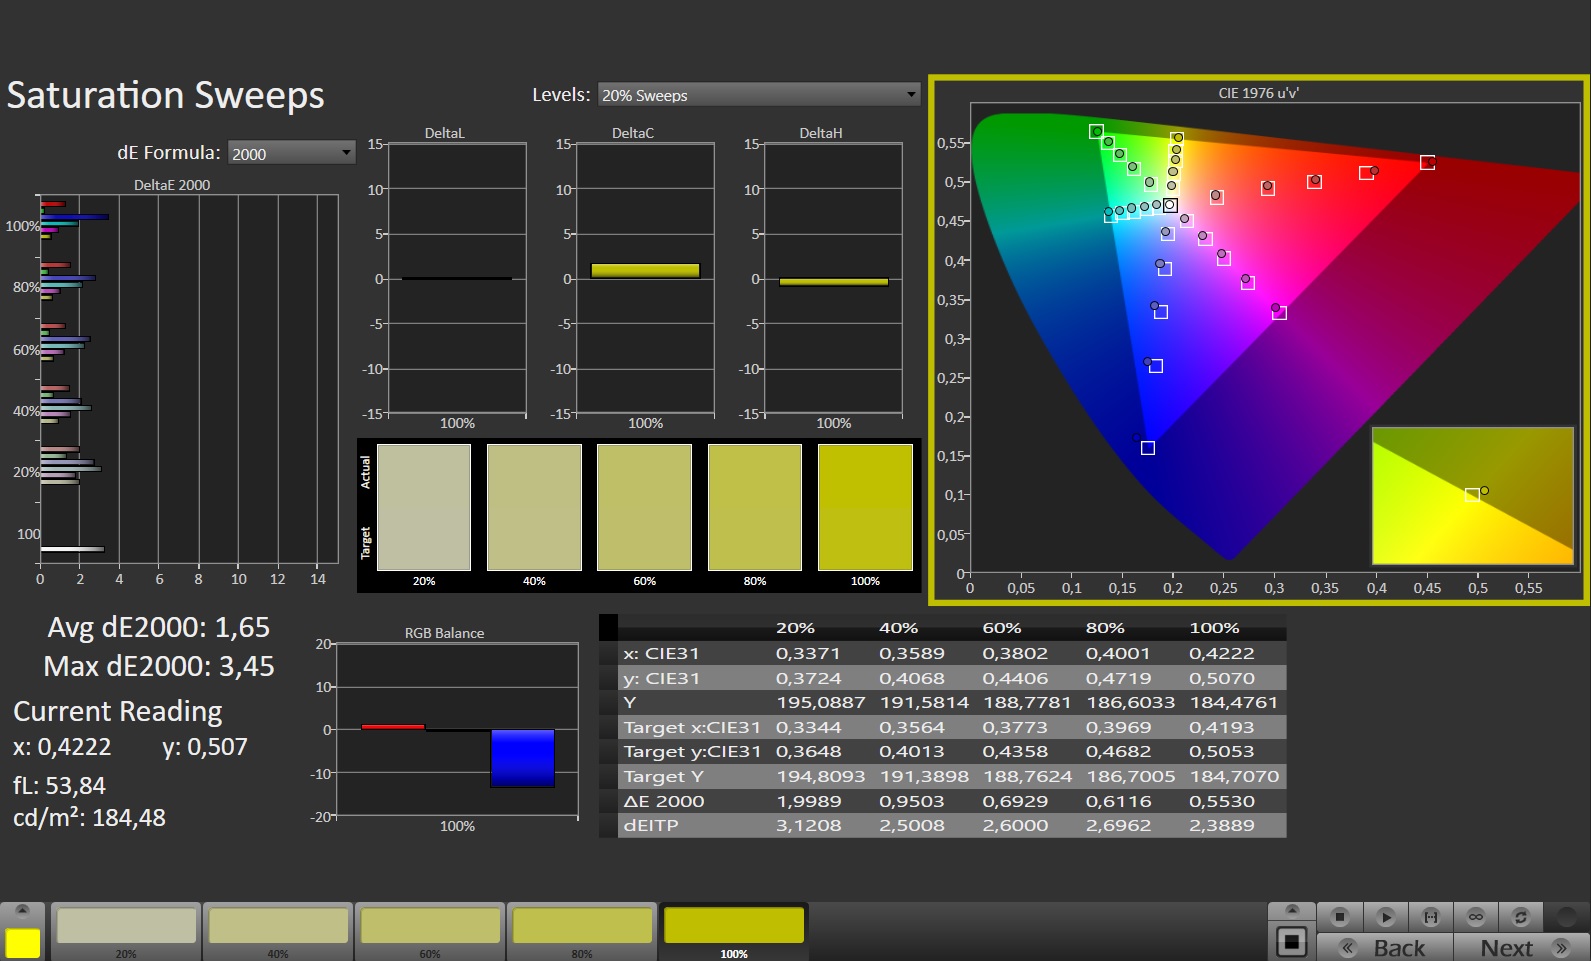
In fase di consegna, la riproduzione del colore è già molto buona e può essere ulteriormente migliorata con una calibrazione, che fa scendere la deviazione del colore da 1,74 a 1 (valore target < 3). Inoltre, anche la scala di grigi viene riprodotta in modo più uniforme.
Il display è in grado di coprire quasi completamente lo spazio colore sRGB, ma non gli spazi colore AdobeRGB e DCI-P3. I display della maggior parte dei concorrenti si comportano meglio in questo caso, con solo il pannello del Legionche si colloca allo stesso livello.

Tempi di risposta del Display
| ↔ Tempi di risposta dal Nero al Bianco | ||
|---|---|---|
| 8.9 ms ... aumenta ↗ e diminuisce ↘ combinato | ↗ 3.7 ms Incremento | 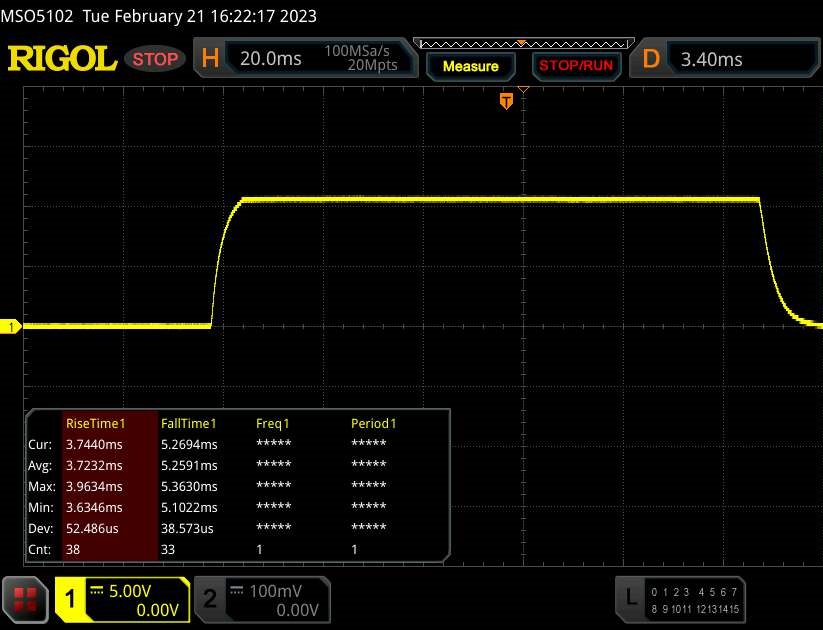 |
| ↘ 5.2 ms Calo | ||
| Lo schermo mostra veloci tempi di risposta durante i nostri tests e dovrebbe esere adatto al gaming In confronto, tutti i dispositivi di test variano da 0.1 (minimo) a 240 (massimo) ms. » 25 % di tutti i dispositivi è migliore. Questo significa che i tempi di risposta rilevati sono migliori rispettto alla media di tutti i dispositivi testati (19.8 ms). | ||
| ↔ Tempo di risposta dal 50% Grigio all'80% Grigio | ||
| 15.6 ms ... aumenta ↗ e diminuisce ↘ combinato | ↗ 7.3 ms Incremento | 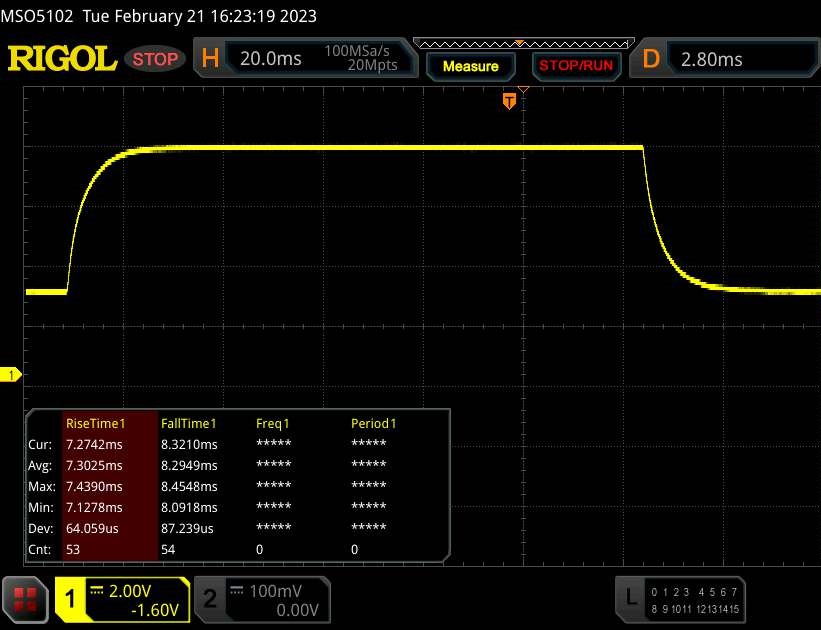 |
| ↘ 8.3 ms Calo | ||
| Lo schermo mostra buoni tempi di risposta durante i nostri tests, ma potrebbe essere troppo lento per i gamers competitivi. In confronto, tutti i dispositivi di test variano da 0.165 (minimo) a 636 (massimo) ms. » 30 % di tutti i dispositivi è migliore. Questo significa che i tempi di risposta rilevati sono migliori rispettto alla media di tutti i dispositivi testati (31 ms). | ||
Sfarfallio dello schermo / PWM (Pulse-Width Modulation)
| flickering dello schermo / PWM non rilevato | 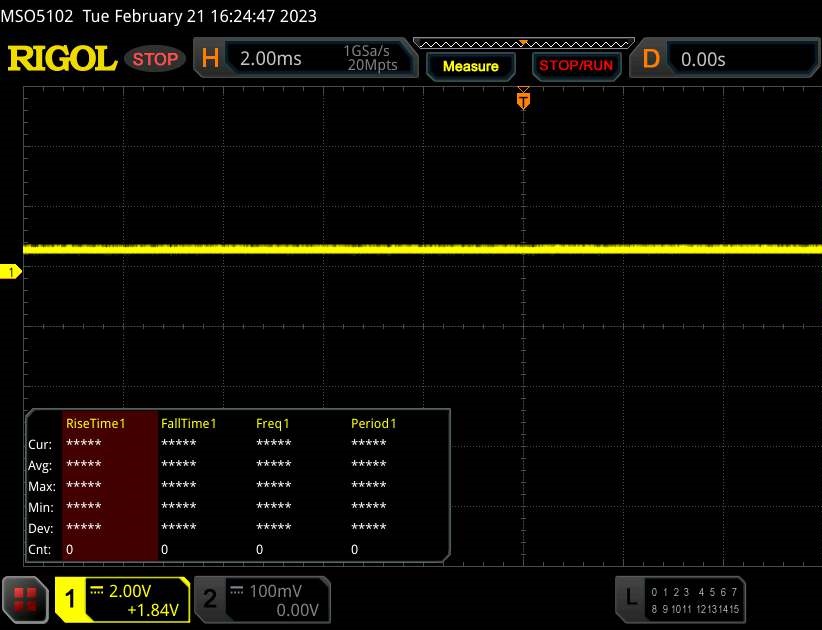 | ||
In confronto: 52 % di tutti i dispositivi testati non utilizza PWM per ridurre la luminosita' del display. Se è rilevato PWM, una media di 7757 (minimo: 5 - massimo: 343500) Hz è stata rilevata. | |||
Gli angoli di visualizzazione del pannello IPS sono stabili, per cui è possibile leggere il display da qualsiasi angolazione. Il display può essere letto anche all'aperto, a condizione che non vi sia luce solare diretta.

Prestazioni - Il portatile HP offre un hardware potente
Con l'Omen 17, Hewlett Packard offre un portatile da 17,3 pollici destinato ai giochi QHD, ma che fa la sua figura anche in altre aree applicative che richiedono prestazioni elevate. Le prestazioni di calcolo necessarie sono fornite dai chip Raptor Lake e Ada Lovelace. La nostra unità di prova dell'Omen è disponibile a circa 3.300 Euro (~$3.582).
Condizioni di prova
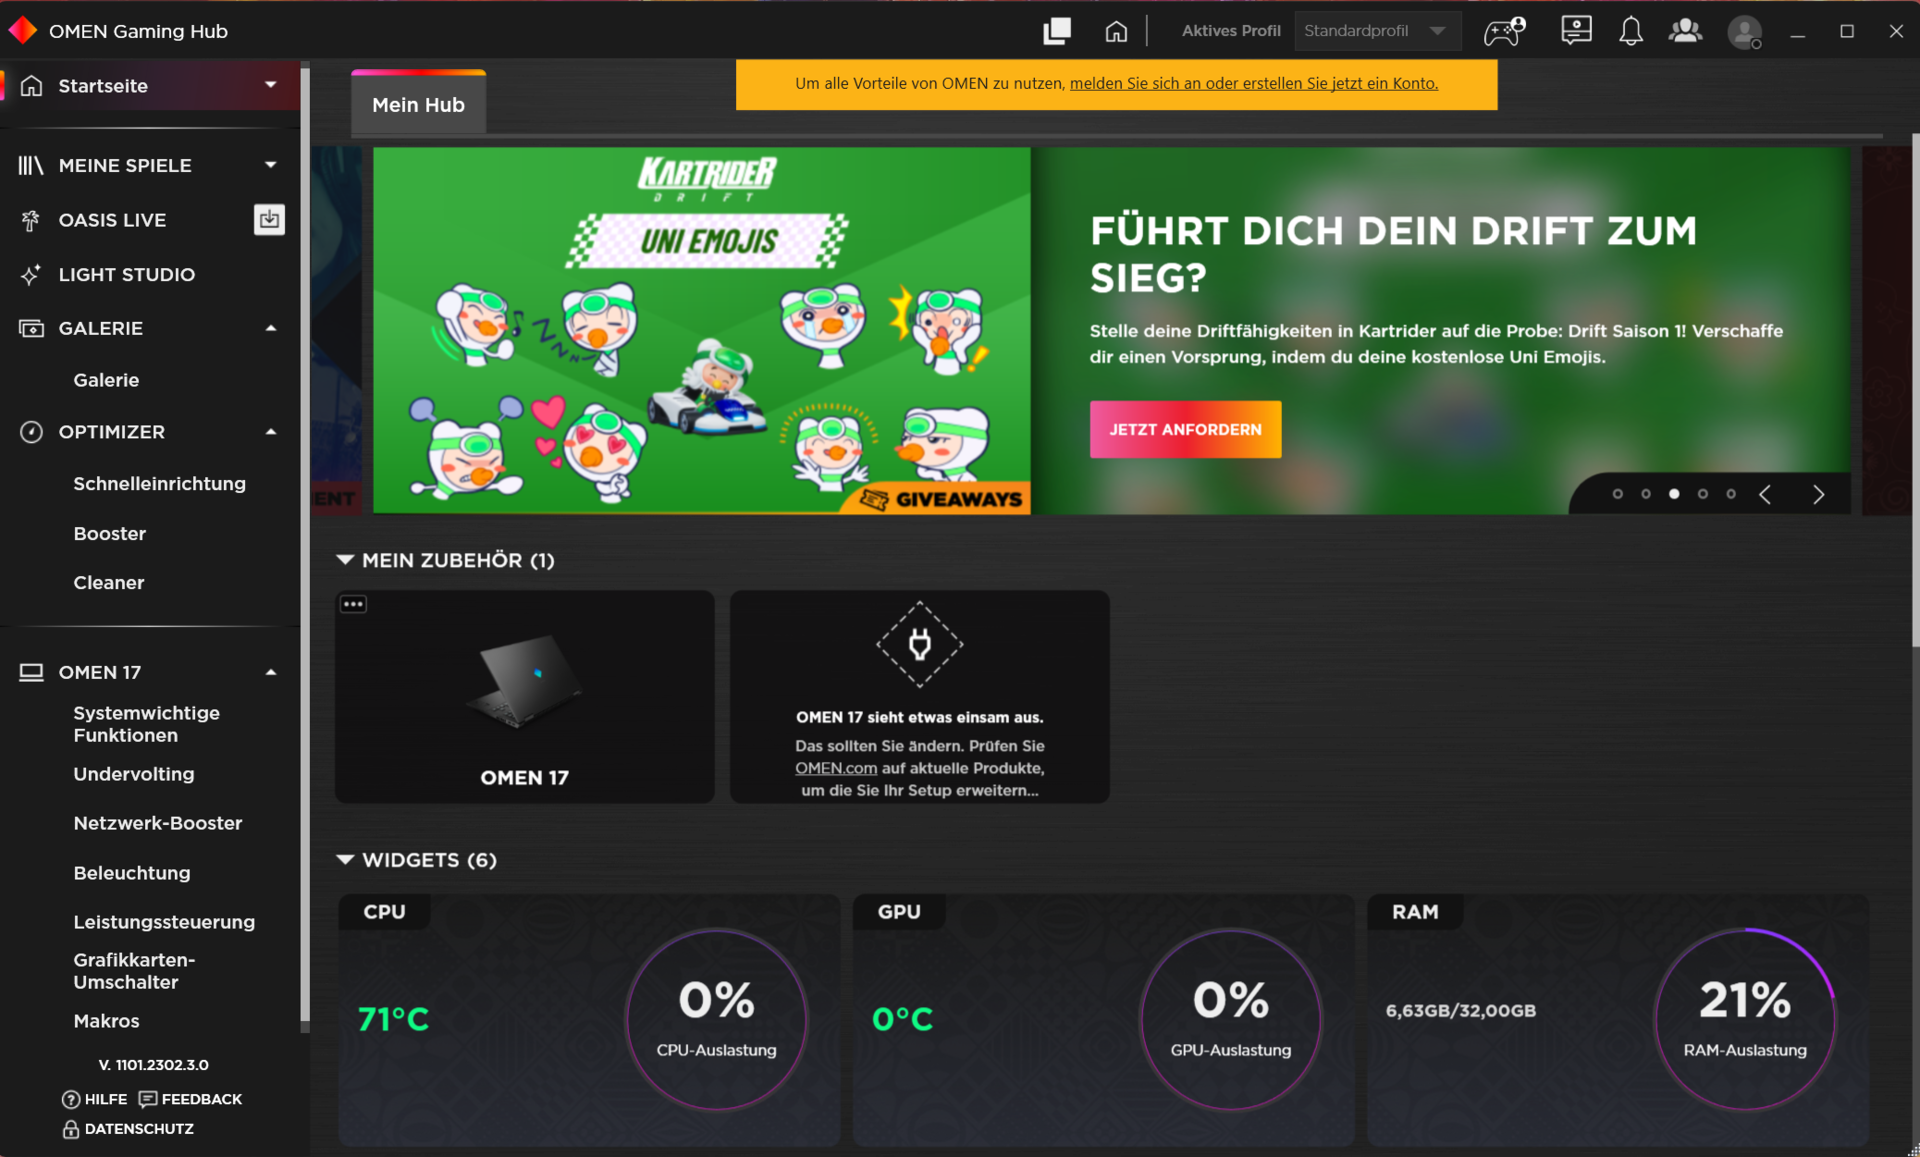
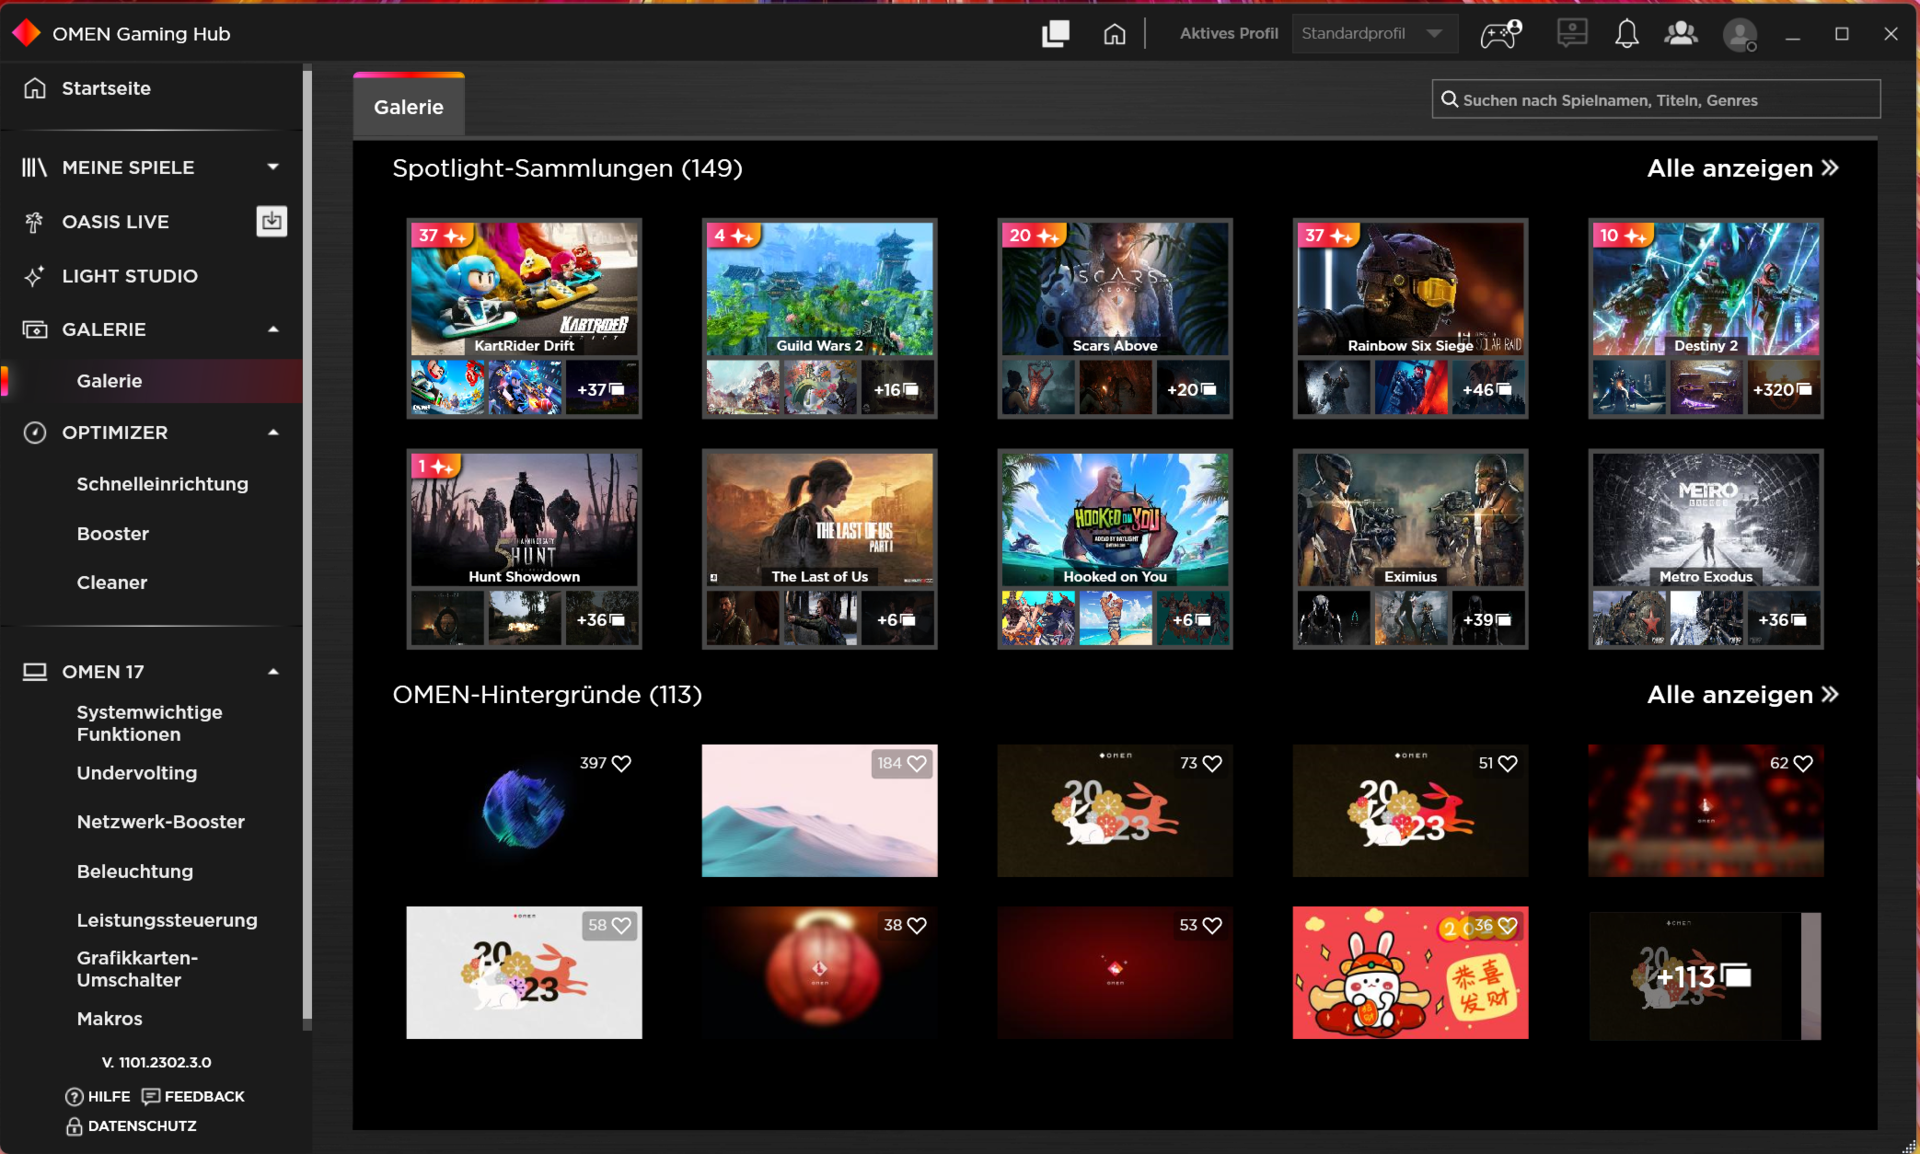
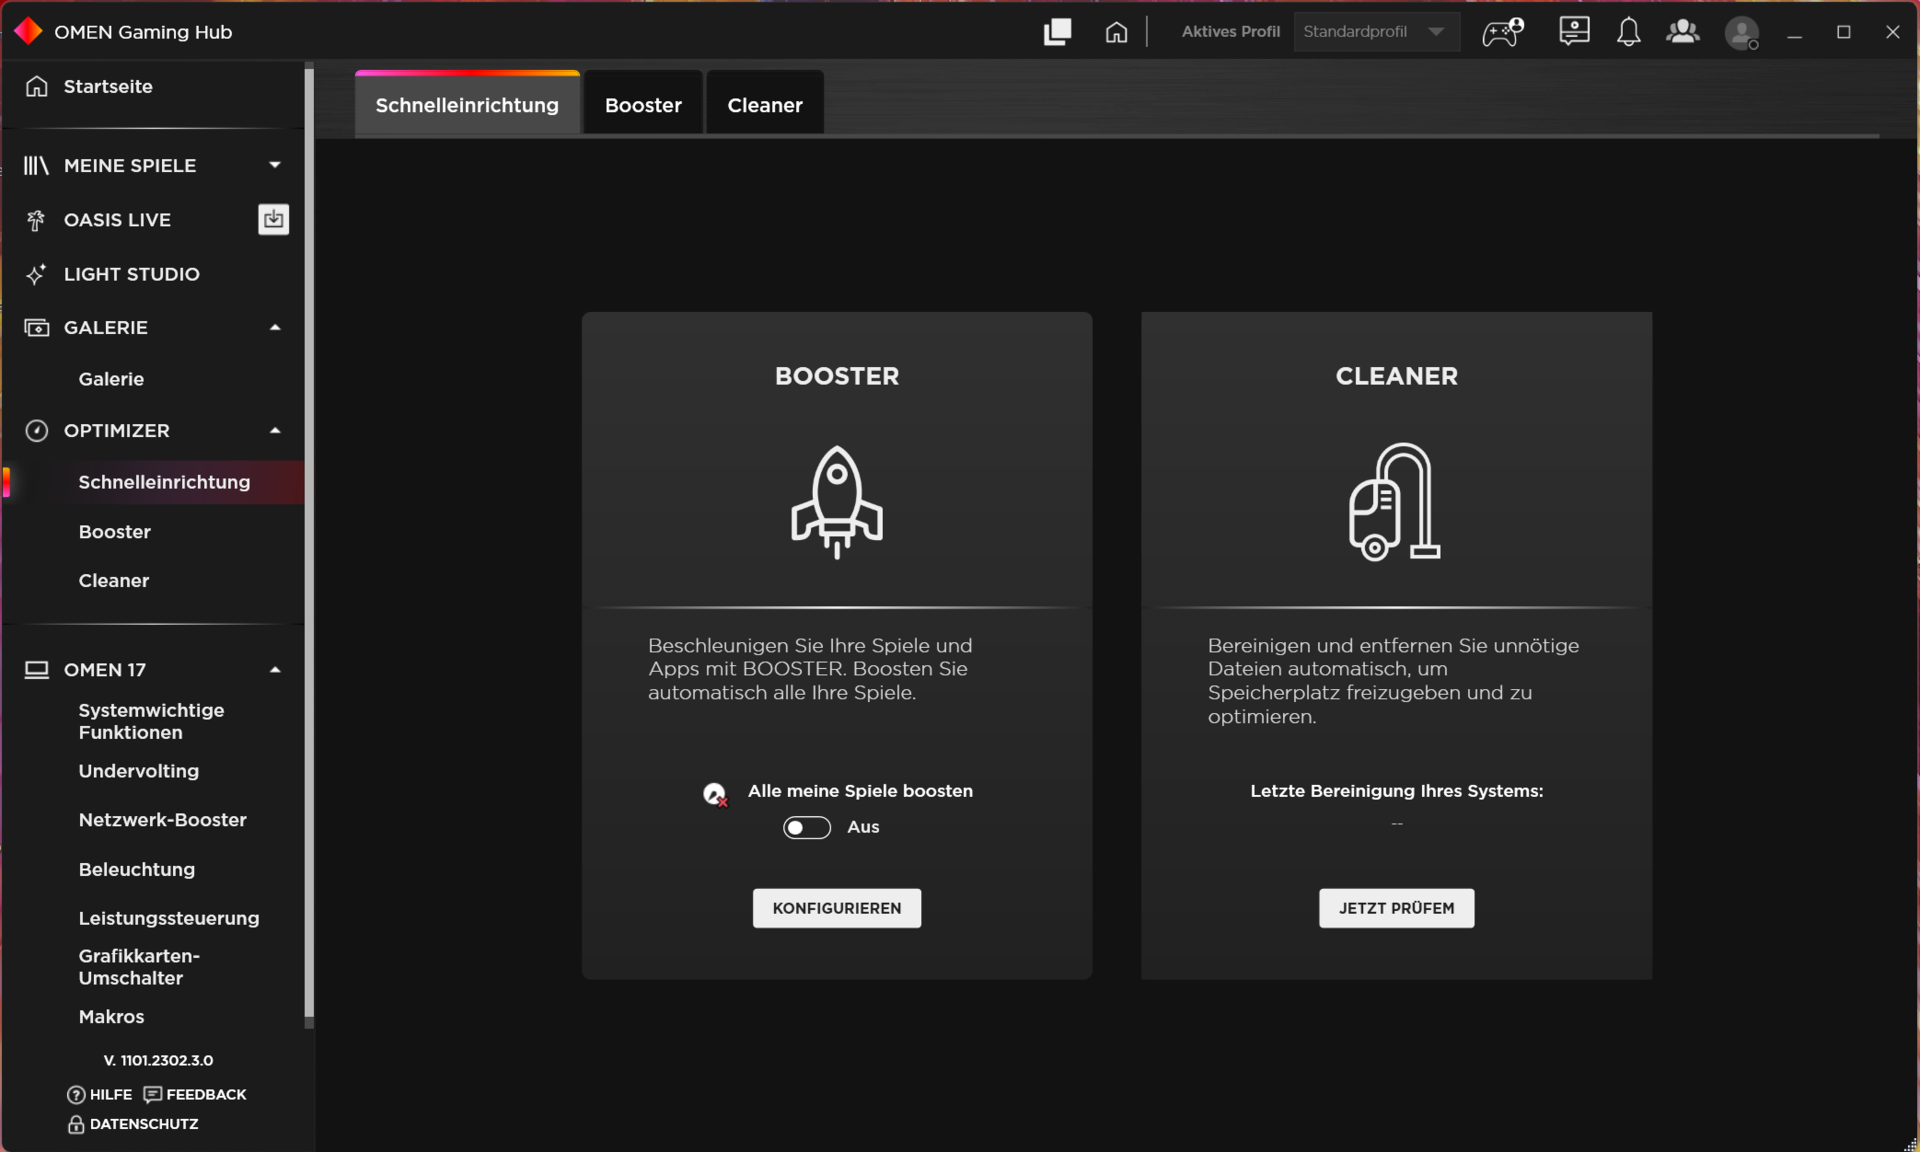
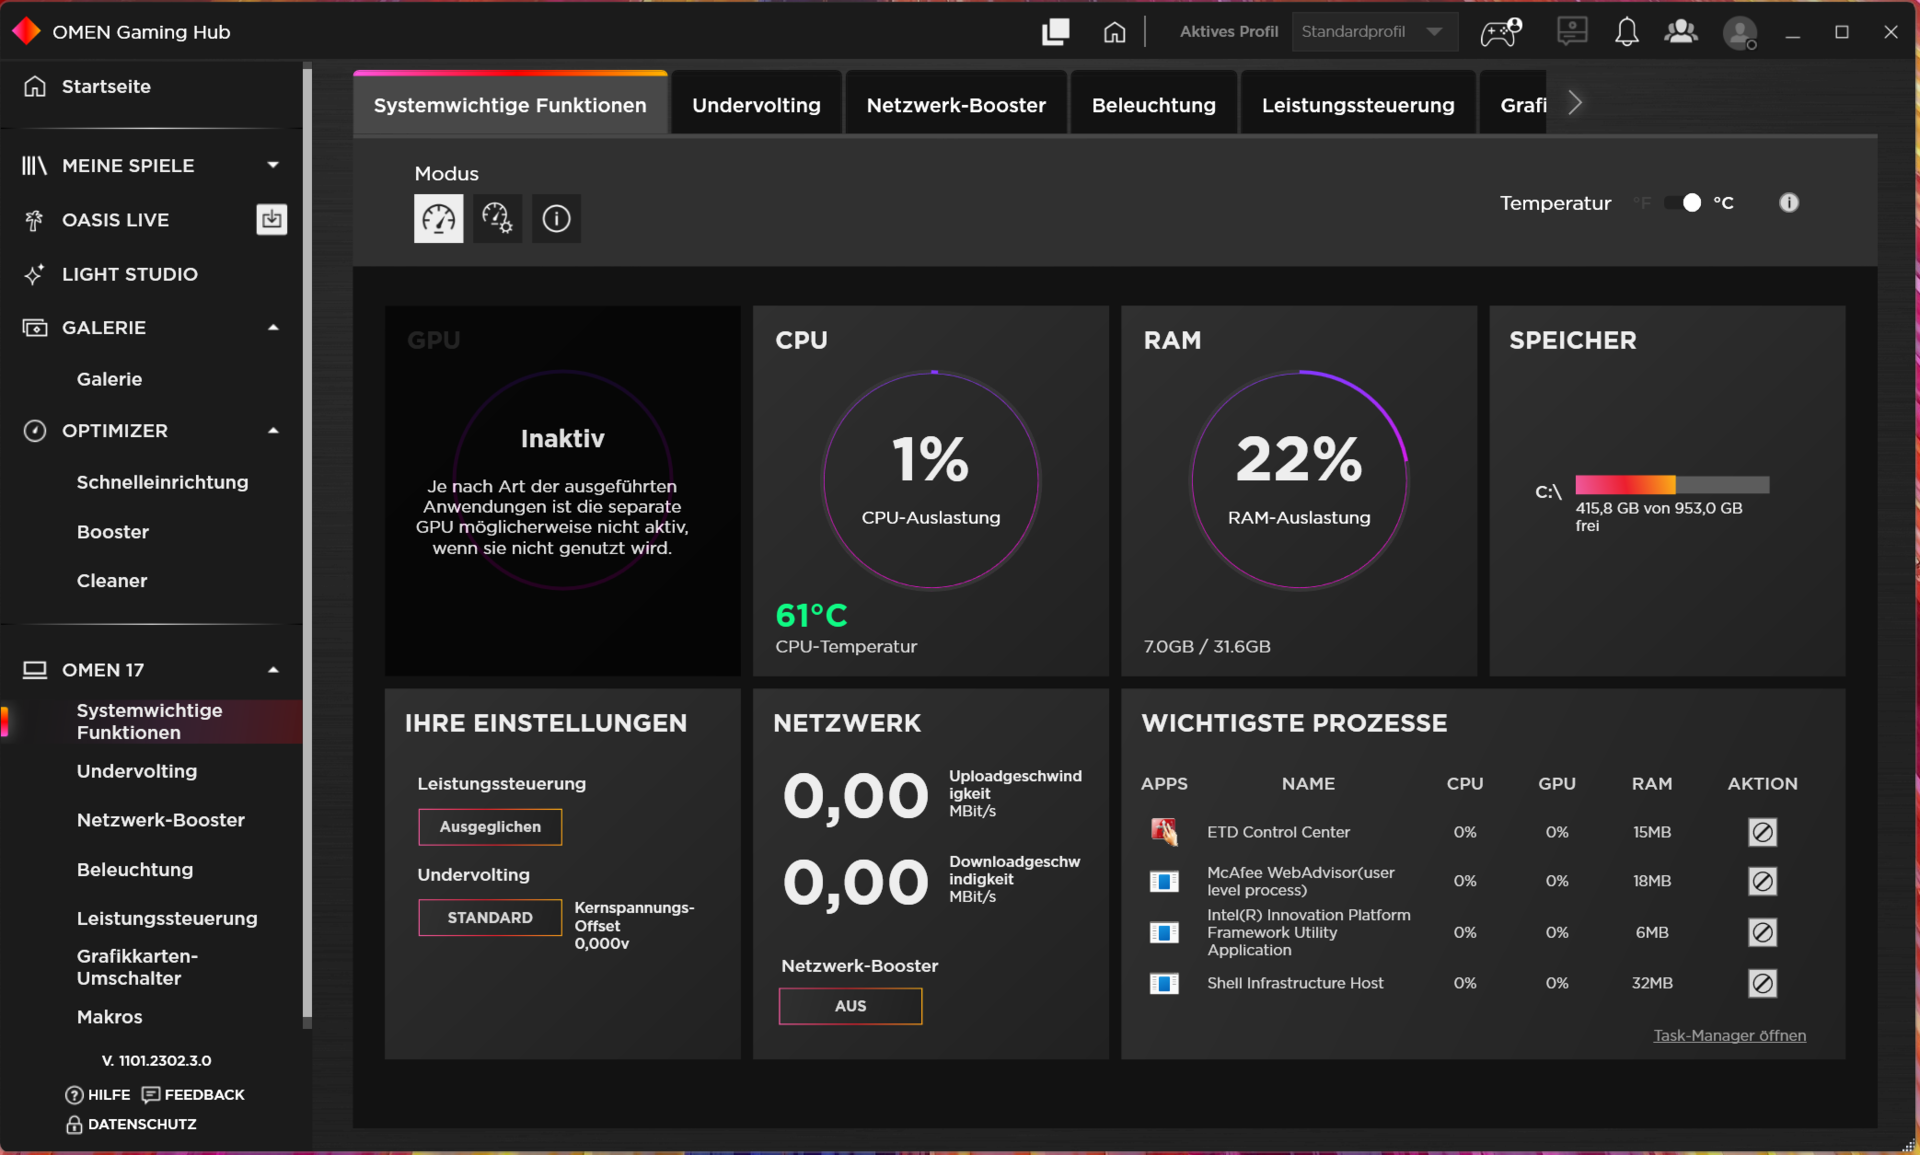
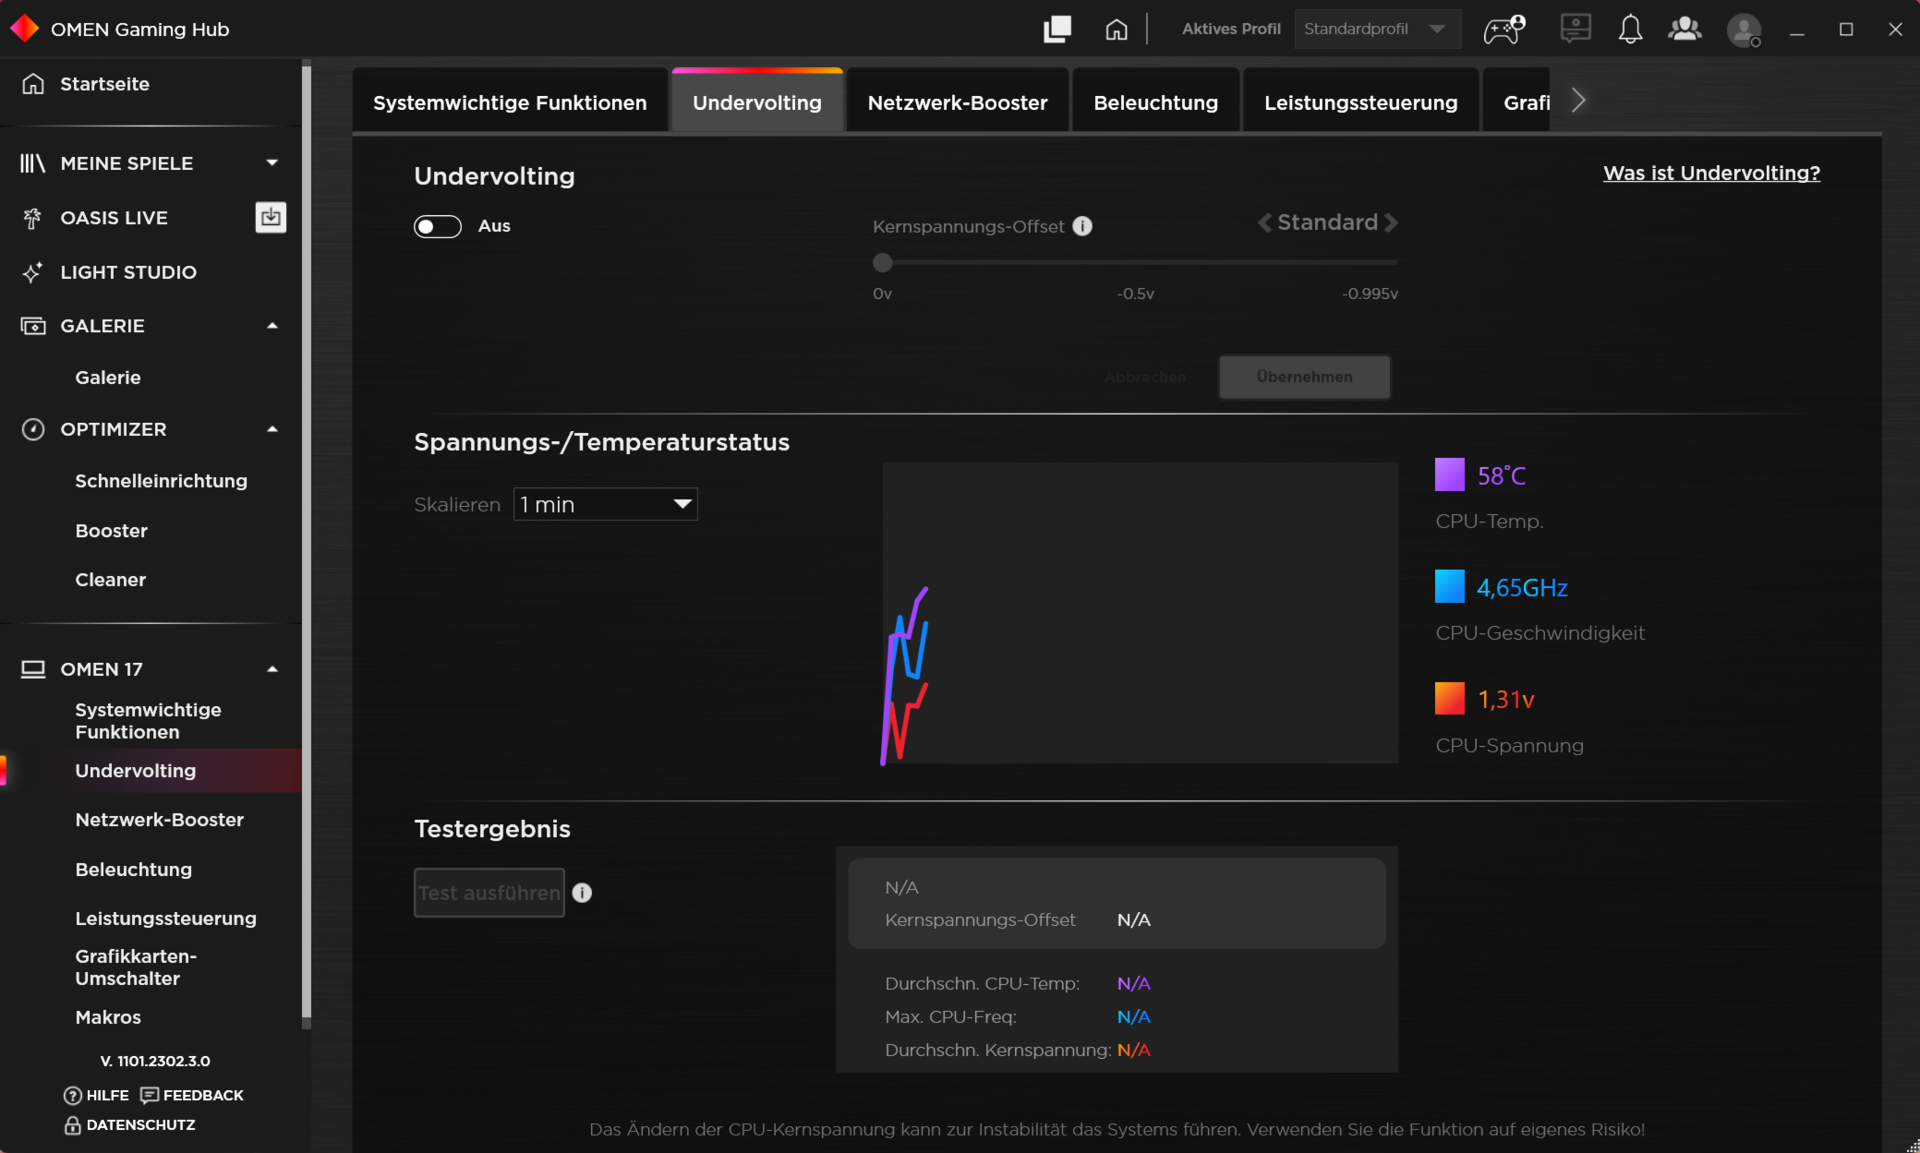
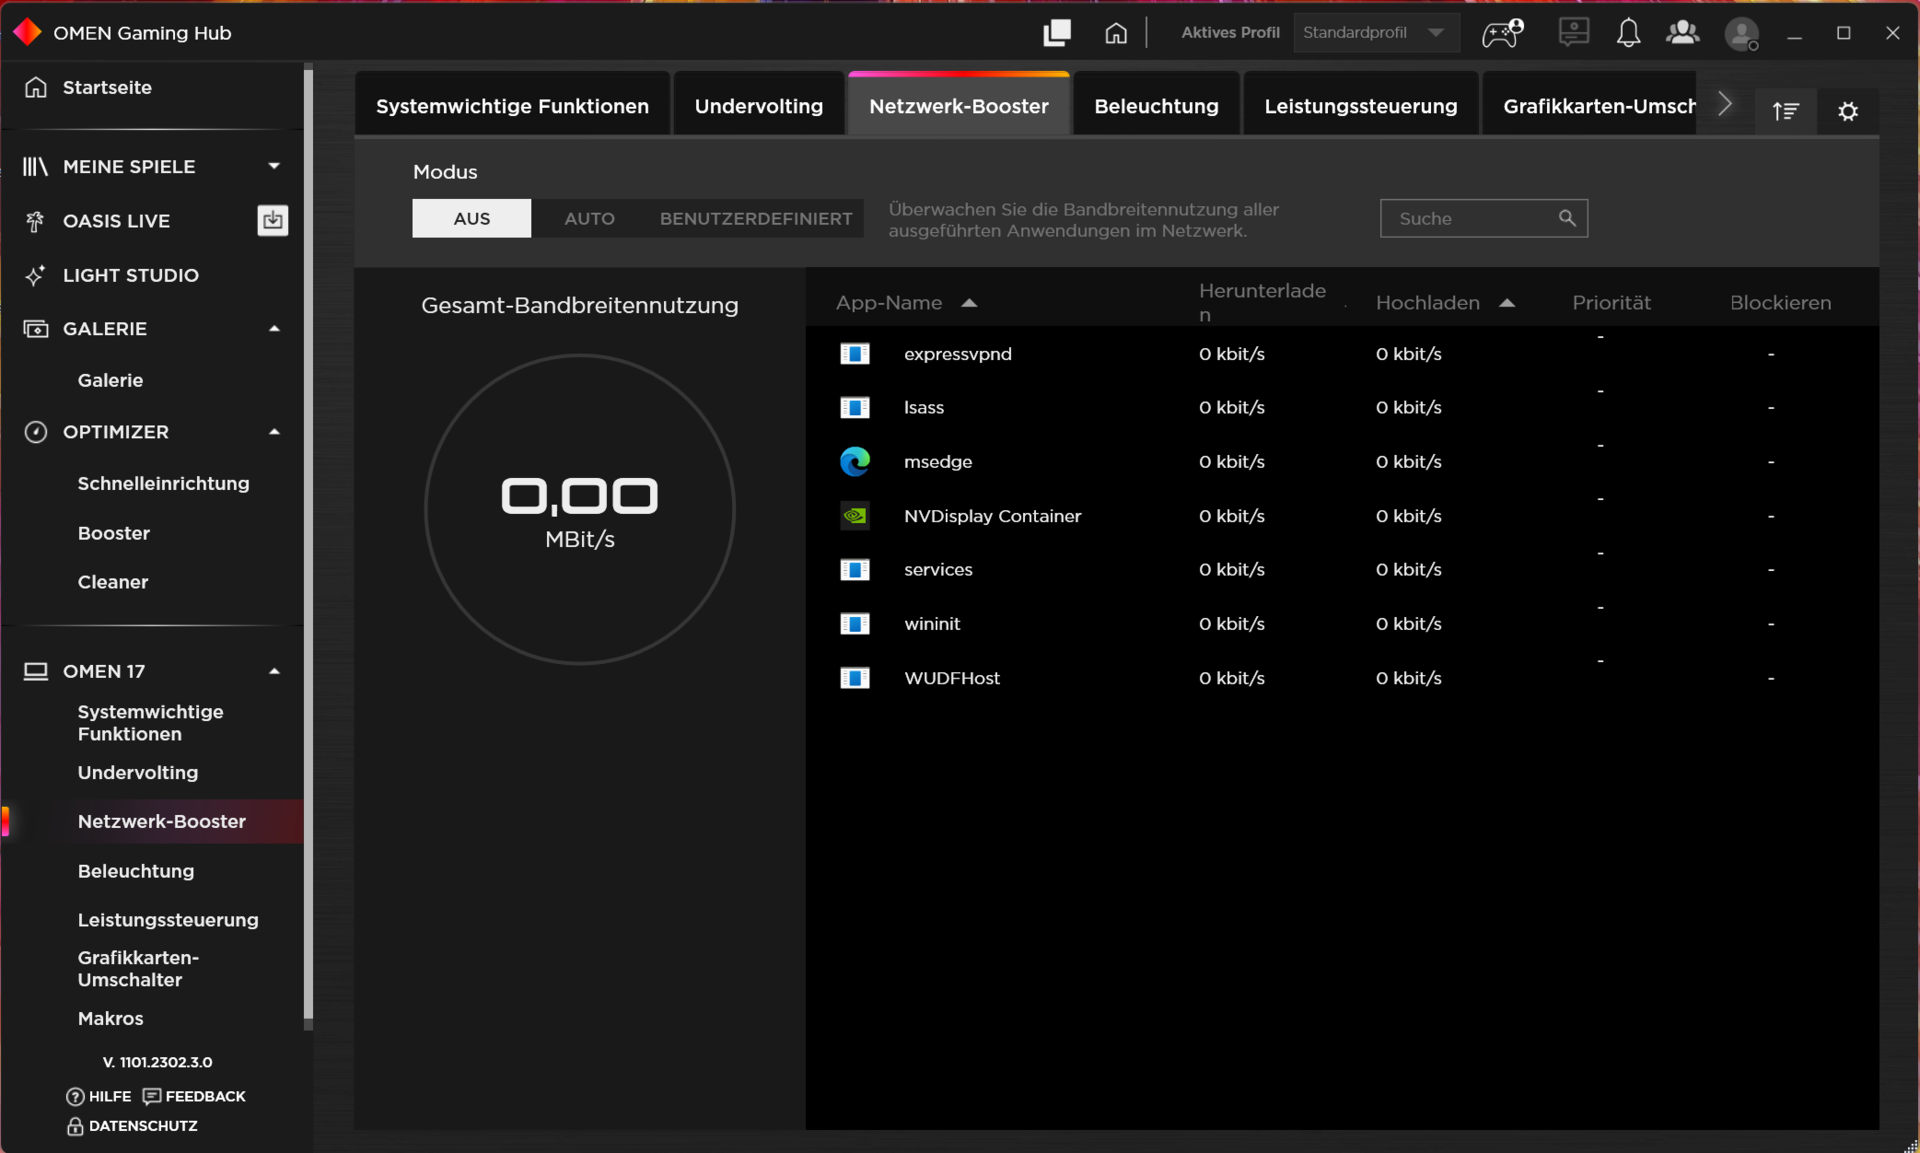
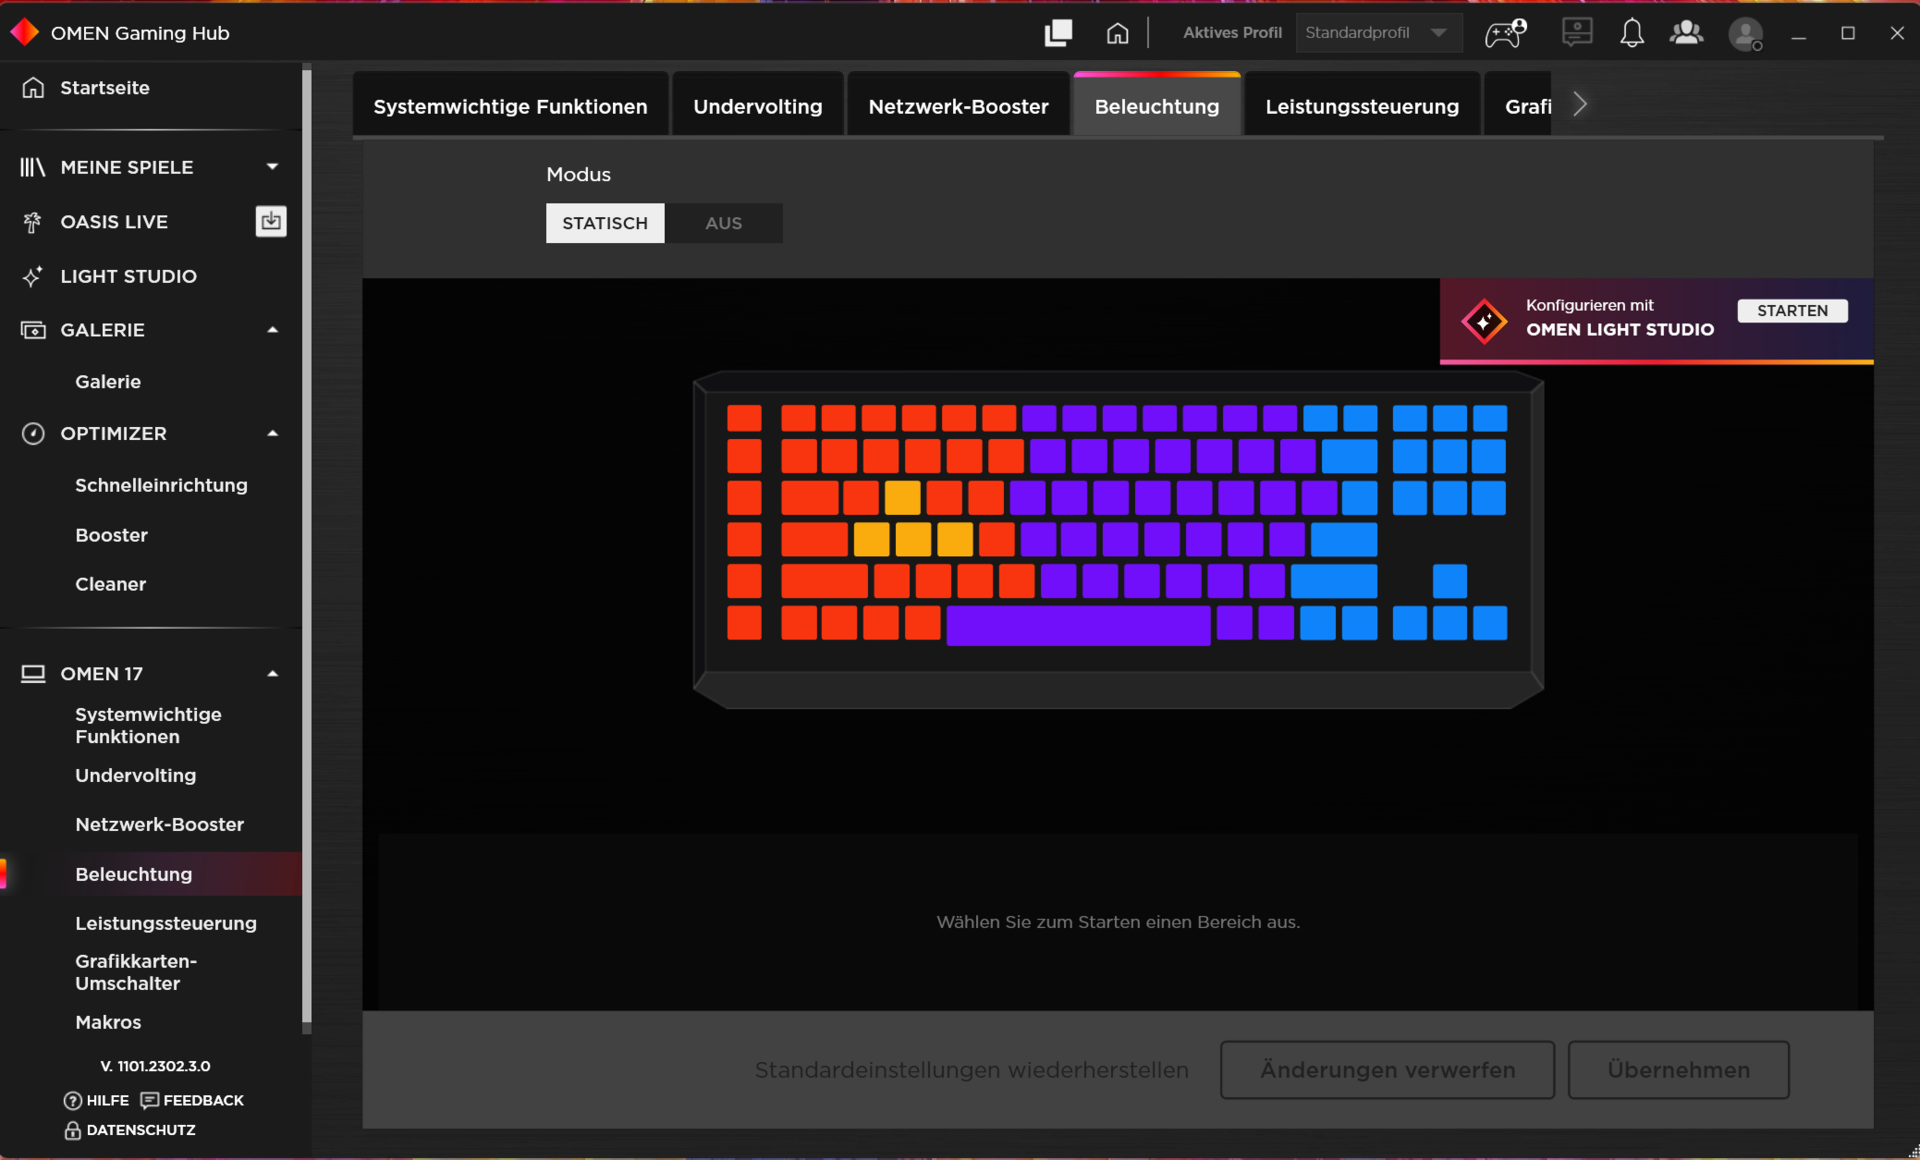
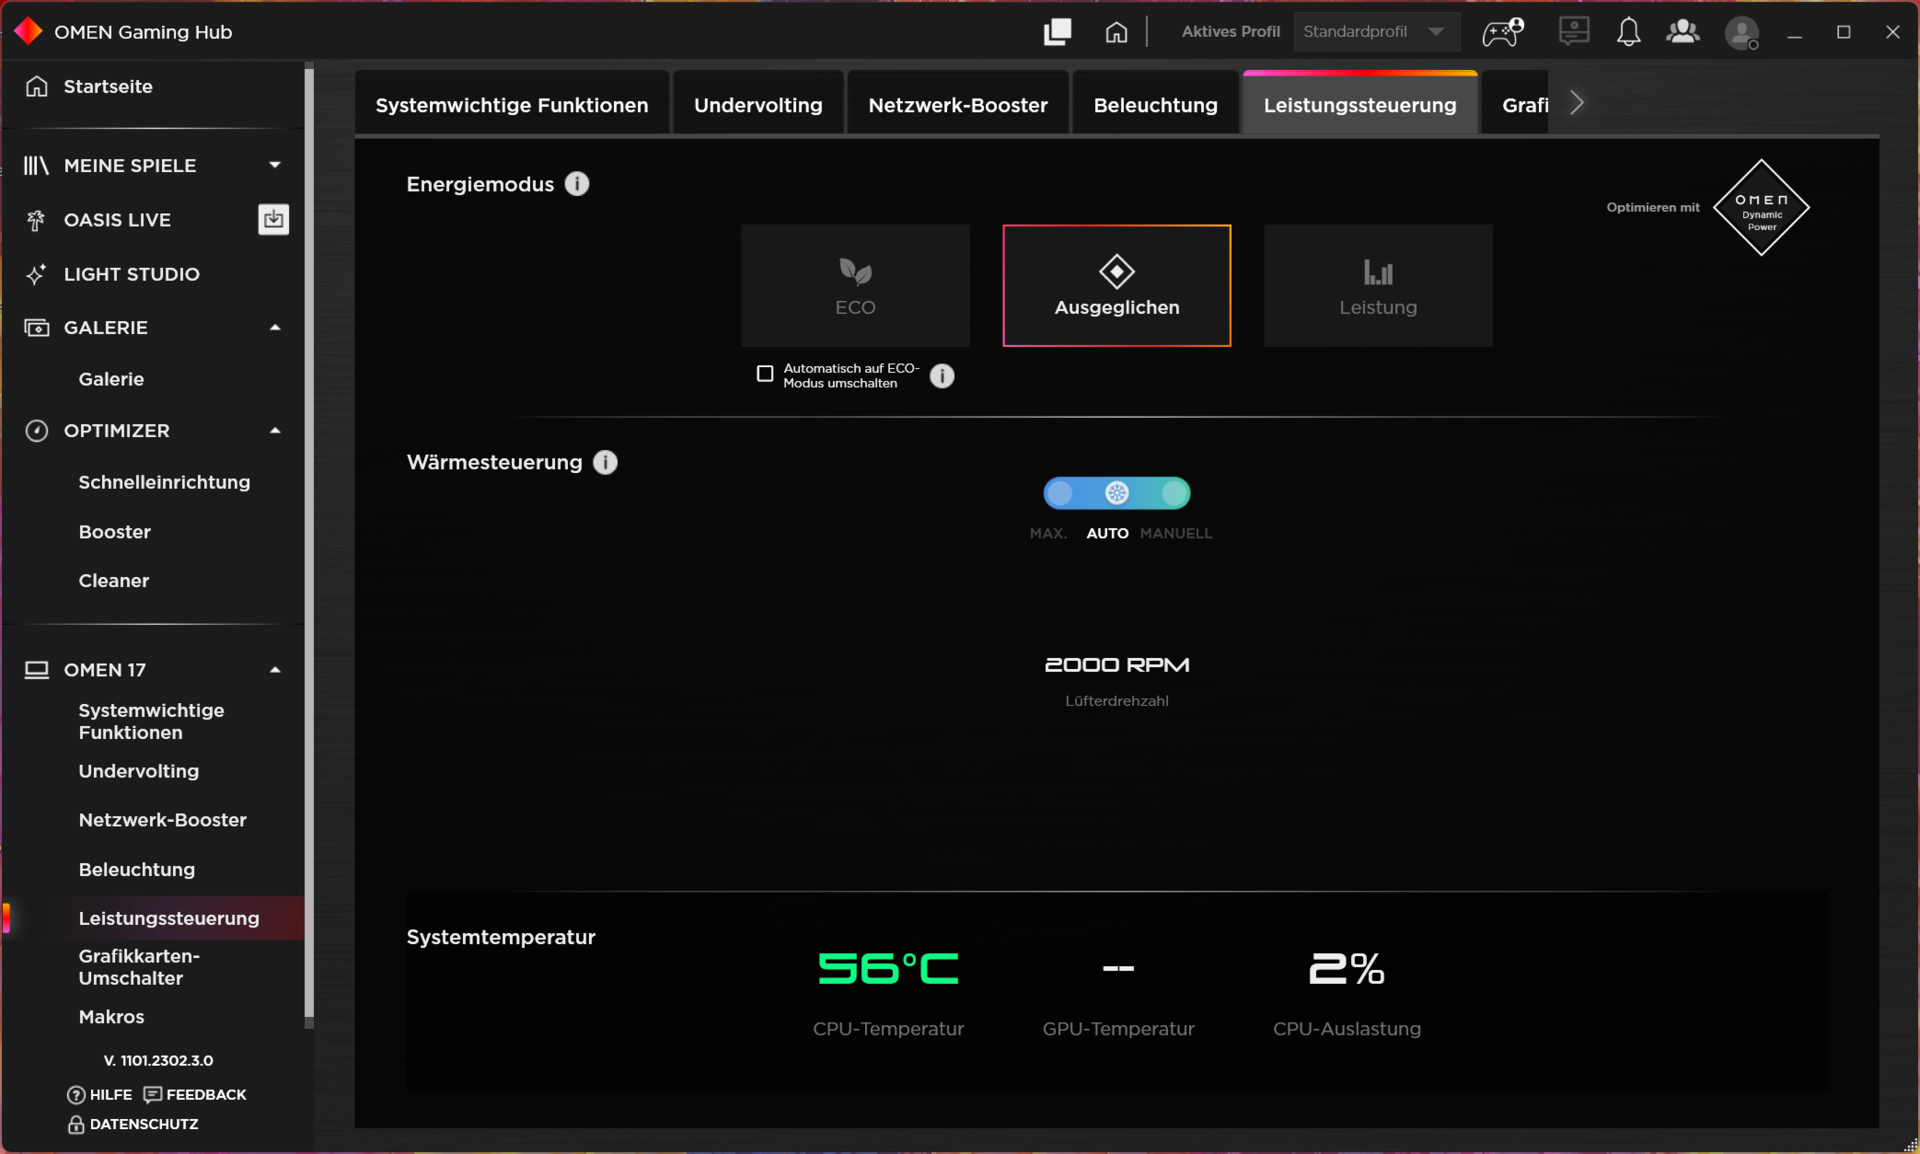
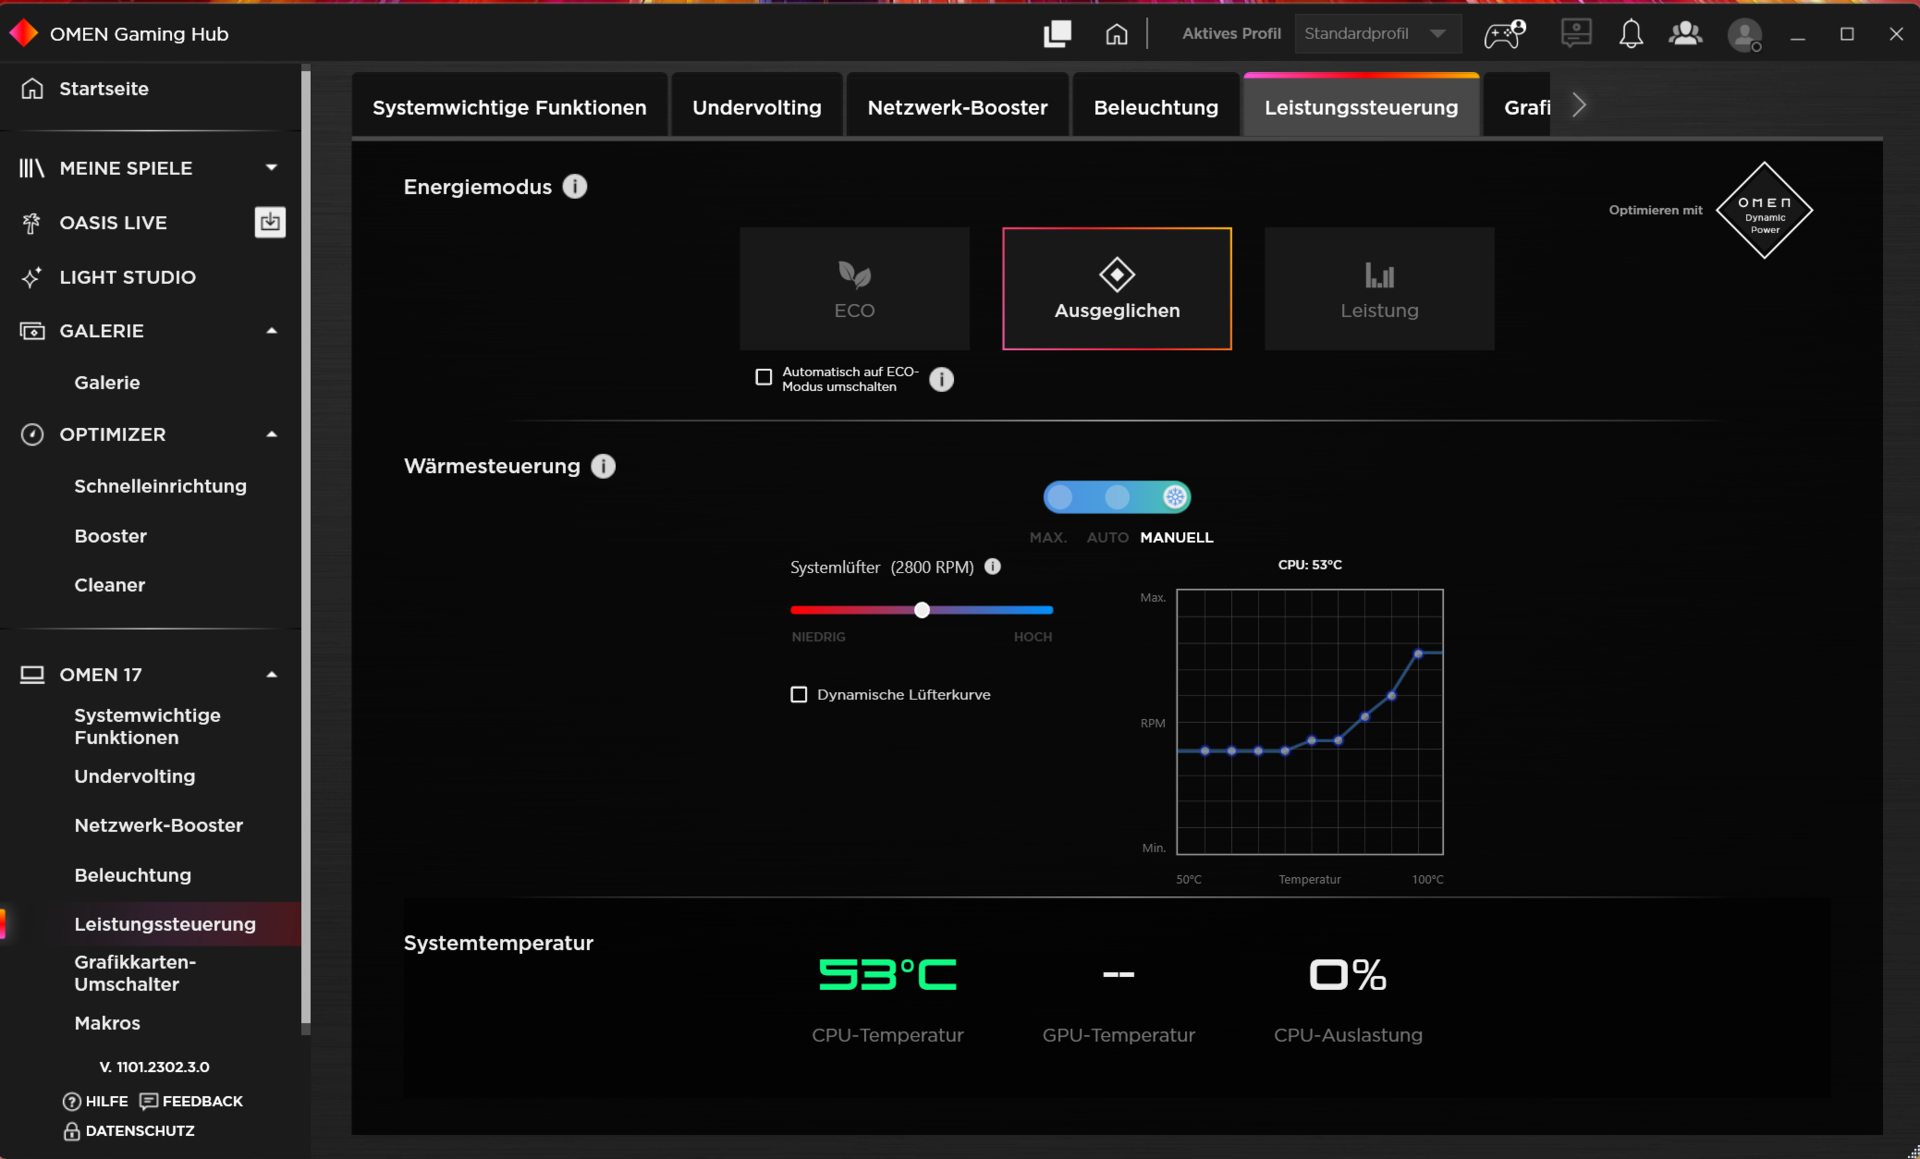
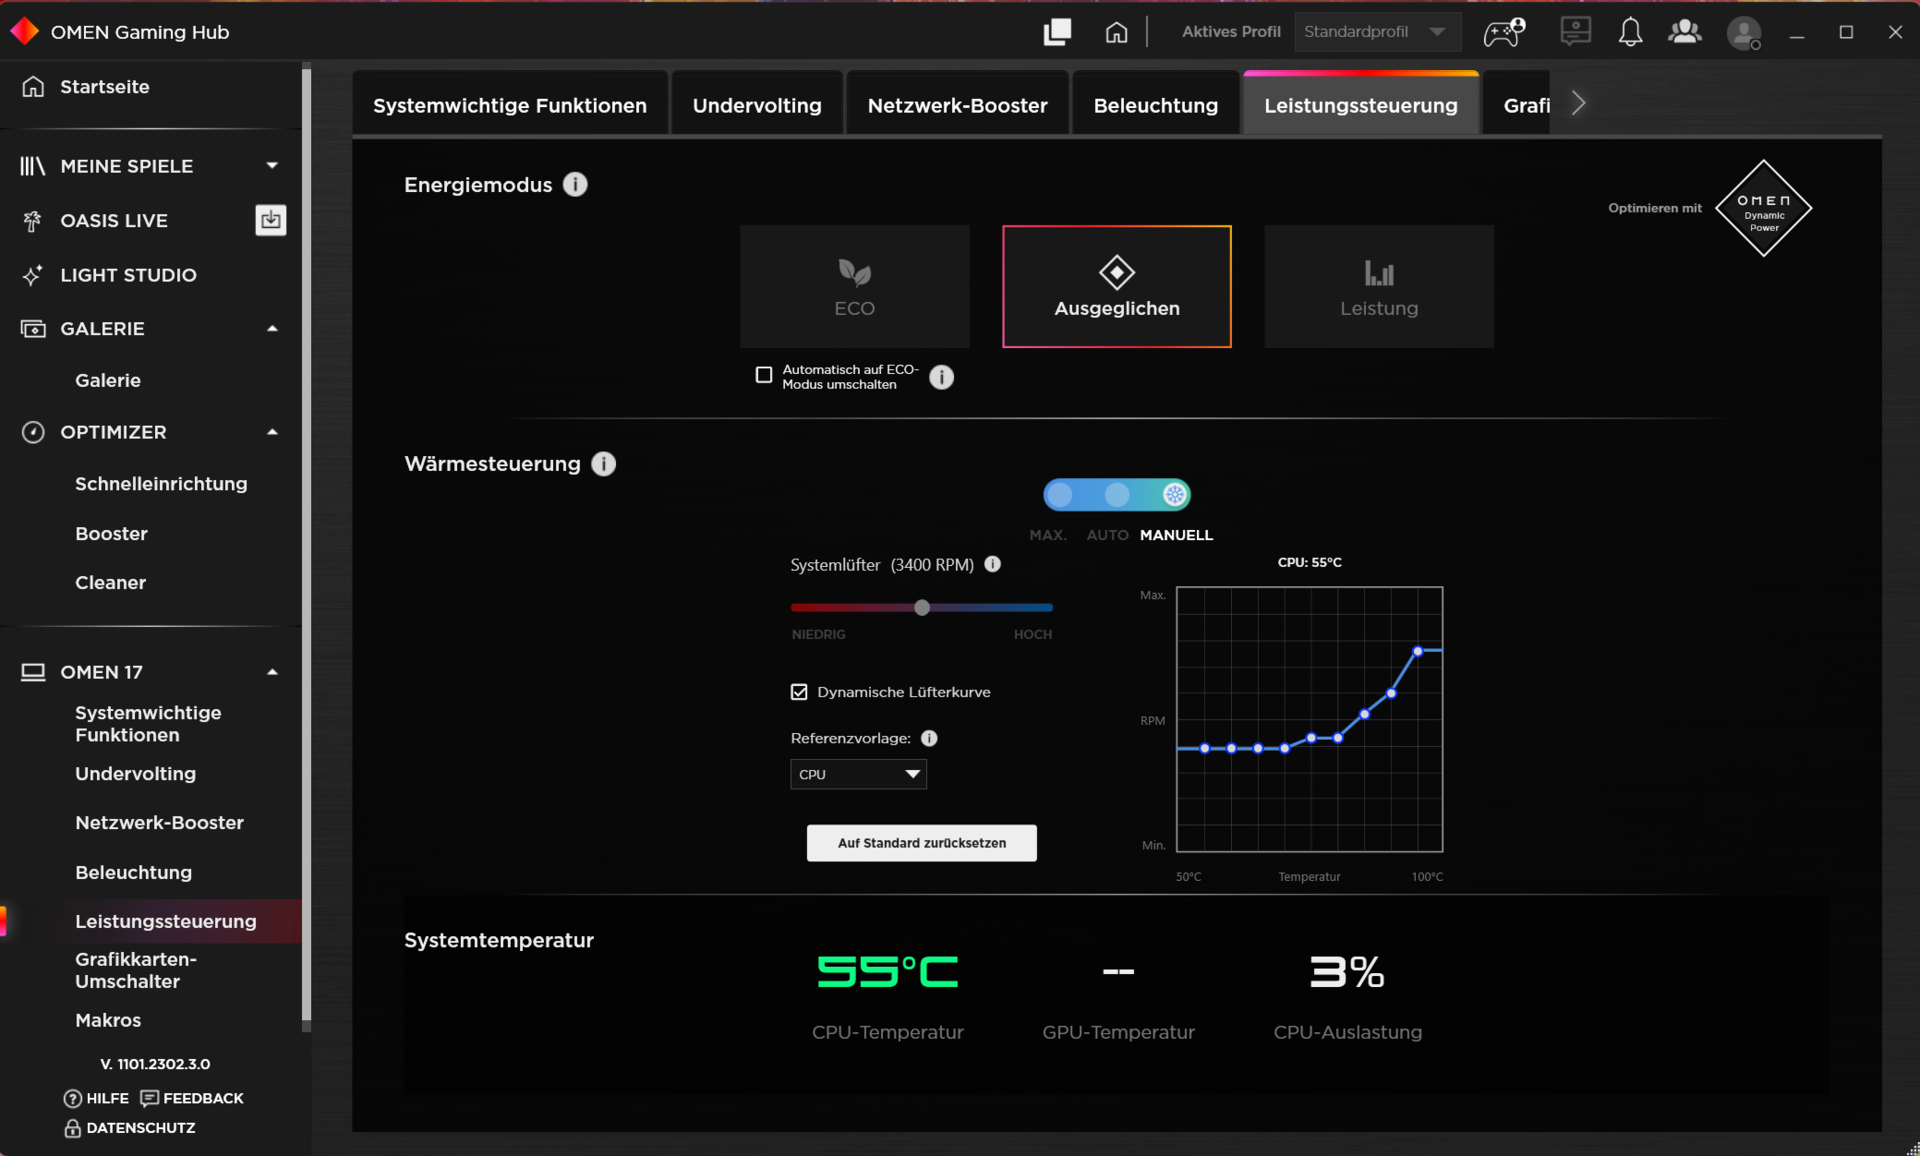
Il software Omen Gaming Hub preinstallato rappresenta il centro di controllo del portatile. Oltre a selezionare una modalità di alimentazione (vedi tabella), consente anche di sottotensionare la CPU e di configurare una curva della ventola individuale. Poiché la modalità "Performance" ha creato alcuni problemi nella nostra unità di test (strani stutter e cali di prestazioni), abbiamo utilizzato principalmente la modalità di alimentazione "Balanced" insieme al controllo automatico della ventola. Optimus è stato attivato.
| Prestazioni | Bilanciato | Eco | |
|---|---|---|---|
| Limite di potenza 1 | 100 Watt | 55 Watt | 55 Watt |
| Limite di potenza 2 | 130 Watt | 130 Watt | 130 Watt |
Processore
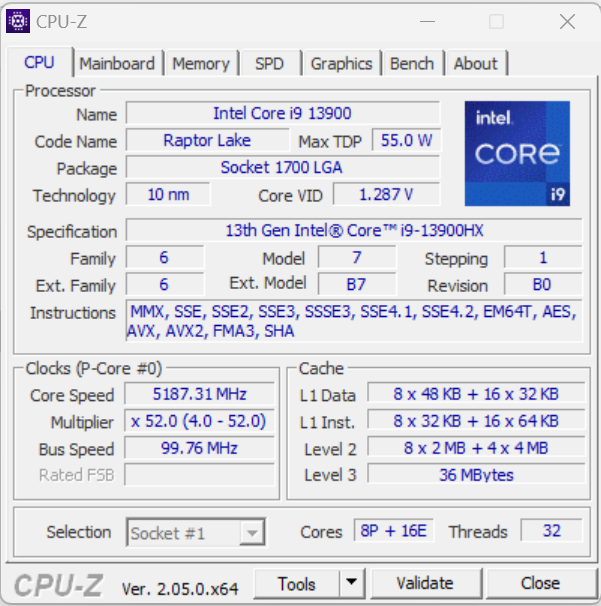
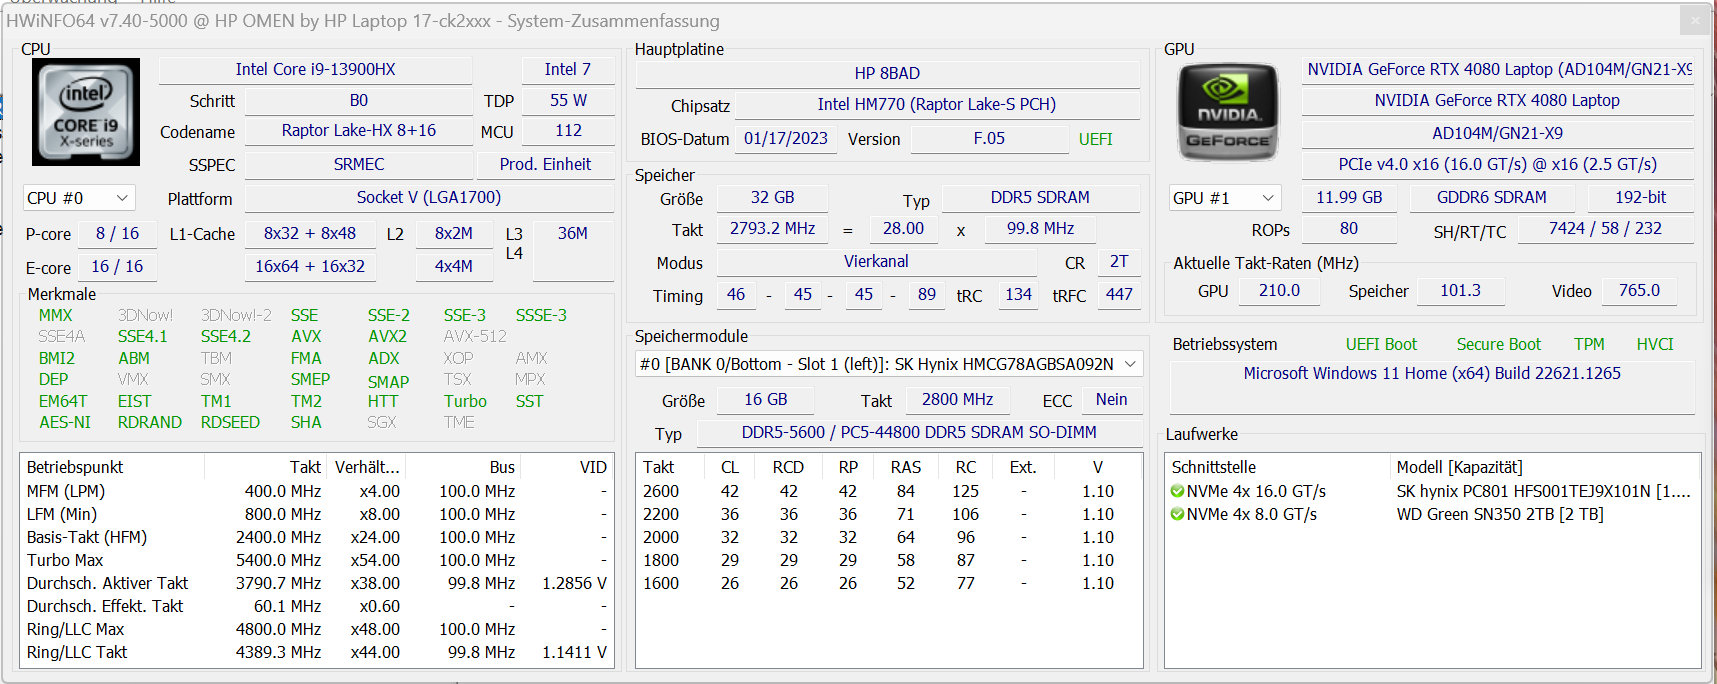
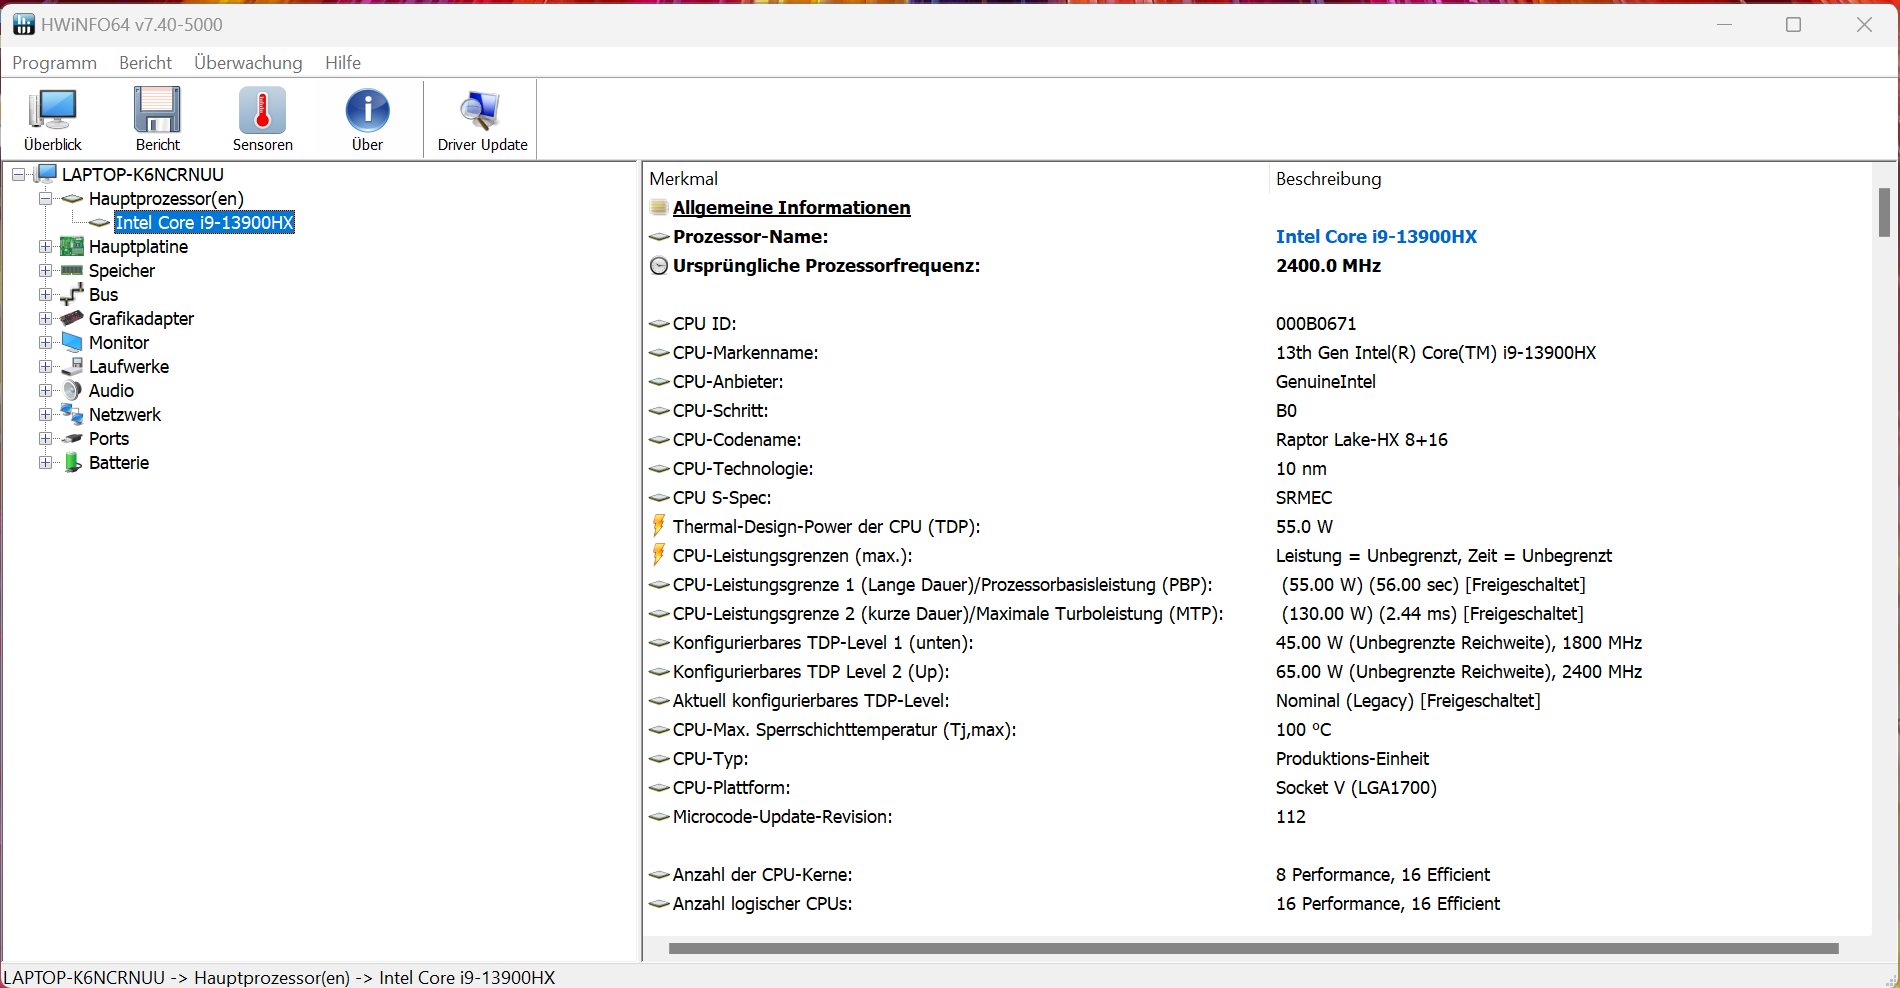
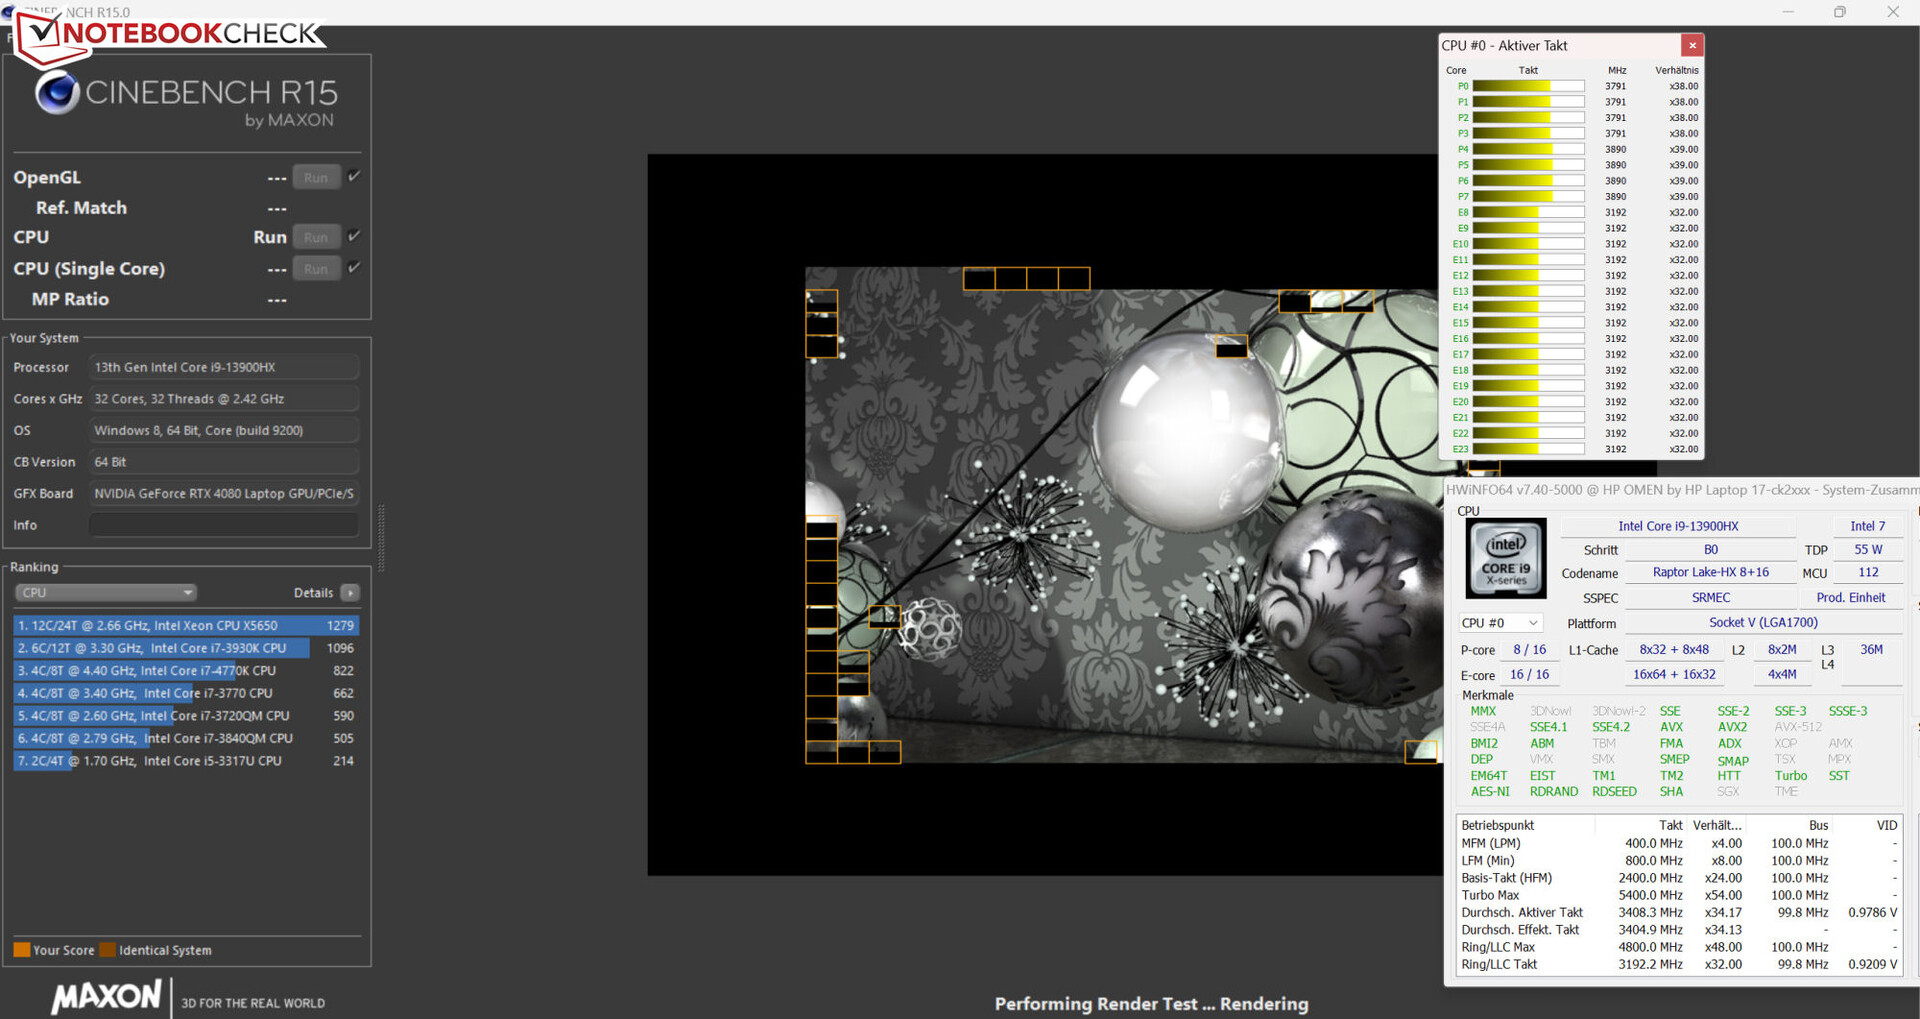
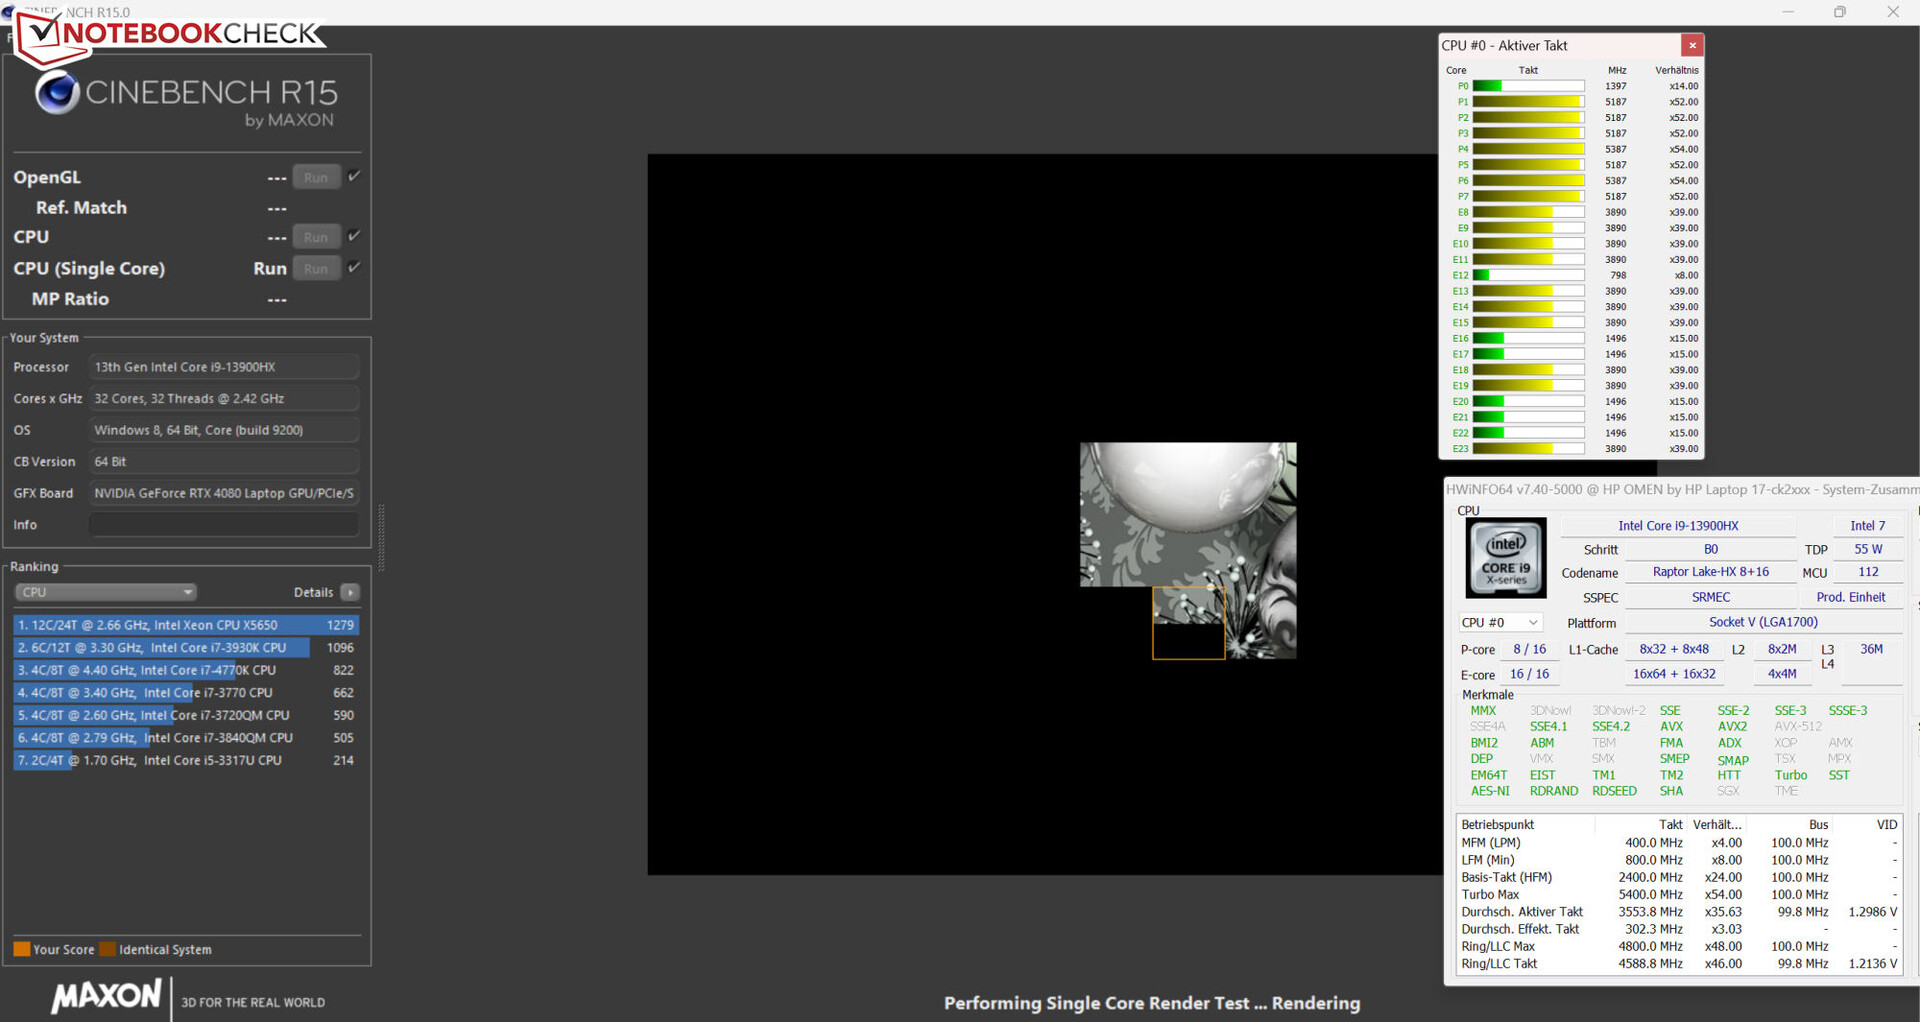
IlCore i9-13900HX(Raptor Lake) è composto da sedici core Efficiency (senza hyperthreading, da 1,6 a 3,9 GHz) e otto core Performance (hyperthreading, da 2,2 a 5,4 GHz), per un totale di 32 core logici della CPU.
Nel funzionamento a rete, il processore esegue i test della CPU del benchmark Cinebench R15 con velocità di clock medio-alte e alte (multithread) e alte e massime (single-thread). Mentre le prestazioni single-thread (254 punti) diminuiscono leggermente nel funzionamento a batteria, il calo delle prestazioni multithread è significativo (1.303 punti).
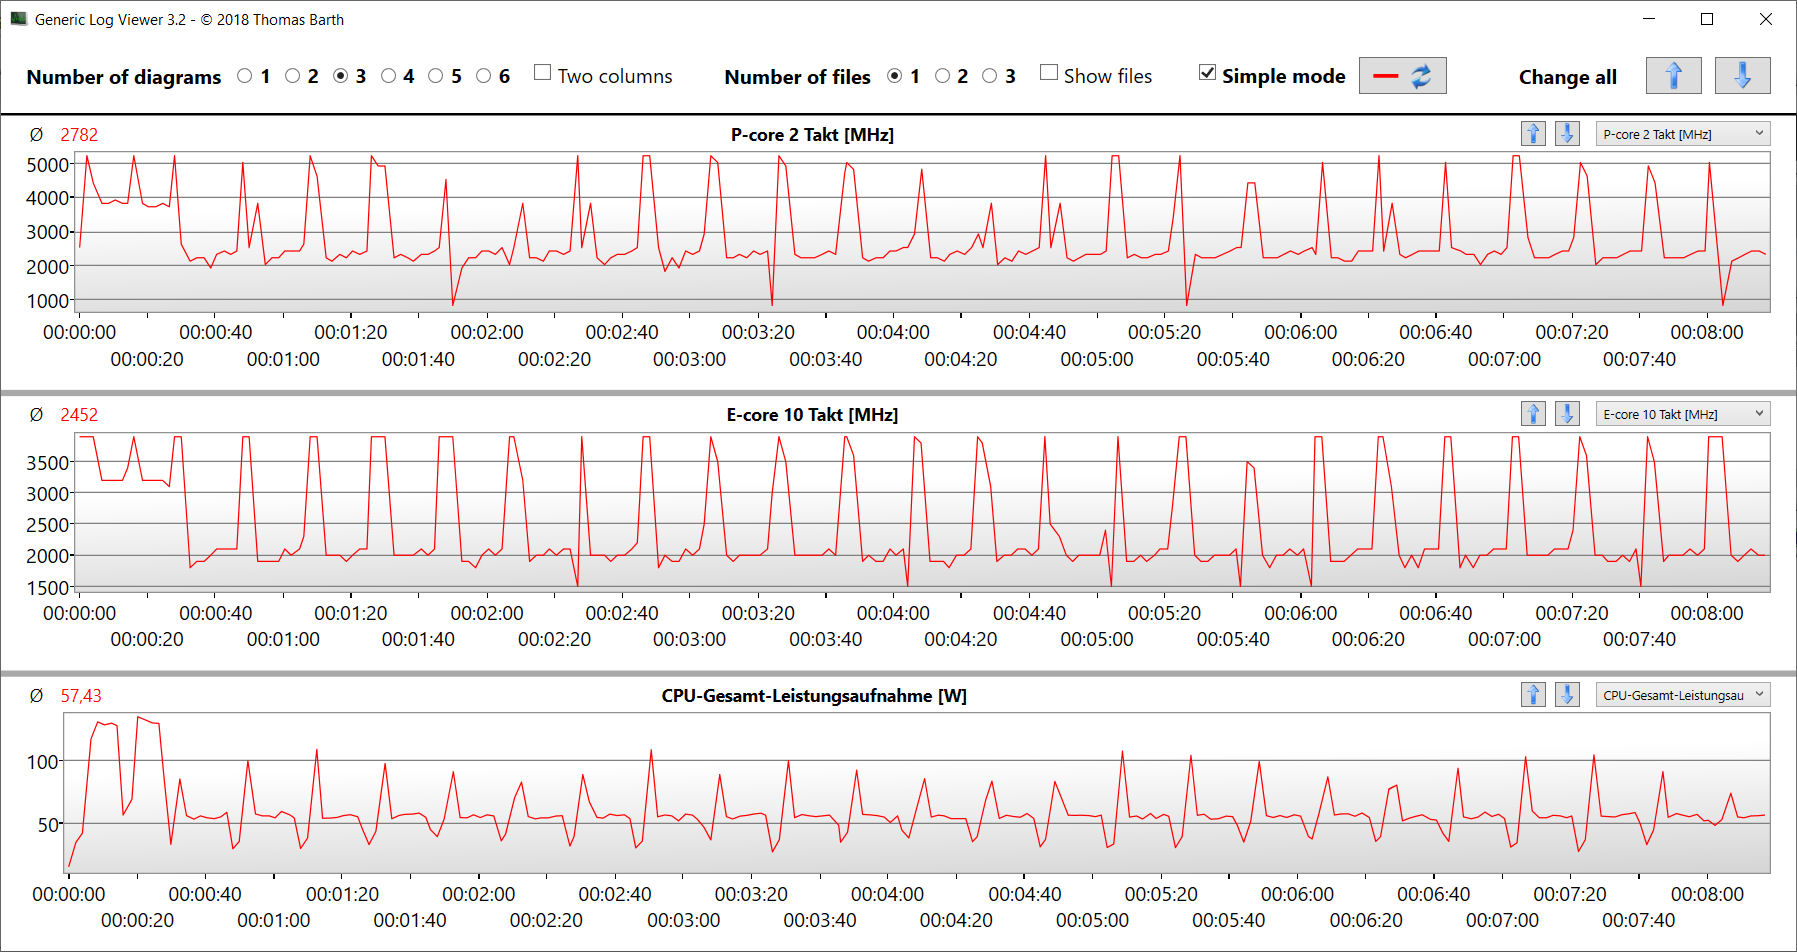
I risultati del benchmark sono al livello (single-thread) della media della CPU o al di sotto (multithread). Nel complesso, la modalità "Performance" comporta solo un leggero vantaggio in termini di prestazioni, con i benchmark AIDA che ne beneficiano maggiormente. D'altra parte, questa modalità fa sì che la velocità della CPU rimanga ad un livello elevato anche in presenza di un carico multithread costante, come dimostra il test del ciclo CB15.
Cinebench R15 Multi Constant Load Test
| CPU Performance rating - Percent | |
| Lenovo Legion Pro 7 16IRX8H | |
| Asus ROG Strix G16 G614JZ | |
| HP Omen 17-ck2097ng | |
| Media Intel Core i9-13900HX | |
| HP Omen 17-ck2097ng | |
| Razer Blade 16 Early 2023 | |
| Media della classe Gaming | |
| Alienware m17 R5 (R9 6900HX, RX 6850M XT) | |
| Cinebench R20 | |
| CPU (Multi Core) | |
| Asus ROG Strix G16 G614JZ | |
| Lenovo Legion Pro 7 16IRX8H | |
| Media Intel Core i9-13900HX (9152 - 12541, n=21) | |
| HP Omen 17-ck2097ng (Leistung) | |
| Media della classe Gaming (4029 - 16433, n=106, ultimi 2 anni) | |
| HP Omen 17-ck2097ng | |
| Razer Blade 16 Early 2023 | |
| Alienware m17 R5 (R9 6900HX, RX 6850M XT) | |
| CPU (Single Core) | |
| Asus ROG Strix G16 G614JZ | |
| HP Omen 17-ck2097ng | |
| HP Omen 17-ck2097ng (Leistung) | |
| Lenovo Legion Pro 7 16IRX8H | |
| Media Intel Core i9-13900HX (722 - 810, n=21) | |
| Media della classe Gaming (442 - 913, n=106, ultimi 2 anni) | |
| Razer Blade 16 Early 2023 | |
| Alienware m17 R5 (R9 6900HX, RX 6850M XT) | |
| Cinebench R15 | |
| CPU Multi 64Bit | |
| Lenovo Legion Pro 7 16IRX8H | |
| Asus ROG Strix G16 G614JZ (turbo) | |
| Asus ROG Strix G16 G614JZ | |
| Razer Blade 16 Early 2023 | |
| Media Intel Core i9-13900HX (3913 - 4970, n=22) | |
| HP Omen 17-ck2097ng (Leistung) | |
| HP Omen 17-ck2097ng | |
| Media della classe Gaming (1578 - 6330, n=105, ultimi 2 anni) | |
| Alienware m17 R5 (R9 6900HX, RX 6850M XT) | |
| CPU Single 64Bit | |
| Asus ROG Strix G16 G614JZ | |
| Asus ROG Strix G16 G614JZ (turbo) | |
| Lenovo Legion Pro 7 16IRX8H | |
| HP Omen 17-ck2097ng | |
| HP Omen 17-ck2097ng (Leistung) | |
| Media della classe Gaming (188.8 - 350, n=106, ultimi 2 anni) | |
| Media Intel Core i9-13900HX (247 - 304, n=22) | |
| Razer Blade 16 Early 2023 | |
| Alienware m17 R5 (R9 6900HX, RX 6850M XT) | |
| Blender - v2.79 BMW27 CPU | |
| Alienware m17 R5 (R9 6900HX, RX 6850M XT) | |
| HP Omen 17-ck2097ng | |
| Media della classe Gaming (79 - 330, n=104, ultimi 2 anni) | |
| Media Intel Core i9-13900HX (101 - 153, n=22) | |
| Razer Blade 16 Early 2023 | |
| HP Omen 17-ck2097ng (Leistung) | |
| Asus ROG Strix G16 G614JZ | |
| Lenovo Legion Pro 7 16IRX8H | |
| HWBOT x265 Benchmark v2.2 - 4k Preset | |
| Lenovo Legion Pro 7 16IRX8H | |
| HP Omen 17-ck2097ng (Leistung) | |
| Asus ROG Strix G16 G614JZ | |
| Media Intel Core i9-13900HX (23.5 - 34.4, n=22) | |
| Media della classe Gaming (11.5 - 44.4, n=105, ultimi 2 anni) | |
| Razer Blade 16 Early 2023 | |
| HP Omen 17-ck2097ng | |
| Alienware m17 R5 (R9 6900HX, RX 6850M XT) | |
| LibreOffice - 20 Documents To PDF | |
| Alienware m17 R5 (R9 6900HX, RX 6850M XT) | |
| Media della classe Gaming (33.2 - 88.8, n=105, ultimi 2 anni) | |
| Asus ROG Strix G16 G614JZ | |
| Razer Blade 16 Early 2023 | |
| HP Omen 17-ck2097ng | |
| Lenovo Legion Pro 7 16IRX8H | |
| Media Intel Core i9-13900HX (32.8 - 51.1, n=21) | |
| HP Omen 17-ck2097ng (Leistung) | |
| R Benchmark 2.5 - Overall mean | |
| Alienware m17 R5 (R9 6900HX, RX 6850M XT) | |
| Media della classe Gaming (0.3439 - 0.759, n=106, ultimi 2 anni) | |
| Razer Blade 16 Early 2023 | |
| Media Intel Core i9-13900HX (0.375 - 0.4564, n=22) | |
| Lenovo Legion Pro 7 16IRX8H | |
| HP Omen 17-ck2097ng (Leistung) | |
| Asus ROG Strix G16 G614JZ | |
| HP Omen 17-ck2097ng | |
* ... Meglio usare valori piccoli
AIDA64: FP32 Ray-Trace | FPU Julia | CPU SHA3 | CPU Queen | FPU SinJulia | FPU Mandel | CPU AES | CPU ZLib | FP64 Ray-Trace | CPU PhotoWorxx
| Performance rating | |
| Lenovo Legion Pro 7 16IRX8H | |
| Asus ROG Strix G16 G614JZ | |
| Media della classe Gaming | |
| Media Intel Core i9-13900HX | |
| HP Omen 17-ck2097ng | |
| Razer Blade 16 Early 2023 | |
| HP Omen 17-ck2097ng | |
| Alienware m17 R5 (R9 6900HX, RX 6850M XT) | |
| AIDA64 / FP32 Ray-Trace | |
| Media della classe Gaming (10227 - 85542, n=105, ultimi 2 anni) | |
| Asus ROG Strix G16 G614JZ (v6.75.6100) | |
| Lenovo Legion Pro 7 16IRX8H (v6.85.6300) | |
| Razer Blade 16 Early 2023 (v6.85.6300) | |
| Razer Blade 16 Early 2023 (v8.20.8100) | |
| Razer Blade 16 Early 2023 (v6.92.6600) | |
| Media Intel Core i9-13900HX (17589 - 27615, n=22) | |
| HP Omen 17-ck2097ng (v6.75.6100, Leistung) | |
| HP Omen 17-ck2097ng (v6.75.6100) | |
| Alienware m17 R5 (R9 6900HX, RX 6850M XT) (v6.75.6100) | |
| AIDA64 / FPU Julia | |
| Media della classe Gaming (51376 - 238426, n=105, ultimi 2 anni) | |
| Lenovo Legion Pro 7 16IRX8H (v6.85.6300) | |
| Asus ROG Strix G16 G614JZ (v6.75.6100) | |
| Razer Blade 16 Early 2023 (v6.85.6300) | |
| Razer Blade 16 Early 2023 (v8.20.8100) | |
| Razer Blade 16 Early 2023 (v6.92.6600) | |
| Media Intel Core i9-13900HX (88686 - 137015, n=22) | |
| HP Omen 17-ck2097ng (v6.75.6100, Leistung) | |
| Alienware m17 R5 (R9 6900HX, RX 6850M XT) (v6.75.6100) | |
| HP Omen 17-ck2097ng (v6.75.6100) | |
| AIDA64 / CPU SHA3 | |
| Lenovo Legion Pro 7 16IRX8H (v6.85.6300) | |
| Asus ROG Strix G16 G614JZ (v6.75.6100) | |
| Media della classe Gaming (2180 - 10115, n=105, ultimi 2 anni) | |
| Razer Blade 16 Early 2023 (v6.85.6300) | |
| Razer Blade 16 Early 2023 (v6.92.6600) | |
| Razer Blade 16 Early 2023 (v8.20.8100) | |
| Media Intel Core i9-13900HX (4362 - 7029, n=22) | |
| HP Omen 17-ck2097ng (v6.75.6100, Leistung) | |
| HP Omen 17-ck2097ng (v6.75.6100) | |
| Alienware m17 R5 (R9 6900HX, RX 6850M XT) (v6.75.6100) | |
| AIDA64 / CPU Queen | |
| Asus ROG Strix G16 G614JZ (v6.75.6100) | |
| Razer Blade 16 Early 2023 (v6.92.6600) | |
| Razer Blade 16 Early 2023 (v6.85.6300) | |
| HP Omen 17-ck2097ng | |
| Lenovo Legion Pro 7 16IRX8H (v6.85.6300) | |
| Media Intel Core i9-13900HX (125644 - 141385, n=22) | |
| HP Omen 17-ck2097ng (v6.75.6100, Leistung) | |
| Media della classe Gaming (49785 - 173351, n=90, ultimi 2 anni) | |
| Alienware m17 R5 (R9 6900HX, RX 6850M XT) (v6.75.6100) | |
| AIDA64 / FPU SinJulia | |
| Asus ROG Strix G16 G614JZ (v6.75.6100) | |
| Razer Blade 16 Early 2023 (v6.85.6300) | |
| Razer Blade 16 Early 2023 (v8.20.8100) | |
| Razer Blade 16 Early 2023 (v6.92.6600) | |
| Lenovo Legion Pro 7 16IRX8H (v6.85.6300) | |
| HP Omen 17-ck2097ng (v6.75.6100, Leistung) | |
| Media Intel Core i9-13900HX (12334 - 17179, n=22) | |
| Media della classe Gaming (4424 - 33636, n=105, ultimi 2 anni) | |
| Alienware m17 R5 (R9 6900HX, RX 6850M XT) (v6.75.6100) | |
| HP Omen 17-ck2097ng (v6.75.6100) | |
| AIDA64 / FPU Mandel | |
| Media della classe Gaming (25115 - 128721, n=105, ultimi 2 anni) | |
| Lenovo Legion Pro 7 16IRX8H (v6.85.6300) | |
| Asus ROG Strix G16 G614JZ (v6.75.6100) | |
| Razer Blade 16 Early 2023 (v6.85.6300) | |
| Razer Blade 16 Early 2023 (v8.20.8100) | |
| Razer Blade 16 Early 2023 (v6.92.6600) | |
| Media Intel Core i9-13900HX (43850 - 69202, n=22) | |
| HP Omen 17-ck2097ng (v6.75.6100, Leistung) | |
| Alienware m17 R5 (R9 6900HX, RX 6850M XT) (v6.75.6100) | |
| HP Omen 17-ck2097ng (v6.75.6100) | |
| AIDA64 / CPU AES | |
| Razer Blade 16 Early 2023 (v6.92.6600) | |
| Razer Blade 16 Early 2023 (v8.20.8100) | |
| Razer Blade 16 Early 2023 (v6.85.6300) | |
| Media Intel Core i9-13900HX (89413 - 237881, n=22) | |
| Asus ROG Strix G16 G614JZ (v6.75.6100) | |
| Lenovo Legion Pro 7 16IRX8H (v6.85.6300) | |
| HP Omen 17-ck2097ng (v6.75.6100, Leistung) | |
| Media della classe Gaming (39258 - 247074, n=105, ultimi 2 anni) | |
| HP Omen 17-ck2097ng (v6.75.6100) | |
| Alienware m17 R5 (R9 6900HX, RX 6850M XT) (v6.75.6100) | |
| AIDA64 / CPU ZLib | |
| Lenovo Legion Pro 7 16IRX8H (v6.85.6300) | |
| Asus ROG Strix G16 G614JZ (v6.75.6100) | |
| Razer Blade 16 Early 2023 (v6.85.6300) | |
| Razer Blade 16 Early 2023 (v6.92.6600) | |
| Razer Blade 16 Early 2023 (v8.20.8100) | |
| Media Intel Core i9-13900HX (1284 - 1958, n=22) | |
| HP Omen 17-ck2097ng (v6.75.6100, Leistung) | |
| Media della classe Gaming (574 - 2531, n=105, ultimi 2 anni) | |
| HP Omen 17-ck2097ng (v6.75.6100) | |
| Alienware m17 R5 (R9 6900HX, RX 6850M XT) (v6.75.6100) | |
| AIDA64 / FP64 Ray-Trace | |
| Media della classe Gaming (5509 - 45446, n=105, ultimi 2 anni) | |
| Lenovo Legion Pro 7 16IRX8H (v6.85.6300) | |
| Asus ROG Strix G16 G614JZ (v6.75.6100) | |
| Razer Blade 16 Early 2023 (v6.85.6300) | |
| Razer Blade 16 Early 2023 (v6.92.6600) | |
| Razer Blade 16 Early 2023 (v8.20.8100) | |
| Media Intel Core i9-13900HX (9481 - 15279, n=22) | |
| HP Omen 17-ck2097ng (v6.75.6100, Leistung) | |
| HP Omen 17-ck2097ng (v6.75.6100) | |
| Alienware m17 R5 (R9 6900HX, RX 6850M XT) (v6.75.6100) | |
| AIDA64 / CPU PhotoWorxx | |
| Razer Blade 16 Early 2023 (v6.85.6300) | |
| Razer Blade 16 Early 2023 (v6.92.6600) | |
| Razer Blade 16 Early 2023 (v8.20.8100) | |
| HP Omen 17-ck2097ng (v6.75.6100) | |
| HP Omen 17-ck2097ng (v6.75.6100, Leistung) | |
| Lenovo Legion Pro 7 16IRX8H (v6.85.6300) | |
| Media Intel Core i9-13900HX (42994 - 51994, n=22) | |
| Media della classe Gaming (12271 - 89891, n=105, ultimi 2 anni) | |
| Asus ROG Strix G16 G614JZ (v6.75.6100) | |
| Alienware m17 R5 (R9 6900HX, RX 6850M XT) (v6.75.6100) | |
Prestazioni del sistema
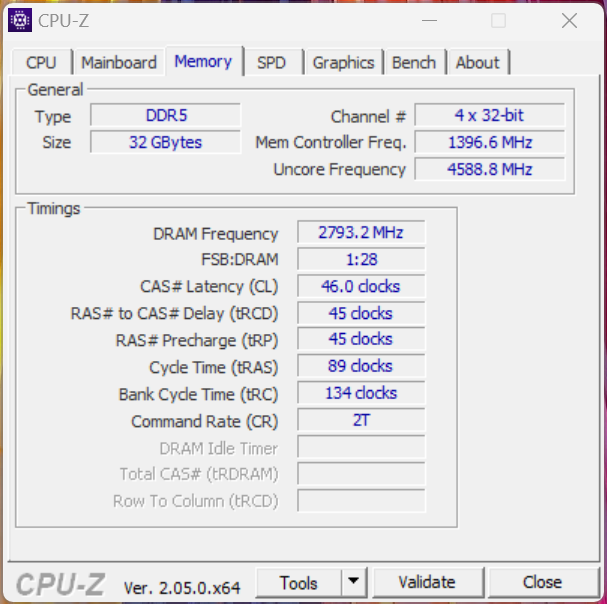
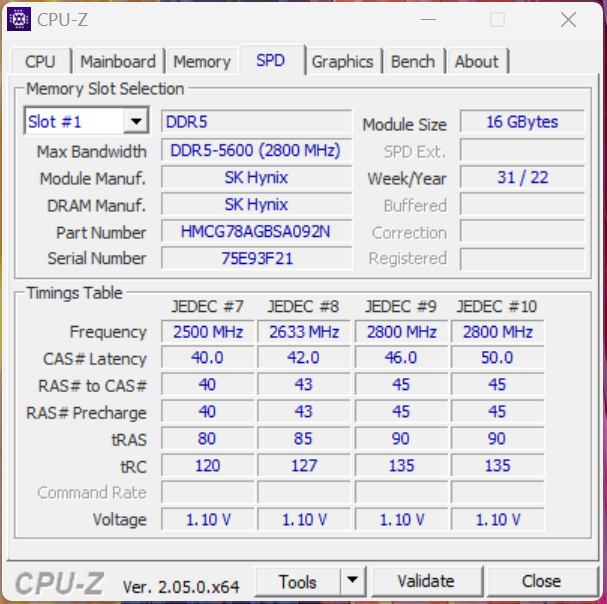
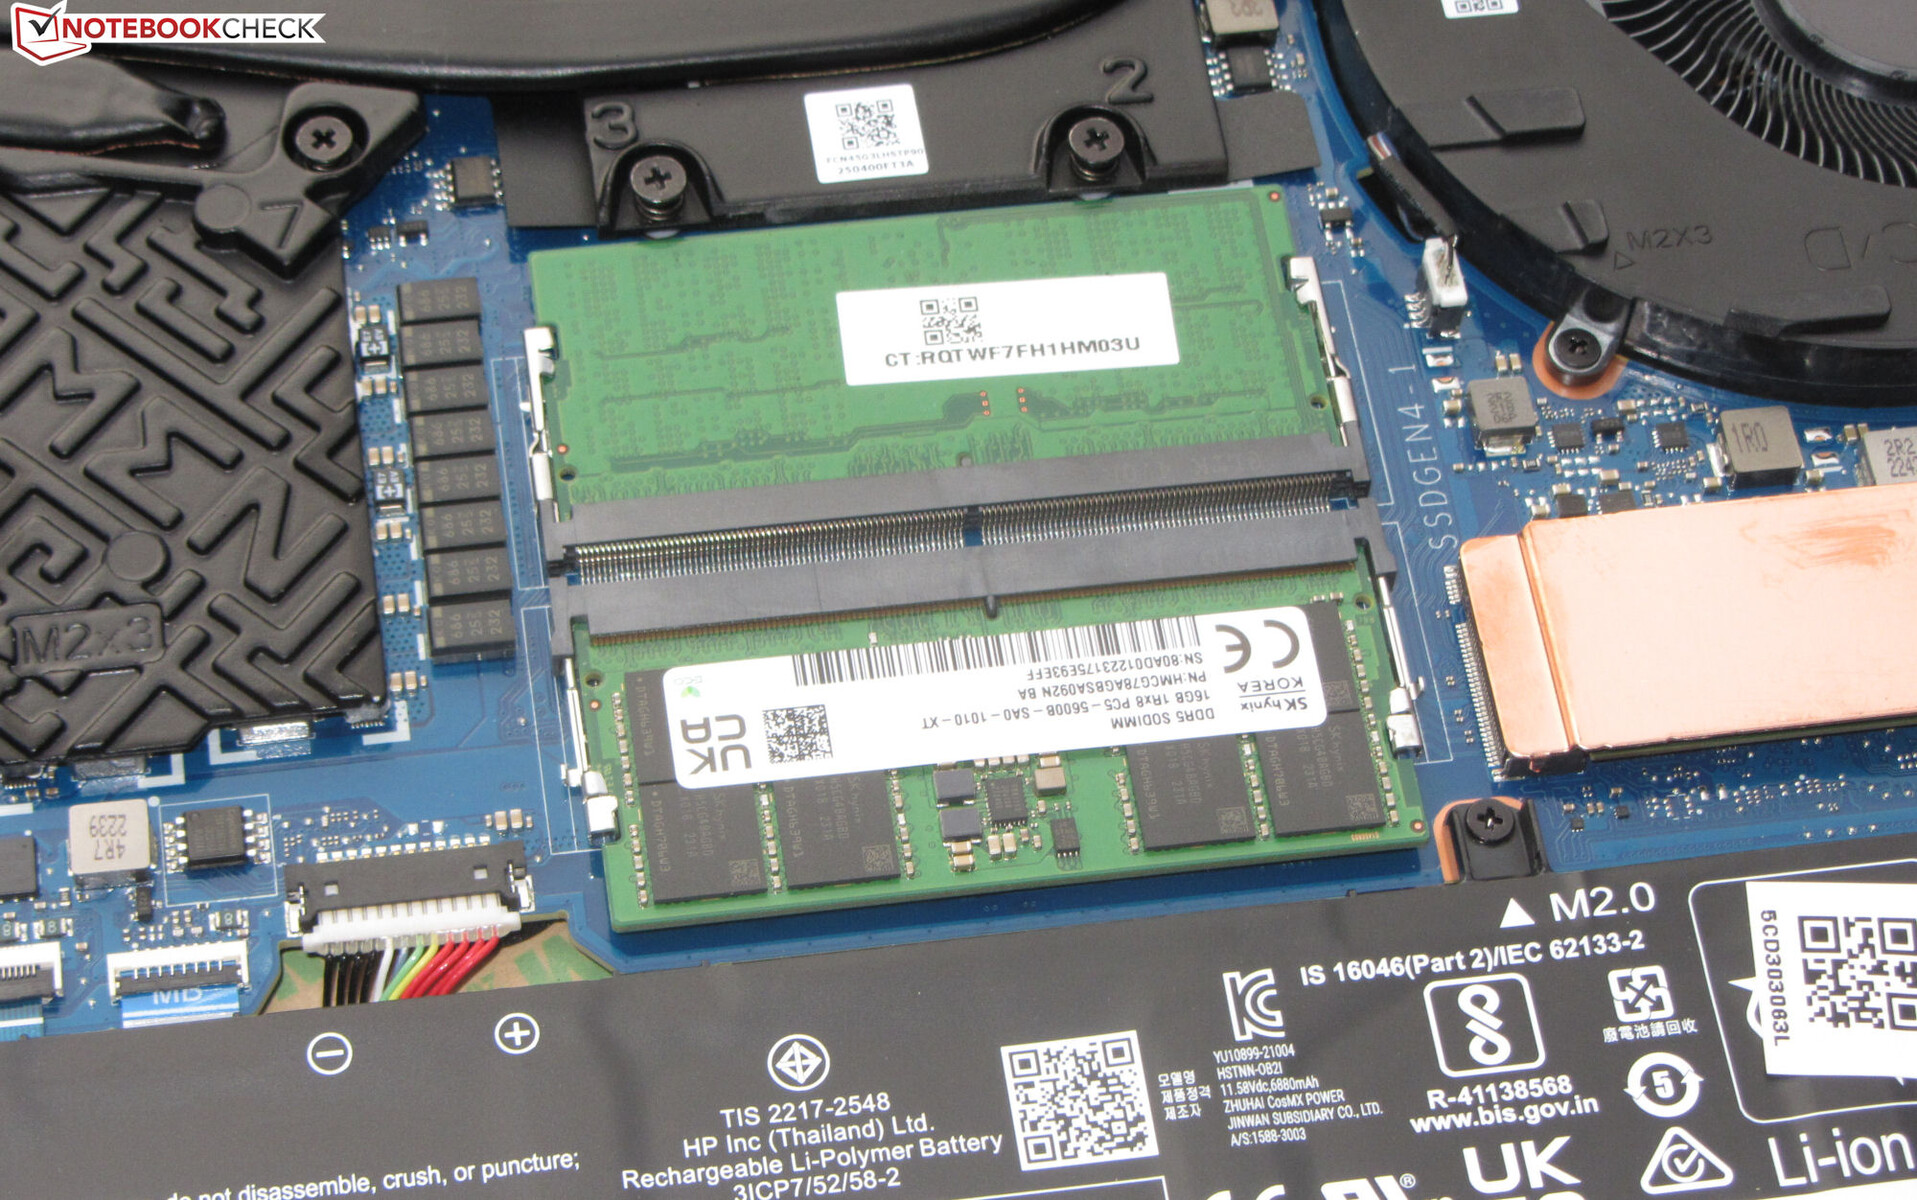
Il sistema, che funziona senza problemi, offre prestazioni di calcolo sufficienti per le applicazioni più esigenti, come il rendering e i giochi. Le velocità di trasferimento della memoria di lavoro si attestano su livelli normali per una memoria DDR5-5600. Sono accompagnate da buoni risultati PC-Mark.
CrossMark: Overall | Productivity | Creativity | Responsiveness
| PCMark 10 / Score | |
| Media della classe Gaming (5828 - 12414, n=93, ultimi 2 anni) | |
| Media Intel Core i9-13900HX, NVIDIA GeForce RTX 4080 Laptop GPU (7609 - 8549, n=3) | |
| Razer Blade 16 Early 2023 | |
| Lenovo Legion Pro 7 16IRX8H | |
| HP Omen 17-ck2097ng | |
| Alienware m17 R5 (R9 6900HX, RX 6850M XT) | |
| Asus ROG Strix G16 G614JZ | |
| PCMark 10 / Essentials | |
| Asus ROG Strix G16 G614JZ | |
| HP Omen 17-ck2097ng | |
| Lenovo Legion Pro 7 16IRX8H | |
| Media Intel Core i9-13900HX, NVIDIA GeForce RTX 4080 Laptop GPU (10982 - 11824, n=3) | |
| Razer Blade 16 Early 2023 | |
| Media della classe Gaming (8810 - 11935, n=97, ultimi 2 anni) | |
| Alienware m17 R5 (R9 6900HX, RX 6850M XT) | |
| PCMark 10 / Productivity | |
| Media della classe Gaming (6845 - 25323, n=95, ultimi 2 anni) | |
| Lenovo Legion Pro 7 16IRX8H | |
| Media Intel Core i9-13900HX, NVIDIA GeForce RTX 4080 Laptop GPU (9976 - 10788, n=3) | |
| HP Omen 17-ck2097ng | |
| Alienware m17 R5 (R9 6900HX, RX 6850M XT) | |
| Razer Blade 16 Early 2023 | |
| Asus ROG Strix G16 G614JZ | |
| PCMark 10 / Digital Content Creation | |
| Razer Blade 16 Early 2023 | |
| Media della classe Gaming (7602 - 19954, n=95, ultimi 2 anni) | |
| Media Intel Core i9-13900HX, NVIDIA GeForce RTX 4080 Laptop GPU (10135 - 14720, n=3) | |
| Alienware m17 R5 (R9 6900HX, RX 6850M XT) | |
| Asus ROG Strix G16 G614JZ | |
| Lenovo Legion Pro 7 16IRX8H | |
| HP Omen 17-ck2097ng | |
| CrossMark / Overall | |
| Asus ROG Strix G16 G614JZ | |
| Media Intel Core i9-13900HX, NVIDIA GeForce RTX 4080 Laptop GPU (1991 - 2194, n=2) | |
| HP Omen 17-ck2097ng | |
| Media della classe Gaming (1366 - 2409, n=94, ultimi 2 anni) | |
| Alienware m17 R5 (R9 6900HX, RX 6850M XT) | |
| Razer Blade 16 Early 2023 | |
| CrossMark / Productivity | |
| Asus ROG Strix G16 G614JZ | |
| Media Intel Core i9-13900HX, NVIDIA GeForce RTX 4080 Laptop GPU (1828 - 2059, n=2) | |
| Media della classe Gaming (1386 - 2254, n=94, ultimi 2 anni) | |
| HP Omen 17-ck2097ng | |
| Alienware m17 R5 (R9 6900HX, RX 6850M XT) | |
| Razer Blade 16 Early 2023 | |
| CrossMark / Creativity | |
| Asus ROG Strix G16 G614JZ | |
| Media Intel Core i9-13900HX, NVIDIA GeForce RTX 4080 Laptop GPU (2239 - 2411, n=2) | |
| Media della classe Gaming (1343 - 2786, n=94, ultimi 2 anni) | |
| HP Omen 17-ck2097ng | |
| Razer Blade 16 Early 2023 | |
| Alienware m17 R5 (R9 6900HX, RX 6850M XT) | |
| CrossMark / Responsiveness | |
| Asus ROG Strix G16 G614JZ | |
| Media Intel Core i9-13900HX, NVIDIA GeForce RTX 4080 Laptop GPU (1808 - 1998, n=2) | |
| HP Omen 17-ck2097ng | |
| Media della classe Gaming (1226 - 2334, n=94, ultimi 2 anni) | |
| Razer Blade 16 Early 2023 | |
| Alienware m17 R5 (R9 6900HX, RX 6850M XT) | |
| PCMark 8 Home Score Accelerated v2 | 5074 punti | |
| PCMark 8 Work Score Accelerated v2 | 6244 punti | |
| PCMark 10 Score | 7609 punti | |
Aiuto | ||
| AIDA64 / Memory Copy | |
| Razer Blade 16 Early 2023 | |
| Razer Blade 16 Early 2023 | |
| Razer Blade 16 Early 2023 | |
| HP Omen 17-ck2097ng | |
| Lenovo Legion Pro 7 16IRX8H | |
| Media Intel Core i9-13900HX (67716 - 79193, n=22) | |
| Media della classe Gaming (21750 - 129946, n=105, ultimi 2 anni) | |
| Asus ROG Strix G16 G614JZ | |
| HP Omen 17-ck1075ng | |
| Alienware m17 R5 (R9 6900HX, RX 6850M XT) | |
| AIDA64 / Memory Read | |
| Razer Blade 16 Early 2023 | |
| Razer Blade 16 Early 2023 | |
| Razer Blade 16 Early 2023 | |
| HP Omen 17-ck2097ng | |
| Lenovo Legion Pro 7 16IRX8H | |
| Media Intel Core i9-13900HX (73998 - 88462, n=22) | |
| Media della classe Gaming (22956 - 118858, n=105, ultimi 2 anni) | |
| Asus ROG Strix G16 G614JZ | |
| HP Omen 17-ck1075ng | |
| Alienware m17 R5 (R9 6900HX, RX 6850M XT) | |
| AIDA64 / Memory Write | |
| Razer Blade 16 Early 2023 | |
| Razer Blade 16 Early 2023 | |
| Razer Blade 16 Early 2023 | |
| HP Omen 17-ck2097ng | |
| Media della classe Gaming (22297 - 135096, n=105, ultimi 2 anni) | |
| Media Intel Core i9-13900HX (65472 - 77045, n=22) | |
| Lenovo Legion Pro 7 16IRX8H | |
| Asus ROG Strix G16 G614JZ | |
| HP Omen 17-ck1075ng | |
| Alienware m17 R5 (R9 6900HX, RX 6850M XT) | |
| AIDA64 / Memory Latency | |
| Media della classe Gaming (75.3 - 259, n=105, ultimi 2 anni) | |
| HP Omen 17-ck1075ng | |
| Razer Blade 16 Early 2023 | |
| Razer Blade 16 Early 2023 | |
| Razer Blade 16 Early 2023 | |
| Alienware m17 R5 (R9 6900HX, RX 6850M XT) | |
| Asus ROG Strix G16 G614JZ | |
| Media Intel Core i9-13900HX (75.3 - 91.1, n=22) | |
| HP Omen 17-ck2097ng | |
| Lenovo Legion Pro 7 16IRX8H | |
* ... Meglio usare valori piccoli
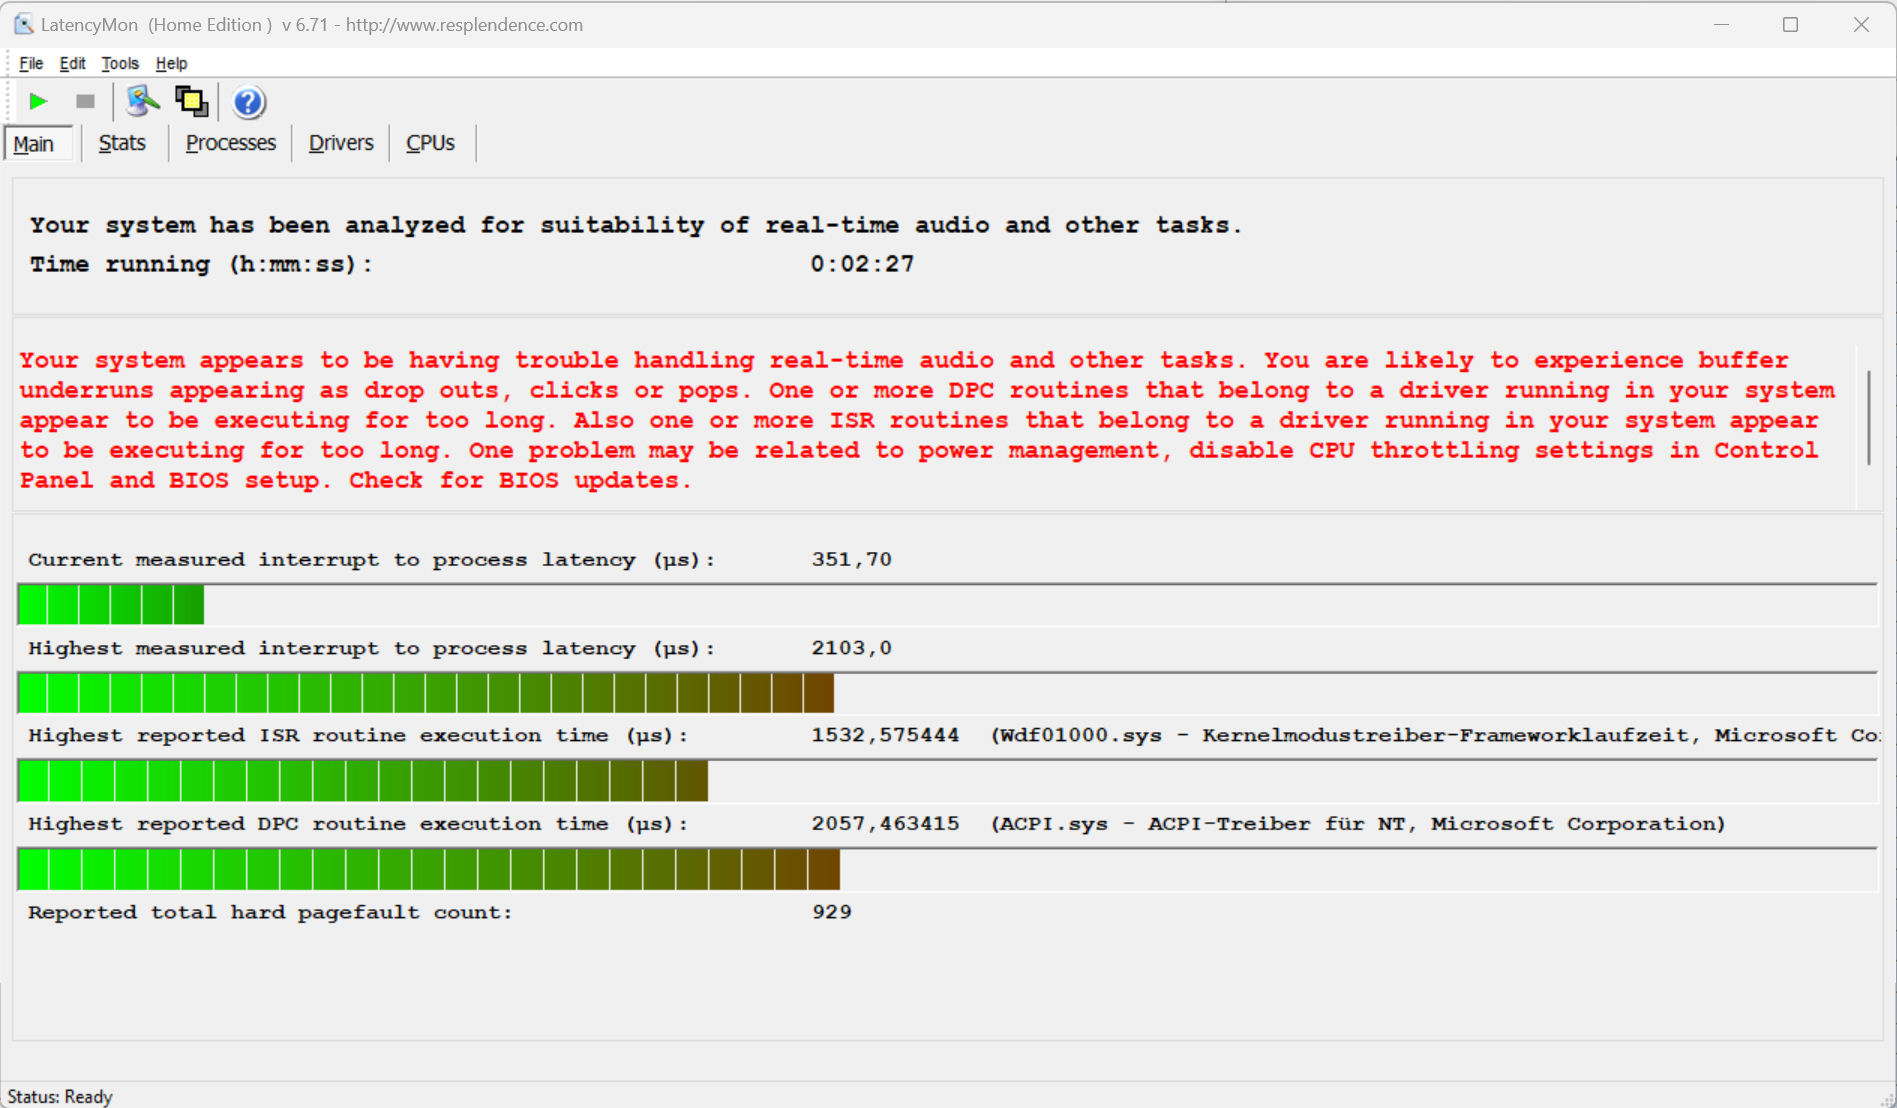
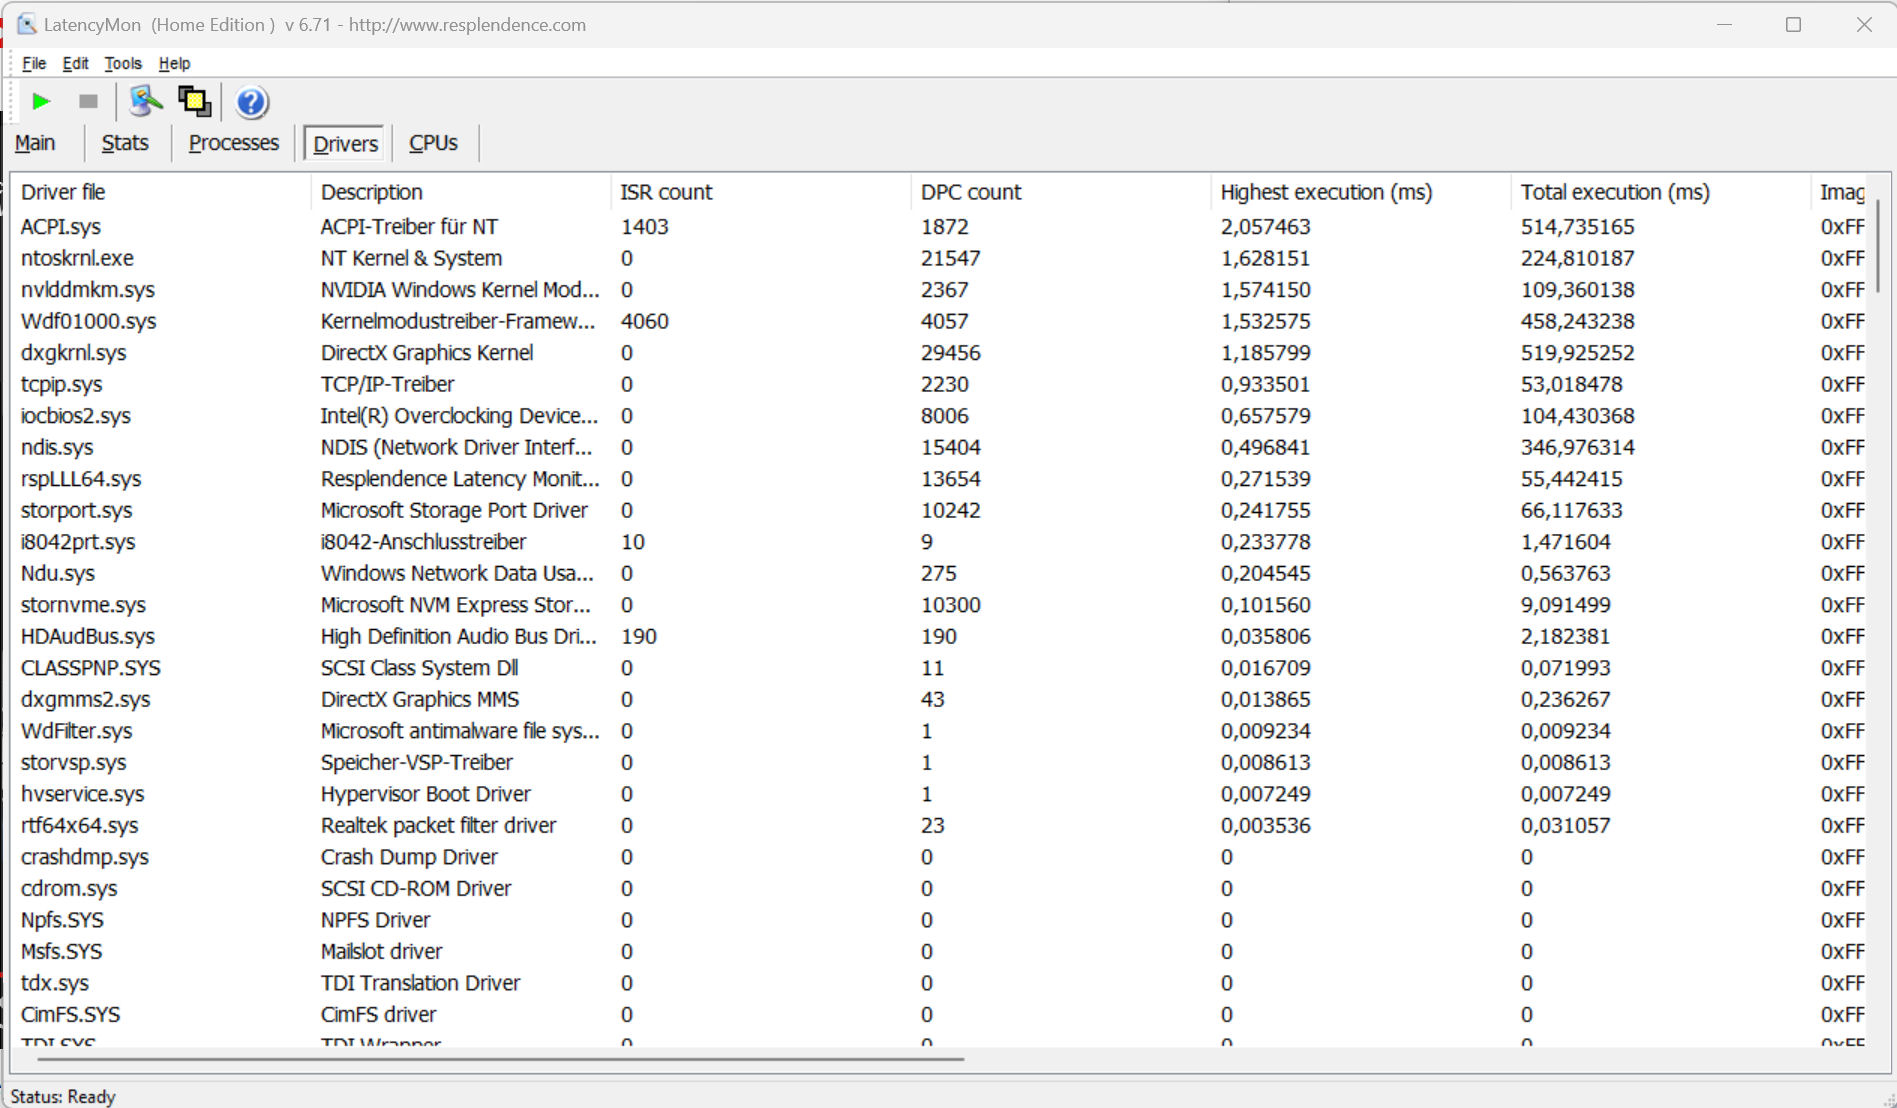
Latenze DPC
Il test standardizzato Latency Monitor (navigazione web, riproduzione video 4k, Prime95 ad alto carico) rivela alcuni comportamenti evidenti. Il sistema non sembra essere adatto all'elaborazione di video e audio in tempo reale. I futuri aggiornamenti del software potrebbero apportare alcuni miglioramenti o peggiorare ulteriormente la situazione.
| DPC Latencies / LatencyMon - interrupt to process latency (max), Web, Youtube, Prime95 | |
| Asus ROG Strix G16 G614JZ | |
| Razer Blade 16 Early 2023 | |
| HP Omen 17-ck2097ng | |
| Alienware m17 R5 (R9 6900HX, RX 6850M XT) | |
| Lenovo Legion Pro 7 16IRX8H | |
* ... Meglio usare valori piccoli
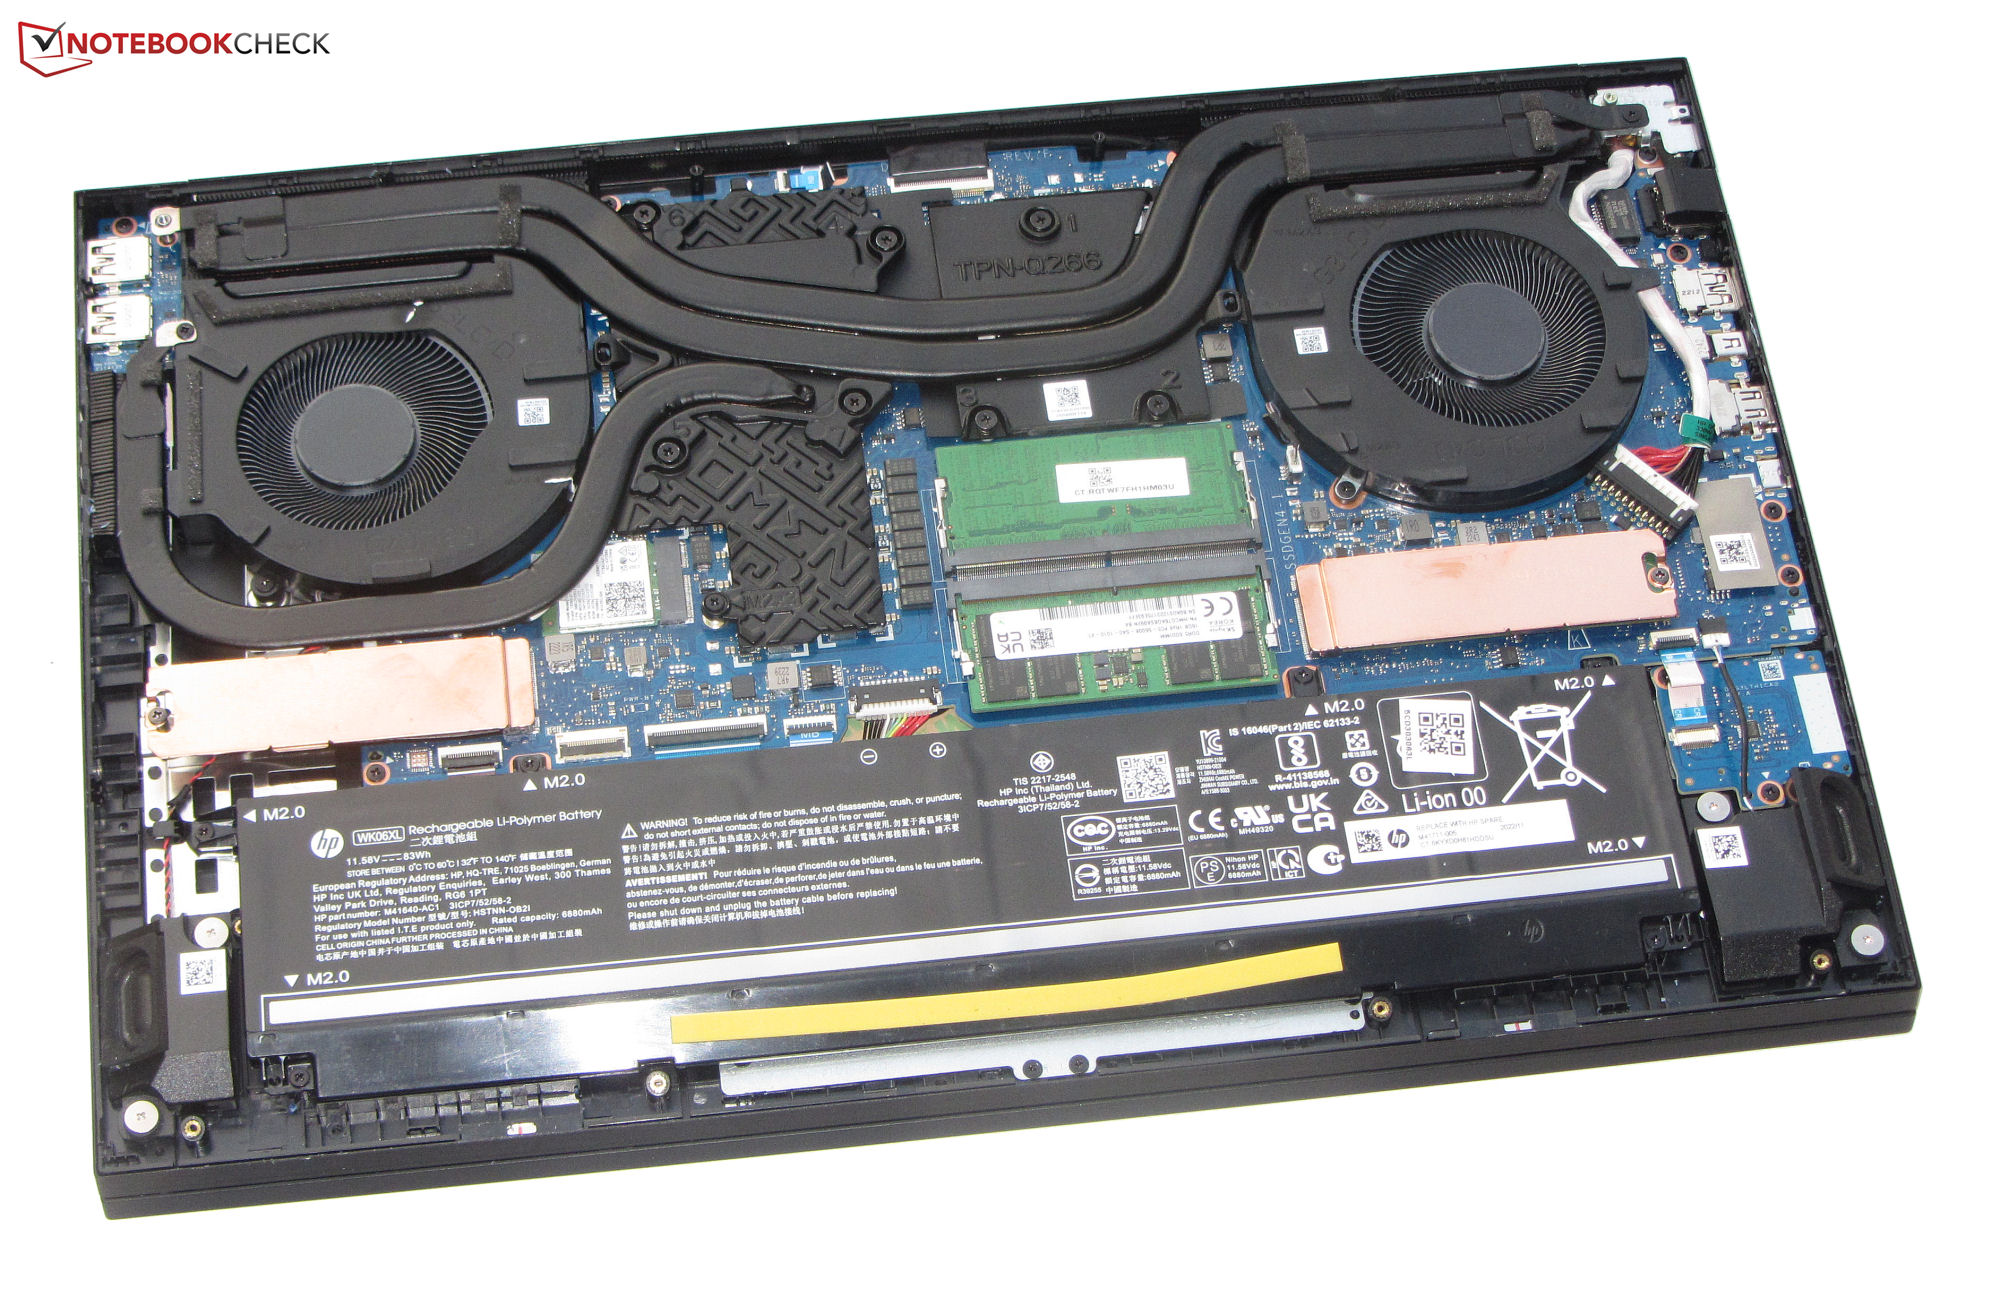
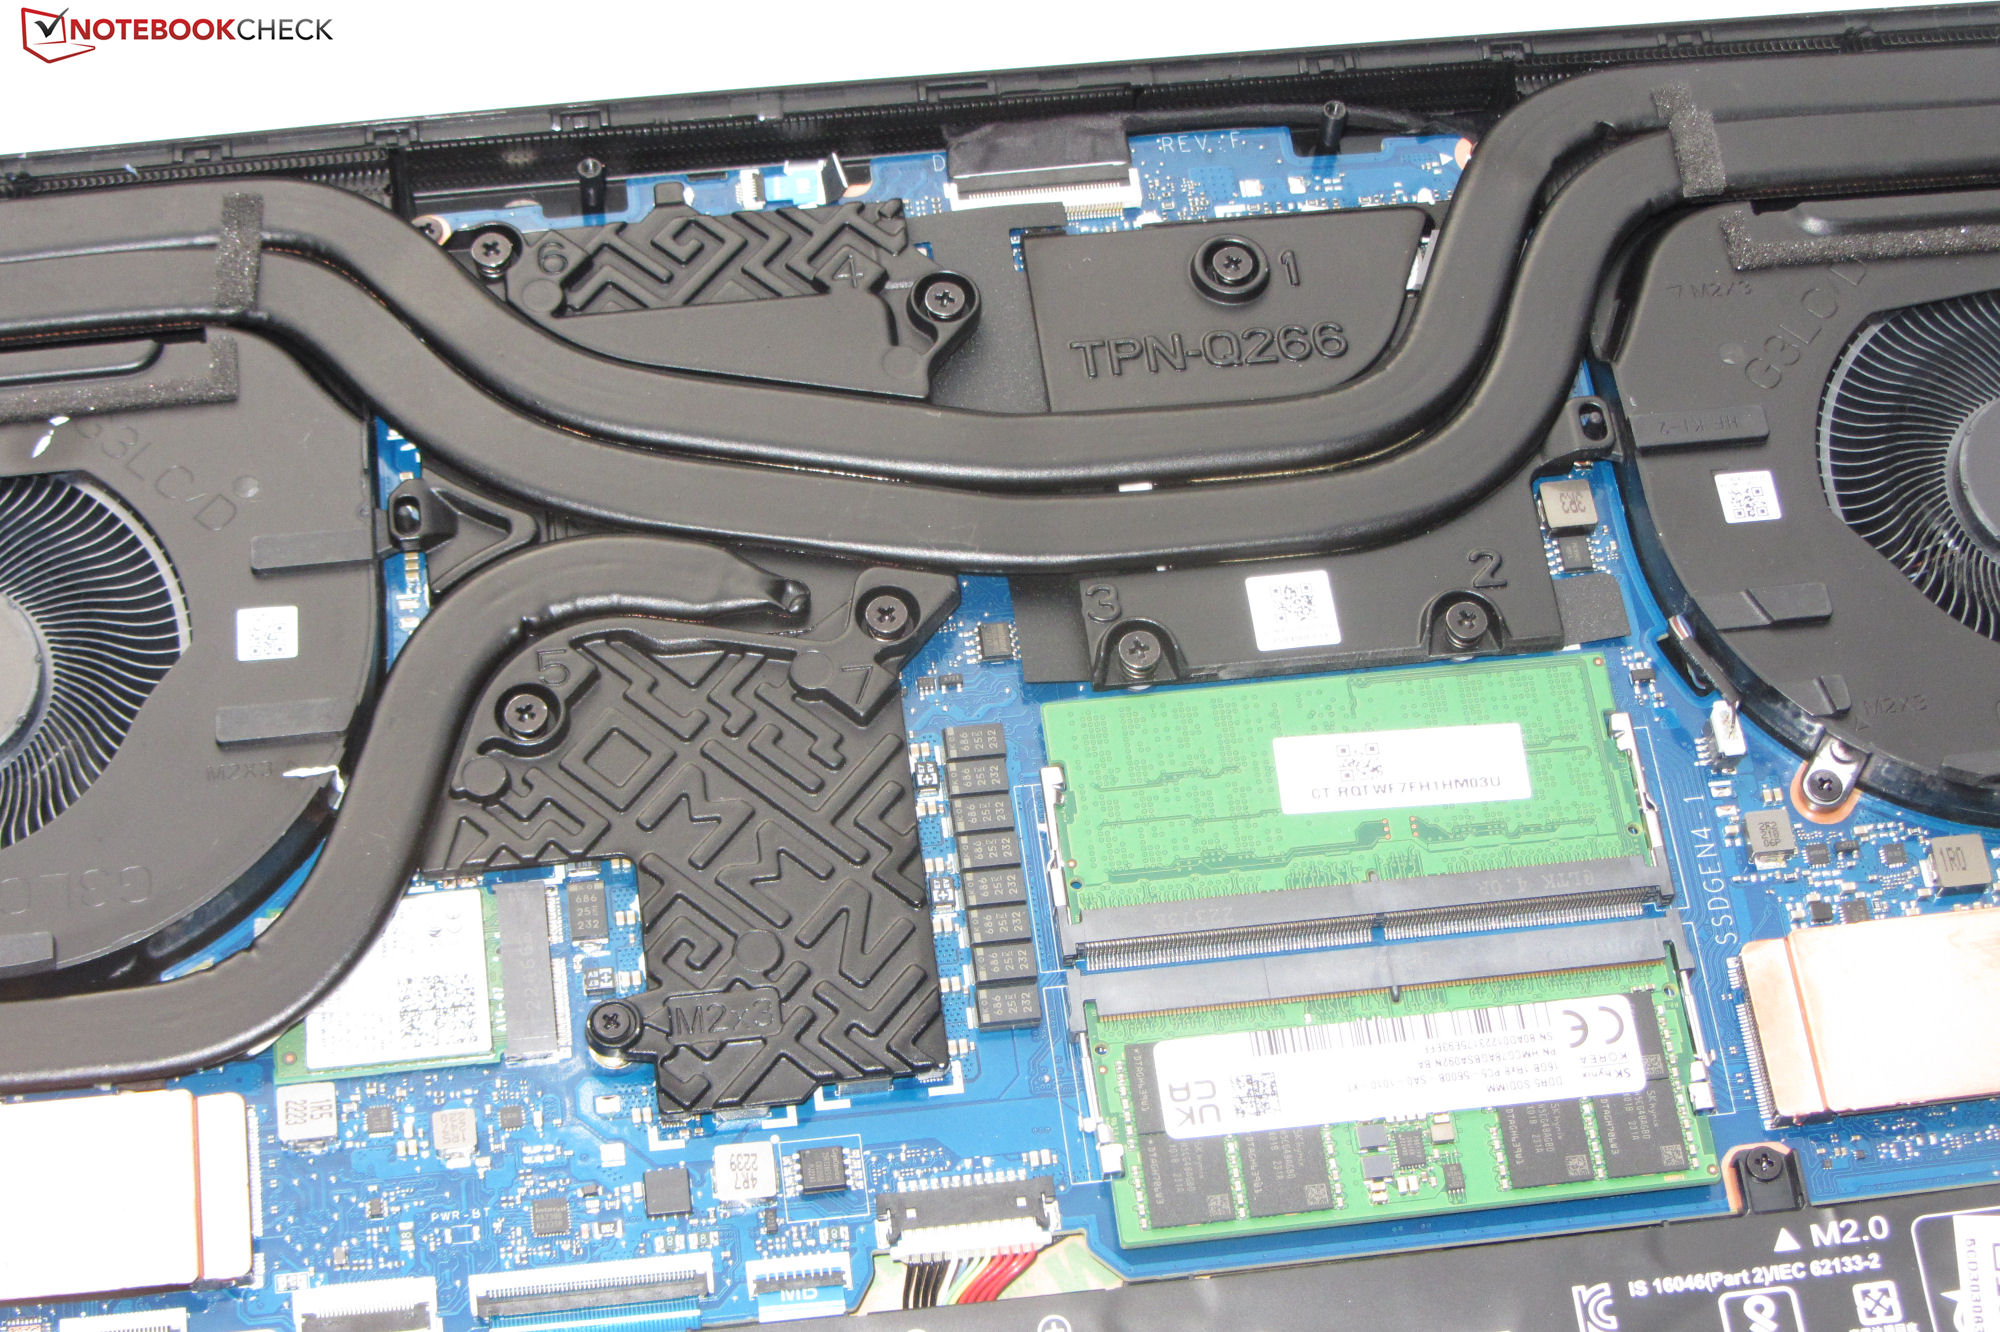
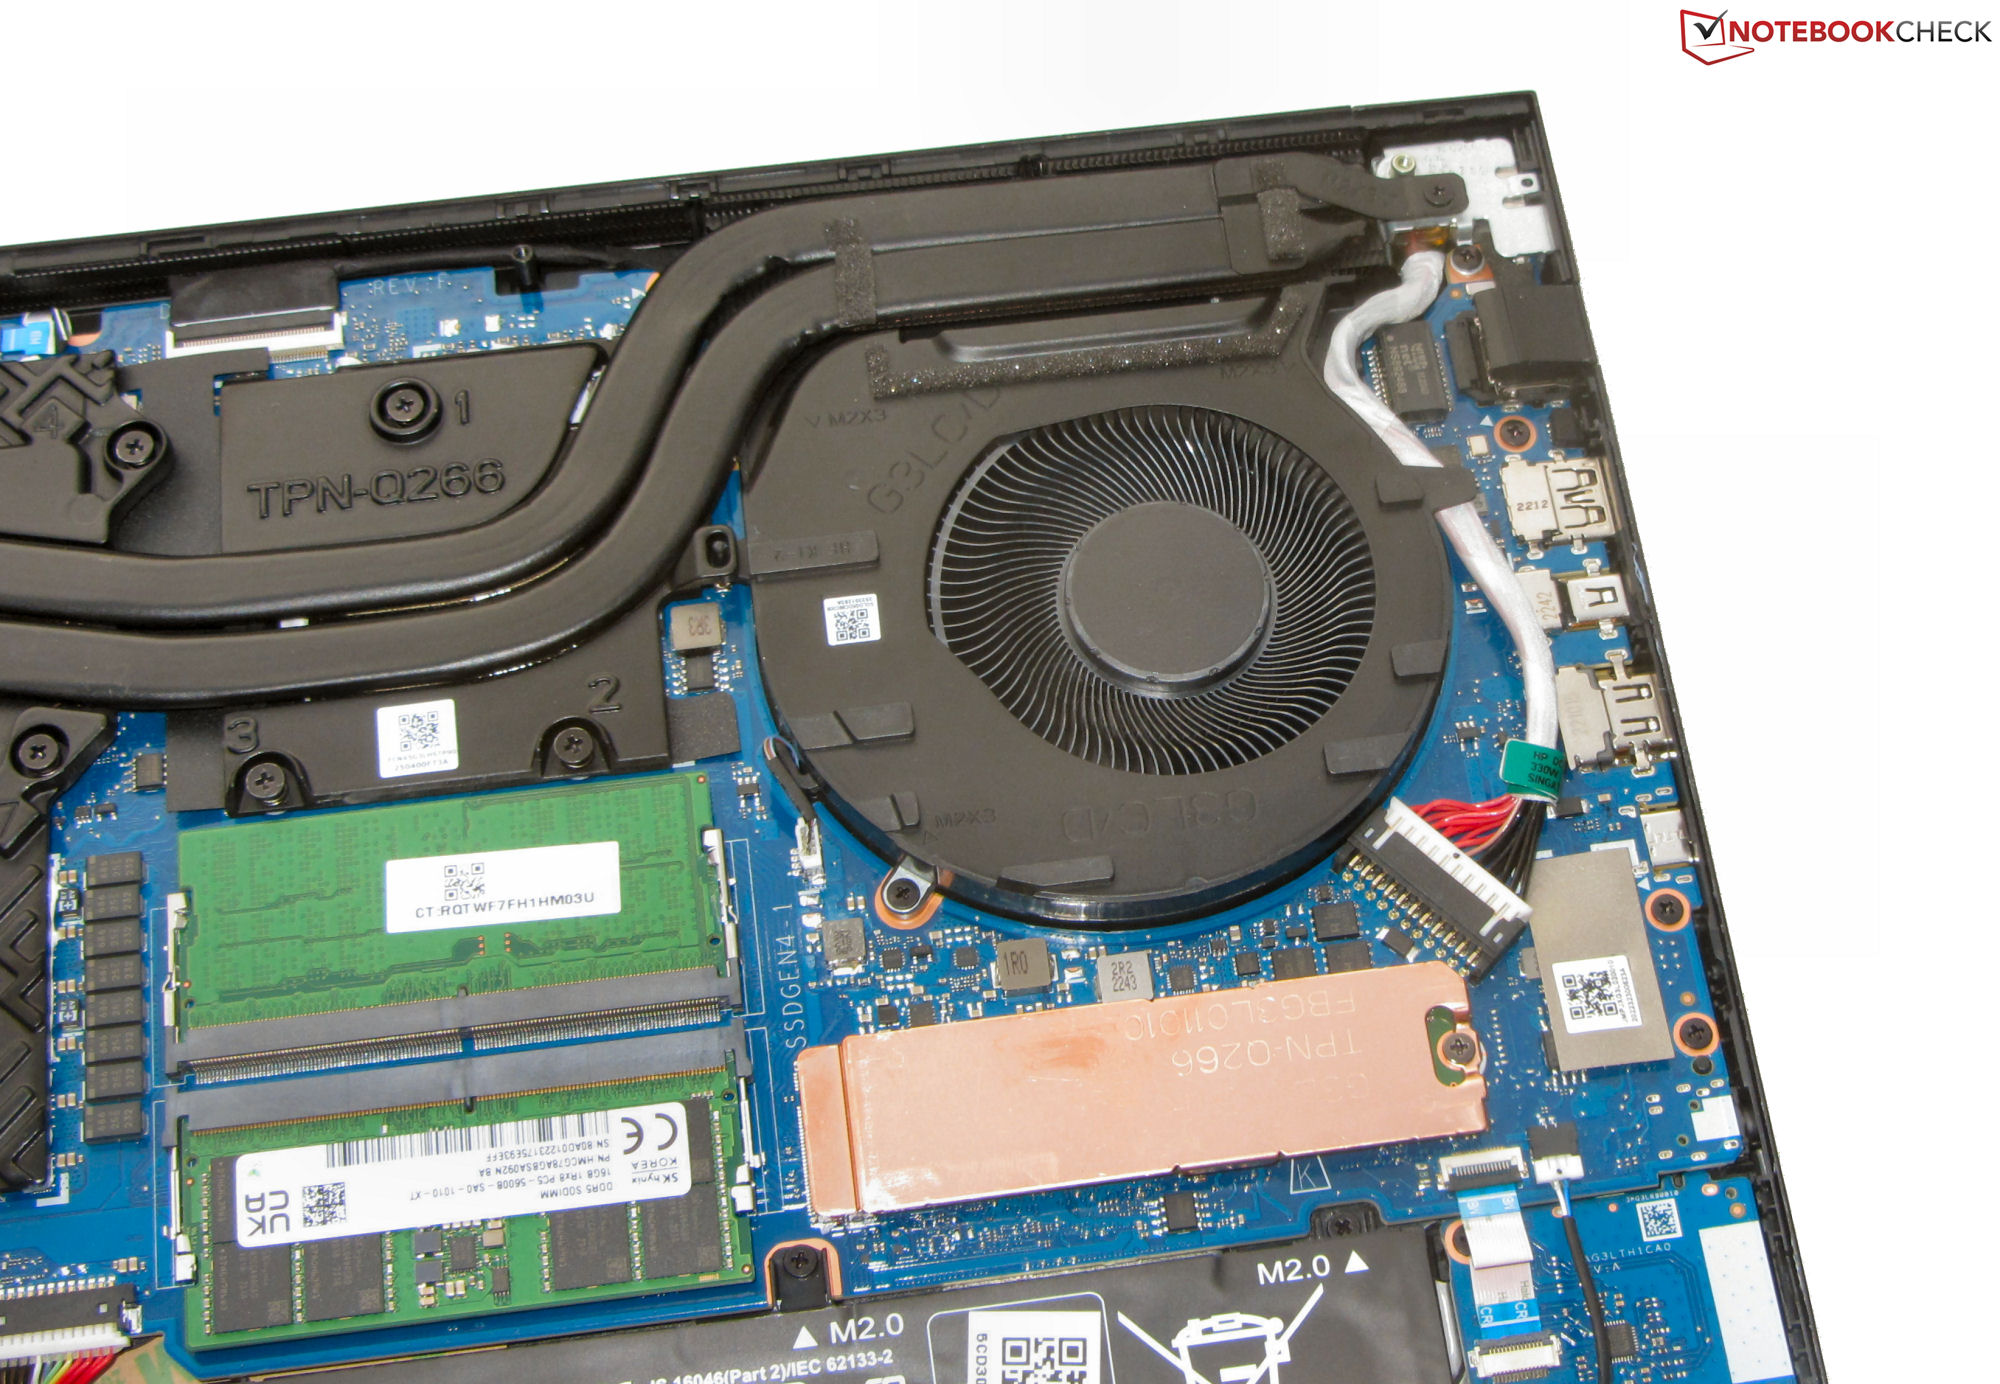
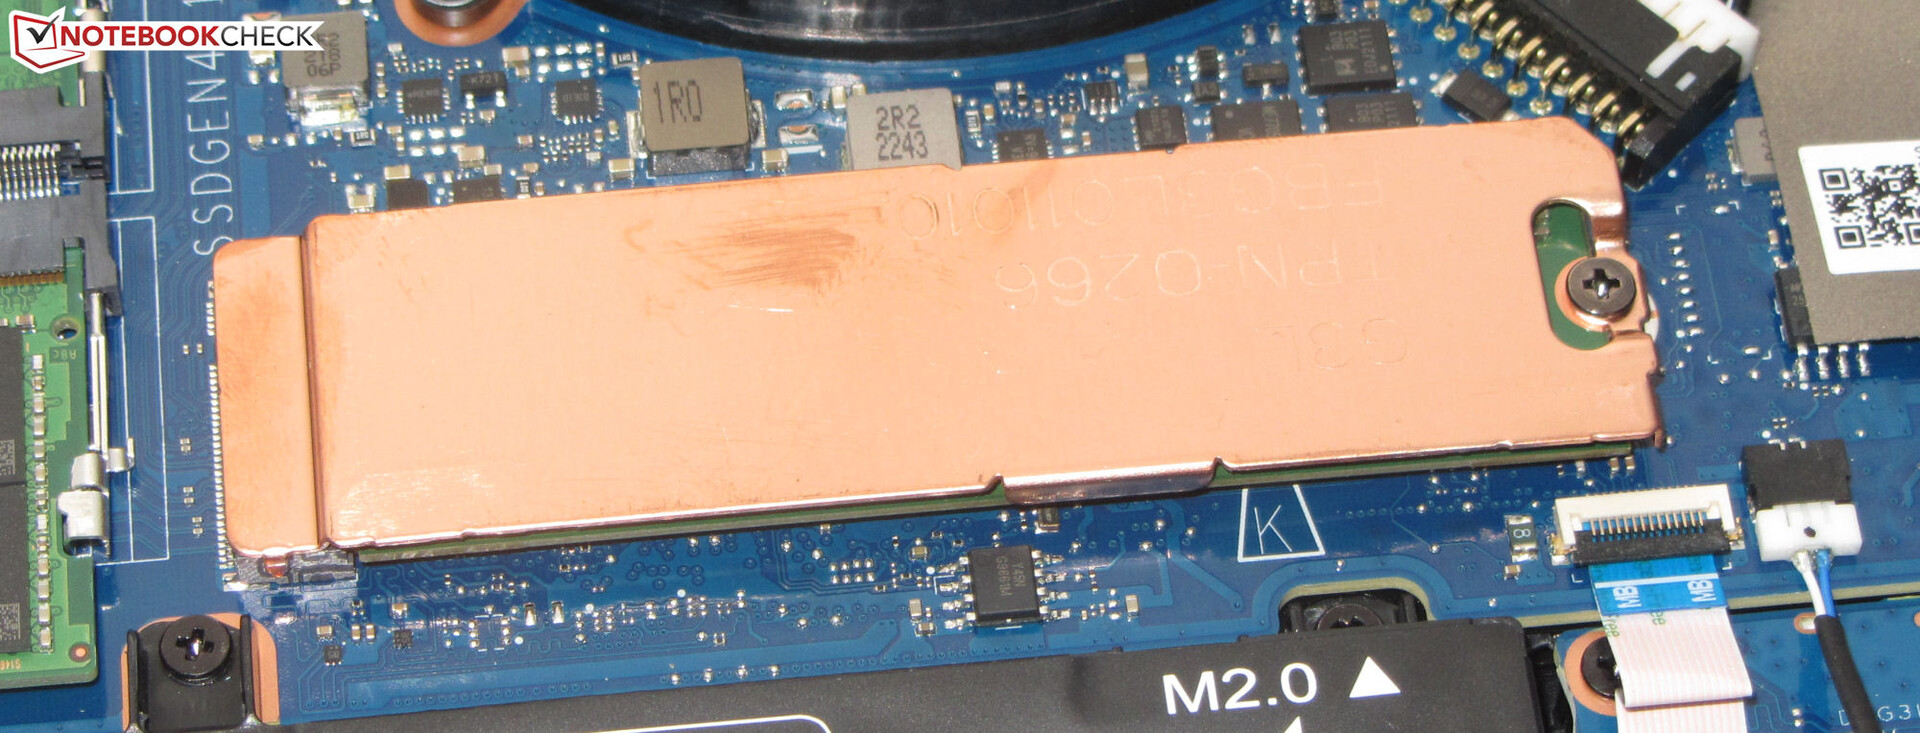
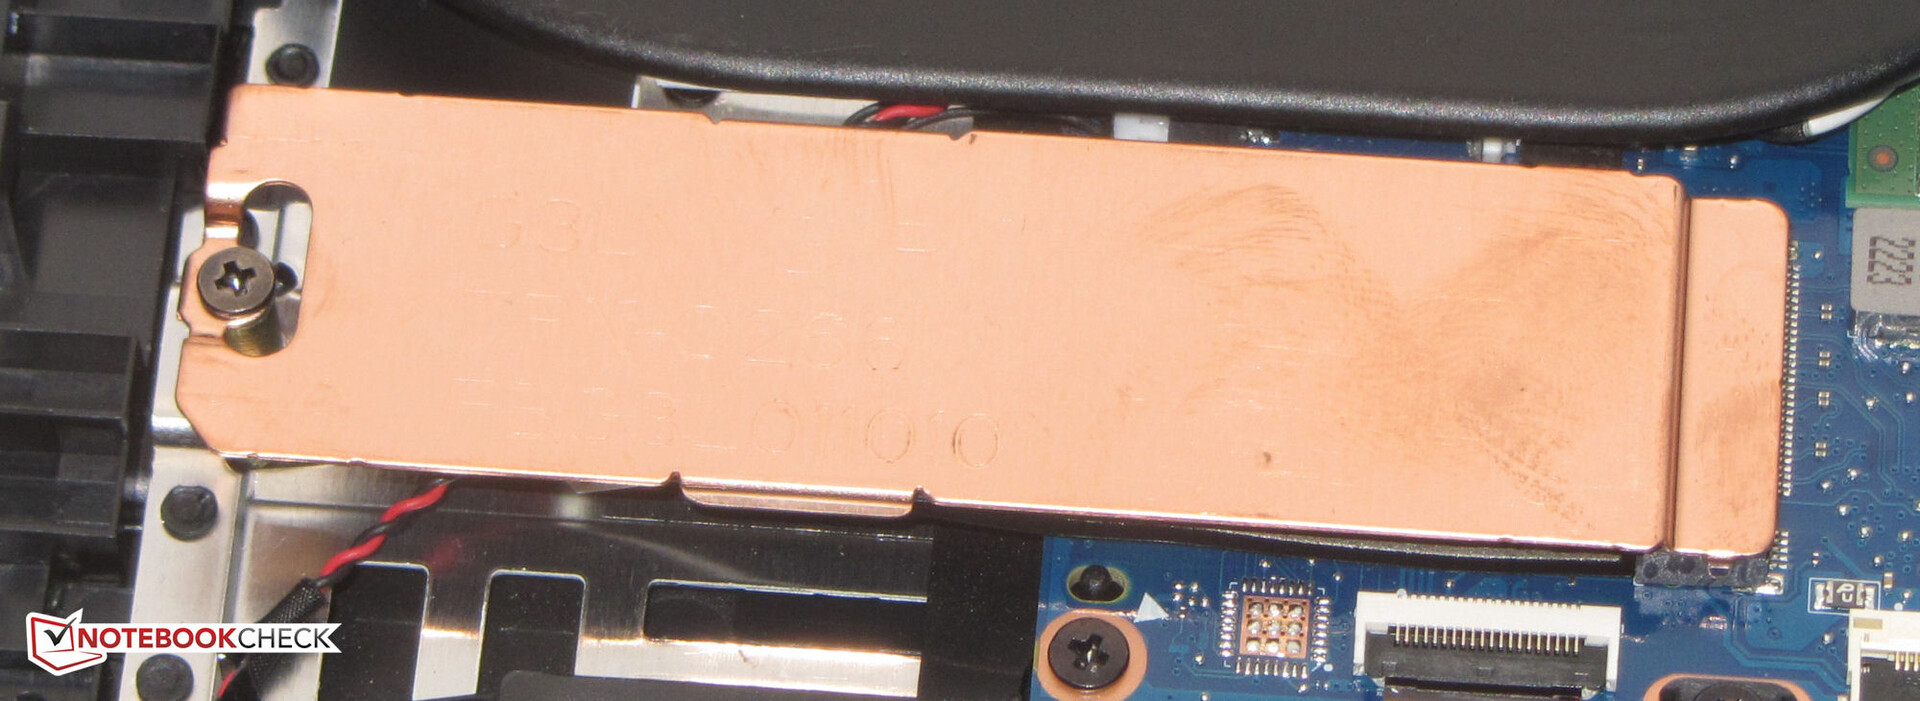
Soluzione di stoccaggio
L'Omen offre spazio per due SSD PCIe 4 nel formato M.2-2280. L'unità SSD PCIe 4 (1 TB) di SK Hynix utilizzata in questo caso offre ottime velocità di trasferimento. Tuttavia, nelle ultime parti del ciclo DiskSpd, osserviamo alcuni occasionali cali di prestazioni, probabilmente dovuti al thermal throttling.

* ... Meglio usare valori piccoli
Disk Throttling: DiskSpd Read Loop, Queue Depth 8
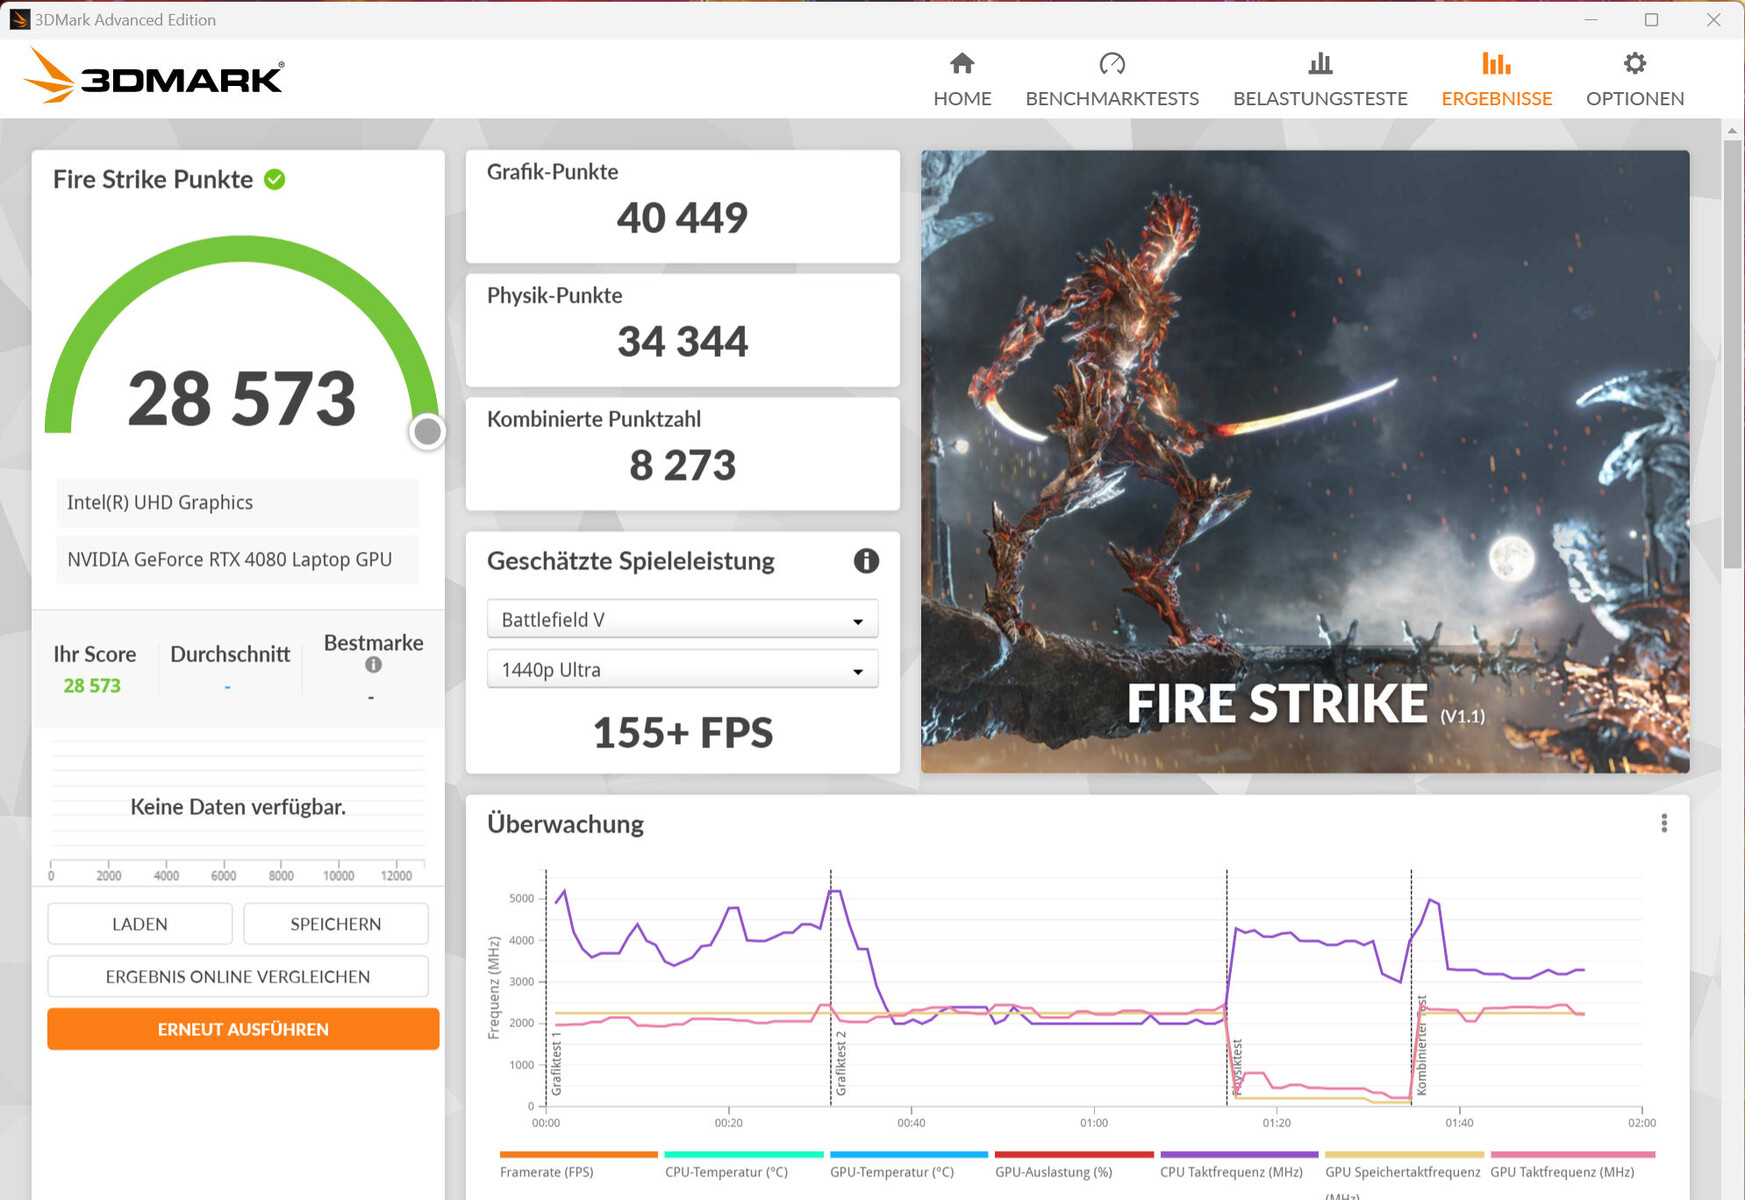
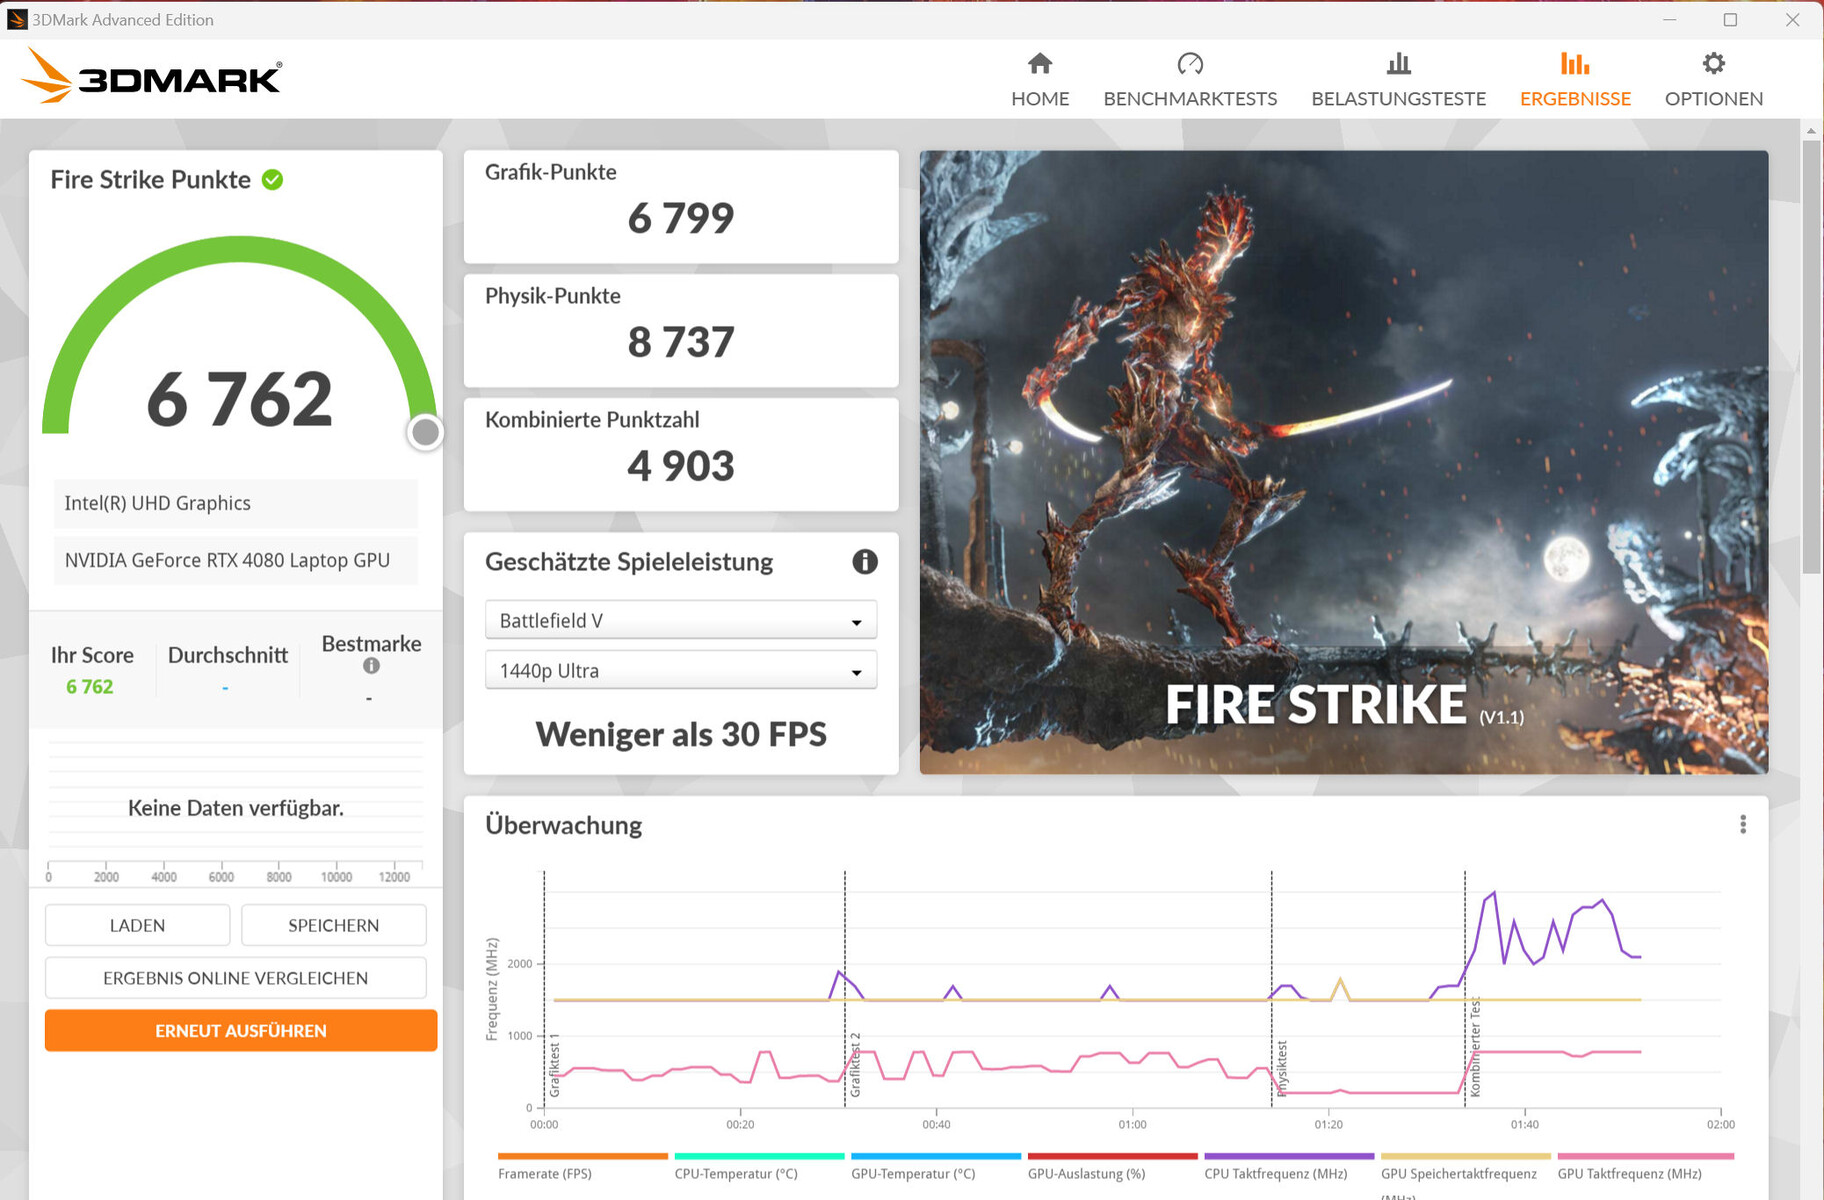
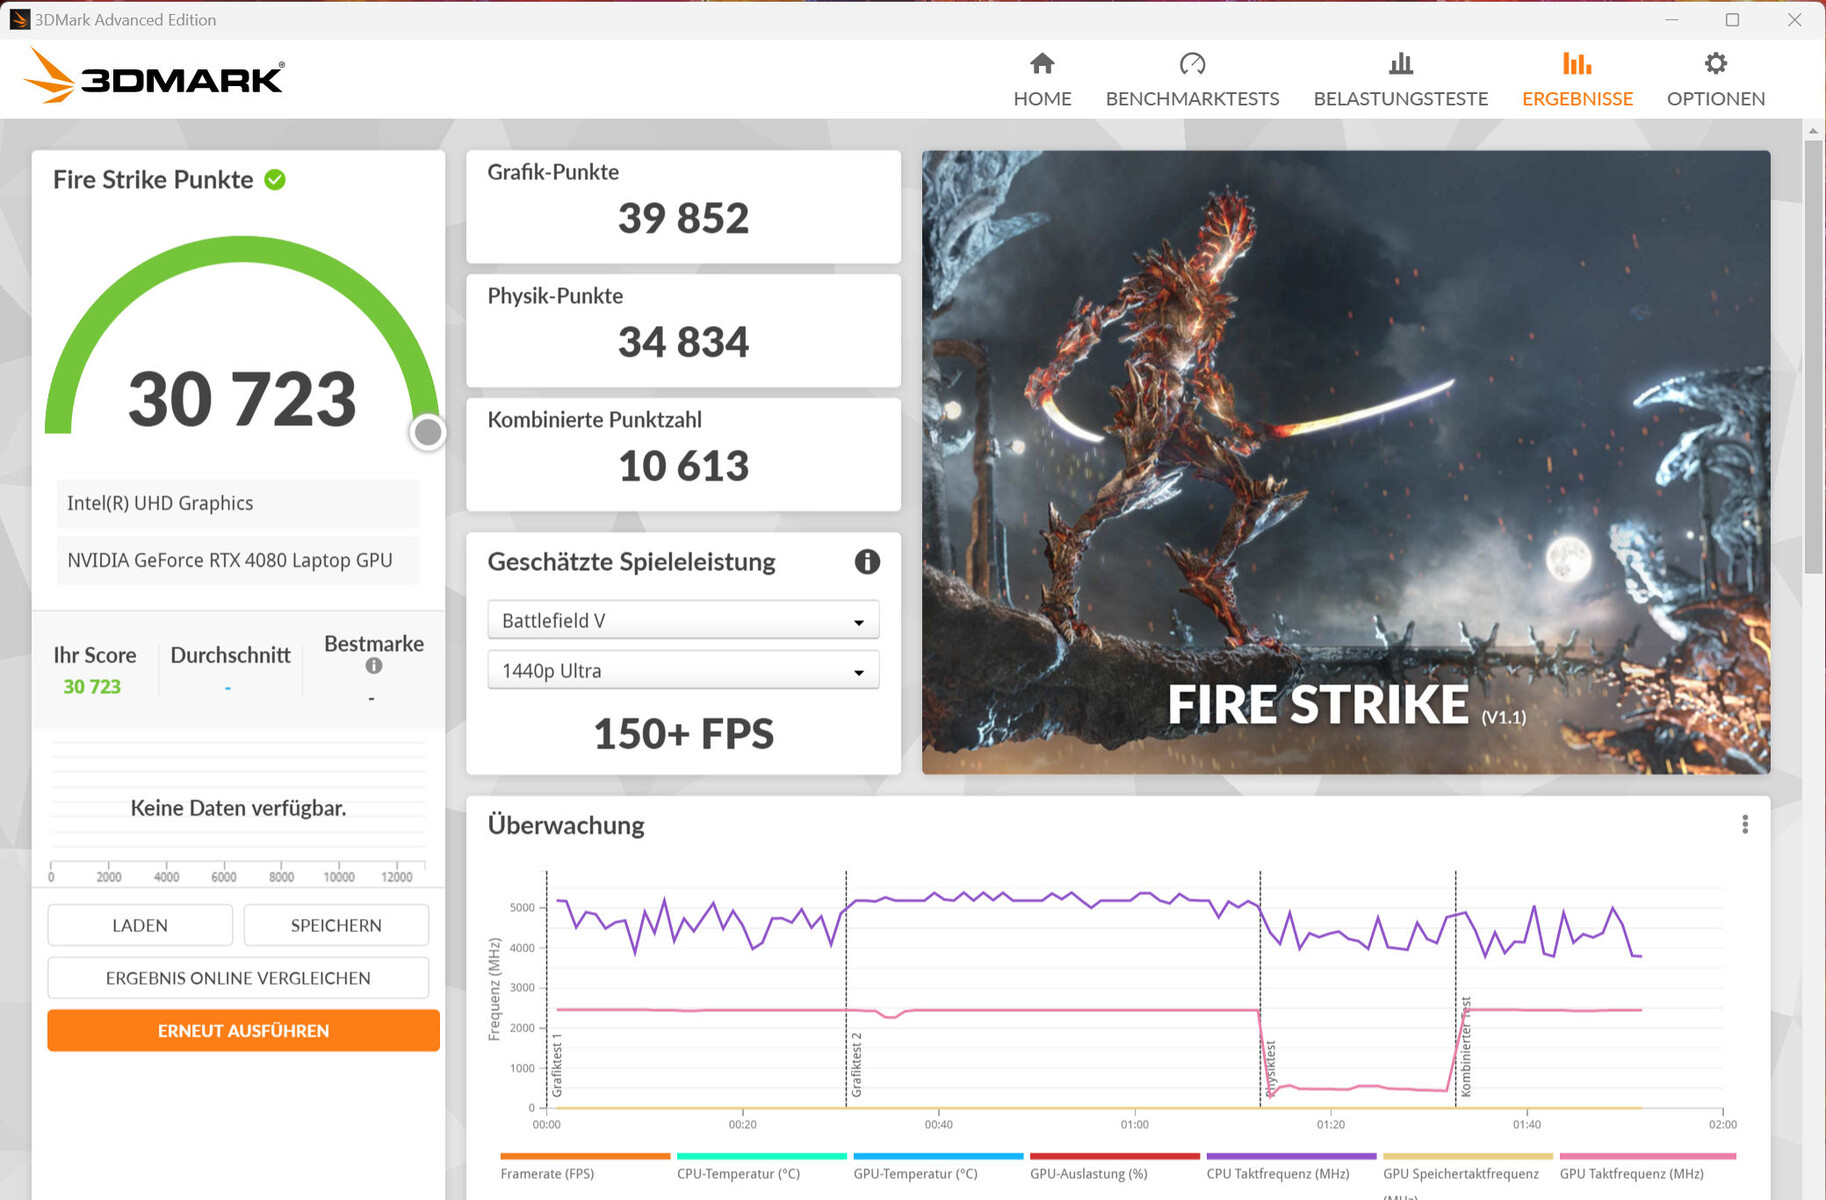
Scheda grafica
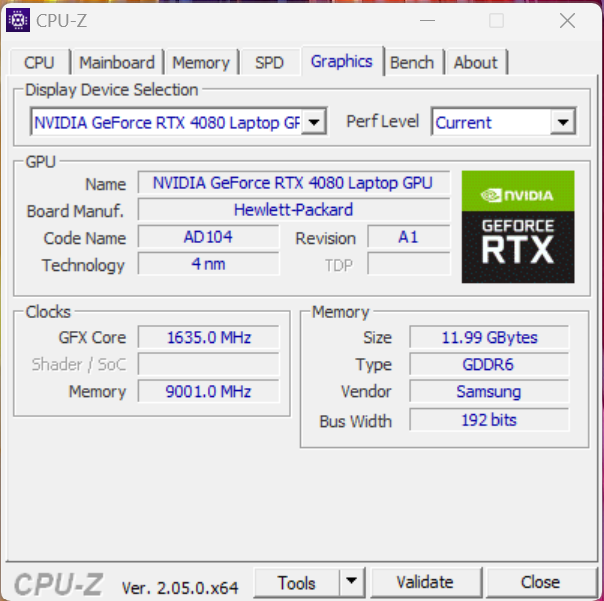
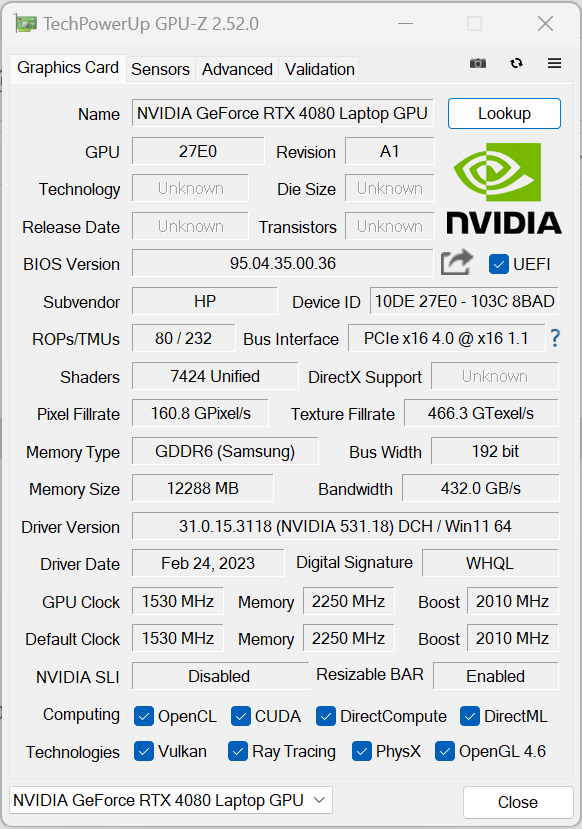
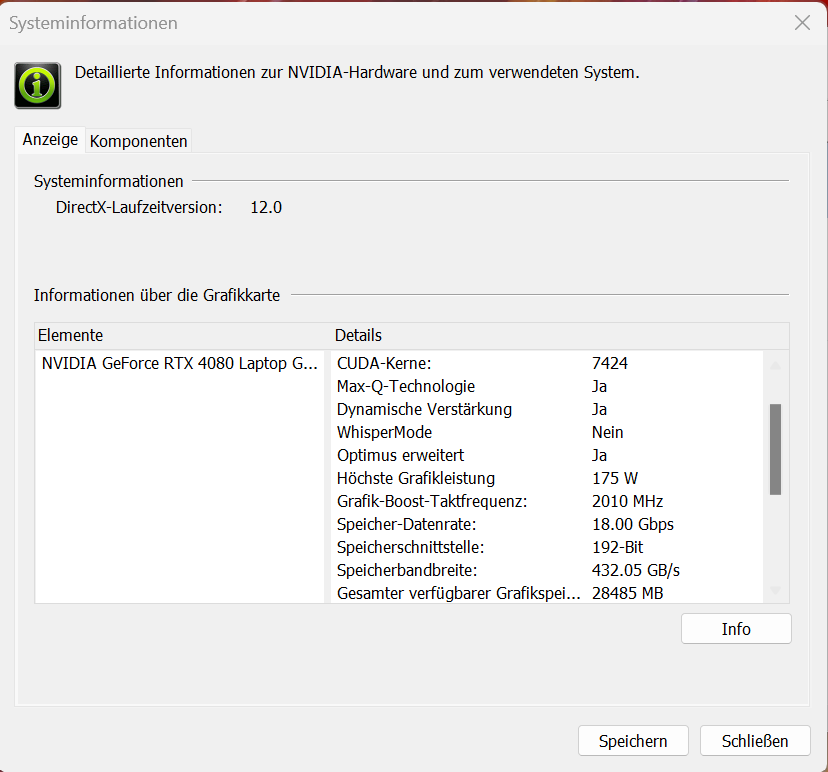
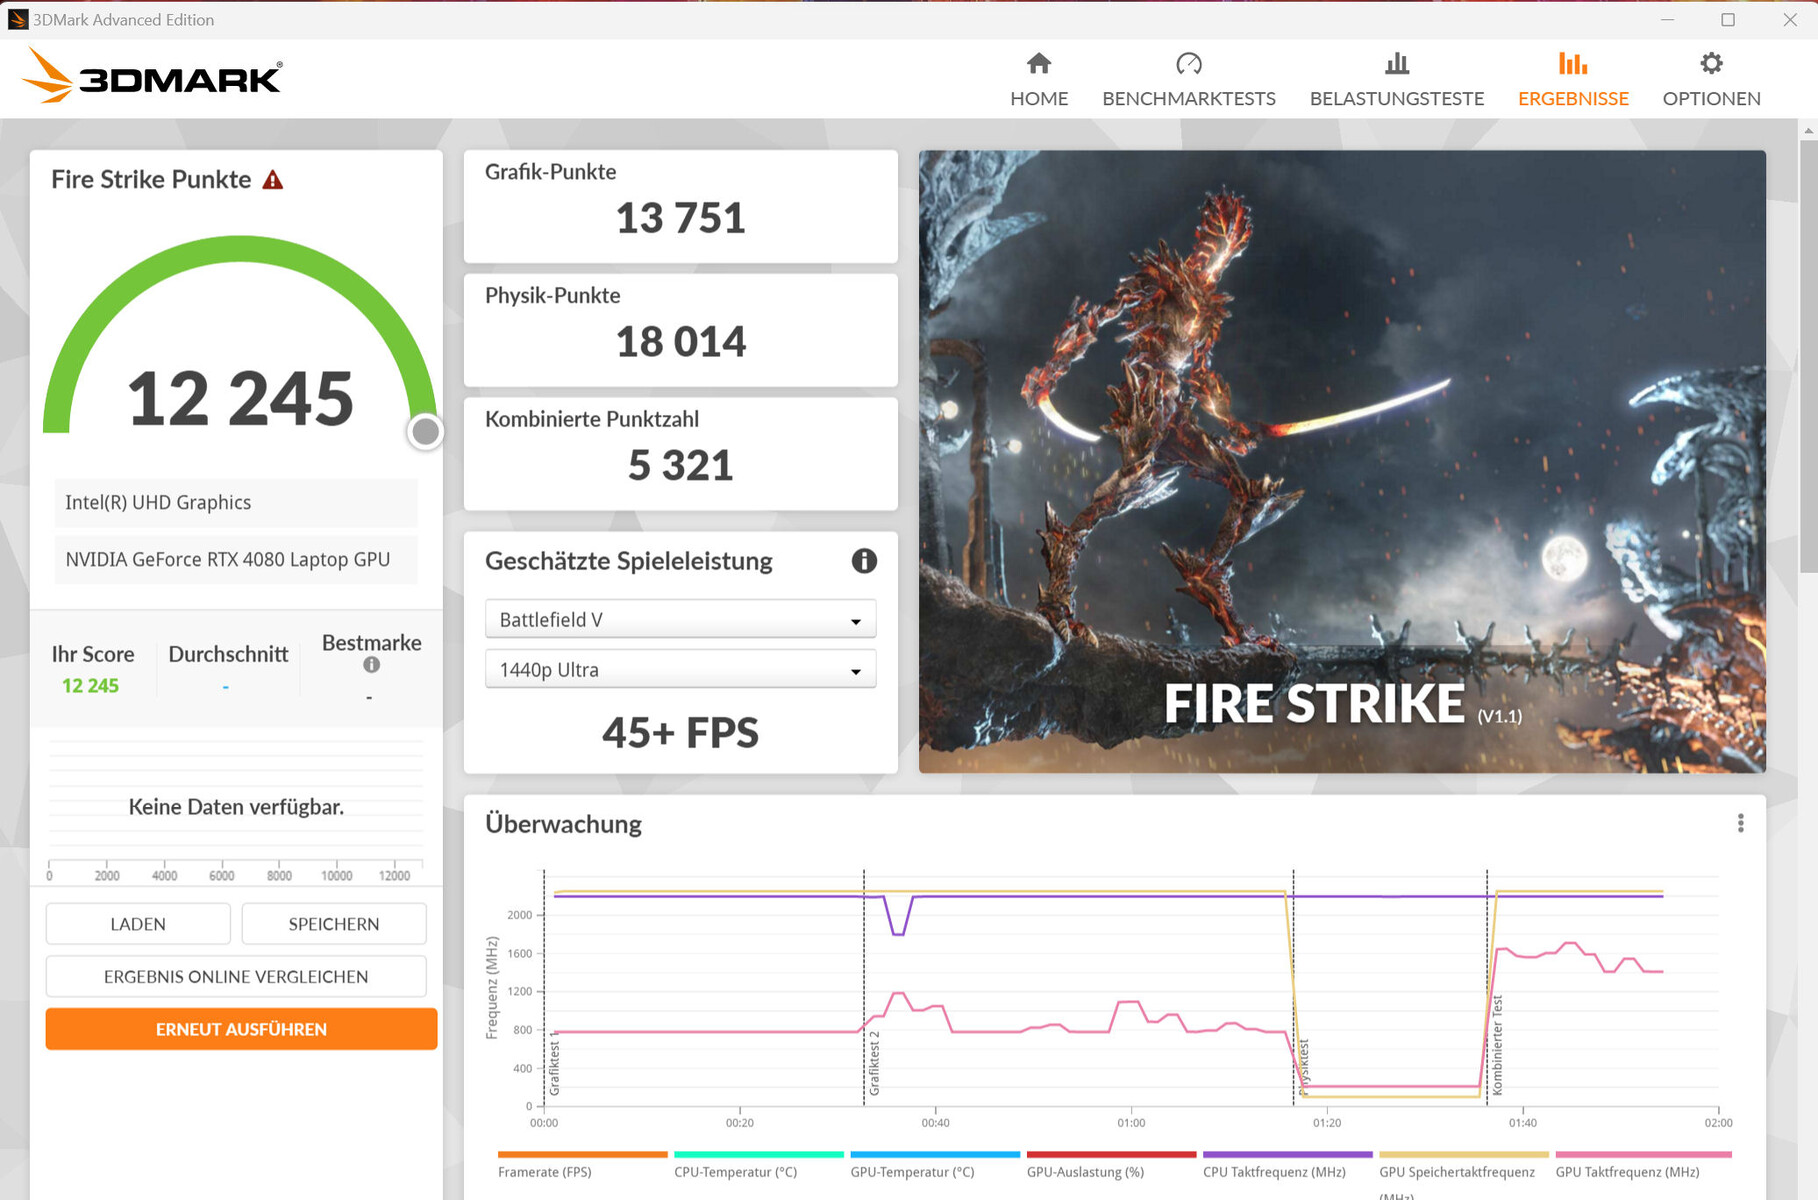
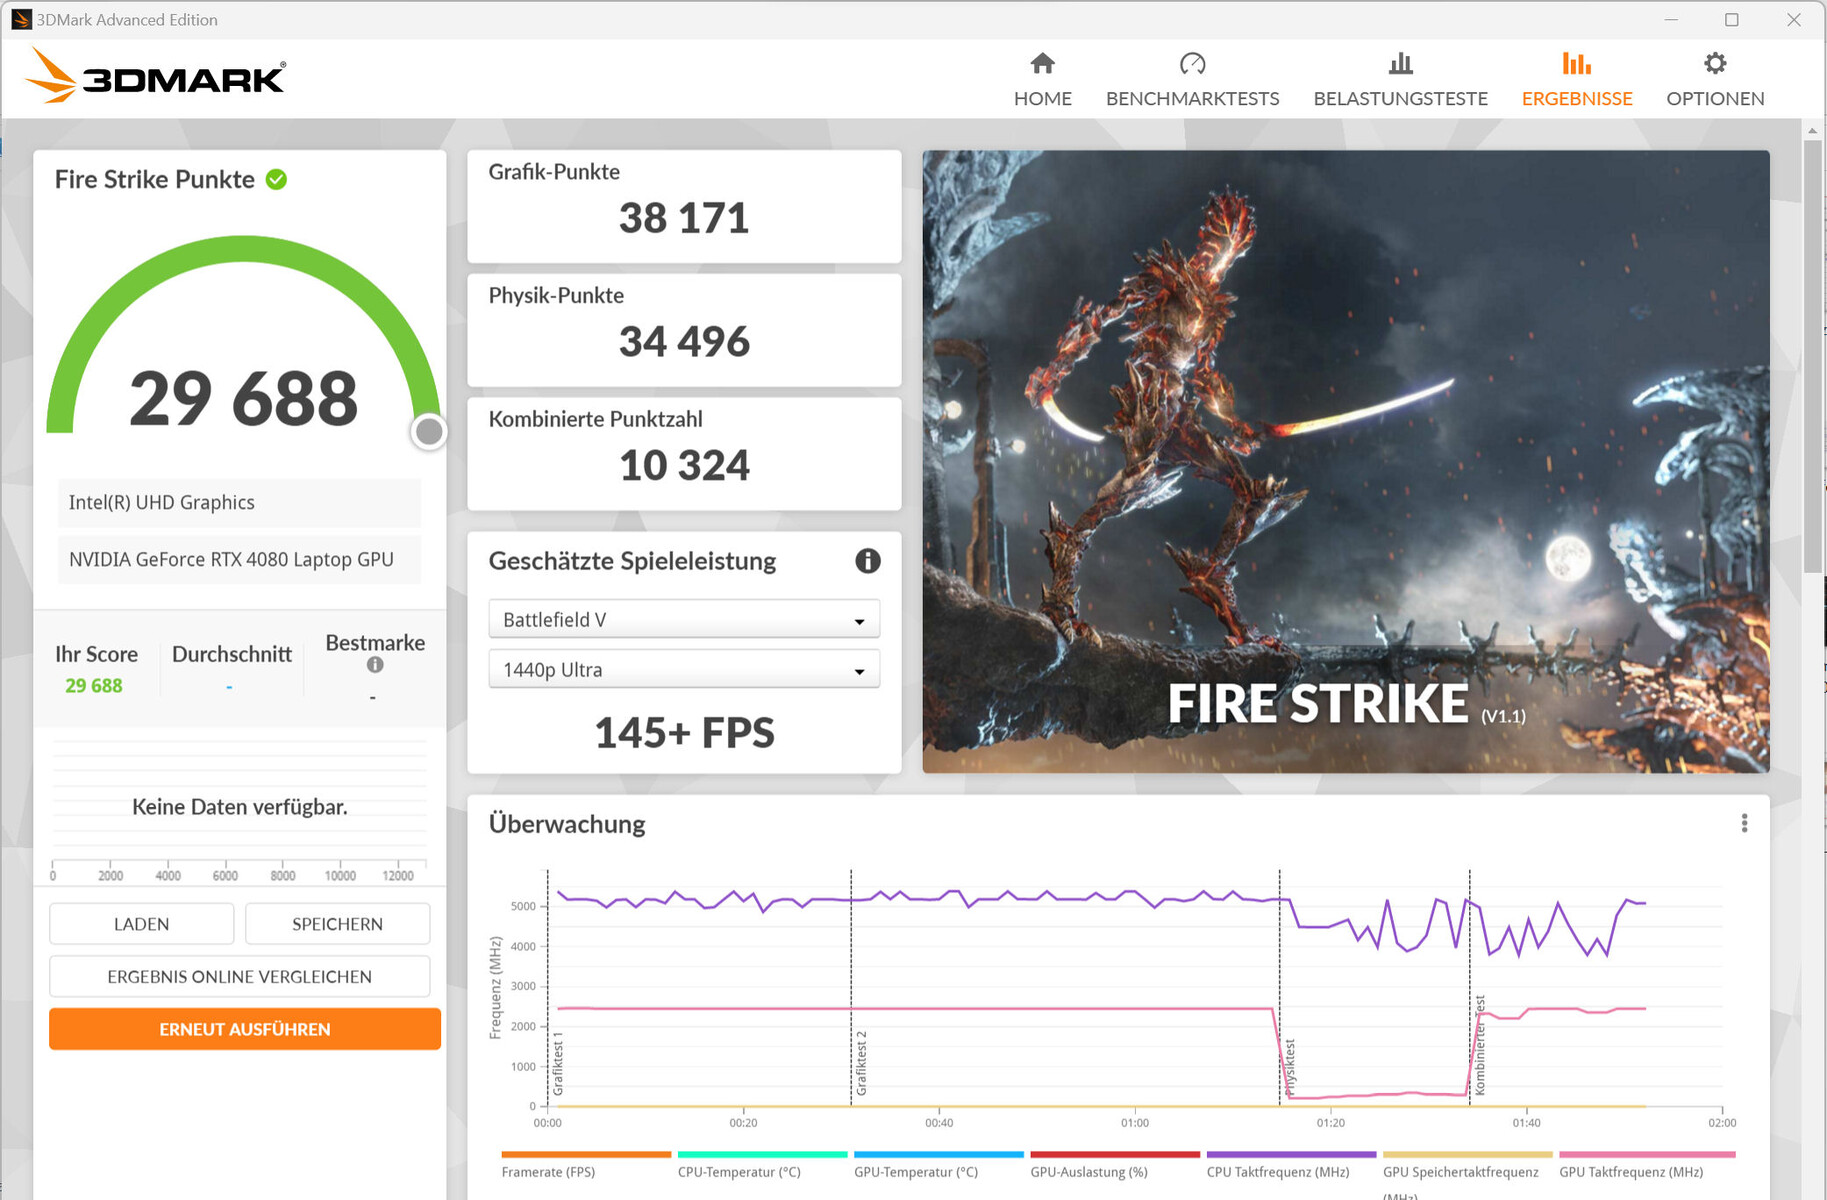
Con laGeForce RTX 4080laptop GPU, HP utilizza l'attuale numero due del portafoglio di GPU mobili di Nvidia. Ha 7.424 shader, un bus a 192 bit ed è in grado di utilizzare la veloce memoria GDDR6 (12.288 MB). La RTX 4080 è configurata con un TGP di 175 watt (150 W + 25 W Dynamic Boost), che è il massimo configurabile secondo Nvidia. Secondo il nostro test The Witcher 3, il TGP non viene utilizzato appieno.
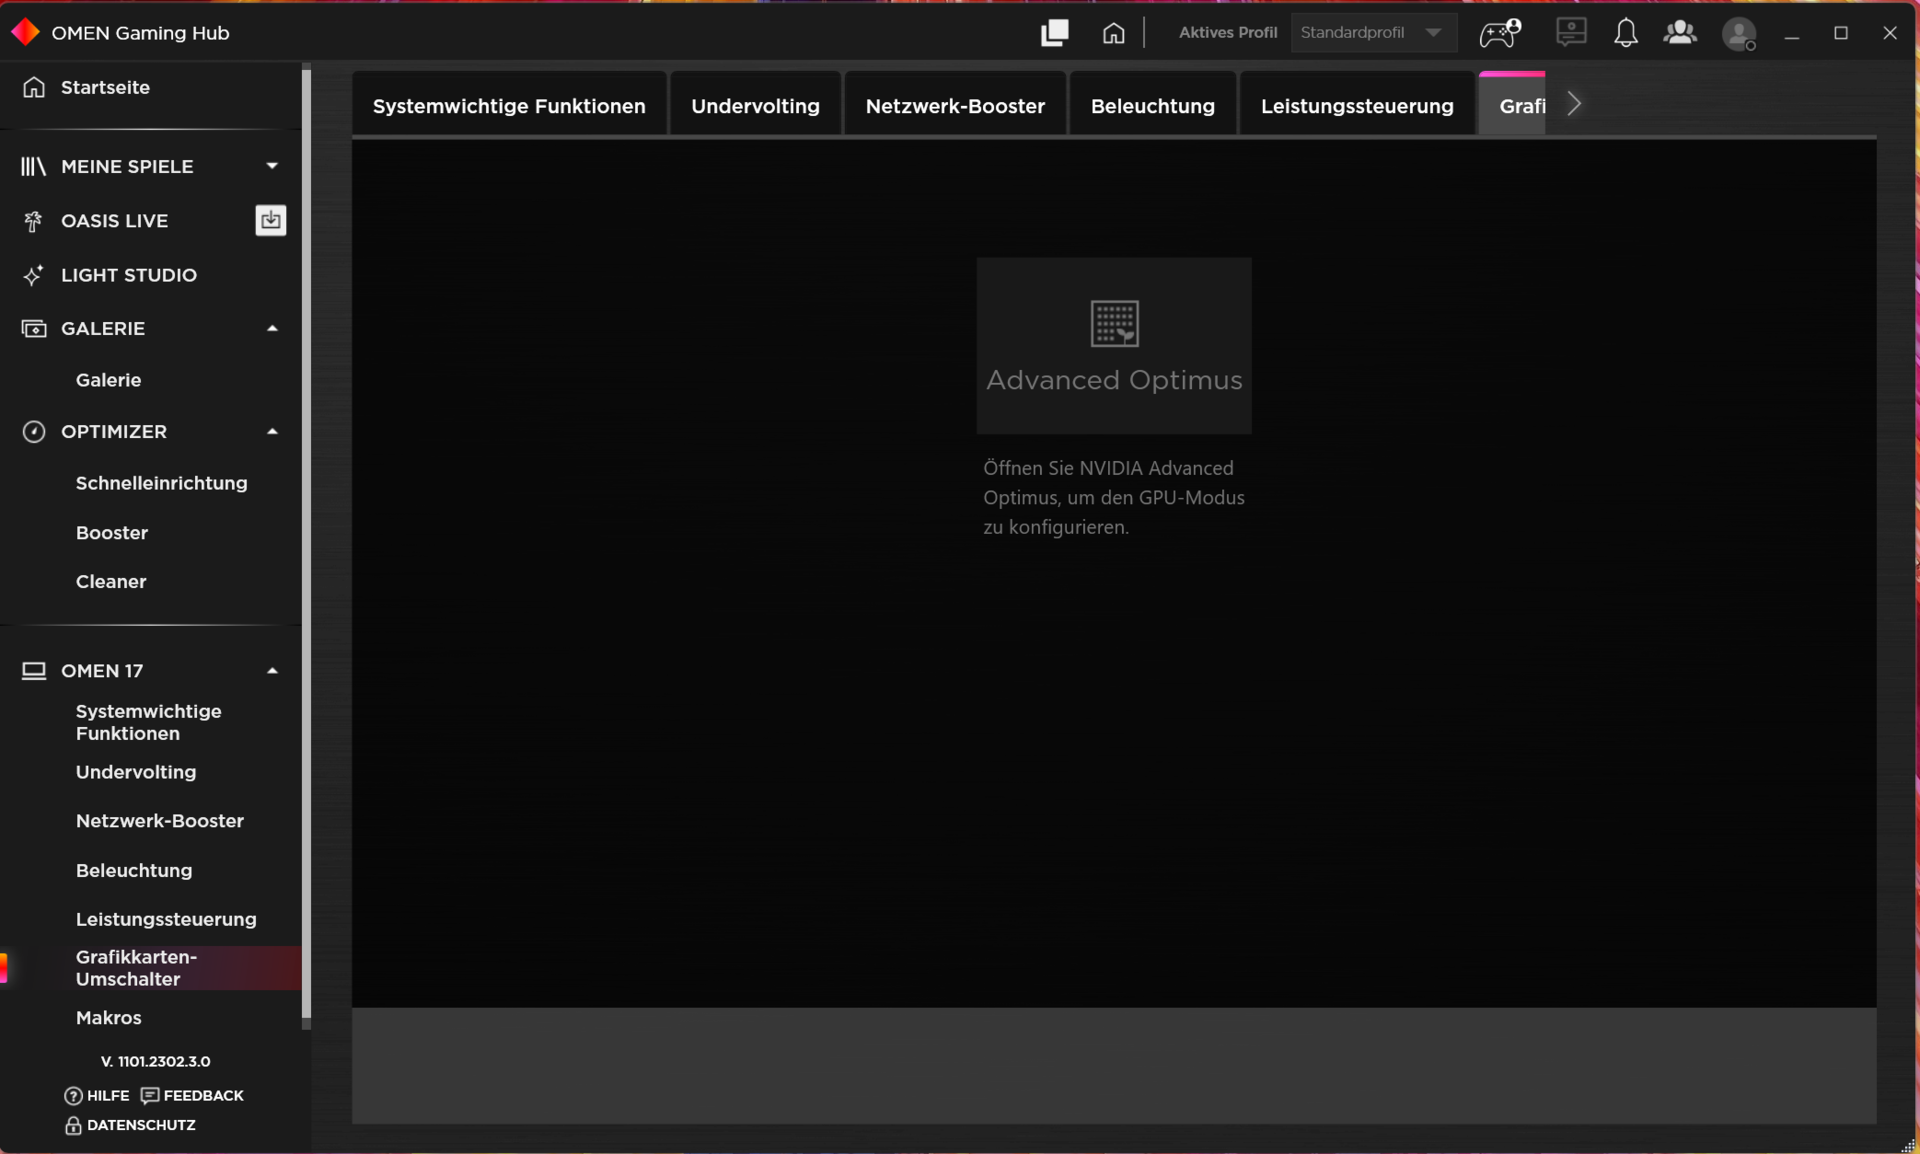
I risultati del benchmark sono inferiori alla media delle GPU RTX 4080 testate finora. Il profilo "Performance" porterà a qualche piccolo aumento occasionale delle prestazioni grafiche. La modalità dGPU non porterà ad ulteriori miglioramenti. Il passaggio da dGPU a Optimus non richiede un riavvio - Optimus avanzato è supportato.
| 3DMark Performance rating - Percent | |
| Asus ROG Strix G16 G614JZ | |
| Lenovo Legion Pro 7 16IRX8H | |
| Razer Blade 16 Early 2023 -1! | |
| Media NVIDIA GeForce RTX 4080 Laptop GPU | |
| HP Omen 17-ck2097ng | |
| HP Omen 17-ck2097ng | |
| HP Omen 17-ck2097ng | |
| Media della classe Gaming | |
| Alienware m17 R5 (R9 6900HX, RX 6850M XT) | |
| 3DMark 11 - 1280x720 Performance GPU | |
| Lenovo Legion Pro 7 16IRX8H | |
| HP Omen 17-ck2097ng (Leistung) | |
| Asus ROG Strix G16 G614JZ | |
| Media NVIDIA GeForce RTX 4080 Laptop GPU (45199 - 63128, n=24) | |
| Razer Blade 16 Early 2023 | |
| HP Omen 17-ck2097ng | |
| HP Omen 17-ck2097ng (Leistung, dGPU) | |
| Media della classe Gaming (21841 - 80022, n=104, ultimi 2 anni) | |
| Alienware m17 R5 (R9 6900HX, RX 6850M XT) | |
| Blender | |
| v3.3 Classroom OPTIX/RTX | |
| Media della classe Gaming (9 - 32, n=106, ultimi 2 anni) | |
| HP Omen 17-ck2097ng (3.3.3) | |
| Media NVIDIA GeForce RTX 4080 Laptop GPU (13 - 20, n=22) | |
| Razer Blade 16 Early 2023 (3.3.3) | |
| Lenovo Legion Pro 7 16IRX8H (3.3.3) | |
| Asus ROG Strix G16 G614JZ (3.3.3) | |
| HP Omen 17-ck2097ng (3.3.3, Leistung) | |
| v3.3 Classroom CUDA | |
| Media della classe Gaming (15 - 228, n=106, ultimi 2 anni) | |
| Lenovo Legion Pro 7 16IRX8H (3.3.3) | |
| HP Omen 17-ck2097ng (3.3.3, Leistung) | |
| Media NVIDIA GeForce RTX 4080 Laptop GPU (21 - 28, n=23) | |
| Razer Blade 16 Early 2023 (3.3.3) | |
| HP Omen 17-ck2097ng (3.3.3) | |
| Asus ROG Strix G16 G614JZ (3.3.3) | |
| HP Omen 17-ck2097ng (3.3.3, dGPU, Leistung) | |
| V-Ray 5 Benchmark | |
| GPU RTX | |
| Media della classe Gaming (1146 - 4363, n=33, ultimi 2 anni) | |
| HP Omen 17-ck2097ng (5.0.1) | |
| HP Omen 17-ck2097ng (5.0.1, dGPU, Leistung) | |
| Razer Blade 16 Early 2023 (5.0.1) | |
| HP Omen 17-ck2097ng (5.0.1, Leistung) | |
| Media NVIDIA GeForce RTX 4080 Laptop GPU (2128 - 2843, n=17) | |
| GPU CUDA | |
| Media della classe Gaming (887 - 3288, n=33, ultimi 2 anni) | |
| HP Omen 17-ck2097ng (5.0.1, dGPU, Leistung) | |
| HP Omen 17-ck2097ng (5.0.1, Leistung) | |
| HP Omen 17-ck2097ng (5.0.1) | |
| Media NVIDIA GeForce RTX 4080 Laptop GPU (1647 - 2112, n=17) | |
| Razer Blade 16 Early 2023 (5.0.1) | |
| CPU | |
| Media della classe Gaming (5864 - 30302, n=32, ultimi 2 anni) | |
| HP Omen 17-ck2097ng (5.0.1, Leistung) | |
| Razer Blade 16 Early 2023 (5.0.1) | |
| HP Omen 17-ck2097ng (5.0.1, dGPU, Leistung) | |
| Media NVIDIA GeForce RTX 4080 Laptop GPU (11906 - 21823, n=17) | |
| HP Omen 17-ck2097ng (5.0.1) | |
| V-Ray Benchmark Next 4.10 | |
| GPU | |
| HP Omen 17-ck2097ng (v4.10.07, Leistung) | |
| Asus ROG Strix G16 G614JZ (v4.10.07 ) | |
| Lenovo Legion Pro 7 16IRX8H (v4.10.07 ) | |
| HP Omen 17-ck2097ng (v4.10.07 ) | |
| Media NVIDIA GeForce RTX 4080 Laptop GPU (812 - 1036, n=16) | |
| HP Omen 17-ck2097ng (v4.10.07, dGPU, Leistung) | |
| Media della classe Gaming (427 - 1627, n=99, ultimi 2 anni) | |
| Alienware m17 R5 (R9 6900HX, RX 6850M XT) (v4.10.07 ) | |
| CPU | |
| Lenovo Legion Pro 7 16IRX8H (v4.10.07 ) | |
| Asus ROG Strix G16 G614JZ (v4.10.07 ) | |
| HP Omen 17-ck2097ng (v4.10.07, Leistung) | |
| Media NVIDIA GeForce RTX 4080 Laptop GPU (19636 - 31653, n=16) | |
| Media della classe Gaming (10048 - 45327, n=97, ultimi 2 anni) | |
| HP Omen 17-ck2097ng (v4.10.07, dGPU, Leistung) | |
| HP Omen 17-ck2097ng (v4.10.07 ) | |
| Alienware m17 R5 (R9 6900HX, RX 6850M XT) (v4.10.07 ) | |
| Geekbench 5.5 - OpenCL Score | |
| Asus ROG Strix G16 G614JZ | |
| HP Omen 17-ck2097ng (Leistung) | |
| HP Omen 17-ck2097ng (dGPU, Leistung) | |
| Razer Blade 16 Early 2023 | |
| HP Omen 17-ck2097ng | |
| Media NVIDIA GeForce RTX 4080 Laptop GPU (146413 - 189320, n=23) | |
| Media della classe Gaming (80702 - 277970, n=101, ultimi 2 anni) | |
| Lenovo Legion Pro 7 16IRX8H | |
| Alienware m17 R5 (R9 6900HX, RX 6850M XT) | |
| Geekbench 6.0 - GPU OpenCL 6.0 | |
| Media della classe Gaming (155885 - 241981, n=3, ultimi 2 anni) | |
| HP Omen 17-ck2097ng | |
| Media NVIDIA GeForce RTX 4080 Laptop GPU (153564 - 175235, n=3) | |
* ... Meglio usare valori piccoli
Prestazioni di gioco
L'Omen, che è destinato ai giochi QHD con impostazioni elevate o massime, consente anche risoluzioni più elevate quando viene collegato il monitor corrispondente. I frame rate dei giochi testati sono inferiori alla media di tutte le GPU RTX 4080 testate finora. Il profilo "Performance" porta a un aumento dei frame rate leggermente superiore alla media. In alcuni giochi, la modalità dGPU è in grado di fornire un ulteriore aumento.
| Performance rating - Percent | |
| Asus ROG Strix G16 G614JZ | |
| Razer Blade 16 Early 2023 | |
| Lenovo Legion Pro 7 16IRX8H | |
| HP Omen 17-ck2097ng | |
| HP Omen 17-ck2097ng | |
| Media NVIDIA GeForce RTX 4080 Laptop GPU | |
| Media della classe Gaming | |
| HP Omen 17-ck2097ng | |
| Alienware m17 R5 (R9 6900HX, RX 6850M XT) | |
| The Witcher 3 - 1920x1080 Ultra Graphics & Postprocessing (HBAO+) | |
| Media della classe Gaming (104.7 - 240, n=6, ultimi 2 anni) | |
| Lenovo Legion Pro 7 16IRX8H | |
| Razer Blade 16 Early 2023 | |
| Asus ROG Strix G16 G614JZ | |
| HP Omen 17-ck2097ng (dGPU) | |
| HP Omen 17-ck2097ng (Leistung) | |
| Media NVIDIA GeForce RTX 4080 Laptop GPU (130.4 - 186.1, n=20) | |
| HP Omen 17-ck2097ng | |
| Alienware m17 R5 (R9 6900HX, RX 6850M XT) | |
| GTA V - 1920x1080 Highest AA:4xMSAA + FX AF:16x | |
| Asus ROG Strix G16 G614JZ | |
| Lenovo Legion Pro 7 16IRX8H | |
| Razer Blade 16 Early 2023 | |
| Media della classe Gaming (48.3 - 186.9, n=93, ultimi 2 anni) | |
| Media NVIDIA GeForce RTX 4080 Laptop GPU (102.9 - 152.7, n=21) | |
| HP Omen 17-ck2097ng (Leistung) | |
| HP Omen 17-ck2097ng (dGPU, Leistung) | |
| HP Omen 17-ck2097ng | |
| Alienware m17 R5 (R9 6900HX, RX 6850M XT) | |
| Final Fantasy XV Benchmark - 1920x1080 High Quality | |
| Asus ROG Strix G16 G614JZ (1.3) | |
| HP Omen 17-ck2097ng (1.3, dGPU, Leistung) | |
| HP Omen 17-ck2097ng (1.3, Leistung) | |
| Lenovo Legion Pro 7 16IRX8H (1.3) | |
| Media NVIDIA GeForce RTX 4080 Laptop GPU (129 - 182.1, n=23) | |
| Razer Blade 16 Early 2023 (1.3) | |
| Media della classe Gaming (41 - 215, n=95, ultimi 2 anni) | |
| HP Omen 17-ck2097ng (1.3) | |
| Alienware m17 R5 (R9 6900HX, RX 6850M XT) (1.3) | |
| Strange Brigade - 1920x1080 ultra AA:ultra AF:16 | |
| Asus ROG Strix G16 G614JZ (1.47.22.14 D3D12) | |
| HP Omen 17-ck2097ng (1.47.22.14 D3D12, dGPU, Leistung) | |
| Razer Blade 16 Early 2023 (1.47.22.14 D3D12) | |
| Lenovo Legion Pro 7 16IRX8H (1.47.22.14 D3D12) | |
| Media NVIDIA GeForce RTX 4080 Laptop GPU (239 - 357, n=22) | |
| HP Omen 17-ck2097ng (1.47.22.14 D3D12, Leistung) | |
| Media della classe Gaming (76.3 - 456, n=86, ultimi 2 anni) | |
| HP Omen 17-ck2097ng (1.47.22.14 D3D12) | |
| Alienware m17 R5 (R9 6900HX, RX 6850M XT) (1.47.22.14 D3D12) | |
| Dota 2 Reborn - 1920x1080 ultra (3/3) best looking | |
| Razer Blade 16 Early 2023 | |
| Asus ROG Strix G16 G614JZ | |
| Lenovo Legion Pro 7 16IRX8H | |
| HP Omen 17-ck2097ng (Leistung) | |
| HP Omen 17-ck2097ng (dGPU, Leistung) | |
| Media NVIDIA GeForce RTX 4080 Laptop GPU (133 - 194.7, n=23) | |
| HP Omen 17-ck2097ng | |
| Media della classe Gaming (84.8 - 248, n=107, ultimi 2 anni) | |
| Alienware m17 R5 (R9 6900HX, RX 6850M XT) | |
| X-Plane 11.11 - 1920x1080 high (fps_test=3) | |
| Asus ROG Strix G16 G614JZ | |
| Razer Blade 16 Early 2023 | |
| Lenovo Legion Pro 7 16IRX8H | |
| HP Omen 17-ck2097ng (dGPU, Leistung) | |
| Media NVIDIA GeForce RTX 4080 Laptop GPU (89.3 - 143.5, n=25) | |
| HP Omen 17-ck2097ng (Leistung) | |
| HP Omen 17-ck2097ng | |
| Media della classe Gaming (55.5 - 143.5, n=109, ultimi 2 anni) | |
| Alienware m17 R5 (R9 6900HX, RX 6850M XT) | |
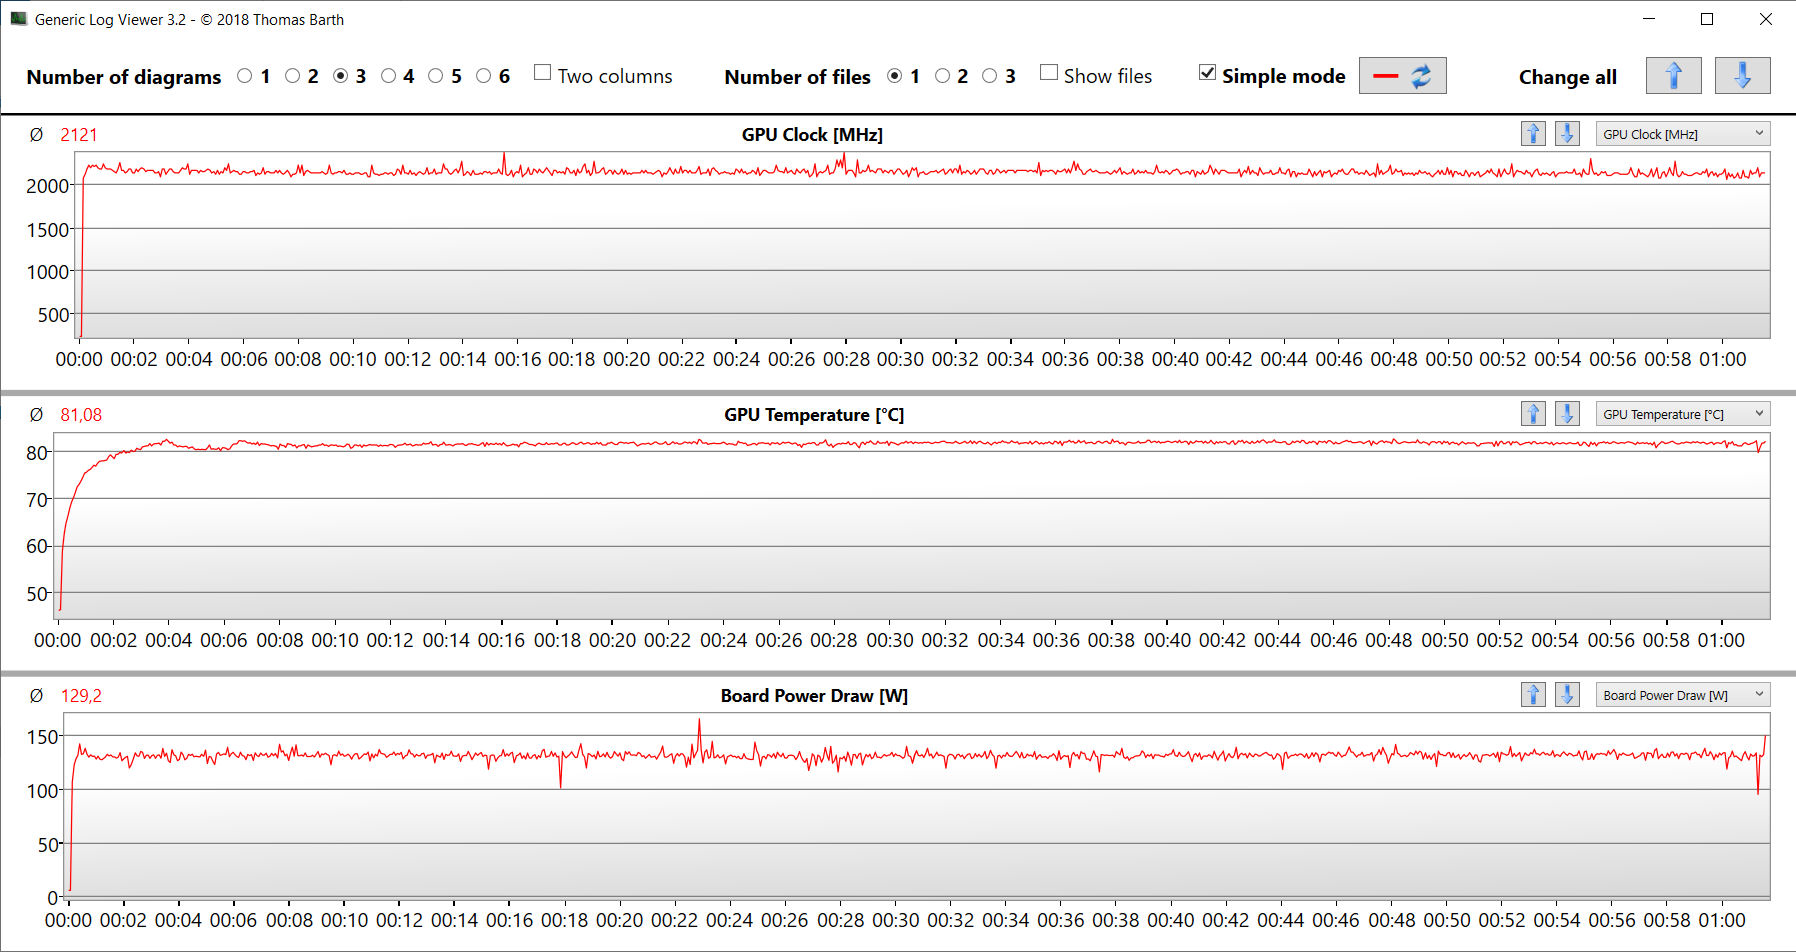
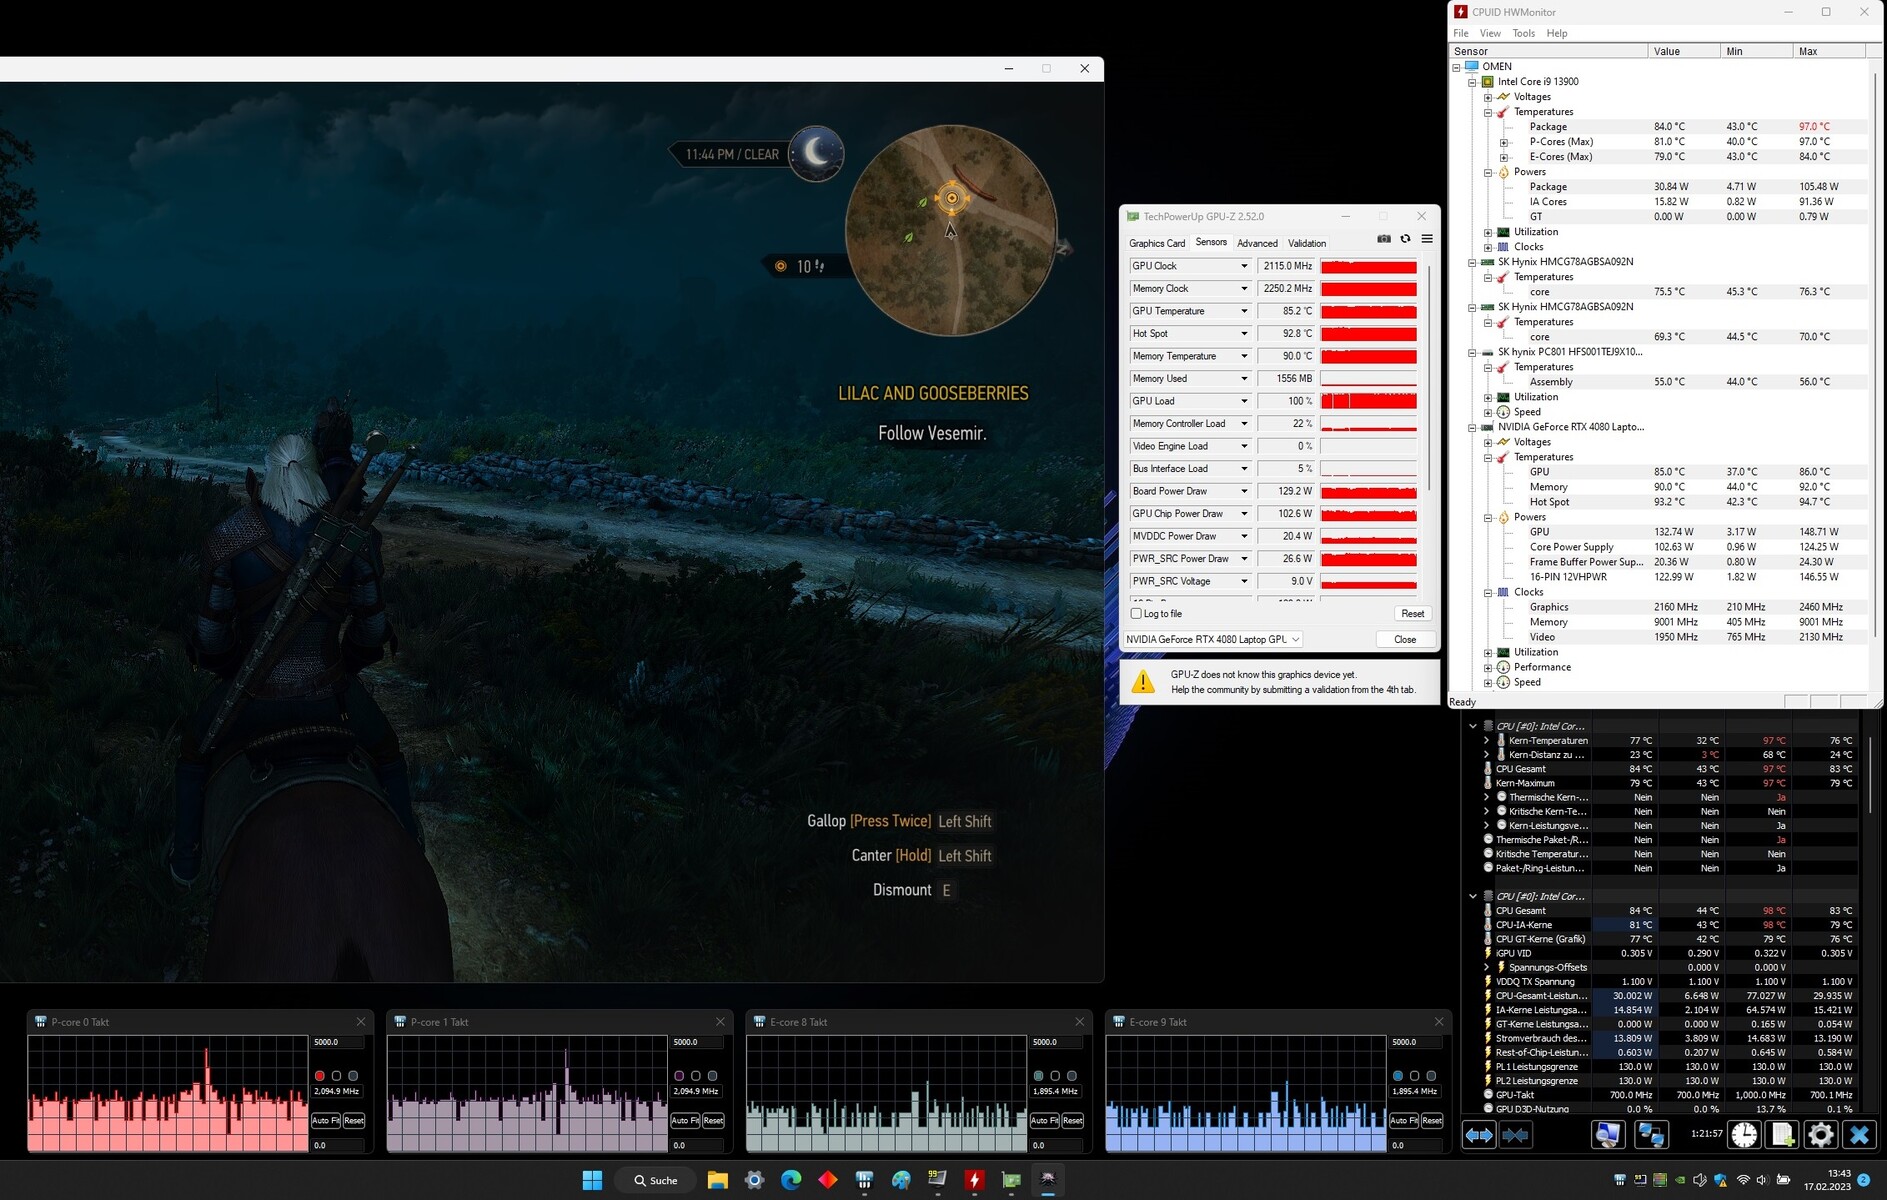
Per valutare se la frequenza dei fotogrammi rimane costante per un periodo di tempo più lungo, abbiamo eseguito il gioco "The Witcher 3" per circa 60 minuti con risoluzione Full-HD e impostazioni di qualità massime. Durante questo periodo il personaggio di gioco non viene spostato. Non notiamo alcun calo della frequenza dei fotogrammi.
The Witcher 3 FPS Chart
| basso | medio | alto | ultra | QHD | |
|---|---|---|---|---|---|
| GTA V (2015) | 183.8 | 183.1 | 175.5 | 121.1 | 116 |
| The Witcher 3 (2015) | 459.7 | 400.5 | 287.8 | 164 | |
| Dota 2 Reborn (2015) | 206 | 180.5 | 167.2 | 155.3 | |
| Final Fantasy XV Benchmark (2018) | 192.4 | 173 | 145.4 | 117.5 | |
| X-Plane 11.11 (2018) | 169 | 146.9 | 119.4 | ||
| Far Cry 5 (2018) | 160 | 132 | 129 | 126 | 124 |
| Strange Brigade (2018) | 388 | 300 | 290 | 276 | 208 |
| F1 22 (2022) | 255 | 248 | 231 | 97.5 | 67.6 |
| The Callisto Protocol (2022) | 167.6 | 153.7 | 148.3 | 111.5 | 83.7 |
| Returnal (2023) | 150 | 147 | 137 | 121 | 92 |
| Atomic Heart (2023) | 170.8 | 142.3 | 121.1 | 100.3 | 79.2 |
| Company of Heroes 3 (2023) | 275 | 244.6 | 206.5 | 205.31 | 153.8 |
| Sons of the Forest (2023) | 78.1 | 75 | 74.6 | 69.7 | 66.8 |
Emissioni - Il portatile HP produce molto rumore
Livelli di rumore
Nel funzionamento quotidiano (ufficio, Internet) e durante il funzionamento a vuoto, le ventole costantemente in funzione sono chiaramente udibili. In condizioni di carico elevato (stress test, Witcher 3), il livello di rumorosità aumenta ulteriormente e può raggiungere i 50 dB (A). La modalità "Performance" porta a un aumento più rapido del livello di rumore fino al massimo, per poi mantenerlo. Il rumore è costituito da un certo fruscio accompagnato da un fischio sommesso.
Il BIOS dell'Omen contiene l'opzione "Fan always on" di HP, attivata di default. La disattivazione di questa opzione non ha portato ad alcun cambiamento nella nostra unità di test.
Rumorosità
| Idle |
| 31 / 32 / 33 dB(A) |
| Sotto carico |
| 45 / 50 dB(A) |
 | ||
30 dB silenzioso 40 dB(A) udibile 50 dB(A) rumoroso |
||
min: | ||
| HP Omen 17-ck2097ng i9-13900HX, GeForce RTX 4080 Laptop GPU | Alienware m17 R5 (R9 6900HX, RX 6850M XT) R9 6900HX, Radeon RX 6850M XT | Razer Blade 16 Early 2023 i9-13950HX, GeForce RTX 4080 Laptop GPU | Lenovo Legion Pro 7 16IRX8H i9-13900HX, GeForce RTX 4080 Laptop GPU | Asus ROG Strix G16 G614JZ i9-13980HX, GeForce RTX 4080 Laptop GPU | HP Omen 17-ck1075ng i7-12700H, GeForce RTX 3070 Ti Laptop GPU | |
|---|---|---|---|---|---|---|
| Noise | 11% | 12% | -2% | 2% | -2% | |
| off /ambiente * (dB) | 24 | 23 4% | 23 4% | 24 -0% | 25 -4% | 25.4 -6% |
| Idle Minimum * (dB) | 31 | 23 26% | 23 26% | 26 16% | 26 16% | 28 10% |
| Idle Average * (dB) | 32 | 28.11 12% | 23 28% | 28 12% | 28 12% | 28 12% |
| Idle Maximum * (dB) | 33 | 28.11 15% | 23.6 28% | 34 -3% | 30 9% | 31.2 5% |
| Load Average * (dB) | 45 | 30.62 32% | 39 13% | 47 -4% | 48 -7% | 52.2 -16% |
| Witcher 3 ultra * (dB) | 45 | 49.75 -11% | 51.6 -15% | 55 -22% | 49 -9% | 52.2 -16% |
| Load Maximum * (dB) | 50 | 50.17 -0% | 51.3 -3% | 56 -12% | 52 -4% | 52.2 -4% |
* ... Meglio usare valori piccoli
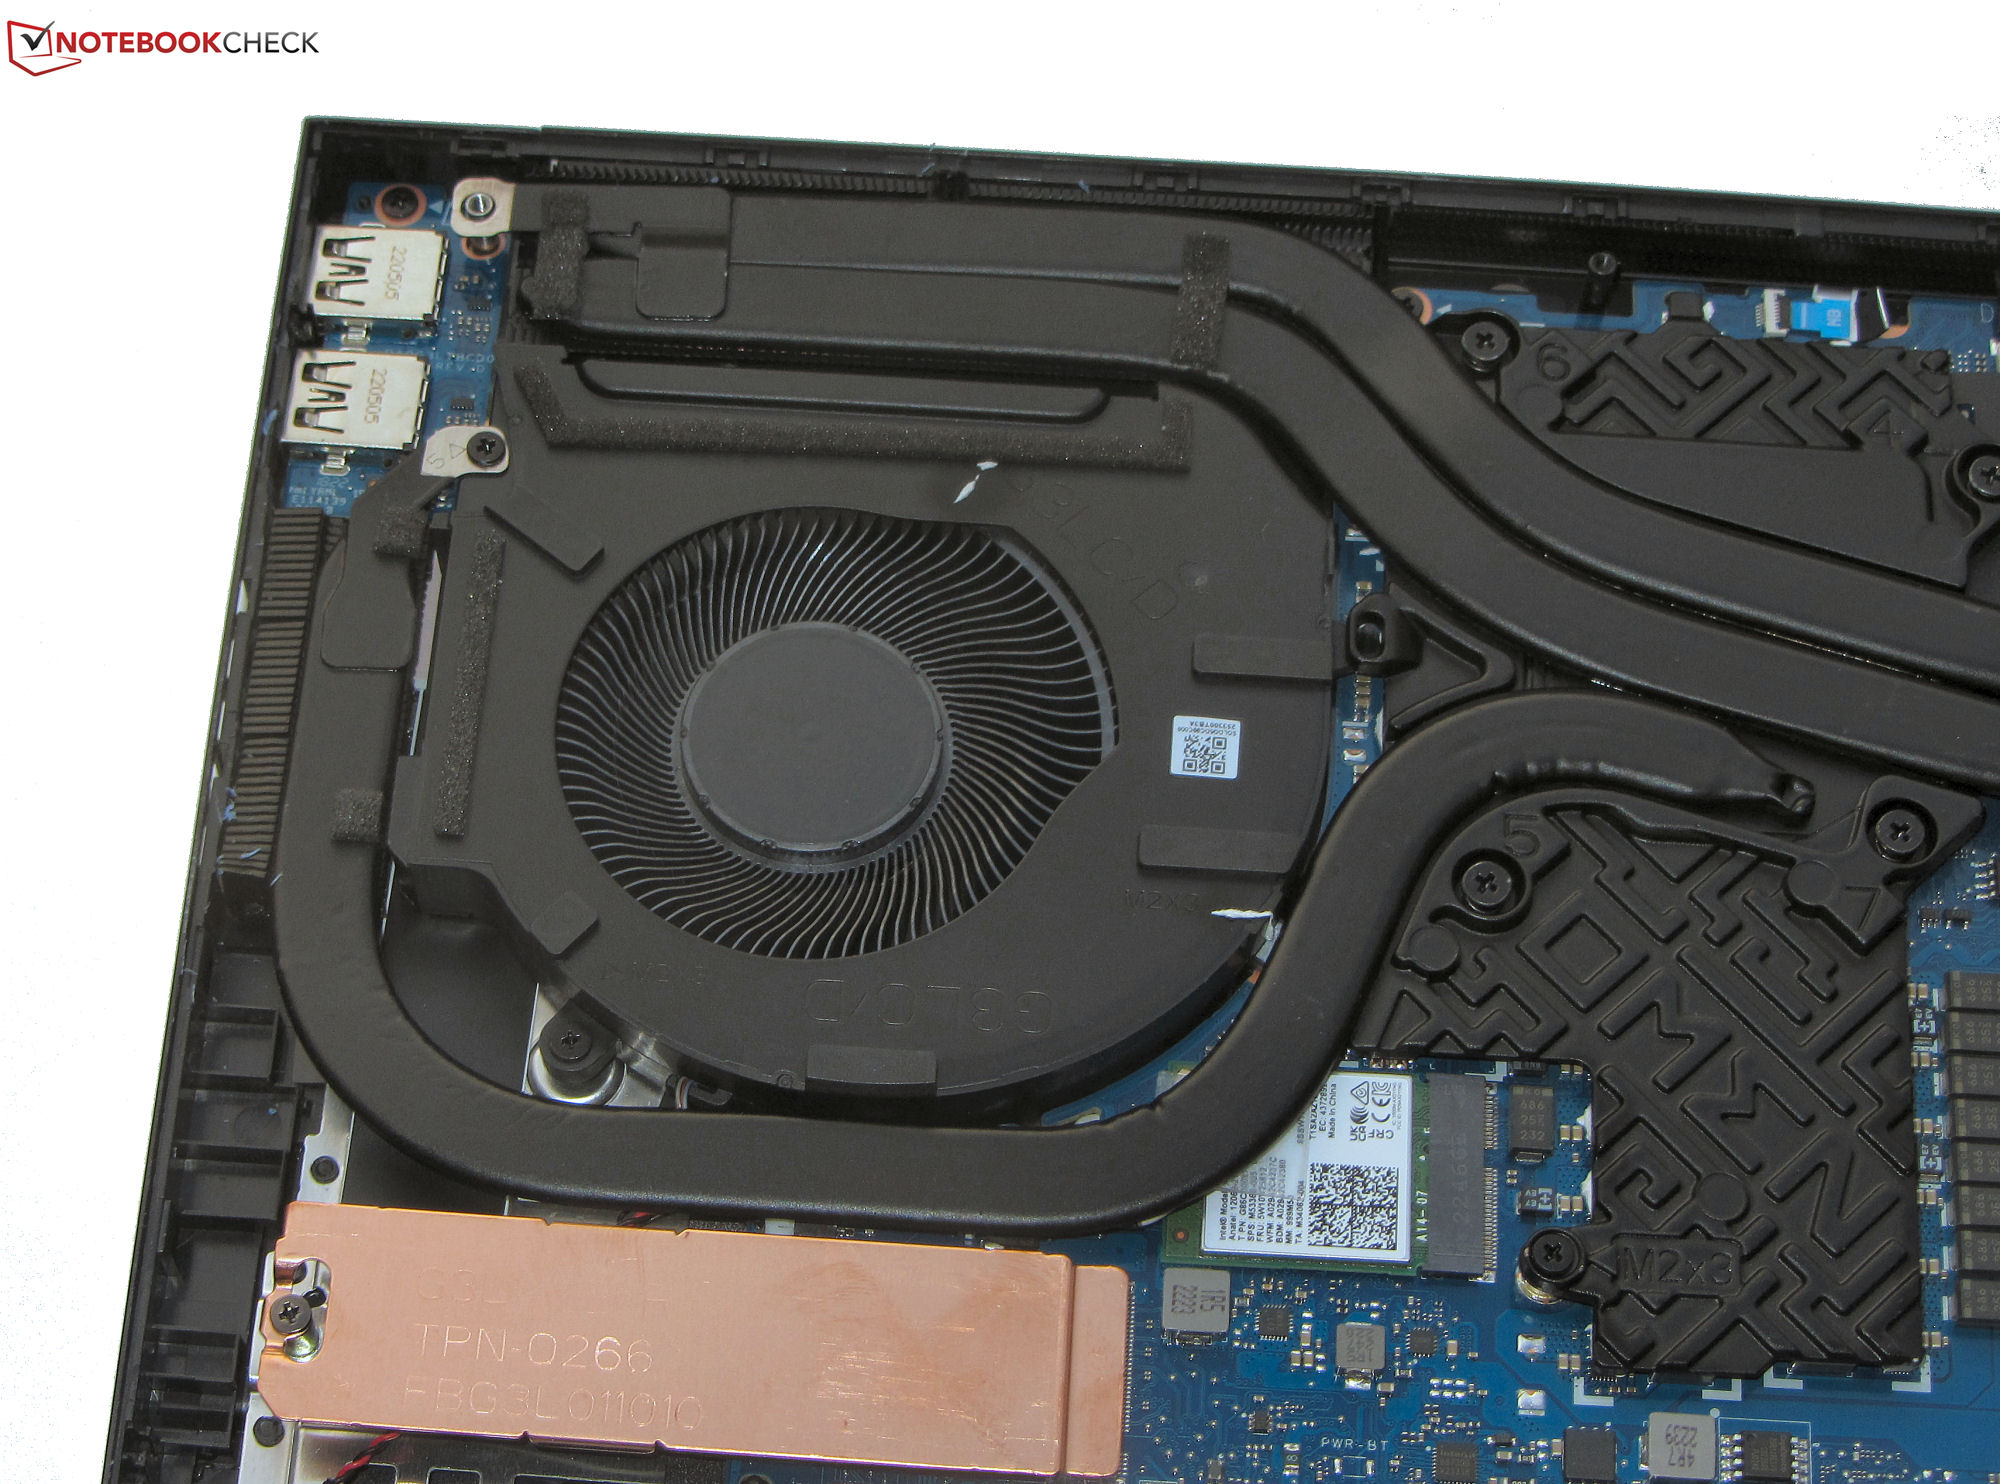
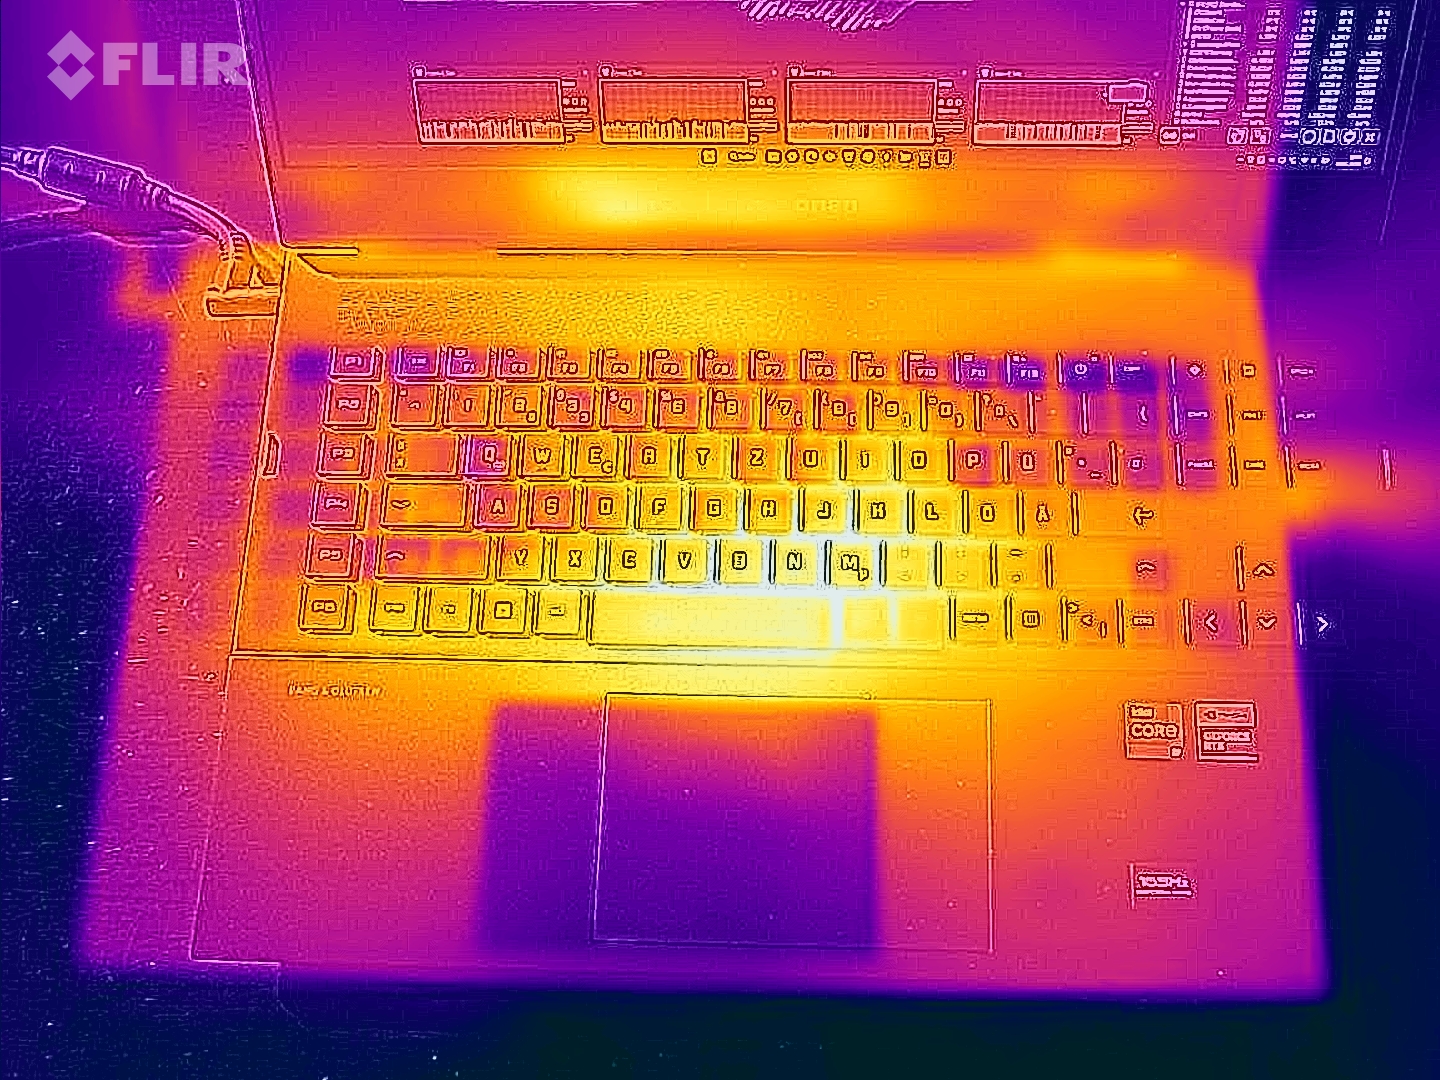
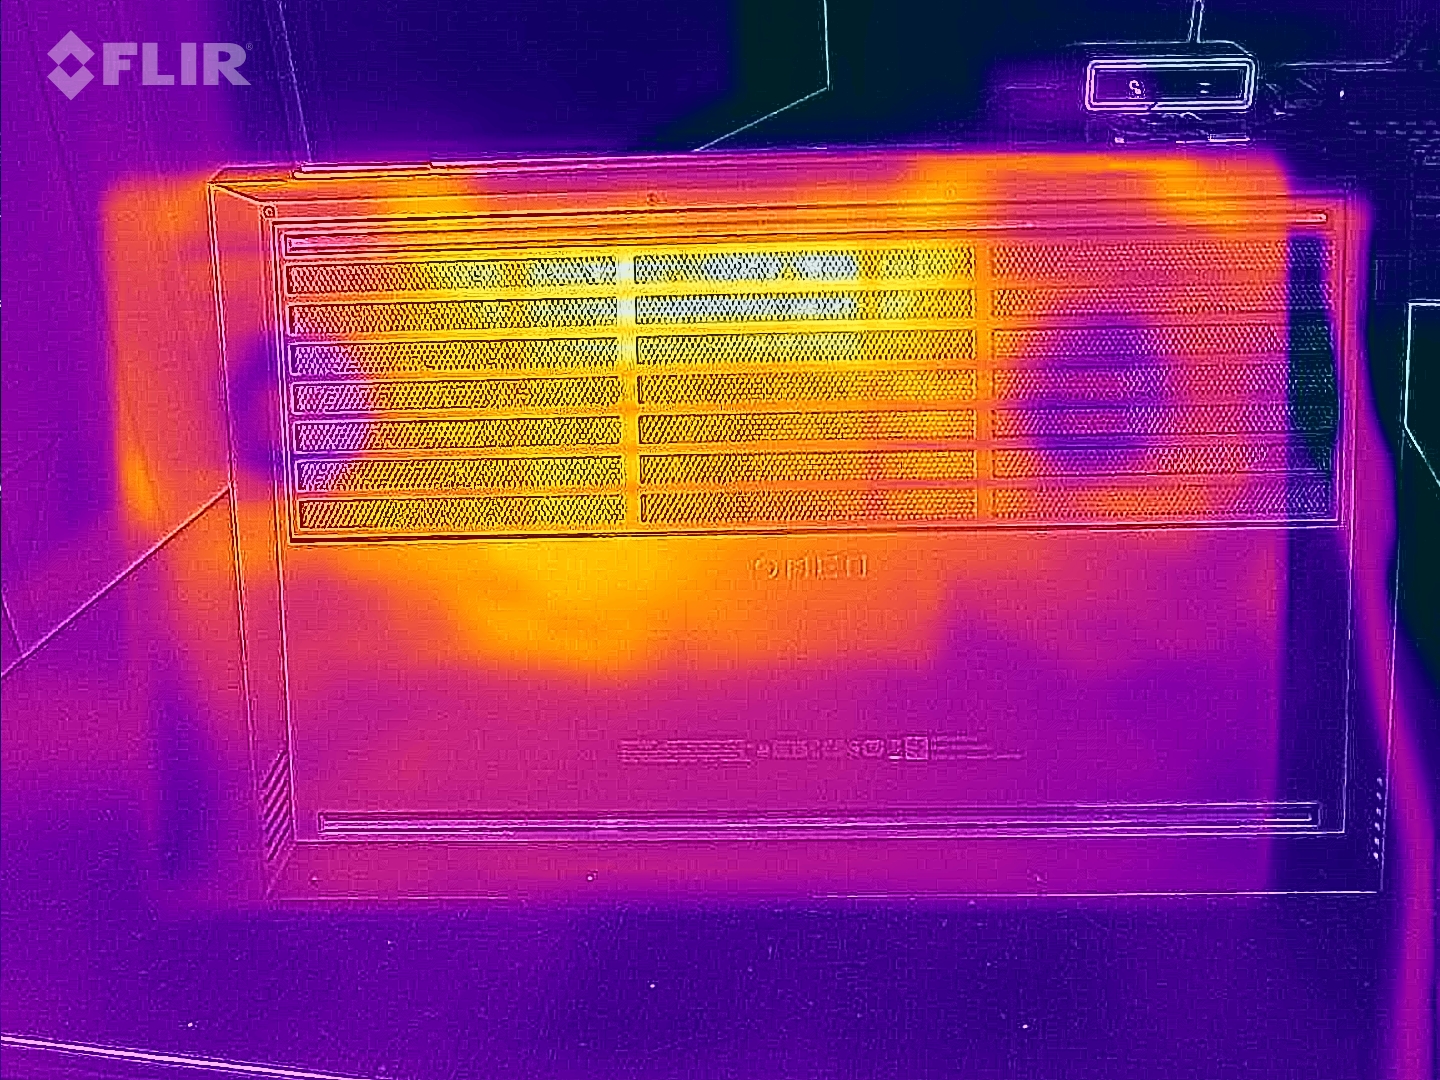
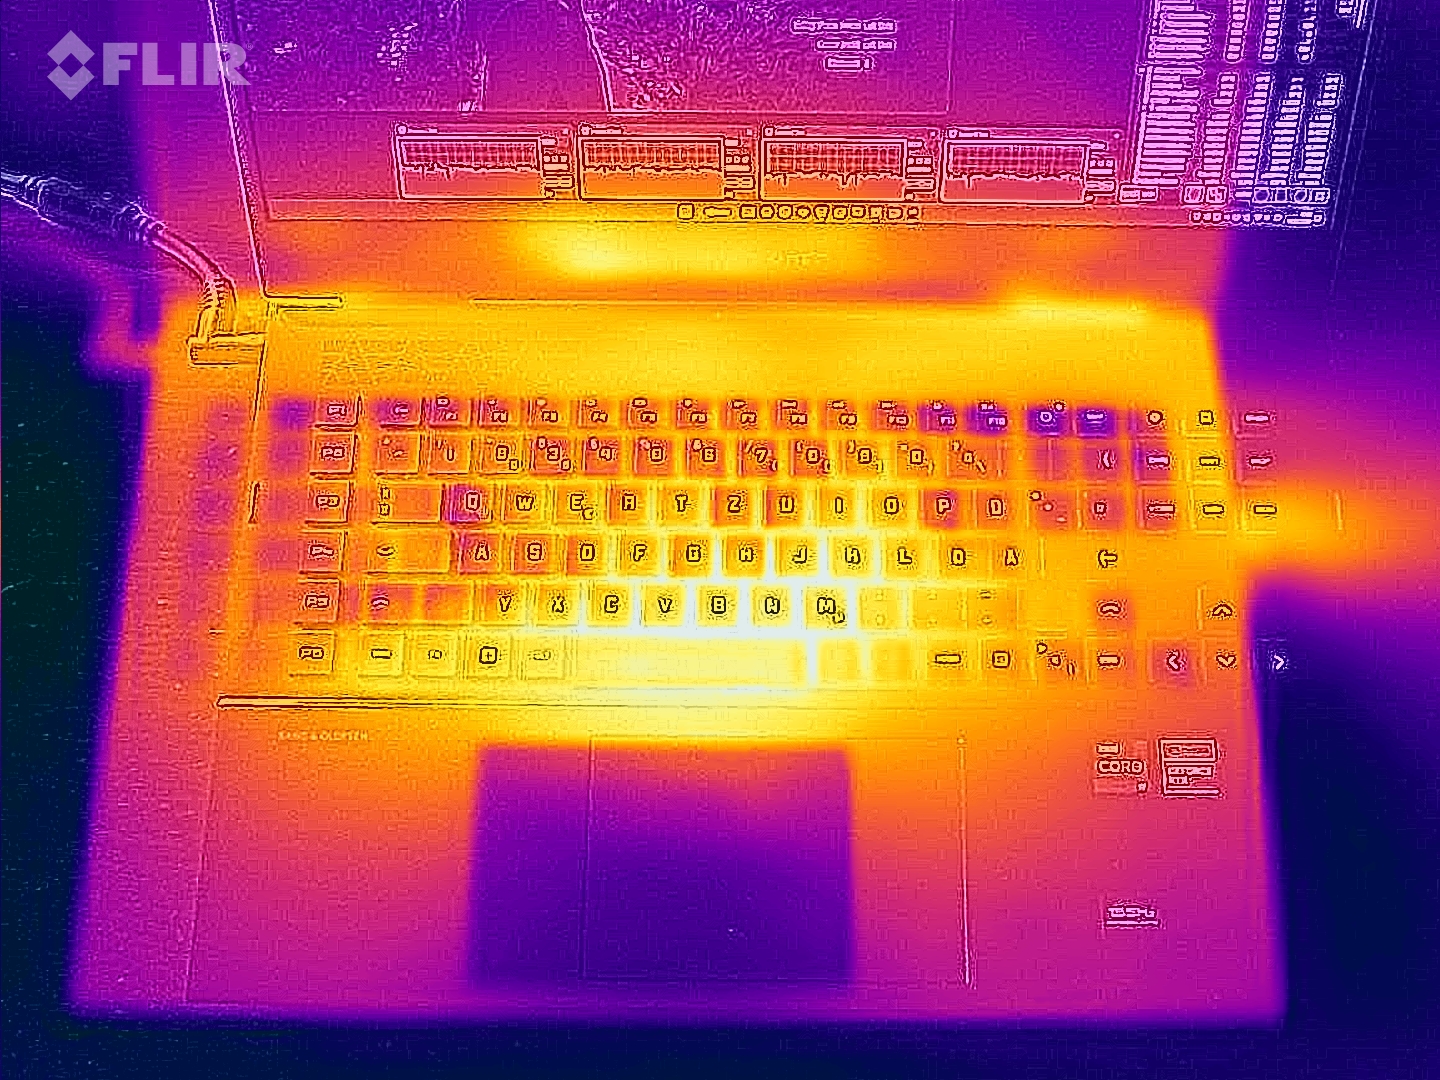
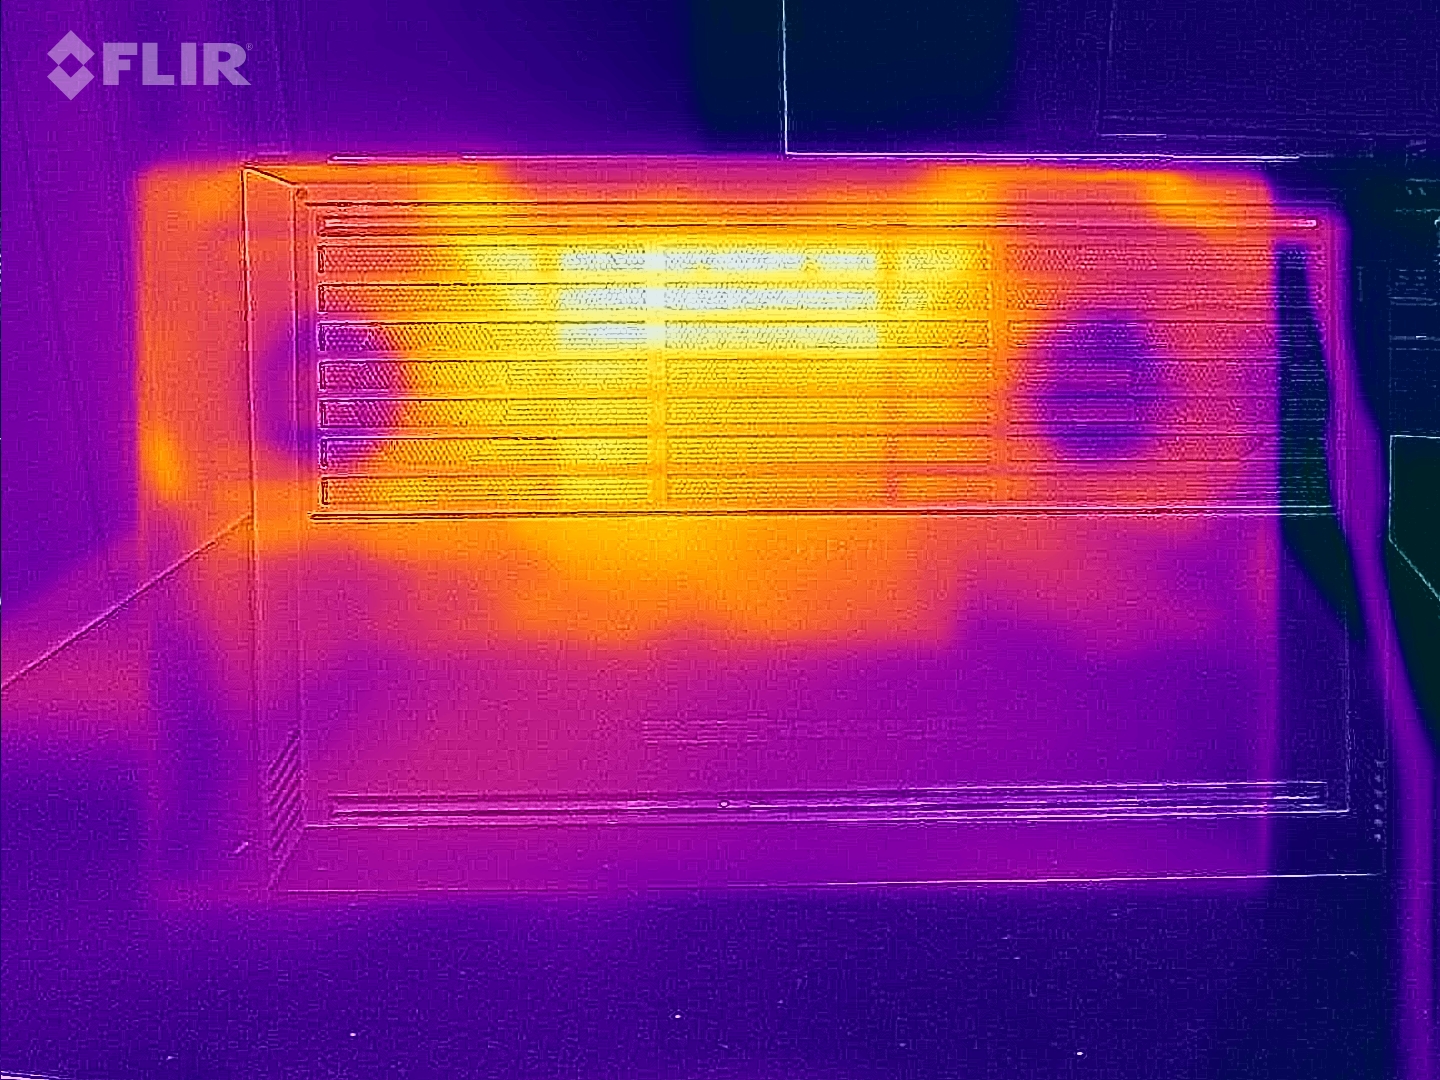
Temperature
Nel funzionamento quotidiano (Office, Internet), le temperature del case rimangono entro la fascia verde. Sotto carico (stress test, The Witcher 3), il portatile si riscalda sensibilmente, ma rimane entro i limiti, almeno nella parte superiore. Le temperature della CPU non destano preoccupazioni.
(±) La temperatura massima sul lato superiore è di 41 °C / 106 F, rispetto alla media di 40.4 °C / 105 F, che varia da 21.2 a 68.8 °C per questa classe Gaming.
(-) Il lato inferiore si riscalda fino ad un massimo di 51 °C / 124 F, rispetto alla media di 43.2 °C / 110 F
(+) In idle, la temperatura media del lato superiore è di 23.7 °C / 75 F, rispetto alla media deld ispositivo di 33.9 °C / 93 F.
(-) Riproducendo The Witcher 3, la temperatura media per il lato superiore e' di 38.2 °C / 101 F, rispetto alla media del dispositivo di 33.9 °C / 93 F.
(+) I poggiapolsi e il touchpad raggiungono la temperatura massima della pelle (35 °C / 95 F) e quindi non sono caldi.
(-) La temperatura media della zona del palmo della mano di dispositivi simili e'stata di 28.8 °C / 83.8 F (-6.2 °C / -11.2 F).
| HP Omen 17-ck2097ng Intel Core i9-13900HX, NVIDIA GeForce RTX 4080 Laptop GPU | Alienware m17 R5 (R9 6900HX, RX 6850M XT) AMD Ryzen 9 6900HX, AMD Radeon RX 6850M XT | Razer Blade 16 Early 2023 Intel Core i9-13950HX, NVIDIA GeForce RTX 4080 Laptop GPU | Lenovo Legion Pro 7 16IRX8H Intel Core i9-13900HX, NVIDIA GeForce RTX 4080 Laptop GPU | Asus ROG Strix G16 G614JZ Intel Core i9-13980HX, NVIDIA GeForce RTX 4080 Laptop GPU | HP Omen 17-ck1075ng Intel Core i7-12700H, NVIDIA GeForce RTX 3070 Ti Laptop GPU | |
|---|---|---|---|---|---|---|
| Heat | -20% | -8% | -28% | -23% | -16% | |
| Maximum Upper Side * (°C) | 41 | 53 -29% | 40 2% | 48 -17% | 54 -32% | 31.3 24% |
| Maximum Bottom * (°C) | 51 | 56 -10% | 37.6 26% | 49 4% | 55 -8% | 43.3 15% |
| Idle Upper Side * (°C) | 24 | 30 -25% | 32.4 -35% | 40 -67% | 29 -21% | 31.3 -30% |
| Idle Bottom * (°C) | 25 | 29 -16% | 31.4 -26% | 33 -32% | 33 -32% | 43.3 -73% |
* ... Meglio usare valori piccoli
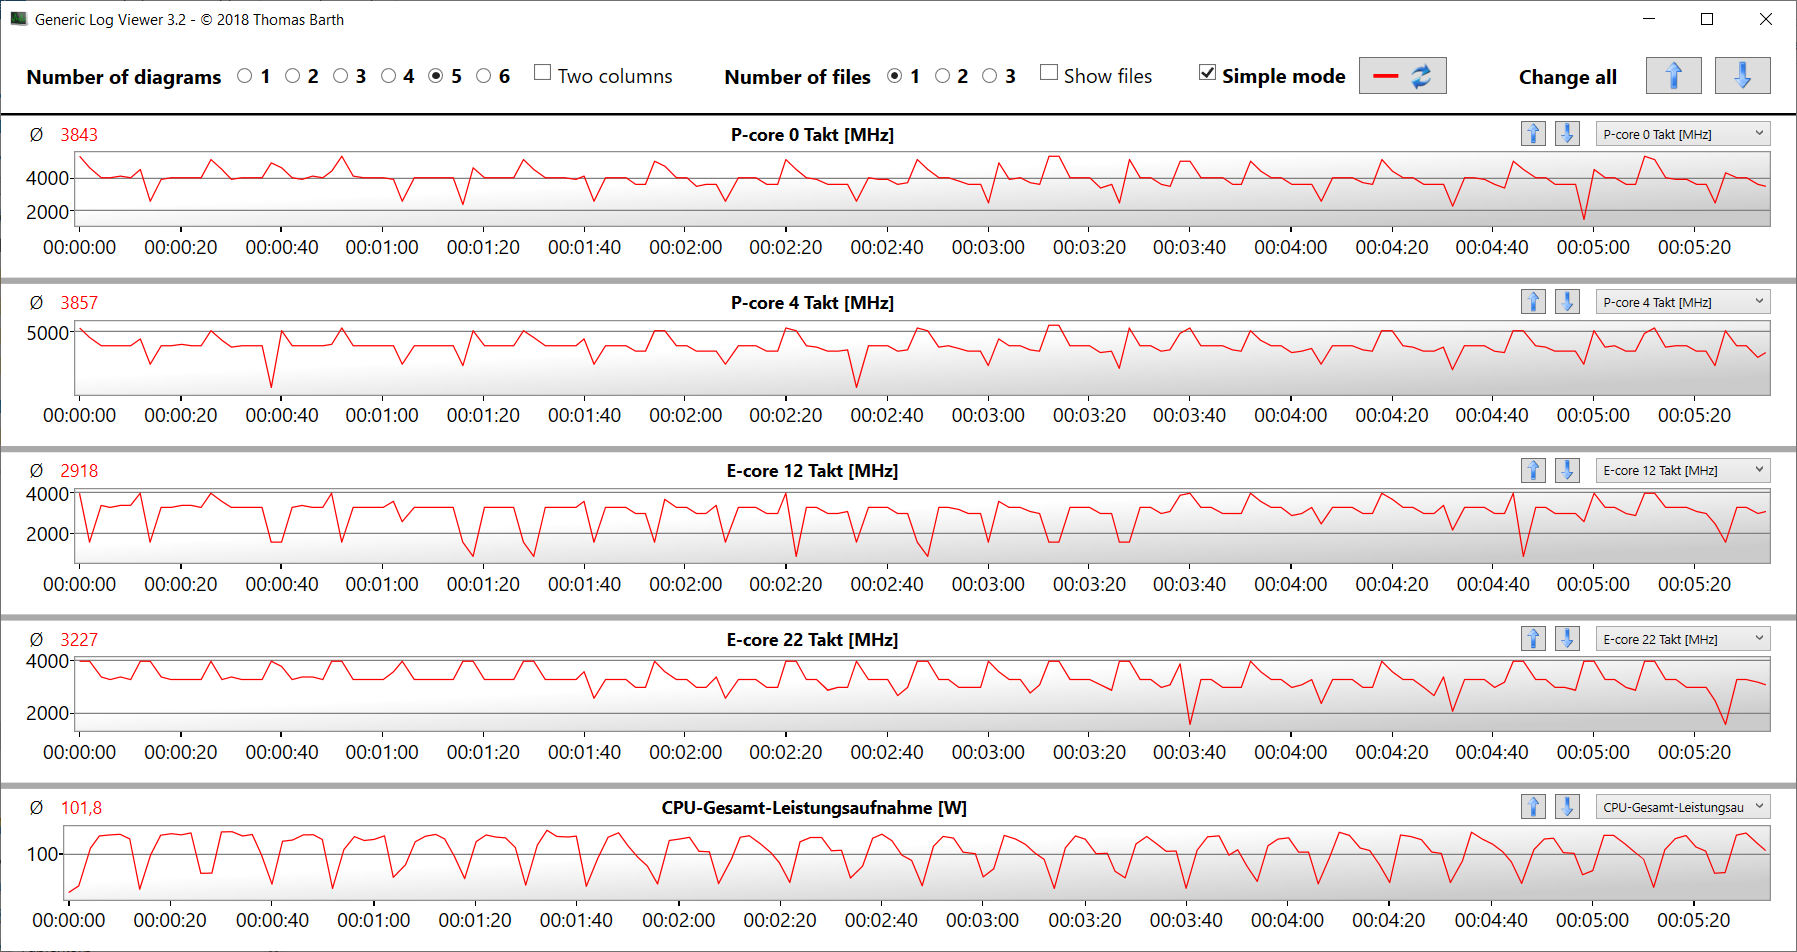
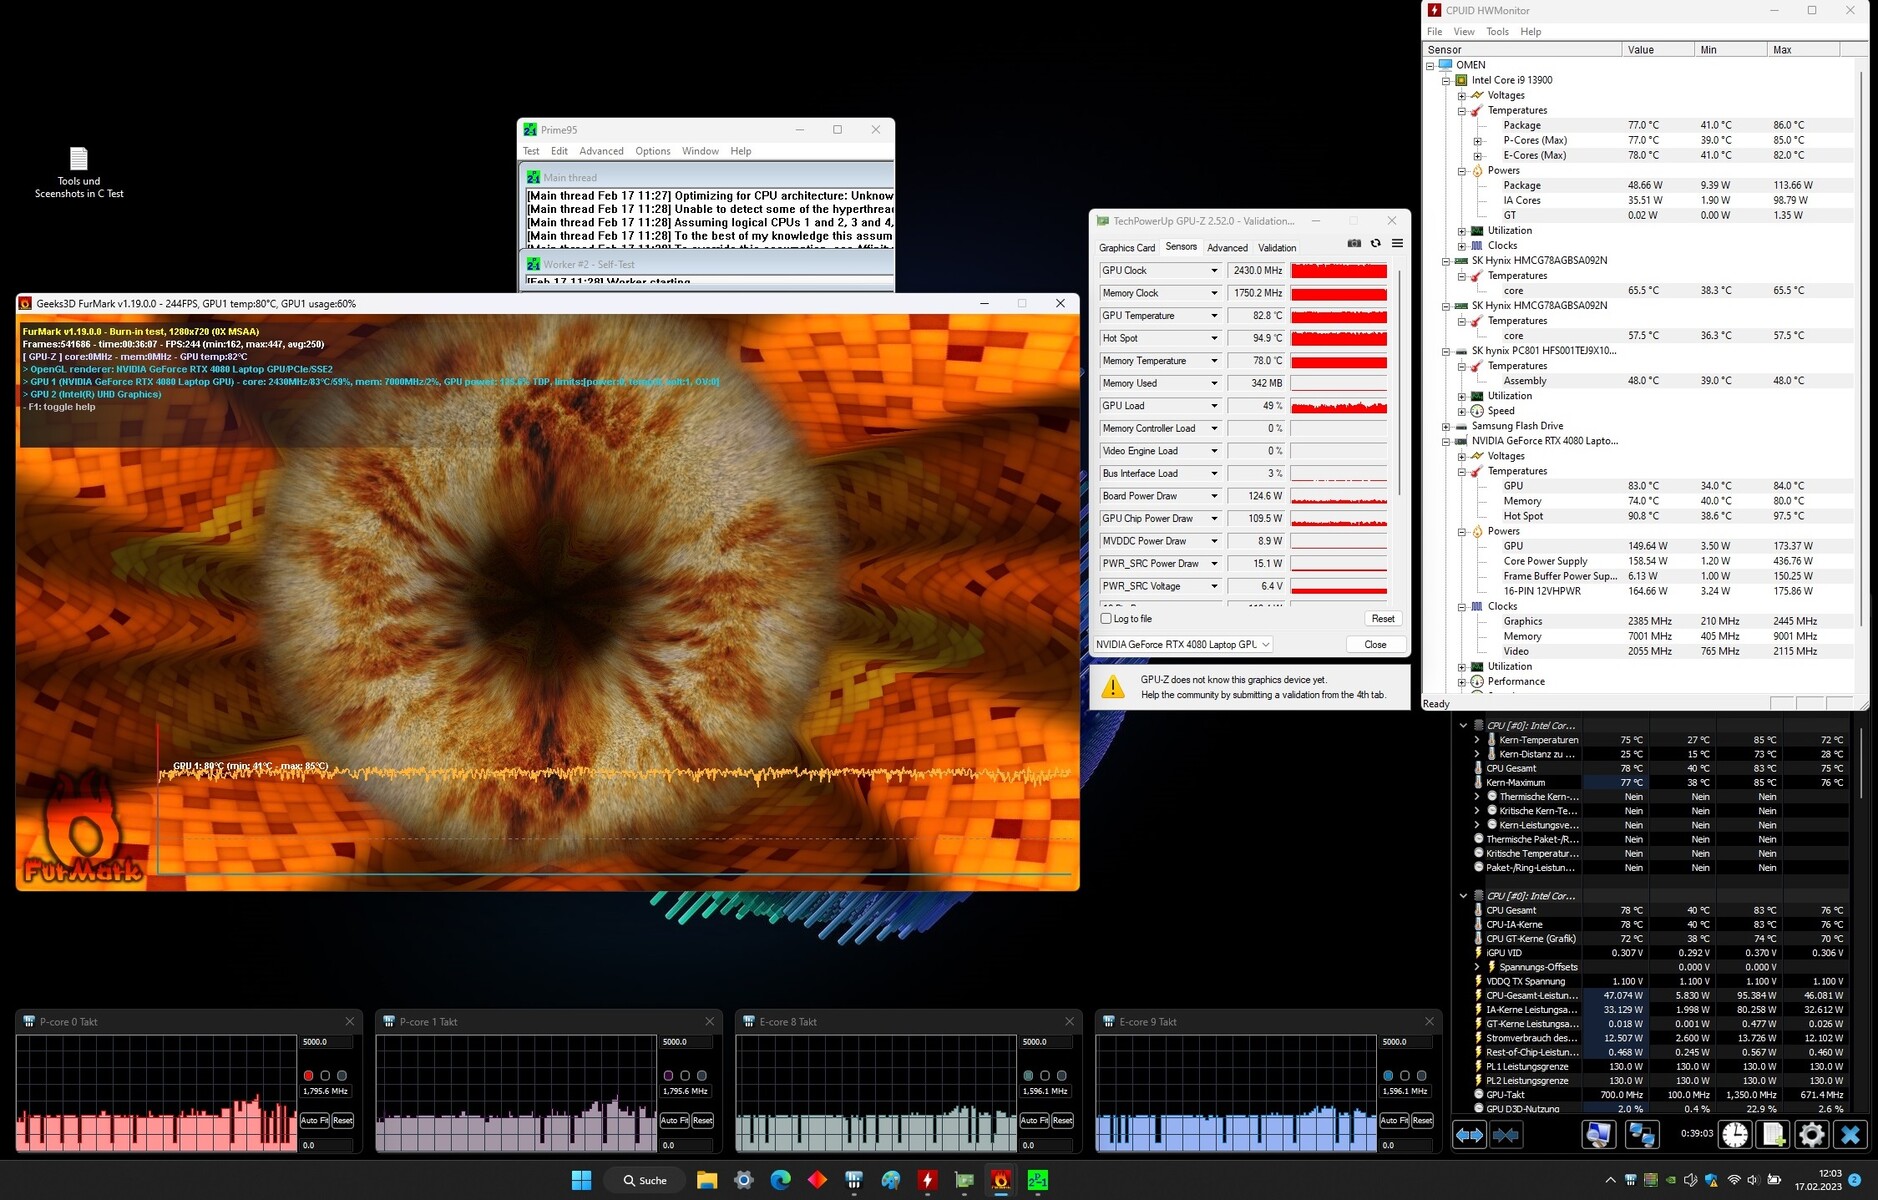
Stress test
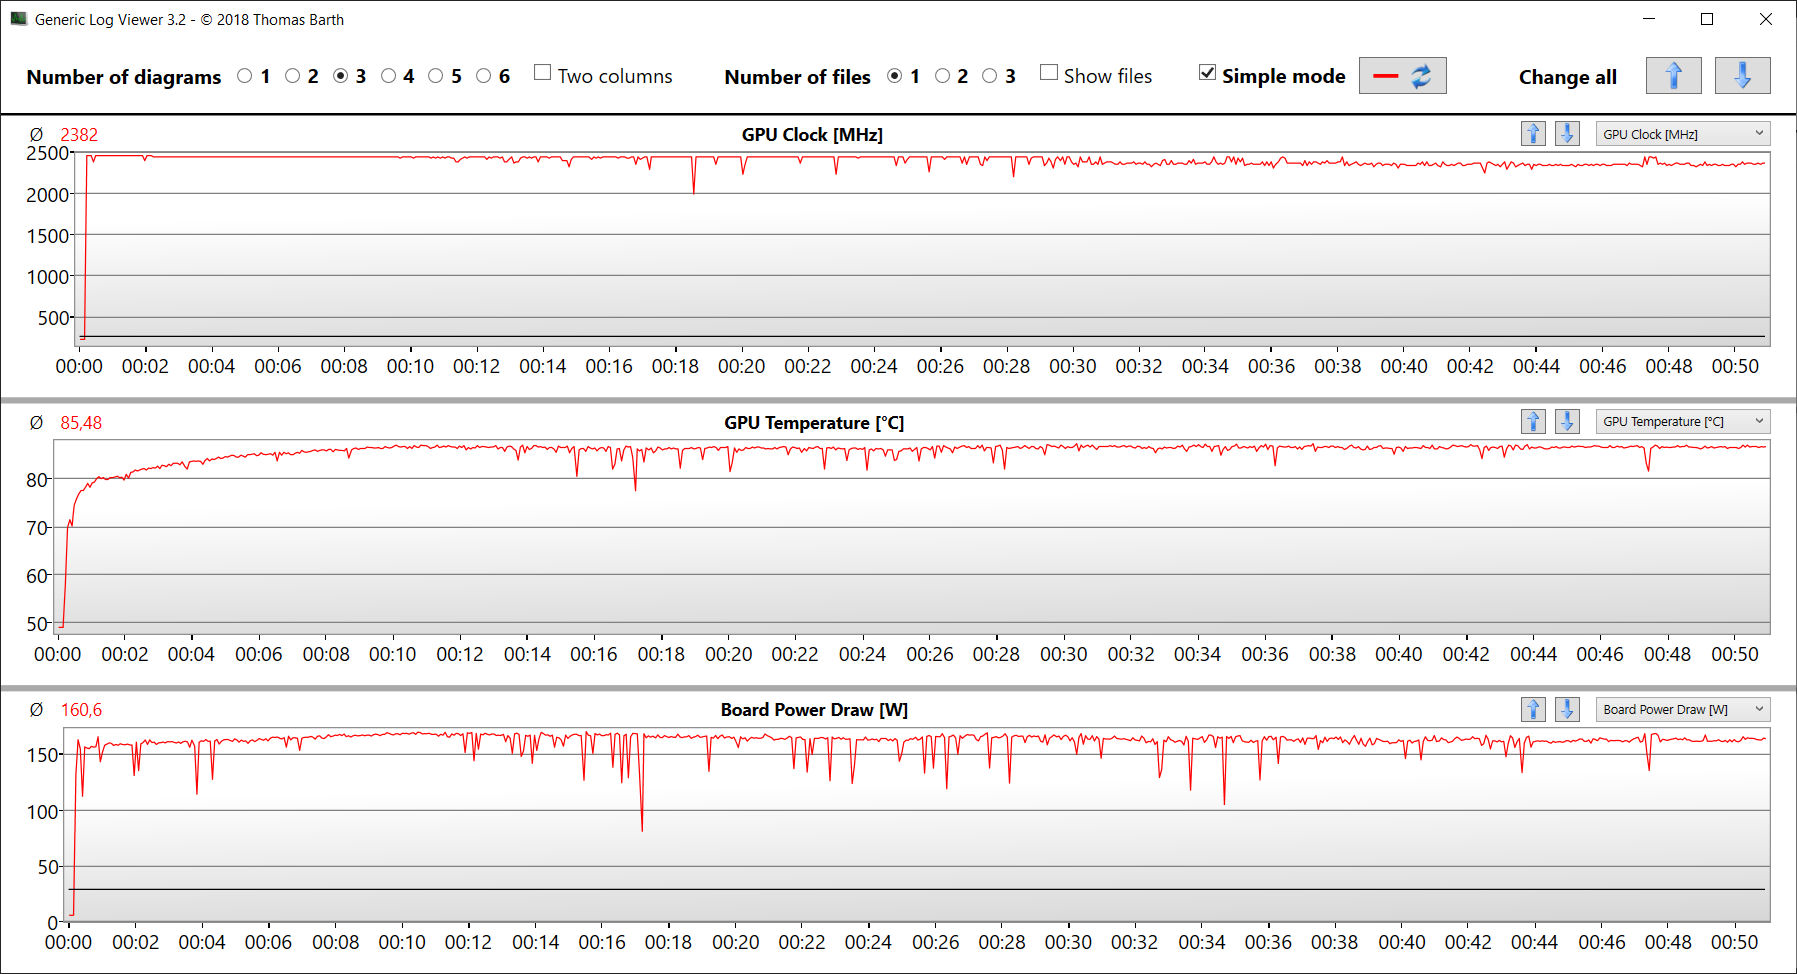
Il nostro stress test con Prime95 e Furmark in esecuzione costante rappresenta uno scenario estremo che utilizziamo per valutare la stabilità del sistema a pieno carico. La CPU (P: 3,8 GHz, E: 3,2 GHz) e la GPU (da 2 a 2,1 GHz) iniziano il test con velocità di clock elevate. Dopo poco tempo, la velocità della CPU scende a circa 1,8 GHz (core P) e 2 GHz (core E), mentre la velocità della GPU aumenta contemporaneamente a 2,3 - 2,4 GHz.
Altoparlanti
Gli altoparlanti stereo producono un suono decente, ma i bassi sono quasi inesistenti.
HP Omen 17-ck2097ng analisi audio
(±) | potenza degli altiparlanti media ma buona (81 dB)
Bassi 100 - 315 Hz
(-) | quasi nessun basso - in media 21% inferiori alla media
(±) | la linearità dei bassi è media (14.6% delta rispetto alla precedente frequenza)
Medi 400 - 2000 Hz
(+) | medi bilanciati - solo only 1.4% rispetto alla media
(+) | medi lineari (2.9% delta rispetto alla precedente frequenza)
Alti 2 - 16 kHz
(+) | Alti bilanciati - appena 2.2% dalla media
(+) | alti lineari (3.8% delta rispetto alla precedente frequenza)
Nel complesso 100 - 16.000 Hz
(+) | suono nel complesso lineare (13.8% differenza dalla media)
Rispetto alla stessa classe
» 21% di tutti i dispositivi testati in questa classe è stato migliore, 7% simile, 71% peggiore
» Il migliore ha avuto un delta di 6%, medio di 18%, peggiore di 132%
Rispetto a tutti i dispositivi testati
» 15% di tutti i dispositivi testati in questa classe è stato migliore, 4% similare, 81% peggiore
» Il migliore ha avuto un delta di 4%, medio di 23%, peggiore di 134%
Asus ROG Strix Scar 17 SE G733CX-LL014W analisi audio
(±) | potenza degli altiparlanti media ma buona (73.3 dB)
Bassi 100 - 315 Hz
(±) | bassi ridotti - in media 6.2% inferiori alla media
(±) | la linearità dei bassi è media (7.5% delta rispetto alla precedente frequenza)
Medi 400 - 2000 Hz
(+) | medi bilanciati - solo only 2% rispetto alla media
(+) | medi lineari (3.9% delta rispetto alla precedente frequenza)
Alti 2 - 16 kHz
(+) | Alti bilanciati - appena 3.5% dalla media
(±) | la linearità degli alti è media (9.3% delta rispetto alla precedente frequenza)
Nel complesso 100 - 16.000 Hz
(+) | suono nel complesso lineare (13.6% differenza dalla media)
Rispetto alla stessa classe
» 20% di tutti i dispositivi testati in questa classe è stato migliore, 7% simile, 73% peggiore
» Il migliore ha avuto un delta di 6%, medio di 18%, peggiore di 132%
Rispetto a tutti i dispositivi testati
» 15% di tutti i dispositivi testati in questa classe è stato migliore, 4% similare, 82% peggiore
» Il migliore ha avuto un delta di 4%, medio di 23%, peggiore di 134%
Gestione dell'alimentazione - Laptop da gioco con alimentatore da 330 watt
Consumo di energia
Il consumo energetico si attesta su livelli normali per l'hardware utilizzato. Durante il nostro test The Witcher 3 il consumo energetico rimane costante, mentre durante lo stress test il consumo cala dopo pochi minuti - la CPU è strozzata. L'alimentatore in dotazione (330 watt) è sufficientemente dimensionato.
| Off / Standby | |
| Idle | |
| Sotto carico |
|
Leggenda:
min: | |
| HP Omen 17-ck2097ng i9-13900HX, GeForce RTX 4080 Laptop GPU | Alienware m17 R5 (R9 6900HX, RX 6850M XT) R9 6900HX, Radeon RX 6850M XT | Razer Blade 16 Early 2023 i9-13950HX, GeForce RTX 4080 Laptop GPU | Lenovo Legion Pro 7 16IRX8H i9-13900HX, GeForce RTX 4080 Laptop GPU | Asus ROG Strix G16 G614JZ i9-13980HX, GeForce RTX 4080 Laptop GPU | HP Omen 17-ck1075ng i7-12700H, GeForce RTX 3070 Ti Laptop GPU | Media NVIDIA GeForce RTX 4080 Laptop GPU | Media della classe Gaming | |
|---|---|---|---|---|---|---|---|---|
| Power Consumption | 18% | -16% | -13% | 5% | 13% | -7% | 13% | |
| Idle Minimum * (Watt) | 16 | 13 19% | 15.2 5% | 18 -13% | 10 37% | 12.2 24% | 16.9 ? -6% | 13 ? 19% |
| Idle Average * (Watt) | 20 | 16.5 17% | 22.8 -14% | 24 -20% | 16 20% | 18 10% | 22 ? -10% | 18.7 ? 6% |
| Idle Maximum * (Watt) | 26 | 17 35% | 49.8 -92% | 32 -23% | 27 -4% | 19.4 25% | 34.1 ? -31% | 24.3 ? 7% |
| Load Average * (Watt) | 135 | 93 31% | 121.2 10% | 130 4% | 129 4% | 128 5% | 117.9 ? 13% | 110.2 ? 18% |
| Witcher 3 ultra * (Watt) | 215 | 239 -11% | 242 -13% | 260 -21% | 247 -15% | 209 3% | ||
| Load Maximum * (Watt) | 299 | 251 16% | 273.7 8% | 320 -7% | 342 -14% | 266 11% | 297 ? 1% | 258 ? 14% |
* ... Meglio usare valori piccoli
Power Consumption The Witcher 3 / Stress Test
Power Consumption with External Monitor
Durata della batteria
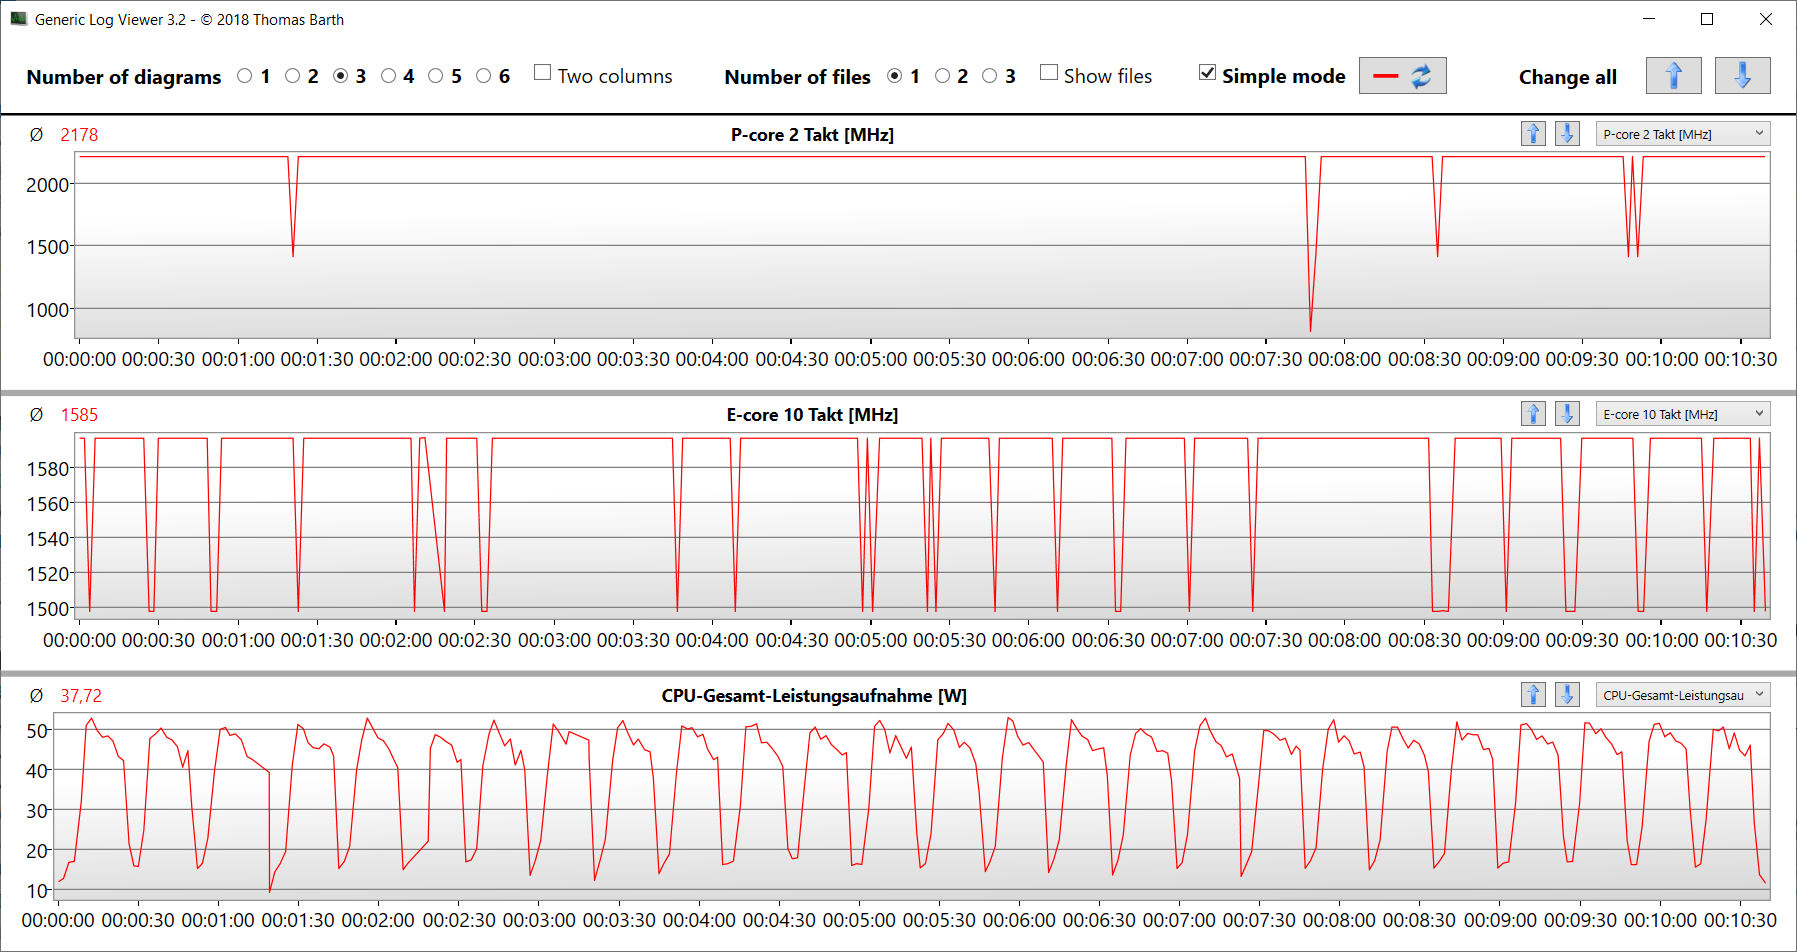
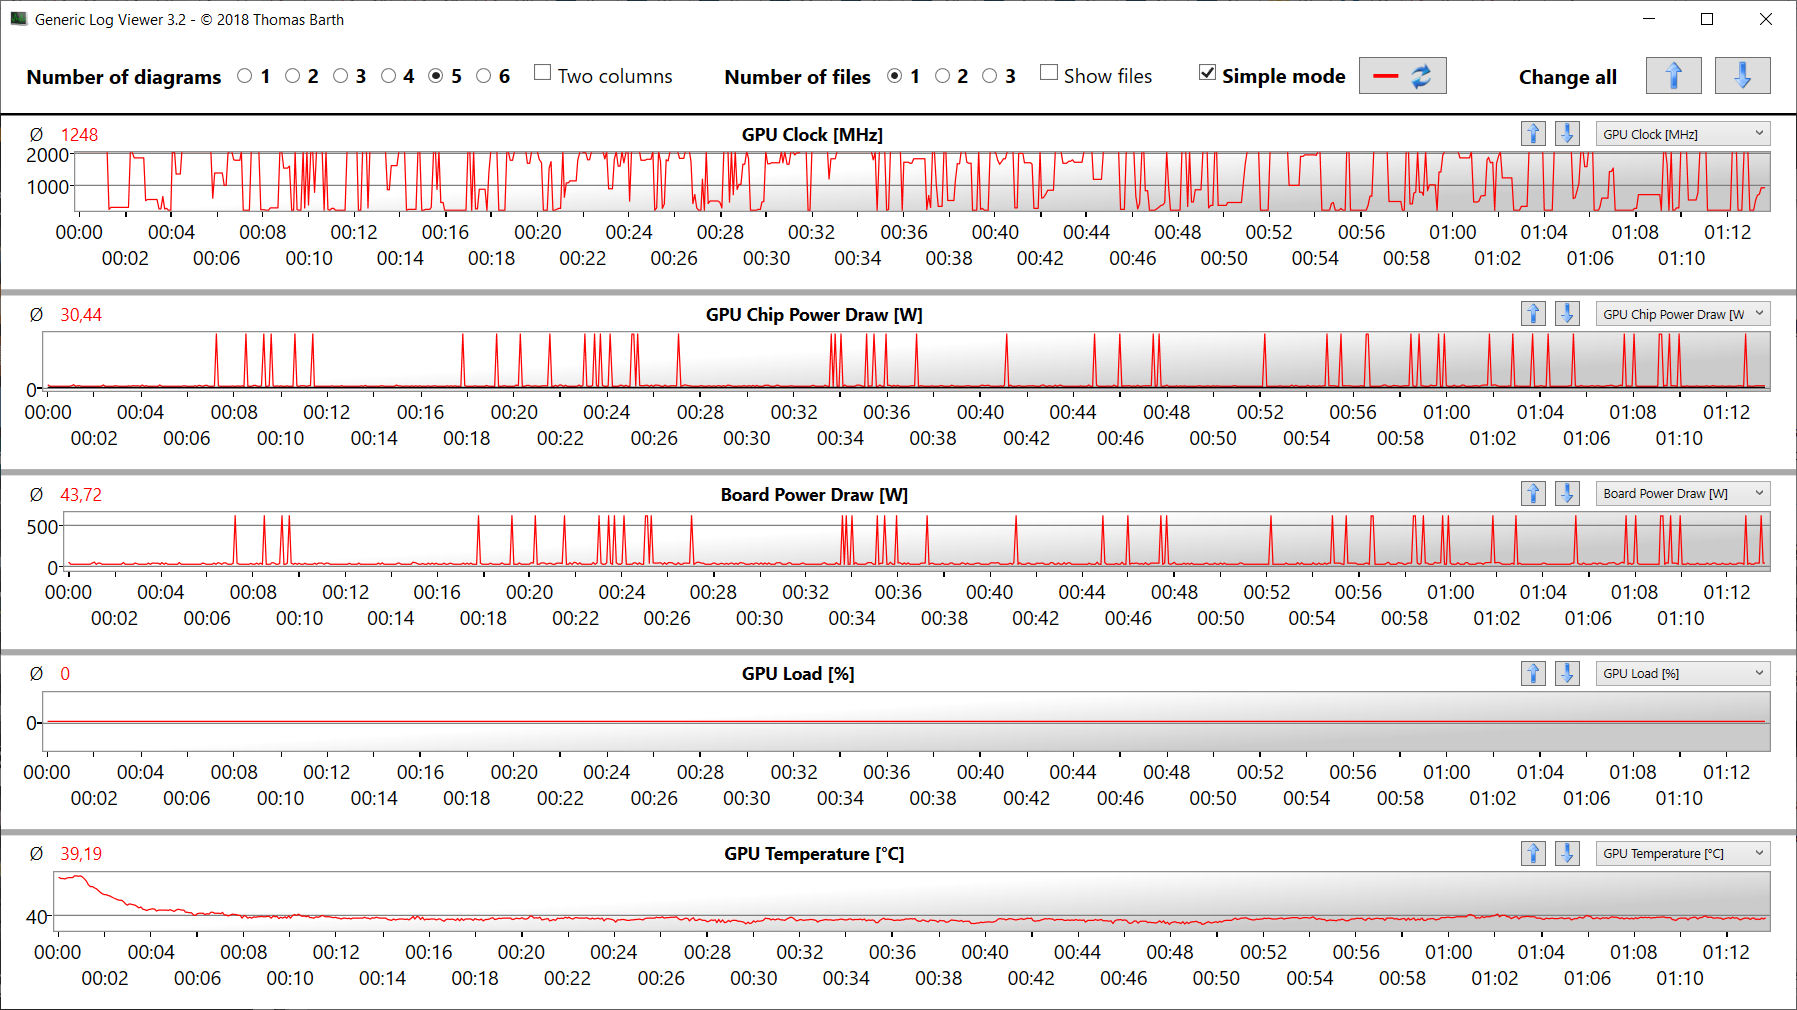
La durata della batteria dell'Omen non è soddisfacente. Anche un portatile da gioco potente deve essere in grado di durare più a lungo in funzionamento Optimus con una batteria da 83 Wh. Finora non siamo stati in grado di stabilire se ciò sia dovuto a un problema hardware o software.
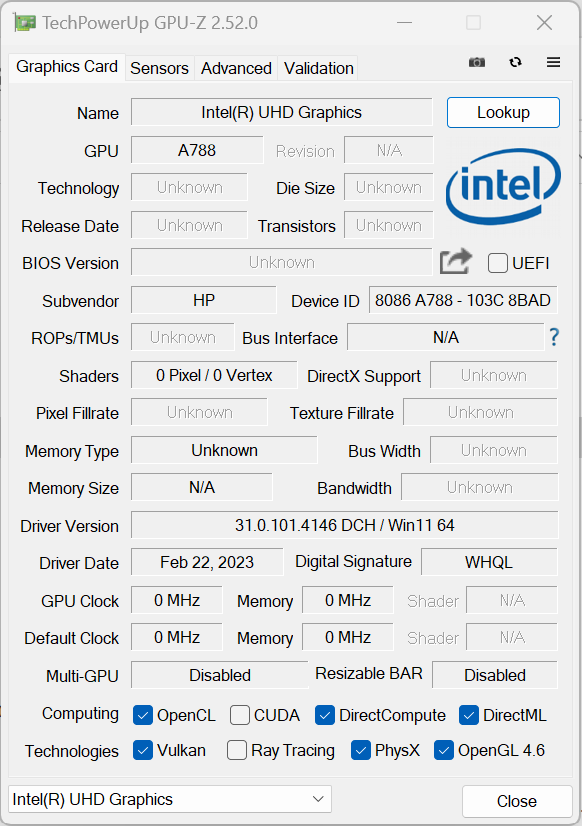
I file di log forniscono un'indicazione del problema: durante i test di runtime a basso carico (WiFi, idle, video), la GPU GeForce dovrebbe essere inattiva e lasciare tutto il lavoro alla iGPU. Tuttavia, la GPU GeForce spesso funziona alla massima velocità - con un carico dello 0%. Secondo GPU-Z, questo comporta un consumo di energia fino a 45 watt.
Per questo motivo, abbiamo chiesto ad HP una nuova unità di test per verificare la situazione, ma non l'abbiamo ancora ricevuta. Non appena riusciremo a ottenerla, effettueremo un nuovo test.
| HP Omen 17-ck2097ng i9-13900HX, GeForce RTX 4080 Laptop GPU, 83 Wh | Alienware m17 R5 (R9 6900HX, RX 6850M XT) R9 6900HX, Radeon RX 6850M XT, 97 Wh | Razer Blade 16 Early 2023 i9-13950HX, GeForce RTX 4080 Laptop GPU, 95.2 Wh | Lenovo Legion Pro 7 16IRX8H i9-13900HX, GeForce RTX 4080 Laptop GPU, 99.9 Wh | Asus ROG Strix G16 G614JZ i9-13980HX, GeForce RTX 4080 Laptop GPU, 90 Wh | HP Omen 17-ck1075ng i7-12700H, GeForce RTX 3070 Ti Laptop GPU, 78 Wh | Media della classe Gaming | |
|---|---|---|---|---|---|---|---|
| Autonomia della batteria | 31% | 60% | 48% | 74% | 80% | 81% | |
| Reader / Idle (h) | 4.2 | 8.9 112% | 6.4 52% | 8.9 112% | 8.16 ? 94% | ||
| H.264 (h) | 3.7 | 4.9 32% | 8.32 ? 125% | ||||
| WiFi v1.3 (h) | 3.6 | 4.8 33% | 6.1 69% | 5.1 42% | 9.7 169% | 6.2 72% | 7.11 ? 98% |
| Load (h) | 1.4 | 1.8 29% | 1.4 0% | 2.1 50% | 1.1 -21% | 2.2 57% | 1.502 ? 7% |
| Gaming (h) | 1 |
Pro
Contro
Verdetto - Un solido portatile da gioco di fascia alta
Con l'Omen 17, HP offre un potente portatile da gioco QHD di fascia alta. Con il suoCore i9-13900HXe il processore GeForce RTX 4080laptop GPU, il portatile dovrebbe funzionare bene anche in altre aree applicative come l'elaborazione video e il rendering. Una veloce unità SSD PCIe 4 (1 TB) fornisce lo spazio di archiviazione necessario e garantisce tempi di caricamento ridotti. È presente anche uno spazio per una seconda unità SSD.
L'HP Omen 17 (2023) rappresenta un solido portatile da gioco, ma non sfrutta appieno il suo potenziale.
Il processore e il core grafico sono in grado di funzionare a velocità di clock costantemente elevate. La rumorosità e lo sviluppo di calore si attestano su livelli elevati, normali per questa classe di portatili. Tuttavia, il portatile produce un rumore eccessivo nel funzionamento quotidiano.
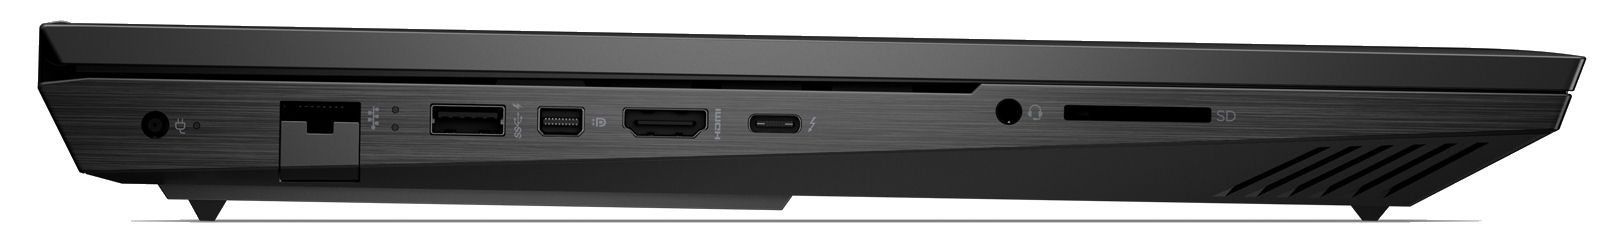
Il display opaco da 17,3 pollici (QHD, IPS, 165 Hz, sRGB) lascia una buona impressione. Nel complesso, si comporta leggermente meglio del pannello FHD del predecessore Omen Predecessore Omenma peggio della maggior parte dei concorrenti. La connessione Thunderbolt 4 offre alcune opzioni di espansione (soluzione docking, GPU esterna). Inoltre, può essere utilizzata per ricaricare la batteria con un caricatore USB-C (min. 65 watt, 20 V) ed è supportato Power Delivery.
A causa di un possibile difetto, non siamo in grado di esprimere un giudizio definitivo sulla durata della batteria in questo momento. Misureremo nuovamente la durata della batteria non appena riceveremo un'unità sostitutiva da HP. Poiché la durata della batteria non ha praticamente alcun impatto sulla valutazione finale di un portatile da gioco, la valutazione cambierà al massimo di poco.
In alternativa, potete dare un'occhiata al modello Lenovo Legion Pro 7 16IRX8Hche è in grado di ottenere prestazioni superiori dalla stessa combinazione CPU/GPU. Inoltre, è dotato di un display più luminoso nel formato 16:10.
Prezzo e disponibilità
L'Omen 17 (2023) è disponibile presso HP a partire da 1499,99 dollari. Un modello simile alla nostra configurazione testata, ma con un i7-13700, costerebbe negli Stati Uniti 2.429,99 dollari.
HP Omen 17-ck2097ng
- 03/28/2023 v7 (old)
Sascha Mölck
Transparency
La selezione dei dispositivi da recensire viene effettuata dalla nostra redazione. Il campione di prova è stato fornito all'autore come prestito dal produttore o dal rivenditore ai fini di questa recensione. L'istituto di credito non ha avuto alcuna influenza su questa recensione, né il produttore ne ha ricevuto una copia prima della pubblicazione. Non vi era alcun obbligo di pubblicare questa recensione. In quanto società mediatica indipendente, Notebookcheck non è soggetta all'autorità di produttori, rivenditori o editori.
Ecco come Notebookcheck esegue i test
Ogni anno, Notebookcheck esamina in modo indipendente centinaia di laptop e smartphone utilizzando procedure standardizzate per garantire che tutti i risultati siano comparabili. Da circa 20 anni sviluppiamo continuamente i nostri metodi di prova e nel frattempo stabiliamo gli standard di settore. Nei nostri laboratori di prova, tecnici ed editori esperti utilizzano apparecchiature di misurazione di alta qualità. Questi test comportano un processo di validazione in più fasi. Il nostro complesso sistema di valutazione si basa su centinaia di misurazioni e parametri di riferimento ben fondati, che mantengono l'obiettività.Price comparison

