Recensione del portatile Eurocom Nightsky TXi317: 125 W GeForce RTX 3080 Ti, una macchina veloce
")
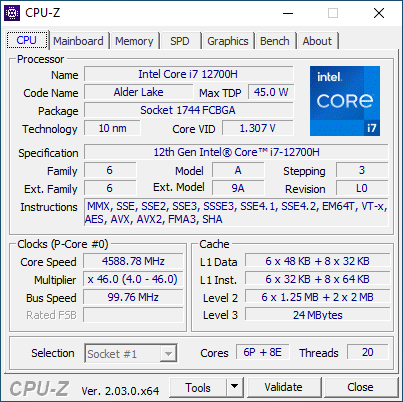
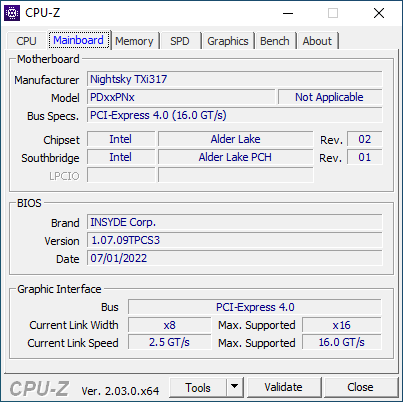
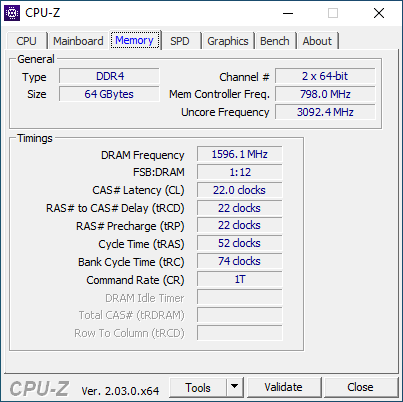
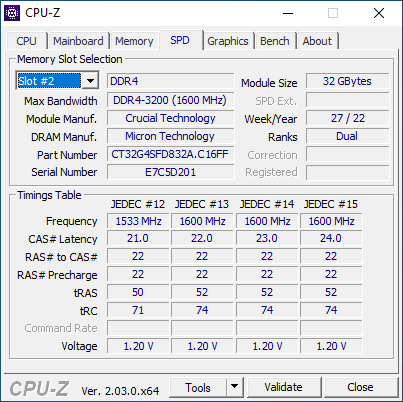
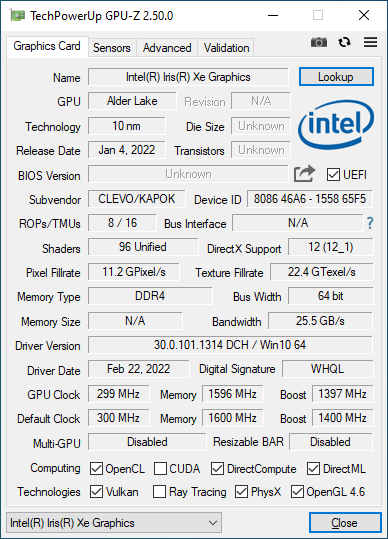
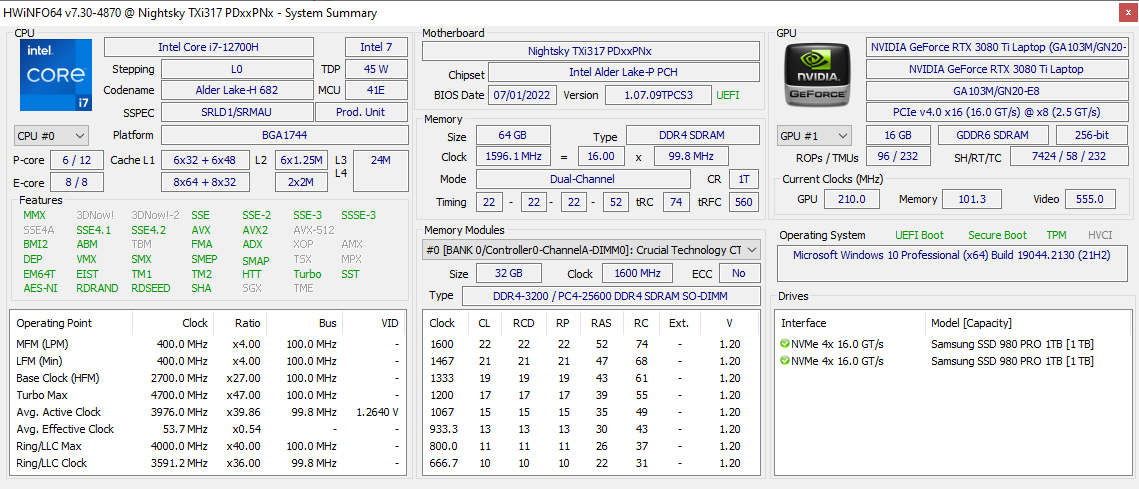
Il Nightsky TXi317 è l'ultimo portatile da gioco da 17,3 pollici di Eurocom che utilizza le CPU Alder Lake-H di Intel di 12a generazione e una GPU TGP GeForce RTX 3080 Ti da 155 W per essere uno dei portatili da gioco più veloci attualmente disponibili. Condivide lo stesso design dello chassis Tongfang dello Schenker XMG Pro 17 E22 e per questo vi consigliamo di consultare la nostra recensione qui per maggiori dettagli sullo chassis e sulle sue caratteristiche fisiche.
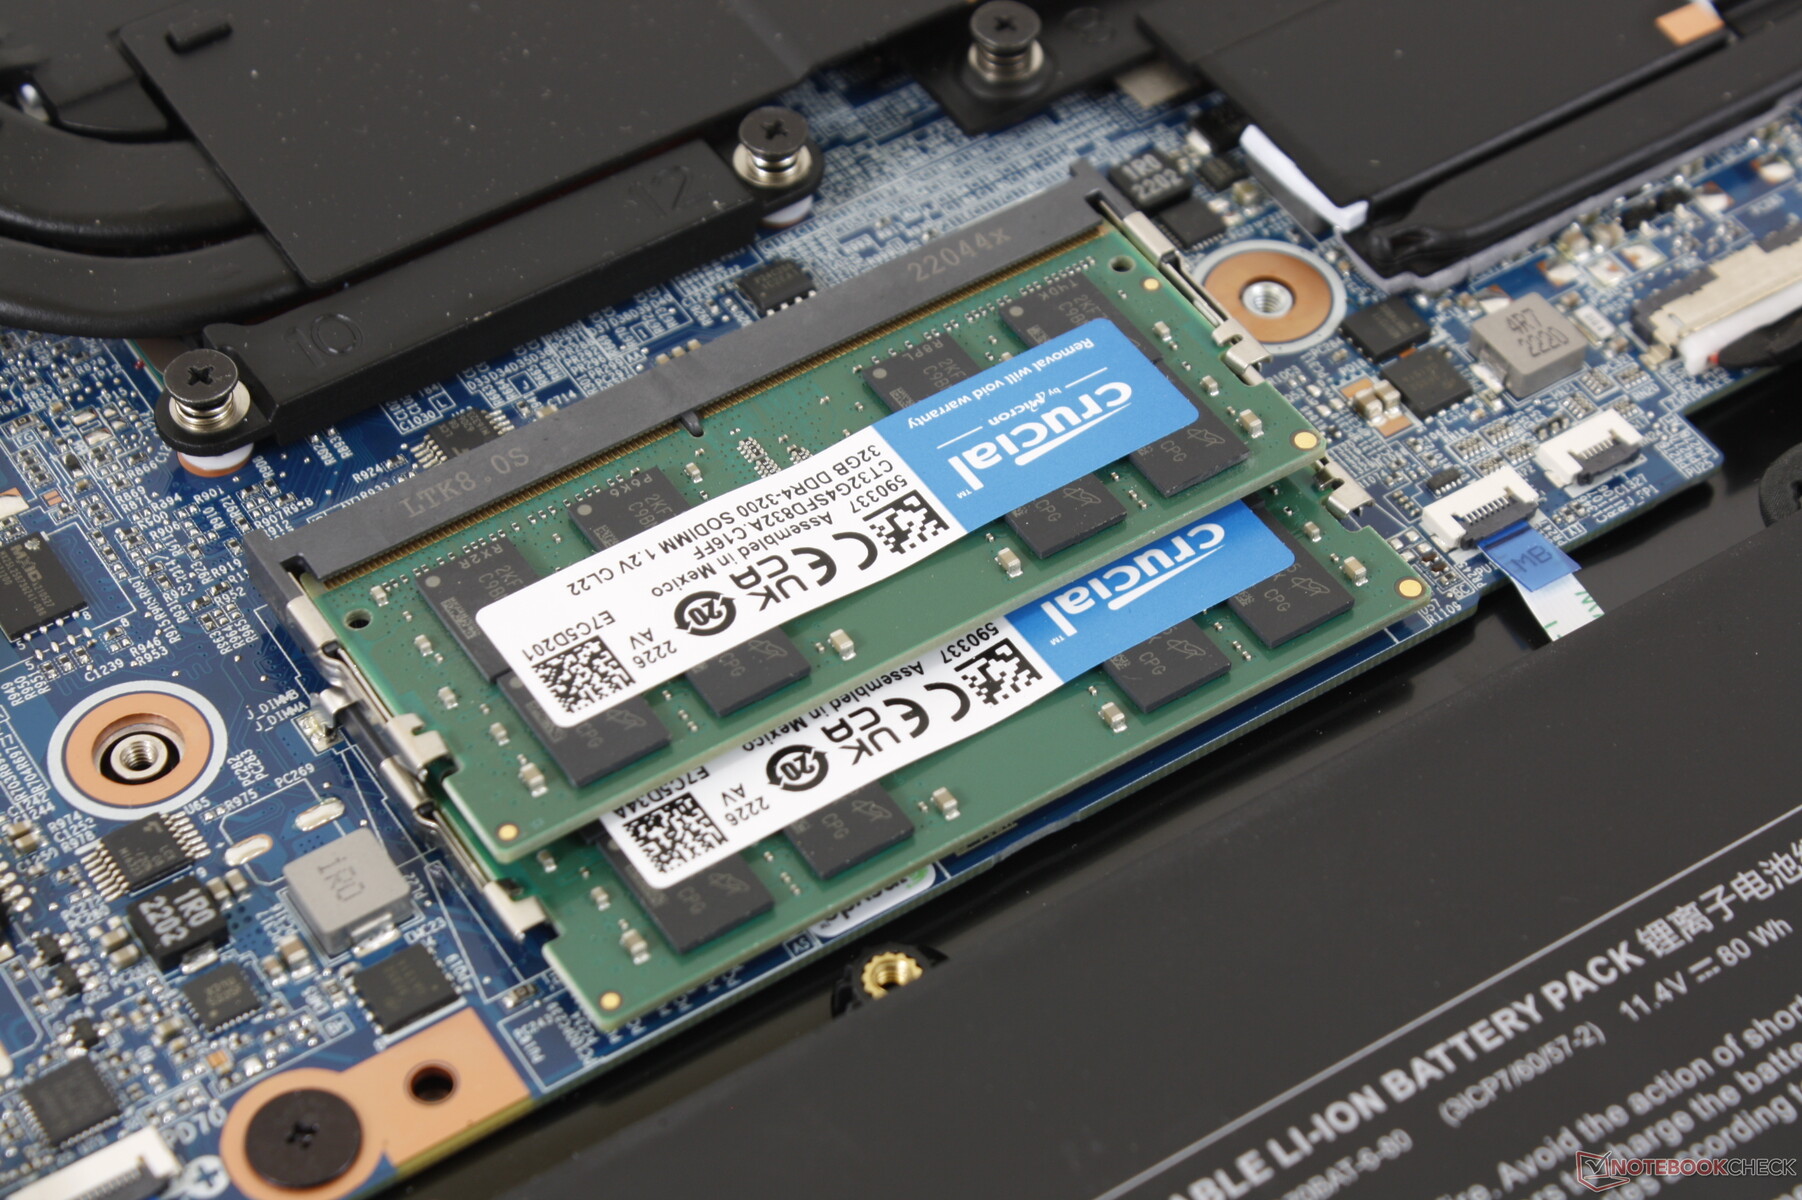
La configurazione oggetto della nostra recensione è dotata di CPU Core i7-12700H, display IPS 1080p a 144 Hz, GPU GeForce RTX 3080 Ti e 64 GB di RAM per circa 4100 dollari. L'opzione GPU di fascia bassa è la RTX 3070 Ti di GeForce, che colloca il Nightsky TXi317 nel mercato dei portatili da gioco per appassionati.
Tra i concorrenti diretti ci sono altri portatili da gioco da 17 pollici ad alte prestazioni come il modello Aorus 17X,MSI Raider GE77oAlienware x17 R2.
Altre recensioni di Eurocom:
Potenziali concorrenti a confronto
Punteggio | Data | Modello | Peso | Altezza | Dimensione | Risoluzione | Prezzo |
|---|---|---|---|---|---|---|---|
| 85.3 % v7 (old) | 10/2022 | Eurocom Nightsky TXi317 i7-12700H, GeForce RTX 3080 Ti Laptop GPU | 2.9 kg | 27 mm | 17.30" | 1920x1080 | |
| 85.4 % v7 (old) | 07/2022 | Schenker XMG Pro 17 E22 i9-12900H, GeForce RTX 3080 Ti Laptop GPU | 2.8 kg | 27 mm | 17.30" | 2560x1440 | |
| 83.7 % v7 (old) | 08/2022 | Aorus 17X XES i9-12900HX, GeForce RTX 3070 Ti Laptop GPU | 2.7 kg | 30 mm | 17.30" | 1920x1080 | |
| 86.8 % v7 (old) | 07/2022 | MSI Raider GE77 HX 12UHS i9-12900HX, GeForce RTX 3080 Ti Laptop GPU | 3.1 kg | 25.9 mm | 17.30" | 3840x2160 | |
| 89.9 % v7 (old) | 07/2022 | Razer Blade 17 Early 2022 i9-12900H, GeForce RTX 3080 Ti Laptop GPU | 2.8 kg | 19.9 mm | 17.30" | 3840x2160 | |
| 89.2 % v7 (old) | 05/2022 | Alienware x17 R2 P48E i9-12900HK, GeForce RTX 3080 Ti Laptop GPU | 3.1 kg | 20.9 mm | 17.30" | 1920x1080 |
Caso
C'è una differenza superficiale tra il Nightsky TXi317 e l'XMG Pro 17 E22: gli angoli posteriori del design Eurocom incorporano finiture lucide color bronzo, mentre il design Schenker no. Per il resto, i telai sono identici.
Lettore di schede SD
| SD Card Reader | |
| average JPG Copy Test (av. of 3 runs) | |
| Alienware x17 R2 P48E (AV Pro V60) | |
| Razer Blade 17 Early 2022 (AV PRO microSD 128 GB V60) | |
| Schenker XMG Pro 17 E22 (AV PRO microSD 128 GB V60) | |
| MSI Raider GE77 HX 12UHS (AV PRO microSD 128 GB V60) | |
| Eurocom Nightsky TXi317 (AV Pro V60) | |
| maximum AS SSD Seq Read Test (1GB) | |
| Alienware x17 R2 P48E (AV Pro V60) | |
| Eurocom Nightsky TXi317 (AV Pro V60) | |
| Schenker XMG Pro 17 E22 (AV PRO microSD 128 GB V60) | |
Comunicazione
Il Wi-Fi 6 è di serie, senza alcuna opzione Wi-Fi 6E da parte del produttore, nonostante l'elevata fascia di prezzo del modello. Le velocità di trasferimento sono comunque costanti e senza problemi di connettività.
| Networking | |
| iperf3 transmit AX12 | |
| Alienware x17 R2 P48E | |
| iperf3 receive AX12 | |
| Alienware x17 R2 P48E | |
| iperf3 receive AXE11000 6GHz | |
| Aorus 17X XES | |
| MSI Raider GE77 HX 12UHS | |
| iperf3 receive AXE11000 | |
| Schenker XMG Pro 17 E22 | |
| Razer Blade 17 Early 2022 | |
| Eurocom Nightsky TXi317 | |
| iperf3 transmit AXE11000 6GHz | |
| Aorus 17X XES | |
| iperf3 transmit AXE11000 | |
| Eurocom Nightsky TXi317 | |
Webcam
La fotocamera è solo da 1 MP, senza opzioni da 2 MP, il che è ancora una volta deludente se si considera l'elevata fascia di prezzo del modello.


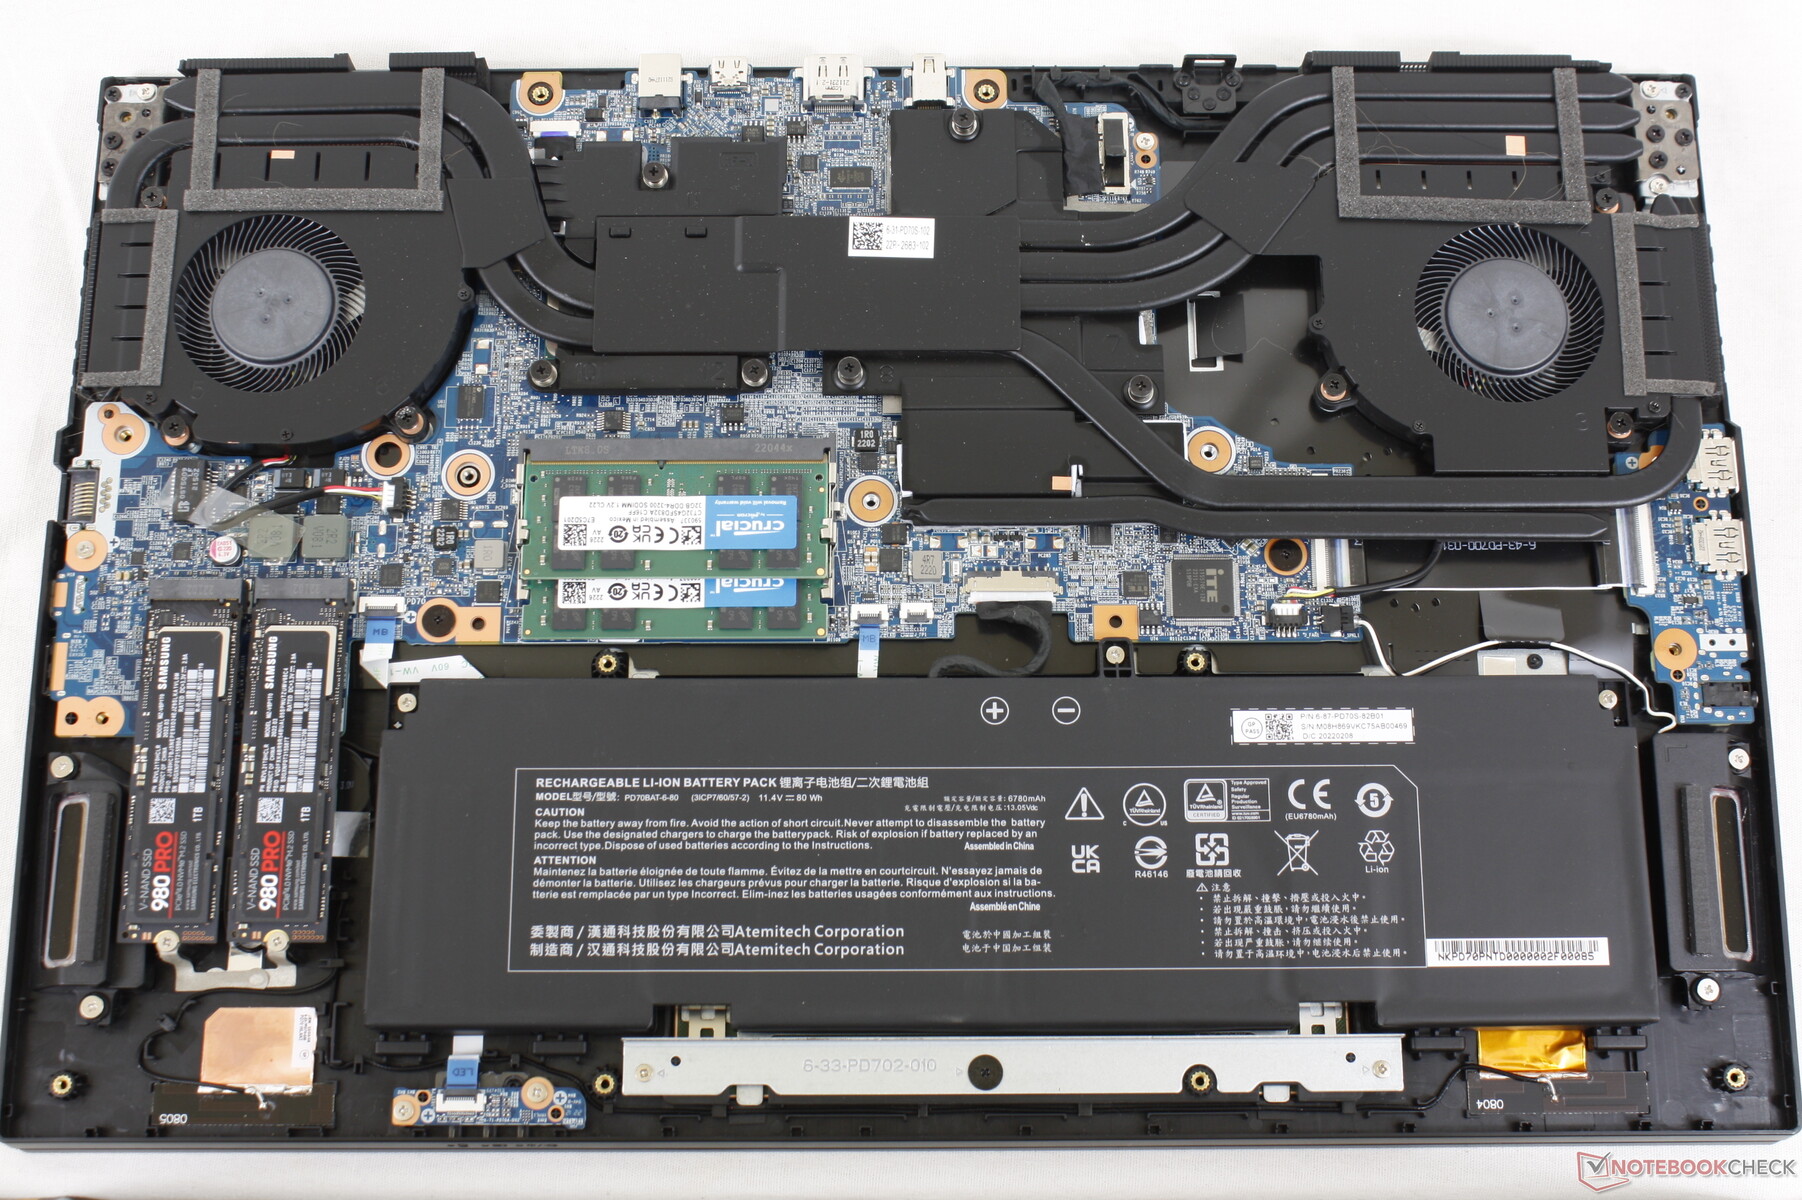
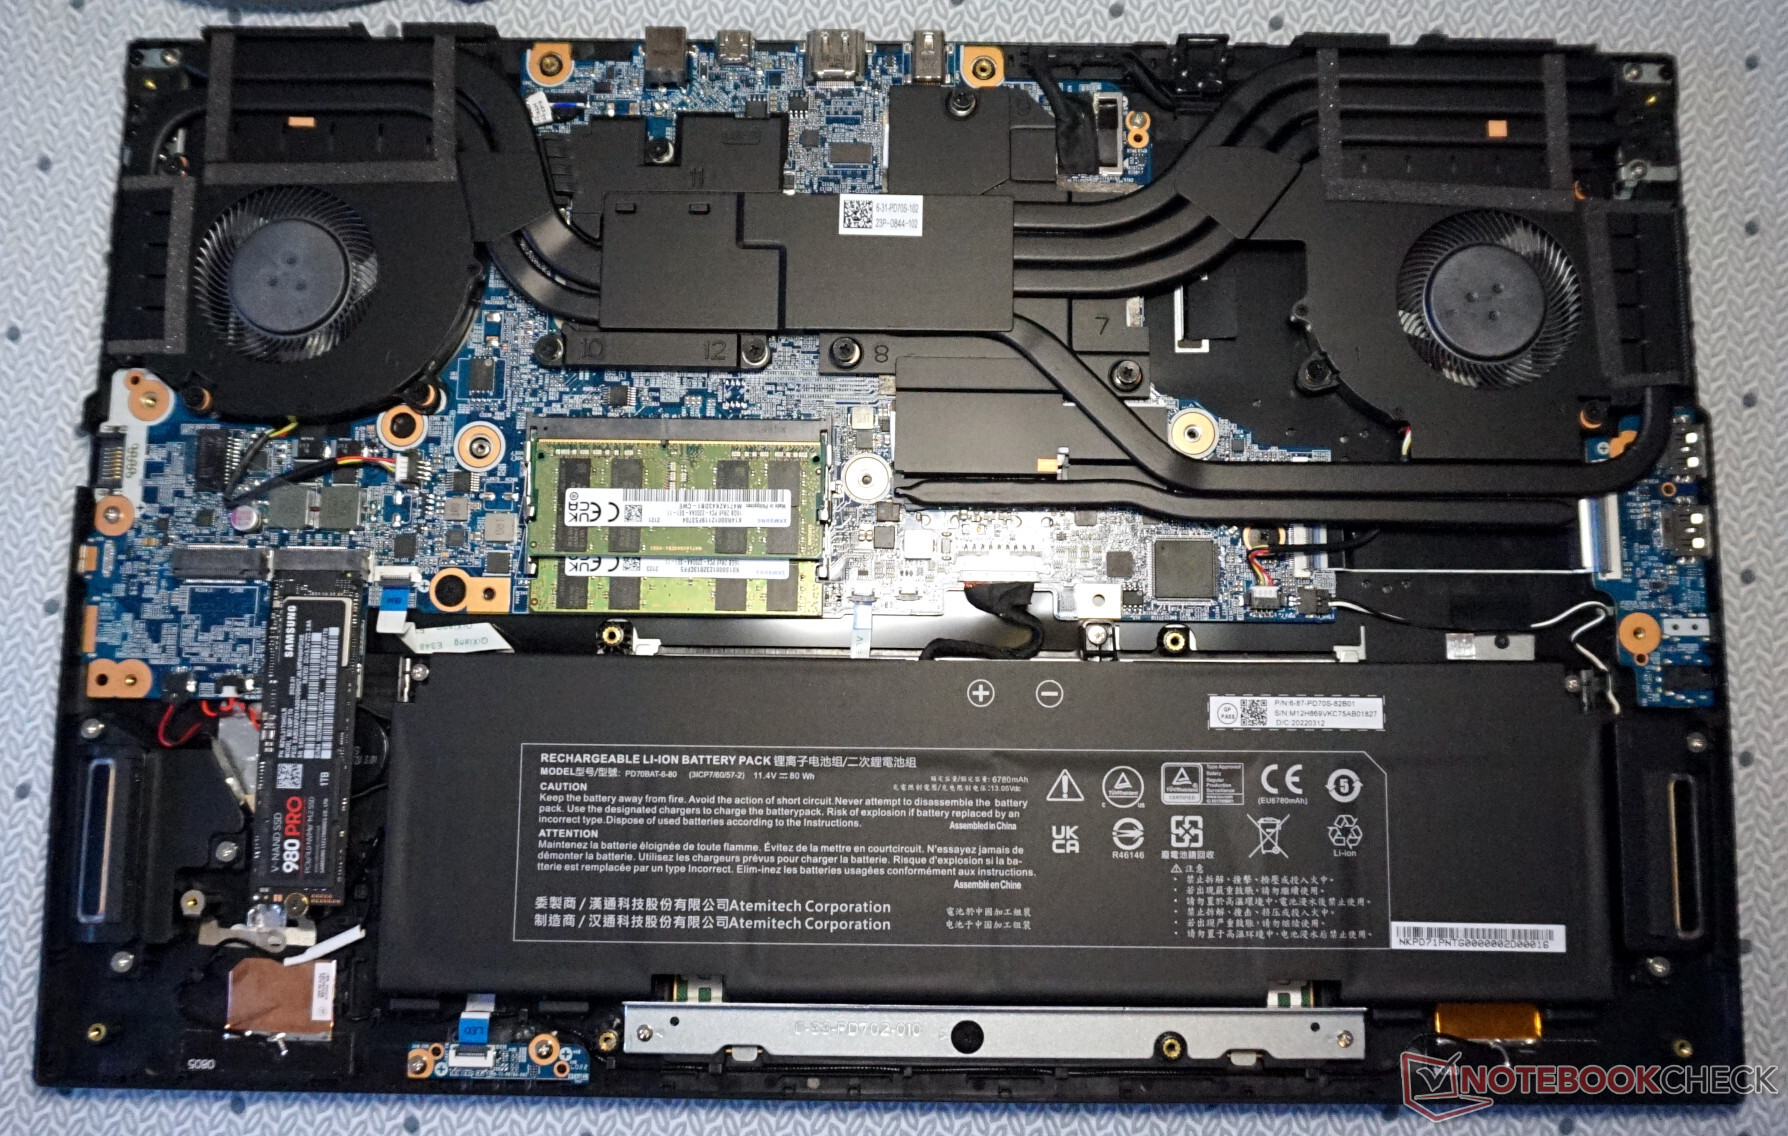
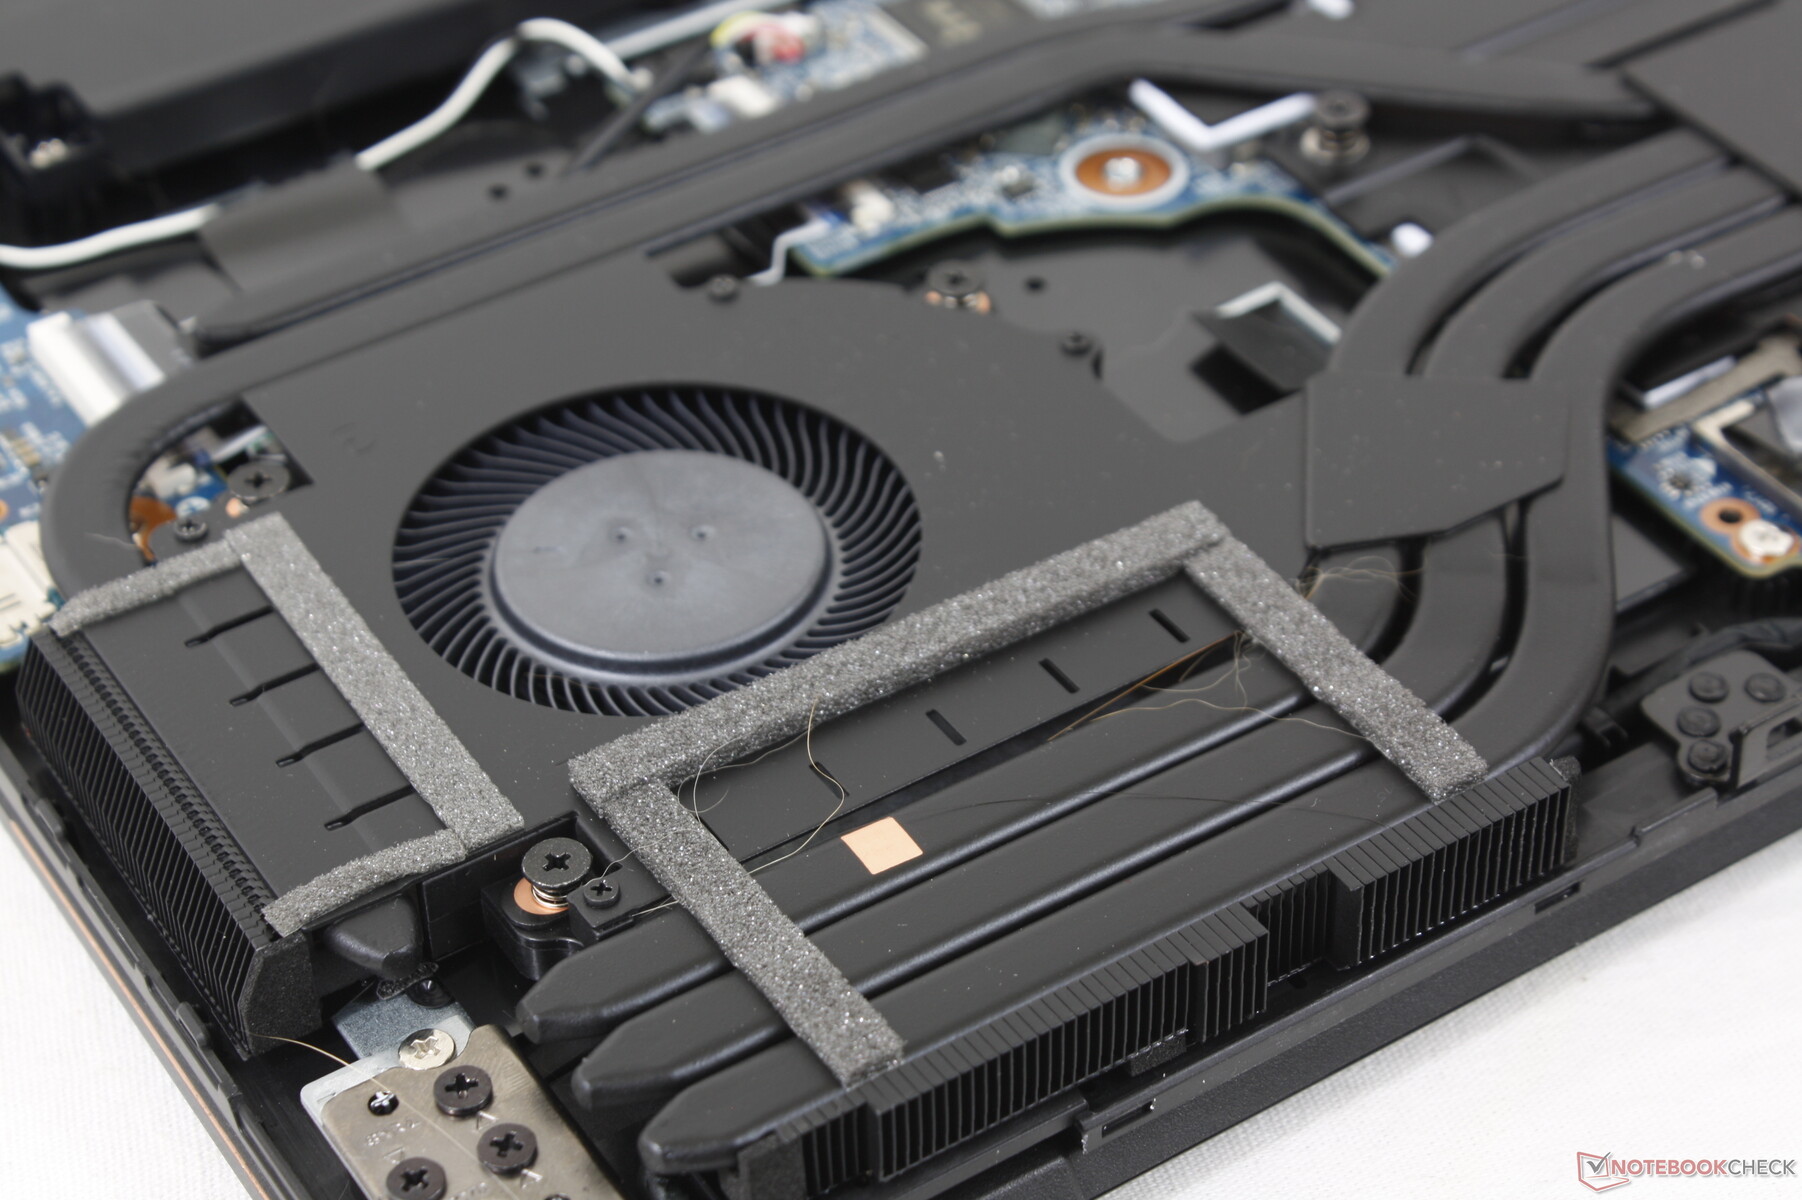
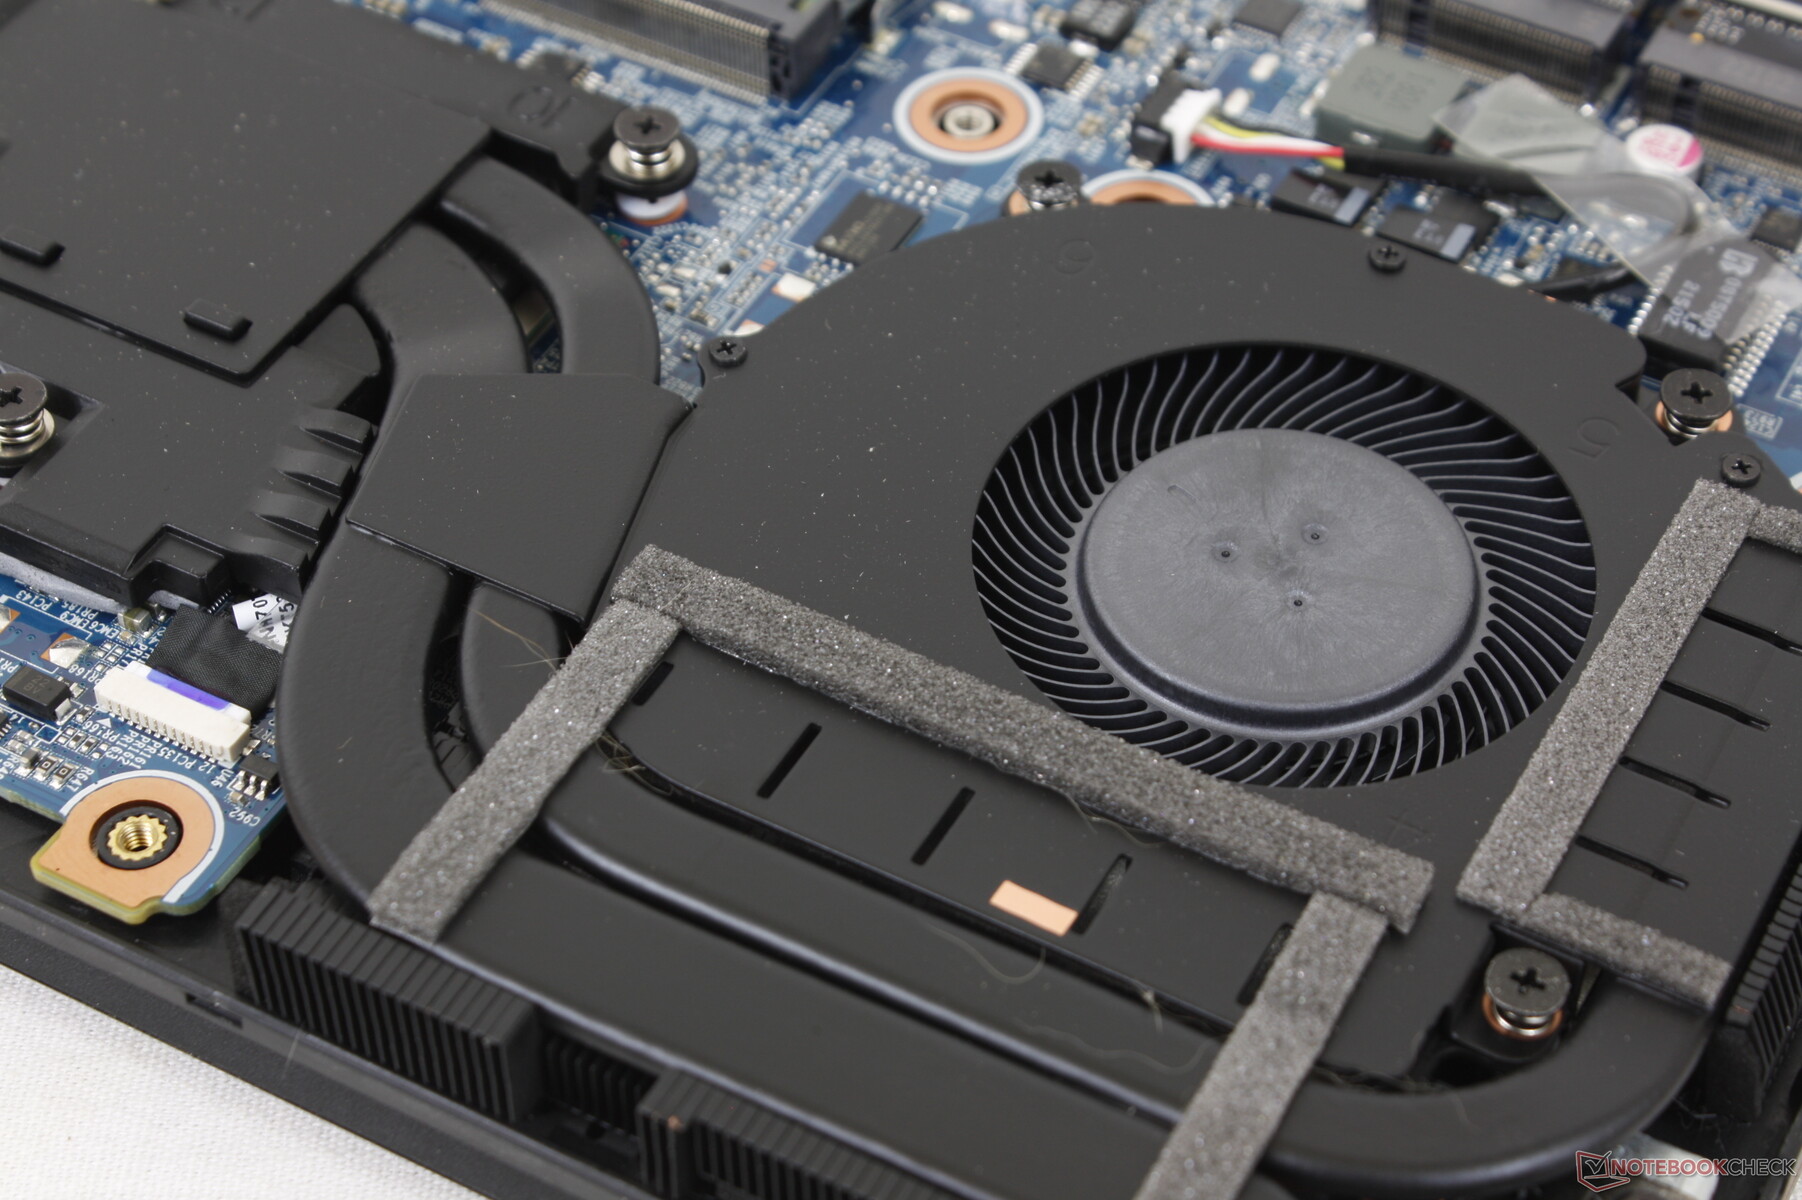
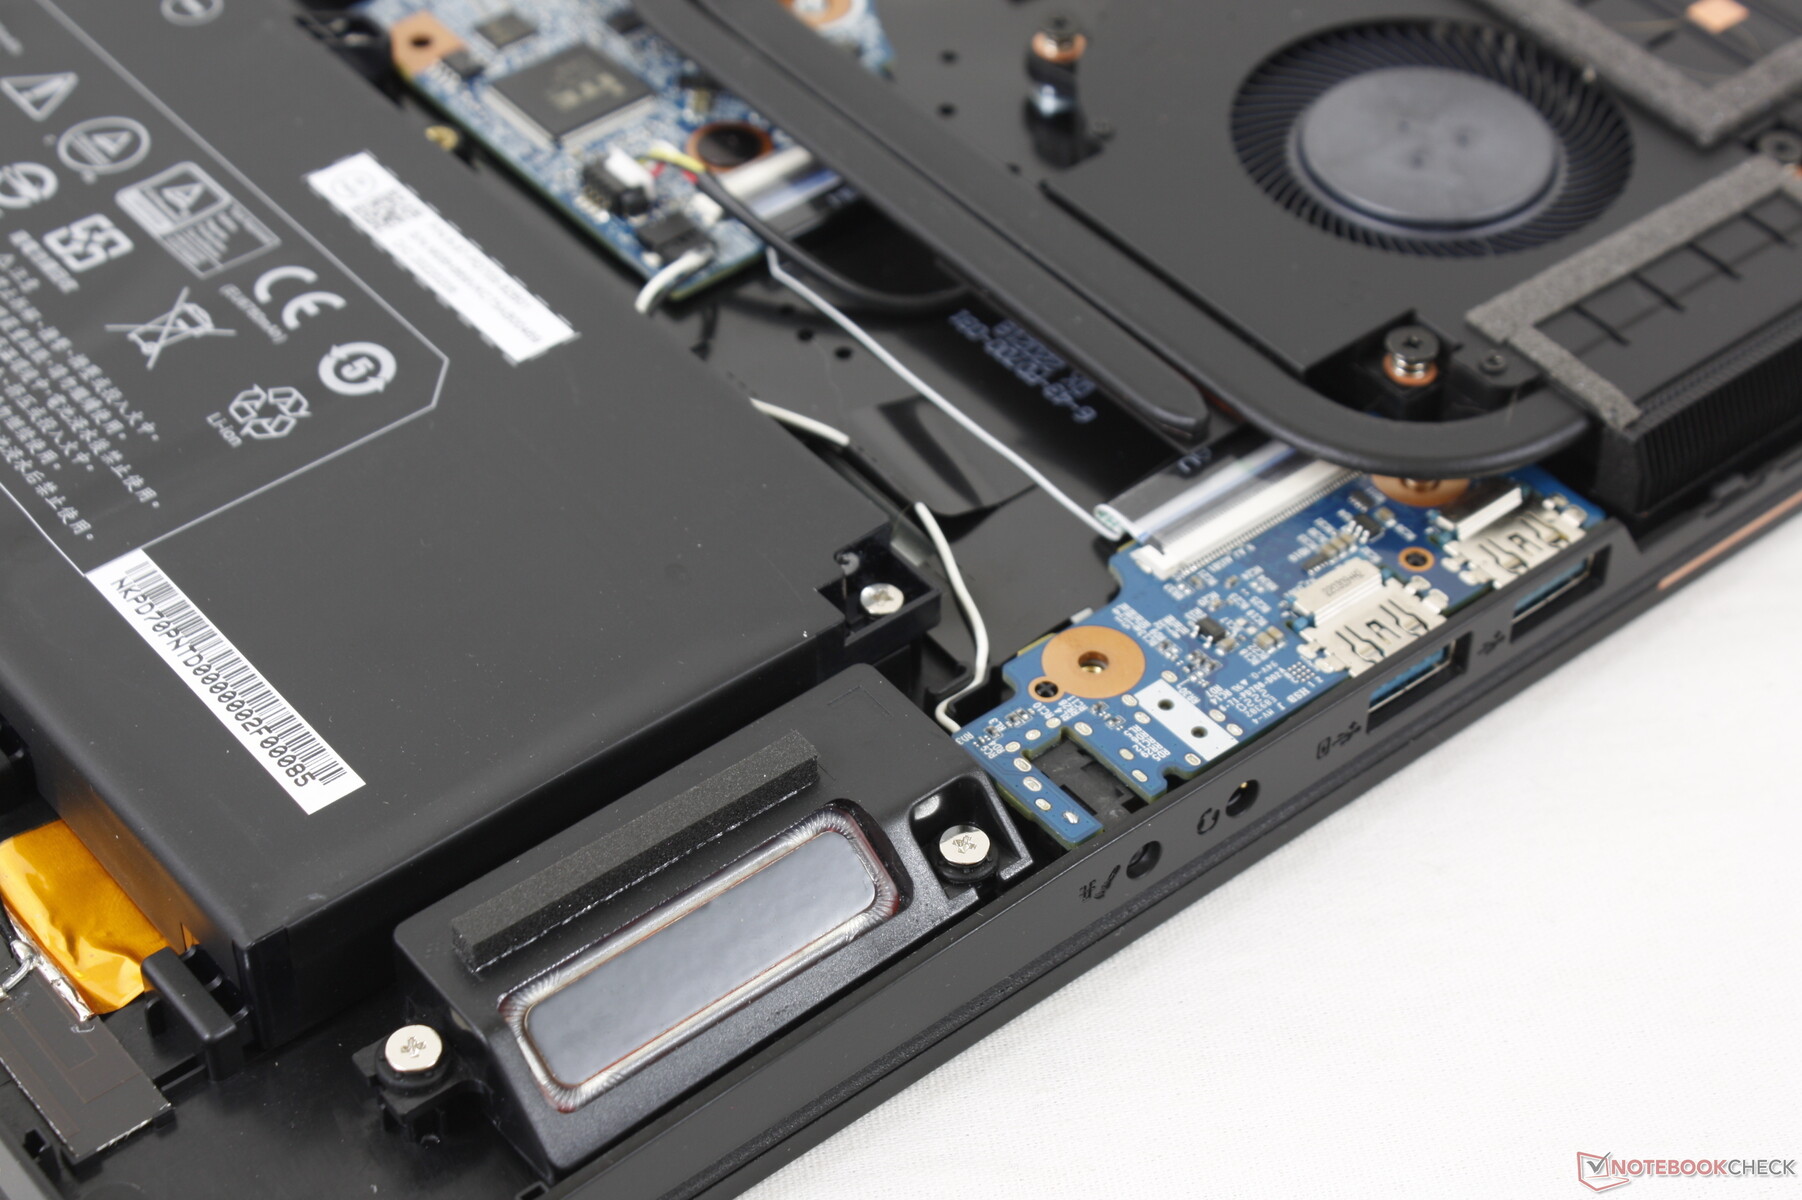
Manutenzione
Il pannello inferiore è fissato da 16 viti Philips per facilitare la manutenzione. La maggior parte degli altri portatili da gioco ha un numero di viti molto inferiore, tuttavia, e quindi occorre un po' più di pazienza per aprire l'Eurocom.
Accessori e garanzia
La confezione al dettaglio non include altri extra oltre all'adattatore CA e alla documentazione. La garanzia standard limitata di un anno del produttore è valida se acquistata negli Stati Uniti.
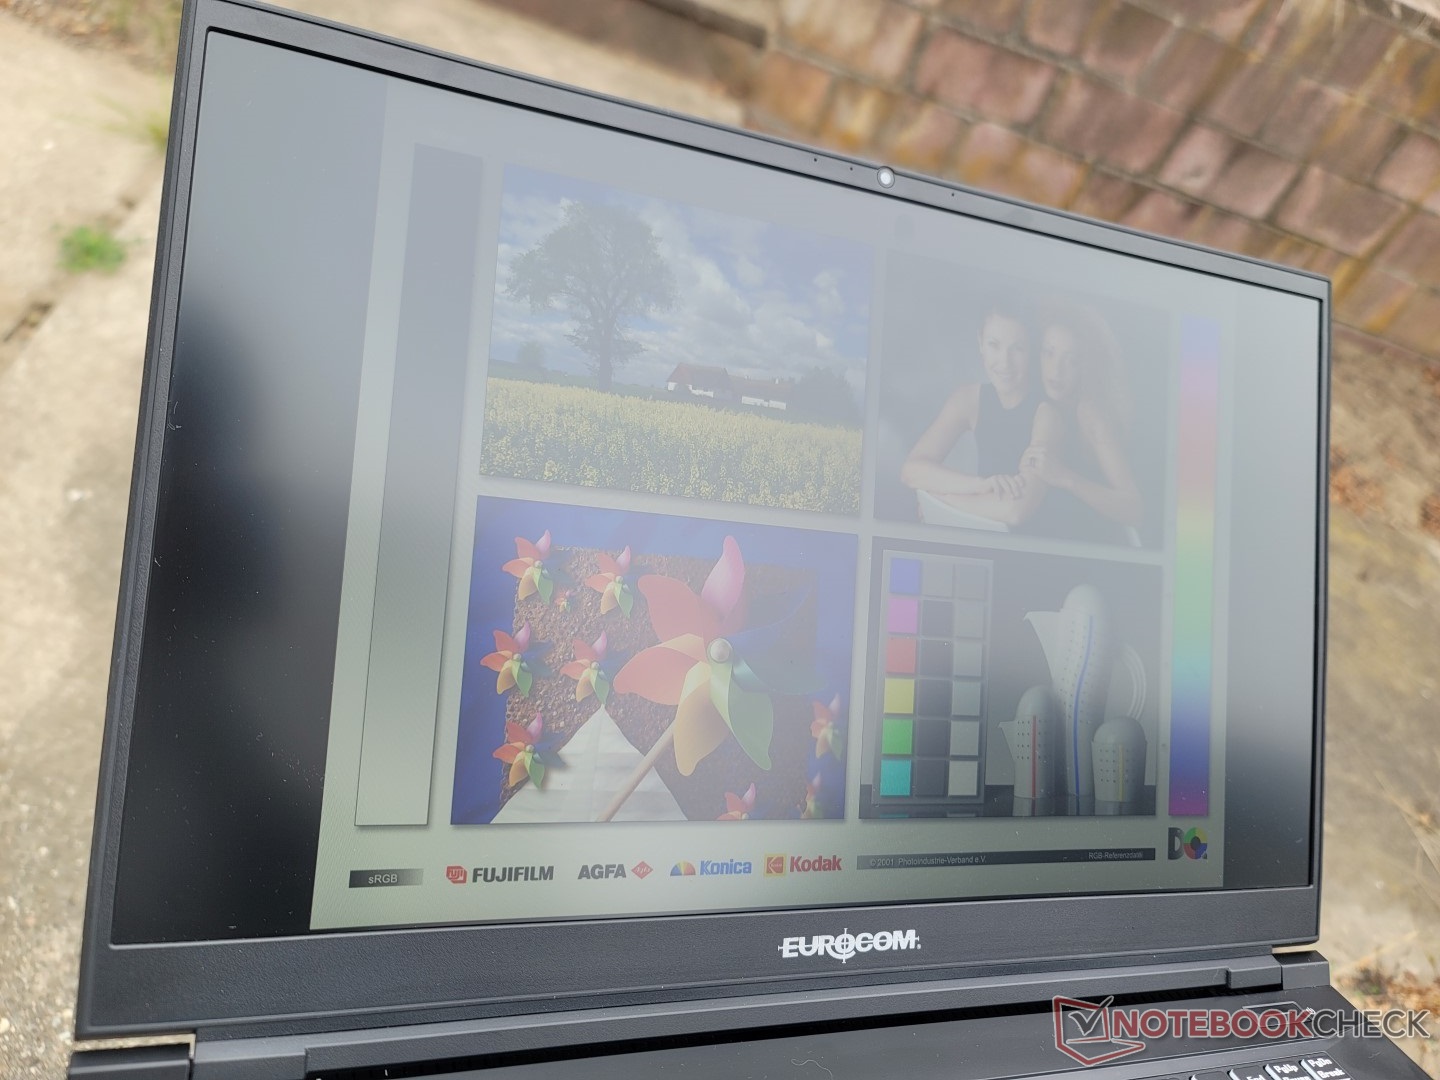
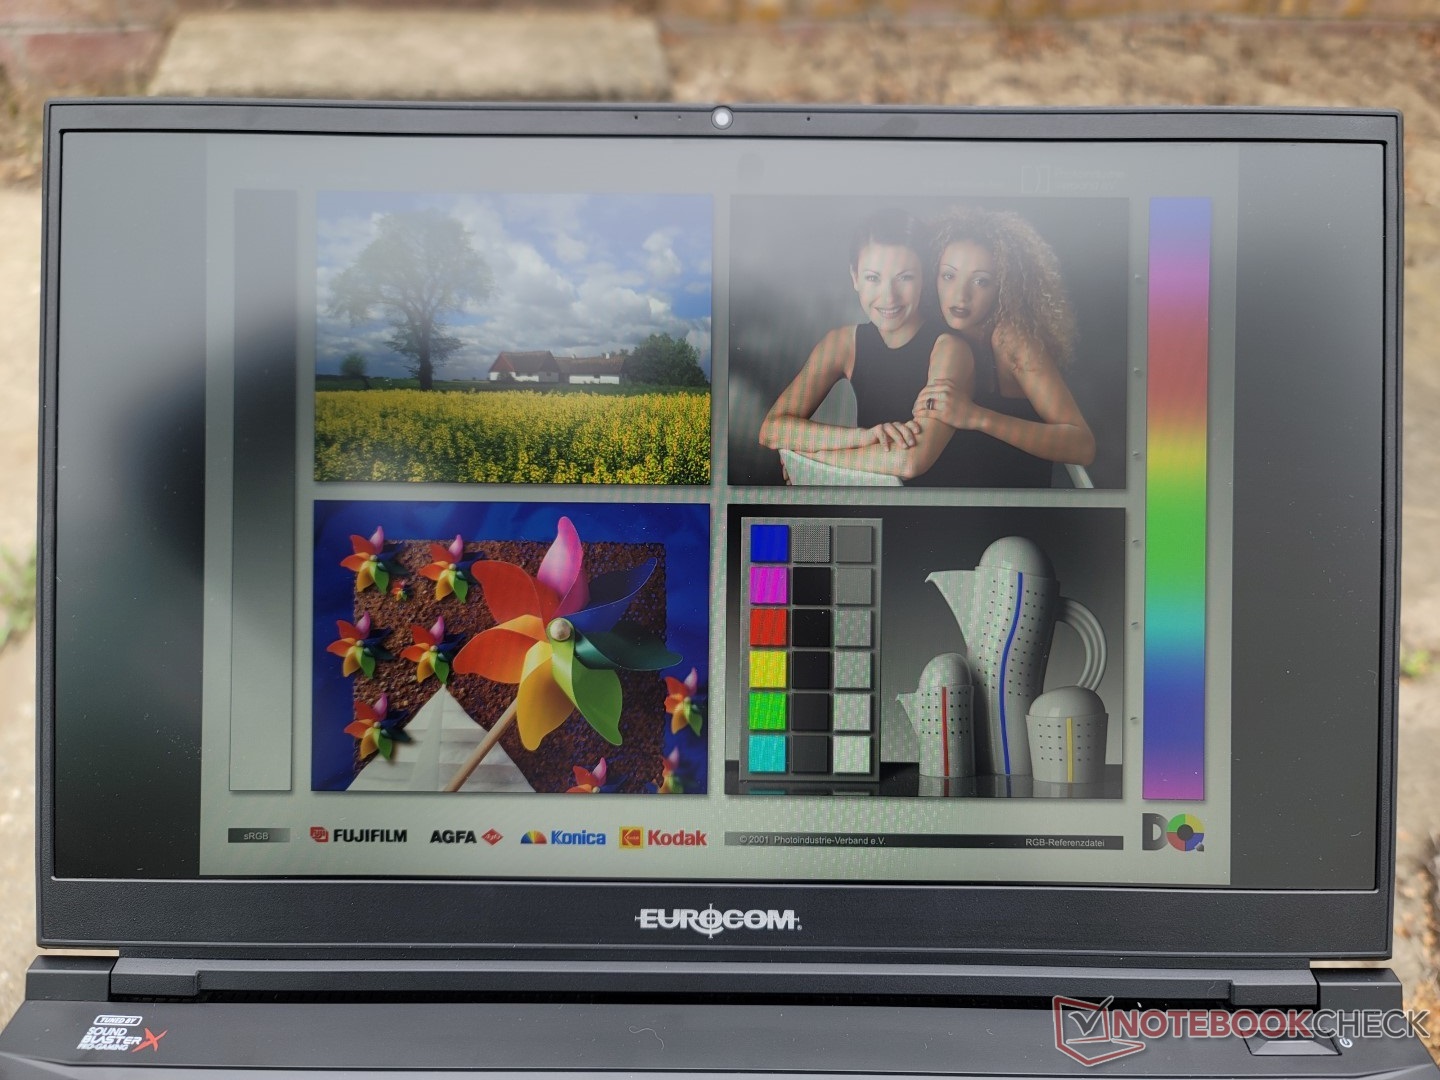
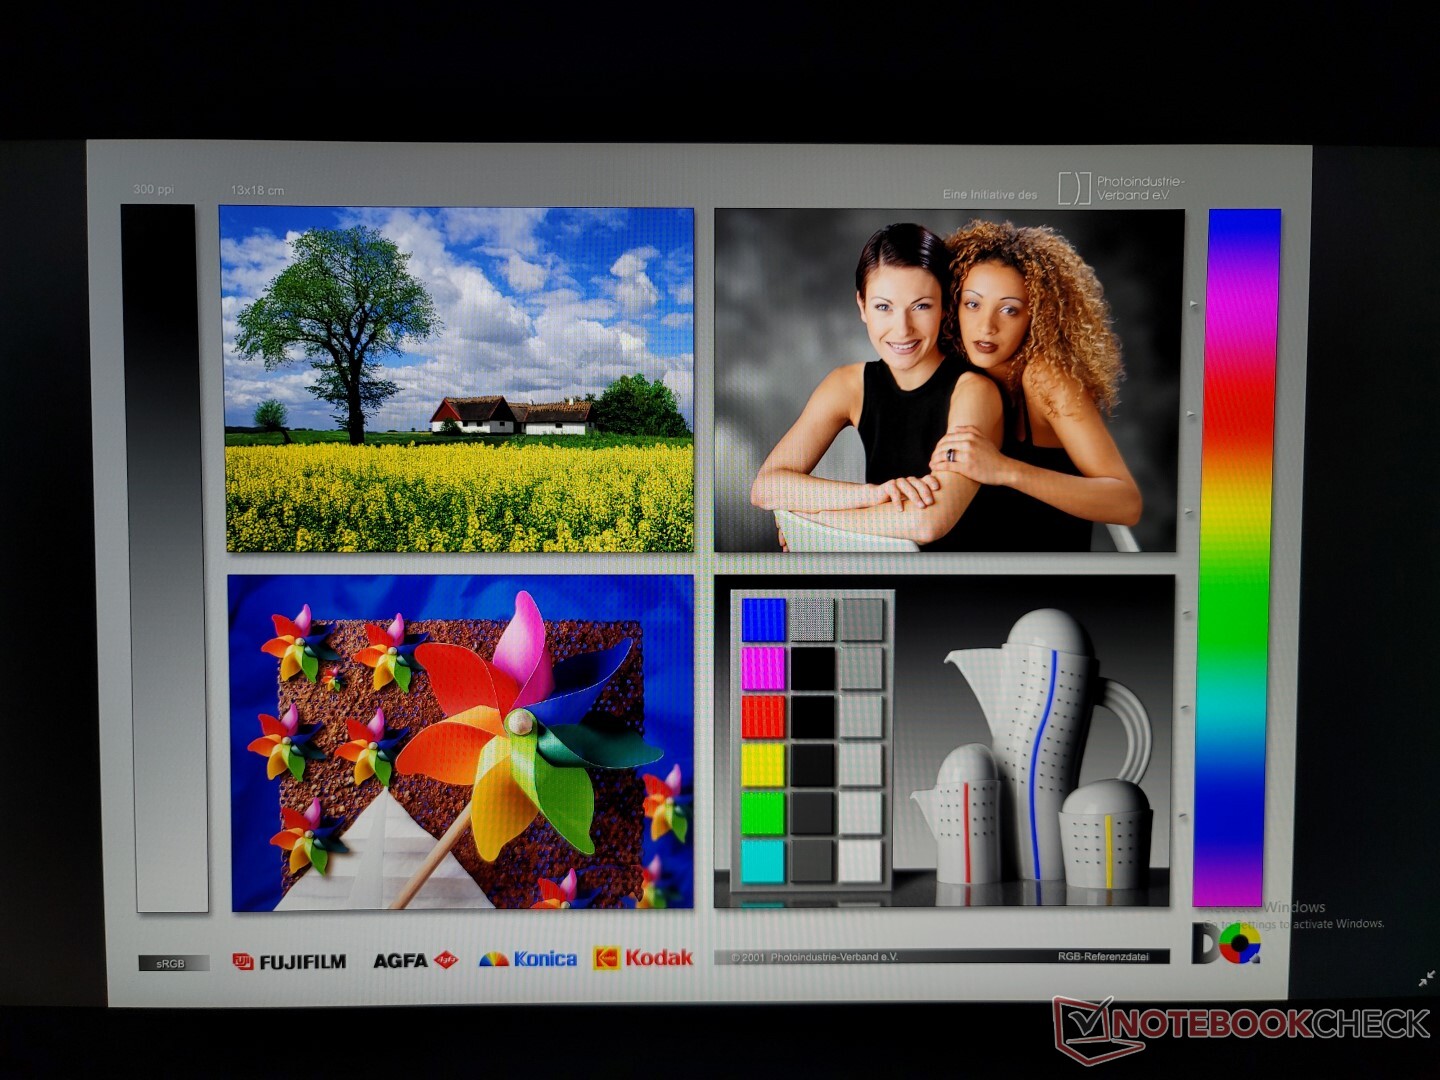
Display
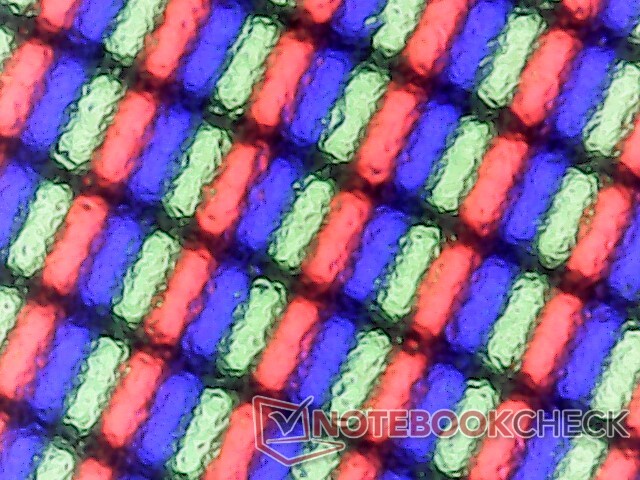
La nostra unità di prova utilizza lo stesso pannello IPS LG Philips LP173WFG-SPB3 presente sul monitor Schenker XMG Focus 17 Schenker XMG Focus 17. Rispetto al pannello BOE a 1440p dell'XMG Pro 17 E22, il nostro pannello LG Philips a 1080p offre colori più ristretti, una frequenza di aggiornamento più lenta e tempi di risposta in bianco e nero più lenti, per essere più un display di fascia media che uno di fascia alta. È comunque molto buono, ma 1440p è sicuramente più adatto di 1080p per un portatile che utilizza una GPU GeForce RTX 3080 Ti.
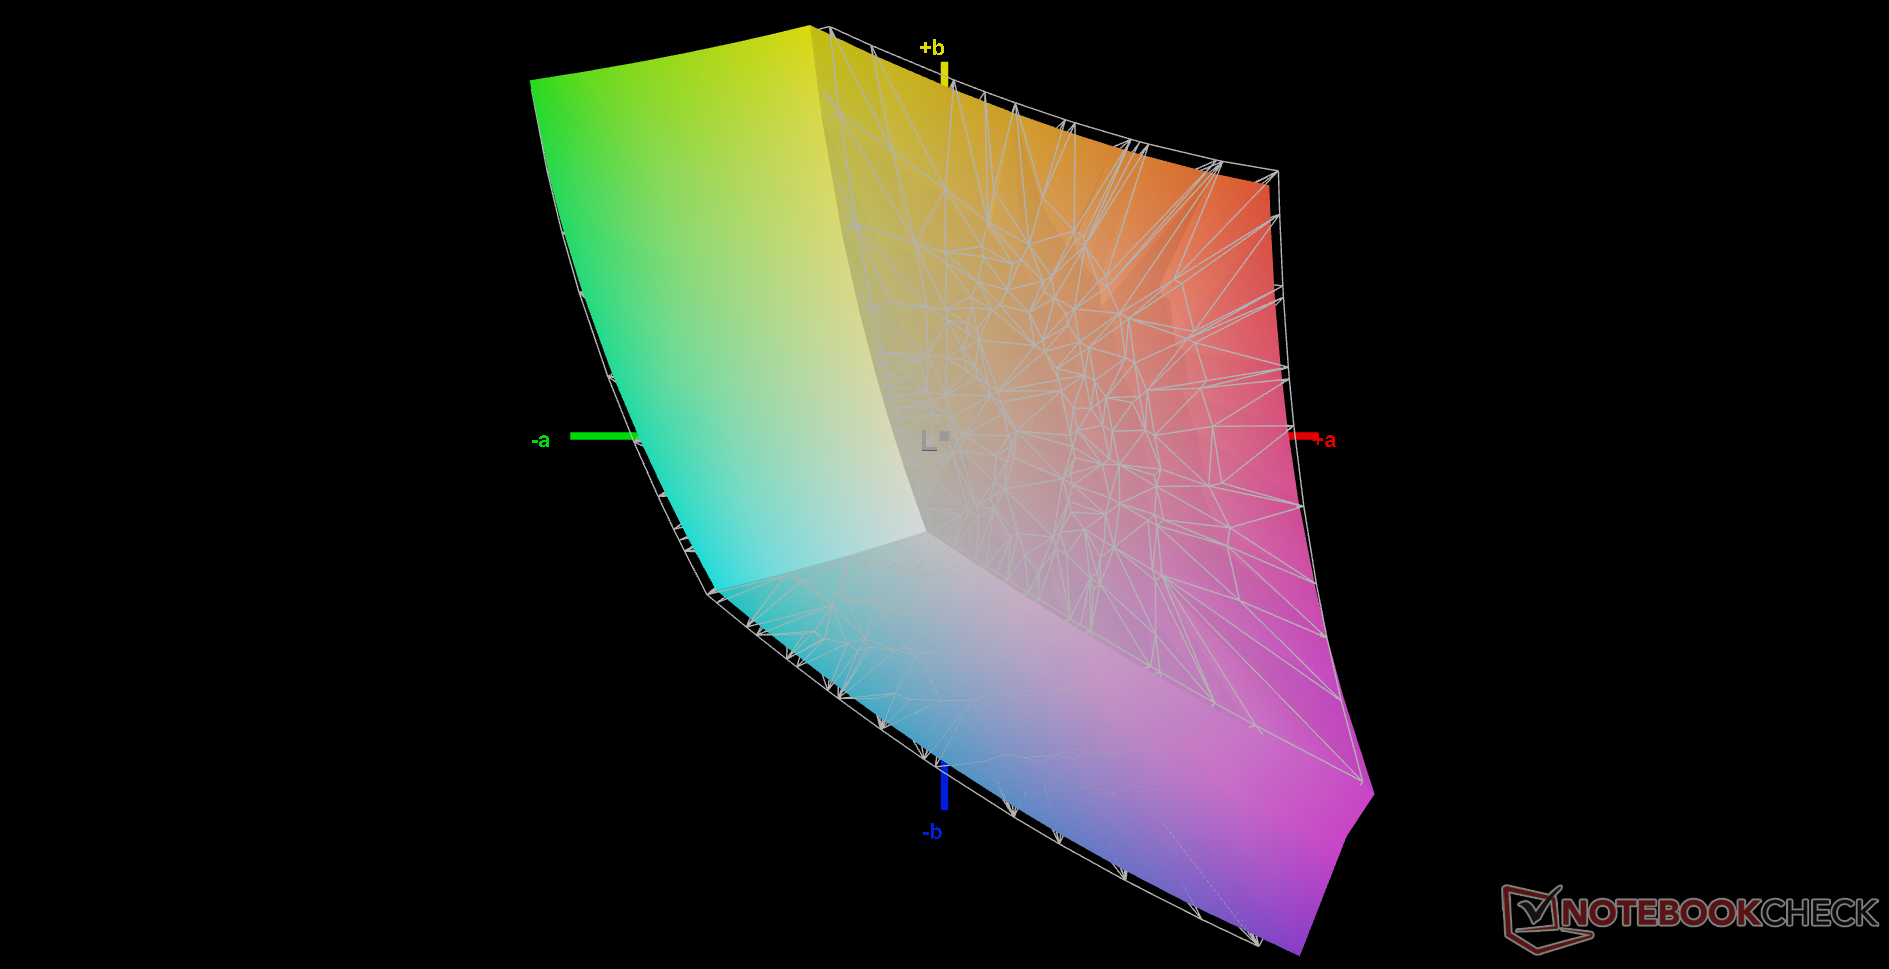
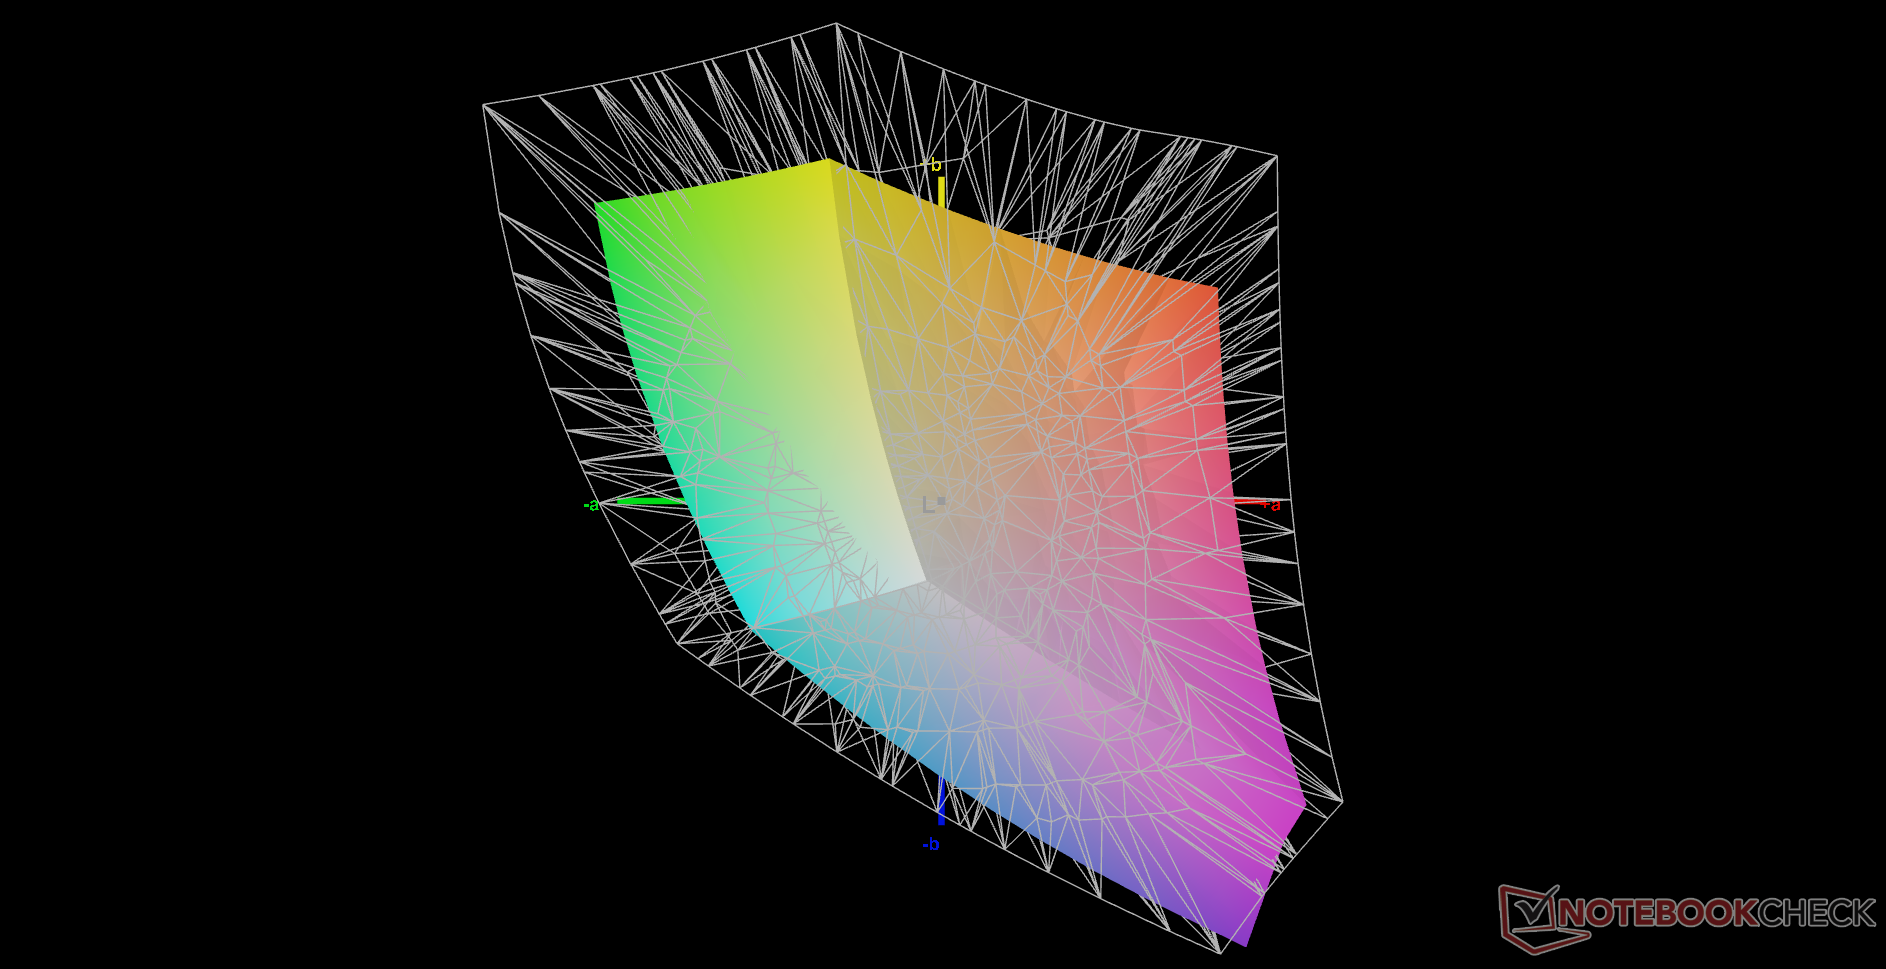
Fortunatamente, il TXi317 è dotato di tre pannelli tra cui scegliere, da 1080p a 4K. Si tenga presente che nessuno di essi è OLED né può offrire una copertura AdobeRGB completa.
- 1080p, 144 Hz, 100% sRGB, IPS
- 1440p, 165 Hz, 100% sRGB, IPS
- 2160p, 60 Hz, 100% sRGB, IPS
| |||||||||||||||||||||||||
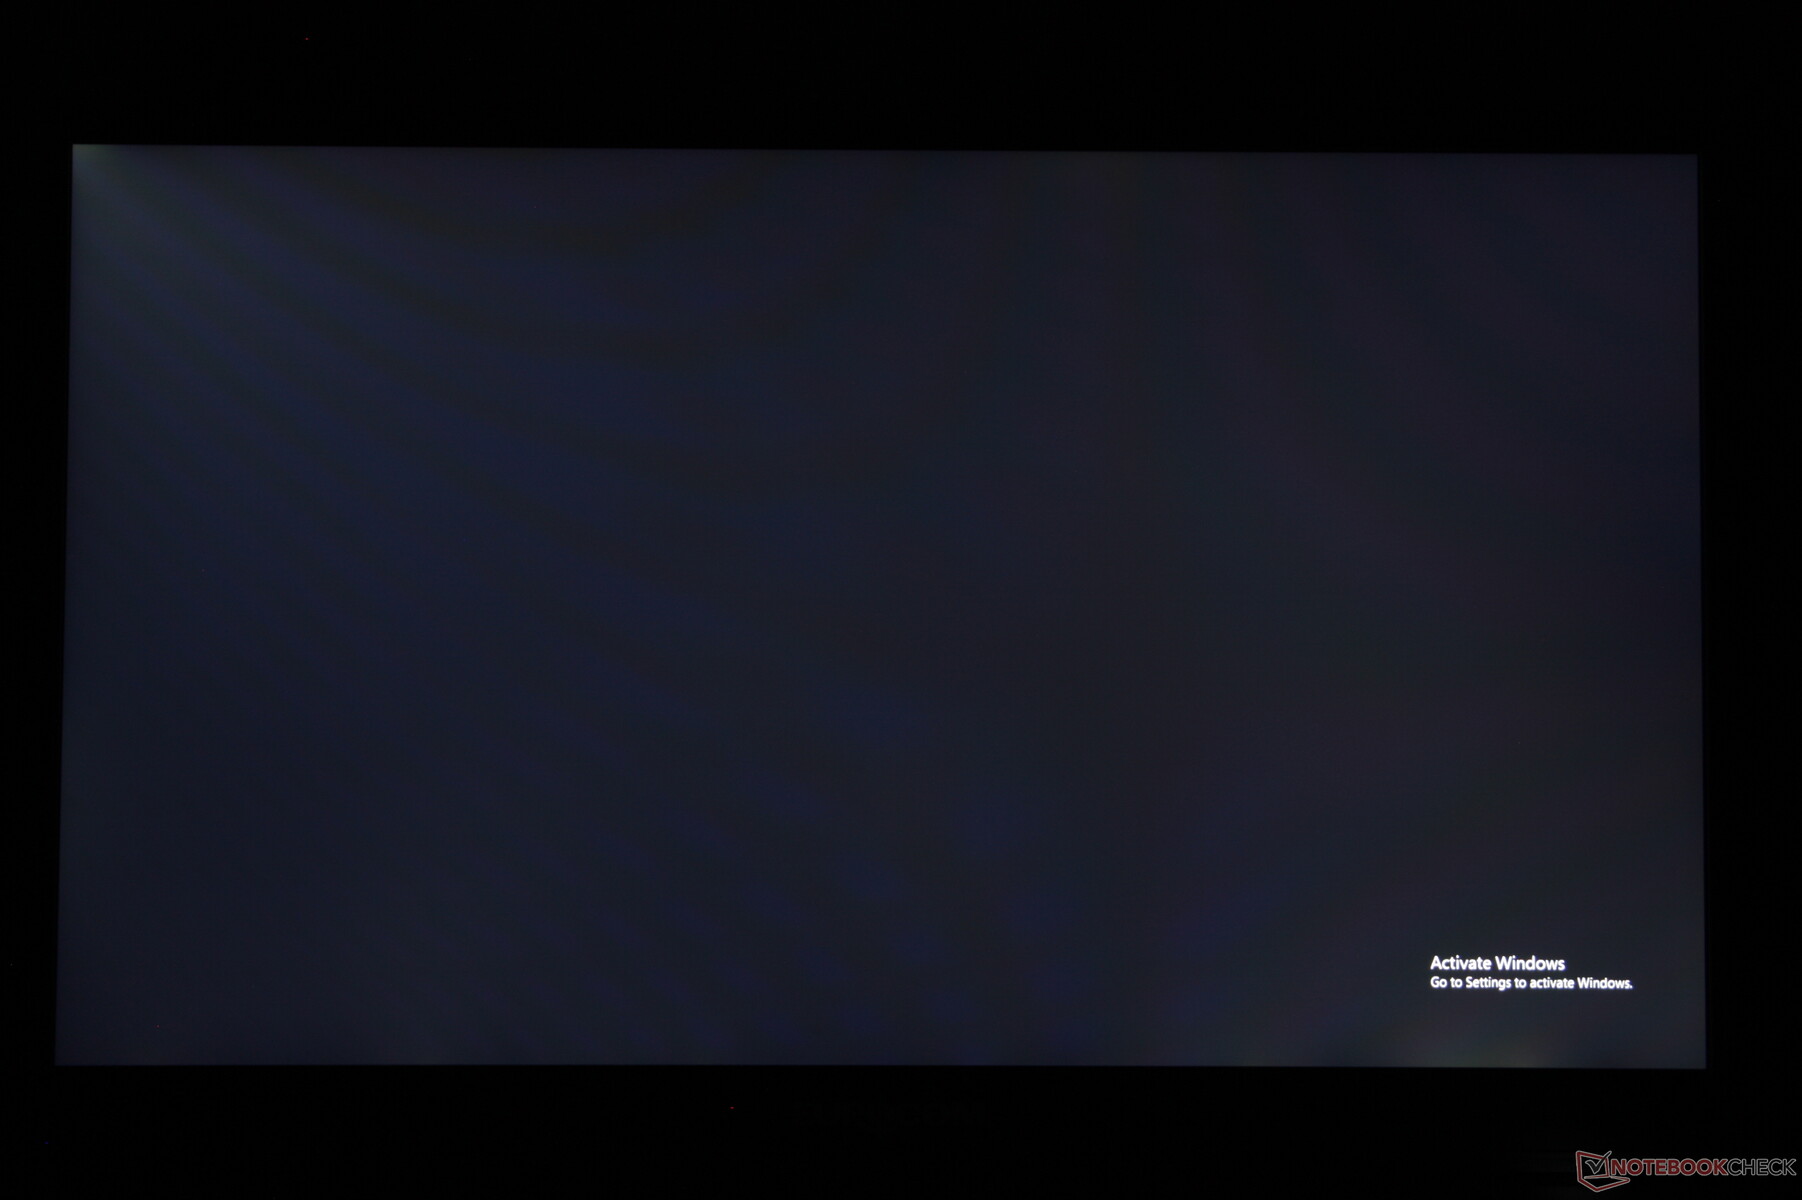
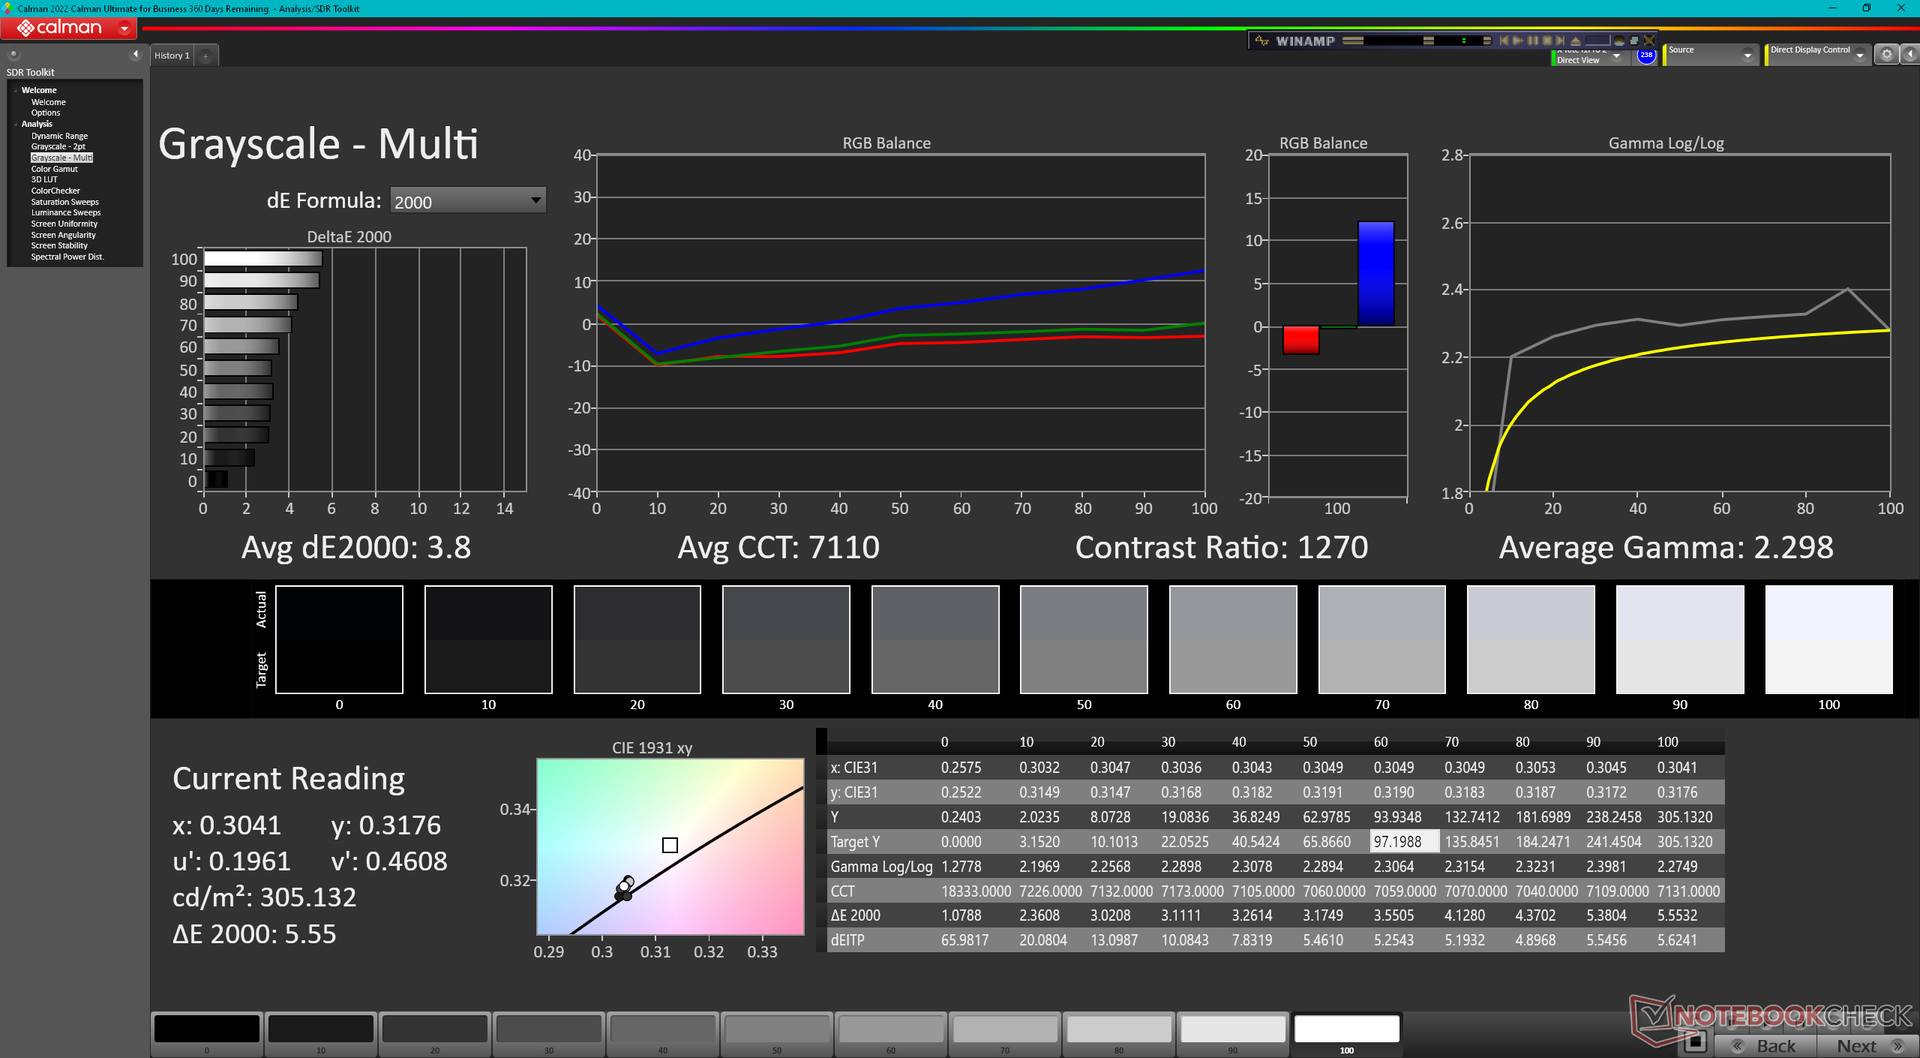
Distribuzione della luminosità: 88 %
Al centro con la batteria: 303.9 cd/m²
Contrasto: 1013:1 (Nero: 0.3 cd/m²)
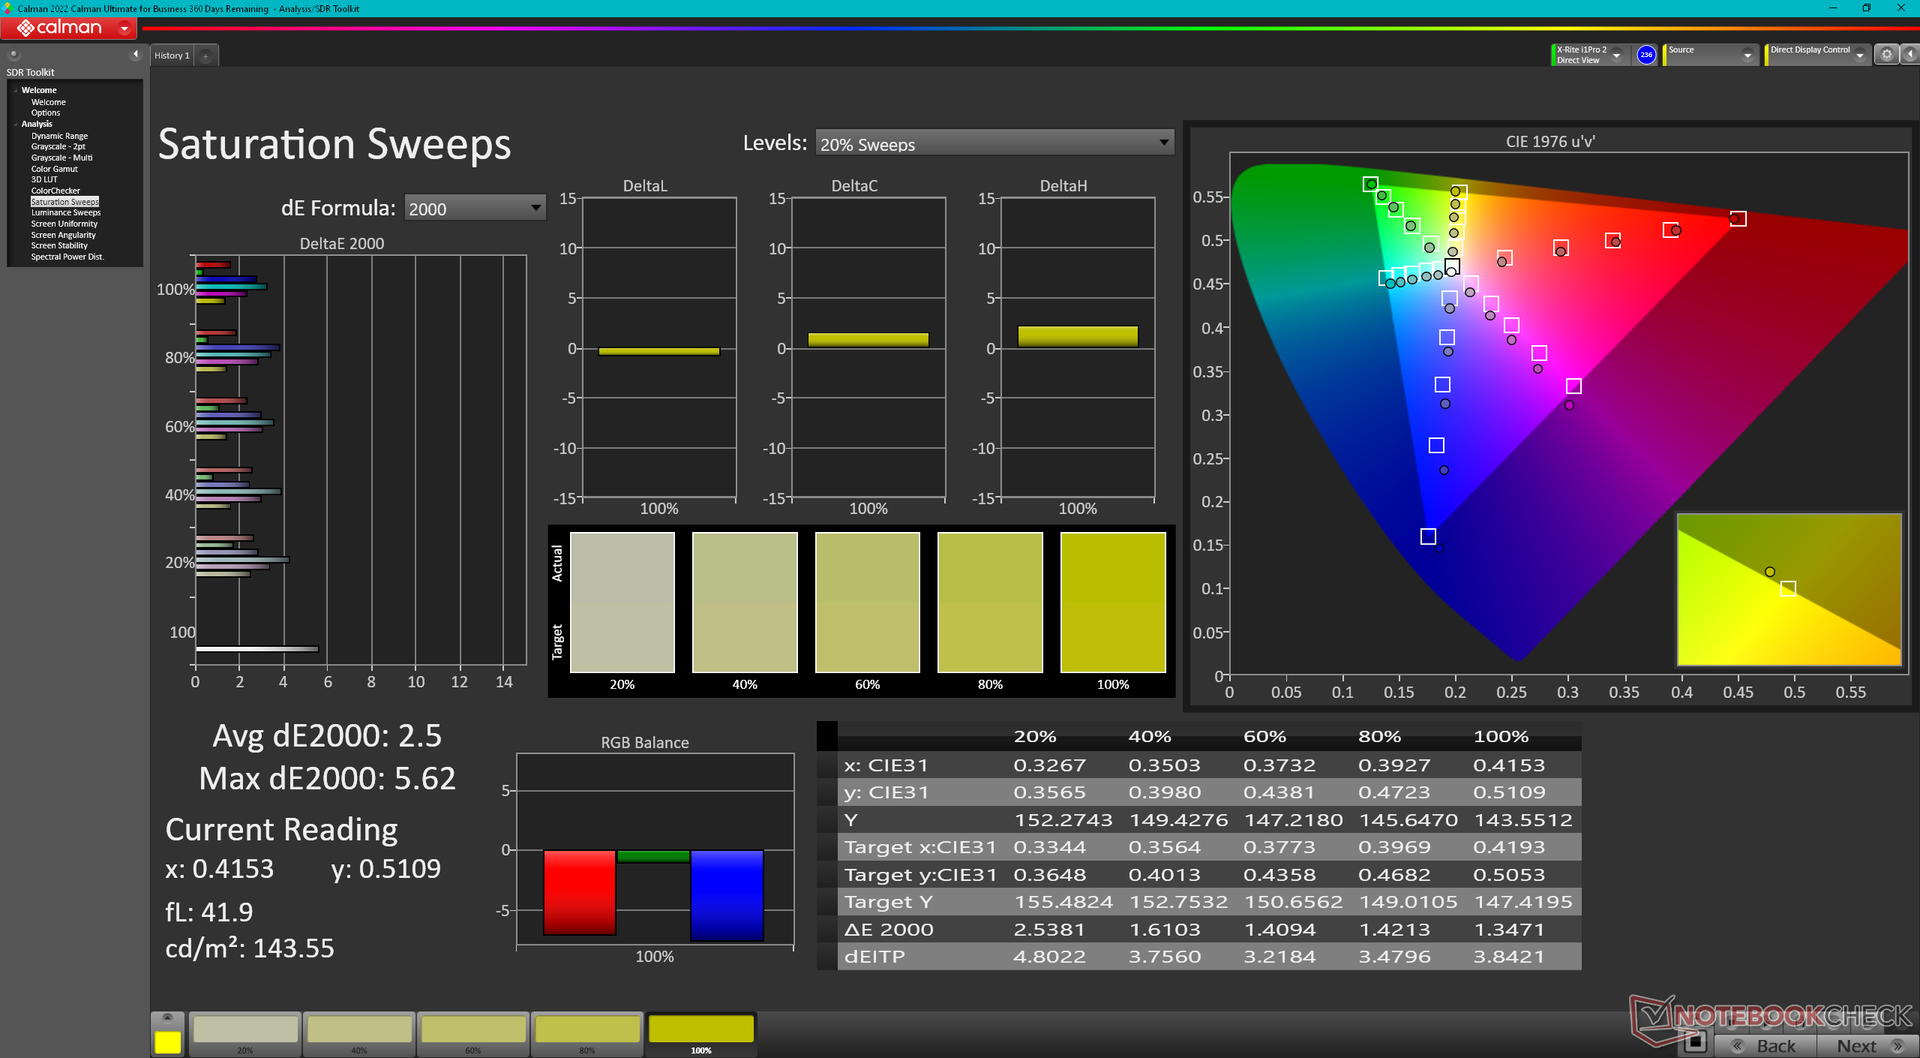
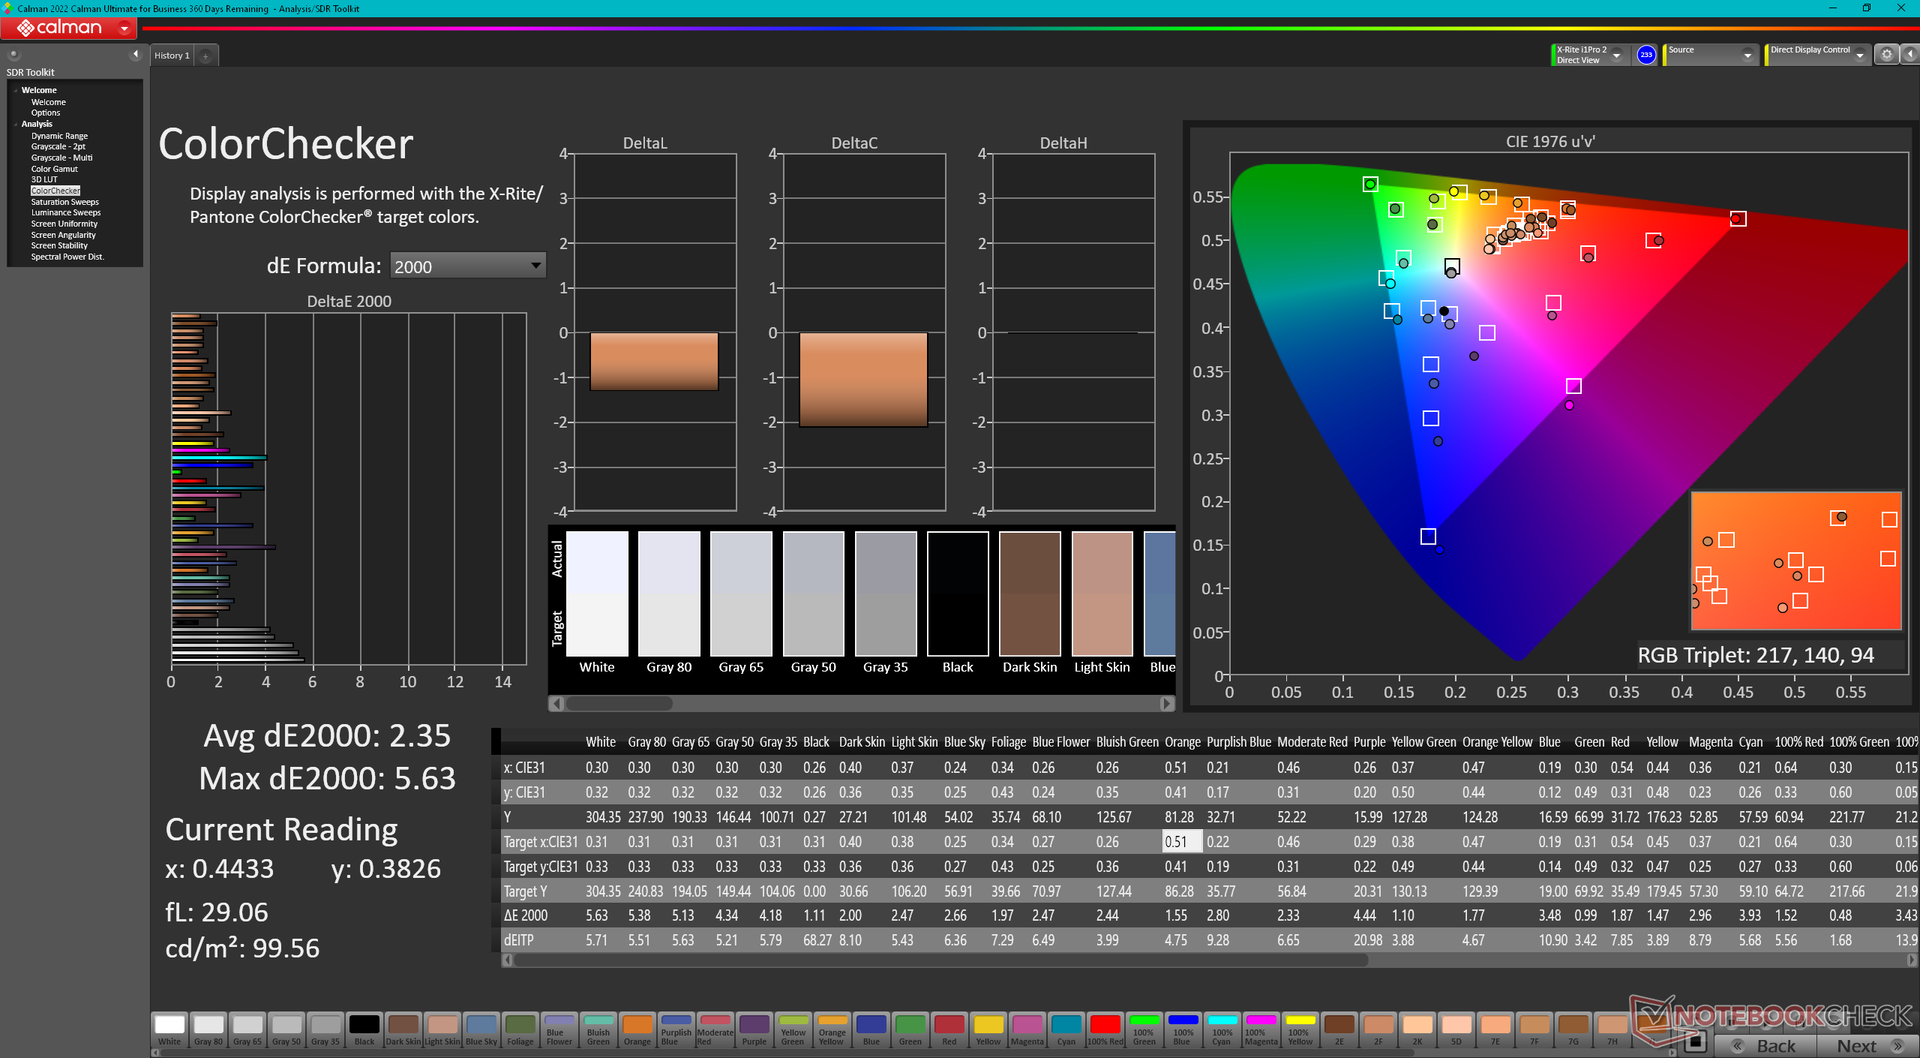
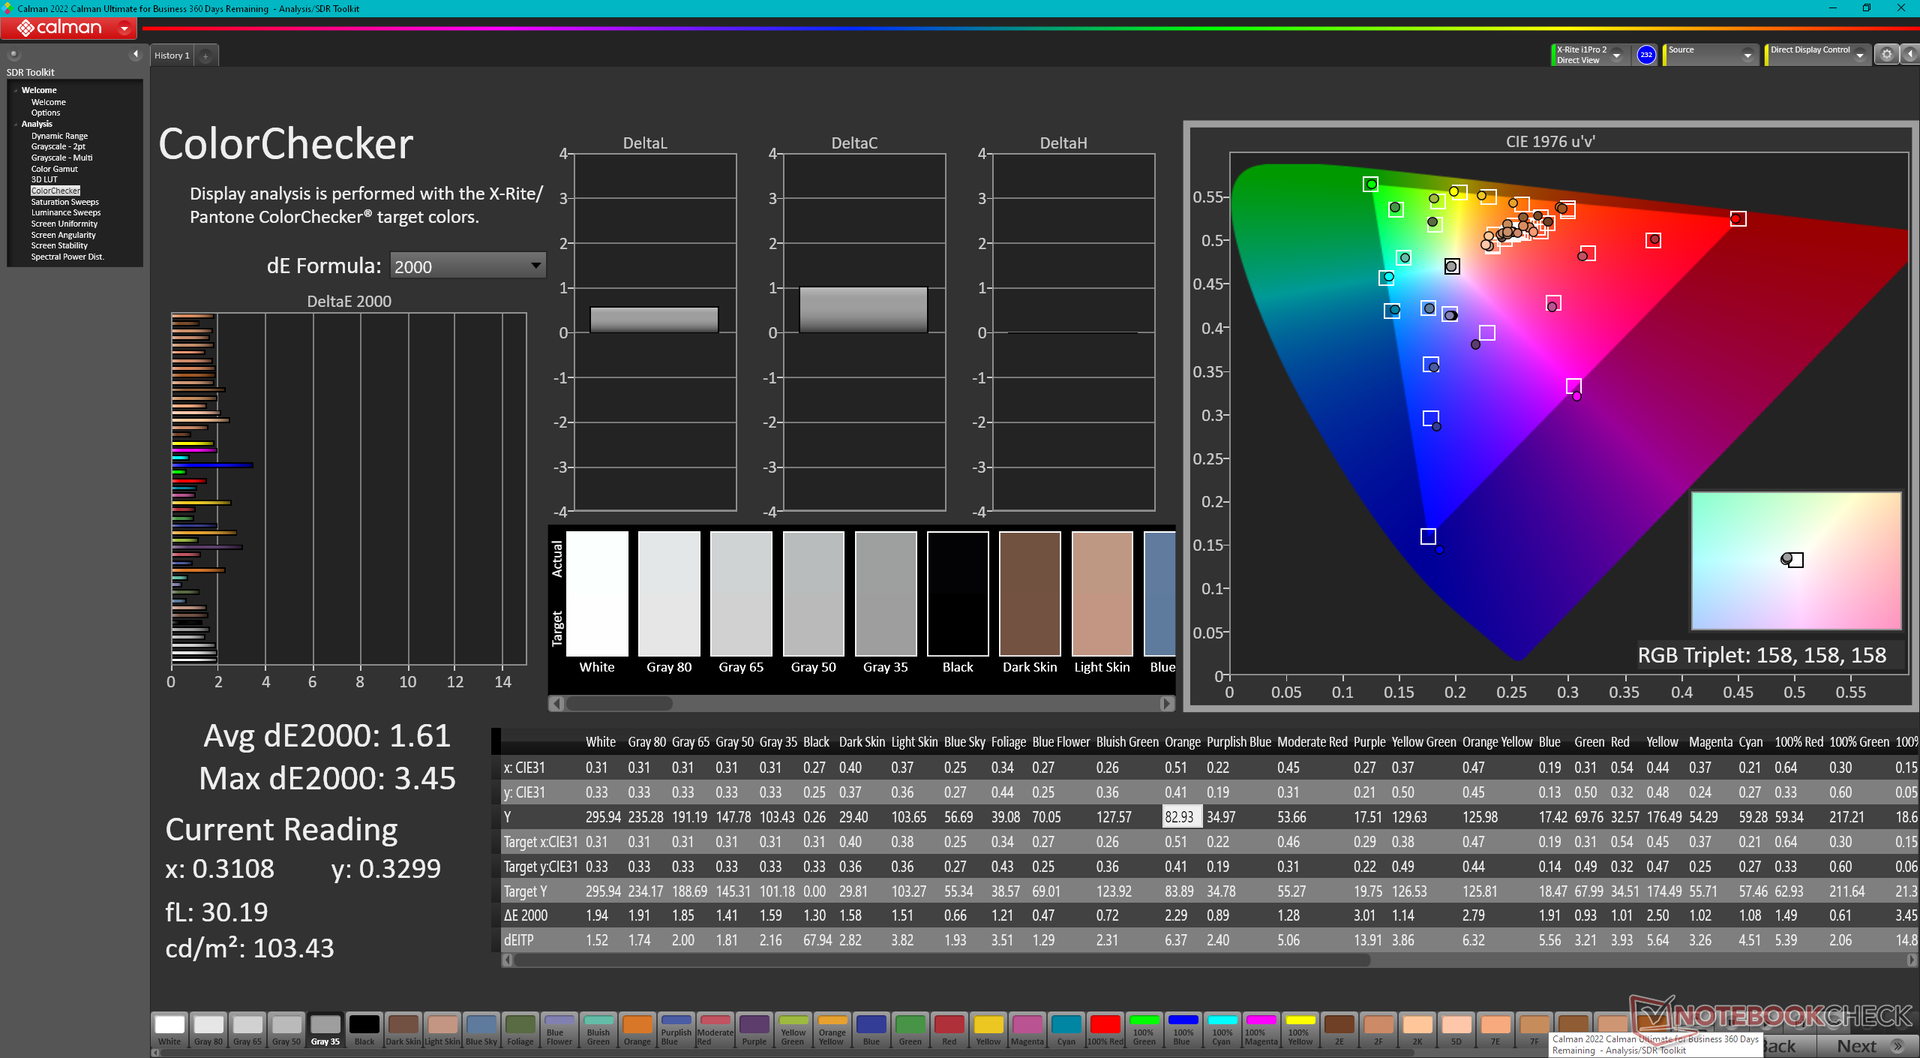
ΔE ColorChecker Calman: 2.35 | ∀{0.5-29.43 Ø4.73}
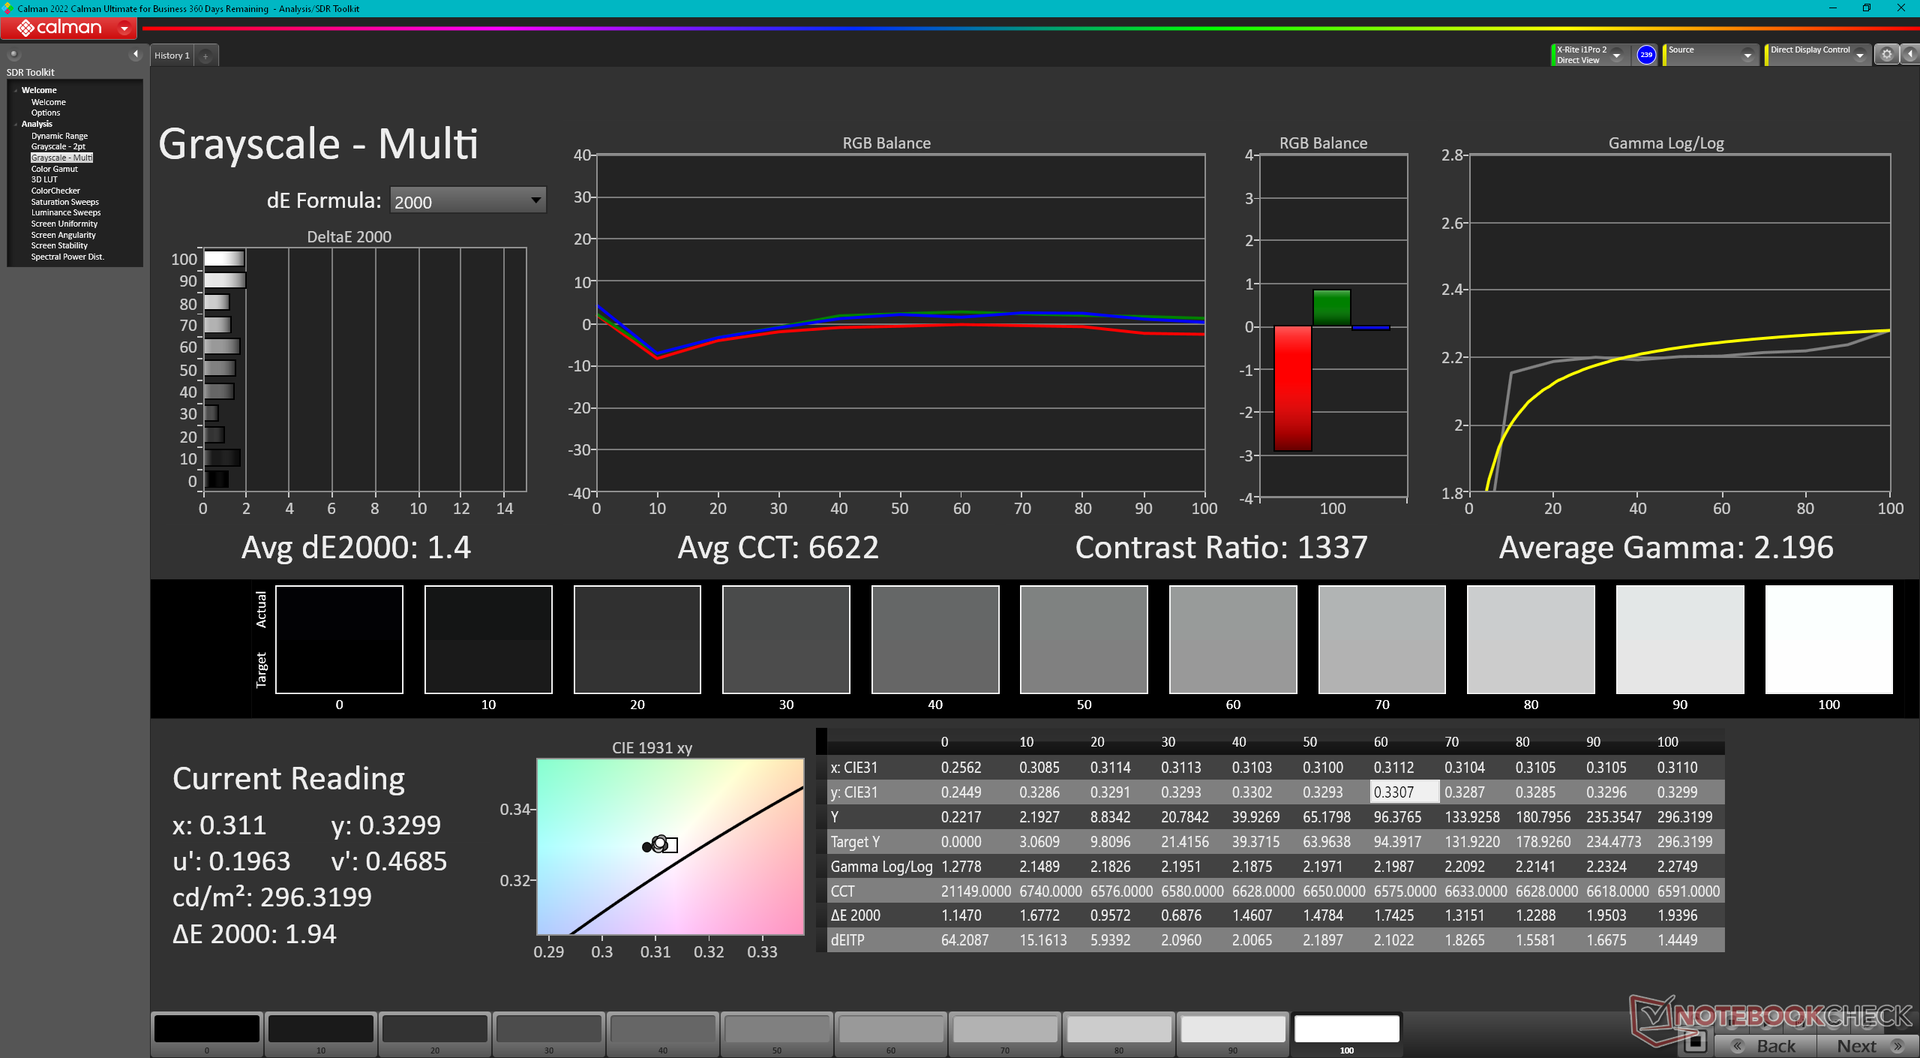
calibrated: 1.61
ΔE Greyscale Calman: 3.8 | ∀{0.09-98 Ø4.97}
65.4% AdobeRGB 1998 (Argyll 3D)
95.2% sRGB (Argyll 3D)
64.5% Display P3 (Argyll 3D)
Gamma: 2.3
CCT: 7110 K
| Eurocom Nightsky TXi317 LG Philips LP173WFG-SPB3, IPS, 1920x1080, 17.3" | Schenker XMG Pro 17 E22 BOE099D, IPS, 2560x1440, 17.3" | Aorus 17X XES Sharp SHP1563, IPS, 1920x1080, 17.3" | MSI Raider GE77 HX 12UHS AU Optronics B173ZAN06.1, IPS, 3840x2160, 17.3" | Razer Blade 17 Early 2022 AU Optronics B173ZAN06.9, IPS, 3840x2160, 17.3" | Alienware x17 R2 P48E AU Optronics B173HAN, IPS, 1920x1080, 17.3" | |
|---|---|---|---|---|---|---|
| Display | 29% | 8% | 29% | 31% | 17% | |
| Display P3 Coverage (%) | 64.5 | 97.5 51% | 70.1 9% | 96.6 50% | 99.4 54% | 79.2 23% |
| sRGB Coverage (%) | 95.2 | 99.9 5% | 99.9 5% | 99.8 5% | 100 5% | 99.8 5% |
| AdobeRGB 1998 Coverage (%) | 65.4 | 85.2 30% | 71.9 10% | 85.8 31% | 87.3 33% | 79.6 22% |
| Response Times | 44% | 58% | 47% | 39% | -1% | |
| Response Time Grey 50% / Grey 80% * (ms) | 10.4 ? | 5.4 ? 48% | 3.4 ? 67% | 5.8 ? 44% | 7.5 ? 28% | 12.4 ? -19% |
| Response Time Black / White * (ms) | 11.2 ? | 6.8 ? 39% | 5.8 ? 48% | 5.6 ? 50% | 5.6 ? 50% | 9.2 ? 18% |
| PWM Frequency (Hz) | ||||||
| Screen | 5% | -24% | -19% | 33% | 2% | |
| Brightness middle (cd/m²) | 303.9 | 349 15% | 278 -9% | 381 25% | 503 66% | 365.4 20% |
| Brightness (cd/m²) | 292 | 319 9% | 273 -7% | 371 27% | 486 66% | 344 18% |
| Brightness Distribution (%) | 88 | 83 -6% | 79 -10% | 84 -5% | 84 -5% | 85 -3% |
| Black Level * (cd/m²) | 0.3 | 0.32 -7% | 0.26 13% | 0.52 -73% | 0.44 -47% | 0.29 3% |
| Contrast (:1) | 1013 | 1091 8% | 1069 6% | 733 -28% | 1143 13% | 1260 24% |
| Colorchecker dE 2000 * | 2.35 | 2.5 -6% | 3.96 -69% | 1.08 54% | 3.17 -35% | |
| Colorchecker dE 2000 max. * | 5.63 | 6.87 -22% | 10.78 -91% | 4.54 19% | 7.69 -37% | |
| Colorchecker dE 2000 calibrated * | 1.61 | 0.64 60% | 1.07 34% | 2.53 -57% | 0.6 63% | 0.51 68% |
| Greyscale dE 2000 * | 3.8 | 3.9 -3% | 6.8 -79% | 1.3 66% | 5.3 -39% | |
| Gamma | 2.3 96% | 2.09 105% | 2.224 99% | 2.151 102% | 2.18 101% | |
| CCT | 7110 91% | 7192 90% | 7651 85% | 6541 99% | 5879 111% | |
| Media totale (Programma / Settaggio) | 26% /
16% | 14% /
-5% | 19% /
6% | 34% /
33% | 6% /
5% |
* ... Meglio usare valori piccoli
Eurocom provvederà a calibrare il display a pagamento. La nostra unità di prova è arrivata non calibrata con valori medi di deltaE in scala di grigi e a colori rispettivamente di 3,8 e 2,35, il che non è affatto male. La calibrazione del pannello da parte nostra migliorerebbe ulteriormente queste medie, portandole a 1,4 e 1,61. Il nostro profilo calibrato è disponibile per il download gratuito qui sopra.

Tempi di risposta del Display
| ↔ Tempi di risposta dal Nero al Bianco | ||
|---|---|---|
| 11.2 ms ... aumenta ↗ e diminuisce ↘ combinato | ↗ 6 ms Incremento | 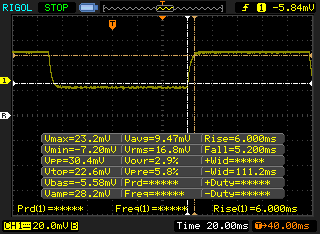 |
| ↘ 5.2 ms Calo | ||
| Lo schermo mostra buoni tempi di risposta durante i nostri tests, ma potrebbe essere troppo lento per i gamers competitivi. In confronto, tutti i dispositivi di test variano da 0.1 (minimo) a 240 (massimo) ms. » 30 % di tutti i dispositivi è migliore. Questo significa che i tempi di risposta rilevati sono migliori rispettto alla media di tutti i dispositivi testati (19.9 ms). | ||
| ↔ Tempo di risposta dal 50% Grigio all'80% Grigio | ||
| 10.4 ms ... aumenta ↗ e diminuisce ↘ combinato | ↗ 6 ms Incremento | 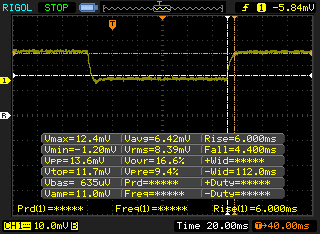 |
| ↘ 4.4 ms Calo | ||
| Lo schermo mostra buoni tempi di risposta durante i nostri tests, ma potrebbe essere troppo lento per i gamers competitivi. In confronto, tutti i dispositivi di test variano da 0.165 (minimo) a 636 (massimo) ms. » 24 % di tutti i dispositivi è migliore. Questo significa che i tempi di risposta rilevati sono migliori rispettto alla media di tutti i dispositivi testati (31.1 ms). | ||
Sfarfallio dello schermo / PWM (Pulse-Width Modulation)
| flickering dello schermo / PWM non rilevato | 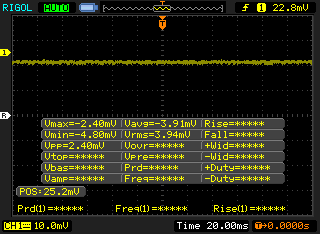 | ||
In confronto: 52 % di tutti i dispositivi testati non utilizza PWM per ridurre la luminosita' del display. Se è rilevato PWM, una media di 7784 (minimo: 5 - massimo: 343500) Hz è stata rilevata. | |||
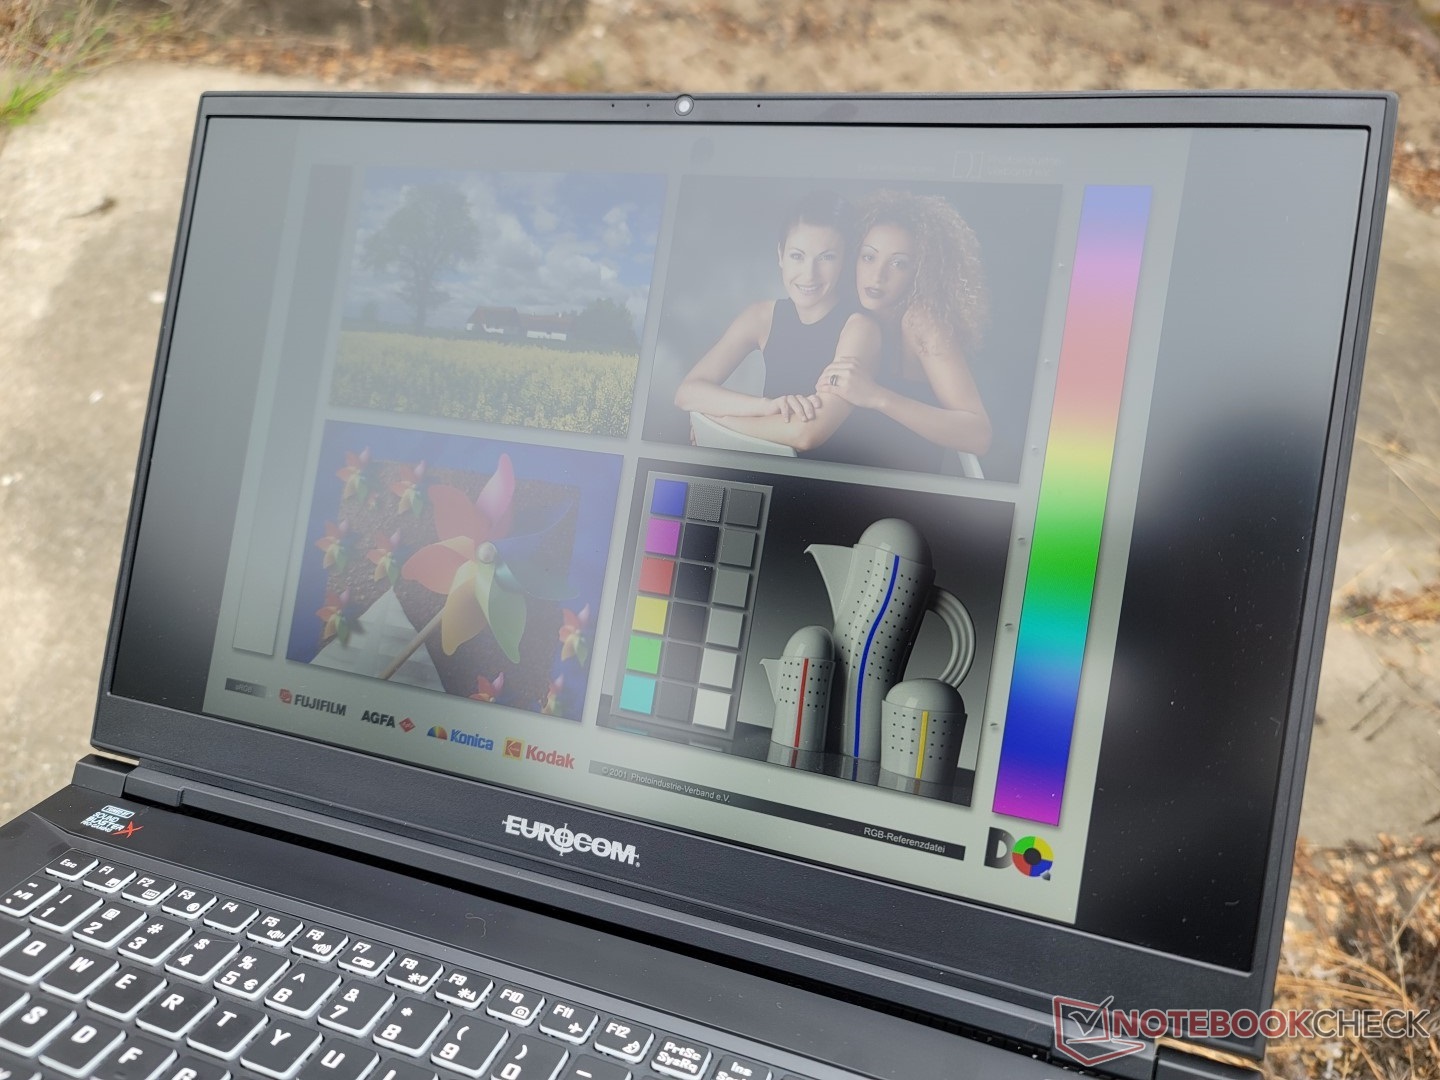
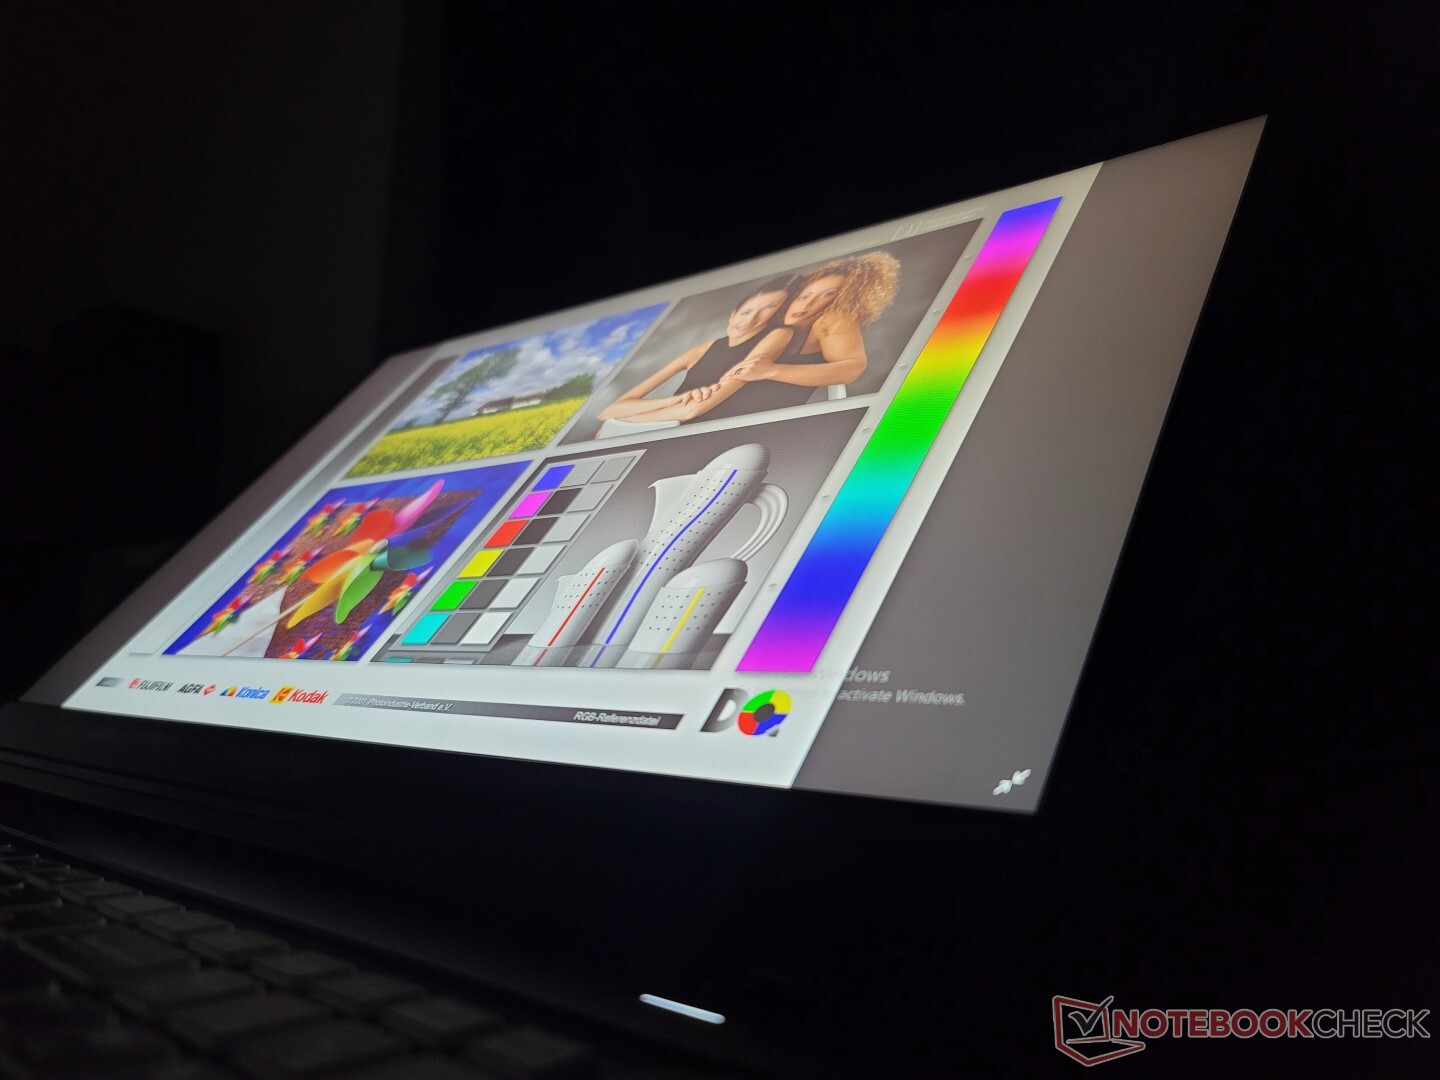
Con un massimo di 300 nits, il display è nella media per quanto riguarda la visibilità all'aperto rispetto ad altri portatili da gioco da 17 pollici. Alcune alternative, come ilRazer Blade 17hanno display molto più luminosi, con oltre 500 nits, per una maggiore leggibilità all'aperto.
Prestazioni
Condizioni di test
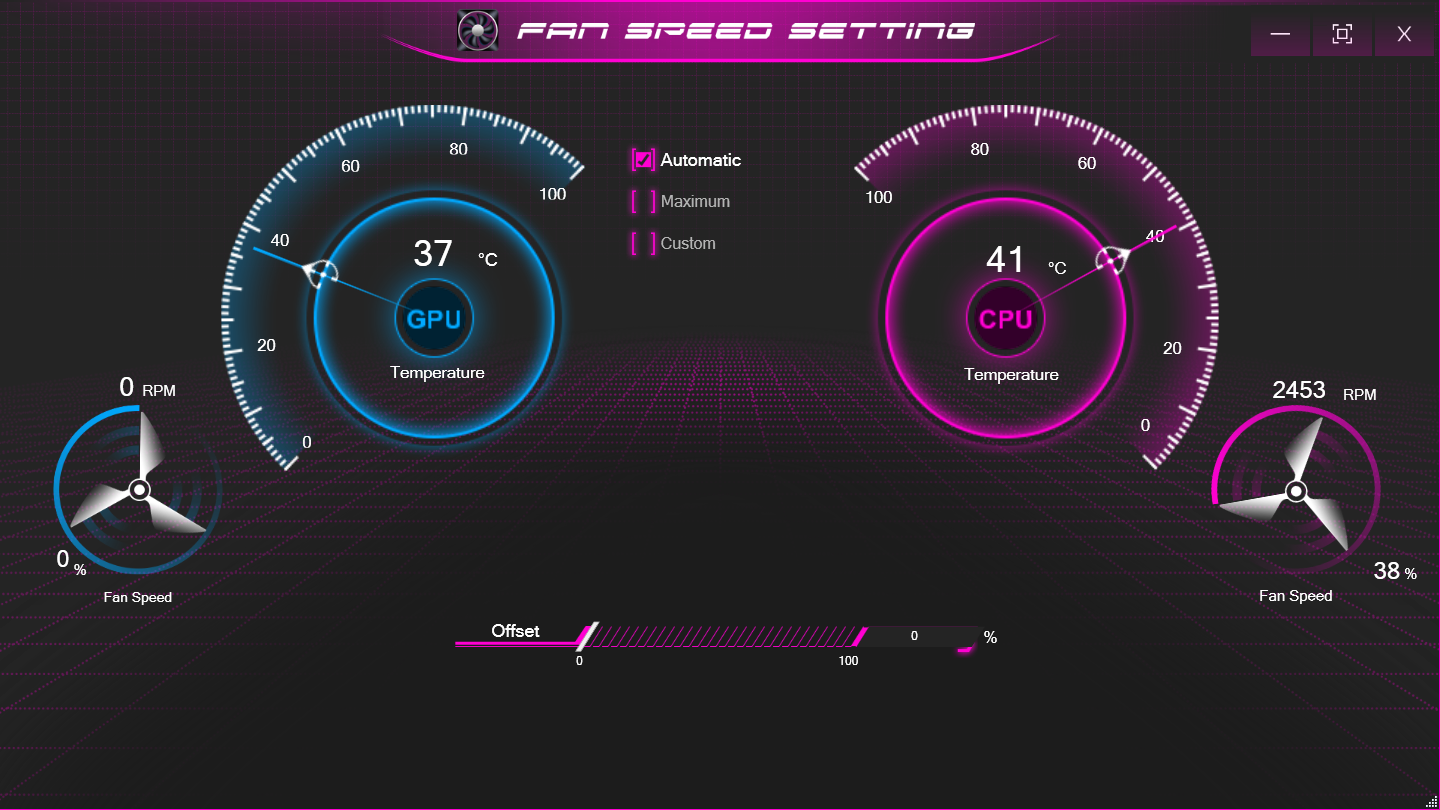
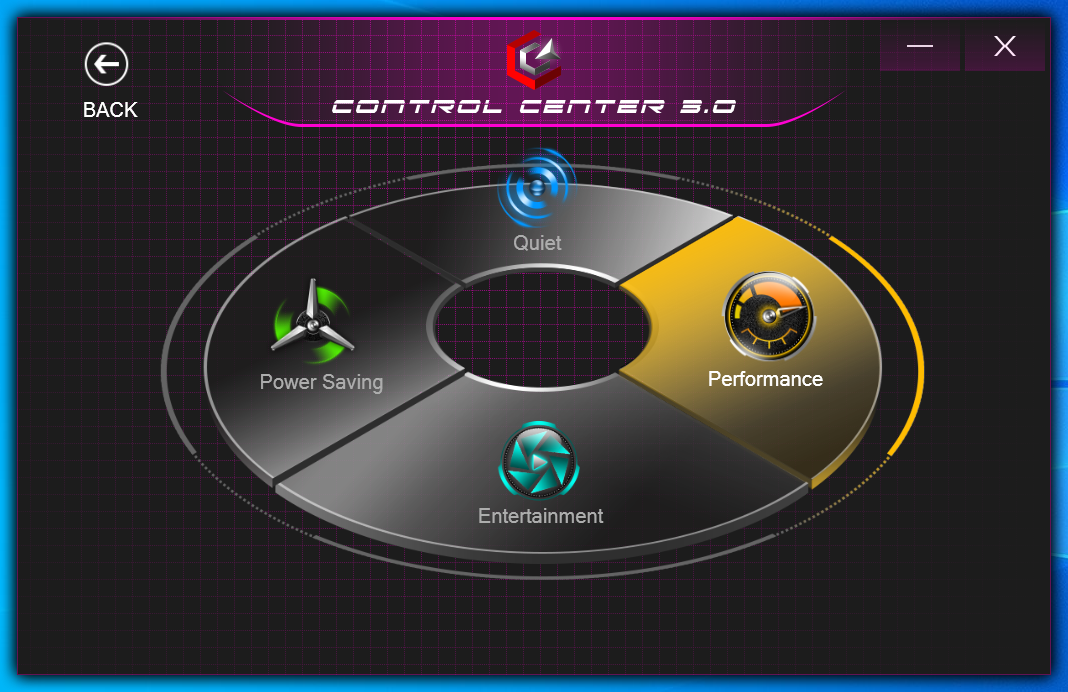
La nostra unità è stata impostata in modalità Performance tramite Windows e il software Control Center 3.0 preinstallato prima di eseguire i benchmark qui sotto per ottenere i punteggi più alti possibili. Ci siamo anche assicurati di impostare Nvidia Optimus sulla grafica discreta; purtroppo il MUX non è supportato.
Processore
Le prestazioni multi-thread grezze sono circa il 10% più veloci rispetto alla media dei laptop del nostro database equipaggiati con lo stesso Core i7-12700H. Il processore di HP Envy 16è molto più lento del nostro Eurocom, anche dopo aver tenuto conto di eventuali limitazioni delle prestazioni
L'aggiornamento al Core i9-12900H dovrebbe aumentare le prestazioni del processore solo marginalmente, di circa il 5-10%, in base alla nostra esperienza con l'Alienware x15 R2 Alienware x15 R2 e Schenker XMG Pro 17 E22
CineBench R15 non è stato eseguito correttamente sulla nostra unità, come sull'ultimo sistema Eurocom che abbiamo recensito all'inizio di quest'anno. Abbiamo contattato il produttore, che ha confermato le nostre conclusioni. Il benchmark è stato omesso per questa recensione.
Cinebench R23 Multi Loop
Cinebench R23: Multi Core | Single Core
Cinebench R15: CPU Multi 64Bit | CPU Single 64Bit
Blender: v2.79 BMW27 CPU
7-Zip 18.03: 7z b 4 | 7z b 4 -mmt1
Geekbench 5.5: Multi-Core | Single-Core
HWBOT x265 Benchmark v2.2: 4k Preset
LibreOffice : 20 Documents To PDF
R Benchmark 2.5: Overall mean
Cinebench R23: Multi Core | Single Core
Cinebench R15: CPU Multi 64Bit | CPU Single 64Bit
Blender: v2.79 BMW27 CPU
7-Zip 18.03: 7z b 4 | 7z b 4 -mmt1
Geekbench 5.5: Multi-Core | Single-Core
HWBOT x265 Benchmark v2.2: 4k Preset
LibreOffice : 20 Documents To PDF
R Benchmark 2.5: Overall mean
* ... Meglio usare valori piccoli
AIDA64: FP32 Ray-Trace | FPU Julia | CPU SHA3 | CPU Queen | FPU SinJulia | FPU Mandel | CPU AES | CPU ZLib | FP64 Ray-Trace | CPU PhotoWorxx
| Performance rating | |
| MSI Raider GE77 HX 12UHS | |
| Aorus 17X XES | |
| Eurocom Nightsky TXi317 | |
| Alienware x17 R2 P48E | |
| Media Intel Core i7-12700H | |
| Schenker XMG Pro 17 E22 | |
| Razer Blade 17 Early 2022 | |
| AIDA64 / FP32 Ray-Trace | |
| MSI Raider GE77 HX 12UHS | |
| Eurocom Nightsky TXi317 | |
| Aorus 17X XES | |
| Media Intel Core i7-12700H (2585 - 17957, n=64) | |
| Alienware x17 R2 P48E | |
| Schenker XMG Pro 17 E22 | |
| Razer Blade 17 Early 2022 | |
| AIDA64 / FPU Julia | |
| MSI Raider GE77 HX 12UHS | |
| Eurocom Nightsky TXi317 | |
| Aorus 17X XES | |
| Media Intel Core i7-12700H (12439 - 90760, n=64) | |
| Alienware x17 R2 P48E | |
| Schenker XMG Pro 17 E22 | |
| Razer Blade 17 Early 2022 | |
| AIDA64 / CPU SHA3 | |
| MSI Raider GE77 HX 12UHS | |
| Eurocom Nightsky TXi317 | |
| Aorus 17X XES | |
| Alienware x17 R2 P48E | |
| Media Intel Core i7-12700H (833 - 4242, n=64) | |
| Schenker XMG Pro 17 E22 | |
| Razer Blade 17 Early 2022 | |
| AIDA64 / CPU Queen | |
| Alienware x17 R2 P48E | |
| Schenker XMG Pro 17 E22 | |
| Aorus 17X XES | |
| Eurocom Nightsky TXi317 | |
| MSI Raider GE77 HX 12UHS | |
| Media Intel Core i7-12700H (57923 - 103202, n=63) | |
| Razer Blade 17 Early 2022 | |
| AIDA64 / FPU SinJulia | |
| MSI Raider GE77 HX 12UHS | |
| Aorus 17X XES | |
| Alienware x17 R2 P48E | |
| Eurocom Nightsky TXi317 | |
| Schenker XMG Pro 17 E22 | |
| Media Intel Core i7-12700H (3249 - 9939, n=64) | |
| Razer Blade 17 Early 2022 | |
| AIDA64 / FPU Mandel | |
| MSI Raider GE77 HX 12UHS | |
| Aorus 17X XES | |
| Eurocom Nightsky TXi317 | |
| Media Intel Core i7-12700H (7135 - 44760, n=64) | |
| Alienware x17 R2 P48E | |
| Schenker XMG Pro 17 E22 | |
| Razer Blade 17 Early 2022 | |
| AIDA64 / CPU AES | |
| MSI Raider GE77 HX 12UHS | |
| Eurocom Nightsky TXi317 | |
| Aorus 17X XES | |
| Alienware x17 R2 P48E | |
| Schenker XMG Pro 17 E22 | |
| Media Intel Core i7-12700H (31839 - 144360, n=64) | |
| Razer Blade 17 Early 2022 | |
| AIDA64 / CPU ZLib | |
| MSI Raider GE77 HX 12UHS | |
| Alienware x17 R2 P48E | |
| Eurocom Nightsky TXi317 | |
| Schenker XMG Pro 17 E22 | |
| Aorus 17X XES | |
| Media Intel Core i7-12700H (305 - 1171, n=64) | |
| Razer Blade 17 Early 2022 | |
| AIDA64 / FP64 Ray-Trace | |
| MSI Raider GE77 HX 12UHS | |
| Aorus 17X XES | |
| Eurocom Nightsky TXi317 | |
| Media Intel Core i7-12700H (1437 - 9692, n=64) | |
| Alienware x17 R2 P48E | |
| Schenker XMG Pro 17 E22 | |
| Razer Blade 17 Early 2022 | |
| AIDA64 / CPU PhotoWorxx | |
| MSI Raider GE77 HX 12UHS | |
| Aorus 17X XES | |
| Razer Blade 17 Early 2022 | |
| Alienware x17 R2 P48E | |
| Media Intel Core i7-12700H (12863 - 52207, n=64) | |
| Eurocom Nightsky TXi317 | |
| Schenker XMG Pro 17 E22 | |
Prestazioni del sistema
CrossMark: Overall | Productivity | Creativity | Responsiveness
| PCMark 10 / Score | |
| Alienware x17 R2 P48E | |
| Aorus 17X XES | |
| Schenker XMG Pro 17 E22 | |
| Eurocom Nightsky TXi317 | |
| Media Intel Core i7-12700H, NVIDIA GeForce RTX 3080 Ti Laptop GPU (6868 - 7638, n=7) | |
| Razer Blade 17 Early 2022 | |
| MSI Raider GE77 HX 12UHS | |
| PCMark 10 / Essentials | |
| Eurocom Nightsky TXi317 | |
| Alienware x17 R2 P48E | |
| Schenker XMG Pro 17 E22 | |
| Aorus 17X XES | |
| Media Intel Core i7-12700H, NVIDIA GeForce RTX 3080 Ti Laptop GPU (9987 - 11318, n=7) | |
| Razer Blade 17 Early 2022 | |
| MSI Raider GE77 HX 12UHS | |
| PCMark 10 / Productivity | |
| Eurocom Nightsky TXi317 | |
| Aorus 17X XES | |
| Schenker XMG Pro 17 E22 | |
| Alienware x17 R2 P48E | |
| MSI Raider GE77 HX 12UHS | |
| Media Intel Core i7-12700H, NVIDIA GeForce RTX 3080 Ti Laptop GPU (8944 - 10726, n=7) | |
| Razer Blade 17 Early 2022 | |
| PCMark 10 / Digital Content Creation | |
| Alienware x17 R2 P48E | |
| Aorus 17X XES | |
| Schenker XMG Pro 17 E22 | |
| Media Intel Core i7-12700H, NVIDIA GeForce RTX 3080 Ti Laptop GPU (8956 - 12249, n=7) | |
| Razer Blade 17 Early 2022 | |
| Eurocom Nightsky TXi317 | |
| MSI Raider GE77 HX 12UHS | |
| CrossMark / Overall | |
| MSI Raider GE77 HX 12UHS | |
| Aorus 17X XES | |
| Alienware x17 R2 P48E | |
| Eurocom Nightsky TXi317 | |
| Media Intel Core i7-12700H, NVIDIA GeForce RTX 3080 Ti Laptop GPU (1761 - 1861, n=4) | |
| Razer Blade 17 Early 2022 | |
| CrossMark / Productivity | |
| MSI Raider GE77 HX 12UHS | |
| Aorus 17X XES | |
| Alienware x17 R2 P48E | |
| Eurocom Nightsky TXi317 | |
| Razer Blade 17 Early 2022 | |
| Media Intel Core i7-12700H, NVIDIA GeForce RTX 3080 Ti Laptop GPU (1645 - 1800, n=4) | |
| CrossMark / Creativity | |
| MSI Raider GE77 HX 12UHS | |
| Aorus 17X XES | |
| Alienware x17 R2 P48E | |
| Media Intel Core i7-12700H, NVIDIA GeForce RTX 3080 Ti Laptop GPU (1936 - 2041, n=4) | |
| Eurocom Nightsky TXi317 | |
| Razer Blade 17 Early 2022 | |
| CrossMark / Responsiveness | |
| Aorus 17X XES | |
| MSI Raider GE77 HX 12UHS | |
| Eurocom Nightsky TXi317 | |
| Alienware x17 R2 P48E | |
| Media Intel Core i7-12700H, NVIDIA GeForce RTX 3080 Ti Laptop GPU (1461 - 1868, n=4) | |
| Razer Blade 17 Early 2022 | |
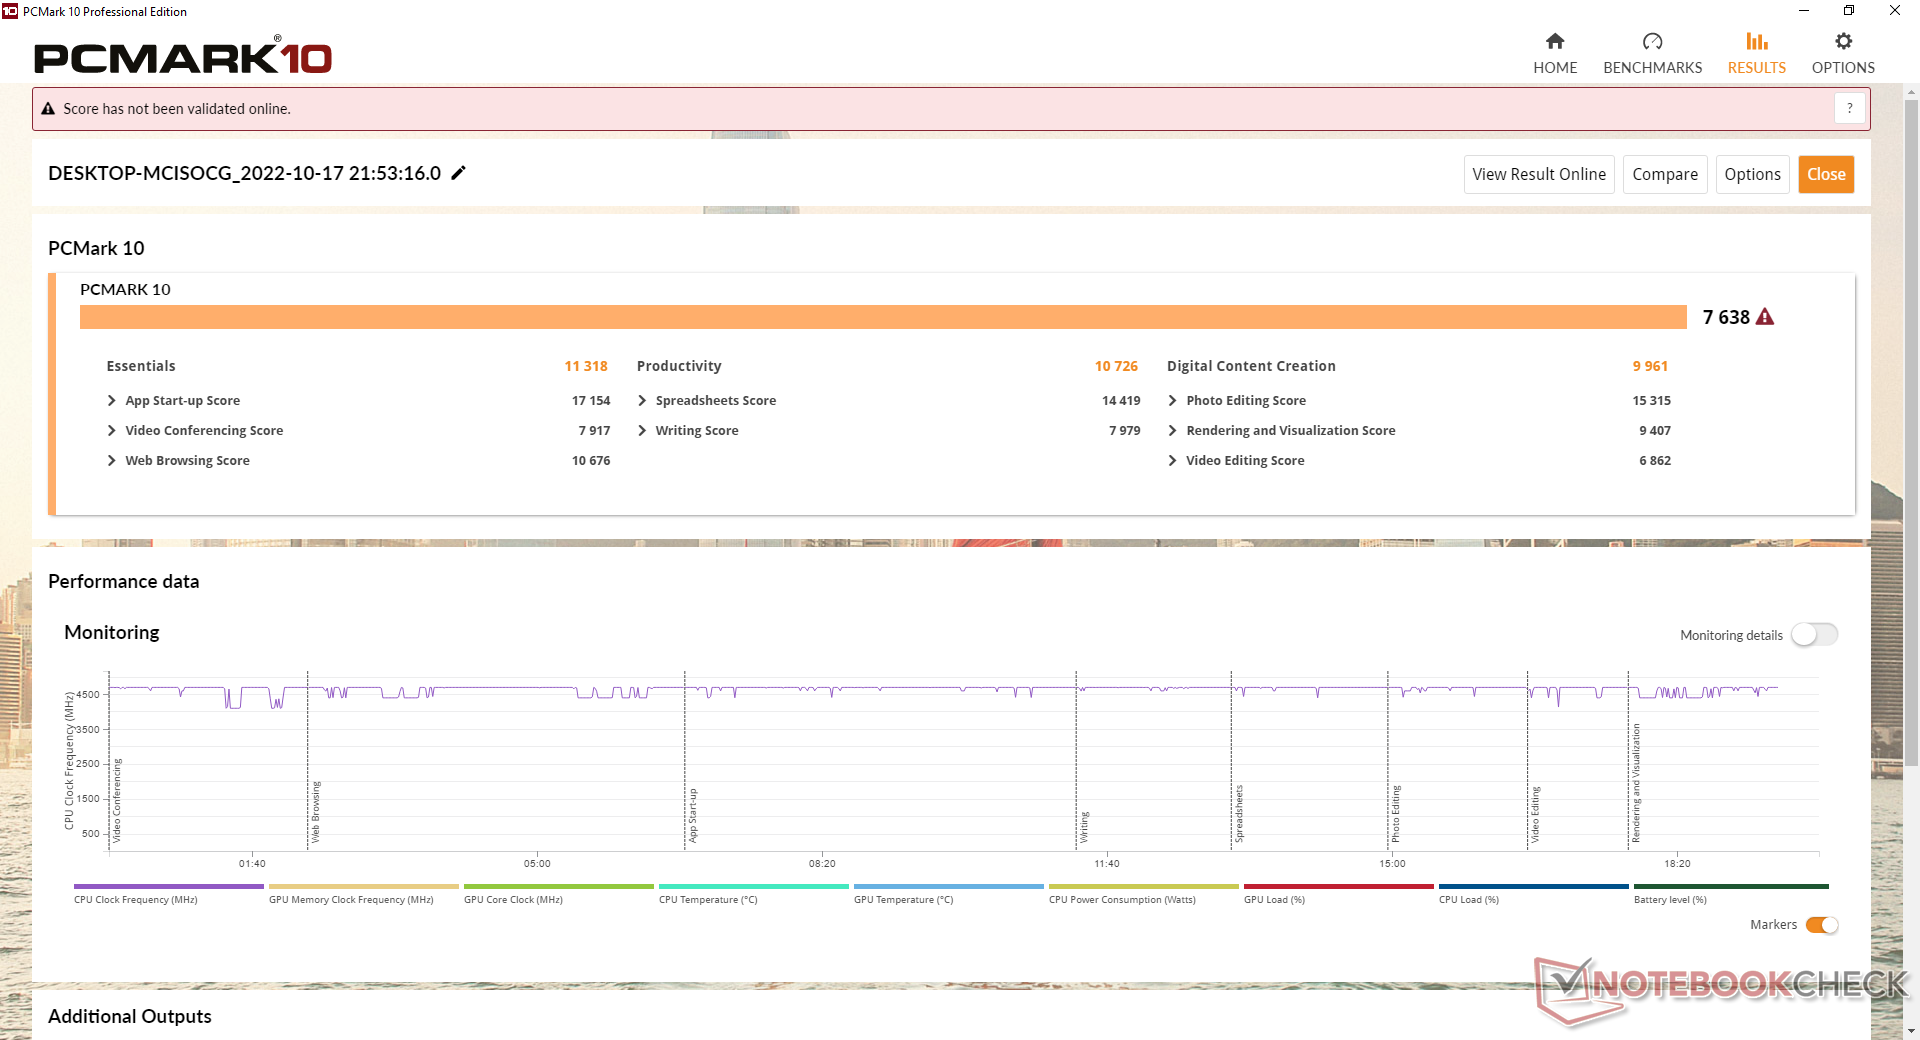
| PCMark 10 Score | 7638 punti | |
Aiuto | ||
| AIDA64 / Memory Copy | |
| MSI Raider GE77 HX 12UHS | |
| Aorus 17X XES | |
| Razer Blade 17 Early 2022 | |
| Alienware x17 R2 P48E | |
| Media Intel Core i7-12700H (25615 - 80511, n=64) | |
| Eurocom Nightsky TXi317 | |
| Schenker XMG Pro 17 E22 | |
| AIDA64 / Memory Read | |
| MSI Raider GE77 HX 12UHS | |
| Aorus 17X XES | |
| Razer Blade 17 Early 2022 | |
| Alienware x17 R2 P48E | |
| Media Intel Core i7-12700H (25586 - 79442, n=64) | |
| Eurocom Nightsky TXi317 | |
| Schenker XMG Pro 17 E22 | |
| AIDA64 / Memory Write | |
| MSI Raider GE77 HX 12UHS | |
| Aorus 17X XES | |
| Razer Blade 17 Early 2022 | |
| Media Intel Core i7-12700H (23679 - 88660, n=64) | |
| Alienware x17 R2 P48E | |
| Eurocom Nightsky TXi317 | |
| Schenker XMG Pro 17 E22 | |
| AIDA64 / Memory Latency | |
| Alienware x17 R2 P48E | |
| Schenker XMG Pro 17 E22 | |
| Eurocom Nightsky TXi317 | |
| Aorus 17X XES | |
| MSI Raider GE77 HX 12UHS | |
| Media Intel Core i7-12700H (76.2 - 133.9, n=62) | |
* ... Meglio usare valori piccoli
Latenza DPC
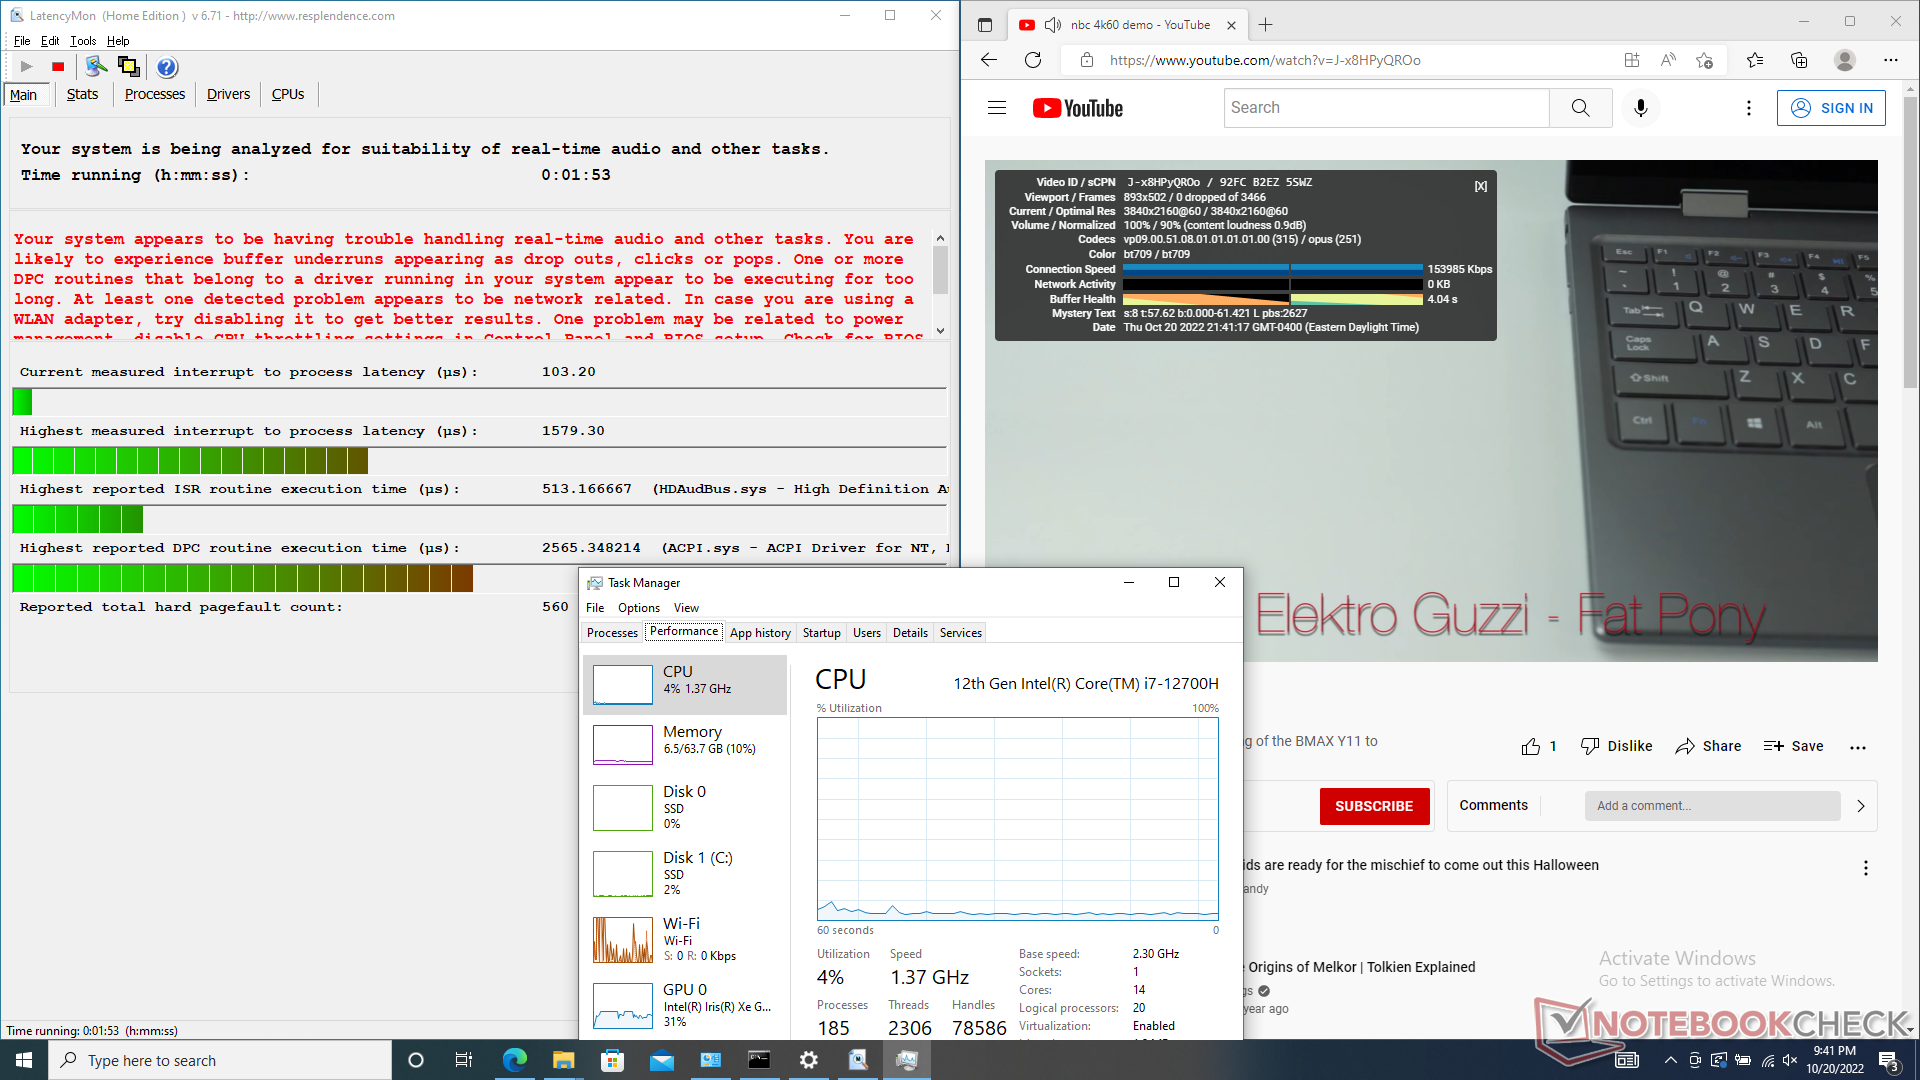
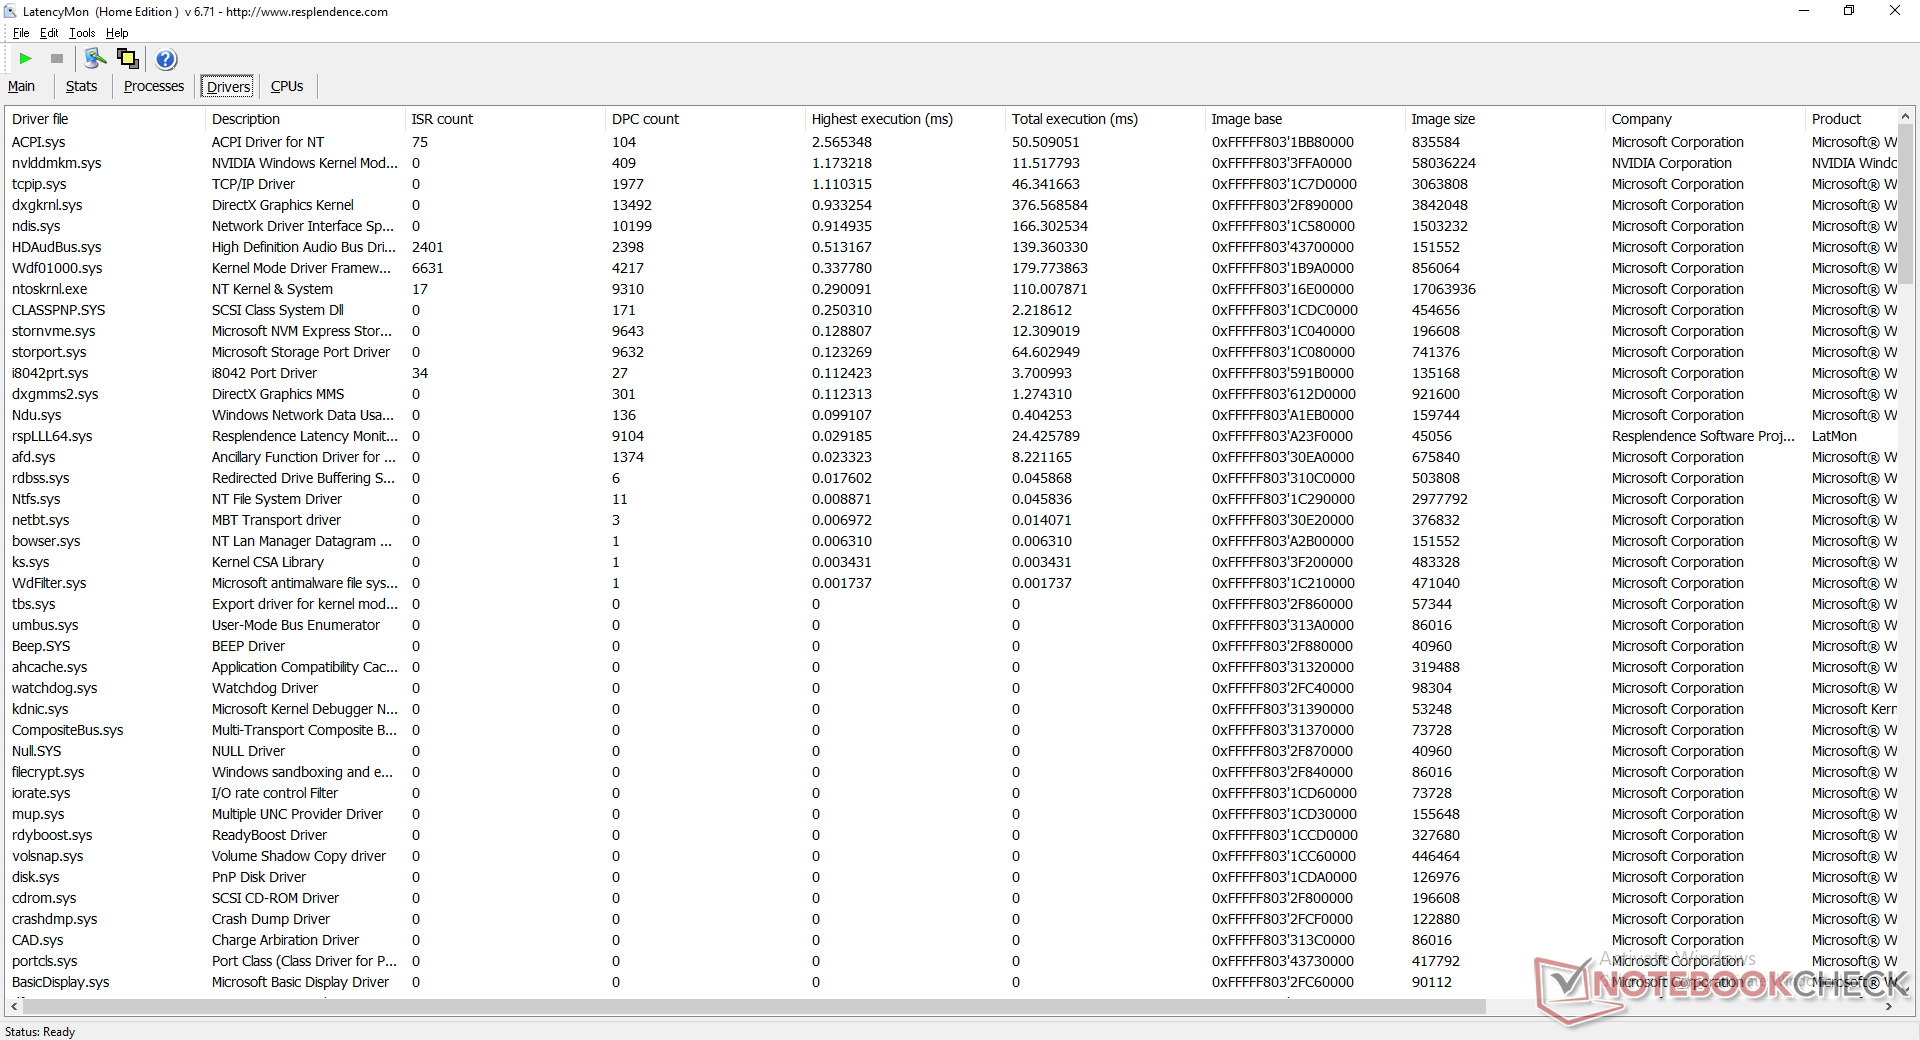
LatencyMon rivela problemi di DPC quando si aprono più schede del browser sulla nostra homepage. la riproduzione di video 4K a 60 FPS è invece perfetta, senza cadute di fotogrammi.
| DPC Latencies / LatencyMon - interrupt to process latency (max), Web, Youtube, Prime95 | |
| MSI Raider GE77 HX 12UHS | |
| Eurocom Nightsky TXi317 | |
| Aorus 17X XES | |
| Alienware x17 R2 P48E | |
| Schenker XMG Pro 17 E22 | |
| Razer Blade 17 Early 2022 | |
* ... Meglio usare valori piccoli
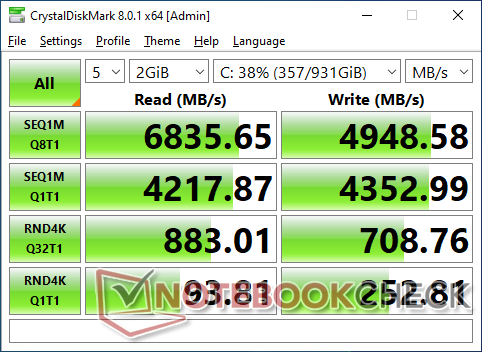
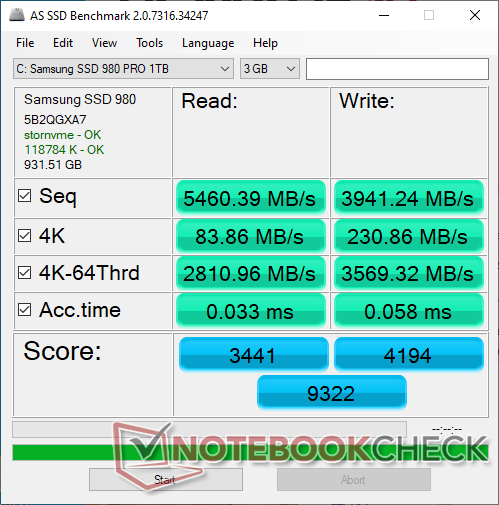
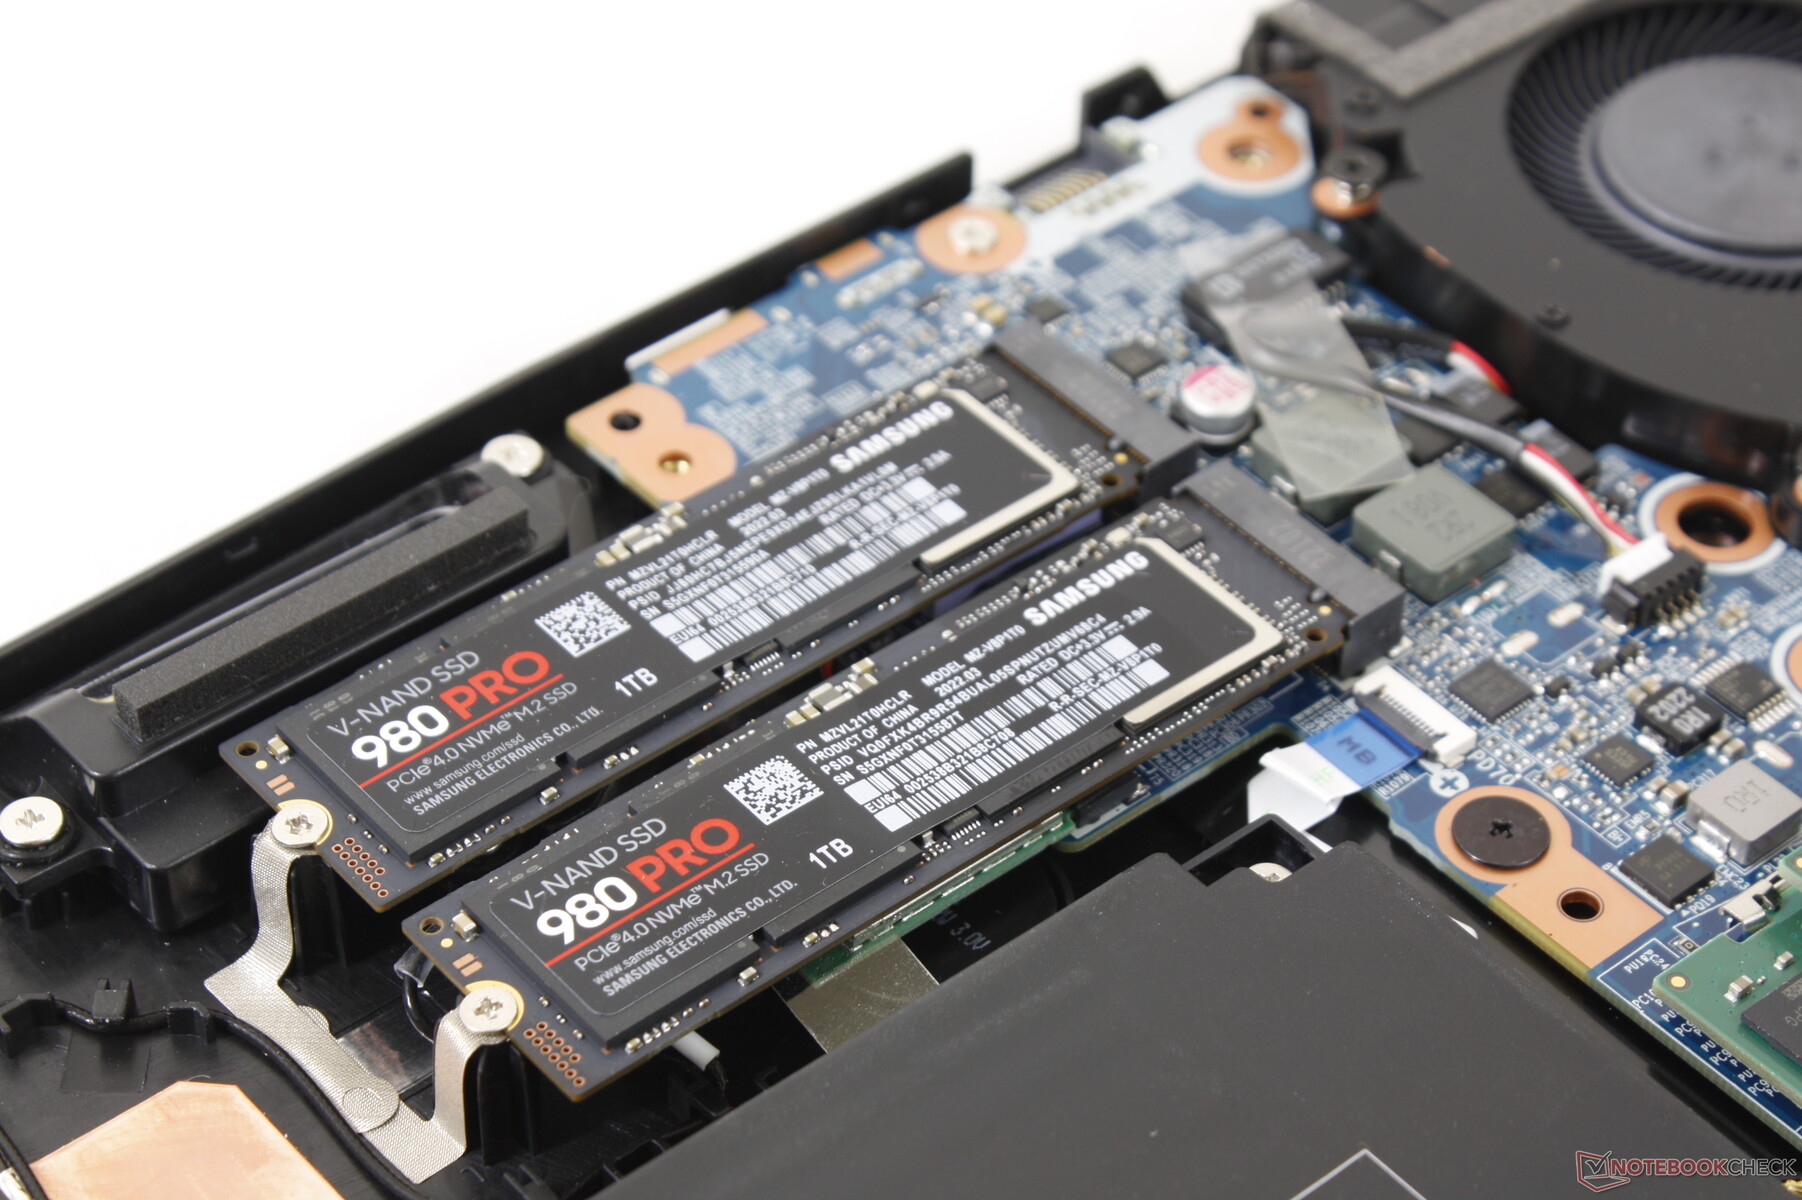
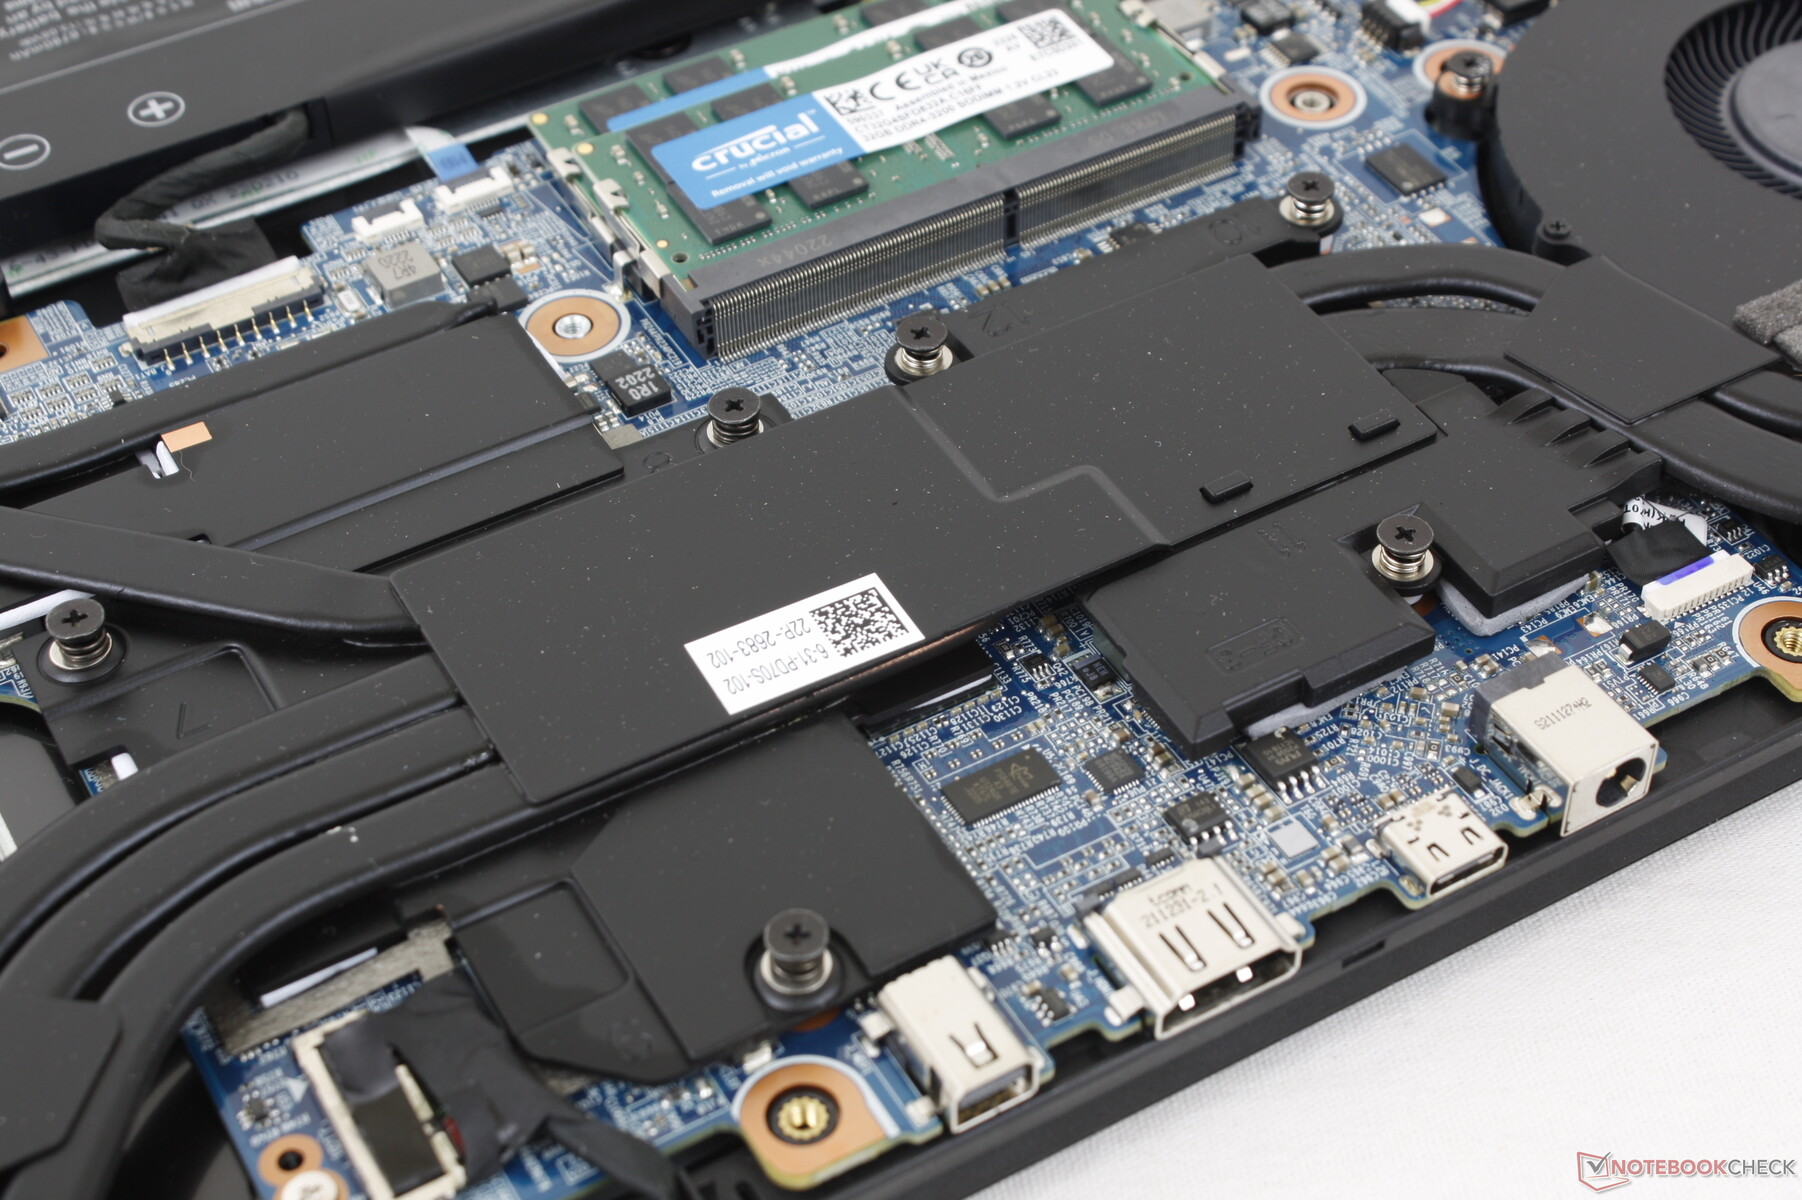
Dispositivi di archiviazione
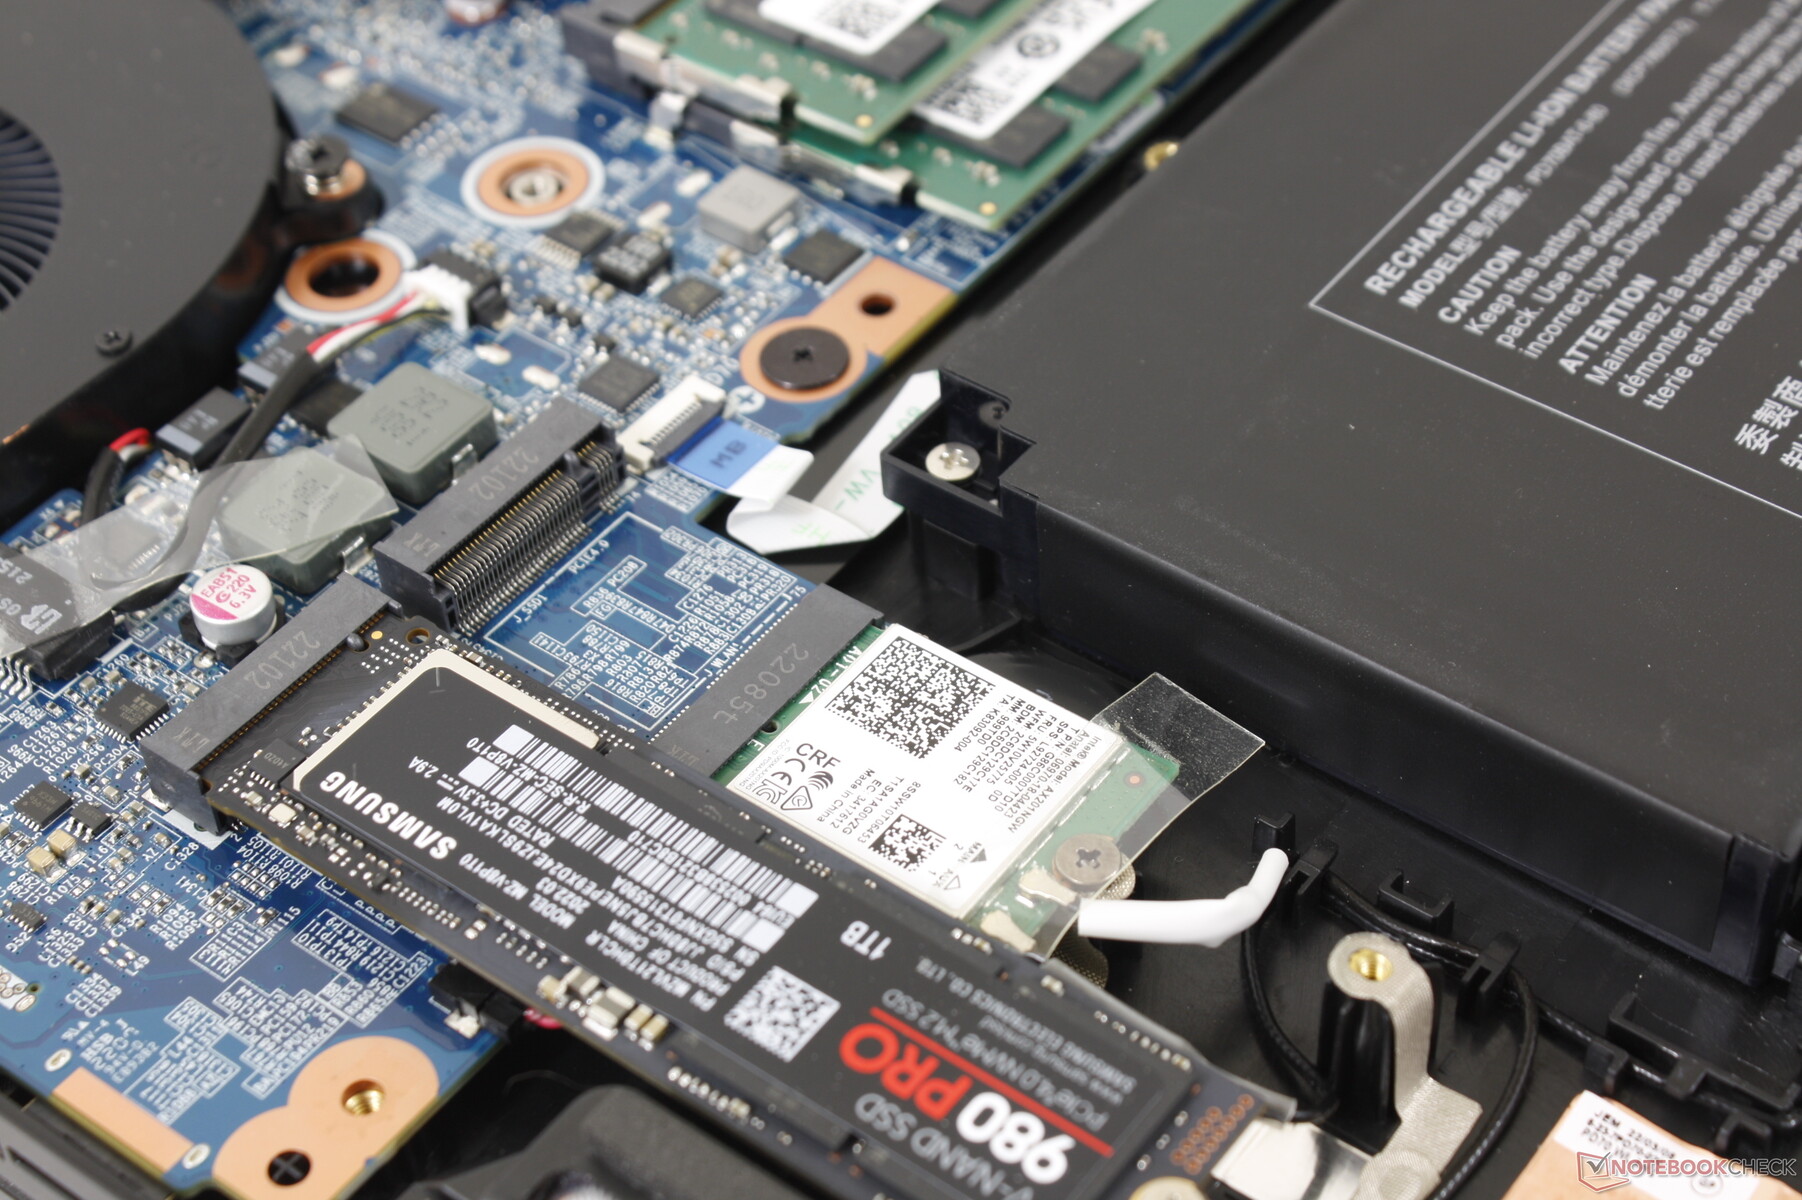
I due slot interni M.2 2280 possono supportare ciascuno unità SSD PCIe4 x4 per velocità folli, almeno in teoria. In realtà, però, le unità rischiano di strozzarsi, poiché lo chassis non ha un diffusore di calore integrato per le unità SSD. Il modello da 1 TB Samsung 980 Pro PCIe4 x4 NVMe da 1 TB nella nostra unità di test scendeva a 1400 MB/s da un massimo iniziale di 6800 MB/s quando si eseguiva DiskSpd in loop, come mostrato dal grafico sottostante. Questi risultati sono generalmente accettabili per i portatili da gioco economici, ma sono deludenti da vedere su macchine di fascia alta come questa.

| Drive Performance rating - Percent | |
| MSI Raider GE77 HX 12UHS | |
| Eurocom Nightsky TXi317 | |
| Aorus 17X XES | |
| Schenker XMG Pro 17 E22 | |
| Razer Blade 17 Early 2022 | |
| Alienware x17 R2 P48E | |
* ... Meglio usare valori piccoli
Disk Throttling: DiskSpd Read Loop, Queue Depth 8
Prestazioni della GPU
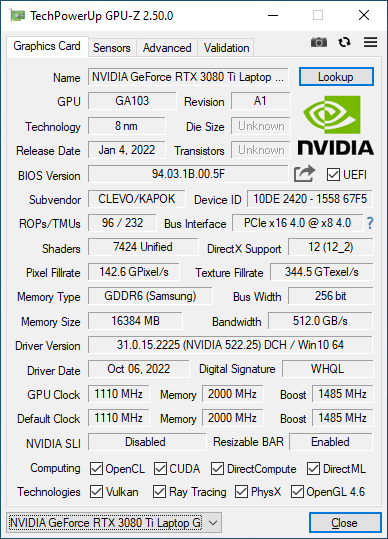
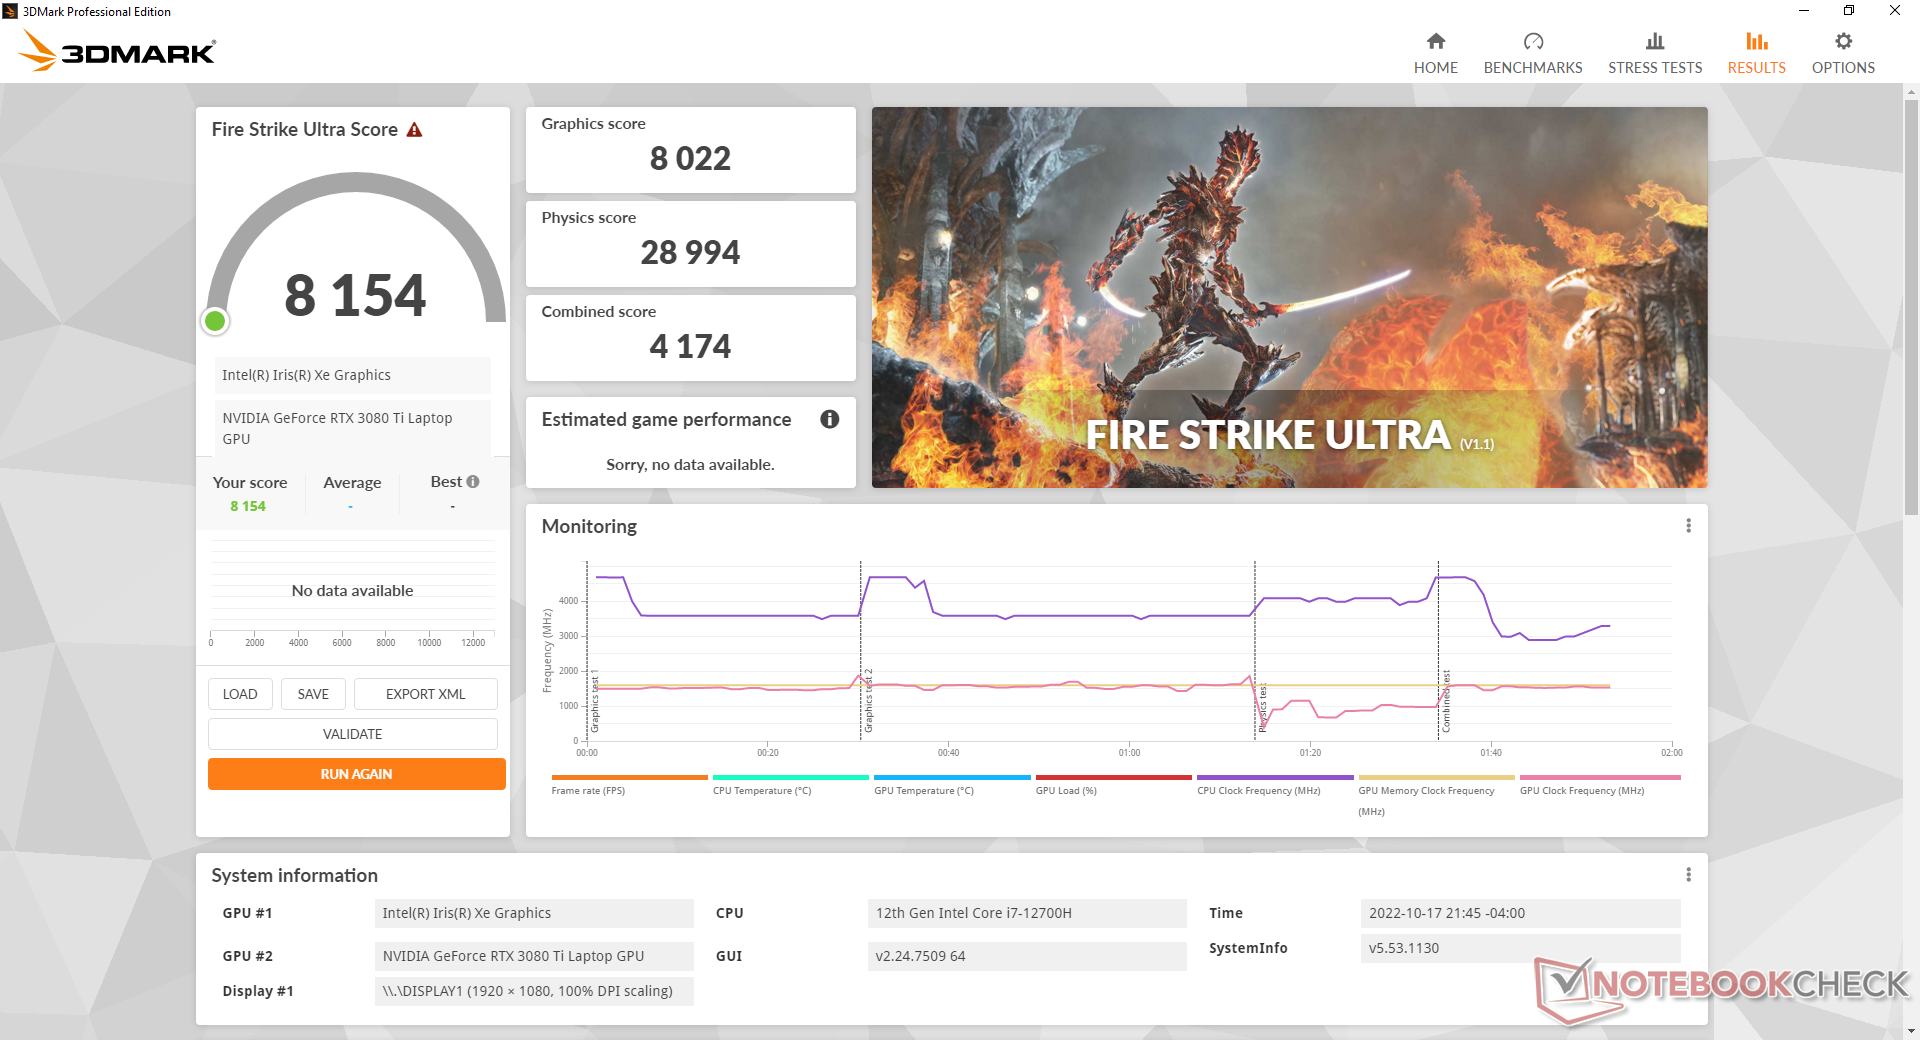
Le prestazioni grafiche sono eccellenti, con risultati leggermente superiori alla maggior parte degli altri portatili con la stessa GeForce RTX 3080 Ti GPU. Il TGP da 125 W non è il più alto come quello dell' Alienware x17 R2 e persino del Razer Blade 17 hanno obiettivi più elevati, ma è almeno superiore a quello di molti portatili ultrasottili come la serie MSI GS.
È interessante notare che il pannello di controllo Nvidia dichiara un TGP di 155 W, mentre Eurocom dichiara un TGP di 125 W. Quest'ultimo numero sembra essere l'obiettivo più preciso, come dimostrerà la nostra sezione Stress Test.
Passando alla GeForce RTX 3070 Ti avrà un impatto sulle prestazioni grafiche di circa il 10%. Le prestazioni complessive sono più lente del 20-30% rispetto al nostro desktop di riferimento desktop GeForce RTX 3080.
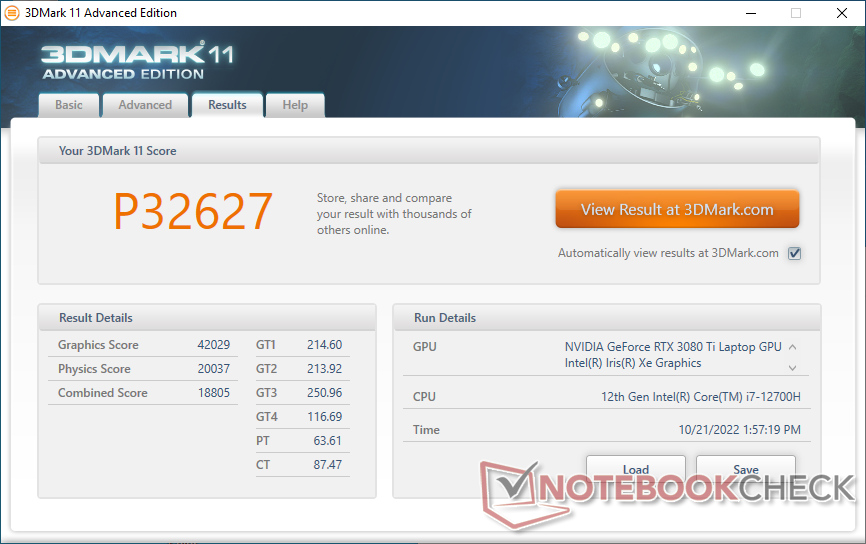
| 3DMark 11 Performance | 32627 punti | |
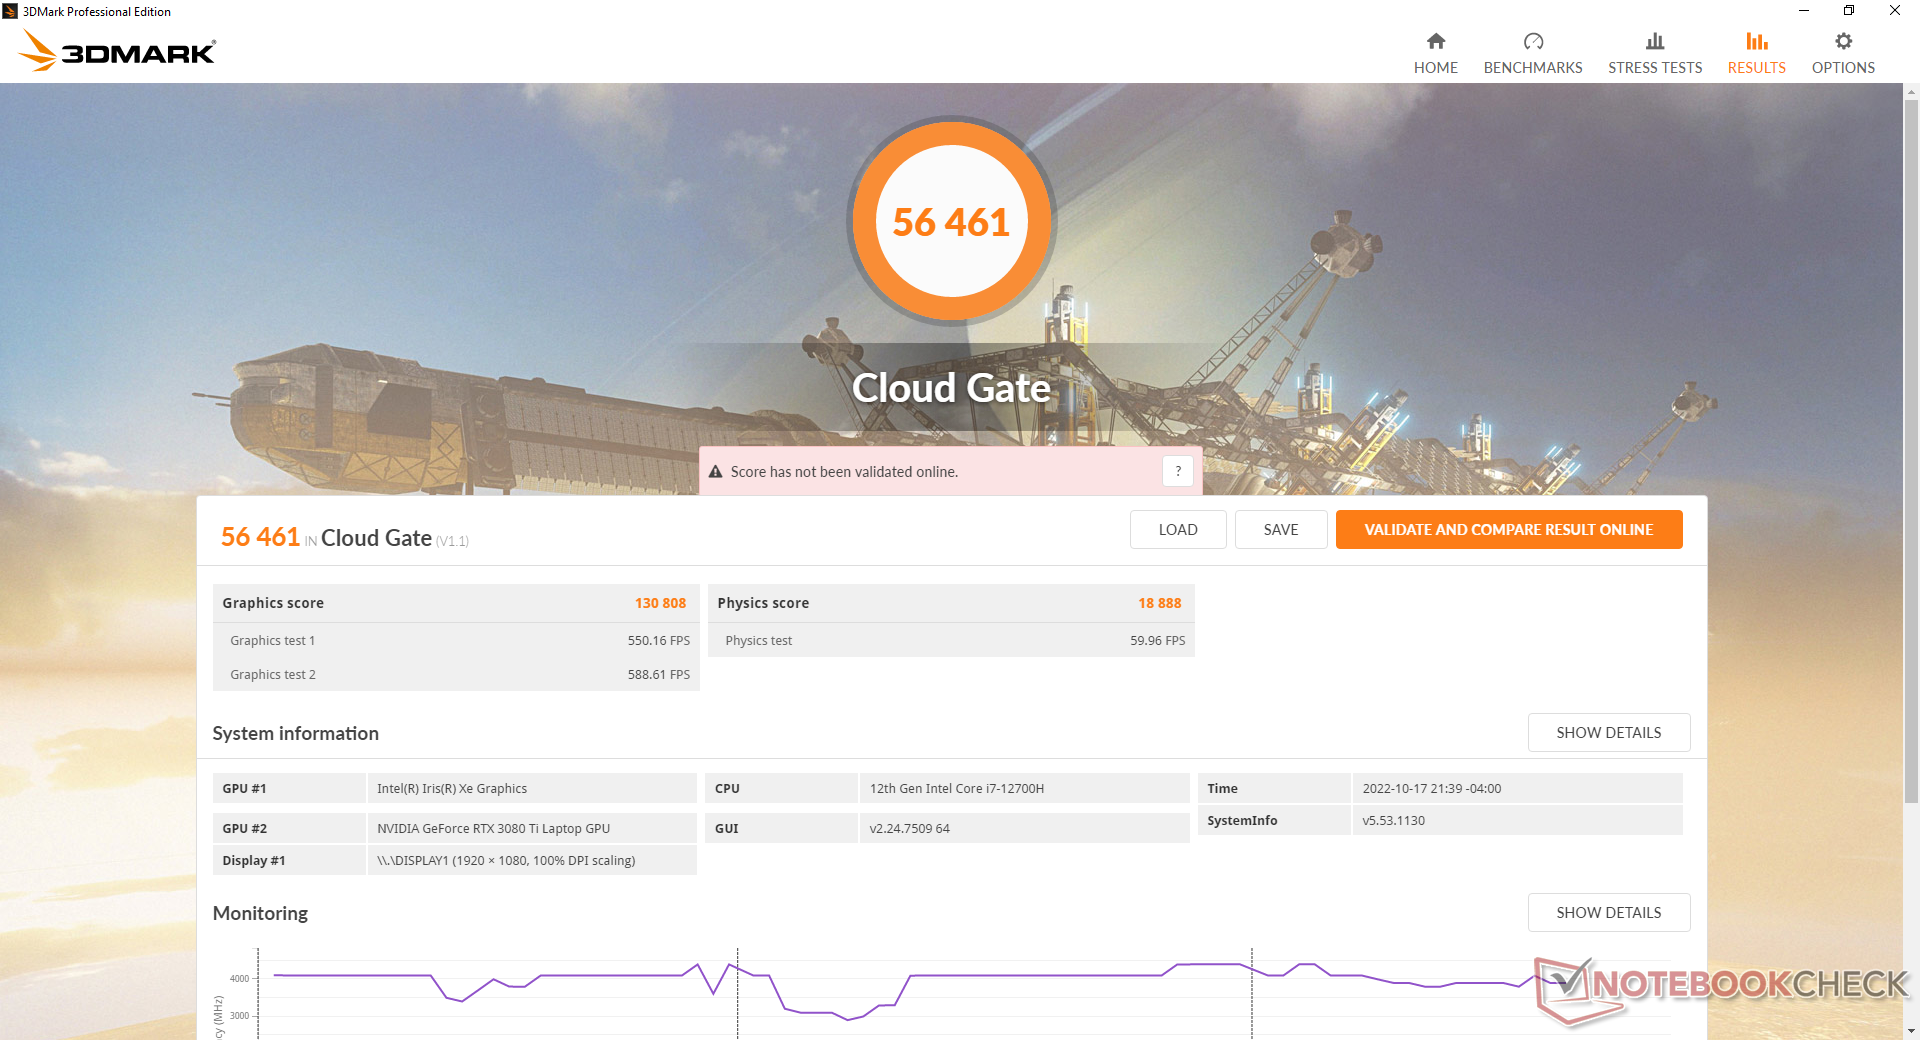
| 3DMark Cloud Gate Standard Score | 56461 punti | |
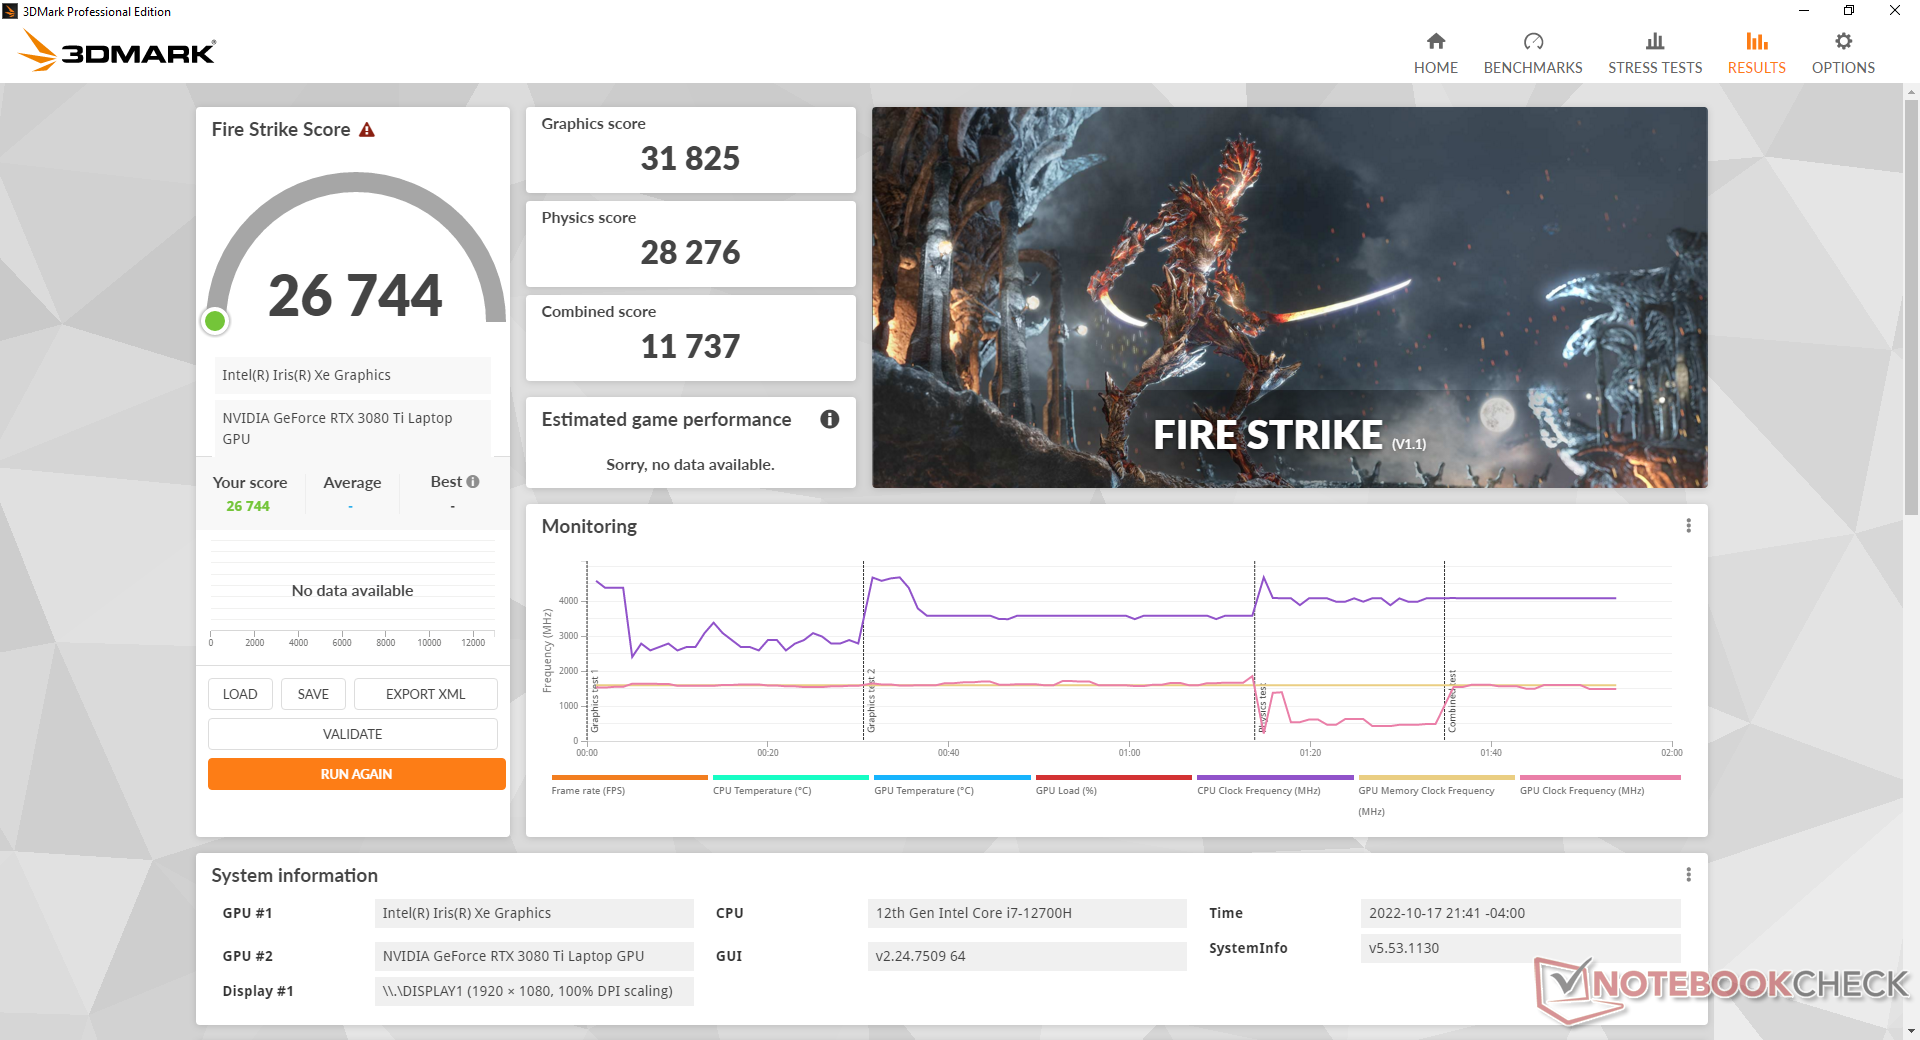
| 3DMark Fire Strike Score | 26744 punti | |
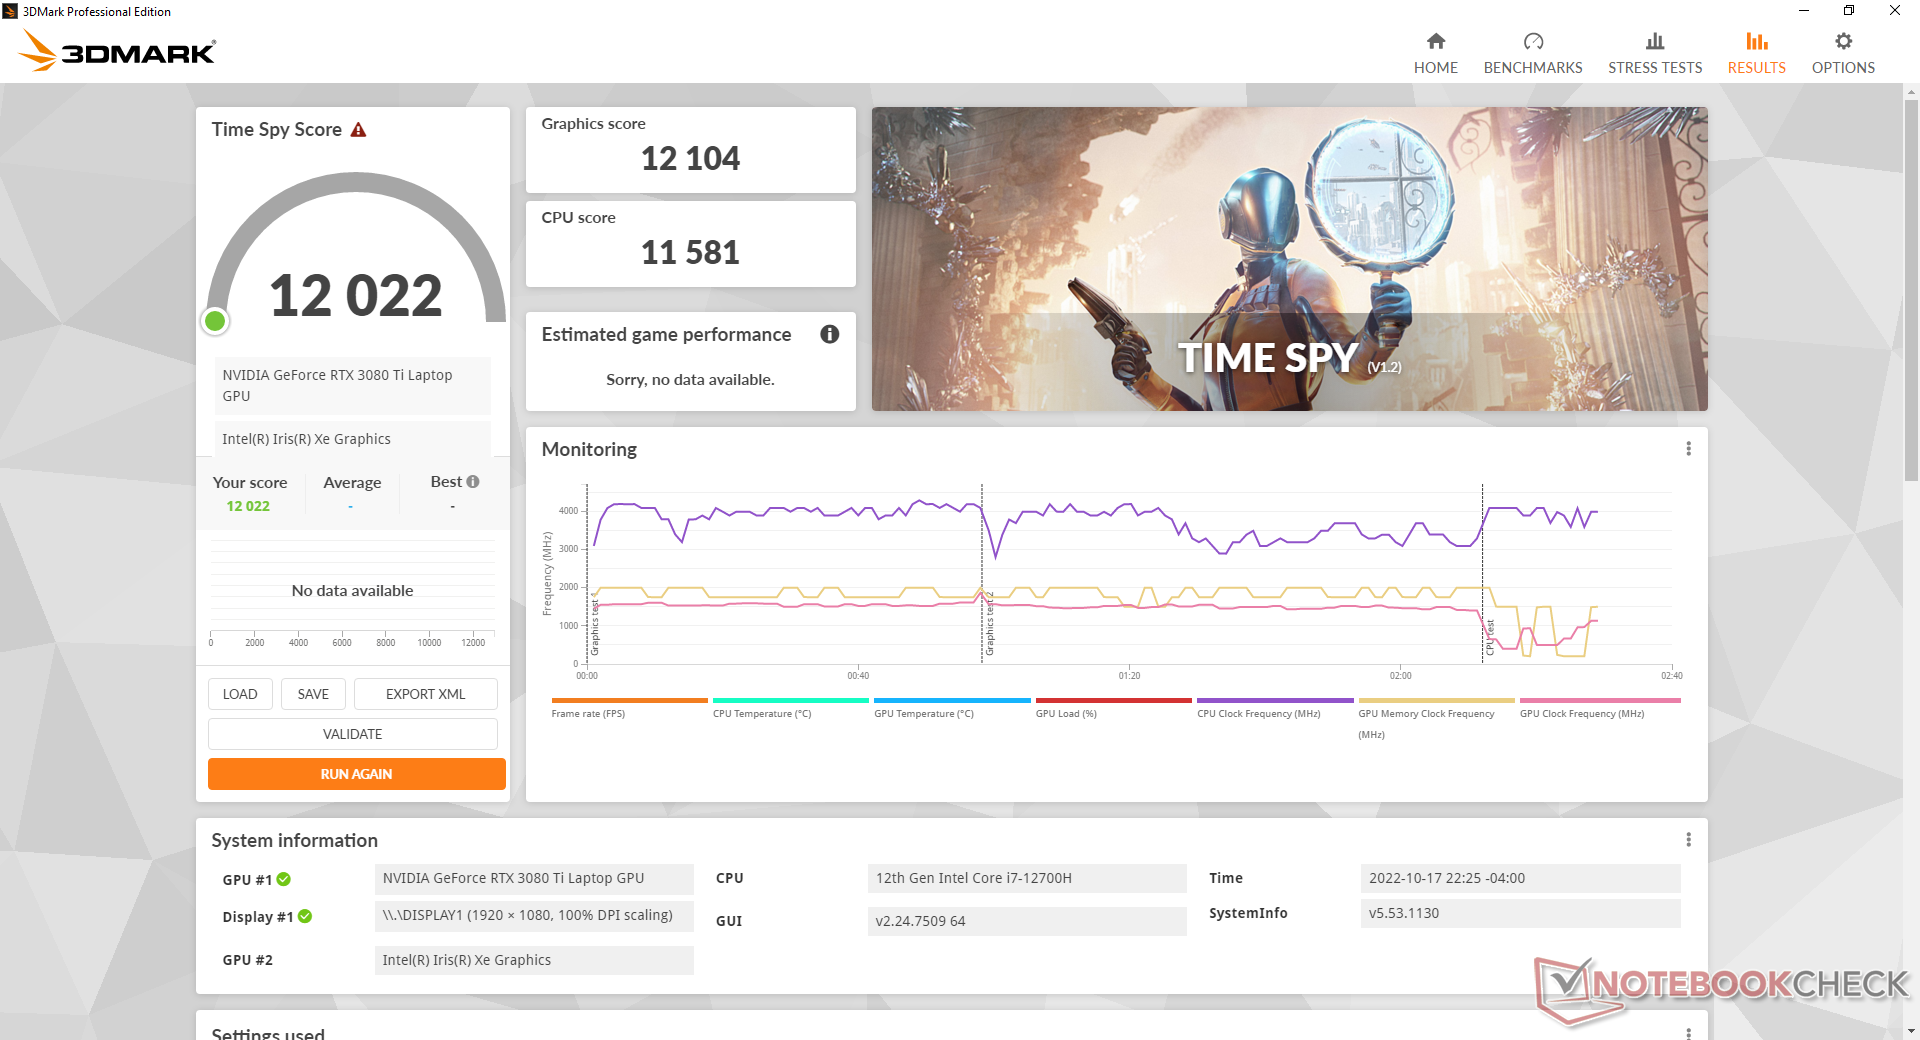
| 3DMark Time Spy Score | 12022 punti | |
Aiuto | ||
* ... Meglio usare valori piccoli
Witcher 3 FPS Chart
| basso | medio | alto | ultra | |
|---|---|---|---|---|
| GTA V (2015) | 186.2 | 181.3 | 169.5 | 107.4 |
| The Witcher 3 (2015) | 391.9 | 313.9 | 212.5 | 109.4 |
| Dota 2 Reborn (2015) | 176.1 | 157.9 | 148.6 | 140.8 |
| Final Fantasy XV Benchmark (2018) | 200 | 147.4 | 115.1 | |
| X-Plane 11.11 (2018) | 124.3 | 106.6 | 96.4 | |
| Strange Brigade (2018) | 416 | 273 | 226 | 199.8 |
| Cyberpunk 2077 1.6 (2022) | 135.4 | 123.2 | 96.2 | 80 |
Emissioni
Rumore del sistema
Il rumore della ventola è quasi sempre presente. Le ventole tendono a girare al minimo se sono al minimo sul desktop, ma anche i carichi più lievi come la navigazione sul web inducono un rumore della ventola di 30 dB(A) contro uno sfondo silenzioso di 23 dB(A). Il rumore della ventola raggiunge rapidamente il massimo di 56 dB(A) quando si eseguono carichi più impegnativi come 3DMark 06 o giochi, anche se si imposta il profilo di alimentazione bilanciato. Questo è un portatile da gioco che non ha paura di essere rumoroso, indipendentemente dall'impostazione del profilo di alimentazione.
La maggior parte degli altri portatili da gioco da 17 pollici raggiunge i 50 dB(A) o più in condizioni simili, quindi questo problema non è esclusivo di Eurocom. Tuttavia, la macchina Eurocom tende a diventare più rumorosa all'improvviso e più rapidamente.
Rumorosità
| Idle |
| 23.3 / 30.7 / 30.7 dB(A) |
| Sotto carico |
| 56.2 / 55.9 dB(A) |
 | ||
30 dB silenzioso 40 dB(A) udibile 50 dB(A) rumoroso |
||
min: | ||
| Eurocom Nightsky TXi317 GeForce RTX 3080 Ti Laptop GPU, i7-12700H, Samsung SSD 980 Pro 1TB MZ-V8P1T0BW | Schenker XMG Pro 17 E22 GeForce RTX 3080 Ti Laptop GPU, i9-12900H, Samsung SSD 980 Pro 1TB MZ-V8P1T0BW | Aorus 17X XES GeForce RTX 3070 Ti Laptop GPU, i9-12900HX, Gigabyte AG470S1TB-SI B10 | MSI Raider GE77 HX 12UHS GeForce RTX 3080 Ti Laptop GPU, i9-12900HX, Samsung PM9A1 MZVL22T0HBLB | Razer Blade 17 Early 2022 GeForce RTX 3080 Ti Laptop GPU, i9-12900H, Samsung PM9A1 MZVL21T0HCLR | Alienware x17 R2 P48E GeForce RTX 3080 Ti Laptop GPU, i9-12900HK, 2x Samsung PM9A1 1TB (RAID 0) | |
|---|---|---|---|---|---|---|
| Noise | -12% | -7% | -11% | 2% | 16% | |
| off /ambiente * (dB) | 23.3 | 26 -12% | 26 -12% | 26 -12% | 26 -12% | 22.7 3% |
| Idle Minimum * (dB) | 23.3 | 26 -12% | 28 -20% | 26 -12% | 26 -12% | 23.1 1% |
| Idle Average * (dB) | 30.7 | 34 -11% | 32 -4% | 34 -11% | 27 12% | 23.1 25% |
| Idle Maximum * (dB) | 30.7 | 42 -37% | 38 -24% | 46 -50% | 32 -4% | 23.1 25% |
| Load Average * (dB) | 56.2 | 58 -3% | 53 6% | 50 11% | 50 11% | 31.9 43% |
| Witcher 3 ultra * (dB) | 56.1 | 57 -2% | 54 4% | 55 2% | 51 9% | 52.5 6% |
| Load Maximum * (dB) | 55.9 | 58 -4% | 55 2% | 57 -2% | 51 9% | 52.5 6% |
* ... Meglio usare valori piccoli
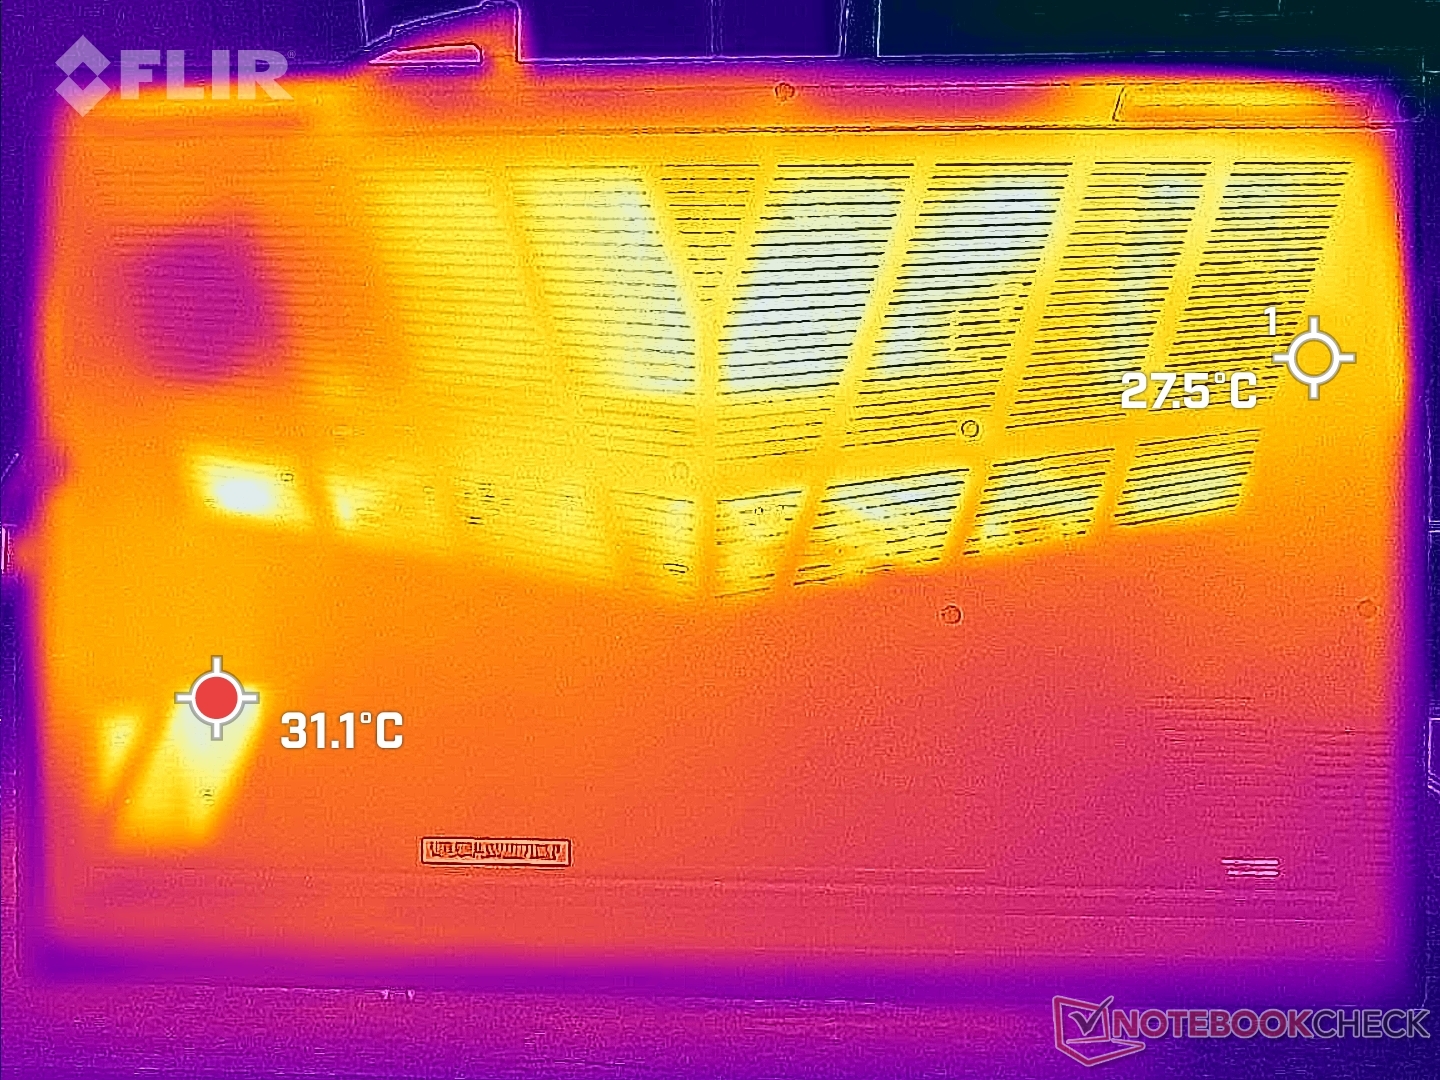
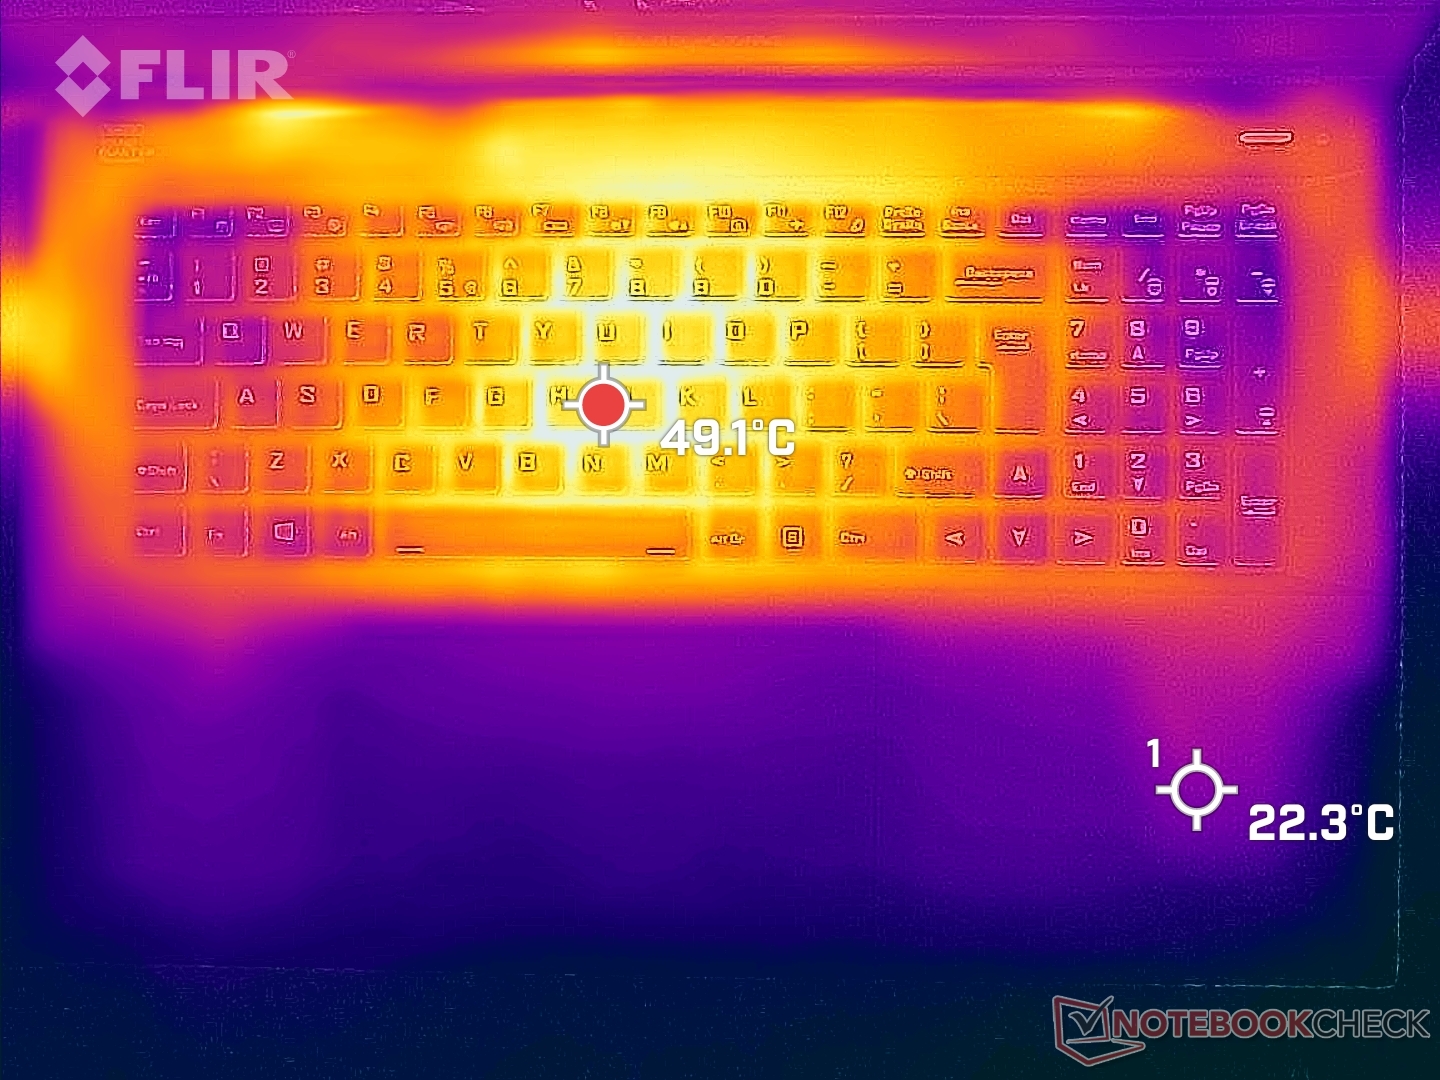
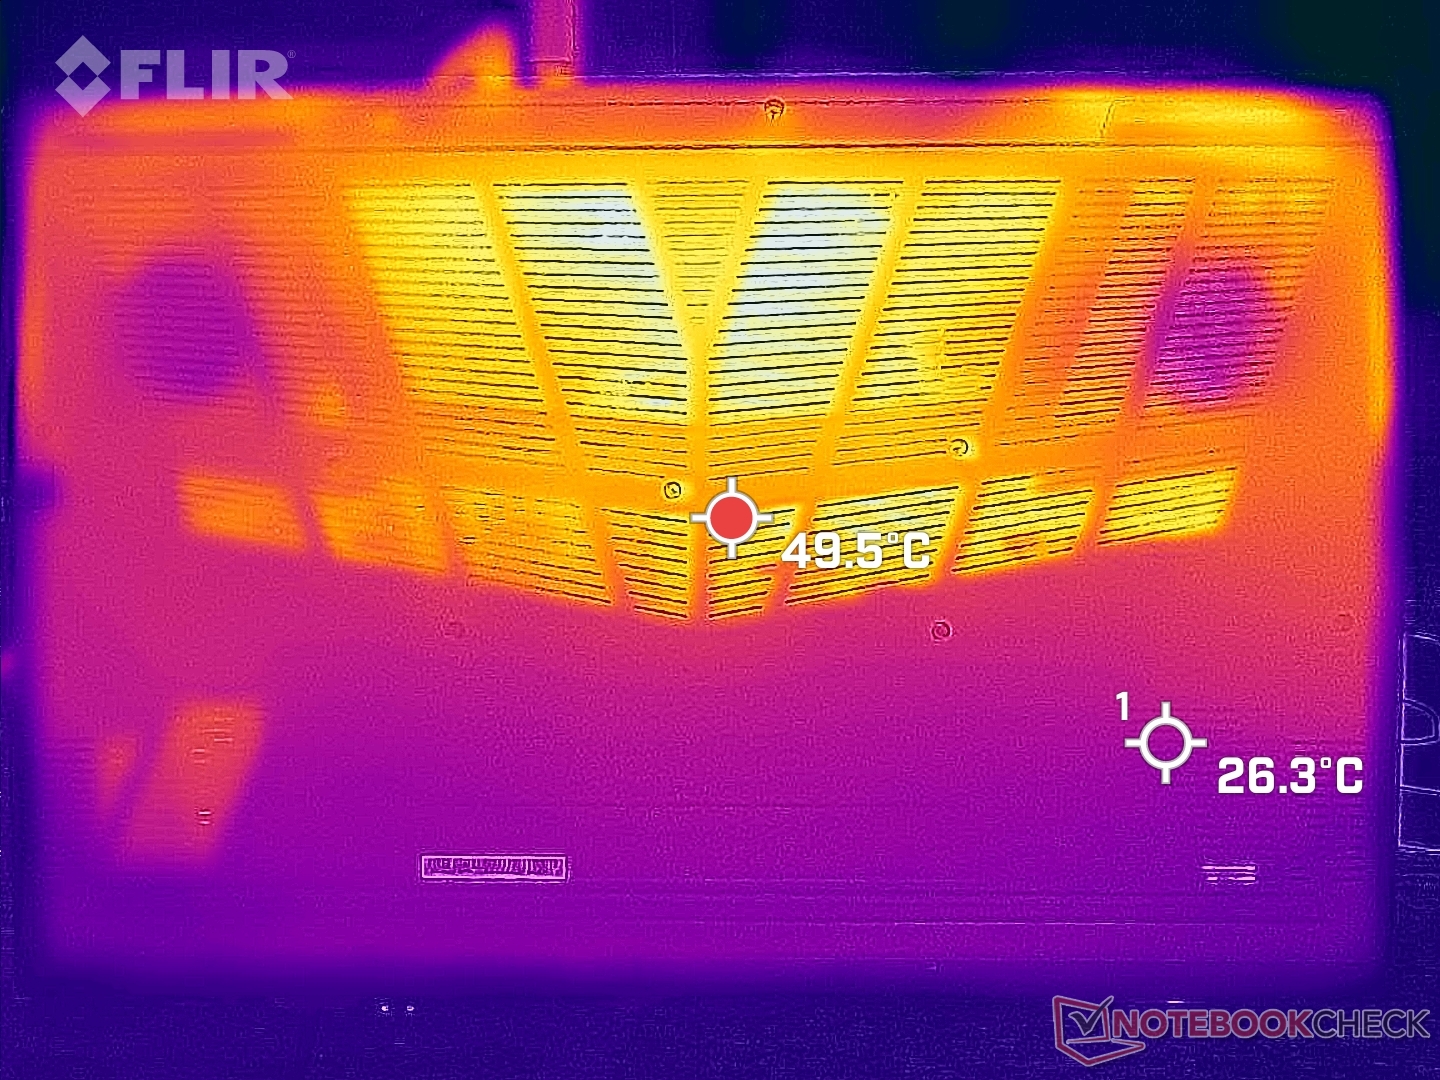
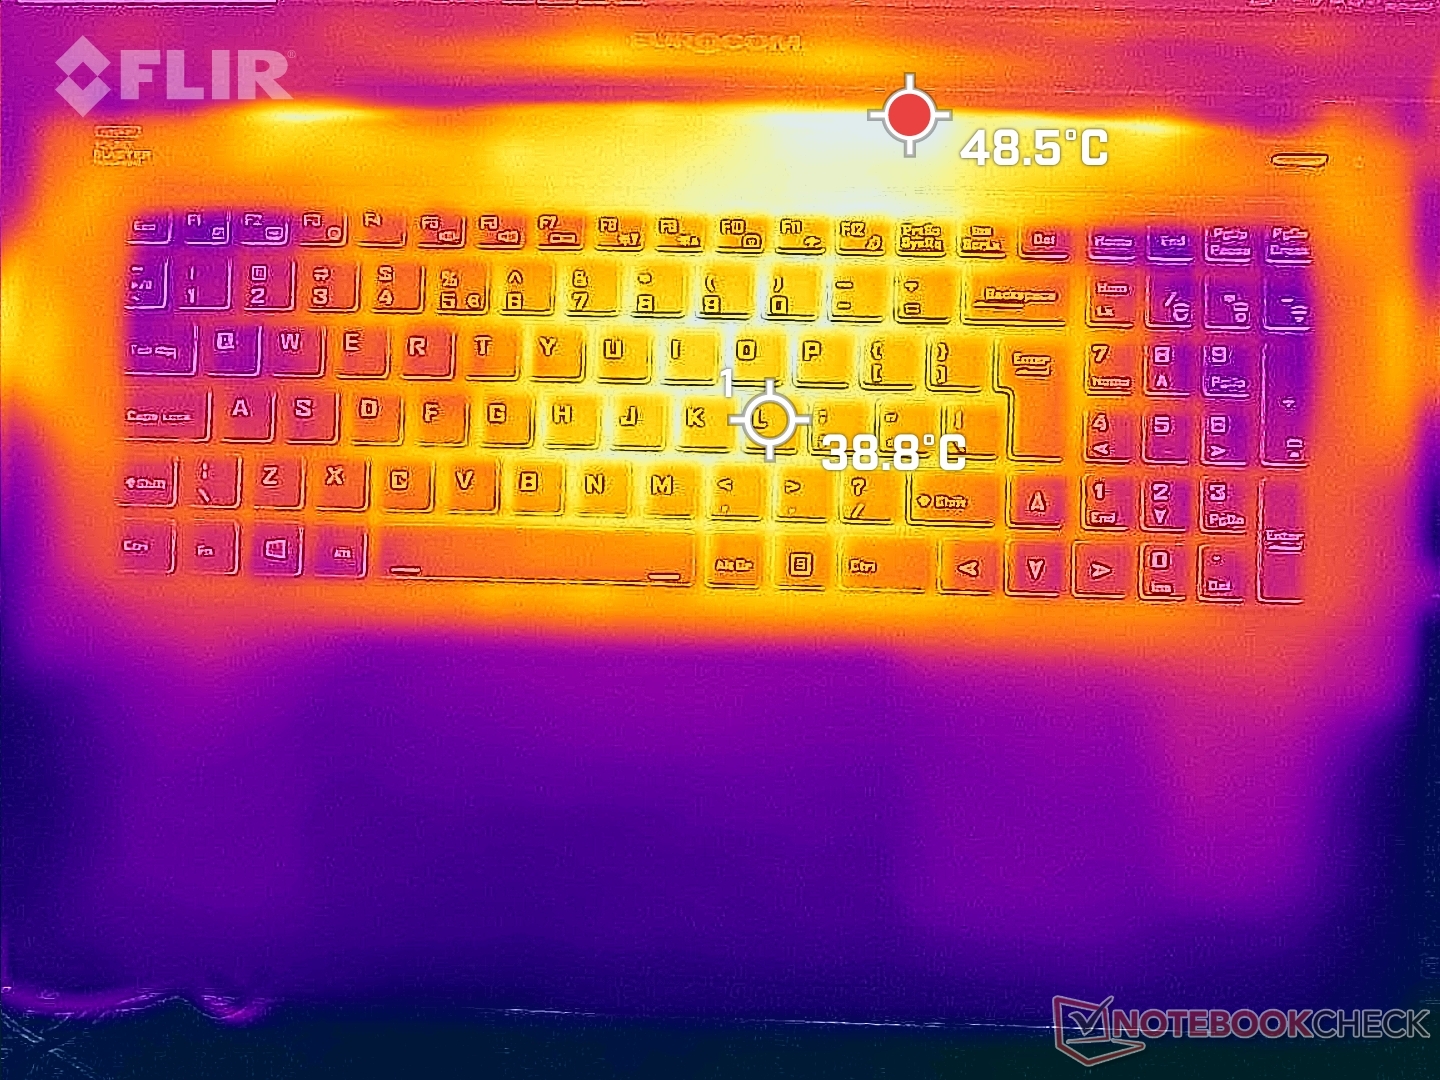
Temperatura
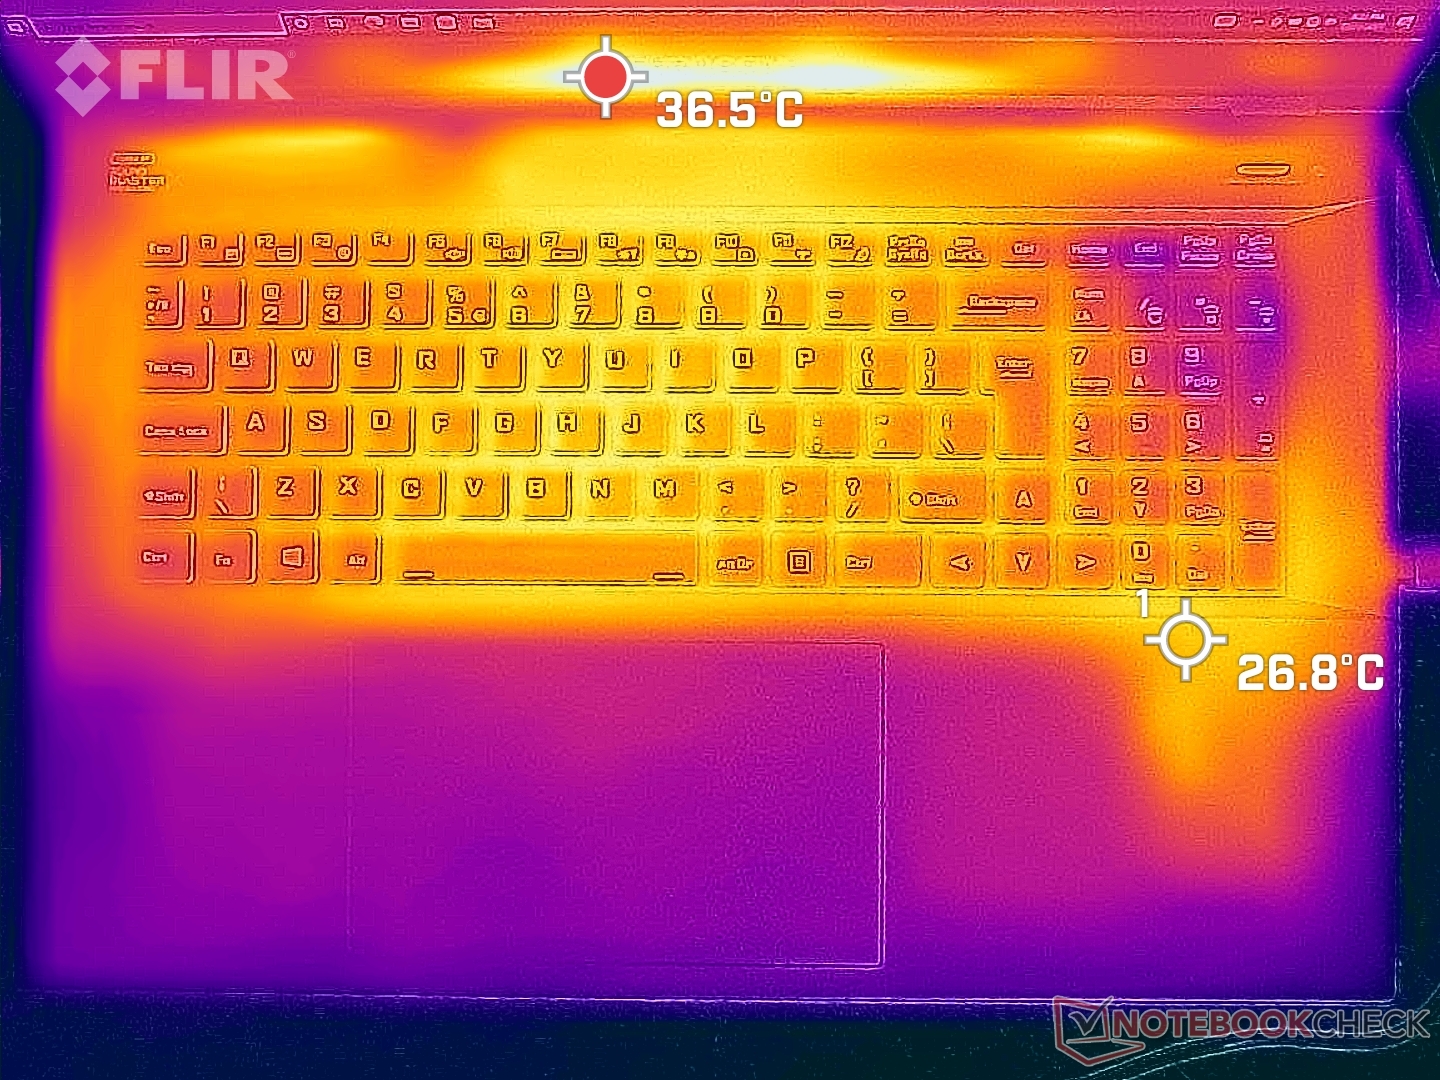
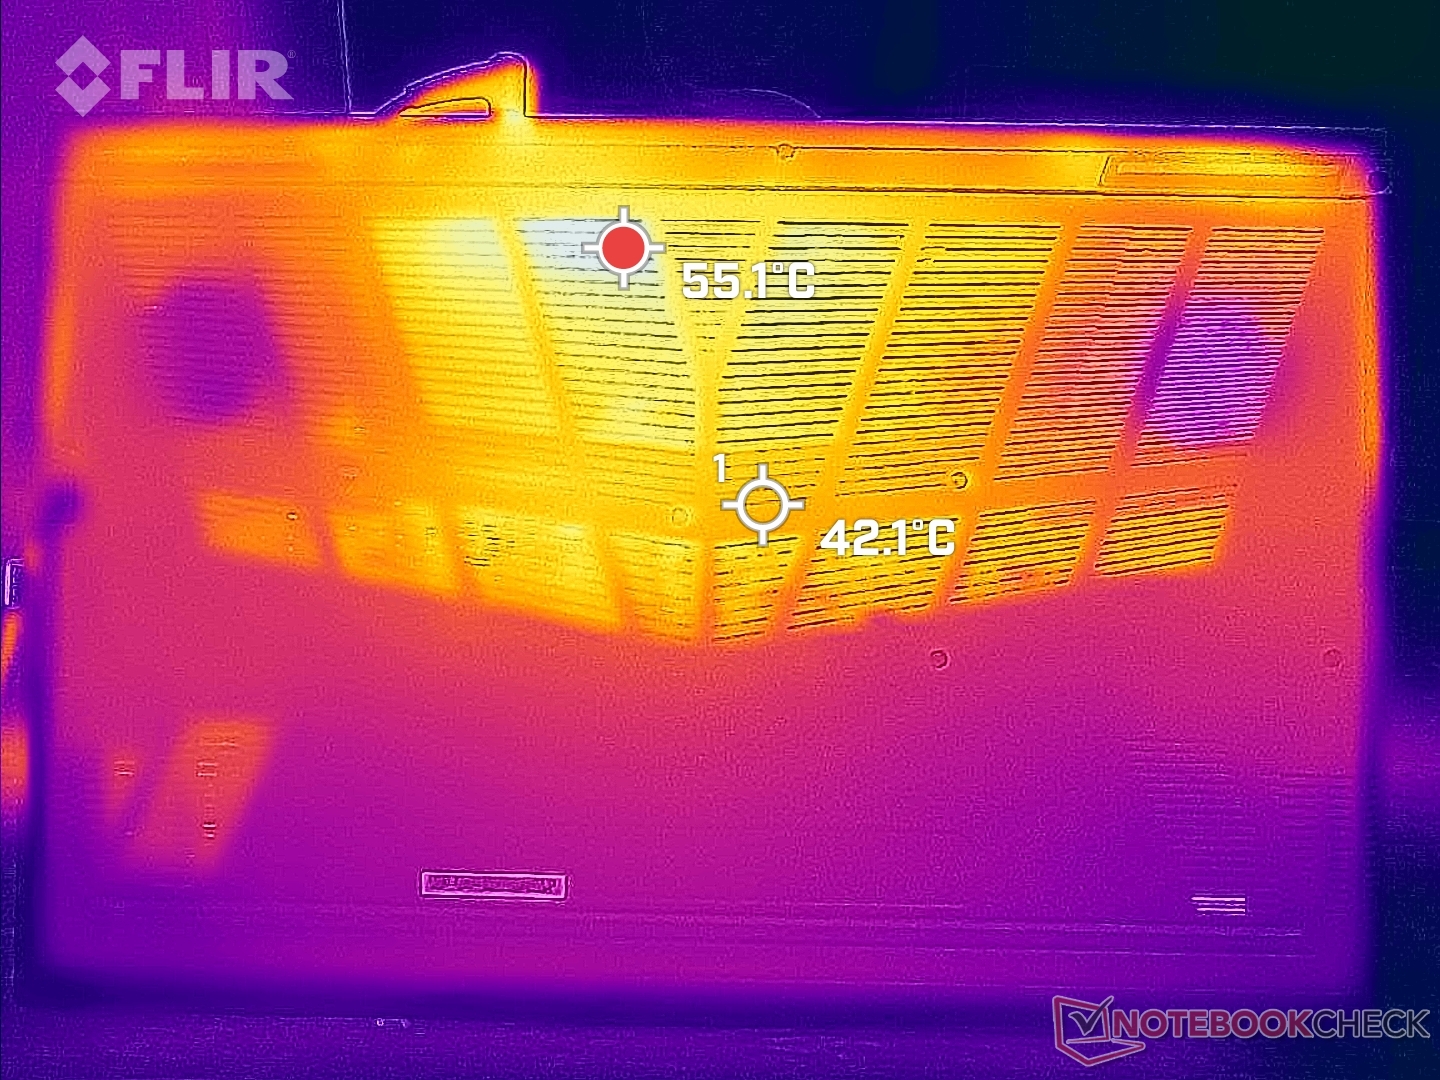
Le temperature della superficie sono più calde verso il centro della tastiera, mentre i poggiapolsi sono molto più freschi per un gioco più confortevole. I portatili più sottili, come il Razer Blade 17 hanno poggiapolsi sensibilmente più caldi e più scomodi per la mano
Si noti che il poggiapolsi destro del Nightsky TXi317 sarà sempre un po' più caldo di quello sinistro, poiché le unità SSD M.2 si trovano sotto il poggiapolsi destro.
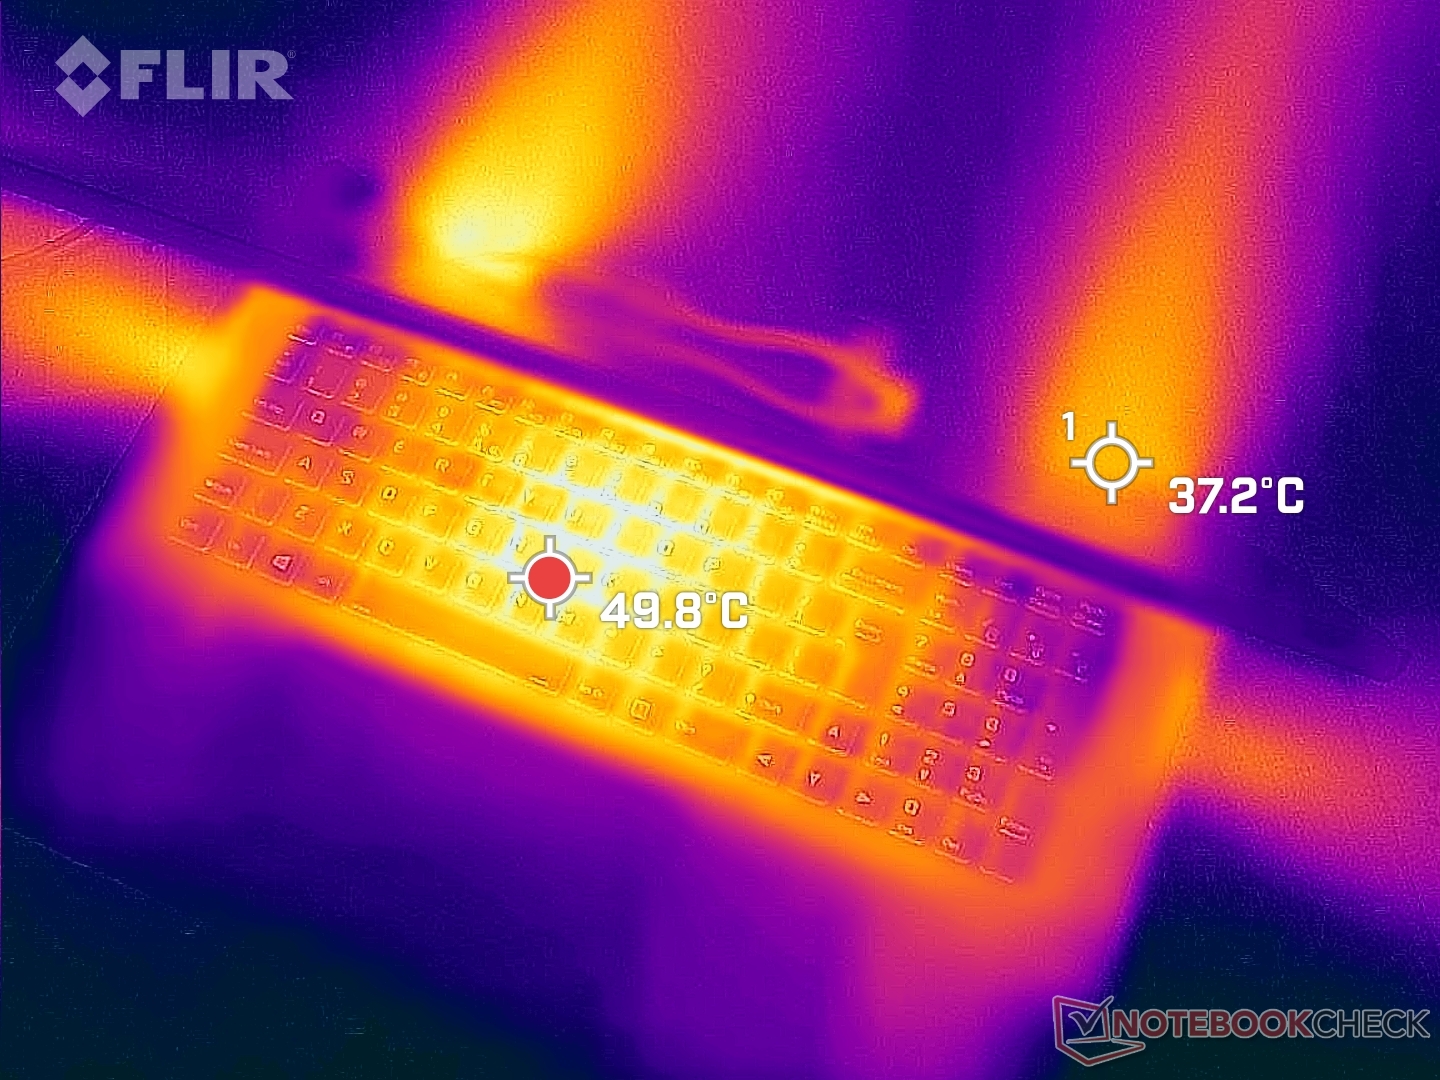
(-) La temperatura massima sul lato superiore è di 50.4 °C / 123 F, rispetto alla media di 40.4 °C / 105 F, che varia da 21.2 a 68.8 °C per questa classe Gaming.
(-) Il lato inferiore si riscalda fino ad un massimo di 47.6 °C / 118 F, rispetto alla media di 43.2 °C / 110 F
(+) In idle, la temperatura media del lato superiore è di 29.4 °C / 85 F, rispetto alla media deld ispositivo di 33.9 °C / 93 F.
(-) Riproducendo The Witcher 3, la temperatura media per il lato superiore e' di 39.2 °C / 103 F, rispetto alla media del dispositivo di 33.9 °C / 93 F.
(+) I poggiapolsi e il touchpad sono piu' freddi della temperatura della pelle con un massimo di 31.2 °C / 88.2 F e sono quindi freddi al tatto.
(-) La temperatura media della zona del palmo della mano di dispositivi simili e'stata di 28.8 °C / 83.8 F (-2.4 °C / -4.4 F).
| Eurocom Nightsky TXi317 Intel Core i7-12700H, NVIDIA GeForce RTX 3080 Ti Laptop GPU | Schenker XMG Pro 17 E22 Intel Core i9-12900H, NVIDIA GeForce RTX 3080 Ti Laptop GPU | Aorus 17X XES Intel Core i9-12900HX, NVIDIA GeForce RTX 3070 Ti Laptop GPU | MSI Raider GE77 HX 12UHS Intel Core i9-12900HX, NVIDIA GeForce RTX 3080 Ti Laptop GPU | Razer Blade 17 Early 2022 Intel Core i9-12900H, NVIDIA GeForce RTX 3080 Ti Laptop GPU | Alienware x17 R2 P48E Intel Core i9-12900HK, NVIDIA GeForce RTX 3080 Ti Laptop GPU | |
|---|---|---|---|---|---|---|
| Heat | -12% | -15% | -19% | -10% | 7% | |
| Maximum Upper Side * (°C) | 50.4 | 56 -11% | 54 -7% | 53 -5% | 50 1% | 49.6 2% |
| Maximum Bottom * (°C) | 47.6 | 60 -26% | 58 -22% | 58 -22% | 56 -18% | 42.4 11% |
| Idle Upper Side * (°C) | 32.6 | 34 -4% | 37 -13% | 38 -17% | 36 -10% | 29.2 10% |
| Idle Bottom * (°C) | 33.2 | 36 -8% | 39 -17% | 43 -30% | 38 -14% | 32 4% |
* ... Meglio usare valori piccoli
Stress test
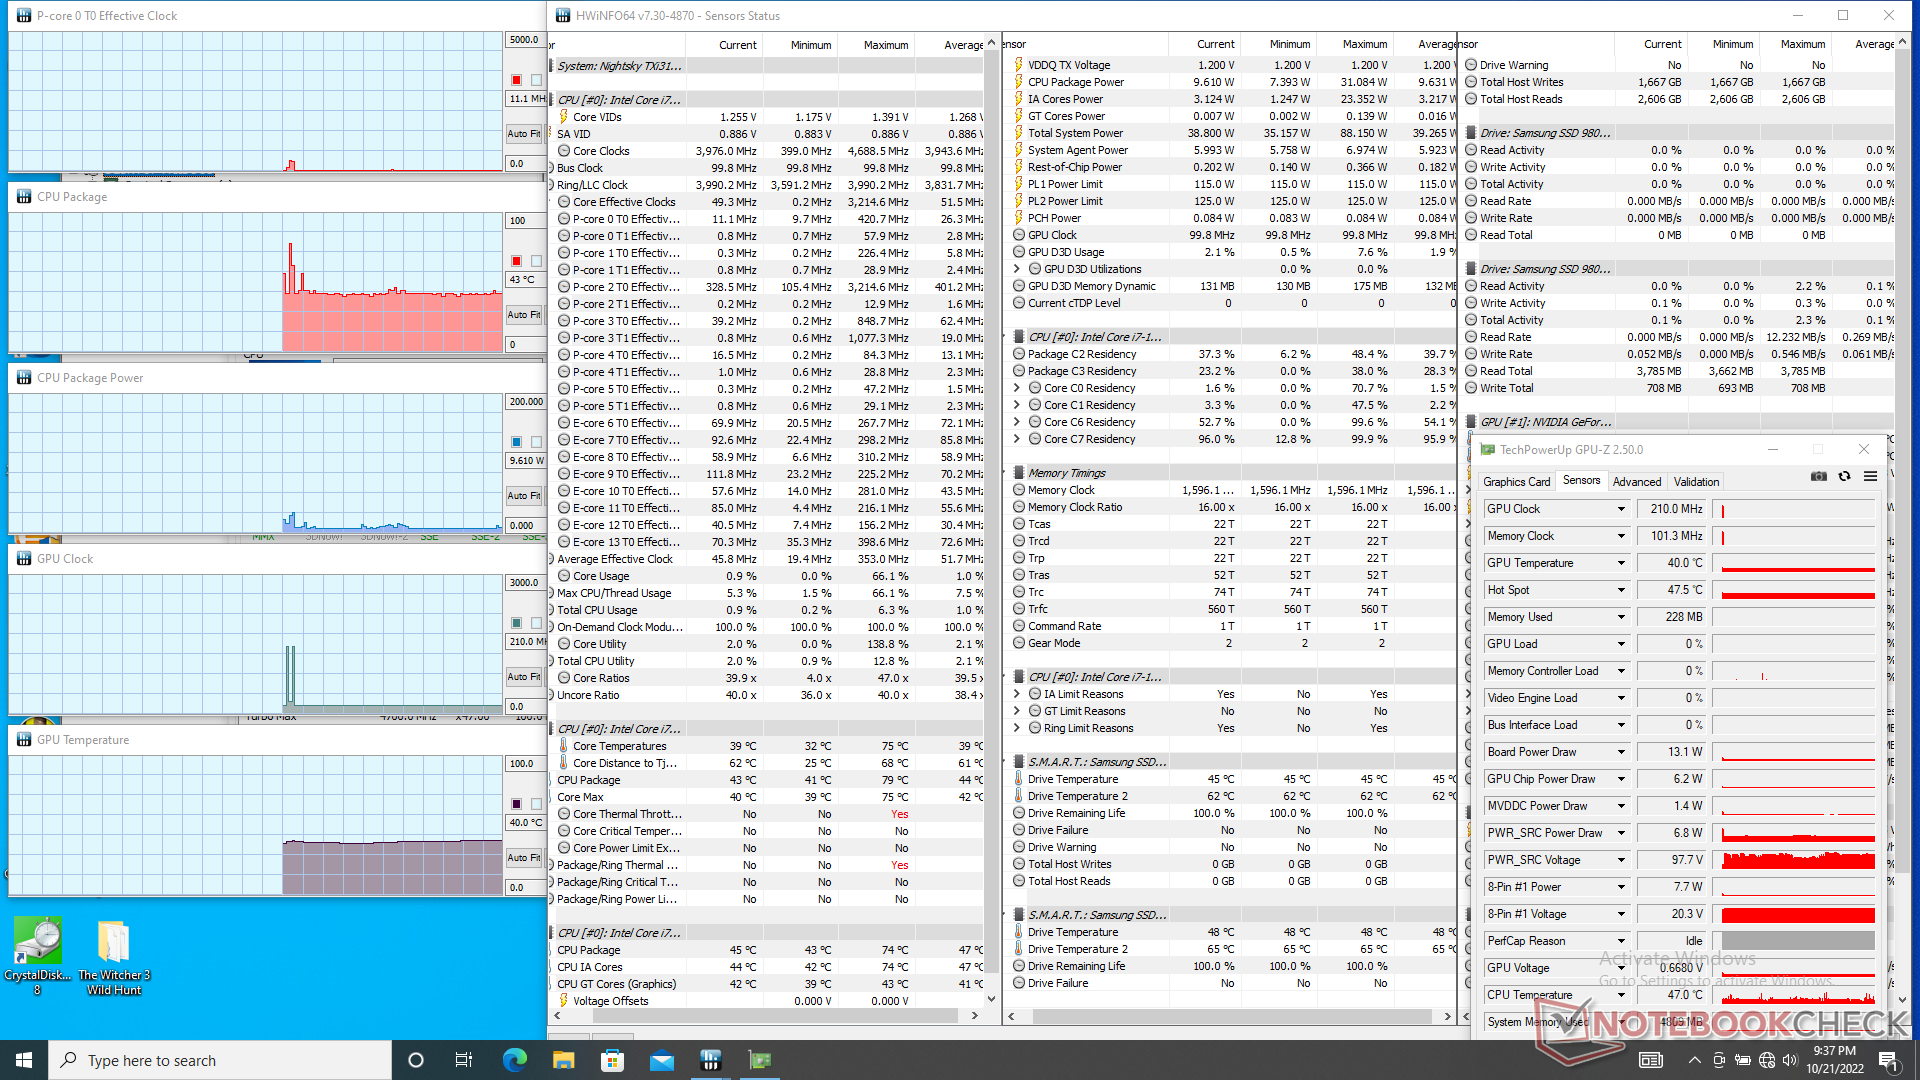
La velocità di clock della CPU, la temperatura e l'assorbimento di potenza della scheda raggiungono rispettivamente 4 GHz, 97 C e 110 W quando si avvia lo stress Prime95. La frequenza di clock e l'assorbimento di potenza sono poi diminuiti costantemente prima di stabilizzarsi rispettivamente a 2,8 GHz e 76 W, senza variazioni della temperatura del core. Ripetendo lo stesso test sulDell G16 7620 con un processore identico, si otterrebbe una velocità di clock stabile leggermente superiore, pari a circa 3,3 GHz, ma una temperatura del core simile, pari a quasi 100 C.
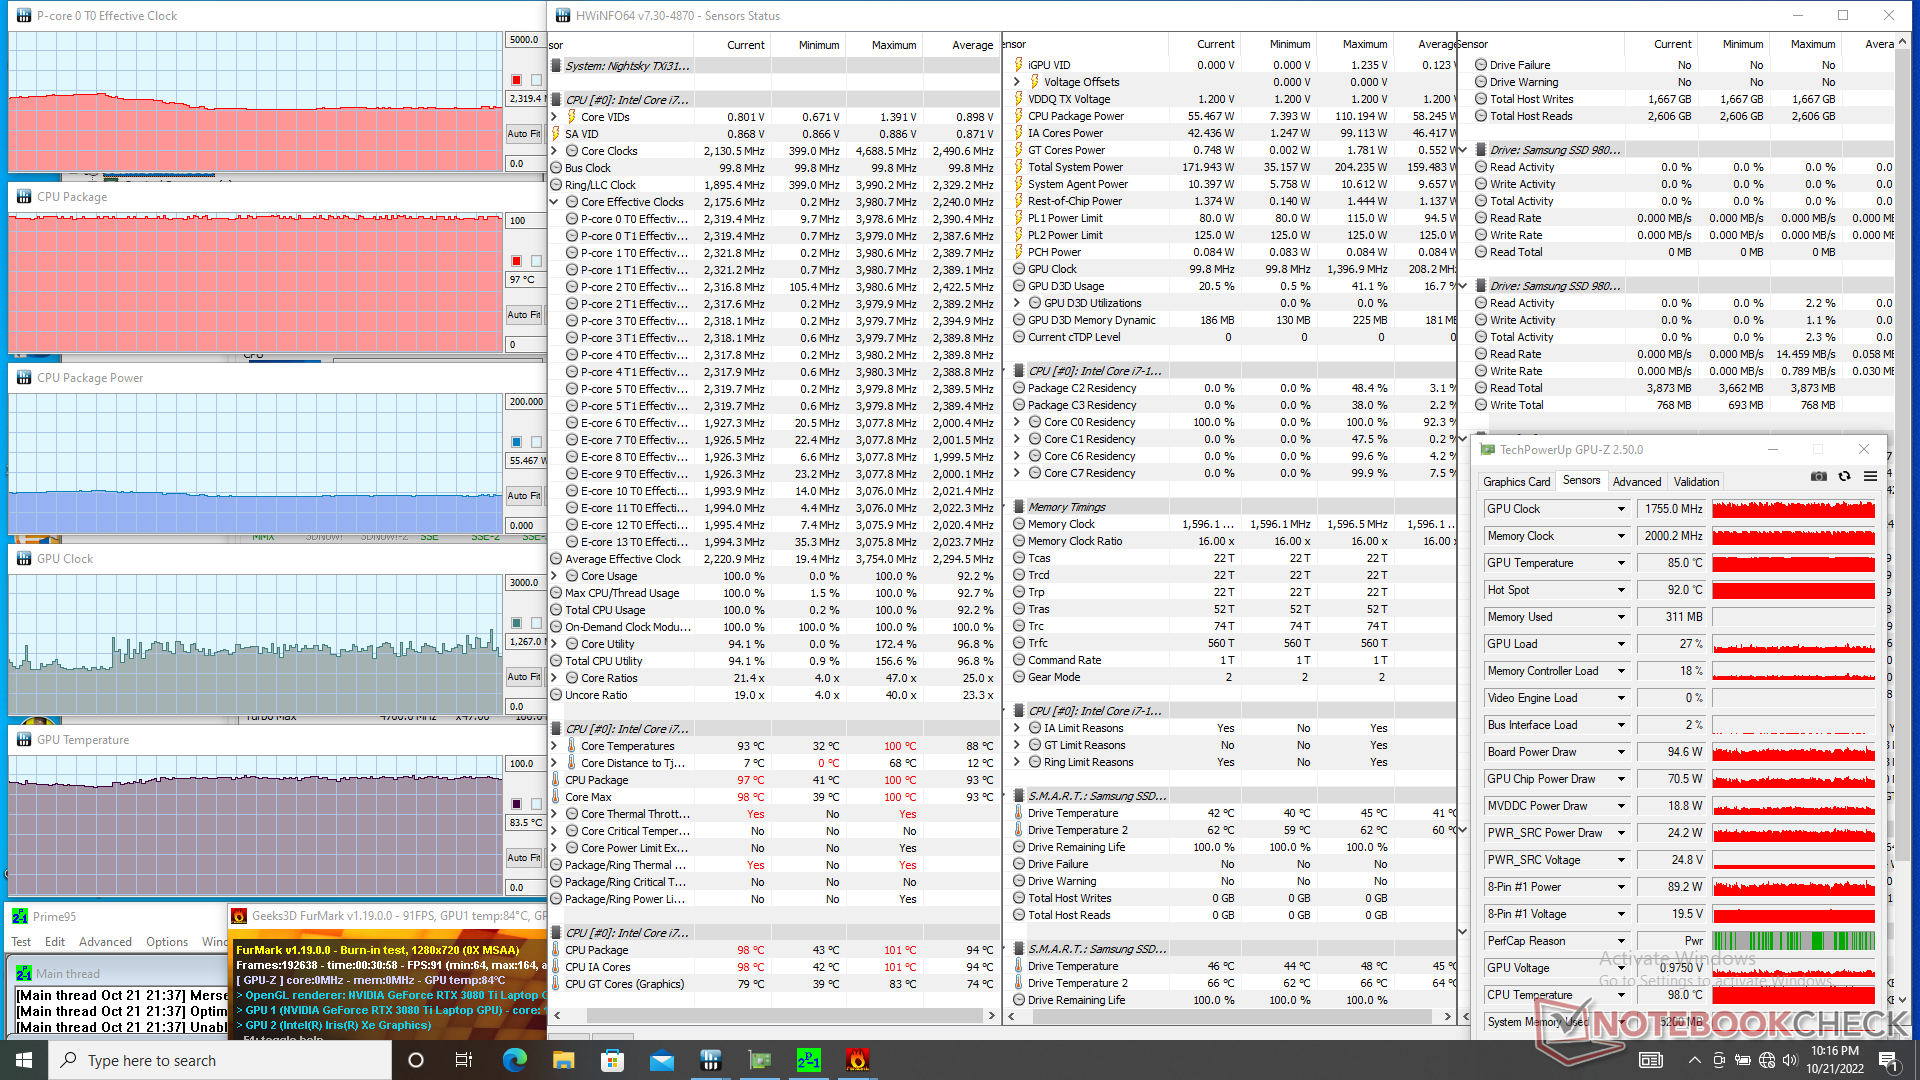
La velocità di clock della GPU, la temperatura e l'assorbimento di potenza della scheda si stabilizzerebbero rispettivamente a 1432 MHz, 87 C e 121 W, quando si esegue Witcher 3. Ripetendo questo test con il profilo di alimentazione "Entertainment", le prestazioni della GPU risulterebbero leggermente ridotte: la velocità di clock e l'assorbimento di potenza scenderebbero rispettivamente a 1327 MHz e 110 W, senza alcuna variazione della temperatura. È un peccato che non ci si possa avvicinare all'obiettivo dichiarato di 125 W - 155 W del TGP.
Eseguendo Witcher 3 su MSI GS77 MSI GS77 con la stessa GPU RTX 3080 Ti si otterrebbe una frequenza di clock della GPU più lenta, una temperatura del nucleo più bassa e un minore consumo energetico della scheda, rispettivamente di 1432 MHz, 75 C e 105 W, rispetto al nostro Eurocom.
Le prestazioni sono limitate se si utilizza la batteria. Un test di Fire Strike con l'alimentazione a batteria restituirebbe punteggi di Fisica e Grafica rispettivamente di 12300 e 5071 punti, rispetto a 28276 e 31825 punti con l'alimentazione a rete.
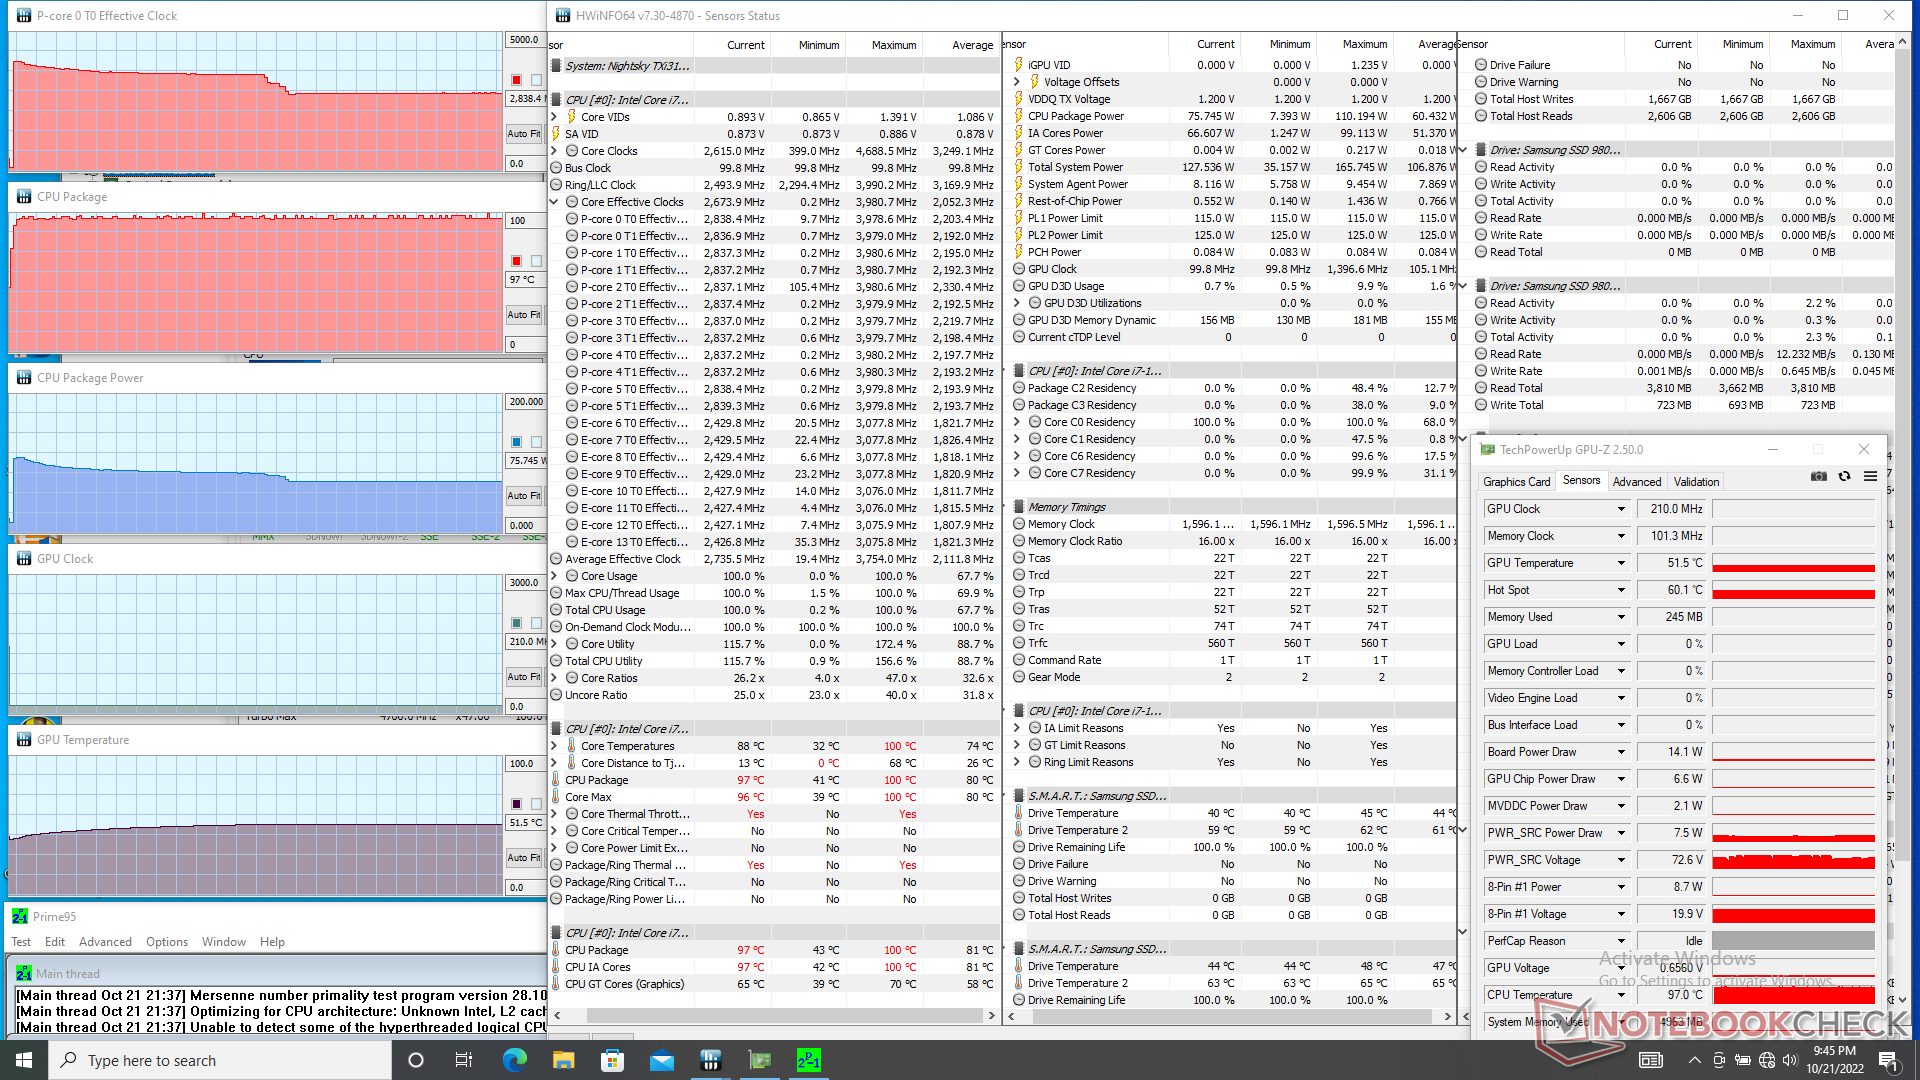
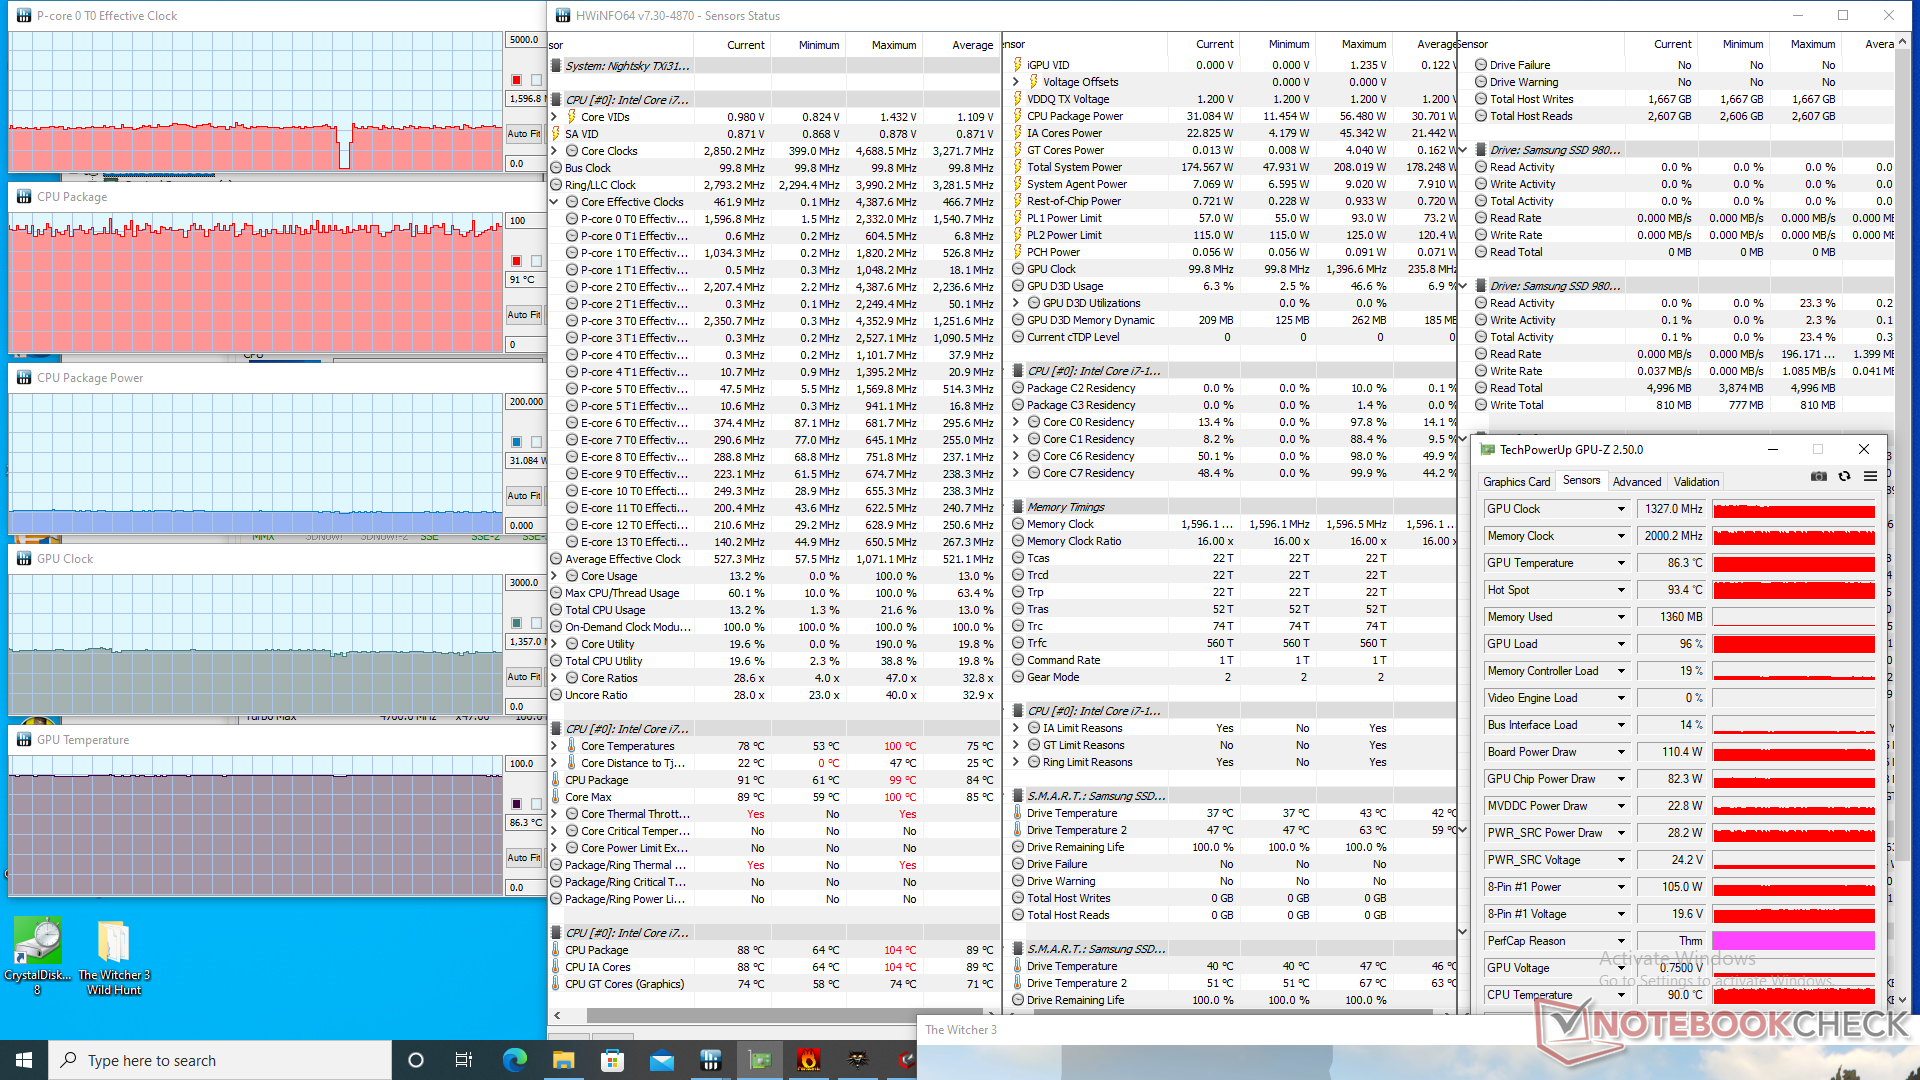
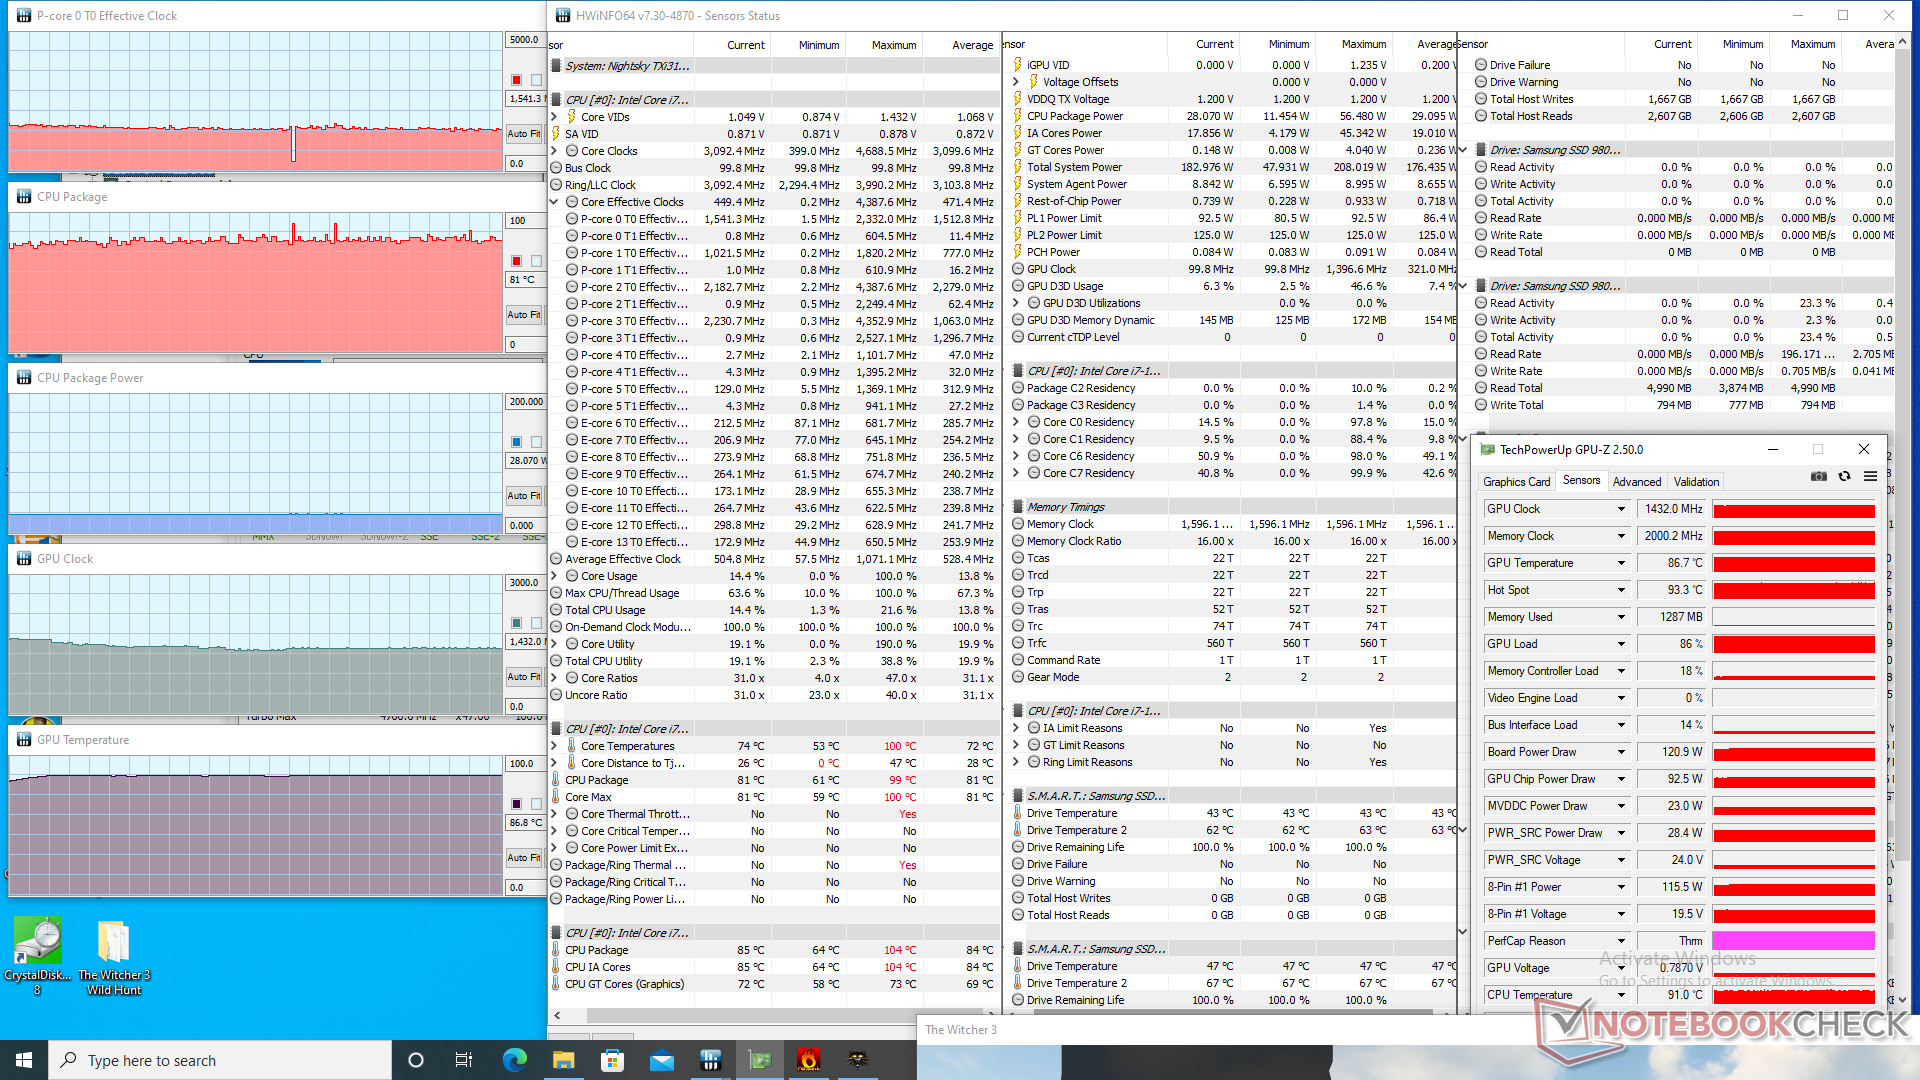
| Clock della CPU (GHz) | Clock della GPU (MHz) | Temperatura media della CPU (°C) | Temperatura media della GPU (°C) | |
| Sistema inattivo | -- | -- | 43 | 40 |
| Stress Prime95 | 2,8 | -- | 97 | 52 |
| Prime95 + FurMark Stress | 2,3 - 2,8 | 1267 - 1755 | 97 | 84 |
| Witcher 3 Stress | 1,5 | 1432 | 81 | 87 |
Altoparlanti
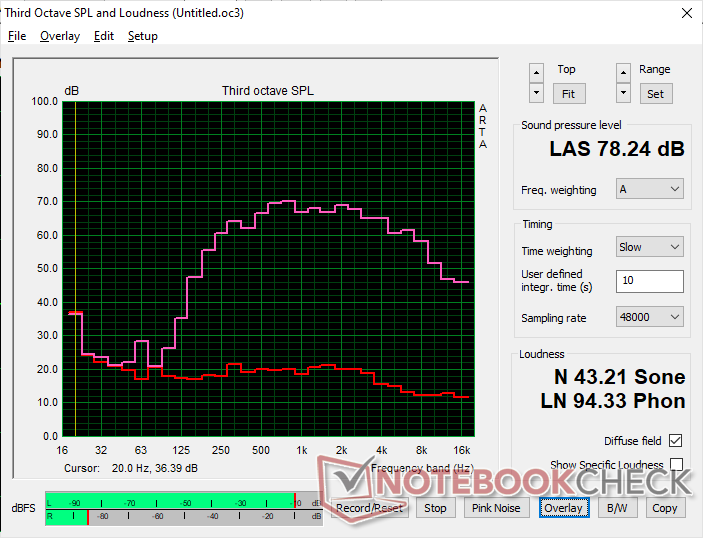
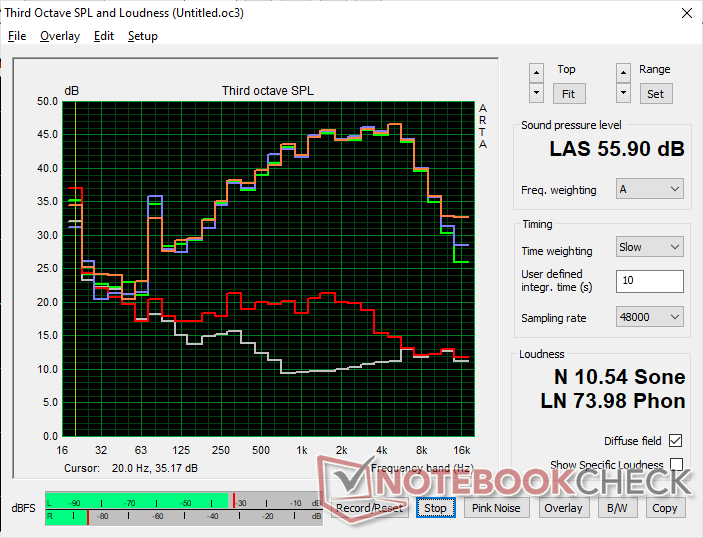
Eurocom Nightsky TXi317 analisi audio
(±) | potenza degli altiparlanti media ma buona (78.2 dB)
Bassi 100 - 315 Hz
(±) | bassi ridotti - in media 14.6% inferiori alla media
(-) | bassi non lineari (16.5% delta rispetto alla precedente frequenza)
Medi 400 - 2000 Hz
(±) | medi elevati - circa 5.1% superiore alla media
(+) | medi lineari (5% delta rispetto alla precedente frequenza)
Alti 2 - 16 kHz
(+) | Alti bilanciati - appena 4% dalla media
(+) | alti lineari (6.2% delta rispetto alla precedente frequenza)
Nel complesso 100 - 16.000 Hz
(±) | la linearità complessiva del suono è media (20.4% di differenza rispetto alla media
Rispetto alla stessa classe
» 72% di tutti i dispositivi testati in questa classe è stato migliore, 6% simile, 22% peggiore
» Il migliore ha avuto un delta di 6%, medio di 18%, peggiore di 132%
Rispetto a tutti i dispositivi testati
» 53% di tutti i dispositivi testati in questa classe è stato migliore, 8% similare, 39% peggiore
» Il migliore ha avuto un delta di 4%, medio di 24%, peggiore di 134%
Apple MacBook Pro 16 2021 M1 Pro analisi audio
(+) | gli altoparlanti sono relativamente potenti (84.7 dB)
Bassi 100 - 315 Hz
(+) | bassi buoni - solo 3.8% dalla media
(+) | bassi in lineaa (5.2% delta rispetto alla precedente frequenza)
Medi 400 - 2000 Hz
(+) | medi bilanciati - solo only 1.3% rispetto alla media
(+) | medi lineari (2.1% delta rispetto alla precedente frequenza)
Alti 2 - 16 kHz
(+) | Alti bilanciati - appena 1.9% dalla media
(+) | alti lineari (2.7% delta rispetto alla precedente frequenza)
Nel complesso 100 - 16.000 Hz
(+) | suono nel complesso lineare (4.6% differenza dalla media)
Rispetto alla stessa classe
» 0% di tutti i dispositivi testati in questa classe è stato migliore, 0% simile, 100% peggiore
» Il migliore ha avuto un delta di 5%, medio di 17%, peggiore di 45%
Rispetto a tutti i dispositivi testati
» 0% di tutti i dispositivi testati in questa classe è stato migliore, 0% similare, 100% peggiore
» Il migliore ha avuto un delta di 4%, medio di 24%, peggiore di 134%
Gestione dell'energia
Consumo di energia
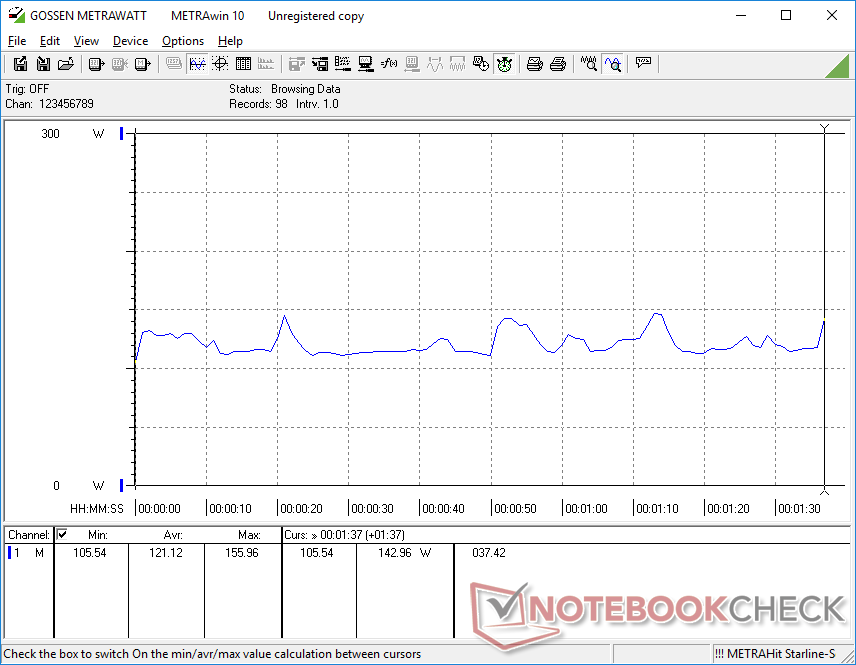
Il funzionamento al minimo sul desktop con l'impostazione di luminosità e il profilo energetico più bassi richiede poco meno di 13 W per essere paragonabile all'XMG Pro 17 E22. Tuttavia, il consumo può raggiungere i 40 W se si utilizza l'impostazione di luminosità massima e il profilo di consumo delle prestazioni con la GPU discreta Nvidia attiva. Si consiglia di utilizzare impostazioni di potenza più basse se non sono necessarie prestazioni aggiuntive, grazie al notevole risparmio energetico.
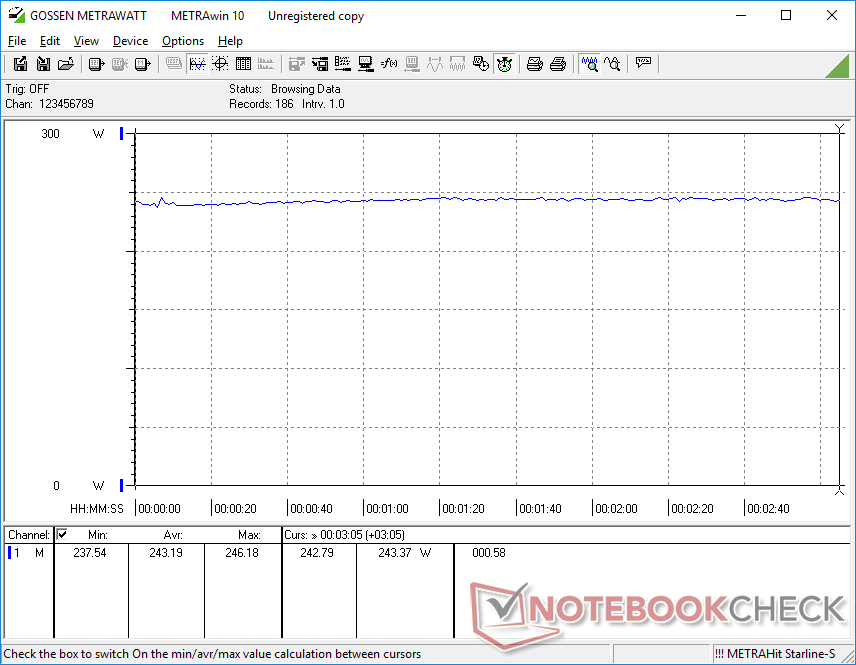
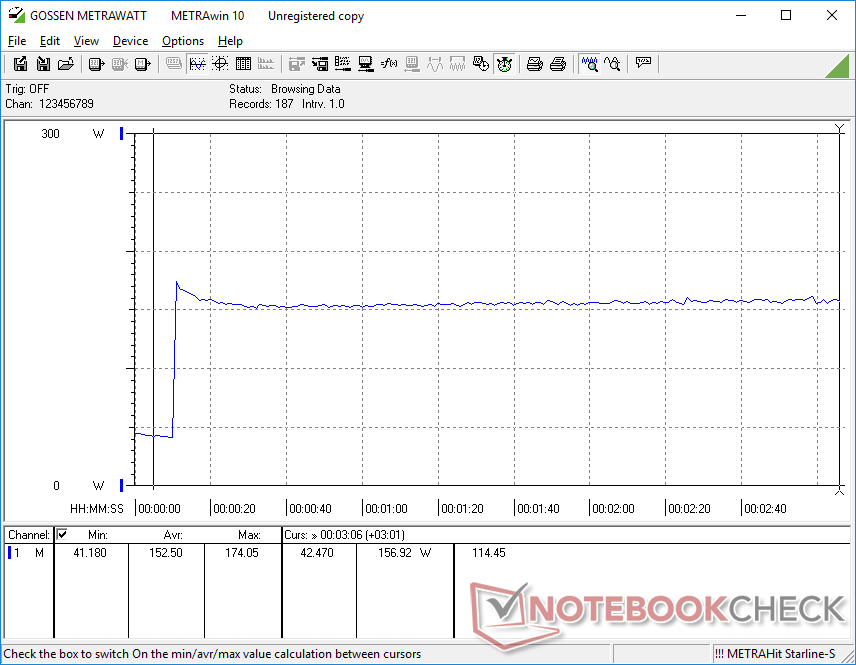
Il consumo di energia quando è in funzione Witcher 3 è quasi identico a quello che abbiamo registrato sulMSI Raider GE77 dotato della stessa GPU. Il sistema è molto più esigente rispetto ai vecchi portatili da gioco che utilizzano la RTX 2080 di GeForce, come ad esempio il modello Lenovo 7 15.Lenovo Legion 7 15 di oltre 80 W
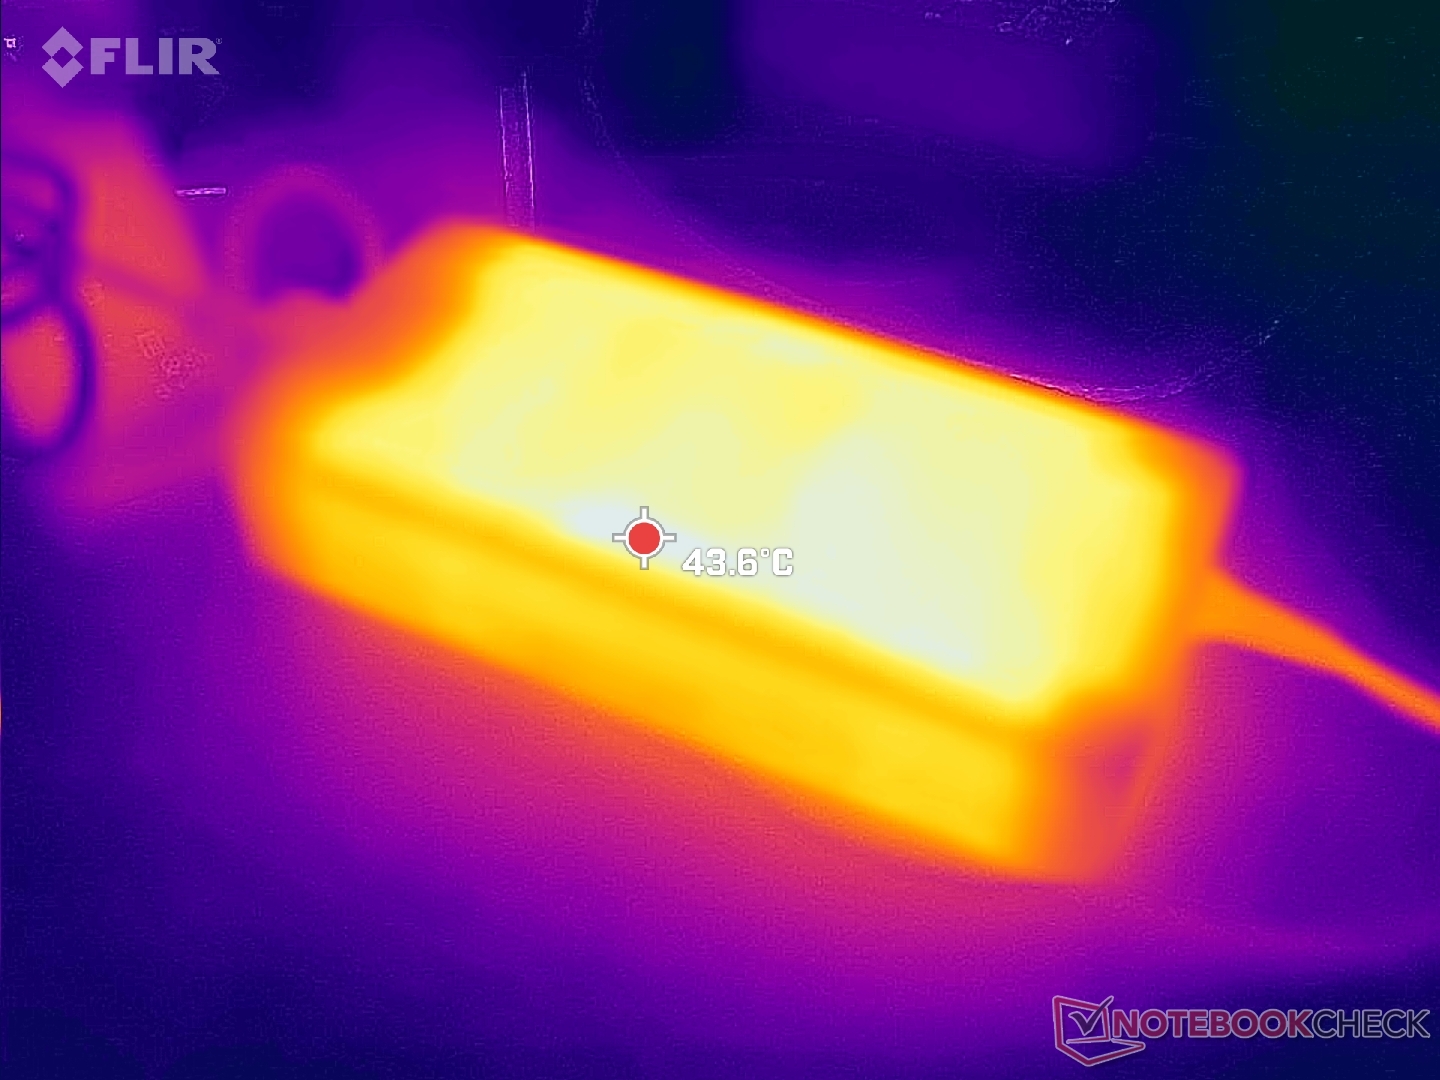
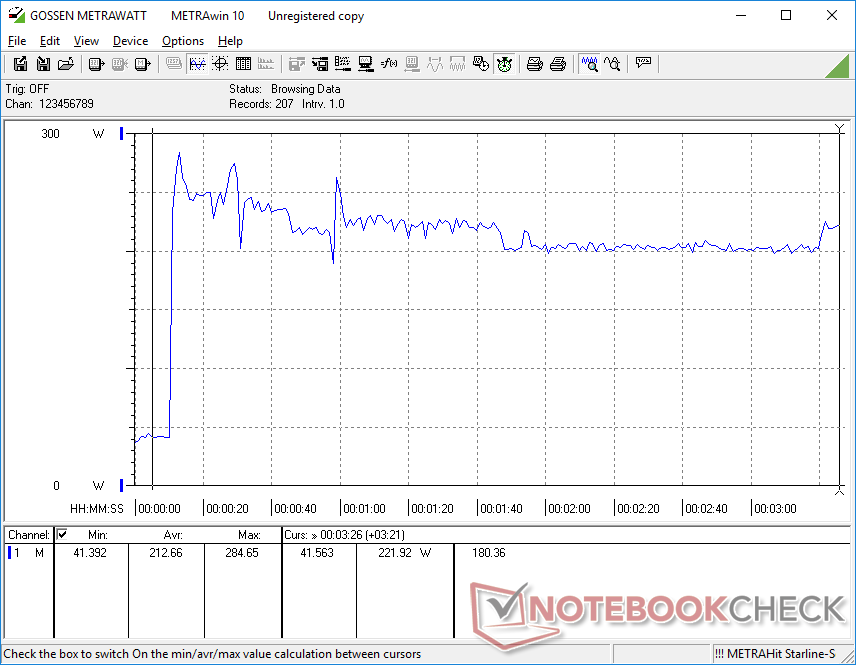
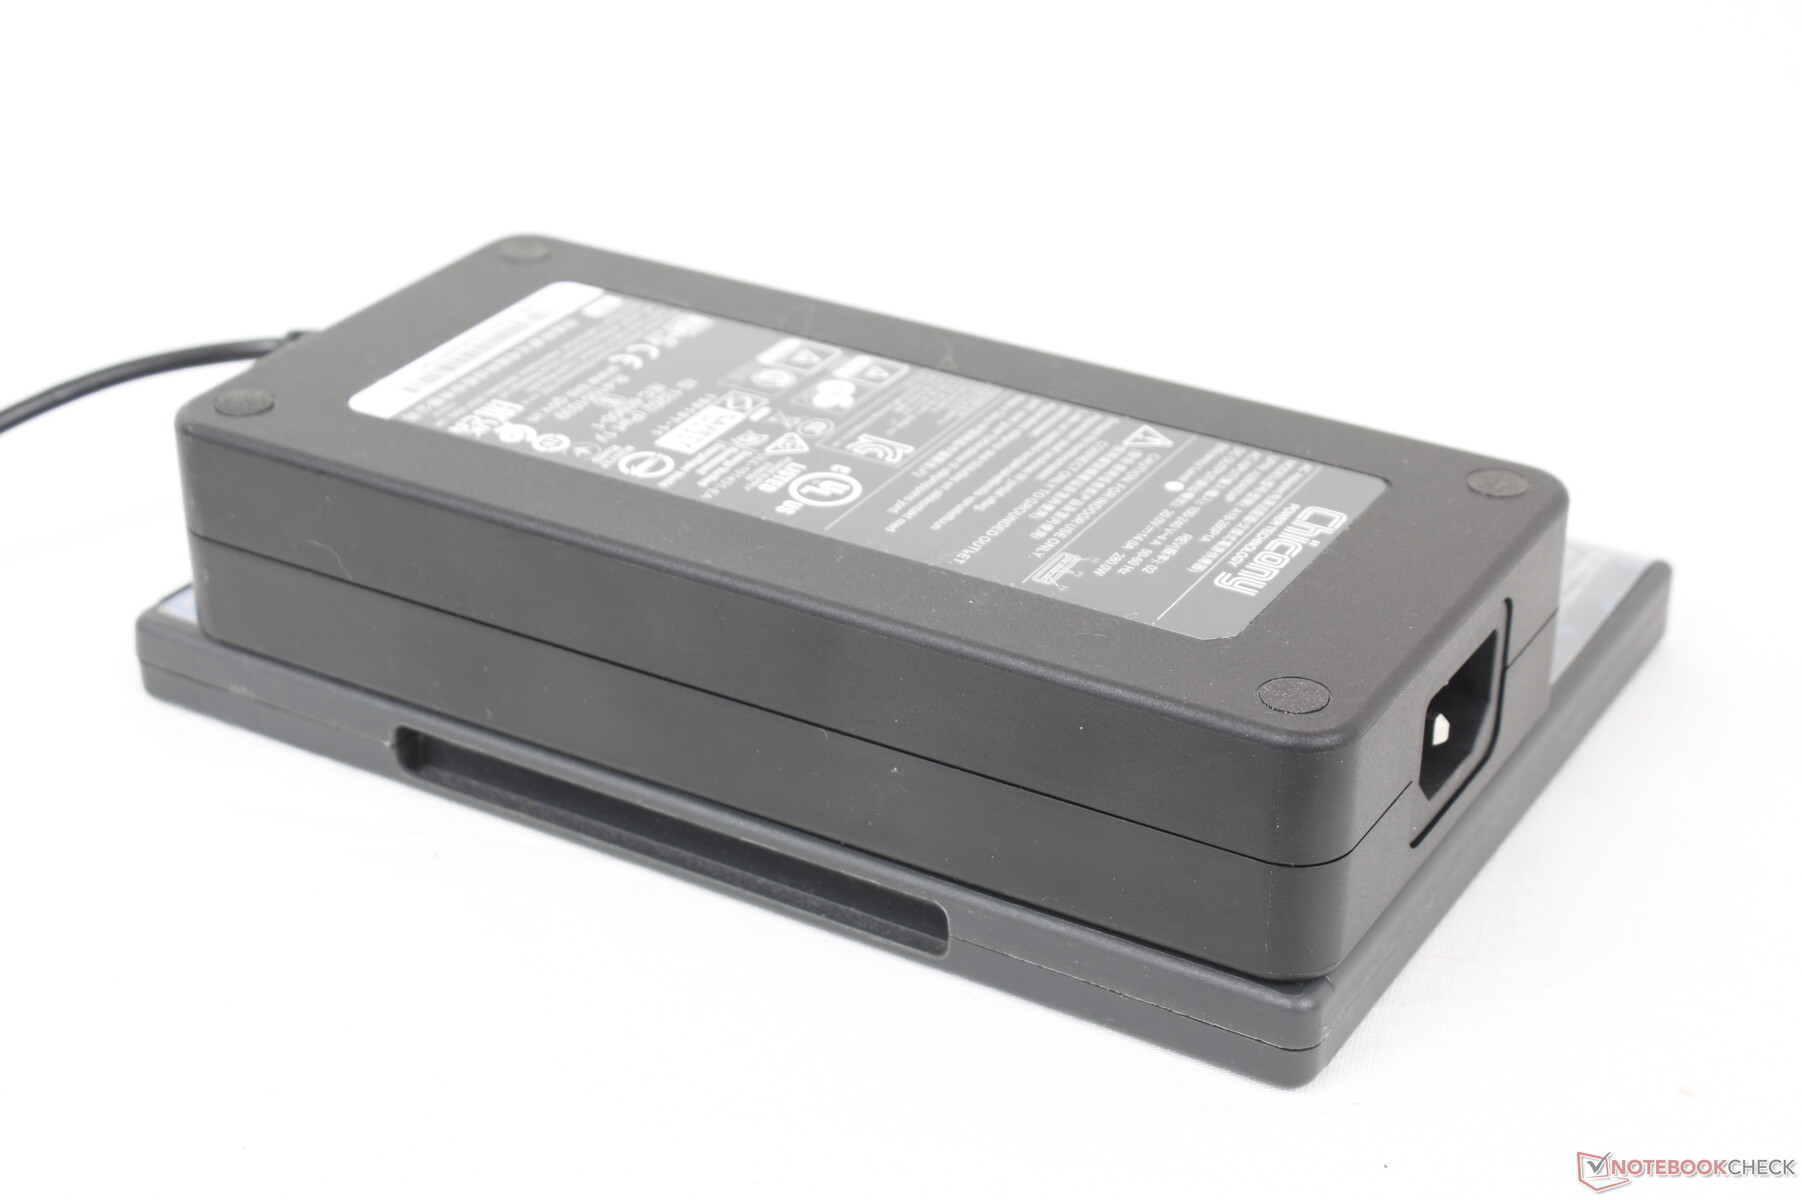
Siamo riusciti a registrare un assorbimento massimo di 285 W dall'adattatore CA da 280 W di grandi dimensioni (~18 x 8,5 x 3,5 cm) quando sia la CPU che la GPU sono al 100% di utilizzo. Questo valore è solo temporaneo, come mostra il grafico sottostante, a causa delle limitazioni termiche. Il sistema è ancora in grado di eseguire giochi e ricaricare contemporaneamente a un ritmo ragionevole.
| Off / Standby | |
| Idle | |
| Sotto carico |
|
Leggenda:
min: | |
| Eurocom Nightsky TXi317 i7-12700H, GeForce RTX 3080 Ti Laptop GPU, Samsung SSD 980 Pro 1TB MZ-V8P1T0BW, IPS, 1920x1080, 17.3" | Schenker XMG Pro 17 E22 i9-12900H, GeForce RTX 3080 Ti Laptop GPU, Samsung SSD 980 Pro 1TB MZ-V8P1T0BW, IPS, 2560x1440, 17.3" | Aorus 17X XES i9-12900HX, GeForce RTX 3070 Ti Laptop GPU, Gigabyte AG470S1TB-SI B10, IPS, 1920x1080, 17.3" | MSI Raider GE77 HX 12UHS i9-12900HX, GeForce RTX 3080 Ti Laptop GPU, Samsung PM9A1 MZVL22T0HBLB, IPS, 3840x2160, 17.3" | Razer Blade 17 Early 2022 i9-12900H, GeForce RTX 3080 Ti Laptop GPU, Samsung PM9A1 MZVL21T0HCLR, IPS, 3840x2160, 17.3" | Alienware x17 R2 P48E i9-12900HK, GeForce RTX 3080 Ti Laptop GPU, 2x Samsung PM9A1 1TB (RAID 0), IPS, 1920x1080, 17.3" | |
|---|---|---|---|---|---|---|
| Power Consumption | 17% | -6% | 4% | 6% | -25% | |
| Idle Minimum * (Watt) | 12.8 | 13 -2% | 18 -41% | 13 -2% | 17 -33% | 24.1 -88% |
| Idle Average * (Watt) | 33.9 | 17 50% | 28 17% | 19 44% | 23 32% | 28.5 16% |
| Idle Maximum * (Watt) | 39.1 | 26 34% | 36 8% | 29 26% | 34 13% | 60 -53% |
| Load Average * (Watt) | 121.1 | 120 1% | 153 -26% | 143 -18% | 120 1% | 128.7 -6% |
| Witcher 3 ultra * (Watt) | 243 | 221 9% | 221 9% | 247 -2% | 229 6% | 254 -5% |
| Load Maximum * (Watt) | 284.7 | 266 7% | 290 -2% | 352 -24% | 243 15% | 323 -13% |
* ... Meglio usare valori piccoli
Power Consumption Witcher 3 / Stresstest
Power Consumption external Monitor
Durata della batteria
L'autonomia della WLAN è breve: poco più di 4 ore di navigazione reale prima di doverla ricaricare. La nostra unità è stata impostata sul profilo energetico Balanced con l'iGPU attiva prima di eseguire il test di durata della batteria. I risultati sono simili a quelli del Razer Blade 17 o dell'Aorus 17X Aorus 17X ma comunque inferiori di oltre due ore rispetto allo Schenker XMG Pro 17 E22.
La ricarica da vuoto a pieno regime è molto lenta, circa 2,5 ore. La maggior parte dei portatili da gioco impiega solo 1,5-2 ore. Il sistema non può essere ricaricato tramite USB-C.
| Eurocom Nightsky TXi317 i7-12700H, GeForce RTX 3080 Ti Laptop GPU, 80 Wh | Schenker XMG Pro 17 E22 i9-12900H, GeForce RTX 3080 Ti Laptop GPU, 80 Wh | Aorus 17X XES i9-12900HX, GeForce RTX 3070 Ti Laptop GPU, 99 Wh | MSI Raider GE77 HX 12UHS i9-12900HX, GeForce RTX 3080 Ti Laptop GPU, 99.99 Wh | Razer Blade 17 Early 2022 i9-12900H, GeForce RTX 3080 Ti Laptop GPU, 82 Wh | Alienware x17 R2 P48E i9-12900HK, GeForce RTX 3080 Ti Laptop GPU, 87 Wh | |
|---|---|---|---|---|---|---|
| Autonomia della batteria | 62% | 5% | 29% | -10% | -52% | |
| WiFi v1.3 (h) | 4.2 | 6.8 62% | 4.4 5% | 5.4 29% | 3.8 -10% | 2 -52% |
| H.264 (h) | 4.6 | 3.8 | 6.5 | 4.8 | ||
| Load (h) | 1.5 | 1.4 | 2 | 1.7 | 0.8 | |
| Reader / Idle (h) | 9.8 | 7.1 | 3.9 |
Pro
Contro
Verdetto - Ha bisogno di una rinfrescata al telaio
L'Eurocom Nightsky TXi317 ha le prestazioni di CPU e GPU di un grande portatile da gioco di punta, ma senza molte delle caratteristiche ausiliarie che ci aspettiamo da un design di medie dimensioni. In particolare, il modello non è in grado di far funzionare le unità SSD per periodi prolungati senza dover ridurre la velocità di trasferimento. È più probabile che il pubblico target di utenti con prestazioni elevate sia deluso dall'impossibilità di sfruttare appieno le nuove unità PCIe4 x4. Alternative come l' Alienware x17o MSI GE66 hanno in genere dei dissipatori di calore sulle unità SSD interne proprio per questo motivo.
L'Eurocom Nightsky TXi317 ha le prestazioni di un costoso portatile da gioco, ma manca di molte funzioni ausiliarie di base e avanzate.
Altri svantaggi minori sono la webcam a bassissima risoluzione, l'assenza dell'otturatore per la privacy, la mancanza del supporto USB-C PD, l'assenza di Advanced Optimus, l'assenza di opzioni Wi-Fi 6E e le temperature interne molto calde che raggiungono quasi i 90 C durante il gioco. Lo chassis rimane indietro anche per quanto riguarda la manutenzione, in quanto il pannello inferiore richiede più tempo per essere rimosso rispetto alla maggior parte degli altri portatili da gioco. A partire da un prezzo di 3000 dollari, il Nightsky TXi317 non offre altrettanto rispetto ad altri concorrenti di fascia alta.
Prezzo e disponibilità
Il Nightsky TXi317 può essere acquistato direttamente da Eurocom qui in varie configurazioni a partire da 3000 dollari USA.
Eurocom Nightsky TXi317
- 10/26/2022 v7 (old)
Allen Ngo
Price comparison

