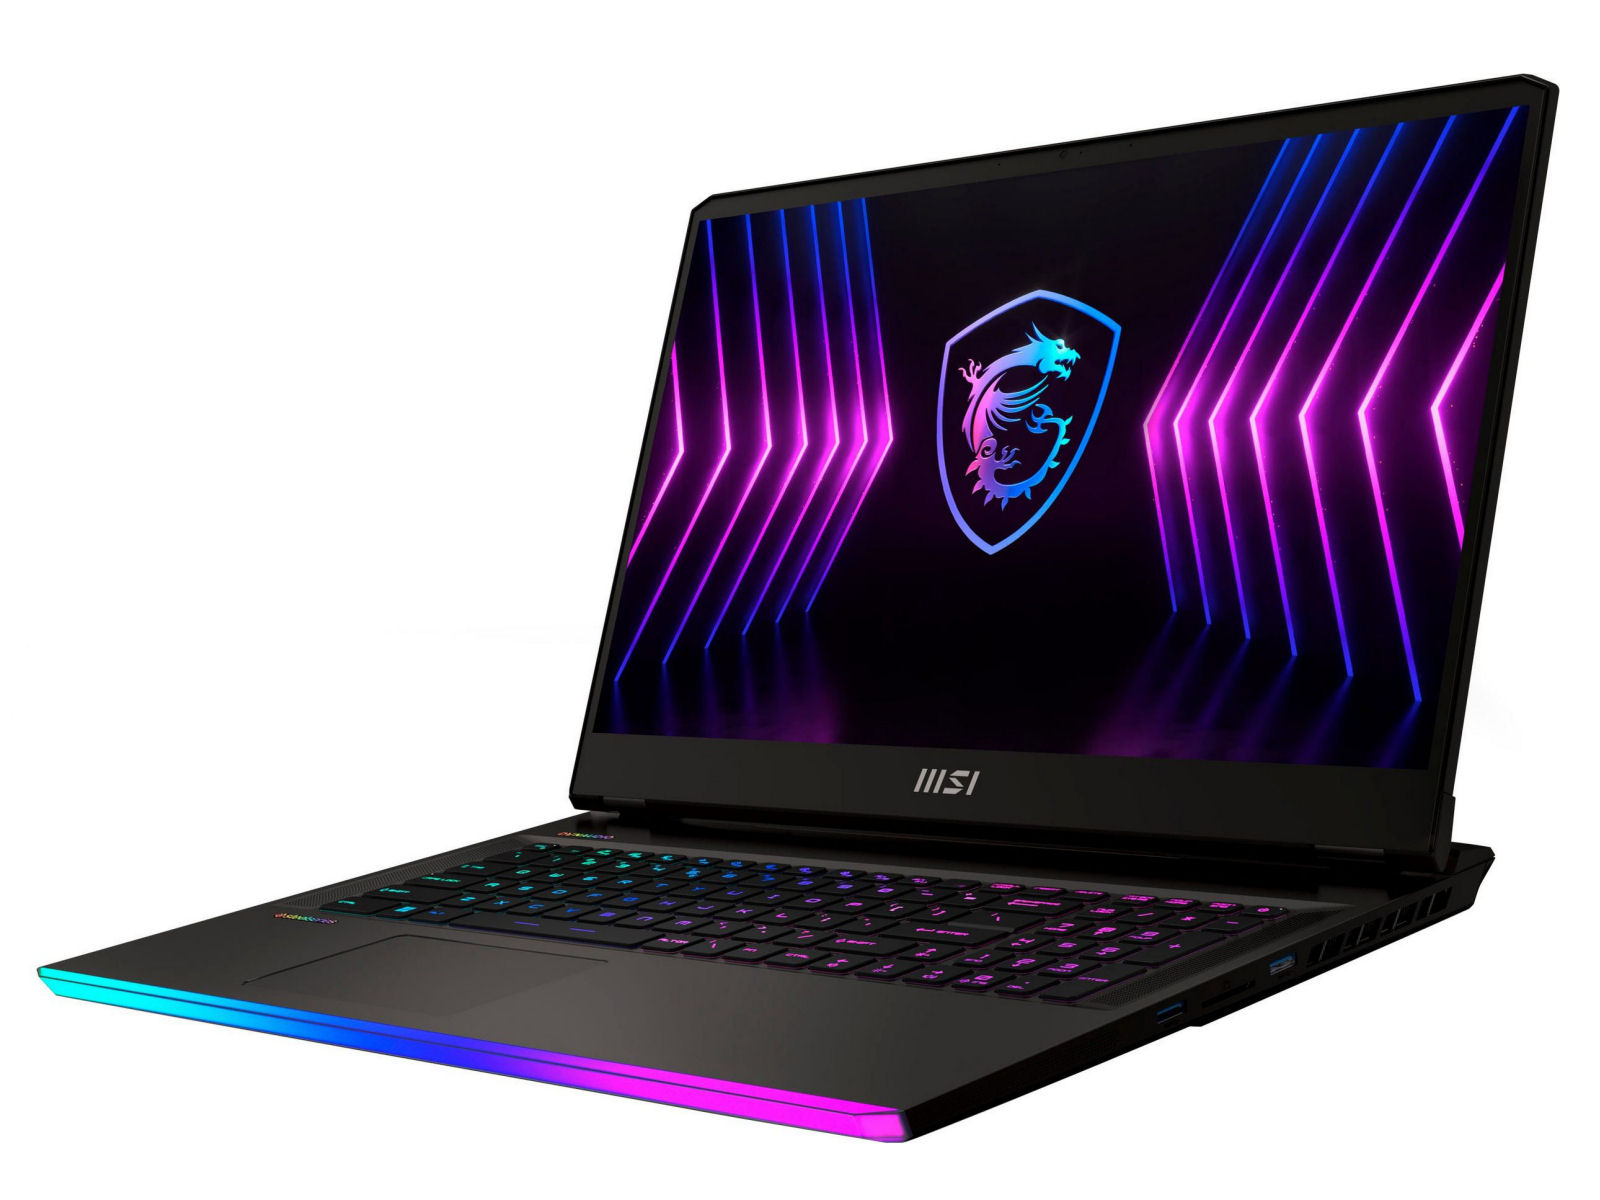
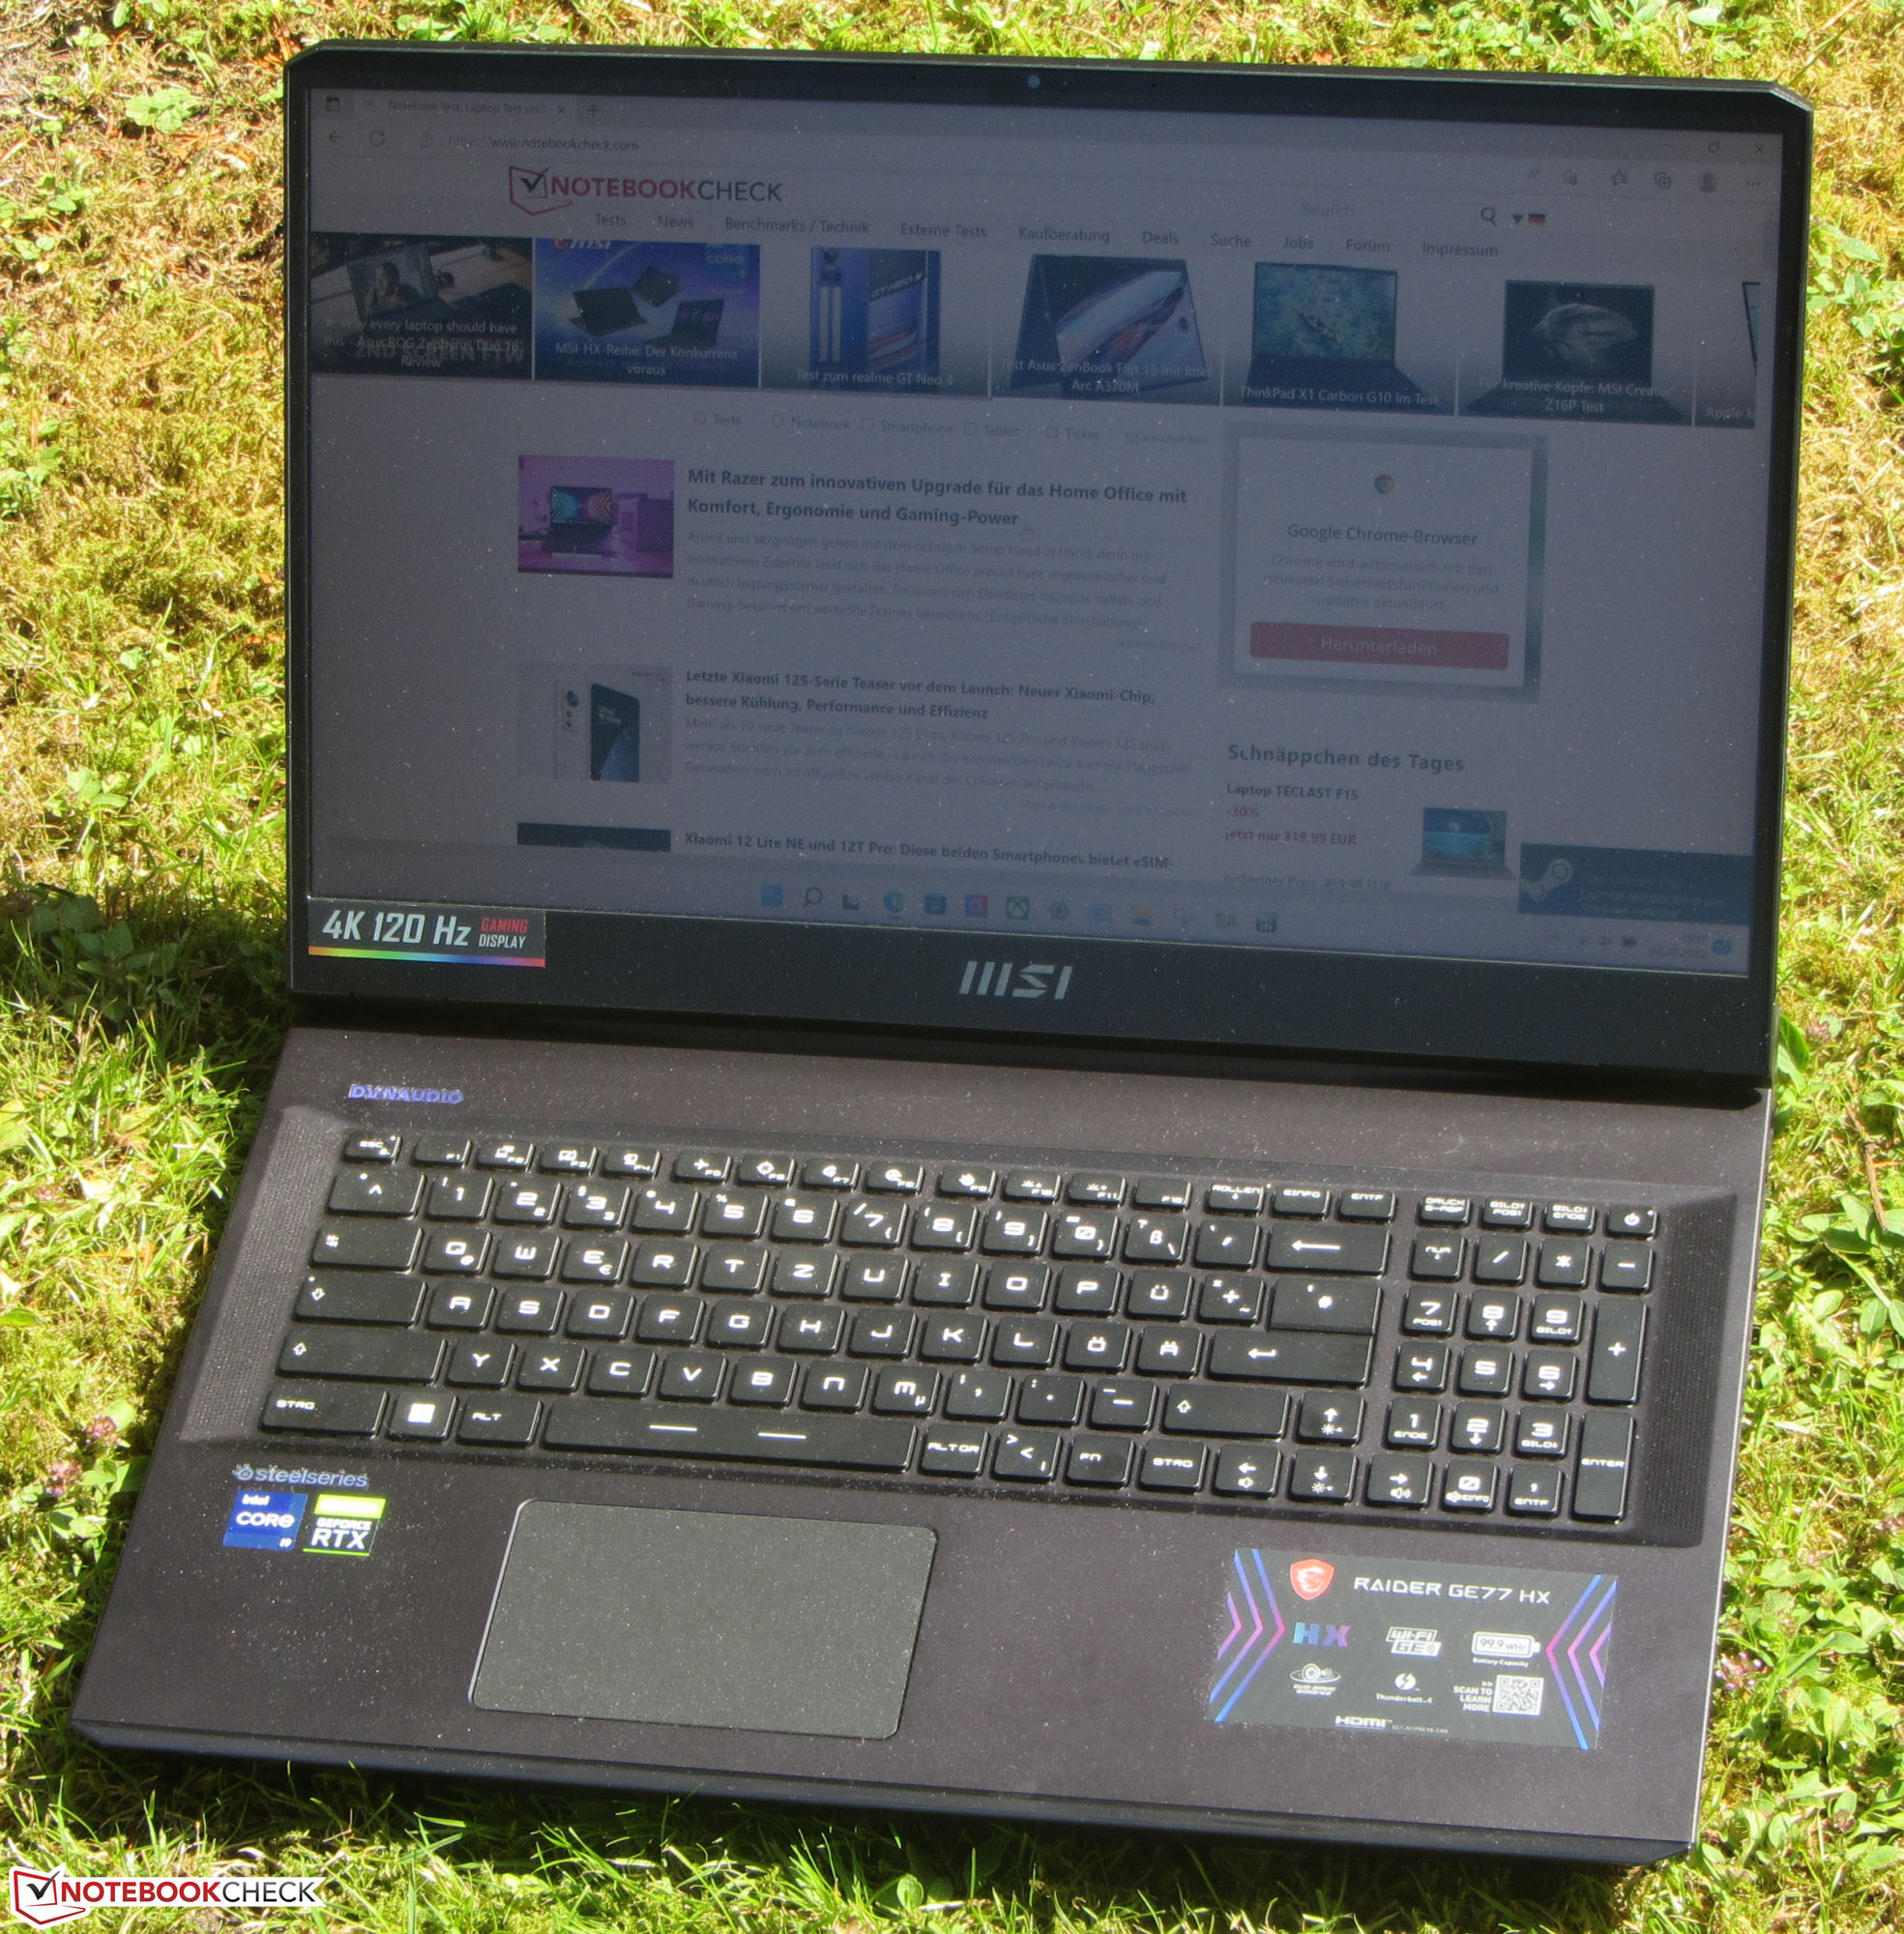
Recensione MSI Raider GE77 HX 12UHS: notebook per il gaming 4K con prestazioni al top

MSI Raider GE77 HX 12UHS si rivolge ai giocatori e agli utenti creativi. Pertanto, la nostra configurazione è dotata dell'hardware più recente e potente Core i9-12900HX CPU, GeForce RTX 3080 Ti Laptop GPU, 64 GB di RAM e uno schermo 4K (17,3 pollici). Il nostro modello costa circa 5.200 dollari. Con il MSI Raider GE66 12UHSabbiamo da poco recensito la versione da 15,6 pollici. La concorrenza è costituita da computer portatili altrettanto potenti (e costosi) come l' Alienware x17 R2 P48E, Medion Erazer Beast X30e il Razer Blade 17 (inizio 2022).
Potenziali concorrenti a confronto
Punteggio | Data | Modello | Peso | Altezza | Dimensione | Risoluzione | Prezzo |
|---|---|---|---|---|---|---|---|
| 86.8 % v7 (old) | 07/2022 | MSI Raider GE77 HX 12UHS i9-12900HX, GeForce RTX 3080 Ti Laptop GPU | 3.1 kg | 25.9 mm | 17.30" | 3840x2160 | |
| 89.9 % v7 (old) | 07/2022 | Razer Blade 17 Early 2022 i9-12900H, GeForce RTX 3080 Ti Laptop GPU | 2.8 kg | 19.9 mm | 17.30" | 3840x2160 | |
| 89.2 % v7 (old) | 05/2022 | Alienware x17 R2 P48E i9-12900HK, GeForce RTX 3080 Ti Laptop GPU | 3.1 kg | 20.9 mm | 17.30" | 1920x1080 | |
| 86.7 % v7 (old) | 05/2022 | Medion Erazer Beast X30 i9-12900HK, GeForce RTX 3080 Ti Laptop GPU | 2.2 kg | 23 mm | 17.30" | 2560x1440 |
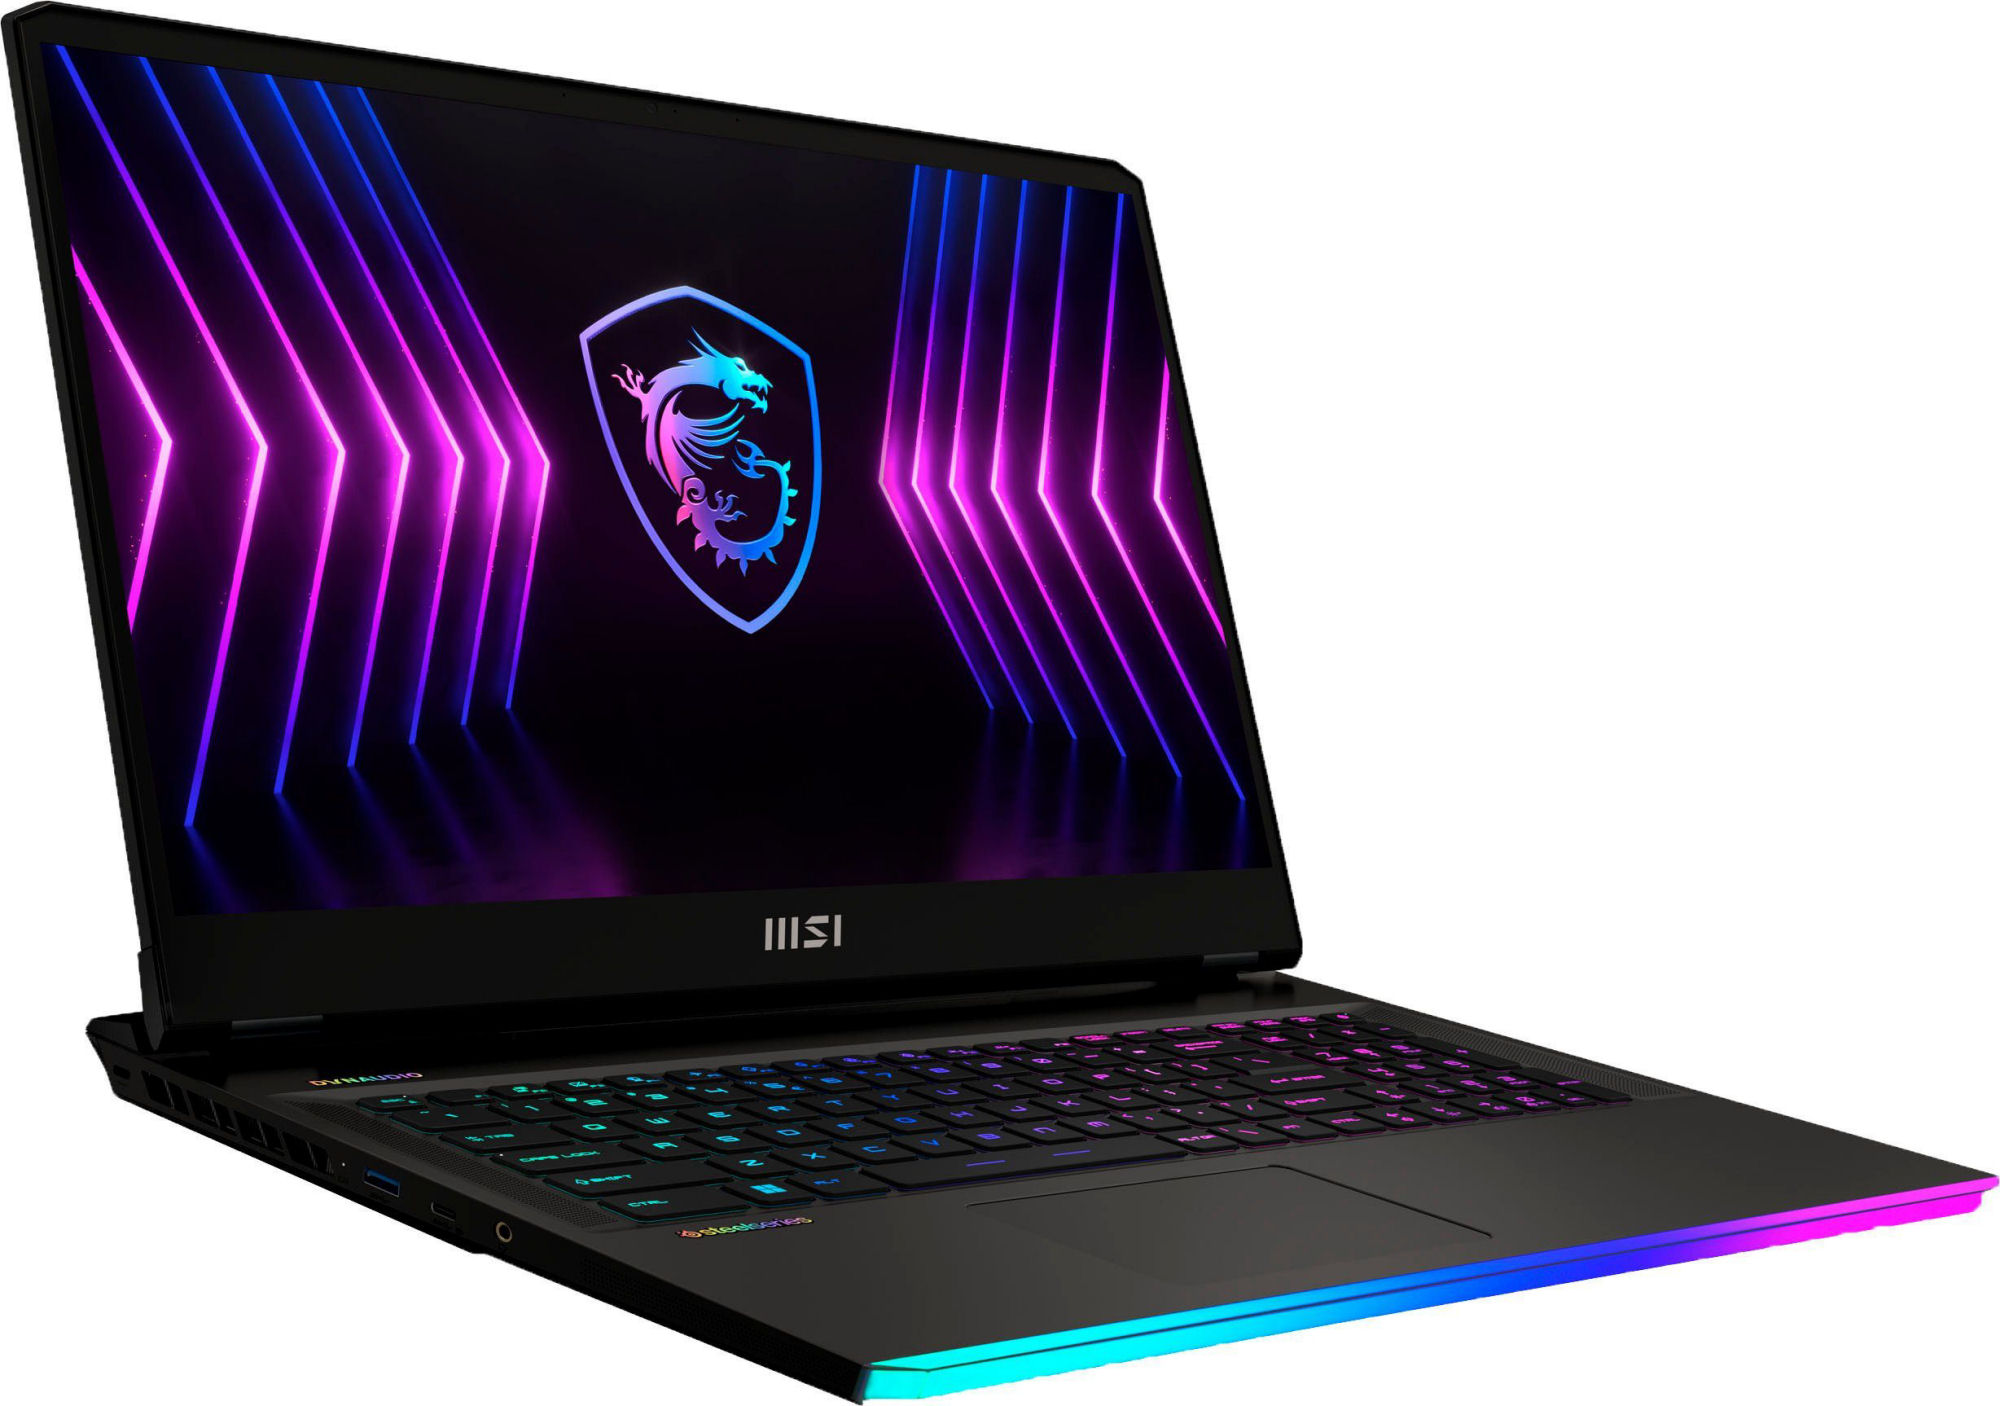
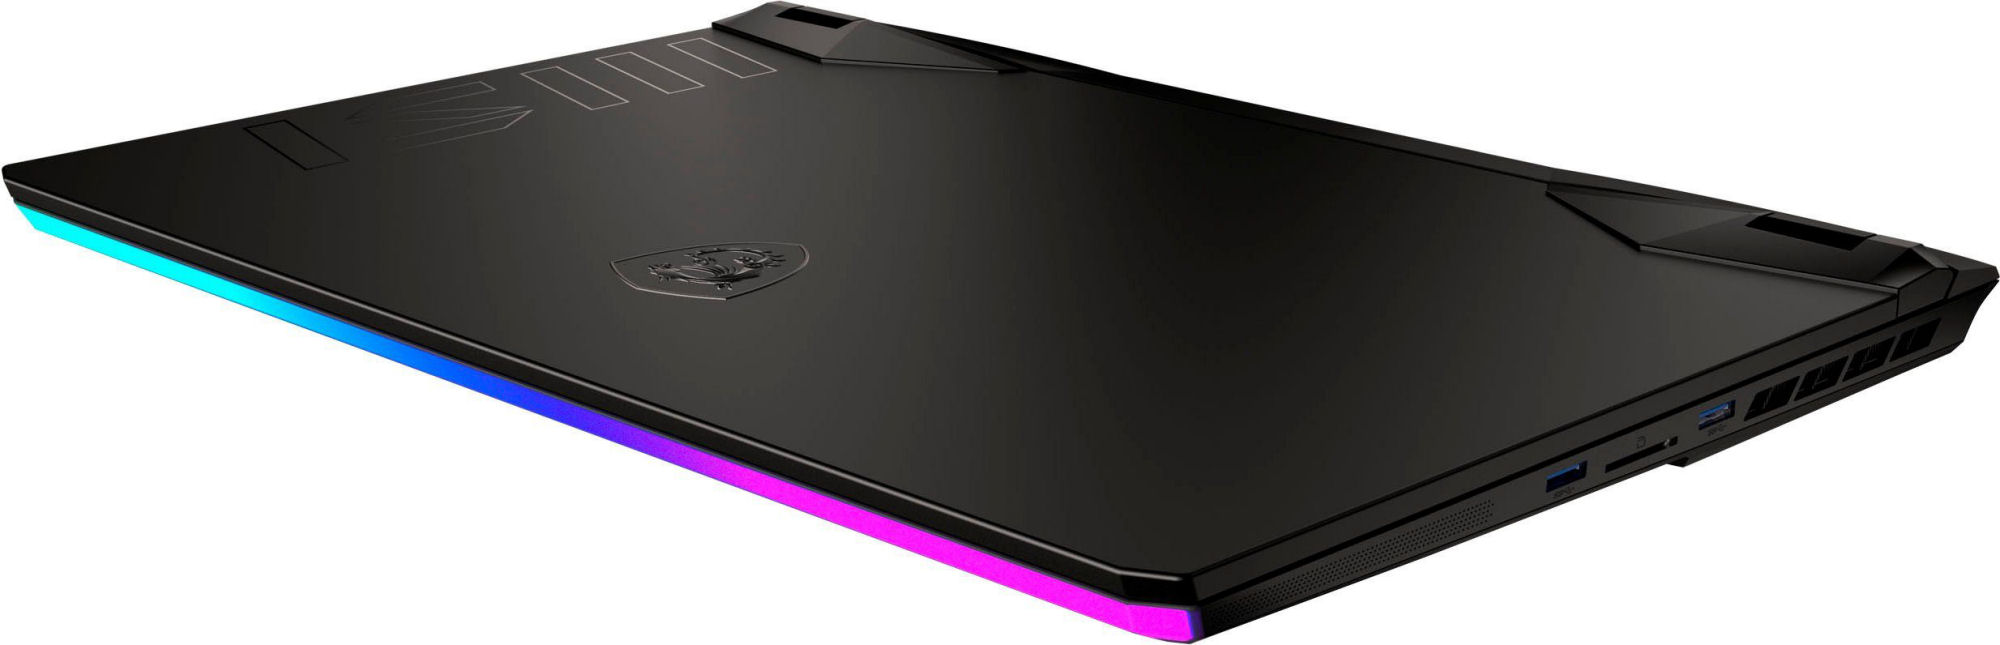
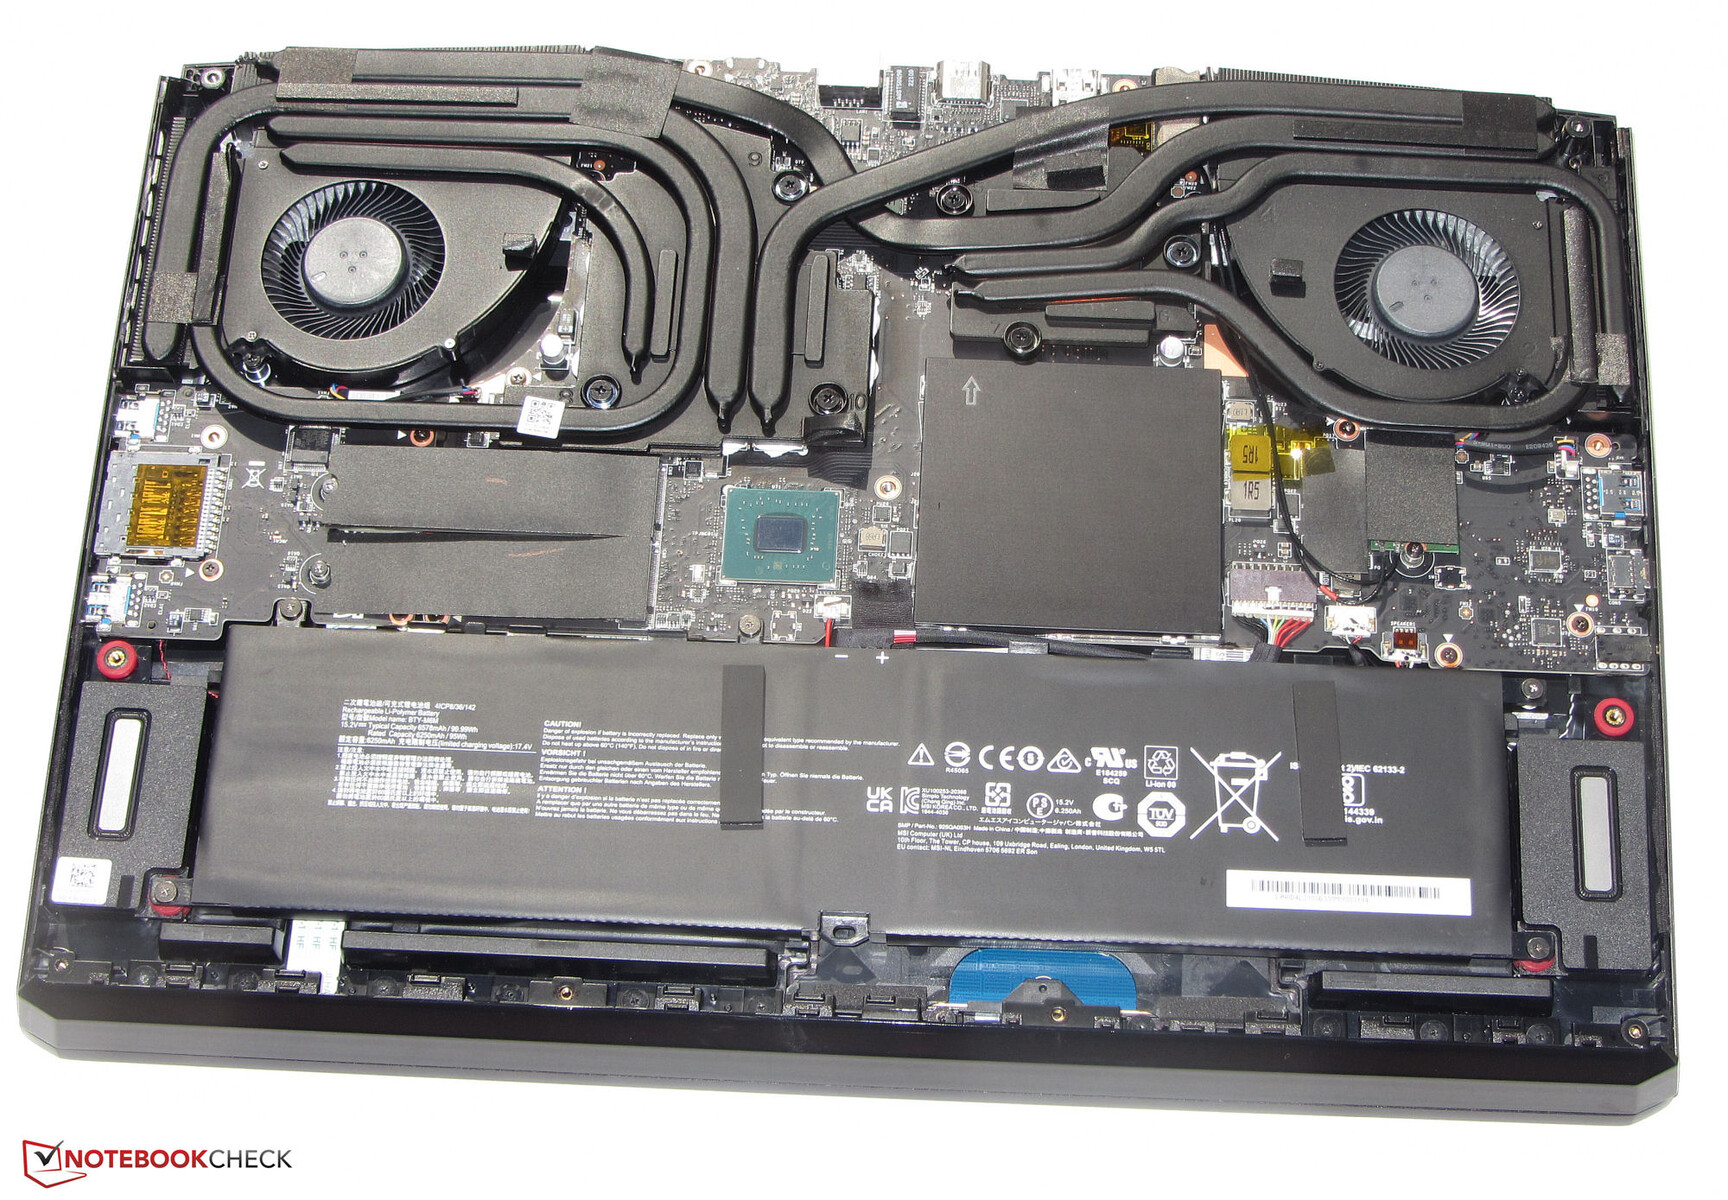
Case - GE77 con un sottile chassis in metallo
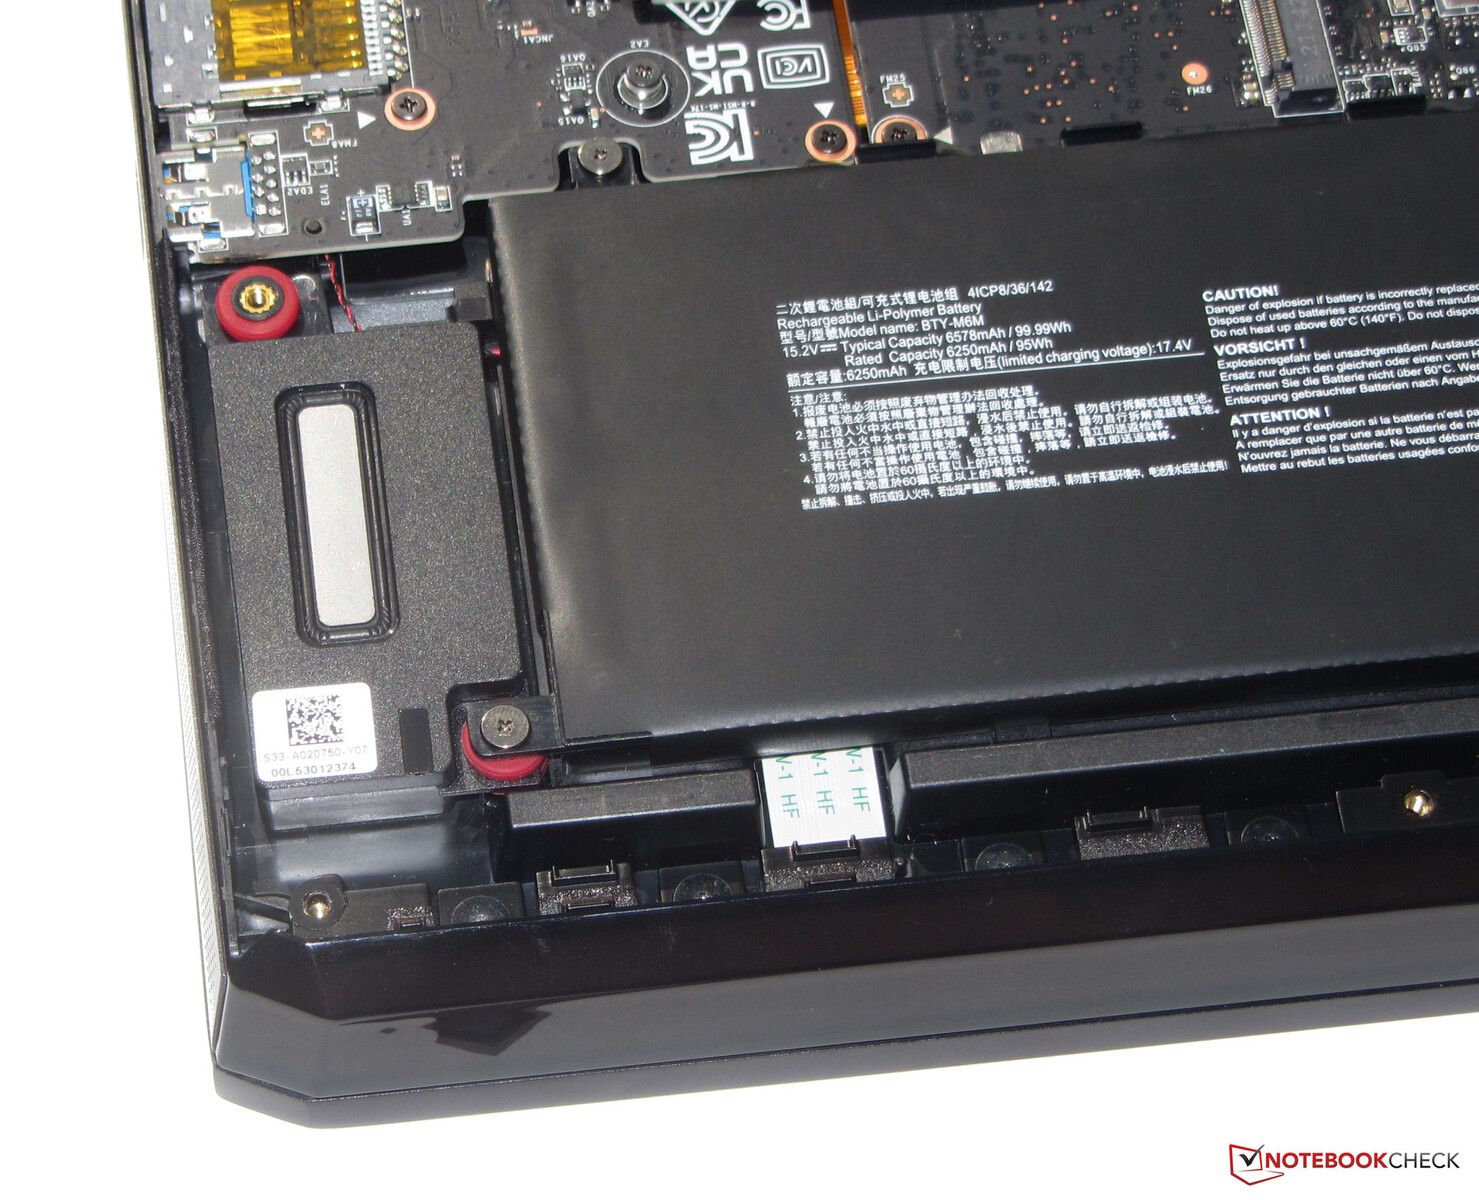
I componenti del Raider occupano uno chassis in metallo con superfici lisce di colore nero opaco. È presente una striscia LED rivolta verso l'utente che può essere disattivata sull'unità di base, che consente di ottenere effetti di luce colorati sul case, altrimenti privo di accenti colorati. In questo modo, nulla impedisce agli utenti di utilizzare il dispositivo in ambienti professionali. L'aspetto del portatile MSI è ulteriormente migliorato dalle cornici abbastanza sottili. La batteria interna (avvitata, non incollata) e il resto dell'hardware sono accessibili dopo aver rimosso la piastra inferiore.
Non abbiamo notato alcun difetto di fabbricazione sul dispositivo da 17,3 pollici. Gli spazi sono uniformi e non ci sono sporgenze di materiale in eccesso. L'unità di base è molto resistente alla torsione dagli angoli, mentre il coperchio può essere leggermente ruotato. Entrambi rientrano nella norma. Le cerniere tengono il coperchio saldamente in posizione, ma permettono di oscillare un po'. Il coperchio può essere aperto fino a un angolo massimo di circa 140 gradi. Può essere aperto anche con una sola mano.

Nel nostro confronto, il portatile MSI e l? Alienware x17 R2 sono i dispositivi più pesanti. In termini di dimensioni, il GE77 si colloca nella media - non è compatto come il Blade e del X30ma significativamente più compatto dell'X17.
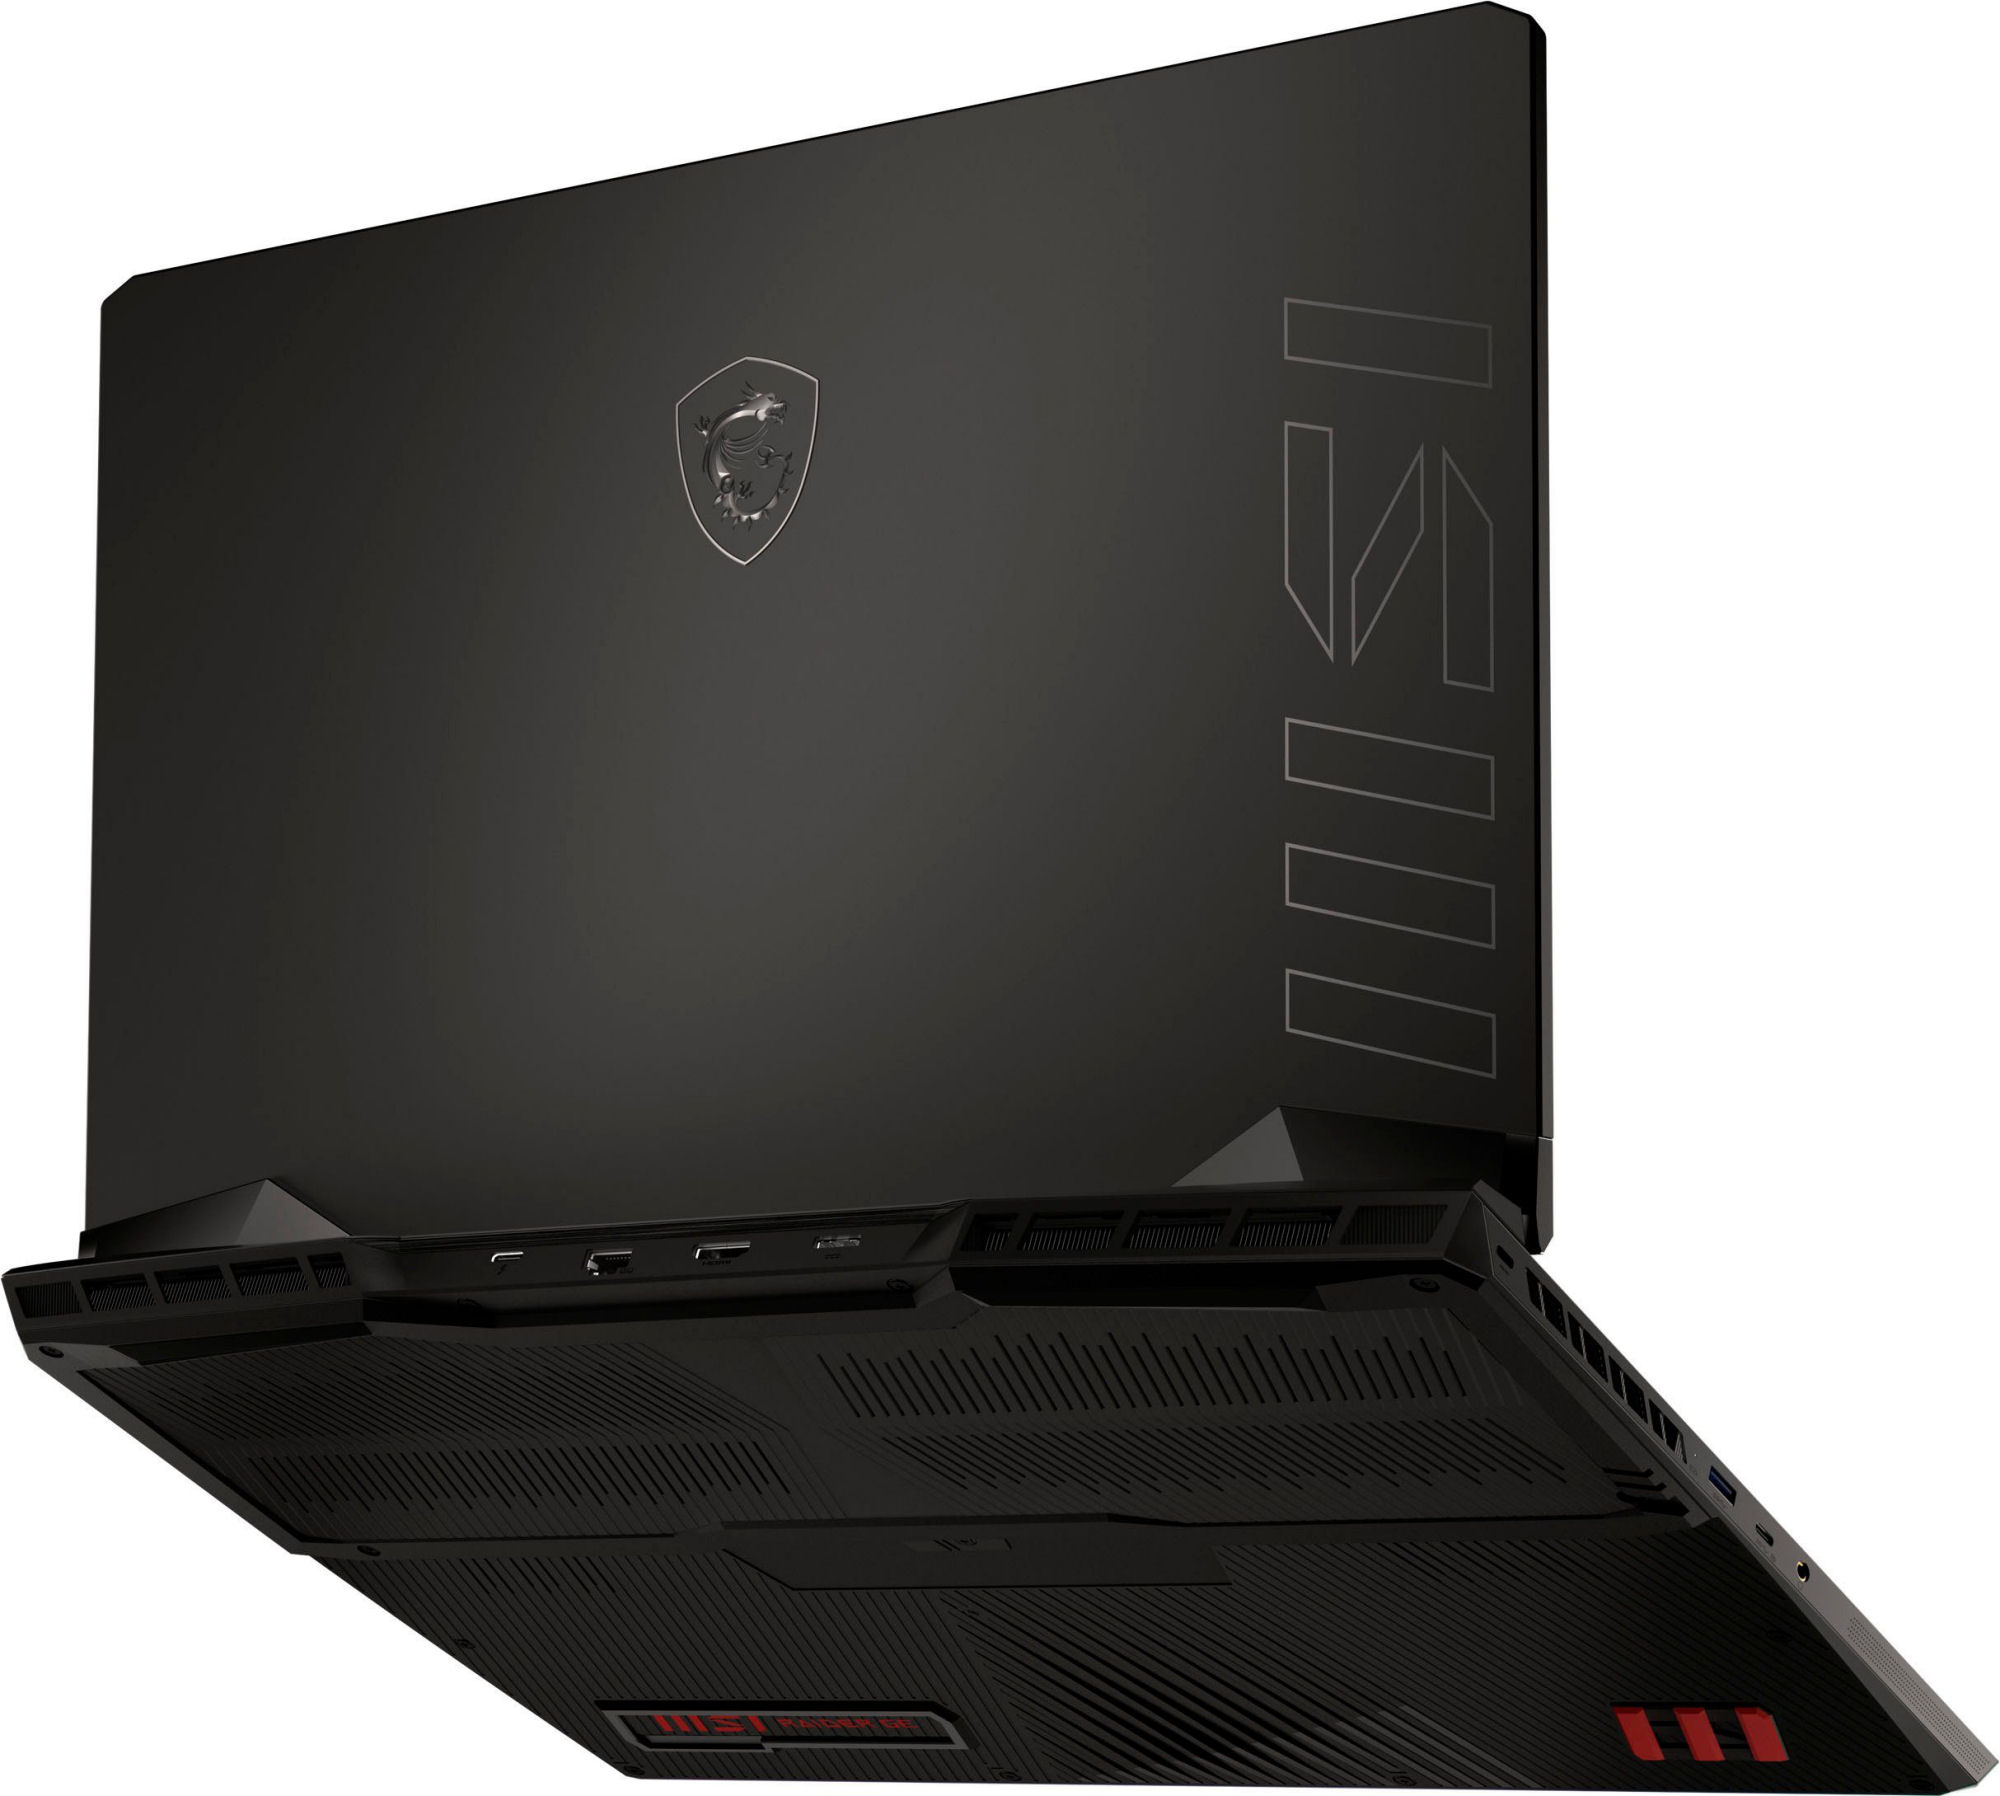
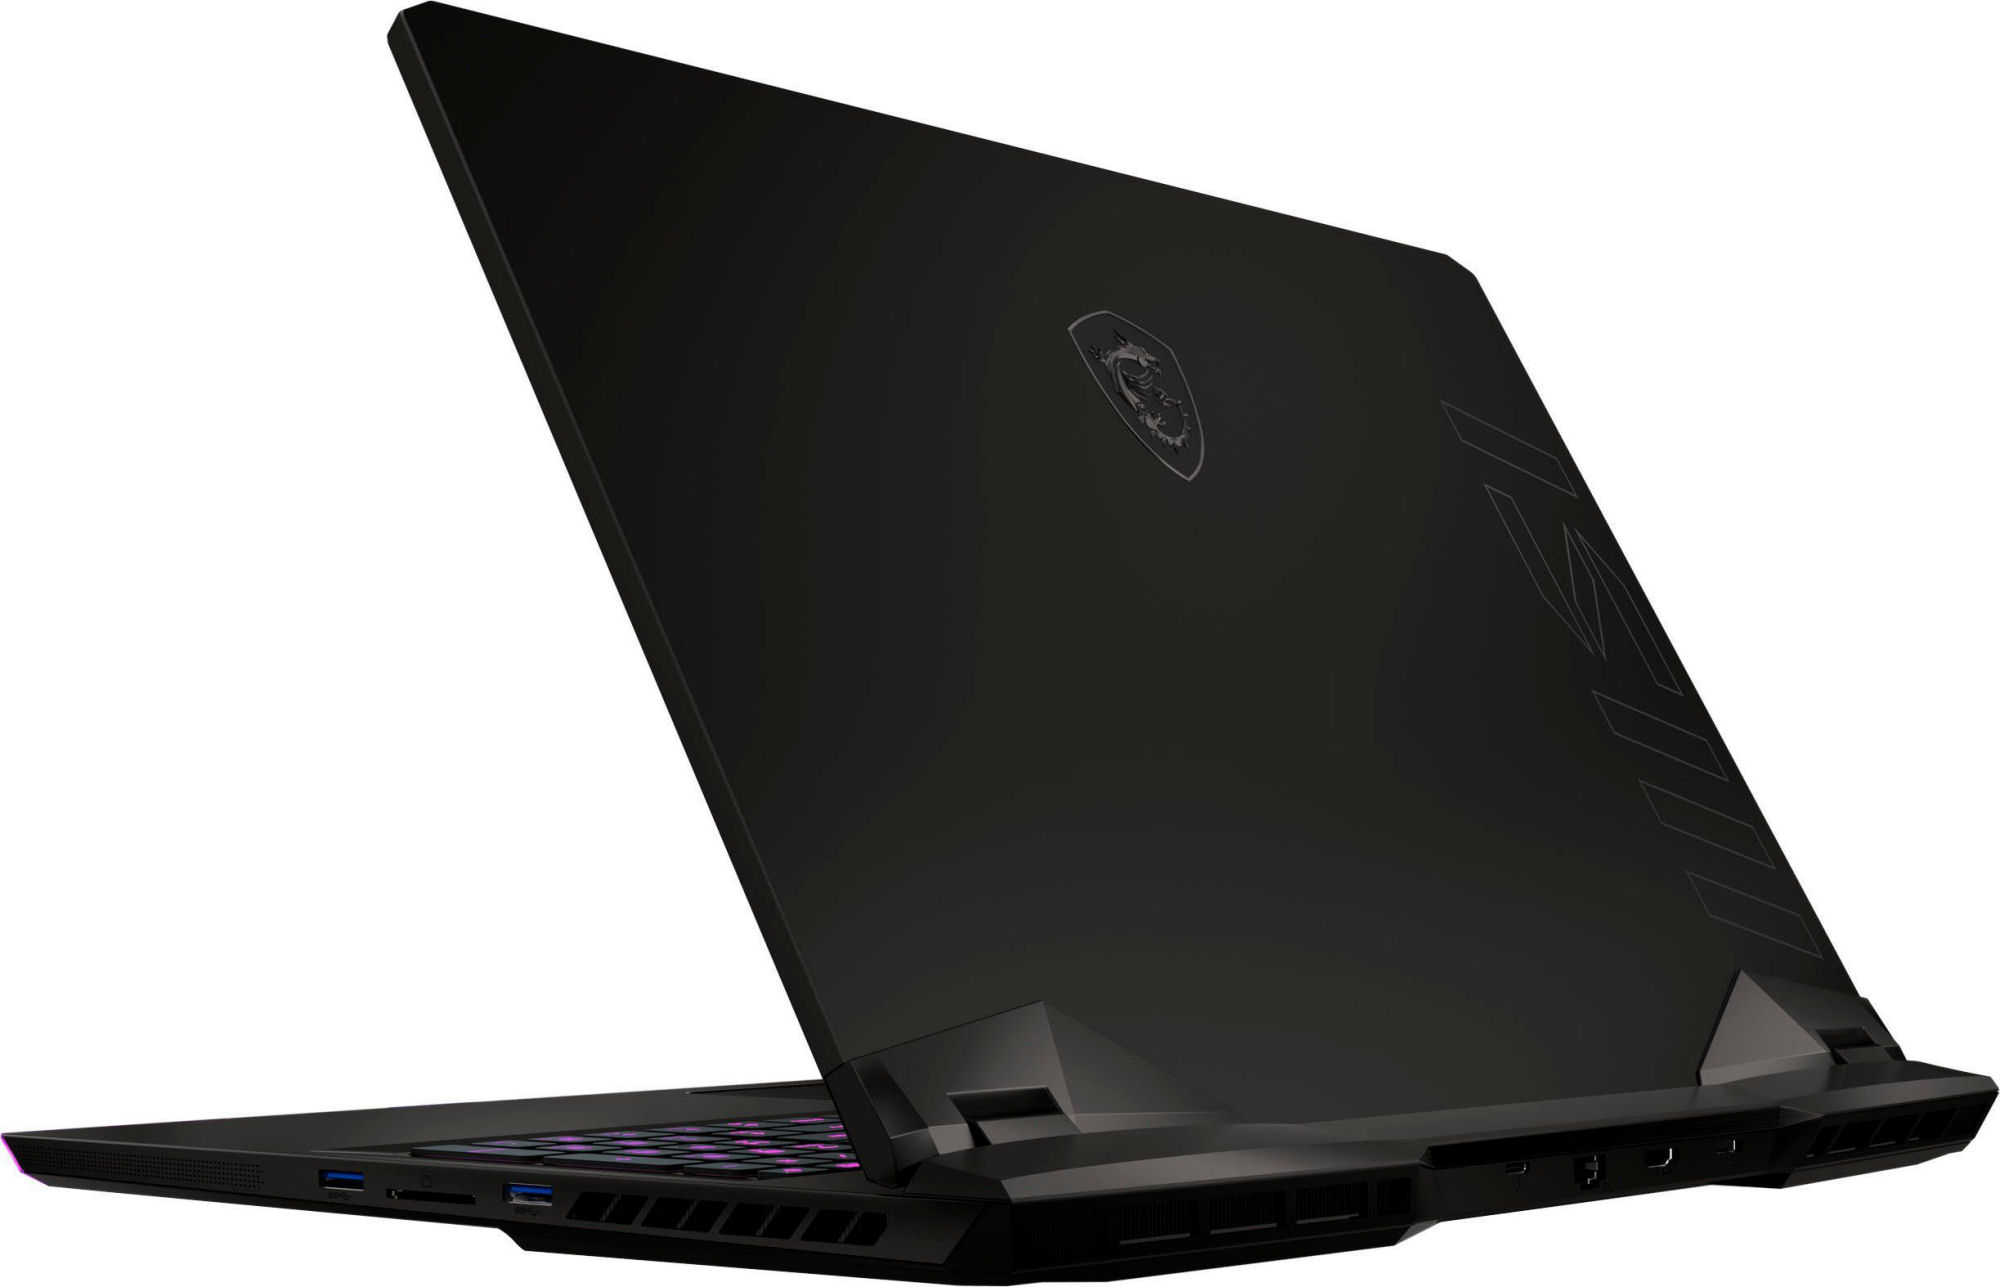
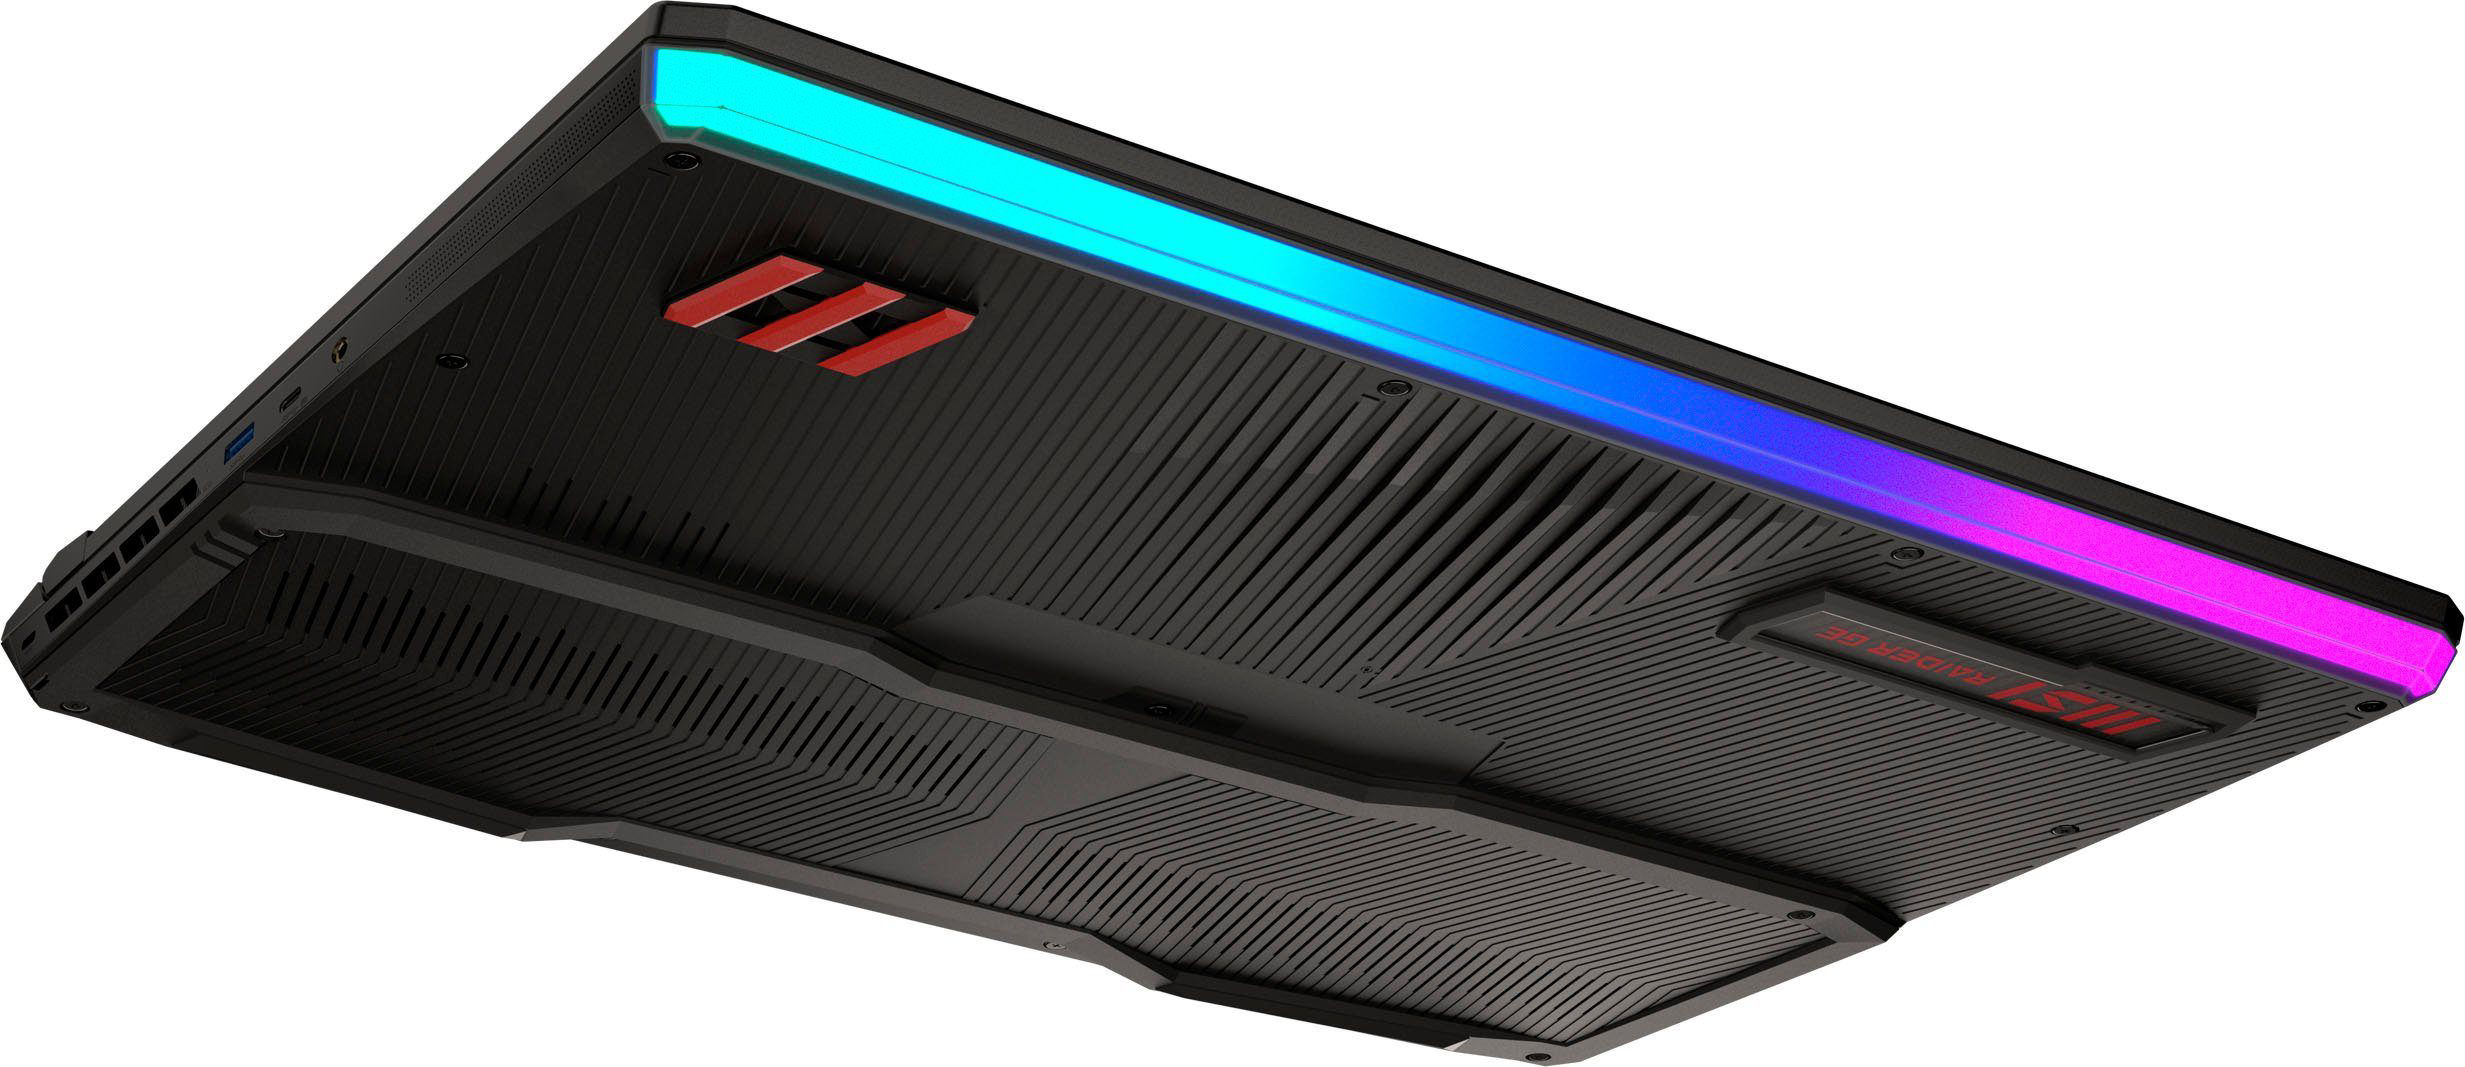
Connettività - Sistema MSI con Thunderbolt 4
Il GE77 è dotato di tre porte USB-A (1x USB 3.2 Gen 2, 2x USB 3.2 Gen 1) e due porte USB-C (1x Thunderbolt 4, 1x USB 3.2 Gen 2). Queste ultime supportano DisplayPort via USB-C, ma non Power Delivery. In totale, il sistema dispone di tre uscite video (2x DP, 1x HDMI). Inoltre, sono presenti un jack audio combinato, una porta Ethernet da 2,5 Gb/s e una porta di blocco del cavo.
Le porte sono presenti su tre lati del case. Due uscite video, la porta Ethernet e la porta dell'adattatore CA si trovano sul retro del case. Questo semplifica la gestione dei cavi, riducendo le possibilità di intralcio.
Lettore di schede SD
| SD Card Reader - average JPG Copy Test (av. of 3 runs) | |
| Alienware x17 R2 P48E (AV Pro V60) | |
| Razer Blade 17 Early 2022 (AV PRO microSD 128 GB V60) | |
| Media della classe Gaming (20.9 - 210, n=54, ultimi 2 anni) | |
| Medion Erazer Beast X30 (AV PRO microSD 128 GB V60) | |
| MSI Raider GE77 HX 12UHS (AV PRO microSD 128 GB V60) | |
Comunicazione
Abbiamo registrato eccellenti velocità di trasferimento Wi-Fi in condizioni ottimali (nessun altro dispositivo Wi-Fi nelle vicinanze, bassa distanza tra il portatile e il server) e sfruttando le capacità dei chip Wi-Fi (Killer AX1675i = Intel AX211; 802.11 ax).
È presente anche un chip Ethernet (Killer E3100G, 2,5 Gb/s) per le comunicazioni via cavo.
| Networking - iperf3 receive AXE11000 6GHz | |
| MSI Raider GE77 HX 12UHS | |
| Media della classe Gaming (975 - 1775, n=37, ultimi 2 anni) | |
| Media Killer Wi-Fi 6E AX1675i 160MHz Wireless Network Adapter (1327 - 1788, n=20) | |
Webcam
La webcam cattura immagini a una risoluzione massima di 1920 x 1080. L'accuratezza del colore è scarsa. I colori si discostano dai valori ideali. Non è presente una copertura meccanica per la webcam.


Accessori
Il portatile viene fornito con i consueti documenti (guida rapida, informazioni sulla garanzia).
Manutenzione
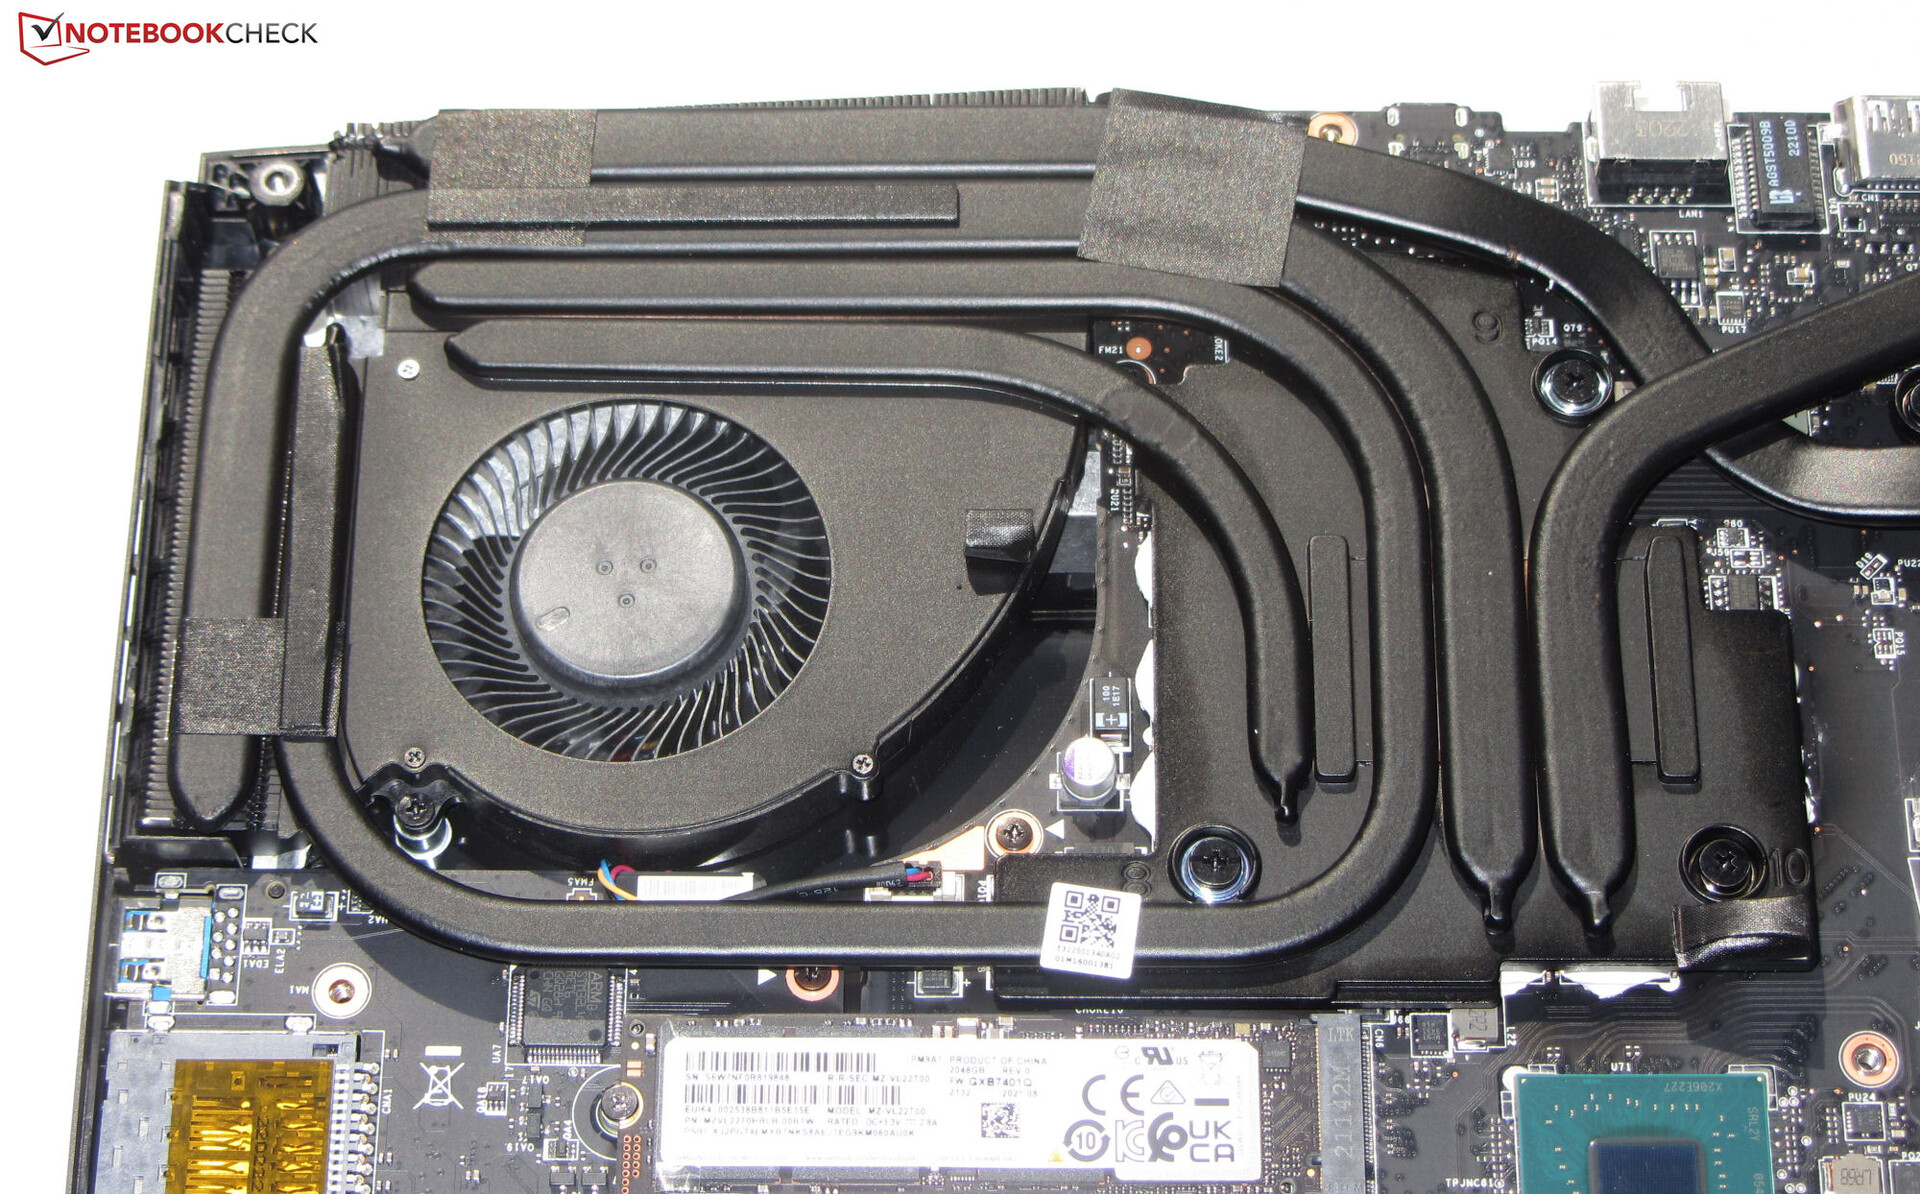
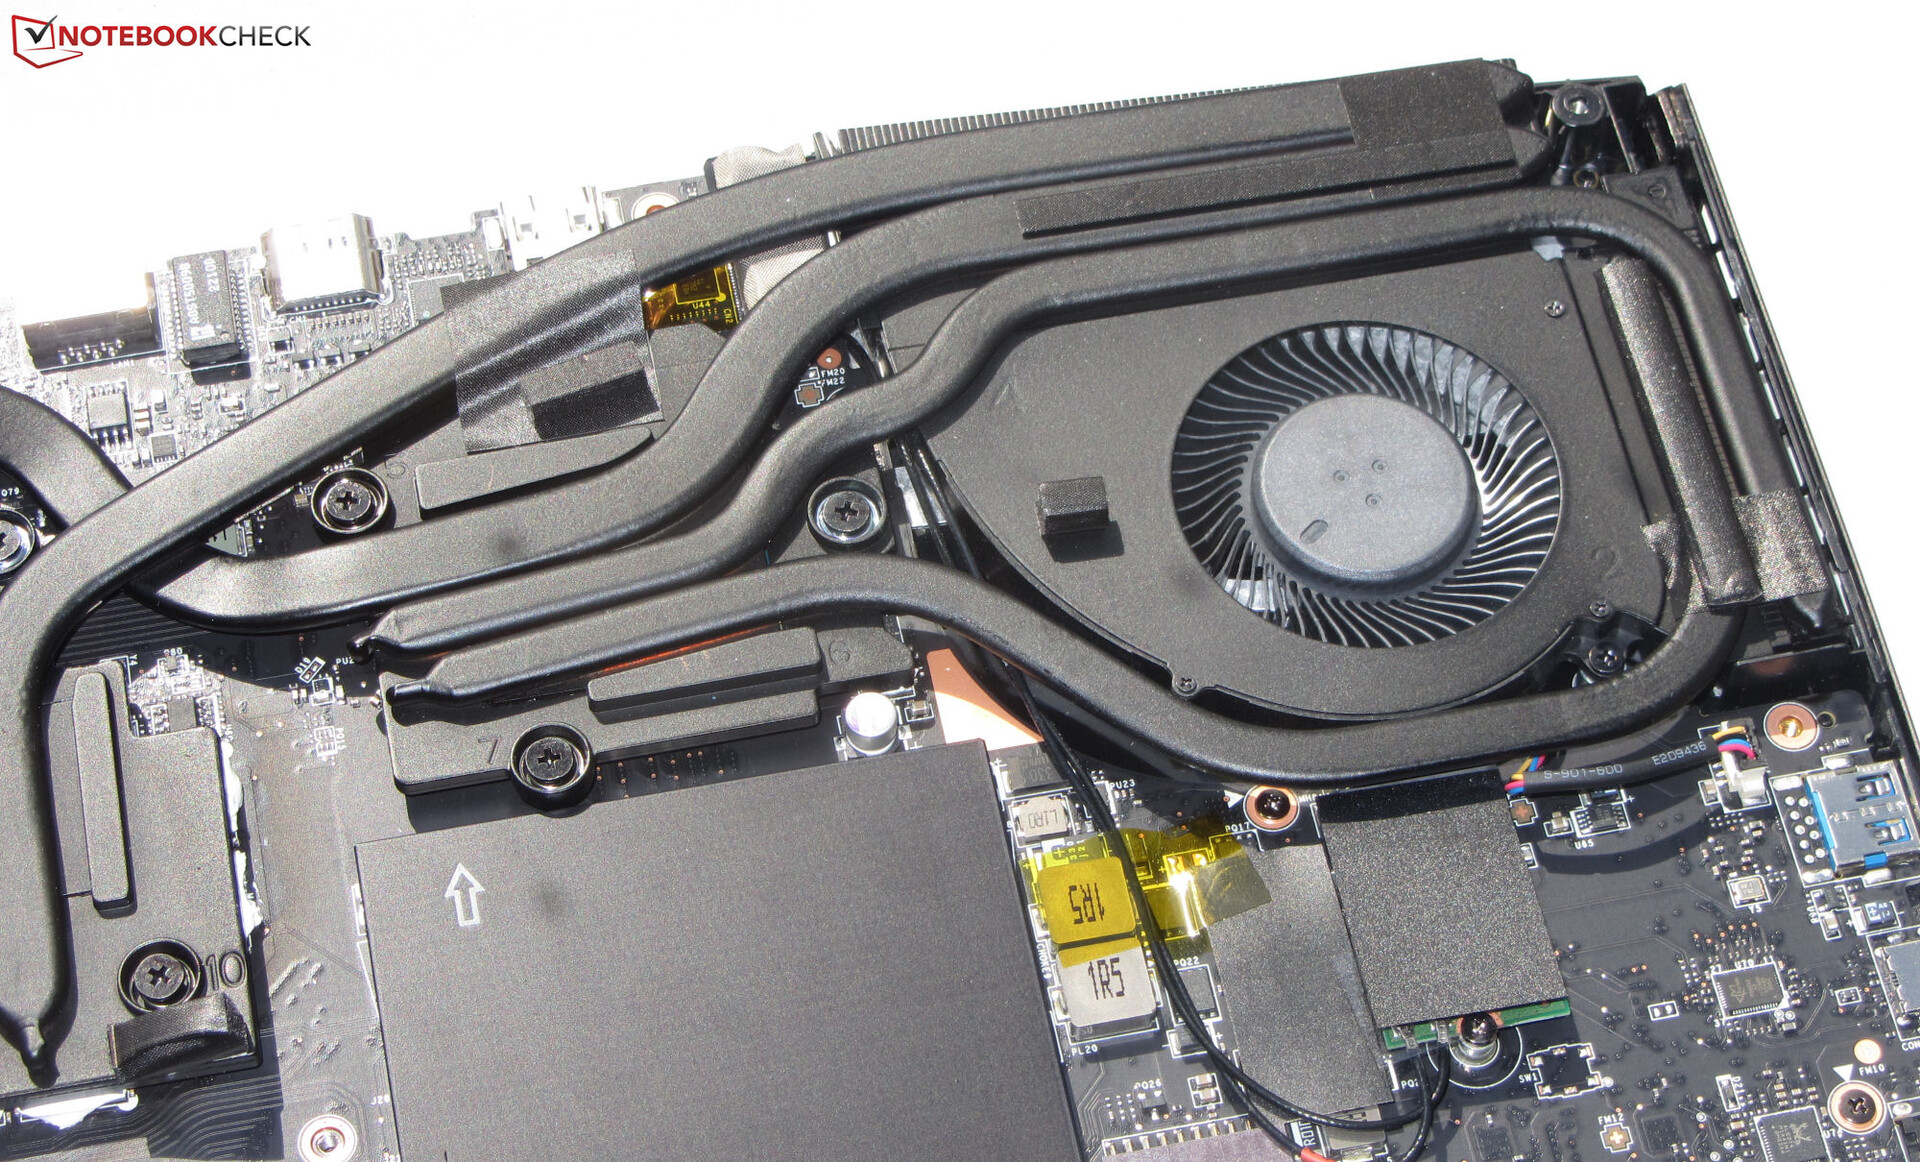
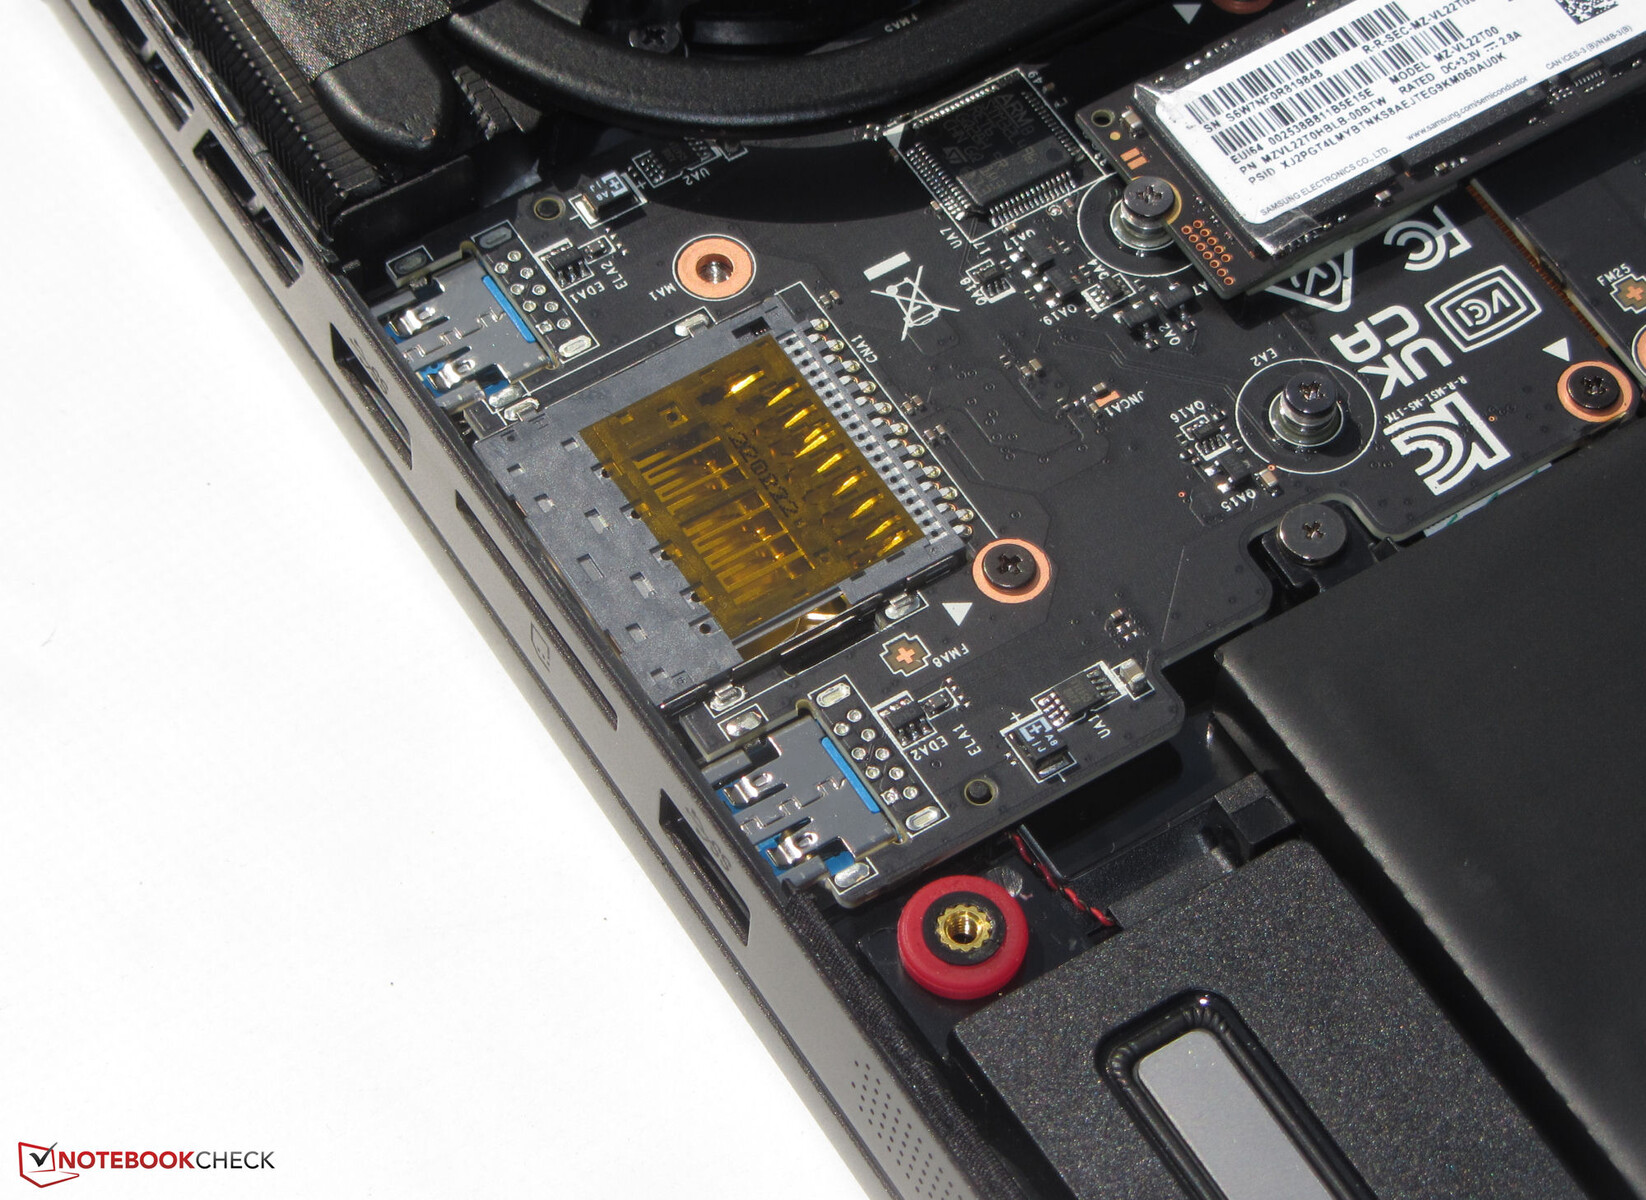
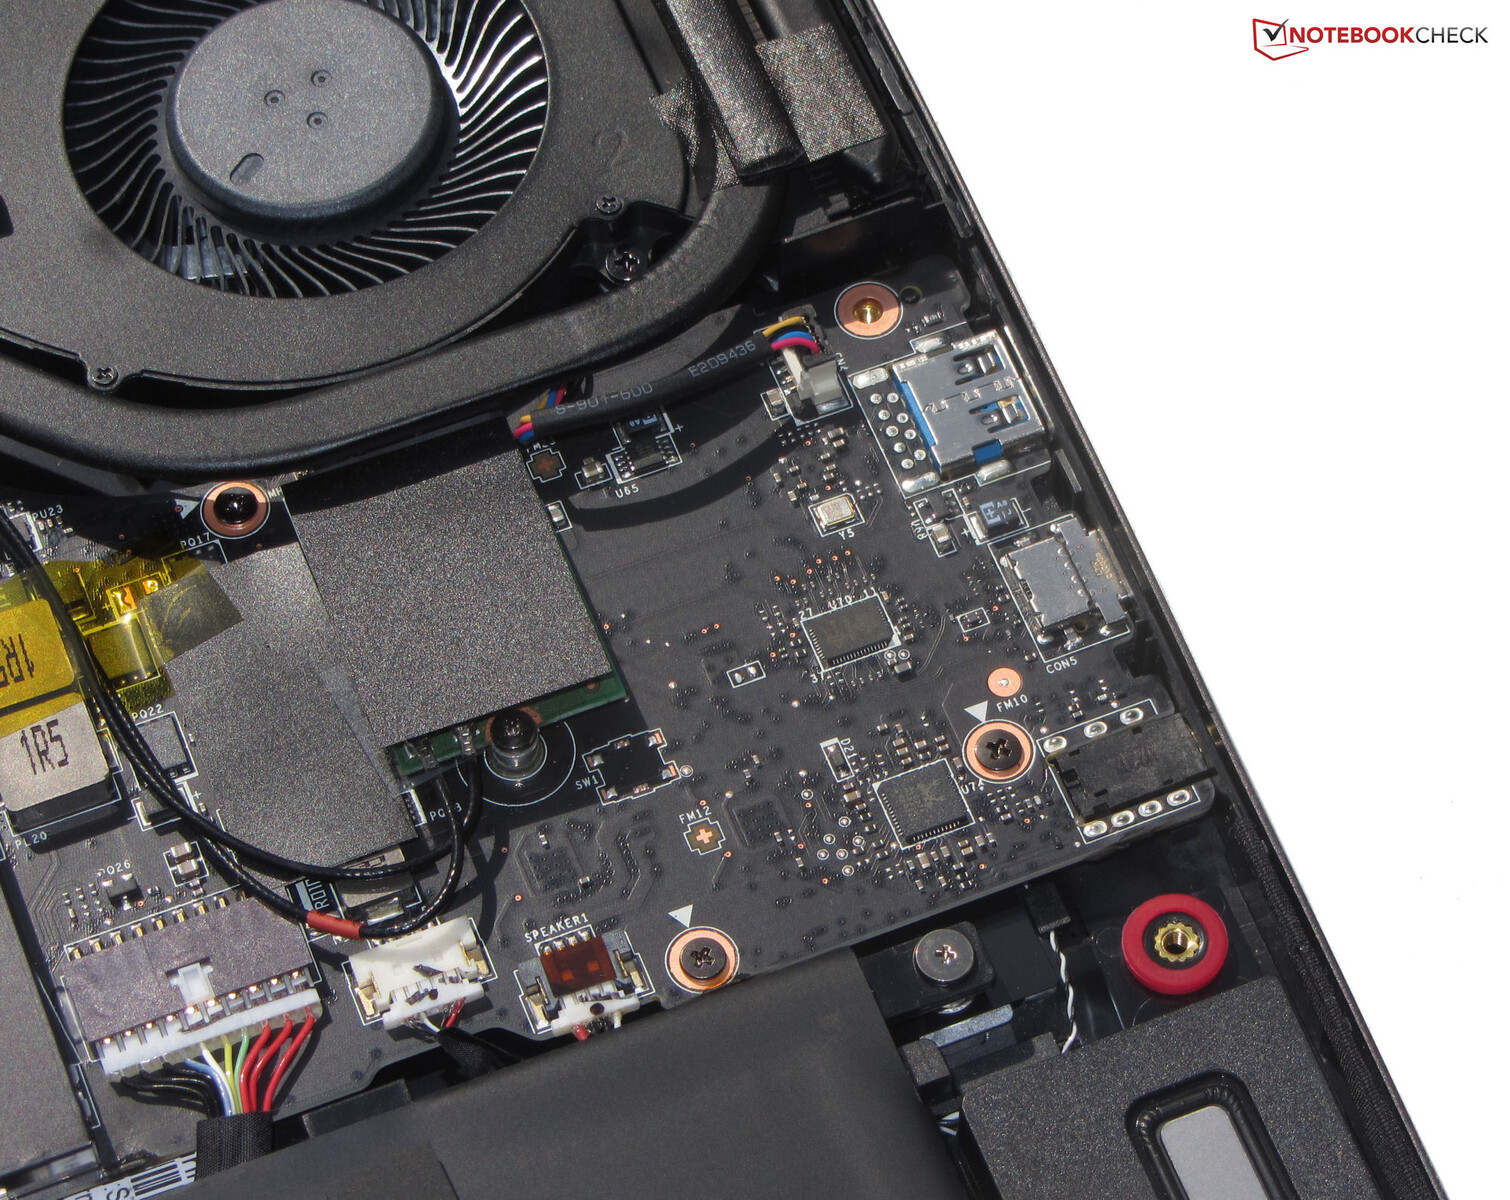
La manutenzione e gli aggiornamenti possono essere eseguiti senza problemi. Dopo aver allentato tutte le viti sul fondo, la piastra inferiore può essere rimossa abbastanza facilmente - un oggetto con un bordo affilato può essere utile in questo caso. A questo punto, gli utenti hanno accesso all'unità SSD (PCIe4, M.2-2280), allo slot per l'unità SSD secondaria (PCIe4, M.2-2280), al modulo Wi-Fi, alla batteria, alla RAM (nascosta sotto un ulteriore coperchio ben fissato), agli altoparlanti e alle ventole.
Garanzia
MSI offre una garanzia standard limitata di un anno. L'estensione della garanzia a due e tre anni costa rispettivamente 80 e 140 dollari.
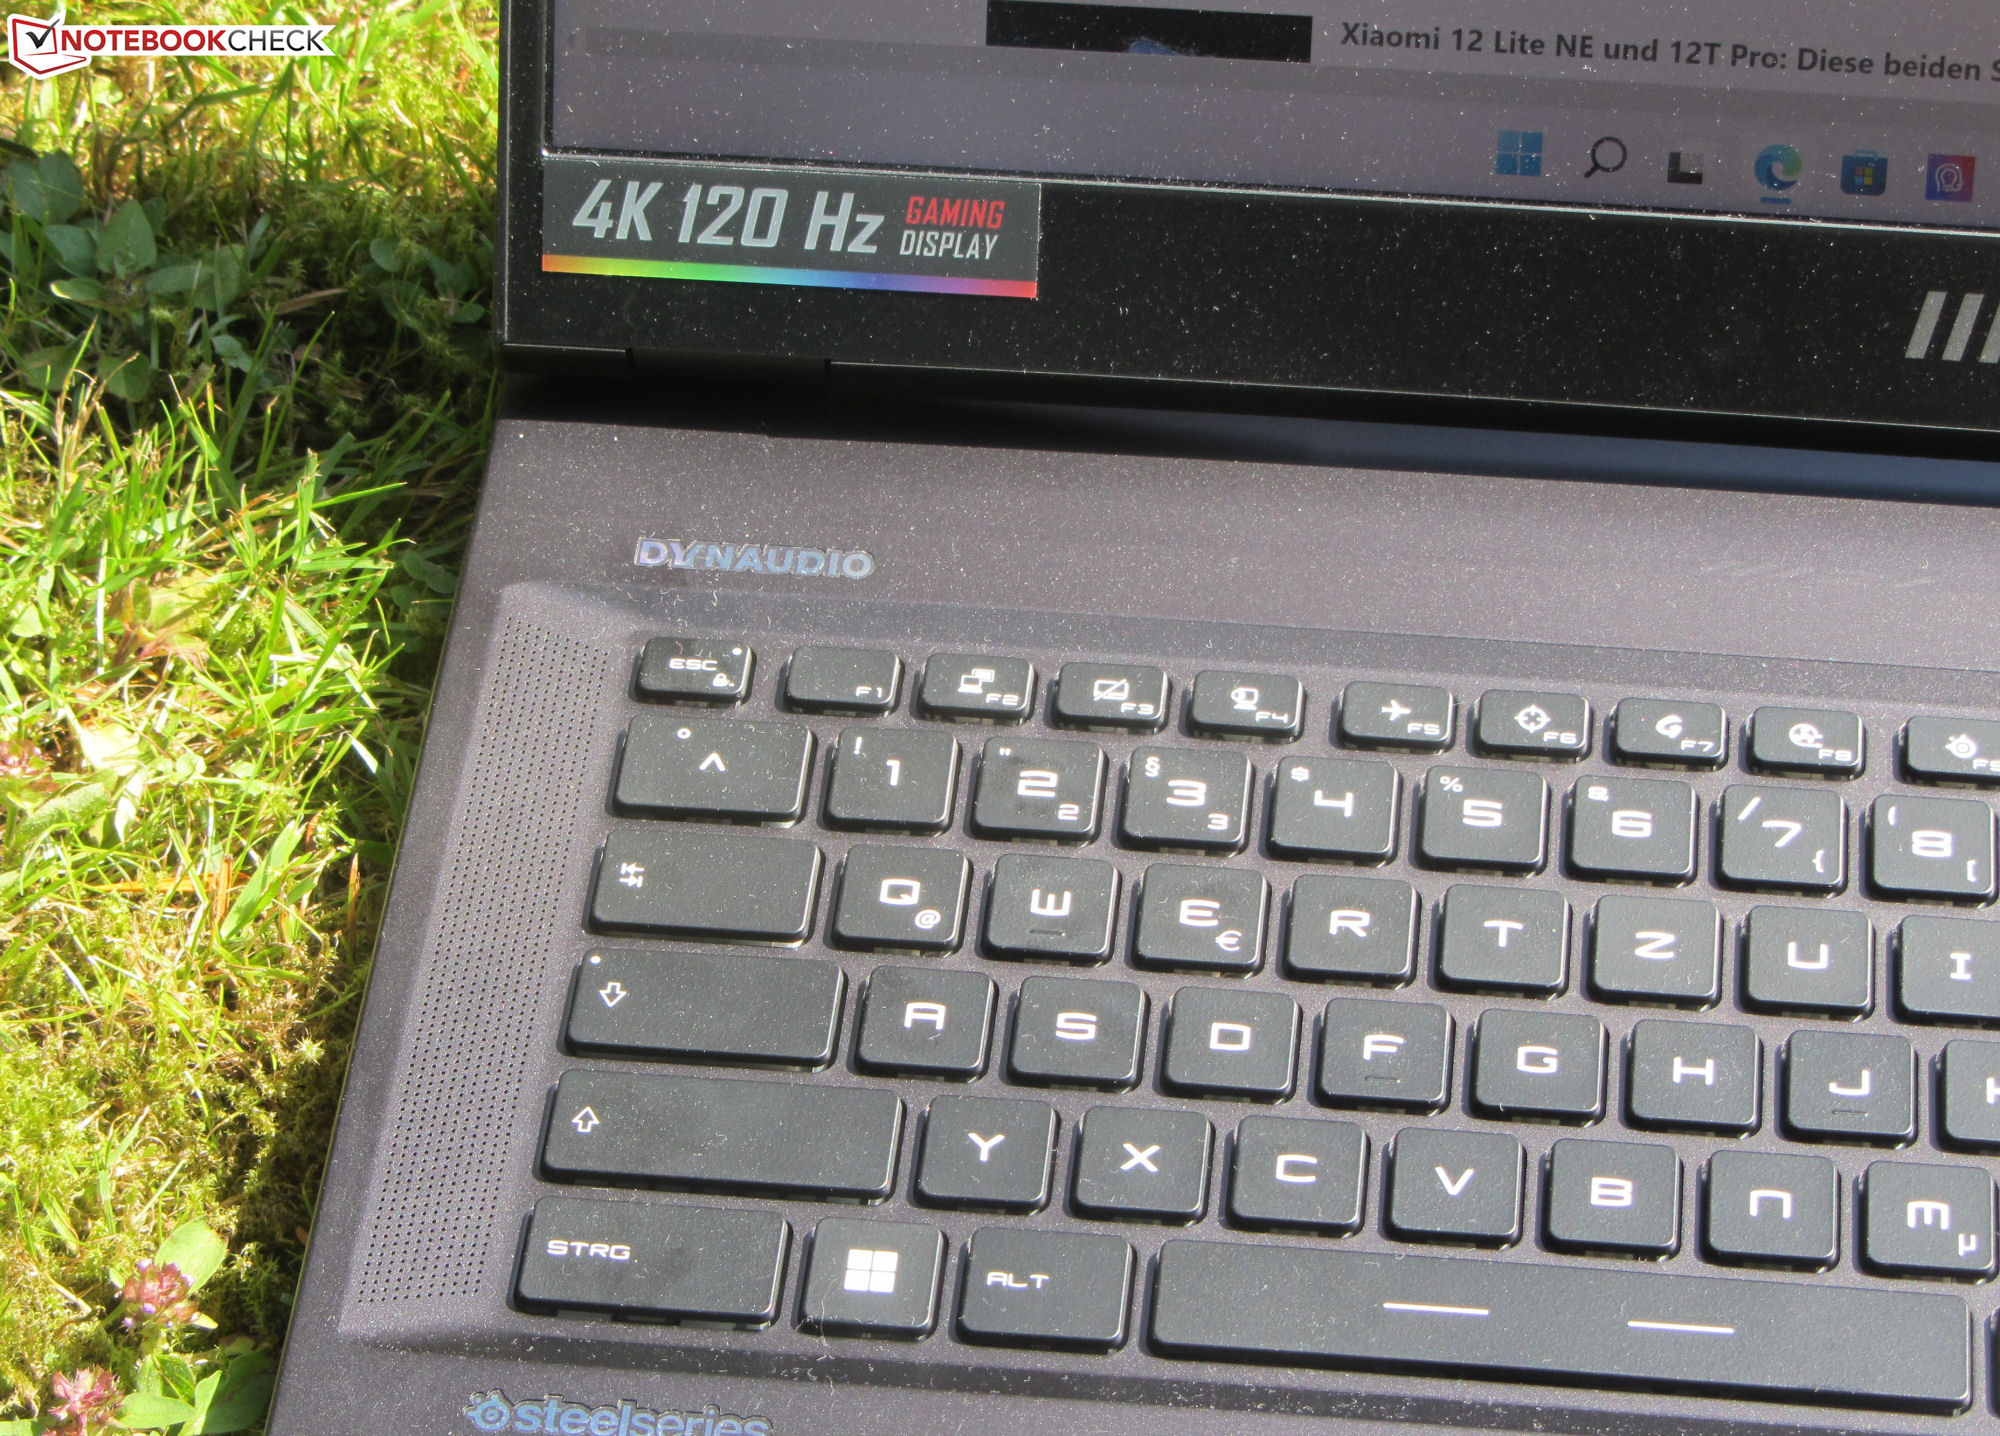
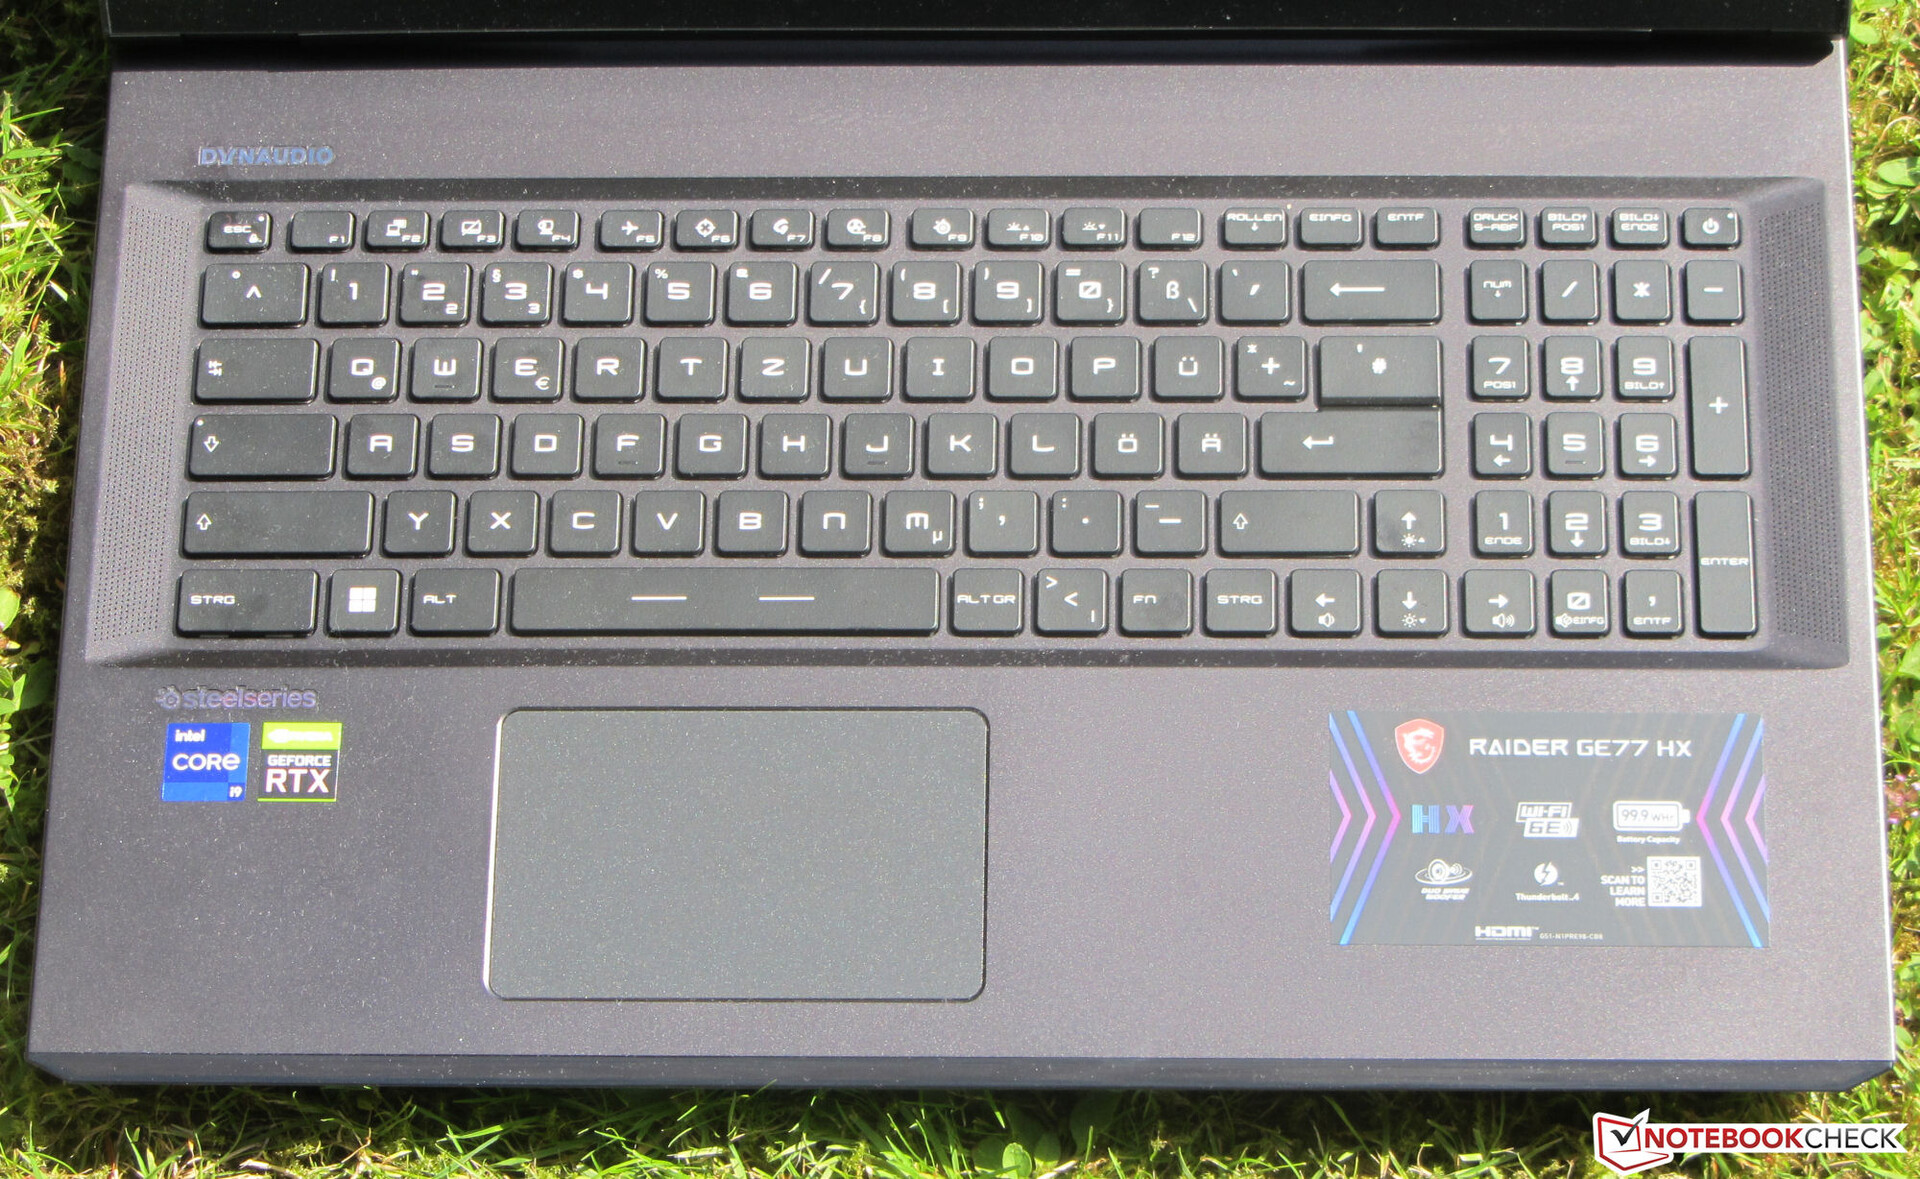
Dispositivi di input - Tastiera con retroilluminazione RGB
Tastiera
I tasti piatti e leggermente ruvidi della tastiera chiclet retroilluminata offrono una corsa moderata e un punto di attuazione distinto. Il feedback della tastiera è discreto. Durante la digitazione, la tastiera cede appena. Come da consuetudine di MSI, il tasto "Fn" non è posizionato dove ci si aspetterebbe da altri portatili. La retroilluminazione della tastiera ha tre impostazioni di luminosità, che possono essere controllate tramite due tasti funzione. Nel complesso, MSI offre una tastiera adatta all'uso quotidiano.
Touchpad
La superficie liscia del ClickPad multi-touch (circa 10,5 x 6,5 cm) ha buone proprietà di scorrimento. Il pad risponde bene fino agli angoli. Offre una corsa breve e un punto di attuazione ben definito.
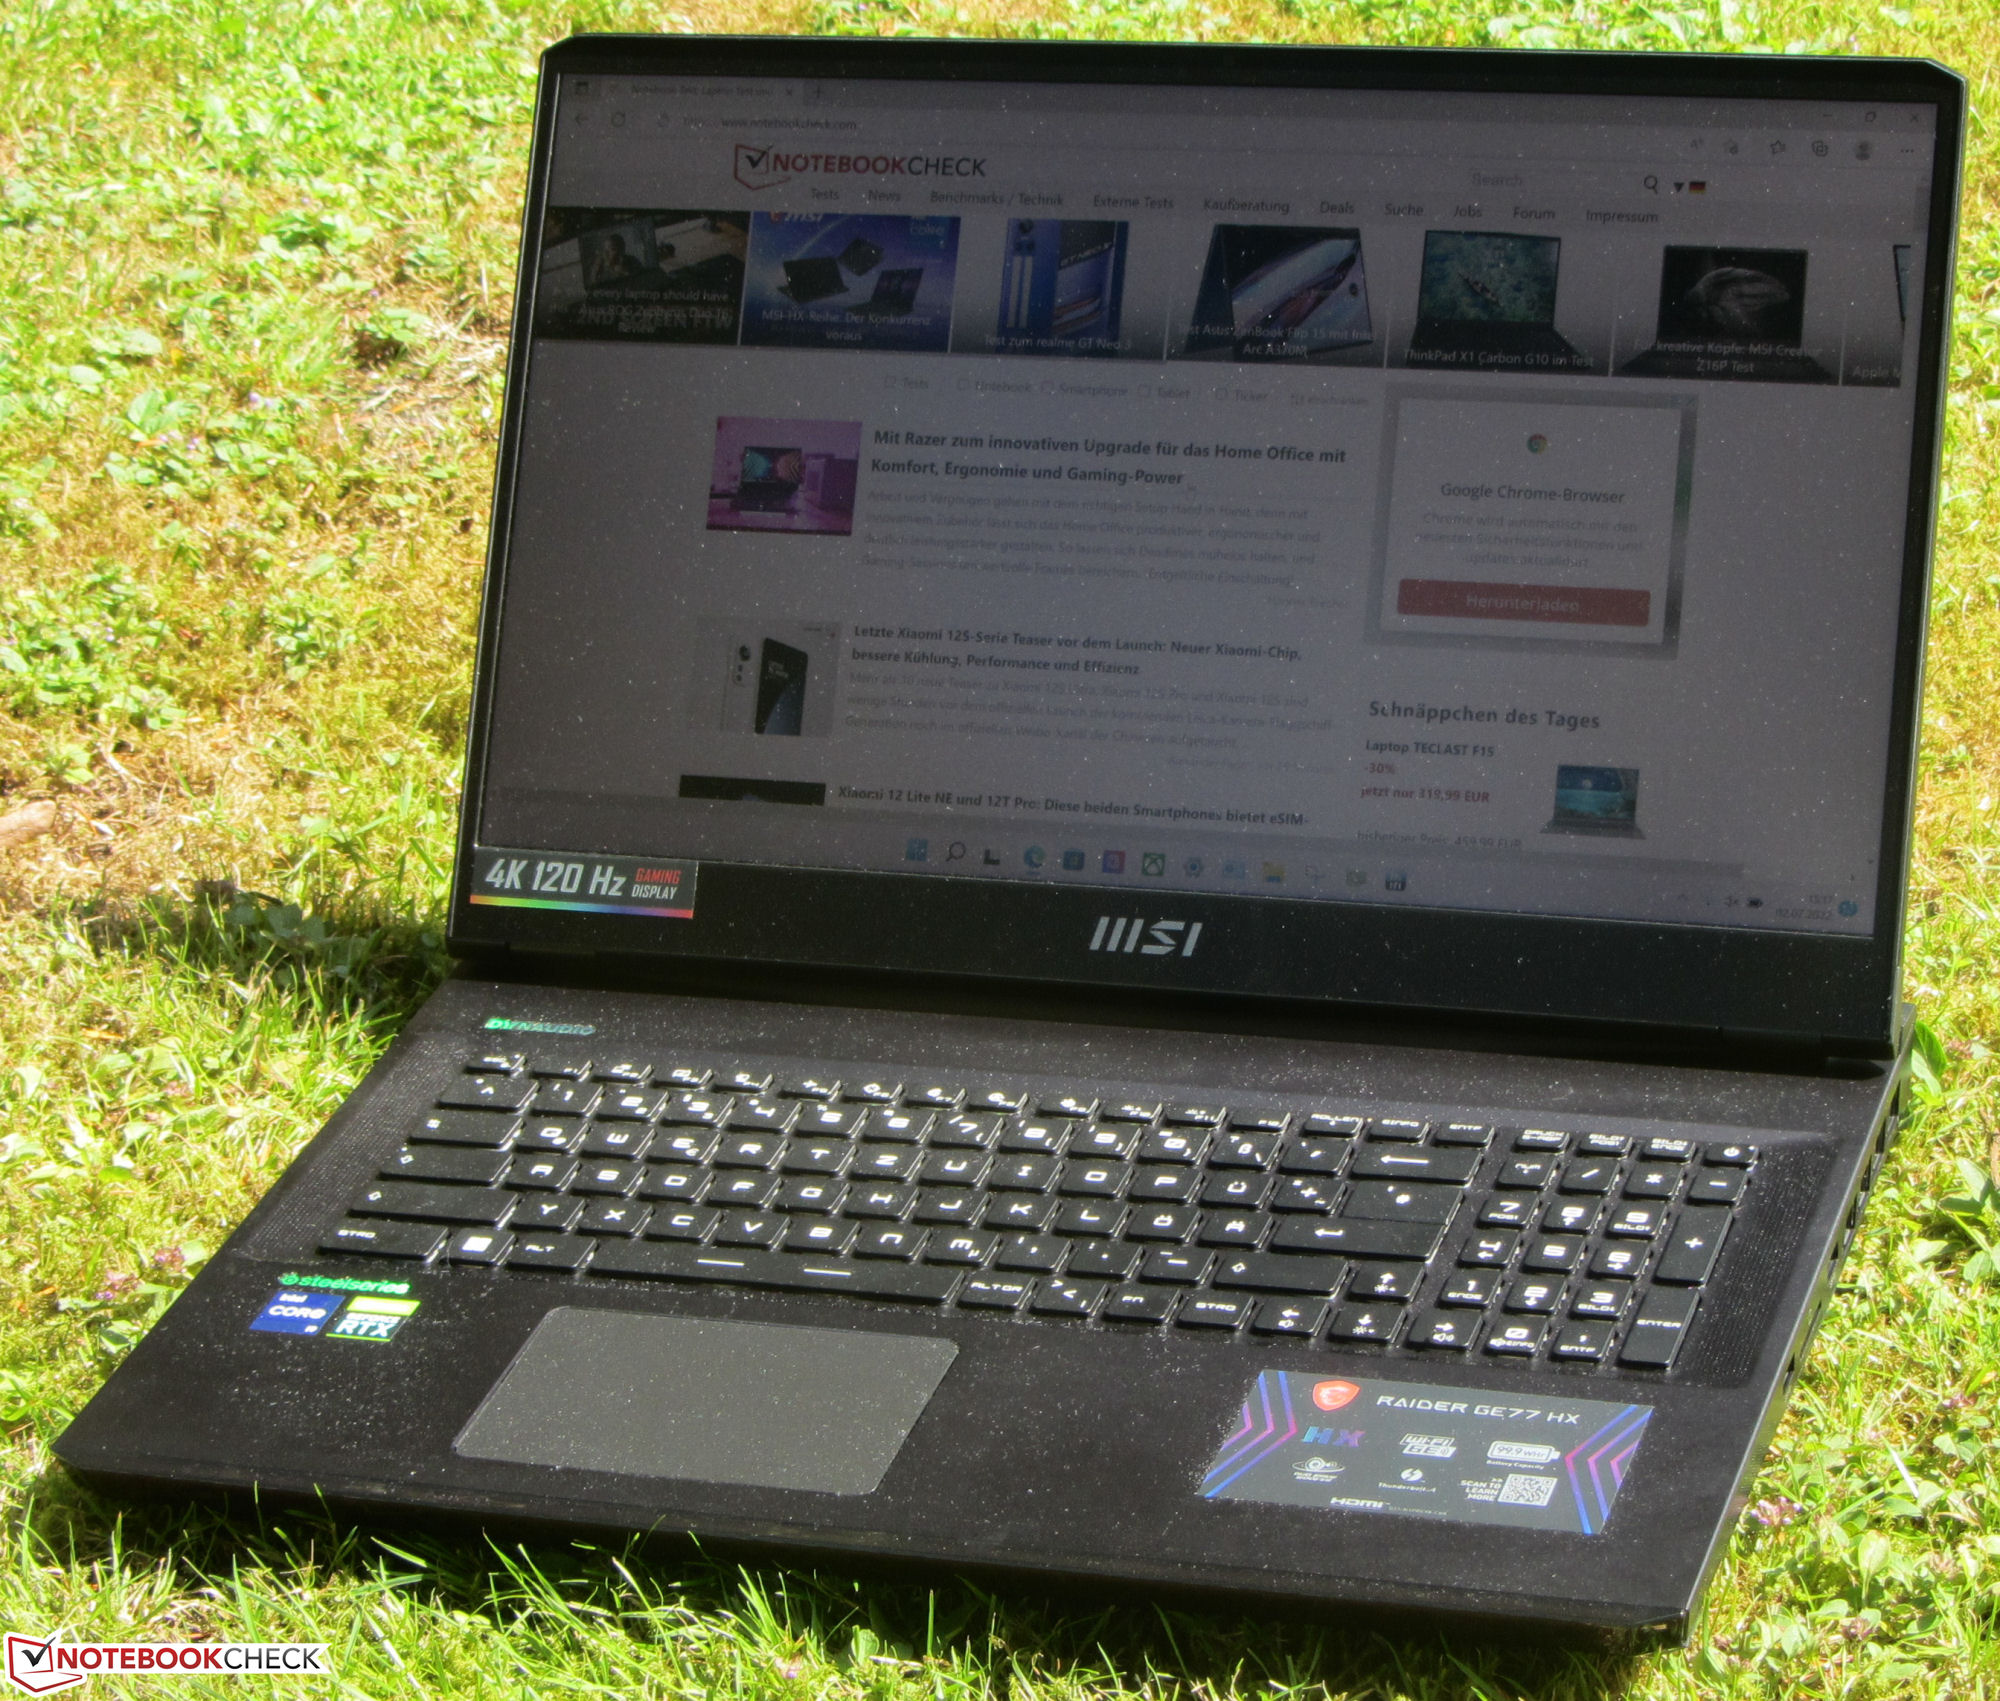
Display - Pannello IPS
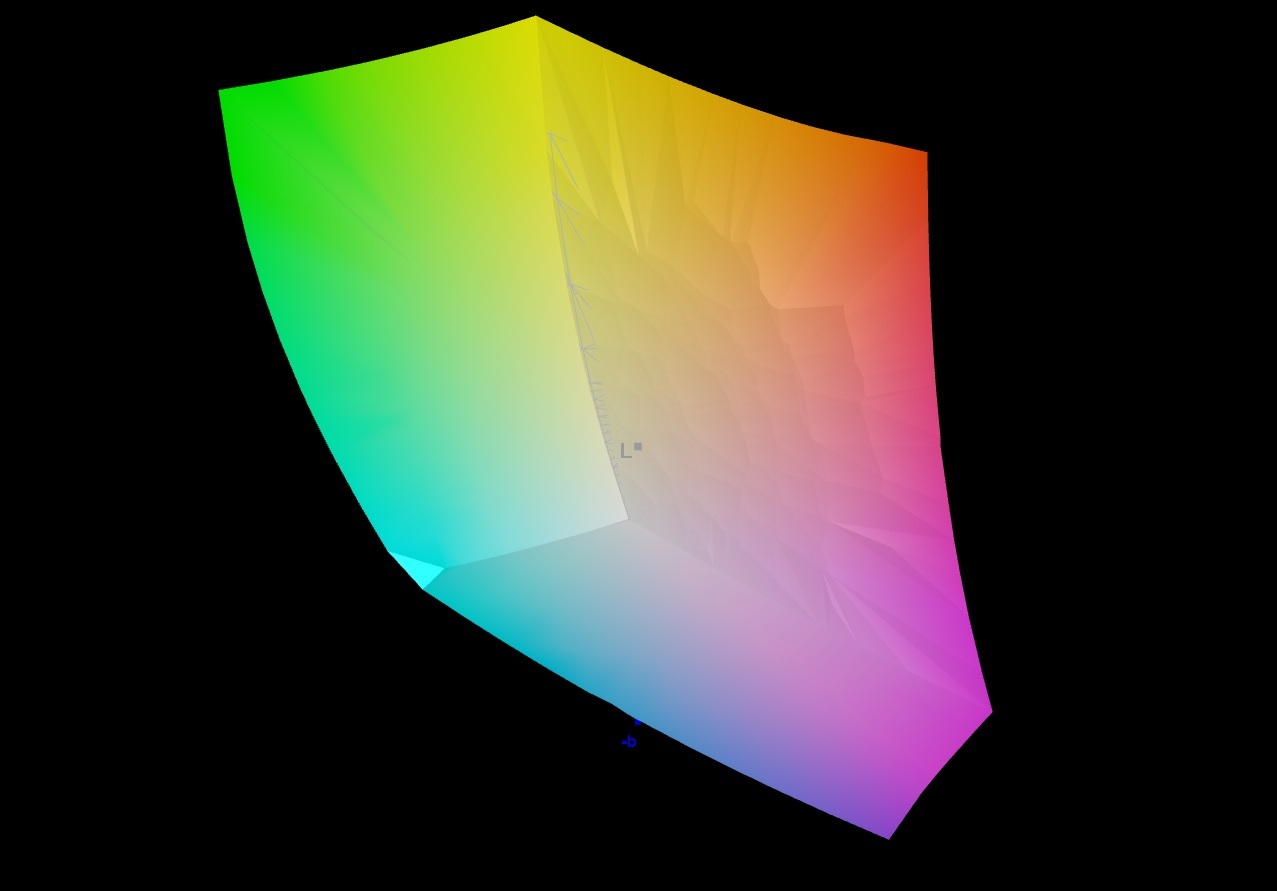
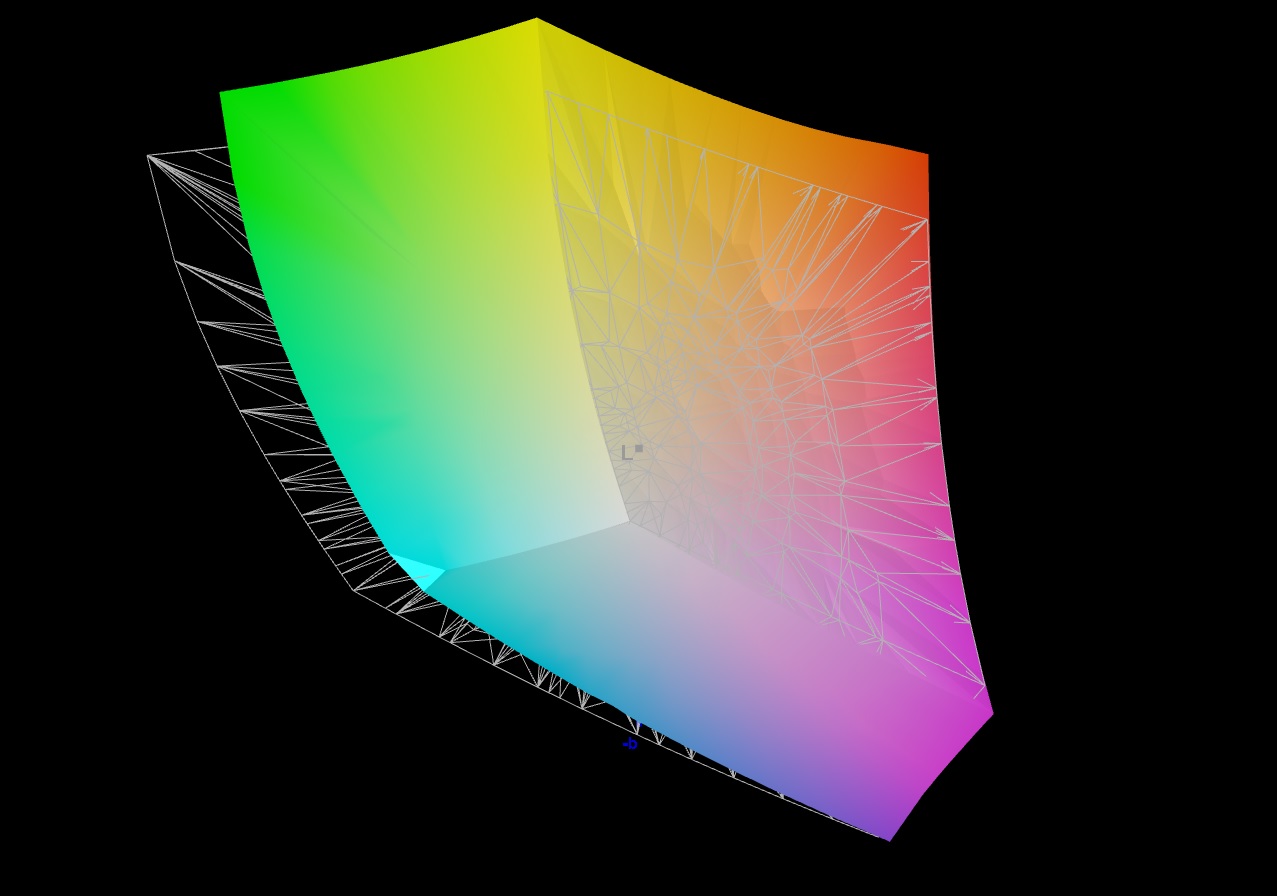
Mentre la luminosità (371,2 nits) del display opaco da 17,3 pollici (3840 x 2160 pixel) supera il minimo desiderato (> 300 nits), il contrasto è scarso (733:1) - ci aspettiamo di più da un portatile che costa 5.200 euro. Come riferimento, consideriamo buoni i valori di 1000:1 e superiori. Il pannello a 120 Hz ha tempi di risposta brevi. Inoltre, non abbiamo rilevato alcuno sfarfallio PWM.
| |||||||||||||||||||||||||
Distribuzione della luminosità: 84 %
Al centro con la batteria: 381 cd/m²
Contrasto: 733:1 (Nero: 0.52 cd/m²)
calibrated: 2.53
85.8% AdobeRGB 1998 (Argyll 3D)
99.8% sRGB (Argyll 3D)
96.6% Display P3 (Argyll 3D)
| MSI Raider GE77 HX 12UHS AU Optronics B173ZAN06.1, IPS, 3840x2160, 17.3" | Razer Blade 17 Early 2022 AU Optronics B173ZAN06.9, IPS, 3840x2160, 17.3" | Alienware x17 R2 P48E AU Optronics B173HAN, IPS, 1920x1080, 17.3" | Medion Erazer Beast X30 BOE CQ NE173QHM-NZ3, IPS, 2560x1440, 17.3" | |
|---|---|---|---|---|
| Display | 2% | -8% | -17% | |
| Display P3 Coverage (%) | 96.6 | 99.4 3% | 79.2 -18% | 67.7 -30% |
| sRGB Coverage (%) | 99.8 | 100 0% | 99.8 0% | 97.6 -2% |
| AdobeRGB 1998 Coverage (%) | 85.8 | 87.3 2% | 79.6 -7% | 69.2 -19% |
| Response Times | -15% | -89% | -102% | |
| Response Time Grey 50% / Grey 80% * (ms) | 5.8 ? | 7.5 ? -29% | 12.4 ? -114% | 14.7 ? -153% |
| Response Time Black / White * (ms) | 5.6 ? | 5.6 ? -0% | 9.2 ? -64% | 8.4 ? -50% |
| PWM Frequency (Hz) | ||||
| Screen | 35% | 31% | 24% | |
| Brightness middle (cd/m²) | 381 | 503 32% | 365.4 -4% | 377 -1% |
| Brightness (cd/m²) | 371 | 486 31% | 344 -7% | 352 -5% |
| Brightness Distribution (%) | 84 | 84 0% | 85 1% | 86 2% |
| Black Level * (cd/m²) | 0.52 | 0.44 15% | 0.29 44% | 0.32 38% |
| Contrast (:1) | 733 | 1143 56% | 1260 72% | 1178 61% |
| Colorchecker dE 2000 calibrated * | 2.53 | 0.6 76% | 0.51 80% | 1.3 49% |
| Colorchecker dE 2000 * | 1.08 | 3.17 | 2.91 | |
| Colorchecker dE 2000 max. * | 4.54 | 7.69 | 6.78 | |
| Greyscale dE 2000 * | 1.3 | 5.3 | 3.4 | |
| Gamma | 2.151 102% | 2.18 101% | 2.109 104% | |
| CCT | 6541 99% | 5879 111% | 7273 89% | |
| Media totale (Programma / Settaggio) | 7% /
17% | -22% /
-2% | -32% /
-10% |
* ... Meglio usare valori piccoli
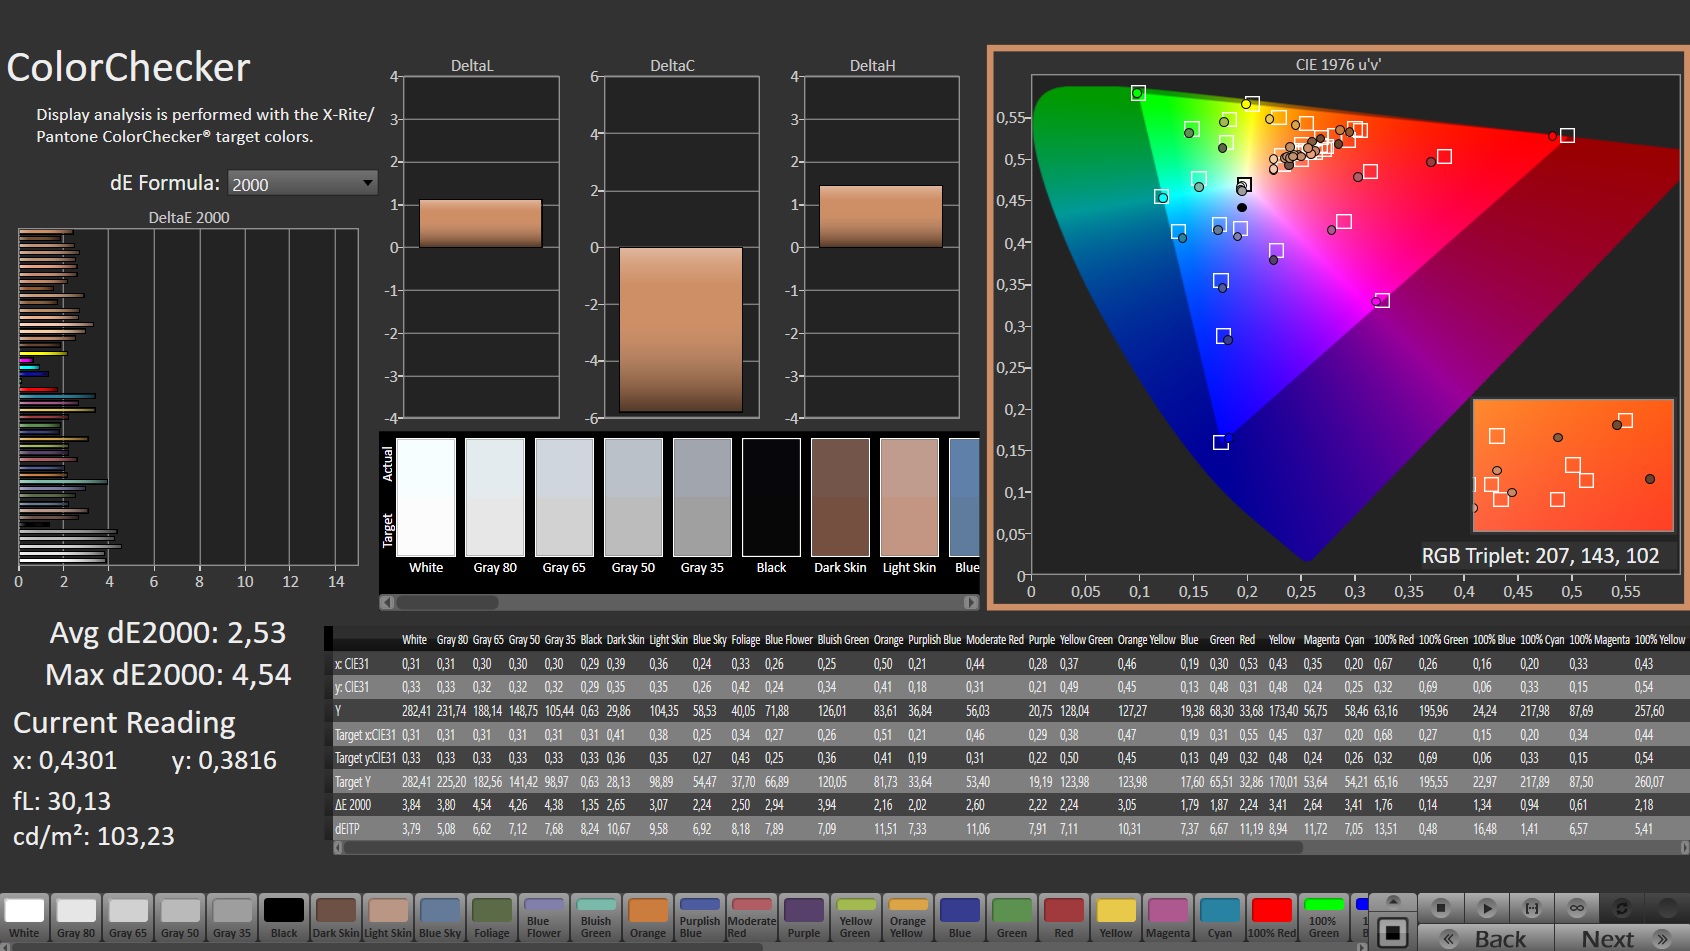
Il software MSI True Color preinstallato consente agli utenti di regolare i colori per un determinato spazio colore o caso d'uso. Noi abbiamo utilizzato l'impostazione predefinita "Display P3". Tuttavia: L'accuratezza del colore è piuttosto scarsa in fabbrica, indipendentemente dalla selezione della preimpostazione. Tutti i colori appaiono eccessivamente gonfiati e lattiginosi, con misure completamente sballate. Questo non può essere l'obiettivo di MSI.
Sospettiamo che il software True Color, il profilo colore preinstallato e/o l'iGPU o i suoi driver interferiscano tra loro. Perché? Non appena viene attivata la modalità dGPU (= il portatile utilizza esclusivamente la GPU GeForce ), il display appare fantastico e i colori diventano accurati. La differenza si nota immediatamente.
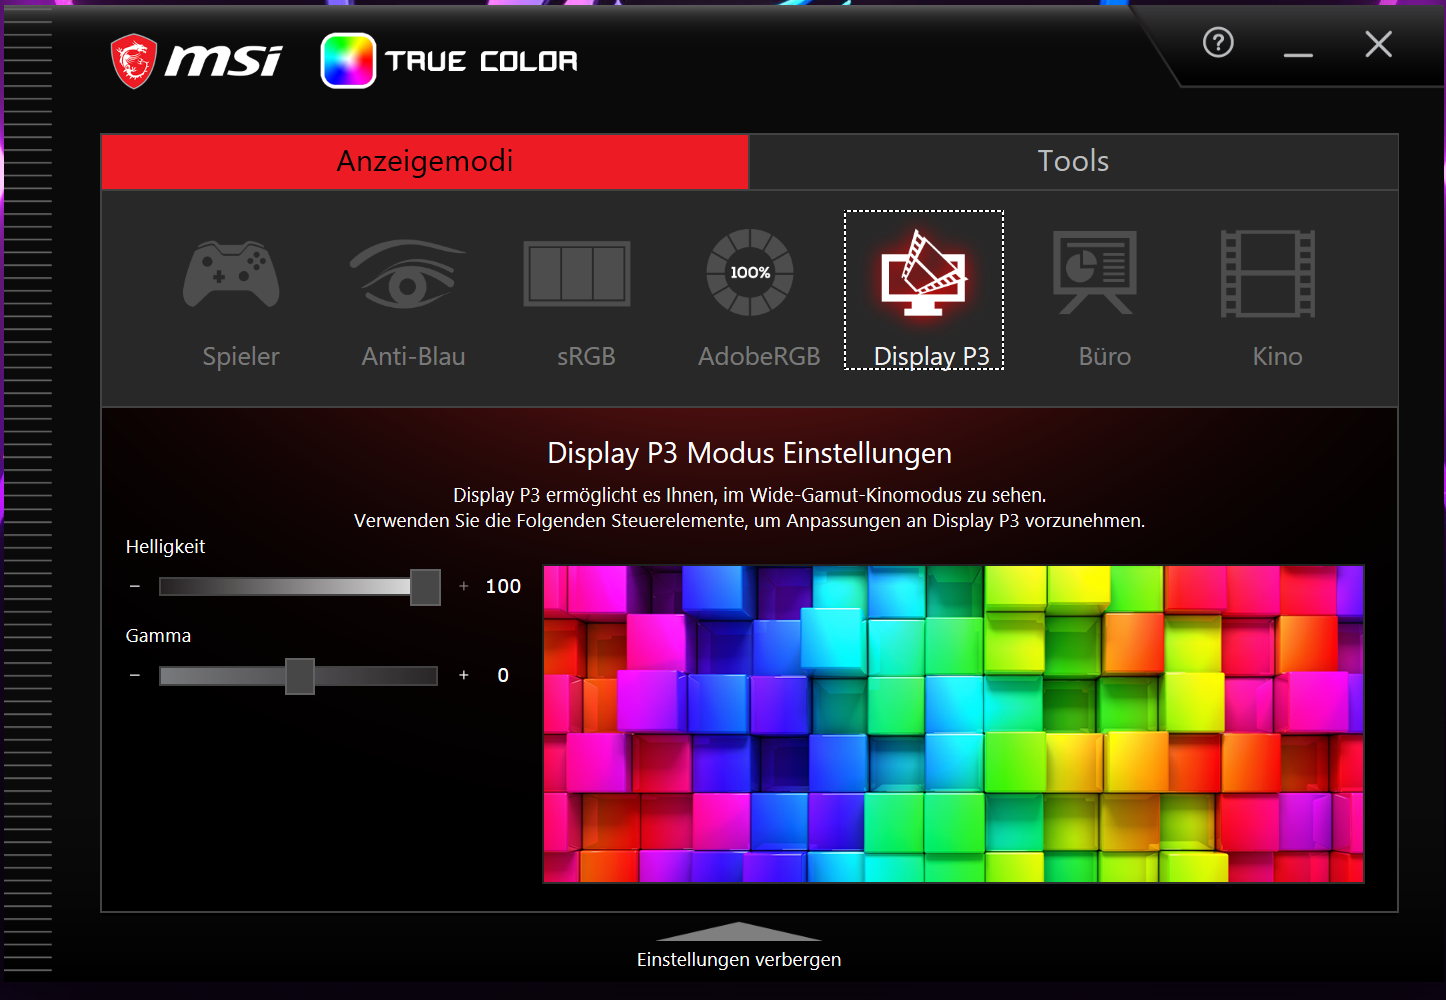
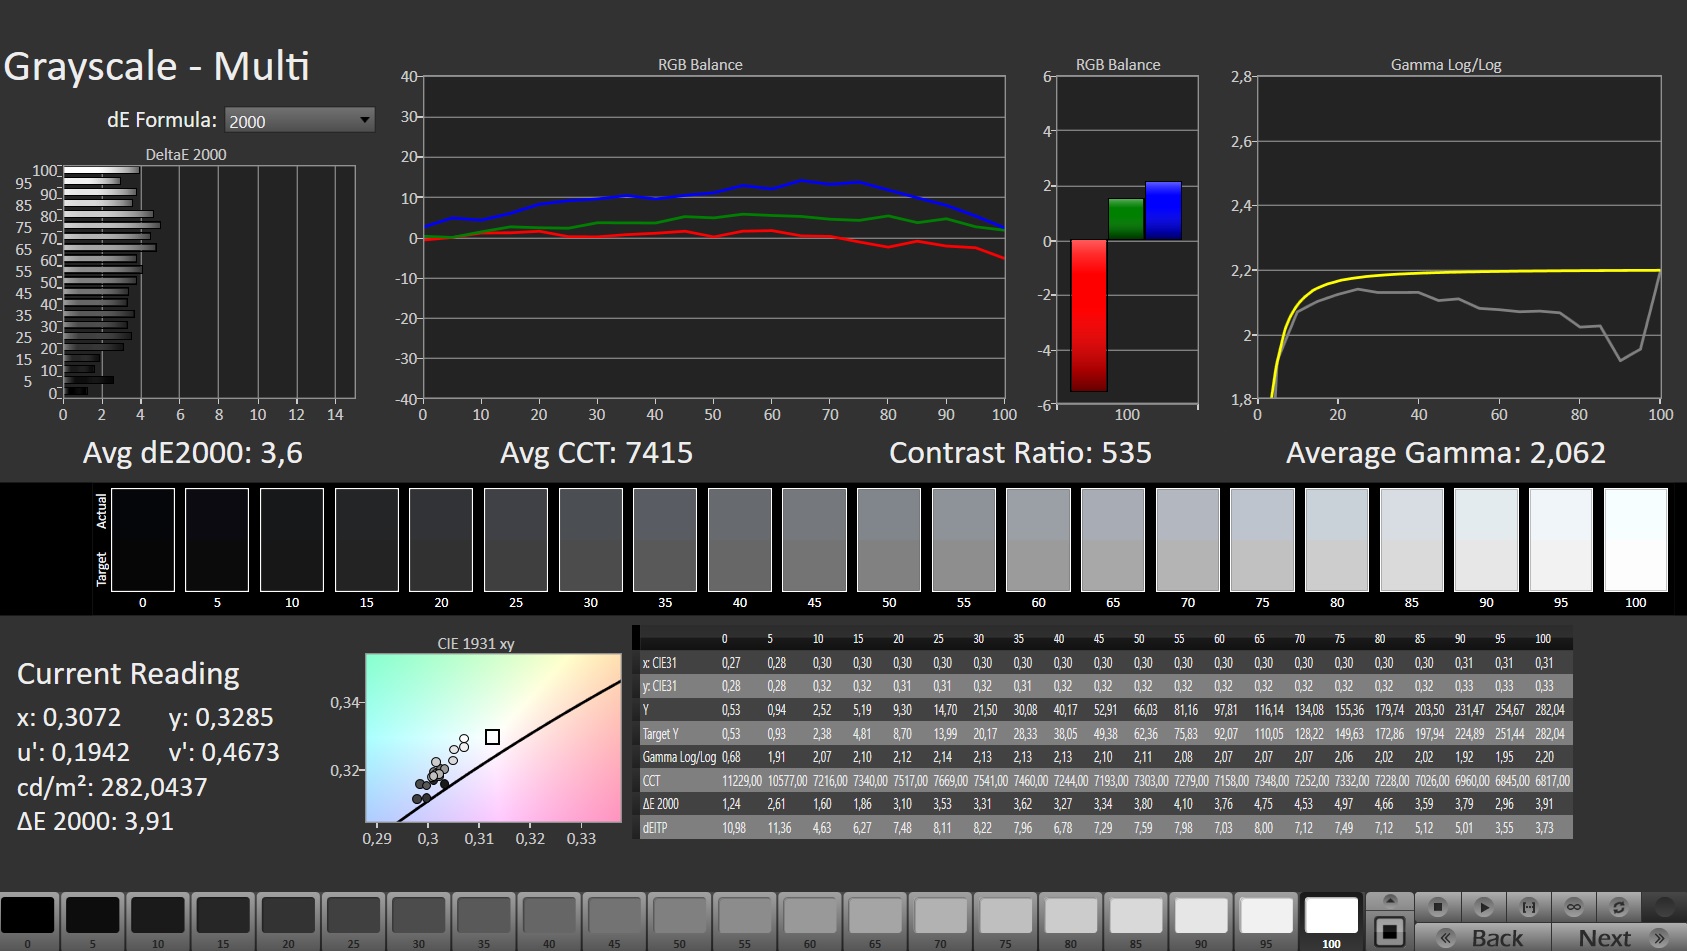
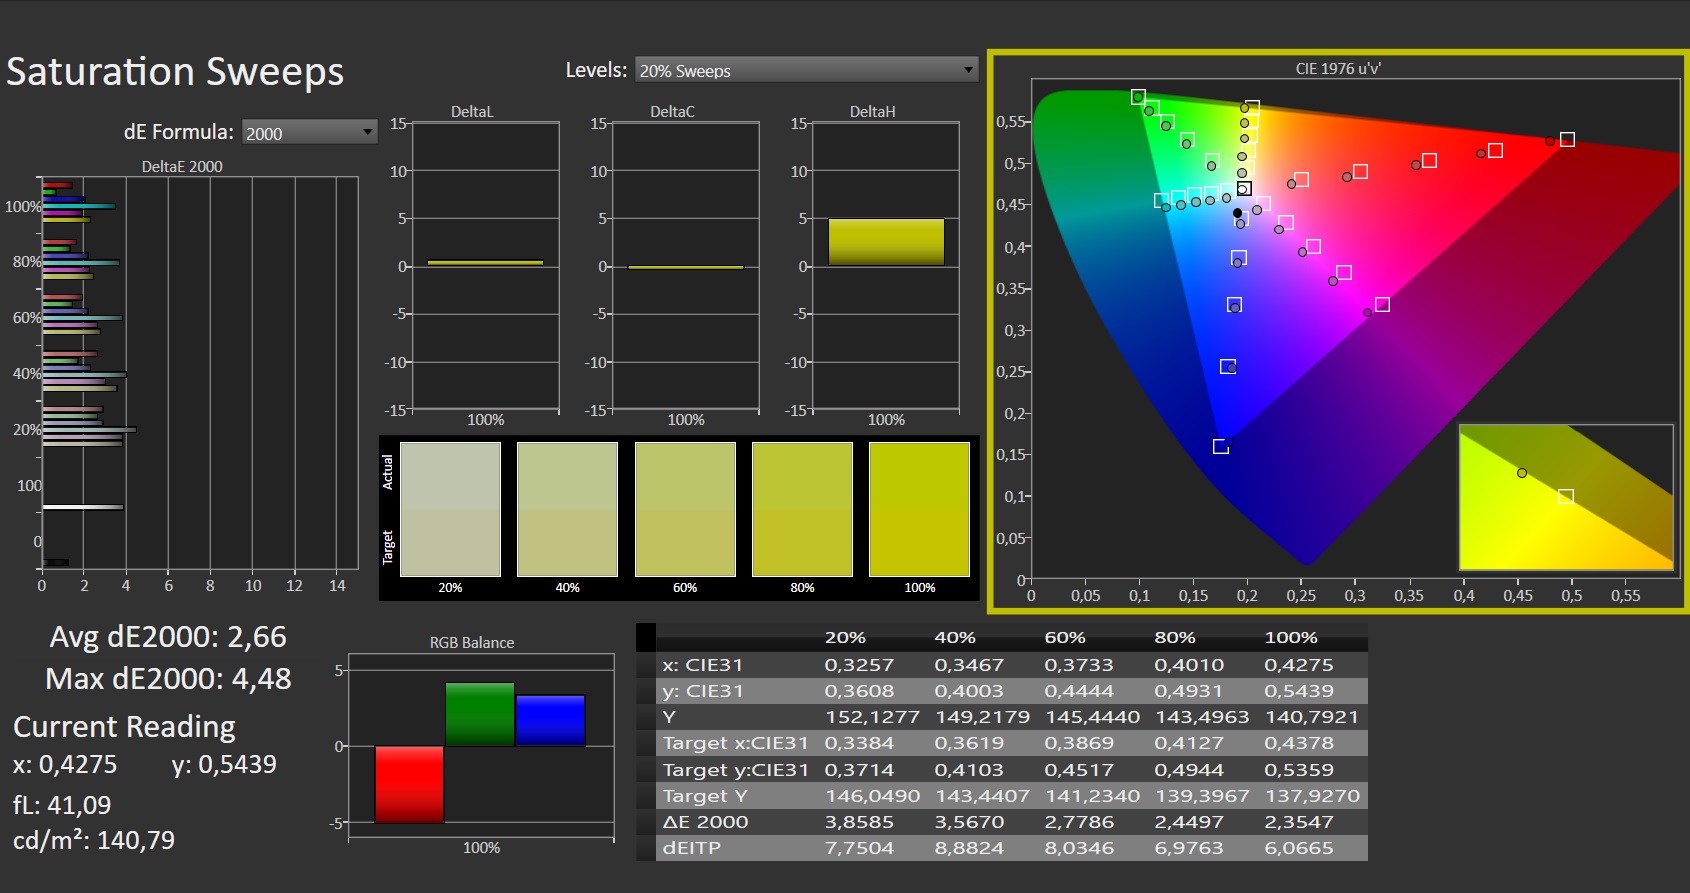
Una calibrazione del display (modalità Optimus) produce miglioramenti significativi. La deviazione del colore rientra nell'intervallo desiderato (deltaE < 3) e la scala di grigi appare più uniforme. Lo schermo è in grado di visualizzare interamente e quasi interamente gli spazi colore sRGB (100 %) e DCI-P3 (97 %) rispettivamente, nonché l'86 % dello spazio colore AdobeRGB.
Nota: il profilo colore collegato modifica i colori in base alla nostra calibrazione.

Tempi di risposta del Display
| ↔ Tempi di risposta dal Nero al Bianco | ||
|---|---|---|
| 5.6 ms ... aumenta ↗ e diminuisce ↘ combinato | ↗ 1.9 ms Incremento | 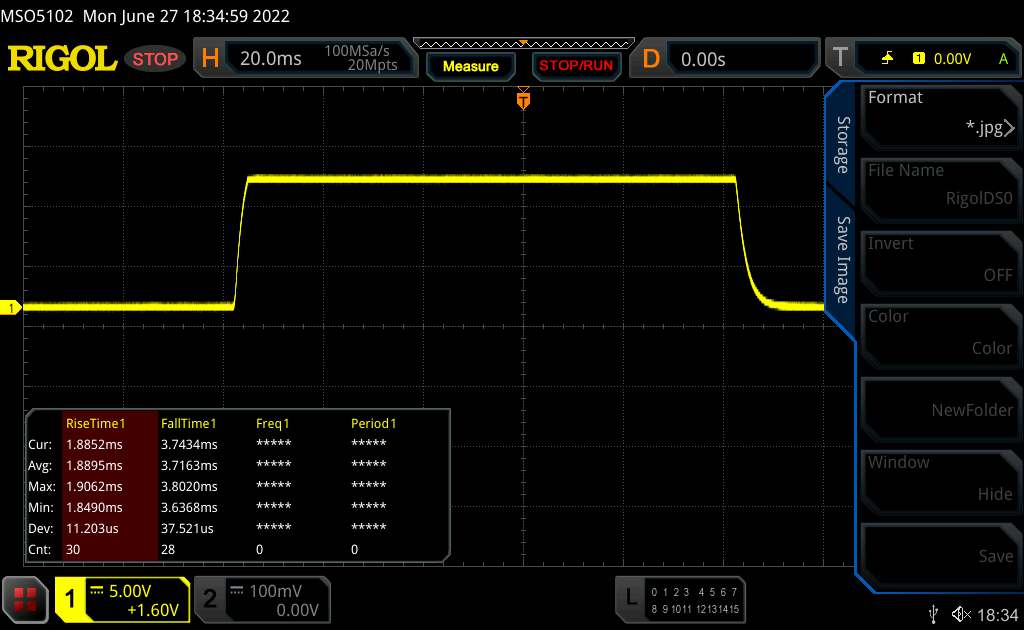 |
| ↘ 3.7 ms Calo | ||
| Lo schermo ha mostrato valori di risposta molto veloci nei nostri tests ed è molto adatto per i gaming veloce. In confronto, tutti i dispositivi di test variano da 0.1 (minimo) a 240 (massimo) ms. » 18 % di tutti i dispositivi è migliore. Questo significa che i tempi di risposta rilevati sono migliori rispettto alla media di tutti i dispositivi testati (19.9 ms). | ||
| ↔ Tempo di risposta dal 50% Grigio all'80% Grigio | ||
| 5.8 ms ... aumenta ↗ e diminuisce ↘ combinato | ↗ 1.6 ms Incremento | 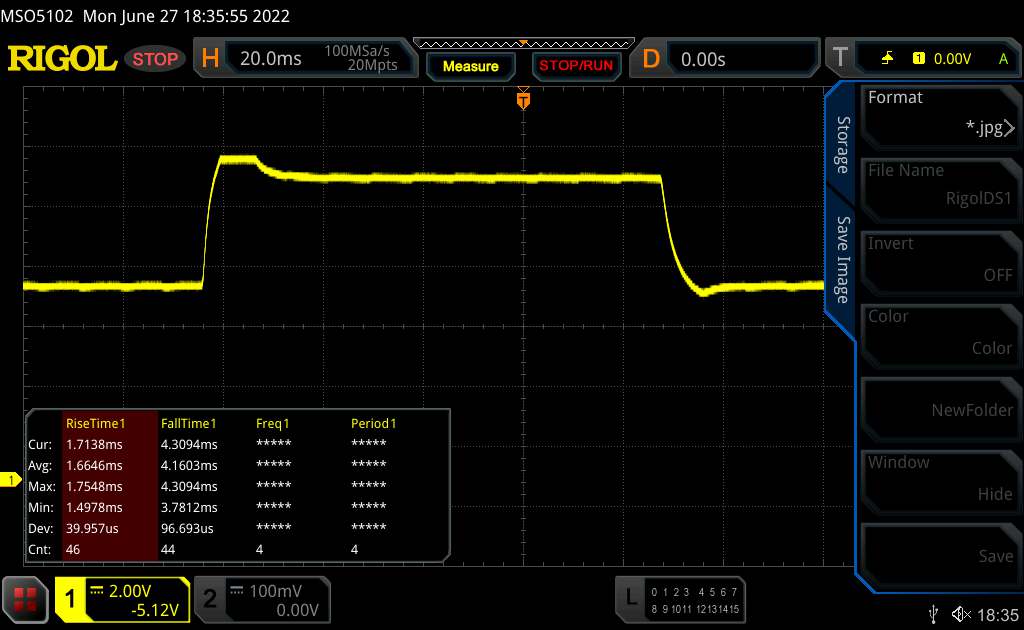 |
| ↘ 4.2 ms Calo | ||
| Lo schermo ha mostrato valori di risposta molto veloci nei nostri tests ed è molto adatto per i gaming veloce. In confronto, tutti i dispositivi di test variano da 0.165 (minimo) a 636 (massimo) ms. » 18 % di tutti i dispositivi è migliore. Questo significa che i tempi di risposta rilevati sono migliori rispettto alla media di tutti i dispositivi testati (31.1 ms). | ||
Sfarfallio dello schermo / PWM (Pulse-Width Modulation)
| flickering dello schermo / PWM non rilevato |  | ||
In confronto: 52 % di tutti i dispositivi testati non utilizza PWM per ridurre la luminosita' del display. Se è rilevato PWM, una media di 7791 (minimo: 5 - massimo: 343500) Hz è stata rilevata. | |||
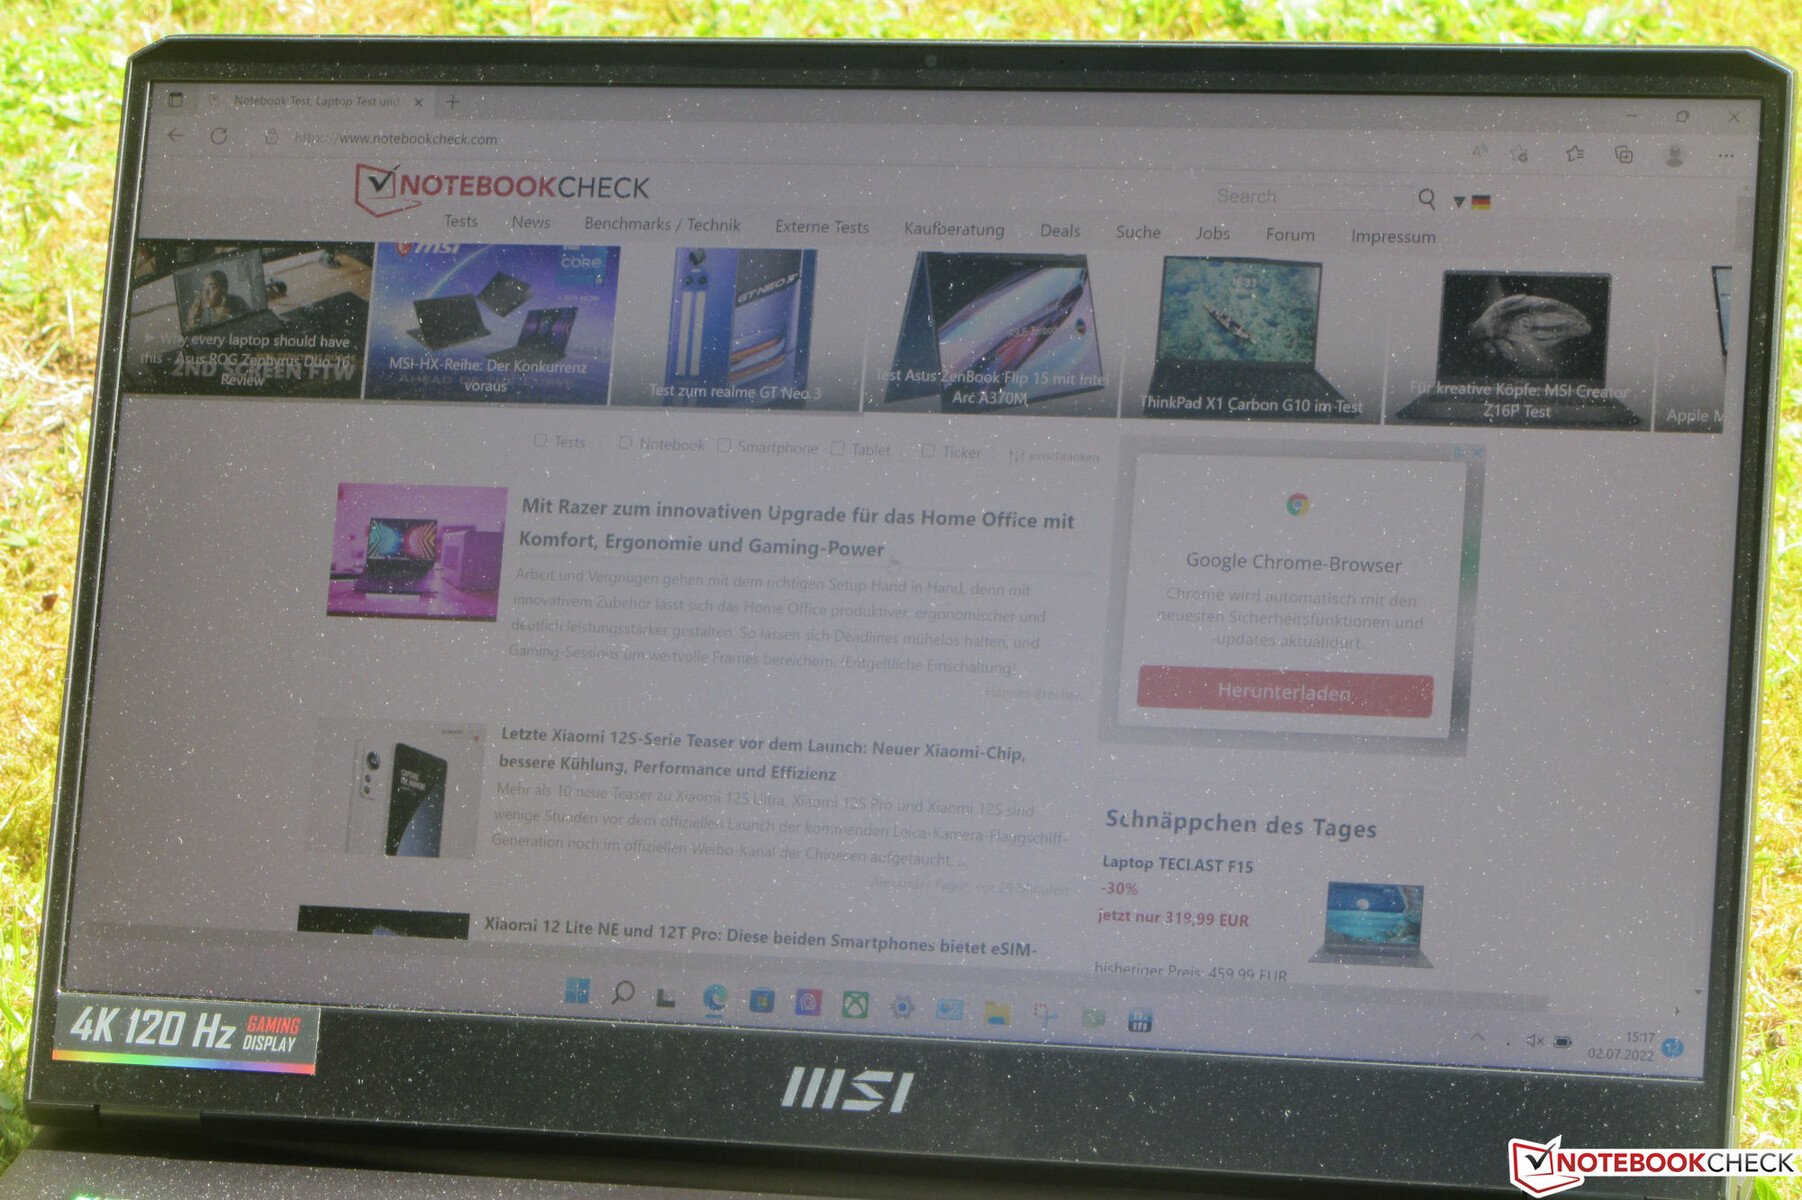
Il pannello IPS ha buoni angoli di visione e rimane leggibile da qualsiasi posizione. All'aperto, il contenuto dello schermo è leggibile a condizione che il sole non sia troppo forte.

Prestazioni - Lustro di Ampere e Alder Lake
Con il Raider GE77 HX 12UHS, MSI offre un portatile da 17,3 pollici ad alte prestazioni che soddisfa tutte le esigenze degli scenari più impegnativi.
Condizioni di prova
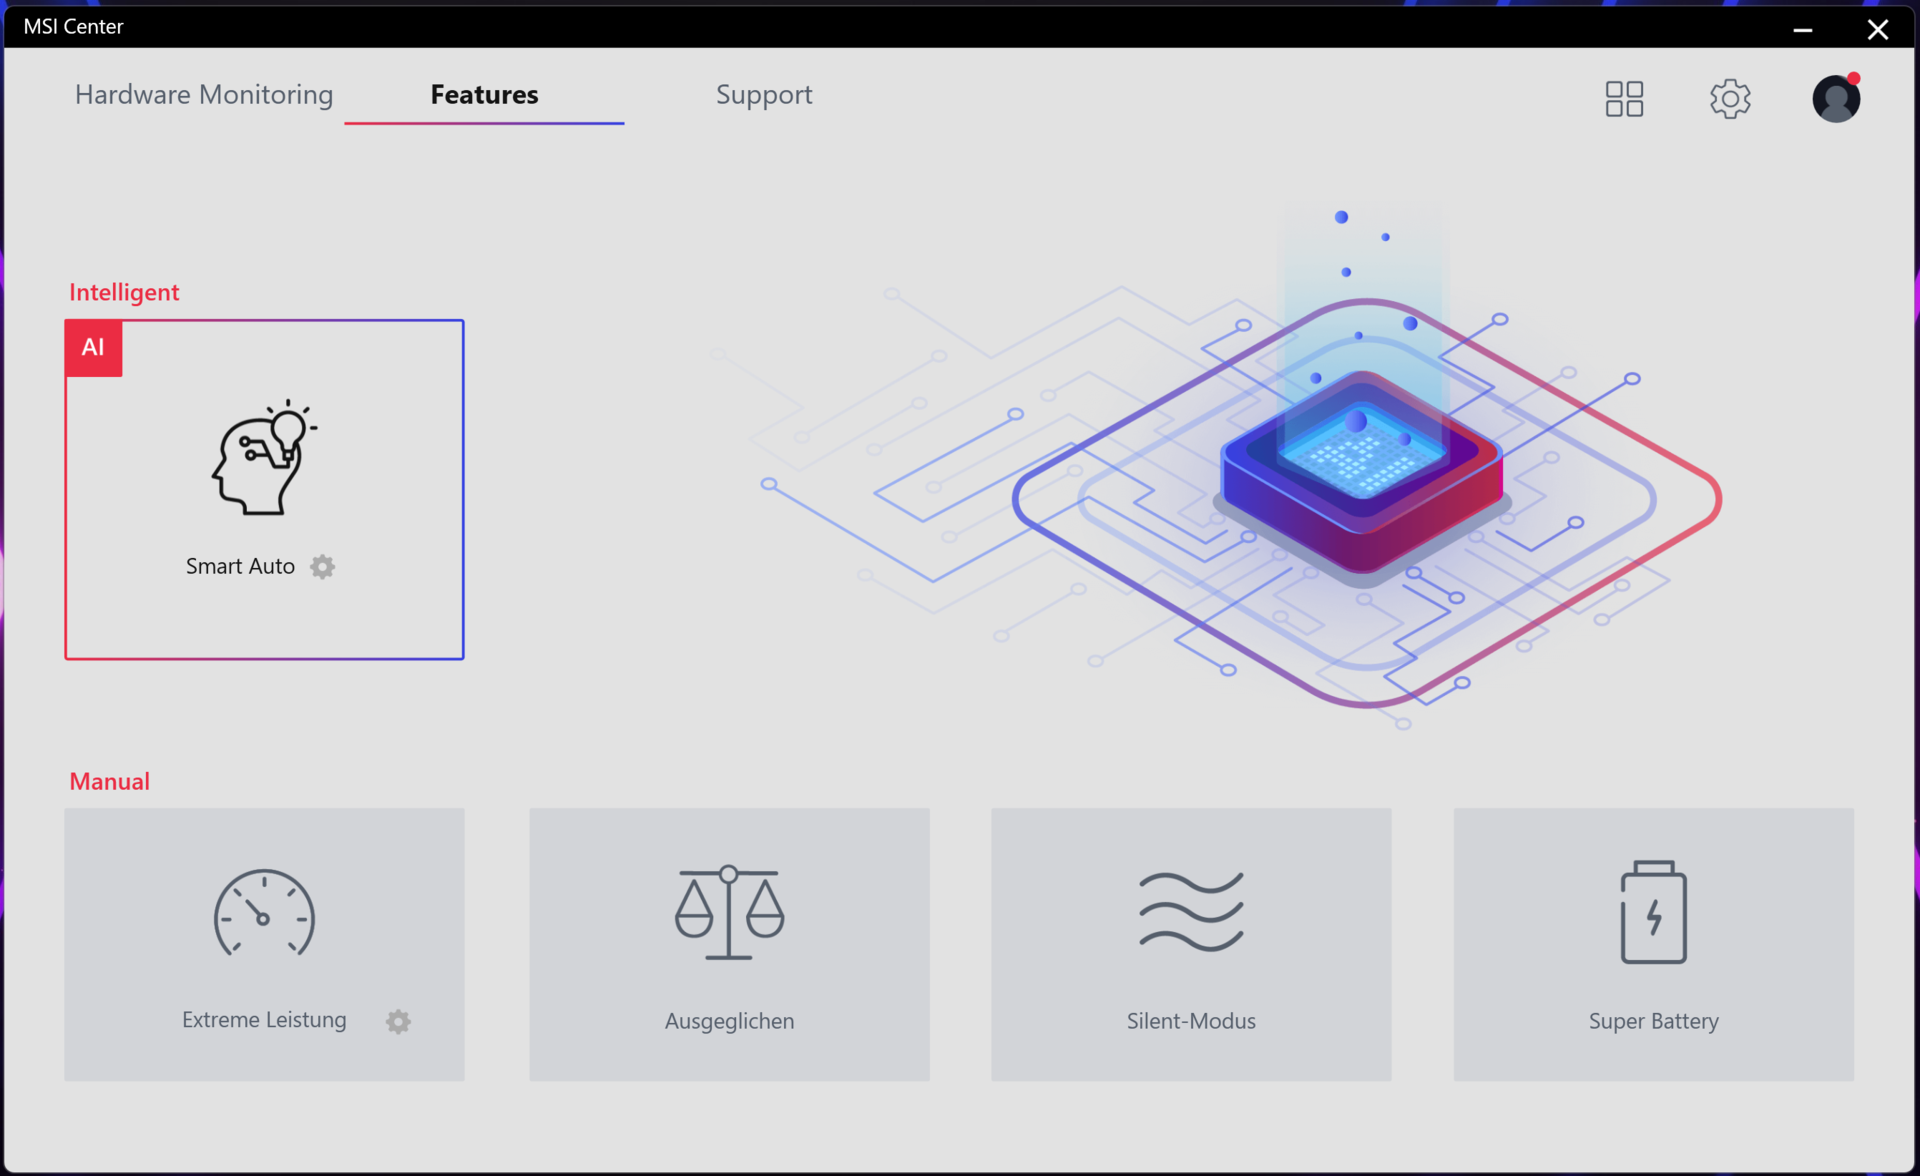
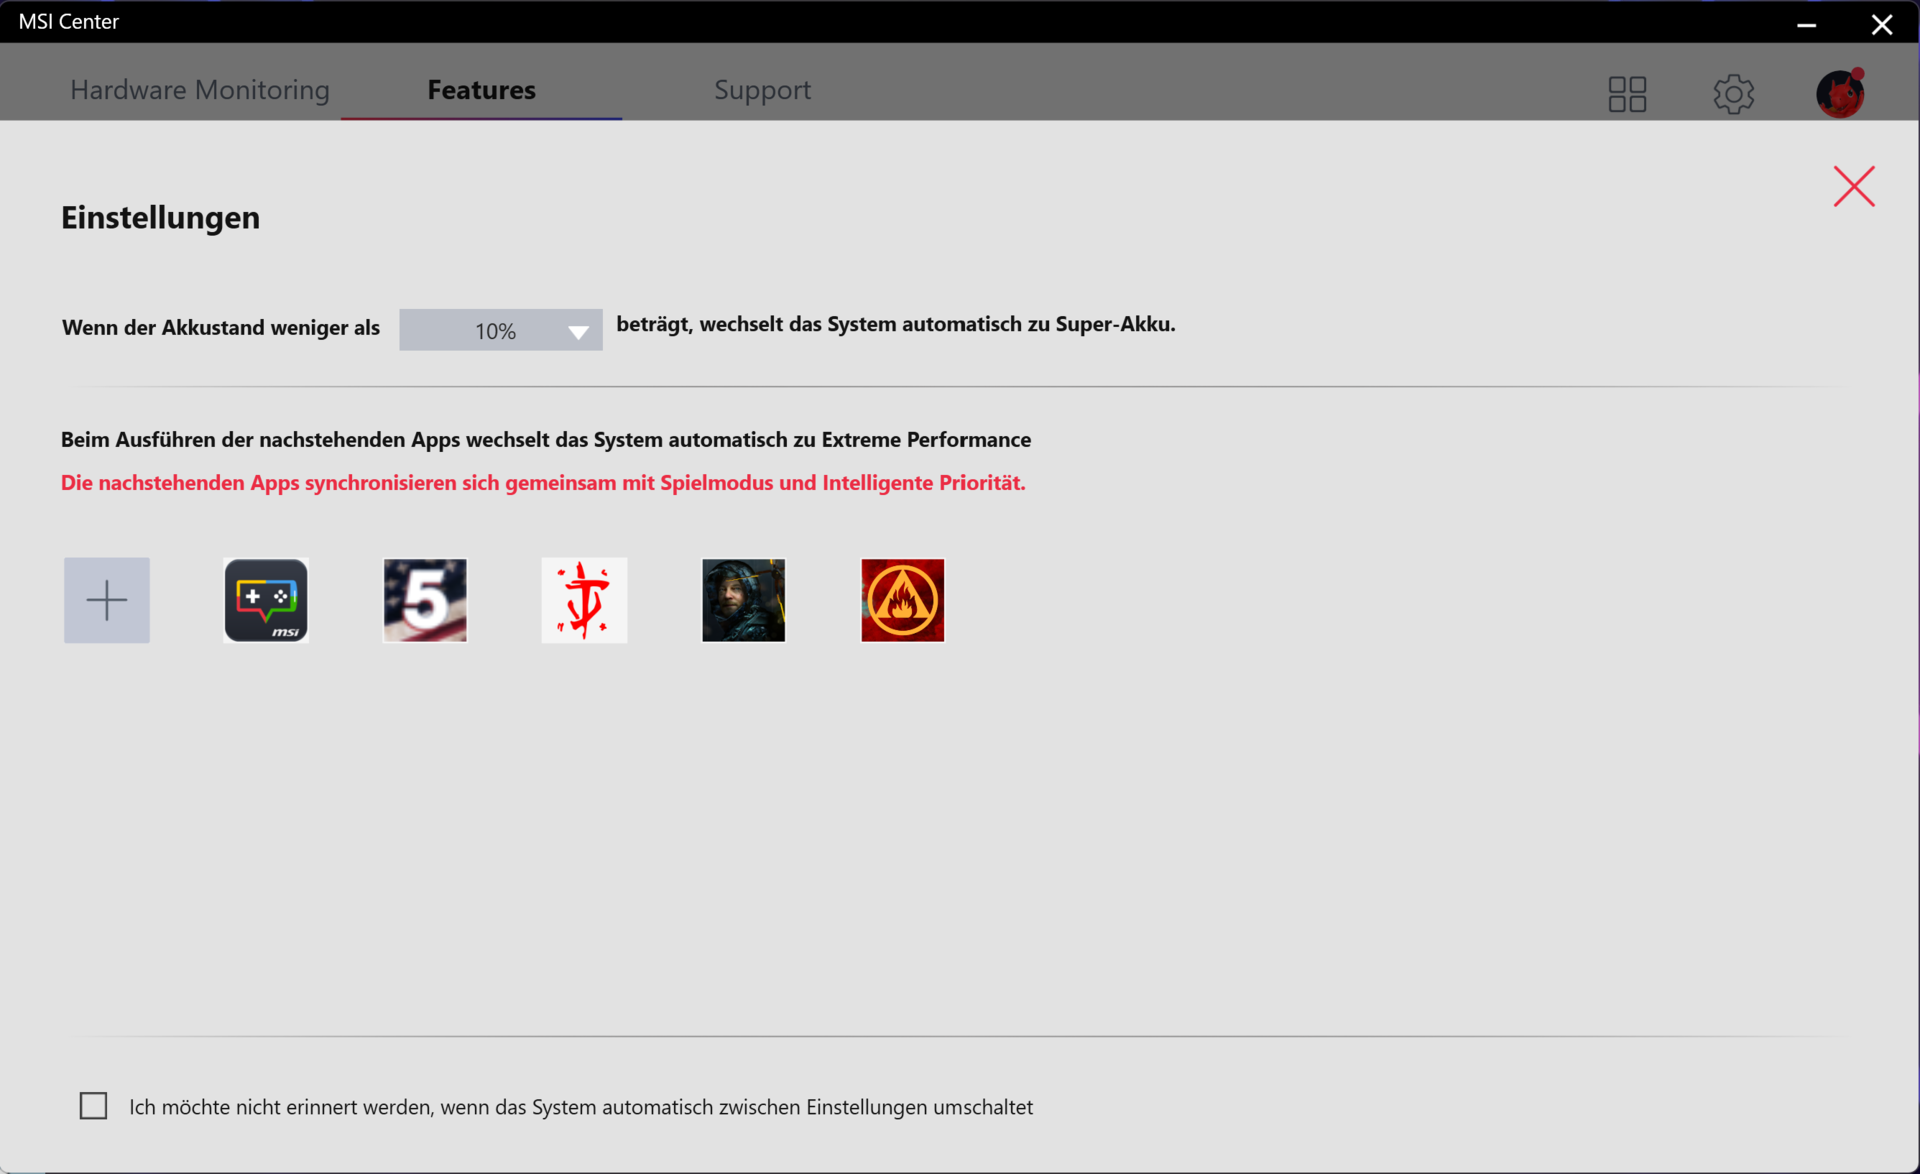
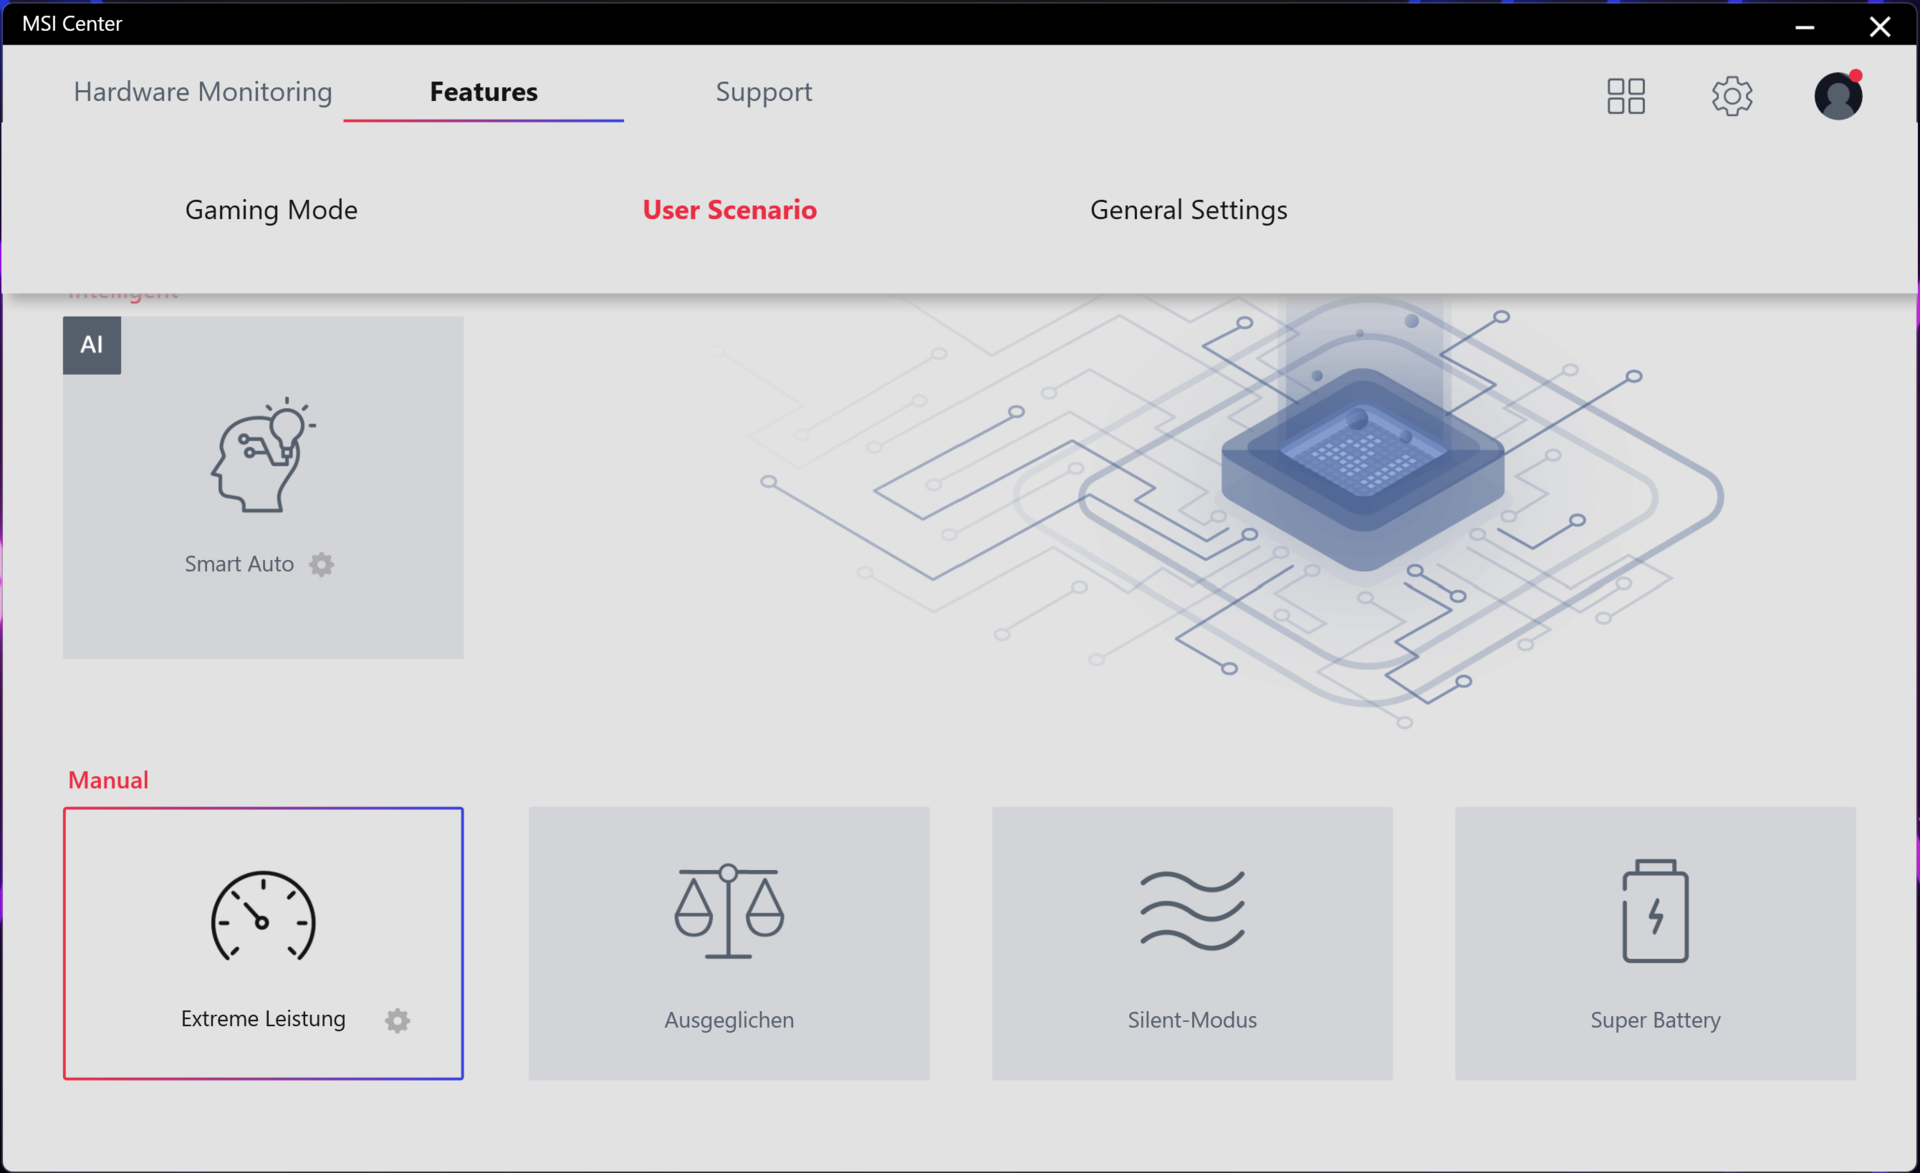
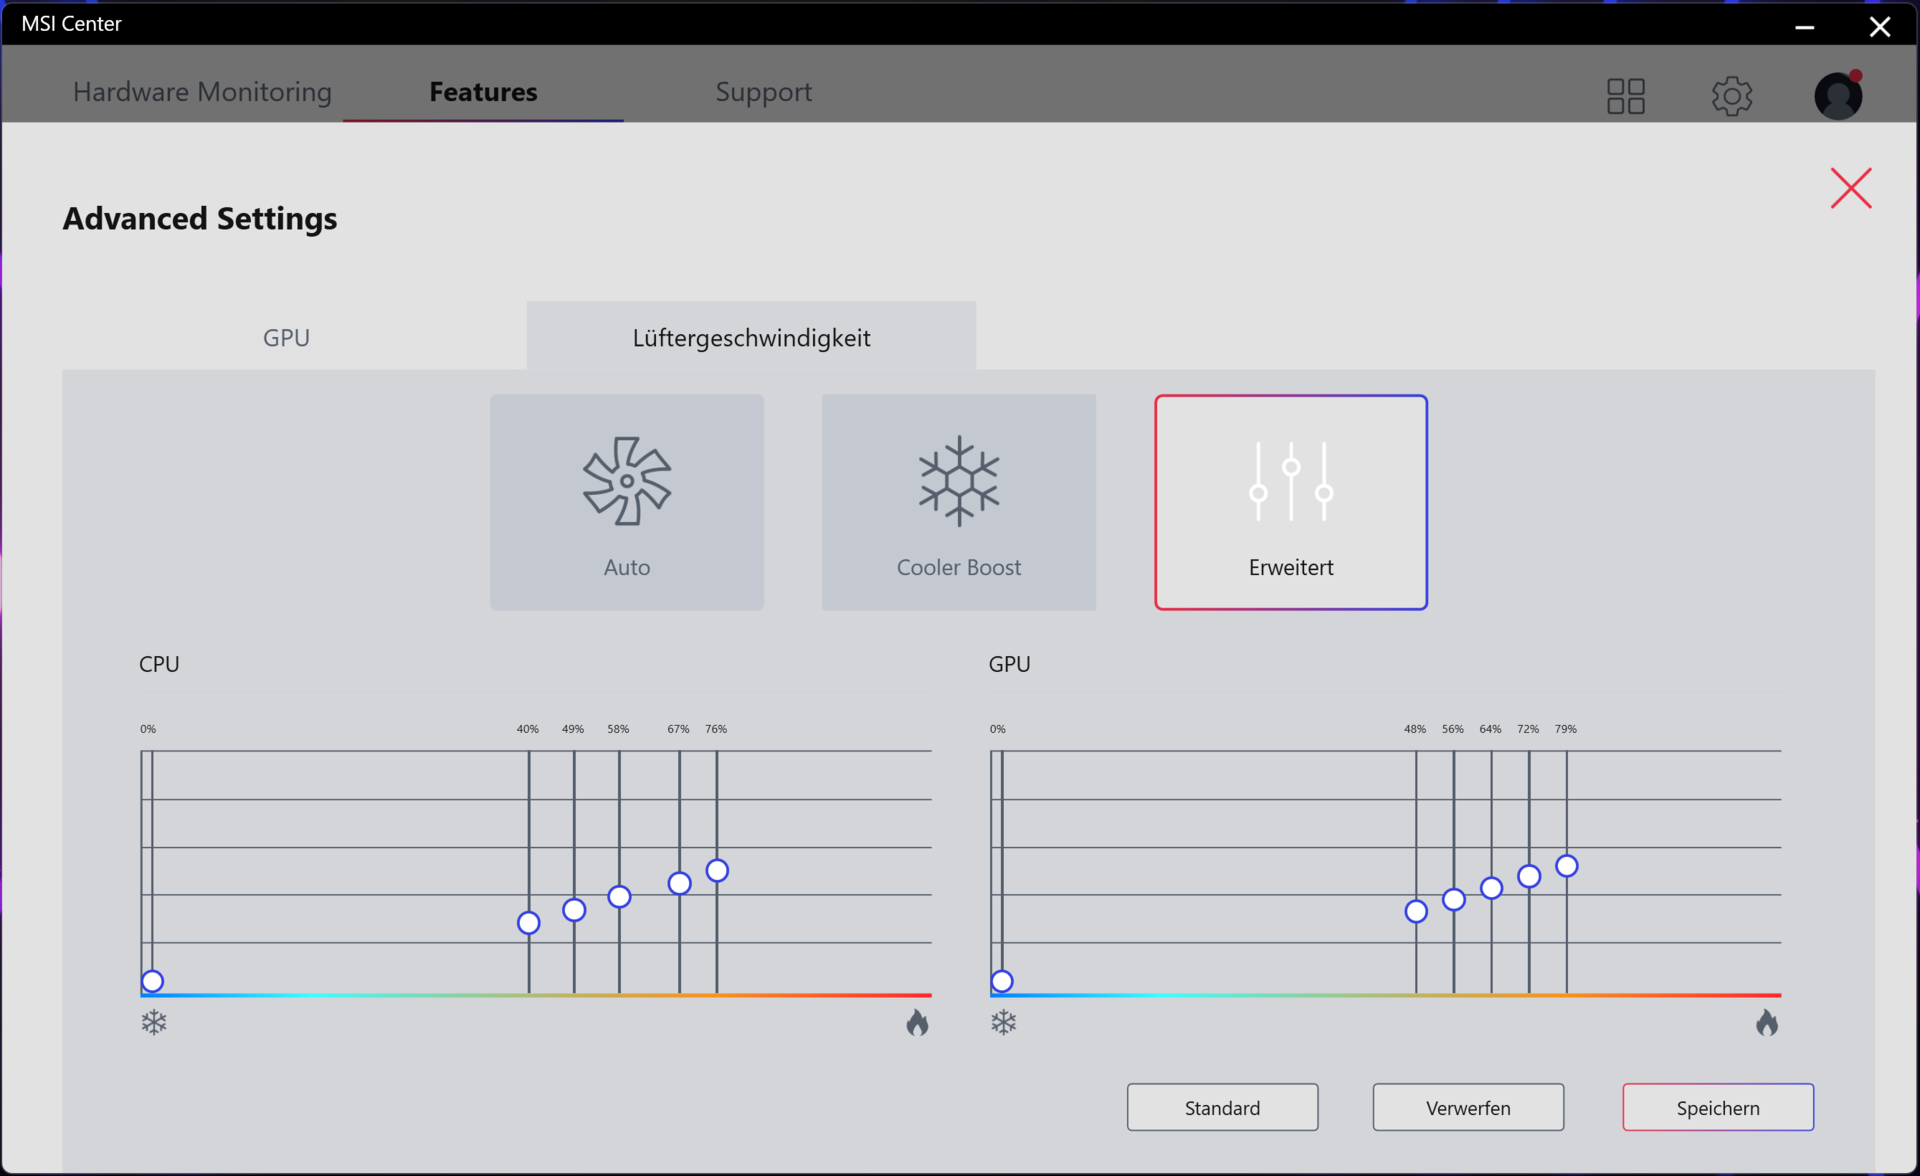
Gli utenti possono passare manualmente da un profilo energetico all'altro tramite il software MSI Center preinstallato. Se si attiva, come abbiamo fatto noi, la funzione universale "Smart Auto" basata sull'intelligenza artificiale, l'MSI Center sceglie automaticamente il profilo in base allo scenario attuale. Questa funzione consente inoltre agli utenti di creare un elenco di applicazioni che all'avvio attivano il profilo "Prestazioni estreme".
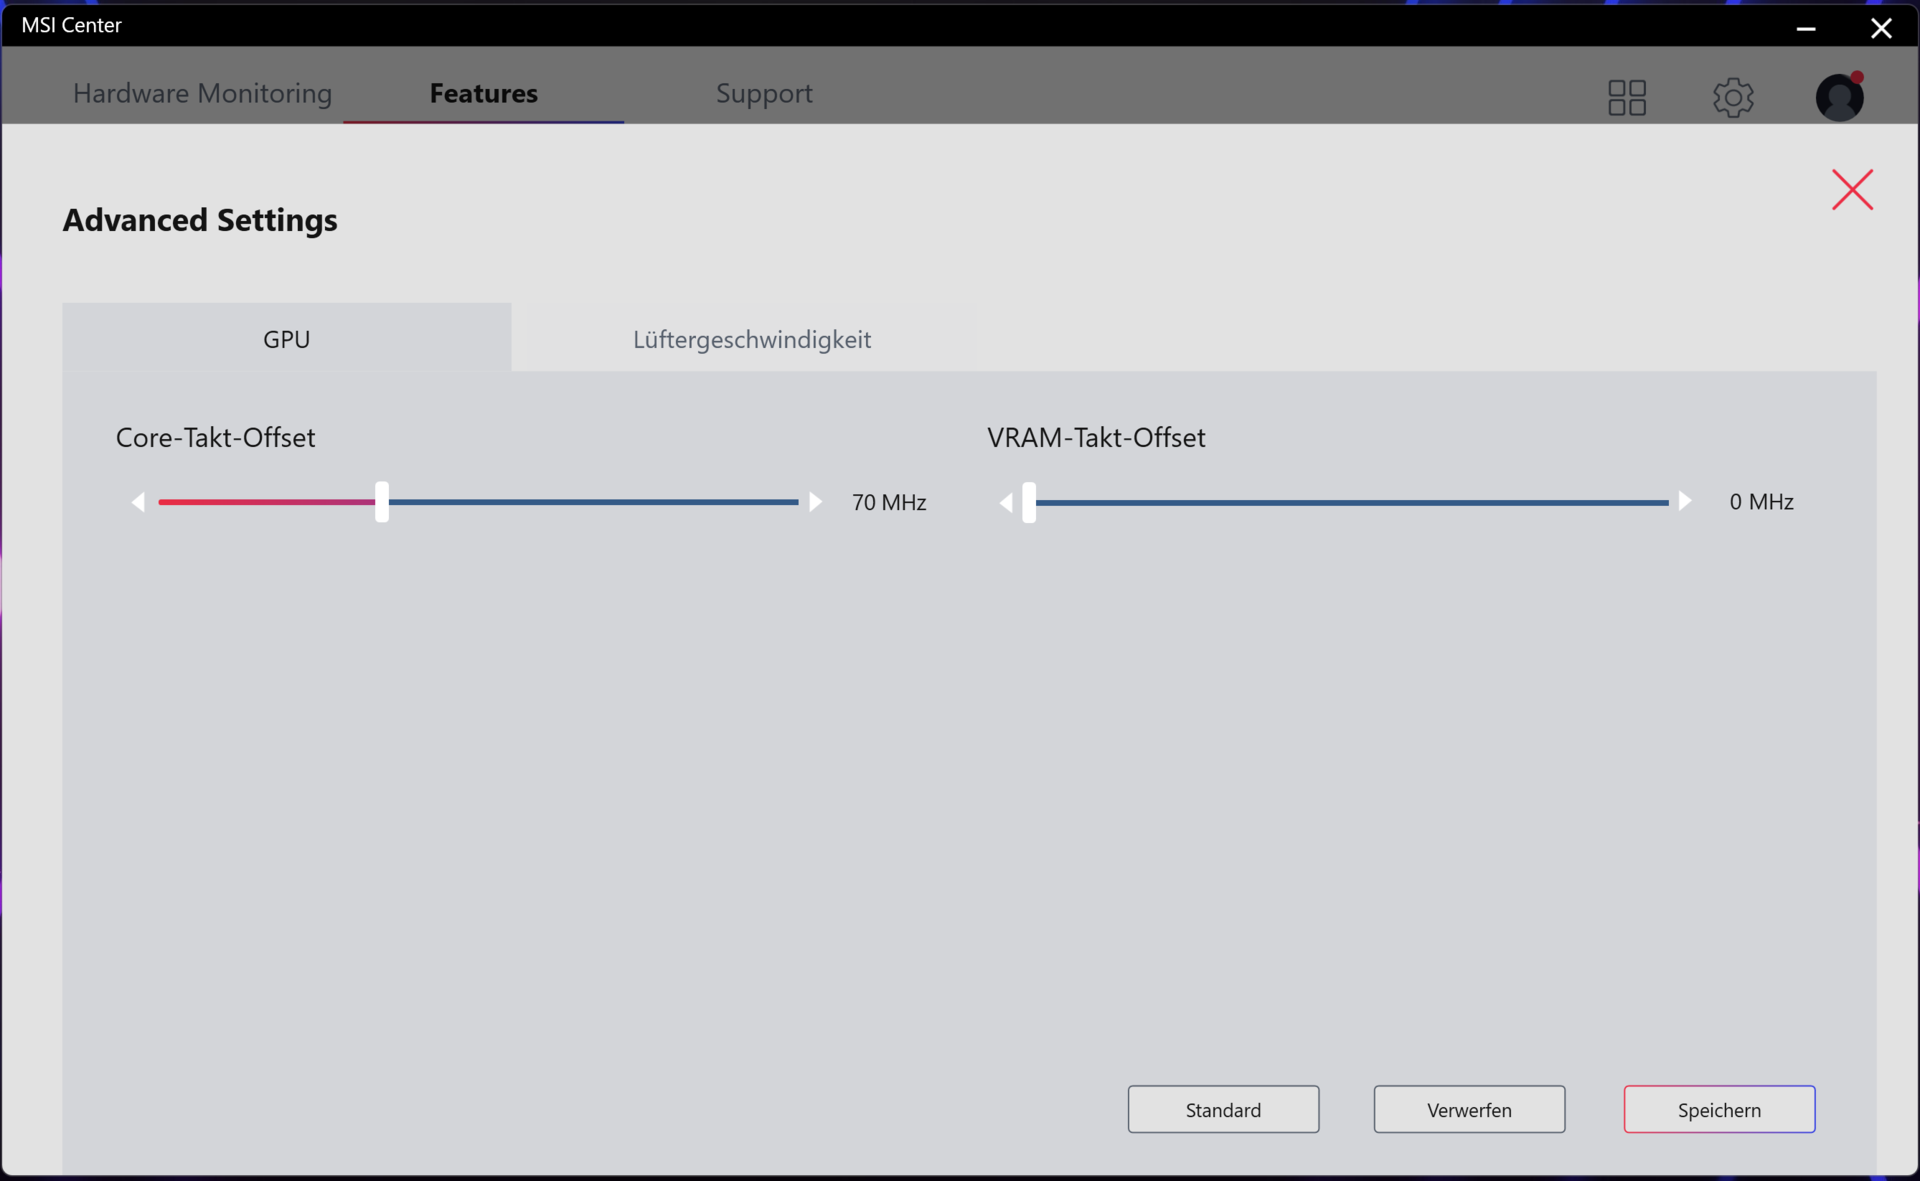
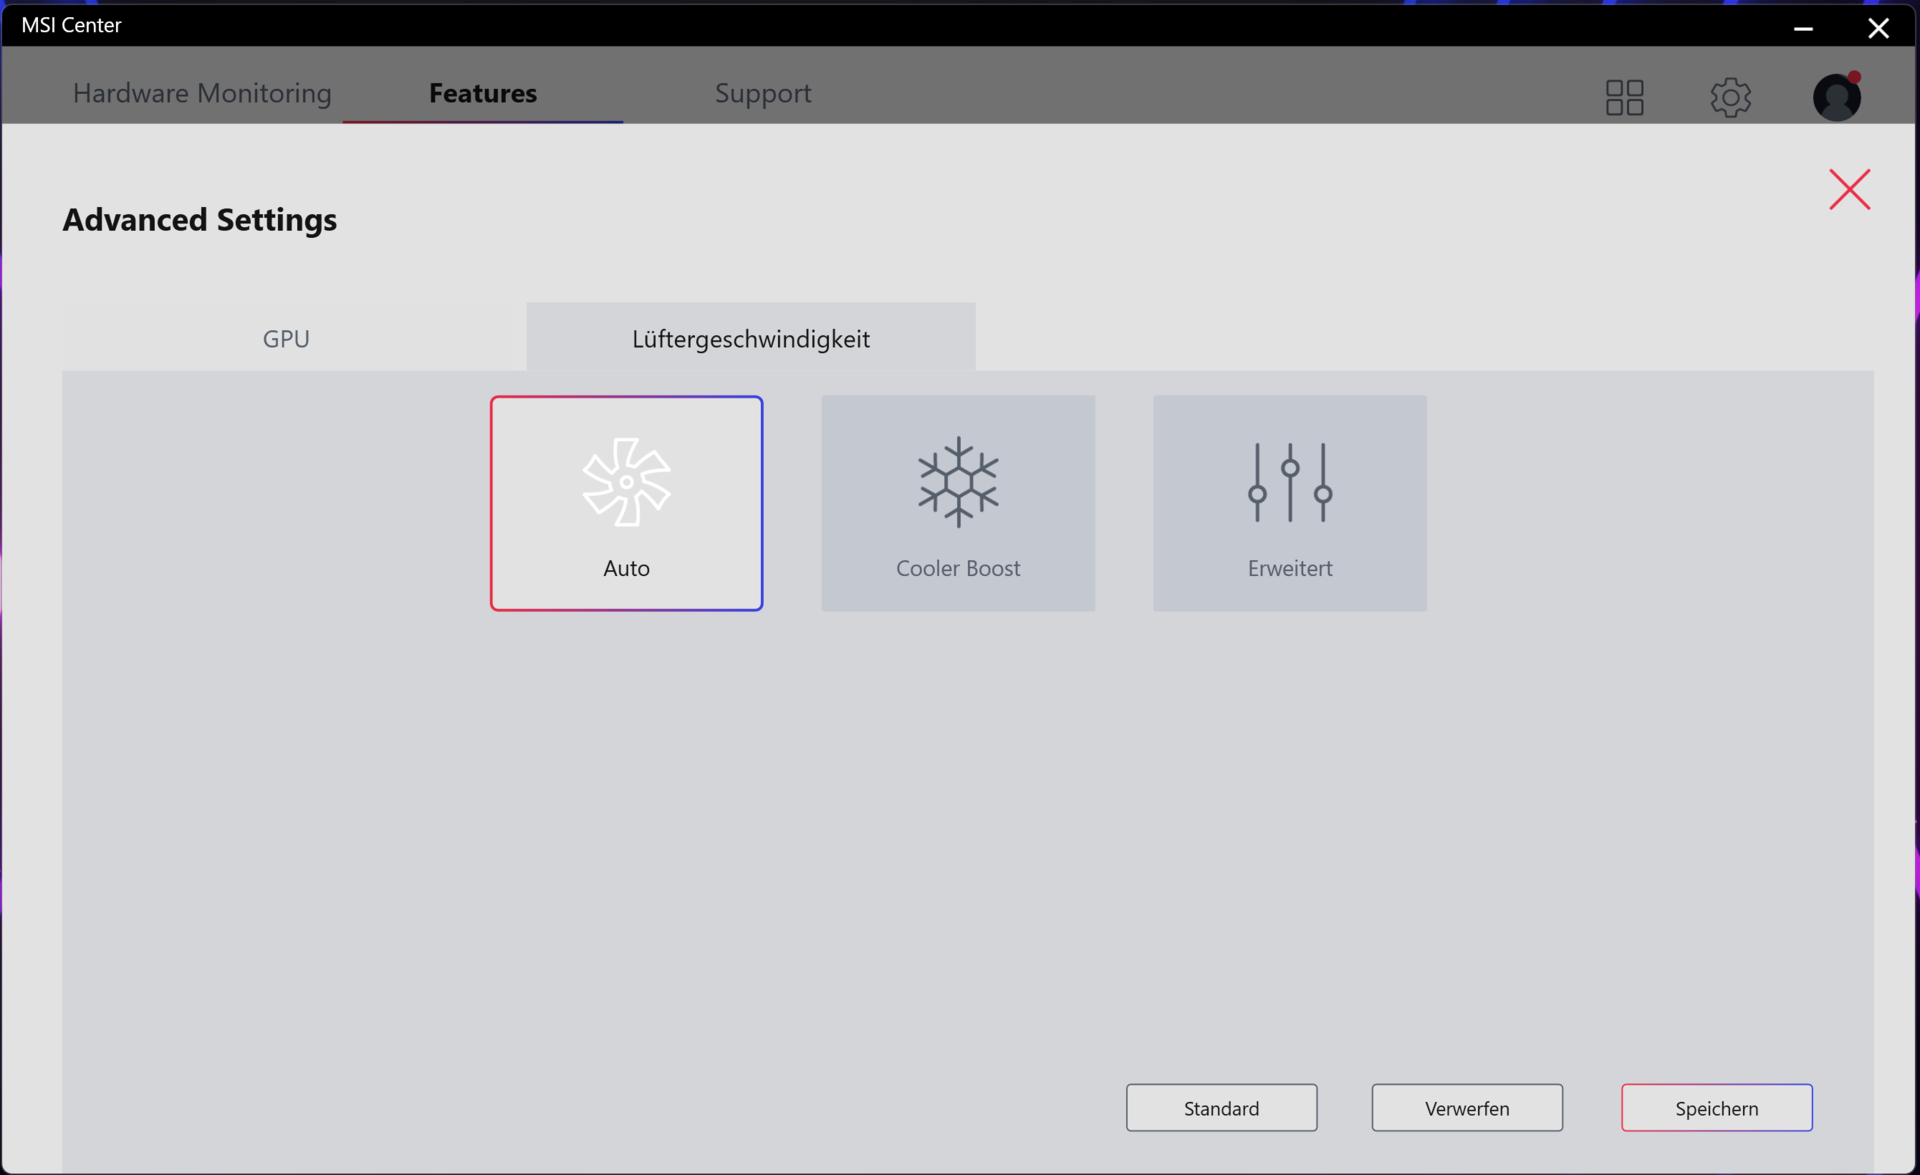
Il profilo "Prestazioni estreme" offre diverse opzioni di ottimizzazione. È possibile, ad esempio, overcloccare la GPU e la VRAM. Inoltre, gli utenti hanno accesso ai controlli della ventola. Qui le opzioni sono "Auto", "Cooler Boost" (le ventole funzionano alla massima velocità) e "Advanced" (curve delle ventole regolabili).
Bug, ottimizzazione dei benchmark o funzione utile? L'esecuzione della nostra suite di benchmark produce risultati piuttosto curiosi quando si utilizza la "modalità silenziosa": Lanciando alcuni benchmark, MSI Center passa automaticamente al profilo "Prestazioni estreme". È il caso dei benchmark Cinebench e AIDA64.
| Prestazioni estreme | Bilanciato | Modalità silenziosa | Super batteria | |
|---|---|---|---|---|
| Limite di potenza 1 | 115 watt | 110 watt | 30 watt | 15 watt |
| Limite di potenza 2 | 180 watt | 150 watt | 30 watt | 15 watt |
Processore
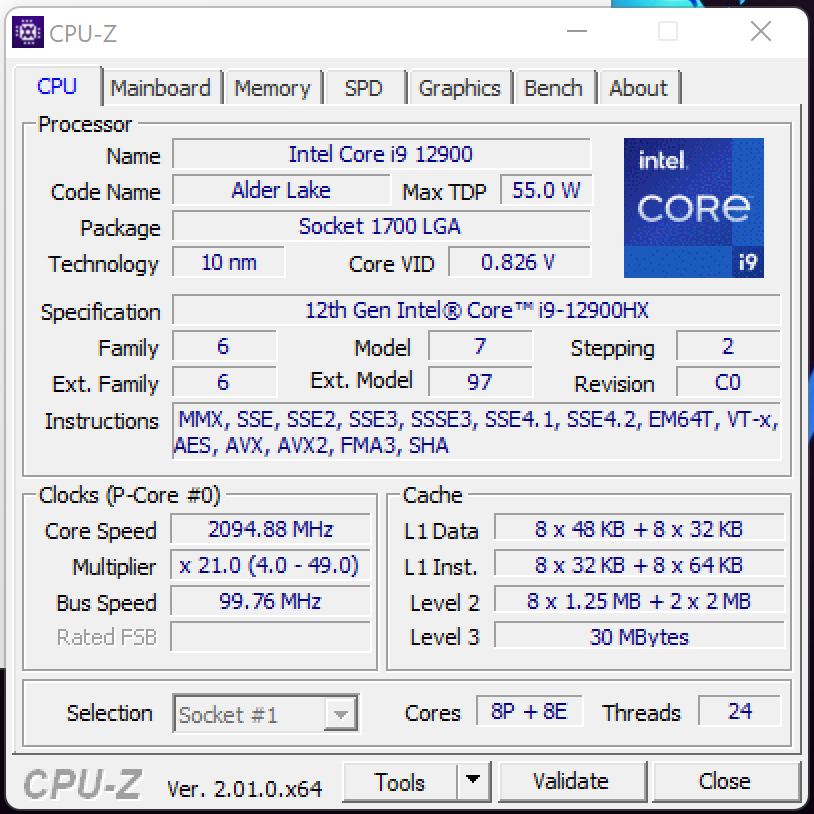
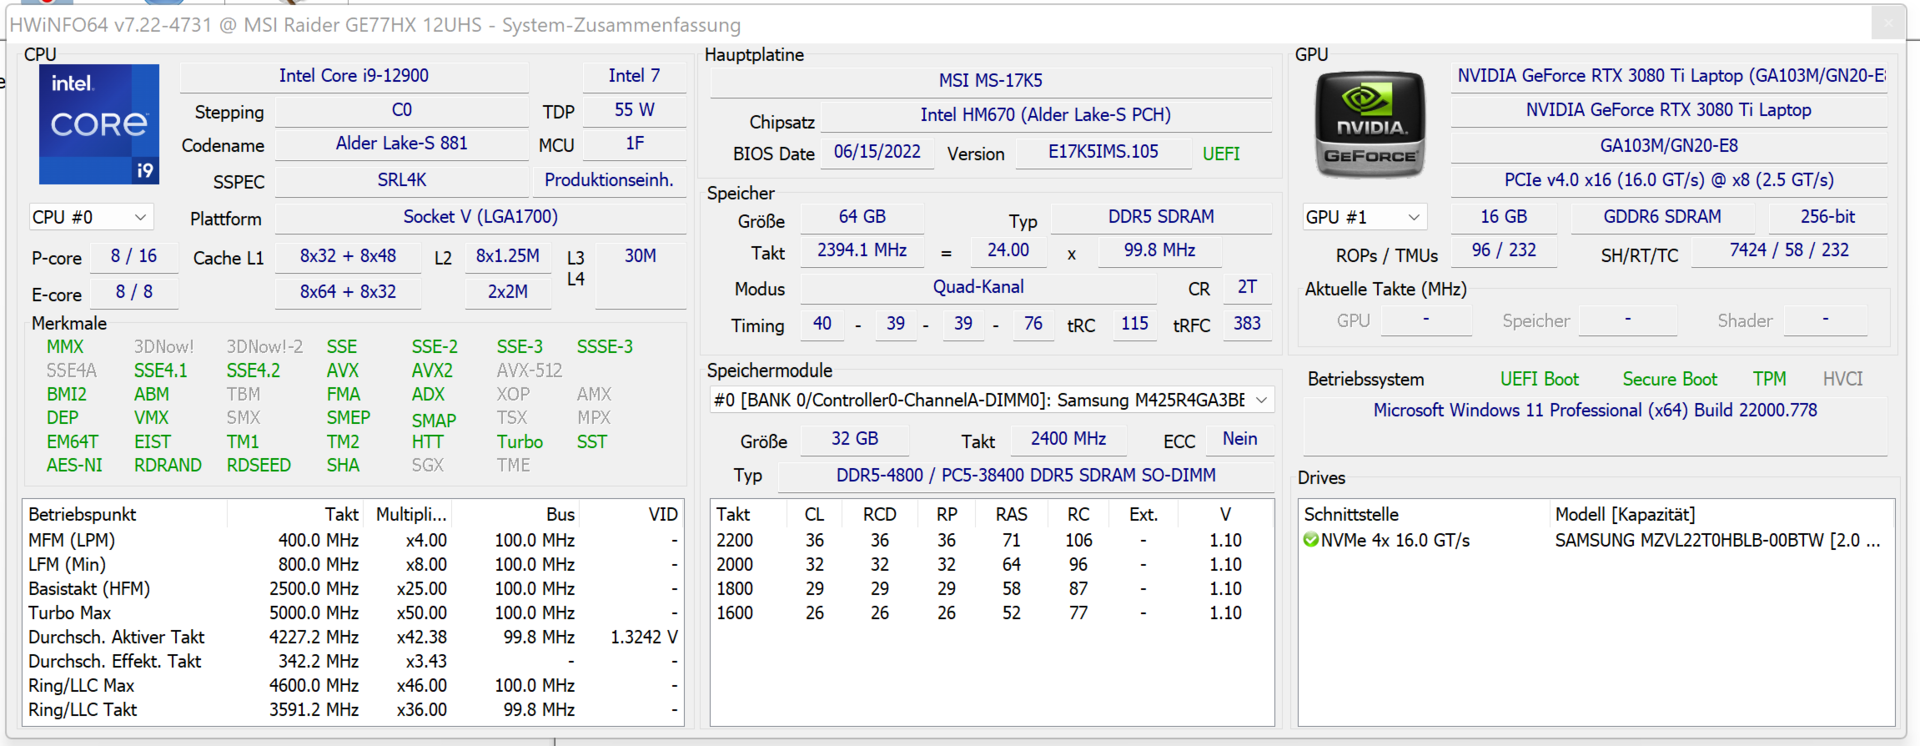
Il Core i7-12900HX (Alder Lake) è composto da otto core per le prestazioni (Hyper-threading, da 2,3 a 5 GHz) e otto core per l'efficienza (senza Hyper-threading, da 1,7 a 3,6 GHz). In totale, ci sono 24 core logici della CPU.
Le velocità di clock rimangono elevate per tutto il benchmark Cinebench R15 Multi (core P: da 4,4 a 4,5 GHz, core E: da 3,3 a 3,4 GHz) e per il test single-thread (core P: da 500 MHz a 5 GHz, core E: da 400 MHz a 3,6 GHz). In modalità batteria, le velocità di clock single-thread sono simili (core P: 400 MHz a 4,8 GHz, core E: 400 MHz a 3,6 GHz), mentre le velocità di clock multi-thread (core P: 1,7 a 2,6 GHz, core E: 1,4 a 2 GHz) non lo sono.
Per determinare se il turbo della CPU è permanentemente attivo durante l'alimentazione di rete, abbiamo eseguito il benchmark Cinebench R15 Multi in un ciclo. Qui osserviamo velocità di clock costantemente elevate. Il profilo "Prestazioni estreme" produce un livello di prestazioni più uniforme.
Cinebench R15 Multi Loop
| CPU Performance rating - Percent | |
| Media della classe Gaming | |
| MSI Raider GE77 HX 12UHS | |
| MSI Raider GE77 HX 12UHS | |
| Media Intel Core i9-12900HX | |
| Alienware x17 R2 P48E | |
| Medion Erazer Beast X30 | |
| Razer Blade 17 Early 2022 | |
| Cinebench R23 | |
| Multi Core | |
| Media della classe Gaming (10488 - 40970, n=112, ultimi 2 anni) | |
| MSI Raider GE77 HX 12UHS (Extreme Leistung) | |
| MSI Raider GE77 HX 12UHS | |
| Media Intel Core i9-12900HX (18337 - 23482, n=8) | |
| Medion Erazer Beast X30 | |
| Alienware x17 R2 P48E | |
| Razer Blade 17 Early 2022 | |
| Single Core | |
| Media della classe Gaming (1166 - 2356, n=112, ultimi 2 anni) | |
| Media Intel Core i9-12900HX (1897 - 1936, n=8) | |
| Razer Blade 17 Early 2022 | |
| MSI Raider GE77 HX 12UHS | |
| Alienware x17 R2 P48E | |
| MSI Raider GE77 HX 12UHS (Extreme Leistung) | |
| Medion Erazer Beast X30 | |
| Cinebench R20 | |
| CPU (Multi Core) | |
| Media della classe Gaming (4029 - 16108, n=111, ultimi 2 anni) | |
| MSI Raider GE77 HX 12UHS (Extreme Leistung) | |
| MSI Raider GE77 HX 12UHS | |
| Media Intel Core i9-12900HX (7037 - 9042, n=8) | |
| Medion Erazer Beast X30 | |
| Alienware x17 R2 P48E | |
| Razer Blade 17 Early 2022 | |
| CPU (Single Core) | |
| Media della classe Gaming (442 - 895, n=111, ultimi 2 anni) | |
| MSI Raider GE77 HX 12UHS | |
| Media Intel Core i9-12900HX (728 - 745, n=8) | |
| MSI Raider GE77 HX 12UHS (Extreme Leistung) | |
| Alienware x17 R2 P48E | |
| Razer Blade 17 Early 2022 | |
| Medion Erazer Beast X30 | |
| Cinebench R15 | |
| CPU Multi 64Bit | |
| Media della classe Gaming (1578 - 6271, n=111, ultimi 2 anni) | |
| MSI Raider GE77 HX 12UHS | |
| MSI Raider GE77 HX 12UHS (Extreme Leistung) | |
| Media Intel Core i9-12900HX (2830 - 3652, n=8) | |
| Alienware x17 R2 P48E | |
| Medion Erazer Beast X30 | |
| Razer Blade 17 Early 2022 | |
| CPU Single 64Bit | |
| Media della classe Gaming (188.8 - 343, n=111, ultimi 2 anni) | |
| MSI Raider GE77 HX 12UHS | |
| Media Intel Core i9-12900HX (274 - 282, n=8) | |
| MSI Raider GE77 HX 12UHS (Extreme Leistung) | |
| Alienware x17 R2 P48E | |
| Razer Blade 17 Early 2022 | |
| Medion Erazer Beast X30 | |
| Blender - v2.79 BMW27 CPU | |
| Razer Blade 17 Early 2022 | |
| Medion Erazer Beast X30 | |
| Alienware x17 R2 P48E | |
| Media Intel Core i9-12900HX (144 - 201, n=8) | |
| Media della classe Gaming (80 - 330, n=109, ultimi 2 anni) | |
| MSI Raider GE77 HX 12UHS | |
| MSI Raider GE77 HX 12UHS (Extreme Leistung) | |
| 7-Zip 18.03 | |
| 7z b 4 | |
| Media della classe Gaming (33491 - 148086, n=110, ultimi 2 anni) | |
| MSI Raider GE77 HX 12UHS (Extreme Leistung) | |
| MSI Raider GE77 HX 12UHS | |
| Media Intel Core i9-12900HX (69778 - 88128, n=7) | |
| Medion Erazer Beast X30 | |
| Alienware x17 R2 P48E | |
| Razer Blade 17 Early 2022 | |
| 7z b 4 -mmt1 | |
| Media della classe Gaming (4199 - 7436, n=110, ultimi 2 anni) | |
| MSI Raider GE77 HX 12UHS | |
| Media Intel Core i9-12900HX (6165 - 6358, n=7) | |
| MSI Raider GE77 HX 12UHS (Extreme Leistung) | |
| Razer Blade 17 Early 2022 | |
| Alienware x17 R2 P48E | |
| Medion Erazer Beast X30 | |
| Geekbench 5.5 | |
| Multi-Core | |
| MSI Raider GE77 HX 12UHS (Extreme Leistung) | |
| Media della classe Gaming (6460 - 27010, n=110, ultimi 2 anni) | |
| MSI Raider GE77 HX 12UHS | |
| Media Intel Core i9-12900HX (15116 - 16925, n=8) | |
| Alienware x17 R2 P48E | |
| Medion Erazer Beast X30 | |
| Razer Blade 17 Early 2022 | |
| Single-Core | |
| Media della classe Gaming (986 - 2474, n=110, ultimi 2 anni) | |
| MSI Raider GE77 HX 12UHS | |
| Media Intel Core i9-12900HX (1874 - 1949, n=8) | |
| MSI Raider GE77 HX 12UHS (Extreme Leistung) | |
| Alienware x17 R2 P48E | |
| Razer Blade 17 Early 2022 | |
| Medion Erazer Beast X30 | |
| HWBOT x265 Benchmark v2.2 - 4k Preset | |
| Media della classe Gaming (11.5 - 44.3, n=110, ultimi 2 anni) | |
| MSI Raider GE77 HX 12UHS (Extreme Leistung) | |
| MSI Raider GE77 HX 12UHS | |
| Media Intel Core i9-12900HX (19.6 - 26.6, n=7) | |
| Alienware x17 R2 P48E | |
| Medion Erazer Beast X30 | |
| Razer Blade 17 Early 2022 | |
| LibreOffice - 20 Documents To PDF | |
| Medion Erazer Beast X30 | |
| Media della classe Gaming (19 - 88.8, n=110, ultimi 2 anni) | |
| MSI Raider GE77 HX 12UHS | |
| Alienware x17 R2 P48E | |
| Razer Blade 17 Early 2022 | |
| Media Intel Core i9-12900HX (33.6 - 42.4, n=7) | |
| MSI Raider GE77 HX 12UHS (Extreme Leistung) | |
| R Benchmark 2.5 - Overall mean | |
| Medion Erazer Beast X30 | |
| Razer Blade 17 Early 2022 | |
| Alienware x17 R2 P48E | |
| Media della classe Gaming (0.3439 - 0.759, n=111, ultimi 2 anni) | |
| MSI Raider GE77 HX 12UHS | |
| MSI Raider GE77 HX 12UHS (Extreme Leistung) | |
| Media Intel Core i9-12900HX (0.4159 - 0.4242, n=7) | |
* ... Meglio usare valori piccoli
AIDA64: FP32 Ray-Trace | FPU Julia | CPU SHA3 | CPU Queen | FPU SinJulia | FPU Mandel | CPU AES | CPU ZLib | FP64 Ray-Trace | CPU PhotoWorxx
| Performance rating | |
| Media della classe Gaming | |
| MSI Raider GE77 HX 12UHS | |
| MSI Raider GE77 HX 12UHS | |
| Media Intel Core i9-12900HX | |
| Alienware x17 R2 P48E | |
| Medion Erazer Beast X30 | |
| Razer Blade 17 Early 2022 | |
| AIDA64 / FP32 Ray-Trace | |
| Media della classe Gaming (10227 - 85542, n=109, ultimi 2 anni) | |
| MSI Raider GE77 HX 12UHS (v6.70.6000, Extreme Leistung) | |
| MSI Raider GE77 HX 12UHS (v6.70.6000) | |
| Media Intel Core i9-12900HX (11535 - 22183, n=7) | |
| Alienware x17 R2 P48E (v6.50.5800) | |
| Medion Erazer Beast X30 (v6.50.5800) | |
| Razer Blade 17 Early 2022 (v6.50.5800) | |
| AIDA64 / FPU Julia | |
| Media della classe Gaming (51376 - 238426, n=109, ultimi 2 anni) | |
| MSI Raider GE77 HX 12UHS (v6.70.6000) | |
| MSI Raider GE77 HX 12UHS (v6.70.6000, Extreme Leistung) | |
| Media Intel Core i9-12900HX (52916 - 110093, n=7) | |
| Alienware x17 R2 P48E (v6.50.5800) | |
| Medion Erazer Beast X30 (v6.50.5800) | |
| Razer Blade 17 Early 2022 (v6.50.5800) | |
| AIDA64 / CPU SHA3 | |
| Media della classe Gaming (2180 - 9817, n=109, ultimi 2 anni) | |
| MSI Raider GE77 HX 12UHS (v6.70.6000) | |
| MSI Raider GE77 HX 12UHS (v6.70.6000, Extreme Leistung) | |
| Media Intel Core i9-12900HX (3559 - 5123, n=7) | |
| Alienware x17 R2 P48E (v6.50.5800) | |
| Medion Erazer Beast X30 (v6.50.5800) | |
| Razer Blade 17 Early 2022 (v6.50.5800) | |
| AIDA64 / CPU Queen | |
| Media della classe Gaming (49785 - 173351, n=100, ultimi 2 anni) | |
| Alienware x17 R2 P48E (v6.50.5800) | |
| Medion Erazer Beast X30 (v6.50.5800) | |
| Media Intel Core i9-12900HX (101029 - 104457, n=7) | |
| MSI Raider GE77 HX 12UHS (v6.70.6000) | |
| MSI Raider GE77 HX 12UHS (v6.70.6000, Extreme Leistung) | |
| Razer Blade 17 Early 2022 (v6.50.5800) | |
| AIDA64 / FPU SinJulia | |
| Media della classe Gaming (4424 - 33636, n=109, ultimi 2 anni) | |
| MSI Raider GE77 HX 12UHS (v6.70.6000, Extreme Leistung) | |
| MSI Raider GE77 HX 12UHS (v6.70.6000) | |
| Media Intel Core i9-12900HX (10475 - 13062, n=7) | |
| Alienware x17 R2 P48E (v6.50.5800) | |
| Medion Erazer Beast X30 (v6.50.5800) | |
| Razer Blade 17 Early 2022 (v6.50.5800) | |
| AIDA64 / FPU Mandel | |
| Media della classe Gaming (25115 - 128721, n=109, ultimi 2 anni) | |
| MSI Raider GE77 HX 12UHS (v6.70.6000, Extreme Leistung) | |
| MSI Raider GE77 HX 12UHS (v6.70.6000) | |
| Media Intel Core i9-12900HX (31779 - 53628, n=7) | |
| Alienware x17 R2 P48E (v6.50.5800) | |
| Medion Erazer Beast X30 (v6.50.5800) | |
| Razer Blade 17 Early 2022 (v6.50.5800) | |
| AIDA64 / CPU AES | |
| MSI Raider GE77 HX 12UHS (v6.70.6000) | |
| MSI Raider GE77 HX 12UHS (v6.70.6000, Extreme Leistung) | |
| Media Intel Core i9-12900HX (125268 - 183146, n=7) | |
| Alienware x17 R2 P48E (v6.50.5800) | |
| Media della classe Gaming (39258 - 247074, n=109, ultimi 2 anni) | |
| Medion Erazer Beast X30 (v6.50.5800) | |
| Razer Blade 17 Early 2022 (v6.50.5800) | |
| AIDA64 / CPU ZLib | |
| Media della classe Gaming (574 - 2531, n=109, ultimi 2 anni) | |
| MSI Raider GE77 HX 12UHS (v6.70.6000) | |
| MSI Raider GE77 HX 12UHS (v6.70.6000, Extreme Leistung) | |
| Media Intel Core i9-12900HX (990 - 1408, n=7) | |
| Alienware x17 R2 P48E (v6.50.5800) | |
| Medion Erazer Beast X30 (v6.50.5800) | |
| Razer Blade 17 Early 2022 (v6.50.5800) | |
| AIDA64 / FP64 Ray-Trace | |
| Media della classe Gaming (5509 - 45446, n=109, ultimi 2 anni) | |
| MSI Raider GE77 HX 12UHS (v6.70.6000, Extreme Leistung) | |
| MSI Raider GE77 HX 12UHS (v6.70.6000) | |
| Media Intel Core i9-12900HX (6663 - 11913, n=7) | |
| Alienware x17 R2 P48E (v6.50.5800) | |
| Medion Erazer Beast X30 (v6.50.5800) | |
| Razer Blade 17 Early 2022 (v6.50.5800) | |
| AIDA64 / CPU PhotoWorxx | |
| MSI Raider GE77 HX 12UHS (v6.70.6000) | |
| MSI Raider GE77 HX 12UHS (v6.70.6000, Extreme Leistung) | |
| Media della classe Gaming (12271 - 89891, n=109, ultimi 2 anni) | |
| Media Intel Core i9-12900HX (40239 - 47710, n=7) | |
| Medion Erazer Beast X30 (v6.50.5800) | |
| Razer Blade 17 Early 2022 (v6.50.5800) | |
| Alienware x17 R2 P48E (v6.50.5800) | |
Prestazioni del sistema
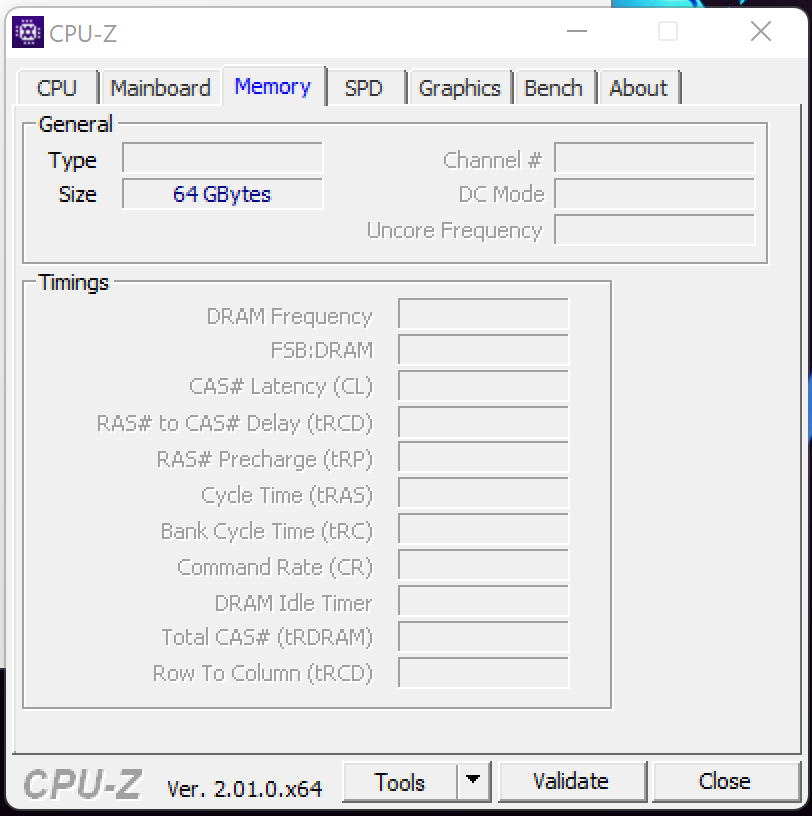
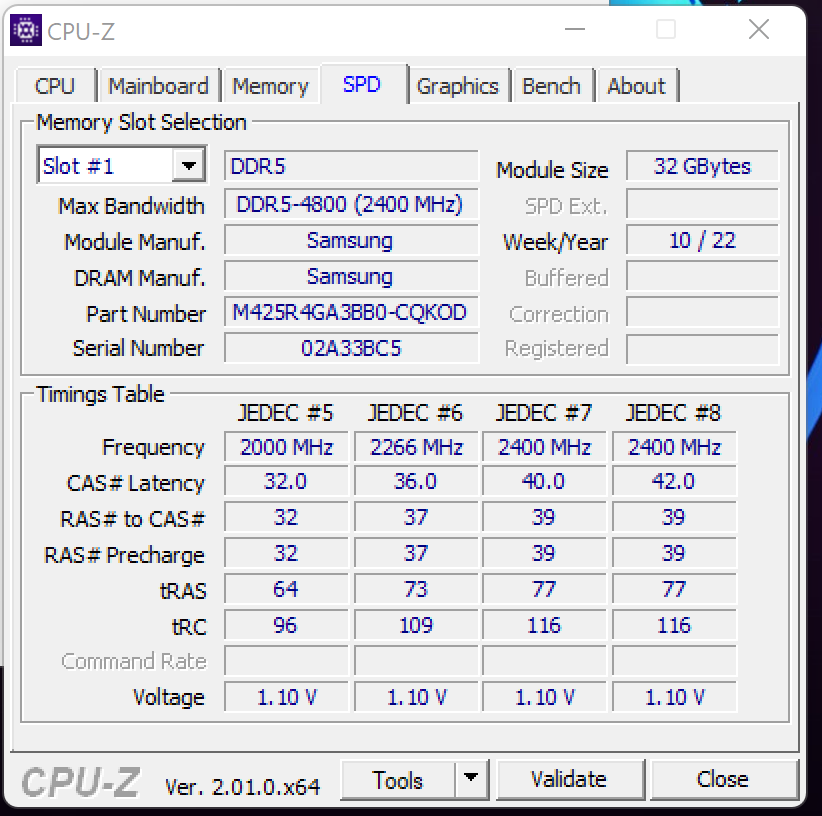
Il GE77 è attualmente uno dei portatili più veloci sul mercato. La combinazione di 24 core logici della CPU e di una GPU RTX 3080 Ti con un TGP massimo rende il sistema adatto a qualsiasi caso d'uso impegnativo, che si tratti di editing video, giochi o rendering. Le velocità di trasferimento della memoria DDR4-4800 sono superiori alla media. Ciò può essere dovuto alla cache della CPU, che in questo particolare modello è più grande rispetto ad altri processori Intel. Inoltre, il sistema ottiene buoni risultati nei benchmark PCMark.
CrossMark: Overall | Productivity | Creativity | Responsiveness
| PCMark 10 / Score | |
| MSI Raider GE77 HX 12UHS (dGPU, Extreme Leistung) | |
| Media della classe Gaming (5828 - 11574, n=95, ultimi 2 anni) | |
| Alienware x17 R2 P48E | |
| Media Intel Core i9-12900HX, NVIDIA GeForce RTX 3080 Ti Laptop GPU (6812 - 8636, n=6) | |
| Medion Erazer Beast X30 | |
| Razer Blade 17 Early 2022 | |
| MSI Raider GE77 HX 12UHS | |
| PCMark 10 / Essentials | |
| Alienware x17 R2 P48E | |
| MSI Raider GE77 HX 12UHS (dGPU, Extreme Leistung) | |
| Media della classe Gaming (8810 - 12600, n=99, ultimi 2 anni) | |
| Media Intel Core i9-12900HX, NVIDIA GeForce RTX 3080 Ti Laptop GPU (9598 - 11192, n=6) | |
| Razer Blade 17 Early 2022 | |
| Medion Erazer Beast X30 | |
| MSI Raider GE77 HX 12UHS | |
| PCMark 10 / Productivity | |
| MSI Raider GE77 HX 12UHS (dGPU, Extreme Leistung) | |
| Media della classe Gaming (6845 - 18766, n=97, ultimi 2 anni) | |
| Media Intel Core i9-12900HX, NVIDIA GeForce RTX 3080 Ti Laptop GPU (9365 - 10932, n=6) | |
| Alienware x17 R2 P48E | |
| MSI Raider GE77 HX 12UHS | |
| Medion Erazer Beast X30 | |
| Razer Blade 17 Early 2022 | |
| PCMark 10 / Digital Content Creation | |
| Media della classe Gaming (7602 - 19657, n=97, ultimi 2 anni) | |
| MSI Raider GE77 HX 12UHS (dGPU, Extreme Leistung) | |
| Alienware x17 R2 P48E | |
| Media Intel Core i9-12900HX, NVIDIA GeForce RTX 3080 Ti Laptop GPU (9543 - 14291, n=6) | |
| Medion Erazer Beast X30 | |
| Razer Blade 17 Early 2022 | |
| MSI Raider GE77 HX 12UHS | |
| CrossMark / Overall | |
| MSI Raider GE77 HX 12UHS | |
| MSI Raider GE77 HX 12UHS (dGPU, Extreme Leistung) | |
| Media Intel Core i9-12900HX, NVIDIA GeForce RTX 3080 Ti Laptop GPU (2108 - 2170, n=5) | |
| Media della classe Gaming (1366 - 2409, n=97, ultimi 2 anni) | |
| Alienware x17 R2 P48E | |
| Razer Blade 17 Early 2022 | |
| Medion Erazer Beast X30 | |
| CrossMark / Productivity | |
| MSI Raider GE77 HX 12UHS | |
| MSI Raider GE77 HX 12UHS (dGPU, Extreme Leistung) | |
| Media Intel Core i9-12900HX, NVIDIA GeForce RTX 3080 Ti Laptop GPU (1978 - 2047, n=5) | |
| Media della classe Gaming (1386 - 2254, n=97, ultimi 2 anni) | |
| Alienware x17 R2 P48E | |
| Razer Blade 17 Early 2022 | |
| Medion Erazer Beast X30 | |
| CrossMark / Creativity | |
| MSI Raider GE77 HX 12UHS | |
| Media Intel Core i9-12900HX, NVIDIA GeForce RTX 3080 Ti Laptop GPU (2288 - 2366, n=5) | |
| MSI Raider GE77 HX 12UHS (dGPU, Extreme Leistung) | |
| Media della classe Gaming (1343 - 2729, n=97, ultimi 2 anni) | |
| Alienware x17 R2 P48E | |
| Medion Erazer Beast X30 | |
| Razer Blade 17 Early 2022 | |
| CrossMark / Responsiveness | |
| MSI Raider GE77 HX 12UHS | |
| Media Intel Core i9-12900HX, NVIDIA GeForce RTX 3080 Ti Laptop GPU (1991 - 2090, n=5) | |
| MSI Raider GE77 HX 12UHS (dGPU, Extreme Leistung) | |
| Media della classe Gaming (1226 - 2334, n=97, ultimi 2 anni) | |
| Alienware x17 R2 P48E | |
| Razer Blade 17 Early 2022 | |
| Medion Erazer Beast X30 | |
| PCMark 8 Home Score Accelerated v2 | 4209 punti | |
| PCMark 8 Creative Score Accelerated v2 | 6879 punti | |
| PCMark 8 Work Score Accelerated v2 | 5259 punti | |
| PCMark 10 Score | 6993 punti | |
Aiuto | ||
| AIDA64 / Memory Copy | |
| Media della classe Gaming (21750 - 129946, n=109, ultimi 2 anni) | |
| MSI Raider GE77 HX 12UHS | |
| MSI Raider GE77 HX 12UHS (v6.70.6000, Extreme Leistung) | |
| Media Intel Core i9-12900HX (62852 - 70863, n=7) | |
| Medion Erazer Beast X30 (v6.50.5800) | |
| Razer Blade 17 Early 2022 (v6.50.5800) | |
| Alienware x17 R2 P48E (v6.50.5800) | |
| AIDA64 / Memory Read | |
| Media della classe Gaming (22956 - 118858, n=109, ultimi 2 anni) | |
| MSI Raider GE77 HX 12UHS | |
| MSI Raider GE77 HX 12UHS (v6.70.6000, Extreme Leistung) | |
| Media Intel Core i9-12900HX (62140 - 72930, n=7) | |
| Medion Erazer Beast X30 (v6.50.5800) | |
| Razer Blade 17 Early 2022 (v6.50.5800) | |
| Alienware x17 R2 P48E (v6.50.5800) | |
| AIDA64 / Memory Write | |
| Media della classe Gaming (22297 - 135096, n=109, ultimi 2 anni) | |
| MSI Raider GE77 HX 12UHS (v6.70.6000, Extreme Leistung) | |
| MSI Raider GE77 HX 12UHS (v6.70.6000) | |
| Medion Erazer Beast X30 (v6.50.5800) | |
| Media Intel Core i9-12900HX (60001 - 68782, n=7) | |
| Razer Blade 17 Early 2022 (v6.50.5800) | |
| Alienware x17 R2 P48E (v6.50.5800) | |
| AIDA64 / Memory Latency | |
| Media della classe Gaming (75.3 - 259, n=109, ultimi 2 anni) | |
| Alienware x17 R2 P48E (v6.50.5800) | |
| Media Intel Core i9-12900HX (83.9 - 93.4, n=7) | |
| MSI Raider GE77 HX 12UHS (v6.70.6000, Extreme Leistung) | |
| MSI Raider GE77 HX 12UHS (v6.70.6000) | |
| Medion Erazer Beast X30 (v6.50.5800) | |
* ... Meglio usare valori piccoli
Latenze DPC
Il test standardizzato Latency Monitor (navigazione web, riproduzione video 4K, Prime95 high load) mostra latenze DPC piuttosto problematiche. Il sistema non sembra essere adatto all'editing di video e audio in tempo reale. I futuri aggiornamenti del software potrebbero migliorare o aggravare la situazione.
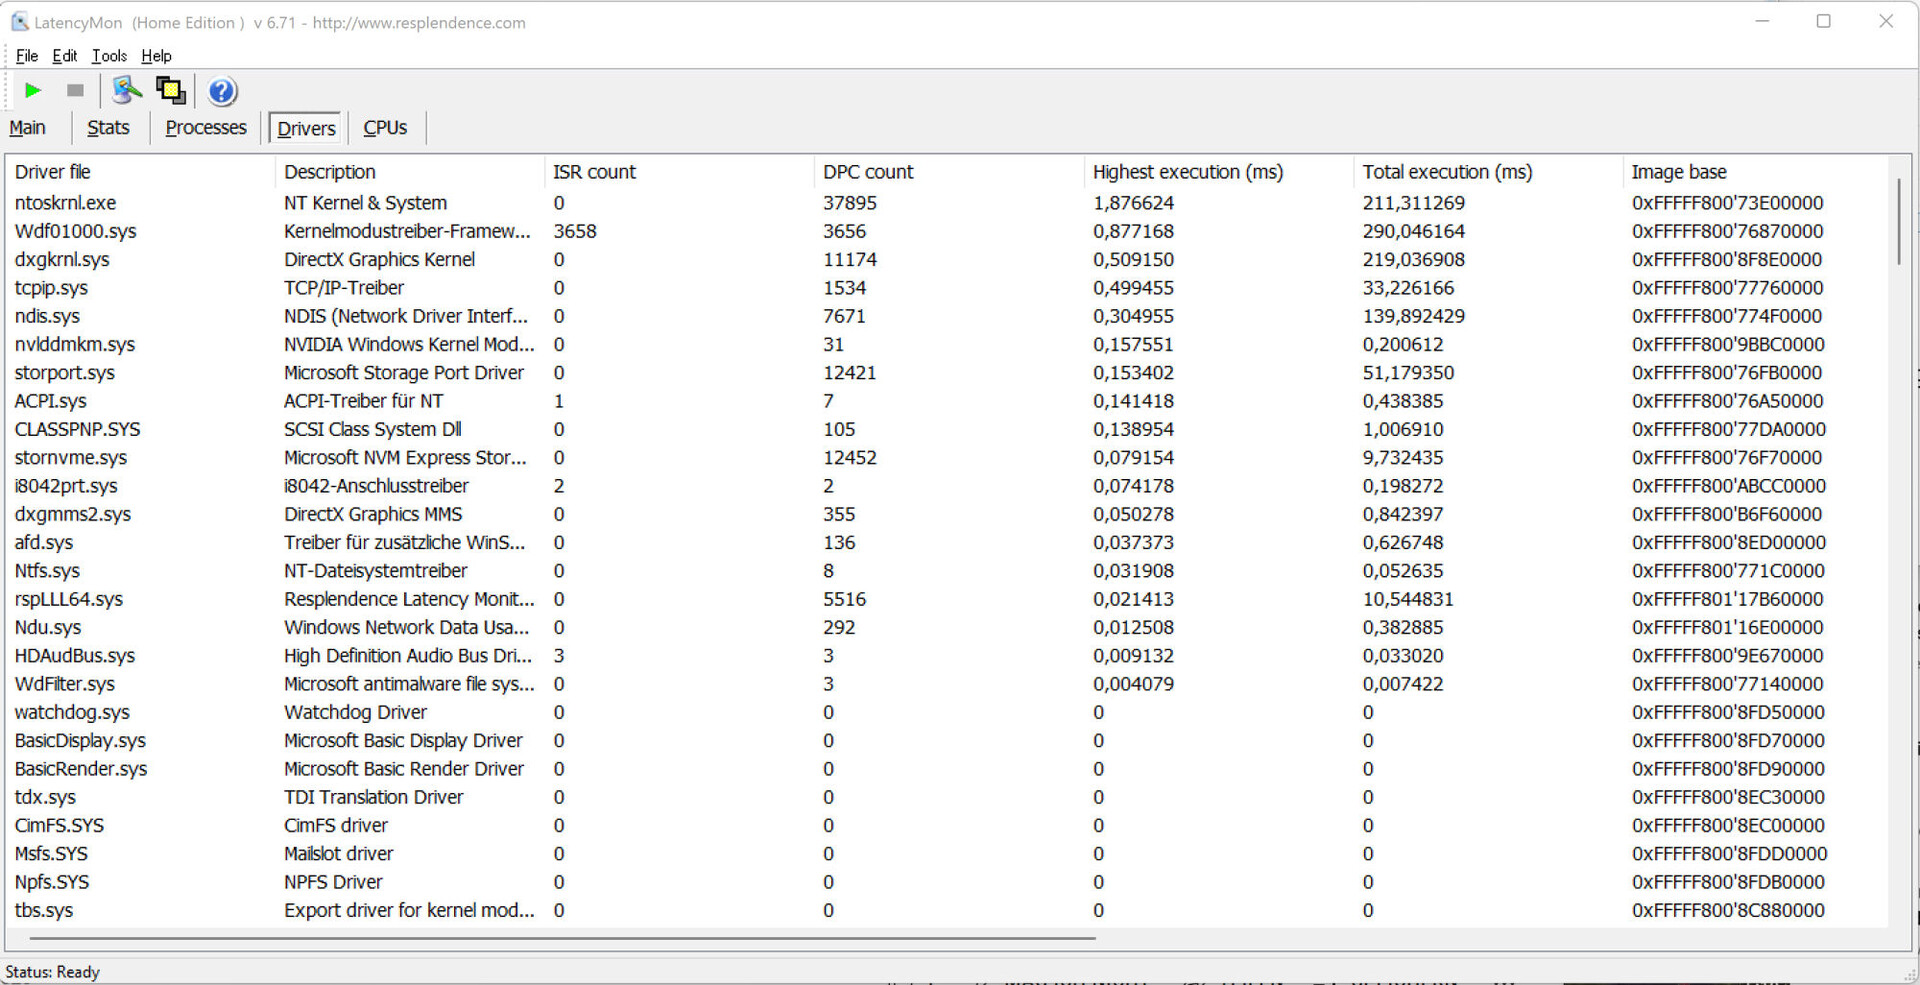
| DPC Latencies / LatencyMon - interrupt to process latency (max), Web, Youtube, Prime95 | |
| MSI Raider GE77 HX 12UHS | |
| Alienware x17 R2 P48E | |
| Medion Erazer Beast X30 | |
| Razer Blade 17 Early 2022 | |
* ... Meglio usare valori piccoli
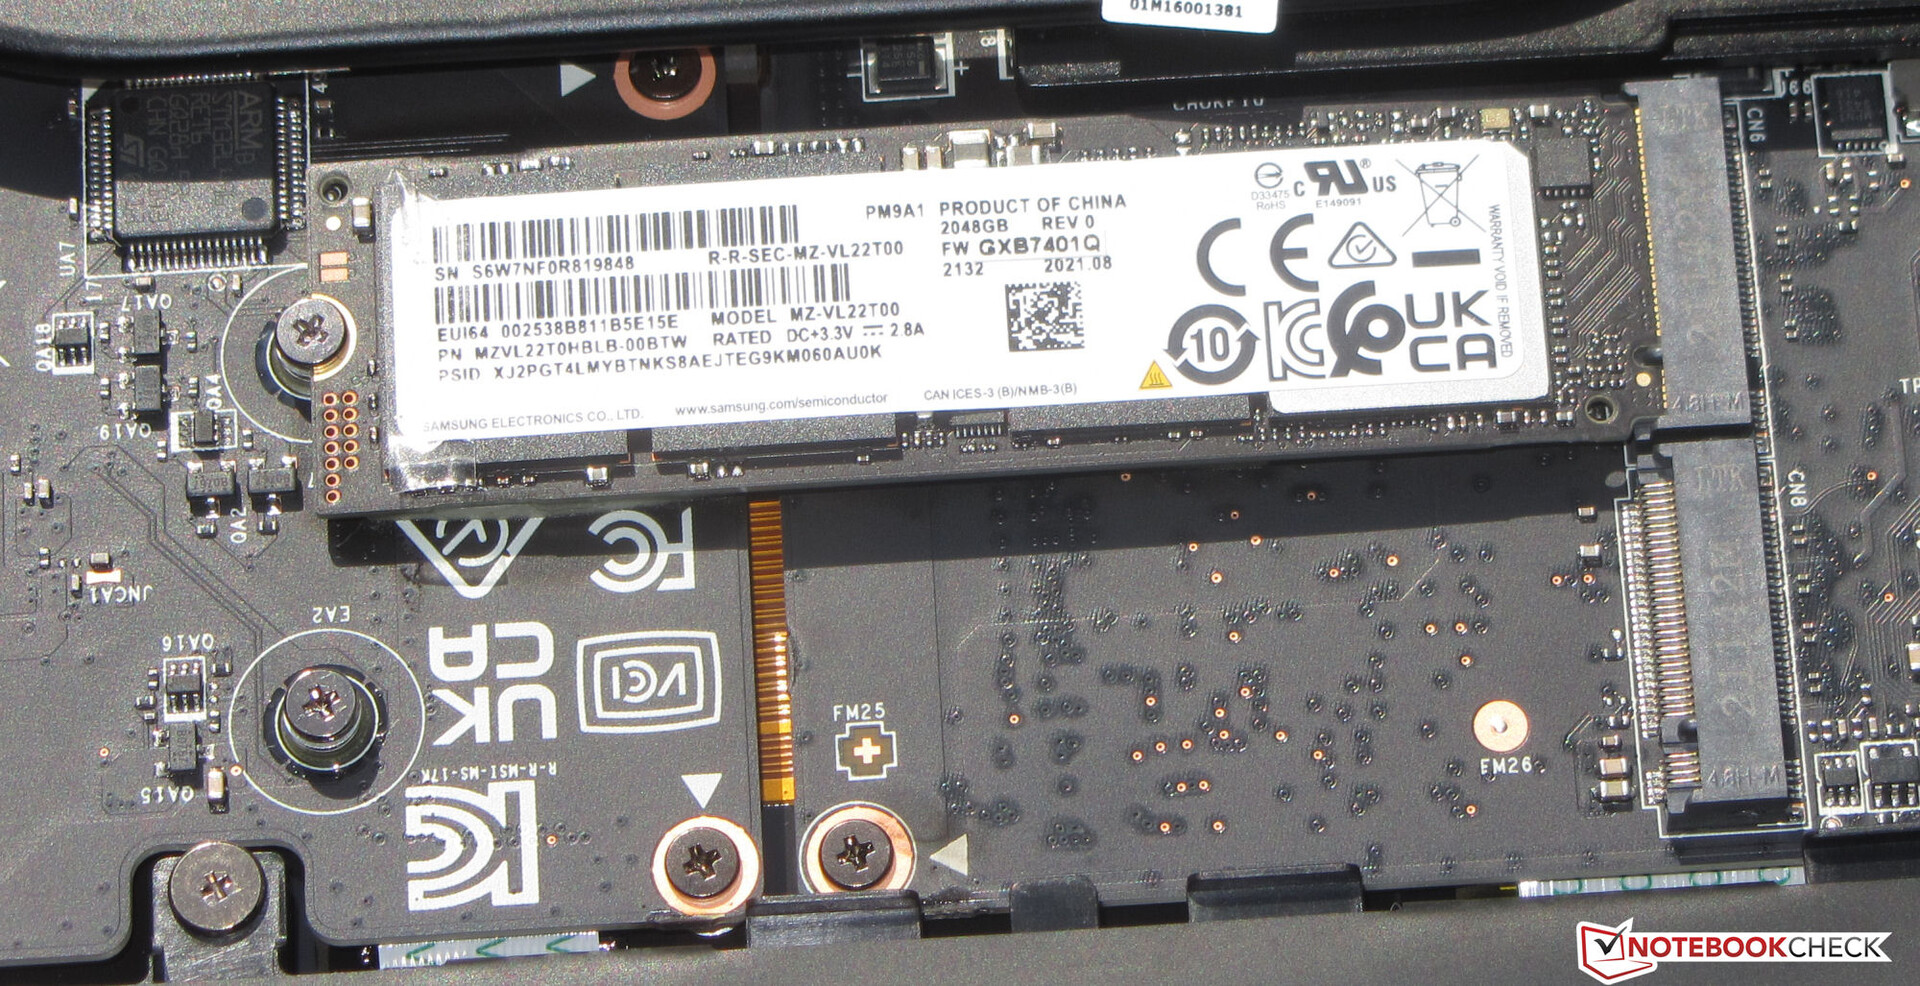
Soluzione di stoccaggio
MSI equipaggia il Raider con un'unità SSD da 2 TB (PCIe4, M.2-2280) di Samsung con eccellenti velocità di trasferimento. C'è spazio per un'unità SSD PCIe4 secondaria.

| Drive Performance rating - Percent | |
| MSI Raider GE77 HX 12UHS | |
| Medion Erazer Beast X30 | |
| Razer Blade 17 Early 2022 | |
| Media Samsung PM9A1 MZVL22T0HBLB | |
| Media della classe Gaming | |
| Alienware x17 R2 P48E | |
* ... Meglio usare valori piccoli
Disk Throttling: DiskSpd Read Loop, Queue Depth 8
Prestazioni della GPU
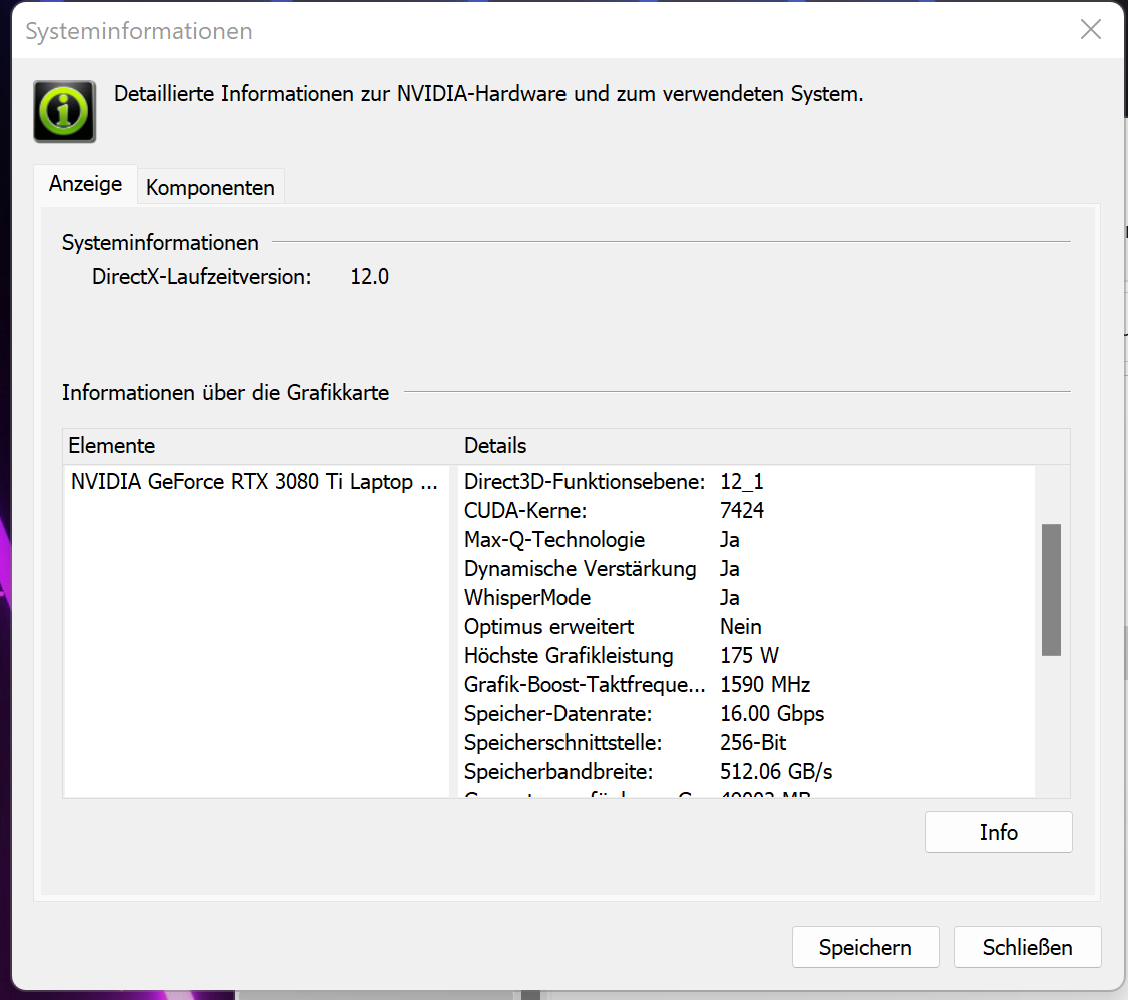
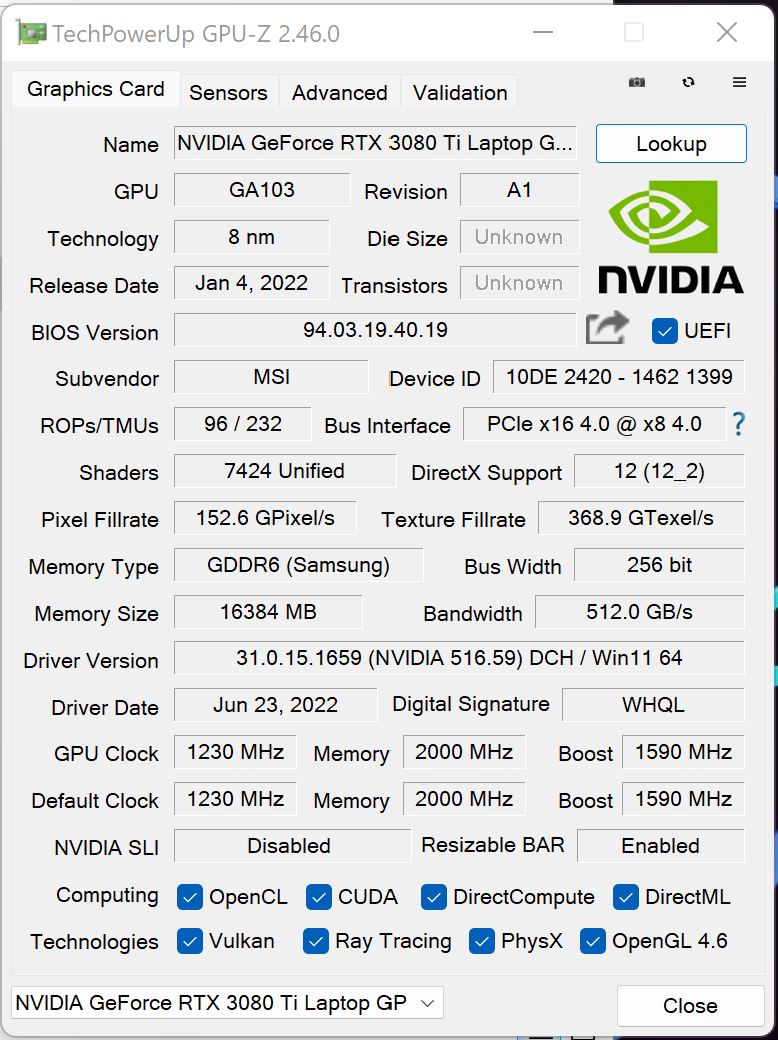
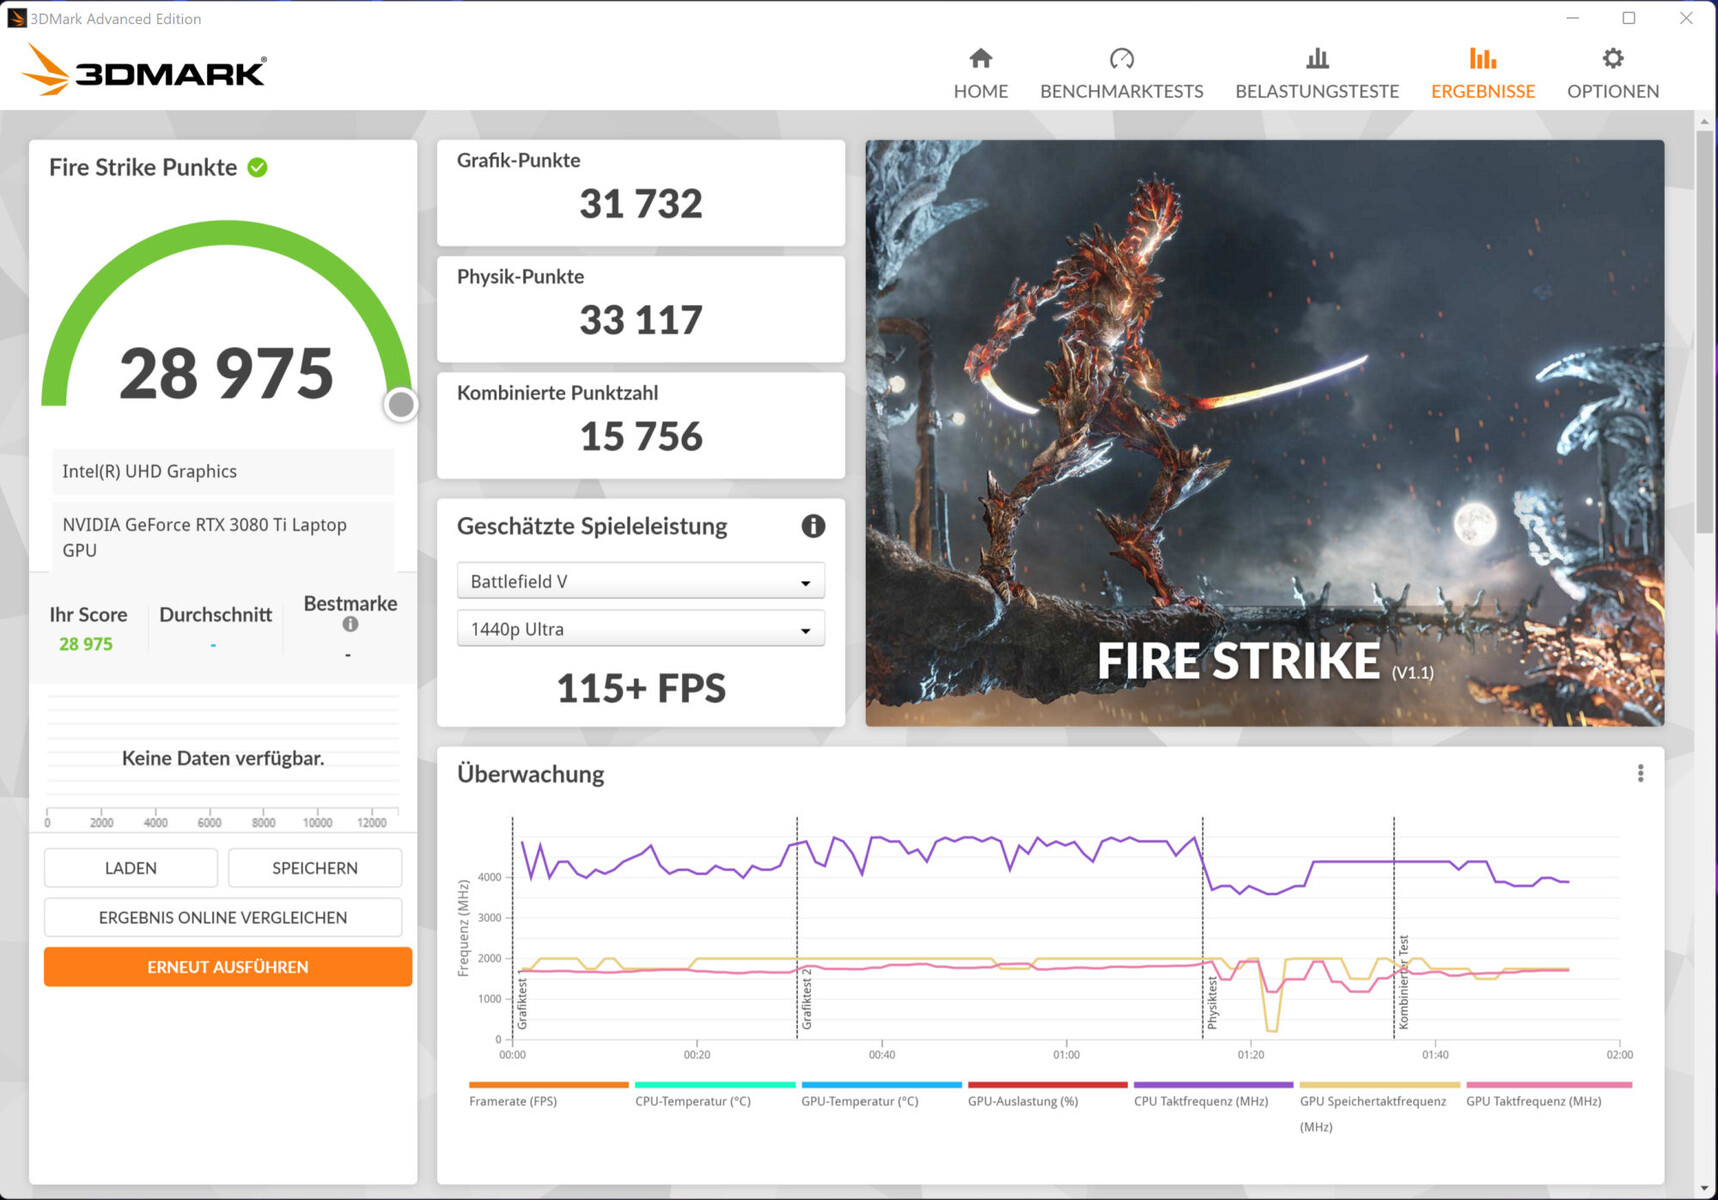
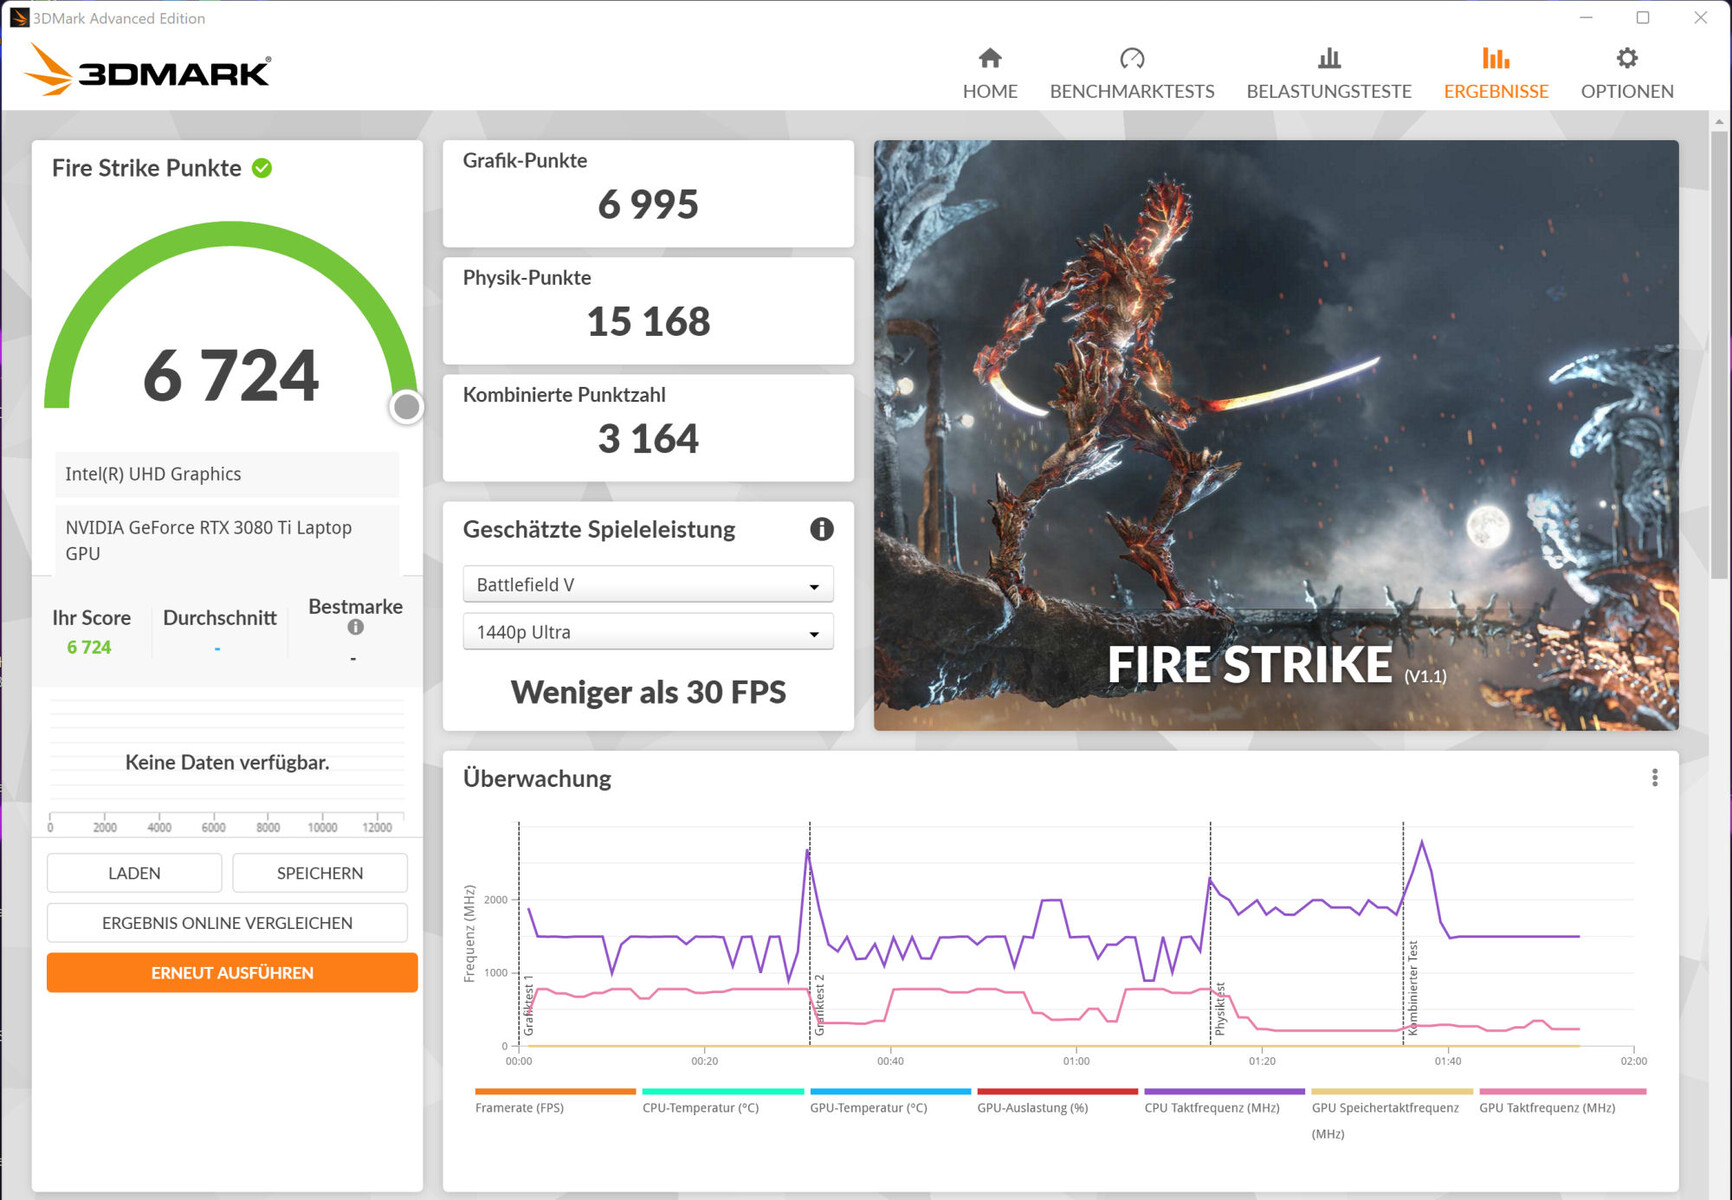
Le prestazioni effettive di una GPU RTX 3000 dipendono da diversi fattori: La soluzione di raffreddamento, la configurazione della memoria e il TGP massimo selezionato dal produttore entro i limiti specificati da Nvidia. Per il portatile con GeForce RTX 3080 Ti per laptop MSI ha impostato un TGP massimo di 175 watt. La GPU ha accesso alla veloce memoria grafica GDDR6 (16384 MB).
I risultati del benchmark superano la media delle nostre precedenti misurazioni della RTX 3080 Ti. Combinando il profilo di potenza "Prestazioni estreme" con l'uscita video diretta tramite la GPU GeForce, abbiamo misurato alcuni dei punteggi più alti che abbiamo visto da questa GPU. Come dimostra il nostro test The Witcher 3, tuttavia, la gamma TGP non viene sfruttata appieno. Advanced Optimus non è supportato. Pertanto, il passaggio da dGPU a Optimus richiede un riavvio.
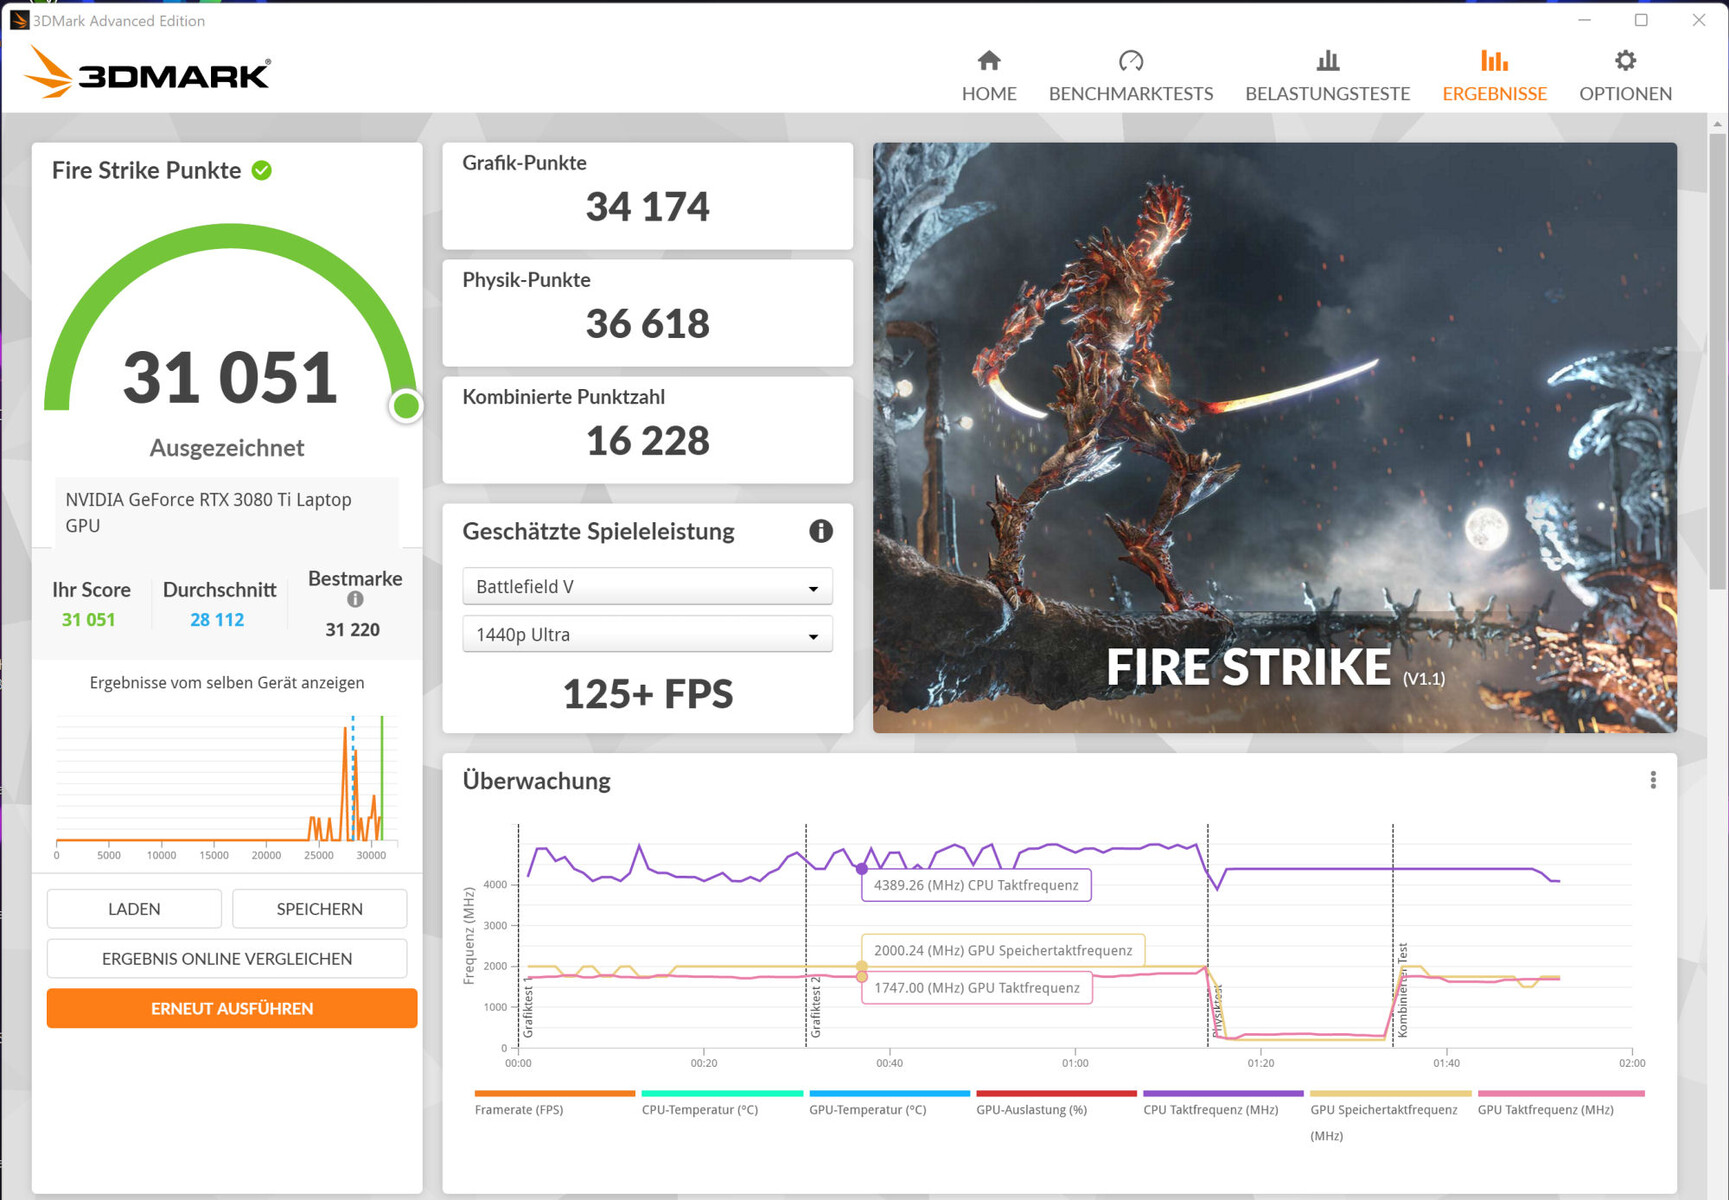
Ma non finisce qui: Il software MSI Center offre impostazioni di overclocking per la GPU e la VRAM. Naturalmente, gli utenti che scelgono di overcloccare lo fanno a proprio rischio e pericolo. Le funzioni di overclock si trovano sotto il profilo energetico "Prestazioni estreme" (selezionare il profilo, quindi fare clic sulla ruota dentata).
| 3DMark Performance rating - Percent | |
| Media della classe Gaming | |
| MSI Raider GE77 HX 12UHS | |
| Alienware x17 R2 P48E | |
| MSI Raider GE77 HX 12UHS | |
| Razer Blade 17 Early 2022 | |
| Medion Erazer Beast X30 | |
| Media NVIDIA GeForce RTX 3080 Ti Laptop GPU | |
| 3DMark 11 - 1280x720 Performance GPU | |
| Media della classe Gaming (21841 - 80022, n=108, ultimi 2 anni) | |
| MSI Raider GE77 HX 12UHS | |
| Alienware x17 R2 P48E | |
| MSI Raider GE77 HX 12UHS (dGPU, Extreme Leistung) | |
| Razer Blade 17 Early 2022 | |
| Medion Erazer Beast X30 | |
| Media NVIDIA GeForce RTX 3080 Ti Laptop GPU (13920 - 45841, n=45) | |
| 3DMark | |
| 1920x1080 Fire Strike Graphics | |
| Media della classe Gaming (12242 - 62849, n=120, ultimi 2 anni) | |
| MSI Raider GE77 HX 12UHS (dGPU, Extreme Leistung) | |
| Alienware x17 R2 P48E | |
| MSI Raider GE77 HX 12UHS | |
| Medion Erazer Beast X30 | |
| Razer Blade 17 Early 2022 | |
| Media NVIDIA GeForce RTX 3080 Ti Laptop GPU (6928 - 34439, n=43) | |
| 2560x1440 Time Spy Graphics | |
| Media della classe Gaming (5012 - 26212, n=119, ultimi 2 anni) | |
| Alienware x17 R2 P48E | |
| MSI Raider GE77 HX 12UHS (dGPU, Extreme Leistung) | |
| MSI Raider GE77 HX 12UHS | |
| Razer Blade 17 Early 2022 | |
| Medion Erazer Beast X30 | |
| Media NVIDIA GeForce RTX 3080 Ti Laptop GPU (4921 - 13835, n=43) | |
| 2560x1440 Port Royal Graphics | |
| Media della classe Gaming (4395 - 17286, n=70, ultimi 2 anni) | |
| MSI Raider GE77 HX 12UHS (dGPU, Extreme Leistung) | |
| Alienware x17 R2 P48E | |
| MSI Raider GE77 HX 12UHS | |
| Razer Blade 17 Early 2022 | |
| Media NVIDIA GeForce RTX 3080 Ti Laptop GPU (6423 - 8462, n=28) | |
| Medion Erazer Beast X30 | |
V-Ray Benchmark Next 4.10: GPU | CPU
Geekbench 5.5: OpenCL Score
SPECviewperf 13: Solidworks (sw-04) | Siemens NX (snx-03) | Showcase (showcase-02) | Medical (medical-02) | Maya (maya-05) | Energy (energy-02) | Creo (creo-02) | Catia (catia-05) | 3ds Max (3dsmax-06)
| V-Ray 5 Benchmark / GPU RTX | |
| Media della classe Gaming (1146 - 4363, n=37, ultimi 2 anni) | |
| MSI Raider GE77 HX 12UHS (5.0.1, Extreme Leistung) | |
| MSI Raider GE77 HX 12UHS (5.0.1) | |
| Razer Blade 17 Early 2022 (5.0.1) | |
| MSI Raider GE77 HX 12UHS (5.0.1, dGPU, Extreme Leistung) | |
| Medion Erazer Beast X30 (5.0.1) | |
| Media NVIDIA GeForce RTX 3080 Ti Laptop GPU (1225 - 1915, n=19) | |
| V-Ray 5 Benchmark / GPU CUDA | |
| Media della classe Gaming (887 - 3288, n=37, ultimi 2 anni) | |
| MSI Raider GE77 HX 12UHS (5.0.1, Extreme Leistung) | |
| Razer Blade 17 Early 2022 (5.0.1) | |
| MSI Raider GE77 HX 12UHS (5.0.1) | |
| MSI Raider GE77 HX 12UHS (5.0.1, dGPU, Extreme Leistung) | |
| Medion Erazer Beast X30 (5.0.1) | |
| Media NVIDIA GeForce RTX 3080 Ti Laptop GPU (846 - 1384, n=20) | |
| V-Ray 5 Benchmark / CPU | |
| Media della classe Gaming (5864 - 30302, n=36, ultimi 2 anni) | |
| MSI Raider GE77 HX 12UHS (5.0.1, dGPU, Extreme Leistung) | |
| MSI Raider GE77 HX 12UHS (5.0.1) | |
| MSI Raider GE77 HX 12UHS (5.0.1, Extreme Leistung) | |
| Alienware x17 R2 P48E (5.0.1) | |
| Media NVIDIA GeForce RTX 3080 Ti Laptop GPU (3692 - 15811, n=25) | |
| Medion Erazer Beast X30 (5.0.1) | |
| Razer Blade 17 Early 2022 (5.0.1) | |
| V-Ray Benchmark Next 4.10 / GPU | |
| Media della classe Gaming (427 - 1333, n=105, ultimi 2 anni) | |
| MSI Raider GE77 HX 12UHS (v4.10.07 ) | |
| Medion Erazer Beast X30 (v4.10.07 ) | |
| MSI Raider GE77 HX 12UHS (v4.10.07, Extreme Leistung) | |
| MSI Raider GE77 HX 12UHS (v4.10.07, dGPU, Extreme Leistung) | |
| Media NVIDIA GeForce RTX 3080 Ti Laptop GPU (311 - 552, n=35) | |
| Razer Blade 17 Early 2022 (v4.10.07 ) | |
| V-Ray Benchmark Next 4.10 / CPU | |
| Media della classe Gaming (10048 - 45327, n=104, ultimi 2 anni) | |
| MSI Raider GE77 HX 12UHS (v4.10.07, Extreme Leistung) | |
| MSI Raider GE77 HX 12UHS (v4.10.07, dGPU, Extreme Leistung) | |
| MSI Raider GE77 HX 12UHS (v4.10.07 ) | |
| Medion Erazer Beast X30 (v4.10.07 ) | |
| Media NVIDIA GeForce RTX 3080 Ti Laptop GPU (5564 - 23947, n=35) | |
| Razer Blade 17 Early 2022 (v4.10.07 ) | |
| Geekbench 5.5 / OpenCL Score | |
| Media della classe Gaming (80702 - 277970, n=107, ultimi 2 anni) | |
| MSI Raider GE77 HX 12UHS | |
| MSI Raider GE77 HX 12UHS (Extreme Leistung) | |
| Alienware x17 R2 P48E | |
| Medion Erazer Beast X30 | |
| Media NVIDIA GeForce RTX 3080 Ti Laptop GPU (88580 - 151633, n=41) | |
| Razer Blade 17 Early 2022 | |
| SPECviewperf 13 / Solidworks (sw-04) | |
| Razer Blade 17 Early 2022 (dGPU, 175W) | |
| MSI Raider GE77 HX 12UHS | |
| Media NVIDIA GeForce RTX 3080 Ti Laptop GPU (62.9 - 133.4, n=8) | |
| Media della classe Gaming (n=1ultimi 2 anni) | |
| SPECviewperf 13 / Siemens NX (snx-03) | |
| MSI Raider GE77 HX 12UHS | |
| Razer Blade 17 Early 2022 (dGPU, 175W) | |
| Media NVIDIA GeForce RTX 3080 Ti Laptop GPU (18.3 - 25.3, n=8) | |
| Media della classe Gaming (n=1ultimi 2 anni) | |
| SPECviewperf 13 / Showcase (showcase-02) | |
| Razer Blade 17 Early 2022 (dGPU, 175W) | |
| MSI Raider GE77 HX 12UHS | |
| Media NVIDIA GeForce RTX 3080 Ti Laptop GPU (110 - 175, n=8) | |
| Media della classe Gaming (n=1ultimi 2 anni) | |
| SPECviewperf 13 / Medical (medical-02) | |
| Razer Blade 17 Early 2022 (dGPU, 175W) | |
| MSI Raider GE77 HX 12UHS | |
| Media NVIDIA GeForce RTX 3080 Ti Laptop GPU (65.3 - 79.1, n=8) | |
| Media della classe Gaming (n=1ultimi 2 anni) | |
| SPECviewperf 13 / Maya (maya-05) | |
| Razer Blade 17 Early 2022 (dGPU, 175W) | |
| Media NVIDIA GeForce RTX 3080 Ti Laptop GPU (212 - 430, n=8) | |
| MSI Raider GE77 HX 12UHS | |
| Media della classe Gaming (n=1ultimi 2 anni) | |
| SPECviewperf 13 / Energy (energy-02) | |
| MSI Raider GE77 HX 12UHS | |
| Razer Blade 17 Early 2022 (dGPU, 175W) | |
| Media NVIDIA GeForce RTX 3080 Ti Laptop GPU (19.3 - 27.3, n=8) | |
| Media della classe Gaming (n=1ultimi 2 anni) | |
| SPECviewperf 13 / Creo (creo-02) | |
| Razer Blade 17 Early 2022 (dGPU, 175W) | |
| MSI Raider GE77 HX 12UHS | |
| Media NVIDIA GeForce RTX 3080 Ti Laptop GPU (177.4 - 311, n=8) | |
| Media della classe Gaming (n=1ultimi 2 anni) | |
| SPECviewperf 13 / Catia (catia-05) | |
| Razer Blade 17 Early 2022 (dGPU, 175W) | |
| MSI Raider GE77 HX 12UHS | |
| Media NVIDIA GeForce RTX 3080 Ti Laptop GPU (130.4 - 190.3, n=8) | |
| Media della classe Gaming (n=1ultimi 2 anni) | |
| SPECviewperf 13 / 3ds Max (3dsmax-06) | |
| Razer Blade 17 Early 2022 (dGPU, 175W) | |
| MSI Raider GE77 HX 12UHS | |
| Media NVIDIA GeForce RTX 3080 Ti Laptop GPU (161 - 260, n=8) | |
| Media della classe Gaming (n=1ultimi 2 anni) | |
| 3DMark 06 Standard Score | 58305 punti | |
| 3DMark 11 Performance | 36734 punti | |
| 3DMark Cloud Gate Standard Score | 61721 punti | |
| 3DMark Fire Strike Score | 28975 punti | |
| 3DMark Time Spy Score | 13320 punti | |
Aiuto | ||
Prestazioni di gioco
L'hardware consente di giocare in 4K con impostazioni elevate o massime. I frame rate sono superiori alla media per una RTX 3080 Ti. Il passaggio all'uscita video diretta tramite la GPU GeForce comporta un aumento dei valori. Spesso la GE77 produce alcuni dei frame rate più alti che abbiamo visto con questa GPU.
| The Witcher 3 - 1920x1080 Ultra Graphics & Postprocessing (HBAO+) | |
| Media della classe Gaming (95 - 240, n=8, ultimi 2 anni) | |
| MSI Raider GE77 HX 12UHS (dGPU, Extreme Leistung) | |
| Alienware x17 R2 P48E | |
| MSI Raider GE77 HX 12UHS | |
| Razer Blade 17 Early 2022 | |
| Medion Erazer Beast X30 | |
| Media NVIDIA GeForce RTX 3080 Ti Laptop GPU (30 - 130.6, n=43) | |
| Dota 2 Reborn | |
| 3840x2160 ultra (3/3) best looking | |
| Media della classe Gaming (105.2 - 199.2, n=33, ultimi 2 anni) | |
| MSI Raider GE77 HX 12UHS (dGPU, Extreme Leistung) | |
| MSI Raider GE77 HX 12UHS (Extreme Leistung) | |
| MSI Raider GE77 HX 12UHS | |
| Media NVIDIA GeForce RTX 3080 Ti Laptop GPU (70.8 - 155.6, n=19) | |
| Razer Blade 17 Early 2022 | |
| 1920x1080 ultra (3/3) best looking | |
| MSI Raider GE77 HX 12UHS (Extreme Leistung) | |
| MSI Raider GE77 HX 12UHS (dGPU, Extreme Leistung) | |
| MSI Raider GE77 HX 12UHS | |
| Alienware x17 R2 P48E | |
| Media della classe Gaming (84.8 - 248, n=112, ultimi 2 anni) | |
| Medion Erazer Beast X30 | |
| Media NVIDIA GeForce RTX 3080 Ti Laptop GPU (29.9 - 170.5, n=45) | |
| Razer Blade 17 Early 2022 | |
| X-Plane 11.11 | |
| 3840x2160 high (fps_test=3) | |
| MSI Raider GE77 HX 12UHS (dGPU, Extreme Leistung) | |
| MSI Raider GE77 HX 12UHS | |
| MSI Raider GE77 HX 12UHS (Extreme Leistung) | |
| Media della classe Gaming (60 - 124.1, n=33, ultimi 2 anni) | |
| Media NVIDIA GeForce RTX 3080 Ti Laptop GPU (32.9 - 109.5, n=20) | |
| Razer Blade 17 Early 2022 | |
| 1920x1080 high (fps_test=3) | |
| MSI Raider GE77 HX 12UHS (dGPU, Extreme Leistung) | |
| MSI Raider GE77 HX 12UHS | |
| MSI Raider GE77 HX 12UHS (Extreme Leistung) | |
| Alienware x17 R2 P48E | |
| Media NVIDIA GeForce RTX 3080 Ti Laptop GPU (32.6 - 127, n=45) | |
| Medion Erazer Beast X30 | |
| Media della classe Gaming (52.1 - 143.5, n=115, ultimi 2 anni) | |
| Razer Blade 17 Early 2022 | |
| Final Fantasy XV Benchmark | |
| 3840x2160 High Quality | |
| Media della classe Gaming (45 - 111.8, n=34, ultimi 2 anni) | |
| MSI Raider GE77 HX 12UHS (1.3, dGPU, Extreme Leistung) | |
| MSI Raider GE77 HX 12UHS (1.3, Extreme Leistung) | |
| MSI Raider GE77 HX 12UHS (1.3) | |
| Razer Blade 17 Early 2022 (1.3) | |
| Media NVIDIA GeForce RTX 3080 Ti Laptop GPU (35.1 - 61.2, n=18) | |
| 1920x1080 High Quality | |
| Media della classe Gaming (41 - 215, n=103, ultimi 2 anni) | |
| MSI Raider GE77 HX 12UHS (1.3, dGPU, Extreme Leistung) | |
| MSI Raider GE77 HX 12UHS (1.3, Extreme Leistung) | |
| MSI Raider GE77 HX 12UHS (1.3) | |
| Alienware x17 R2 P48E (1.3) | |
| Media NVIDIA GeForce RTX 3080 Ti Laptop GPU (30.7 - 140.6, n=42) | |
| Razer Blade 17 Early 2022 (1.3) | |
| Medion Erazer Beast X30 (1.3) | |
| GTA V | |
| 1920x1080 Highest AA:4xMSAA + FX AF:16x | |
| MSI Raider GE77 HX 12UHS (Extreme Leistung) | |
| MSI Raider GE77 HX 12UHS (dGPU, Extreme Leistung) | |
| MSI Raider GE77 HX 12UHS | |
| Media della classe Gaming (48.3 - 186.9, n=102, ultimi 2 anni) | |
| Alienware x17 R2 P48E | |
| Media NVIDIA GeForce RTX 3080 Ti Laptop GPU (30 - 139.2, n=42) | |
| Medion Erazer Beast X30 | |
| Razer Blade 17 Early 2022 | |
| 3840x2160 Highest AA:4xMSAA + FX AF:16x | |
| Media della classe Gaming (40.5 - 116.7, n=25, ultimi 2 anni) | |
| MSI Raider GE77 HX 12UHS (Extreme Leistung) | |
| MSI Raider GE77 HX 12UHS (dGPU, Extreme Leistung) | |
| MSI Raider GE77 HX 12UHS | |
| Razer Blade 17 Early 2022 | |
| Media NVIDIA GeForce RTX 3080 Ti Laptop GPU (37.7 - 67.2, n=14) | |
| Strange Brigade | |
| 3840x2160 ultra AA:ultra AF:16 | |
| Media della classe Gaming (66.7 - 187.2, n=34, ultimi 2 anni) | |
| MSI Raider GE77 HX 12UHS (1.47.22.14 D3D12, dGPU, Extreme Leistung) | |
| MSI Raider GE77 HX 12UHS (1.47.22.14 D3D12, Extreme Leistung) | |
| MSI Raider GE77 HX 12UHS (1.47.22.14 D3D12) | |
| Razer Blade 17 Early 2022 (1.47.22.14 D3D12) | |
| Media NVIDIA GeForce RTX 3080 Ti Laptop GPU (61.7 - 100.7, n=15) | |
| 1920x1080 ultra AA:ultra AF:16 | |
| Media della classe Gaming (76.3 - 456, n=93, ultimi 2 anni) | |
| MSI Raider GE77 HX 12UHS (1.47.22.14 D3D12, dGPU, Extreme Leistung) | |
| Alienware x17 R2 P48E (1.47.22.14 D3D12) | |
| MSI Raider GE77 HX 12UHS (1.47.22.14 D3D12, Extreme Leistung) | |
| MSI Raider GE77 HX 12UHS (1.47.22.14 D3D12) | |
| Razer Blade 17 Early 2022 (1.47.22.14 D3D12) | |
| Medion Erazer Beast X30 (1.47.22.14 D3D12) | |
| Media NVIDIA GeForce RTX 3080 Ti Laptop GPU (42.3 - 224, n=41) | |
| F1 2021 | |
| 1920x1080 Ultra High Preset + Raytracing AA:T AF:16x | |
| MSI Raider GE77 HX 12UHS (874931, dGPU, Extreme Leistung) | |
| MSI Raider GE77 HX 12UHS (874931) | |
| MSI Raider GE77 HX 12UHS (874931, Extreme Leistung) | |
| Razer Blade 17 Early 2022 (874931) | |
| Medion Erazer Beast X30 (874931) | |
| Media NVIDIA GeForce RTX 3080 Ti Laptop GPU (30.2 - 160.6, n=30) | |
| 3840x2160 Ultra High Preset + Raytracing AA:T AF:16x | |
| MSI Raider GE77 HX 12UHS (874931, dGPU, Extreme Leistung) | |
| MSI Raider GE77 HX 12UHS (874931, Extreme Leistung) | |
| MSI Raider GE77 HX 12UHS (874931) | |
| Razer Blade 17 Early 2022 (874931) | |
| Media NVIDIA GeForce RTX 3080 Ti Laptop GPU (41.1 - 70.2, n=18) | |
Per determinare se la frequenza dei fotogrammi rimane costante per un lungo periodo di tempo, abbiamo eseguito il gioco "The Witcher 3" per 60 minuti alla risoluzione Full HD e con le impostazioni di qualità massime. Il personaggio non viene spostato per tutta la durata del test. Non abbiamo notato cali di frame rate.
Witcher 3 FPS Chart
| basso | medio | alto | ultra | QHD | 4K | |
|---|---|---|---|---|---|---|
| GTA V (2015) | 186.8 | 187 | 184.3 | 136 | 121.1 | 122 |
| The Witcher 3 (2015) | 498 | 392 | 249 | 126.7 | 62.1 | |
| Dota 2 Reborn (2015) | 203 | 184 | 174.8 | 165.7 | 144.7 | |
| Final Fantasy XV Benchmark (2018) | 217 | 175.6 | 132 | 98.6 | 57.9 | |
| X-Plane 11.11 (2018) | 172.8 | 152.3 | 121.1 | 103 | ||
| Far Cry 5 (2018) | 214 | 176 | 167 | 156 | 131 | 73 |
| Strange Brigade (2018) | 505 | 291 | 234 | 209 | 159.9 | 96.6 |
| F1 2021 (2021) | 354 | 243 | 207 | 133.8 | 104.3 | 64 |
Emissioni - Il sistema MSI diventa rumoroso sotto carico
Rumore del sistema
Anche durante il funzionamento al minimo e con carichi ridotti, il controllo delle ventole non funziona in modo del tutto fluido. Ad esempio, a volte le ventole rimangono ferme per un'esperienza completamente silenziosa, altre volte diventano molto evidenti (fino a 46 dB(A)). Sotto carico, il portatile MSI produce livelli di rumore massimo molto elevati, fino a 55 dB(A) (testWitcher 3 ) o 57 dB(A) (stress test).
Per un funzionamento silenzioso, si consiglia di utilizzare la "Modalità silenziosa". Il sistema è più silenzioso, ma non del tutto, e allo stesso tempo le prestazioni sono notevolmente ridotte.
Rumorosità
| Idle |
| 26 / 34 / 46 dB(A) |
| Sotto carico |
| 50 / 57 dB(A) |
 | ||
30 dB silenzioso 40 dB(A) udibile 50 dB(A) rumoroso |
||
min: | ||
| MSI Raider GE77 HX 12UHS Intel Core i9-12900HX, NVIDIA GeForce RTX 3080 Ti Laptop GPU | Razer Blade 17 Early 2022 Intel Core i9-12900H, NVIDIA GeForce RTX 3080 Ti Laptop GPU | Alienware x17 R2 P48E Intel Core i9-12900HK, NVIDIA GeForce RTX 3080 Ti Laptop GPU | Medion Erazer Beast X30 Intel Core i9-12900HK, NVIDIA GeForce RTX 3080 Ti Laptop GPU | |
|---|---|---|---|---|
| Noise | 10% | 22% | 8% | |
| off /ambiente * (dB) | 26 | 26 -0% | 22.7 13% | 26 -0% |
| Idle Minimum * (dB) | 26 | 26 -0% | 23.1 11% | 27 -4% |
| Idle Average * (dB) | 34 | 27 21% | 23.1 32% | 29 15% |
| Idle Maximum * (dB) | 46 | 32 30% | 23.1 50% | 34 26% |
| Load Average * (dB) | 50 | 50 -0% | 31.9 36% | 48 4% |
| Witcher 3 ultra * (dB) | 55 | 51 7% | 52.5 5% | 51 7% |
| Load Maximum * (dB) | 57 | 51 11% | 52.5 8% | 53 7% |
* ... Meglio usare valori piccoli
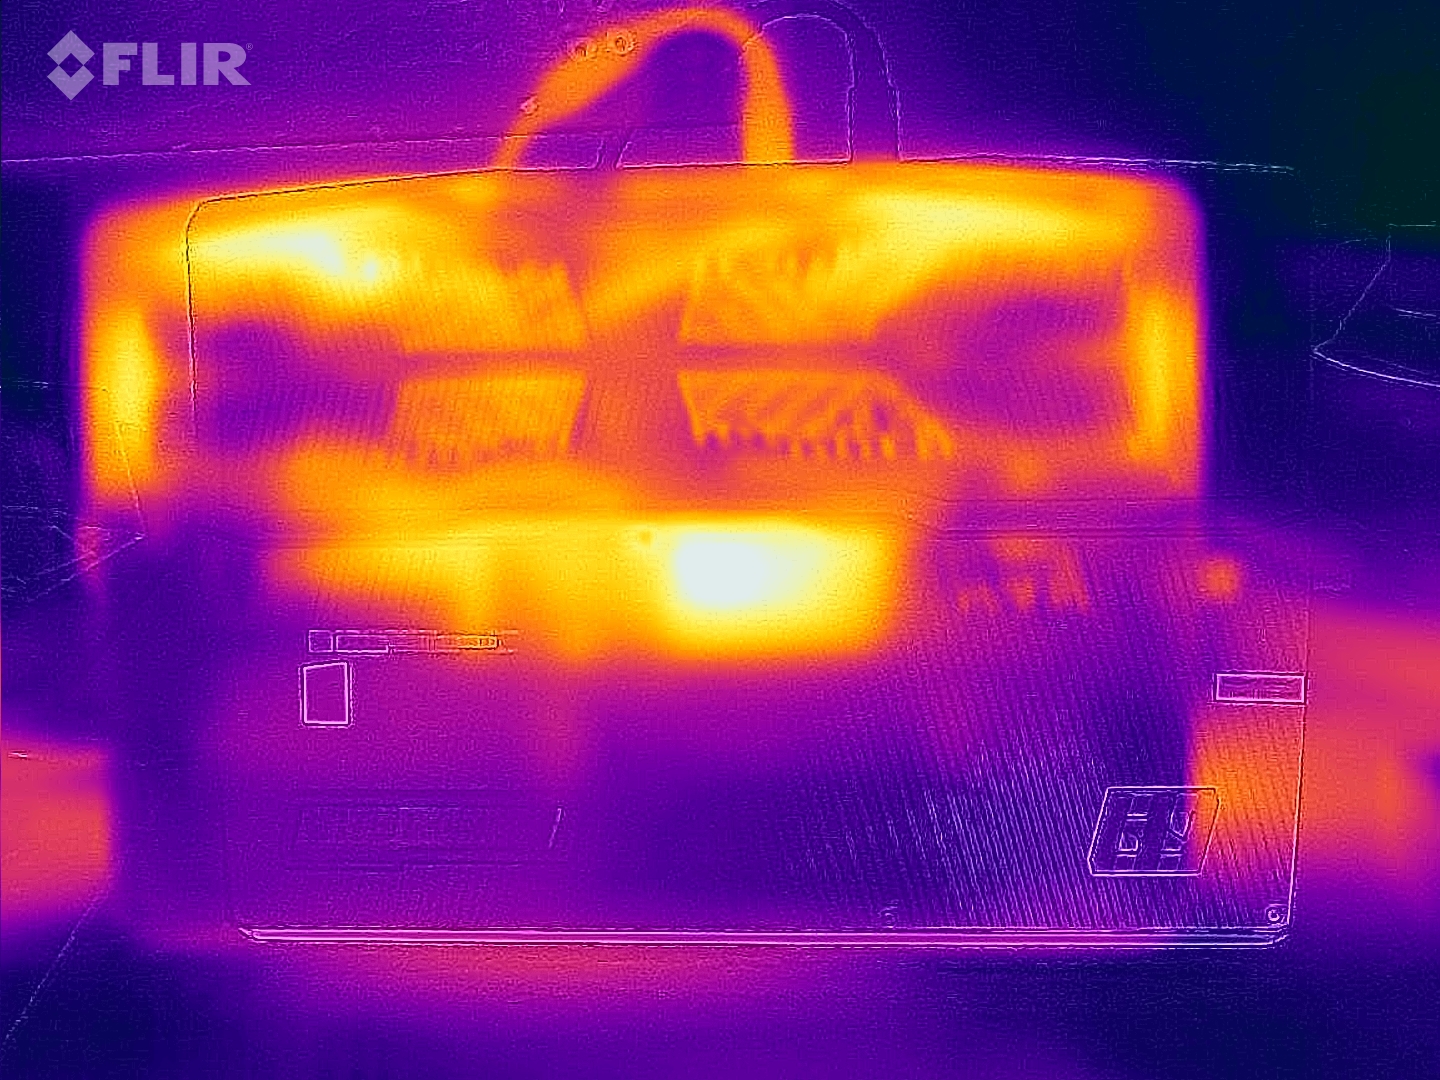
Temperatura
Durante l'uso quotidiano (ufficio, web) le temperature superficiali rimangono entro un intervallo accettabile. Sotto carico (stress test, Witcher 3 test), il portatile si riscalda in modo significativo, ma non eccessivo. Gli utenti non dovranno preoccuparsi nemmeno delle temperature della CPU.
(-) La temperatura massima sul lato superiore è di 53 °C / 127 F, rispetto alla media di 40.4 °C / 105 F, che varia da 21.2 a 68.8 °C per questa classe Gaming.
(-) Il lato inferiore si riscalda fino ad un massimo di 58 °C / 136 F, rispetto alla media di 43.2 °C / 110 F
(±) In idle, la temperatura media del lato superiore è di 34.8 °C / 95 F, rispetto alla media deld ispositivo di 33.9 °C / 93 F.
(-) Riproducendo The Witcher 3, la temperatura media per il lato superiore e' di 44.1 °C / 111 F, rispetto alla media del dispositivo di 33.9 °C / 93 F.
(+) I poggiapolsi e il touchpad raggiungono la temperatura massima della pelle (35 °C / 95 F) e quindi non sono caldi.
(-) La temperatura media della zona del palmo della mano di dispositivi simili e'stata di 28.8 °C / 83.8 F (-6.2 °C / -11.2 F).
| MSI Raider GE77 HX 12UHS Intel Core i9-12900HX, NVIDIA GeForce RTX 3080 Ti Laptop GPU | Razer Blade 17 Early 2022 Intel Core i9-12900H, NVIDIA GeForce RTX 3080 Ti Laptop GPU | Alienware x17 R2 P48E Intel Core i9-12900HK, NVIDIA GeForce RTX 3080 Ti Laptop GPU | Medion Erazer Beast X30 Intel Core i9-12900HK, NVIDIA GeForce RTX 3080 Ti Laptop GPU | |
|---|---|---|---|---|
| Heat | 7% | 21% | 5% | |
| Maximum Upper Side * (°C) | 53 | 50 6% | 49.6 6% | 55 -4% |
| Maximum Bottom * (°C) | 58 | 56 3% | 42.4 27% | 62 -7% |
| Idle Upper Side * (°C) | 38 | 36 5% | 29.2 23% | 32 16% |
| Idle Bottom * (°C) | 43 | 38 12% | 32 26% | 36 16% |
* ... Meglio usare valori piccoli
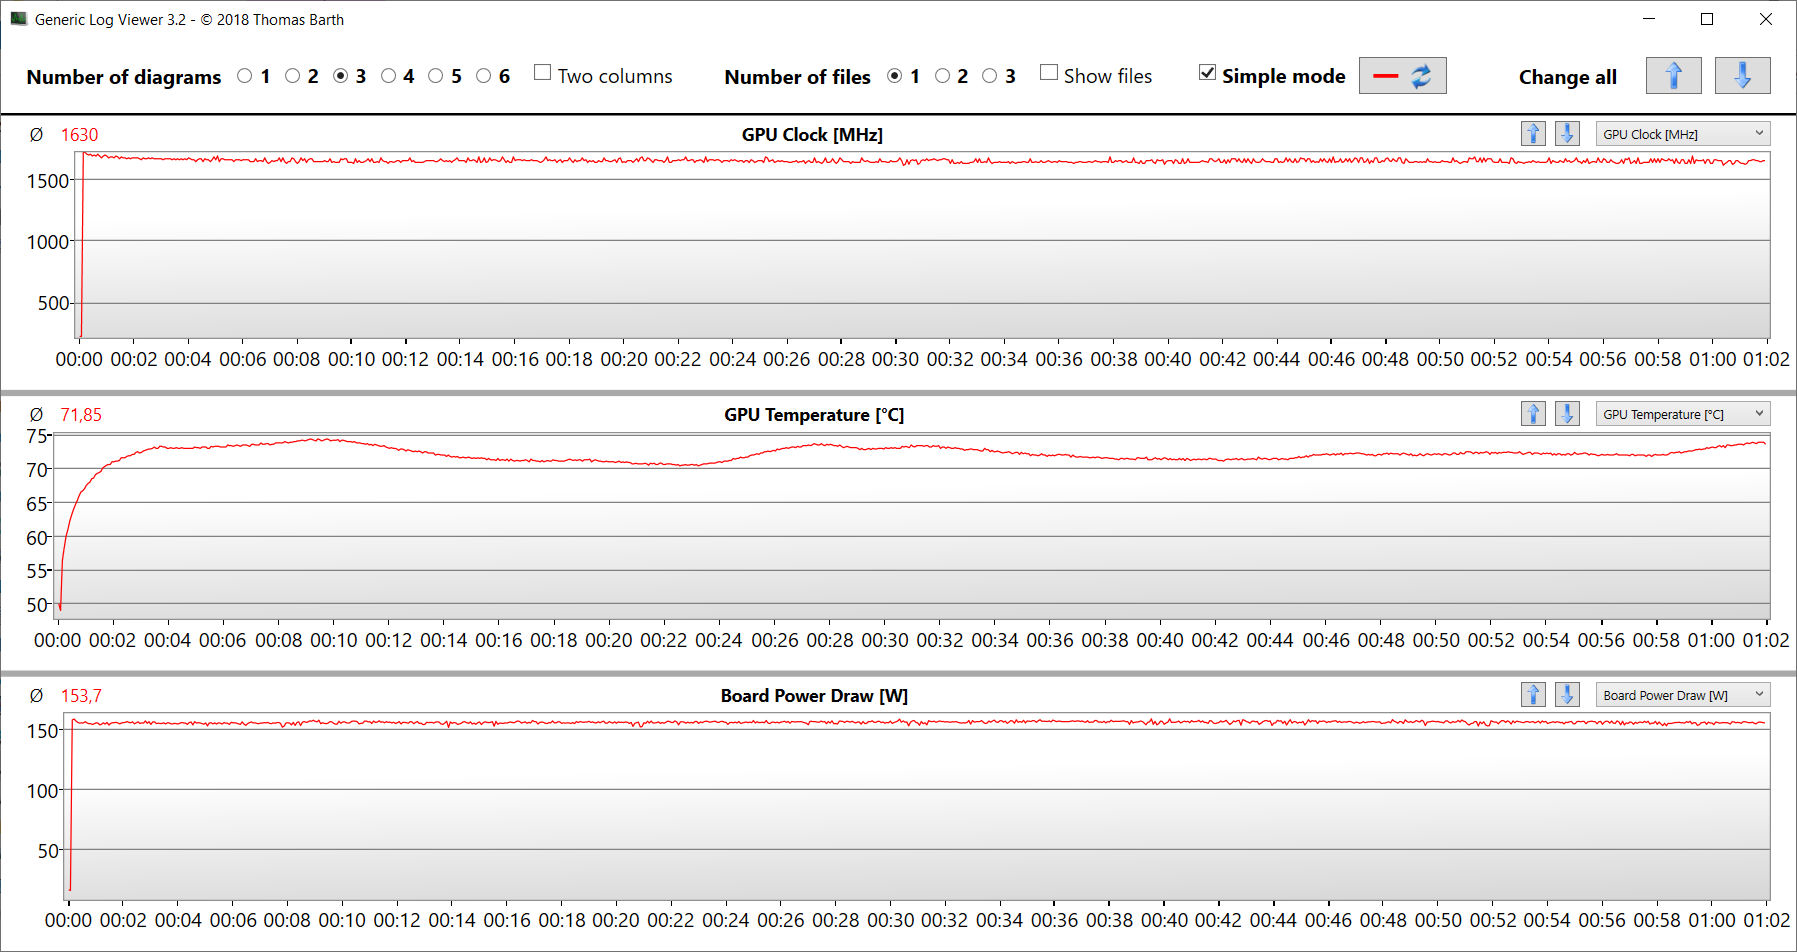
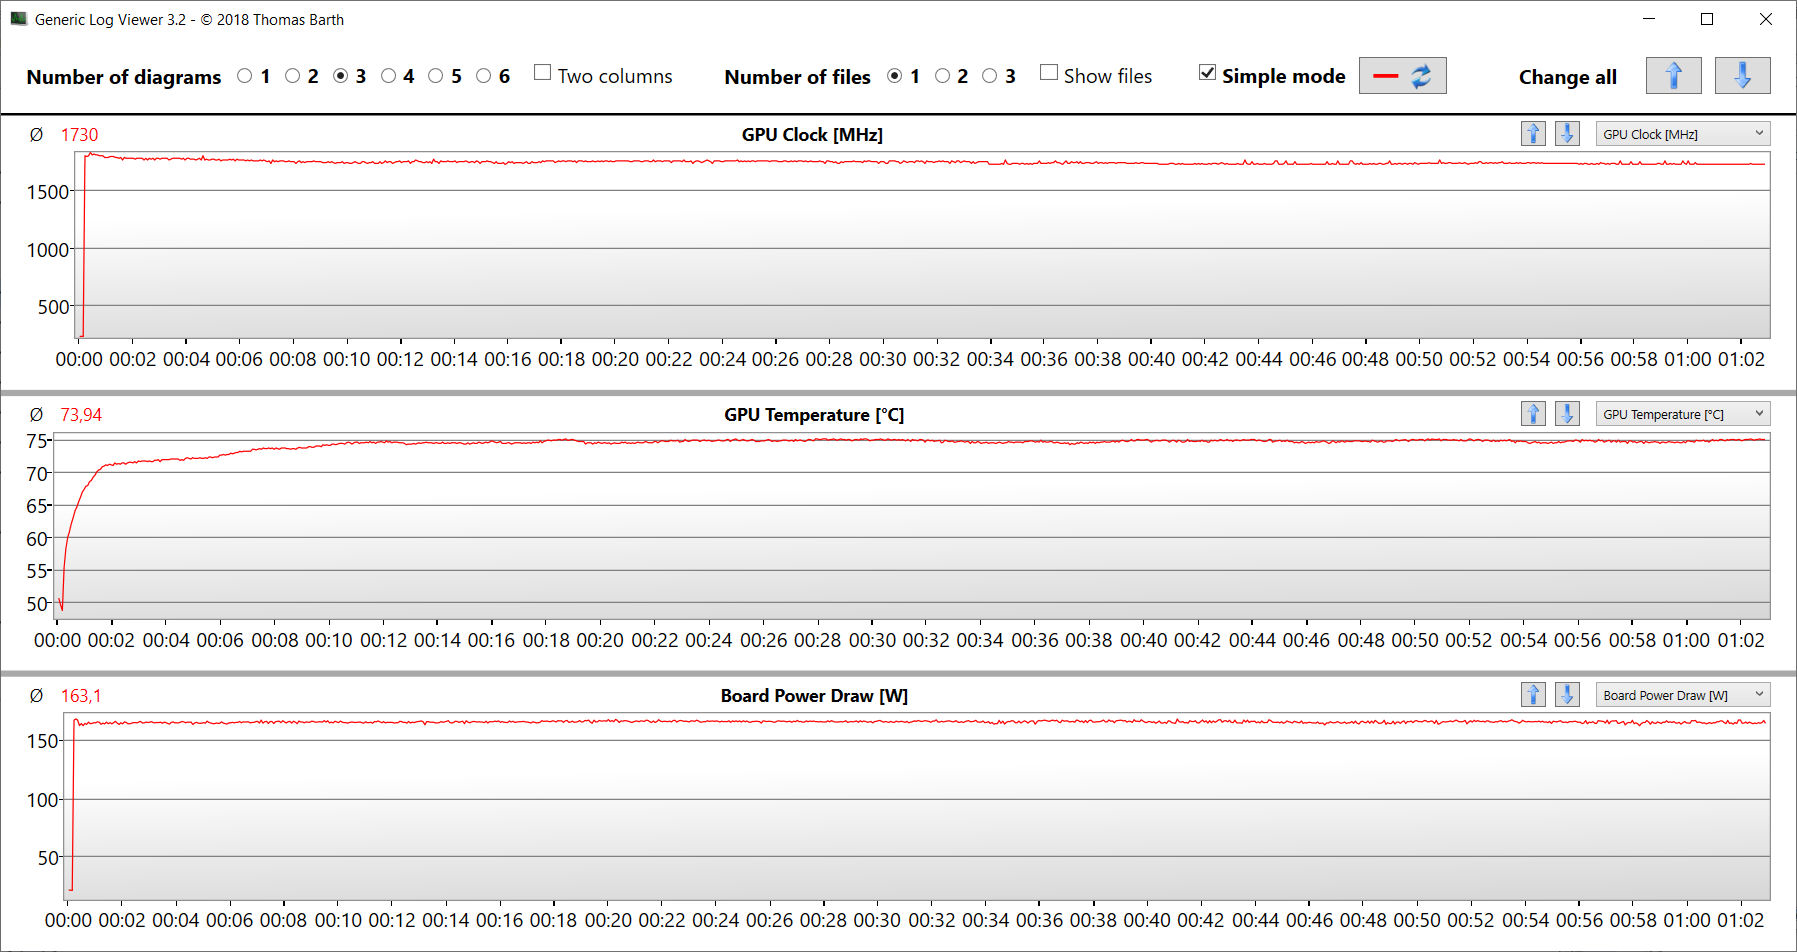
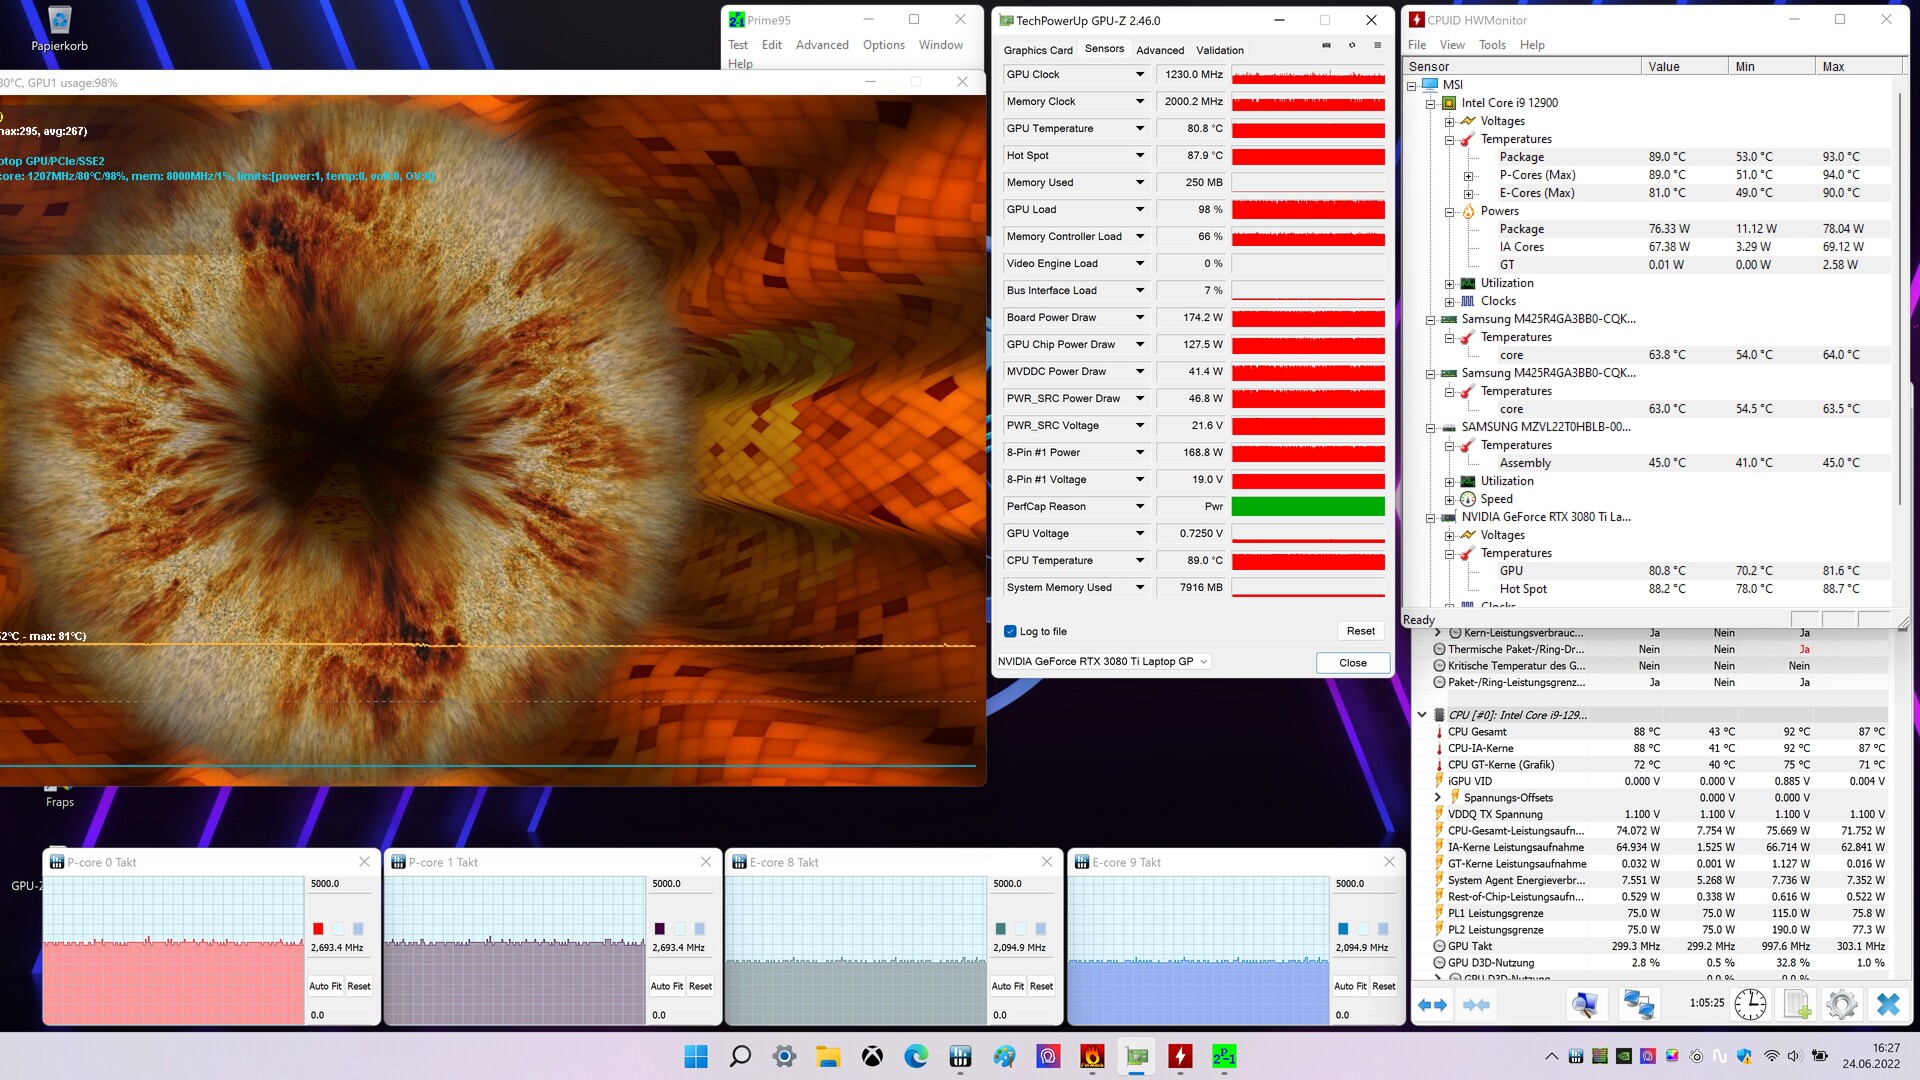
Stress test
All'inizio dello stress test (esecuzione di Prime95 e FurMark per almeno un'ora), sia la CPU che la GPU funzionano a velocità elevate. Successivamente, le velocità di clock scendono a 1,3 (CPU) e 1100 MHz (GPU). Lo stress test rappresenta uno scenario estremo. Si utilizza questo test per determinare se il sistema rimane stabile sotto pieno carico.
Altoparlanti
Il portatile è dotato di due altoparlanti e due woofer, che insieme producono un suono decente, anche se un po' più di bassi non guasterebbero. Per un'esperienza sonora migliore, si consiglia di utilizzare cuffie o altoparlanti esterni.
MSI Raider GE77 HX 12UHS analisi audio
(+) | gli altoparlanti sono relativamente potenti (85 dB)
Bassi 100 - 315 Hz
(±) | bassi ridotti - in media 11% inferiori alla media
(±) | la linearità dei bassi è media (11.3% delta rispetto alla precedente frequenza)
Medi 400 - 2000 Hz
(+) | medi bilanciati - solo only 4.3% rispetto alla media
(+) | medi lineari (3.2% delta rispetto alla precedente frequenza)
Alti 2 - 16 kHz
(+) | Alti bilanciati - appena 2.3% dalla media
(+) | alti lineari (5% delta rispetto alla precedente frequenza)
Nel complesso 100 - 16.000 Hz
(+) | suono nel complesso lineare (11% differenza dalla media)
Rispetto alla stessa classe
» 7% di tutti i dispositivi testati in questa classe è stato migliore, 3% simile, 89% peggiore
» Il migliore ha avuto un delta di 6%, medio di 18%, peggiore di 132%
Rispetto a tutti i dispositivi testati
» 6% di tutti i dispositivi testati in questa classe è stato migliore, 2% similare, 92% peggiore
» Il migliore ha avuto un delta di 4%, medio di 24%, peggiore di 134%
Razer Blade 17 Early 2022 analisi audio
(+) | gli altoparlanti sono relativamente potenti (83 dB)
Bassi 100 - 315 Hz
(±) | bassi ridotti - in media 7.4% inferiori alla media
(±) | la linearità dei bassi è media (9.7% delta rispetto alla precedente frequenza)
Medi 400 - 2000 Hz
(+) | medi bilanciati - solo only 3% rispetto alla media
(+) | medi lineari (3.7% delta rispetto alla precedente frequenza)
Alti 2 - 16 kHz
(+) | Alti bilanciati - appena 2.5% dalla media
(+) | alti lineari (6.1% delta rispetto alla precedente frequenza)
Nel complesso 100 - 16.000 Hz
(+) | suono nel complesso lineare (9.2% differenza dalla media)
Rispetto alla stessa classe
» 3% di tutti i dispositivi testati in questa classe è stato migliore, 1% simile, 95% peggiore
» Il migliore ha avuto un delta di 6%, medio di 18%, peggiore di 132%
Rispetto a tutti i dispositivi testati
» 3% di tutti i dispositivi testati in questa classe è stato migliore, 1% similare, 96% peggiore
» Il migliore ha avuto un delta di 4%, medio di 24%, peggiore di 134%
Gestione dell'energia - Laptop da gioco con un'autonomia decente
Consumo di energia
Il consumo di energia durante l'idle corrisponde alle nostre aspettative per l'hardware installato. Durante i test di Witcher 3 e di stress, il consumo energetico sale rispettivamente a una media di 247 watt e 352 watt - quest'ultimo valore rappresenta un picco temporaneo. Mentre il consumo energetico rimane costante per tutta la durata del Witcher 3 test, oscilla invece durante lo stress test. L'adattatore CA da 330 watt in dotazione è sufficientemente dimensionato.
| Off / Standby | |
| Idle | |
| Sotto carico |
|
Leggenda:
min: | |
| MSI Raider GE77 HX 12UHS Intel Core i9-12900HX, NVIDIA GeForce RTX 3080 Ti Laptop GPU | Razer Blade 17 Early 2022 Intel Core i9-12900H, NVIDIA GeForce RTX 3080 Ti Laptop GPU | Alienware x17 R2 P48E Intel Core i9-12900HK, NVIDIA GeForce RTX 3080 Ti Laptop GPU | Medion Erazer Beast X30 Intel Core i9-12900HK, NVIDIA GeForce RTX 3080 Ti Laptop GPU | Media NVIDIA GeForce RTX 3080 Ti Laptop GPU | Media della classe Gaming | |
|---|---|---|---|---|---|---|
| Power Consumption | -3% | -38% | 16% | -5% | 13% | |
| Idle Minimum * (Watt) | 13 | 17 -31% | 24.1 -85% | 12 8% | 17.2 ? -32% | 13.2 ? -2% |
| Idle Average * (Watt) | 19 | 23 -21% | 28.5 -50% | 16 16% | 23.3 ? -23% | 18.9 ? 1% |
| Idle Maximum * (Watt) | 29 | 34 -17% | 60 -107% | 22 24% | 30.8 ? -6% | 24.3 ? 16% |
| Load Average * (Watt) | 143 | 120 16% | 128.7 10% | 118 17% | 121.2 ? 15% | 108 ? 24% |
| Witcher 3 ultra * (Watt) | 247 | 229 7% | 254 -3% | 223 10% | ||
| Load Maximum * (Watt) | 352 | 243 31% | 323 8% | 290 18% | 276 ? 22% | 254 ? 28% |
* ... Meglio usare valori piccoli
Consumption Witcher 3 / Stress Test
Consumption external Monitor
Durata della batteria
Il portatile da 17,3 pollici ha raggiunto un'autonomia di 5:24 ore e 6:29 ore nei nostri test Wi-Fi (accesso periodico a siti web tramite script) e video (cortometraggio Big Buck Bunny (codec H.264, FHD)). Le funzioni di risparmio energetico del portatile sono disattivate per entrambi i test e la luminosità del display è impostata su 150 nits. Per il test video sono stati disattivati anche i moduli wireless.
| MSI Raider GE77 HX 12UHS i9-12900HX, GeForce RTX 3080 Ti Laptop GPU, 99.99 Wh | Razer Blade 17 Early 2022 i9-12900H, GeForce RTX 3080 Ti Laptop GPU, 82 Wh | Alienware x17 R2 P48E i9-12900HK, GeForce RTX 3080 Ti Laptop GPU, 87 Wh | Medion Erazer Beast X30 i9-12900HK, GeForce RTX 3080 Ti Laptop GPU, 91.2 Wh | Media della classe Gaming | |
|---|---|---|---|---|---|
| Autonomia della batteria | -25% | -61% | 1% | 5% | |
| Reader / Idle (h) | 9.8 | 7.1 -28% | 3.9 -60% | 7.7 -21% | 8.71 ? -11% |
| H.264 (h) | 6.5 | 4.8 -26% | 6.4 -2% | 8.26 ? 27% | |
| WiFi v1.3 (h) | 5.4 | 3.8 -30% | 2 -63% | 5.7 6% | 7.02 ? 30% |
| Load (h) | 2 | 1.7 -15% | 0.8 -60% | 2.4 20% | 1.47 ? -26% |
Pro
Contro
Verdetto - Molta potenza per molto denaro
Per la nostra configurazione del Raider GE77, MSI richiede circa 5.200 dollari. Per questo prezzo, gli acquirenti ricevono un portatile molto potente per applicazioni impegnative come l'editing video, il rendering e il gaming 4K.
L'MSI Raider GE77 HX 12 UHS è uno dei laptop più potenti attualmente disponibili.
I componenti principali sono costituiti da un Core i9-12900HX CPU, una GeForce RTX 3080 Ti Laptop (175 watt TGP, 16 GB VRAM) e 64 GB di RAM, che garantiscono un livello di prestazioni complessivo elevato. La GPU GeForce in particolare ha ottenuto alcuni dei punteggi più alti che abbiamo visto da questo chip.
Sia la CPU che la GPU sono in grado di funzionare a velocità di clock costantemente elevate. Le emissioni di calore e rumore relativamente elevate corrispondono alle nostre aspettative per questa classe di dispositivi. Con circa 5,5-6,5 ore, l'autonomia della batteria è buona per un potente laptop 4K. La porta Thunderbolt 4 consente un'ulteriore espandibilità tramite una GPU esterna o una soluzione docking.
Il display 4K opaco (IPS, 120 Hz) offre una luminosità massima sufficiente, tempi di risposta brevi e una buona copertura dello spazio colore. Tuttavia, è carente in termini di contrasto. Anche se l'accuratezza del colore era fuori dalla fabbrica, questo può essere risolto con una calibrazione. Sospettiamo un conflitto tra il software MSI True Color, il profilo colore preinstallato e/o l'iGPU o i suoi driver. Questo è inaccettabile per un portatile di questa categoria di prezzo.
IlRazer Blade 17 (inizio 2022) è una potenziale alternativa al GE77. Sebbene offra un livello di prestazioni complessivo inferiore rispetto al sistema MSI, è più compatto e leggero. In termini di durata della batteria, non può competere con il Raider.
Prezzo e disponibilità
Diverse configurazioni di MSI Raider GE77 HX 12UHS sono disponibili sul negozio ufficiale di MSI https://us-store.msi.com/Raider-GE77HX-12UHS-074?utm_source=hatch&utm_campaign=MSI+Systems&utm_content=s1657617933395q1wqa52417 (Core i9-12800HX, RTX 3080 Ti, FHD 360 Hz, 1 TB SSD) e rivenditori online come Xotic PC (Core i9-12900HX, RTX 3080 Ti, QHD 240 Hz, 1 TB SSD) rispettivamente per circa 3.000 e 3700 dollari.
MSI Raider GE77 HX 12UHS
- 07/12/2022 v7 (old)
Sascha Mölck
Price comparison

