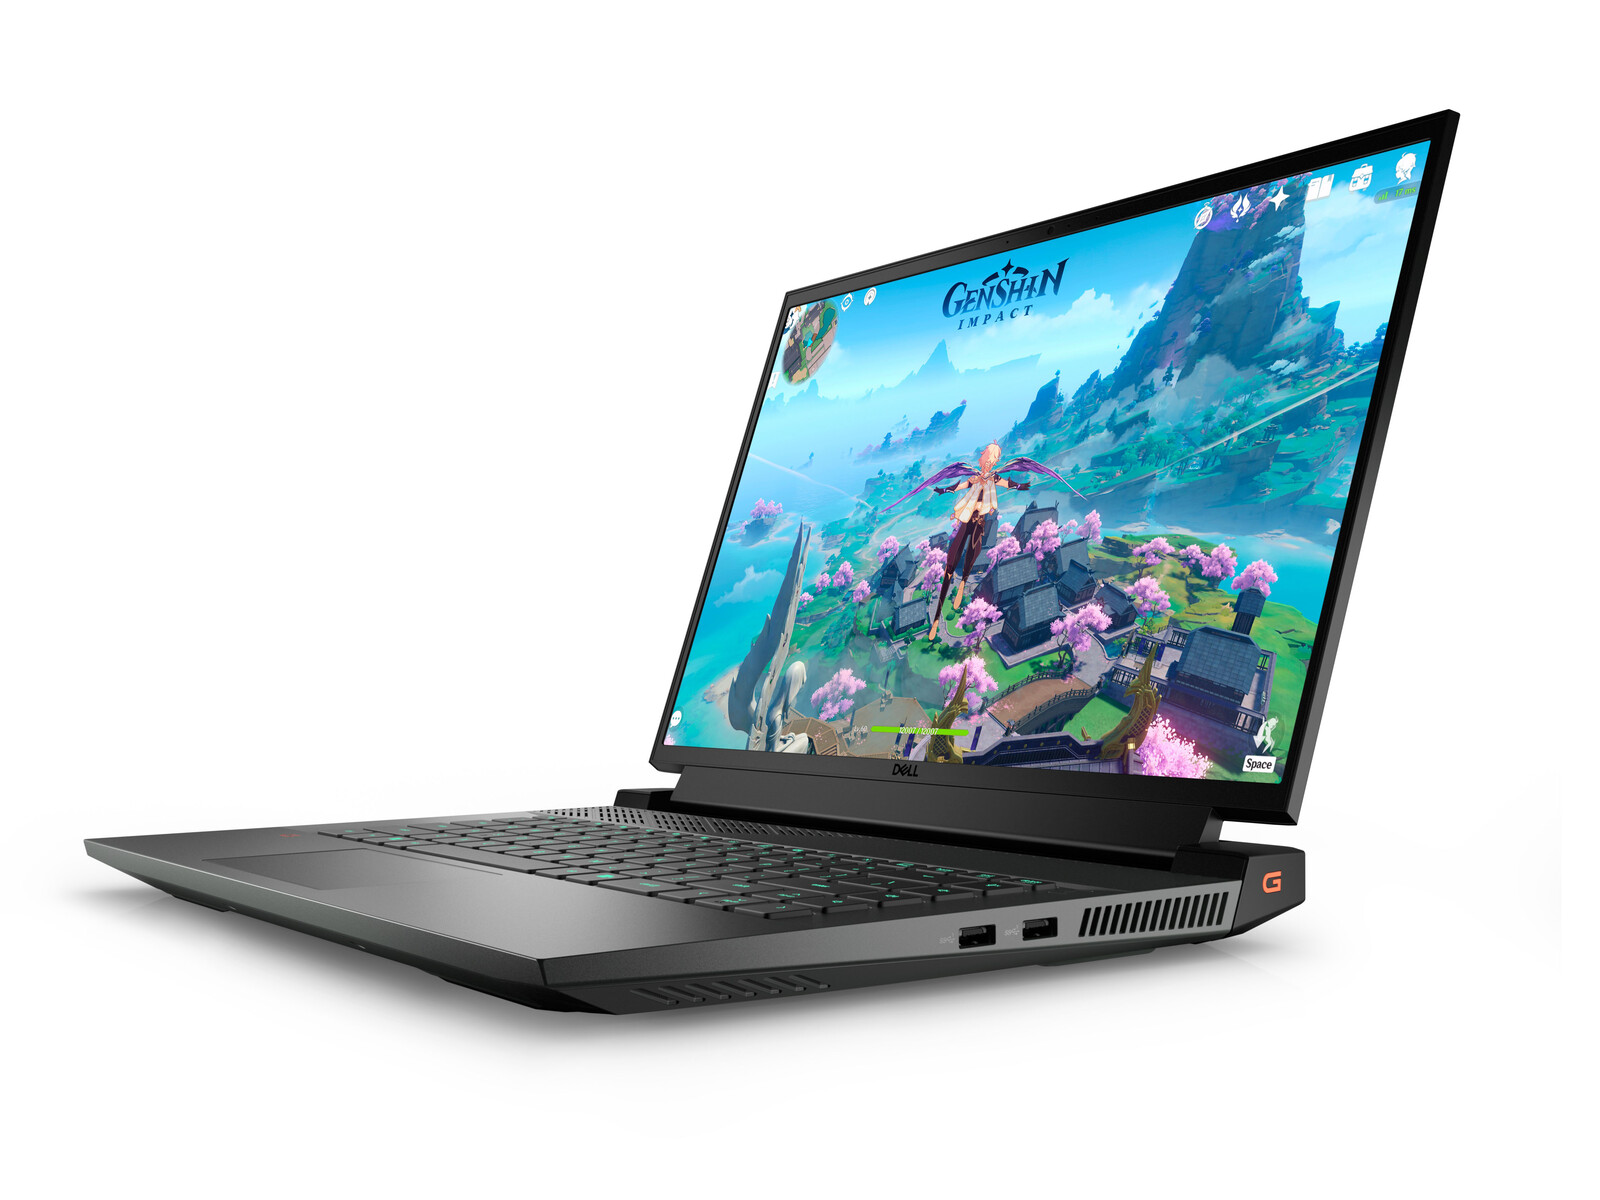
Recensione del portatile Dell G16 7620: Struttura robusta per prestazioni veloci
La serie G di Dell è costituita da computer portatili da gioco di fascia economica e media, in contrasto con la serie Alienware di fascia più alta. La serie ha solo un paio di anni di vita, con i modelli iniziali G15 e G17 che coprono rispettivamente i formati da 15,6 e 17,3 pollici. Per il 2022, Dell ha introdotto un modello da 16 pollici chiamato G16 completo delle più recenti CPU Intel di 12a generazione della serie Core-H e delle GPU Nvidia RTX Ampere
La nostra unità in prova è una configurazione di fascia media con CPU Core i7-12700H e GPU RTX 3060 da 130 W GeForce per circa 1500 dollari al dettaglio. Altre SKU sono disponibili con la più lenta RTX 3050 Ti, la più veloce RTX 3070 Ti o il Core i9-12900H. Tutte le configurazioni attuali sono dotate dello stesso display da 16 pollici a 1600p e 165 Hz
I concorrenti in questo settore includono altri portatili da gioco da 16 pollici come il modello Lenovo Legion 7 16, HP Victus 16, Asus ROG Zephyrus M16, o Acer Swift X SFX16
Altre recensioni Dell
Potenziali concorrenti a confronto
Punteggio | Data | Modello | Peso | Altezza | Dimensione | Risoluzione | Prezzo |
|---|---|---|---|---|---|---|---|
| 86.1 % v7 (old) | 10/2022 | Dell G16 7620 i7-12700H, GeForce RTX 3060 Laptop GPU | 2.6 kg | 26.9 mm | 16.00" | 2560x1600 | |
| 90.8 % v7 (old) | 09/2022 | Lenovo Legion 7 16ARHA7 R9 6900HX, Radeon RX 6850M XT | 2.6 kg | 19.4 mm | 16.00" | 2560x1600 | |
| 82.3 % v7 (old) | 05/2022 | HP Victus 16-e0145ng R5 5600H, GeForce RTX 3050 Ti Laptop GPU | 2.4 kg | 23.5 mm | 16.10" | 1920x1080 | |
| 85.6 % v7 (old) | 07/2021 | Asus ROG Zephyrus M16 GU603H i9-11900H, GeForce RTX 3070 Laptop GPU | 2 kg | 20 mm | 16.00" | 2560x1600 | |
| 86.6 % v7 (old) | 07/2022 | Lenovo Legion 5 Pro 16IAH7H i7-12700H, GeForce RTX 3060 Laptop GPU | 2.6 kg | 27 mm | 16.00" | 2560x1600 | |
| 86.2 % v7 (old) | 07/2022 | Acer Swift X SFX16-51G-5388 i5-11320H, GeForce RTX 3050 4GB Laptop GPU | 1.8 kg | 18.9 mm | 16.10" | 1920x1080 |
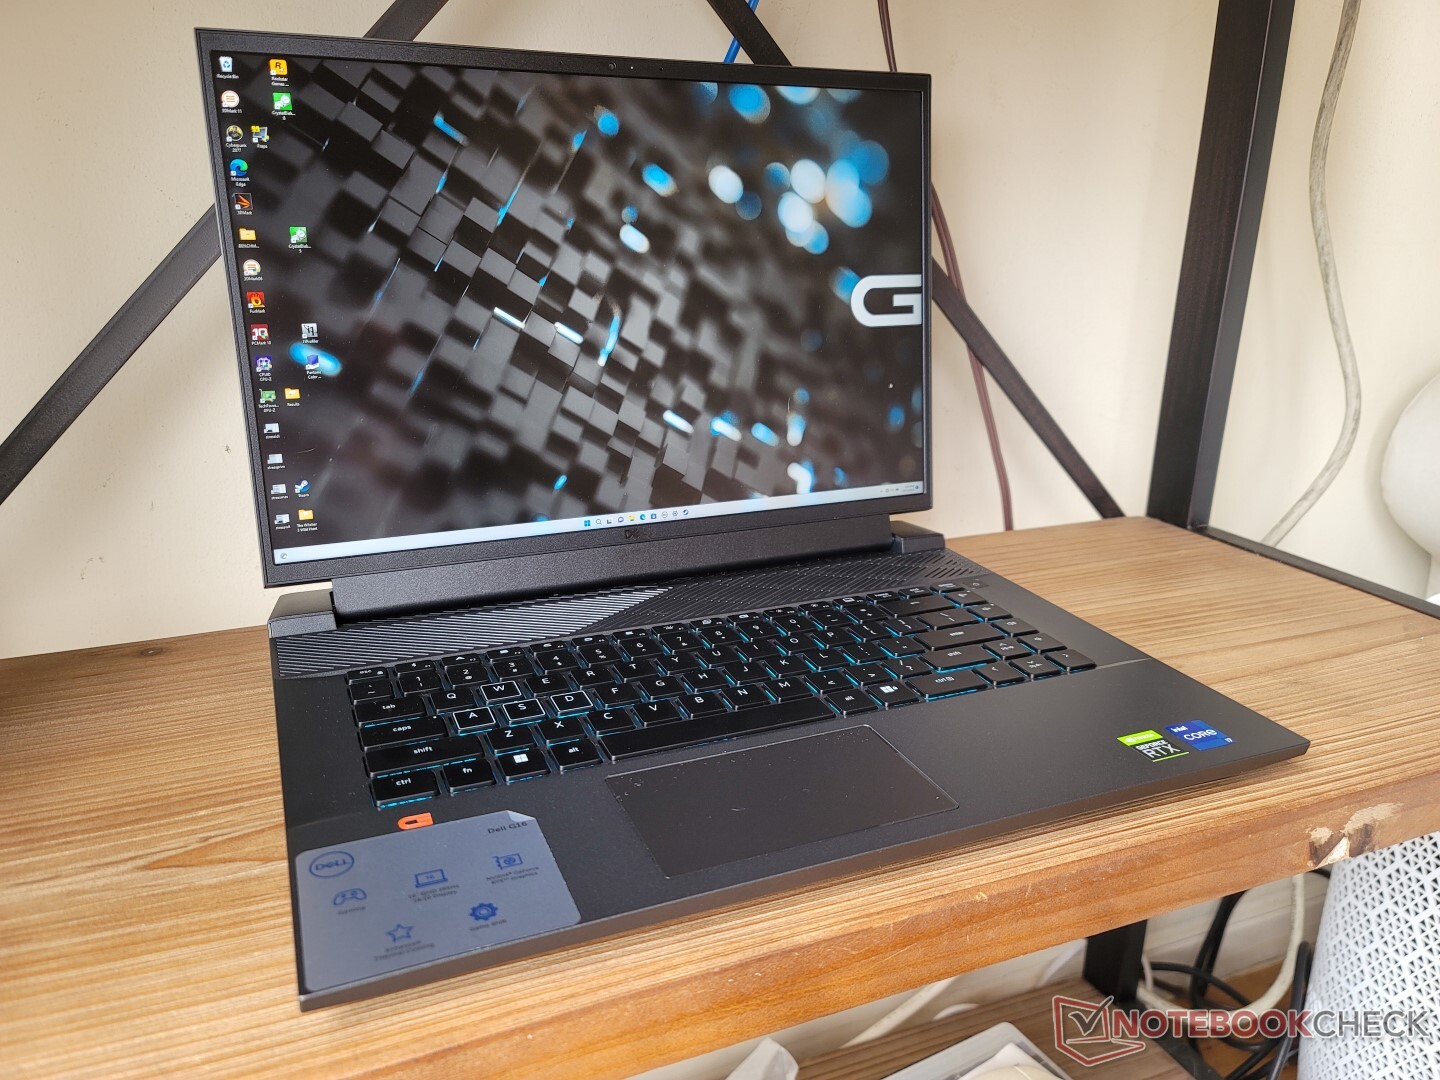
Caso - Un G15 più grande
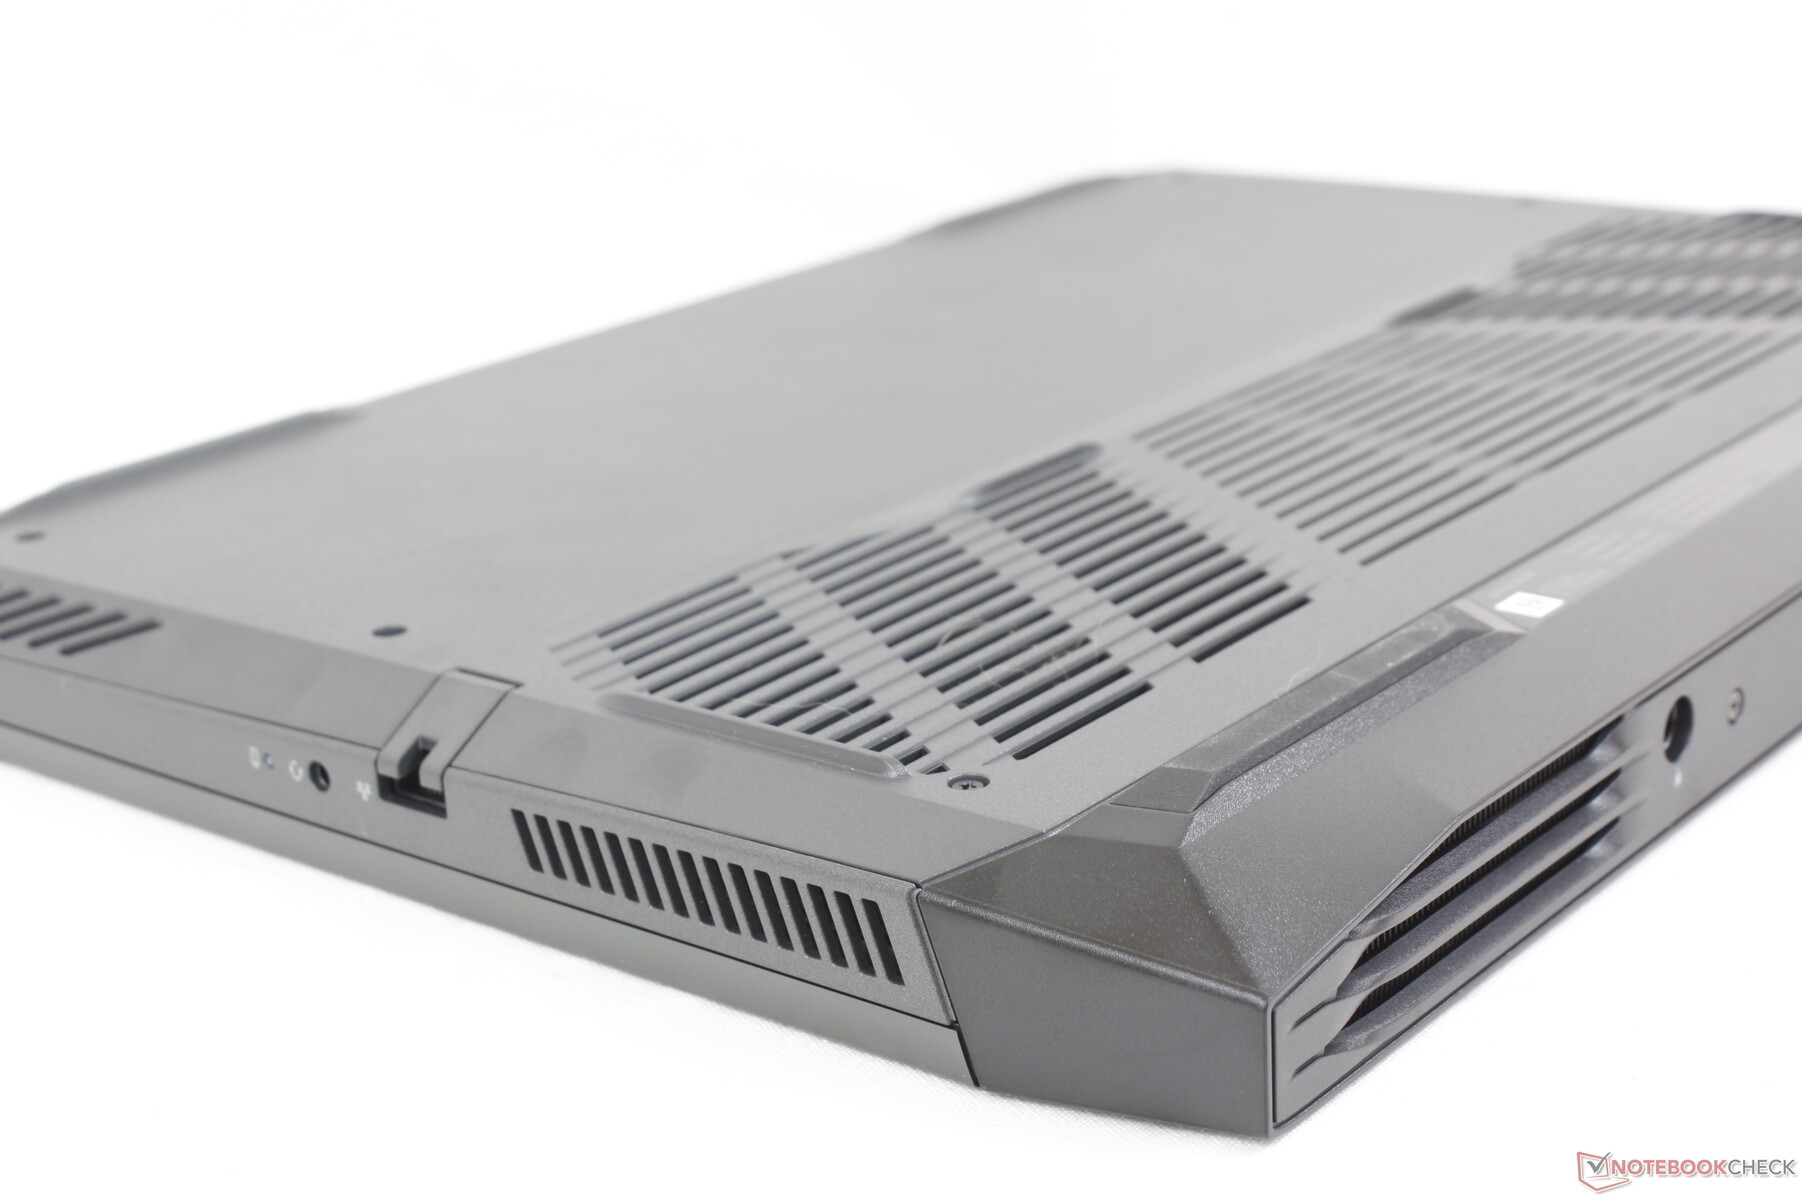
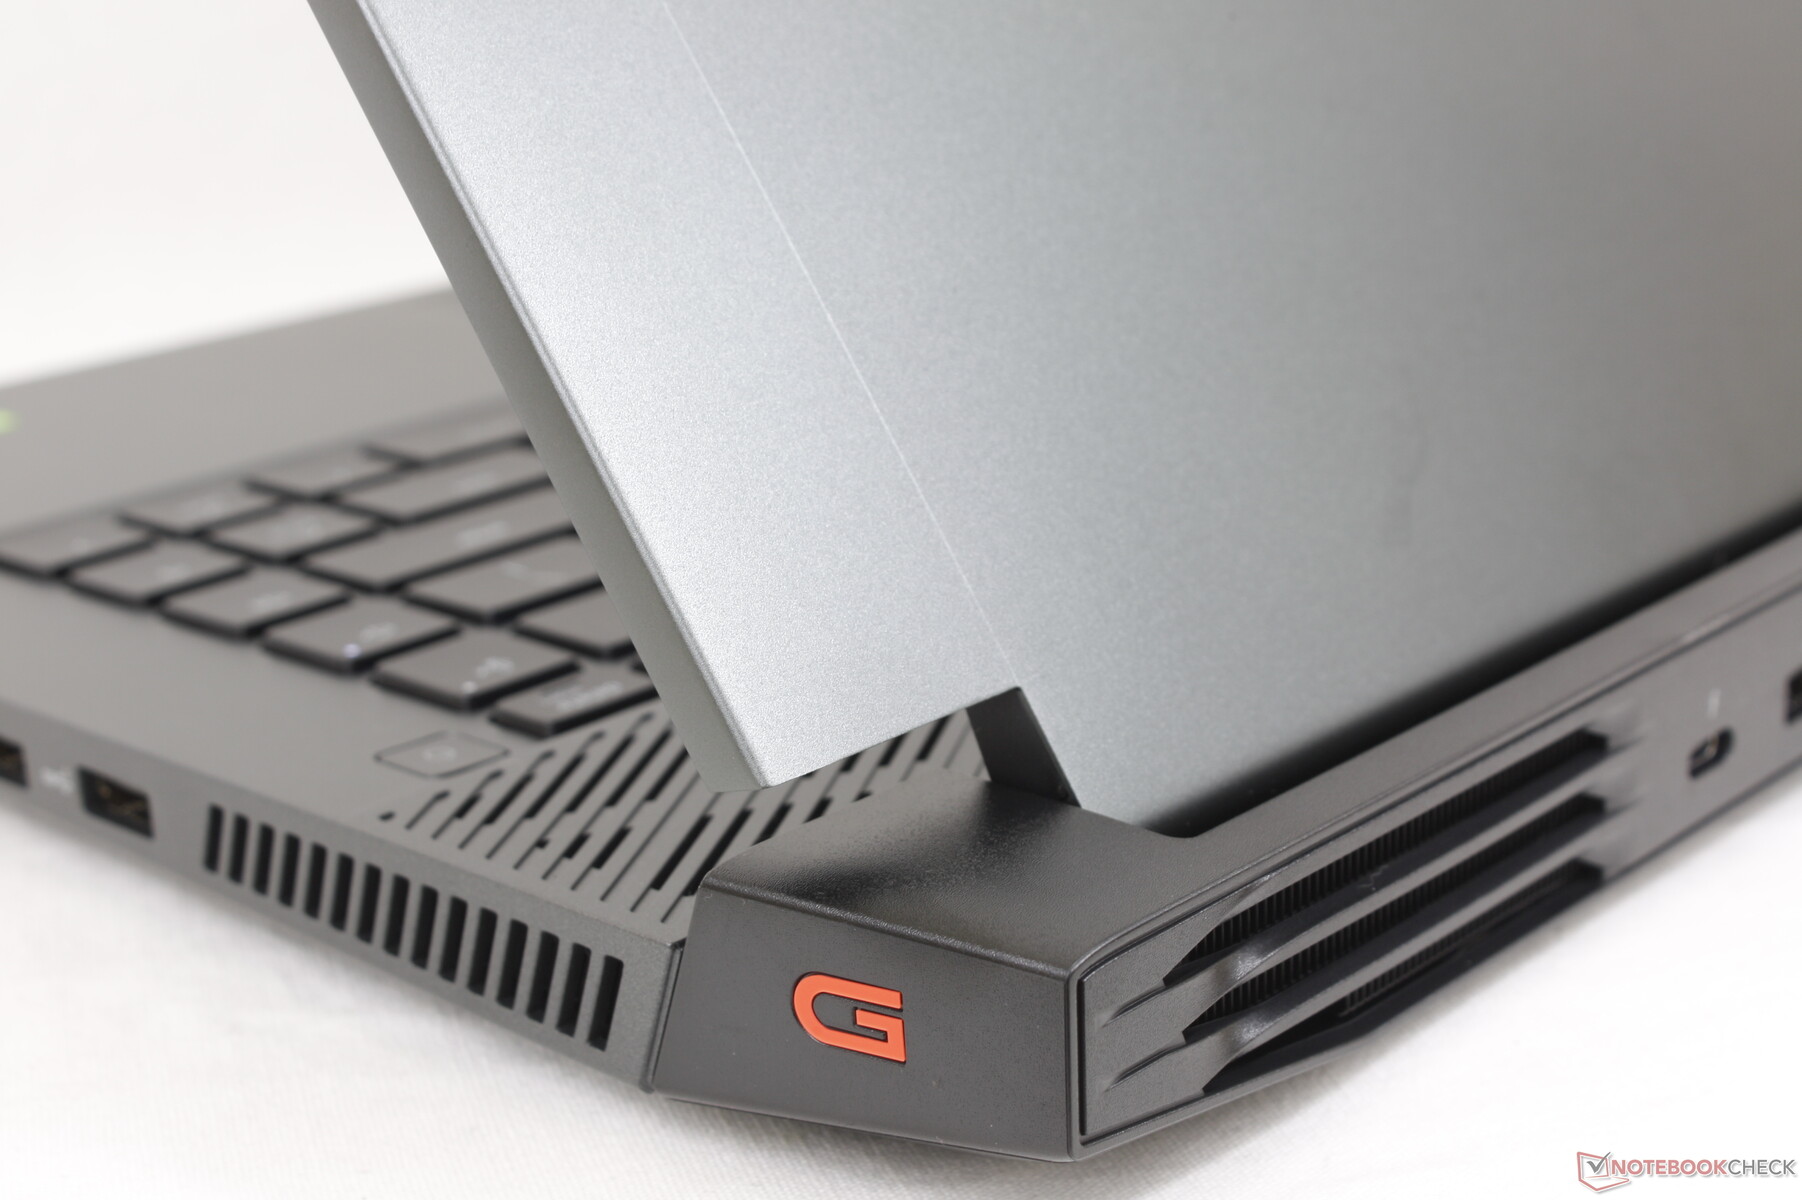
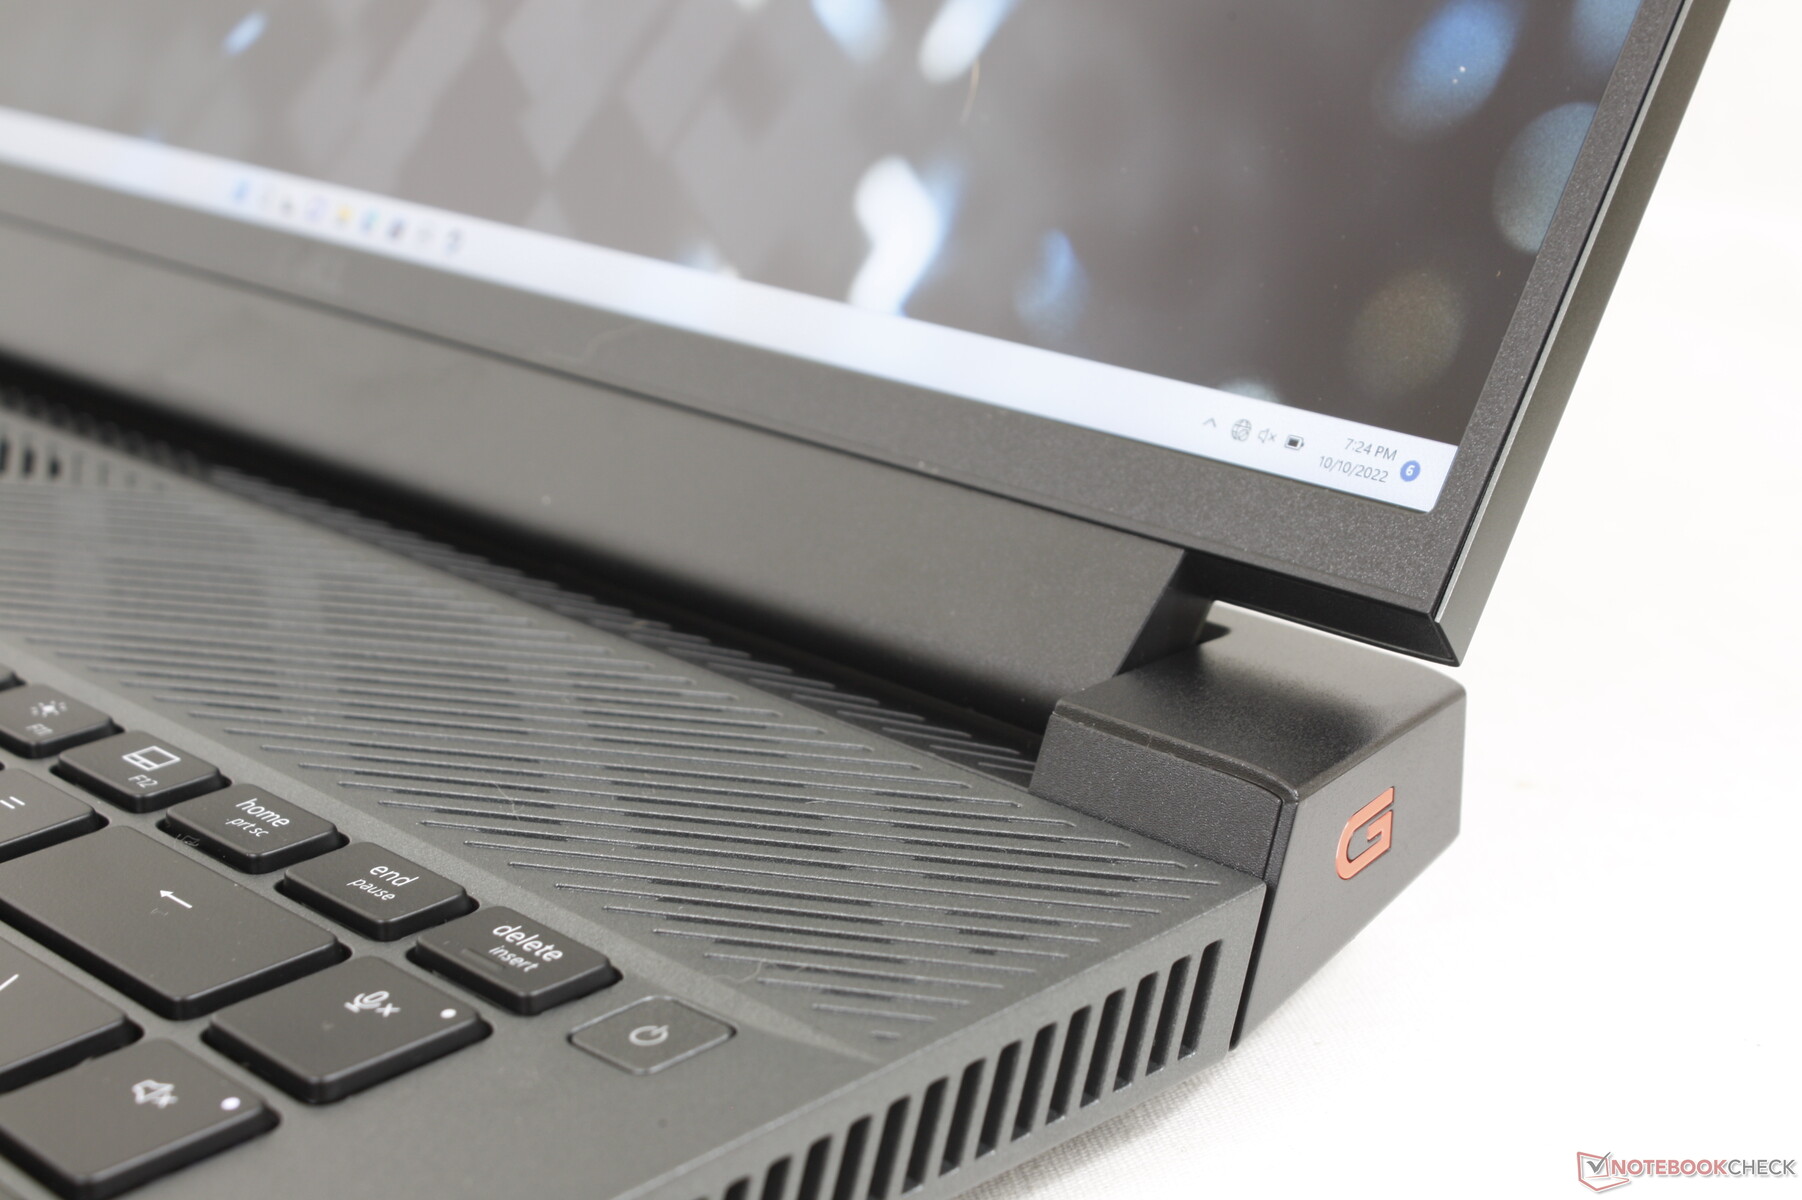
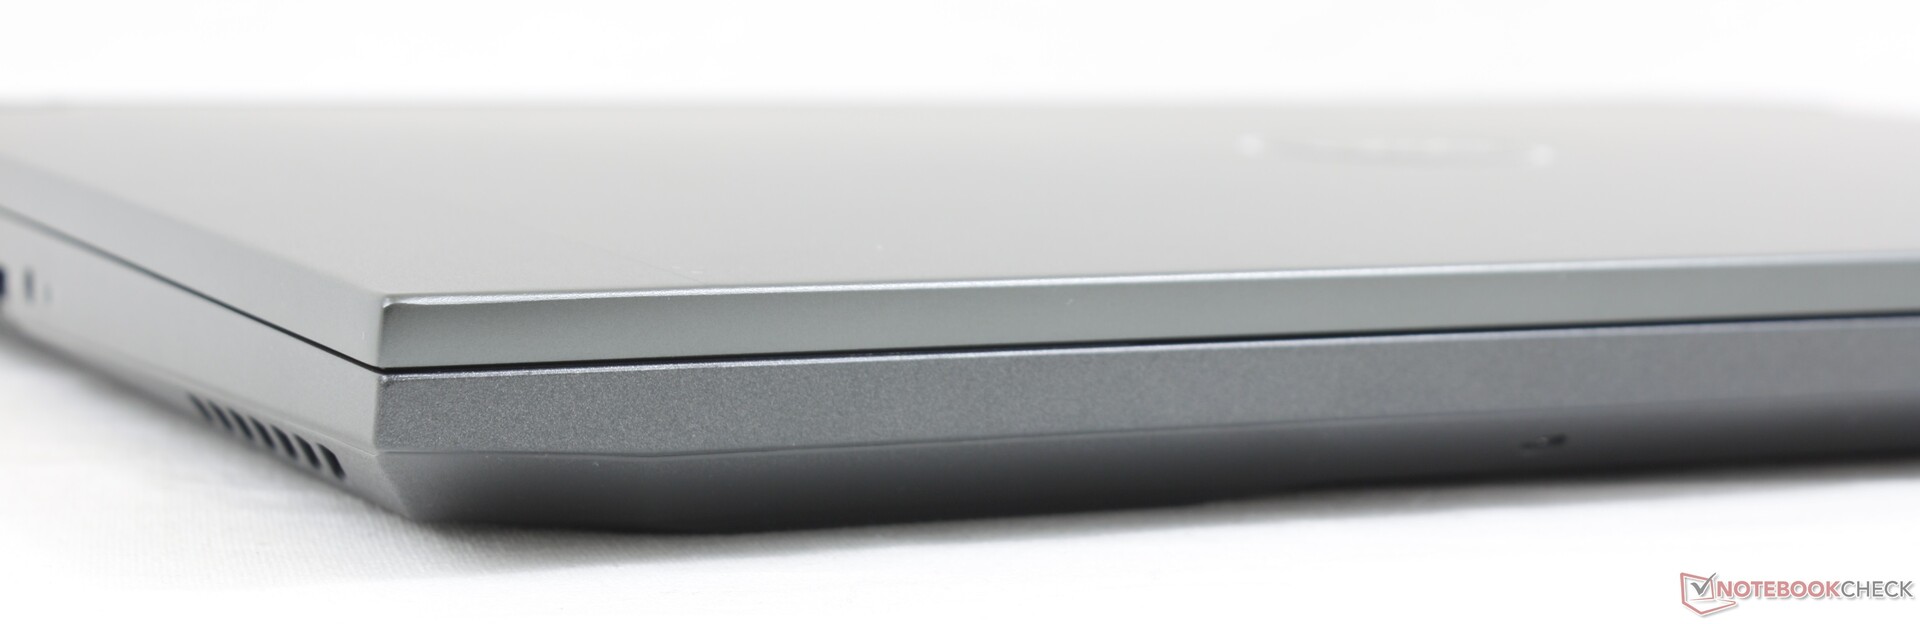
Il design complessivo presenta molte somiglianze con l'attuale 16:9 da 15,6 pollici Dell G15 ma rinnovato per il nuovo fattore di forma 16:10. La base in plastica color ossidiana e i materiali del coperchio in alluminio anodizzato rimangono invariati per garantire una consistenza e una sensazione familiare. l'estetica da "gamer", come la cornice interna lucida del display o l'anello RGB dei portatili Alienware, non è presente sulla serie G.
La rigidità del telaio è solida intorno alla base e al centro della tastiera, dove le flessioni e le torsioni sono minime. Il coperchio presenta una flessione relativamente maggiore, ma non tale da destare preoccupazione.
I portatili da gioco Dell sono in genere più pesanti della concorrenza e il G16 non fa eccezione. Con un peso di 2,6 kg, il modello è più pesante del modello HP Victus 16acer Swift X e Asus Zephyrus M16 di diverse centinaia di grammi ciascuno. Il G16 è di conseguenza più spesso della maggior parte degli altri portatili da gioco della sua categoria.
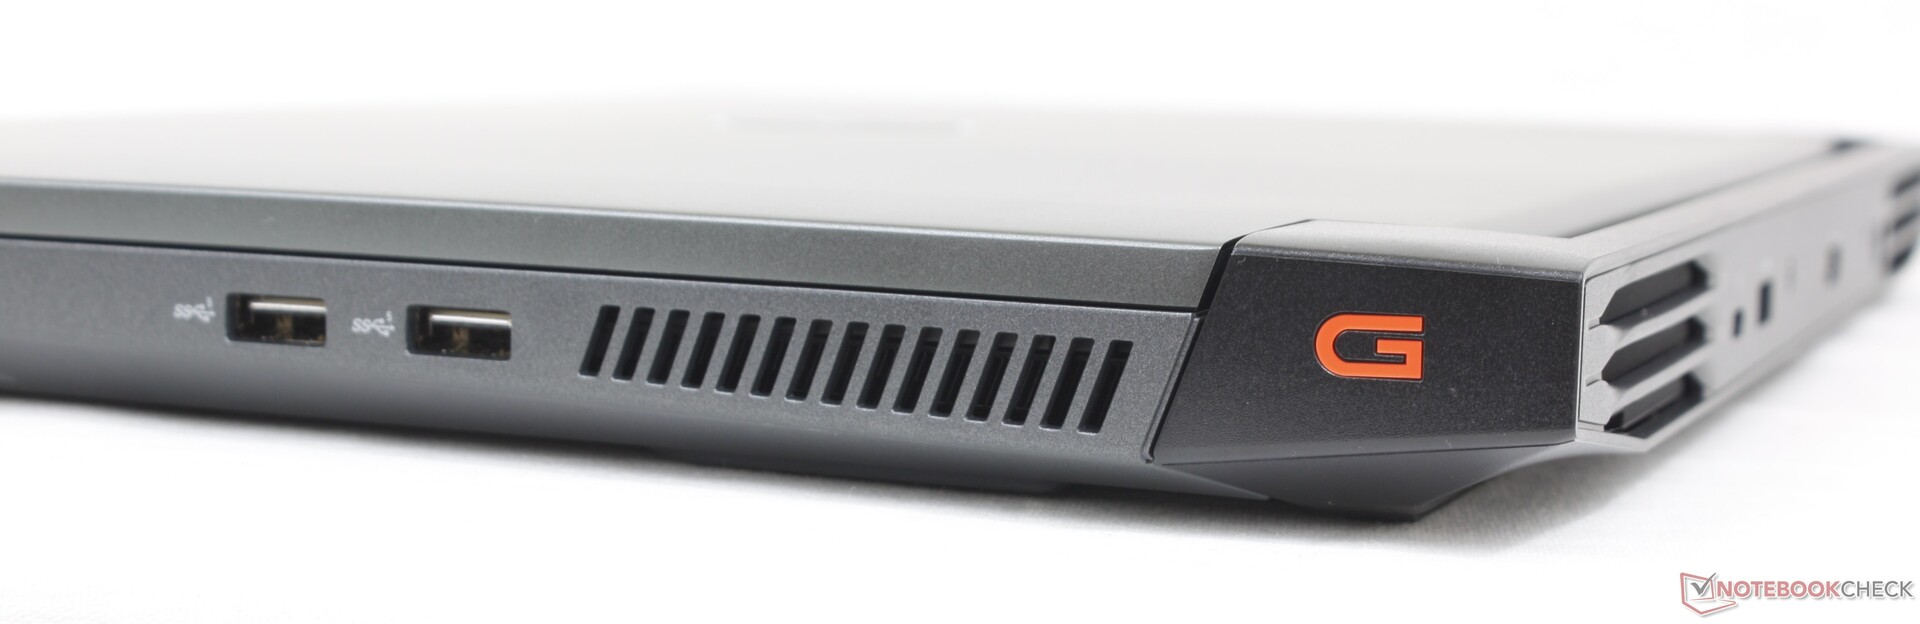
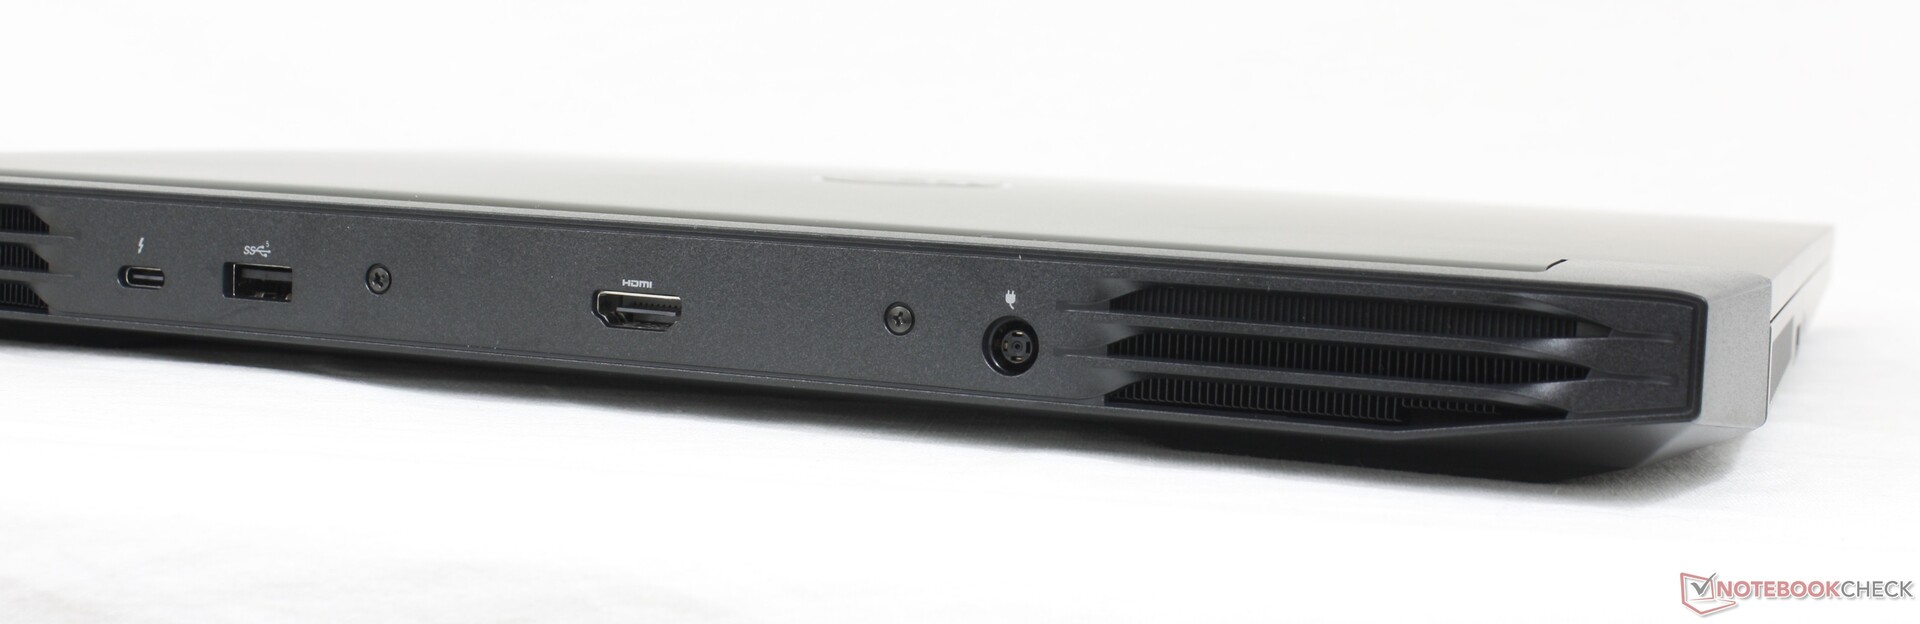
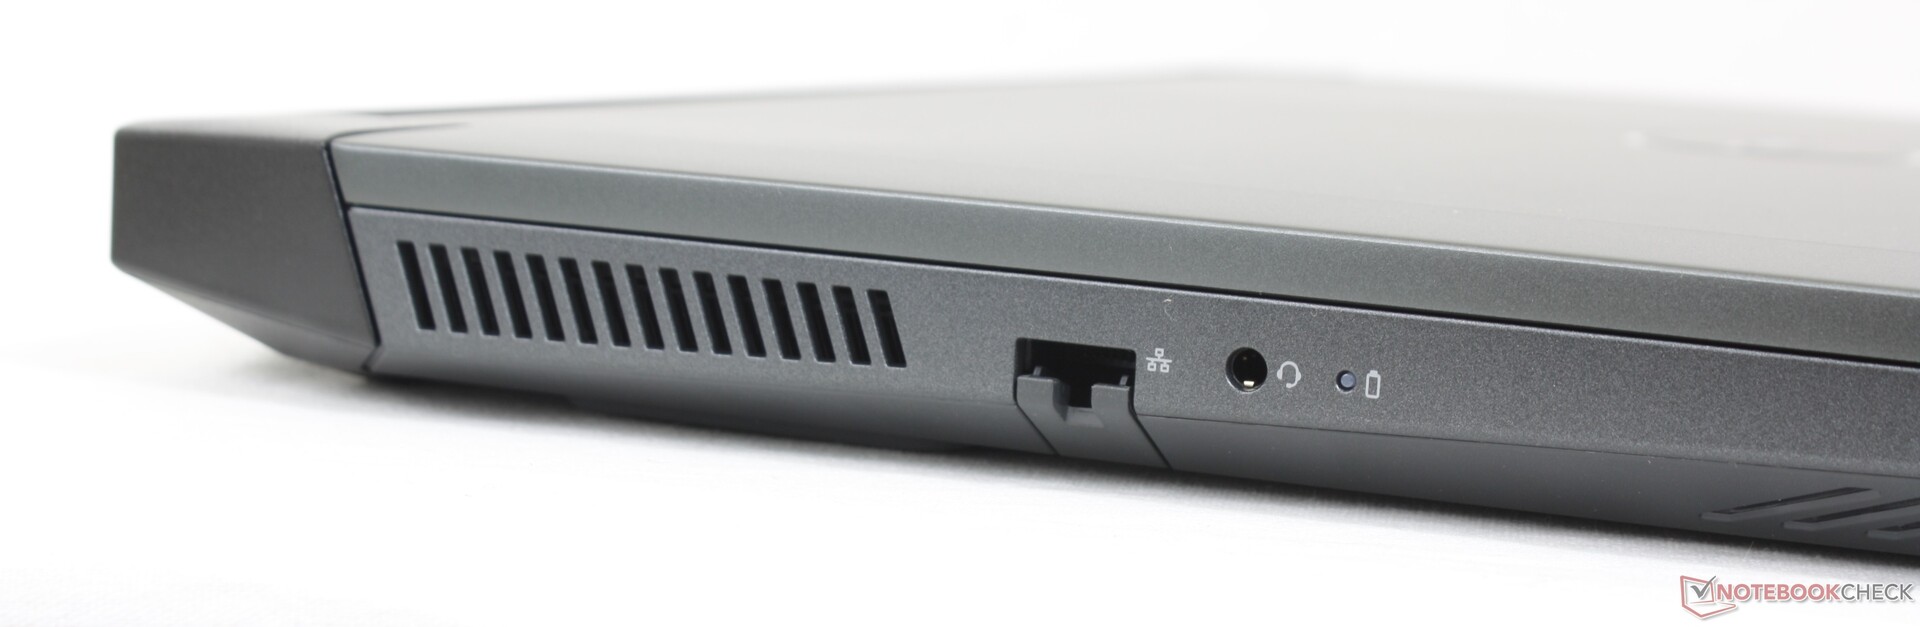
Connettività - Supporto Thunderbolt 4
Le porte sono molto simili a quelle dell'HP Victus 16, anche se riorganizzate. Infatti, la metà delle porte del G16 si trova sul retro a causa delle ampie griglie di ventilazione sui bordi destro e sinistro. Ci piacerebbe vedere un maggior numero di porte USB-C in futuro, dato che ce n'è solo una rispetto alle tre della concorrenza.Lenovo Legion 5 Pro.
Comunicazione - 6 GHz Non incluso
La connettività Wi-Fi 6 e Bluetooth 5.2 è garantita da un Intel AX201 di serie. Non ci sono opzioni Wi-Fi 6E che possano far risparmiare sui costi. Le velocità di trasferimento sono comunque costanti, se non addirittura insignificanti, quando sono state accoppiate al nostro router AXE11000.
| Networking | |
| iperf3 transmit AX12 | |
| Acer Swift X SFX16-51G-5388 | |
| Asus ROG Zephyrus M16 GU603H | |
| iperf3 receive AX12 | |
| Acer Swift X SFX16-51G-5388 | |
| Asus ROG Zephyrus M16 GU603H | |
| iperf3 receive AXE11000 6GHz | |
| Lenovo Legion 5 Pro 16IAH7H | |
| Lenovo Legion 7 16ARHA7 | |
| iperf3 receive AXE11000 | |
| Dell G16 7620 | |
| HP Victus 16-e0145ng | |
| iperf3 transmit AXE11000 6GHz | |
| Lenovo Legion 7 16ARHA7 | |
| Lenovo Legion 5 Pro 16IAH7H | |
| iperf3 transmit AXE11000 | |
| Dell G16 7620 | |
| HP Victus 16-e0145ng | |
Webcam
La webcam è una deludente 1 MP per un'immagine molto confusa. Non c'è nemmeno un sensore IR o un otturatore per la privacy.


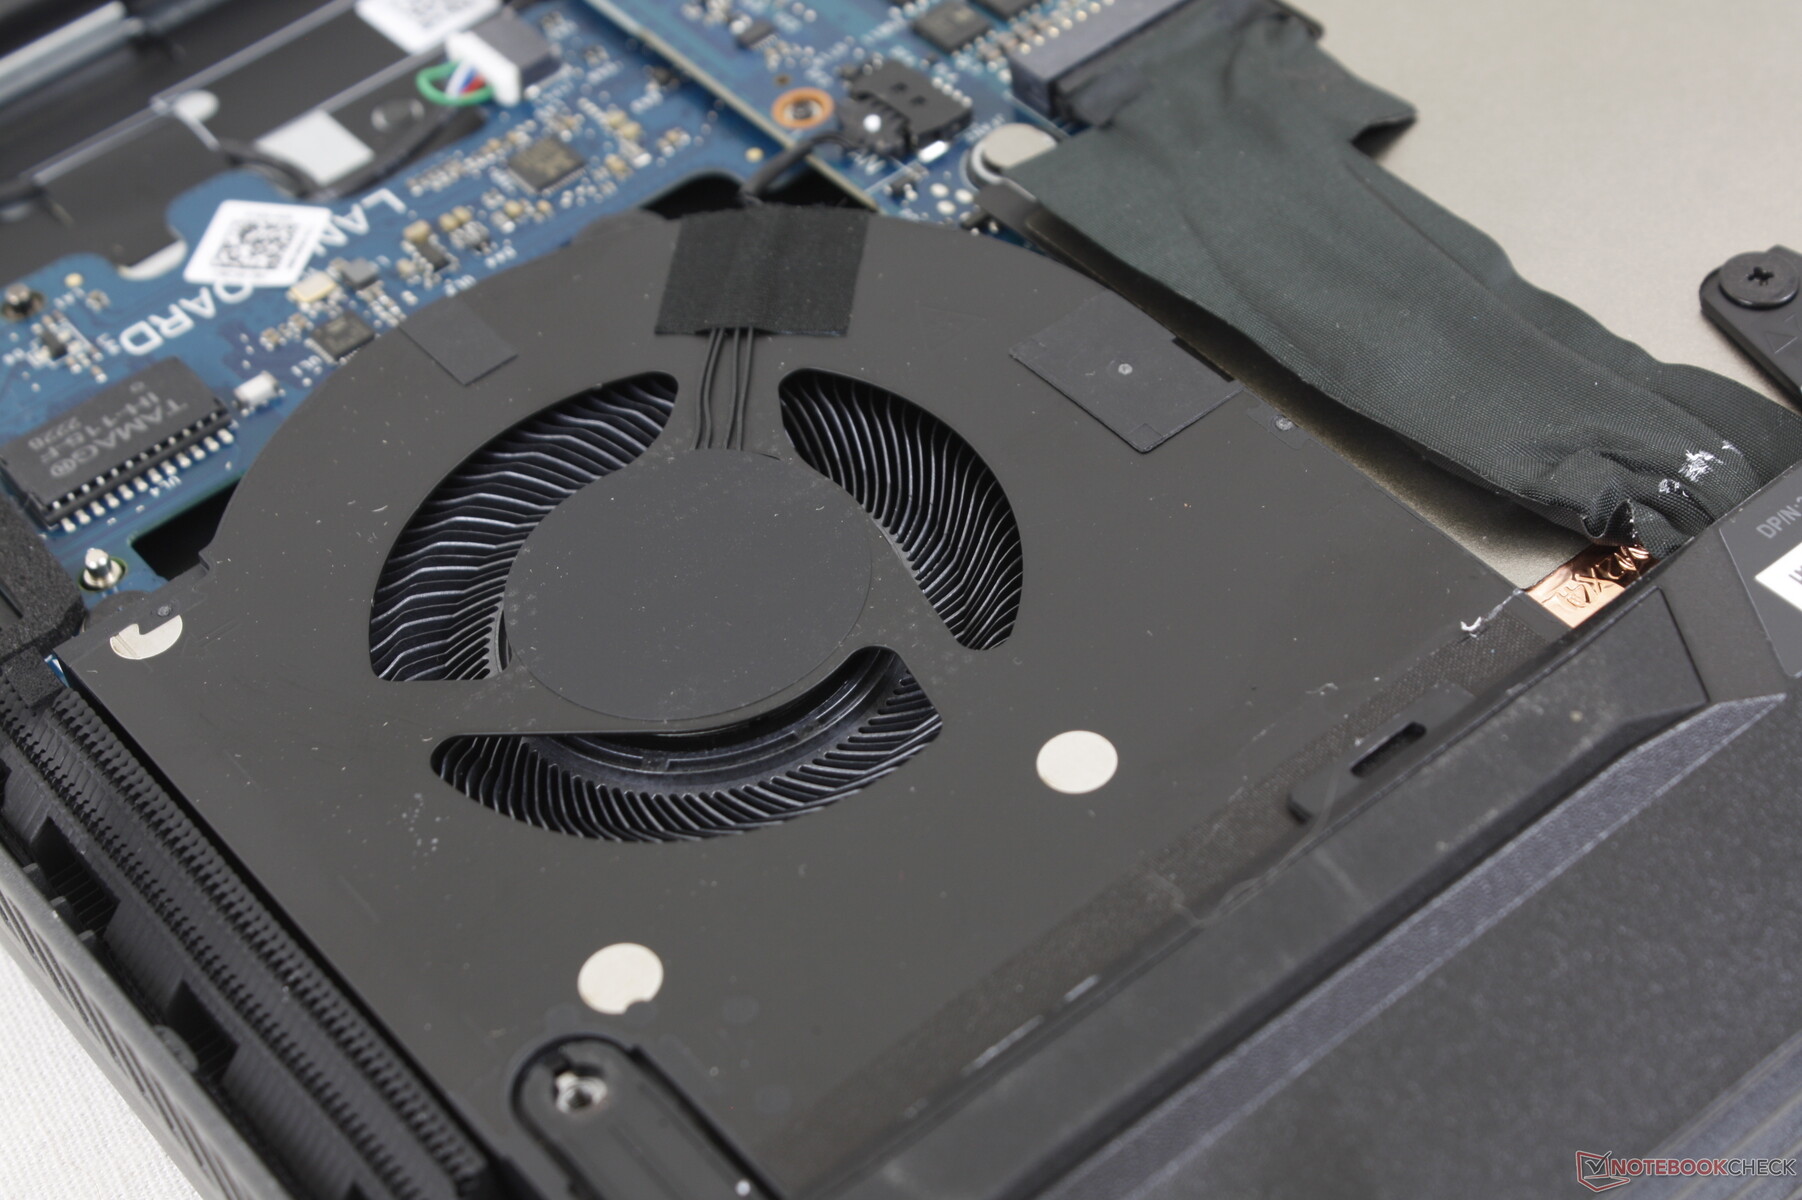
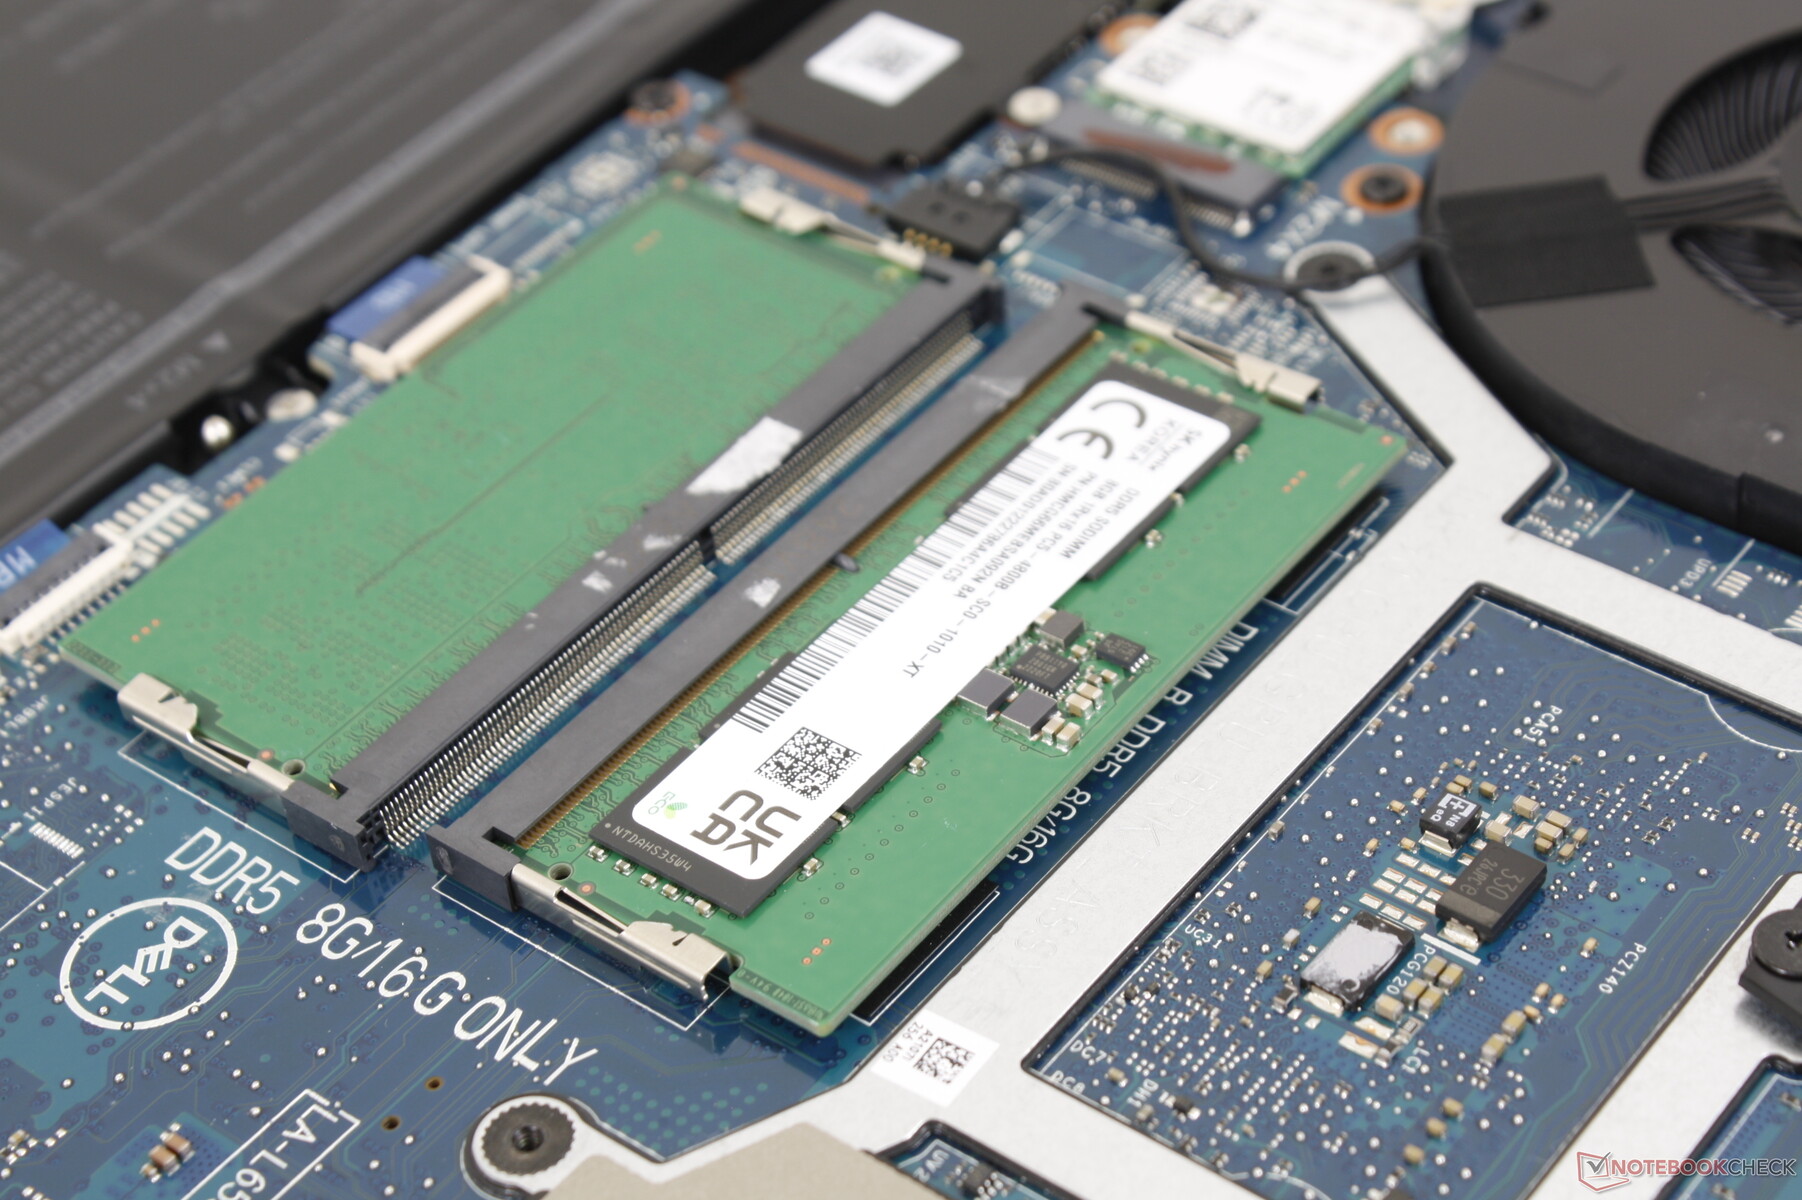
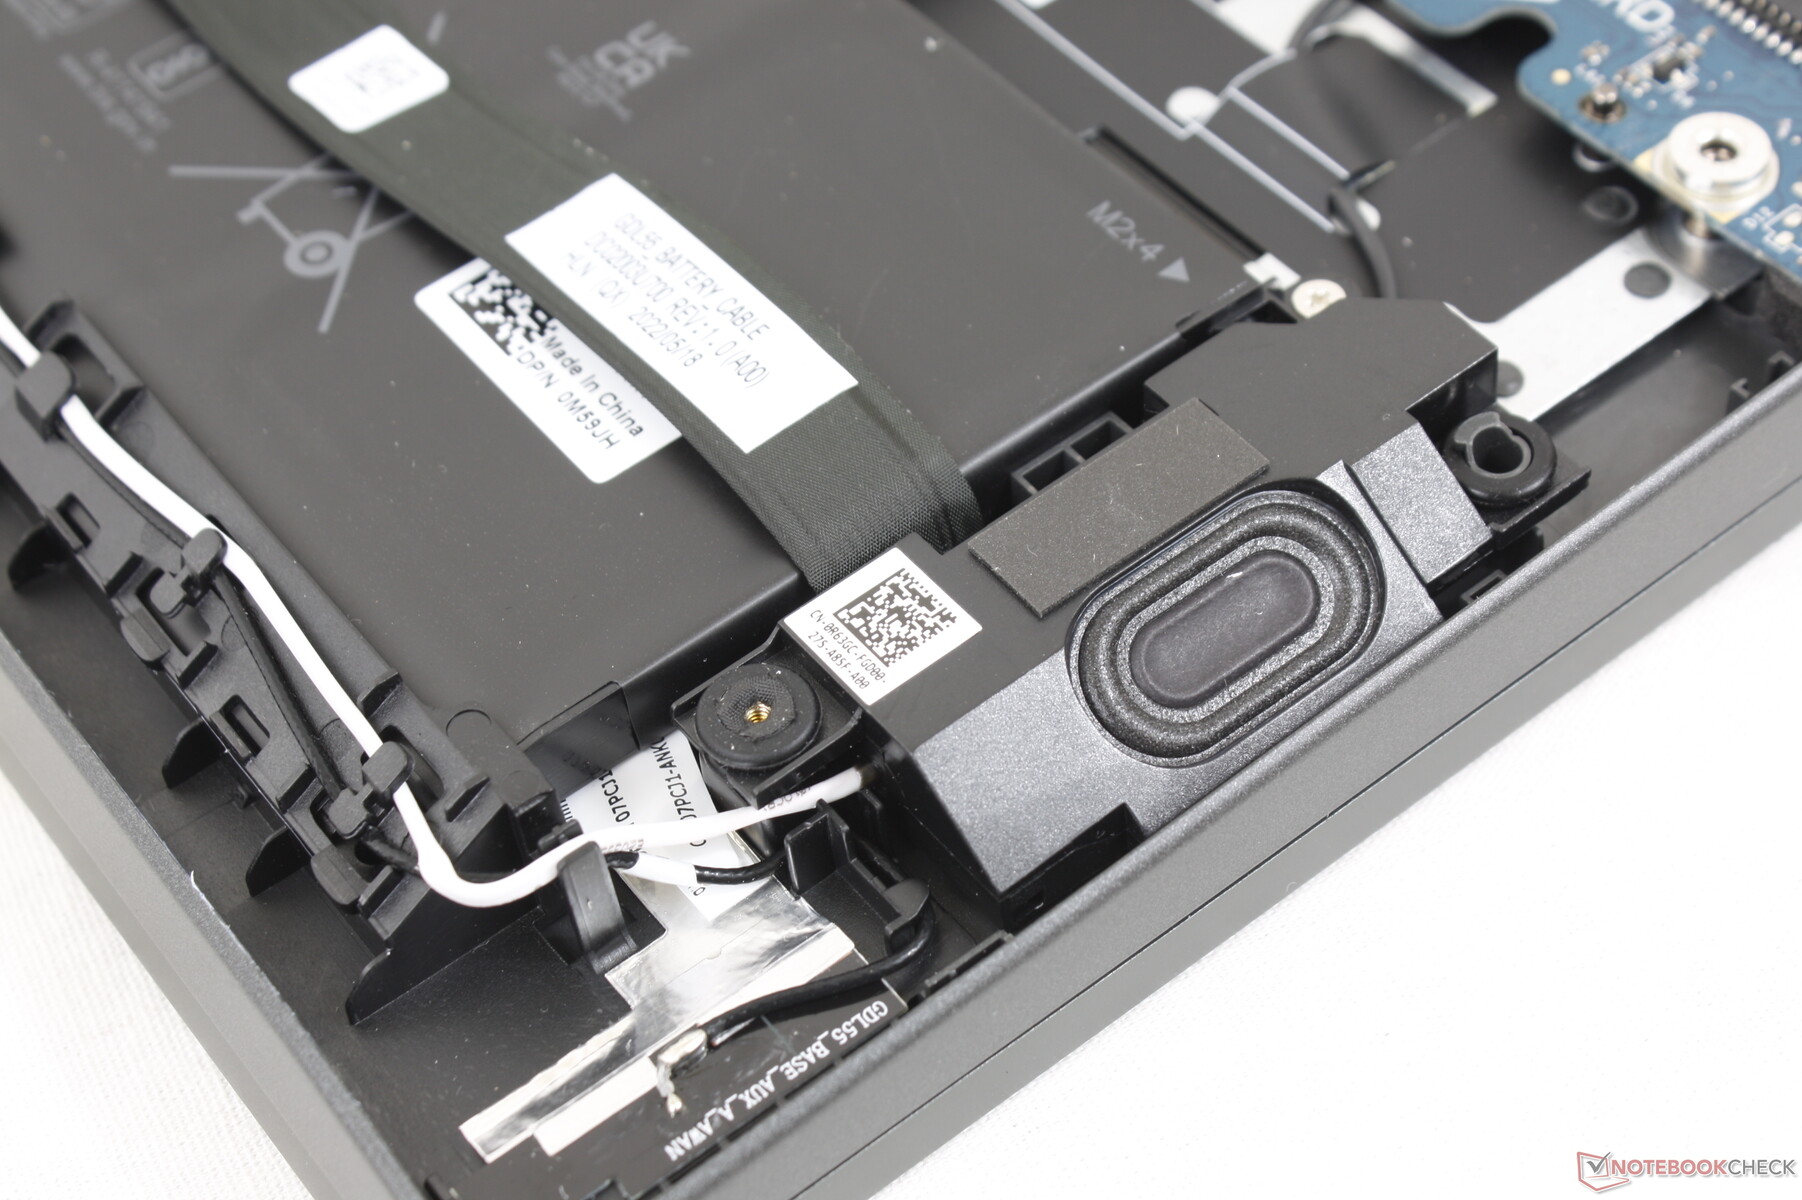
Manutenzione
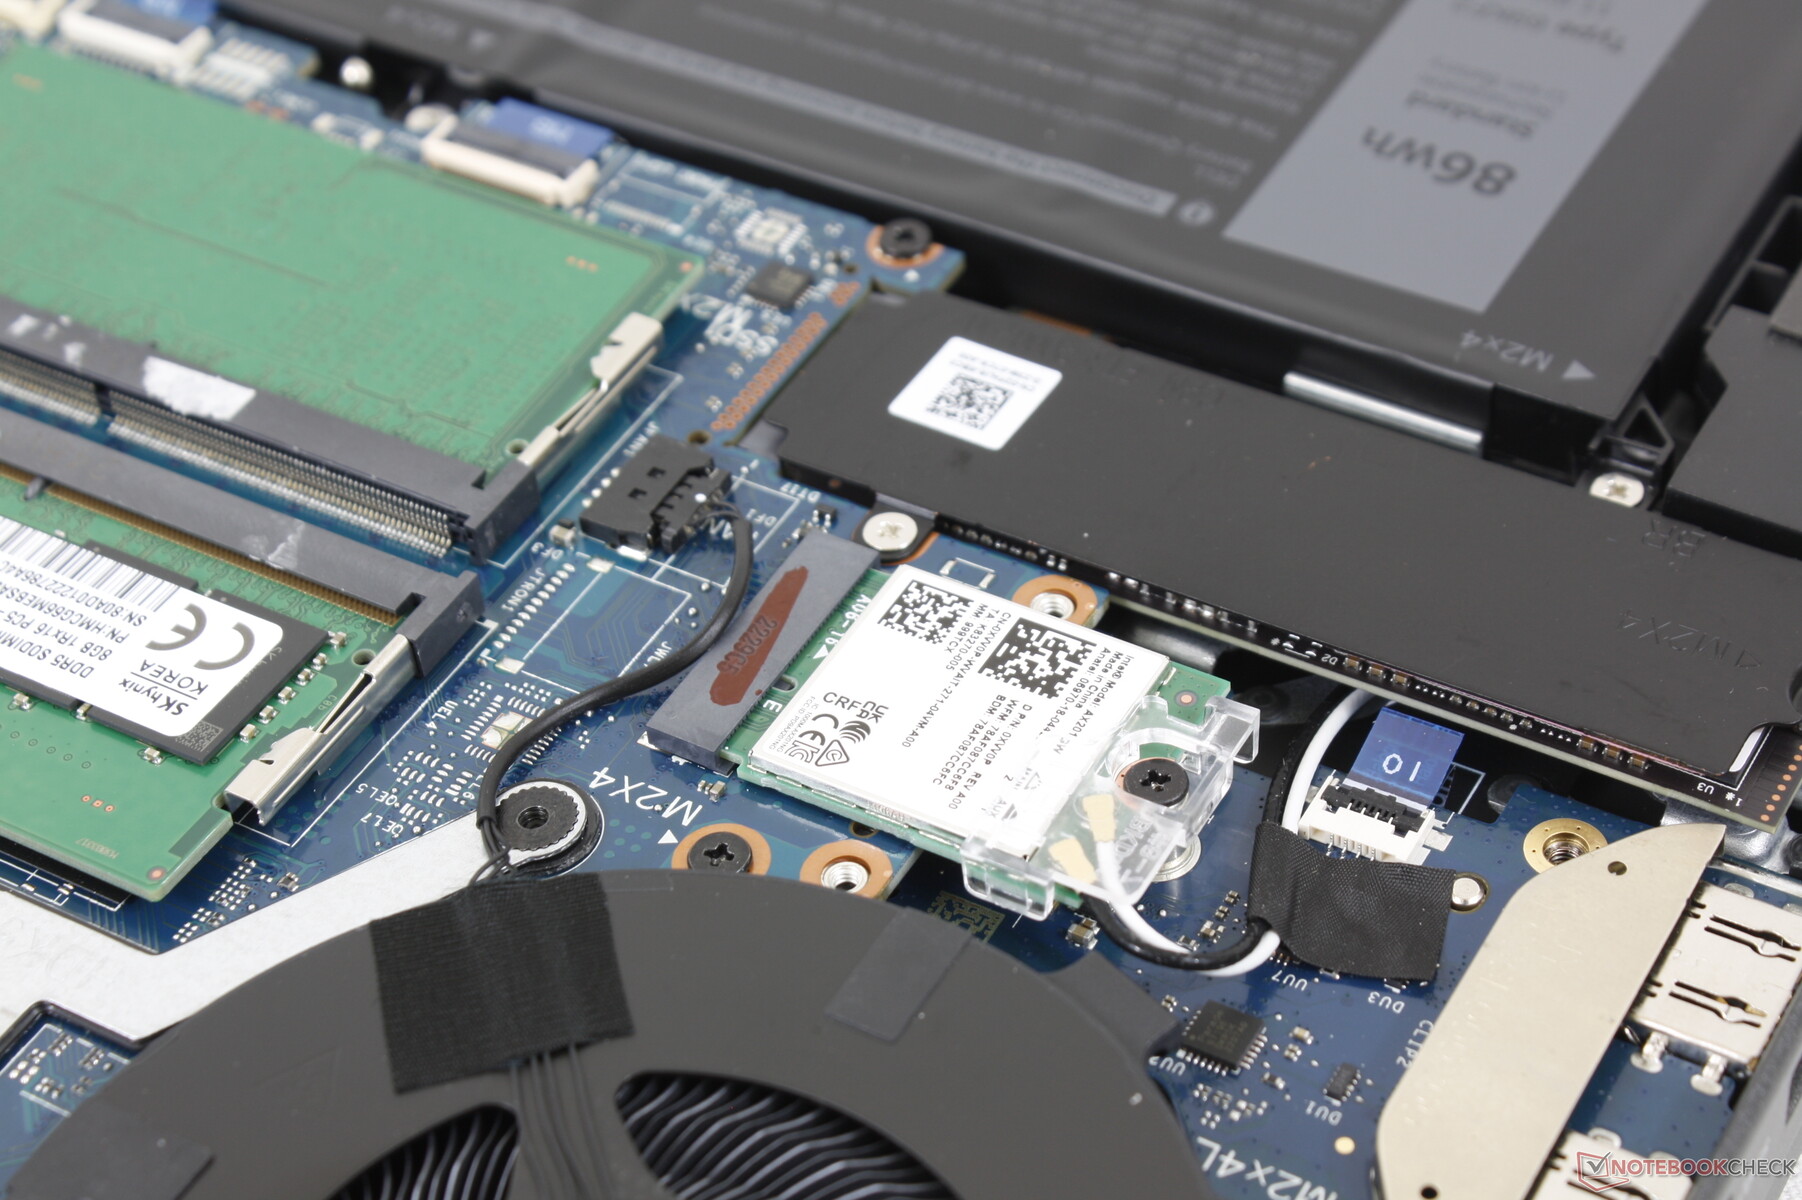
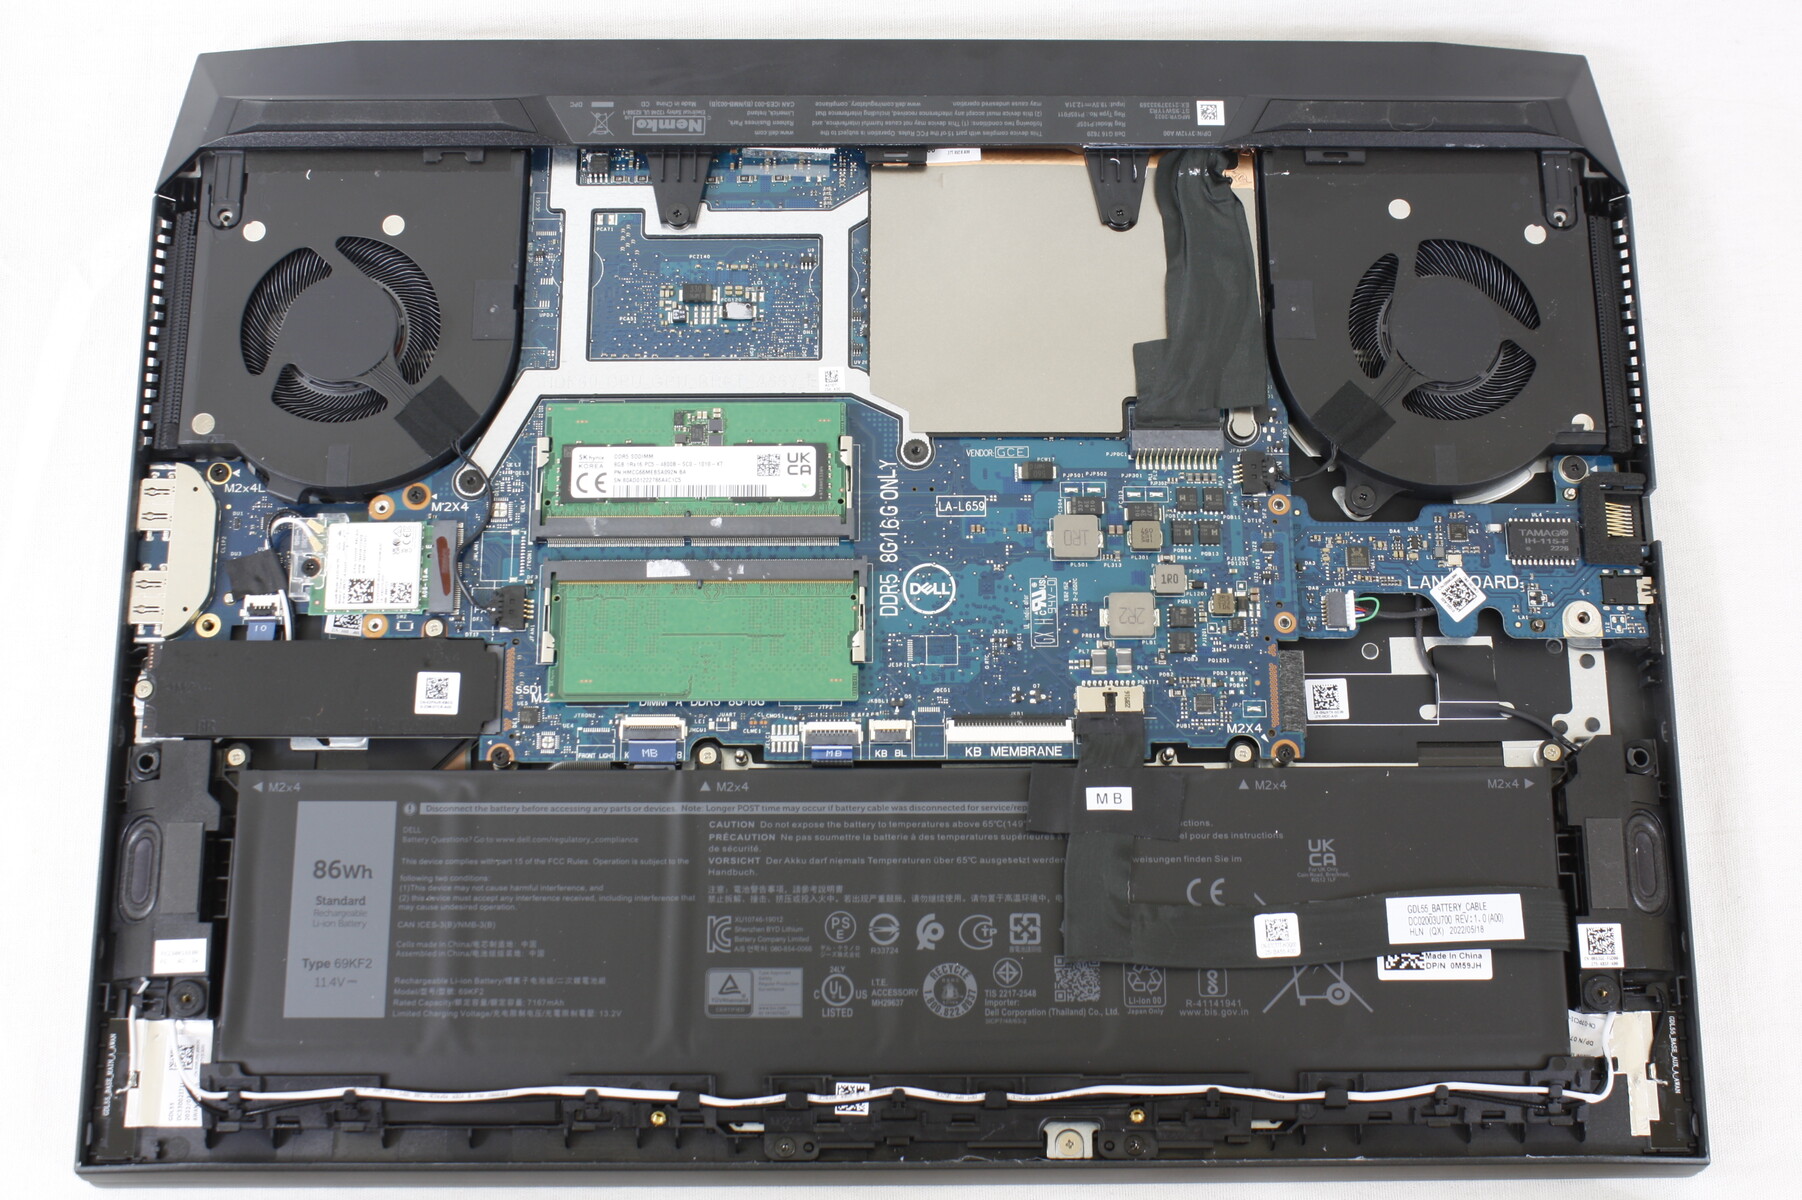
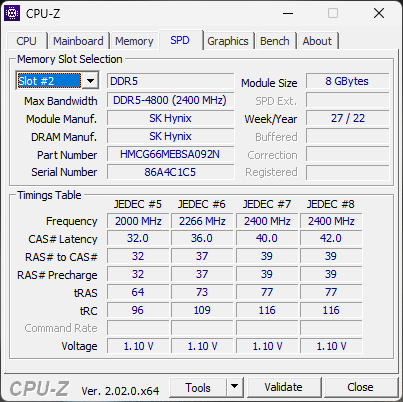
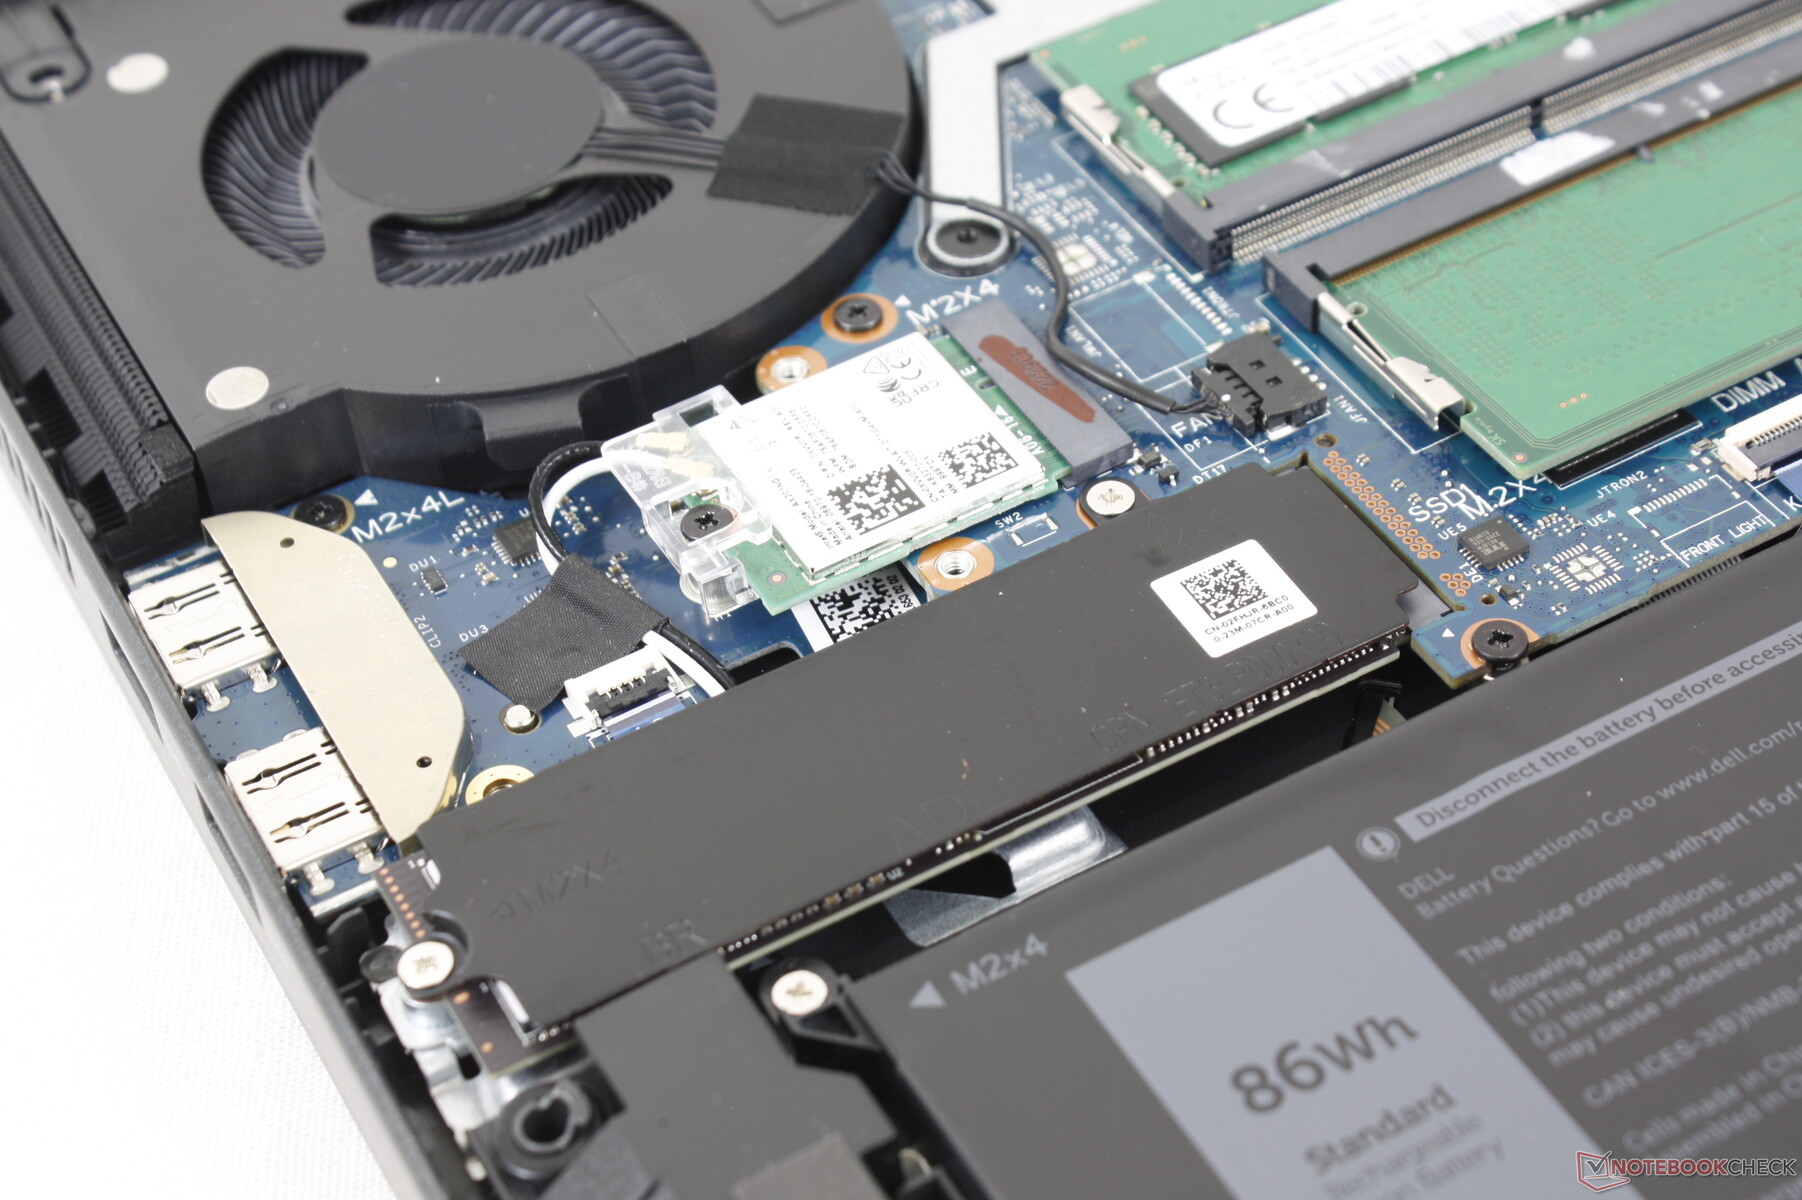
Il pannello inferiore è fissato da 8 viti Philips per facilitare la manutenzione. Gli utenti hanno accesso diretto a 2 slot SODIMM DDR5, 1 slot SSD M.2 2280, batteria e modulo WLAN M.2 rimovibile. Le heat pipe e i processori si trovano sul lato opposto e richiedono un ulteriore smontaggio per essere accessibili.
Accessori e garanzia
La confezione non contiene altri extra oltre all'adattatore CA e alla documentazione. Se acquistato negli Stati Uniti, si applica la consueta garanzia limitata di un anno del produttore.
Dispositivi di input - Niente più Numpad
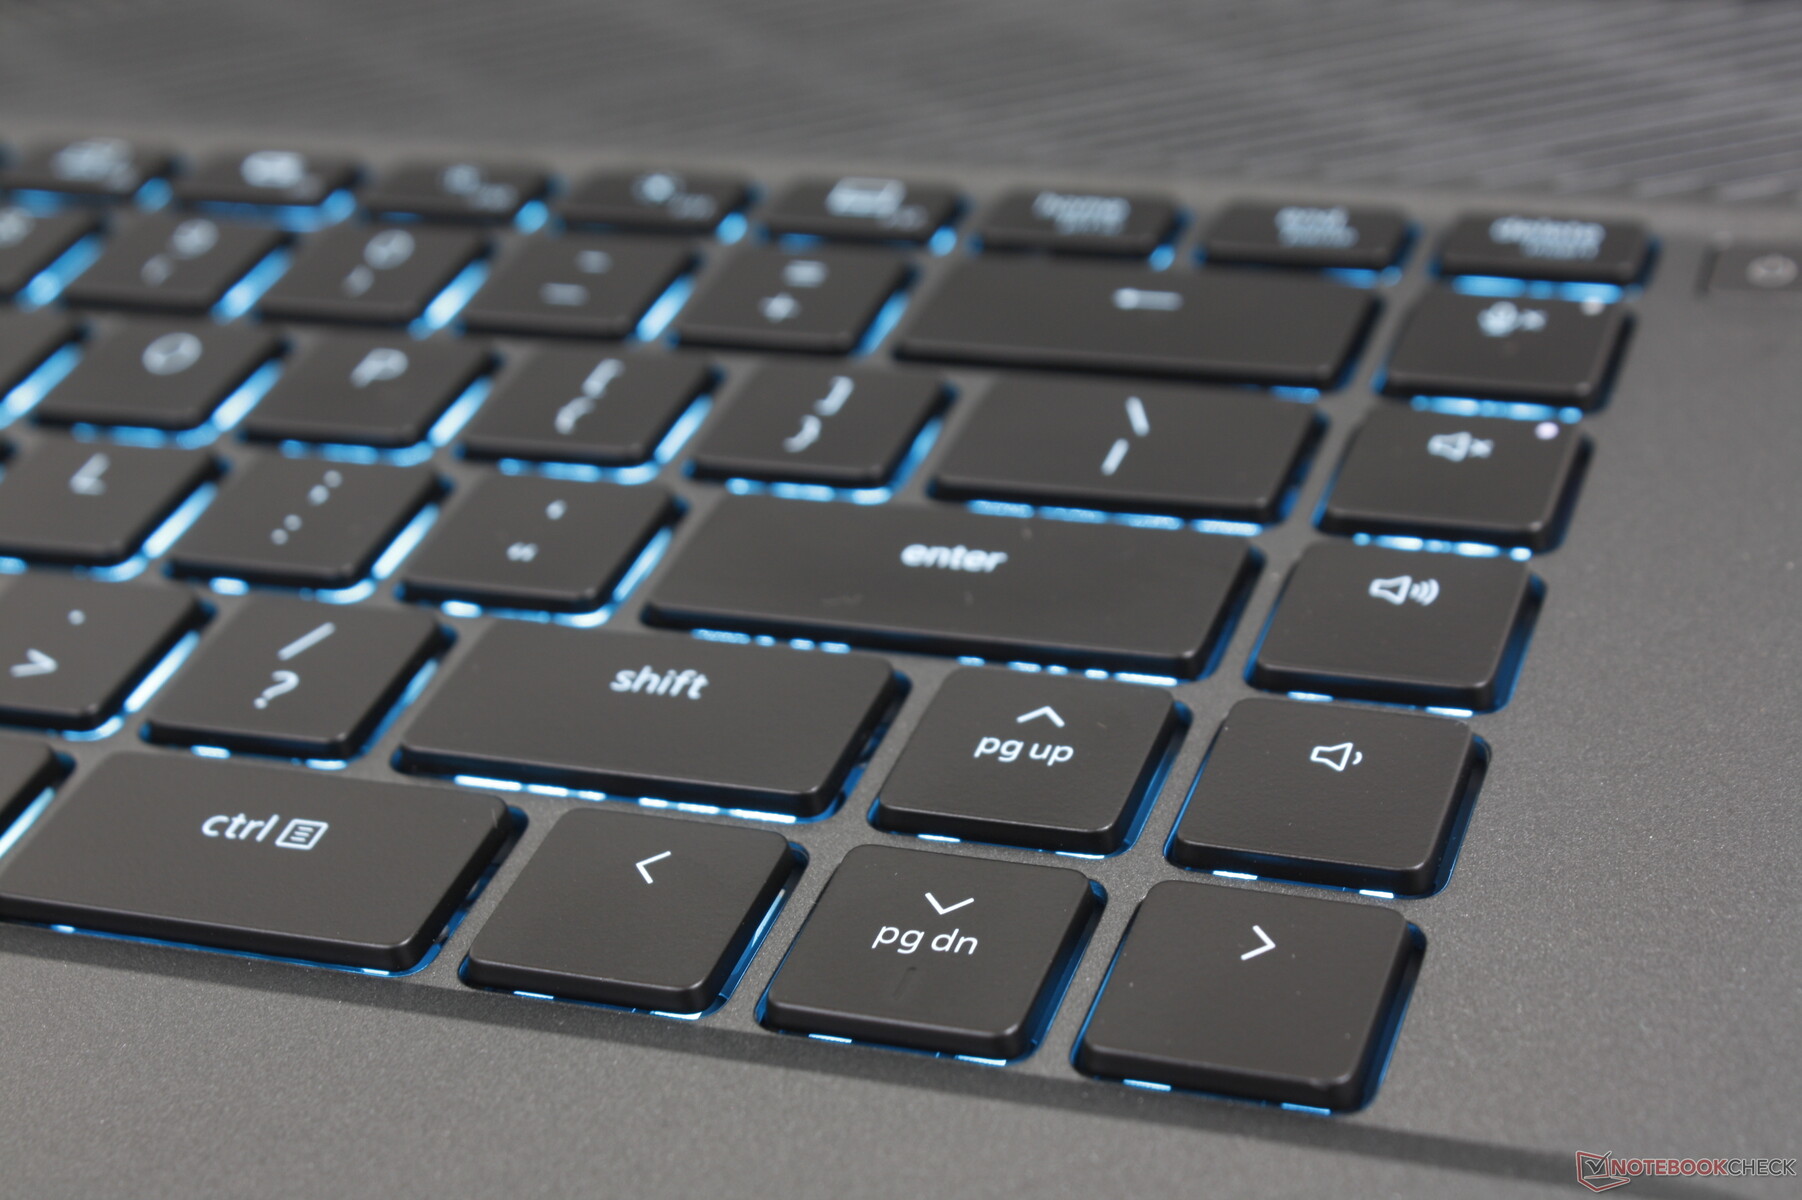
Tastiera
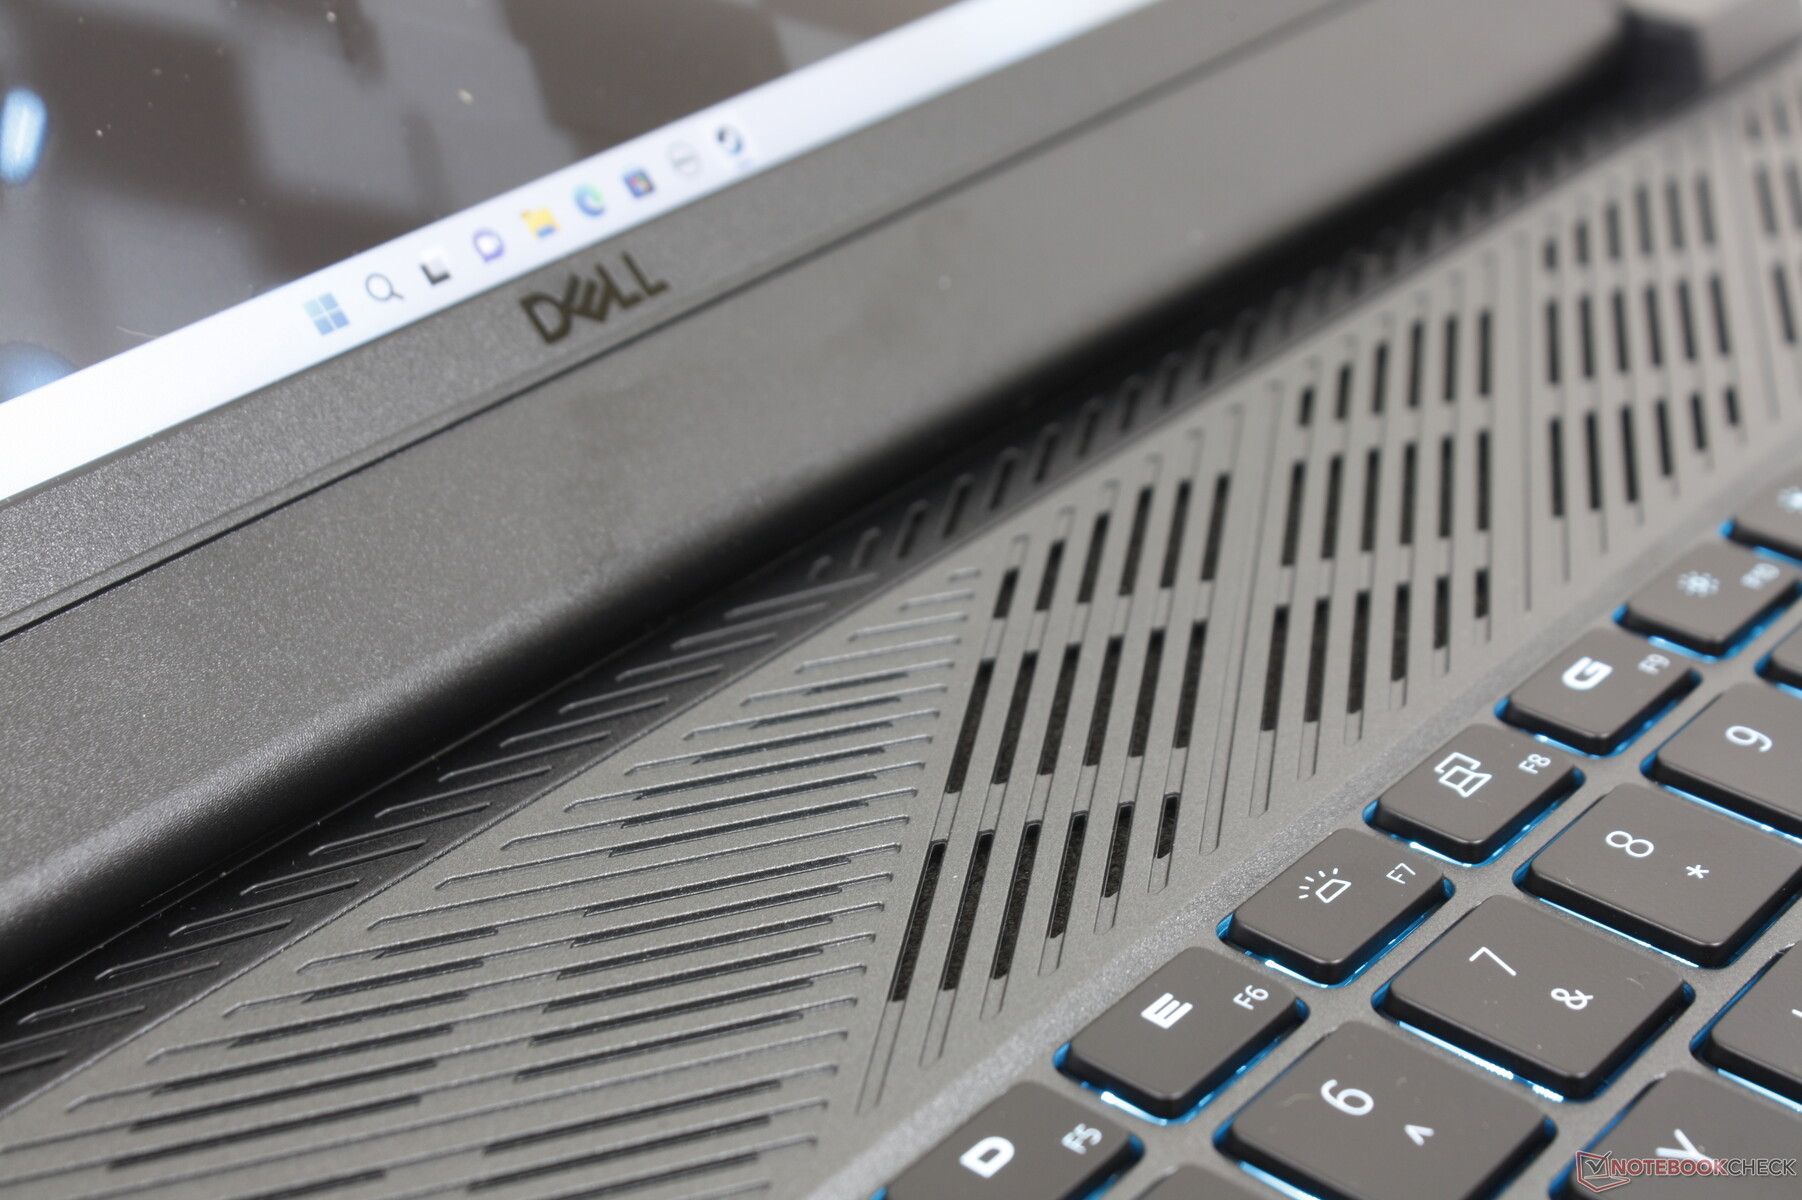
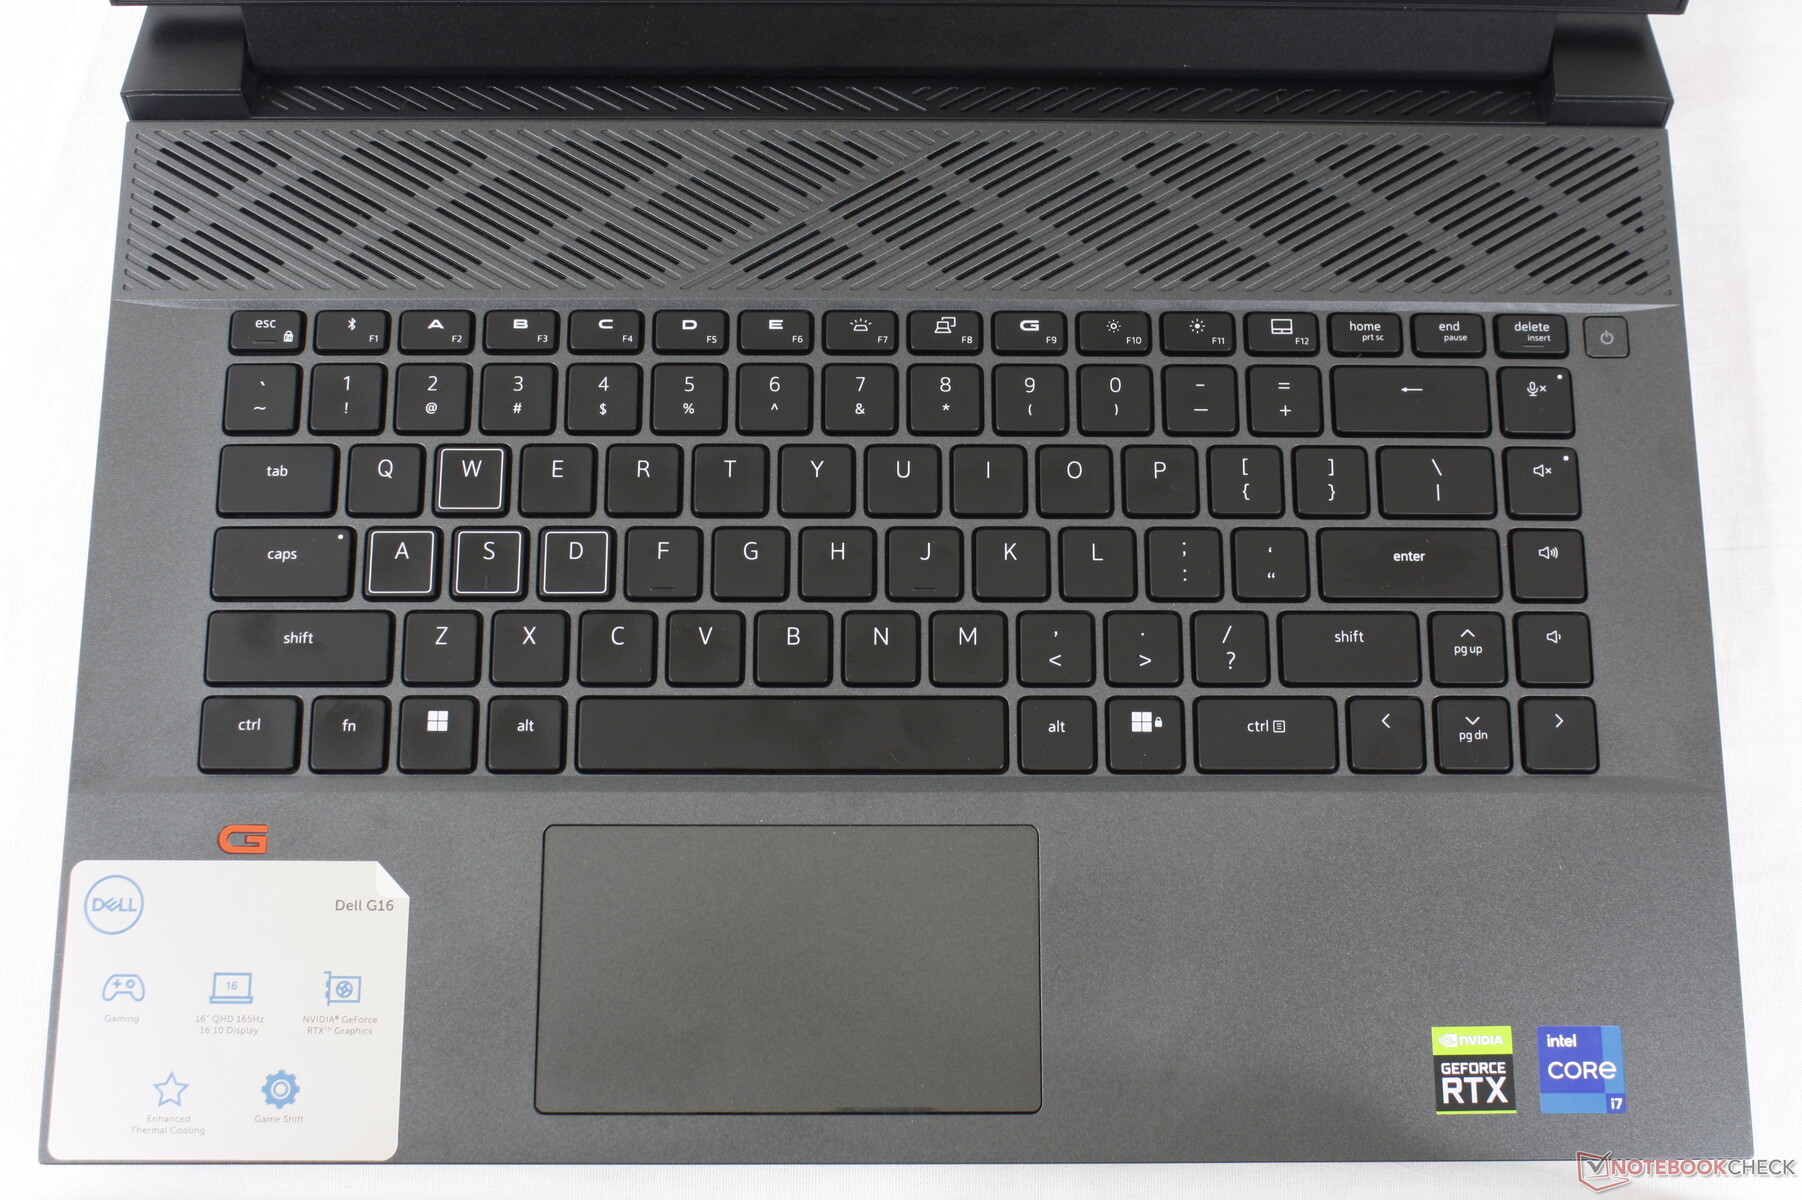
Sebbene Dell avrebbe potuto facilmente utilizzare la stessa tastiera del G15 per il suo nuovo modello G16, ha invece optato per una tastiera completamente diversa. La tastiera del G16 ha eliminato il tastierino numerico a favore di tasti freccia a grandezza naturale, il che non è un buon risultato a seconda dell'applicazione o del gioco. Il lato positivo è che il feedback dei tasti è più nitido e deciso rispetto al modello G15, per un'esperienza di digitazione più soddisfacente.
Purtroppo, gli utenti dovranno pagare di più per la funzione di illuminazione RGB per tasto del G16. Per il resto, il modello è dotato di una retroilluminazione a LED blu a zona singola, come mostrano le immagini qui sotto.
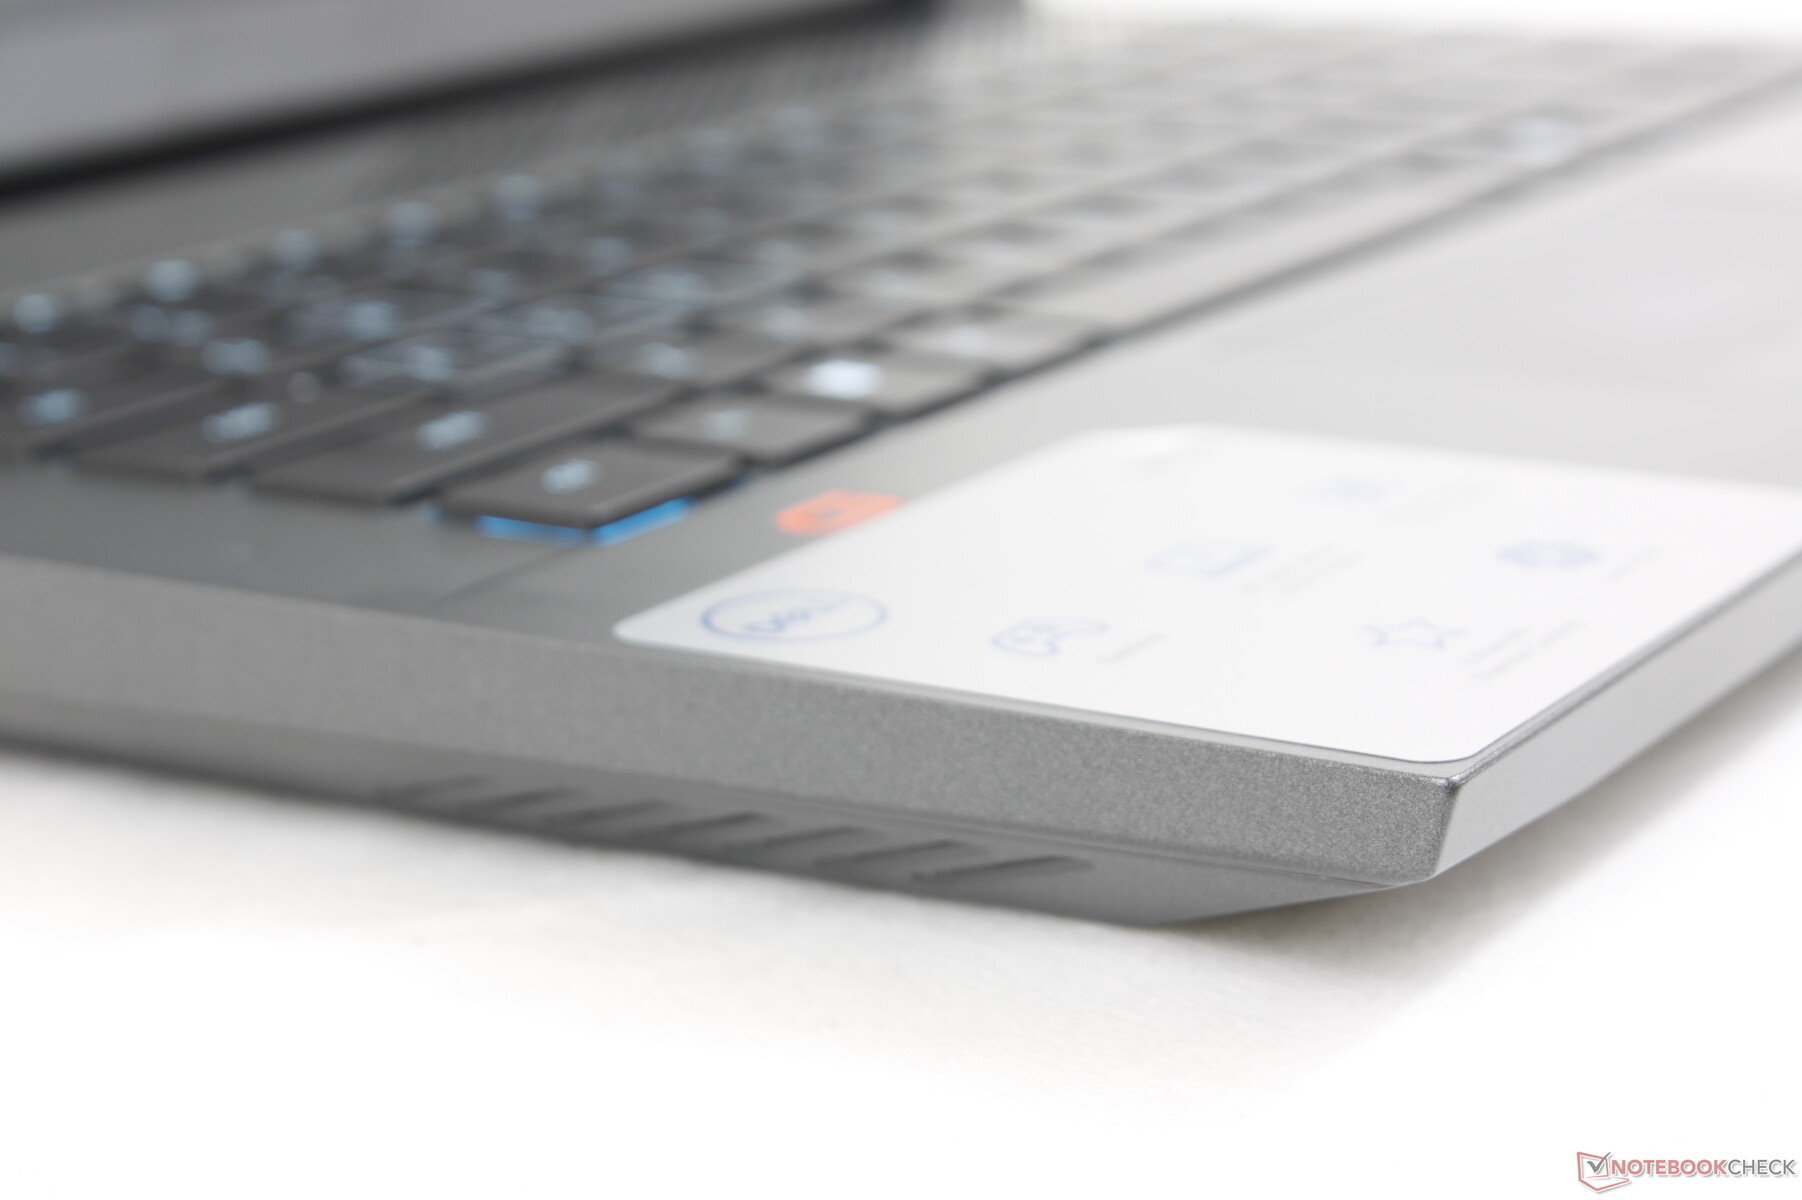
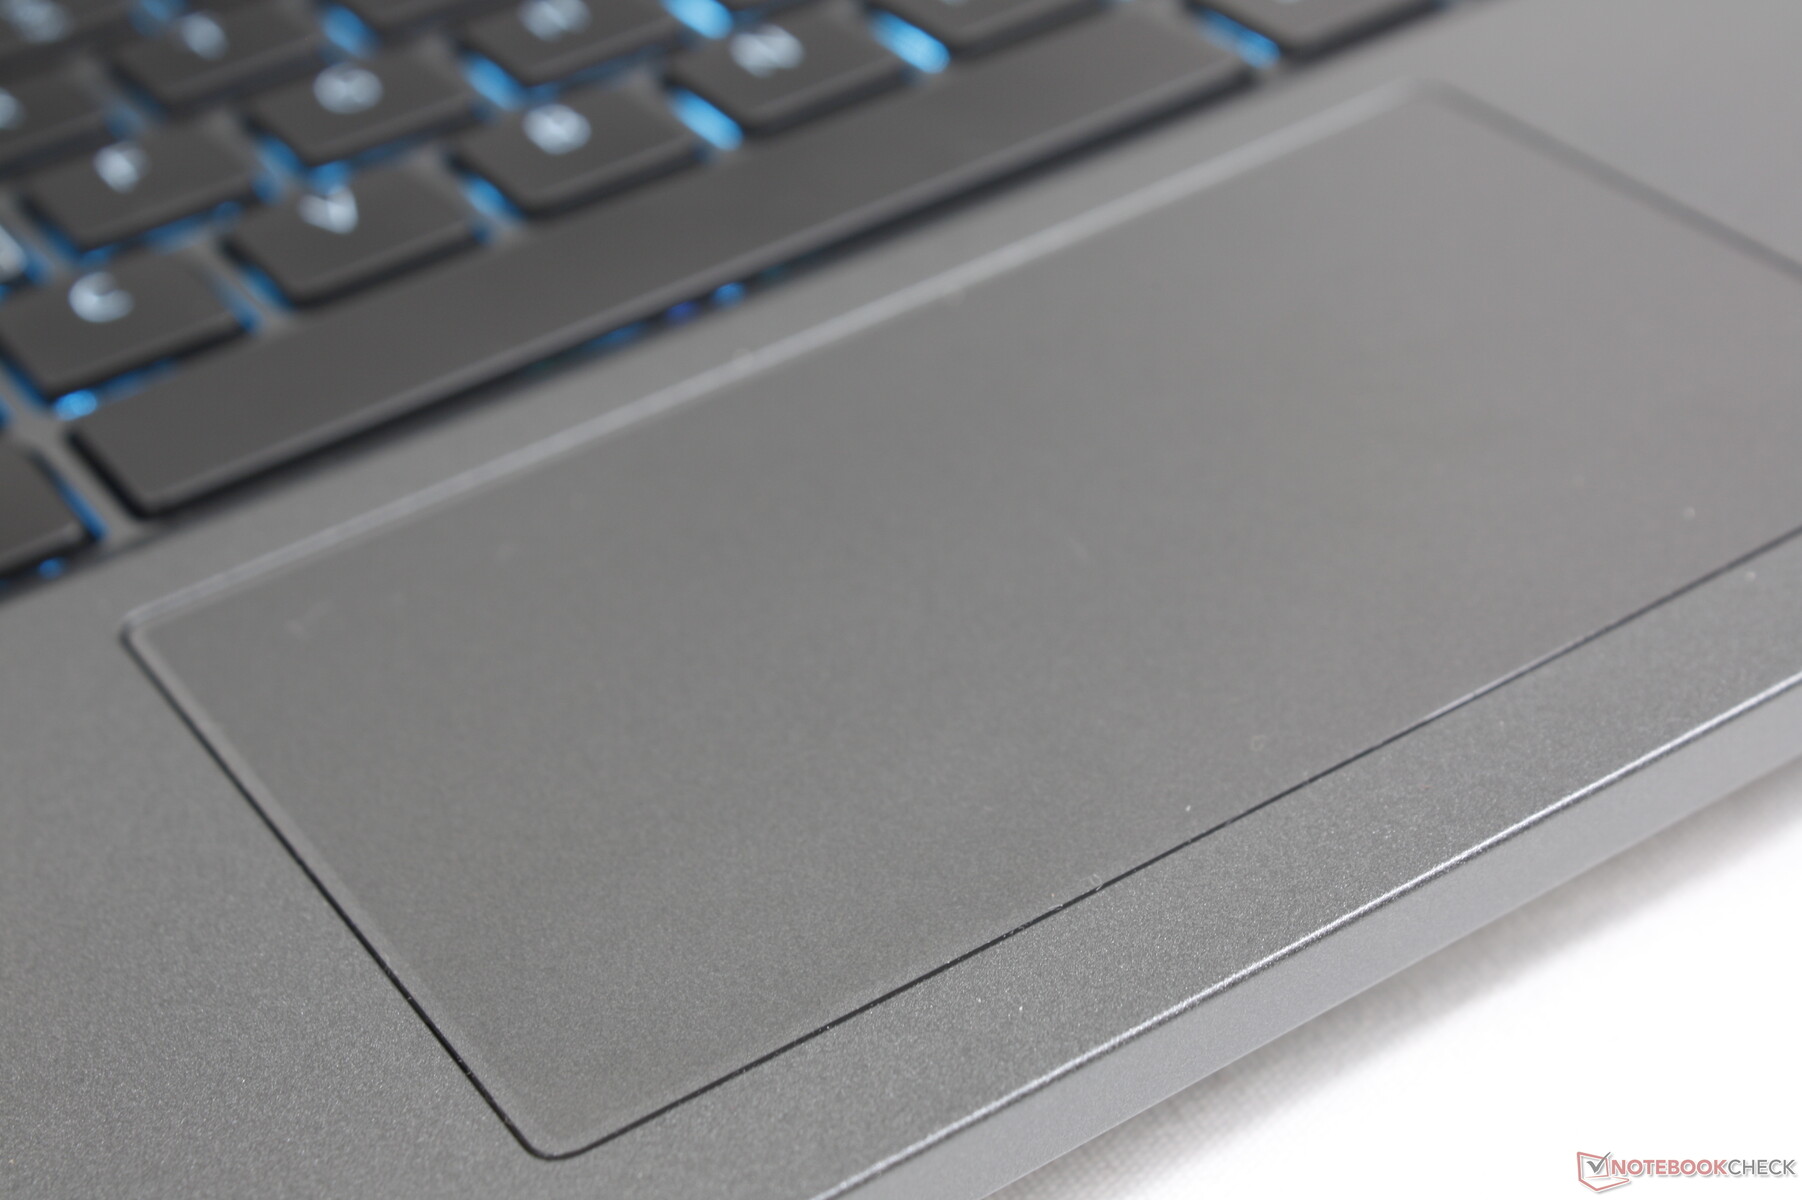
Touchpad
Con soli 10,5 x 6 cm, il clickpad del G16 è uno dei più piccoli che abbiamo visto su qualsiasi portatile di questa fascia di prezzo. Il clickpad del modello Inspiron 16 Plus 7620 misura 11,5 x 8 cm. Tuttavia, le dimensioni ridotte non costituiscono un ostacolo, in quanto il pubblico di riferimento dei videogiocatori probabilmente avrà sempre a disposizione un mouse.

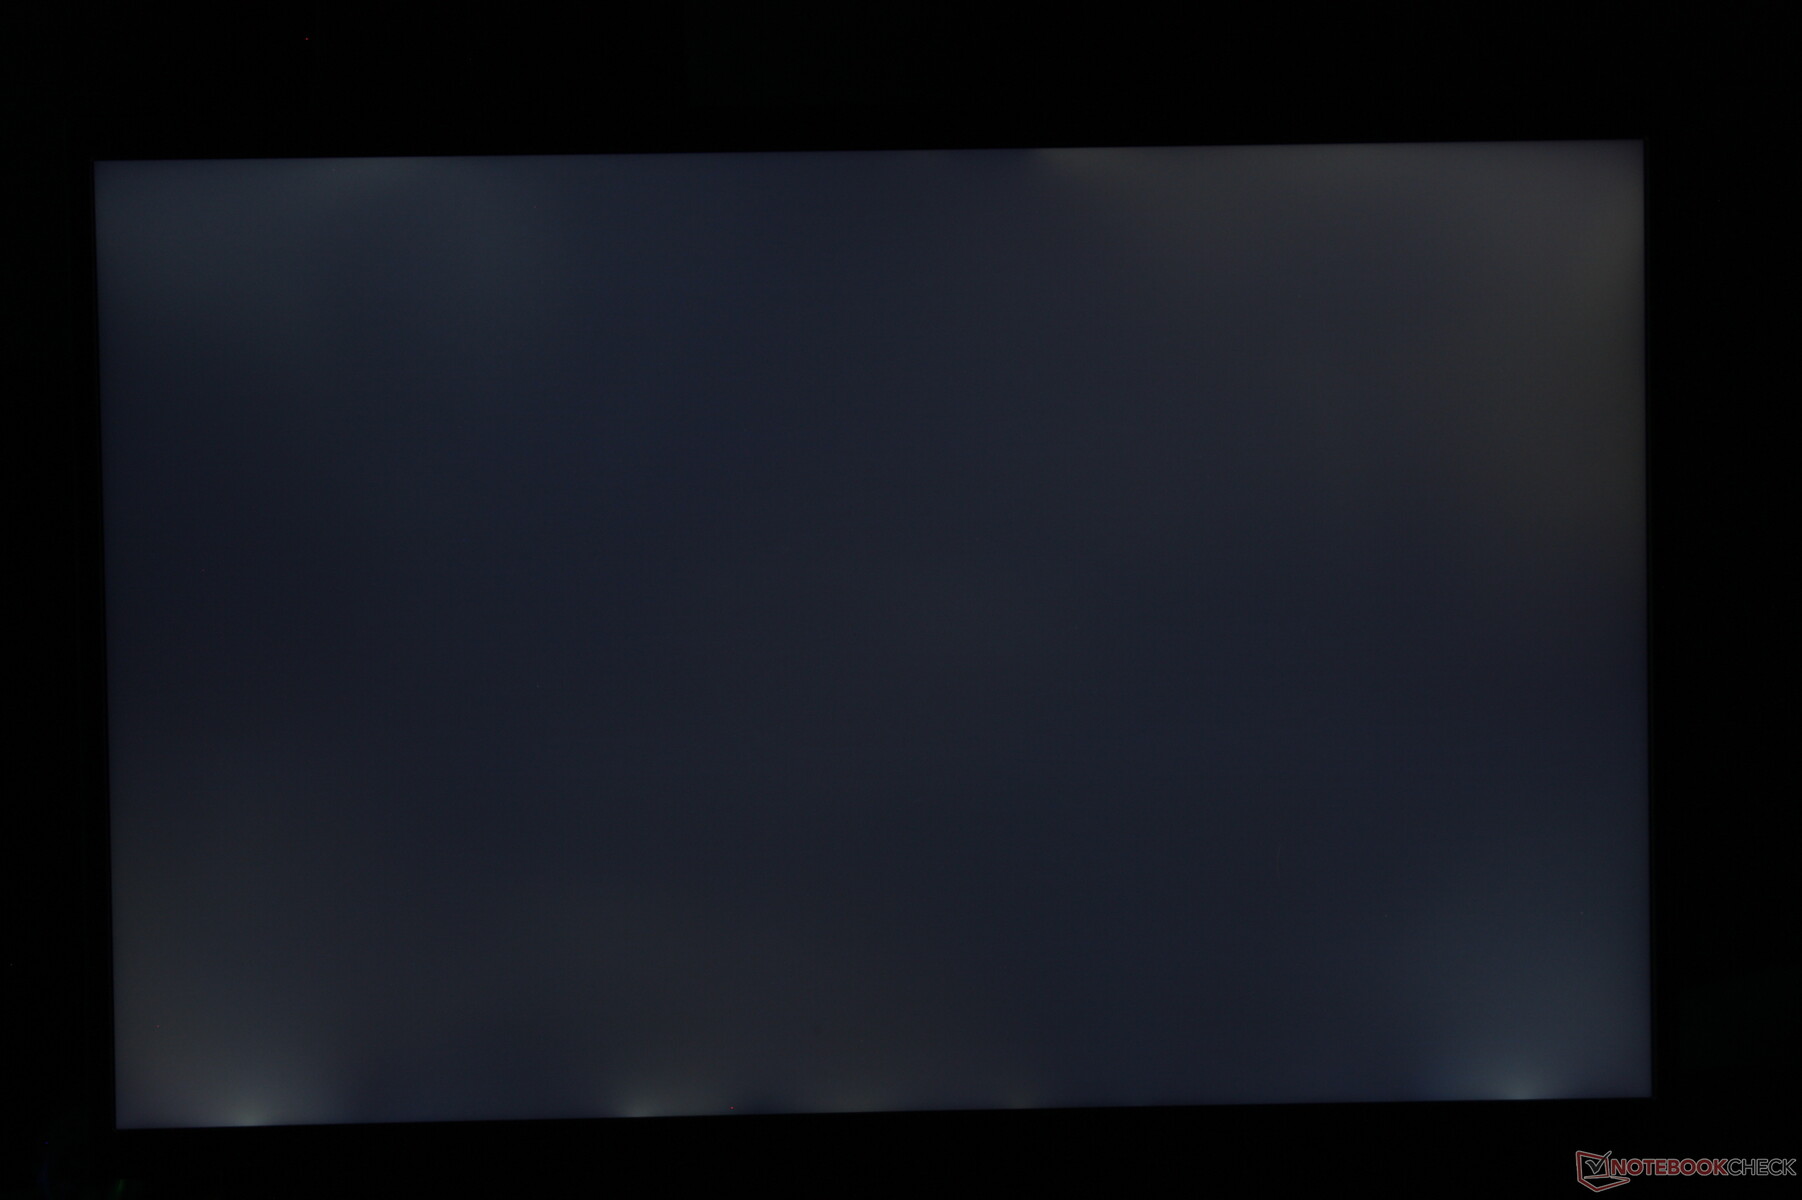
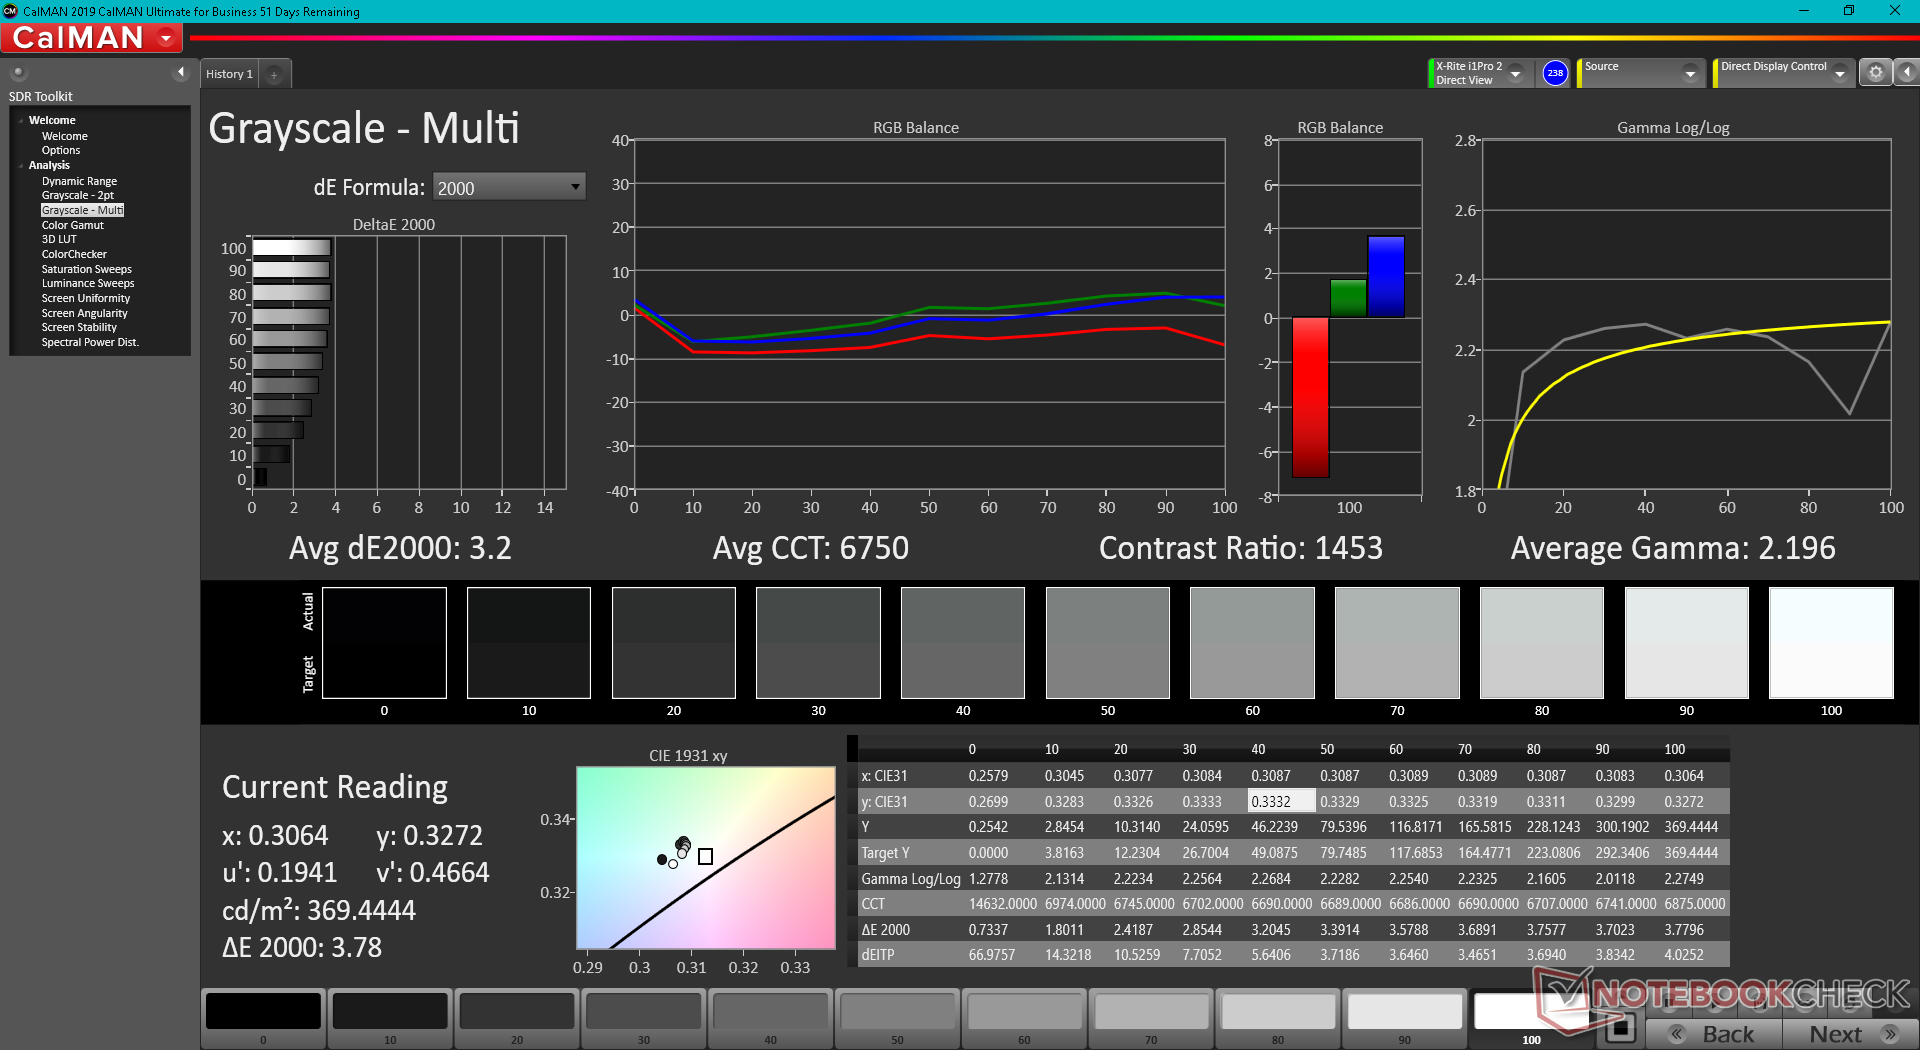
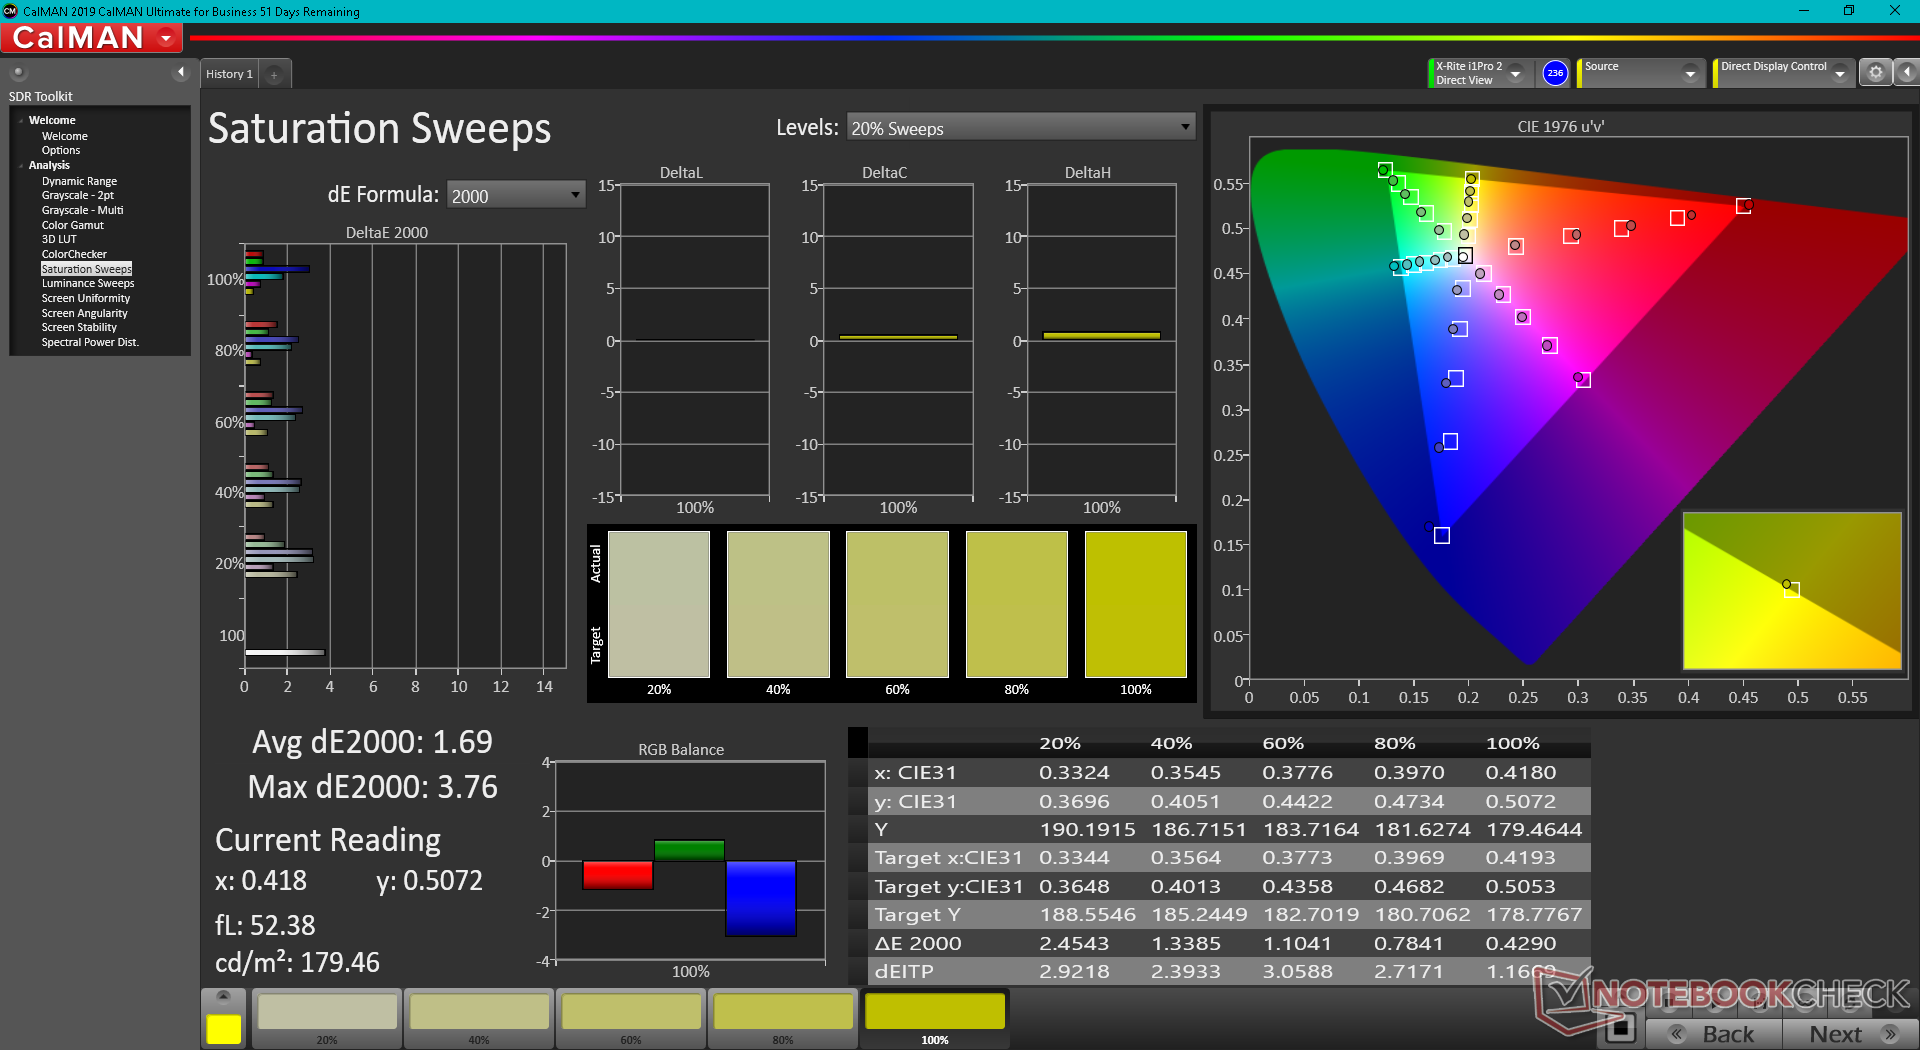
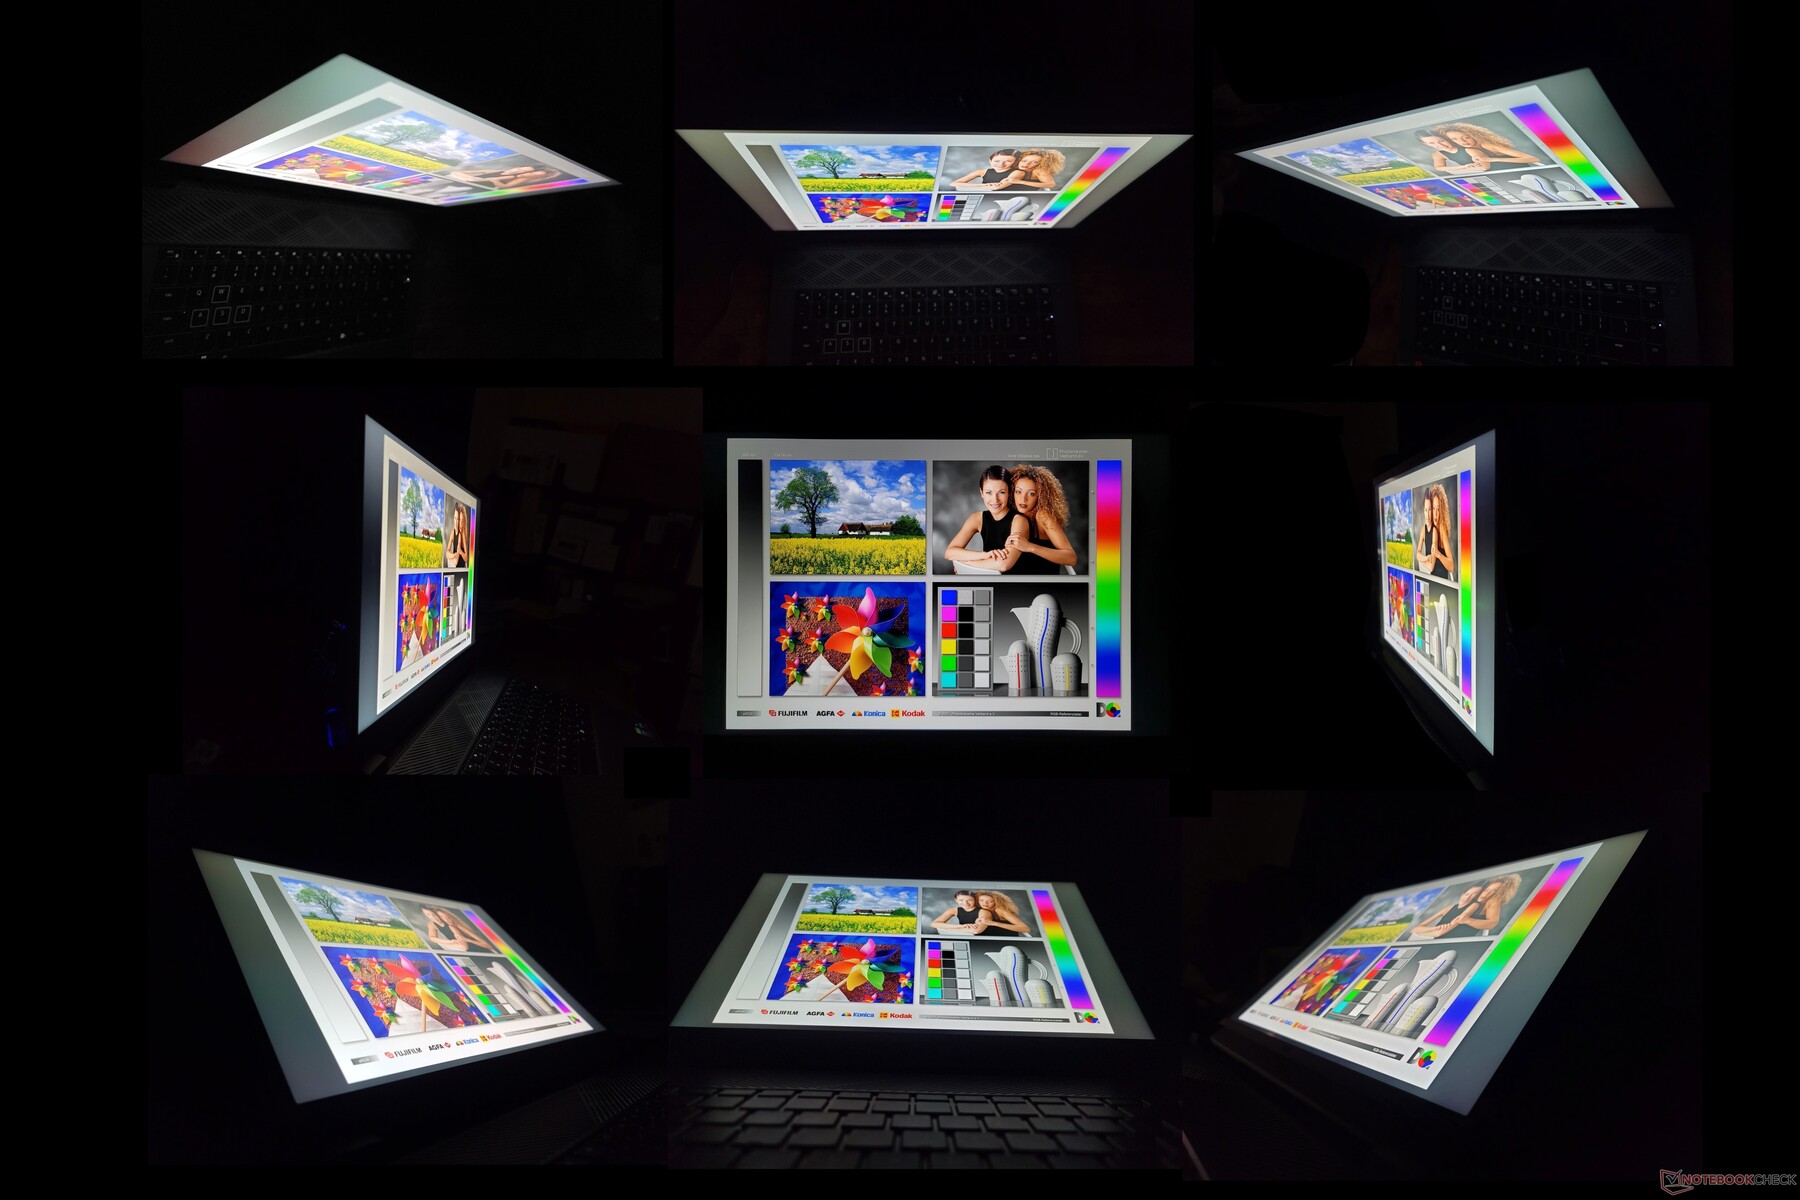
Display - IPS, full sRGB, 165 Hz e tempi di risposta rapidi
Il pannello è simile a quello attualmente in dotazione al Lenovo Legion 7 16ARHA7, in quanto condividono lo stesso produttore, la stessa frequenza di aggiornamento elevata, la stessa risoluzione, lo stesso target 100% sRGB e persino rapporti di contrasto e tempi di risposta in bianco e nero quasi identici. La qualità dell'immagine è significativamente migliore rispetto al pannello Chi Mei presente sull'HP Victus 16. Anche se è un po' un peccato che non ci siano altre opzioni tra cui scegliere, questo significa almeno che tutti i possessori di G16 dovrebbero ottenere la stessa eccellente esperienza visiva senza configurazioni impreviste di display di fascia bassa.
| |||||||||||||||||||||||||
Distribuzione della luminosità: 83 %
Al centro con la batteria: 369.4 cd/m²
Contrasto: 1154:1 (Nero: 0.32 cd/m²)
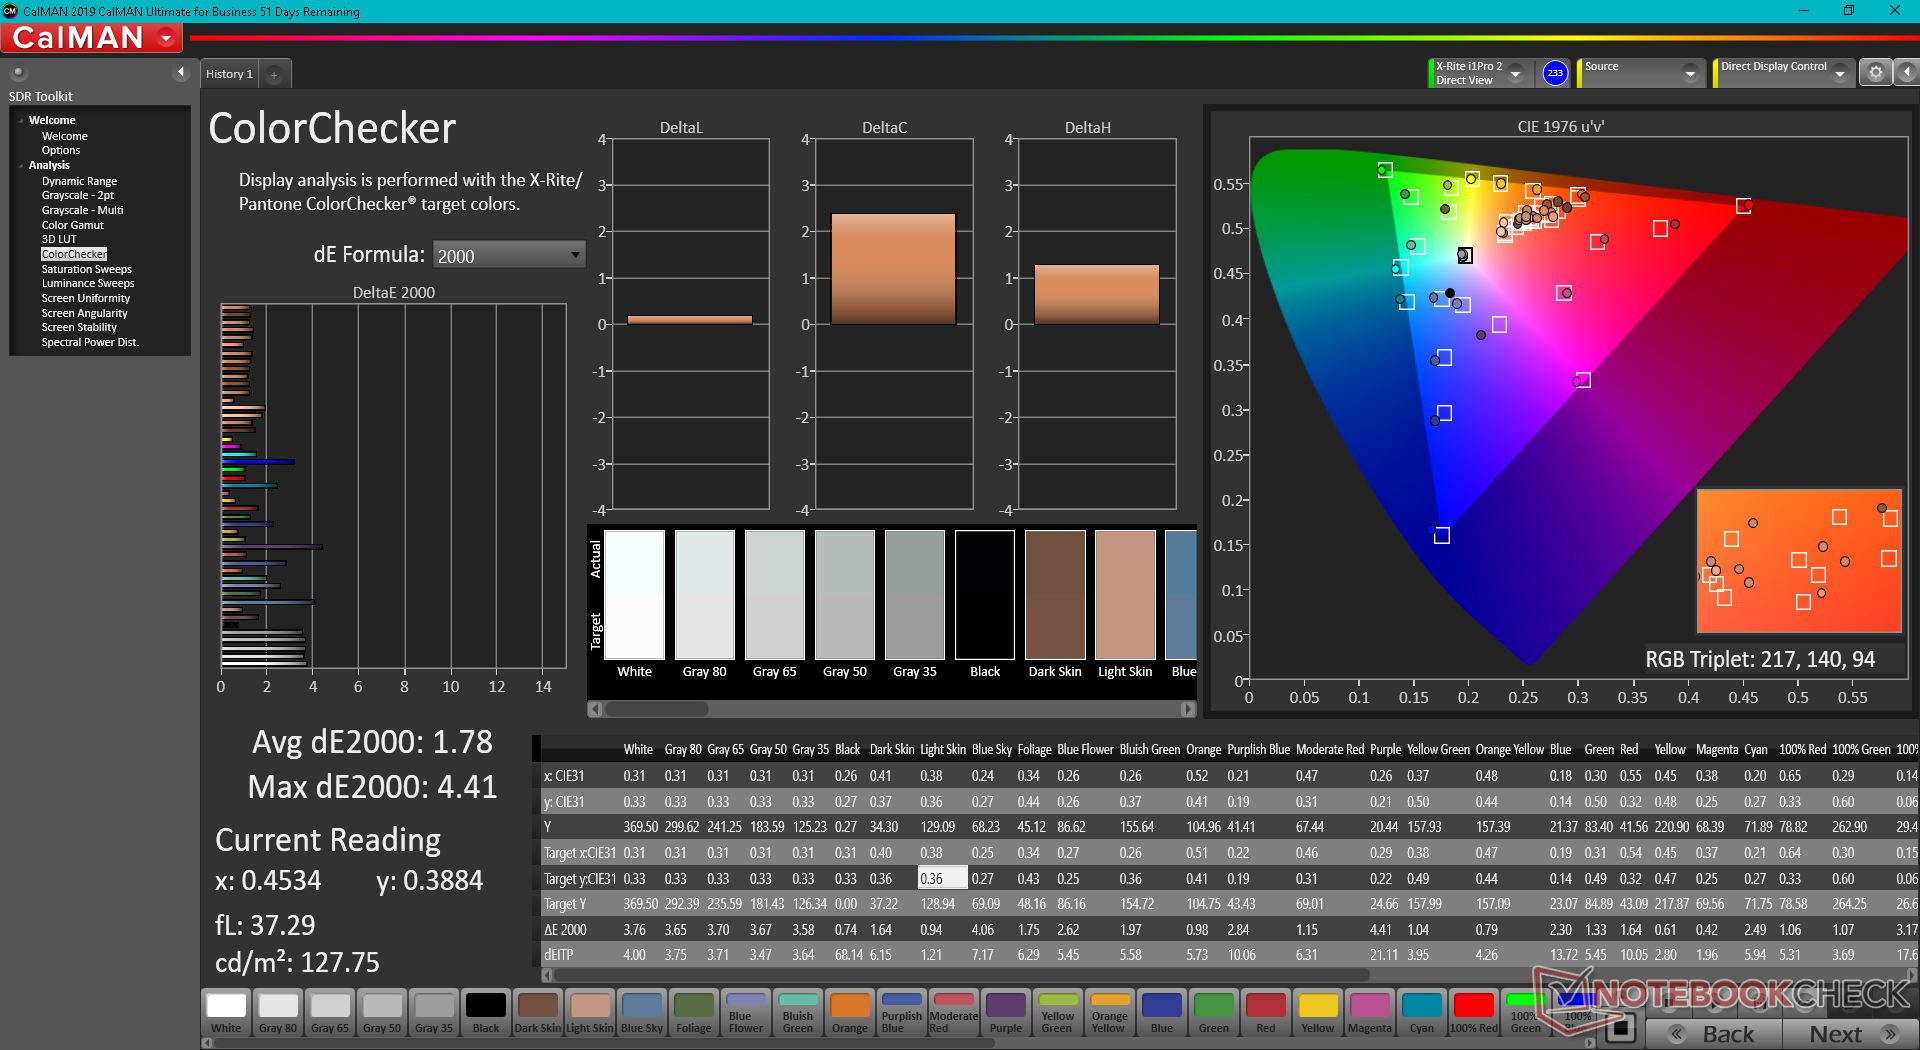
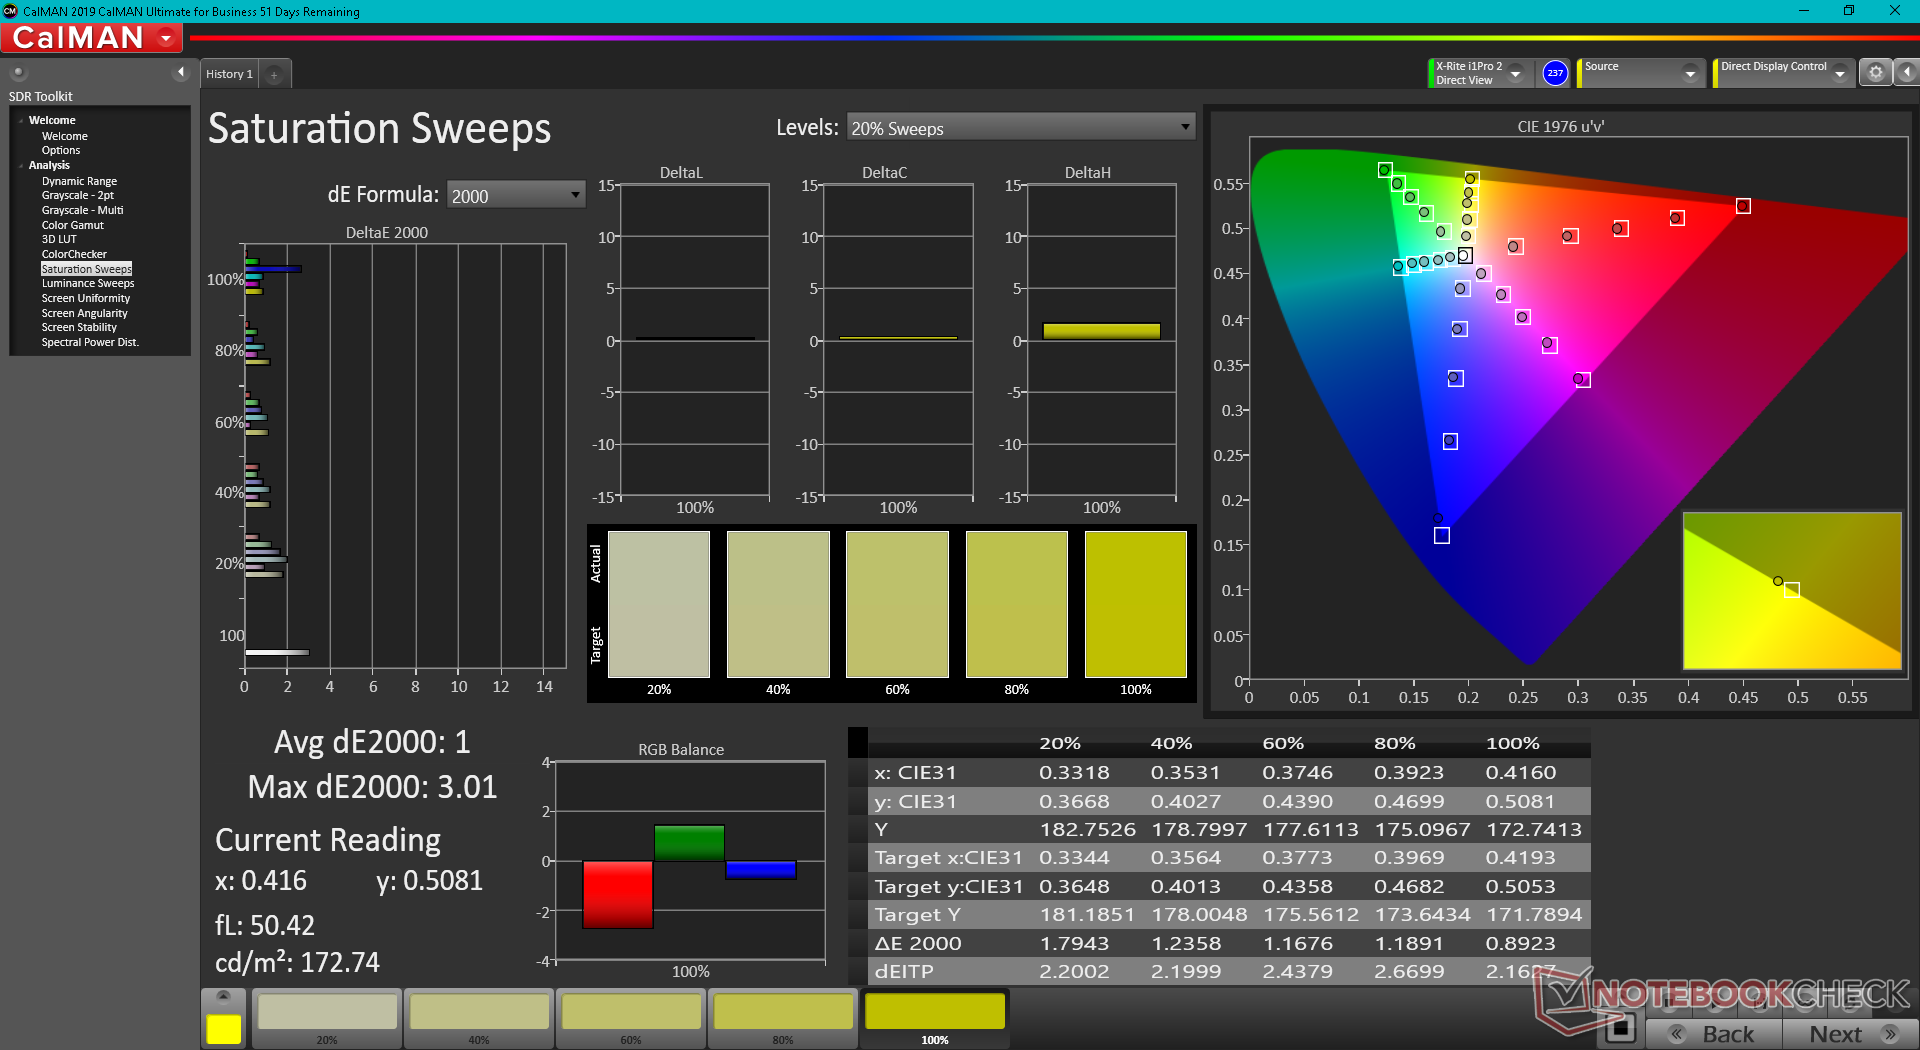
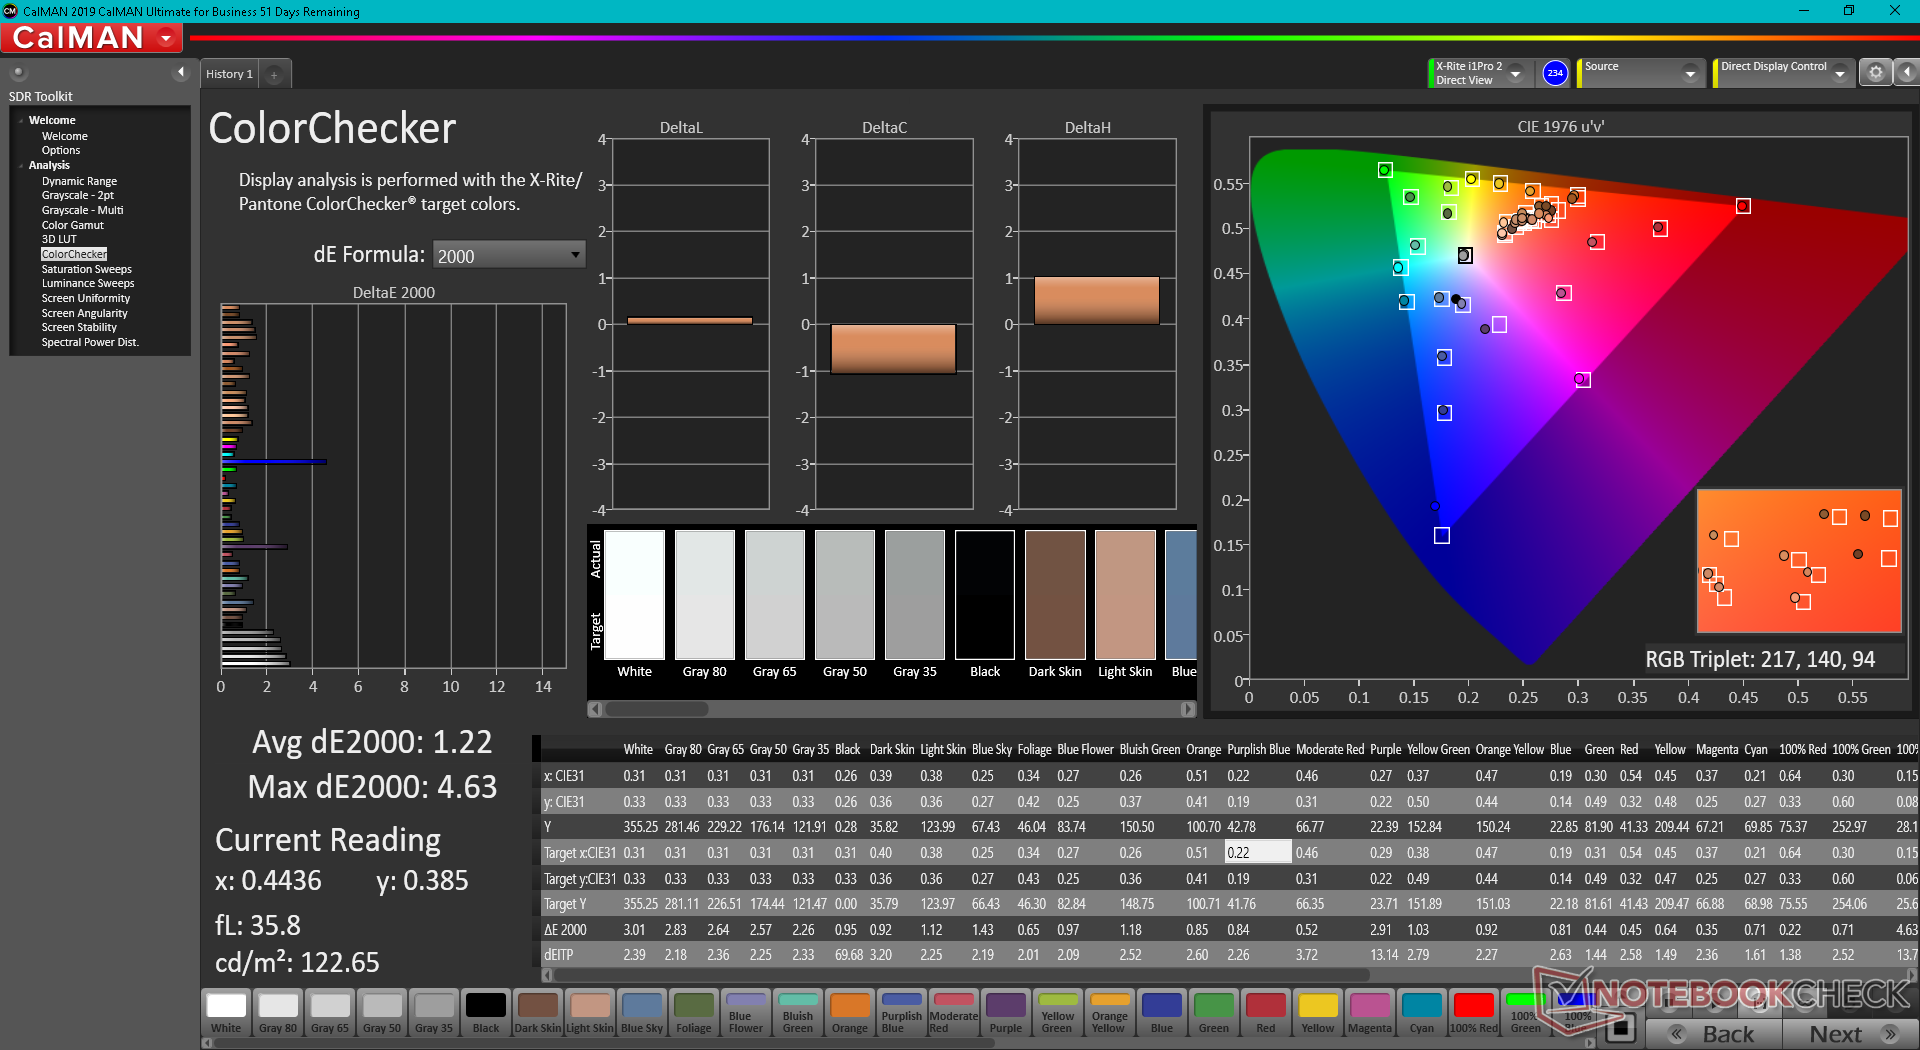
ΔE ColorChecker Calman: 1.78 | ∀{0.5-29.43 Ø4.72}
calibrated: 1.22
ΔE Greyscale Calman: 3.2 | ∀{0.09-98 Ø4.97}
70.5% AdobeRGB 1998 (Argyll 3D)
98% sRGB (Argyll 3D)
68.3% Display P3 (Argyll 3D)
Gamma: 2.2
CCT: 6750 K
| Dell G16 7620 BOE NE16QDM, IPS, 2560x1600, 16" | Lenovo Legion 7 16ARHA7 BOE CQ NE160QDM-NY1, IPS, 2560x1600, 16" | HP Victus 16-e0145ng CMN1609, IPS, 1920x1080, 16.1" | Asus ROG Zephyrus M16 GU603H AU Optronics AUOC199, IPS, 2560x1600, 16" | Lenovo Legion 5 Pro 16IAH7H BOE CCQ_NE160QDM_NY1, IPS, 2560x1600, 16" | Acer Swift X SFX16-51G-5388 Chi Mei N161HCA-EA3, , 1920x1080, 16.1" | |
|---|---|---|---|---|---|---|
| Display | -6% | -38% | 0% | -4% | ||
| Display P3 Coverage (%) | 68.3 | 63.7 -7% | 41.6 -39% | 68.53 0% | 65.1 -5% | |
| sRGB Coverage (%) | 98 | 95.3 -3% | 61.9 -37% | 98.38 0% | 95.65 -2% | |
| AdobeRGB 1998 Coverage (%) | 70.5 | 65.7 -7% | 43 -39% | 70.45 0% | 66.75 -5% | |
| Response Times | 1% | -166% | 43% | -11% | -171% | |
| Response Time Grey 50% / Grey 80% * (ms) | 8.6 ? | 9.2 ? -7% | 29.6 ? -244% | 4.8 ? 44% | 14 ? -63% | 30 ? -249% |
| Response Time Black / White * (ms) | 10.4 ? | 9.6 ? 8% | 19.4 ? -87% | 6 ? 42% | 6 ? 42% | 20 ? -92% |
| PWM Frequency (Hz) | ||||||
| Screen | -2% | -119% | -29% | 3% | 14% | |
| Brightness middle (cd/m²) | 369.4 | 478.8 30% | 257 -30% | 448 21% | 515 39% | 276 -25% |
| Brightness (cd/m²) | 348 | 477 37% | 239 -31% | 446 28% | 475 36% | 264 -24% |
| Brightness Distribution (%) | 83 | 90 8% | 88 6% | 86 4% | 85 2% | 85 2% |
| Black Level * (cd/m²) | 0.32 | 0.43 -34% | 0.25 22% | 0.48 -50% | 0.45 -41% | 0.16 50% |
| Contrast (:1) | 1154 | 1113 -4% | 1028 -11% | 933 -19% | 1144 -1% | 1725 49% |
| Colorchecker dE 2000 * | 1.78 | 2.24 -26% | 6.91 -288% | 2.76 -55% | 2.38 -34% | 1.8 -1% |
| Colorchecker dE 2000 max. * | 4.41 | 4.49 -2% | 22.27 -405% | 7.09 -61% | 4.37 1% | 3.77 15% |
| Colorchecker dE 2000 calibrated * | 1.22 | 1.89 -55% | 3.61 -196% | 2.86 -134% | 1.1 10% | 0.63 48% |
| Greyscale dE 2000 * | 3.2 | 2.3 28% | 7.5 -134% | 3.1 3% | 2.71 15% | 2.76 14% |
| Gamma | 2.2 100% | 2.25 98% | 2.125 104% | 2.153 102% | 2.49 88% | 2.37 93% |
| CCT | 6750 96% | 6955 93% | 6025 108% | 6826 95% | 6117 106% | 6564 99% |
| Color Space (Percent of AdobeRGB 1998) (%) | 87 | |||||
| Color Space (Percent of sRGB) (%) | 100 | |||||
| Media totale (Programma / Settaggio) | -2% /
-2% | -108% /
-108% | 7% /
-16% | -3% /
0% | -54% /
-16% |
* ... Meglio usare valori piccoli
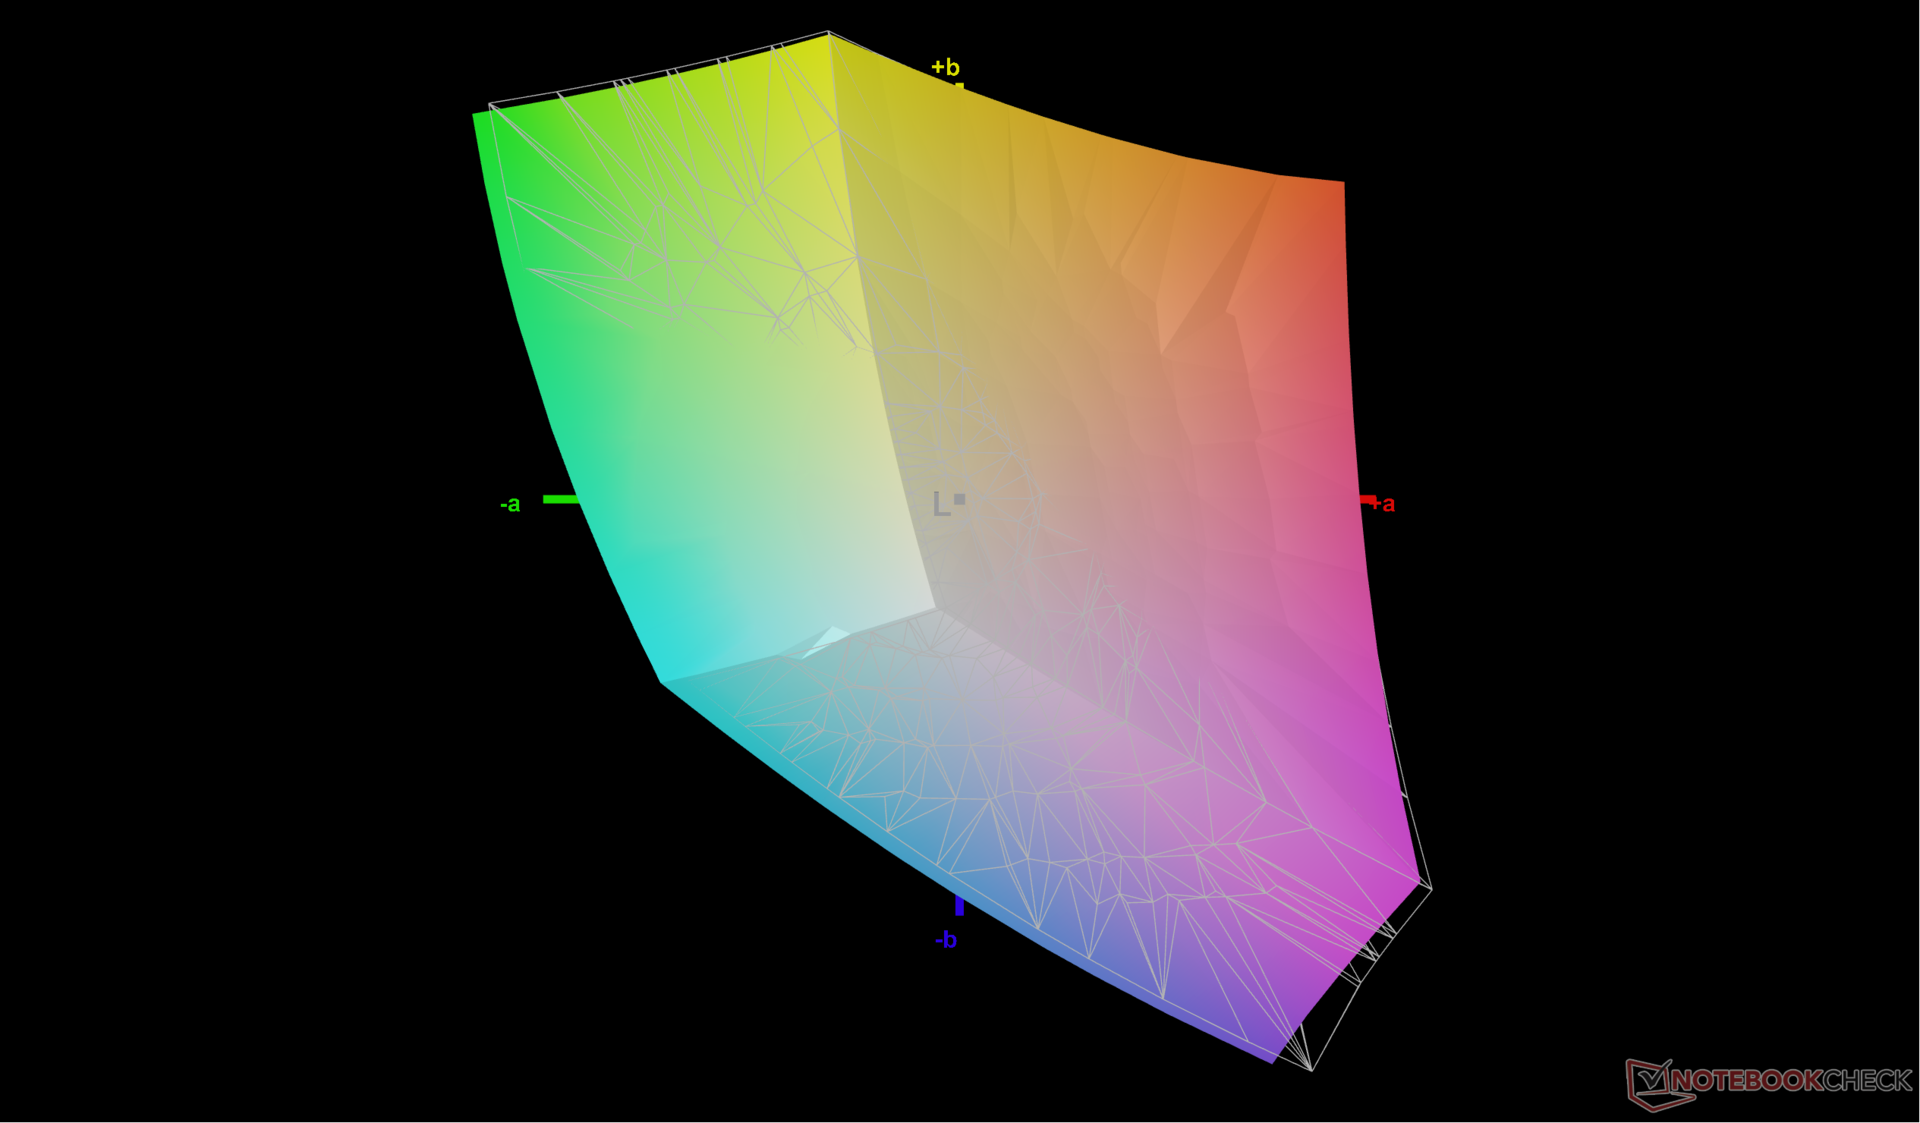
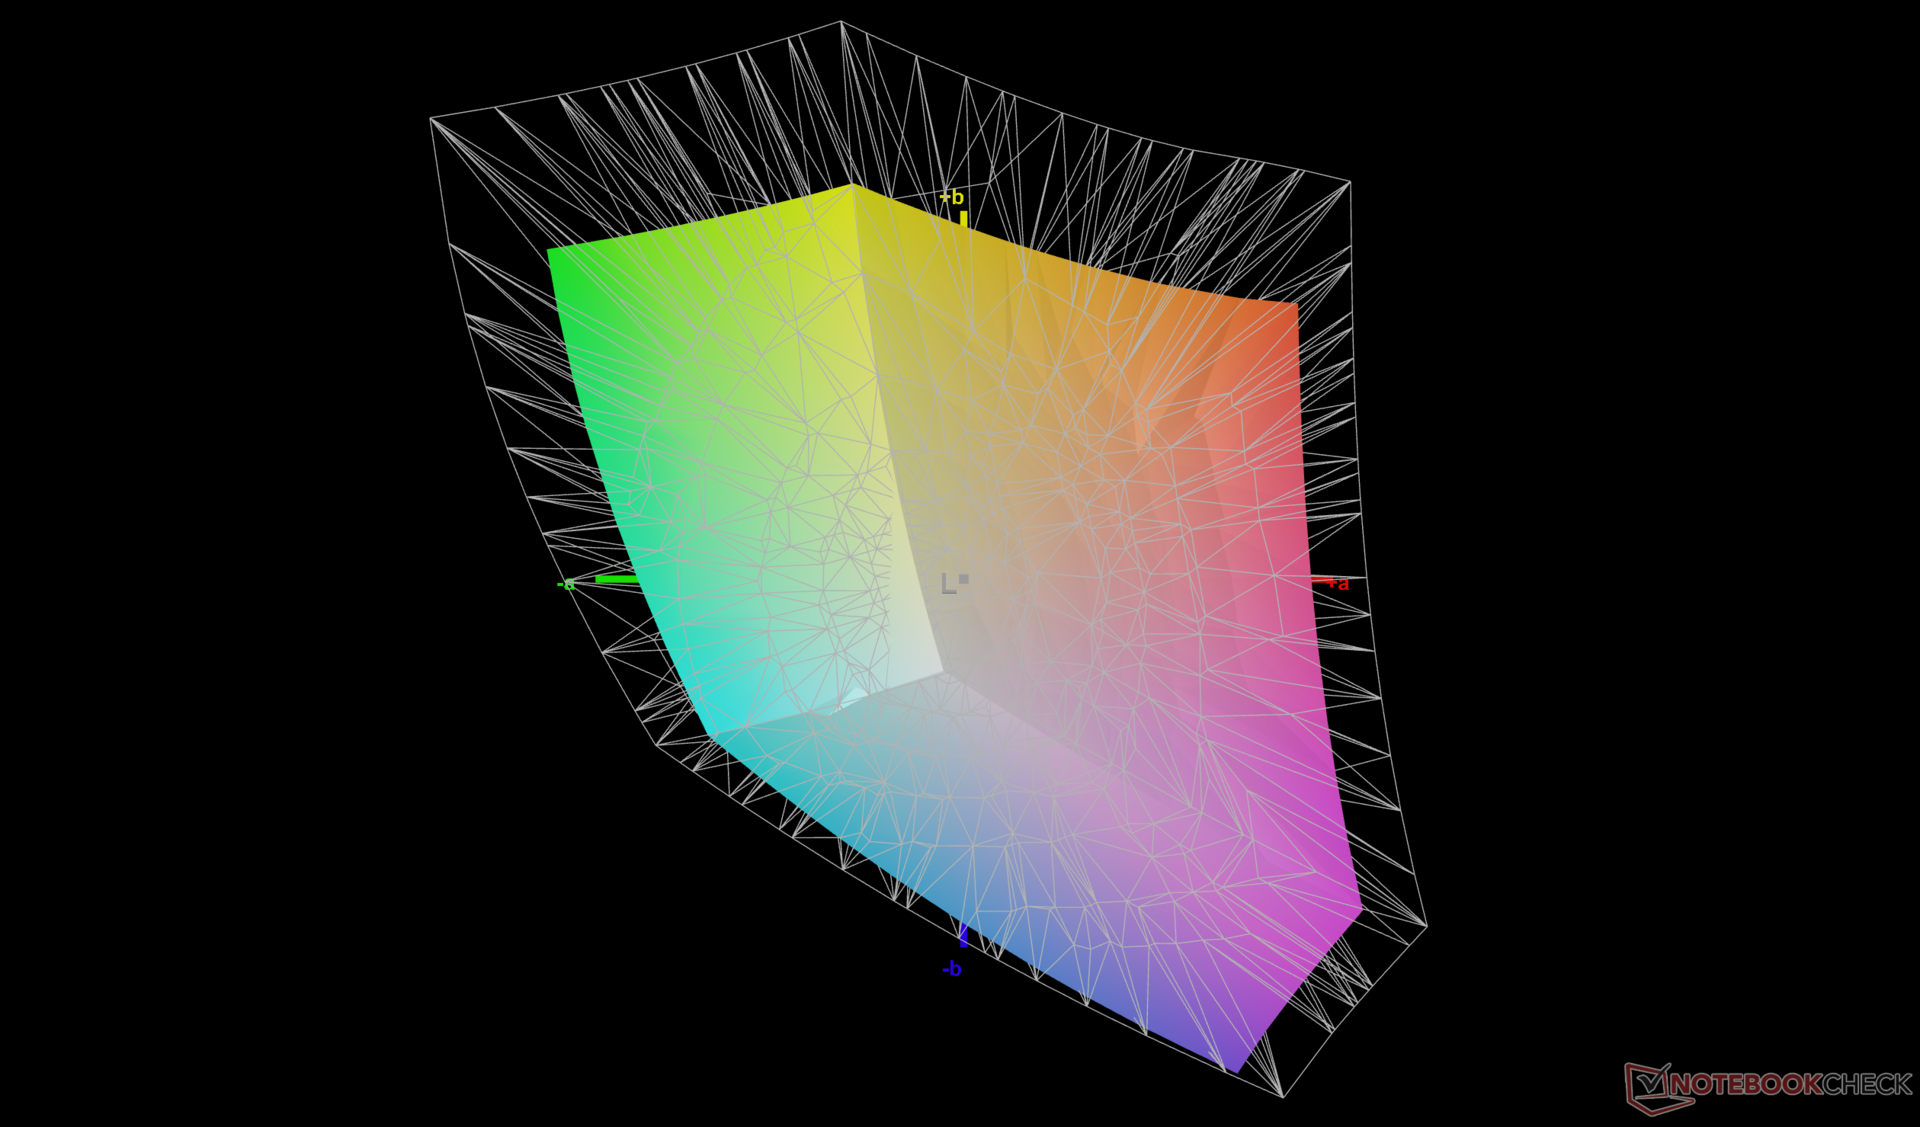
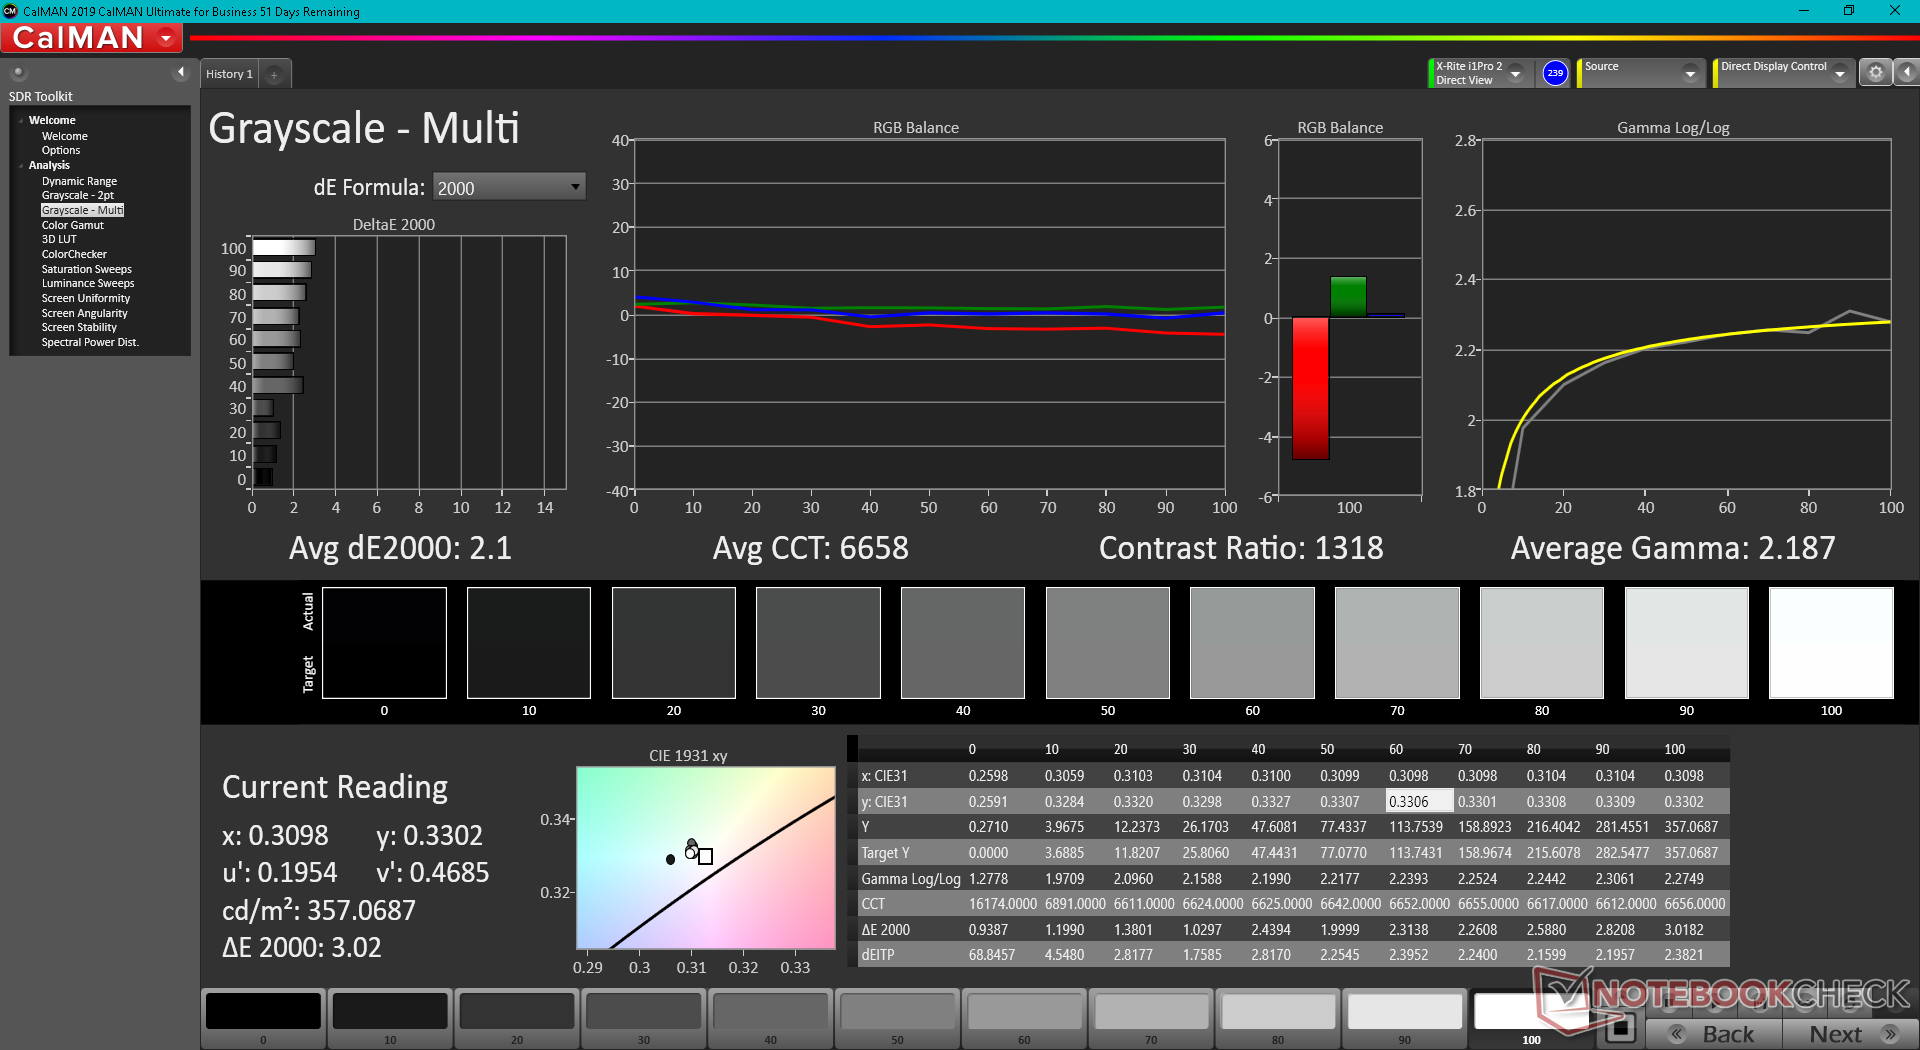
I colori sono calibrati in modo decente, anche se Dell non esegue alcuna procedura di pre-calibrazione per il G16. La calibrazione del pannello da parte nostra con un colorimetro X-Rite migliorerebbe solo marginalmente i valori medi del DeltaE della scala di grigi e del colore, che passerebbero da 3,2 e 1,78 a 2,1 e 1,22, rispettivamente. Una calibrazione da parte dell'utente finale non è quindi necessaria per la maggior parte dei proprietari.
Gli utenti possono applicare il nostro profilo calibrato qui sopra per ottenere una visualizzazione più accurata.
Tempi di risposta del Display
| ↔ Tempi di risposta dal Nero al Bianco | ||
|---|---|---|
| 10.4 ms ... aumenta ↗ e diminuisce ↘ combinato | ↗ 5.2 ms Incremento | 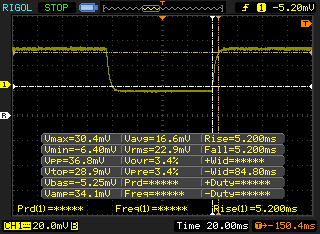 |
| ↘ 5.2 ms Calo | ||
| Lo schermo mostra buoni tempi di risposta durante i nostri tests, ma potrebbe essere troppo lento per i gamers competitivi. In confronto, tutti i dispositivi di test variano da 0.1 (minimo) a 240 (massimo) ms. » 28 % di tutti i dispositivi è migliore. Questo significa che i tempi di risposta rilevati sono migliori rispettto alla media di tutti i dispositivi testati (19.8 ms). | ||
| ↔ Tempo di risposta dal 50% Grigio all'80% Grigio | ||
| 8.6 ms ... aumenta ↗ e diminuisce ↘ combinato | ↗ 3.4 ms Incremento | 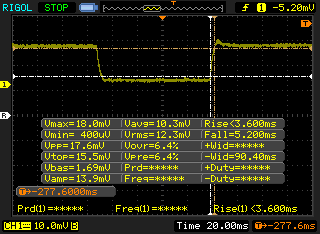 |
| ↘ 5.2 ms Calo | ||
| Lo schermo mostra veloci tempi di risposta durante i nostri tests e dovrebbe esere adatto al gaming In confronto, tutti i dispositivi di test variano da 0.165 (minimo) a 636 (massimo) ms. » 22 % di tutti i dispositivi è migliore. Questo significa che i tempi di risposta rilevati sono migliori rispettto alla media di tutti i dispositivi testati (31 ms). | ||
Sfarfallio dello schermo / PWM (Pulse-Width Modulation)
| flickering dello schermo / PWM non rilevato | 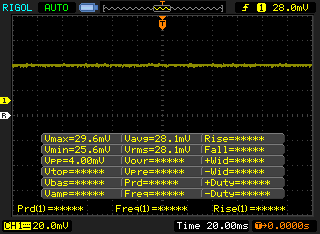 | ||
In confronto: 52 % di tutti i dispositivi testati non utilizza PWM per ridurre la luminosita' del display. Se è rilevato PWM, una media di 7747 (minimo: 5 - massimo: 343500) Hz è stata rilevata. | |||
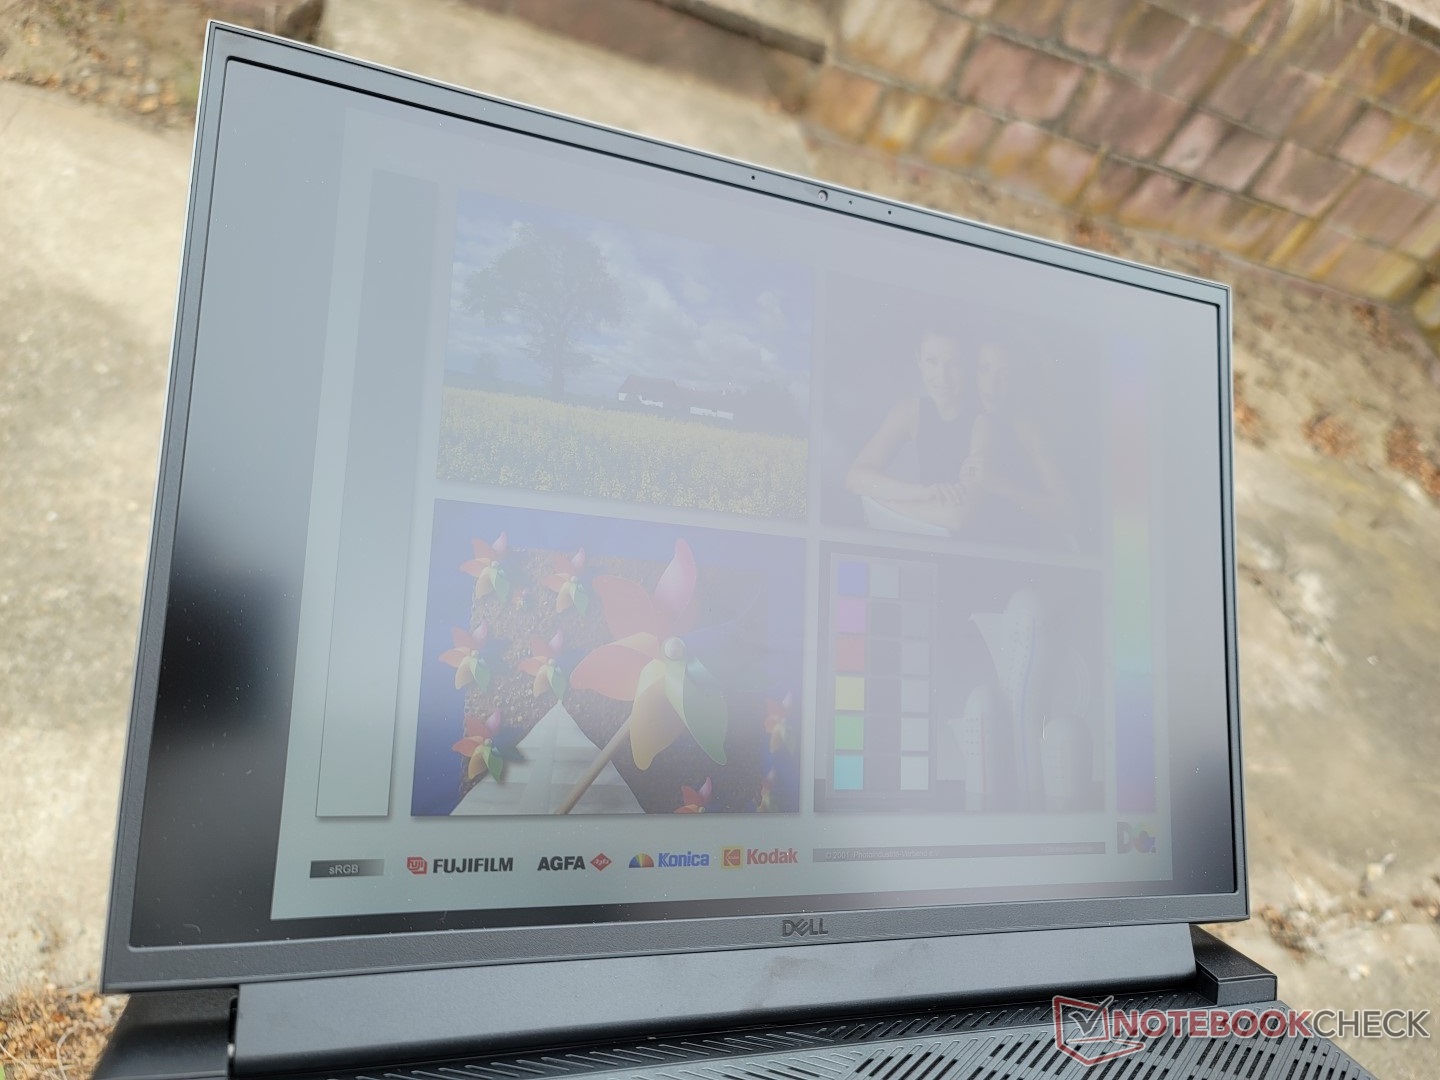
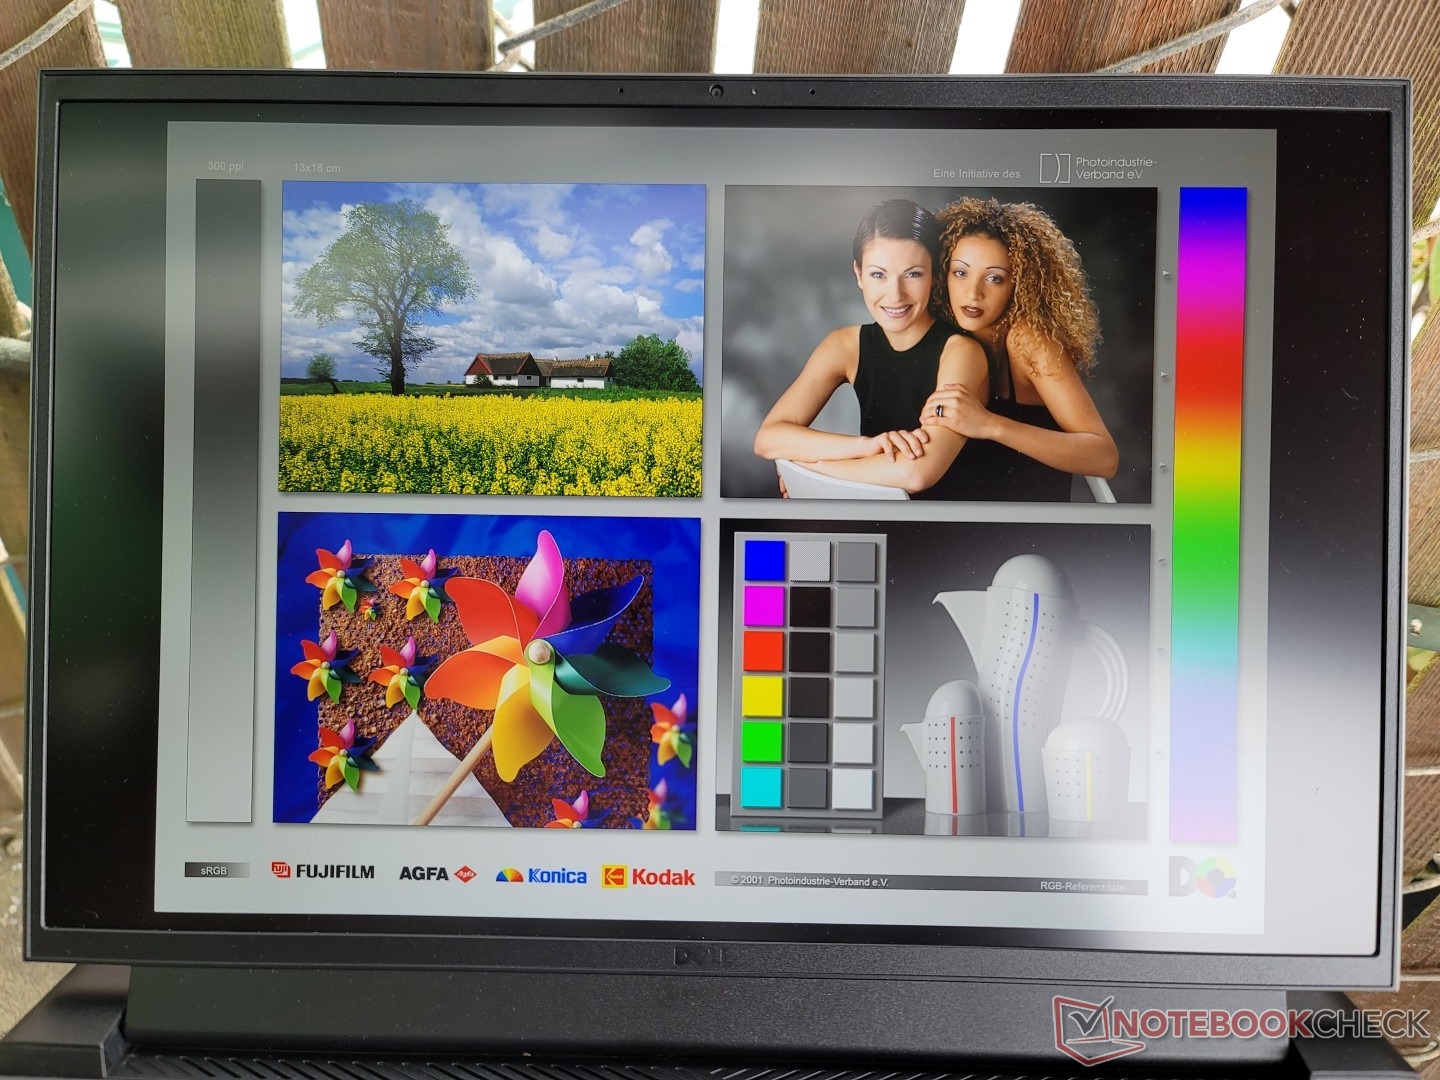
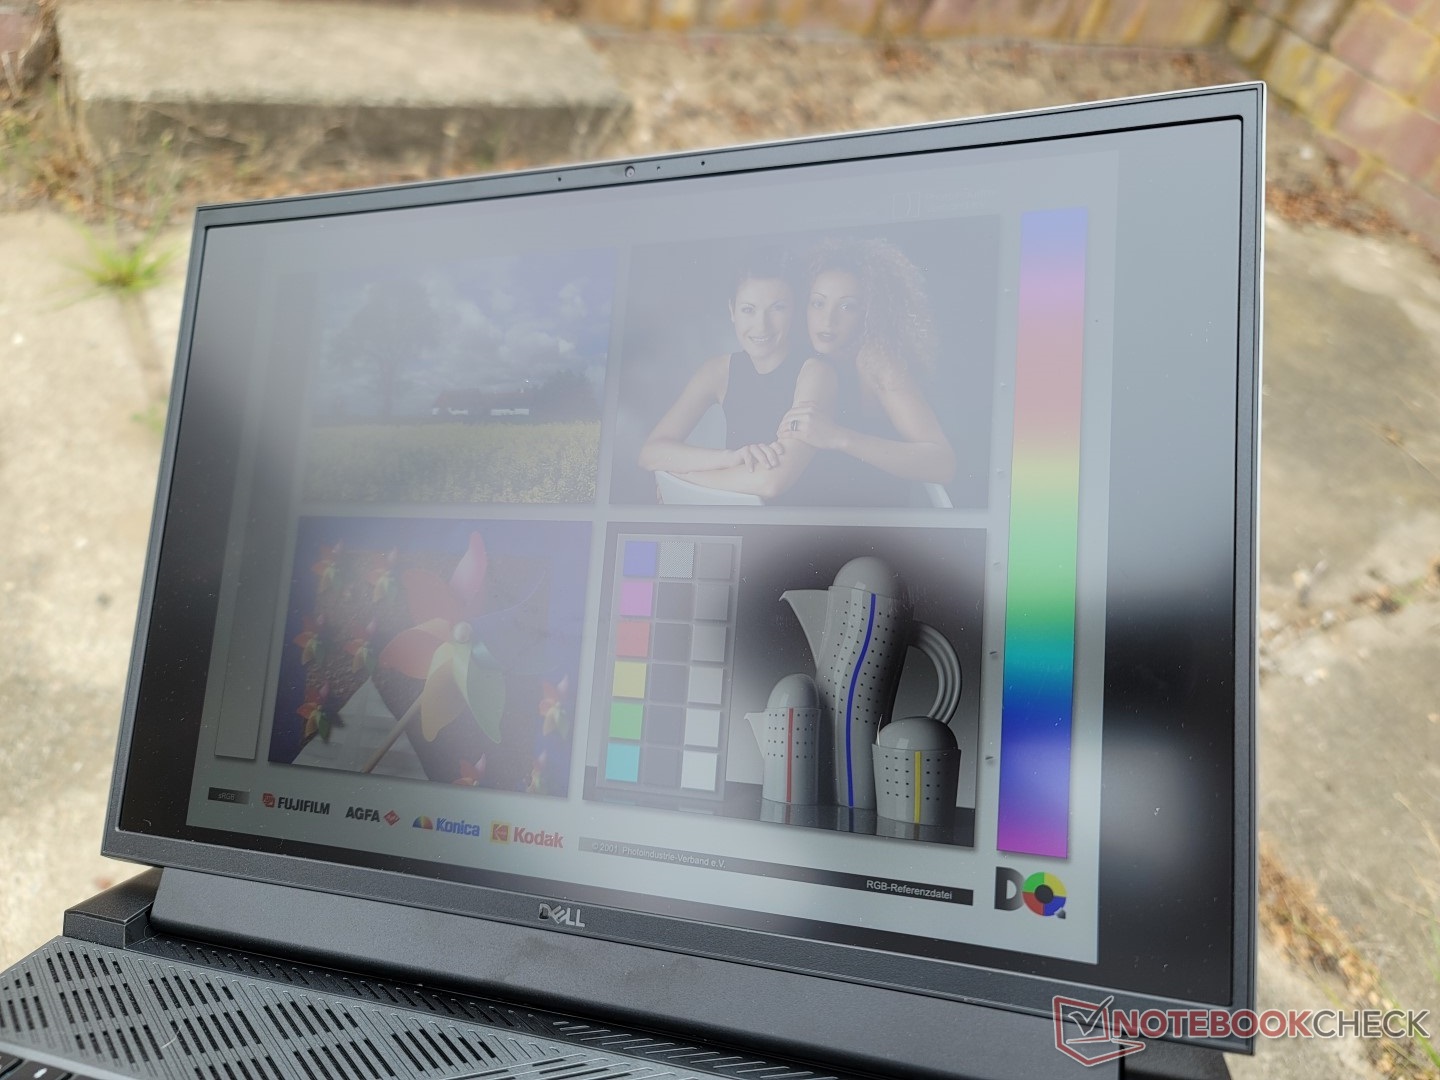
La visibilità all'aperto è discreta se all'ombra, ma i riflessi diventano troppo forti se l'illuminazione ambientale è più intensa. Alternative come il Lenovo Legion 5 Pro 16 o Legion 7 16 hanno display molto più luminosi di circa 500 nit ciascuno, se la visibilità all'aperto è un problema.
Prestazioni: più veloci della media
Condizioni di test
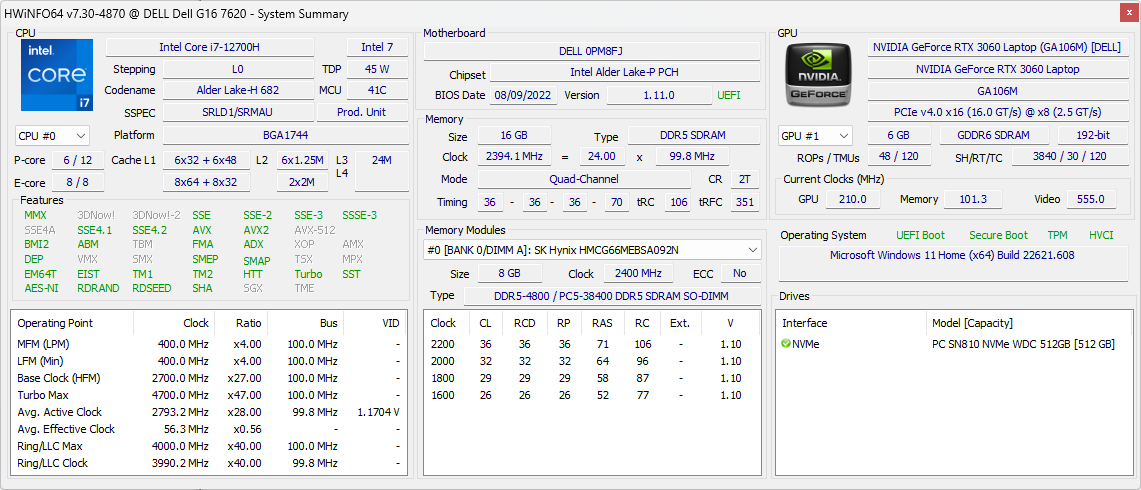
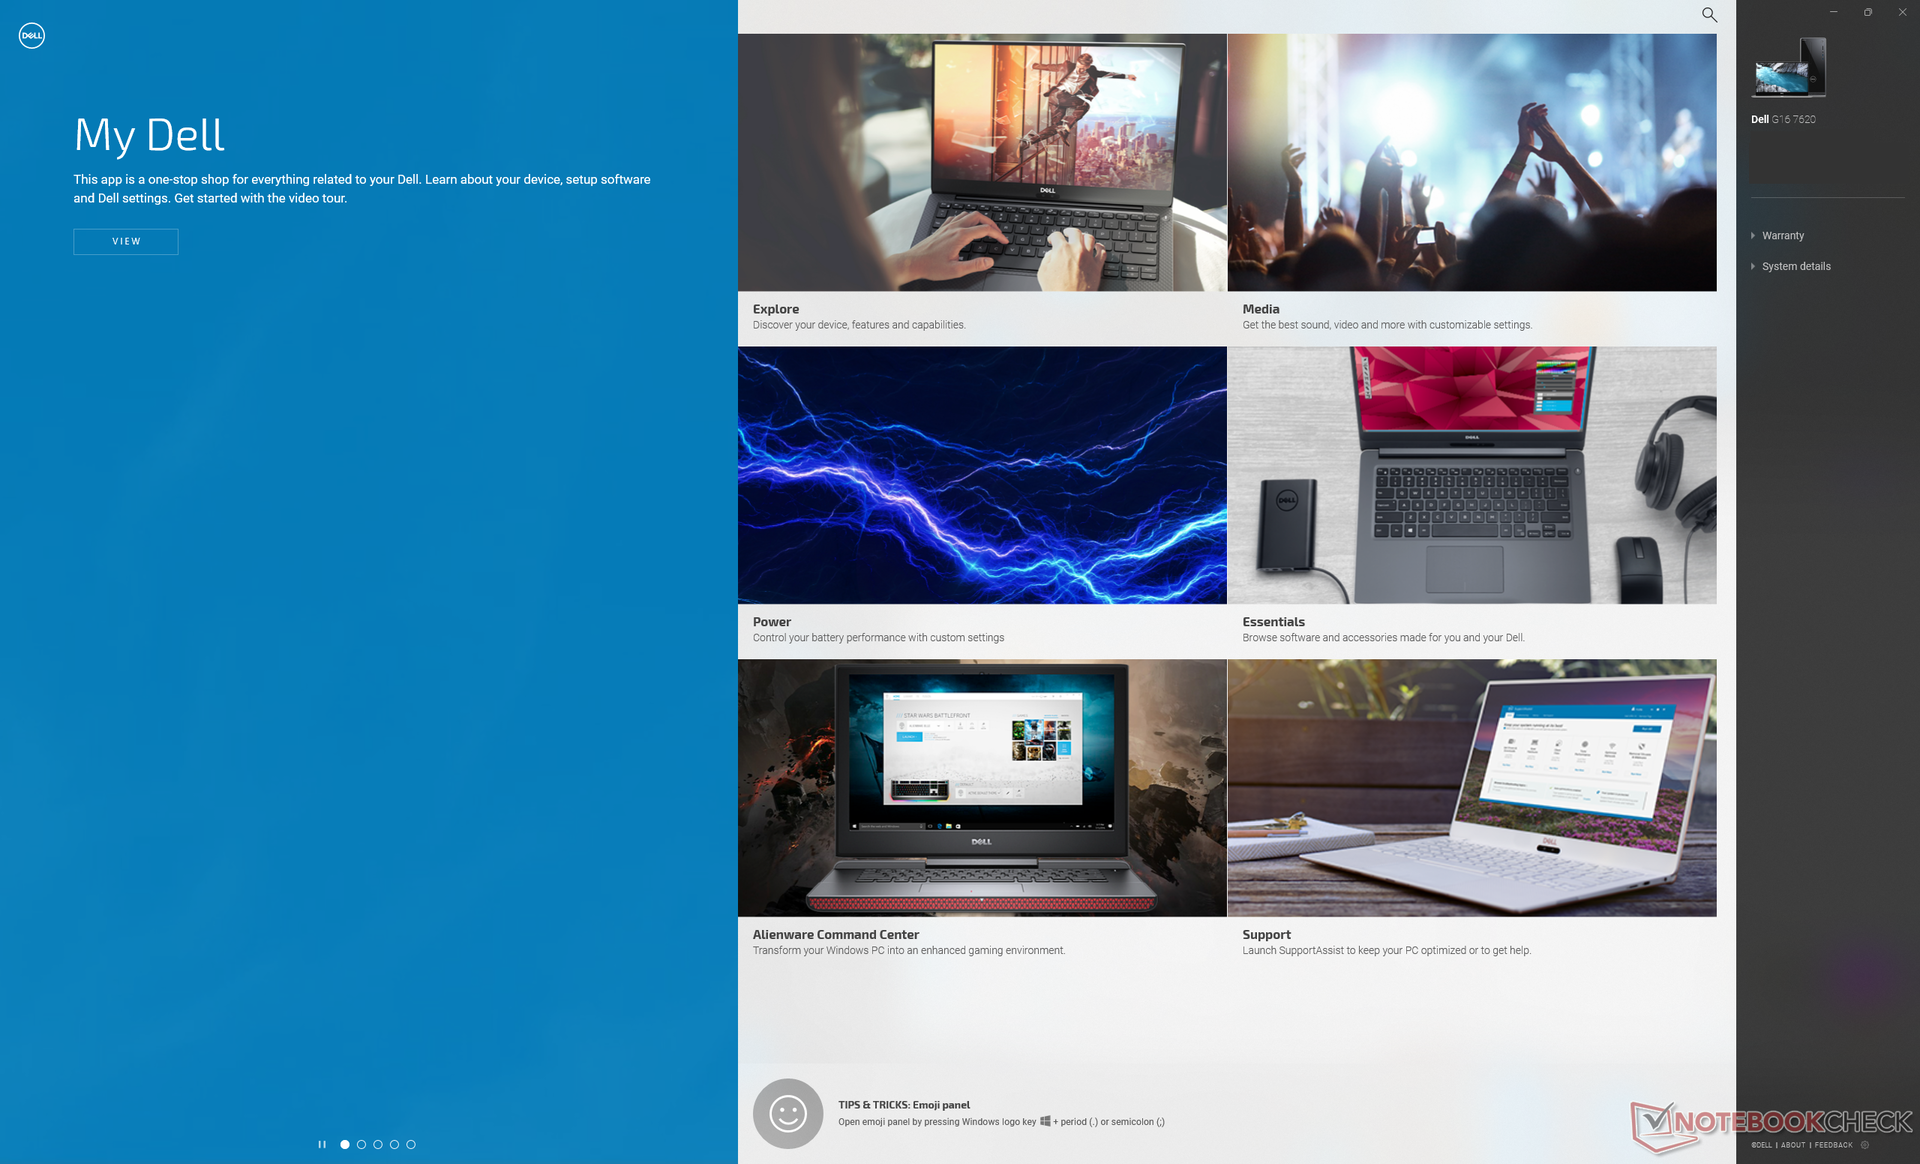
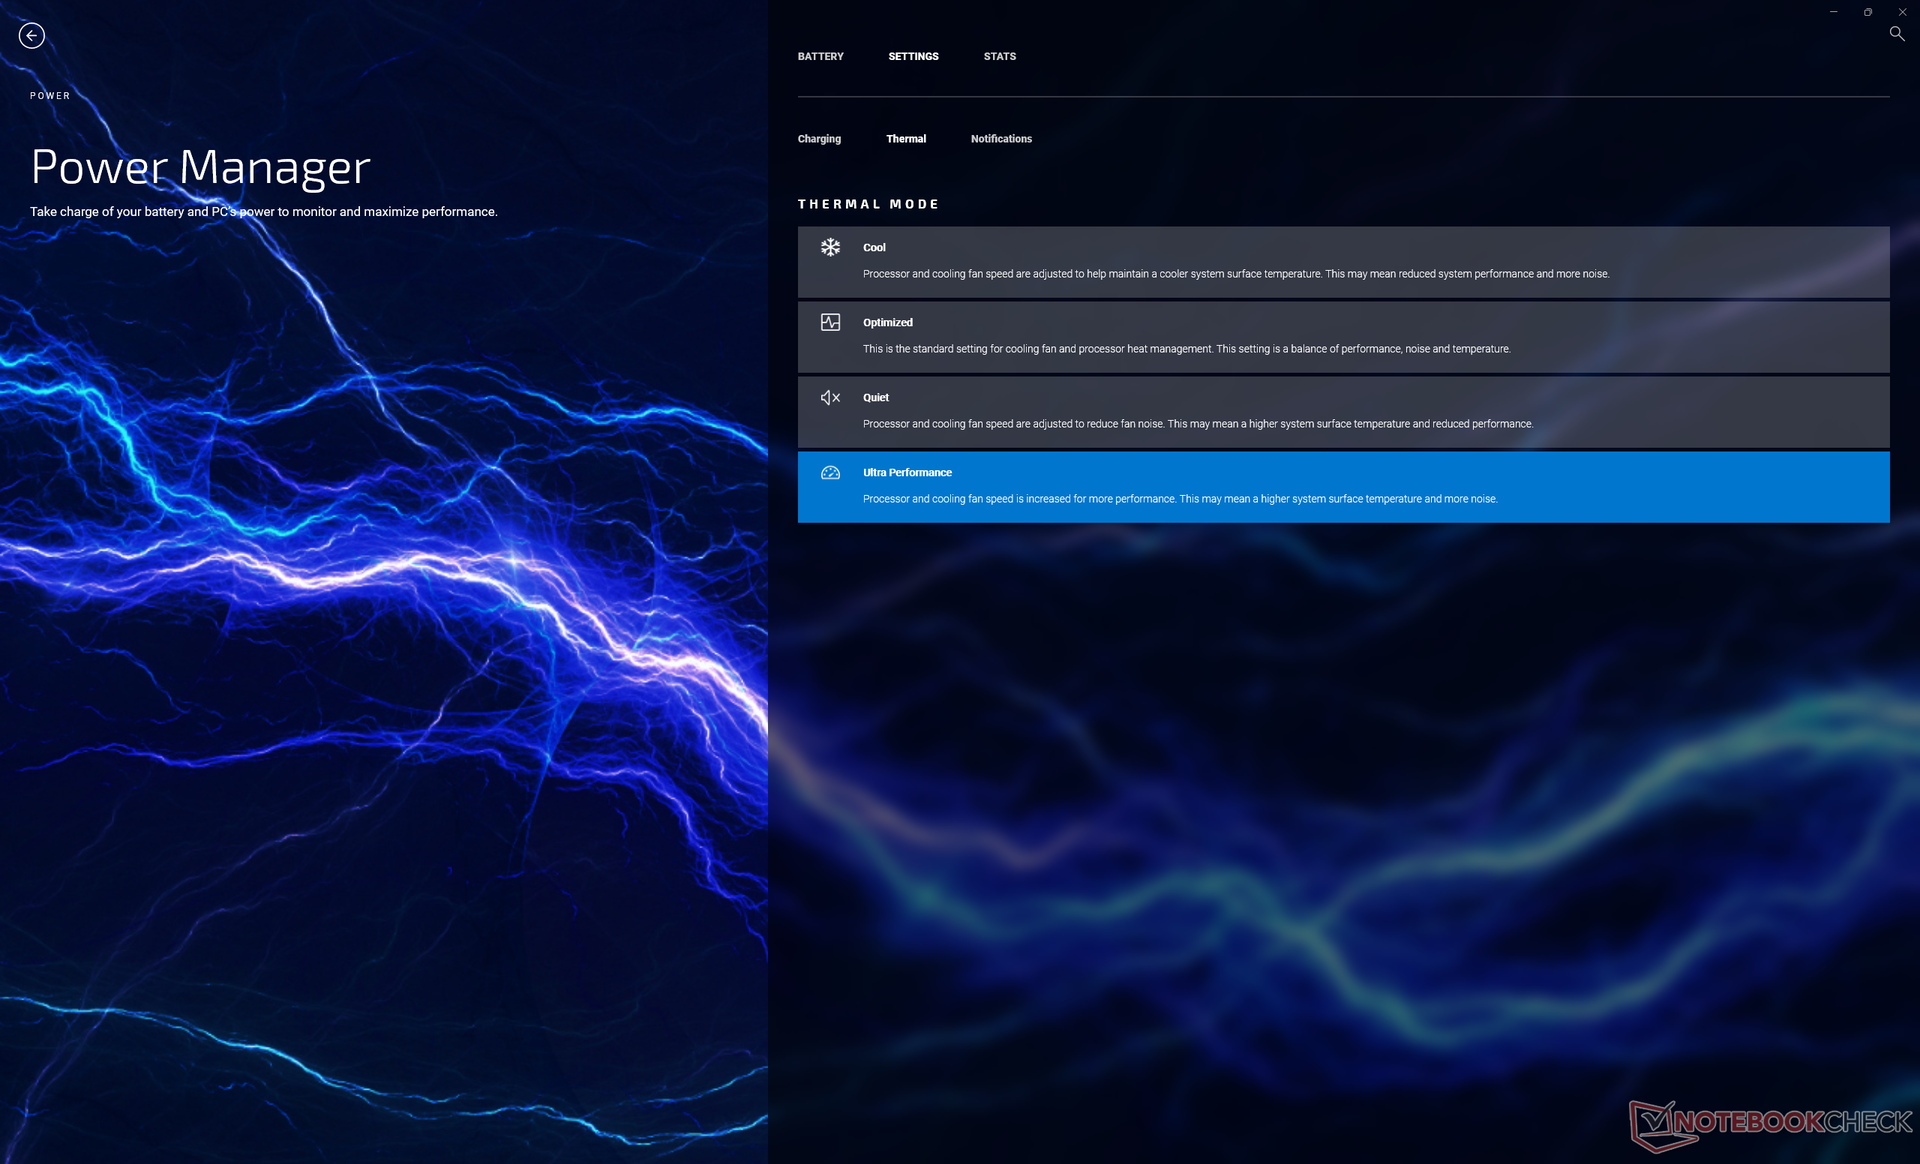
Abbiamo impostato la nostra unità in modalità Performance tramite Windows e Ultra Performance tramite il software My Dell prima di eseguire i benchmark qui sotto. Ci siamo anche assicurati di disabilitare Optimus e di impostare il sistema in modalità GPU discreta tramite il pannello di controllo Nvidia. Si consiglia di familiarizzare con My Dell e Dell Update, in quanto queste due applicazioni preinstallate sono fondamentali per regolare il comportamento del sistema.
Processore
Le prestazioni multi-thread sono eccellenti, con risultati dal 5 al 10% più veloci rispetto alla media dei laptop del nostro database con lo stesso processore Core i7-12700H CPU. La CPU è più veloce di circa il 20-30% rispetto alla stessa CPU Core i9-11900H di ultima generazione Core i9-11900H nei carichi di lavoro multi-thread, ma le prestazioni single-thread possono essere inferiori fino al 10%
L'aggiornamento al Core i9-12900H dovrebbe aumentare le prestazioni solo del 5% circa, in base alla nostra esperienza con l'Alienware x15 R2.Alienware x15 R2. Pertanto, il Core i7-12700H è l'opzione migliore in termini di prestazioni per dollaro
La sostenibilità delle prestazioni è eccellente e migliore di quella delDell Inspiron 16 Plus 7620 equipaggiato con la stessa CPU, come dimostra il nostro grafico di confronto del loop test CineBench R15 xT riportato di seguito.
Cinebench R15 Multi Loop
Cinebench R23: Multi Core | Single Core
Cinebench R15: CPU Multi 64Bit | CPU Single 64Bit
Blender: v2.79 BMW27 CPU
7-Zip 18.03: 7z b 4 | 7z b 4 -mmt1
Geekbench 5.5: Multi-Core | Single-Core
HWBOT x265 Benchmark v2.2: 4k Preset
LibreOffice : 20 Documents To PDF
R Benchmark 2.5: Overall mean
* ... Meglio usare valori piccoli
AIDA64: FP32 Ray-Trace | FPU Julia | CPU SHA3 | CPU Queen | FPU SinJulia | FPU Mandel | CPU AES | CPU ZLib | FP64 Ray-Trace | CPU PhotoWorxx
| Performance rating | |
| Lenovo Legion 7 16ARHA7 | |
| Dell G16 7620 | |
| Lenovo Legion 5 Pro 16IAH7H | |
| Media Intel Core i7-12700H | |
| HP Victus 16-e0145ng | |
| Acer Swift X SFX16-51G-5388 | |
| Asus ROG Zephyrus M16 GU603H -9! | |
| AIDA64 / FP32 Ray-Trace | |
| Lenovo Legion 7 16ARHA7 | |
| Dell G16 7620 | |
| Lenovo Legion 5 Pro 16IAH7H | |
| Lenovo Legion 5 Pro 16IAH7H | |
| HP Victus 16-e0145ng | |
| Media Intel Core i7-12700H (2585 - 17957, n=64) | |
| Acer Swift X SFX16-51G-5388 | |
| AIDA64 / FPU Julia | |
| Lenovo Legion 7 16ARHA7 | |
| Dell G16 7620 | |
| Lenovo Legion 5 Pro 16IAH7H | |
| Lenovo Legion 5 Pro 16IAH7H | |
| HP Victus 16-e0145ng | |
| Media Intel Core i7-12700H (12439 - 90760, n=64) | |
| Acer Swift X SFX16-51G-5388 | |
| AIDA64 / CPU SHA3 | |
| Dell G16 7620 | |
| Lenovo Legion 7 16ARHA7 | |
| Lenovo Legion 5 Pro 16IAH7H | |
| Lenovo Legion 5 Pro 16IAH7H | |
| Media Intel Core i7-12700H (833 - 4242, n=64) | |
| HP Victus 16-e0145ng | |
| Acer Swift X SFX16-51G-5388 | |
| AIDA64 / CPU Queen | |
| Lenovo Legion 7 16ARHA7 | |
| Dell G16 7620 | |
| Lenovo Legion 5 Pro 16IAH7H | |
| Media Intel Core i7-12700H (57923 - 103202, n=63) | |
| HP Victus 16-e0145ng | |
| Acer Swift X SFX16-51G-5388 | |
| AIDA64 / FPU SinJulia | |
| Lenovo Legion 7 16ARHA7 | |
| Lenovo Legion 5 Pro 16IAH7H | |
| Lenovo Legion 5 Pro 16IAH7H | |
| Dell G16 7620 | |
| Media Intel Core i7-12700H (3249 - 9939, n=64) | |
| HP Victus 16-e0145ng | |
| Acer Swift X SFX16-51G-5388 | |
| AIDA64 / FPU Mandel | |
| Lenovo Legion 7 16ARHA7 | |
| HP Victus 16-e0145ng | |
| Lenovo Legion 5 Pro 16IAH7H | |
| Lenovo Legion 5 Pro 16IAH7H | |
| Dell G16 7620 | |
| Media Intel Core i7-12700H (7135 - 44760, n=64) | |
| Acer Swift X SFX16-51G-5388 | |
| AIDA64 / CPU AES | |
| Lenovo Legion 7 16ARHA7 | |
| Lenovo Legion 5 Pro 16IAH7H | |
| Lenovo Legion 5 Pro 16IAH7H | |
| Media Intel Core i7-12700H (31839 - 144360, n=64) | |
| Dell G16 7620 | |
| Acer Swift X SFX16-51G-5388 | |
| HP Victus 16-e0145ng | |
| AIDA64 / CPU ZLib | |
| Lenovo Legion 5 Pro 16IAH7H | |
| Lenovo Legion 5 Pro 16IAH7H | |
| Dell G16 7620 | |
| Media Intel Core i7-12700H (305 - 1171, n=64) | |
| Lenovo Legion 7 16ARHA7 | |
| HP Victus 16-e0145ng | |
| Acer Swift X SFX16-51G-5388 | |
| Asus ROG Zephyrus M16 GU603H | |
| AIDA64 / FP64 Ray-Trace | |
| Lenovo Legion 7 16ARHA7 | |
| Dell G16 7620 | |
| Lenovo Legion 5 Pro 16IAH7H | |
| Lenovo Legion 5 Pro 16IAH7H | |
| HP Victus 16-e0145ng | |
| Media Intel Core i7-12700H (1437 - 9692, n=64) | |
| Acer Swift X SFX16-51G-5388 | |
| AIDA64 / CPU PhotoWorxx | |
| Acer Swift X SFX16-51G-5388 | |
| Dell G16 7620 | |
| Lenovo Legion 5 Pro 16IAH7H | |
| Lenovo Legion 5 Pro 16IAH7H | |
| Media Intel Core i7-12700H (12863 - 52207, n=64) | |
| Lenovo Legion 7 16ARHA7 | |
| HP Victus 16-e0145ng | |
Prestazioni del sistema
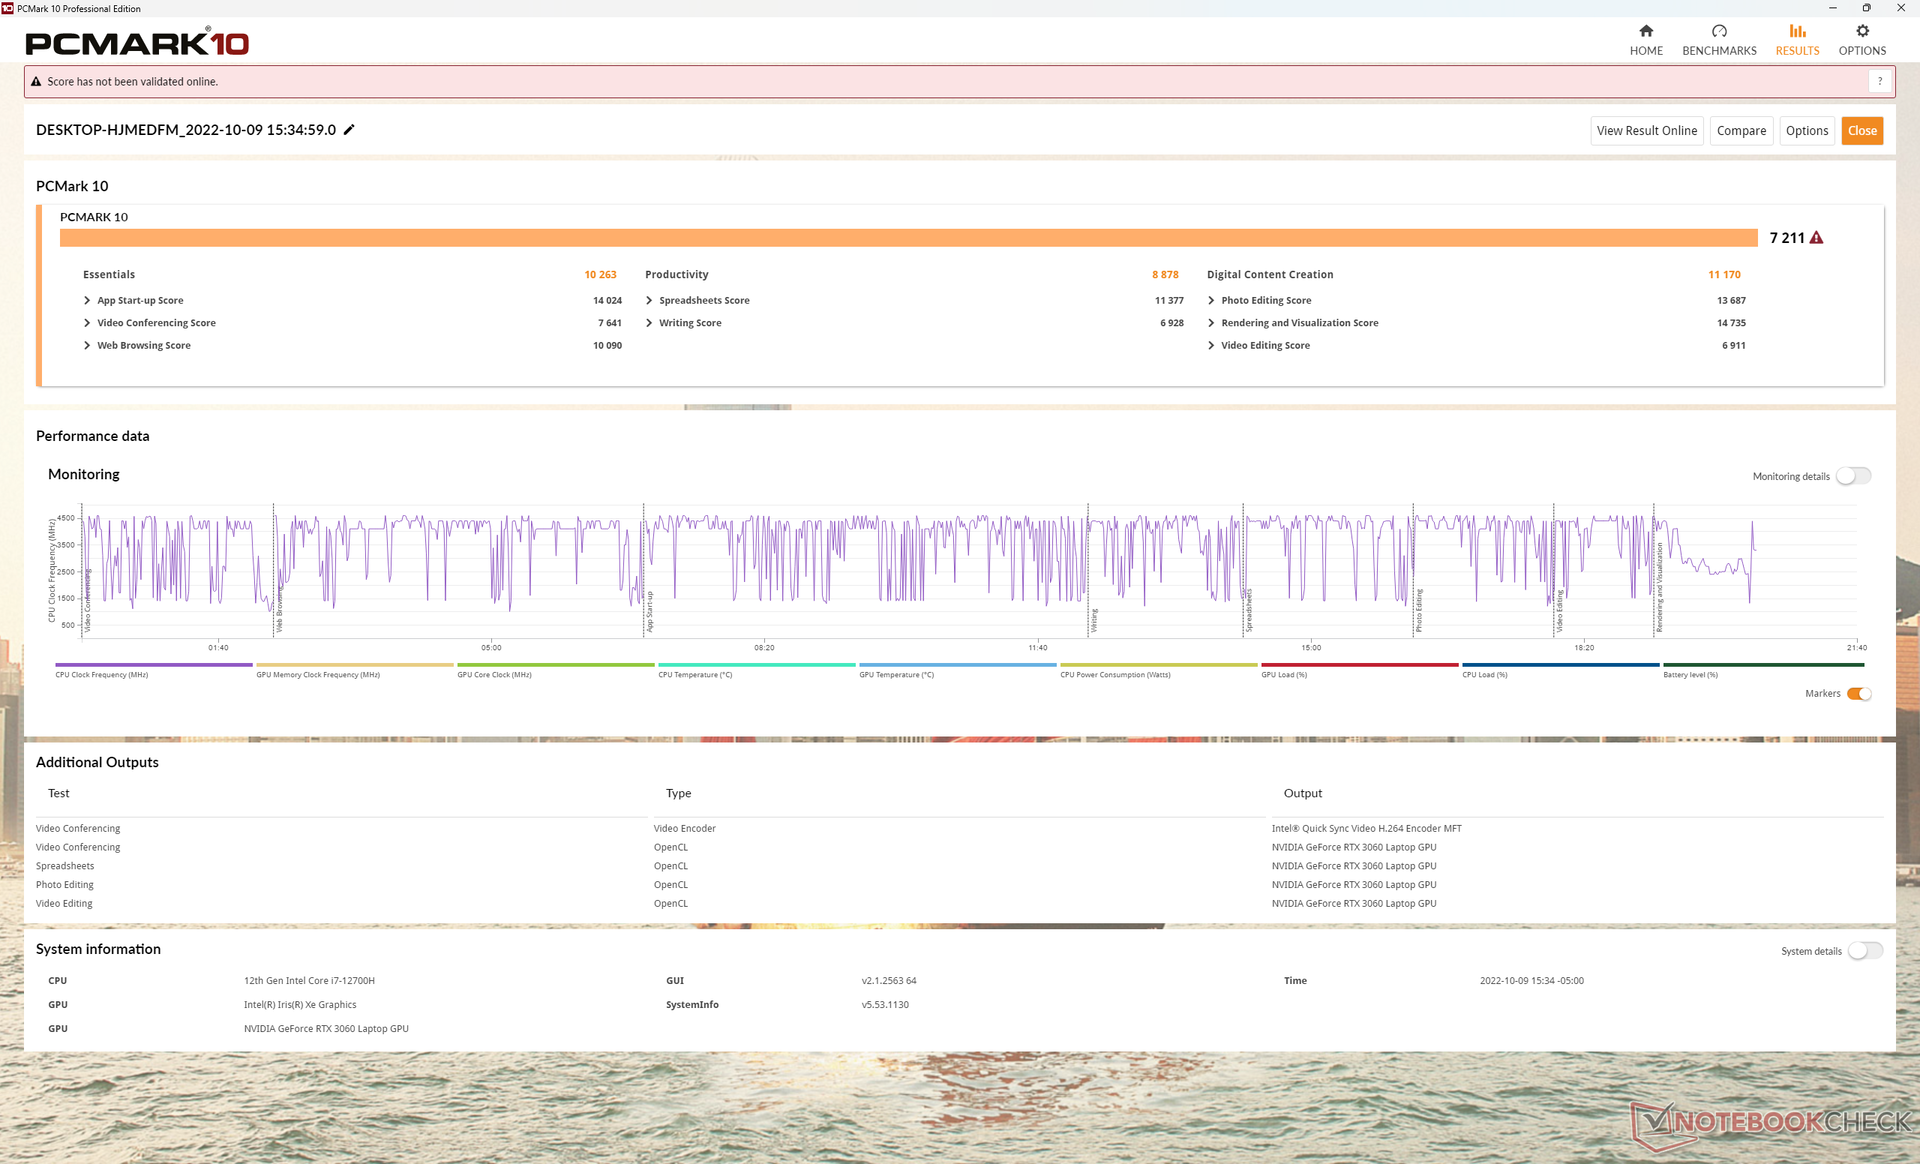
I risultati di PCMark sono entro pochi punti percentuali rispetto ad altri portatili con la stessa CPU Core i7-12700H e GPU RTX 3060. I punteggi sono anche più alti in media rispetto all'Alienware m15 R5 dello scorso anno Alienware m15 R5 con la stessa GPU ma con il più lento AMD Ryzen 7 5800H.
CrossMark: Overall | Productivity | Creativity | Responsiveness
| PCMark 10 / Score | |
| Lenovo Legion 5 Pro 16IAH7H | |
| Lenovo Legion 7 16ARHA7 | |
| Media Intel Core i7-12700H, NVIDIA GeForce RTX 3060 Laptop GPU (5986 - 8156, n=12) | |
| Dell G16 7620 | |
| Asus ROG Zephyrus M16 GU603H | |
| HP Victus 16-e0145ng | |
| Acer Swift X SFX16-51G-5388 | |
| PCMark 10 / Essentials | |
| Lenovo Legion 5 Pro 16IAH7H | |
| Media Intel Core i7-12700H, NVIDIA GeForce RTX 3060 Laptop GPU (9289 - 12144, n=12) | |
| Asus ROG Zephyrus M16 GU603H | |
| Lenovo Legion 7 16ARHA7 | |
| Dell G16 7620 | |
| HP Victus 16-e0145ng | |
| Acer Swift X SFX16-51G-5388 | |
| PCMark 10 / Productivity | |
| Lenovo Legion 5 Pro 16IAH7H | |
| Media Intel Core i7-12700H, NVIDIA GeForce RTX 3060 Laptop GPU (6161 - 10362, n=12) | |
| Asus ROG Zephyrus M16 GU603H | |
| Lenovo Legion 7 16ARHA7 | |
| Dell G16 7620 | |
| Acer Swift X SFX16-51G-5388 | |
| HP Victus 16-e0145ng | |
| PCMark 10 / Digital Content Creation | |
| Lenovo Legion 7 16ARHA7 | |
| Lenovo Legion 5 Pro 16IAH7H | |
| Dell G16 7620 | |
| Media Intel Core i7-12700H, NVIDIA GeForce RTX 3060 Laptop GPU (8950 - 12554, n=12) | |
| Asus ROG Zephyrus M16 GU603H | |
| HP Victus 16-e0145ng | |
| Acer Swift X SFX16-51G-5388 | |
| CrossMark / Overall | |
| Media Intel Core i7-12700H, NVIDIA GeForce RTX 3060 Laptop GPU (1649 - 2017, n=11) | |
| Dell G16 7620 | |
| Lenovo Legion 5 Pro 16IAH7H | |
| Lenovo Legion 7 16ARHA7 | |
| Acer Swift X SFX16-51G-5388 | |
| CrossMark / Productivity | |
| Media Intel Core i7-12700H, NVIDIA GeForce RTX 3060 Laptop GPU (1536 - 1958, n=11) | |
| Lenovo Legion 5 Pro 16IAH7H | |
| Dell G16 7620 | |
| Lenovo Legion 7 16ARHA7 | |
| Acer Swift X SFX16-51G-5388 | |
| CrossMark / Creativity | |
| Media Intel Core i7-12700H, NVIDIA GeForce RTX 3060 Laptop GPU (1816 - 2084, n=11) | |
| Dell G16 7620 | |
| Lenovo Legion 5 Pro 16IAH7H | |
| Lenovo Legion 7 16ARHA7 | |
| Acer Swift X SFX16-51G-5388 | |
| CrossMark / Responsiveness | |
| Lenovo Legion 5 Pro 16IAH7H | |
| Media Intel Core i7-12700H, NVIDIA GeForce RTX 3060 Laptop GPU (1210 - 2207, n=11) | |
| Dell G16 7620 | |
| Lenovo Legion 7 16ARHA7 | |
| Acer Swift X SFX16-51G-5388 | |
| PCMark 10 Score | 7211 punti | |
Aiuto | ||
| AIDA64 / Memory Copy | |
| Acer Swift X SFX16-51G-5388 | |
| Lenovo Legion 5 Pro 16IAH7H | |
| Lenovo Legion 5 Pro 16IAH7H | |
| Dell G16 7620 | |
| Media Intel Core i7-12700H (25615 - 80511, n=64) | |
| Lenovo Legion 7 16ARHA7 | |
| HP Victus 16-e0145ng | |
| AIDA64 / Memory Read | |
| Dell G16 7620 | |
| Lenovo Legion 5 Pro 16IAH7H | |
| Lenovo Legion 5 Pro 16IAH7H | |
| Media Intel Core i7-12700H (25586 - 79442, n=64) | |
| Acer Swift X SFX16-51G-5388 | |
| Lenovo Legion 7 16ARHA7 | |
| HP Victus 16-e0145ng | |
| AIDA64 / Memory Write | |
| Acer Swift X SFX16-51G-5388 | |
| Lenovo Legion 5 Pro 16IAH7H | |
| Lenovo Legion 5 Pro 16IAH7H | |
| Dell G16 7620 | |
| Lenovo Legion 7 16ARHA7 | |
| Media Intel Core i7-12700H (23679 - 88660, n=64) | |
| HP Victus 16-e0145ng | |
| AIDA64 / Memory Latency | |
| Lenovo Legion 5 Pro 16IAH7H | |
| Lenovo Legion 5 Pro 16IAH7H | |
| Acer Swift X SFX16-51G-5388 | |
| Dell G16 7620 | |
| Lenovo Legion 7 16ARHA7 | |
| Media Intel Core i7-12700H (76.2 - 133.9, n=62) | |
| HP Victus 16-e0145ng | |
| Asus ROG Zephyrus M16 GU603H | |
* ... Meglio usare valori piccoli
Latenza DPC
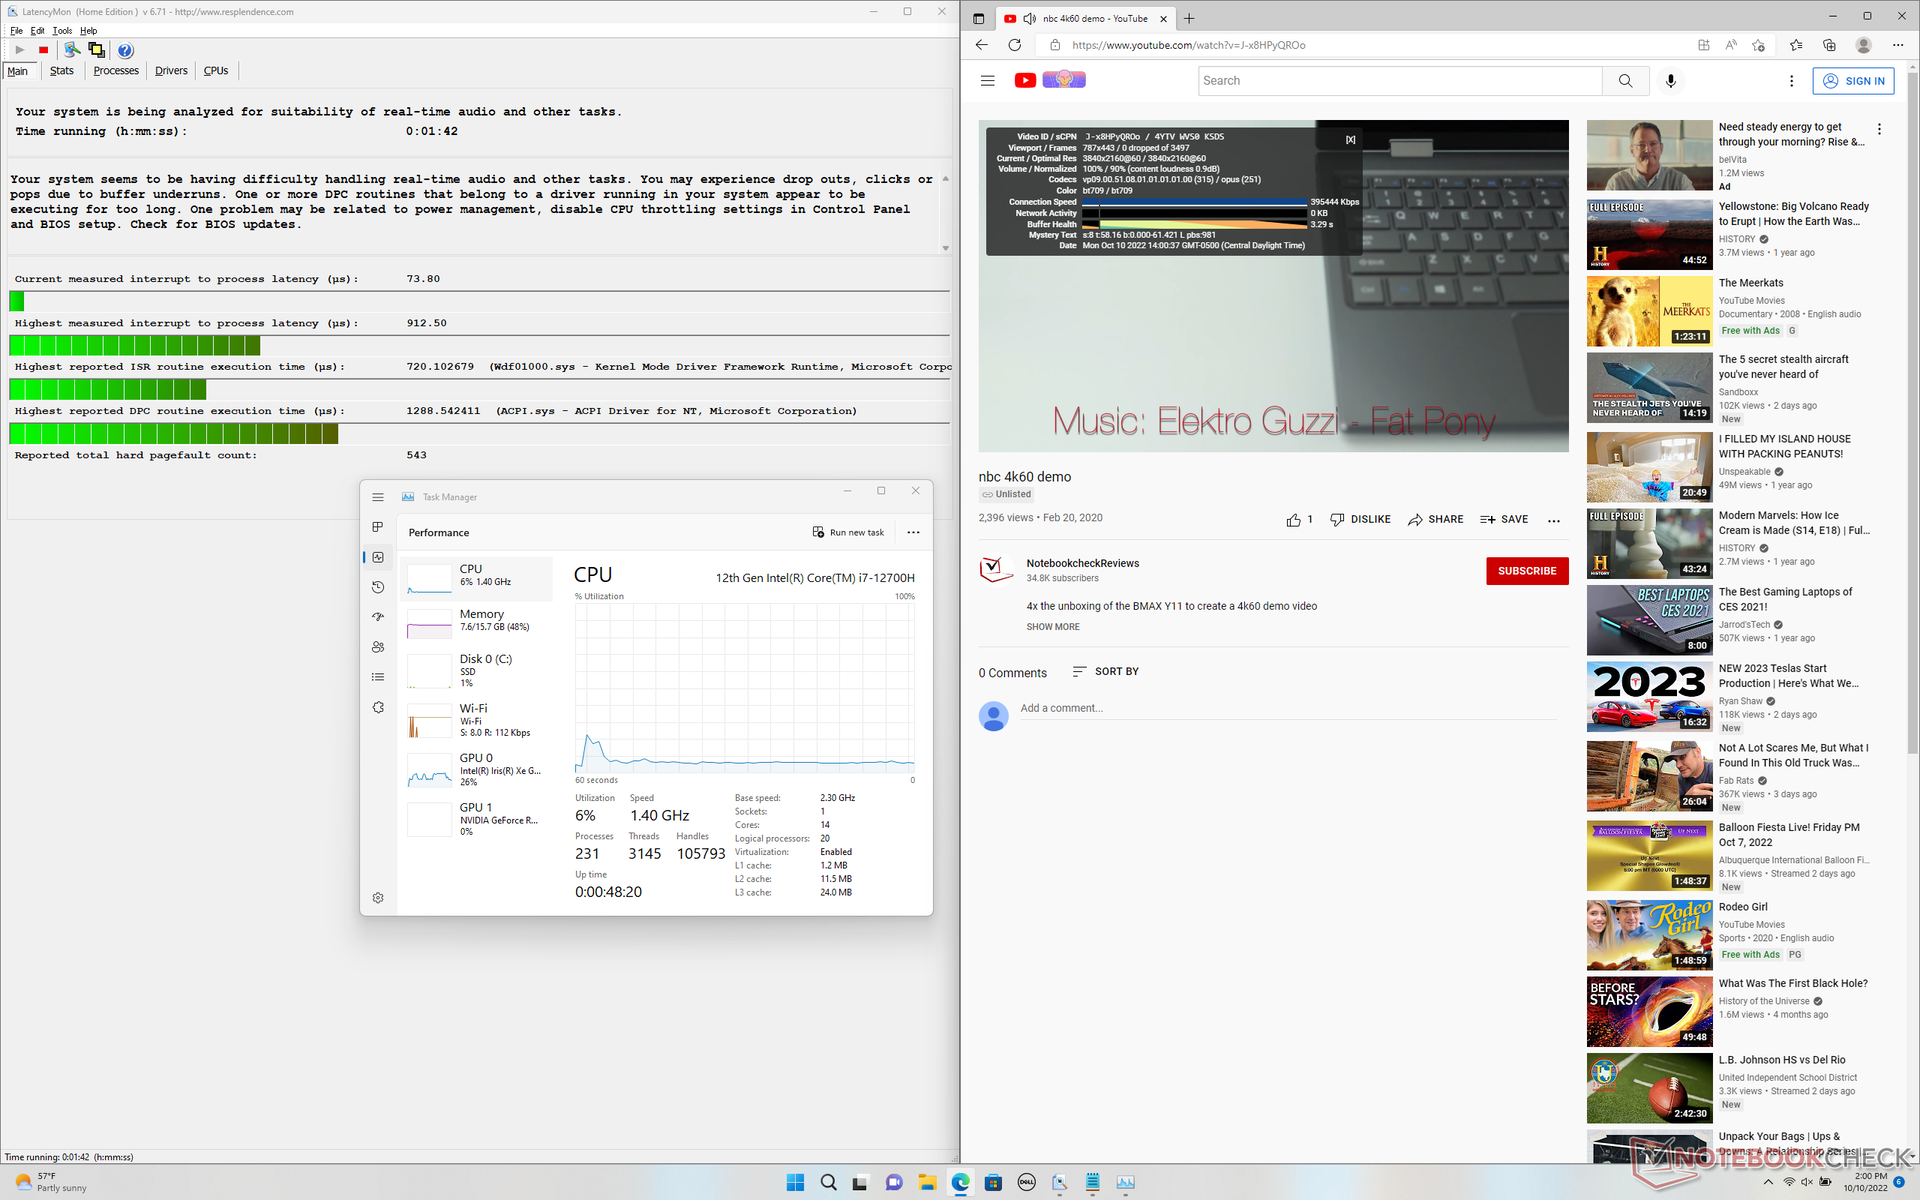
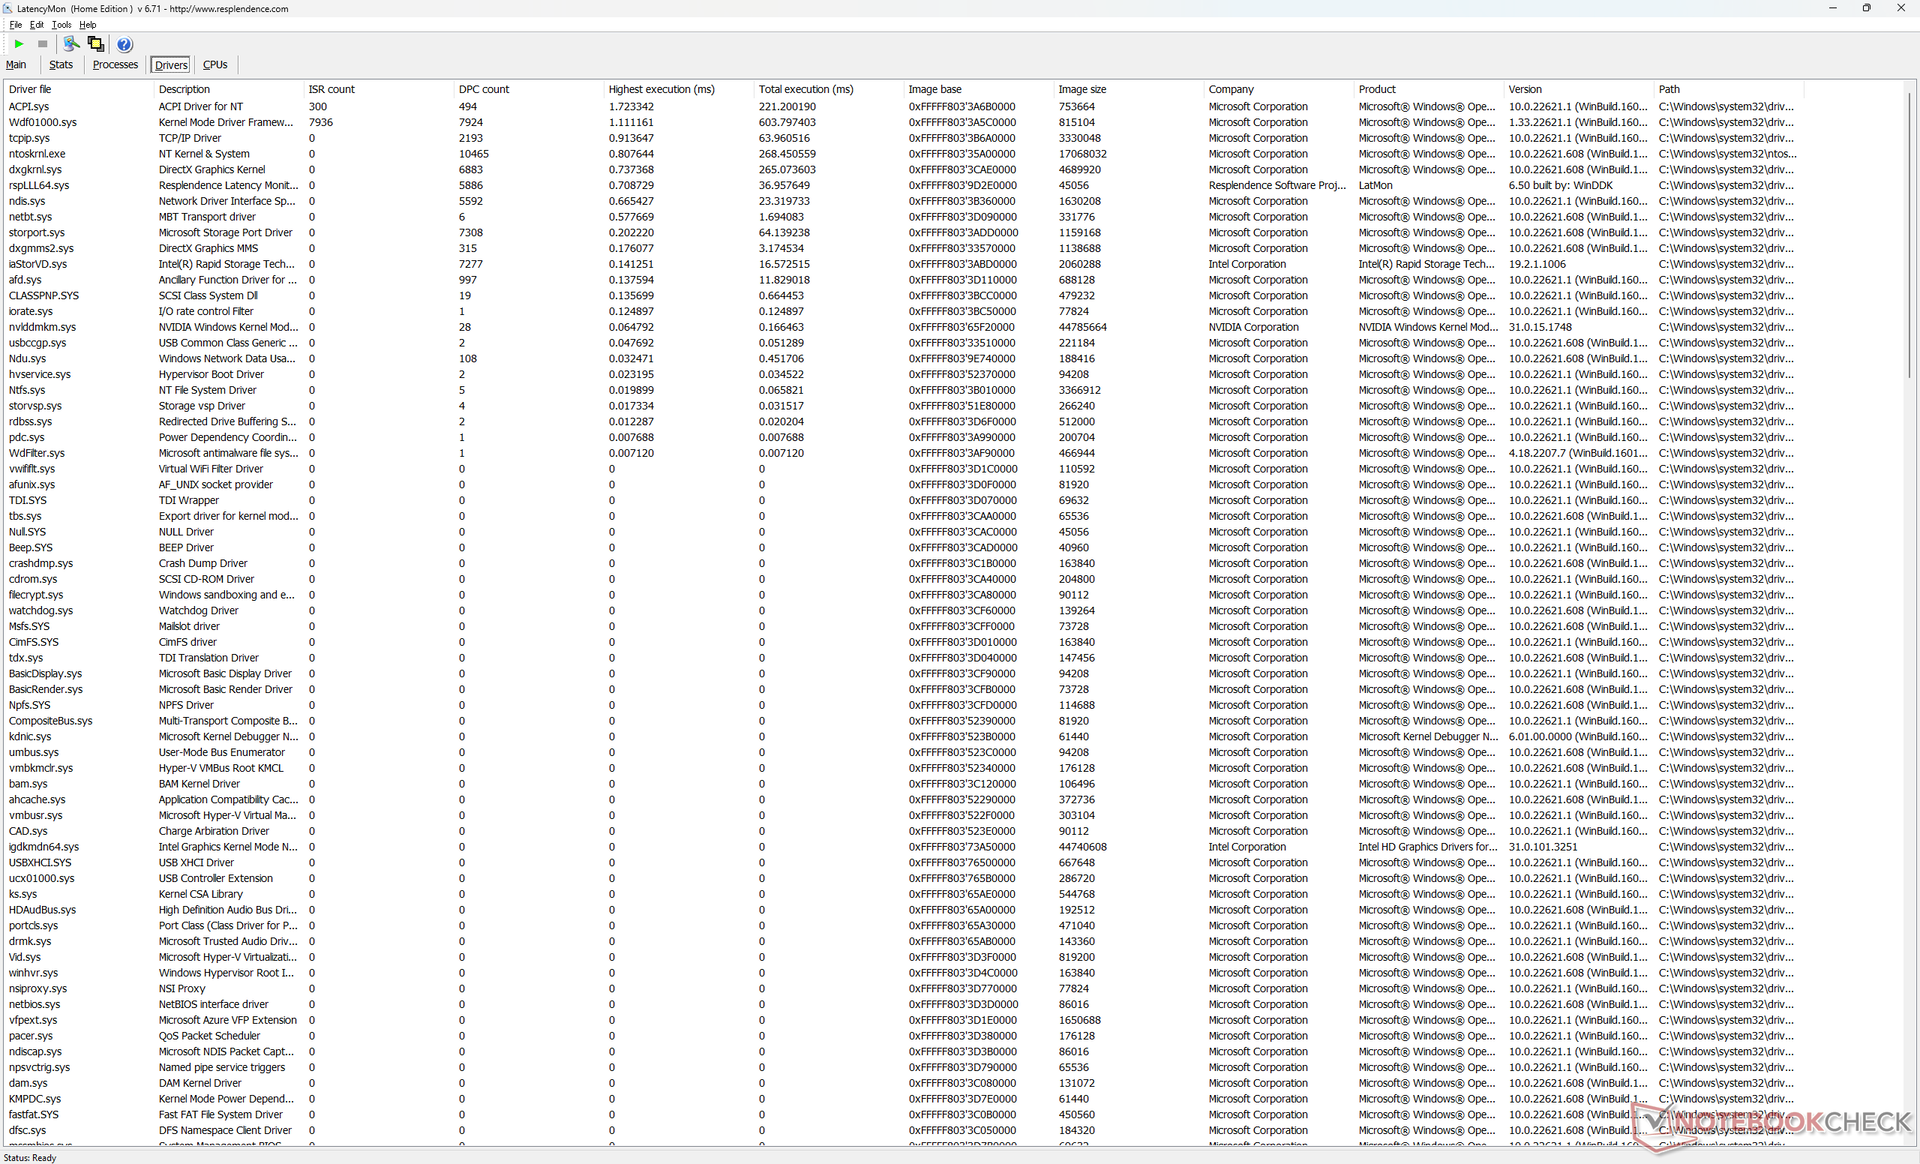
LatencyMon rivela lievi problemi di DPC quando si aprono più schede del browser sulla nostra homepage. la riproduzione di video 4K a 60 FPS è invece perfetta, senza cadute di fotogrammi.
| DPC Latencies / LatencyMon - interrupt to process latency (max), Web, Youtube, Prime95 | |
| Acer Swift X SFX16-51G-5388 | |
| Lenovo Legion 7 16ARHA7 | |
| Asus ROG Zephyrus M16 GU603H | |
| Dell G16 7620 | |
| HP Victus 16-e0145ng | |
| Lenovo Legion 5 Pro 16IAH7H | |
* ... Meglio usare valori piccoli
Dispositivi di archiviazione
La scheda madre può ospitare fino a due SSD M.2 2280, come mostrano le immagini qui sotto. Tuttavia, tutte le configurazioni al momento vengono fornite con il secondo connettore rimosso, il che significa che la G16 può supportare solo un SSD M.2 2280 interno
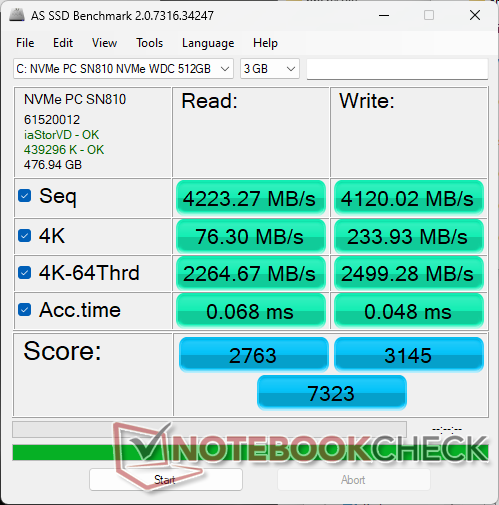
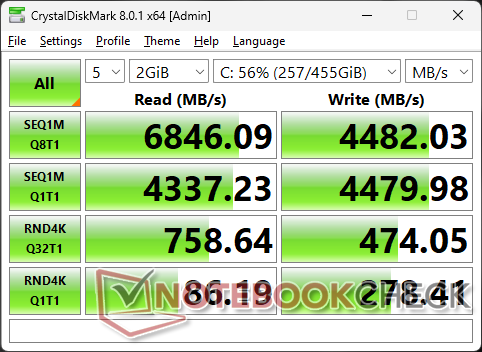
La nostra unità di prova viene fornita con il modello di fascia media superiore WDC PC SN810 SSD PCIe4 x4 NVMe per velocità teoriche di lettura e scrittura sequenziale fino a 6000 MB/s e 4000 MB/s, rispettivamente, secondo il produttore. L'unità nella nostra unità è in grado di raggiungere 6700 MB/s, ma non è in grado di sostenere queste velocità per periodi prolungati. Quando si esegue DiskSpd in loop, ad esempio, le velocità di lettura si riducono a 3500 MB/s.


| Drive Performance rating - Percent | |
| Lenovo Legion 5 Pro 16IAH7H | |
| Asus ROG Zephyrus M16 GU603H | |
| Dell G16 7620 | |
| Lenovo Legion 7 16ARHA7 | |
| HP Victus 16-e0145ng | |
| Acer Swift X SFX16-51G-5388 | |
* ... Meglio usare valori piccoli
Disk Throttling: DiskSpd Read Loop, Queue Depth 8
Prestazioni della GPU - Grafica TGP da 130 W
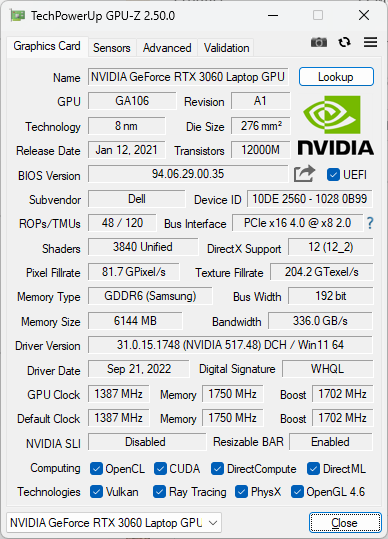
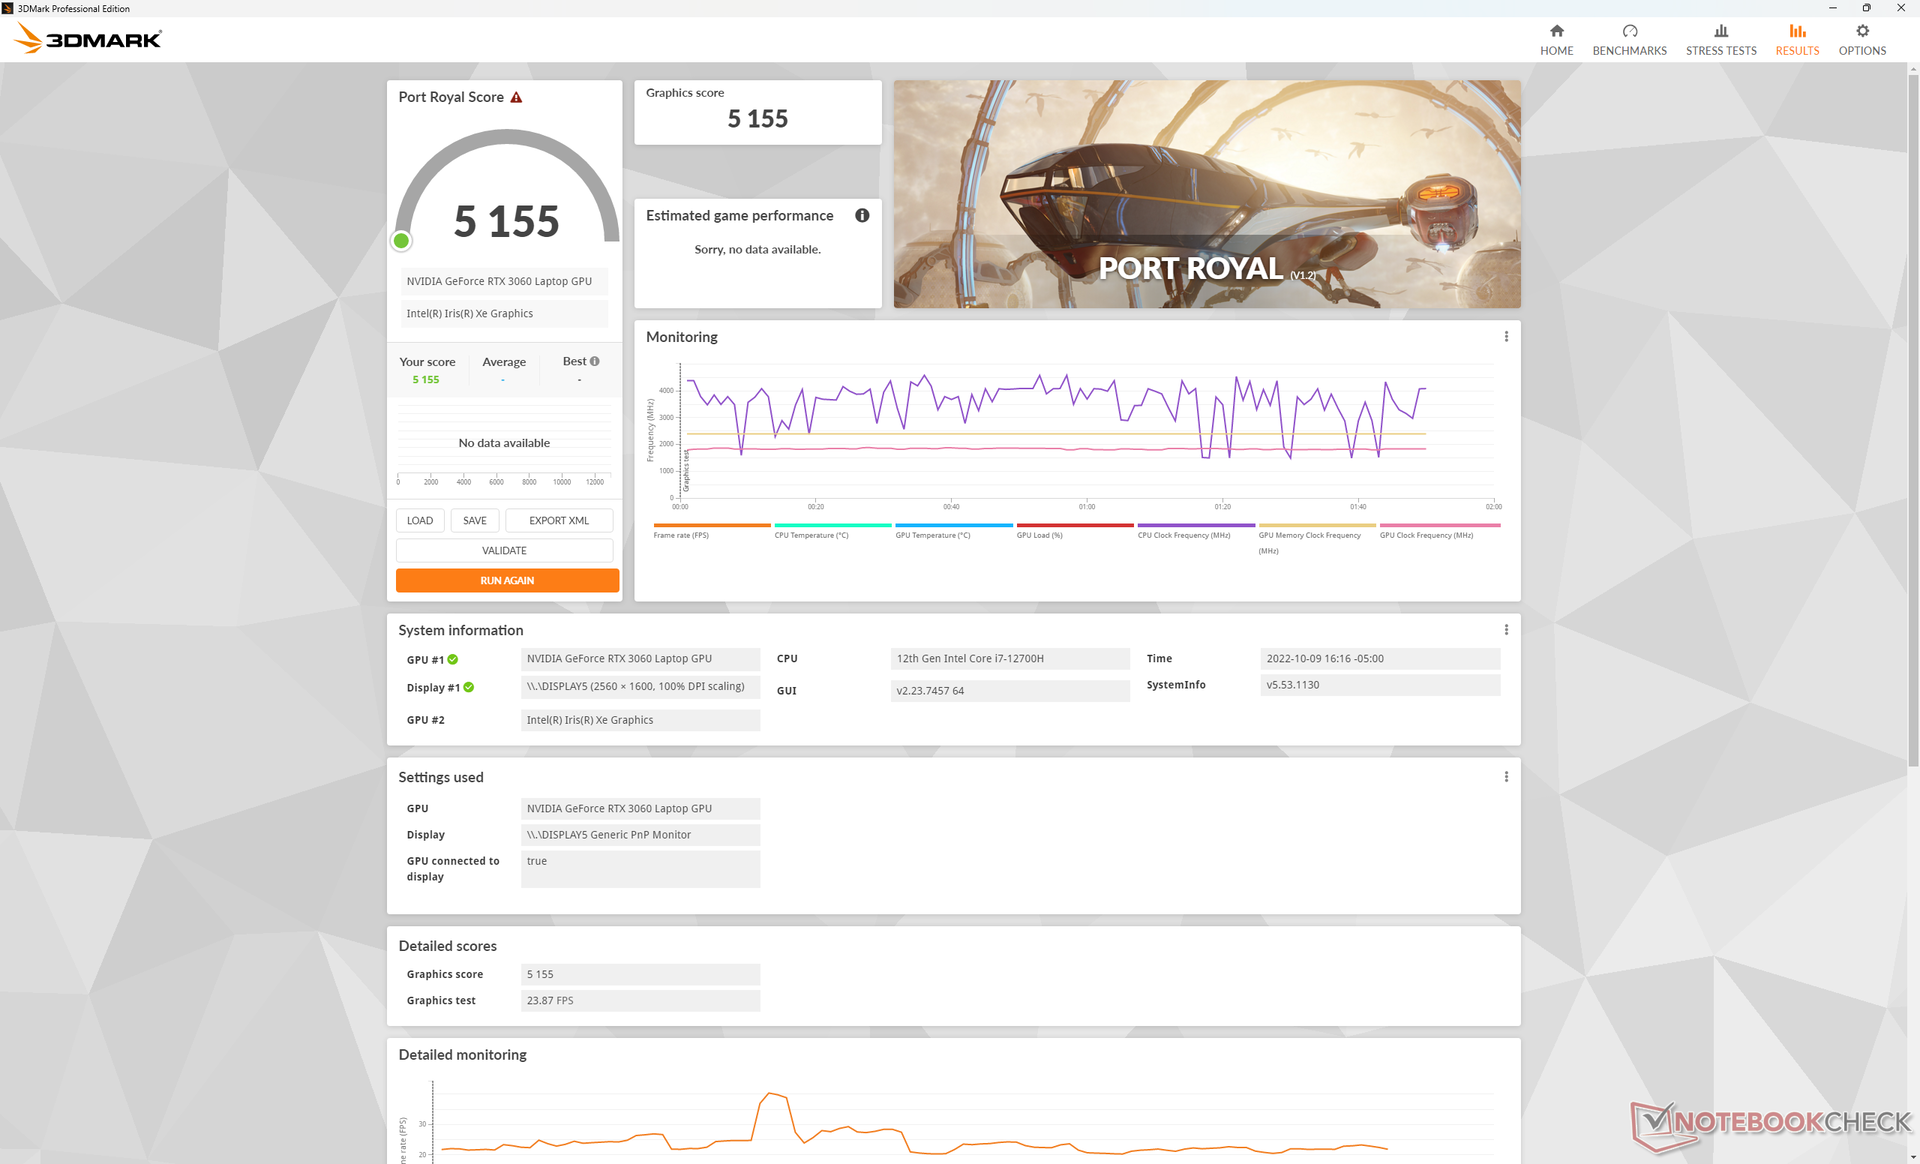
Le prestazioni grafiche sono eccellenti, con risultati dal 5 al 10% più veloci rispetto alla media dei laptop del nostro database equipaggiati con la stessa scheda RTX60 GeForce RTX 3060 GPU. Le prestazioni complessive sono ora entro il 10% di una RTX 3060 desktop adeguata. Ciò è dovuto in parte all'obiettivo di 130 W TGP del Dell G16, che si colloca nella fascia più alta dello spettro quando si tratta di portatili da gioco.
L'aggiornamento alla RTX 3070 Ti dovrebbe incrementare le prestazioni grafiche di circa il 20-30%, mentre il downgrade alla RTX 3050 Ti dovrebbe incrementare le prestazioni grafiche di circa il 20-30% RTX 3050 Ti diminuirà le prestazioni di circa il 30-35%.
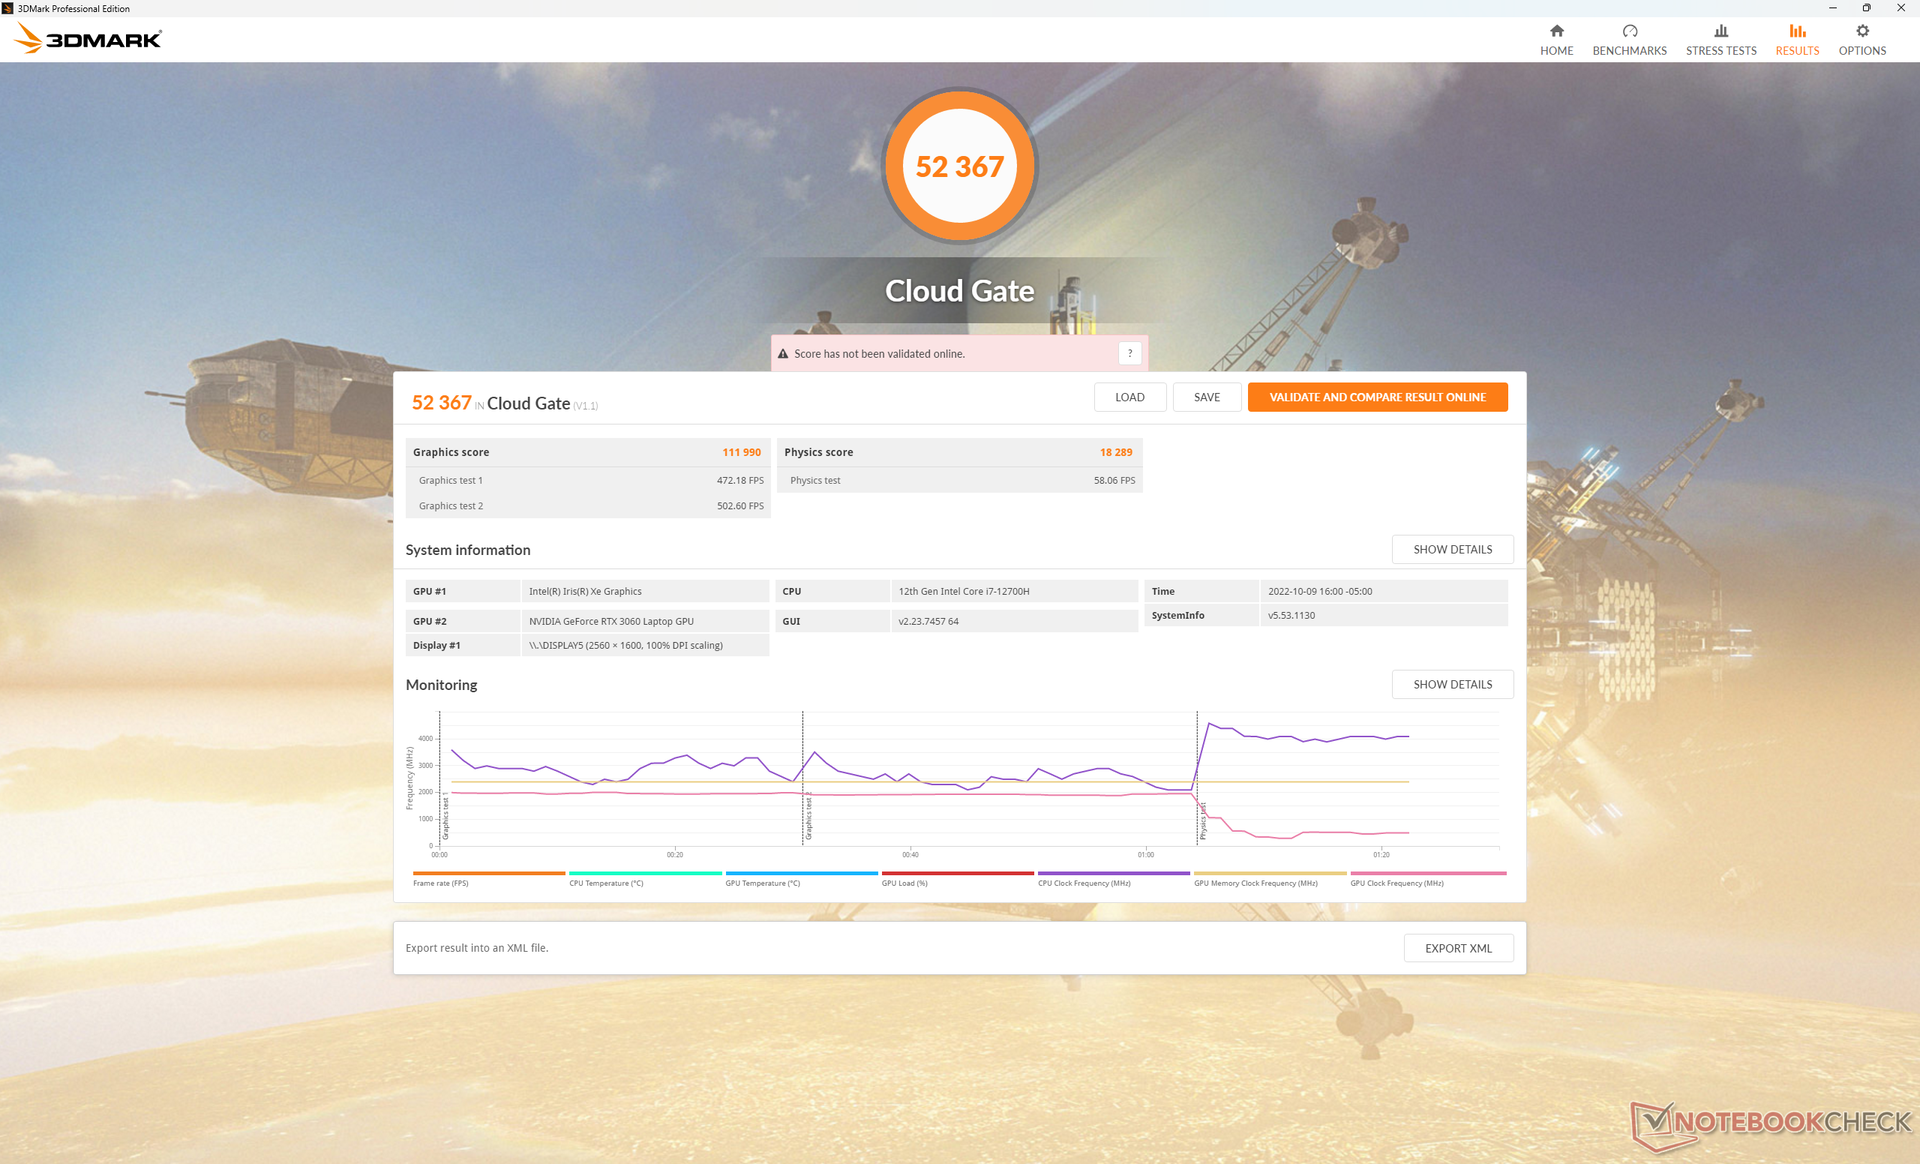
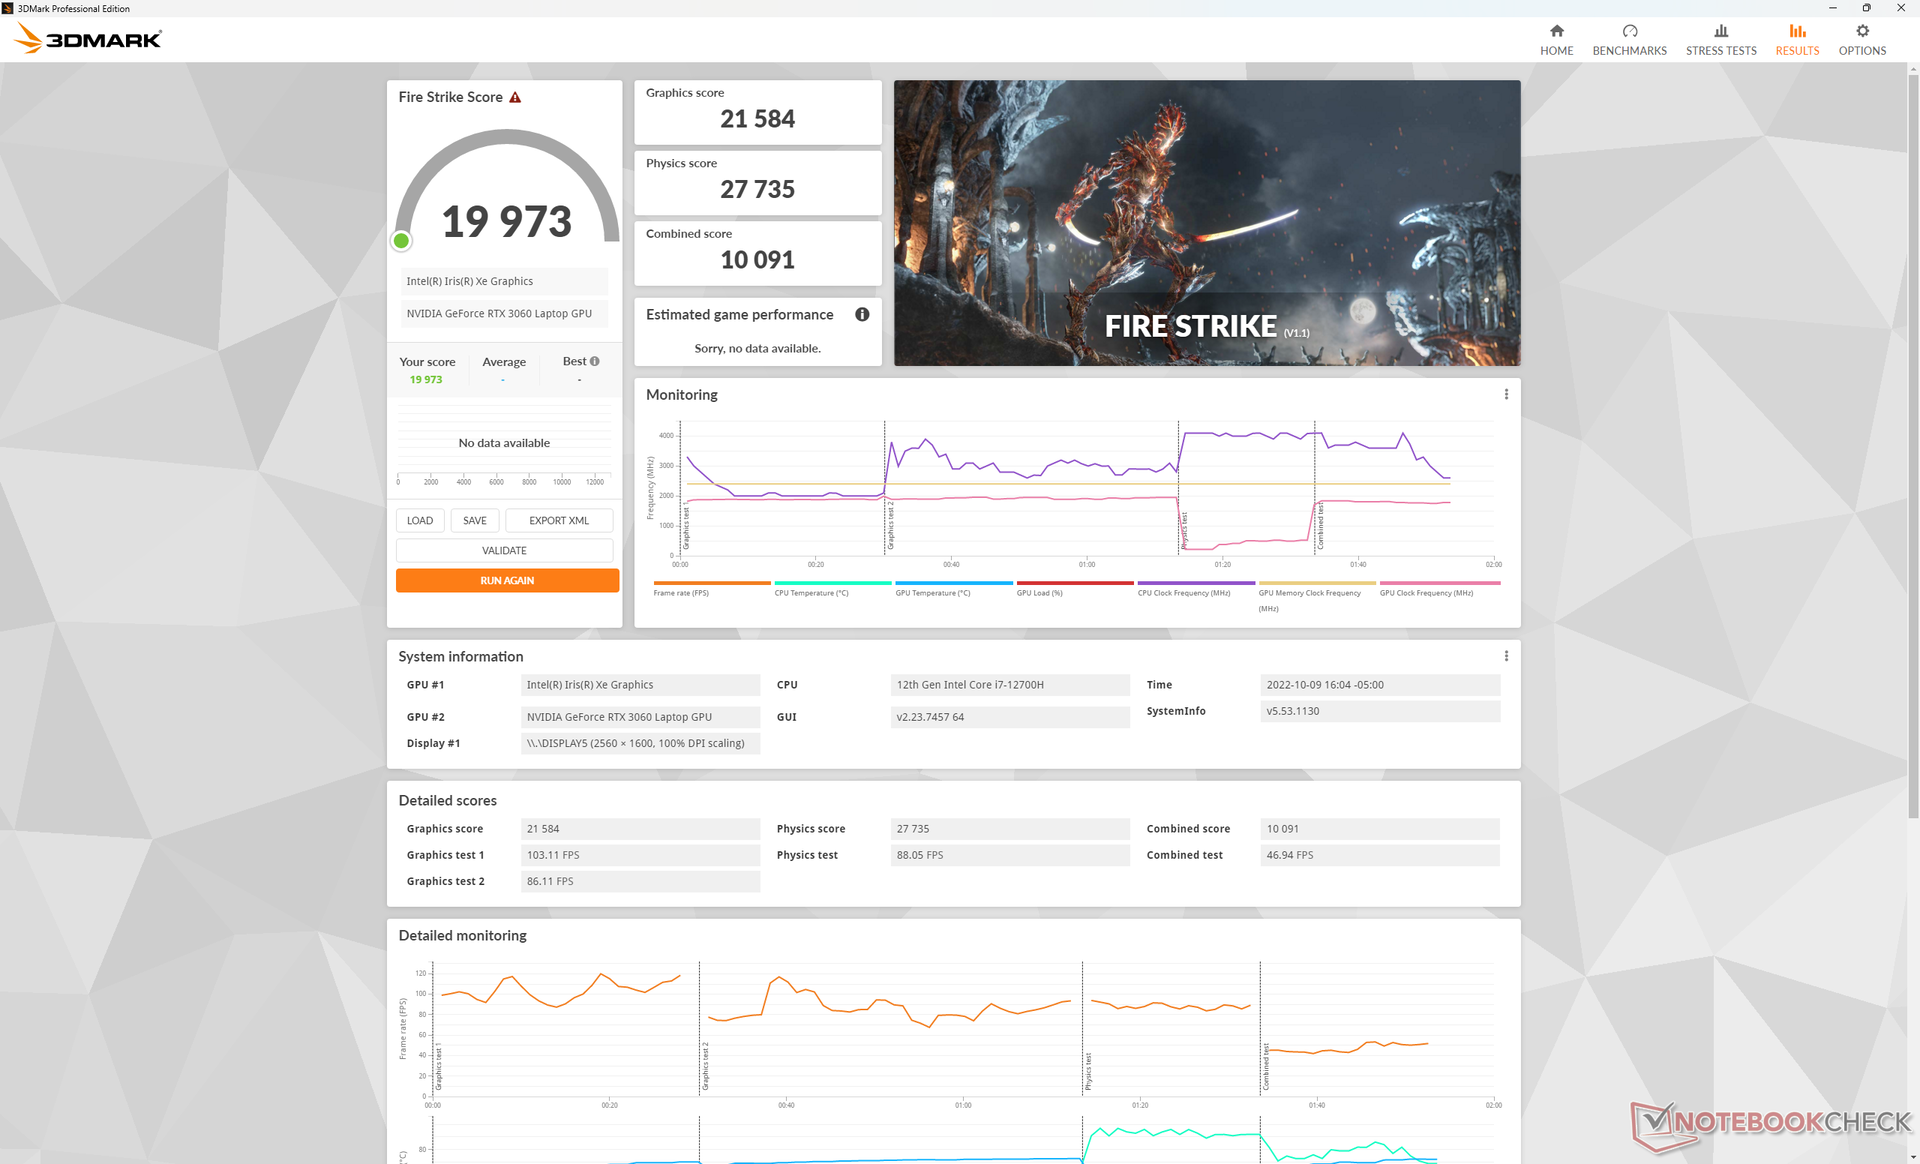
L'esecuzione in modalità Ottimizzata invece che in modalità Ultra Performance ha un impatto minimo sulle prestazioni. Un test su Fire Strike in modalità Ottimizzata restituirebbe punteggi di Fisica e Grafica rispettivamente di 26289 e 21492 punti, rispetto a 27735 e 21584 punti in modalità Ultra Performance.
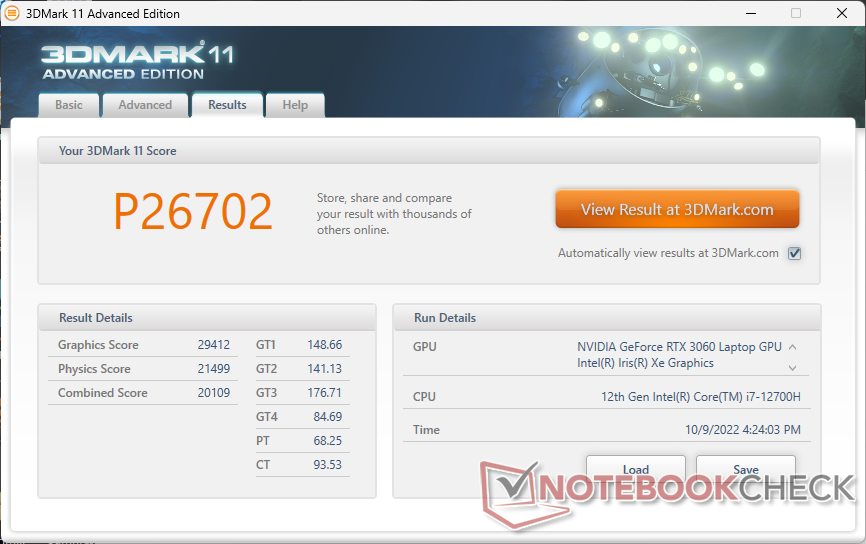
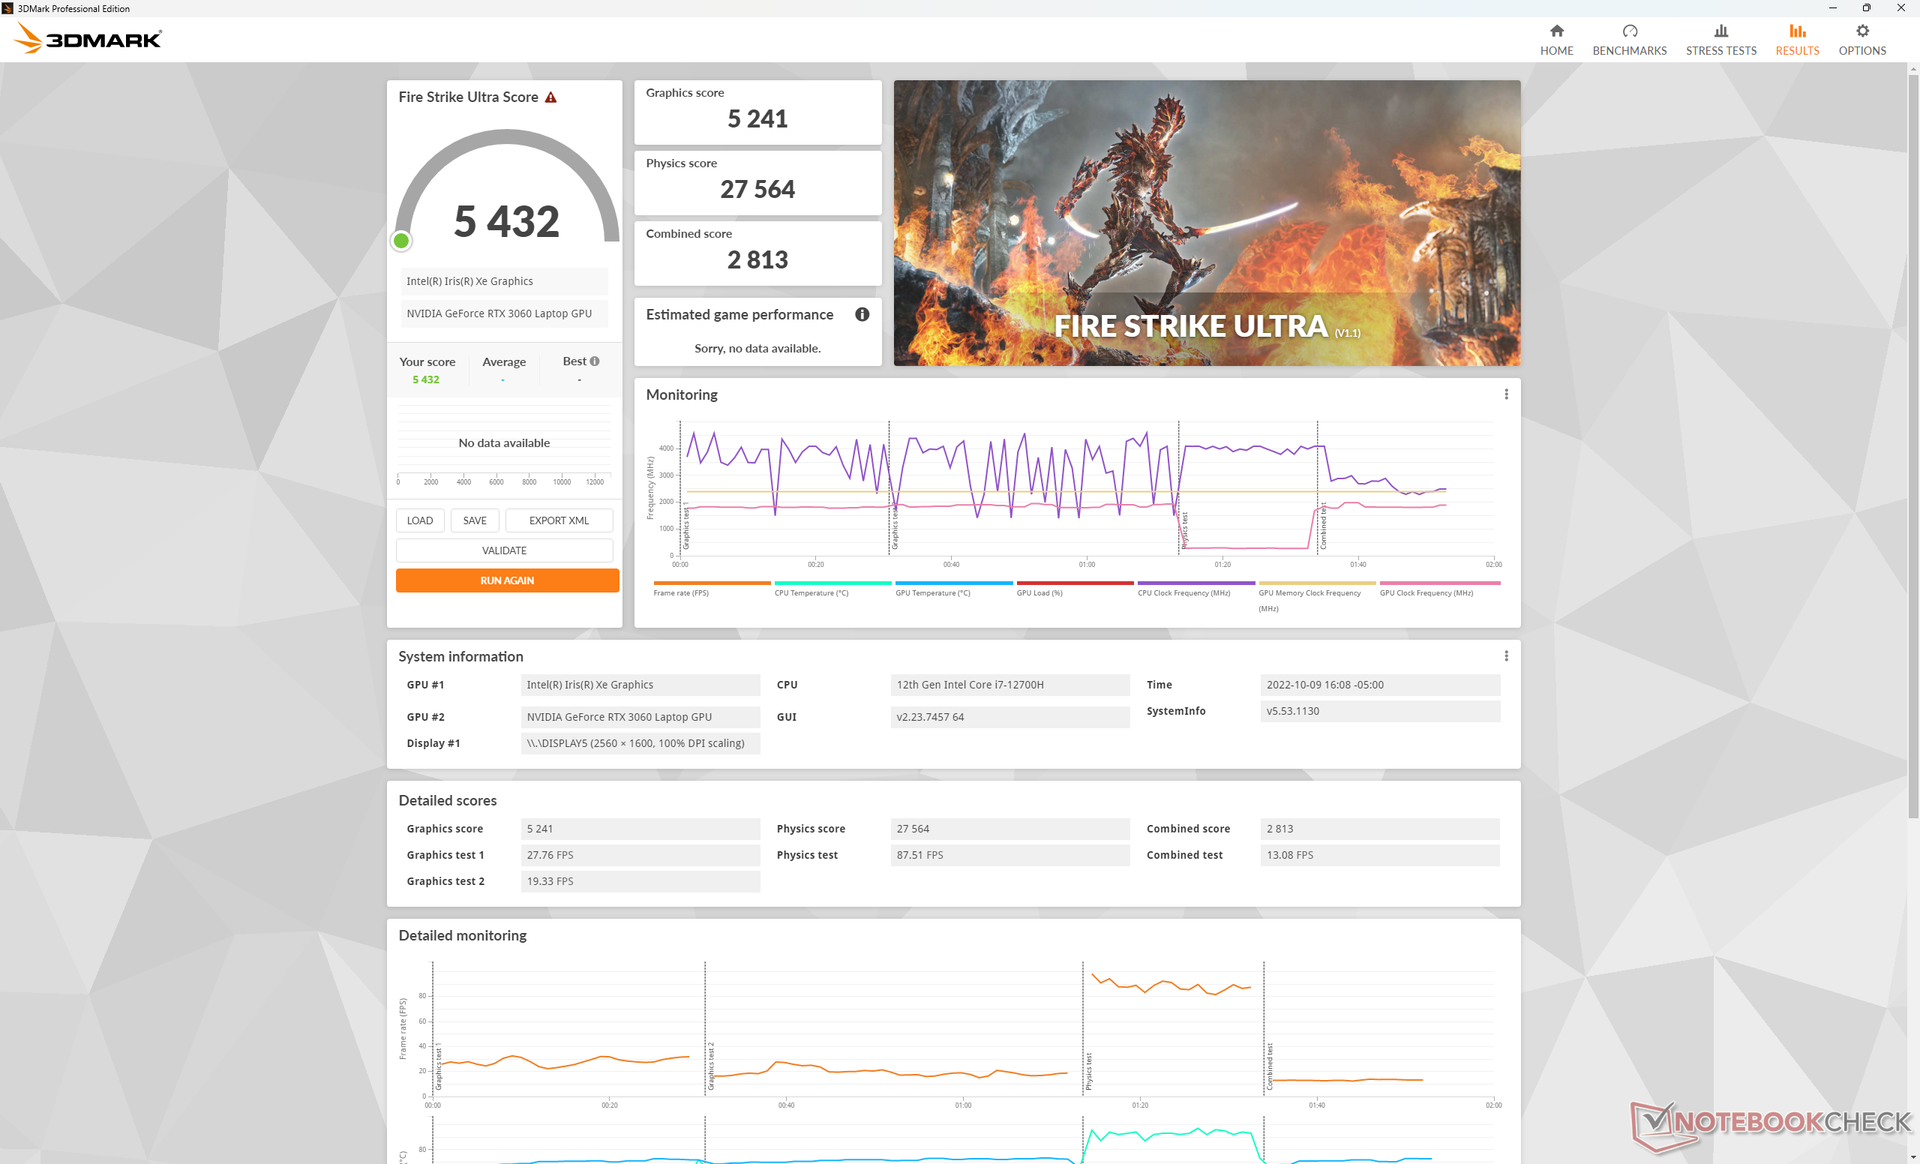
| 3DMark 11 Performance | 26702 punti | |
| 3DMark Cloud Gate Standard Score | 52367 punti | |
| 3DMark Fire Strike Score | 19973 punti | |
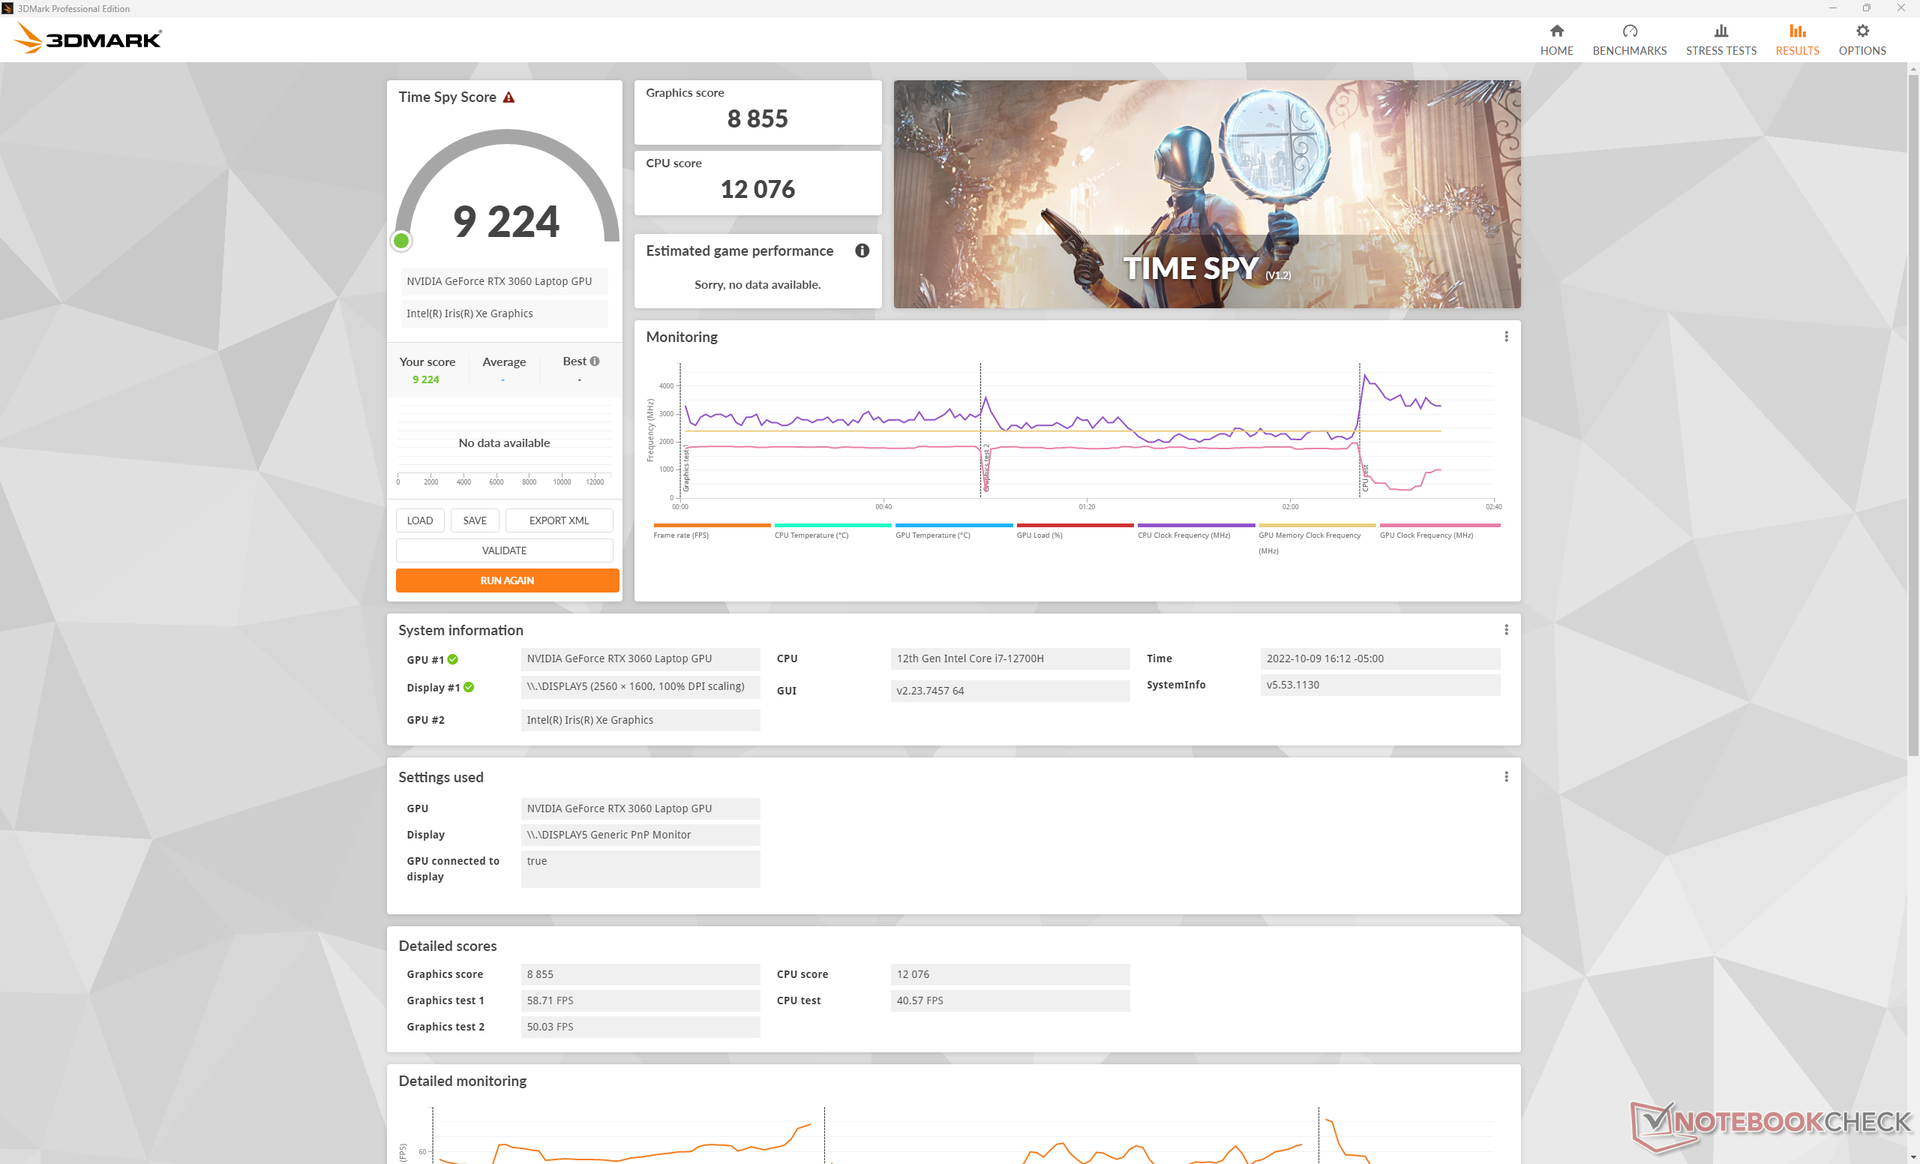
| 3DMark Time Spy Score | 9224 punti | |
Aiuto | ||
* ... Meglio usare valori piccoli
È possibile osservare un calo temporaneo delle prestazioni fino a 43 FPS durante l'esecuzione di Witcher 3, come mostrato dal grafico sottostante. Questo cambiamento improvviso è solitamente causato da una cattiva gestione delle risorse da parte di alcune applicazioni in background, come ad esempio i software preinstallati dal produttore, che interrompono l'applicazione in corso.
Witcher 3 FPS Chart
| basso | medio | alto | ultra | QHD | |
|---|---|---|---|---|---|
| GTA V (2015) | 185.6 | 179.9 | 176.2 | 108.7 | 82.1 |
| The Witcher 3 (2015) | 415.2 | 260.5 | 167.2 | 86.6 | |
| Dota 2 Reborn (2015) | 171.8 | 159.3 | 159 | 147.2 | |
| Final Fantasy XV Benchmark (2018) | 176.7 | 123.3 | 89.4 | 67.1 | |
| X-Plane 11.11 (2018) | 147.8 | 130.5 | 102.6 | ||
| Strange Brigade (2018) | 395 | 228 | 180.2 | 155.5 | 113 |
| Cyberpunk 2077 1.6 (2022) | 125.1 | 105.4 | 80.4 | 66.8 | 41.6 |
Emissioni
Rumore di sistema: quasi mai silenzioso
Le ventole interne del G16 non sono quasi mai inattive, anche quando sono impostate sul profilo di potenza più basso. In modalità "Quiet", ad esempio, siamo ancora in grado di registrare un rumore della ventola di 28 dB(A) a fronte di uno sfondo silenzioso di 23 dB(A). Si tratta di un rumore abbastanza forte da essere percepito durante lo streaming video e anche più alto di quello di molti altri portatili da gioco in condizioni simili, come il Lenovo Legion 7 16 o l'HP Victus 16.
La buona notizia è che l'elevato rumore di fondo significa che le ventole aumentano più lentamente quando vengono introdotti carichi più elevati. Quando si esegue la prima scena di benchmark di 3DMark 06, ad esempio, il rumore della ventola raggiunge i 32 dB(A) rispetto ai 40 dB(A) o più dell'Acer Swift X SFX16 HP Victus 16.
Il rumore della ventola si stabilizza a 45,7 dB(A) e 48,3 dB(A) quando si utilizza la modalità Balanced e Performance Witcher 3 in modalità Bilanciata e Performance, rispettivamente.
Rumorosità
| Idle |
| 28.3 / 28.8 / 28.9 dB(A) |
| Sotto carico |
| 32.4 / 48.1 dB(A) |
 | ||
30 dB silenzioso 40 dB(A) udibile 50 dB(A) rumoroso |
||
min: | ||
| Dell G16 7620 GeForce RTX 3060 Laptop GPU, i7-12700H, WDC PC SN810 512GB | Lenovo Legion 7 16ARHA7 Radeon RX 6850M XT, R9 6900HX, Samsung PM9A1 MZVL22T0HBLB | HP Victus 16-e0145ng GeForce RTX 3050 Ti Laptop GPU, R5 5600H, Samsung SSD PM981a MZVLB512HBJQ | Asus ROG Zephyrus M16 GU603H GeForce RTX 3070 Laptop GPU, i9-11900H, Samsung PM9A1 MZVL22T0HBLB | Lenovo Legion 5 Pro 16IAH7H GeForce RTX 3060 Laptop GPU, i7-12700H, 2x Samsung PM9A1 MZVL21T0HCLR (RAID 0) | Acer Swift X SFX16-51G-5388 GeForce RTX 3050 4GB Laptop GPU, i5-11320H, Samsung PM991 MZVLQ512HBLU | |
|---|---|---|---|---|---|---|
| Noise | 8% | -9% | -17% | -14% | -1% | |
| off /ambiente * (dB) | 23.2 | 22.8 2% | 26 -12% | 25 -8% | 24.6 -6% | 25.4 -9% |
| Idle Minimum * (dB) | 28.3 | 23 19% | 26 8% | 25 12% | 28.7 -1% | 25.4 10% |
| Idle Average * (dB) | 28.8 | 23 20% | 28 3% | 31 -8% | 32 -11% | 25.4 12% |
| Idle Maximum * (dB) | 28.9 | 23 20% | 34 -18% | 42 -45% | 32 -11% | 27.8 4% |
| Load Average * (dB) | 32.4 | 26.8 17% | 44 -36% | 48 -48% | 45.2 -40% | 41 -27% |
| Witcher 3 ultra * (dB) | 48.3 | 54.3 -12% | 48 1% | 52 -8% | ||
| Load Maximum * (dB) | 48.1 | 54.2 -13% | 53 -10% | 56 -16% | 54.4 -13% | 47 2% |
* ... Meglio usare valori piccoli
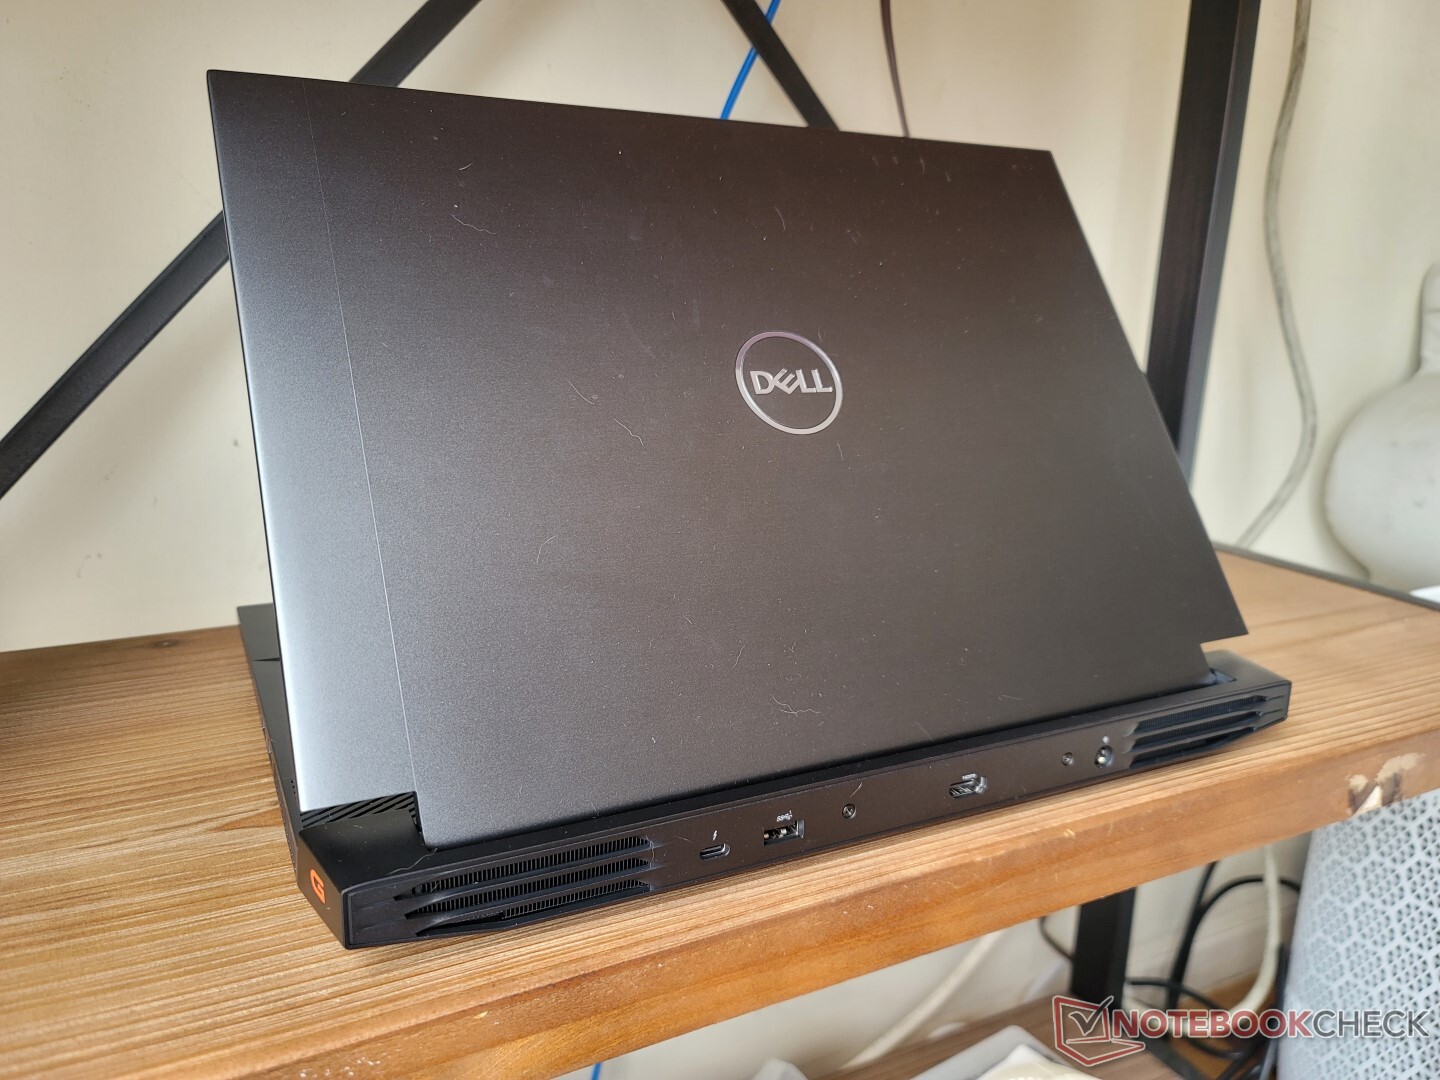
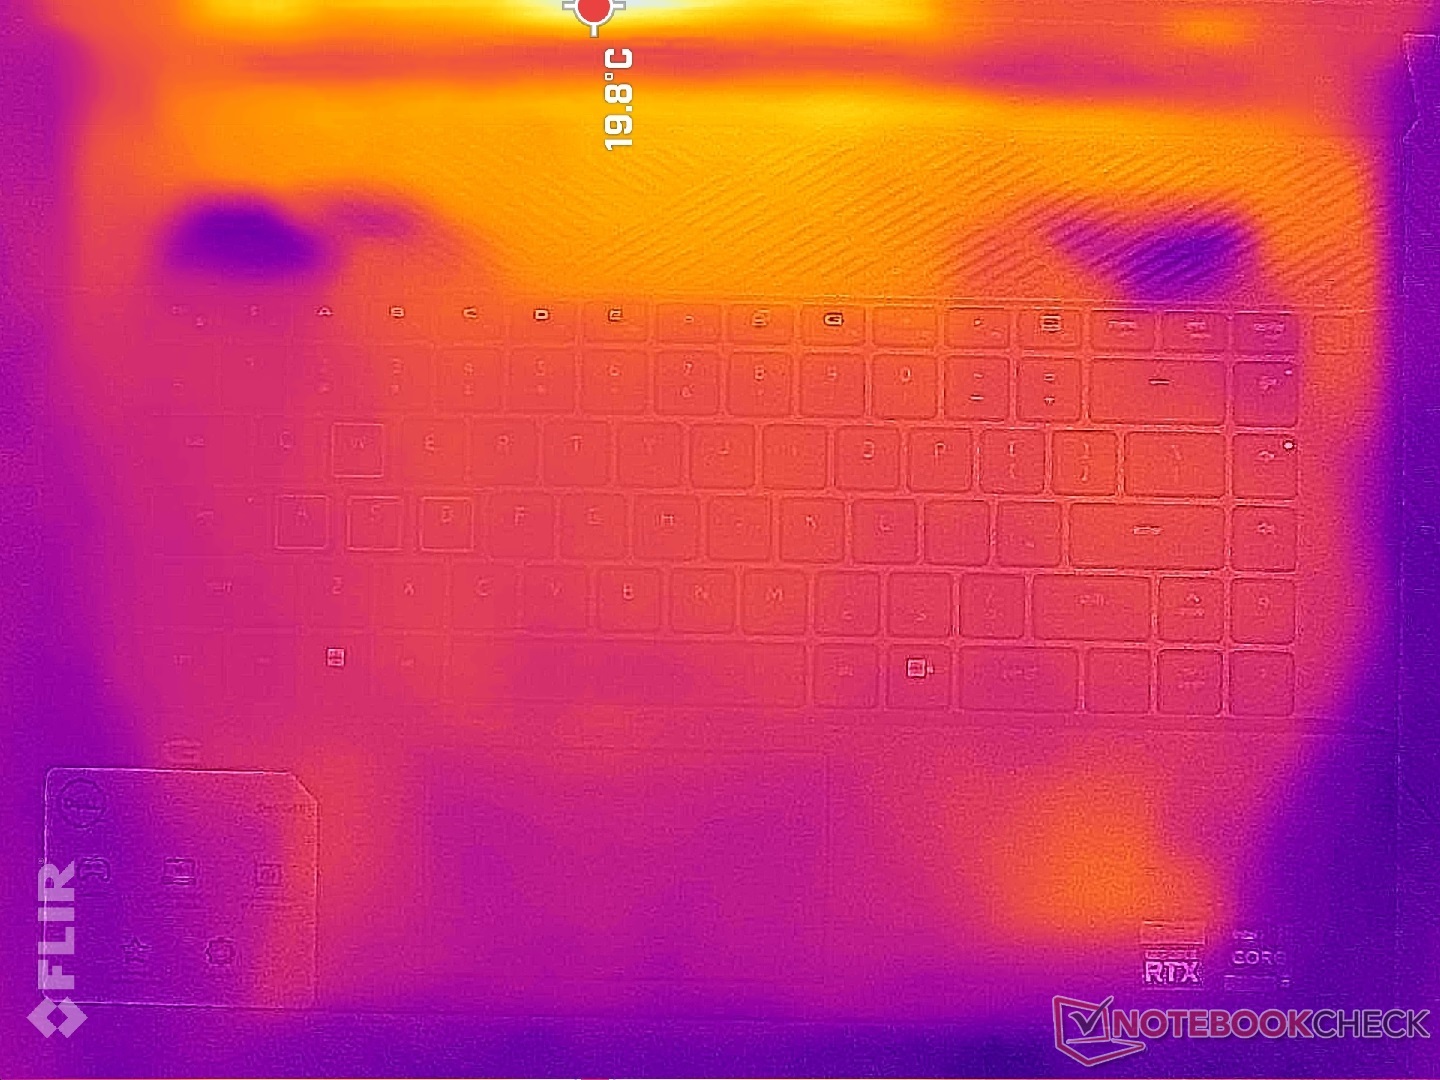
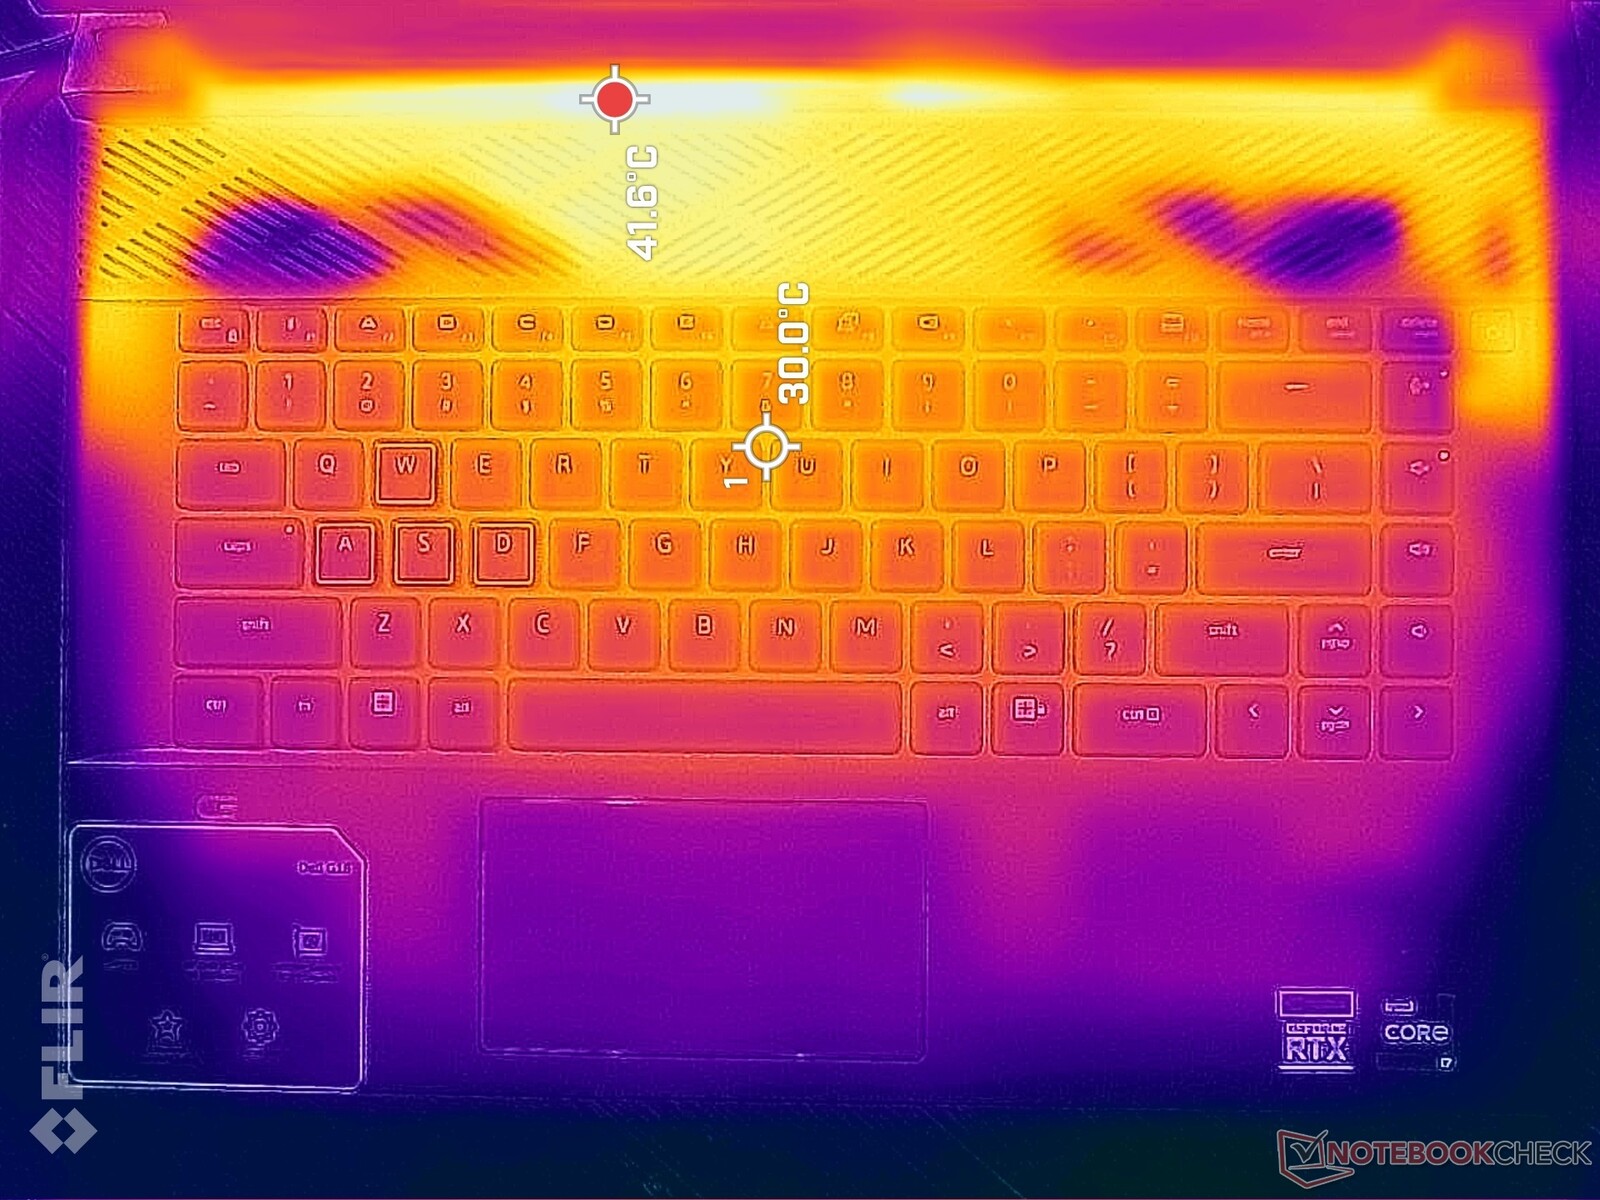
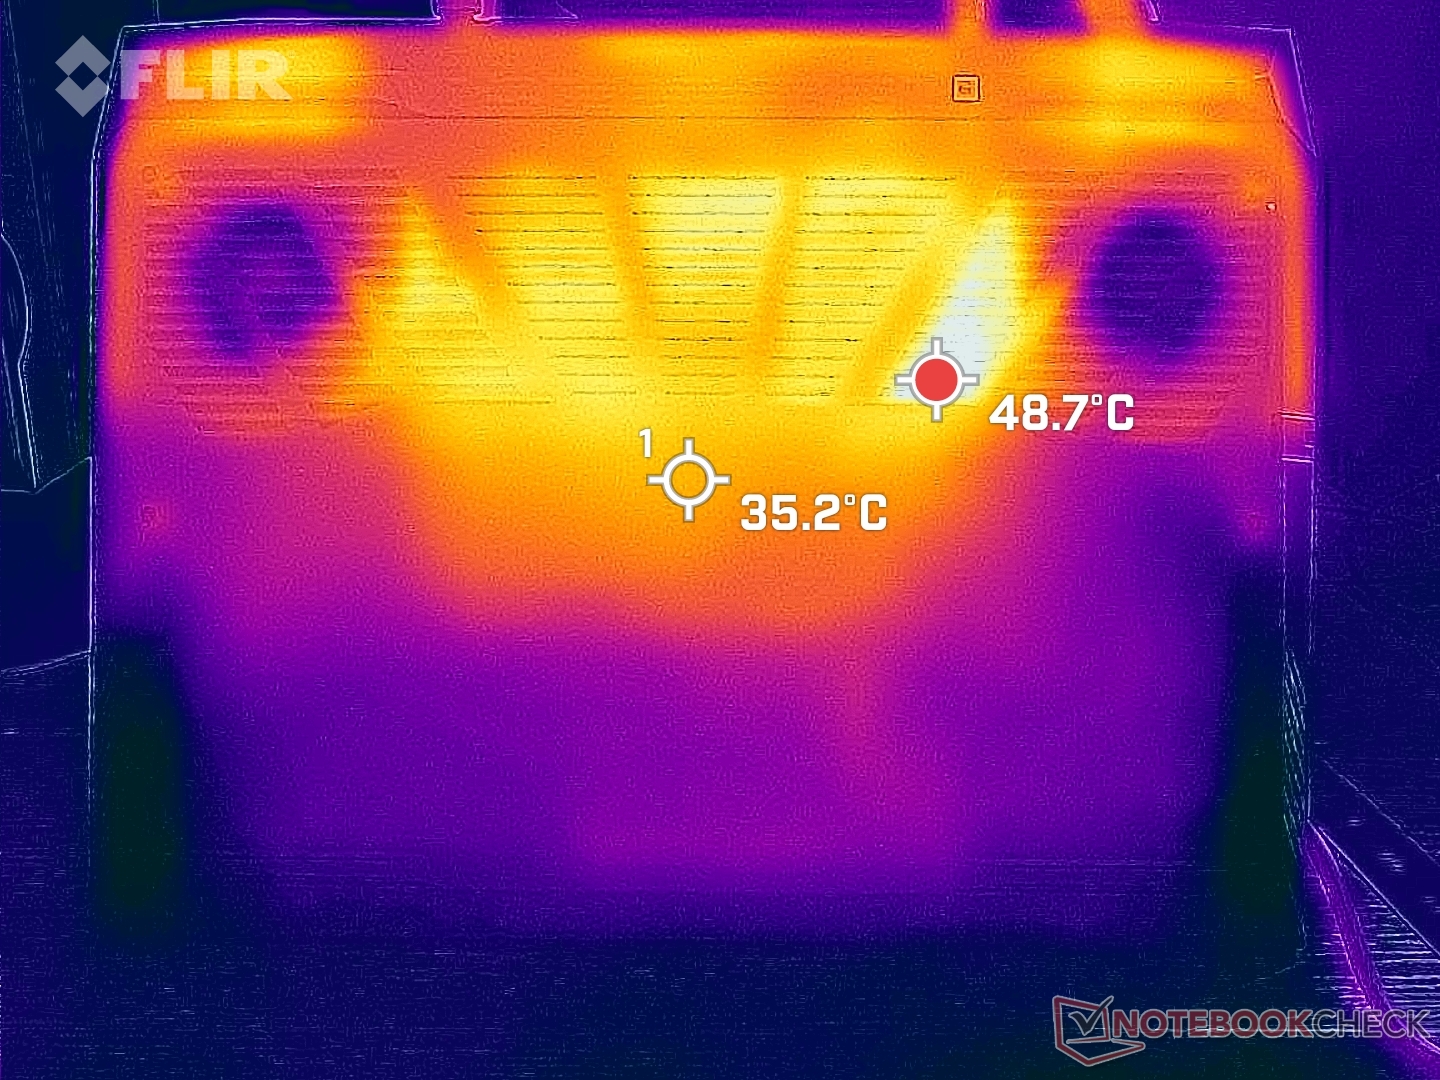
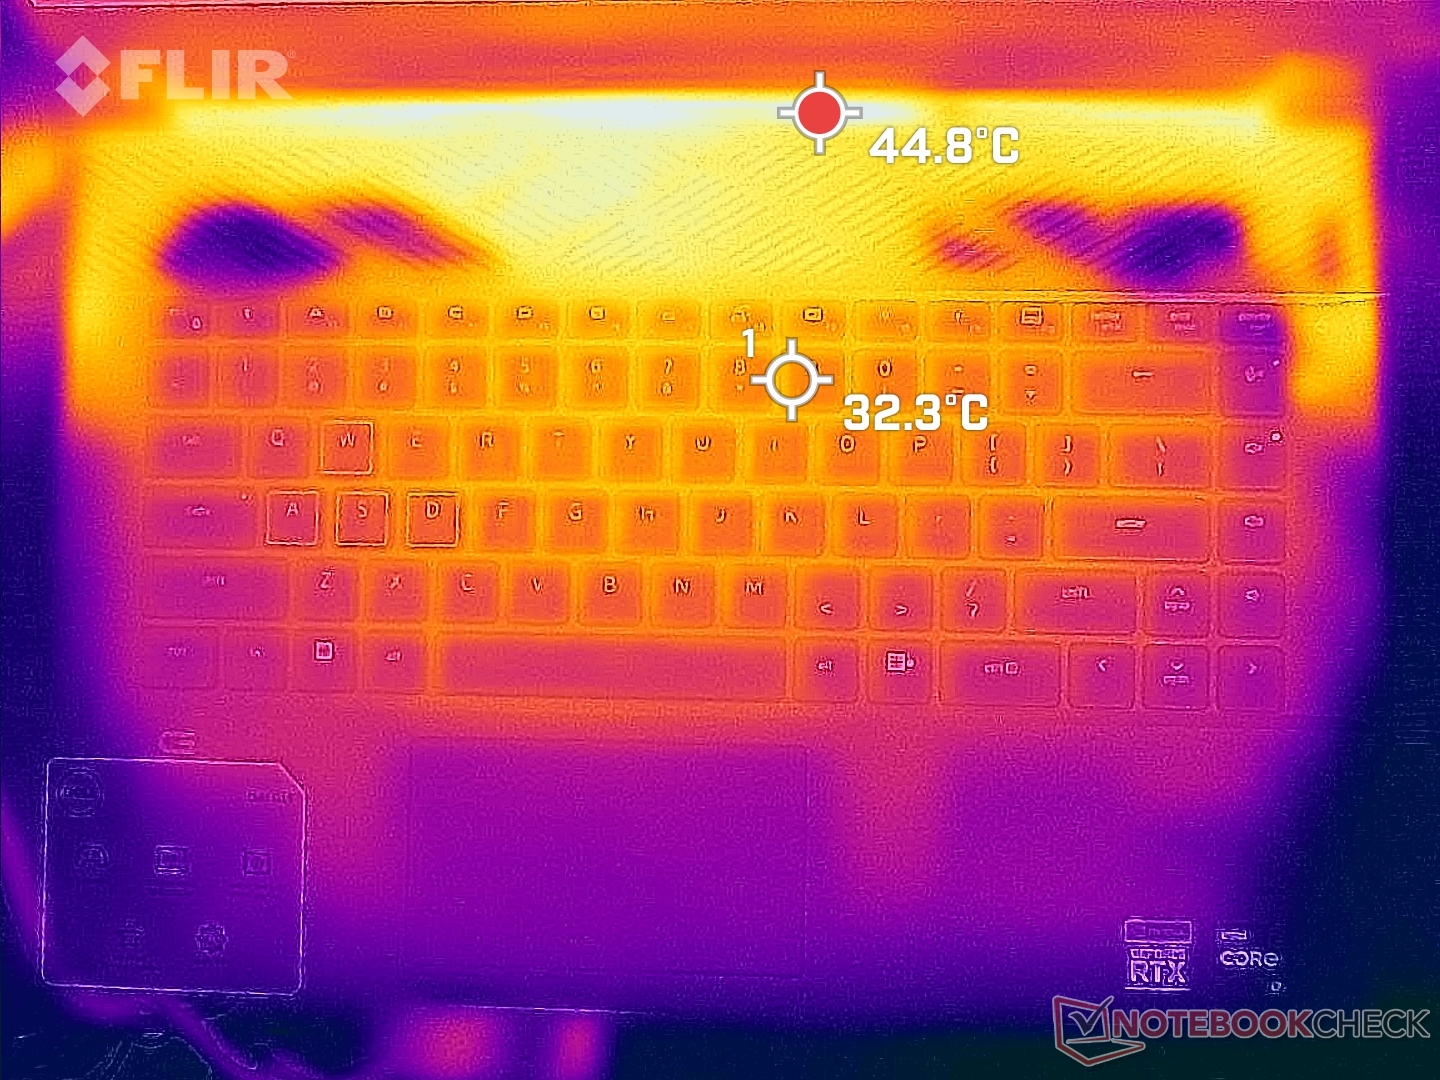
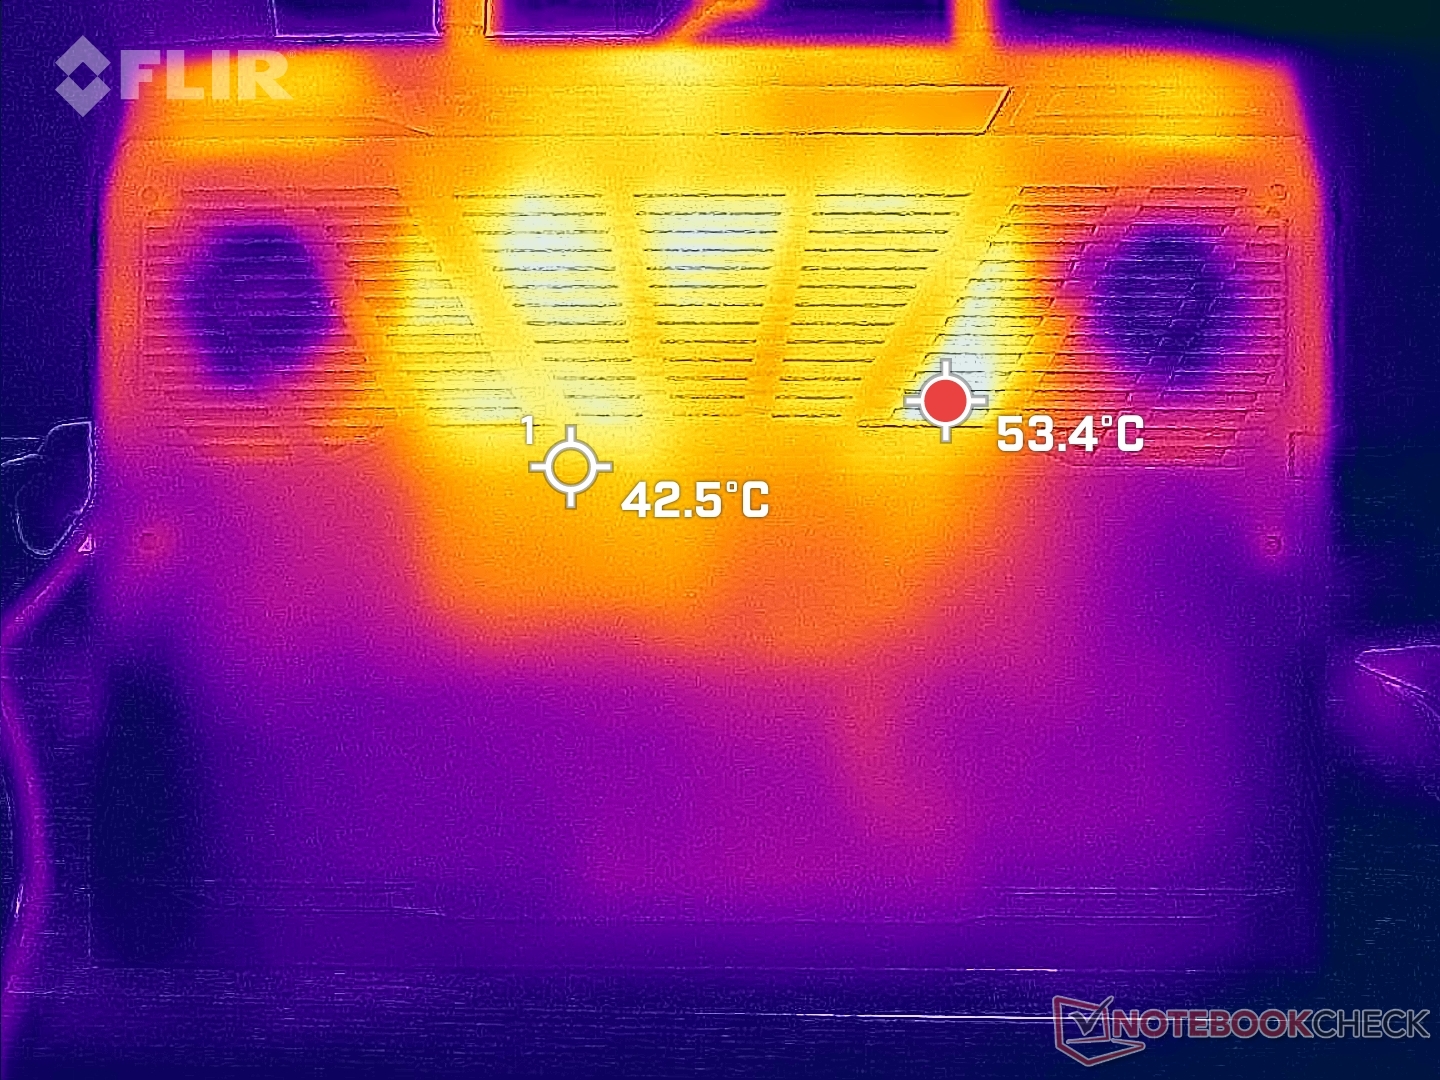
Temperatura - Molto calda verso la parte posteriore
Le temperature di superficie durante il gioco possono raggiungere i 48 C e i 51 C rispettivamente sulla parte superiore e inferiore, rispetto ai 54 C e ai 46 C del modello HP Victory 16 HP Victus 16 in condizioni simili. I punti caldi sono fortunatamente verso la parte posteriore e lontani dai tasti della tastiera o dalle aree frontali. In questo modo, i poggiapolsi e i tasti non diventano mai fastidiosamente caldi durante il gioco.
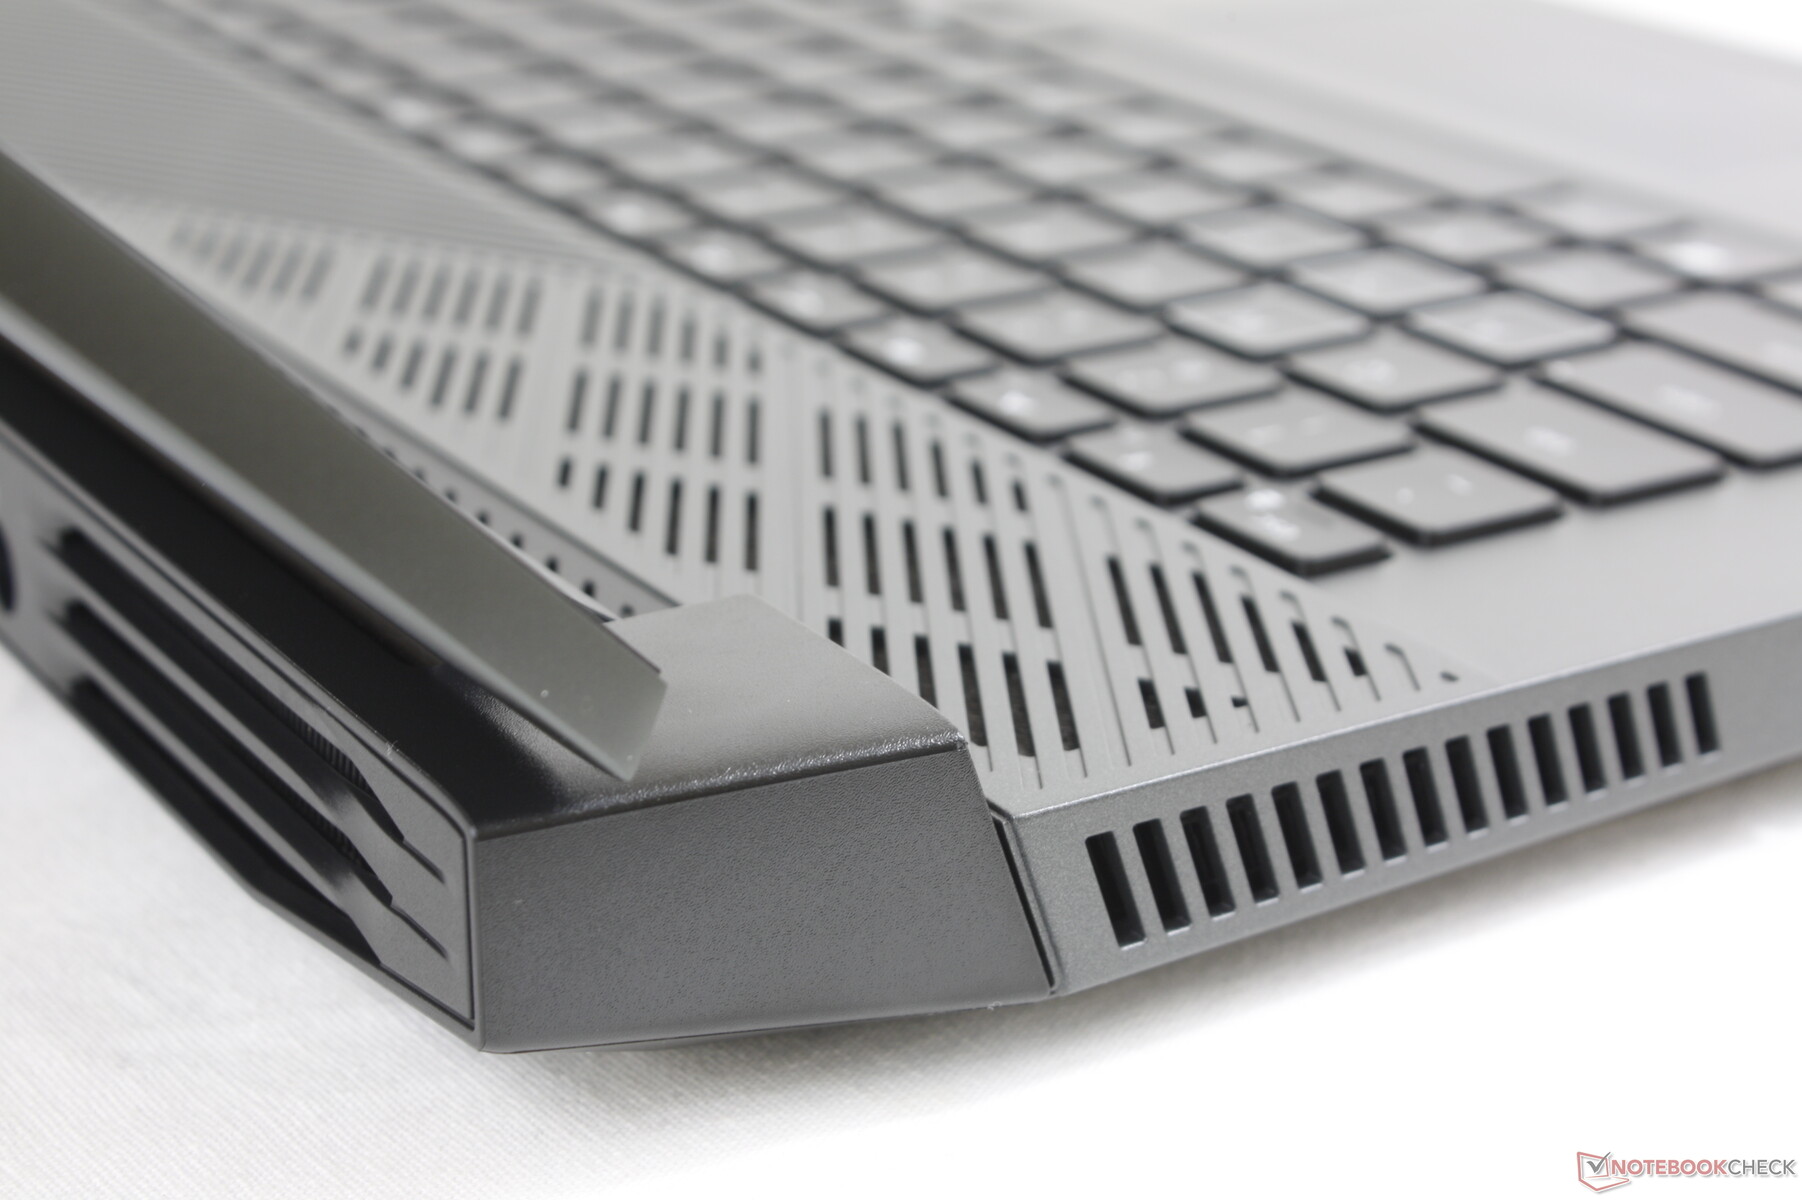
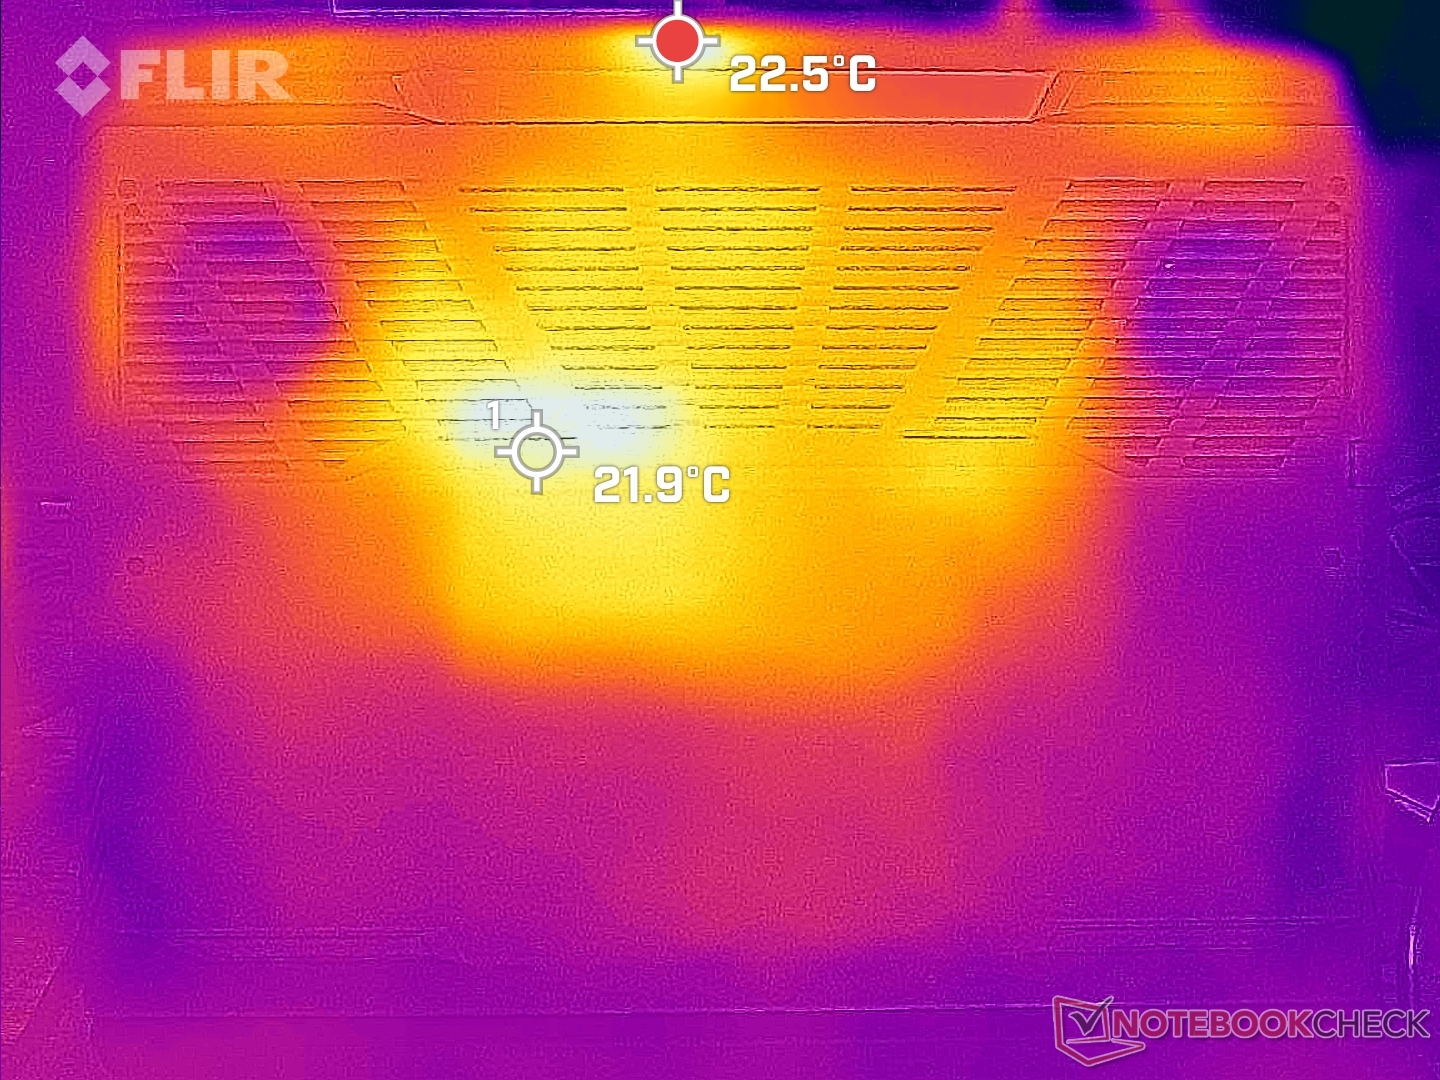
Gran parte della parte posteriore è dedicata alla ventilazione, come dimostrano le numerose griglie su tutti i lati della base.
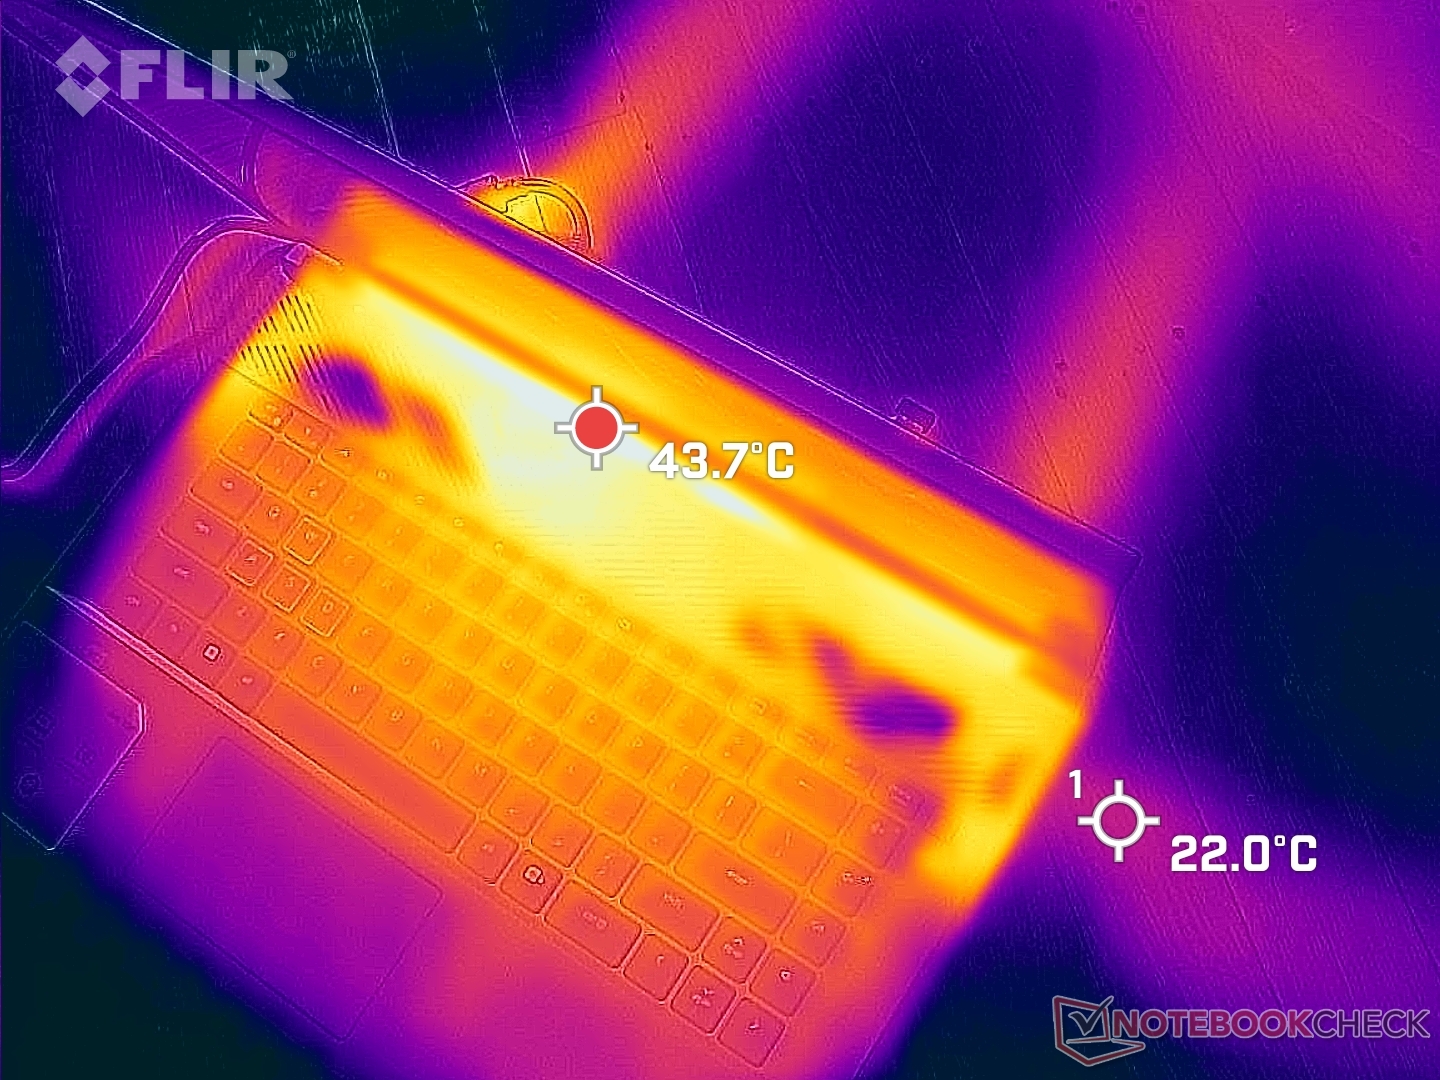
(-) La temperatura massima sul lato superiore è di 47.6 °C / 118 F, rispetto alla media di 40.4 °C / 105 F, che varia da 21.2 a 68.8 °C per questa classe Gaming.
(-) Il lato inferiore si riscalda fino ad un massimo di 54 °C / 129 F, rispetto alla media di 43.2 °C / 110 F
(+) In idle, la temperatura media del lato superiore è di 21.8 °C / 71 F, rispetto alla media deld ispositivo di 33.9 °C / 93 F.
(±) Riproducendo The Witcher 3, la temperatura media per il lato superiore e' di 33.7 °C / 93 F, rispetto alla media del dispositivo di 33.9 °C / 93 F.
(+) I poggiapolsi e il touchpad sono piu' freddi della temperatura della pelle con un massimo di 30.2 °C / 86.4 F e sono quindi freddi al tatto.
(±) La temperatura media della zona del palmo della mano di dispositivi simili e'stata di 28.8 °C / 83.8 F (-1.4 °C / -2.6 F).
| Dell G16 7620 Intel Core i7-12700H, NVIDIA GeForce RTX 3060 Laptop GPU | Lenovo Legion 7 16ARHA7 AMD Ryzen 9 6900HX, AMD Radeon RX 6850M XT | HP Victus 16-e0145ng AMD Ryzen 5 5600H, NVIDIA GeForce RTX 3050 Ti Laptop GPU | Asus ROG Zephyrus M16 GU603H Intel Core i9-11900H, NVIDIA GeForce RTX 3070 Laptop GPU | Lenovo Legion 5 Pro 16IAH7H Intel Core i7-12700H, NVIDIA GeForce RTX 3060 Laptop GPU | Acer Swift X SFX16-51G-5388 Intel Core i5-11320H, NVIDIA GeForce RTX 3050 4GB Laptop GPU | |
|---|---|---|---|---|---|---|
| Heat | -10% | -26% | -35% | -19% | -15% | |
| Maximum Upper Side * (°C) | 47.6 | 37.2 22% | 54 -13% | 52 -9% | 45.8 4% | 52.4 -10% |
| Maximum Bottom * (°C) | 54 | 43 20% | 47 13% | 53 2% | 66.3 -23% | 50 7% |
| Idle Upper Side * (°C) | 23 | 34 -48% | 41 -78% | 38 -65% | 30.4 -32% | 30.3 -32% |
| Idle Bottom * (°C) | 24.6 | 32.8 -33% | 31 -26% | 41 -67% | 30.4 -24% | 30.4 -24% |
* ... Meglio usare valori piccoli
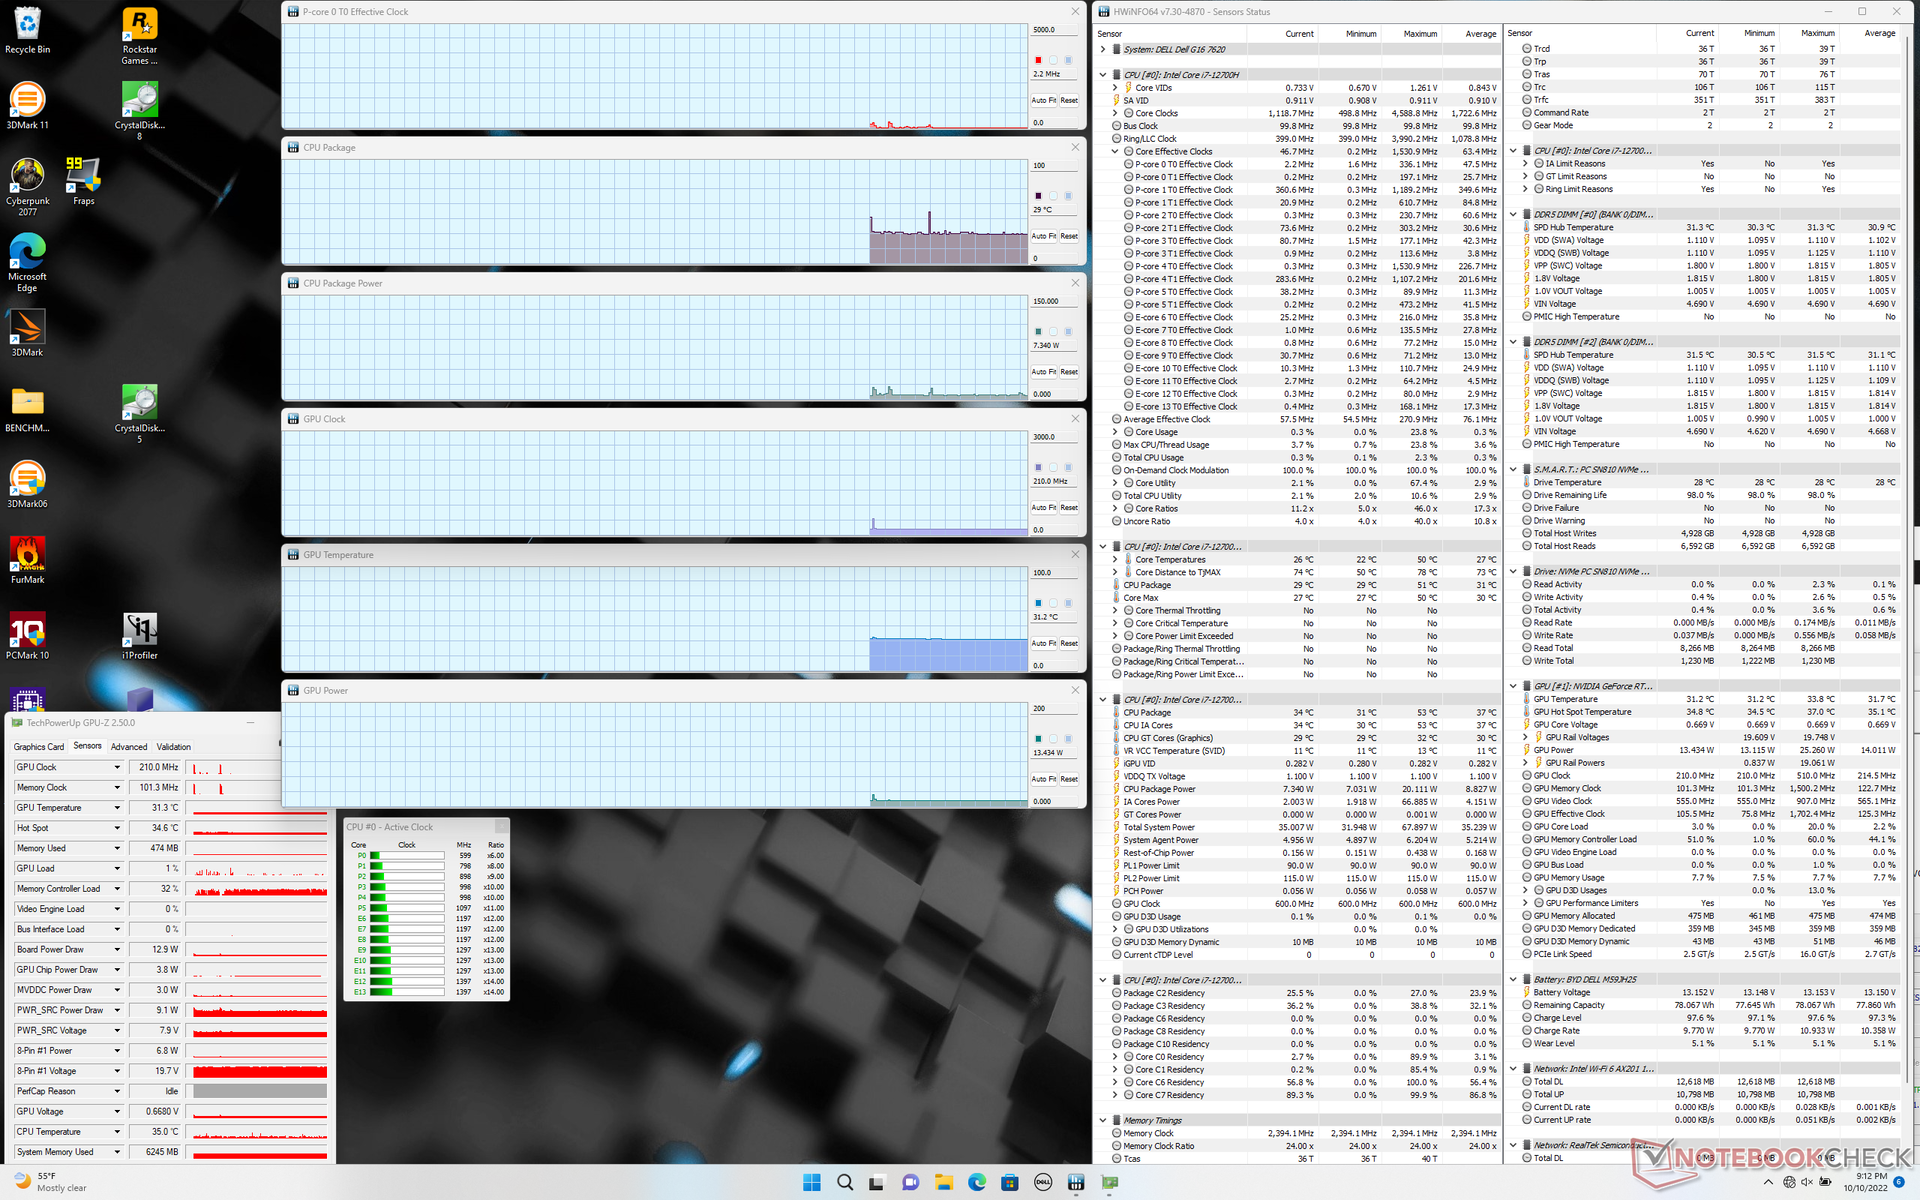
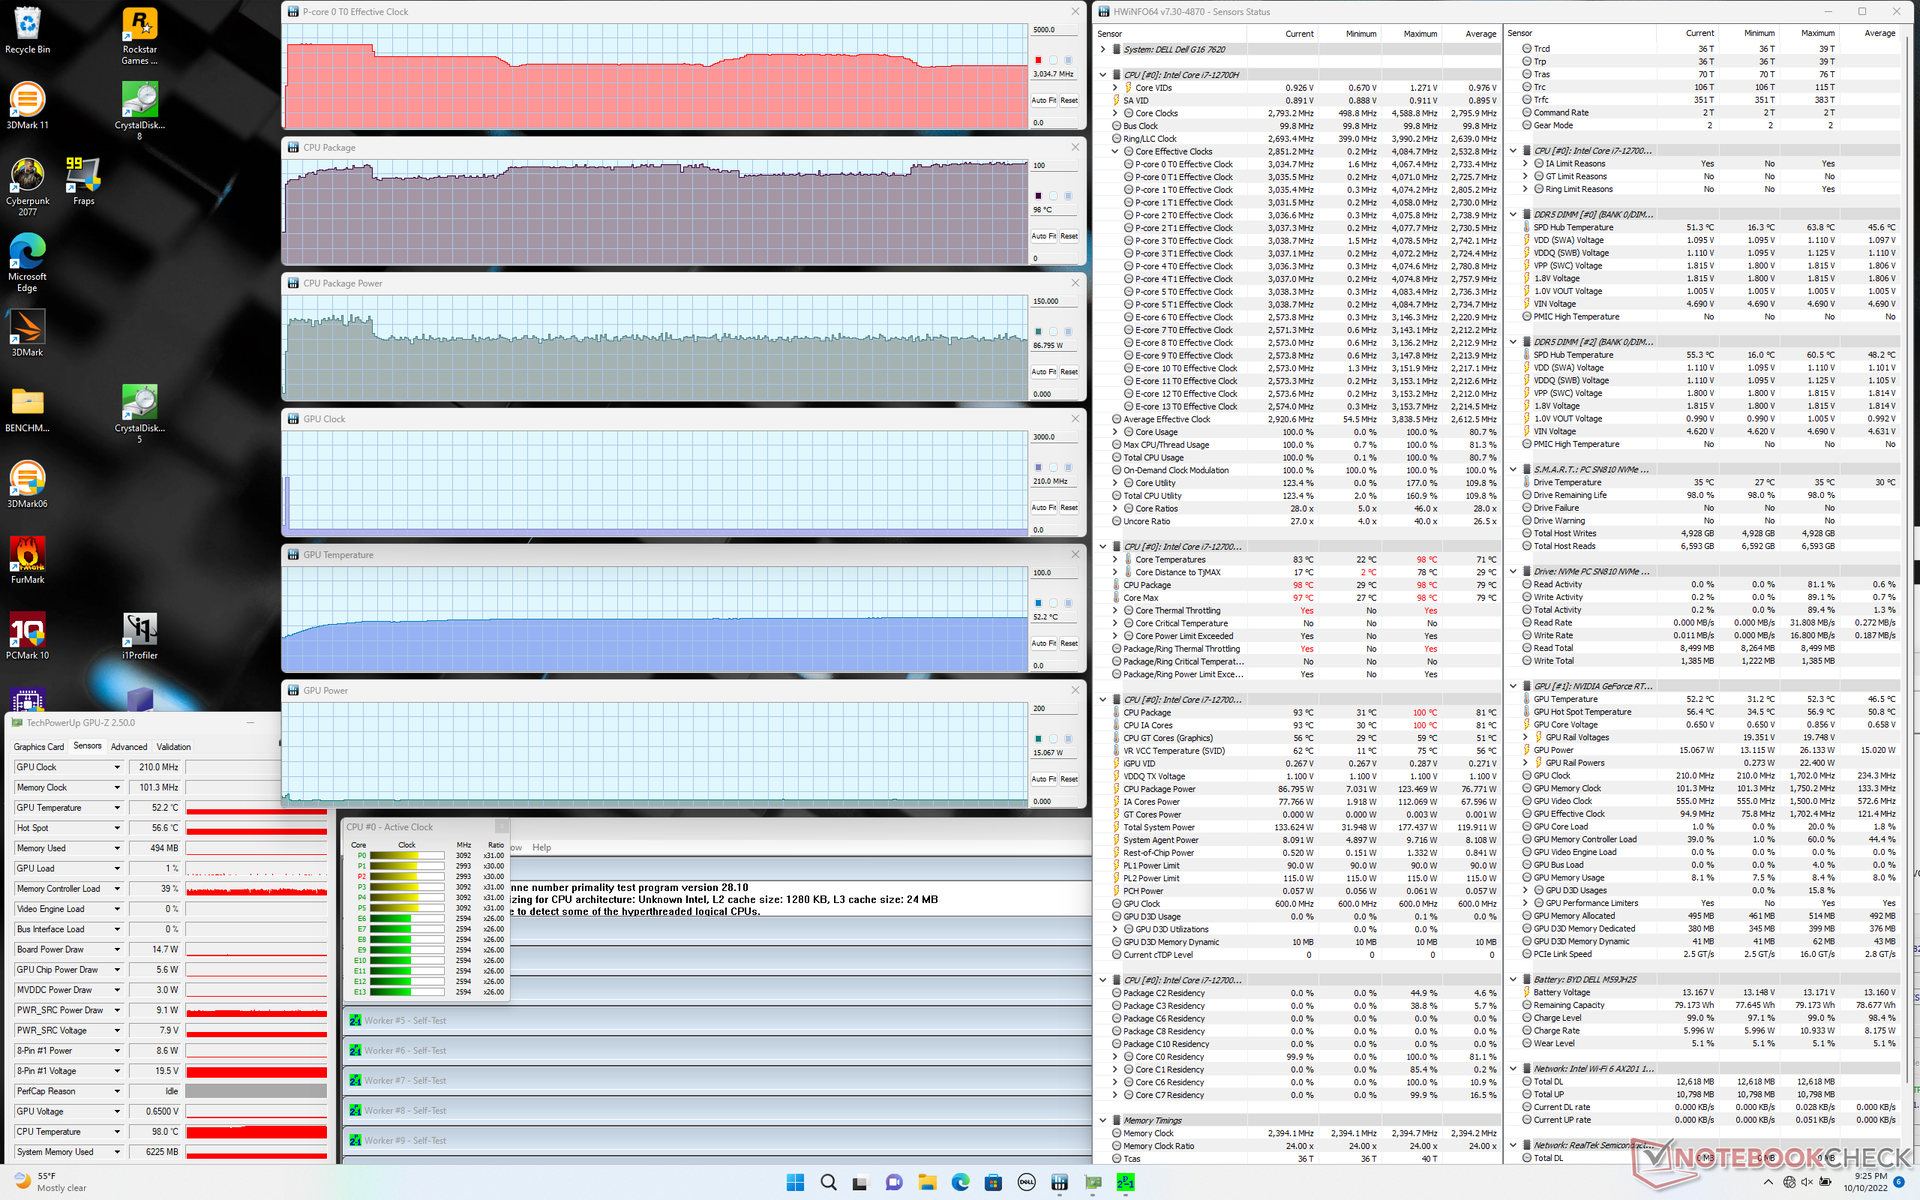
Stress test
Le temperature della CPU diventano molto elevate quando il sistema è sotto stress. Durante l'esecuzione di Prime95, ad esempio, le frequenze di clock e l'assorbimento di potenza della scheda aumentano rispettivamente a 4,1 GHz e 117 W, durando per circa un minuto fino a 99 C. La CPU scende quindi a 3,1-3,5 GHz e a un assorbimento di potenza della scheda inferiore, pari a 88 W, per evitare che le temperature del nucleo raggiungano i 100 C. In confronto, l'esecuzione di questo stesso test sull' HP Envy 16 con la stessa CPU Core i7-12700H e la GPU GeForce, si otterrebbe una temperatura del core di soli 66 C. La temperatura del core già elevata del G16 suggerisce che la SKU Core i9-12900H, più costosa, probabilmente porterà solo un piccolo aumento delle prestazioni.
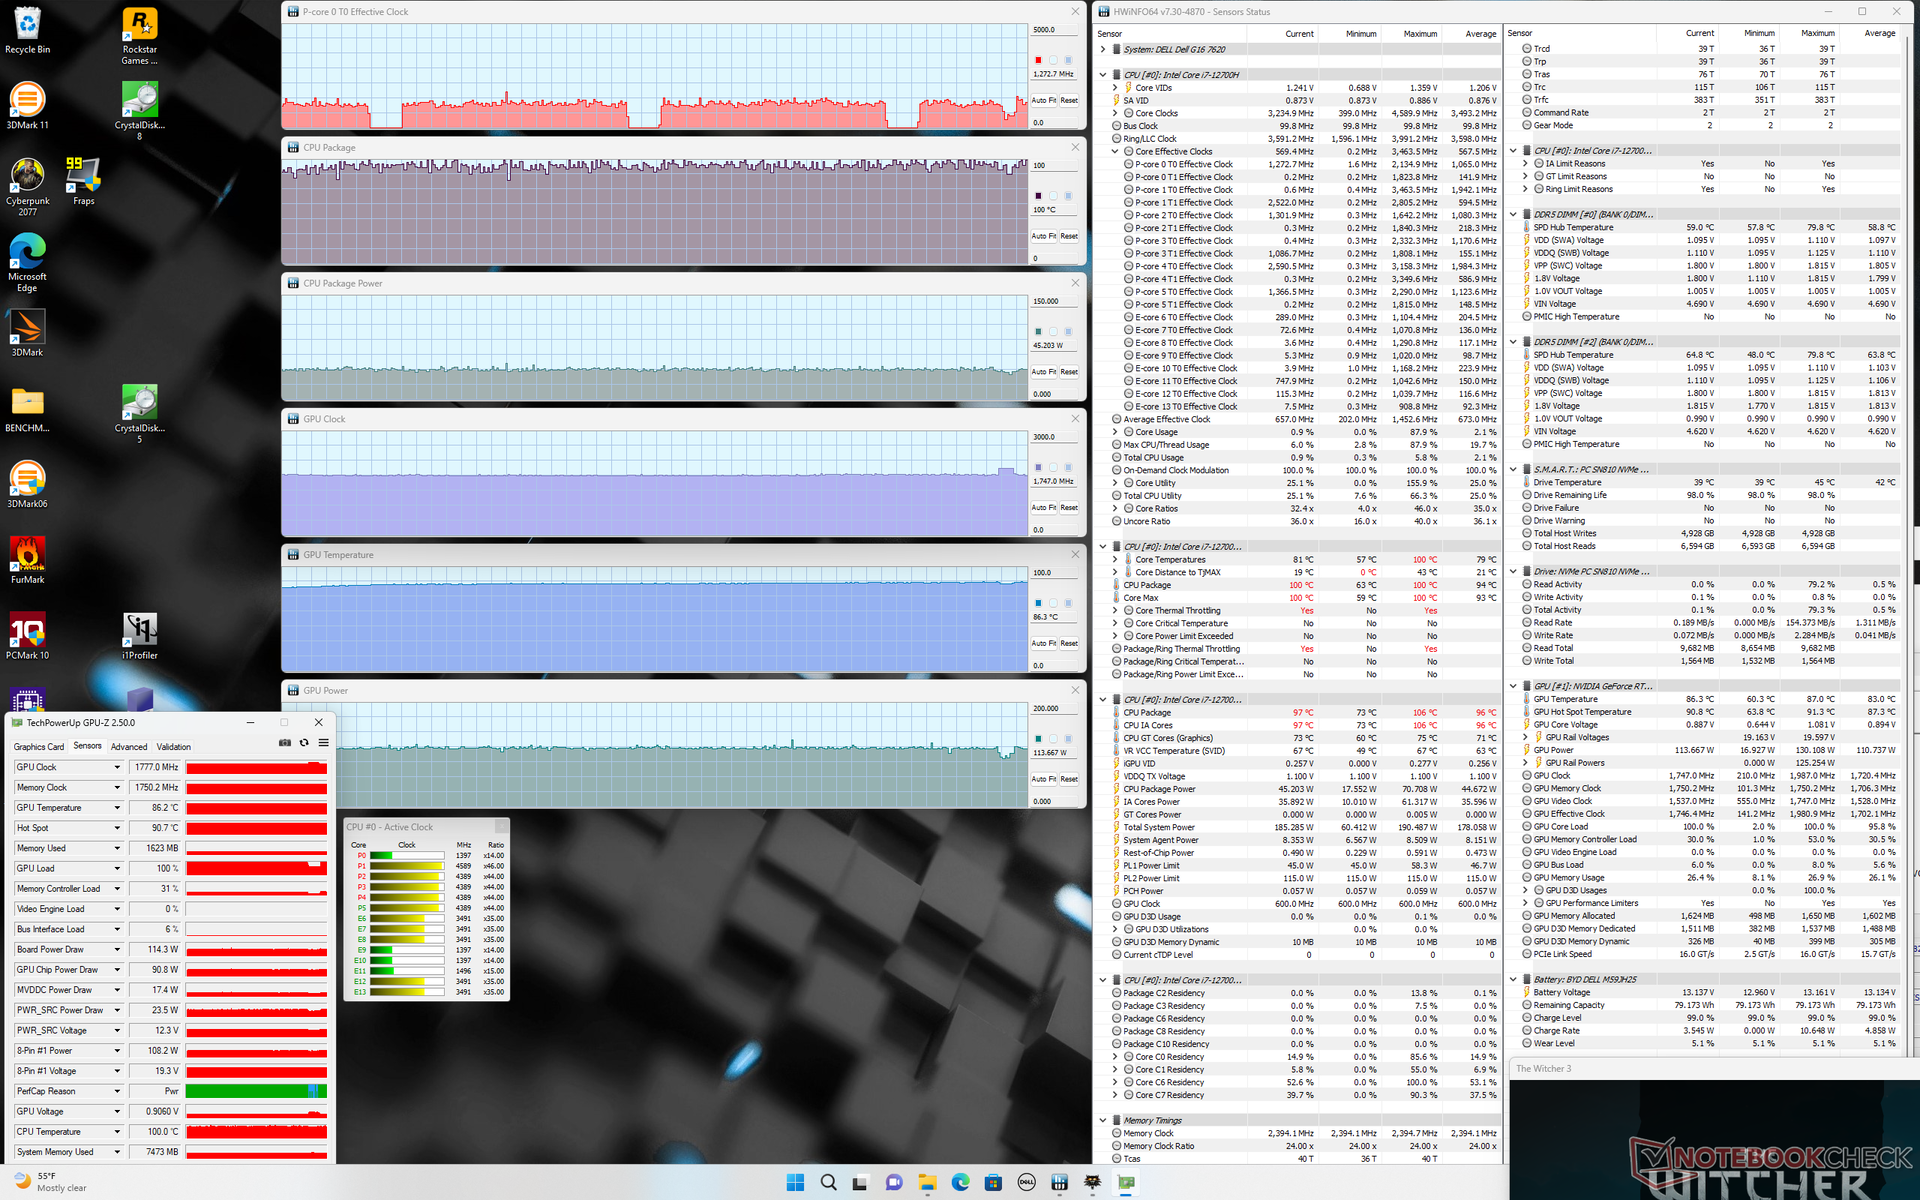
L'esecuzione di Witcher 3 ha portato a un clock del core della GPU, a una temperatura e a un assorbimento di potenza della scheda stabili, rispettivamente, a 1777 MHz, 86 C e 114 W, contro l'obiettivo TGP di 130 W. Ripetendo lo stesso test sul già citato Envy 16 si otterrebbe una frequenza di clock del core leggermente più bassa e temperature e consumi inferiori. Tuttavia, la cosa più preoccupante è che la temperatura della CPU del G16 supera di nuovo i 90 C ed è molto più calda di quella dei portatili da gioco della concorrenza.
Il funzionamento a batteria limita fortemente le prestazioni. Un test di Fire Strike a batteria restituisce punteggi fisici e grafici rispettivamente di 19465 e 4162 punti, rispetto a 27735 e 21584 punti con l'alimentazione di rete.
| Clock della CPU (GHz) | Clock della GPU (MHz) | Temperatura media della CPU (°C) | Temperatura media della GPU (°C) | |
| Sistema inattivo | -- | -- | 29 | 31 |
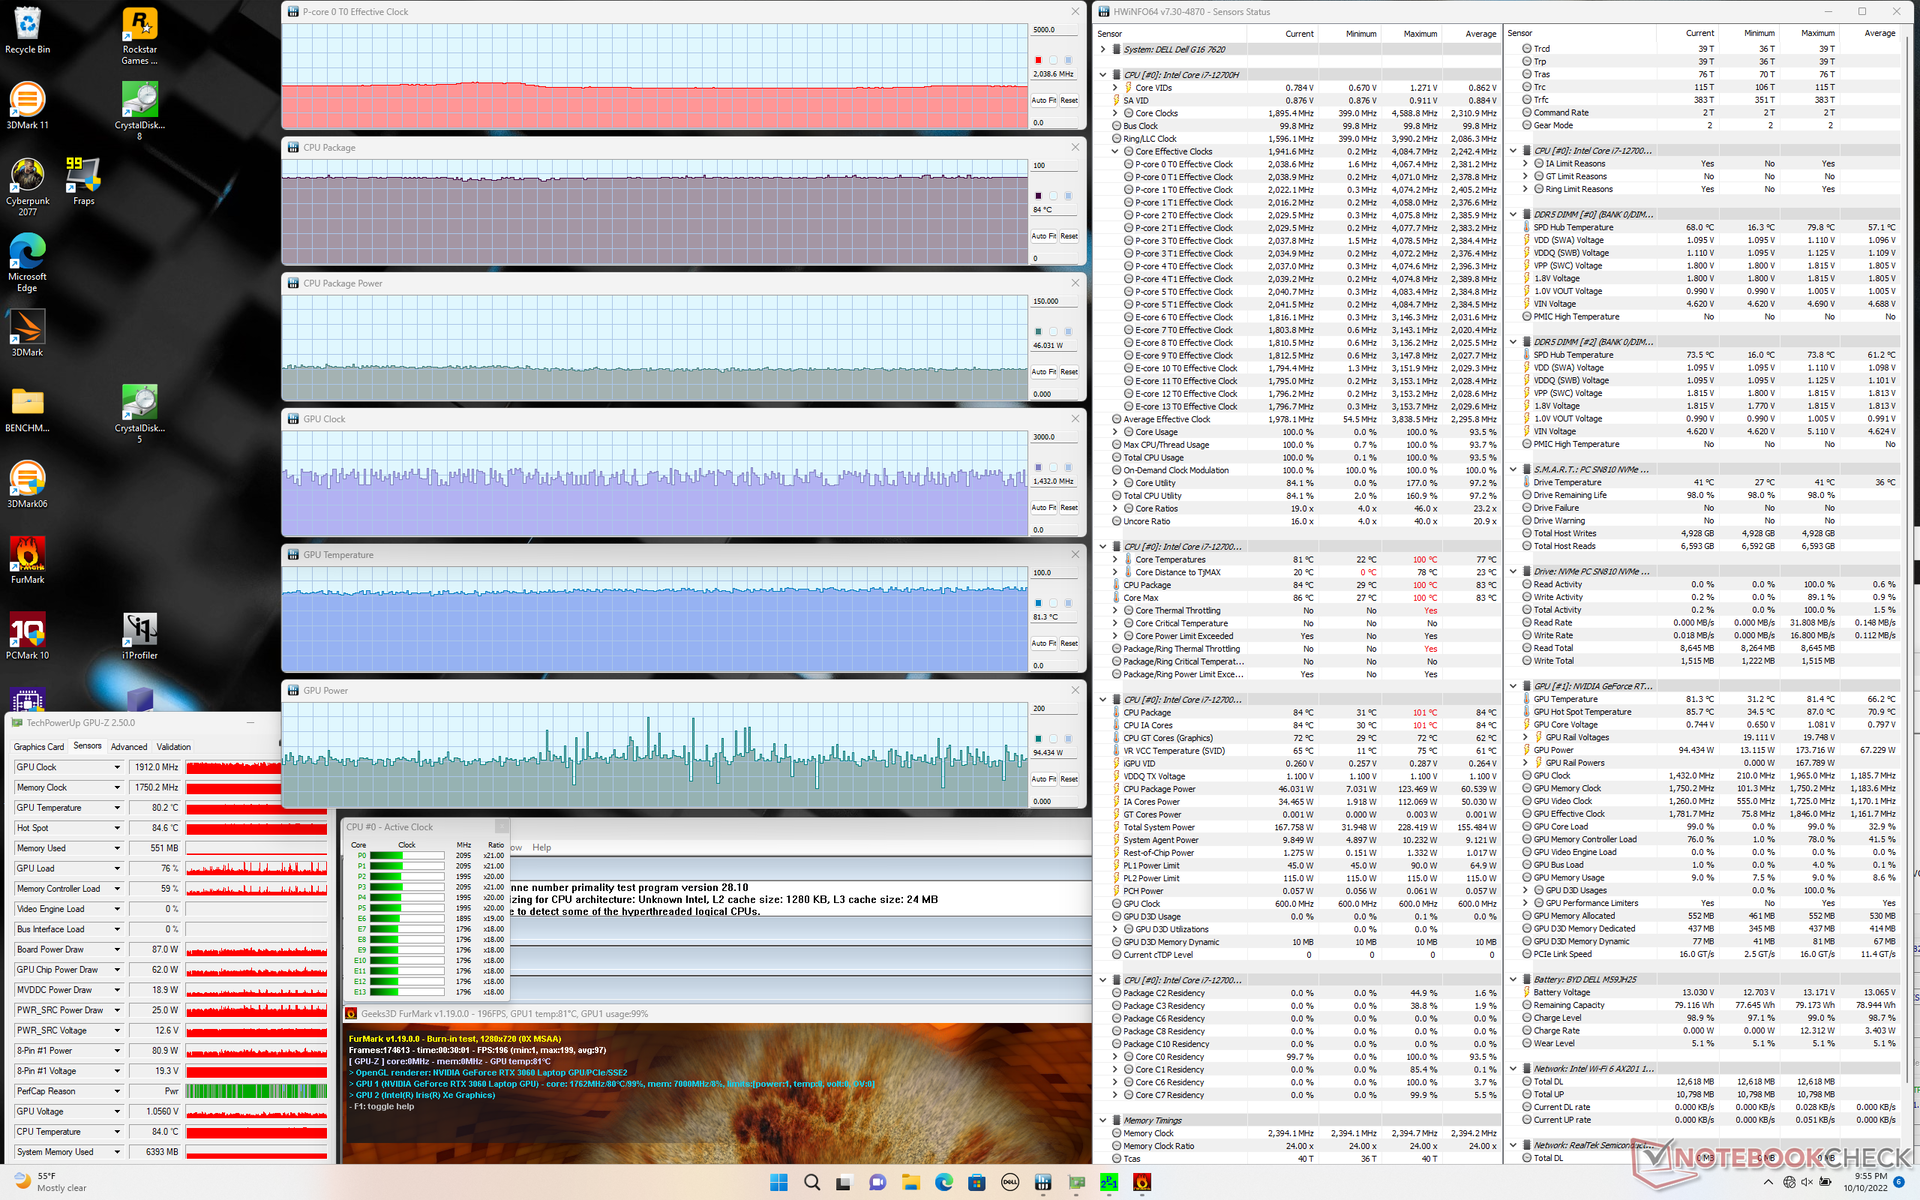
| Stress Prime95 | 3,1 - 3,6 | -- | 86 - 98 | 52 |
| Prime95 + FurMark Stress | 2,0 | ~1432 - ~1912 | 84 | 81 |
| Witcher 3 Stress | ~1.3 | 1777 | ~99 | 86 |
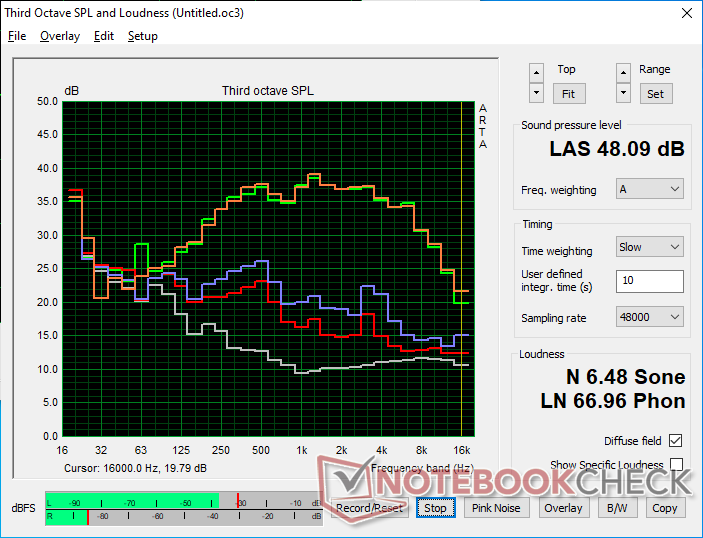
Altoparlanti
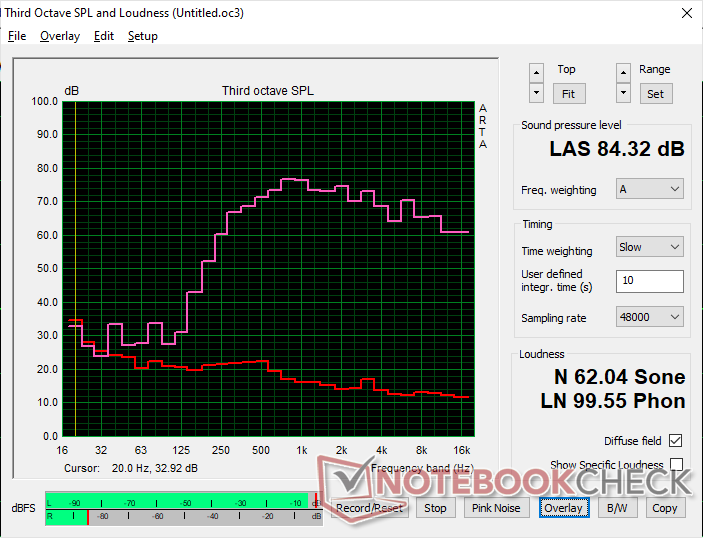
Dell G16 7620 analisi audio
(+) | gli altoparlanti sono relativamente potenti (84.3 dB)
Bassi 100 - 315 Hz
(-) | quasi nessun basso - in media 21.8% inferiori alla media
(±) | la linearità dei bassi è media (14.5% delta rispetto alla precedente frequenza)
Medi 400 - 2000 Hz
(+) | medi bilanciati - solo only 4.9% rispetto alla media
(+) | medi lineari (3.5% delta rispetto alla precedente frequenza)
Alti 2 - 16 kHz
(+) | Alti bilanciati - appena 2.6% dalla media
(±) | la linearità degli alti è media (7.7% delta rispetto alla precedente frequenza)
Nel complesso 100 - 16.000 Hz
(±) | la linearità complessiva del suono è media (17.2% di differenza rispetto alla media
Rispetto alla stessa classe
» 47% di tutti i dispositivi testati in questa classe è stato migliore, 11% simile, 42% peggiore
» Il migliore ha avuto un delta di 6%, medio di 18%, peggiore di 132%
Rispetto a tutti i dispositivi testati
» 32% di tutti i dispositivi testati in questa classe è stato migliore, 8% similare, 60% peggiore
» Il migliore ha avuto un delta di 4%, medio di 23%, peggiore di 134%
Apple MacBook Pro 16 2021 M1 Pro analisi audio
(+) | gli altoparlanti sono relativamente potenti (84.7 dB)
Bassi 100 - 315 Hz
(+) | bassi buoni - solo 3.8% dalla media
(+) | bassi in lineaa (5.2% delta rispetto alla precedente frequenza)
Medi 400 - 2000 Hz
(+) | medi bilanciati - solo only 1.3% rispetto alla media
(+) | medi lineari (2.1% delta rispetto alla precedente frequenza)
Alti 2 - 16 kHz
(+) | Alti bilanciati - appena 1.9% dalla media
(+) | alti lineari (2.7% delta rispetto alla precedente frequenza)
Nel complesso 100 - 16.000 Hz
(+) | suono nel complesso lineare (4.6% differenza dalla media)
Rispetto alla stessa classe
» 0% di tutti i dispositivi testati in questa classe è stato migliore, 0% simile, 100% peggiore
» Il migliore ha avuto un delta di 5%, medio di 17%, peggiore di 45%
Rispetto a tutti i dispositivi testati
» 0% di tutti i dispositivi testati in questa classe è stato migliore, 0% similare, 100% peggiore
» Il migliore ha avuto un delta di 4%, medio di 23%, peggiore di 134%
Gestione dell'energia: un'esigenza nella maggior parte degli scenari
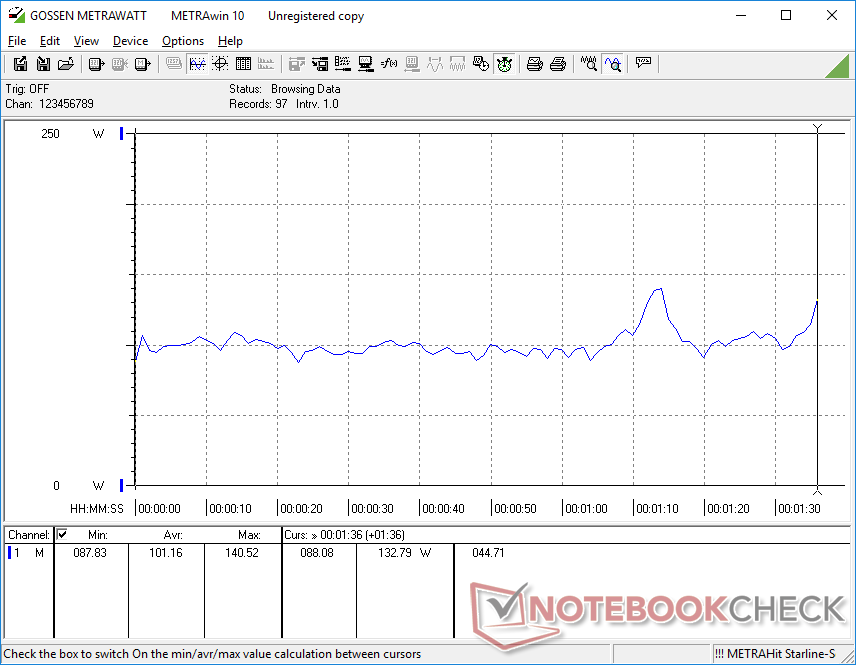
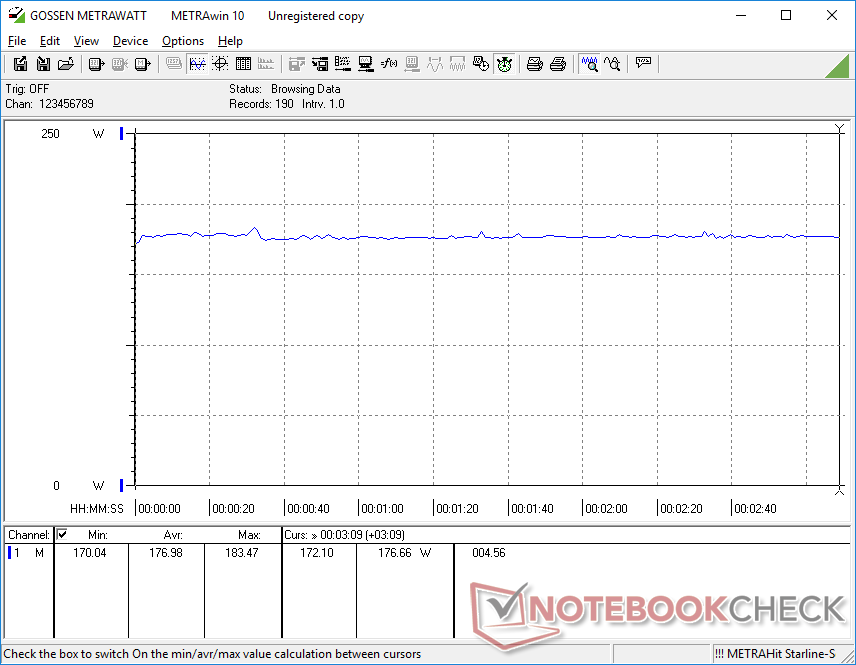
Consumo di energia
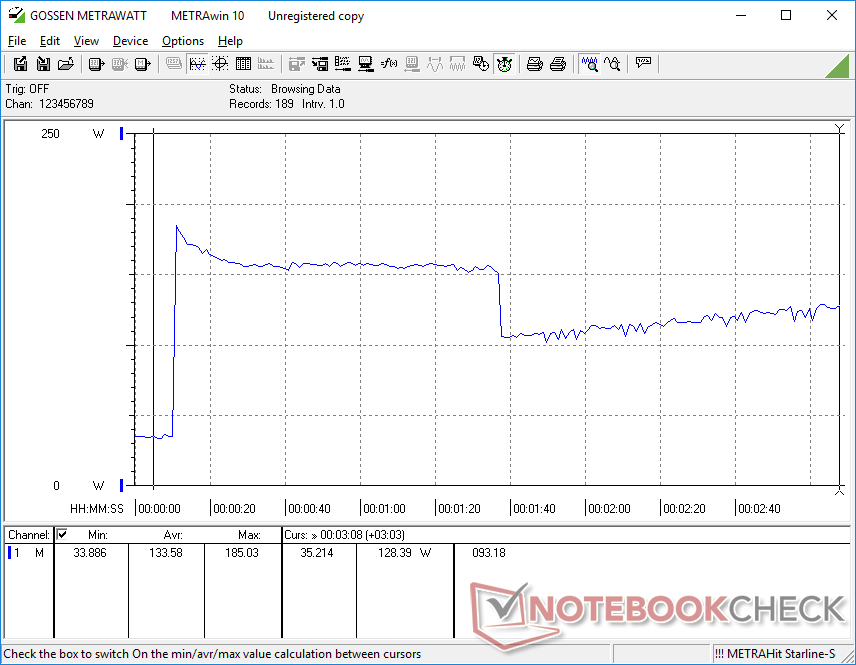
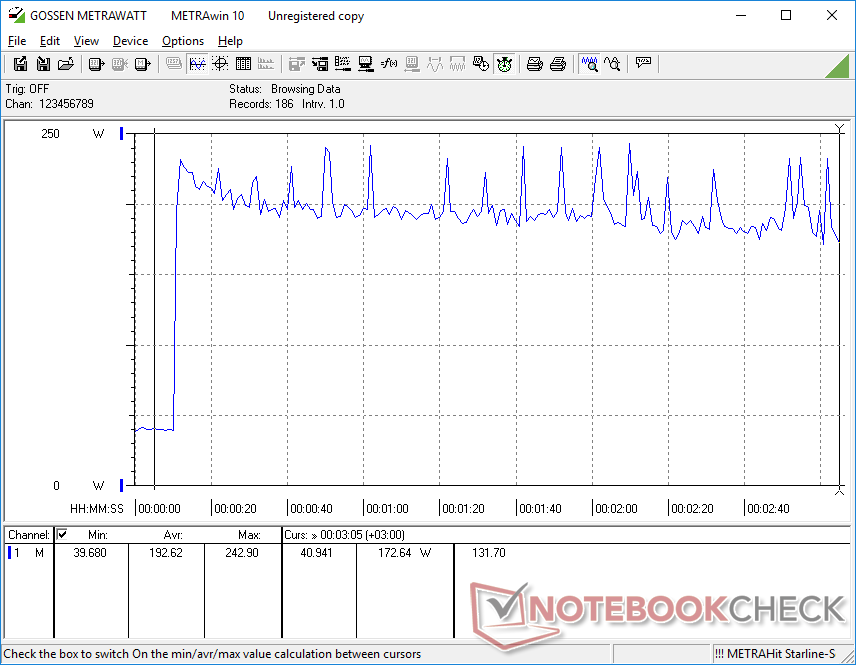
Il consumo di energia è relativamente alto quando è al minimo sul desktop, da 14 a 32 W. Tuttavia, questo intervallo è solo leggermente superiore a quello dell'HP Envy 16 con la stessa CPU e GPU. Ci si aspetta un consumo di 177 W durante l'esecuzione di giochi, ovvero circa 20 W in meno rispetto al Lenovo 5 Pro Lenovo Legion 5 Pro o Asus ROG Strix Scar 15
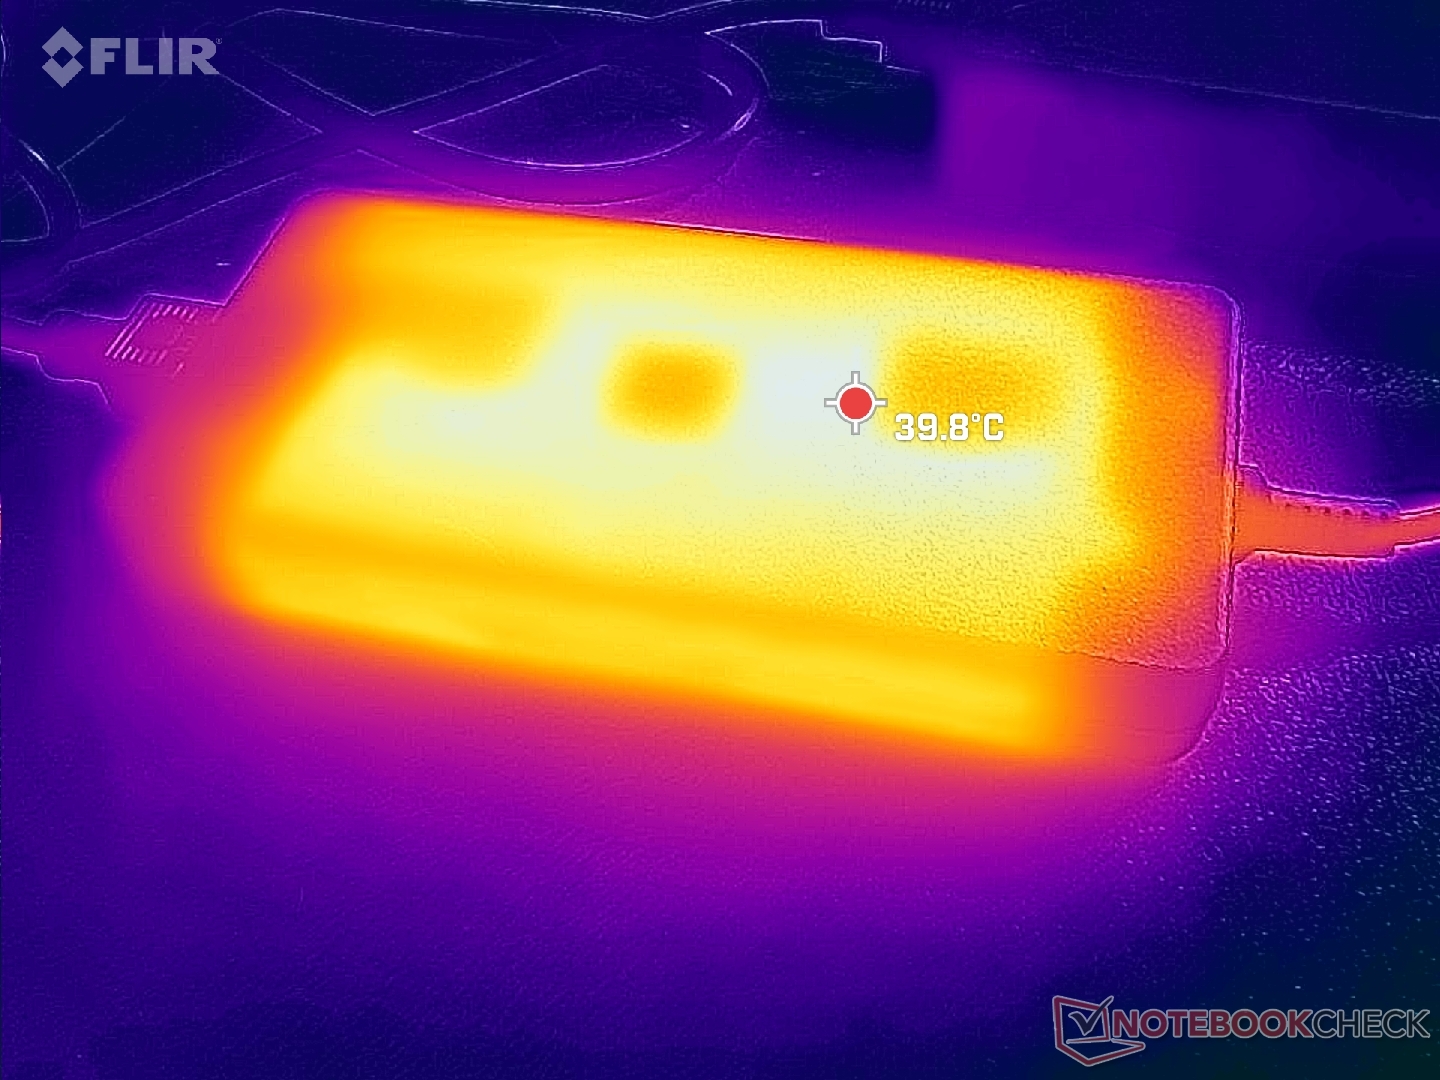
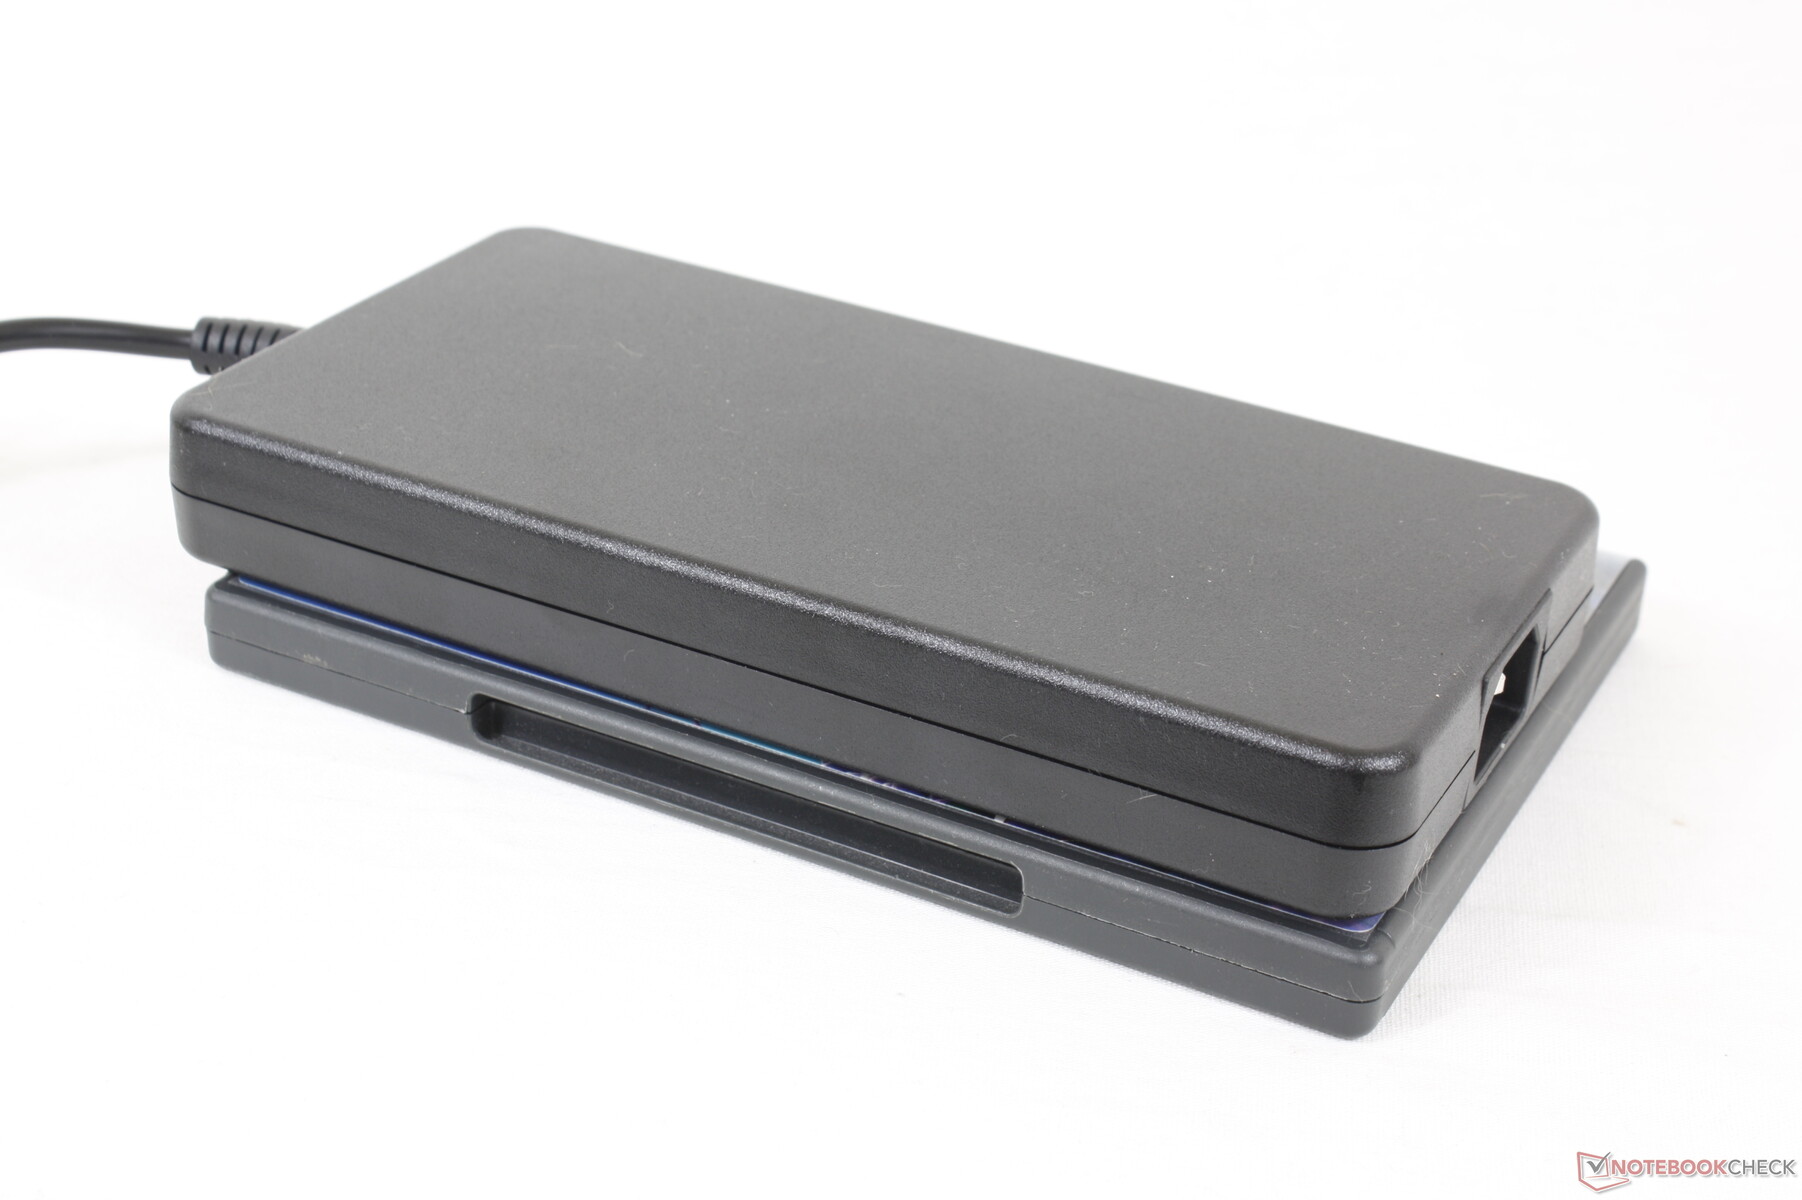
Siamo riusciti a registrare un consumo massimo di 243 W dall'adattatore CA da 240 W di grandi dimensioni (~19,9 x 10 x 2,5 cm) quando la CPU e la GPU sono utilizzate al 100%. Il consumo oscilla tra 180 W e 240 W in queste condizioni, probabilmente a causa di limitazioni termiche.
| Off / Standby | |
| Idle | |
| Sotto carico |
|
Leggenda:
min: | |
| Dell G16 7620 i7-12700H, GeForce RTX 3060 Laptop GPU, WDC PC SN810 512GB, IPS, 2560x1600, 16" | Lenovo Legion 7 16ARHA7 R9 6900HX, Radeon RX 6850M XT, Samsung PM9A1 MZVL22T0HBLB, IPS, 2560x1600, 16" | HP Victus 16-e0145ng R5 5600H, GeForce RTX 3050 Ti Laptop GPU, Samsung SSD PM981a MZVLB512HBJQ, IPS, 1920x1080, 16.1" | Asus ROG Zephyrus M16 GU603H i9-11900H, GeForce RTX 3070 Laptop GPU, Samsung PM9A1 MZVL22T0HBLB, IPS, 2560x1600, 16" | Lenovo Legion 5 Pro 16IAH7H i7-12700H, GeForce RTX 3060 Laptop GPU, 2x Samsung PM9A1 MZVL21T0HCLR (RAID 0), IPS, 2560x1600, 16" | Acer Swift X SFX16-51G-5388 i5-11320H, GeForce RTX 3050 4GB Laptop GPU, Samsung PM991 MZVLQ512HBLU, , 1920x1080, 16.1" | |
|---|---|---|---|---|---|---|
| Power Consumption | -2% | 35% | 6% | -39% | 51% | |
| Idle Minimum * (Watt) | 14.4 | 9.9 31% | 7 51% | 11 24% | 22.8 -58% | 7 51% |
| Idle Average * (Watt) | 17.8 | 22 -24% | 9 49% | 20 -12% | 26.5 -49% | 10.1 43% |
| Idle Maximum * (Watt) | 31.5 | 23.1 27% | 15 52% | 30 5% | 41 -30% | 15 52% |
| Load Average * (Watt) | 101.2 | 94.4 7% | 93 8% | 111 -10% | 191 -89% | 63.3 37% |
| Witcher 3 ultra * (Watt) | 176.9 | 249 -41% | 134.5 24% | 156 12% | 194.7 -10% | 63.3 64% |
| Load Maximum * (Watt) | 242.9 | 276 -14% | 185 24% | 197 19% | 238 2% | 94 61% |
* ... Meglio usare valori piccoli
Power Consumption Witcher 3 / Stresstest
Power Consumption external Monitor
Durata della batteria: non eccezionale
I tempi di esecuzione sono nella media anche per un portatile da gioco di grandi dimensioni. L'autonomia della batteria WLAN dura poco meno di 5 ore, rispetto alle 7 ore del modello Lenovo 7 16ARHA7.Lenovo Legion 7 16ARHA7 o HP Victus 16.
La ricarica da vuoto a pieno regime richiede circa 2 ore. Il modello non supporta USB-PD e quindi non può essere ricaricato tramite USB-C.
| Dell G16 7620 i7-12700H, GeForce RTX 3060 Laptop GPU, 84 Wh | Lenovo Legion 7 16ARHA7 R9 6900HX, Radeon RX 6850M XT, 99 Wh | HP Victus 16-e0145ng R5 5600H, GeForce RTX 3050 Ti Laptop GPU, 70 Wh | Asus ROG Zephyrus M16 GU603H i9-11900H, GeForce RTX 3070 Laptop GPU, 90 Wh | Lenovo Legion 5 Pro 16IAH7H i7-12700H, GeForce RTX 3060 Laptop GPU, 80 Wh | Acer Swift X SFX16-51G-5388 i5-11320H, GeForce RTX 3050 4GB Laptop GPU, 58.7 Wh | |
|---|---|---|---|---|---|---|
| Autonomia della batteria | 57% | 42% | 90% | -21% | 88% | |
| Reader / Idle (h) | 7.1 | 4.9 -31% | 13.3 87% | |||
| WiFi v1.3 (h) | 5 | 7.3 46% | 7.1 42% | 7.7 54% | 3.6 -28% | 8.1 62% |
| Load (h) | 0.7 | 1.8 157% | 1.6 129% | 0.6 -14% | 1.5 114% | |
| H.264 (h) | 4.1 | 8.4 | ||||
| Witcher 3 ultra (h) | 2.1 | |||||
| Gaming (h) | 1.1 |
Pro
Contro
Verdetto - Grande e veloce
Il G16 presenta molte somiglianze con alcuni dei più recenti portatili Portatili Alienware nel bene e nel male. In particolare, il sistema è più grande e più pesante di molti concorrenti e funziona anche in modo molto più caldo, con temperature del nucleo che si aggirano intorno ai 90 C quando si gioca. Il G16 non è quindi la soluzione migliore per gli utenti che desiderano un portatile da gioco sottile e leggero. Alternative come ilLenovo Legion 7 16 o Asus ROG Zephyrus M16 sono più sottili, più leggeri o addirittura entrambi, pur offrendo opzioni di display e processore simili.
Il Dell G16 eccelle in termini di prestazioni al costo di un ingombro maggiore, di un peso più elevato e di temperature più elevate.
Dove il sistema Dell fatica, recupera in termini di prestazioni. Il sistema è più veloce della maggior parte degli altri portatili con la stessa CPU e GPU, come risultato diretto del suo profilo più spesso e delle temperature più calde. Nonostante ciò, la durata media della batteria, la mancanza di supporto per le unità SSD secondarie, la webcam scadente e l'ingombro eccessivo del blocco di alimentazione lasciano un ampio margine di miglioramento.
Prezzo e disponibilità
Il Dell G16 7620 è ora disponibile sul sito Best Buy nella nostra configurazione attuale al prezzo di 1600 dollari. Al momento non è ancora presente su Amazon. Altre SKU possono essere ordinate direttamente da Dell da 1140 a 1935 dollari.
Dell G16 7620
- 10/18/2022 v7 (old)
Allen Ngo
Price comparison

