Recensione del portatile per il gaming Schenker XMG Neo 15: Ryzen 6000 con raffreddamento a liquido
Il Neo 15 basato su Intel che abbiamo recensito a luglioera un portatile insolito, dotato di una connessione per il sistema di raffreddamento opzionale OASIS (venduto separatamente per circa 199 euro, o 198 dollari), che abbiamo testato nello stesso periodo.
XMG ha lanciato un nuovo modello Neo 15 dotato dell'ultimo processore AMD Ryzen. Il passaggio a una CPU AMD ha comportato anche altri cambiamenti nella selezione delle porte e simili.
Come si comporta il Neo basato su AMD rispetto al modello basato su Intel? In questa recensione proveremo una variante con la RTX 3070 Ti leggermente più economica (che costa comunque 2.850 euro, o 2.826 dollari) e daremo un'occhiata a cosa significano i cambiamenti hardware per le prestazioni e le emissioni del portatile.
Oltre a confrontare i Neo 15 basati su AMD e Intel, metteremo il modello in esame a confronto con altri portatili da gioco dotati di RTX 3070 Ti, come l'MSI Raider GE67 MSI Raider GE67, Asus ROG Strix Scar 15, Acer Nitro 5 e MSI Stealth GS66.
Potenziali concorrenti a confronto
Punteggio | Data | Modello | Peso | Altezza | Dimensione | Risoluzione | Prezzo |
|---|---|---|---|---|---|---|---|
| 88 % v7 (old) | 11/2022 | Schenker XMG Neo 15 (Ryzen 9 6900HX, RTX 3070 Ti) R9 6900HX, GeForce RTX 3070 Ti Laptop GPU | 2.3 kg | 26.6 mm | 15.60" | 2560x1440 | |
| 88.4 % v7 (old) | 07/2022 | Schenker XMG Neo 15 (i7-12700H, RTX 3080 Ti) i7-12700H, GeForce RTX 3080 Ti Laptop GPU | 2.3 kg | 26.6 mm | 15.60" | 2560x1440 | |
| 87.7 % v7 (old) | 07/2022 | MSI GE67 HX 12UGS i7-12800HX, GeForce RTX 3070 Ti Laptop GPU | 2.5 kg | 23.4 mm | 15.60" | 1920x1080 | |
| 86.3 % v7 (old) | 06/2022 | Asus ROG Strix Scar 15 G533ZW-LN106WS i9-12900H, GeForce RTX 3070 Ti Laptop GPU | 2.3 kg | 27.2 mm | 15.60" | 2560x1440 | |
| 84 % v7 (old) | 06/2022 | Acer Nitro 5 AN515-58-72QR i7-12700H, GeForce RTX 3070 Ti Laptop GPU | 2.5 kg | 26.8 mm | 15.60" | 2560x1440 | |
| 84.5 % v7 (old) | 02/2022 | MSI Stealth GS66 12UGS i7-12700H, GeForce RTX 3070 Ti Laptop GPU | 2.2 kg | 19.8 mm | 15.60" | 2560x1440 |
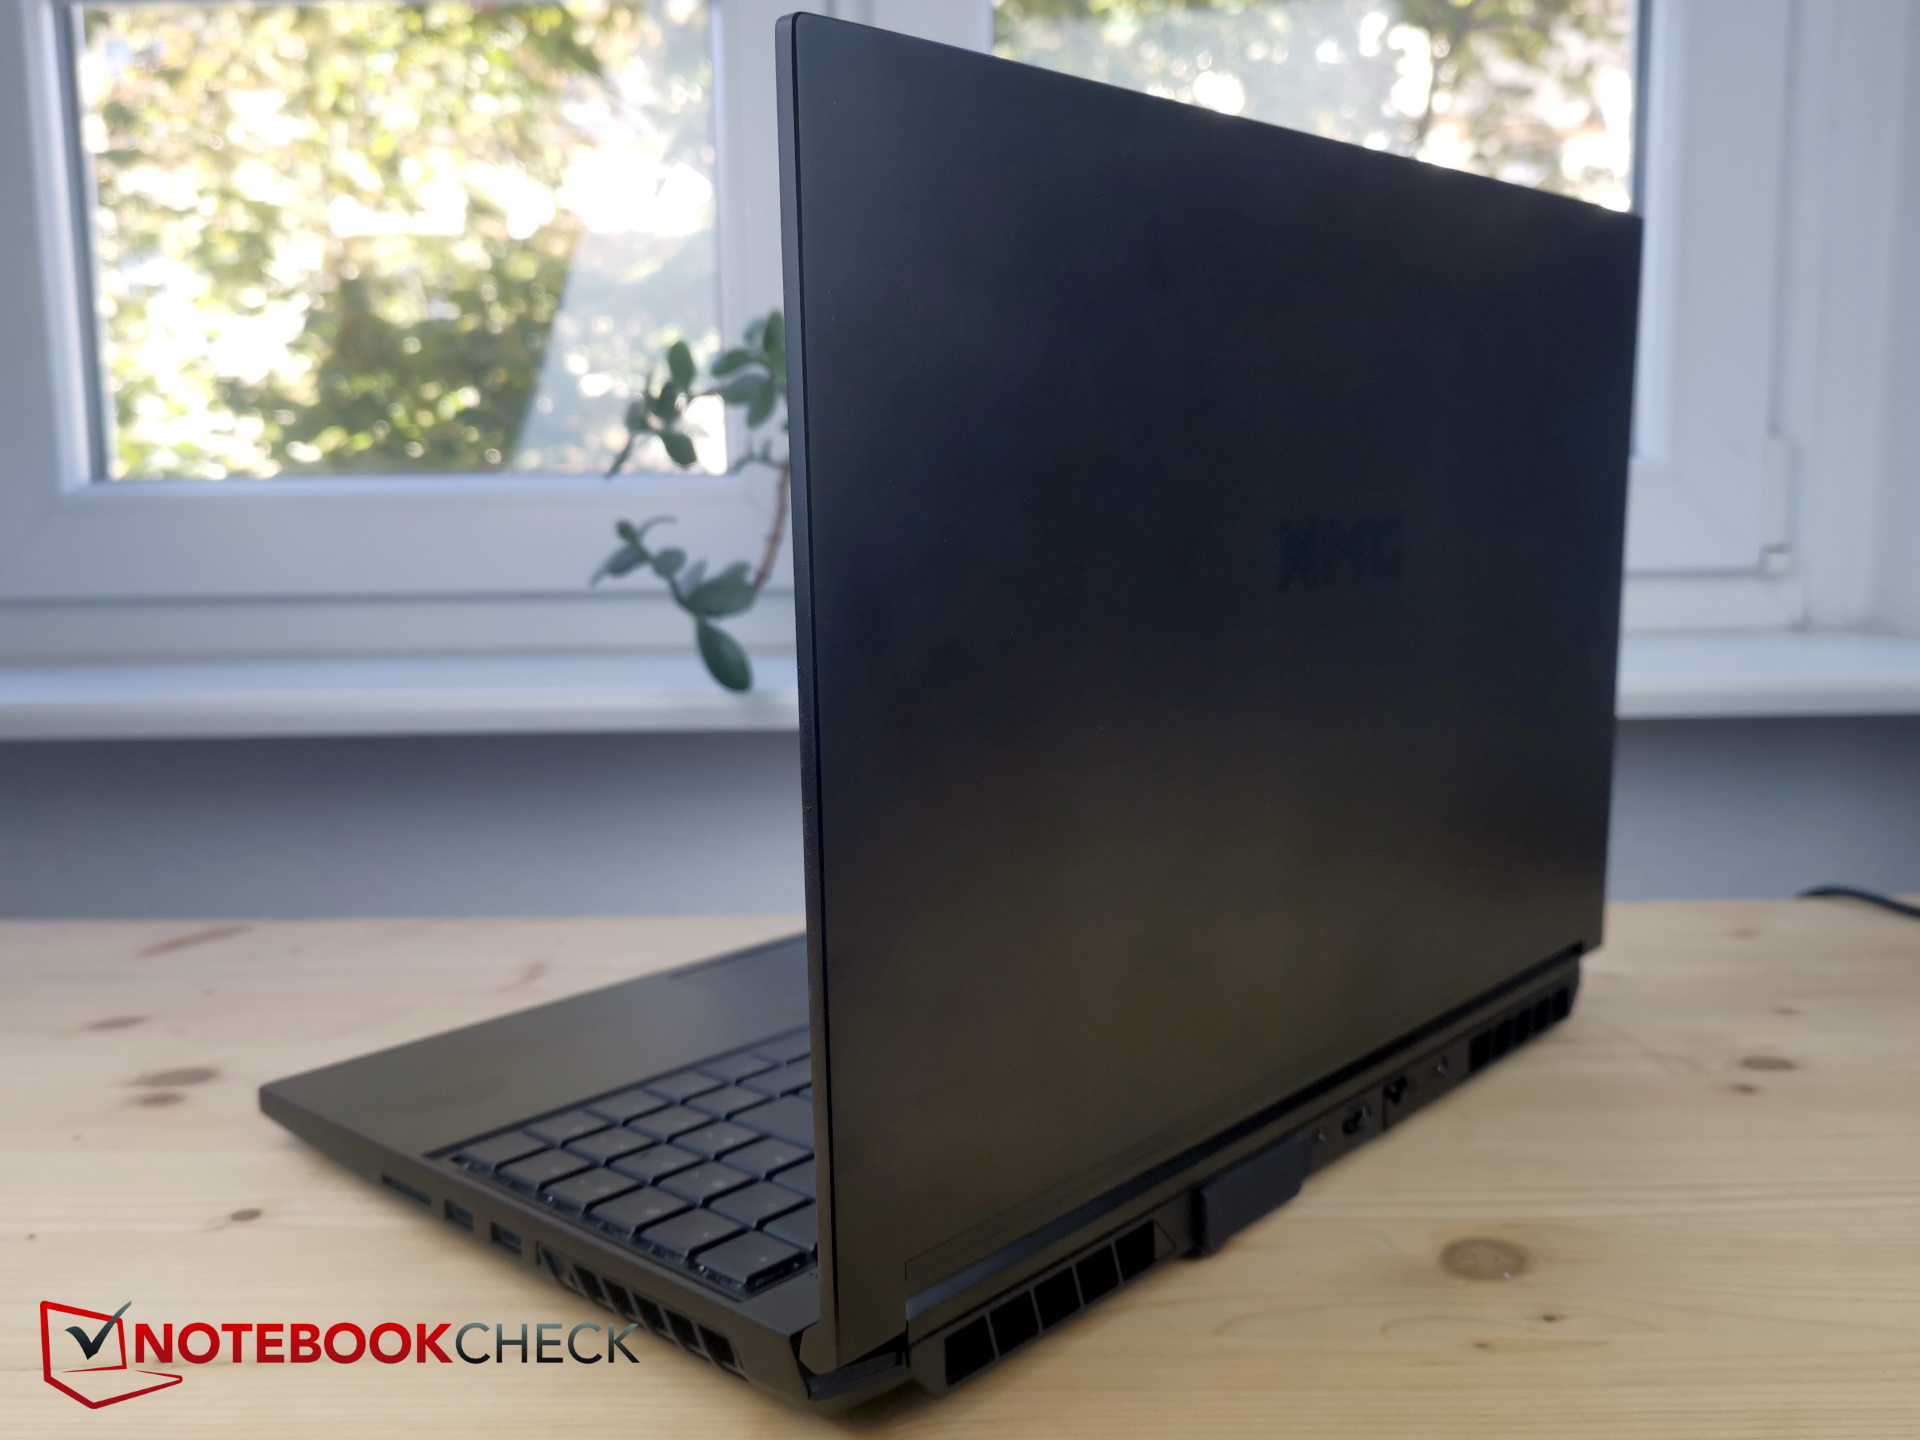
Custodia - tastiera robusta, custodia inferiore (eccessivamente) morbida
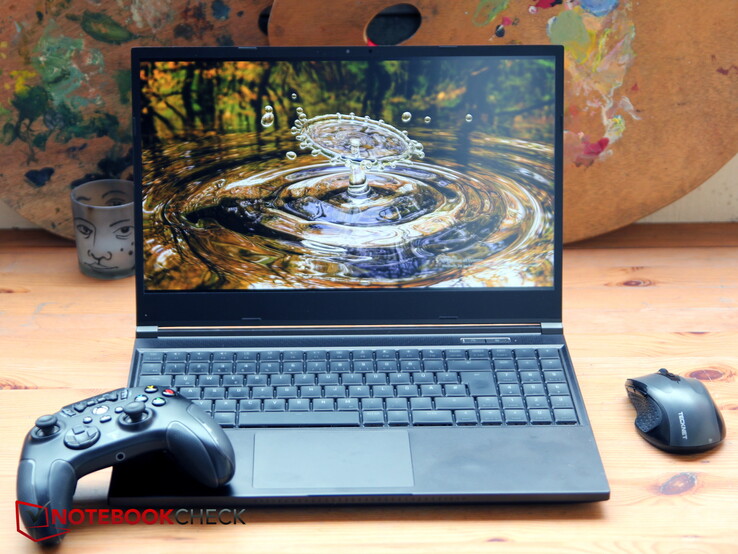
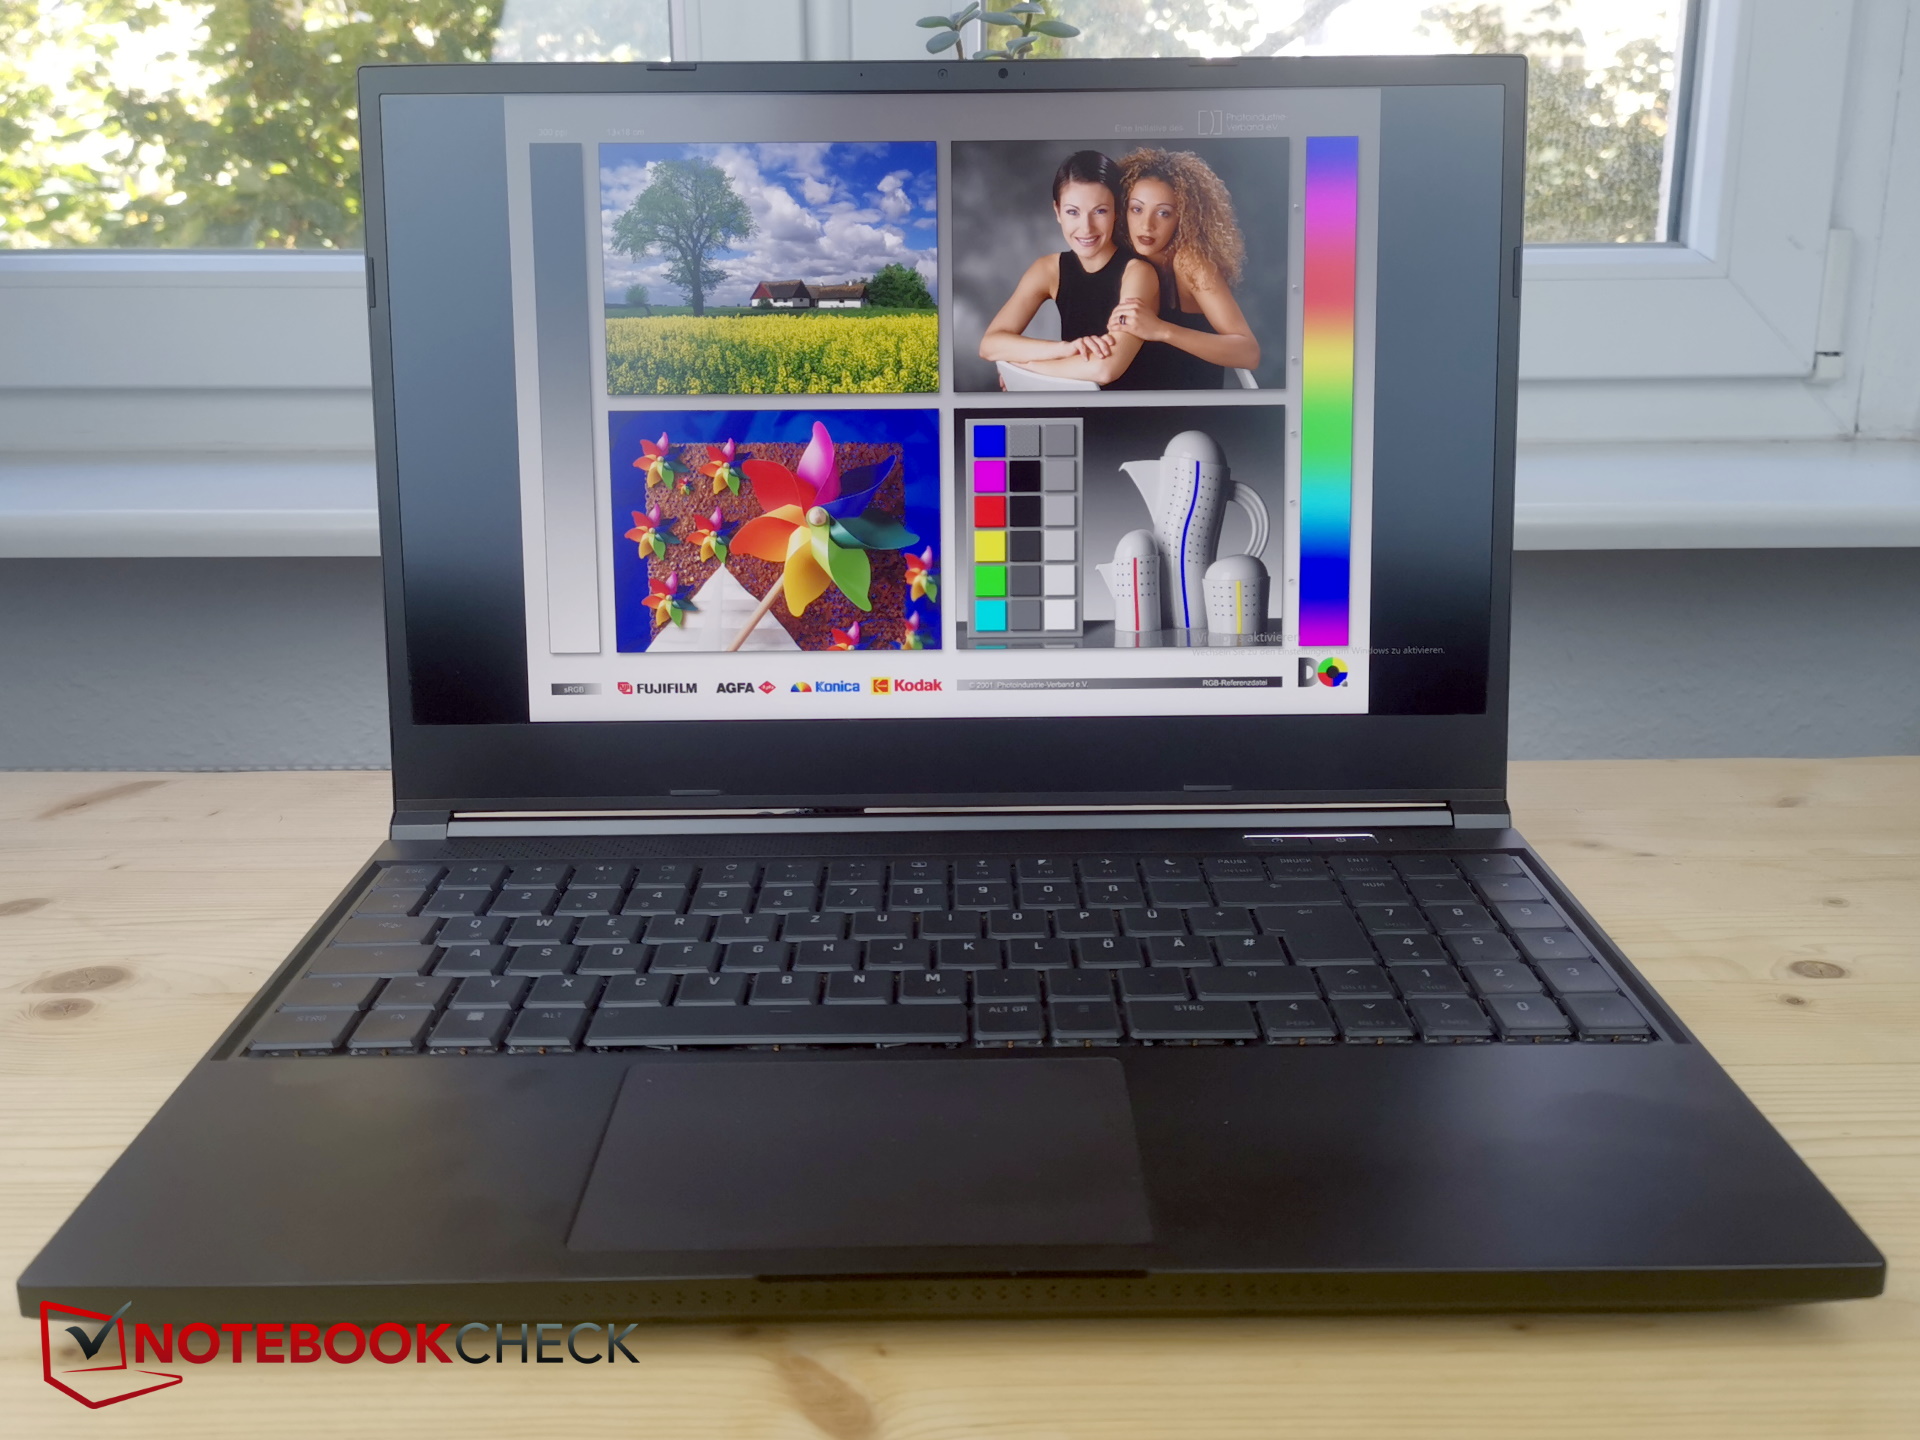
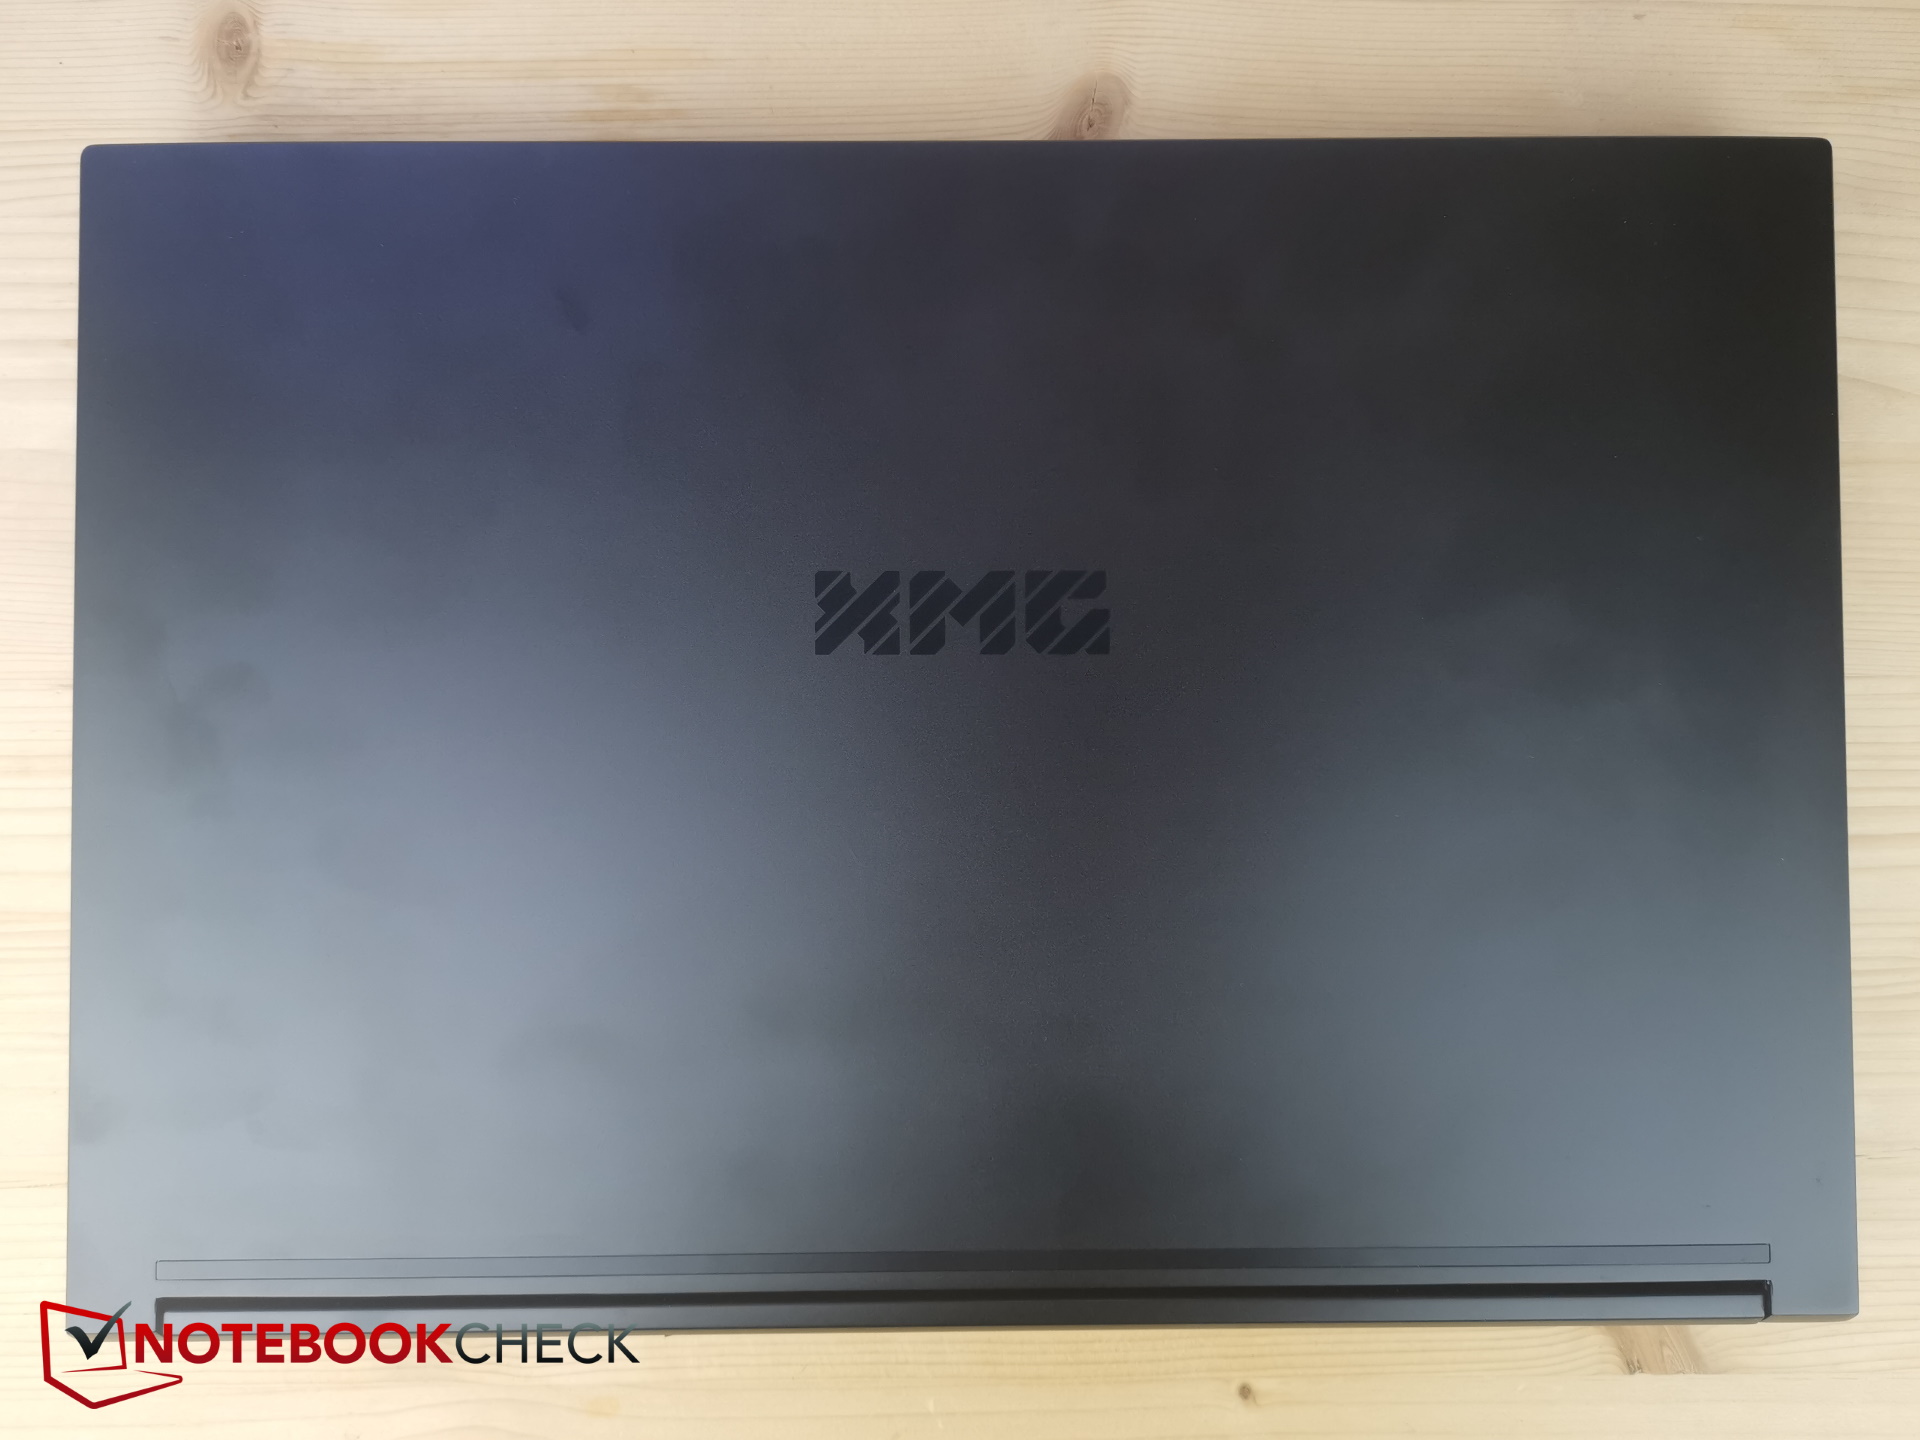
Per essere un portatile da gioco, il Neo 15 non ha un design troppo appariscente. Per la maggior parte, la sua combinazione di colori va dal grigio scuro al nero. Il coperchio del display e la sezione di base sono in metallo, mentre la parte inferiore e la cornice sono in plastica morbida. Al centro del coperchio è presente il logo XMG. La barra LED tratteggiata sulla parte anteriore conferisce al dispositivo una certa estetica da gioco.
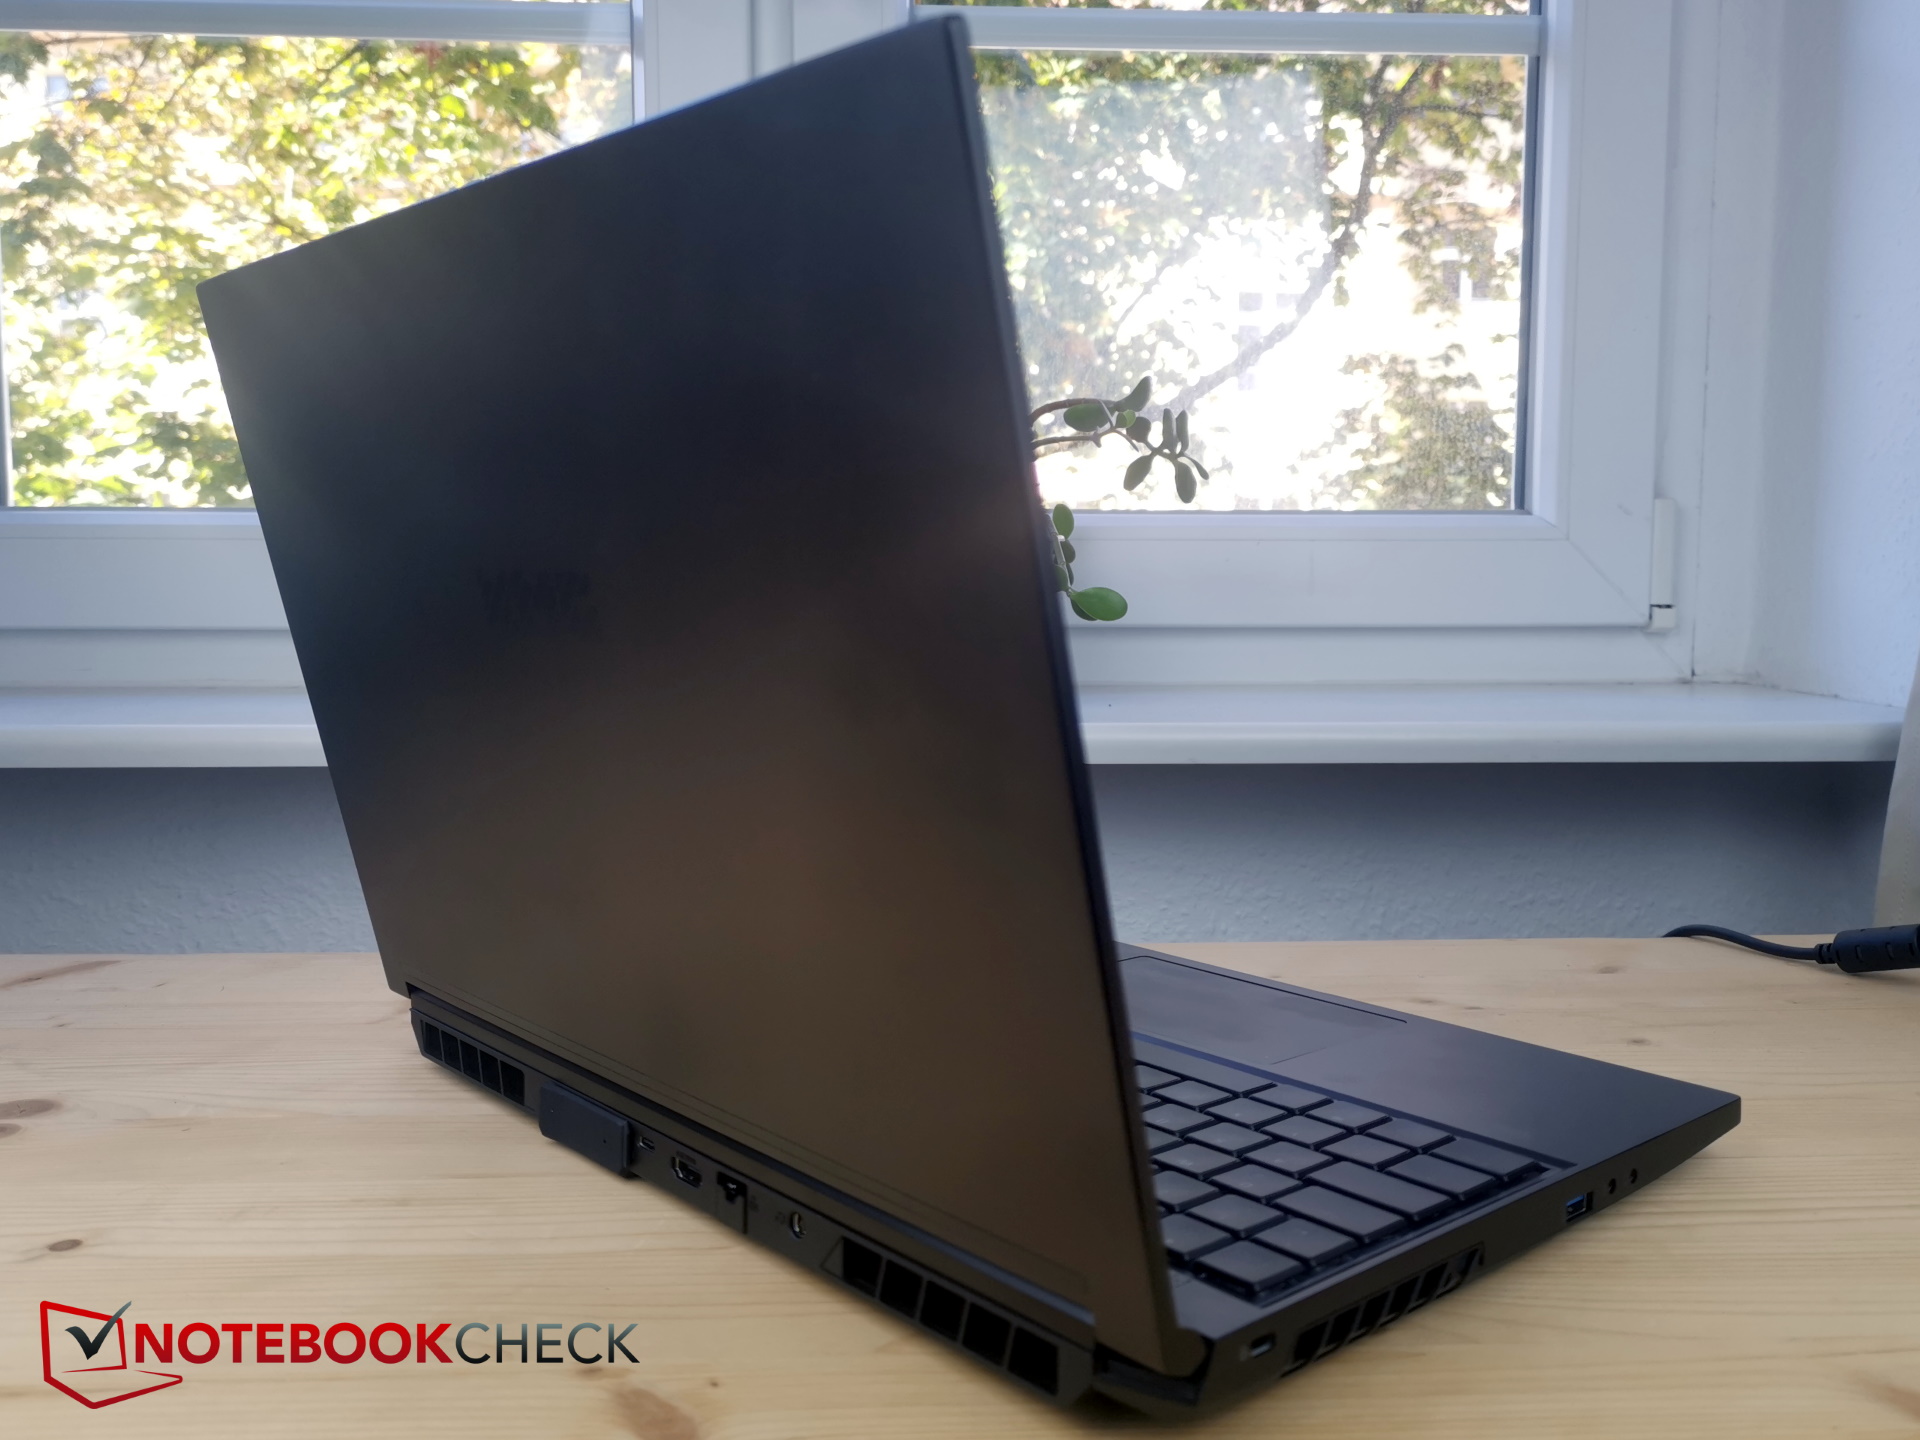
Grazie all'uso del metallo, il Neo 15 risulta molto solido, soprattutto nella sezione di base. Il portatile non presenta praticamente alcuna flessione e non emette alcuno scricchiolio quando viene ruotato o piegato. Naturalmente, il coperchio sarà un po' meno rigido. Detto questo, il display può sopportare alcune torsioni senza risentirne. Un inconveniente, tuttavia, è che le impronte digitali possono accumularsi sulla superficie opaca.
Sfortunatamente, la custodia inferiore in plastica è così morbida che questo può accadere: se si tiene il dispositivo nel punto "sbagliato" (cioè l'area intorno alla presa d'aria in basso a destra) usando una sola mano, questo punto può essere spinto così tanto da toccare le ventole in rotazione.
A parte questo, il Neo 15 ha un'ottima vestibilità e finitura, è molto compatto e robusto ed è dotato di cerniere sufficientemente solide ma non troppo rigide.
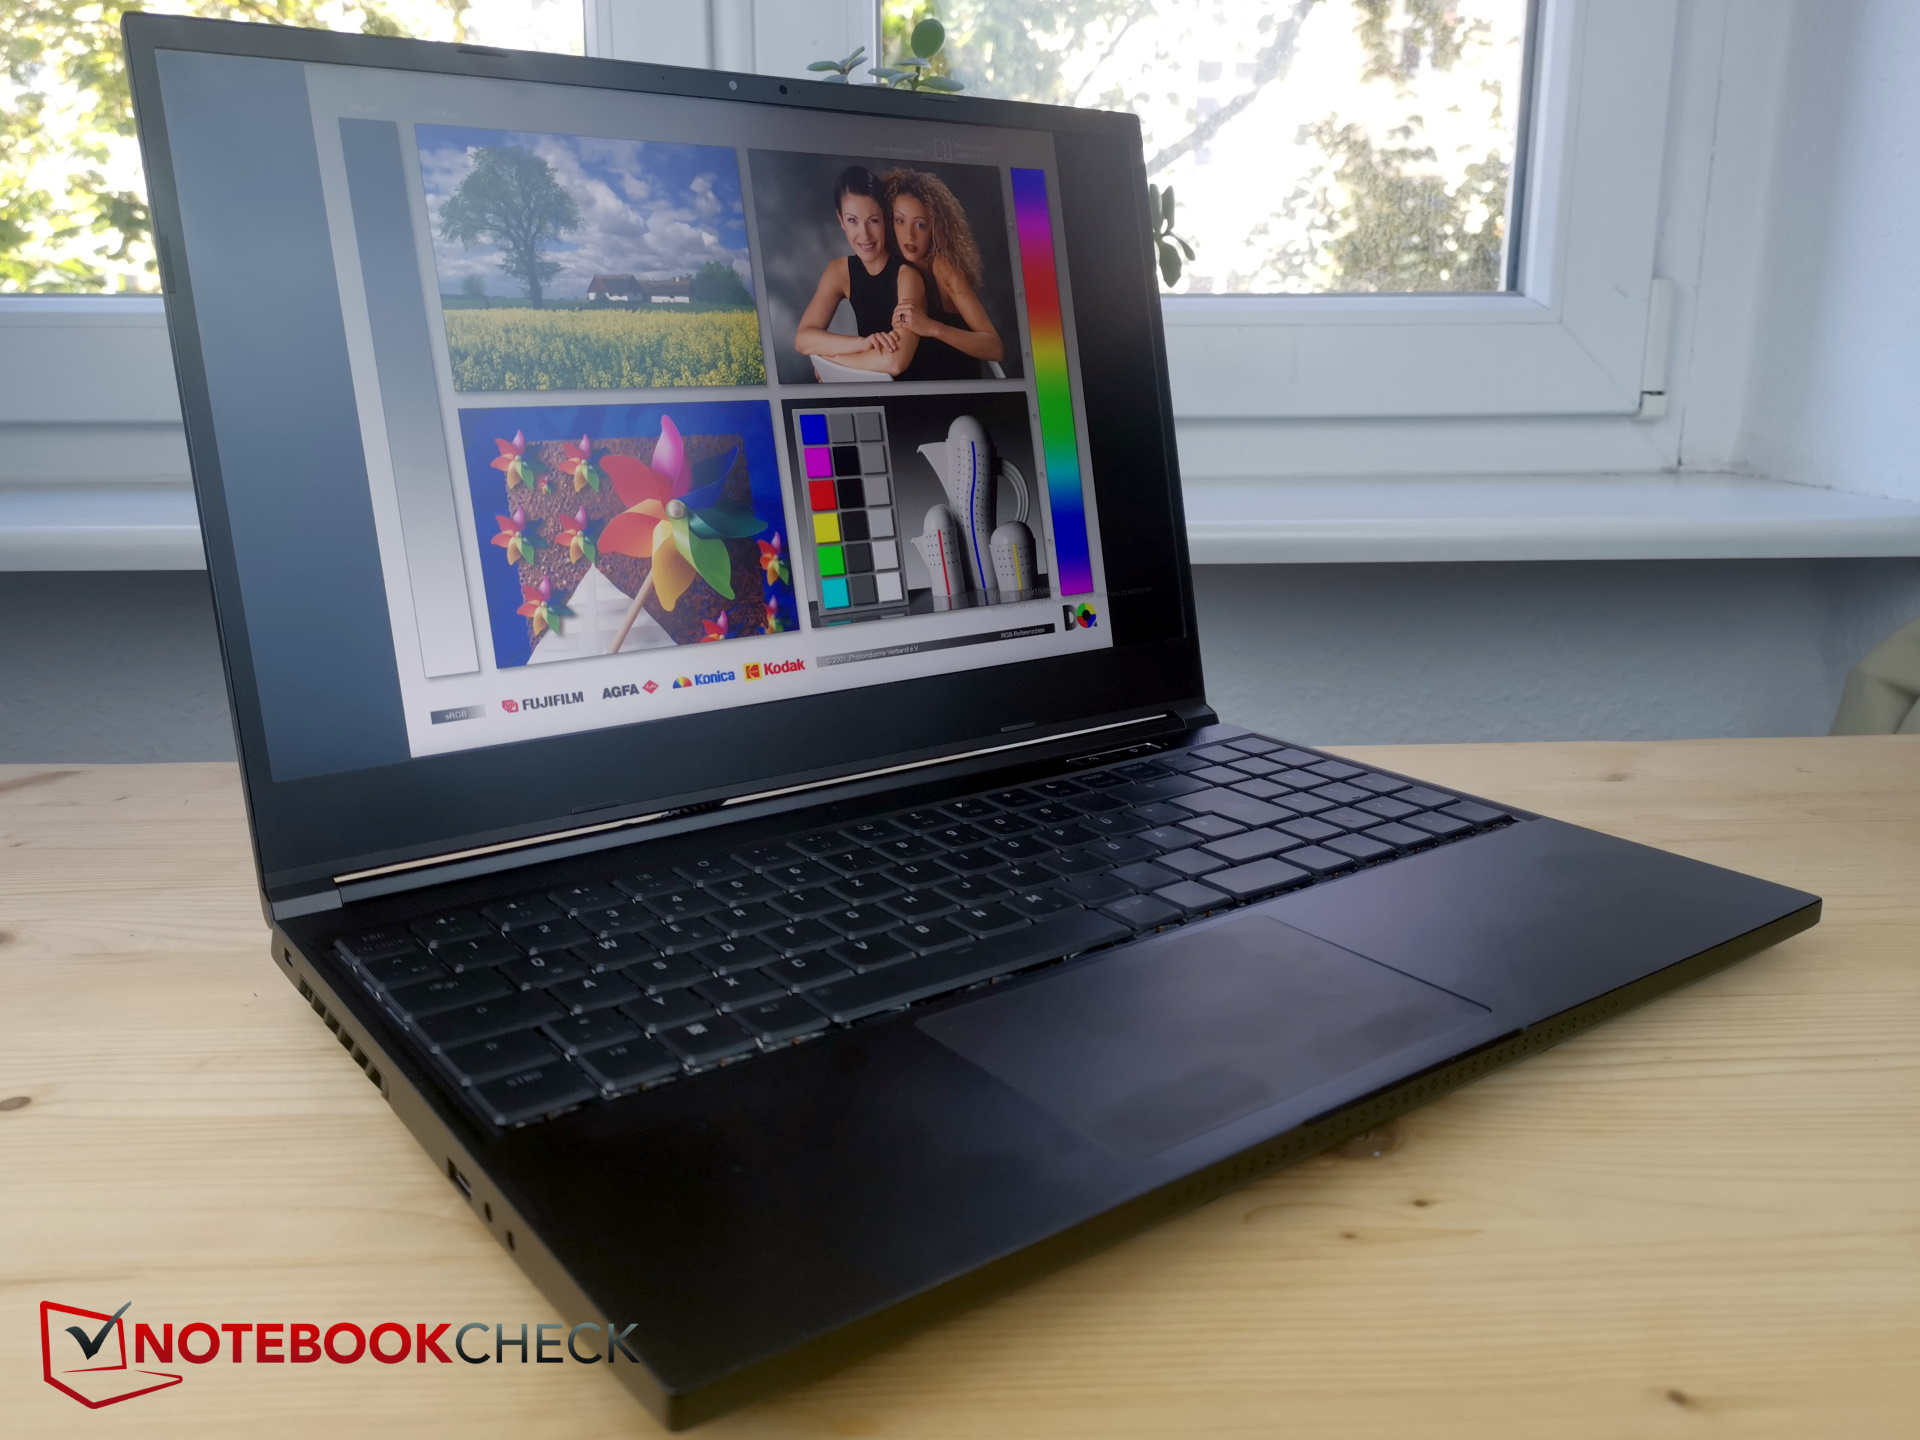
Con uno spessore di 26,6 mm (1,05"), il Neo non vuole competere con il sottile Razer Blade 15 Razer Blade 15. Ma sembra leggermente più sottile di quanto non sia in realtà grazie al suo design compatto. La maggior parte dei concorrenti ha all'incirca lo stesso spessore; solo l' MSI Stealth è notevolmente più sottile.
La compattezza del portatile si riflette anche nelle sue dimensioni: nessuno degli altri portatili occupa una profondità così ridotta come il Neo 15. In termini di peso, il Neo si colloca al centro del gruppo di confronto. Solo lo Stealth è più leggero di circa 100 g (0,22 lb), mentre sia il Nitro che l'MSI GE67 pesano circa 200 g (0,44 lb) in più.
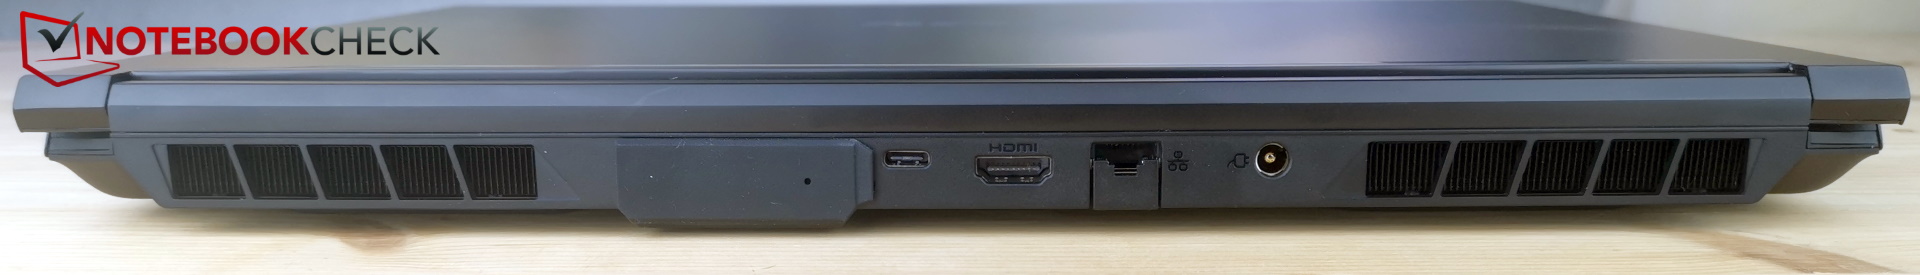
Caratteristiche tecniche - Assenza di Thunderbolt, porta USB-C lenta
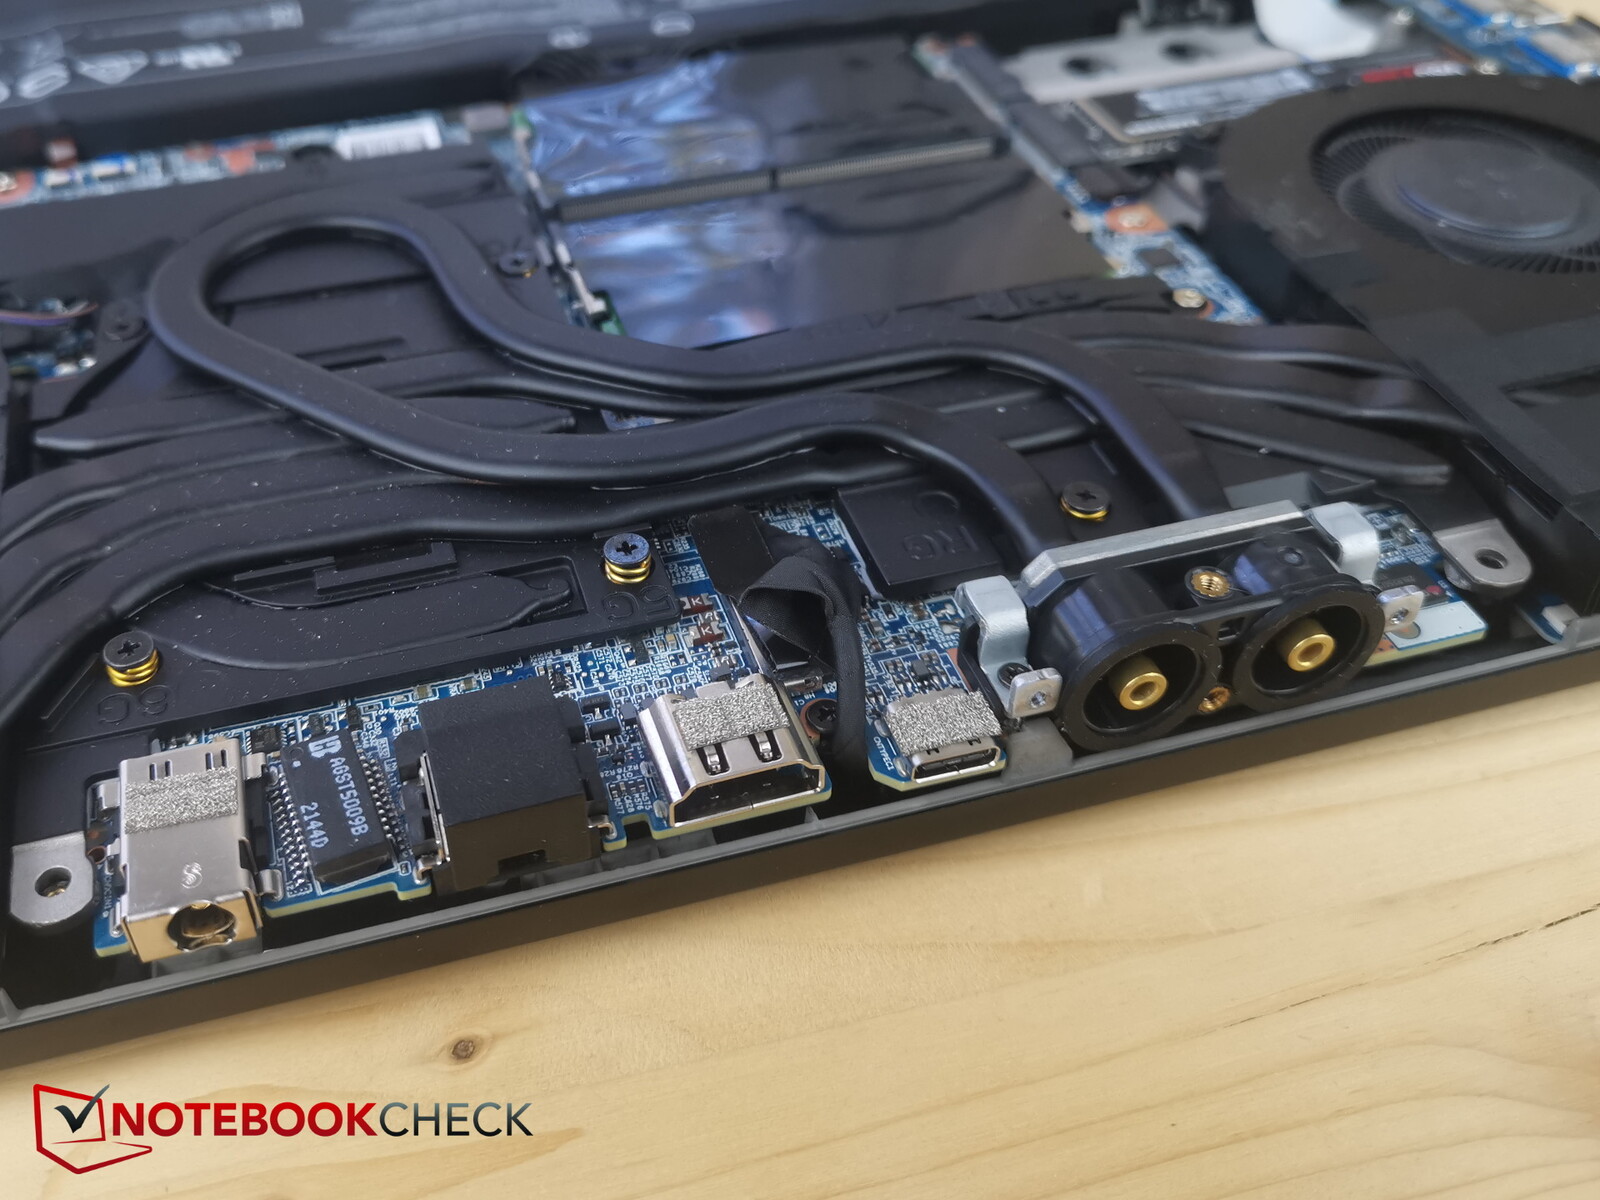
Purtroppo, la porta USB-C del Neo 15 basato su AMD è diversa da quella del modello Intel. Sulla versione AMD, non solo non c'è Thunderbolt, ma la porta USB-C è solo di tipo 3.2 Gen2x1 invece che Gen2x2. Anche Power Delivery non è supportato.
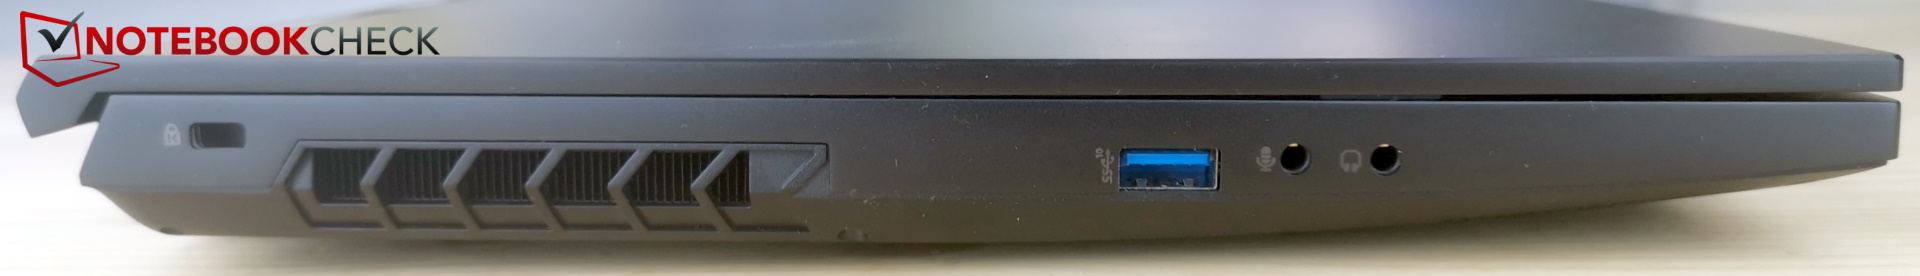
Una nota positiva è che il portatile dispone di due jack audio separati (microfono + cuffie) e le porte sono ben disposte a sinistra, a destra e sul retro. Il collegamento all'acqua per XMG OASIS si trova anch'esso sul retro.
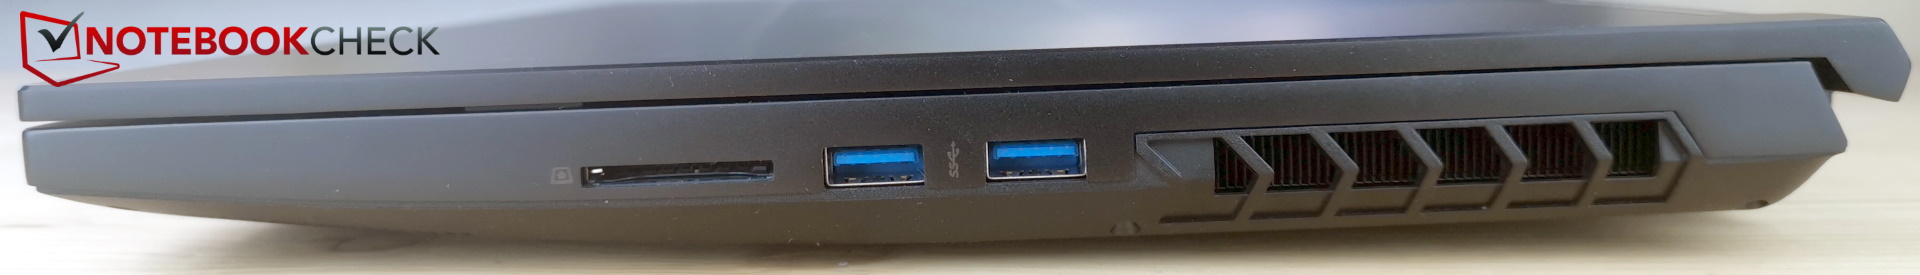
Lettore di schede SD
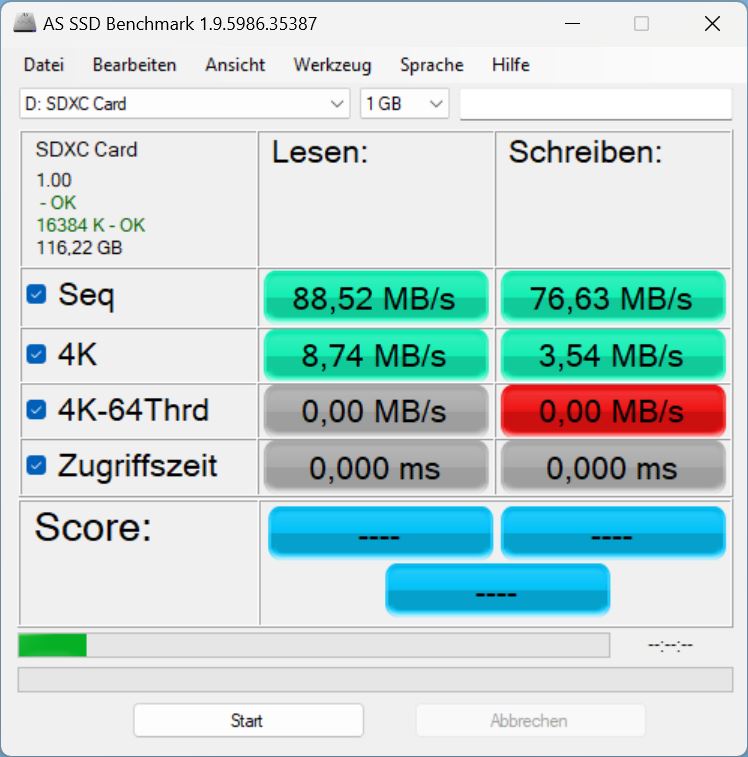
Il lettore di schede accetta le normali schede SD. Quando si inserisce una scheda SD, circa metà della scheda fuoriesce dallo slot perché non è dotato di un meccanismo di blocco.
La velocità di trasferimento del lettore di schede si colloca più o meno all'estremità inferiore dello spettro.
| SD Card Reader | |
| average JPG Copy Test (av. of 3 runs) | |
| Media della classe Gaming (20.9 - 210, n=55, ultimi 2 anni) | |
| Schenker XMG Neo 15 (i7-12700H, RTX 3080 Ti) | |
| MSI GE67 HX 12UGS (Toshiba Exceria Pro SDXC 64 GB UHS-II) | |
| Schenker XMG Neo 15 (Ryzen 9 6900HX, RTX 3070 Ti) | |
| maximum AS SSD Seq Read Test (1GB) | |
| Media della classe Gaming (25.5 - 261, n=52, ultimi 2 anni) | |
| Schenker XMG Neo 15 (Ryzen 9 6900HX, RTX 3070 Ti) | |
| Schenker XMG Neo 15 (i7-12700H, RTX 3080 Ti) | |
| MSI GE67 HX 12UGS (Toshiba Exceria Pro SDXC 64 GB UHS-II) | |
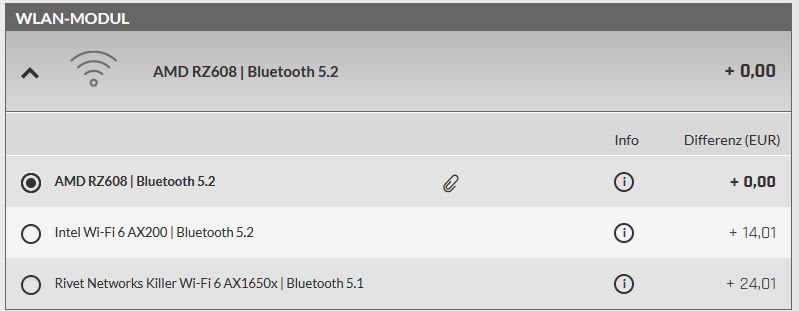
Connettività
Il Neo è dotato di un modulo wireless Intel AX200. Sebbene questa scheda wireless supporti il Wi-Fi 6, non funziona ancora con la banda di frequenza a 6 GHz. Offre una velocità di trasferimento buona e stabile, ma gli altri moduli Wi-Fi nel confronto sono marginalmente più veloci.
Webcam
Il lato positivo: il Neo 15 è dotato di una webcam Full HD. Gli aspetti negativi: la qualità dell'immagine è peggiore di quella di alcuni modelli a 720p (vedi foto sotto).


 GeForce RTX 3070 Ti Laptop GPU, R9 6900HX, Samsung SSD 980 Pro 1TB MZ-V8P1T0BW")
 GeForce RTX 3070 Ti Laptop GPU, R9 6900HX, Samsung SSD 980 Pro 1TB MZ-V8P1T0BW")
Sicurezza
Il Neo 15 non dispone di un sensore di impronte digitali, ma è dotato di TPM 2.0 e di uno slot Kensington.
Accessori e garanzia
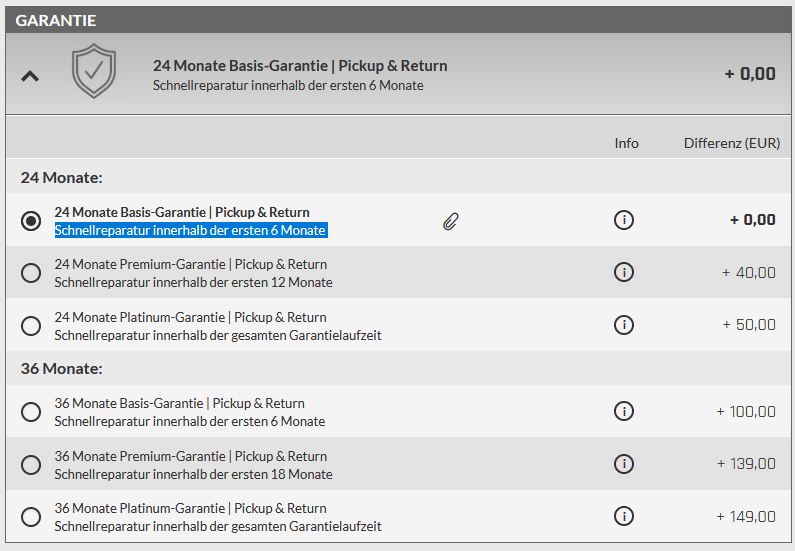
A differenza di molti altri produttori, Schenker è nota per non lesinare sugli accessori. Ad esempio, nella confezione sono inclusi un grande mousepad e una chiavetta USB contenente i driver.
L'azienda offre una garanzia di 24 mesi che comprende il servizio di ritiro e restituzione e la riparazione rapida entro i primi sei mesi dall'acquisto.
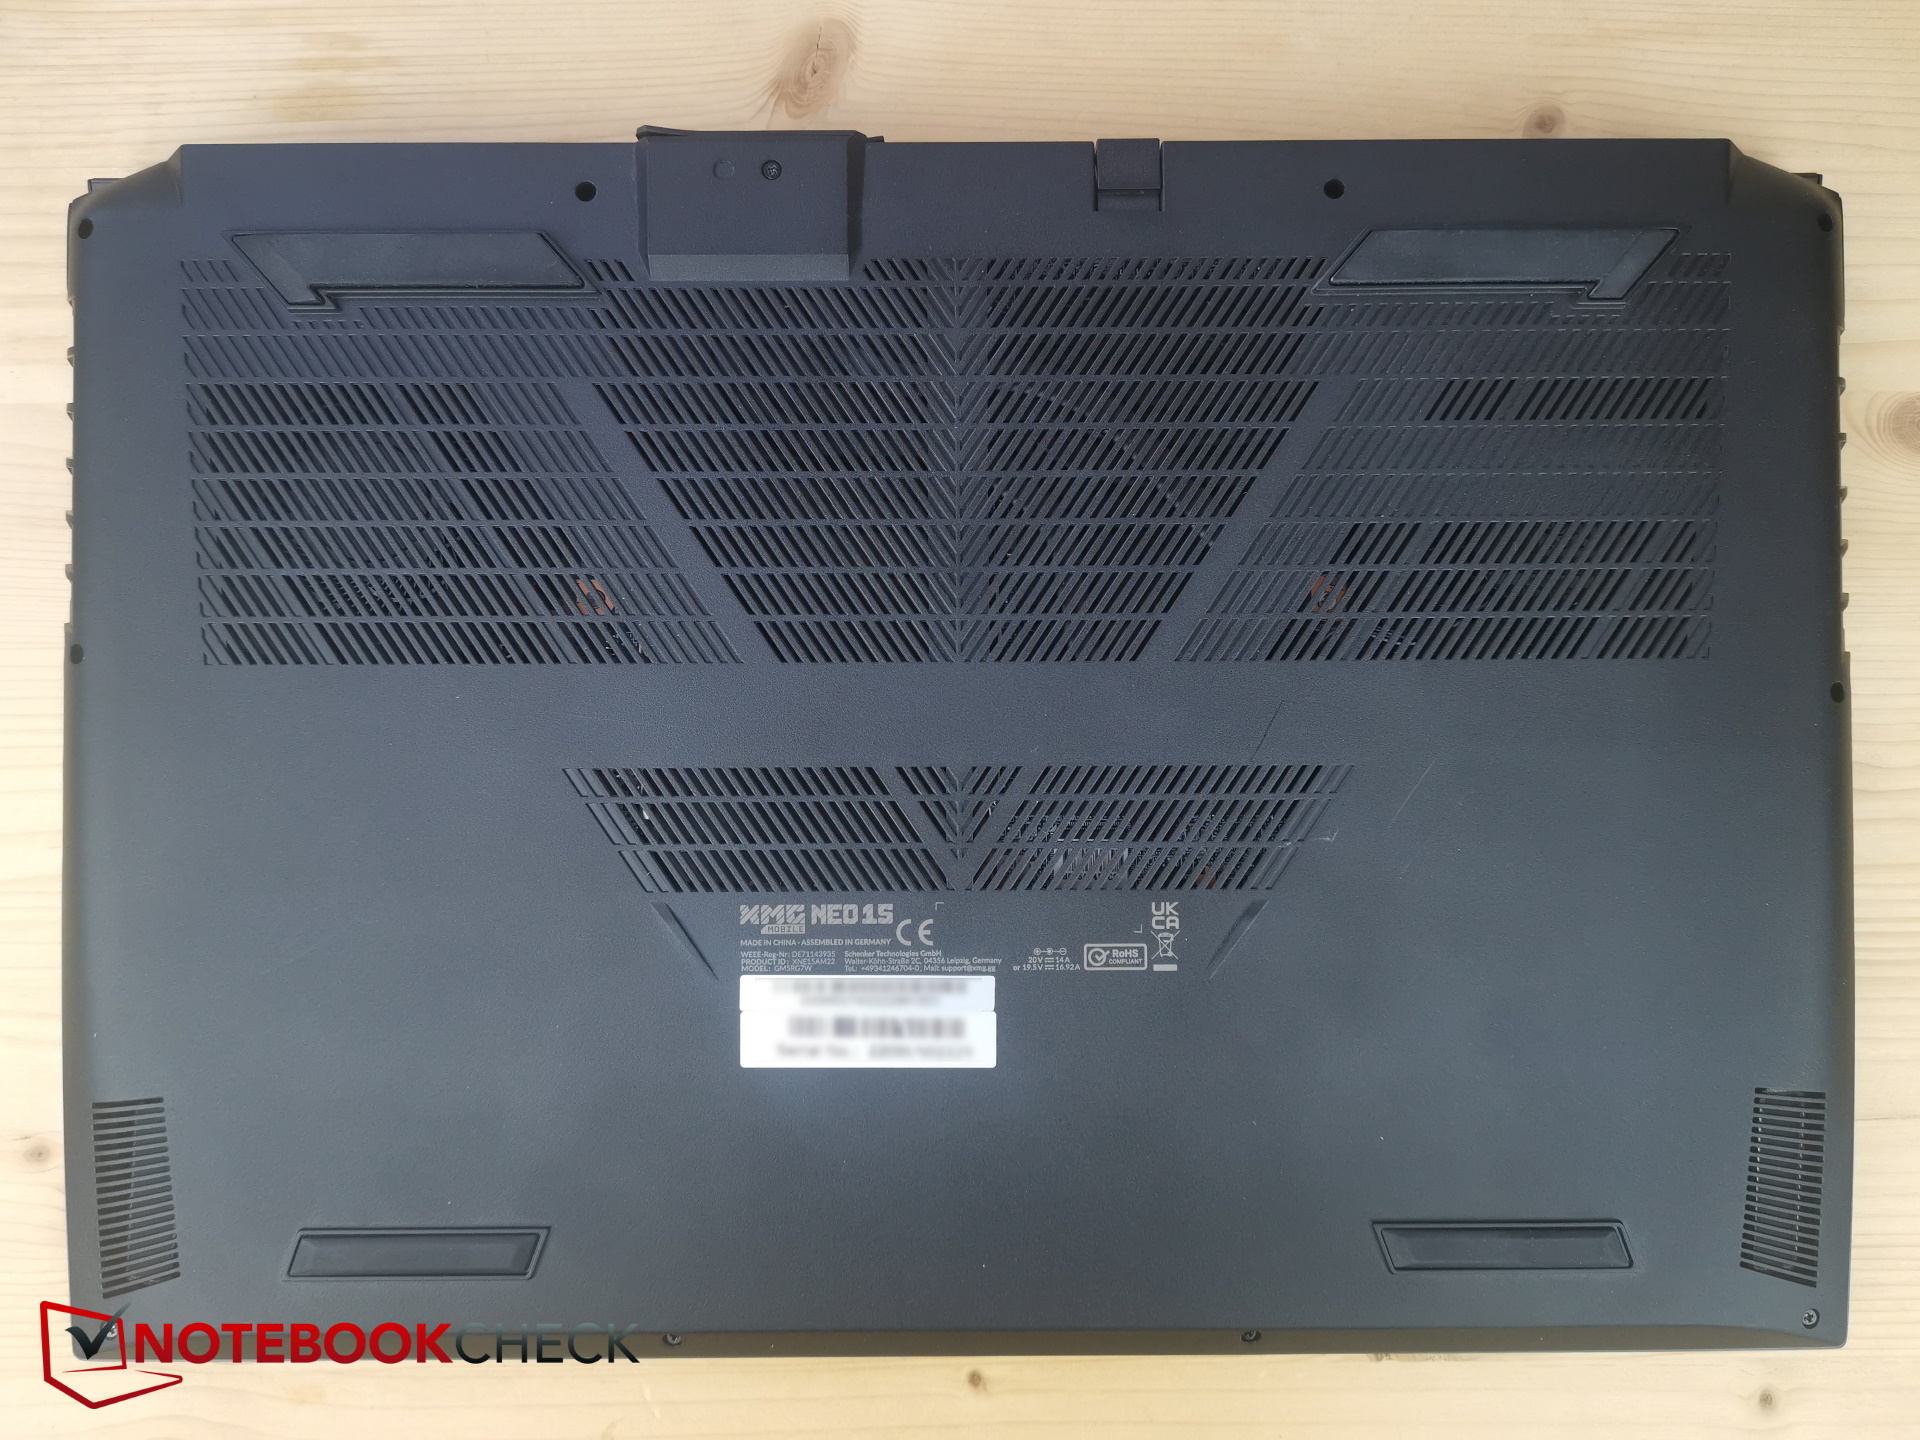
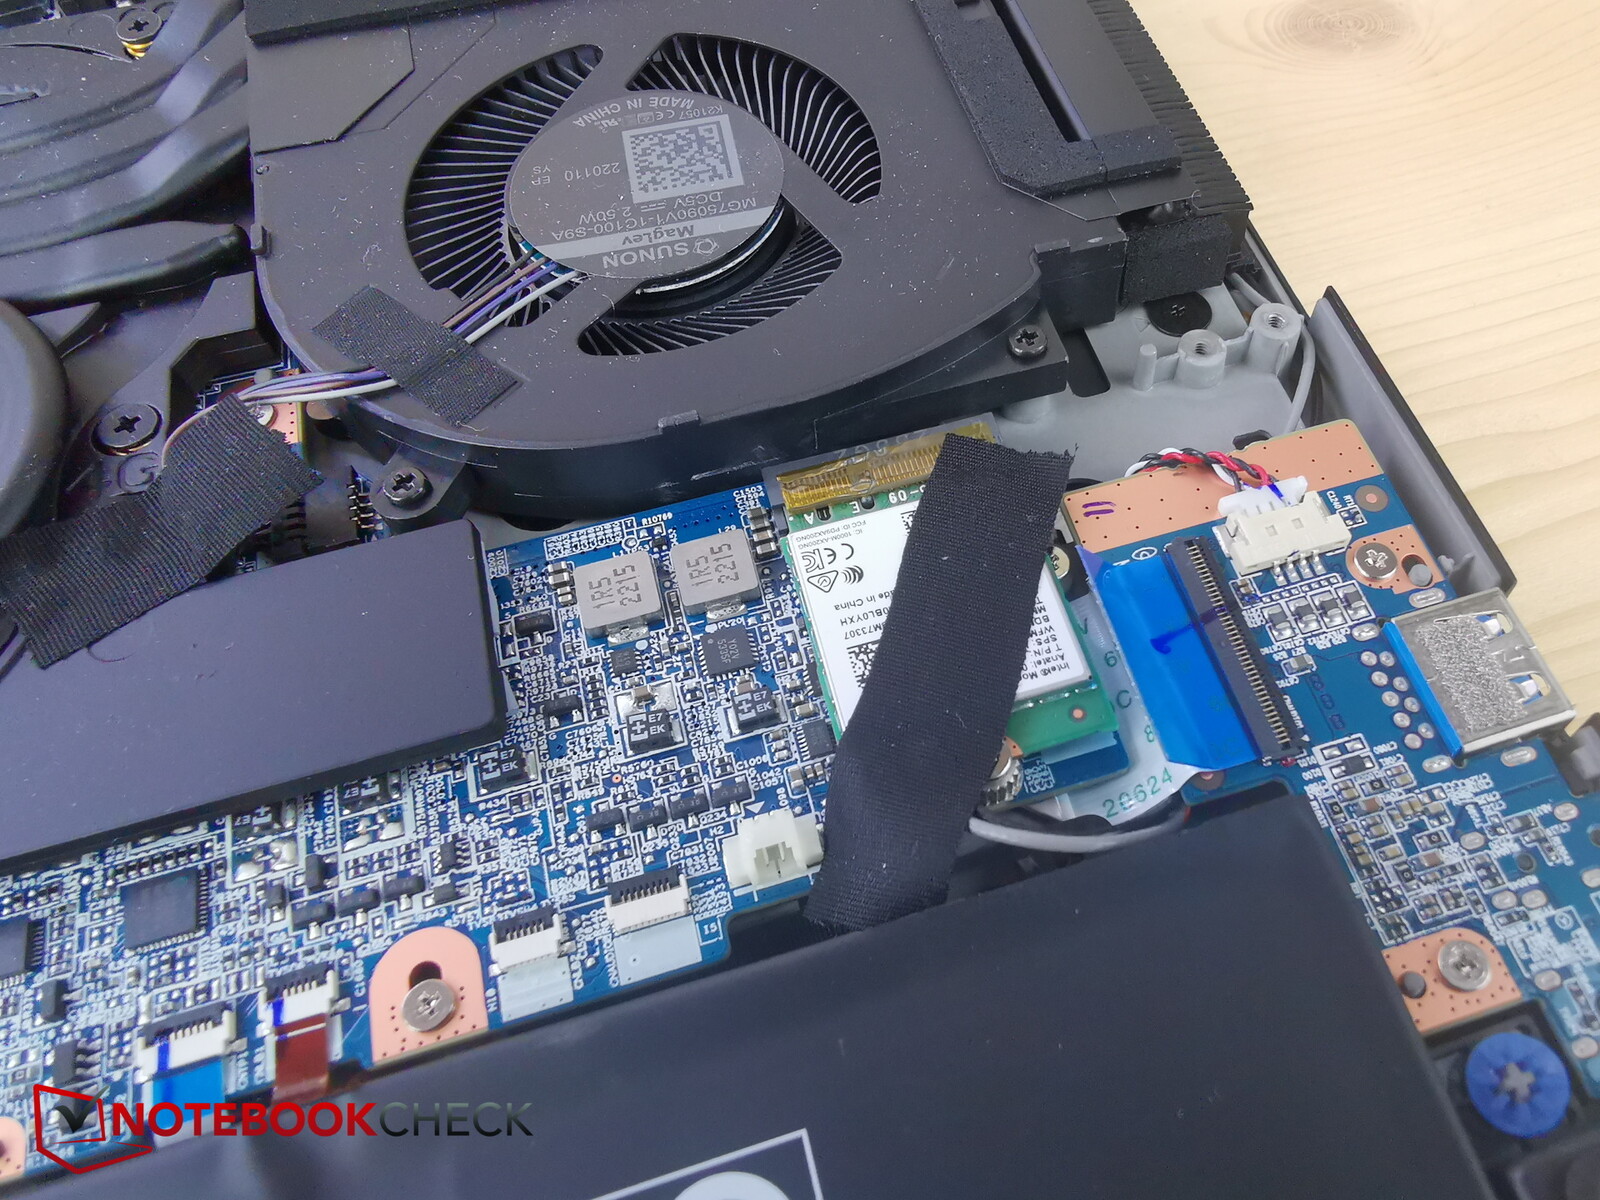
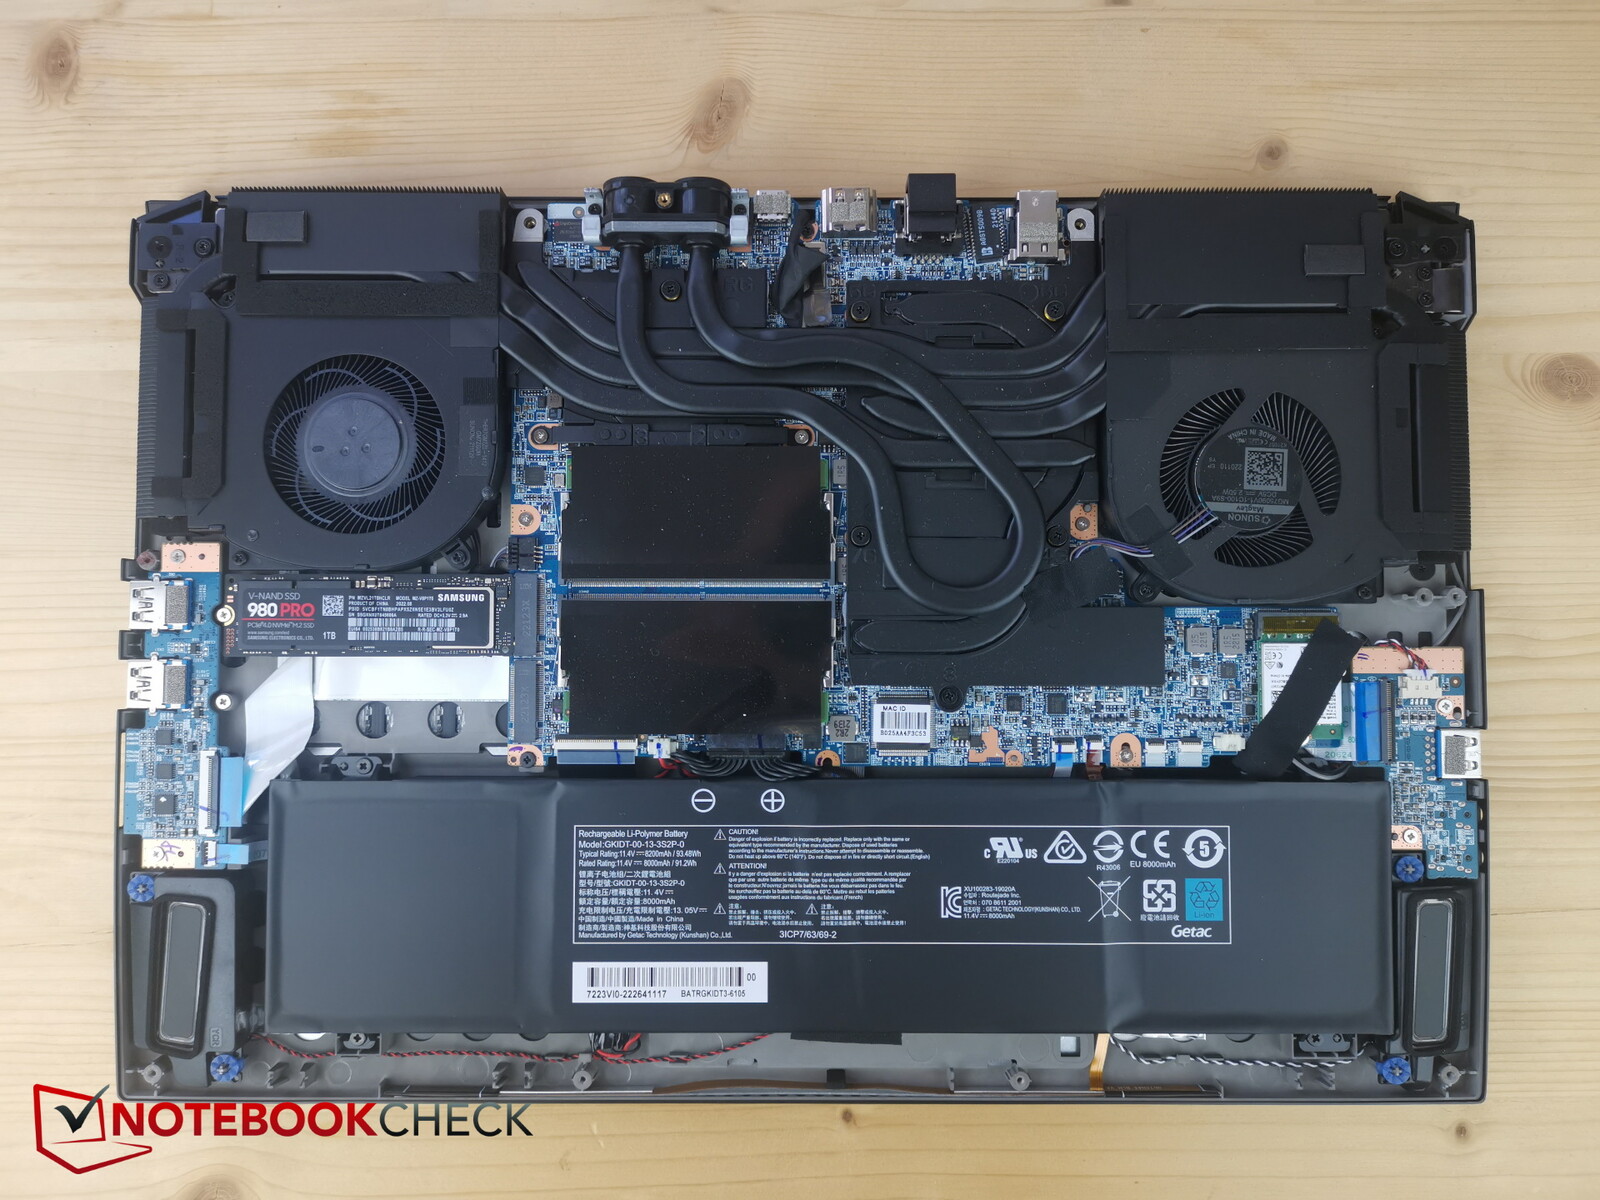
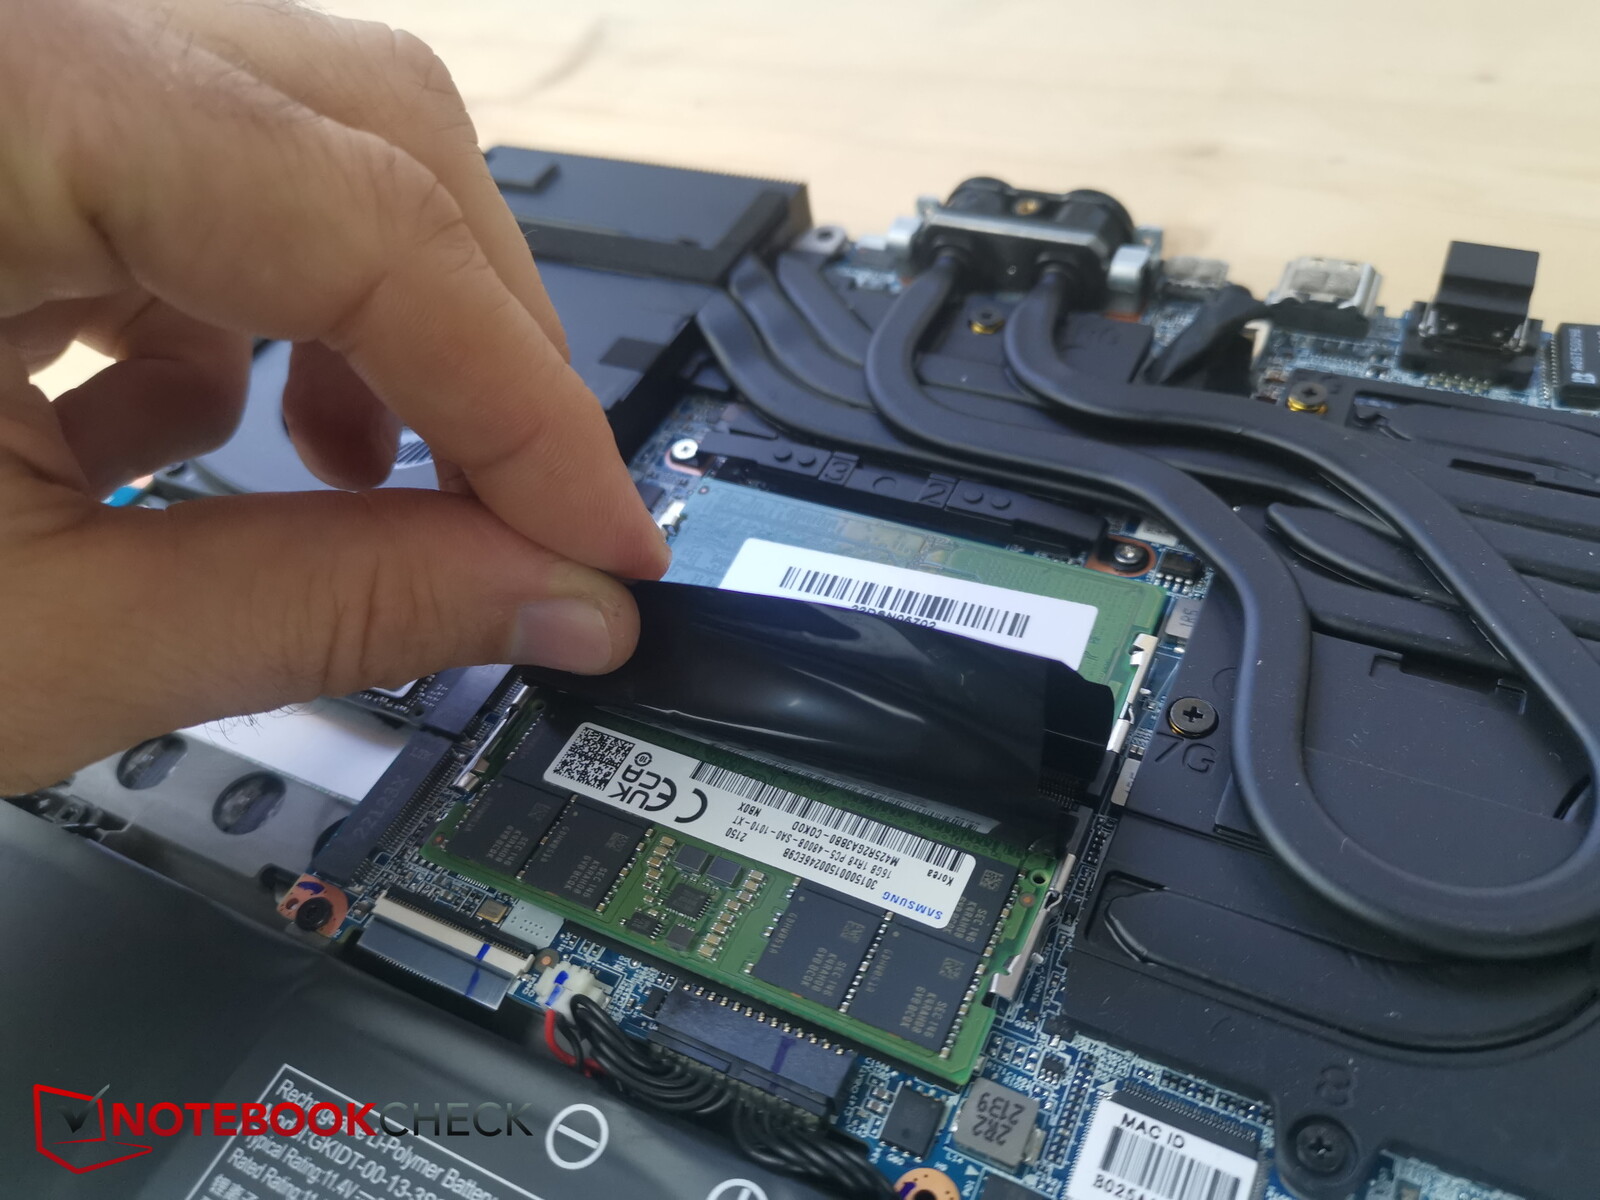
Manutenzione
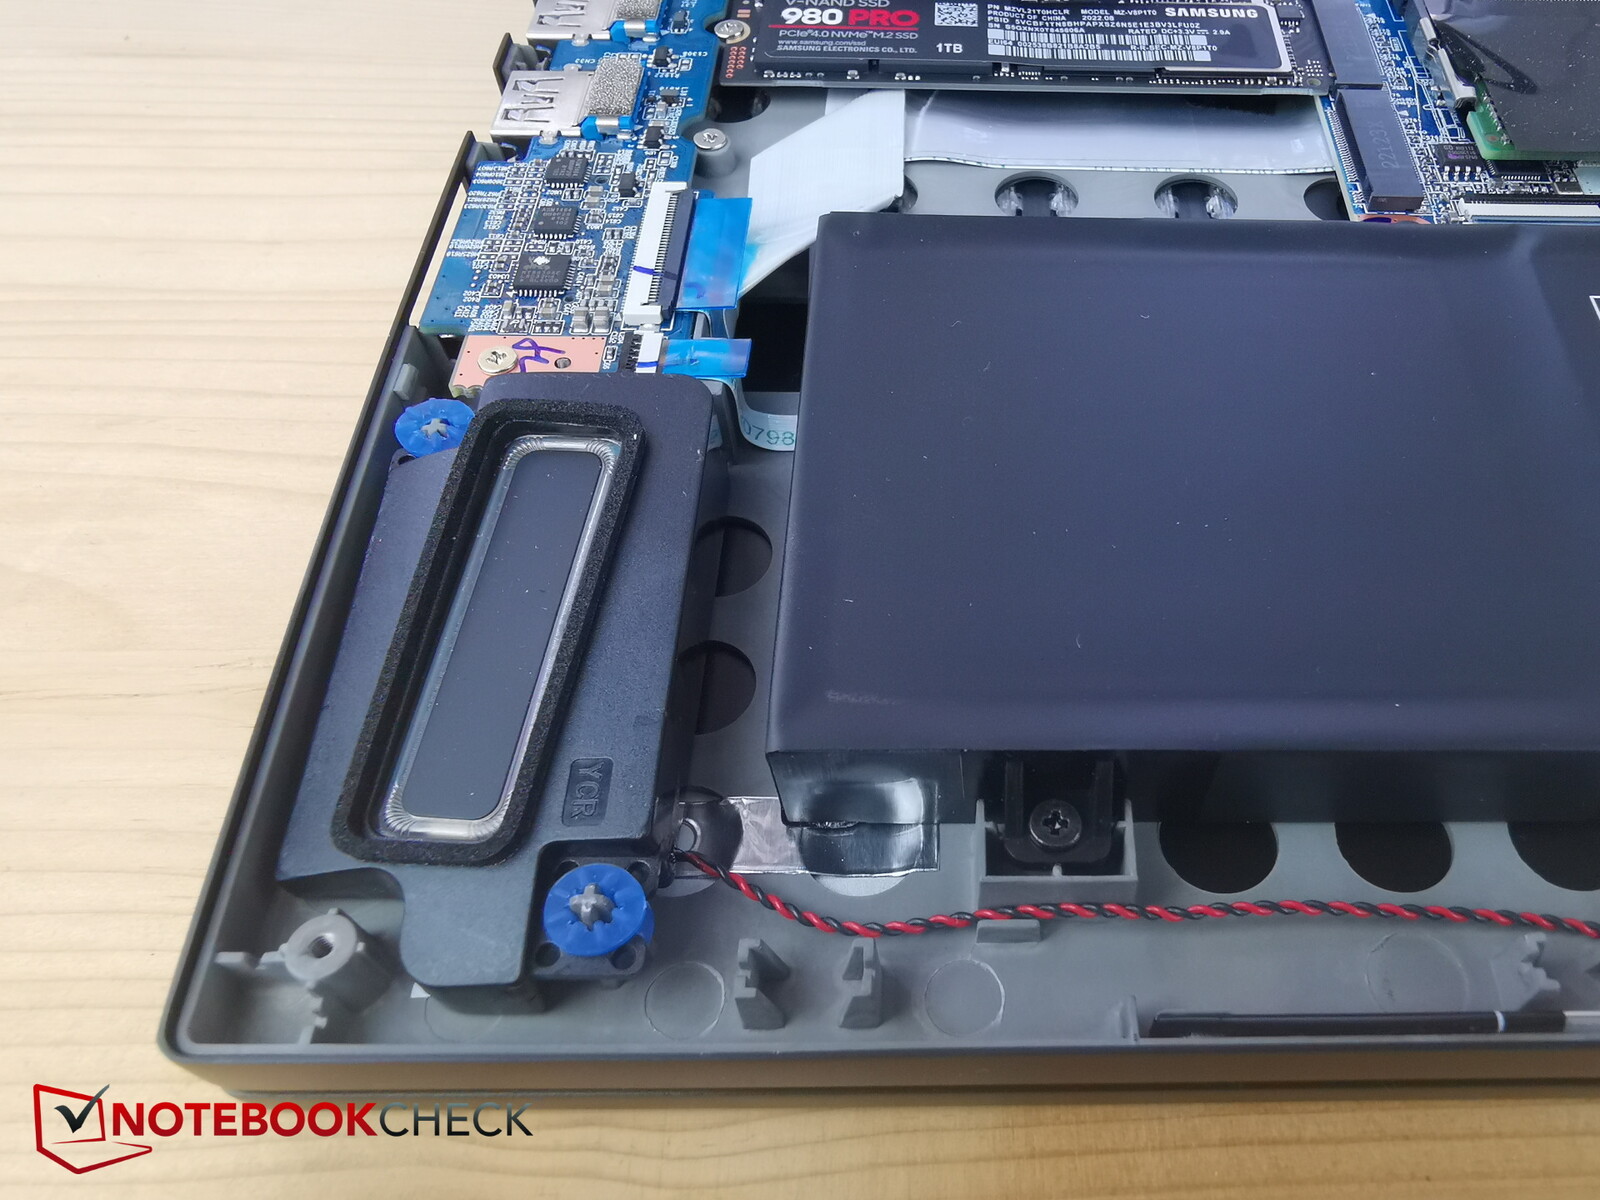
Il fondo in plastica è fissato in posizione da un totale di 14 viti con testa a croce, quattro delle quali si trovano sulle porte di raffreddamento a liquido. È molto facile sollevare il pannello inferiore partendo dal retro. Una volta aperto lo chassis del portatile, si avrà accesso ai due slot per SSD M.2, alle ventole, alla batteria, al modulo Wi-Fi e ai due slot per la RAM.
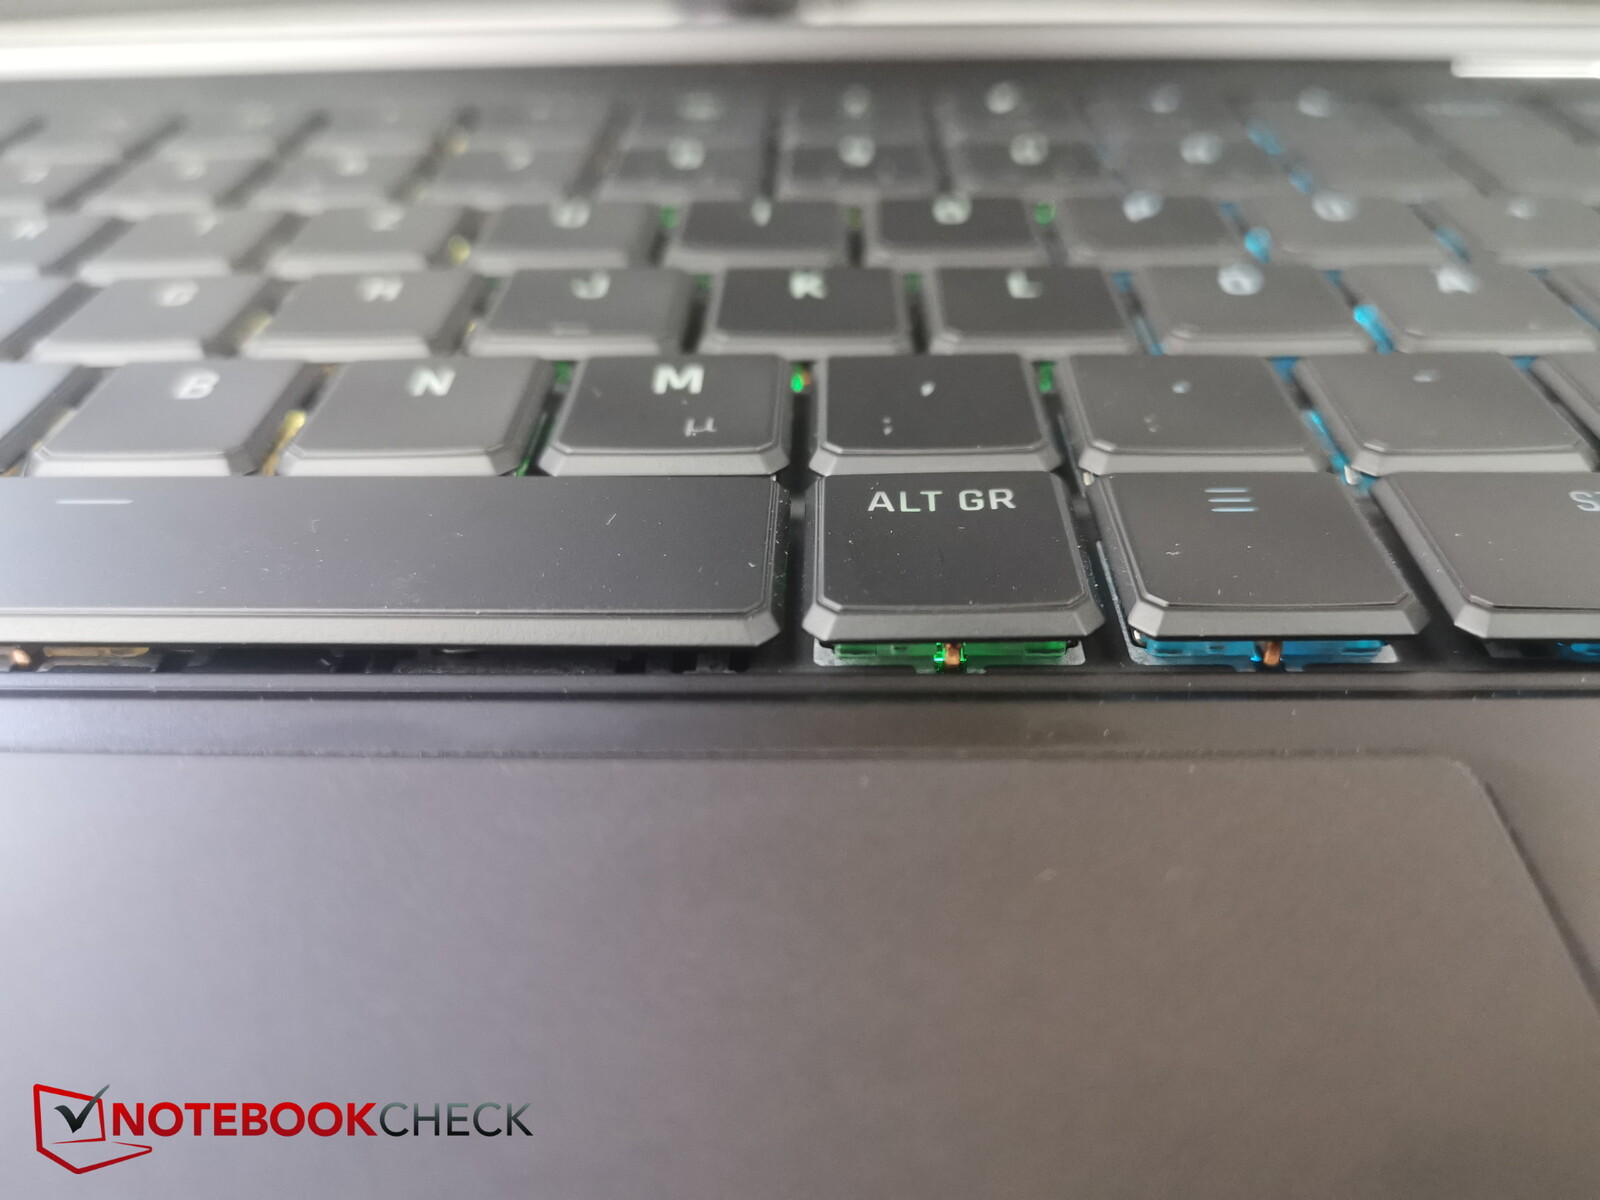
Dispositivi di ingresso - Interruttori opto-meccanici
Tastiera
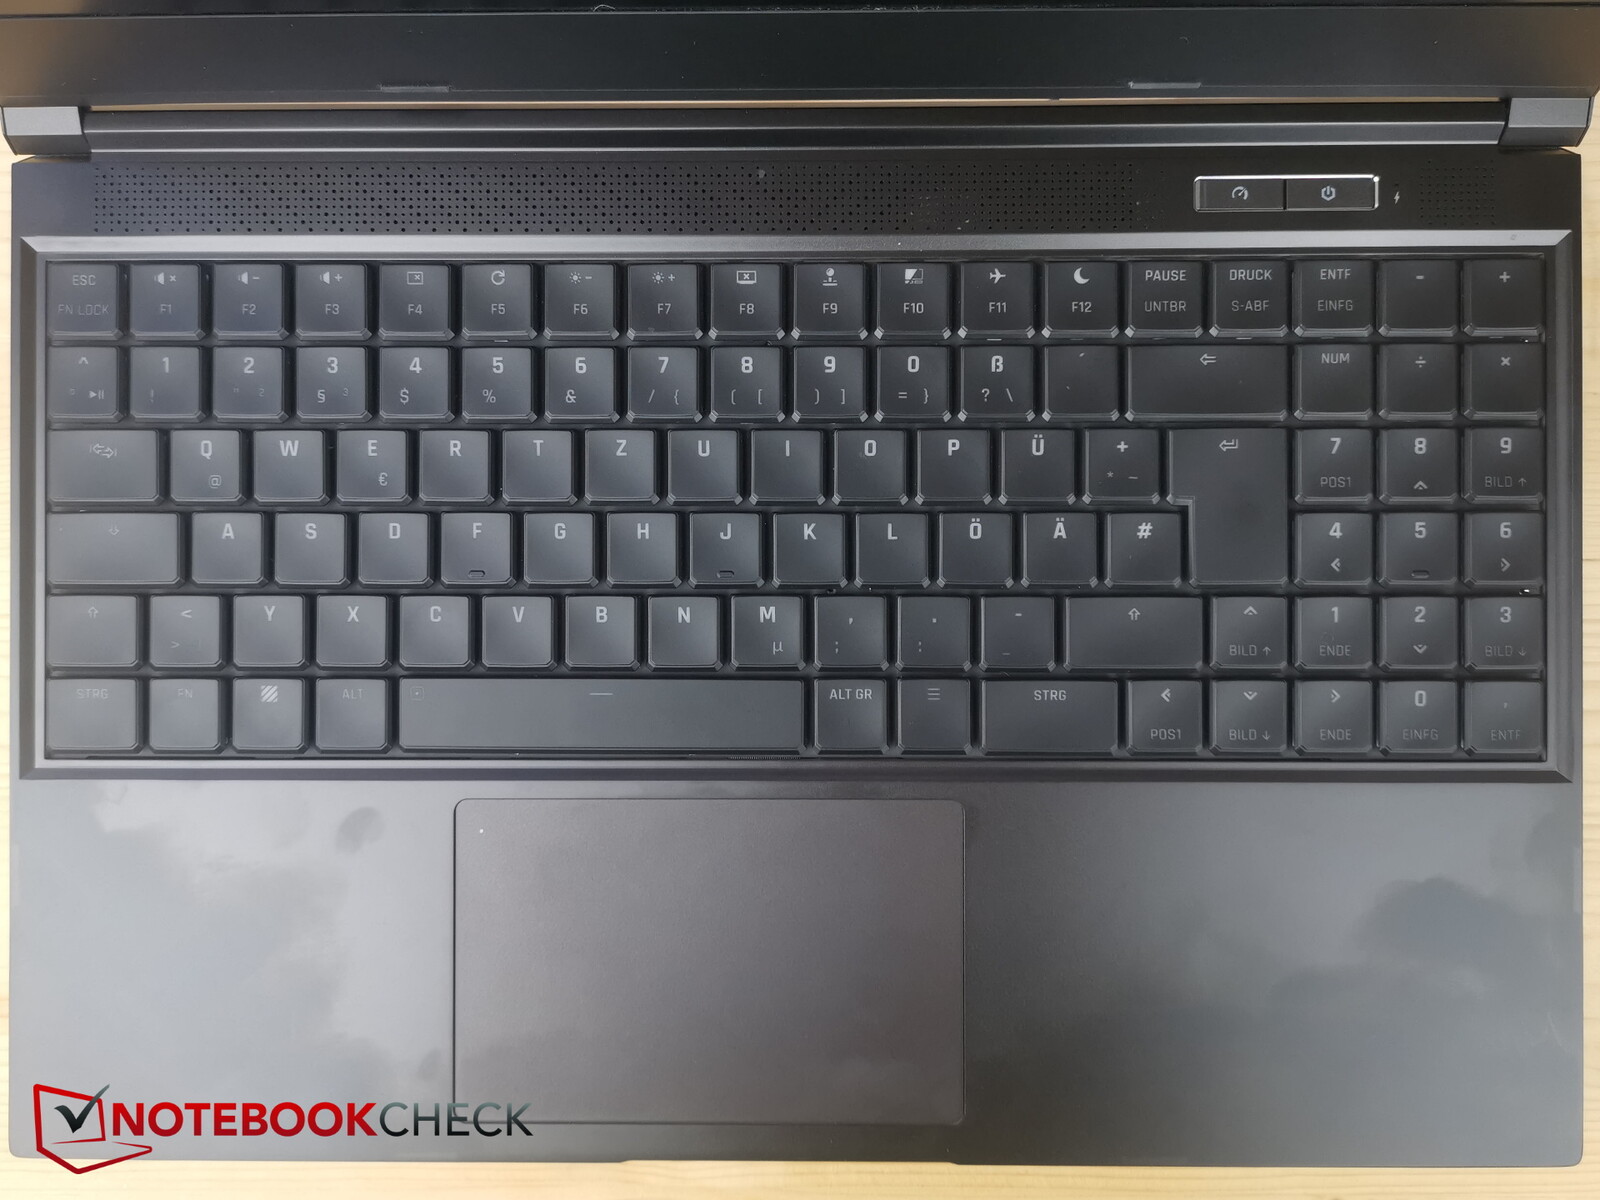
La tastiera opto-meccanica occupa quasi l'intera larghezza del portatile da 15 pollici. È abbastanza grande da ospitare tasti di dimensioni reali e persino un tastierino numerico delle stesse dimensioni accanto ad essi. Non c'è molto spazio tra i tasti, ma non è un problema viste le dimensioni.
La tastiera ha un layout molto ordinato: tutto si inserisce in un rettangolo senza tacche o simili. Da un lato, ciò significa che nessuno dei tasti spicca o è isolato dagli altri e l'utente deve affidarsi solo alle legende e alla propria esperienza per navigare sulla tastiera. D'altra parte, ogni cosa è al suo posto.
La tastiera del Neo è anche abbastanza comoda da digitare grazie alla corsa moderata dei tasti e al feedback chiaro, che consente una digitazione veloce. Il suono della digitazione è un po' "sferragliante", ma non troppo. Il portatile è inoltre dotato di illuminazione RGB per ogni tasto per l'utilizzo in ambienti bui.
Touchpad
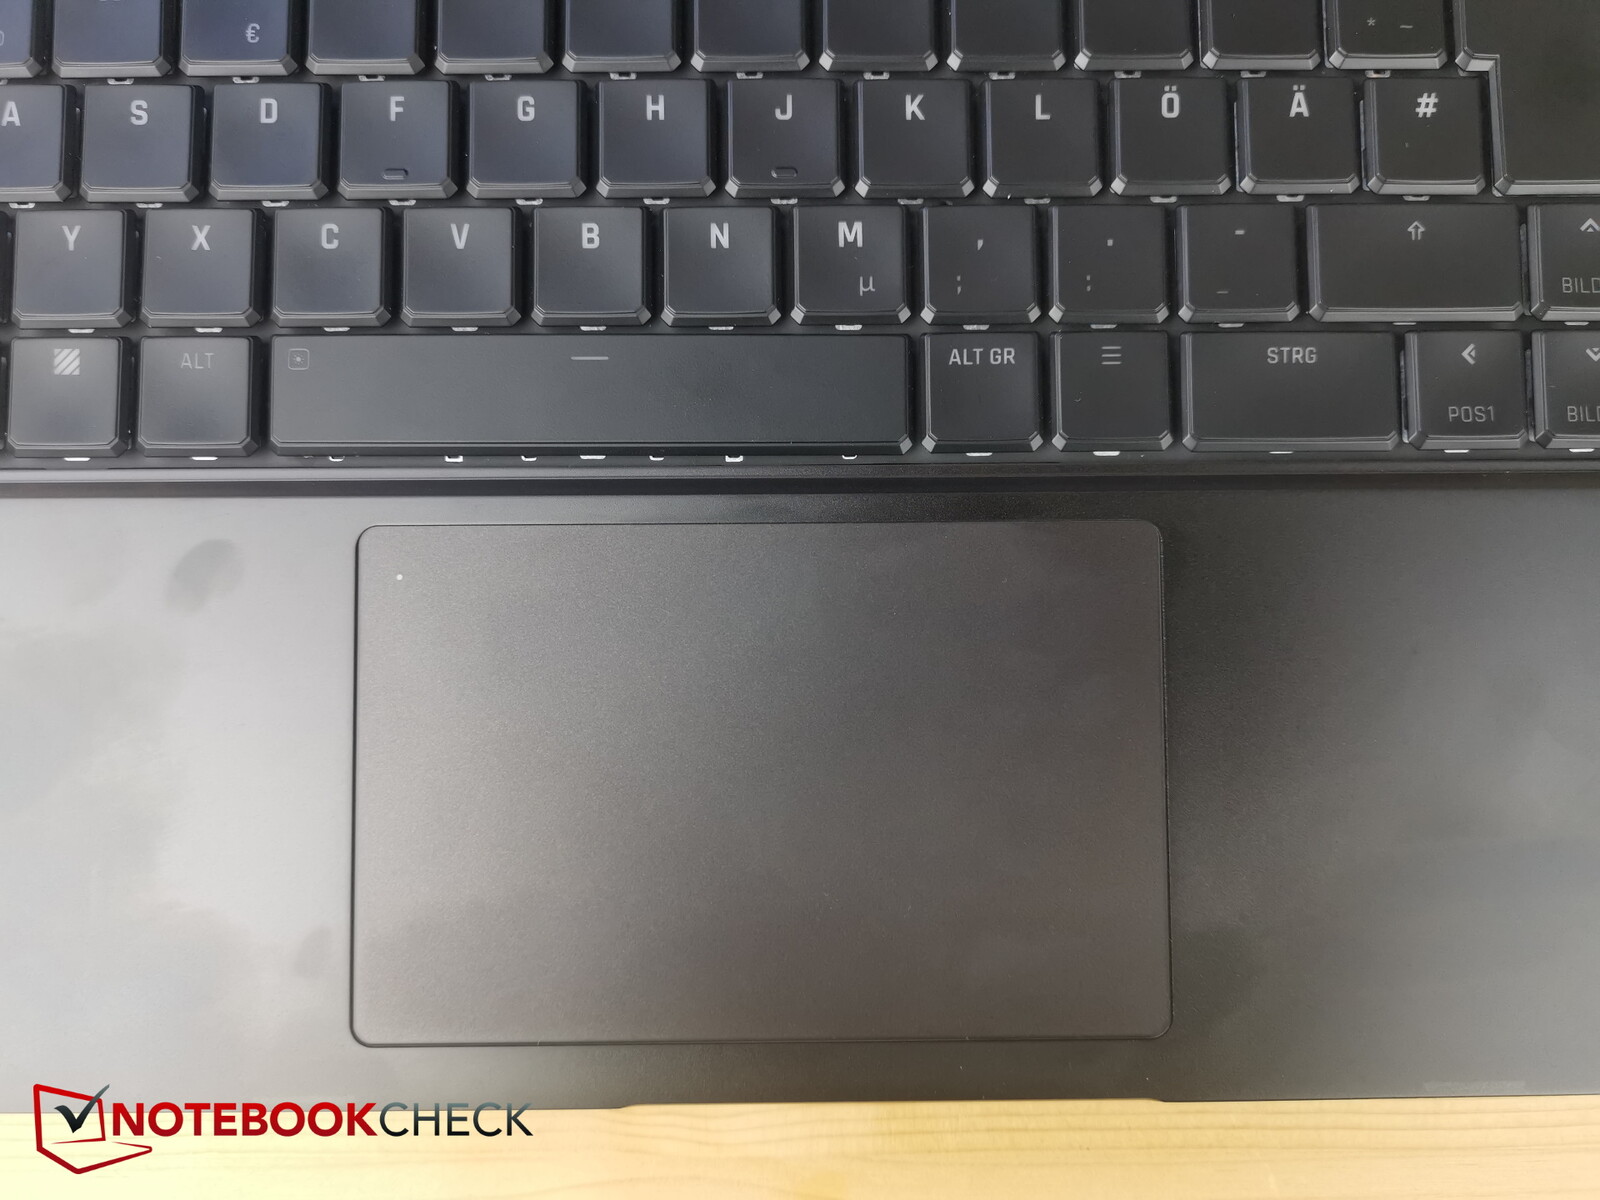
Il touchpad è di buone dimensioni (circa 11,6 x 7,4 cm, o 4,6 x 2,9") e ha una superficie liscia, il che significa che non si verificano balbettii anche quando si fa scorrere lentamente il dito sul touchpad. Nell'angolo superiore sinistro è presente un piccolo LED che indica se il touchpad è abilitato o meno.
I pulsanti integrati sono leggermente più rigidi di quelli che troveremmo comodi, ma forniscono un feedback distintivo e un chiaro suono di clic.
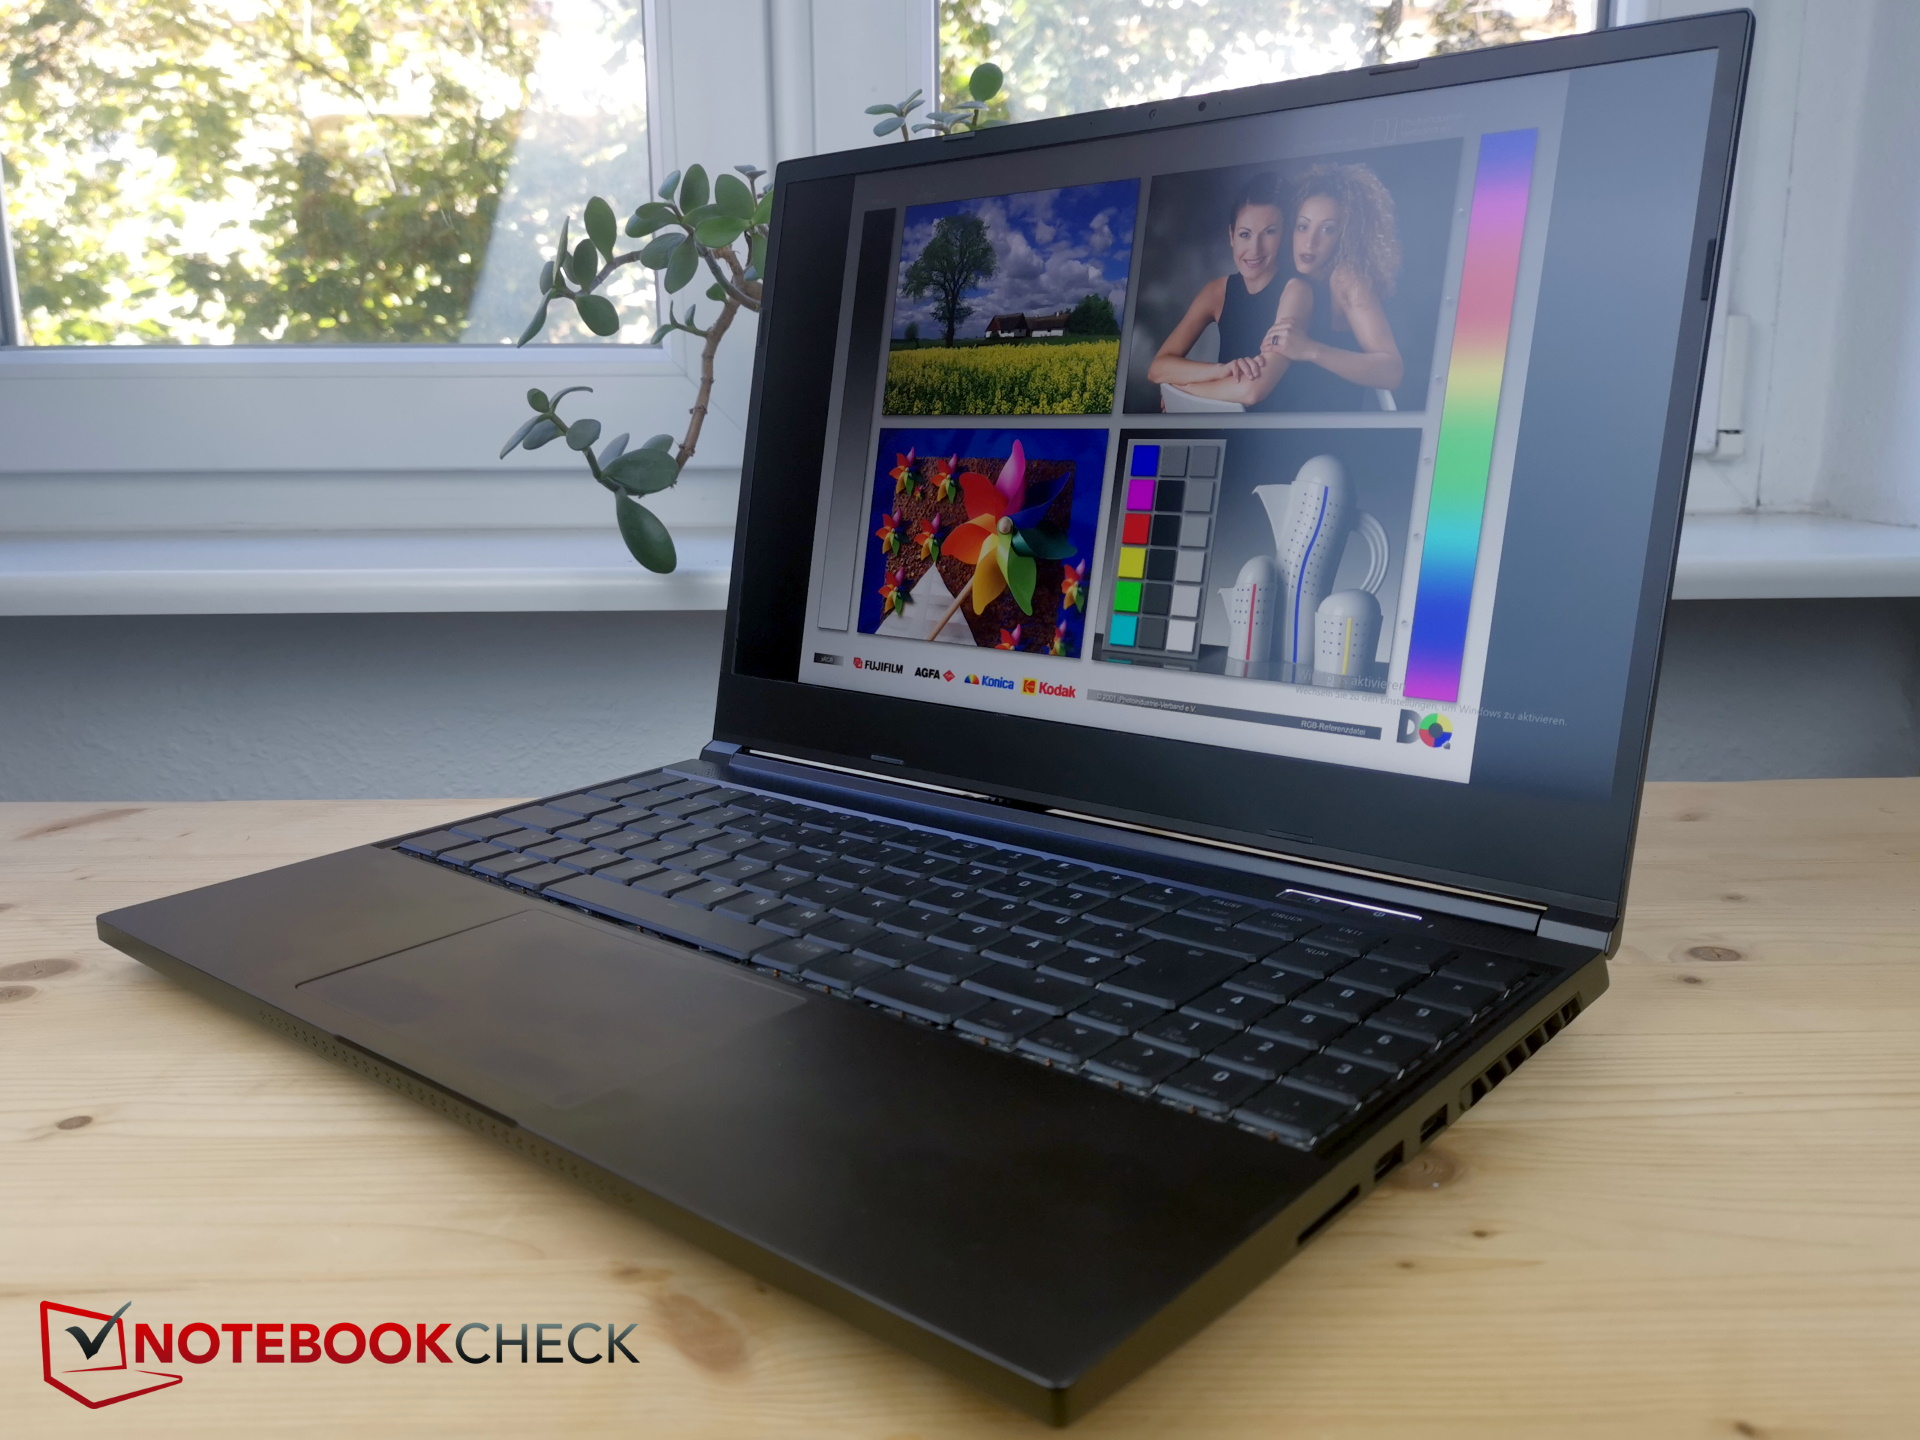
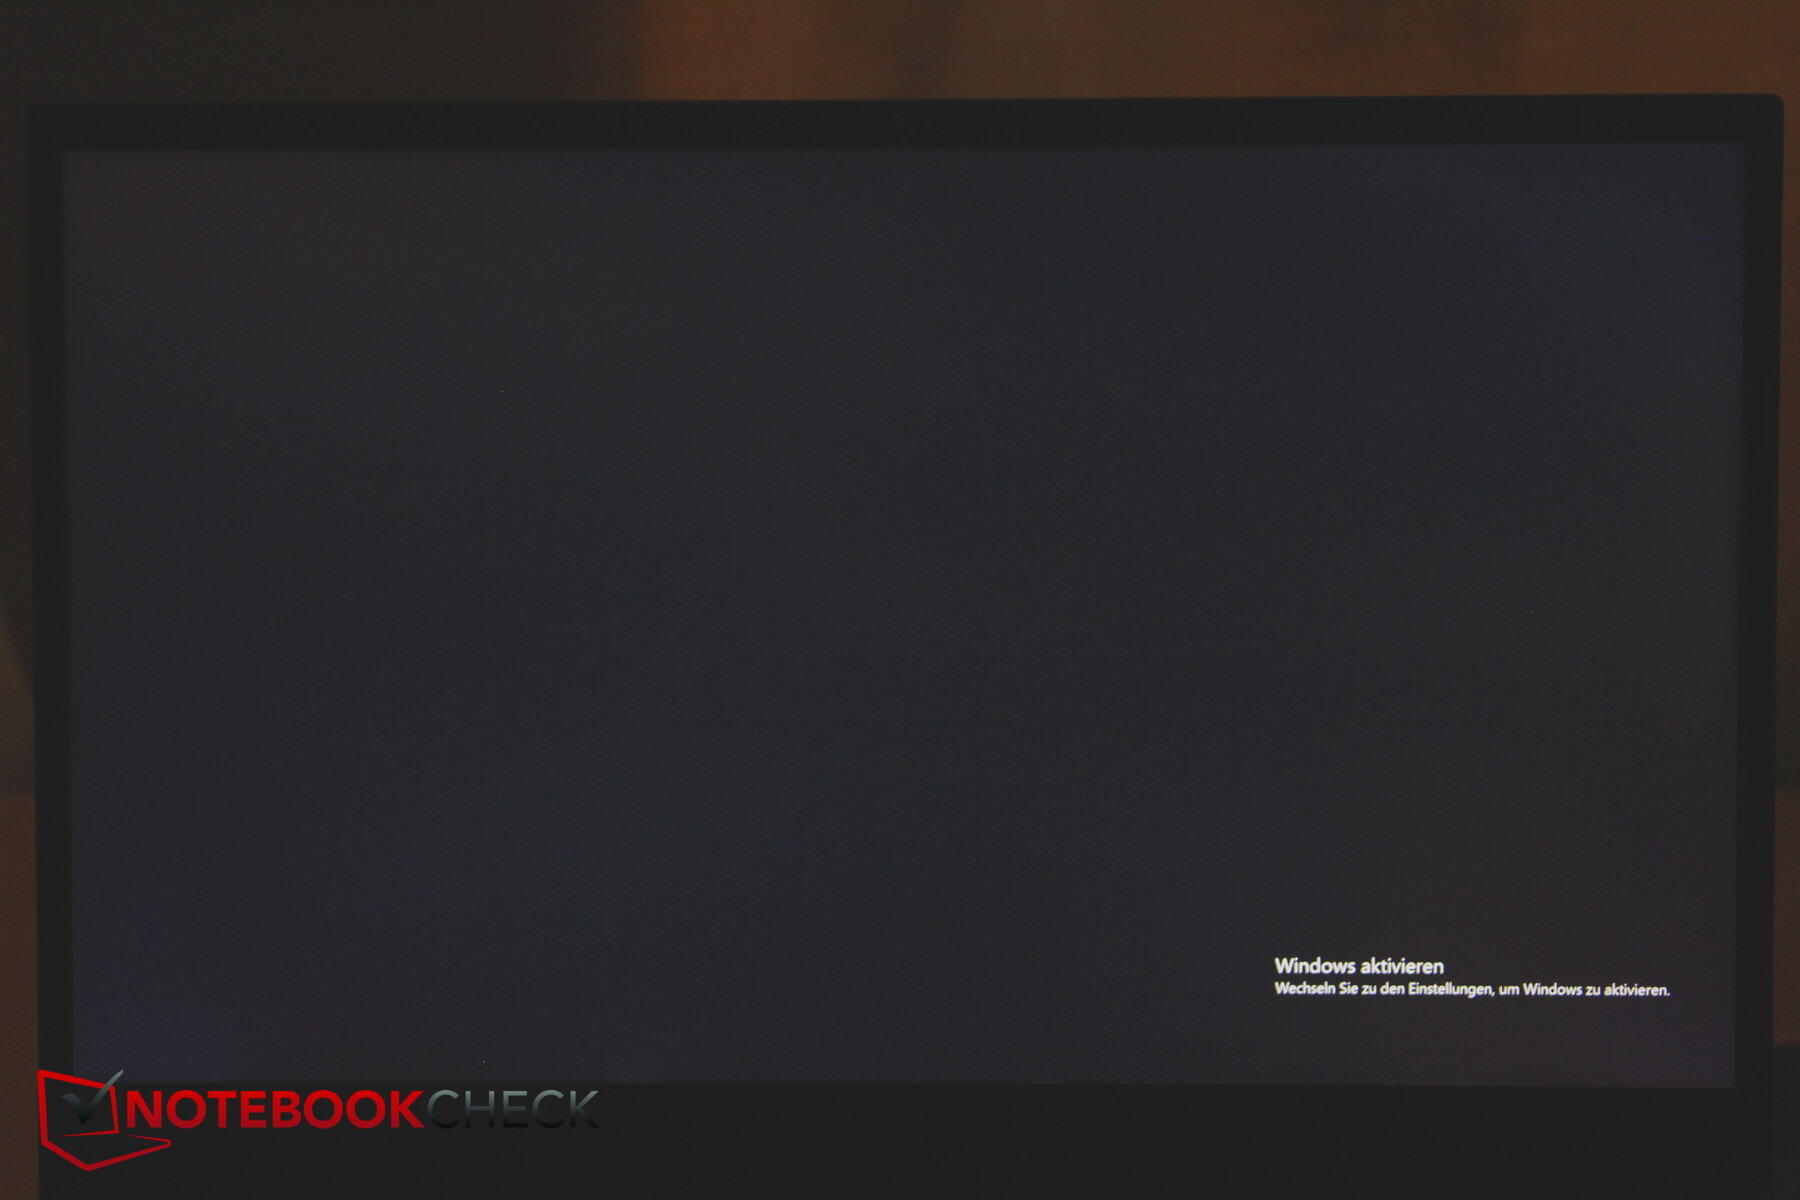
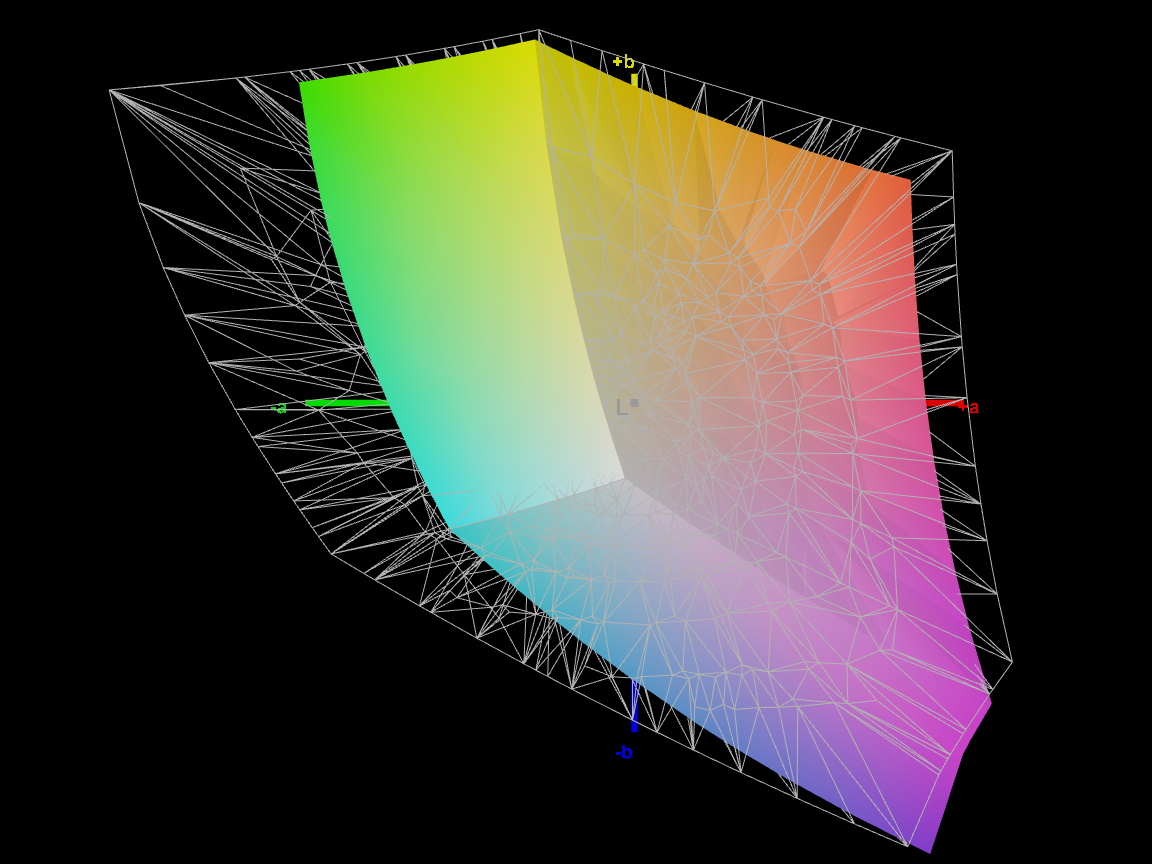
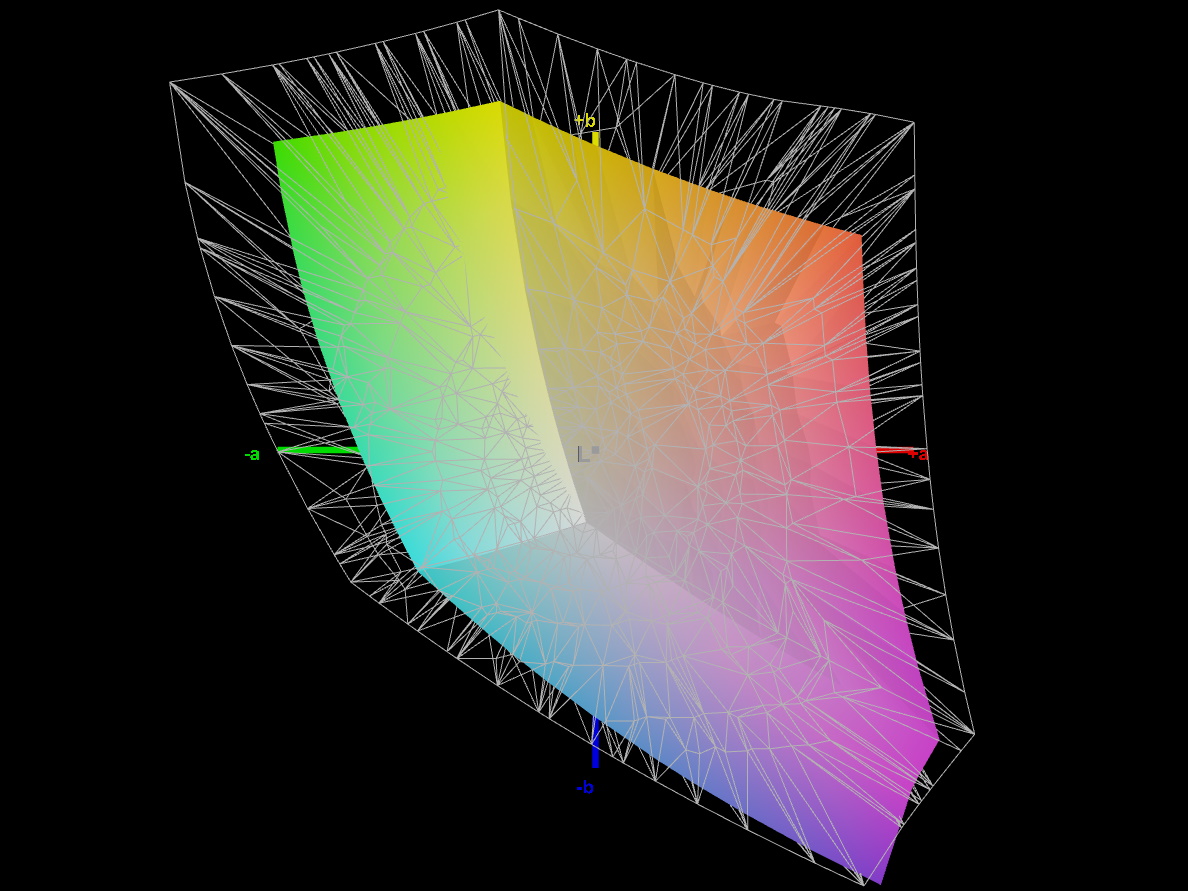
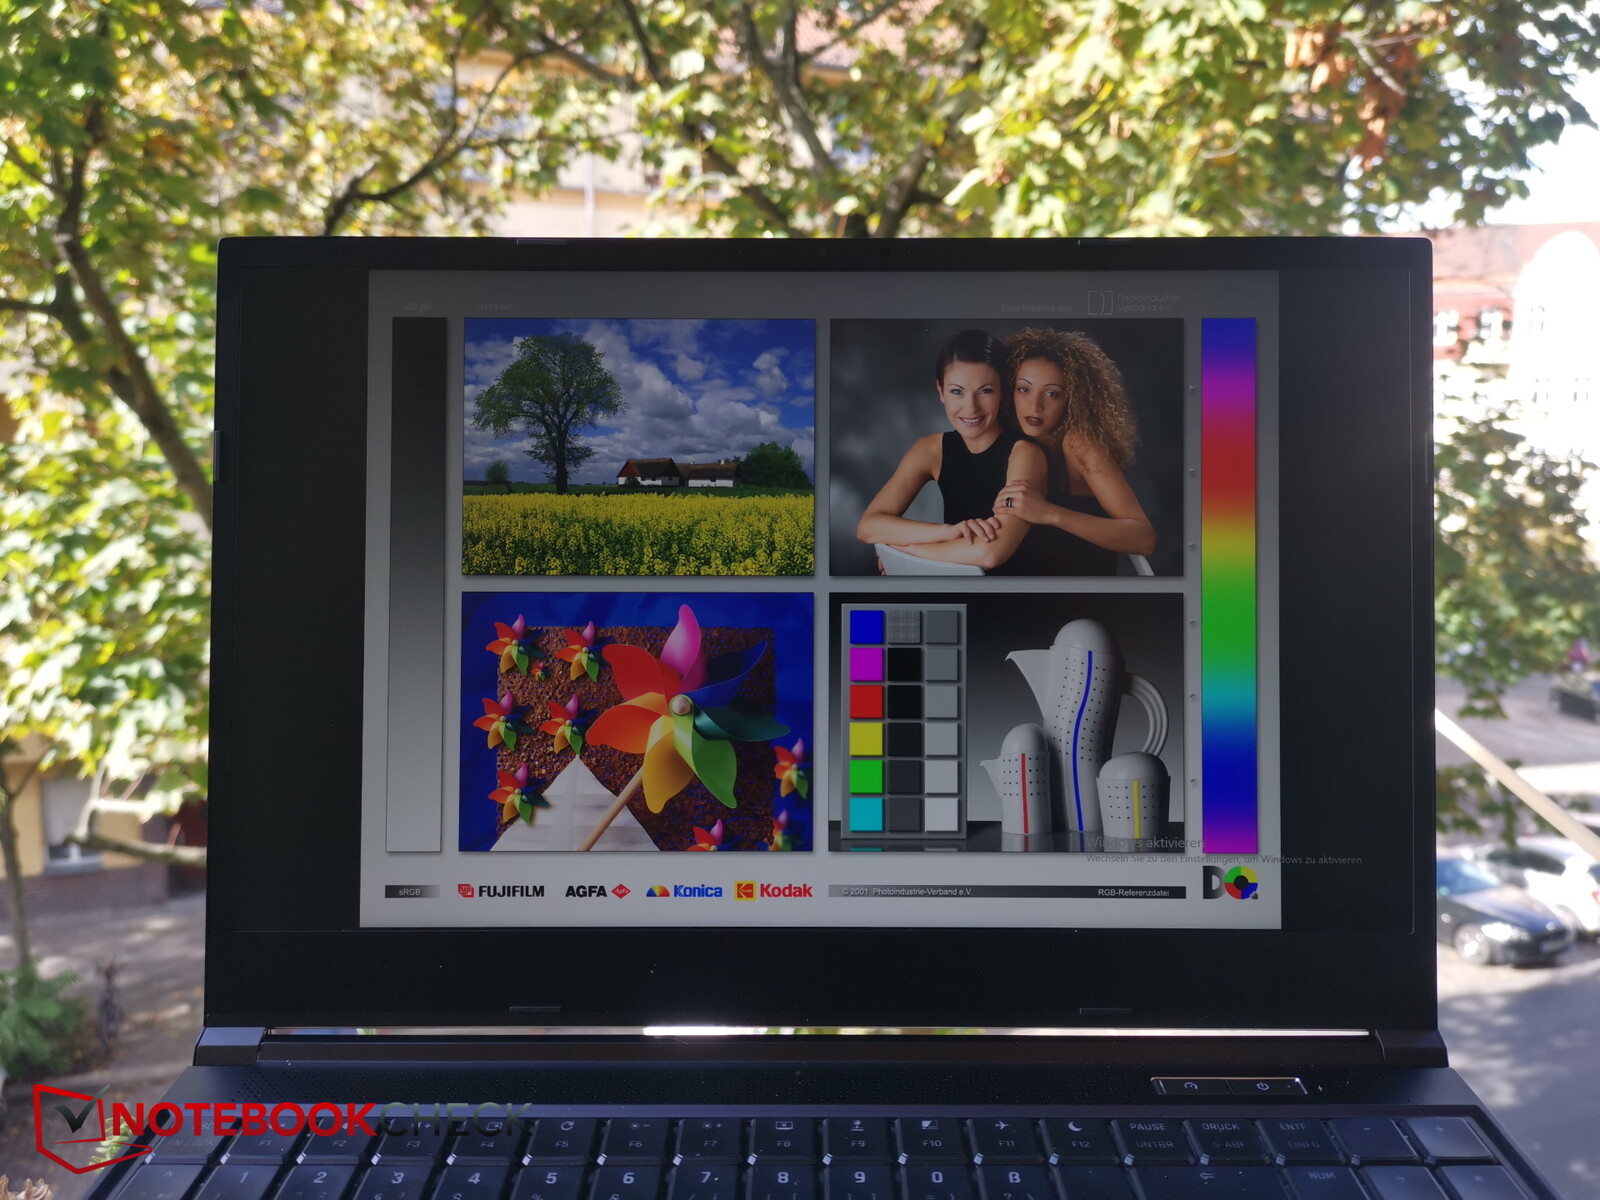
Display - Display QHD a 240 Hz con copertura sRGB completa
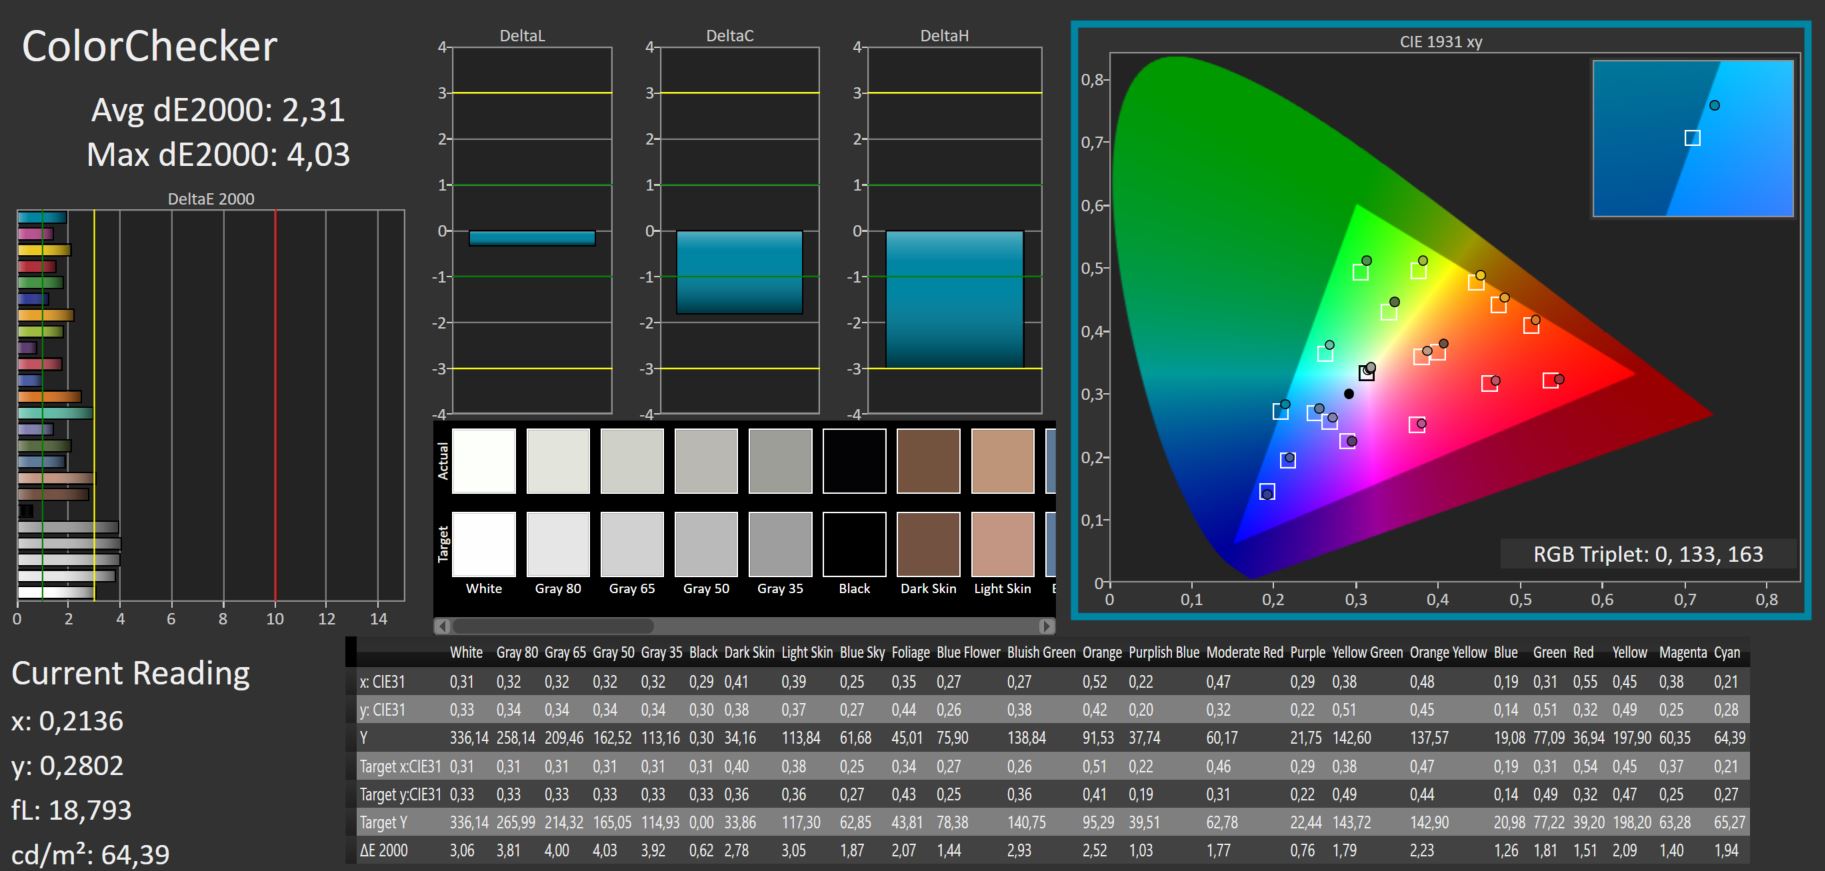
Schenker utilizza lo stesso pannello IPS QHD 16:9 con una risoluzione di 2.560 x 1.440 su tutti i modelli. Il display ha un picco di luminosità di 350 nits, un livello relativamente buono che pone il Neo 15 davanti sia all'MSI Stealth che all'Acer Nitro.
Tuttavia, la distribuzione della luminosità di appena l'82% è leggermente inferiore alla media. In particolare, la luminosità dello schermo è significativamente più bassa nella parte inferiore dello schermo.
Il livello di nero e il contrasto sono ottimi per un portatile di questa classe. Il display ha anche un buon tempo di risposta e non utilizza il PWM.
| |||||||||||||||||||||||||
Distribuzione della luminosità: 82 %
Al centro con la batteria: 367 cd/m²
Contrasto: 1321:1 (Nero: 0.28 cd/m²)
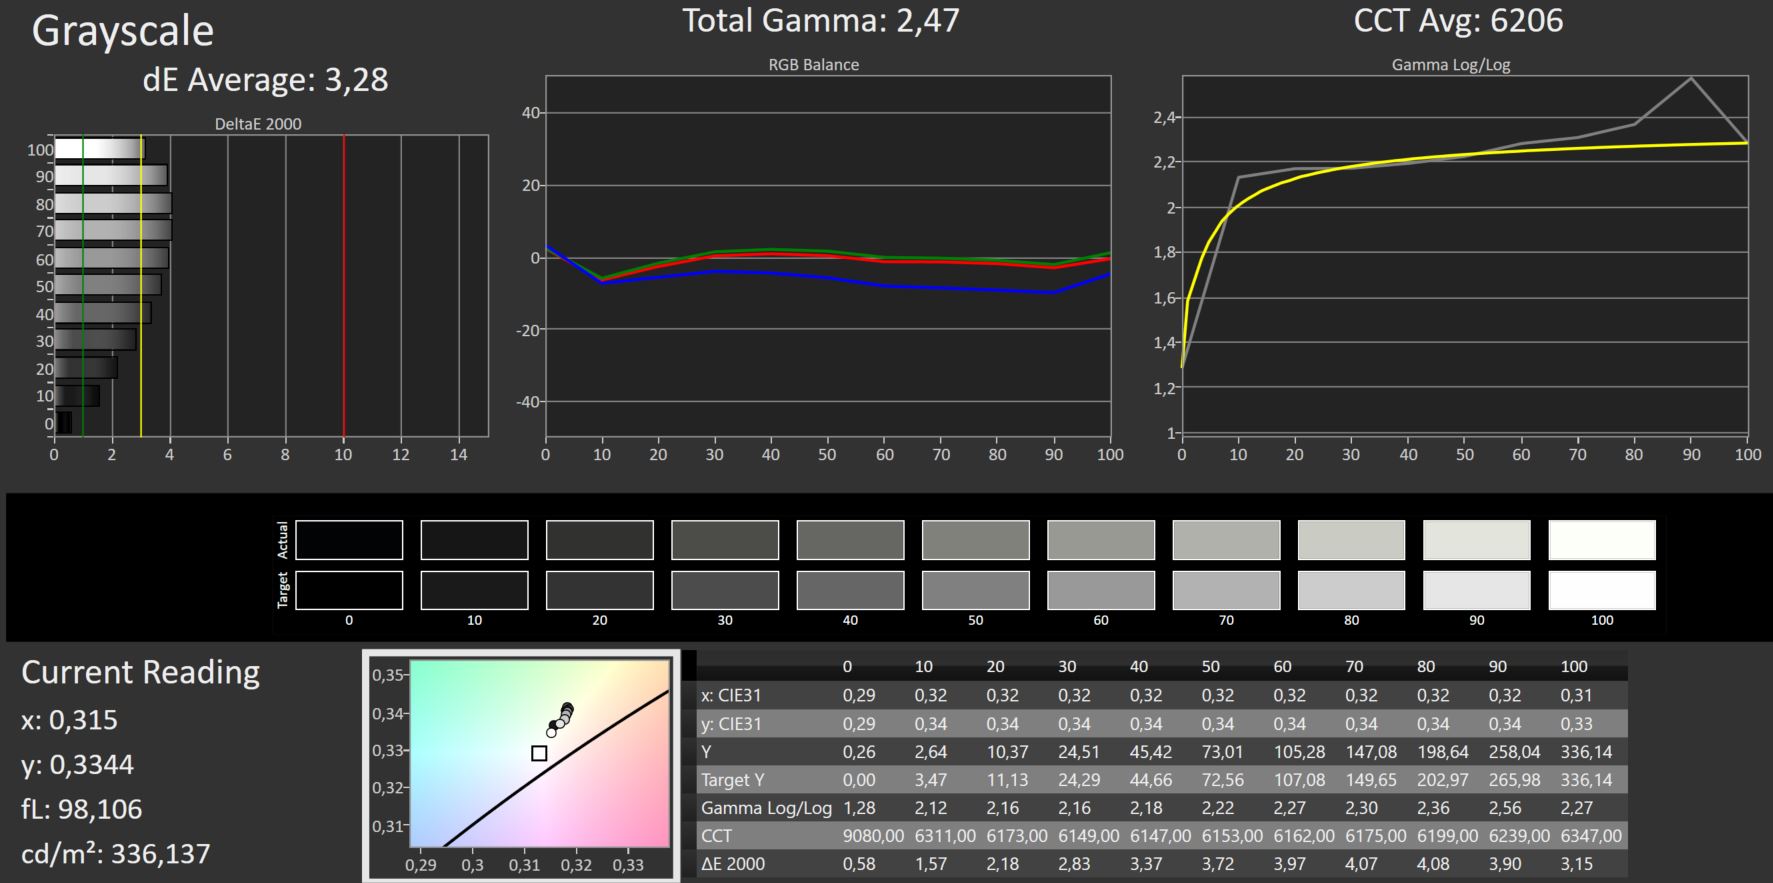
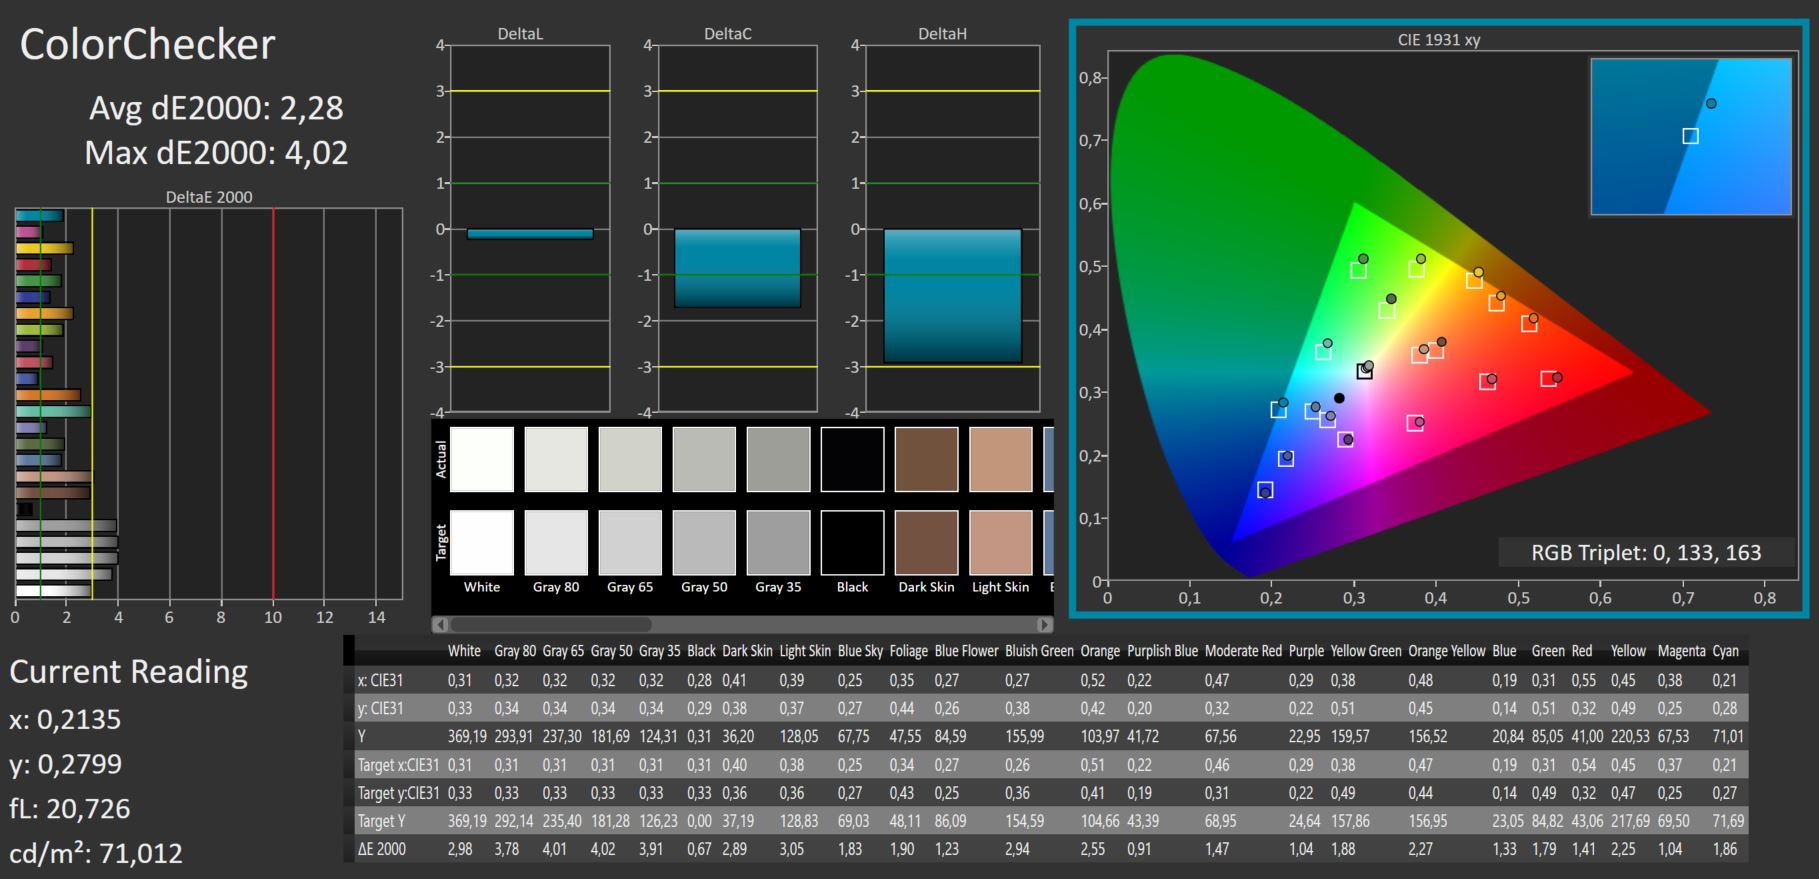
ΔE ColorChecker Calman: 2.31 | ∀{0.5-29.43 Ø4.73}
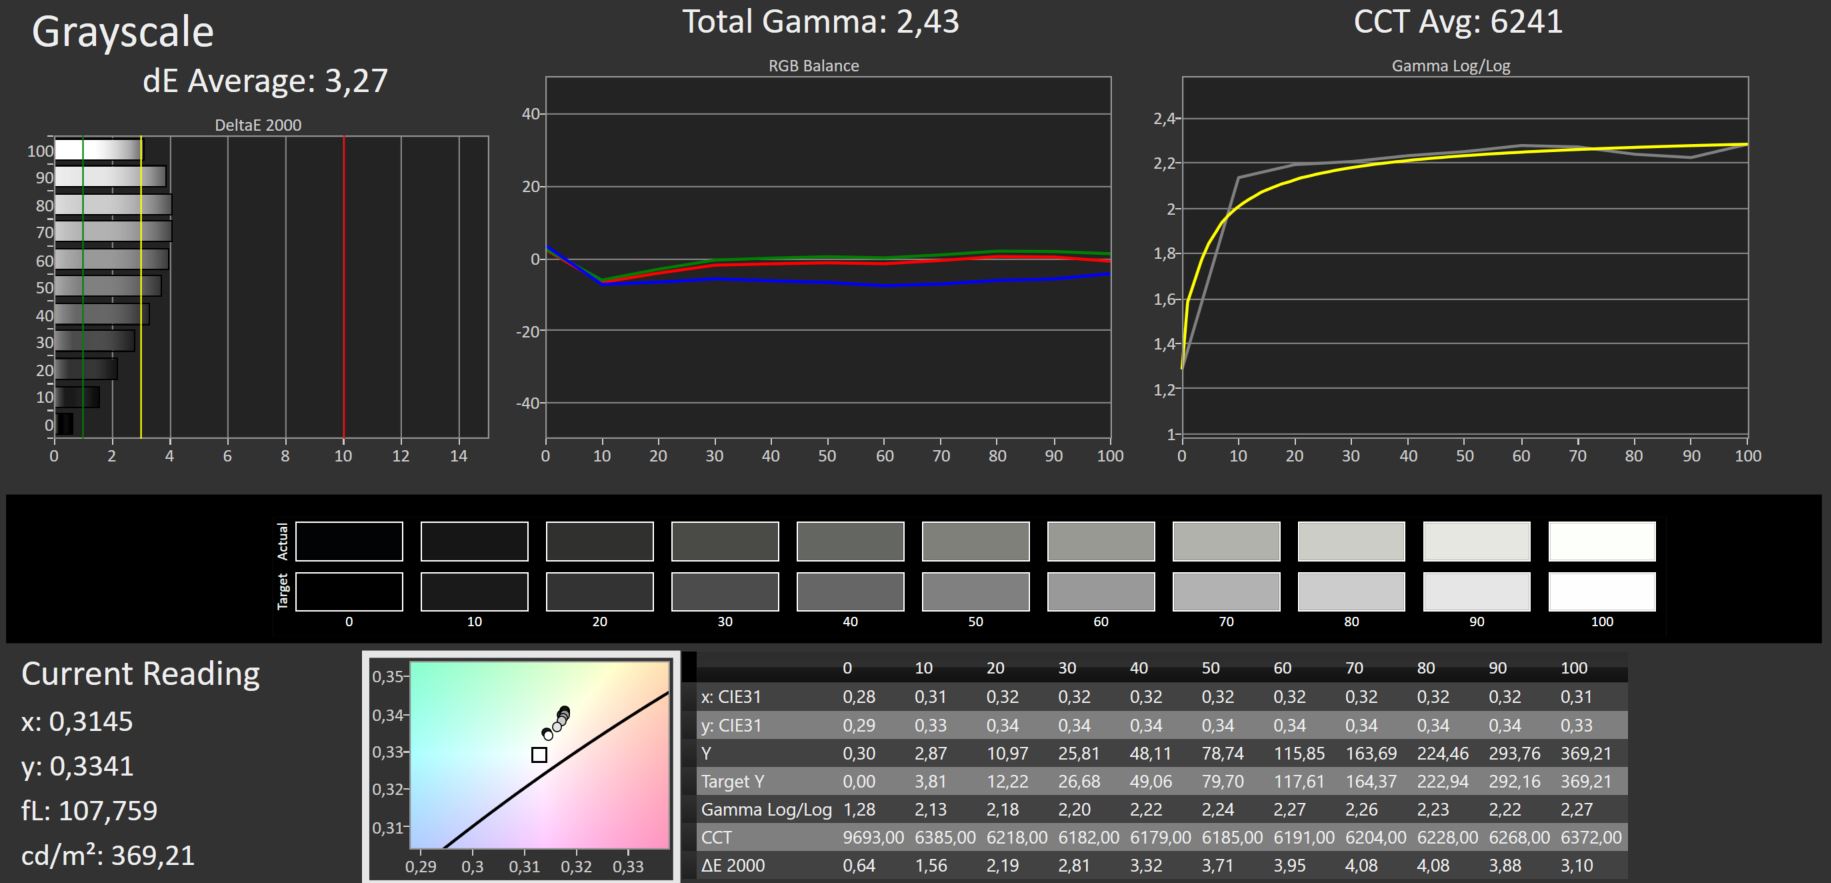
ΔE Greyscale Calman: 3.28 | ∀{0.09-98 Ø4.97}
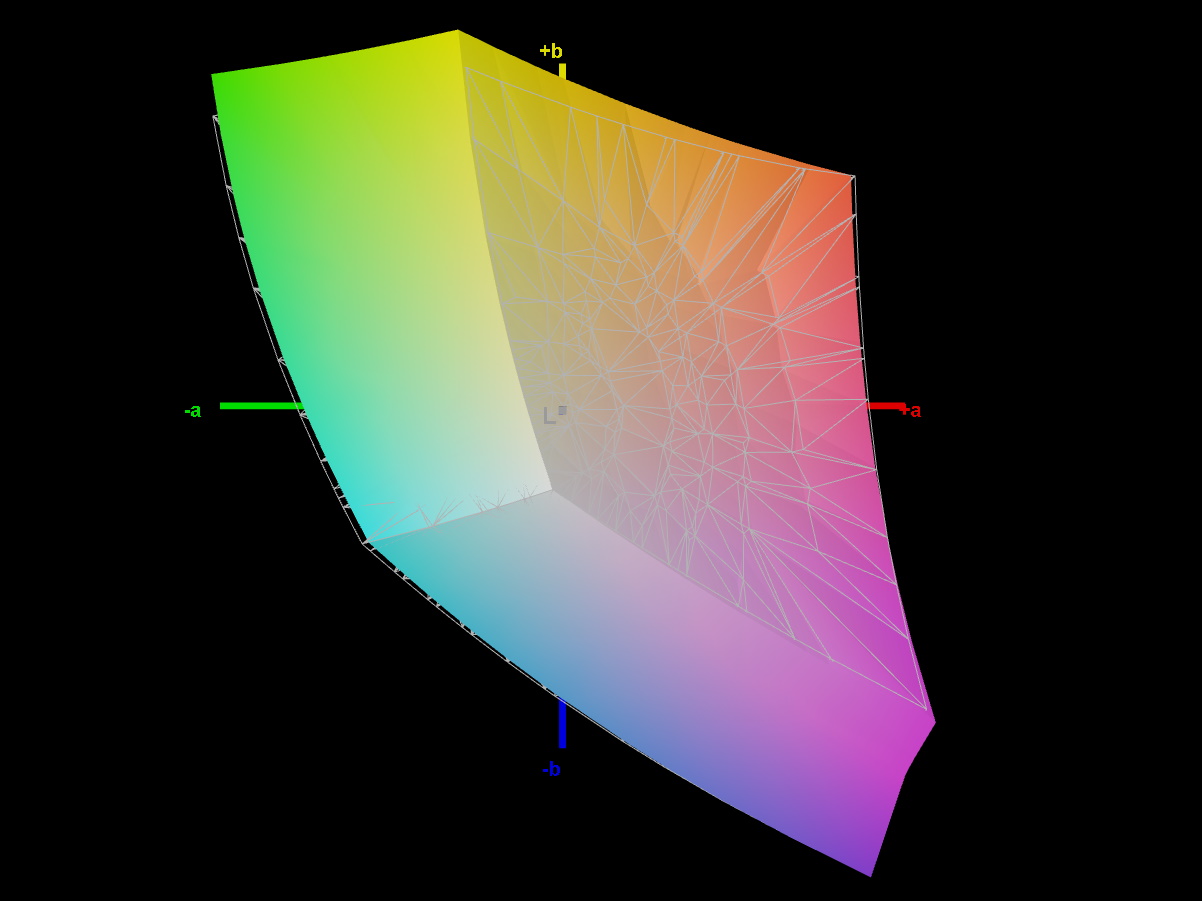
70.4% AdobeRGB 1998 (Argyll 3D)
97.7% sRGB (Argyll 3D)
68.9% Display P3 (Argyll 3D)
Gamma: 2.47
CCT: 6206 K
| Schenker XMG Neo 15 (Ryzen 9 6900HX, RTX 3070 Ti) BOE0A67, IPS, 2560x1440, 15.6" | Schenker XMG Neo 15 (i7-12700H, RTX 3080 Ti) BOE0A67, IPS, 2560x1440, 15.6" | MSI GE67 HX 12UGS Samsung ATNA562P02-0, OLED, 1920x1080, 15.6" | Asus ROG Strix Scar 15 G533ZW-LN106WS BOE CQ NE156QHM-NZ2, IPS-level, 2560x1440, 15.6" | Acer Nitro 5 AN515-58-72QR Chi Mei N156KME-GNA, IPS, 2560x1440, 15.6" | MSI Stealth GS66 12UGS Sharp LQ156T1JW04 (SHP153C), IPS-Level, 2560x1440, 15.6" | |
|---|---|---|---|---|---|---|
| Display | -1% | 1% | 21% | 21% | 21% | |
| Display P3 Coverage (%) | 68.9 | 68.2 -1% | 71.7 4% | 96.2 40% | 95.6 39% | 96.4 40% |
| sRGB Coverage (%) | 97.7 | 97.2 -1% | 89.7 -8% | 99.9 2% | 99.8 2% | 99.7 2% |
| AdobeRGB 1998 Coverage (%) | 70.4 | 69.4 -1% | 75.2 7% | 84.5 20% | 85.2 21% | 85.6 22% |
| Response Times | 0% | 97% | 39% | -22% | 29% | |
| Response Time Grey 50% / Grey 80% * (ms) | 12.4 ? | 12.4 ? -0% | 0.25 ? 98% | 7.86 ? 37% 4.21 ? 66% | 15.7 ? -27% | 6 ? 52% |
| Response Time Black / White * (ms) | 8.8 ? | 8.8 ? -0% | 0.4 ? 95% | 7.5 ? 15% | 10.2 ? -16% | 8.4 ? 5% |
| PWM Frequency (Hz) | 480.4 ? | |||||
| Screen | 15% | -30% | -35% | -30% | -43% | |
| Brightness middle (cd/m²) | 370 | 365 -1% | 356.1 -4% | 346 -6% | 332 -10% | 272 -26% |
| Brightness (cd/m²) | 343 | 335 -2% | 358 4% | 329 -4% | 303 -12% | 253 -26% |
| Brightness Distribution (%) | 82 | 81 -1% | 99 21% | 91 11% | 86 5% | 87 6% |
| Black Level * (cd/m²) | 0.28 | 0.32 -14% | 0.59 -111% | 0.29 -4% | 0.25 11% | |
| Contrast (:1) | 1321 | 1141 -14% | 586 -56% | 1145 -13% | 1088 -18% | |
| Colorchecker dE 2000 * | 2.31 | 1.38 40% | 4.83 -109% | 3.06 -32% | 3.61 -56% | 3.73 -61% |
| Colorchecker dE 2000 max. * | 4.03 | 2.01 50% | 7.94 -97% | 5.81 -44% | 7.71 -91% | 9.43 -134% |
| Greyscale dE 2000 * | 3.28 | 1.36 59% | 3.1 5% | 5.2 -59% | 6.5 -98% | |
| Gamma | 2.47 89% | 2.48 89% | 2.2 100% | 2.12 104% | 2.155 102% | 2.172 101% |
| CCT | 6206 105% | 6412 101% | 5938 109% | 7021 93% | 6724 97% | 6485 100% |
| Colorchecker dE 2000 calibrated * | 1.22 | 2.57 | 0.59 | 0.98 | ||
| Media totale (Programma / Settaggio) | 5% /
9% | 23% /
1% | 8% /
-5% | -10% /
-17% | 2% /
-17% |
* ... Meglio usare valori piccoli
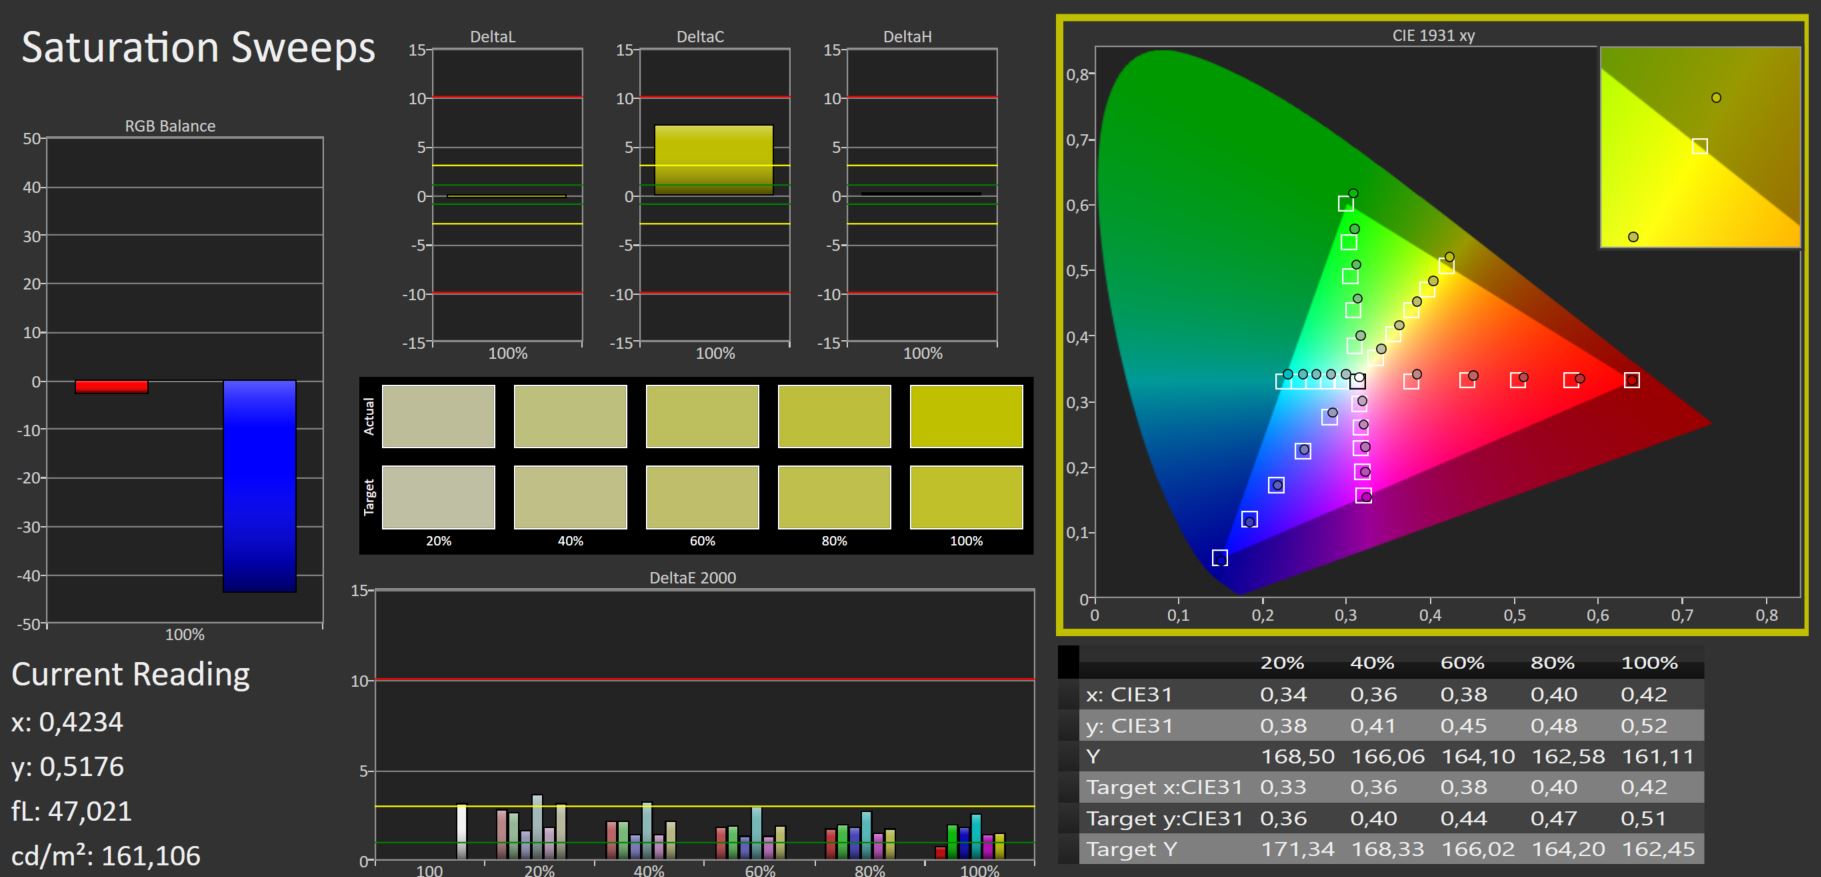
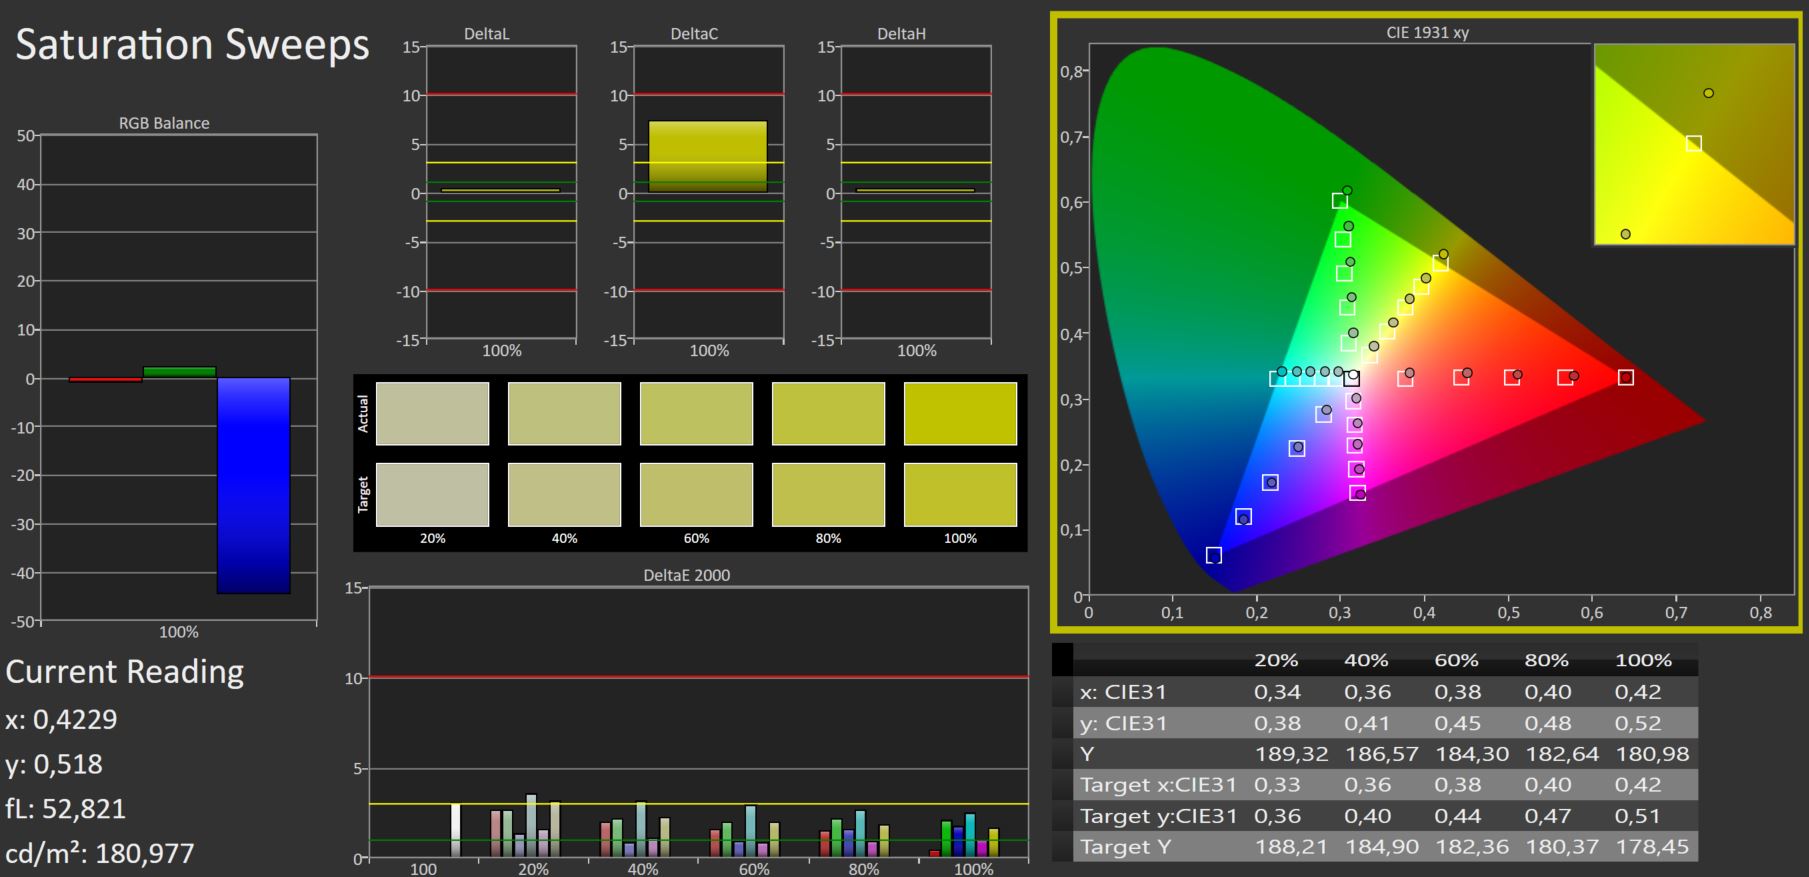
Lo schermo non è adatto all'editing professionale di foto e video. Sebbene il display abbia una copertura completa sRGB, è riuscito a coprire solo il 70% circa dello spazio colore AdobeRGB e DisplayP3.
Il display è già ben calibrato fin dall'inizio. Nonostante i valori di Delta E non siano particolarmente bassi, non c'è stato alcun miglioramento nemmeno dopo aver calibrato manualmente lo schermo.
Tempi di risposta del Display
| ↔ Tempi di risposta dal Nero al Bianco | ||
|---|---|---|
| 8.8 ms ... aumenta ↗ e diminuisce ↘ combinato | ↗ 4.6 ms Incremento | 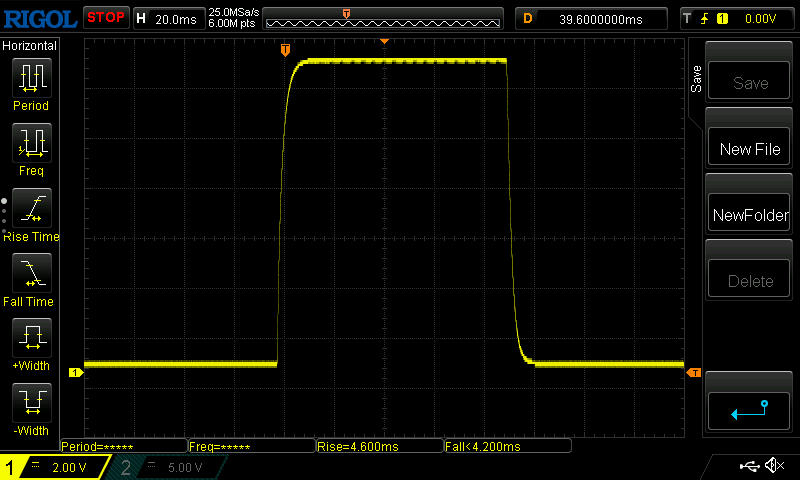 |
| ↘ 4.2 ms Calo | ||
| Lo schermo mostra veloci tempi di risposta durante i nostri tests e dovrebbe esere adatto al gaming In confronto, tutti i dispositivi di test variano da 0.1 (minimo) a 240 (massimo) ms. » 24 % di tutti i dispositivi è migliore. Questo significa che i tempi di risposta rilevati sono migliori rispettto alla media di tutti i dispositivi testati (19.9 ms). | ||
| ↔ Tempo di risposta dal 50% Grigio all'80% Grigio | ||
| 12.4 ms ... aumenta ↗ e diminuisce ↘ combinato | ↗ 5.8 ms Incremento | 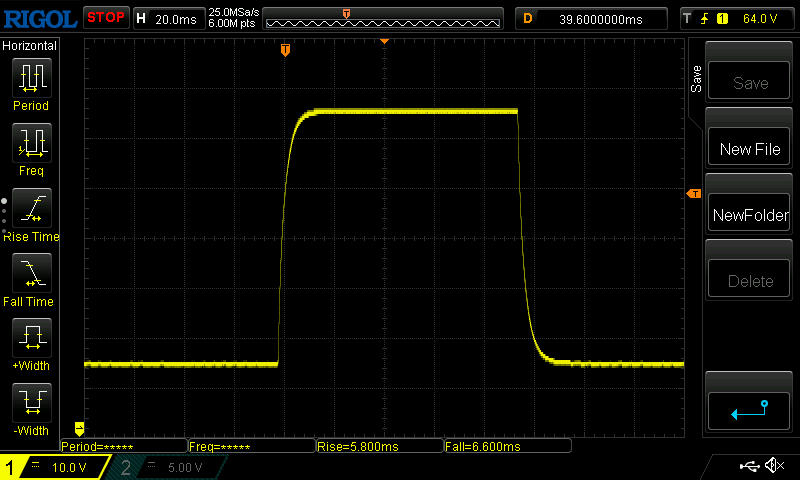 |
| ↘ 6.6 ms Calo | ||
| Lo schermo mostra buoni tempi di risposta durante i nostri tests, ma potrebbe essere troppo lento per i gamers competitivi. In confronto, tutti i dispositivi di test variano da 0.165 (minimo) a 636 (massimo) ms. » 26 % di tutti i dispositivi è migliore. Questo significa che i tempi di risposta rilevati sono migliori rispettto alla media di tutti i dispositivi testati (31.1 ms). | ||
Sfarfallio dello schermo / PWM (Pulse-Width Modulation)
| flickering dello schermo / PWM non rilevato | 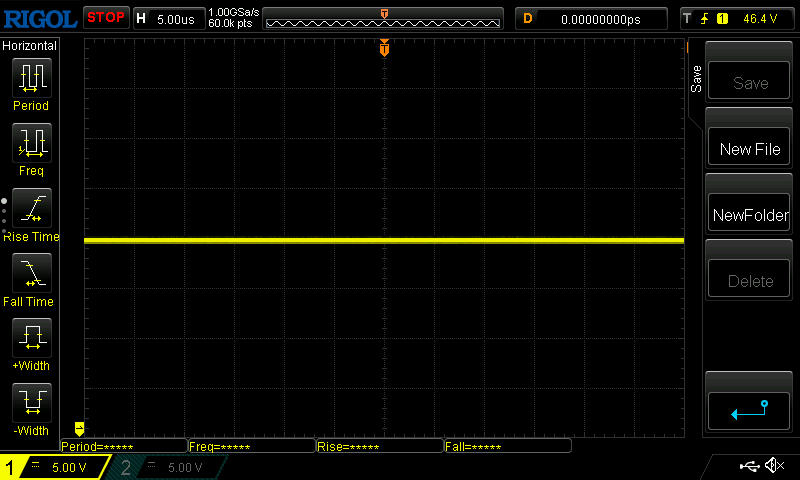 | ||
In confronto: 52 % di tutti i dispositivi testati non utilizza PWM per ridurre la luminosita' del display. Se è rilevato PWM, una media di 7801 (minimo: 5 - massimo: 343500) Hz è stata rilevata. | |||
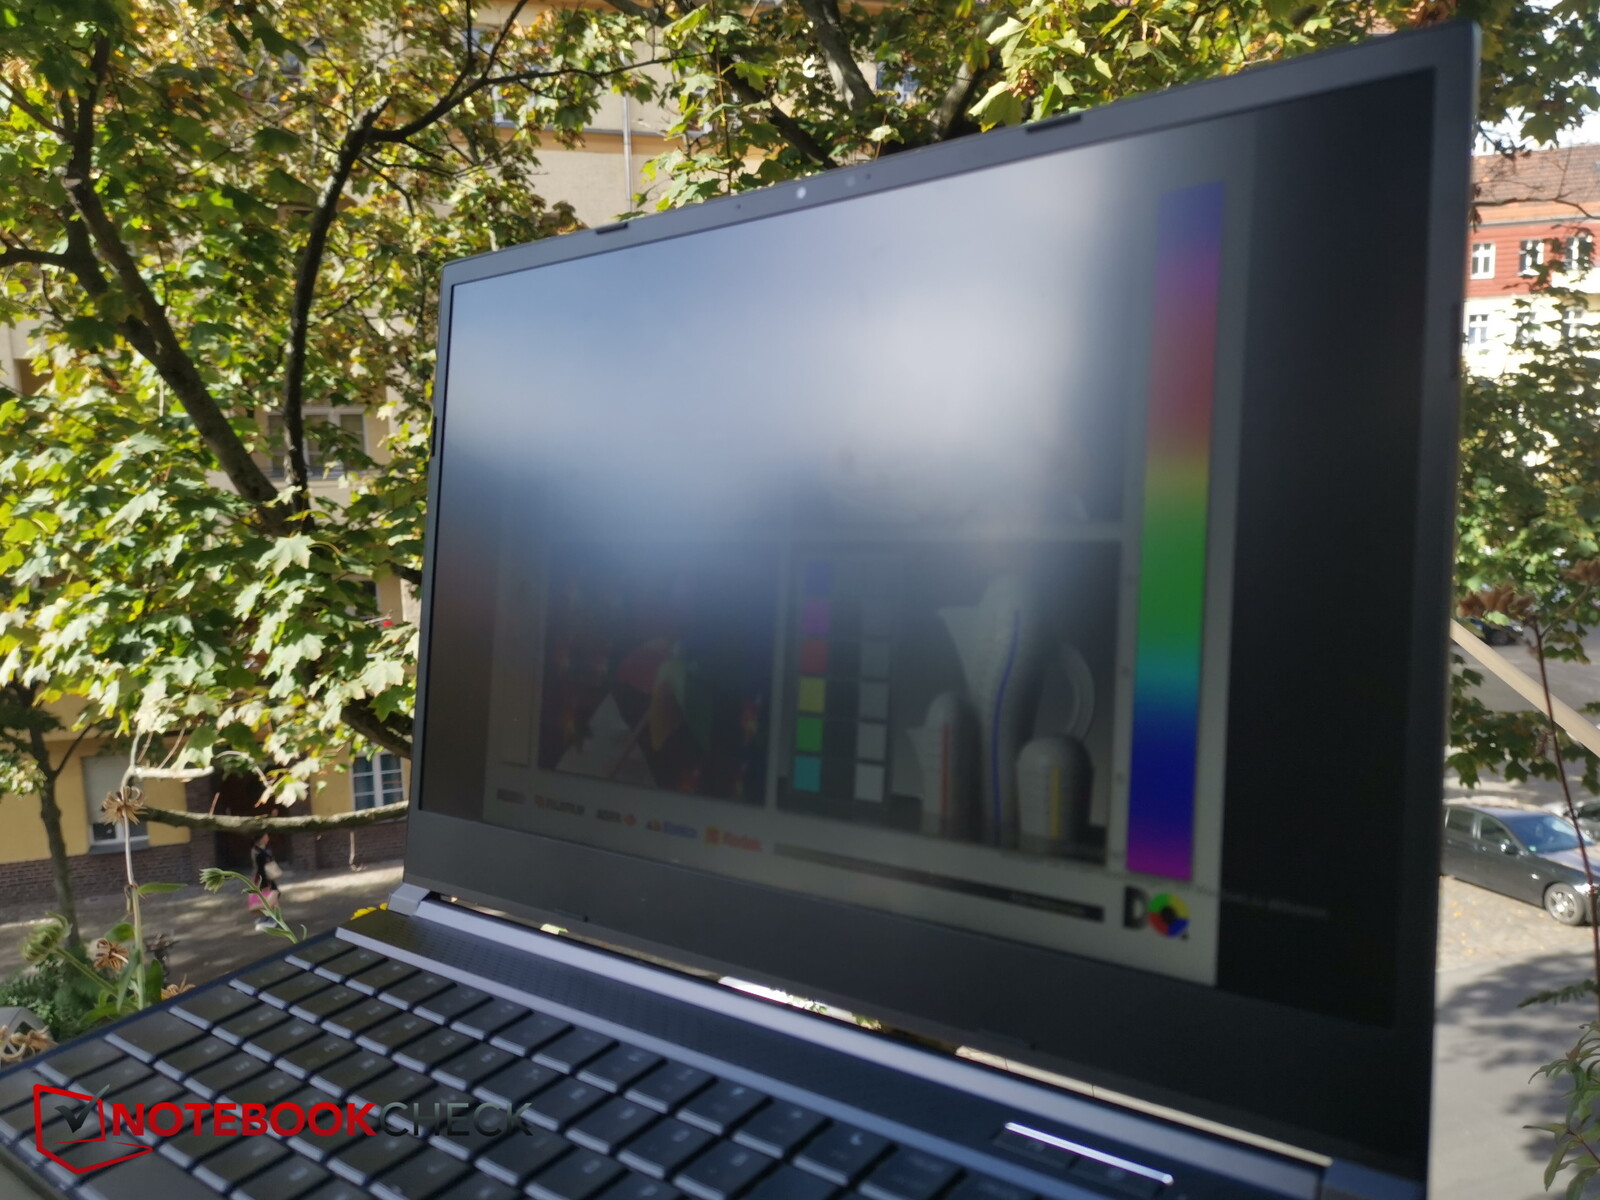
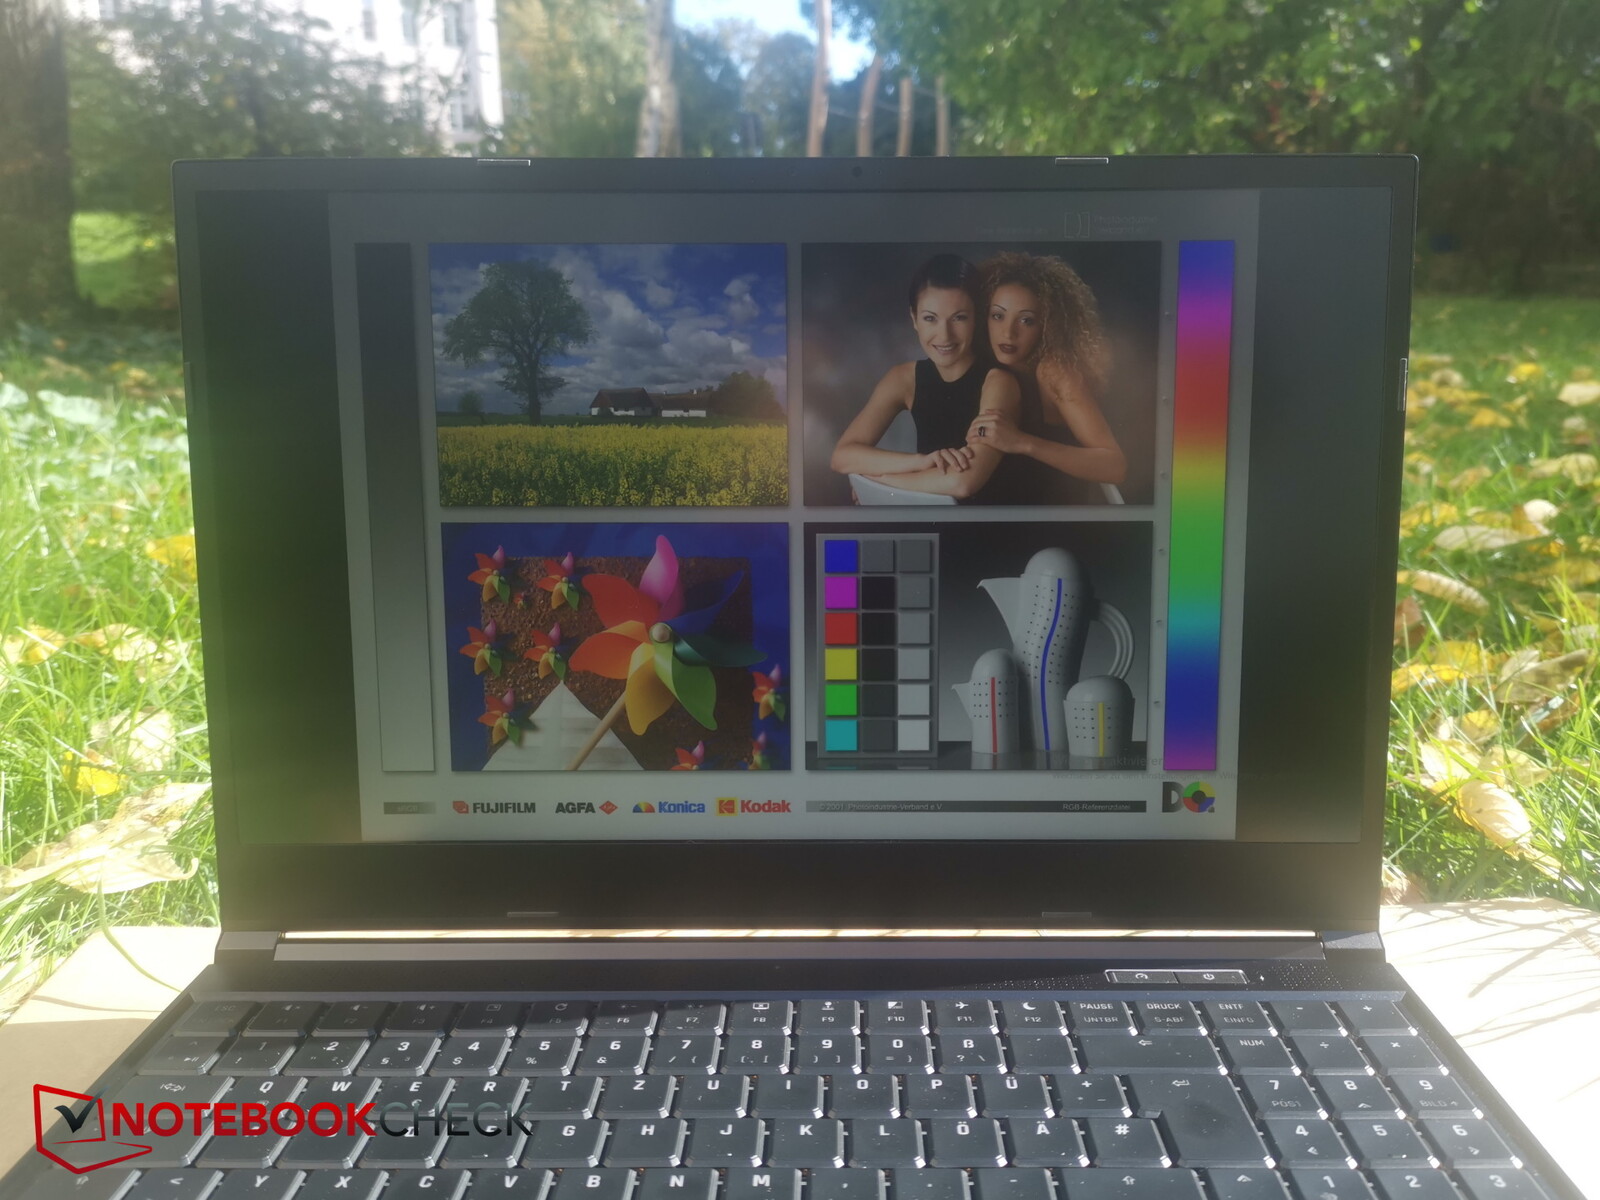
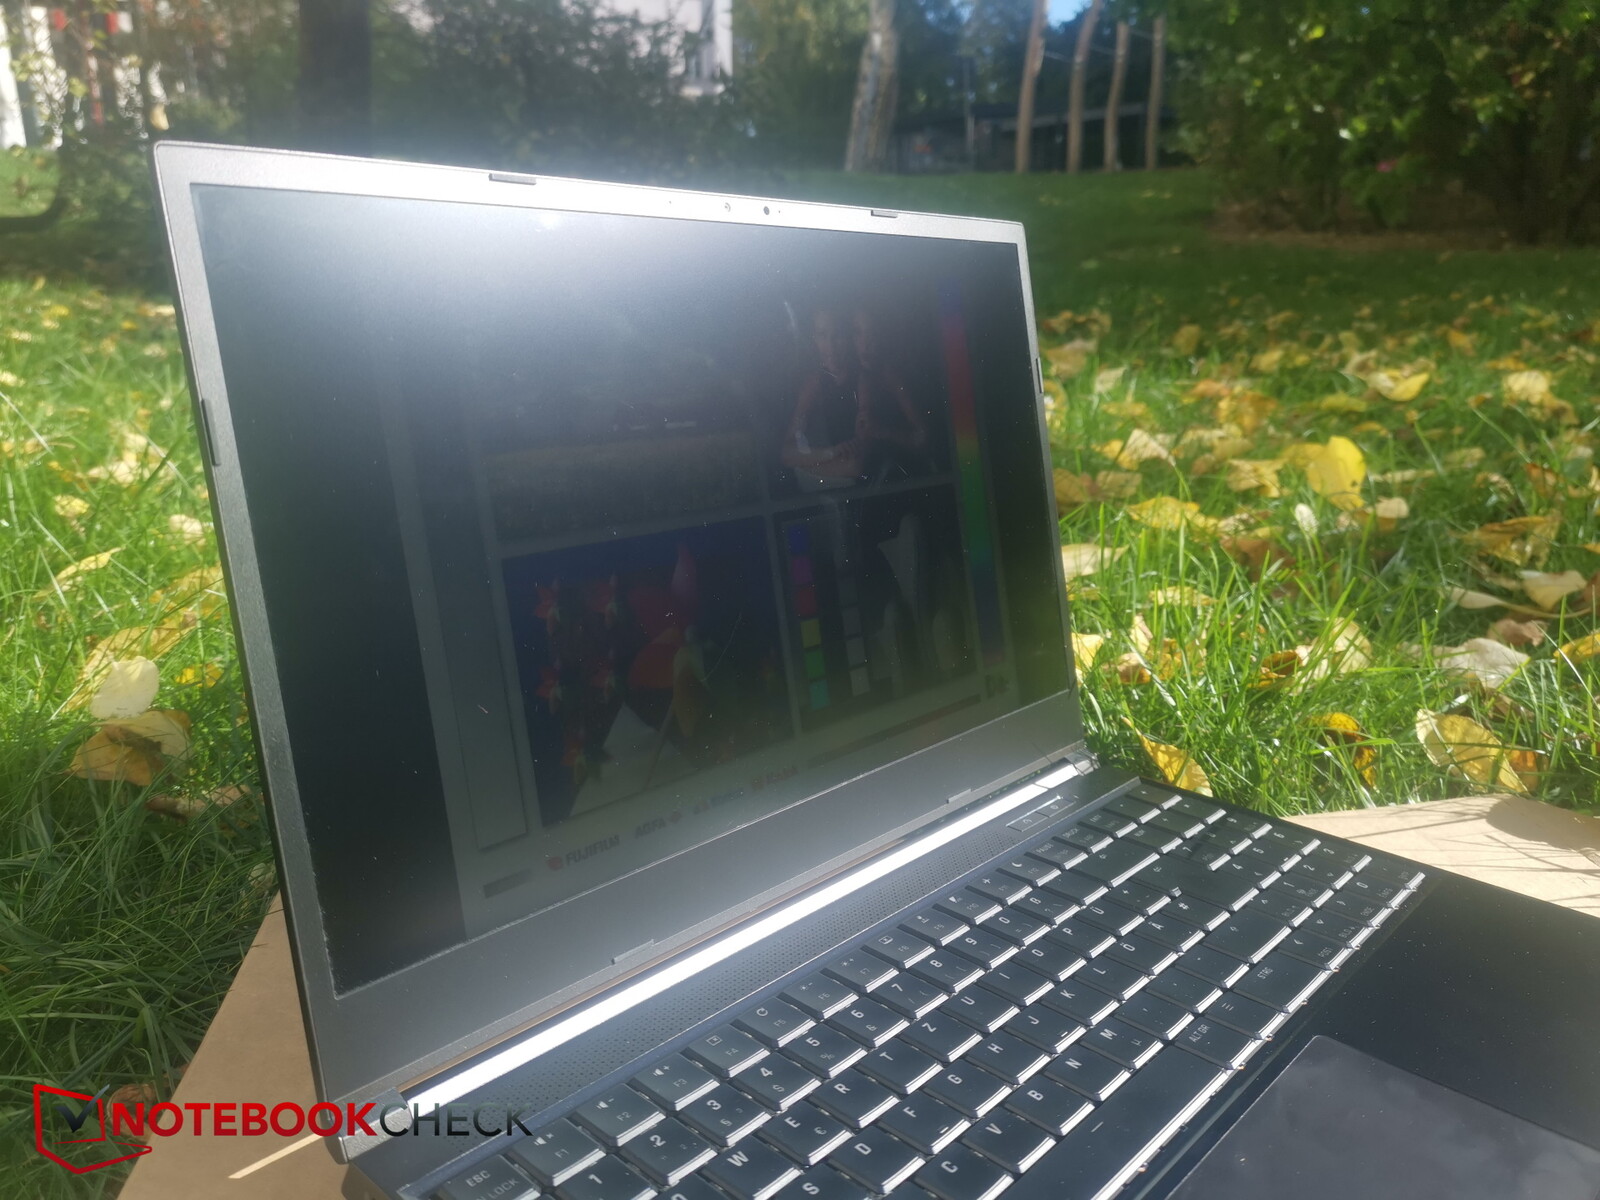
Quando si utilizza il dispositivo all'aperto, è necessario cercare un luogo ombreggiato e assicurarsi di guardare il display in modo diretto. Questo perché il contenuto dello schermo è molto difficile da leggere se visto in posizione angolata o sotto la luce diretta del sole.

Prestazioni: AMD e Intel quasi alla pari
Sul sito web di bestware troverete molti modi diversi per configurare il Neo 15 M22. Ma è sempre dotato dello stesso pannello e dello stesso processore AMD. Chi desidera invece una CPU Intel può guardare al Neo 15 E22.
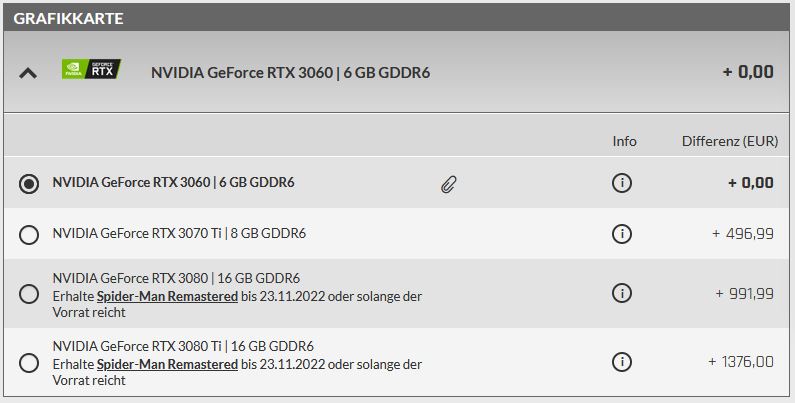
La RTX 3070 Ti nella nostra unità di recensione aggiunge circa 497 euro (494 dollari) al prezzo di acquisto rispetto all'opzione della GPU di fascia più bassa (RTX 3060). L'aggiornamento da una RTX 3060 a una RTX 3080 Ti costerà ben 1.376 euro (1.368 dollari) RTX 3080 Ti.
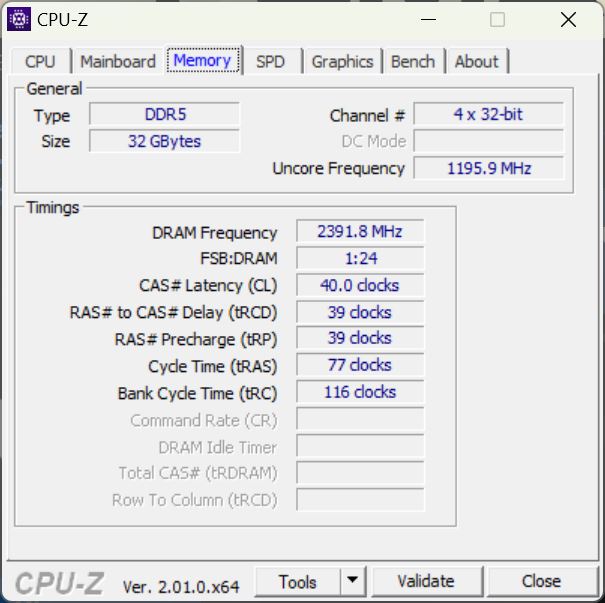
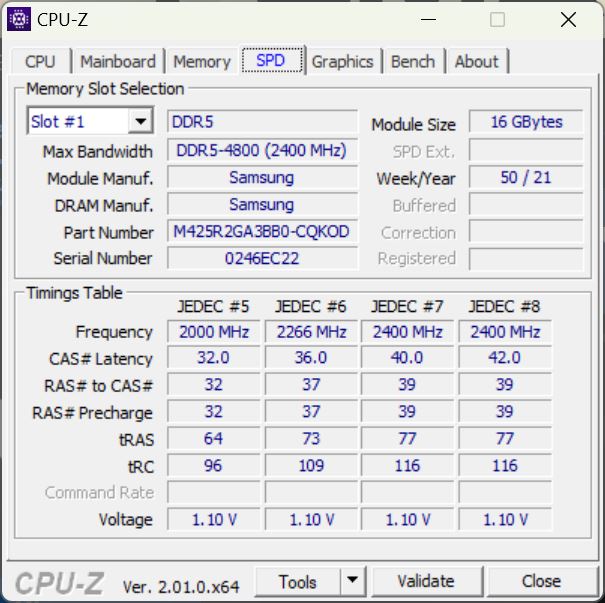
Anche molti altri componenti, come l'SSD, la RAM DDR5 e il modulo Wi-Fi, sono aggiornabili.
Condizioni di prova
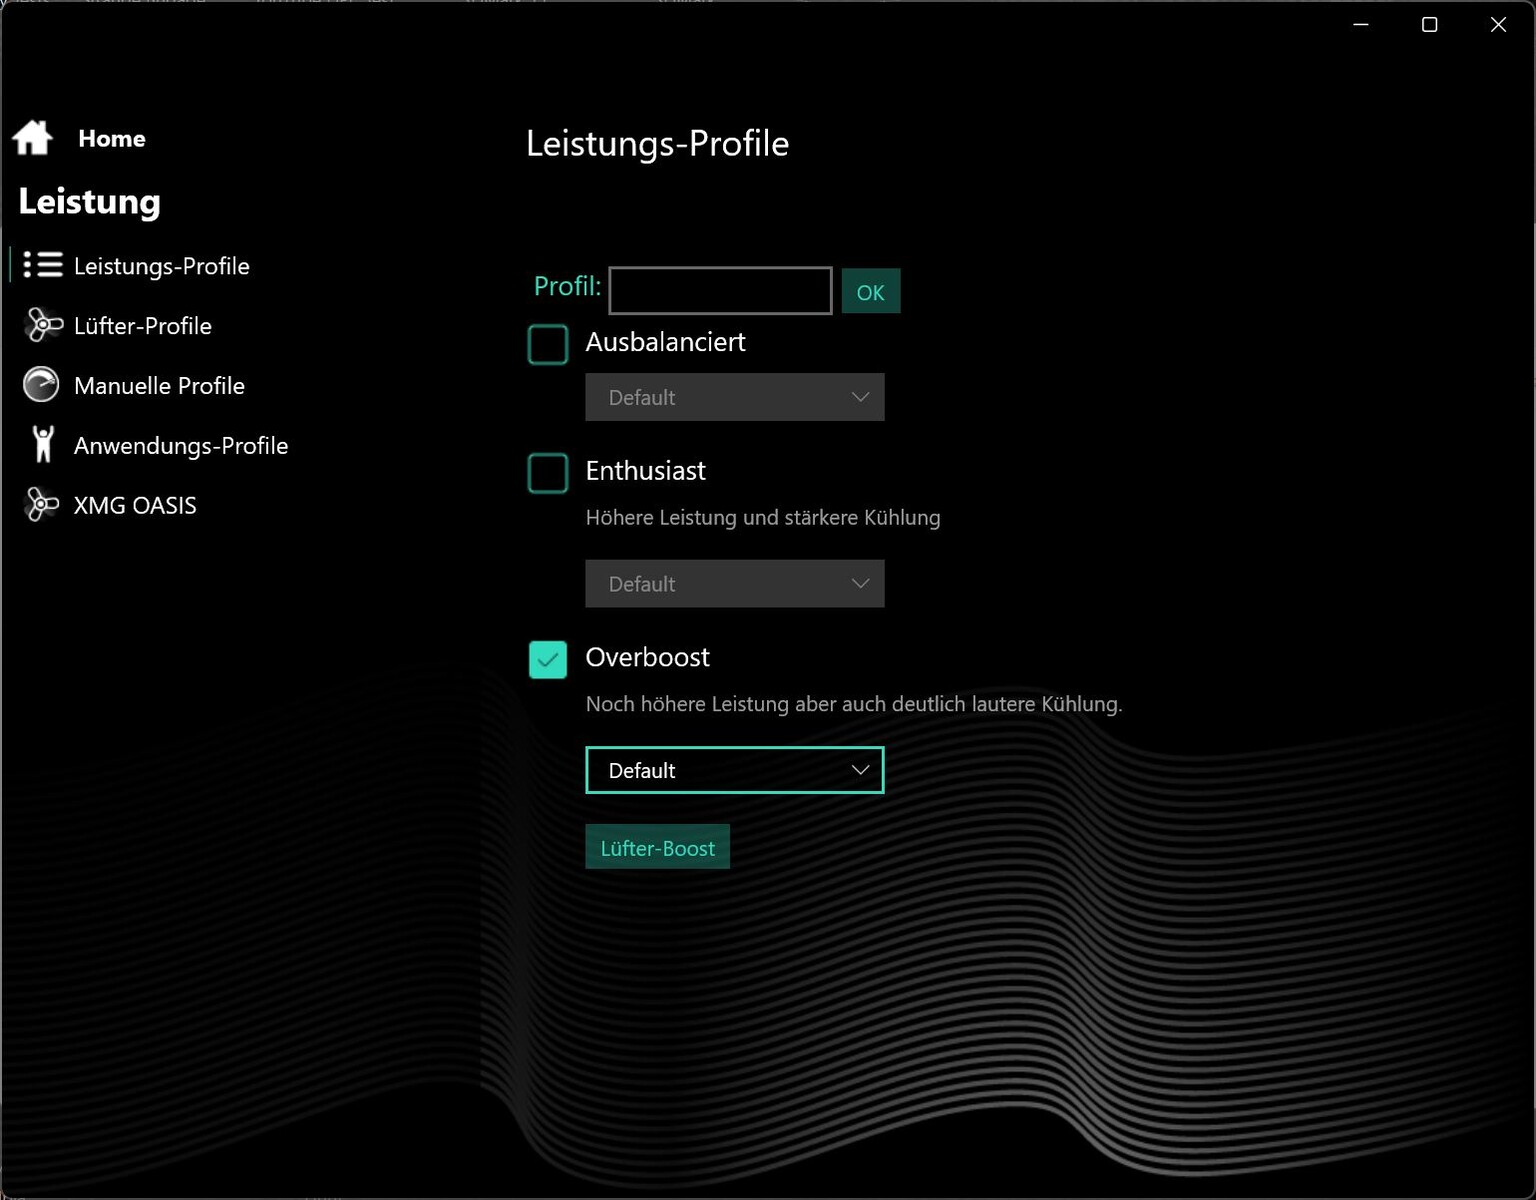
Il software Control Center offre alcuni profili di prestazioni (Balanced, Enthusiast e Overboost). Abbiamo selezionato la modalità più potente (Overboost) per ottenere i migliori risultati di benchmark, nonostante Schenker raccomandi l'opzione intermedia, progettata per essere il miglior compromesso tra prestazioni e livelli di rumore.
Inoltre, il software consente agli utenti di regolare manualmente vari parametri (ad esempio Dynamic Boost) e i valori di offset. Ci piacerebbe tuttavia che alle opzioni fosse aggiunta una modalità silenziosa.

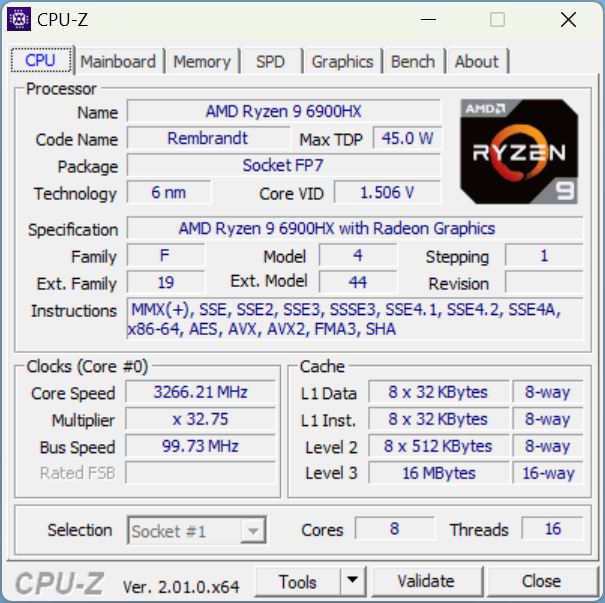
Processore

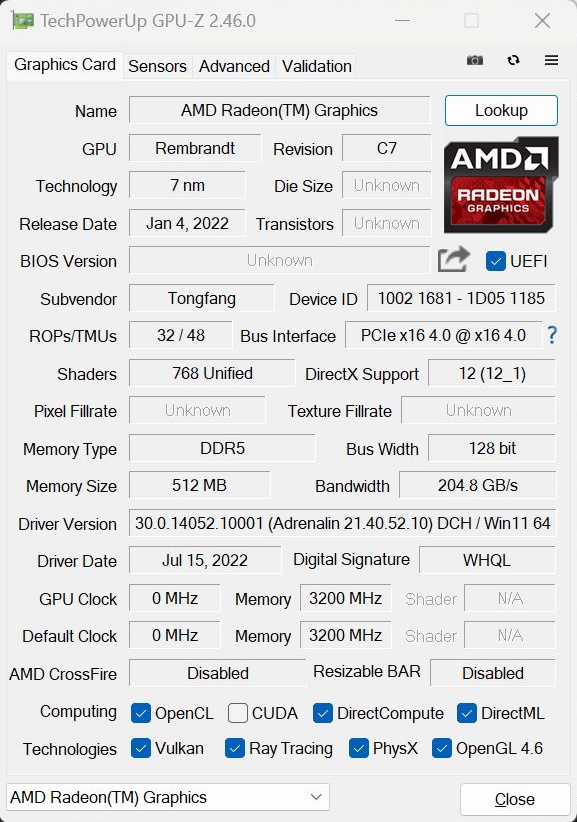
A differenza del Neo 15 E22, che dispone di un processore Core i7-12700Hil Neo M22 è alimentato da un AMD Ryzen 9 6900HX. La CPU Zen 3+ ha otto core che possono funzionare fino a 4,9 GHz ed eseguire 16 thread in contemporanea. Il processore ospita anche una Radeon 680M gPU integrata.
Durante l'esecuzione continua di Cinebench in loop, la CPU Ryzen ha fornito le sue solite prestazioni costanti senza alcun calo dopo le prime esecuzioni. Tuttavia, il Core i7-12700H del Neo 15 basato su Intel è leggermente più veloce. E questo vale naturalmente anche per il Core i9-12900H del ROG Strix o anche il Core i7-12800HX dell'MSI GE67.
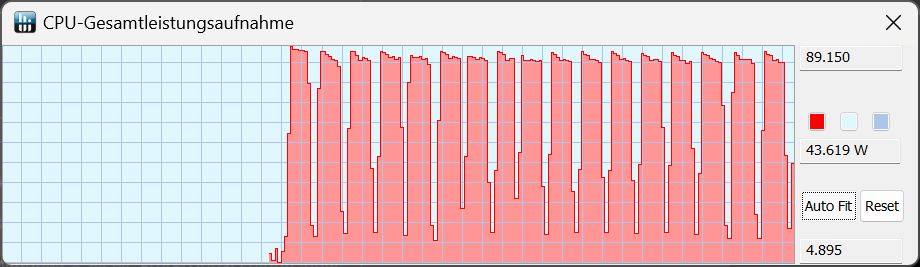
Il TDP è sempre rimasto sotto i 90 watt. In modalità Enthusiast, il consumo energetico è leggermente diminuito a circa 85 watt.
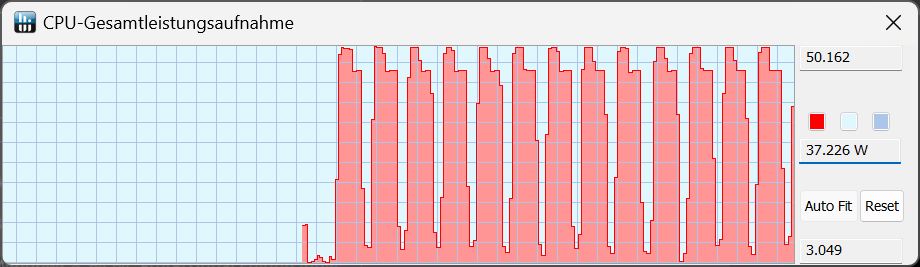
Al contrario, si è registrato un calo delle prestazioni quando il portatile era alimentato a batteria, con un TDP ridotto a "soli" 50 watt.
Cinebench R15 Multi Sustained Load
Cinebench R23: Multi Core | Single Core
Cinebench R20: CPU (Multi Core) | CPU (Single Core)
Cinebench R15: CPU Multi 64Bit | CPU Single 64Bit
Blender: v2.79 BMW27 CPU
7-Zip 18.03: 7z b 4 | 7z b 4 -mmt1
Geekbench 5.5: Multi-Core | Single-Core
HWBOT x265 Benchmark v2.2: 4k Preset
LibreOffice : 20 Documents To PDF
R Benchmark 2.5: Overall mean
| CPU Performance rating | |
| Media della classe Gaming | |
| MSI GE67 HX 12UGS | |
| Asus ROG Strix Scar 15 G533ZW-LN106WS | |
| MSI Stealth GS66 12UGS | |
| Schenker XMG Neo 15 (i7-12700H, RTX 3080 Ti) | |
| Acer Nitro 5 AN515-58-72QR | |
| Schenker XMG Neo 15 (Ryzen 9 6900HX, RTX 3070 Ti) | |
| Media AMD Ryzen 9 6900HX | |
| Cinebench R23 / Multi Core | |
| Media della classe Gaming (10488 - 40970, n=113, ultimi 2 anni) | |
| MSI GE67 HX 12UGS | |
| Asus ROG Strix Scar 15 G533ZW-LN106WS | |
| MSI Stealth GS66 12UGS | |
| Schenker XMG Neo 15 (i7-12700H, RTX 3080 Ti) | |
| Acer Nitro 5 AN515-58-72QR | |
| Schenker XMG Neo 15 (Ryzen 9 6900HX, RTX 3070 Ti) | |
| Media AMD Ryzen 9 6900HX (9709 - 15100, n=19) | |
| Cinebench R23 / Single Core | |
| Media della classe Gaming (1166 - 2356, n=113, ultimi 2 anni) | |
| Asus ROG Strix Scar 15 G533ZW-LN106WS | |
| Acer Nitro 5 AN515-58-72QR | |
| MSI GE67 HX 12UGS | |
| Schenker XMG Neo 15 (i7-12700H, RTX 3080 Ti) | |
| MSI Stealth GS66 12UGS | |
| Schenker XMG Neo 15 (Ryzen 9 6900HX, RTX 3070 Ti) | |
| Media AMD Ryzen 9 6900HX (1516 - 1616, n=19) | |
| Cinebench R20 / CPU (Multi Core) | |
| Media della classe Gaming (4029 - 16108, n=112, ultimi 2 anni) | |
| MSI GE67 HX 12UGS | |
| Asus ROG Strix Scar 15 G533ZW-LN106WS | |
| Schenker XMG Neo 15 (i7-12700H, RTX 3080 Ti) | |
| MSI Stealth GS66 12UGS | |
| Acer Nitro 5 AN515-58-72QR | |
| Schenker XMG Neo 15 (Ryzen 9 6900HX, RTX 3070 Ti) | |
| Media AMD Ryzen 9 6900HX (3742 - 5813, n=19) | |
| Cinebench R20 / CPU (Single Core) | |
| Media della classe Gaming (442 - 895, n=112, ultimi 2 anni) | |
| Asus ROG Strix Scar 15 G533ZW-LN106WS | |
| Acer Nitro 5 AN515-58-72QR | |
| MSI Stealth GS66 12UGS | |
| Schenker XMG Neo 15 (i7-12700H, RTX 3080 Ti) | |
| MSI GE67 HX 12UGS | |
| Schenker XMG Neo 15 (Ryzen 9 6900HX, RTX 3070 Ti) | |
| Media AMD Ryzen 9 6900HX (595 - 631, n=19) | |
| Cinebench R15 / CPU Multi 64Bit | |
| Media della classe Gaming (1578 - 6271, n=113, ultimi 2 anni) | |
| MSI GE67 HX 12UGS | |
| Asus ROG Strix Scar 15 G533ZW-LN106WS | |
| MSI Stealth GS66 12UGS | |
| Acer Nitro 5 AN515-58-72QR | |
| Schenker XMG Neo 15 (i7-12700H, RTX 3080 Ti) | |
| Schenker XMG Neo 15 (Ryzen 9 6900HX, RTX 3070 Ti) | |
| Media AMD Ryzen 9 6900HX (1588 - 2411, n=19) | |
| Cinebench R15 / CPU Single 64Bit | |
| Media della classe Gaming (188.8 - 343, n=112, ultimi 2 anni) | |
| Asus ROG Strix Scar 15 G533ZW-LN106WS | |
| Acer Nitro 5 AN515-58-72QR | |
| Schenker XMG Neo 15 (i7-12700H, RTX 3080 Ti) | |
| MSI Stealth GS66 12UGS | |
| MSI GE67 HX 12UGS | |
| Schenker XMG Neo 15 (Ryzen 9 6900HX, RTX 3070 Ti) | |
| Media AMD Ryzen 9 6900HX (241 - 261, n=19) | |
| Blender / v2.79 BMW27 CPU | |
| Media AMD Ryzen 9 6900HX (212 - 357, n=21) | |
| Schenker XMG Neo 15 (Ryzen 9 6900HX, RTX 3070 Ti) | |
| Acer Nitro 5 AN515-58-72QR | |
| MSI Stealth GS66 12UGS | |
| Schenker XMG Neo 15 (i7-12700H, RTX 3080 Ti) | |
| Asus ROG Strix Scar 15 G533ZW-LN106WS | |
| Media della classe Gaming (80 - 330, n=110, ultimi 2 anni) | |
| MSI GE67 HX 12UGS | |
| 7-Zip 18.03 / 7z b 4 | |
| Media della classe Gaming (33491 - 148086, n=111, ultimi 2 anni) | |
| MSI GE67 HX 12UGS | |
| Schenker XMG Neo 15 (i7-12700H, RTX 3080 Ti) | |
| MSI Stealth GS66 12UGS | |
| Asus ROG Strix Scar 15 G533ZW-LN106WS | |
| Schenker XMG Neo 15 (Ryzen 9 6900HX, RTX 3070 Ti) | |
| Media AMD Ryzen 9 6900HX (49526 - 65336, n=20) | |
| Acer Nitro 5 AN515-58-72QR | |
| 7-Zip 18.03 / 7z b 4 -mmt1 | |
| Media della classe Gaming (4199 - 7436, n=111, ultimi 2 anni) | |
| Asus ROG Strix Scar 15 G533ZW-LN106WS | |
| Schenker XMG Neo 15 (i7-12700H, RTX 3080 Ti) | |
| Schenker XMG Neo 15 (Ryzen 9 6900HX, RTX 3070 Ti) | |
| Acer Nitro 5 AN515-58-72QR | |
| MSI Stealth GS66 12UGS | |
| Media AMD Ryzen 9 6900HX (5090 - 6070, n=20) | |
| MSI GE67 HX 12UGS | |
| Geekbench 5.5 / Multi-Core | |
| Media della classe Gaming (6460 - 27010, n=111, ultimi 2 anni) | |
| MSI GE67 HX 12UGS | |
| Asus ROG Strix Scar 15 G533ZW-LN106WS | |
| Schenker XMG Neo 15 (i7-12700H, RTX 3080 Ti) | |
| MSI Stealth GS66 12UGS | |
| Schenker XMG Neo 15 (Ryzen 9 6900HX, RTX 3070 Ti) | |
| Acer Nitro 5 AN515-58-72QR | |
| Media AMD Ryzen 9 6900HX (8313 - 10490, n=21) | |
| Geekbench 5.5 / Single-Core | |
| Media della classe Gaming (986 - 2474, n=111, ultimi 2 anni) | |
| Asus ROG Strix Scar 15 G533ZW-LN106WS | |
| Acer Nitro 5 AN515-58-72QR | |
| MSI GE67 HX 12UGS | |
| Schenker XMG Neo 15 (i7-12700H, RTX 3080 Ti) | |
| MSI Stealth GS66 12UGS | |
| Schenker XMG Neo 15 (Ryzen 9 6900HX, RTX 3070 Ti) | |
| Media AMD Ryzen 9 6900HX (1523 - 1652, n=21) | |
| HWBOT x265 Benchmark v2.2 / 4k Preset | |
| Media della classe Gaming (11.5 - 44.3, n=111, ultimi 2 anni) | |
| MSI GE67 HX 12UGS | |
| Asus ROG Strix Scar 15 G533ZW-LN106WS | |
| Schenker XMG Neo 15 (i7-12700H, RTX 3080 Ti) | |
| MSI Stealth GS66 12UGS | |
| Acer Nitro 5 AN515-58-72QR | |
| Schenker XMG Neo 15 (Ryzen 9 6900HX, RTX 3070 Ti) | |
| Media AMD Ryzen 9 6900HX (12.6 - 18.7, n=20) | |
| LibreOffice / 20 Documents To PDF | |
| Schenker XMG Neo 15 (Ryzen 9 6900HX, RTX 3070 Ti) | |
| Media AMD Ryzen 9 6900HX (44.8 - 81.7, n=20) | |
| Media della classe Gaming (19 - 88.8, n=111, ultimi 2 anni) | |
| Schenker XMG Neo 15 (i7-12700H, RTX 3080 Ti) | |
| MSI GE67 HX 12UGS | |
| Acer Nitro 5 AN515-58-72QR | |
| MSI Stealth GS66 12UGS | |
| Asus ROG Strix Scar 15 G533ZW-LN106WS | |
| R Benchmark 2.5 / Overall mean | |
| Schenker XMG Neo 15 (Ryzen 9 6900HX, RTX 3070 Ti) | |
| Media AMD Ryzen 9 6900HX (0.4627 - 0.4974, n=20) | |
| MSI GE67 HX 12UGS | |
| Schenker XMG Neo 15 (i7-12700H, RTX 3080 Ti) | |
| Acer Nitro 5 AN515-58-72QR | |
| MSI Stealth GS66 12UGS | |
| Asus ROG Strix Scar 15 G533ZW-LN106WS | |
| Media della classe Gaming (0.3439 - 0.759, n=112, ultimi 2 anni) | |
* ... Meglio usare valori piccoli
AIDA64: FP32 Ray-Trace | FPU Julia | CPU SHA3 | CPU Queen | FPU SinJulia | FPU Mandel | CPU AES | CPU ZLib | FP64 Ray-Trace | CPU PhotoWorxx
| Performance rating | |
| Media della classe Gaming | |
| Media AMD Ryzen 9 6900HX | |
| Schenker XMG Neo 15 (Ryzen 9 6900HX, RTX 3070 Ti) | |
| MSI GE67 HX 12UGS | |
| Asus ROG Strix Scar 15 G533ZW-LN106WS | |
| MSI Stealth GS66 12UGS | |
| Schenker XMG Neo 15 (i7-12700H, RTX 3080 Ti) | |
| Acer Nitro 5 AN515-58-72QR | |
| AIDA64 / FP32 Ray-Trace | |
| Media della classe Gaming (10227 - 85542, n=110, ultimi 2 anni) | |
| Schenker XMG Neo 15 (Ryzen 9 6900HX, RTX 3070 Ti) | |
| Media AMD Ryzen 9 6900HX (10950 - 17963, n=20) | |
| MSI GE67 HX 12UGS | |
| Asus ROG Strix Scar 15 G533ZW-LN106WS | |
| Schenker XMG Neo 15 (i7-12700H, RTX 3080 Ti) | |
| MSI Stealth GS66 12UGS | |
| Acer Nitro 5 AN515-58-72QR | |
| AIDA64 / FPU Julia | |
| Media della classe Gaming (51376 - 238426, n=110, ultimi 2 anni) | |
| Schenker XMG Neo 15 (Ryzen 9 6900HX, RTX 3070 Ti) | |
| Media AMD Ryzen 9 6900HX (71414 - 110797, n=20) | |
| MSI GE67 HX 12UGS | |
| Asus ROG Strix Scar 15 G533ZW-LN106WS | |
| Schenker XMG Neo 15 (i7-12700H, RTX 3080 Ti) | |
| MSI Stealth GS66 12UGS | |
| Acer Nitro 5 AN515-58-72QR | |
| AIDA64 / CPU SHA3 | |
| Media della classe Gaming (2180 - 9817, n=110, ultimi 2 anni) | |
| MSI GE67 HX 12UGS | |
| Schenker XMG Neo 15 (Ryzen 9 6900HX, RTX 3070 Ti) | |
| Asus ROG Strix Scar 15 G533ZW-LN106WS | |
| Media AMD Ryzen 9 6900HX (2471 - 3804, n=20) | |
| Schenker XMG Neo 15 (i7-12700H, RTX 3080 Ti) | |
| MSI Stealth GS66 12UGS | |
| Acer Nitro 5 AN515-58-72QR | |
| AIDA64 / CPU Queen | |
| Media della classe Gaming (49785 - 173351, n=101, ultimi 2 anni) | |
| Schenker XMG Neo 15 (Ryzen 9 6900HX, RTX 3070 Ti) | |
| Asus ROG Strix Scar 15 G533ZW-LN106WS | |
| Media AMD Ryzen 9 6900HX (84185 - 107544, n=20) | |
| Acer Nitro 5 AN515-58-72QR | |
| Schenker XMG Neo 15 (i7-12700H, RTX 3080 Ti) | |
| MSI Stealth GS66 12UGS | |
| MSI GE67 HX 12UGS | |
| AIDA64 / FPU SinJulia | |
| Media della classe Gaming (4424 - 33636, n=110, ultimi 2 anni) | |
| Schenker XMG Neo 15 (Ryzen 9 6900HX, RTX 3070 Ti) | |
| Media AMD Ryzen 9 6900HX (10970 - 13205, n=20) | |
| MSI GE67 HX 12UGS | |
| Asus ROG Strix Scar 15 G533ZW-LN106WS | |
| Schenker XMG Neo 15 (i7-12700H, RTX 3080 Ti) | |
| Acer Nitro 5 AN515-58-72QR | |
| MSI Stealth GS66 12UGS | |
| AIDA64 / FPU Mandel | |
| Media della classe Gaming (25115 - 128721, n=110, ultimi 2 anni) | |
| Schenker XMG Neo 15 (Ryzen 9 6900HX, RTX 3070 Ti) | |
| Media AMD Ryzen 9 6900HX (39164 - 61370, n=20) | |
| MSI GE67 HX 12UGS | |
| Asus ROG Strix Scar 15 G533ZW-LN106WS | |
| Schenker XMG Neo 15 (i7-12700H, RTX 3080 Ti) | |
| MSI Stealth GS66 12UGS | |
| Acer Nitro 5 AN515-58-72QR | |
| AIDA64 / CPU AES | |
| MSI GE67 HX 12UGS | |
| Media AMD Ryzen 9 6900HX (54613 - 142360, n=20) | |
| Media della classe Gaming (39258 - 247074, n=110, ultimi 2 anni) | |
| Asus ROG Strix Scar 15 G533ZW-LN106WS | |
| MSI Stealth GS66 12UGS | |
| Schenker XMG Neo 15 (Ryzen 9 6900HX, RTX 3070 Ti) | |
| Schenker XMG Neo 15 (i7-12700H, RTX 3080 Ti) | |
| Acer Nitro 5 AN515-58-72QR | |
| AIDA64 / CPU ZLib | |
| Media della classe Gaming (574 - 2531, n=110, ultimi 2 anni) | |
| MSI GE67 HX 12UGS | |
| Asus ROG Strix Scar 15 G533ZW-LN106WS | |
| Schenker XMG Neo 15 (i7-12700H, RTX 3080 Ti) | |
| Acer Nitro 5 AN515-58-72QR | |
| MSI Stealth GS66 12UGS | |
| Media AMD Ryzen 9 6900HX (578 - 911, n=20) | |
| Schenker XMG Neo 15 (Ryzen 9 6900HX, RTX 3070 Ti) | |
| AIDA64 / FP64 Ray-Trace | |
| Media della classe Gaming (5509 - 45446, n=110, ultimi 2 anni) | |
| Schenker XMG Neo 15 (Ryzen 9 6900HX, RTX 3070 Ti) | |
| Media AMD Ryzen 9 6900HX (5798 - 9540, n=20) | |
| MSI GE67 HX 12UGS | |
| Asus ROG Strix Scar 15 G533ZW-LN106WS | |
| Schenker XMG Neo 15 (i7-12700H, RTX 3080 Ti) | |
| MSI Stealth GS66 12UGS | |
| Acer Nitro 5 AN515-58-72QR | |
| AIDA64 / CPU PhotoWorxx | |
| Media della classe Gaming (12271 - 89891, n=110, ultimi 2 anni) | |
| Schenker XMG Neo 15 (i7-12700H, RTX 3080 Ti) | |
| MSI Stealth GS66 12UGS | |
| Asus ROG Strix Scar 15 G533ZW-LN106WS | |
| MSI GE67 HX 12UGS | |
| Schenker XMG Neo 15 (Ryzen 9 6900HX, RTX 3070 Ti) | |
| Media AMD Ryzen 9 6900HX (26873 - 30604, n=20) | |
| Acer Nitro 5 AN515-58-72QR | |
Prestazioni del sistema
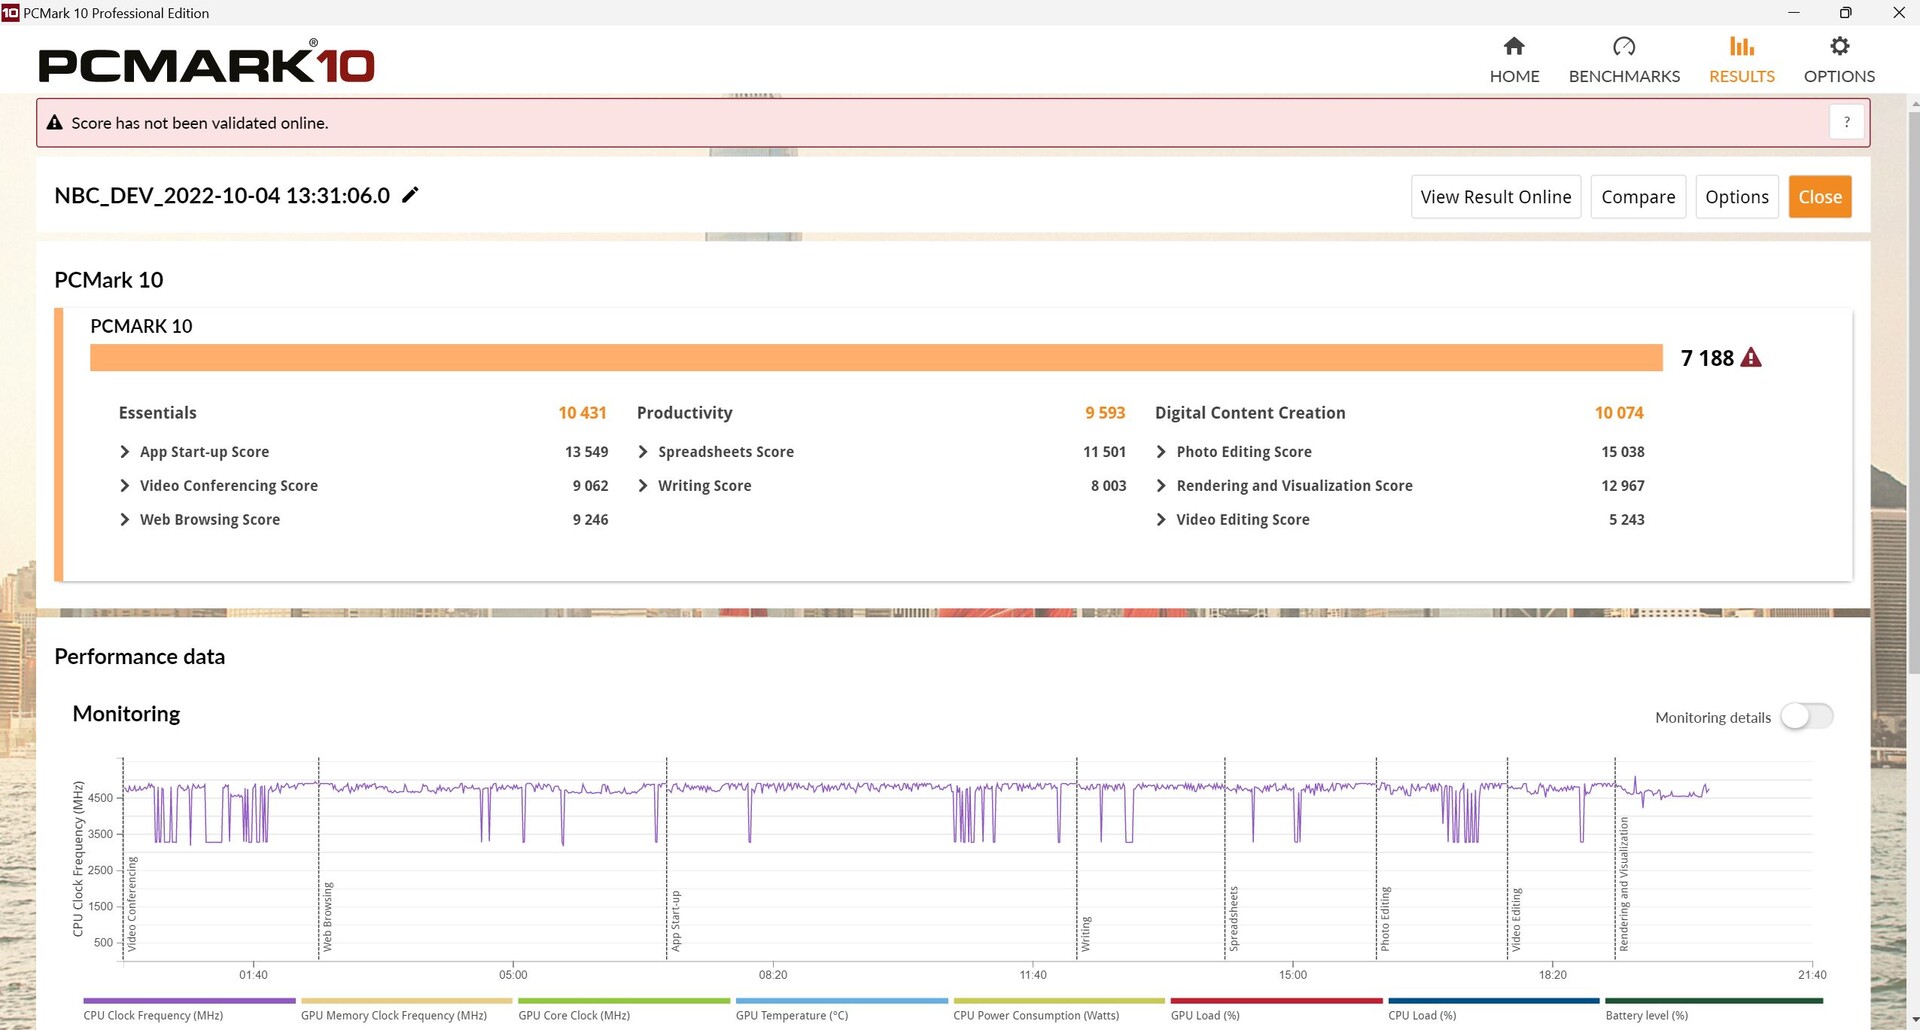
In PCMark 10, il Neo 15 ha ottenuto risultati più o meno in linea con le nostre aspettative. Tuttavia, a parte il vacillante Acer Nitro 5, tutti gli altri concorrenti sono stati più veloci, in particolare l'MSI Raider GE67 MSI Raider GE67 e Asus ROG Strix.
CrossMark: Overall | Productivity | Creativity | Responsiveness
| PCMark 10 / Score | |
| Media della classe Gaming (5828 - 11574, n=96, ultimi 2 anni) | |
| MSI GE67 HX 12UGS | |
| Asus ROG Strix Scar 15 G533ZW-LN106WS | |
| MSI Stealth GS66 12UGS | |
| Schenker XMG Neo 15 (i7-12700H, RTX 3080 Ti) | |
| Media AMD Ryzen 9 6900HX, NVIDIA GeForce RTX 3070 Ti Laptop GPU (7161 - 7332, n=3) | |
| Schenker XMG Neo 15 (Ryzen 9 6900HX, RTX 3070 Ti) | |
| Acer Nitro 5 AN515-58-72QR | |
| PCMark 10 / Essentials | |
| MSI GE67 HX 12UGS | |
| MSI Stealth GS66 12UGS | |
| Asus ROG Strix Scar 15 G533ZW-LN106WS | |
| Media AMD Ryzen 9 6900HX, NVIDIA GeForce RTX 3070 Ti Laptop GPU (10431 - 10934, n=3) | |
| Media della classe Gaming (8810 - 12600, n=100, ultimi 2 anni) | |
| Schenker XMG Neo 15 (i7-12700H, RTX 3080 Ti) | |
| Schenker XMG Neo 15 (Ryzen 9 6900HX, RTX 3070 Ti) | |
| Acer Nitro 5 AN515-58-72QR | |
| PCMark 10 / Productivity | |
| Media della classe Gaming (6845 - 18766, n=98, ultimi 2 anni) | |
| Asus ROG Strix Scar 15 G533ZW-LN106WS | |
| MSI GE67 HX 12UGS | |
| Schenker XMG Neo 15 (Ryzen 9 6900HX, RTX 3070 Ti) | |
| Media AMD Ryzen 9 6900HX, NVIDIA GeForce RTX 3070 Ti Laptop GPU (9043 - 9960, n=3) | |
| MSI Stealth GS66 12UGS | |
| Schenker XMG Neo 15 (i7-12700H, RTX 3080 Ti) | |
| Acer Nitro 5 AN515-58-72QR | |
| PCMark 10 / Digital Content Creation | |
| Media della classe Gaming (7602 - 19657, n=98, ultimi 2 anni) | |
| MSI GE67 HX 12UGS | |
| Schenker XMG Neo 15 (i7-12700H, RTX 3080 Ti) | |
| Asus ROG Strix Scar 15 G533ZW-LN106WS | |
| MSI Stealth GS66 12UGS | |
| Acer Nitro 5 AN515-58-72QR | |
| Media AMD Ryzen 9 6900HX, NVIDIA GeForce RTX 3070 Ti Laptop GPU (9351 - 10817, n=3) | |
| Schenker XMG Neo 15 (Ryzen 9 6900HX, RTX 3070 Ti) | |
| CrossMark / Overall | |
| Asus ROG Strix Scar 15 G533ZW-LN106WS | |
| Media della classe Gaming (1366 - 2409, n=98, ultimi 2 anni) | |
| MSI GE67 HX 12UGS | |
| Schenker XMG Neo 15 (i7-12700H, RTX 3080 Ti) | |
| Acer Nitro 5 AN515-58-72QR | |
| Media AMD Ryzen 9 6900HX, NVIDIA GeForce RTX 3070 Ti Laptop GPU (1624 - 1743, n=2) | |
| Schenker XMG Neo 15 (Ryzen 9 6900HX, RTX 3070 Ti) | |
| CrossMark / Productivity | |
| Asus ROG Strix Scar 15 G533ZW-LN106WS | |
| MSI GE67 HX 12UGS | |
| Media della classe Gaming (1386 - 2254, n=98, ultimi 2 anni) | |
| Acer Nitro 5 AN515-58-72QR | |
| Schenker XMG Neo 15 (i7-12700H, RTX 3080 Ti) | |
| Media AMD Ryzen 9 6900HX, NVIDIA GeForce RTX 3070 Ti Laptop GPU (1591 - 1722, n=2) | |
| Schenker XMG Neo 15 (Ryzen 9 6900HX, RTX 3070 Ti) | |
| CrossMark / Creativity | |
| Media della classe Gaming (1343 - 2729, n=98, ultimi 2 anni) | |
| Asus ROG Strix Scar 15 G533ZW-LN106WS | |
| MSI GE67 HX 12UGS | |
| Schenker XMG Neo 15 (i7-12700H, RTX 3080 Ti) | |
| Acer Nitro 5 AN515-58-72QR | |
| Media AMD Ryzen 9 6900HX, NVIDIA GeForce RTX 3070 Ti Laptop GPU (1749 - 1809, n=2) | |
| Schenker XMG Neo 15 (Ryzen 9 6900HX, RTX 3070 Ti) | |
| CrossMark / Responsiveness | |
| Asus ROG Strix Scar 15 G533ZW-LN106WS | |
| MSI GE67 HX 12UGS | |
| Media della classe Gaming (1226 - 2334, n=98, ultimi 2 anni) | |
| Acer Nitro 5 AN515-58-72QR | |
| Schenker XMG Neo 15 (i7-12700H, RTX 3080 Ti) | |
| Media AMD Ryzen 9 6900HX, NVIDIA GeForce RTX 3070 Ti Laptop GPU (1382 - 1615, n=2) | |
| Schenker XMG Neo 15 (Ryzen 9 6900HX, RTX 3070 Ti) | |
| PCMark 10 Score | 7188 punti | |
Aiuto | ||
| AIDA64 / Memory Copy | |
| Media della classe Gaming (21750 - 129946, n=110, ultimi 2 anni) | |
| Schenker XMG Neo 15 (i7-12700H, RTX 3080 Ti) | |
| MSI Stealth GS66 12UGS | |
| Asus ROG Strix Scar 15 G533ZW-LN106WS | |
| Media AMD Ryzen 9 6900HX (47938 - 53345, n=20) | |
| Schenker XMG Neo 15 (Ryzen 9 6900HX, RTX 3070 Ti) | |
| MSI GE67 HX 12UGS | |
| Acer Nitro 5 AN515-58-72QR | |
| AIDA64 / Memory Read | |
| Media della classe Gaming (22956 - 118858, n=110, ultimi 2 anni) | |
| Schenker XMG Neo 15 (i7-12700H, RTX 3080 Ti) | |
| MSI Stealth GS66 12UGS | |
| Asus ROG Strix Scar 15 G533ZW-LN106WS | |
| MSI GE67 HX 12UGS | |
| Schenker XMG Neo 15 (Ryzen 9 6900HX, RTX 3070 Ti) | |
| Media AMD Ryzen 9 6900HX (43892 - 53321, n=20) | |
| Acer Nitro 5 AN515-58-72QR | |
| AIDA64 / Memory Write | |
| Media della classe Gaming (22297 - 135096, n=110, ultimi 2 anni) | |
| MSI Stealth GS66 12UGS | |
| Schenker XMG Neo 15 (i7-12700H, RTX 3080 Ti) | |
| Asus ROG Strix Scar 15 G533ZW-LN106WS | |
| MSI GE67 HX 12UGS | |
| Schenker XMG Neo 15 (Ryzen 9 6900HX, RTX 3070 Ti) | |
| Media AMD Ryzen 9 6900HX (51085 - 57202, n=20) | |
| Acer Nitro 5 AN515-58-72QR | |
| AIDA64 / Memory Latency | |
| Media della classe Gaming (75.3 - 259, n=110, ultimi 2 anni) | |
| Asus ROG Strix Scar 15 G533ZW-LN106WS | |
| MSI GE67 HX 12UGS | |
| MSI Stealth GS66 12UGS | |
| Schenker XMG Neo 15 (Ryzen 9 6900HX, RTX 3070 Ti) | |
| Media AMD Ryzen 9 6900HX (80.7 - 120.6, n=20) | |
| Acer Nitro 5 AN515-58-72QR | |
| Acer Nitro 5 AN515-58-72QR | |
* ... Meglio usare valori piccoli
Latenza DPC
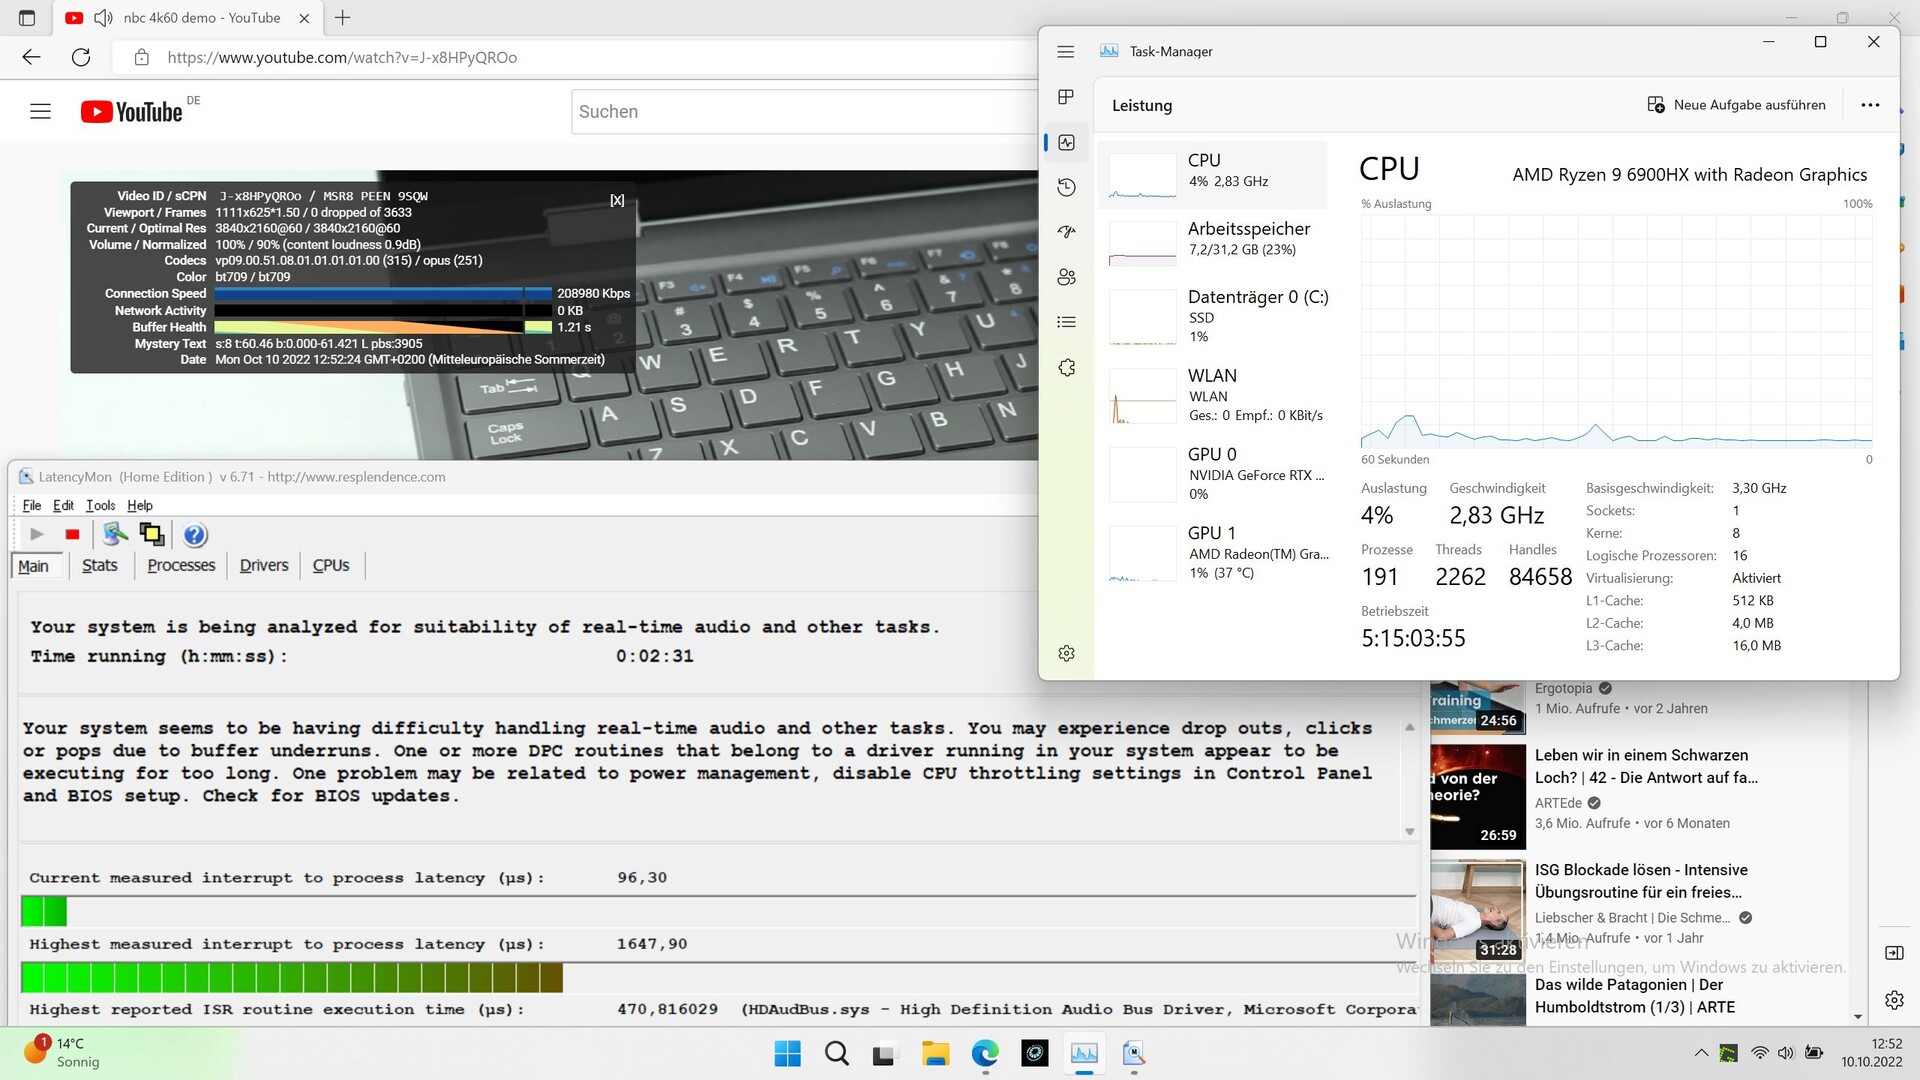
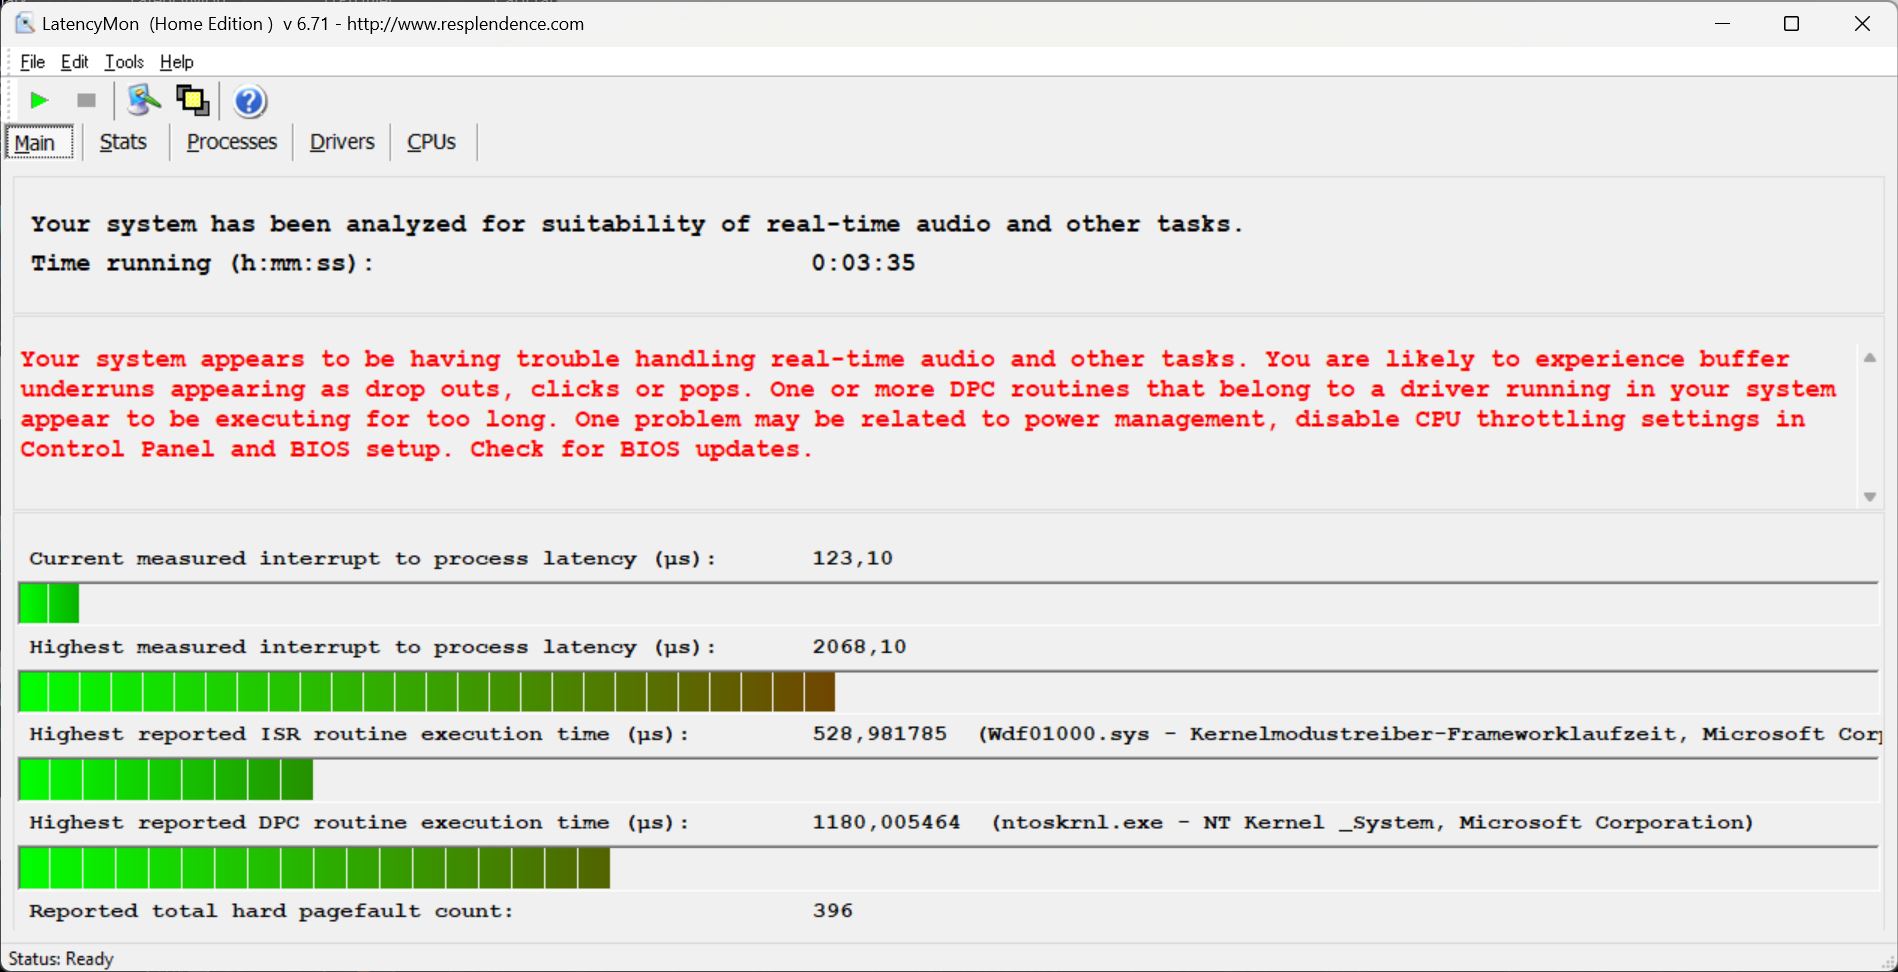
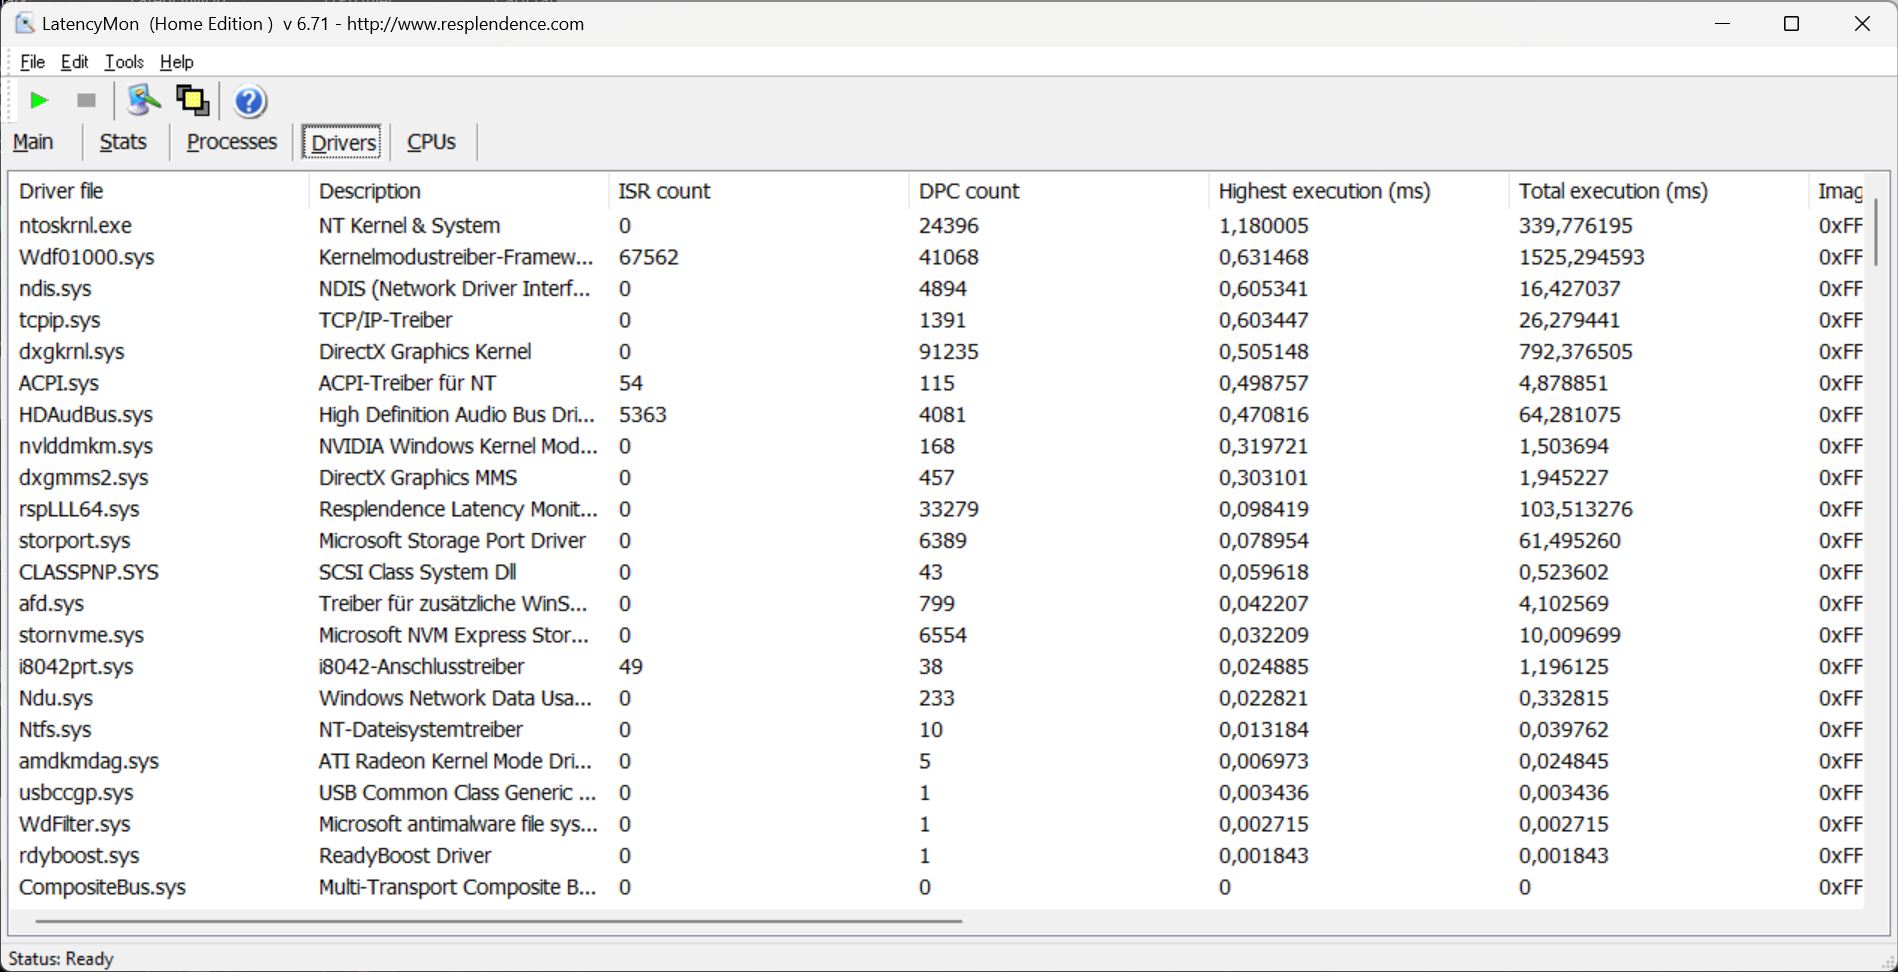
Abbiamo riscontrato i primi problemi di DPC dopo aver aperto diverse schede del browser alla nostra pagina iniziale. La latenza è aumentata durante la riproduzione dei nostri video YouTube 4K a 60 FPS. Si sospetta che i driver del kernel siano la causa principale di questo problema.
Ma almeno non si sono verificate cadute di fotogrammi e l'utilizzo della CPU/GPU è molto basso durante la riproduzione del video di test.
| DPC Latencies / LatencyMon - interrupt to process latency (max), Web, Youtube, Prime95 | |
| Schenker XMG Neo 15 (i7-12700H, RTX 3080 Ti) | |
| MSI Stealth GS66 12UGS | |
| Schenker XMG Neo 15 (Ryzen 9 6900HX, RTX 3070 Ti) | |
| MSI GE67 HX 12UGS | |
| Asus ROG Strix Scar 15 G533ZW-LN106WS | |
| Acer Nitro 5 AN515-58-72QR | |
* ... Meglio usare valori piccoli
Memoria di massa
Il Neo 15 può essere configurato con innumerevoli opzioni di SSD. La nostra unità in prova è dotata di un'unità SSD Samsung 980 Pro da 1 TB, attualmente al 12° posto nella nostra classifica di benchmark SSD/HDD di https://www.notebookcheck.net/Laptop-harddisks-HDD-SSD-benchmarks.22089.0.html. L'unità è in grado di mantenere le sue ottime prestazioni anche per un periodo prolungato.

* ... Meglio usare valori piccoli
Sustained Load Read: DiskSpd Read Loop, Queue Depth 8
Scheda grafica

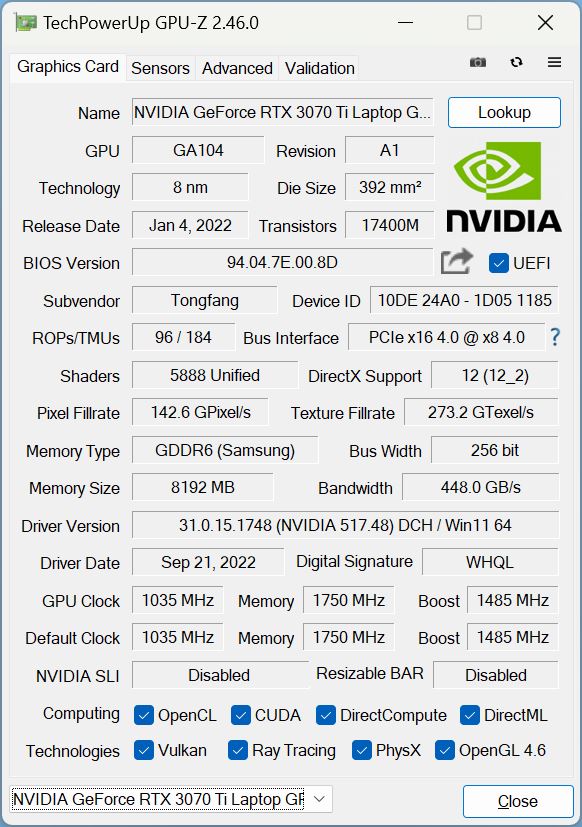
La nostra unità di recensione ha una GeForce RTX 3070 Ti con un obiettivo TGP di 150 watt, incluso Dynamic Boost. Questi valori possono essere regolati manualmente nel Control Center. In alternativa, è possibile acquistare il Neo 15 con diverse GPU che vanno da una RTX 3060 a RTX 3080 Ti.
Proprio come ci aspettavamo, la GPU dell'unità in prova ha ottenuto un punteggio superiore del 5-10% rispetto a una RTX 3070 Ti media. La MSI GE67 è l'unico dispositivo del confronto ad essere significativamente più veloce. Anche se lo Strix Scar ha spesso ottenuto punteggi migliori rispetto al Neo, le differenze di prestazioni sono per lo più trascurabili, pari a circa il 2 percento.
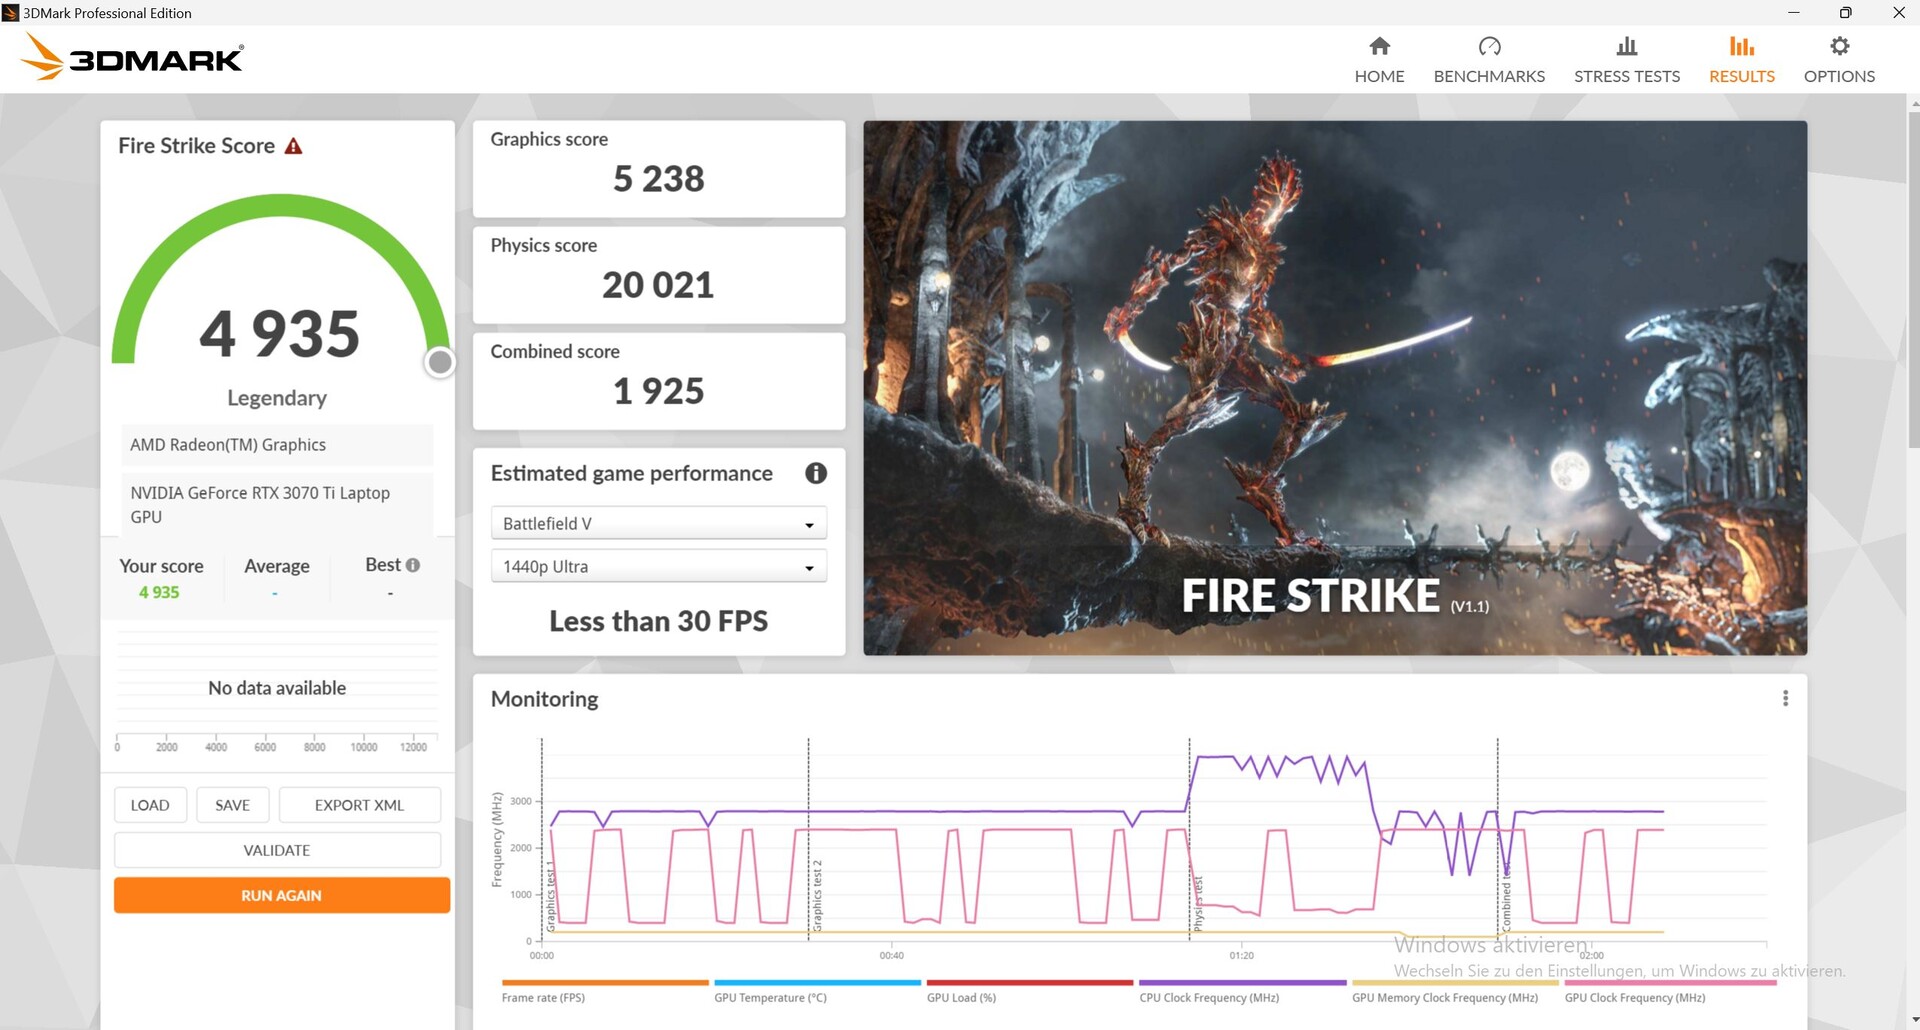
Il Neo 15 perde una quantità enorme di prestazioni 3D quando funziona a batteria. Ad esempio, quando abbiamo scollegato il portatile ed eseguito nuovamente Fire Strike, il punteggio di fisica e grafica è stato rispettivamente di soli 20.021 e 5.238, invece dei 26.338 e 28.105 ottenuti quando il Neo era collegato alla rete elettrica.
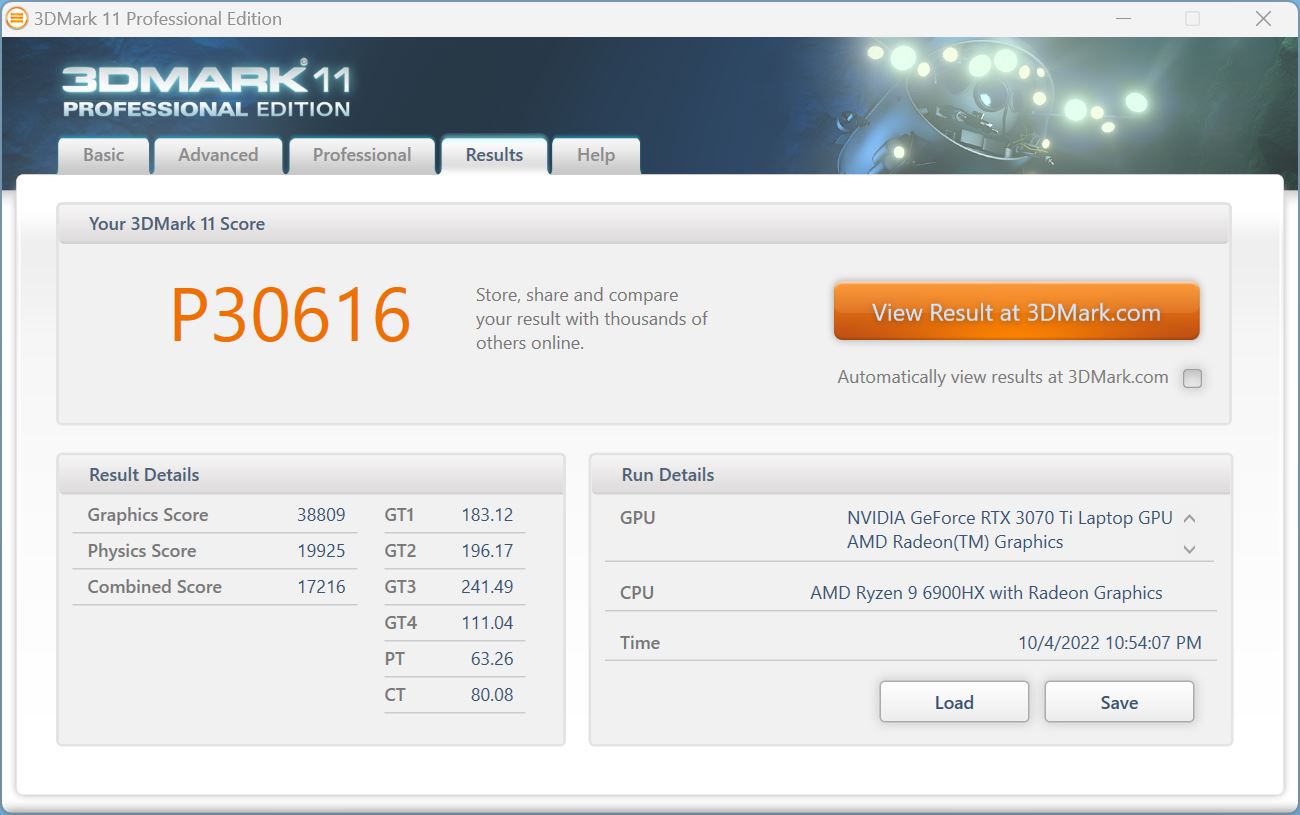

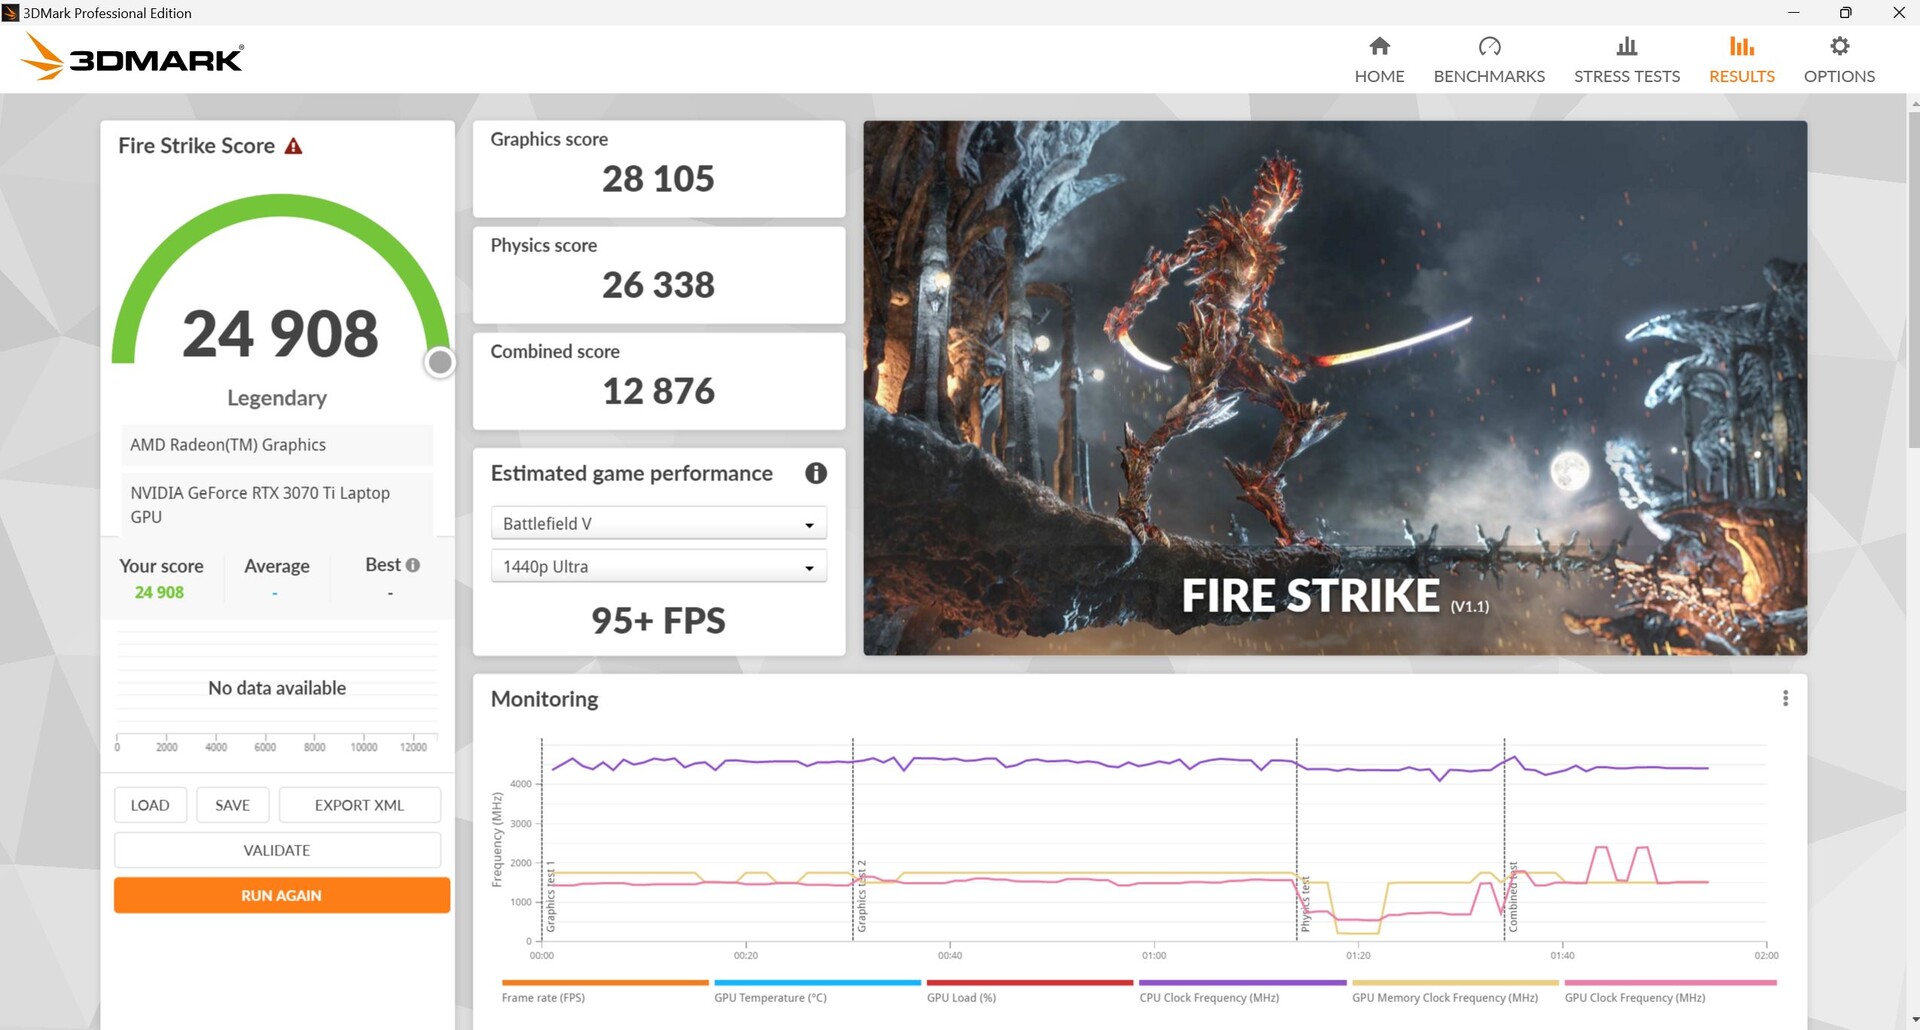
| 3DMark 11 Performance | 30616 punti | |
| 3DMark Cloud Gate Standard Score | 57616 punti | |
| 3DMark Fire Strike Score | 24908 punti | |
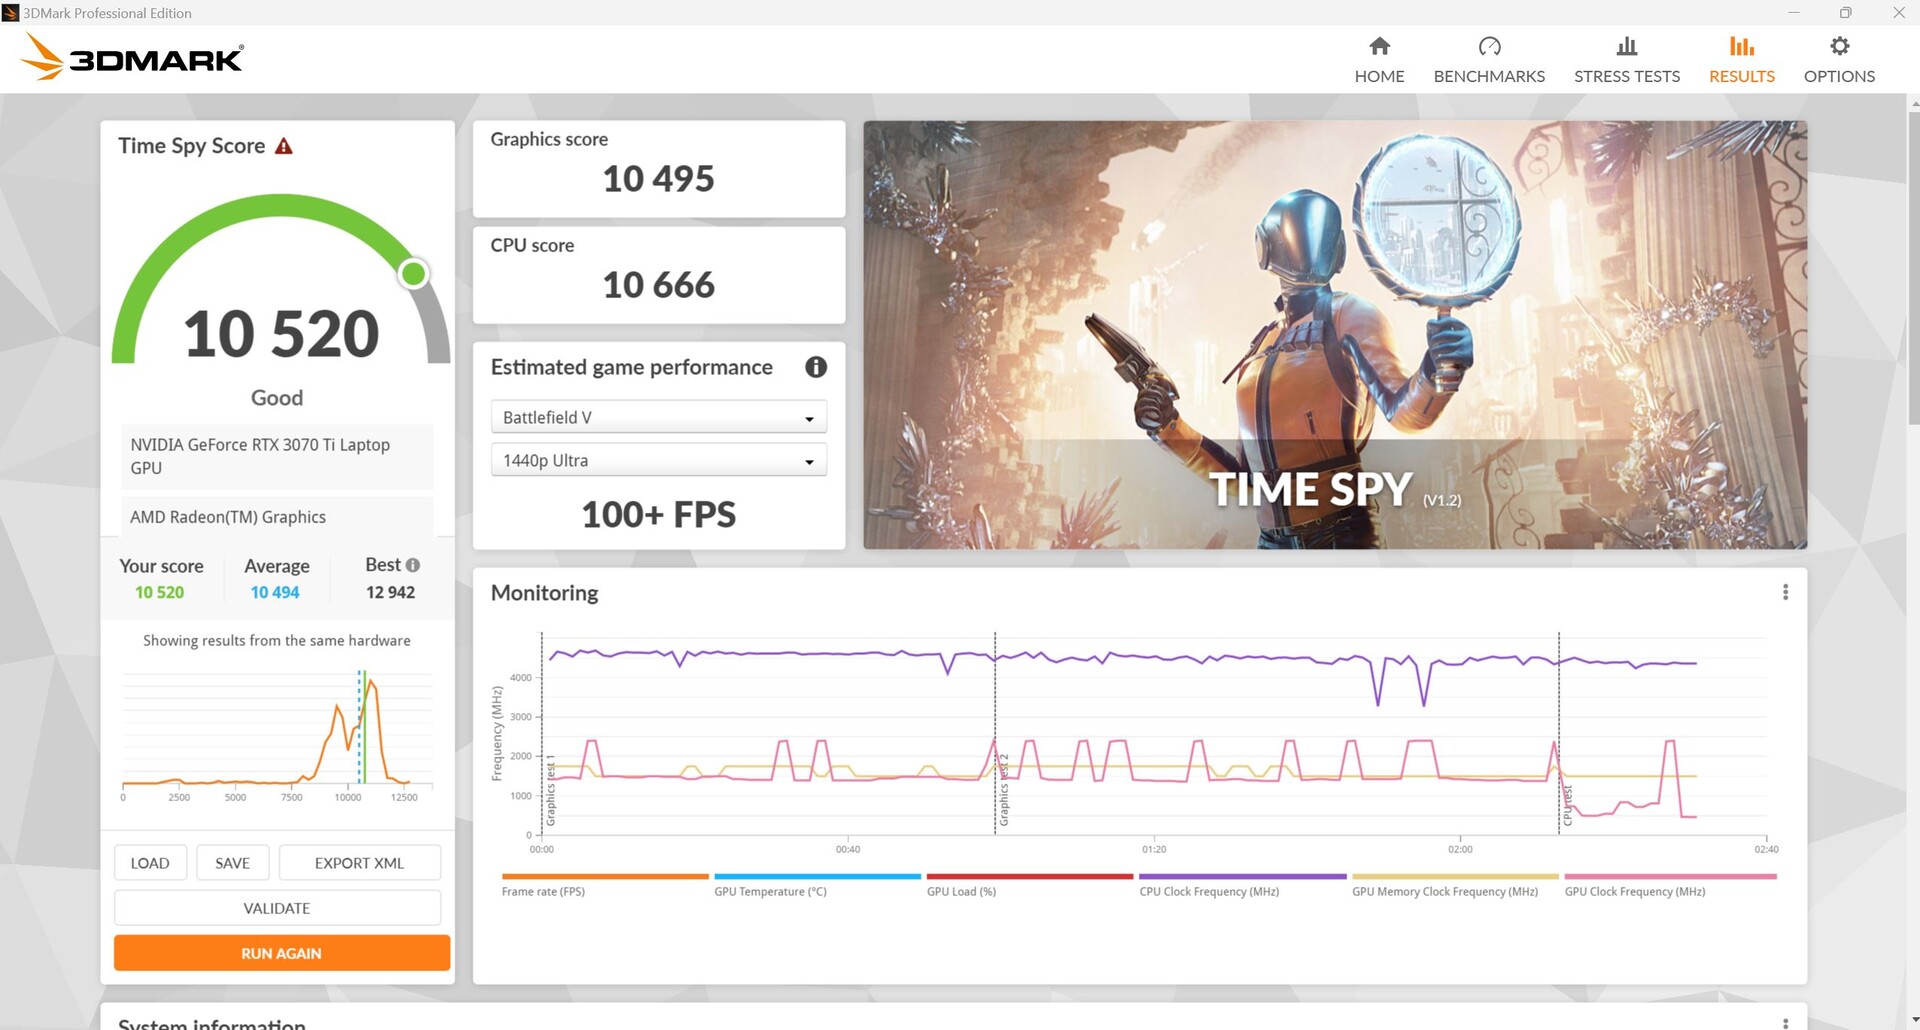
| 3DMark Time Spy Score | 10520 punti | |
Aiuto | ||
* ... Meglio usare valori piccoli
Prestazioni di gioco
Il Neo 15 è essenzialmente in grado di eseguire senza problemi tutti i giochi testati, anche con risoluzione QHD e impostazioni massime. Il portatile inizia ad avere qualche problema solo quando le impostazioni di ray-tracing sono impostate su valori elevati in giochi come Dying Light 2 (35 FPS).
Nel confronto, i risultati dei test di gioco dipingono un quadro simile a quelli di 3DMark: la GPU del Neo si comporta in gran parte (ma non sempre) meglio di una RTX 3070 Ti media. Detto questo, l'Asus ROG Strix Scar e in particolare l'MSI GE67 sono stati più veloci del Neo.
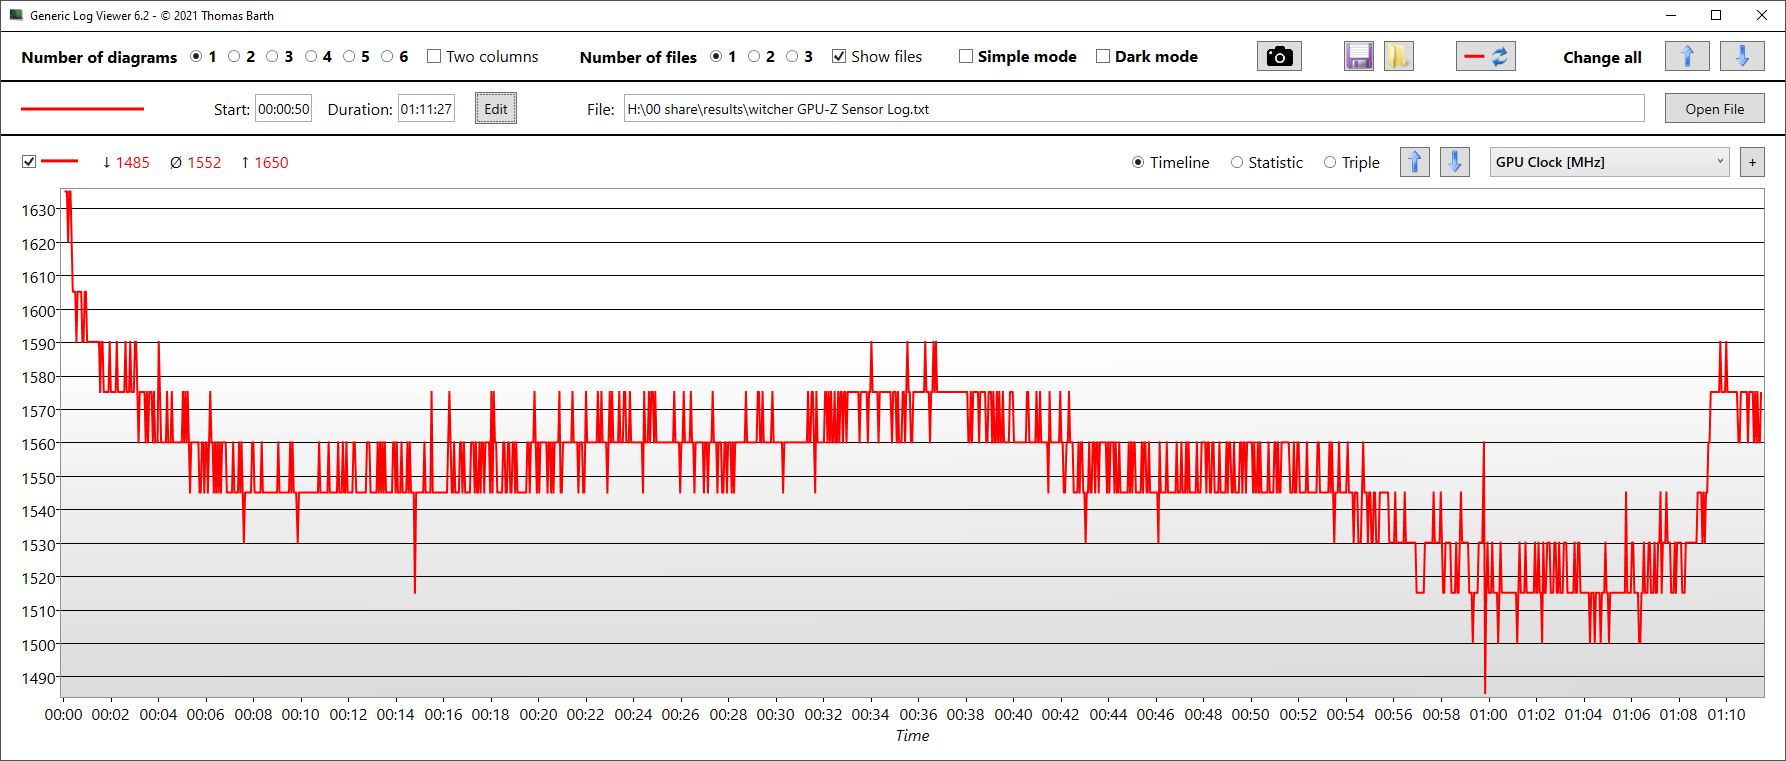
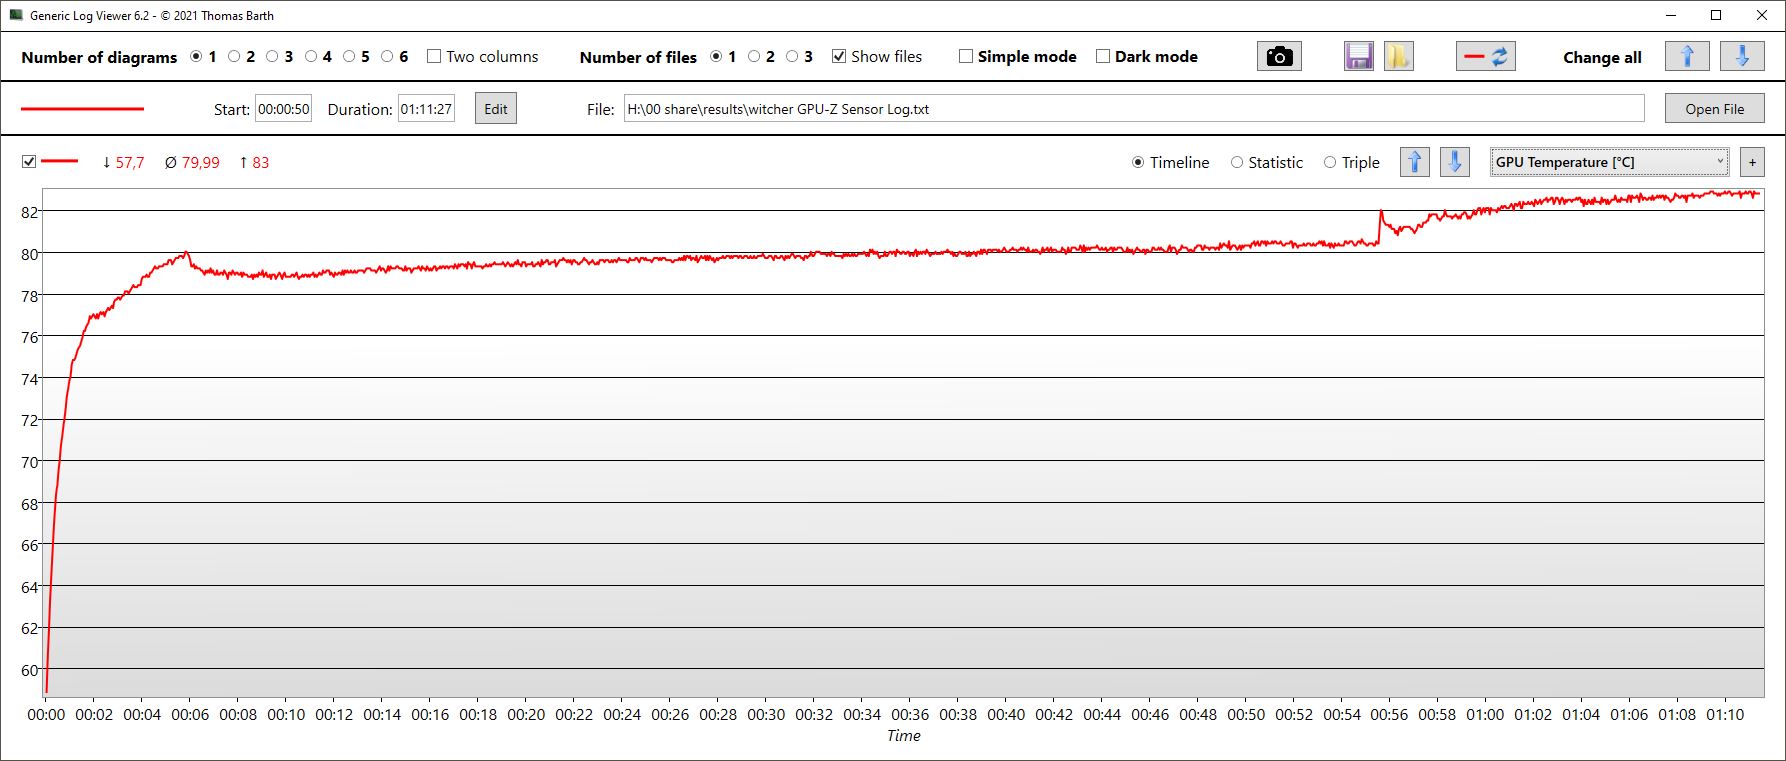
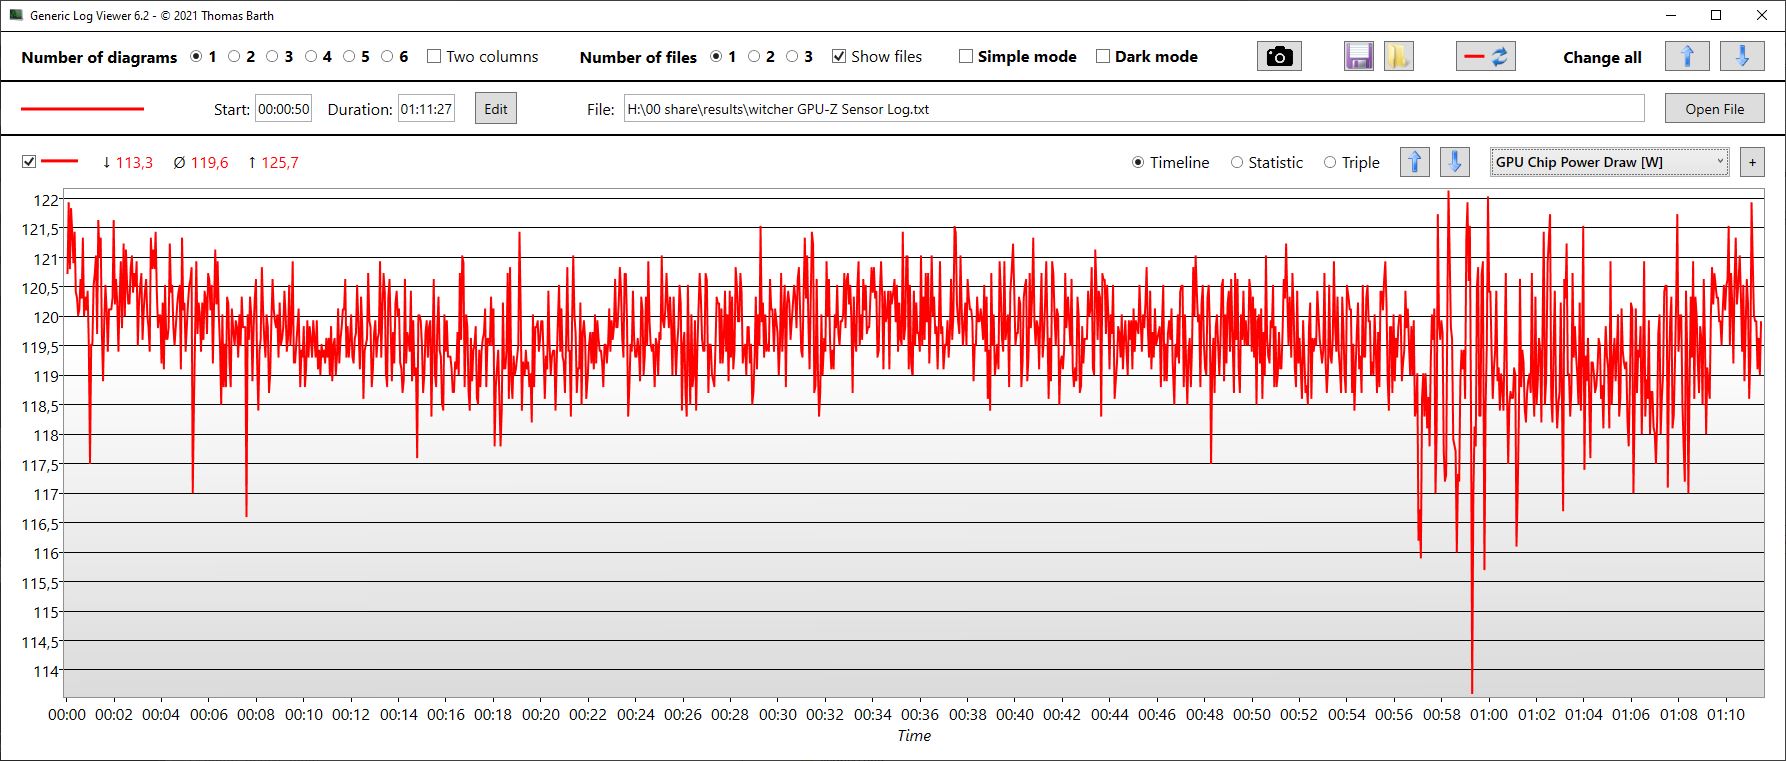
In Witcher 3, i frame rate sono rimasti per lo più stabili. Tuttavia, abbiamo notato che la temperatura della GPU (registrata in parallelo) ha continuato ad aumentare per tutta la durata del test e non si è stabilizzata. Ciò indica che la GPU potrebbe iniziare a subire un throttling termico dopo aver eseguito giochi impegnativi per lungo tempo, anche se ciò non si è verificato durante il test di un'ora. Il consumo energetico della GPU è stato di 120 watt in media.
Nel confronto, anche il Neo basato su Intel con una RTX 3080 Ti non è stato sostanzialmente più veloce con le stesse impostazioni. In generale, la GPU estremamente costosa del Neo basato su Intel difficilmente giustifica il suo prezzo elevato con i guadagni di prestazioni che offre. A seconda del gioco e delle impostazioni, il vantaggio è stato solo dell'1-25% circa.
Witcher 3 FPS chart
| basso | medio | alto | ultra | QHD | |
|---|---|---|---|---|---|
| GTA V (2015) | 176.6 | 170.3 | 156.2 | 97.6 | 93 |
| The Witcher 3 (2015) | 195 | 110 | |||
| Dota 2 Reborn (2015) | 135.9 | 123.1 | 116.3 | 114.1 | |
| X-Plane 11.11 (2018) | 109.5 | 94.9 | 77.6 | ||
| Far Cry 5 (2018) | 119 | 110 | 102 | ||
| Strange Brigade (2018) | 305 | 224 | 206 | 189 | 143 |
| Dying Light 2 (2022) | 82.5 | 59 |
Emissioni - Più freddo dell'Intel Neo al minimo
Emissioni acustiche
Sebbene il portatile non disponga di una modalità silenziosa, le ventole interne spesso non girano al minimo. È interessante notare che, nonostante la GPU più debole, il Neo basato su AMD non è così silenzioso sotto carico come la sua controparte basata su Intel. Tra i concorrenti, solo l'Acer Nitro 5 è leggermente più silenzioso. Ma è anche meno performante del Neo.
Quando le ventole sono inattive, il telaio emette un rumore sommesso ma acuto. Sebbene questo rumore non sia udibile quando le ventole sono in funzione, è comunque fastidioso in un ambiente silenzioso.
Rumorosità
| Idle |
| 23 / 25.82 / 27.3 dB(A) |
| Sotto carico |
| 42.7 / 56 dB(A) |
 | ||
30 dB silenzioso 40 dB(A) udibile 50 dB(A) rumoroso |
||
min: | ||
| Schenker XMG Neo 15 (Ryzen 9 6900HX, RTX 3070 Ti) GeForce RTX 3070 Ti Laptop GPU, R9 6900HX, Samsung SSD 980 Pro 1TB MZ-V8P1T0BW | Schenker XMG Neo 15 (i7-12700H, RTX 3080 Ti) GeForce RTX 3080 Ti Laptop GPU, i7-12700H, Samsung SSD 980 Pro 1TB MZ-V8P1T0BW | MSI GE67 HX 12UGS GeForce RTX 3070 Ti Laptop GPU, i7-12800HX, Samsung PM9A1 MZVL21T0HCLR | Asus ROG Strix Scar 15 G533ZW-LN106WS GeForce RTX 3070 Ti Laptop GPU, i9-12900H, Samsung PM9A1 MZVL22T0HBLB | Acer Nitro 5 AN515-58-72QR GeForce RTX 3070 Ti Laptop GPU, i7-12700H, Samsung PM9A1 MZVL21T0HCLR | MSI Stealth GS66 12UGS GeForce RTX 3070 Ti Laptop GPU, i7-12700H, WDC PC SN810 1TB | |
|---|---|---|---|---|---|---|
| Noise | -1% | 3% | -30% | -8% | -9% | |
| off /ambiente * (dB) | 23 | 23 -0% | 22.7 1% | 26.86 -17% | 26 -13% | 24 -4% |
| Idle Minimum * (dB) | 23 | 23 -0% | 22.9 -0% | 39.07 -70% | 26 -13% | 31 -35% |
| Idle Average * (dB) | 25.82 | 26.39 -2% | 22.9 11% | 39.07 -51% | 29 -12% | 32 -24% |
| Idle Maximum * (dB) | 27.3 | 26.39 3% | 22.9 16% | 39.07 -43% | 33 -21% | 35 -28% |
| Load Average * (dB) | 42.7 | 45.52 -7% | 44.4 -4% | 53.34 -25% | 47 -10% | 48 -12% |
| Witcher 3 ultra * (dB) | 56 | 55.89 -0% | 55.7 1% | 56.6 -1% | 53 5% | 43 23% |
| Load Maximum * (dB) | 56 | 55.89 -0% | 57.4 -2% | 56.6 -1% | 53 5% | 48 14% |
* ... Meglio usare valori piccoli
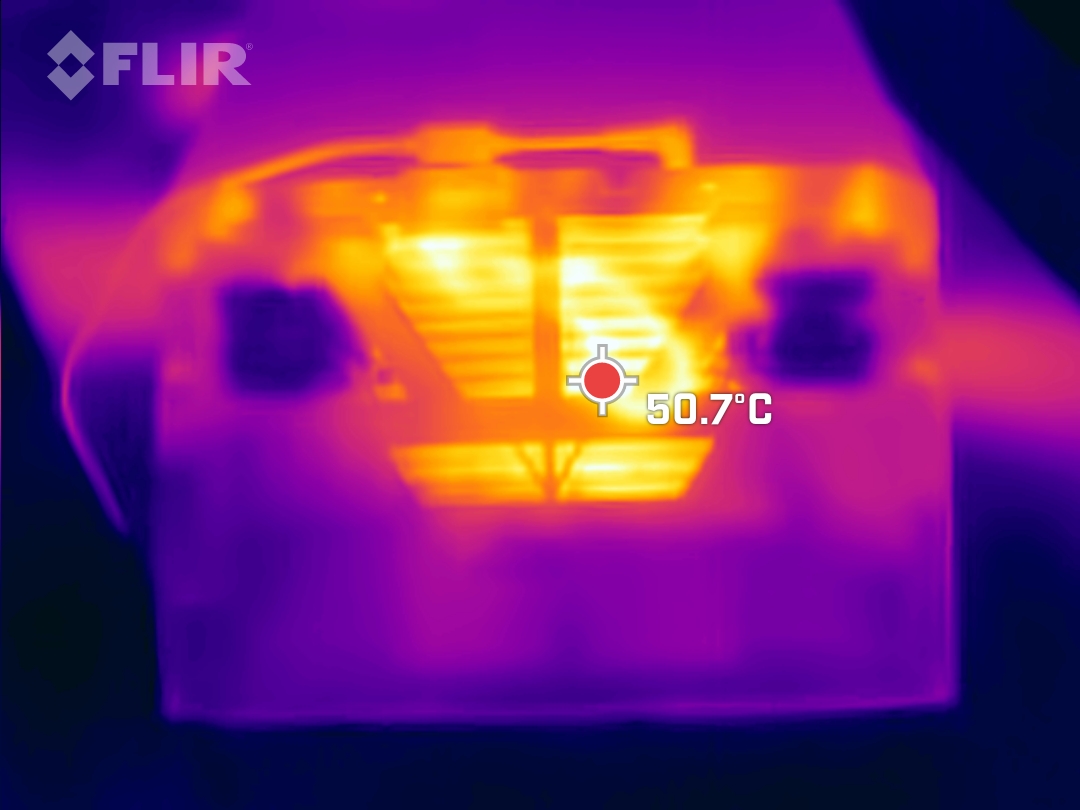
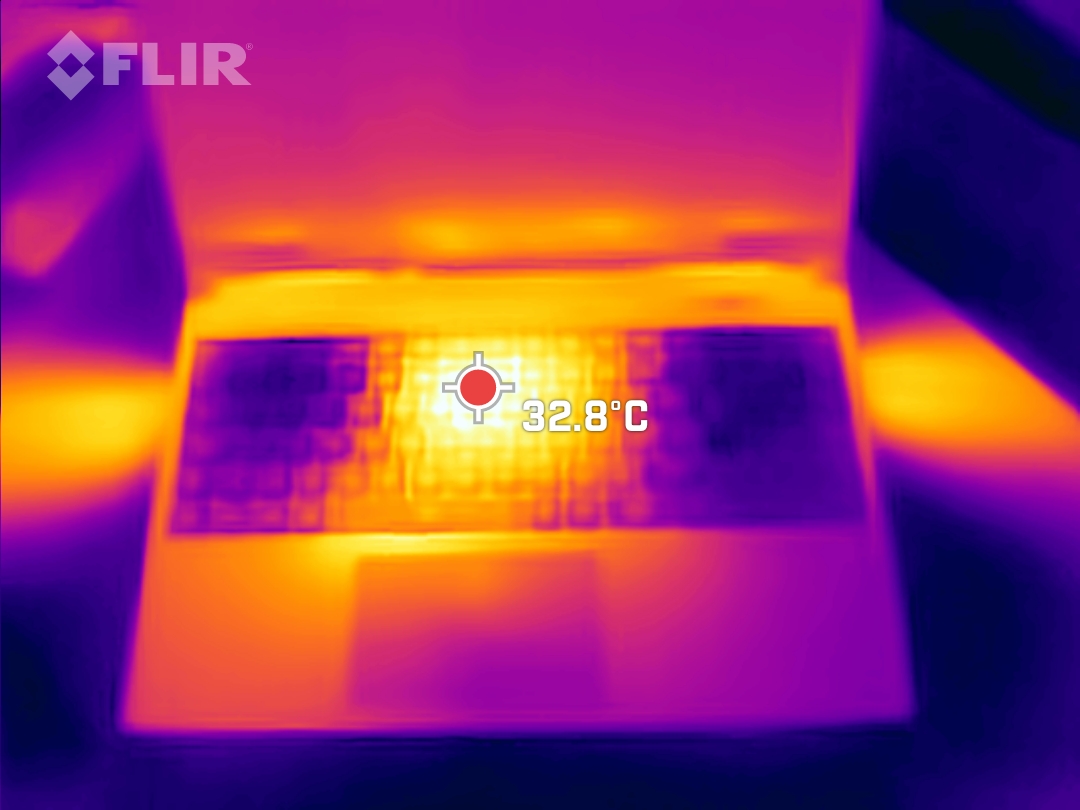
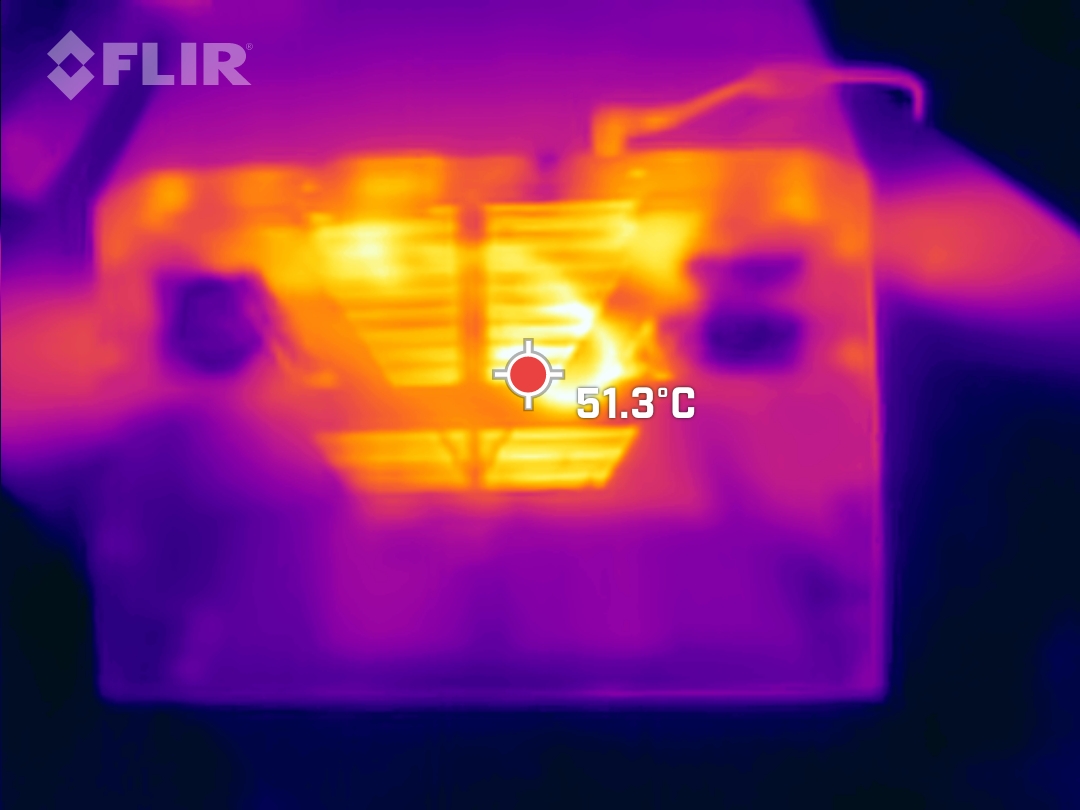
Temperatura
Al minimo, le temperature del case rimangono più confortevoli rispetto al Neo basato su Intel con RTX 3080 Ti. Tuttavia, questo vantaggio scompare sotto carico. Gli altri dispositivi del gruppo di confronto possono scaldarsi quanto il Neo. Tuttavia, è l'MSI GE67, altamente performante ma leggermente più ingombrante, ad essere più fresco rispetto agli altri portatili da gioco.
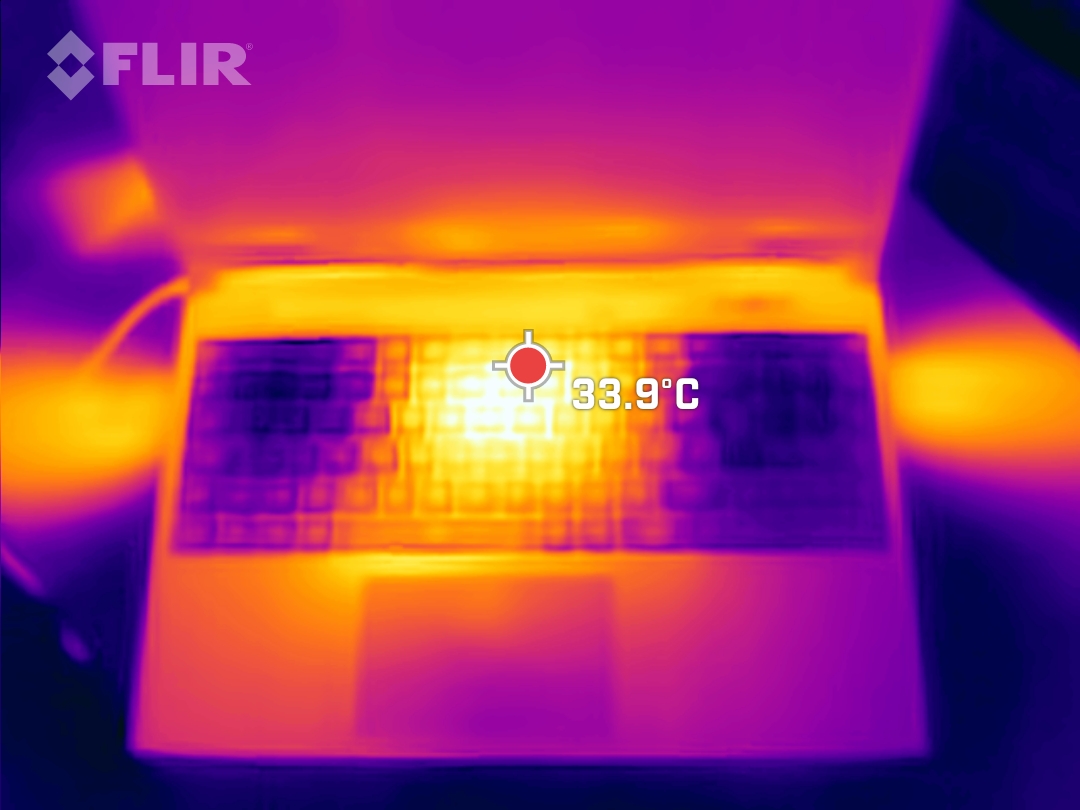
I poggiapolsi non diventano mai spiacevolmente caldi e lo stesso vale per i tasti WASD. Il calore si concentra soprattutto al centro e nell'area vicina al display. Il sottile pannello inferiore in plastica è dotato di molte prese d'aria, che lo rendono notevolmente più caldo del piano tastiera.
(±) La temperatura massima sul lato superiore è di 41 °C / 106 F, rispetto alla media di 40.4 °C / 105 F, che varia da 21.2 a 68.8 °C per questa classe Gaming.
(-) Il lato inferiore si riscalda fino ad un massimo di 57 °C / 135 F, rispetto alla media di 43.2 °C / 110 F
(+) In idle, la temperatura media del lato superiore è di 27.1 °C / 81 F, rispetto alla media deld ispositivo di 33.9 °C / 93 F.
(±) Riproducendo The Witcher 3, la temperatura media per il lato superiore e' di 33.3 °C / 92 F, rispetto alla media del dispositivo di 33.9 °C / 93 F.
(+) I poggiapolsi e il touchpad sono piu' freddi della temperatura della pelle con un massimo di 31 °C / 87.8 F e sono quindi freddi al tatto.
(-) La temperatura media della zona del palmo della mano di dispositivi simili e'stata di 28.8 °C / 83.8 F (-2.2 °C / -4 F).
| Schenker XMG Neo 15 (Ryzen 9 6900HX, RTX 3070 Ti) AMD Ryzen 9 6900HX, NVIDIA GeForce RTX 3070 Ti Laptop GPU | Schenker XMG Neo 15 (i7-12700H, RTX 3080 Ti) Intel Core i7-12700H, NVIDIA GeForce RTX 3080 Ti Laptop GPU | MSI GE67 HX 12UGS Intel Core i7-12800HX, NVIDIA GeForce RTX 3070 Ti Laptop GPU | Asus ROG Strix Scar 15 G533ZW-LN106WS Intel Core i9-12900H, NVIDIA GeForce RTX 3070 Ti Laptop GPU | Acer Nitro 5 AN515-58-72QR Intel Core i7-12700H, NVIDIA GeForce RTX 3070 Ti Laptop GPU | MSI Stealth GS66 12UGS Intel Core i7-12700H, NVIDIA GeForce RTX 3070 Ti Laptop GPU | |
|---|---|---|---|---|---|---|
| Heat | -20% | 11% | -14% | -9% | -5% | |
| Maximum Upper Side * (°C) | 41 | 44 -7% | 34.4 16% | 42.6 -4% | 48 -17% | 54 -32% |
| Maximum Bottom * (°C) | 57 | 56 2% | 42 26% | 50.2 12% | 51 11% | 59 -4% |
| Idle Upper Side * (°C) | 28 | 38 -36% | 24 14% | 36.2 -29% | 34 -21% | 26 7% |
| Idle Bottom * (°C) | 30 | 41 -37% | 33.2 -11% | 40.2 -34% | 33 -10% | 27 10% |
* ... Meglio usare valori piccoli
Test da sforzo
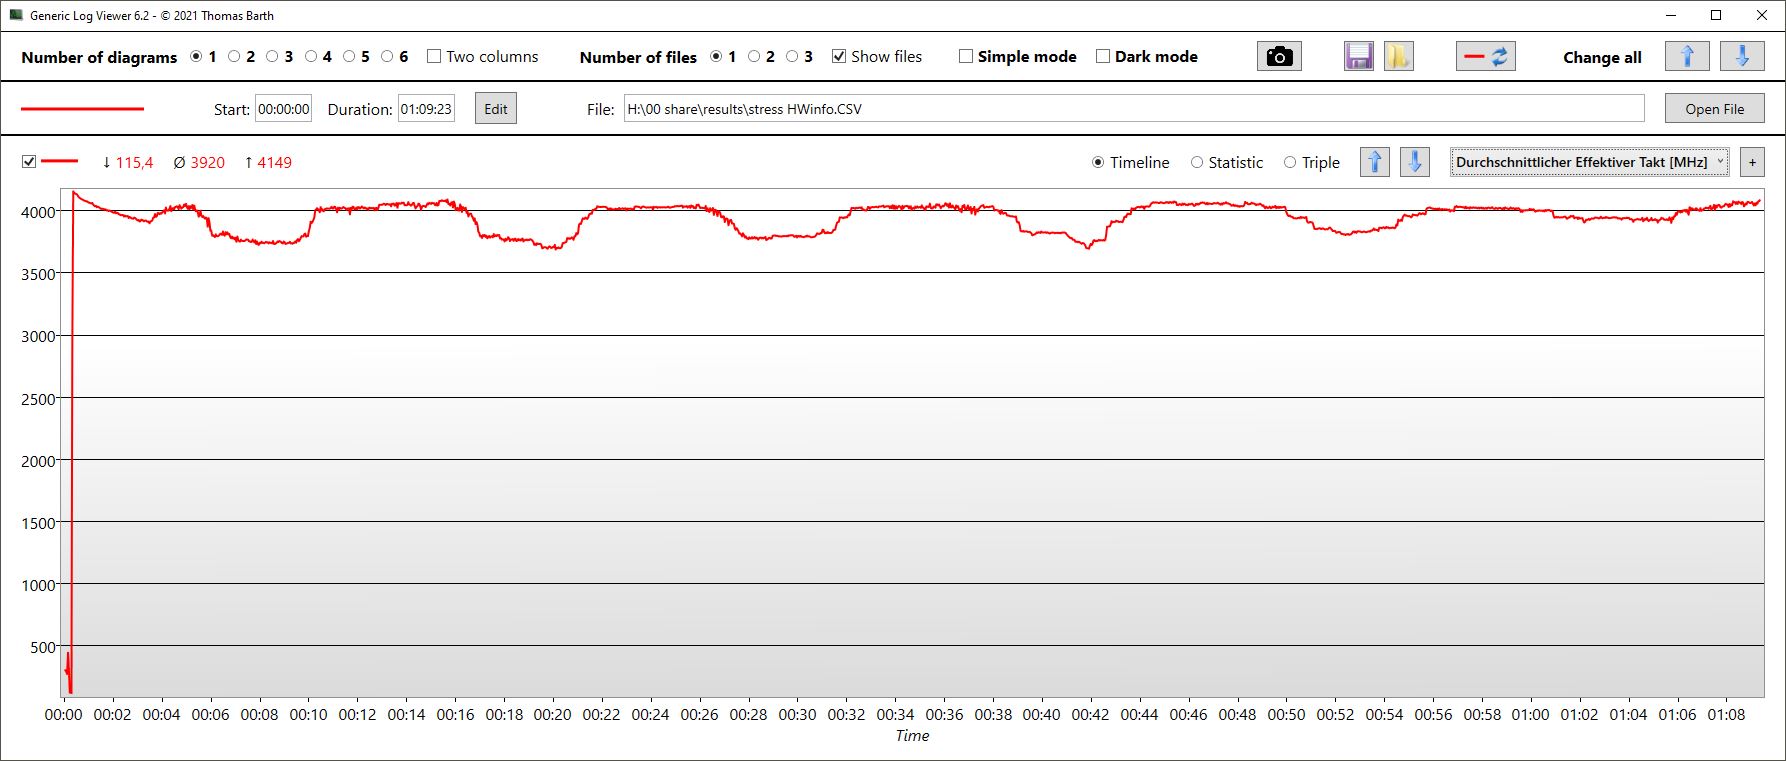
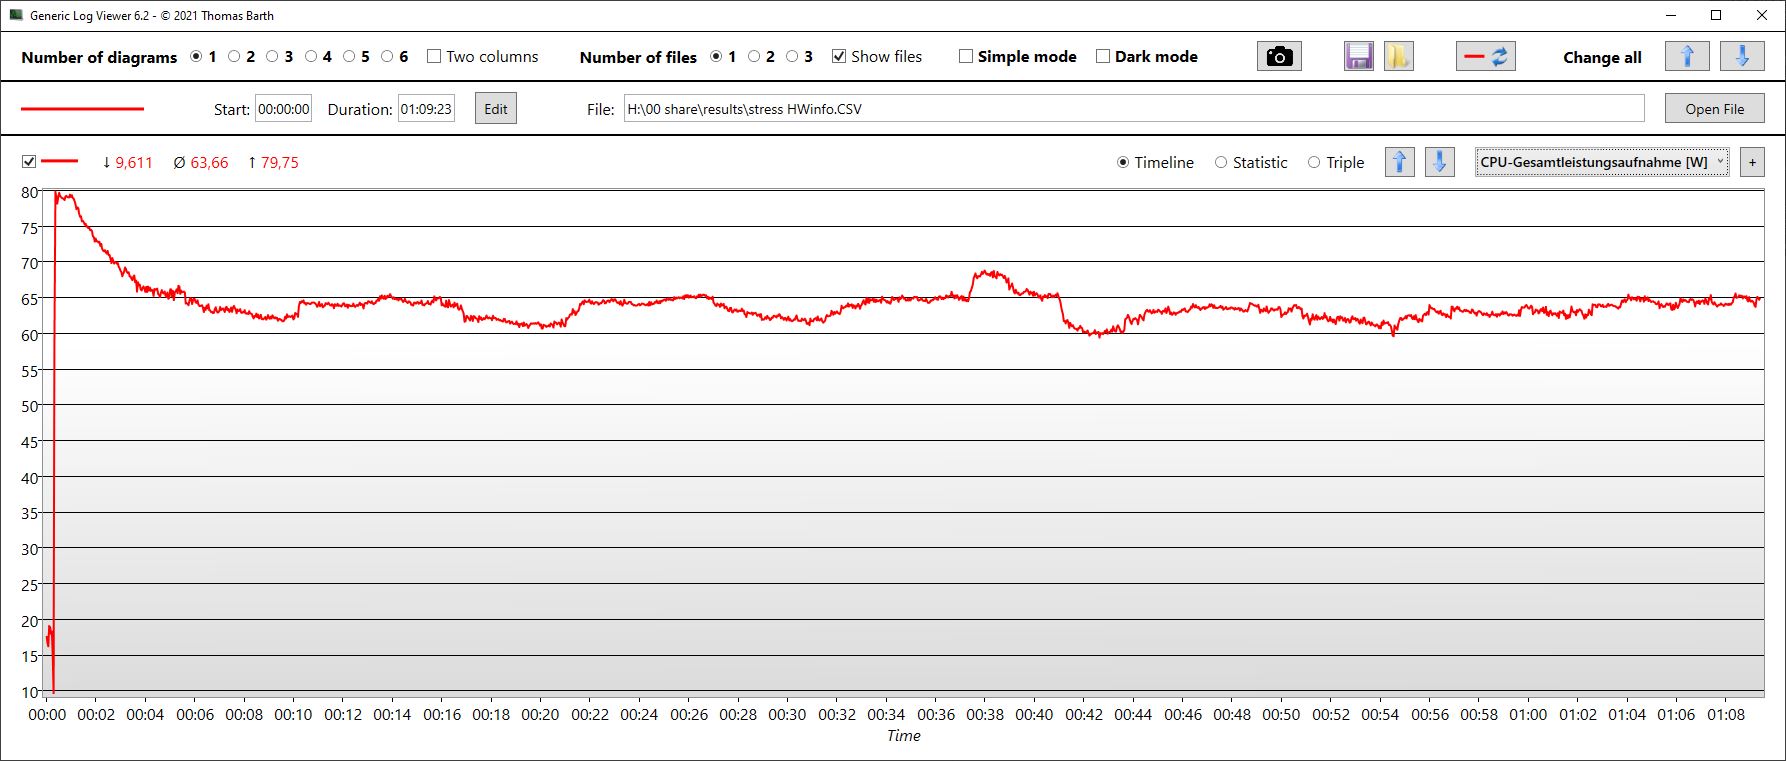
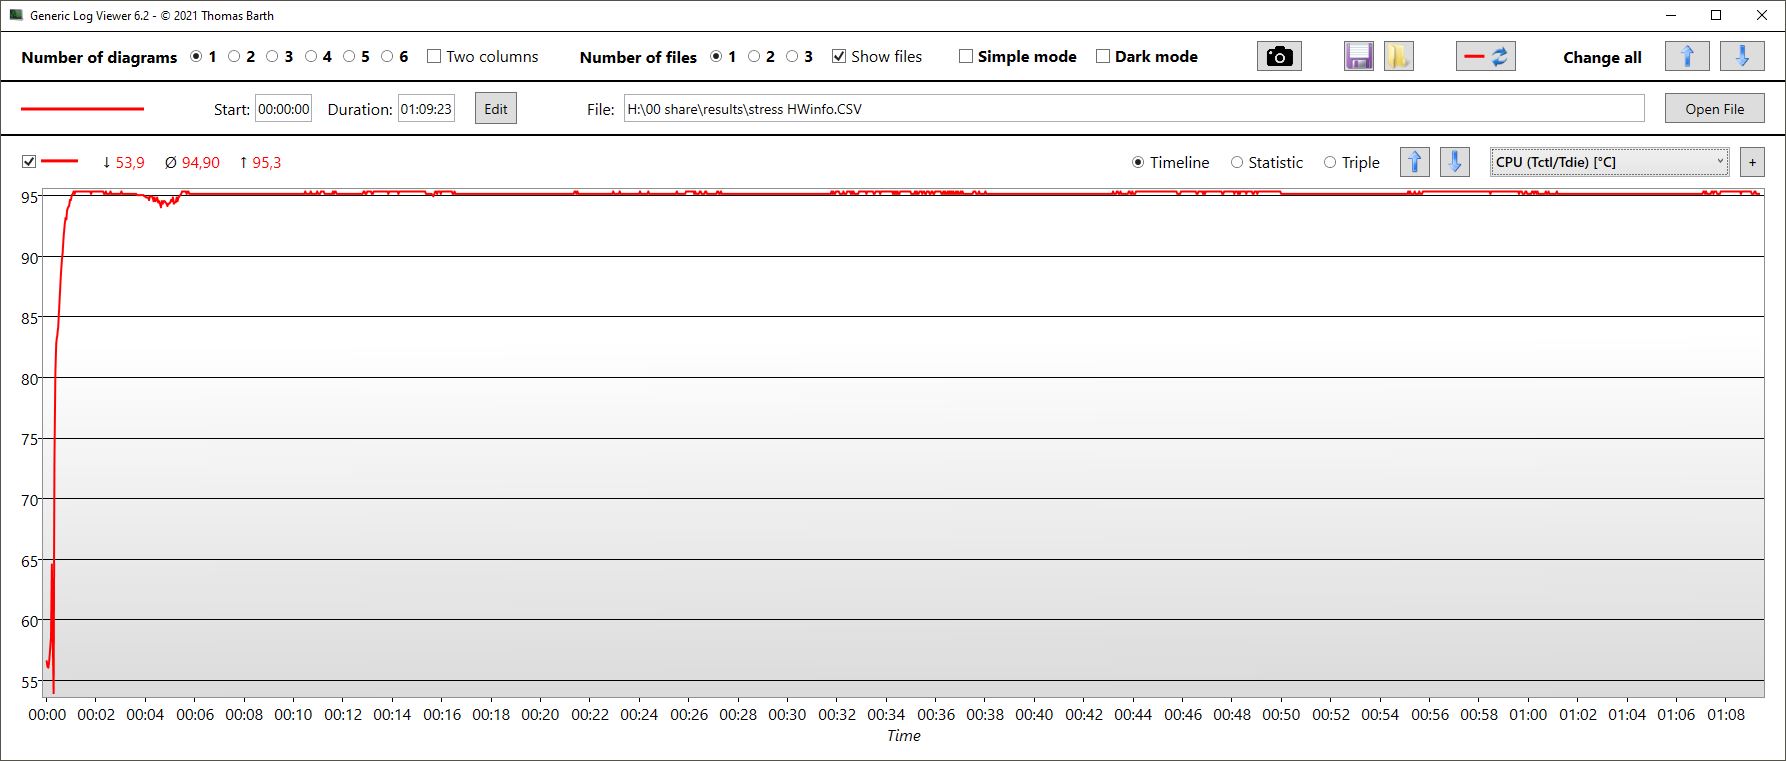
A differenza di molti sistemi basati su Intel, la velocità di clock della CPU del Neo è riuscita a rimanere abbastanza stabile durante il nostro stress test di un'ora. I core hanno iniziato il test a 4,1 GHz e non sono scesi sotto i 3,9 GHz. Sono riusciti anche ad avvicinarsi occasionalmente al valore iniziale. Le temperature dei core sono rimaste costanti a 95 °C (203 °F) e il consumo energetico è stato in media di 64 watt.
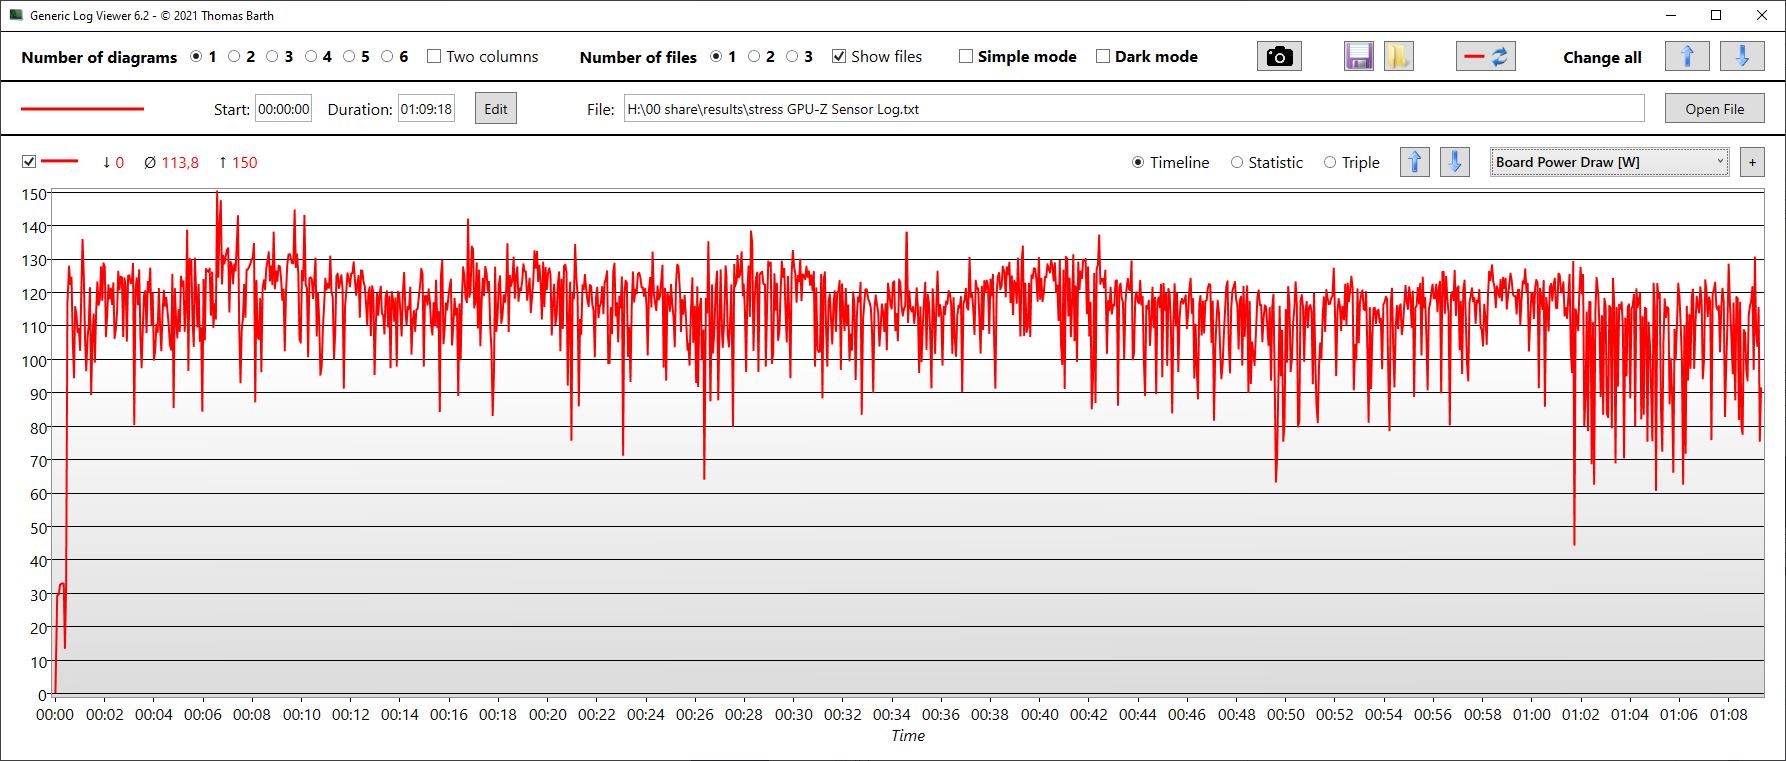
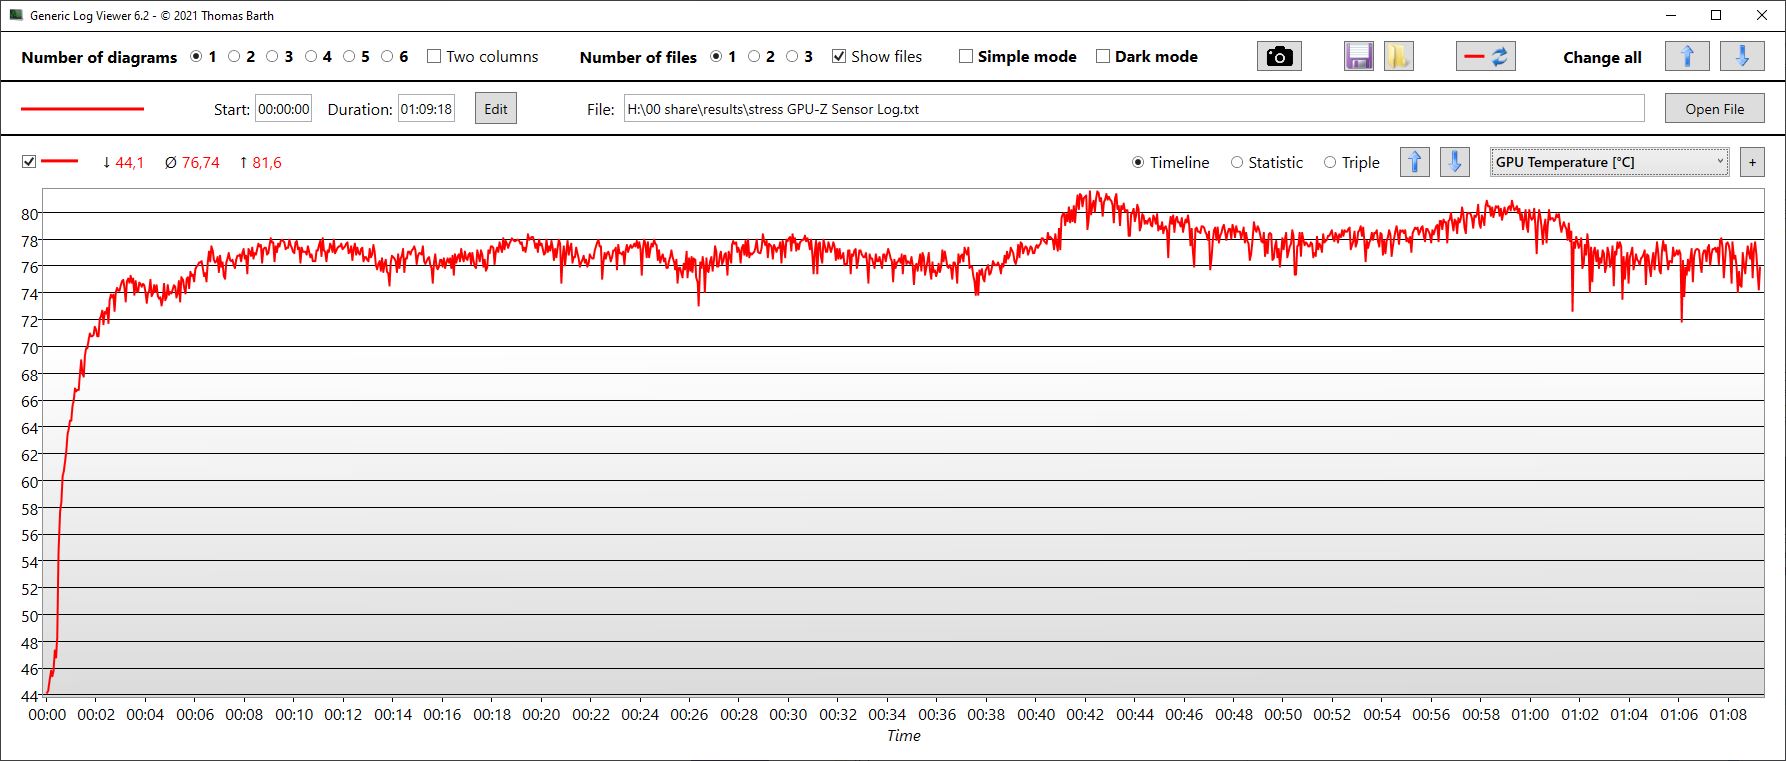
I valori della GPU hanno subito maggiori fluttuazioni. Dopo aver funzionato inizialmente a 1,7 GHz, la GPU è scesa talvolta a 1 GHz prima di tornare alla velocità di clock iniziale. La velocità della VRAM è rimasta costante durante il test. Le temperature della GPU si sono stabilizzate intorno ai 78°C (172°F), mentre il consumo energetico ha raramente raggiunto l'obiettivo dei 150 watt, con una media di circa 114 watt.
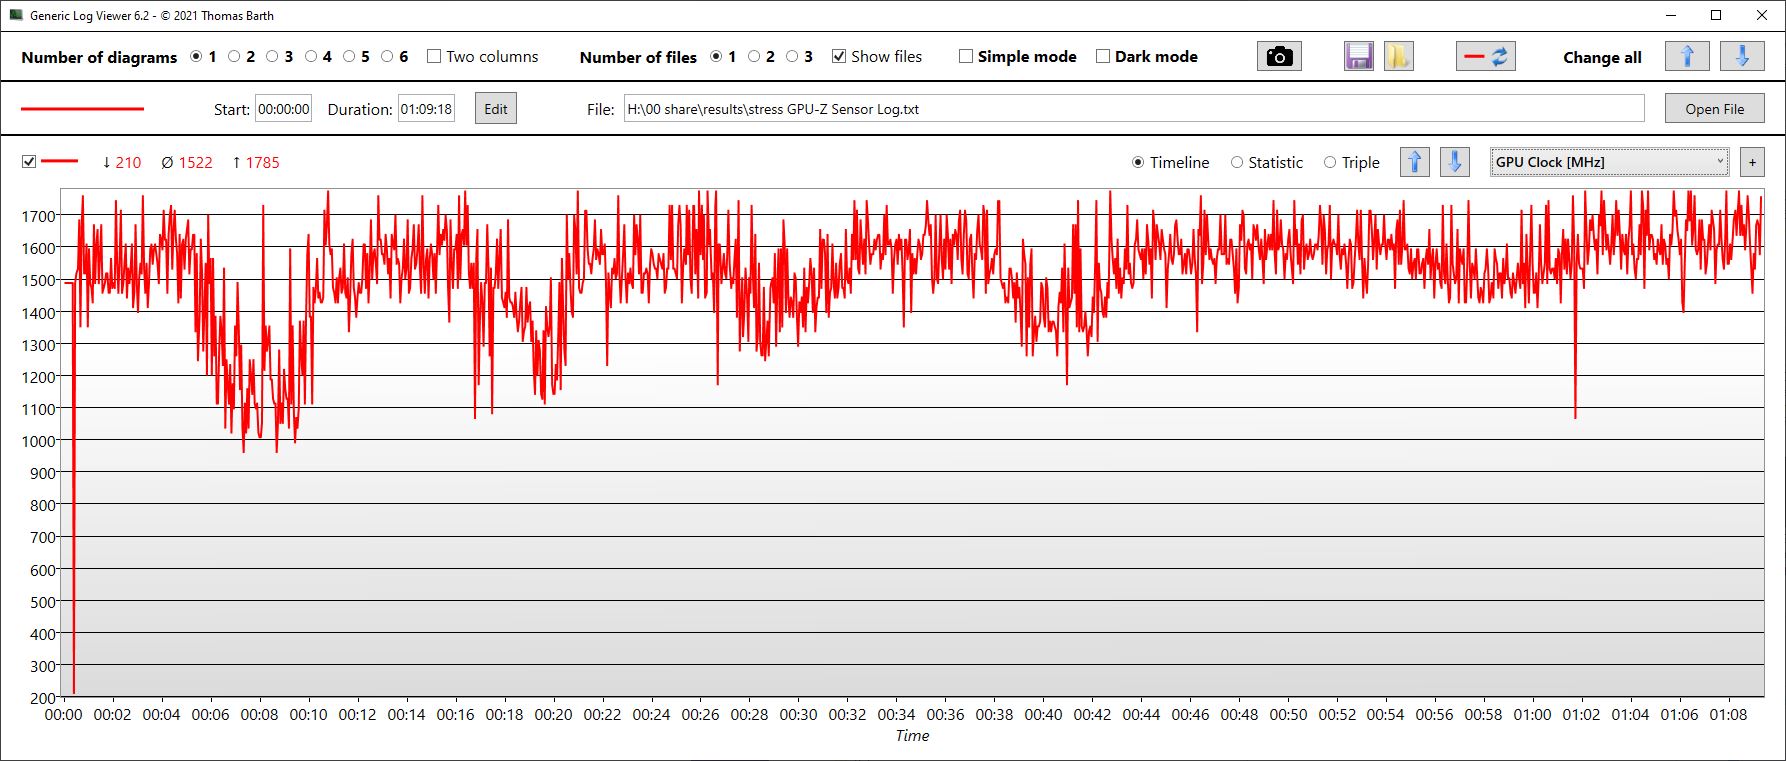
| Clock della CPU (GHz) | Clock della GPU (MHz) | Temperatura media della CPU (°C) | Temperatura media della GPU (°C) | |
| Sistema inattivo | -- | -- | 55 | 44 |
| Prime95 + FurMark Stress | 3,9 | 1.522 | 95 | 77 |
| Witcher 3 Stress | 3,1 | 1.550 | 67 | 83 |
Altoparlanti
Schenker XMG Neo 15 (Ryzen 9 6900HX, RTX 3070 Ti) analisi audio
(±) | potenza degli altiparlanti media ma buona (78.26 dB)
Bassi 100 - 315 Hz
(-) | quasi nessun basso - in media 19.2% inferiori alla media
(±) | la linearità dei bassi è media (8.2% delta rispetto alla precedente frequenza)
Medi 400 - 2000 Hz
(±) | medi elevati - circa 6.6% superiore alla media
(±) | linearità dei medi adeguata (9.9% delta rispetto alla precedente frequenza)
Alti 2 - 16 kHz
(+) | Alti bilanciati - appena 2.8% dalla media
(+) | alti lineari (6% delta rispetto alla precedente frequenza)
Nel complesso 100 - 16.000 Hz
(±) | la linearità complessiva del suono è media (19.1% di differenza rispetto alla media
Rispetto alla stessa classe
» 64% di tutti i dispositivi testati in questa classe è stato migliore, 7% simile, 28% peggiore
» Il migliore ha avuto un delta di 6%, medio di 18%, peggiore di 132%
Rispetto a tutti i dispositivi testati
» 46% di tutti i dispositivi testati in questa classe è stato migliore, 7% similare, 47% peggiore
» Il migliore ha avuto un delta di 4%, medio di 24%, peggiore di 134%
Asus ROG Strix Scar 15 G533ZW-LN106WS analisi audio
(±) | potenza degli altiparlanti media ma buona (80.5 dB)
Bassi 100 - 315 Hz
(+) | bassi buoni - solo 3.7% dalla media
(+) | bassi in lineaa (5.5% delta rispetto alla precedente frequenza)
Medi 400 - 2000 Hz
(±) | medi elevati - circa 7.1% superiore alla media
(+) | medi lineari (3.1% delta rispetto alla precedente frequenza)
Alti 2 - 16 kHz
(+) | Alti bilanciati - appena 3.3% dalla media
(+) | alti lineari (5.9% delta rispetto alla precedente frequenza)
Nel complesso 100 - 16.000 Hz
(+) | suono nel complesso lineare (12.2% differenza dalla media)
Rispetto alla stessa classe
» 13% di tutti i dispositivi testati in questa classe è stato migliore, 4% simile, 83% peggiore
» Il migliore ha avuto un delta di 6%, medio di 18%, peggiore di 132%
Rispetto a tutti i dispositivi testati
» 10% di tutti i dispositivi testati in questa classe è stato migliore, 2% similare, 88% peggiore
» Il migliore ha avuto un delta di 4%, medio di 24%, peggiore di 134%
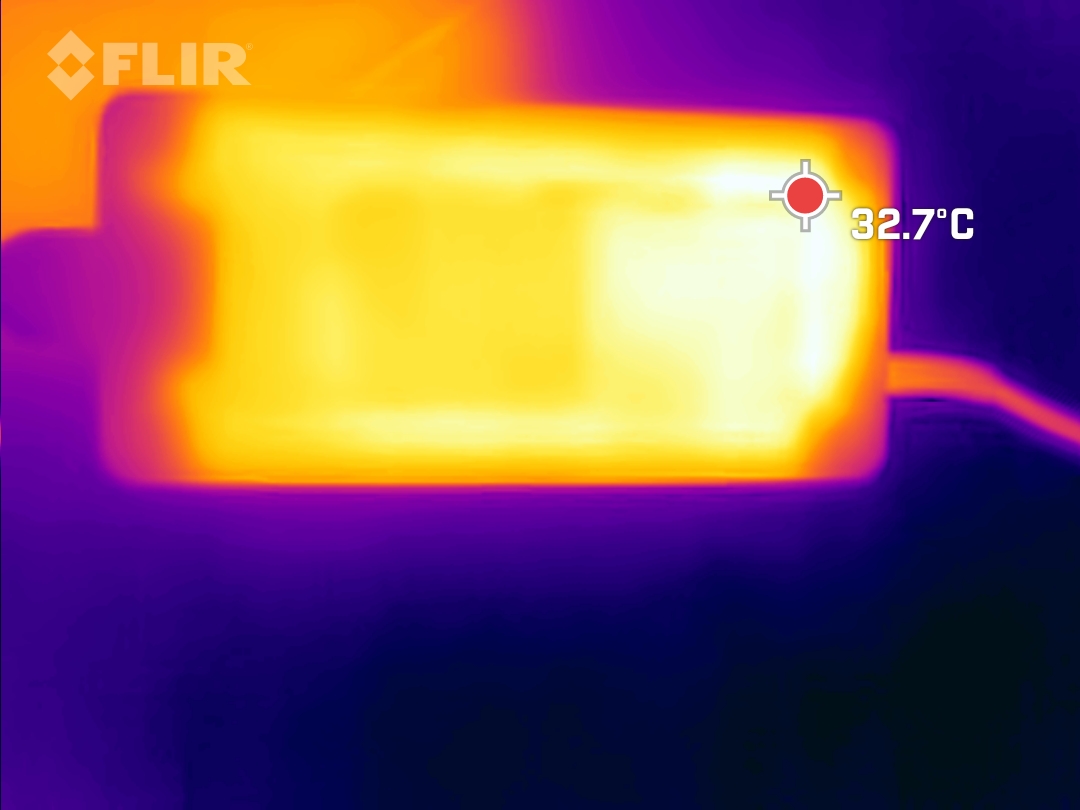
Gestione dell'alimentazione - XMG Neo 15 ha un'ottima durata della batteria
Consumo di energia
Il portatile consuma tra i 13 e i 20 watt al minimo, a seconda del profilo di prestazioni selezionato e della luminosità del display. Nella migliore delle ipotesi si tratta di un risultato medio nel nostro confronto.
Durante l'esecuzione di Witcher 3, il sistema ha consumato circa 200 watt, una frazione in più rispetto all'Asus ROG Strix, leggermente più veloce.
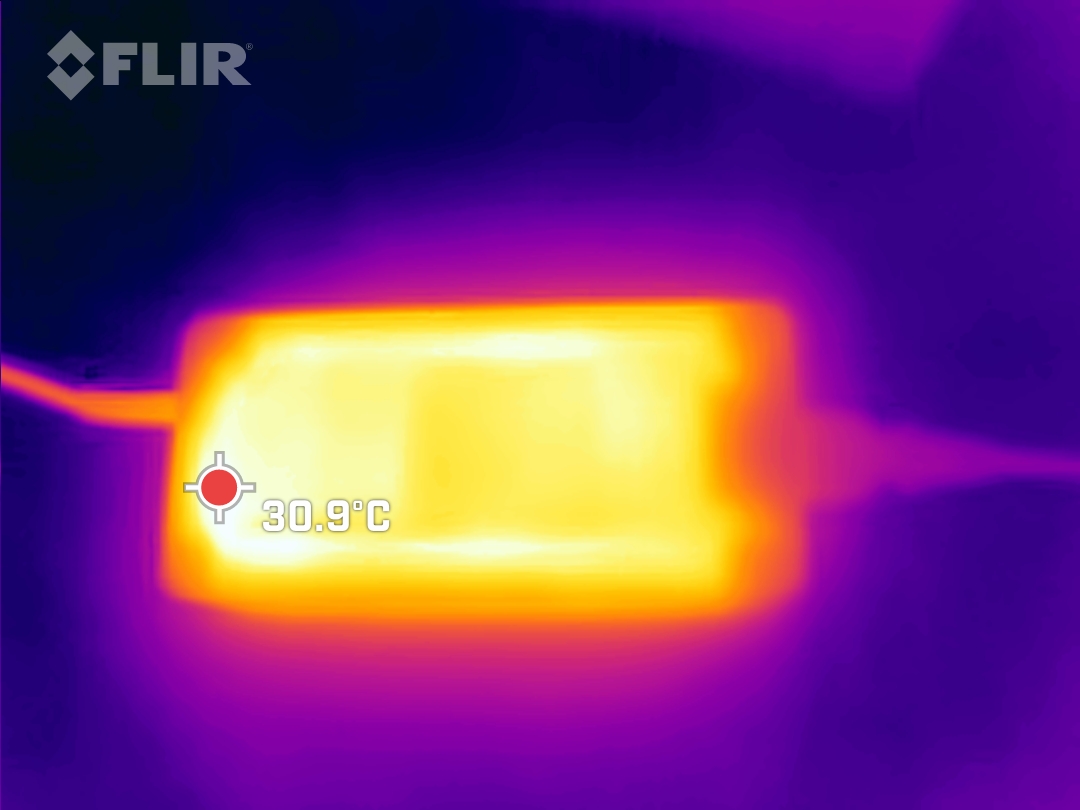
Durante lo stress test, abbiamo misurato un picco temporaneo di consumo di 260 watt. Il caricabatterie da 280 watt è in grado di gestire senza problemi i requisiti energetici del portatile, soprattutto se si considera che il consumo di energia si è stabilizzato a 210 watt nel corso dello stress test.
| Off / Standby | |
| Idle | |
| Sotto carico |
|
Leggenda:
min: | |
| Schenker XMG Neo 15 (Ryzen 9 6900HX, RTX 3070 Ti) R9 6900HX, GeForce RTX 3070 Ti Laptop GPU, Samsung SSD 980 Pro 1TB MZ-V8P1T0BW, IPS, 2560x1440, 15.6" | Schenker XMG Neo 15 (i7-12700H, RTX 3080 Ti) i7-12700H, GeForce RTX 3080 Ti Laptop GPU, Samsung SSD 980 Pro 1TB MZ-V8P1T0BW, IPS, 2560x1440, 15.6" | MSI GE67 HX 12UGS i7-12800HX, GeForce RTX 3070 Ti Laptop GPU, Samsung PM9A1 MZVL21T0HCLR, OLED, 1920x1080, 15.6" | Asus ROG Strix Scar 15 G533ZW-LN106WS i9-12900H, GeForce RTX 3070 Ti Laptop GPU, Samsung PM9A1 MZVL22T0HBLB, IPS-level, 2560x1440, 15.6" | Acer Nitro 5 AN515-58-72QR i7-12700H, GeForce RTX 3070 Ti Laptop GPU, Samsung PM9A1 MZVL21T0HCLR, IPS, 2560x1440, 15.6" | MSI Stealth GS66 12UGS i7-12700H, GeForce RTX 3070 Ti Laptop GPU, WDC PC SN810 1TB, IPS-Level, 2560x1440, 15.6" | Media NVIDIA GeForce RTX 3070 Ti Laptop GPU | Media della classe Gaming | |
|---|---|---|---|---|---|---|---|---|
| Power Consumption | -14% | -20% | 5% | 3% | 3% | -19% | -11% | |
| Idle Minimum * (Watt) | 13 | 15 -15% | 16.1 -24% | 7.56 42% | 7 46% | 11 15% | 14.2 ? -9% | 13.3 ? -2% |
| Idle Average * (Watt) | 17 | 18 -6% | 17.1 -1% | 13.5 21% | 15 12% | 16 6% | 19.9 ? -17% | 19 ? -12% |
| Idle Maximum * (Watt) | 20 | 18 10% | 26.6 -33% | 16.87 16% | 24 -20% | 23 -15% | 26.2 ? -31% | 24.5 ? -23% |
| Load Average * (Watt) | 89 | 123 -38% | 116.3 -31% | 128.9 -45% | 124 -39% | 110 -24% | 125.8 ? -41% | 108.1 ? -21% |
| Witcher 3 ultra * (Watt) | 200 | 234 -17% | 237 -19% | 196.2 2% | 195.1 2% | 151 24% | ||
| Load Maximum * (Watt) | 260 | 301 -16% | 291.1 -12% | 274.86 -6% | 220 15% | 230 12% | 248 ? 5% | 254 ? 2% |
* ... Meglio usare valori piccoli
Power Consumption Witcher 3 / Stress test
Power Consumption with External Monitor
Durata della batteria
Schenker ha dotato il portatile di una batteria da 96Wh. A parte l'Acer Nitro, tutti i dispositivi del confronto hanno batterie di dimensioni simili.
L'XMG Neo 15 offre un'eccellente durata della batteria rispetto alla concorrenza. Sembra che Schenker abbia fatto un buon lavoro di messa a punto delle modalità di alimentazione.
In ogni caso, con la luminosità dello schermo abbassata, il portatile ci ha garantito quasi 11 ore di navigazione web e riproduzione video. Anche con la massima luminosità dello schermo, siamo riusciti a navigare in Internet per 8,5 ore tramite Wi-Fi.
| Schenker XMG Neo 15 (Ryzen 9 6900HX, RTX 3070 Ti) R9 6900HX, GeForce RTX 3070 Ti Laptop GPU, 93 Wh | Schenker XMG Neo 15 (i7-12700H, RTX 3080 Ti) i7-12700H, GeForce RTX 3080 Ti Laptop GPU, 93 Wh | MSI GE67 HX 12UGS i7-12800HX, GeForce RTX 3070 Ti Laptop GPU, 99.9 Wh | Asus ROG Strix Scar 15 G533ZW-LN106WS i9-12900H, GeForce RTX 3070 Ti Laptop GPU, 90 Wh | Acer Nitro 5 AN515-58-72QR i7-12700H, GeForce RTX 3070 Ti Laptop GPU, 57.5 Wh | MSI Stealth GS66 12UGS i7-12700H, GeForce RTX 3070 Ti Laptop GPU, 99.9 Wh | Media della classe Gaming | |
|---|---|---|---|---|---|---|---|
| Autonomia della batteria | -23% | -9% | -29% | -48% | -25% | -22% | |
| H.264 (h) | 10.7 | 7.1 -34% | 8.5 -21% | 4.7 -56% | 8.26 ? -23% | ||
| WiFi v1.3 (h) | 10.9 | 7.7 -29% | 5.6 -49% | 8.4 -23% | 3.9 -64% | 5.4 -50% | 7.01 ? -36% |
| Load (h) | 1.6 | 1.5 -6% | 2.1 31% | 0.9 -44% | 1.2 -25% | 1.6 0% | 1.47 ? -8% |
| Reader / Idle (h) | 8.4 | 5.7 | 7.8 | 8.71 ? | |||
| Witcher 3 ultra (h) | 1.2 |
Pro
Contro
Verdetto - Intel o AMD? È una questione di preferenze.
Il Neo 15 è un ottimo portatile da gioco anche con processore AMD. Al minimo, il Neo basato su AMD funziona molto più freddamente e ha una durata della batteria più lunga rispetto alla sua controparte basata su Intel. Il rovescio della medaglia è che le prestazioni della CPU sono leggermente inferiori e manca il supporto Thunderbolt. I consumatori devono decidere cosa è più importante per loro
Le prestazioni di gioco del portatile si collocano nella fascia media superiore, ma possono essere ulteriormente migliorate utilizzando l'ampia gamma di impostazioni manuali disponibili.
Siamo colpiti dalla superba durata della batteria, ma siamo un po' combattuti su alcuni aspetti. Ci piacciono i robusti materiali metallici utilizzati sul display e sulla tastiera, ma la parte inferiore è troppo morbida per i nostri gusti. Il dispositivo è dotato di una webcam Full HD, ma la qualità delle immagini è talmente scarsa che molti modelli a 720p sono in grado di fare meglio. C'è ancora un po' di margine di miglioramento. Detto questo, si tratta di una critica relativamente minore.
L'XMG Neo 15 con AMD Ryzen è un portatile da gioco performante e senza grossi svantaggi, dotato di connessione per il raffreddamento ad acqua esterno opzionale. Ciononostante, alcune delle tante ottime idee di questo portatile possono ancora essere perfezionate.
Se siete alla ricerca di alternative, vi consigliamo in particolare il modello MSI GE6 HX 12UGSche è superiore in quasi tutti i test sulle prestazioni e non è peggiore in termini di emissioni. Potete anche dare un'occhiata all' Asus ROG Strix Scar, un computer portatile che è in grado di competere con il Neo 15.
Prezzo e disponibilità
Il Neo 15 può essere configurato in molti modi sul negozio online di XMG (bestware.com). Il modello da noi recensito, , costa 2.877 euro (2.850 dollari). Potete risparmiare quasi 500 euro (495 dollari) optando per una RTX 3060 invece che per una RTX 3070 Ti! Se cercate sui siti web di confronto, potreste anche trovare il portatile a un prezzo leggermente inferiore.
Schenker XMG Neo 15 (Ryzen 9 6900HX, RTX 3070 Ti)
- 10/26/2022 v7 (old)
Christian Hintze
Price comparison

