Recensione del Lenovo IdeaPad Gaming 3 15IAH7: Uno dei più potenti laptop con RTX 3050 Ti

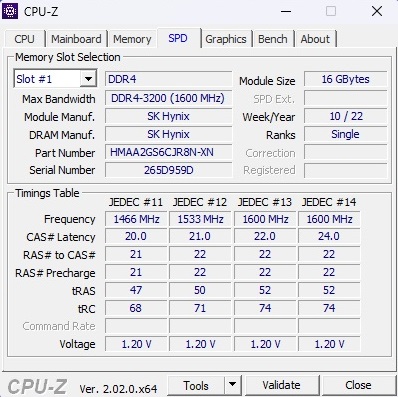
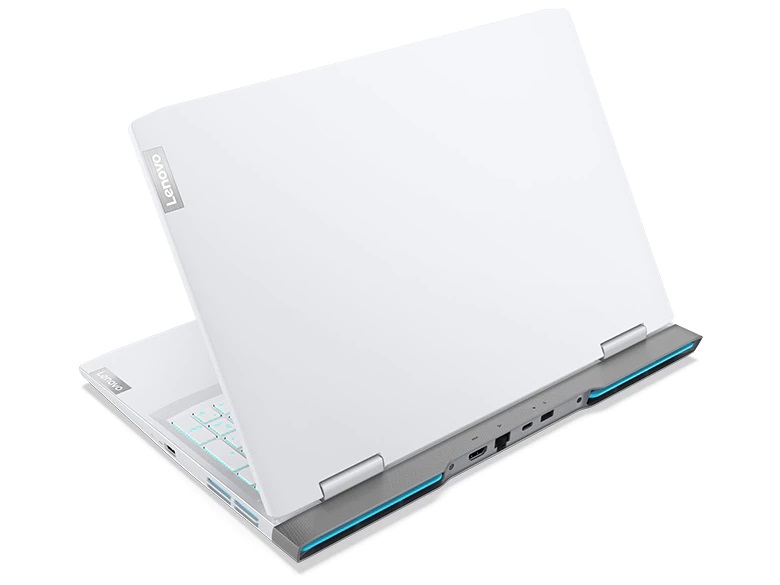
Sebbene siano disponibili diversi portatili da gioco nella fascia di prezzo intorno ai 1.000 euro (~$978), la maggior parte di questi rinuncia a un display con una luminosità decente e una solida copertura dello spazio colore. Tuttavia, di tanto in tanto si può trovare un'eccezione positiva, come l'IdeaPad Gaming 3 15IAH7 che abbiamo testato, che offre un Core i5-12500H, aGeForce RTX 3050 Ti, 16 GB di RAM DDR4 (purtroppo solo in modalità single-channel) e un SSD NVMe da 512 GB. Lo schermo IPS da 15,6 pollici ha una frequenza di aggiornamento di 165 Hz, che promette buoni tempi di risposta, e una risoluzione di 1920 x 1080 pixel.
Tra i concorrenti dell'IdeaPad Gaming 3 15IAH7 ci sono altri portatili con RTX 3050 Ti, come l'HP Victus 16-e0145ng e l'HP Victus 16-e0145ng HP Victus 16-e0145ng, ilDell G15 5515e il Dell Inspiron 16 Plus 7620. Includiamo anche il modello fratello 15ARH7 (Ryzen 5 6600H & RTX 3050) nei nostri grafici come dispositivo di confronto.
Potenziali concorrenti a confronto
Punteggio | Data | Modello | Peso | Altezza | Dimensione | Risoluzione | Prezzo |
|---|---|---|---|---|---|---|---|
| 82.8 % v7 (old) | 10/2022 | Lenovo IdeaPad Gaming 3 15IAH7 i5-12500H, GeForce RTX 3050 Ti Laptop GPU | 2.4 kg | 26 mm | 15.60" | 1920x1080 | |
| 80.8 % v7 (old) | 09/2022 | Lenovo IdeaPad Gaming 3 15ARH7 R5 6600H, GeForce RTX 3050 4GB Laptop GPU | 2.4 kg | 21.8 mm | 15.60" | 1920x1080 | |
| 82.7 % v7 (old) | 10/2021 | Dell G15 5515 R7 5800H, GeForce RTX 3050 Ti Laptop GPU | 2.4 kg | 24.9 mm | 15.60" | 1920x1080 | |
| 82.3 % v7 (old) | 05/2022 | HP Victus 16-e0145ng R5 5600H, GeForce RTX 3050 Ti Laptop GPU | 2.4 kg | 23.5 mm | 16.10" | 1920x1080 | |
| 87.4 % v7 (old) | 08/2022 | Dell Inspiron 16 Plus 7620 i7-12700H, GeForce RTX 3050 Ti Laptop GPU | 2.1 kg | 18.99 mm | 16.00" | 3072x1920 |
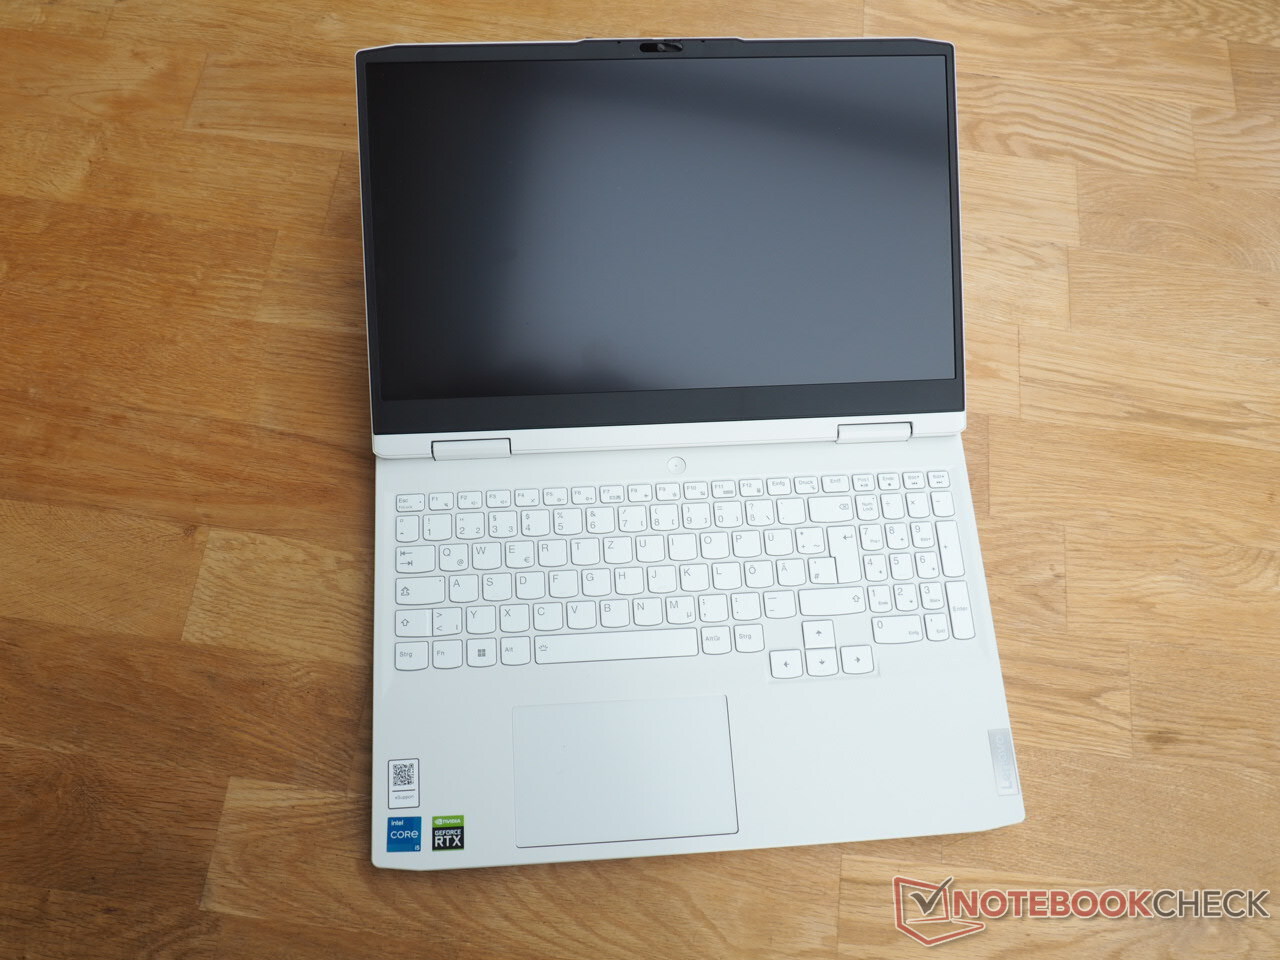
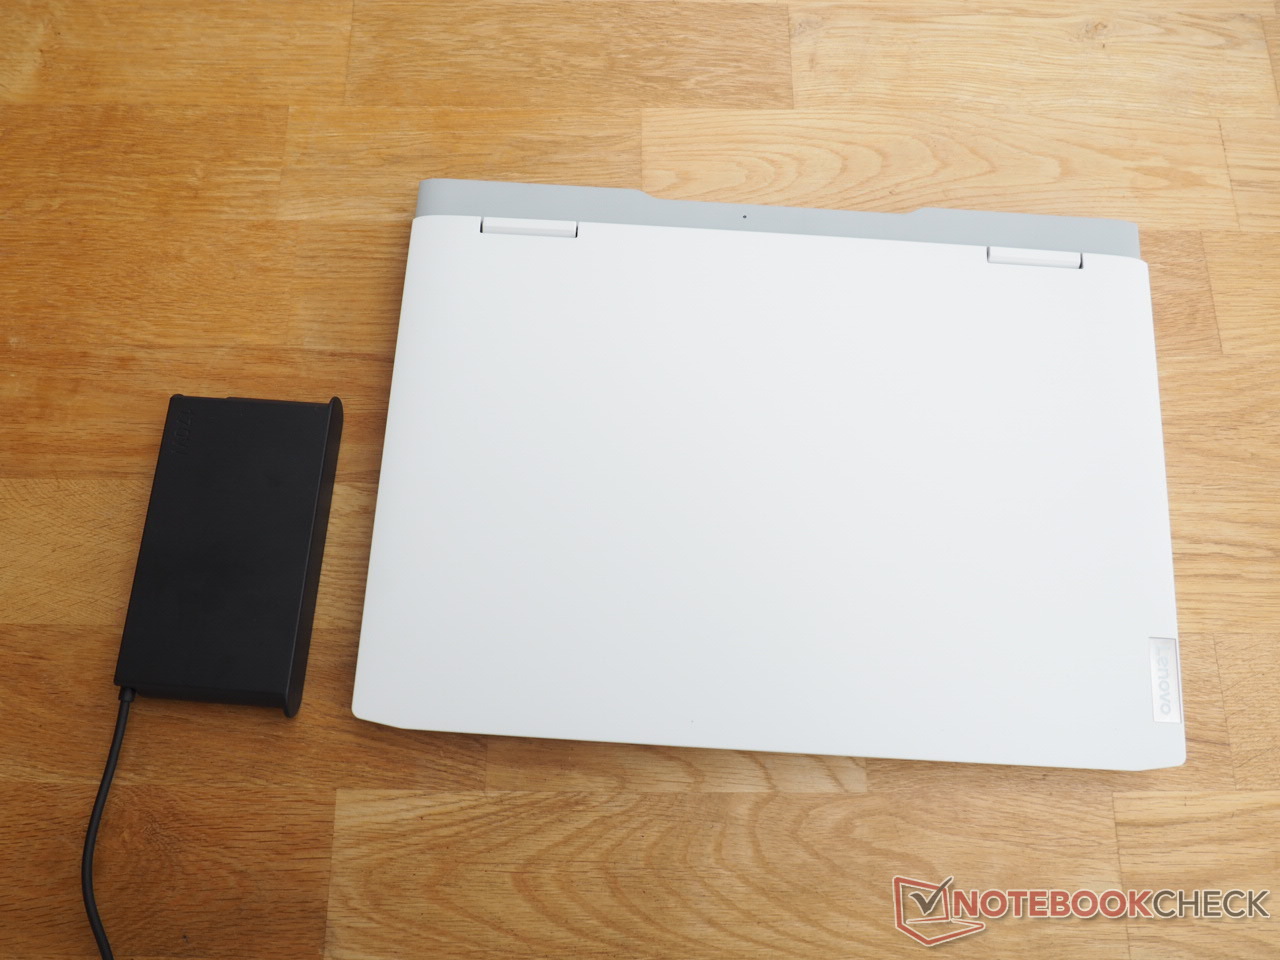
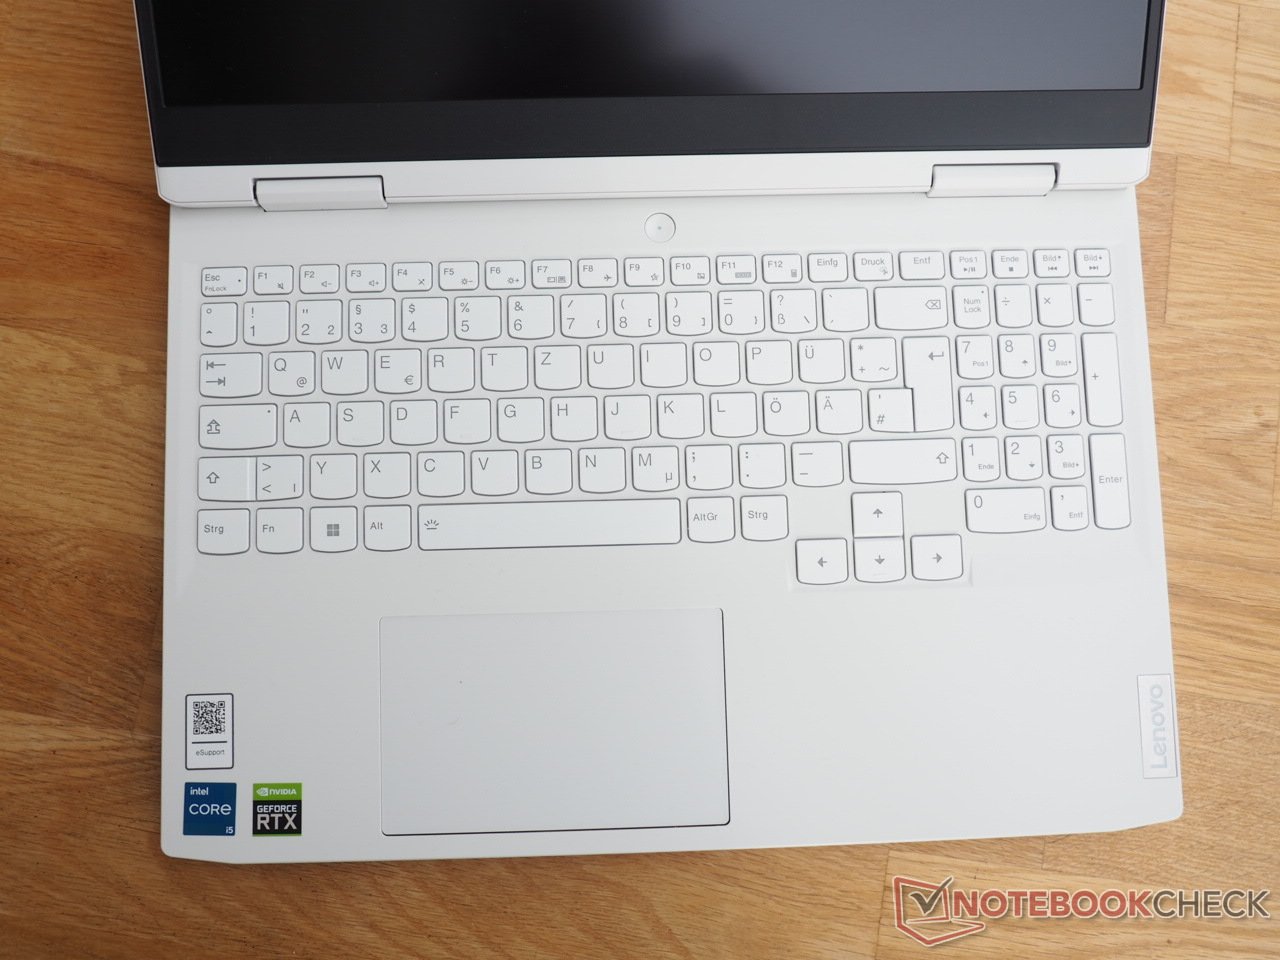
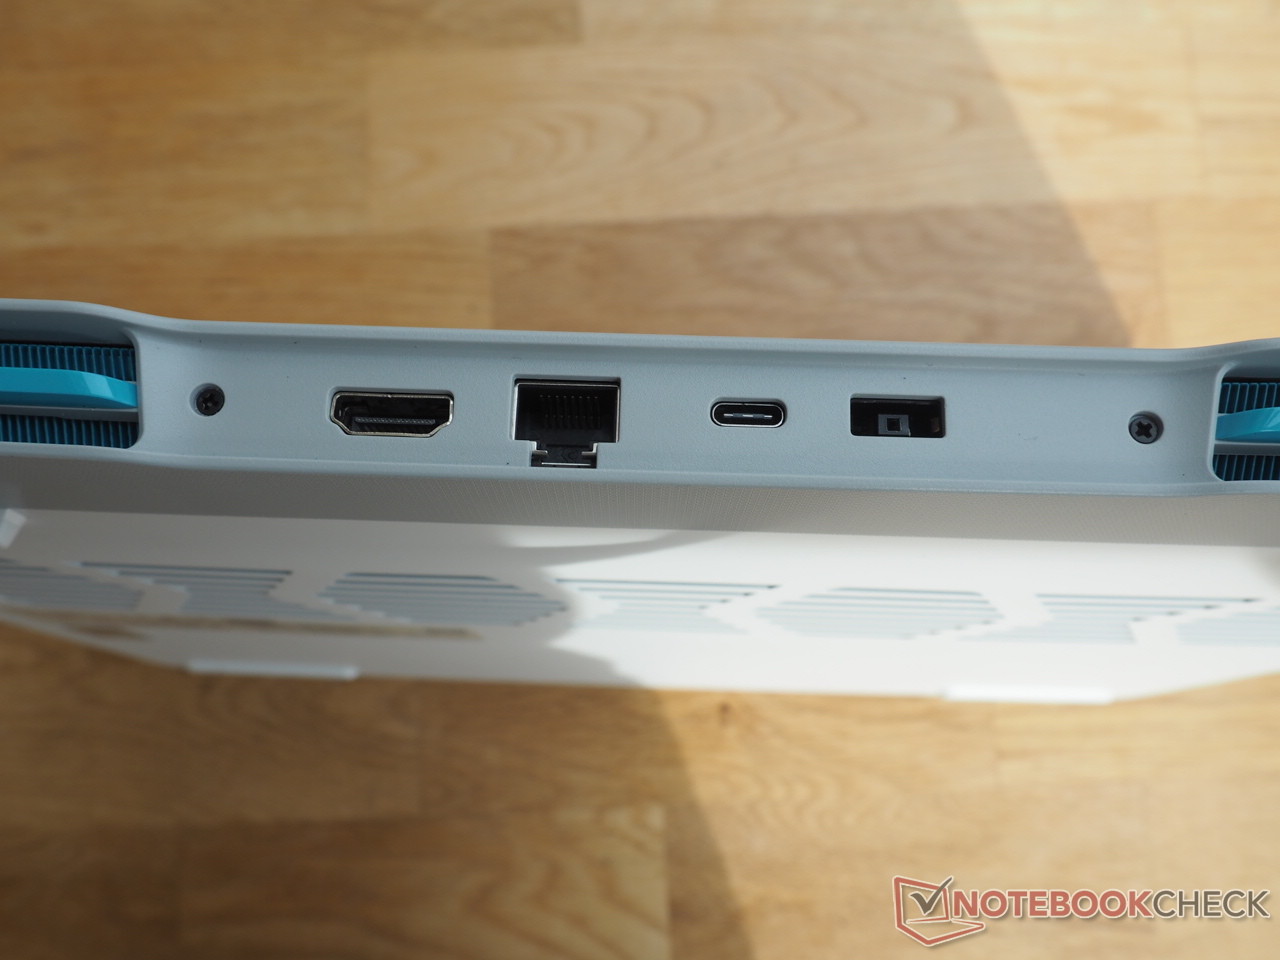
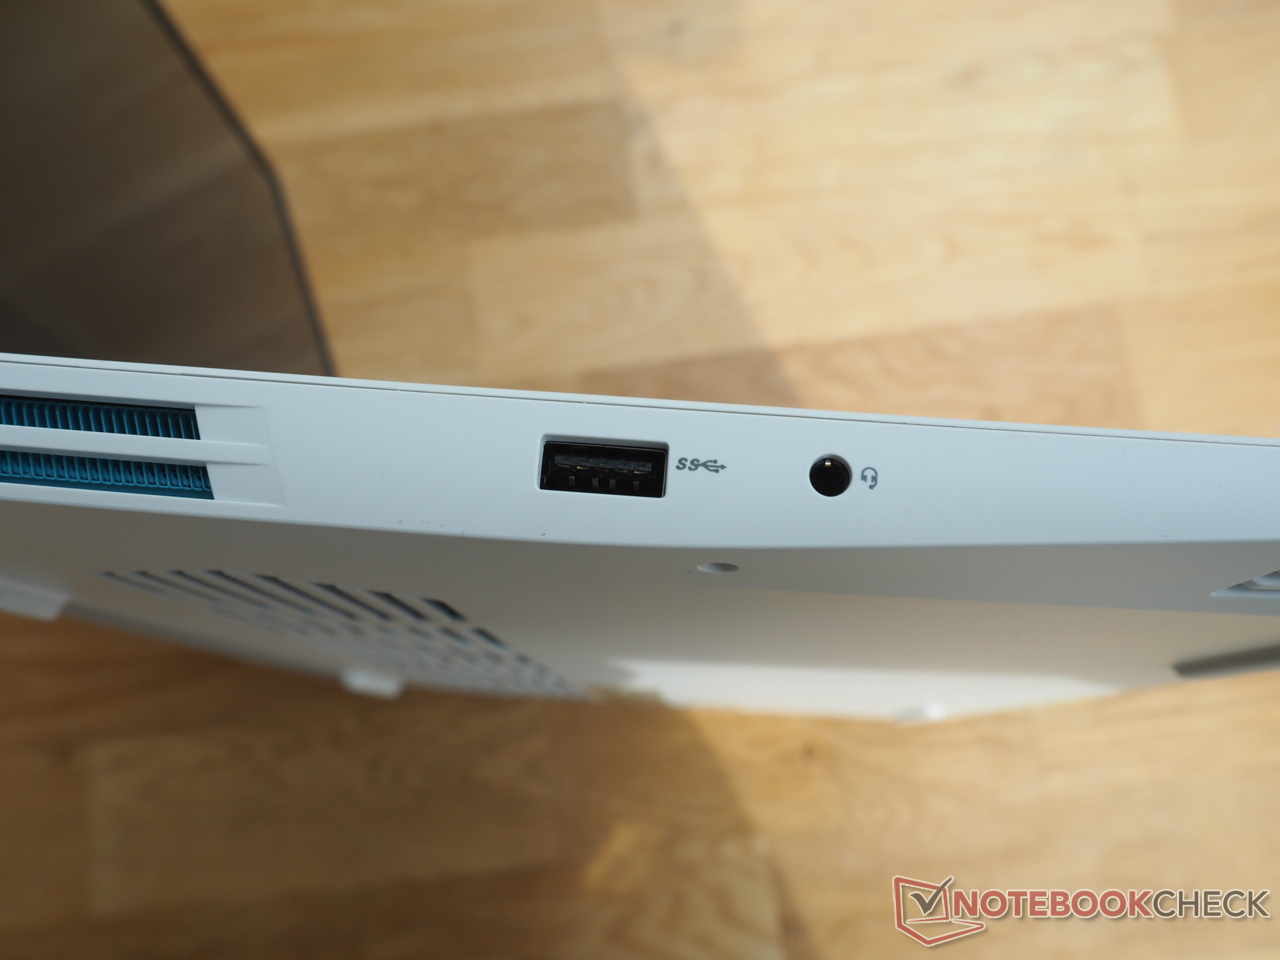
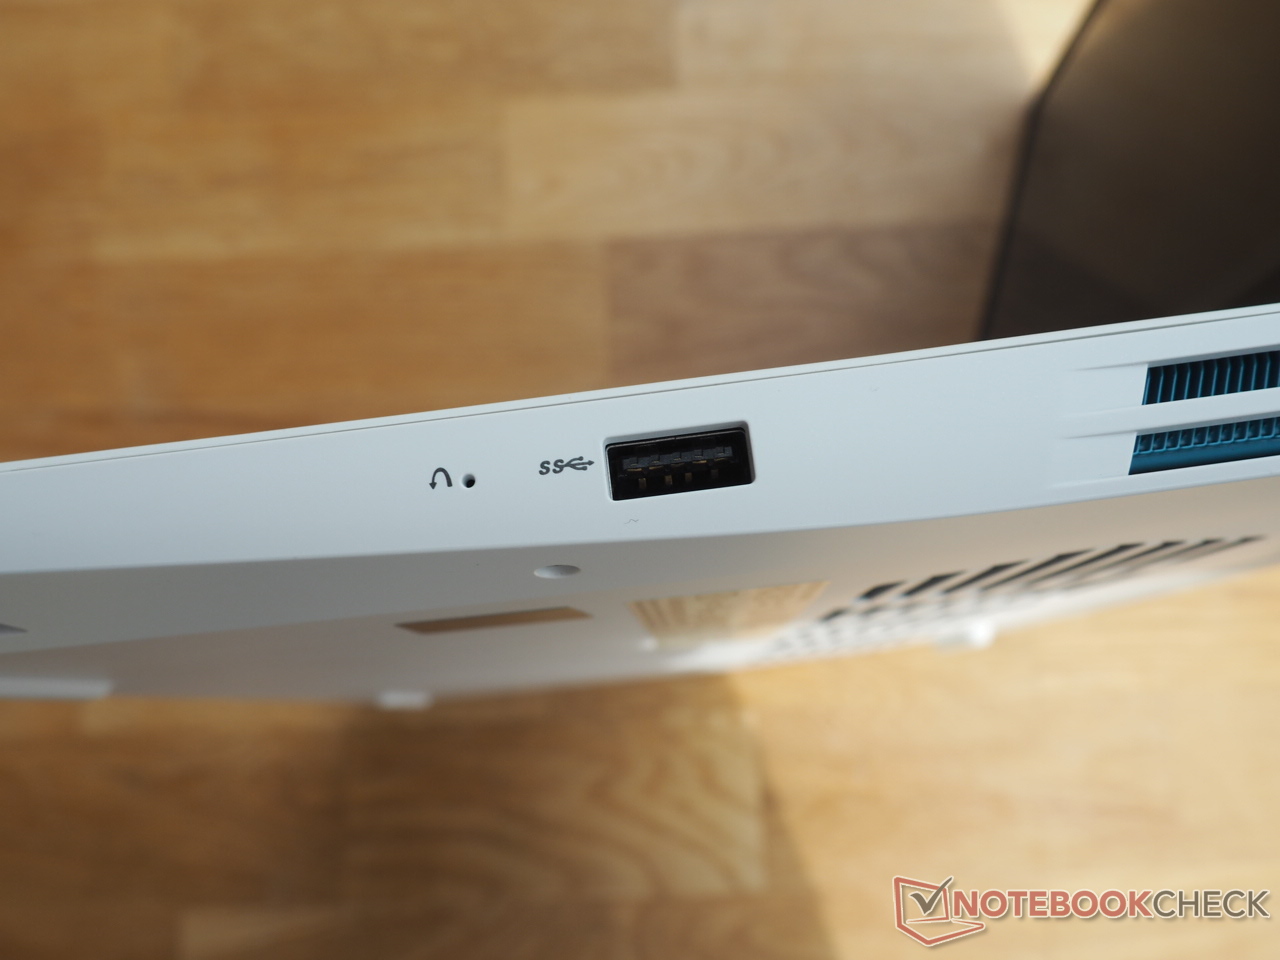
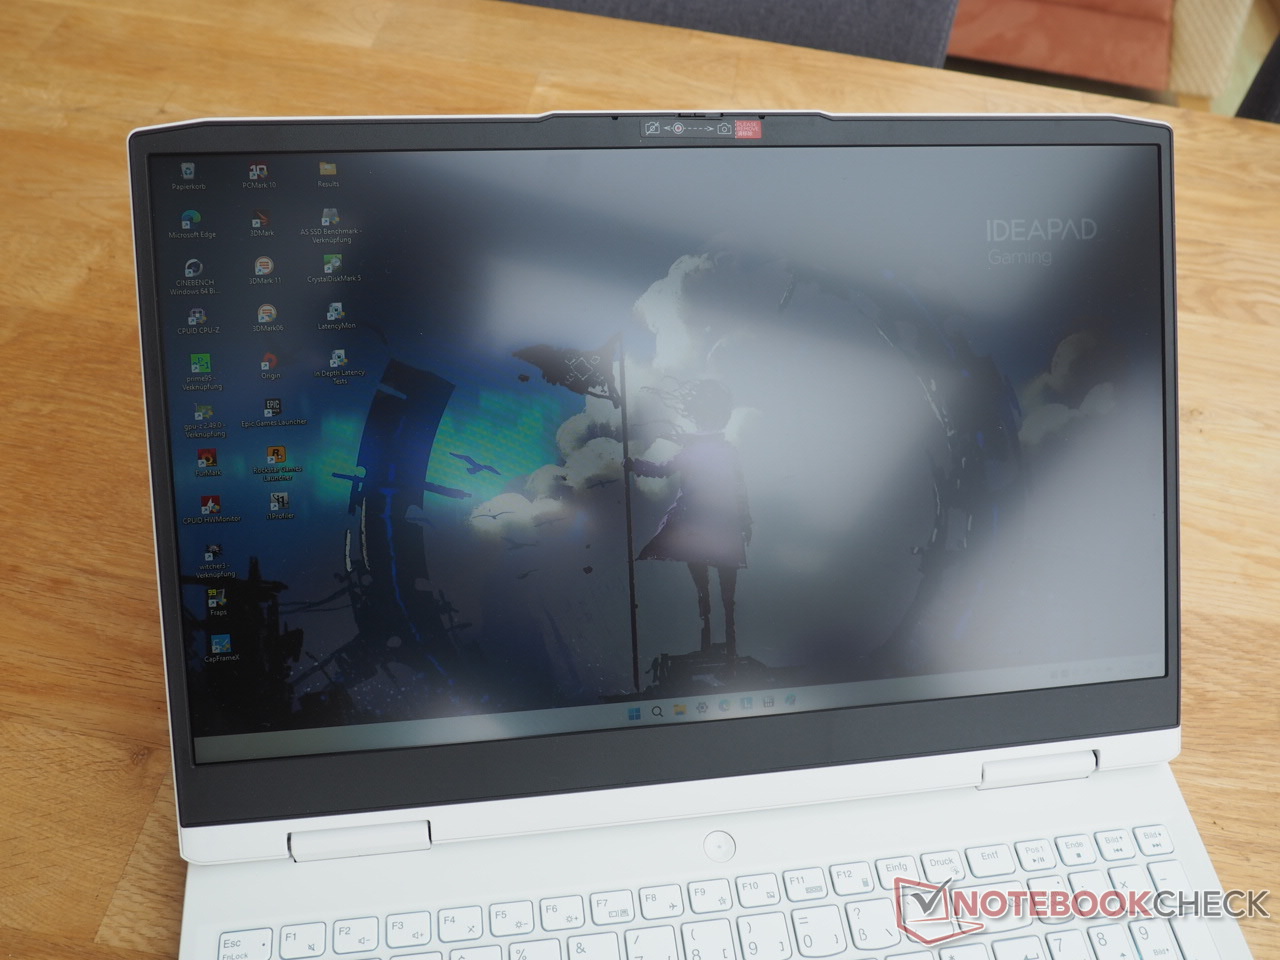
Poiché, a parte il colore (Glacier White invece di Onyx Grey) e il layout della tastiera (German invece di US), il case è identico al modello fratello elencato sopra, non parleremo ulteriormente del case, della dotazione e dei dispositivi di input. Potete trovare le informazioni corrispondenti nella recensione del modello fratello.
Webcam


Display
Osservando il campo di confronto, si può facilmente notare che i portatili da gioco economici sono spesso dotati di un display scarso.
| |||||||||||||||||||||||||
Distribuzione della luminosità: 92 %
Al centro con la batteria: 338 cd/m²
Contrasto: 1252:1 (Nero: 0.27 cd/m²)
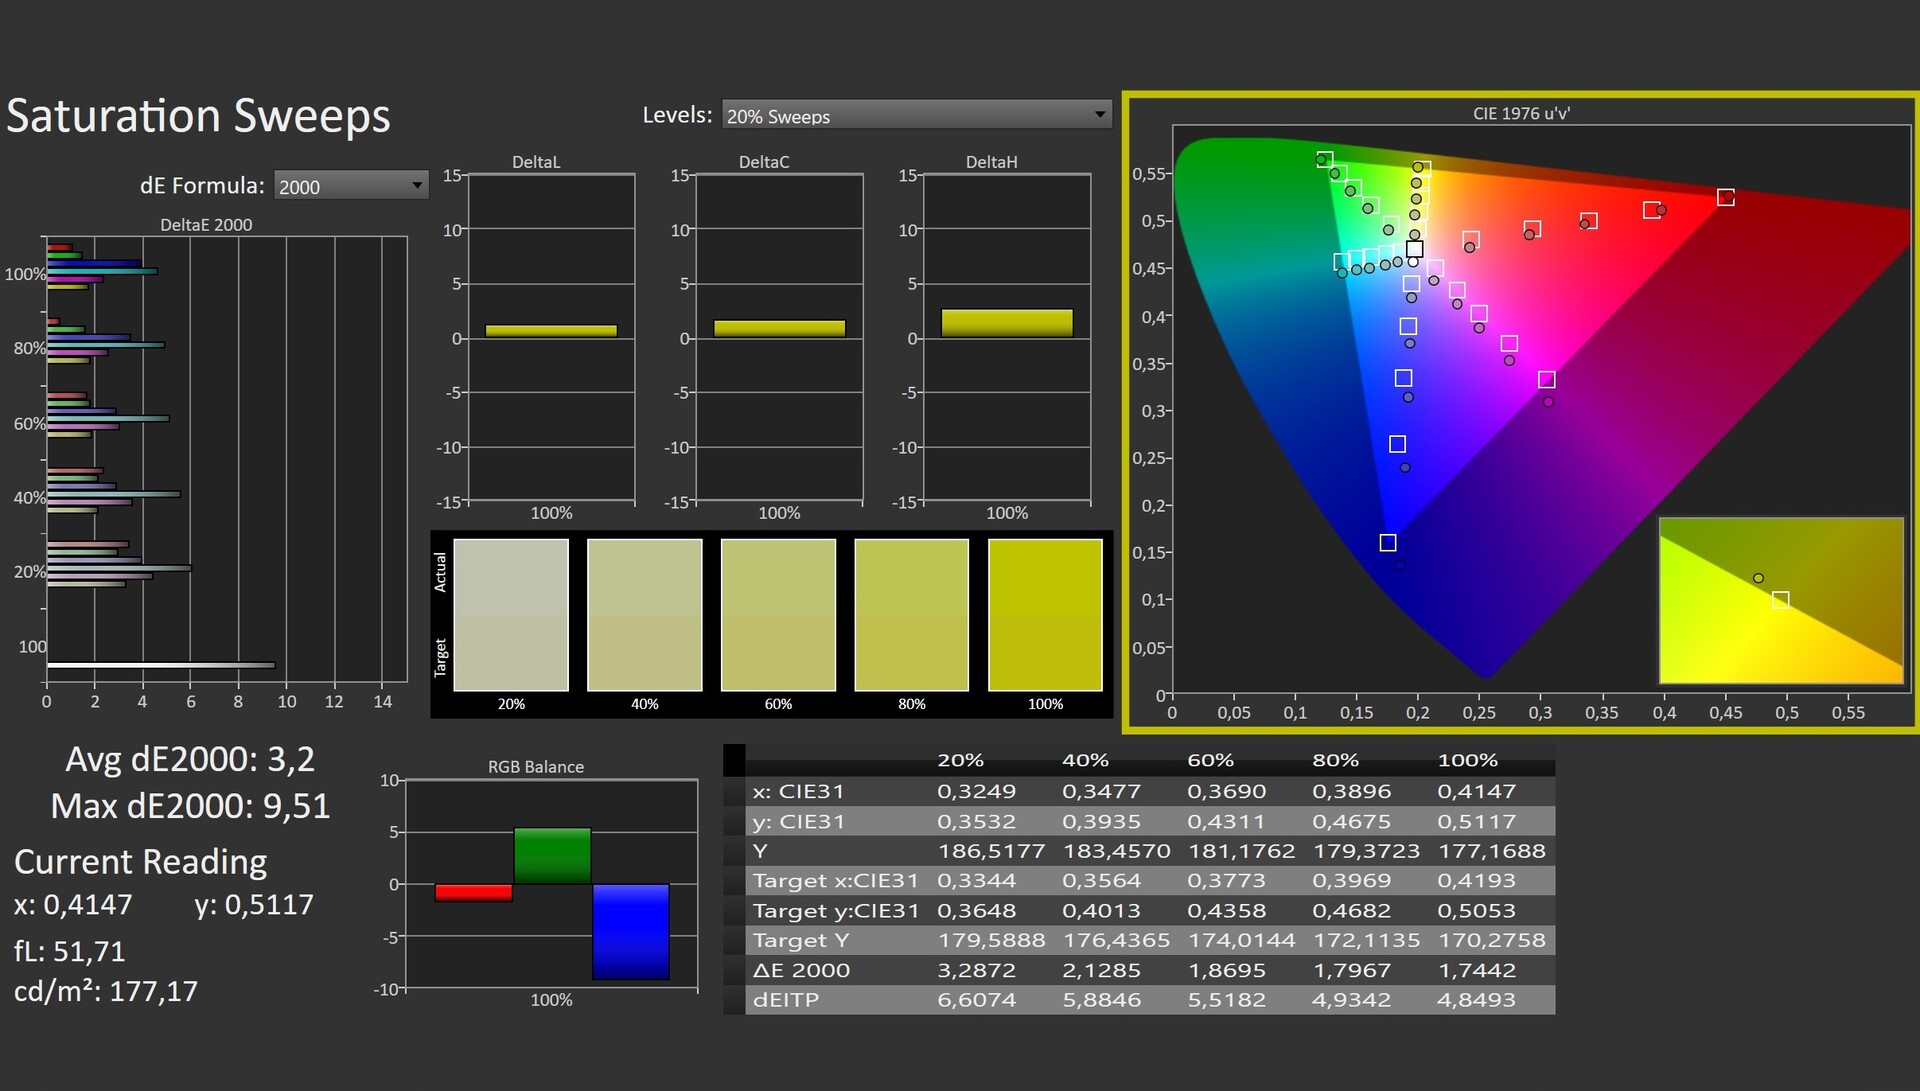
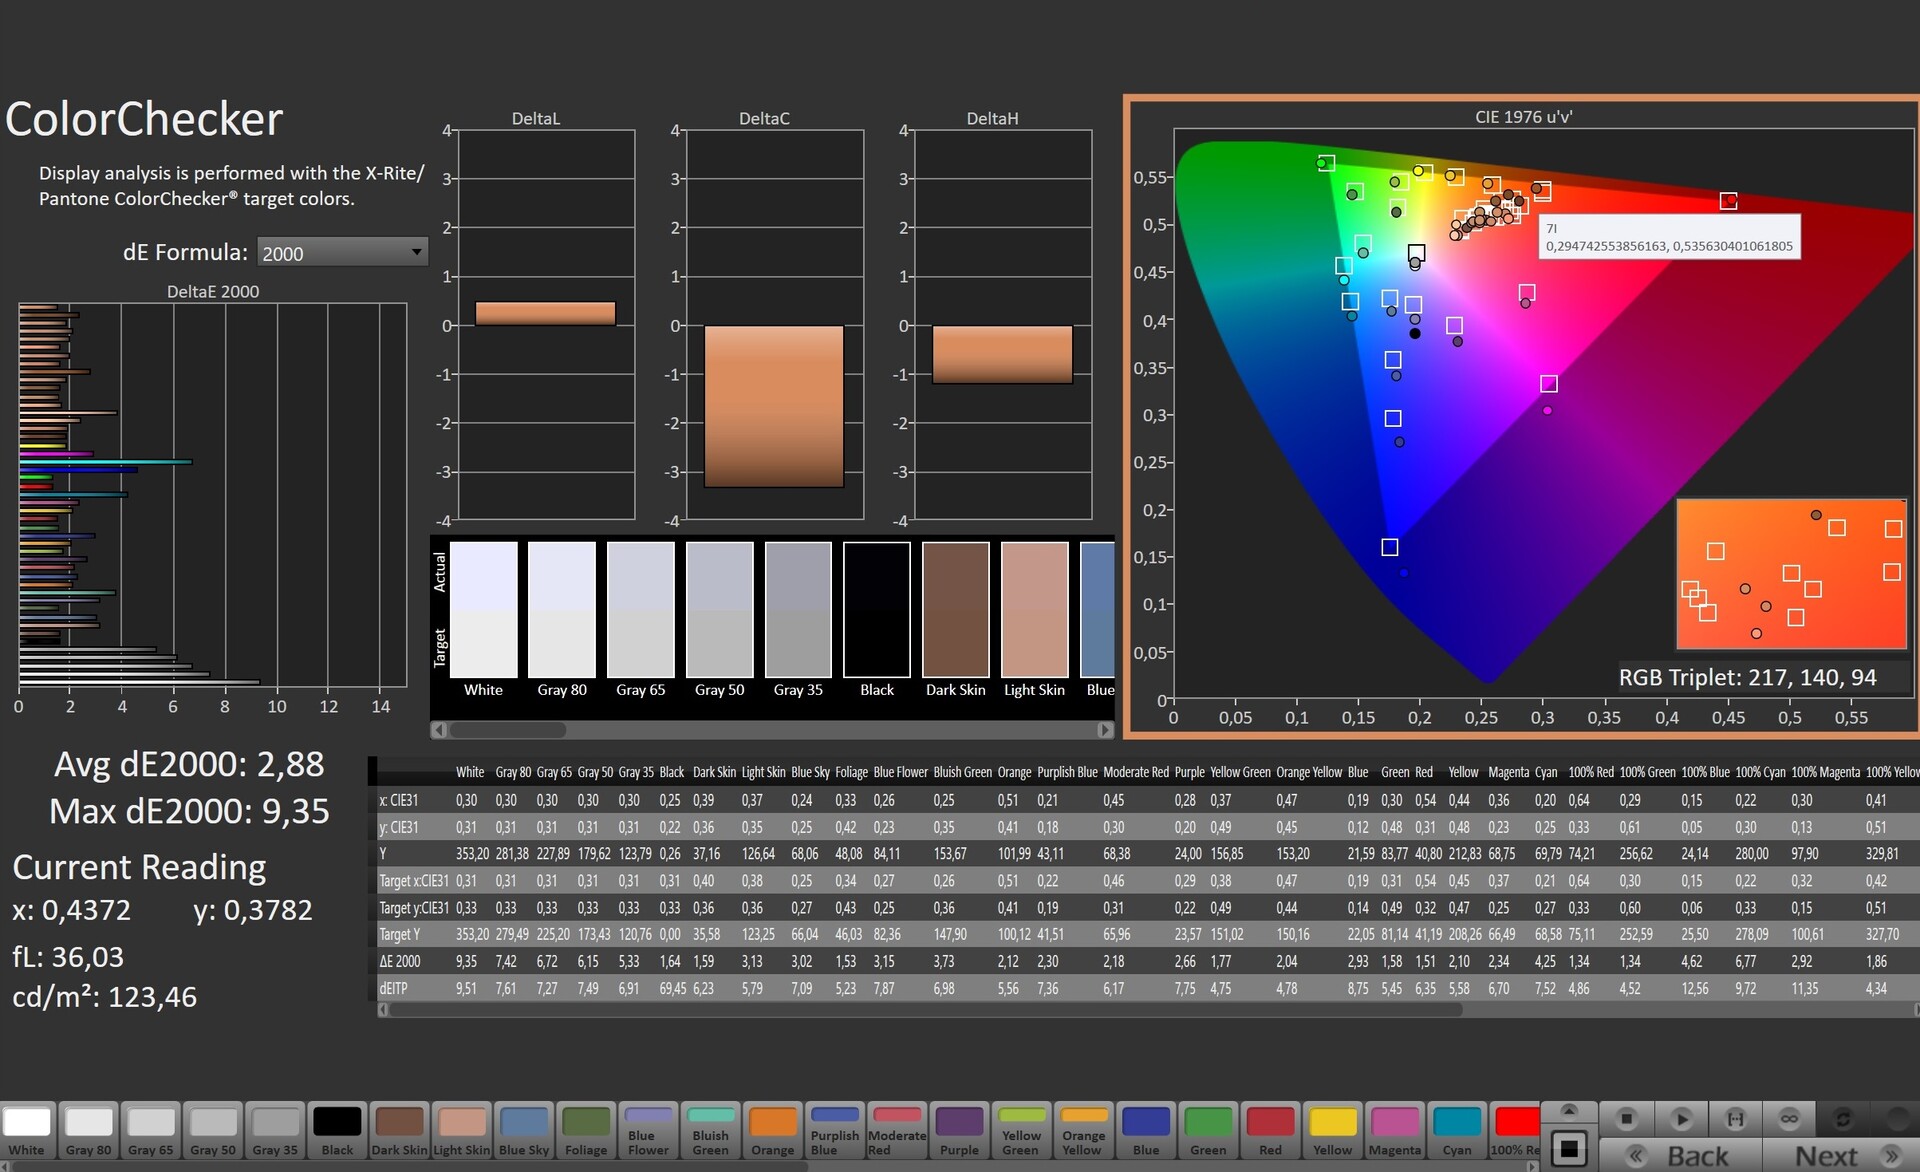
ΔE ColorChecker Calman: 2.88 | ∀{0.5-29.43 Ø4.73}
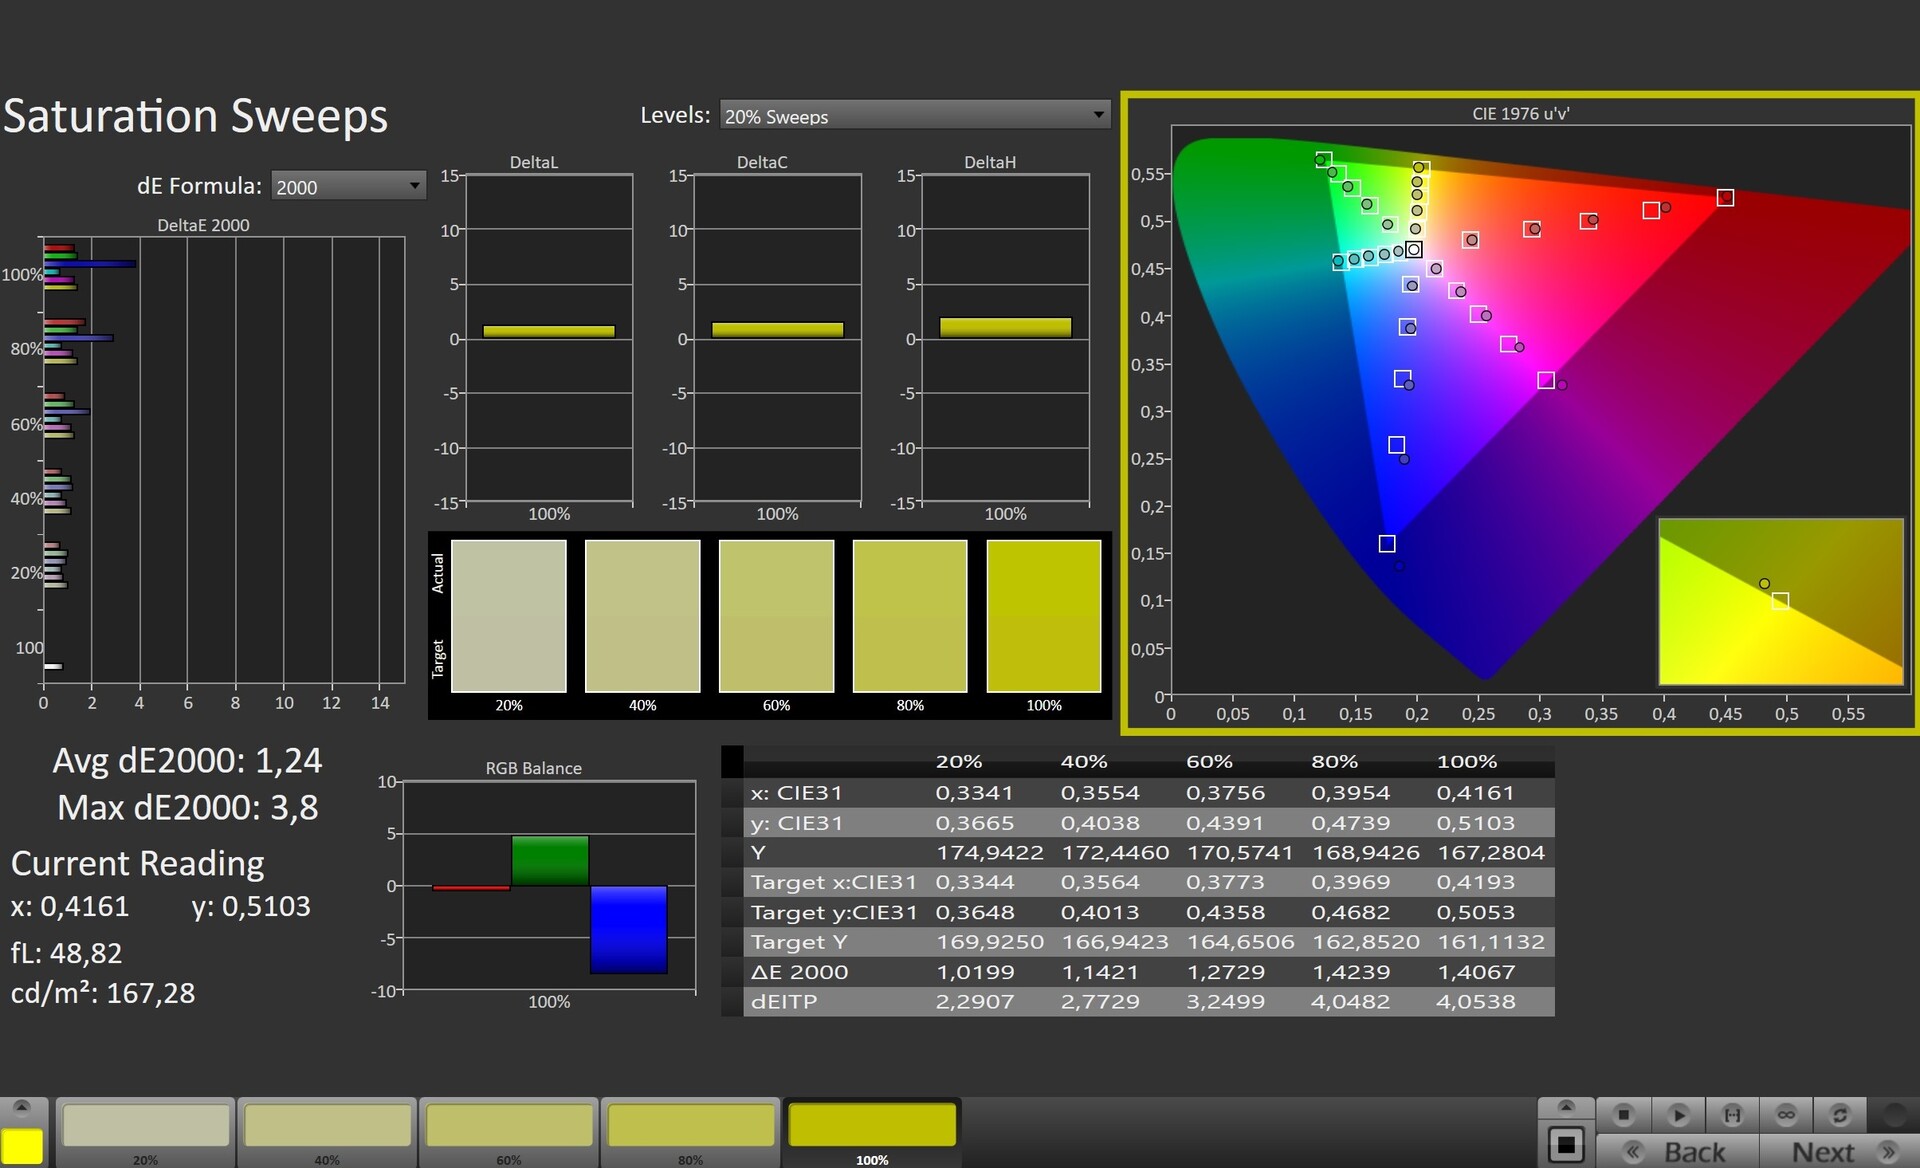
calibrated: 1.22
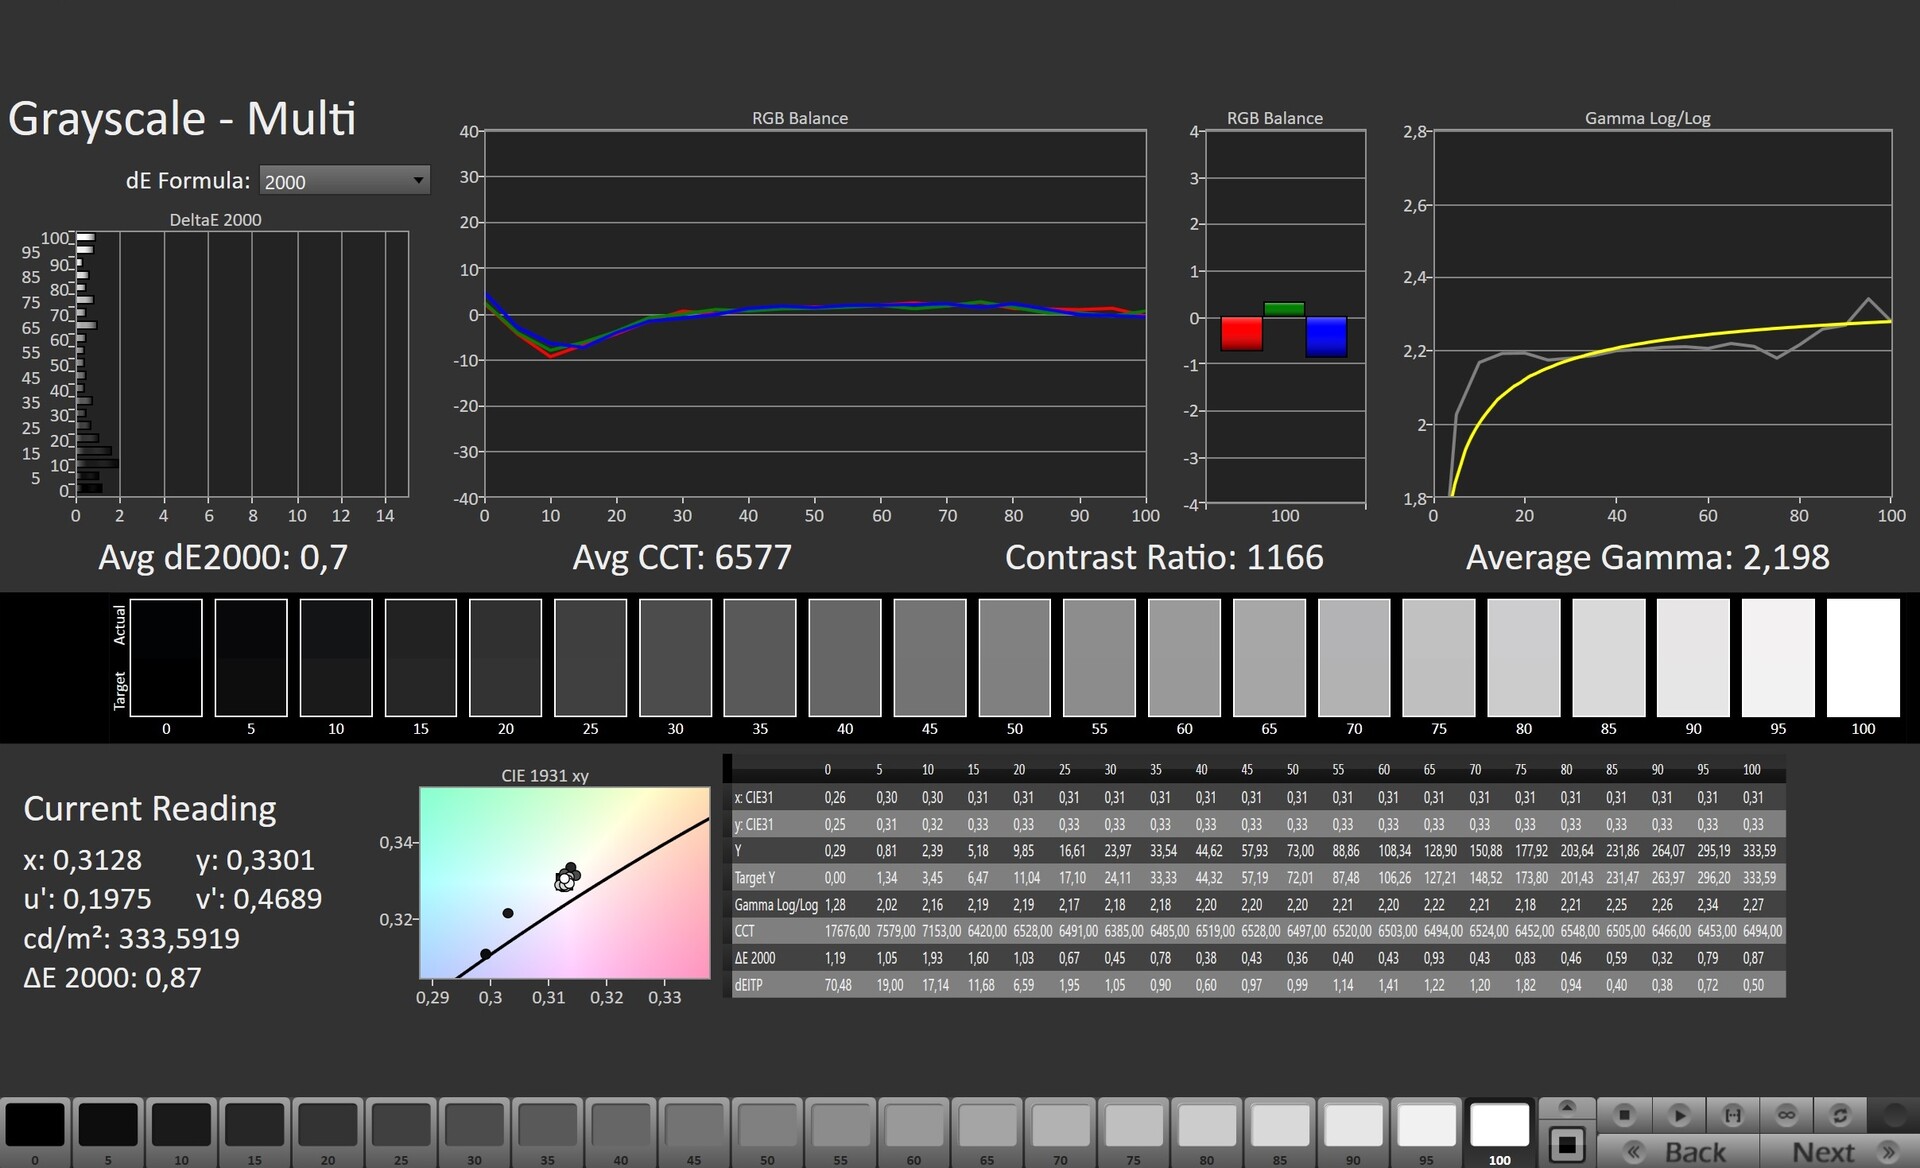
ΔE Greyscale Calman: 5 | ∀{0.09-98 Ø4.97}
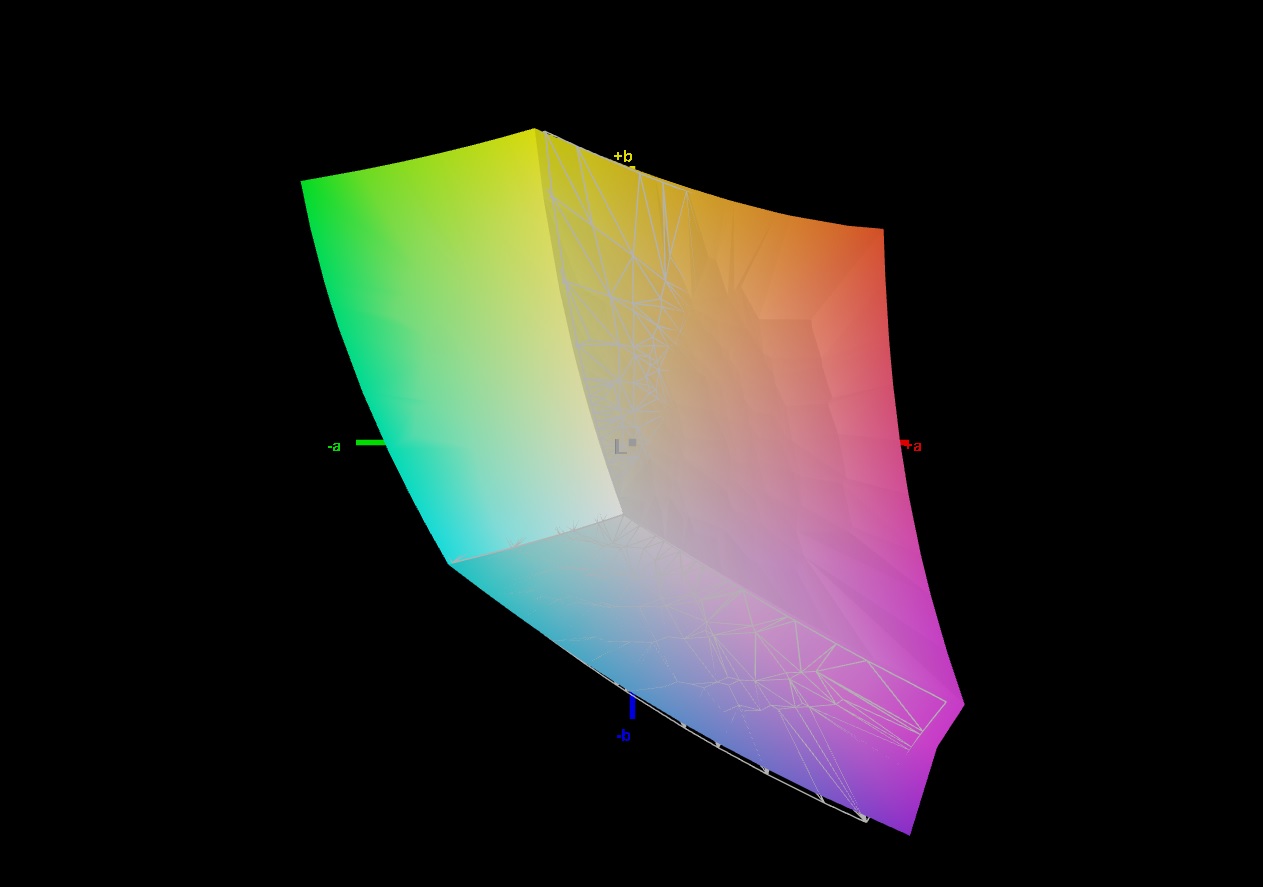
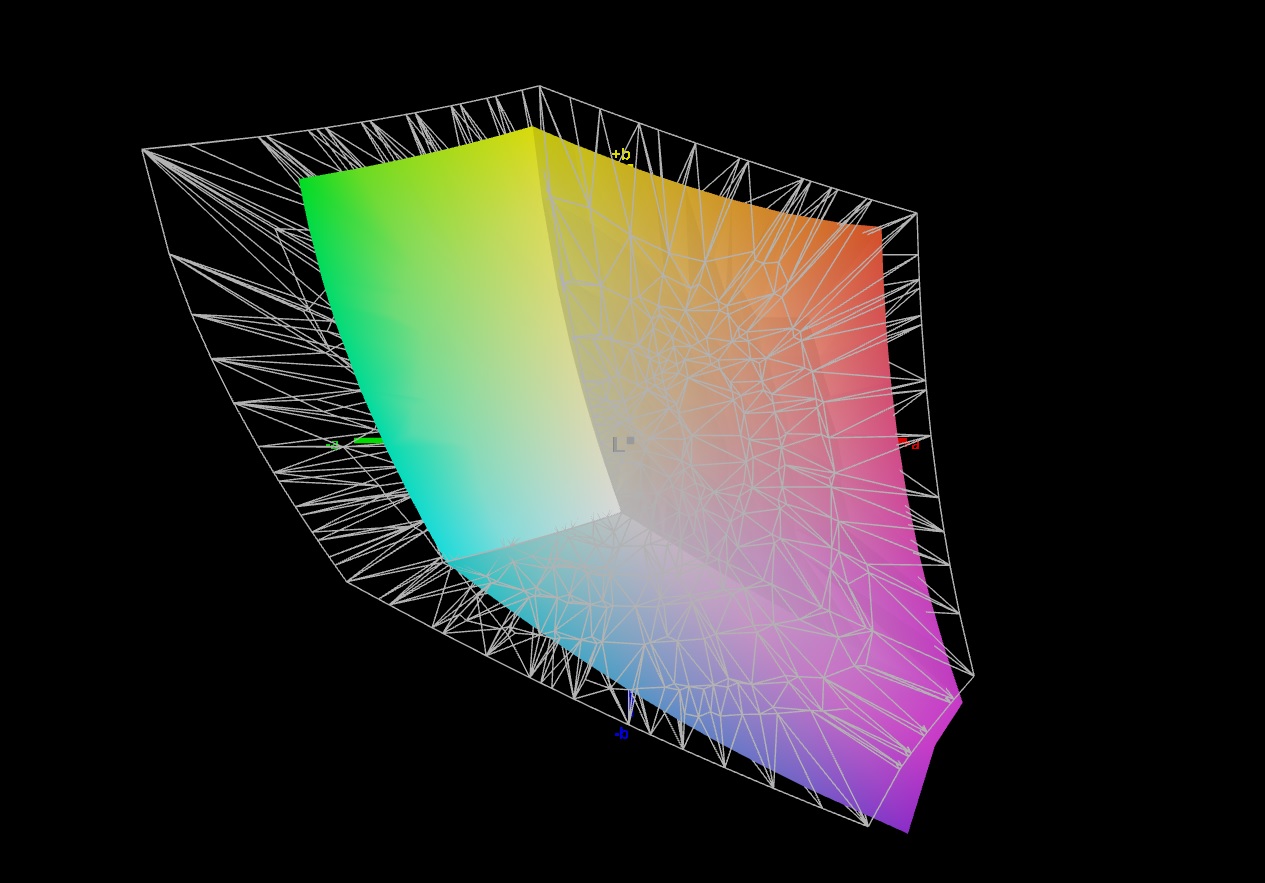
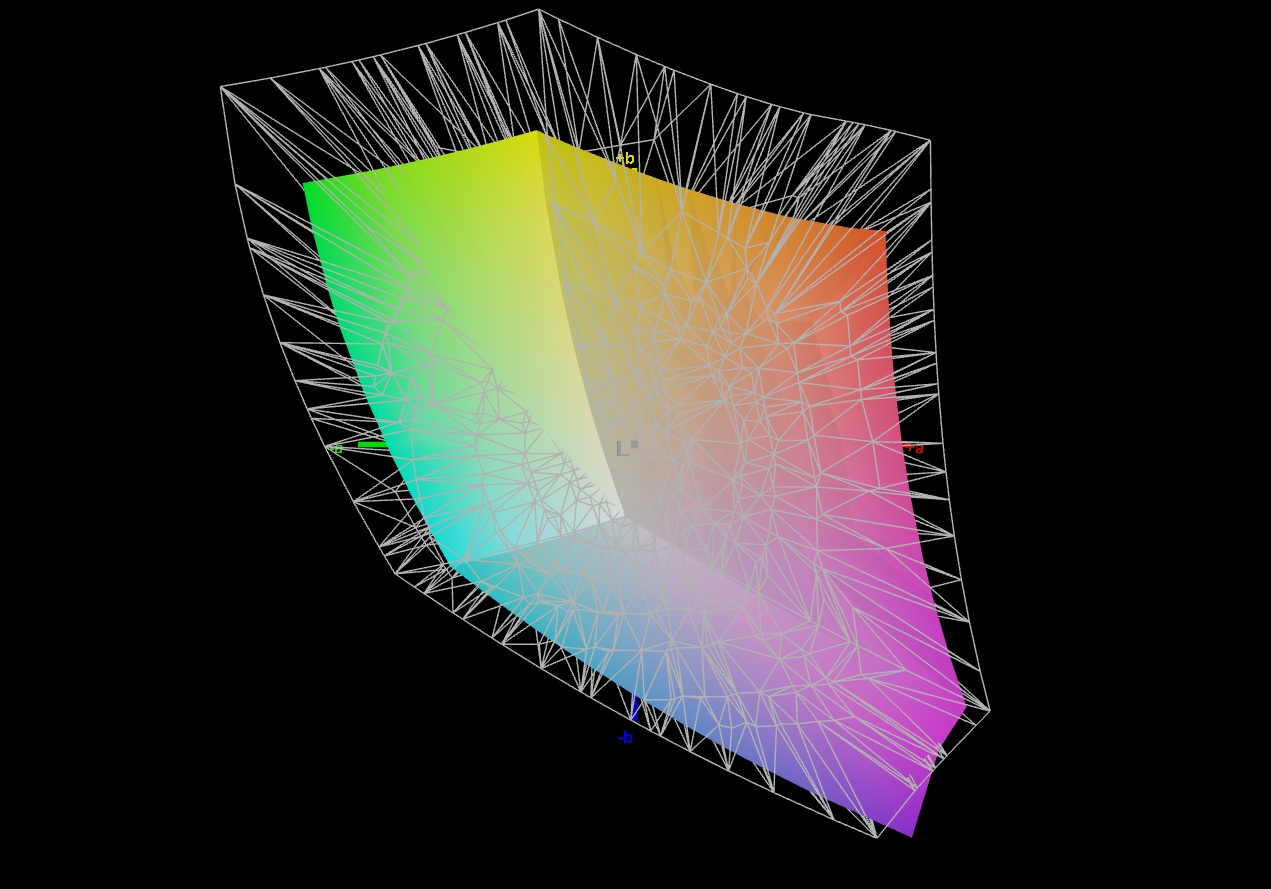
69.9% AdobeRGB 1998 (Argyll 3D)
99.2% sRGB (Argyll 3D)
69.1% Display P3 (Argyll 3D)
Gamma: 2.162
CCT: 7497 K
| Lenovo IdeaPad Gaming 3 15IAH7 Lenovo LEN156FHD, IPS, 1920x1080, 15.6" | Lenovo IdeaPad Gaming 3 15ARH7 LEN156FHD, IPS, 1920x1080, 15.6" | Dell G15 5515 BOE092A, IPS, 1920x1080, 15.6" | HP Victus 16-e0145ng CMN1609, IPS, 1920x1080, 16.1" | Dell Inspiron 16 Plus 7620 BOE NE16N41, IPS, 3072x1920, 16" | |
|---|---|---|---|---|---|
| Display | -42% | -43% | -39% | 2% | |
| Display P3 Coverage (%) | 69.1 | 39.4 -43% | 39.1 -43% | 41.6 -40% | 70.8 2% |
| sRGB Coverage (%) | 99.2 | 58 -42% | 56.9 -43% | 61.9 -38% | 99.5 0% |
| AdobeRGB 1998 Coverage (%) | 69.9 | 40.7 -42% | 40.4 -42% | 43 -38% | 73.2 5% |
| Response Times | -90% | -97% | -130% | -213% | |
| Response Time Grey 50% / Grey 80% * (ms) | 13 ? | 20.8 ? -60% | 25.2 ? -94% | 29.6 ? -128% | 38 ? -192% |
| Response Time Black / White * (ms) | 8.4 ? | 18.4 ? -119% | 16.8 ? -100% | 19.4 ? -131% | 28 ? -233% |
| PWM Frequency (Hz) | 200 ? | ||||
| Screen | -45% | -64% | -66% | 21% | |
| Brightness middle (cd/m²) | 338 | 287.8 -15% | 278 -18% | 257 -24% | 288.9 -15% |
| Brightness (cd/m²) | 329 | 268 -19% | 262 -20% | 239 -27% | 276 -16% |
| Brightness Distribution (%) | 92 | 86 -7% | 83 -10% | 88 -4% | 92 0% |
| Black Level * (cd/m²) | 0.27 | 0.3 -11% | 0.36 -33% | 0.25 7% | 0.26 4% |
| Contrast (:1) | 1252 | 959 -23% | 772 -38% | 1028 -18% | 1111 -11% |
| Colorchecker dE 2000 * | 2.88 | 6.3 -119% | 5.74 -99% | 6.91 -140% | 1.88 35% |
| Colorchecker dE 2000 max. * | 9.35 | 21.32 -128% | 19.63 -110% | 22.27 -138% | 4.37 53% |
| Colorchecker dE 2000 calibrated * | 1.22 | 2.53 -107% | 4.7 -285% | 3.61 -196% | 0.42 66% |
| Greyscale dE 2000 * | 5 | 4 20% | 3.1 38% | 7.5 -50% | 1.4 72% |
| Gamma | 2.162 102% | 2.21 100% | 2.011 109% | 2.125 104% | 2.3 96% |
| CCT | 7497 87% | 6762 96% | 6207 105% | 6025 108% | 6634 98% |
| Media totale (Programma / Settaggio) | -59% /
-51% | -68% /
-64% | -78% /
-69% | -63% /
-16% |
* ... Meglio usare valori piccoli
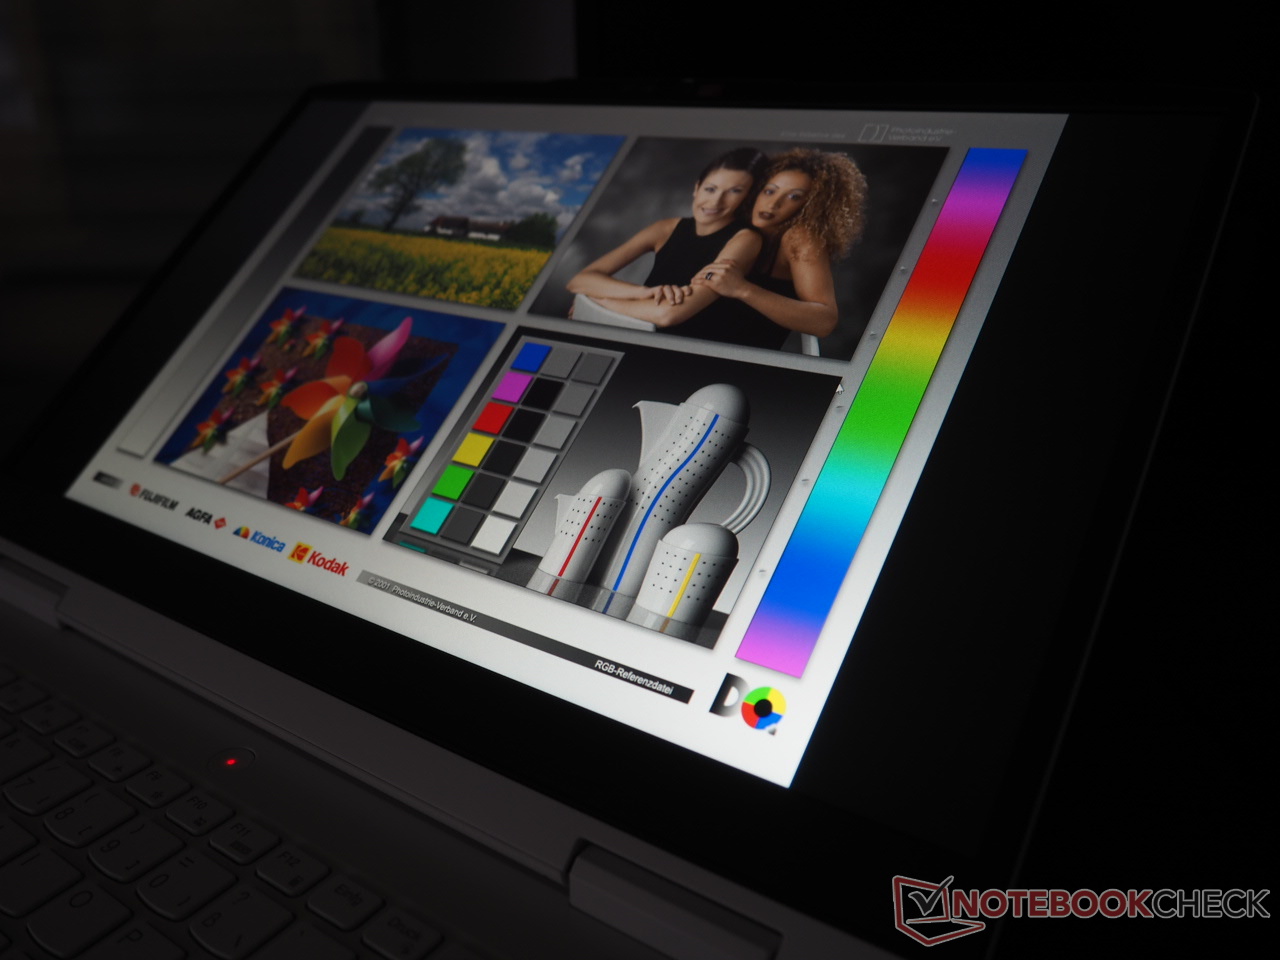
Spazi colore ridotti e bassa luminosità sono molto diffusi nel segmento dei 1.000 euro. Ma questo non è il caso dell'IdeaPad Gaming 15 15IAH7: circa il 100% di copertura sRGB e una luminosità media di 329 cd/m² rendono giustizia al prezzo del portatile.
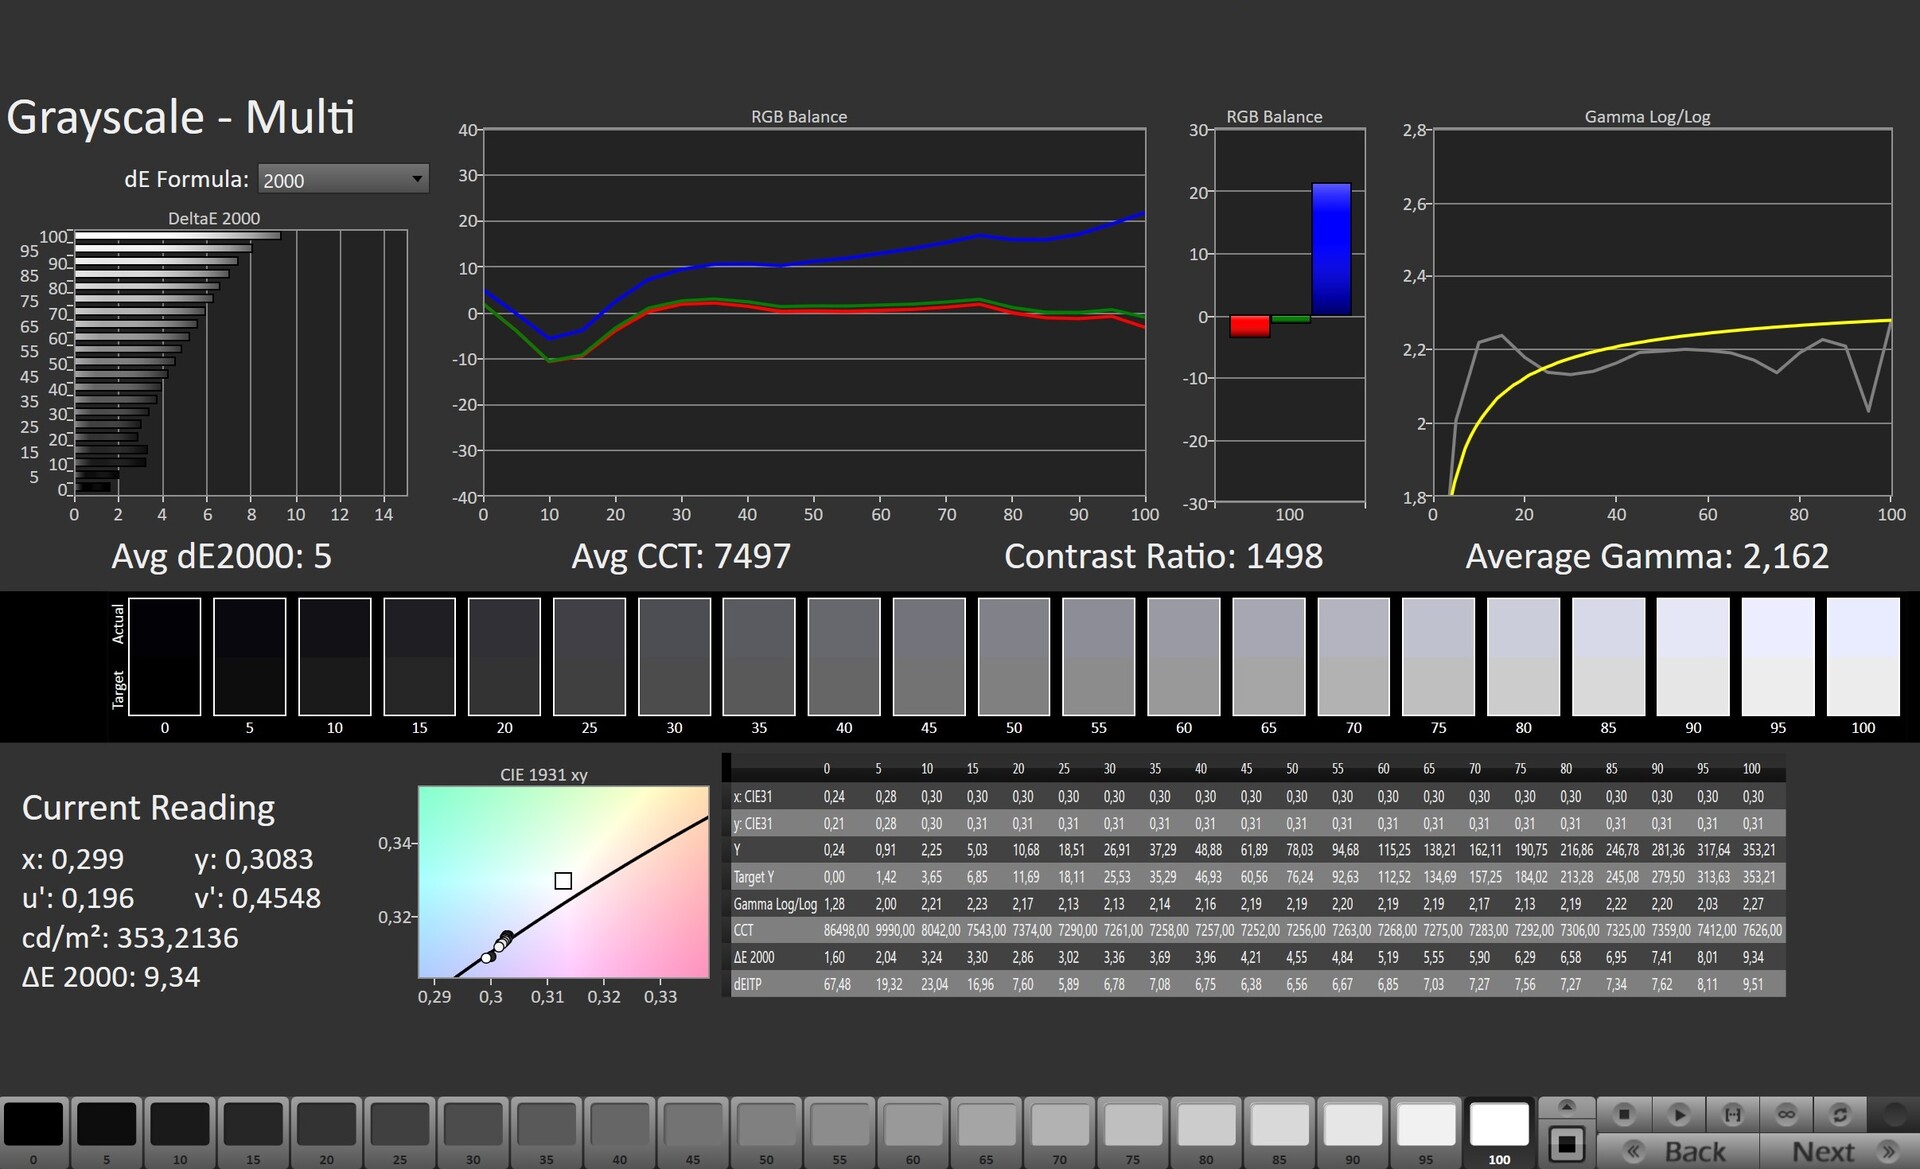
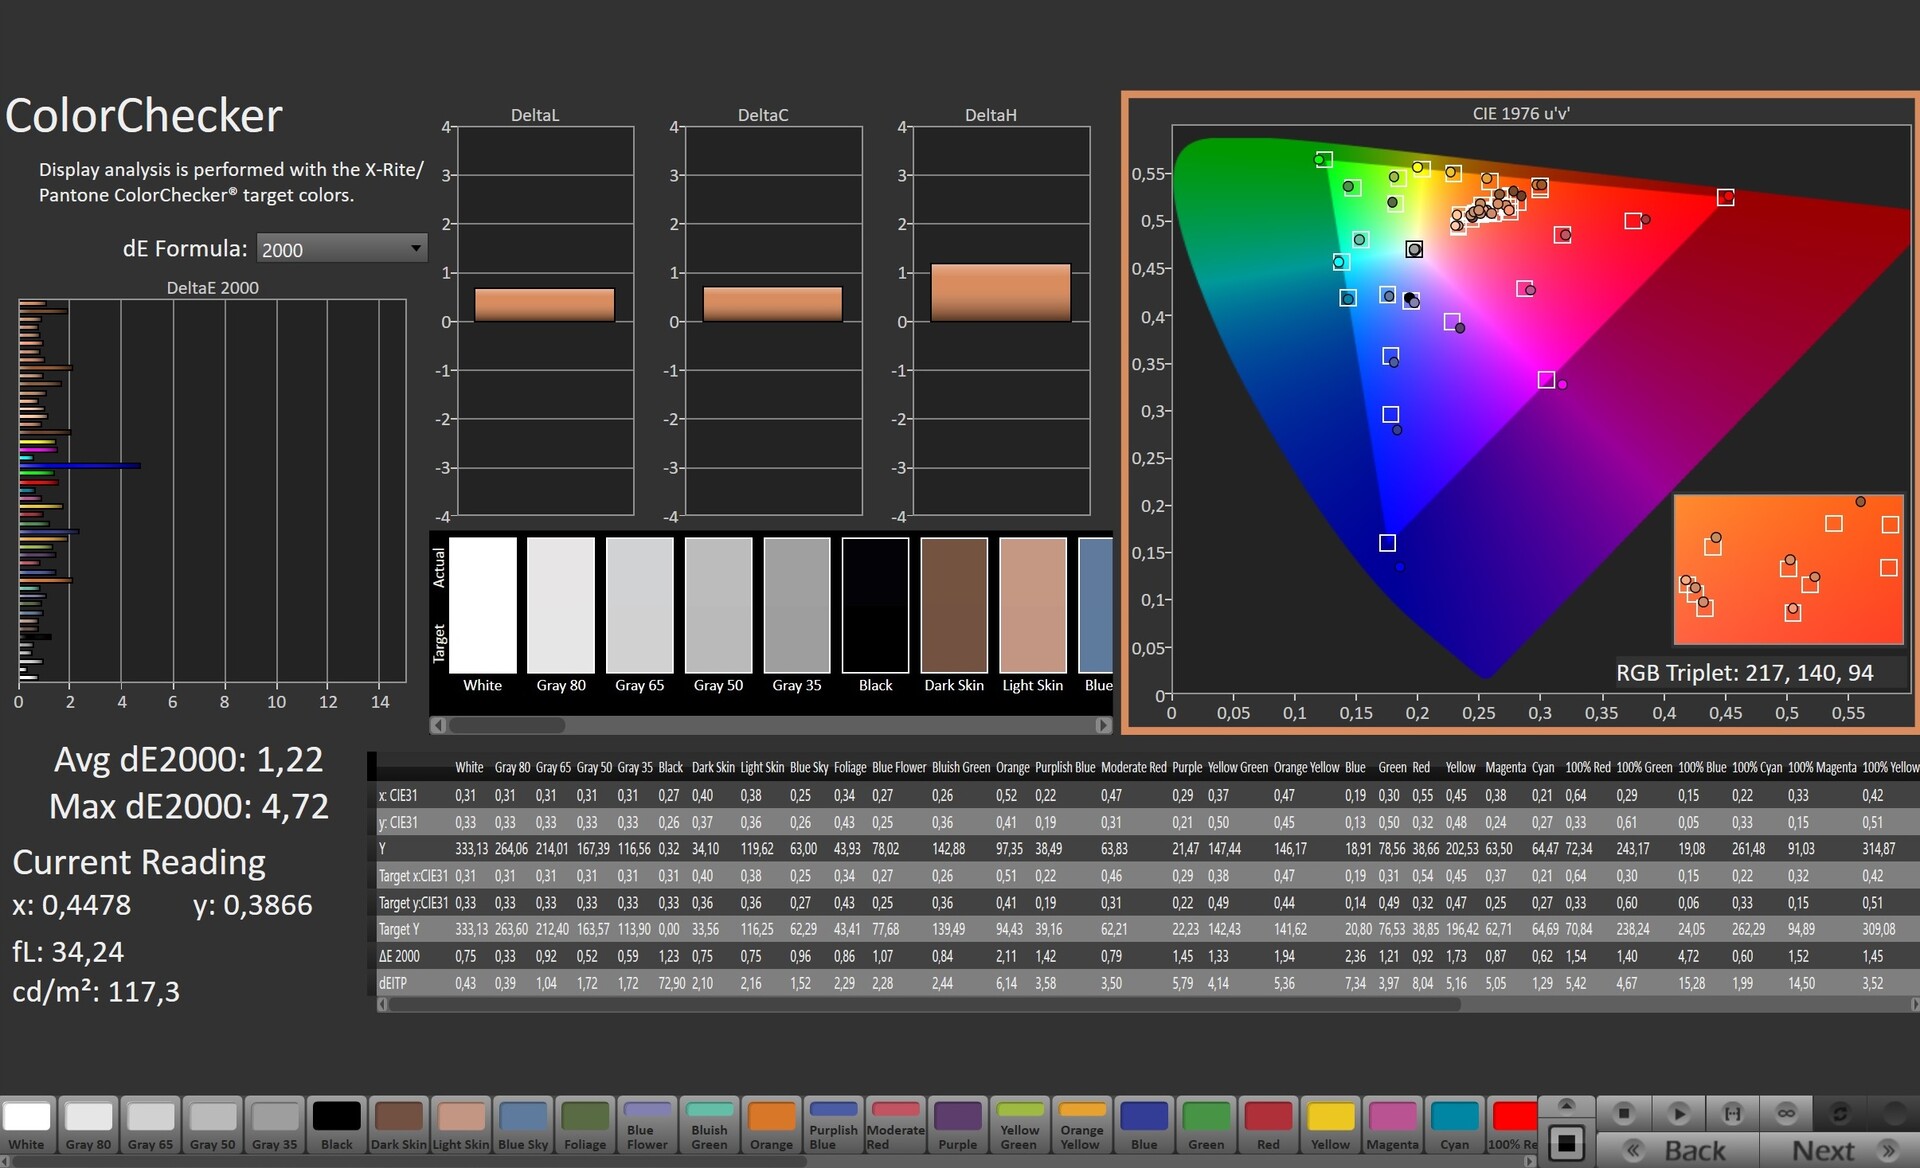
Il portatile da 15 pollici fa una buona figura anche nelle altre discipline. Un tempo di risposta compreso tra 8 e 13 ms è sicuramente un buon valore. Lo stesso vale per il contrasto di 1252:1, anch'esso superiore alla media.
L'unica cosa di cui ci si può lamentare è l'accuratezza del colore. In fase di consegna, il pannello da 165 Hz presenta una chiara tonalità blu. Tuttavia, questo aspetto può essere corretto con una calibrazione (il nostro file ICC può essere scaricato gratuitamente in alto a destra, accanto al grafico della distribuzione della luminosità). La nostra unità di prova non mostra alcun bleeding dello schermo o sfarfallio PWM.
Tempi di risposta del Display
| ↔ Tempi di risposta dal Nero al Bianco | ||
|---|---|---|
| 8.4 ms ... aumenta ↗ e diminuisce ↘ combinato | ↗ 4.2 ms Incremento | 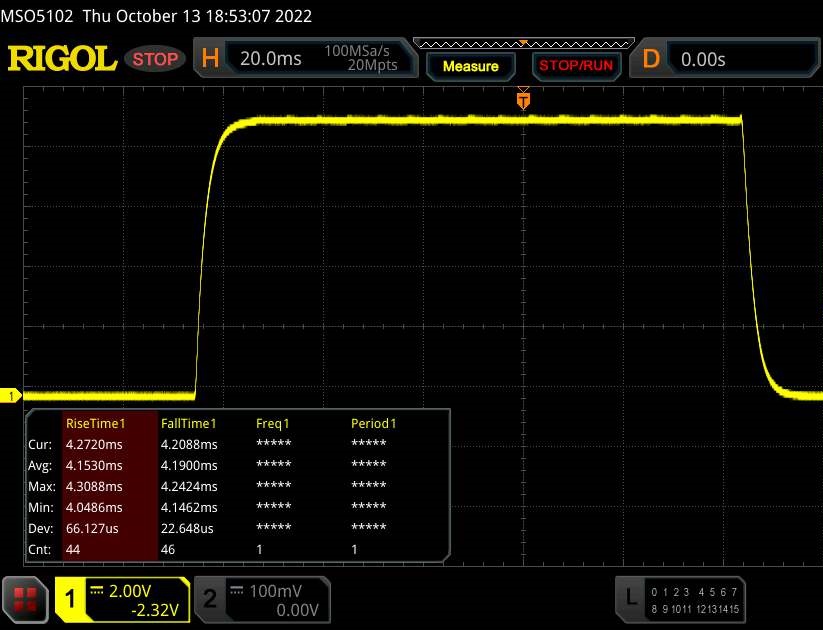 |
| ↘ 4.2 ms Calo | ||
| Lo schermo mostra veloci tempi di risposta durante i nostri tests e dovrebbe esere adatto al gaming In confronto, tutti i dispositivi di test variano da 0.1 (minimo) a 240 (massimo) ms. » 24 % di tutti i dispositivi è migliore. Questo significa che i tempi di risposta rilevati sono migliori rispettto alla media di tutti i dispositivi testati (19.9 ms). | ||
| ↔ Tempo di risposta dal 50% Grigio all'80% Grigio | ||
| 13 ms ... aumenta ↗ e diminuisce ↘ combinato | ↗ 6.3 ms Incremento | 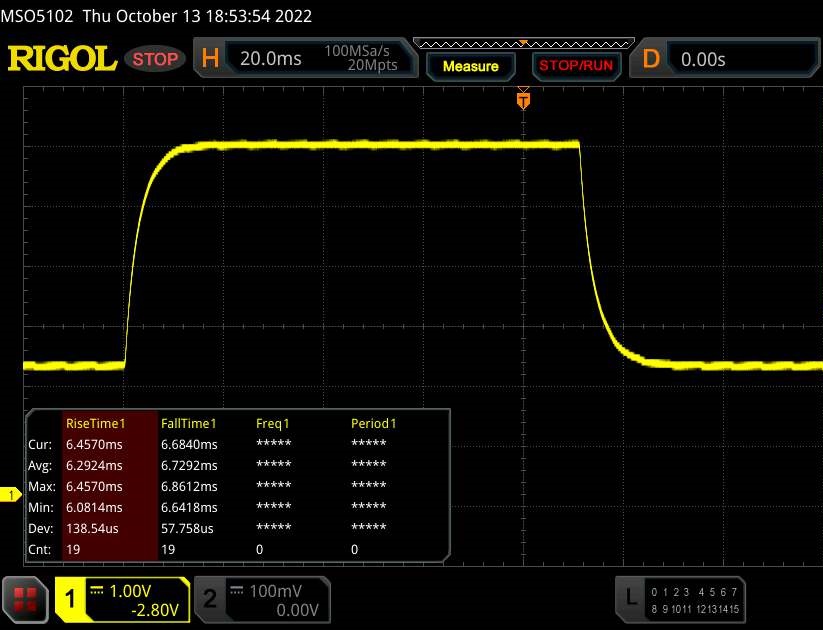 |
| ↘ 6.7 ms Calo | ||
| Lo schermo mostra buoni tempi di risposta durante i nostri tests, ma potrebbe essere troppo lento per i gamers competitivi. In confronto, tutti i dispositivi di test variano da 0.165 (minimo) a 636 (massimo) ms. » 26 % di tutti i dispositivi è migliore. Questo significa che i tempi di risposta rilevati sono migliori rispettto alla media di tutti i dispositivi testati (31.1 ms). | ||
Sfarfallio dello schermo / PWM (Pulse-Width Modulation)
| flickering dello schermo / PWM non rilevato |  | ||
In confronto: 52 % di tutti i dispositivi testati non utilizza PWM per ridurre la luminosita' del display. Se è rilevato PWM, una media di 7791 (minimo: 5 - massimo: 343500) Hz è stata rilevata. | |||
Prestazioni
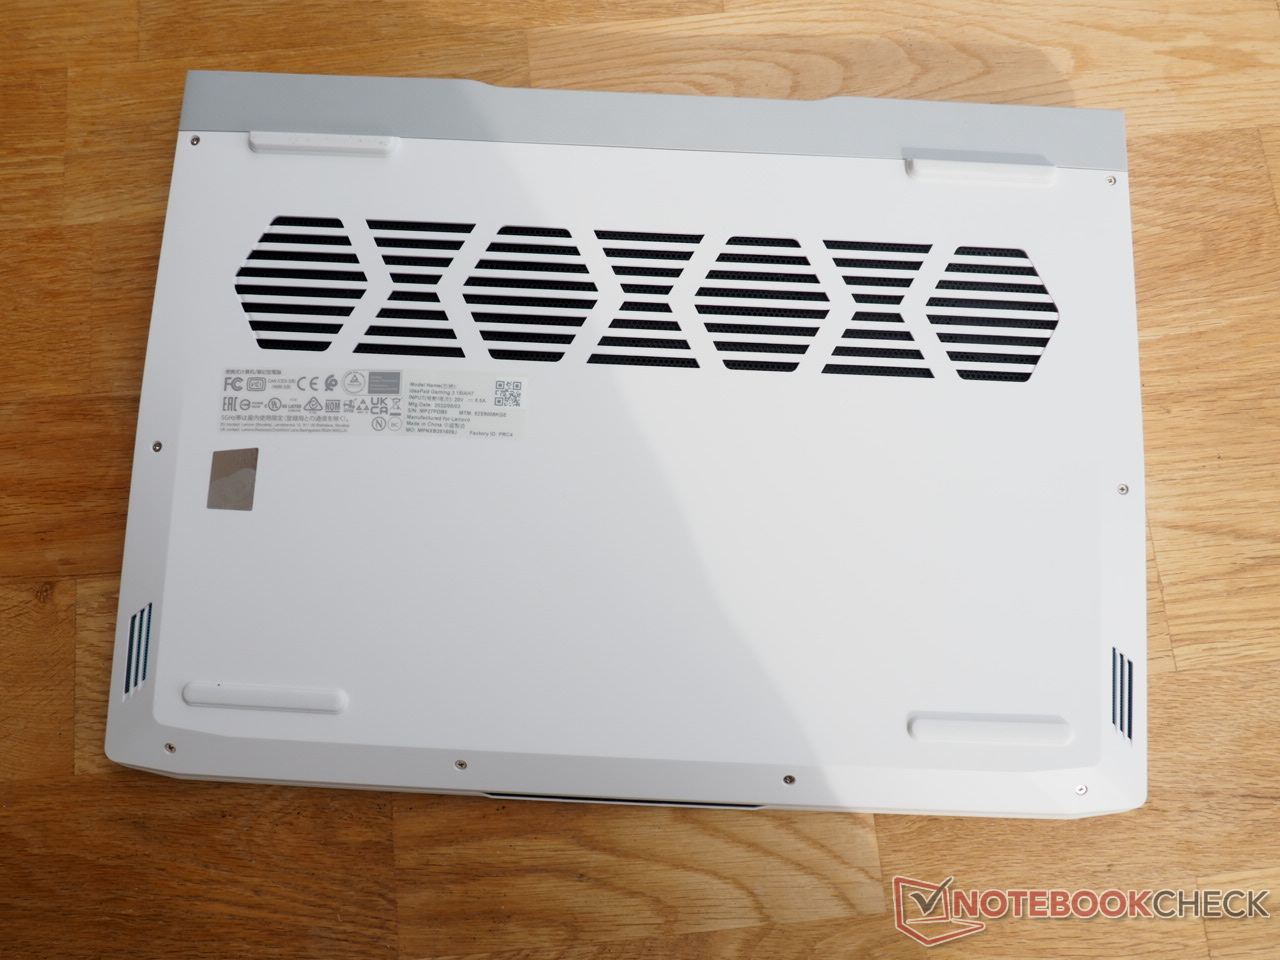
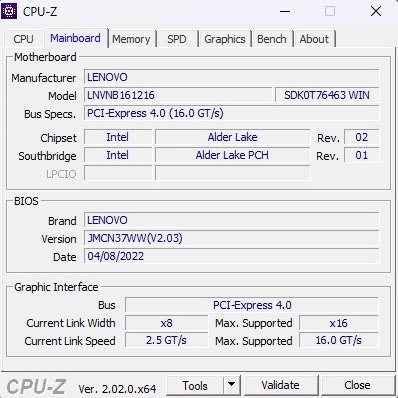
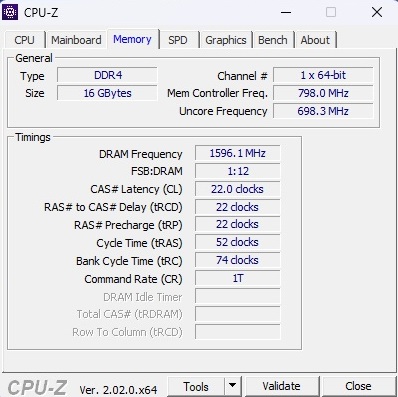
Le prestazioni dell'IdeaPad Gaming 3 15IAH7 lo collocano nella fascia media. Il processore con molti core e 16 GB di memoria di lavoro dovrebbero offrire riserve sufficienti per gli anni futuri, anche se per motivi di prestazioni, Lenovo avrebbe dovuto utilizzare RAM a doppio canale invece di un singolo modulo RAM. Anche se l'unità SSD M.2 integrata è disponibile solo nel formato 2242, il case offre comunque spazio per una classica unità SSD 2280. La scheda grafica lascia impressioni contrastanti. Da un lato, la RTX 3050 Ti offre un solido rapporto qualità-prezzo, ma dall'altro lato, 4 GB di VRAM non sono molto a prova di futuro.
Condizioni di prova
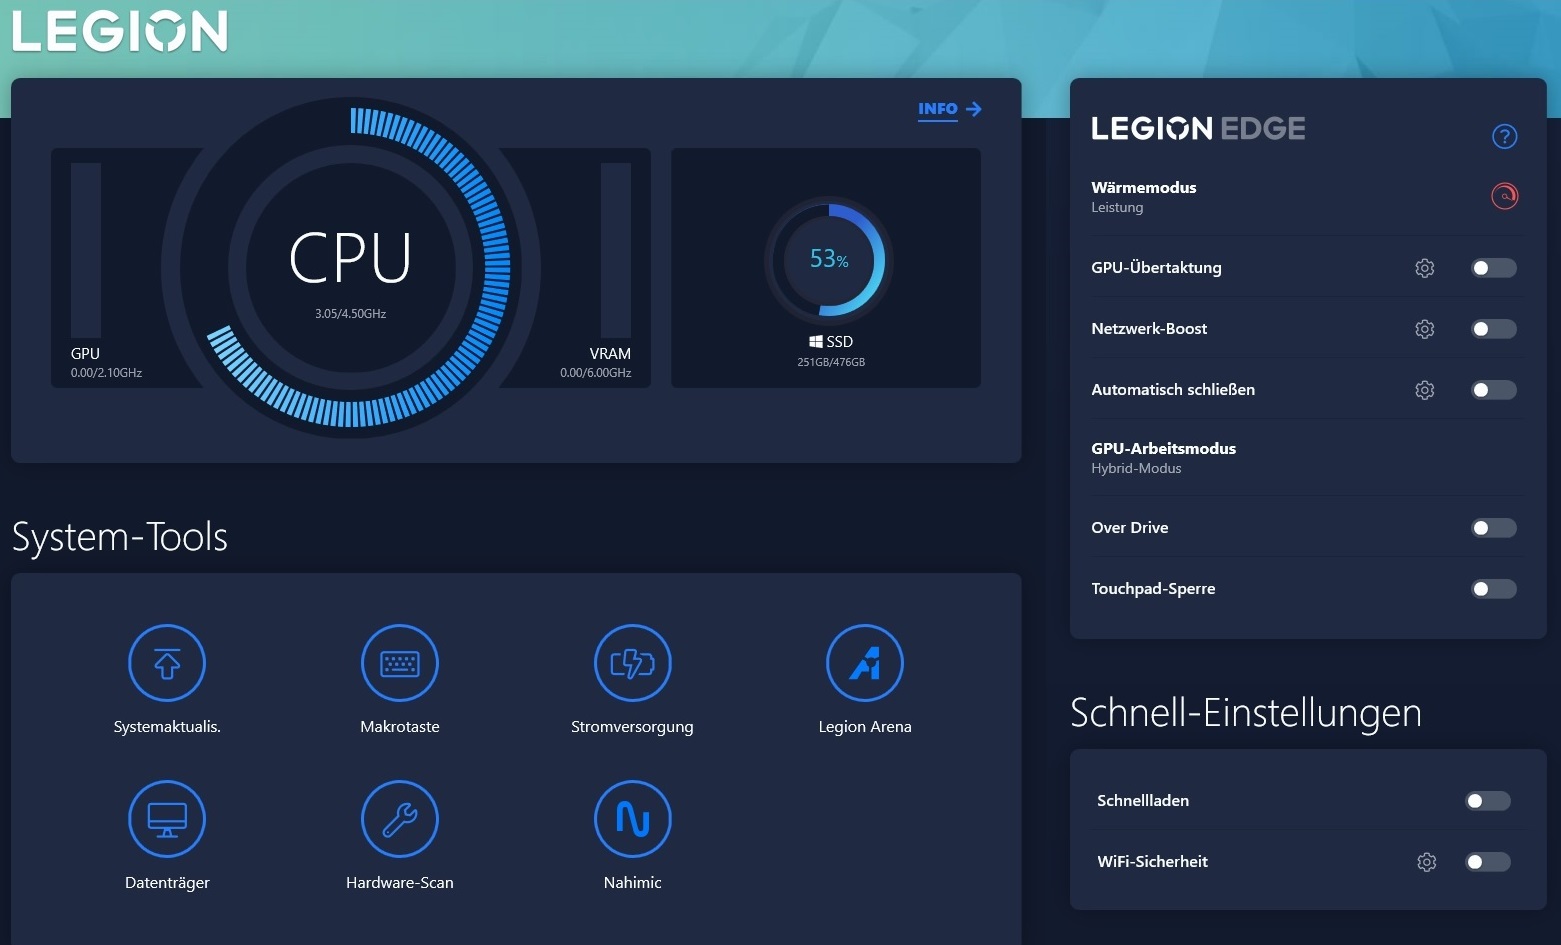
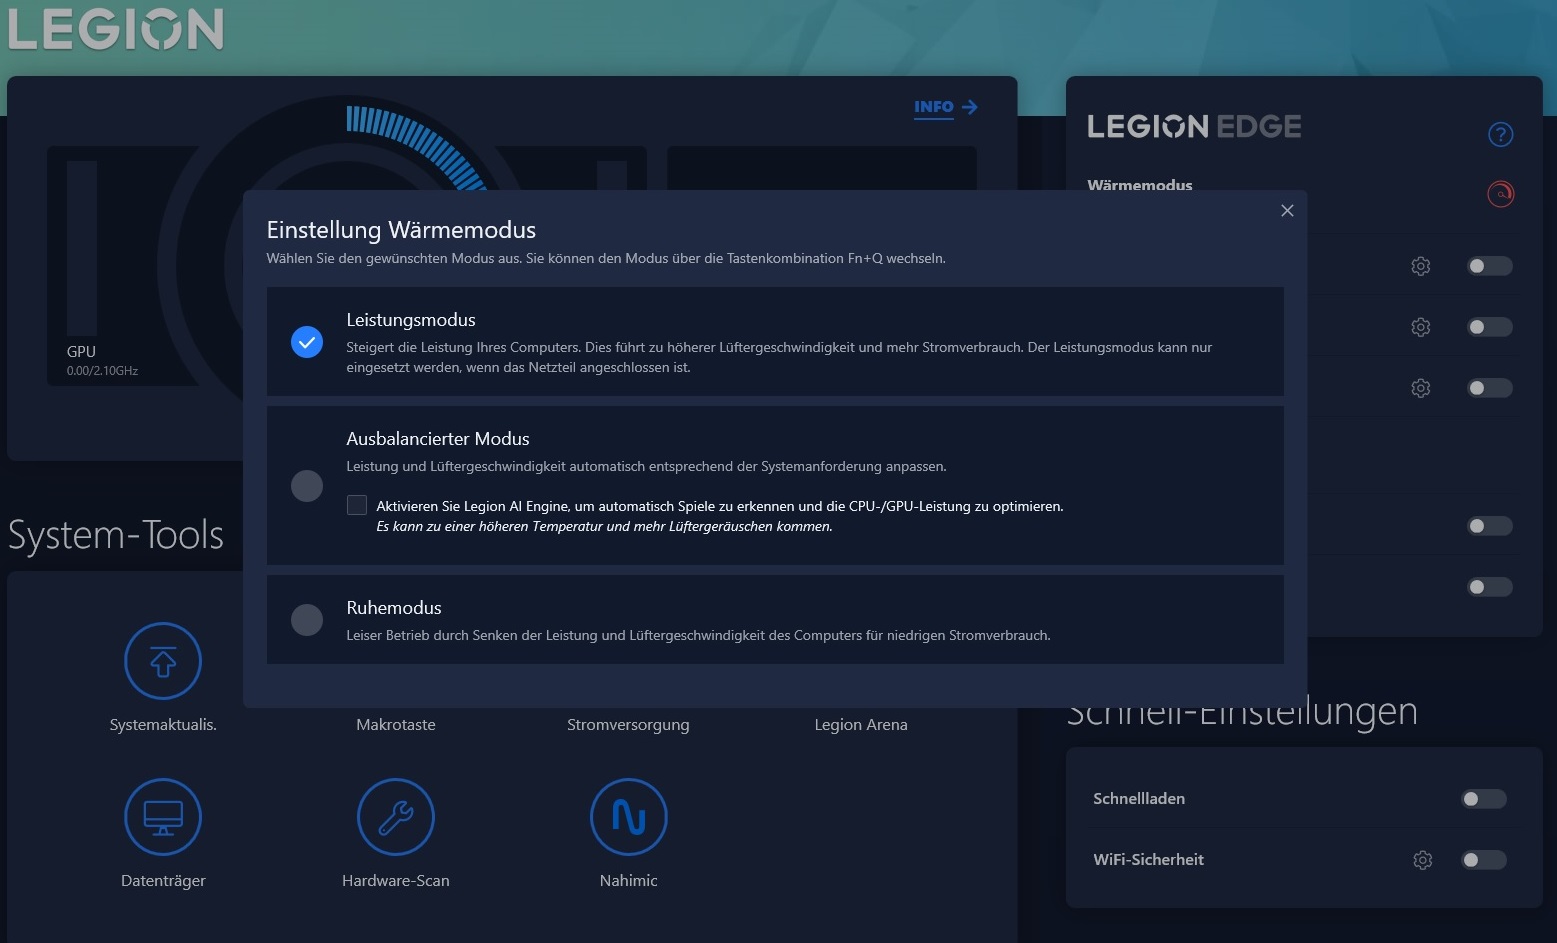
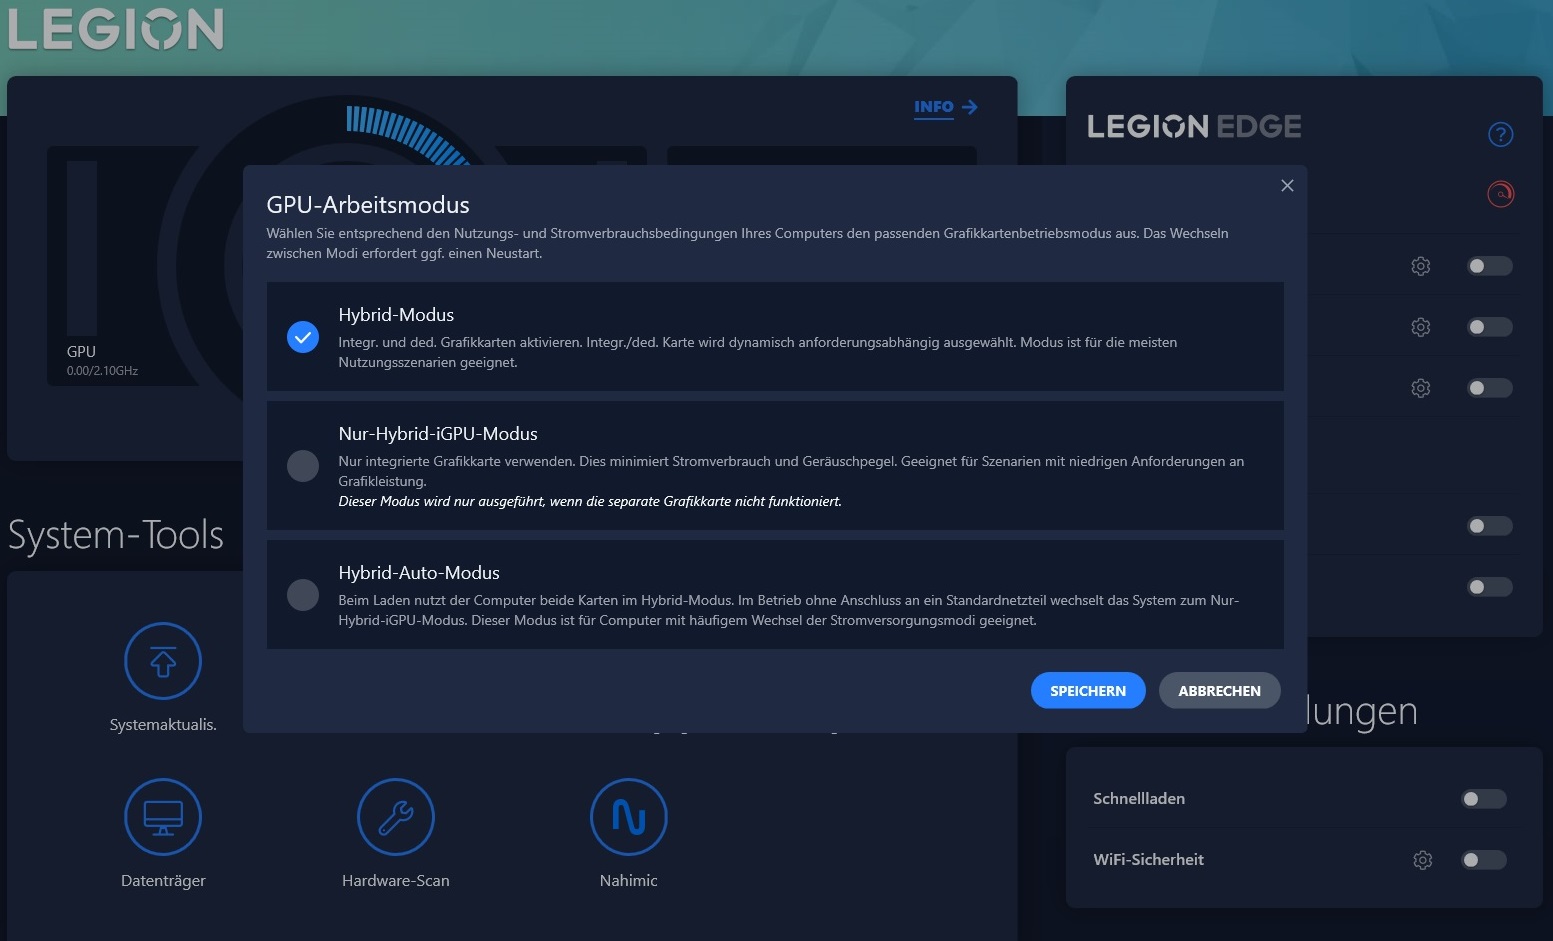
Il software Lenovo Vantage preinstallato offre decine di opzioni di impostazione, tra cui la modalità di alimentazione e la modalità operativa della GPU sono particolarmente importanti. A meno che non sia indicato diversamente, tutte le nostre misurazioni sono state eseguite con la modalità Performance e la normale commutazione grafica ibrida attivata. Tuttavia, considerando il basso calo delle prestazioni (vedi grafico), raccomandiamo piuttosto di utilizzare la modalità bilanciata (profilo adattato) nella pratica. In modalità Silenziosa, il funzionamento del dispositivo è di nuovo significativamente più silenzioso. Nonostante un calo di circa il 30% nella frequenza dei fotogrammi, molti giochi sono ancora giocabili.
| Witcher 3 (FHD/Ultra) | Livello di rumore | Prestazioni |
| Modalità Performance | 46 dB(A) | base (~60 FPS) |
| Modalità regolata | 43 dB(A) | -7% (~56 FPS) |
| Modalità silenziosa | 34 dB(A) | -30% (~42 FPS) |
Processore
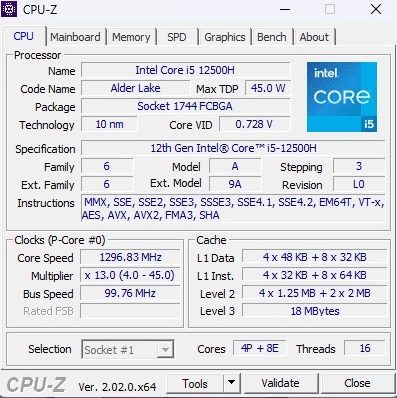
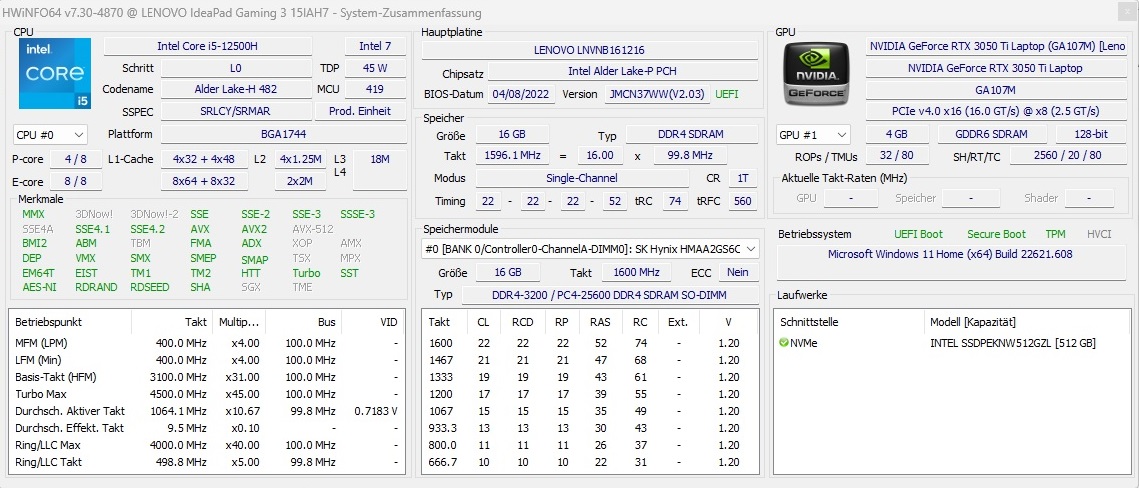
Il Core i5-12500H è un modello a 12 core della generazione Alder Lake di Intel che include 4 core Performance (incluso l'hyperthreading) e 8 core Efficiency (senza hyperthreading) e ha un TDP di 45 Watt. Nei test della CPU, il chip a 10 nm offre prestazioni molto buone. Dal momento che le prestazioni rimangono stabili, l'IdeaPad Gaming 3 15IAH7 si posiziona addirittura davanti al Core i7-12700Hdel Dell Inspiron 16 Plus dopo un po' di tempo nel ciclo Cinebench, raggiungendo il primo posto. Le CPU Ryzen degli altri concorrenti (R5 5600H, R5 6600H E R7 5800H) rimangono leggermente indietro.
Cinebench R15 Multi Constant Load Test
* ... Meglio usare valori piccoli
AIDA64: FP32 Ray-Trace | FPU Julia | CPU SHA3 | CPU Queen | FPU SinJulia | FPU Mandel | CPU AES | CPU ZLib | FP64 Ray-Trace | CPU PhotoWorxx
| Performance rating | |
| Media della classe Gaming | |
| Dell G15 5515 | |
| Dell Inspiron 16 Plus 7620 | |
| Lenovo IdeaPad Gaming 3 15IAH7 | |
| Lenovo IdeaPad Gaming 3 15ARH7 | |
| Media Intel Core i5-12500H | |
| HP Victus 16-e0145ng | |
| AIDA64 / FP32 Ray-Trace | |
| Media della classe Gaming (10227 - 85542, n=107, ultimi 2 anni) | |
| Dell G15 5515 | |
| Lenovo IdeaPad Gaming 3 15IAH7 | |
| Dell Inspiron 16 Plus 7620 | |
| Lenovo IdeaPad Gaming 3 15ARH7 | |
| Media Intel Core i5-12500H (6851 - 13947, n=9) | |
| HP Victus 16-e0145ng | |
| AIDA64 / FPU Julia | |
| Media della classe Gaming (51376 - 238426, n=107, ultimi 2 anni) | |
| Dell G15 5515 | |
| Lenovo IdeaPad Gaming 3 15ARH7 | |
| HP Victus 16-e0145ng | |
| Lenovo IdeaPad Gaming 3 15IAH7 | |
| Dell Inspiron 16 Plus 7620 | |
| Media Intel Core i5-12500H (29874 - 68178, n=9) | |
| AIDA64 / CPU SHA3 | |
| Media della classe Gaming (2180 - 9817, n=107, ultimi 2 anni) | |
| Lenovo IdeaPad Gaming 3 15IAH7 | |
| Dell G15 5515 | |
| Media Intel Core i5-12500H (2287 - 3337, n=9) | |
| Dell Inspiron 16 Plus 7620 | |
| Lenovo IdeaPad Gaming 3 15ARH7 | |
| HP Victus 16-e0145ng | |
| AIDA64 / CPU Queen | |
| Media della classe Gaming (49785 - 173351, n=98, ultimi 2 anni) | |
| Dell G15 5515 | |
| Dell Inspiron 16 Plus 7620 | |
| Lenovo IdeaPad Gaming 3 15IAH7 | |
| Media Intel Core i5-12500H (77935 - 80703, n=9) | |
| Lenovo IdeaPad Gaming 3 15ARH7 | |
| HP Victus 16-e0145ng | |
| AIDA64 / FPU SinJulia | |
| Media della classe Gaming (4424 - 33636, n=107, ultimi 2 anni) | |
| Dell G15 5515 | |
| Lenovo IdeaPad Gaming 3 15ARH7 | |
| HP Victus 16-e0145ng | |
| Dell Inspiron 16 Plus 7620 | |
| Lenovo IdeaPad Gaming 3 15IAH7 | |
| Media Intel Core i5-12500H (6590 - 7431, n=9) | |
| AIDA64 / FPU Mandel | |
| Media della classe Gaming (25115 - 128721, n=107, ultimi 2 anni) | |
| Dell G15 5515 | |
| Lenovo IdeaPad Gaming 3 15ARH7 | |
| HP Victus 16-e0145ng | |
| Lenovo IdeaPad Gaming 3 15IAH7 | |
| Dell Inspiron 16 Plus 7620 | |
| Media Intel Core i5-12500H (18252 - 34041, n=9) | |
| AIDA64 / CPU AES | |
| Dell G15 5515 | |
| Lenovo IdeaPad Gaming 3 15IAH7 | |
| Media della classe Gaming (39258 - 247074, n=107, ultimi 2 anni) | |
| Lenovo IdeaPad Gaming 3 15ARH7 | |
| Media Intel Core i5-12500H (50298 - 111567, n=9) | |
| Dell Inspiron 16 Plus 7620 | |
| HP Victus 16-e0145ng | |
| AIDA64 / CPU ZLib | |
| Media della classe Gaming (574 - 2531, n=107, ultimi 2 anni) | |
| Dell Inspiron 16 Plus 7620 | |
| Lenovo IdeaPad Gaming 3 15IAH7 | |
| Media Intel Core i5-12500H (746 - 924, n=9) | |
| Dell G15 5515 | |
| Lenovo IdeaPad Gaming 3 15ARH7 | |
| HP Victus 16-e0145ng | |
| AIDA64 / FP64 Ray-Trace | |
| Media della classe Gaming (5509 - 45446, n=107, ultimi 2 anni) | |
| Dell G15 5515 | |
| Lenovo IdeaPad Gaming 3 15IAH7 | |
| Dell Inspiron 16 Plus 7620 | |
| Lenovo IdeaPad Gaming 3 15ARH7 | |
| Media Intel Core i5-12500H (3848 - 7405, n=9) | |
| HP Victus 16-e0145ng | |
| AIDA64 / CPU PhotoWorxx | |
| Media della classe Gaming (12271 - 89891, n=107, ultimi 2 anni) | |
| Dell Inspiron 16 Plus 7620 | |
| Media Intel Core i5-12500H (13686 - 43813, n=9) | |
| HP Victus 16-e0145ng | |
| Lenovo IdeaPad Gaming 3 15ARH7 | |
| Dell G15 5515 | |
| Lenovo IdeaPad Gaming 3 15IAH7 | |
Prestazioni del sistema
Secondo PCMark 10, anche le prestazioni del sistema sono di tutto rispetto. Con 6.755 punti, è battuto solo dal Dell Inspiron 16 Plus. Soggettivamente, il sistema operativo risponde in modo comodamente veloce.
CrossMark: Overall | Productivity | Creativity | Responsiveness
| PCMark 10 / Score | |
| Media della classe Gaming (5828 - 11574, n=94, ultimi 2 anni) | |
| Dell Inspiron 16 Plus 7620 | |
| Lenovo IdeaPad Gaming 3 15IAH7 | |
| Lenovo IdeaPad Gaming 3 15ARH7 | |
| Dell G15 5515 | |
| HP Victus 16-e0145ng | |
| PCMark 10 / Essentials | |
| Media della classe Gaming (8810 - 12600, n=98, ultimi 2 anni) | |
| Dell Inspiron 16 Plus 7620 | |
| Lenovo IdeaPad Gaming 3 15IAH7 | |
| HP Victus 16-e0145ng | |
| Dell G15 5515 | |
| Lenovo IdeaPad Gaming 3 15ARH7 | |
| PCMark 10 / Productivity | |
| Media della classe Gaming (6845 - 18766, n=96, ultimi 2 anni) | |
| Lenovo IdeaPad Gaming 3 15IAH7 | |
| Dell Inspiron 16 Plus 7620 | |
| Lenovo IdeaPad Gaming 3 15ARH7 | |
| Dell G15 5515 | |
| HP Victus 16-e0145ng | |
| PCMark 10 / Digital Content Creation | |
| Media della classe Gaming (7602 - 19657, n=96, ultimi 2 anni) | |
| Dell Inspiron 16 Plus 7620 | |
| Lenovo IdeaPad Gaming 3 15IAH7 | |
| HP Victus 16-e0145ng | |
| Dell G15 5515 | |
| Lenovo IdeaPad Gaming 3 15ARH7 | |
| CrossMark / Overall | |
| Media della classe Gaming (1366 - 2409, n=96, ultimi 2 anni) | |
| Dell Inspiron 16 Plus 7620 | |
| Lenovo IdeaPad Gaming 3 15ARH7 | |
| CrossMark / Productivity | |
| Media della classe Gaming (1386 - 2254, n=96, ultimi 2 anni) | |
| Dell Inspiron 16 Plus 7620 | |
| Lenovo IdeaPad Gaming 3 15ARH7 | |
| CrossMark / Creativity | |
| Media della classe Gaming (1343 - 2729, n=96, ultimi 2 anni) | |
| Dell Inspiron 16 Plus 7620 | |
| Lenovo IdeaPad Gaming 3 15ARH7 | |
| CrossMark / Responsiveness | |
| Media della classe Gaming (1226 - 2334, n=96, ultimi 2 anni) | |
| Dell Inspiron 16 Plus 7620 | |
| Lenovo IdeaPad Gaming 3 15ARH7 | |
| PCMark 10 Score | 6755 punti | |
Aiuto | ||
| AIDA64 / Memory Copy | |
| Media della classe Gaming (21750 - 129946, n=107, ultimi 2 anni) | |
| Dell Inspiron 16 Plus 7620 | |
| Media Intel Core i5-12500H (23850 - 66598, n=9) | |
| HP Victus 16-e0145ng | |
| Dell G15 5515 | |
| Lenovo IdeaPad Gaming 3 15ARH7 | |
| Lenovo IdeaPad Gaming 3 15IAH7 | |
| AIDA64 / Memory Read | |
| Media della classe Gaming (22956 - 118858, n=107, ultimi 2 anni) | |
| Dell Inspiron 16 Plus 7620 | |
| Media Intel Core i5-12500H (24879 - 68013, n=9) | |
| HP Victus 16-e0145ng | |
| Dell G15 5515 | |
| Lenovo IdeaPad Gaming 3 15ARH7 | |
| Lenovo IdeaPad Gaming 3 15IAH7 | |
| AIDA64 / Memory Write | |
| Media della classe Gaming (22297 - 135096, n=107, ultimi 2 anni) | |
| Dell Inspiron 16 Plus 7620 | |
| Media Intel Core i5-12500H (23543 - 58797, n=9) | |
| HP Victus 16-e0145ng | |
| Dell G15 5515 | |
| Lenovo IdeaPad Gaming 3 15ARH7 | |
| Lenovo IdeaPad Gaming 3 15IAH7 | |
| AIDA64 / Memory Latency | |
| Media della classe Gaming (75.3 - 259, n=107, ultimi 2 anni) | |
| Media Intel Core i5-12500H (83.8 - 114.7, n=9) | |
| Dell Inspiron 16 Plus 7620 | |
| Lenovo IdeaPad Gaming 3 15IAH7 | |
| Lenovo IdeaPad Gaming 3 15ARH7 | |
| Dell G15 5515 | |
| HP Victus 16-e0145ng | |
* ... Meglio usare valori piccoli
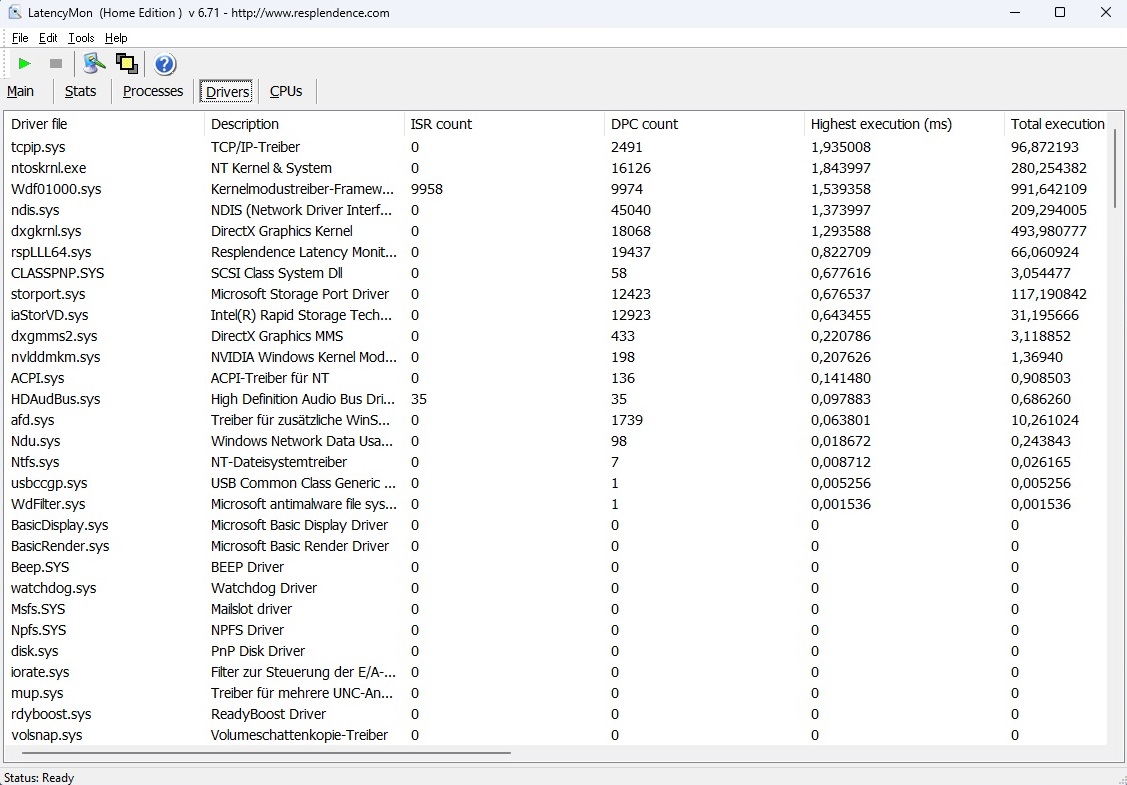
Latenze DPC
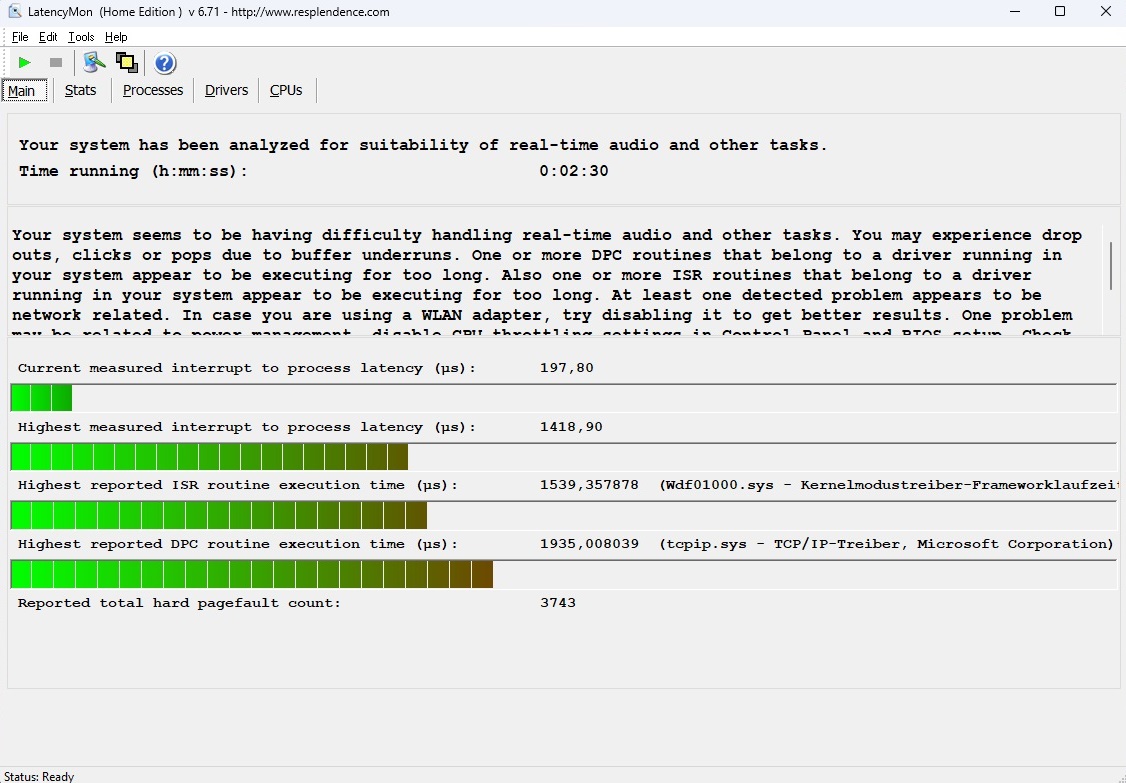
Nel test della latenza, il portatile da 15 pollici non se la cava molto bene. Lo strumento LatencyMon segnala potenziali problemi con l'elaborazione audio e video in tempo reale. Tuttavia, solo pochissimi utenti dovrebbero essere interessati da questi scenari applicativi.
| DPC Latencies / LatencyMon - interrupt to process latency (max), Web, Youtube, Prime95 | |
| Lenovo IdeaPad Gaming 3 15IAH7 | |
| Dell Inspiron 16 Plus 7620 | |
| HP Victus 16-e0145ng | |
| Lenovo IdeaPad Gaming 3 15ARH7 | |
| Dell G15 5515 | |
* ... Meglio usare valori piccoli
Soluzione di stoccaggio
Le prestazioni delle unità SSD si collocano a metà del nostro campo di confronto. Il modello da 512 GB di Intel (660p) non è né particolarmente veloce né particolarmente lento per un'unità NVMe. È bello che, come la velocità della CPU, anche la velocità dell'SSD rimanga relativamente costante.

* ... Meglio usare valori piccoli
Constant Performance Reading: DiskSpd Read Loop, Queue Depth 8
Scheda grafica
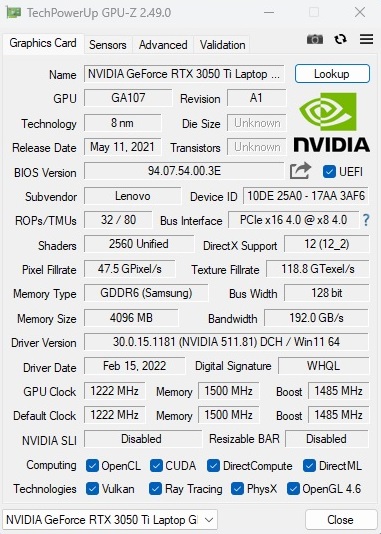
Le prestazioni delle GPU Ampere di Nvidia dipendono in larga misura dal TGP regolato. Lenovo ha scelto un valore relativamente alto per l'IdeaPad Gaming 3, a tutto vantaggio dei risultati del benchmark. 85 Watt sono abbastanza per una RTX 3050 Ti. Il portatile da 15 pollici si comporta altrettanto bene nei benchmark 3DMarks. Sommando tutti i valori, la RTX 3050 Ti è quasi il 25% più veloce della media attuale di questa scheda grafica. In una certa misura, questo compensa il fatto che è già possibile ottenere dispositivi con la RTX 3060che include 6 invece di 4 GB di VRAM, nel segmento dei 1000 euro.
| 3DMark 11 Performance | 19254 punti | |
| 3DMark Cloud Gate Standard Score | 48874 punti | |
| 3DMark Fire Strike Score | 14086 punti | |
| 3DMark Time Spy Score | 6213 punti | |
Aiuto | ||
* ... Meglio usare valori piccoli
Prestazioni di gioco
La tendenza positiva dei test grafici sintetici continua nei nostri test di gioco. Sebbene le prestazioni di alcuni giochi possano risentire notevolmente della RAM a canale singolo (motivo per cui raccomandiamo di passare a 2 x 8 GB), anche i giochi che non sono pesanti dal punto di vista della RAM vengono eseguiti in modo significativamente più veloce rispetto a una RTX 3050 Ti con un TGP inferiore.
| The Witcher 3 | |
| 1920x1080 High Graphics & Postprocessing (Nvidia HairWorks Off) | |
| Media della classe Gaming (181 - 341, n=3, ultimi 2 anni) | |
| Lenovo IdeaPad Gaming 3 15IAH7 | |
| Dell Inspiron 16 Plus 7620 | |
| Lenovo IdeaPad Gaming 3 15ARH7 | |
| HP Victus 16-e0145ng | |
| Dell G15 5515 | |
| Media NVIDIA GeForce RTX 3050 Ti Laptop GPU (30 - 110, n=26) | |
| 1920x1080 Ultra Graphics & Postprocessing (HBAO+) | |
| Media della classe Gaming (95 - 240, n=8, ultimi 2 anni) | |
| Lenovo IdeaPad Gaming 3 15IAH7 | |
| Dell Inspiron 16 Plus 7620 | |
| Dell G15 5515 | |
| Lenovo IdeaPad Gaming 3 15ARH7 | |
| HP Victus 16-e0145ng | |
| Media NVIDIA GeForce RTX 3050 Ti Laptop GPU (19 - 58.5, n=29) | |
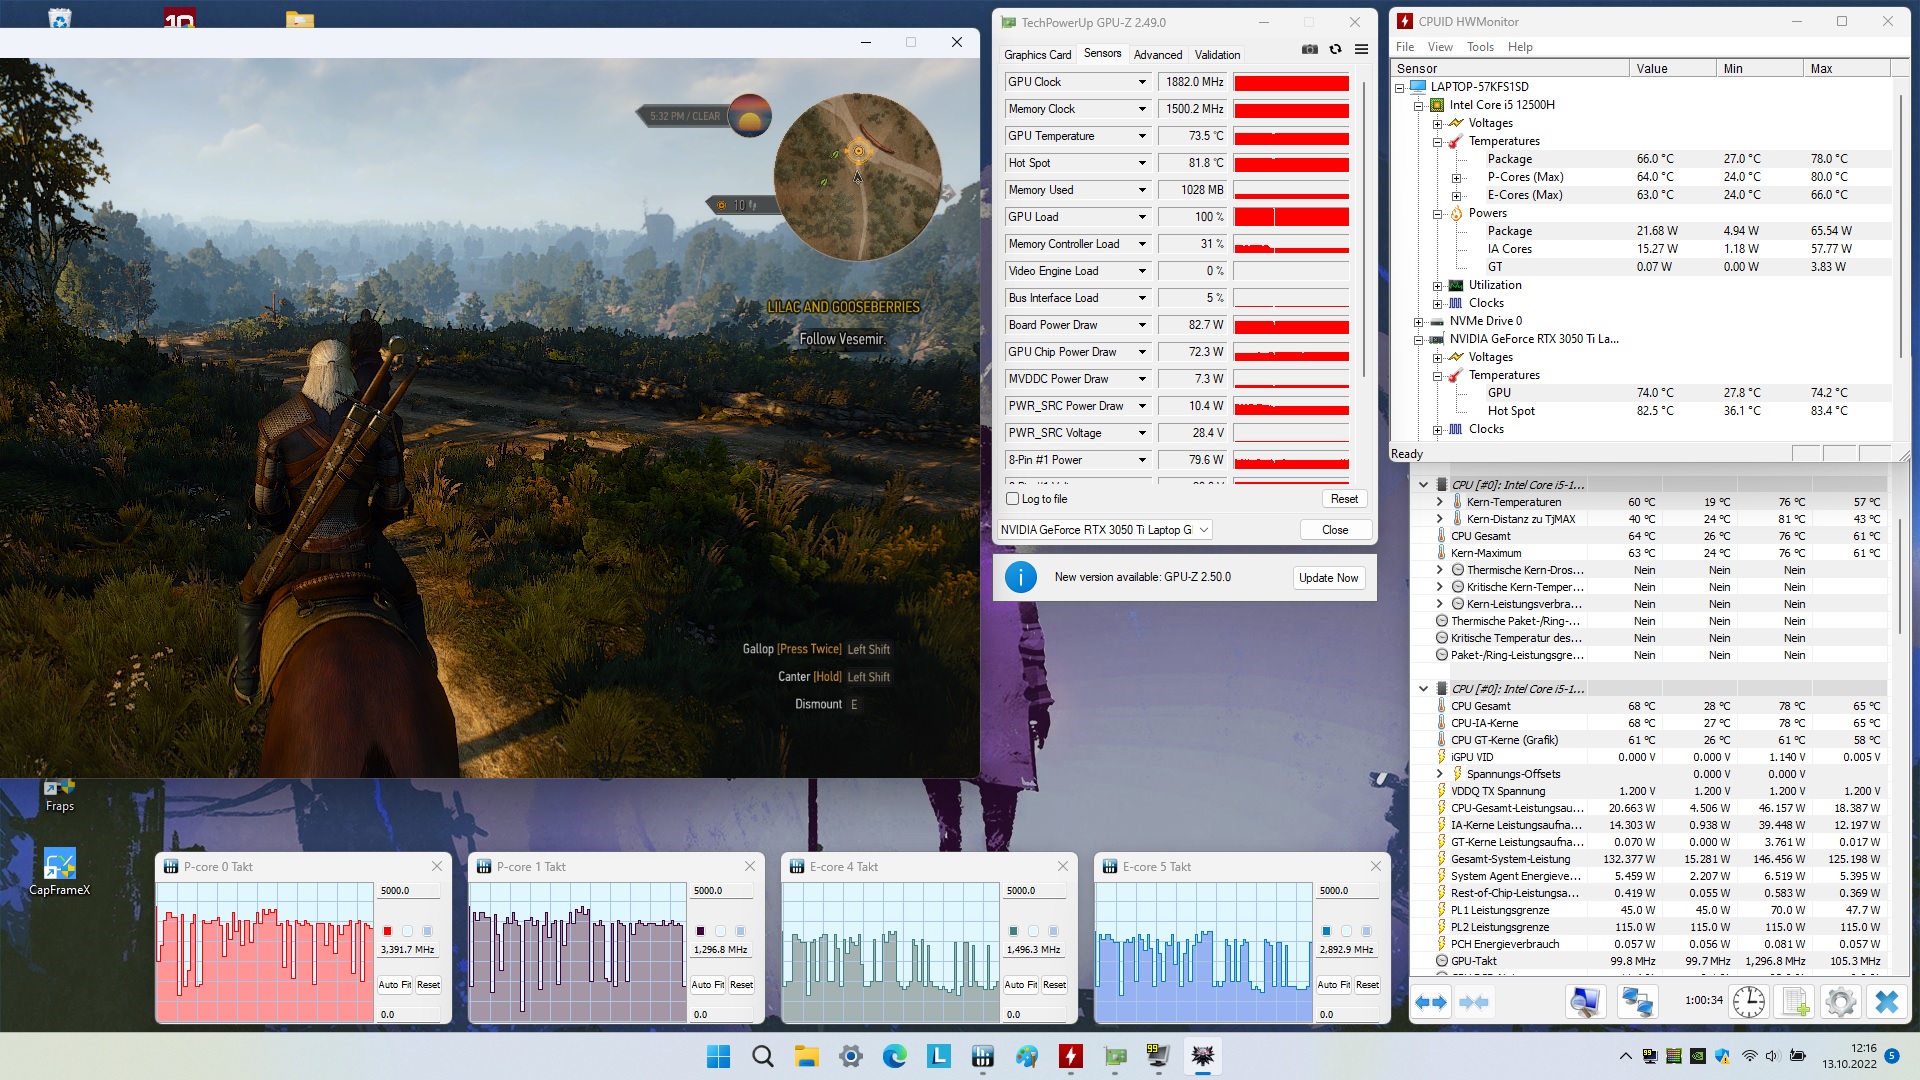
Nel nostro test costante di 60 minuti non abbiamo notato comportamenti evidenti Il Witcher 3. Fondamentalmente, l'IdeaPad Gaming 3 15IAH7 è in grado di gestire quasi tutti i giochi moderni a dettagli elevati e massimi nella risoluzione nativa di 1920 x 1080 pixel, a patto di fare a meno del ray tracing (in cui la RTX 3050 Ti mostra alcune notevoli debolezze).
The Witcher 3 FPS Chart
| basso | medio | alto | ultra | |
|---|---|---|---|---|
| GTA V (2015) | 160.7 | 130.6 | 73.5 | |
| The Witcher 3 (2015) | 173 | 110 | 58.5 | |
| Dota 2 Reborn (2015) | 145.9 | 127.3 | 113.8 | 107.8 |
| Final Fantasy XV Benchmark (2018) | 81.5 | 58.8 | ||
| X-Plane 11.11 (2018) | 109.9 | 98.1 | 81.1 | |
| Strange Brigade (2018) | 145.5 | 117.3 | 101.3 | |
| Ghostwire Tokyo (2022) | 79.5 | 76.8 | 75.9 | |
| Tiny Tina's Wonderlands (2022) | 92.1 | 67.2 | 51.7 | |
| Vampire Bloodhunt (2022) | 111.8 | 110.9 | 106.1 | |
| F1 22 (2022) | 111 | 92 | 32 | |
| The Quarry (2022) | 69.7 | 58.3 | 45.8 |
Emissioni
Emissioni sonore
In modalità Performance, il portatile da 15 pollici non è molto silenzioso. Già durante il funzionamento al minimo, è possibile sentire il rumore della ventola, da 29 a 32 dB(A). Sotto carico, il dispositivo produce un enorme volume di rumore, da 42 a 54 dB(A), anche se altri portatili da gioco come il Victus 16 raggiungono un volume simile. Tuttavia, grazie alle altre due modalità di alimentazione, il dispositivo può essere facilmente e rapidamente silenziato.
Rumorosità
| Idle |
| 29 / 30 / 32 dB(A) |
| Sotto carico |
| 42 / 54 dB(A) |
 | ||
30 dB silenzioso 40 dB(A) udibile 50 dB(A) rumoroso |
||
min: | ||
| Lenovo IdeaPad Gaming 3 15IAH7 GeForce RTX 3050 Ti Laptop GPU, i5-12500H | Lenovo IdeaPad Gaming 3 15ARH7 GeForce RTX 3050 4GB Laptop GPU, R5 6600H | Dell G15 5515 GeForce RTX 3050 Ti Laptop GPU, R7 5800H | HP Victus 16-e0145ng GeForce RTX 3050 Ti Laptop GPU, R5 5600H | Dell Inspiron 16 Plus 7620 GeForce RTX 3050 Ti Laptop GPU, i7-12700H | |
|---|---|---|---|---|---|
| Noise | 11% | 7% | 0% | 4% | |
| off /ambiente * (dB) | 25 | 23.3 7% | 24 4% | 26 -4% | 23.3 7% |
| Idle Minimum * (dB) | 29 | 23.8 18% | 25 14% | 26 10% | 25.7 11% |
| Idle Average * (dB) | 30 | 23.8 21% | 26 13% | 28 7% | 26.1 13% |
| Idle Maximum * (dB) | 32 | 27.2 15% | 30 6% | 34 -6% | 30.6 4% |
| Load Average * (dB) | 42 | 34.8 17% | 44 -5% | 44 -5% | 46.2 -10% |
| Witcher 3 ultra * (dB) | 46 | 49.3 -7% | 44 4% | 48 -4% | 49.2 -7% |
| Load Maximum * (dB) | 54 | 49.4 9% | 48 11% | 53 2% | 49.4 9% |
* ... Meglio usare valori piccoli
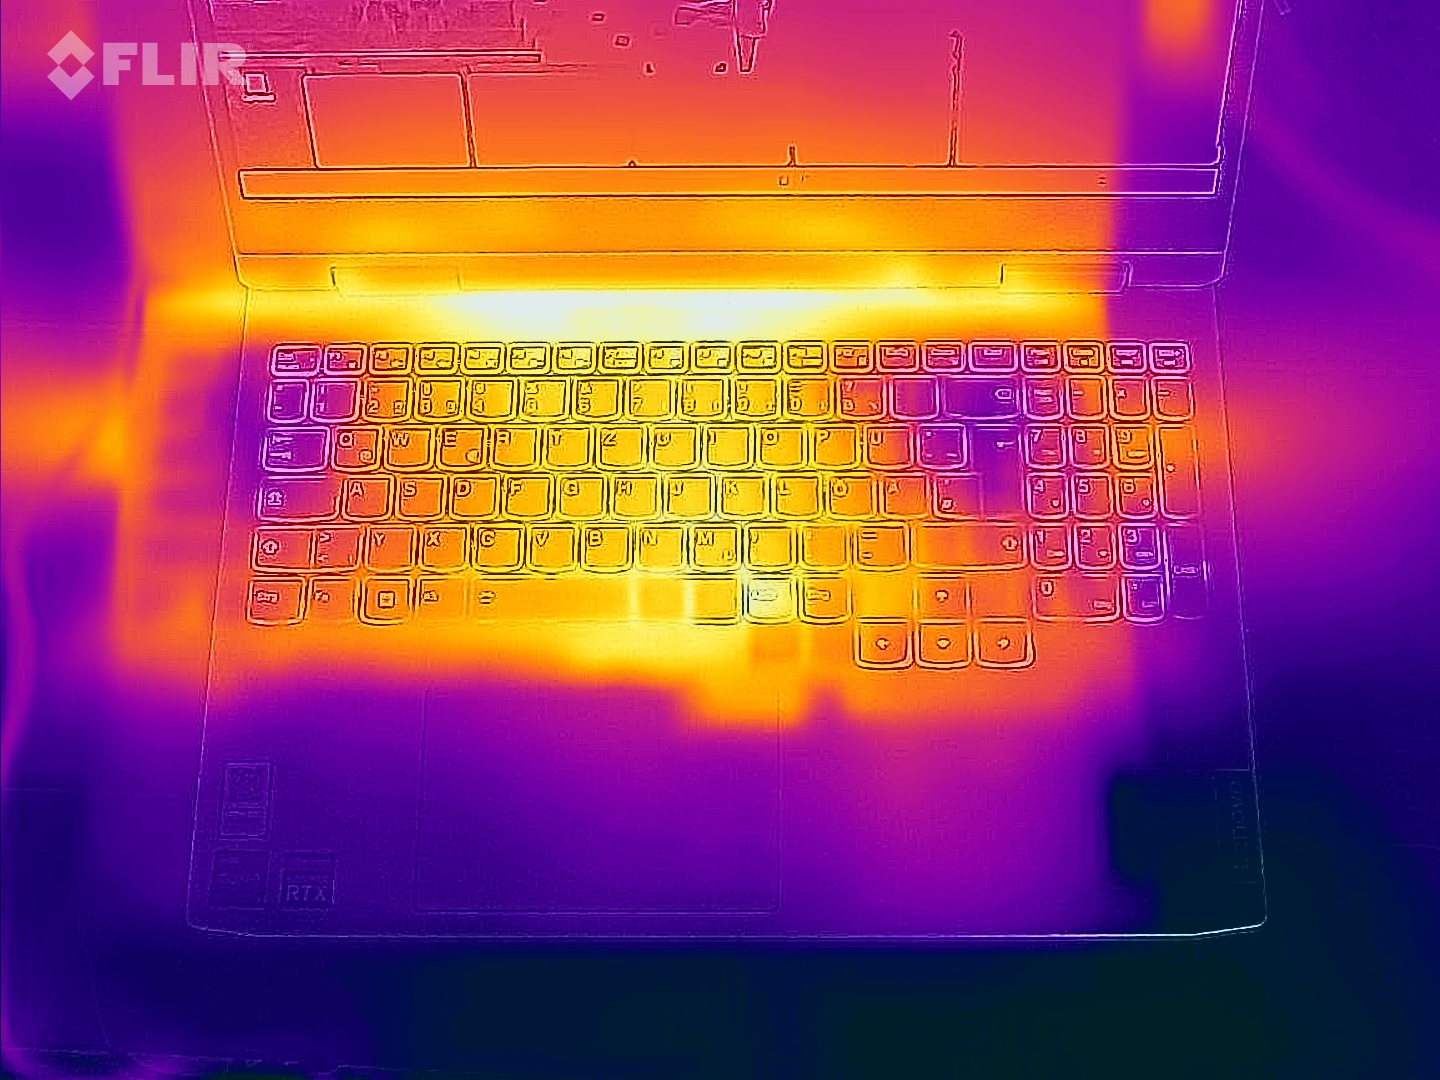
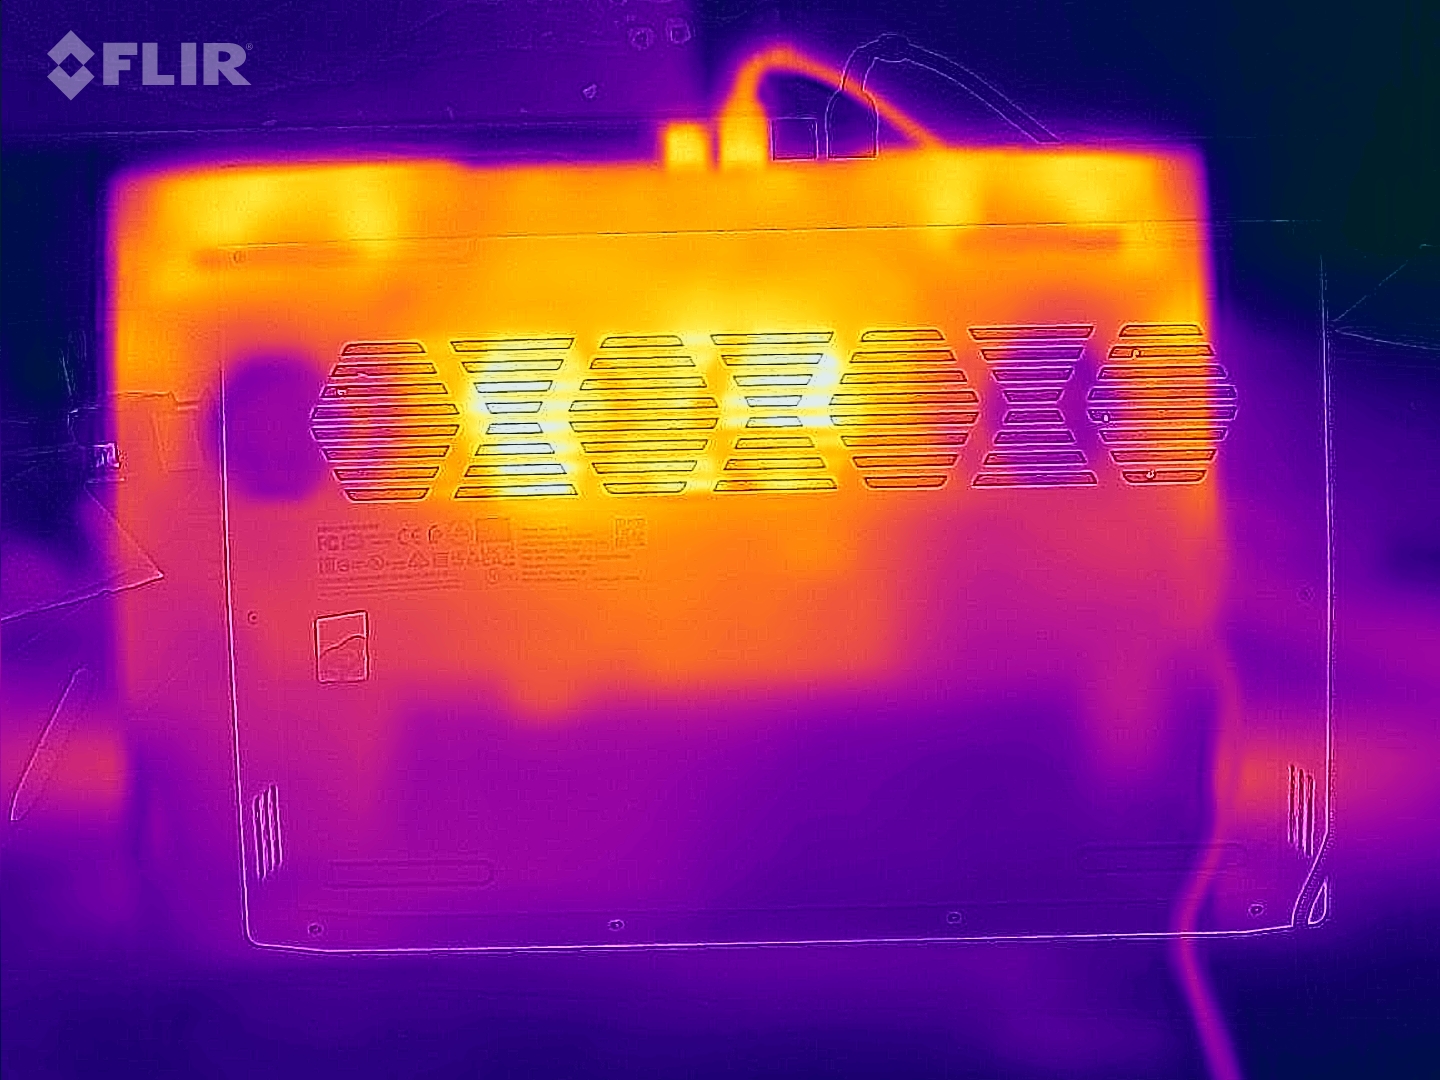
Temperature
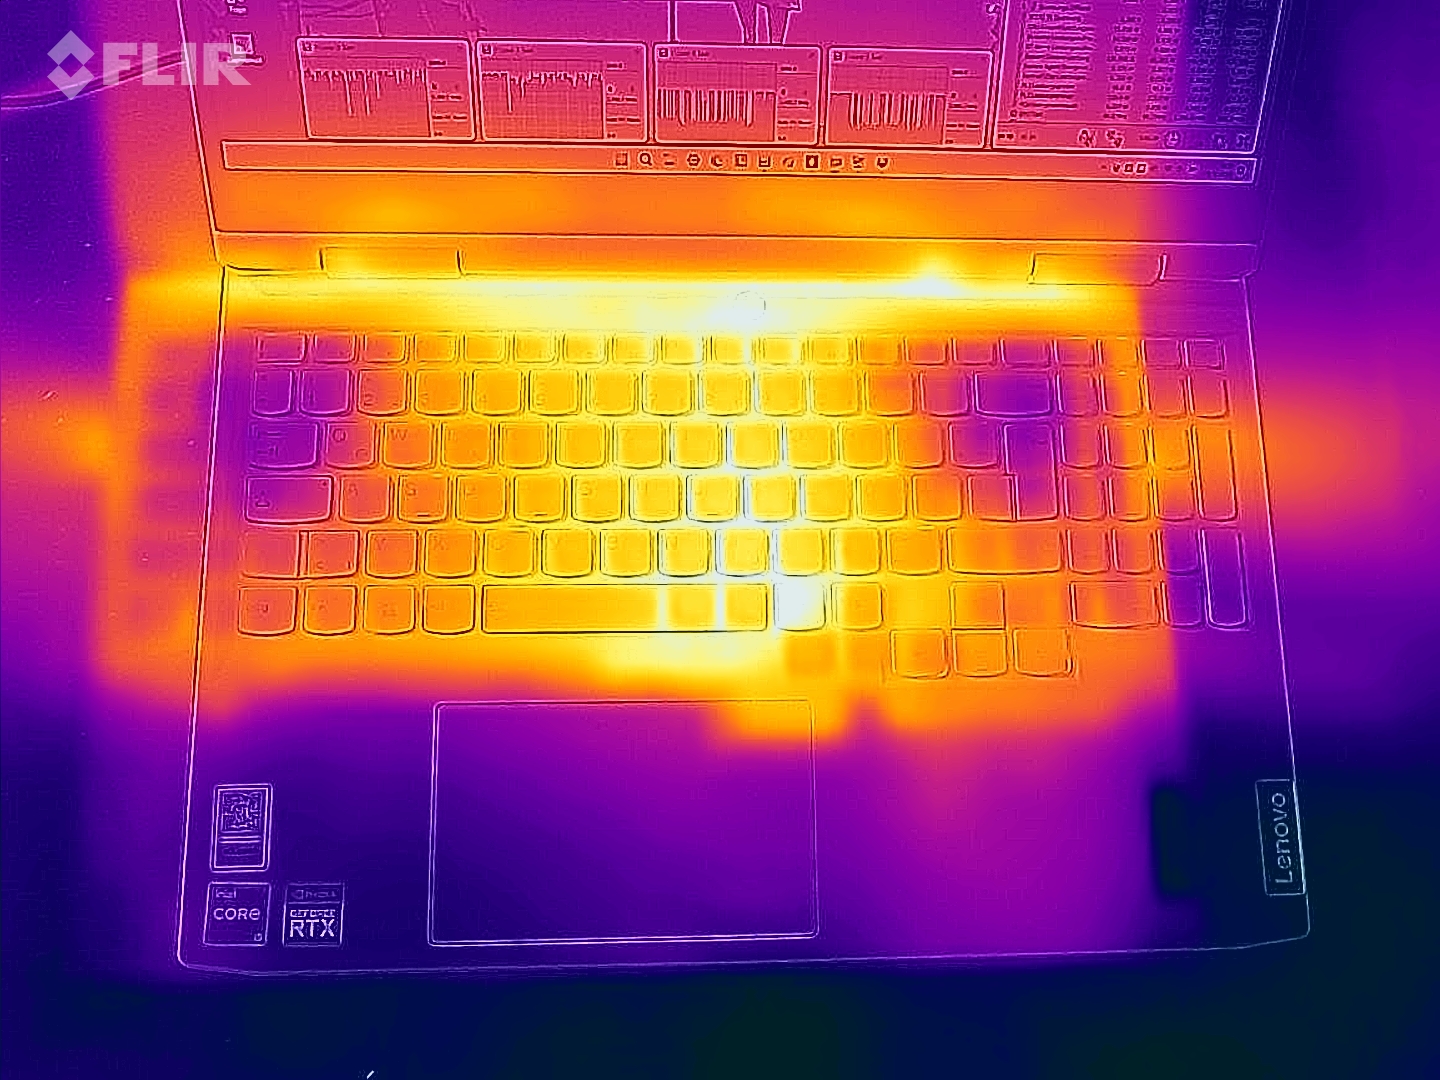
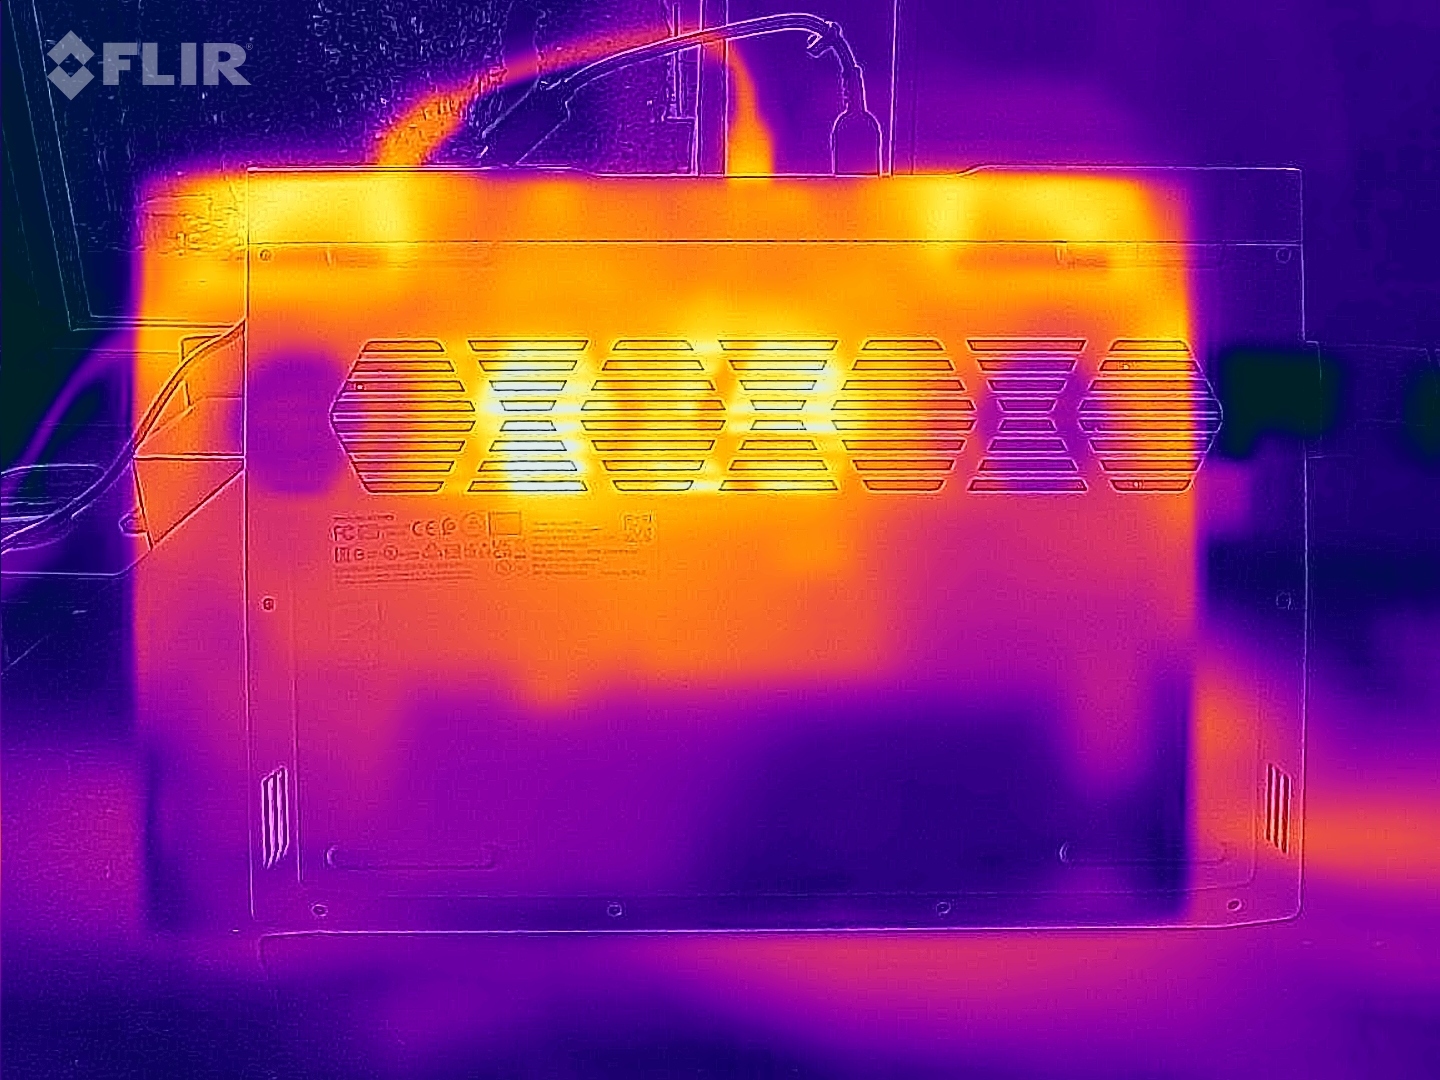
Anche l'andamento delle temperature è tipico di un portatile da gioco. Mentre il dispositivo Lenovo rimane comodamente fresco durante il funzionamento inattivo, le temperature raggiungono i 47 °C (~117 °F) nella parte superiore e i 52 °C (~126 °F) nella parte inferiore durante il funzionamento in 3D. Non è quindi il caso di provare a giocare con il portatile sulle ginocchia.
(-) La temperatura massima sul lato superiore è di 47 °C / 117 F, rispetto alla media di 40.4 °C / 105 F, che varia da 21.2 a 68.8 °C per questa classe Gaming.
(-) Il lato inferiore si riscalda fino ad un massimo di 52 °C / 126 F, rispetto alla media di 43.2 °C / 110 F
(+) In idle, la temperatura media del lato superiore è di 24.2 °C / 76 F, rispetto alla media deld ispositivo di 33.9 °C / 93 F.
(-) Riproducendo The Witcher 3, la temperatura media per il lato superiore e' di 39.2 °C / 103 F, rispetto alla media del dispositivo di 33.9 °C / 93 F.
(±) I poggiapolsi e il touchpad possono diventare molto caldi al tatto con un massimo di 37 °C / 98.6 F.
(-) La temperatura media della zona del palmo della mano di dispositivi simili e'stata di 28.8 °C / 83.8 F (-8.2 °C / -14.8 F).
| Lenovo IdeaPad Gaming 3 15IAH7 GeForce RTX 3050 Ti Laptop GPU, i5-12500H | Lenovo IdeaPad Gaming 3 15ARH7 GeForce RTX 3050 4GB Laptop GPU, R5 6600H | Dell G15 5515 GeForce RTX 3050 Ti Laptop GPU, R7 5800H | HP Victus 16-e0145ng GeForce RTX 3050 Ti Laptop GPU, R5 5600H | Dell Inspiron 16 Plus 7620 GeForce RTX 3050 Ti Laptop GPU, i7-12700H | |
|---|---|---|---|---|---|
| Heat | -3% | -3% | -25% | -8% | |
| Maximum Upper Side * (°C) | 47 | 47.6 -1% | 50 -6% | 54 -15% | 46 2% |
| Maximum Bottom * (°C) | 52 | 46.6 10% | 49 6% | 47 10% | 45.8 12% |
| Idle Upper Side * (°C) | 25 | 27.2 -9% | 26 -4% | 41 -64% | 29.2 -17% |
| Idle Bottom * (°C) | 24 | 27.2 -13% | 26 -8% | 31 -29% | 31 -29% |
* ... Meglio usare valori piccoli
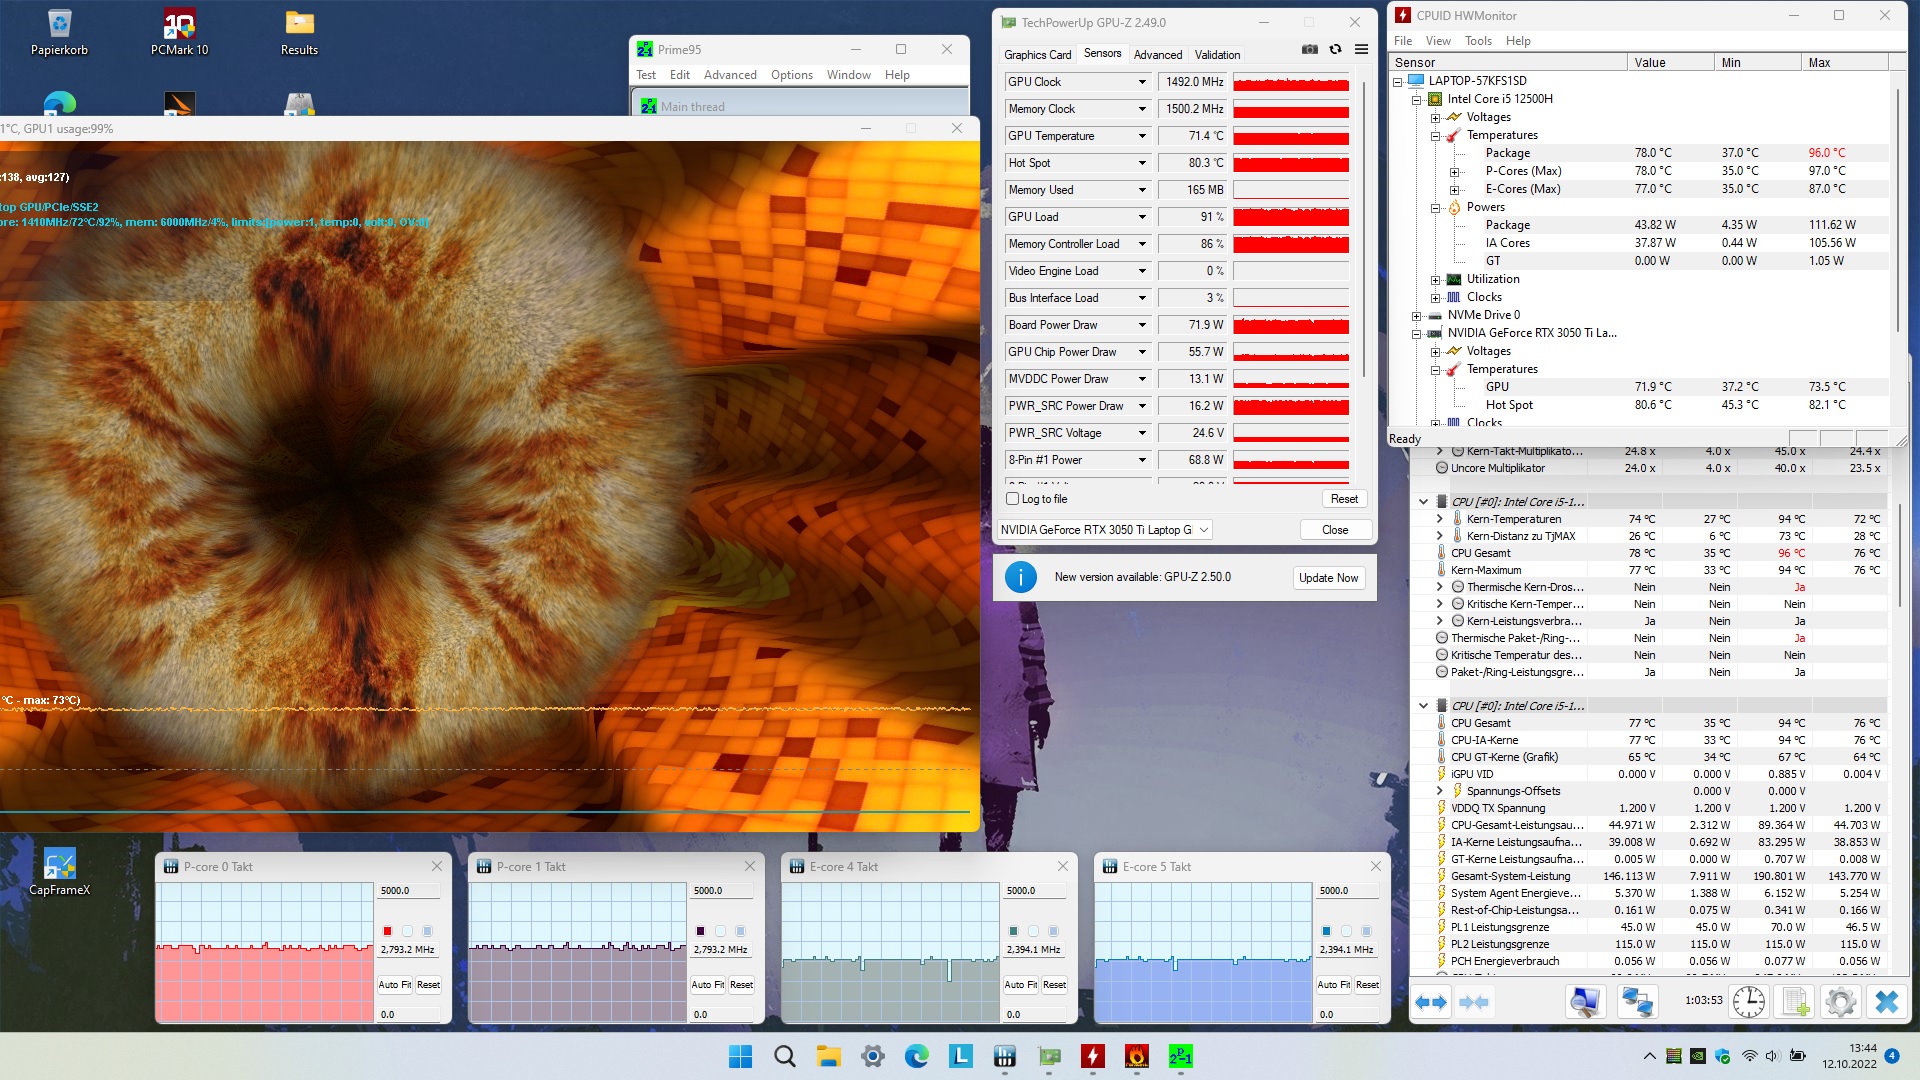
Stress test
Lo stress test con un'ora di FurMark e Prime95 non rivela nulla di strano. Il portatile da 15 pollici rimane lontano dal throttling e dai valori critici dell'hardware. Consideriamo circa 71 °C (~160 °F) per la GPU e 78 °C (~172 °F) per la CPU a pieno carico come valori moderati.
Altoparlanti
Lenovo IdeaPad Gaming 3 15IAH7 analisi audio
(+) | gli altoparlanti sono relativamente potenti (83 dB)
Bassi 100 - 315 Hz
(-) | quasi nessun basso - in media 17.1% inferiori alla media
(±) | la linearità dei bassi è media (12.8% delta rispetto alla precedente frequenza)
Medi 400 - 2000 Hz
(±) | medi elevati - circa 5.6% superiore alla media
(+) | medi lineari (4.5% delta rispetto alla precedente frequenza)
Alti 2 - 16 kHz
(+) | Alti bilanciati - appena 2% dalla media
(+) | alti lineari (4.6% delta rispetto alla precedente frequenza)
Nel complesso 100 - 16.000 Hz
(+) | suono nel complesso lineare (14.4% differenza dalla media)
Rispetto alla stessa classe
» 27% di tutti i dispositivi testati in questa classe è stato migliore, 7% simile, 66% peggiore
» Il migliore ha avuto un delta di 6%, medio di 18%, peggiore di 132%
Rispetto a tutti i dispositivi testati
» 18% di tutti i dispositivi testati in questa classe è stato migliore, 4% similare, 78% peggiore
» Il migliore ha avuto un delta di 4%, medio di 24%, peggiore di 134%
Dell G15 5515 analisi audio
(±) | potenza degli altiparlanti media ma buona (76 dB)
Bassi 100 - 315 Hz
(-) | quasi nessun basso - in media 22% inferiori alla media
(±) | la linearità dei bassi è media (14.9% delta rispetto alla precedente frequenza)
Medi 400 - 2000 Hz
(+) | medi bilanciati - solo only 2.8% rispetto alla media
(+) | medi lineari (3% delta rispetto alla precedente frequenza)
Alti 2 - 16 kHz
(+) | Alti bilanciati - appena 1.4% dalla media
(+) | alti lineari (3.7% delta rispetto alla precedente frequenza)
Nel complesso 100 - 16.000 Hz
(±) | la linearità complessiva del suono è media (16.8% di differenza rispetto alla media
Rispetto alla stessa classe
» 44% di tutti i dispositivi testati in questa classe è stato migliore, 11% simile, 46% peggiore
» Il migliore ha avuto un delta di 6%, medio di 18%, peggiore di 132%
Rispetto a tutti i dispositivi testati
» 29% di tutti i dispositivi testati in questa classe è stato migliore, 8% similare, 63% peggiore
» Il migliore ha avuto un delta di 4%, medio di 24%, peggiore di 134%
Gestione dell'alimentazione
Consumo di energia
Anche il consumo energetico non spicca. Anche se in media la Gaming 3 consuma un po' di più rispetto ad altri portatili con RTX 3050 Ti, ciò è dovuto principalmente al TGP più elevato.
| Off / Standby | |
| Idle | |
| Sotto carico |
|
Leggenda:
min: | |
| Lenovo IdeaPad Gaming 3 15IAH7 GeForce RTX 3050 Ti Laptop GPU, i5-12500H | Lenovo IdeaPad Gaming 3 15ARH7 GeForce RTX 3050 4GB Laptop GPU, R5 6600H | Dell G15 5515 GeForce RTX 3050 Ti Laptop GPU, R7 5800H | HP Victus 16-e0145ng GeForce RTX 3050 Ti Laptop GPU, R5 5600H | Dell Inspiron 16 Plus 7620 GeForce RTX 3050 Ti Laptop GPU, i7-12700H | Media della classe Gaming | |
|---|---|---|---|---|---|---|
| Power Consumption | 8% | 7% | 5% | 6% | -53% | |
| Idle Minimum * (Watt) | 8 | 7.7 4% | 5 37% | 7 12% | 6.8 15% | 13.2 ? -65% |
| Idle Average * (Watt) | 10 | 9.1 9% | 9 10% | 9 10% | 9.6 4% | 18.9 ? -89% |
| Idle Maximum * (Watt) | 16 | 15.6 2% | 20 -25% | 15 6% | 17 -6% | 24.3 ? -52% |
| Load Average * (Watt) | 99 | 90.7 8% | 94 5% | 93 6% | 117.5 -19% | 108.3 ? -9% |
| Witcher 3 ultra * (Watt) | 144.6 | 122.9 15% | 123 15% | 134.5 7% | 113.1 22% | |
| Load Maximum * (Watt) | 168 | 155.2 8% | 172 -2% | 185 -10% | 137.4 18% | 254 ? -51% |
* ... Meglio usare valori piccoli
Power Consumption The Witcher 3 / Stress Test
Power Consumption With External Monitor
Durata della batteria
A seconda del modello, l'IdeaPad offre una batteria da 45-Wh o da 60-Wh. A differenza del suo fratello AMD, la versione Intel testata è fortunatamente in grado di ottenere una batteria più potente. Tuttavia, a causa del consumo più elevato, le differenze rimangono nei limiti. Con appena 6 ore, l'autonomia della batteria durante la navigazione Internet wireless con una luminosità del display ridotta a 150 cd/m² risulta persino leggermente inferiore a quella della versione AMD. Anche gli altri concorrenti sono in vantaggio da questo punto di vista.
| Lenovo IdeaPad Gaming 3 15IAH7 GeForce RTX 3050 Ti Laptop GPU, i5-12500H, 60 Wh | Lenovo IdeaPad Gaming 3 15ARH7 GeForce RTX 3050 4GB Laptop GPU, R5 6600H, 45 Wh | Dell G15 5515 GeForce RTX 3050 Ti Laptop GPU, R7 5800H, 56 Wh | HP Victus 16-e0145ng GeForce RTX 3050 Ti Laptop GPU, R5 5600H, 70 Wh | Dell Inspiron 16 Plus 7620 GeForce RTX 3050 Ti Laptop GPU, i7-12700H, 86 Wh | Media della classe Gaming | |
|---|---|---|---|---|---|---|
| Autonomia della batteria | 10% | 36% | 20% | 63% | 19% | |
| WiFi v1.3 (h) | 5.9 | 6.5 10% | 8 36% | 7.1 20% | 9.6 63% | 7.04 ? 19% |
| Reader / Idle (h) | 2.4 | 13.5 | 18.6 | 8.71 ? | ||
| Load (h) | 0.9 | 1.5 | 1.2 | 1.47 ? | ||
| H.264 (h) | 8.8 | 8.26 ? |
Pro
Contro
Il verdetto
Se non si tiene conto della qualità mediocre del case in termini di materiali e lavorazione, Lenovo ha creato un portatile da gioco economico di successo con l'IdeaPad Gaming 3 15IAH7.
Grazie agli elevati TDP e al costante sviluppo delle prestazioni, il processoreCore i5-12500He GeForce RTX 3050 Tisono in grado di mostrare tutta la loro potenza, mentre al contrario i concorrenti (per lo più più lenti) offrono una migliore durata della batteria. Tuttavia, quasi nessuno dei portatili alternativi è in grado di raggiungere la qualità dell'immagine del Gaming 3. La maggior parte dei concorrenti è rimasta indietro per quanto riguarda la qualità dell'immagine. La maggior parte dei concorrenti rimane indietro in termini di spazio colore e luminosità. Nel nostro campo di confronto, solo il Dell Inspiron 16 Plusè in grado di avvicinarsi al portatile Lenovo.
Chi si aspetta un buon display ma non vuole spendere troppo per un portatile da gioco dovrebbe dare un'occhiata più da vicino all'IdeaPad Gaming 3 15IAH7.
Prezzo e disponibilità
Al momento di questo test, l'IdeaPad Gaming 3 15IAH7 con Core i5-12500H, GeForce RTX 3050 Ti, 8 GB di RAM e 512 GB di SSD è disponibile per 1031 dollari da BestBuy.
Lenovo IdeaPad Gaming 3 15IAH7
- 10/14/2022 v7 (old)
Florian Glaser
Price comparison

