Debutto delle prestazioni di Ryzen 5 6600H: Recensione del portatile Lenovo IdeaPad Gaming 3 15ARH7
La serie IdeaPad Gaming 3 ospita alcuni dei portatili da gioco più economici di Lenovo, in contrapposizione alla serie di fascia media Legion 5 Pro e alla serie di fascia più alta Legion 7. Quest'ultimo modello 2022 si distingue per essere uno dei primi a montare la CPU AMD Zen 3+ Ryzen 5 6600H, in sostituzione della soluzione Intel di 10a generazione nella serie IdeaPad Gaming 3i 2020 IdeaPad Gaming 3i. Inoltre, introduce un nuovo design dello chassis per distinguersi ulteriormente dai modelli di vecchia generazione
Le configurazioni includono la CPU Ryzen 5 6600H o Ryzen 7 6800H con la GPU RTX 3050 o 3050 Ti da 85 W GeForce. Lo stesso pannello IPS 1080p a 120 Hz è presente su tutte le SKU. La nostra specifica unità di recensione con 6600H, RTX 3050, SSD da 256 GB e 8 GB di RAM è l'opzione di fascia più bassa a circa 800 dollari al dettaglio
Tra i concorrenti ci sono altri portatili da gioco economici da 15,6 o 16 pollici, come il modello Acer Nitro 5, HP Victus, Asus TUF Dash 15o la MSI serie GF
Altre recensioni Lenovo
Potenziali concorrenti a confronto
Punteggio | Data | Modello | Peso | Altezza | Dimensione | Risoluzione | Prezzo |
|---|---|---|---|---|---|---|---|
| 80.8 % v7 (old) | 09/2022 | Lenovo IdeaPad Gaming 3 15ARH7 R5 6600H, GeForce RTX 3050 4GB Laptop GPU | 2.4 kg | 21.8 mm | 15.60" | 1920x1080 | |
| 78.4 % v7 (old) | 07/2020 | Lenovo IdeaPad Gaming 3i 15IMH05 i5-10300H, GeForce GTX 1650 Mobile | 2.2 kg | 24.9 mm | 15.60" | 1920x1080 | |
| 82.6 % v7 (old) | 05/2022 | Lenovo Legion 5 15ACH6A-82NW0010GE R5 5600H, Radeon RX 6600M | 2.5 kg | 25.75 mm | 15.60" | 1920x1080 | |
| 82.3 % v7 (old) | 09/2022 | Gigabyte A5 K1 R5 5600H, GeForce RTX 3060 Laptop GPU | 2.2 kg | 34 mm | 15.60" | 1920x1080 | |
| 85.8 % v7 (old) | 07/2022 | Asus TUF Dash F15 FX517ZR i7-12650H, GeForce RTX 3070 Laptop GPU | 2 kg | 20.7 mm | 15.60" | 2560x1440 | |
| 81 % v7 (old) | 06/2022 | Dell G15 5510 i5-10500H, GeForce RTX 3050 4GB Laptop GPU | 2.5 kg | 23 mm | 15.60" | 1920x1080 |
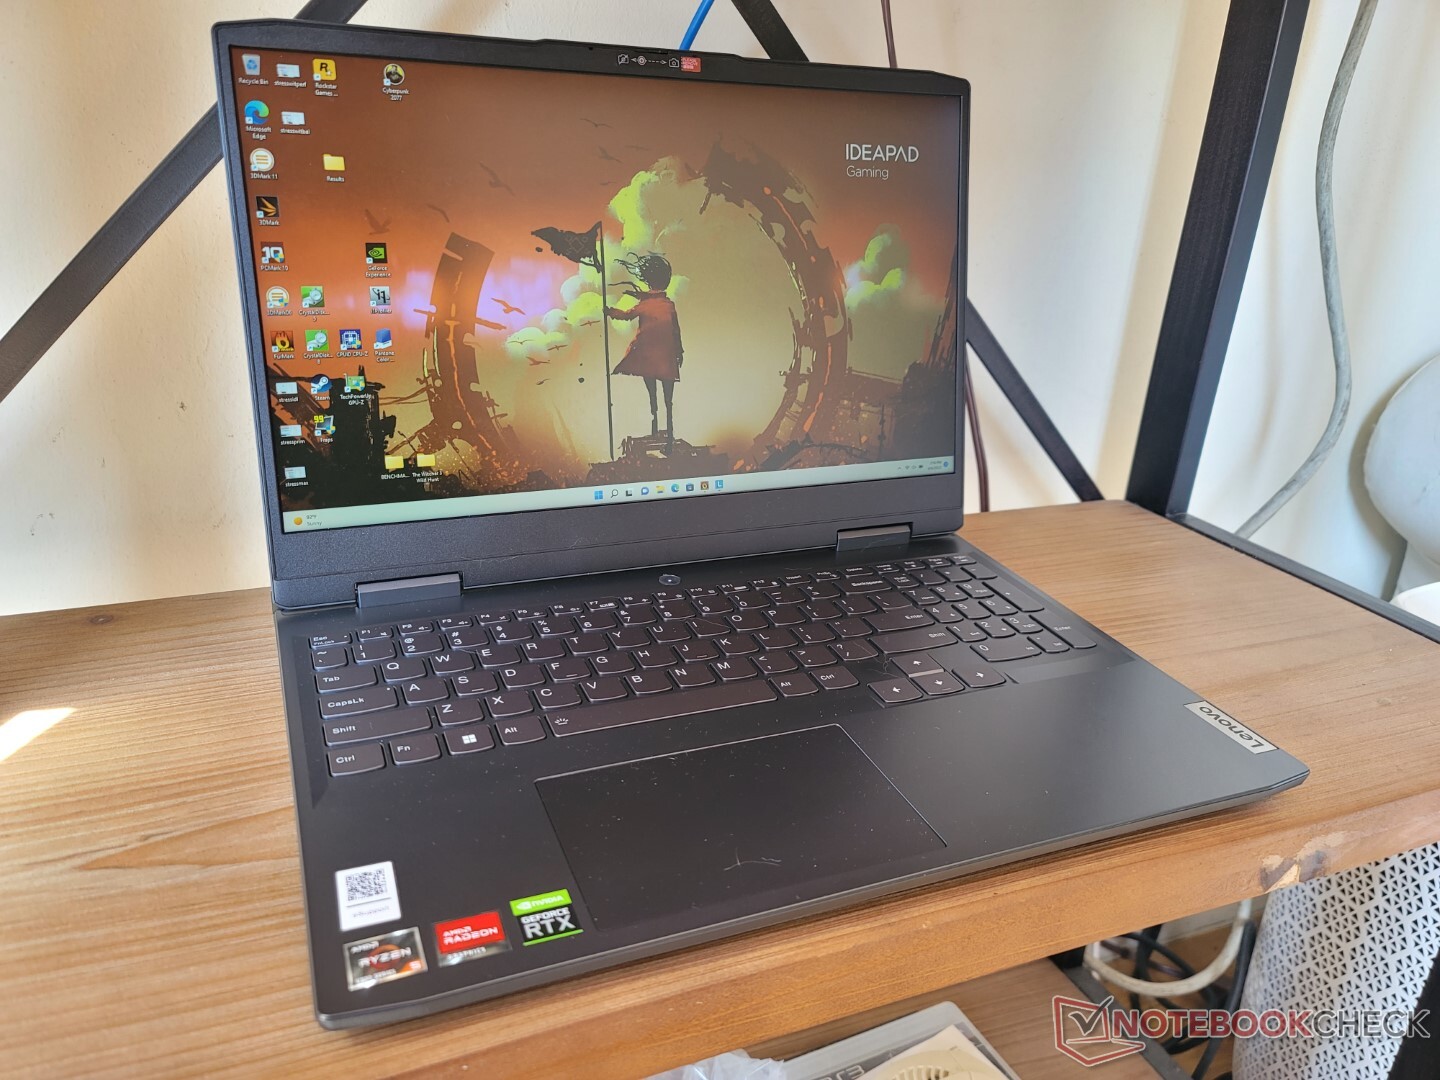
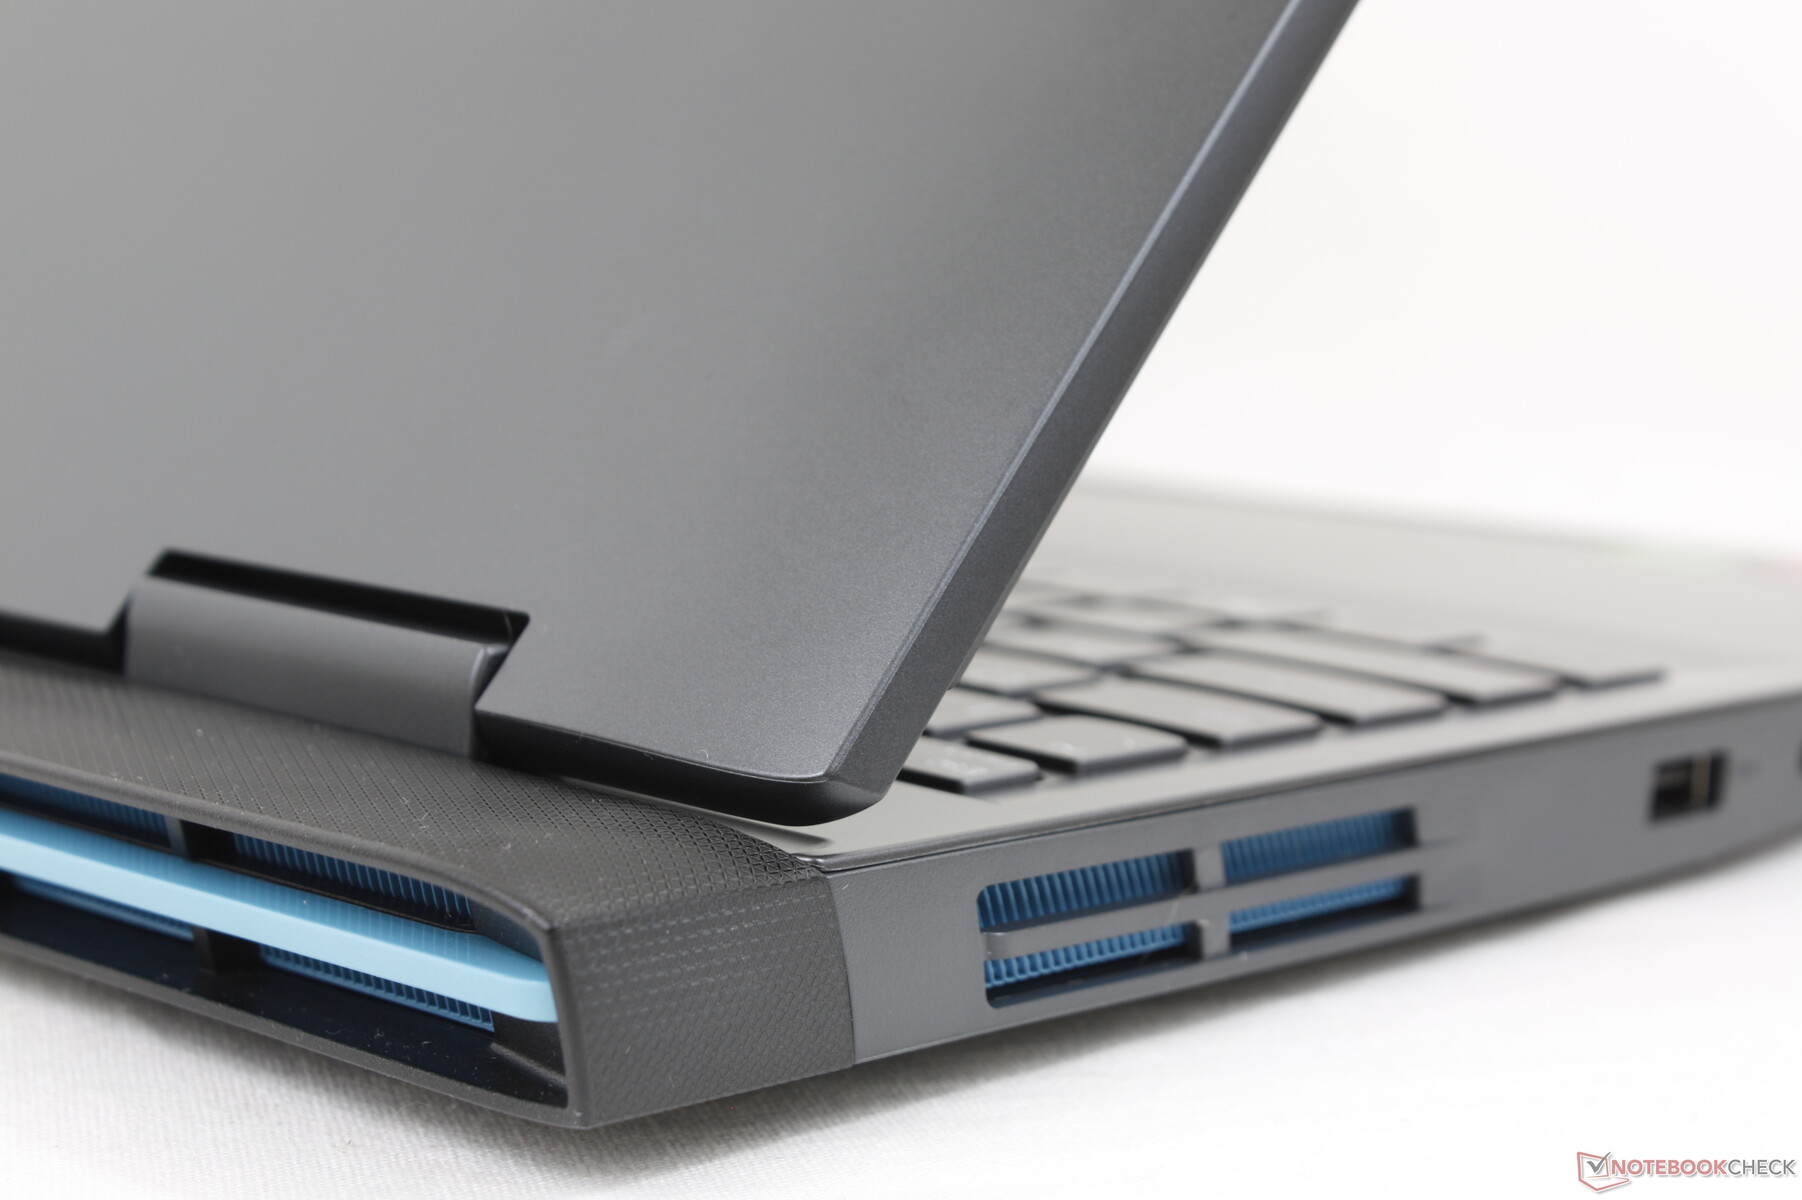
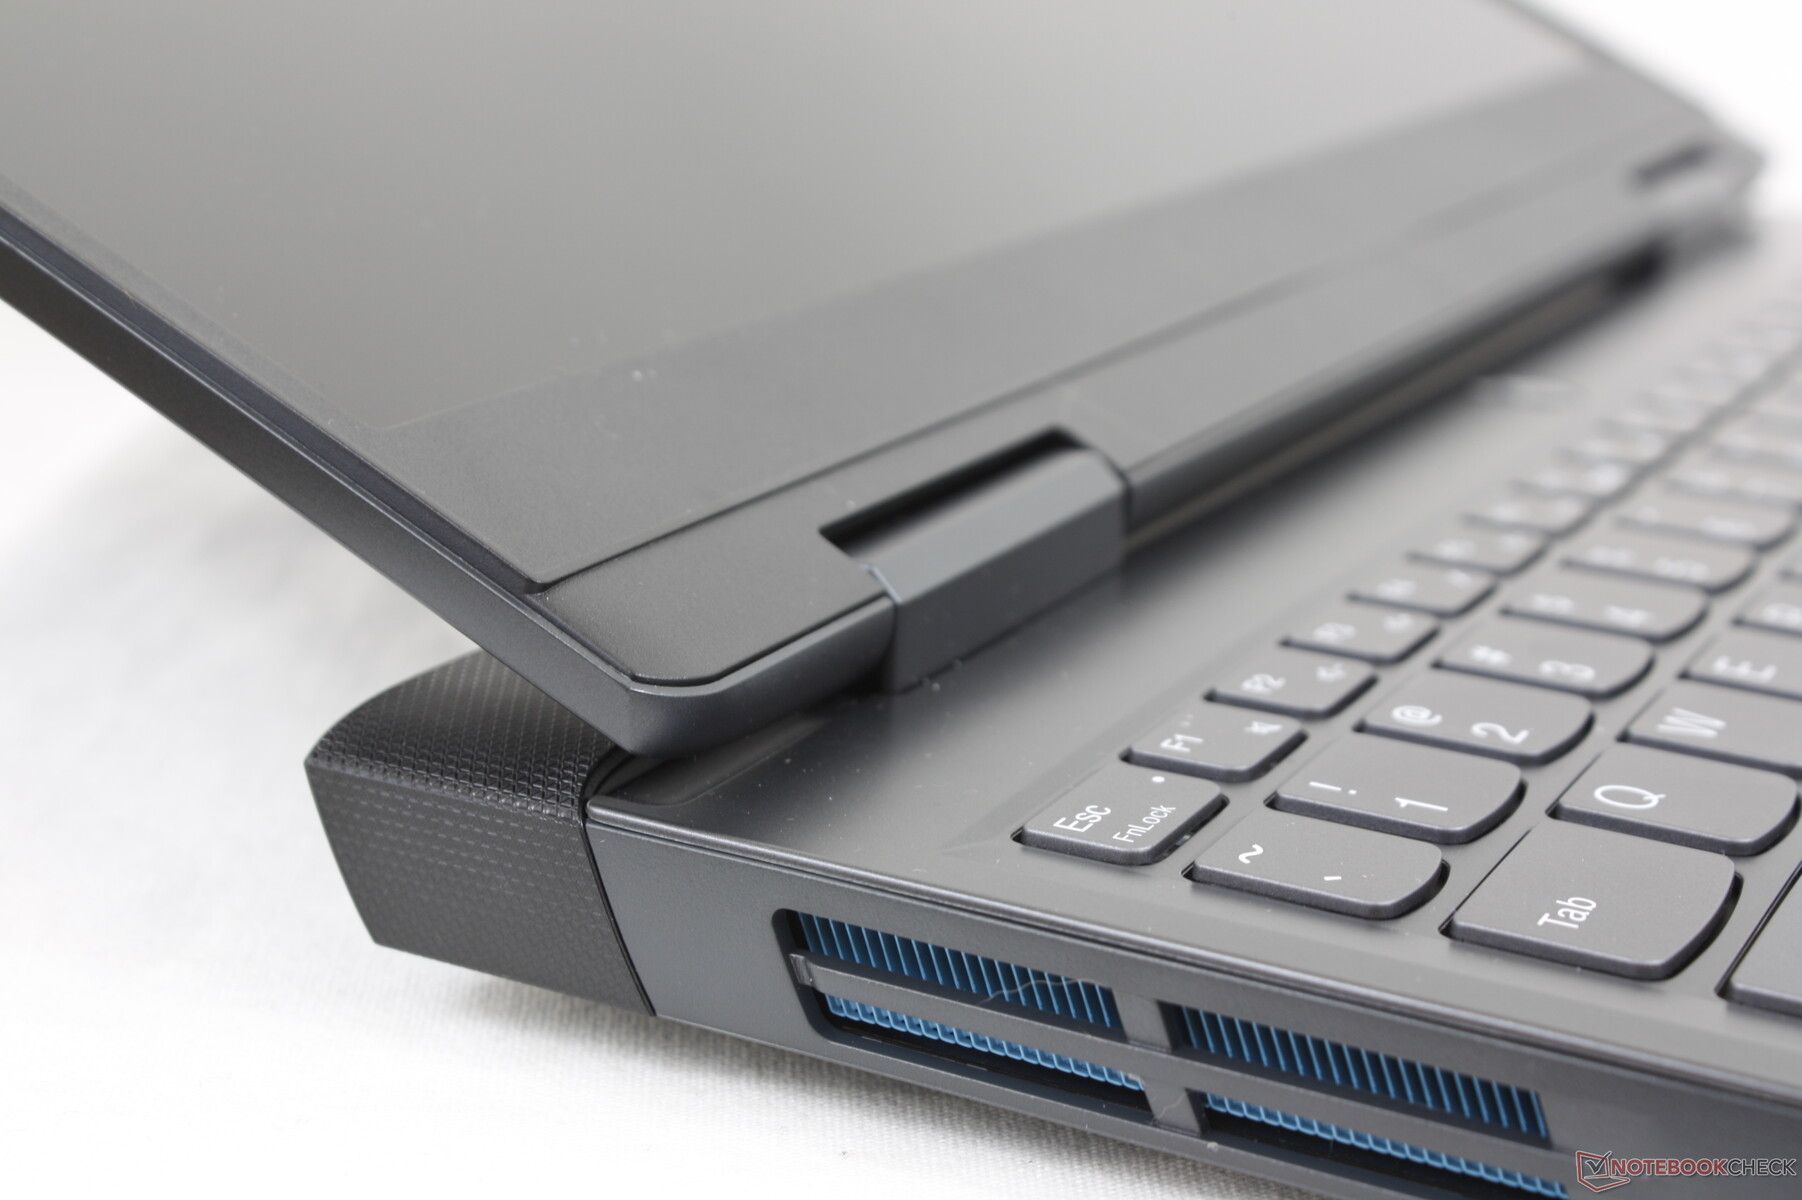
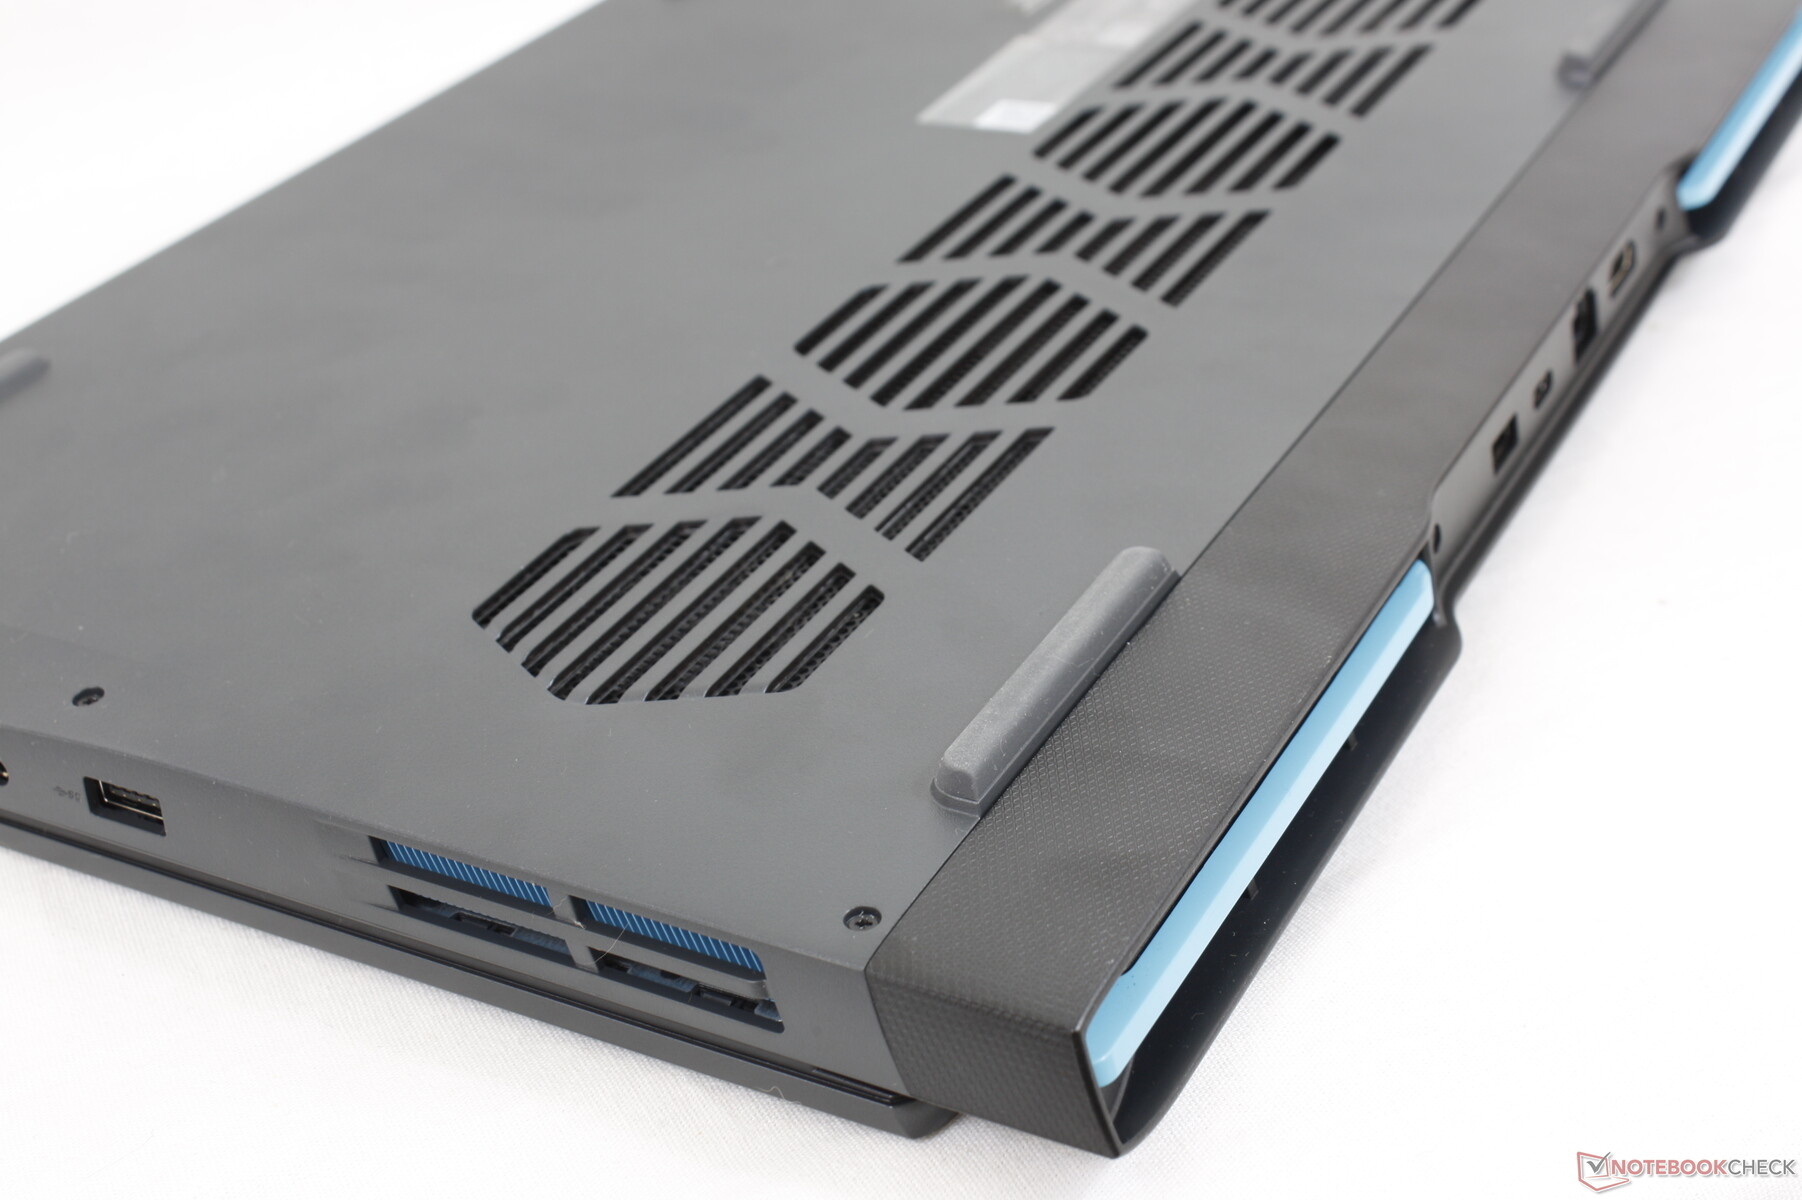
Custodia - Nuovo look ispirato a Legion
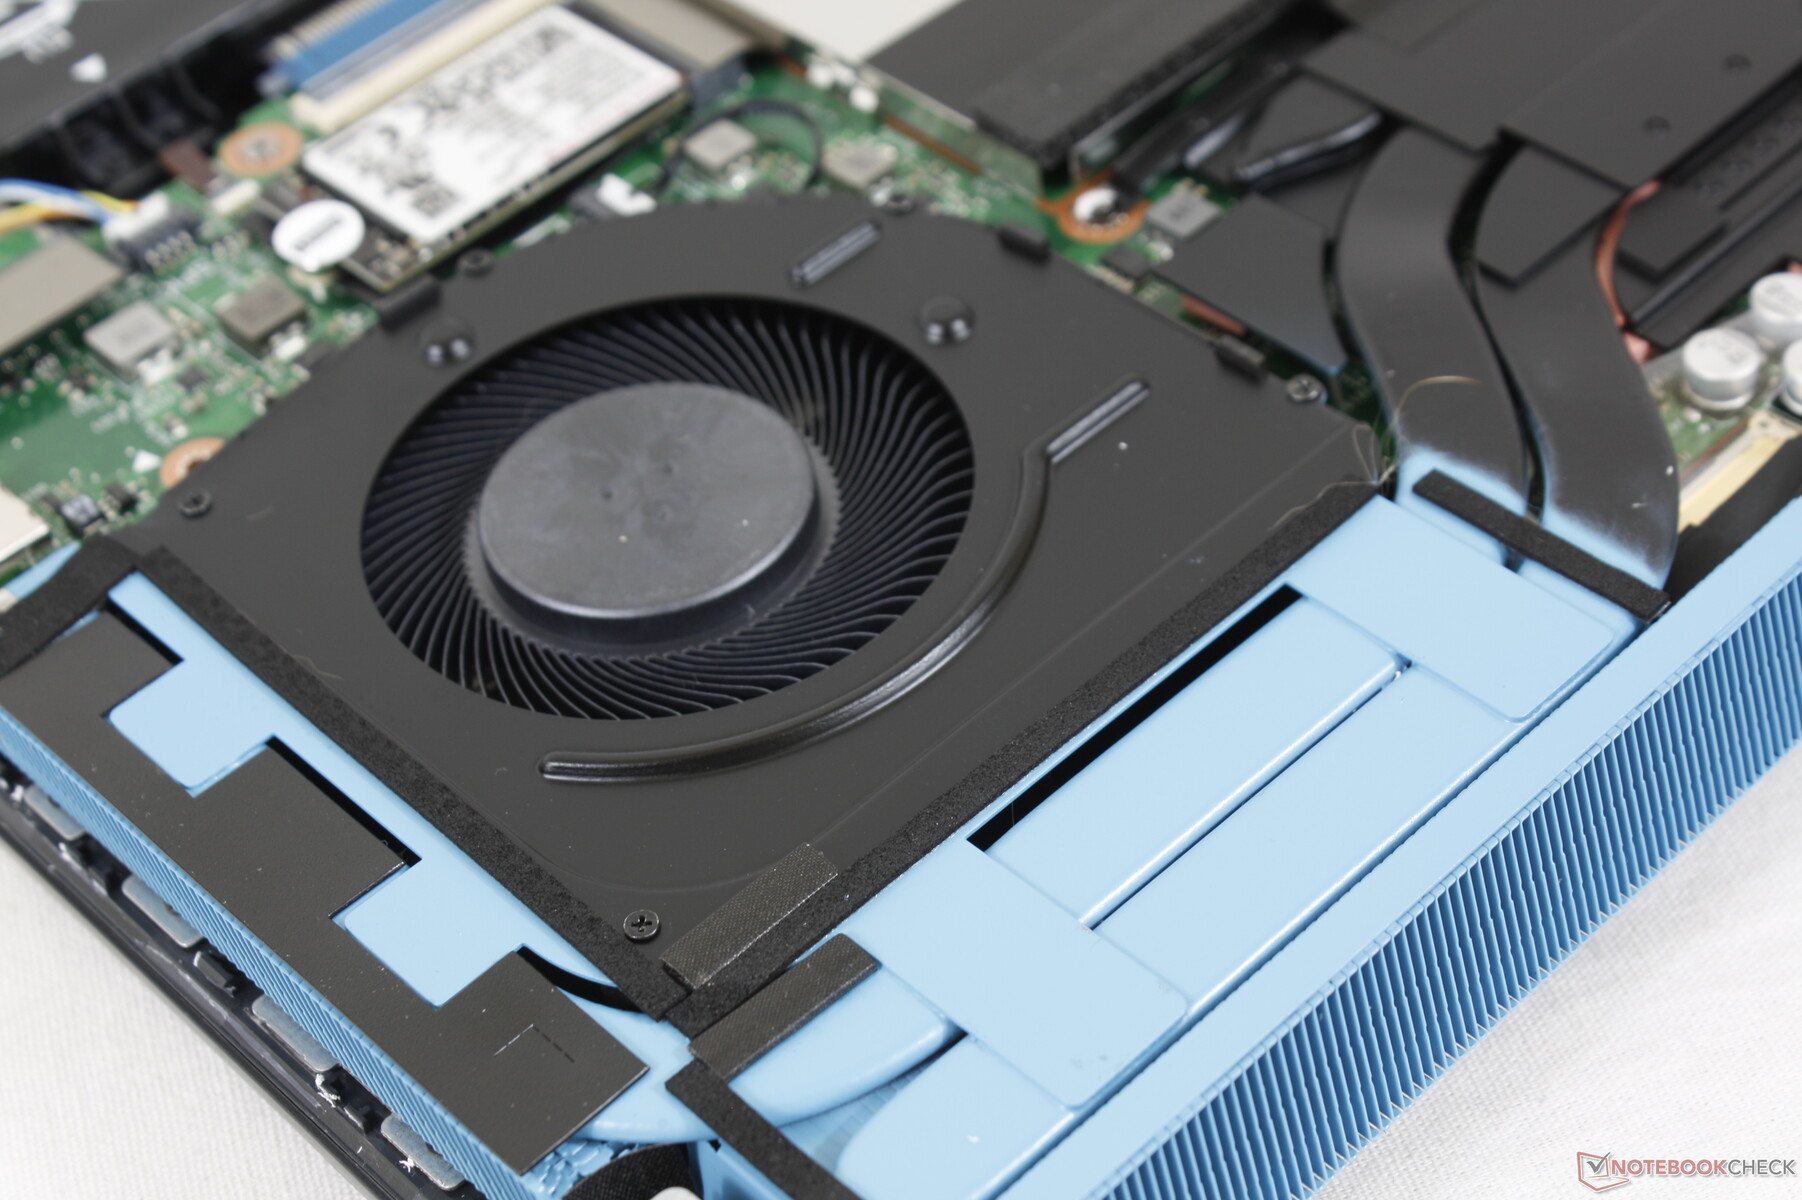
Il telaio ridisegnato può essere meglio descritto come una versione più economica del modello Legion 5mentre quest'ultimo è costituito per lo più da lega metallica, il nuovo IdeaPad Gaming 3 15 è per lo più in policarbonato e plastica. Il cambiamento visivo più evidente rispetto al ideaPad 2020 riguarda il nuovo design della parte posteriore, volto a migliorare il raffreddamento, ma al costo di un ingombro maggiore e di un peso più elevato.
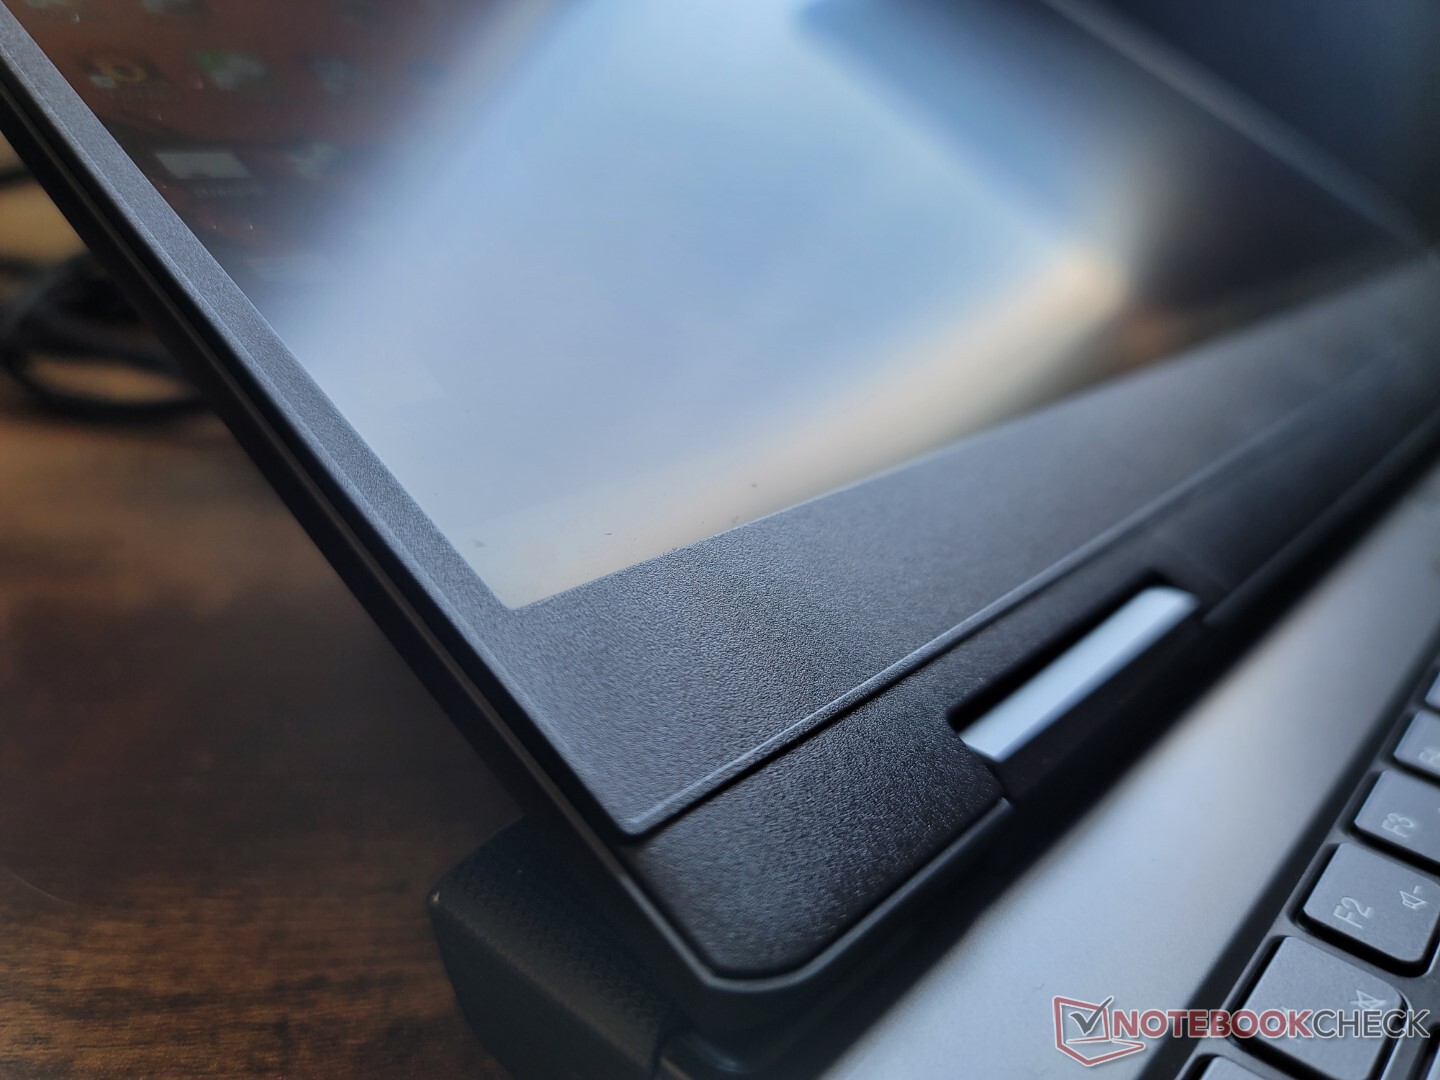
La rigidità del telaio è piuttosto buona intorno alla base, in quanto le torsioni e le depressioni sono minime rispetto ad altri portatili da gioco economici come MSI GF63 o HP Gaming 15 HP Pavilion Gaming 15. Le cerniere, tuttavia, sono un'altra storia e il display tende a traballare più di quanto vorremmo quando si regolano gli angoli. Lo scricchiolio diventa udibile quando il display viene aperto completamente, il che potrebbe essere un potenziale problema a distanza di anni.
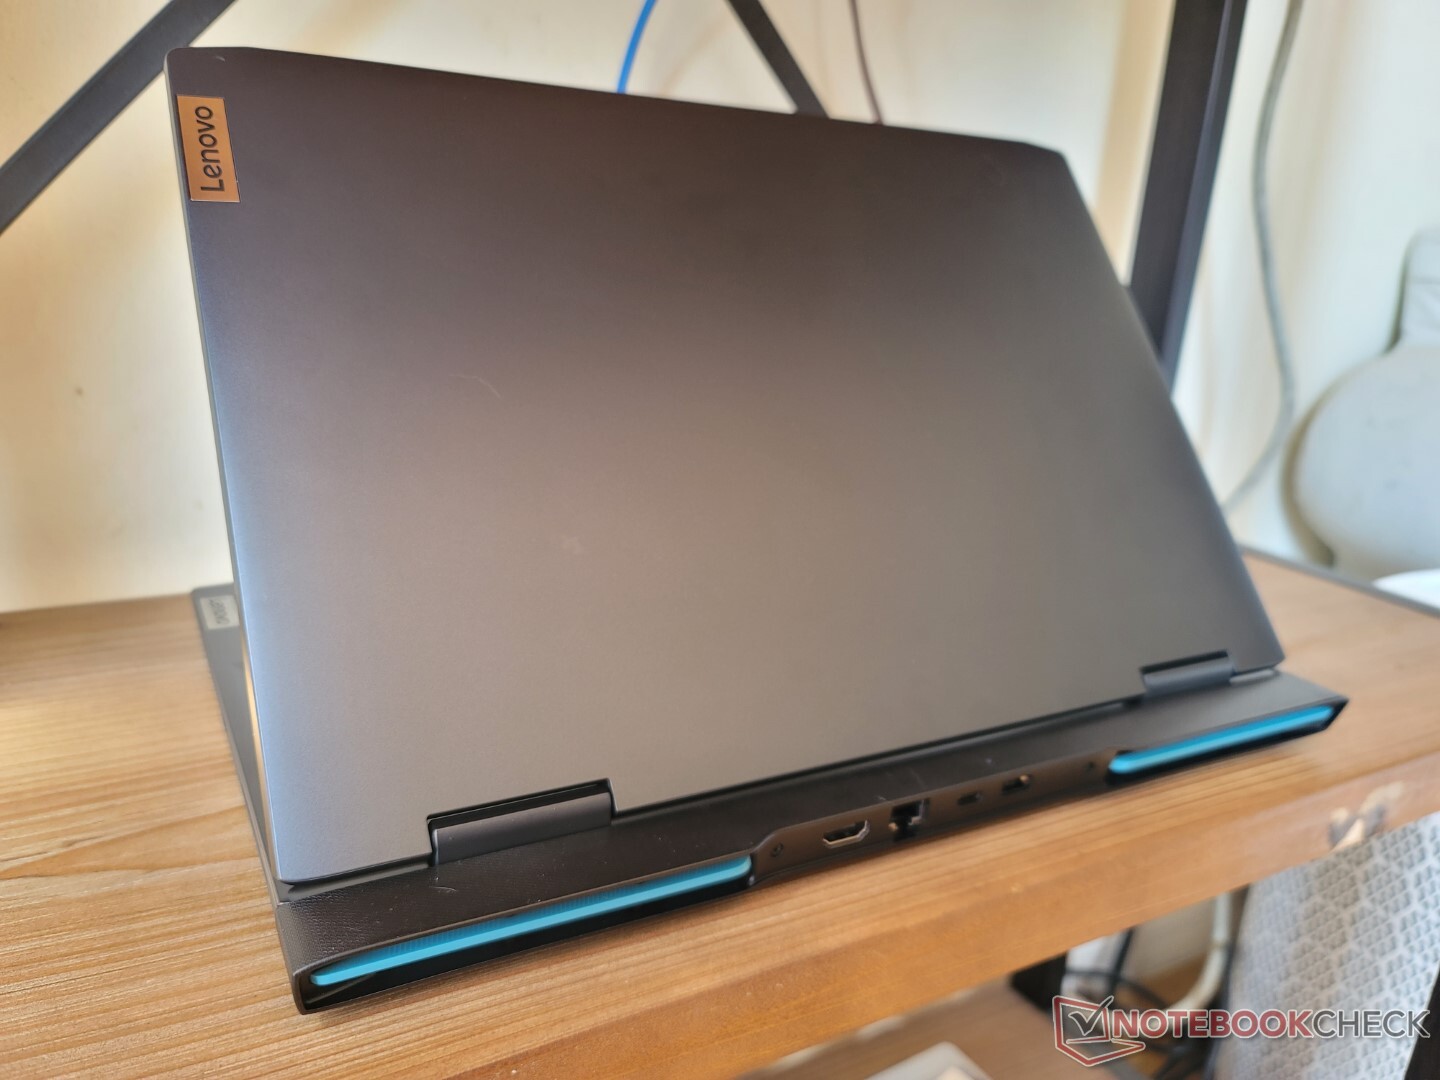
Rispetto all'IdeaPad Gaming 3 del 2020, il nostro modello 2022 è più grande e più pesante di circa 200 g. È anche più sottile di qualche millimetro, ma il profilo leggermente più sottile fa poco per placare lo chassis notevolmente più ingombrante. L'aumento di dimensioni e peso può essere attribuito al nuovo retro allungato ispirato alla serie Legion.
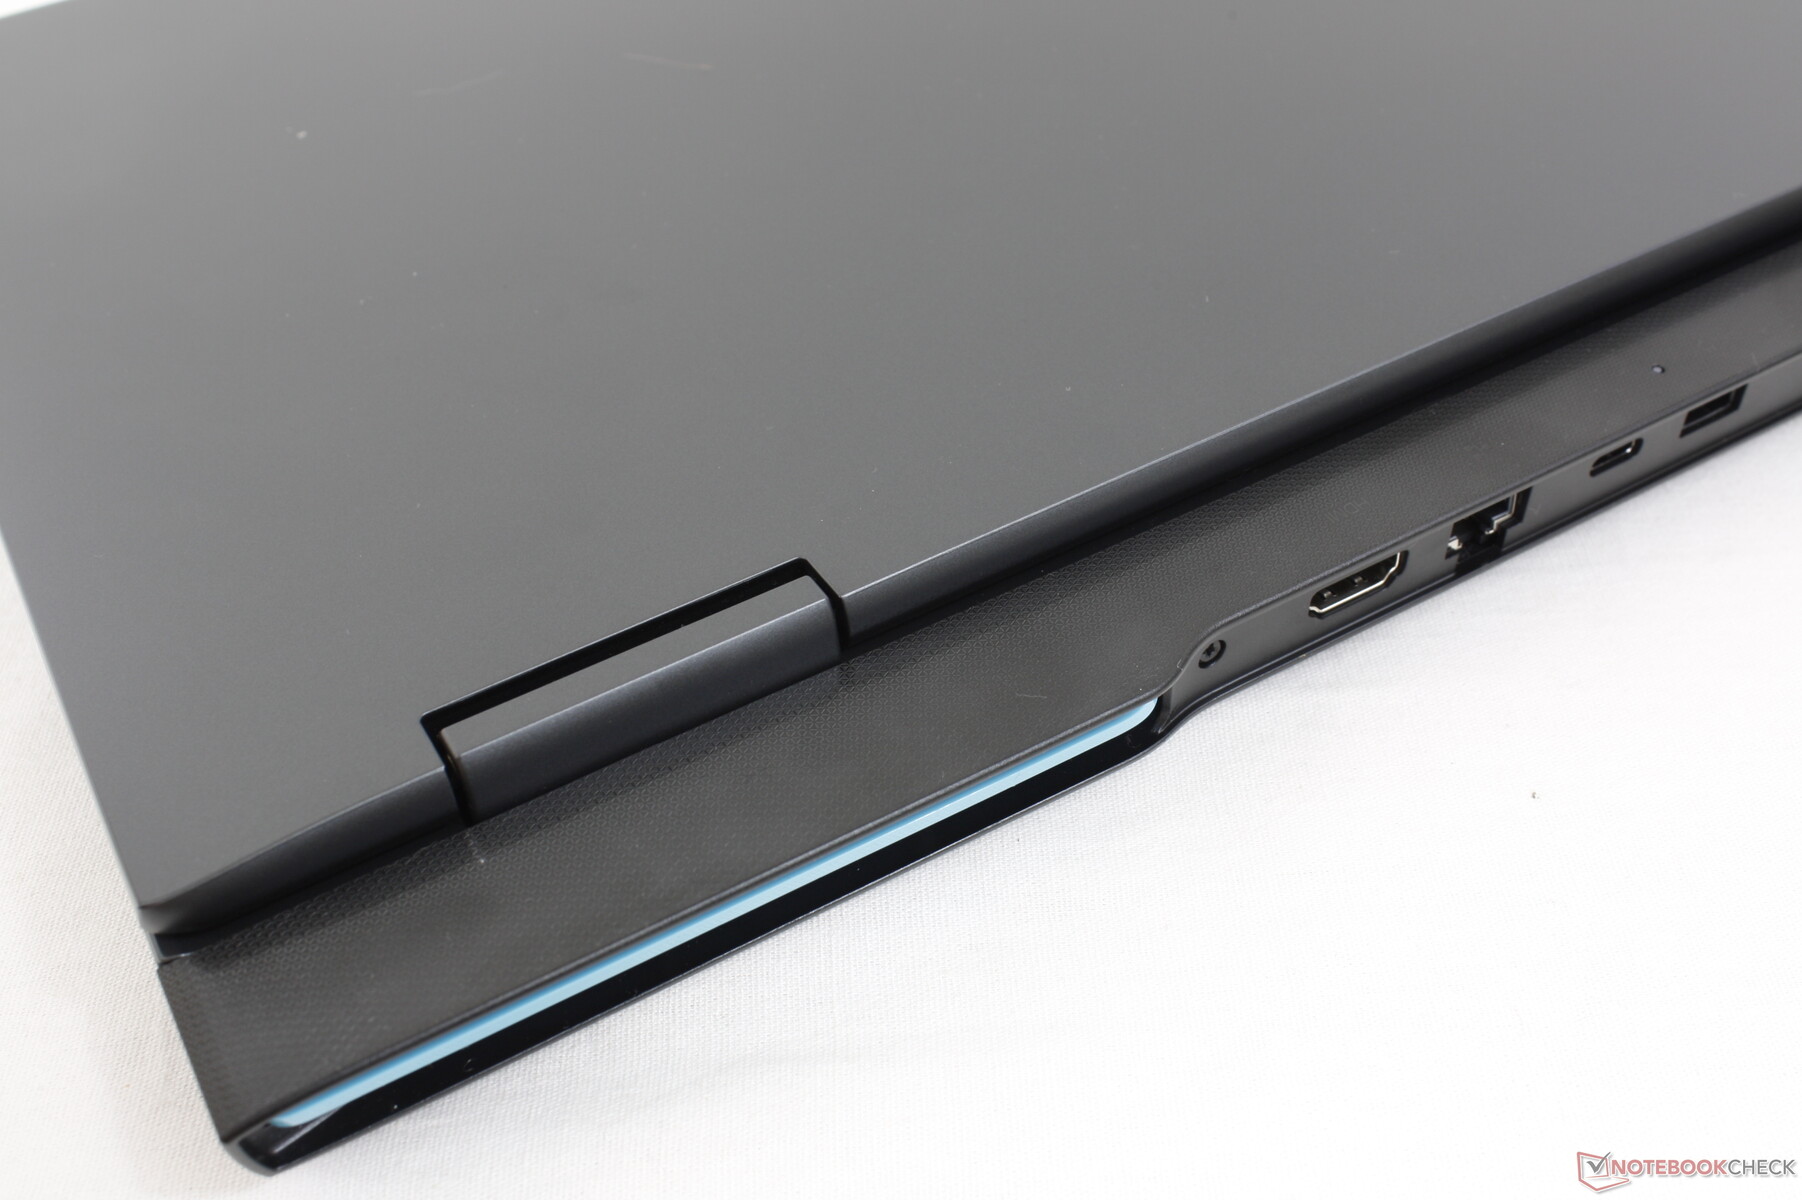
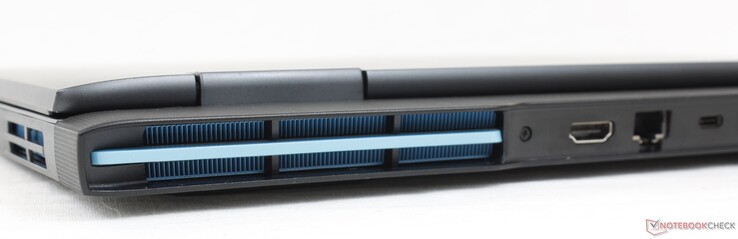
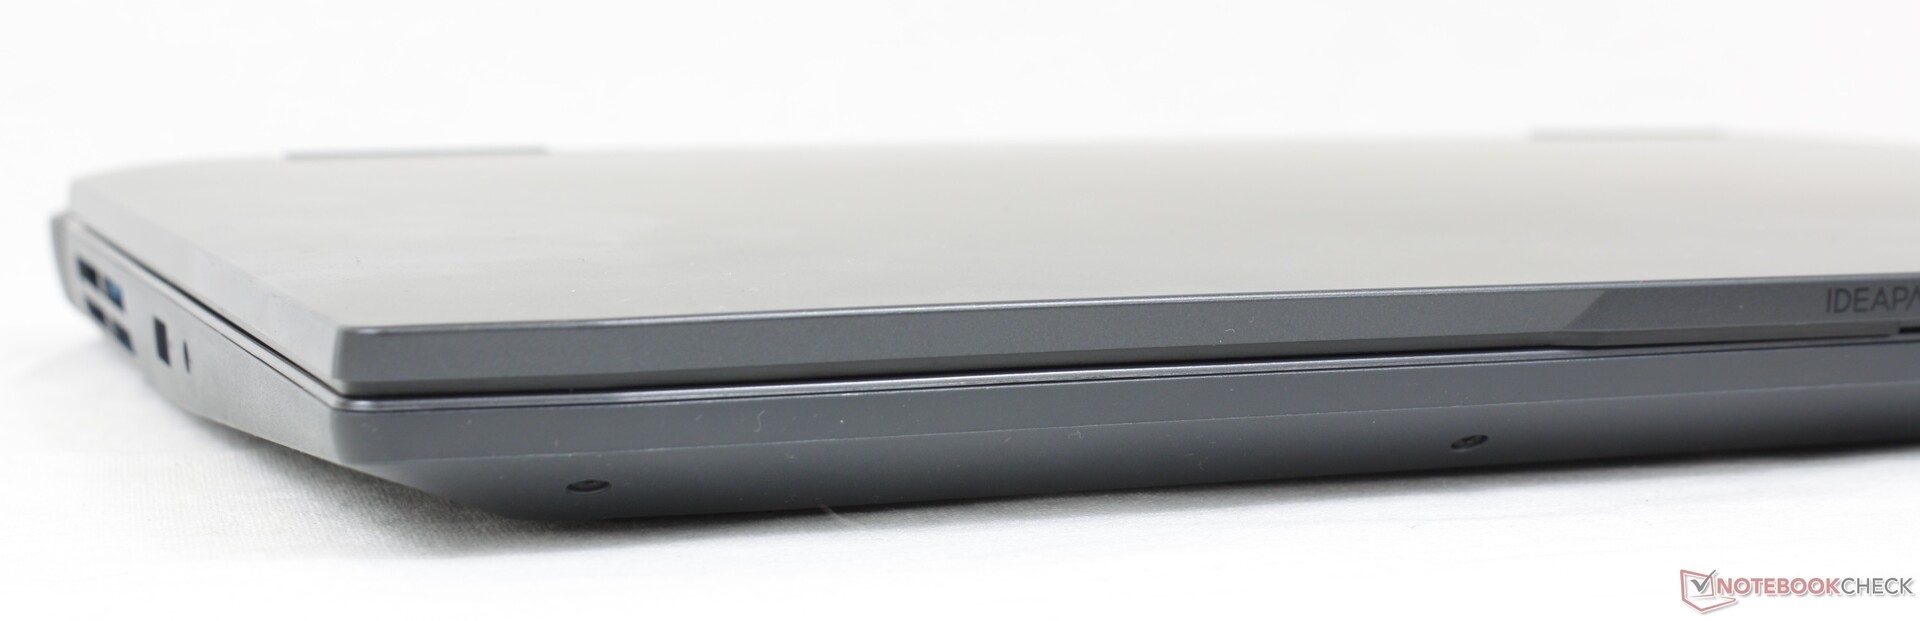
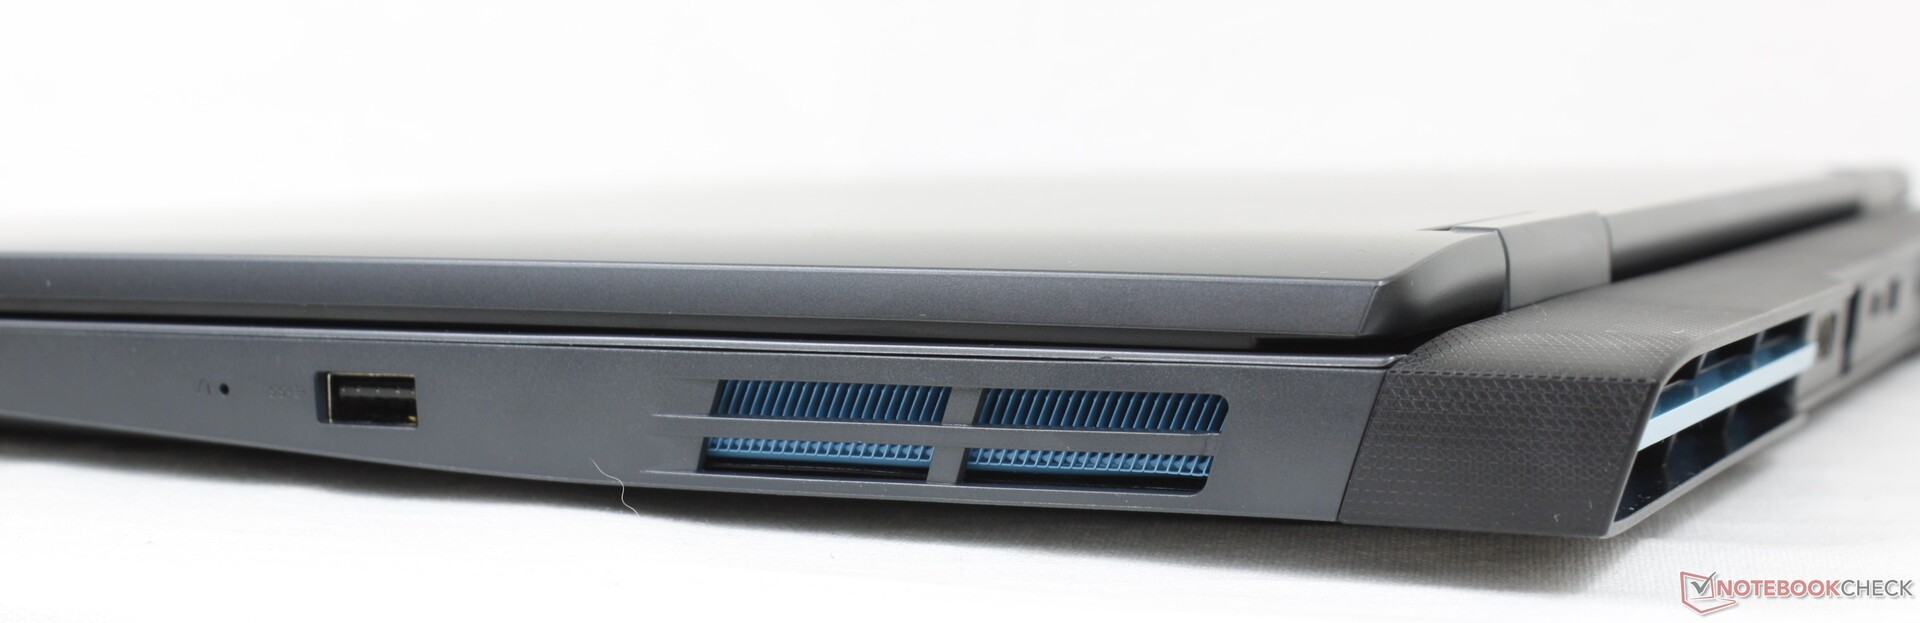
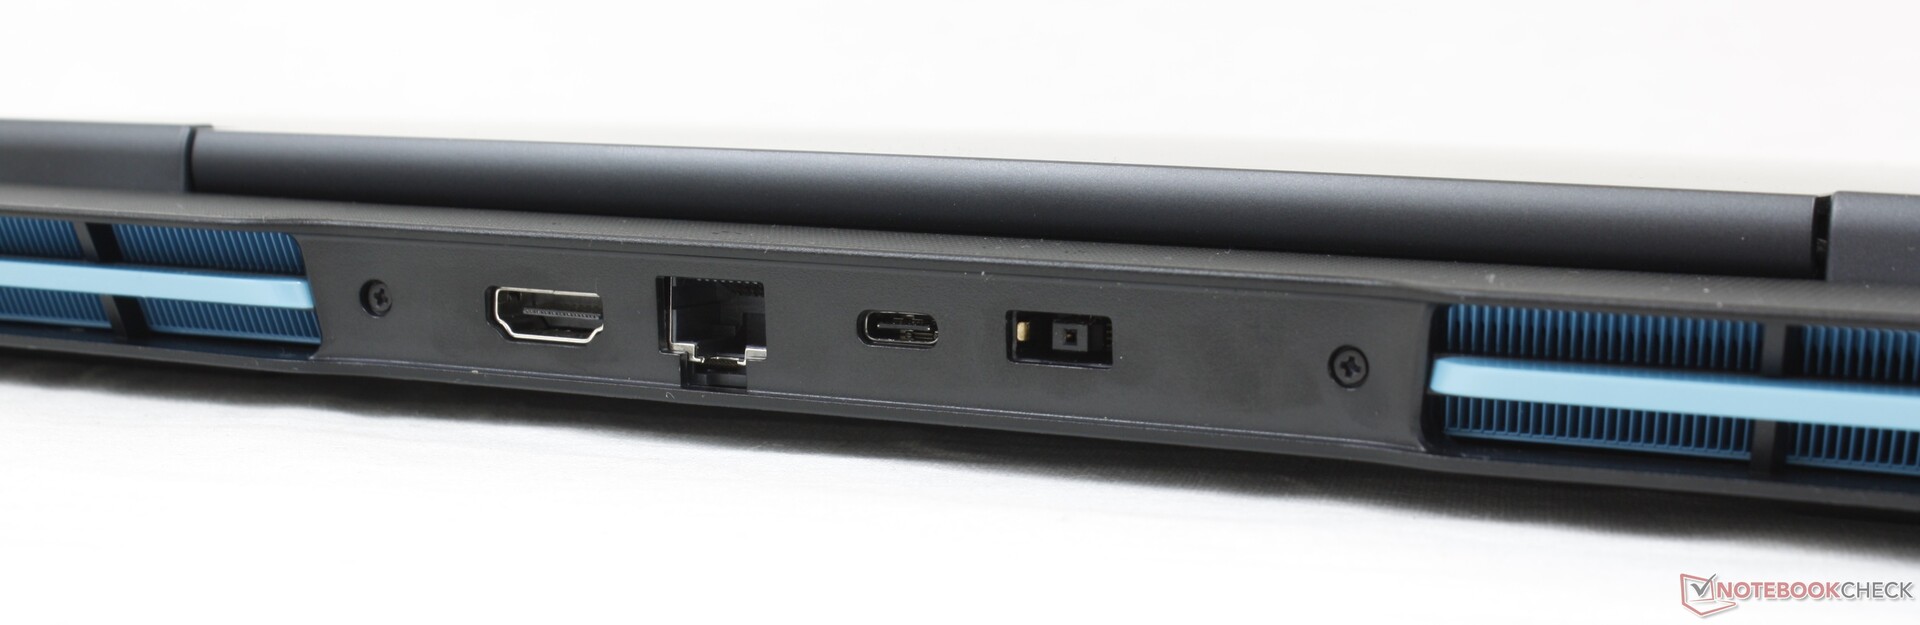
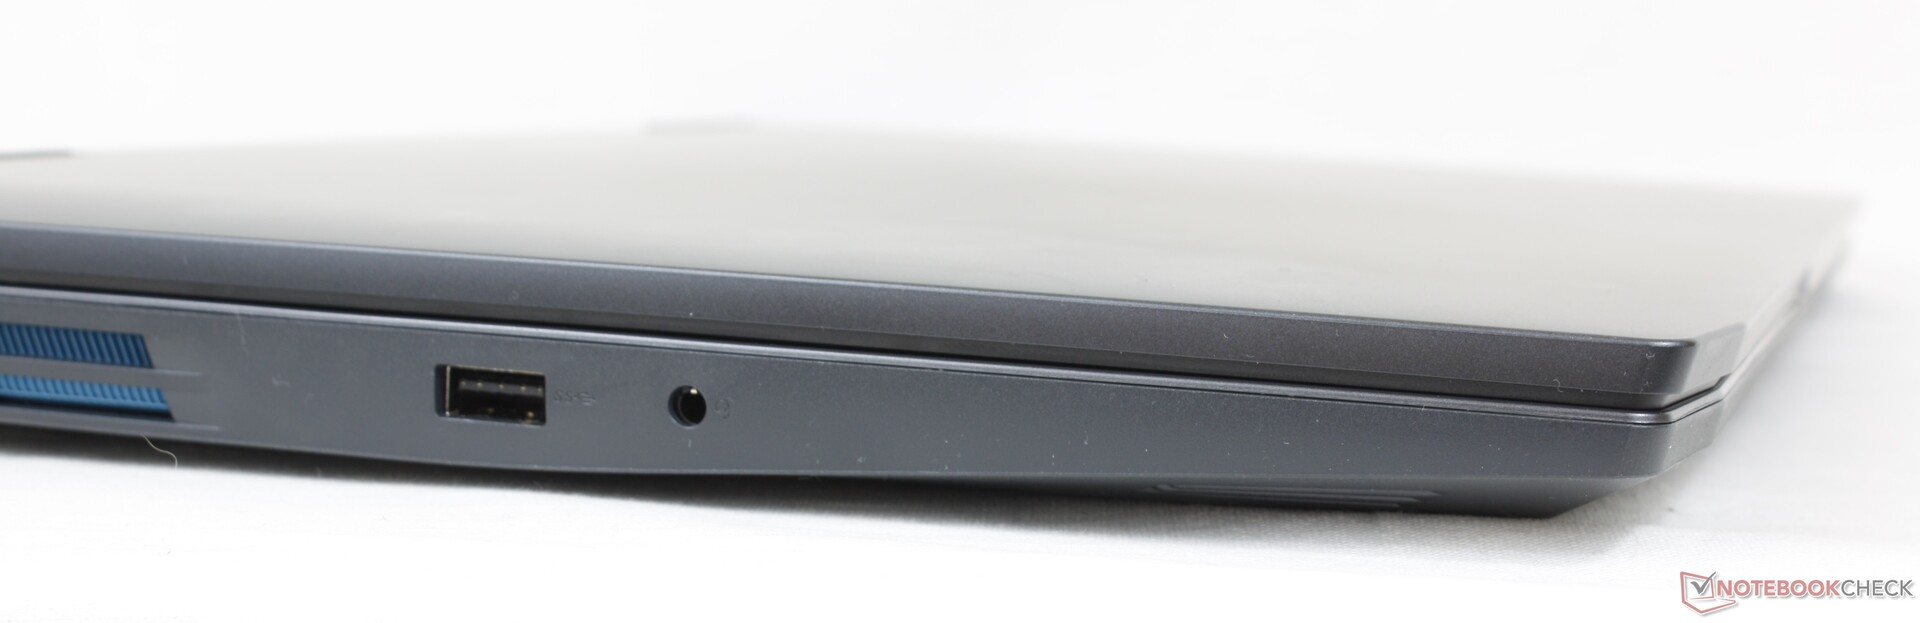
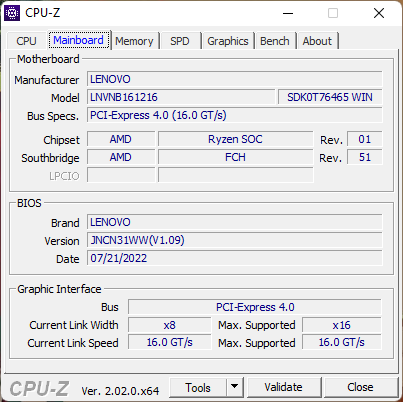
Connettività - Nessun supporto Thunderbolt
Le porte sono discrete e paragonabili a quelle di altri portatili da gioco economici. Tuttavia, il posizionamento delle porte non è omogeneo, poiché la maggior parte di esse si trova sul retro dell'unità, dove possono essere difficili da raggiungere. Tenete presente che Thunderbolt non è supportato, a differenza di molti portatili da gioco con processore Intel.
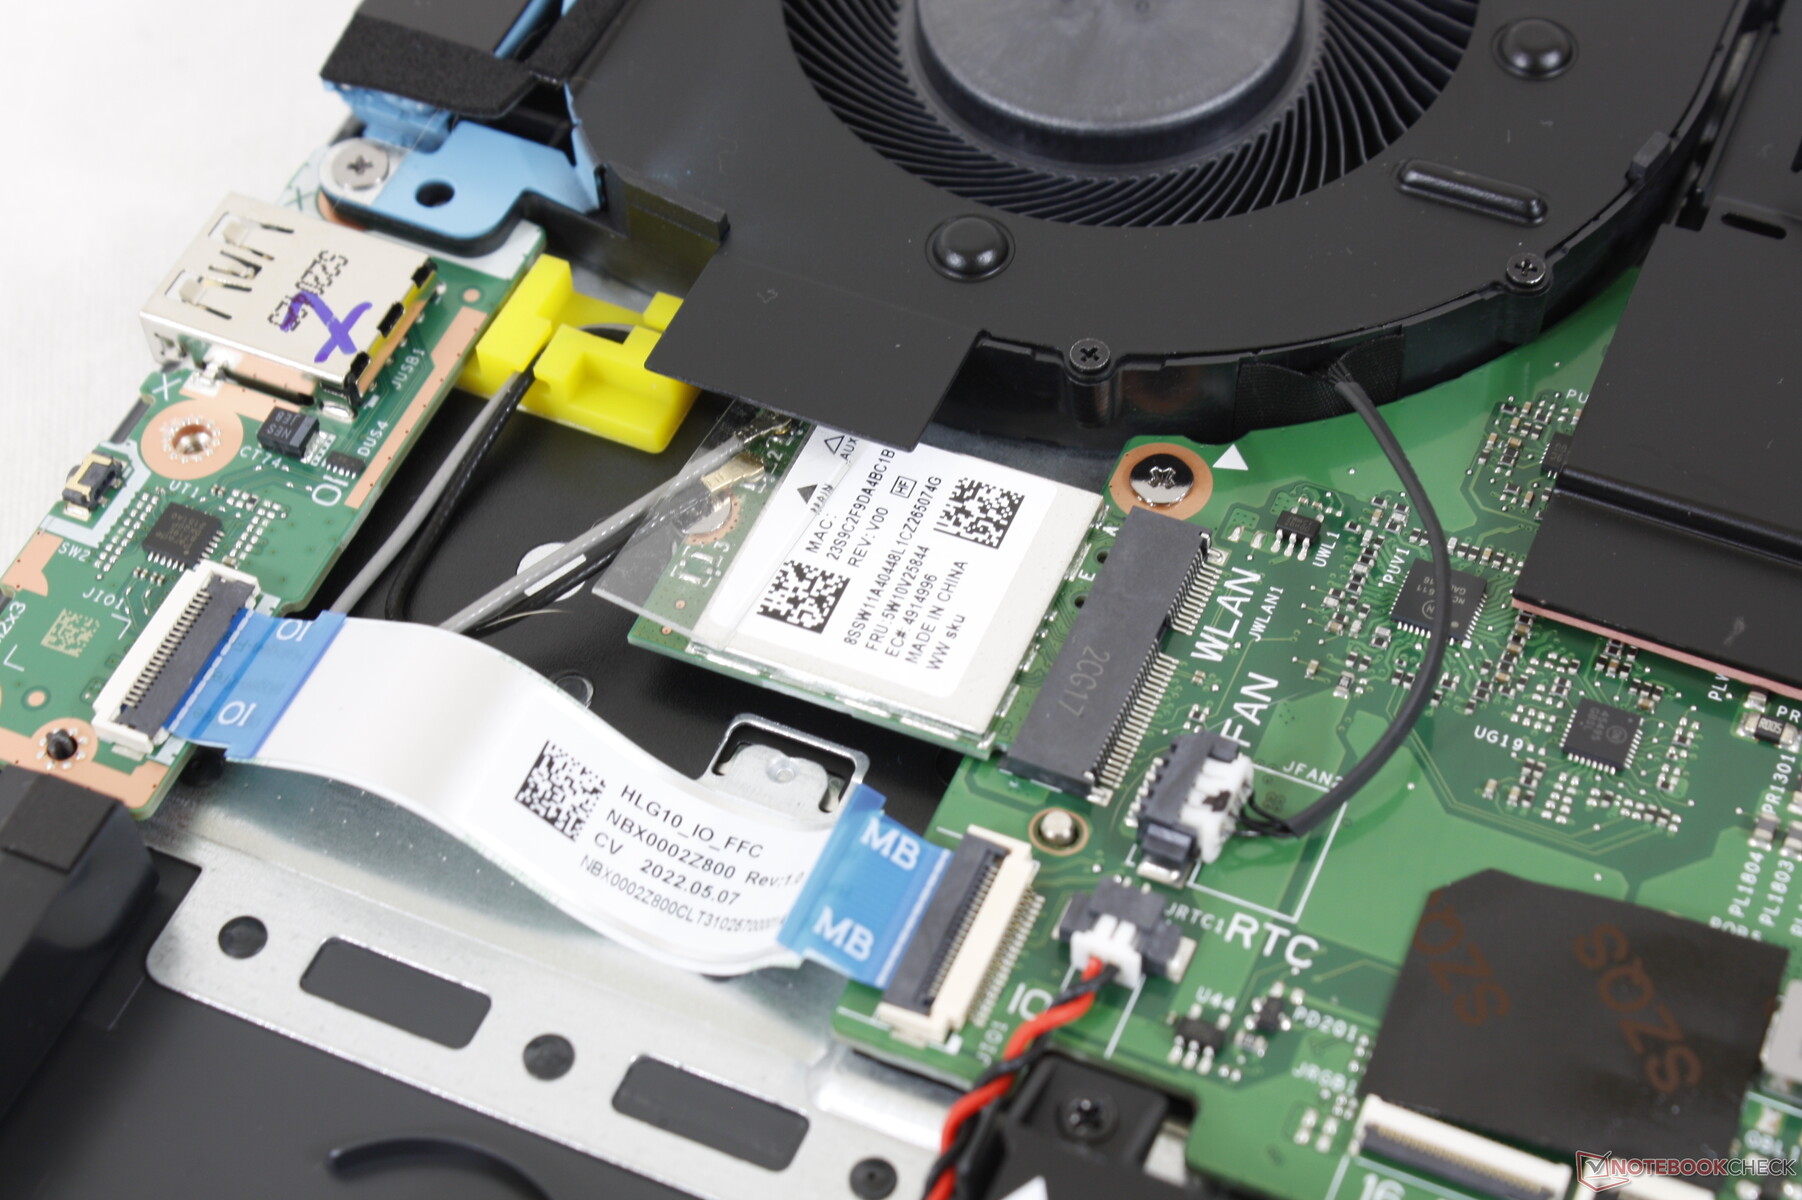
Comunicazione
L'unità viene fornita con un Realtek RTL8852BE per la connettività Wi-Fi 6 e Bluetooth 5.1 invece di un modulo Intel AX, probabilmente per risparmiare sui costi. Le velocità di trasferimento sono significativamente più basse, ma sono comunque costanti e sufficientemente veloci per la maggior parte degli scopi, compresi lo streaming o il download di video 4K.
| Networking | |
| iperf3 transmit AX12 | |
| Lenovo Legion 5 15ACH6A-82NW0010GE | |
| Lenovo IdeaPad Gaming 3i 15IMH05 | |
| iperf3 receive AX12 | |
| Lenovo Legion 5 15ACH6A-82NW0010GE | |
| Lenovo IdeaPad Gaming 3i 15IMH05 | |
| iperf3 receive AXE11000 | |
| Gigabyte A5 K1 | |
| Dell G15 5510 | |
| Asus TUF Dash F15 FX517ZR | |
| Lenovo IdeaPad Gaming 3 15ARH7 | |
| iperf3 transmit AXE11000 | |
| Gigabyte A5 K1 | |
| Asus TUF Dash F15 FX517ZR | |
| Lenovo IdeaPad Gaming 3 15ARH7 | |
Webcam
La webcam integrata è da solo 1 MP, per un'immagine poco nitida. Sebbene sia presente un otturatore per la privacy, non c'è IR per il supporto di Hello.


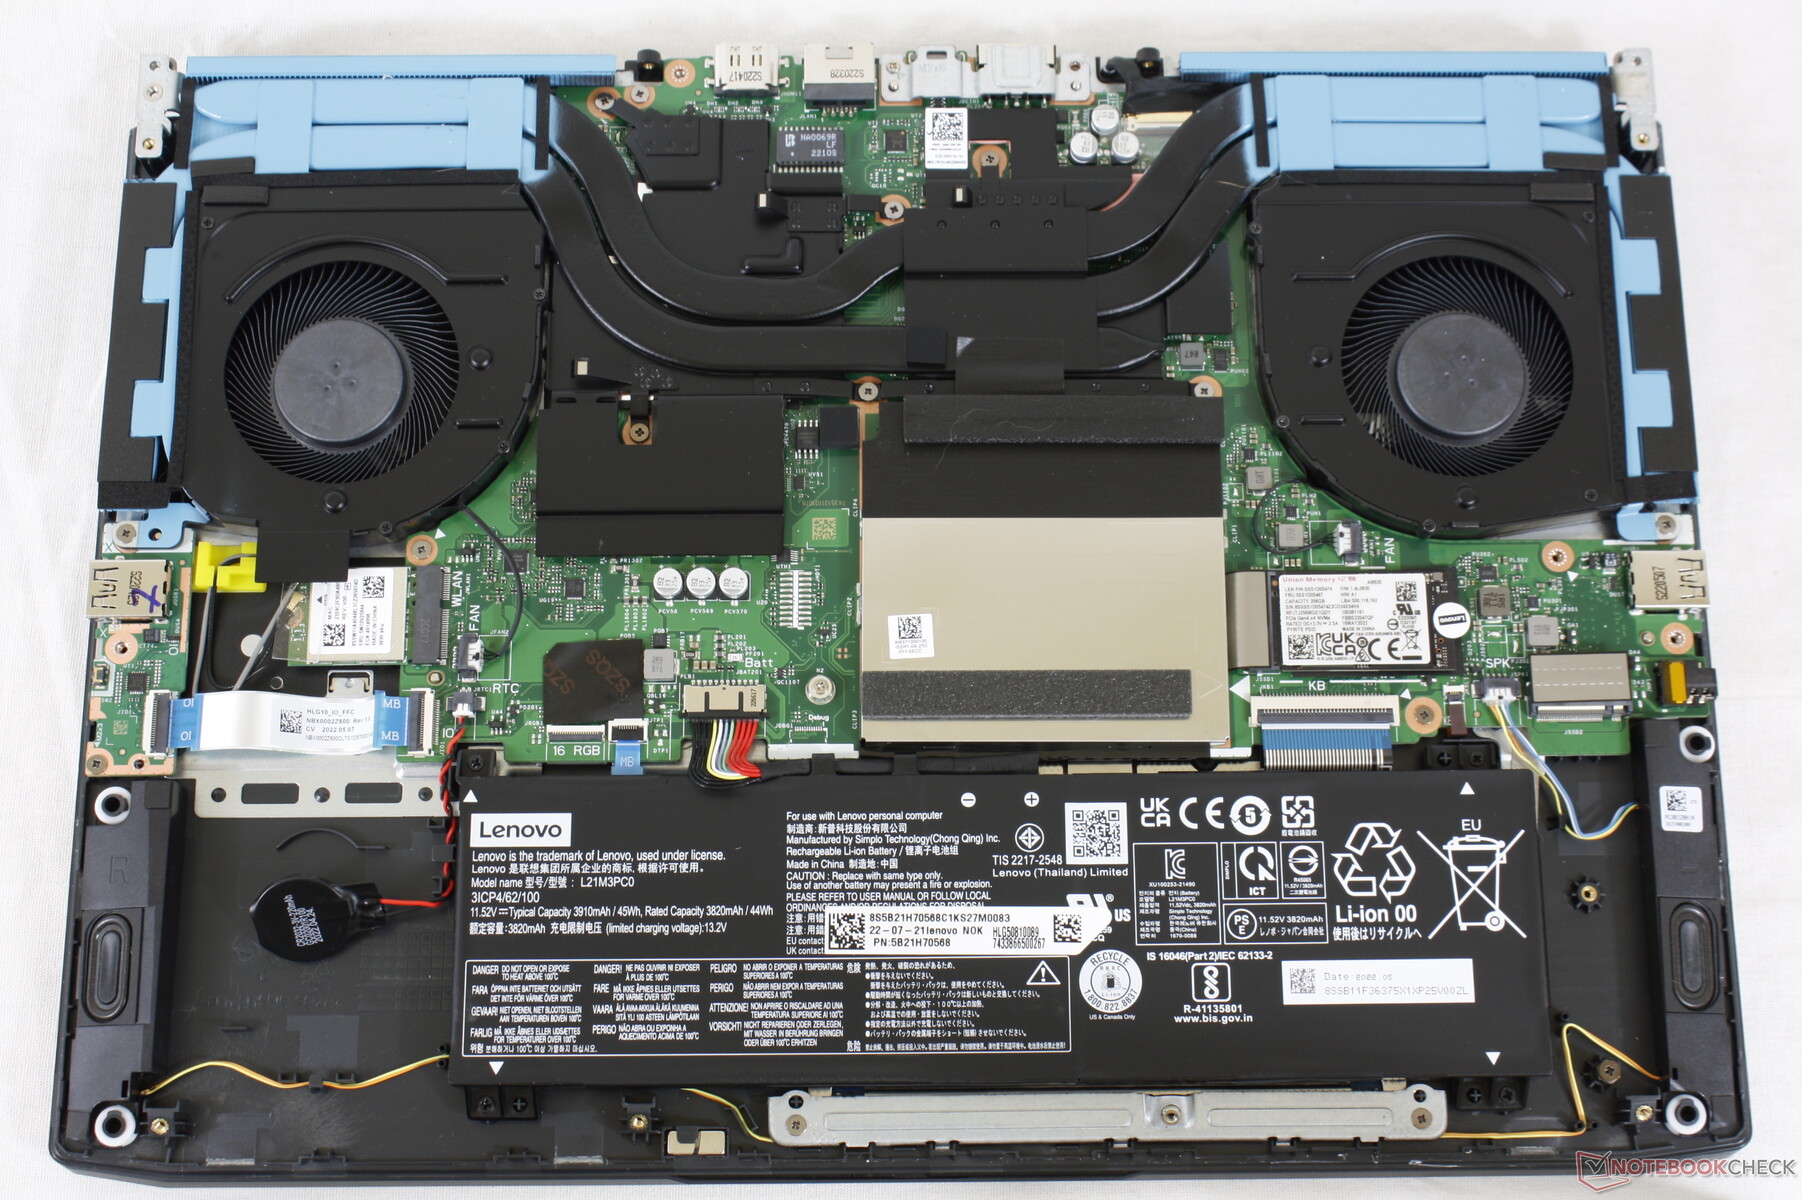
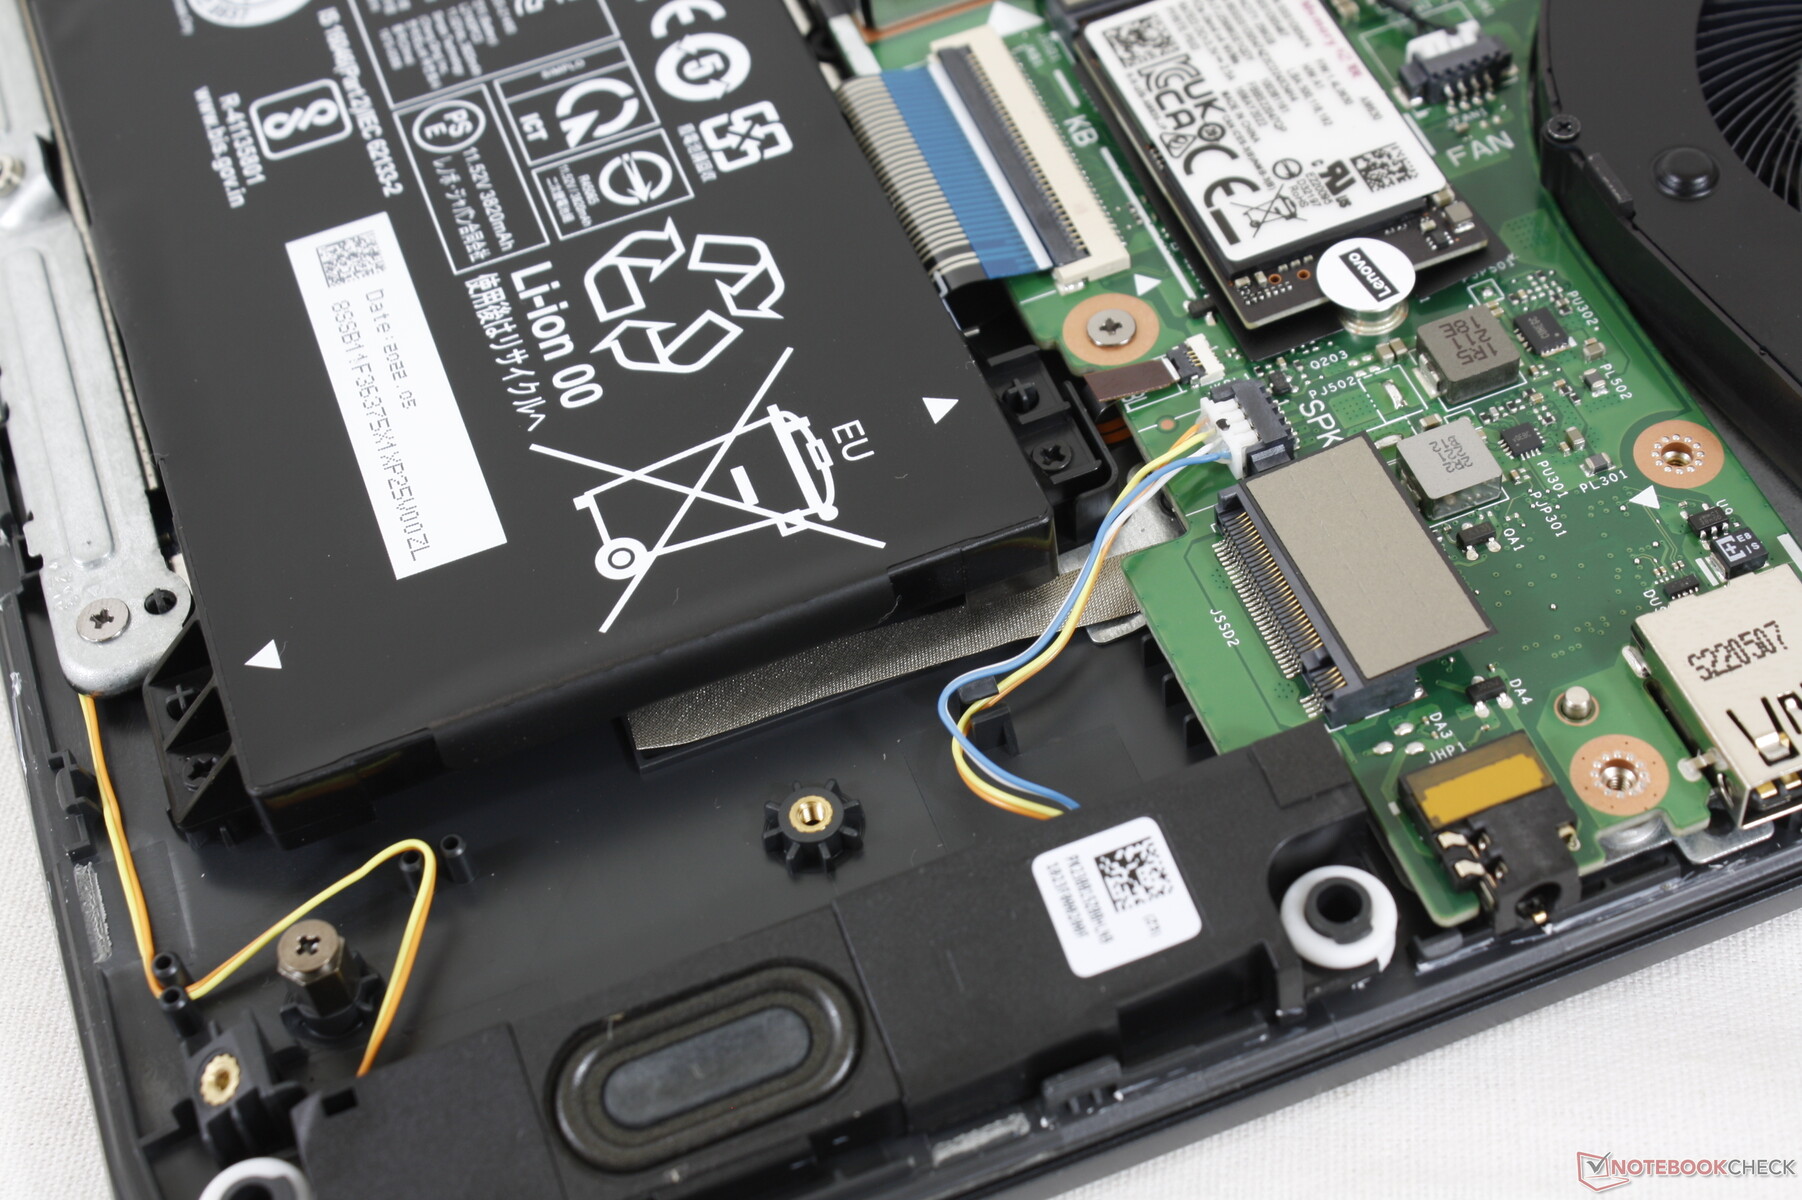
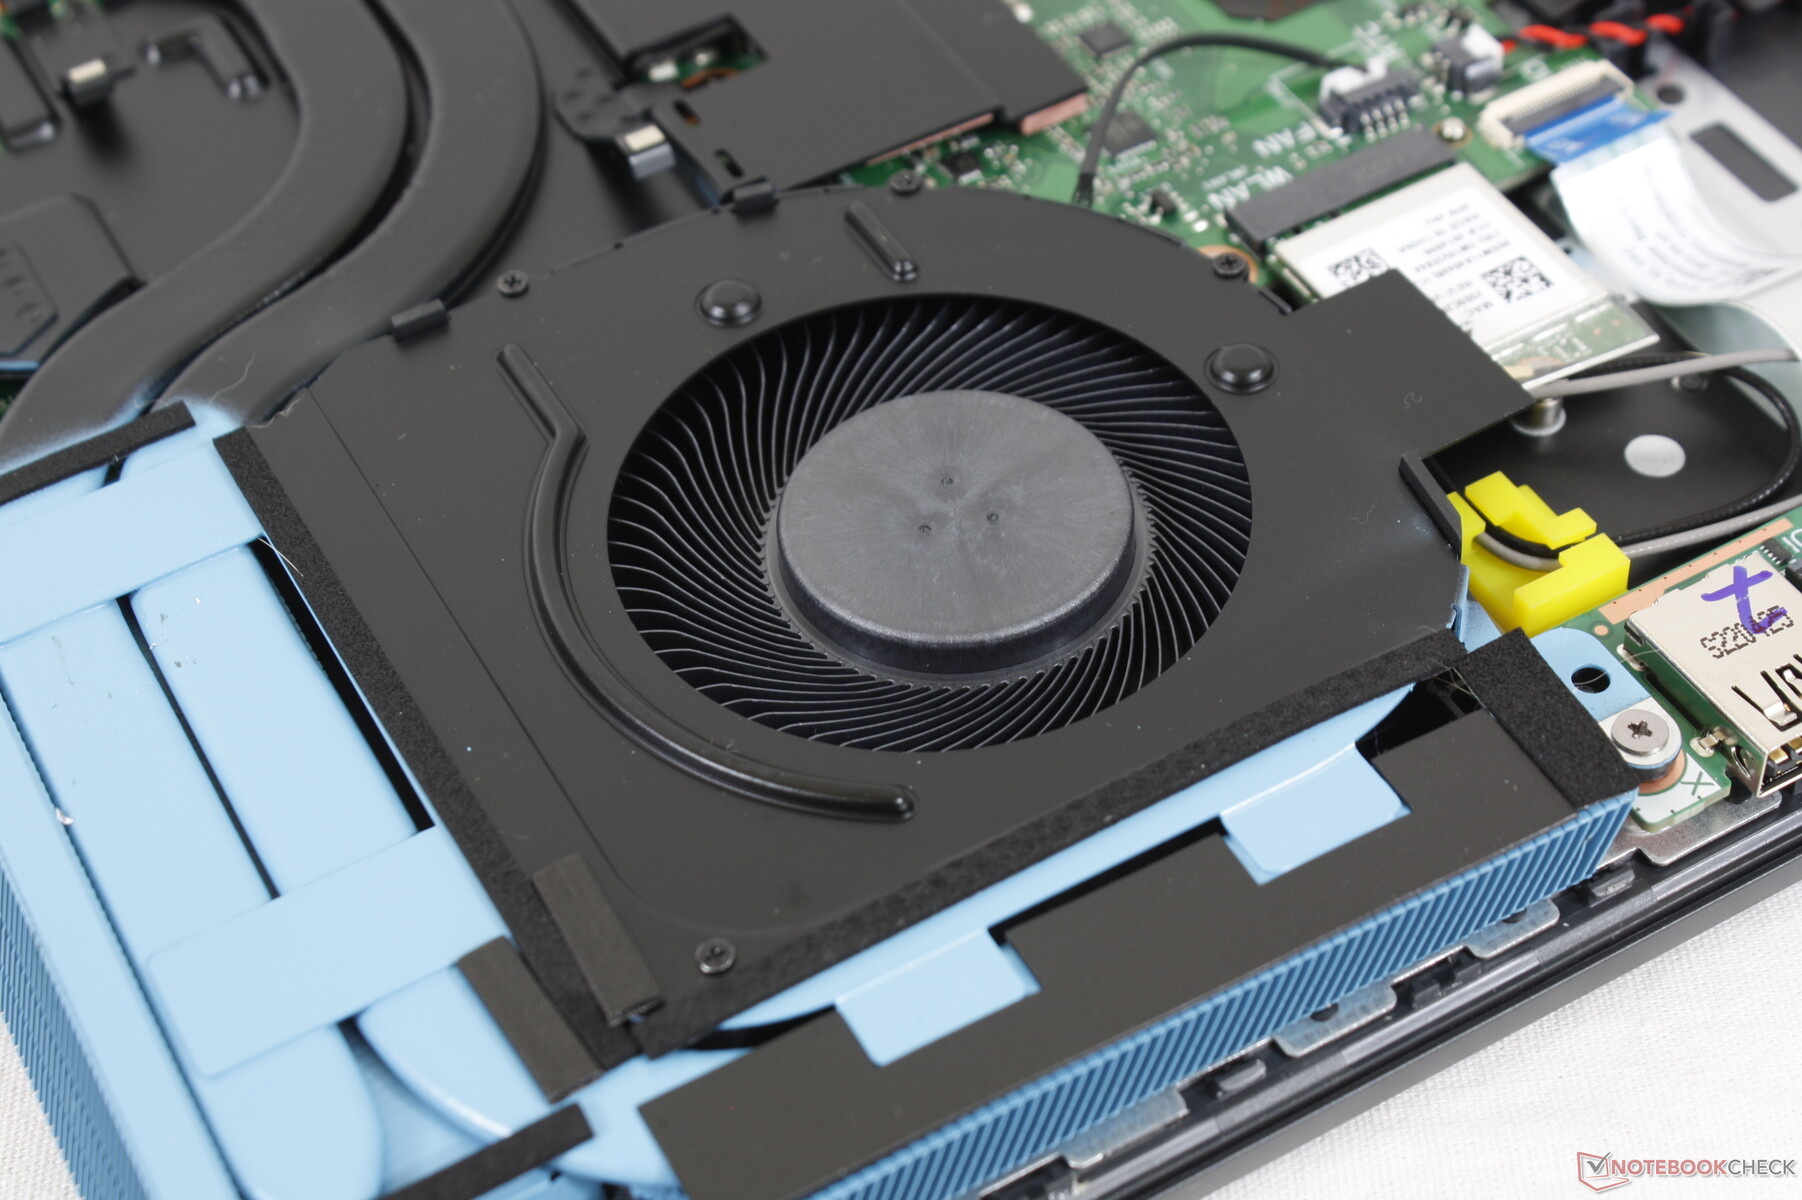
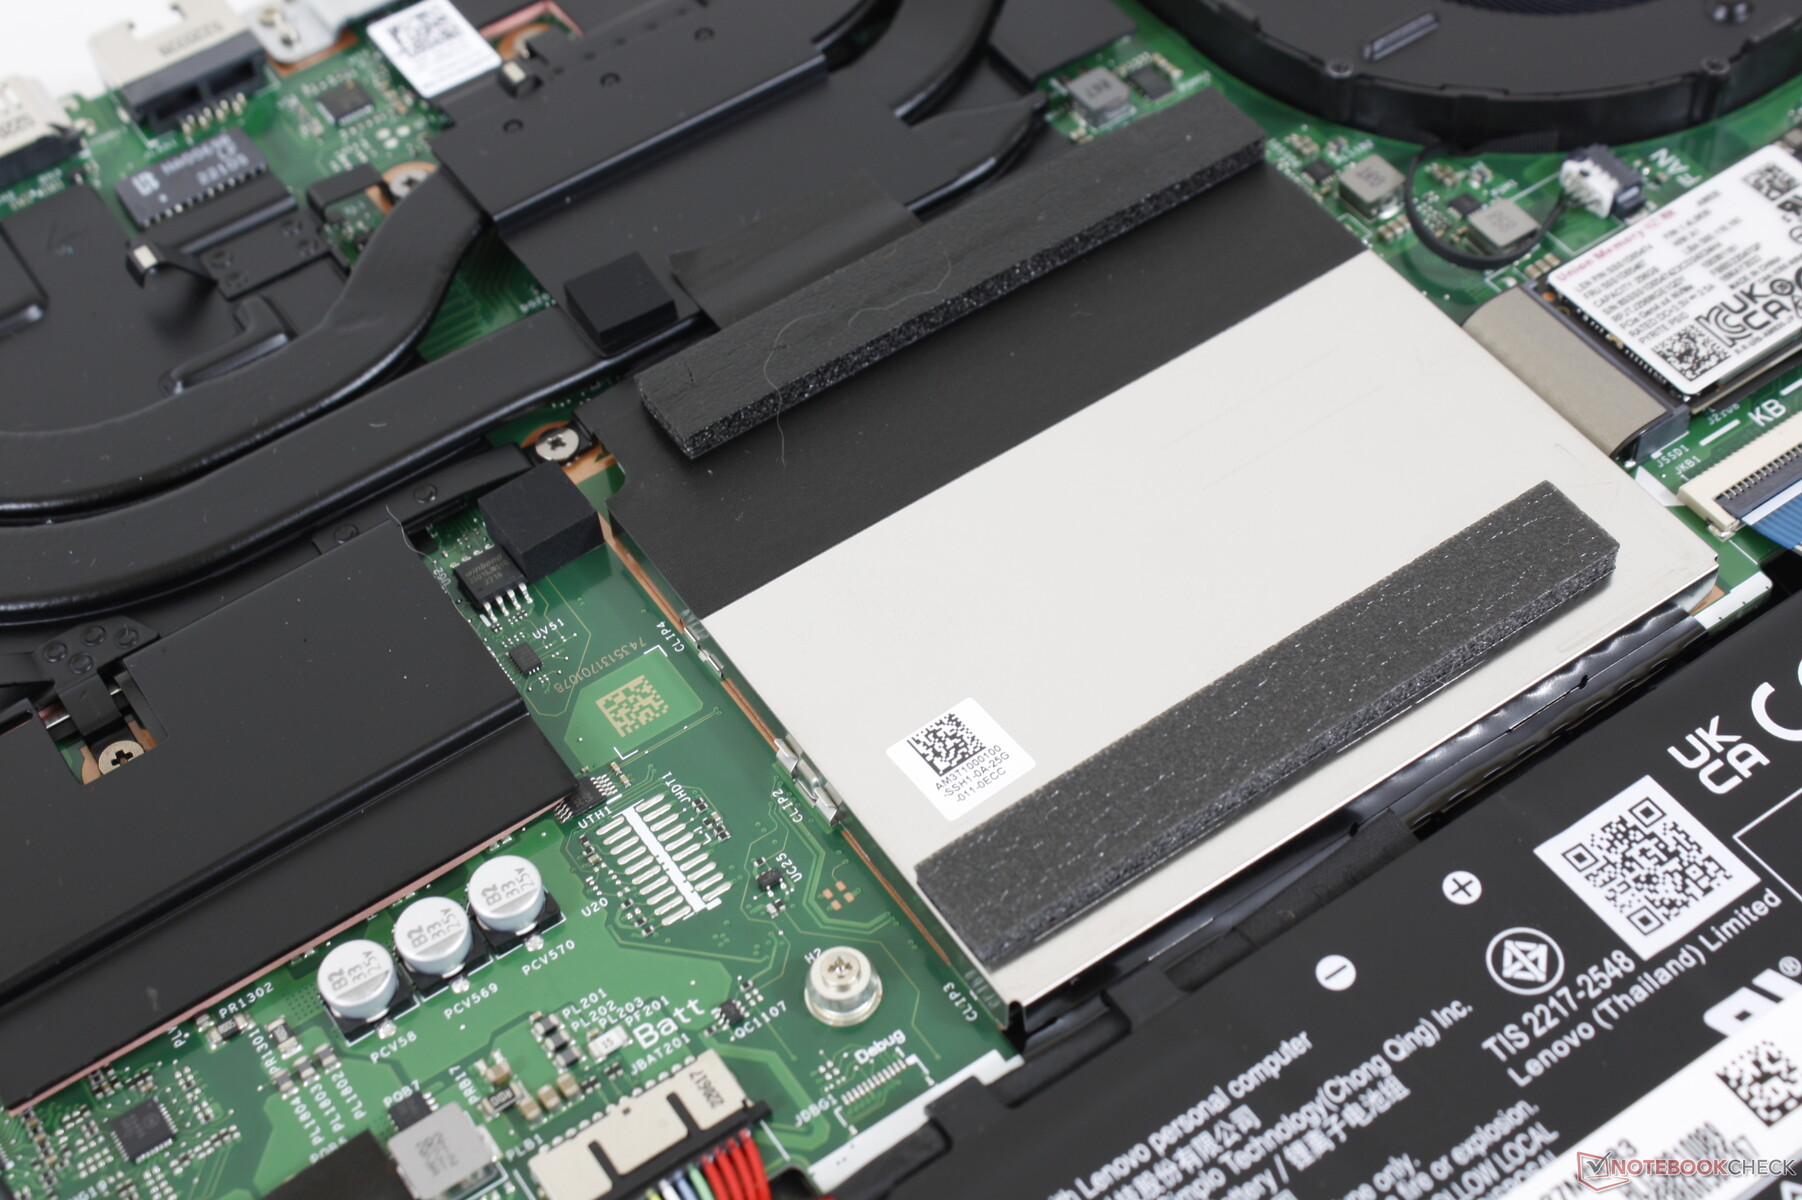
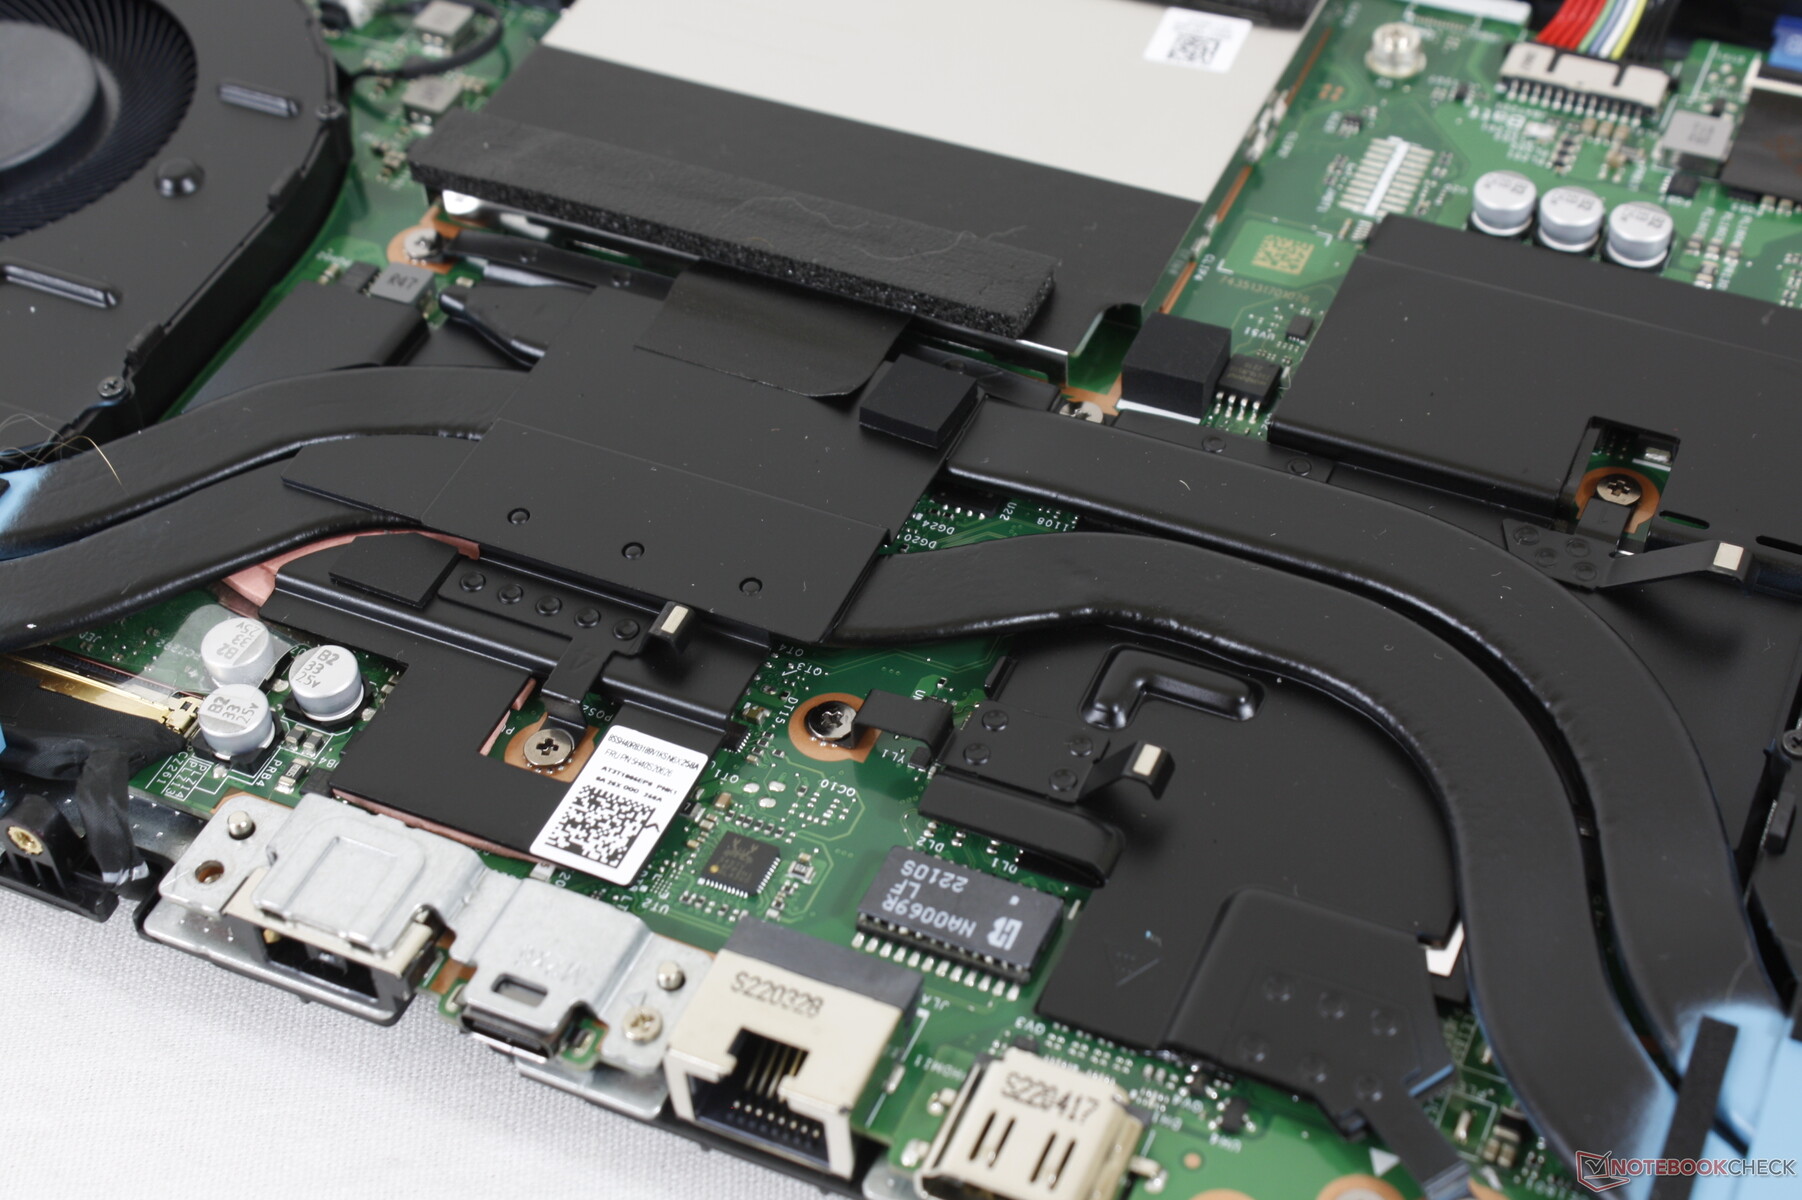
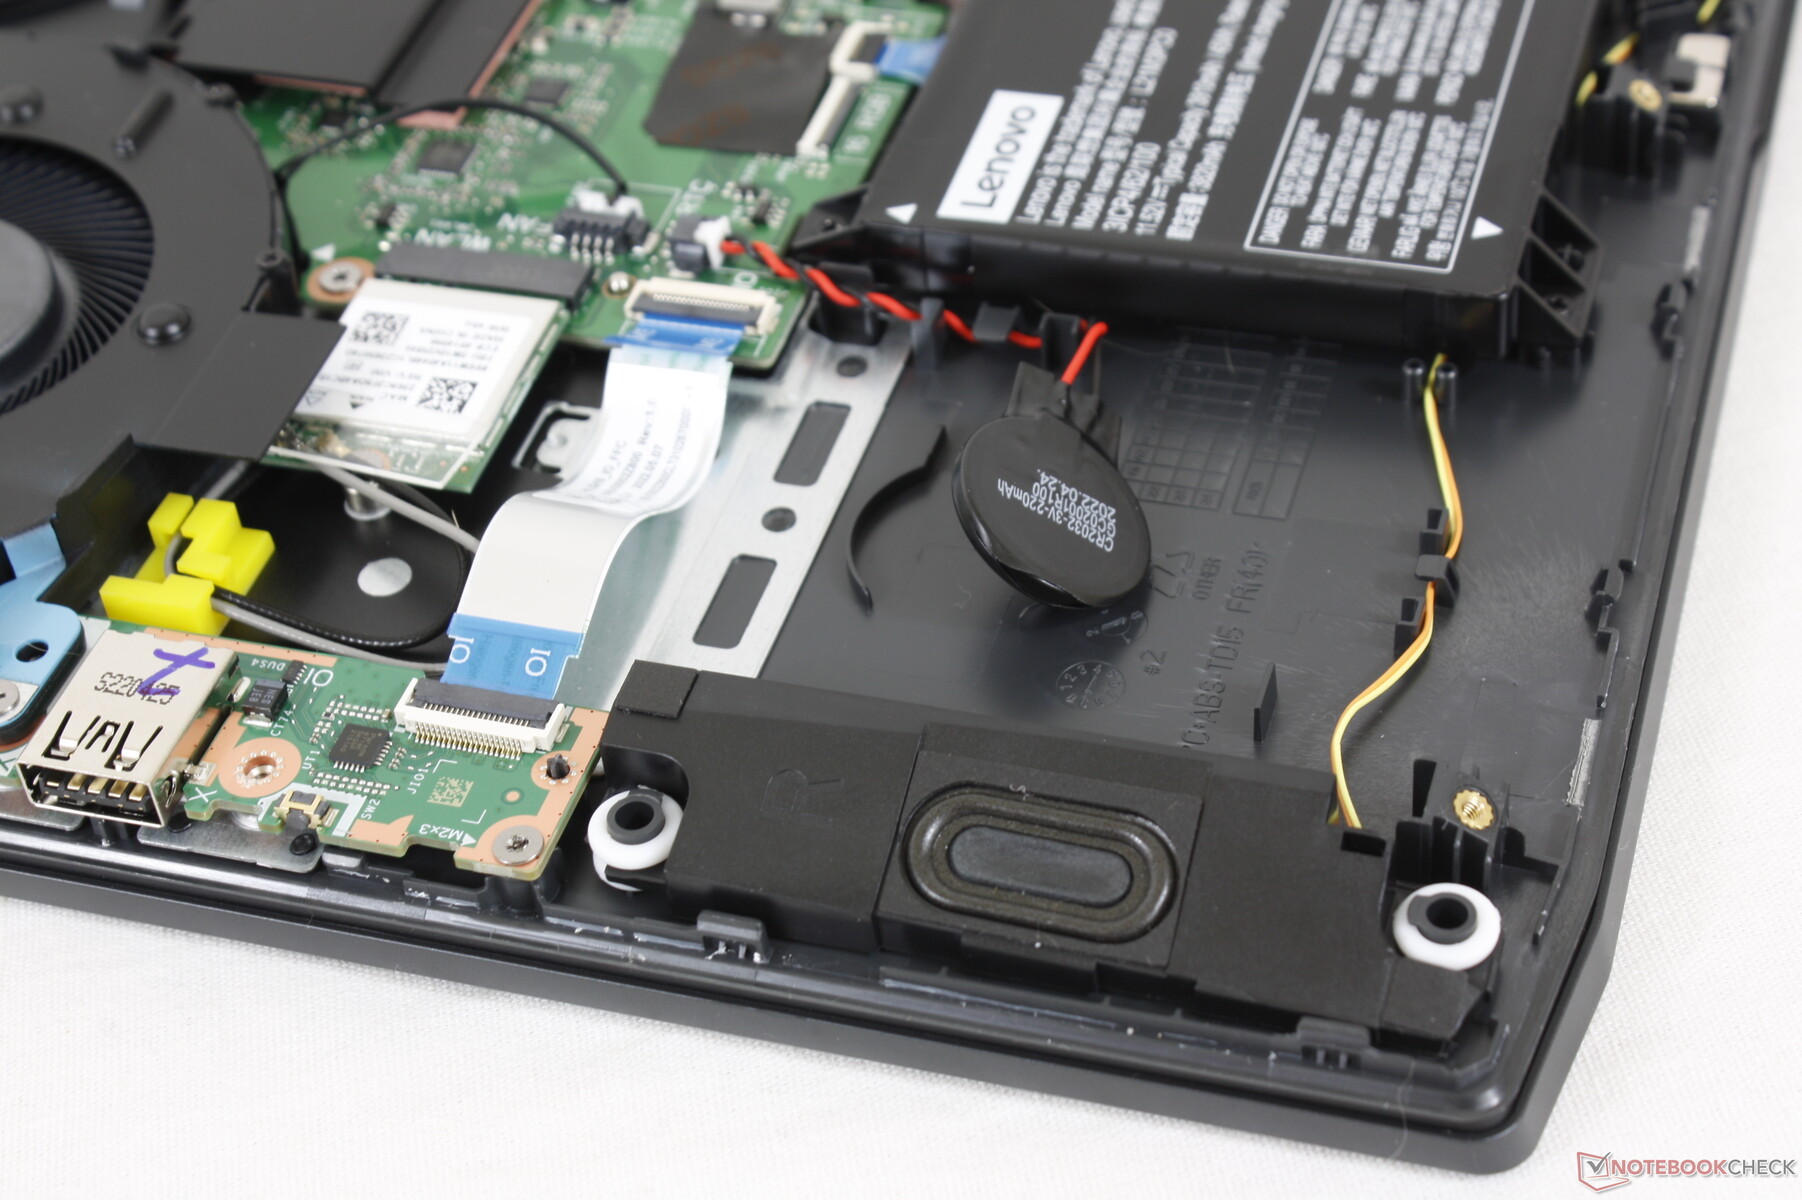
Manutenzione - Troppo difficile da aprire
Il pannello inferiore è molto difficile da rimuovere. È fissato da 12 viti Philips, ma solo 8 sono facilmente accessibili. Per accedere alle altre 4, è necessario staccare prima la scocca posteriore, fissata da altre 2 viti vicino alle porte posteriori. La rimozione del guscio posteriore dalla scocca è un passaggio in più che non è presente nella maggior parte degli altri portatili da gioco. È chiaro che Lenovo non ha progettato l'IdeaPad Gaming 3 15 per essere facilmente aggiornabile dall'utente finale, il che è un peccato, dato che ci sono molte possibilità di aggiornamento, tra cui 2 slot SODIMM e 2 alloggiamenti M.2 per lo storage.
Accessori e garanzia
La confezione non contiene altri extra oltre all'adattatore CA e alla documentazione. Se acquistato negli Stati Uniti, si applica la consueta garanzia limitata di un anno.
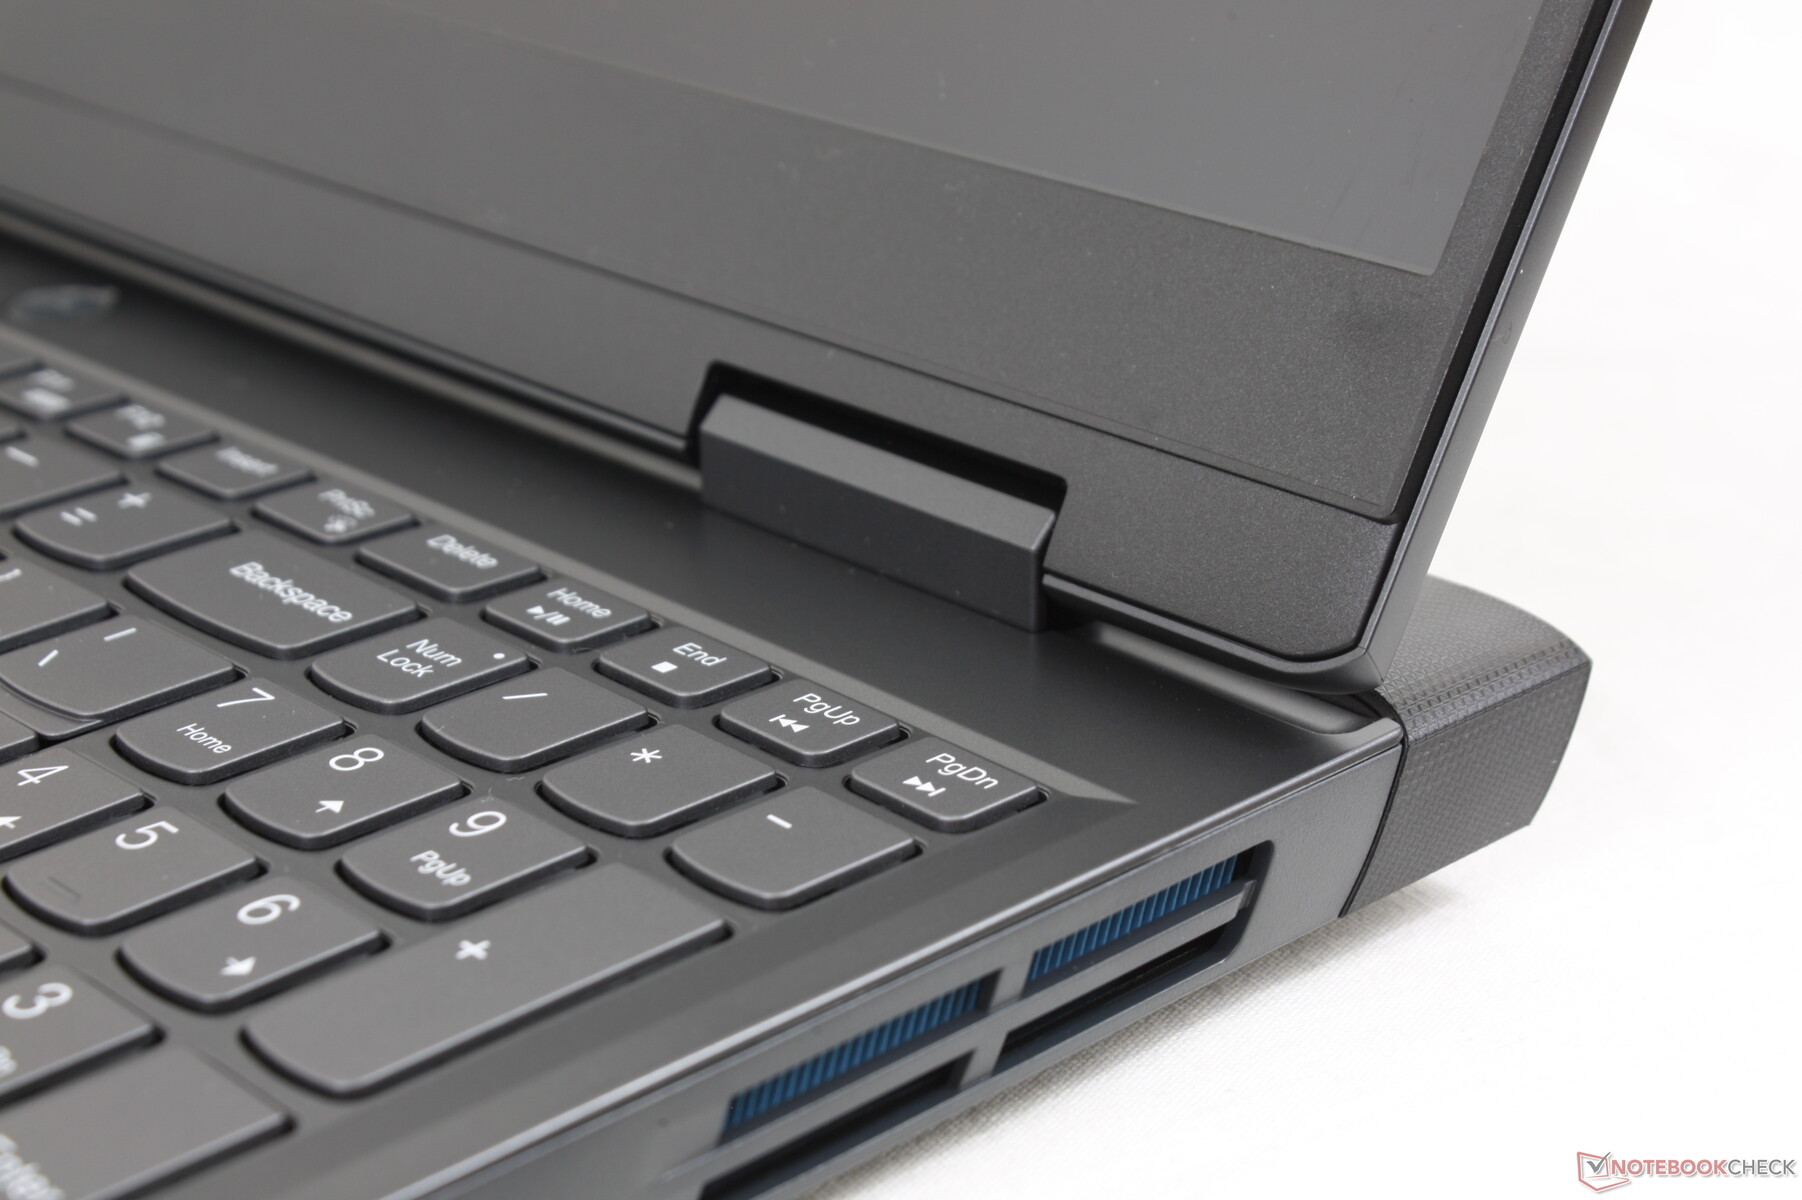
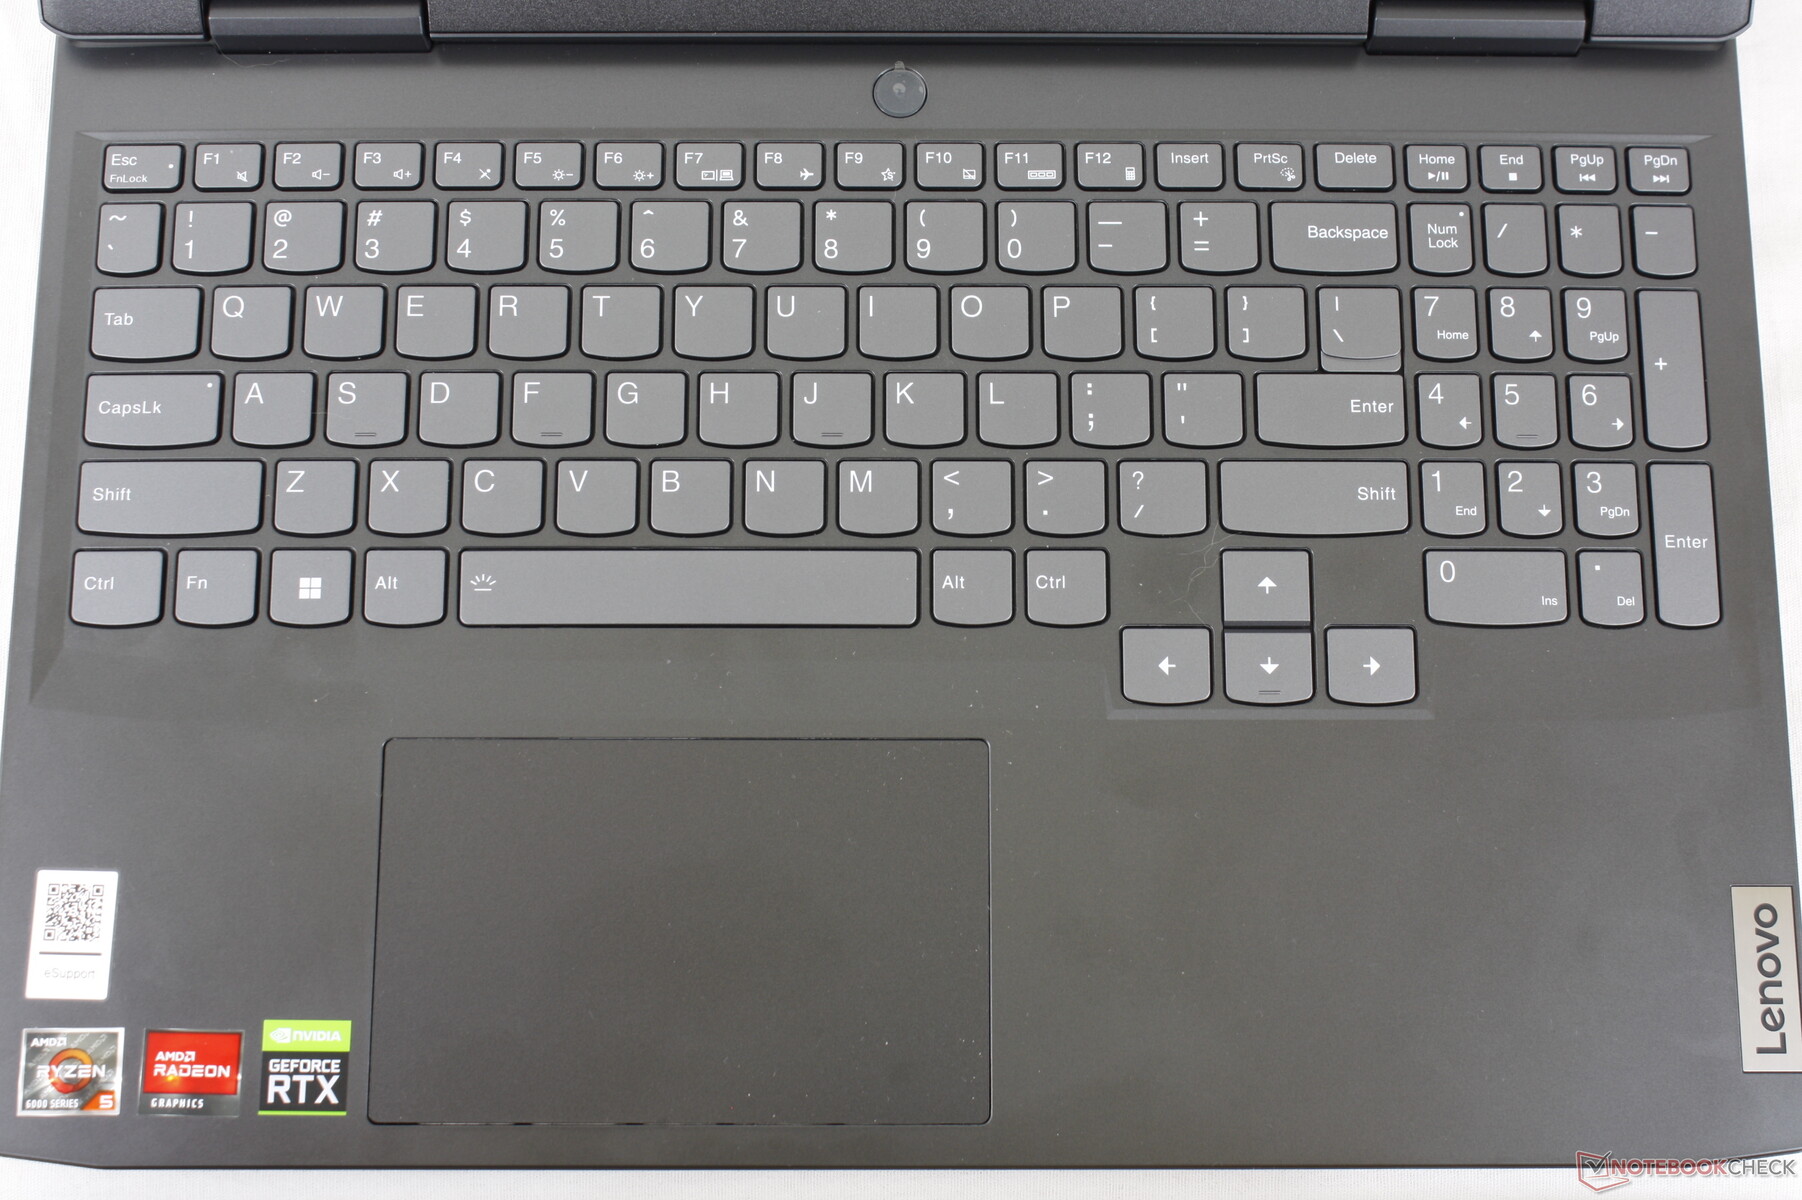
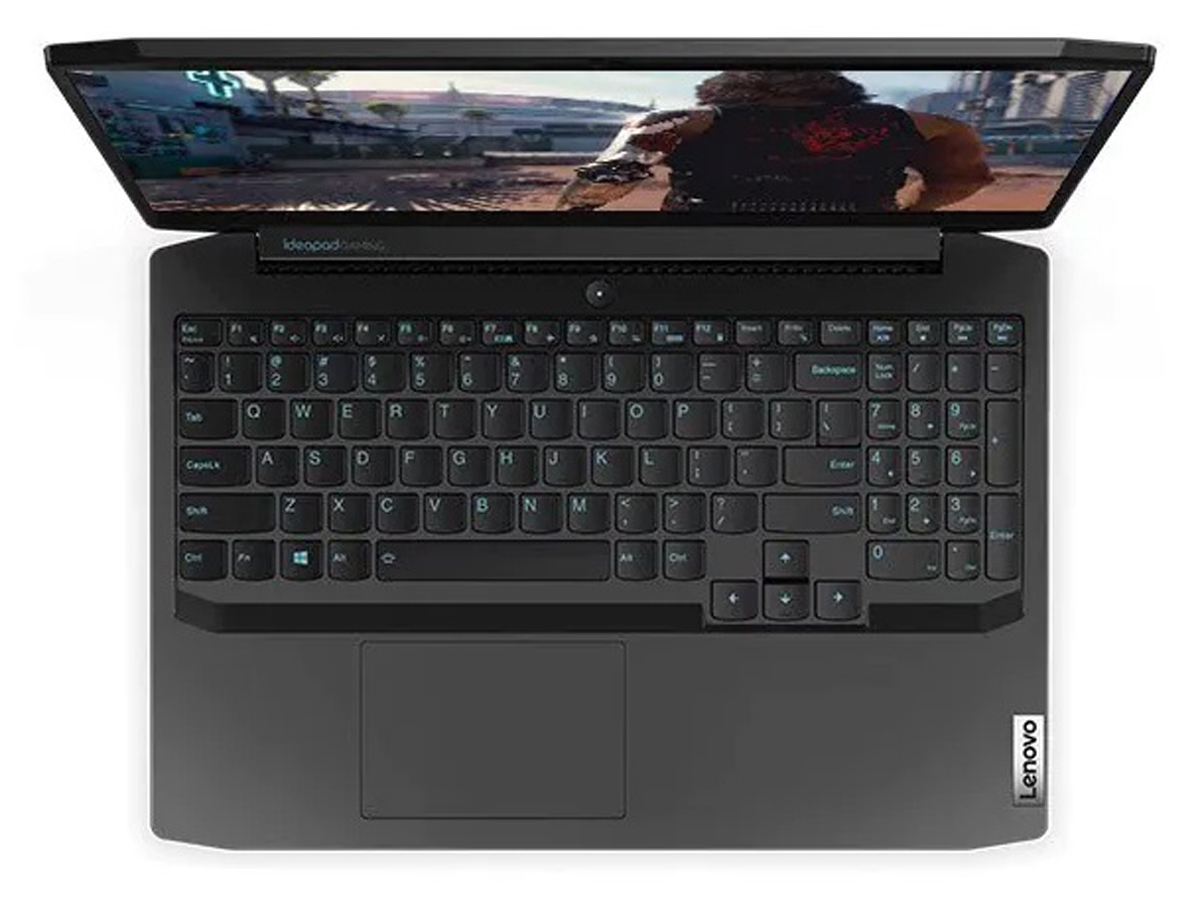
Dispositivi di input - IdeaPad classico
Tastiera
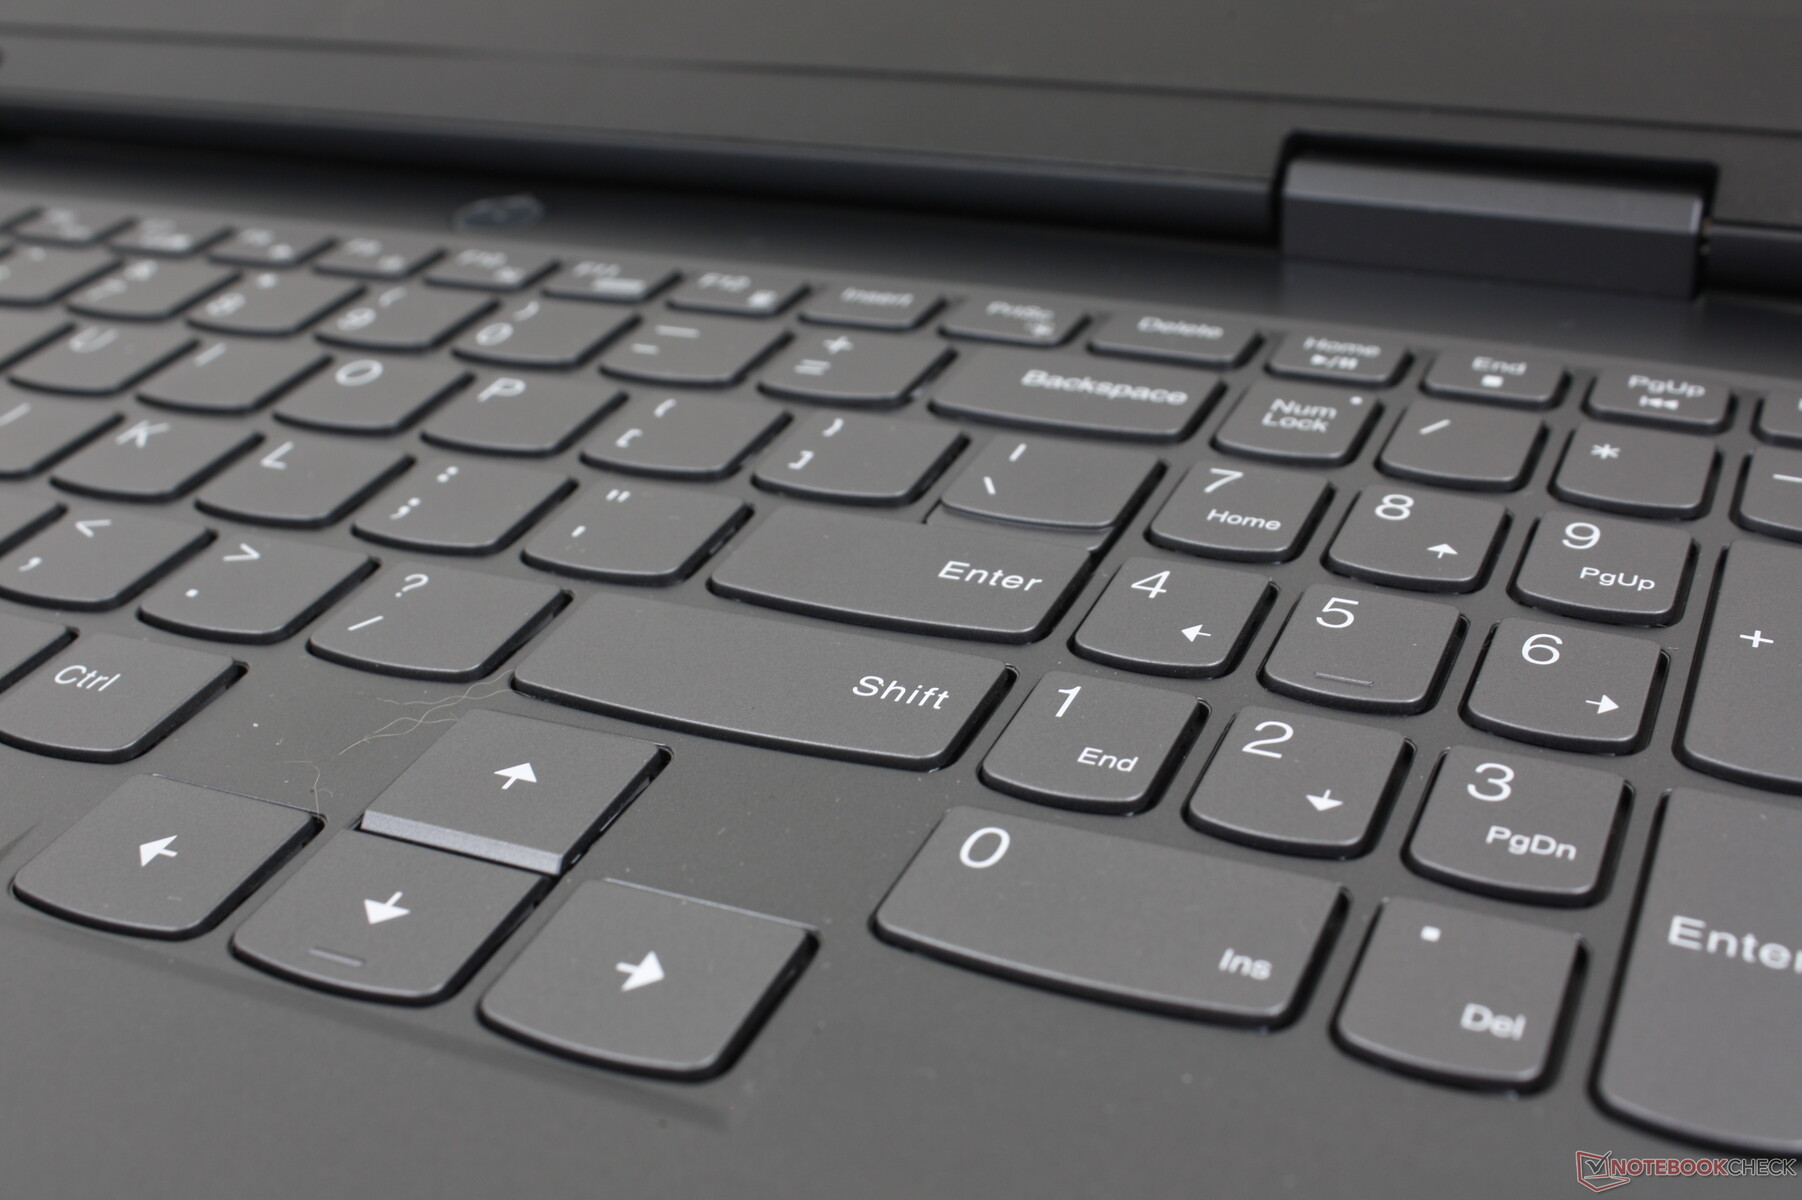
Le lettere e i simboli su ciascun tasto sono ora bianchi, mentre erano blu chiaro sull'IdeaPad Gaming 3i 2020. Per il resto, le dimensioni e la sensazione dei tasti sono rimaste invariate, per un'esperienza di digitazione sostanzialmente identica tra i due modelli, nonostante le modifiche allo chassis. Il feedback dei tasti è leggero e poco profondo, simile a quello di molti Ultrabook di fascia media ed economica come l'Asus VivoBook 3i Asus VivoBook o IdeaPad standard.
La retroilluminazione bianca a due livelli è di serie per illuminare la stampa su ogni tasto, compresi i simboli secondari più piccoli.
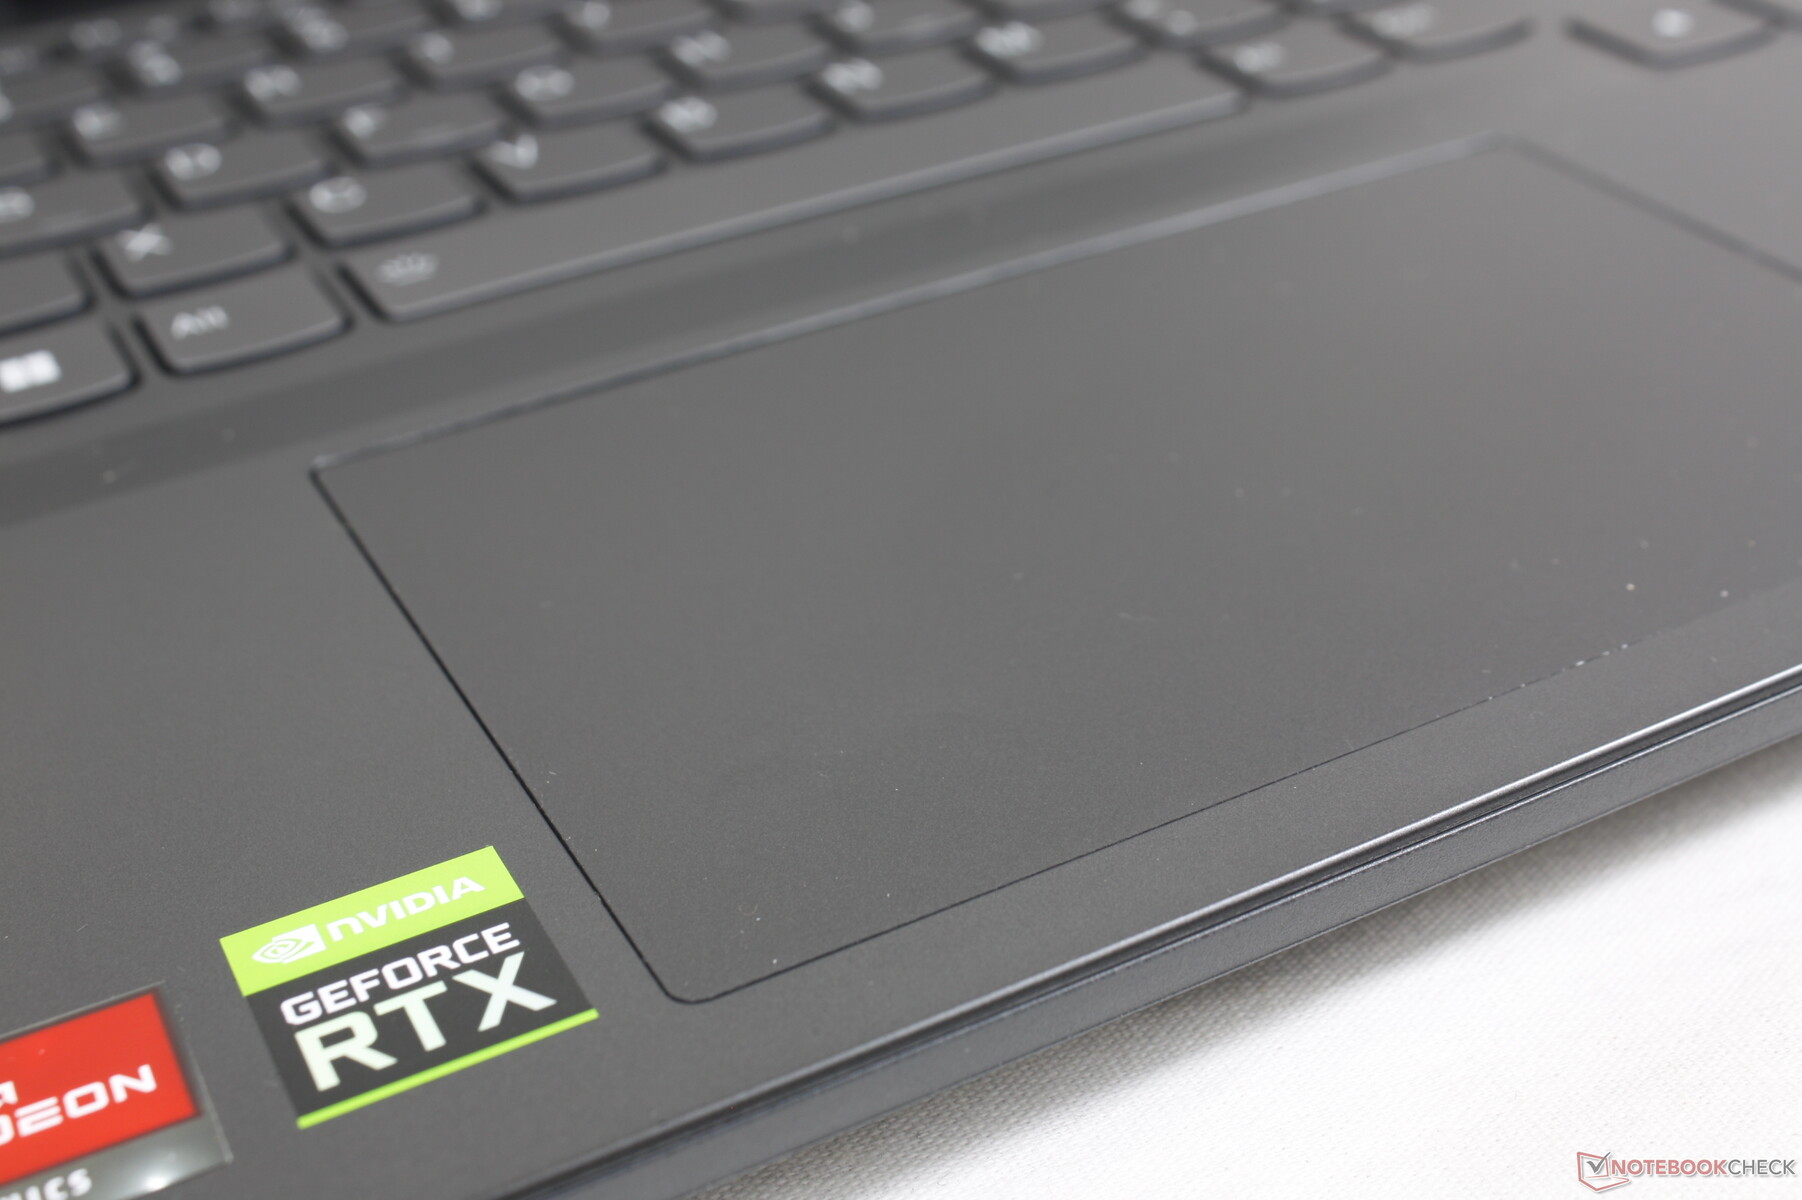
Touchpad
Il clickpad è più grande di quello del modello MSI Bravo 15 (12,5 x 7,5 cm contro 10,5 x 6,5 cm). Sfortunatamente, sia la trazione che il feedback sono rispettivamente più appiccicosi e più spugnosi rispetto alla maggior parte degli altri portatili, per un'esperienza d'uso peggiore. Il dito si impunta spesso quando si scivola a velocità medie e il clic non è soddisfacente a causa del feedback appiccicoso.

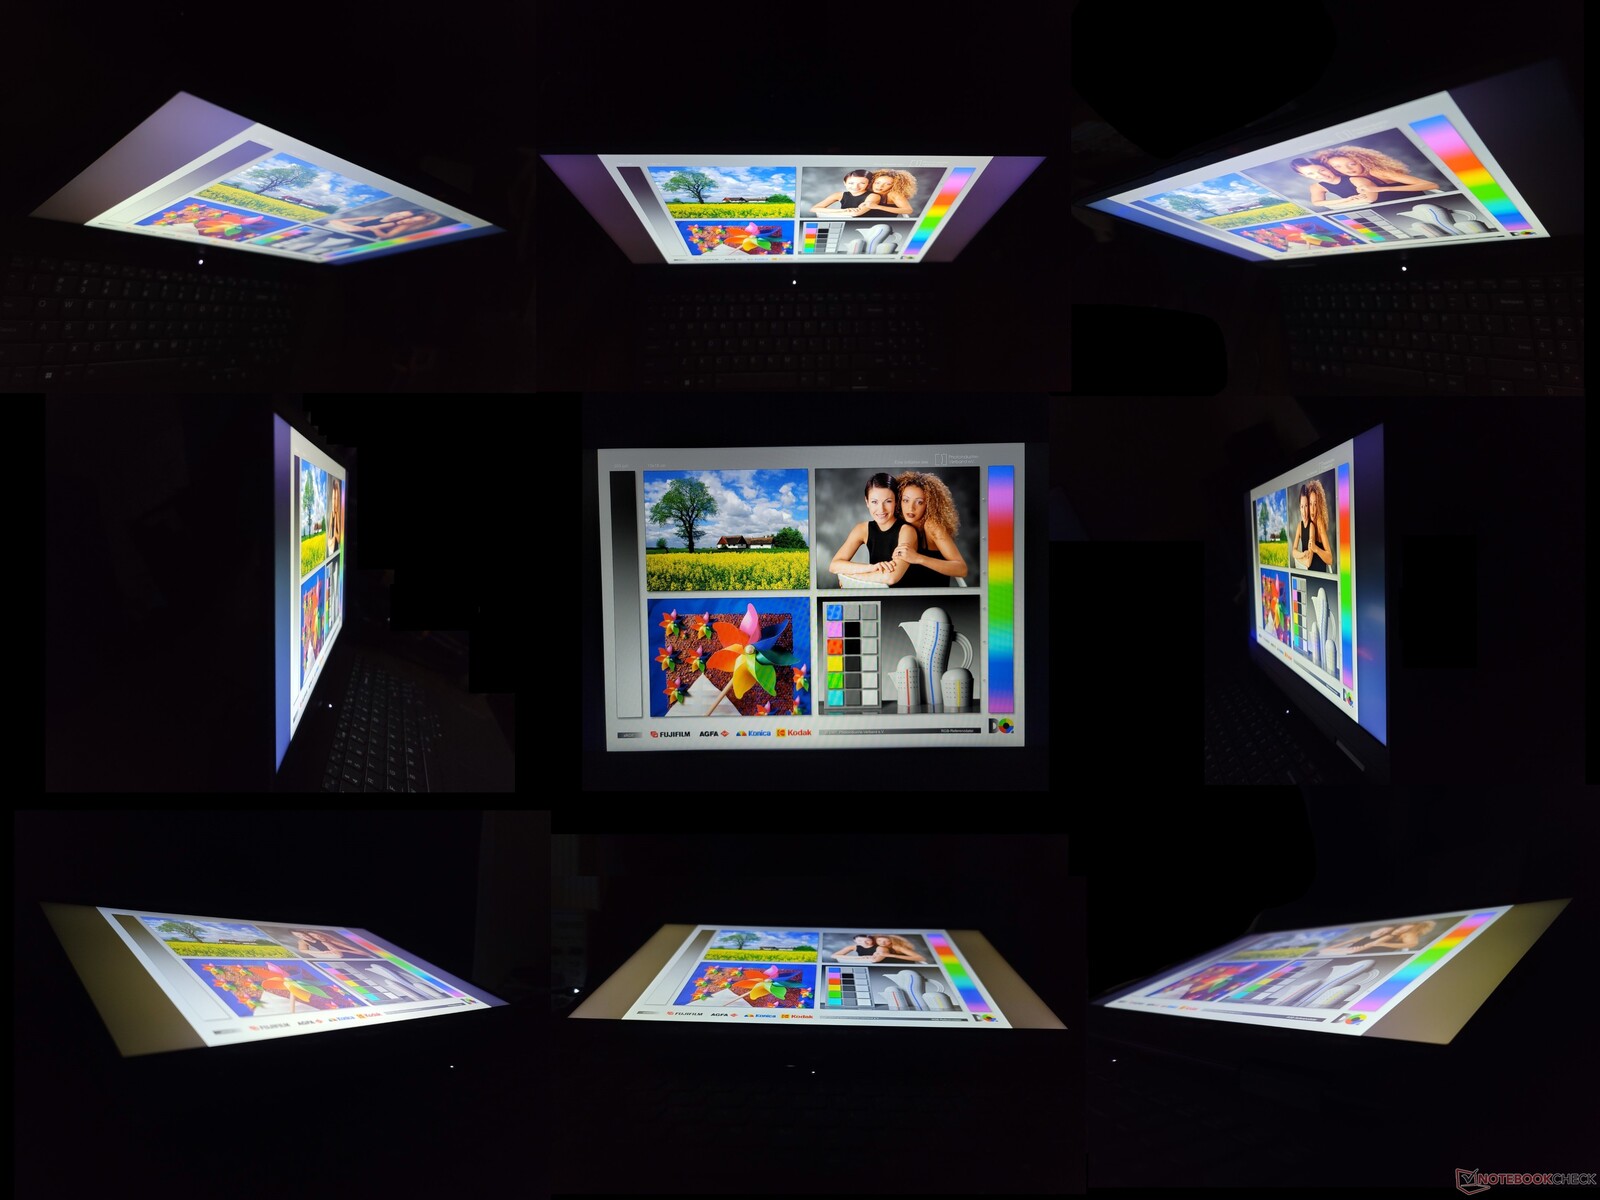
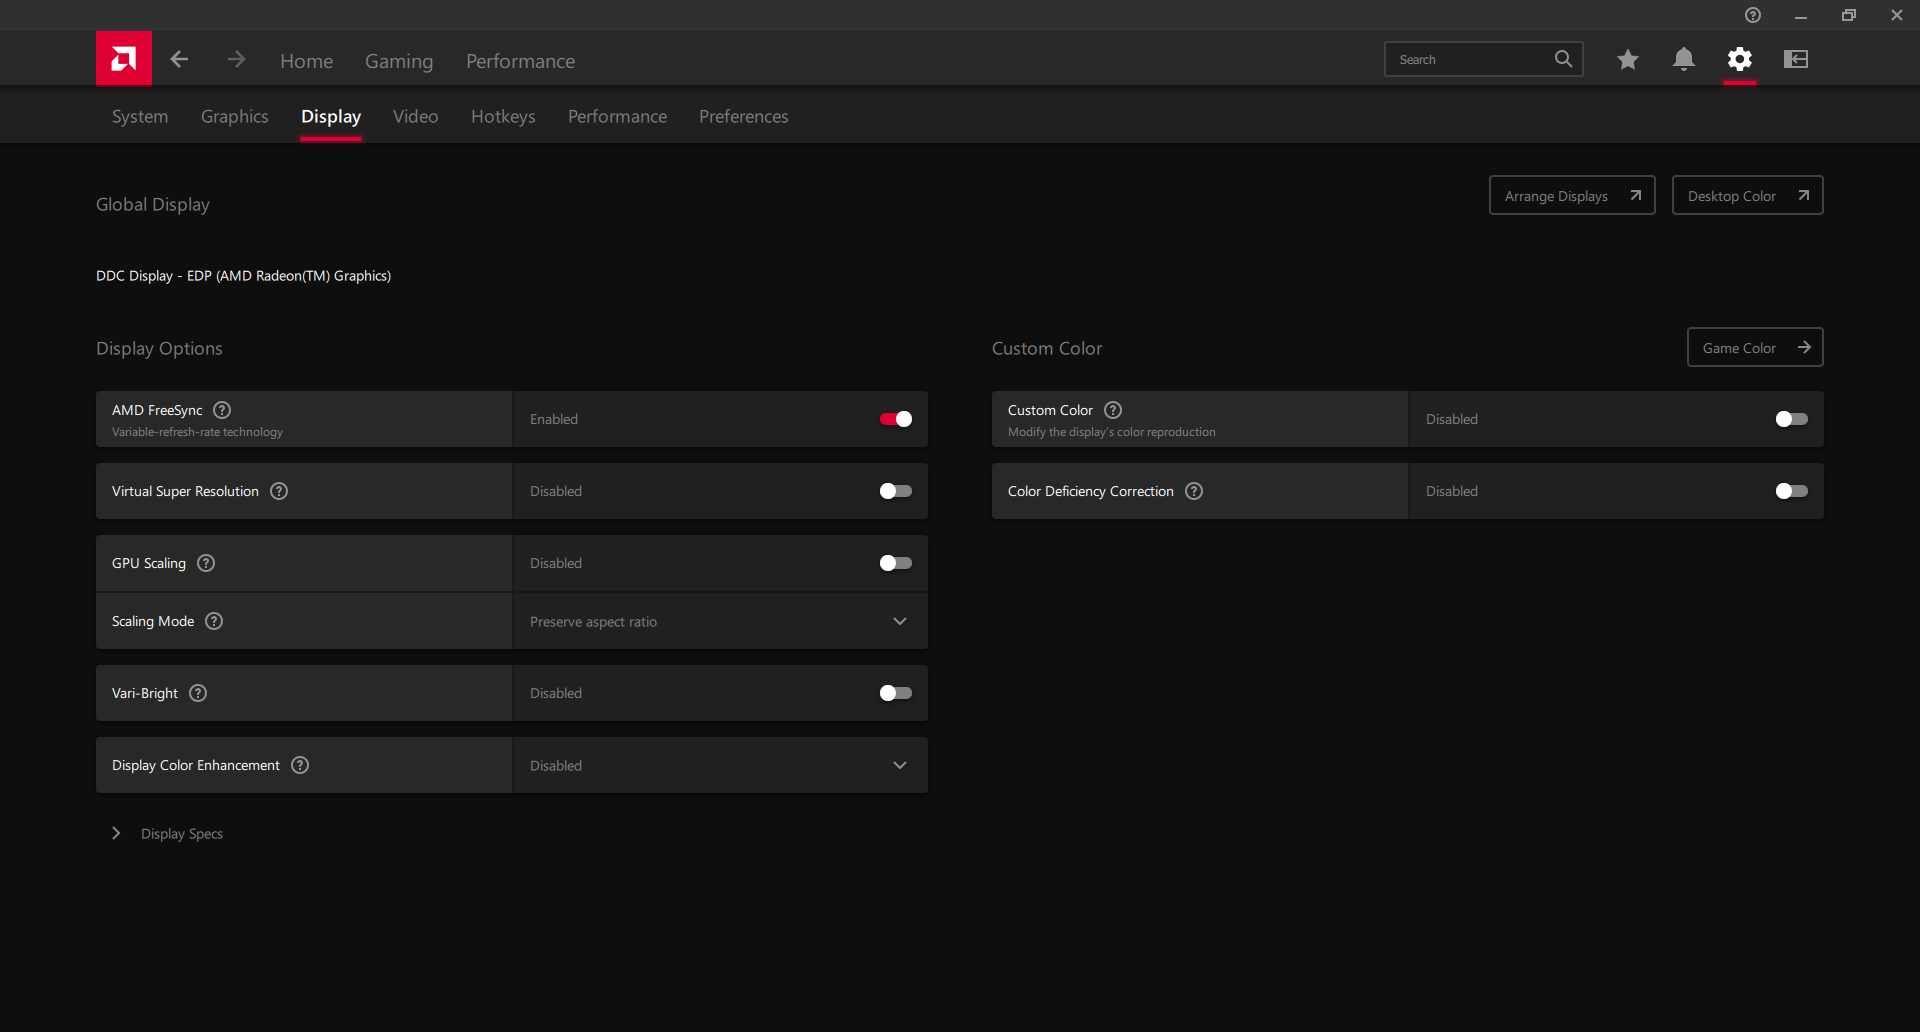
Display: FreeSync e 120 Hz di serie
Tra le caratteristiche positive del display vi sono il supporto per la frequenza di aggiornamento nativa di 120 Hz e il FreeSync. Anche i tempi di risposta del bianco e nero e del grigio sono decenti, con circa 9-10 ms ciascuno. Per i giochi, il display è in grado di ridurre al minimo l'effetto ghosting e lo screen tearing.
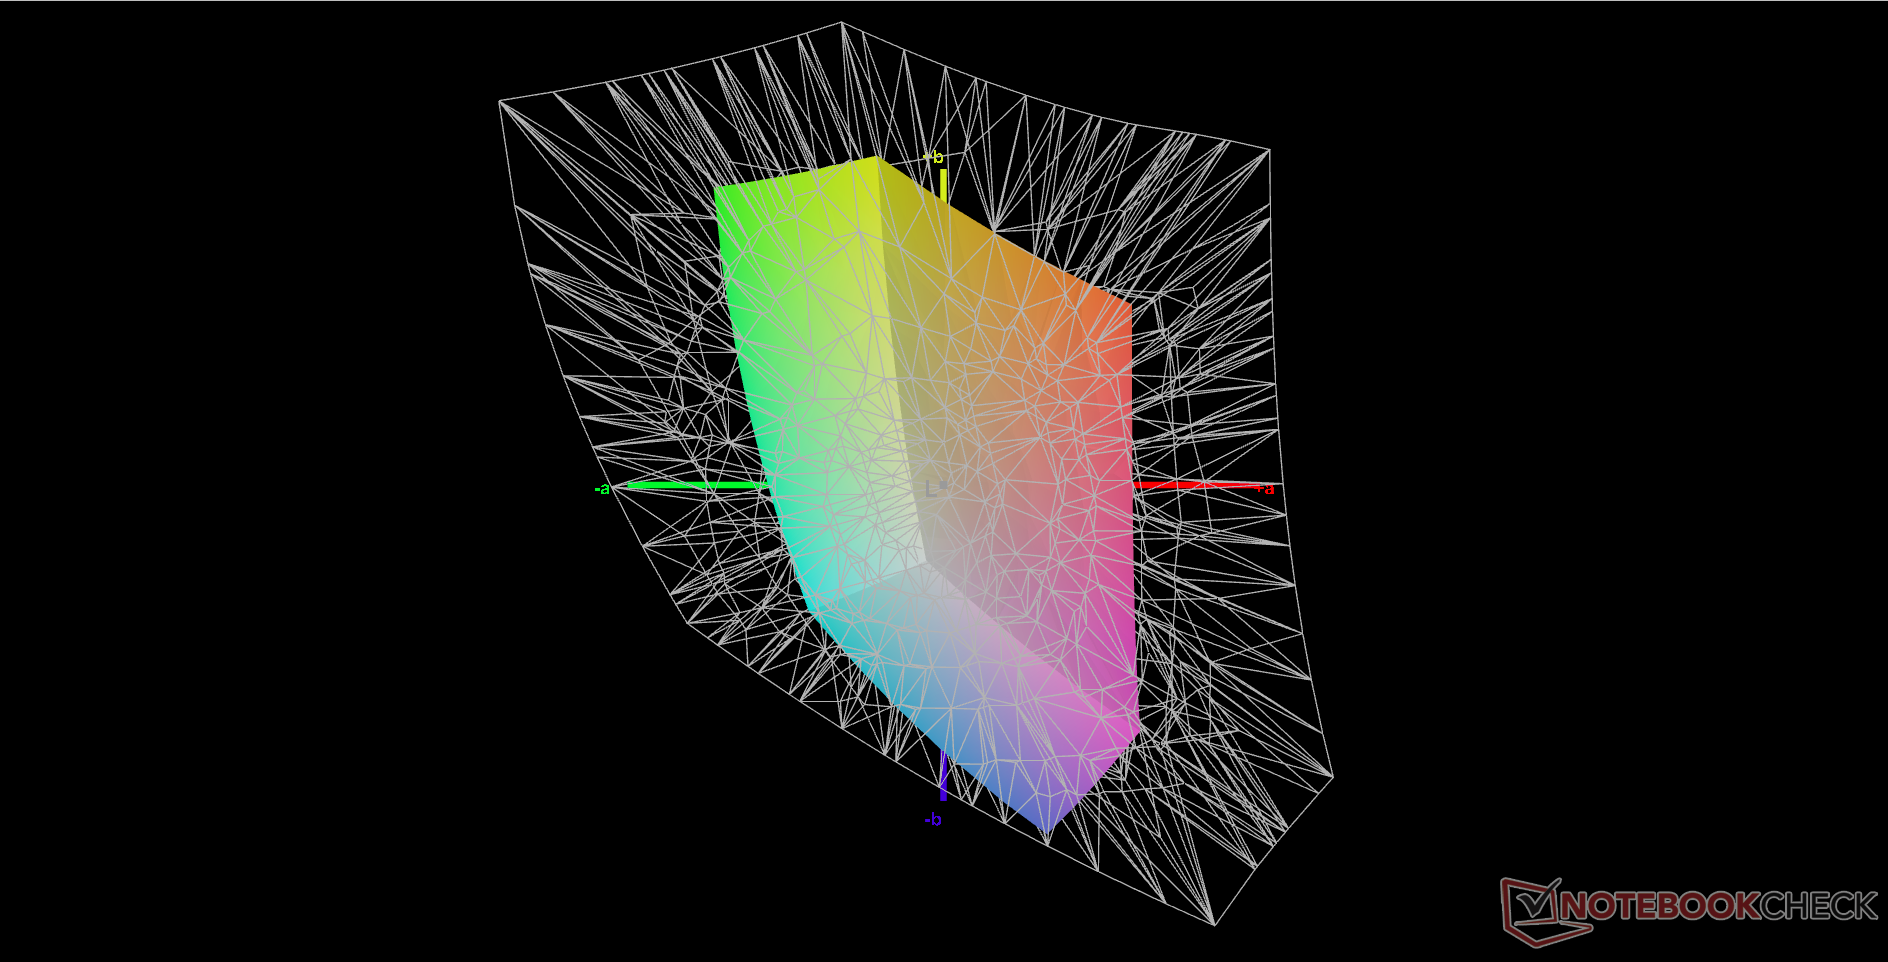
L'aspetto peggiore del display è il suo profilo cromatico limitato ad appena il 58% di sRGB, indicativo di un pannello economico inadatto alla maggior parte degli editor. Lenovo vuole che gli utenti passino alla serie di laptop Legion per ottenere colori migliori e una retroilluminazione più luminosa, dato che non ci sono altre opzioni di visualizzazione tra cui scegliere su questo particolare modello di IdeaPad.
Si noti che, mentre il pannello qui presente condivide lo stesso ID LEN156FHD del ThinkBook 15 G4 o IdeaPad 5 15ALC05sono comunque molto diversi per alcuni aspetti. Ad esempio, i display dei suddetti ThinkBook o IdeaPad 5 non supportano 120 Hz o FreeSync.


| |||||||||||||||||||||||||
Distribuzione della luminosità: 86 %
Al centro con la batteria: 287.8 cd/m²
Contrasto: 959:1 (Nero: 0.3 cd/m²)
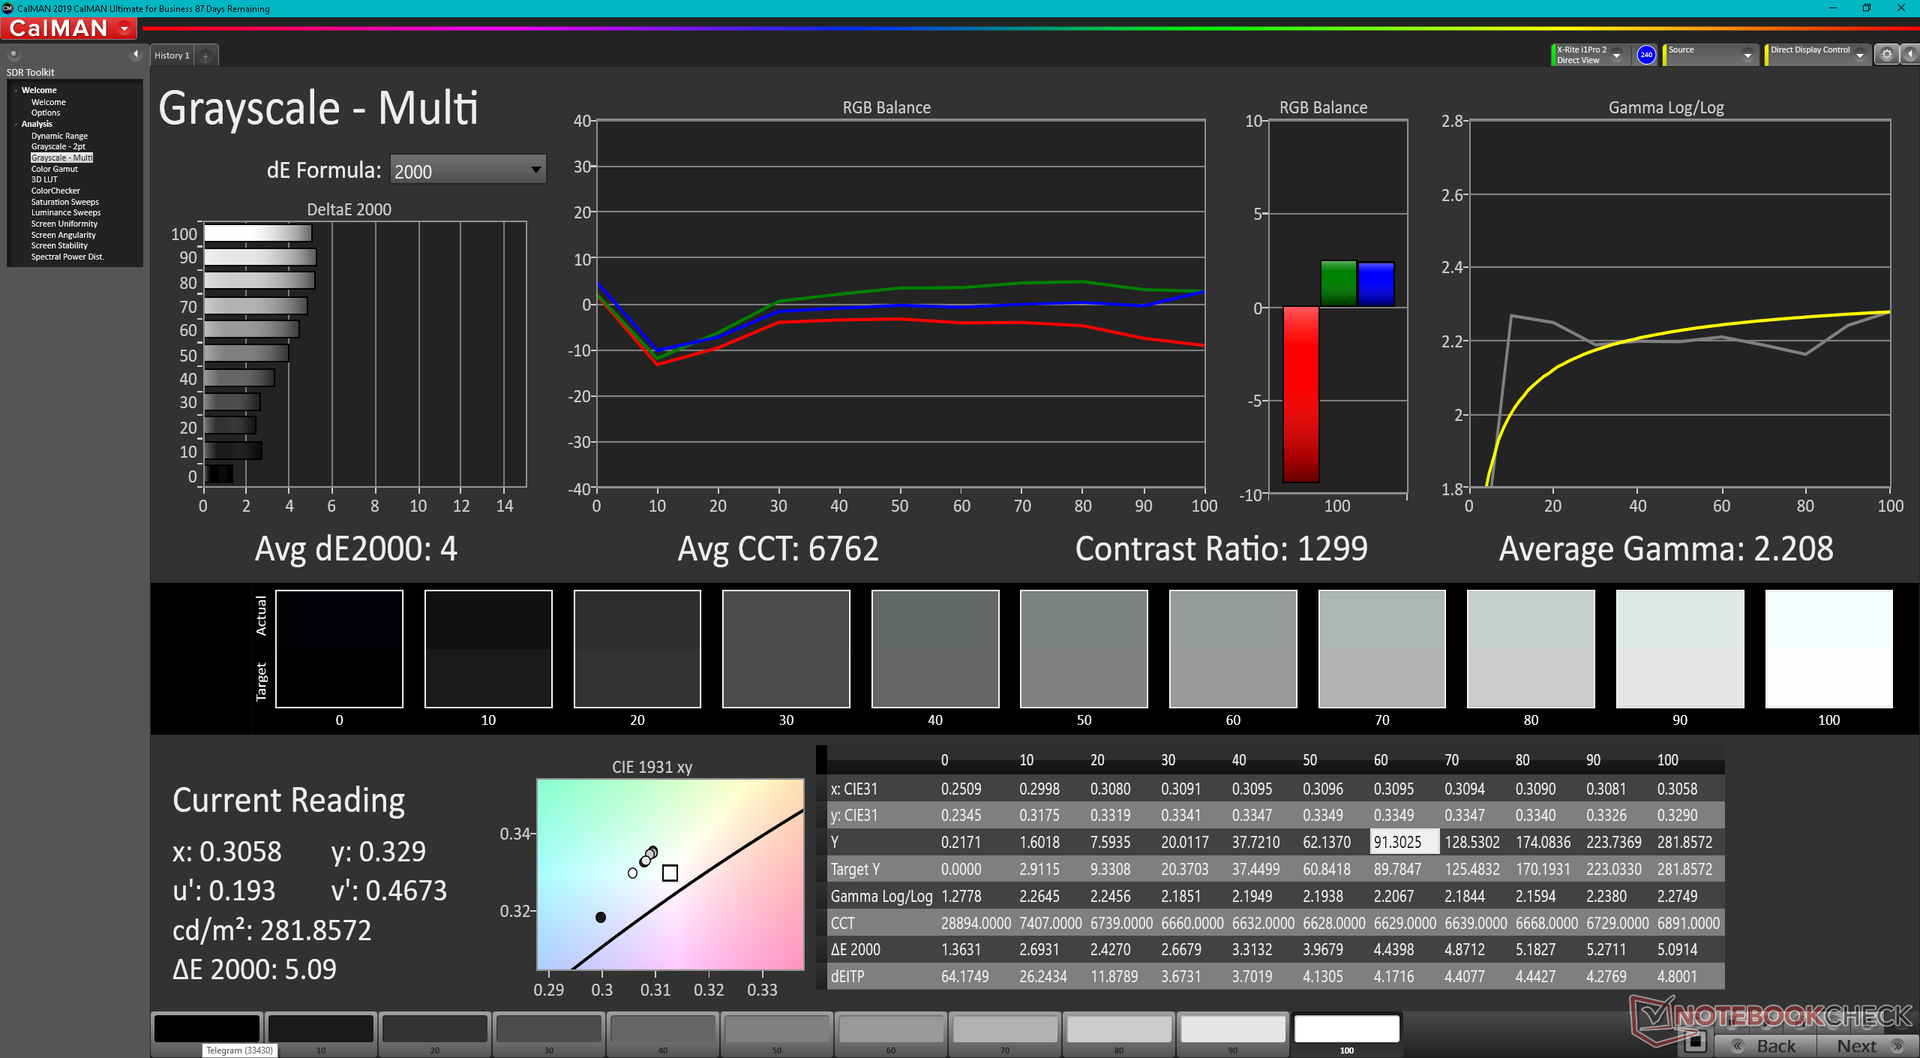
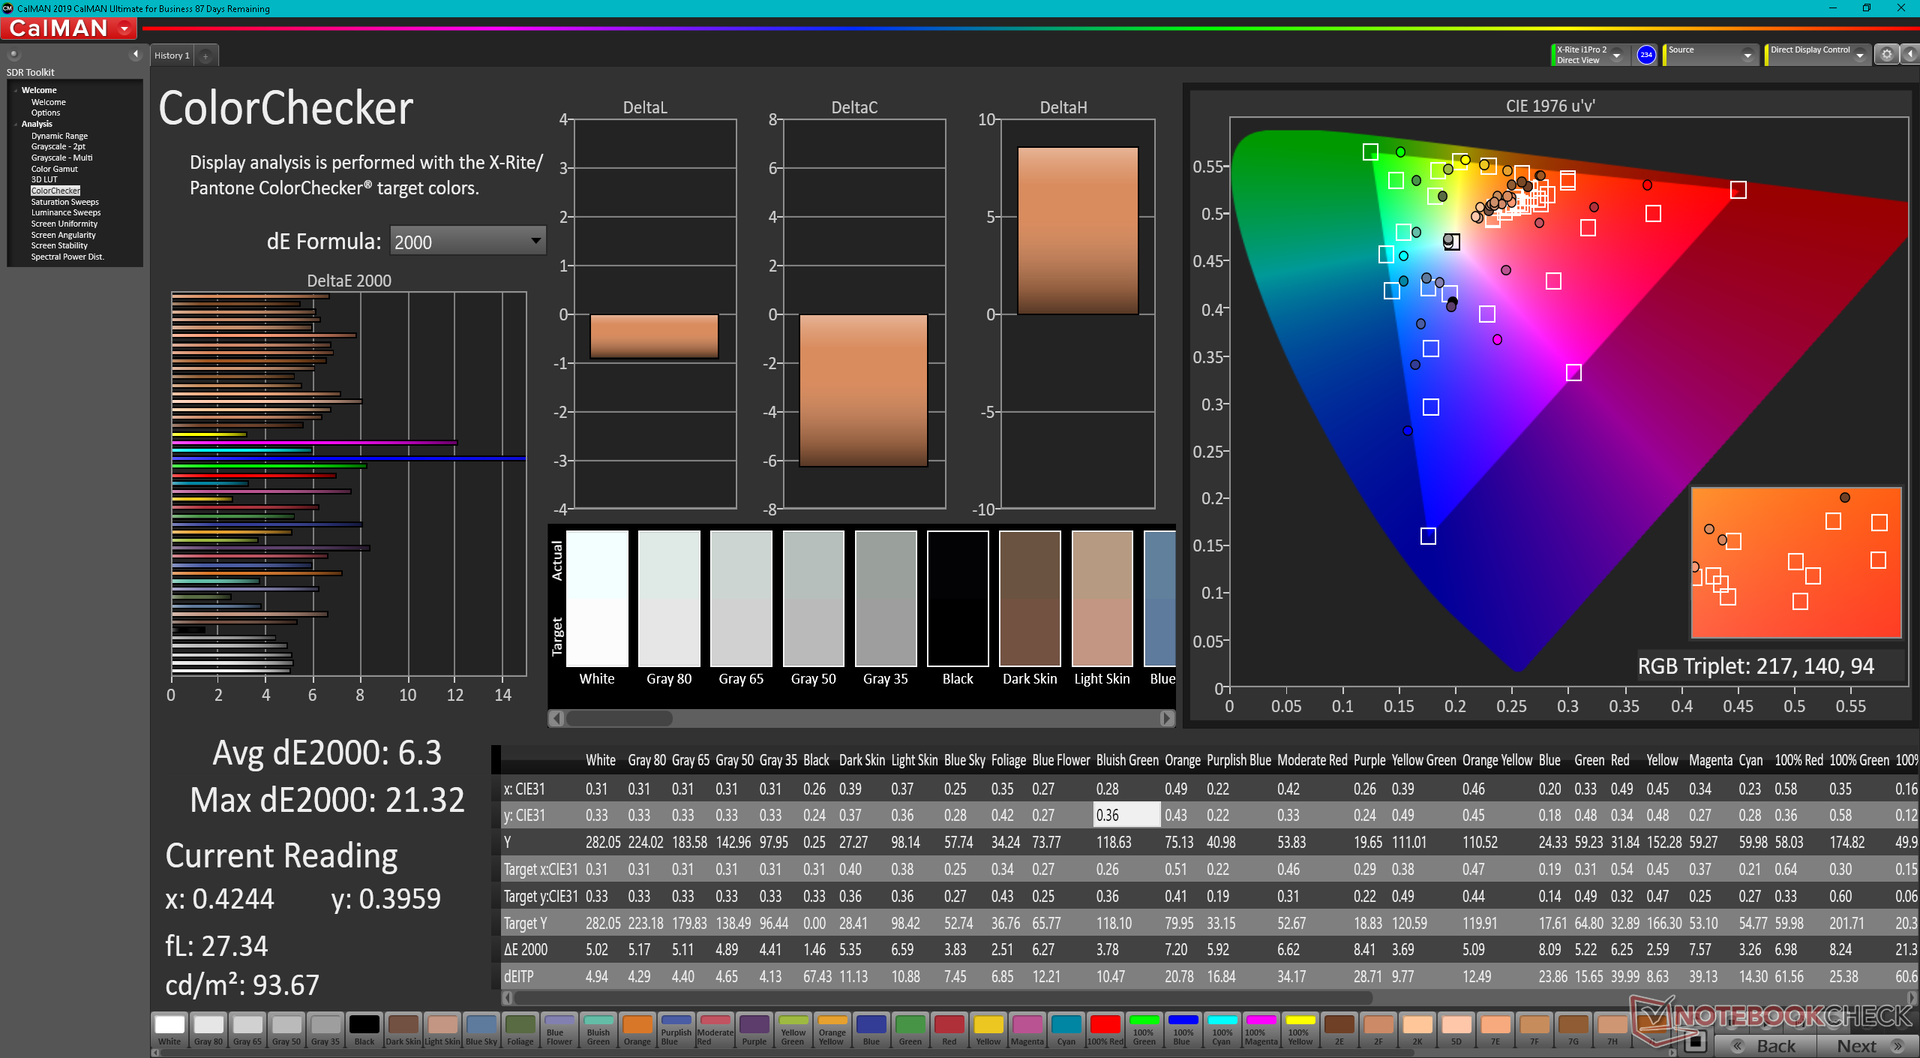
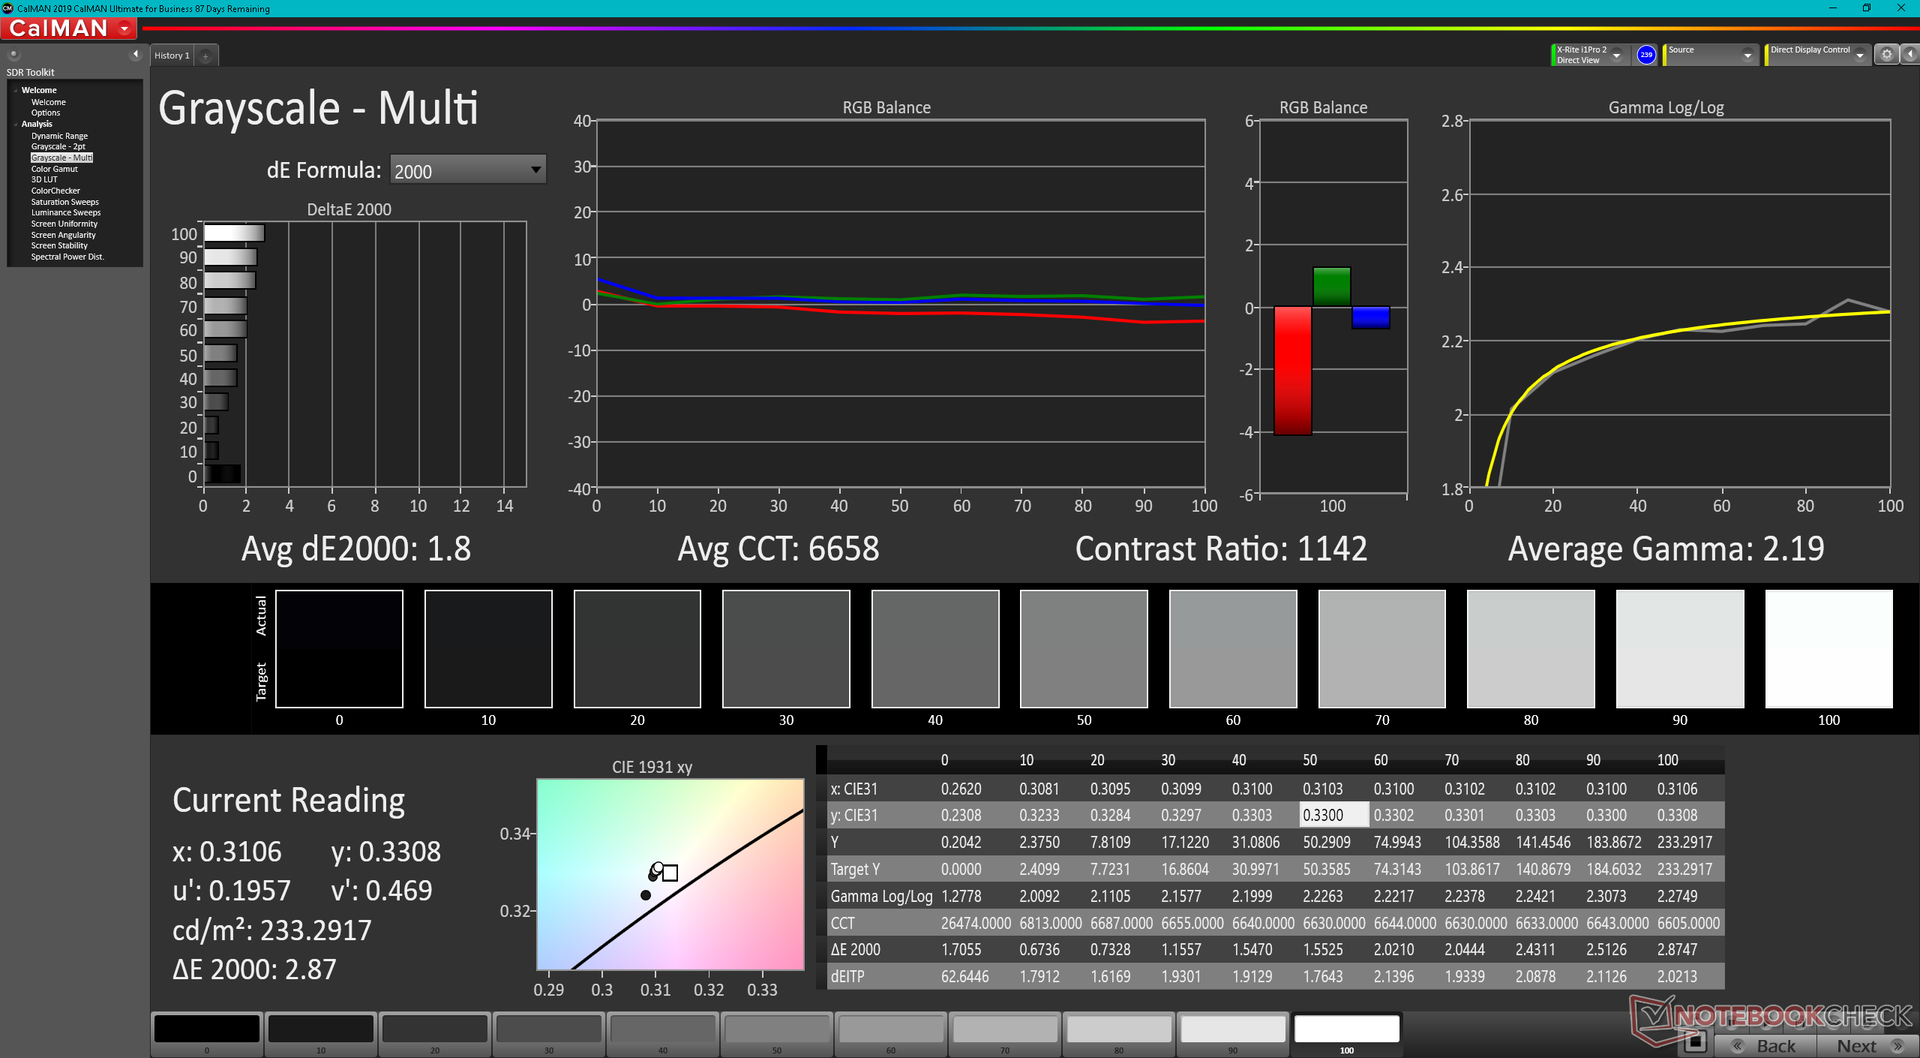
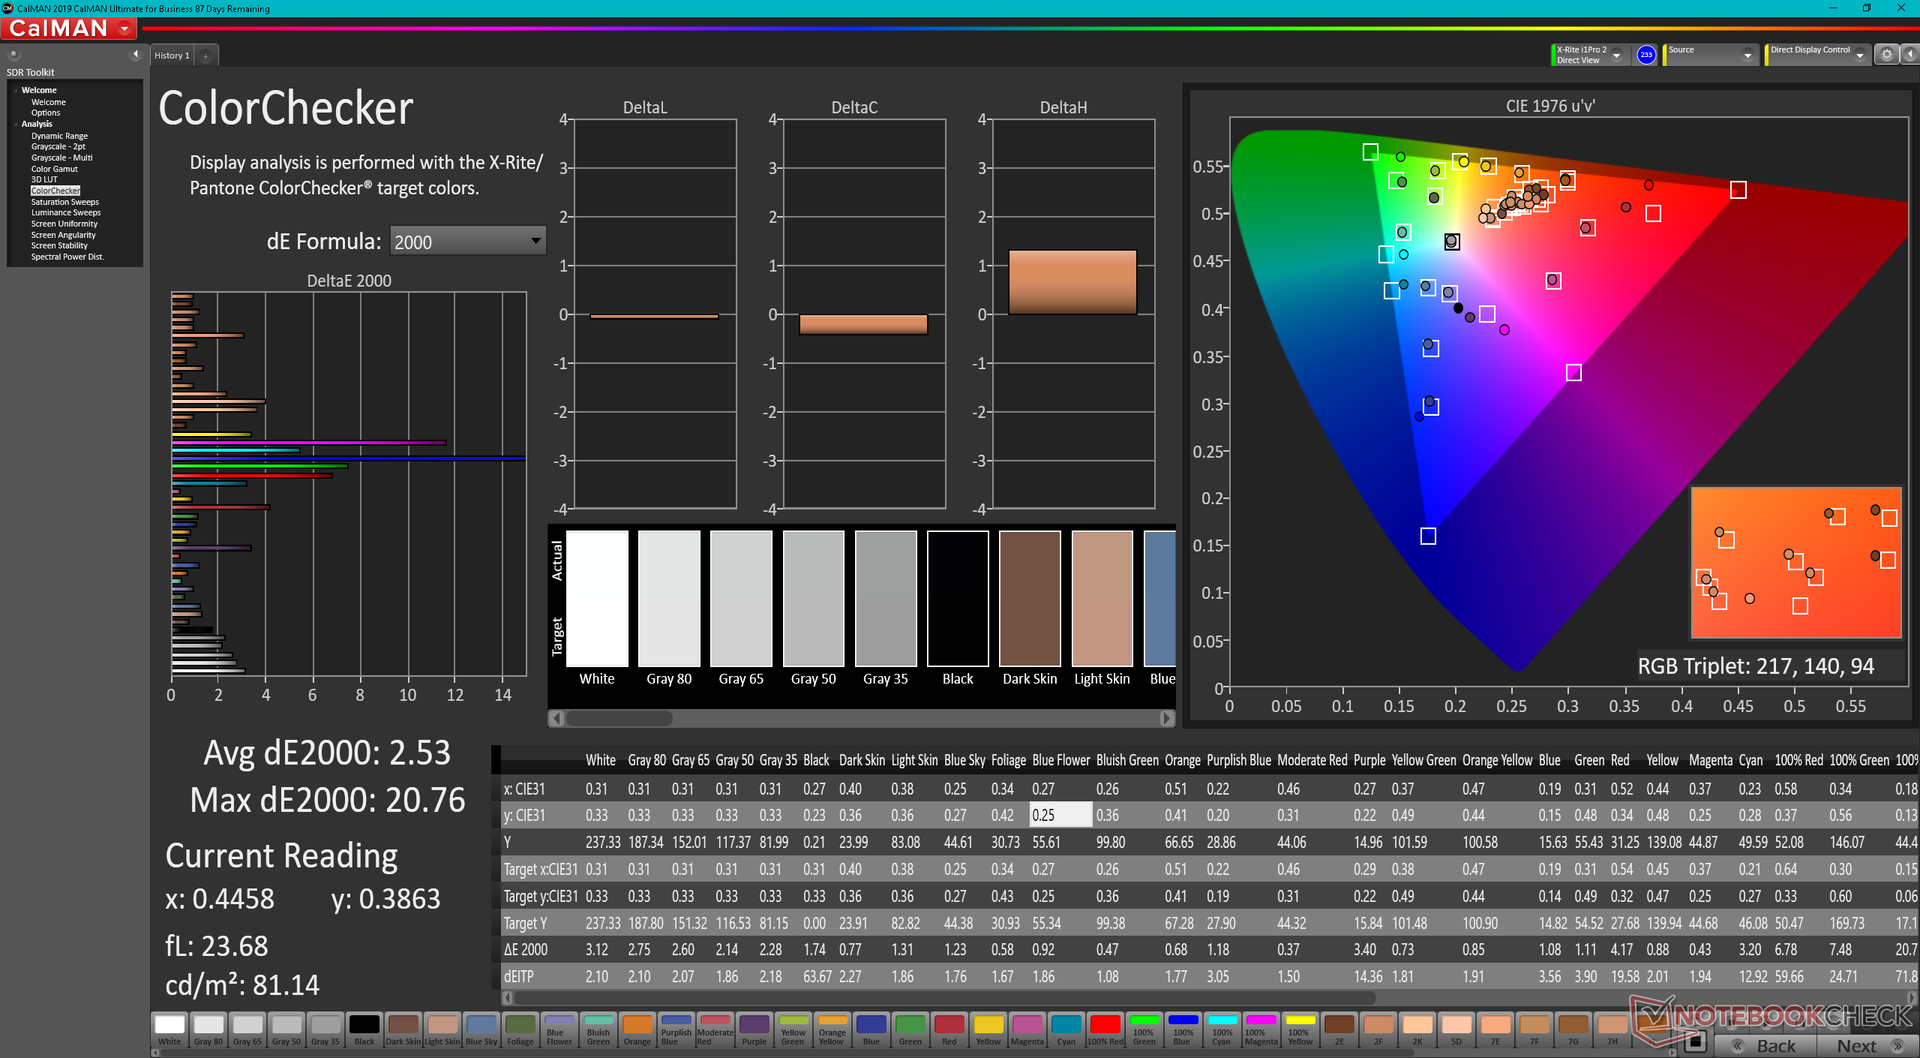
ΔE ColorChecker Calman: 6.3 | ∀{0.5-29.43 Ø4.73}
calibrated: 2.53
ΔE Greyscale Calman: 4 | ∀{0.09-98 Ø4.97}
40.7% AdobeRGB 1998 (Argyll 3D)
58% sRGB (Argyll 3D)
39.4% Display P3 (Argyll 3D)
Gamma: 2.21
CCT: 6762 K
| Lenovo IdeaPad Gaming 3 15ARH7 LEN156FHD, IPS, 1920x1080, 15.6" | Lenovo IdeaPad Gaming 3i 15IMH05 BOE CQ NV156FHM-NX1, IPS, 1920x1080, 15.6" | Lenovo Legion 5 15ACH6A-82NW0010GE LGD06A5, IPS, 1920x1080, 15.6" | Gigabyte A5 K1 BOEhydis NV156FHM-N4K (BOE08B3), IPS, 1920x1080, 15.6" | Asus TUF Dash F15 FX517ZR BOE CQ NE156QHM-NY1, IPS, 2560x1440, 15.6" | Dell G15 5510 YMHWH_156HRA (CMN1522), IPS, 1920x1080, 15.6" | |
|---|---|---|---|---|---|---|
| Display | -3% | 76% | 61% | 111% | 6% | |
| Display P3 Coverage (%) | 39.4 | 38.04 -3% | 71.1 80% | 64.4 63% | 98.4 150% | 41.6 6% |
| sRGB Coverage (%) | 58 | 56.6 -2% | 99.1 71% | 92.5 59% | 99.9 72% | 62.2 7% |
| AdobeRGB 1998 Coverage (%) | 40.7 | 39.3 -3% | 72.3 78% | 66.1 62% | 85.9 111% | 43 6% |
| Response Times | -6% | 48% | 39% | 61% | -37% | |
| Response Time Grey 50% / Grey 80% * (ms) | 20.8 ? | 25 ? -20% | 15 ? 28% | 14.5 ? 30% | 5.6 ? 73% | 33.3 ? -60% |
| Response Time Black / White * (ms) | 18.4 ? | 17 ? 8% | 6 ? 67% | 9.5 ? 48% | 9.4 ? 49% | 20.7 ? -13% |
| PWM Frequency (Hz) | ||||||
| Screen | -16% | 24% | 19% | 31% | 12% | |
| Brightness middle (cd/m²) | 287.8 | 305 6% | 371 29% | 295 3% | 286 -1% | 288 0% |
| Brightness (cd/m²) | 268 | 294 10% | 328 22% | 281 5% | 266 -1% | 264 -1% |
| Brightness Distribution (%) | 86 | 70 -19% | 85 -1% | 83 -3% | 87 1% | 88 2% |
| Black Level * (cd/m²) | 0.3 | 0.405 -35% | 0.32 -7% | 0.29 3% | 0.25 17% | 0.24 20% |
| Contrast (:1) | 959 | 753 -21% | 1159 21% | 1017 6% | 1144 19% | 1200 25% |
| Colorchecker dE 2000 * | 6.3 | 6.01 5% | 3.25 48% | 4.36 31% | 2.14 66% | 3.67 42% |
| Colorchecker dE 2000 max. * | 21.32 | 21.9 -3% | 6.33 70% | 6.92 68% | 5.22 76% | 18.12 15% |
| Colorchecker dE 2000 calibrated * | 2.53 | 5.12 -102% | 1.11 56% | 1.2 53% | 0.67 74% | 3.22 -27% |
| Greyscale dE 2000 * | 4 | 3.23 19% | 4.94 -24% | 3.9 2% | 2.8 30% | 2.6 35% |
| Gamma | 2.21 100% | 2.43 91% | 2.45 90% | 2.106 104% | 2.23 99% | 2.187 101% |
| CCT | 6762 96% | 6818 95% | 6064 107% | 7300 89% | 7092 92% | 6971 93% |
| Color Space (Percent of AdobeRGB 1998) (%) | 36 | |||||
| Color Space (Percent of sRGB) (%) | 56 | |||||
| Media totale (Programma / Settaggio) | -8% /
-11% | 49% /
38% | 40% /
31% | 68% /
53% | -6% /
4% |
* ... Meglio usare valori piccoli
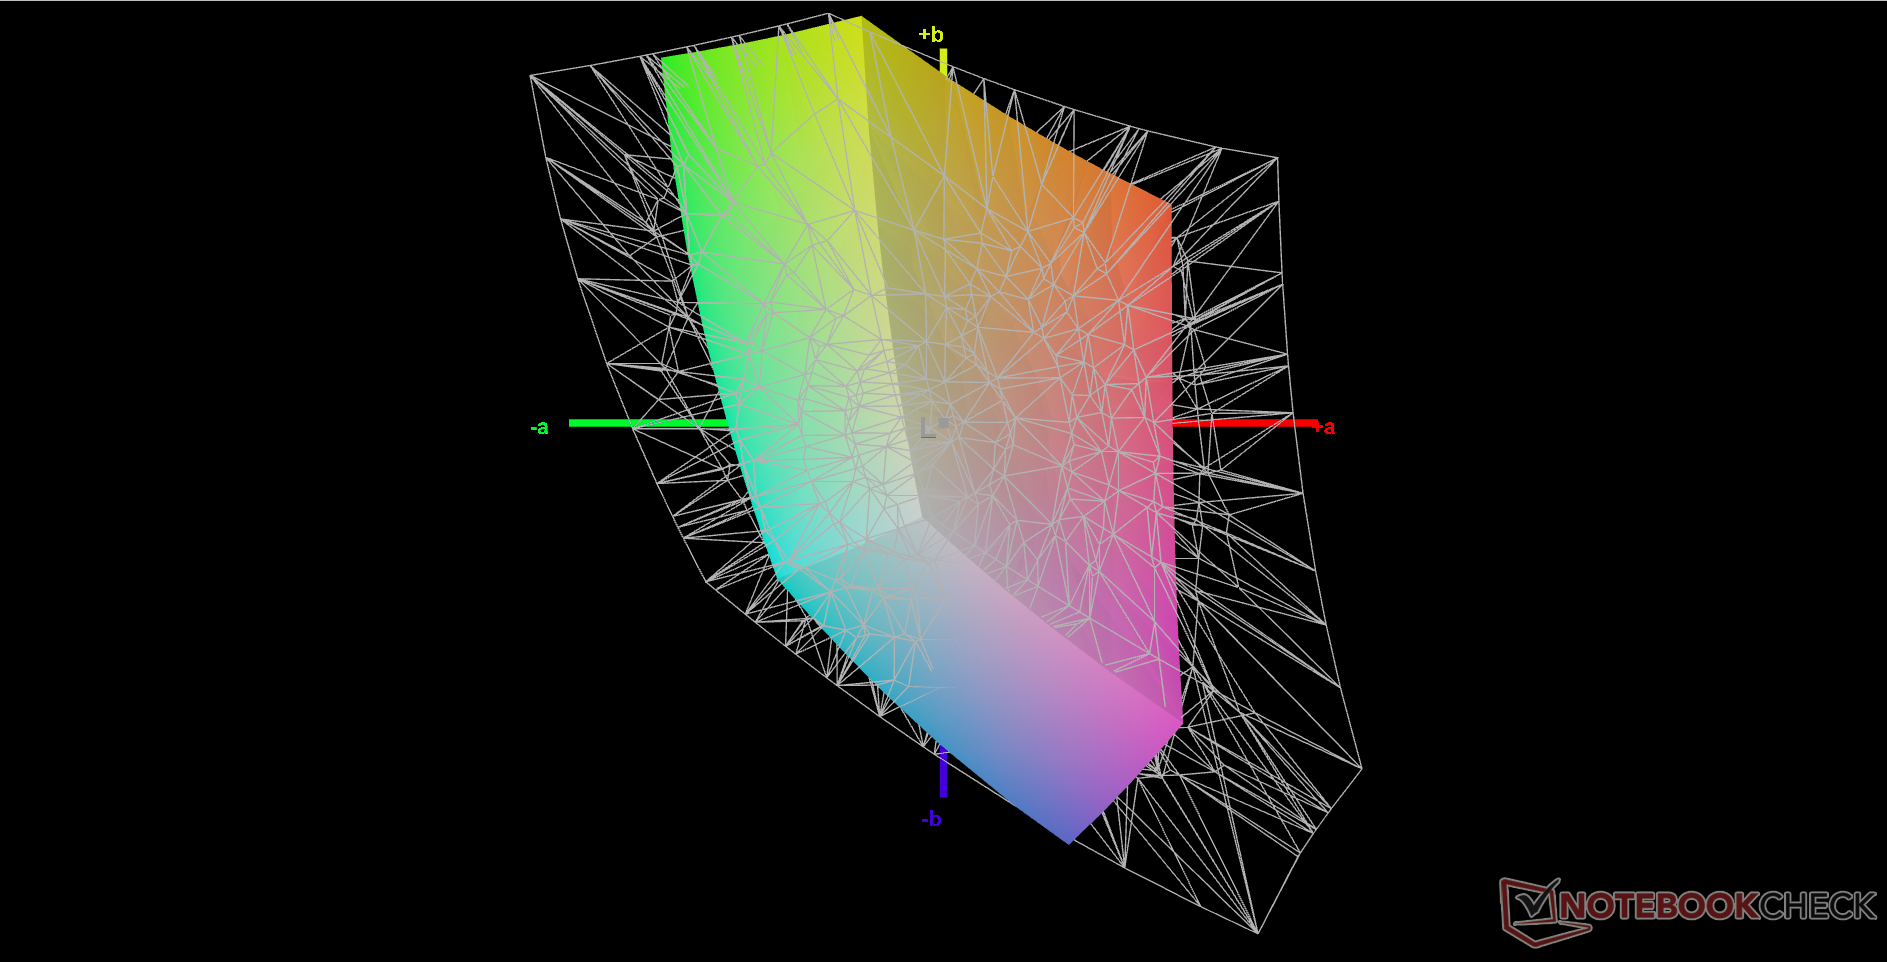
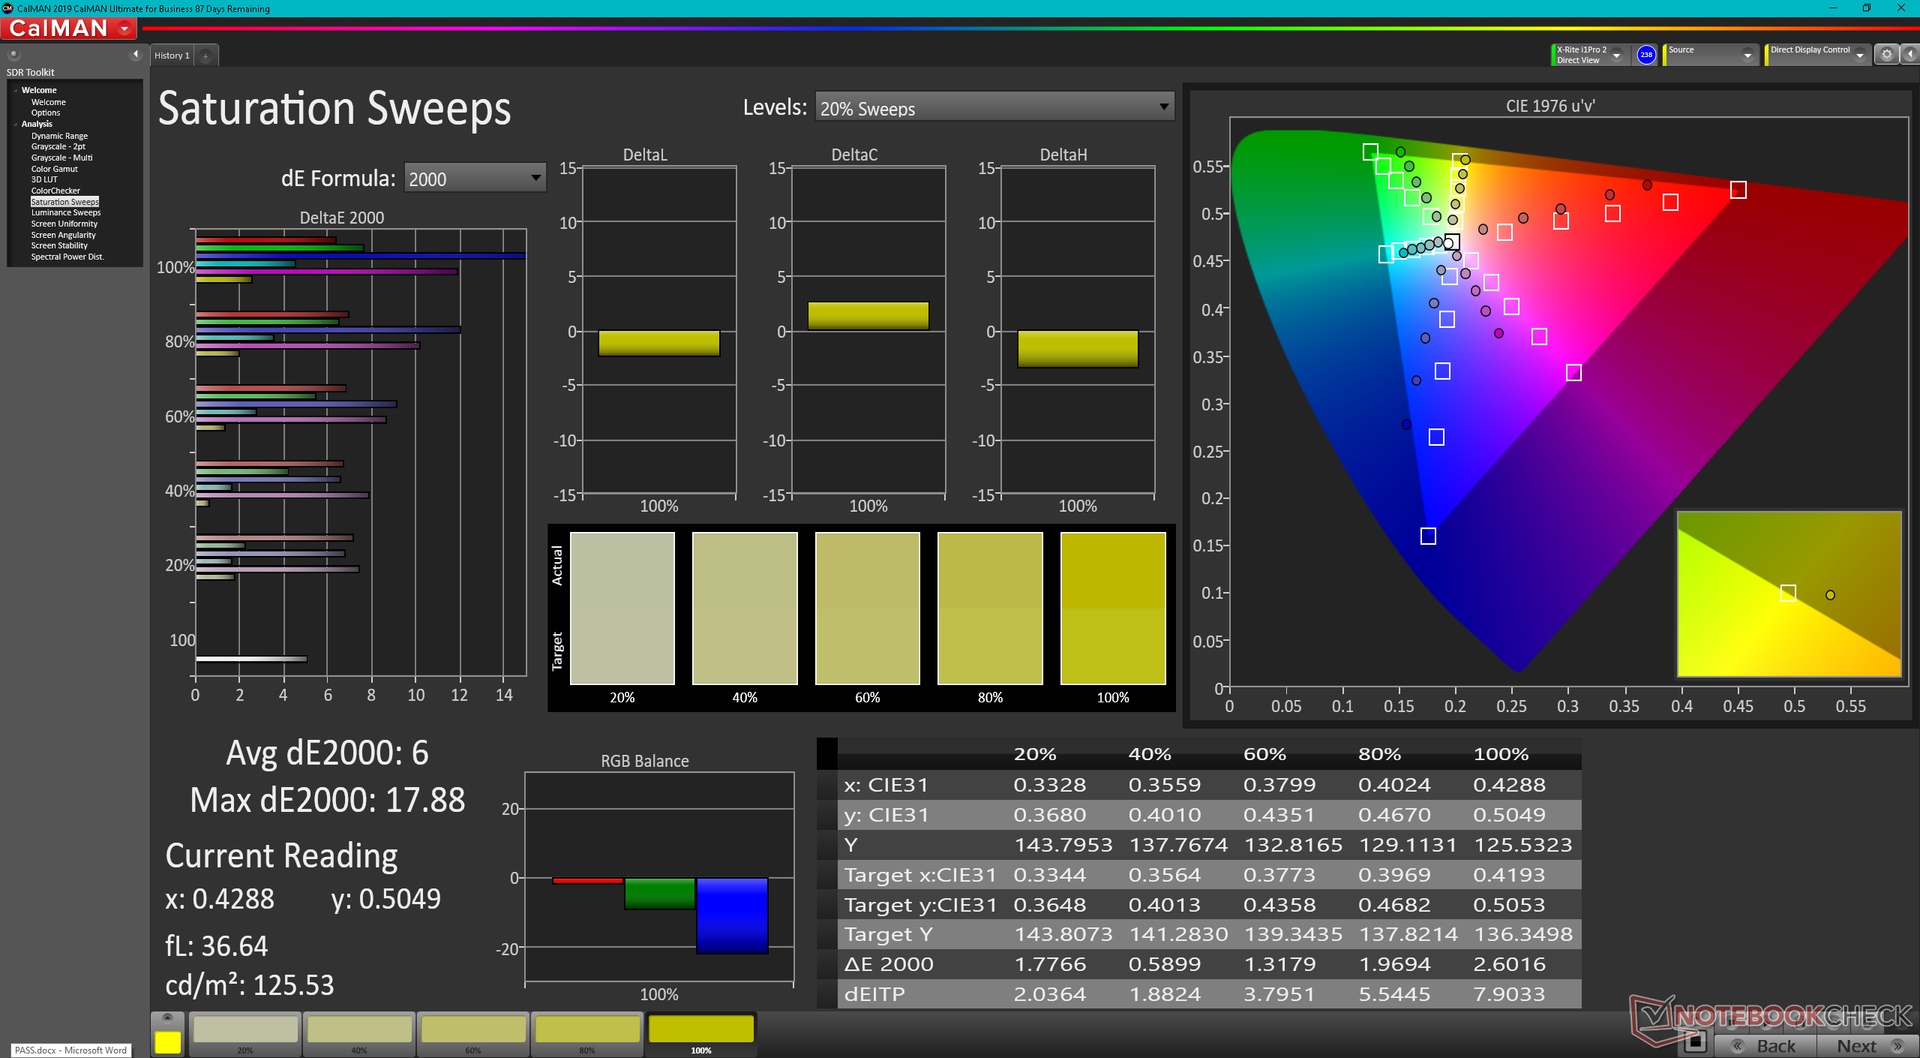
Il display non è calibrato in fabbrica, il che è prevedibile per un portatile da gioco economico. Ciononostante, i valori medi di scala di grigi e deltaE del colore non sono terribili: 4 e 6,3 rispettivamente. La calibrazione del display migliorerebbe questi valori rispettivamente a 1,8 e 2,53, ma i colori saturi rimangono molto imprecisi a causa del gamut ristretto di cui sopra.

Tempi di risposta del Display
| ↔ Tempi di risposta dal Nero al Bianco | ||
|---|---|---|
| 18.4 ms ... aumenta ↗ e diminuisce ↘ combinato | ↗ 10 ms Incremento | 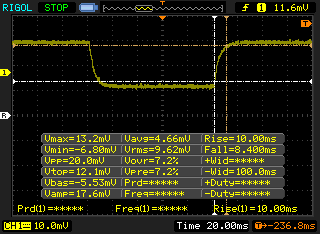 |
| ↘ 8.4 ms Calo | ||
| Lo schermo mostra buoni tempi di risposta durante i nostri tests, ma potrebbe essere troppo lento per i gamers competitivi. In confronto, tutti i dispositivi di test variano da 0.1 (minimo) a 240 (massimo) ms. » 41 % di tutti i dispositivi è migliore. Questo significa che i tempi di risposta rilevati sono simili alla media di tutti i dispositivi testati (19.9 ms). | ||
| ↔ Tempo di risposta dal 50% Grigio all'80% Grigio | ||
| 20.8 ms ... aumenta ↗ e diminuisce ↘ combinato | ↗ 11.2 ms Incremento | 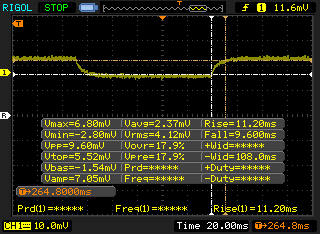 |
| ↘ 9.6 ms Calo | ||
| Lo schermo mostra buoni tempi di risposta durante i nostri tests, ma potrebbe essere troppo lento per i gamers competitivi. In confronto, tutti i dispositivi di test variano da 0.165 (minimo) a 636 (massimo) ms. » 33 % di tutti i dispositivi è migliore. Questo significa che i tempi di risposta rilevati sono migliori rispettto alla media di tutti i dispositivi testati (31.1 ms). | ||
Sfarfallio dello schermo / PWM (Pulse-Width Modulation)
| flickering dello schermo / PWM non rilevato |  | ||
In confronto: 52 % di tutti i dispositivi testati non utilizza PWM per ridurre la luminosita' del display. Se è rilevato PWM, una media di 7791 (minimo: 5 - massimo: 343500) Hz è stata rilevata. | |||
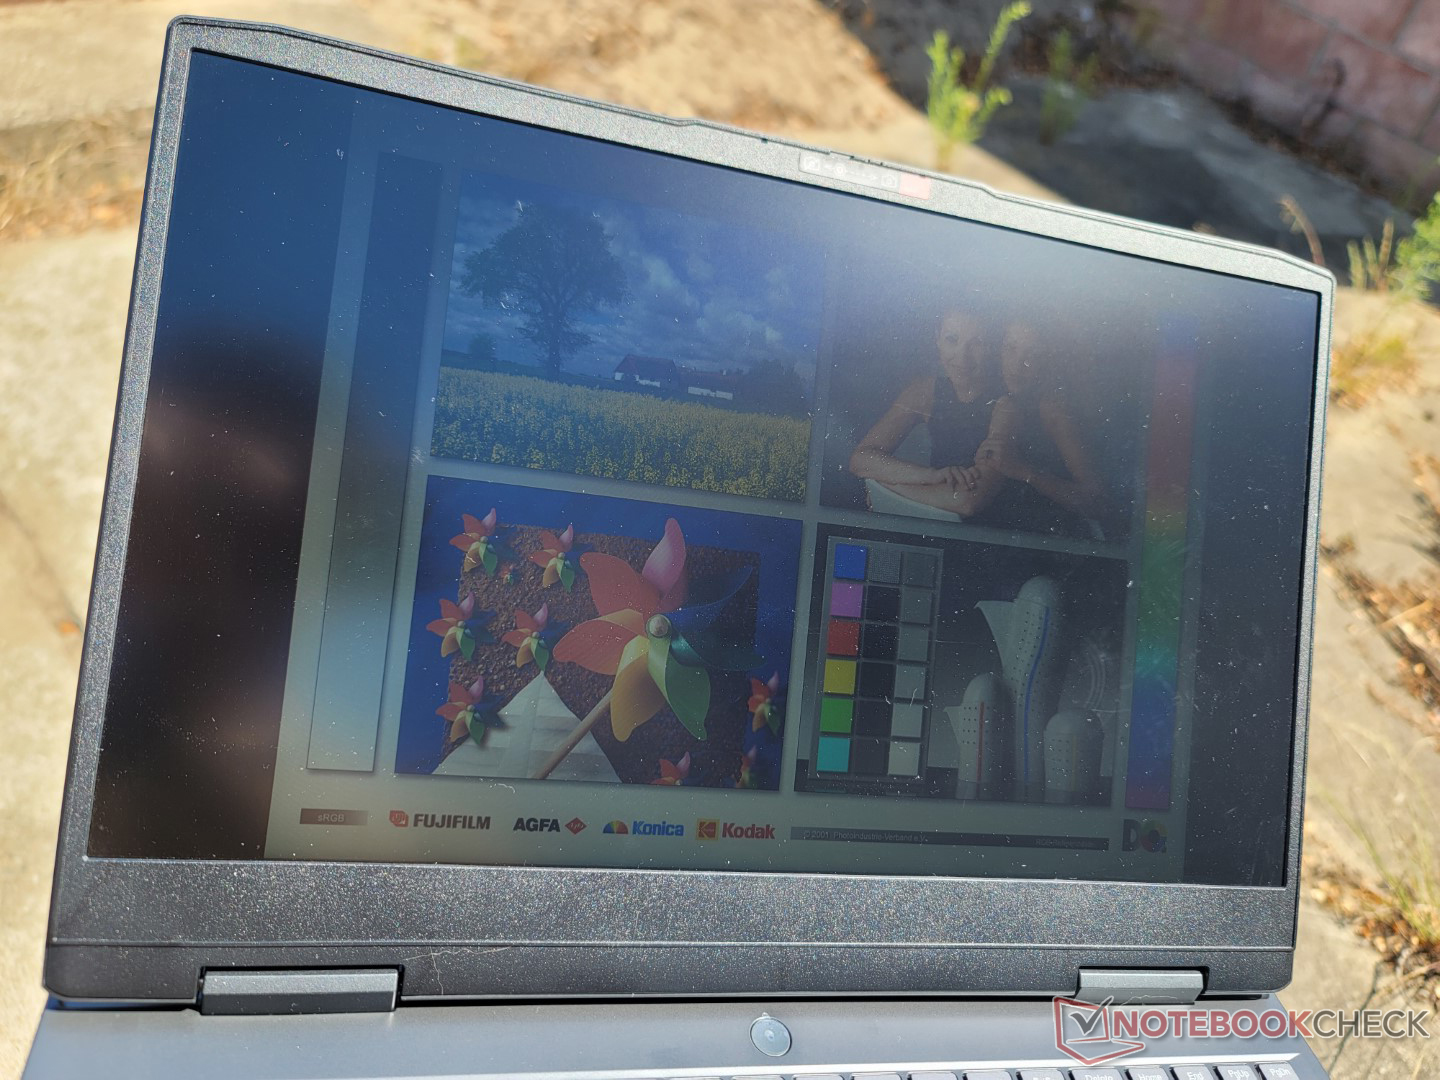
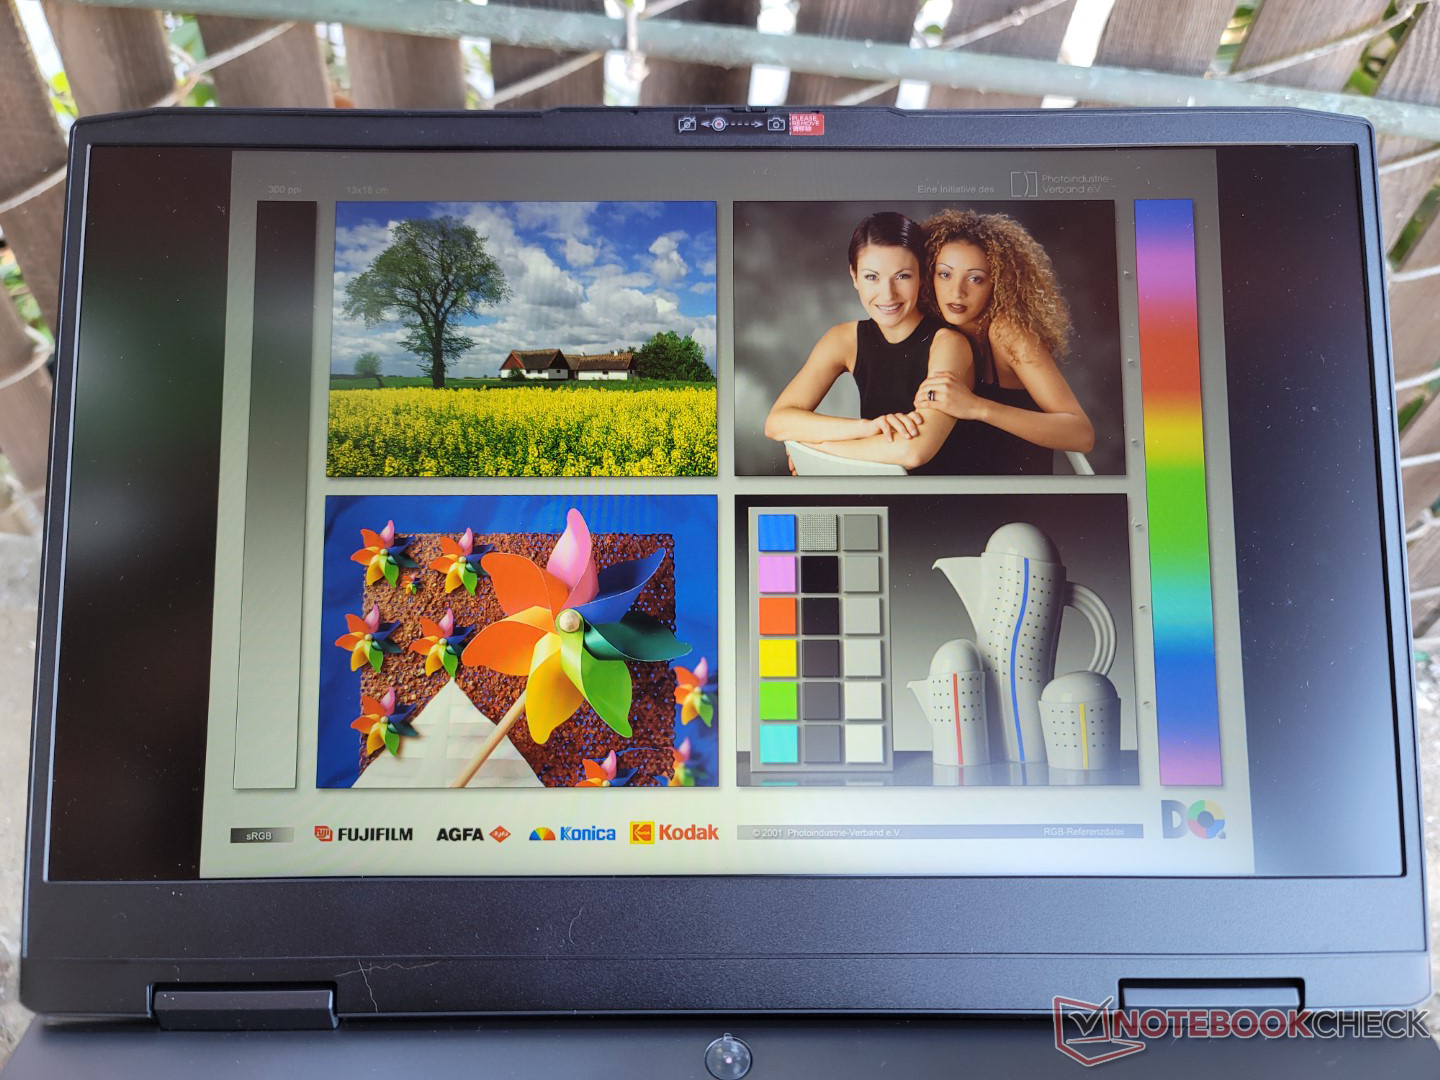
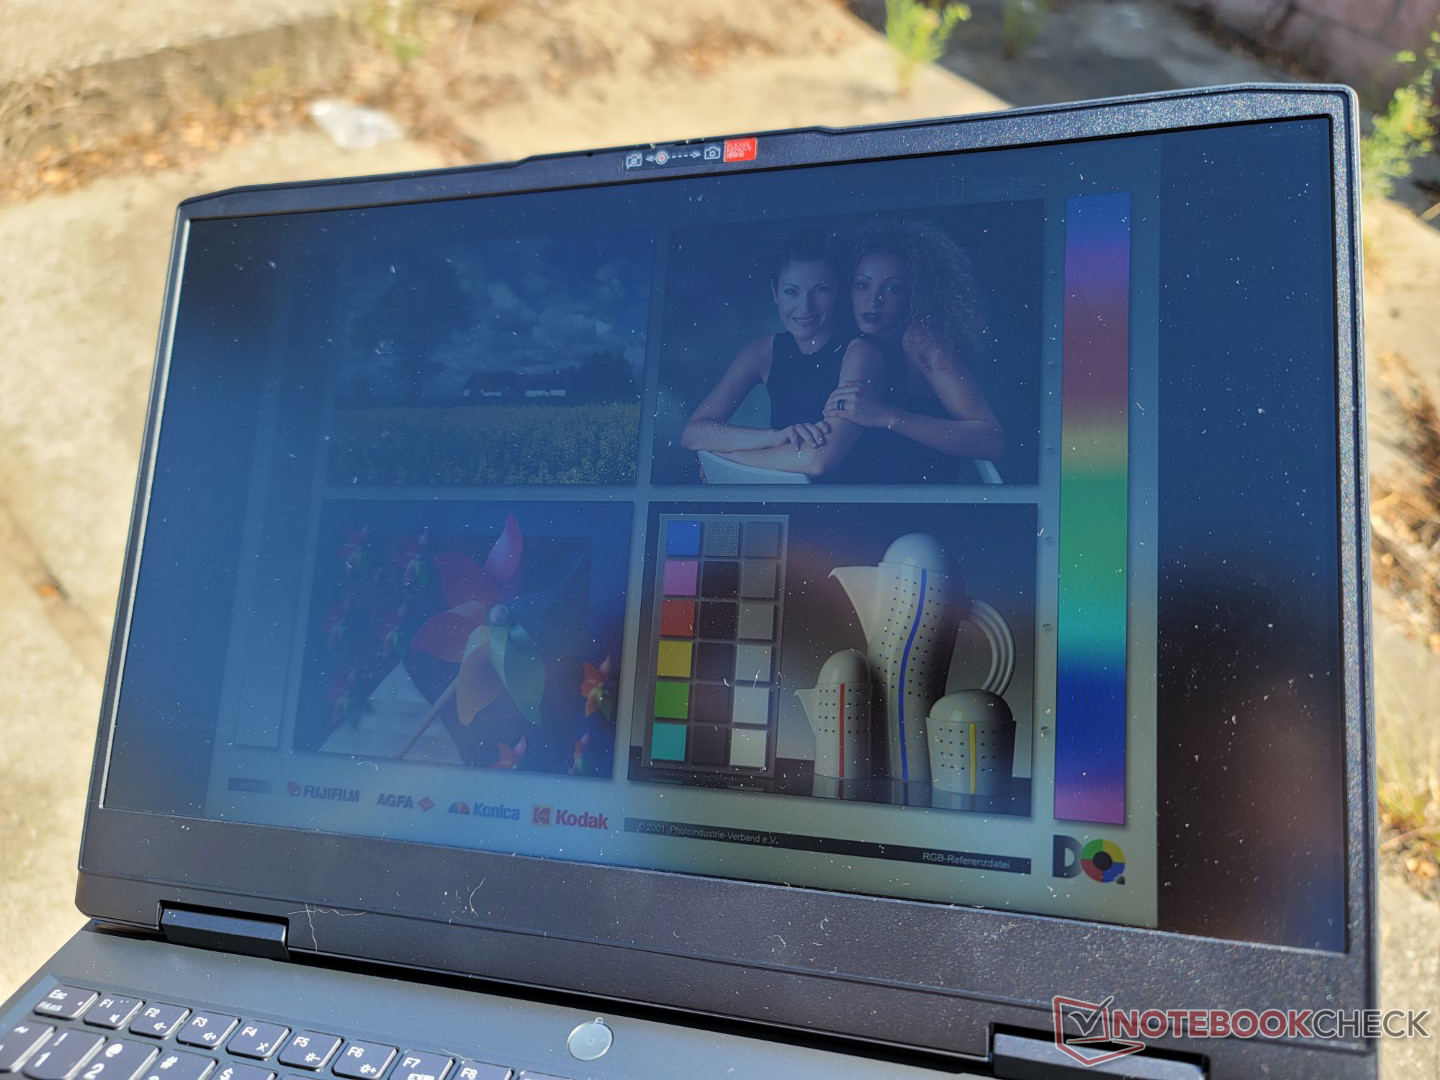
La visibilità all'aperto non è migliore o peggiore di quella della maggior parte dei portatili da gioco economici o di fascia alta, poiché questi tipi di sistemi non sono progettati per essere utilizzati spesso all'aperto. È consigliabile lavorare all'ombra quando possibile, altrimenti lo schermo si sbiadisce.
Prestazioni
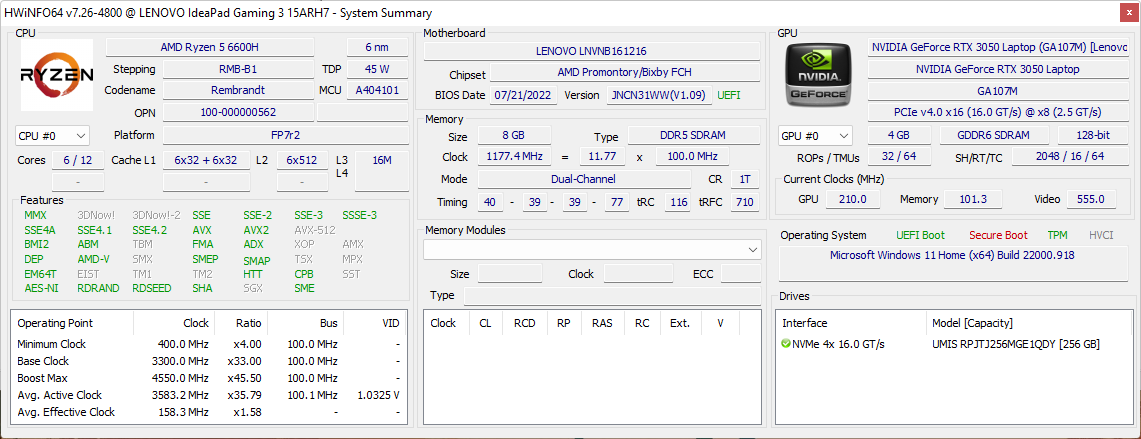
Condizioni di test
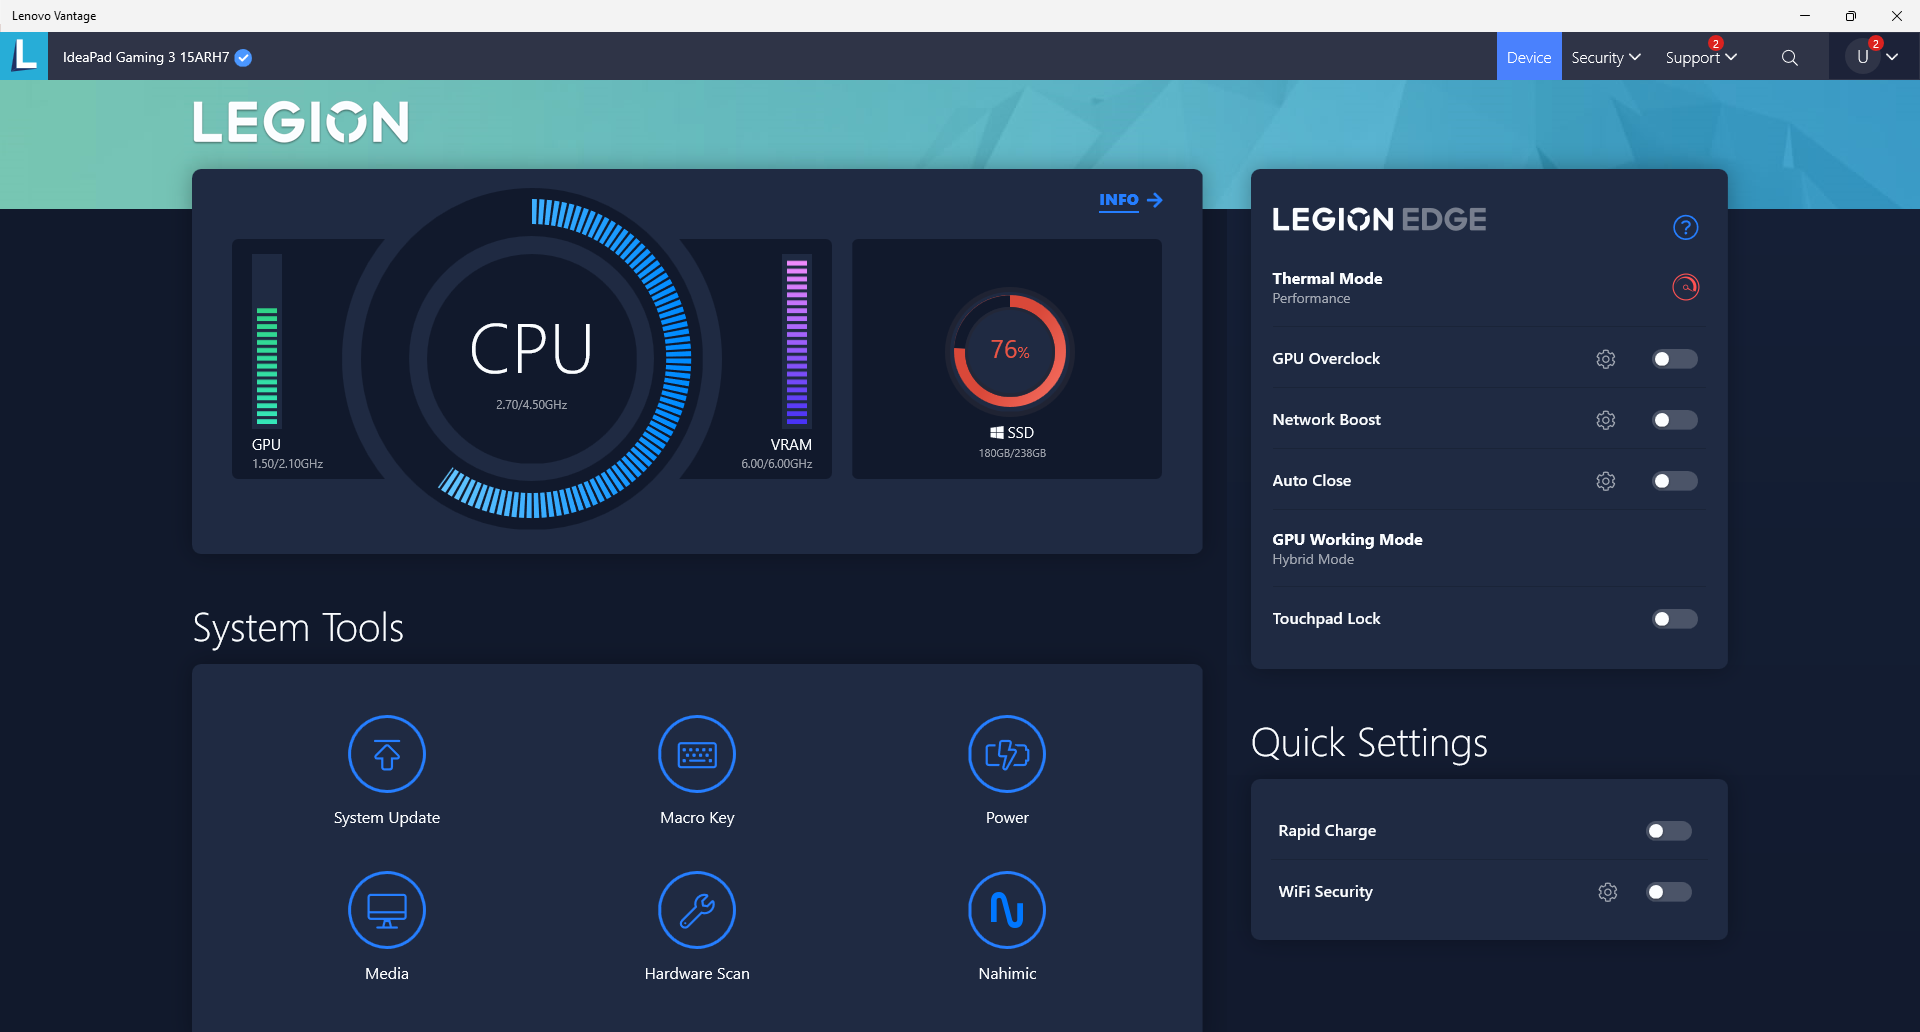
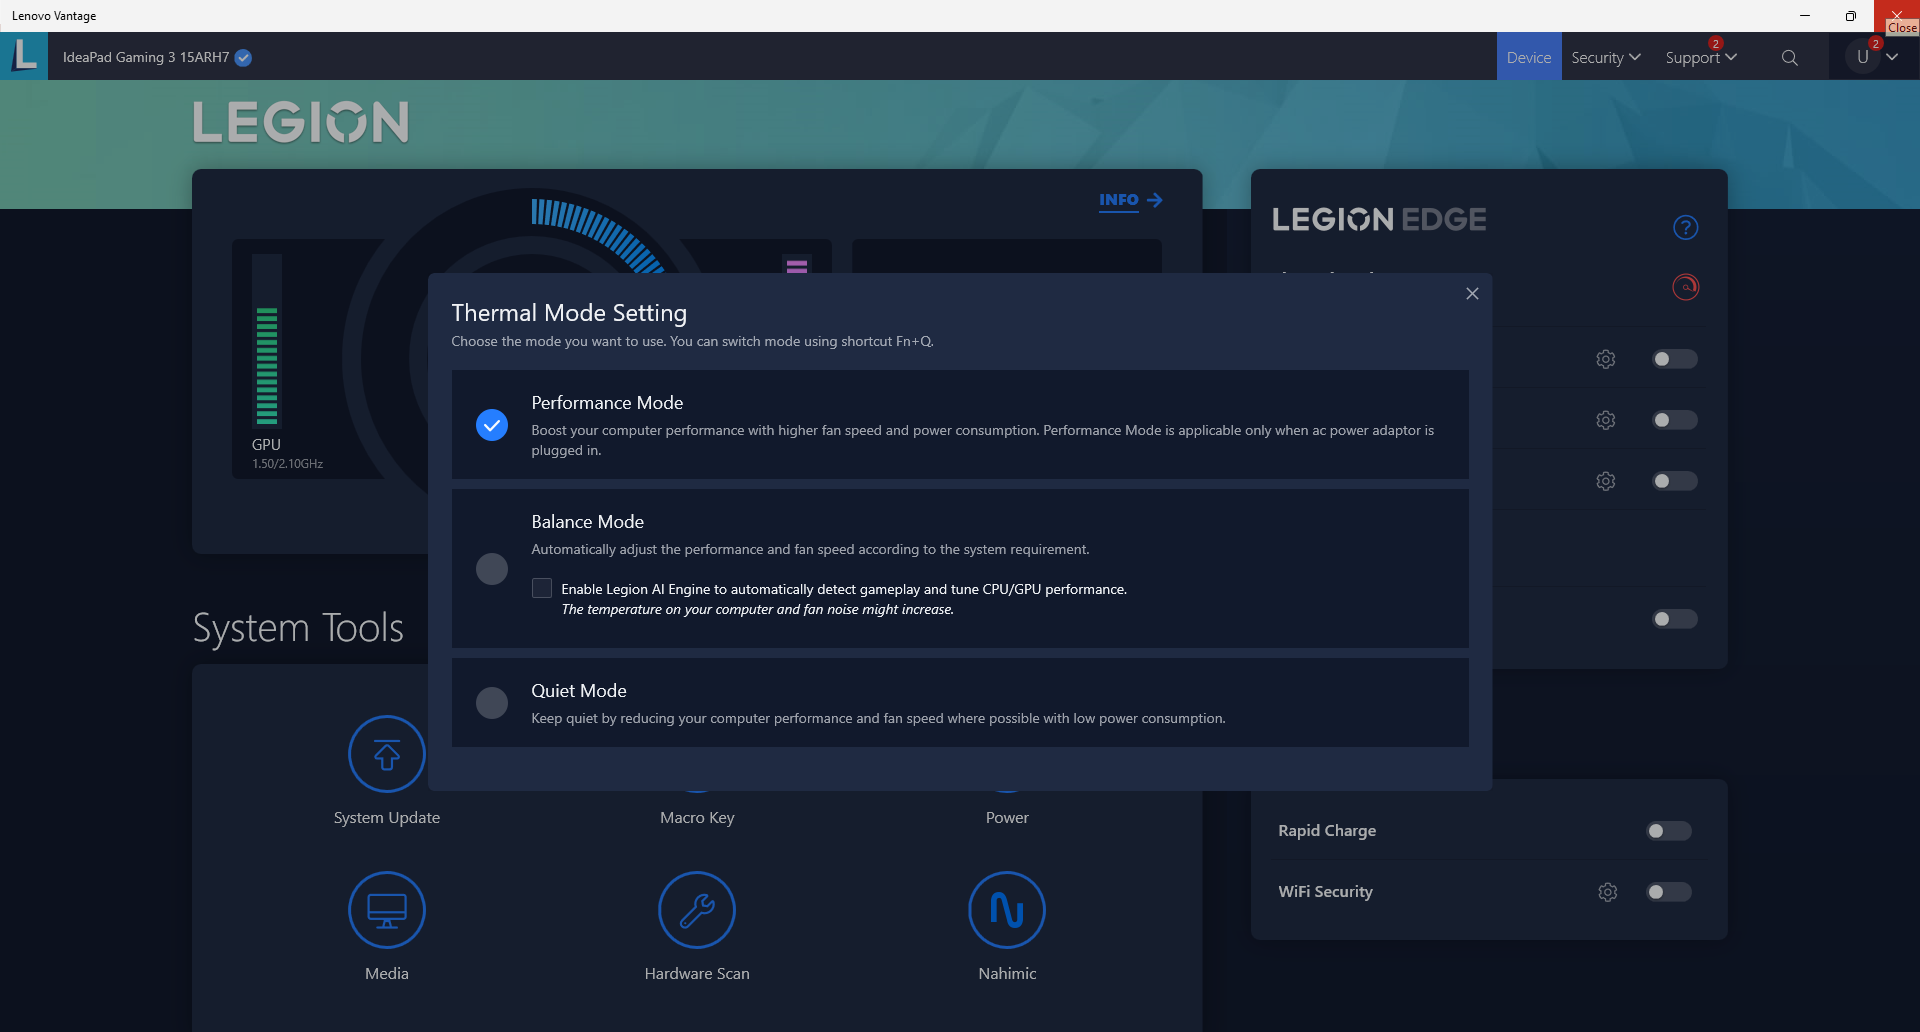
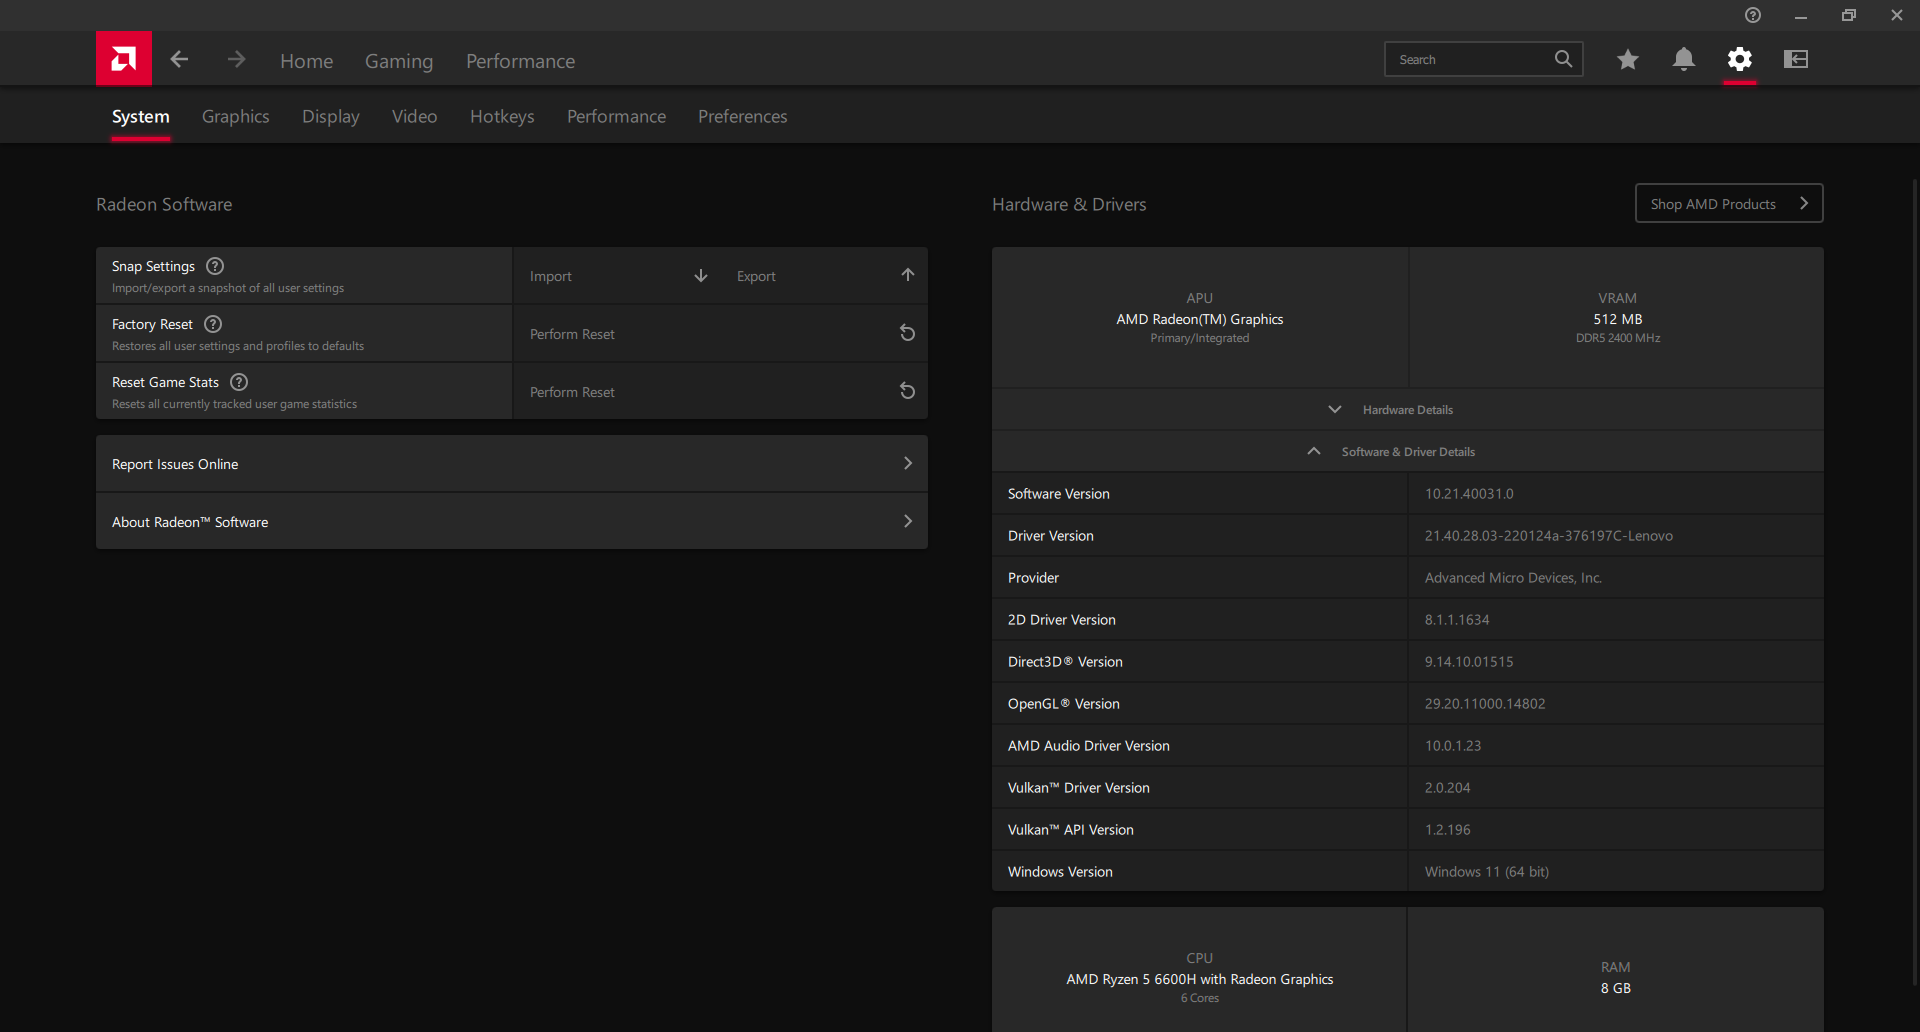
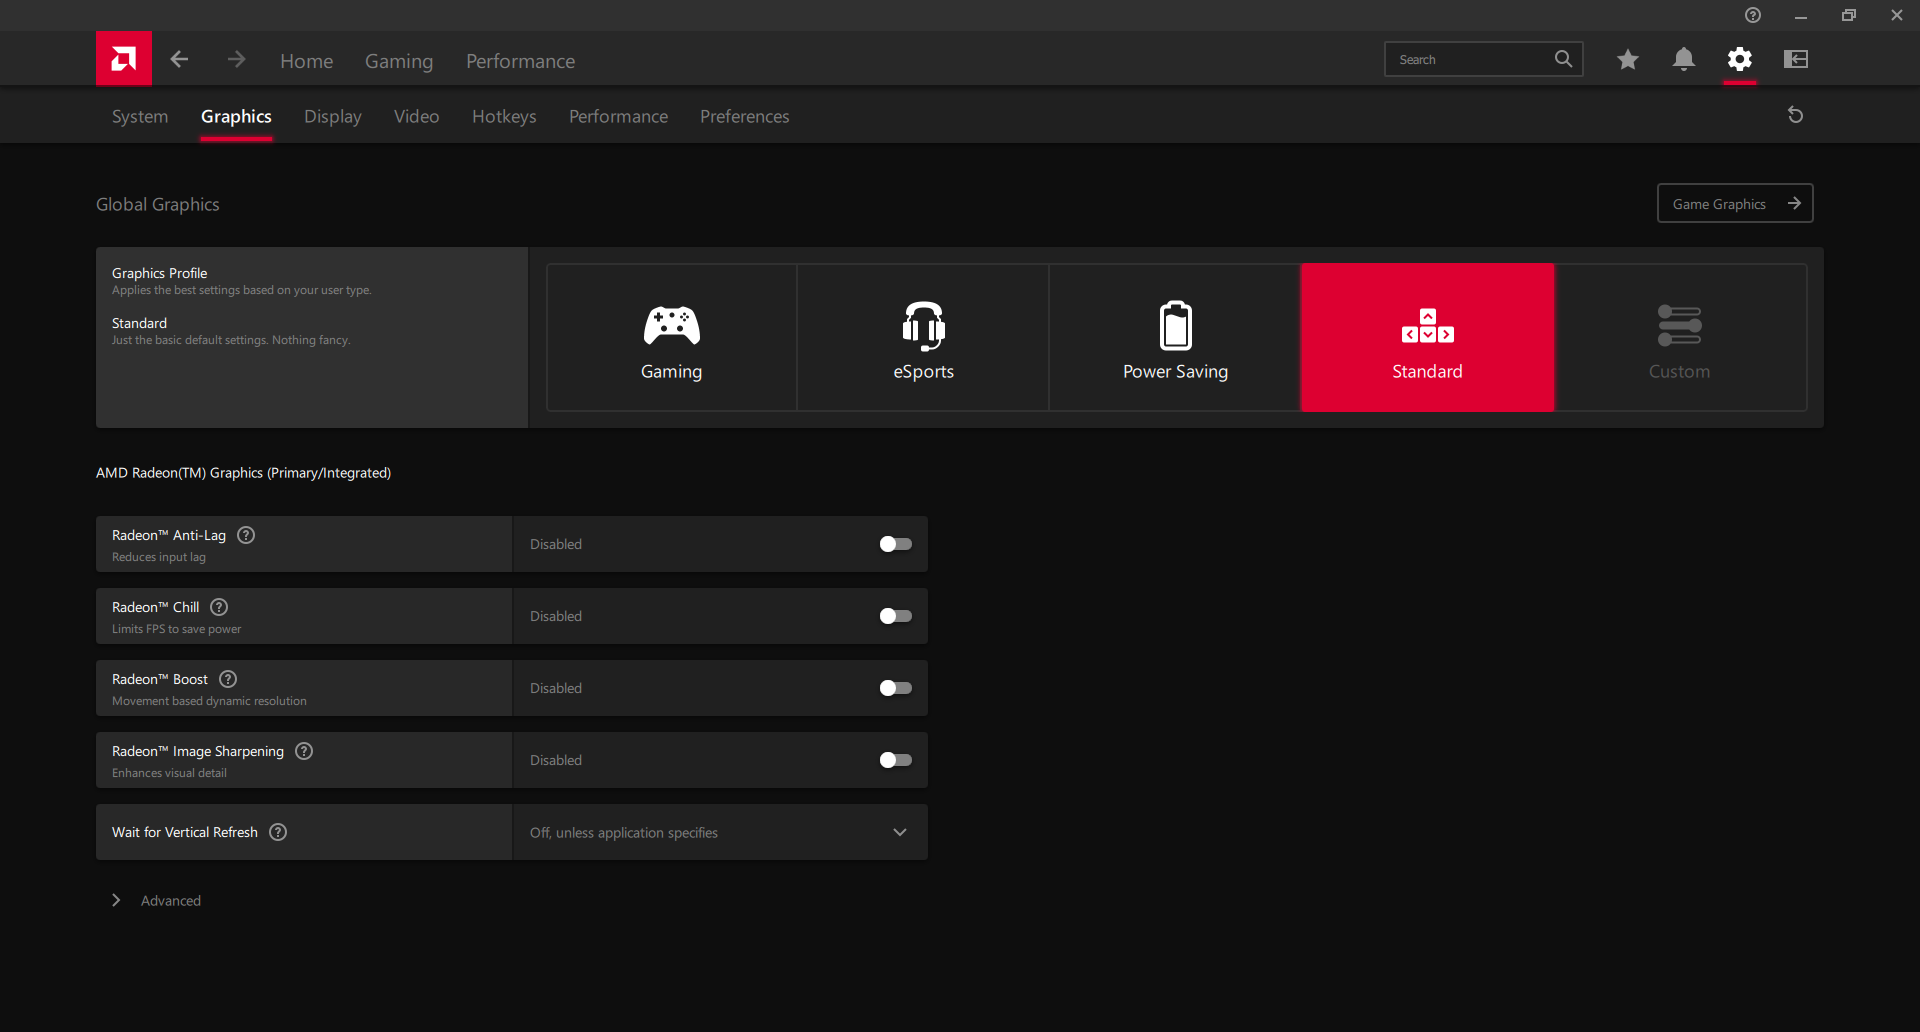
La nostra unità è stata impostata in modalità Performance sia in Windows che nel software Lenovo Vantage preinstallato prima di eseguire i benchmark qui sotto. Abbiamo anche verificato che la GPU Nvidia fosse attiva tramite il pannello di controllo Nvidia e che le impostazioni grafiche globali del software Radeon fossero impostate su Standard. Si consiglia agli utenti di familiarizzare con Vantage e con il software Radeon, in quanto fungono da hub di controllo rispettivamente per gli aggiornamenti Lenovo e per la maggior parte delle impostazioni del display.
Non c'è un interruttore MUX, come ci si può aspettare da una macchina da gioco economica.

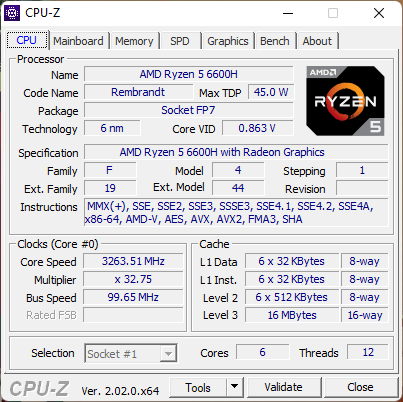
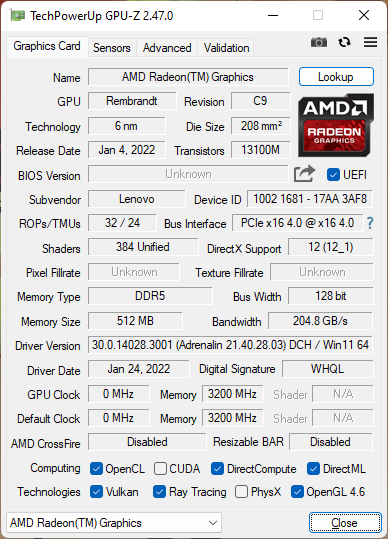
Processore: prestazioni simili a quelle del Ryzen 5 5600H
Lo Zen 3 Ryzen 5 5600H era già un incremento apprezzabile rispetto allo Zen 2 Ryzen 5 4600H. Pertanto, il passaggio dallo Zen 3 Ryzen 5 5600H allo Zen3+ Ryzen 5 6600H dovrebbe offrire solo vantaggi minori alla CPU. I vantaggi sono così minimi, infatti, che i risultati dei benchmark sono quasi identici tra i due modelli. IlGigabyte A5 K1 con il 5600H, ad esempio, è a pochi punti percentuali dal 6600H del nostro Lenovo. L'ultima generazione Ryzen 7 5800H o Core i7-11800H sono quindi ancora processori più veloci a mani basse.
Consultate la nostra pagina dedicata al Ryzen 5 6600H per una panoramica del processore.
Cinebench R15 Multi Loop
Cinebench R23: Multi Core | Single Core
Cinebench R15: CPU Multi 64Bit | CPU Single 64Bit
Blender: v2.79 BMW27 CPU
7-Zip 18.03: 7z b 4 | 7z b 4 -mmt1
Geekbench 5.5: Multi-Core | Single-Core
HWBOT x265 Benchmark v2.2: 4k Preset
LibreOffice : 20 Documents To PDF
R Benchmark 2.5: Overall mean
Cinebench R23: Multi Core | Single Core
Cinebench R15: CPU Multi 64Bit | CPU Single 64Bit
Blender: v2.79 BMW27 CPU
7-Zip 18.03: 7z b 4 | 7z b 4 -mmt1
Geekbench 5.5: Multi-Core | Single-Core
HWBOT x265 Benchmark v2.2: 4k Preset
LibreOffice : 20 Documents To PDF
R Benchmark 2.5: Overall mean
* ... Meglio usare valori piccoli
AIDA64: FP32 Ray-Trace | FPU Julia | CPU SHA3 | CPU Queen | FPU SinJulia | FPU Mandel | CPU AES | CPU ZLib | FP64 Ray-Trace | CPU PhotoWorxx
| Performance rating | |
| Asus TUF Dash F15 FX517ZR | |
| Media AMD Ryzen 5 6600H | |
| Lenovo IdeaPad Gaming 3 15ARH7 | |
| Lenovo Legion 5 15ACH6A-82NW0010GE | |
| Gigabyte A5 K1 | |
| Dell G15 5510 | |
| Lenovo IdeaPad Gaming 3i 15IMH05 | |
| AIDA64 / FP32 Ray-Trace | |
| Asus TUF Dash F15 FX517ZR | |
| Lenovo Legion 5 15ACH6A-82NW0010GE | |
| Gigabyte A5 K1 | |
| Lenovo IdeaPad Gaming 3 15ARH7 | |
| Media AMD Ryzen 5 6600H (10645 - 12871, n=4) | |
| Dell G15 5510 | |
| Lenovo IdeaPad Gaming 3i 15IMH05 | |
| AIDA64 / FPU Julia | |
| Lenovo Legion 5 15ACH6A-82NW0010GE | |
| Gigabyte A5 K1 | |
| Lenovo IdeaPad Gaming 3 15ARH7 | |
| Media AMD Ryzen 5 6600H (66739 - 78277, n=4) | |
| Asus TUF Dash F15 FX517ZR | |
| Dell G15 5510 | |
| Lenovo IdeaPad Gaming 3i 15IMH05 | |
| AIDA64 / CPU SHA3 | |
| Asus TUF Dash F15 FX517ZR | |
| Lenovo Legion 5 15ACH6A-82NW0010GE | |
| Lenovo IdeaPad Gaming 3 15ARH7 | |
| Media AMD Ryzen 5 6600H (2231 - 2689, n=4) | |
| Gigabyte A5 K1 | |
| Dell G15 5510 | |
| Lenovo IdeaPad Gaming 3i 15IMH05 | |
| AIDA64 / CPU Queen | |
| Asus TUF Dash F15 FX517ZR | |
| Media AMD Ryzen 5 6600H (77711 - 82119, n=4) | |
| Lenovo IdeaPad Gaming 3 15ARH7 | |
| Gigabyte A5 K1 | |
| Lenovo Legion 5 15ACH6A-82NW0010GE | |
| Dell G15 5510 | |
| Lenovo IdeaPad Gaming 3i 15IMH05 | |
| AIDA64 / FPU SinJulia | |
| Media AMD Ryzen 5 6600H (9184 - 9739, n=4) | |
| Lenovo IdeaPad Gaming 3 15ARH7 | |
| Gigabyte A5 K1 | |
| Lenovo Legion 5 15ACH6A-82NW0010GE | |
| Asus TUF Dash F15 FX517ZR | |
| Dell G15 5510 | |
| Lenovo IdeaPad Gaming 3i 15IMH05 | |
| AIDA64 / FPU Mandel | |
| Lenovo Legion 5 15ACH6A-82NW0010GE | |
| Gigabyte A5 K1 | |
| Lenovo IdeaPad Gaming 3 15ARH7 | |
| Media AMD Ryzen 5 6600H (36591 - 43222, n=4) | |
| Asus TUF Dash F15 FX517ZR | |
| Dell G15 5510 | |
| Lenovo IdeaPad Gaming 3i 15IMH05 | |
| AIDA64 / CPU AES | |
| Lenovo IdeaPad Gaming 3 15ARH7 | |
| Lenovo Legion 5 15ACH6A-82NW0010GE | |
| Media AMD Ryzen 5 6600H (43461 - 104138, n=4) | |
| Asus TUF Dash F15 FX517ZR | |
| Gigabyte A5 K1 | |
| Dell G15 5510 | |
| Lenovo IdeaPad Gaming 3i 15IMH05 | |
| AIDA64 / CPU ZLib | |
| Asus TUF Dash F15 FX517ZR | |
| Lenovo IdeaPad Gaming 3 15ARH7 | |
| Lenovo Legion 5 15ACH6A-82NW0010GE | |
| Gigabyte A5 K1 | |
| Media AMD Ryzen 5 6600H (523 - 660, n=4) | |
| Dell G15 5510 | |
| Lenovo IdeaPad Gaming 3i 15IMH05 | |
| AIDA64 / FP64 Ray-Trace | |
| Asus TUF Dash F15 FX517ZR | |
| Lenovo Legion 5 15ACH6A-82NW0010GE | |
| Gigabyte A5 K1 | |
| Lenovo IdeaPad Gaming 3 15ARH7 | |
| Media AMD Ryzen 5 6600H (5659 - 6911, n=4) | |
| Dell G15 5510 | |
| Lenovo IdeaPad Gaming 3i 15IMH05 | |
| AIDA64 / CPU PhotoWorxx | |
| Asus TUF Dash F15 FX517ZR | |
| Media AMD Ryzen 5 6600H (16218 - 29621, n=4) | |
| Gigabyte A5 K1 | |
| Lenovo IdeaPad Gaming 3i 15IMH05 | |
| Lenovo IdeaPad Gaming 3 15ARH7 | |
| Dell G15 5510 | |
| Lenovo Legion 5 15ACH6A-82NW0010GE | |
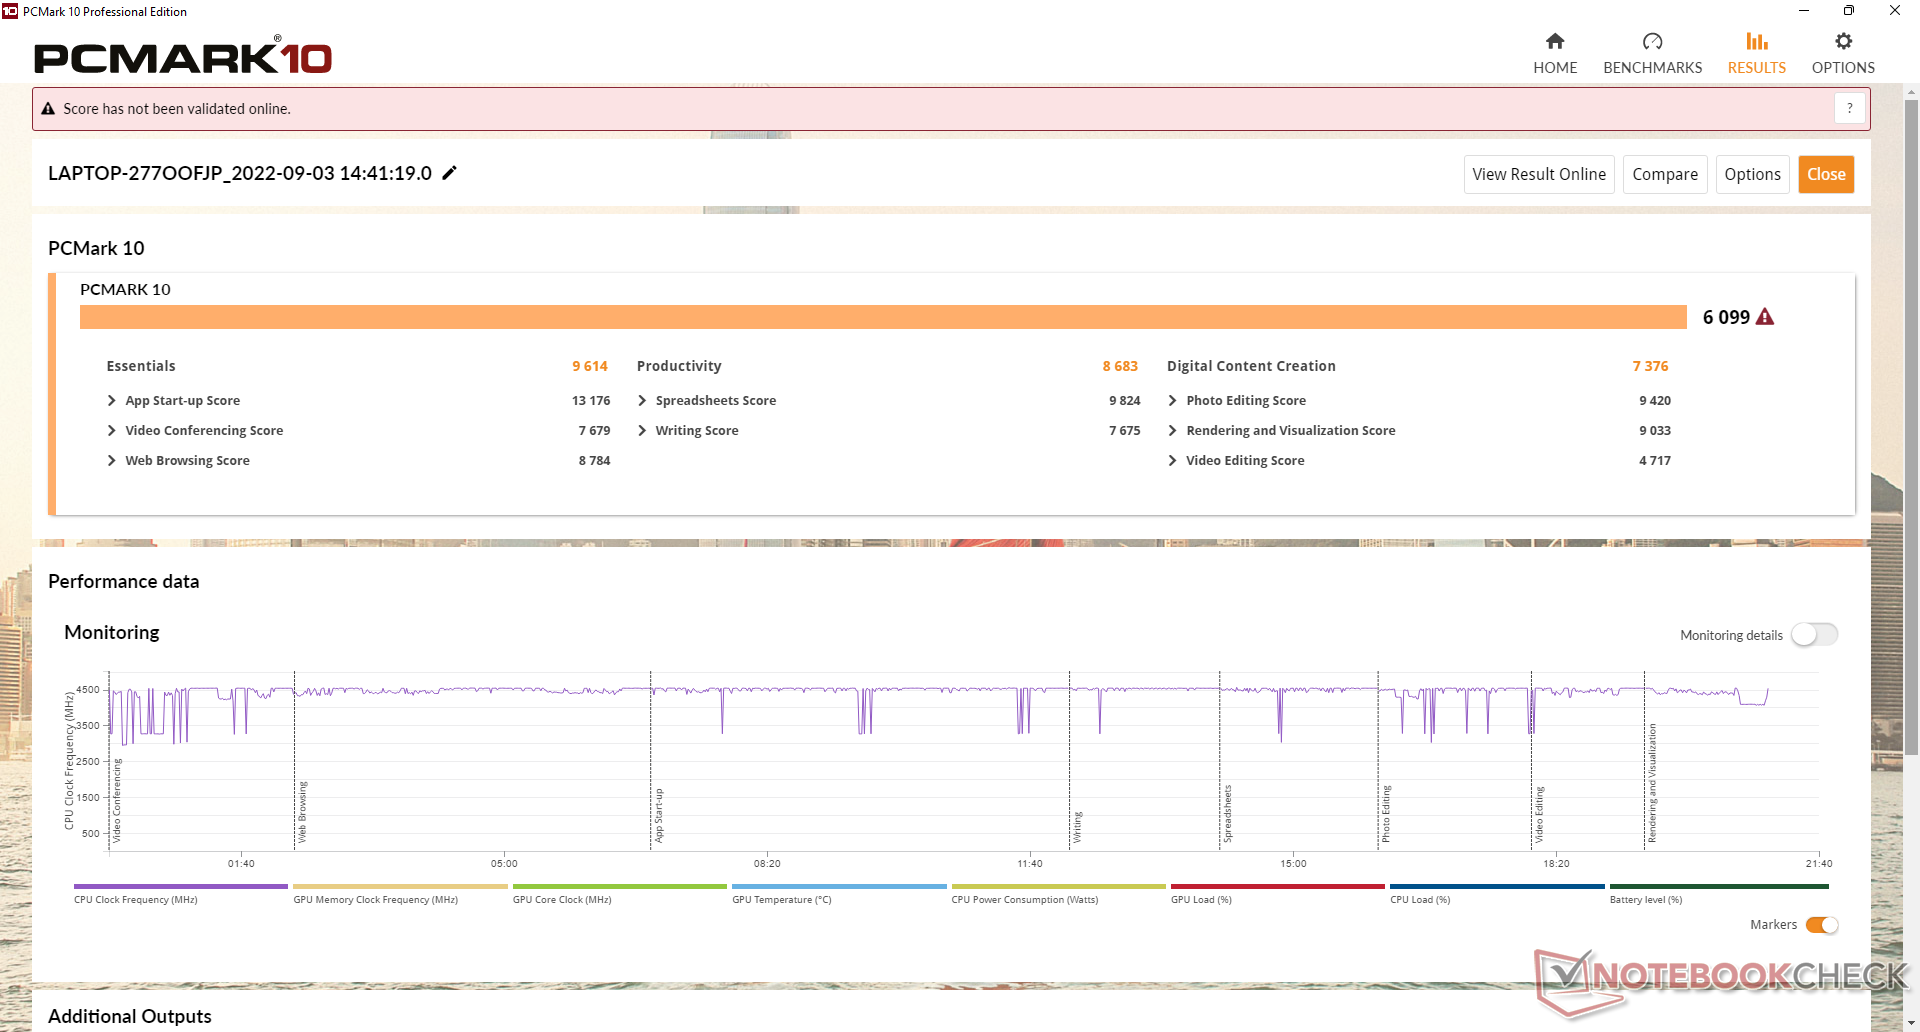
Prestazioni del sistema
I punteggi di PCMark sono costantemente superiori a quelli del vecchio IdeaPad Gaming 3i 15IMH05, ma ancora inferiori a quelli dell'IdeaPad Gaming 3i 15ACH6A Legion 5 15ACH6A con la più potente GPU Radeon RX 6600M. Il subscore Digital Content Creation, in particolare, è nettamente migliore rispetto a quello dell'IdeaPad Gaming 3i 15IMH05, grazie al salto generazionale nelle prestazioni grafiche.
CrossMark: Overall | Productivity | Creativity | Responsiveness
| PCMark 10 / Score | |
| Lenovo Legion 5 15ACH6A-82NW0010GE | |
| Asus TUF Dash F15 FX517ZR | |
| Gigabyte A5 K1 | |
| Lenovo IdeaPad Gaming 3 15ARH7 | |
| Media AMD Ryzen 5 6600H, NVIDIA GeForce RTX 3050 4GB Laptop GPU (n=1) | |
| Dell G15 5510 | |
| Lenovo IdeaPad Gaming 3i 15IMH05 | |
| PCMark 10 / Essentials | |
| Lenovo Legion 5 15ACH6A-82NW0010GE | |
| Gigabyte A5 K1 | |
| Asus TUF Dash F15 FX517ZR | |
| Lenovo IdeaPad Gaming 3 15ARH7 | |
| Media AMD Ryzen 5 6600H, NVIDIA GeForce RTX 3050 4GB Laptop GPU (n=1) | |
| Lenovo IdeaPad Gaming 3i 15IMH05 | |
| Dell G15 5510 | |
| PCMark 10 / Productivity | |
| Asus TUF Dash F15 FX517ZR | |
| Lenovo Legion 5 15ACH6A-82NW0010GE | |
| Gigabyte A5 K1 | |
| Lenovo IdeaPad Gaming 3 15ARH7 | |
| Media AMD Ryzen 5 6600H, NVIDIA GeForce RTX 3050 4GB Laptop GPU (n=1) | |
| Lenovo IdeaPad Gaming 3i 15IMH05 | |
| Dell G15 5510 | |
| PCMark 10 / Digital Content Creation | |
| Lenovo Legion 5 15ACH6A-82NW0010GE | |
| Asus TUF Dash F15 FX517ZR | |
| Gigabyte A5 K1 | |
| Lenovo IdeaPad Gaming 3 15ARH7 | |
| Media AMD Ryzen 5 6600H, NVIDIA GeForce RTX 3050 4GB Laptop GPU (n=1) | |
| Dell G15 5510 | |
| Lenovo IdeaPad Gaming 3i 15IMH05 | |
| CrossMark / Overall | |
| Asus TUF Dash F15 FX517ZR | |
| Lenovo IdeaPad Gaming 3 15ARH7 | |
| Media AMD Ryzen 5 6600H, NVIDIA GeForce RTX 3050 4GB Laptop GPU (n=1) | |
| CrossMark / Productivity | |
| Asus TUF Dash F15 FX517ZR | |
| Lenovo IdeaPad Gaming 3 15ARH7 | |
| Media AMD Ryzen 5 6600H, NVIDIA GeForce RTX 3050 4GB Laptop GPU (n=1) | |
| CrossMark / Creativity | |
| Asus TUF Dash F15 FX517ZR | |
| Lenovo IdeaPad Gaming 3 15ARH7 | |
| Media AMD Ryzen 5 6600H, NVIDIA GeForce RTX 3050 4GB Laptop GPU (n=1) | |
| CrossMark / Responsiveness | |
| Asus TUF Dash F15 FX517ZR | |
| Lenovo IdeaPad Gaming 3 15ARH7 | |
| Media AMD Ryzen 5 6600H, NVIDIA GeForce RTX 3050 4GB Laptop GPU (n=1) | |
| PCMark 10 Score | 6099 punti | |
Aiuto | ||
| AIDA64 / Memory Copy | |
| Asus TUF Dash F15 FX517ZR | |
| Media AMD Ryzen 5 6600H (28335 - 50886, n=4) | |
| Gigabyte A5 K1 | |
| Lenovo Legion 5 15ACH6A-82NW0010GE | |
| Dell G15 5510 | |
| Lenovo IdeaPad Gaming 3i 15IMH05 | |
| Lenovo IdeaPad Gaming 3 15ARH7 | |
| AIDA64 / Memory Read | |
| Asus TUF Dash F15 FX517ZR | |
| Gigabyte A5 K1 | |
| Media AMD Ryzen 5 6600H (34300 - 51684, n=4) | |
| Lenovo Legion 5 15ACH6A-82NW0010GE | |
| Lenovo IdeaPad Gaming 3i 15IMH05 | |
| Dell G15 5510 | |
| Lenovo IdeaPad Gaming 3 15ARH7 | |
| AIDA64 / Memory Write | |
| Asus TUF Dash F15 FX517ZR | |
| Media AMD Ryzen 5 6600H (31788 - 55160, n=4) | |
| Gigabyte A5 K1 | |
| Dell G15 5510 | |
| Lenovo IdeaPad Gaming 3i 15IMH05 | |
| Lenovo IdeaPad Gaming 3 15ARH7 | |
| Lenovo Legion 5 15ACH6A-82NW0010GE | |
| AIDA64 / Memory Latency | |
| Asus TUF Dash F15 FX517ZR | |
| Media AMD Ryzen 5 6600H (81.7 - 112.7, n=4) | |
| Lenovo Legion 5 15ACH6A-82NW0010GE | |
| Lenovo IdeaPad Gaming 3 15ARH7 | |
| Dell G15 5510 | |
| Gigabyte A5 K1 | |
| Lenovo IdeaPad Gaming 3i 15IMH05 | |
* ... Meglio usare valori piccoli
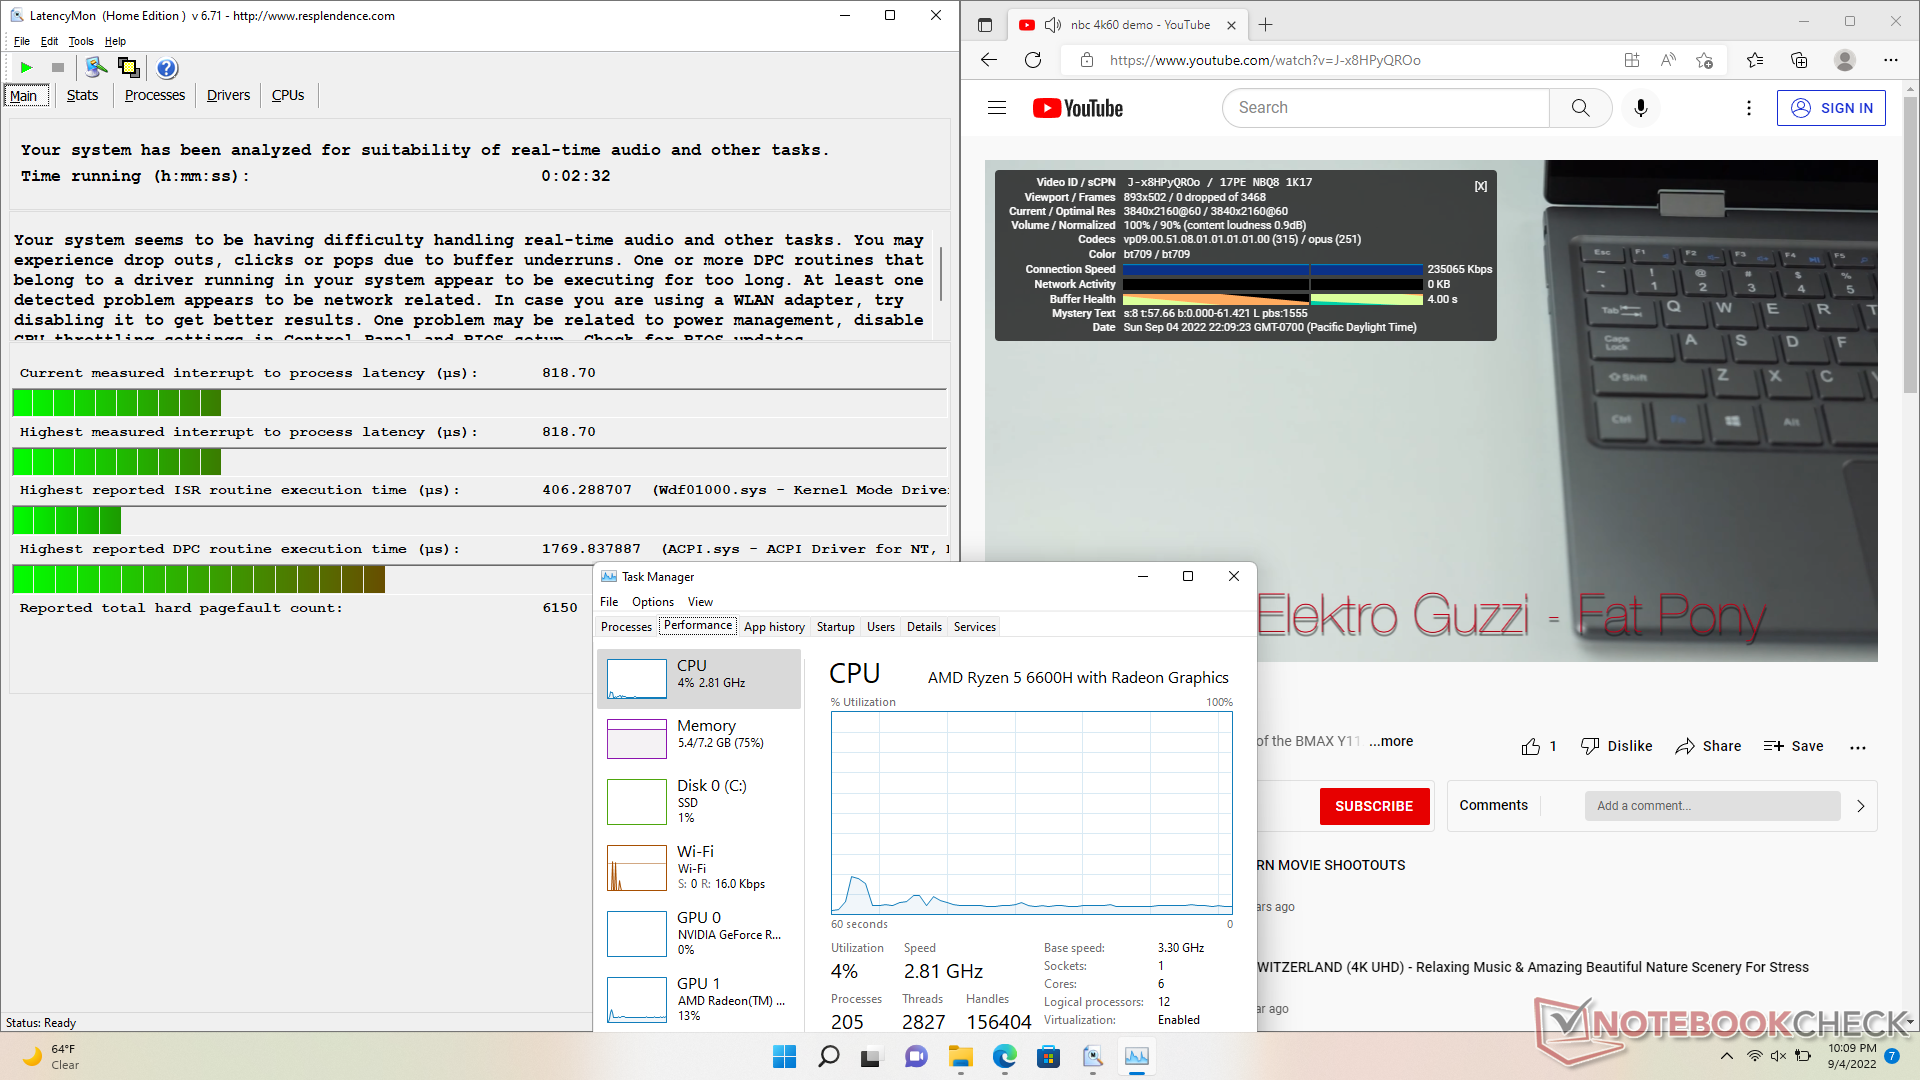
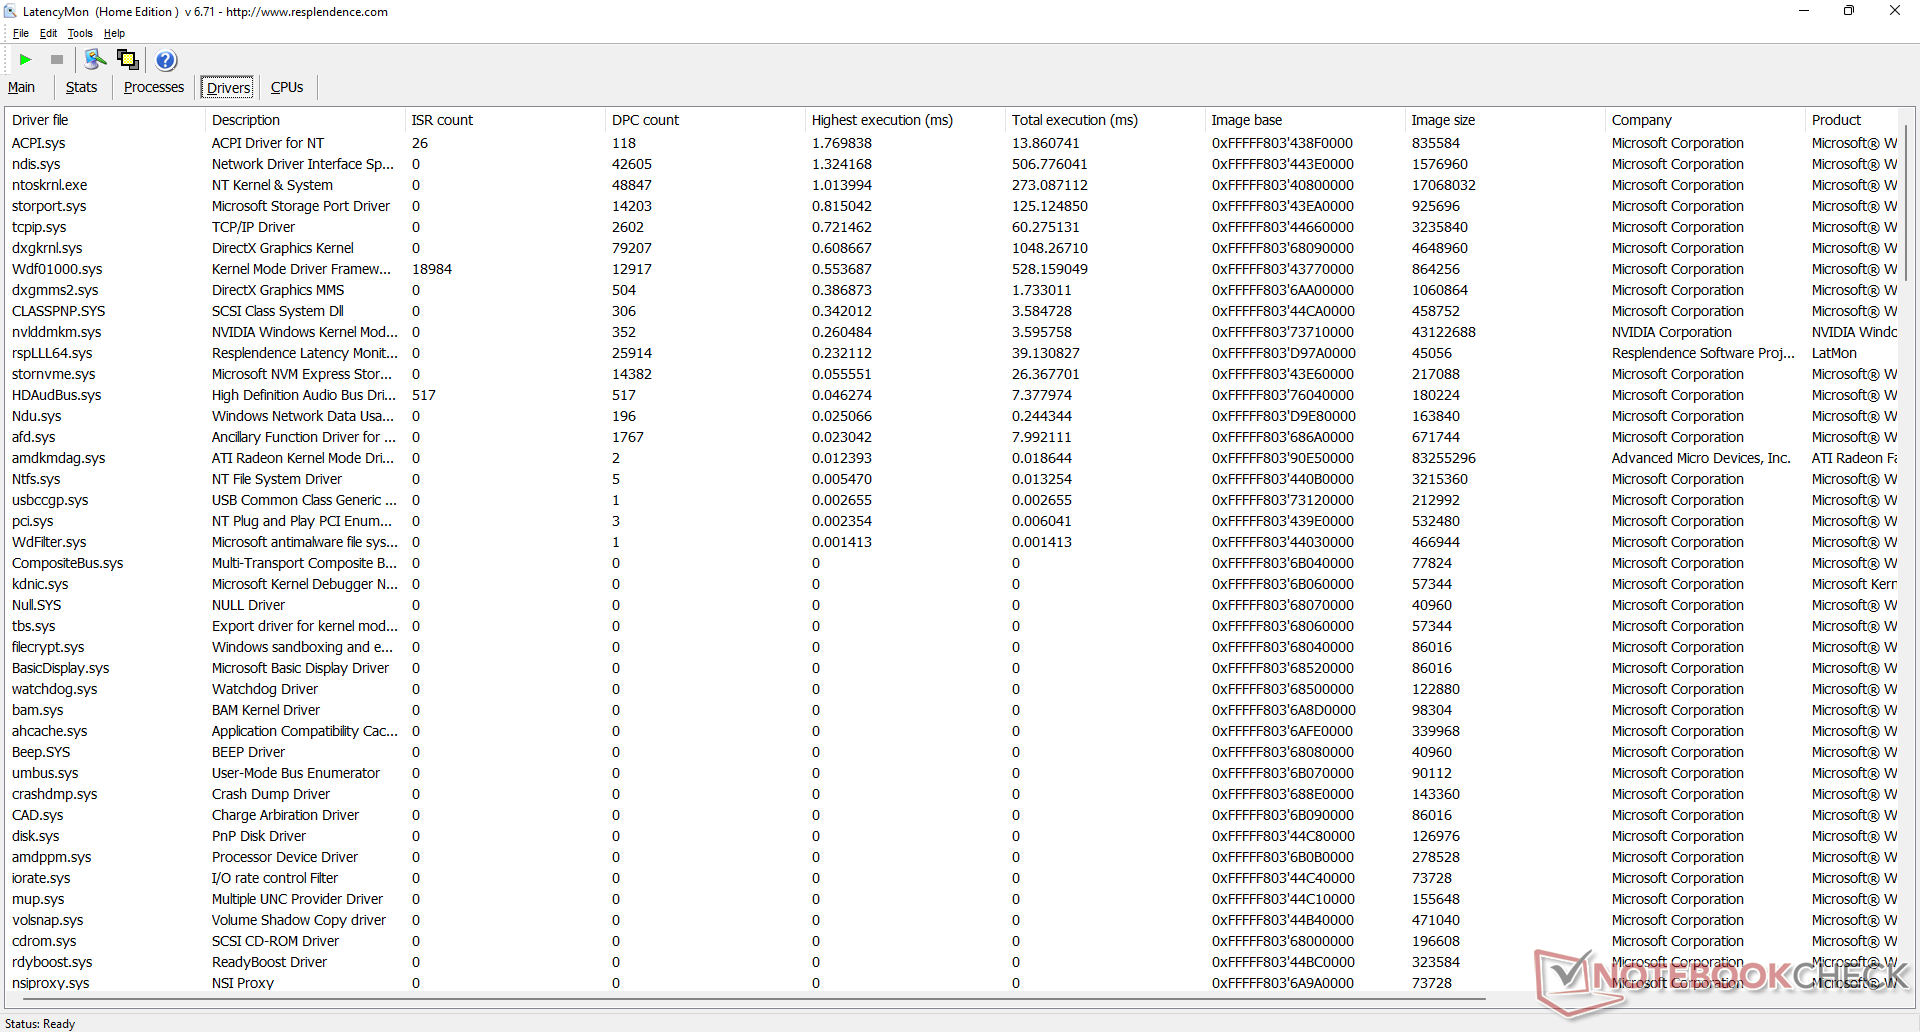
Latenza DPC
LatencyMon rivela lievi problemi di DPC quando si aprono più schede del browser della nostra homepage. la riproduzione di video 4K a 60 FPS è invece perfetta, con 0 cadute di fotogrammi e con un utilizzo della iGPU inferiore rispetto all'Intel Core U-series Iris Xe (13% contro ~40%).
| DPC Latencies / LatencyMon - interrupt to process latency (max), Web, Youtube, Prime95 | |
| Dell G15 5510 | |
| Gigabyte A5 K1 | |
| Lenovo Legion 5 15ACH6A-82NW0010GE | |
| Lenovo IdeaPad Gaming 3 15ARH7 | |
| Lenovo IdeaPad Gaming 3i 15IMH05 | |
| Asus TUF Dash F15 FX517ZR | |
* ... Meglio usare valori piccoli
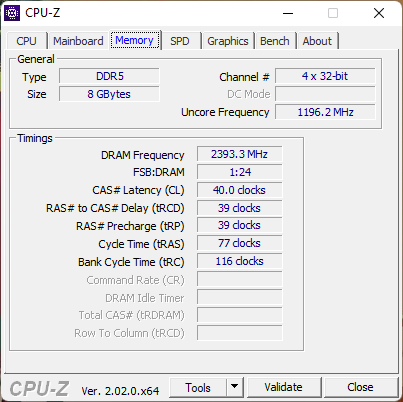
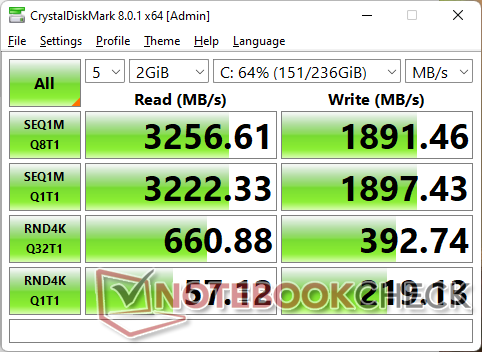
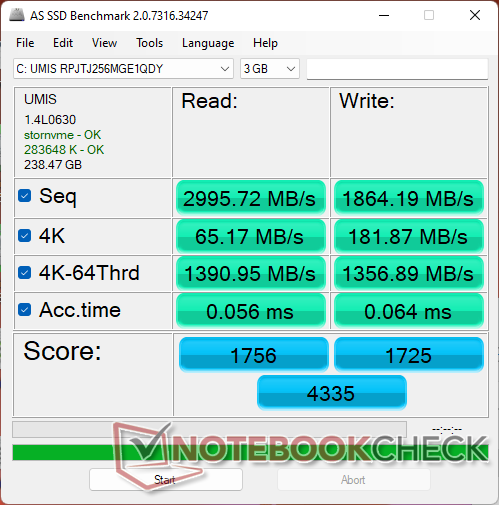
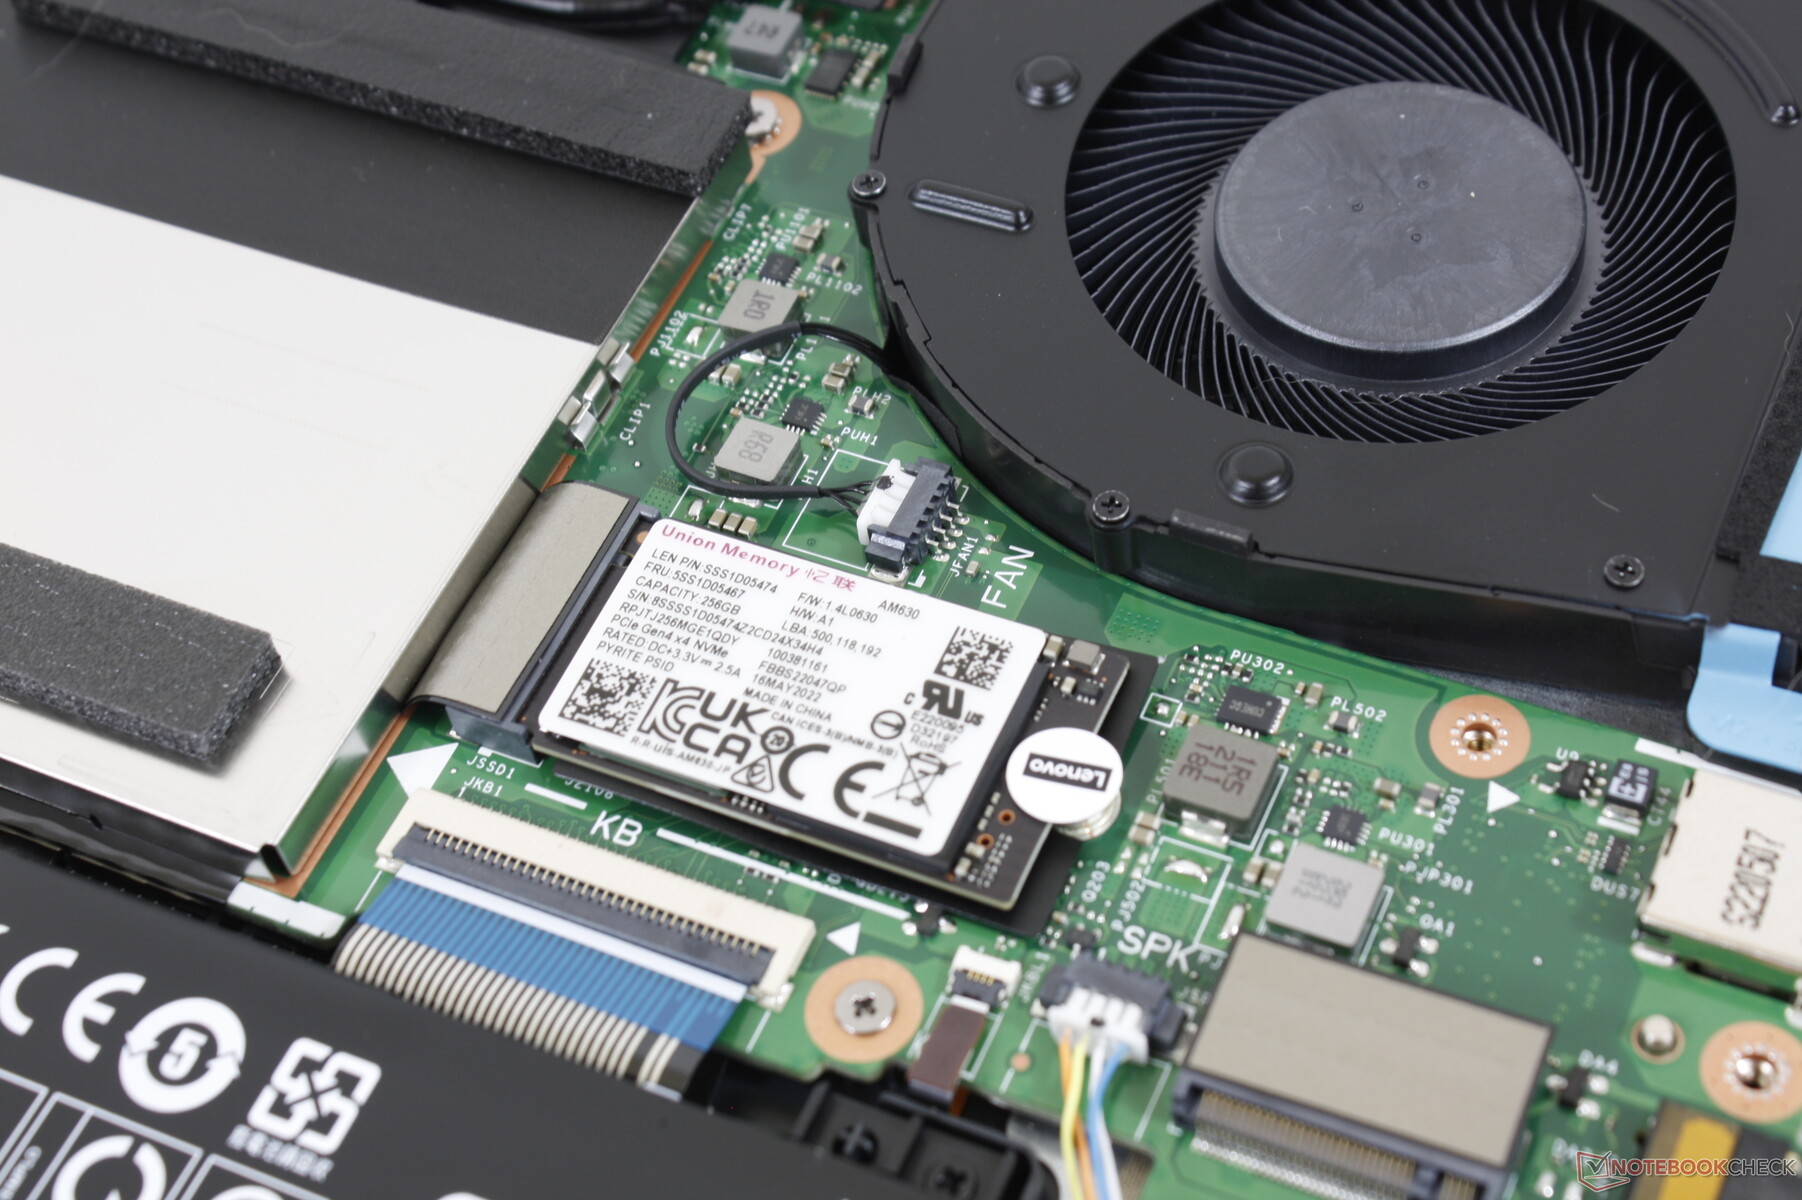
Dispositivi di archiviazione - Fino a due SSD PCIe4 x4
Sebbene il sistema possa supportare fino a due unità SSD M.2 PCIe4 x4 NVMe simultaneamente, l'unità SSD PCIe4 x4 da 256 GB è in grado di supportare un'unità SSD M.2 PCIe4 x4 Lenovo AM630 nella nostra unità di test è lento rispetto ad altre unità SSD PCIe4 x4. L'unità Samsung PM9A1, ad esempio, può raggiungere velocità fino a 7000 MB/s rispetto ai soli ~3000 MB/s del nostro IdeaPad. Inoltre, l'unità nella nostra unità si riduce a 2000 MB/s quando si esegue DiskSpd in loop, come mostrato dal grafico sottostante, il che significa che non è in grado di sostenere le velocità di trasferimento massime per lunghi periodi. Per un portatile da gioco economico, tuttavia, questo non è un problema particolarmente critico.

| Drive Performance rating - Percent | |
| Lenovo IdeaPad Gaming 3 15ARH7 | |
| Asus TUF Dash F15 FX517ZR | |
| Gigabyte A5 K1 | |
| Dell G15 5510 | |
| Lenovo Legion 5 15ACH6A-82NW0010GE | |
| Lenovo IdeaPad Gaming 3i 15IMH05 | |
* ... Meglio usare valori piccoli
Disk Throttling: DiskSpd Read Loop, Queue Depth 8
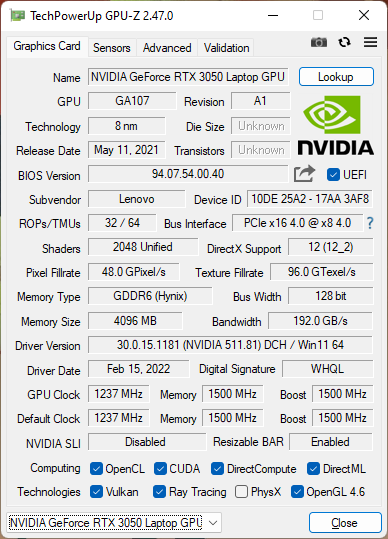
Prestazioni della GPU
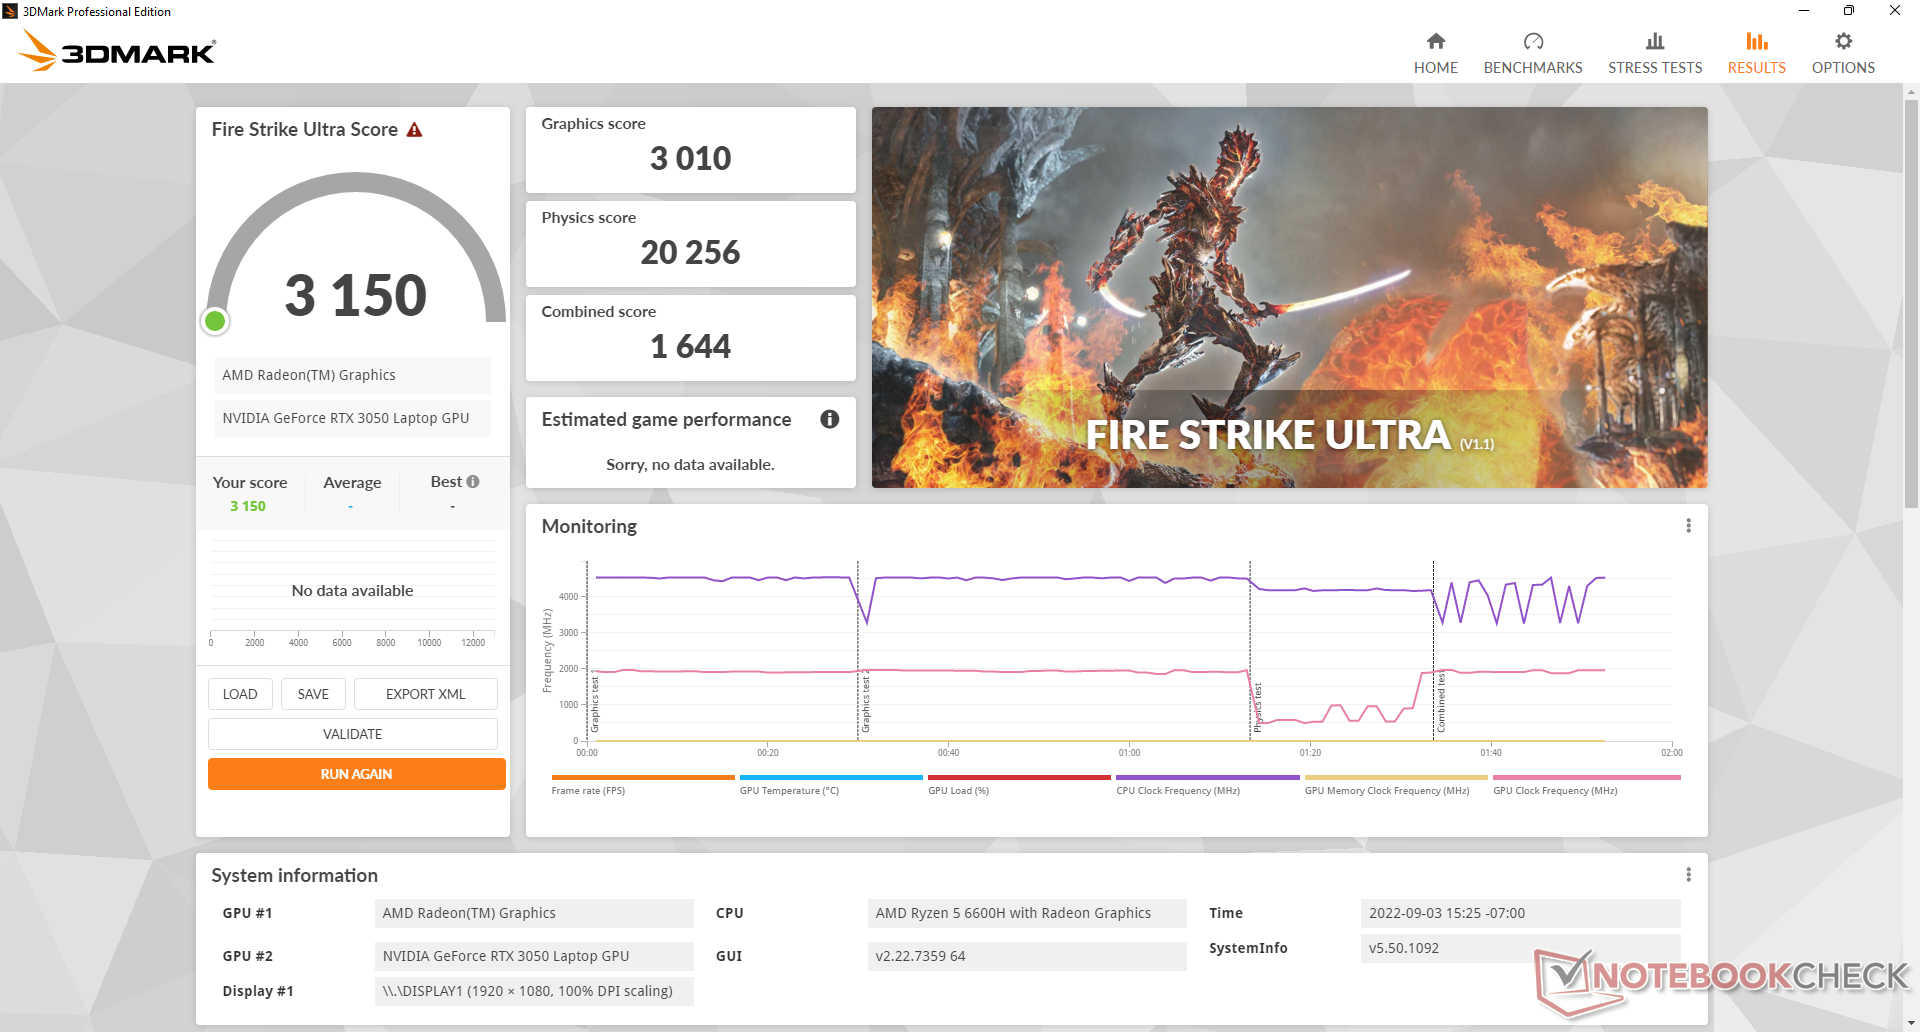
Le prestazioni grafiche sono circa il 15% più veloci rispetto alla media dei laptop del nostro database equipaggiati con la stessa GeForce RTX 3050 GPU. L'aggiornamento alla RTX 3050 Ti probabilmente aumenterà le prestazioni solo di un altro 10% in base alla nostra esperienza con altri laptop RTX 3050 Ti. Gli utenti che cercano un'opzione RTX 3060 dovranno invece considerare la più costosa serie Legion.
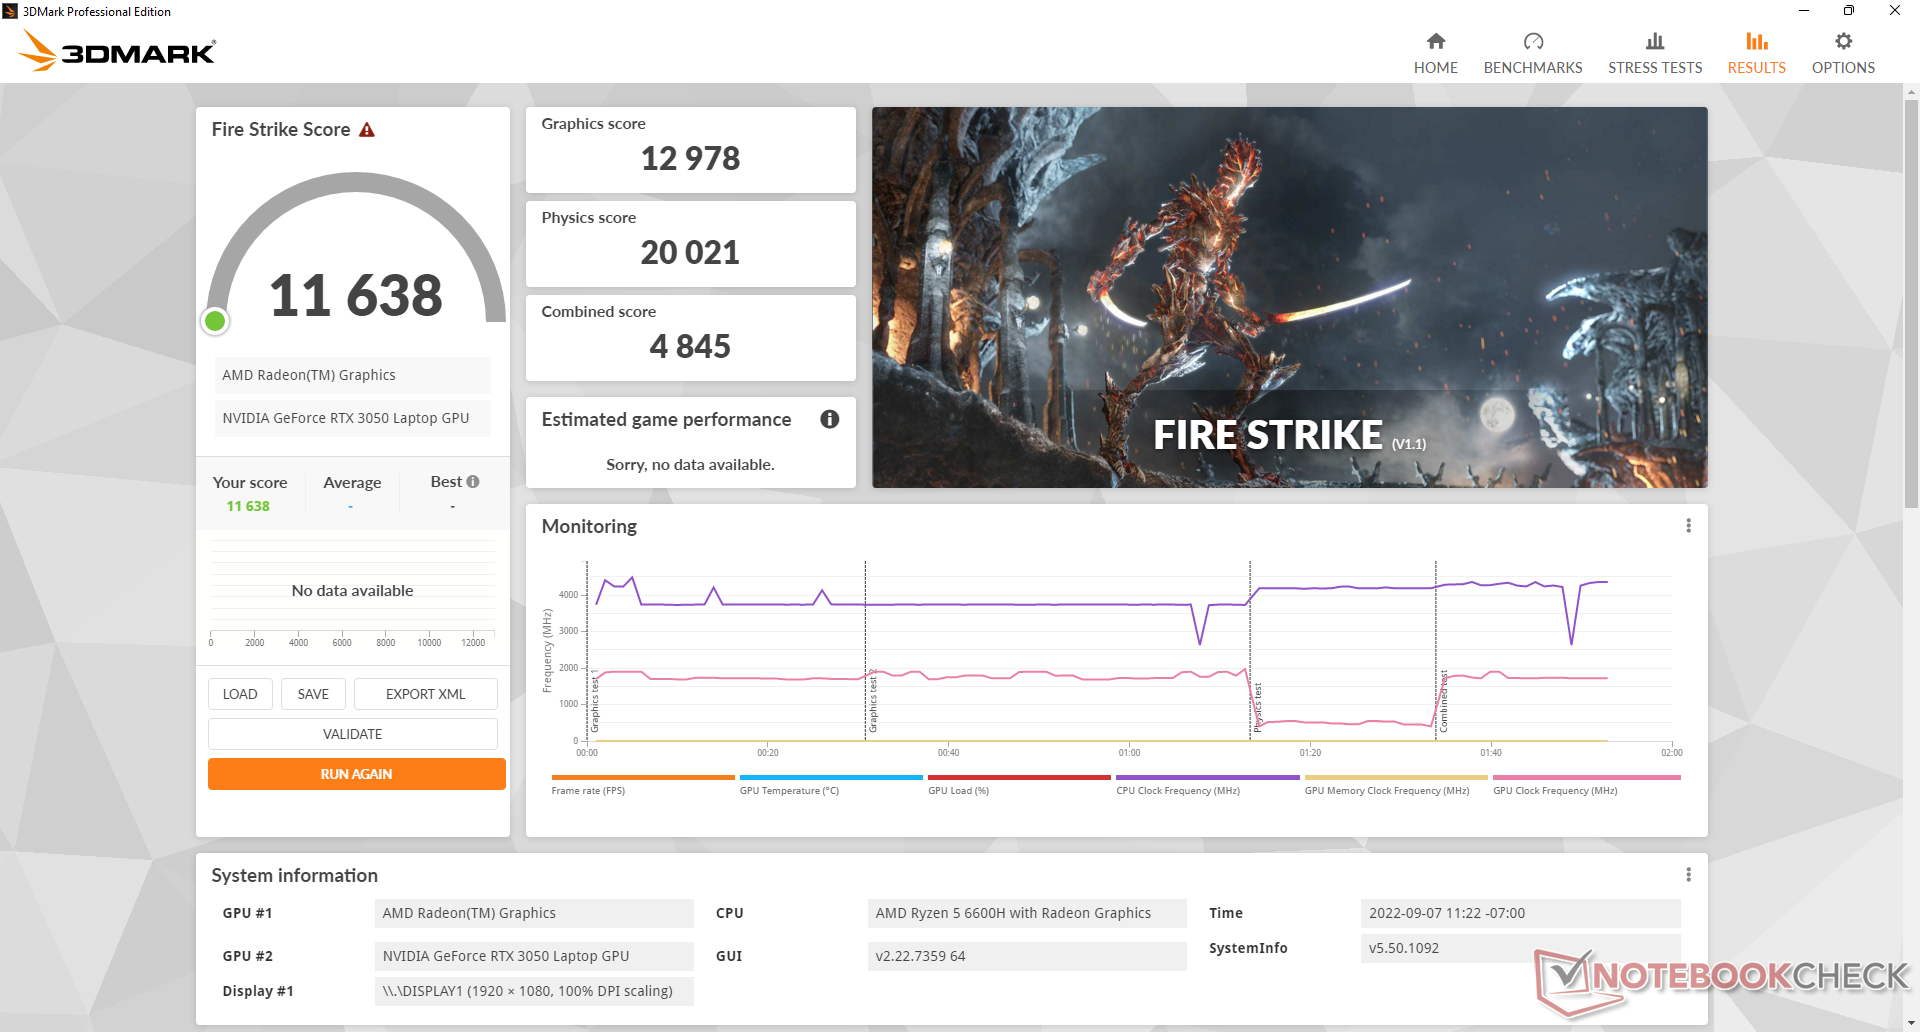
Le prestazioni si riducono se si utilizza il profilo energetico Balanced. Un test su Fire Strike in modalità Balanced riduce le prestazioni grafiche dell'8% (14157 contro 12978 punti), mentre le prestazioni della CPU rimangono pressoché invariate.
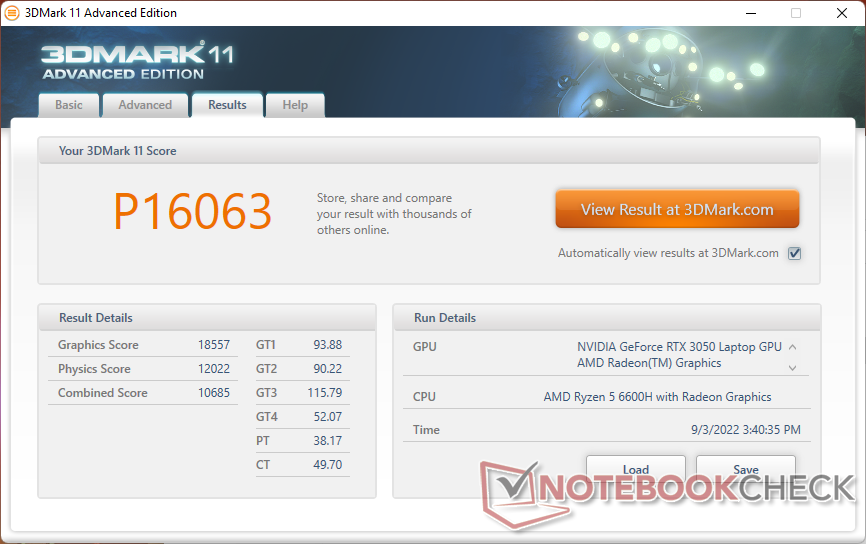

| 3DMark 11 Performance | 16063 punti | |
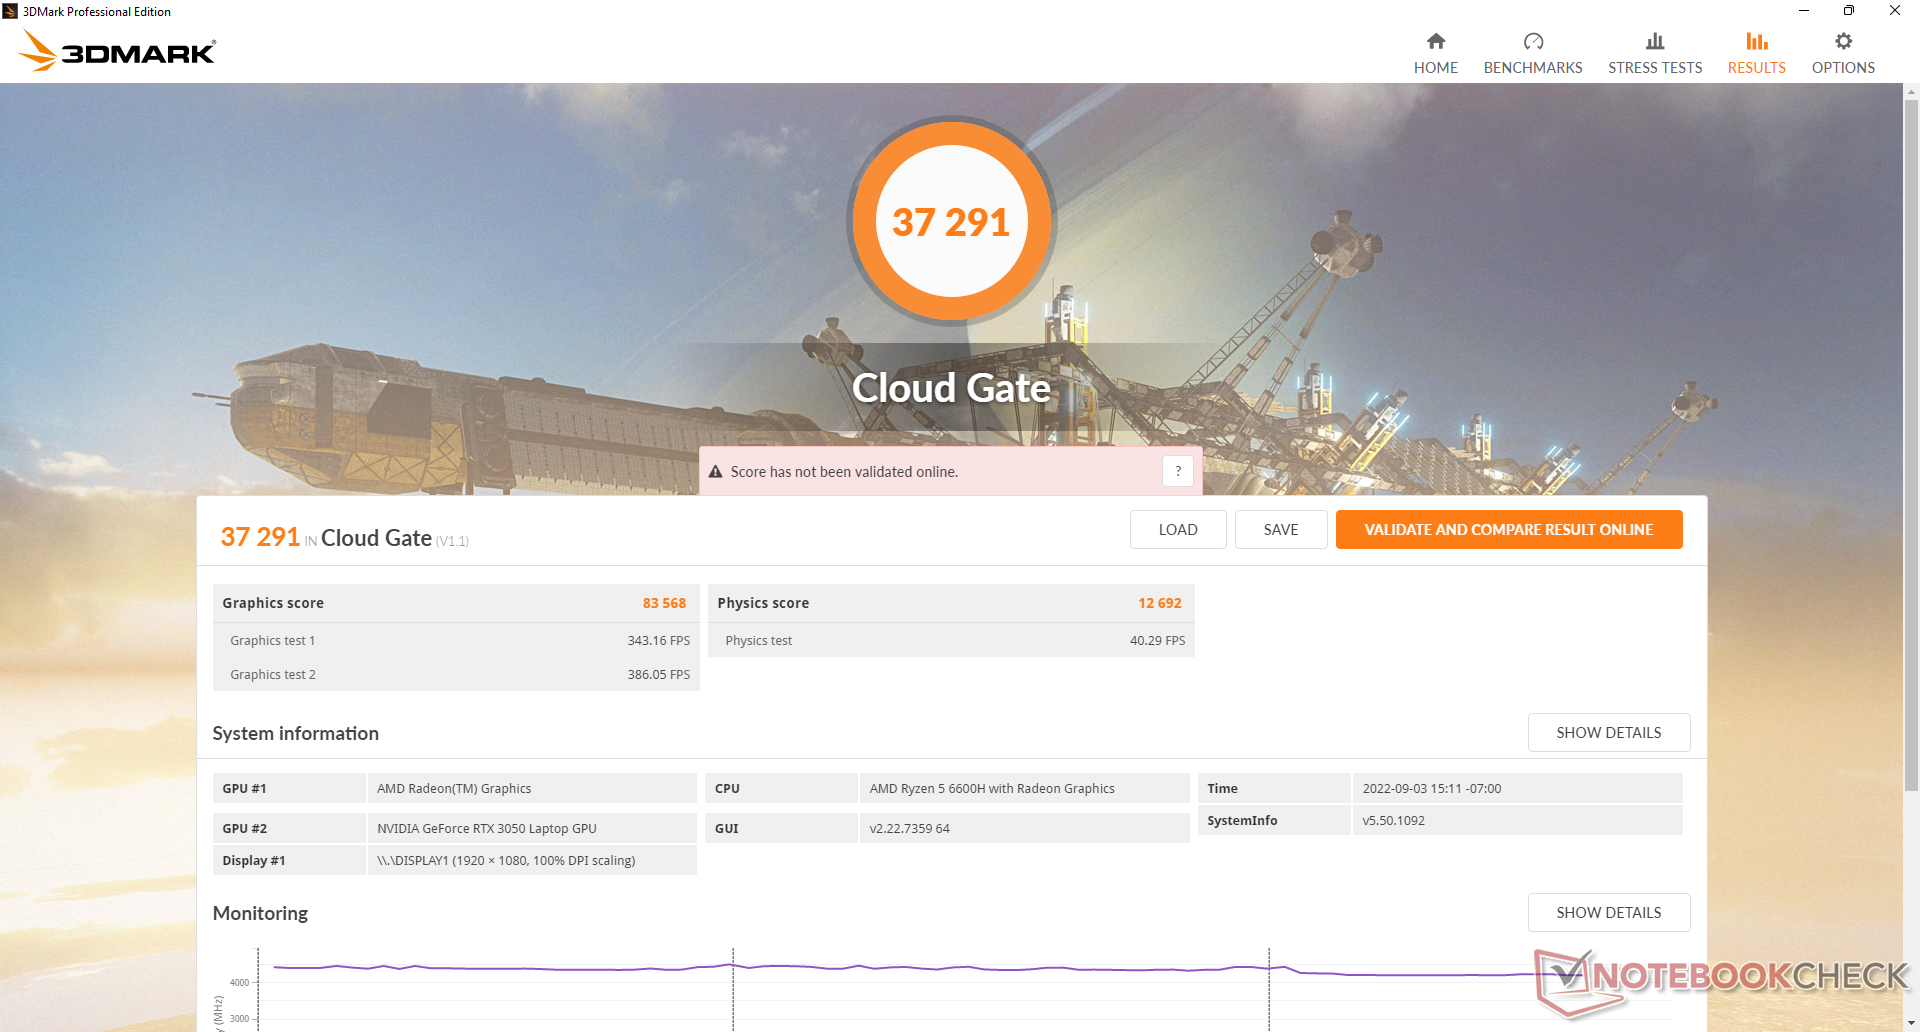
| 3DMark Cloud Gate Standard Score | 37291 punti | |
| 3DMark Fire Strike Score | 12525 punti | |
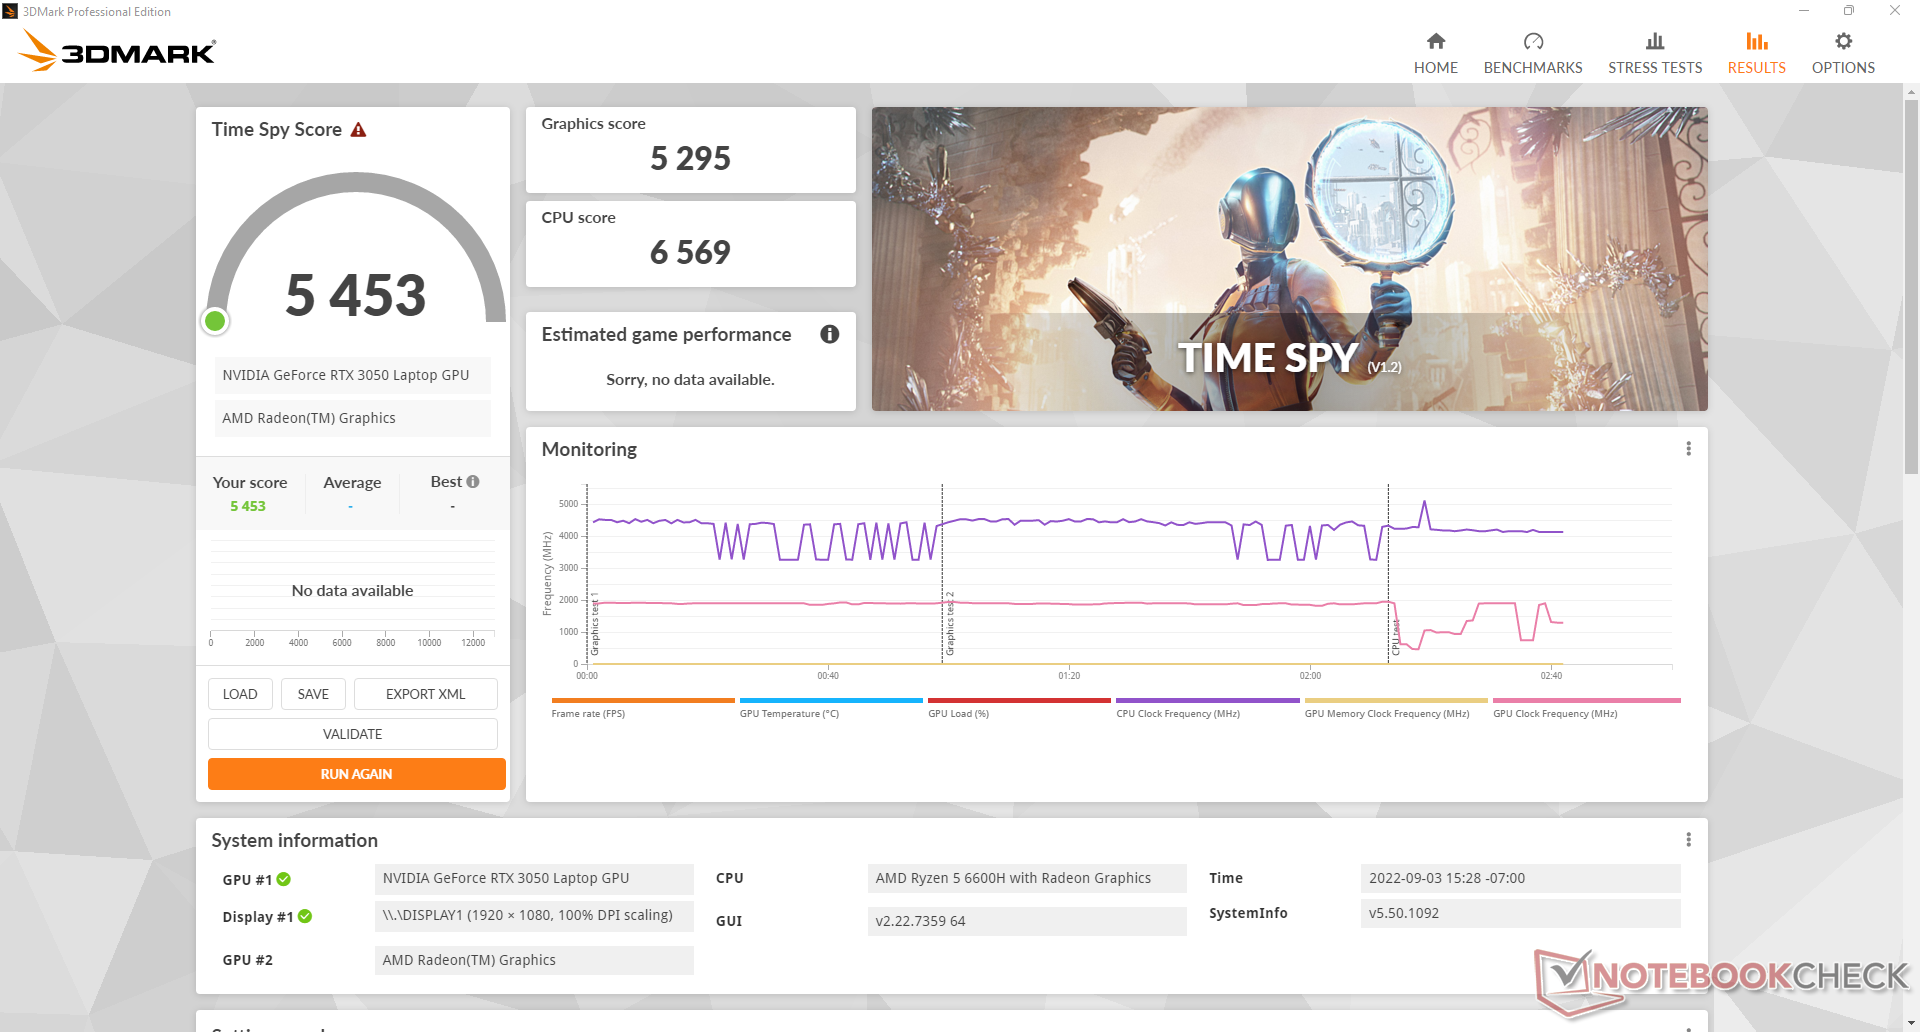
| 3DMark Time Spy Score | 5453 punti | |
Aiuto | ||
Witcher 3 FPS Chart
| basso | medio | alto | ultra | |
|---|---|---|---|---|
| GTA V (2015) | 144 | 133.3 | 103.5 | 60.3 |
| The Witcher 3 (2015) | 213.9 | 167.7 | 105.1 | 55.8 |
| Dota 2 Reborn (2015) | 117.2 | 106.4 | 100.6 | 95.2 |
| Final Fantasy XV Benchmark (2018) | 116.4 | 73.6 | 53.5 | |
| X-Plane 11.11 (2018) | 84.4 | 77.1 | 63.6 | |
| Strange Brigade (2018) | 248 | 134.7 | 109.1 | 95.1 |
| Cyberpunk 2077 1.6 (2022) | 72.9 | 62.4 | 45.5 | 36.5 |
Emissioni: quasi 50 dB(A) durante il gioco
Rumore del sistema
Il rumore della ventola al minimo può essere di 23,8 o 27,3 dB(A) se si imposta il profilo energetico Performance. Pertanto, la modalità Performance non è consigliata se si naviga sul web o si fa streaming. Il livello di rumorosità è di circa 31,4 dB(A) o inferiore con la maggior parte dei carichi quotidiani.
Le ventole possono raggiungere i 49,3 dB(A) quando si gioca in modalità Performance, un valore paragonabile a quello della maggior parte dei portatili da gioco, compresi quelli di Lenovo Legion 5 15. La rumorosità delle ventole scende significativamente a 43,9 dB(A) se si gioca con il profilo di alimentazione Bilanciato, ma questo ha un leggero costo per le prestazioni grafiche, come già detto. Tuttavia, alcuni giocatori potrebbero ritenere che la riduzione delle prestazioni valga la pena per una macchina complessivamente più silenziosa.
Rumorosità
| Idle |
| 23.8 / 23.8 / 27.2 dB(A) |
| Sotto carico |
| 34.8 / 49.4 dB(A) |
 | ||
30 dB silenzioso 40 dB(A) udibile 50 dB(A) rumoroso |
||
min: | ||
| Lenovo IdeaPad Gaming 3 15ARH7 GeForce RTX 3050 4GB Laptop GPU, R5 6600H, Lenovo UMIS AM630 RPJTJ256MGE1QDY | Lenovo IdeaPad Gaming 3i 15IMH05 GeForce GTX 1650 Mobile, i5-10300H, SK hynix BC511 HFM512GDHTNI-87A0B | Lenovo Legion 5 15ACH6A-82NW0010GE Radeon RX 6600M, R5 5600H, Micron 2210 MTFDHBA512QFD | Gigabyte A5 K1 GeForce RTX 3060 Laptop GPU, R5 5600H, ESR512GTLG-E6GBTNB4 | Asus TUF Dash F15 FX517ZR GeForce RTX 3070 Laptop GPU, i7-12650H, Samsung PM991a MZVLQ1T0HBLB | Dell G15 5510 GeForce RTX 3050 4GB Laptop GPU, i5-10500H, SK Hynix BC711 HFM512GD3HX015N | |
|---|---|---|---|---|---|---|
| Noise | -20% | -16% | -22% | -15% | -10% | |
| off /ambiente * (dB) | 23.3 | 30.7 -32% | 25 -7% | 26 -12% | 26 -12% | 26 -12% |
| Idle Minimum * (dB) | 23.8 | 30.7 -29% | 25 -5% | 26 -9% | 26 -9% | 26 -9% |
| Idle Average * (dB) | 23.8 | 30.7 -29% | 25 -5% | 29 -22% | 32 -34% | 27 -13% |
| Idle Maximum * (dB) | 27.2 | 30.7 -13% | 34.5 -27% | 32 -18% | 33 -21% | 33 -21% |
| Load Average * (dB) | 34.8 | 49.7 -43% | 51.1 -47% | 57 -64% | 48 -38% | 45 -29% |
| Witcher 3 ultra * (dB) | 49.3 | 47 5% | 56 -14% | 47 5% | 45 9% | |
| Load Maximum * (dB) | 49.4 | 50.3 -2% | 51.3 -4% | 58 -17% | 49 1% | 47 5% |
* ... Meglio usare valori piccoli
Temperatura
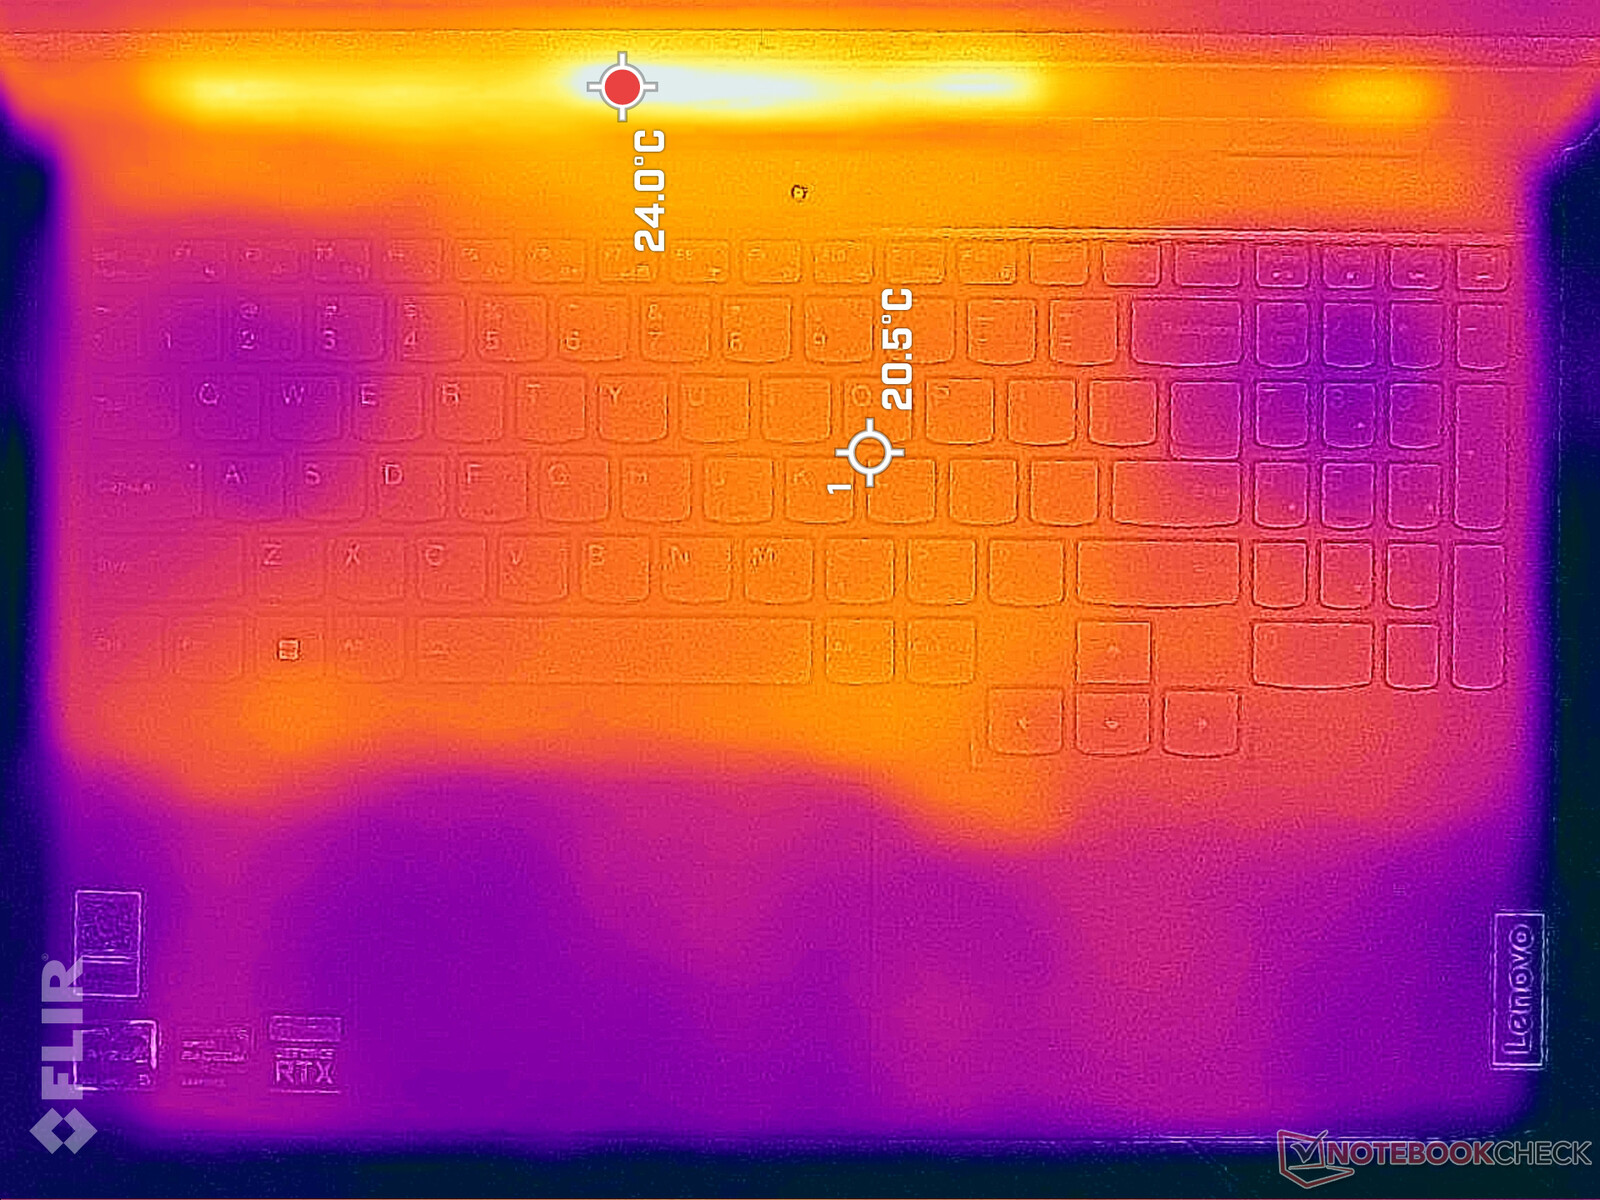
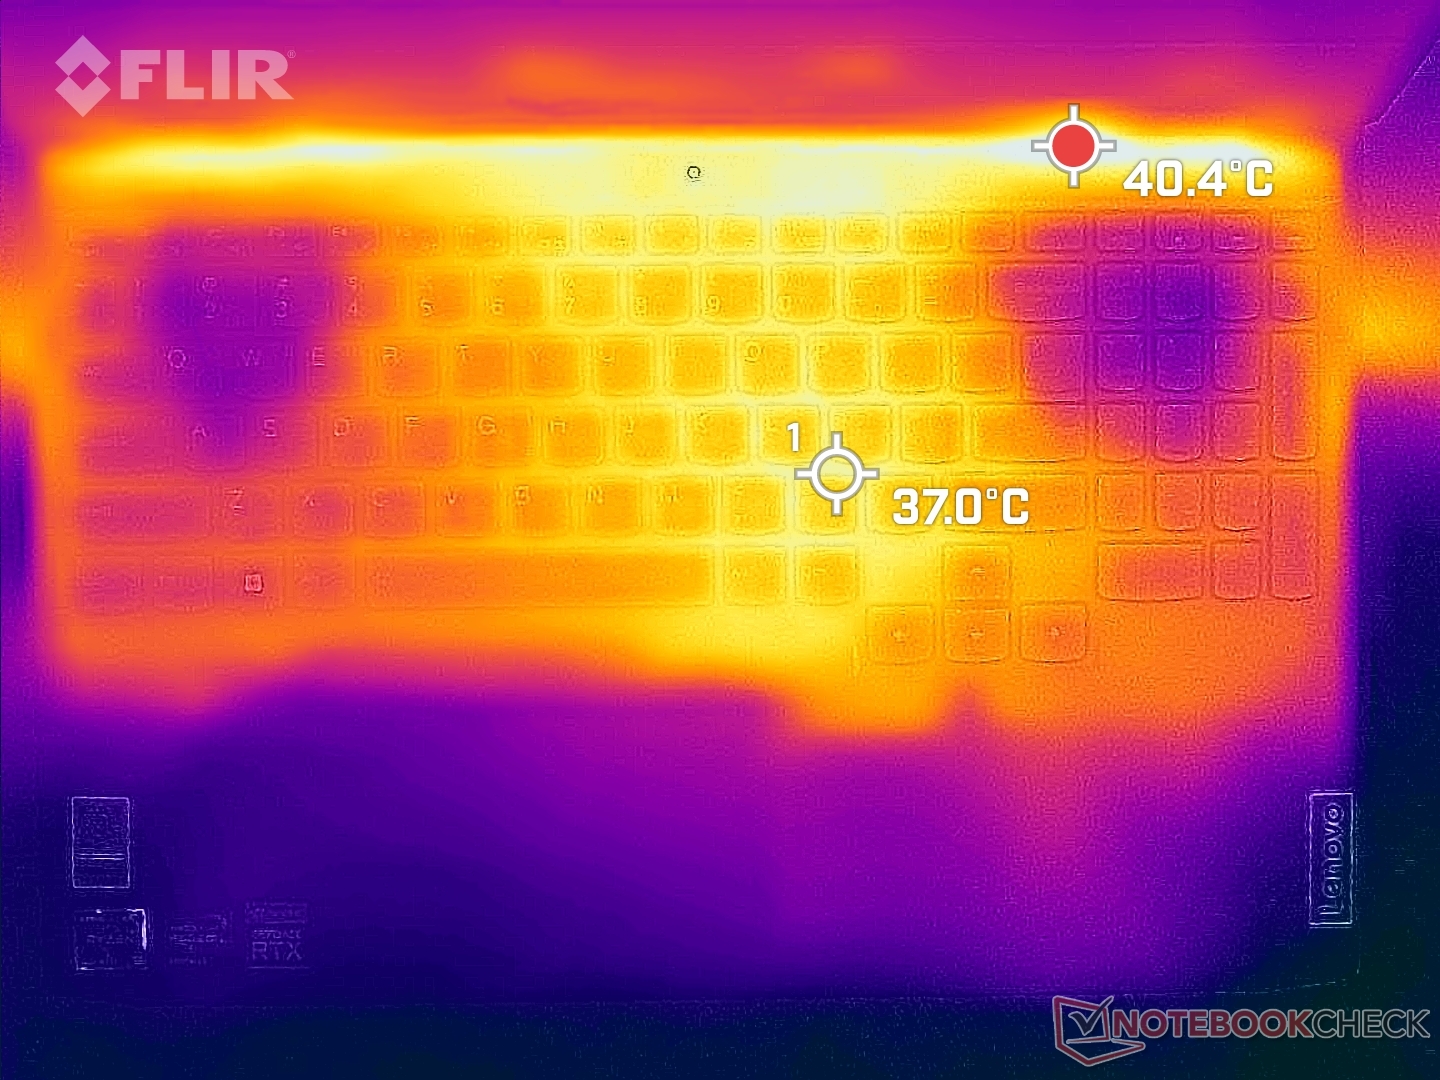
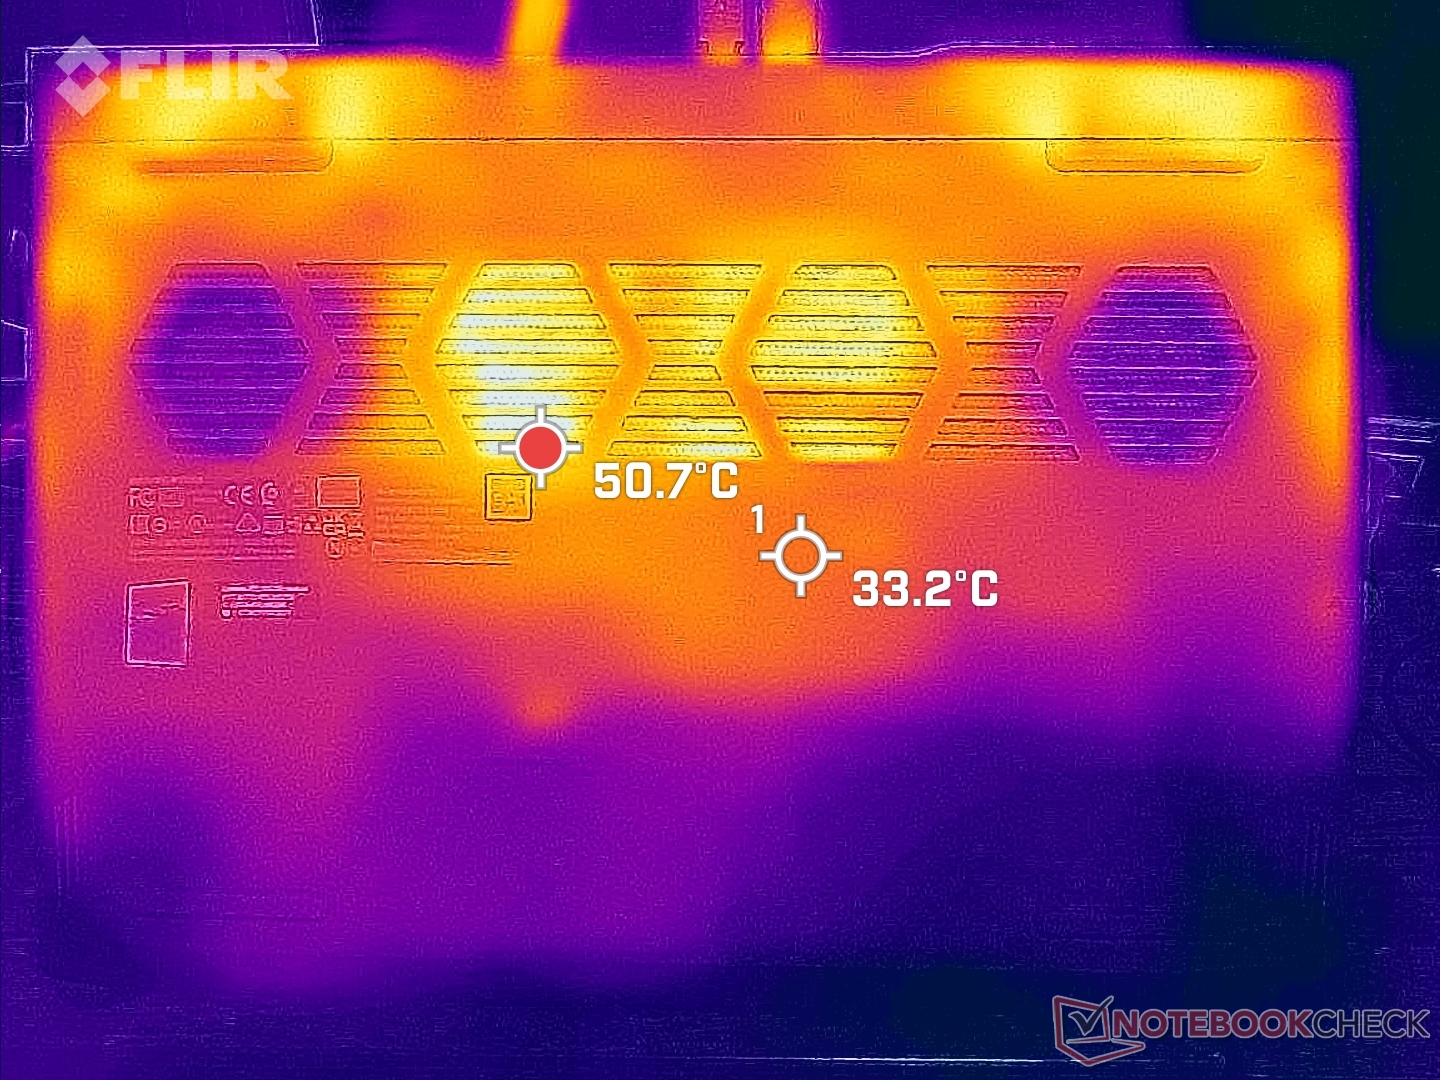
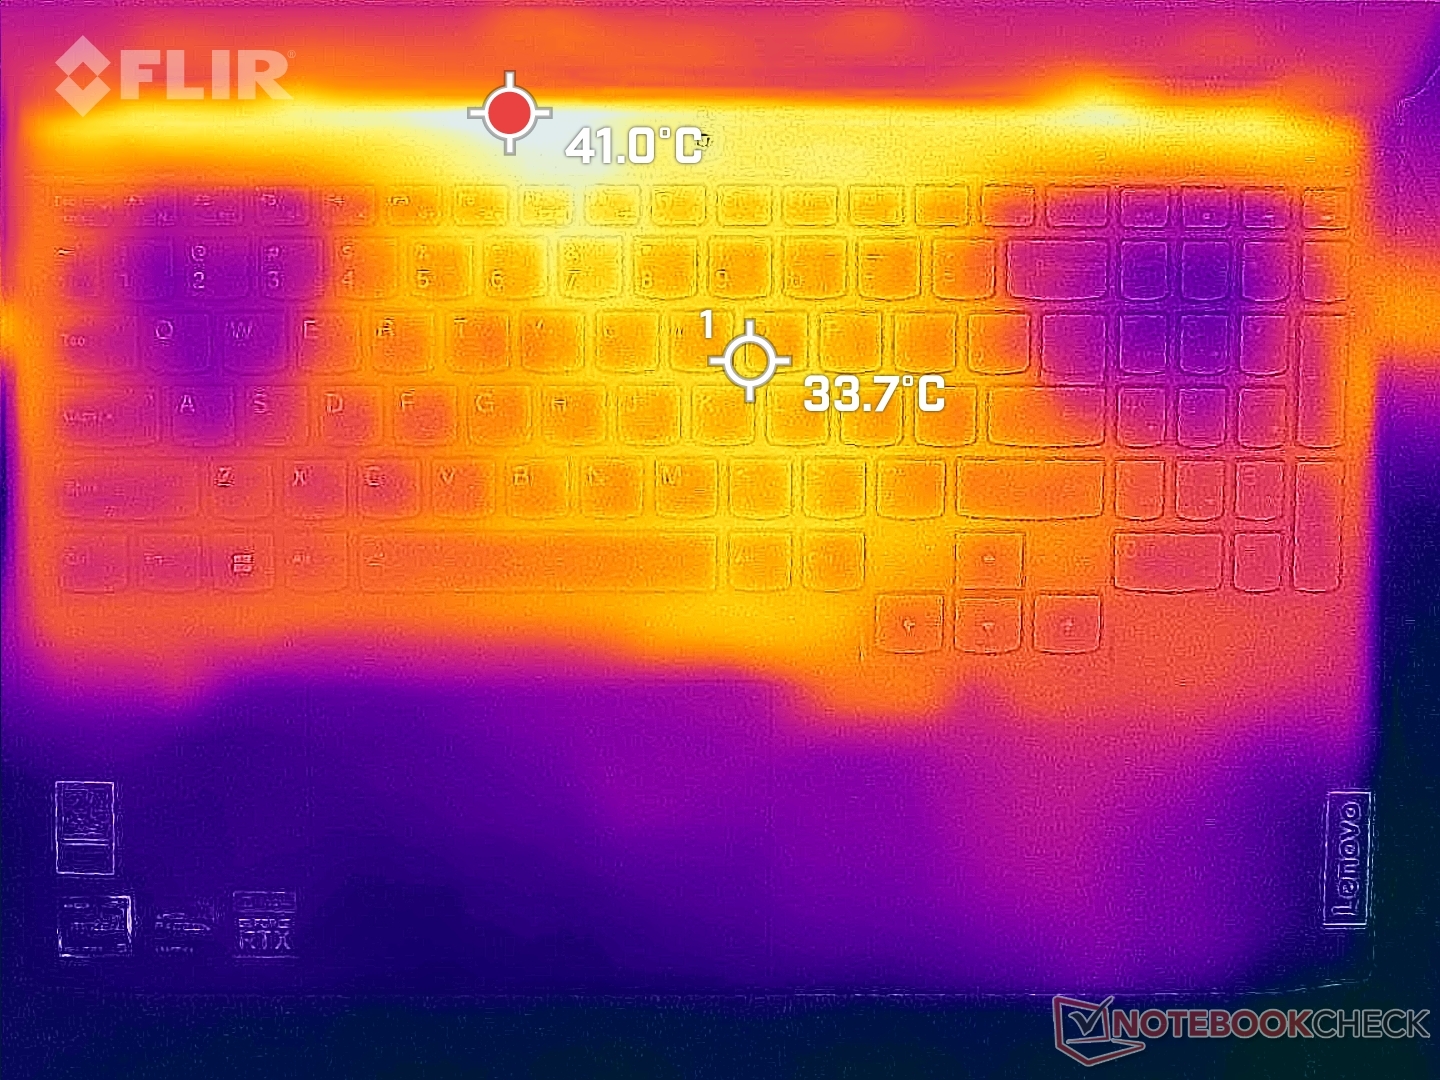
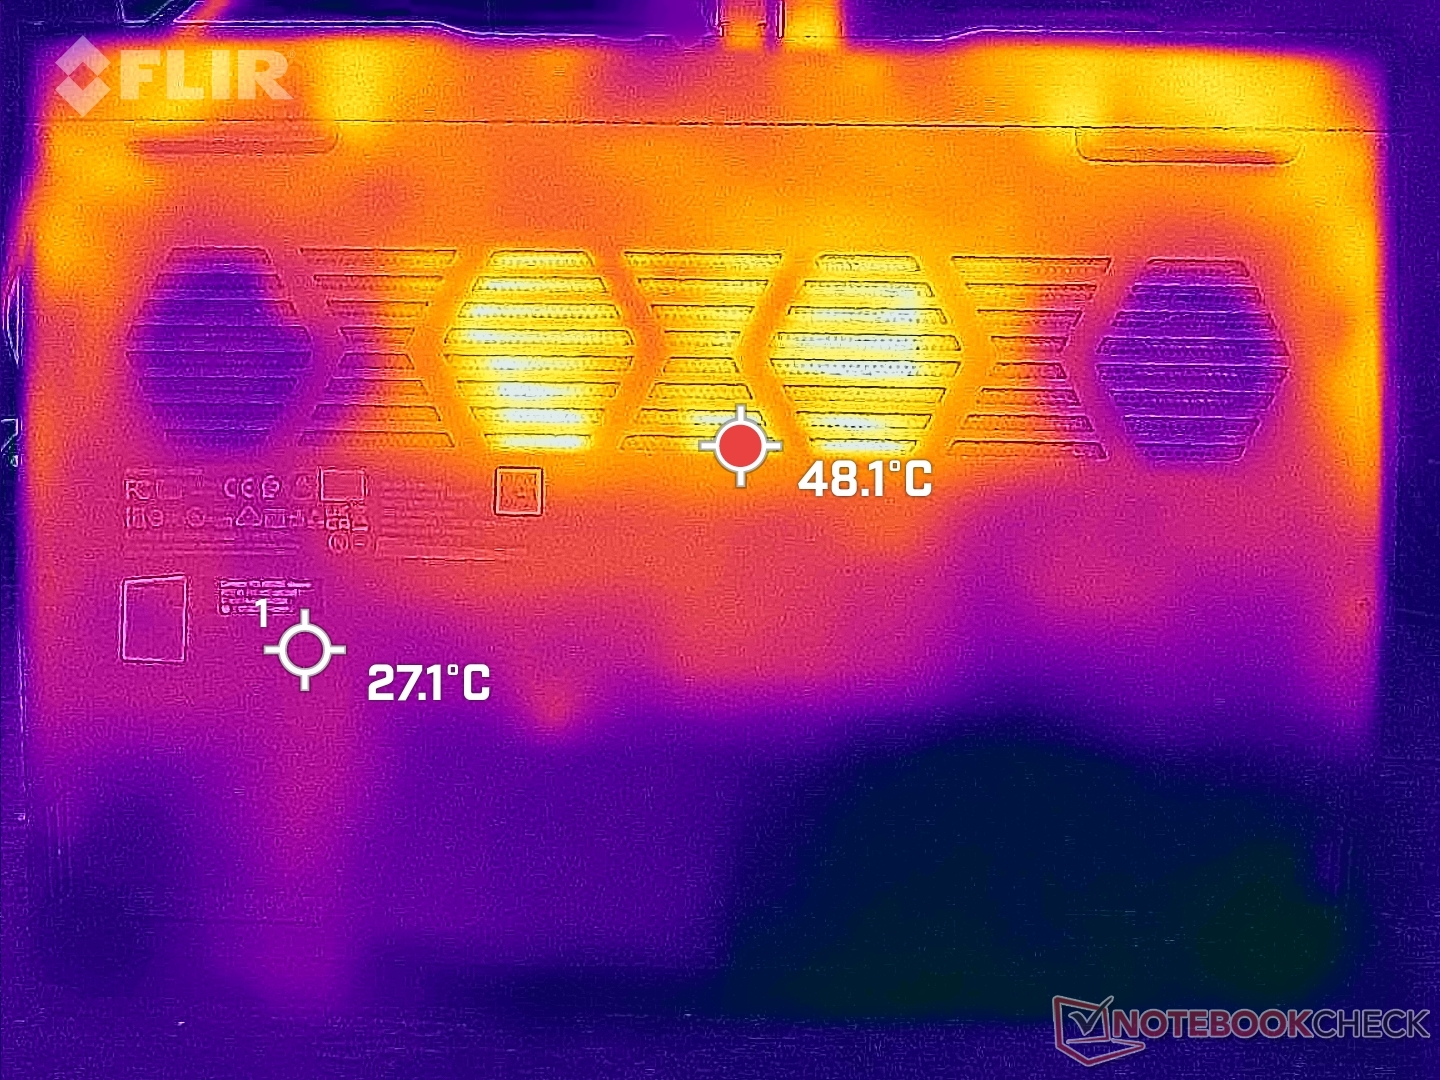
Le temperature superficiali sono più calde vicino al centro della tastiera, mentre i tasti WASD e il tastierino numerico sono molto più freschi, poiché l'aria fresca viene aspirata attraverso questi tasti, come mostrano le mappe di temperatura qui sotto. Questa situazione è migliore rispetto a quella del vecchio IdeaPad Gaming 3i 15IMH05 o del Dell G15 5510.Dell G15 5510 che hanno tasti WASD più caldi. Il punto caldo della tastiera può raggiungere i 43 C quando si gioca, il che è comunque paragonabile ai punti caldi dei già citati IdeaPad e Dell G15.
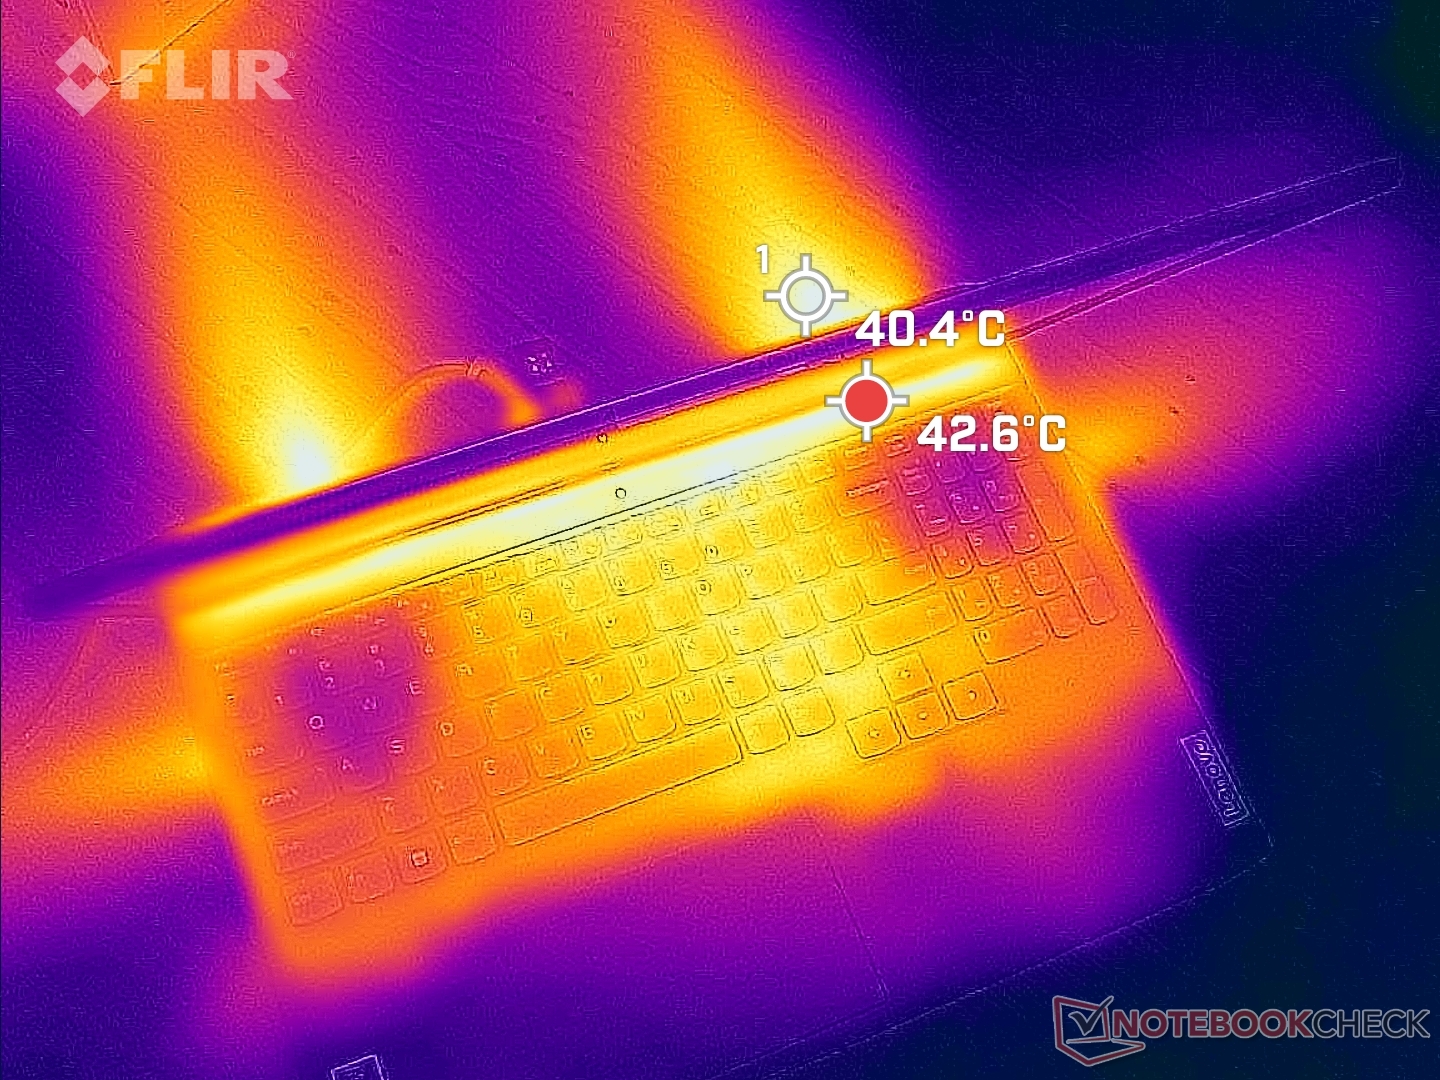
(-) La temperatura massima sul lato superiore è di 47.6 °C / 118 F, rispetto alla media di 40.4 °C / 105 F, che varia da 21.2 a 68.8 °C per questa classe Gaming.
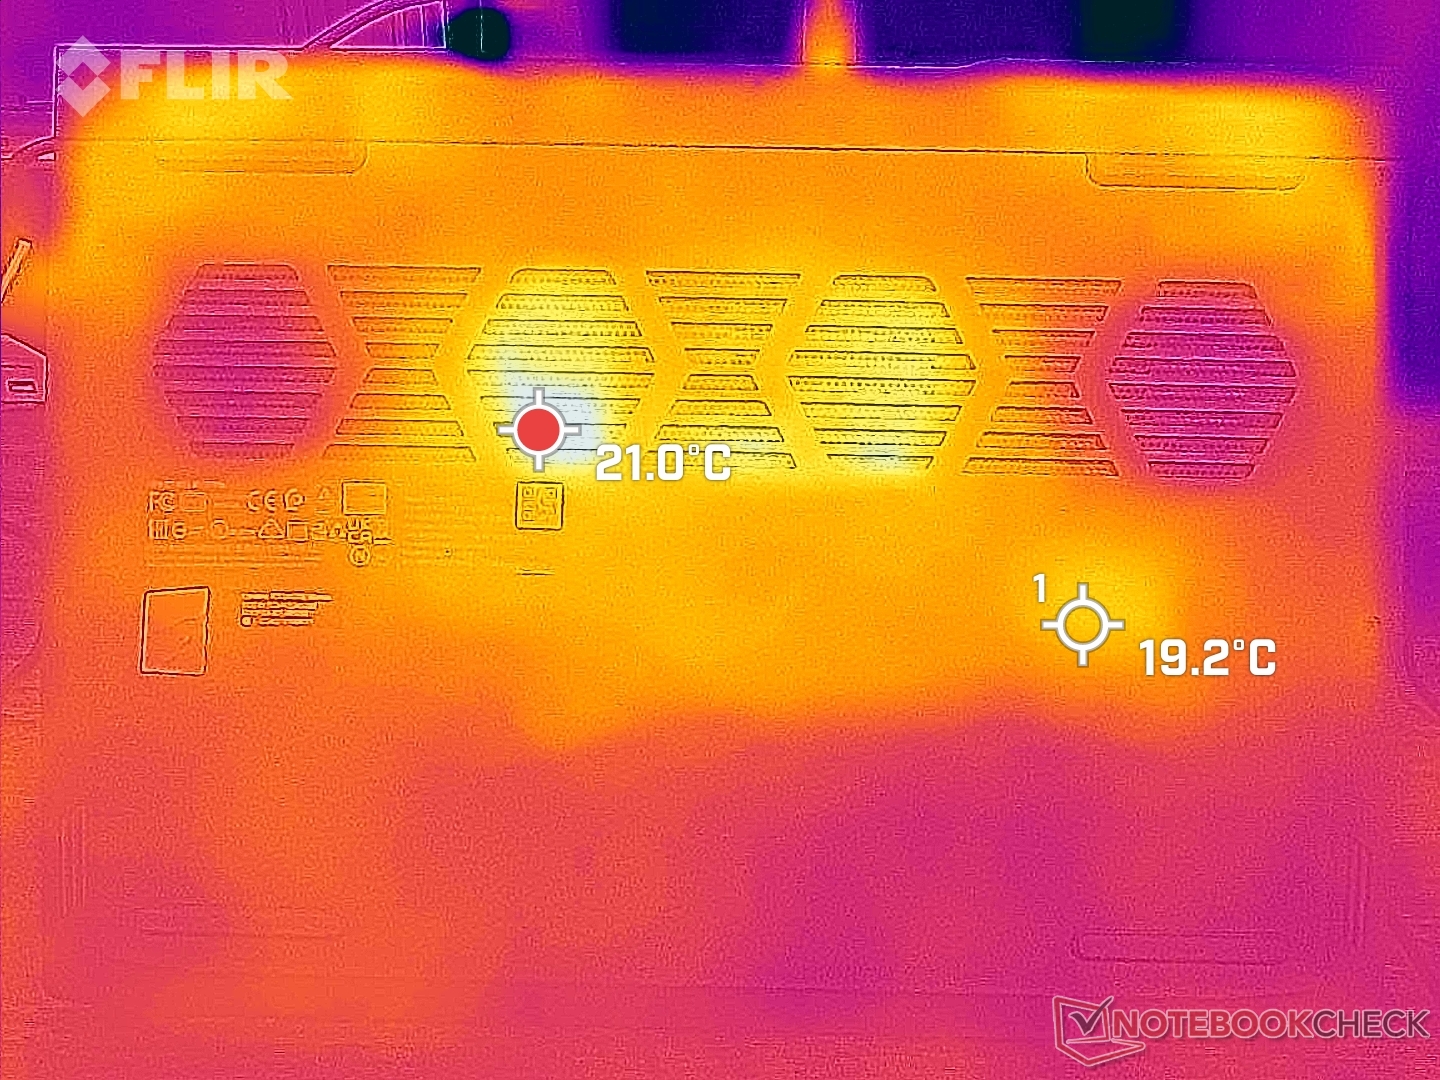
(-) Il lato inferiore si riscalda fino ad un massimo di 46.6 °C / 116 F, rispetto alla media di 43.2 °C / 110 F
(+) In idle, la temperatura media del lato superiore è di 25.7 °C / 78 F, rispetto alla media deld ispositivo di 33.9 °C / 93 F.
(±) Riproducendo The Witcher 3, la temperatura media per il lato superiore e' di 36.4 °C / 98 F, rispetto alla media del dispositivo di 33.9 °C / 93 F.
(+) I poggiapolsi e il touchpad raggiungono la temperatura massima della pelle (34.2 °C / 93.6 F) e quindi non sono caldi.
(-) La temperatura media della zona del palmo della mano di dispositivi simili e'stata di 28.8 °C / 83.8 F (-5.4 °C / -9.8 F).
| Lenovo IdeaPad Gaming 3 15ARH7 AMD Ryzen 5 6600H, NVIDIA GeForce RTX 3050 4GB Laptop GPU | Lenovo IdeaPad Gaming 3i 15IMH05 Intel Core i5-10300H, NVIDIA GeForce GTX 1650 Mobile | Lenovo Legion 5 15ACH6A-82NW0010GE AMD Ryzen 5 5600H, AMD Radeon RX 6600M | Gigabyte A5 K1 AMD Ryzen 5 5600H, NVIDIA GeForce RTX 3060 Laptop GPU | Asus TUF Dash F15 FX517ZR Intel Core i7-12650H, NVIDIA GeForce RTX 3070 Laptop GPU | Dell G15 5510 Intel Core i5-10500H, NVIDIA GeForce RTX 3050 4GB Laptop GPU | |
|---|---|---|---|---|---|---|
| Heat | 0% | -5% | -11% | -19% | -2% | |
| Maximum Upper Side * (°C) | 47.6 | 43 10% | 39.9 16% | 50 -5% | 52 -9% | 52 -9% |
| Maximum Bottom * (°C) | 46.6 | 50.6 -9% | 43.8 6% | 51 -9% | 52 -12% | 49 -5% |
| Idle Upper Side * (°C) | 27.2 | 27.2 -0% | 34.1 -25% | 30 -10% | 33 -21% | 26 4% |
| Idle Bottom * (°C) | 27.2 | 27.5 -1% | 31.7 -17% | 33 -21% | 36 -32% | 26 4% |
* ... Meglio usare valori piccoli
Stress test
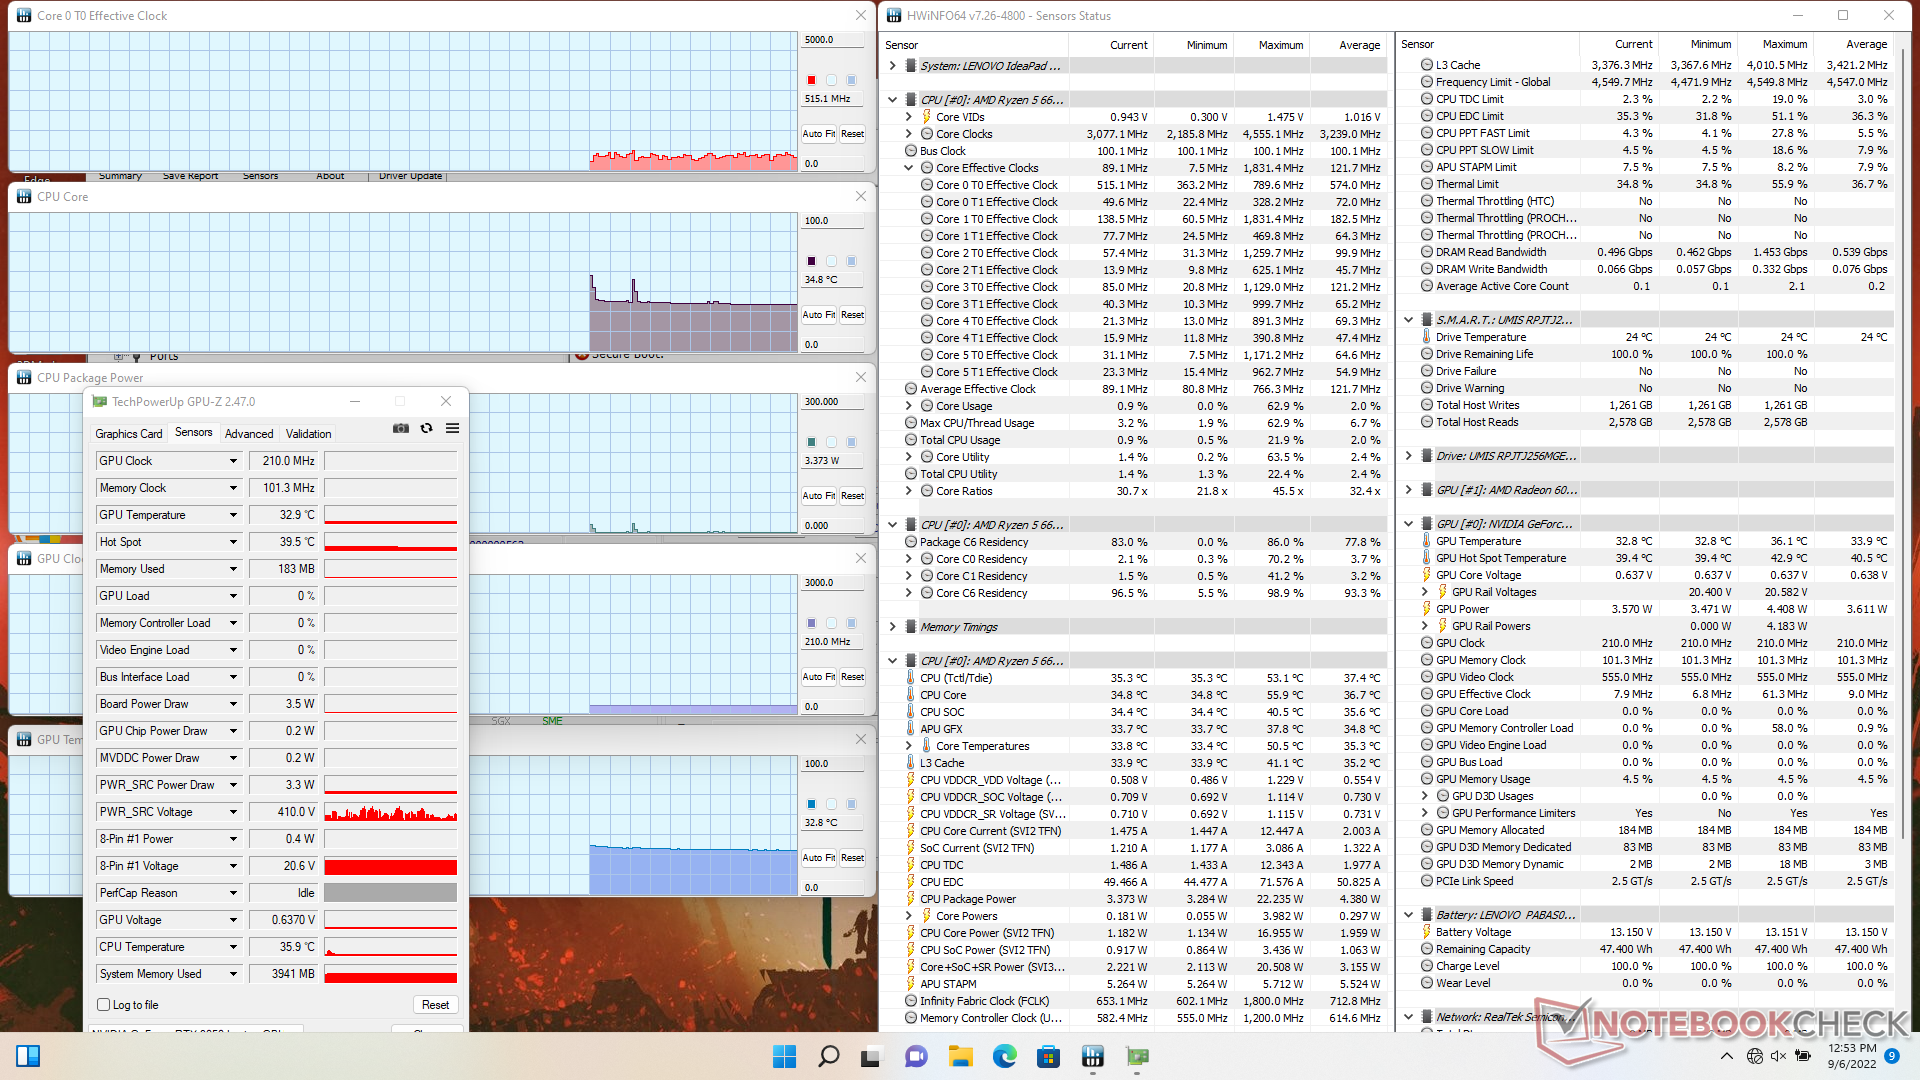
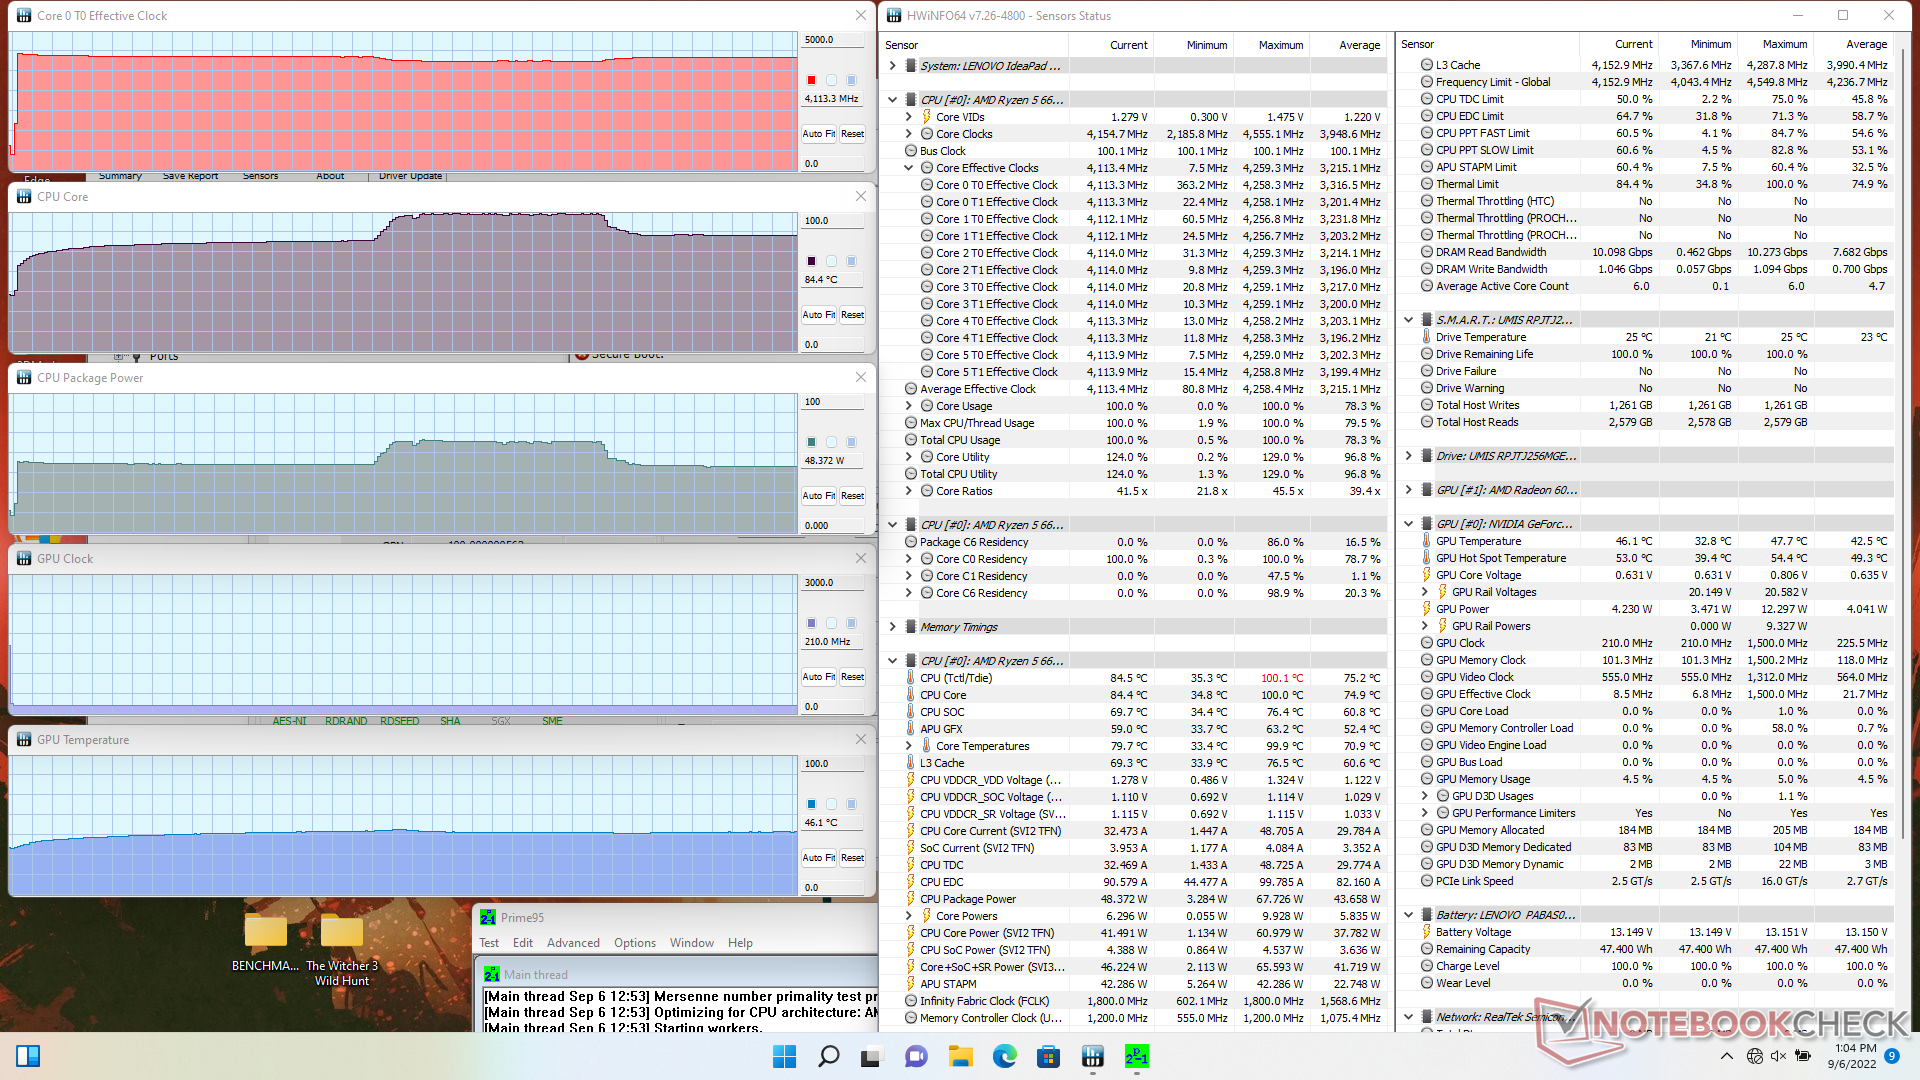
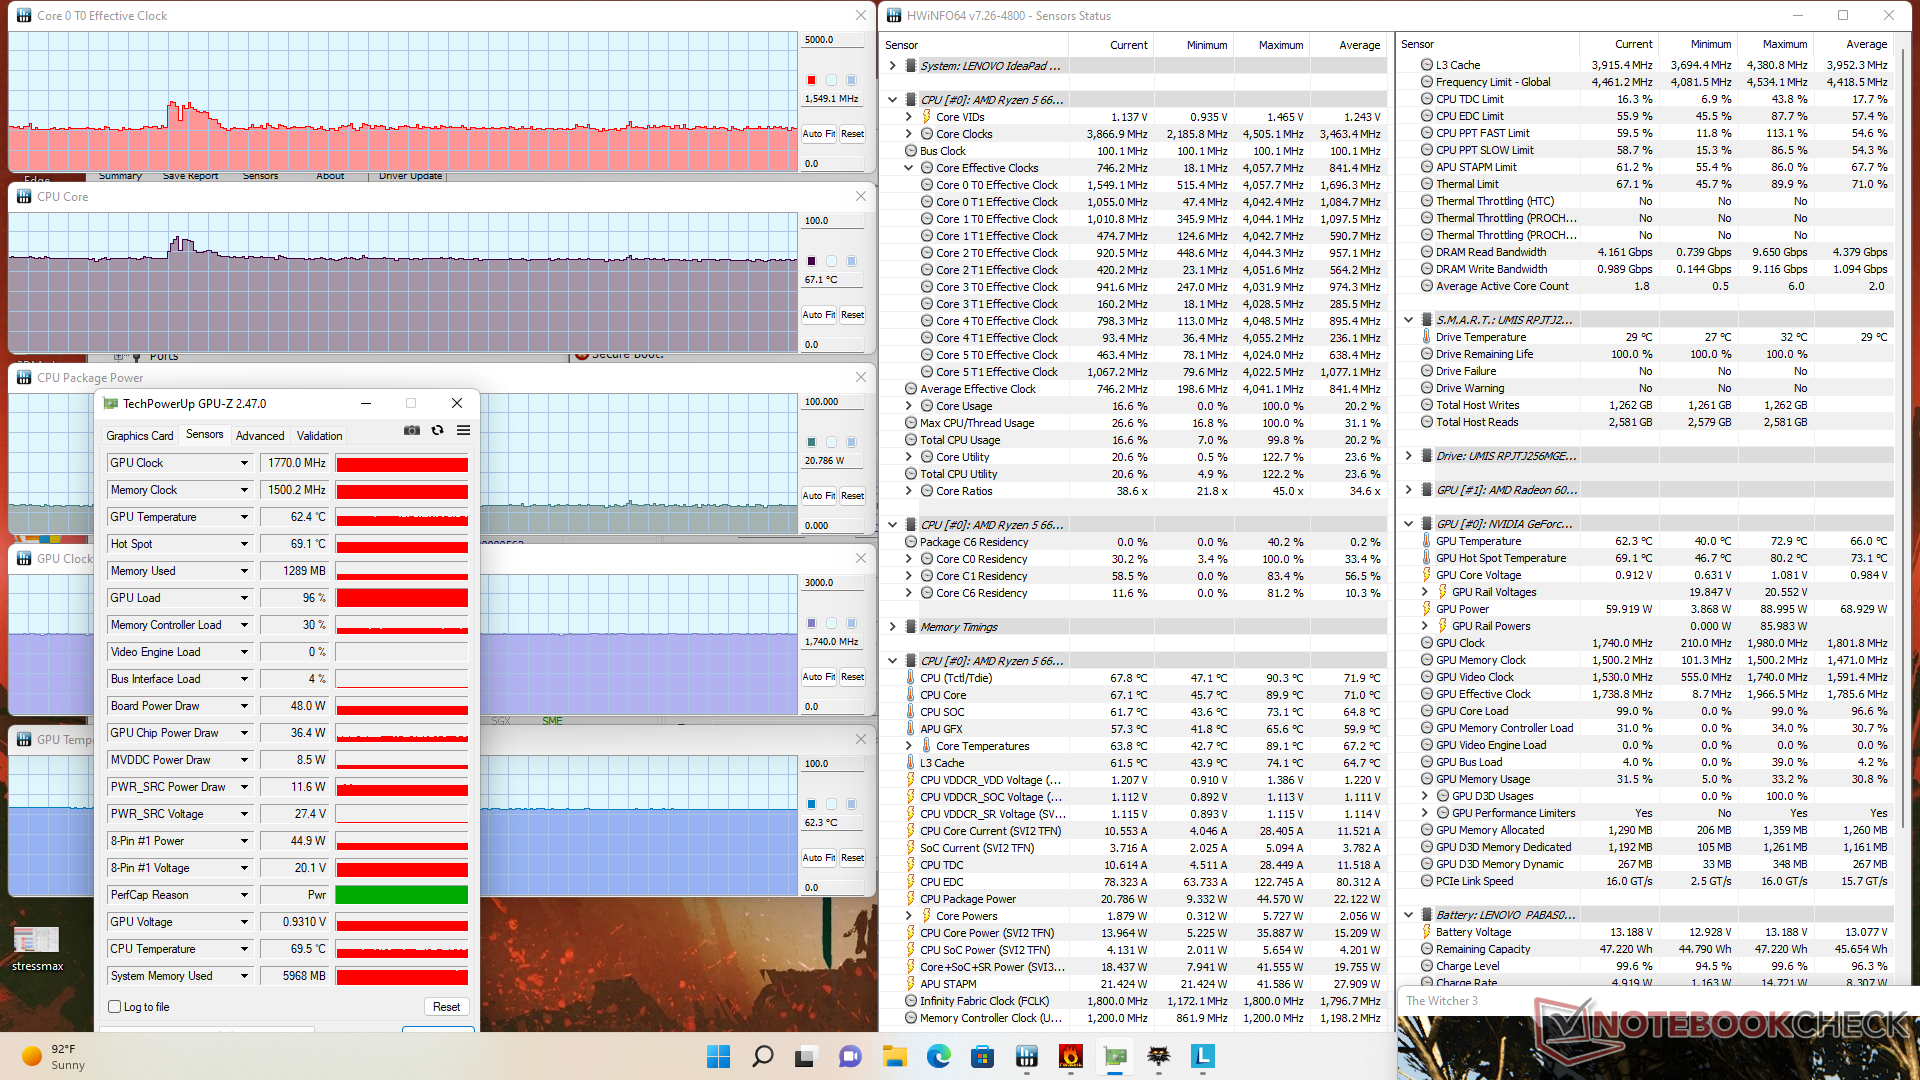
Quando si esegue Prime95 per stressare la CPU, la velocità di clock e la temperatura raggiungono rispettivamente i 4,3 GHz e i 70 C, con un assorbimento di potenza della scheda di 51 W. È interessante notare che la temperatura del core e l'assorbimento di potenza della scheda dopo pochi minuti raggiungono rispettivamente i 67 W e i 100 C, prima di scendere a 48 W e 84 C, come mostra lo screenshot qui sotto. Il processore non soffre di throttling anche quando è sottoposto al 100% di utilizzo per lunghi periodi, il che è coerente con i risultati di CineBench R15 xT riportati in precedenza.
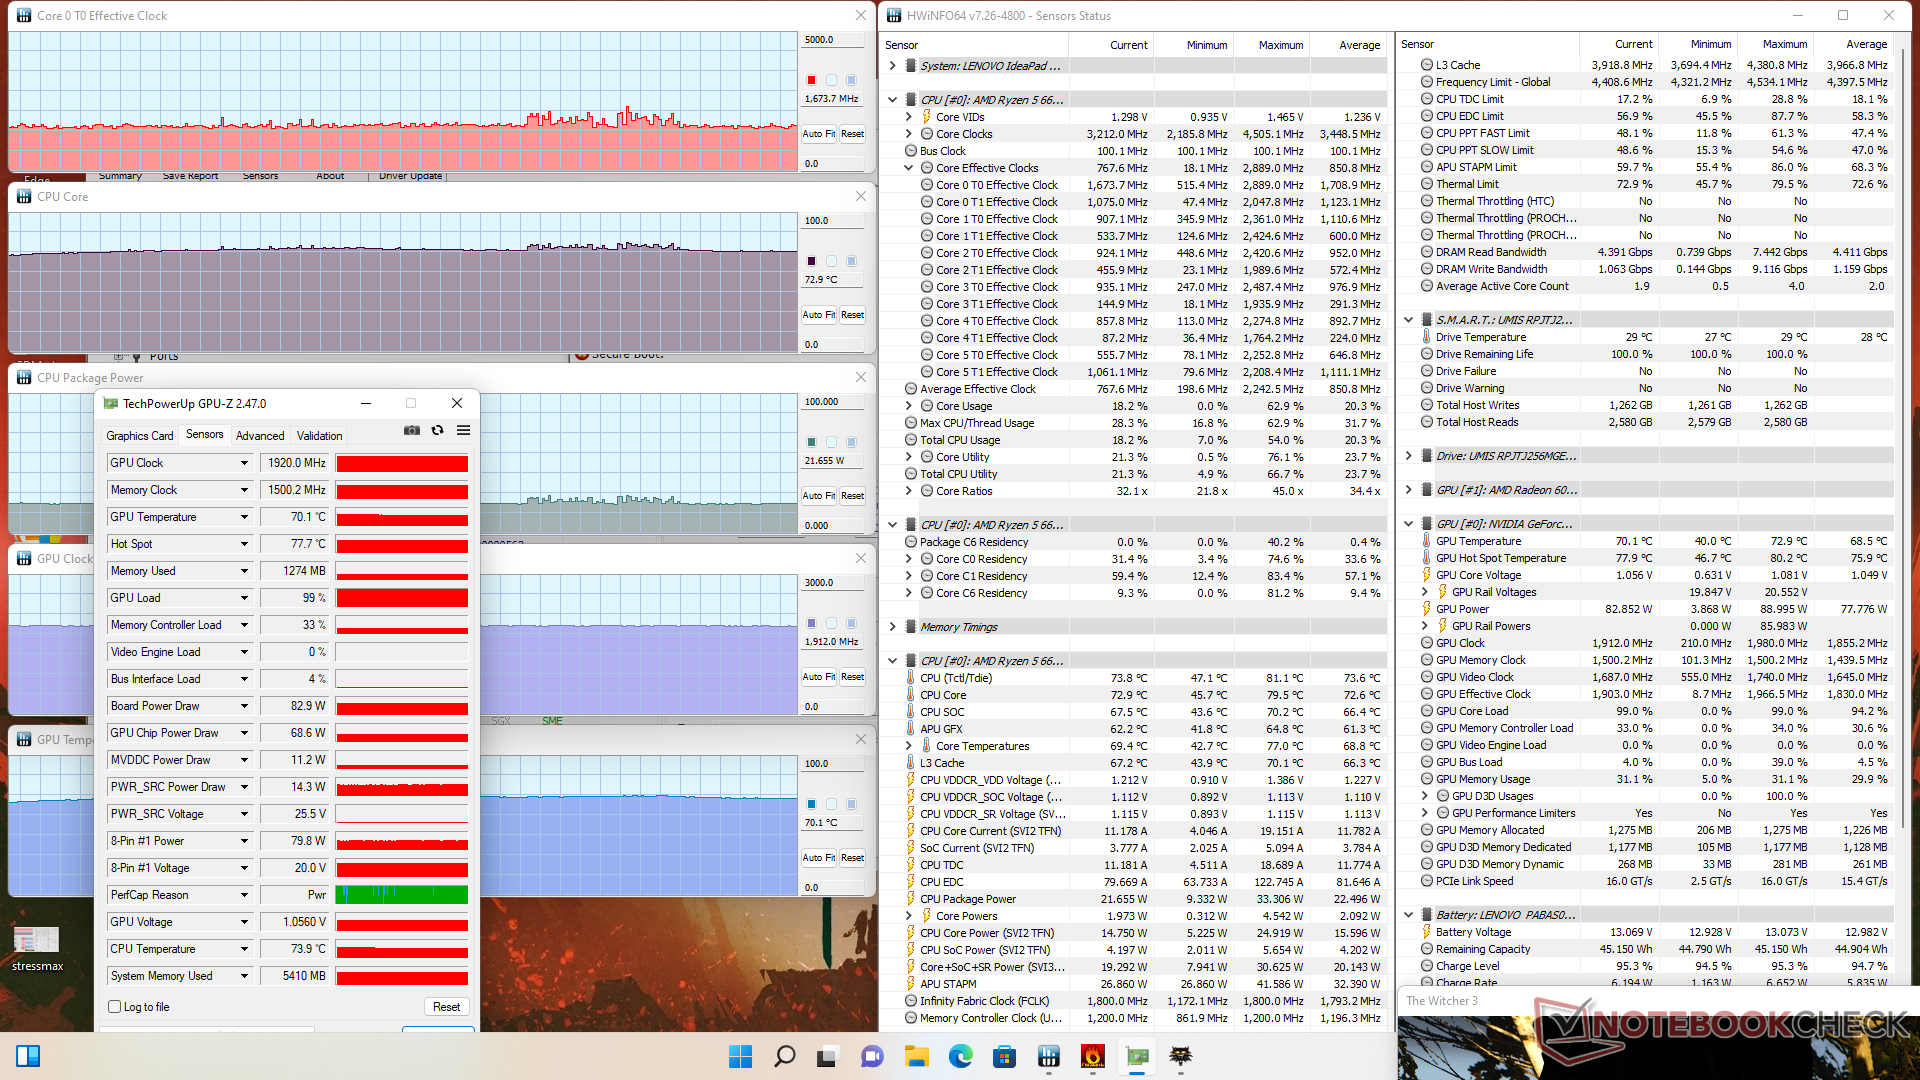
La velocità di clock della GPU, la temperatura e l'assorbimento di potenza della scheda in modalità Performance si stabilizzano a 1920 punti Witcher 3 in modalità Performance si stabilizzano rispettivamente a 1920 MHz, 70 C e 83 W, rispetto a 1770 MHz, 62 C e 48 W in modalità Balanced. Poiché la rumorosità della ventola è ridotta in modalità Bilanciata, gli utenti devono sopportare la massima rumorosità della ventola del portatile in modalità Prestazioni se vogliono sfruttare al massimo la GPU.
Il funzionamento a batteria limita la potenza della GPU più di quella della CPU. Un test di Fire Strike a batteria restituirebbe punteggi di Fisica e Grafica rispettivamente di 19770 e 9119 punti, rispetto a 20214 e 14157 punti con l'alimentazione di rete.
| Clock della CPU (GHz) | Clock della GPU (MHz) | Temperatura media della CPU (°C) | Temperatura media della GPU (°C) | |
| Sistema inattivo | -- | -- | 35 | 33 |
| Stress Prime95 | 4.0 - 4.1 | -- | 85 | 46 |
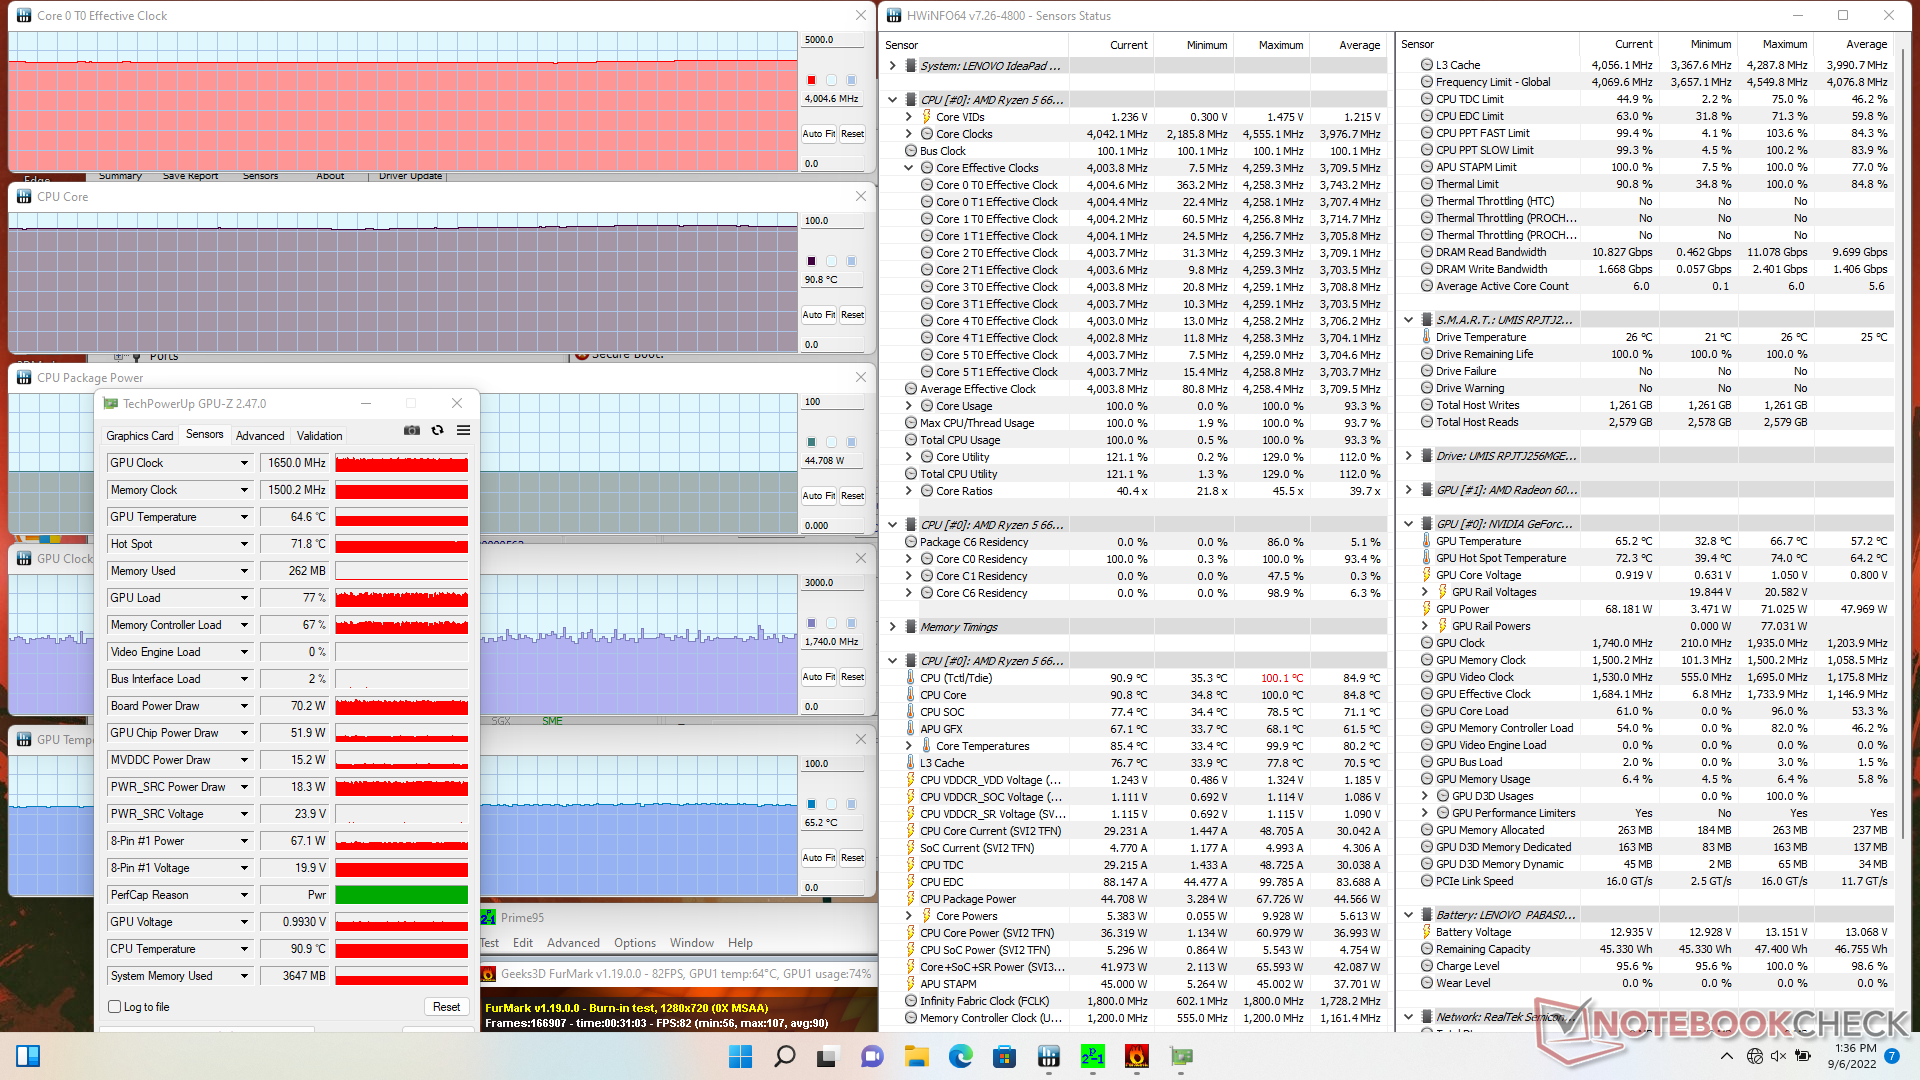
| Prime95 + FurMark Stress | 4.0 | 1650 | 91 | 65 |
| Witcher 3 Stress (modalità Performance) | 1.7 | 1920 | 73 | 70 |
| Witcher 3 Stress (modalità bilanciata) | 1,6 | 1770 | 67 | 62 |
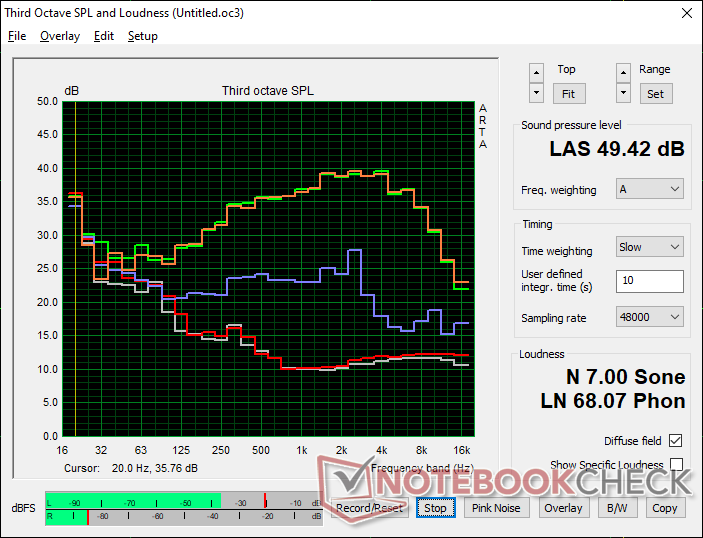
Altoparlanti
Lenovo IdeaPad Gaming 3 15ARH7 analisi audio
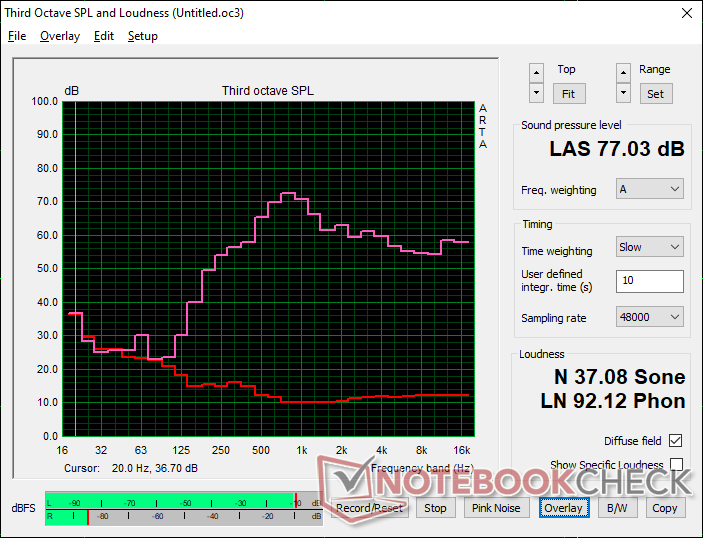
(±) | potenza degli altiparlanti media ma buona (77 dB)
Bassi 100 - 315 Hz
(-) | quasi nessun basso - in media 15.6% inferiori alla media
(±) | la linearità dei bassi è media (12.2% delta rispetto alla precedente frequenza)
Medi 400 - 2000 Hz
(±) | medi elevati - circa 8% superiore alla media
(±) | linearità dei medi adeguata (7.7% delta rispetto alla precedente frequenza)
Alti 2 - 16 kHz
(+) | Alti bilanciati - appena 2.5% dalla media
(+) | alti lineari (3.8% delta rispetto alla precedente frequenza)
Nel complesso 100 - 16.000 Hz
(±) | la linearità complessiva del suono è media (18.8% di differenza rispetto alla media
Rispetto alla stessa classe
» 62% di tutti i dispositivi testati in questa classe è stato migliore, 8% simile, 30% peggiore
» Il migliore ha avuto un delta di 6%, medio di 18%, peggiore di 132%
Rispetto a tutti i dispositivi testati
» 43% di tutti i dispositivi testati in questa classe è stato migliore, 8% similare, 49% peggiore
» Il migliore ha avuto un delta di 4%, medio di 24%, peggiore di 134%
Apple MacBook Pro 16 2021 M1 Pro analisi audio
(+) | gli altoparlanti sono relativamente potenti (84.7 dB)
Bassi 100 - 315 Hz
(+) | bassi buoni - solo 3.8% dalla media
(+) | bassi in lineaa (5.2% delta rispetto alla precedente frequenza)
Medi 400 - 2000 Hz
(+) | medi bilanciati - solo only 1.3% rispetto alla media
(+) | medi lineari (2.1% delta rispetto alla precedente frequenza)
Alti 2 - 16 kHz
(+) | Alti bilanciati - appena 1.9% dalla media
(+) | alti lineari (2.7% delta rispetto alla precedente frequenza)
Nel complesso 100 - 16.000 Hz
(+) | suono nel complesso lineare (4.6% differenza dalla media)
Rispetto alla stessa classe
» 0% di tutti i dispositivi testati in questa classe è stato migliore, 0% simile, 100% peggiore
» Il migliore ha avuto un delta di 5%, medio di 17%, peggiore di 45%
Rispetto a tutti i dispositivi testati
» 0% di tutti i dispositivi testati in questa classe è stato migliore, 0% similare, 100% peggiore
» Il migliore ha avuto un delta di 4%, medio di 24%, peggiore di 134%
Gestione dell'energia - Simile all'ultima generazione
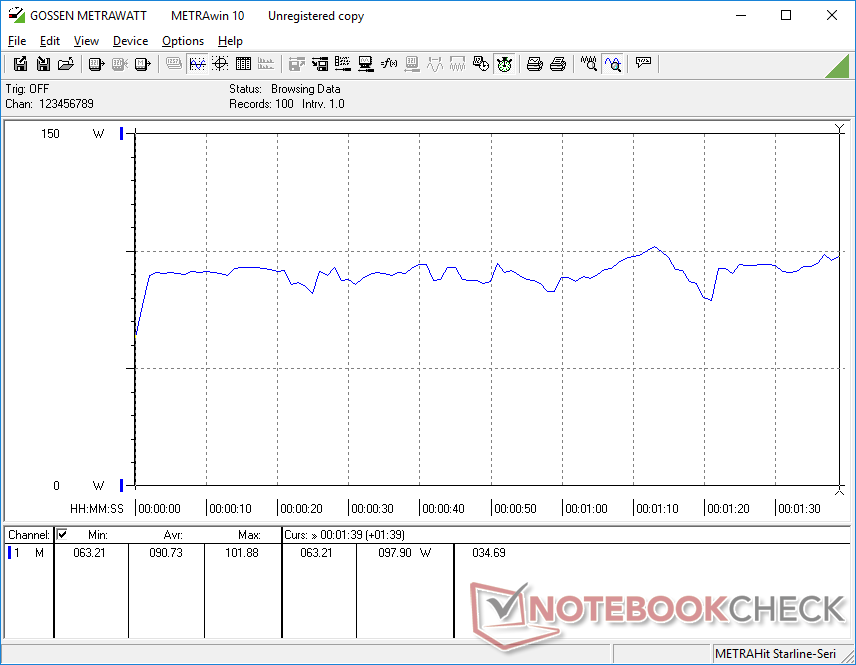
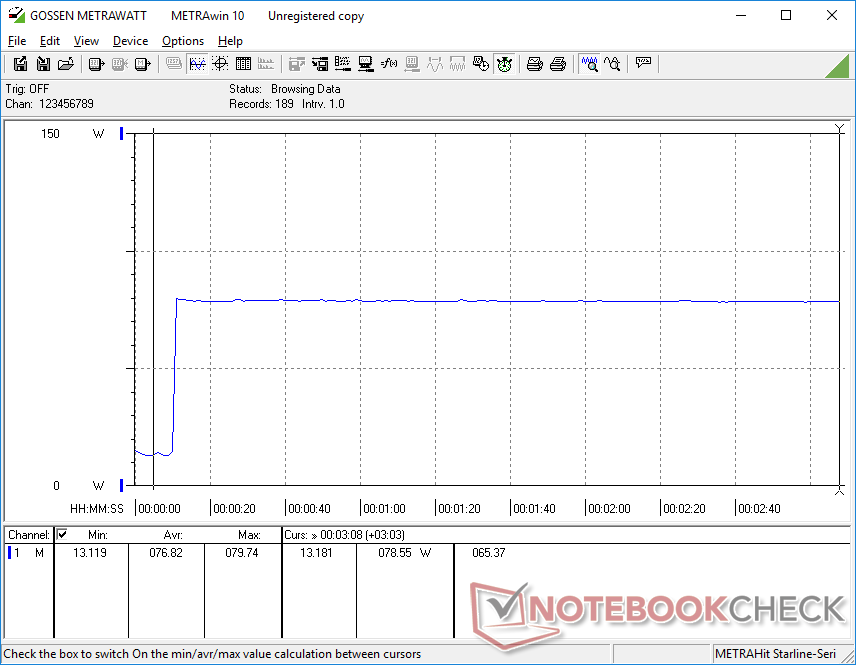
Consumo di energia
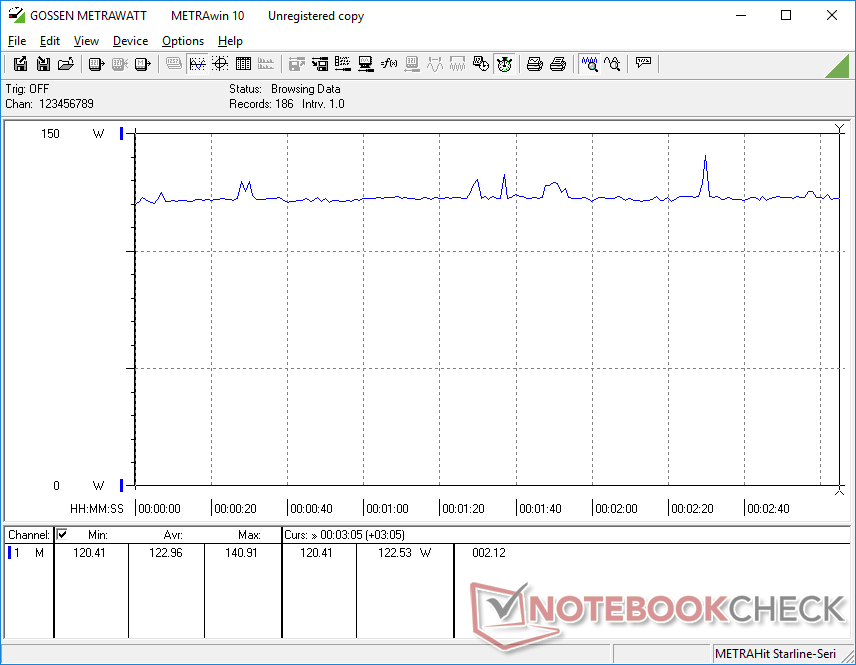
Il consumo oscilla tra i 90 W e i 123 W quando si gioca, rispetto ai 103 W e ai 140 W del Dell G5 5510 dotato della stessa GPU ma di una CPU Core i5-10500H di 10a generazione. Il consumo è generalmente inferiore sul nostro Lenovo anche quando si esegue Prime95, nonostante l'aumento delle prestazioni del 40% rispetto al Core i5, che garantisce prestazioni superiori per watt. Tuttavia, non è più efficiente del Ryzen 5 5600H, il che rende il 6600H ancora più simile a un rebrand.
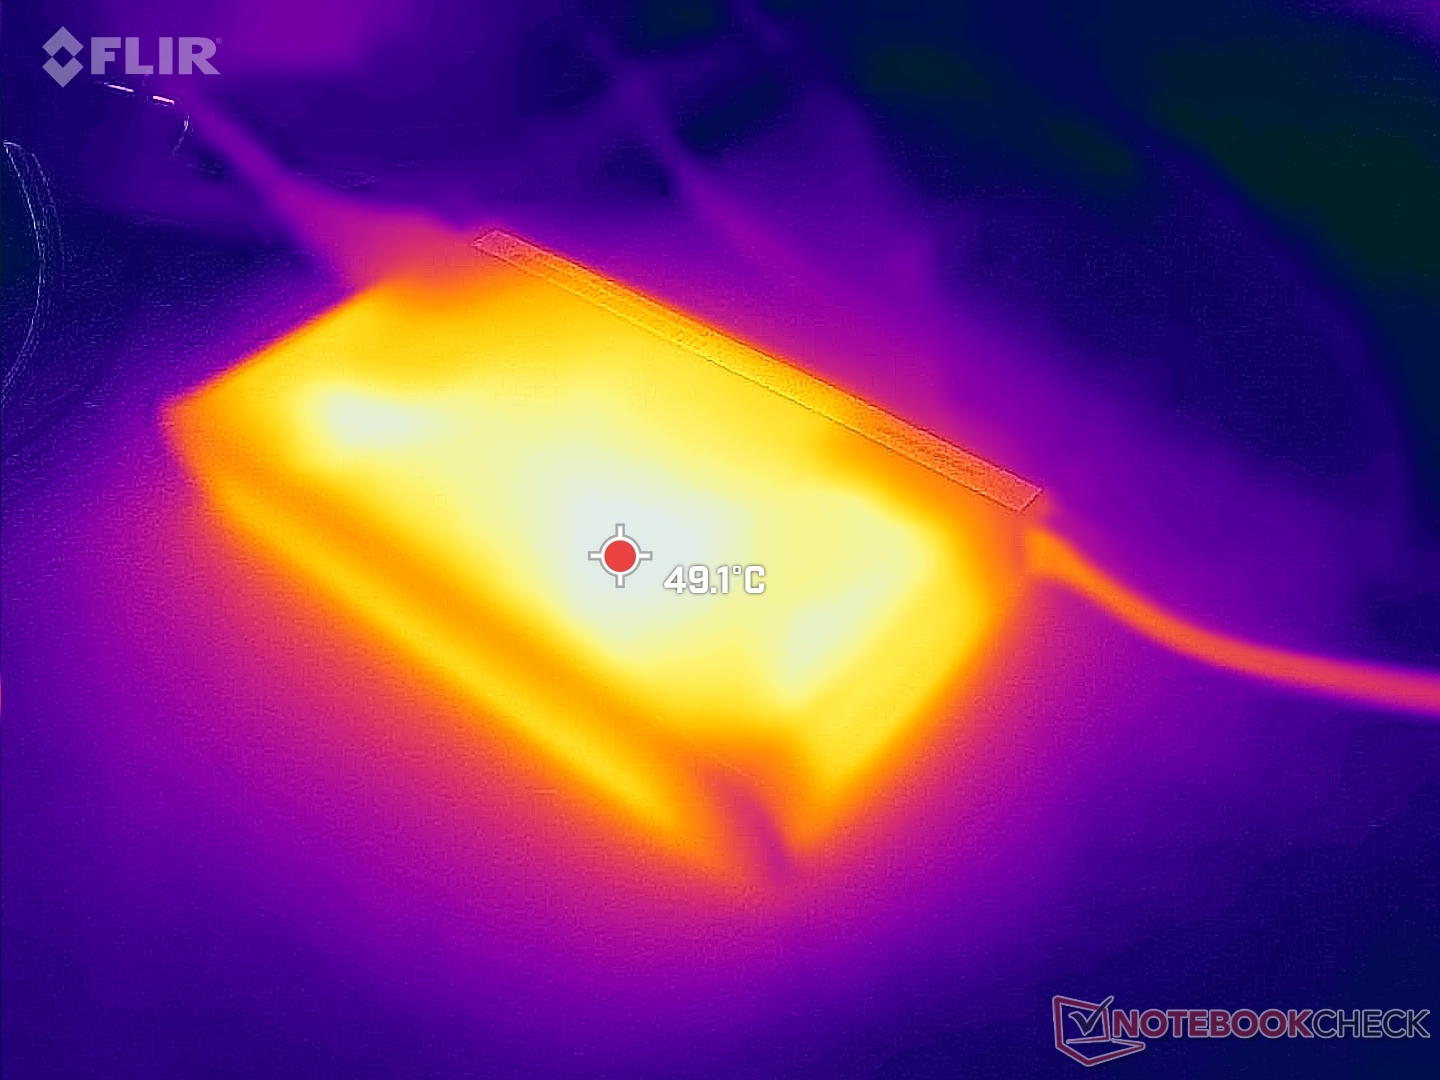
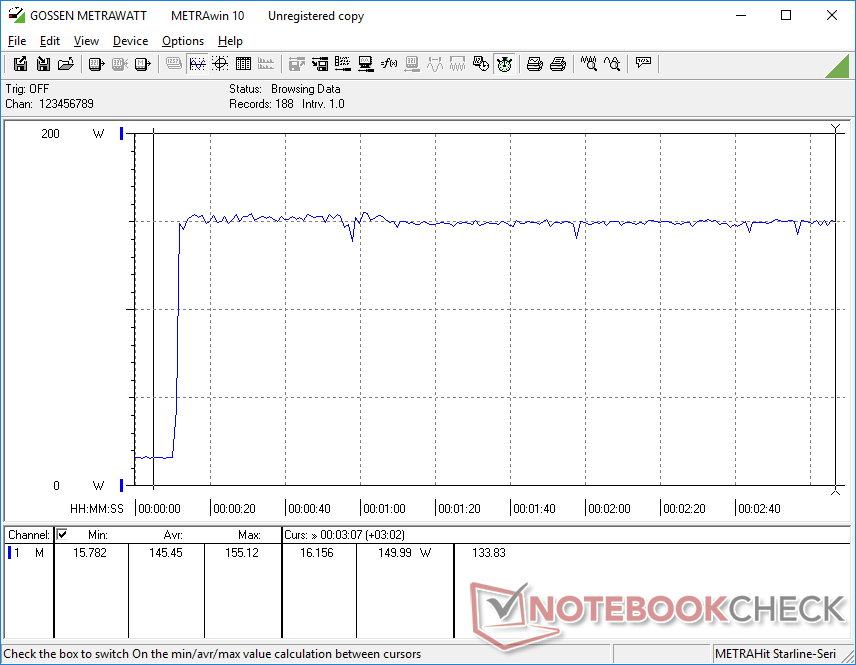
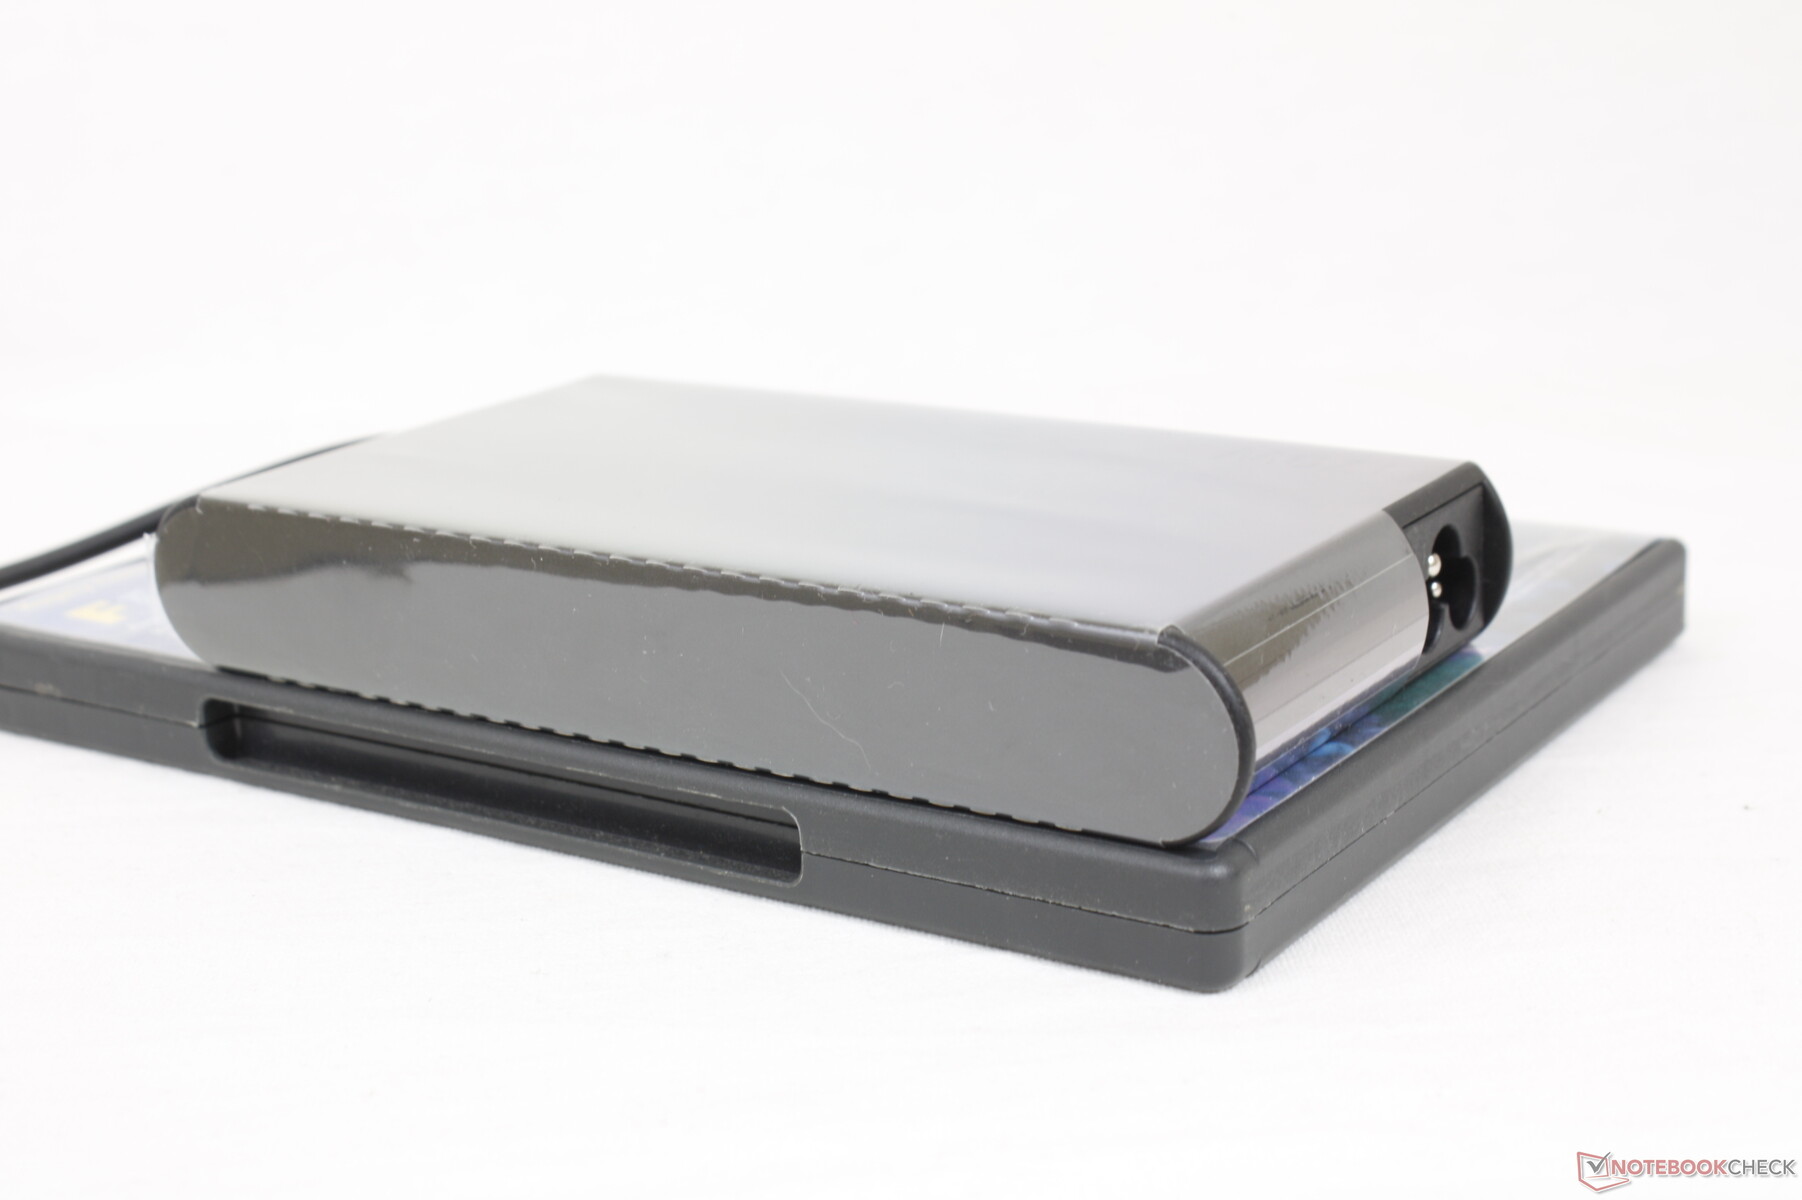
Siamo riusciti a misurare un consumo massimo di 156 W dall'adattatore CA da 170 W di dimensioni medio-piccole (~14,8 x 7,8 x 2,2 cm) quando si eseguono contemporaneamente Prime95 e FurMark. Il livello di carica della batteria scendeva dal 100% al 95% nel corso di mezz'ora, prima di tornare al 100% una volta terminato lo stress test.
| Off / Standby | |
| Idle | |
| Sotto carico |
|
Leggenda:
min: | |
| Lenovo IdeaPad Gaming 3 15ARH7 R5 6600H, GeForce RTX 3050 4GB Laptop GPU, Lenovo UMIS AM630 RPJTJ256MGE1QDY, IPS, 1920x1080, 15.6" | Lenovo IdeaPad Gaming 3i 15IMH05 i5-10300H, GeForce GTX 1650 Mobile, SK hynix BC511 HFM512GDHTNI-87A0B, IPS, 1920x1080, 15.6" | Lenovo Legion 5 15ACH6A-82NW0010GE R5 5600H, Radeon RX 6600M, Micron 2210 MTFDHBA512QFD, IPS, 1920x1080, 15.6" | Gigabyte A5 K1 R5 5600H, GeForce RTX 3060 Laptop GPU, ESR512GTLG-E6GBTNB4, IPS, 1920x1080, 15.6" | Asus TUF Dash F15 FX517ZR i7-12650H, GeForce RTX 3070 Laptop GPU, Samsung PM991a MZVLQ1T0HBLB, IPS, 2560x1440, 15.6" | Dell G15 5510 i5-10500H, GeForce RTX 3050 4GB Laptop GPU, SK Hynix BC711 HFM512GD3HX015N, IPS, 1920x1080, 15.6" | |
|---|---|---|---|---|---|---|
| Power Consumption | 8% | -39% | -34% | -30% | 5% | |
| Idle Minimum * (Watt) | 7.7 | 5.1 34% | 10 -30% | 10 -30% | 10 -30% | 3 61% |
| Idle Average * (Watt) | 9.1 | 8.2 10% | 13.2 -45% | 12 -32% | 14 -54% | 8 12% |
| Idle Maximum * (Watt) | 15.6 | 10.6 32% | 15.6 -0% | 17 -9% | 20 -28% | 13 17% |
| Load Average * (Watt) | 90.7 | 128 -41% | 178 -96% | 113 -25% | 122 -35% | 103 -14% |
| Witcher 3 ultra * (Watt) | 122.9 | 109 11% | 181 -47% | 181.4 -48% | 138.6 -13% | 139.5 -14% |
| Load Maximum * (Watt) | 155.2 | 150 3% | 180 -16% | 245 -58% | 189 -22% | 204 -31% |
* ... Meglio usare valori piccoli
Power Consumption Witcher 3 / Stresstest
Power Consumption external Monitor
Durata della batteria
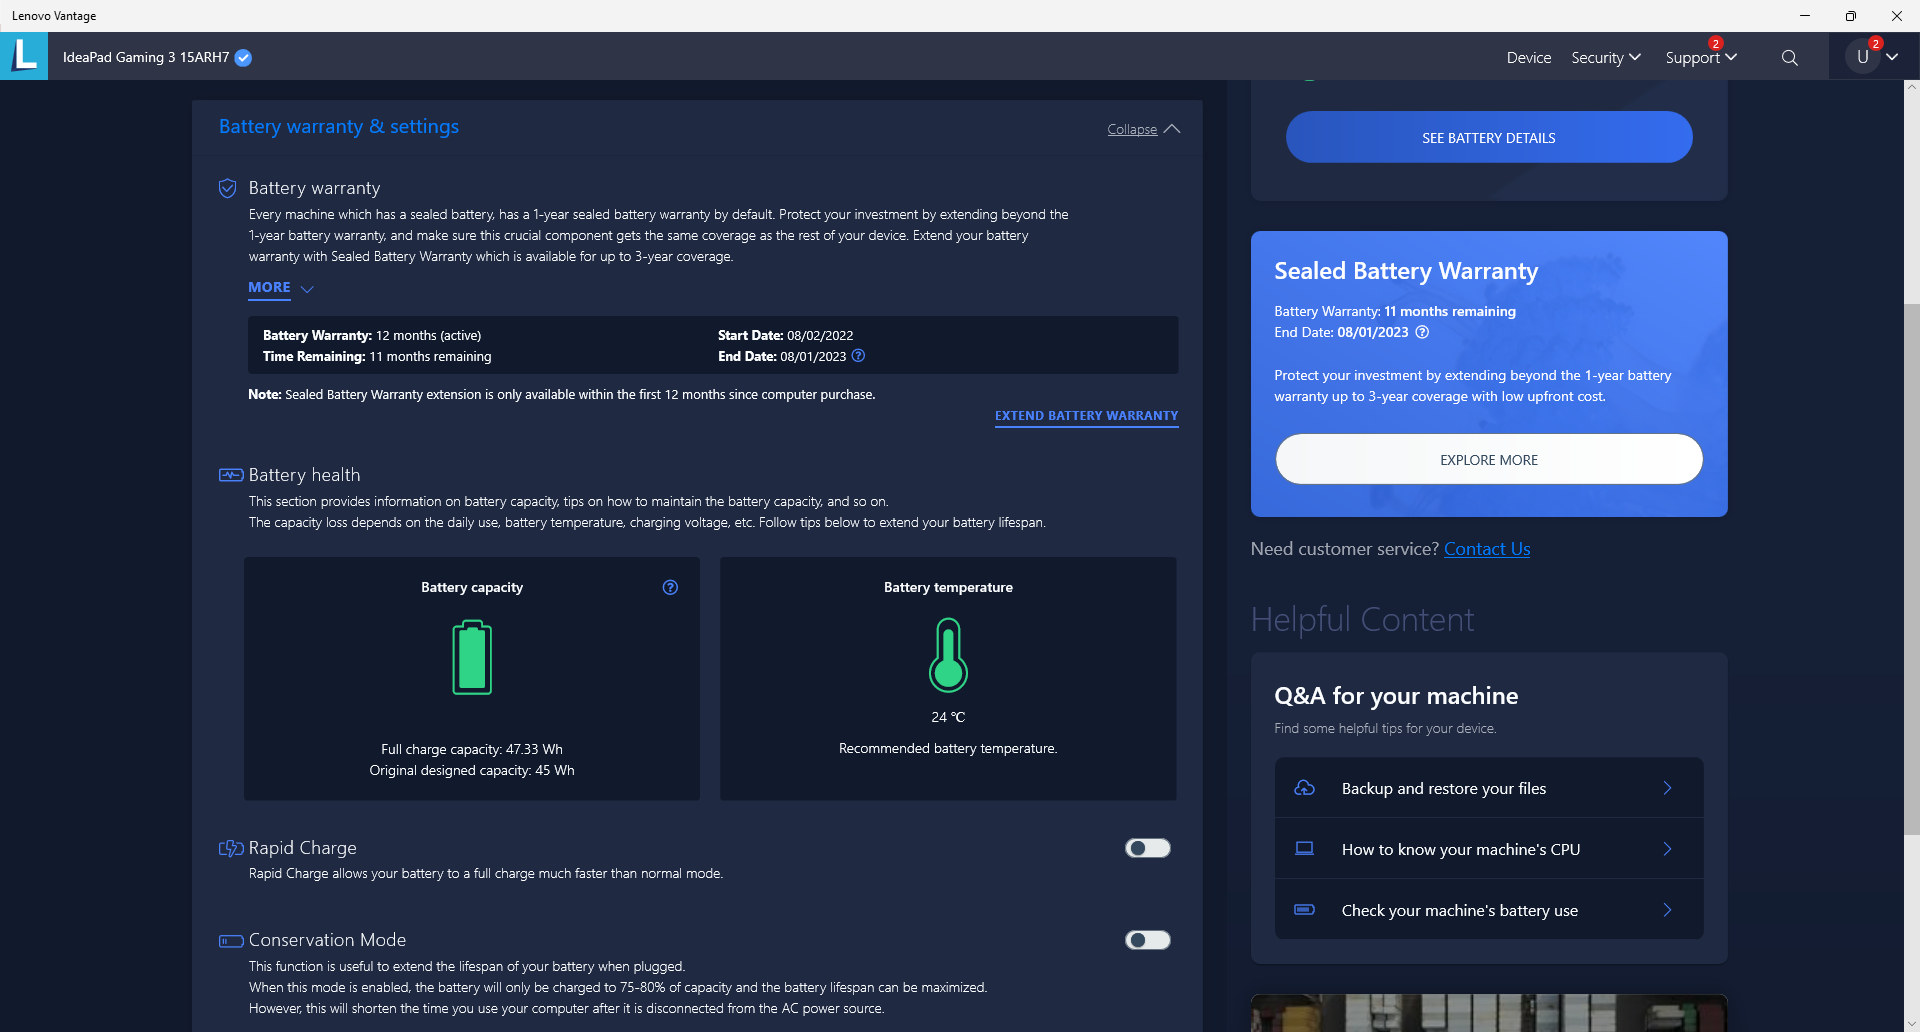
La capacità della batteria è ridotta a soli 45 Wh, un valore tipico dei portatili da gioco economici. La navigazione web nel mondo reale con il profilo di alimentazione bilanciato e la GPU integrata attiva durerebbe circa 6,5 ore prima di dover essere ricaricata, proprio come abbiamo osservato sull'IdeaPad Gaming 3i.IdeaPad Gaming 3i.
La ricarica da vuoto a pieno con l'adattatore CA proprietario incluso richiede circa 1,5-2 ore. Possiamo confermare che anche la maggior parte dei caricatori USB-C è in grado di ricaricare il sistema.
Va detto che l'autonomia della batteria in modalità Risparmio energetico (o modalità Lenovo Quiet) con l'iGPU attiva e la luminosità del display impostata al minimo è insolitamente breve: solo 2 ore e 22 minuti. Abbiamo ripetuto questo test per essere sicuri e i risultati non sono cambiati. È possibile che il sistema soffra di un problema di consumo energetico in determinate impostazioni e condizioni della batteria.
| Lenovo IdeaPad Gaming 3 15ARH7 R5 6600H, GeForce RTX 3050 4GB Laptop GPU, 45 Wh | Lenovo IdeaPad Gaming 3i 15IMH05 i5-10300H, GeForce GTX 1650 Mobile, 45 Wh | Lenovo Legion 5 15ACH6A-82NW0010GE R5 5600H, Radeon RX 6600M, 80 Wh | Gigabyte A5 K1 R5 5600H, GeForce RTX 3060 Laptop GPU, 48.96 Wh | Asus TUF Dash F15 FX517ZR i7-12650H, GeForce RTX 3070 Laptop GPU, 76 Wh | Dell G15 5510 i5-10500H, GeForce RTX 3050 4GB Laptop GPU, 56 Wh | |
|---|---|---|---|---|---|---|
| Autonomia della batteria | 171% | 199% | 6% | 171% | 125% | |
| Reader / Idle (h) | 2.4 | 12.4 417% | 12.8 433% | 10.8 350% | 11.3 371% | |
| WiFi v1.3 (h) | 6.5 | 6.3 -3% | 9.2 42% | 6.9 6% | 7 8% | 6 -8% |
| Load (h) | 0.9 | 1.8 100% | 2 122% | 2.3 156% | 1 11% | |
| H.264 (h) | 7.3 | 5.8 |
Pro
Contro
Verdetto - La nuova CPU Ryzen 5 6600U non offre molto ai portatili da gioco
La differenza maggiore tra il Ryzen 5 5600H e Ryzen 5 6600H è che il primo è dotato di grafica Radeon RX Vega integrata, mentre il secondo è dotato di Radeon 660M integrata per prestazioni iGPU significativamente più veloci. Per il resto, i due processori sono quasi identici in termini di prestazioni della CPU. Il problema di questa soluzione sui portatili da gioco è che quasi tutti i modelli di portatili da gioco sono già dotati di una grafica discreta più veloce che rende la soluzione integrata quasi inutile nella stragrande maggioranza dei casi. Quindi, per massimizzare le prestazioni di gioco, è meglio evitare la Radeon 660M o 680M e puntare invece su una GPU più veloce come la RTX 3060 anche se ciò significa accontentarsi di un Ryzen 5 5600H o Ryzen 7 5800H di ultima generazione Ryzen 7 5800H CPU AMD.
Il Ryzen 5 6600H dà quindi il meglio di sé su laptop e mini PC senza opzione GPU dedicata. Solo allora le prestazioni e l'efficienza della Radeon 660M integrata possono davvero brillare.
Per quanto riguarda il portatile Lenovo in sé, merita sicuramente un elogio per i suoi ampi tasti freccia, il prezzo di partenza basso e il display IPS standard da 120 Hz a 1080p con FreeSync e tempi di risposta decenti. I colori sono scarsi, ma questo è un inconveniente comune ai portatili da gioco economici come questo. Le nostre critiche più importanti riguardano invece la difficile manutenzione e il peso elevato del portatile. Alternative economiche come il modello MSI GF63, Acer Nitro 5, HP Pavilion Gaming 15, o Asus TUF Dash sono tutti più leggeri e facili da aggiornare. Il tentativo di aggiungere più RAM o memoria nell'IdeaPad Gaming 3 è fastidiosamente più scomodo in confronto.
Prezzo e disponibilità
Il Lenovo IdeaPad Gaming 3 15ARH7 è ora ampiamente disponibile presso i principali rivenditori online come Walmart, Best Buye Amazon al prezzo di 969 dollari. Si noti che queste SKU vengono tutte spedite con la GPU RTX 3050 Ti di GeForce, leggermente più veloce, anziché con la RTX 3050. La nostra configurazione con la RTX 3050 non è così comune al momento.
Lenovo IdeaPad Gaming 3 15ARH7
- 09/09/2022 v7 (old)
Allen Ngo
Price comparison

