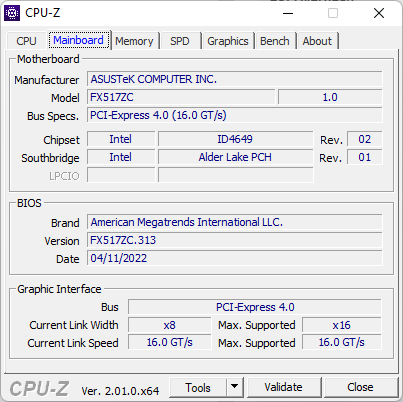
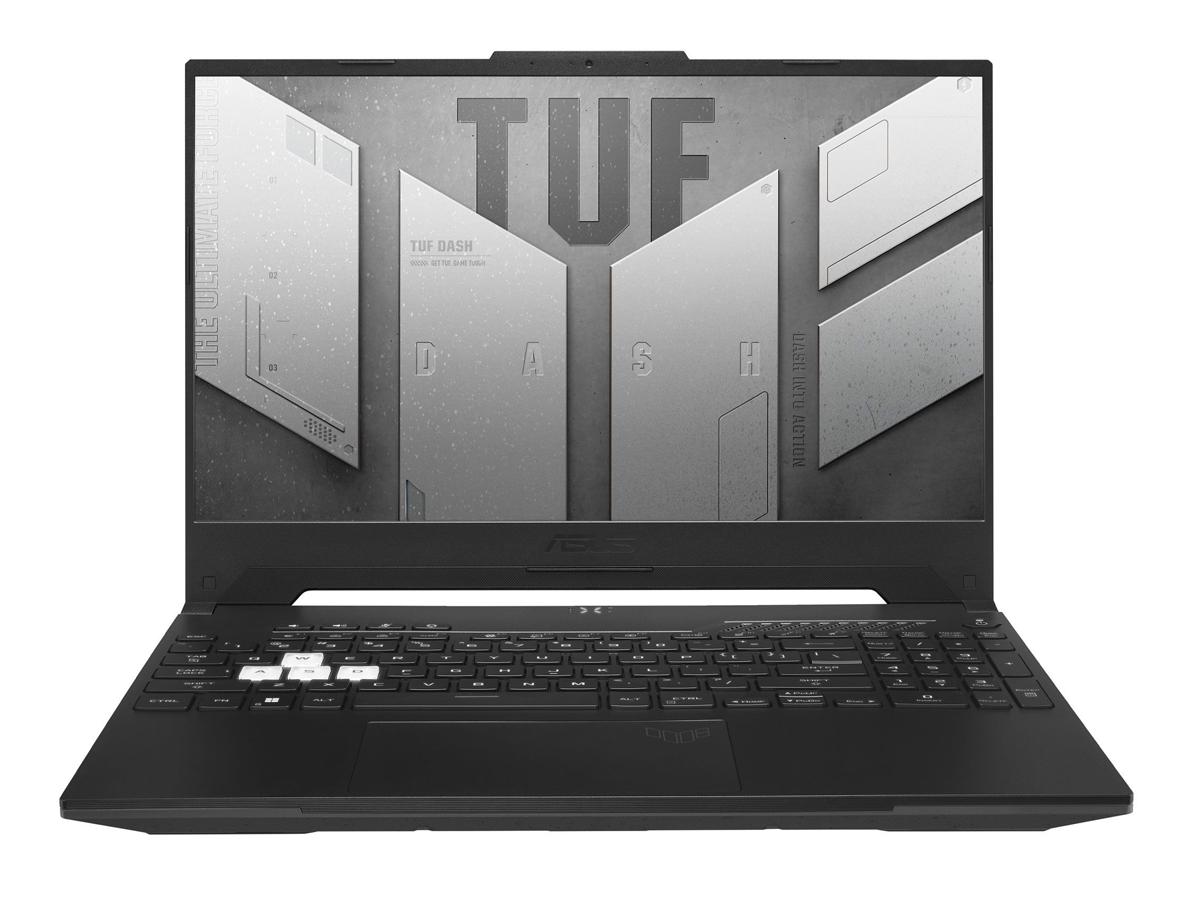
Recensione del portatile Asus TUF Dash F15 FX517ZC: 1440p, 165 Hz e colori P3 completi per meno di 1000 dollari
A differenza della serie di punta Asus ROG, la serie Asus TUF ospita laptop da gioco di fascia media che in genere omettono caratteristiche lussuose come le luci RGB o l'Asus Keystone a favore di prezzi più accessibili. La serie TUF Dash F15 FX517, in particolare, può essere configurata con l'opzione economica GeForce RTX 3050 (FX517ZC) fino alla RTX 3070 (FX517ZR). Questa recensione si concentra sull'opzione RTX 3050.
Consigliamo di consultare la nostra recensione sulla configurazione RTX 3070, che condivide lo stesso display 1440p 165 Hz, la CPU Core i7-12650H e sostanzialmente le stesse caratteristiche fisiche della configurazione RTX 3050. I concorrenti in questo settore includono altri portatili da gioco a prezzi accessibili, con un prezzo di 1000 dollari o meno, come il modello Dell G15 5510, MSI Bravo 15, Lenovo IdeaPad Gaming 3 15o il Gigabyte G5.
Altre recensioni di Asus
Potenziali concorrenti a confronto
Punteggio | Data | Modello | Peso | Altezza | Dimensione | Risoluzione | Prezzo |
|---|---|---|---|---|---|---|---|
| 84.9 % v7 (old) | 08/2022 | Asus TUF Dash F15 FX517ZC i7-12650H, GeForce RTX 3050 4GB Laptop GPU | 1.9 kg | 20.7 mm | 15.60" | 2560x1440 | |
| 85.8 % v7 (old) | 07/2022 | Asus TUF Dash F15 FX517ZR i7-12650H, GeForce RTX 3070 Laptop GPU | 2 kg | 20.7 mm | 15.60" | 2560x1440 | |
| 81 % v7 (old) | 06/2022 | Dell G15 5510 i5-10500H, GeForce RTX 3050 4GB Laptop GPU | 2.5 kg | 23 mm | 15.60" | 1920x1080 | |
| 78.2 % v7 (old) | 04/2022 | MSI Bravo 15 B5DD-010US R5 5600H, Radeon RX 5500M | 2.3 kg | 24.95 mm | 15.60" | 1920x1080 | |
| 79.7 % v7 (old) | 03/2022 | Lenovo Ideapad Gaming 3 15IHU-82K1002RGE i5-11300H, GeForce RTX 3050 Ti Laptop GPU | 2 kg | 24.2 mm | 15.60" | 1920x1080 | |
| 81.7 % v7 (old) | 11/2021 | Gigabyte G5 GD i5-11400H, GeForce RTX 3050 4GB Laptop GPU | 2.1 kg | 31.6 mm | 15.60" | 1920x1080 |
Caso
Connettività
È importante notare che, pur essendo presenti due porte USB-C, solo quella più vicina al bordo frontale supporta la ricarica USB-C. Per il resto, entrambe sono in grado di funzionare con DisplayPort-over-USB.
Comunicazione
Il modello viene fornito senza supporto Wi-Fi 6E, probabilmente per risparmiare sui costi. Le prestazioni sono comunque sufficienti e stabili per il target dei giocatori economici.
| Networking | |
| iperf3 transmit AX12 | |
| Gigabyte G5 GD | |
| Lenovo Ideapad Gaming 3 15IHU-82K1002RGE | |
| MSI Bravo 15 B5DD-010US | |
| iperf3 receive AX12 | |
| Lenovo Ideapad Gaming 3 15IHU-82K1002RGE | |
| Gigabyte G5 GD | |
| MSI Bravo 15 B5DD-010US | |
| iperf3 receive AXE11000 | |
| Dell G15 5510 | |
| Asus TUF Dash F15 FX517ZR | |
| Asus TUF Dash F15 FX517ZC | |
| iperf3 transmit AXE11000 | |
| Asus TUF Dash F15 FX517ZR | |
| Asus TUF Dash F15 FX517ZC | |
Webcam
La webcam integrata è quella standard da 1 MP, priva di otturatore per la privacy e di funzioni IR.


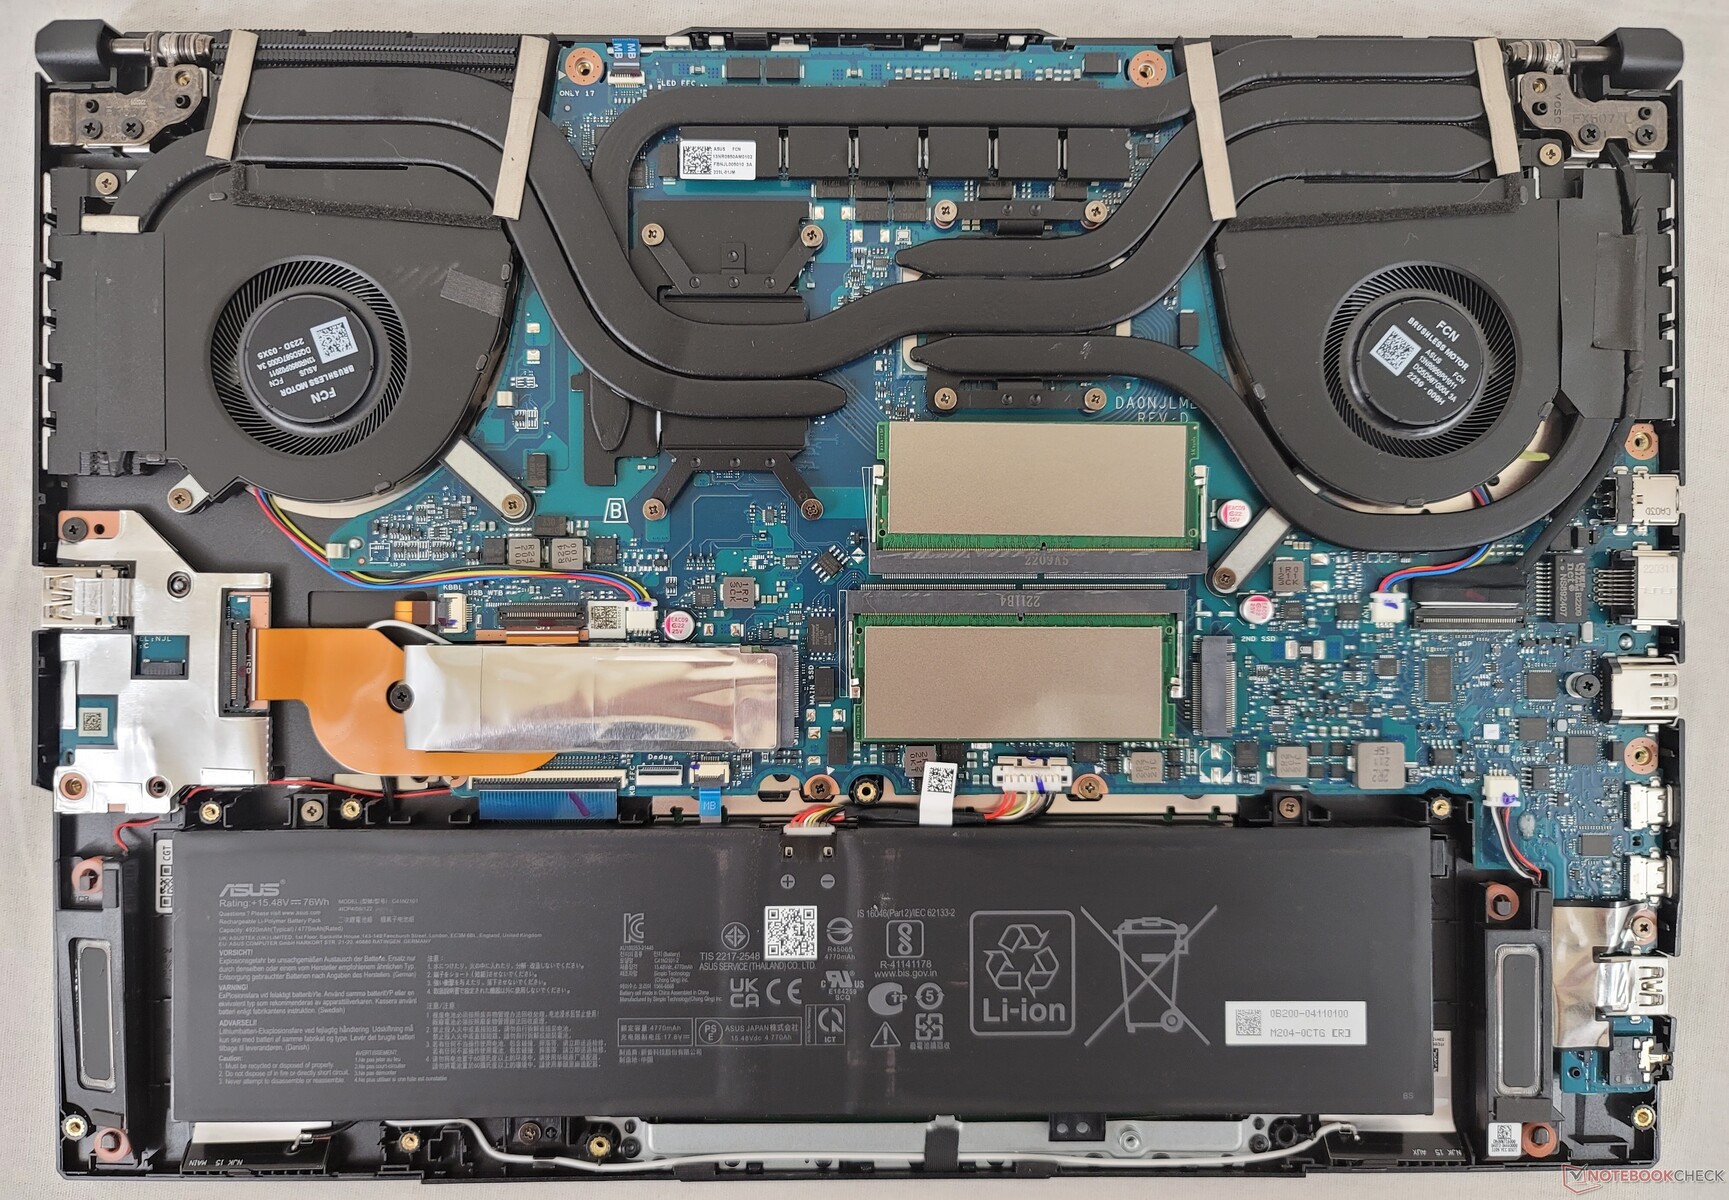
Manutenzione
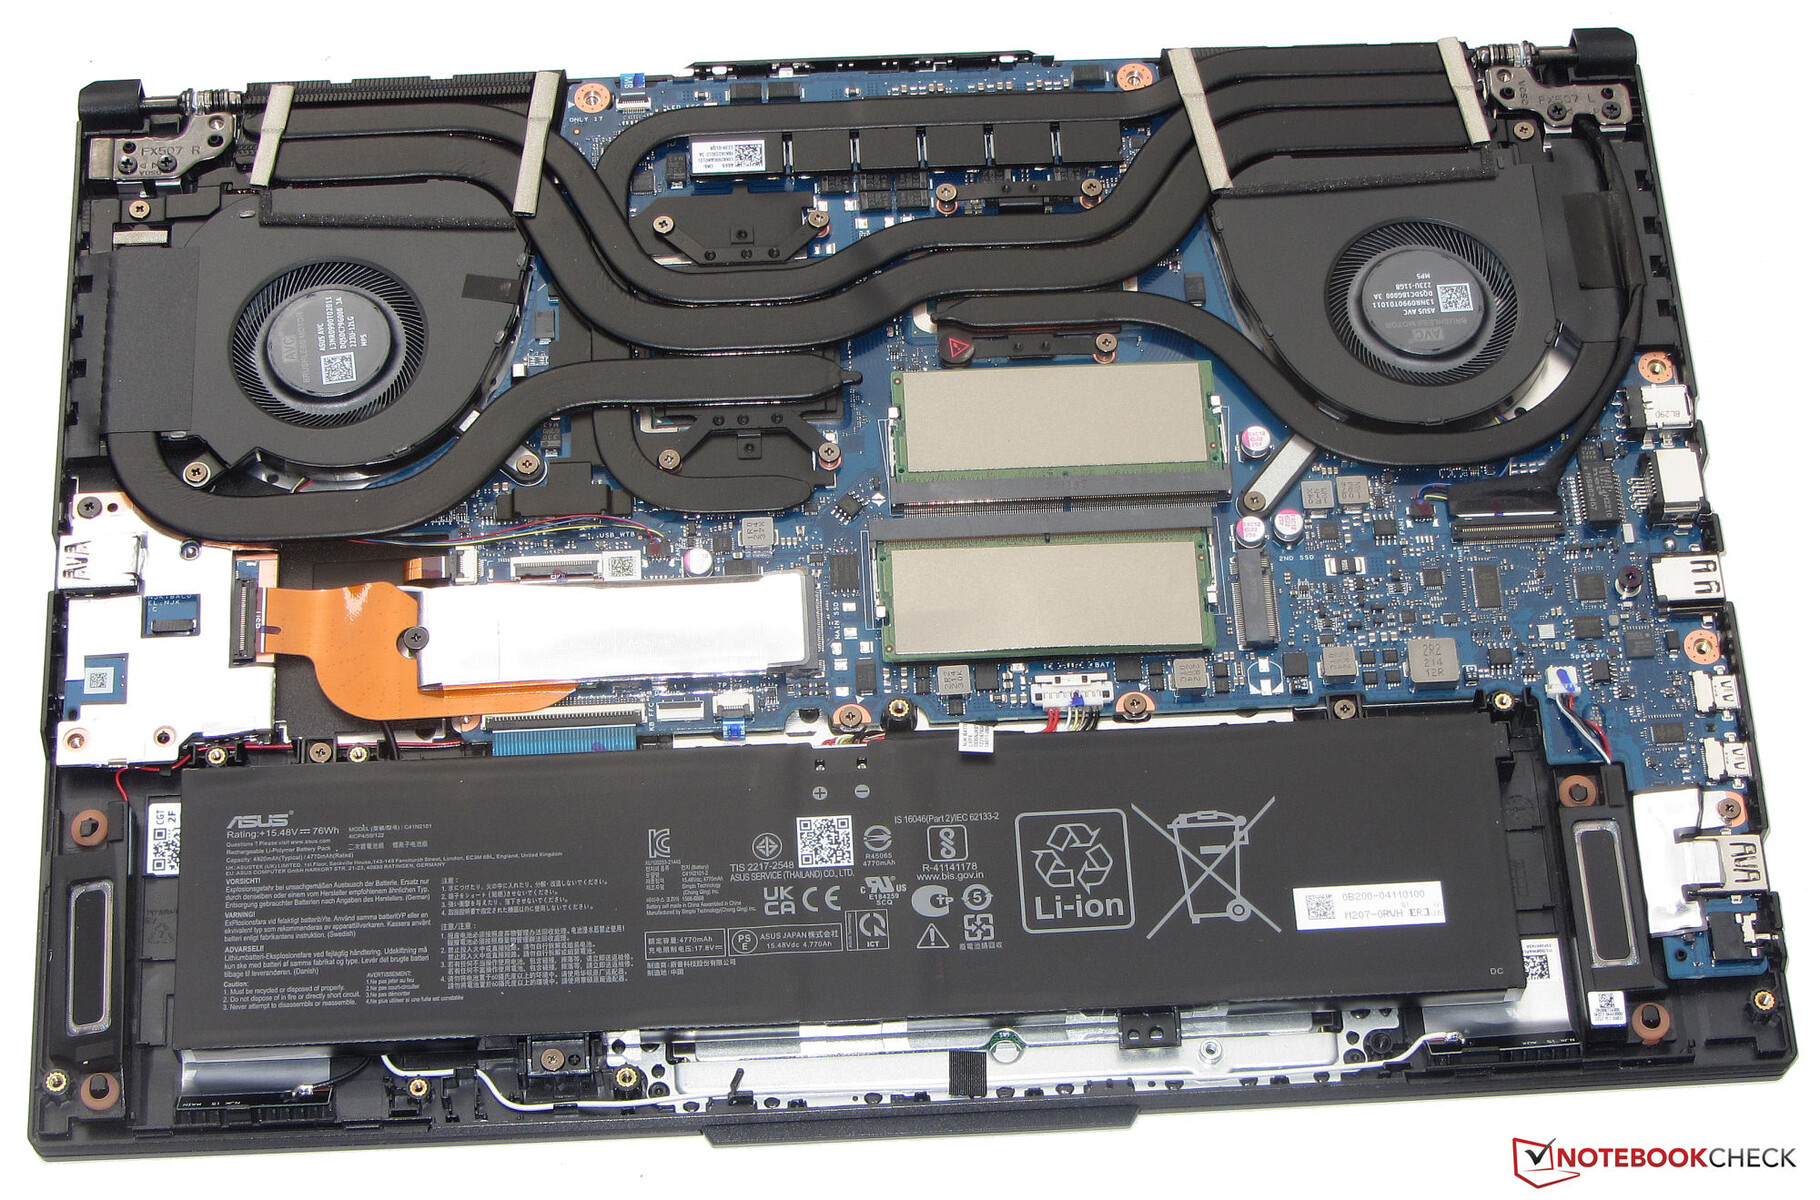
Il pannello inferiore può essere rimosso molto facilmente con un semplice cacciavite Philips per rivelare 2 alloggiamenti M.2, 2 slot SODIMM e il modulo WLAN nascosto sotto l'unità SSD M.2 primaria. Rispetto all'FX517ZR, l'FX517ZC utilizza un minor numero di heat pipe in rame sopra la GPU, come mostrato di seguito, per un peso leggermente inferiore.
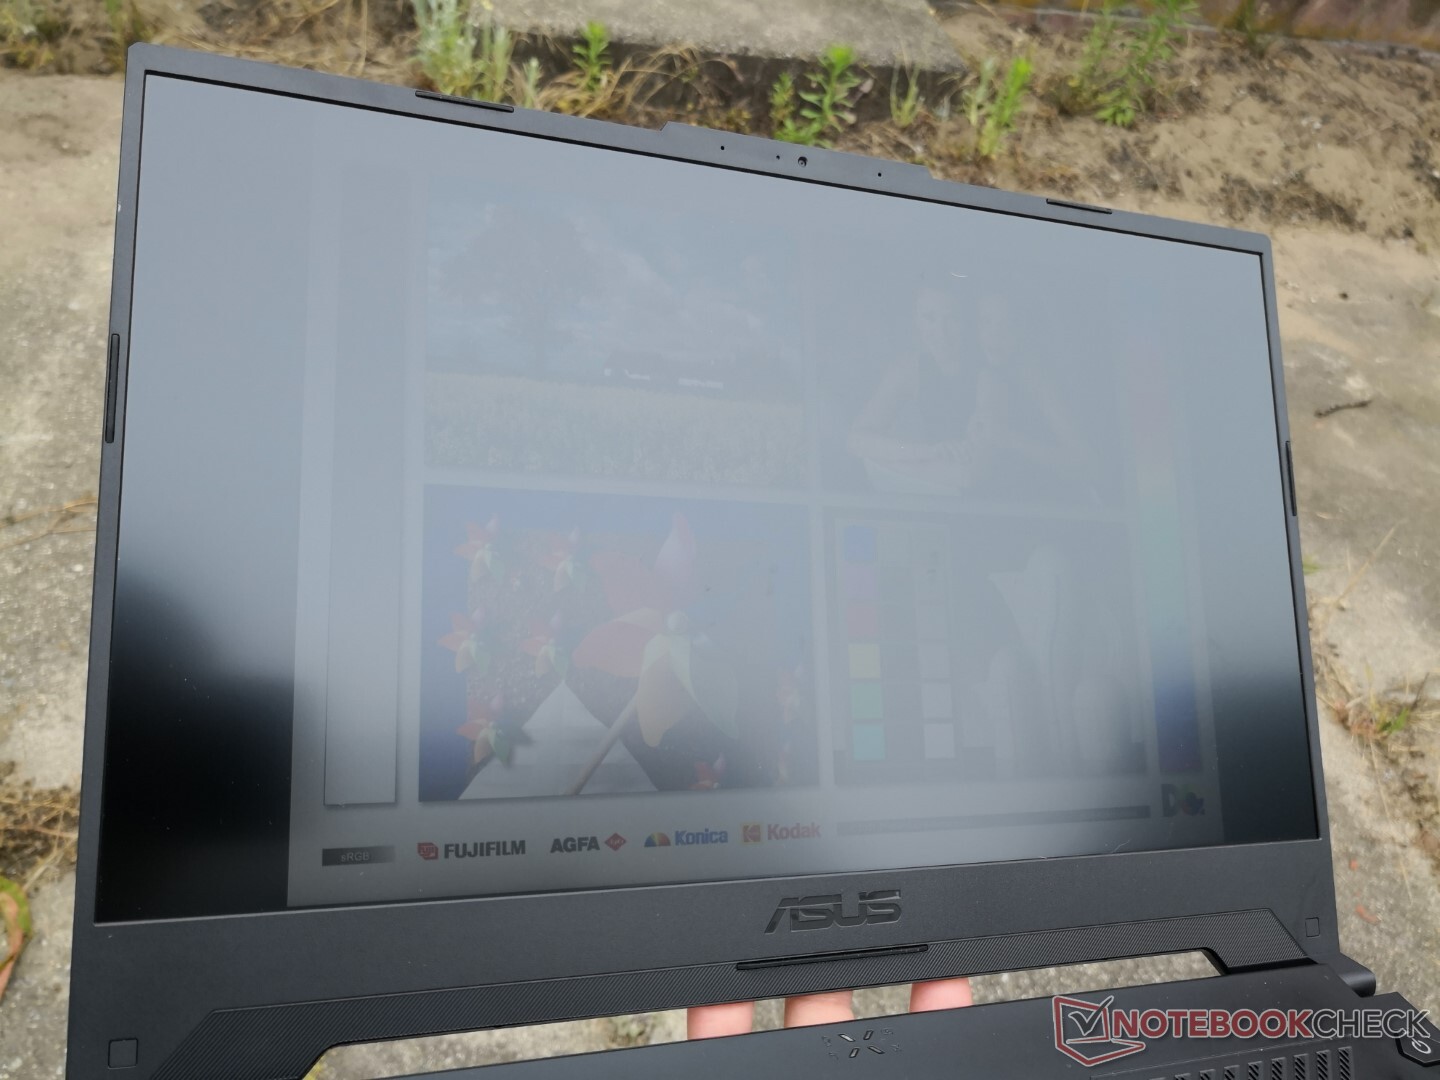
Display


| |||||||||||||||||||||||||
Distribuzione della luminosità: 88 %
Al centro con la batteria: 354.2 cd/m²
Contrasto: 1107:1 (Nero: 0.32 cd/m²)
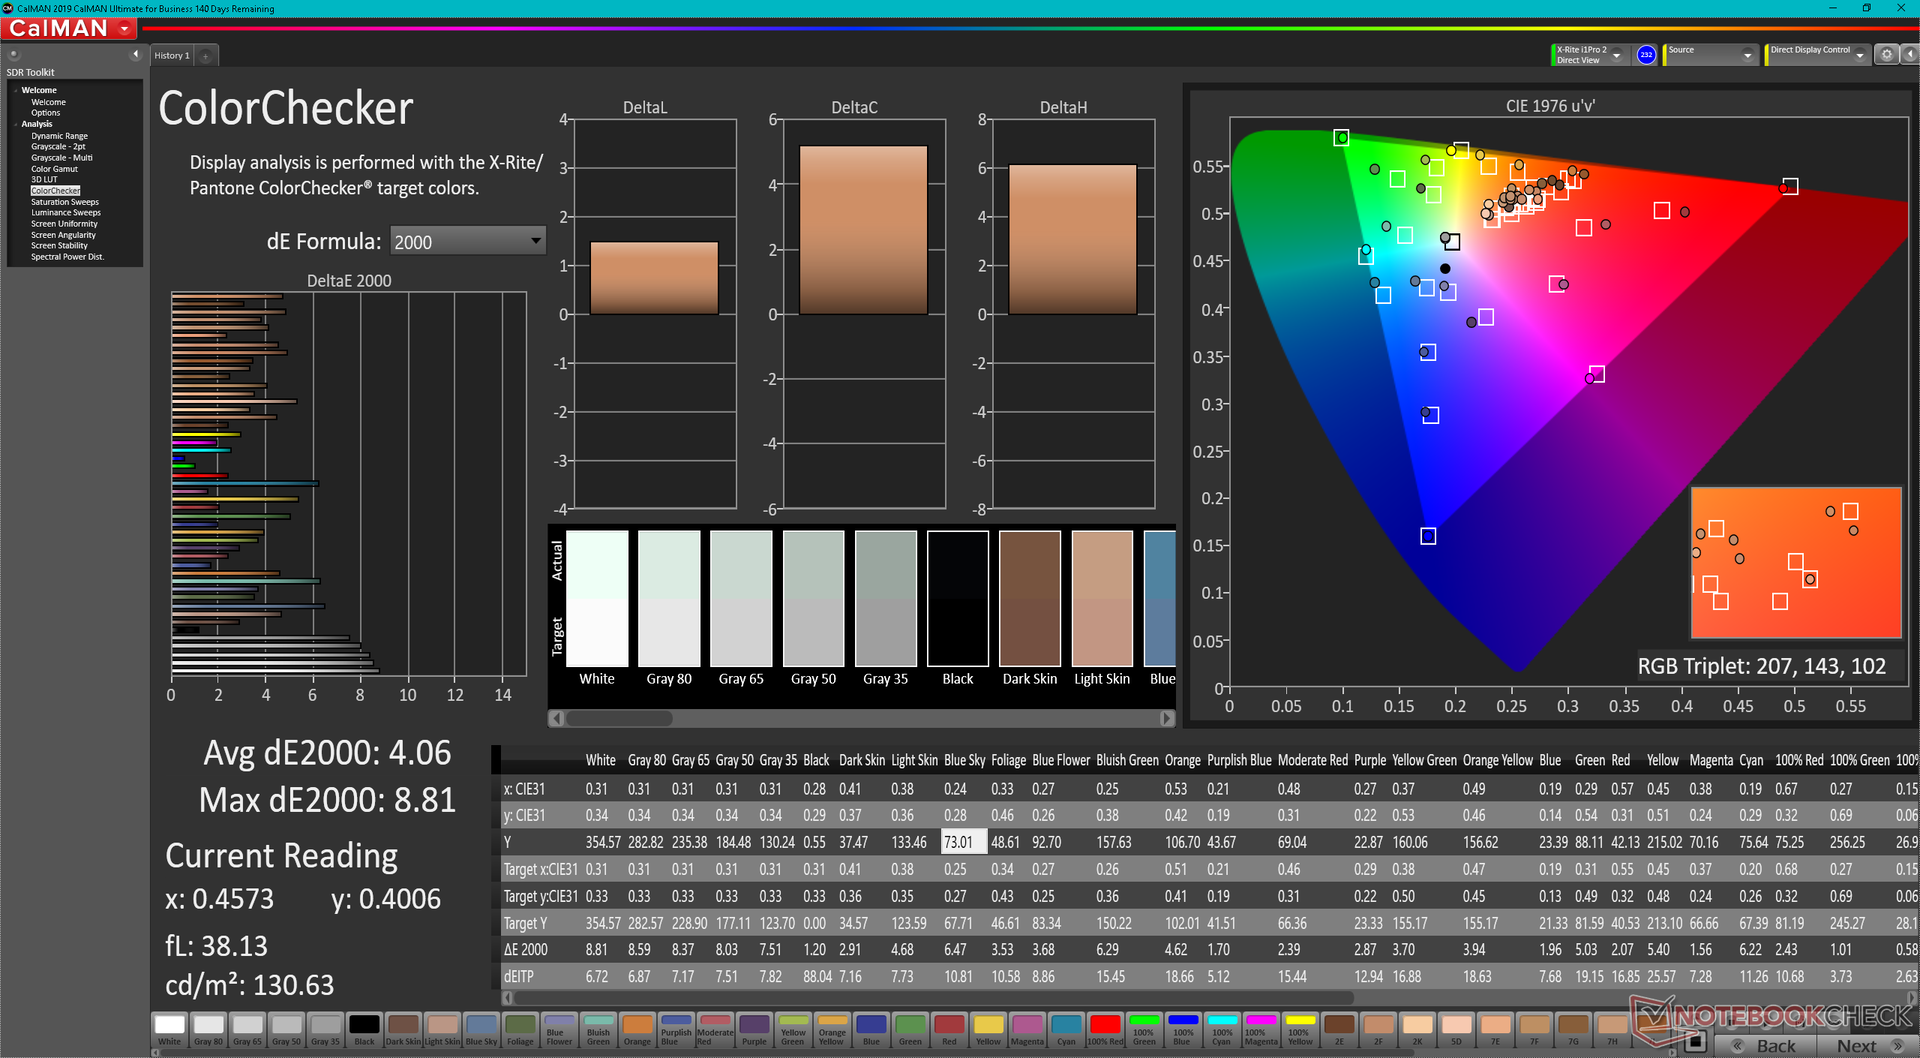
ΔE ColorChecker Calman: 4.06 | ∀{0.5-29.43 Ø4.71}
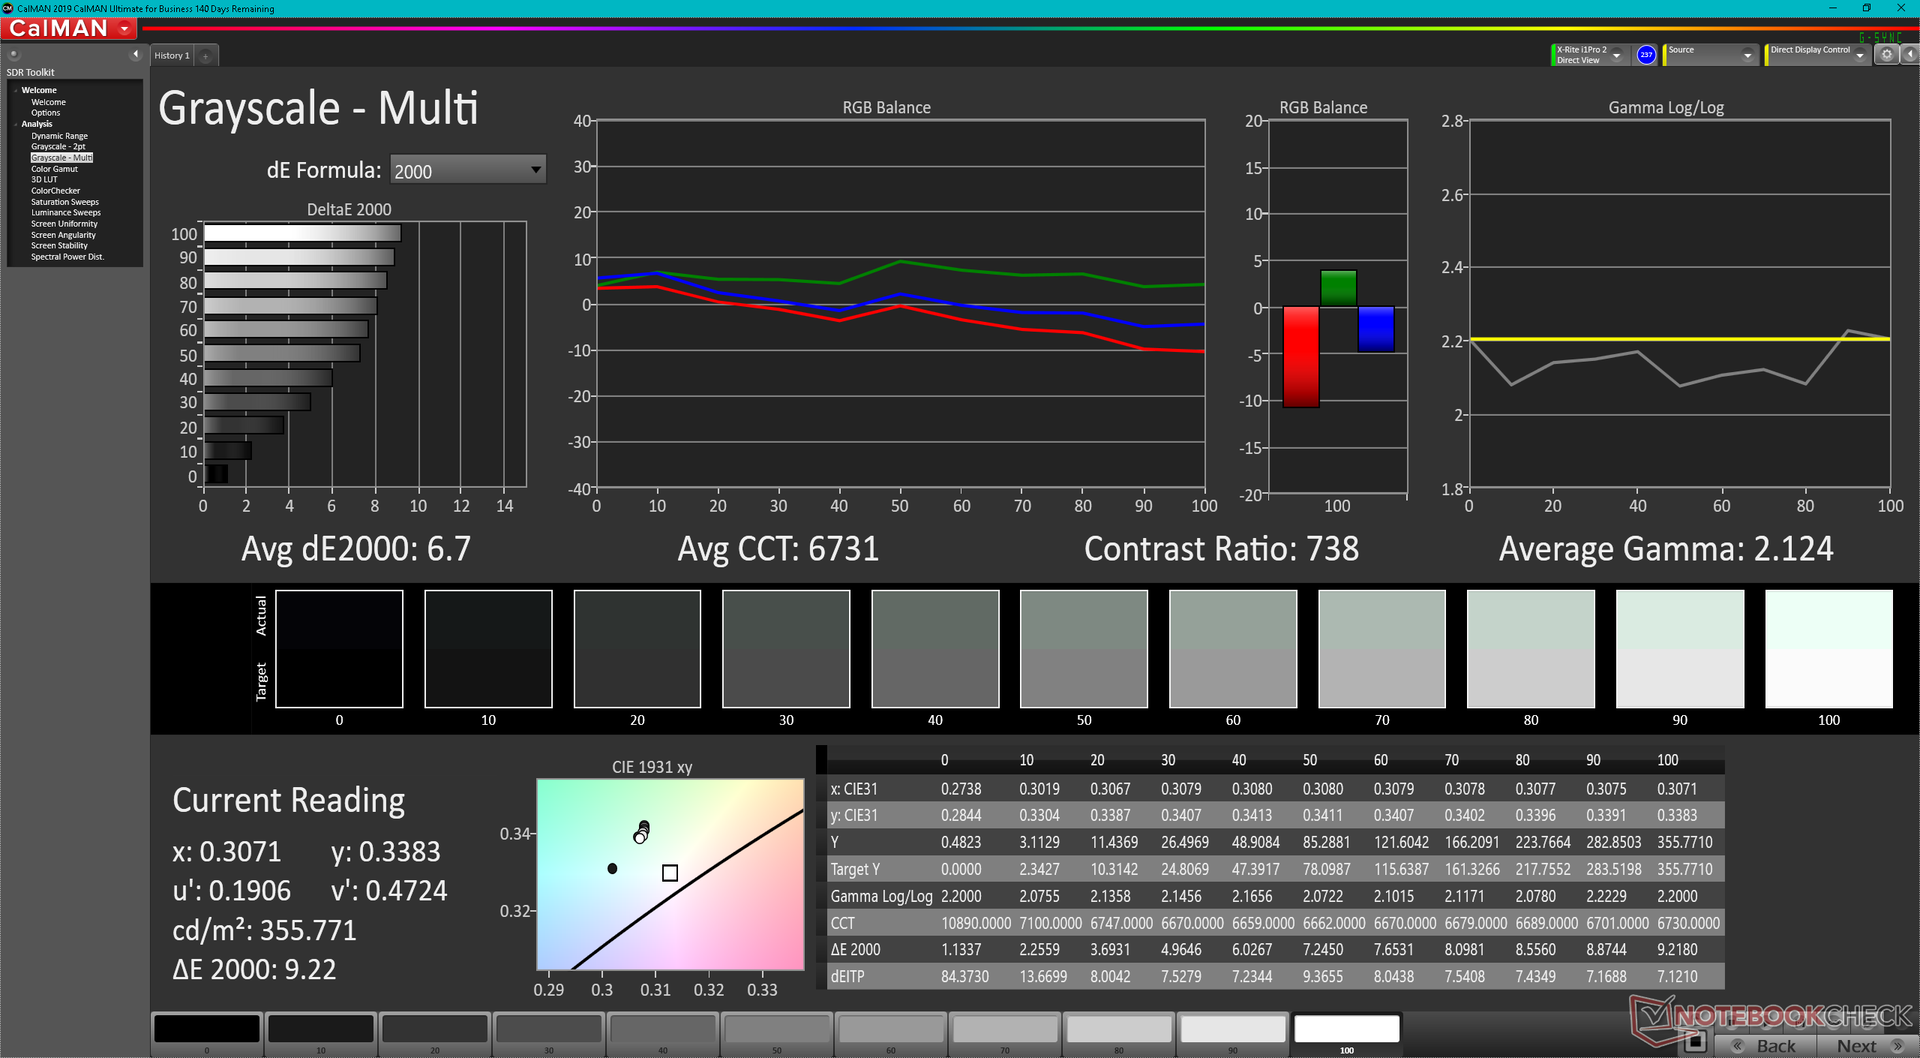
ΔE Greyscale Calman: 6.7 | ∀{0.09-98 Ø4.96}
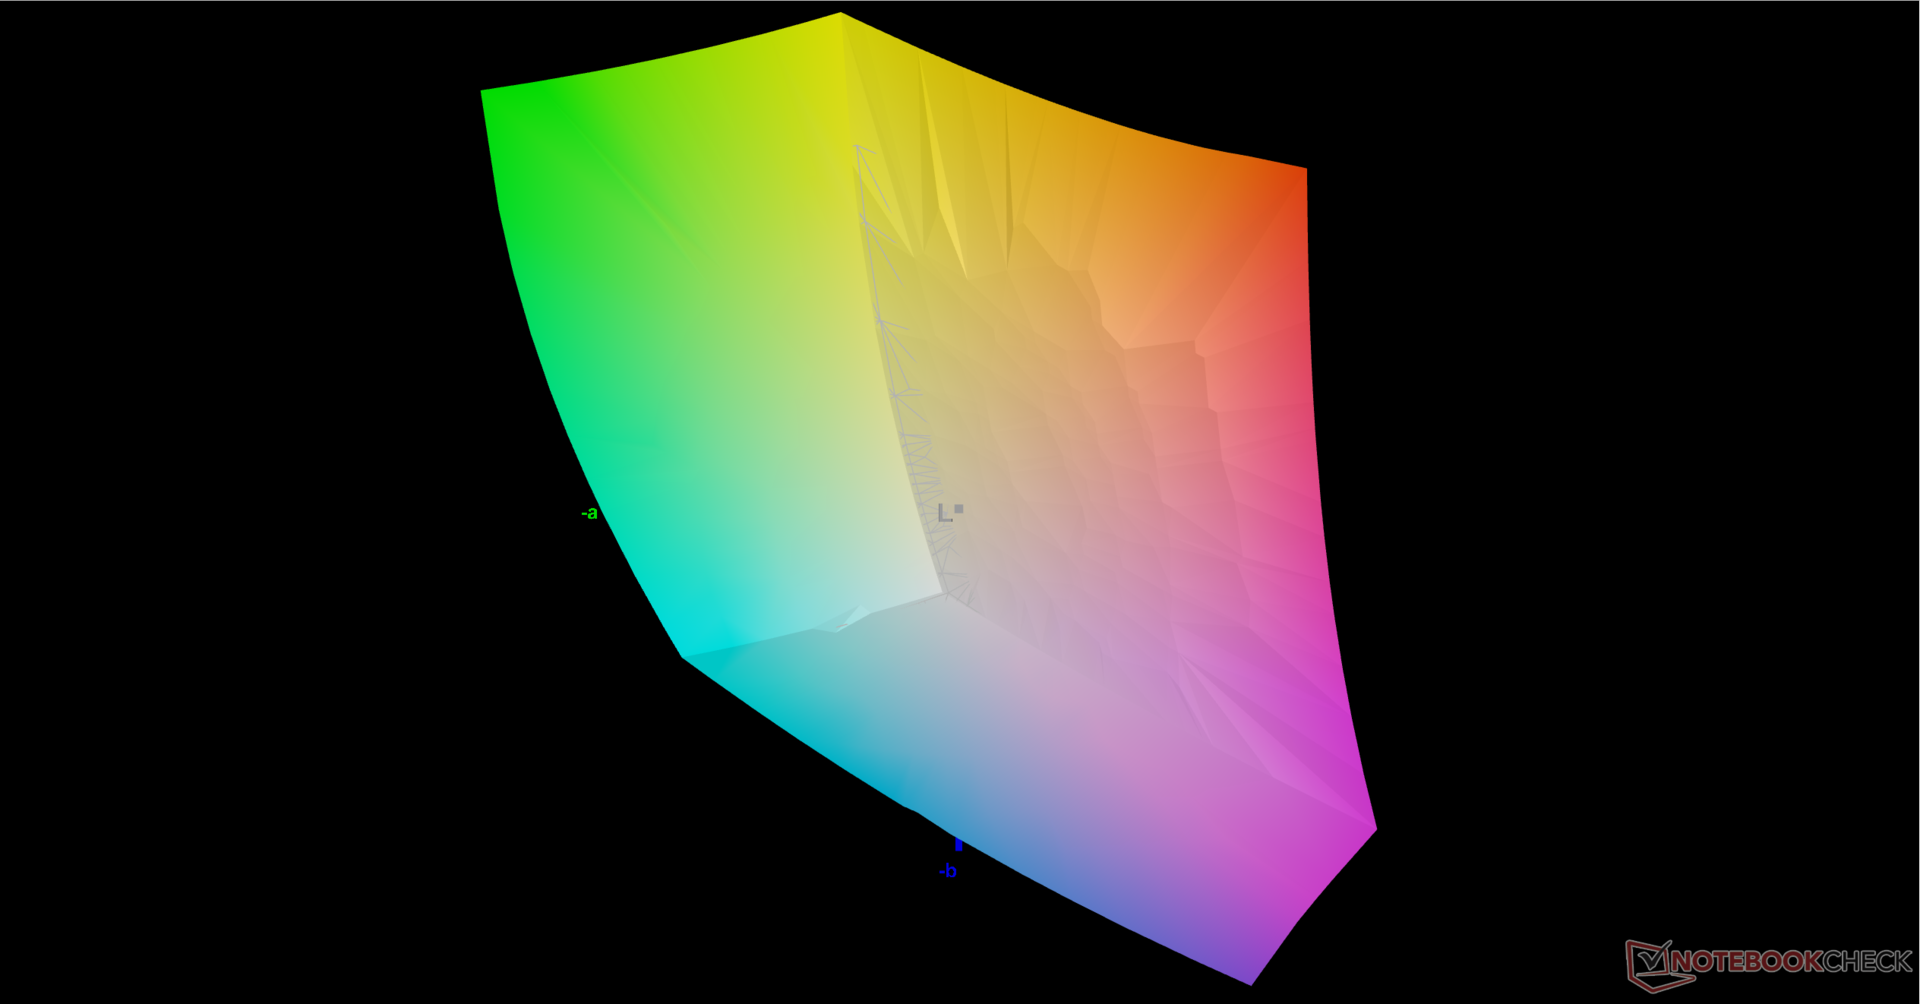
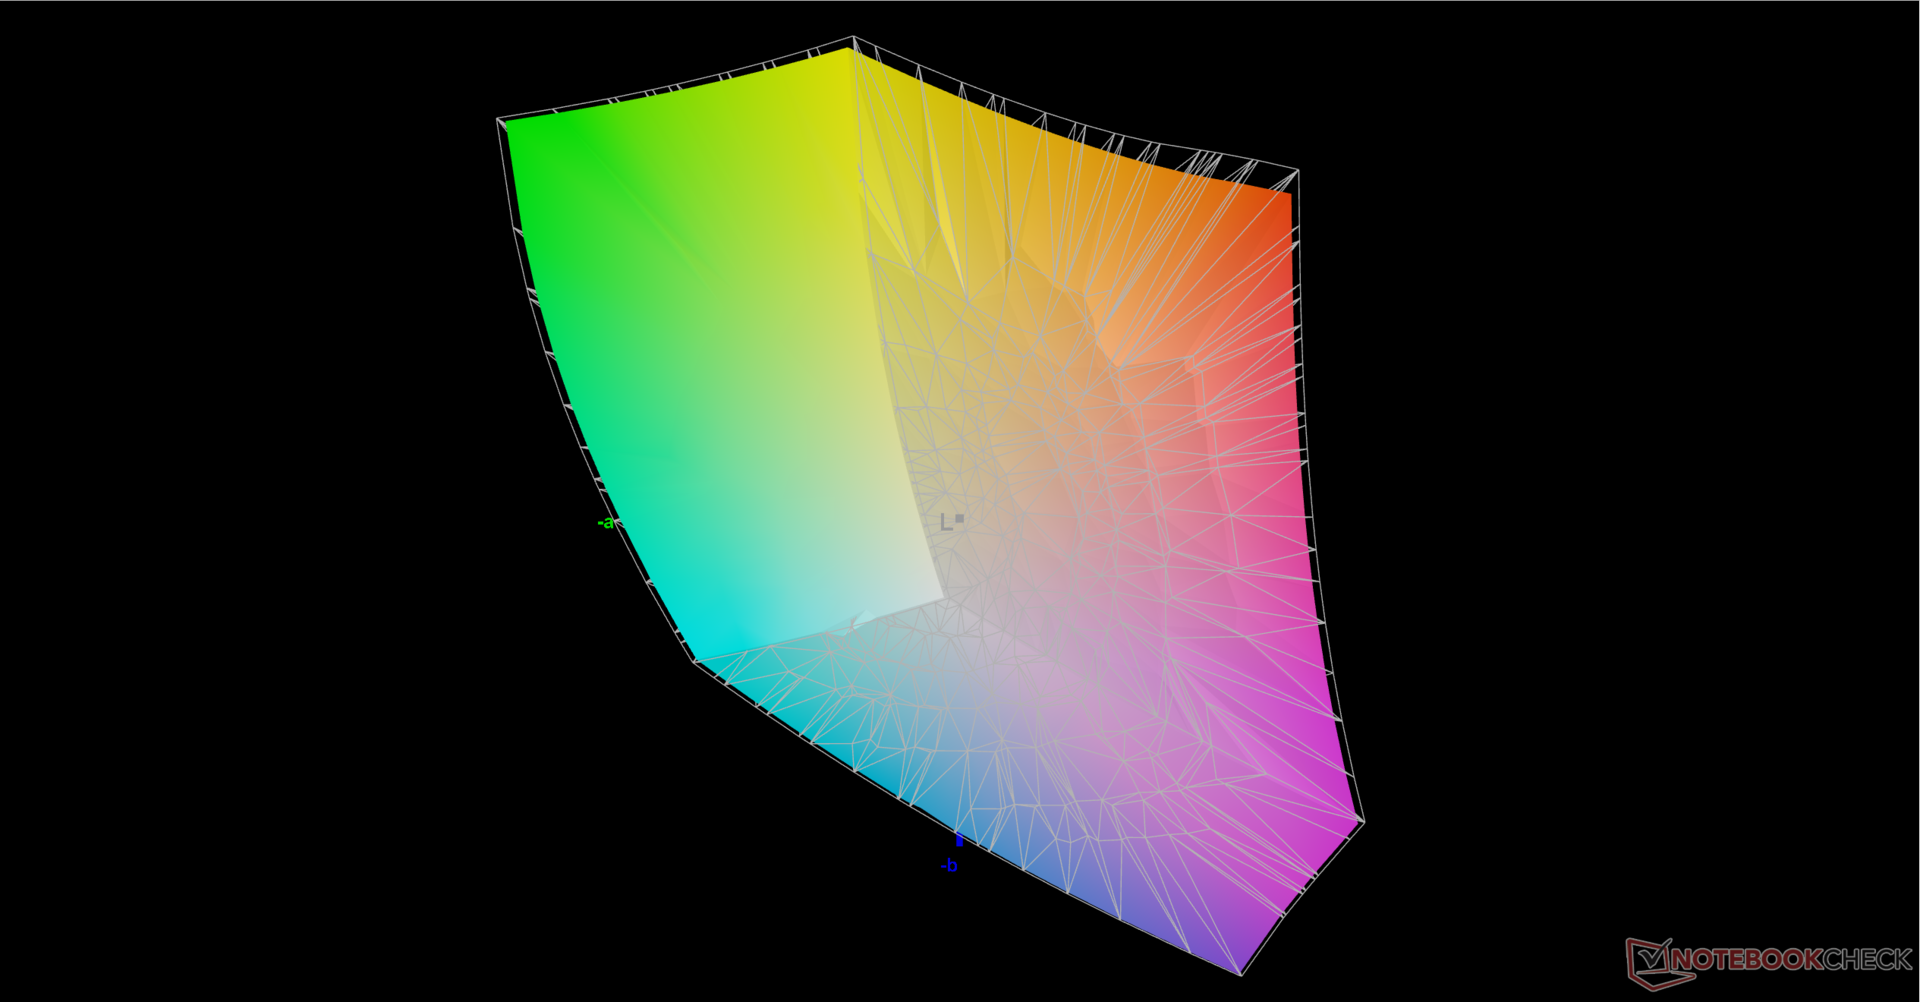
85.1% AdobeRGB 1998 (Argyll 3D)
99.9% sRGB (Argyll 3D)
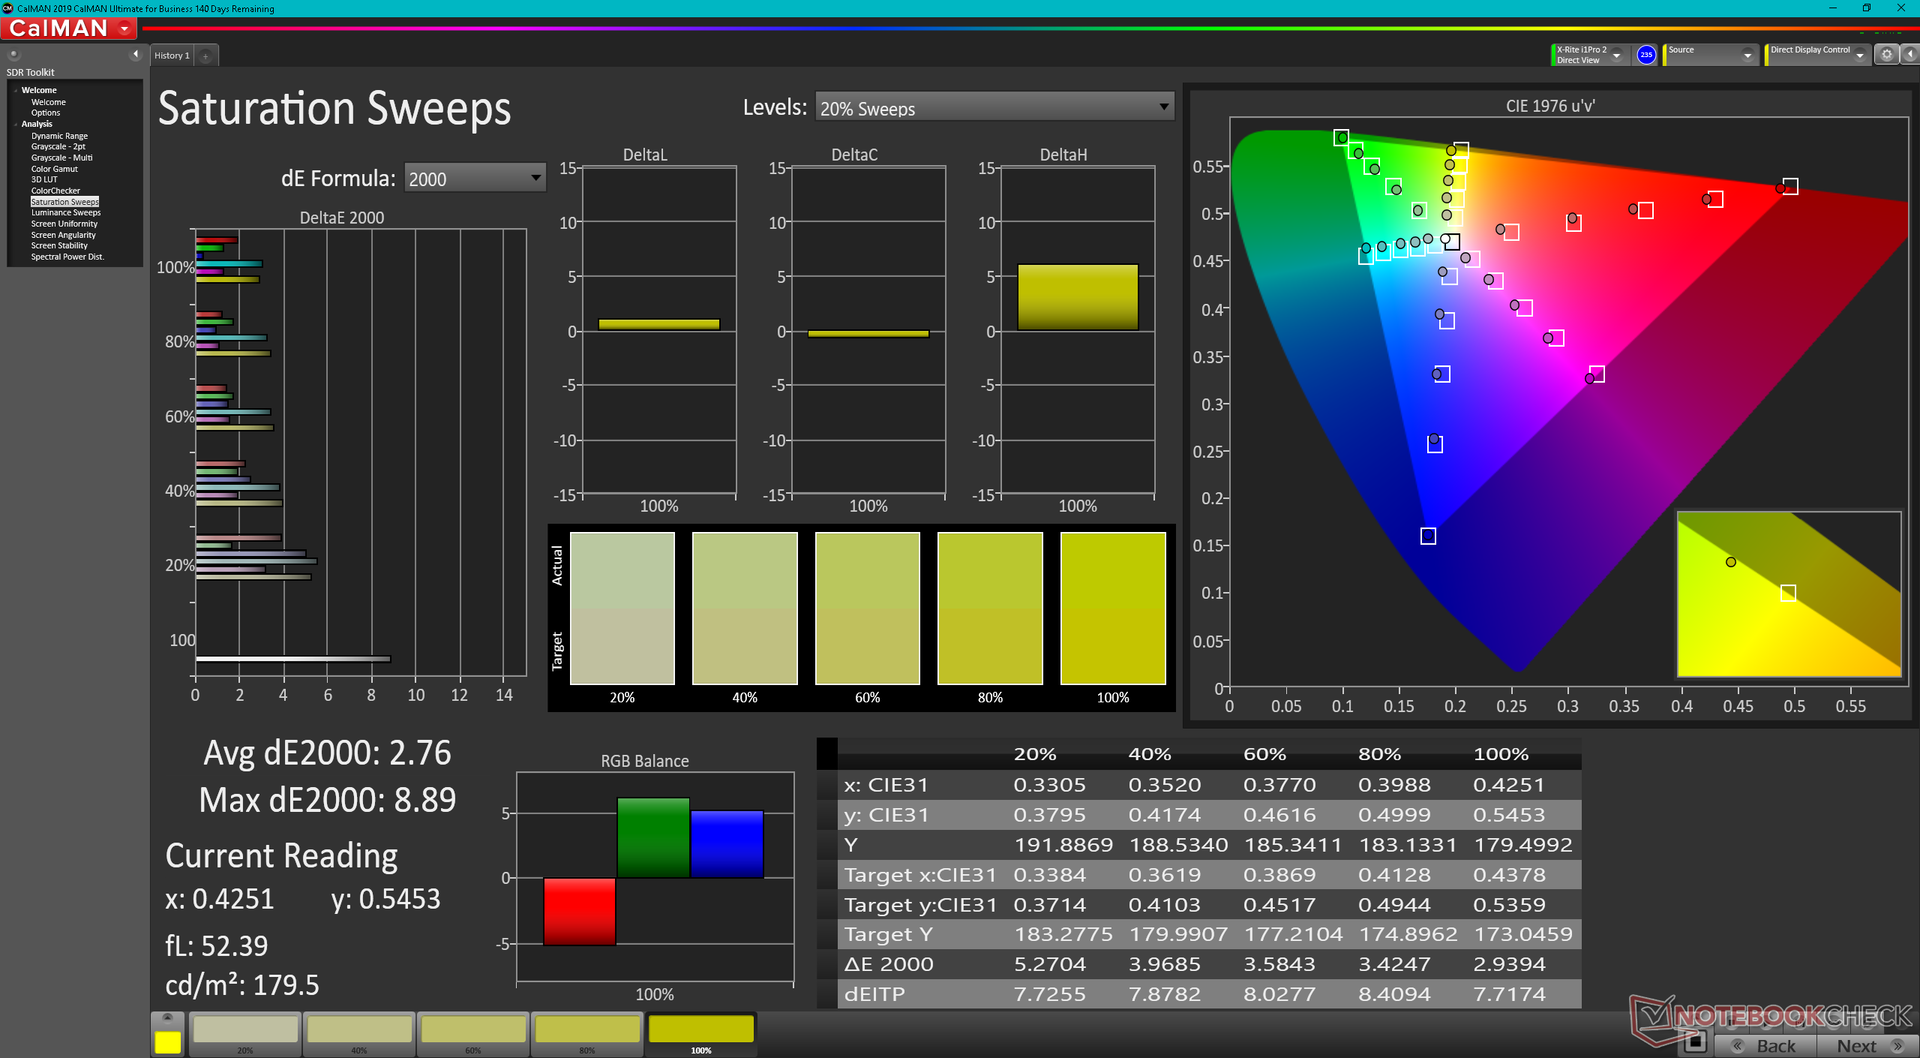
95.8% Display P3 (Argyll 3D)
Gamma: 2.12
CCT: 6731 K
| Asus TUF Dash F15 FX517ZC BOE CQ NE156QHM-NY1, IPS, 2560x1440, 15.6" | Asus TUF Dash F15 FX517ZR BOE CQ NE156QHM-NY1, IPS, 2560x1440, 15.6" | Dell G15 5510 YMHWH_156HRA (CMN1522), IPS, 1920x1080, 15.6" | MSI Bravo 15 B5DD-010US Chi Mei N156HRA-EA1, IPS, 1920x1080, 15.6" | Lenovo Ideapad Gaming 3 15IHU-82K1002RGE LEN156FHD, IPS, 1920x1080, 15.6" | Gigabyte G5 GD Chi Mei N156HRA-EA1, IPS, 1920x1080, 15.6" | |
|---|---|---|---|---|---|---|
| Display | 1% | -48% | -47% | -50% | -48% | |
| Display P3 Coverage (%) | 95.8 | 98.4 3% | 41.6 -57% | 42.1 -56% | 39.7 -59% | 41.8 -56% |
| sRGB Coverage (%) | 99.9 | 99.9 0% | 62.2 -38% | 62.8 -37% | 59.6 -40% | 62.3 -38% |
| AdobeRGB 1998 Coverage (%) | 85.1 | 85.9 1% | 43 -49% | 43.6 -49% | 41.1 -52% | 43.2 -49% |
| Response Times | 22% | -198% | -162% | -345% | -217% | |
| Response Time Grey 50% / Grey 80% * (ms) | 8.4 ? | 5.6 ? 33% | 33.3 ? -296% | 25.6 ? -205% | 46.4 ? -452% | 34.4 ? -310% |
| Response Time Black / White * (ms) | 10.4 ? | 9.4 ? 10% | 20.7 ? -99% | 22.8 ? -119% | 35.2 ? -238% | 23.2 ? -123% |
| PWM Frequency (Hz) | ||||||
| Screen | 17% | -5% | -25% | -15% | -5% | |
| Brightness middle (cd/m²) | 354.2 | 286 -19% | 288 -19% | 265.1 -25% | 307 -13% | 261 -26% |
| Brightness (cd/m²) | 330 | 266 -19% | 264 -20% | 245 -26% | 292 -12% | 246 -25% |
| Brightness Distribution (%) | 88 | 87 -1% | 88 0% | 87 -1% | 88 0% | 87 -1% |
| Black Level * (cd/m²) | 0.32 | 0.25 22% | 0.24 25% | 0.35 -9% | 0.21 34% | 0.19 41% |
| Contrast (:1) | 1107 | 1144 3% | 1200 8% | 757 -32% | 1462 32% | 1374 24% |
| Colorchecker dE 2000 * | 4.06 | 2.14 47% | 3.67 10% | 4.68 -15% | 5.9 -45% | 3.9 4% |
| Colorchecker dE 2000 max. * | 8.81 | 5.22 41% | 18.12 -106% | 19.96 -127% | 21.6 -145% | 19.26 -119% |
| Greyscale dE 2000 * | 6.7 | 2.8 58% | 2.6 61% | 4.5 33% | 4.9 27% | 2.7 60% |
| Gamma | 2.12 104% | 2.23 99% | 2.187 101% | 2.22 99% | 2.26 97% | 2.248 98% |
| CCT | 6731 97% | 7092 92% | 6971 93% | 6632 98% | 6504 100% | 6828 95% |
| Colorchecker dE 2000 calibrated * | 0.67 | 3.22 | 3.7 | 4.8 | 3.24 | |
| Media totale (Programma / Settaggio) | 13% /
14% | -84% /
-45% | -78% /
-51% | -137% /
-74% | -90% /
-48% |
* ... Meglio usare valori piccoli
Tempi di risposta del Display
| ↔ Tempi di risposta dal Nero al Bianco | ||
|---|---|---|
| 10.4 ms ... aumenta ↗ e diminuisce ↘ combinato | ↗ 6.4 ms Incremento | 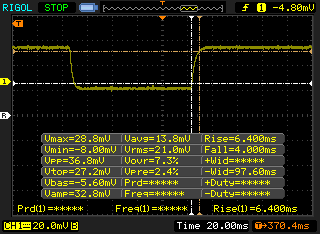 |
| ↘ 4 ms Calo | ||
| Lo schermo mostra buoni tempi di risposta durante i nostri tests, ma potrebbe essere troppo lento per i gamers competitivi. In confronto, tutti i dispositivi di test variano da 0.1 (minimo) a 240 (massimo) ms. » 28 % di tutti i dispositivi è migliore. Questo significa che i tempi di risposta rilevati sono migliori rispettto alla media di tutti i dispositivi testati (19.8 ms). | ||
| ↔ Tempo di risposta dal 50% Grigio all'80% Grigio | ||
| 8.4 ms ... aumenta ↗ e diminuisce ↘ combinato | ↗ 4.4 ms Incremento | 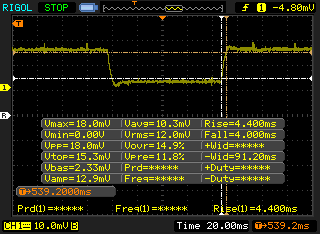 |
| ↘ 4 ms Calo | ||
| Lo schermo mostra veloci tempi di risposta durante i nostri tests e dovrebbe esere adatto al gaming In confronto, tutti i dispositivi di test variano da 0.165 (minimo) a 636 (massimo) ms. » 22 % di tutti i dispositivi è migliore. Questo significa che i tempi di risposta rilevati sono migliori rispettto alla media di tutti i dispositivi testati (31 ms). | ||
Sfarfallio dello schermo / PWM (Pulse-Width Modulation)
| flickering dello schermo / PWM non rilevato | 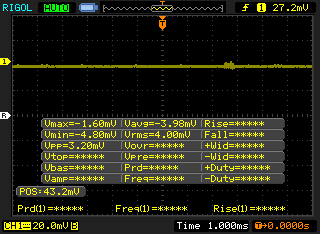 | ||
In confronto: 52 % di tutti i dispositivi testati non utilizza PWM per ridurre la luminosita' del display. Se è rilevato PWM, una media di 7747 (minimo: 5 - massimo: 343500) Hz è stata rilevata. | |||

Prestazioni

Condizioni di test
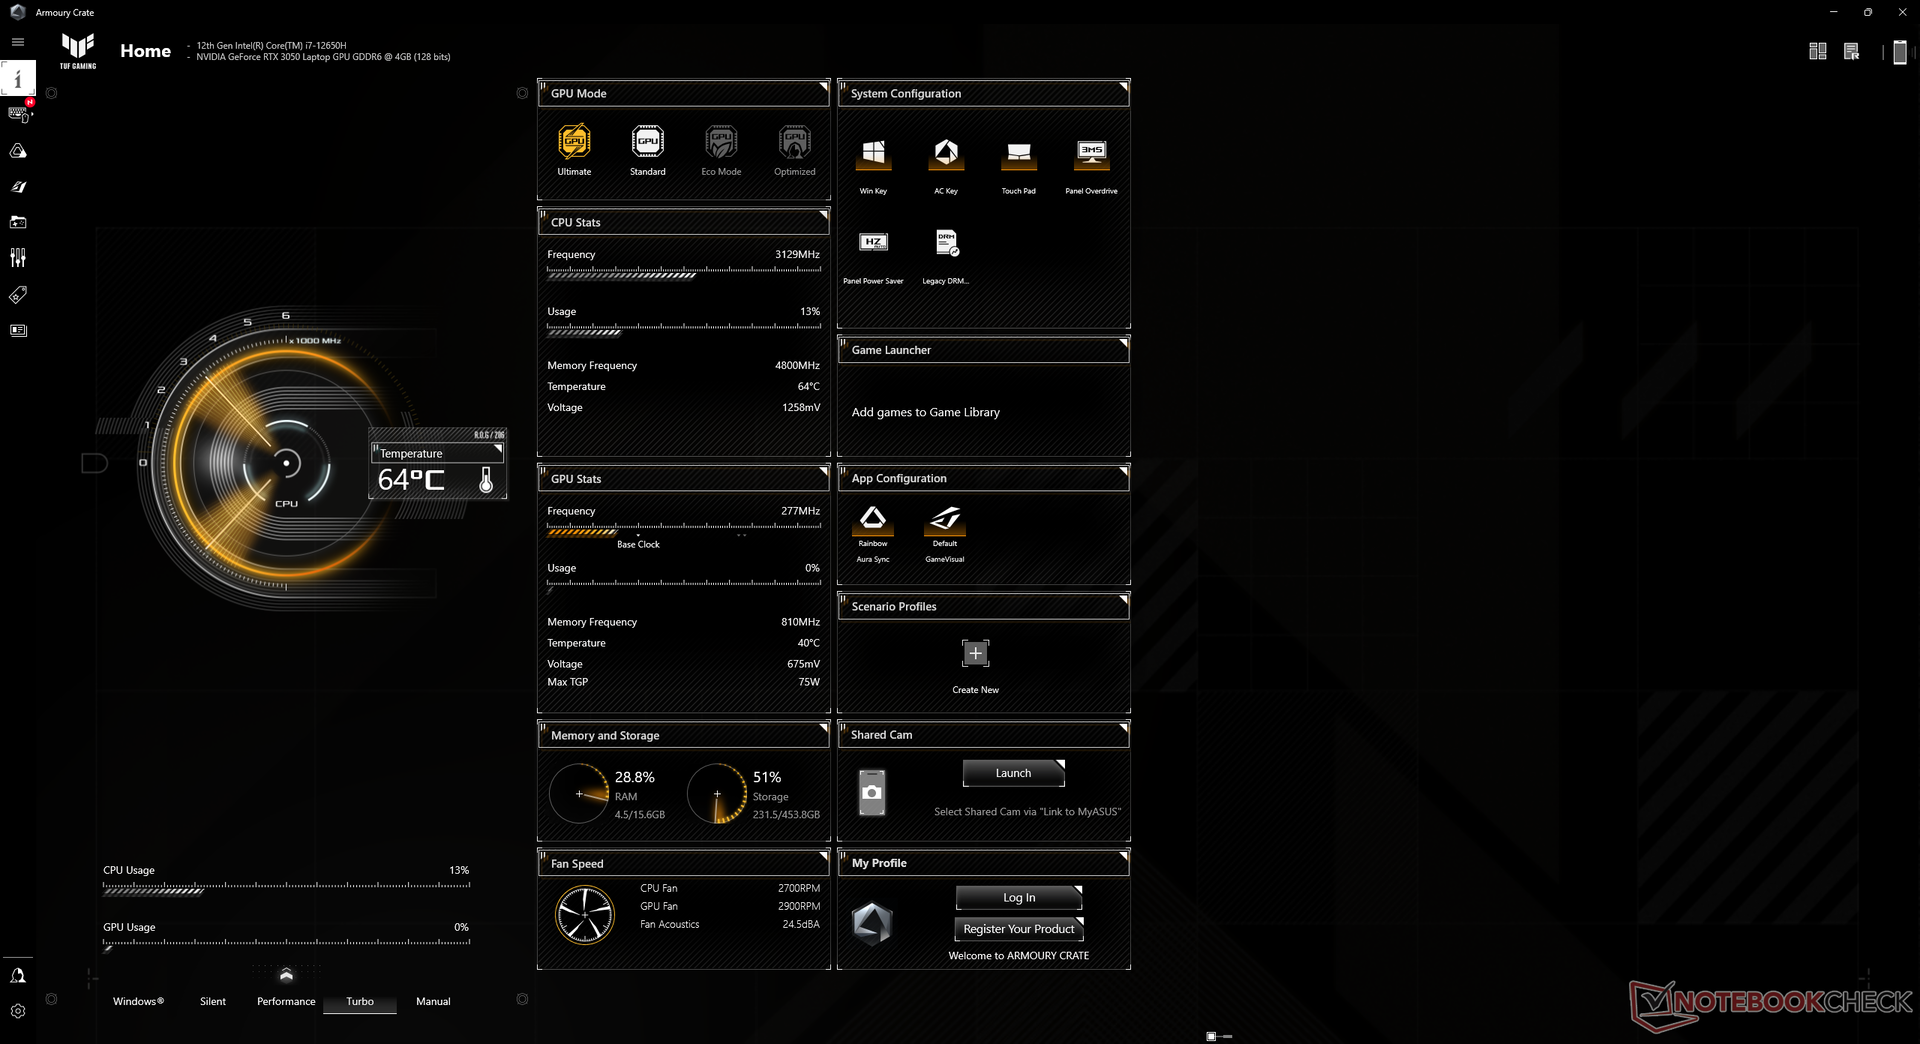
Abbiamo impostato la nostra unità in modalità Turbo e GPU discreta prima di eseguire i benchmark delle prestazioni riportati di seguito. Il sistema utilizza MSHybrid/MUX per la commutazione della grafica, che gli utenti possono attivare tramite il software Armoury Crate. Si consiglia vivamente di familiarizzare con Armoury Crate, che funge da centro di comando del sistema. Il modello ha anche un pratico tasto dedicato sulla tastiera per lanciare l'applicazione.

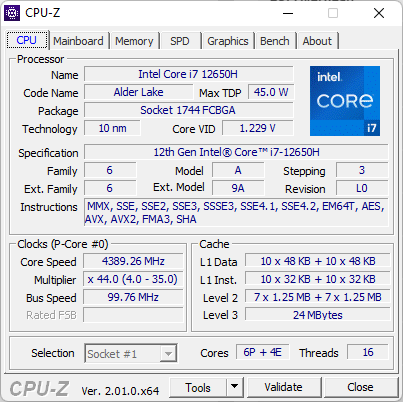
Processore
Le prestazioni complessive della CPU sono molto simili a quelle del Core i7-11800H nelle applicazioni multi-thread, mentre sono più veloci di circa il 15-20% nelle applicazioni single-thread.
Cinebench R15 Multi Loop
Cinebench R23: Multi Core | Single Core
Cinebench R15: CPU Multi 64Bit | CPU Single 64Bit
Blender: v2.79 BMW27 CPU
7-Zip 18.03: 7z b 4 | 7z b 4 -mmt1
Geekbench 5.5: Multi-Core | Single-Core
HWBOT x265 Benchmark v2.2: 4k Preset
LibreOffice : 20 Documents To PDF
R Benchmark 2.5: Overall mean
| Cinebench R20 / CPU (Multi Core) | |
| MSI GE67 HX 12UGS | |
| MSI Vector GP66 12UGS | |
| Acer Nitro 5 AN515-58-72QR | |
| MSI Raider GE66 12UHS | |
| Gigabyte A5 X1 | |
| MSI GP66 Leopard 11UH-028 | |
| Asus TUF Dash F15 FX517ZC | |
| Dell G15 5515 | |
| Media Intel Core i7-12650H (2106 - 6009, n=14) | |
| MSI GS66 Stealth 10UG | |
| MSI Bravo 15 B5DD-010US | |
| Gigabyte G5 GD | |
| Cinebench R20 / CPU (Single Core) | |
| MSI Vector GP66 12UGS | |
| MSI Raider GE66 12UHS | |
| Acer Nitro 5 AN515-58-72QR | |
| Asus TUF Dash F15 FX517ZC | |
| MSI GE67 HX 12UGS | |
| Media Intel Core i7-12650H (552 - 696, n=14) | |
| MSI GP66 Leopard 11UH-028 | |
| Gigabyte A5 X1 | |
| Gigabyte G5 GD | |
| Dell G15 5515 | |
| MSI Bravo 15 B5DD-010US | |
| MSI GS66 Stealth 10UG | |
| Cinebench R15 / CPU Multi 64Bit | |
| MSI GE67 HX 12UGS | |
| Acer Nitro 5 AN515-58-72QR | |
| MSI Raider GE66 12UHS | |
| MSI Vector GP66 12UGS | |
| Gigabyte A5 X1 | |
| MSI GP66 Leopard 11UH-028 | |
| Dell G15 5515 | |
| Asus TUF Dash F15 FX517ZC | |
| Media Intel Core i7-12650H (753 - 2253, n=14) | |
| MSI GS66 Stealth 10UG | |
| Gigabyte G5 GD | |
| MSI Bravo 15 B5DD-010US | |
| Cinebench R15 / CPU Single 64Bit | |
| MSI Vector GP66 12UGS | |
| MSI Raider GE66 12UHS | |
| Acer Nitro 5 AN515-58-72QR | |
| MSI GE67 HX 12UGS | |
| Asus TUF Dash F15 FX517ZC | |
| Media Intel Core i7-12650H (206 - 261, n=14) | |
| Gigabyte A5 X1 | |
| Dell G15 5515 | |
| MSI GP66 Leopard 11UH-028 | |
| MSI Bravo 15 B5DD-010US | |
| Gigabyte G5 GD | |
| MSI GS66 Stealth 10UG | |
| HWBOT x265 Benchmark v2.2 / 4k Preset | |
| MSI GE67 HX 12UGS | |
| MSI Vector GP66 12UGS | |
| MSI Raider GE66 12UHS | |
| Acer Nitro 5 AN515-58-72QR | |
| Gigabyte A5 X1 | |
| MSI GP66 Leopard 11UH-028 | |
| Dell G15 5515 | |
| Asus TUF Dash F15 FX517ZC | |
| Media Intel Core i7-12650H (6.62 - 17.4, n=16) | |
| MSI GS66 Stealth 10UG | |
| MSI Bravo 15 B5DD-010US | |
| Gigabyte G5 GD | |
| LibreOffice / 20 Documents To PDF | |
| Dell G15 5515 | |
| Gigabyte A5 X1 | |
| MSI Bravo 15 B5DD-010US | |
| Asus TUF Dash F15 FX517ZC | |
| MSI GP66 Leopard 11UH-028 | |
| MSI GS66 Stealth 10UG | |
| Media Intel Core i7-12650H (35.1 - 58.5, n=14) | |
| Gigabyte G5 GD | |
| MSI GE67 HX 12UGS | |
| Acer Nitro 5 AN515-58-72QR | |
| MSI Vector GP66 12UGS | |
| MSI Raider GE66 12UHS | |
| R Benchmark 2.5 / Overall mean | |
| MSI GS66 Stealth 10UG | |
| Gigabyte G5 GD | |
| MSI GP66 Leopard 11UH-028 | |
| MSI Bravo 15 B5DD-010US | |
| Dell G15 5515 | |
| Gigabyte A5 X1 | |
| Asus TUF Dash F15 FX517ZC | |
| Media Intel Core i7-12650H (0.4584 - 0.515, n=14) | |
| MSI GE67 HX 12UGS | |
| Acer Nitro 5 AN515-58-72QR | |
| MSI Raider GE66 12UHS | |
| MSI Vector GP66 12UGS | |
* ... Meglio usare valori piccoli
AIDA64: FP32 Ray-Trace | FPU Julia | CPU SHA3 | CPU Queen | FPU SinJulia | FPU Mandel | CPU AES | CPU ZLib | FP64 Ray-Trace | CPU PhotoWorxx
| Performance rating | |
| Asus TUF Dash F15 FX517ZR | |
| MSI Bravo 15 B5DD-010US | |
| Media Intel Core i7-12650H | |
| Gigabyte G5 GD | |
| Dell G15 5510 | |
| Asus TUF Dash F15 FX517ZC | |
| Lenovo Ideapad Gaming 3 15IHU-82K1002RGE | |
| AIDA64 / FP32 Ray-Trace | |
| Asus TUF Dash F15 FX517ZR | |
| Media Intel Core i7-12650H (5422 - 15620, n=14) | |
| MSI Bravo 15 B5DD-010US | |
| Gigabyte G5 GD | |
| Dell G15 5510 | |
| Lenovo Ideapad Gaming 3 15IHU-82K1002RGE | |
| Asus TUF Dash F15 FX517ZC | |
| AIDA64 / FPU Julia | |
| Asus TUF Dash F15 FX517ZR | |
| MSI Bravo 15 B5DD-010US | |
| Media Intel Core i7-12650H (26386 - 76434, n=14) | |
| Dell G15 5510 | |
| Gigabyte G5 GD | |
| Lenovo Ideapad Gaming 3 15IHU-82K1002RGE | |
| Asus TUF Dash F15 FX517ZC | |
| AIDA64 / CPU SHA3 | |
| Asus TUF Dash F15 FX517ZR | |
| Gigabyte G5 GD | |
| Media Intel Core i7-12650H (1479 - 3244, n=14) | |
| MSI Bravo 15 B5DD-010US | |
| Lenovo Ideapad Gaming 3 15IHU-82K1002RGE | |
| Dell G15 5510 | |
| Asus TUF Dash F15 FX517ZC | |
| AIDA64 / CPU Queen | |
| Asus TUF Dash F15 FX517ZR | |
| Media Intel Core i7-12650H (59278 - 89537, n=14) | |
| MSI Bravo 15 B5DD-010US | |
| Asus TUF Dash F15 FX517ZC | |
| Dell G15 5510 | |
| Gigabyte G5 GD | |
| Lenovo Ideapad Gaming 3 15IHU-82K1002RGE | |
| AIDA64 / FPU SinJulia | |
| MSI Bravo 15 B5DD-010US | |
| Asus TUF Dash F15 FX517ZR | |
| Dell G15 5510 | |
| Media Intel Core i7-12650H (4690 - 8726, n=14) | |
| Gigabyte G5 GD | |
| Asus TUF Dash F15 FX517ZC | |
| Lenovo Ideapad Gaming 3 15IHU-82K1002RGE | |
| AIDA64 / FPU Mandel | |
| MSI Bravo 15 B5DD-010US | |
| Asus TUF Dash F15 FX517ZR | |
| Media Intel Core i7-12650H (15001 - 37738, n=14) | |
| Gigabyte G5 GD | |
| Dell G15 5510 | |
| Lenovo Ideapad Gaming 3 15IHU-82K1002RGE | |
| Asus TUF Dash F15 FX517ZC | |
| AIDA64 / CPU AES | |
| Gigabyte G5 GD | |
| MSI Bravo 15 B5DD-010US | |
| Lenovo Ideapad Gaming 3 15IHU-82K1002RGE | |
| Asus TUF Dash F15 FX517ZR | |
| Media Intel Core i7-12650H (32702 - 92530, n=14) | |
| Asus TUF Dash F15 FX517ZC | |
| Dell G15 5510 | |
| AIDA64 / CPU ZLib | |
| Asus TUF Dash F15 FX517ZR | |
| Media Intel Core i7-12650H (443 - 891, n=14) | |
| Asus TUF Dash F15 FX517ZC | |
| MSI Bravo 15 B5DD-010US | |
| Gigabyte G5 GD | |
| Dell G15 5510 | |
| Lenovo Ideapad Gaming 3 15IHU-82K1002RGE | |
| AIDA64 / FP64 Ray-Trace | |
| Asus TUF Dash F15 FX517ZR | |
| Media Intel Core i7-12650H (3096 - 8448, n=14) | |
| Gigabyte G5 GD | |
| MSI Bravo 15 B5DD-010US | |
| Dell G15 5510 | |
| Lenovo Ideapad Gaming 3 15IHU-82K1002RGE | |
| Asus TUF Dash F15 FX517ZC | |
| AIDA64 / CPU PhotoWorxx | |
| Asus TUF Dash F15 FX517ZR | |
| Media Intel Core i7-12650H (22046 - 44164, n=14) | |
| Asus TUF Dash F15 FX517ZC | |
| Gigabyte G5 GD | |
| MSI Bravo 15 B5DD-010US | |
| Dell G15 5510 | |
| Lenovo Ideapad Gaming 3 15IHU-82K1002RGE | |
Prestazioni del sistema
CrossMark: Overall | Productivity | Creativity | Responsiveness
| PCMark 10 / Score | |
| Asus TUF Dash F15 FX517ZC | |
| Media Intel Core i7-12650H, NVIDIA GeForce RTX 3050 4GB Laptop GPU (n=1) | |
| Asus TUF Dash F15 FX517ZR | |
| MSI Bravo 15 B5DD-010US | |
| Gigabyte G5 GD | |
| Lenovo Ideapad Gaming 3 15IHU-82K1002RGE | |
| Dell G15 5510 | |
| PCMark 10 / Essentials | |
| Asus TUF Dash F15 FX517ZC | |
| Media Intel Core i7-12650H, NVIDIA GeForce RTX 3050 4GB Laptop GPU (n=1) | |
| Asus TUF Dash F15 FX517ZR | |
| MSI Bravo 15 B5DD-010US | |
| Gigabyte G5 GD | |
| Lenovo Ideapad Gaming 3 15IHU-82K1002RGE | |
| Dell G15 5510 | |
| PCMark 10 / Productivity | |
| Asus TUF Dash F15 FX517ZR | |
| Asus TUF Dash F15 FX517ZC | |
| Media Intel Core i7-12650H, NVIDIA GeForce RTX 3050 4GB Laptop GPU (n=1) | |
| Lenovo Ideapad Gaming 3 15IHU-82K1002RGE | |
| MSI Bravo 15 B5DD-010US | |
| Gigabyte G5 GD | |
| Dell G15 5510 | |
| PCMark 10 / Digital Content Creation | |
| Asus TUF Dash F15 FX517ZC | |
| Media Intel Core i7-12650H, NVIDIA GeForce RTX 3050 4GB Laptop GPU (n=1) | |
| Asus TUF Dash F15 FX517ZR | |
| MSI Bravo 15 B5DD-010US | |
| Gigabyte G5 GD | |
| Dell G15 5510 | |
| Lenovo Ideapad Gaming 3 15IHU-82K1002RGE | |
| CrossMark / Overall | |
| Asus TUF Dash F15 FX517ZR | |
| Asus TUF Dash F15 FX517ZC | |
| Media Intel Core i7-12650H, NVIDIA GeForce RTX 3050 4GB Laptop GPU (n=1) | |
| Lenovo Ideapad Gaming 3 15IHU-82K1002RGE | |
| CrossMark / Productivity | |
| Asus TUF Dash F15 FX517ZC | |
| Media Intel Core i7-12650H, NVIDIA GeForce RTX 3050 4GB Laptop GPU (n=1) | |
| Asus TUF Dash F15 FX517ZR | |
| Lenovo Ideapad Gaming 3 15IHU-82K1002RGE | |
| CrossMark / Creativity | |
| Asus TUF Dash F15 FX517ZR | |
| Asus TUF Dash F15 FX517ZC | |
| Media Intel Core i7-12650H, NVIDIA GeForce RTX 3050 4GB Laptop GPU (n=1) | |
| Lenovo Ideapad Gaming 3 15IHU-82K1002RGE | |
| CrossMark / Responsiveness | |
| Asus TUF Dash F15 FX517ZC | |
| Media Intel Core i7-12650H, NVIDIA GeForce RTX 3050 4GB Laptop GPU (n=1) | |
| Asus TUF Dash F15 FX517ZR | |
| Lenovo Ideapad Gaming 3 15IHU-82K1002RGE | |
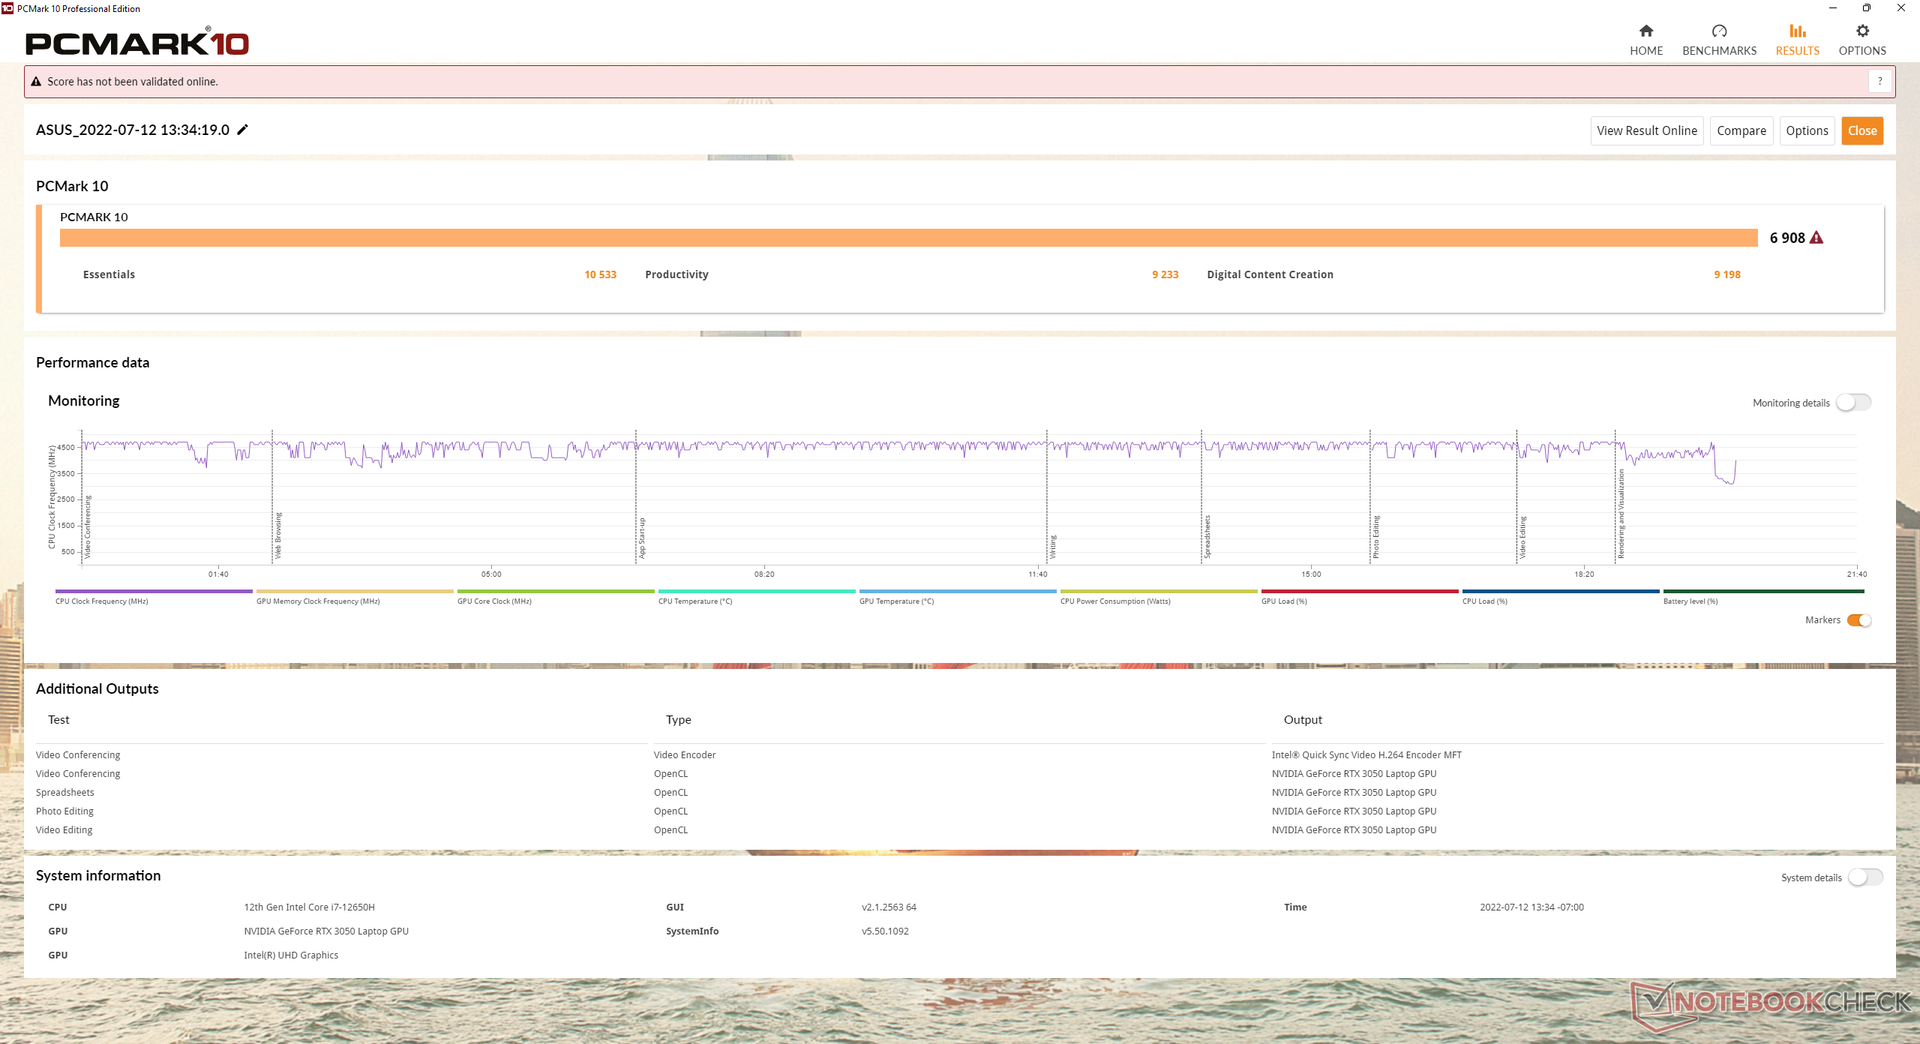
| PCMark 10 Score | 6908 punti | |
Aiuto | ||
| AIDA64 / Memory Copy | |
| Asus TUF Dash F15 FX517ZR | |
| Media Intel Core i7-12650H (43261 - 69735, n=14) | |
| Asus TUF Dash F15 FX517ZC | |
| Gigabyte G5 GD | |
| MSI Bravo 15 B5DD-010US | |
| Dell G15 5510 | |
| Lenovo Ideapad Gaming 3 15IHU-82K1002RGE | |
| AIDA64 / Memory Read | |
| Asus TUF Dash F15 FX517ZR | |
| Media Intel Core i7-12650H (47313 - 67412, n=14) | |
| Asus TUF Dash F15 FX517ZC | |
| Gigabyte G5 GD | |
| MSI Bravo 15 B5DD-010US | |
| Dell G15 5510 | |
| Lenovo Ideapad Gaming 3 15IHU-82K1002RGE | |
| AIDA64 / Memory Write | |
| Asus TUF Dash F15 FX517ZR | |
| Media Intel Core i7-12650H (45617 - 59361, n=14) | |
| Asus TUF Dash F15 FX517ZC | |
| Gigabyte G5 GD | |
| Dell G15 5510 | |
| MSI Bravo 15 B5DD-010US | |
| Lenovo Ideapad Gaming 3 15IHU-82K1002RGE | |
| AIDA64 / Memory Latency | |
| Asus TUF Dash F15 FX517ZR | |
| Gigabyte G5 GD | |
| Lenovo Ideapad Gaming 3 15IHU-82K1002RGE | |
| Media Intel Core i7-12650H (71.6 - 103.9, n=14) | |
| Dell G15 5510 | |
| MSI Bravo 15 B5DD-010US | |
| Asus TUF Dash F15 FX517ZC | |
* ... Meglio usare valori piccoli
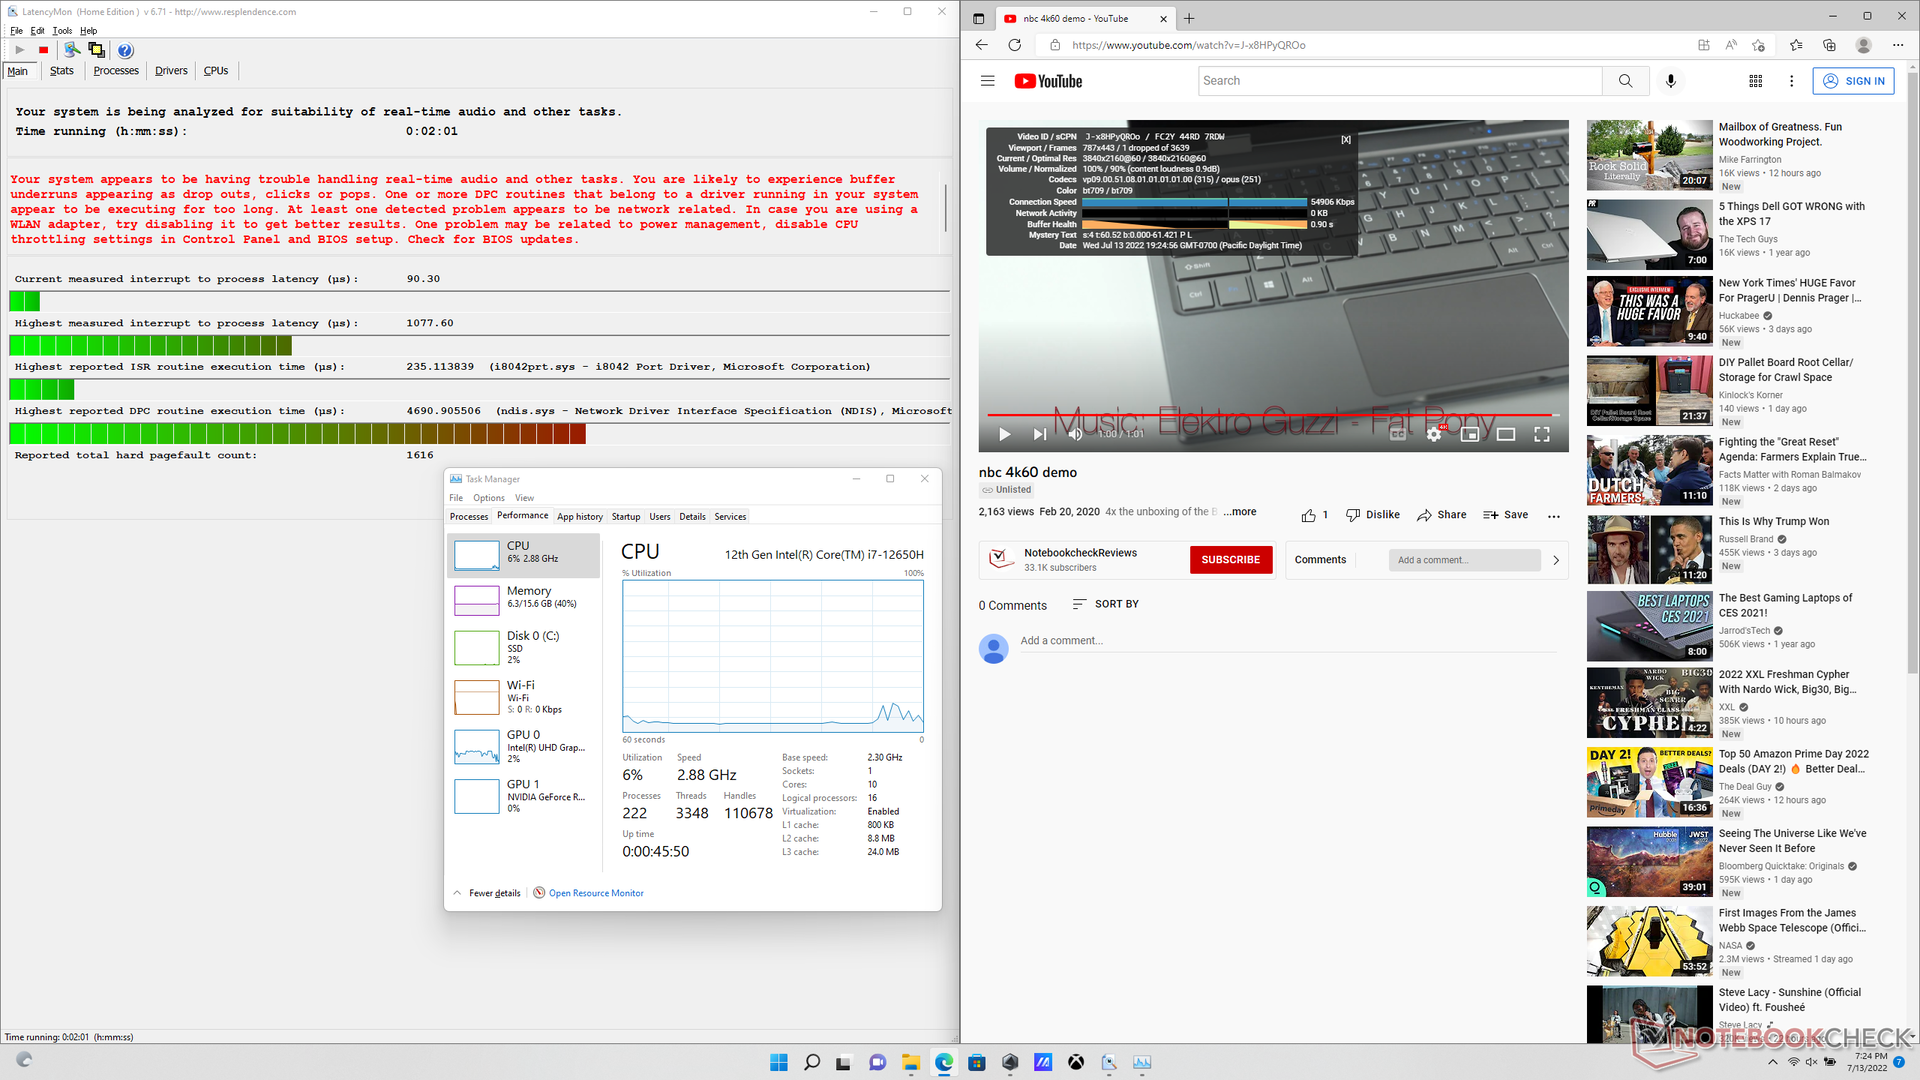
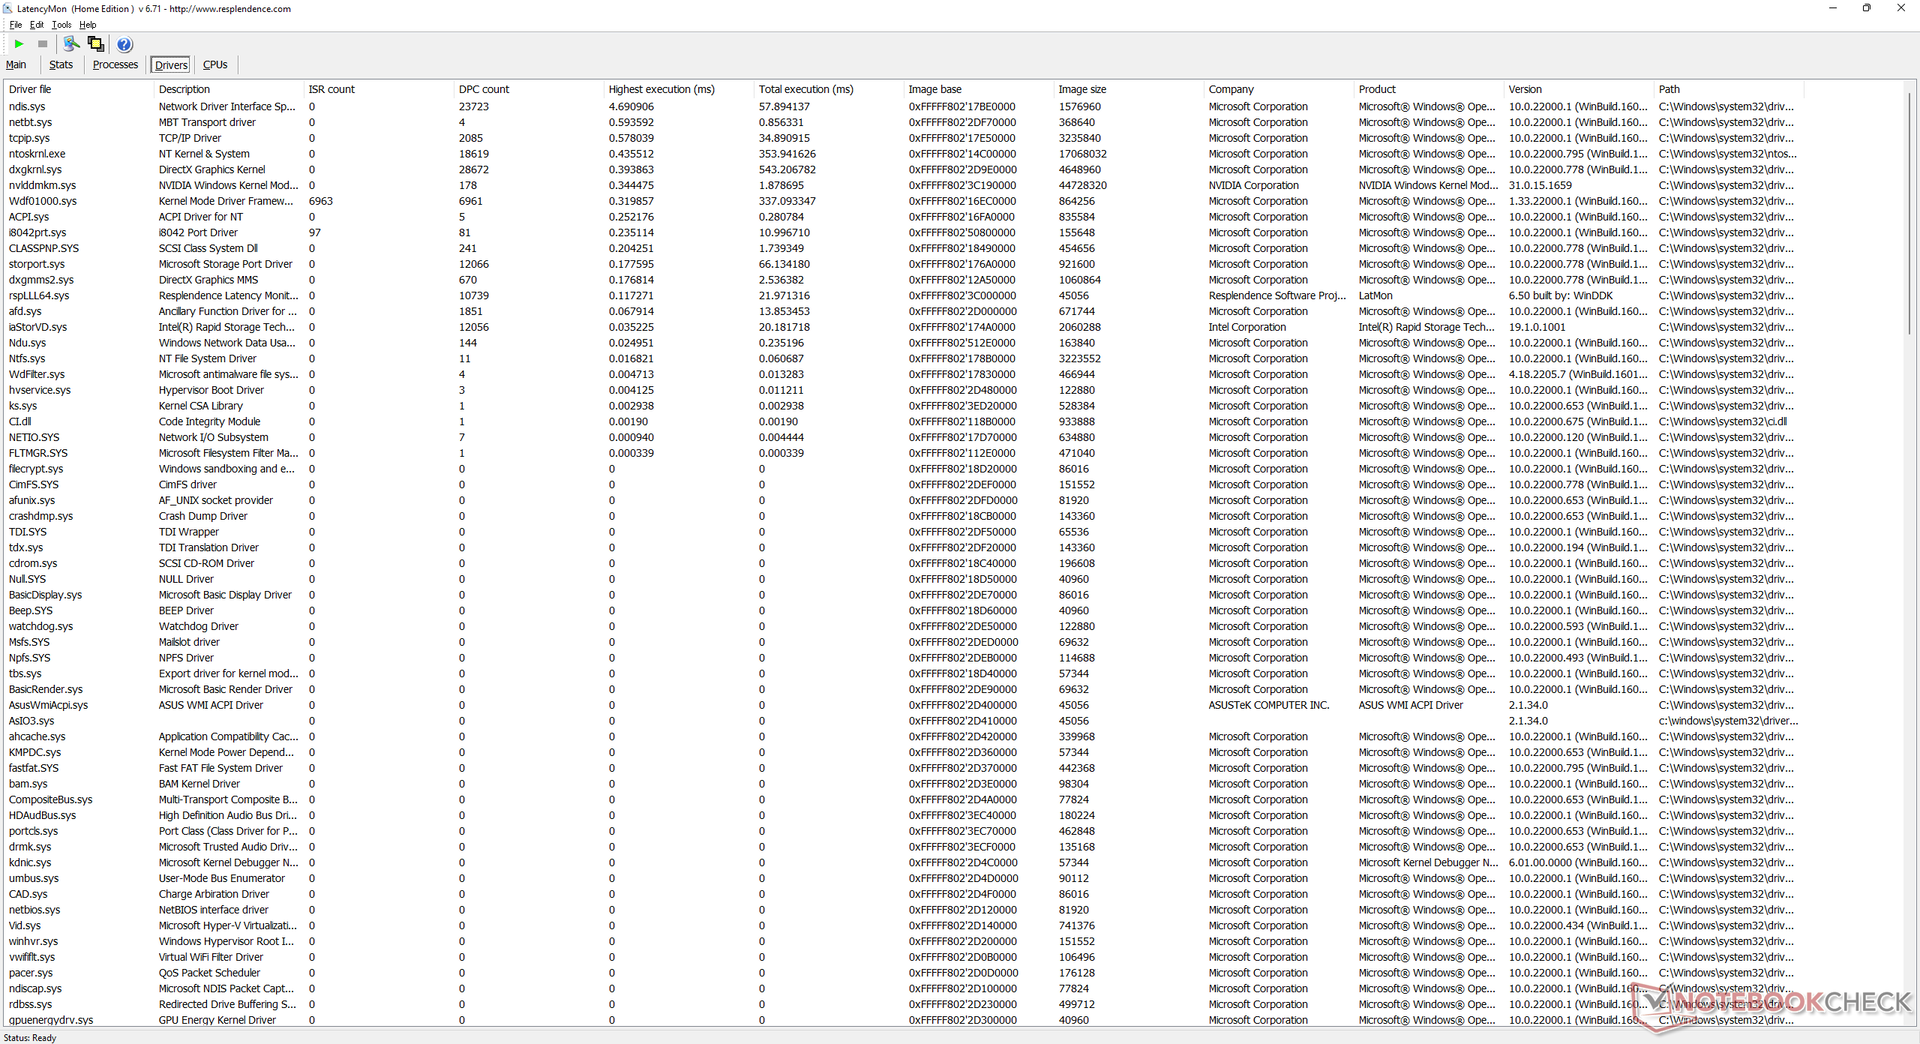
Latenza DPC
Abbiamo riscontrato problemi di DPC quando si aprivano più schede del browser sulla nostra homepage. la riproduzione di video 4K a 60 FPS è invece perfetta, con un solo fotogramma perso durante il nostro video di un minuto.
| DPC Latencies / LatencyMon - interrupt to process latency (max), Web, Youtube, Prime95 | |
| Dell G15 5510 | |
| MSI Bravo 15 B5DD-010US | |
| Asus TUF Dash F15 FX517ZC | |
| Lenovo Ideapad Gaming 3 15IHU-82K1002RGE | |
| Asus TUF Dash F15 FX517ZR | |
| Gigabyte G5 GD | |
* ... Meglio usare valori piccoli
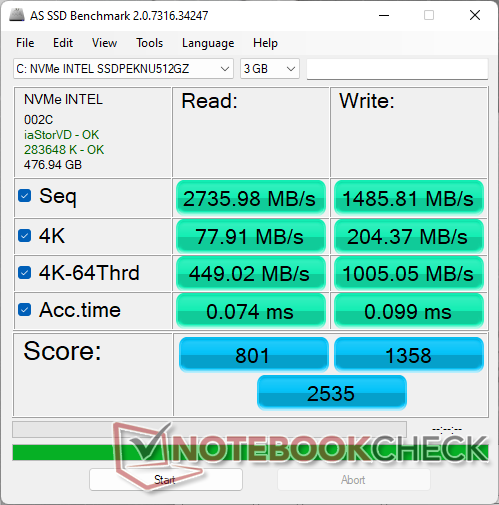
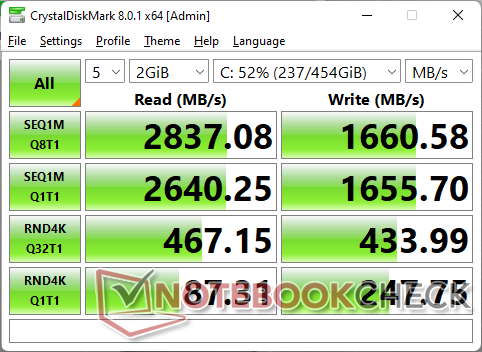
Dispositivi di archiviazione - Supporta fino a 2 unità SSD M.2
La nostra unità di prova viene fornita con un SSD SSD Intel 670p per una velocità di lettura sequenziale sostenuta di circa 2300 MB/s. Il sistema può supportare fino a due unità SSD M.2 2280 interne contemporaneamente.

| Drive Performance rating - Percent | |
| Gigabyte G5 GD | |
| Asus TUF Dash F15 FX517ZR | |
| Dell G15 5510 | |
| Asus TUF Dash F15 FX517ZC | |
| Lenovo Ideapad Gaming 3 15IHU-82K1002RGE | |
| MSI Bravo 15 B5DD-010US | |
* ... Meglio usare valori piccoli
Disk Throttling: DiskSpd Read Loop, Queue Depth 8
Prestazioni della GPU
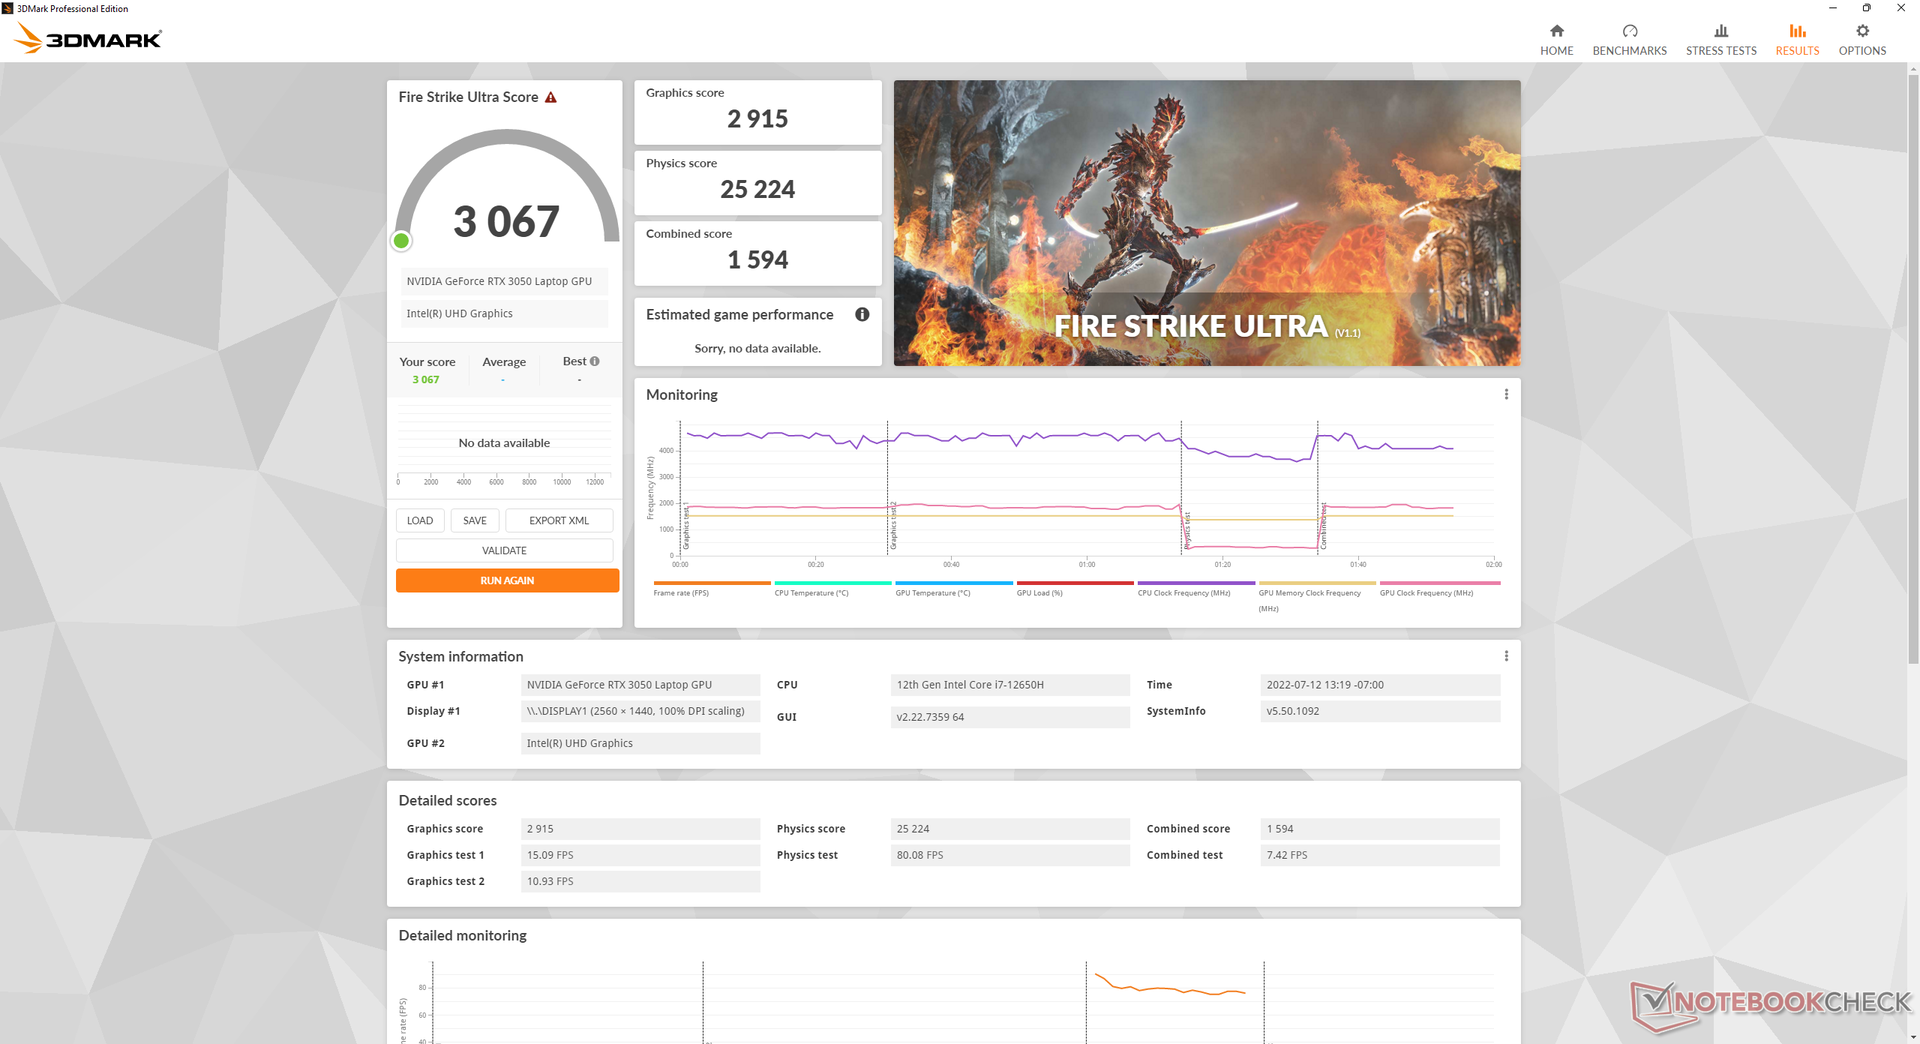
Il nostro 75 W GeForce RTX 3050 ha prestazioni inferiori di circa il 40% rispetto alla RTX 3050 da 105 W GeForce RTX 3070 dell'FX517ZR. La differenza diventa più pronunciata quando si eseguono titoli pesanti per la GPU, come Cyberpunk 2077, dove la nostra RTX 3050 può essere in ritardo di quasi il 50%. I giocatori di laptop che utilizzano ancora la vecchia RTX 2060 non si perdono molto, poiché la GPU Turing è più veloce della RTX 3050 di circa il 25%.
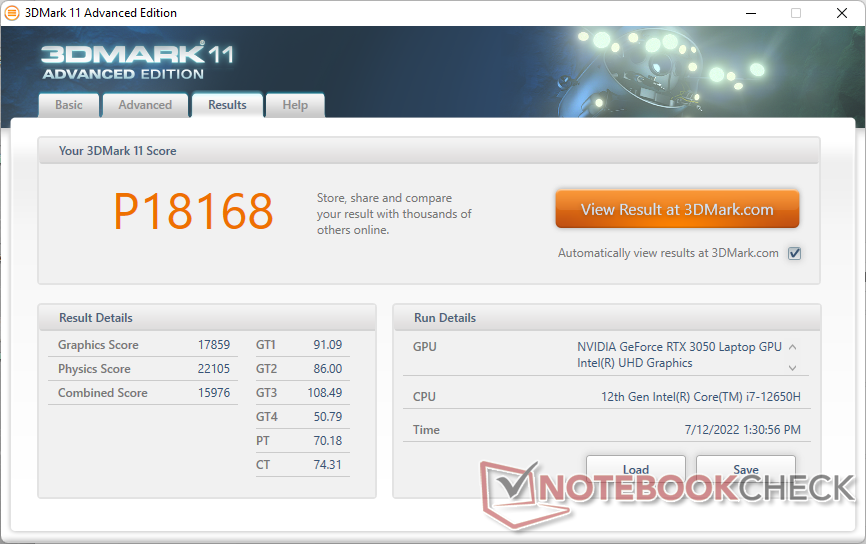
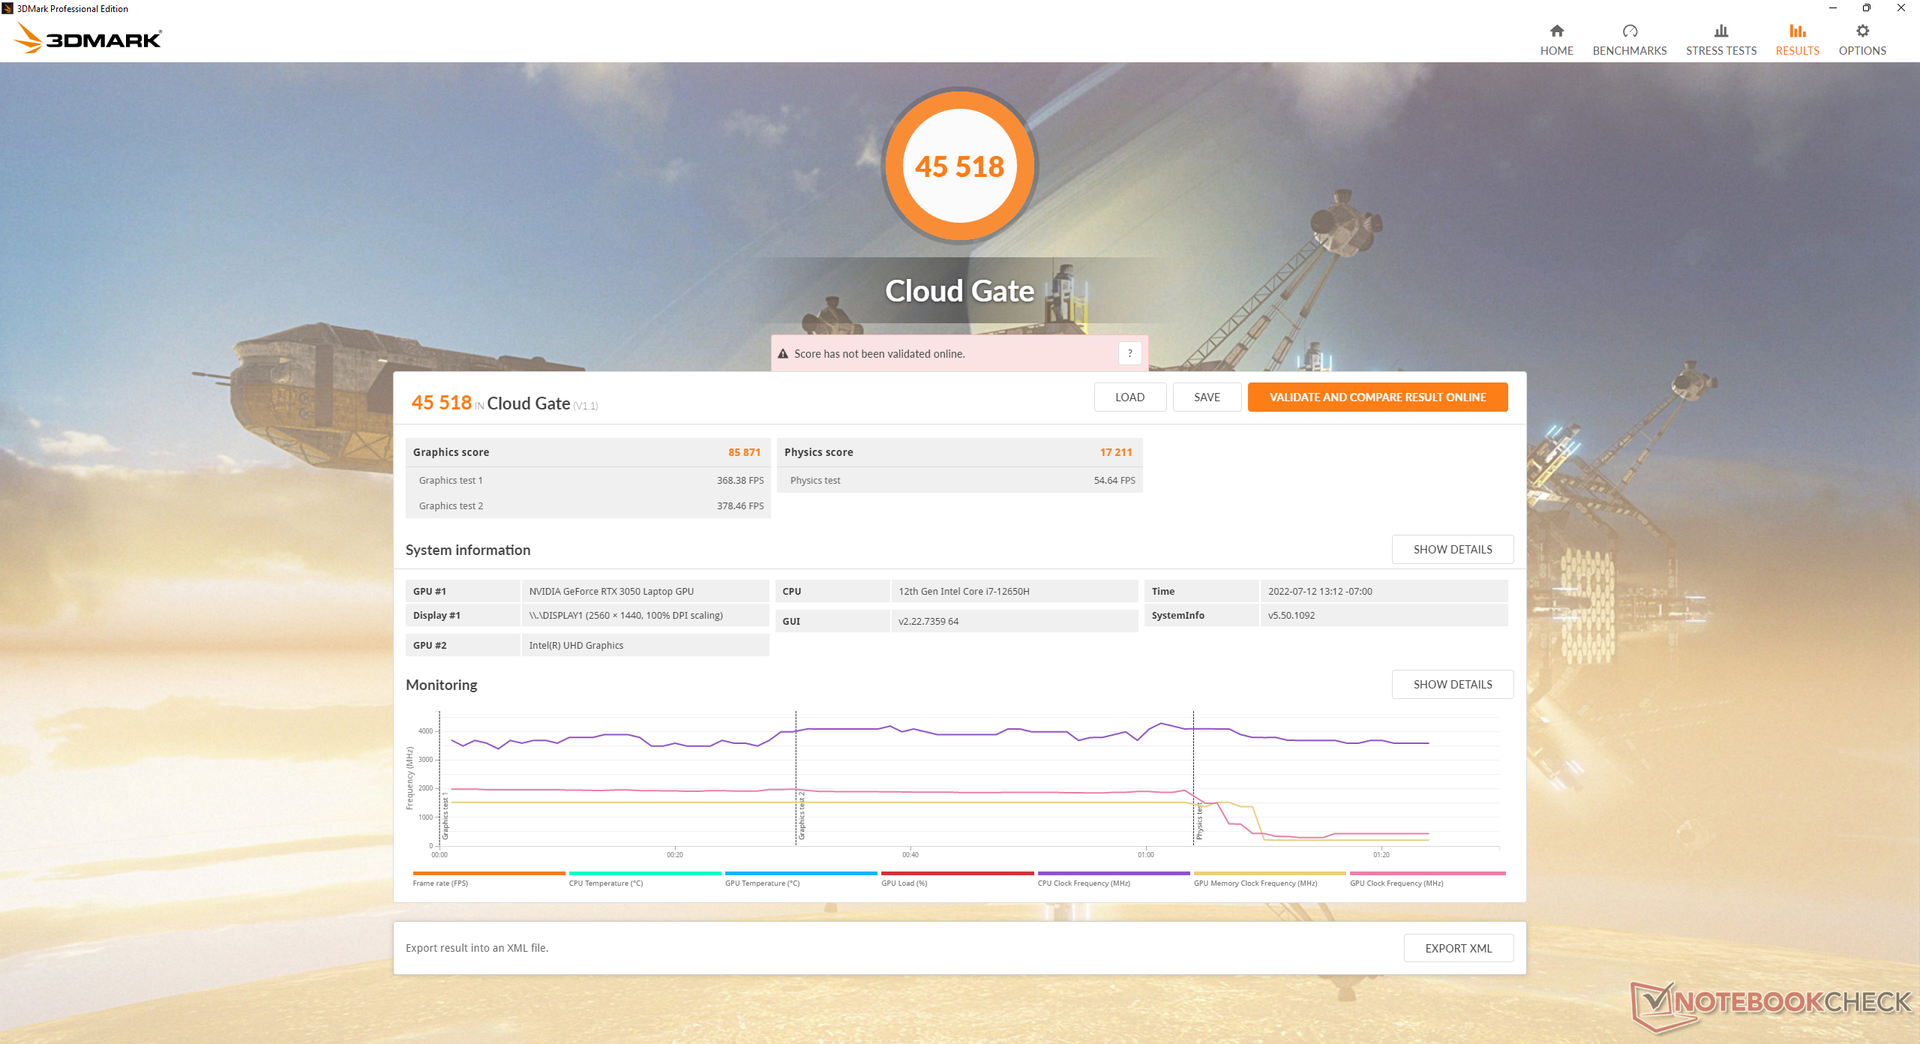
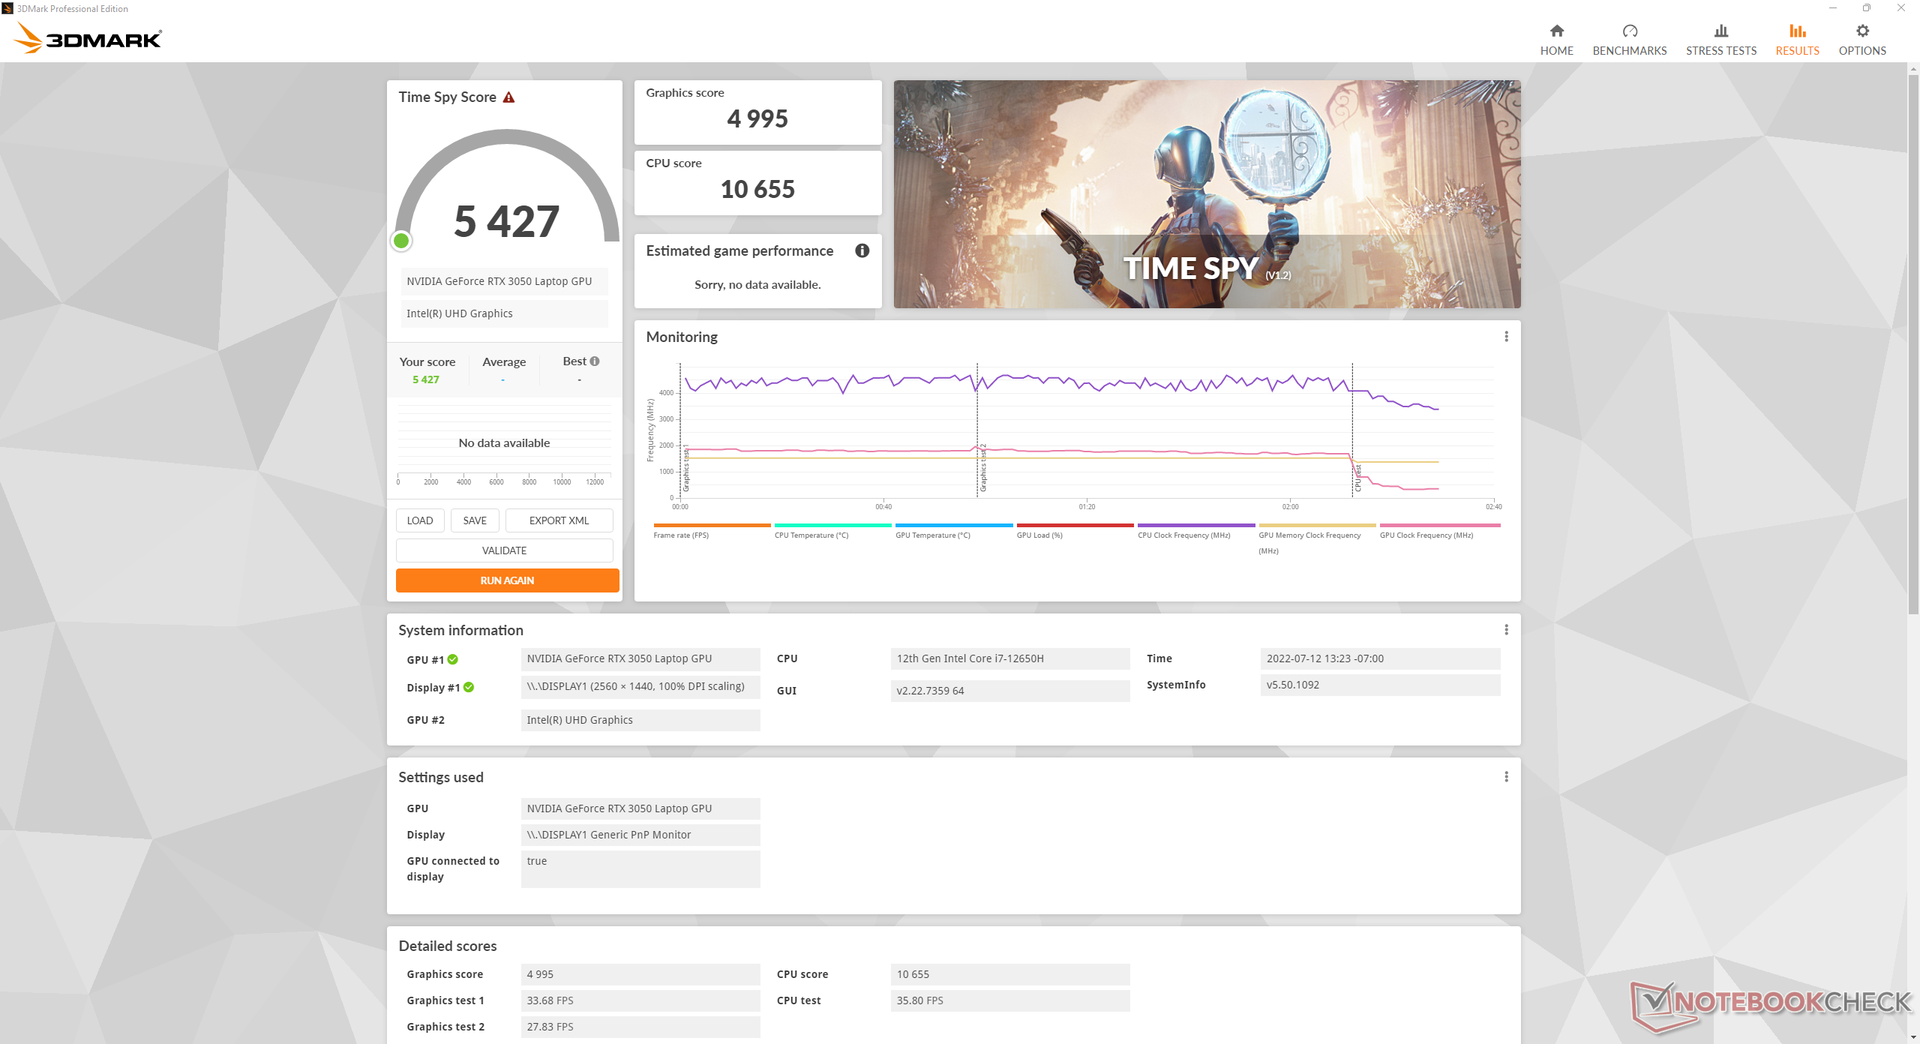
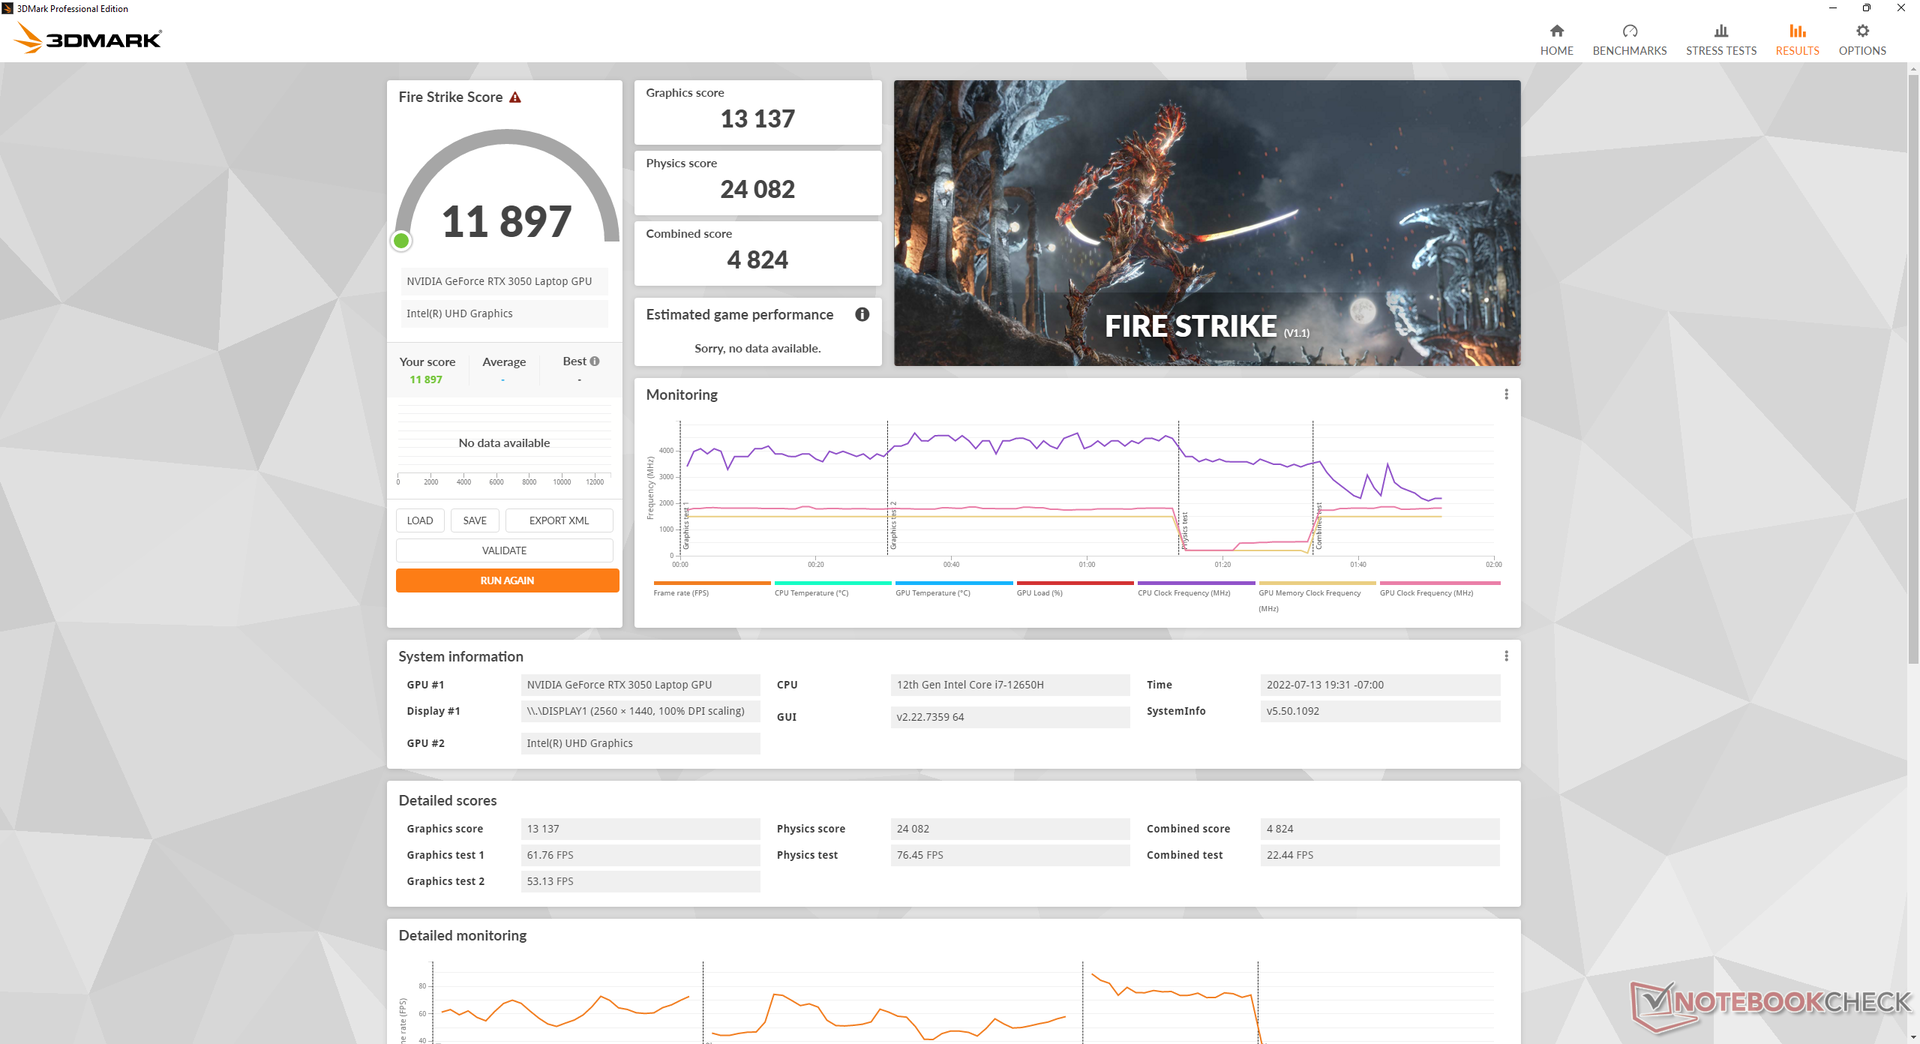
| 3DMark 11 Performance | 18168 punti | |
| 3DMark Cloud Gate Standard Score | 45518 punti | |
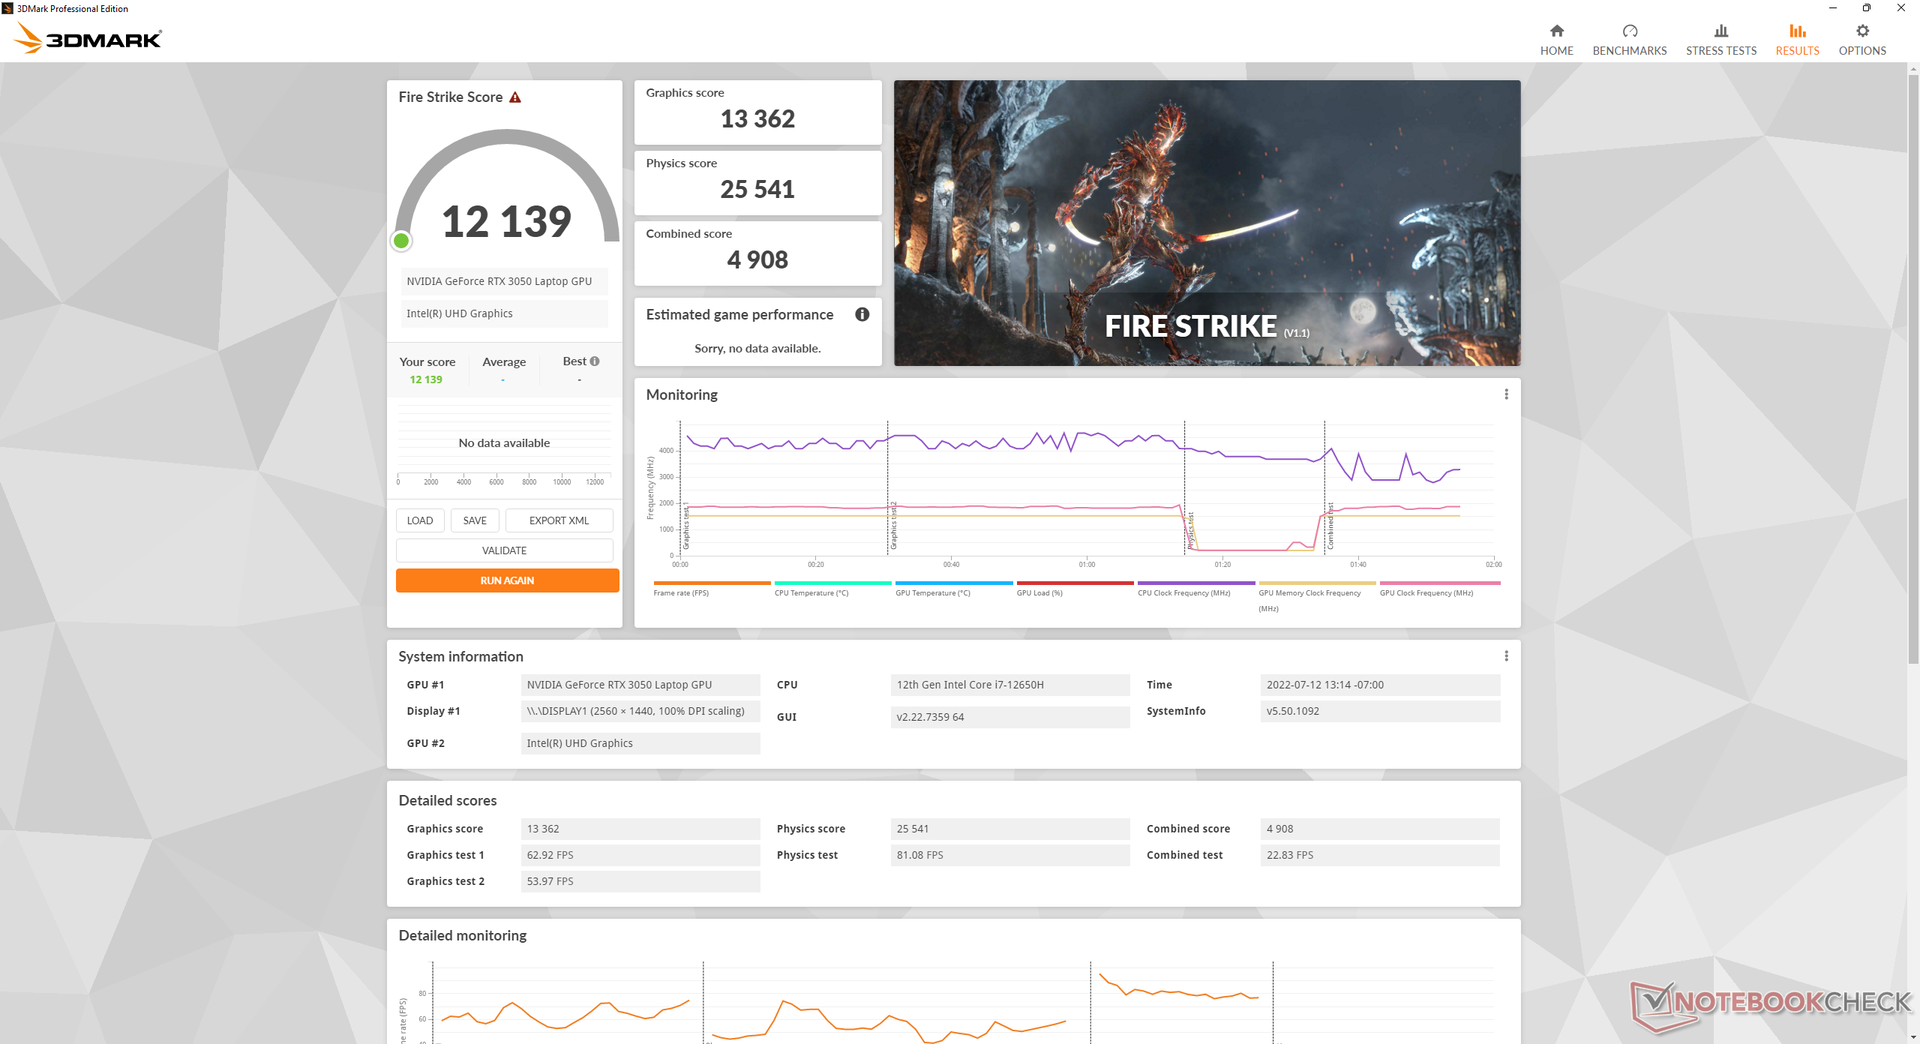
| 3DMark Fire Strike Score | 12139 punti | |
| 3DMark Time Spy Score | 5427 punti | |
Aiuto | ||
Witcher 3 FPS Chart
| basso | medio | alto | ultra | |
|---|---|---|---|---|
| GTA V (2015) | 184 | 179 | 148.2 | 70.9 |
| The Witcher 3 (2015) | 282.1 | 171.6 | 98.7 | 51.9 |
| Dota 2 Reborn (2015) | 176.5 | 163.2 | 156.3 | 147.7 |
| Final Fantasy XV Benchmark (2018) | 143.4 | 74 | 51 | |
| X-Plane 11.11 (2018) | 148.1 | 129.9 | 103.1 | |
| Strange Brigade (2018) | 320 | 135.8 | 108.1 | 90.8 |
| Cyberpunk 2077 1.6 (2022) | 77.9 | 62.1 | 44 | 36.1 |
Emissioni
Rumore di sistema - Oltre 50 dB(A) durante il gioco
Il rumore della ventola dipende in larga misura dalle impostazioni del profilo energetico di Armoury Crate: Windows, Silenzioso, Bilanciato, Turbo e Manuale. Consigliamo vivamente la modalità Silenziosa se si naviga semplicemente sul web o in streaming, perché altrimenti le ventole interne possono essere piuttosto rumorose. Se si attiva la modalità Bilanciata, ad esempio, la ventola raggiunge spesso i 32 dB(A) a fronte di uno sfondo silenzioso di 24 dB(A) solo per la navigazione sul web
Il rumore della ventola si stabilizza a 48,7 dB(A) e 53,4 dB(A) quando si gioca rispettivamente in modalità Bilanciata e Turbo. La nostra sezione Stress Test mostra che un TDP e un TGP più elevati sono accessibili solo in modalità Turbo, il che significa che gli utenti devono sopportare le ventole più rumorose se vogliono sfruttare appieno le prestazioni del portatile. La gamma di 50+ dB(A) è superiore a quella della maggior parte degli altri portatili da gioco, tra cui Dell G15 5510 o Lenovo Ideapad Gaming 3 15 ciascuno con la stessa GPU RTX 3050.
Rumorosità
| Idle |
| 24 / 24 / 32.3 dB(A) |
| Sotto carico |
| 43.7 / 53.6 dB(A) |
 | ||
30 dB silenzioso 40 dB(A) udibile 50 dB(A) rumoroso |
||
min: | ||
| Asus TUF Dash F15 FX517ZC GeForce RTX 3050 4GB Laptop GPU, i7-12650H, Intel SSD 670p SSDPEKNU512GZ | Asus TUF Dash F15 FX517ZR GeForce RTX 3070 Laptop GPU, i7-12650H, Samsung PM991a MZVLQ1T0HBLB | Dell G15 5510 GeForce RTX 3050 4GB Laptop GPU, i5-10500H, SK Hynix BC711 HFM512GD3HX015N | MSI Bravo 15 B5DD-010US Radeon RX 5500M, R5 5600H, Kingston OM8PCP3512F-AB | Lenovo Ideapad Gaming 3 15IHU-82K1002RGE GeForce RTX 3050 Ti Laptop GPU, i5-11300H, Micron 2210 MTFDHBA512QFD | Gigabyte G5 GD GeForce RTX 3050 4GB Laptop GPU, i5-11400H, ESR512GTLG-E6GBTNB4 | |
|---|---|---|---|---|---|---|
| Noise | -6% | -1% | -2% | 4% | -9% | |
| off /ambiente * (dB) | 23.9 | 26 -9% | 26 -9% | 24.5 -3% | 23.9 -0% | 24 -0% |
| Idle Minimum * (dB) | 24 | 26 -8% | 26 -8% | 24.5 -2% | 23.9 -0% | 29 -21% |
| Idle Average * (dB) | 24 | 32 -33% | 27 -13% | 32.8 -37% | 26.8 -12% | 30 -25% |
| Idle Maximum * (dB) | 32.3 | 33 -2% | 33 -2% | 32.8 -2% | 26.8 17% | 32 1% |
| Load Average * (dB) | 43.7 | 48 -10% | 45 -3% | 34.5 21% | 43.5 -0% | 53 -21% |
| Witcher 3 ultra * (dB) | 53.4 | 47 12% | 45 16% | 42.5 20% | 43.5 19% | 52 3% |
| Load Maximum * (dB) | 53.6 | 49 9% | 47 12% | 58.5 -9% | 53.1 1% | 54 -1% |
* ... Meglio usare valori piccoli
Temperatura
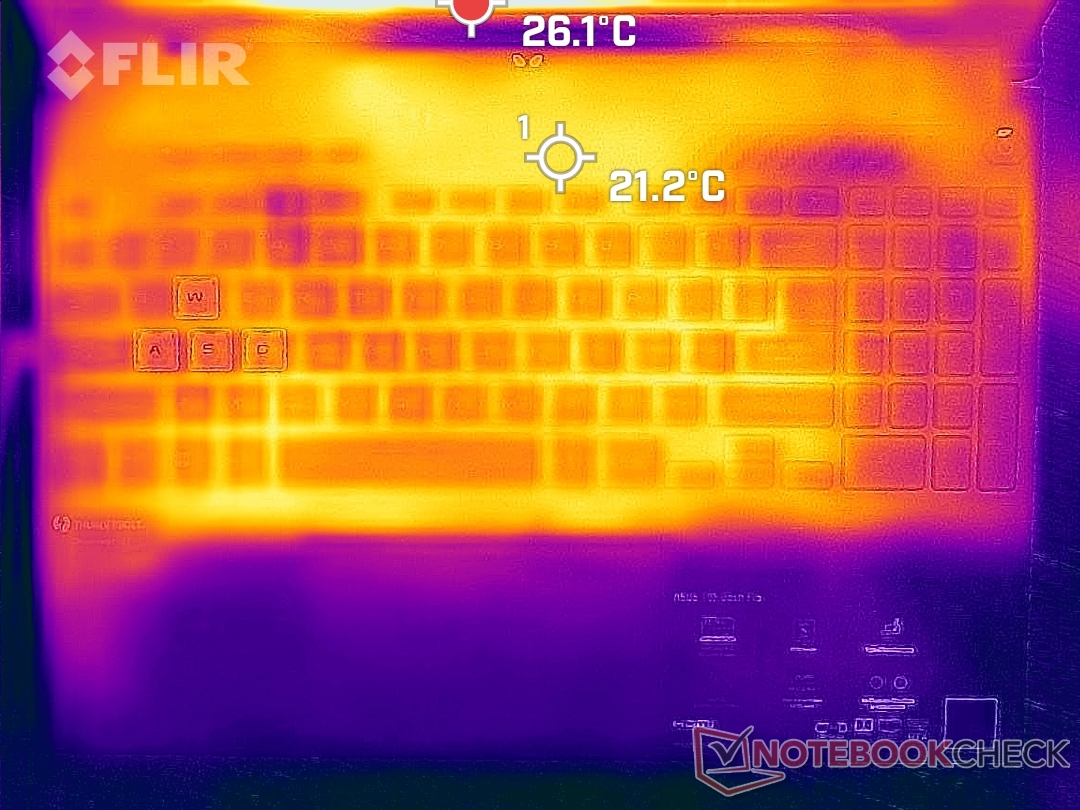
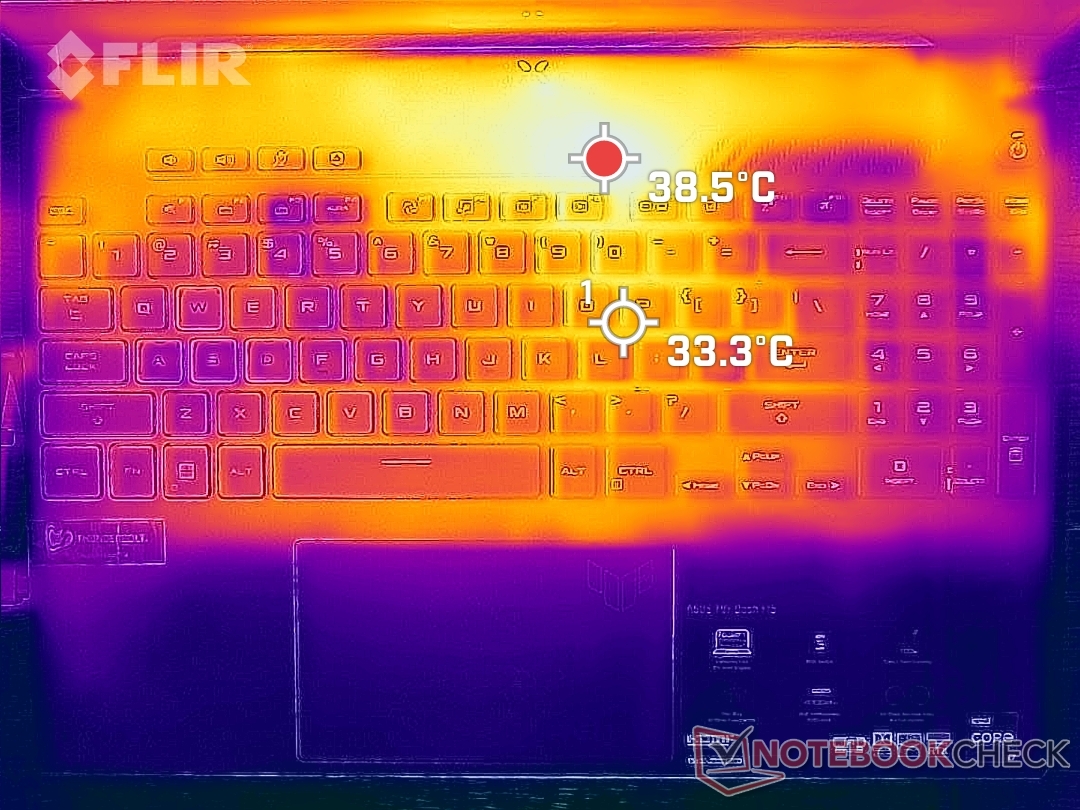
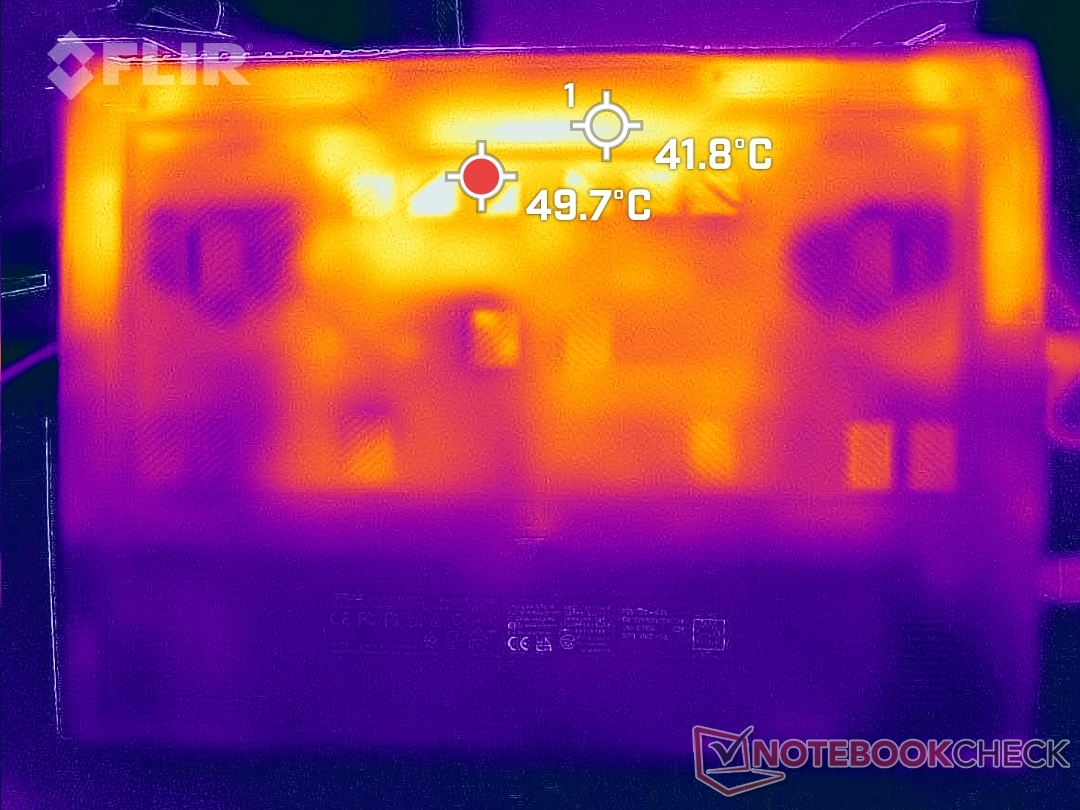
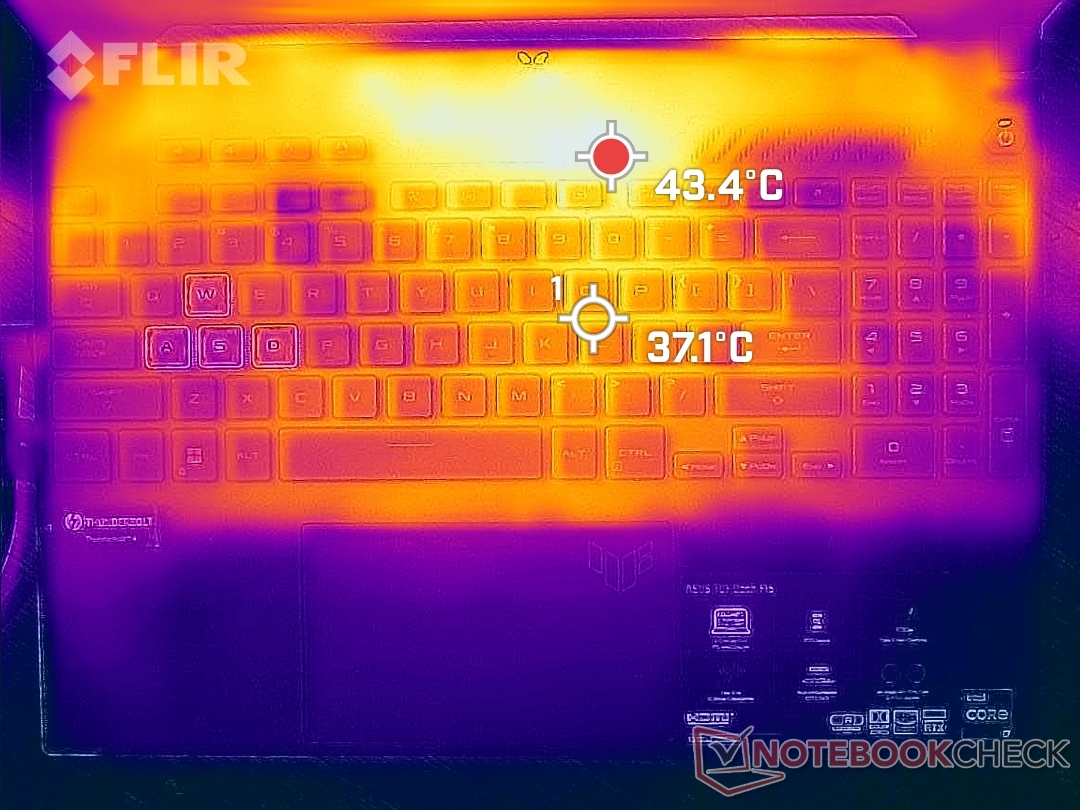
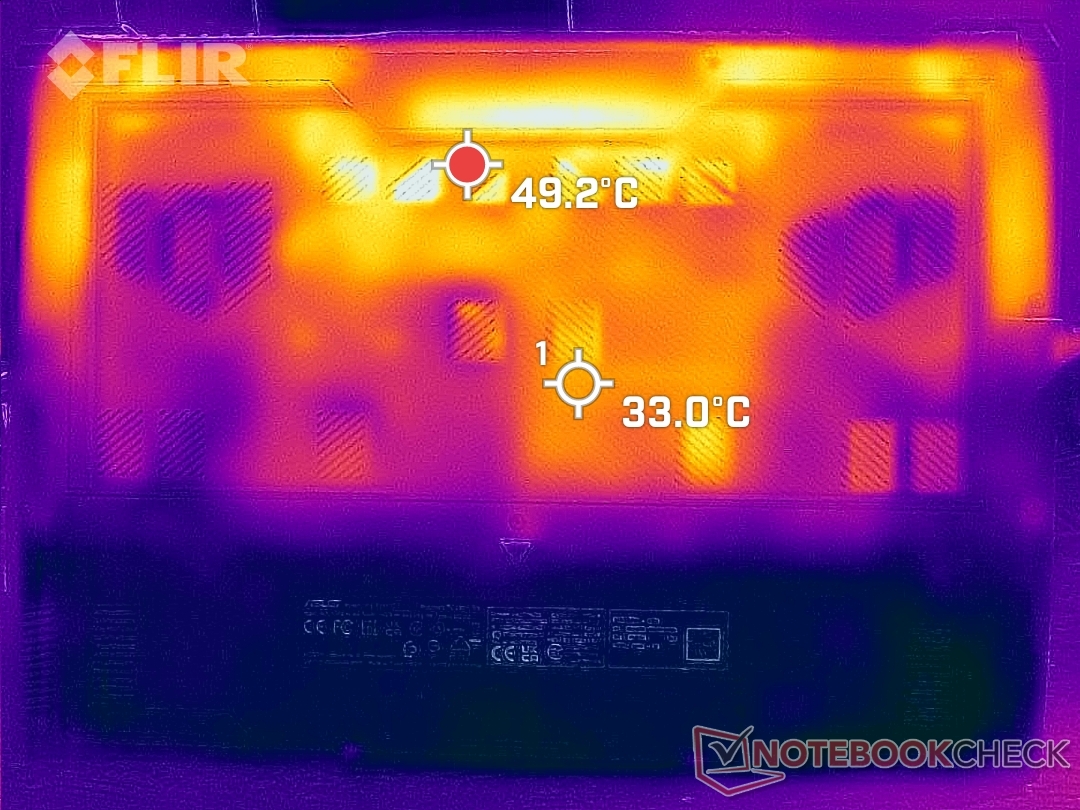
Le temperature della superficie possono raggiungere i 33°C e i 37°C sul centro della tastiera quando si gioca, il che è più fresco di quello che abbiamo osservato sull'Acer Swift X Acer Swift X 16 dotato della stessa GPU RTX 3050 di qualche grado. Il punto caldo dell'Asus può raggiungere i 43 C o più, ma fortunatamente quest'area si trova sopra la prima fila di tasti della tastiera, come mostrano le mappe di temperatura qui sotto, dove è improbabile che gli utenti tocchino quando giocano.
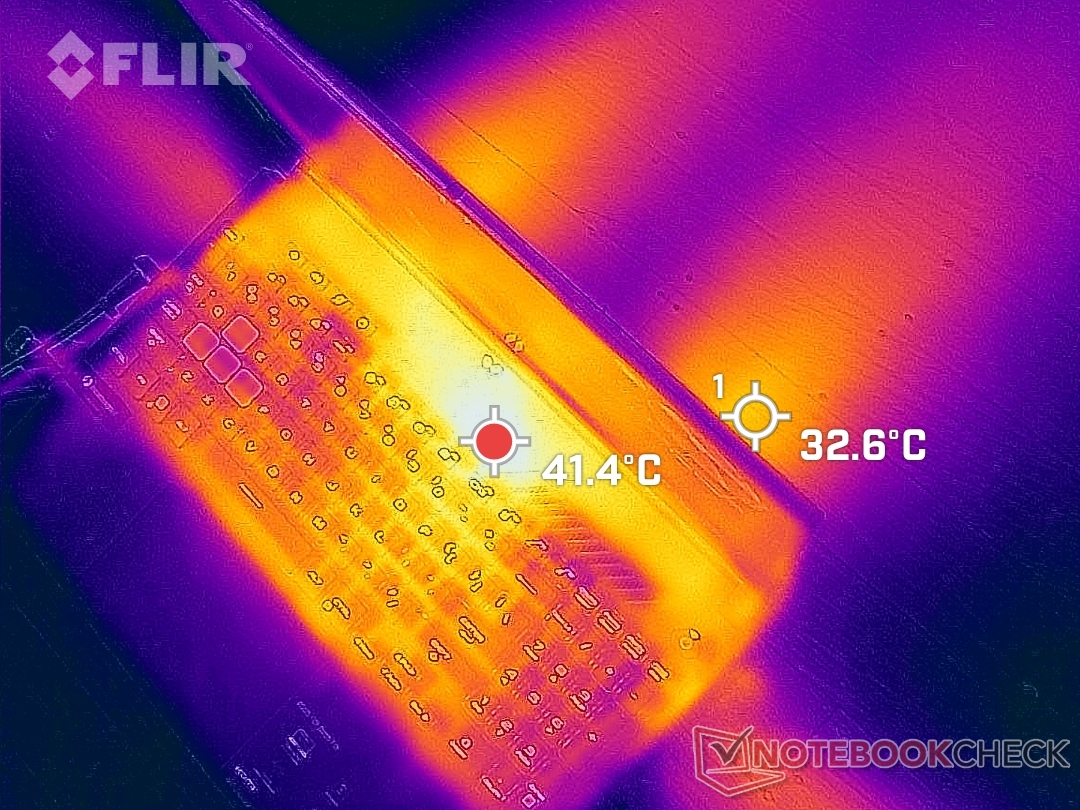
(±) La temperatura massima sul lato superiore è di 43.4 °C / 110 F, rispetto alla media di 40.4 °C / 105 F, che varia da 21.2 a 68.8 °C per questa classe Gaming.
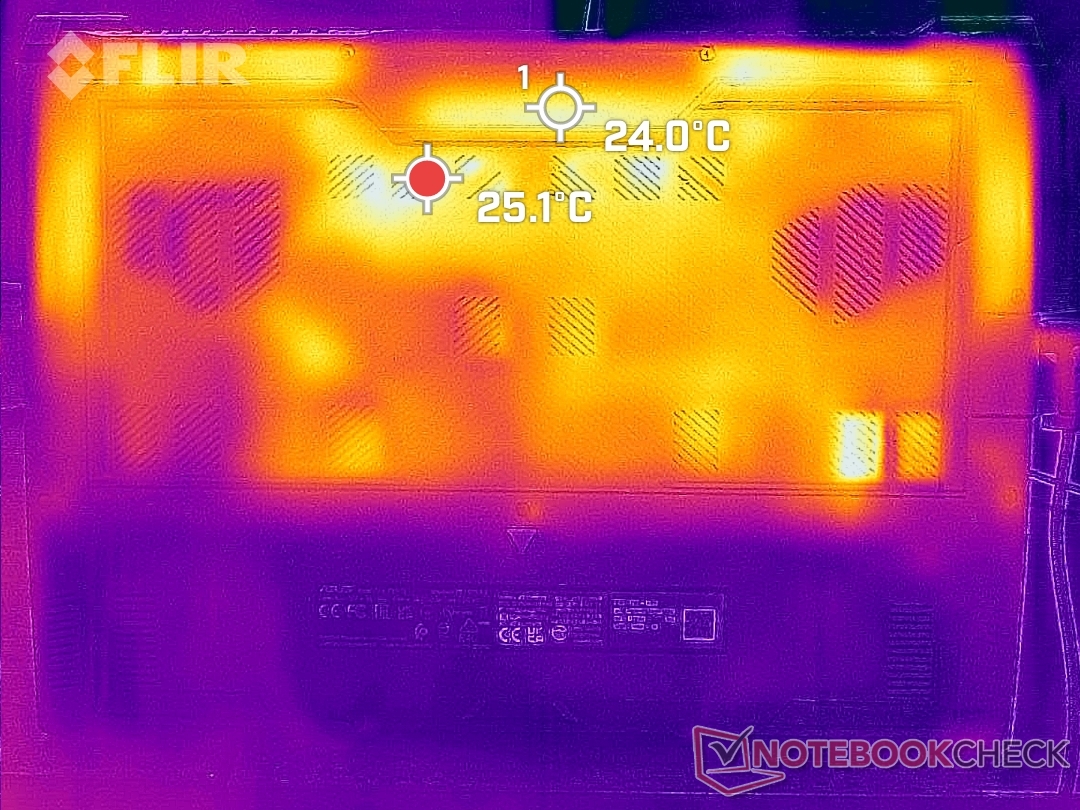
(±) Il lato inferiore si riscalda fino ad un massimo di 44.4 °C / 112 F, rispetto alla media di 43.2 °C / 110 F
(+) In idle, la temperatura media del lato superiore è di 19.2 °C / 67 F, rispetto alla media deld ispositivo di 33.9 °C / 93 F.
(+) Riproducendo The Witcher 3, la temperatura media per il lato superiore e' di 26.3 °C / 79 F, rispetto alla media del dispositivo di 33.9 °C / 93 F.
(+) I poggiapolsi e il touchpad sono piu' freddi della temperatura della pelle con un massimo di 19.4 °C / 66.9 F e sono quindi freddi al tatto.
(+) La temperatura media della zona del palmo della mano di dispositivi simili e'stata di 28.8 °C / 83.8 F (+9.4 °C / 16.9 F).
| Asus TUF Dash F15 FX517ZC Intel Core i7-12650H, NVIDIA GeForce RTX 3050 4GB Laptop GPU | Asus TUF Dash F15 FX517ZR Intel Core i7-12650H, NVIDIA GeForce RTX 3070 Laptop GPU | Dell G15 5510 Intel Core i5-10500H, NVIDIA GeForce RTX 3050 4GB Laptop GPU | MSI Bravo 15 B5DD-010US AMD Ryzen 5 5600H, AMD Radeon RX 5500M | Lenovo Ideapad Gaming 3 15IHU-82K1002RGE Intel Core i5-11300H, NVIDIA GeForce RTX 3050 Ti Laptop GPU | Gigabyte G5 GD Intel Core i5-11400H, NVIDIA GeForce RTX 3050 4GB Laptop GPU | |
|---|---|---|---|---|---|---|
| Heat | -36% | -15% | -32% | -10% | -20% | |
| Maximum Upper Side * (°C) | 43.4 | 52 -20% | 52 -20% | 52.2 -20% | 43.2 -0% | 45 -4% |
| Maximum Bottom * (°C) | 44.4 | 52 -17% | 49 -10% | 48.6 -9% | 47.9 -8% | 50 -13% |
| Idle Upper Side * (°C) | 21.2 | 33 -56% | 26 -23% | 38 -79% | 24.9 -17% | 28 -32% |
| Idle Bottom * (°C) | 24 | 36 -50% | 26 -8% | 28.4 -18% | 27 -13% | 31 -29% |
* ... Meglio usare valori piccoli
Stress test
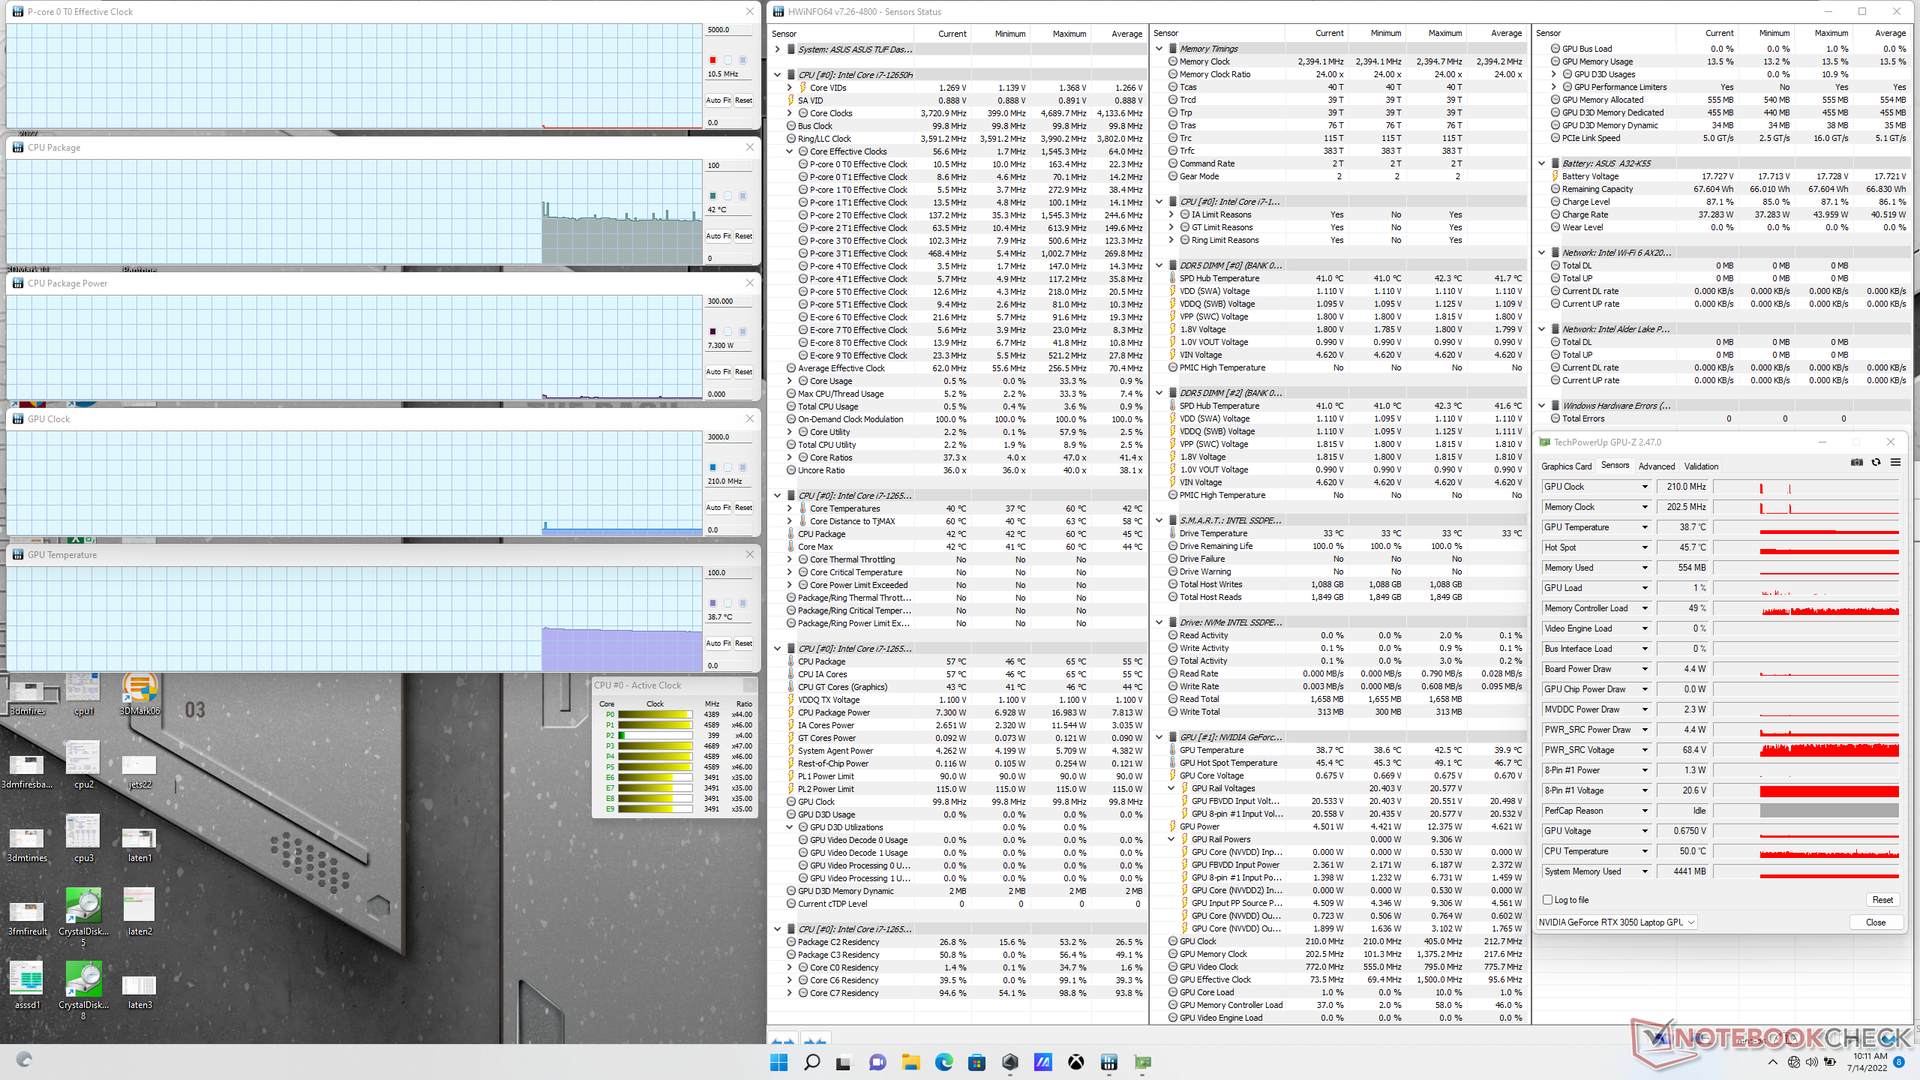
Le velocità di clock della CPU, la temperatura del core e l'assorbimento di potenza del package raggiungevano rispettivamente 3,7 GHz, 95 C e 93 W all'avvio dello stress Prime95. Tuttavia, le velocità di clock iniziavano immediatamente a diminuire prima di stabilizzarsi a 2,9 GHz e con un assorbimento di potenza del package di 57 W, per evitare che le temperature del core salissero ulteriormente. È chiaro che la soluzione di raffreddamento è un fattore che limita le prestazioni della CPU.
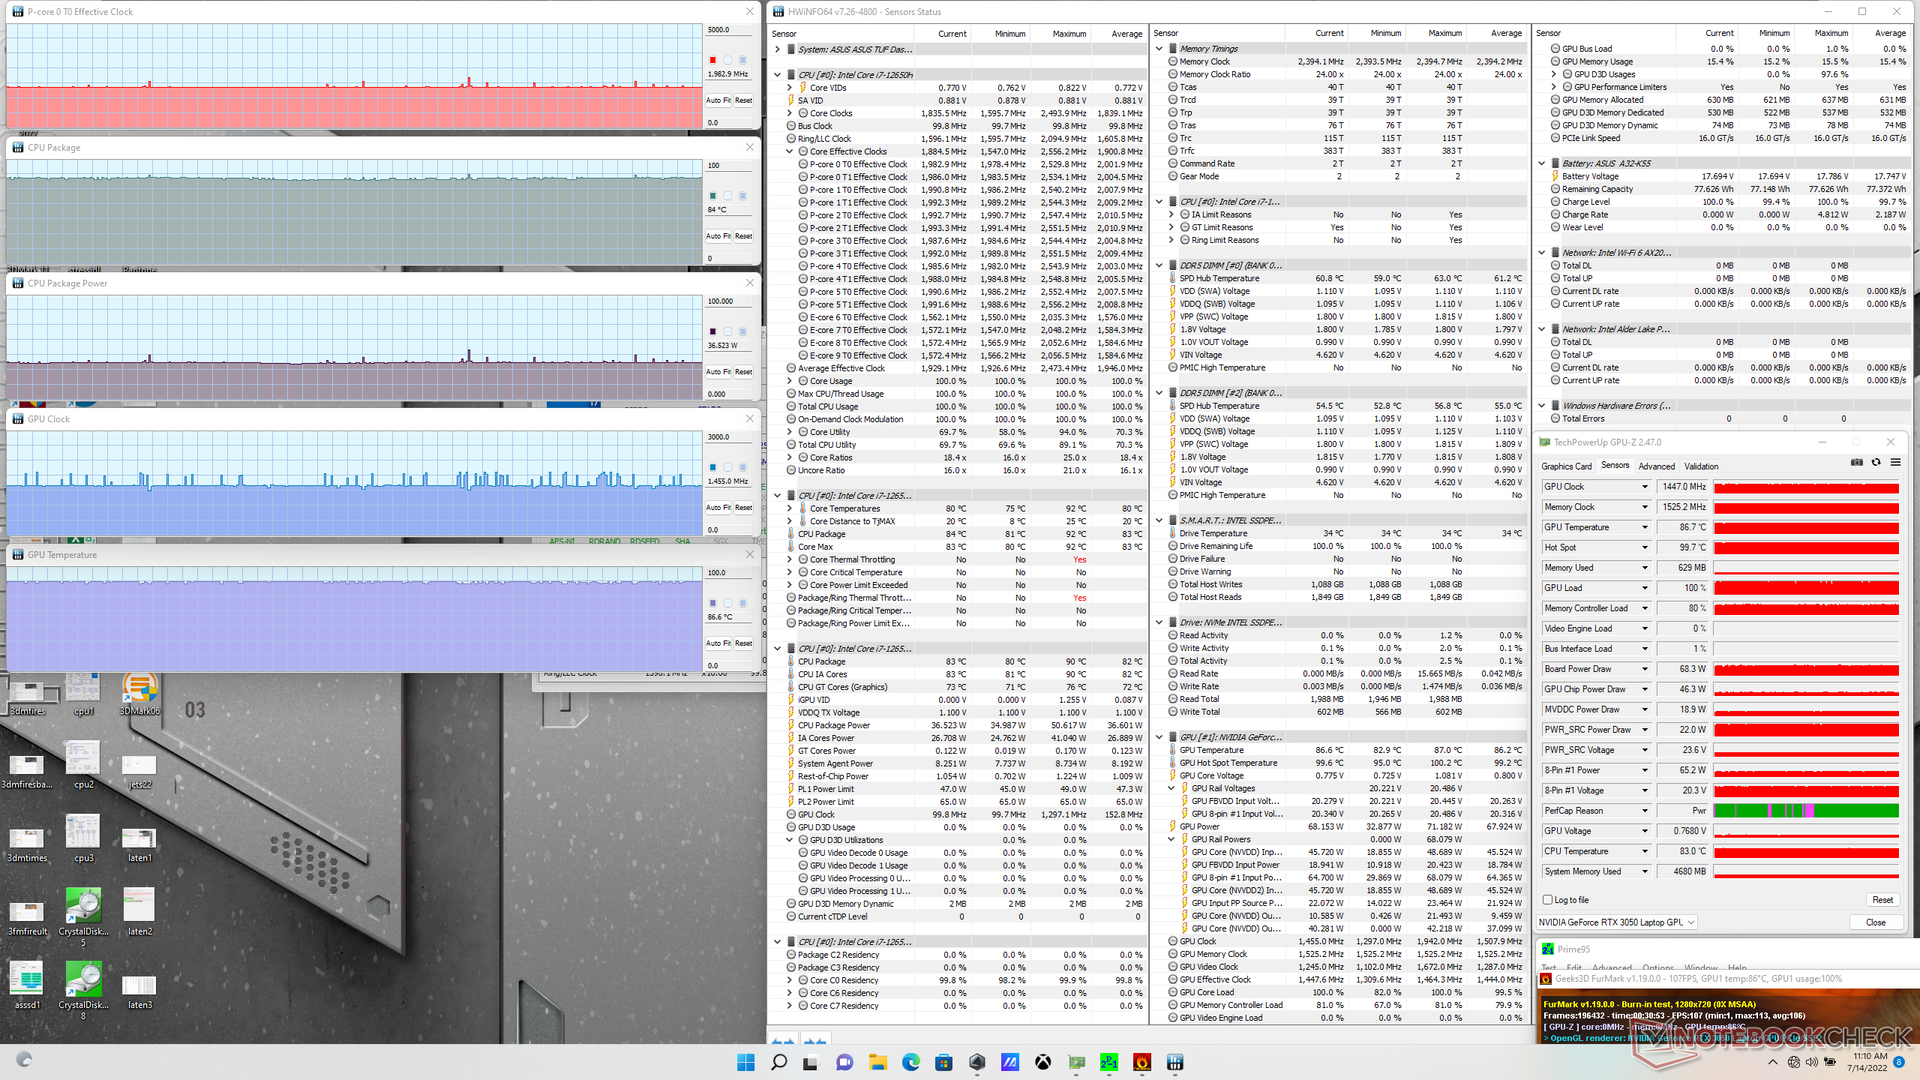
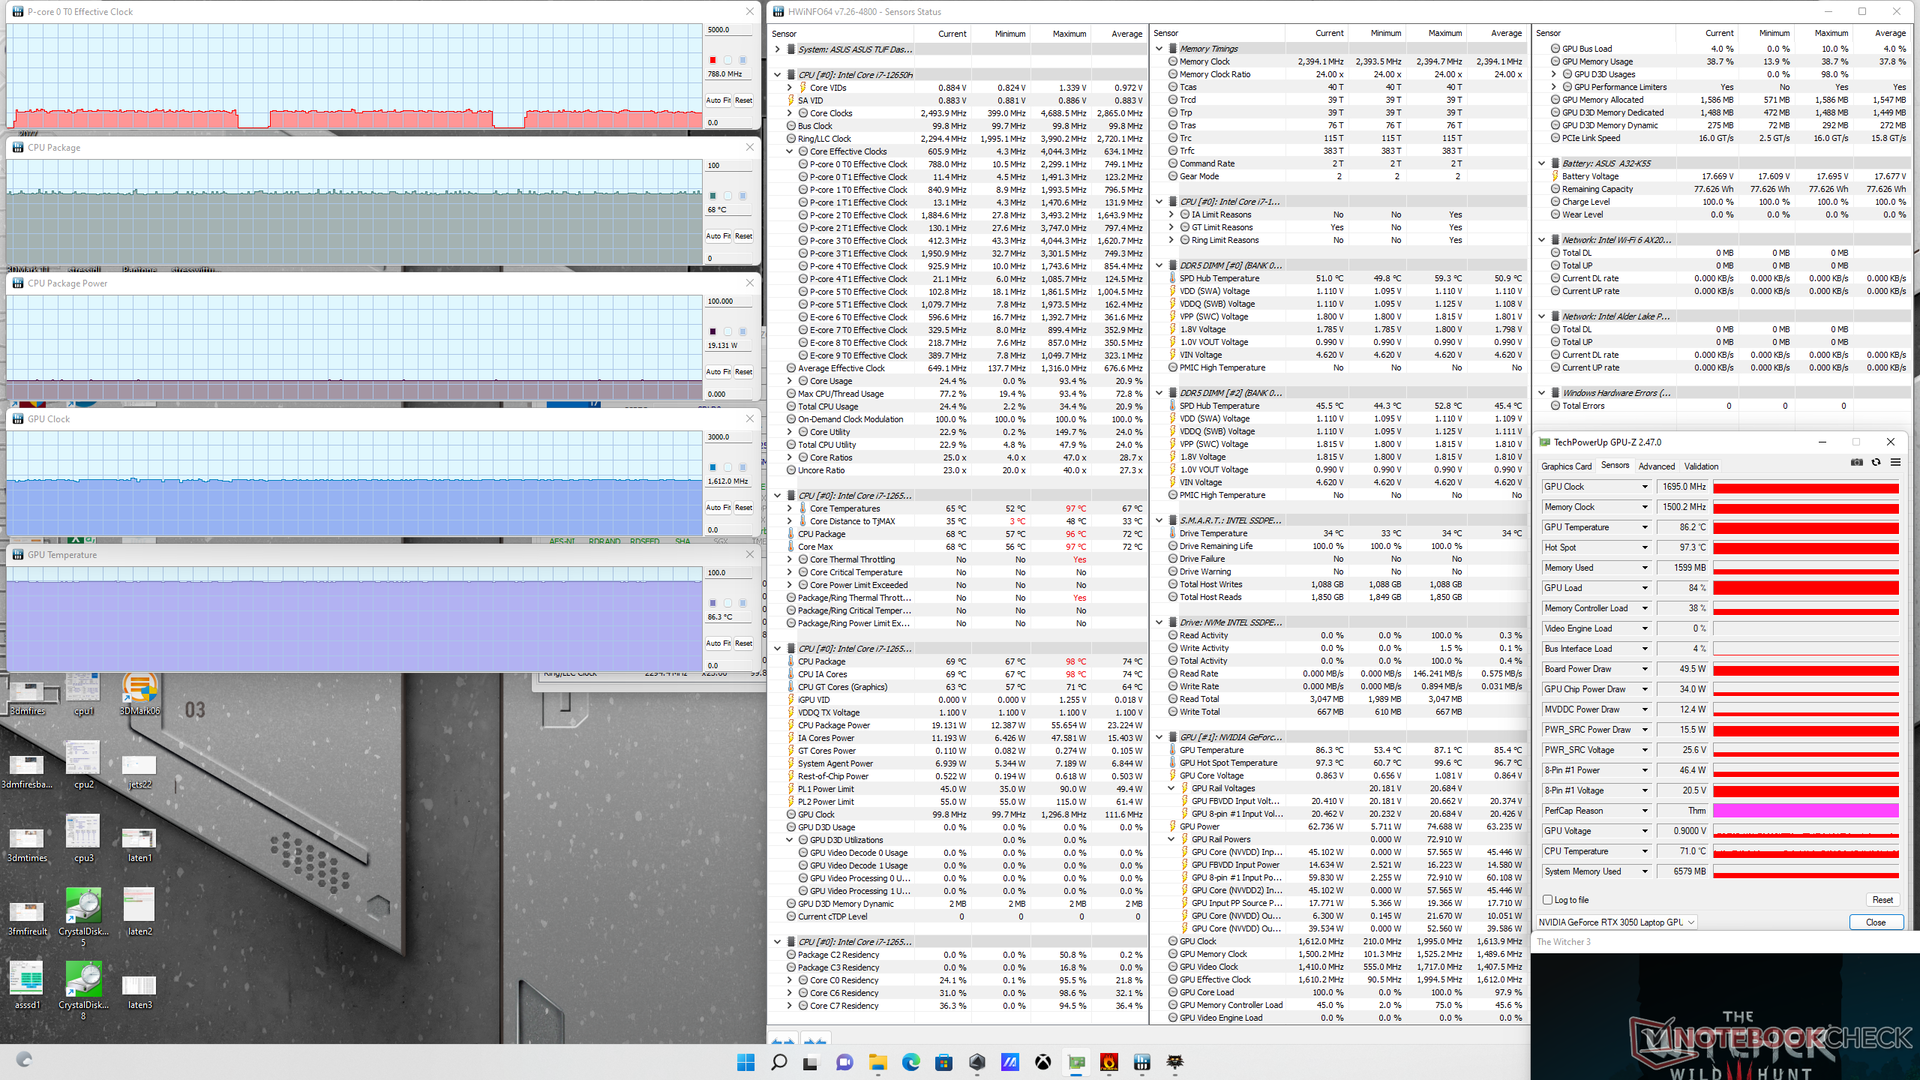
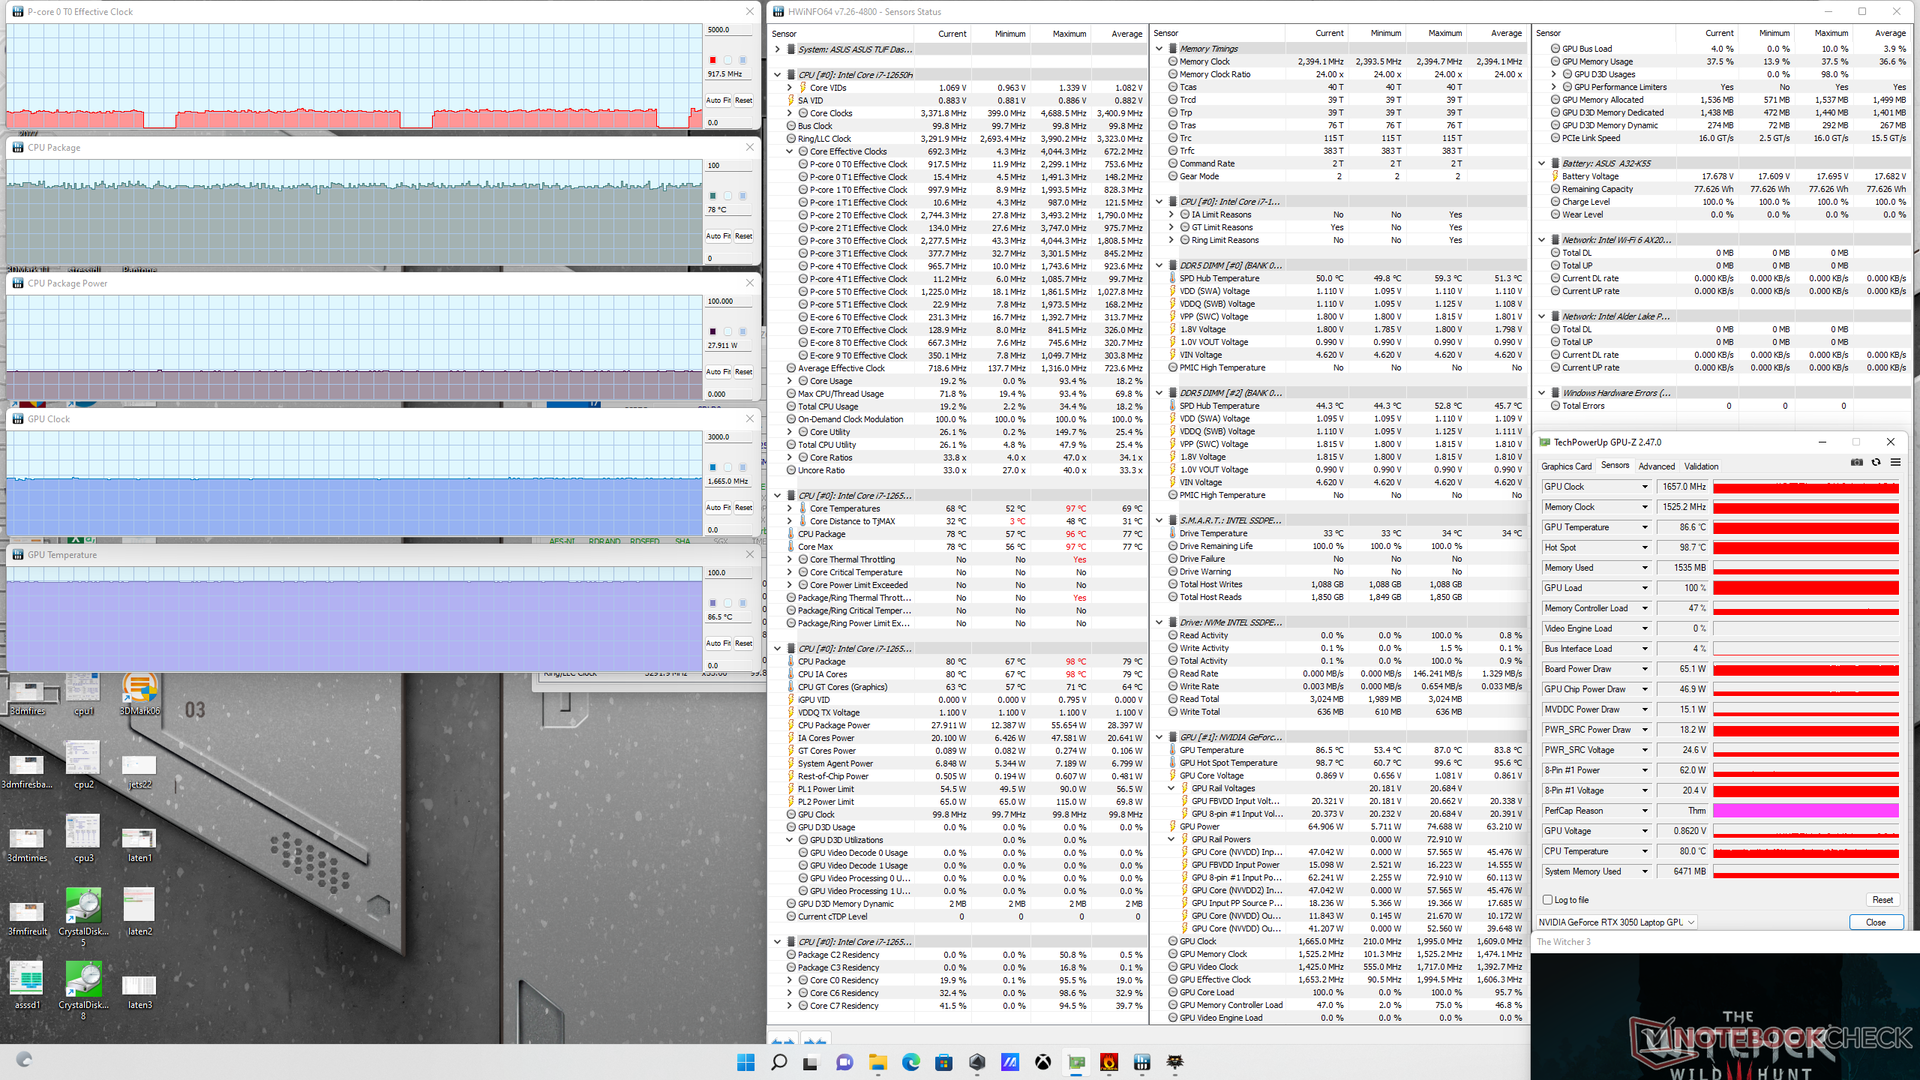
Il clock della GPU, il clock della memoria e la temperatura del core si stabilizzano rispettivamente a 1612 MHz, 1500 MHz e 86 C quando si utilizza il profilo di alimentazione bilanciato Witcher 3 con il profilo di alimentazione bilanciato. Il clock della GPU e il clock della memoria aumenterebbero di poco se si utilizzasse la modalità Turbo, ma la temperatura della GPU rimarrebbe invariata in quanto il rumore della ventola è più elevato in modalità Turbo, come notato in precedenza, per compensare i clock più elevati. Si noti che l'assorbimento di potenza del pacchetto GPU e CPU aumenterebbe da 50 W a 65 W e da 19 W a 28 W, rispettivamente, quando si utilizza la modalità Turbo Witcher 3 in modalità Turbo.
La temperatura della GPU durante il gioco è altrettanto calda di quella dell'FX517ZR, anche se la nostra GPU è molto più lenta.
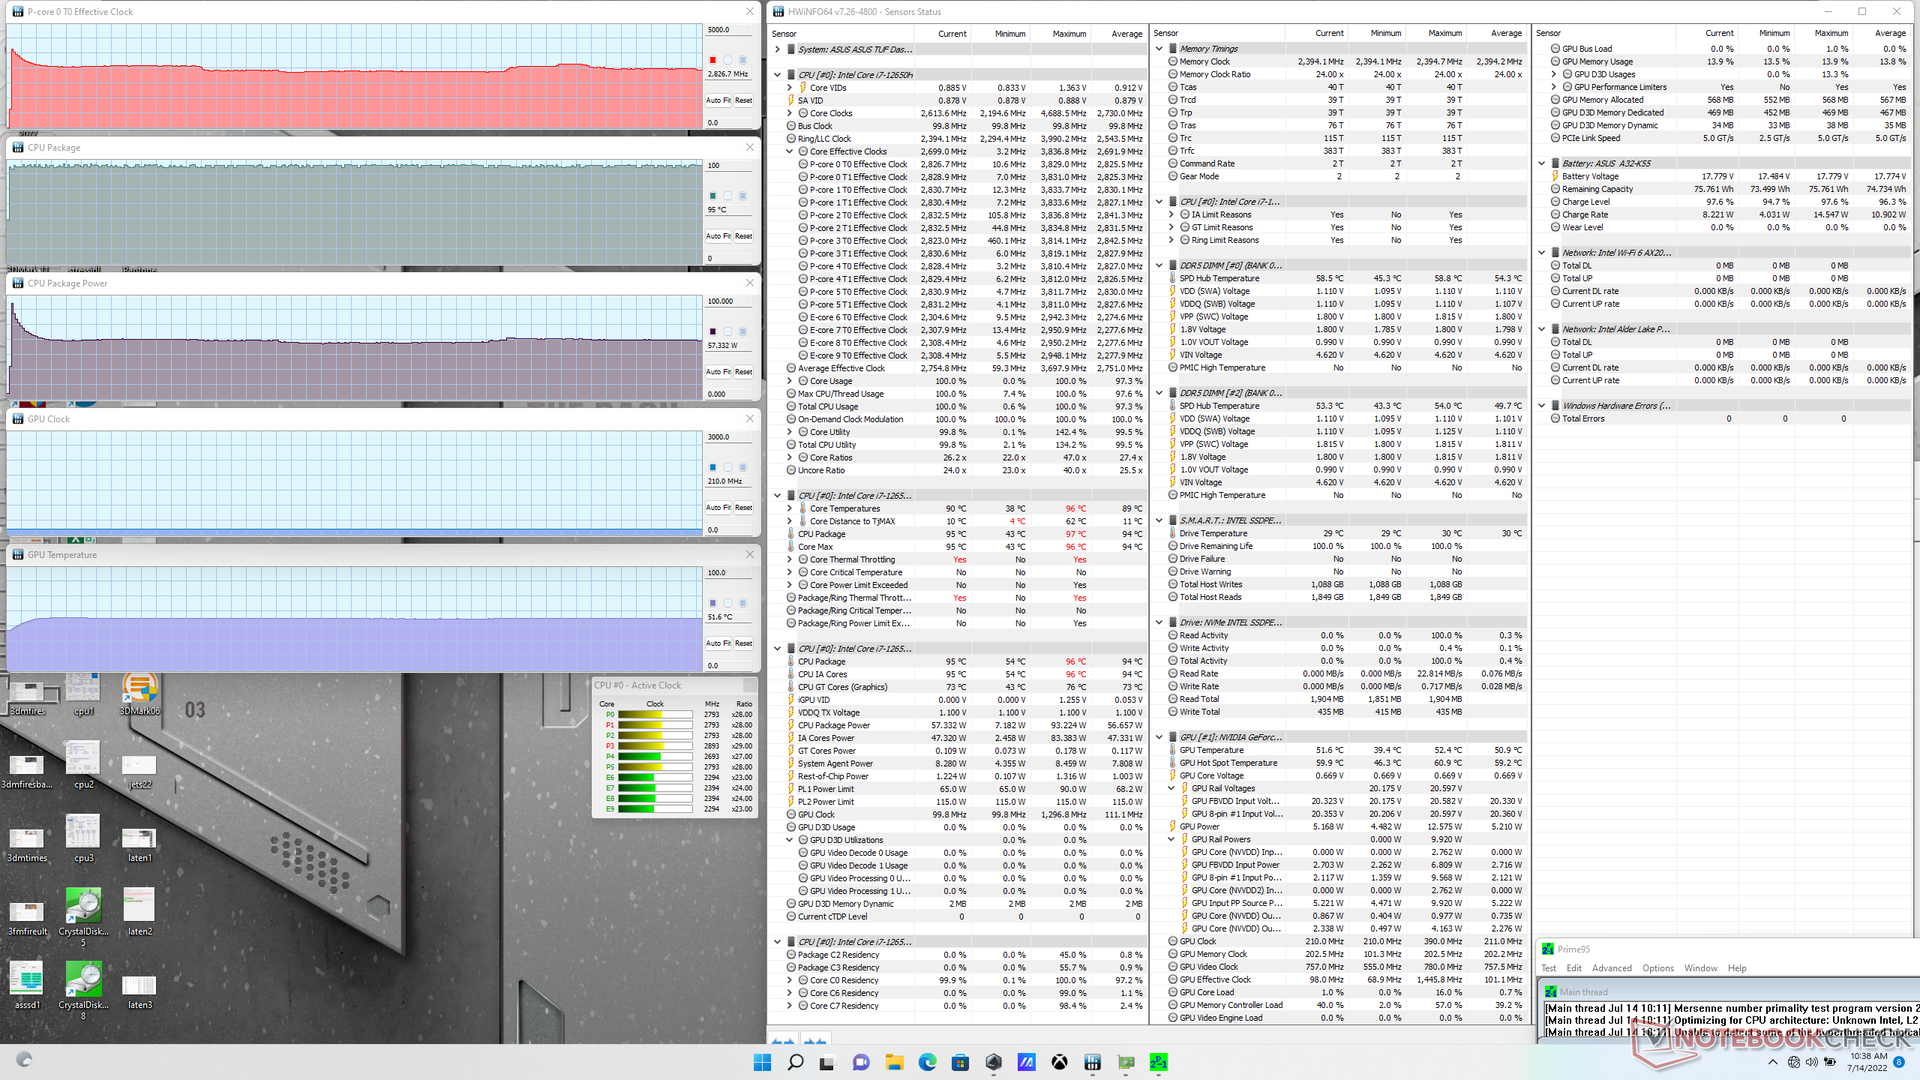
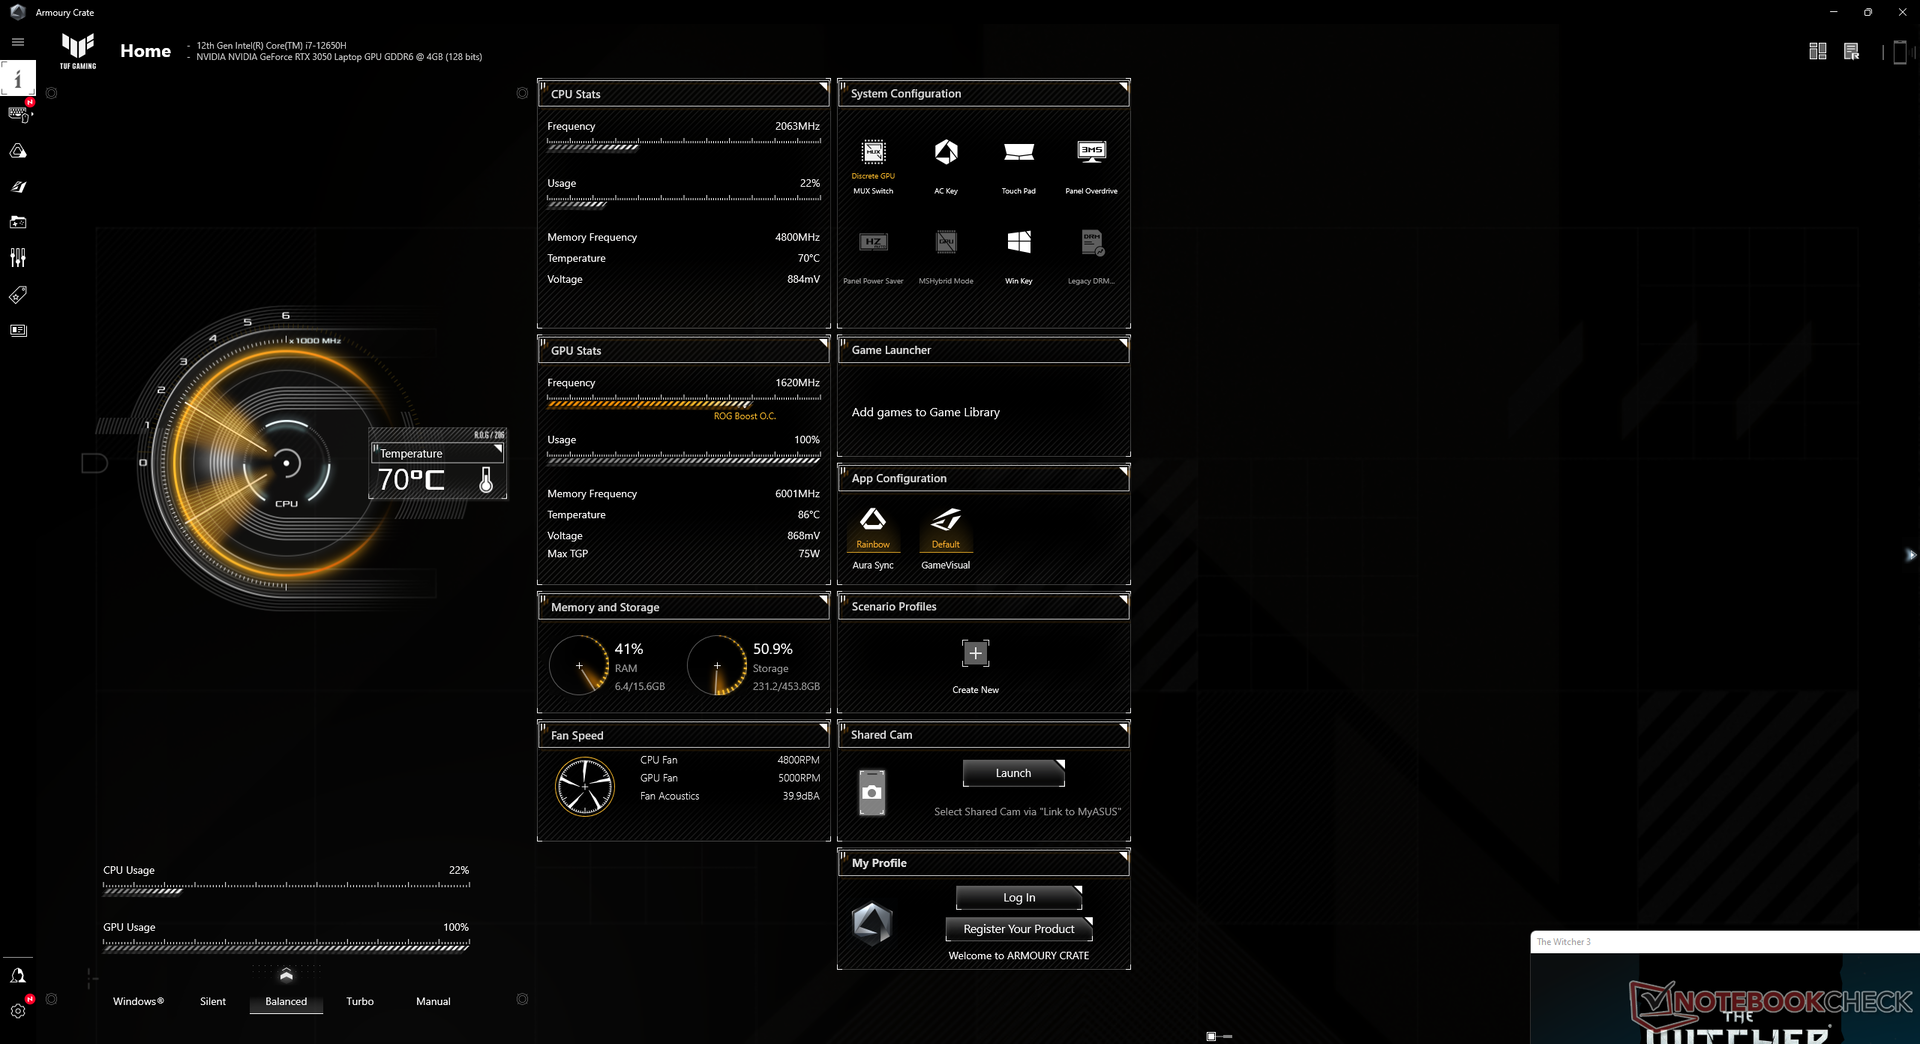
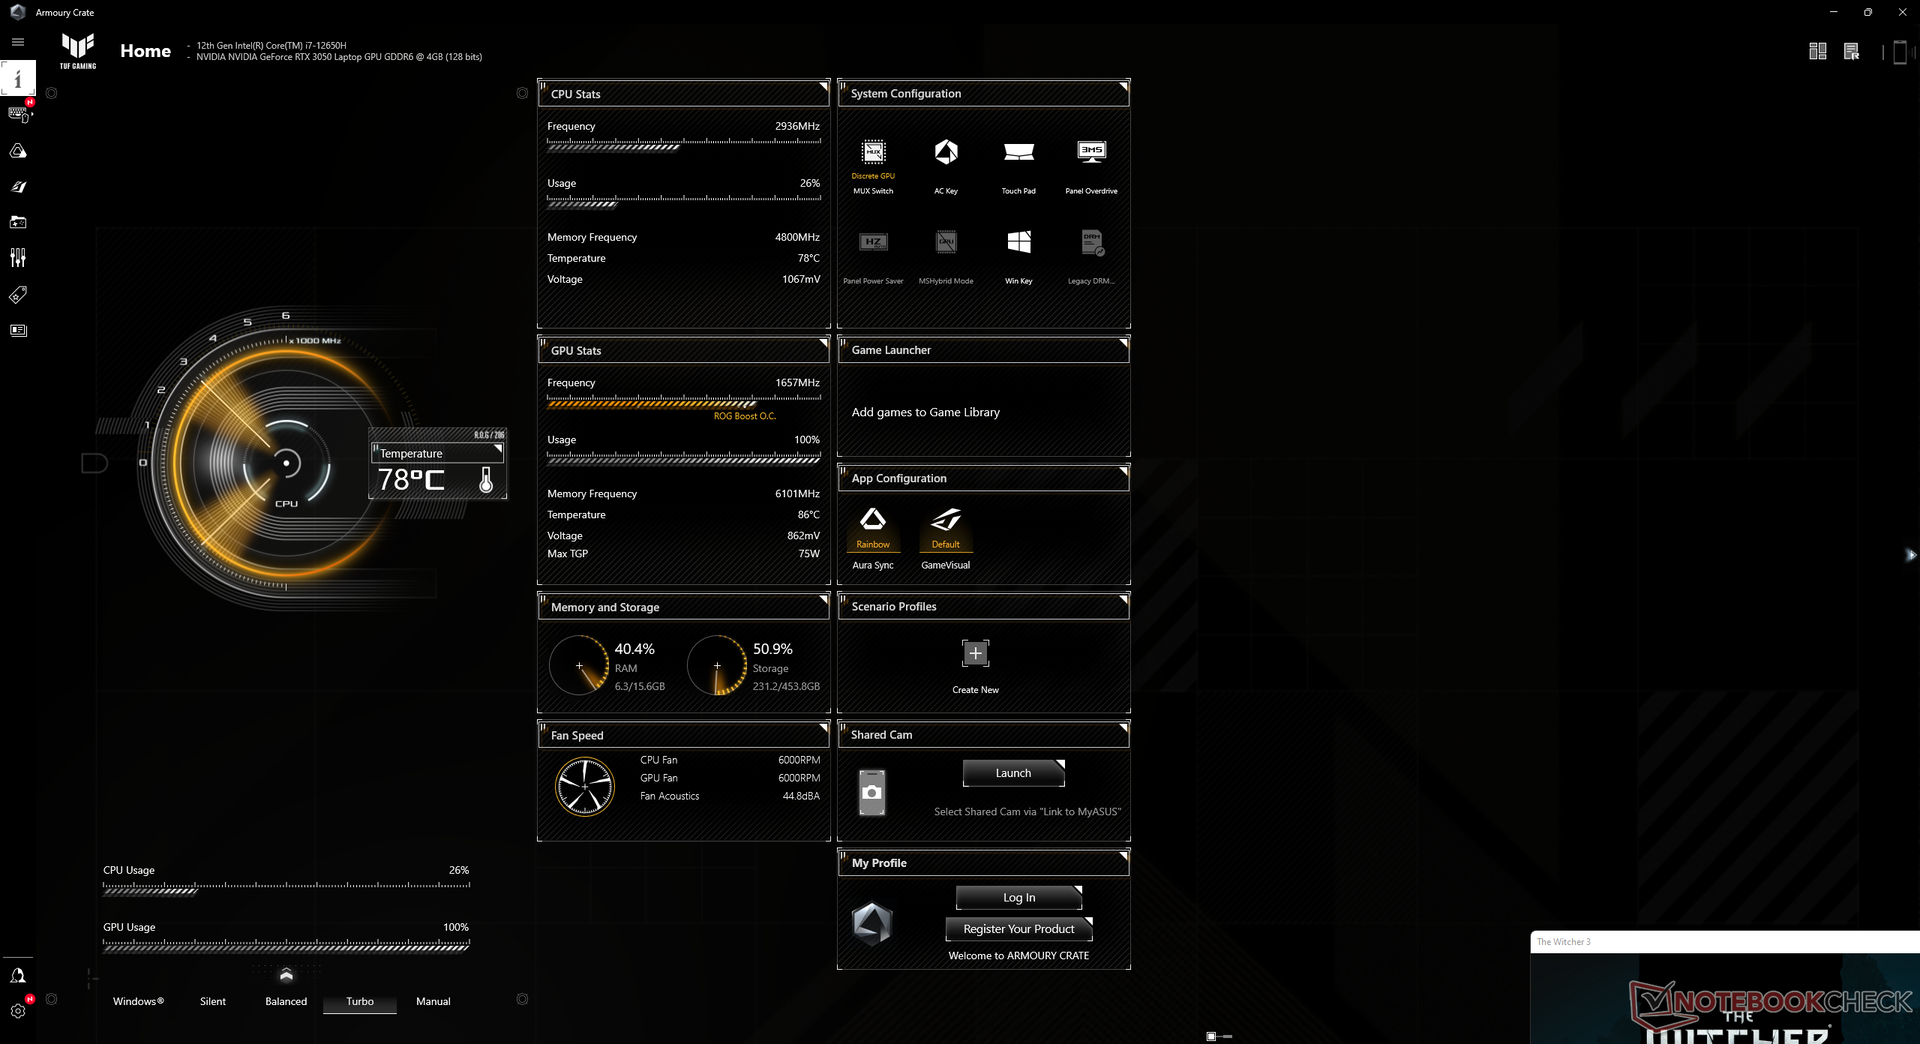
| Clock della CPU (GHz) | Clock della GPU (MHz) | Temperatura media della CPU (°C) | Temperatura media della GPU (°C) | |
| Sistema inattivo | -- | -- | 42 | 39 |
| Stress Prime95 | ~2,9 | -- | 95 | 52 |
| StressPrime95 + FurMark | 2,0 | 1455 | 84 | 87 |
| Witcher 3 Stress (modalità bilanciata) | ~0,8 | 1612 | 68 | 86 |
| Witcher 3 Stress (modalità Turbo) | ~0,9 | 1665 | 78 | 86 |
Altoparlanti
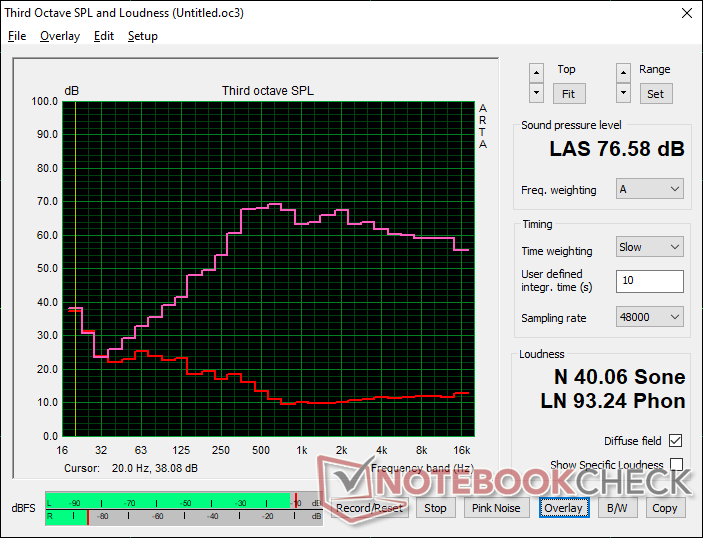
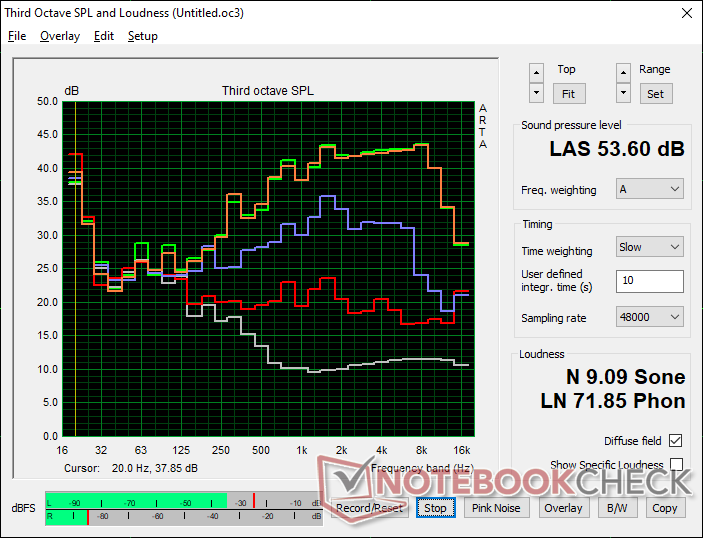
Asus TUF Dash F15 FX517ZC analisi audio
(±) | potenza degli altiparlanti media ma buona (76.6 dB)
Bassi 100 - 315 Hz
(±) | bassi ridotti - in media 11.8% inferiori alla media
(±) | la linearità dei bassi è media (8.6% delta rispetto alla precedente frequenza)
Medi 400 - 2000 Hz
(±) | medi elevati - circa 6.1% superiore alla media
(+) | medi lineari (4.9% delta rispetto alla precedente frequenza)
Alti 2 - 16 kHz
(+) | Alti bilanciati - appena 1.6% dalla media
(+) | alti lineari (2.8% delta rispetto alla precedente frequenza)
Nel complesso 100 - 16.000 Hz
(+) | suono nel complesso lineare (14.2% differenza dalla media)
Rispetto alla stessa classe
» 25% di tutti i dispositivi testati in questa classe è stato migliore, 7% simile, 68% peggiore
» Il migliore ha avuto un delta di 6%, medio di 18%, peggiore di 132%
Rispetto a tutti i dispositivi testati
» 17% di tutti i dispositivi testati in questa classe è stato migliore, 4% similare, 79% peggiore
» Il migliore ha avuto un delta di 4%, medio di 23%, peggiore di 134%
Apple MacBook Pro 16 2021 M1 Pro analisi audio
(+) | gli altoparlanti sono relativamente potenti (84.7 dB)
Bassi 100 - 315 Hz
(+) | bassi buoni - solo 3.8% dalla media
(+) | bassi in lineaa (5.2% delta rispetto alla precedente frequenza)
Medi 400 - 2000 Hz
(+) | medi bilanciati - solo only 1.3% rispetto alla media
(+) | medi lineari (2.1% delta rispetto alla precedente frequenza)
Alti 2 - 16 kHz
(+) | Alti bilanciati - appena 1.9% dalla media
(+) | alti lineari (2.7% delta rispetto alla precedente frequenza)
Nel complesso 100 - 16.000 Hz
(+) | suono nel complesso lineare (4.6% differenza dalla media)
Rispetto alla stessa classe
» 0% di tutti i dispositivi testati in questa classe è stato migliore, 0% simile, 100% peggiore
» Il migliore ha avuto un delta di 5%, medio di 17%, peggiore di 45%
Rispetto a tutti i dispositivi testati
» 0% di tutti i dispositivi testati in questa classe è stato migliore, 0% similare, 100% peggiore
» Il migliore ha avuto un delta di 4%, medio di 23%, peggiore di 134%
Gestione dell'energia - Ancora affamati di energia
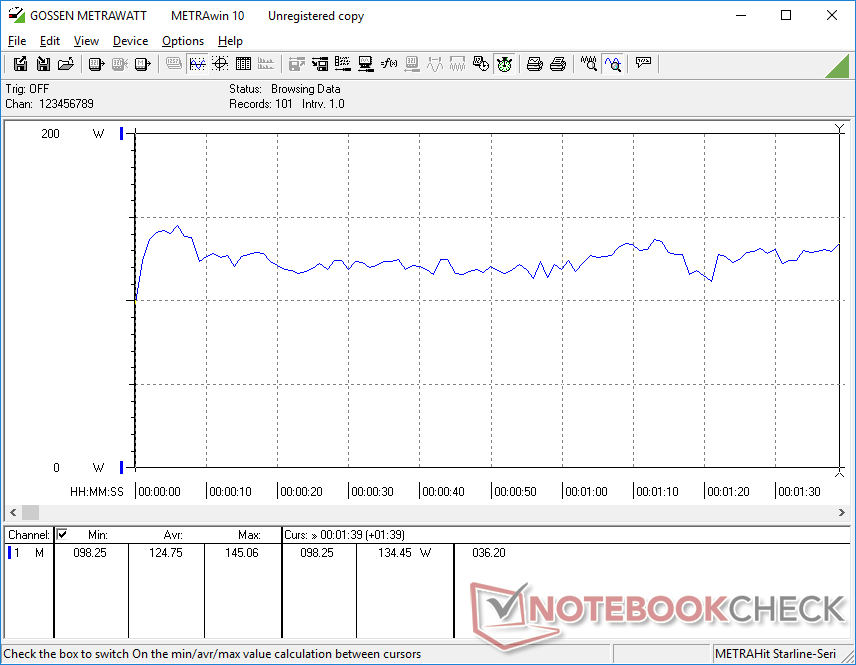
Consumo di energia
Se la RTX 3050 è più lenta del 40% rispetto alla RTX 3070, significa che possiamo aspettarci un consumo energetico inferiore del 40%? Sfortunatamente, il nostro FX517ZC richiede solo il 7% in meno rispetto all'FX517ZR quando si eseguono gli stessi giochi con le stesse impostazioni grafiche
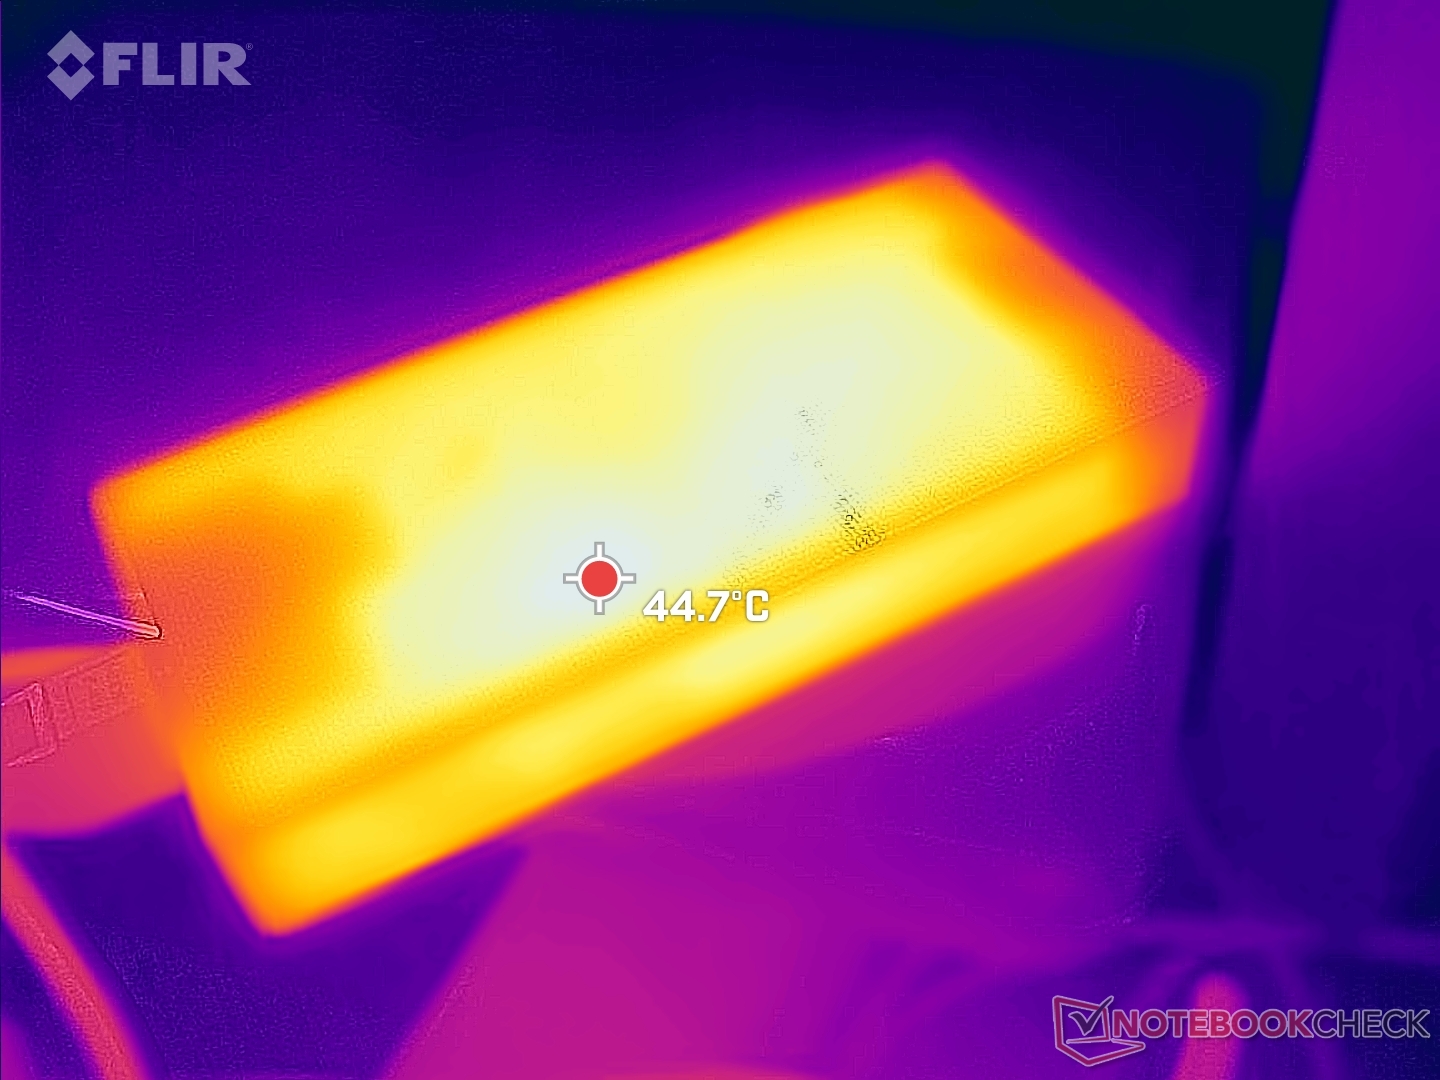
Si noti che l'FX517ZC viene fornito con un adattatore CA da 180 W (~15 x 7,2 x 2,3 cm), mentre l'FX517ZR viene fornito con un adattatore da 200 W leggermente più grande.
| Off / Standby | |
| Idle | |
| Sotto carico |
|
Leggenda:
min: | |
| Asus TUF Dash F15 FX517ZC i7-12650H, GeForce RTX 3050 4GB Laptop GPU, Intel SSD 670p SSDPEKNU512GZ, IPS, 2560x1440, 15.6" | Asus TUF Dash F15 FX517ZR i7-12650H, GeForce RTX 3070 Laptop GPU, Samsung PM991a MZVLQ1T0HBLB, IPS, 2560x1440, 15.6" | Dell G15 5510 i5-10500H, GeForce RTX 3050 4GB Laptop GPU, SK Hynix BC711 HFM512GD3HX015N, IPS, 1920x1080, 15.6" | MSI Bravo 15 B5DD-010US R5 5600H, Radeon RX 5500M, Kingston OM8PCP3512F-AB, IPS, 1920x1080, 15.6" | Lenovo Ideapad Gaming 3 15IHU-82K1002RGE i5-11300H, GeForce RTX 3050 Ti Laptop GPU, Micron 2210 MTFDHBA512QFD, IPS, 1920x1080, 15.6" | Gigabyte G5 GD i5-11400H, GeForce RTX 3050 4GB Laptop GPU, ESR512GTLG-E6GBTNB4, IPS, 1920x1080, 15.6" | |
|---|---|---|---|---|---|---|
| Power Consumption | 4% | 28% | 33% | 35% | 6% | |
| Idle Minimum * (Watt) | 9.2 | 10 -9% | 3 67% | 6.6 28% | 4.9 47% | 13 -41% |
| Idle Average * (Watt) | 15.9 | 14 12% | 8 50% | 9.8 38% | 8.3 48% | 15 6% |
| Idle Maximum * (Watt) | 29.5 | 20 32% | 13 56% | 10.8 63% | 8.9 70% | 20 32% |
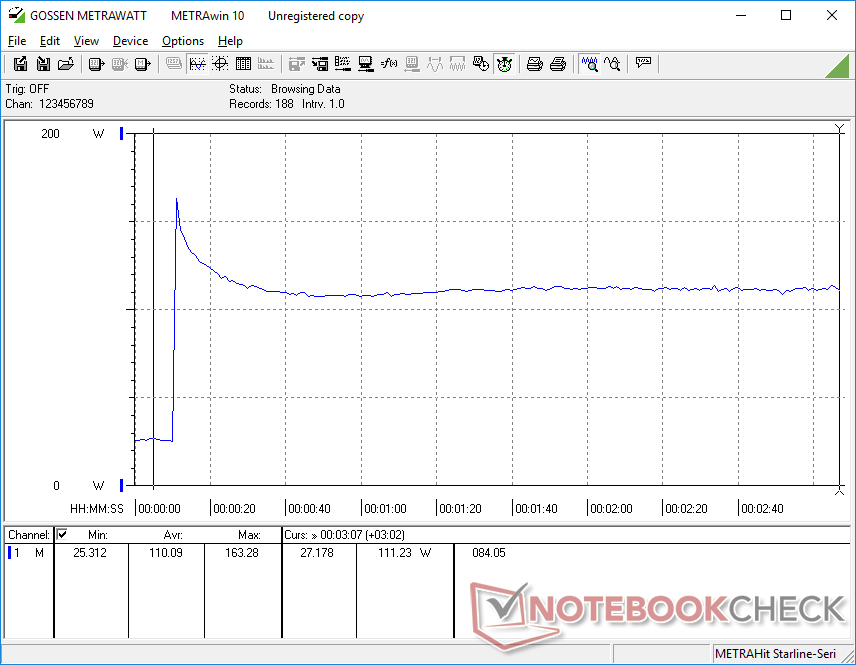
| Load Average * (Watt) | 124.8 | 122 2% | 103 17% | 70.5 44% | 81 35% | 102 18% |
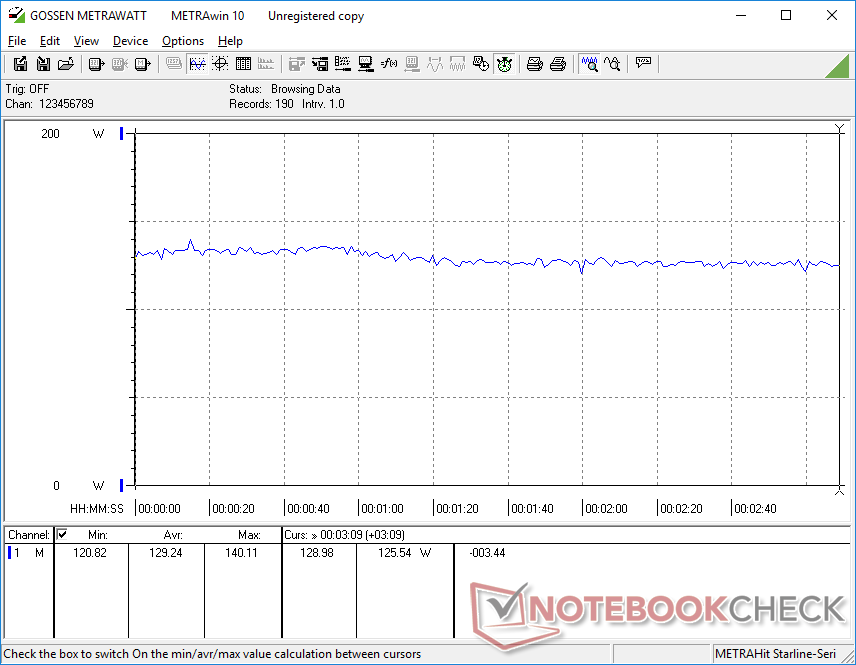
| Witcher 3 ultra * (Watt) | 129.2 | 138.6 -7% | 139.5 -8% | 103.2 20% | 119 8% | 124 4% |
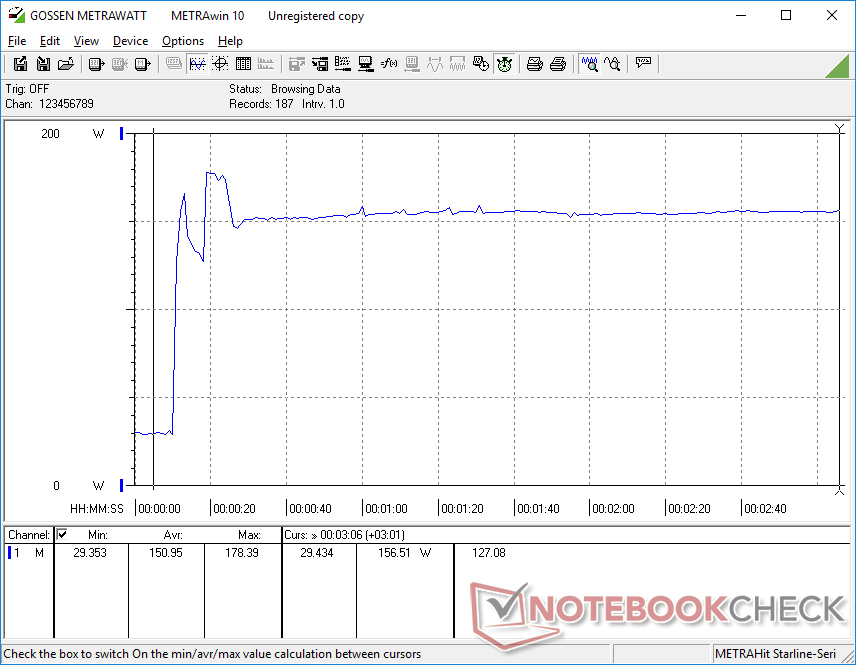
| Load Maximum * (Watt) | 178.4 | 189 -6% | 204 -14% | 175 2% | 172 4% | 148 17% |
* ... Meglio usare valori piccoli
Power Consumption Witcher 3 / Stresstest
Power Consumption external Monitor
Durata della batteria: non così lunga
La durata della batteria è inferiore alle aspettative, ma ci aspettiamo che si tratti di un bug. Impostando il profilo energetico Bilanciato con la GPU integrata attiva tramite MSHybrid, siamo riusciti a registrare un'autonomia di sole 4 ore rispetto alle 7 ore dell'FX517ZR. I risultati non sono migliorati nemmeno dopo aver ripetuto il test.
| Asus TUF Dash F15 FX517ZC i7-12650H, GeForce RTX 3050 4GB Laptop GPU, 76 Wh | Asus TUF Dash F15 FX517ZR i7-12650H, GeForce RTX 3070 Laptop GPU, 76 Wh | Dell G15 5510 i5-10500H, GeForce RTX 3050 4GB Laptop GPU, 56 Wh | MSI Bravo 15 B5DD-010US R5 5600H, Radeon RX 5500M, 53 Wh | Lenovo Ideapad Gaming 3 15IHU-82K1002RGE i5-11300H, GeForce RTX 3050 Ti Laptop GPU, 45 Wh | Gigabyte G5 GD i5-11400H, GeForce RTX 3050 4GB Laptop GPU, 41 Wh | |
|---|---|---|---|---|---|---|
| Autonomia della batteria | 75% | 50% | 58% | 65% | -22% | |
| WiFi v1.3 (h) | 4 | 7 75% | 6 50% | 6.3 58% | 6.6 65% | 3.1 -22% |
| Reader / Idle (h) | 10.8 | 11.3 | 9.2 | 5.7 | ||
| H.264 (h) | 5.8 | 7.7 | 3.6 | |||
| Load (h) | 2.3 | 1 | 1 | 1.1 | 1.1 |
Pro
Contro
Verdetto - Prezzo di base con un eccellente display di alto livello
A parte l'ovvio risparmio sul prezzo, si possono preferire i portatili da gioco entry-level per le loro ventole più silenziose, le temperature più basse, la maggiore durata della batteria e il minore consumo energetico rispetto alle opzioni più potenti di fascia alta. Pertanto, ci aspettavamo che l'Asus TUF Dash F15 FX517ZC e la sua RTX 3050 fossero più silenziosi, più freschi, più duraturi e meno esigenti della sua controparte TUF Dash F15 FX517ZR RTX 3070. La realtà è che le differenze tra l'FX517ZC e l'FX517ZR in termini di temperatura, consumo energetico e rumorosità sono purtroppo minime rispetto all'ampio divario di prestazioni delle GPU. In altre parole, se speravate che l'FX517ZC fosse sensibilmente più silenzioso, più fresco e più duraturo rispetto alle configurazioni di fascia superiore, potreste rimanere delusi.
L'Asus TUF Dash F15 FX517ZC è dotato di un display IPS 1440p165 migliore di quanto ci si aspettasse per la sua fascia di prezzo. Il consumo energetico, la rumorosità della ventola e la durata della batteria, tuttavia, non sono migliori rispetto ai modelli più veloci di fascia alta.
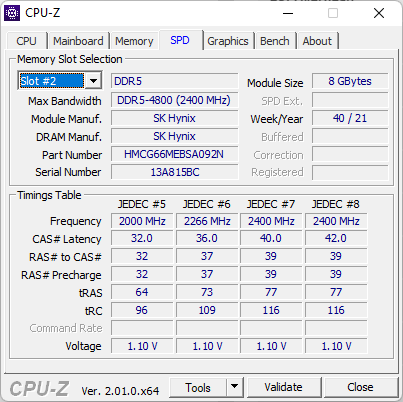
Per un portatile da gioco entry-level, tuttavia, l'FX517ZC è ancora piuttosto buono, in quanto non lesina sul display, sulla RAM o sulla CPU, come invece fanno molti altri modelli molti altri portatili da gioco nella fascia di prezzo inferiore ai 1.000 dollari. Il pannello 1440p offre una copertura P3 completa, tempi di risposta rapidi, sincronizzazione adattiva e 165 Hz, una rarità per un sistema economico. La CPU Core i7-12650H di 12a generazione, pur non essendo molto diversa dal Core i7-11800H di 11a generazione, in questo caso si abbina bene alla conveniente GPU RTX 3050.
Prezzo e disponibilità
La serie Asus TUF Dash F15 FX517 è ora ampiamente disponibile online. Tuttavia, la nostra specifica SKU RTX 3050 è poco diffusa. Gli utenti troveranno le configurazioni RTX 3050 Ti, RTX 3060 e RTX 3070 più facilmente disponibili al momento in cui scriviamo. La configurazione RTX 3060 si può trovare su Amazon per 1070 dollari, mentre la RTX 3050 Ti è disponibile su Best Buy per 1200 dollari.
Asus TUF Dash F15 FX517ZC
- 08/08/2022 v7 (old)
Allen Ngo
Price comparison

