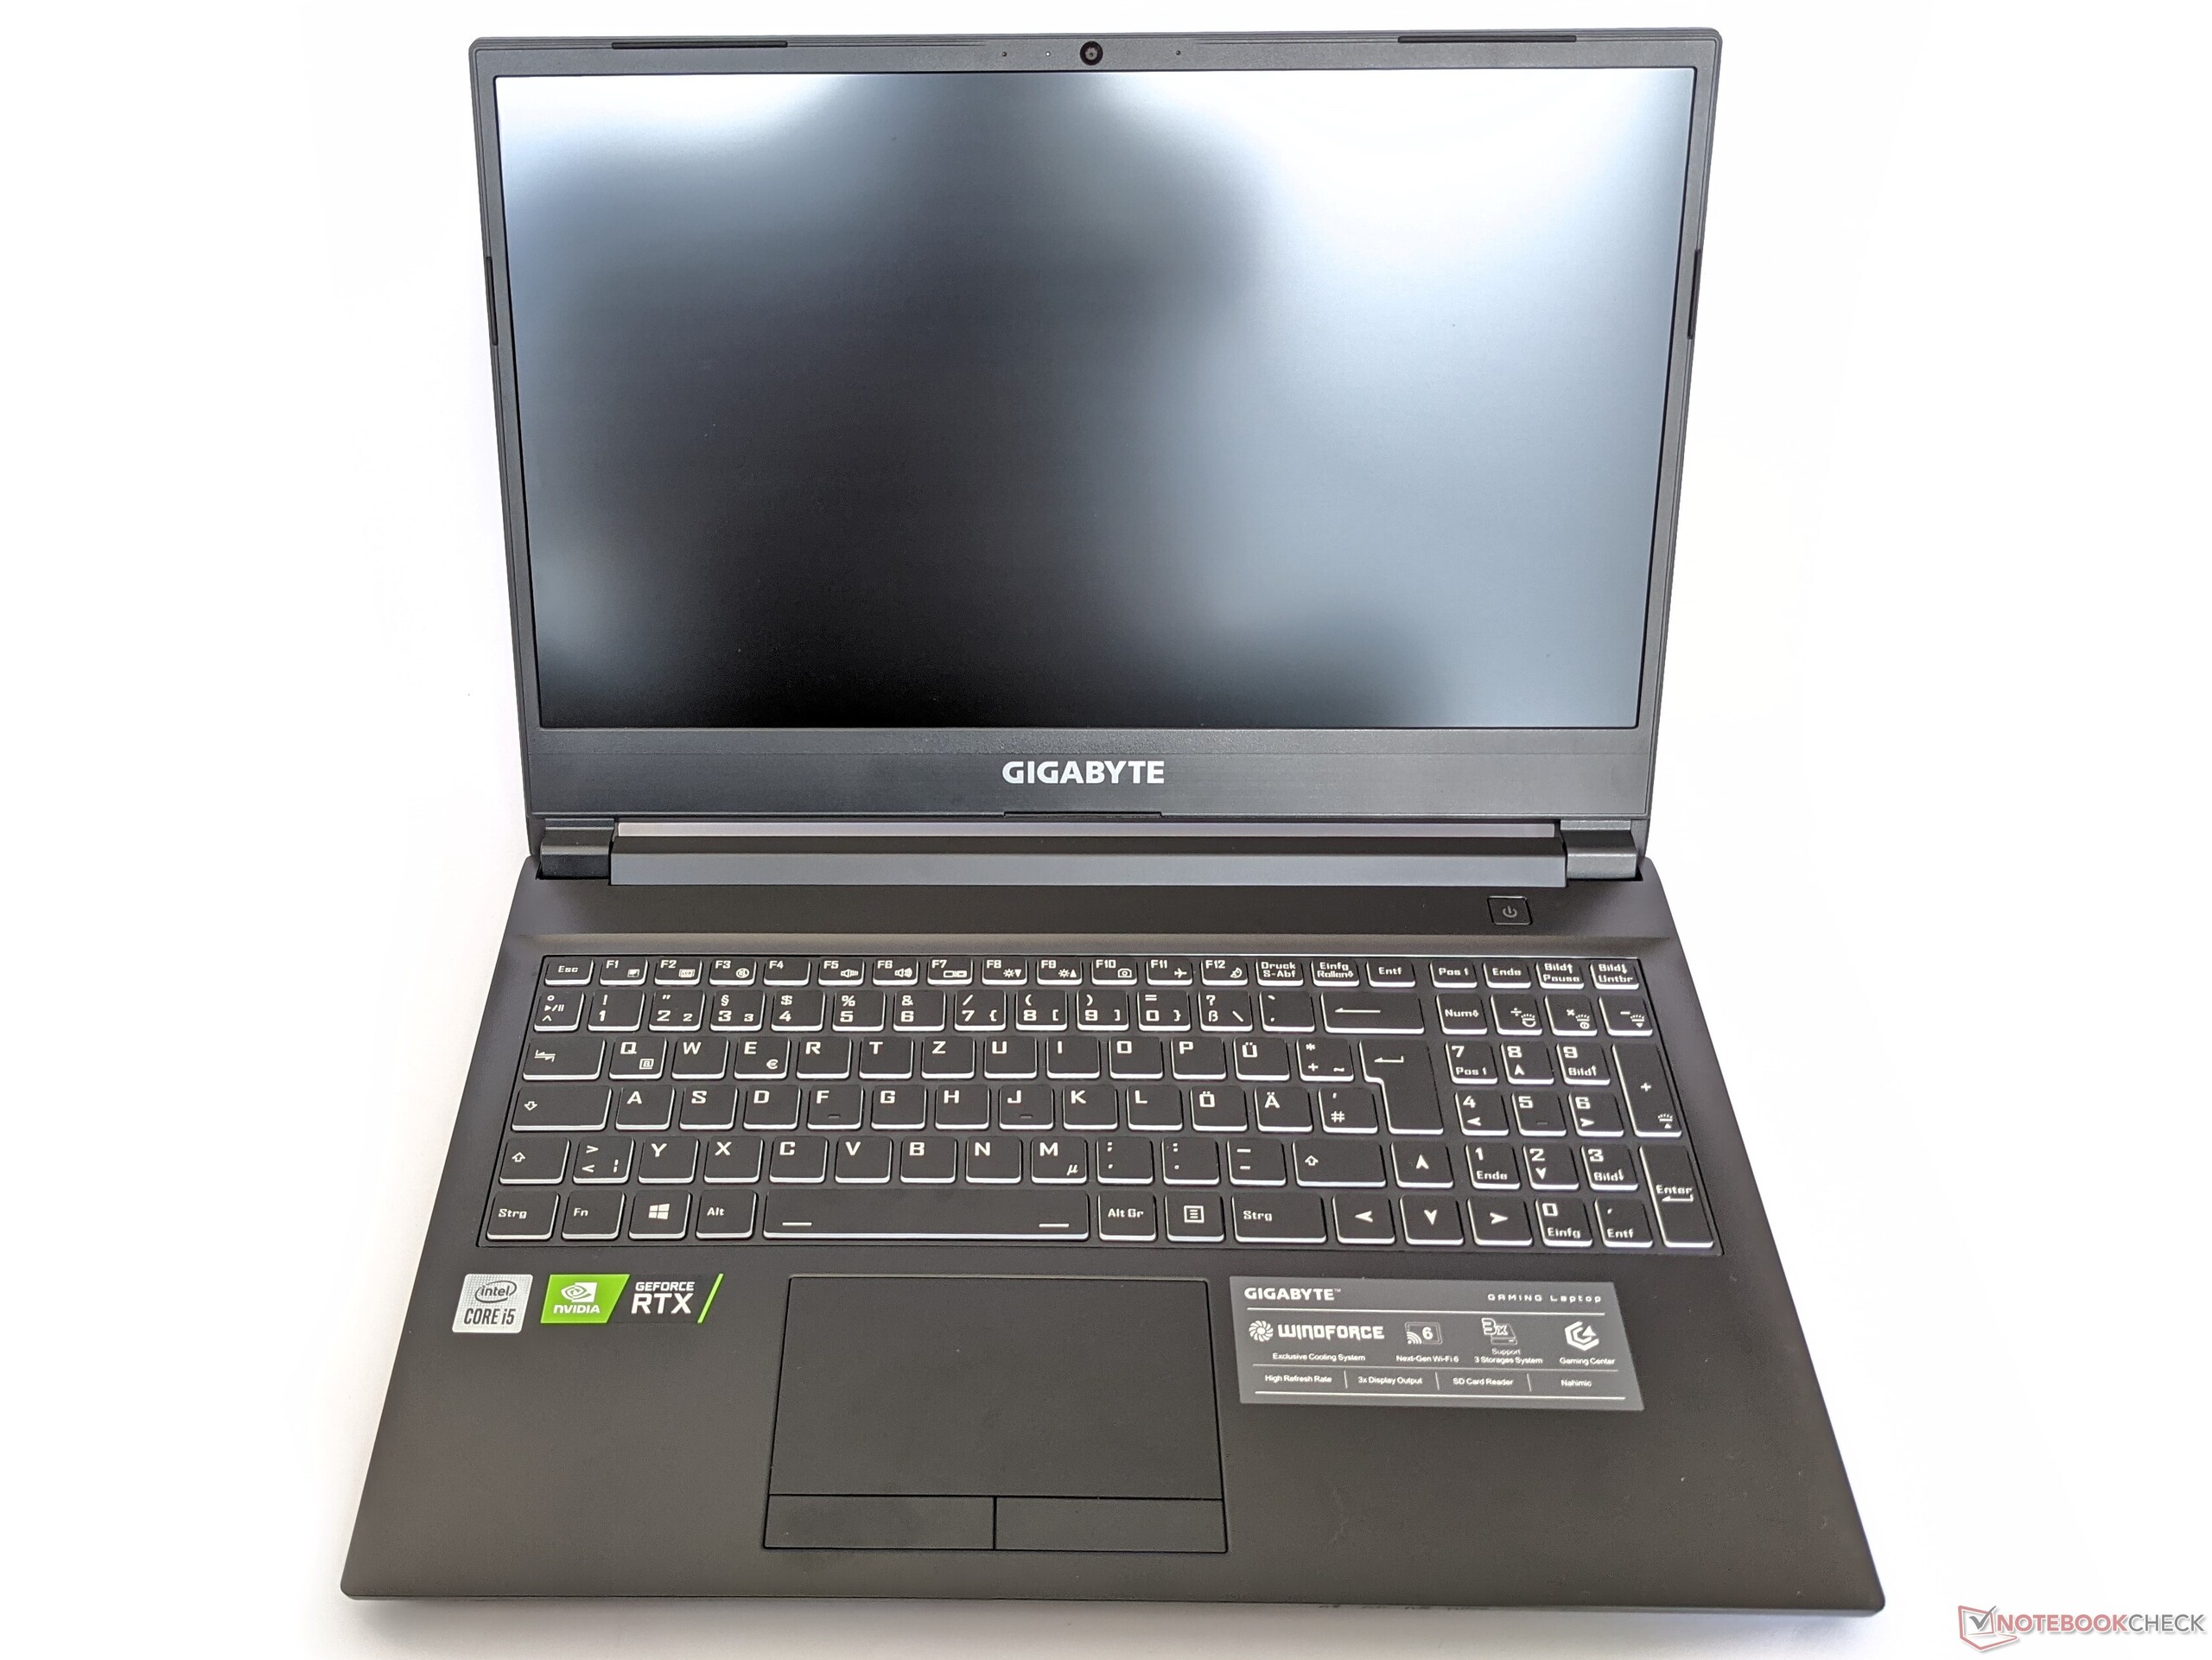
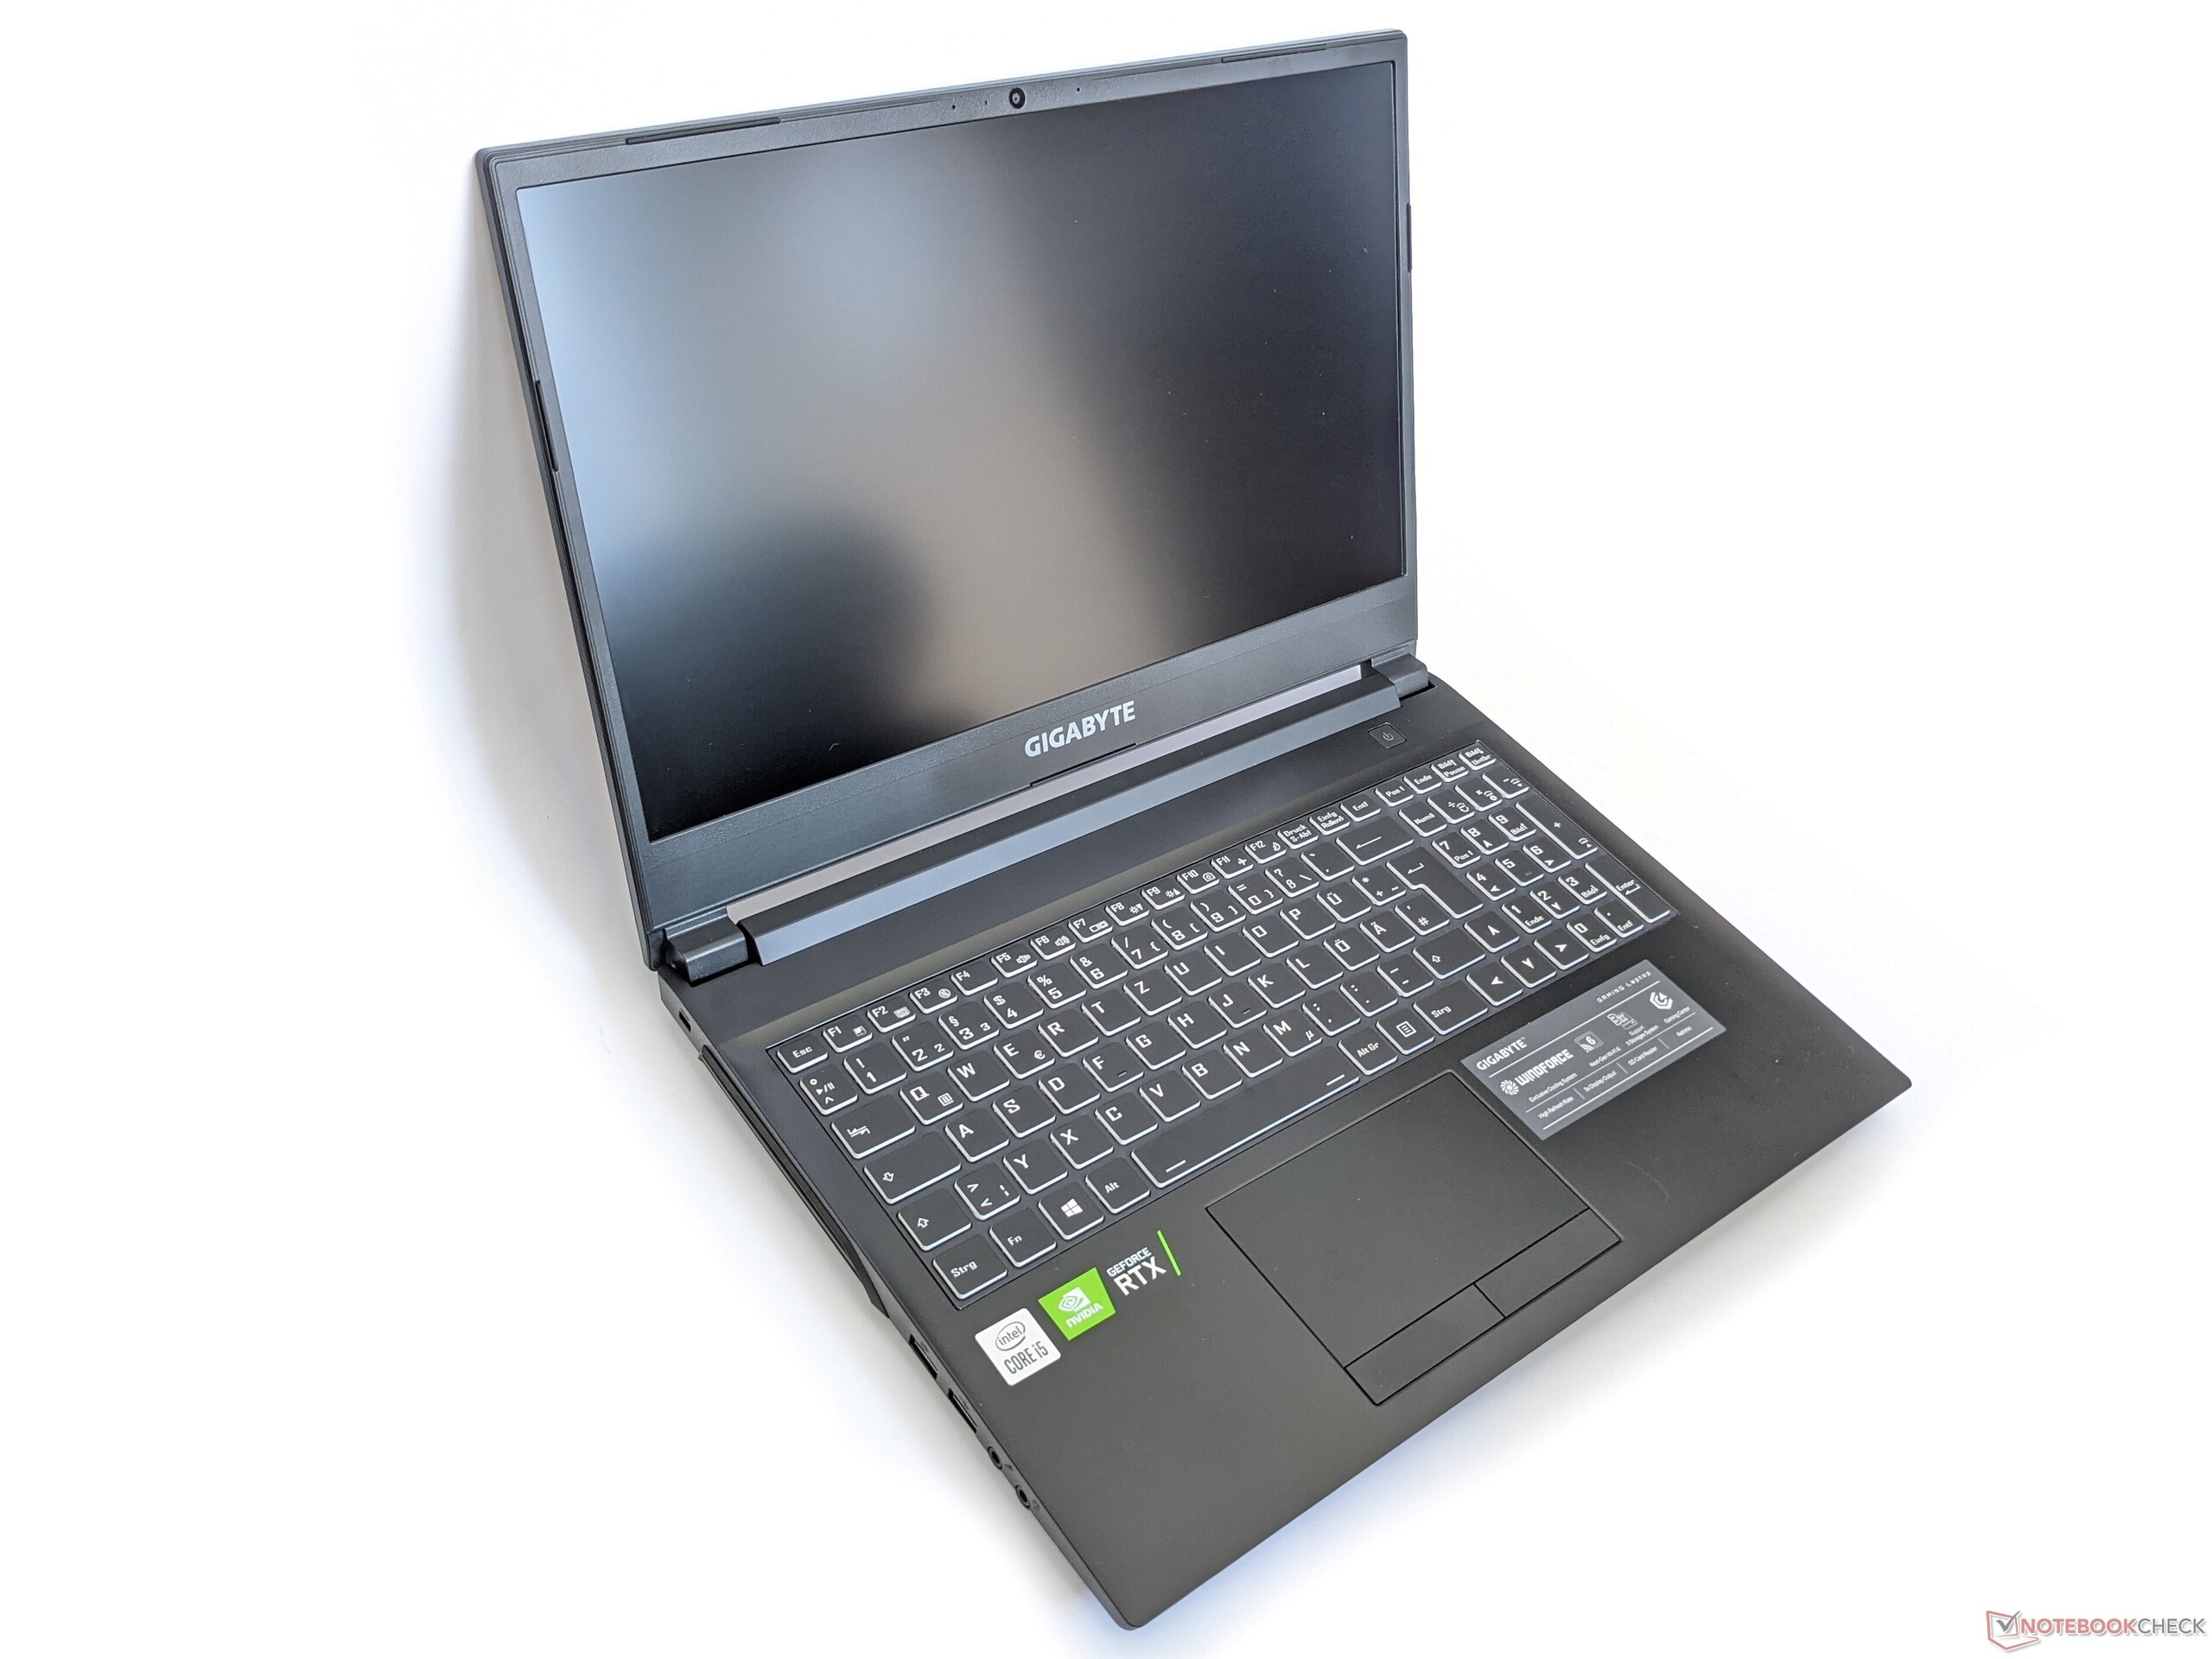
Recensione del Gigabyte G5 GD: Economico Computer portatile per il gaming senza Windows

La sua configurazione (Core i5-11400H,GeForce RTX 3050) e il prezzo (circa 750 euro (~$848)) posizionano il Gigabyte G5 GD come un portatile da gioco entry-level. I concorrenti includono dispositivi come il Lenovo Legion 5 15ACH, ilMSI GF65 Thin 10UEe il Dell G15 5515.
Non entreremo in ulteriori dettagli riguardanti il case, la connettività, i dispositivi di input e gli altoparlanti in questa recensione. Le informazioni corrispondenti possono essere trovate nella recensione dell'identico Gigabyte G5 KC.
Possible contenders in comparison
Punteggio | Data | Modello | Peso | Altezza | Dimensione | Risoluzione | Prezzo |
|---|---|---|---|---|---|---|---|
| 81.7 % v7 (old) | 11/2021 | Gigabyte G5 GD i5-11400H, GeForce RTX 3050 4GB Laptop GPU | 2.1 kg | 31.6 mm | 15.60" | 1920x1080 | |
| 82.7 % v7 (old) | 10/2021 | Dell G15 5515 R7 5800H, GeForce RTX 3050 Ti Laptop GPU | 2.4 kg | 24.9 mm | 15.60" | 1920x1080 | |
| 83.4 % v7 (old) | 09/2021 | Lenovo Legion 5 15ACH-82JU00C6GE-FL R7 5800H, GeForce RTX 3060 Laptop GPU | 2.5 kg | 26 mm | 15.60" | 1920x1080 | |
| 80.4 % v7 (old) | 03/2021 | MSI GF65 Thin 10UE i7-10750H, GeForce RTX 3060 Laptop GPU | 1.9 kg | 21.7 mm | 15.60" | 1920x1080 |


| SD Card Reader | |
| average JPG Copy Test (av. of 3 runs) | |
| Media della classe Gaming (20.9 - 210, n=54, ultimi 2 anni) | |
| Gigabyte G5 GD (AV PRO microSD 128 GB V60) | |
| Gigabyte G5 KC (AV PRO microSD 128 GB V60) | |
| maximum AS SSD Seq Read Test (1GB) | |
| Media della classe Gaming (25.5 - 261, n=51, ultimi 2 anni) | |
| Gigabyte G5 GD (AV PRO microSD 128 GB V60) | |
| Gigabyte G5 KC (AV PRO microSD 128 GB V60) | |


Display - 144 Hz IPS
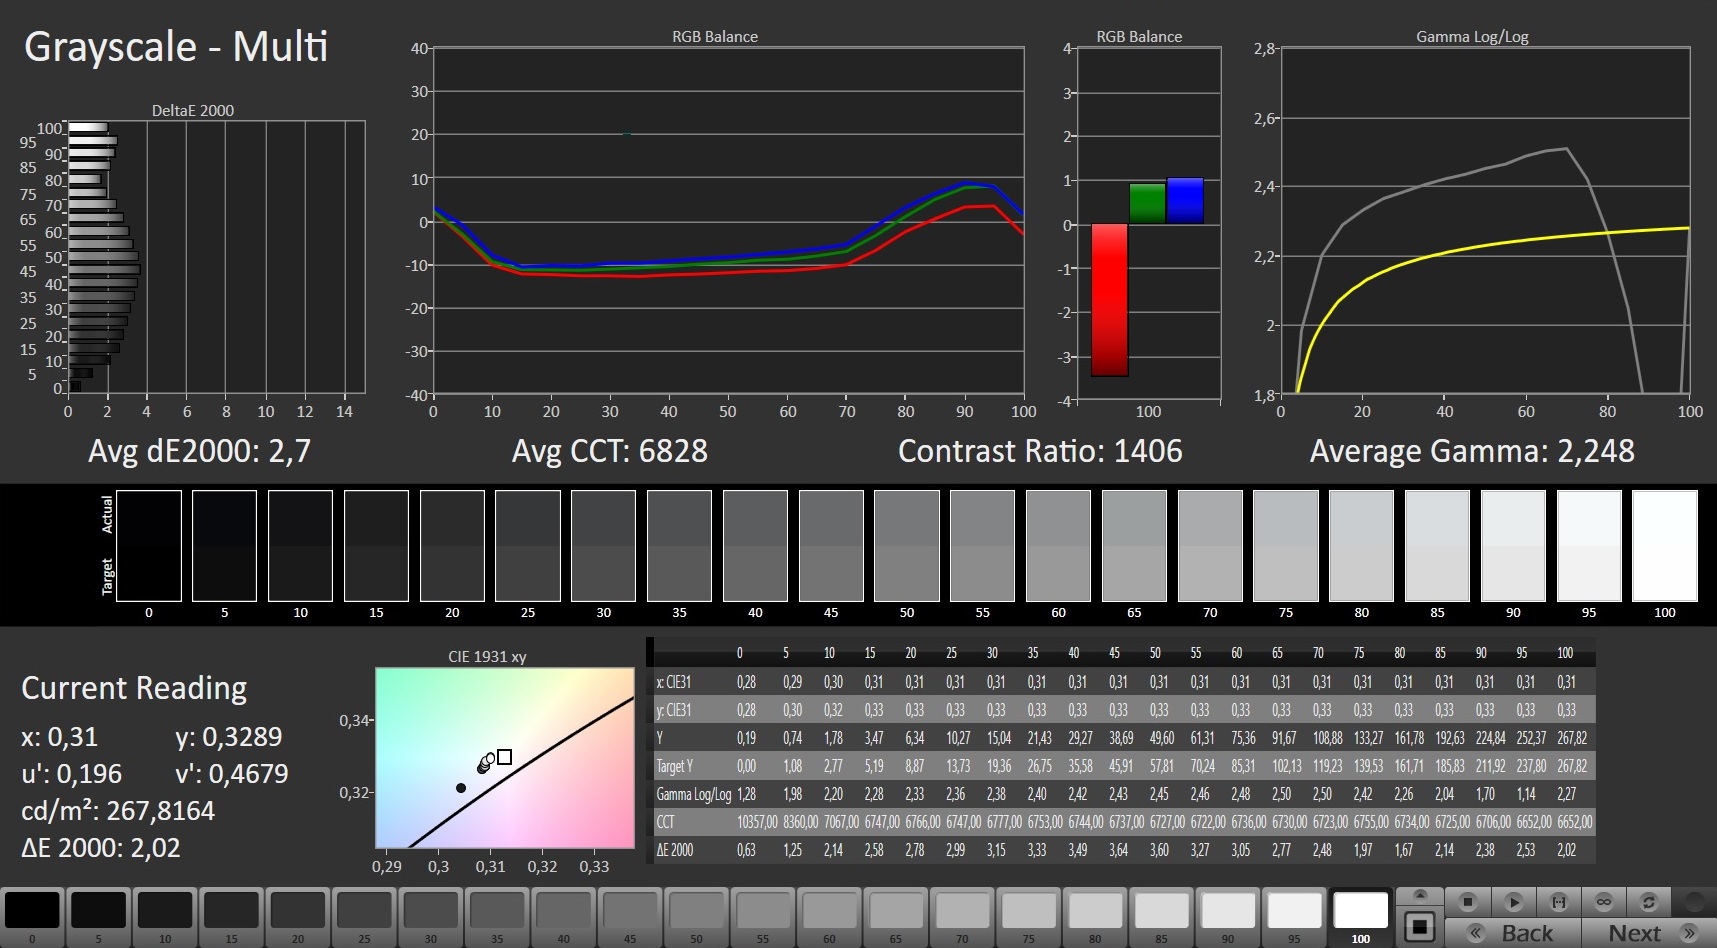
Mentre il contrasto (1.374:1) del display opaco da 15,6 pollici (1920x1080 pixel) soddisfa l'obiettivo (> 1.000:1), la luminosità media (245,7 cd/m²) è troppo bassa. Consideriamo buoni i valori superiori a 300 cd/m². Il pannello a 144 Hz ha tempi di risposta scadenti. Il flickering PWM non è stato osservato
| |||||||||||||||||||||||||
Distribuzione della luminosità: 87 %
Al centro con la batteria: 261 cd/m²
Contrasto: 1374:1 (Nero: 0.19 cd/m²)
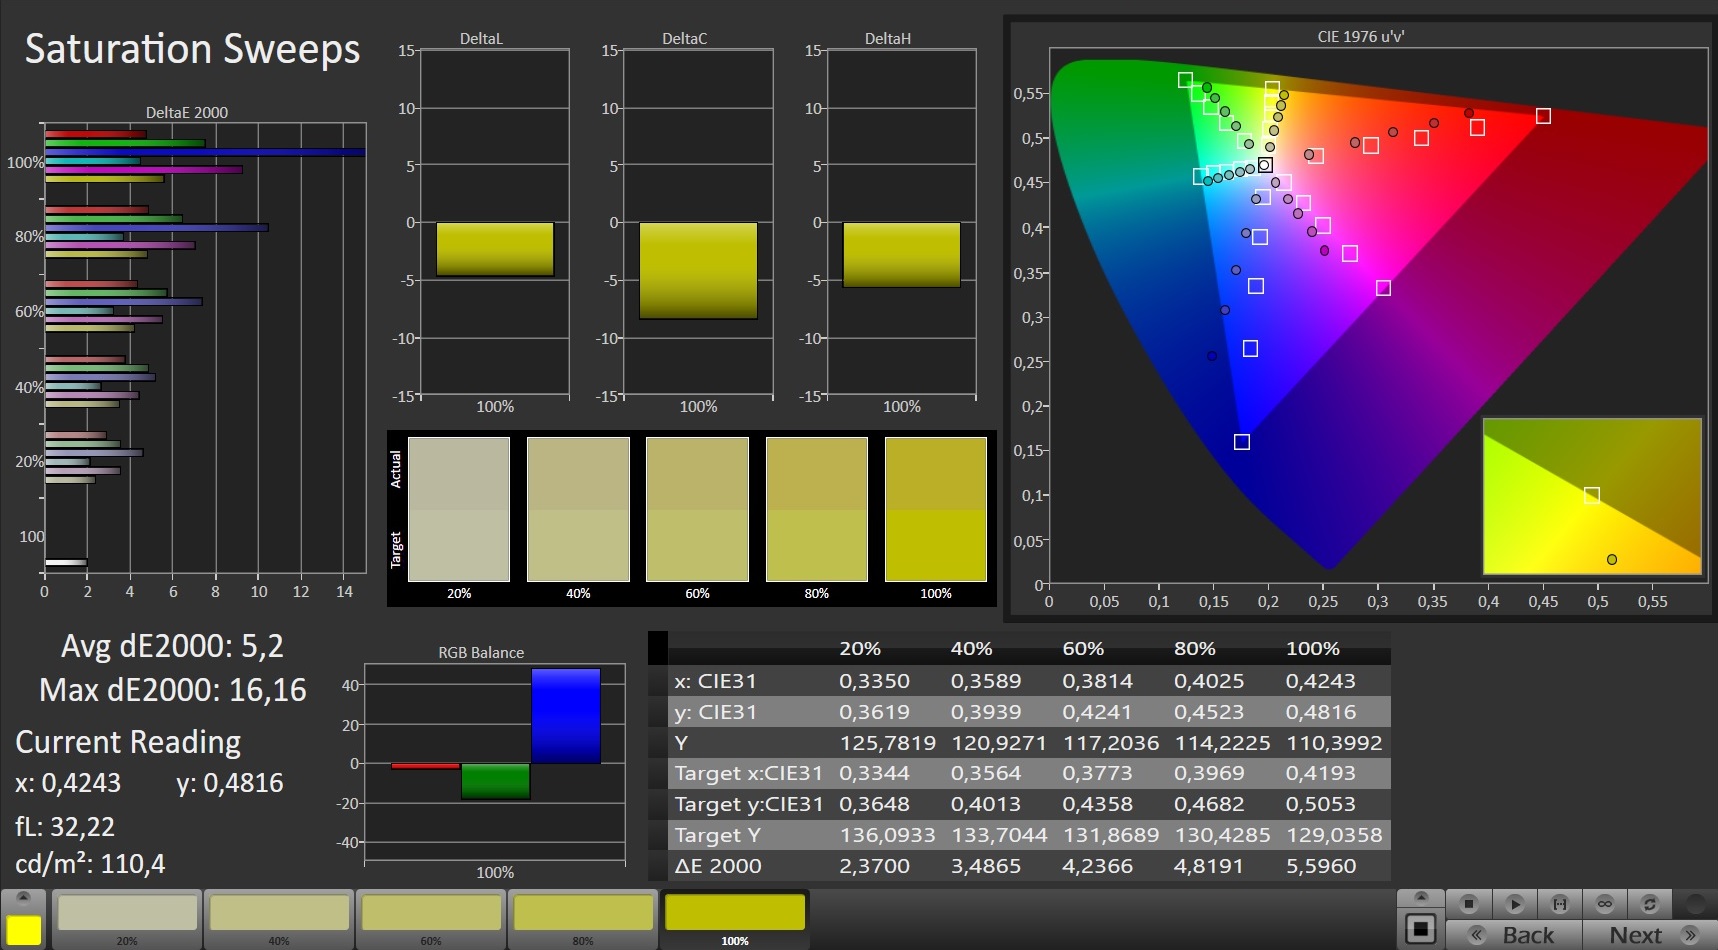
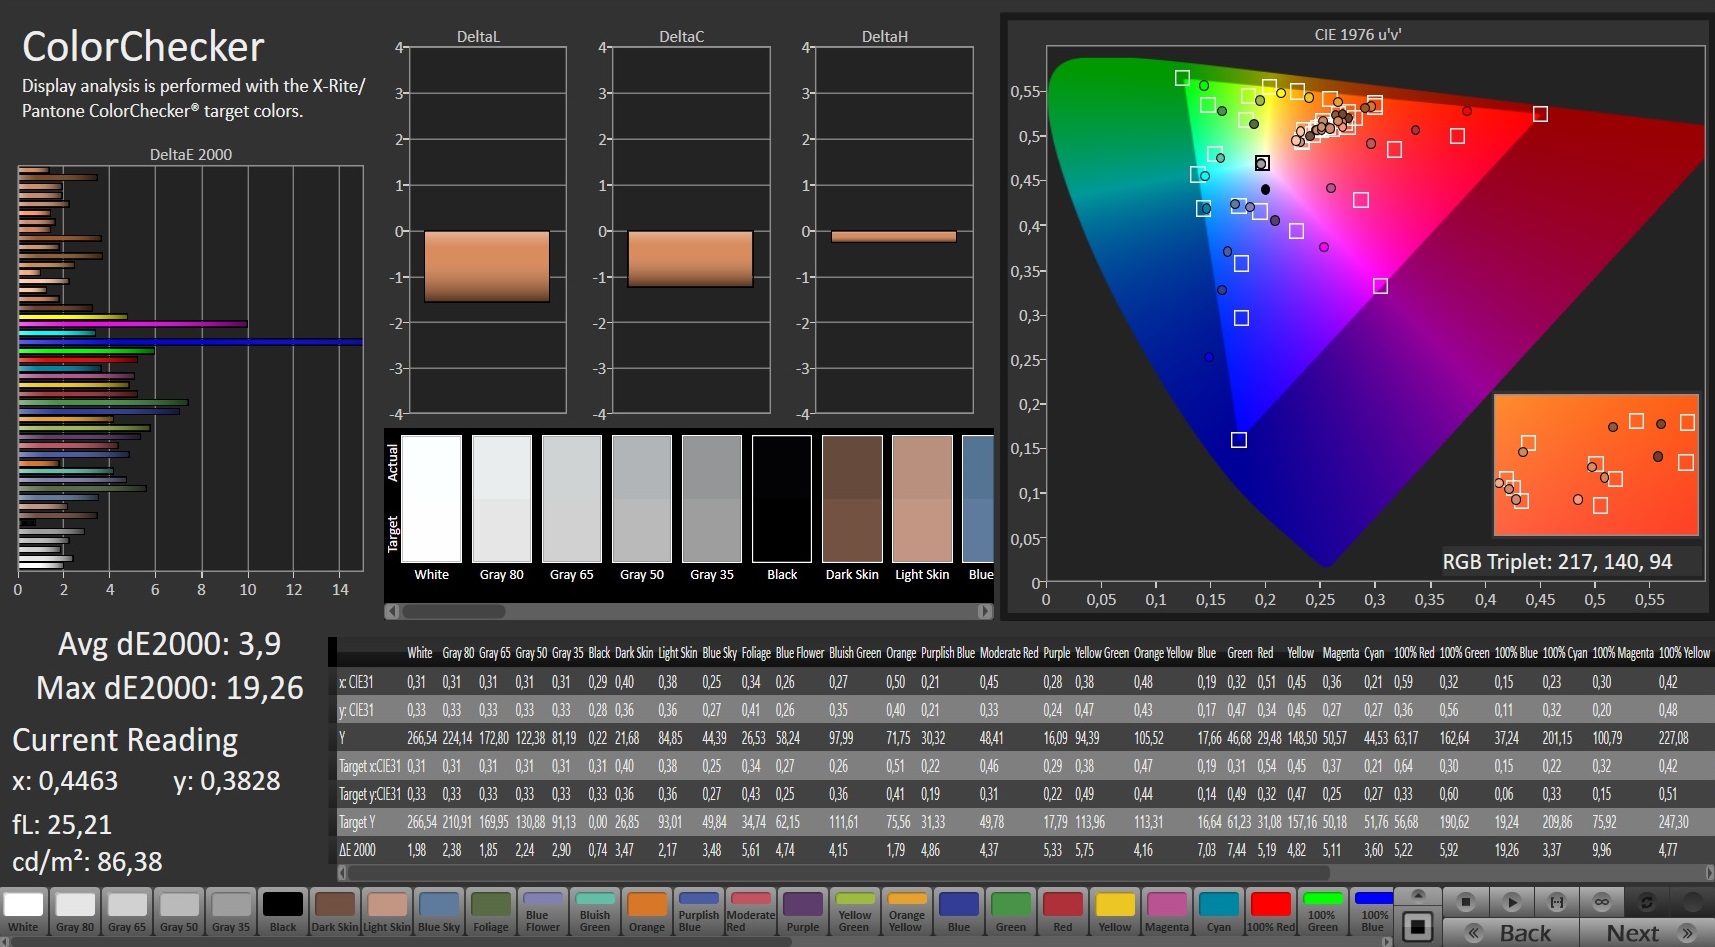
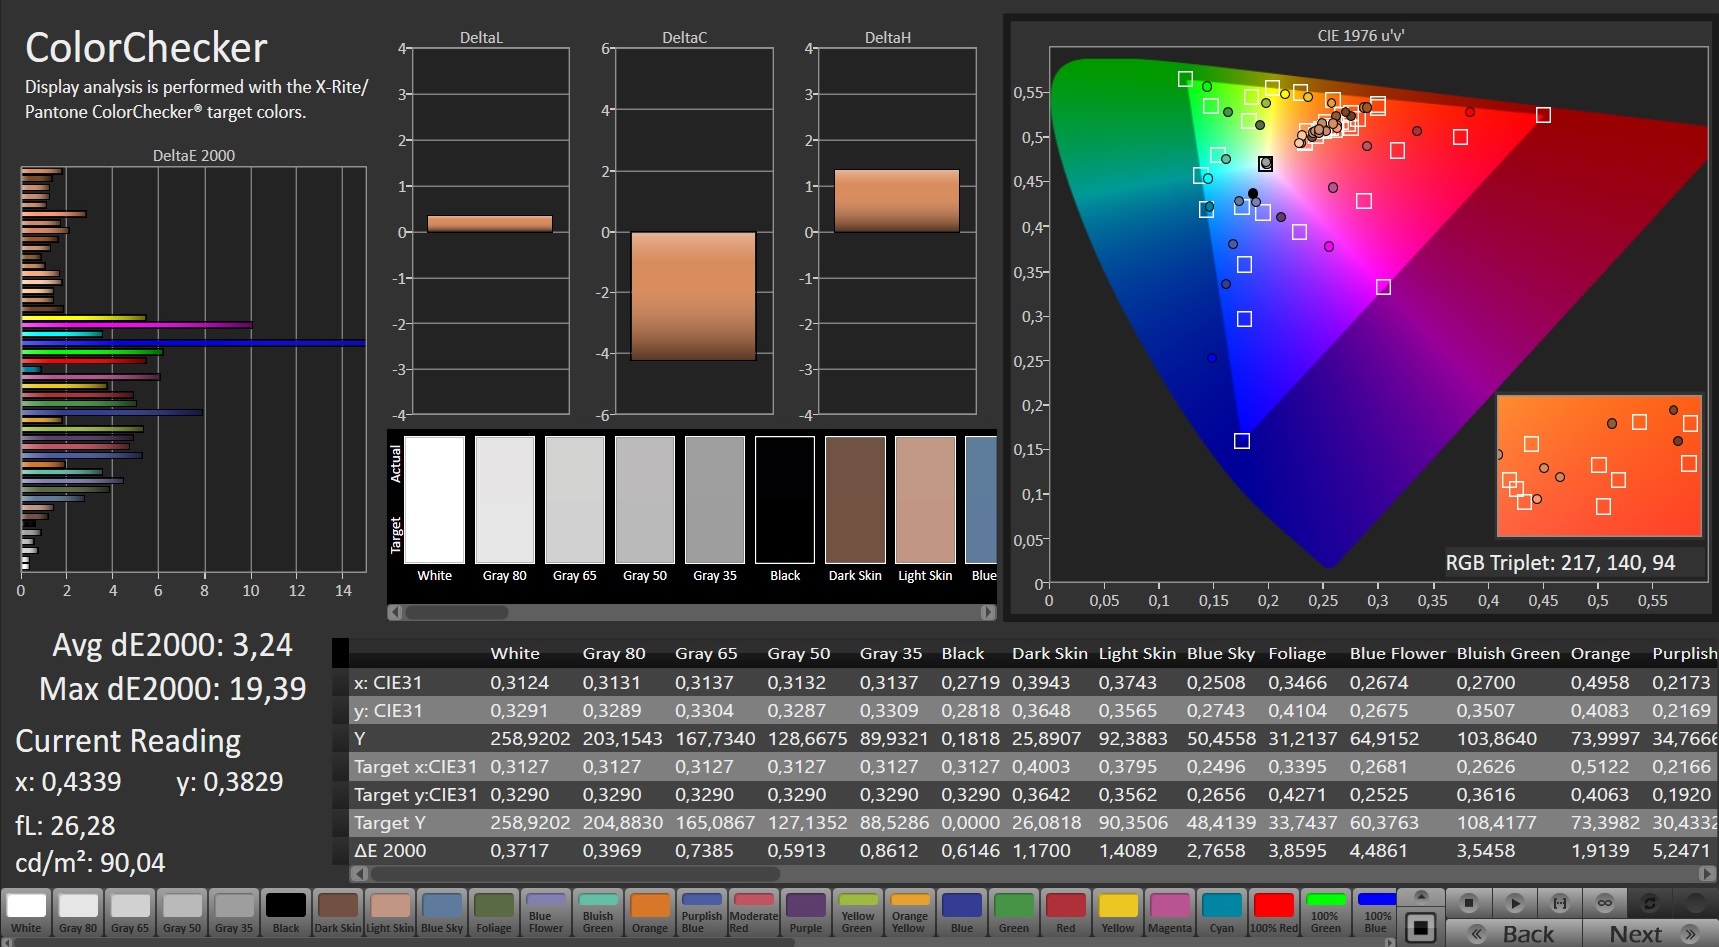
ΔE ColorChecker Calman: 3.9 | ∀{0.5-29.43 Ø4.72}
calibrated: 3.24
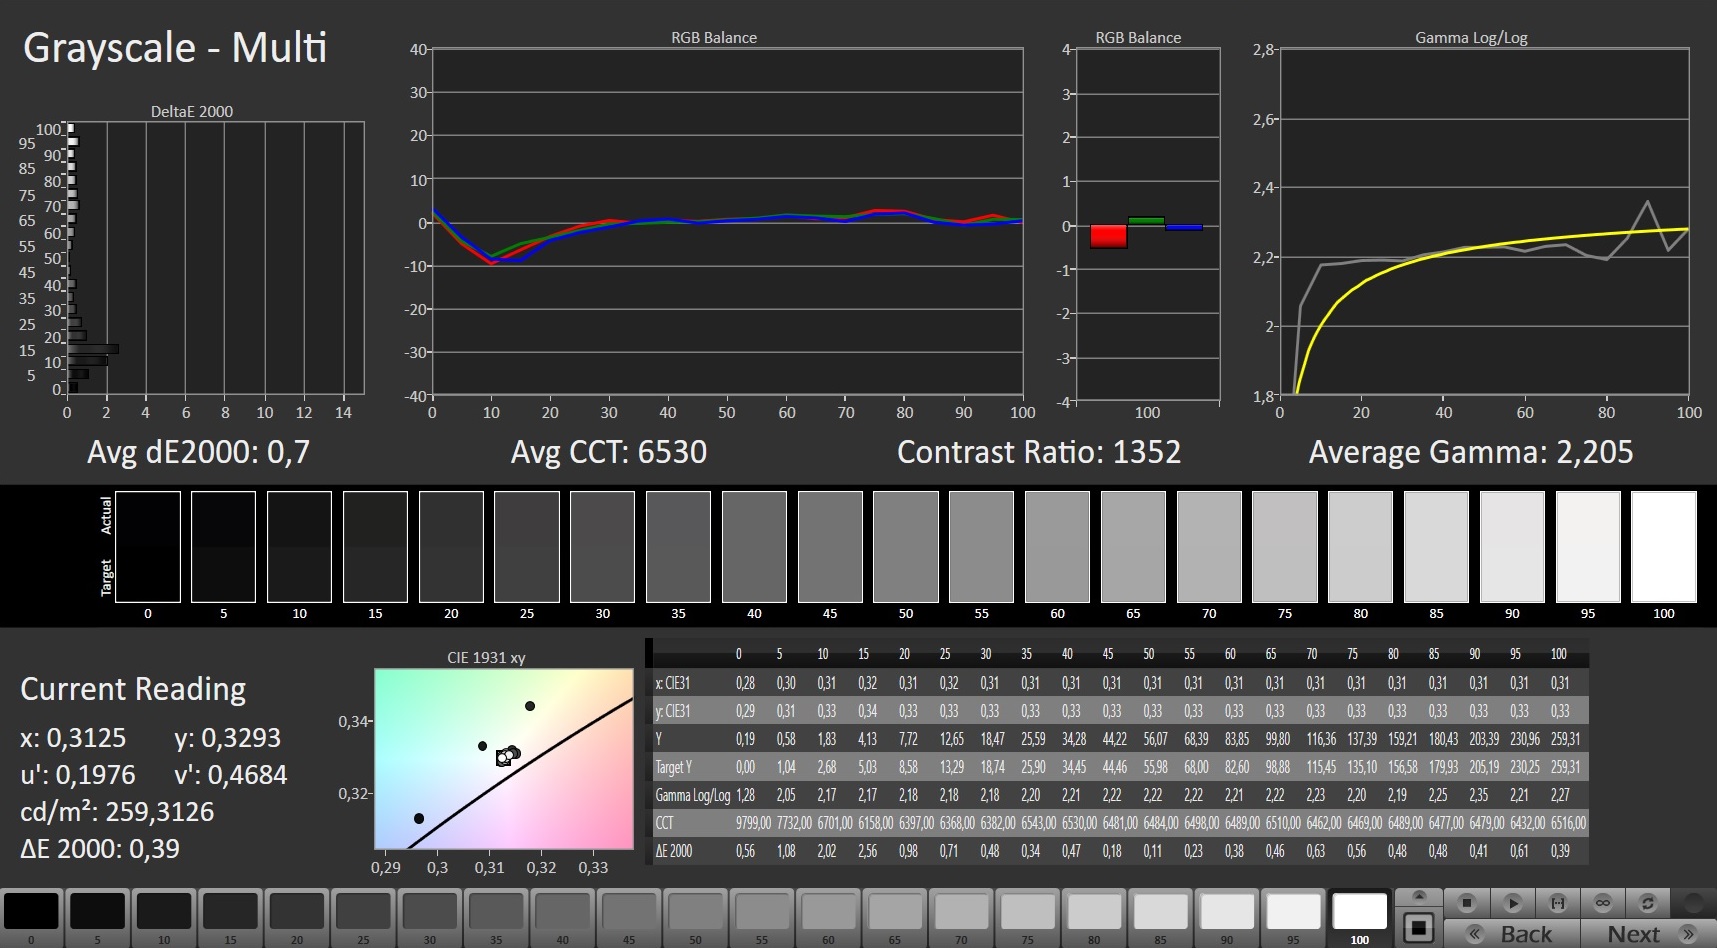
ΔE Greyscale Calman: 2.7 | ∀{0.09-98 Ø4.97}
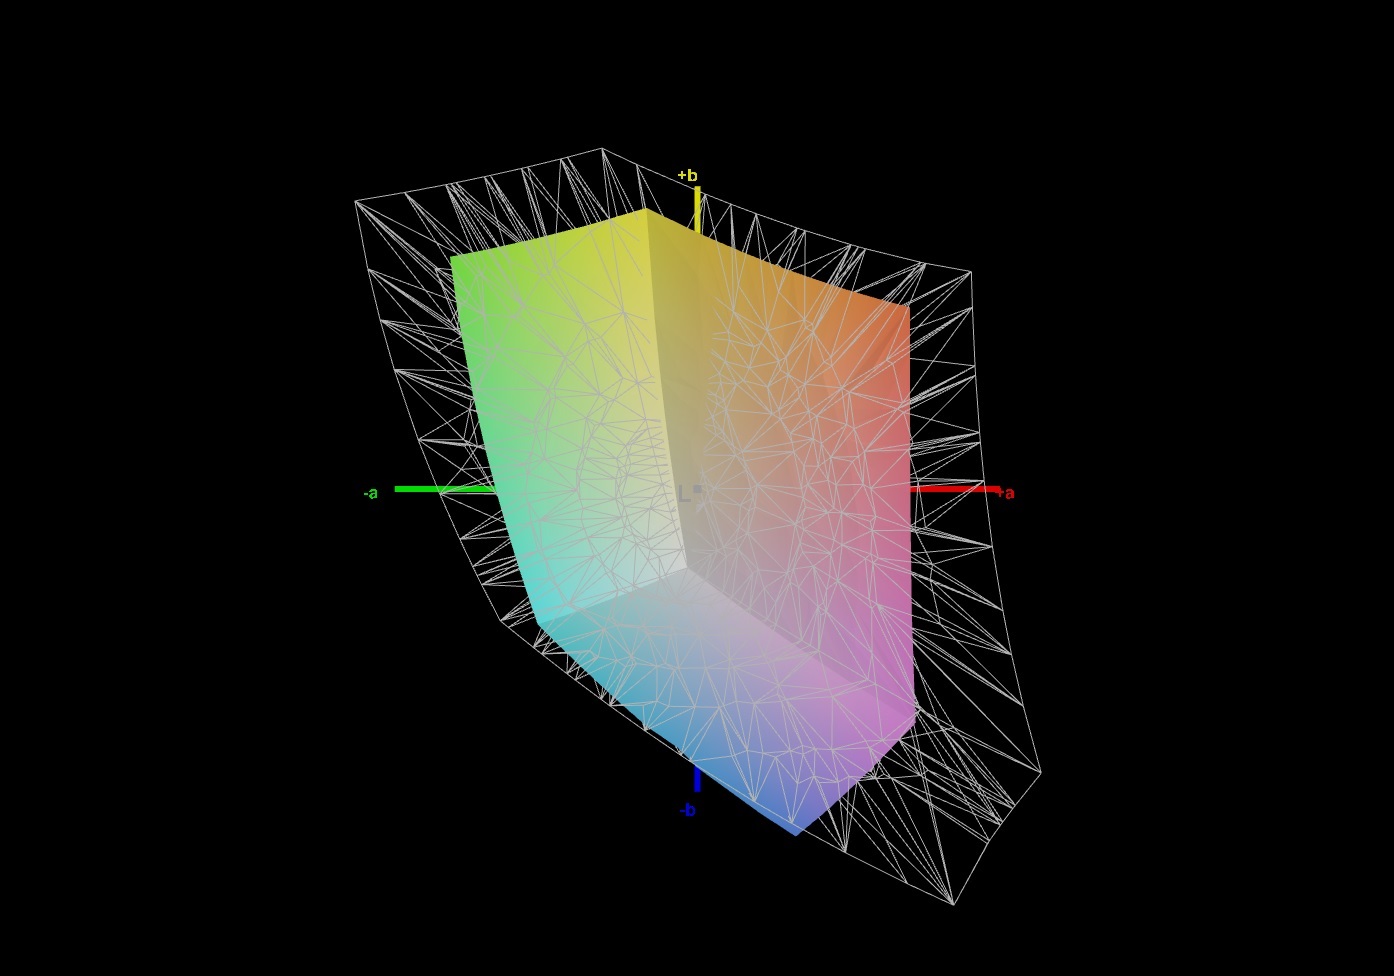
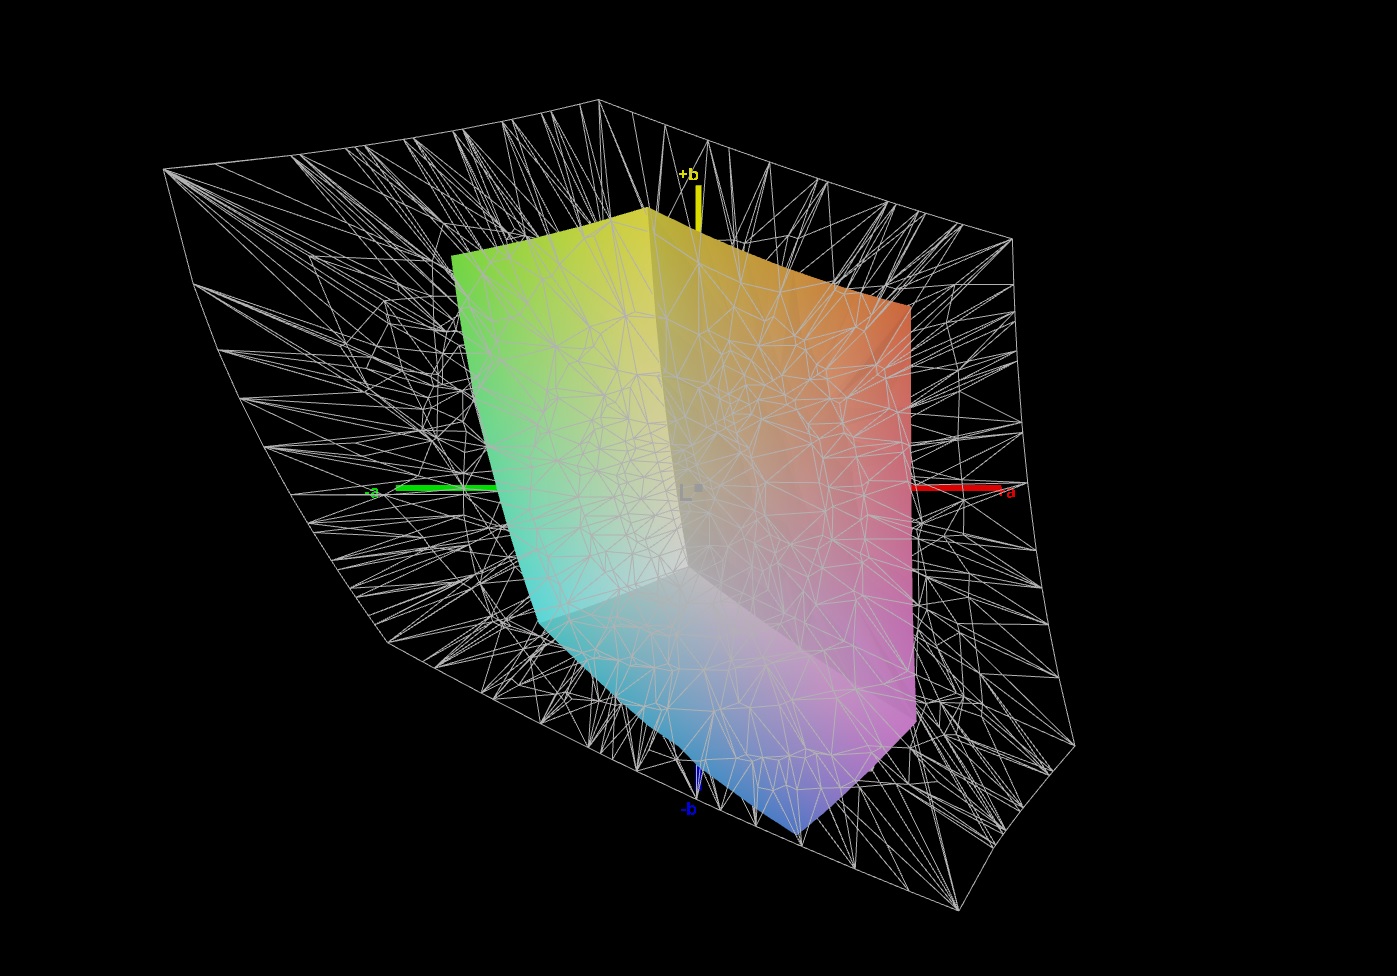
43.2% AdobeRGB 1998 (Argyll 3D)
62.3% sRGB (Argyll 3D)
41.8% Display P3 (Argyll 3D)
Gamma: 2.248
CCT: 6828 K
| Gigabyte G5 GD Chi Mei N156HRA-EA1, IPS, 1920x1080, 15.6" | Dell G15 5515 BOE092A, IPS, 1920x1080, 15.6" | Lenovo Legion 5 15ACH-82JU00C6GE-FL B156HAN12.H, , 1920x1080, 15.6" | MSI GF65 Thin 10UE AU Optronics B156HAN08.4, IPS, 1920x1080, 15.6" | Gigabyte G5 KC LM156LF-1F02, IPS, 1920x1080, 15.6" | |
|---|---|---|---|---|---|
| Display | -7% | 56% | -10% | 60% | |
| Display P3 Coverage (%) | 41.8 | 39.1 -6% | 65.4 56% | 37.65 -10% | 68.2 63% |
| sRGB Coverage (%) | 62.3 | 56.9 -9% | 96.3 55% | 56.3 -10% | 96.7 55% |
| AdobeRGB 1998 Coverage (%) | 43.2 | 40.4 -6% | 67.5 56% | 38.9 -10% | 69.6 61% |
| Response Times | 28% | 60% | -22% | 63% | |
| Response Time Grey 50% / Grey 80% * (ms) | 34.4 ? | 25.2 ? 27% | 13.6 ? 60% | 36.8 ? -7% | 10 ? 71% |
| Response Time Black / White * (ms) | 23.2 ? | 16.8 ? 28% | 9.2 ? 60% | 31.6 ? -36% | 10.4 ? 55% |
| PWM Frequency (Hz) | 200 ? | ||||
| Screen | -26% | 2% | -12% | -24% | |
| Brightness middle (cd/m²) | 261 | 278 7% | 350 34% | 266.5 2% | 295 13% |
| Brightness (cd/m²) | 246 | 262 7% | 350 42% | 262 7% | 275 12% |
| Brightness Distribution (%) | 87 | 83 -5% | 96 10% | 91 5% | 86 -1% |
| Black Level * (cd/m²) | 0.19 | 0.36 -89% | 0.3 -58% | 0.18 5% | 0.23 -21% |
| Contrast (:1) | 1374 | 772 -44% | 1167 -15% | 1481 8% | 1283 -7% |
| Colorchecker dE 2000 * | 3.9 | 5.74 -47% | 3.9 -0% | 5.33 -37% | 5.21 -34% |
| Colorchecker dE 2000 max. * | 19.26 | 19.63 -2% | 8.2 57% | 18.28 5% | 14.03 27% |
| Colorchecker dE 2000 calibrated * | 3.24 | 4.7 -45% | 1.6 51% | 4.36 -35% | 1.73 47% |
| Greyscale dE 2000 * | 2.7 | 3.1 -15% | 5.5 -104% | 4.5 -67% | 9.4 -248% |
| Gamma | 2.248 98% | 2.011 109% | 2.15 102% | 2.35 94% | 2.046 108% |
| CCT | 6828 95% | 6207 105% | 7414 88% | 6289 103% | 8002 81% |
| Color Space (Percent of AdobeRGB 1998) (%) | 35.6 | ||||
| Color Space (Percent of sRGB) (%) | 55.8 | ||||
| Media totale (Programma / Settaggio) | -2% /
-14% | 39% /
22% | -15% /
-13% | 33% /
7% |
* ... Meglio usare valori piccoli
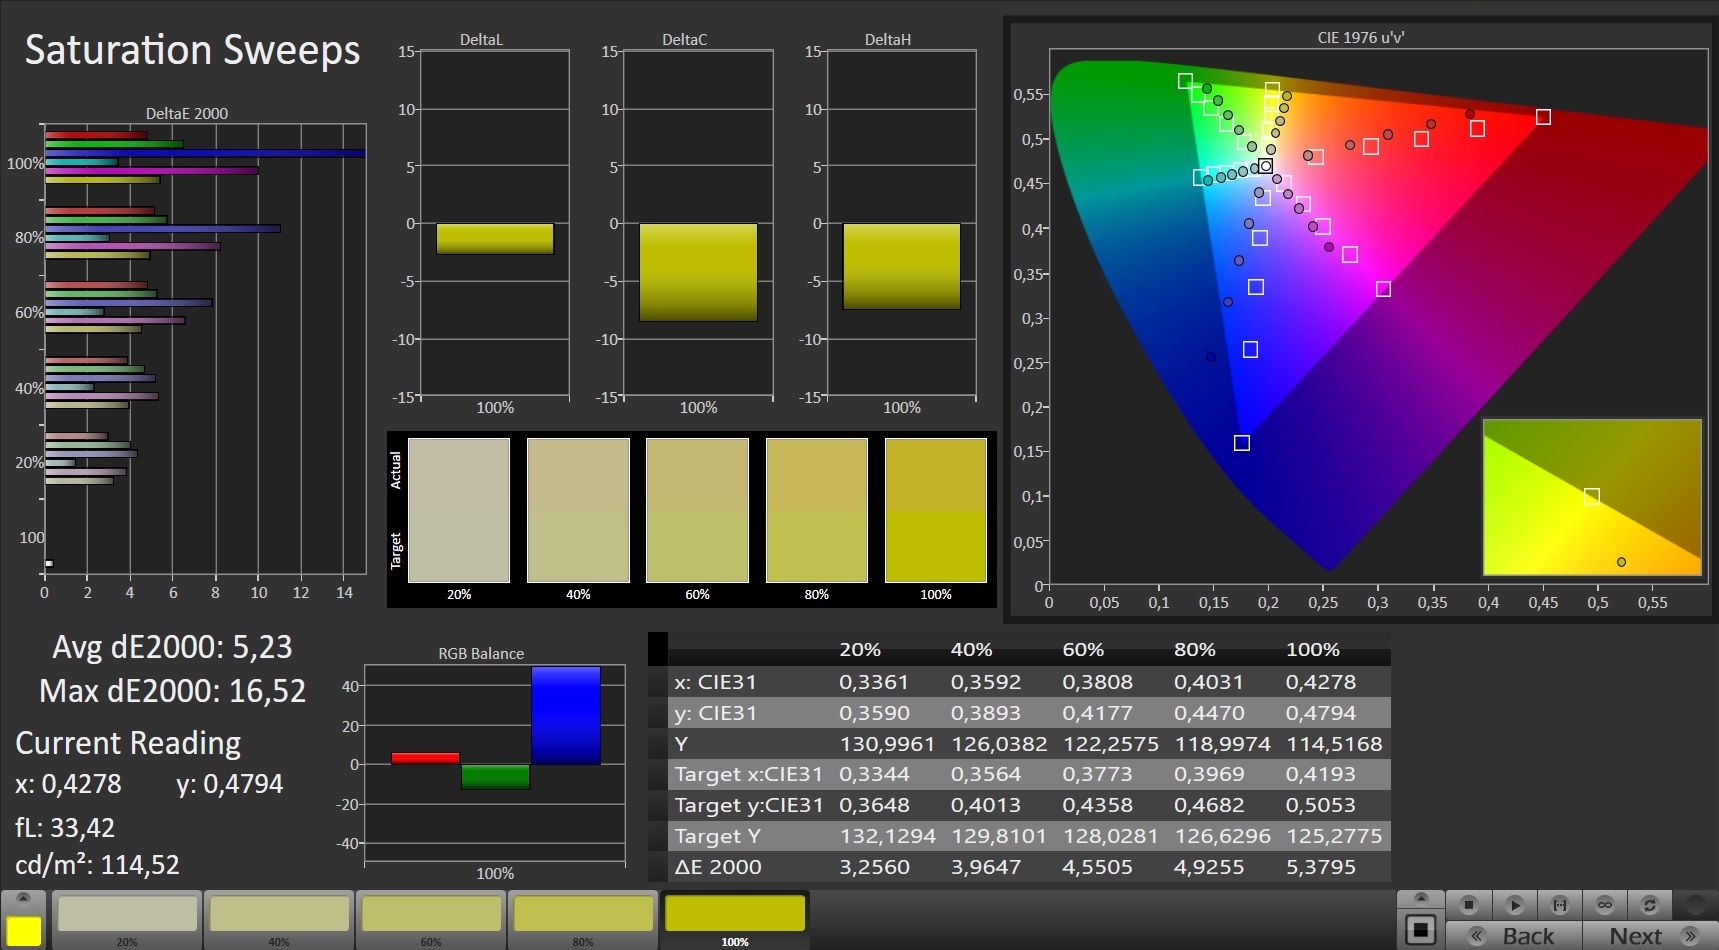
Fuori dalla scatola, la riproduzione dei colori si discosta leggermente dall'obiettivo. Tuttavia, questo non è evidente. La calibrazione fornisce solo piccoli miglioramenti. Inoltre, il pannello non soffre di una tinta blu. Il display non può rappresentare gli spazi colore AdobeRGB (43%), sRGB (62%), e DCI-P3 (42%)
Tempi di risposta del Display
| ↔ Tempi di risposta dal Nero al Bianco | ||
|---|---|---|
| 23.2 ms ... aumenta ↗ e diminuisce ↘ combinato | ↗ 13.2 ms Incremento | 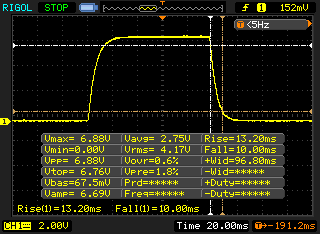 |
| ↘ 10 ms Calo | ||
| Lo schermo mostra buoni tempi di risposta durante i nostri tests, ma potrebbe essere troppo lento per i gamers competitivi. In confronto, tutti i dispositivi di test variano da 0.1 (minimo) a 240 (massimo) ms. » 53 % di tutti i dispositivi è migliore. Questo significa che i tempi di risposta rilevati sono peggiori rispetto alla media di tutti i dispositivi testati (19.8 ms). | ||
| ↔ Tempo di risposta dal 50% Grigio all'80% Grigio | ||
| 34.4 ms ... aumenta ↗ e diminuisce ↘ combinato | ↗ 16.4 ms Incremento | 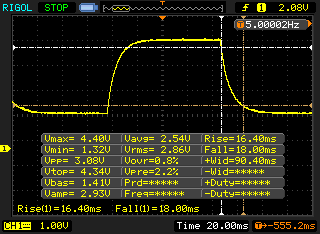 |
| ↘ 18 ms Calo | ||
| Lo schermo mostra tempi di risposta lenti nei nostri tests e sarà insoddisfacente per i gamers. In confronto, tutti i dispositivi di test variano da 0.165 (minimo) a 636 (massimo) ms. » 48 % di tutti i dispositivi è migliore. Questo significa che i tempi di risposta rilevati sono peggiori rispetto alla media di tutti i dispositivi testati (31 ms). | ||
Sfarfallio dello schermo / PWM (Pulse-Width Modulation)
| flickering dello schermo / PWM non rilevato | 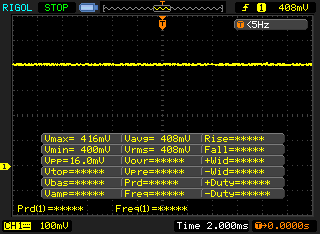 | ||
In confronto: 52 % di tutti i dispositivi testati non utilizza PWM per ridurre la luminosita' del display. Se è rilevato PWM, una media di 7763 (minimo: 5 - massimo: 343500) Hz è stata rilevata. | |||
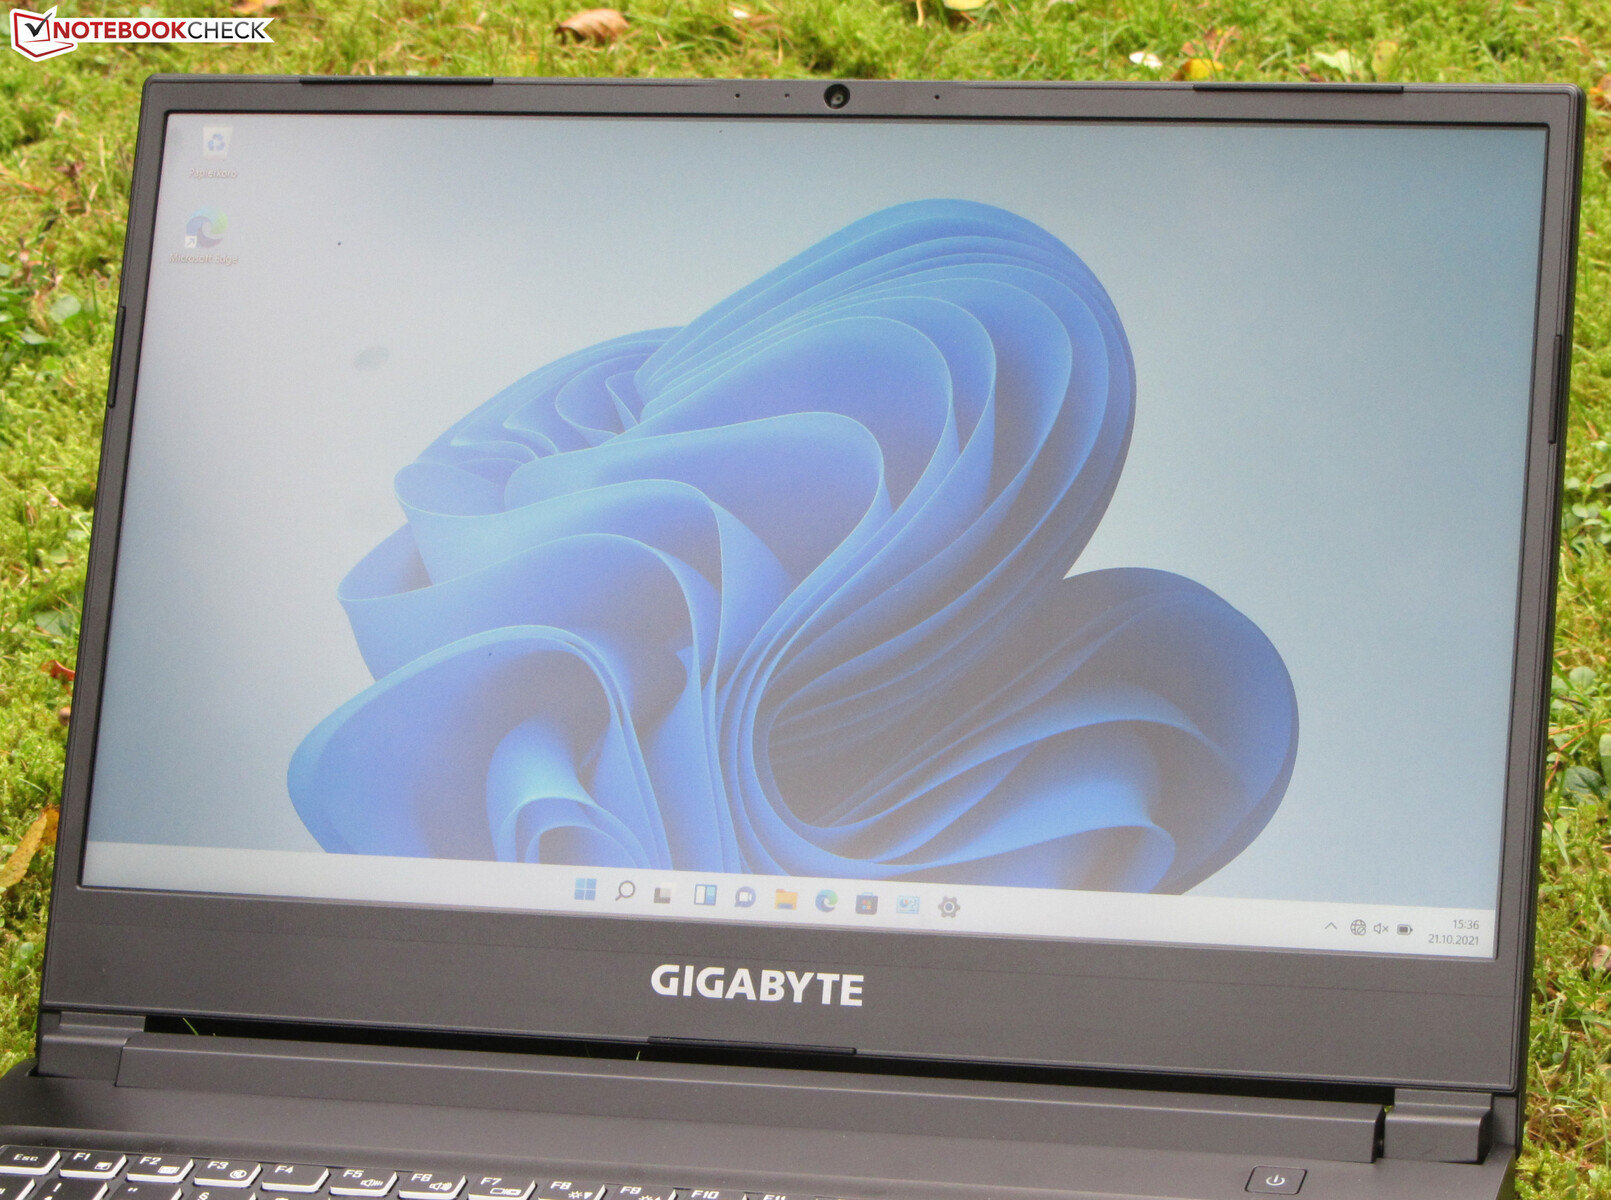
Il pannello IPS stabile nell'angolo di visione può essere letto da qualsiasi posizione. La leggibilità all'aperto è possibile quando il sole non splende troppo forte

Prestazioni - laptop Gigabyte con prestazioni RTX 3050 complete
Il Gigabyte G5 GD è un portatile da gioco da 15,6 pollici che porta ogni gioco moderno senza problemi sullo schermo
Condizioni di prova
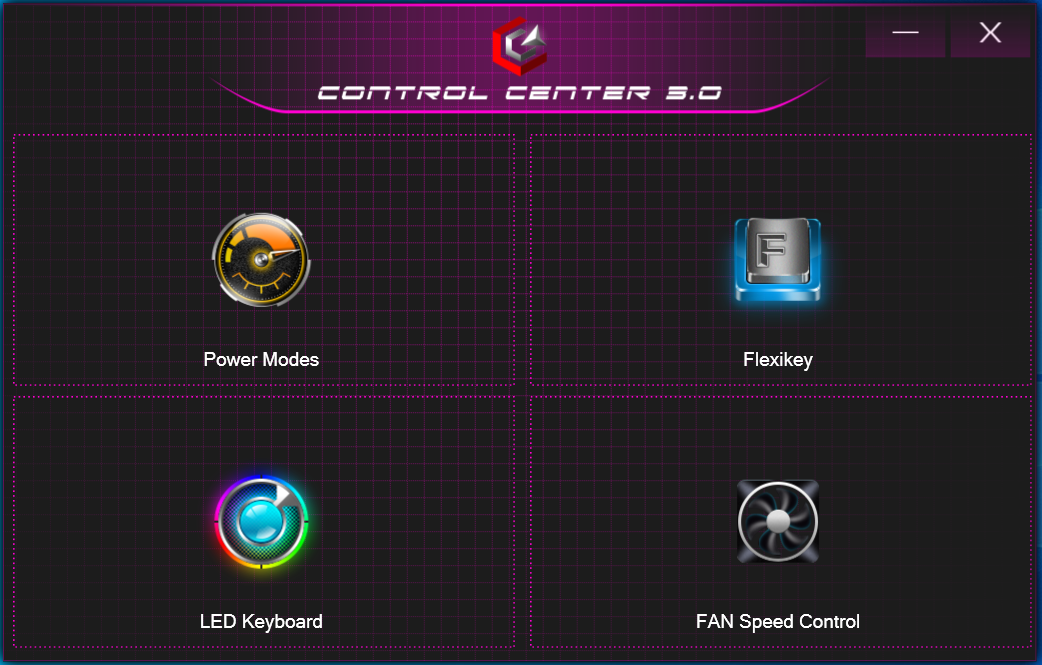
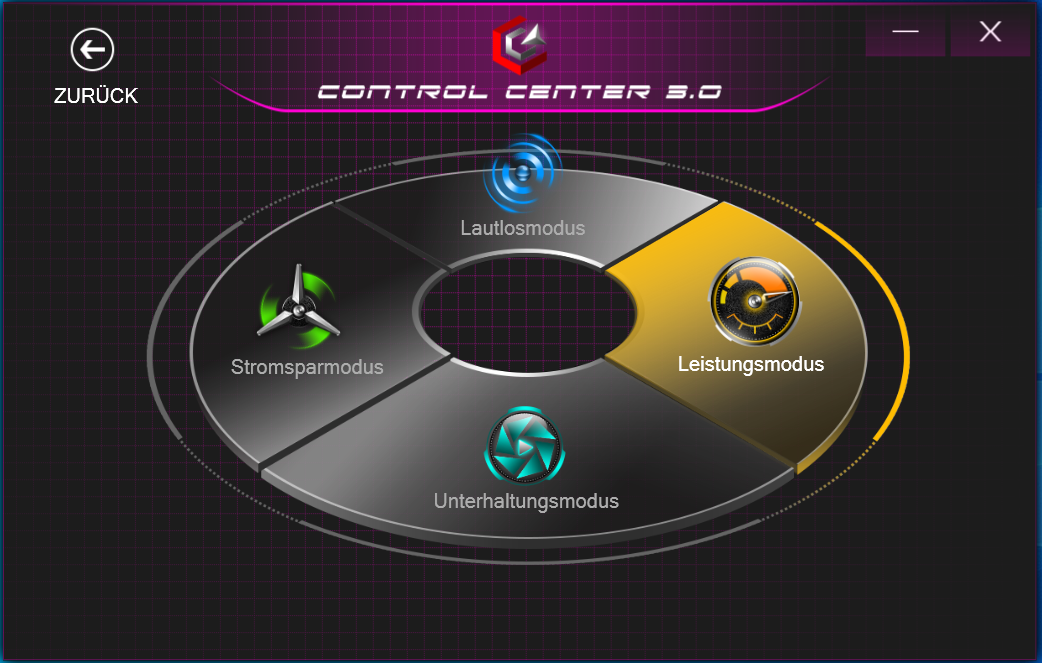
Il Control Center preinstallato permette di scegliere un profilo di prestazioni (vedi tabella), tra le altre cose. Abbiamo usato il profilo "Entertainment Mode" che include il controllo automatico della ventola. Abbiamo anche eseguito alcuni benchmark sotto i profili "Performance Mode" e "Power Saving Mode". I risultati possono essere trovati nelle tabelle di confronto.
| Modalità Performance | Modalità Intrattenimento | Modalità Risparmio energetico | Modalità Silenziosa | |
|---|---|---|---|---|
| Limite di potenza 1 | 60 watt | 45 watt | 30 watt | 15 watt |
| Limite di potenza 2 | 135 watt | 109 watt | 30 watt | 30 watt |
Consigli di auto-aiuto: Problemi di BIOS con il G5 GD
Il dispositivo di prova fornitoci ha mostrato un problema: il throttling della CPU durante l'esecuzione di applicazioni 3D. Questo si rifletteva in giochi choppati - a volte in misura maggiore, a volte in misura minore. È stato possibile ricondurre il problema al BIOS: Delle sette versioni di BIOS rilasciate finora, solo le prime tre (da FB01 a FB03) funzionano senza problemi - il nostro dispositivo di prova è stato fornito con la versione FB07 del BIOS. Pertanto, alla fine abbiamo scelto di installare il BIOS versione FB03 per effettuare i nostri test
Windows 10 o Windows 11 - dipende dalla versione del BIOS
Il G5 è compatibile con Windows 11 solo a partire dalla versione FB06 del BIOS. Le versioni precedenti causano il blocco del portatile anche prima dell'avvio effettivo di un sistema operativo Windows 11 precedentemente installato. Windows 10 funziona con tutte le versioni del BIOS.
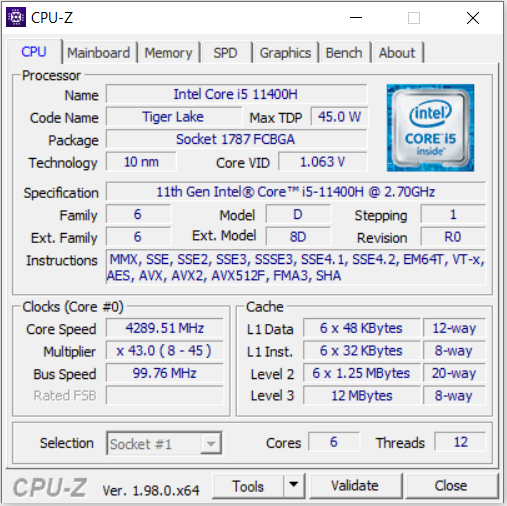
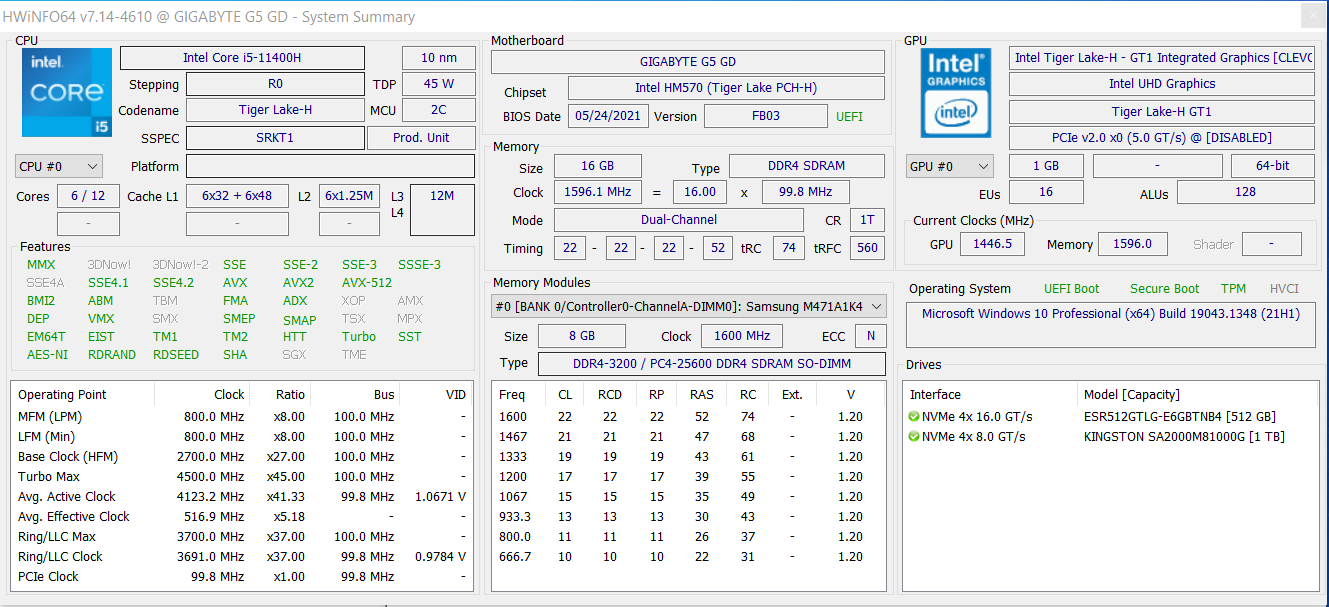
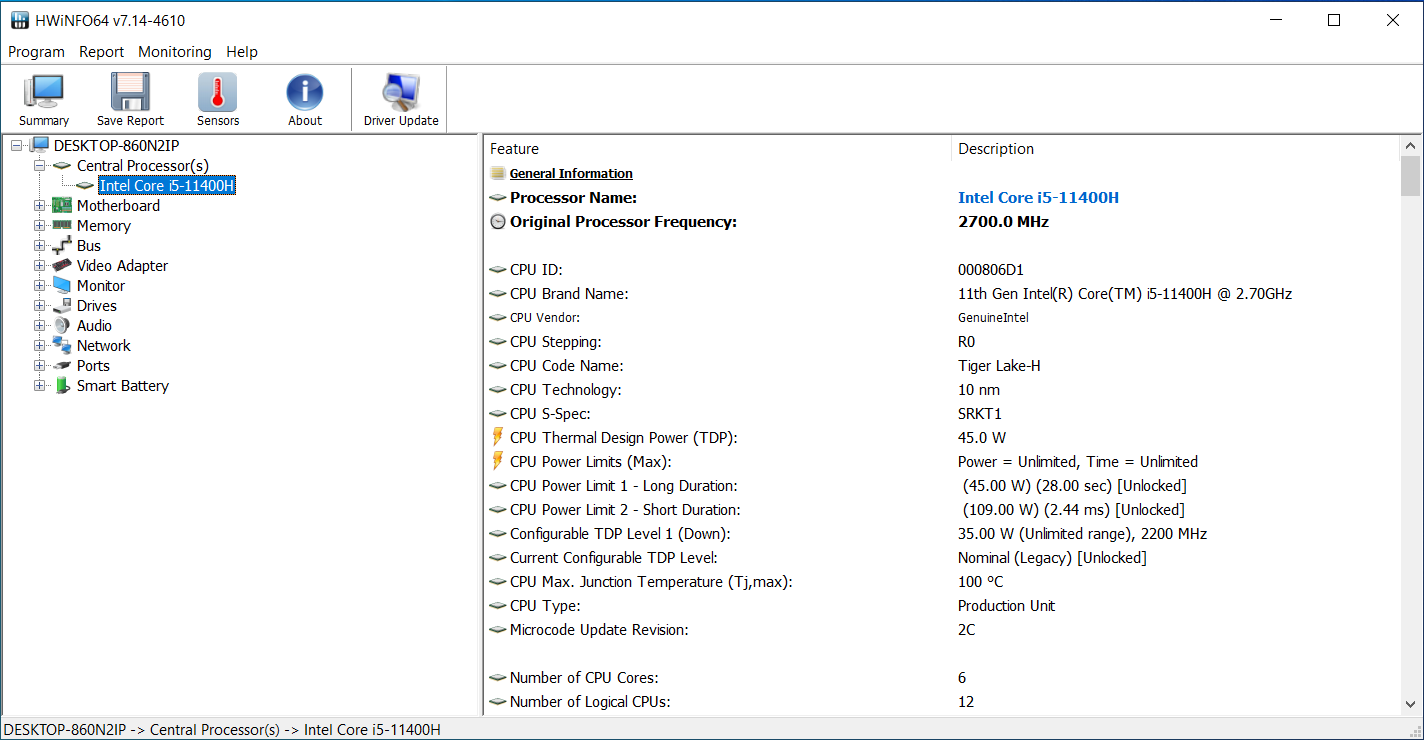
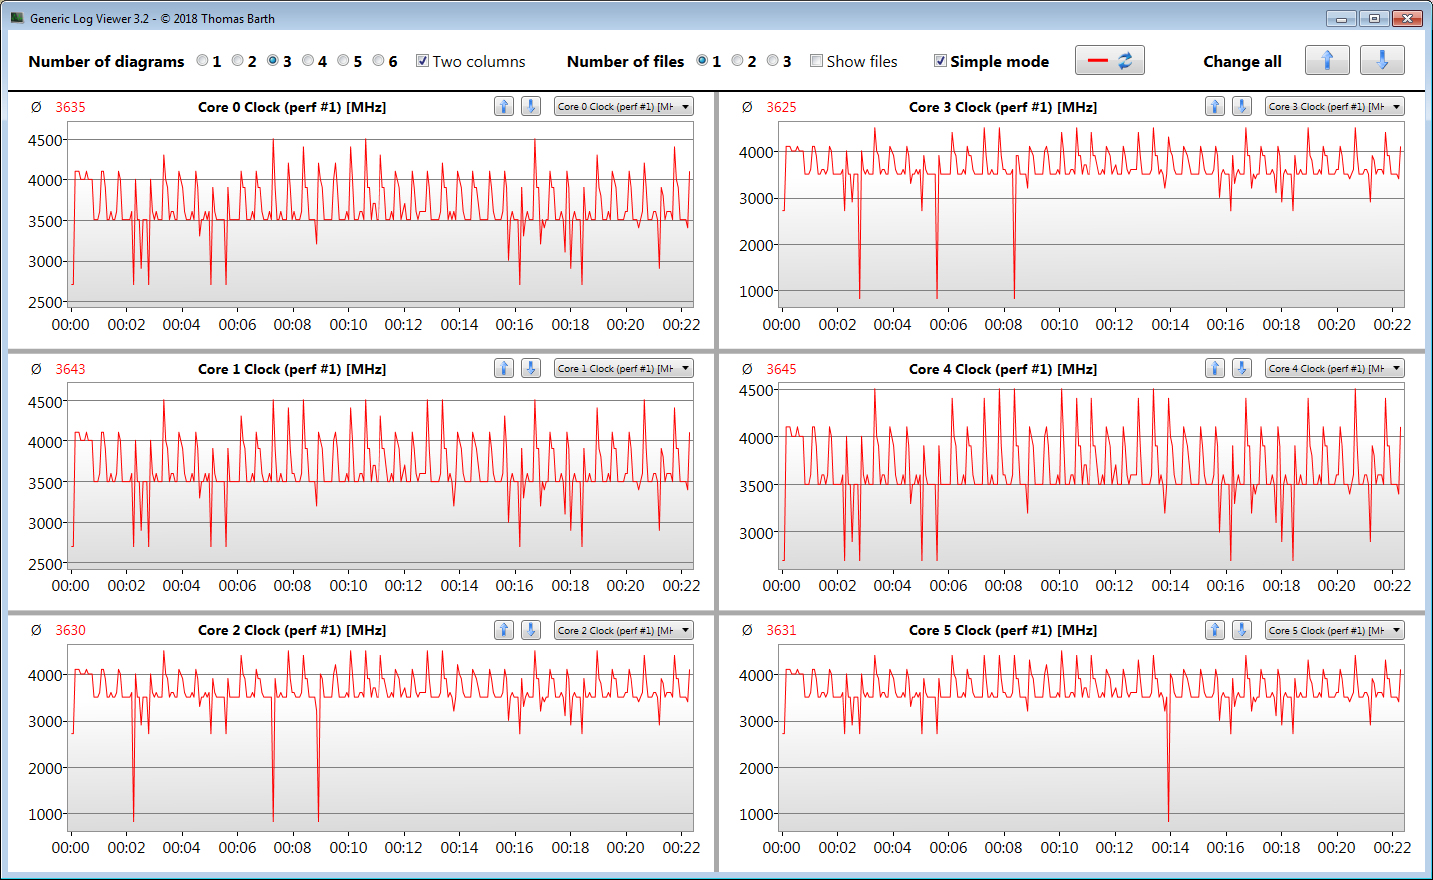
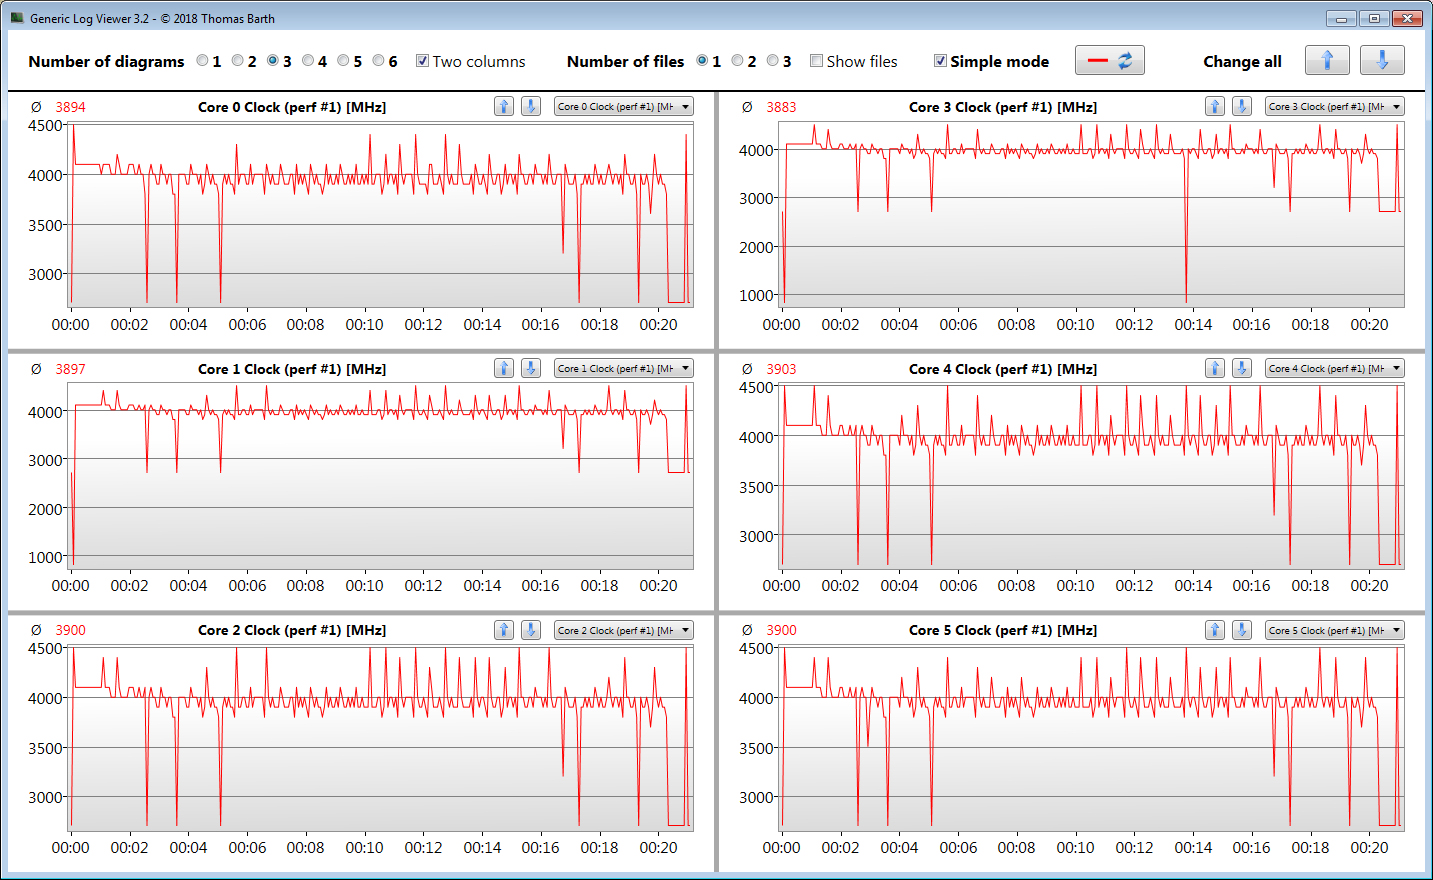
Processore
Il processore hexa-core Core i7-11400H (Tiger Lake) raggiunge frequenze di clock di 4.1 GHz (sei core) a 4.5 GHz (un core). Hyper-Threading (due thread per core) è supportato. I test della CPU del benchmark CB R15 sono eseguiti a 4,1 GHz (multi) e da 4,1 a 4,5 GHz (singolo). Le frequenze di clock sono da 1.9 a 2 GHz (multi) e da 3.1 a 4.5 GHz (singolo), rispettivamente, a batteria
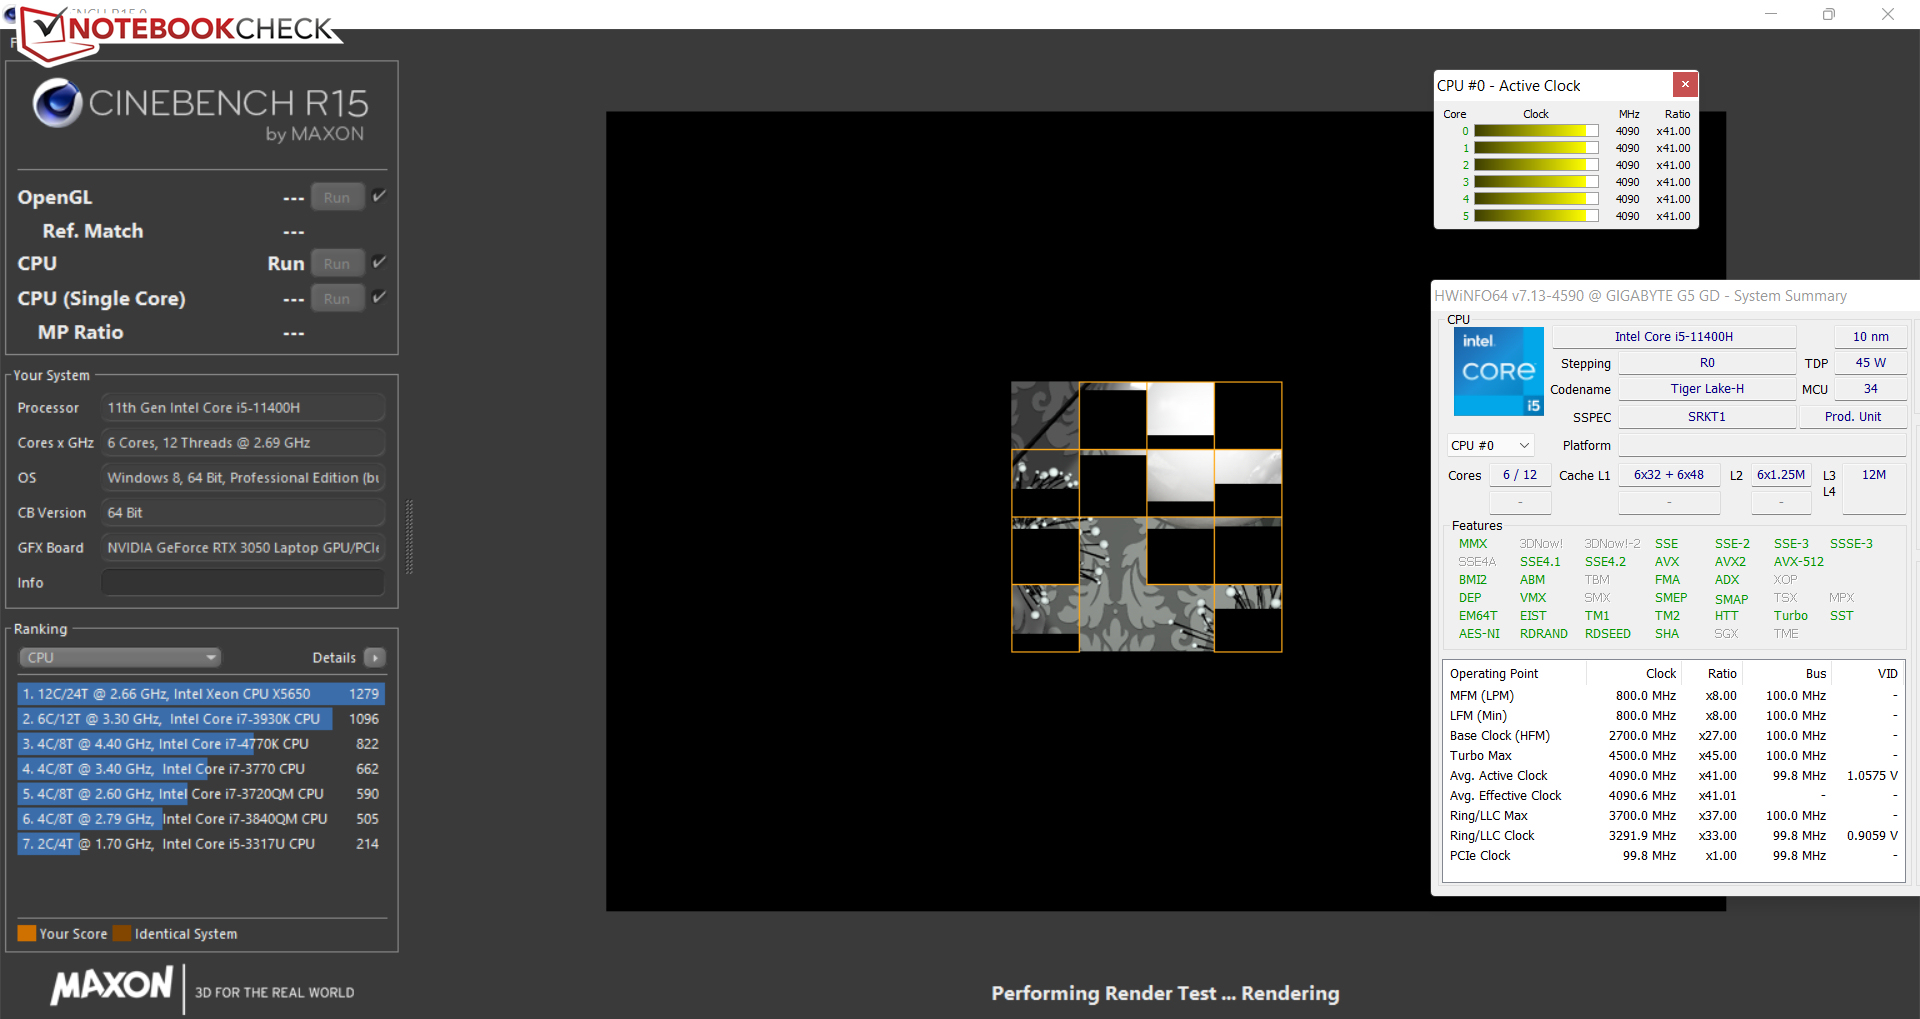
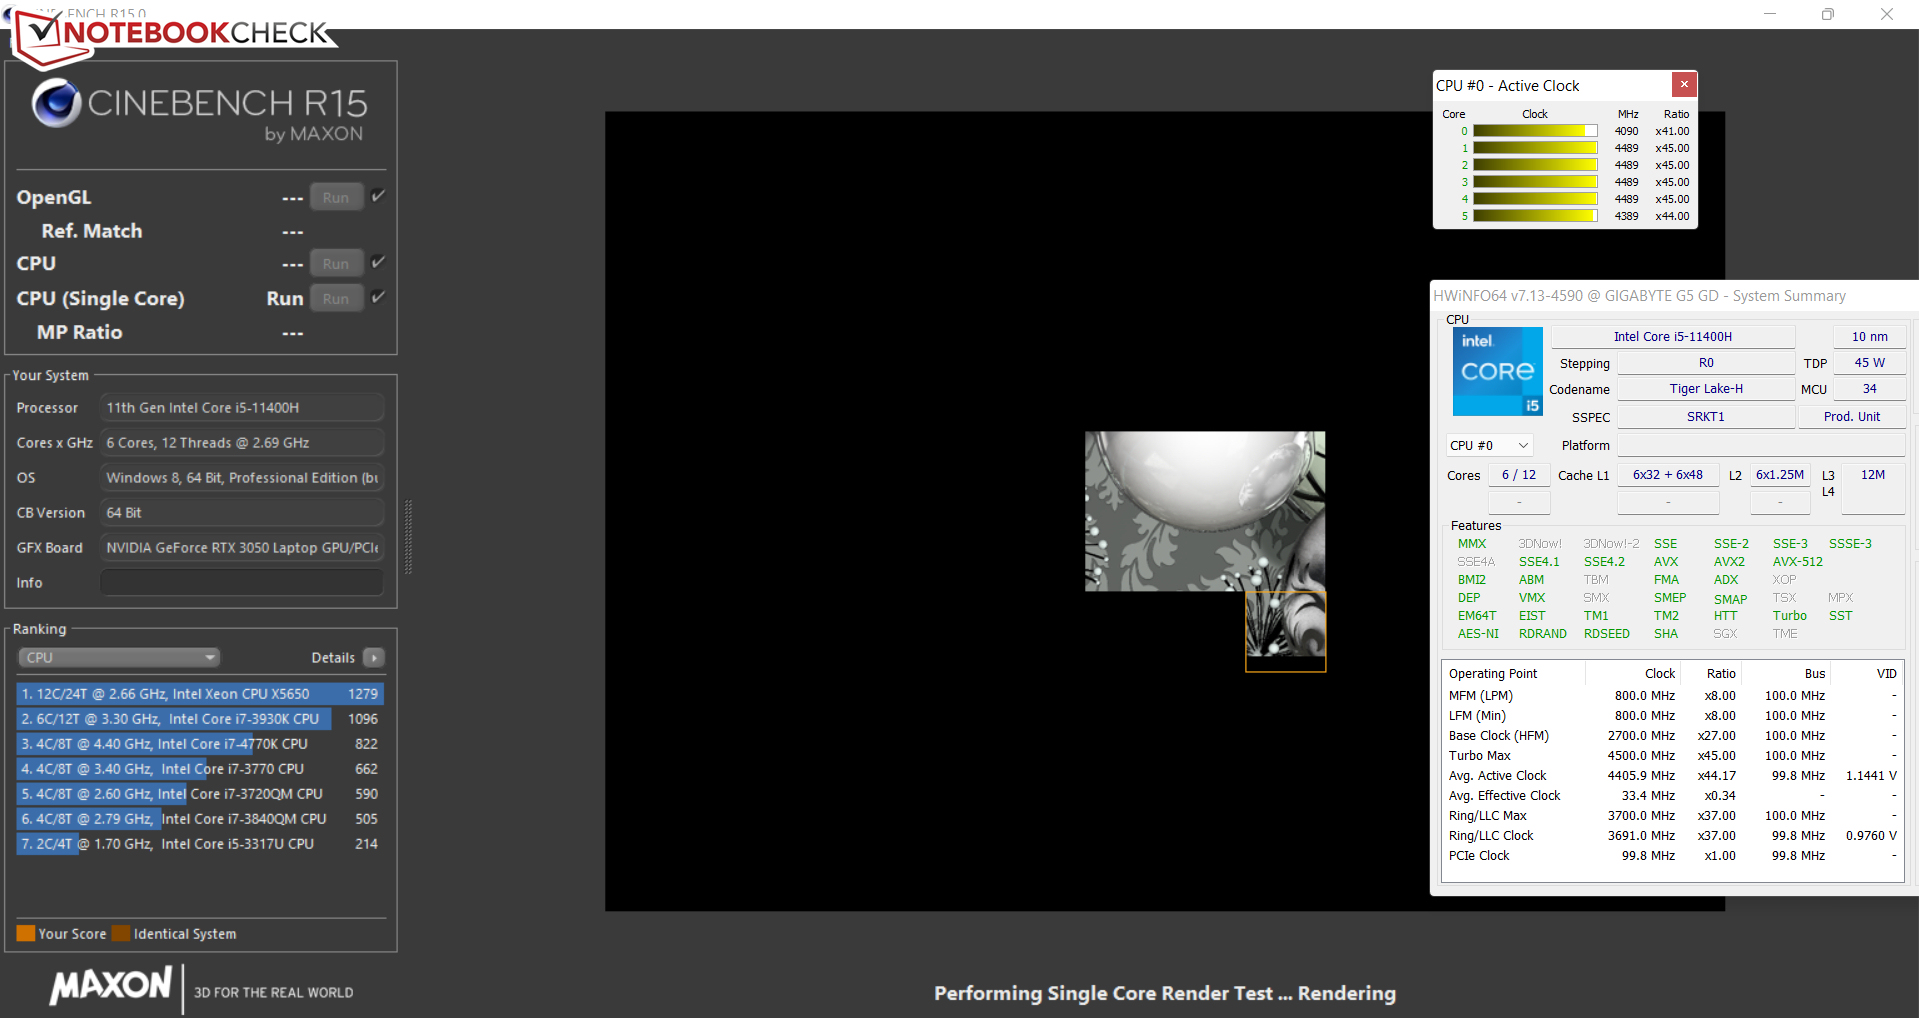
Il test di resistenza Cinebench R15 multi (min. 30 minuti) mostra che la CPU Turbo è usata continuamente - ad un livello medio. Un leggero aumento della frequenza di clock Turbo si ottiene selezionando il profilo "Performance Mode".
Strano: Mentre il profilo "Performance Mode" aumenta un po' le prestazioni multithread, le prestazioni single-thread calano allo stesso tempo. Questo potrebbe essere legato alla versione obsoleta del BIOS che abbiamo dovuto installare.
Cinebench R15 Multi endurance test
| CPU Performance rating - Percent | |
| Media della classe Gaming | |
| Lenovo Legion 5 15ACH-82JU00C6GE-FL | |
| Dell G15 5515 | |
| Gigabyte G5 GD | |
| Gigabyte G5 GD | |
| Media Intel Core i5-11400H | |
| Gigabyte G5 GD | |
| MSI GF65 Thin 10UE | |
| Gigabyte G5 KC | |
| Cinebench R23 | |
| Multi Core | |
| Media della classe Gaming (10488 - 40970, n=109, ultimi 2 anni) | |
| Lenovo Legion 5 15ACH-82JU00C6GE-FL | |
| Dell G15 5515 | |
| Gigabyte G5 GD (Leistungsmodus) | |
| Gigabyte G5 GD | |
| Media Intel Core i5-11400H (6674 - 9406, n=7) | |
| MSI GF65 Thin 10UE | |
| Gigabyte G5 KC | |
| Gigabyte G5 GD (Stromsparmodus) | |
| Single Core | |
| Media della classe Gaming (1166 - 2356, n=109, ultimi 2 anni) | |
| Gigabyte G5 GD | |
| Gigabyte G5 GD (Stromsparmodus) | |
| Media Intel Core i5-11400H (1349 - 1472, n=6) | |
| Dell G15 5515 | |
| Lenovo Legion 5 15ACH-82JU00C6GE-FL | |
| Gigabyte G5 GD (Leistungsmodus) | |
| MSI GF65 Thin 10UE | |
| Gigabyte G5 KC | |
| Cinebench R20 | |
| CPU (Multi Core) | |
| Media della classe Gaming (4029 - 16108, n=108, ultimi 2 anni) | |
| Lenovo Legion 5 15ACH-82JU00C6GE-FL | |
| Dell G15 5515 | |
| Gigabyte G5 GD (Leistungsmodus) | |
| Gigabyte G5 GD | |
| Media Intel Core i5-11400H (2550 - 3740, n=7) | |
| Gigabyte G5 KC | |
| MSI GF65 Thin 10UE | |
| Gigabyte G5 GD (Stromsparmodus) | |
| CPU (Single Core) | |
| Media della classe Gaming (442 - 895, n=108, ultimi 2 anni) | |
| Gigabyte G5 GD | |
| Gigabyte G5 GD (Stromsparmodus) | |
| Media Intel Core i5-11400H (522 - 569, n=6) | |
| Dell G15 5515 | |
| Lenovo Legion 5 15ACH-82JU00C6GE-FL | |
| Gigabyte G5 GD (Leistungsmodus) | |
| MSI GF65 Thin 10UE | |
| Gigabyte G5 KC | |
| Cinebench R15 | |
| CPU Multi 64Bit | |
| Media della classe Gaming (1578 - 6271, n=107, ultimi 2 anni) | |
| Lenovo Legion 5 15ACH-82JU00C6GE-FL | |
| Dell G15 5515 | |
| Gigabyte G5 GD (Leistungsmodus) | |
| Gigabyte G5 GD | |
| Media Intel Core i5-11400H (1014 - 1532, n=7) | |
| Gigabyte G5 KC | |
| MSI GF65 Thin 10UE | |
| Gigabyte G5 GD (Stromsparmodus) | |
| CPU Single 64Bit | |
| Media della classe Gaming (188.8 - 343, n=108, ultimi 2 anni) | |
| Dell G15 5515 | |
| Lenovo Legion 5 15ACH-82JU00C6GE-FL | |
| Gigabyte G5 GD (Stromsparmodus) | |
| Gigabyte G5 GD | |
| Media Intel Core i5-11400H (202 - 219, n=6) | |
| MSI GF65 Thin 10UE | |
| Gigabyte G5 GD (Leistungsmodus) | |
| Gigabyte G5 KC | |
| Blender - v2.79 BMW27 CPU | |
| Gigabyte G5 GD (Stromsparmodus) | |
| MSI GF65 Thin 10UE | |
| Media Intel Core i5-11400H (340 - 483, n=6) | |
| Gigabyte G5 KC | |
| Gigabyte G5 GD | |
| Gigabyte G5 GD (Leistungsmodus) | |
| Dell G15 5515 | |
| Lenovo Legion 5 15ACH-82JU00C6GE-FL | |
| Media della classe Gaming (80 - 330, n=106, ultimi 2 anni) | |
| 7-Zip 18.03 | |
| 7z b 4 | |
| Media della classe Gaming (33491 - 148086, n=107, ultimi 2 anni) | |
| Dell G15 5515 | |
| Lenovo Legion 5 15ACH-82JU00C6GE-FL | |
| Gigabyte G5 GD (Leistungsmodus) | |
| Gigabyte G5 GD | |
| Media Intel Core i5-11400H (27615 - 40268, n=6) | |
| MSI GF65 Thin 10UE | |
| Gigabyte G5 KC | |
| Gigabyte G5 GD (Stromsparmodus) | |
| 7z b 4 -mmt1 | |
| Media della classe Gaming (4199 - 7436, n=107, ultimi 2 anni) | |
| Dell G15 5515 | |
| Lenovo Legion 5 15ACH-82JU00C6GE-FL | |
| MSI GF65 Thin 10UE | |
| Gigabyte G5 GD | |
| Gigabyte G5 GD (Stromsparmodus) | |
| Media Intel Core i5-11400H (4802 - 5343, n=6) | |
| Gigabyte G5 KC | |
| Gigabyte G5 GD (Leistungsmodus) | |
| Geekbench 5.5 | |
| Multi-Core | |
| Media della classe Gaming (6460 - 27010, n=107, ultimi 2 anni) | |
| Lenovo Legion 5 15ACH-82JU00C6GE-FL | |
| Dell G15 5515 | |
| Gigabyte G5 GD (Leistungsmodus) | |
| Gigabyte G5 GD | |
| MSI GF65 Thin 10UE | |
| Gigabyte G5 KC | |
| Gigabyte G5 KC | |
| Media Intel Core i5-11400H (4679 - 7018, n=7) | |
| Gigabyte G5 GD (Stromsparmodus) | |
| Single-Core | |
| Media della classe Gaming (986 - 2474, n=107, ultimi 2 anni) | |
| Gigabyte G5 GD (Stromsparmodus) | |
| Gigabyte G5 GD | |
| Media Intel Core i5-11400H (1396 - 1528, n=7) | |
| Lenovo Legion 5 15ACH-82JU00C6GE-FL | |
| Dell G15 5515 | |
| Gigabyte G5 GD (Leistungsmodus) | |
| MSI GF65 Thin 10UE | |
| Gigabyte G5 KC | |
| Gigabyte G5 KC | |
| HWBOT x265 Benchmark v2.2 - 4k Preset | |
| Media della classe Gaming (11.5 - 44.3, n=107, ultimi 2 anni) | |
| Lenovo Legion 5 15ACH-82JU00C6GE-FL | |
| Dell G15 5515 | |
| Gigabyte G5 GD (Leistungsmodus) | |
| Gigabyte G5 GD | |
| Media Intel Core i5-11400H (8.19 - 11.3, n=6) | |
| MSI GF65 Thin 10UE | |
| Gigabyte G5 KC | |
| Gigabyte G5 GD (Stromsparmodus) | |
| LibreOffice - 20 Documents To PDF | |
| Lenovo Legion 5 15ACH-82JU00C6GE-FL | |
| Dell G15 5515 | |
| Gigabyte G5 KC | |
| Media della classe Gaming (19 - 88.8, n=107, ultimi 2 anni) | |
| Media Intel Core i5-11400H (41.4 - 53, n=6) | |
| MSI GF65 Thin 10UE | |
| Gigabyte G5 GD (Leistungsmodus) | |
| Gigabyte G5 GD | |
| Gigabyte G5 GD (Stromsparmodus) | |
| R Benchmark 2.5 - Overall mean | |
| Gigabyte G5 KC | |
| Gigabyte G5 GD (Leistungsmodus) | |
| Media Intel Core i5-11400H (0.581 - 0.644, n=6) | |
| MSI GF65 Thin 10UE | |
| Gigabyte G5 GD | |
| Gigabyte G5 GD (Stromsparmodus) | |
| Lenovo Legion 5 15ACH-82JU00C6GE-FL | |
| Dell G15 5515 | |
| Media della classe Gaming (0.3439 - 0.759, n=108, ultimi 2 anni) | |
* ... Meglio usare valori piccoli
| Performance rating - Percent | |
| Media della classe Gaming | |
| Lenovo Legion 5 15ACH-82JU00C6GE-FL | |
| Dell G15 5515 | |
| Gigabyte G5 GD | |
| Gigabyte G5 GD | |
| Media Intel Core i5-11400H | |
| Gigabyte G5 KC | |
Prestazioni del sistema
Il sistema veloce e fluido offre abbastanza potenza di calcolo per tutti i compiti comuni - il gioco, l'editing video e l'elaborazione delle immagini non sono grandi sfide per il portatile. Questo è accompagnato da buoni risultati PCMark

| PCMark 8 Home Score Accelerated v2 | 4312 punti | |
| PCMark 8 Creative Score Accelerated v2 | 5850 punti | |
| PCMark 8 Work Score Accelerated v2 | 6010 punti | |
| PCMark 10 Score | 5895 punti | |
Aiuto | ||
| PCMark 10 / Score | |
| Media della classe Gaming (5828 - 11574, n=94, ultimi 2 anni) | |
| Lenovo Legion 5 15ACH-82JU00C6GE-FL | |
| Dell G15 5515 | |
| Gigabyte G5 KC | |
| Gigabyte G5 GD | |
| Media Intel Core i5-11400H, NVIDIA GeForce RTX 3050 4GB Laptop GPU (5136 - 5895, n=2) | |
| MSI GF65 Thin 10UE | |
| PCMark 10 / Essentials | |
| Media della classe Gaming (8810 - 12600, n=98, ultimi 2 anni) | |
| Lenovo Legion 5 15ACH-82JU00C6GE-FL | |
| Dell G15 5515 | |
| Gigabyte G5 GD | |
| MSI GF65 Thin 10UE | |
| Gigabyte G5 KC | |
| Media Intel Core i5-11400H, NVIDIA GeForce RTX 3050 4GB Laptop GPU (8610 - 9155, n=2) | |
| PCMark 10 / Productivity | |
| Media della classe Gaming (6845 - 21327, n=96, ultimi 2 anni) | |
| Lenovo Legion 5 15ACH-82JU00C6GE-FL | |
| Dell G15 5515 | |
| Gigabyte G5 GD | |
| Media Intel Core i5-11400H, NVIDIA GeForce RTX 3050 4GB Laptop GPU (8149 - 8506, n=2) | |
| Gigabyte G5 KC | |
| MSI GF65 Thin 10UE | |
| PCMark 10 / Digital Content Creation | |
| Media della classe Gaming (7602 - 19657, n=96, ultimi 2 anni) | |
| Gigabyte G5 KC | |
| Lenovo Legion 5 15ACH-82JU00C6GE-FL | |
| Dell G15 5515 | |
| Gigabyte G5 GD | |
| Media Intel Core i5-11400H, NVIDIA GeForce RTX 3050 4GB Laptop GPU (5242 - 7140, n=2) | |
| MSI GF65 Thin 10UE | |
| AIDA64 / Memory Copy | |
| Media della classe Gaming (21750 - 129946, n=106, ultimi 2 anni) | |
| Gigabyte G5 GD | |
| Dell G15 5515 | |
| Lenovo Legion 5 15ACH-82JU00C6GE-FL | |
| Gigabyte G5 KC | |
| Media Intel Core i5-11400H (20513 - 42471, n=4) | |
| AIDA64 / Memory Read | |
| Media della classe Gaming (22956 - 118858, n=106, ultimi 2 anni) | |
| Gigabyte G5 GD | |
| Dell G15 5515 | |
| Lenovo Legion 5 15ACH-82JU00C6GE-FL | |
| Gigabyte G5 KC | |
| Media Intel Core i5-11400H (23172 - 48221, n=4) | |
| AIDA64 / Memory Write | |
| Media della classe Gaming (22297 - 135096, n=106, ultimi 2 anni) | |
| Gigabyte G5 GD | |
| Gigabyte G5 KC | |
| Dell G15 5515 | |
| Media Intel Core i5-11400H (21862 - 45893, n=4) | |
| Lenovo Legion 5 15ACH-82JU00C6GE-FL | |
| AIDA64 / Memory Latency | |
| Media della classe Gaming (75.3 - 259, n=106, ultimi 2 anni) | |
| Gigabyte G5 GD | |
| Lenovo Legion 5 15ACH-82JU00C6GE-FL | |
| Dell G15 5515 | |
| Media Intel Core i5-11400H (73.3 - 95.9, n=5) | |
| Gigabyte G5 KC | |
* ... Meglio usare valori piccoli
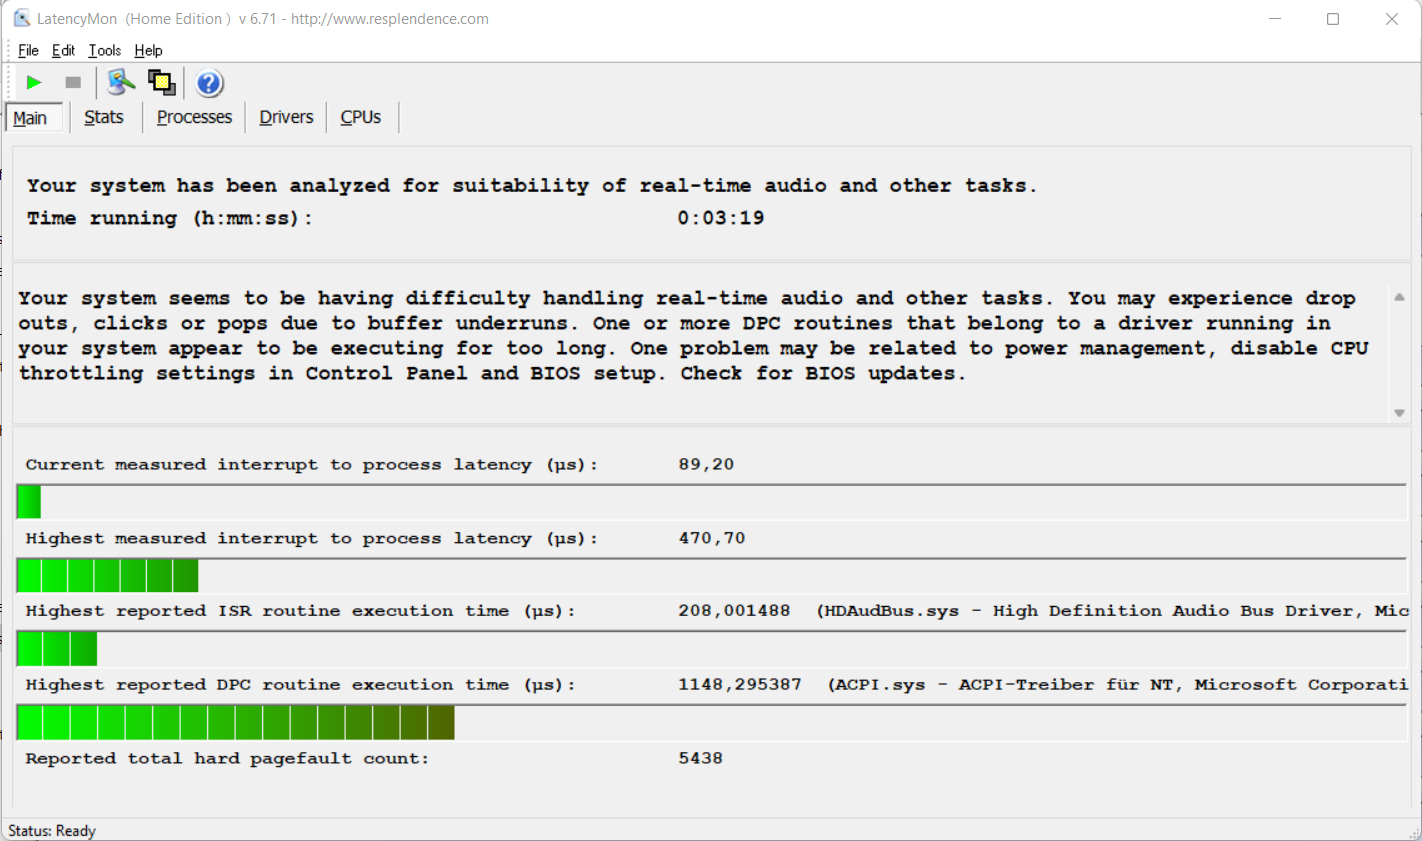
Latenze DPC
Il nostro test standardizzato di monitoraggio della latenza (navigazione web, riproduzione video 4K, Prime95 ad alto carico) ha rivelato irregolarità con le latenze DPC. Il sistema non sembra essere adatto all'editing video e audio in tempo reale. I futuri aggiornamenti del software potrebbero portare a miglioramenti o anche a prestazioni peggiori
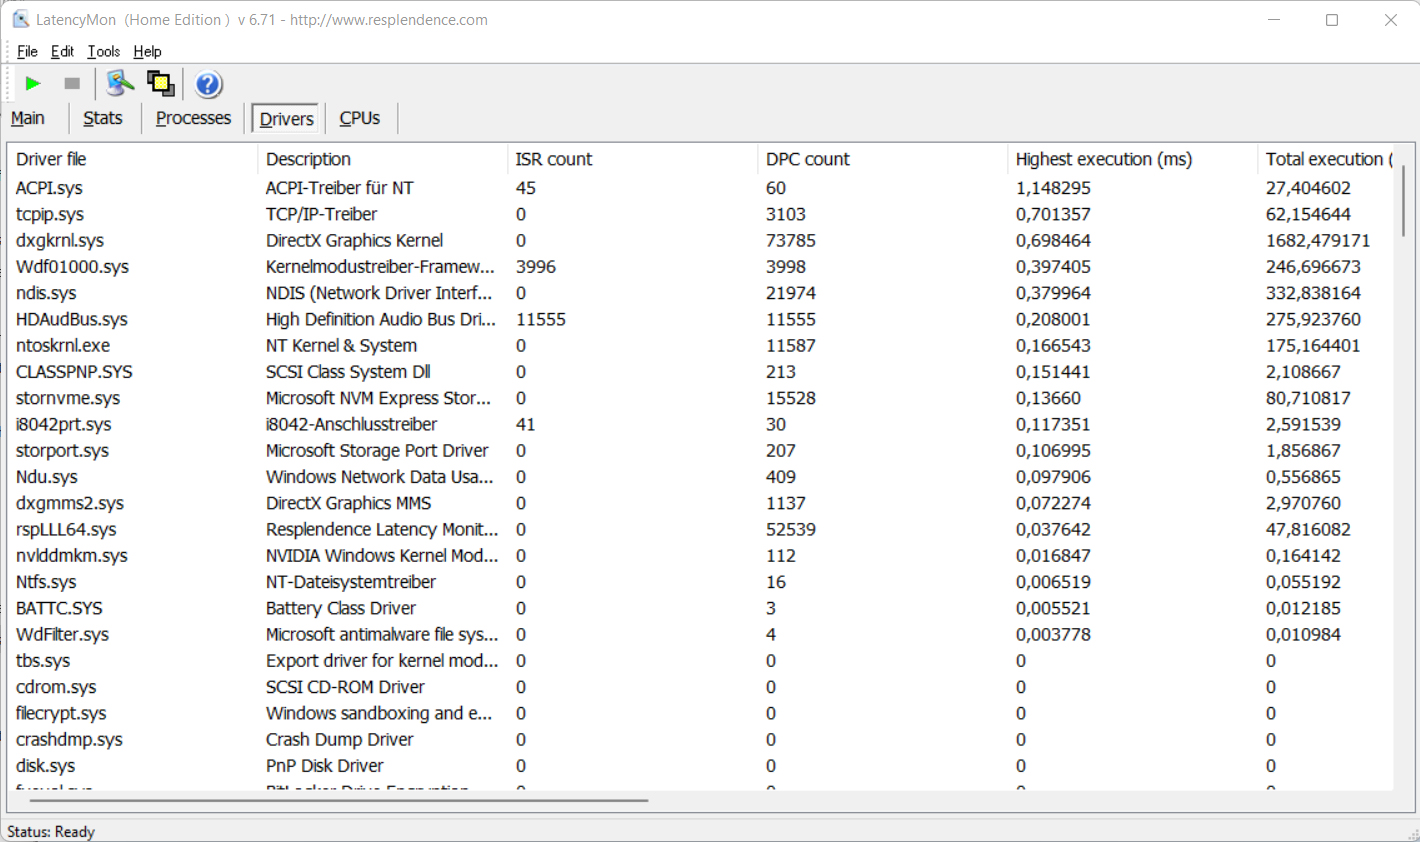
| DPC Latencies / LatencyMon - interrupt to process latency (max), Web, Youtube, Prime95 | |
| MSI GF65 Thin 10UE | |
| Lenovo Legion 5 15ACH-82JU00C6GE-FL | |
| Dell G15 5515 | |
| Gigabyte G5 KC | |
| Gigabyte G5 GD | |
* ... Meglio usare valori piccoli
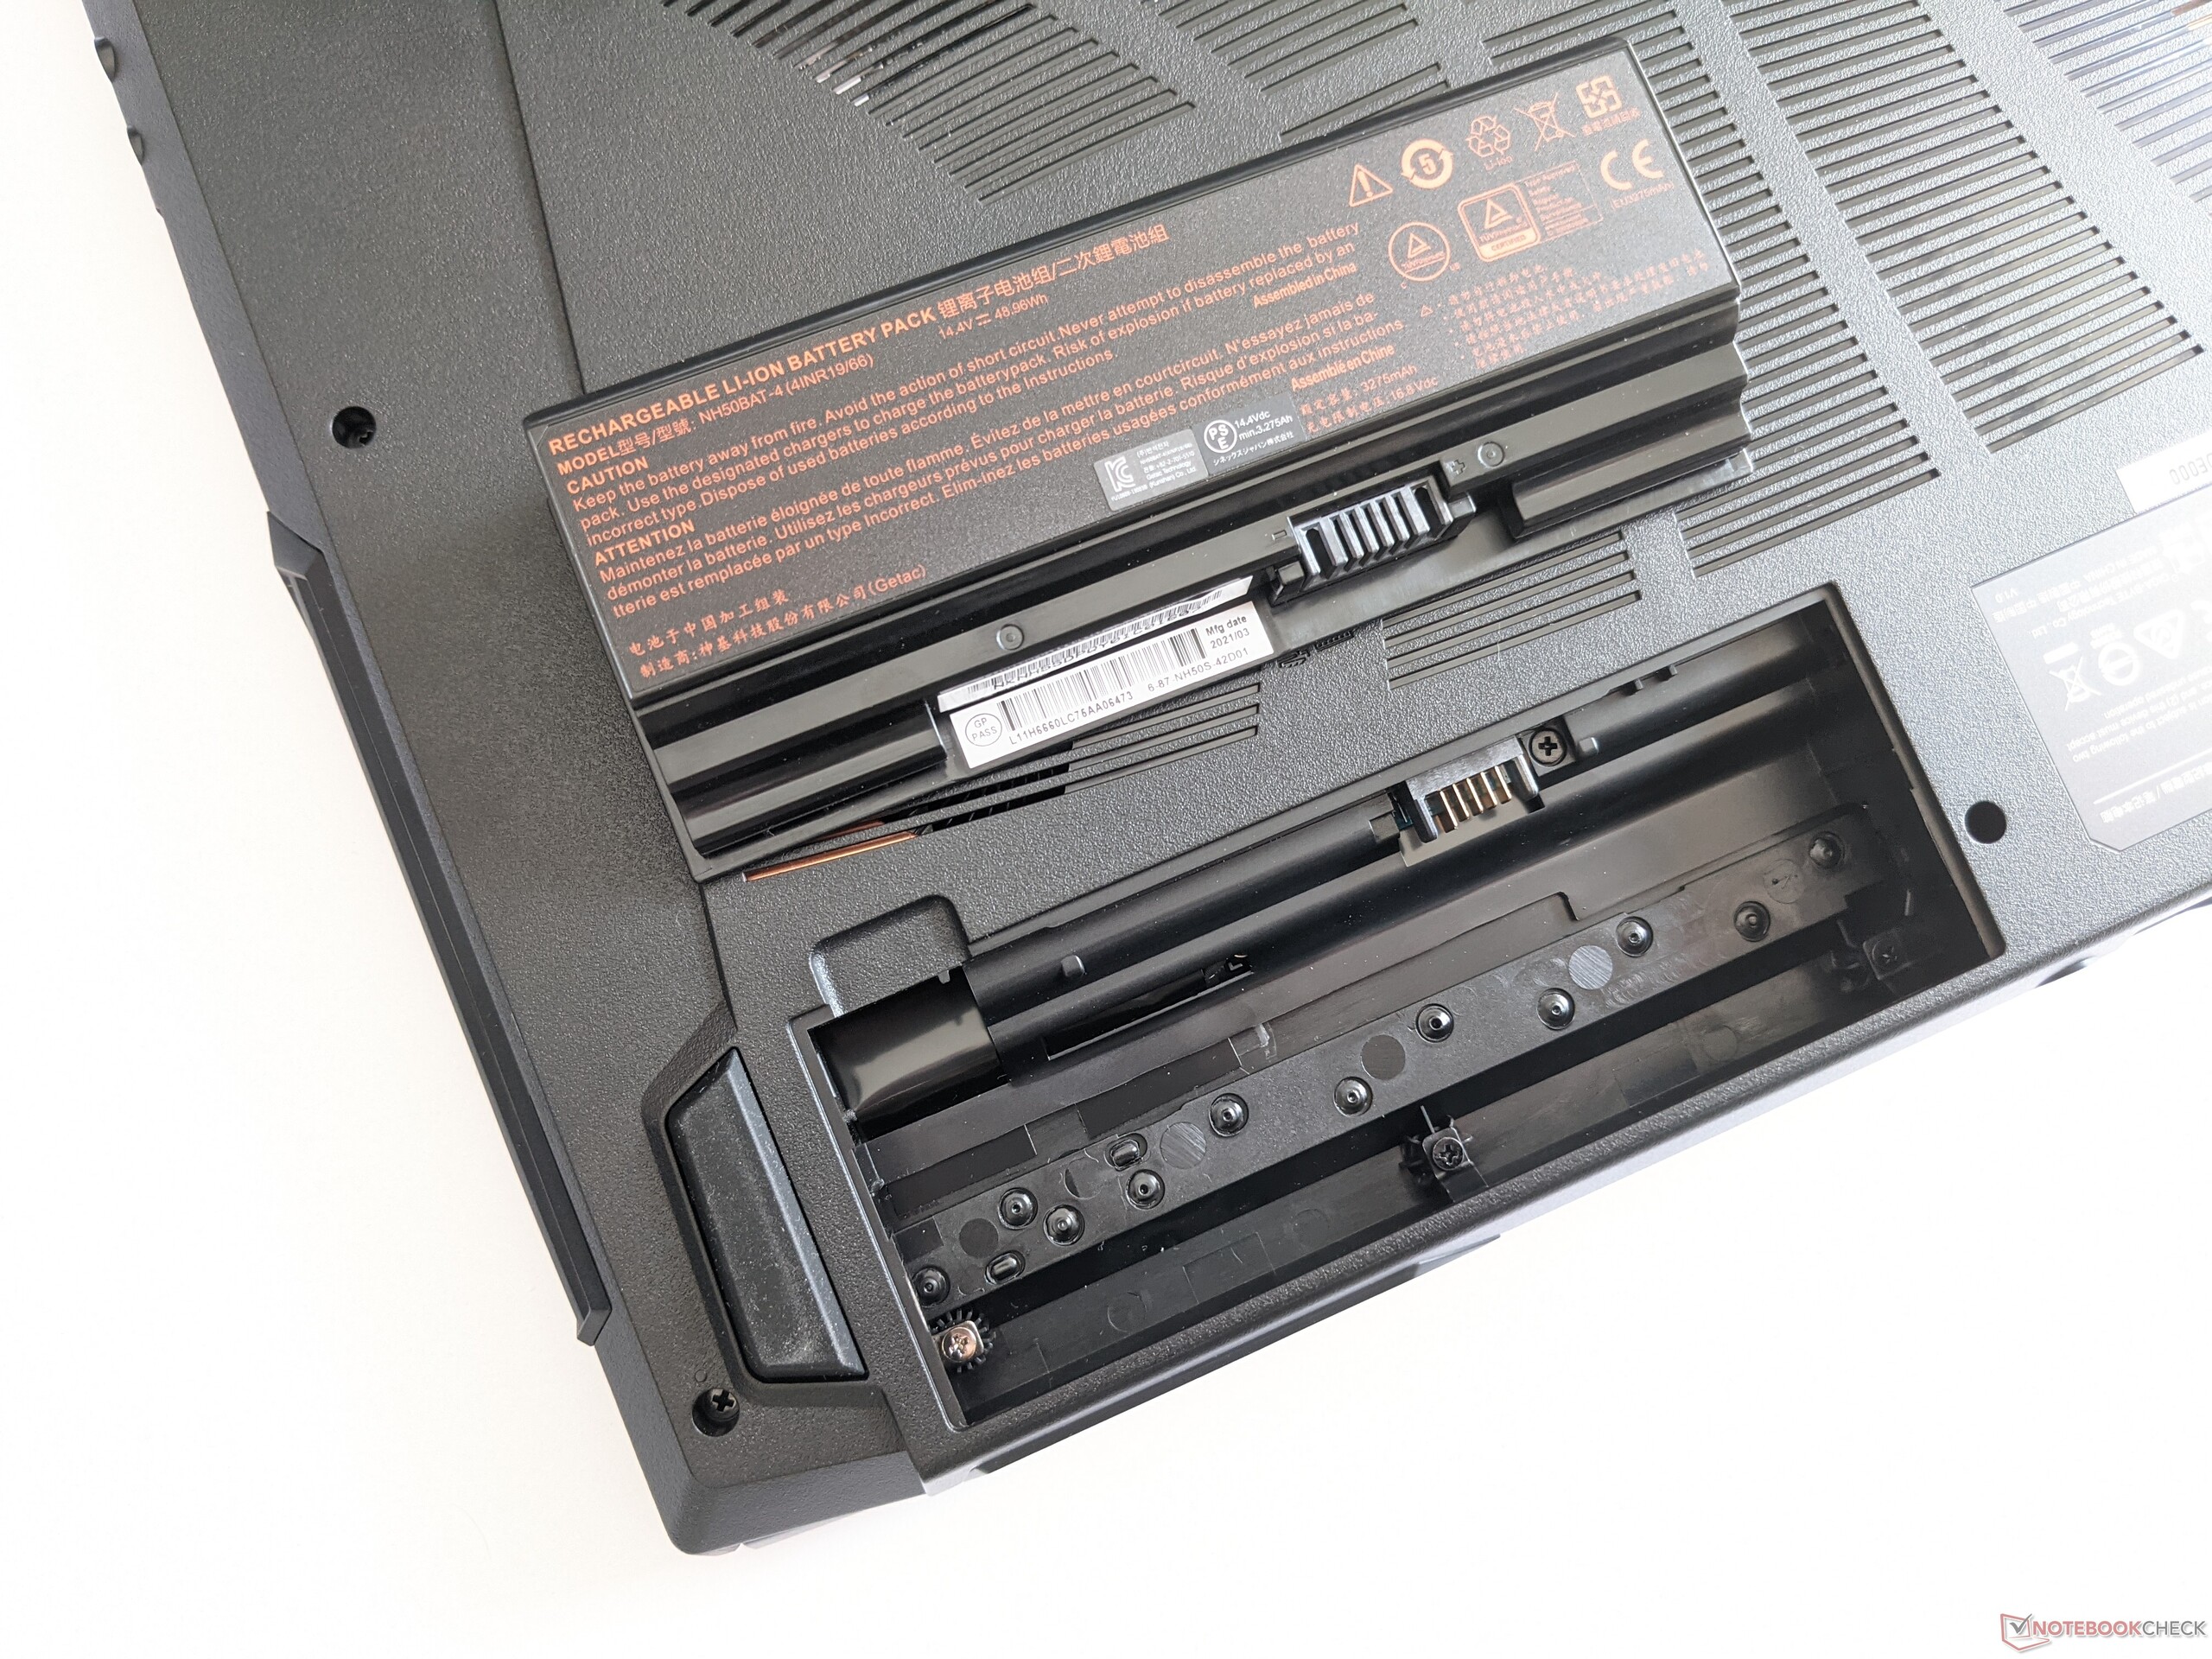
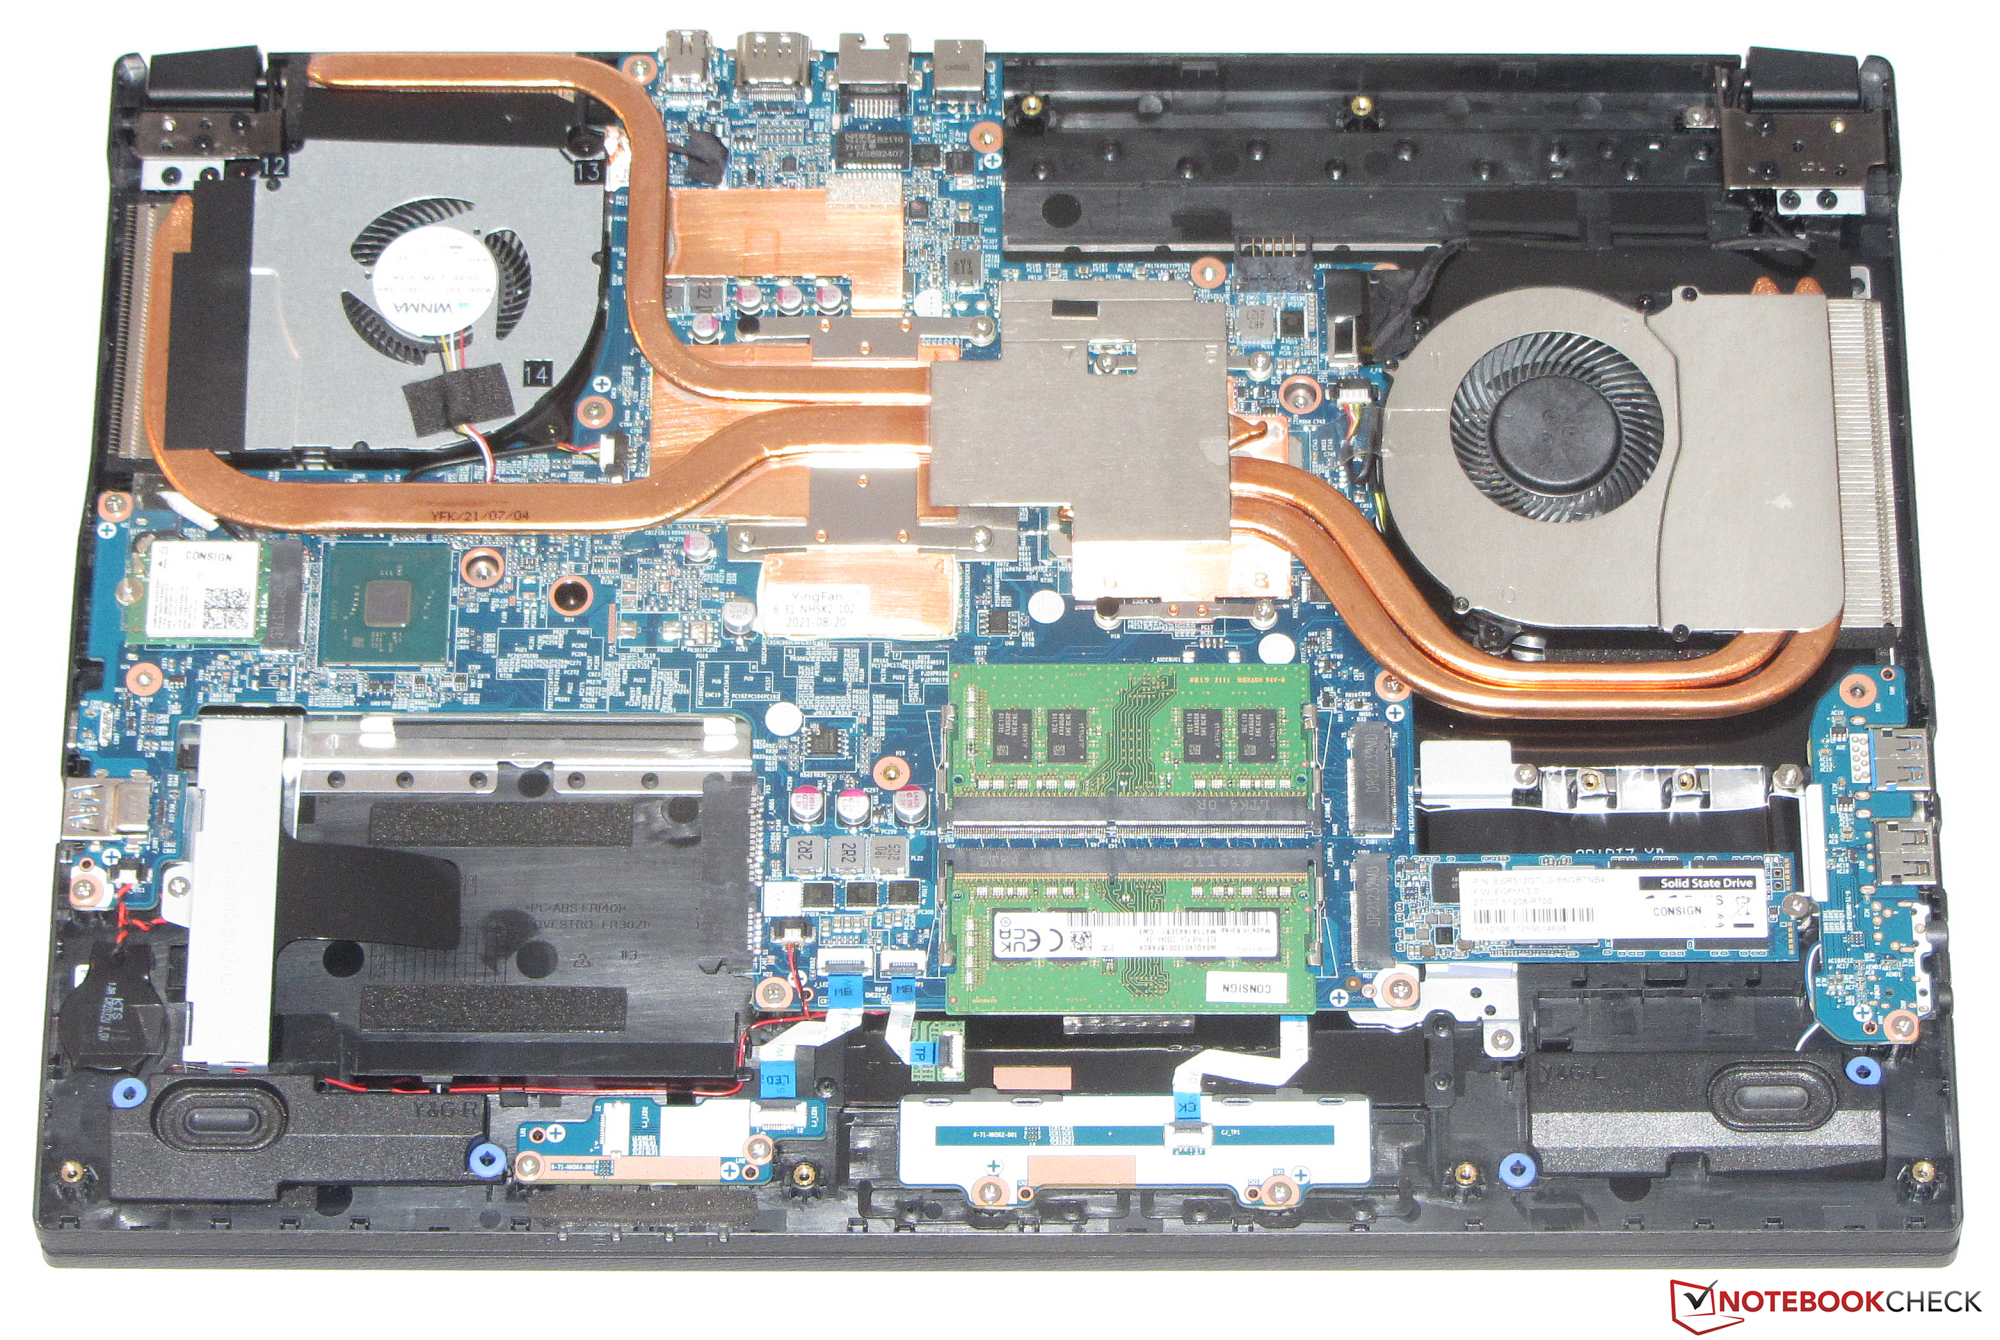
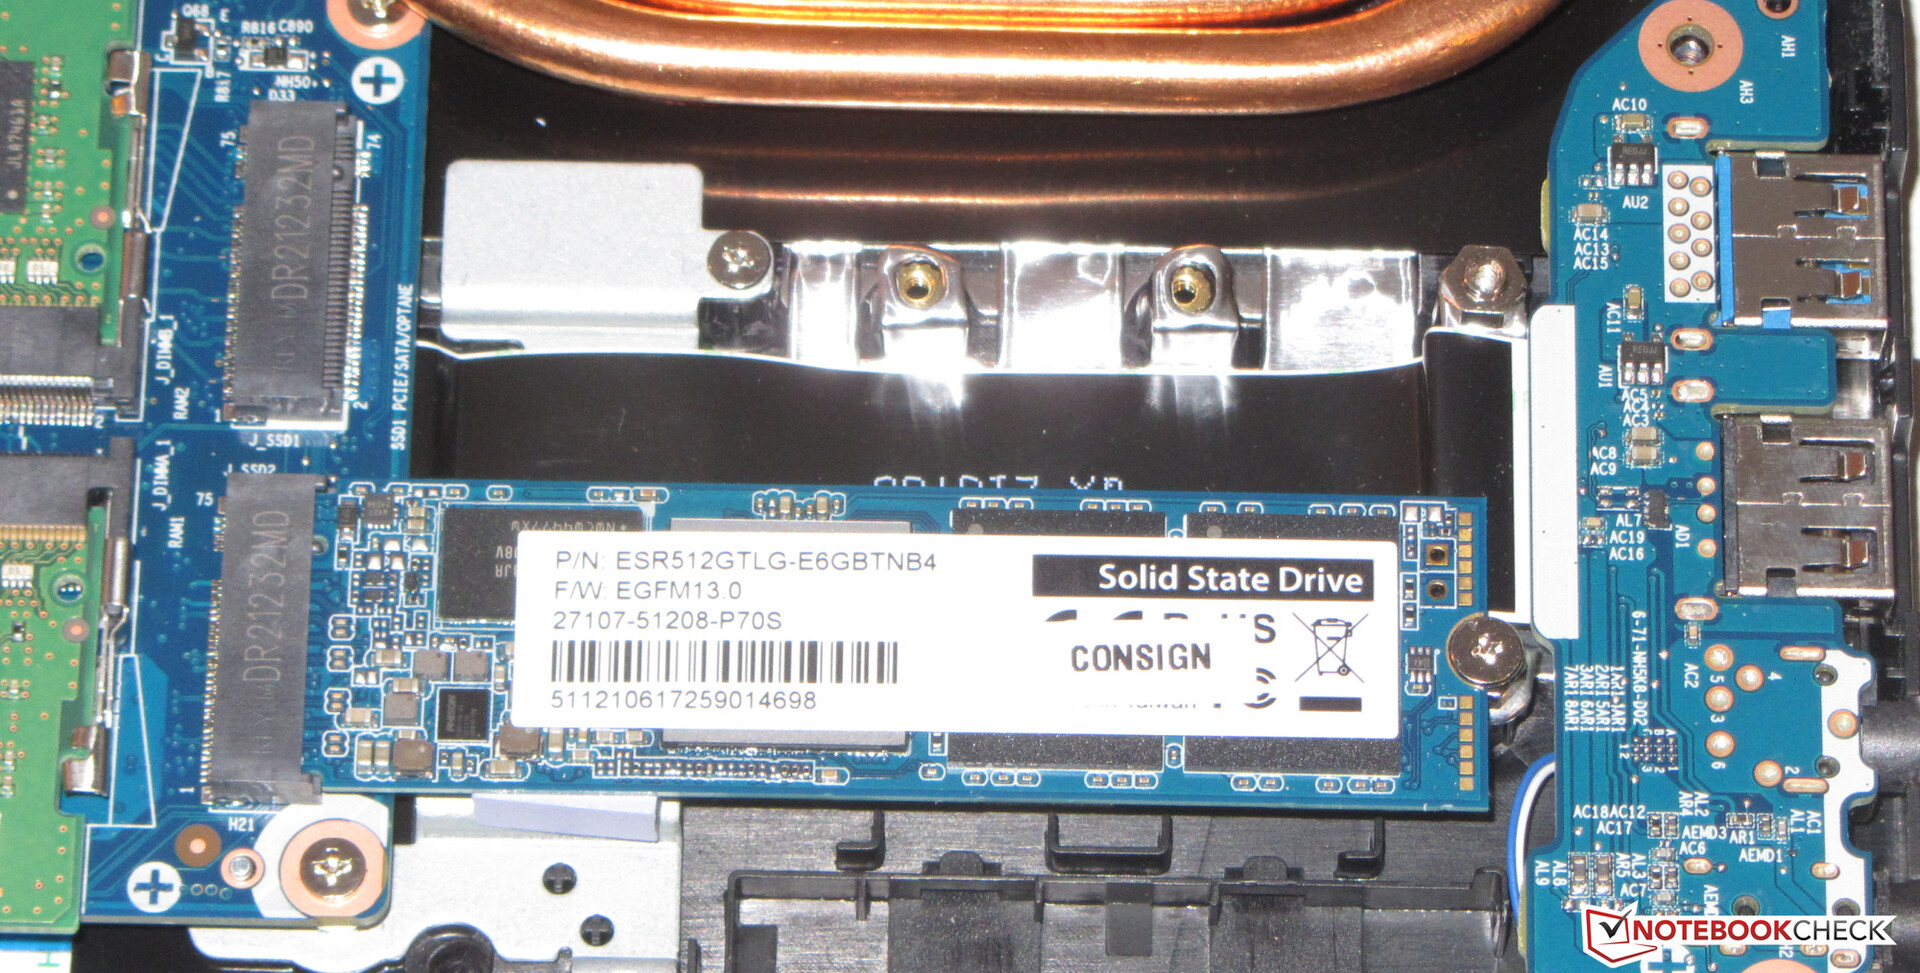
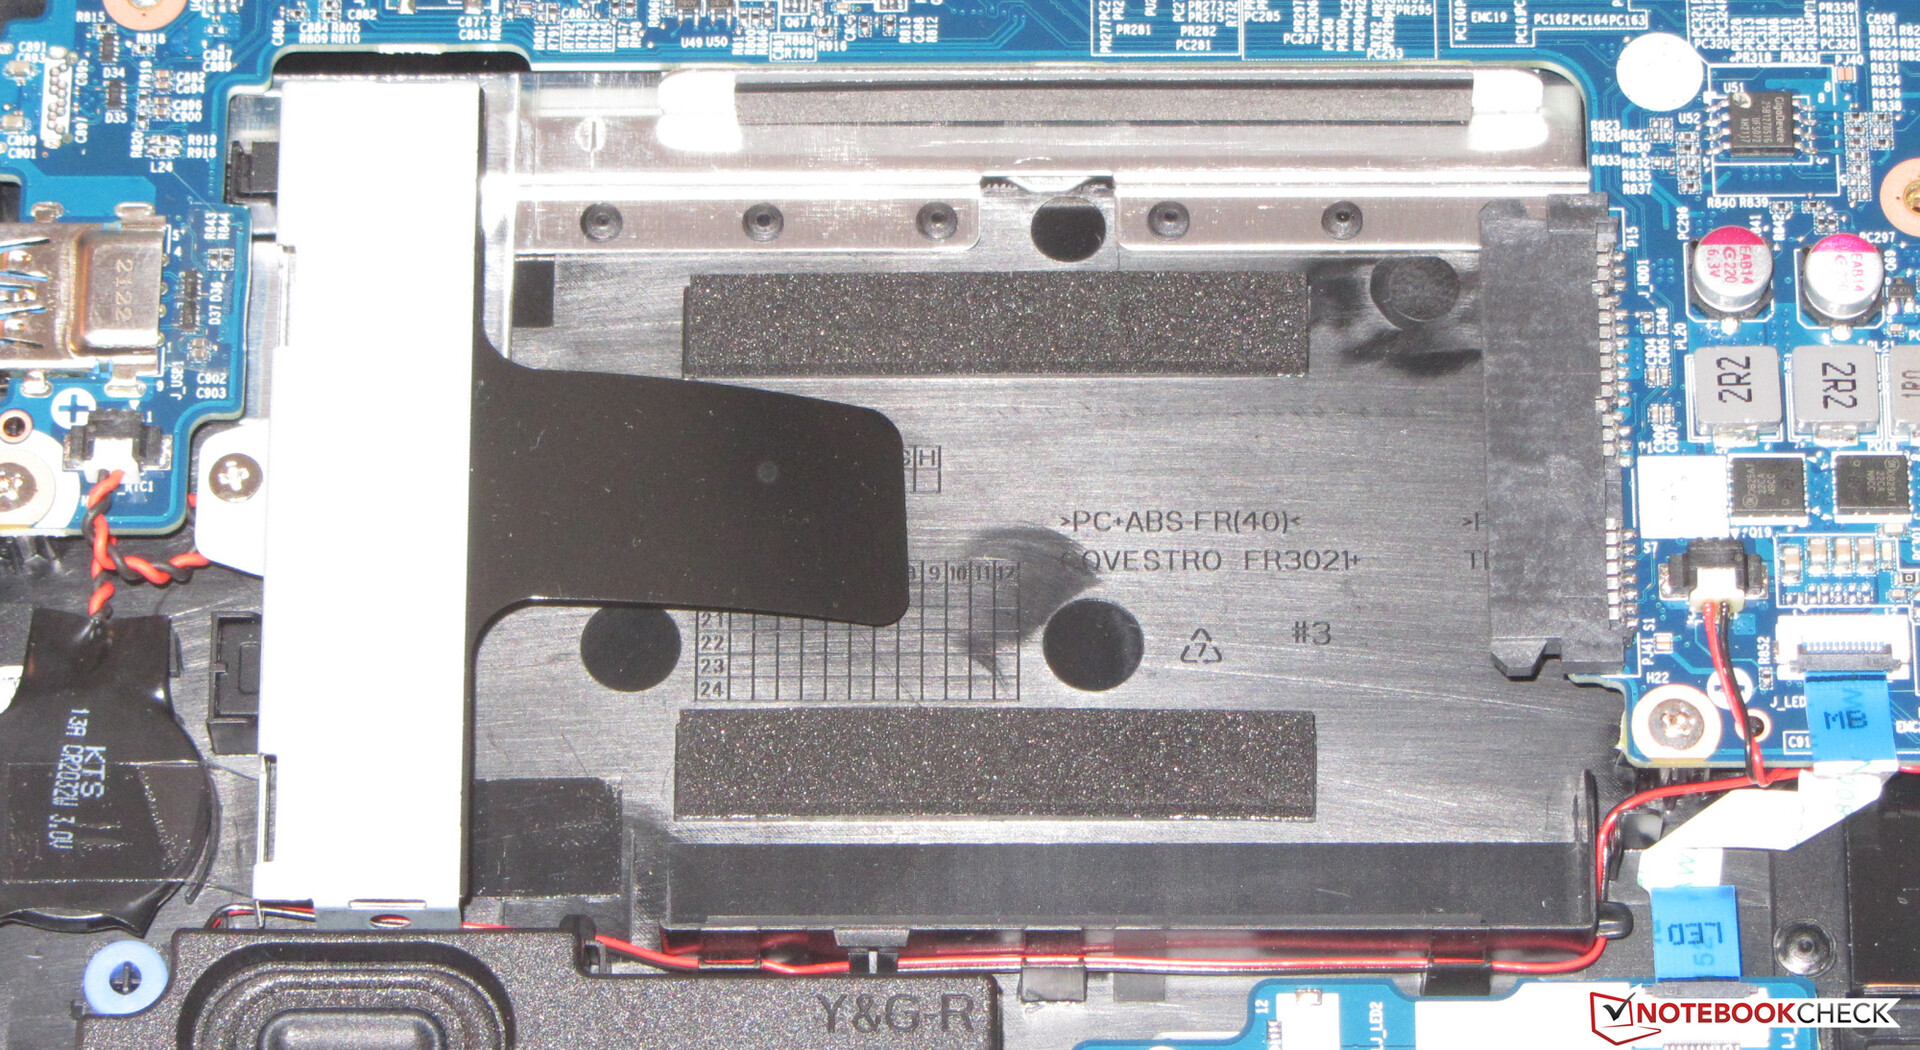
Stoccaggio
Un SSD NVMe da 512 GB (M.2 2280) di Phison serve come unità di sistema. La connessione via PCIe 4 rende molto buone le velocità di trasferimento. Lo spazio di archiviazione potrebbe essere ampliato attraverso un secondo SSD M.2 (PCIe 3/SATA) e un'unità di archiviazione da 2,5 pollici. Entrambi gli slot M.2 possono ospitare SSD nei formati 2242, 2260 e 2280

| Drive Performance rating - Percent | |
| Media della classe Gaming | |
| Gigabyte G5 GD | |
| Gigabyte G5 KC | |
| Media ESR512GTLG-E6GBTNB4 | |
| MSI GF65 Thin 10UE | |
| Lenovo Legion 5 15ACH-82JU00C6GE-FL | |
| Dell G15 5515 | |
* ... Meglio usare valori piccoli
Continuous load read: DiskSpd Read Loop, Queue Depth 8
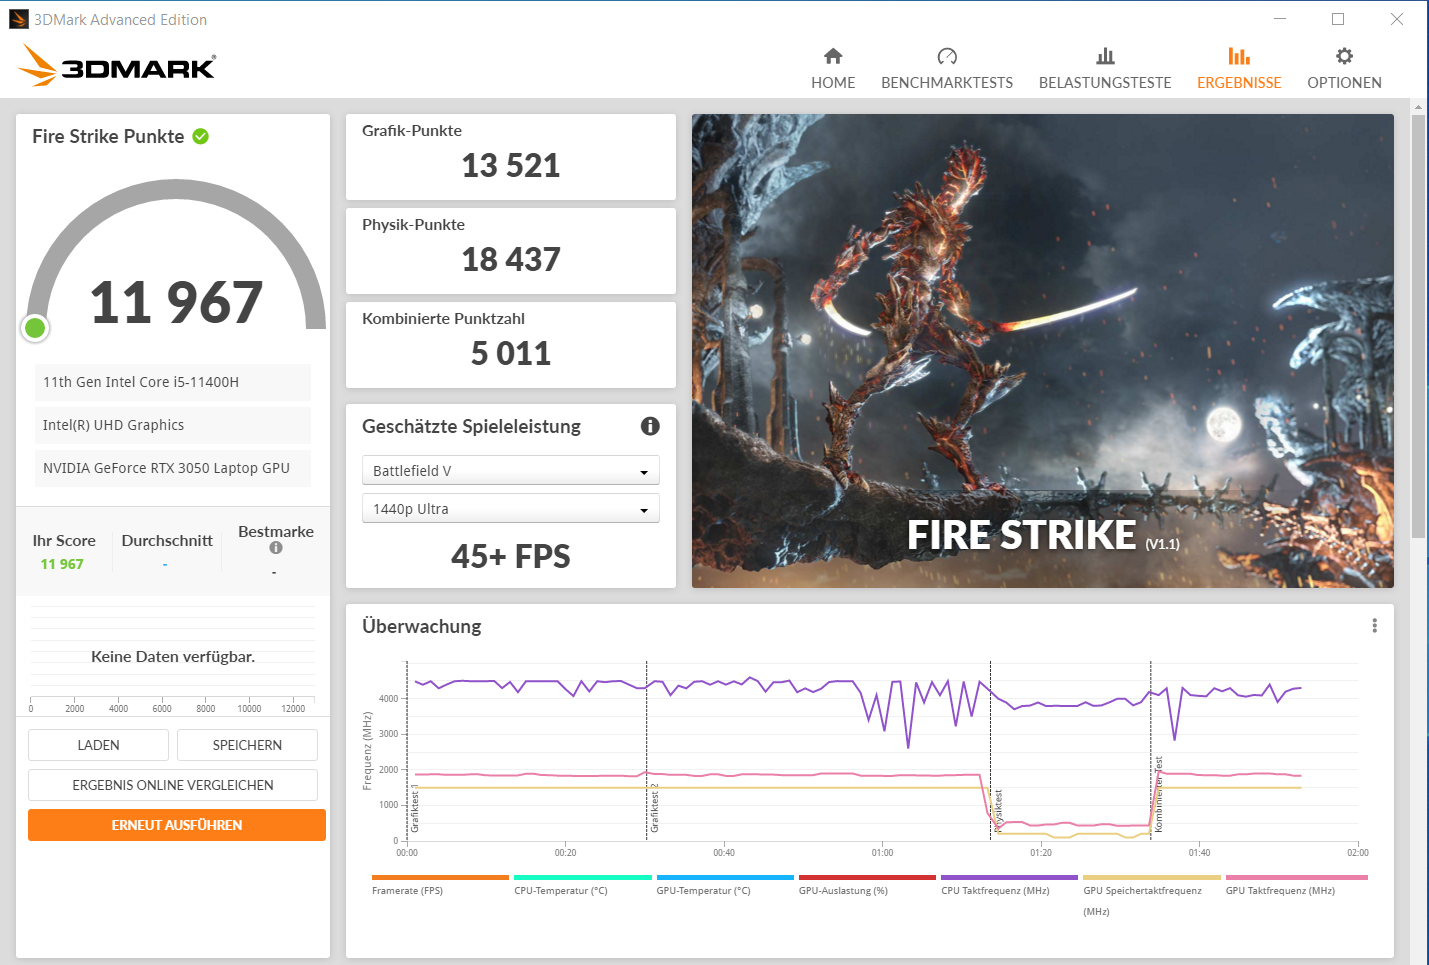
Prestazioni della GPU
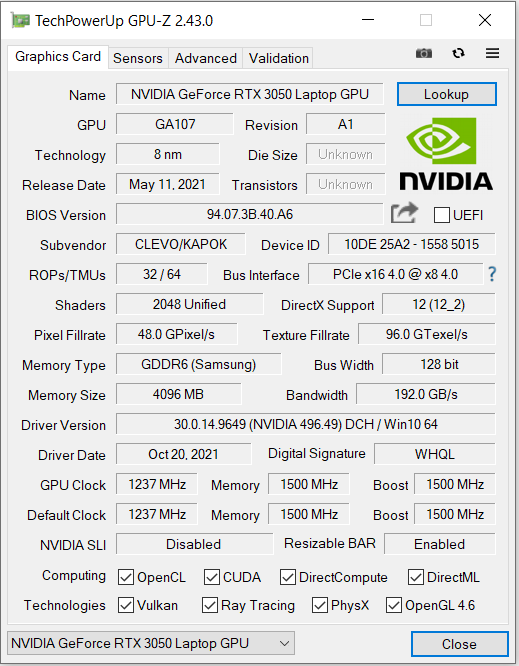
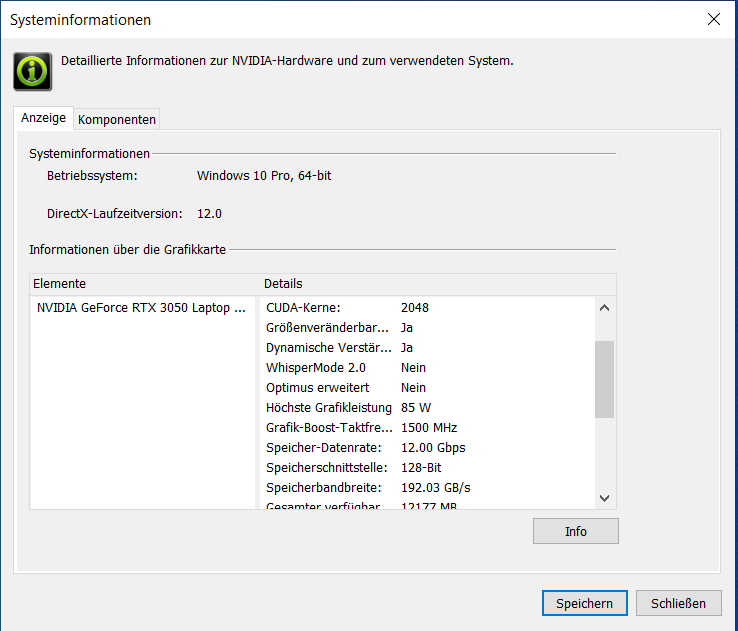
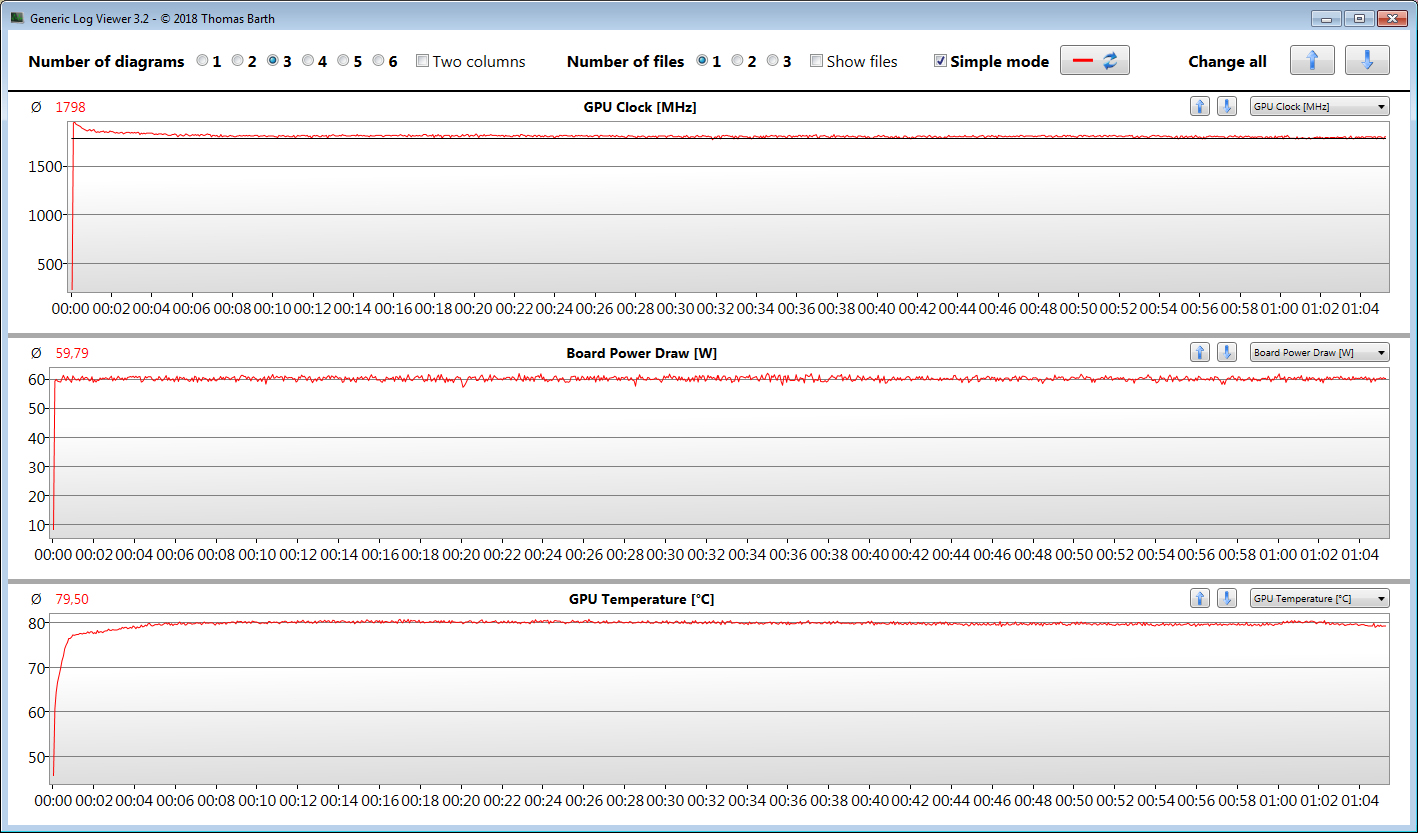
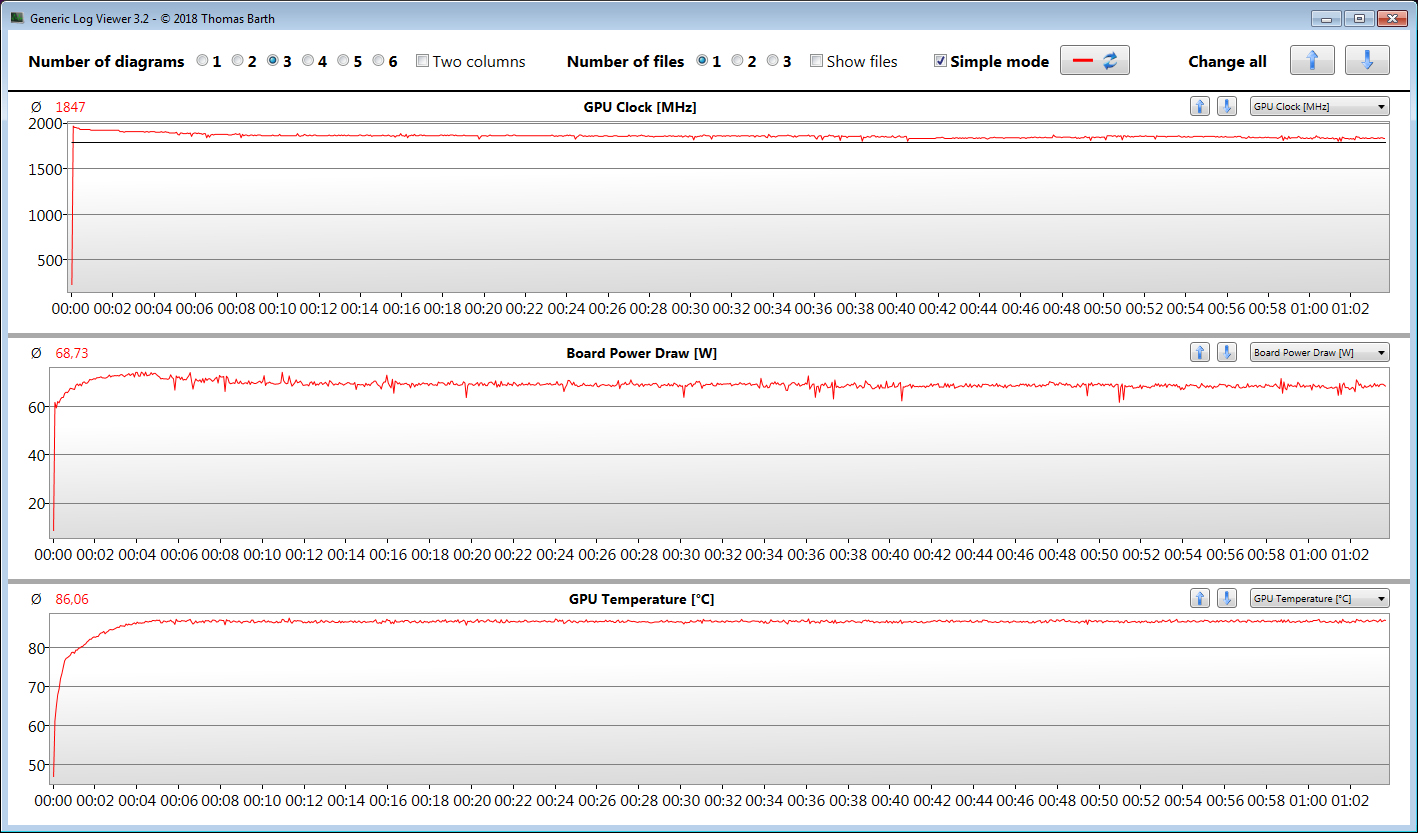
Gigabyte concede ilGeForce RTX 3050 laptop GPU (panoramica di tutti i portatili RTX 3050 compresi i loro TGP) un TGP massimo di 85 watt. Di conseguenza, fornisce i migliori risultati di 3DMark che siamo stati in grado di determinare con la RTX 3050 finora. Il profilo "Performance Mode" porta a un leggero aumento delle prestazioni grafiche.
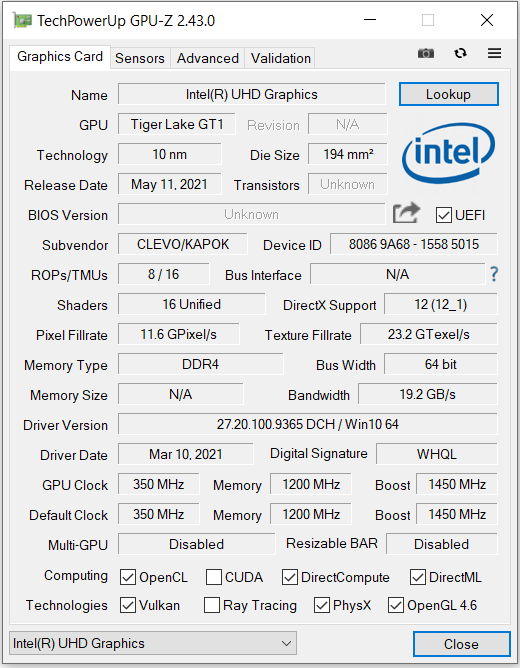
La RTX 3050 può accedere alla veloce memoria grafica GDDR6 (4.096 MB). Il sitoUHD Graphics Xe 16EUs il core grafico integrato nel processore è attivo, e il portatile funziona con la soluzione di commutazione grafica Optimus di Nvidia.
| 3DMark 06 Standard Score | 42599 punti | |
| 3DMark 11 Performance | 16190 punti | |
| 3DMark Cloud Gate Standard Score | 37239 punti | |
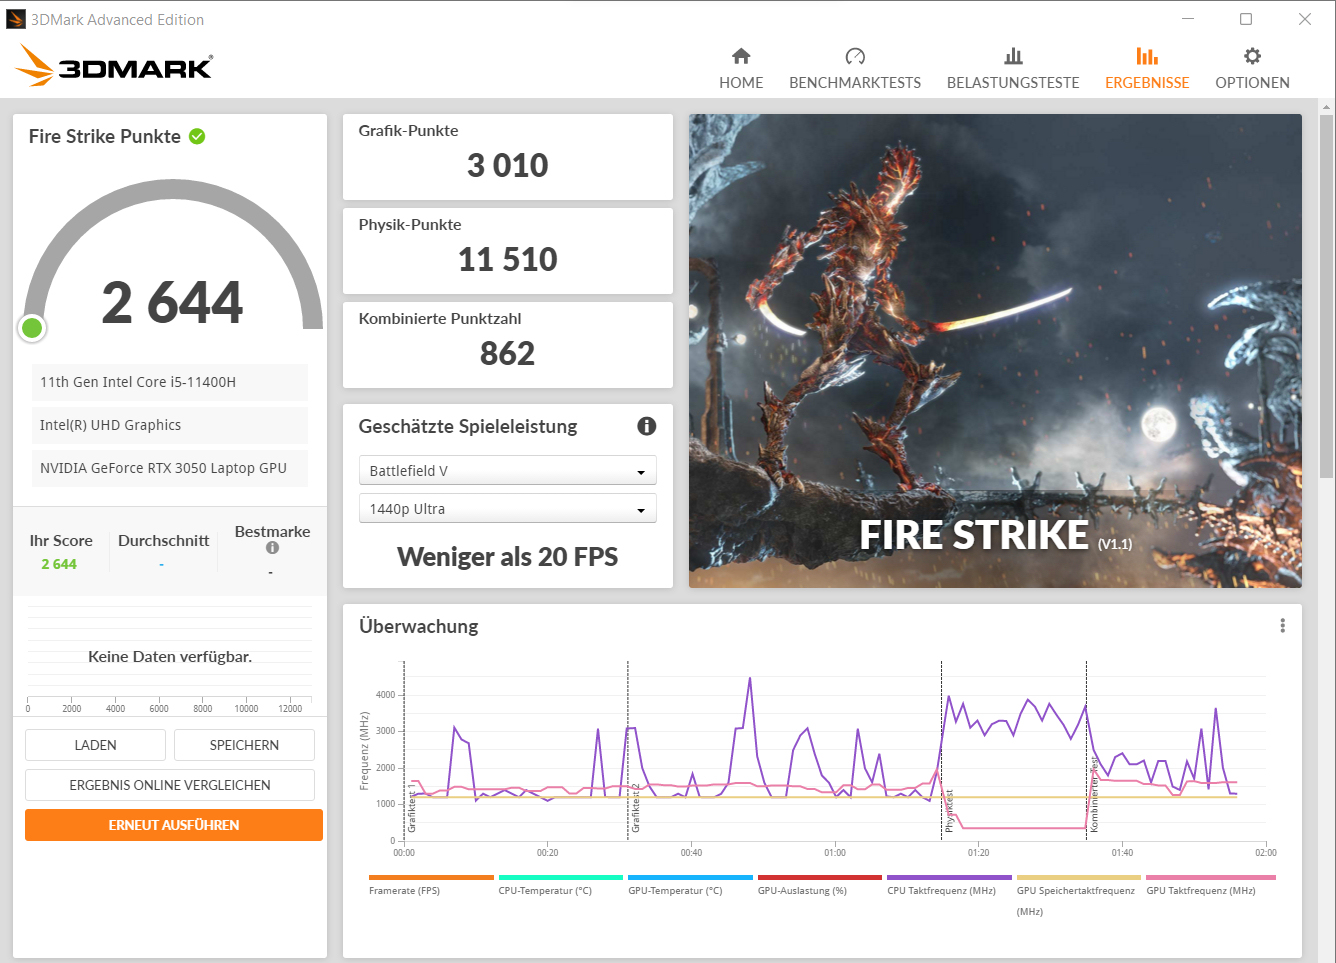
| 3DMark Fire Strike Score | 11967 punti | |
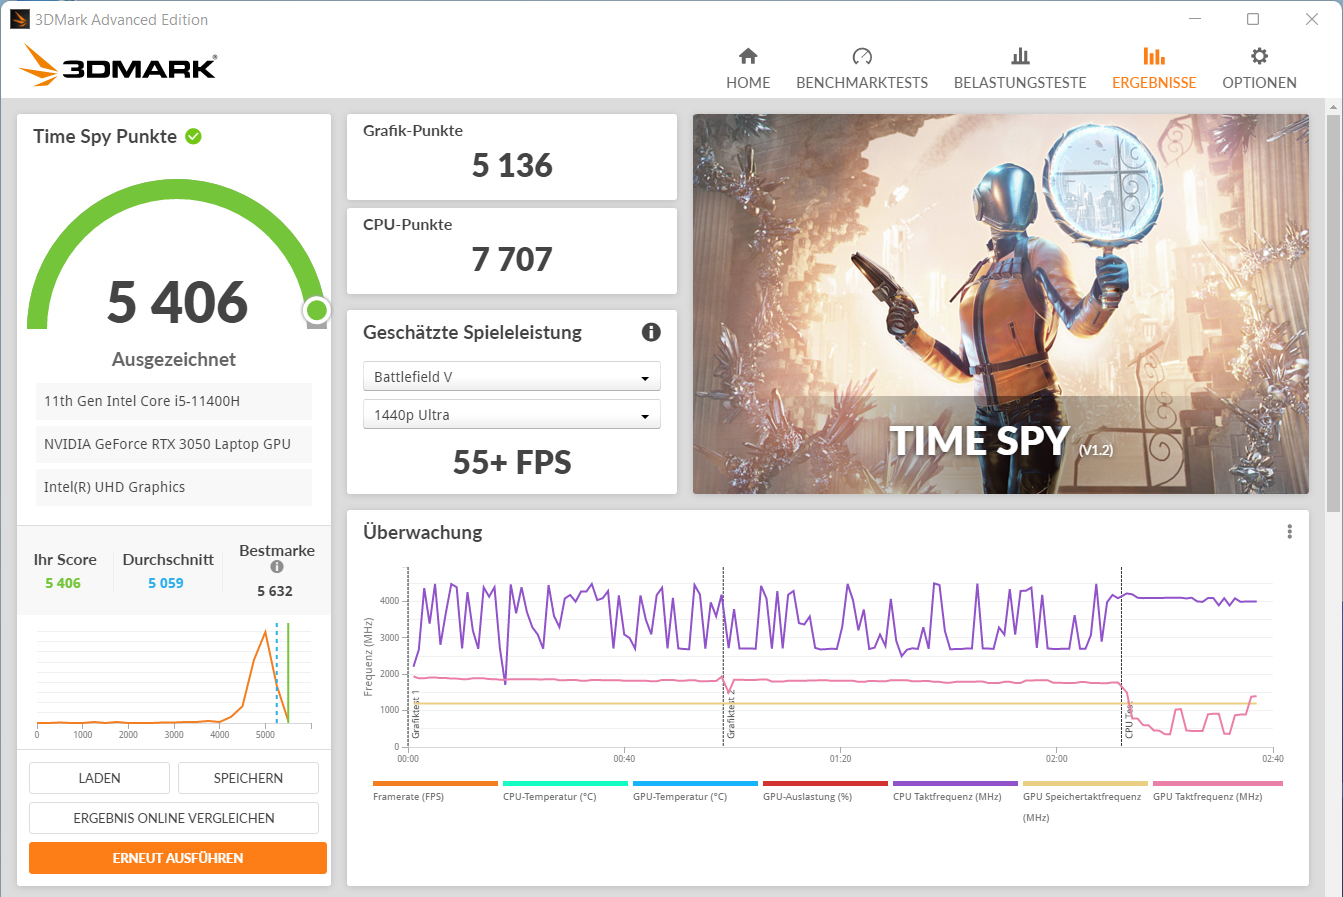
| 3DMark Time Spy Score | 5406 punti | |
Aiuto | ||
| 3DMark Performance rating - Percent | |
| Media della classe Gaming | |
| Lenovo Legion 5 15ACH-82JU00C6GE-FL | |
| Gigabyte G5 KC | |
| MSI GF65 Thin 10UE | |
| Dell G15 5515 | |
| Gigabyte G5 GD | |
| Gigabyte G5 GD -1! | |
| Media NVIDIA GeForce RTX 3050 4GB Laptop GPU | |
| Acer Nitro 5 AN517-53-54DQ | |
| Gigabyte G5 GD -1! | |
| 3DMark 11 - 1280x720 Performance GPU | |
| Media della classe Gaming (21841 - 80022, n=105, ultimi 2 anni) | |
| Lenovo Legion 5 15ACH-82JU00C6GE-FL | |
| Gigabyte G5 KC | |
| MSI GF65 Thin 10UE | |
| Dell G15 5515 | |
| Gigabyte G5 GD (Leistungsmodus) | |
| Gigabyte G5 GD | |
| Acer Nitro 5 AN517-53-54DQ | |
| Media NVIDIA GeForce RTX 3050 4GB Laptop GPU (11980 - 18557, n=23) | |
| Gigabyte G5 GD (Stromsparmodus) | |
| 3DMark | |
| 1280x720 Cloud Gate Standard Graphics | |
| Media della classe Gaming (86886 - 223650, n=61, ultimi 2 anni) | |
| Lenovo Legion 5 15ACH-82JU00C6GE-FL | |
| Gigabyte G5 KC | |
| MSI GF65 Thin 10UE | |
| Gigabyte G5 GD | |
| Dell G15 5515 | |
| Media NVIDIA GeForce RTX 3050 4GB Laptop GPU (33426 - 87403, n=18) | |
| Acer Nitro 5 AN517-53-54DQ | |
| 1920x1080 Fire Strike Graphics | |
| Media della classe Gaming (12242 - 62849, n=117, ultimi 2 anni) | |
| Lenovo Legion 5 15ACH-82JU00C6GE-FL | |
| Gigabyte G5 KC | |
| MSI GF65 Thin 10UE | |
| Dell G15 5515 | |
| Gigabyte G5 GD (Leistungsmodus) | |
| Gigabyte G5 GD | |
| Acer Nitro 5 AN517-53-54DQ | |
| Media NVIDIA GeForce RTX 3050 4GB Laptop GPU (9138 - 14157, n=22) | |
| Gigabyte G5 GD (Stromsparmodus) | |
| 2560x1440 Time Spy Graphics | |
| Media della classe Gaming (5012 - 26212, n=117, ultimi 2 anni) | |
| Lenovo Legion 5 15ACH-82JU00C6GE-FL | |
| Gigabyte G5 KC | |
| MSI GF65 Thin 10UE | |
| Dell G15 5515 | |
| Gigabyte G5 GD (Leistungsmodus) | |
| Gigabyte G5 GD | |
| Acer Nitro 5 AN517-53-54DQ | |
| Media NVIDIA GeForce RTX 3050 4GB Laptop GPU (3281 - 5295, n=23) | |
| Gigabyte G5 GD (Stromsparmodus) | |
Prestazioni di gioco
Il portatile porta tutti gli ultimi giochi senza problemi sullo schermo. Di solito, la risoluzione Full HD e le impostazioni di qualità da alta a massima possono essere selezionate. Alcuni titoli affamati di prestazioni - Cyberpunk 2077, per esempio - richiederanno dei compromessi in termini di livelli di qualità. Il G5 GD offre i migliori frame rate che siamo stati in grado di registrare con ilRTX 3050 laptop GPU finora. Il divario con laRTX 3050 Ti laptopGPU nelDell G15 5515 non è così grande
| The Witcher 3 - 1920x1080 Ultra Graphics & Postprocessing (HBAO+) | |
| Media della classe Gaming (95 - 240, n=7, ultimi 2 anni) | |
| Gigabyte G5 KC | |
| Lenovo Legion 5 15ACH-82JU00C6GE-FL (Ultra Performance) | |
| Lenovo Legion 5 15ACH-82JU00C6GE-FL (Auto) | |
| Lenovo Legion 5 15ACH-82JU00C6GE-FL (Eco) | |
| MSI GF65 Thin 10UE | |
| Dell G15 5515 | |
| Gigabyte G5 GD (Leistungsmodus) | |
| Gigabyte G5 GD | |
| Media NVIDIA GeForce RTX 3050 4GB Laptop GPU (31.5 - 55.8, n=21) | |
| Gigabyte G5 GD (Stromsparmodus) | |
| Dota 2 Reborn - 1920x1080 ultra (3/3) best looking | |
| Media della classe Gaming (84.8 - 248, n=109, ultimi 2 anni) | |
| Gigabyte G5 GD (Leistungsmodus) | |
| Gigabyte G5 GD | |
| Gigabyte G5 KC | |
| Gigabyte G5 GD (Stromsparmodus) | |
| Media NVIDIA GeForce RTX 3050 4GB Laptop GPU (82.8 - 147.7, n=22) | |
| Dell G15 5515 | |
| Lenovo Legion 5 15ACH-82JU00C6GE-FL | |
| MSI GF65 Thin 10UE | |
| X-Plane 11.11 - 1920x1080 high (fps_test=3) | |
| Media della classe Gaming (52.1 - 143.5, n=112, ultimi 2 anni) | |
| Gigabyte G5 GD (Leistungsmodus) | |
| Gigabyte G5 KC | |
| Gigabyte G5 GD | |
| Gigabyte G5 GD (Stromsparmodus) | |
| Media NVIDIA GeForce RTX 3050 4GB Laptop GPU (51.6 - 103.1, n=22) | |
| Dell G15 5515 | |
| Lenovo Legion 5 15ACH-82JU00C6GE-FL | |
| MSI GF65 Thin 10UE | |
| Final Fantasy XV Benchmark - 1920x1080 High Quality | |
| Media della classe Gaming (41 - 215, n=98, ultimi 2 anni) | |
| Lenovo Legion 5 15ACH-82JU00C6GE-FL (1.3) | |
| Gigabyte G5 KC (1.3) | |
| MSI GF65 Thin 10UE (1.3) | |
| Dell G15 5515 (1.3) | |
| Gigabyte G5 GD (1.3, Leistungsmodus) | |
| Gigabyte G5 GD (1.3) | |
| Media NVIDIA GeForce RTX 3050 4GB Laptop GPU (35.9 - 53.5, n=21) | |
| Gigabyte G5 GD (1.3, Stromsparmodus) | |
| GTA V - 1920x1080 Highest AA:4xMSAA + FX AF:16x | |
| Media della classe Gaming (48.3 - 186.9, n=97, ultimi 2 anni) | |
| Gigabyte G5 KC | |
| Lenovo Legion 5 15ACH-82JU00C6GE-FL | |
| Dell G15 5515 | |
| Gigabyte G5 GD | |
| MSI GF65 Thin 10UE | |
| Gigabyte G5 GD (Leistungsmodus) | |
| Media NVIDIA GeForce RTX 3050 4GB Laptop GPU (48 - 72.5, n=21) | |
| Gigabyte G5 GD (Stromsparmodus) | |
| Strange Brigade - 1920x1080 ultra AA:ultra AF:16 | |
| Media della classe Gaming (76.3 - 456, n=88, ultimi 2 anni) | |
| Gigabyte G5 KC (1.47.22.14 D3D12) | |
| MSI GF65 Thin 10UE (1.47.22.14 D3D12) | |
| Dell G15 5515 (1.47.22.14 D3D12) | |
| Gigabyte G5 GD (1.47.22.14 D3D12, Leistungsmodus) | |
| Gigabyte G5 GD (1.47.22.14 D3D12) | |
| Media NVIDIA GeForce RTX 3050 4GB Laptop GPU (57.9 - 95.1, n=21) | |
| Gigabyte G5 GD (1.47.22.14 D3D12, Stromsparmodus) | |
| F1 2021 - 1920x1080 Ultra High Preset + Raytracing AA:T AF:16x | |
| Gigabyte G5 KC (803111) | |
| Lenovo Legion 5 15ACH-82JU00C6GE-FL | |
| Dell G15 5515 (807588) | |
| Gigabyte G5 GD (824817) | |
| Media NVIDIA GeForce RTX 3050 4GB Laptop GPU (44.1 - 62, n=8) | |
| Gigabyte G5 GD (824817, Stromsparmodus) | |
| Deathloop - 1920x1080 High Preset | |
| Gigabyte G5 GD | |
| Media NVIDIA GeForce RTX 3050 4GB Laptop GPU (n=1) | |
| New World - 1920x1080 Very High Video Quality | |
| Dell G15 5515 | |
| Gigabyte G5 GD | |
| Media NVIDIA GeForce RTX 3050 4GB Laptop GPU (n=1) | |
| Alan Wake Remastered - 1920x1080 High Preset | |
| Gigabyte G5 GD | |
| Media NVIDIA GeForce RTX 3050 4GB Laptop GPU (n=1) | |
| Far Cry 6 - 1920x1080 Ultra Graphics Quality + HD Textures AA:T | |
| Media della classe Gaming (n=1ultimi 2 anni) | |
| Gigabyte G5 GD | |
| Dell G15 5515 | |
| Media NVIDIA GeForce RTX 3050 4GB Laptop GPU (45 - 59, n=3) | |
| Back 4 Blood - 1920x1080 Epic Preset (DX12) AA:T | |
| Gigabyte G5 GD | |
| Media NVIDIA GeForce RTX 3050 4GB Laptop GPU (n=1) | |
| Guardians of the Galaxy - 1920x1080 High Preset | |
| Gigabyte G5 GD | |
| Media NVIDIA GeForce RTX 3050 4GB Laptop GPU (n=1) | |
| Riders Republic - 1920x1080 Ultra Preset | |
| Gigabyte G5 GD | |
| Media NVIDIA GeForce RTX 3050 4GB Laptop GPU (n=1) | |
| Forza Horizon 5 - 1920x1080 High Preset | |
| Gigabyte G5 GD | |
| Media NVIDIA GeForce RTX 3050 4GB Laptop GPU (n=1) | |
Al fine di verificare se il frame rate rimane in gran parte costante per un periodo di tempo prolungato, abbiamo lasciato il gioco The Witcher 3 in esecuzione per circa 60 minuti a risoluzione Full HD e impostazioni di qualità massima. Il personaggio non viene mosso. Non è stato riscontrato un calo di frame rate
The Witcher 3 FPS diagram
| basso | medio | alto | ultra | |
|---|---|---|---|---|
| GTA V (2015) | 178 | 171 | 138 | 70.8 |
| The Witcher 3 (2015) | 258 | 166 | 93.6 | 51.7 |
| Dota 2 Reborn (2015) | 146 | 137 | 131 | 123 |
| Final Fantasy XV Benchmark (2018) | 136 | 73.1 | 51.1 | |
| X-Plane 11.11 (2018) | 112 | 95.7 | 77.3 | |
| Far Cry 5 (2018) | 131 | 84 | 79 | 75 |
| Strange Brigade (2018) | 287 | 130 | 105 | 91.3 |
| F1 2021 (2021) | 235 | 150 | 126 | 59.4 |
| Deathloop (2021) | 109 | 63.4 | 51.7 | 38.1 |
| New World (2021) | 95 | 65.2 | 60.2 | 49.2 |
| Alan Wake Remastered (2021) | 91.9 | 70.6 | 64.2 | |
| Far Cry 6 (2021) | 110 | 77 | 67 | 59 |
| Back 4 Blood (2021) | 247 | 138 | 112 | 103 |
| Guardians of the Galaxy (2021) | 96 | 74 | 73 | 32 |
| Riders Republic (2021) | 144 | 80 | 61 | 55 |
| Forza Horizon 5 (2021) | 154 | 87 | 77 | 28 |
Emissioni - Il G5 produce molto rumore sotto carico
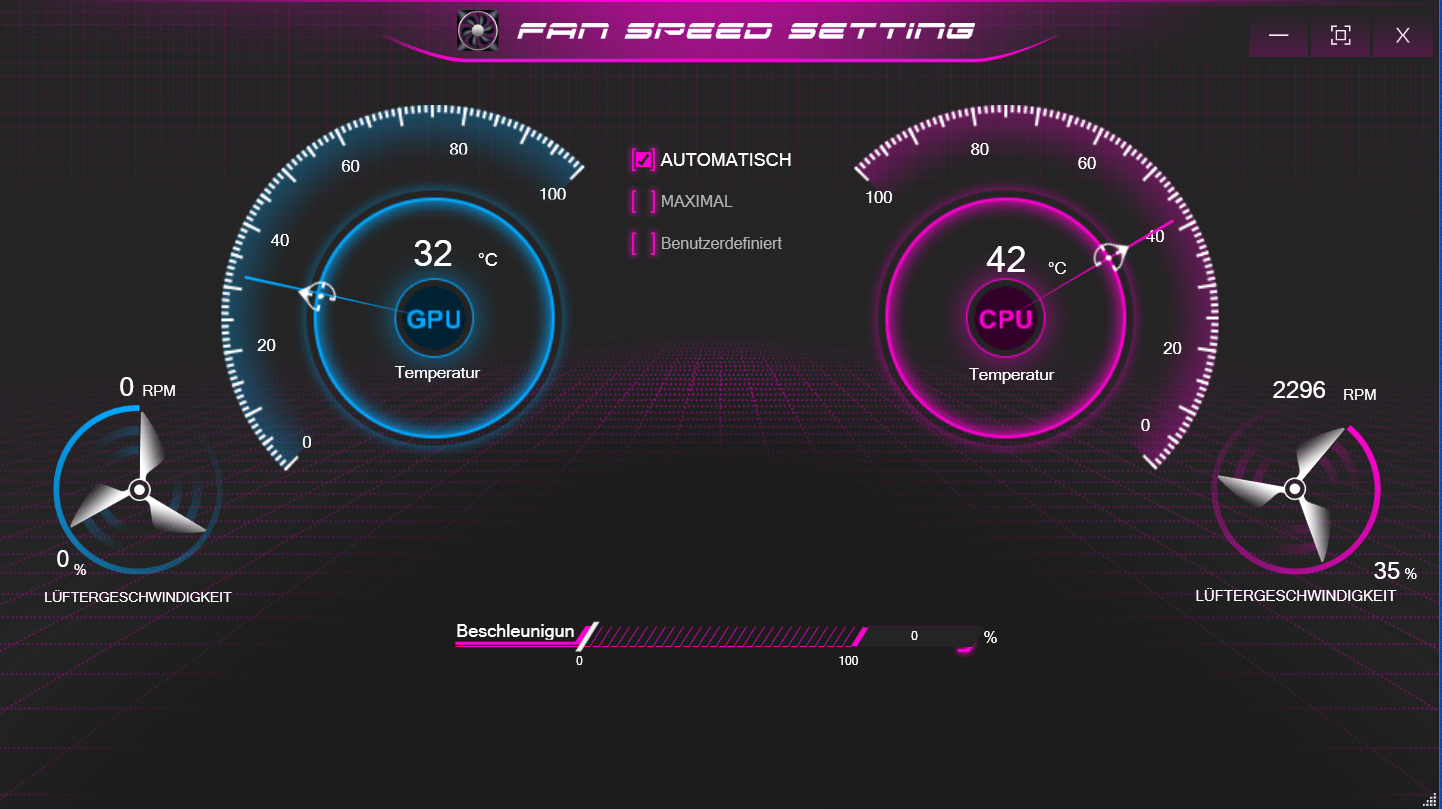
Rumore del ventilatore
Nell'uso quotidiano (ufficio, Internet), le due ventole lavorano a bassa velocità e sono appena percettibili. Di tanto in tanto, si fermano. Tuttavia, diventa abbastanza forte sotto carico con livelli massimi di pressione sonora di 54 dB(A) (stress test) e 52 dB(A) ( il nostro The Witcher 3 test), rispettivamente. Il livello di rumore sotto carico può essere ridotto considerevolmente utilizzando i profili "Power Saving Mode" e "Silent Mode" - con prestazioni di calcolo ridotte. Nel complesso, ilDell G15 5515 produce meno rumore
| Gigabyte G5 GD GeForce RTX 3050 4GB Laptop GPU, i5-11400H | Dell G15 5515 GeForce RTX 3050 Ti Laptop GPU, R7 5800H | Lenovo Legion 5 15ACH-82JU00C6GE-FL GeForce RTX 3060 Laptop GPU, R7 5800H | MSI GF65 Thin 10UE GeForce RTX 3060 Laptop GPU, i7-10750H | Gigabyte G5 KC GeForce RTX 3060 Laptop GPU, i5-10500H | |
|---|---|---|---|---|---|
| Noise | 11% | 1% | 0% | -16% | |
| off /ambiente * (dB) | 24 | 24 -0% | 24.2 -1% | 24.7 -3% | 27 -13% |
| Idle Minimum * (dB) | 29 | 25 14% | 29 -0% | 33.1 -14% | 31 -7% |
| Idle Average * (dB) | 30 | 26 13% | 29 3% | 33.1 -10% | 32 -7% |
| Idle Maximum * (dB) | 32 | 30 6% | 29 9% | 33.1 -3% | 51 -59% |
| Load Average * (dB) | 53 | 44 17% | 53.5 -1% | 42.7 19% | 57 -8% |
| Witcher 3 ultra * (dB) | 52 | 44 15% | 53.5 -3% | 40.6 22% | 56 -8% |
| Load Maximum * (dB) | 54 | 48 11% | 53.5 1% | 59.4 -10% | 58 -7% |
* ... Meglio usare valori piccoli
Rumorosità
| Idle |
| 29 / 30 / 32 dB(A) |
| Sotto carico |
| 53 / 54 dB(A) |
 | ||
30 dB silenzioso 40 dB(A) udibile 50 dB(A) rumoroso |
||
min: | ||
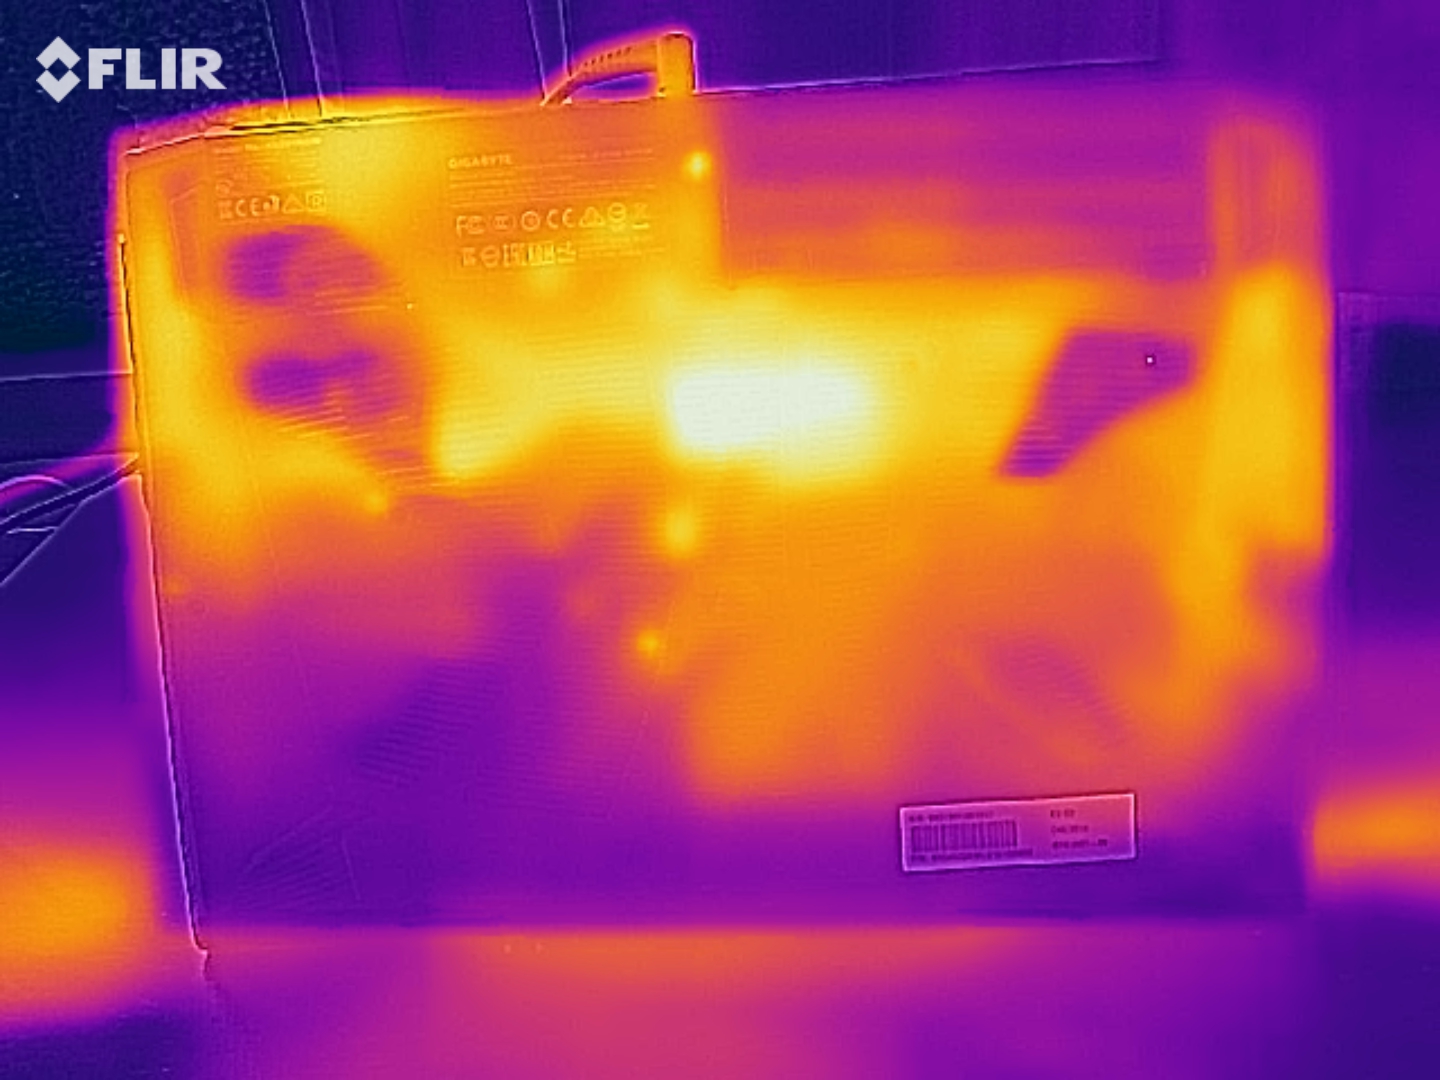
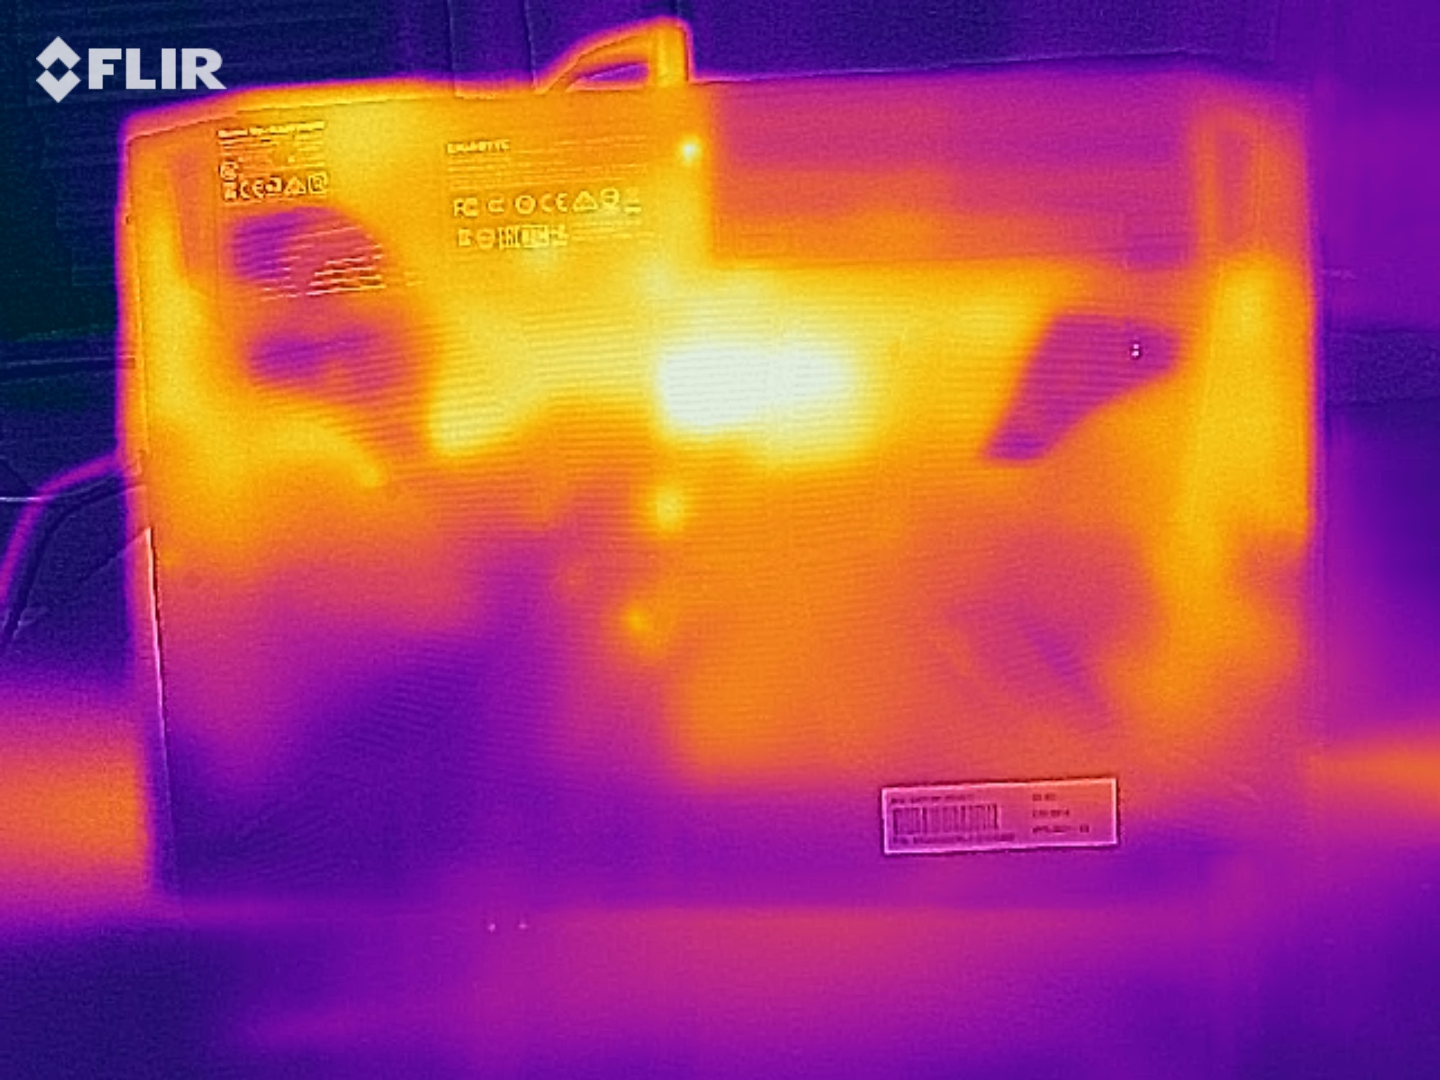
Temperatura
Le temperature del case del G5 rimangono ben all'interno del range verde nell'uso quotidiano (ufficio, Internet). Sotto carico (stress test, il nostro The Witcher 3 test), le temperature sono più alte in alcune aree, ma rimangono moderate nel complesso. La concorrenza è generalmente alla pari. Anche le temperature della CPU non sono motivo di preoccupazione
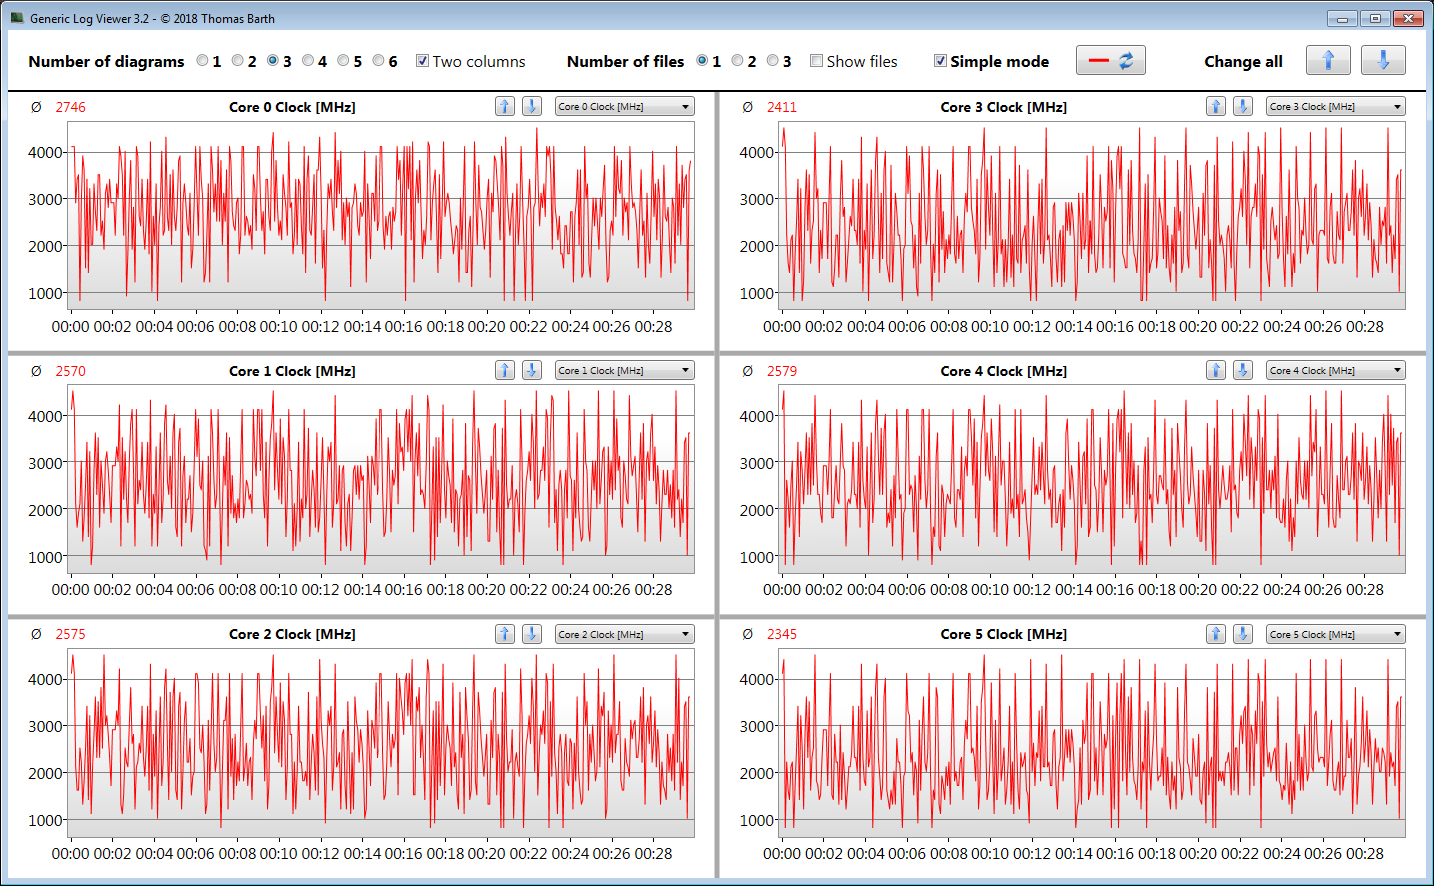
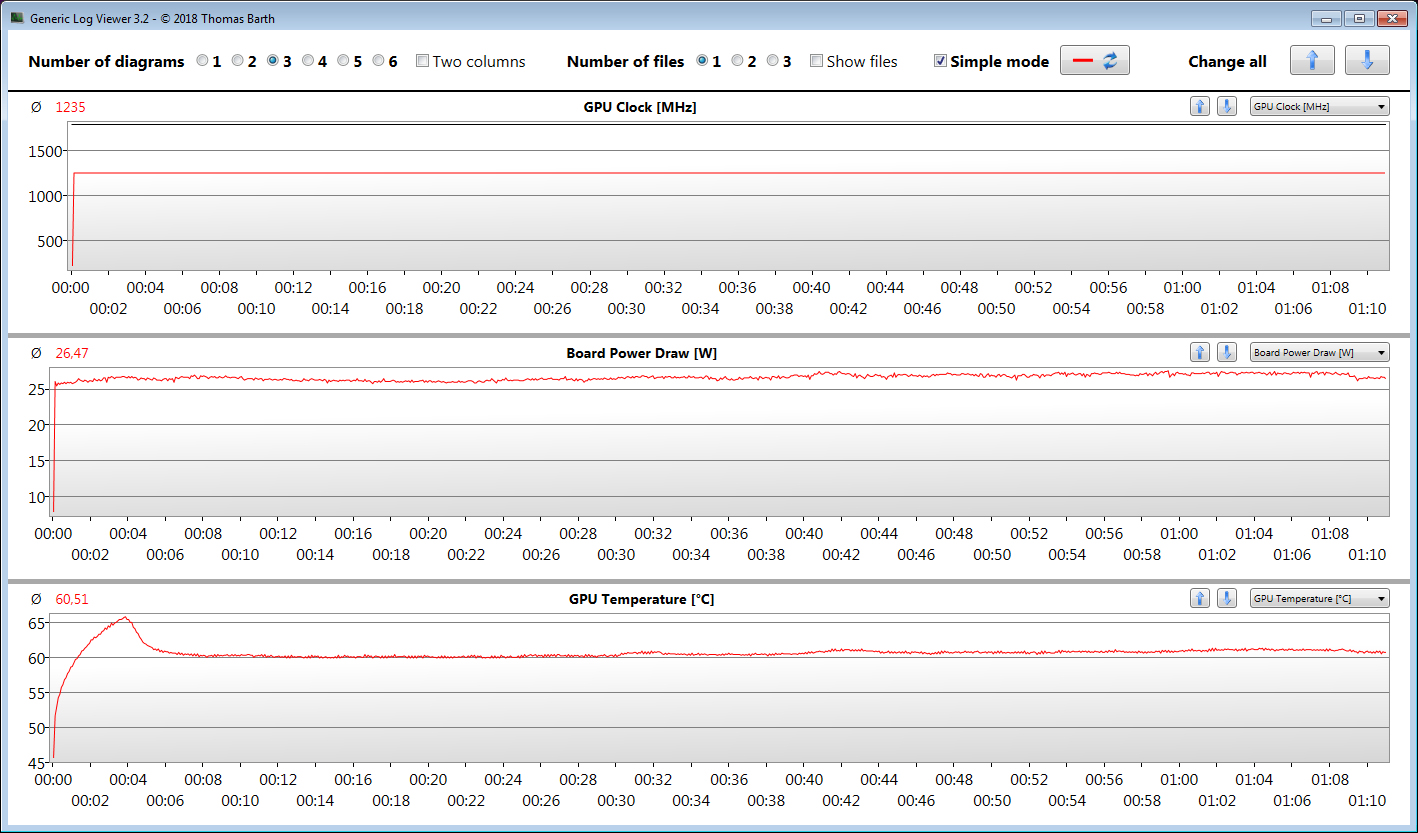
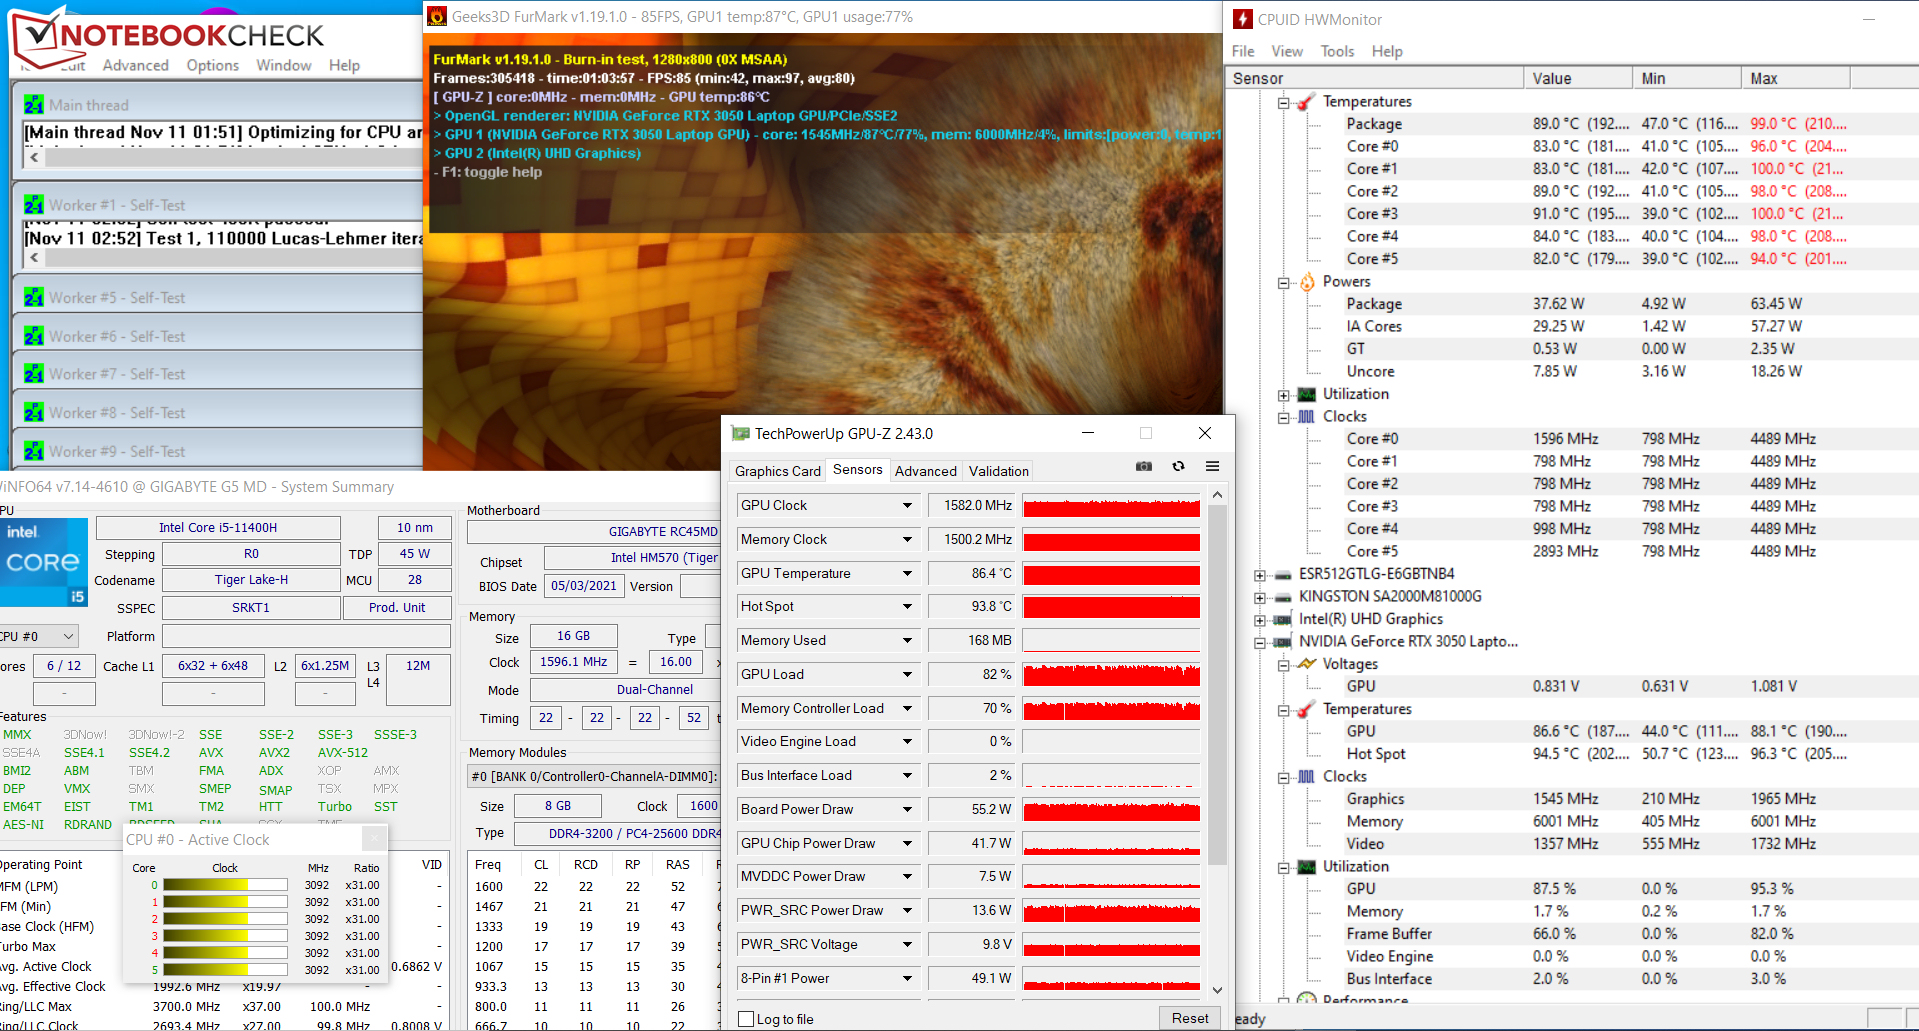
Test da sforzo
La CPU e la GPU elaborano lo stress test (Prime95 e FurMark vengono eseguiti per almeno un'ora) a 2,6 - 3,1 GHz e circa 1.600 MHz, rispettivamente. Il test rappresenta uno scenario estremo che usiamo per verificare se il sistema rimane stabile sotto pieno carico
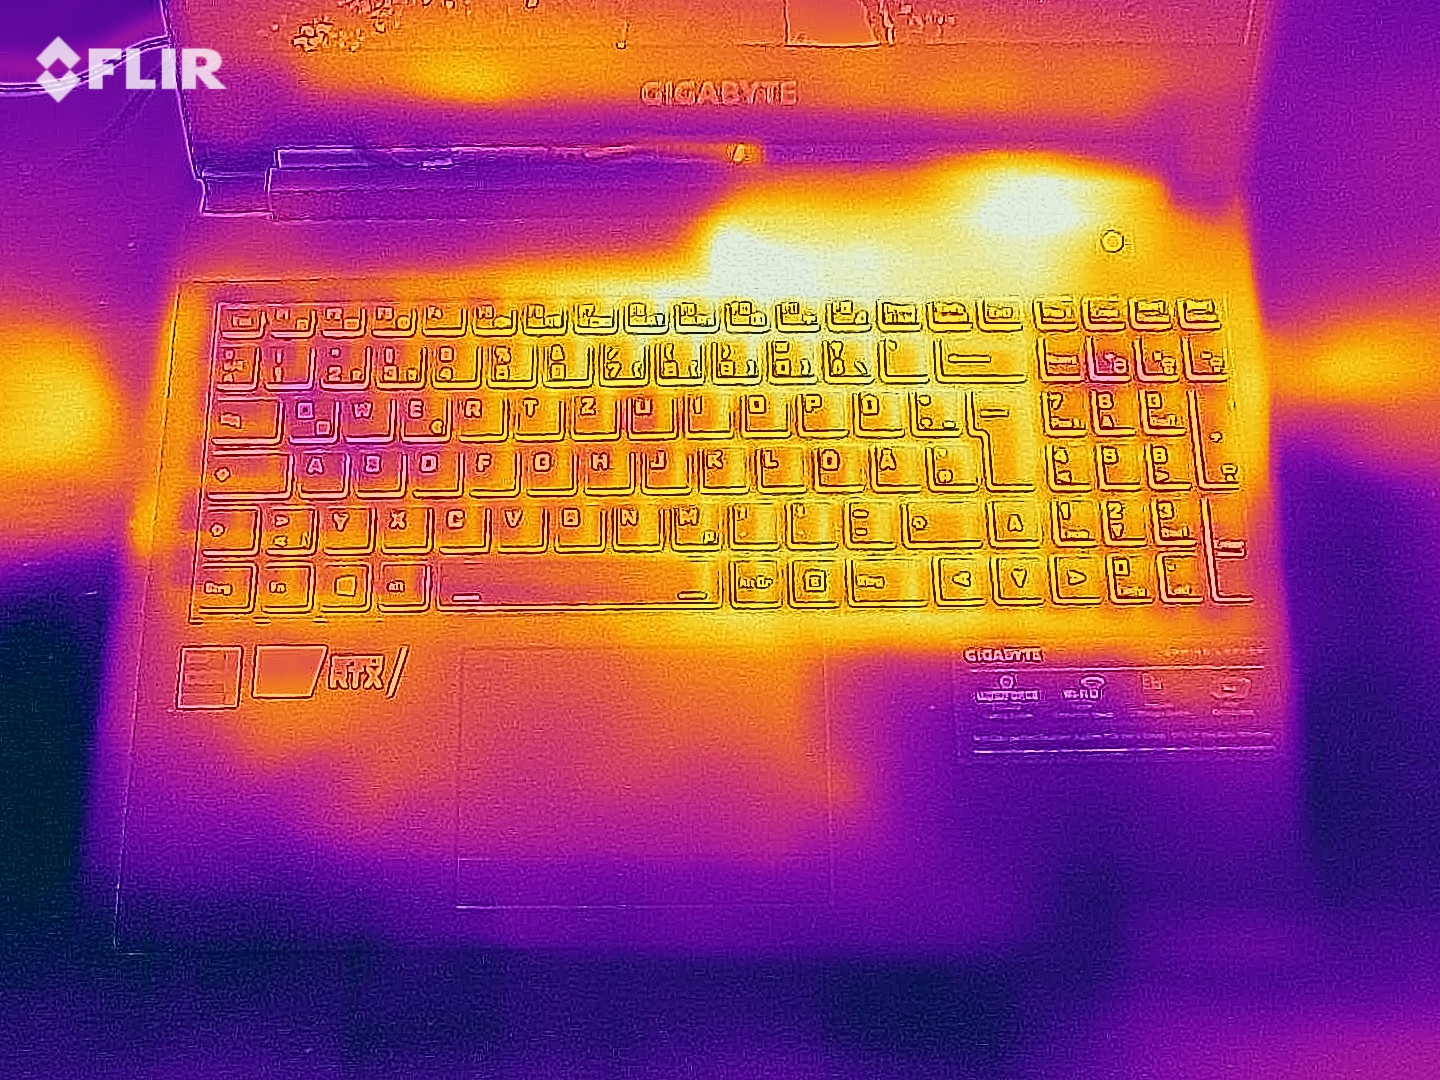
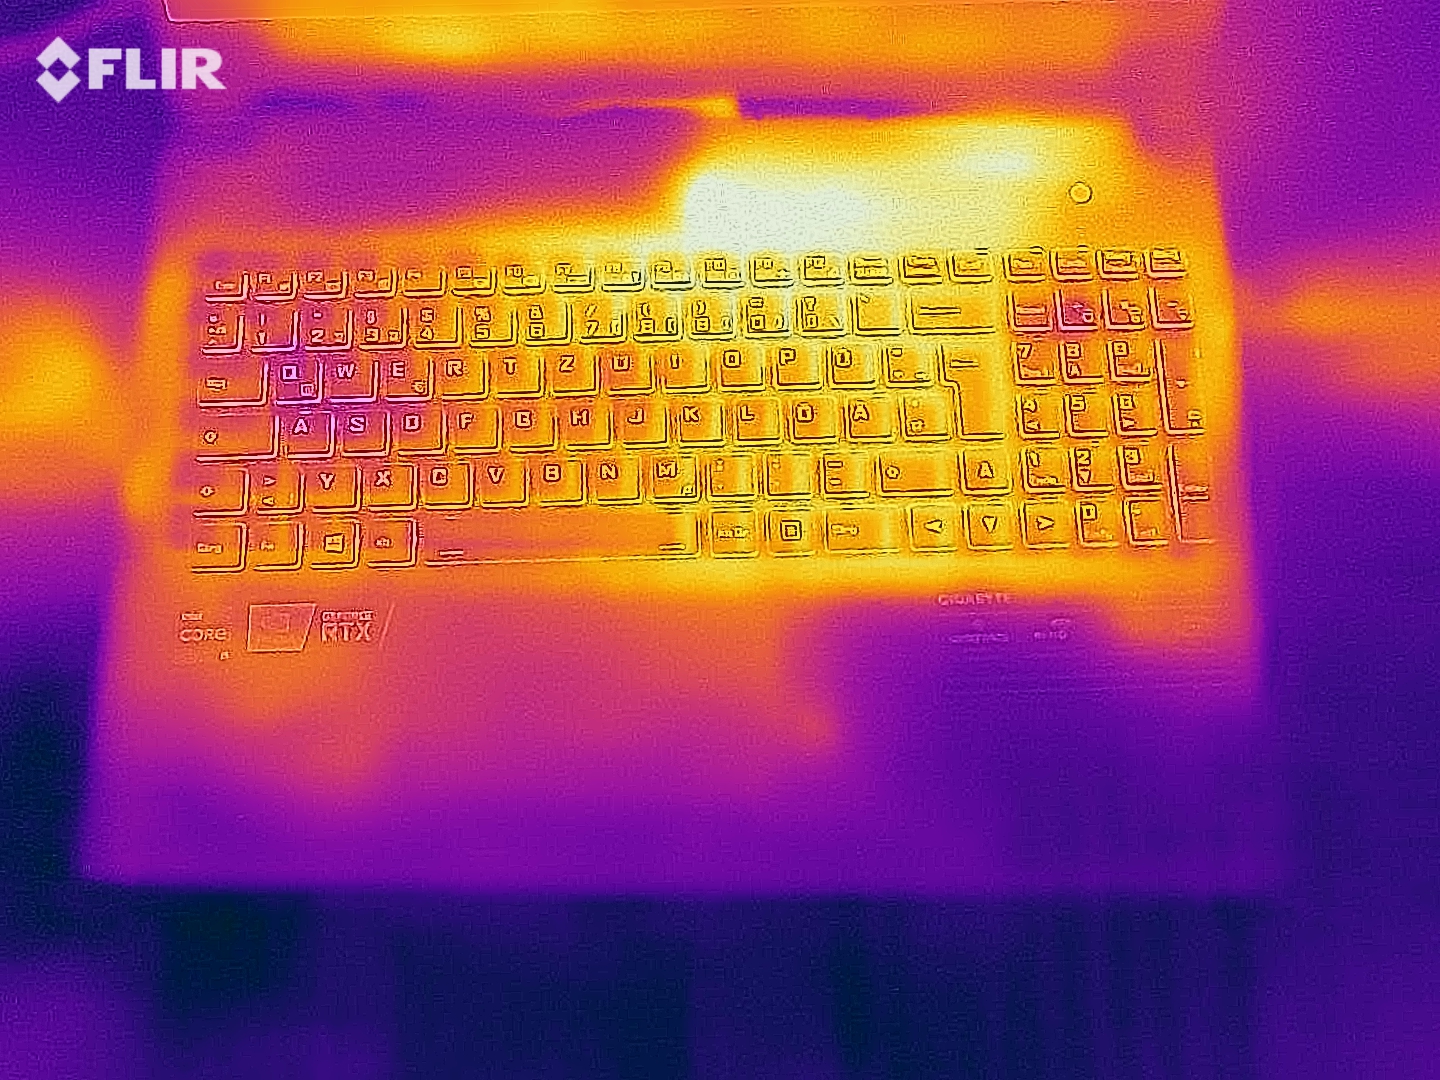
(±) La temperatura massima sul lato superiore è di 45 °C / 113 F, rispetto alla media di 40.4 °C / 105 F, che varia da 21.2 a 68.8 °C per questa classe Gaming.
(-) Il lato inferiore si riscalda fino ad un massimo di 50 °C / 122 F, rispetto alla media di 43.2 °C / 110 F
(+) In idle, la temperatura media del lato superiore è di 26.7 °C / 80 F, rispetto alla media deld ispositivo di 33.9 °C / 93 F.
(±) Riproducendo The Witcher 3, la temperatura media per il lato superiore e' di 36.3 °C / 97 F, rispetto alla media del dispositivo di 33.9 °C / 93 F.
(+) I poggiapolsi e il touchpad raggiungono la temperatura massima della pelle (33 °C / 91.4 F) e quindi non sono caldi.
(-) La temperatura media della zona del palmo della mano di dispositivi simili e'stata di 28.8 °C / 83.8 F (-4.2 °C / -7.6 F).
| Gigabyte G5 GD GeForce RTX 3050 4GB Laptop GPU, i5-11400H | Dell G15 5515 GeForce RTX 3050 Ti Laptop GPU, R7 5800H | Lenovo Legion 5 15ACH-82JU00C6GE-FL GeForce RTX 3060 Laptop GPU, R7 5800H | MSI GF65 Thin 10UE GeForce RTX 3060 Laptop GPU, i7-10750H | Gigabyte G5 KC GeForce RTX 3060 Laptop GPU, i5-10500H | |
|---|---|---|---|---|---|
| Heat | 4% | 8% | 5% | -9% | |
| Maximum Upper Side * (°C) | 45 | 50 -11% | 42.6 5% | 43.4 4% | 50 -11% |
| Maximum Bottom * (°C) | 50 | 49 2% | 52.2 -4% | 41.8 16% | 49 2% |
| Idle Upper Side * (°C) | 28 | 26 7% | 24.9 11% | 30.2 -8% | 33 -18% |
| Idle Bottom * (°C) | 31 | 26 16% | 25.3 18% | 28.4 8% | 34 -10% |
* ... Meglio usare valori piccoli
Altoparlanti
Gigabyte G5 GD analisi audio
(±) | potenza degli altiparlanti media ma buona (80 dB)
Bassi 100 - 315 Hz
(-) | quasi nessun basso - in media 25.4% inferiori alla media
(-) | bassi non lineari (16.2% delta rispetto alla precedente frequenza)
Medi 400 - 2000 Hz
(+) | medi bilanciati - solo only 3.2% rispetto alla media
(+) | medi lineari (4.6% delta rispetto alla precedente frequenza)
Alti 2 - 16 kHz
(+) | Alti bilanciati - appena 3.9% dalla media
(±) | la linearità degli alti è media (10.1% delta rispetto alla precedente frequenza)
Nel complesso 100 - 16.000 Hz
(±) | la linearità complessiva del suono è media (19.1% di differenza rispetto alla media
Rispetto alla stessa classe
» 64% di tutti i dispositivi testati in questa classe è stato migliore, 7% simile, 28% peggiore
» Il migliore ha avuto un delta di 6%, medio di 18%, peggiore di 132%
Rispetto a tutti i dispositivi testati
» 46% di tutti i dispositivi testati in questa classe è stato migliore, 7% similare, 47% peggiore
» Il migliore ha avuto un delta di 4%, medio di 24%, peggiore di 134%
Dell G15 5515 analisi audio
(±) | potenza degli altiparlanti media ma buona (76 dB)
Bassi 100 - 315 Hz
(-) | quasi nessun basso - in media 22% inferiori alla media
(±) | la linearità dei bassi è media (14.9% delta rispetto alla precedente frequenza)
Medi 400 - 2000 Hz
(+) | medi bilanciati - solo only 2.8% rispetto alla media
(+) | medi lineari (3% delta rispetto alla precedente frequenza)
Alti 2 - 16 kHz
(+) | Alti bilanciati - appena 1.4% dalla media
(+) | alti lineari (3.7% delta rispetto alla precedente frequenza)
Nel complesso 100 - 16.000 Hz
(±) | la linearità complessiva del suono è media (16.8% di differenza rispetto alla media
Rispetto alla stessa classe
» 44% di tutti i dispositivi testati in questa classe è stato migliore, 11% simile, 46% peggiore
» Il migliore ha avuto un delta di 6%, medio di 18%, peggiore di 132%
Rispetto a tutti i dispositivi testati
» 29% di tutti i dispositivi testati in questa classe è stato migliore, 8% similare, 63% peggiore
» Il migliore ha avuto un delta di 4%, medio di 24%, peggiore di 134%
Consumo energetico - Il portatile Gigabyte offre solo una breve autonomia della batteria
Il G5 consuma una quantità relativamente alta di energia nell'uso inattivo e sotto basso carico. La concorrenza fa un lavoro migliore qui. La richiesta è normale per l'hardware installato qui quando il dispositivo è sotto carico medio-alto. Il seguente diagramma illustra il consumo costante di energia del portatile durante il nostro test su Witcher 3. L'alimentatore sembra avere una capacità adeguata con un'uscita nominale di 150 watt. La batteria non si scarica quando l'hardware del portatile è sotto pieno carico
| Off / Standby | |
| Idle | |
| Sotto carico |
|
Leggenda:
min: | |
Energy consumption during The Witcher 3
| Gigabyte G5 GD i5-11400H, GeForce RTX 3050 4GB Laptop GPU | Dell G15 5515 R7 5800H, GeForce RTX 3050 Ti Laptop GPU | Lenovo Legion 5 15ACH-82JU00C6GE-FL R7 5800H, GeForce RTX 3060 Laptop GPU | MSI GF65 Thin 10UE i7-10750H, GeForce RTX 3060 Laptop GPU | Gigabyte G5 KC i5-10500H, GeForce RTX 3060 Laptop GPU | Media della classe Gaming | |
|---|---|---|---|---|---|---|
| Power Consumption | 16% | -1% | 13% | -7% | -25% | |
| Idle Minimum * (Watt) | 13 | 5 62% | 7.3 44% | 5.4 58% | 8 38% | 13.1 ? -1% |
| Idle Average * (Watt) | 15 | 9 40% | 10.5 30% | 12.8 15% | 13 13% | 18.8 ? -25% |
| Idle Maximum * (Watt) | 20 | 20 -0% | 15.7 22% | 19.5 2% | 20 -0% | 24.4 ? -22% |
| Load Average * (Watt) | 102 | 94 8% | 108 -6% | 86.6 15% | 98 4% | 108.6 ? -6% |
| Witcher 3 ultra * (Watt) | 124 | 123 1% | 175 -41% | 115.7 7% | 166 -34% | |
| Load Maximum * (Watt) | 148 | 172 -16% | 228 -54% | 175.2 -18% | 242 -64% | 255 ? -72% |
* ... Meglio usare valori piccoli
Durata della batteria
Il 15.6 pollici raggiunge tempi di esecuzione di 3:06 ore e 3:34 ore nel test Wi-Fi (accesso a siti web tramite uno script) e nel test video (cortometraggio Big Buck Bunny
(codifica H.264, Full HD) in esecuzione in un loop), rispettivamente. Le funzioni di risparmio energetico sono qui disabilitate, e la luminosità del display è impostata a circa 150 cd/m². Inoltre, i moduli wireless sono disabilitati per il test video.L'uso dei profili energetici "Power Saving Mode" e "Silent Mode" non porta ad alcun miglioramento della durata della batteria.
| Gigabyte G5 GD i5-11400H, GeForce RTX 3050 4GB Laptop GPU, 41 Wh | Dell G15 5515 R7 5800H, GeForce RTX 3050 Ti Laptop GPU, 56 Wh | Lenovo Legion 5 15ACH-82JU00C6GE-FL R7 5800H, GeForce RTX 3060 Laptop GPU, 80 Wh | MSI GF65 Thin 10UE i7-10750H, GeForce RTX 3060 Laptop GPU, 51 Wh | Gigabyte G5 KC i5-10500H, GeForce RTX 3060 Laptop GPU, 48.96 Wh | Media della classe Gaming | |
|---|---|---|---|---|---|---|
| Autonomia della batteria | 119% | 46% | 48% | 2% | 91% | |
| Reader / Idle (h) | 5.7 | 13.5 137% | 11.1 95% | 5.2 -9% | 8.71 ? 53% | |
| H.264 (h) | 3.6 | 8.8 144% | 4.3 19% | 8.9 ? 147% | ||
| WiFi v1.3 (h) | 3.1 | 8 158% | 4.8 55% | 4.6 48% | 3.6 16% | 6.98 ? 125% |
| Load (h) | 1.1 | 1.5 36% | 1.8 64% | 1.1 0% | 1.1 0% | 1.51 ? 37% |
Pro
Contro
Verdetto - Solido portatile da gioco a un prezzo basso
Il G5 GD ha lasciato una buona impressione generale - nonostante alcuni difetti. Per un prezzo basso, è possibile ottenere un portatile da gioco Full HD che porta tutti gli ultimi giochi senza problemi sullo schermo (anche se non sempre al massimo dei dettagli)
IlCore i5-11400H processore e ilGeForce RTX 3050 laptop GPU possono lavorare a frequenze di clock costanti - se è installata una versione funzionante del BIOS. Grazie a un TGP di 85 watt, la GPU offre i migliori risultati complessivi che siamo stati in grado di determinare per la RTX 3050 finora
Gigabyte offre un portatile da gioco entry-level con il G5 GD, che è disponibile per poco meno di 750 euro (~$848).
Il portatile si riscalda notevolmente sotto carico, ma non eccessivamente. Il rumore è un po' sopra la media. Il portatile funziona tranquillamente quando si eseguono le attività quotidiane, comunque. Il profilo energetico "Power Saving Mode" è raccomandato per questo. La potenza di calcolo ridotta che ne risulta è ancora più che sufficiente per le applicazioni d'ufficio e Internet, così come per i giochi in HD
La scarsa capacità di archiviazione (512 GB, PCIe 4) può essere espansa: C'è spazio per un secondo SSD M.2 (PCIe 3 o SATA) e un'unità di archiviazione da 2,5 pollici. Il display opaco (Full HD, IPS, 144 Hz) offre angoli di visualizzazione stabili, un buon contrasto e una riproduzione dei colori decente. C'è margine di miglioramento in termini di luminosità, copertura dello spazio colore e tempi di risposta. Inoltre, la durata della batteria non è niente di speciale
Il livello di prezzo relativamente basso di 750 Euro (~$848) è dovuto anche al fatto che non è incluso alcun sistema operativo Windows. Di conseguenza, Linux sarebbe la prima scelta ovvia per un sistema operativo, ma installare e configurare il sistema sarebbe probabilmente una seccatura troppo grande per molti utenti. Alla fine, si arriverà probabilmente a Windows 10 nella maggior parte dei casi. Windows 11 è attualmente compatibile solo con le versioni più recenti del BIOS, che causano problemi in termini di prestazioni di gioco. Gli utenti dovranno aspettare i futuri aggiornamenti del BIOS in questo caso
Un'alternativa al G5 GD sarebbe il Dell G15 5515. È dotato di componenti più potenti, e allo stesso tempo, offre una durata della batteria molto migliore rispetto al portatile Gigabyte.
Prezzo e disponibilità
Al momento della scrittura, il Gigabyte G5 GD può essere trovato su Amazon nella nostra stessa configurazione di test (Core i5-11400H, GeForce RTX 3050, 16 GB di RAM, 512 GB SSD) e con Windows 10 Home al prezzo scontato di 849 dollari su https://www.amazon.com/GIGABYTE-G5-GD-Anti-Glare-GD-51US123SH/dp/B093Z27X2L/?tag=nbcreviewsnet-20.
Gigabyte G5 GD
- 11/21/2021 v7 (old)
Sascha Mölck
Price comparison

