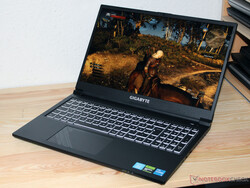
Recensione del Gigabyte G5 KF: gaming Laptop con RTX 4060 a 969 euro
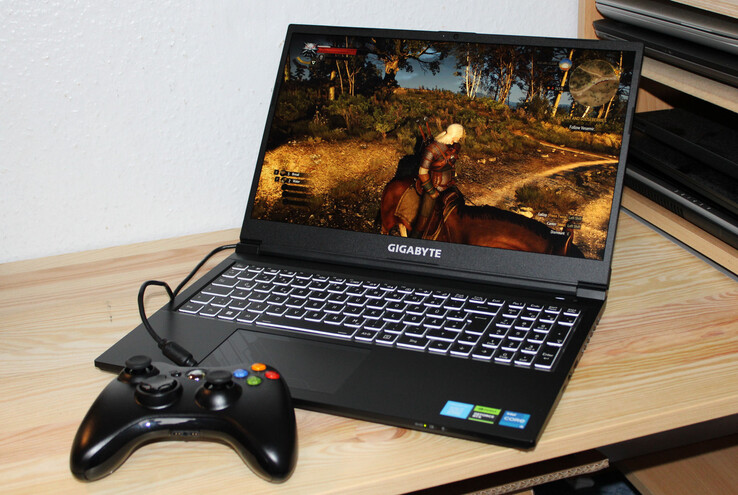
Il G5 KF è un computer portatile da gioco nel segmento di prezzo più basso - il dispositivo da 15,6 pollici le costerà circa 969 euro (1.026 dollari). Anche se la licenza di Windows non è inclusa nel prezzo. Il portatile Gigabyte è in concorrenza con modelli del calibro di MSI Cyborg 15 A12VF, Intel NUC X15, Lenovo Legion Slim 5 16APH8eAsus TUF A15 FA507.
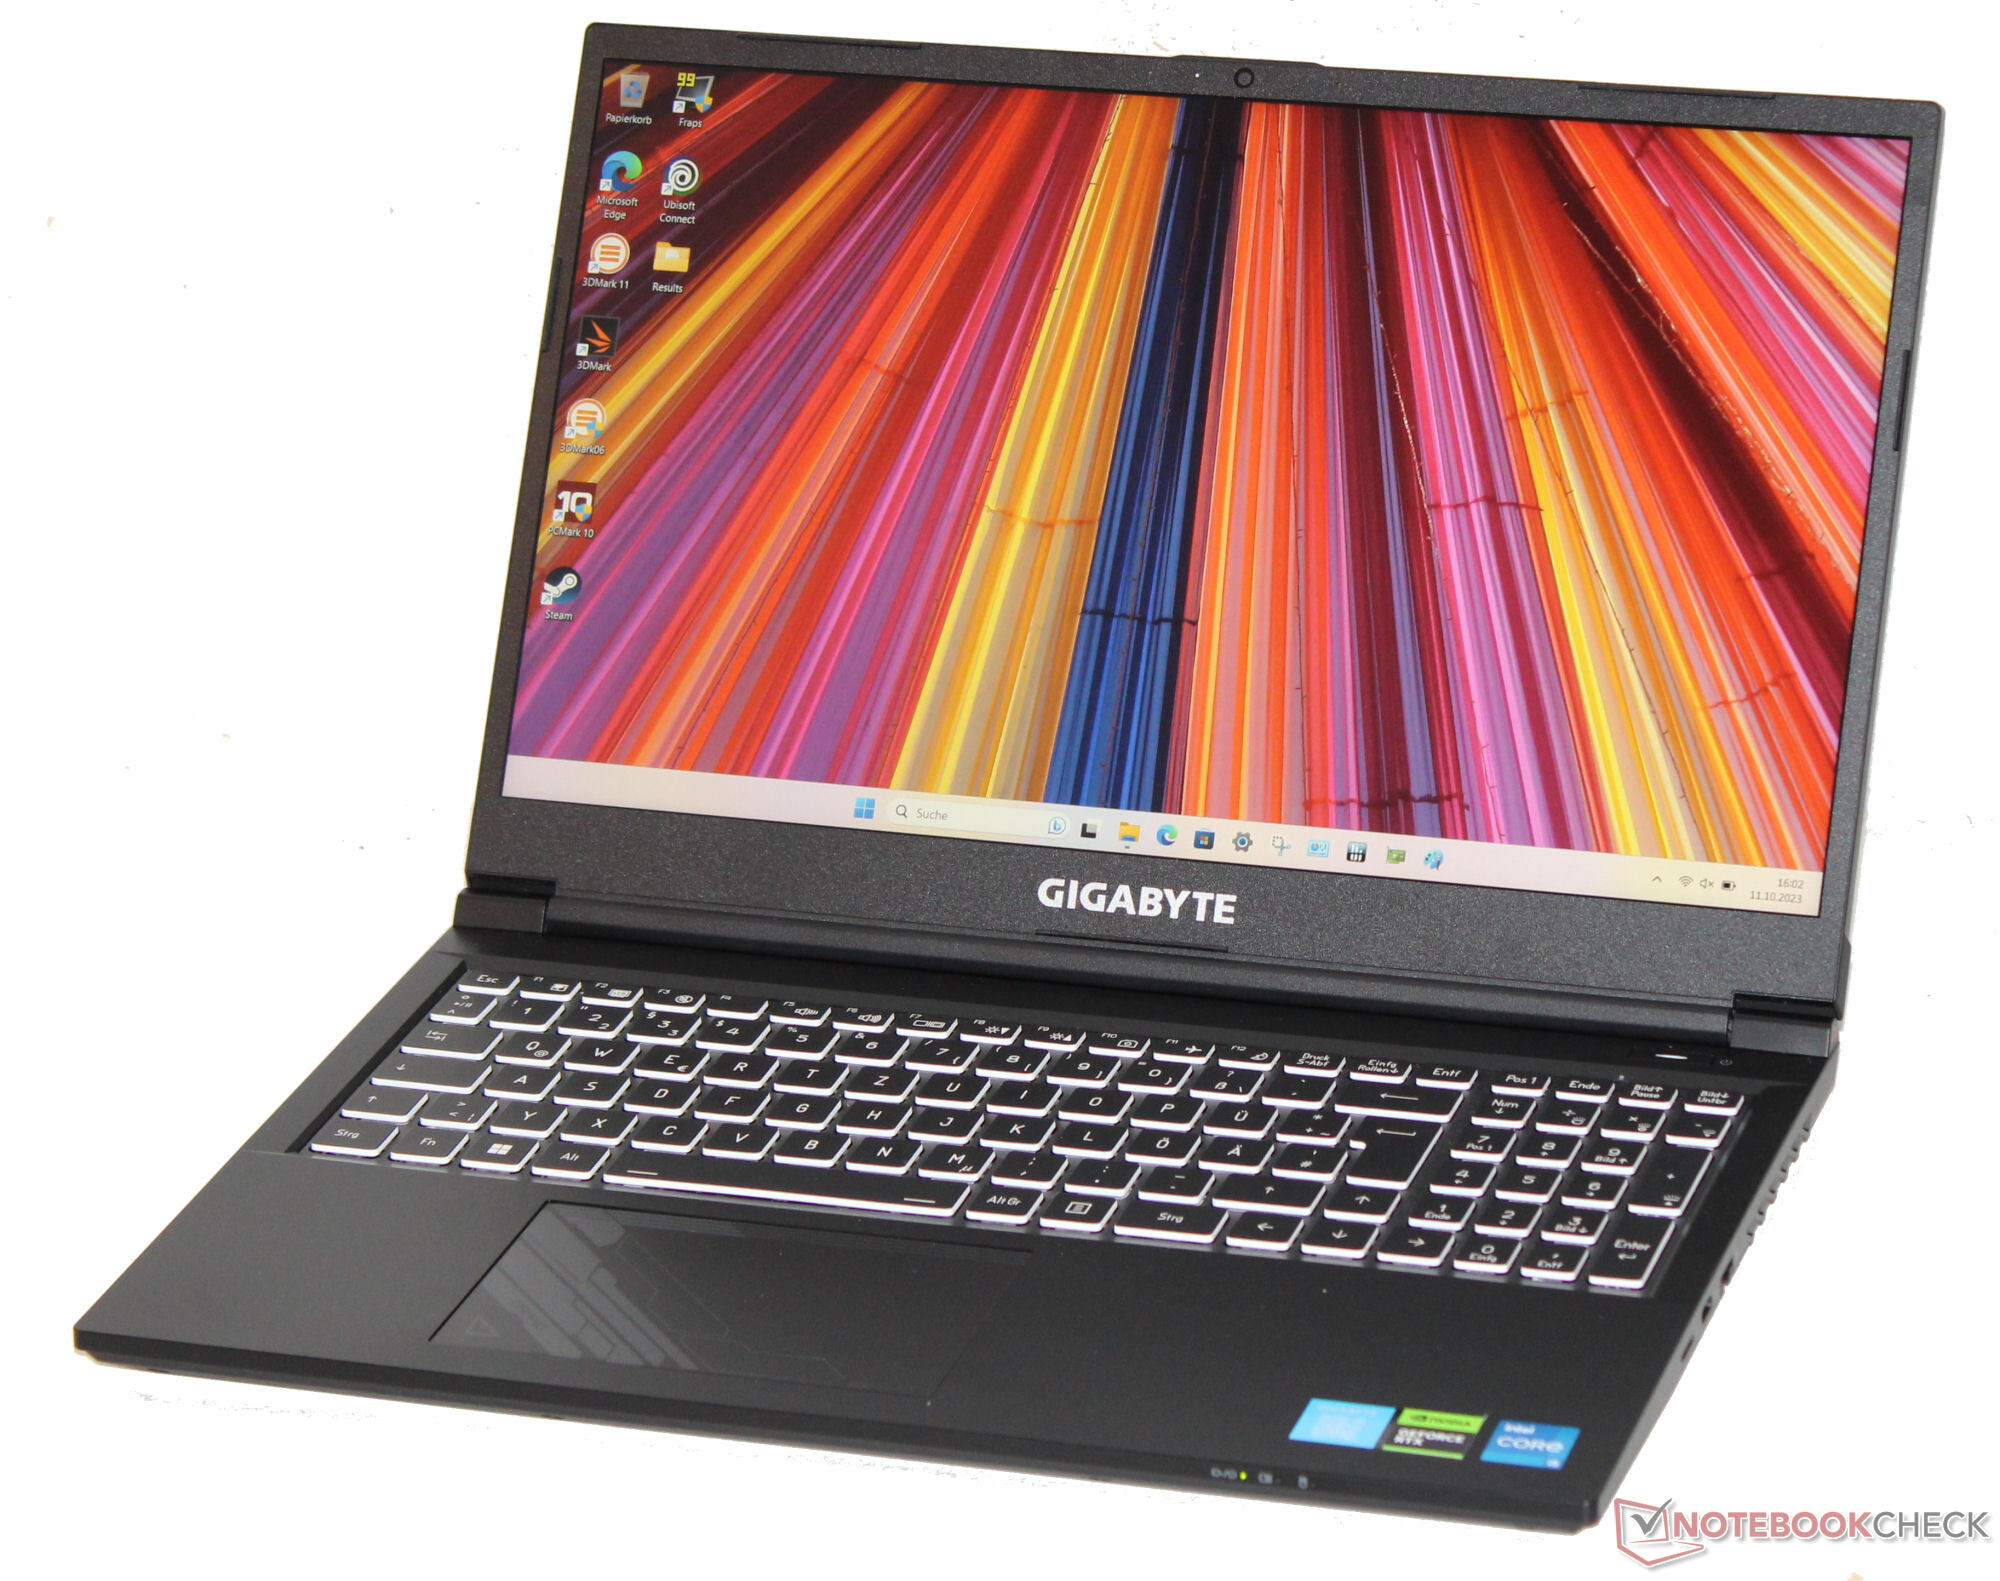
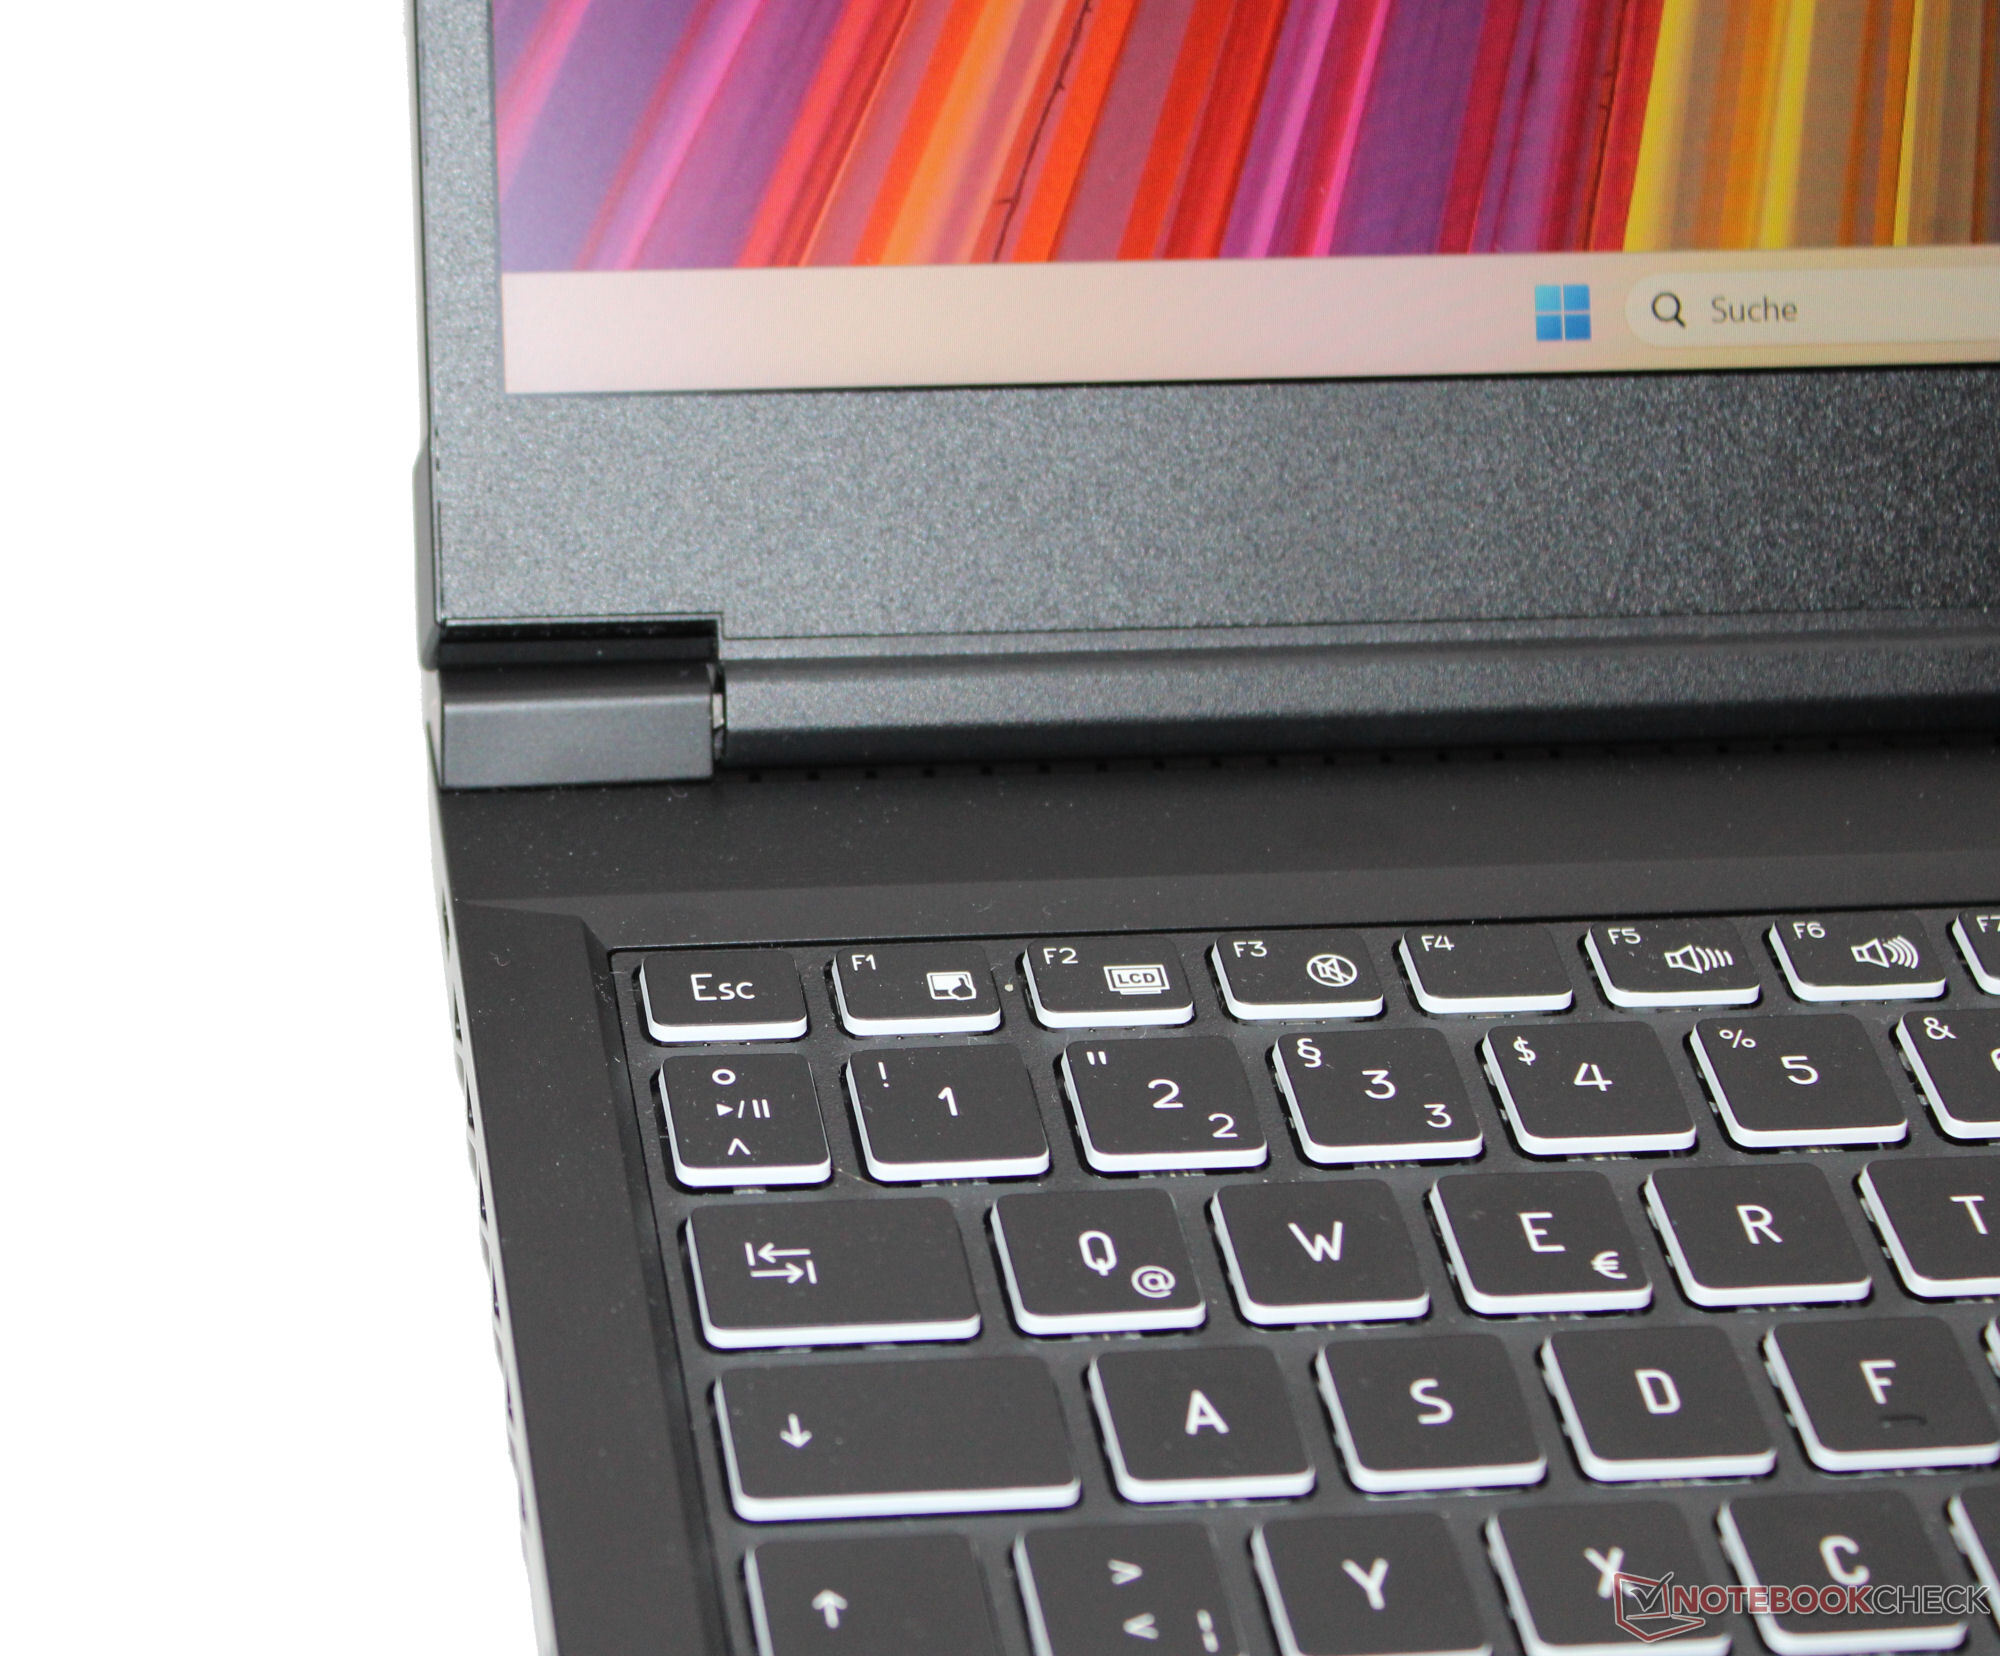
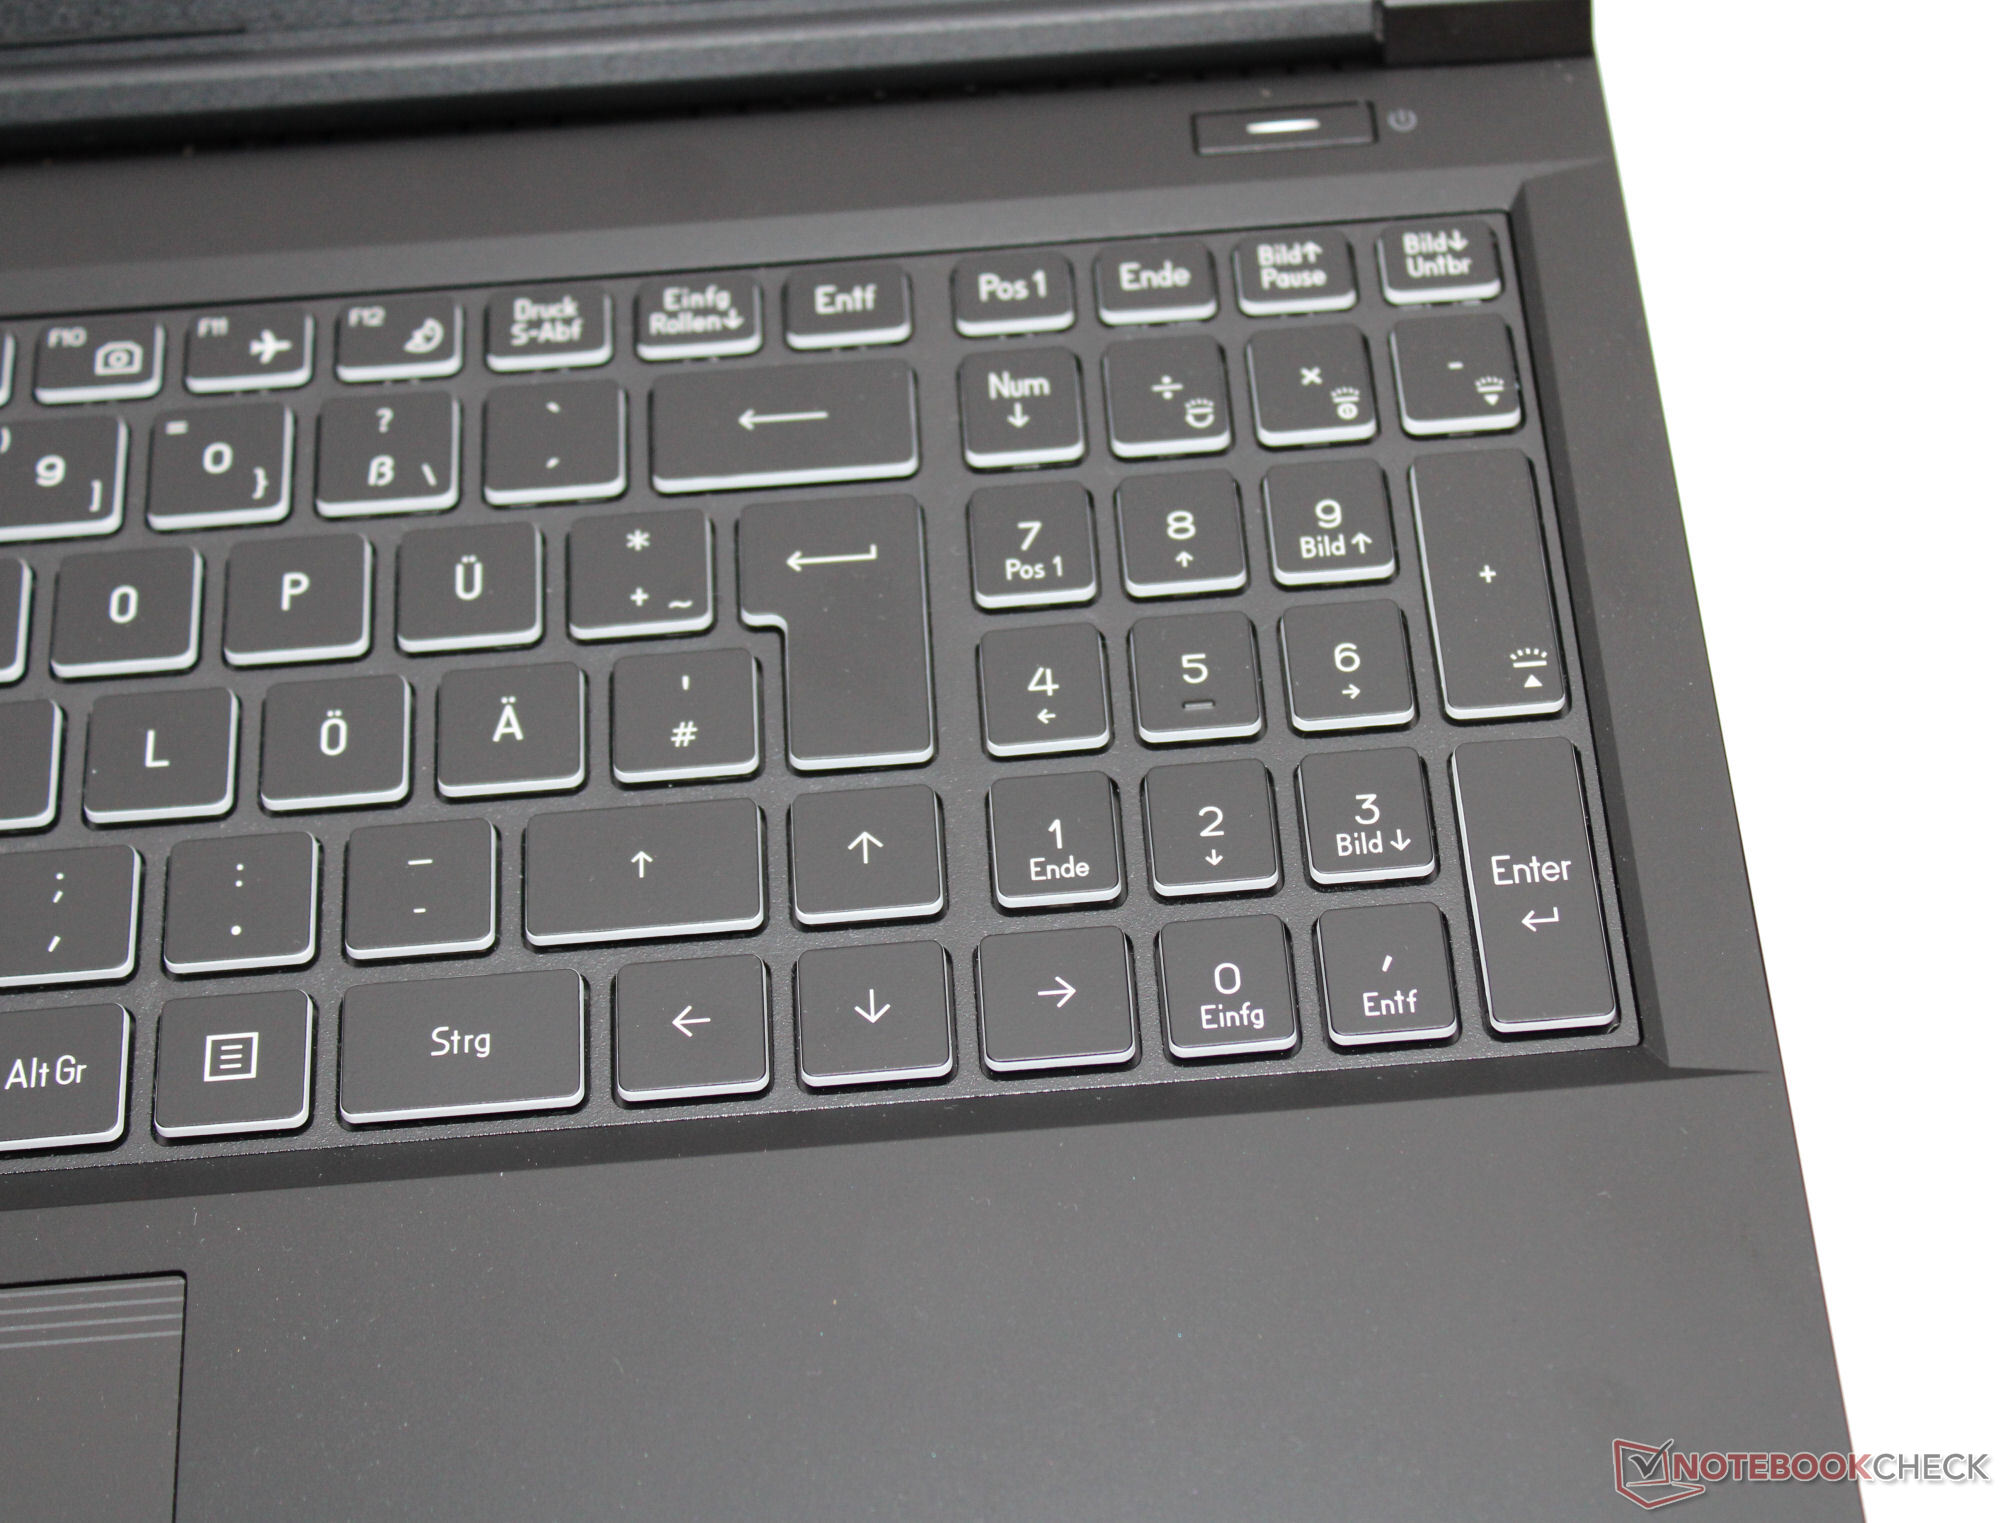
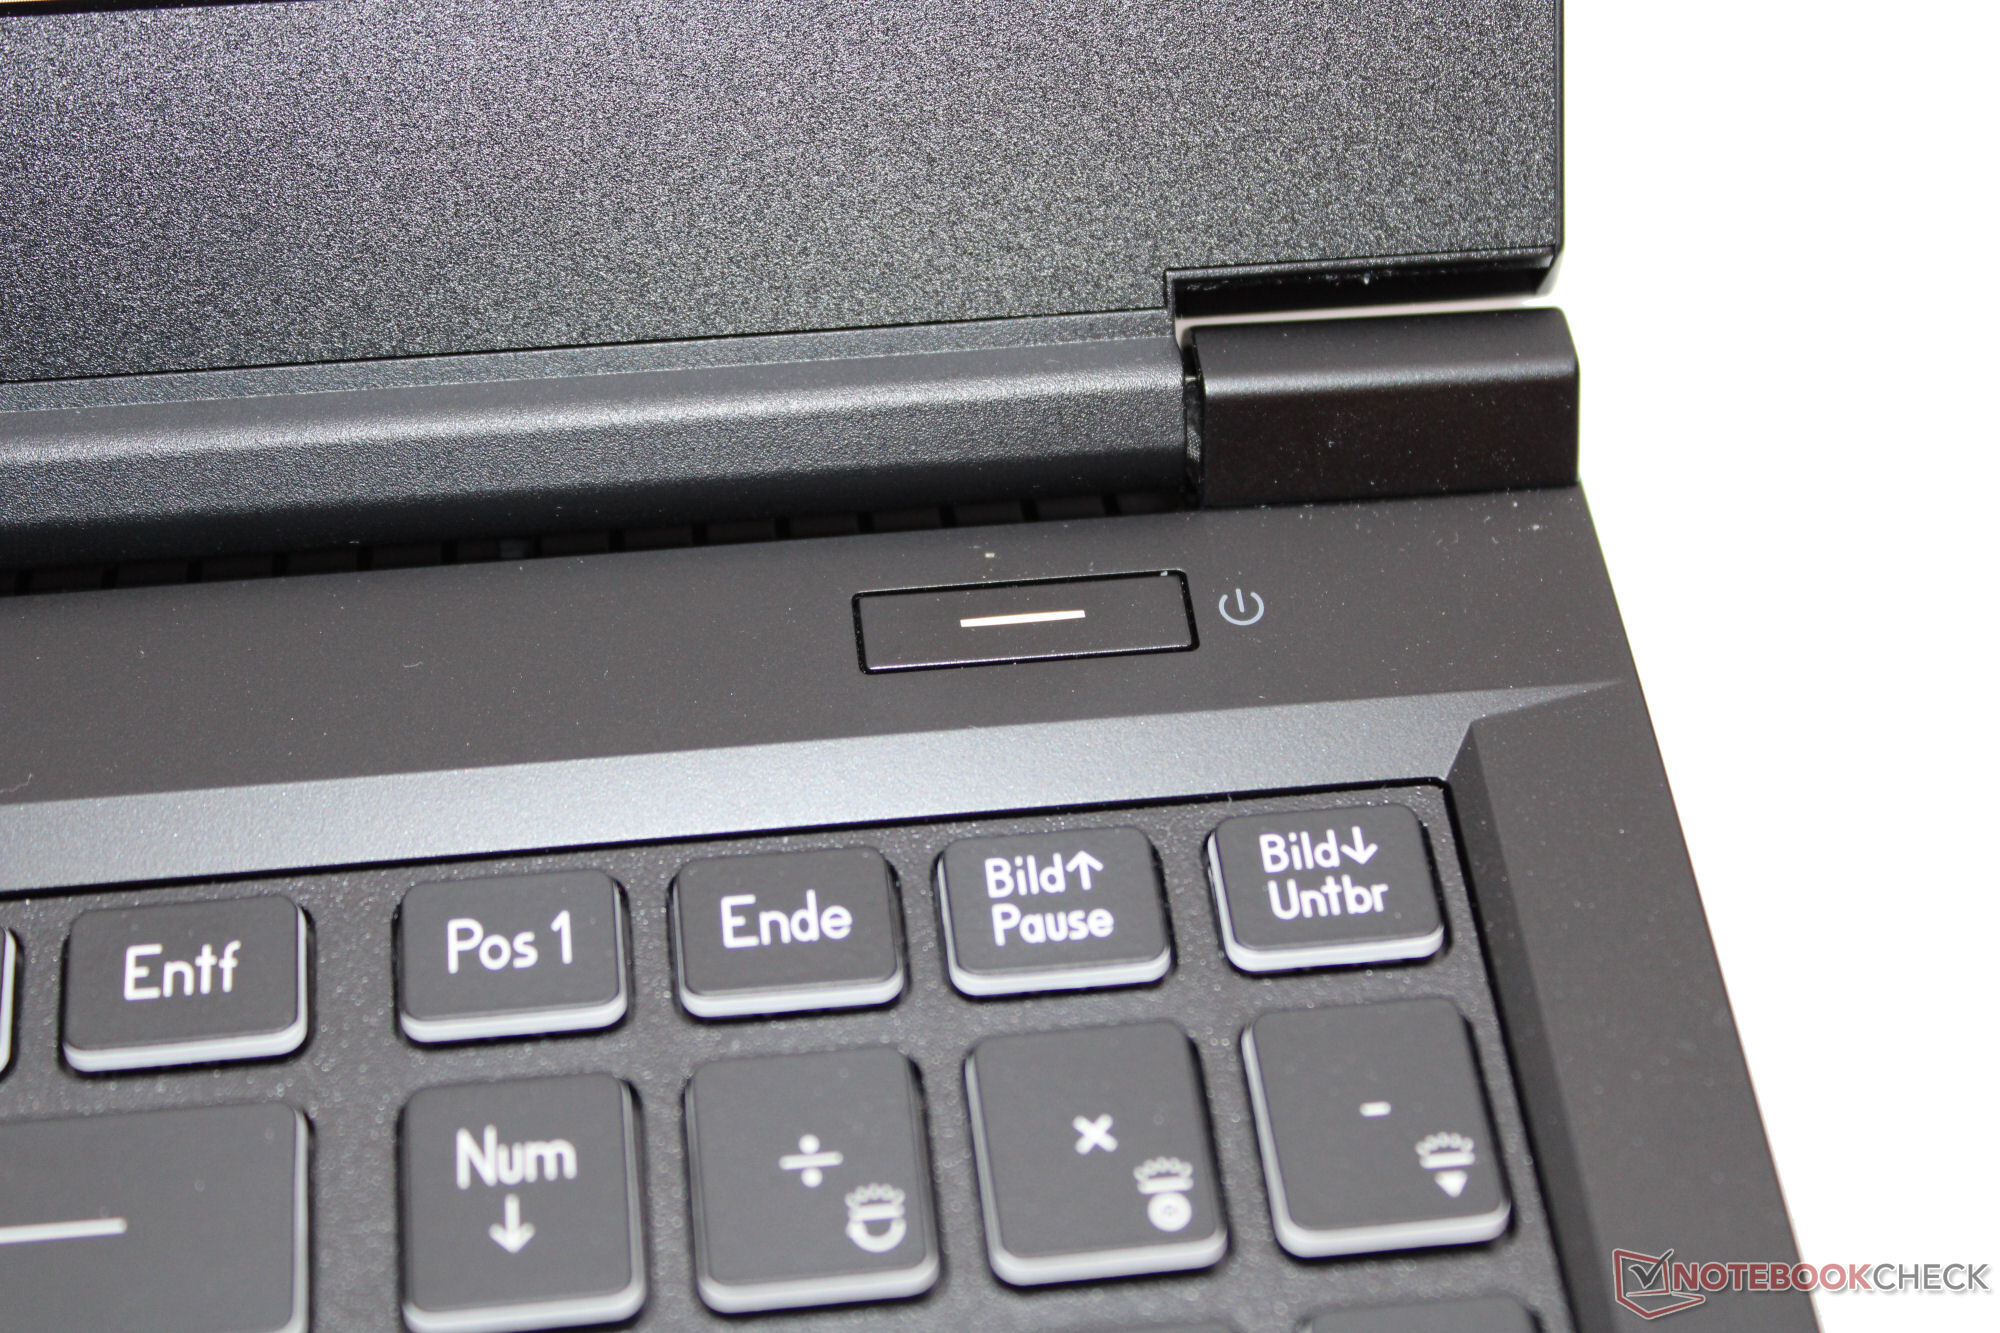
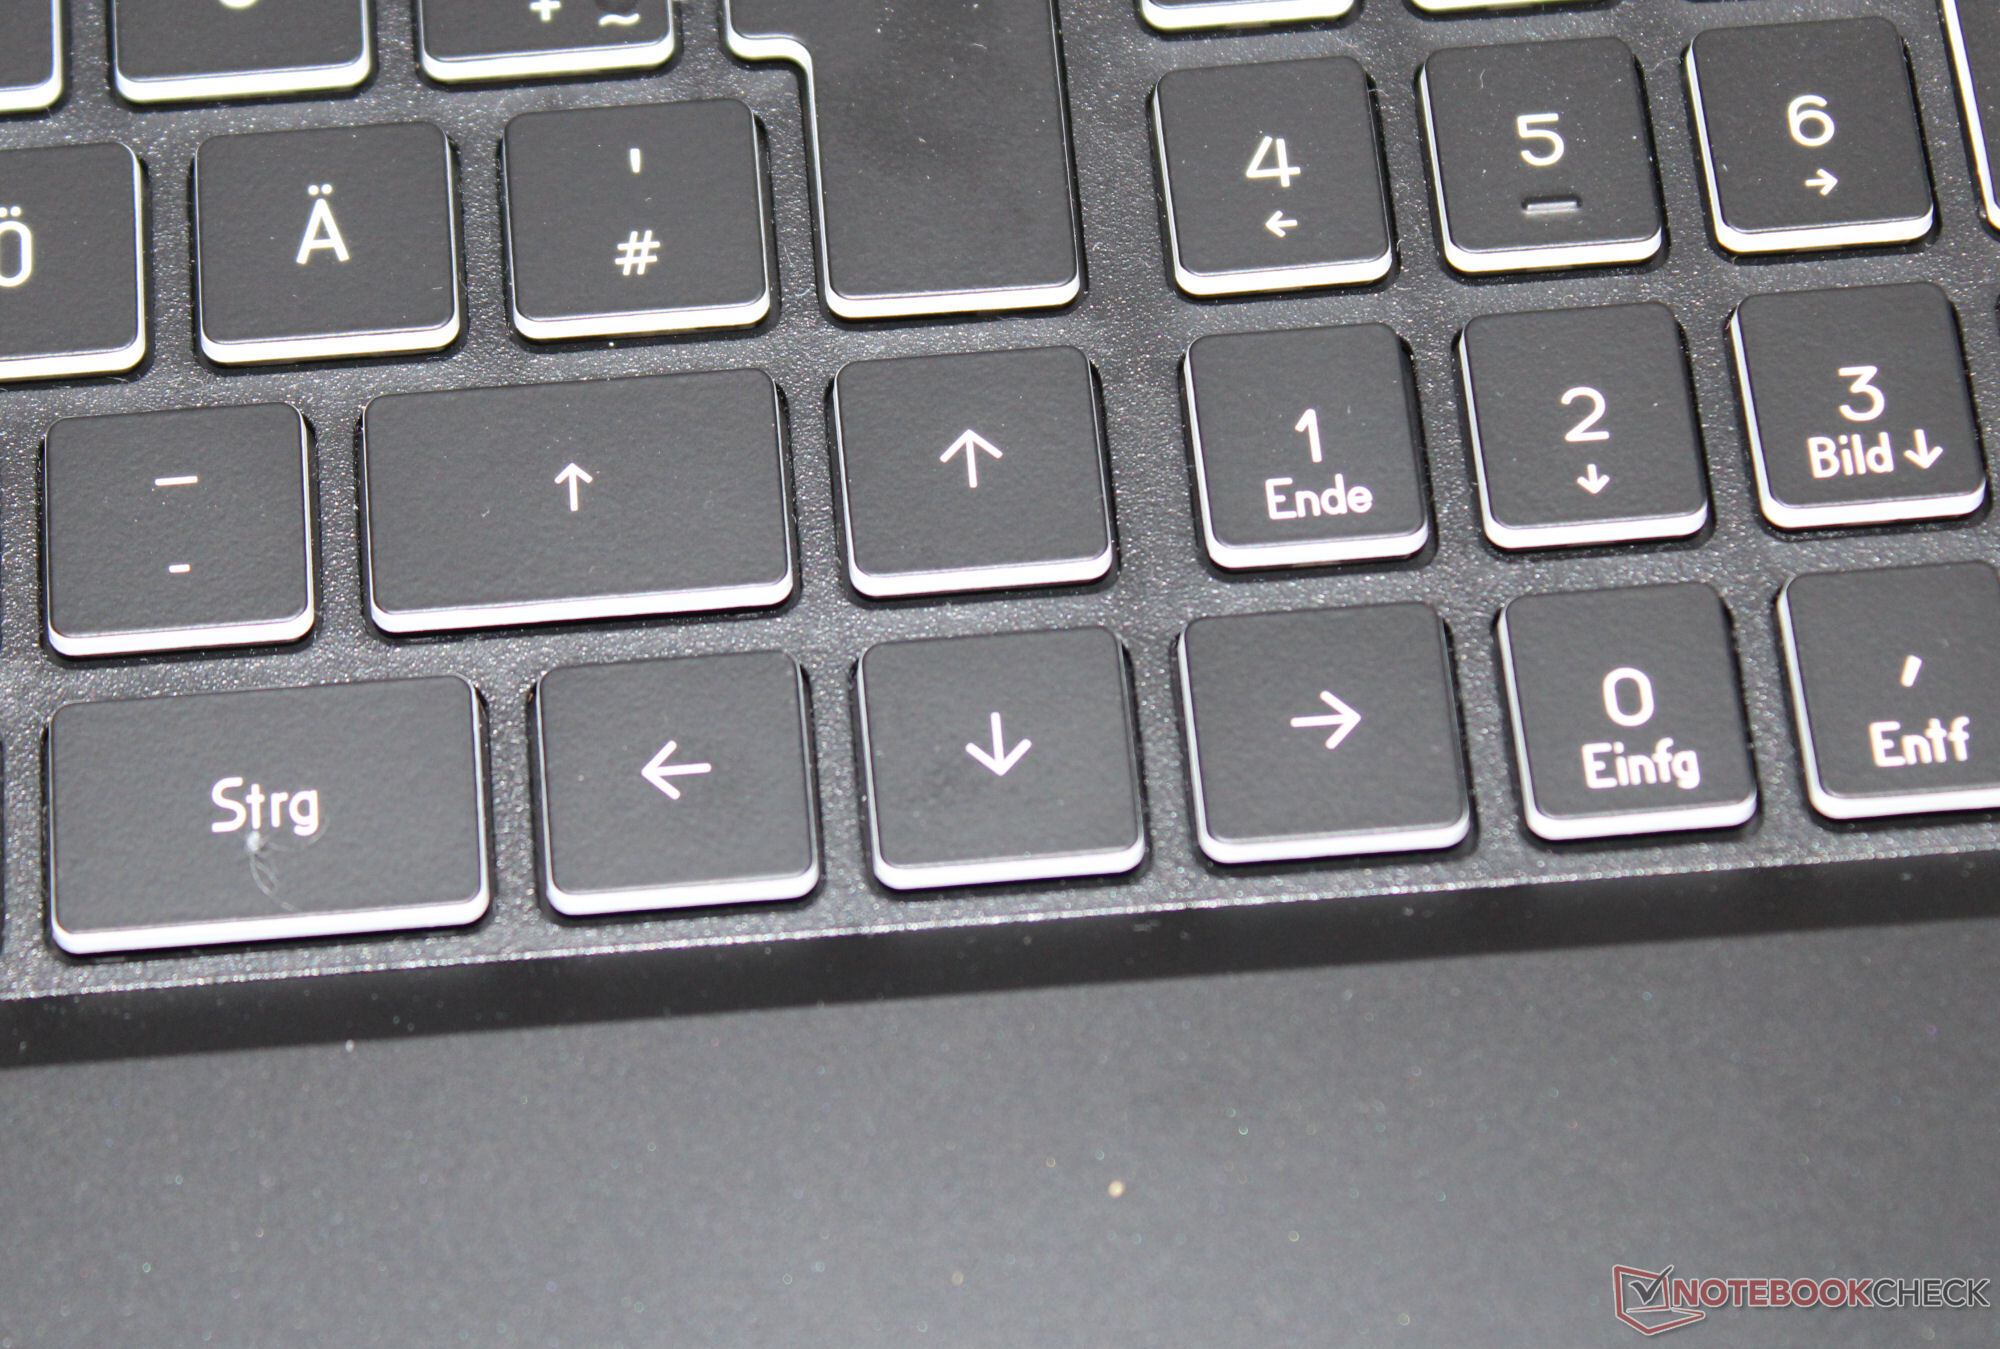
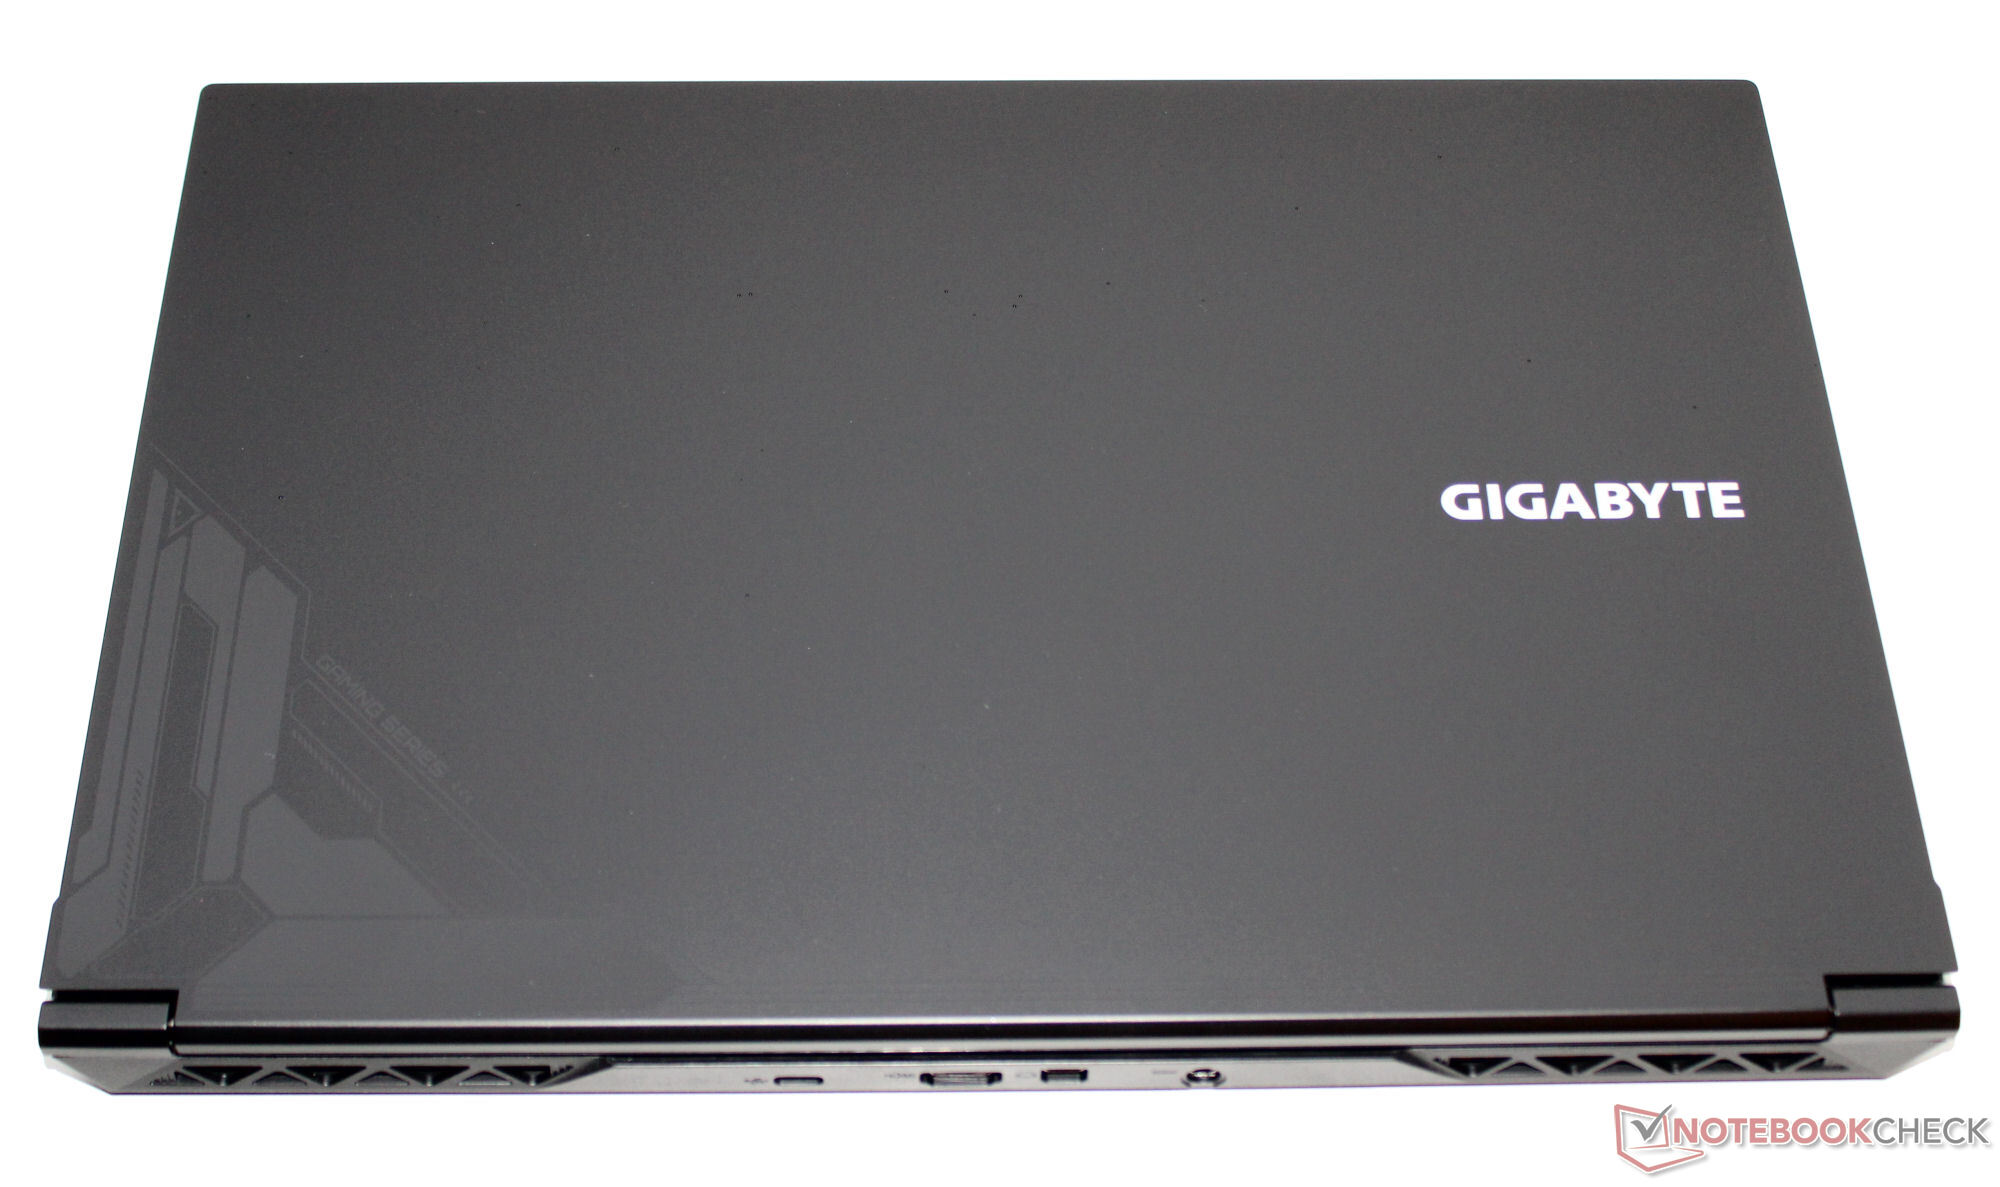
Il G5 KF è il seguito del G5 KE e condivide lo stesso design fisico. Può quindi fare riferimento alla la nostra recensione del G5 KE per maggiori informazioni sul telaio, le caratteristiche, i dispositivi di input e il display.
Potenziali concorrenti a confronto
Punteggio | Data | Modello | Peso | Altezza | Dimensione | Risoluzione | Prezzo |
|---|---|---|---|---|---|---|---|
| 81.8 % v7 (old) | 10/2023 | Gigabyte G5 KF i5-12500H, GeForce RTX 4060 Laptop GPU | 1.9 kg | 22.7 mm | 15.60" | 1920x1080 | |
| 82.4 % v7 (old) | 04/2023 | MSI Cyborg 15 A12VF i7-12650H, GeForce RTX 4060 Laptop GPU | 2 kg | 22.9 mm | 15.60" | 1920x1080 | |
| 84.4 % v7 (old) | 10/2023 | Intel NUC X15 LAPAC71H i7-12700H, A730M | 2.2 kg | 26.7 mm | 15.60" | 1920x1080 | |
| 86.3 % v7 (old) | 06/2023 | Asus TUF A15 FA507 R7 7735HS, GeForce RTX 4050 Laptop GPU | 2.2 kg | 24.9 mm | 15.60" | 1920x1080 | |
| 87.7 % v7 (old) | 08/2023 | Lenovo Legion Slim 5 16APH8 R7 7840HS, GeForce RTX 4060 Laptop GPU | 2.4 kg | 25.2 mm | 16.00" | 2560x1600 |
| SD Card Reader | |
| average JPG Copy Test (av. of 3 runs) | |
| Media della classe Gaming (20.9 - 210, n=54, ultimi 2 anni) | |
| Gigabyte G5 KE (AV PRO microSD 128 GB V60) | |
| Gigabyte G5 KF | |
| Lenovo Legion Slim 5 16APH8 (PNY EliteX-Pro60 V60 256 GB) | |
| maximum AS SSD Seq Read Test (1GB) | |
| Media della classe Gaming (25.5 - 261, n=51, ultimi 2 anni) | |
| Gigabyte G5 KE (AV PRO microSD 128 GB V60) | |
| Gigabyte G5 KF | |
| Lenovo Legion Slim 5 16APH8 (PNY EliteX-Pro60 V60 256 GB) | |


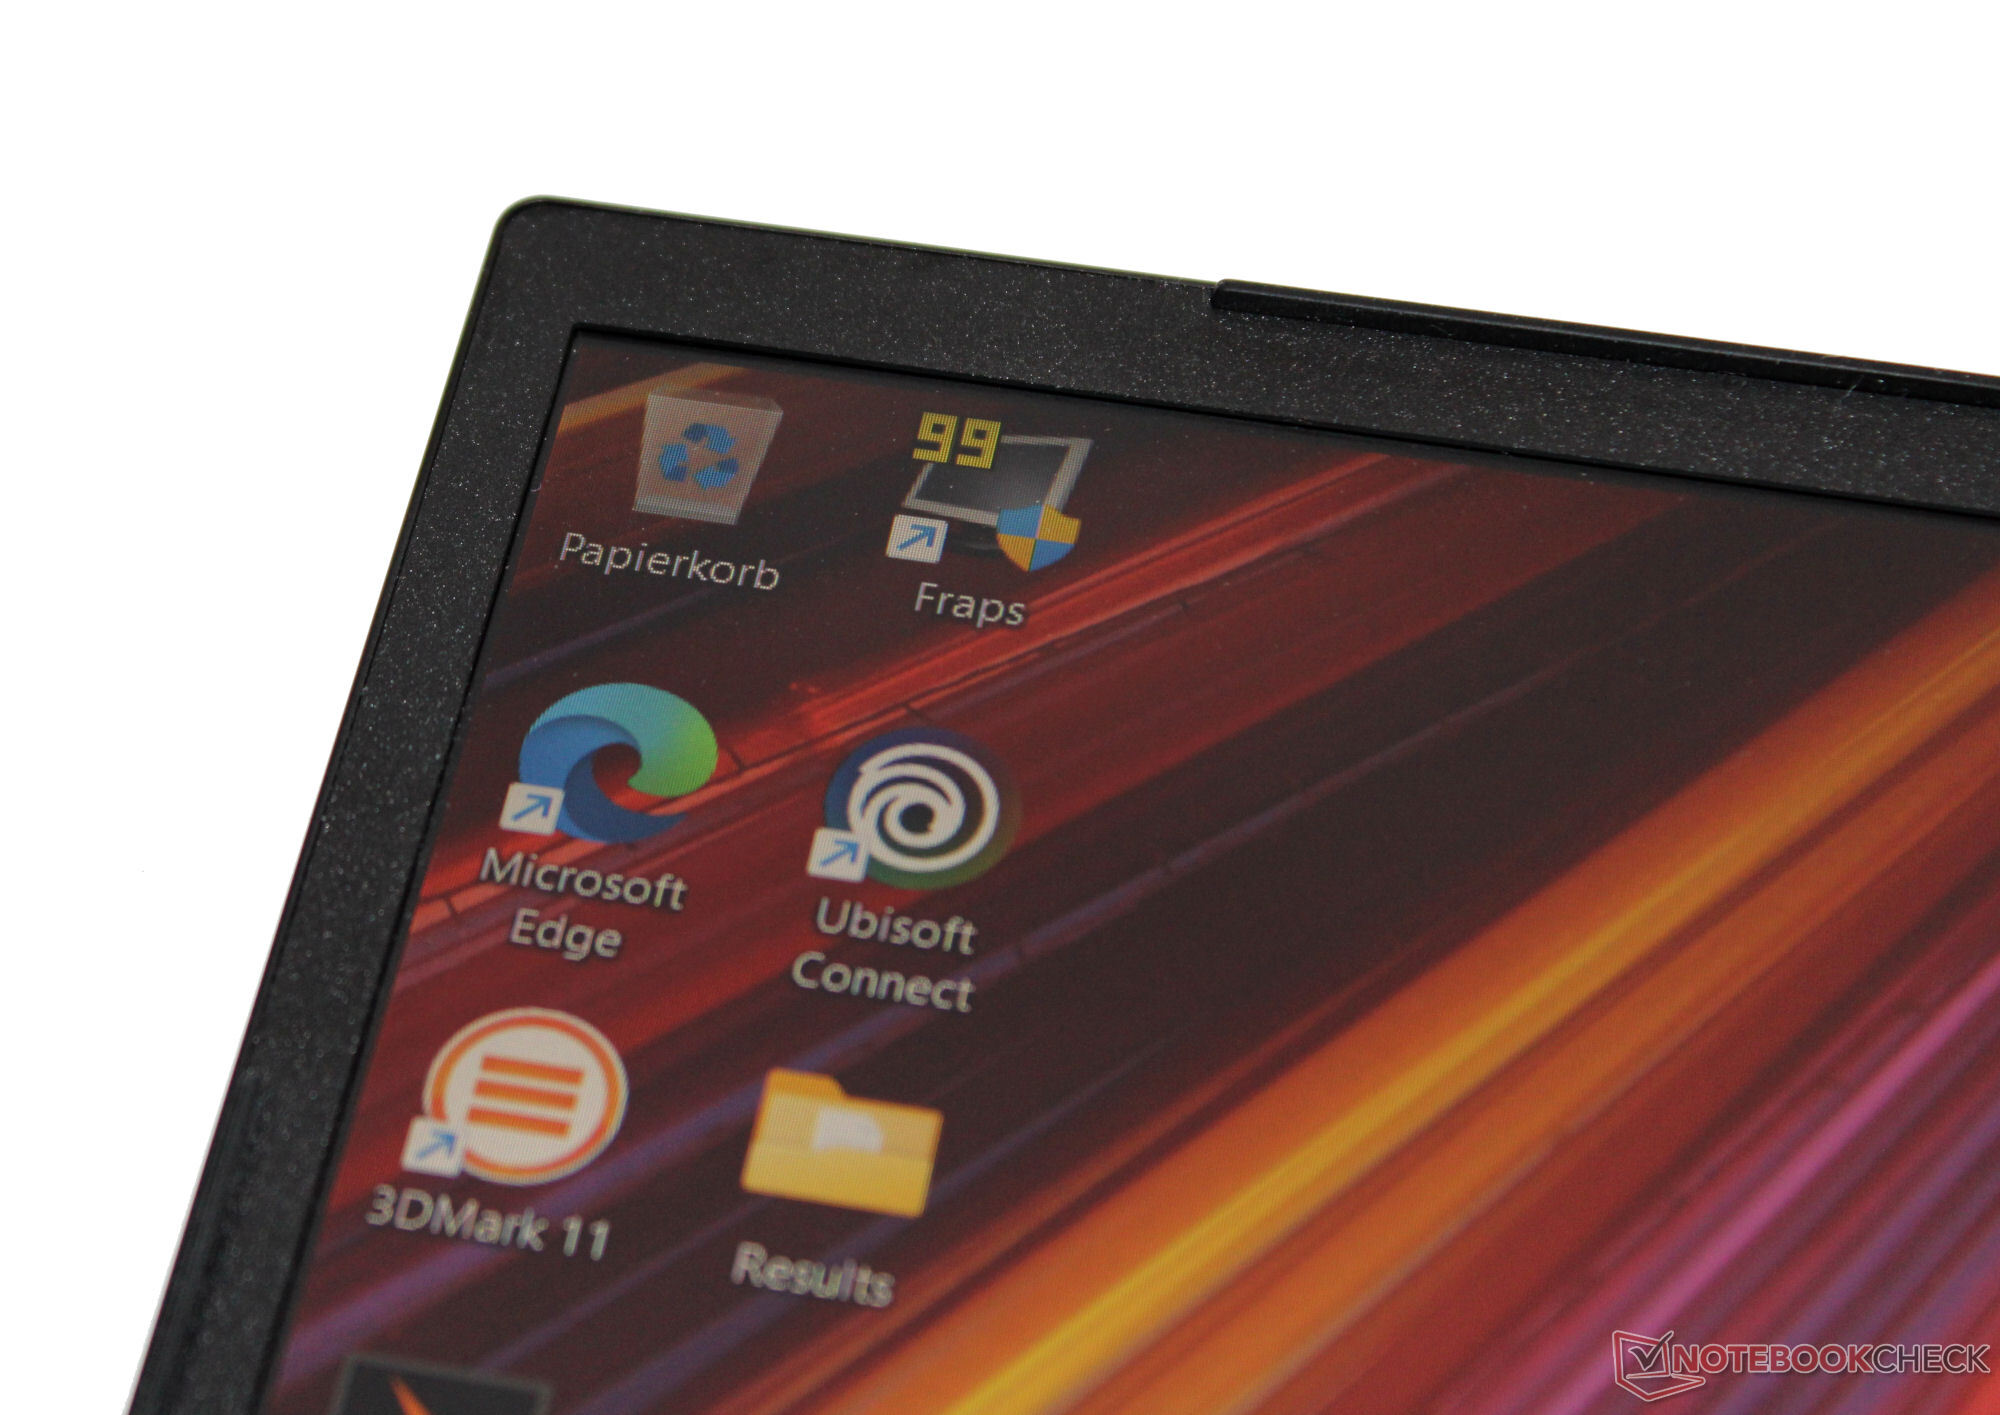
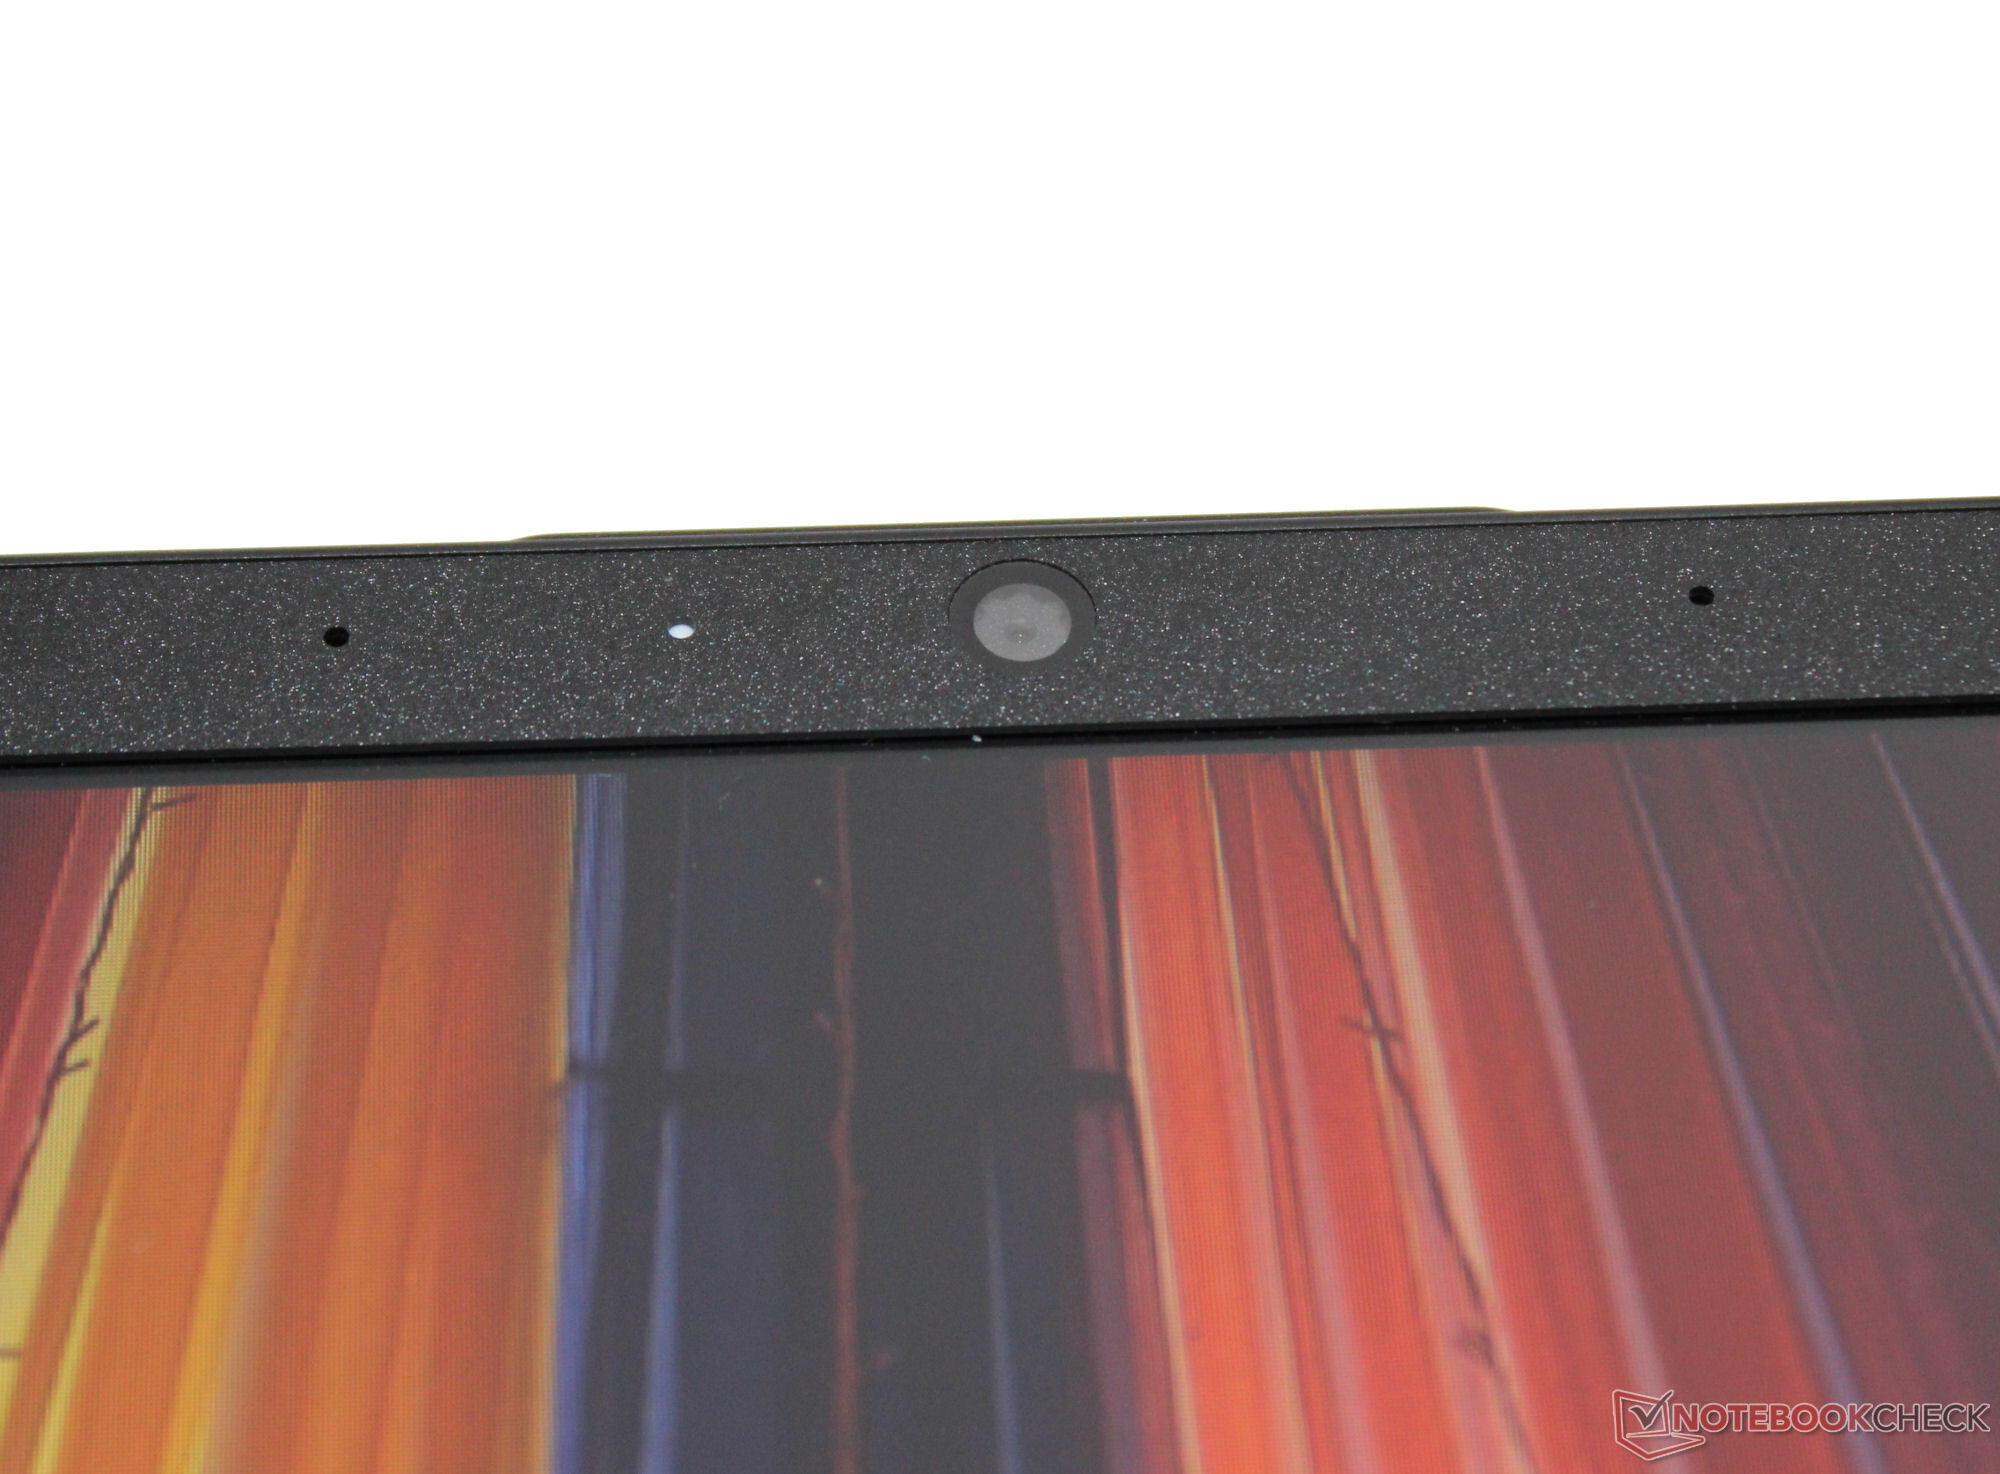
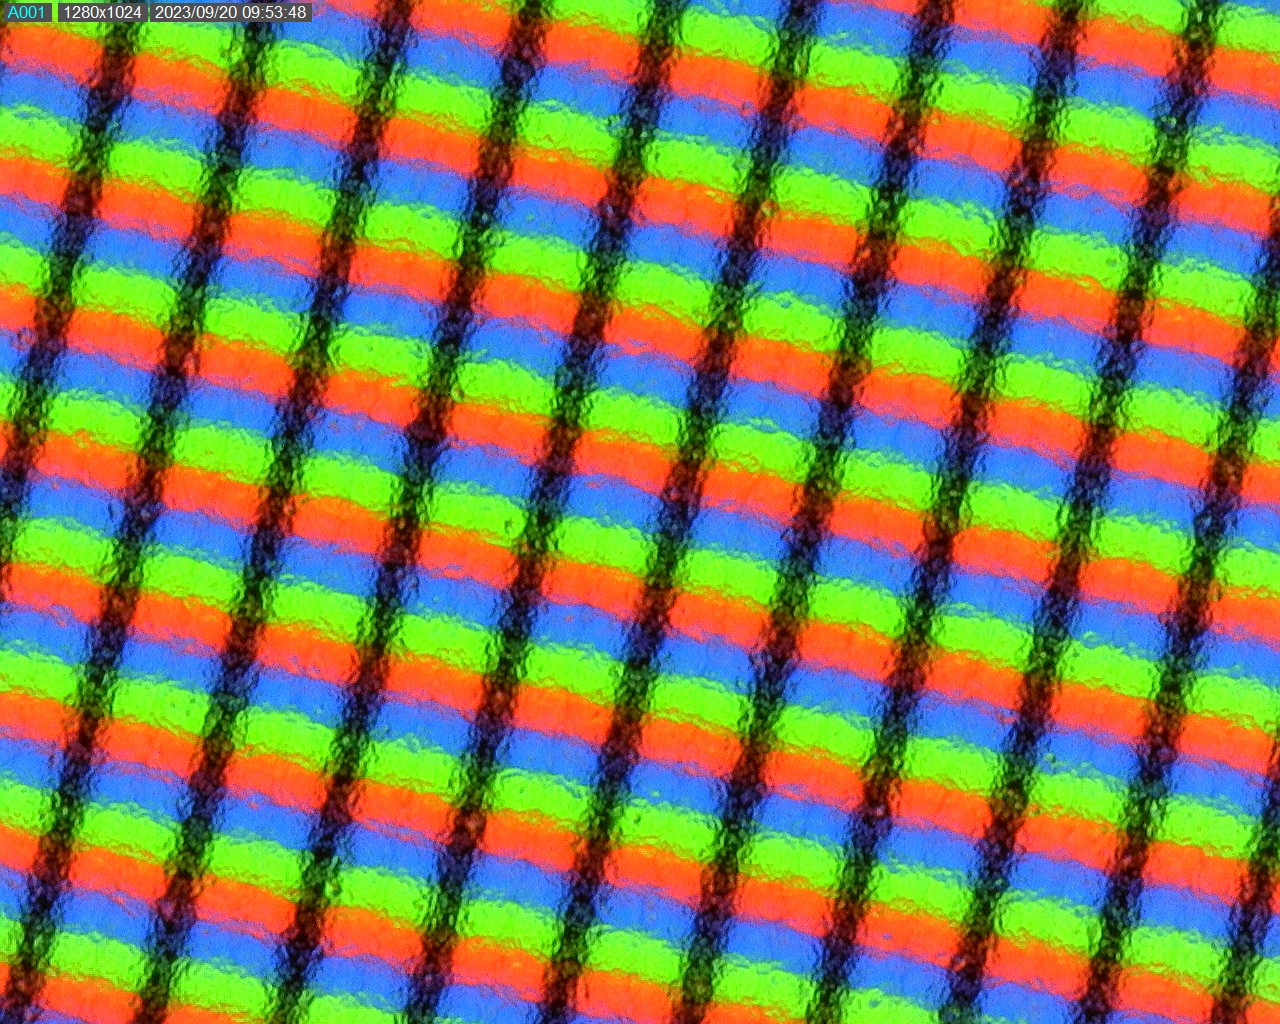
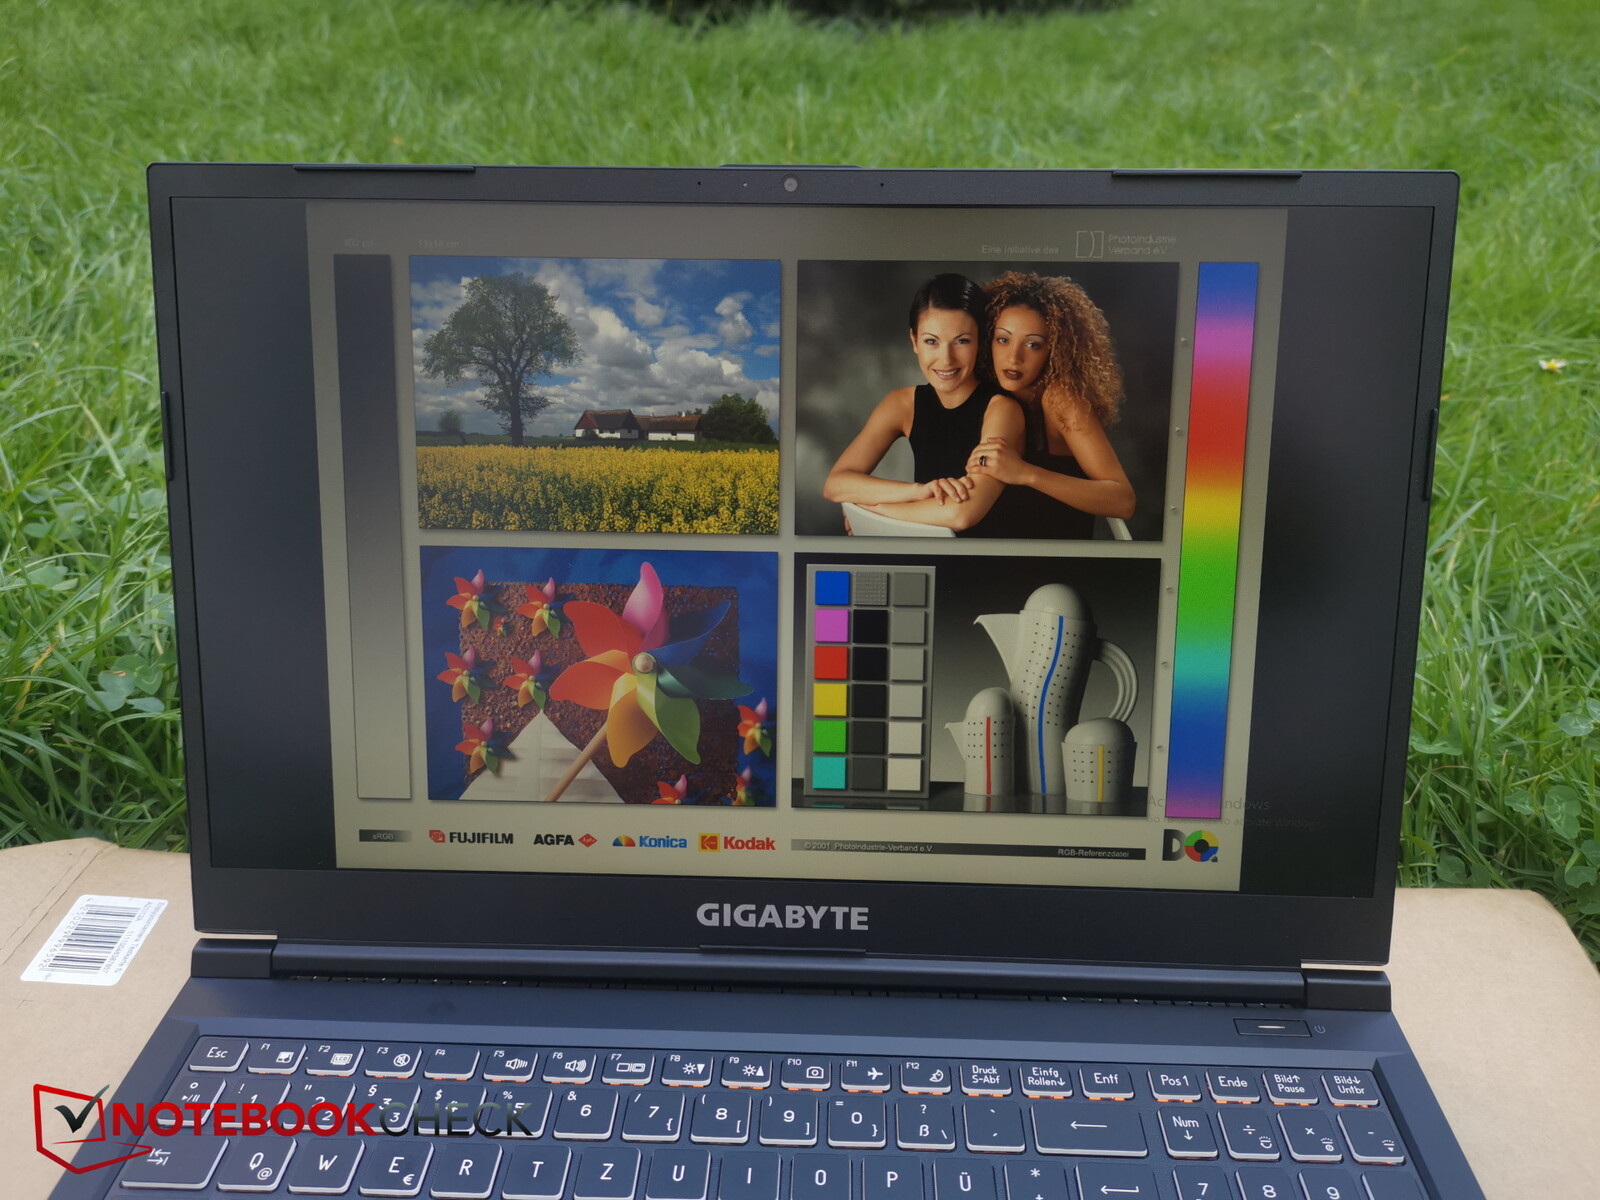
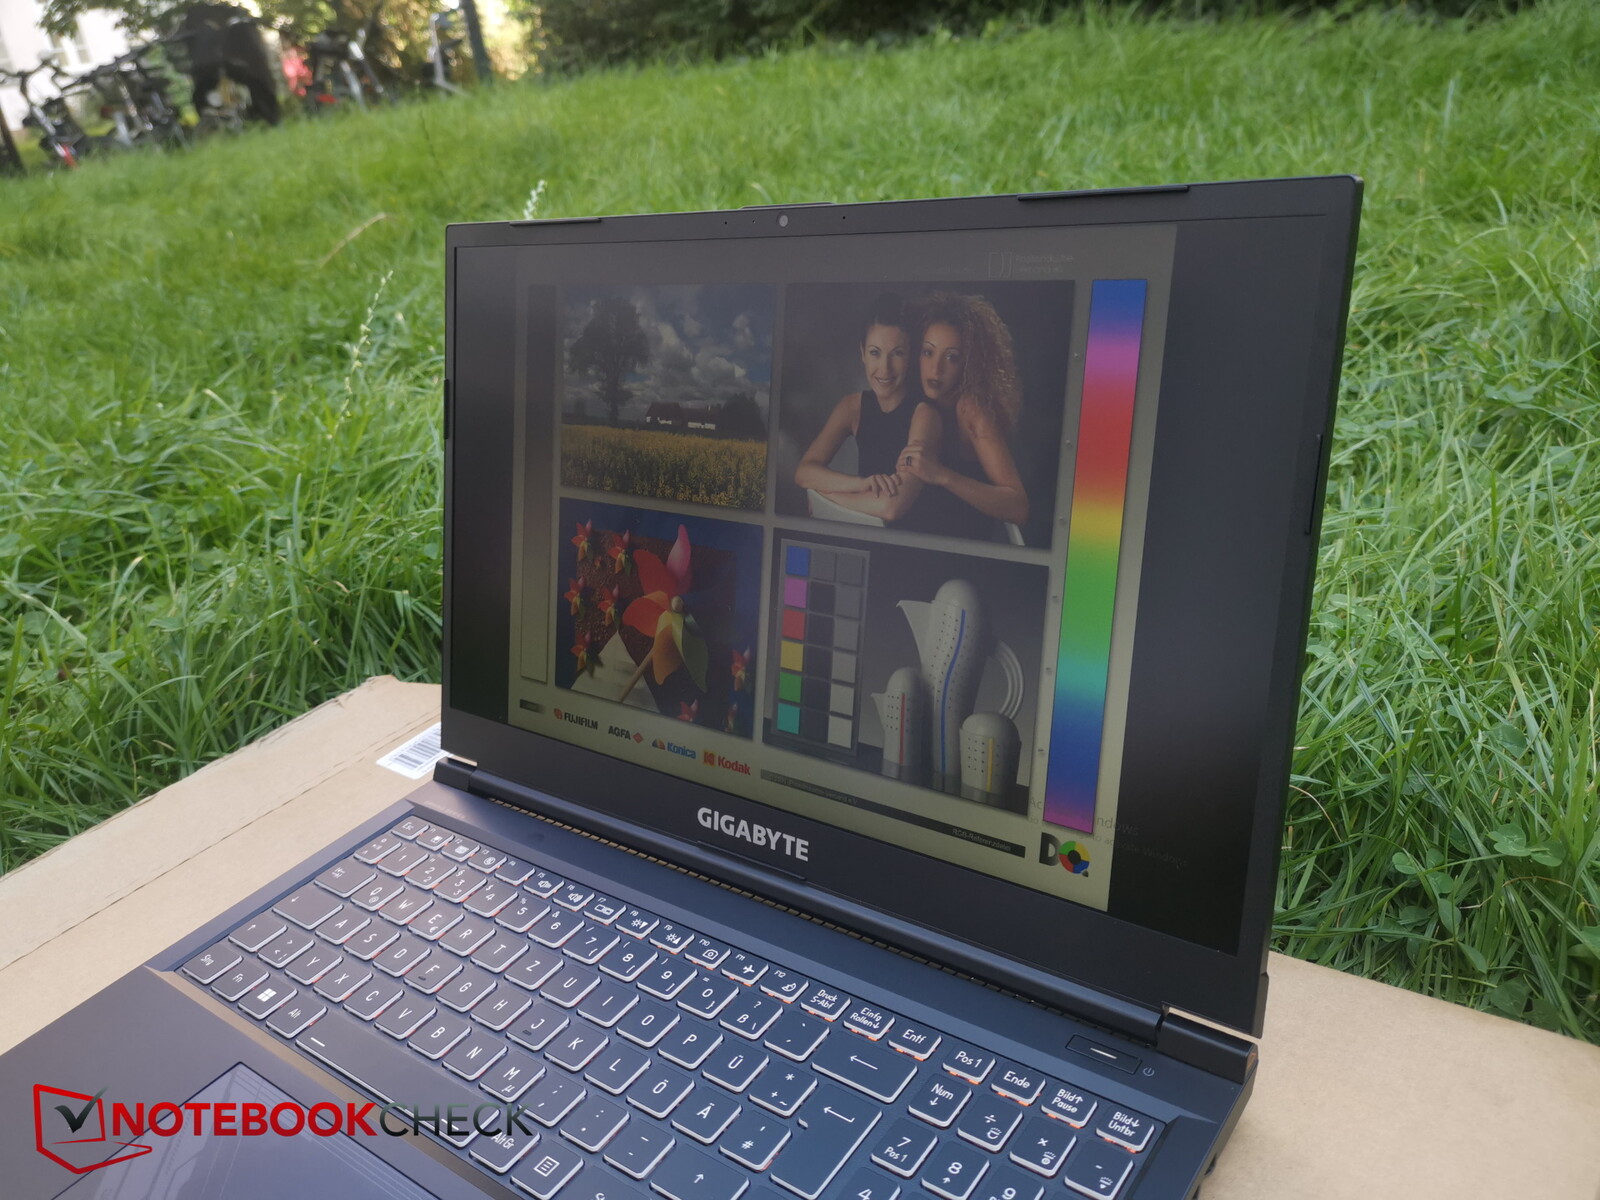
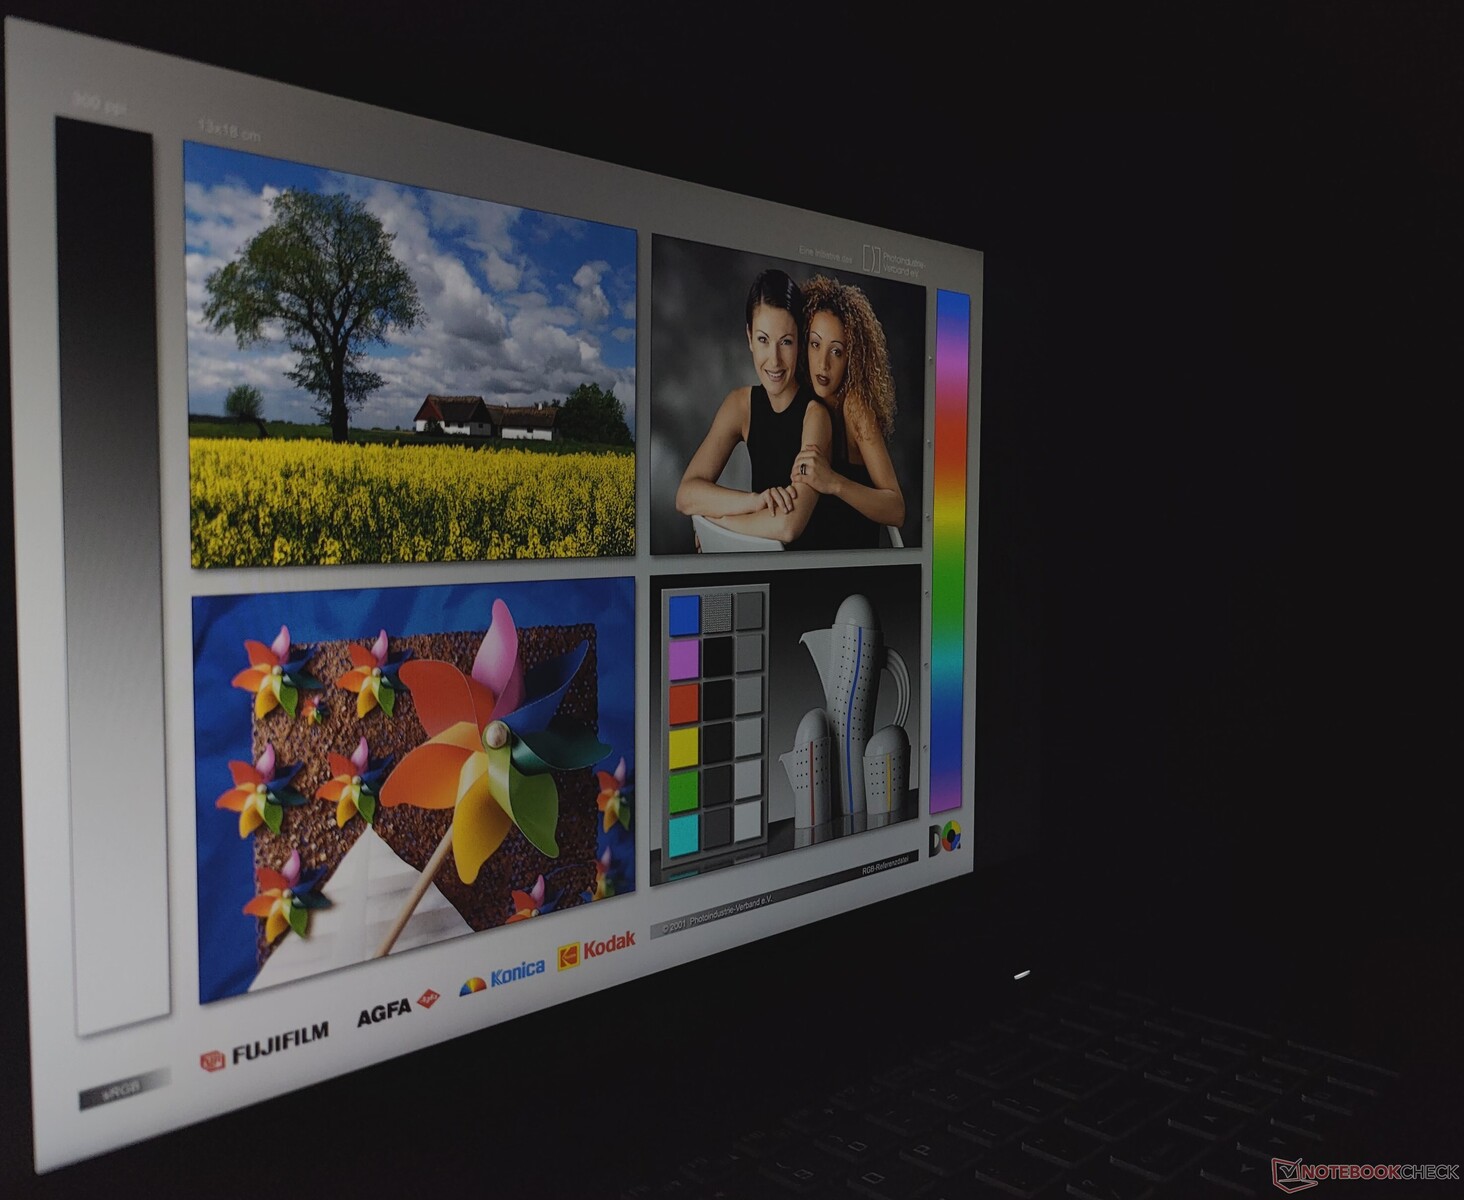
Display - Pannello FHD a 144 Hz
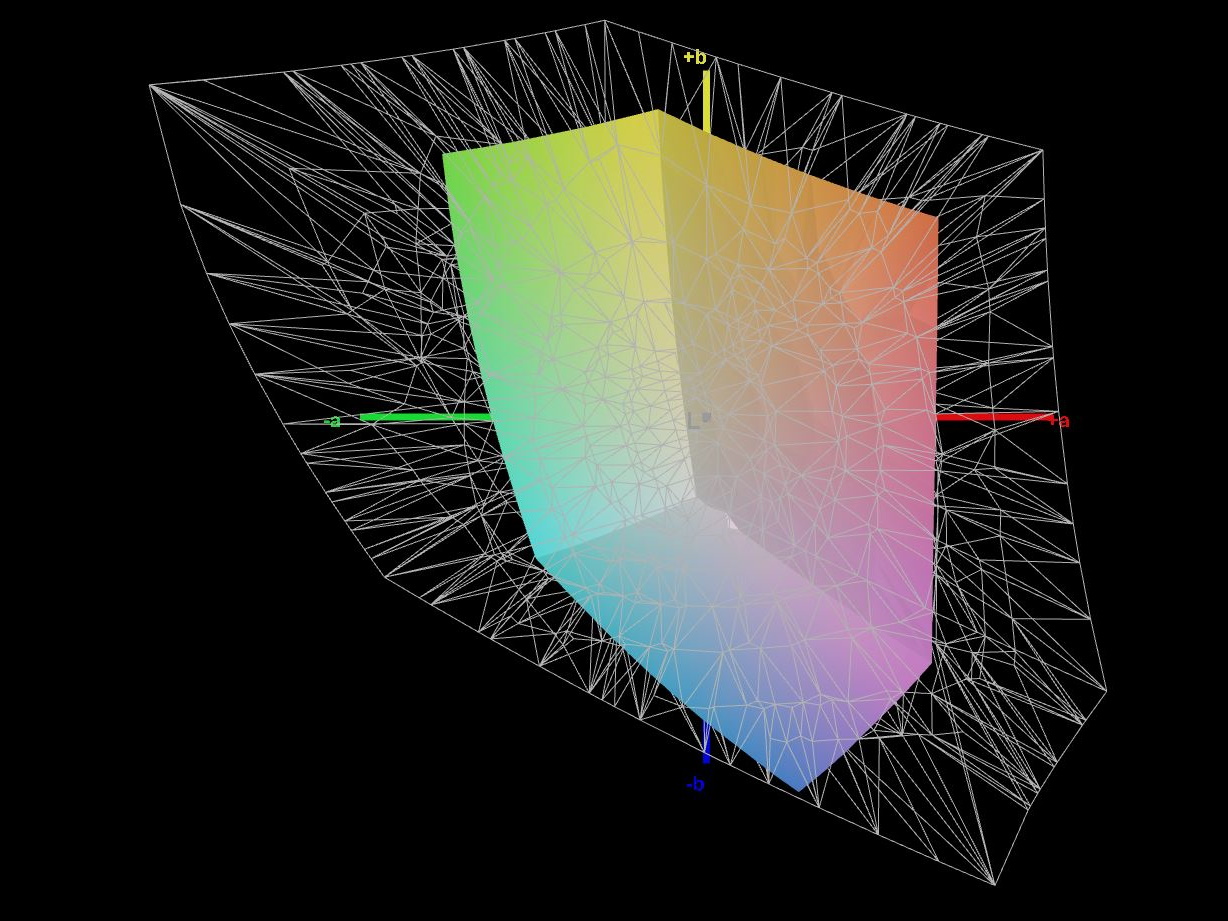
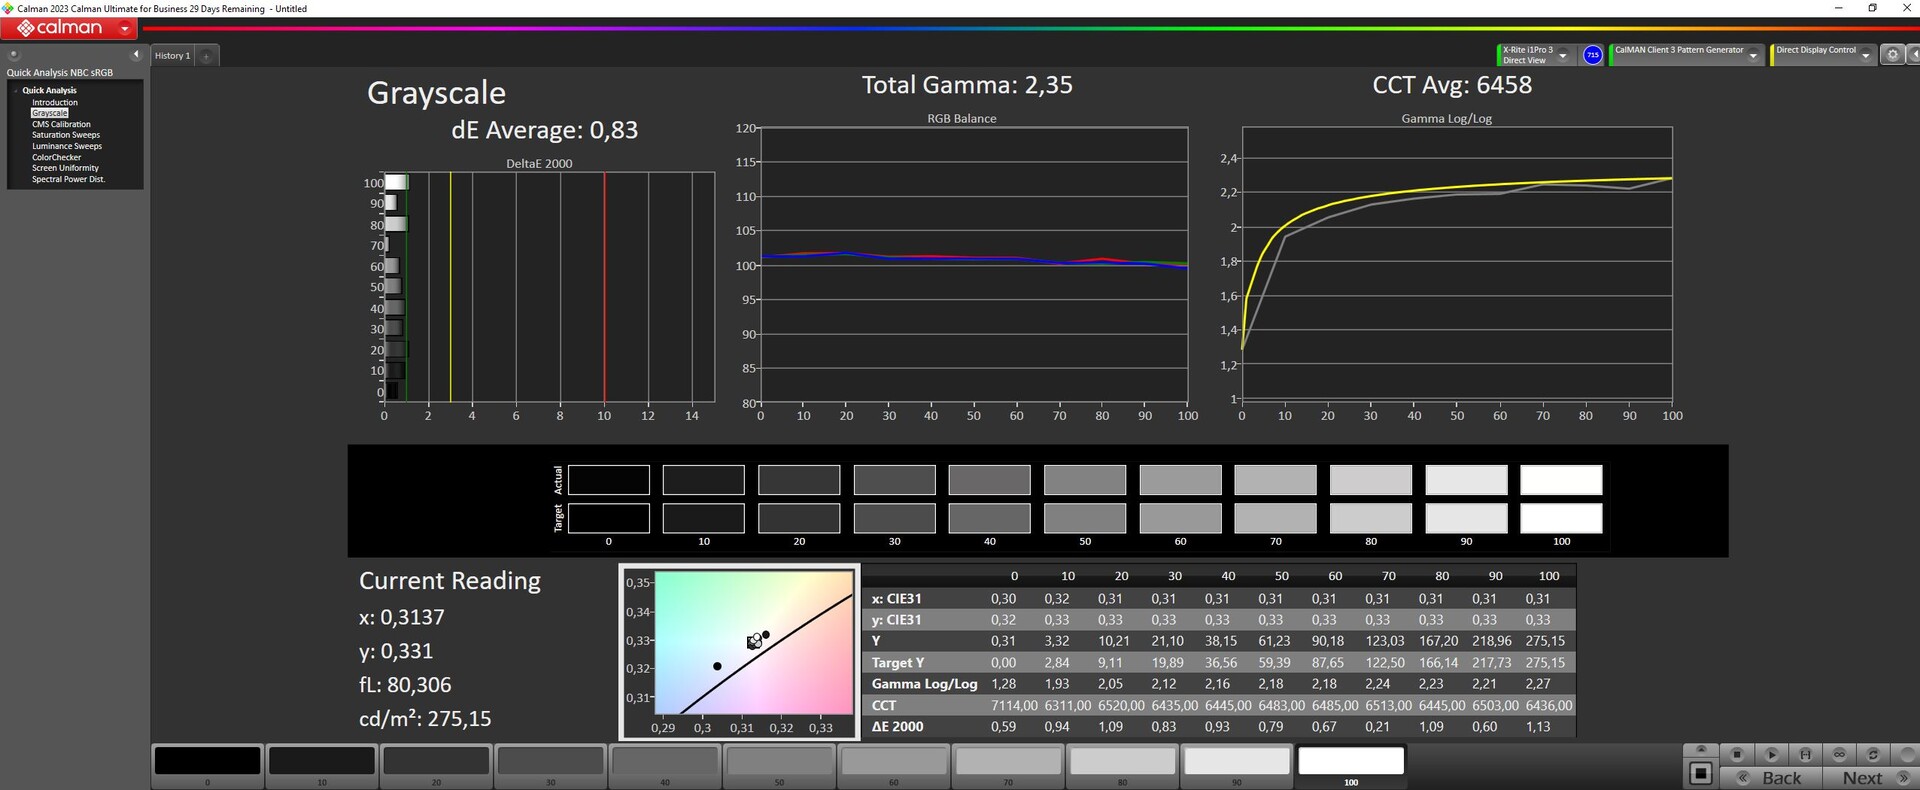
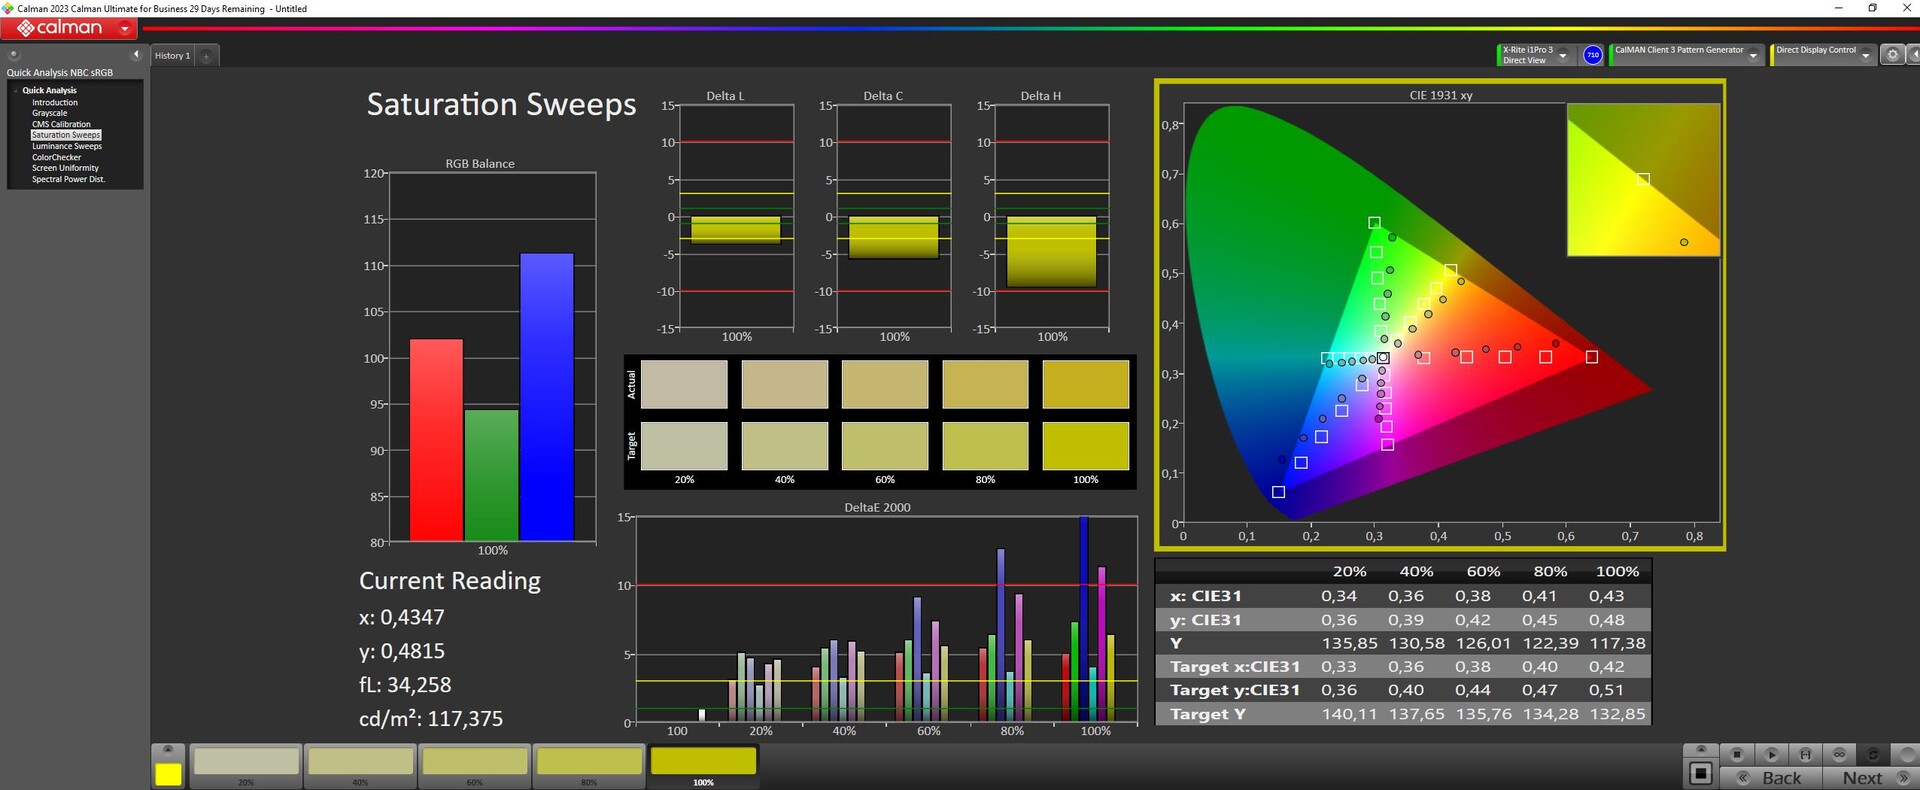
Il display opaco FHD (prodotto da Chi Mei) è stato ripreso dal modello G5 KE. Sebbene abbia un buon angolo di visione, il pannello IPS da 144 Hz non è all'altezza degli standard in termini di luminosità e contrasto. Il display non è in grado di riprodurre i consueti spazi di colore (sRGB, AdobeRG e DCI-P3). Ma almeno non presenta lo sfarfallio PWM a qualsiasi livello di luminosità. Non sono disponibili altre opzioni di pannello. Il Asus TUF A15, Intel NUC X15 e Lenovo Slim 5 16APH8 sono tutti dotati di display migliori.
| |||||||||||||||||||||||||
Distribuzione della luminosità: 85 %
Al centro con la batteria: 297 cd/m²
Contrasto: 874:1 (Nero: 0.34 cd/m²)
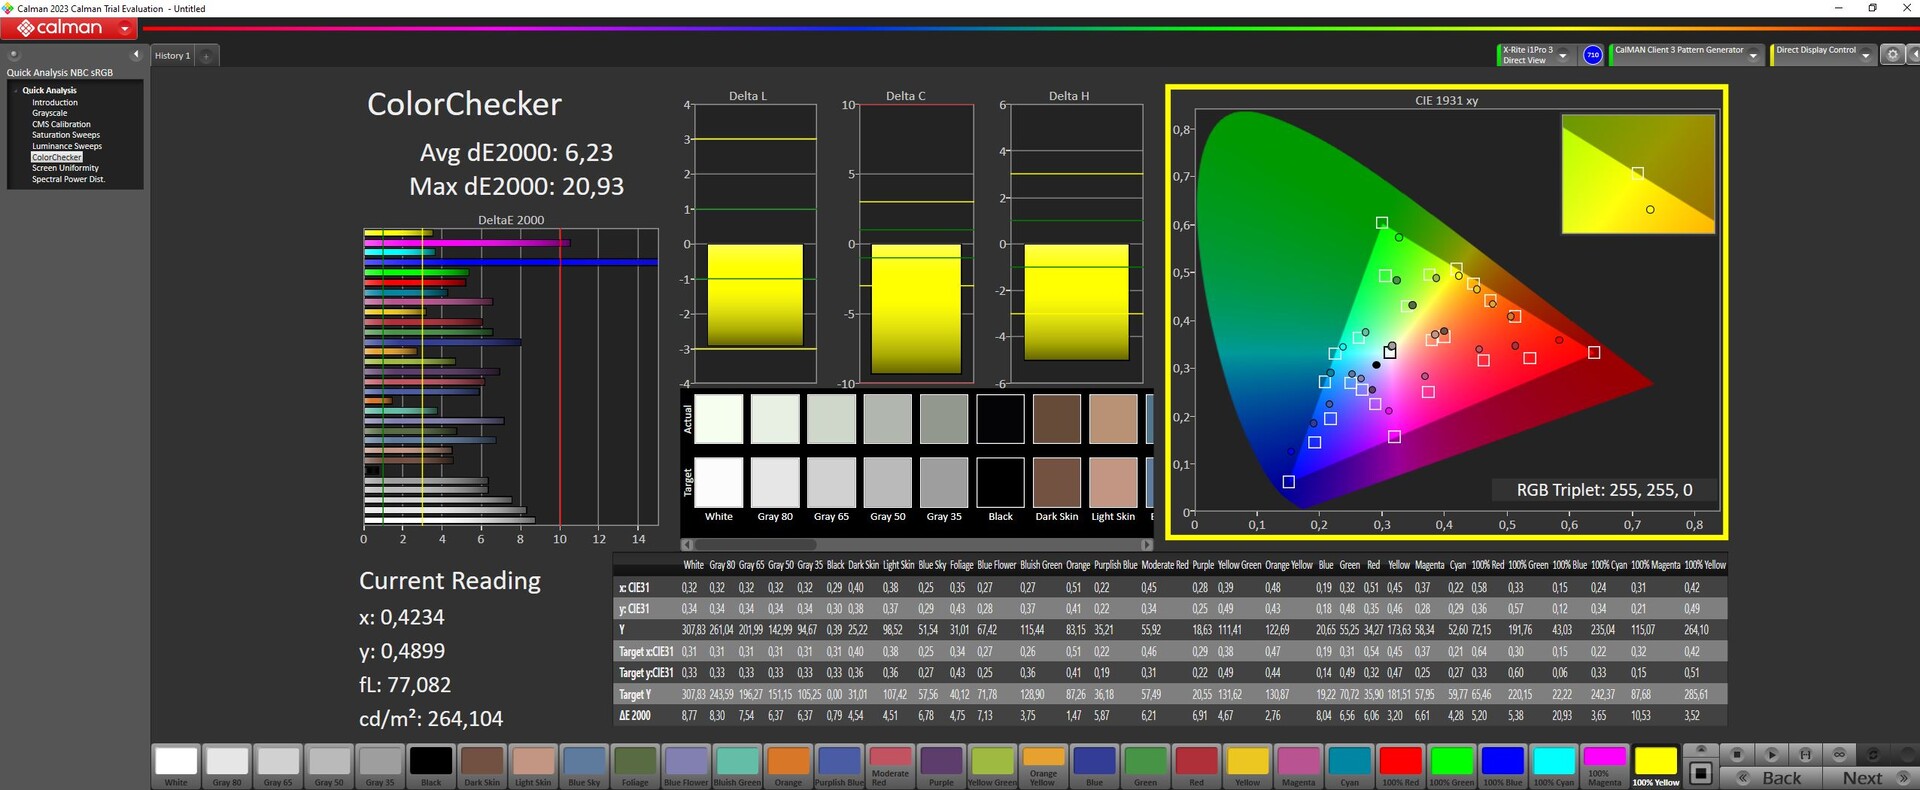
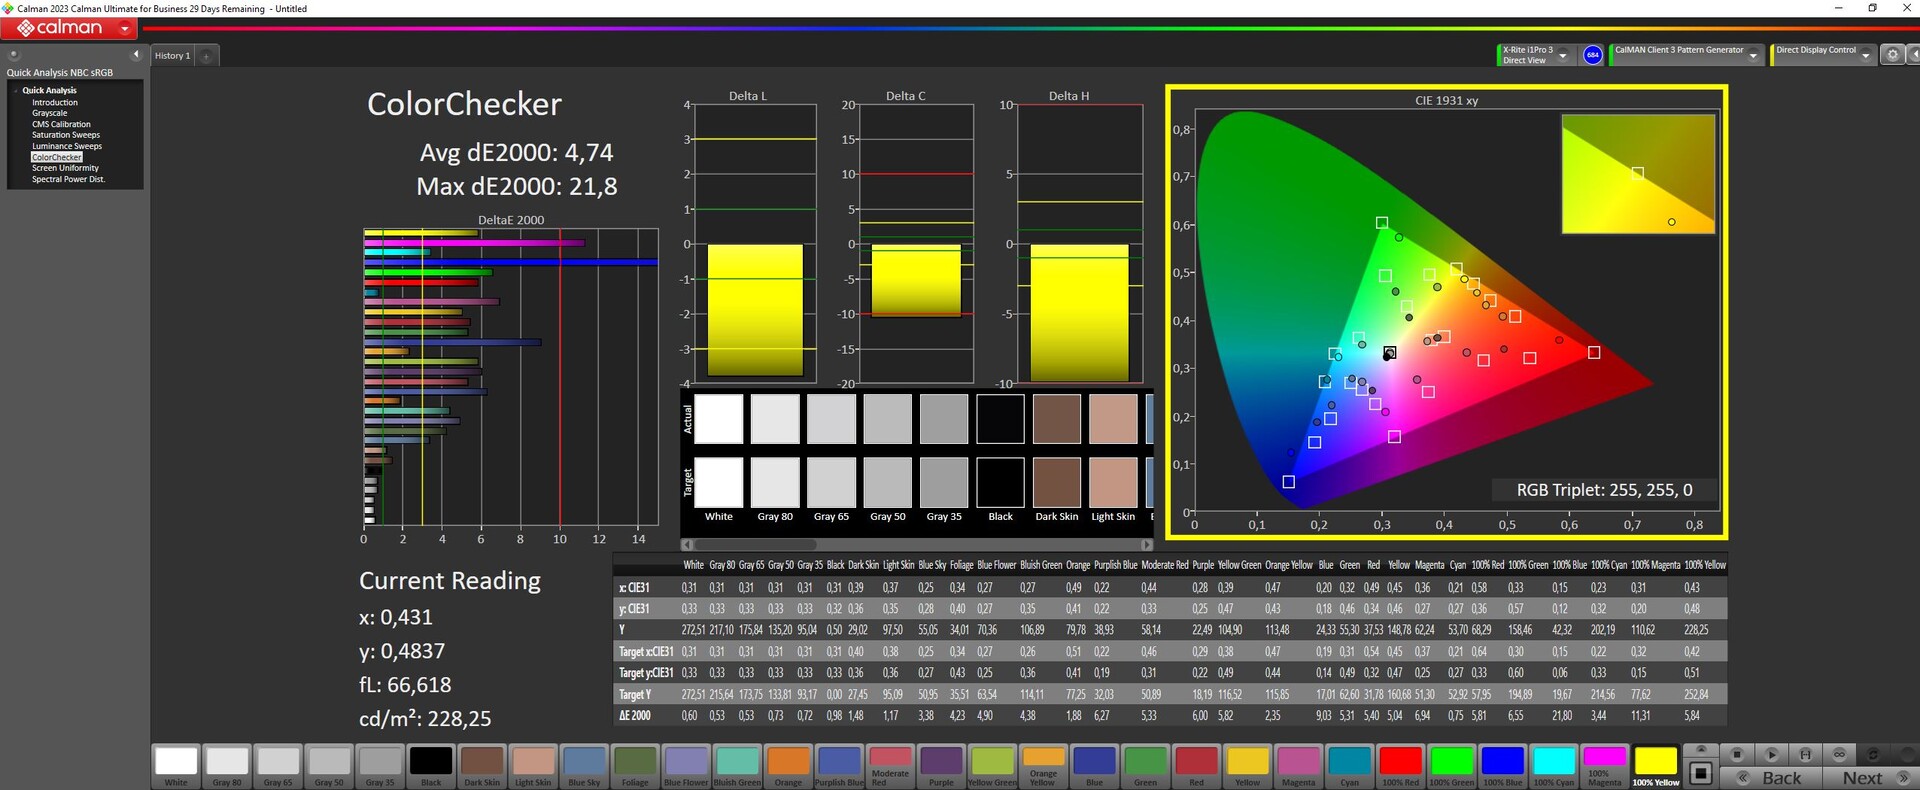
ΔE ColorChecker Calman: 6.23 | ∀{0.5-29.43 Ø4.71}
calibrated: 4.74
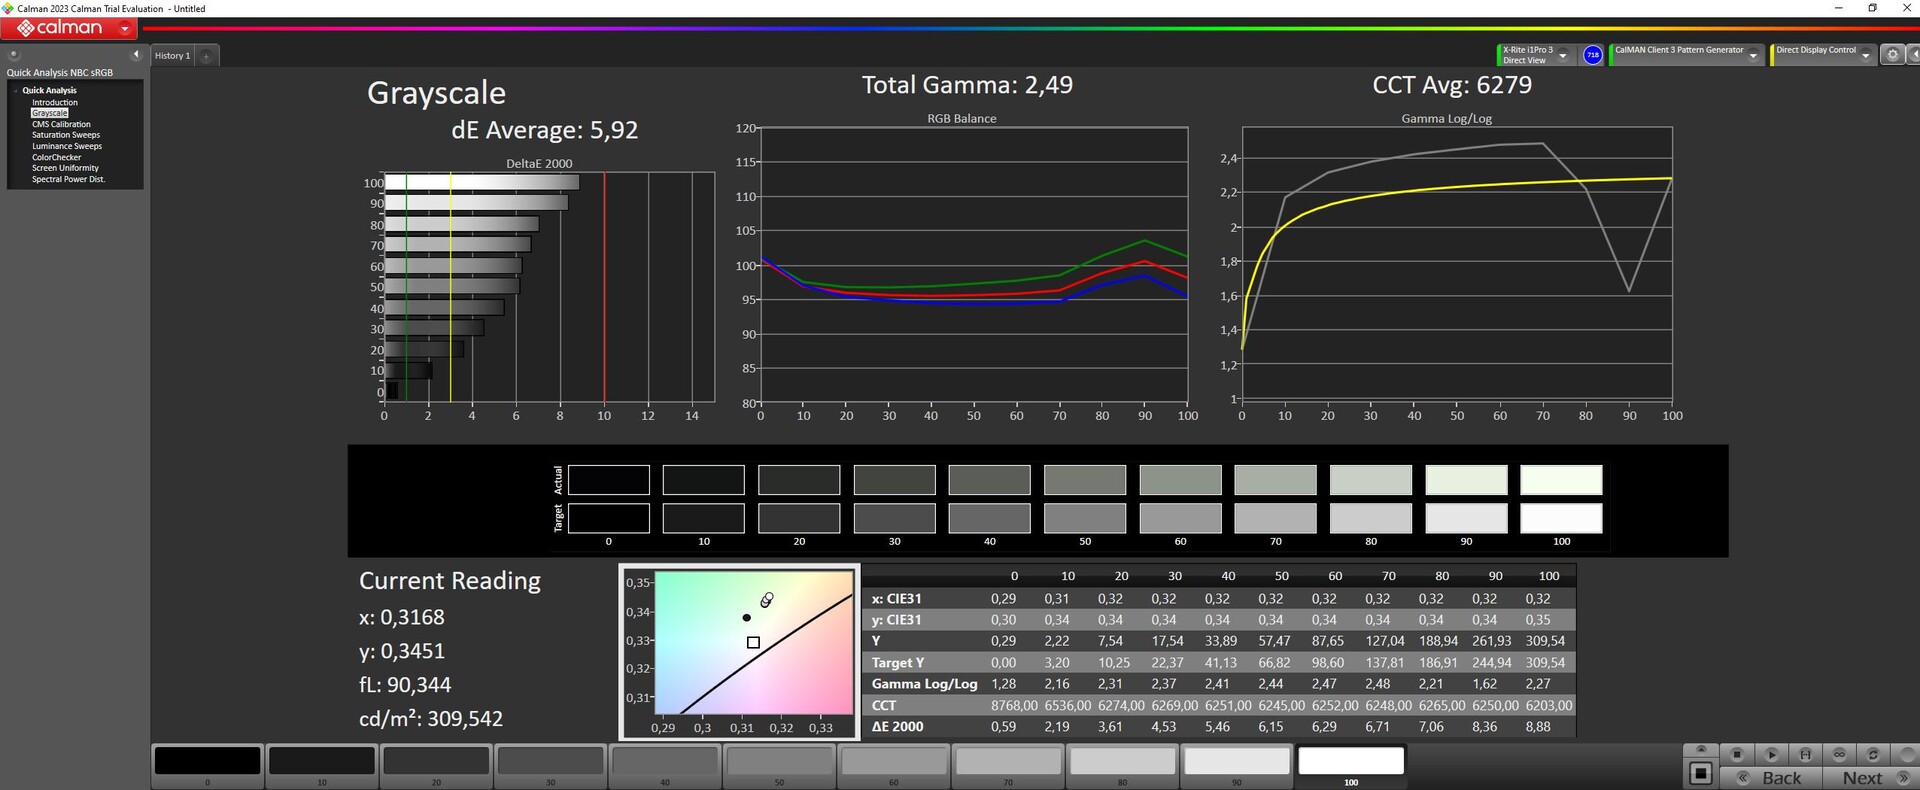
ΔE Greyscale Calman: 5.92 | ∀{0.09-98 Ø4.96}
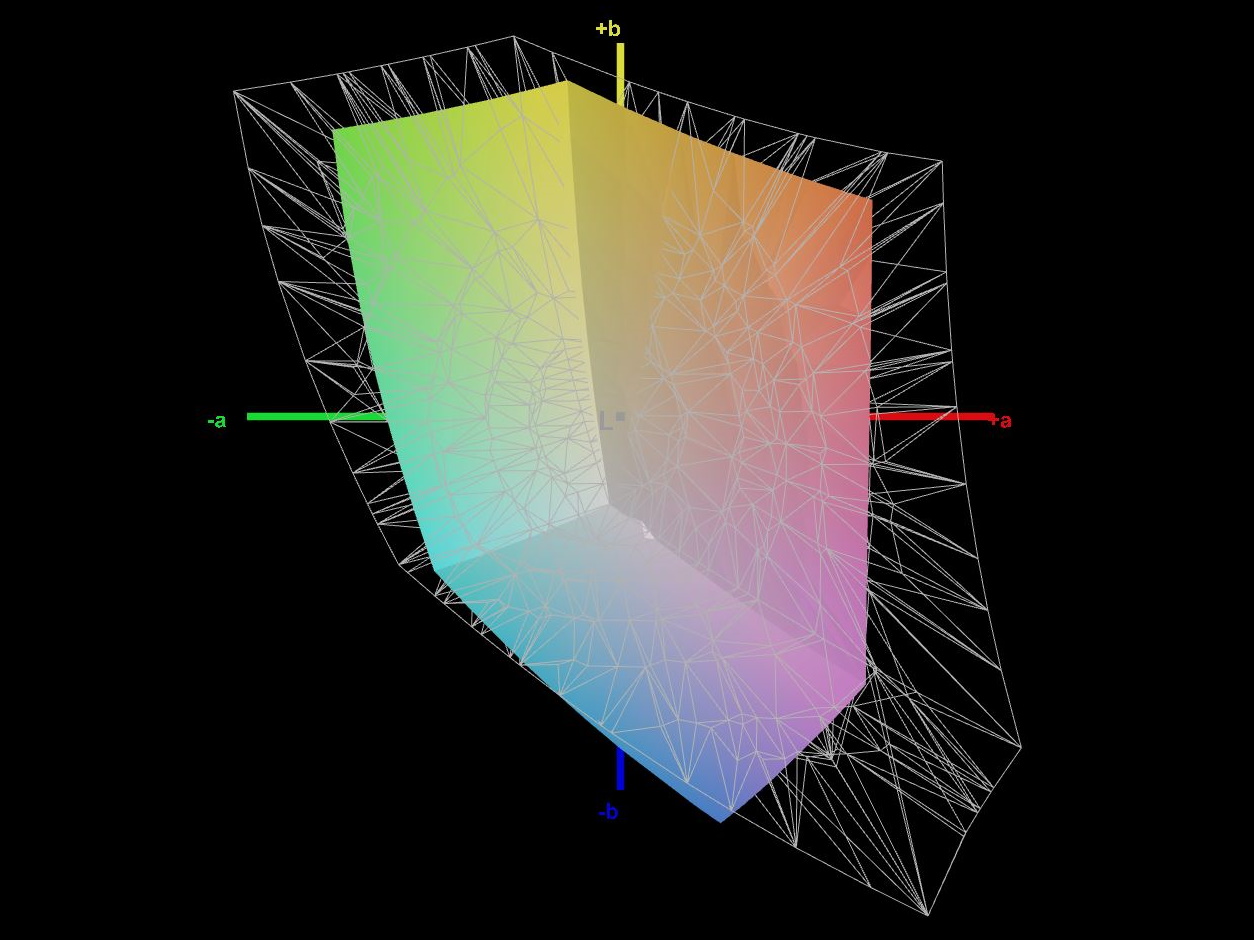
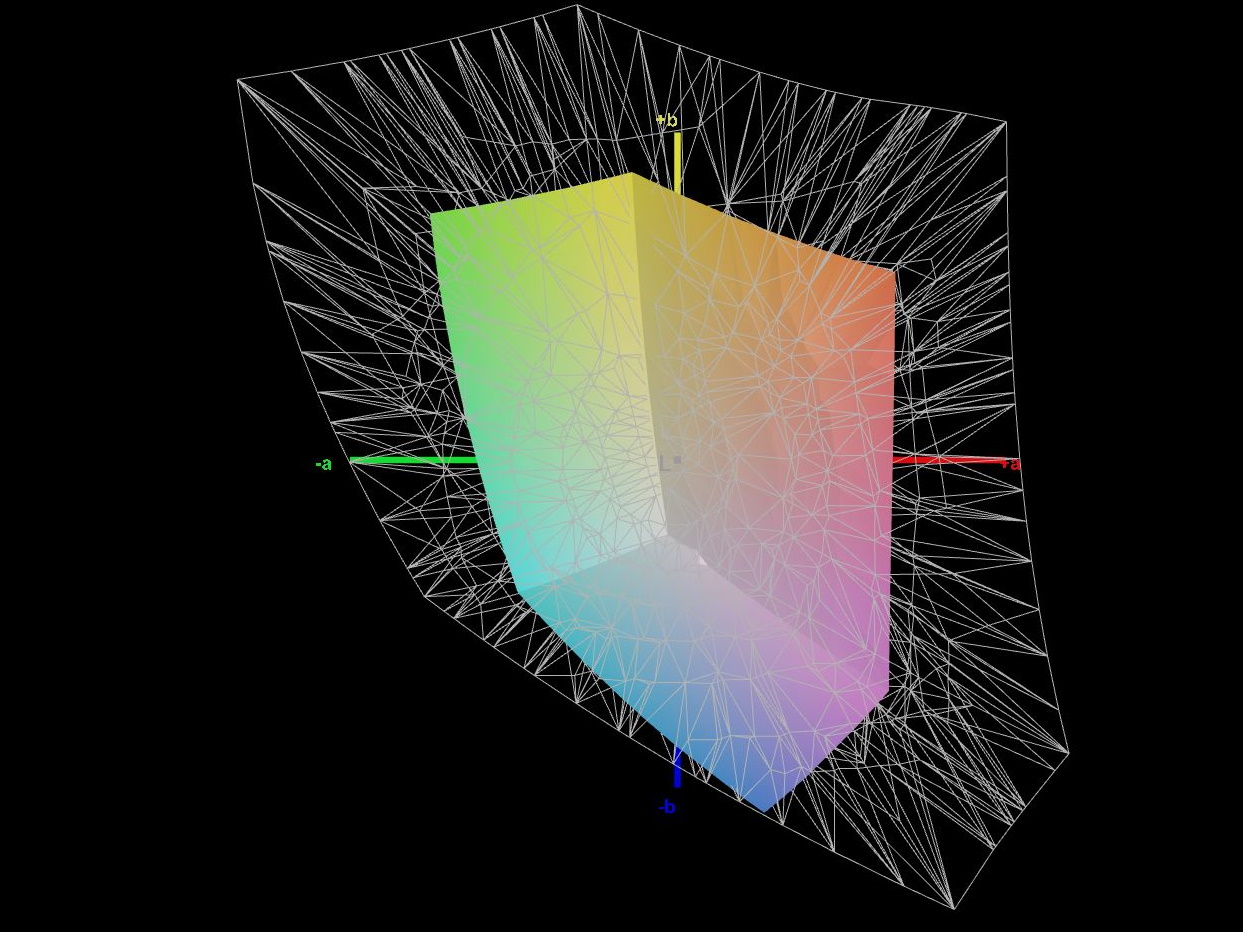
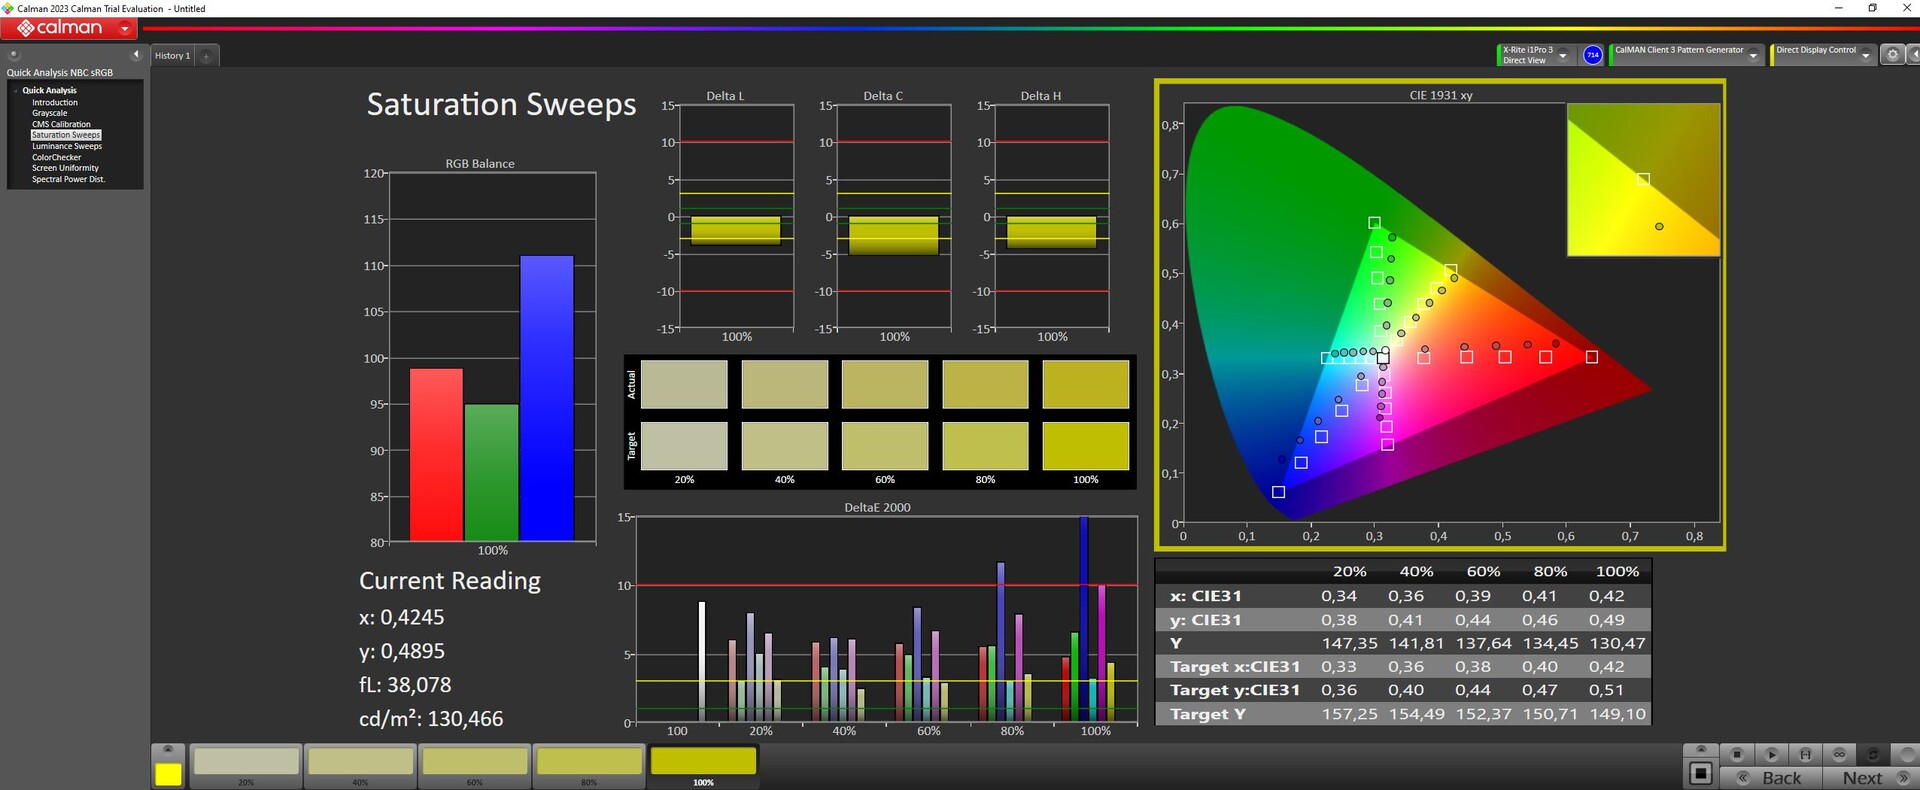
44.7% AdobeRGB 1998 (Argyll 3D)
64.3% sRGB (Argyll 3D)
43.2% Display P3 (Argyll 3D)
Gamma: 2.49
CCT: 6279 K
| Gigabyte G5 KF Chi Mei N156HRA-EA1, IPS, 1920x1080, 15.6" | MSI Cyborg 15 A12VF AU Optronics B156HAN15.1, IPS, 1920x1080, 15.6" | Intel NUC X15 LAPAC71H BOE HF NV156FHM-N4G, IPS, 1920x1080, 15.6" | Asus TUF A15 FA507 N156HMA-GA1, IPS, 1920x1080, 15.6" | Lenovo Legion Slim 5 16APH8 BOE NJ NE160QDM-NYC, IPS, 2560x1600, 16" | Gigabyte G5 KE Chi Mei N156HRA-EA1, IPS, 1920x1080, 15.6" | |
|---|---|---|---|---|---|---|
| Display | -2% | 47% | 50% | 58% | -6% | |
| Display P3 Coverage (%) | 43.2 | 42.3 -2% | 64.9 50% | 64.9 50% | 69.3 60% | 40.7 -6% |
| sRGB Coverage (%) | 64.3 | 62.6 -3% | 92.6 44% | 96.5 50% | 100 56% | 61 -5% |
| AdobeRGB 1998 Coverage (%) | 44.7 | 43.7 -2% | 66.3 48% | 66.6 49% | 70 57% | 42.1 -6% |
| Response Times | -9% | 51% | -57% | 43% | -40% | |
| Response Time Grey 50% / Grey 80% * (ms) | 25.1 ? | 22 ? 12% | 7.8 ? 69% | 30.4 ? -21% | 10.7 ? 57% | 26.64 ? -6% |
| Response Time Black / White * (ms) | 10.8 ? | 14 ? -30% | 7.3 ? 32% | 20.8 ? -93% | 7.8 ? 28% | 18.65 ? -73% |
| PWM Frequency (Hz) | ||||||
| Screen | 22% | 51% | 48% | 39% | 1% | |
| Brightness middle (cd/m²) | 297 | 247 -17% | 365 23% | 288 -3% | 371.6 25% | 269 -9% |
| Brightness (cd/m²) | 275 | 234 -15% | 356 29% | 271 -1% | 343 25% | 248 -10% |
| Brightness Distribution (%) | 85 | 89 5% | 86 1% | 91 7% | 84 -1% | 85 0% |
| Black Level * (cd/m²) | 0.34 | 0.25 26% | 0.17 50% | 0.17 50% | 0.44 -29% | 0.5 -47% |
| Contrast (:1) | 874 | 988 13% | 2147 146% | 1694 94% | 845 -3% | 538 -38% |
| Colorchecker dE 2000 * | 6.23 | 3.78 39% | 3.51 44% | 1.9 70% | 1.52 76% | 4.54 27% |
| Colorchecker dE 2000 max. * | 20.93 | 6.42 69% | 6.37 70% | 3.3 84% | 2.68 87% | 17.28 17% |
| Colorchecker dE 2000 calibrated * | 4.74 | 3.94 17% | 1.88 60% | 0.9 81% | 0.33 93% | 3.34 30% |
| Greyscale dE 2000 * | 5.92 | 2.16 64% | 3.83 35% | 2.7 54% | 1.2 80% | 3.8 36% |
| Gamma | 2.49 88% | 2.33 94% | 2.47 89% | 2.32 95% | 2.1 105% | 2.17 101% |
| CCT | 6279 104% | 6906 94% | 7362 88% | 6535 99% | 6503 100% | 7408 88% |
| Media totale (Programma / Settaggio) | 4% /
13% | 50% /
50% | 14% /
34% | 47% /
44% | -15% /
-6% |
* ... Meglio usare valori piccoli
Tempi di risposta del Display
| ↔ Tempi di risposta dal Nero al Bianco | ||
|---|---|---|
| 10.8 ms ... aumenta ↗ e diminuisce ↘ combinato | ↗ 9.9 ms Incremento | 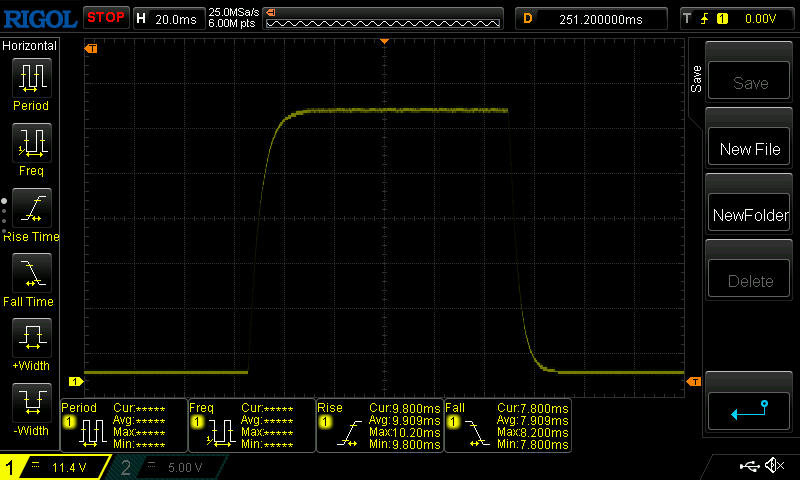 |
| ↘ 7.9 ms Calo | ||
| Lo schermo mostra buoni tempi di risposta durante i nostri tests, ma potrebbe essere troppo lento per i gamers competitivi. In confronto, tutti i dispositivi di test variano da 0.1 (minimo) a 240 (massimo) ms. » 29 % di tutti i dispositivi è migliore. Questo significa che i tempi di risposta rilevati sono migliori rispettto alla media di tutti i dispositivi testati (19.8 ms). | ||
| ↔ Tempo di risposta dal 50% Grigio all'80% Grigio | ||
| 25.1 ms ... aumenta ↗ e diminuisce ↘ combinato | ↗ 11.7 ms Incremento | 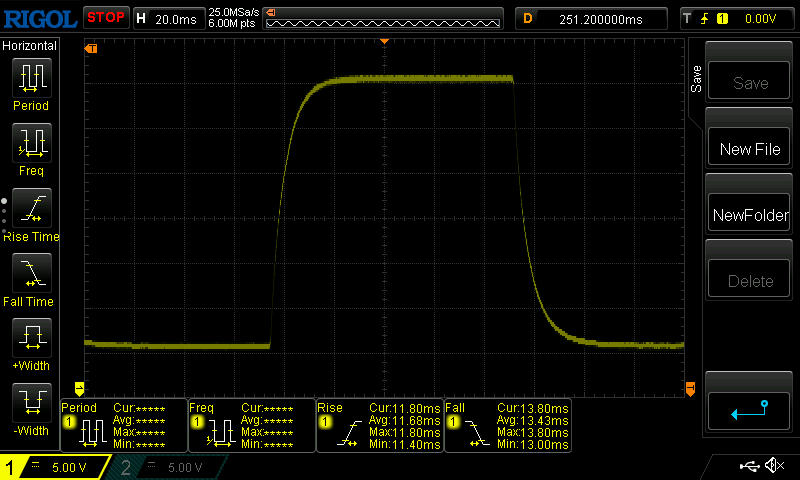 |
| ↘ 13.4 ms Calo | ||
| Lo schermo mostra tempi di risposta relativamente lenti nei nostri tests e potrebbe essere troppo lento per i gamers. In confronto, tutti i dispositivi di test variano da 0.165 (minimo) a 636 (massimo) ms. » 36 % di tutti i dispositivi è migliore. Questo significa che i tempi di risposta rilevati sono migliori rispettto alla media di tutti i dispositivi testati (31 ms). | ||
Sfarfallio dello schermo / PWM (Pulse-Width Modulation)
| flickering dello schermo / PWM non rilevato | 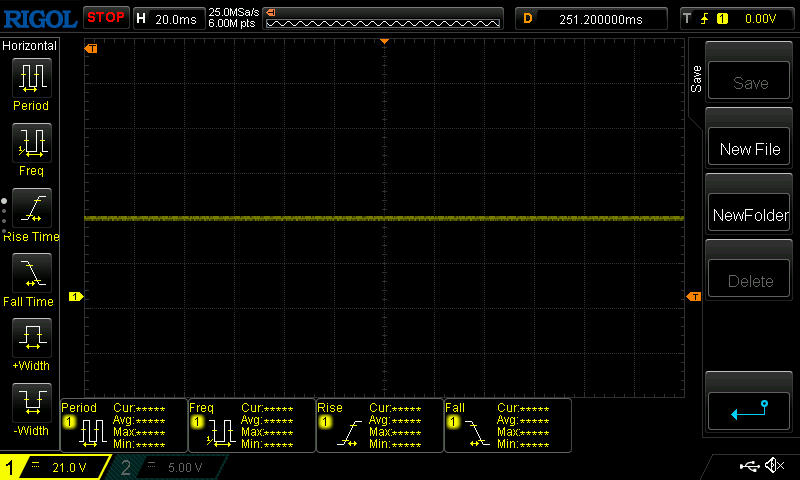 | ||
In confronto: 52 % di tutti i dispositivi testati non utilizza PWM per ridurre la luminosita' del display. Se è rilevato PWM, una media di 7754 (minimo: 5 - massimo: 343500) Hz è stata rilevata. | |||

Performance - Alder Lake incontra Ada Lovelace
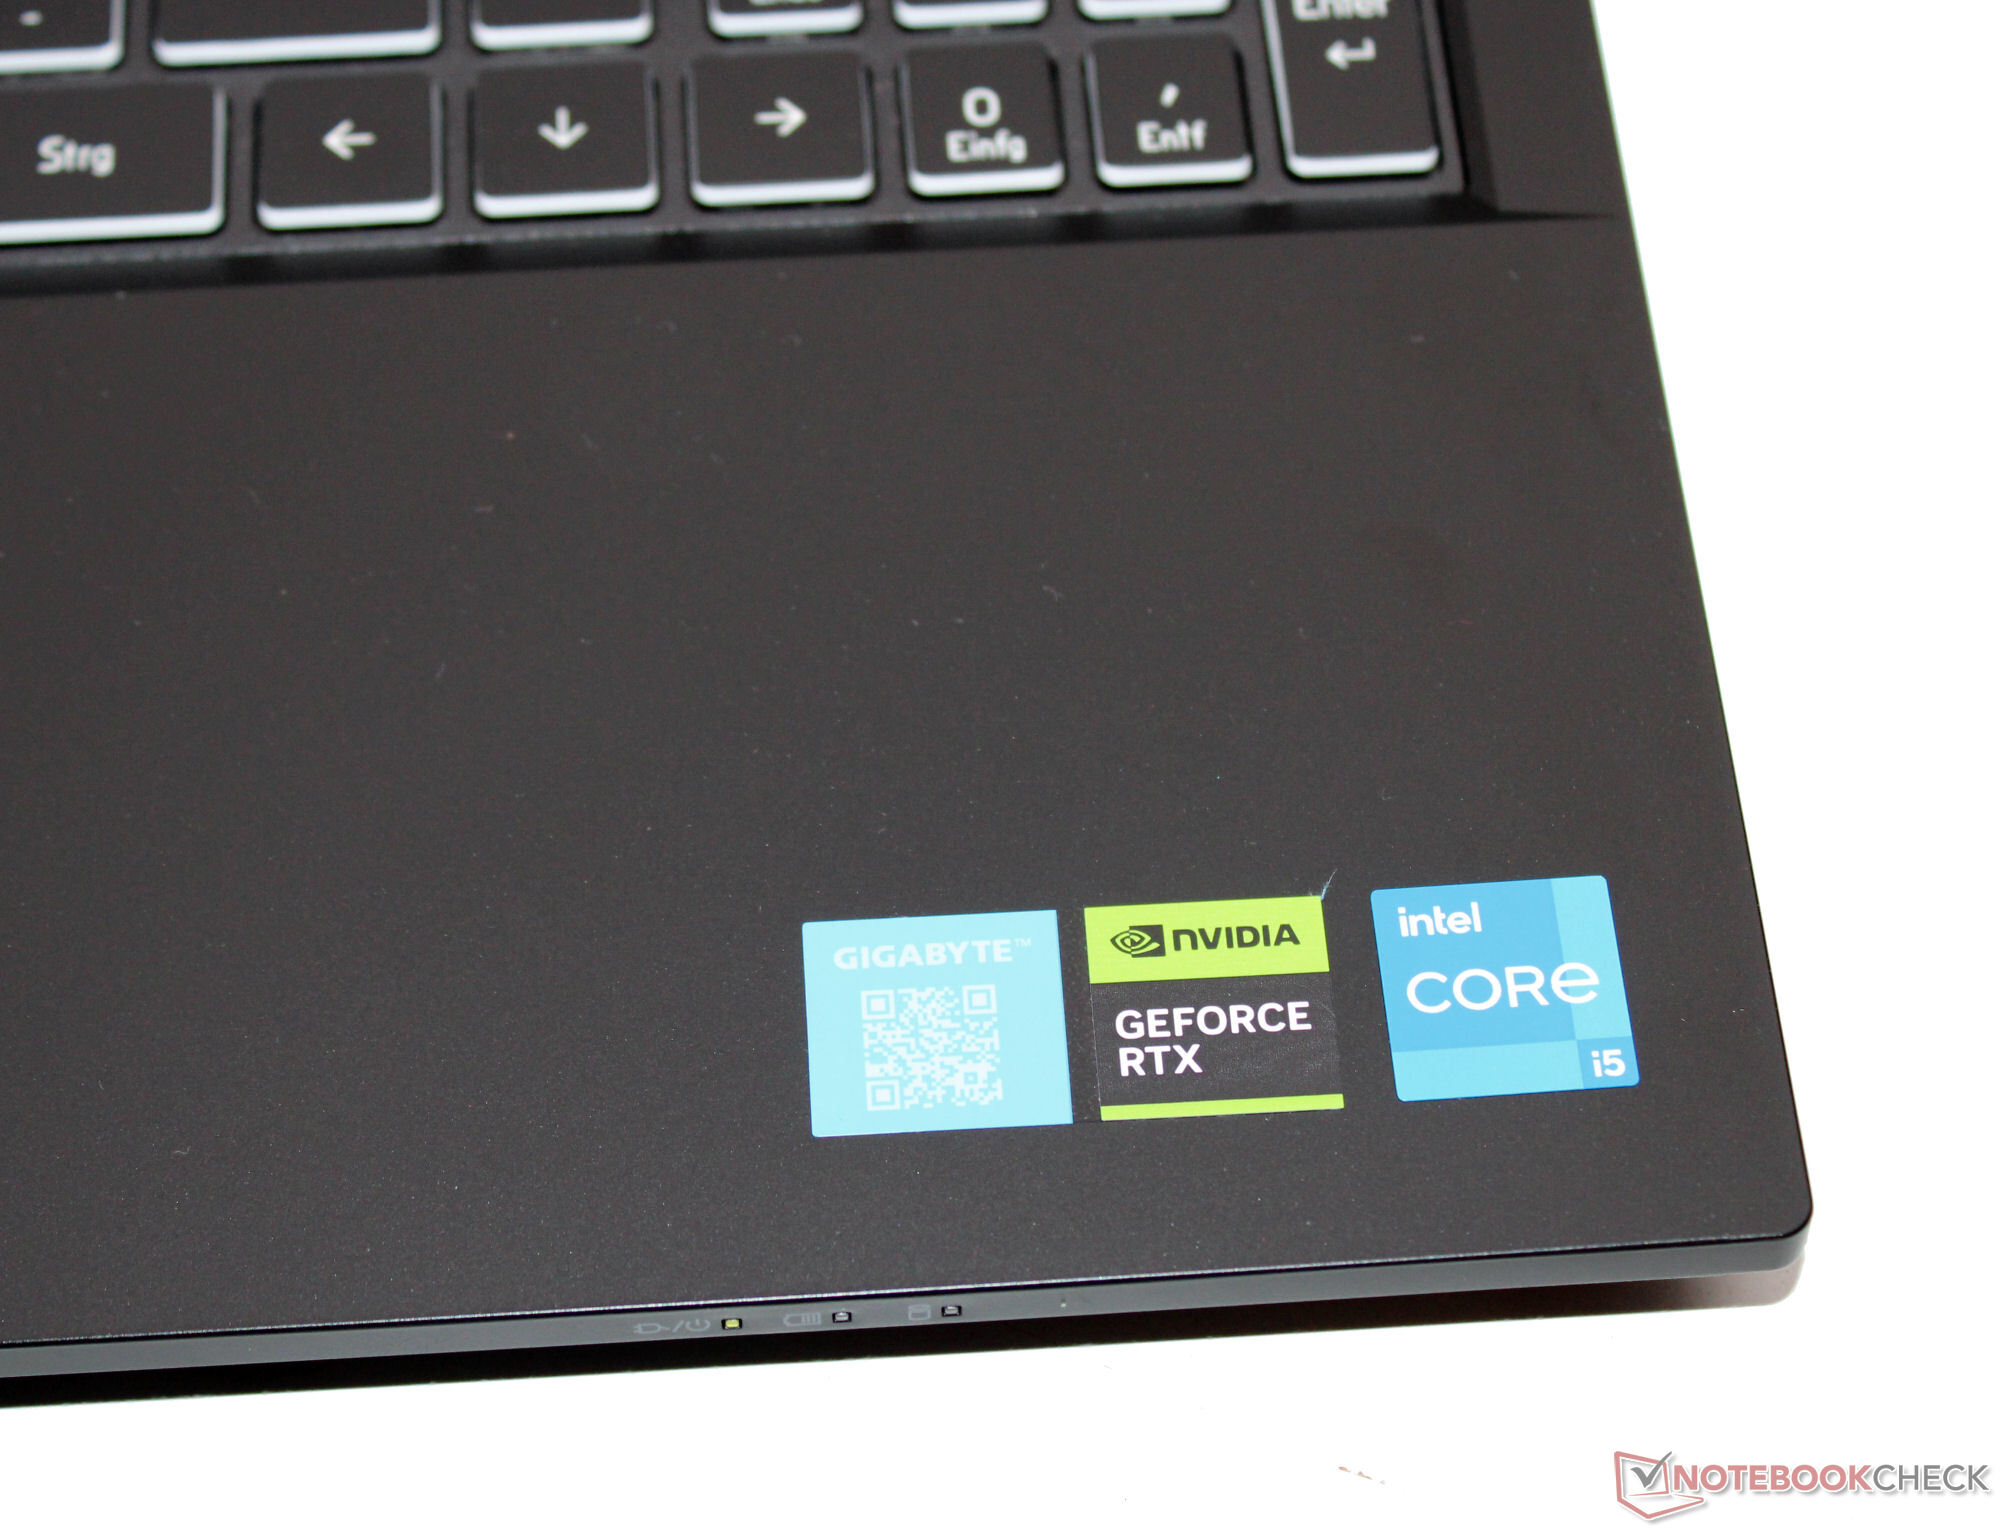
Con il G5 KF, Gigabyte ha un portatile da gioco FHD relativamente conveniente nella sua linea di prodotti. Il portatile monta un Core i5-12500H e GeForce RTX 4060e può essere acquistato a poco meno di 1.000 euro (1.059 dollari). L'azienda offre anche modelli meno costosi con la RTX 4050 (G5 MF) o RTX 3050 (G5 GE).
Condizioni del test
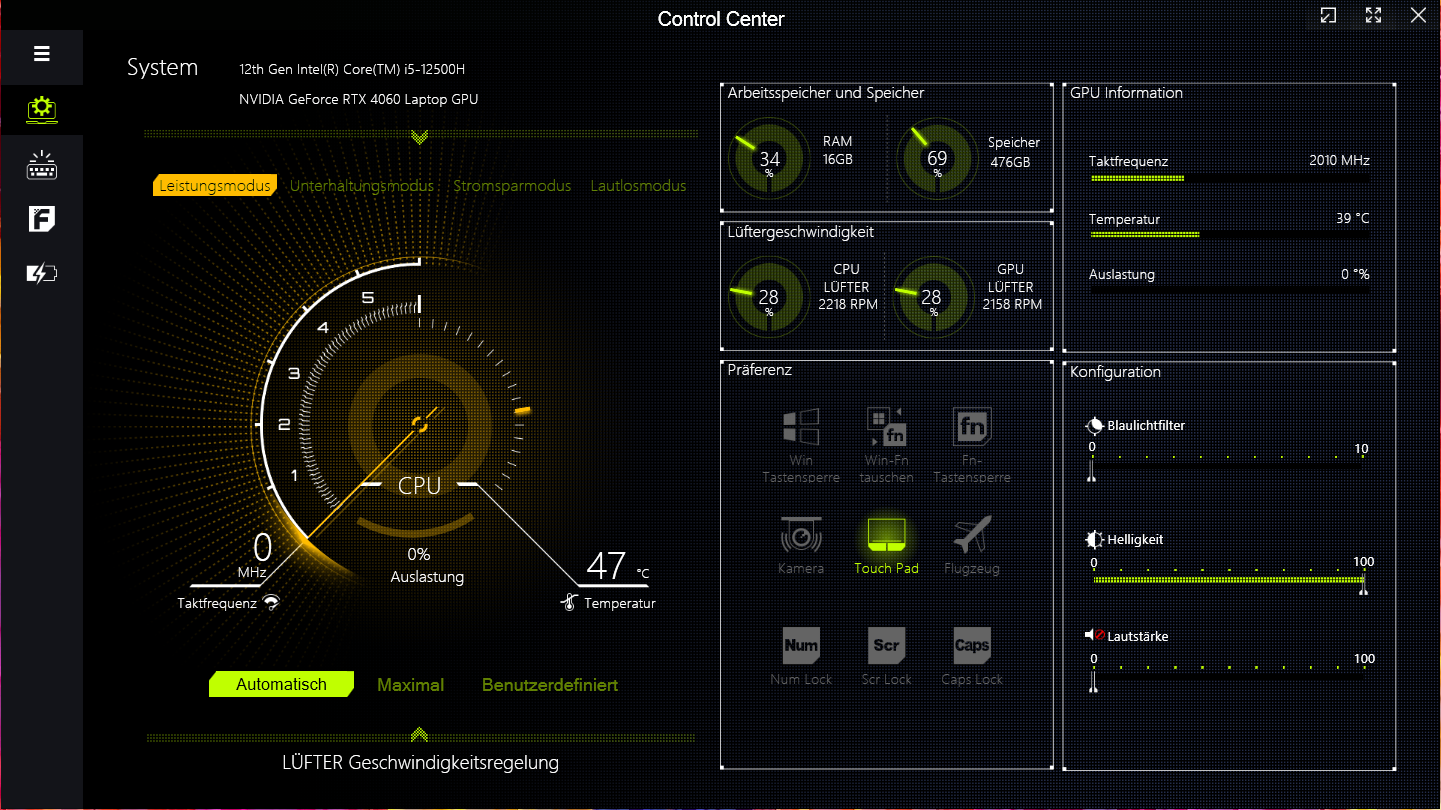
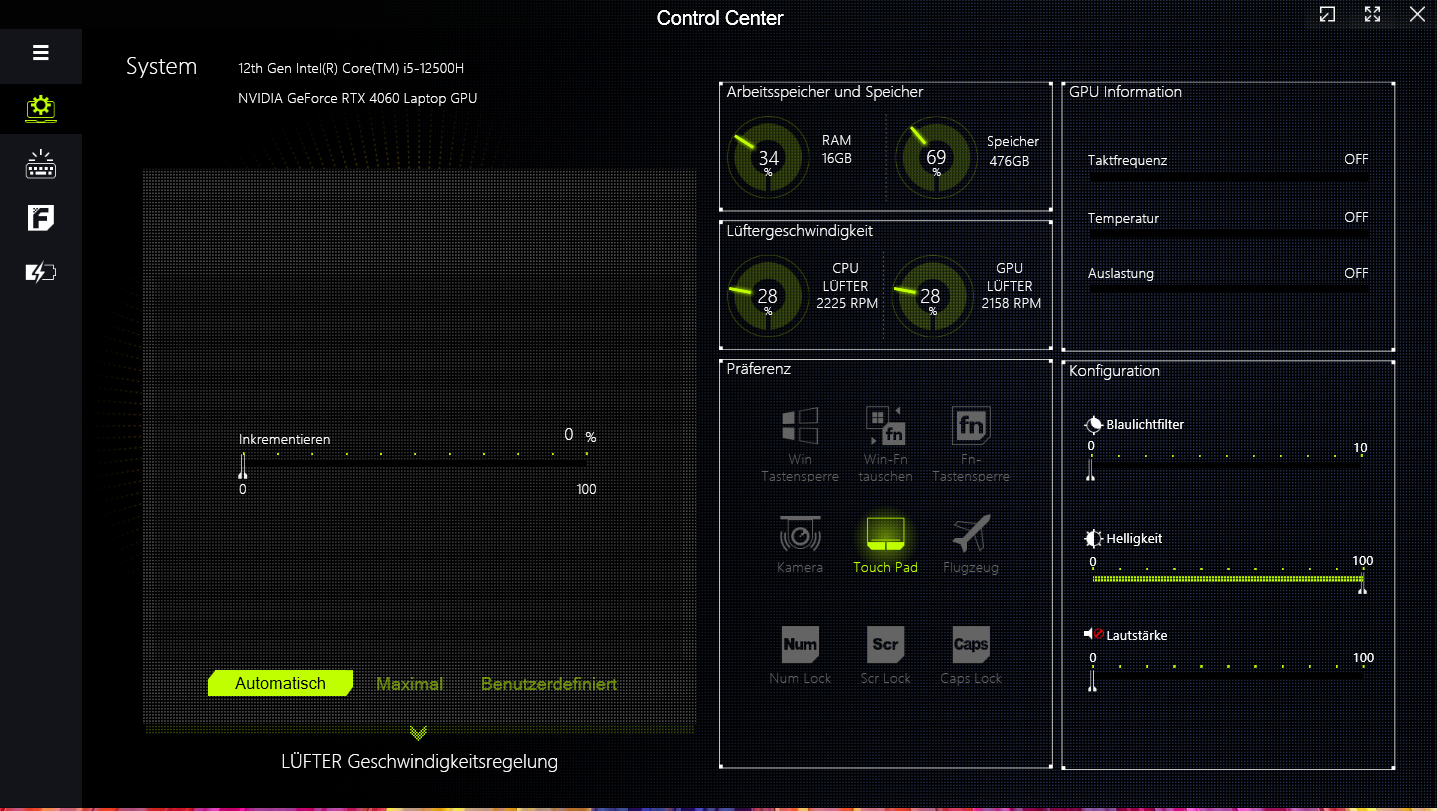
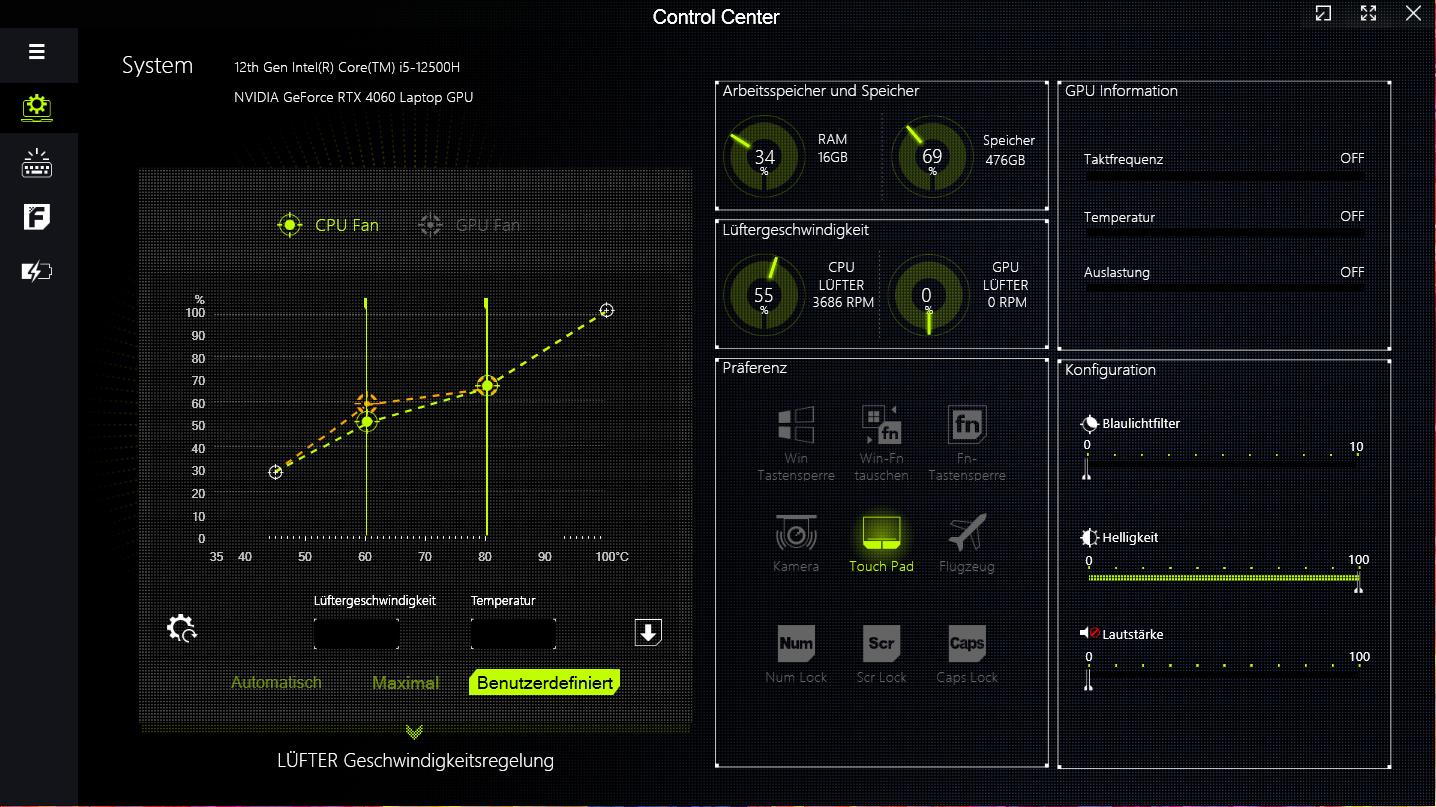
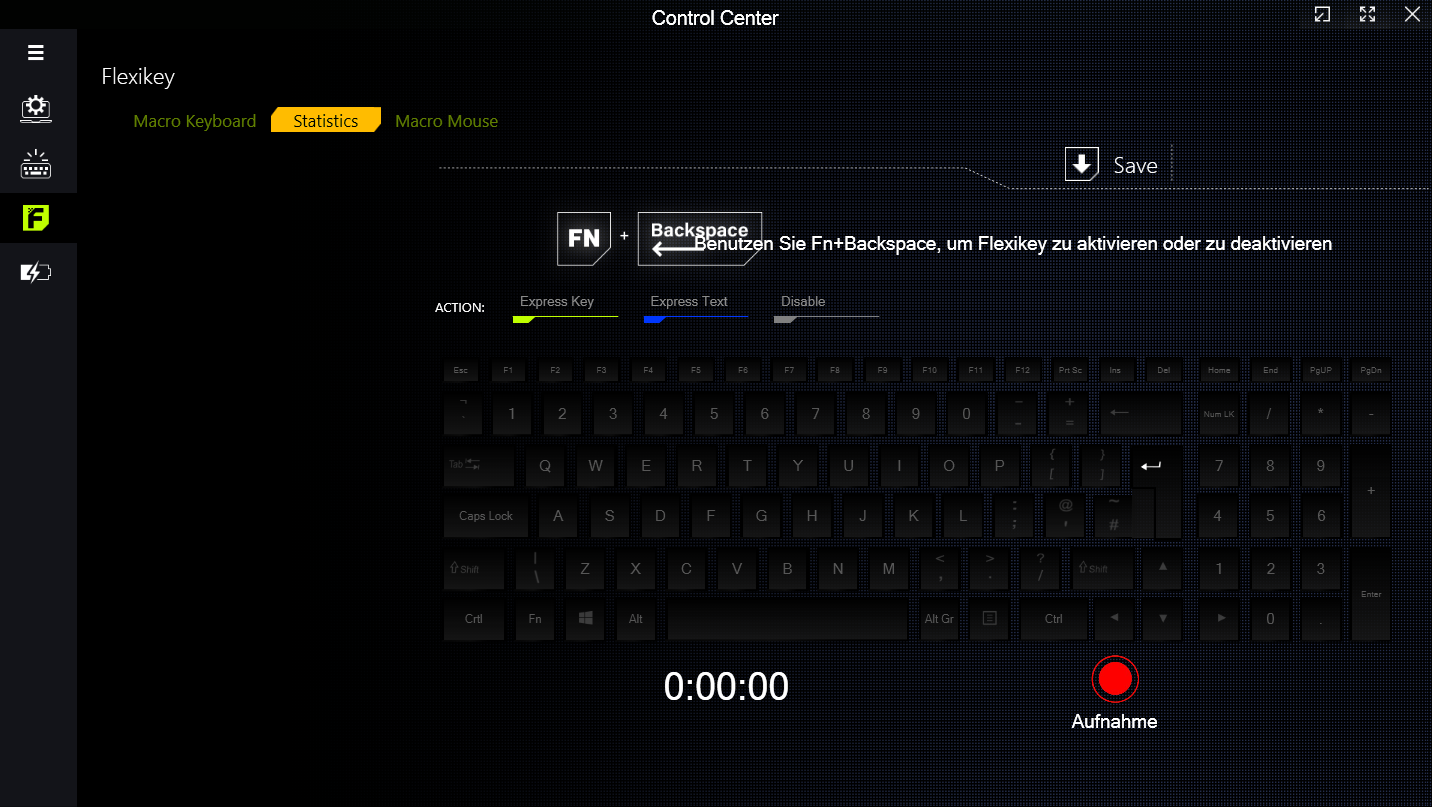
Il G5 offre quattro modalità di prestazioni specificate dal produttore (vedere tabella). Può passare da una all'altra utilizzando il software Control Center. Abbiamo utilizzato la "Modalità prestazioni" per i nostri benchmark e la "Modalità risparmio energetico" per i test di durata della batteria.
| Modalità Performance | Modalità Intrattenimento | Modalità Risparmio energetico | Modalità Silenziosa | |
|---|---|---|---|---|
| Limite di potenza 1 (HWInfo) | 60 Watt | 50 Watt | 45 Watt | 15 Watt |
| Limite di potenza 2 (HWInfo) | 125 Watt | 115 Watt | 30 Watt | 30 Watt |
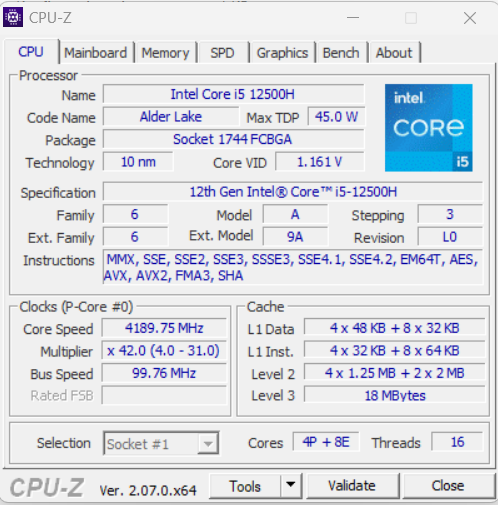
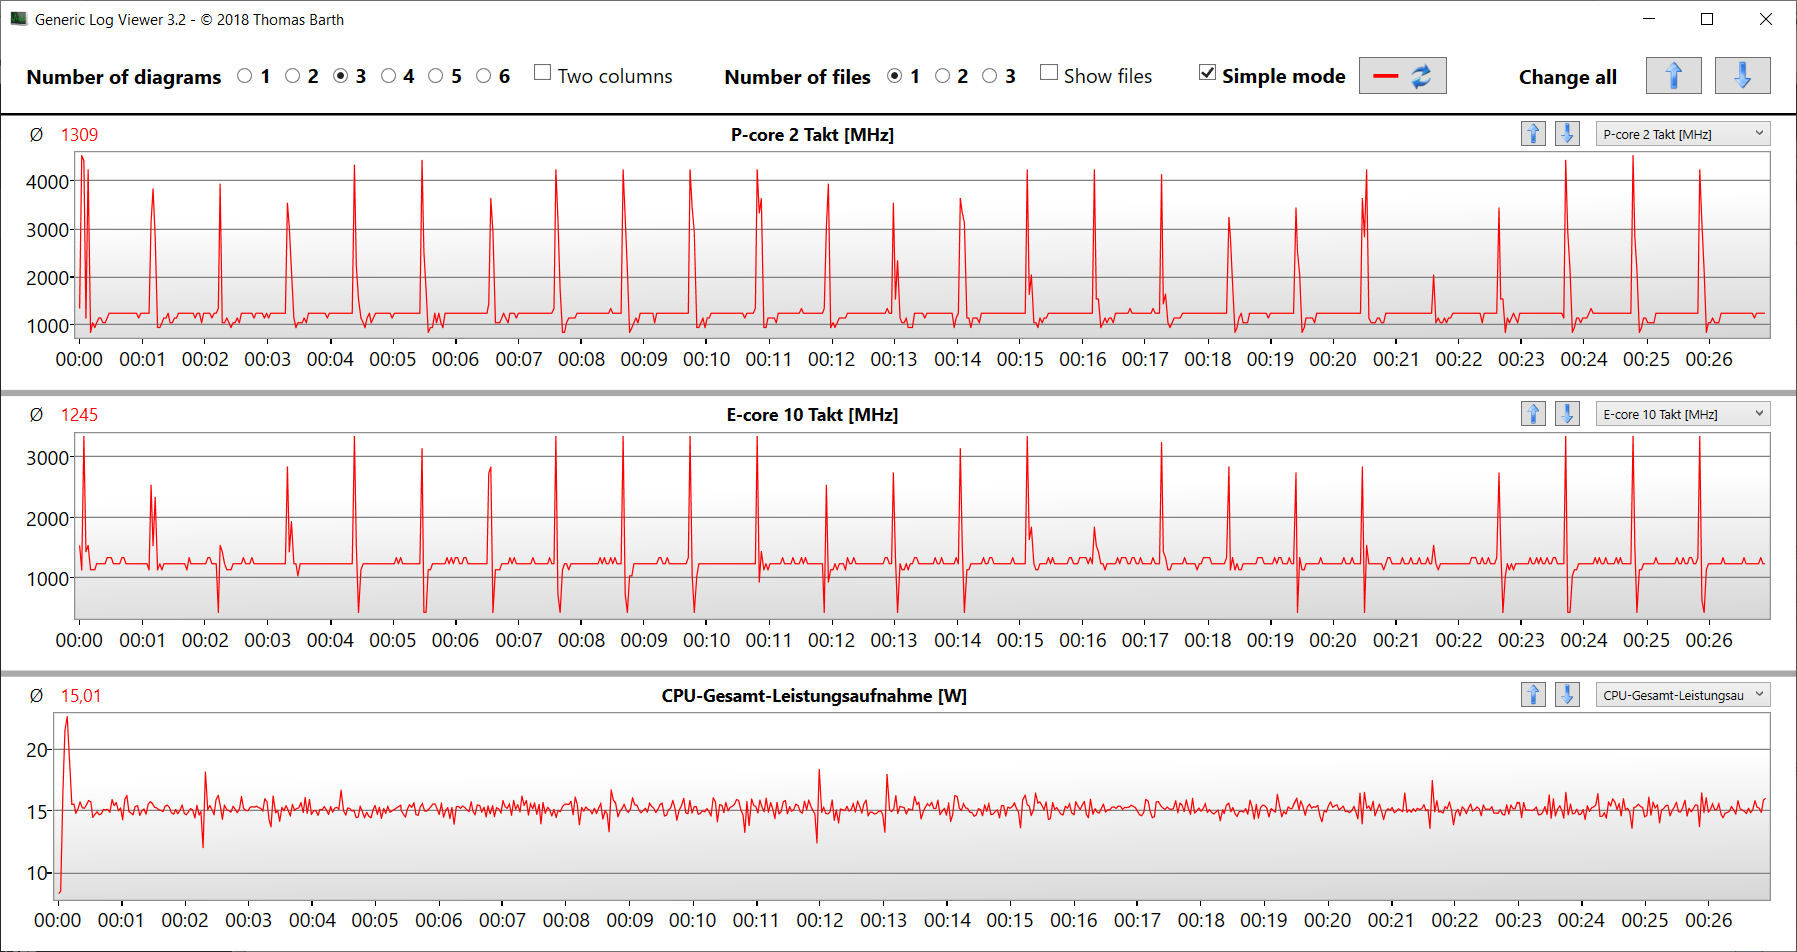
Processore
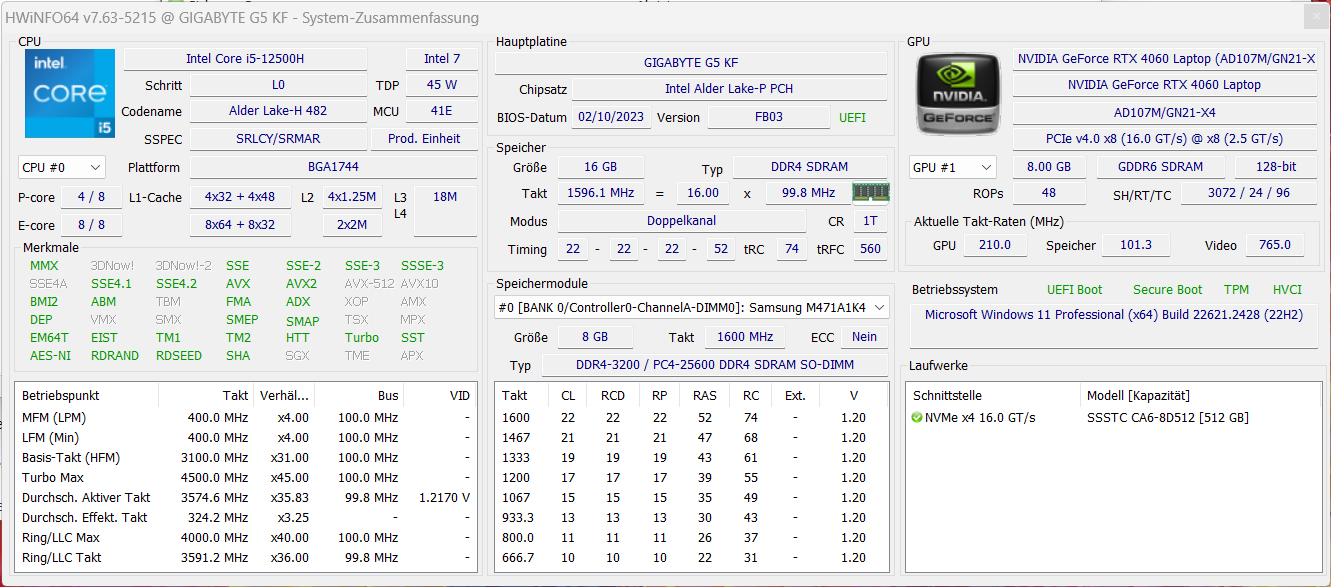
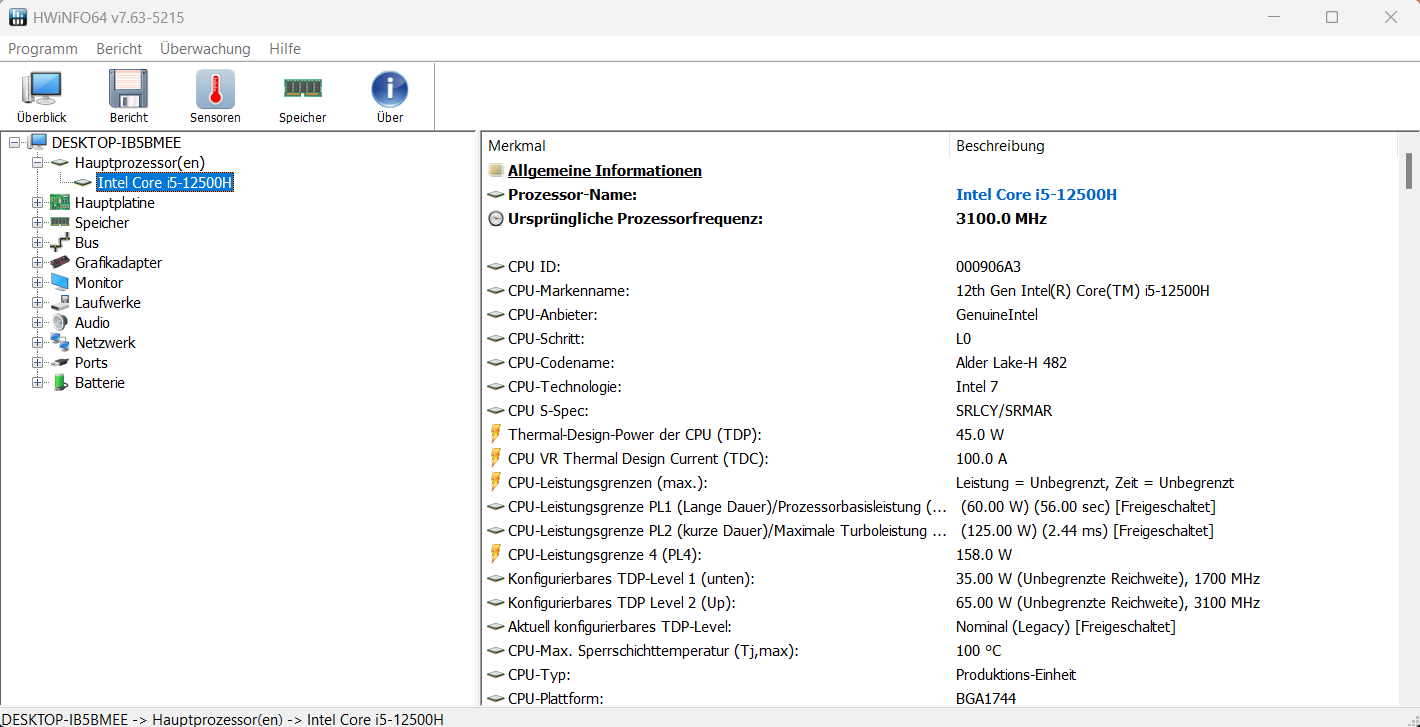
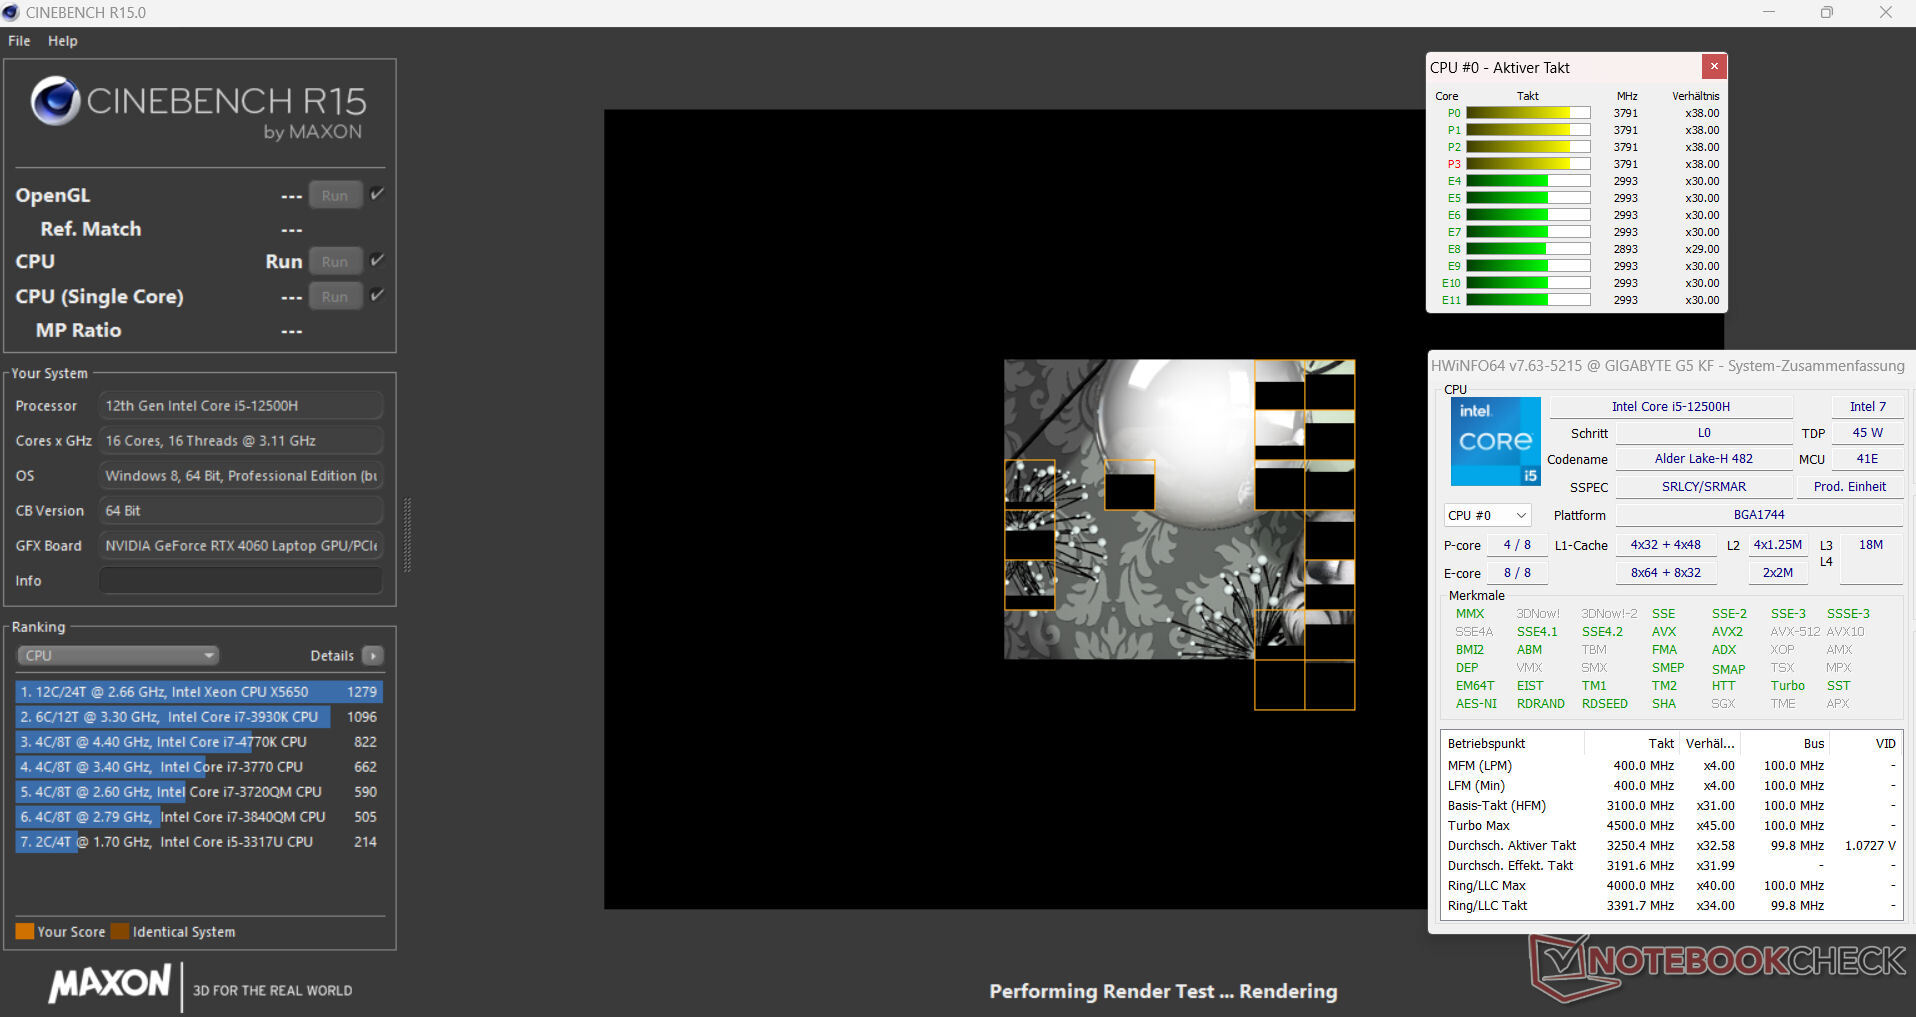
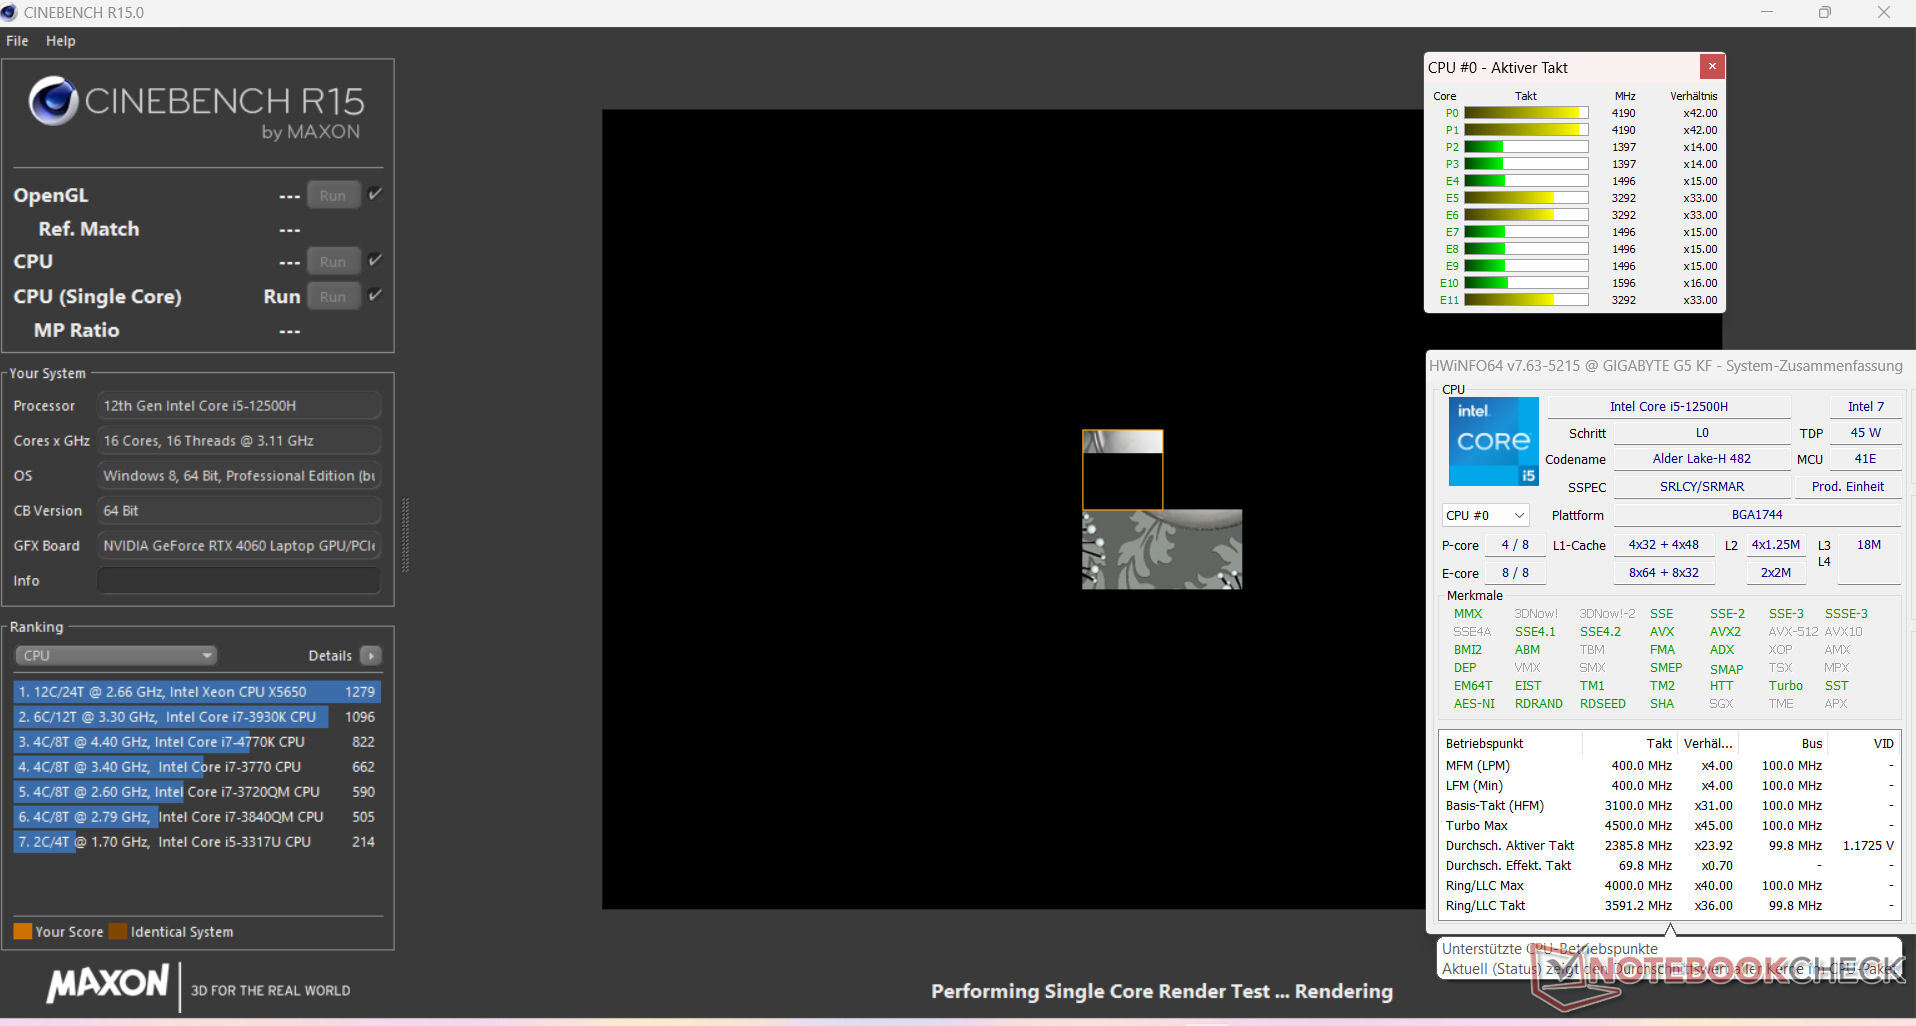
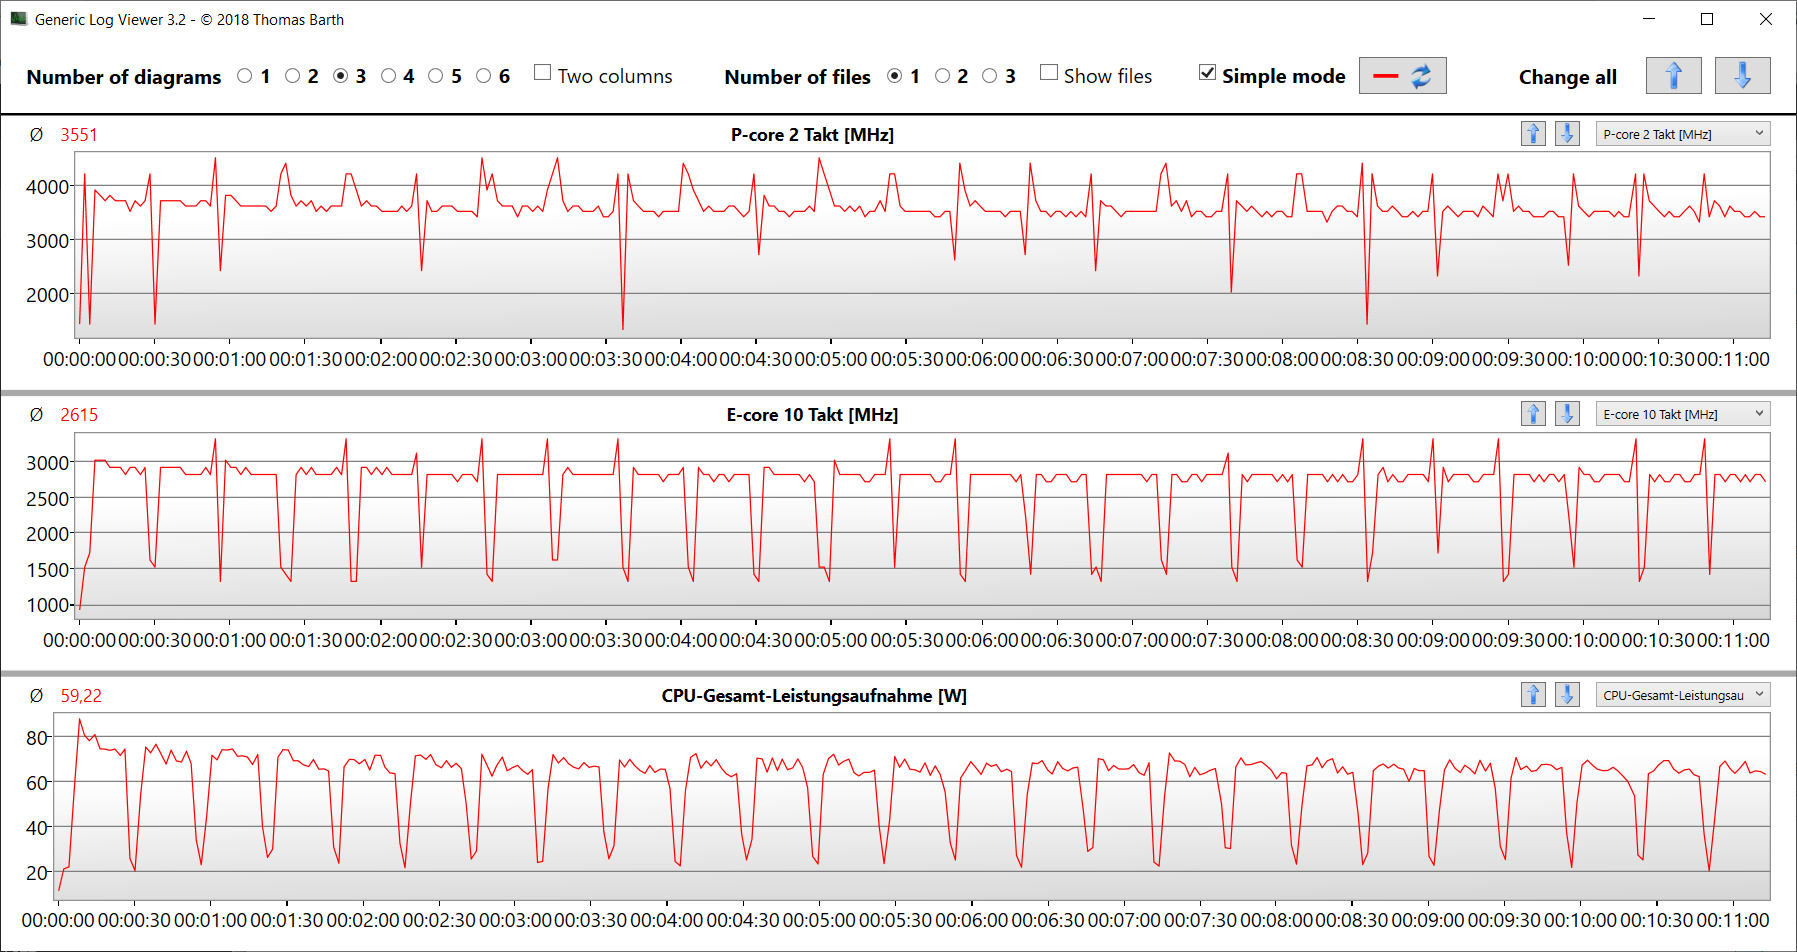
I 12 core della CPU del Core i5-12500H (4 core P, 8 core E) possono raggiungere frequenze massime di 4,5 GHz (P) e 3,3 GHz (E). In caso di carico multi-thread sostenuto (cioè CB15 in un ciclo), la velocità di clock è scesa leggermente tra la prima e la seconda esecuzione, per poi rimanere a un livello relativamente costante.
I risultati dei benchmark sono in linea con quanto abbiamo visto dalla CPU in media (quando è collegata alla rete). Per quanto riguarda l'alimentazione a batteria, il punteggio single-thread più rilevante in CB15 (159 punti) ha registrato un calo minore rispetto al punteggio multi-thread (741 punti).
Cinebench R15 Multi Sustained load
| CPU Performance rating - Percent | |
| Media della classe Gaming | |
| Lenovo Legion Slim 5 16APH8 | |
| Intel NUC X15 LAPAC71H | |
| MSI Cyborg 15 A12VF | |
| Asus TUF A15 FA507 | |
| Gigabyte G5 KE | |
| Media Intel Core i5-12500H | |
| Gigabyte G5 KF | |
* ... Meglio usare valori piccoli
AIDA64: FP32 Ray-Trace | FPU Julia | CPU SHA3 | CPU Queen | FPU SinJulia | FPU Mandel | CPU AES | CPU ZLib | FP64 Ray-Trace | CPU PhotoWorxx
| Performance rating | |
| Media della classe Gaming | |
| Lenovo Legion Slim 5 16APH8 | |
| Asus TUF A15 FA507 | |
| Intel NUC X15 LAPAC71H | |
| Gigabyte G5 KE | |
| MSI Cyborg 15 A12VF | |
| Gigabyte G5 KF | |
| Media Intel Core i5-12500H | |
| AIDA64 / FP32 Ray-Trace | |
| Media della classe Gaming (10227 - 85542, n=105, ultimi 2 anni) | |
| Lenovo Legion Slim 5 16APH8 | |
| Asus TUF A15 FA507 | |
| Intel NUC X15 LAPAC71H | |
| MSI Cyborg 15 A12VF | |
| Gigabyte G5 KE | |
| Media Intel Core i5-12500H (6851 - 13947, n=9) | |
| Gigabyte G5 KF | |
| AIDA64 / FPU Julia | |
| Media della classe Gaming (51376 - 238426, n=105, ultimi 2 anni) | |
| Lenovo Legion Slim 5 16APH8 | |
| Asus TUF A15 FA507 | |
| MSI Cyborg 15 A12VF | |
| Gigabyte G5 KE | |
| Intel NUC X15 LAPAC71H | |
| Gigabyte G5 KF | |
| Media Intel Core i5-12500H (29874 - 68178, n=9) | |
| AIDA64 / CPU SHA3 | |
| Media della classe Gaming (2180 - 10115, n=105, ultimi 2 anni) | |
| Lenovo Legion Slim 5 16APH8 | |
| Asus TUF A15 FA507 | |
| Gigabyte G5 KE | |
| Intel NUC X15 LAPAC71H | |
| MSI Cyborg 15 A12VF | |
| Gigabyte G5 KF | |
| Media Intel Core i5-12500H (2287 - 3337, n=9) | |
| AIDA64 / CPU Queen | |
| Lenovo Legion Slim 5 16APH8 | |
| Media della classe Gaming (49785 - 173351, n=90, ultimi 2 anni) | |
| Asus TUF A15 FA507 | |
| Intel NUC X15 LAPAC71H | |
| MSI Cyborg 15 A12VF | |
| Gigabyte G5 KE | |
| Gigabyte G5 KF | |
| Media Intel Core i5-12500H (77935 - 80703, n=9) | |
| AIDA64 / FPU SinJulia | |
| Lenovo Legion Slim 5 16APH8 | |
| Media della classe Gaming (4424 - 33636, n=105, ultimi 2 anni) | |
| Asus TUF A15 FA507 | |
| MSI Cyborg 15 A12VF | |
| Intel NUC X15 LAPAC71H | |
| Gigabyte G5 KE | |
| Gigabyte G5 KF | |
| Media Intel Core i5-12500H (6590 - 7431, n=9) | |
| AIDA64 / FPU Mandel | |
| Media della classe Gaming (25115 - 128721, n=105, ultimi 2 anni) | |
| Lenovo Legion Slim 5 16APH8 | |
| Asus TUF A15 FA507 | |
| Gigabyte G5 KE | |
| Intel NUC X15 LAPAC71H | |
| MSI Cyborg 15 A12VF | |
| Media Intel Core i5-12500H (18252 - 34041, n=9) | |
| Gigabyte G5 KF | |
| AIDA64 / CPU AES | |
| Intel NUC X15 LAPAC71H | |
| Gigabyte G5 KE | |
| Media della classe Gaming (39258 - 247074, n=105, ultimi 2 anni) | |
| Gigabyte G5 KF | |
| Media Intel Core i5-12500H (50298 - 111567, n=9) | |
| Lenovo Legion Slim 5 16APH8 | |
| Asus TUF A15 FA507 | |
| MSI Cyborg 15 A12VF | |
| AIDA64 / CPU ZLib | |
| Media della classe Gaming (574 - 2531, n=105, ultimi 2 anni) | |
| Lenovo Legion Slim 5 16APH8 | |
| Gigabyte G5 KE | |
| MSI Cyborg 15 A12VF | |
| Media Intel Core i5-12500H (746 - 924, n=9) | |
| Gigabyte G5 KF | |
| Intel NUC X15 LAPAC71H | |
| Asus TUF A15 FA507 | |
| AIDA64 / FP64 Ray-Trace | |
| Media della classe Gaming (5509 - 45446, n=105, ultimi 2 anni) | |
| Lenovo Legion Slim 5 16APH8 | |
| Asus TUF A15 FA507 | |
| Gigabyte G5 KE | |
| Intel NUC X15 LAPAC71H | |
| MSI Cyborg 15 A12VF | |
| Media Intel Core i5-12500H (3848 - 7405, n=9) | |
| Gigabyte G5 KF | |
| AIDA64 / CPU PhotoWorxx | |
| Media della classe Gaming (12271 - 89891, n=105, ultimi 2 anni) | |
| Intel NUC X15 LAPAC71H | |
| MSI Cyborg 15 A12VF | |
| Lenovo Legion Slim 5 16APH8 | |
| Media Intel Core i5-12500H (13686 - 43813, n=9) | |
| Gigabyte G5 KE | |
| Asus TUF A15 FA507 | |
| Gigabyte G5 KF | |
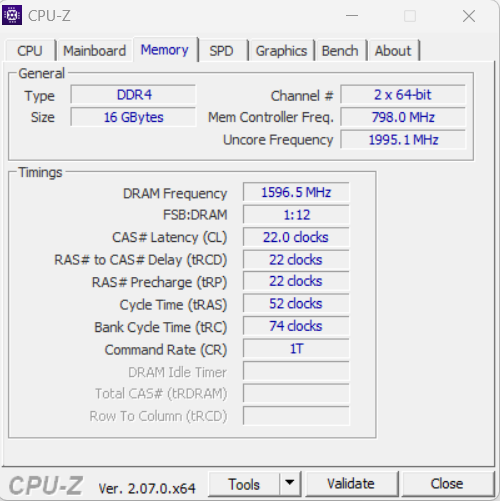
Prestazioni del sistema
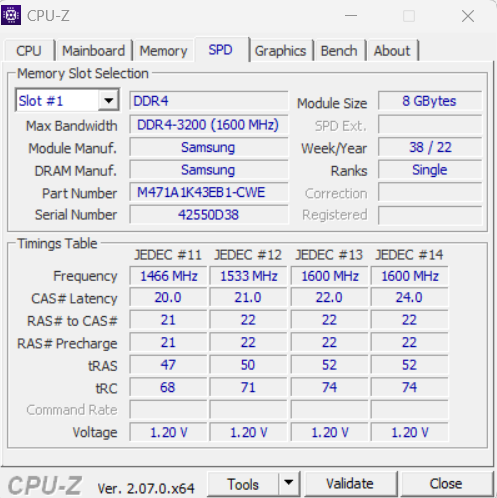
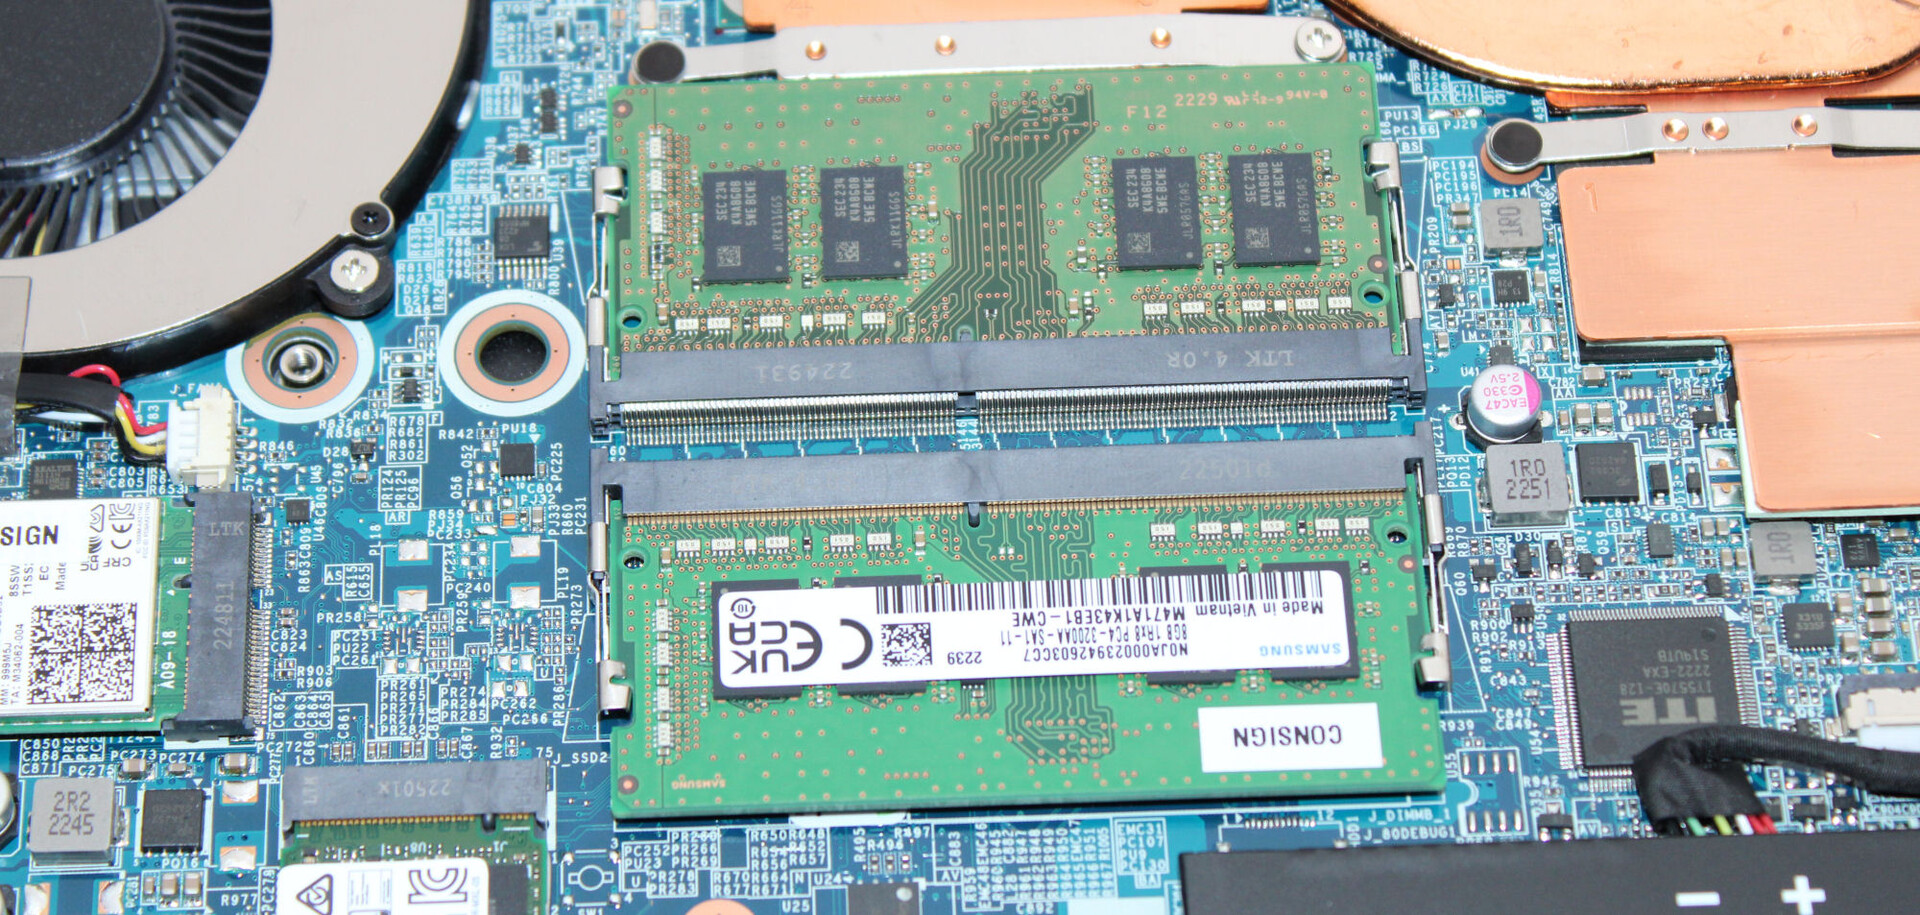
Il sistema funziona senza problemi e ha una potenza sufficiente per gestire applicazioni impegnative, come il rendering e il gioco. Le velocità di trasferimento della memoria sono abbastanza tipiche per una RAM DDR4-3200.
CrossMark: Overall | Productivity | Creativity | Responsiveness
| PCMark 10 / Score | |
| Media della classe Gaming (5828 - 12414, n=93, ultimi 2 anni) | |
| Lenovo Legion Slim 5 16APH8 | |
| Asus TUF A15 FA507 | |
| Gigabyte G5 KE | |
| MSI Cyborg 15 A12VF | |
| Intel NUC X15 LAPAC71H | |
| Gigabyte G5 KF | |
| Media Intel Core i5-12500H, NVIDIA GeForce RTX 4060 Laptop GPU (n=1) | |
| PCMark 10 / Essentials | |
| Lenovo Legion Slim 5 16APH8 | |
| Gigabyte G5 KE | |
| MSI Cyborg 15 A12VF | |
| Media della classe Gaming (8810 - 11935, n=97, ultimi 2 anni) | |
| Asus TUF A15 FA507 | |
| Intel NUC X15 LAPAC71H | |
| Gigabyte G5 KF | |
| Media Intel Core i5-12500H, NVIDIA GeForce RTX 4060 Laptop GPU (n=1) | |
| PCMark 10 / Productivity | |
| Media della classe Gaming (6845 - 25323, n=95, ultimi 2 anni) | |
| Lenovo Legion Slim 5 16APH8 | |
| MSI Cyborg 15 A12VF | |
| Gigabyte G5 KF | |
| Media Intel Core i5-12500H, NVIDIA GeForce RTX 4060 Laptop GPU (n=1) | |
| Gigabyte G5 KE | |
| Asus TUF A15 FA507 | |
| Intel NUC X15 LAPAC71H | |
| PCMark 10 / Digital Content Creation | |
| Media della classe Gaming (7602 - 19954, n=95, ultimi 2 anni) | |
| Lenovo Legion Slim 5 16APH8 | |
| Intel NUC X15 LAPAC71H | |
| Asus TUF A15 FA507 | |
| Gigabyte G5 KE | |
| MSI Cyborg 15 A12VF | |
| Gigabyte G5 KF | |
| Media Intel Core i5-12500H, NVIDIA GeForce RTX 4060 Laptop GPU (n=1) | |
| CrossMark / Overall | |
| Media della classe Gaming (1366 - 2409, n=94, ultimi 2 anni) | |
| Intel NUC X15 LAPAC71H | |
| Lenovo Legion Slim 5 16APH8 | |
| MSI Cyborg 15 A12VF | |
| Gigabyte G5 KE | |
| Gigabyte G5 KF | |
| Media Intel Core i5-12500H, NVIDIA GeForce RTX 4060 Laptop GPU (n=1) | |
| Asus TUF A15 FA507 | |
| CrossMark / Productivity | |
| Media della classe Gaming (1386 - 2254, n=94, ultimi 2 anni) | |
| Intel NUC X15 LAPAC71H | |
| Lenovo Legion Slim 5 16APH8 | |
| Gigabyte G5 KE | |
| MSI Cyborg 15 A12VF | |
| Gigabyte G5 KF | |
| Media Intel Core i5-12500H, NVIDIA GeForce RTX 4060 Laptop GPU (n=1) | |
| Asus TUF A15 FA507 | |
| CrossMark / Creativity | |
| Media della classe Gaming (1343 - 2786, n=94, ultimi 2 anni) | |
| Lenovo Legion Slim 5 16APH8 | |
| Intel NUC X15 LAPAC71H | |
| MSI Cyborg 15 A12VF | |
| Gigabyte G5 KE | |
| Gigabyte G5 KF | |
| Media Intel Core i5-12500H, NVIDIA GeForce RTX 4060 Laptop GPU (n=1) | |
| Asus TUF A15 FA507 | |
| CrossMark / Responsiveness | |
| Intel NUC X15 LAPAC71H | |
| Gigabyte G5 KF | |
| Media Intel Core i5-12500H, NVIDIA GeForce RTX 4060 Laptop GPU (n=1) | |
| Gigabyte G5 KE | |
| Media della classe Gaming (1226 - 2334, n=94, ultimi 2 anni) | |
| MSI Cyborg 15 A12VF | |
| Lenovo Legion Slim 5 16APH8 | |
| Asus TUF A15 FA507 | |
| PCMark 10 Score | 6318 punti | |
Aiuto | ||
| AIDA64 / Memory Copy | |
| Media della classe Gaming (21750 - 129946, n=105, ultimi 2 anni) | |
| Intel NUC X15 LAPAC71H | |
| Lenovo Legion Slim 5 16APH8 | |
| MSI Cyborg 15 A12VF | |
| Asus TUF A15 FA507 | |
| Media Intel Core i5-12500H (23850 - 66598, n=9) | |
| Gigabyte G5 KE | |
| Gigabyte G5 KF | |
| AIDA64 / Memory Read | |
| Media della classe Gaming (22956 - 118858, n=105, ultimi 2 anni) | |
| Intel NUC X15 LAPAC71H | |
| MSI Cyborg 15 A12VF | |
| Lenovo Legion Slim 5 16APH8 | |
| Media Intel Core i5-12500H (24879 - 68013, n=9) | |
| Asus TUF A15 FA507 | |
| Gigabyte G5 KE | |
| Gigabyte G5 KF | |
| AIDA64 / Memory Write | |
| Lenovo Legion Slim 5 16APH8 | |
| Media della classe Gaming (22297 - 135096, n=105, ultimi 2 anni) | |
| Intel NUC X15 LAPAC71H | |
| MSI Cyborg 15 A12VF | |
| Asus TUF A15 FA507 | |
| Media Intel Core i5-12500H (23543 - 58797, n=9) | |
| Gigabyte G5 KE | |
| Gigabyte G5 KF | |
| AIDA64 / Memory Latency | |
| Media della classe Gaming (75.3 - 259, n=105, ultimi 2 anni) | |
| Media Intel Core i5-12500H (83.8 - 114.7, n=9) | |
| Gigabyte G5 KE | |
| Lenovo Legion Slim 5 16APH8 | |
| MSI Cyborg 15 A12VF | |
| Intel NUC X15 LAPAC71H | |
| Gigabyte G5 KF | |
| Asus TUF A15 FA507 | |
* ... Meglio usare valori piccoli
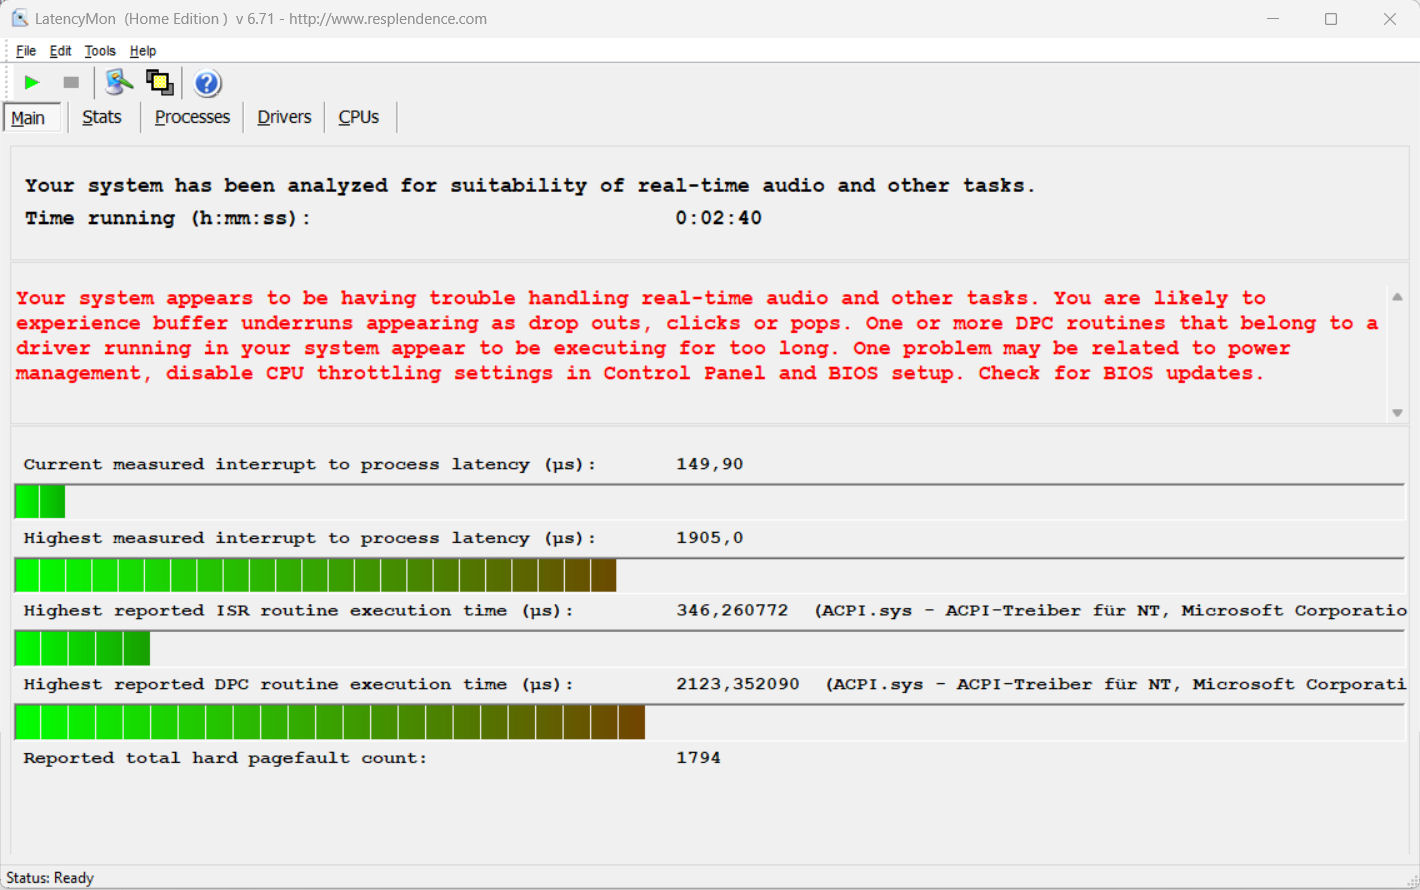
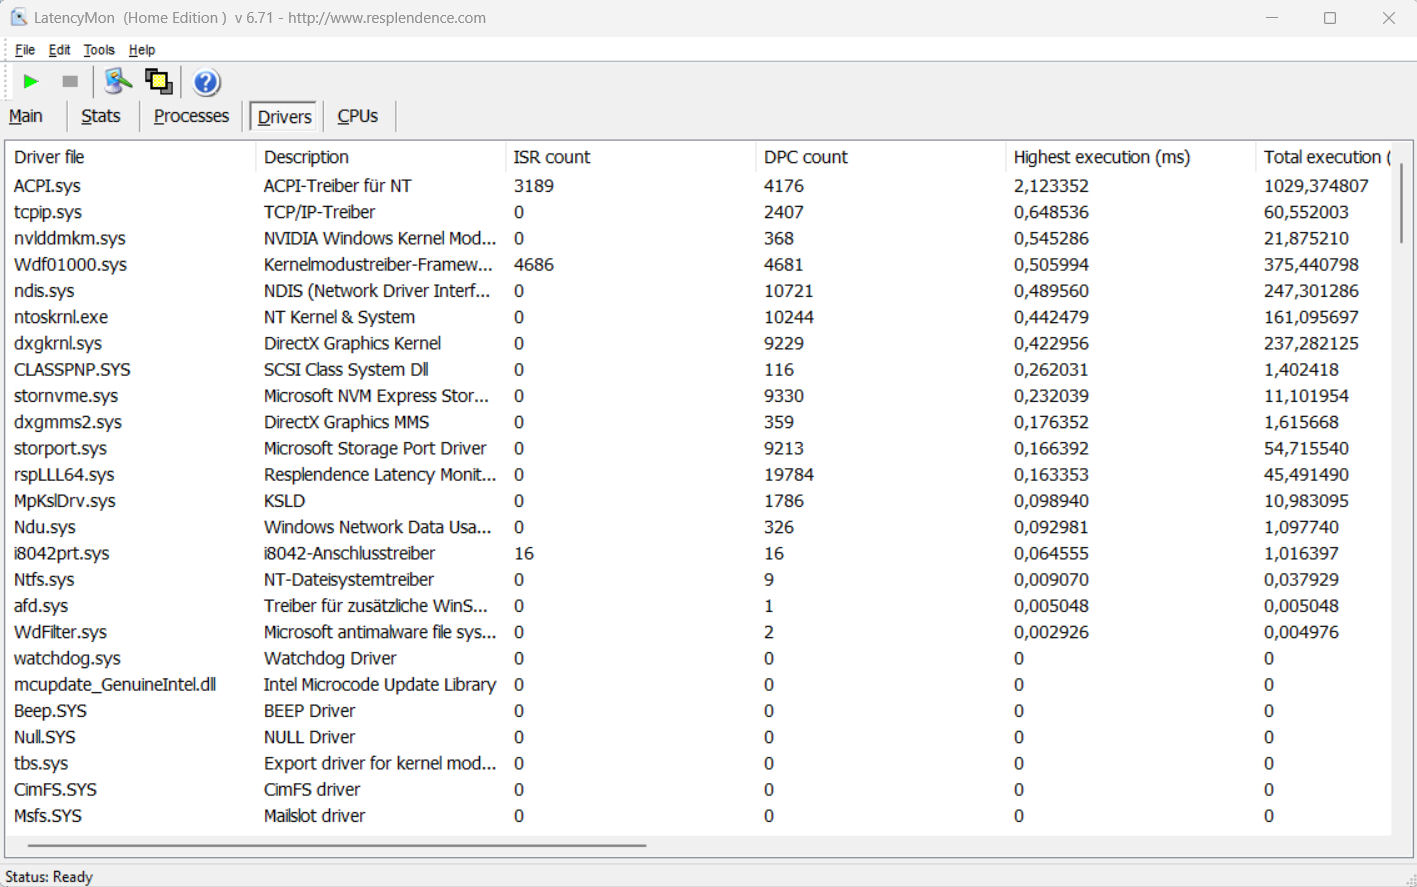
Latenza DPC
Il nostro test di monitoraggio della latenza standardizzato (navigazione web, riproduzione di video 4K e Prime95 ad alto carico) ha rivelato alcuni problemi. Il sistema non sembra essere adatto all'elaborazione video e audio in tempo reale. Speriamo che questo aspetto possa essere migliorato con i futuri aggiornamenti del software.
| DPC Latencies / LatencyMon - interrupt to process latency (max), Web, Youtube, Prime95 | |
| Gigabyte G5 KF | |
| MSI Cyborg 15 A12VF | |
| Lenovo Legion Slim 5 16APH8 | |
| Gigabyte G5 KE | |
| Intel NUC X15 LAPAC71H | |
* ... Meglio usare valori piccoli
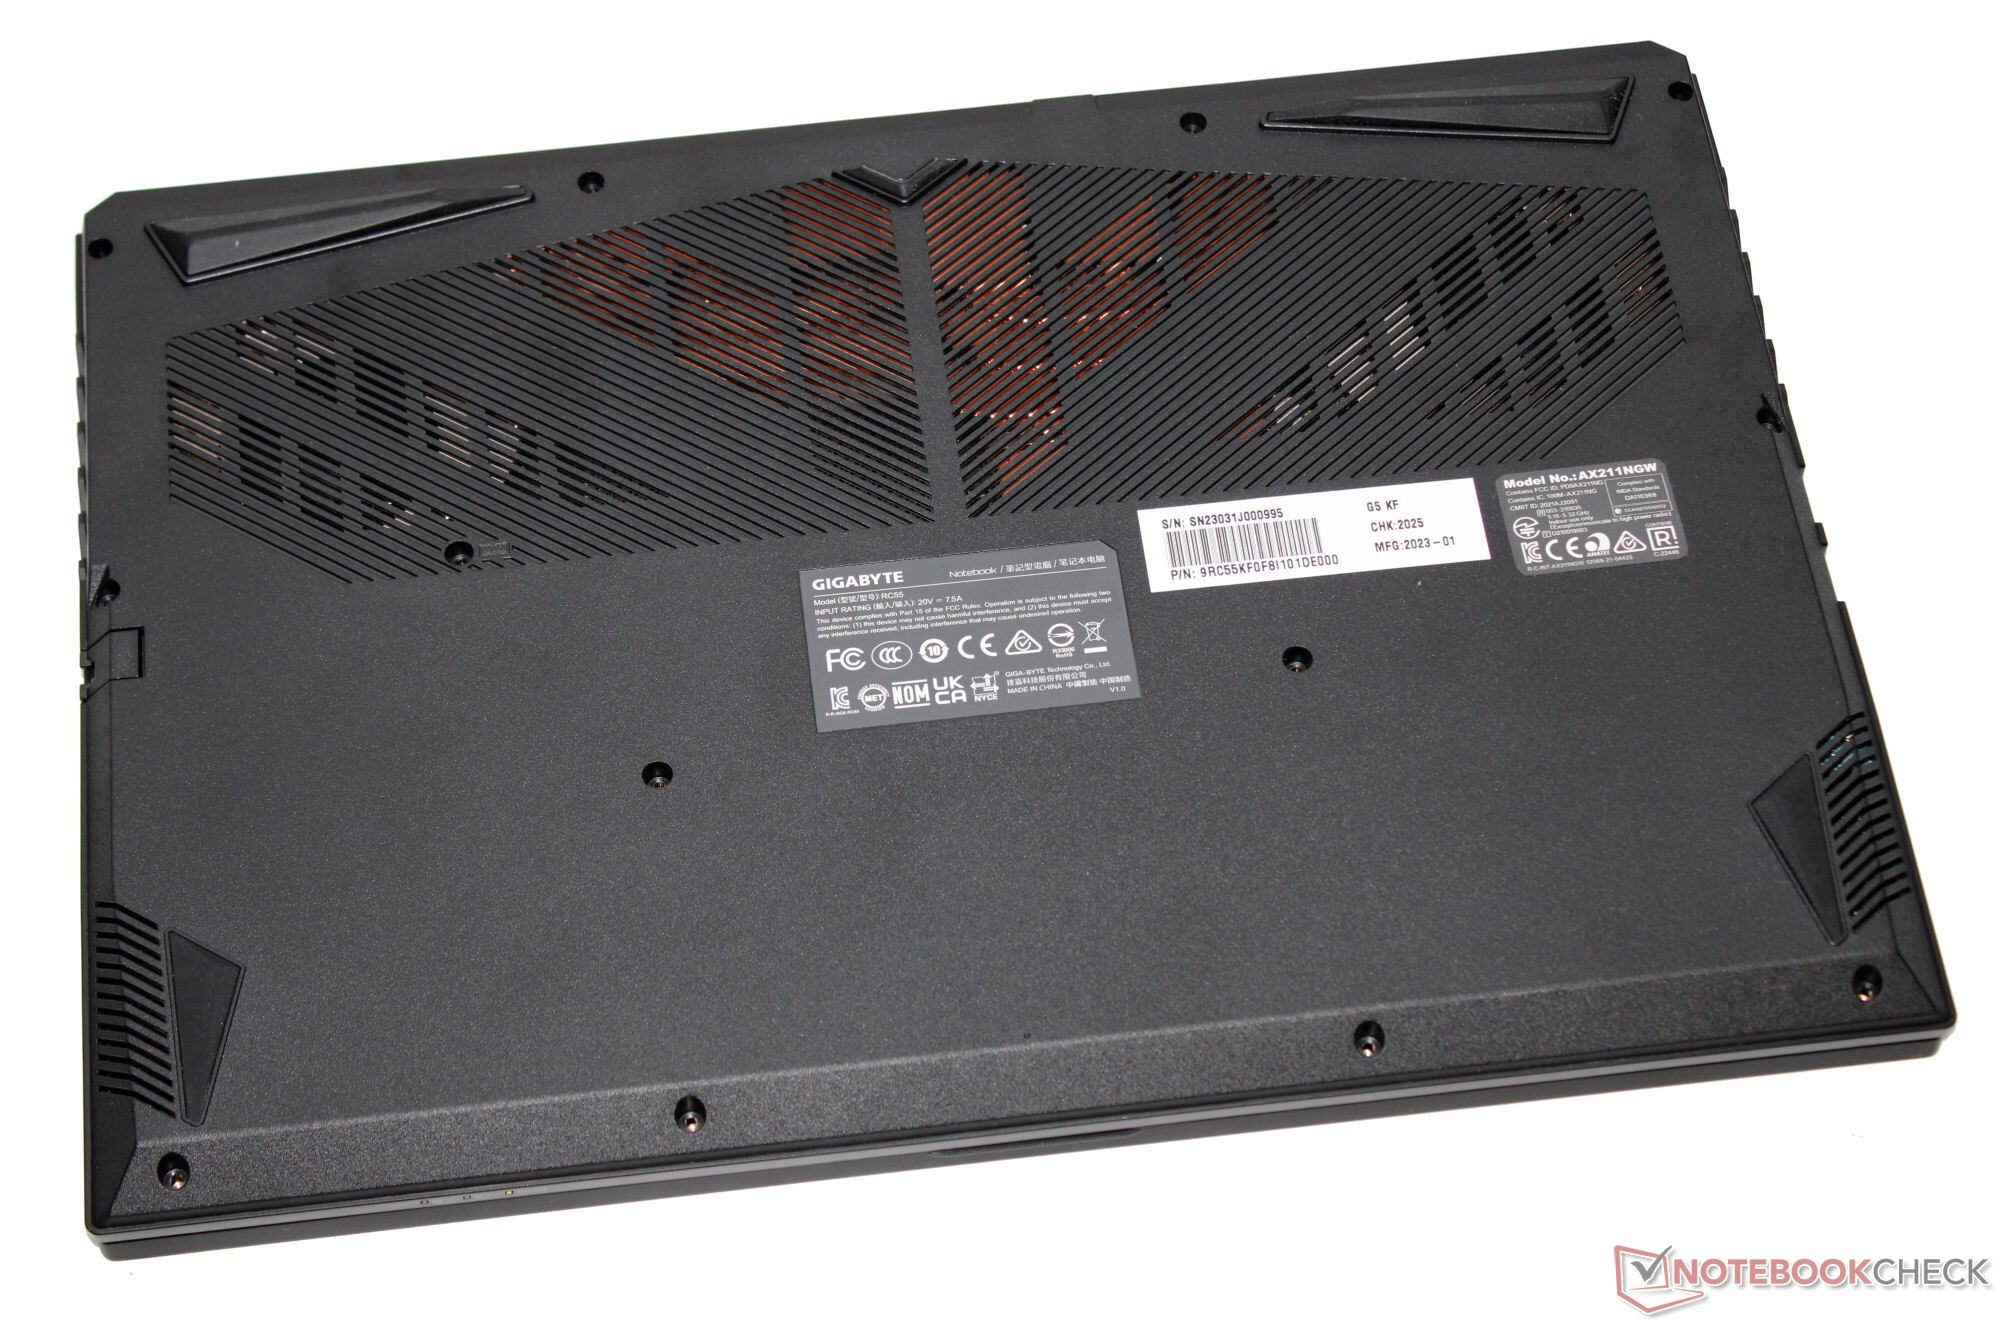
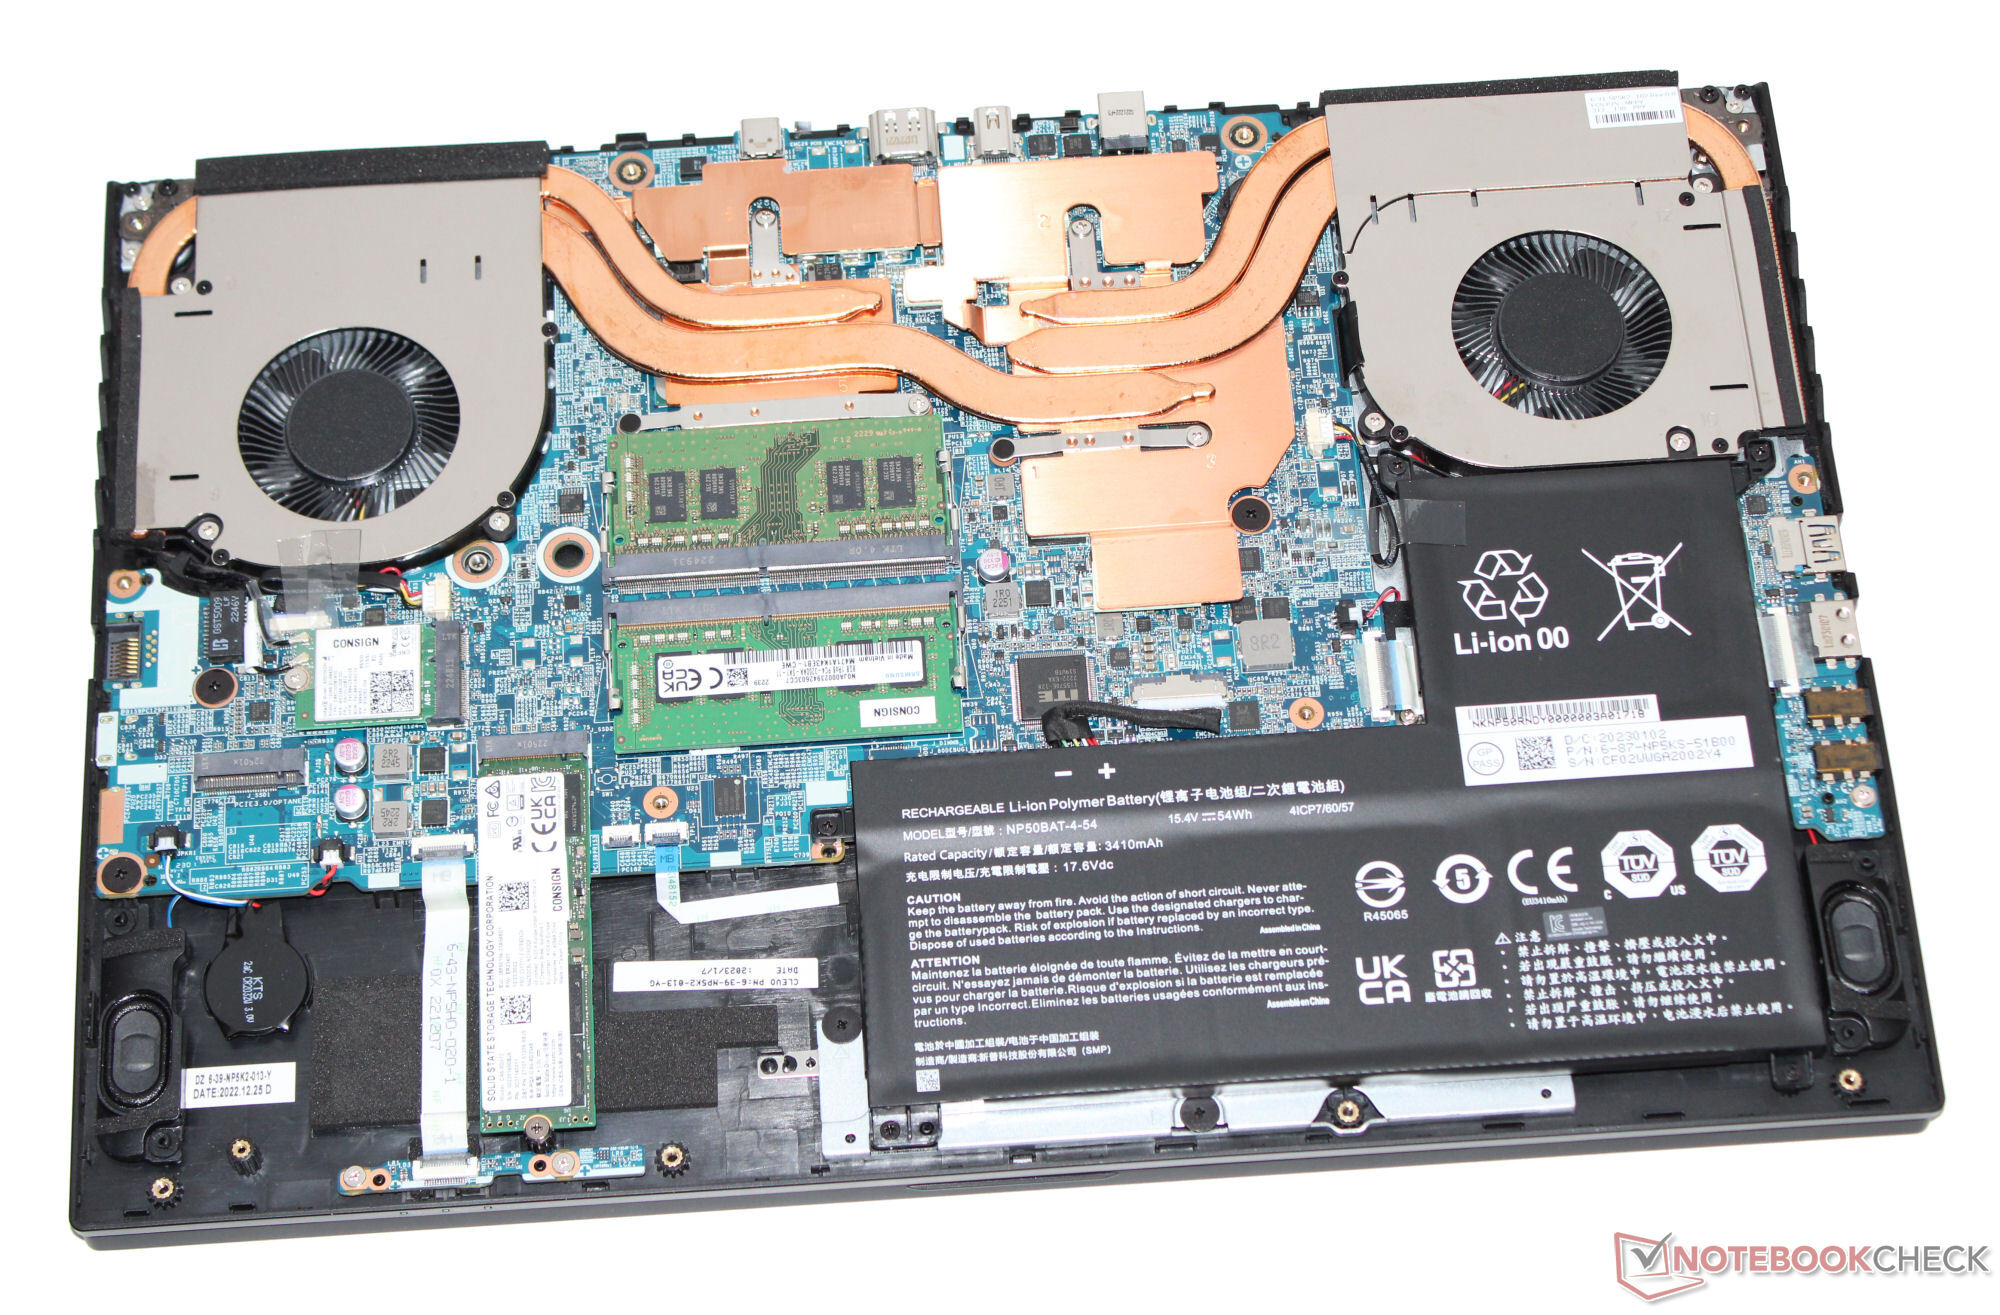
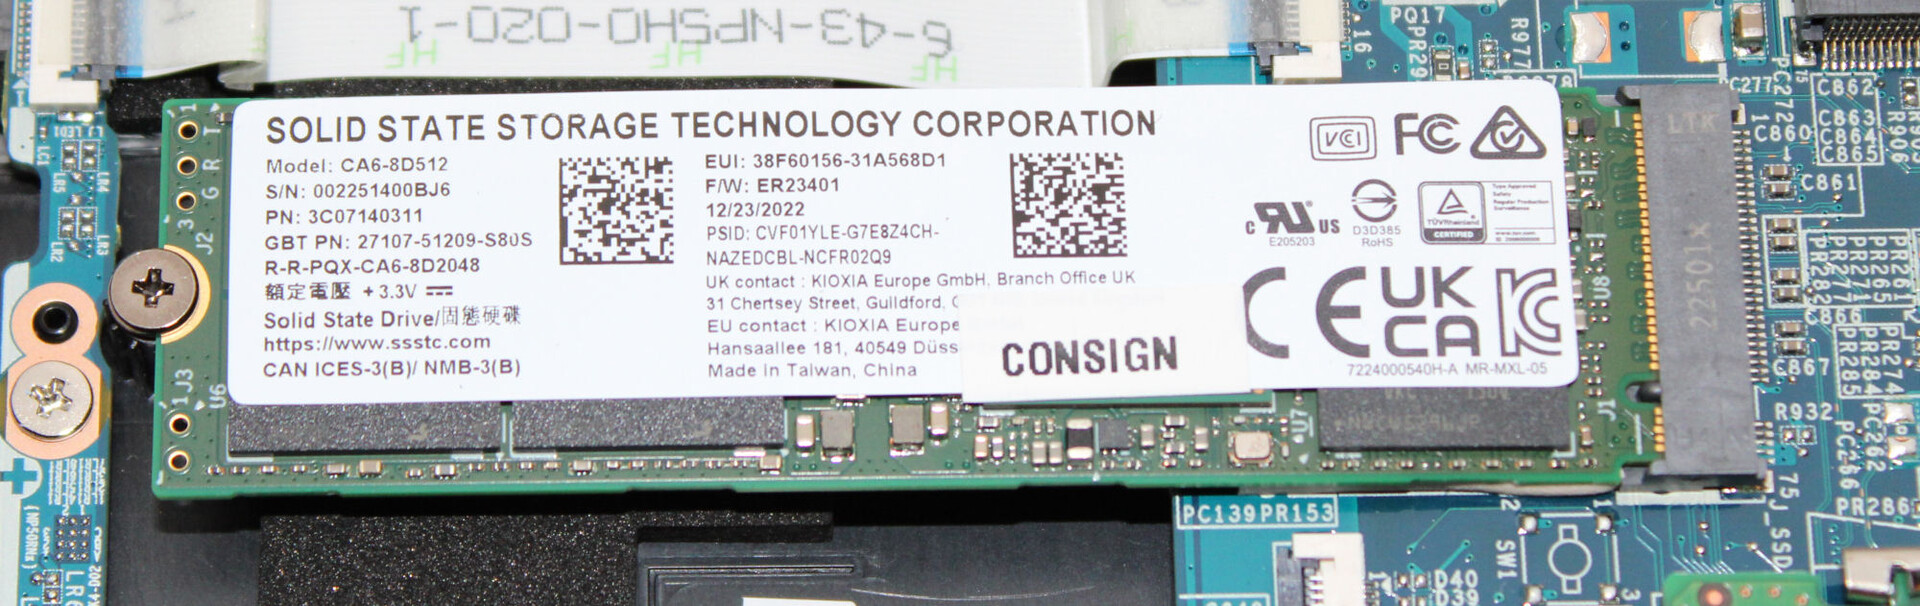
Memoria di massa
Gigabyte ha equipaggiato il G5 con un SSD da 512 GB (PCIe 4.0, M2. 2280) di SSSTC che offre un'ottima velocità di trasferimento dati. Tuttavia, è soggetto a cali di prestazioni causati dal throttling termico. Il notebook dispone anche di uno slot PCIe 3.0 per ospitare un secondo SSD M.2 2280.

| Drive Performance rating - Percent | |
| Intel NUC X15 LAPAC71H | |
| Gigabyte G5 KF | |
| Media SSSTC CA6-8D512 | |
| Media della classe Gaming | |
| Lenovo Legion Slim 5 16APH8 | |
| Gigabyte G5 KE | |
| MSI Cyborg 15 A12VF | |
| Asus TUF A15 FA507 | |
* ... Meglio usare valori piccoli
Dauerleistung Lesen: DiskSpd Read Loop, Queue Depth 8
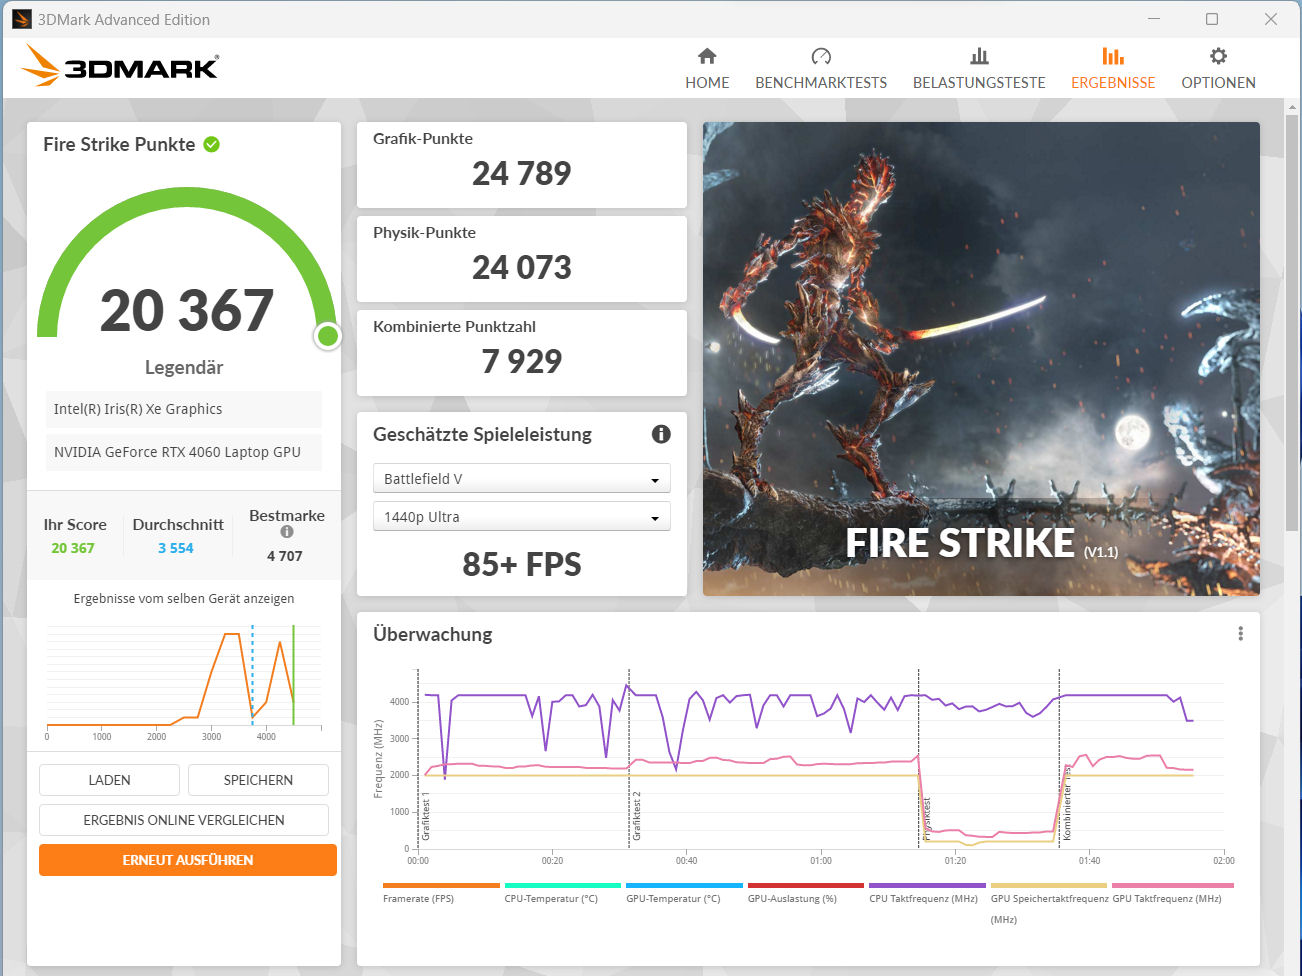
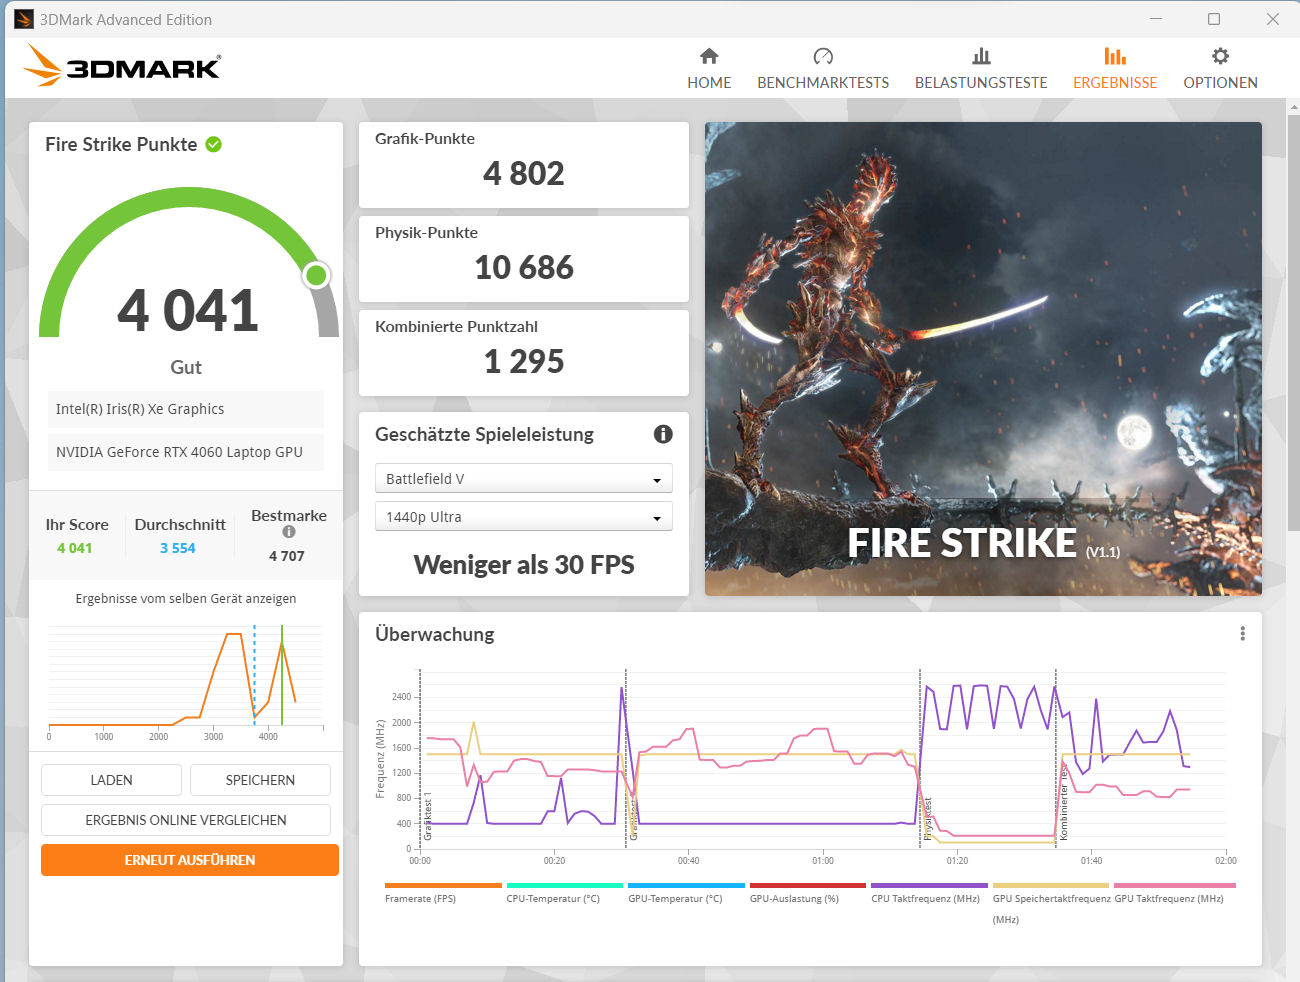
Scheda grafica
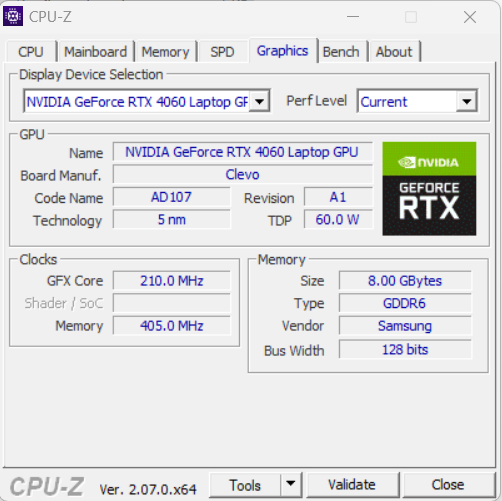
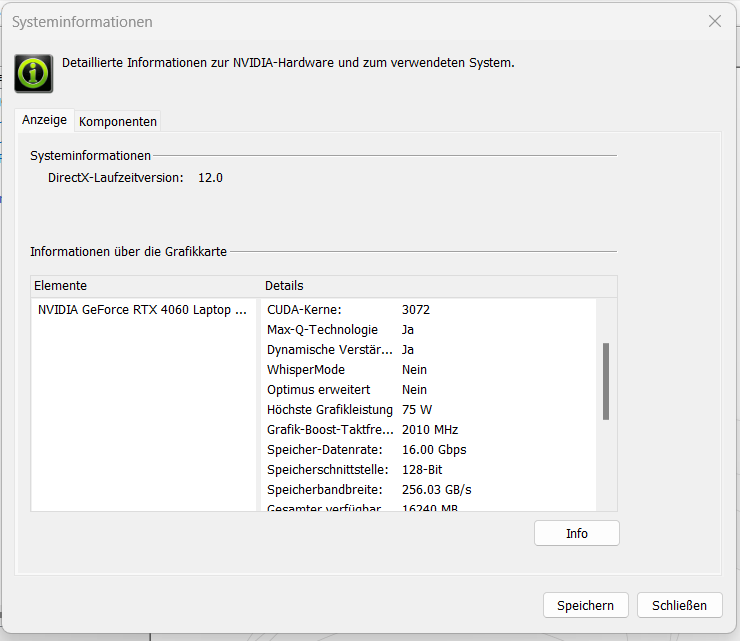
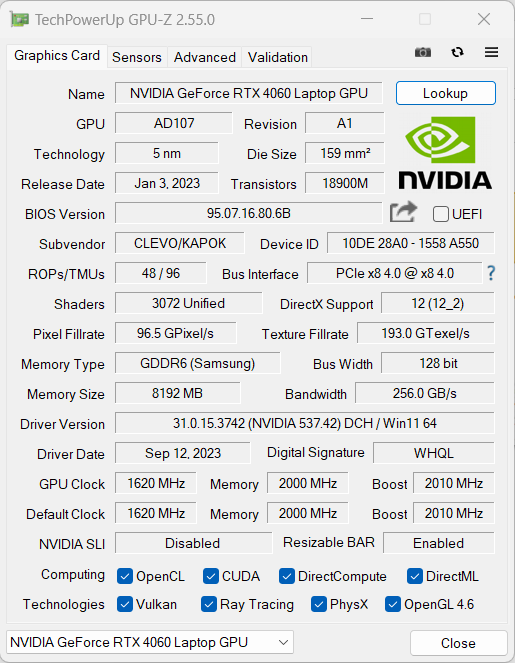
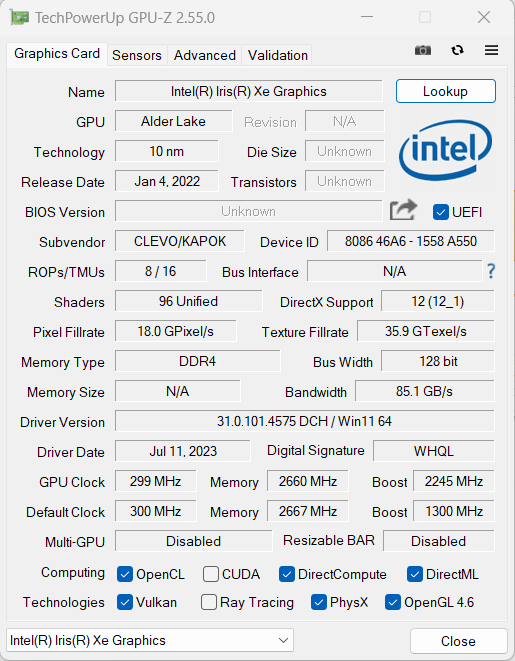
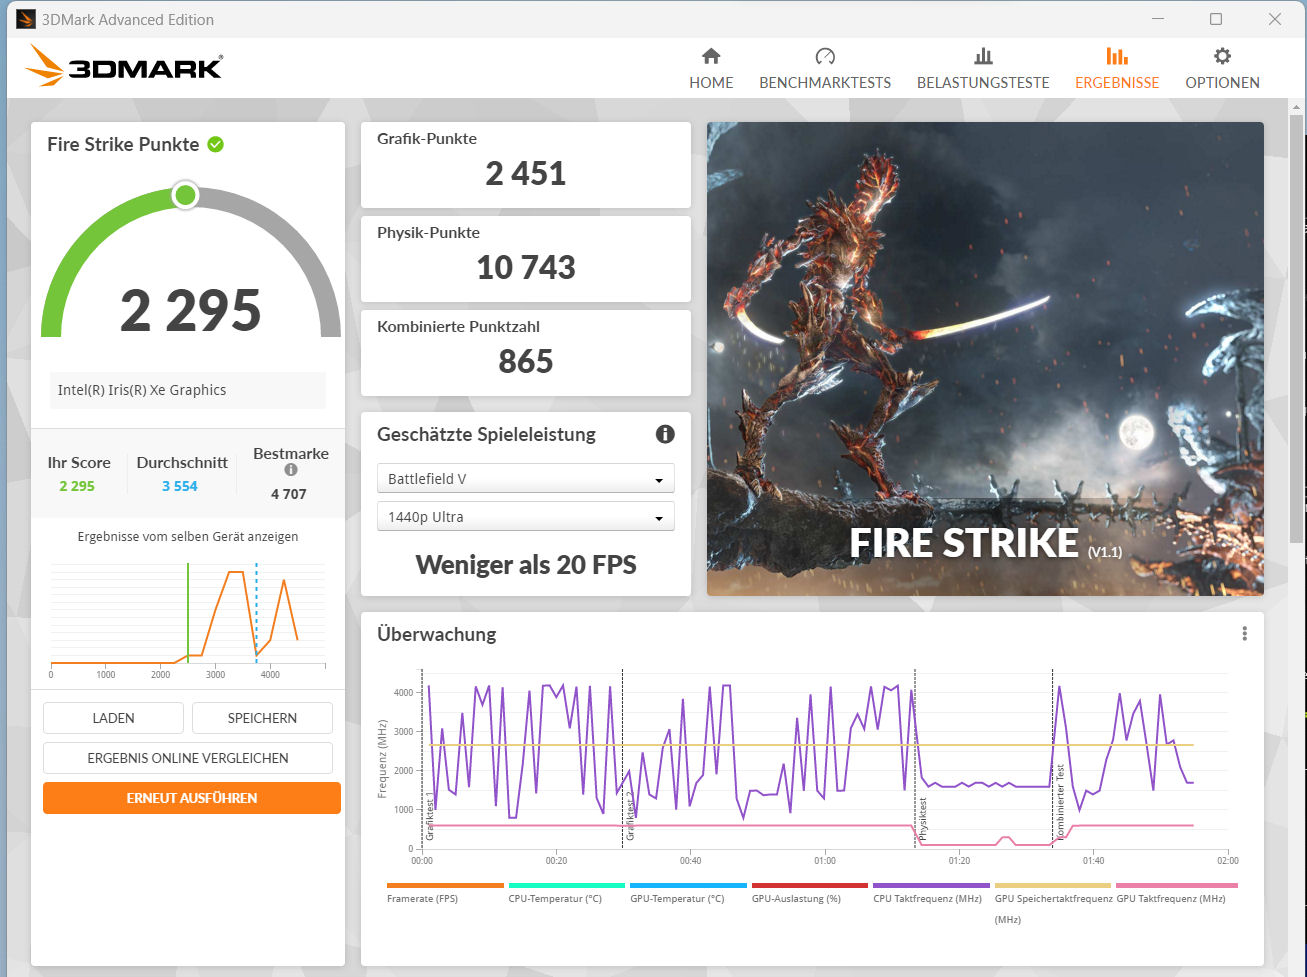
La GeForce RTX 4060 vanta 3.072 unità di shading, un bus di memoria a 128 bit e 8.192 MB di scattante memoria video GDDR6. Gigabyte ha specificato un TGP massimo di 75 W, che si colloca all'estremità inferiore della gamma media. Il TGP è stato completamente utilizzato durante il nostro test su Witcher 3.
I risultati del benchmark rientrano nella media di quanto abbiamo visto finora con la RTX 4060. Nonostante il suo TGP inferiore, la RTX 4060 ha prestazioni migliori rispetto alla RTX 3060 nel G5 KE. Questo perché l'architettura Ada Lovelace è più efficiente. Il G5 KF non dispone di una modalità dGPU.


| 3DMark Performance rating - Percent | |
| Media della classe Gaming | |
| Media NVIDIA GeForce RTX 4060 Laptop GPU | |
| Gigabyte G5 KF | |
| Gigabyte G5 KE | |
| MSI Cyborg 15 A12VF | |
| Lenovo Legion Slim 5 16APH8 -1! | |
| Asus TUF A15 FA507 -1! | |
| Intel NUC X15 LAPAC71H | |
| 3DMark 06 Standard Score | 45111 punti | |
| 3DMark 11 Performance | 28012 punti | |
| 3DMark Cloud Gate Standard Score | 51746 punti | |
| 3DMark Fire Strike Score | 20367 punti | |
| 3DMark Time Spy Score | 9269 punti | |
Aiuto | ||
* ... Meglio usare valori piccoli
Prestazioni di gioco
Il notebook Gigabyte è stato progettato per eseguire giochi in FHD e con impostazioni alte o massime. È possibile utilizzare risoluzioni più elevate collegando il notebook a un monitor che le supporta, anche se potrebbe essere necessario abbassare alcune impostazioni. Nei nostri test, le frequenze dei fotogrammi sono state inferiori a quelle che la RTX 4060 è in grado di raggiungere in media, e sono state all'incirca uguali a quelle della G5 KE G5 KEg5 KE.
| The Witcher 3 - 1920x1080 Ultra Graphics & Postprocessing (HBAO+) | |
| Media della classe Gaming (104.7 - 240, n=7, ultimi 2 anni) | |
| Media NVIDIA GeForce RTX 4060 Laptop GPU (77 - 159.7, n=42) | |
| Lenovo Legion Slim 5 16APH8 | |
| Gigabyte G5 KF | |
| Gigabyte G5 KE | |
| Asus TUF A15 FA507 | |
| MSI Cyborg 15 A12VF | |
| Intel NUC X15 LAPAC71H | |
| Final Fantasy XV Benchmark - 1920x1080 High Quality | |
| Media della classe Gaming (41 - 215, n=95, ultimi 2 anni) | |
| Media NVIDIA GeForce RTX 4060 Laptop GPU (75.1 - 109.8, n=51) | |
| Lenovo Legion Slim 5 16APH8 | |
| Gigabyte G5 KF | |
| Gigabyte G5 KE | |
| Asus TUF A15 FA507 | |
| MSI Cyborg 15 A12VF | |
| Intel NUC X15 LAPAC71H | |
| Dota 2 Reborn - 1920x1080 ultra (3/3) best looking | |
| Media della classe Gaming (84.8 - 248, n=107, ultimi 2 anni) | |
| Media NVIDIA GeForce RTX 4060 Laptop GPU (115 - 183.8, n=53) | |
| Gigabyte G5 KE | |
| Lenovo Legion Slim 5 16APH8 | |
| MSI Cyborg 15 A12VF | |
| Gigabyte G5 KF | |
| Asus TUF A15 FA507 | |
| Intel NUC X15 LAPAC71H | |
| Starfield - 1920x1080 Ultra Preset | |
| Media della classe Gaming (n=1ultimi 2 anni) | |
| XMG Pro 15 E23 | |
| Media NVIDIA GeForce RTX 4060 Laptop GPU (39.7 - 41, n=3) | |
| Gigabyte G5 KF | |
| Intel NUC X15 LAPAC71H | |
| Lies of P - 1920x1080 Best Preset | |
| XMG Pro 15 E23 | |
| Media NVIDIA GeForce RTX 4060 Laptop GPU (106.2 - 126.6, n=3) | |
| Gigabyte G5 KF | |
| Intel NUC X15 LAPAC71H | |
| EA Sports FC 24 - 1920x1080 Ultra Preset | |
| Gigabyte G5 KF | |
| XMG Pro 15 E23 | |
| Media NVIDIA GeForce RTX 4060 Laptop GPU (136.9 - 138, n=3) | |
| Intel NUC X15 LAPAC71H | |
| Media della classe Gaming (n=1ultimi 2 anni) | |
| Assassin's Creed Mirage - 1920x1080 Ultra High Preset (Adaptive Quality Off) | |
| XMG Pro 15 E23 | |
| Media NVIDIA GeForce RTX 4060 Laptop GPU (65 - 93, n=6) | |
| Gigabyte G5 KF | |
| Intel NUC X15 LAPAC71H | |
| The Crew Motorfest - 1920x1080 Ultra Preset | |
| XMG Pro 15 E23 | |
| Gigabyte G5 KF | |
| Media NVIDIA GeForce RTX 4060 Laptop GPU (60 - 60, n=3) | |
| Intel NUC X15 LAPAC71H | |
| F1 23 - 1920x1080 Ultra High Preset AA:T AF:16x | |
| Media NVIDIA GeForce RTX 4060 Laptop GPU (43.8 - 119.9, n=13) | |
| XMG Pro 15 E23 | |
| Gigabyte G5 KF | |
| Intel NUC X15 LAPAC71H | |
| Baldur's Gate 3 - 1920x1080 Ultra Preset AA:T | |
| Media della classe Gaming (59.4 - 246, n=104, ultimi 2 anni) | |
| XMG Pro 15 E23 | |
| Media NVIDIA GeForce RTX 4060 Laptop GPU (66.5 - 105.5, n=19) | |
| Gigabyte G5 KF | |
| Intel NUC X15 LAPAC71H | |
| Diablo 4 - 3840x2160 Ultra Preset | |
| XMG Pro 15 E23 | |
| Media NVIDIA GeForce RTX 4060 Laptop GPU (n=1) | |
| Lords of the Fallen - 1920x1080 Ultra Preset | |
| XMG Pro 15 E23 | |
| Intel NUC X15 LAPAC71H | |
| Media NVIDIA GeForce RTX 4060 Laptop GPU (32.8 - 38.1, n=3) | |
| Gigabyte G5 KF | |
Per verificare se il portatile è in grado di mantenere le sue prestazioni per un periodo di tempo più lungo, abbiamo eseguito "The Witcher 3" per circa 60 minuti in Full HD e con le impostazioni massime. Il personaggio del giocatore non è stato spostato per nulla durante questo tempo. Le frequenze dei fotogrammi sono rimaste per lo più stabili, ma abbiamo osservato alcuni piccoli cali occasionali (circa 10 FPS) nella fase finale di questo test.
Witcher 3 FPS chart
| basso | medio | alto | ultra | |
|---|---|---|---|---|
| GTA V (2015) | 183.5 | 178.3 | 171.5 | 107.6 |
| The Witcher 3 (2015) | 314.3 | 251.1 | 172.8 | 92.5 |
| Dota 2 Reborn (2015) | 158.6 | 146.6 | 137.55 | 131.2 |
| Final Fantasy XV Benchmark (2018) | 186.5 | 126 | 91.9 | |
| X-Plane 11.11 (2018) | 120.4 | 108 | 87.1 | |
| Far Cry 5 (2018) | 151 | 125 | 119 | 110 |
| Strange Brigade (2018) | 379 | 253 | 197.9 | 172.1 |
| Gears Tactics (2020) | 303.9 | 225.6 | 156.5 | 112.2 |
| Cyberpunk 2077 1.6 (2022) | 105.4 | 86.7 | 74.5 | 68.7 |
| Diablo 4 (2023) | 227 | 204 | 180.4 | 151 |
| F1 23 (2023) | 213 | 211 | 157.4 | 51.8 |
| Starfield (2023) | 71.2 | 61.4 | 47 | 39.8 |
| The Crew Motorfest (2023) | 60 | 60 | 60 | 60 |
| Lies of P (2023) | 159.4 | 138.5 | 126.9 | 106.2 |
| Baldur's Gate 3 (2023) | 113.1 | 93.2 | 78 | 75.1 |
| Cyberpunk 2077 (2023) | 105.9 | 91.1 | 78 | 70.5 |
| EA Sports FC 24 (2023) | 198.3 | 172.9 | 142.9 | 138 |
| Assassin's Creed Mirage (2023) | 120 | 115 | 106 | 83 |
| Lords of the Fallen (2023) | 80 | 64.7 | 46.7 | 32.8 |
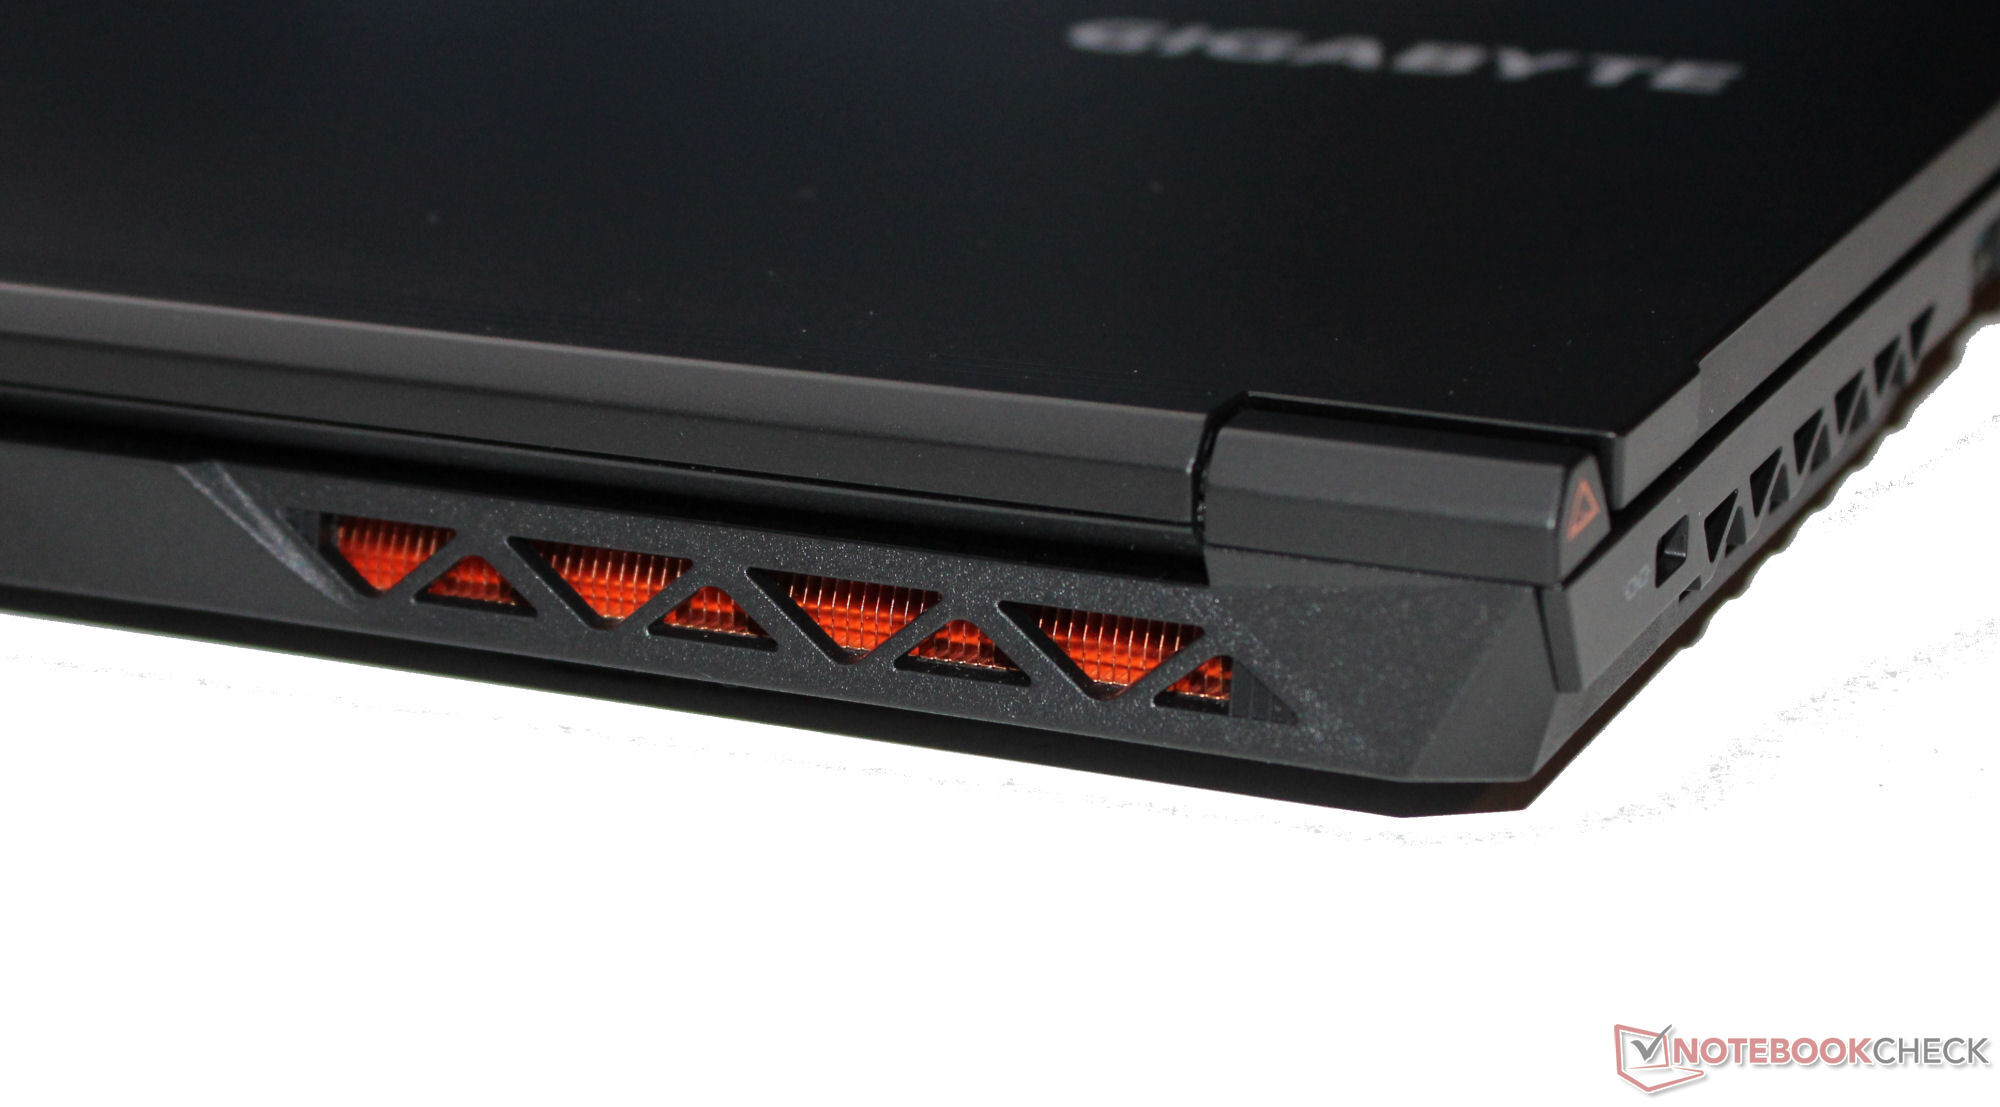
Emissioni - Il notebook può essere molto rumoroso
Emissioni di rumore
Durante il gioco, il livello di rumore può raggiungere i 55,5 dB(A) in "Modalità Performance". Può ridurre la quantità di rumore passando alla "Modalità intrattenimento" o, meglio ancora, alla "Modalità silenziosa". Nell'uso quotidiano (ad esempio, applicazioni da ufficio e navigazione in Internet), le due ventole girano spesso a bassa velocità e talvolta possono rimanere completamente ferme.
Rumorosità
| Idle |
| 23 / 23 / 28 dB(A) |
| Sotto carico |
| 29.94 / 55.5 dB(A) |
 | ||
30 dB silenzioso 40 dB(A) udibile 50 dB(A) rumoroso |
||
min: | ||
| Gigabyte G5 KF GeForce RTX 4060 Laptop GPU, i5-12500H, SSSTC CA6-8D512 | MSI Cyborg 15 A12VF GeForce RTX 4060 Laptop GPU, i7-12650H, Samsung PM9B1 1024GB MZVL41T0HBLB | Intel NUC X15 LAPAC71H A730M, i7-12700H, Samsung 990 Pro 1 TB | Asus TUF A15 FA507 GeForce RTX 4050 Laptop GPU, R7 7735HS, Micron 2400 MTFDKBA512QFM | Lenovo Legion Slim 5 16APH8 GeForce RTX 4060 Laptop GPU, R7 7840HS, SK hynix PC801 HFS512GEJ9X115N | Gigabyte G5 KE GeForce RTX 3060 Laptop GPU, i5-12500H, Gigabyte AG4512G-SI B10 | |
|---|---|---|---|---|---|---|
| Noise | -37% | -6% | 9% | -1% | -22% | |
| off /ambiente * (dB) | 23 | 27 -17% | 23 -0% | 23.3 -1% | 22.9 -0% | 19.52 15% |
| Idle Minimum * (dB) | 23 | 27 -17% | 23 -0% | 23.3 -1% | 23.1 -0% | 31.05 -35% |
| Idle Average * (dB) | 23 | 37.5 -63% | 24 -4% | 23.3 -1% | 23.1 -0% | 31.05 -35% |
| Idle Maximum * (dB) | 28 | 38 -36% | 24 14% | 23.3 17% | 27.7 1% | 31.05 -11% |
| Load Average * (dB) | 29.94 | 56.3 -88% | 50.61 -69% | 29.6 1% | 33.3 -11% | 55.66 -86% |
| Witcher 3 ultra * (dB) | 55.05 | 50.65 8% | 43 22% | 54 2% | 55.7 -1% | |
| Load Maximum * (dB) | 55.5 | 56.3 -1% | 50.89 8% | 43 23% | 54 3% | 55.51 -0% |
* ... Meglio usare valori piccoli
Temperatura
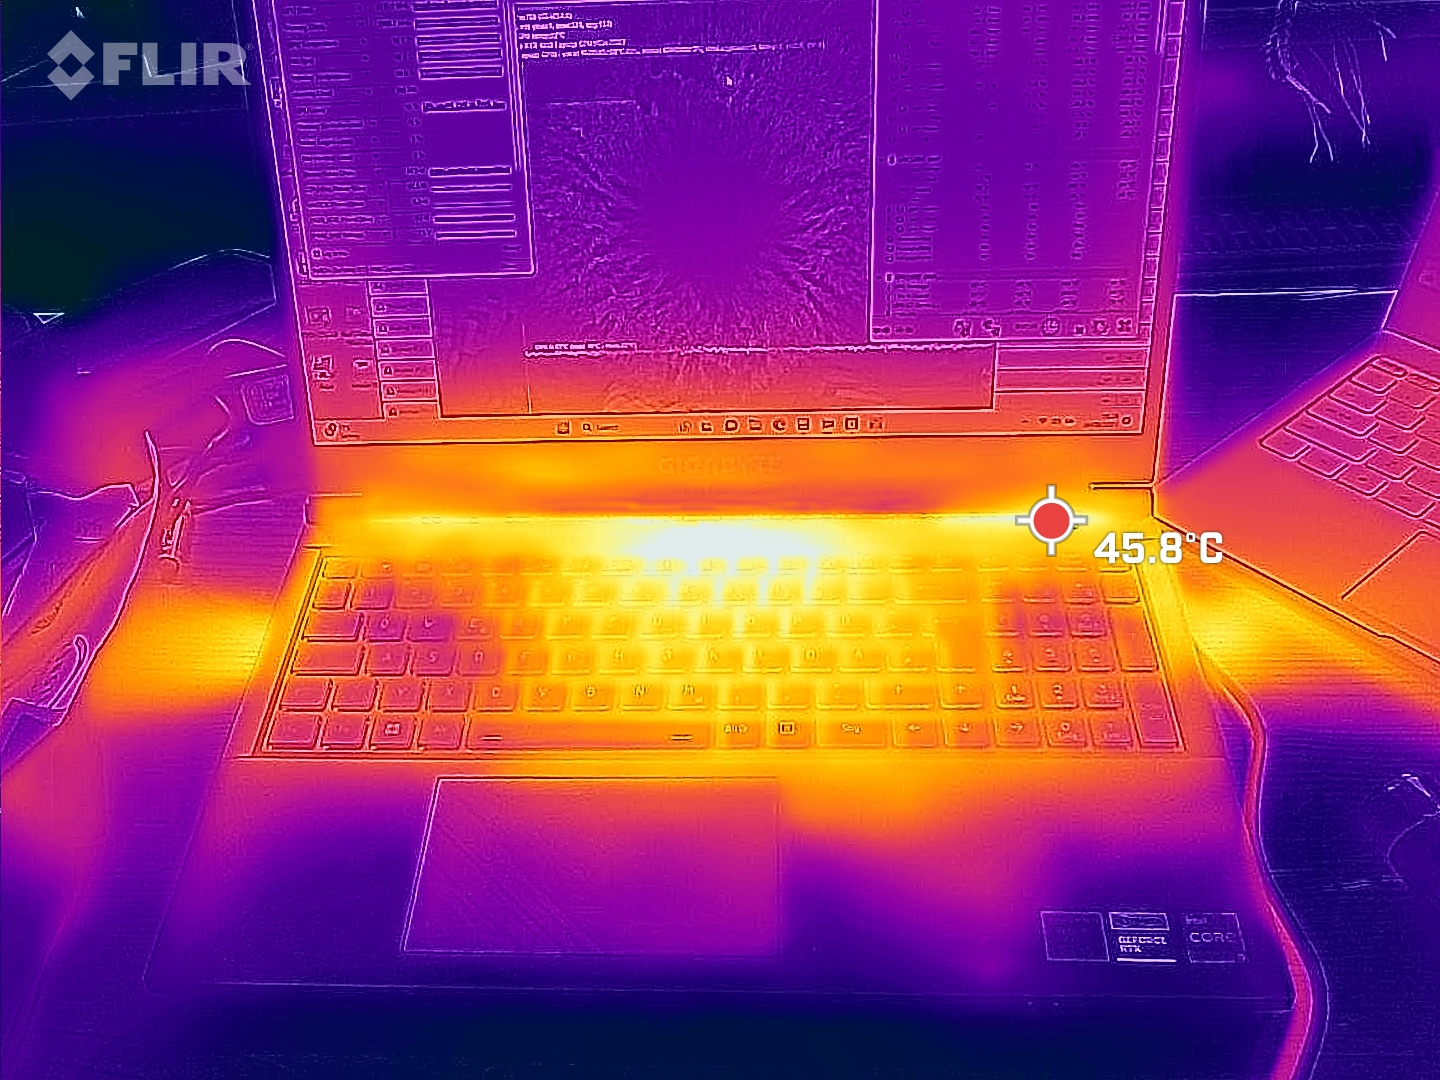
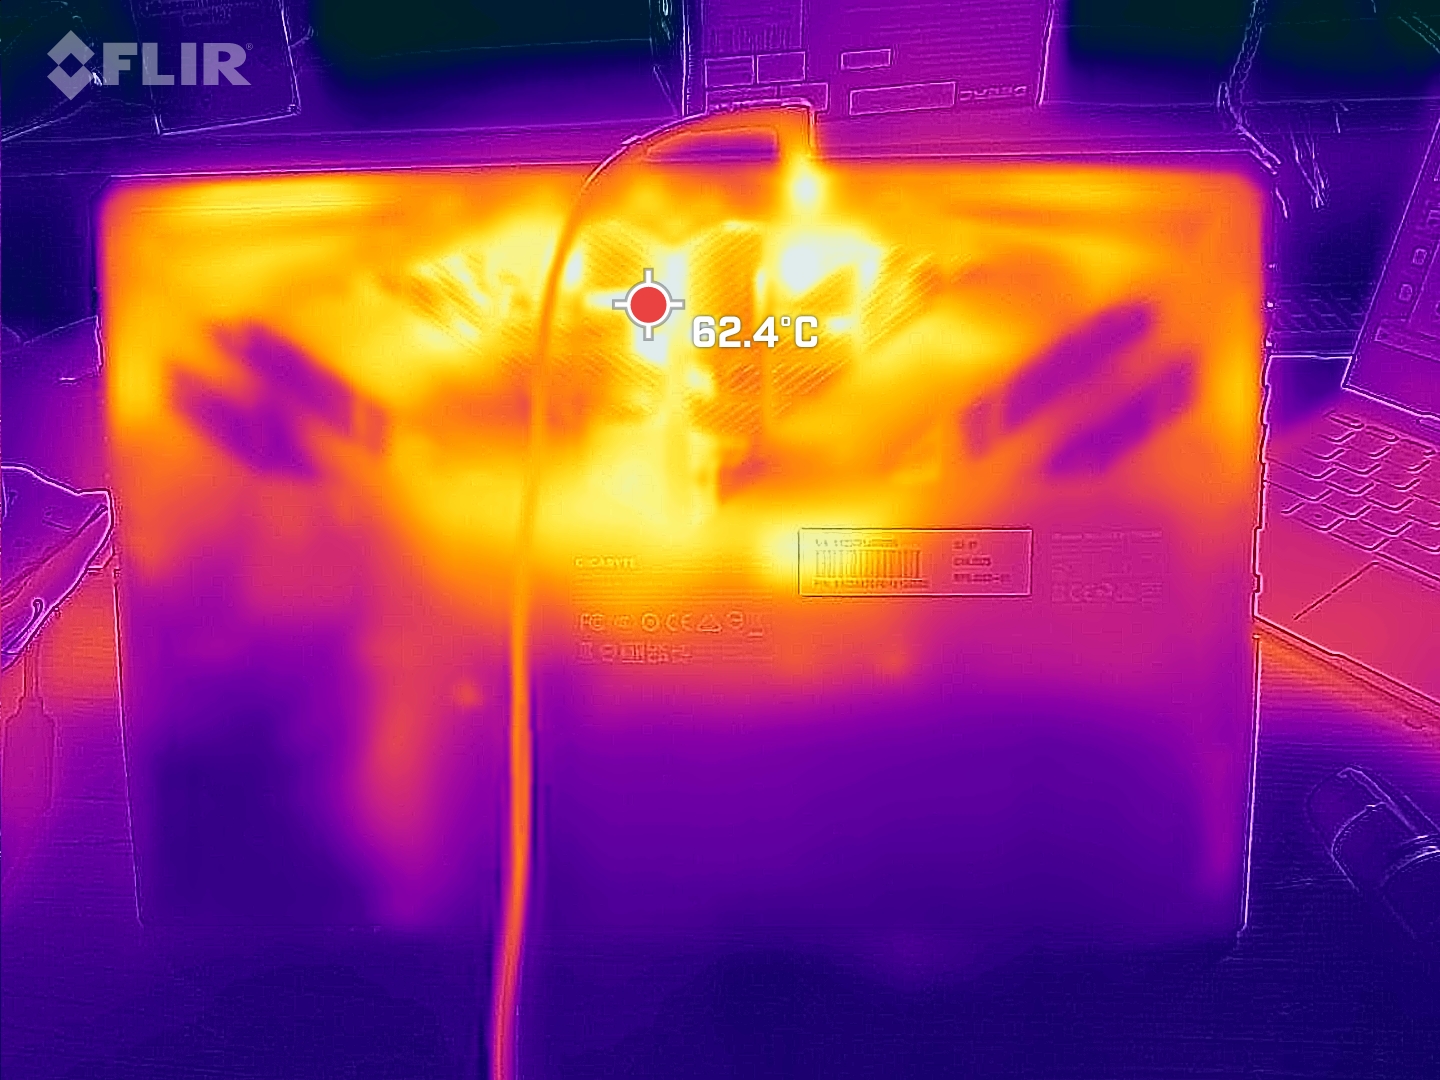
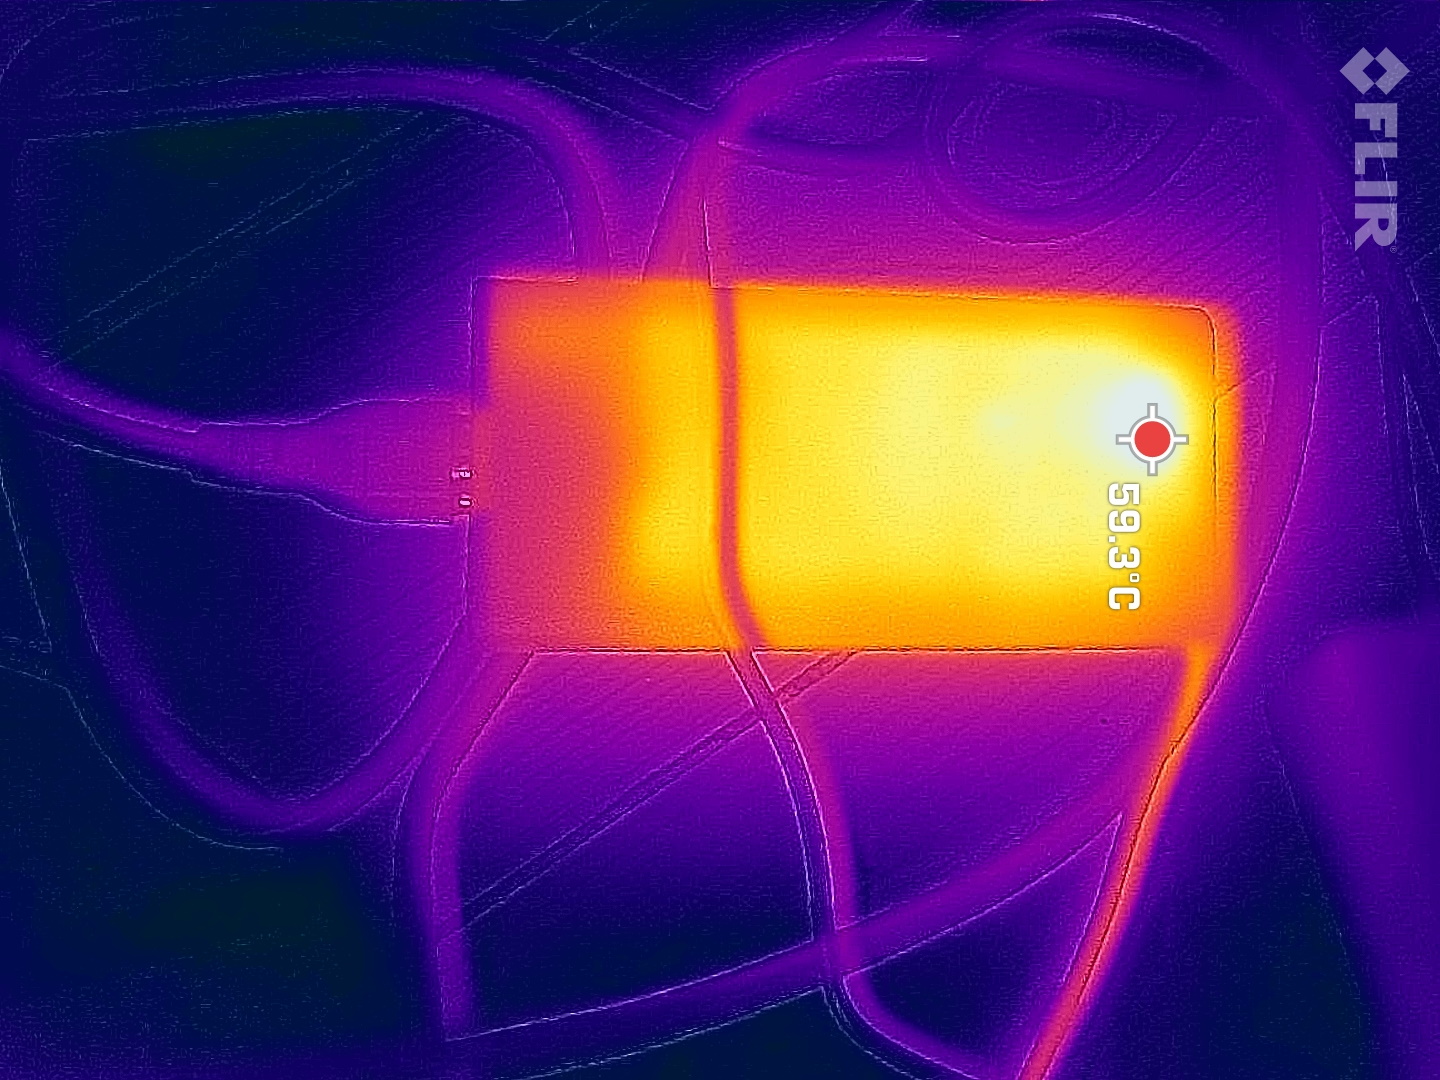
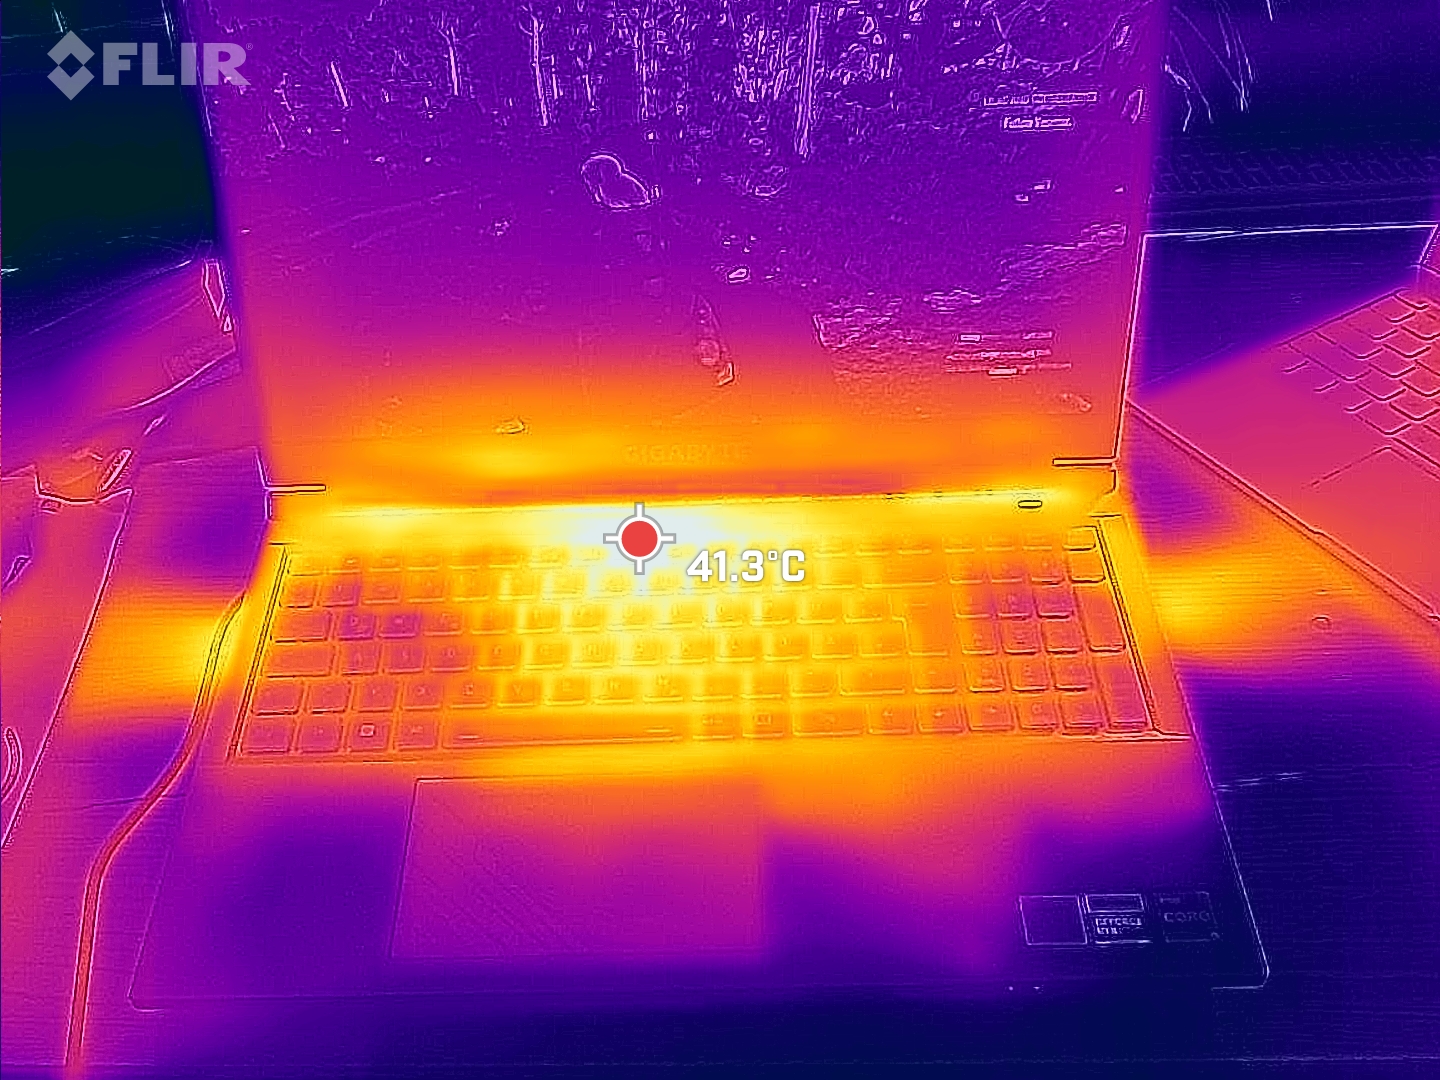
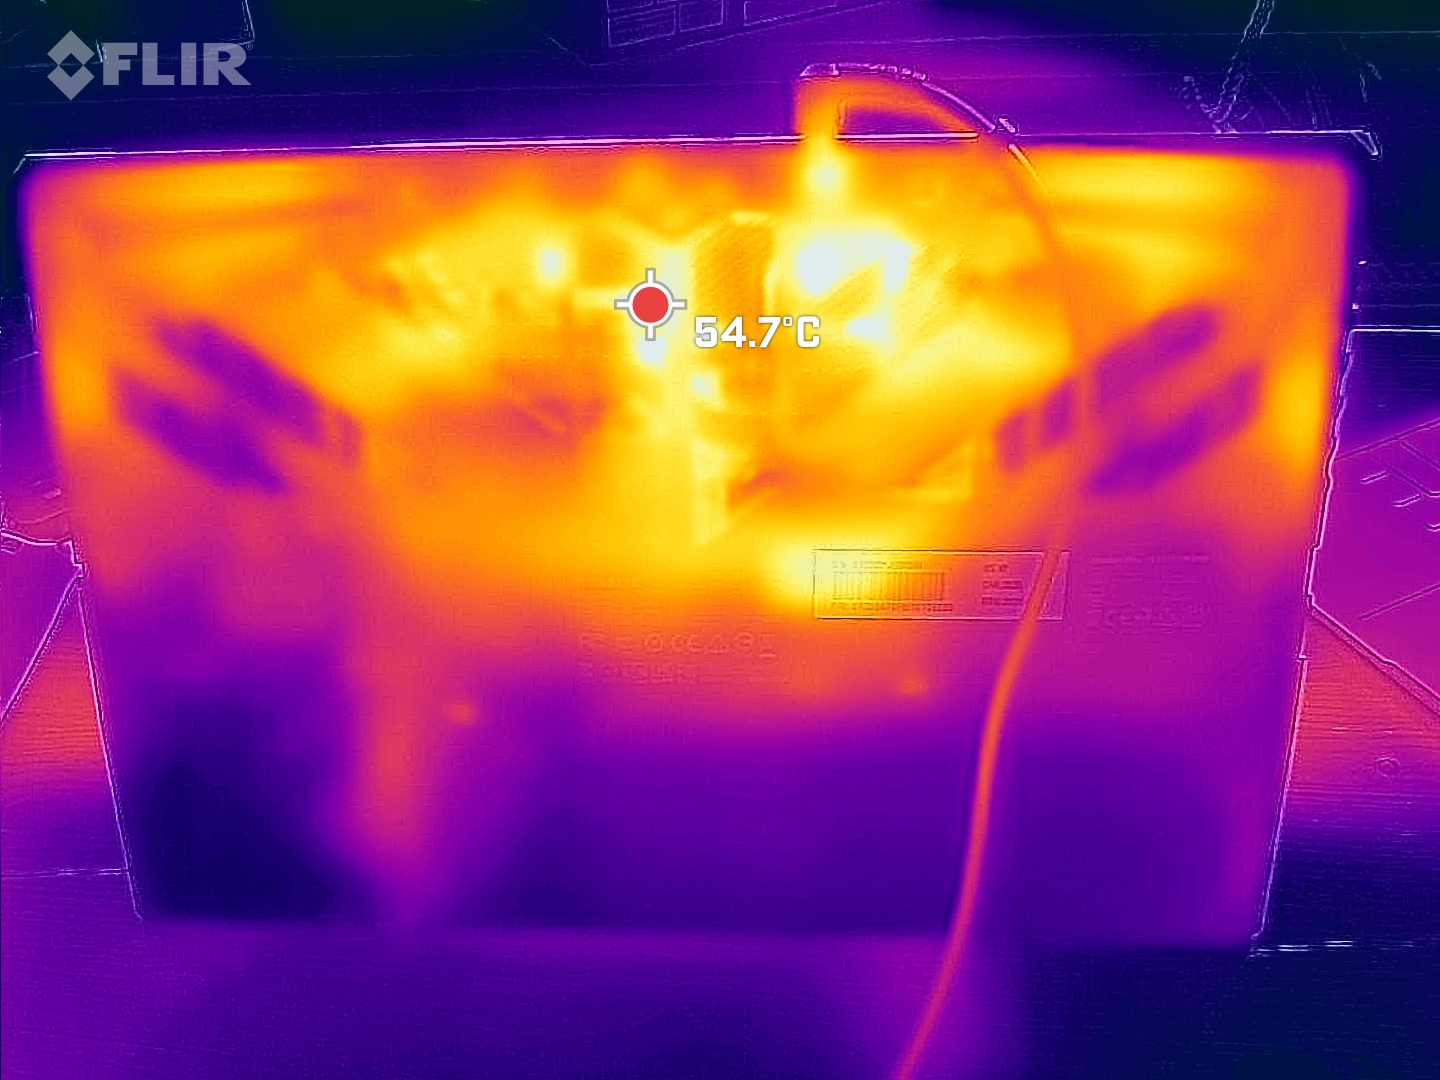
Alcuni punti della superficie del portatile si scaldano sensibilmente sotto carico pesante (ad esempio, stress test, test Witcher 3 ). Al contrario, le temperature dello chassis sono più moderate sui dispositivi concorrenti. Detto questo, le temperature della superficie del G5 KF si mantengono in un intervallo accettabile nell'uso quotidiano (ad esempio, applicazioni da ufficio, navigazione in Internet).
(-) La temperatura massima sul lato superiore è di 54 °C / 129 F, rispetto alla media di 40.4 °C / 105 F, che varia da 21.2 a 68.8 °C per questa classe Gaming.
(-) Il lato inferiore si riscalda fino ad un massimo di 61 °C / 142 F, rispetto alla media di 43.2 °C / 110 F
(+) In idle, la temperatura media del lato superiore è di 30.7 °C / 87 F, rispetto alla media deld ispositivo di 33.9 °C / 93 F.
(±) Riproducendo The Witcher 3, la temperatura media per il lato superiore e' di 37.3 °C / 99 F, rispetto alla media del dispositivo di 33.9 °C / 93 F.
(+) I poggiapolsi e il touchpad raggiungono la temperatura massima della pelle (34 °C / 93.2 F) e quindi non sono caldi.
(-) La temperatura media della zona del palmo della mano di dispositivi simili e'stata di 28.8 °C / 83.8 F (-5.2 °C / -9.4 F).
| Gigabyte G5 KF Intel Core i5-12500H, NVIDIA GeForce RTX 4060 Laptop GPU | MSI Cyborg 15 A12VF Intel Core i7-12650H, NVIDIA GeForce RTX 4060 Laptop GPU | Intel NUC X15 LAPAC71H Intel Core i7-12700H, Intel Arc A730M | Asus TUF A15 FA507 AMD Ryzen 7 7735HS, NVIDIA GeForce RTX 4050 Laptop GPU | Lenovo Legion Slim 5 16APH8 AMD Ryzen 7 7840HS, NVIDIA GeForce RTX 4060 Laptop GPU | Gigabyte G5 KE Intel Core i5-12500H, NVIDIA GeForce RTX 3060 Laptop GPU | |
|---|---|---|---|---|---|---|
| Heat | 23% | 11% | 20% | 25% | 1% | |
| Maximum Upper Side * (°C) | 54 | 47.5 12% | 59 -9% | 48.9 9% | 40.6 25% | 52.6 3% |
| Maximum Bottom * (°C) | 61 | 35.5 42% | 51 16% | 44.6 27% | 42 31% | 62.4 -2% |
| Idle Upper Side * (°C) | 34 | 27.7 19% | 28 18% | 27.1 20% | 27.8 18% | 33.6 1% |
| Idle Bottom * (°C) | 36 | 29.5 18% | 30 17% | 27.5 24% | 26.6 26% | 34.8 3% |
* ... Meglio usare valori piccoli
Test da sforzo
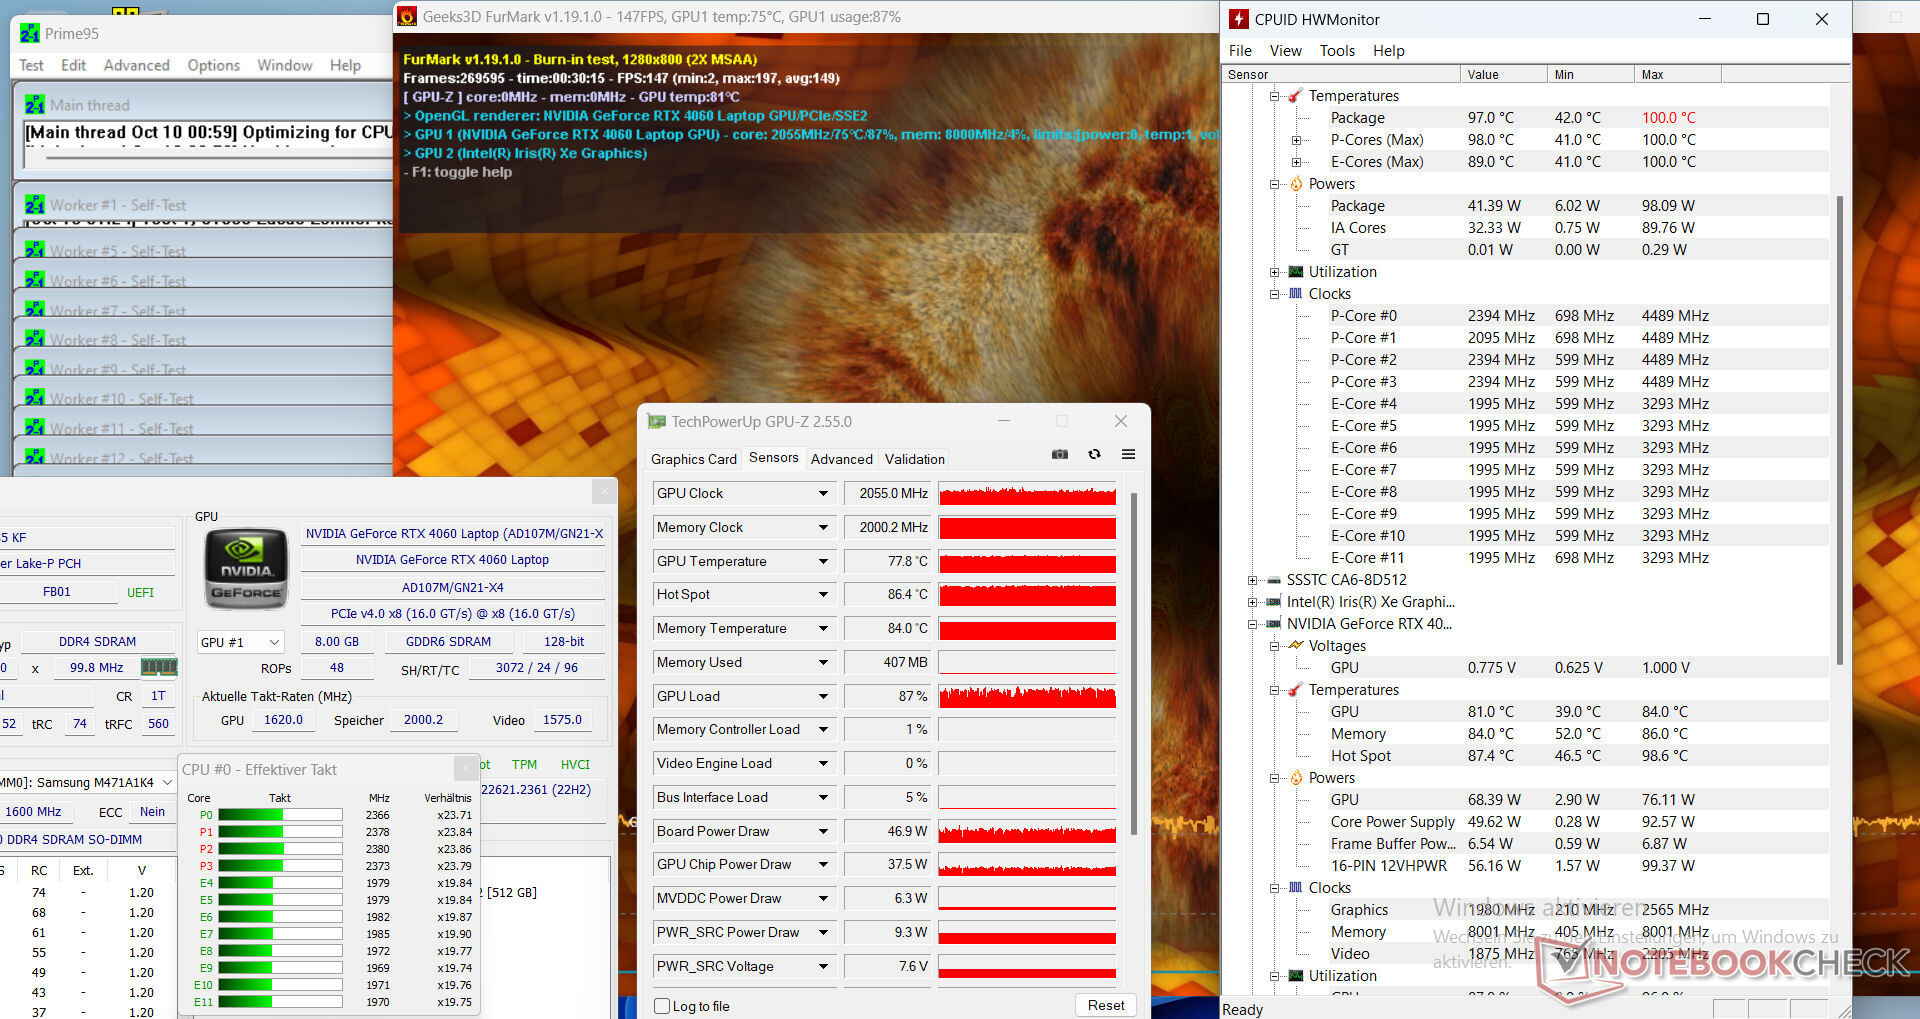
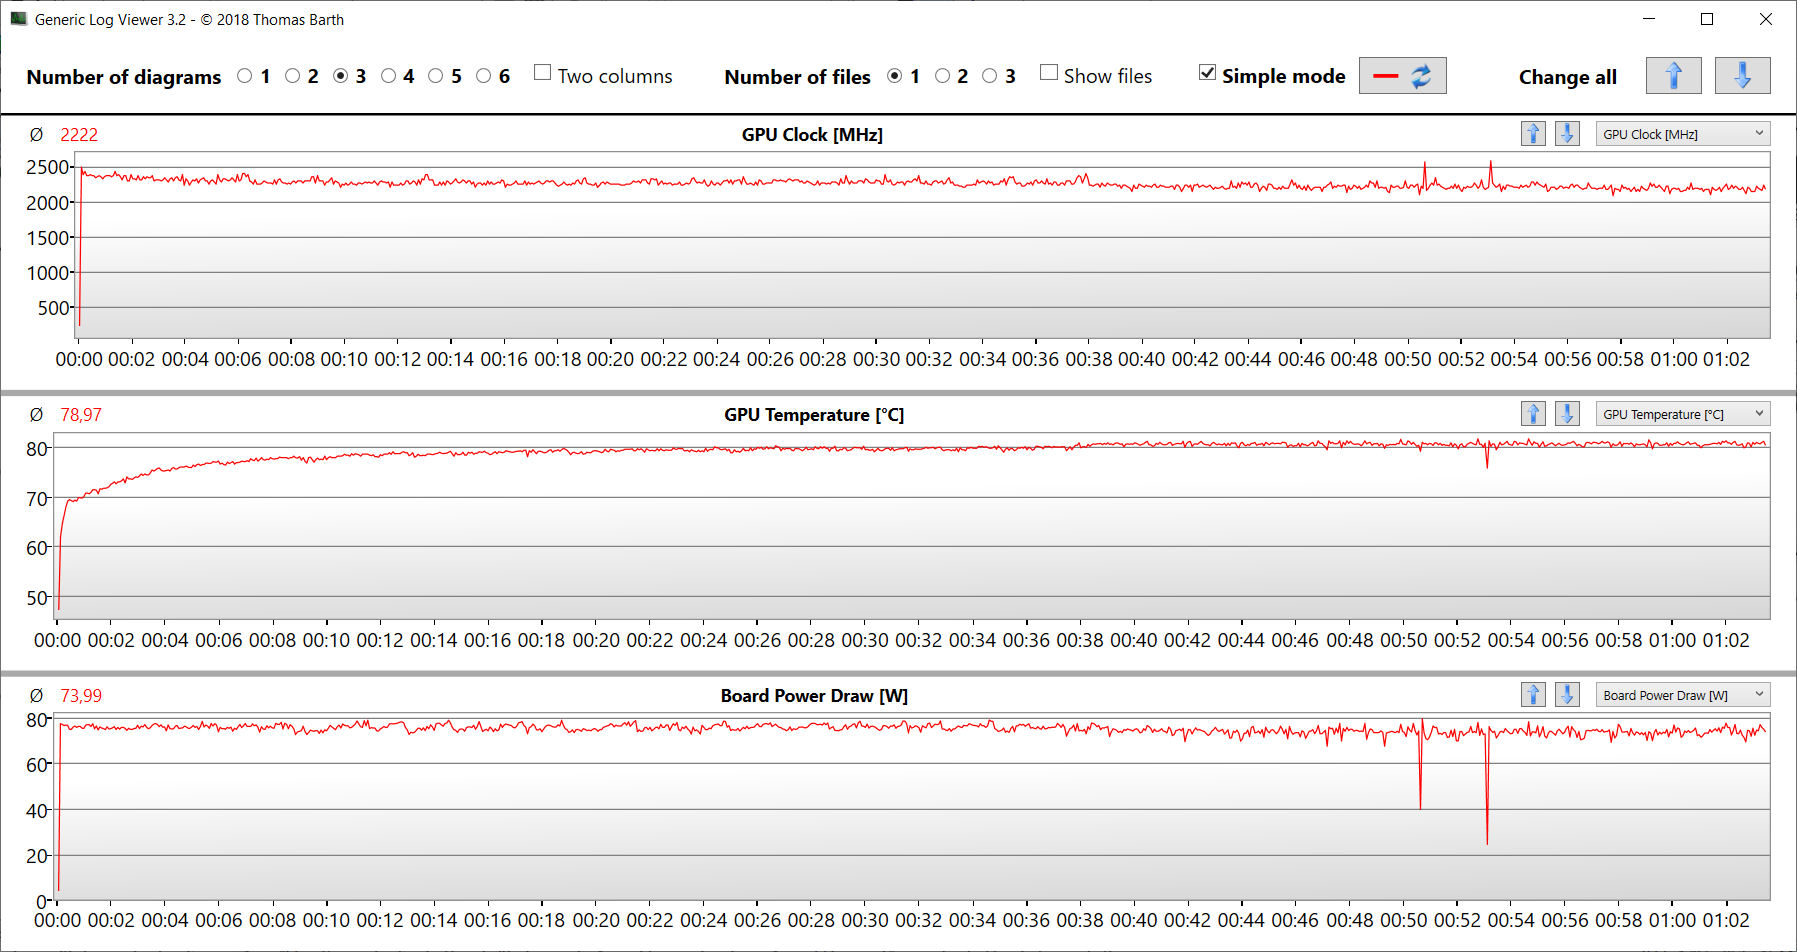
Il nostro test di stress (esecuzione di Prime95 e FurMark per un periodo prolungato) rappresenta uno scenario estremo progettato per determinare la stabilità del sistema a pieno carico. Dopo aver iniziato con velocità di clock elevate, la CPU e la GPU hanno iniziato a rallentare man mano che il test proseguiva. Dopo circa 30 minuti, la CPU funzionava all'incirca al suo clock di base, mentre la GPU si aggirava intorno ai 2 GHz.
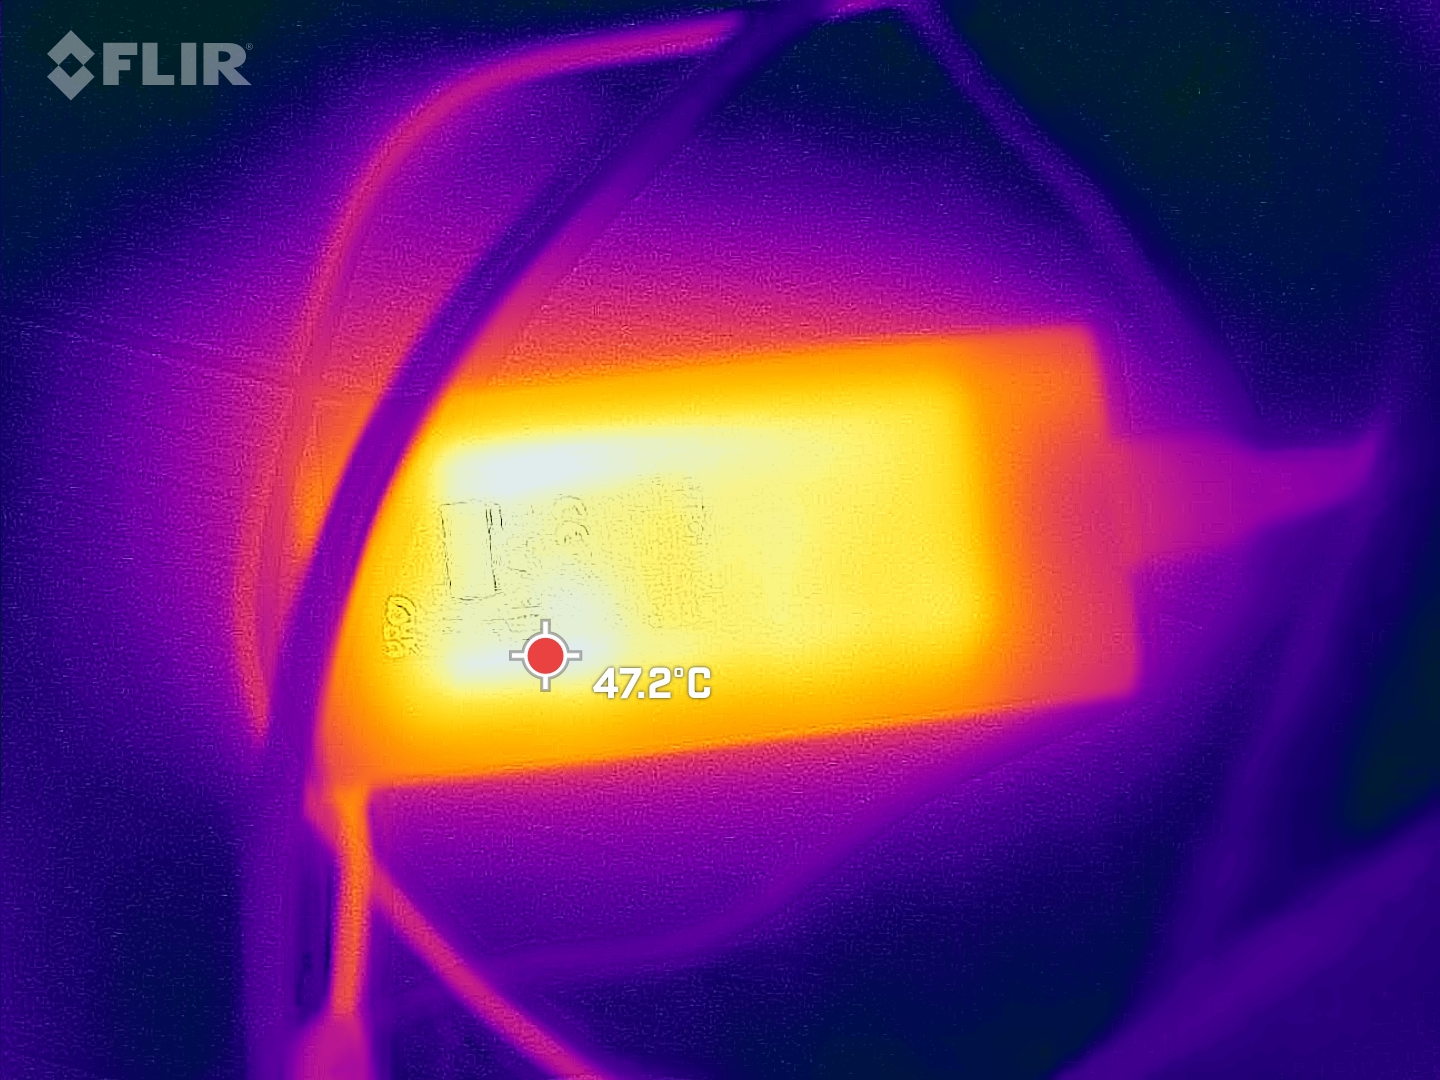
L'alimentatore si è spento dopo 49 minuti di stress test e la sua temperatura superficiale è salita a 68°C (154,4°F). Per un periodo prolungato, la quantità di energia richiesta dall'hardware sembra superare quella che l'adattatore da 150 watt può fornire. Nei casi d'uso "tipici" (ad esempio, giochi, applicazioni da ufficio), tuttavia, non ci aspettiamo che l'alimentatore si spenga da solo. Il test di stress simula una situazione che raramente si verifica nella vita reale (ad esempio, la CPU e la GPU funzionano contemporaneamente alla massima capacità).
Altoparlanti
Gli altoparlanti stereo hanno un suono decente, ma i bassi sono quasi inesistenti.
Gigabyte G5 KF analisi audio
(±) | potenza degli altiparlanti media ma buona (78.6 dB)
Bassi 100 - 315 Hz
(-) | quasi nessun basso - in media 15.6% inferiori alla media
(+) | bassi in lineaa (1.7% delta rispetto alla precedente frequenza)
Medi 400 - 2000 Hz
(±) | medi elevati - circa 9.7% superiore alla media
(±) | linearità dei medi adeguata (10.4% delta rispetto alla precedente frequenza)
Alti 2 - 16 kHz
(+) | Alti bilanciati - appena 3.2% dalla media
(+) | alti lineari (6.9% delta rispetto alla precedente frequenza)
Nel complesso 100 - 16.000 Hz
(±) | la linearità complessiva del suono è media (22.7% di differenza rispetto alla media
Rispetto alla stessa classe
» 82% di tutti i dispositivi testati in questa classe è stato migliore, 5% simile, 13% peggiore
» Il migliore ha avuto un delta di 6%, medio di 18%, peggiore di 132%
Rispetto a tutti i dispositivi testati
» 67% di tutti i dispositivi testati in questa classe è stato migliore, 6% similare, 27% peggiore
» Il migliore ha avuto un delta di 4%, medio di 23%, peggiore di 134%
Asus TUF A15 FA507 analisi audio
(±) | potenza degli altiparlanti media ma buona (79.3 dB)
Bassi 100 - 315 Hz
(±) | bassi ridotti - in media 13.7% inferiori alla media
(+) | bassi in lineaa (6.2% delta rispetto alla precedente frequenza)
Medi 400 - 2000 Hz
(±) | medi elevati - circa 7.6% superiore alla media
(±) | linearità dei medi adeguata (7.3% delta rispetto alla precedente frequenza)
Alti 2 - 16 kHz
(+) | Alti bilanciati - appena 2.1% dalla media
(±) | la linearità degli alti è media (7.5% delta rispetto alla precedente frequenza)
Nel complesso 100 - 16.000 Hz
(±) | la linearità complessiva del suono è media (17.2% di differenza rispetto alla media
Rispetto alla stessa classe
» 47% di tutti i dispositivi testati in questa classe è stato migliore, 11% simile, 42% peggiore
» Il migliore ha avuto un delta di 6%, medio di 18%, peggiore di 132%
Rispetto a tutti i dispositivi testati
» 32% di tutti i dispositivi testati in questa classe è stato migliore, 8% similare, 60% peggiore
» Il migliore ha avuto un delta di 4%, medio di 23%, peggiore di 134%
Gestione dell'energia - Il G5 non la stupirà con la sua resistenza
Consumo di energia
Durante il nostro test su Witcher 3, il consumo di energia del portatile si è mantenuto a un livello stabile, come previsto. Tuttavia, la richiesta di energia ha oscillato durante lo stress test; il G5 KF ha costantemente assorbito più energia di quella prevista dal caricabatterie (150 watt). Di conseguenza, l'adattatore si è spento da solo dopo circa 50 minuti. L'alimentatore non sembra avere molto spazio. Il modello da 180 watt fornito con il G5 KE sarebbe stata una scelta migliore in questo caso.
| Off / Standby | |
| Idle | |
| Sotto carico |
|
Leggenda:
min: | |
| Gigabyte G5 KF i5-12500H, GeForce RTX 4060 Laptop GPU, SSSTC CA6-8D512, IPS, 1920x1080, 15.6" | MSI Cyborg 15 A12VF i7-12650H, GeForce RTX 4060 Laptop GPU, Samsung PM9B1 1024GB MZVL41T0HBLB, IPS, 1920x1080, 15.6" | Intel NUC X15 LAPAC71H i7-12700H, A730M, Samsung 990 Pro 1 TB, IPS, 1920x1080, 15.6" | Asus TUF A15 FA507 R7 7735HS, GeForce RTX 4050 Laptop GPU, Micron 2400 MTFDKBA512QFM, IPS, 1920x1080, 15.6" | Lenovo Legion Slim 5 16APH8 R7 7840HS, GeForce RTX 4060 Laptop GPU, SK hynix PC801 HFS512GEJ9X115N, IPS, 2560x1600, 16" | Gigabyte G5 KE i5-12500H, GeForce RTX 3060 Laptop GPU, Gigabyte AG4512G-SI B10, IPS, 1920x1080, 15.6" | Media NVIDIA GeForce RTX 4060 Laptop GPU | Media della classe Gaming | |
|---|---|---|---|---|---|---|---|---|
| Power Consumption | 13% | -30% | -7% | -27% | -27% | -44% | -71% | |
| Idle Minimum * (Watt) | 7 | 6 14% | 7.5 -7% | 8 -14% | 9.4 -34% | 7.66 -9% | 11.5 ? -64% | 13 ? -86% |
| Idle Average * (Watt) | 10.2 | 8.8 14% | 11.9 -17% | 12.1 -19% | 15.5 -52% | 10.3 -1% | 16 ? -57% | 19 ? -86% |
| Idle Maximum * (Watt) | 16.1 | 11.9 26% | 13.9 14% | 12.5 22% | 24.4 -52% | 16.05 -0% | 20.3 ? -26% | 24.6 ? -53% |
| Load Average * (Watt) | 59.3 | 89 -50% | 137 -131% | 74.9 -26% | 74.1 -25% | 115.8 -95% | 92.9 ? -57% | 110.7 ? -87% |
| Witcher 3 ultra * (Watt) | 129 | 90.3 30% | 166 -29% | 136.6 -6% | 112.9 12% | 168.7 -31% | ||
| Load Maximum * (Watt) | 183 | 99 46% | 203 -11% | 185 -1% | 206.5 -13% | 234.6 -28% | 210 ? -15% | 259 ? -42% |
* ... Meglio usare valori piccoli
Energieaufnahme Witcher 3 / Stresstest
Power consumption with external monitor
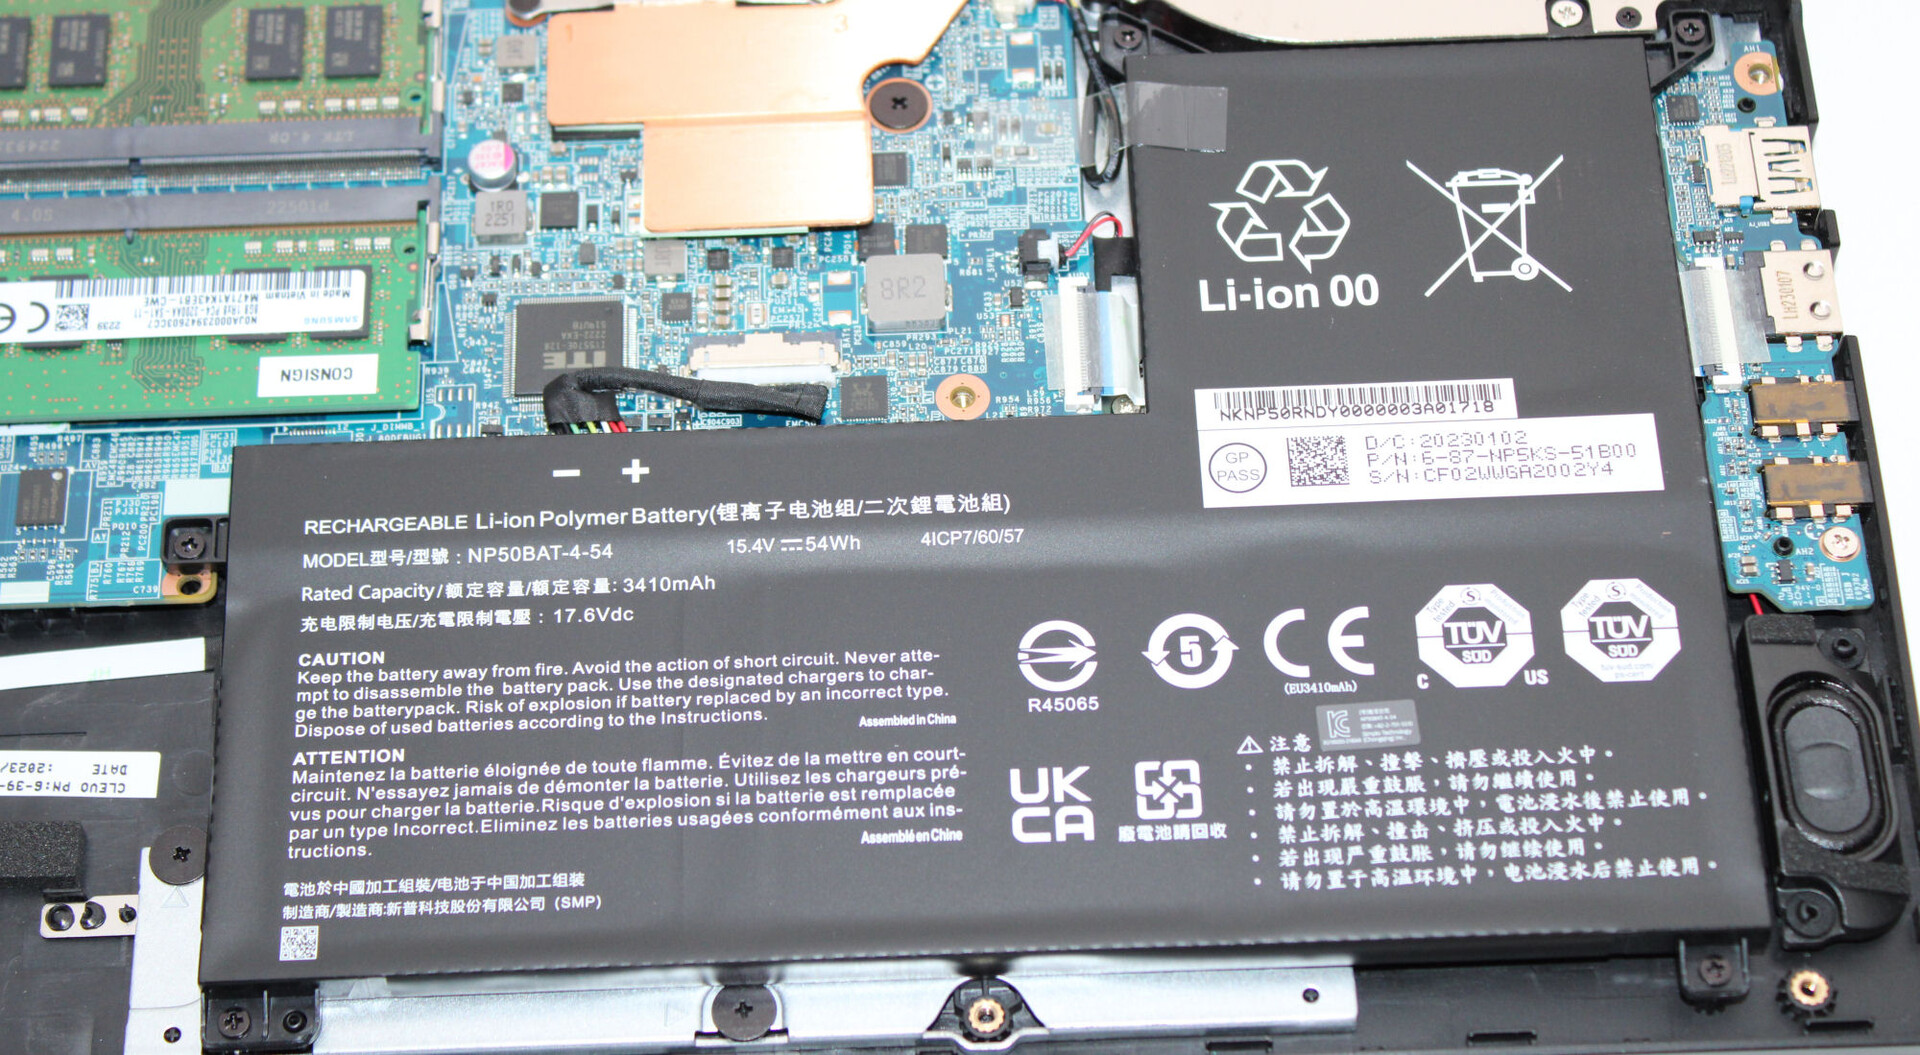
Durata della batteria
Il dispositivo da 15,6 pollici è durato rispettivamente 5h 16min e 4h 28min nel nostro test Wi-Fi (accesso a siti web utilizzando uno script) e nel test video (riproduzione del cortometraggio Big Buck Bunny in loop, in FHD e codificato in formato H.264). Durante i test, la luminosità del display era impostata a circa 150 cd/m² e i moduli wireless erano disattivati.
In termini di durata della batteria, il G5 non ha fatto una bella figura nel confronto diretto con un concorrente come l' MSI Cyborg. Il laptop MSI è in grado di durare molto più a lungo del G5, anche se hanno specifiche hardware comparabili e una capacità della batteria quasi identica.
| Gigabyte G5 KF i5-12500H, GeForce RTX 4060 Laptop GPU, 54 Wh | MSI Cyborg 15 A12VF i7-12650H, GeForce RTX 4060 Laptop GPU, 53.5 Wh | Intel NUC X15 LAPAC71H i7-12700H, A730M, 62.3 Wh | Asus TUF A15 FA507 R7 7735HS, GeForce RTX 4050 Laptop GPU, 90 Wh | Lenovo Legion Slim 5 16APH8 R7 7840HS, GeForce RTX 4060 Laptop GPU, 80 Wh | Gigabyte G5 KE i5-12500H, GeForce RTX 3060 Laptop GPU, 54 Wh | Media della classe Gaming | |
|---|---|---|---|---|---|---|---|
| Autonomia della batteria | 56% | 8% | 87% | 15% | -27% | 27% | |
| Reader / Idle (h) | 8.6 | 13.6 58% | 11.7 36% | 8.27 ? -4% | |||
| H.264 (h) | 4.5 | 8 78% | 12.5 178% | 2.2 -51% | 8.32 ? 85% | ||
| WiFi v1.3 (h) | 5.3 | 7.5 42% | 5.7 8% | 11.7 121% | 7.1 34% | 5.7 8% | 7.11 ? 34% |
| Load (h) | 1.6 | 2.3 44% | 1 -37% | 1.2 -25% | 1 -37% | 1.502 ? -6% | |
| Witcher 3 ultra (h) | 1.3 |
Pro
Contro
Verdetto - Un'offerta solida, con un grande potenziale di ottimizzazione

Nonostante abbia una GPU più recente e teoricamente più potente, il G5 KF è "solo" in grado di offrire circa le stesse prestazioni di gioco del suo predecessore del suo predecessoreanche se consuma molta meno energia. La più efficiente RTX 4060 (75 W) funziona a un TGP inferiore rispetto a quello di RTX 3060 (115 W) nel G5 KE. A parità di TGP, il G5 KF si comporta meglio del KE.
Con il G5 KF, Gigabyte ha realizzato un laptop da gioco FHD economico. Ma gli utenti dovranno fare i conti con una serie di difetti.
Il portatile diventa sensibilmente caldo sotto carico in alcune aree e produce anche molto rumore. È possibile attenuare il problema del rumore utilizzando i profili di prestazioni forniti, ma le prestazioni ne risentiranno. Purtroppo, l'alimentatore ridotto (150 watt invece di 180 watt) non è in grado di gestire ogni tipo di situazione di carico (ad esempio, gli stress test).
La quantità di memoria integrata (512 GB) sembra misera per un notebook da gioco. Realisticamente, il sistema può durare da 4 a 5,5 ore con una singola carica, il che non è certo una sorpresa per nessuno. Inoltre, la porta Thunderbolt 4 sul G5 KE ha lasciato il posto ad una porta USB 3.2 Gen 2. Anche il display Full HD opaco (15,6 pollici, IPS, 144Hz) non vincerà alcun premio: la copertura del colore, la luminosità e il contrasto non sono all'altezza dello standard. Il prezzo relativamente basso del portatile è dovuto anche al fatto che la licenza di Windows non è inclusa nel sistema.
Il Asus TUF A15 FA507 è un'alternativa al G5 KF. Nonostante abbia una GPU più debole sulla carta, ha prestazioni grafiche solo marginalmente inferiori rispetto al G5. L'A15 offre anche migliori prestazioni della CPU, una durata della batteria significativamente più lunga e una porta USB4. Il TUF A15 può essere acquistato a 1.099 euro (circa 1.165 dollari) in questo momento, con Windows 11 incluso.
Prezzo e disponibilità
Gigabyte G5 KF le costerà circa €984 (US$950) da Amazon.de o Amazon.com. Tenga presente che il modello su Amazon USA ha solo 8 GB di RAM, ma viene fornito con Windows 11. Anche i prezzi possono variare nel tempo. Per chi ha un budget limitato, può prendere in considerazione i modelli G5 MF (RTX 4050, 8 GB di RAM) e G5 GE (RTX 3050, 8 GB di RAM), entrambi con lo stesso design fisico.
Gigabyte G5 KF
- 10/18/2023 v7 (old)
Sascha Mölck
Transparency
La selezione dei dispositivi da recensire viene effettuata dalla nostra redazione. Il campione di prova è stato fornito all'autore come prestito dal produttore o dal rivenditore ai fini di questa recensione. L'istituto di credito non ha avuto alcuna influenza su questa recensione, né il produttore ne ha ricevuto una copia prima della pubblicazione. Non vi era alcun obbligo di pubblicare questa recensione. In quanto società mediatica indipendente, Notebookcheck non è soggetta all'autorità di produttori, rivenditori o editori.
Ecco come Notebookcheck esegue i test
Ogni anno, Notebookcheck esamina in modo indipendente centinaia di laptop e smartphone utilizzando procedure standardizzate per garantire che tutti i risultati siano comparabili. Da circa 20 anni sviluppiamo continuamente i nostri metodi di prova e nel frattempo stabiliamo gli standard di settore. Nei nostri laboratori di prova, tecnici ed editori esperti utilizzano apparecchiature di misurazione di alta qualità. Questi test comportano un processo di validazione in più fasi. Il nostro complesso sistema di valutazione si basa su centinaia di misurazioni e parametri di riferimento ben fondati, che mantengono l'obiettività.Price comparison

