Recensione dell'MSI Cyborg 15 A12VF: gaming Laptop con RTX 4060 a bassa potenza
Il portatile da gioco di MSI non vuole - e non è nemmeno in grado - di stabilire nuovi record di prestazioni. IlCore i7-12650He GeForce RTX 4060sono gestiti con limiti di potenza conservativi e un TGP basso (45 Watt), con un conseguente consumo energetico piuttosto ridotto. Per il portatile è sufficiente un alimentatore da 120 Watt. Tra i concorrenti ci sono portatili come Asus TUF Gaming A16 FA617, ilAorus 15 XE5, ilMSI Katana 15 B12VEK, ilHP Victus 15e il Schenker XMG Fusion 15.
Potenziali concorrenti a confronto
Punteggio | Data | Modello | Peso | Altezza | Dimensione | Risoluzione | Prezzo |
|---|---|---|---|---|---|---|---|
| 82.4 % v7 (old) | 04/2023 | MSI Cyborg 15 A12VF i7-12650H, GeForce RTX 4060 Laptop GPU | 2 kg | 22.9 mm | 15.60" | 1920x1080 | |
| 86.2 % v7 (old) | 02/2023 | Asus TUF Gaming A16 FA617 R7 7735HS, Radeon RX 7600S | 2.2 kg | 27 mm | 16.00" | 1920x1200 | |
| 85.5 % v7 (old) | 12/2022 | Aorus 15 XE5 i7-12700H, GeForce RTX 3070 Ti Laptop GPU | 2.3 kg | 24 mm | 15.60" | 2560x1440 | |
| 87.4 % v7 (old) | 08/2022 | Schenker XMG Fusion 15 (Mid 22) i7-11800H, GeForce RTX 3070 Laptop GPU | 1.9 kg | 21.65 mm | 15.60" | 2560x1440 | |
| 82.9 % v7 (old) | 03/2023 | MSI Katana 15 B12VEK i7-12650H, GeForce RTX 4050 Laptop GPU | 2.3 kg | 24.9 mm | 15.60" | 1920x1080 | |
| 81 % v7 (old) | 01/2023 | HP Victus 15 fa0020nr i7-12700H, GeForce RTX 3050 Ti Laptop GPU | 2.3 kg | 23.6 mm | 15.60" | 1920x1080 |
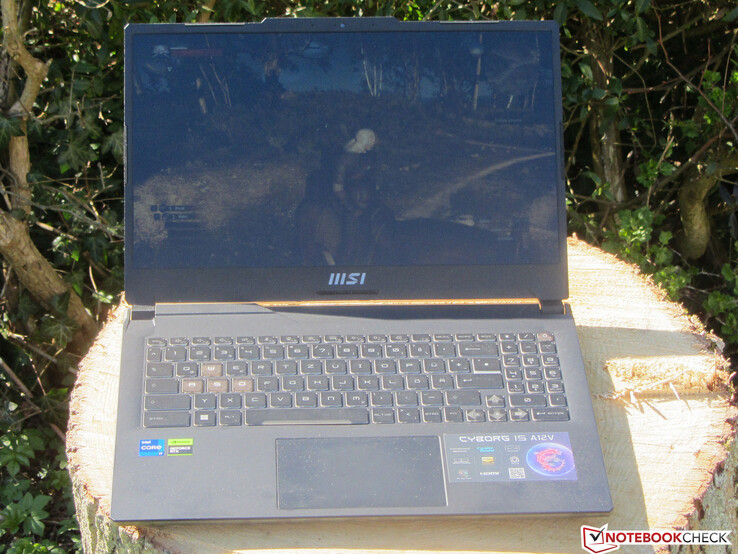
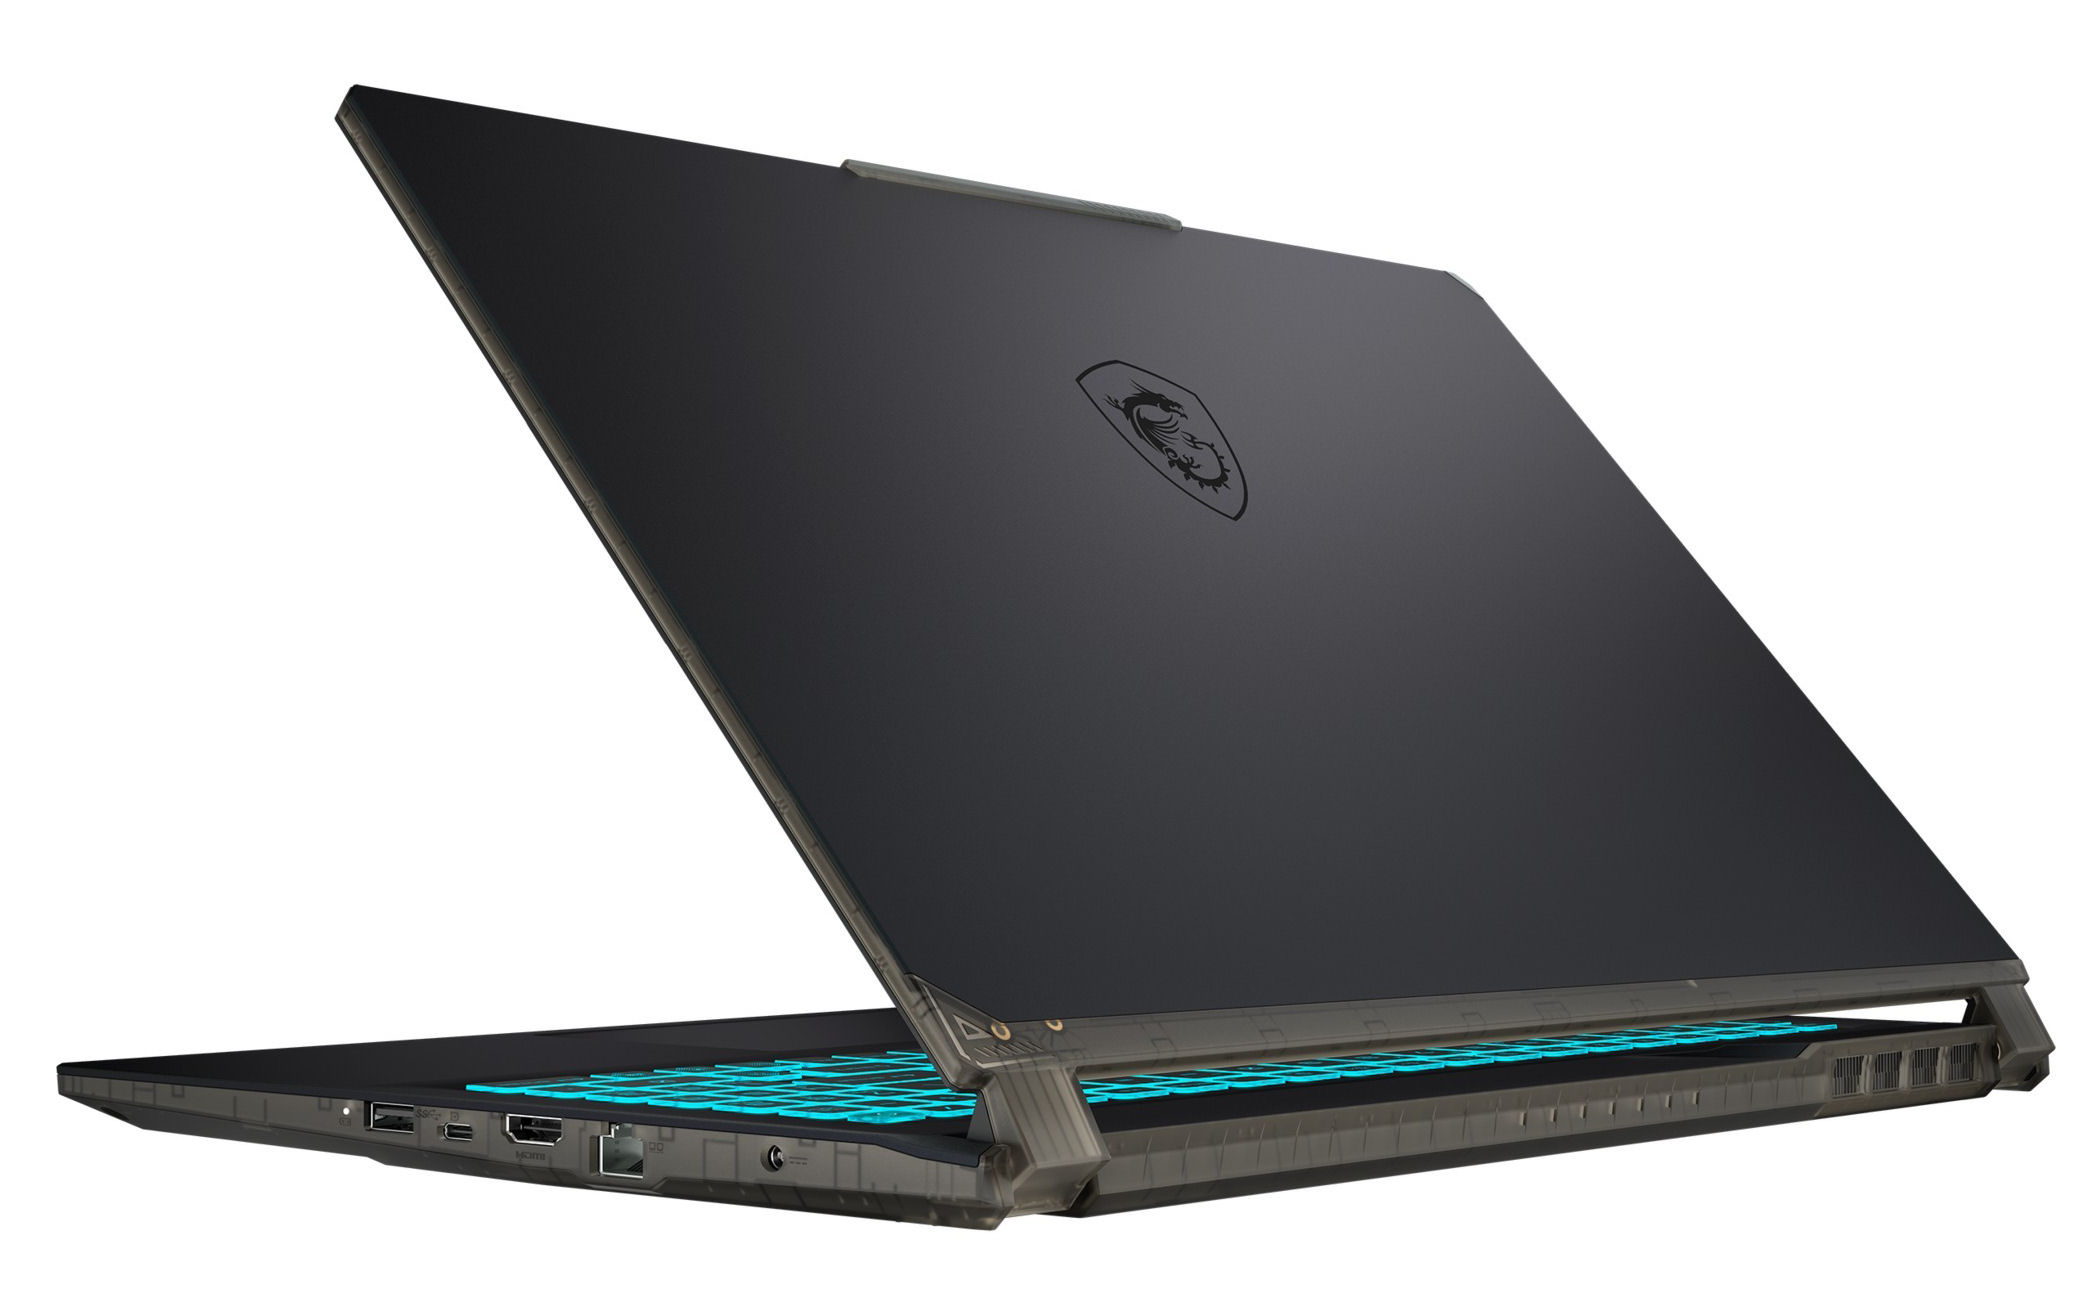
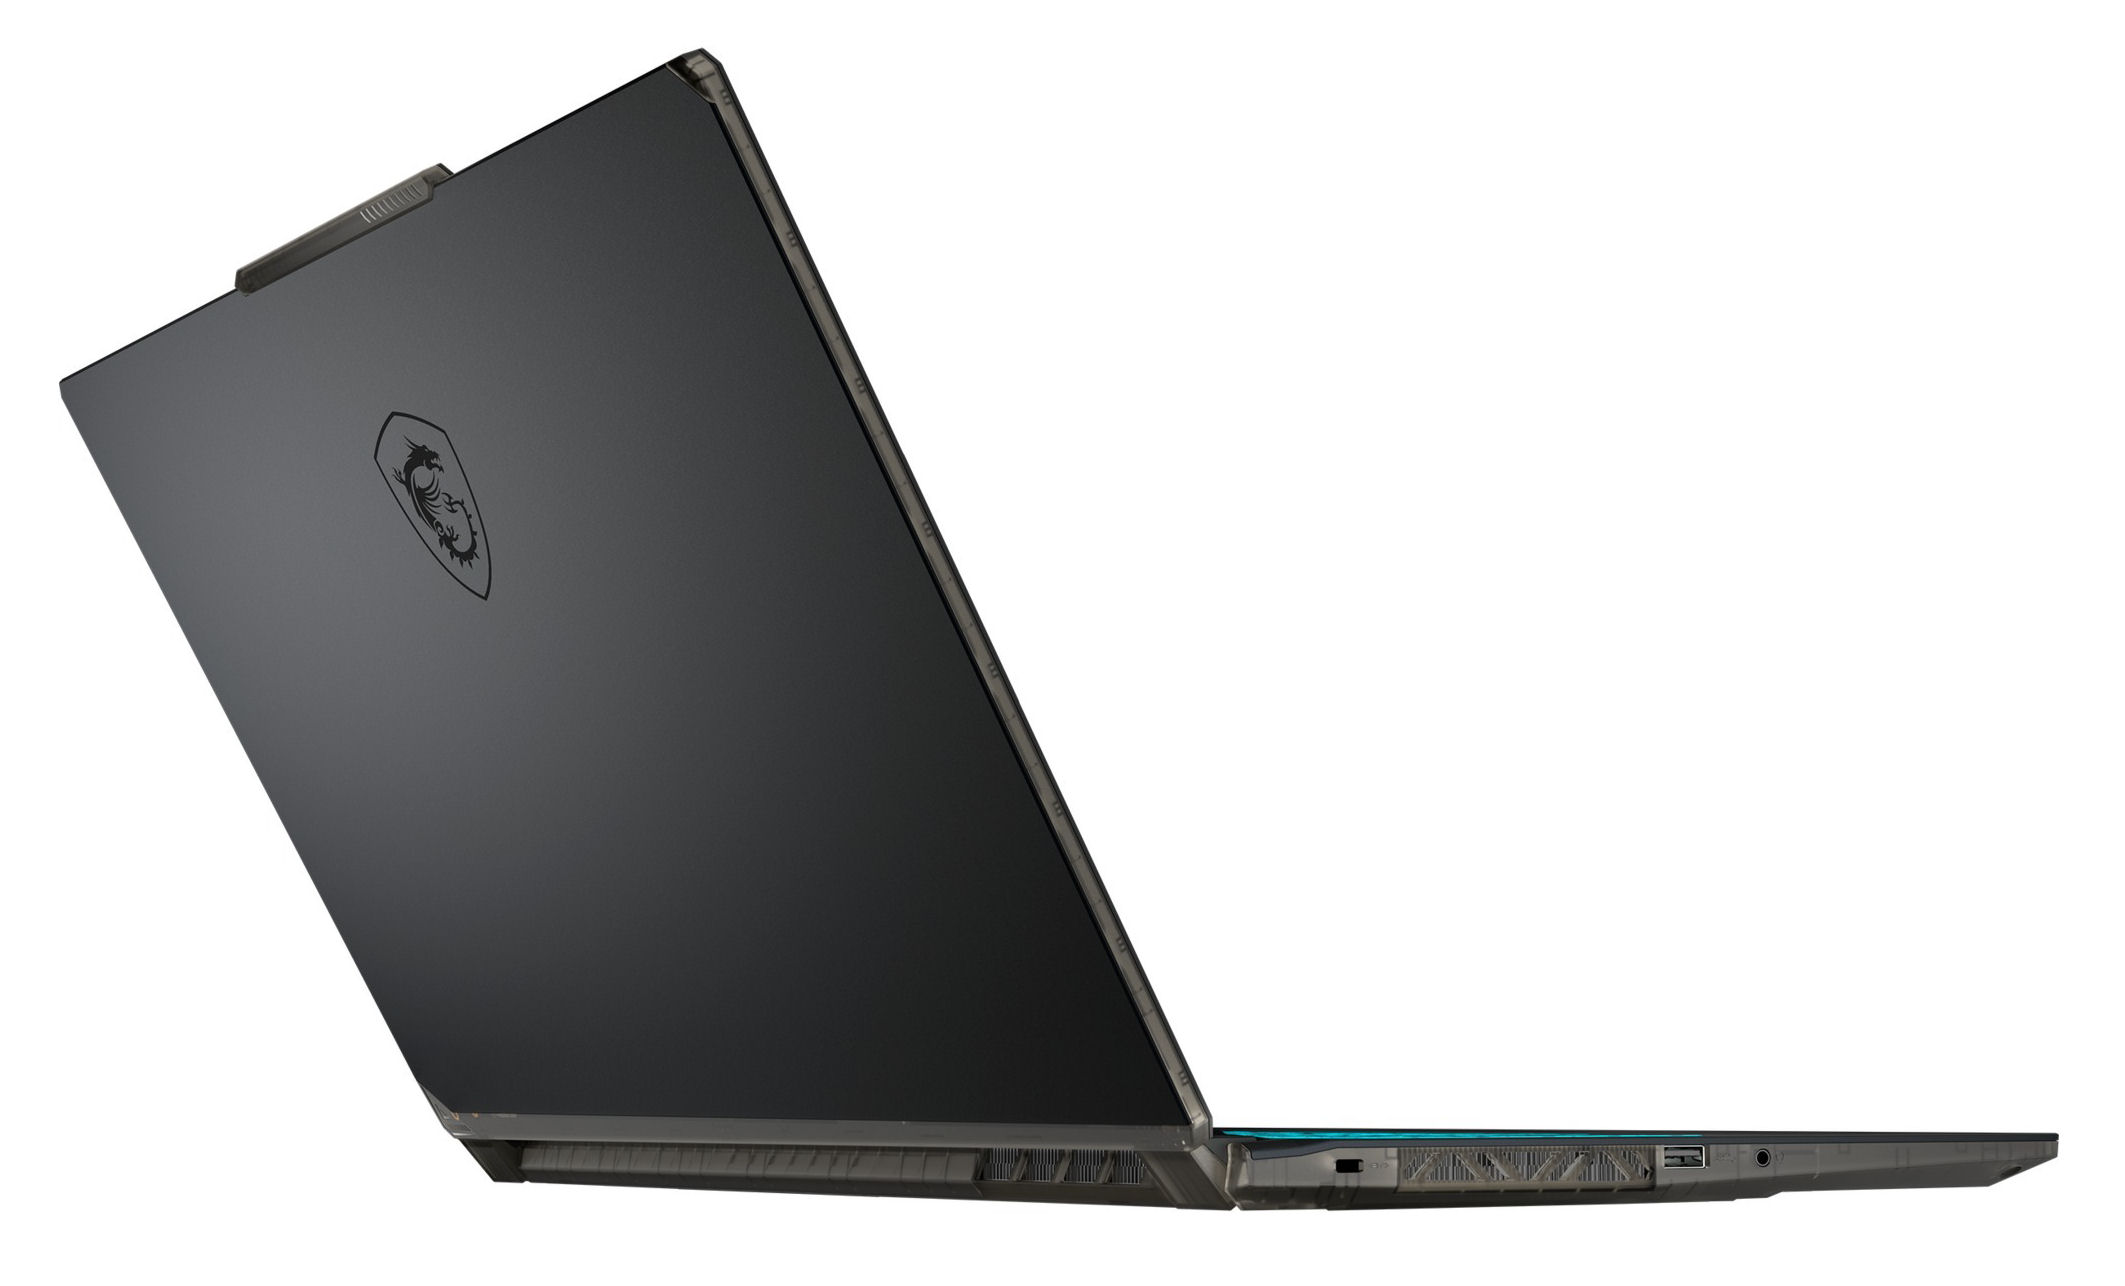
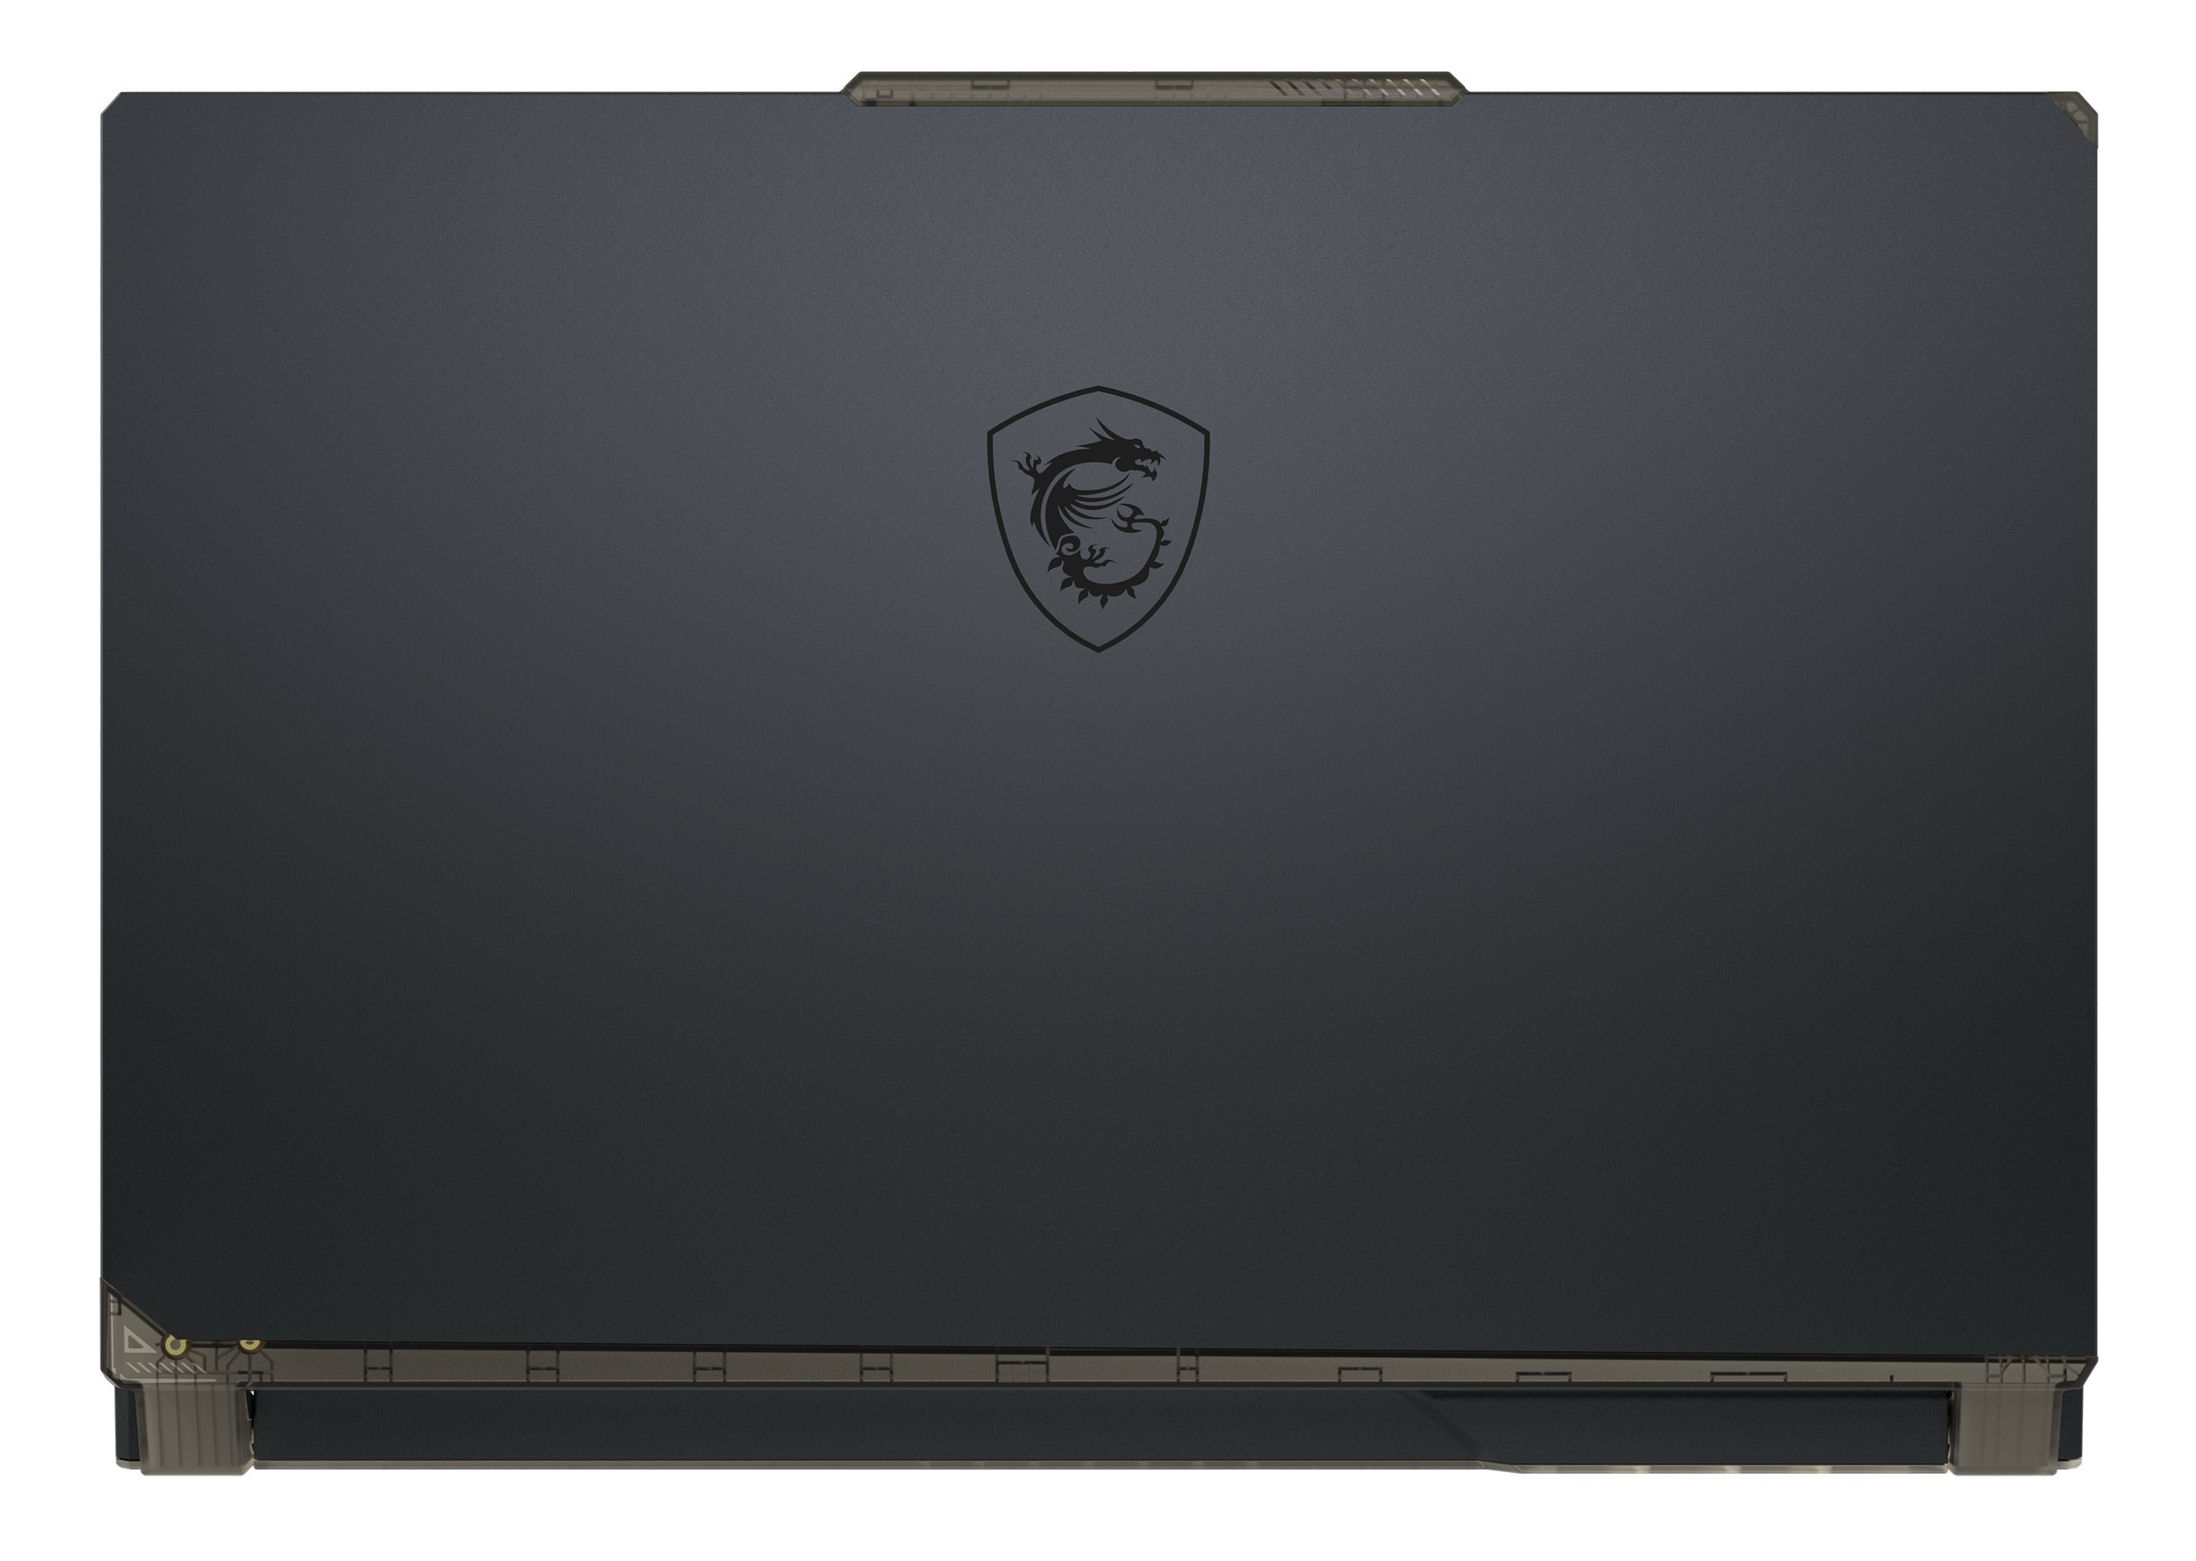
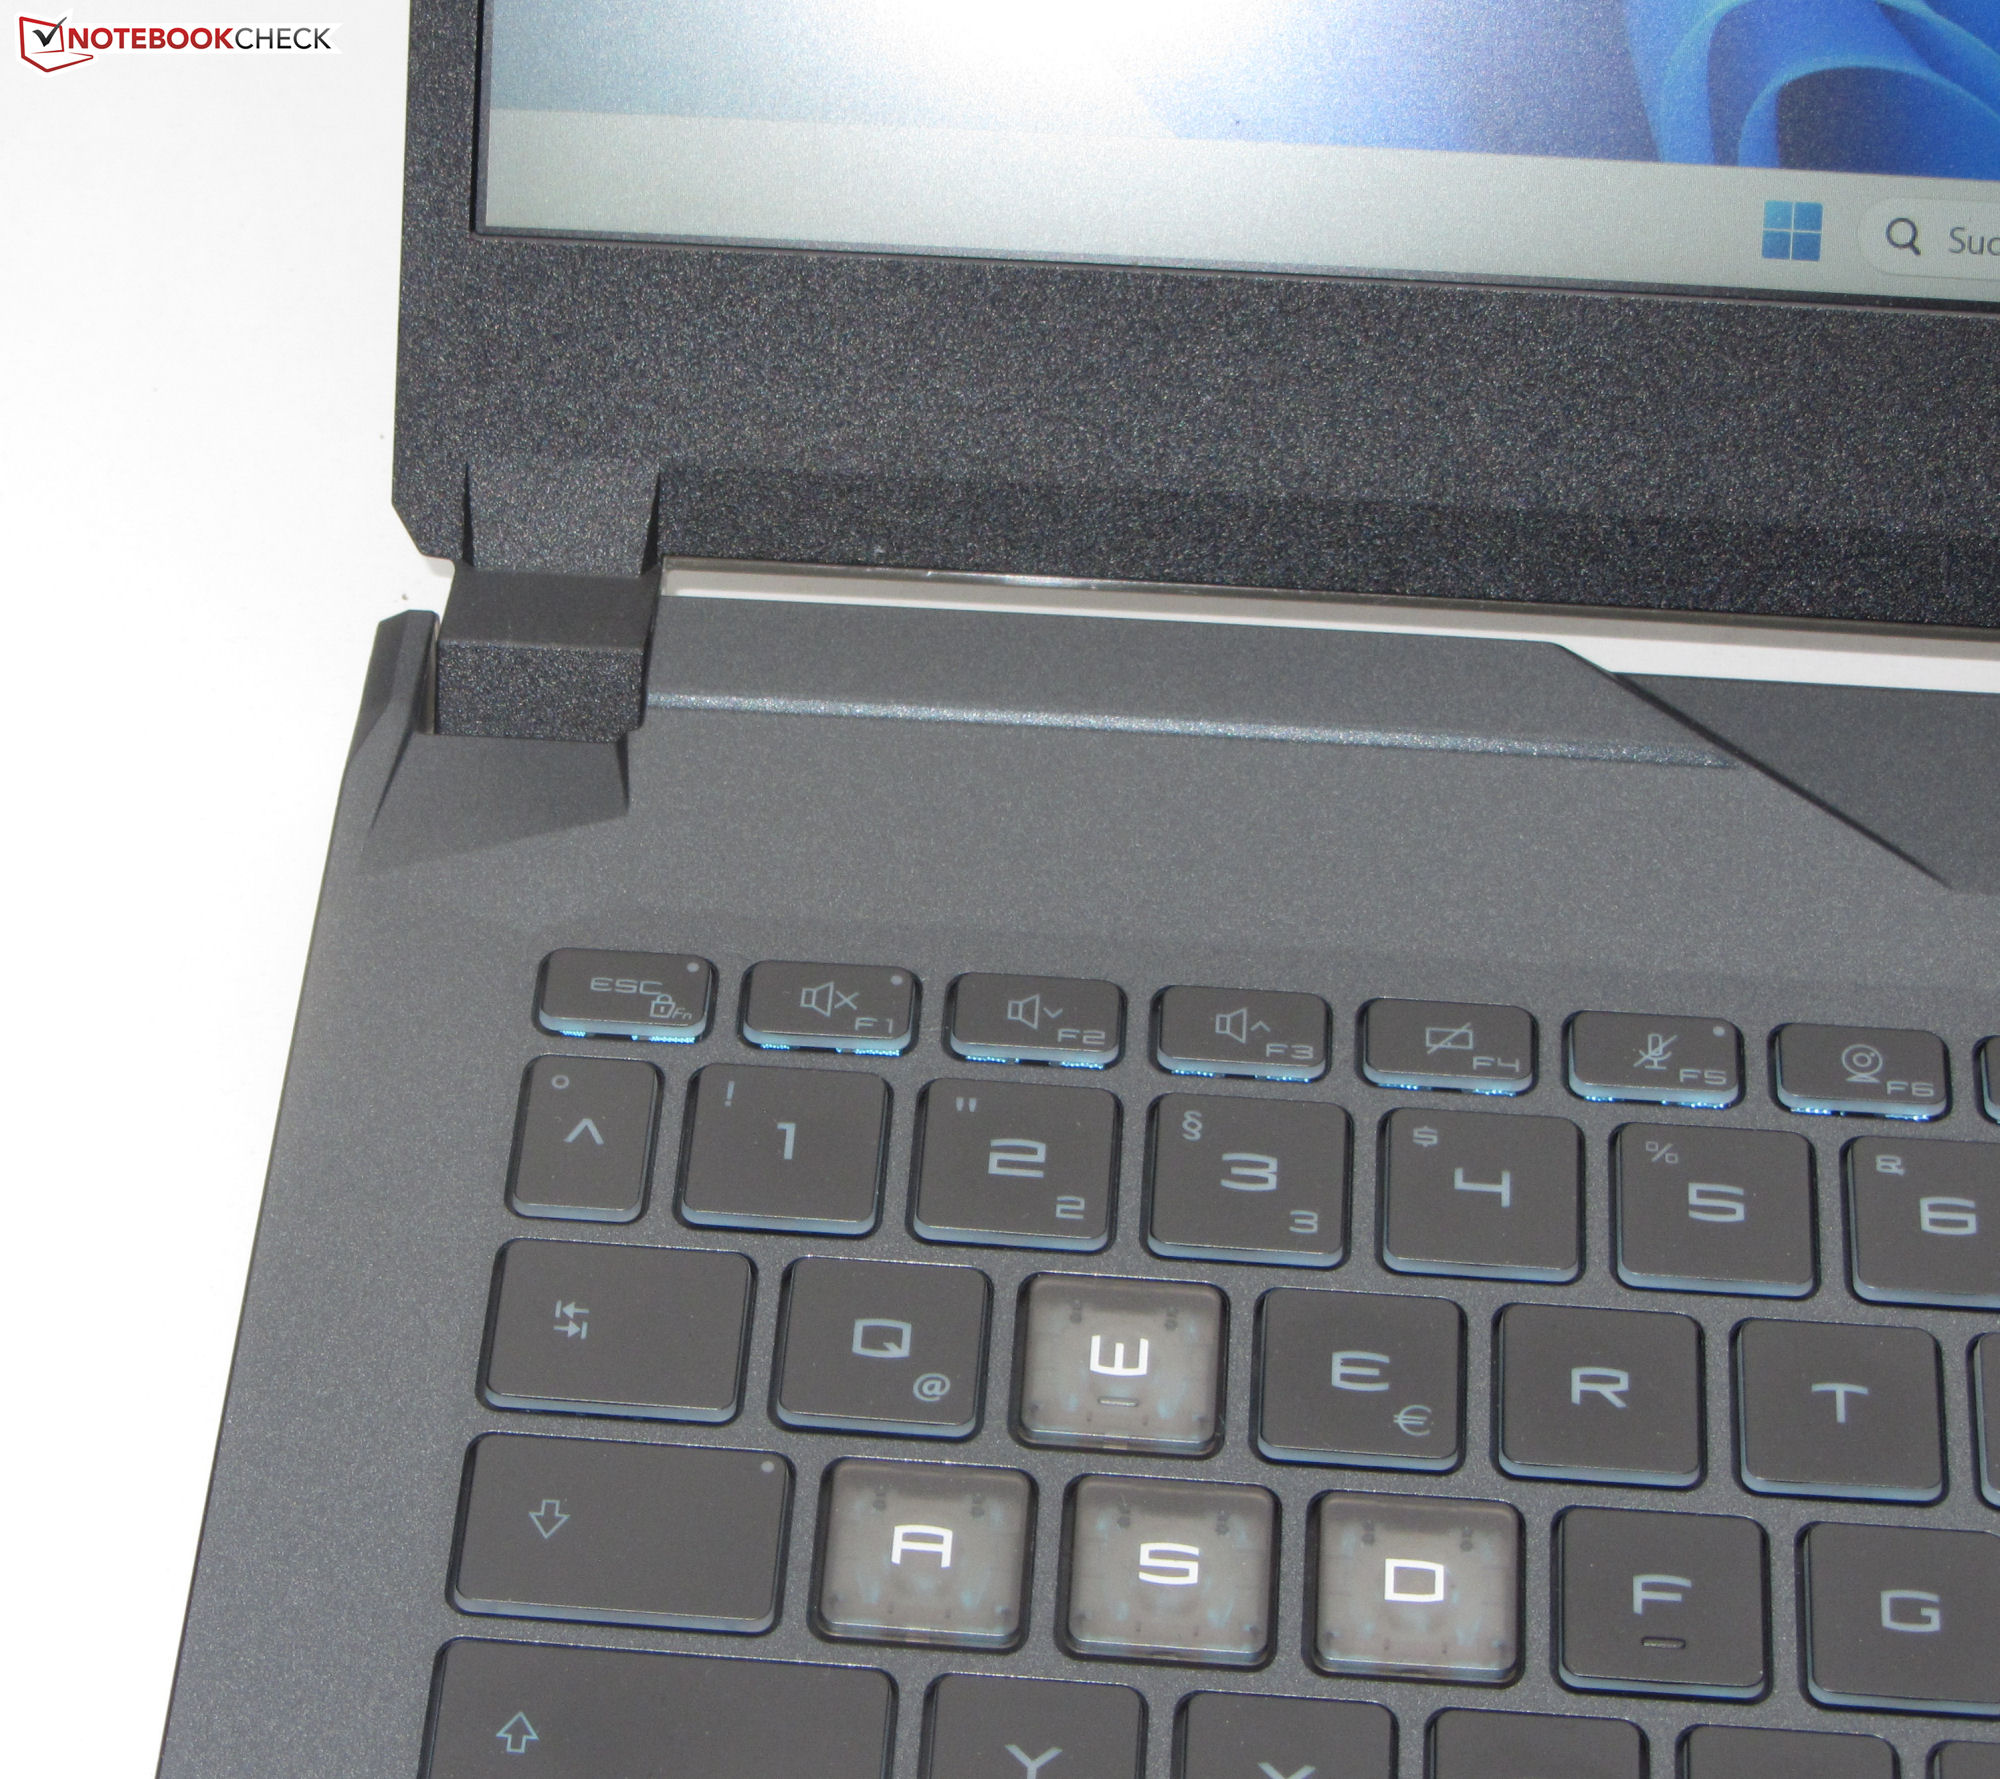
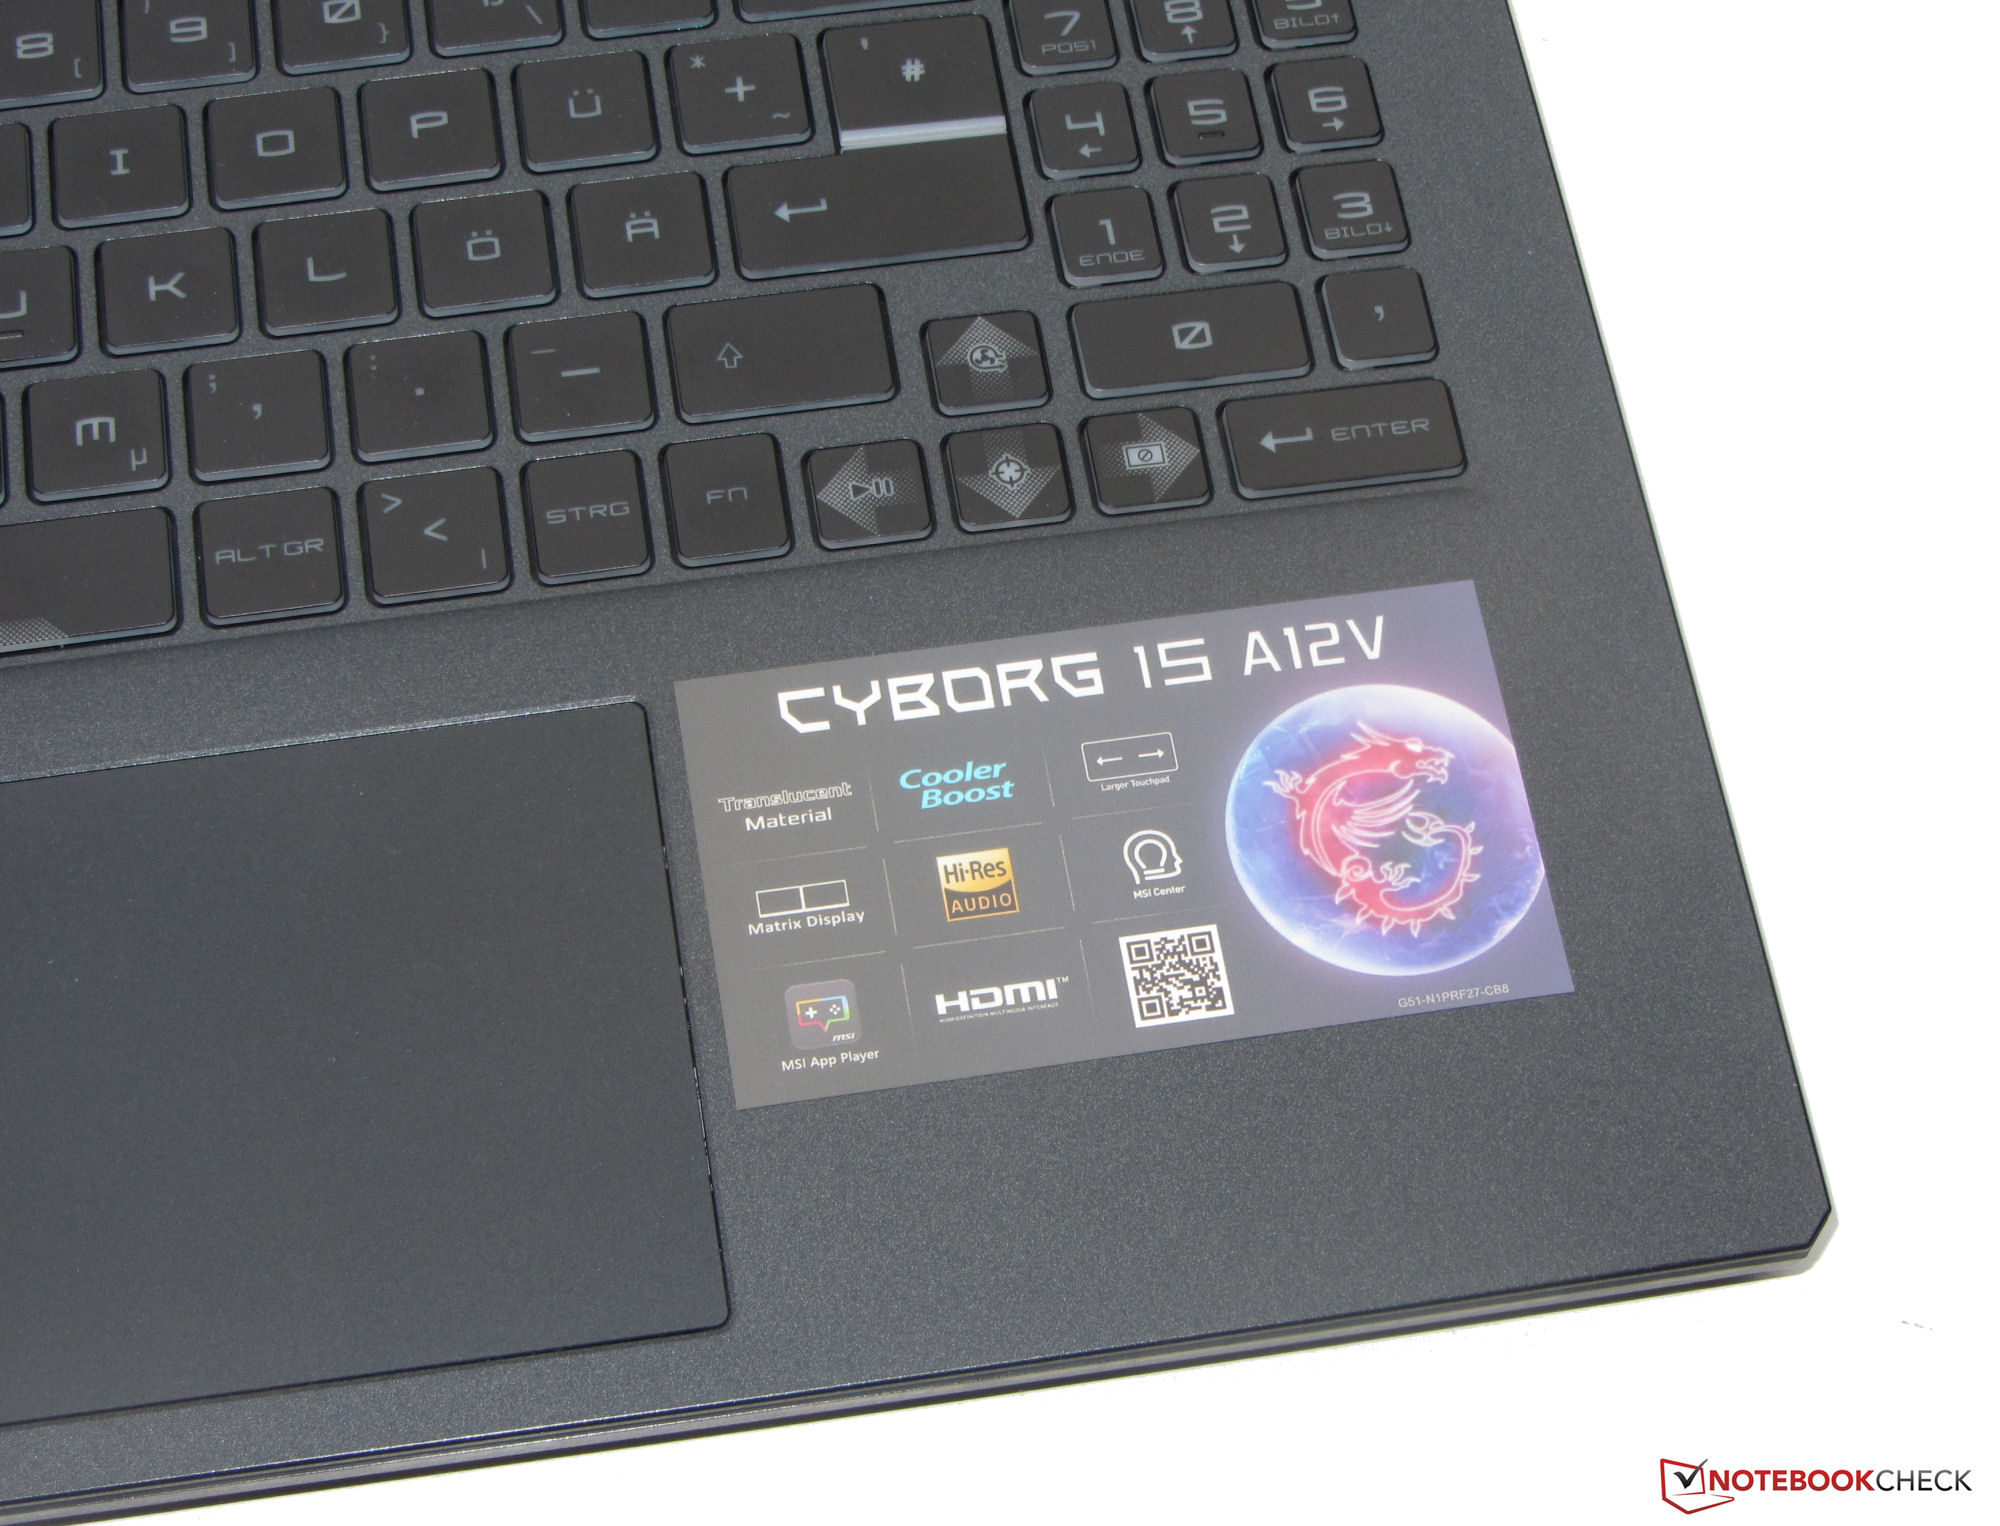
Custodia - A12VF con angolo di apertura di 180 gradi
La maggior parte delle parti del case compatto è in plastica, mentre il metallo è utilizzato solo per la parte posteriore del coperchio del case. MSI utilizza un design prevalentemente discreto e il portatile non sfigurerebbe in un ufficio professionale. Il colore nero di base è alleggerito da alcuni elementi trasparenti del case, come il fondo, mentre l'illuminazione della tastiera in blu turchese aggiunge un po' di colore.
Il portatile non presenta difetti di lavorazione. Gli spazi sono uniformi e non si notano sporgenze di materiale. Anche se l'unità base e il coperchio possono subire deformazioni, queste rimangono nei limiti. Le cerniere tengono il coperchio saldamente in posizione, con un angolo di apertura massimo di 180 gradi. Il portatile può essere aperto con una sola mano.
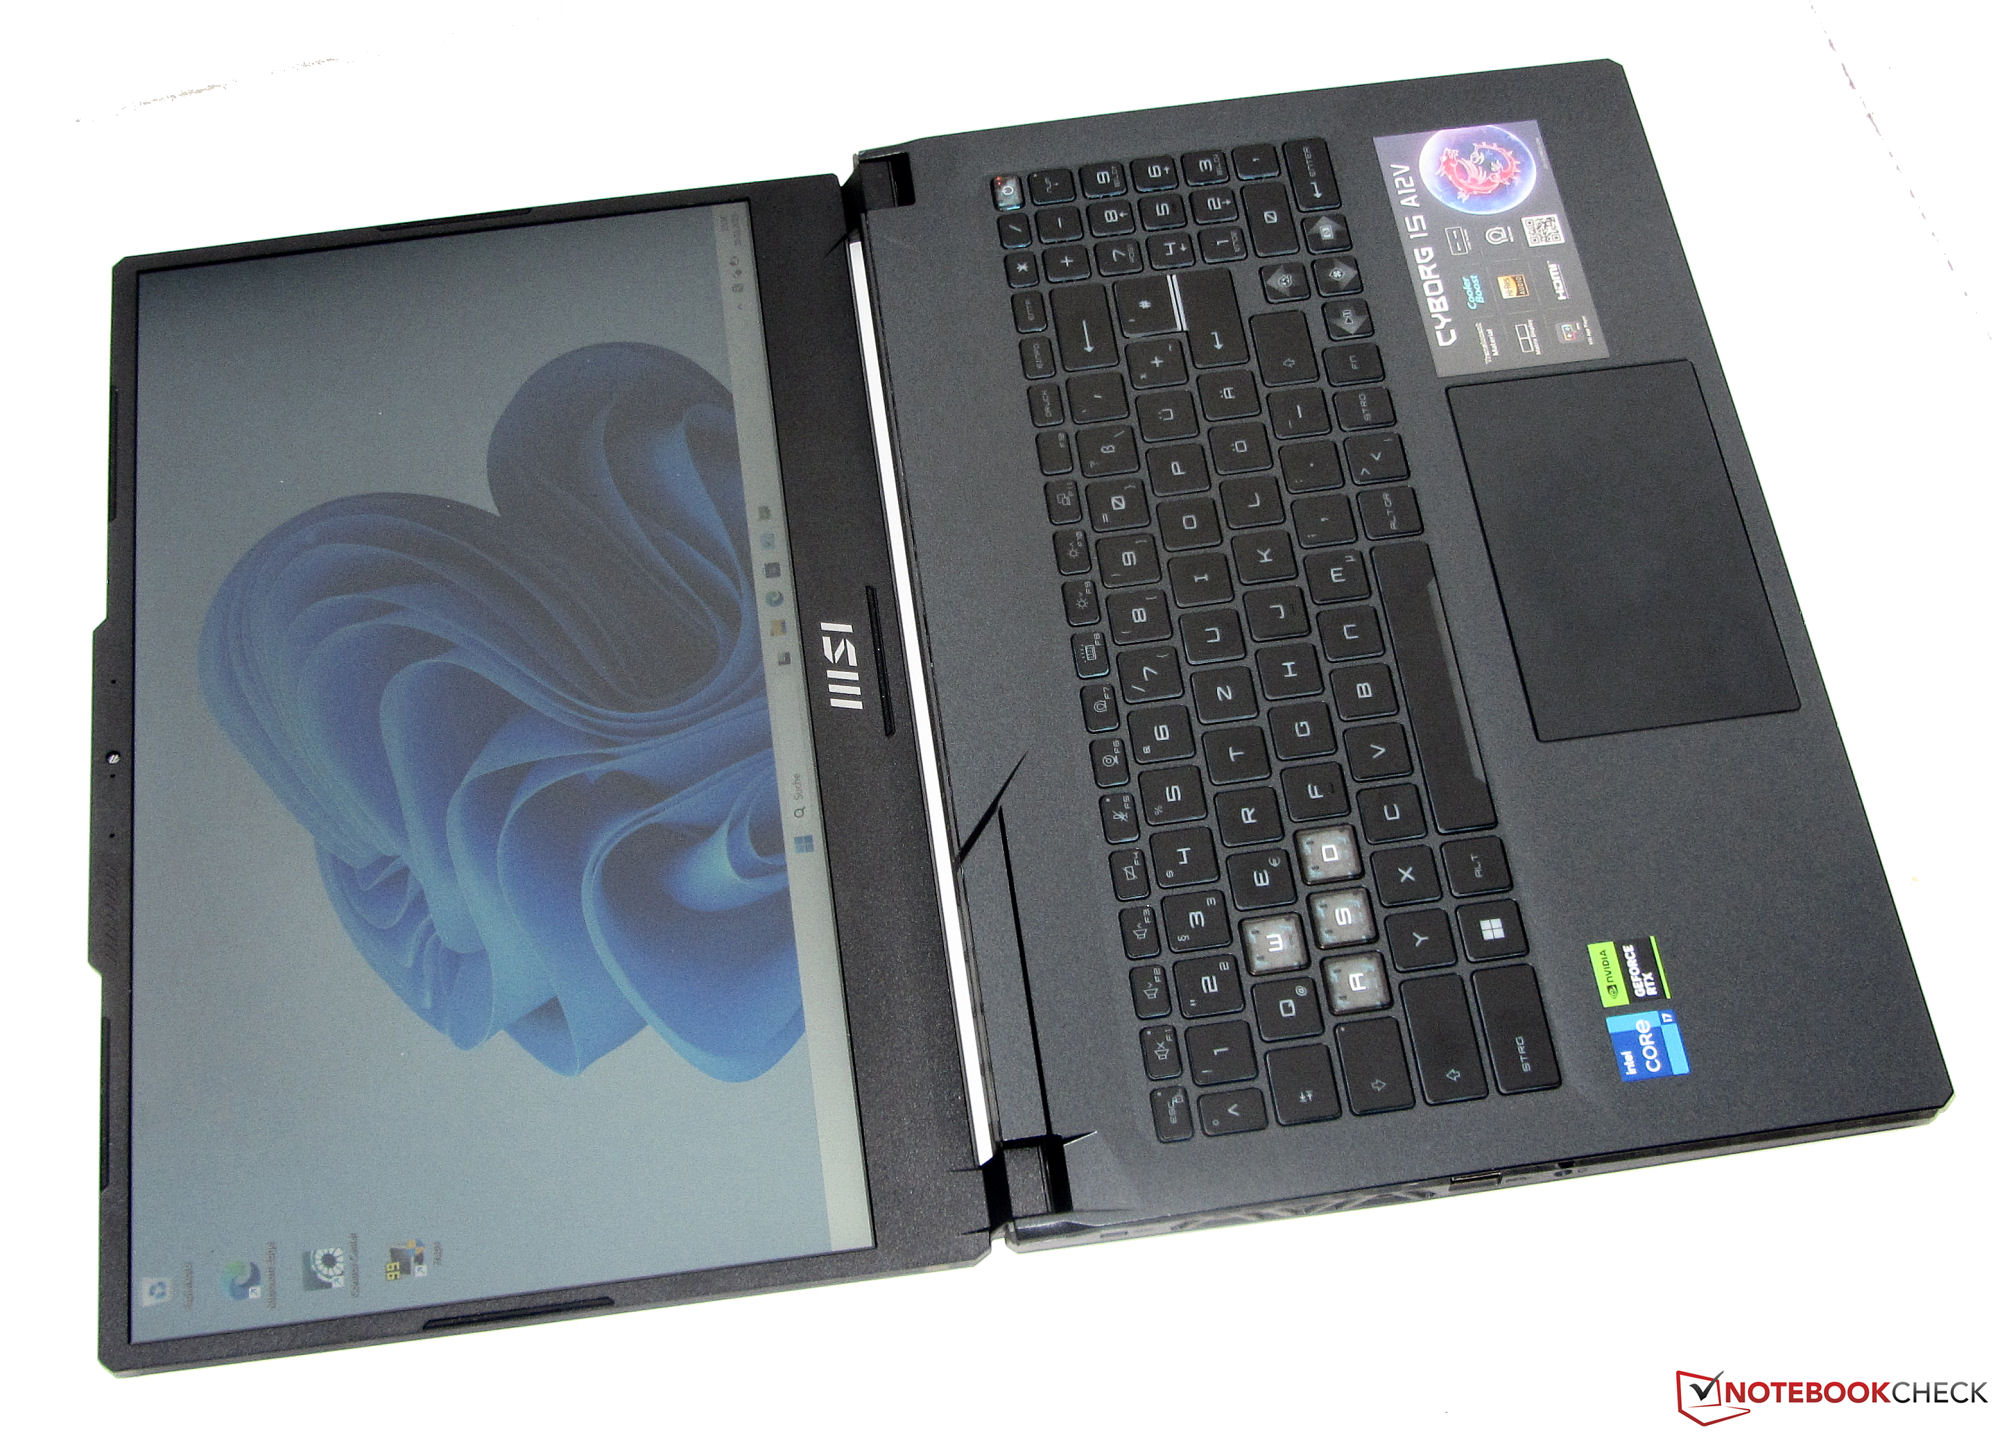
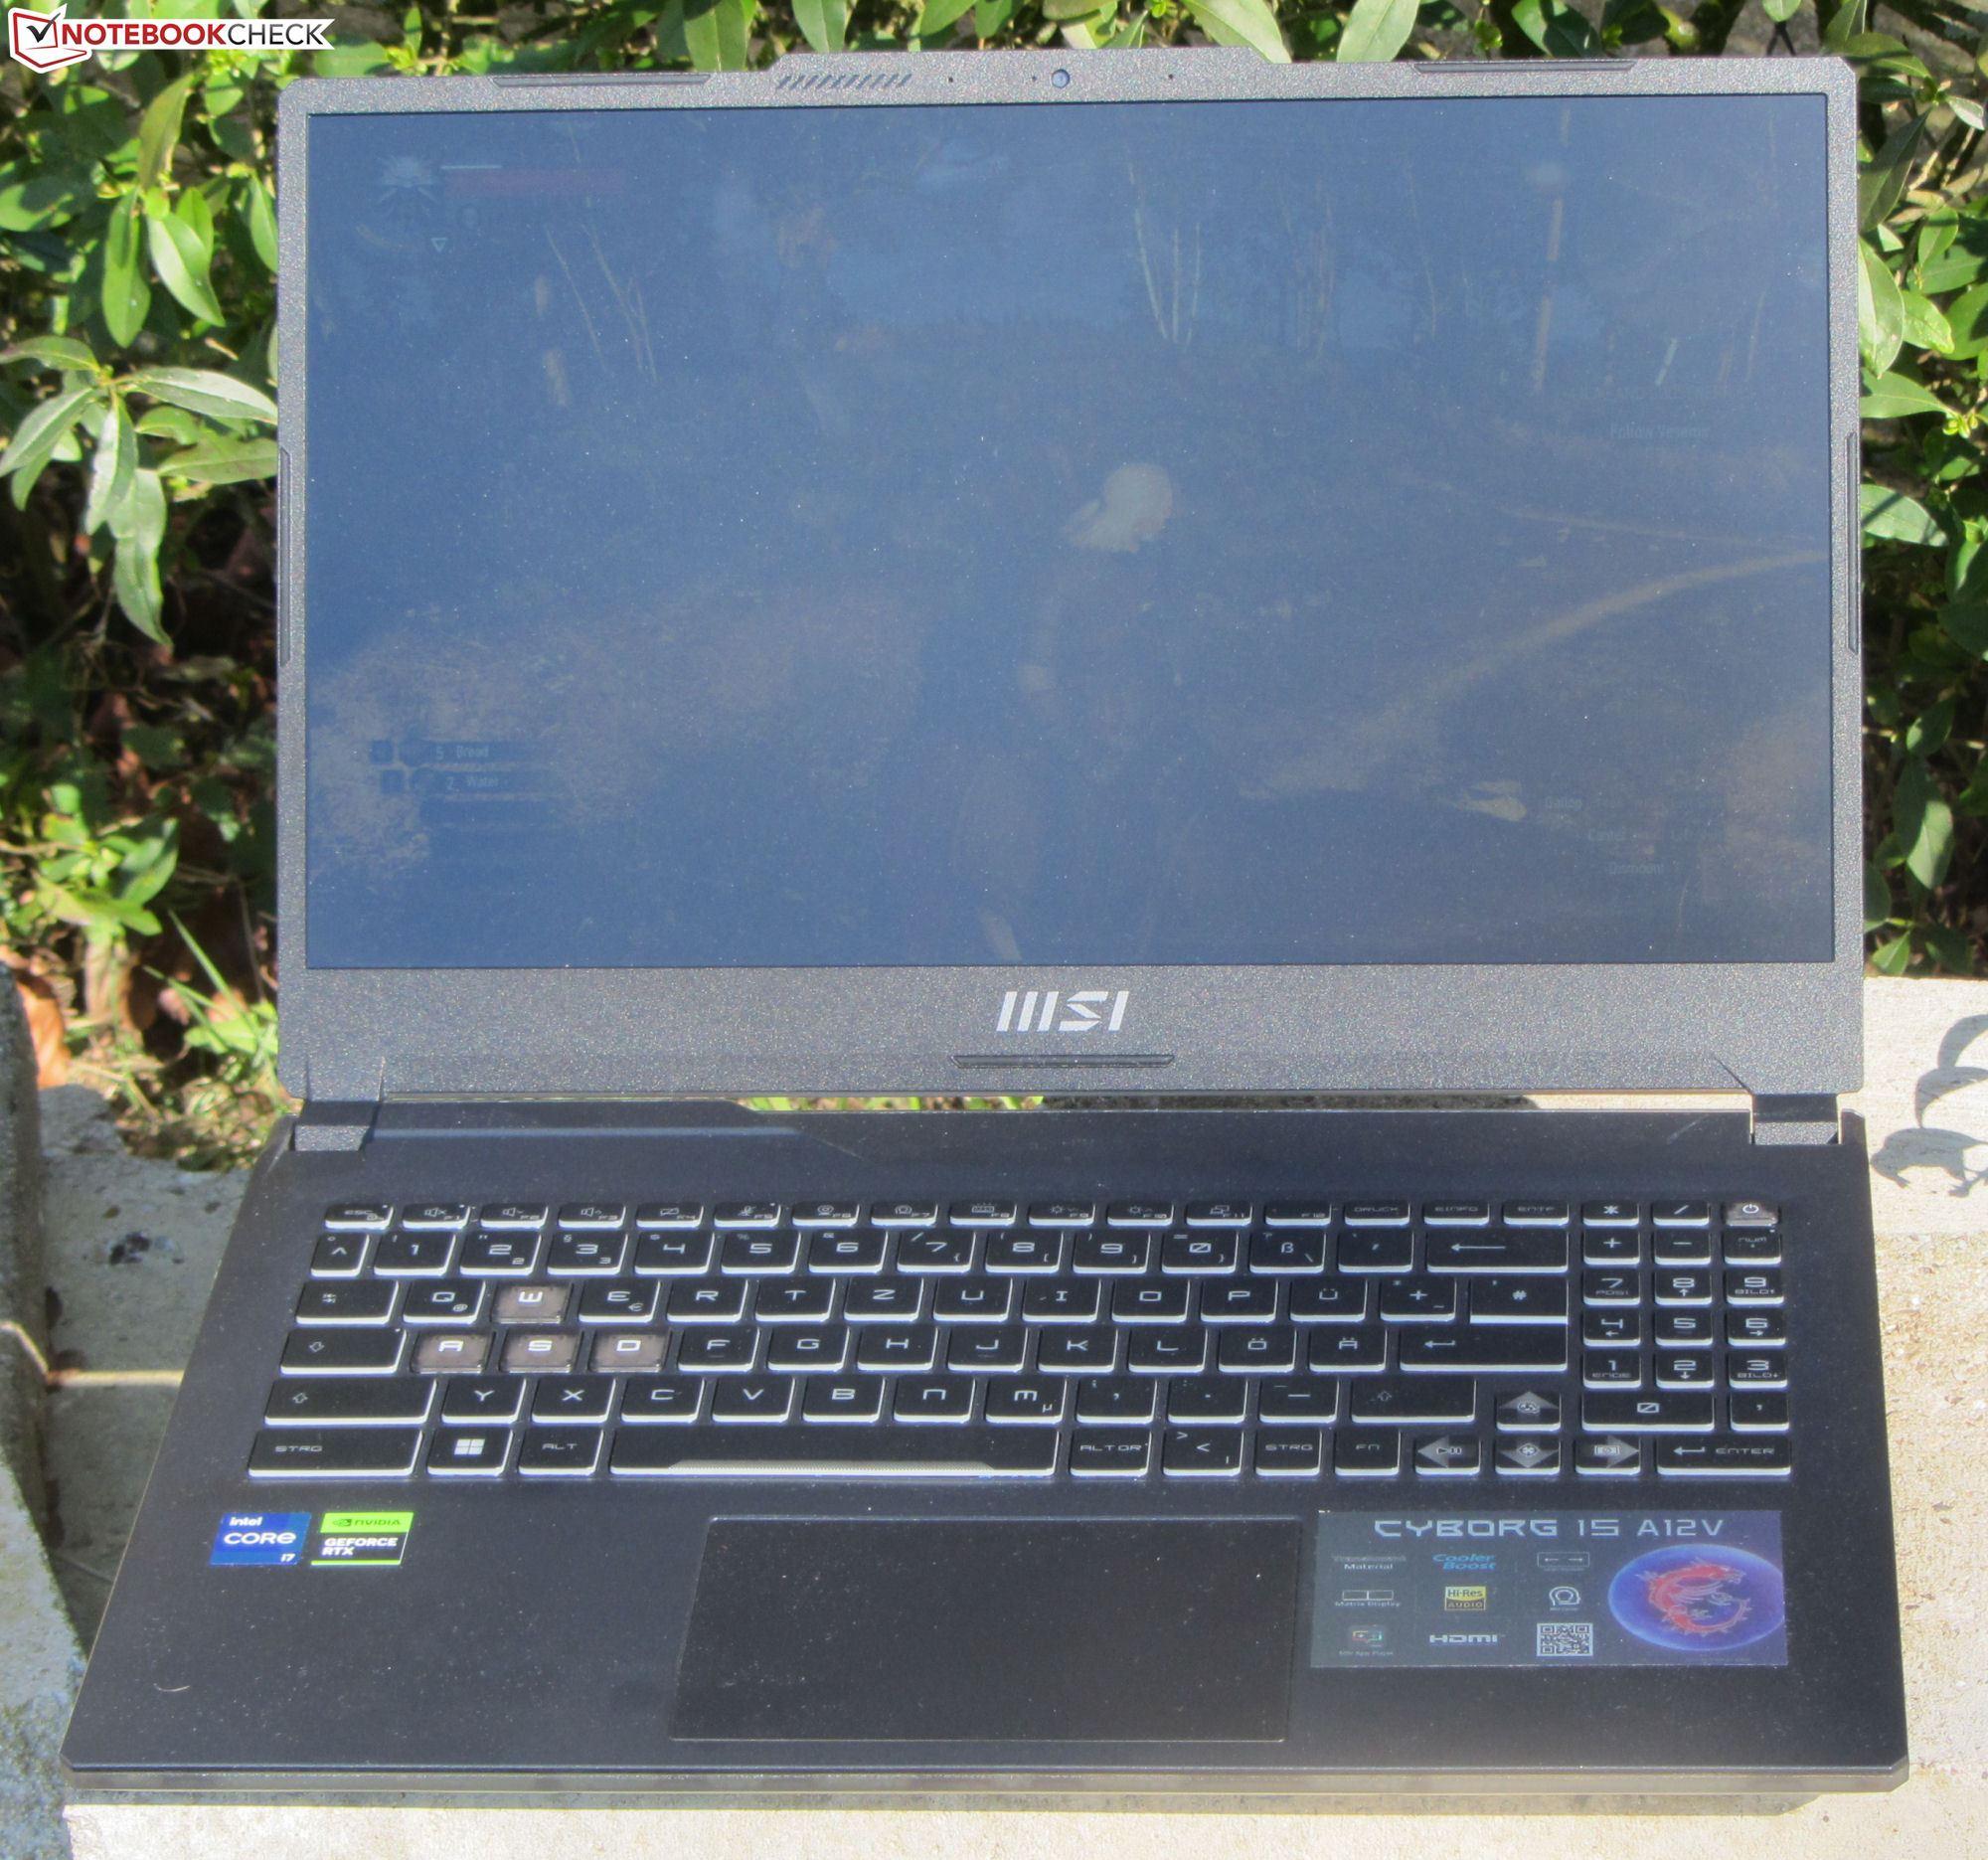
Sebbene le dimensioni del portatile MSI siano simili a quelle dei concorrenti, si tratta di uno dei portatili da gioco più leggeri nel formato da 15,6 pollici.
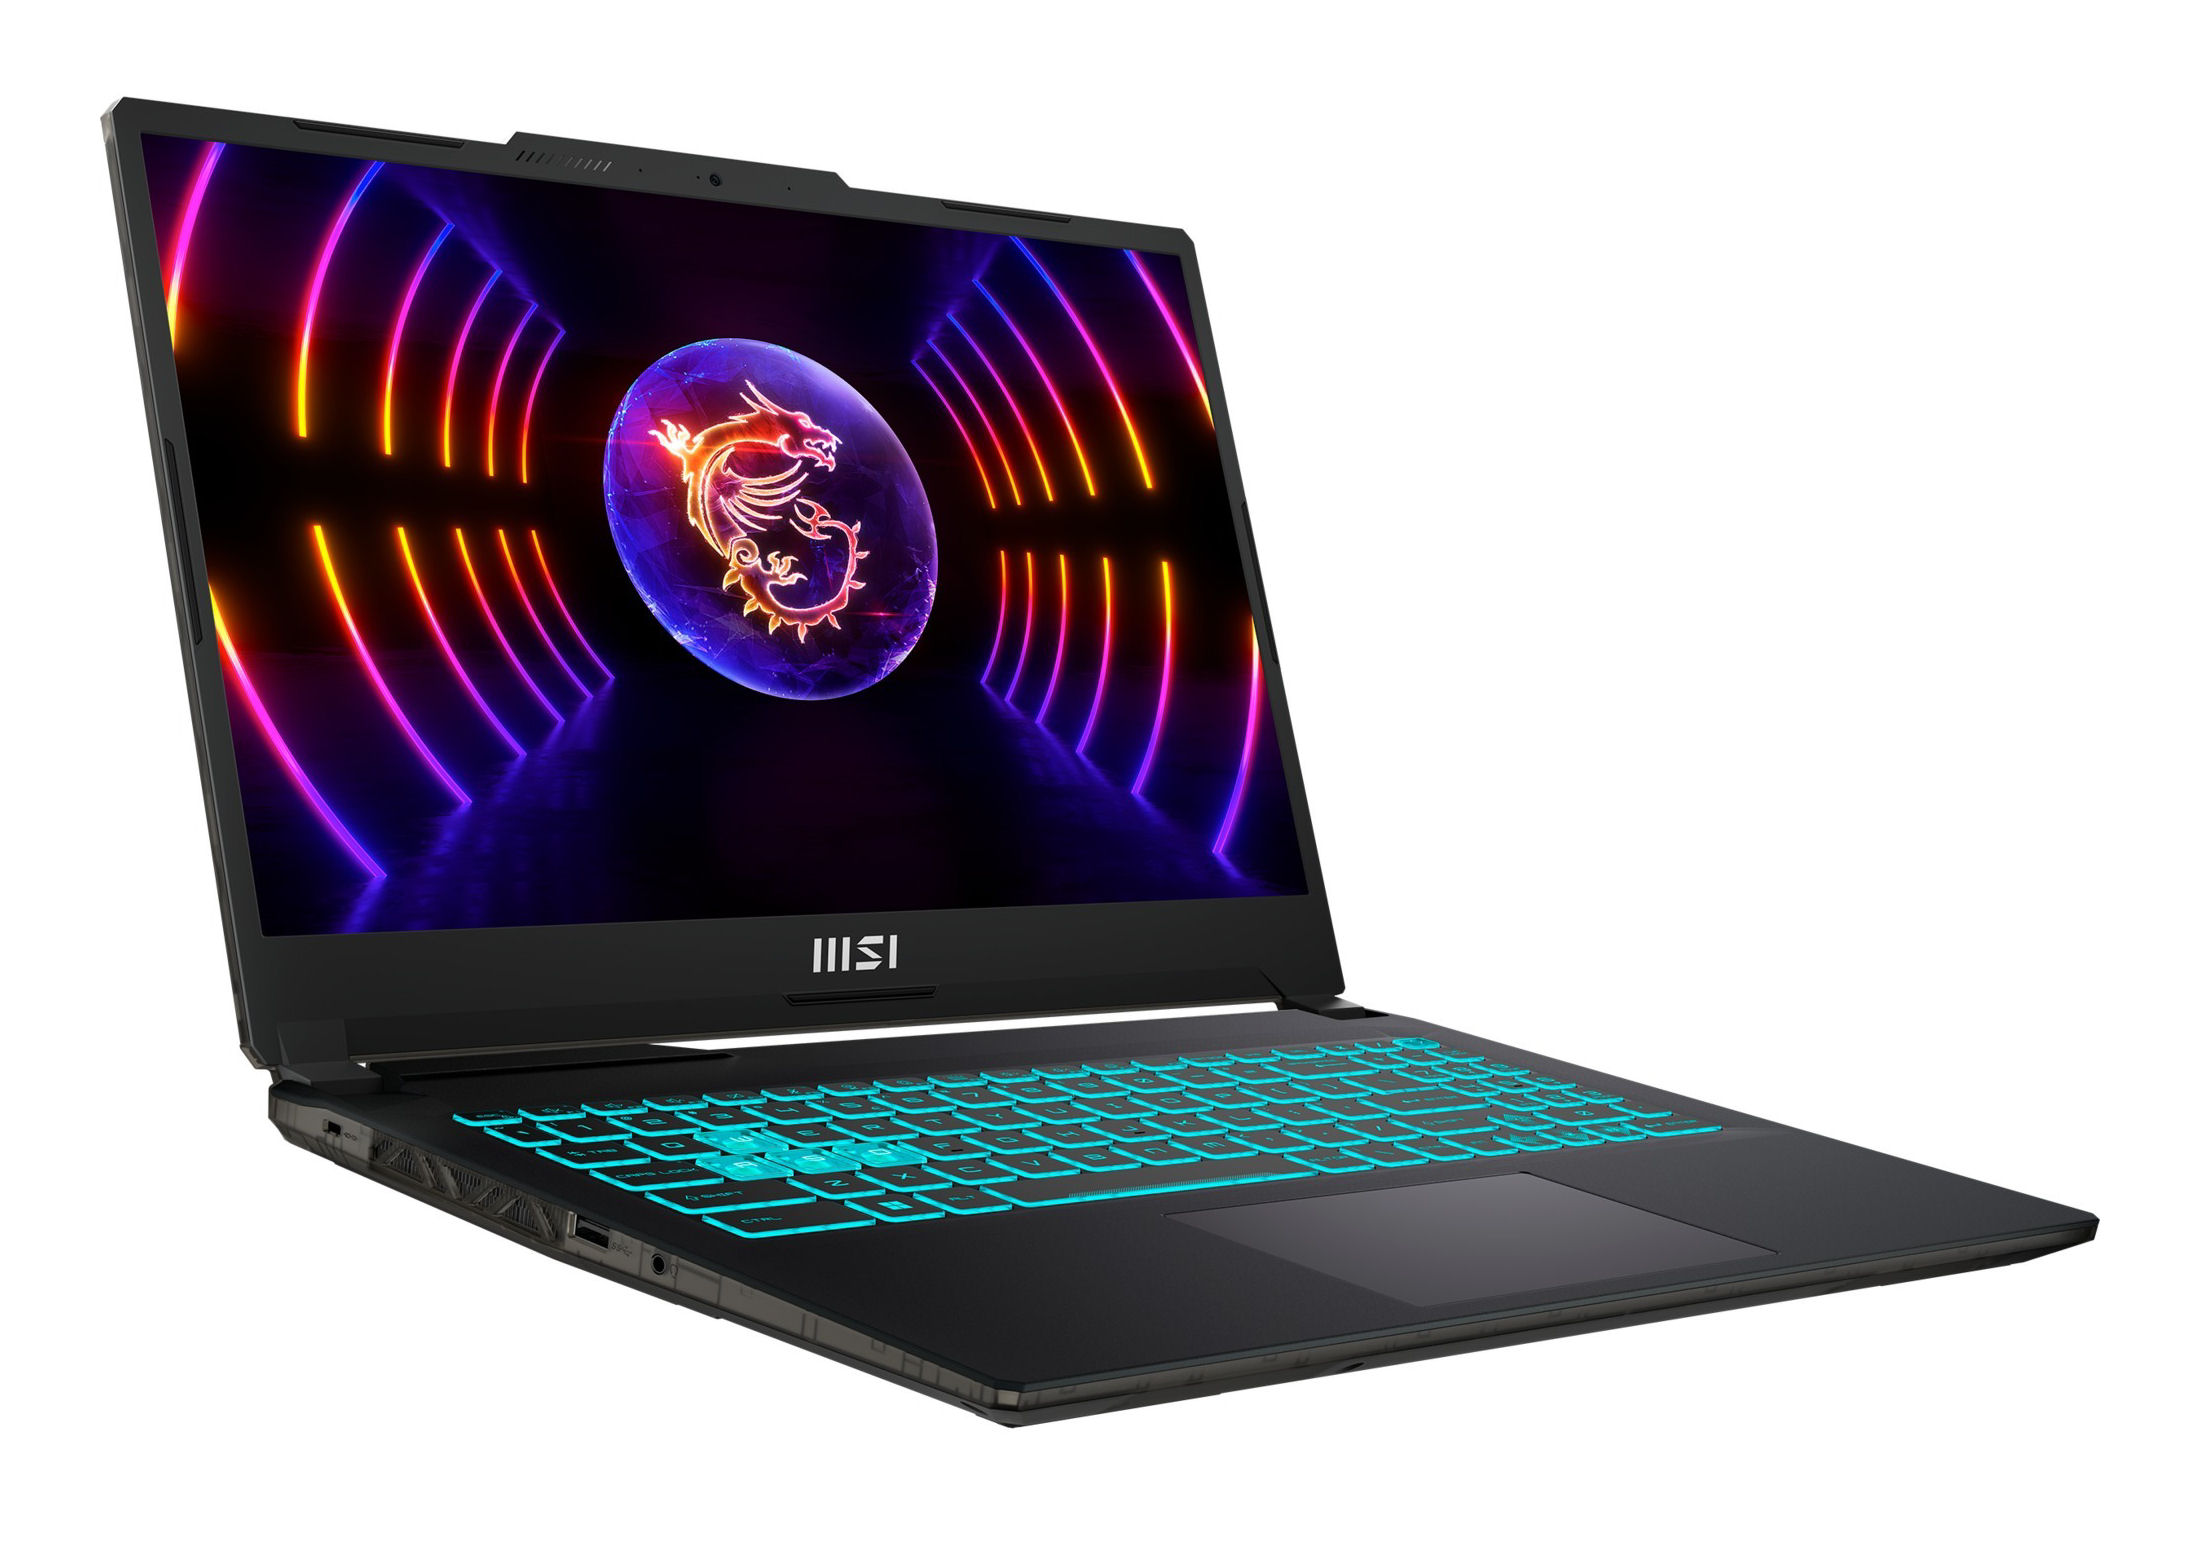
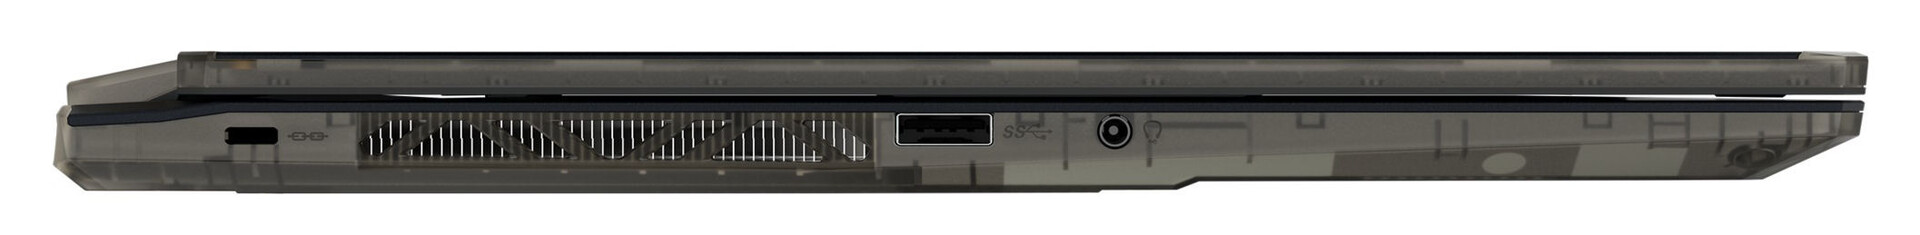
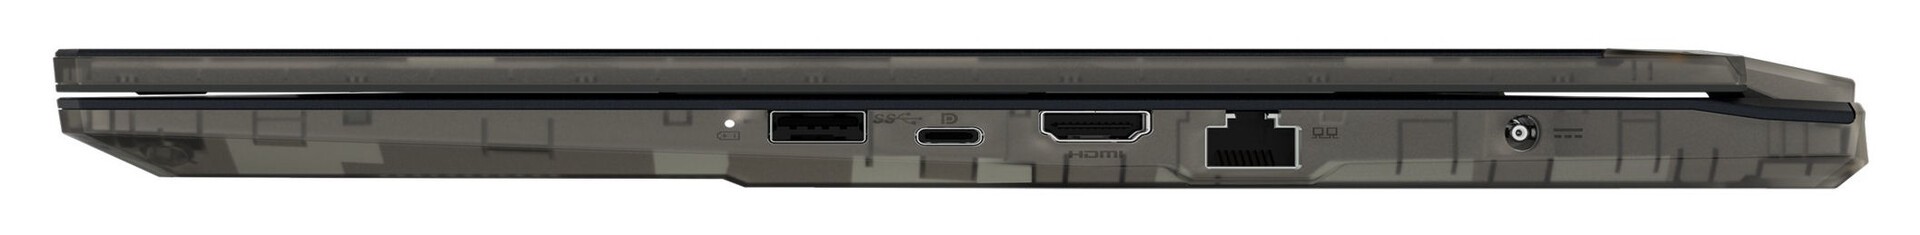
Dotazione - Il portatile MSI non offre Thunderbolt
La dotazione di connessioni è limitata, con due porte USB-A disponibili (USB 3.2 Gen 1) e una singola porta USB-C (USB 3.2 Gen 1). Quest'ultima supporta anche DisplayPort. Insieme ci sono due opzioni di uscita video (1x DP, 1x HDMI). Inoltre, sono presenti una porta audio combinata, una porta Gigabit Ethernet e un'apertura per il blocco dei cavi. Non è disponibile un lettore di schede di memoria.
Comunicazione
Le velocità di trasferimento WLAN determinate in condizioni ottimali (senza altri dispositivi WLAN nelle vicinanze e a breve distanza tra il portatile e il PC server) risultano eccellenti e corrispondono alle capacità del chip Wi-Fi (Intel AX201). Le connessioni di rete cablate sono gestite da un chip Gigabit Ethernet (RTL8168/8111; 1 Gbit/s) di Realtek.
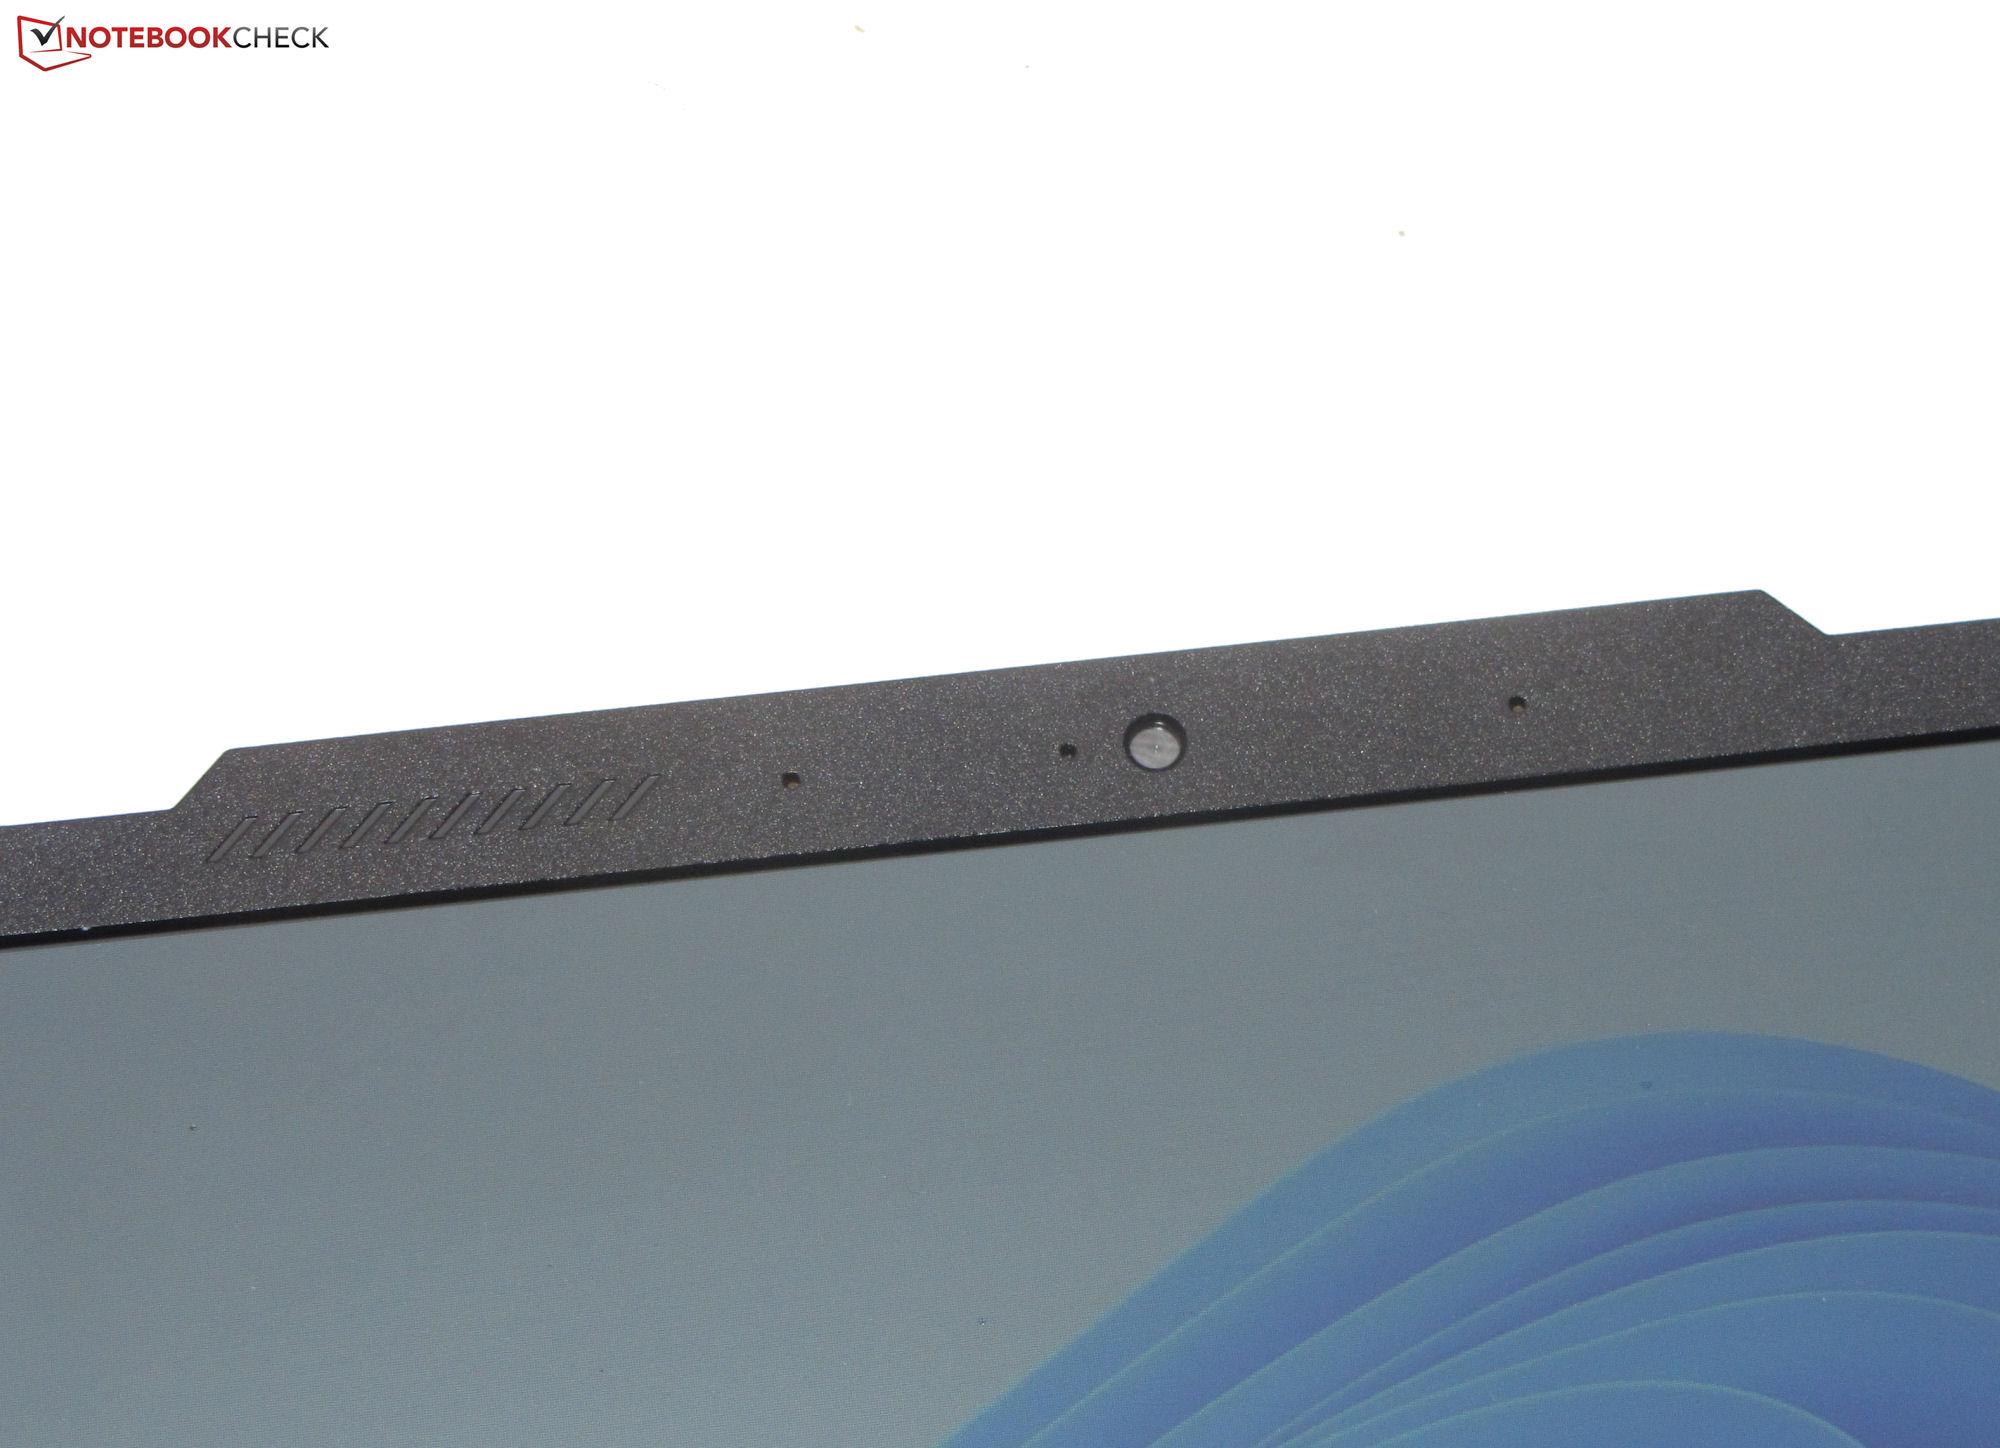
Webcam
La webcam (0,9 MP, max. 1.280 x 720 pixel) non offre una copertura meccanica. La qualità che offre è standard. L'accuratezza del colore è carente e con una deviazione del colore di circa 16, l'obiettivo di DeltaE < 3 viene mancato.


Accessori
Il portatile non include altri accessori oltre alla consueta documentazione (istruzioni per l'avvio rapido e informazioni sulla garanzia).
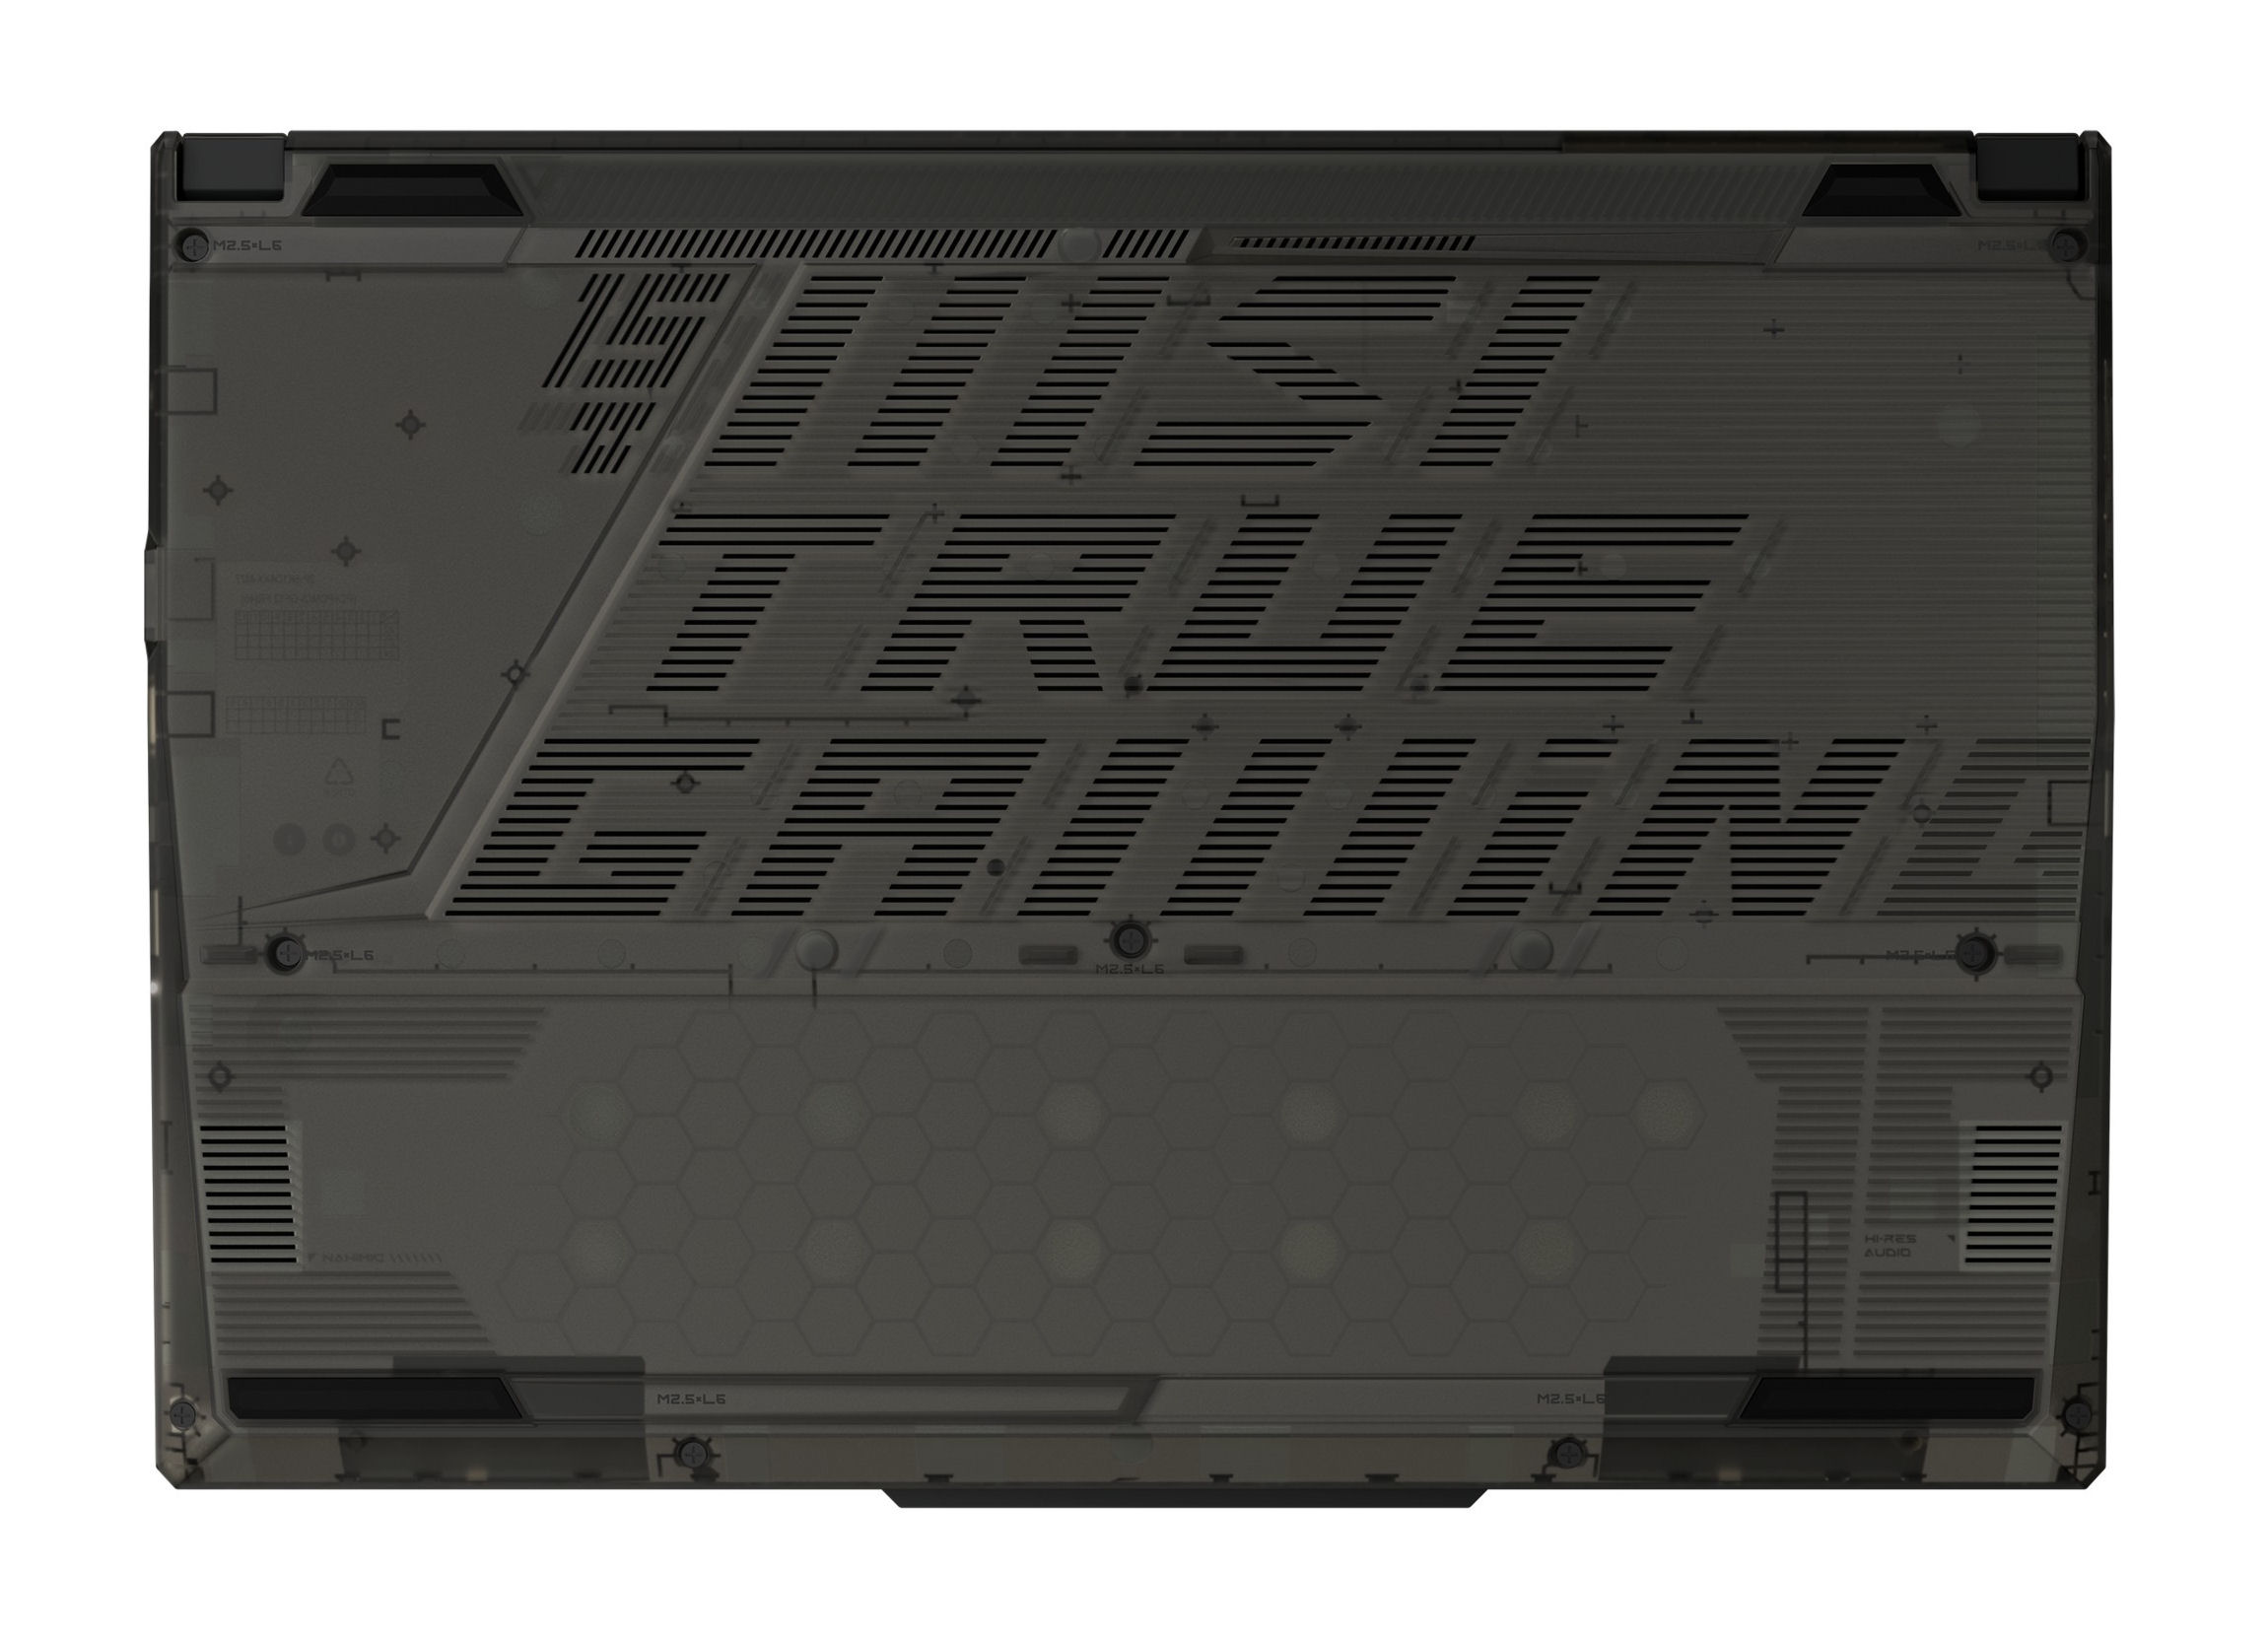
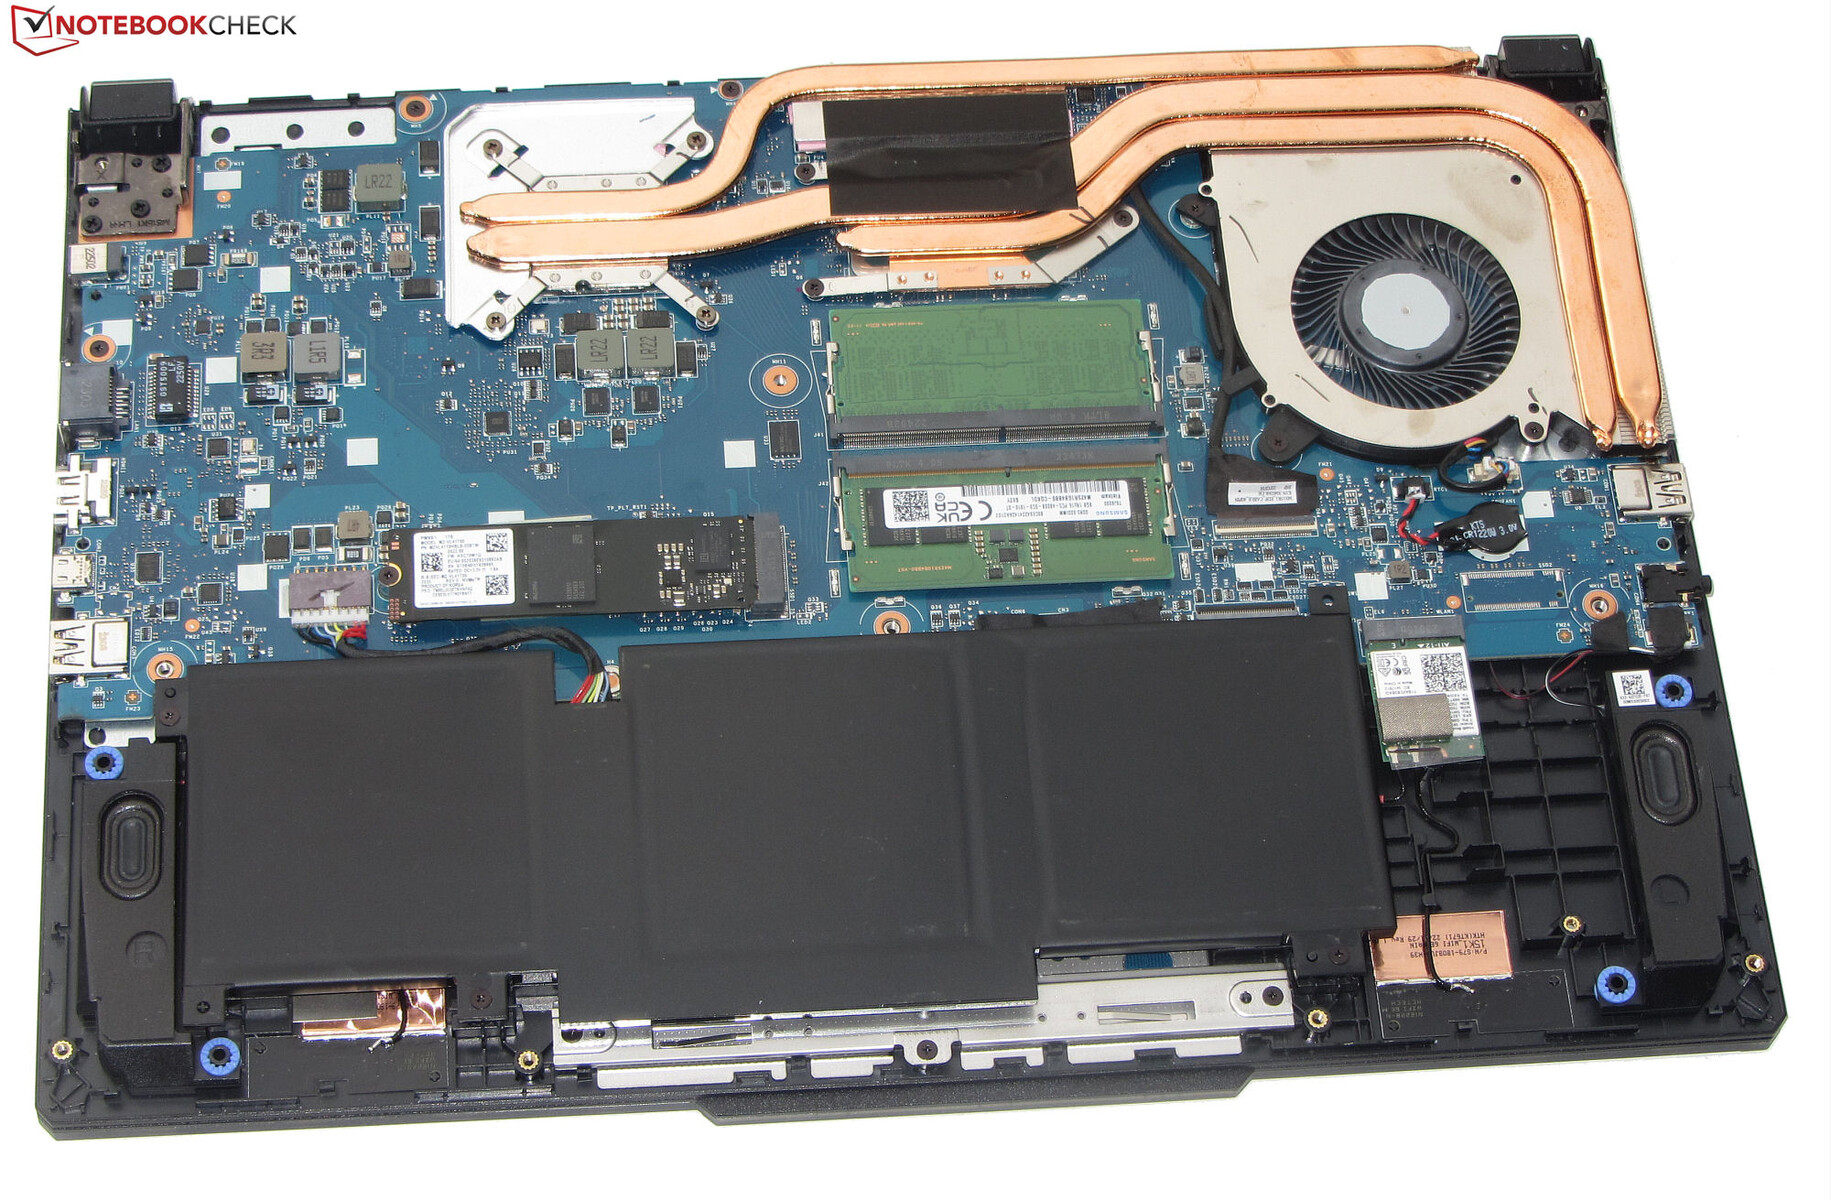
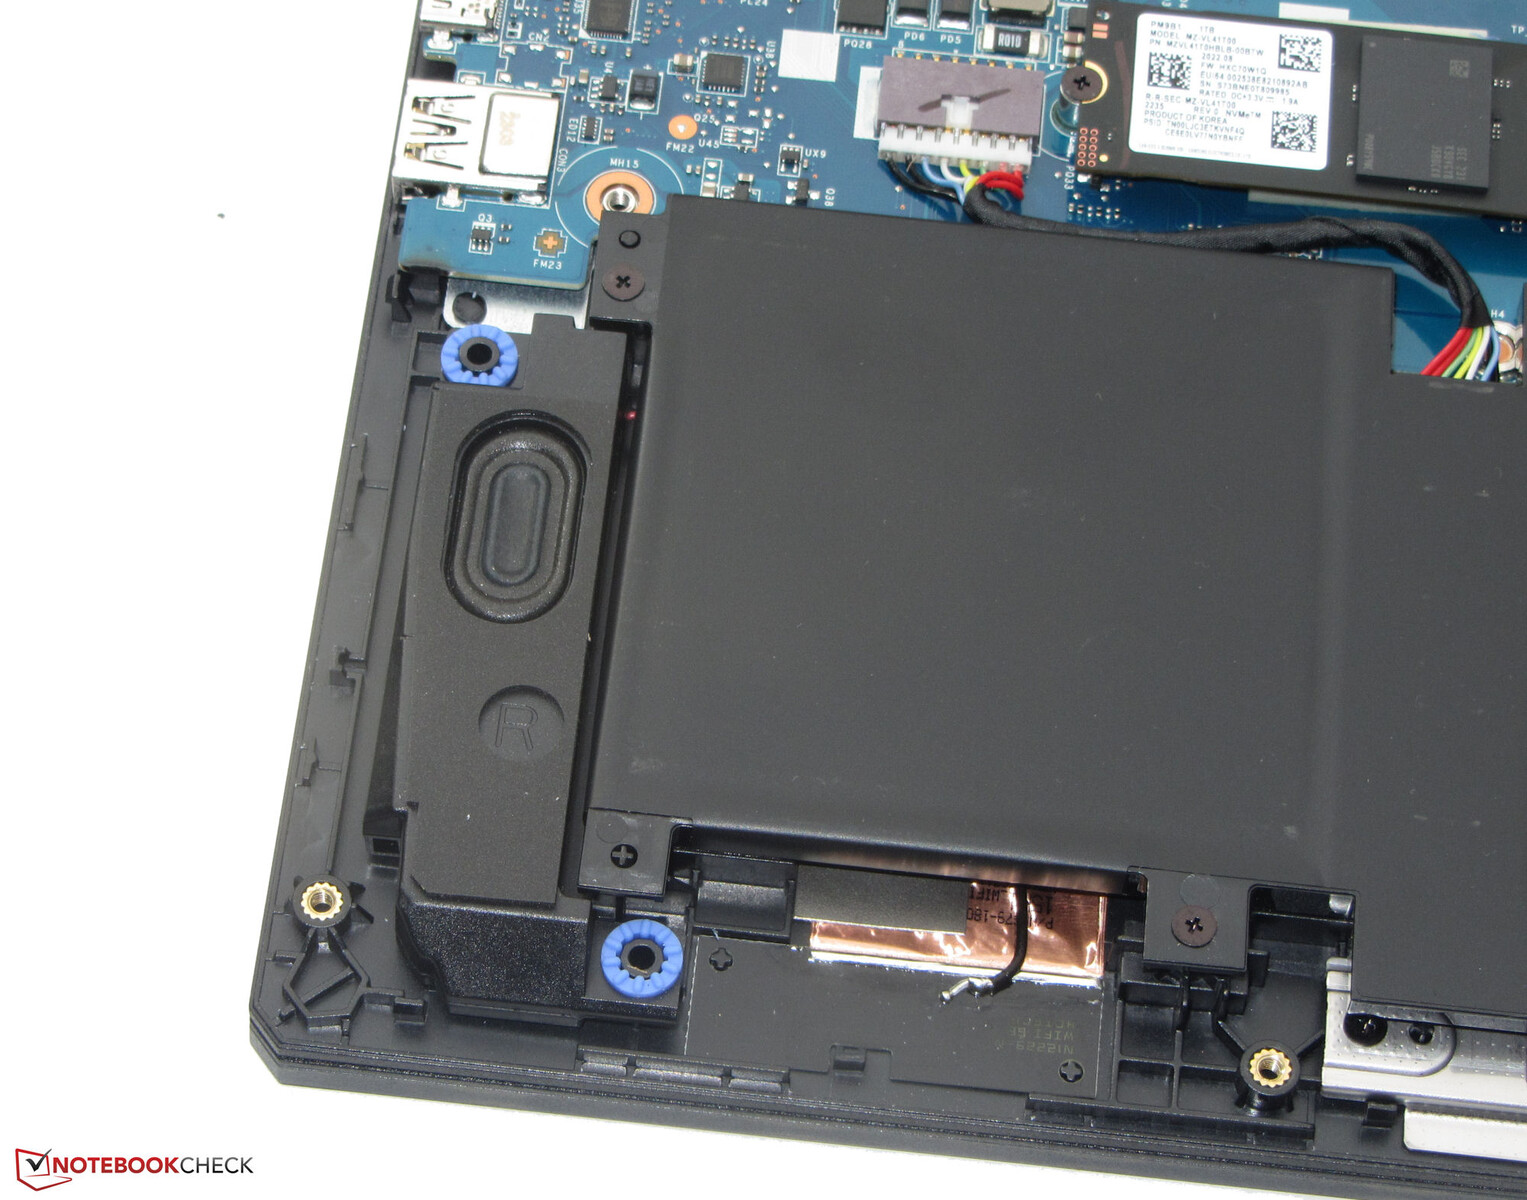
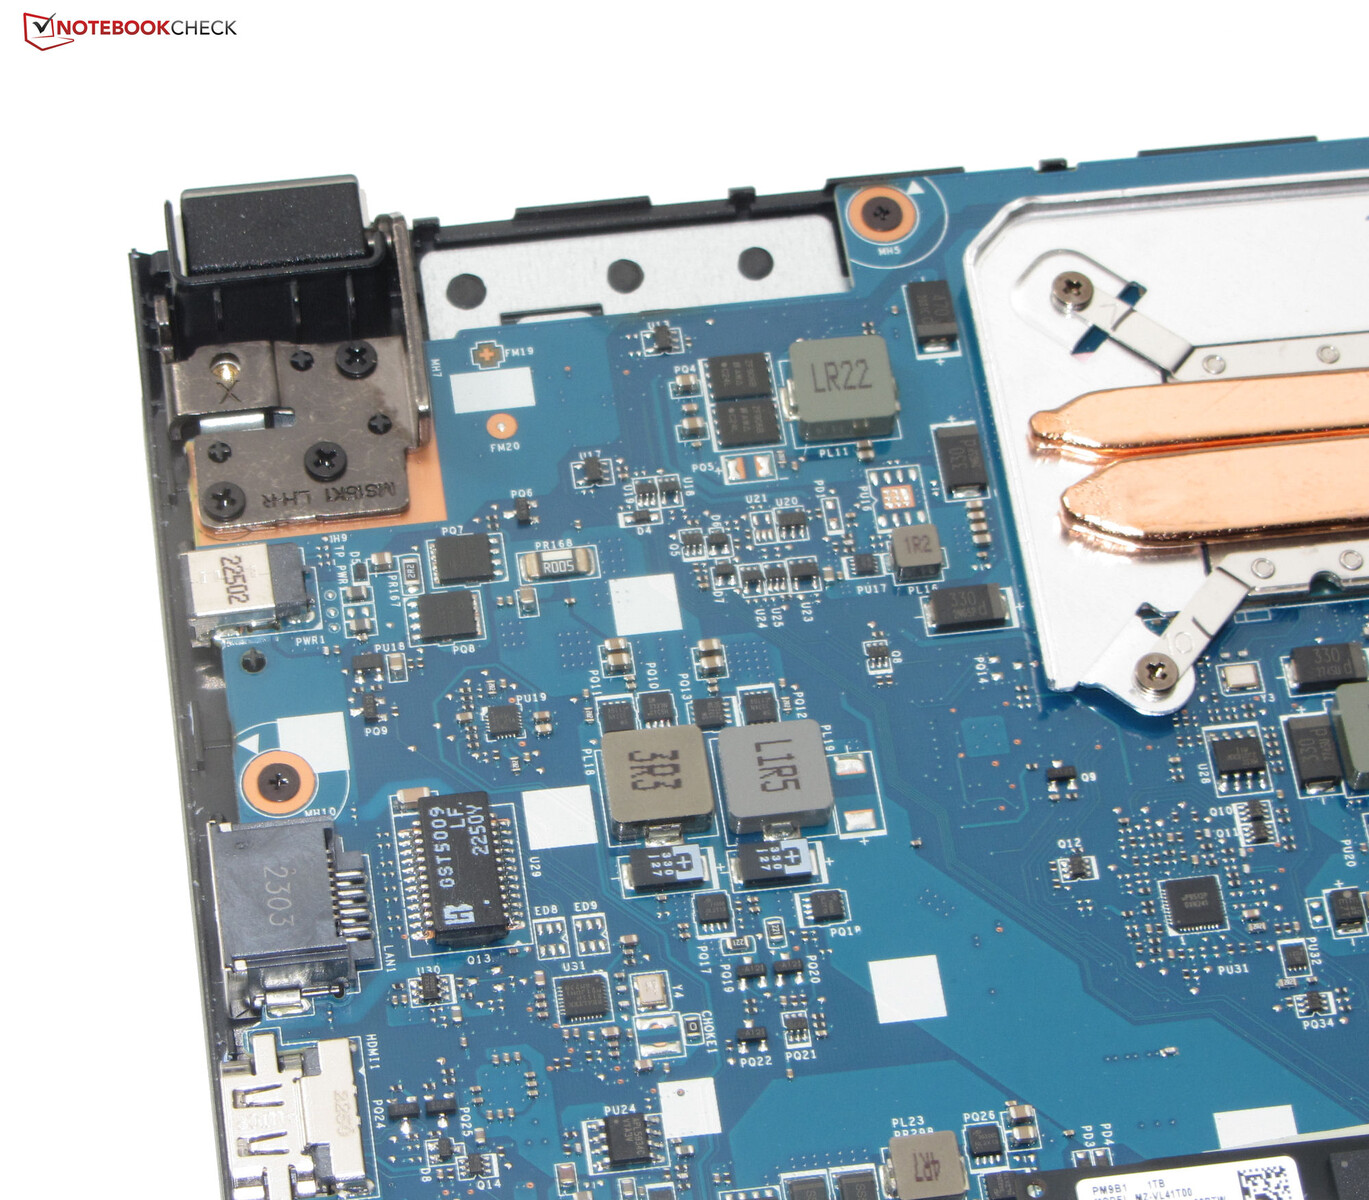
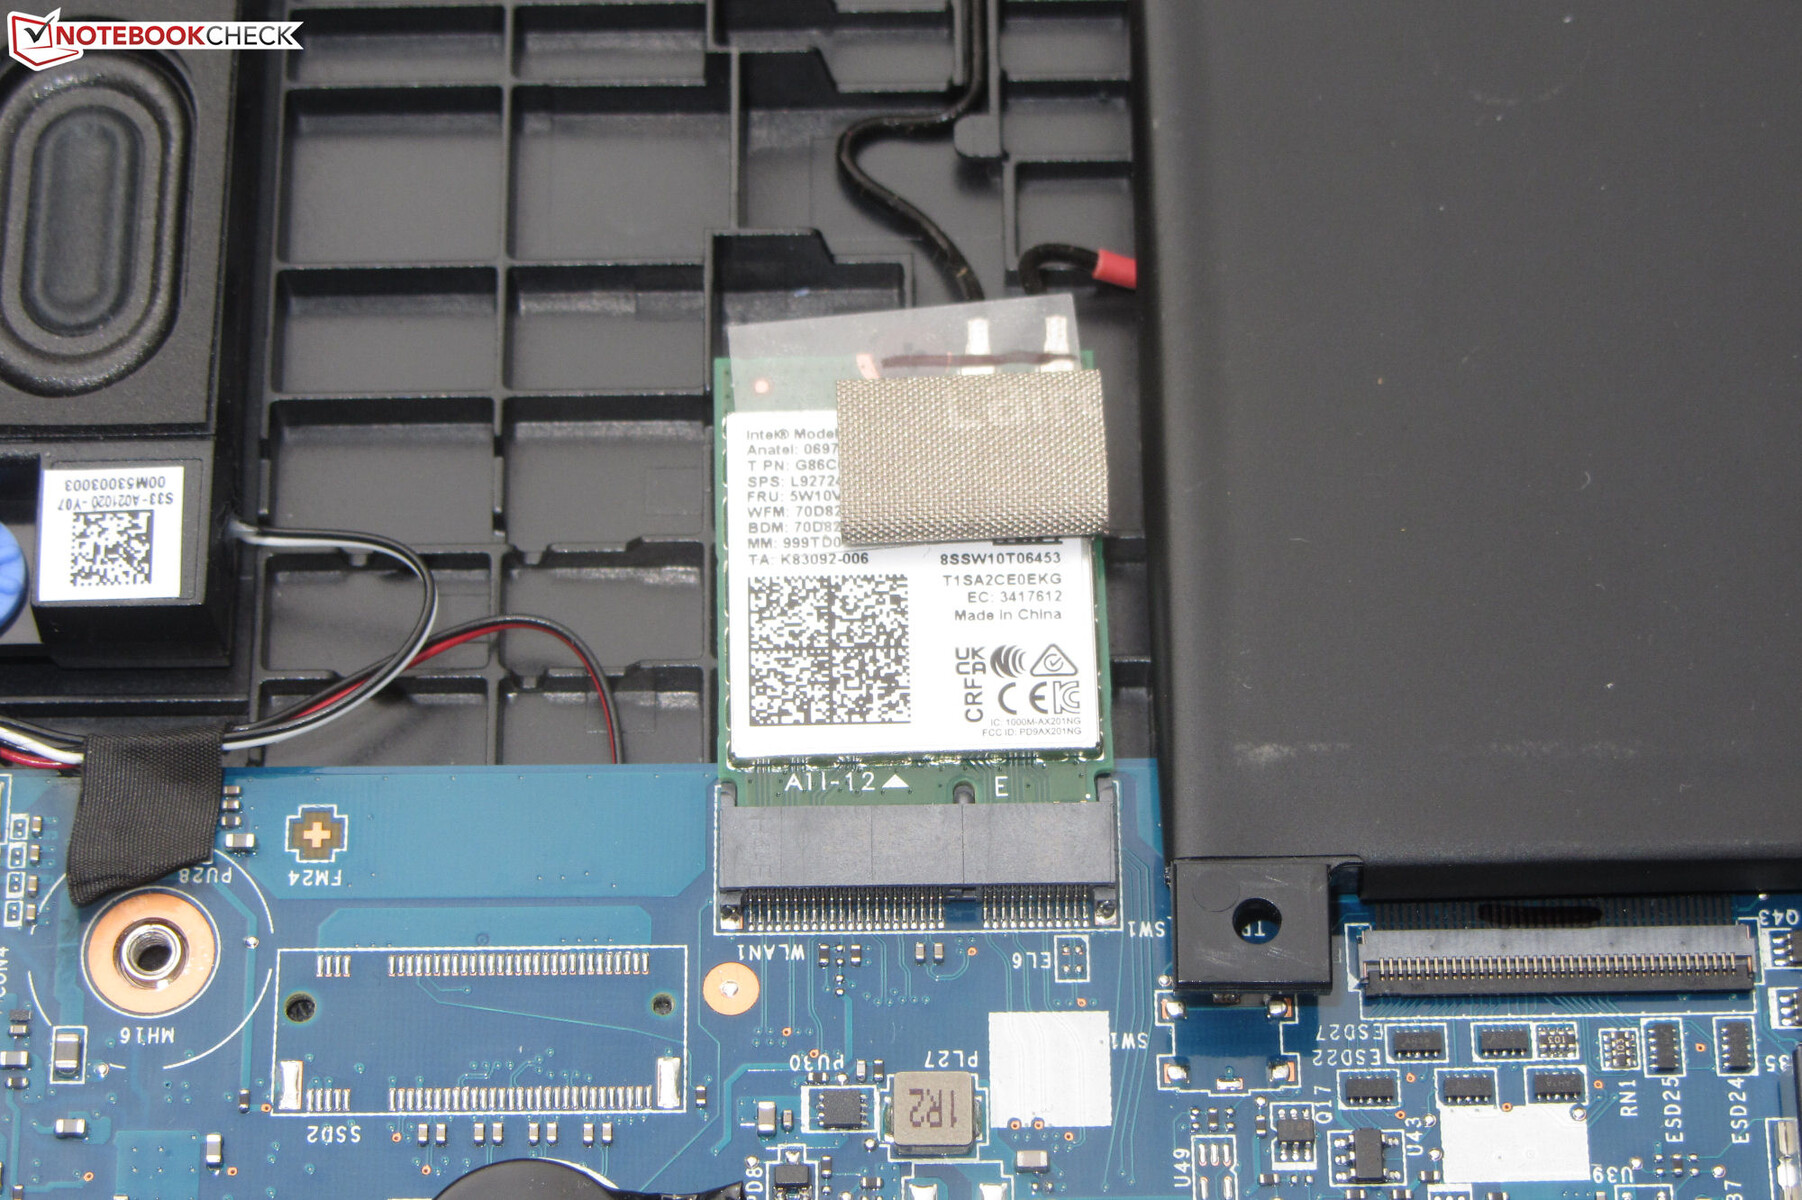
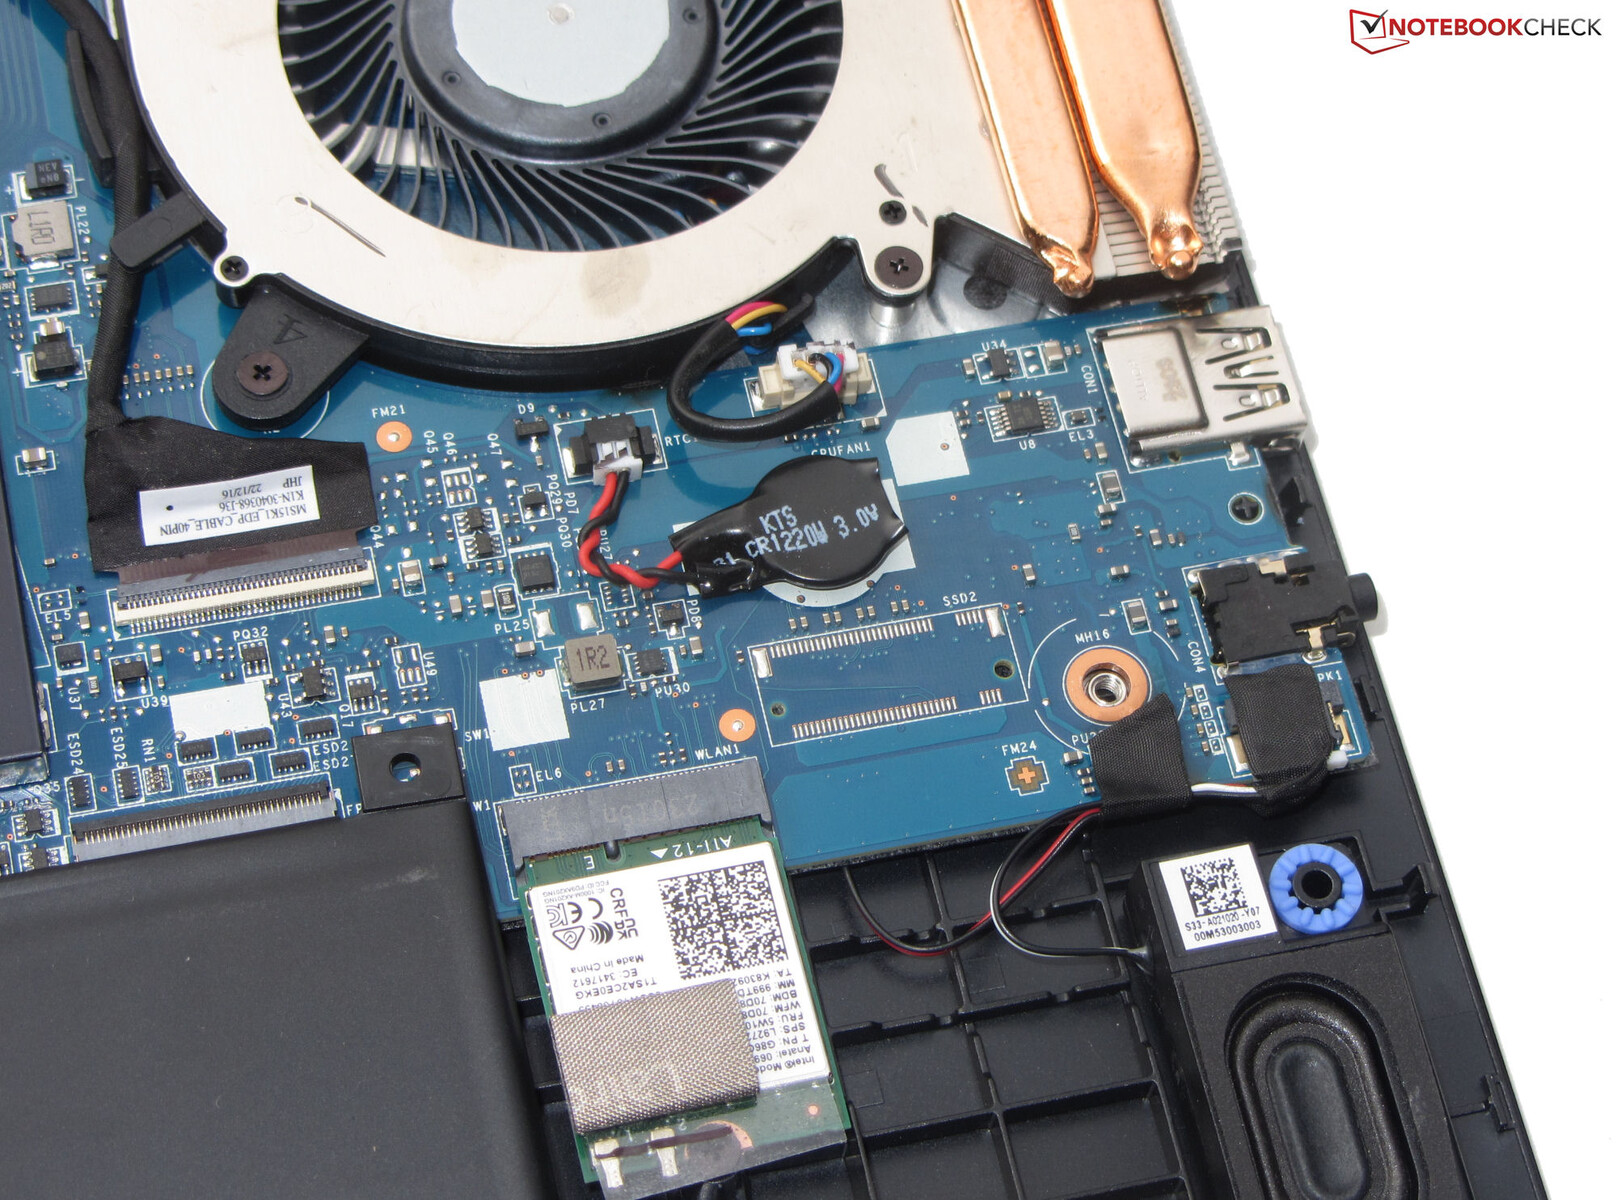
Manutenzione
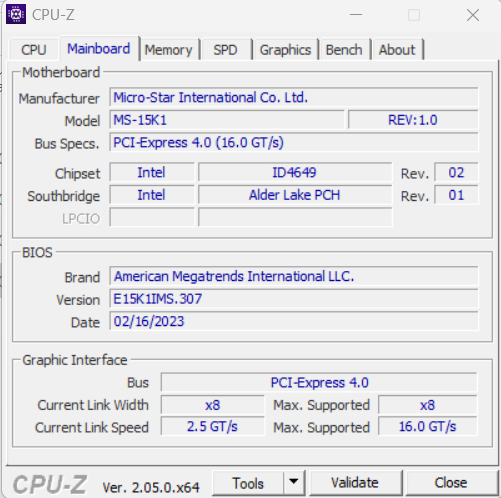
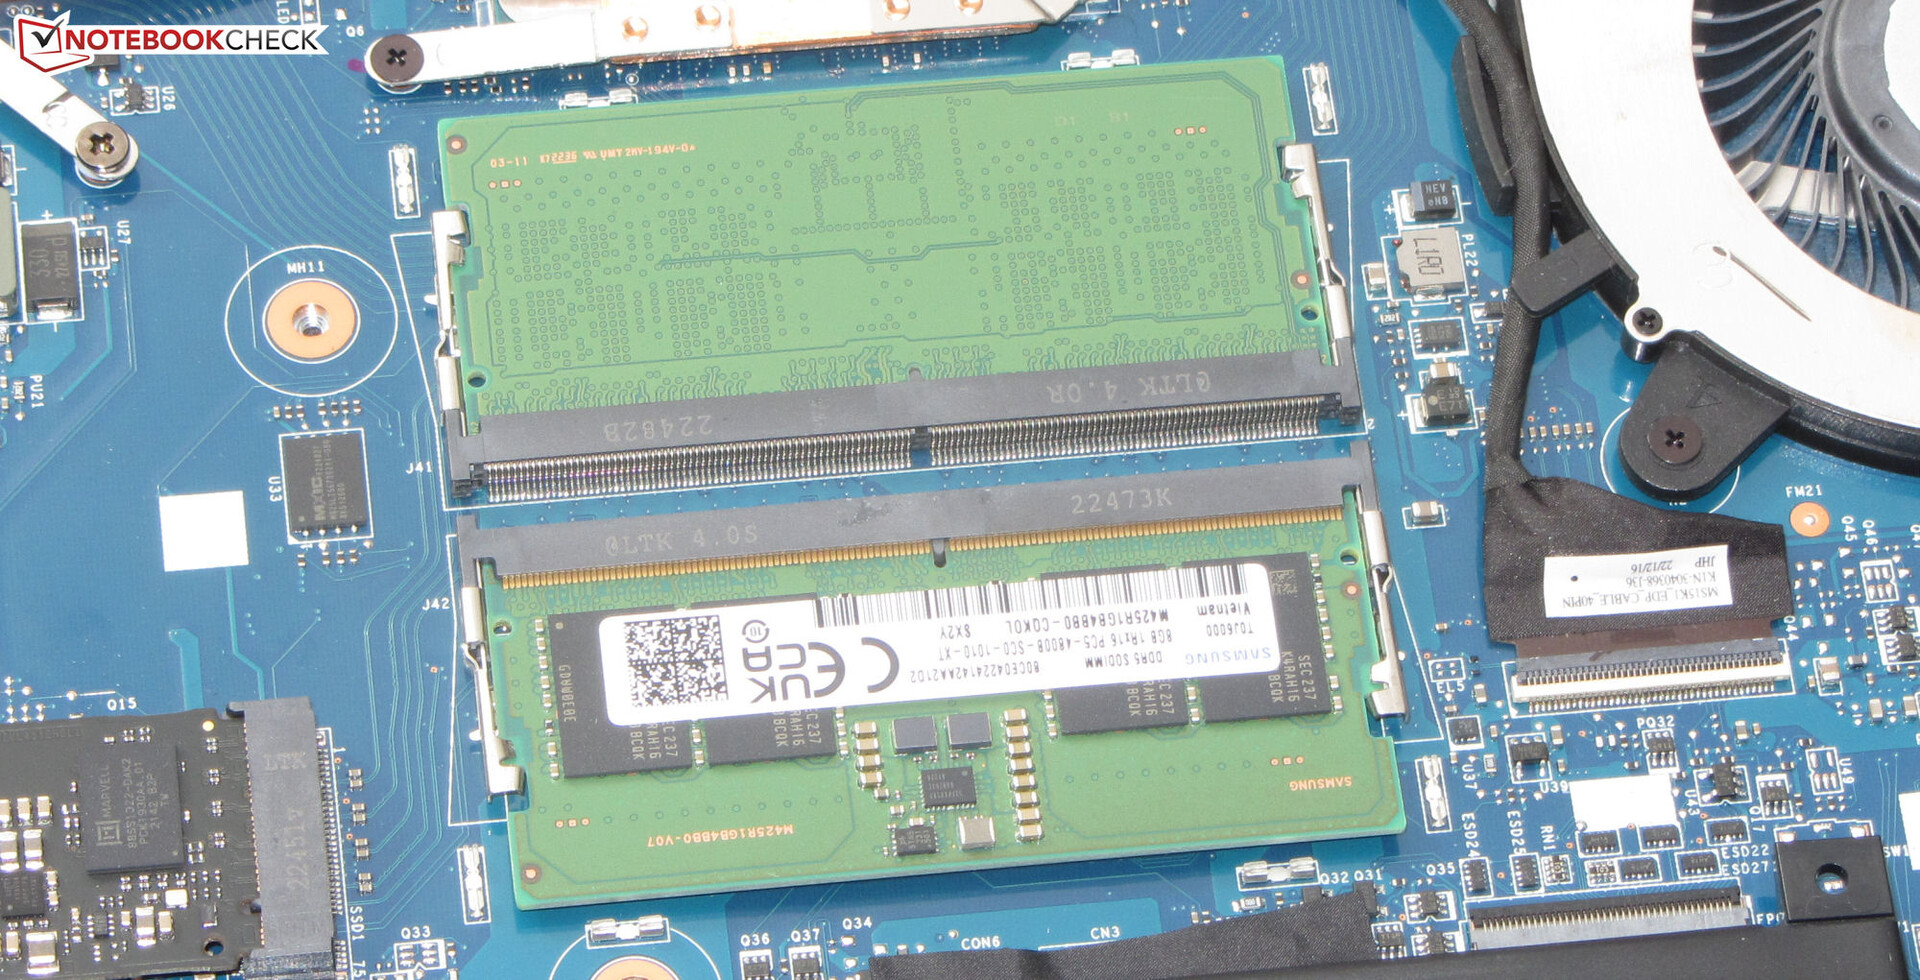
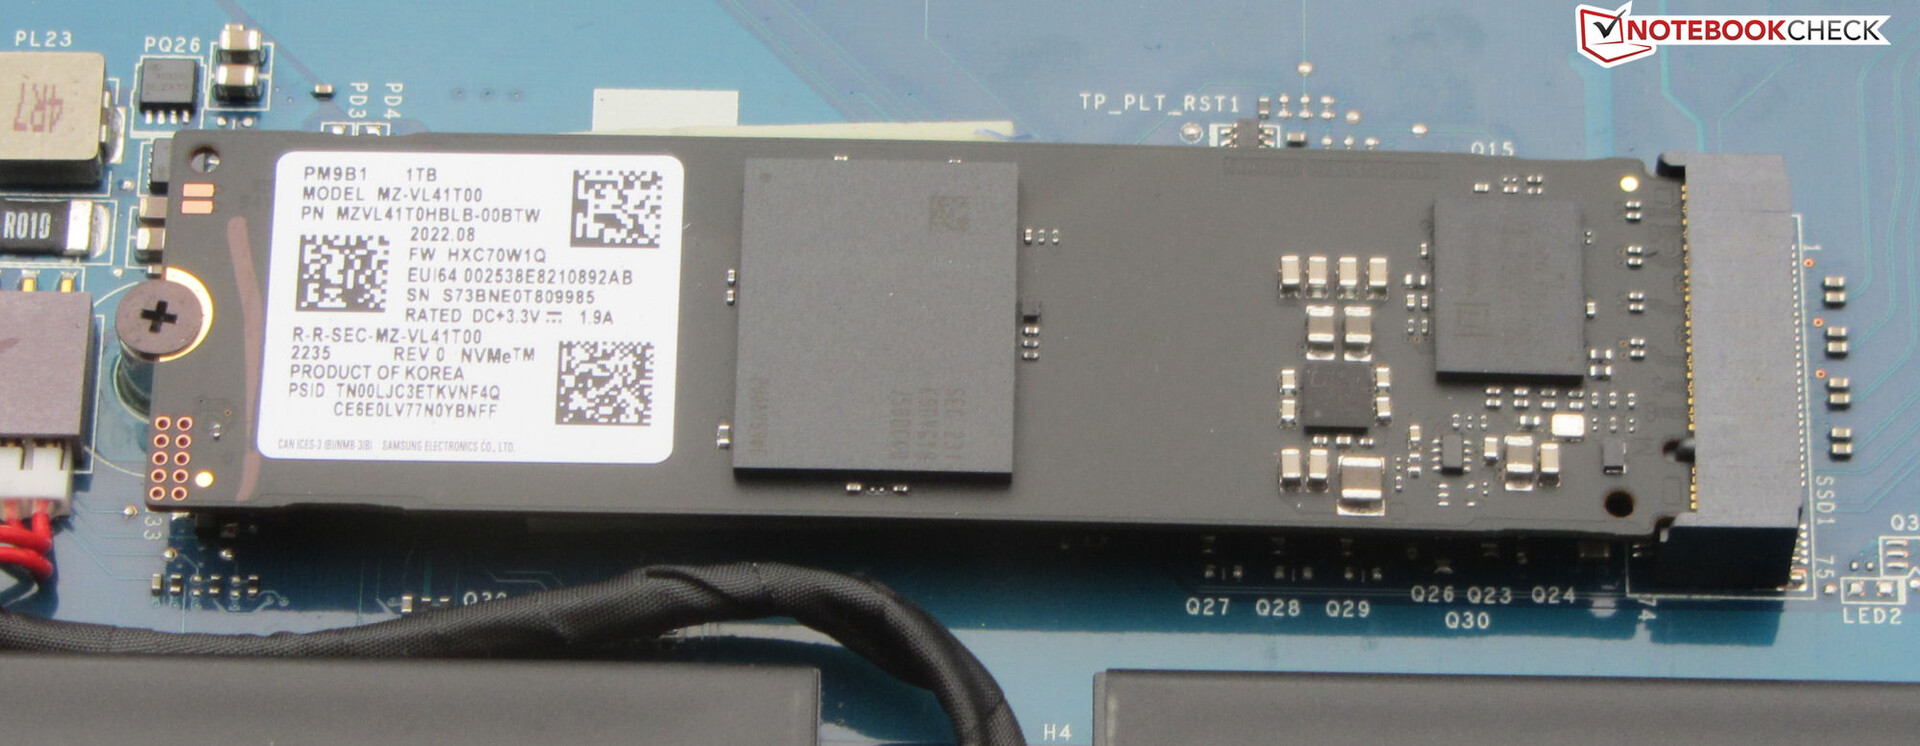
Dopo aver rimosso tutte le viti sul fondo, il fondo del case può essere rimosso con l'aiuto di un piccolo strumento per fare leva o di una spatola. Ma bisogna fare attenzione, poiché è tenuto da clip di plastica piuttosto strette. Dopo aver rimosso il fondo, è possibile accedere ai banchi di memoria di lavoro (entrambi occupati), all'unità SSD (PCIe 4), alla batteria del BIOS, al modulo WLAN, alla ventola, agli altoparlanti e alla batteria.
Garanzia
MSI offre un periodo di garanzia di 2 anni per il portatile da 15,6 pollici in Germania. È inoltre possibile acquistare un'estensione della garanzia di uno o due anni per circa 120 e 250 Euro (~$133 e $276) rispettivamente.
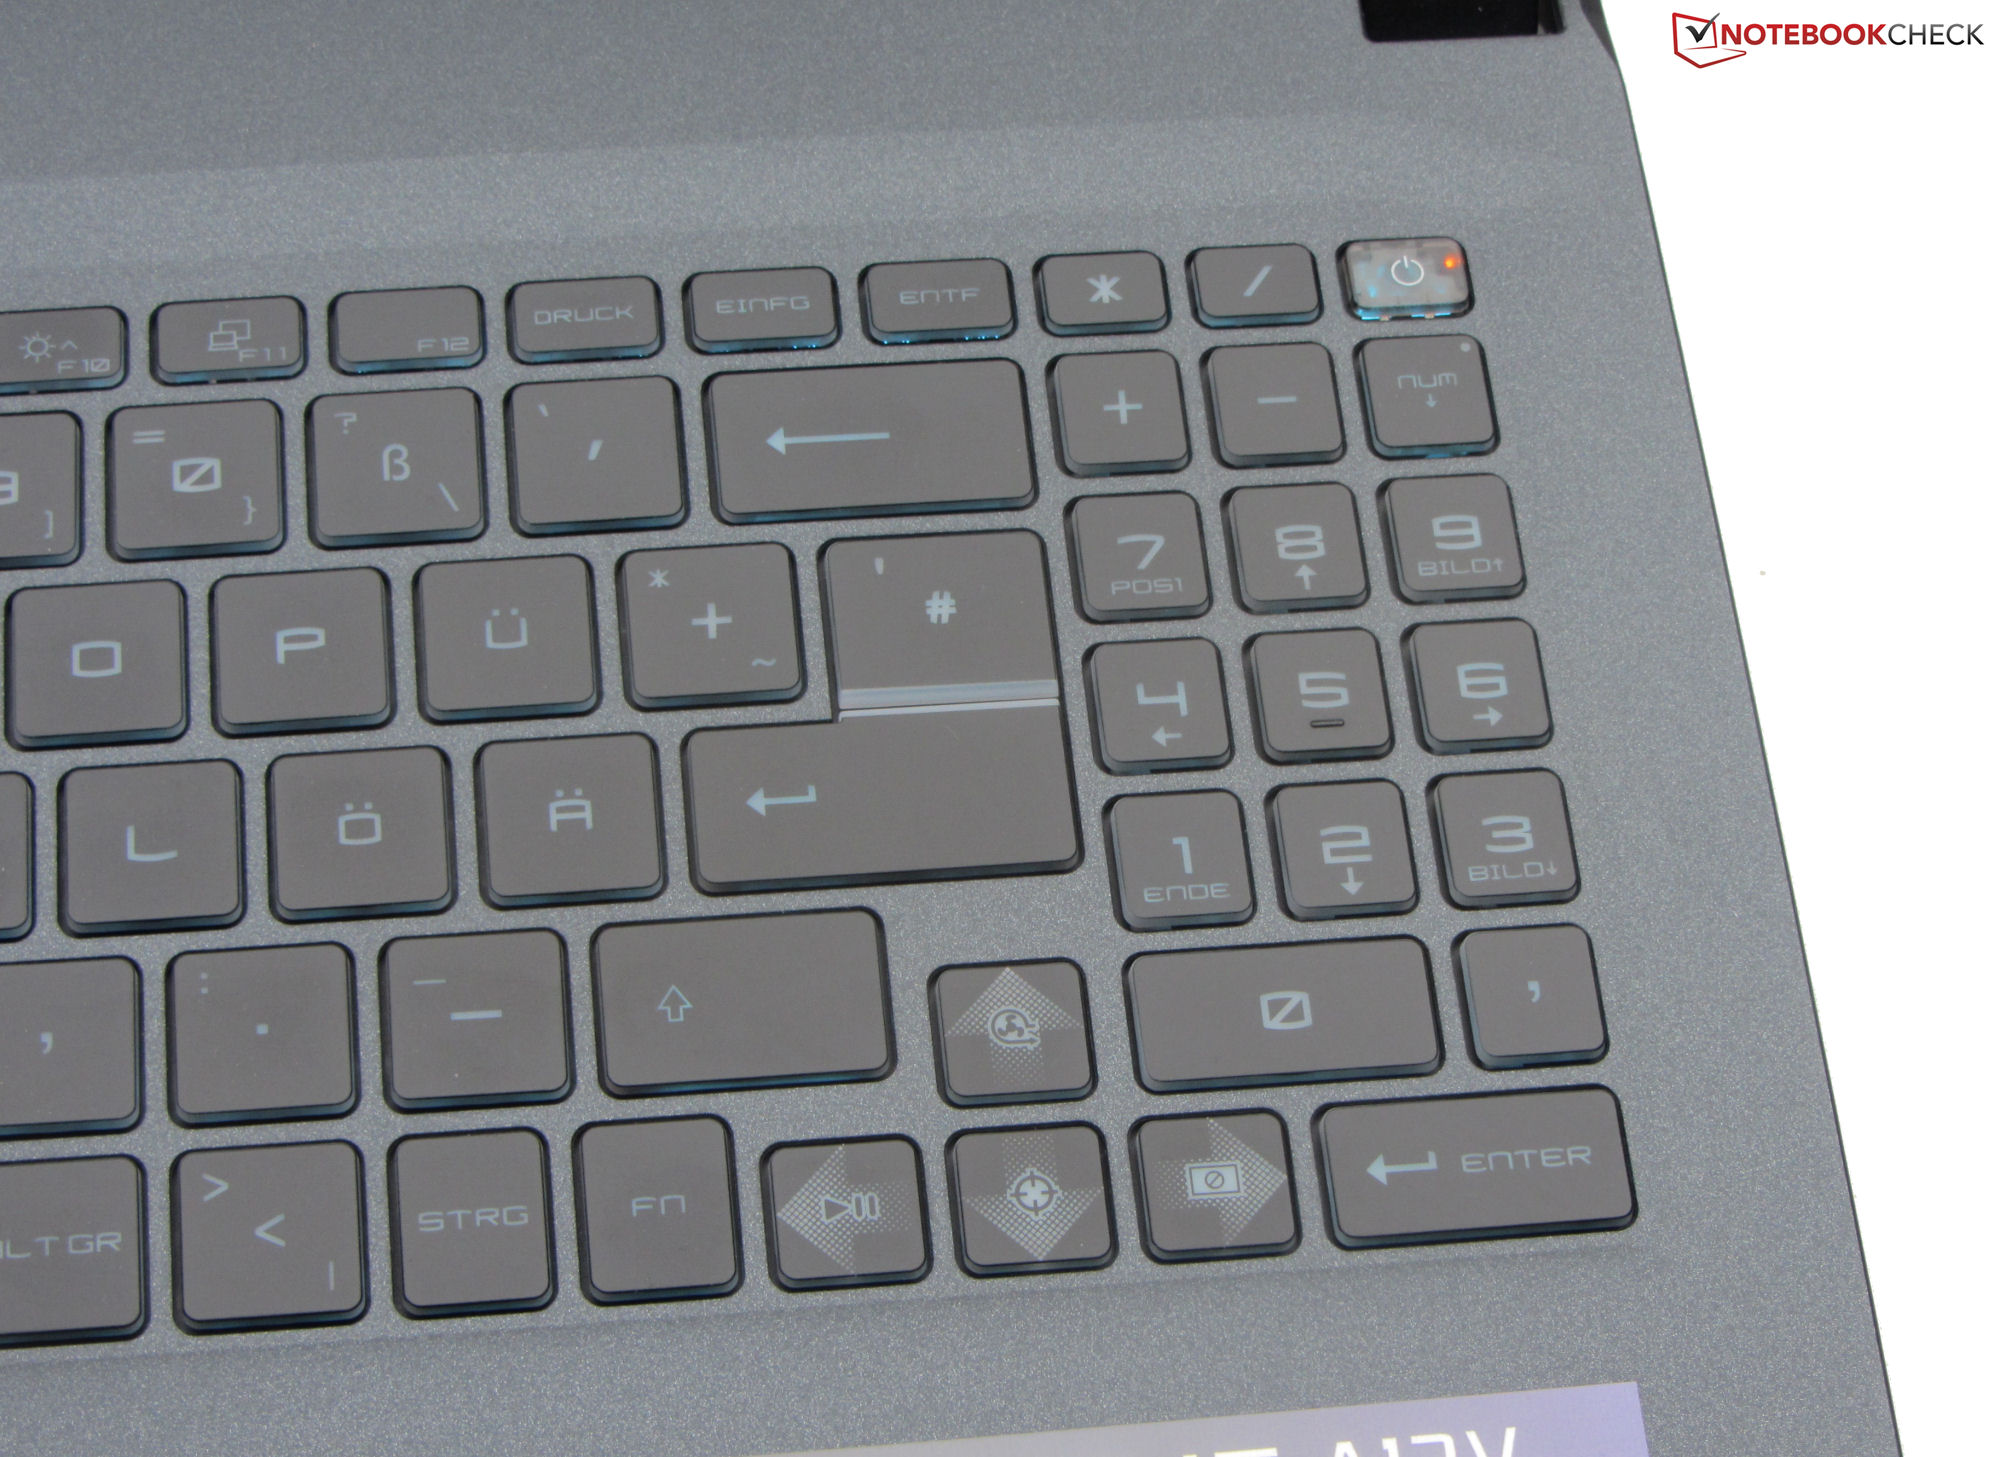
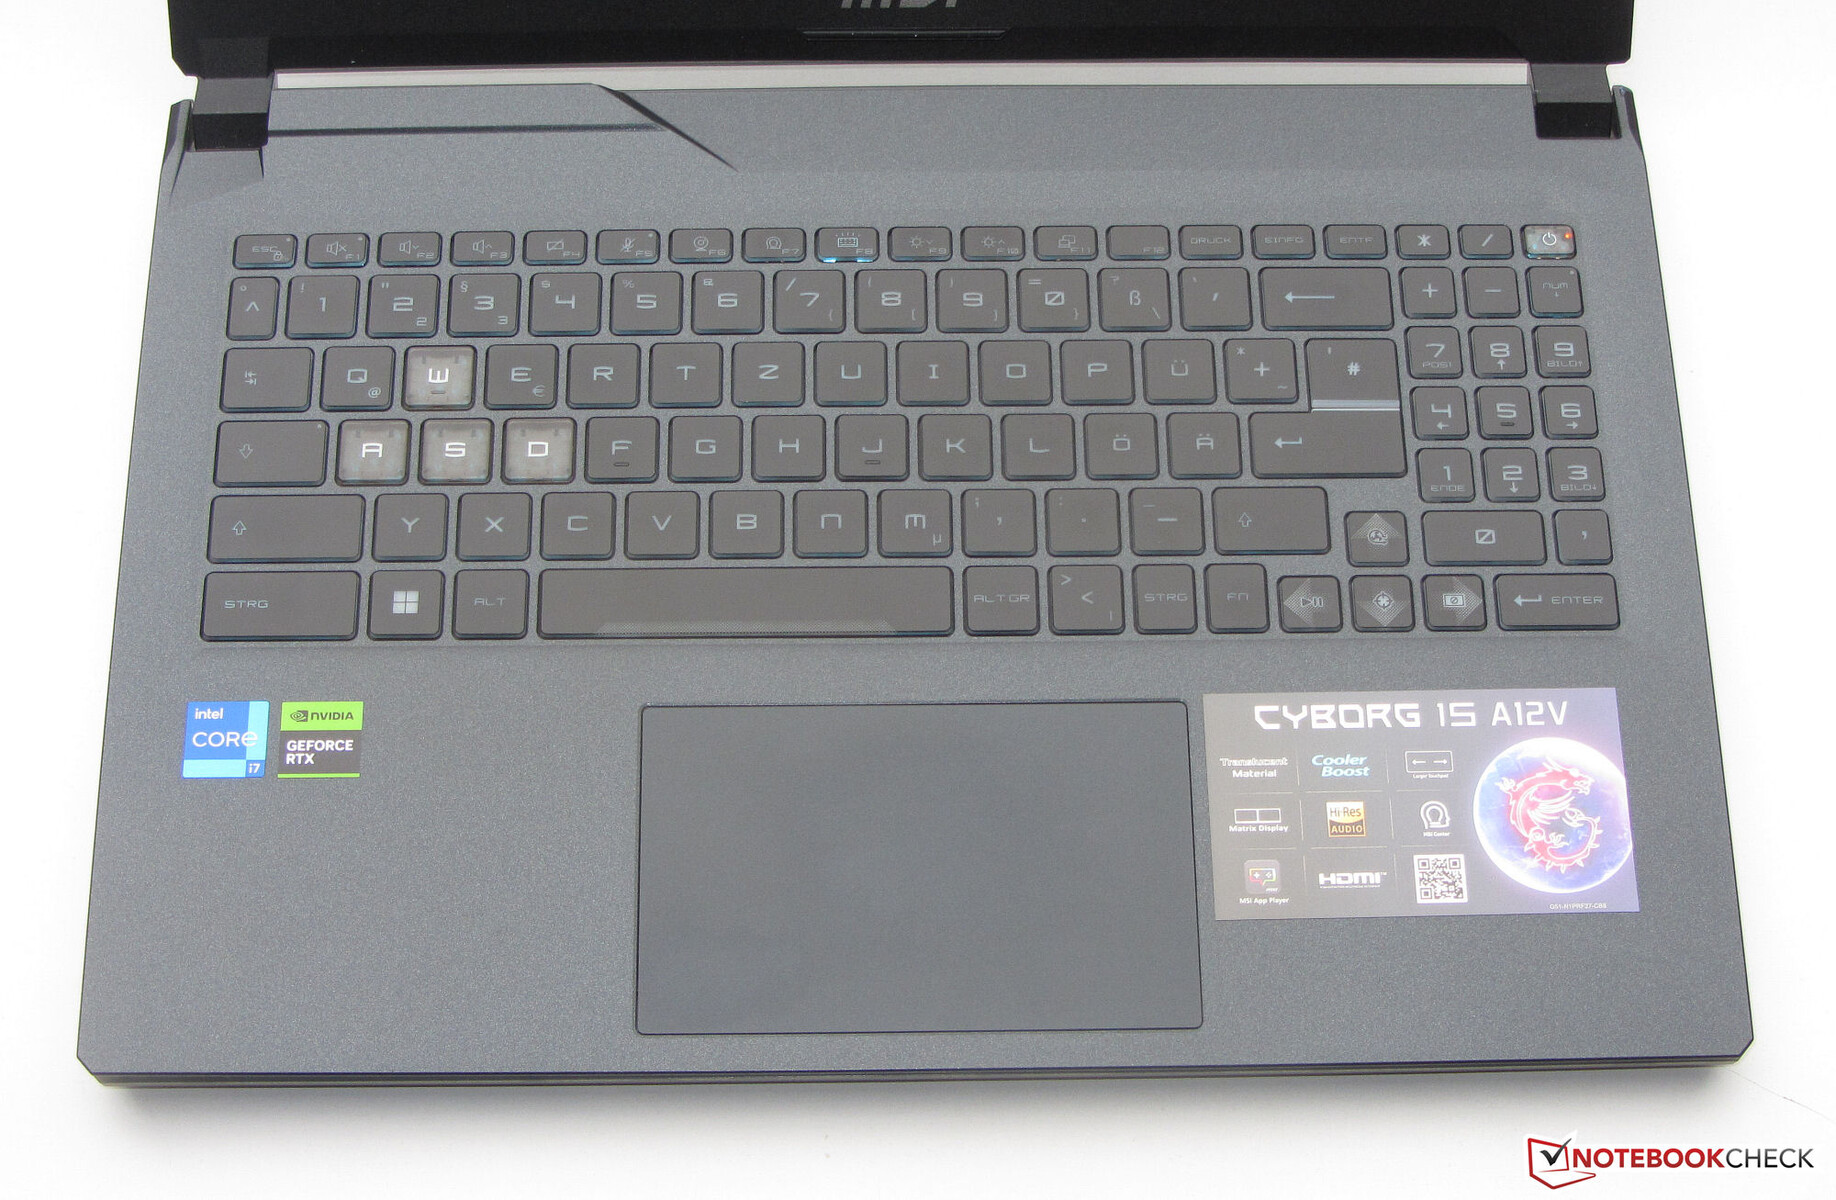
Dispositivi di input - Il Cyborg distingue i tasti WASD per i giochi
Tastiera
I tasti piatti e lisci della tastiera chiclet illuminata offrono una corsa breve e un punto di pressione chiaro. La resistenza dei tasti è discreta. La tastiera presenta un leggero cedimento durante la digitazione, ma non risulta fastidioso. Come tipico dei dispositivi MSI, il tasto "Fn" non è collocato nella stessa posizione delle tastiere di altri portatili. L'illuminazione monocolore della tastiera offre tre livelli di luminosità ed è controllata tramite un tasto funzione. Nel complesso, MSI offre una tastiera adatta all'uso quotidiano.
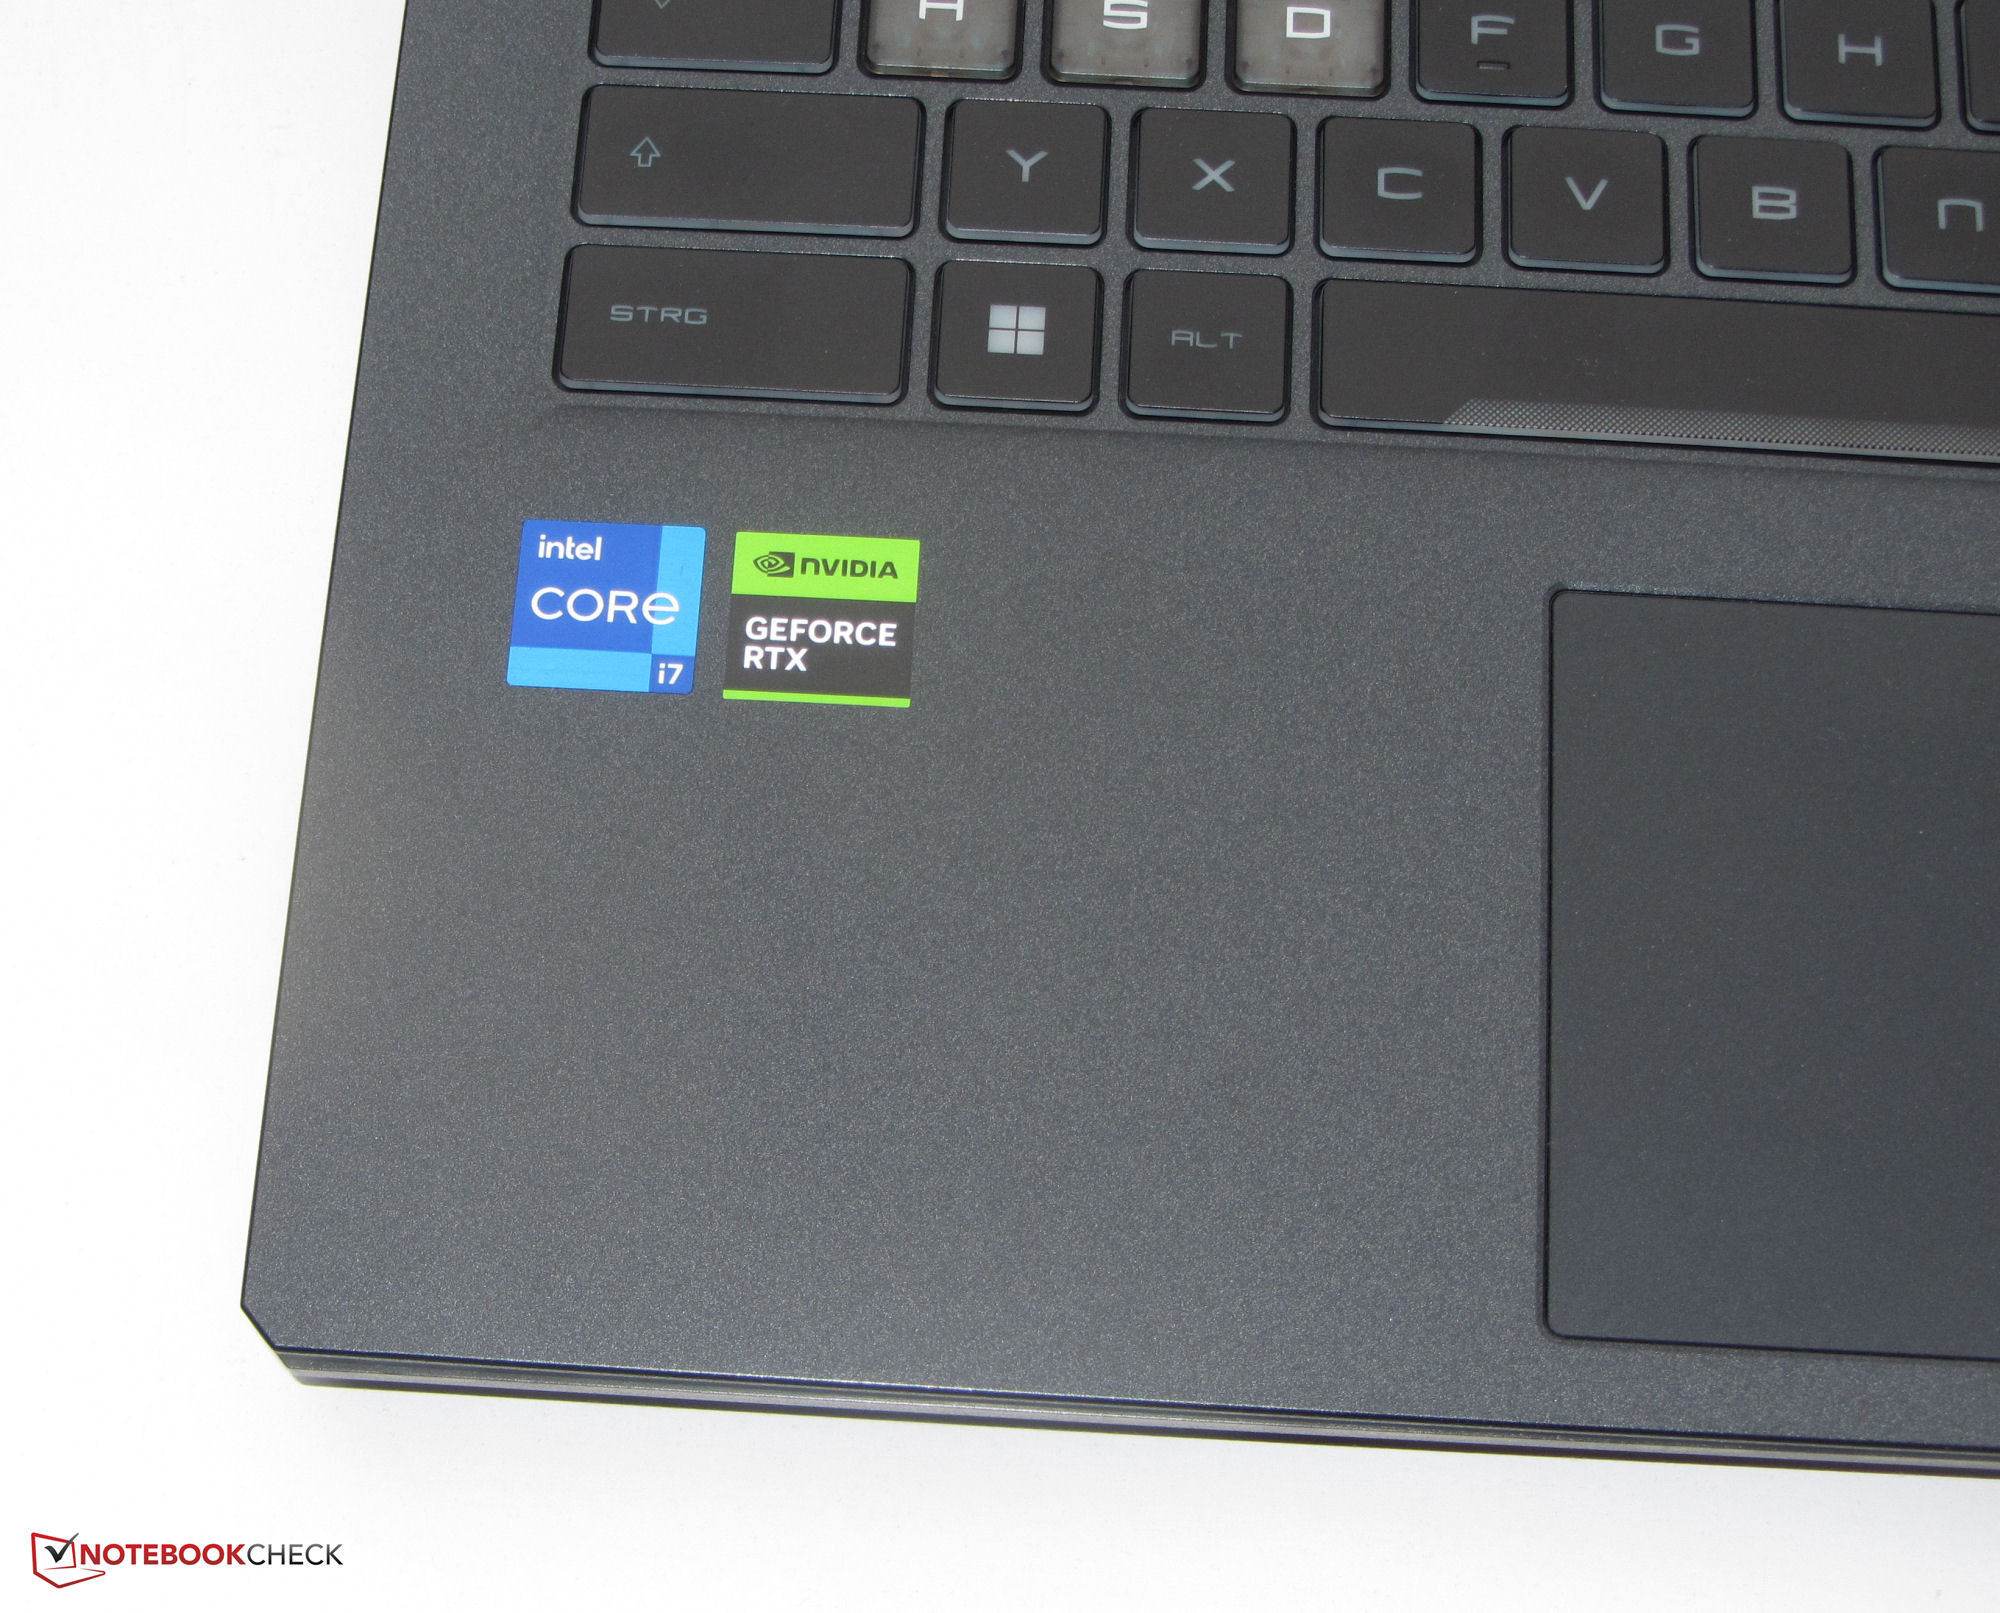
Touchpad
La superficie liscia del Clickpad multitouch (~12 x 7,5 cm, ~4,7 x 2,8 pollici) facilita lo scorrimento delle dita. Risponde agli input agli angoli e offre anche una corsa breve e un punto di pressione chiaro.
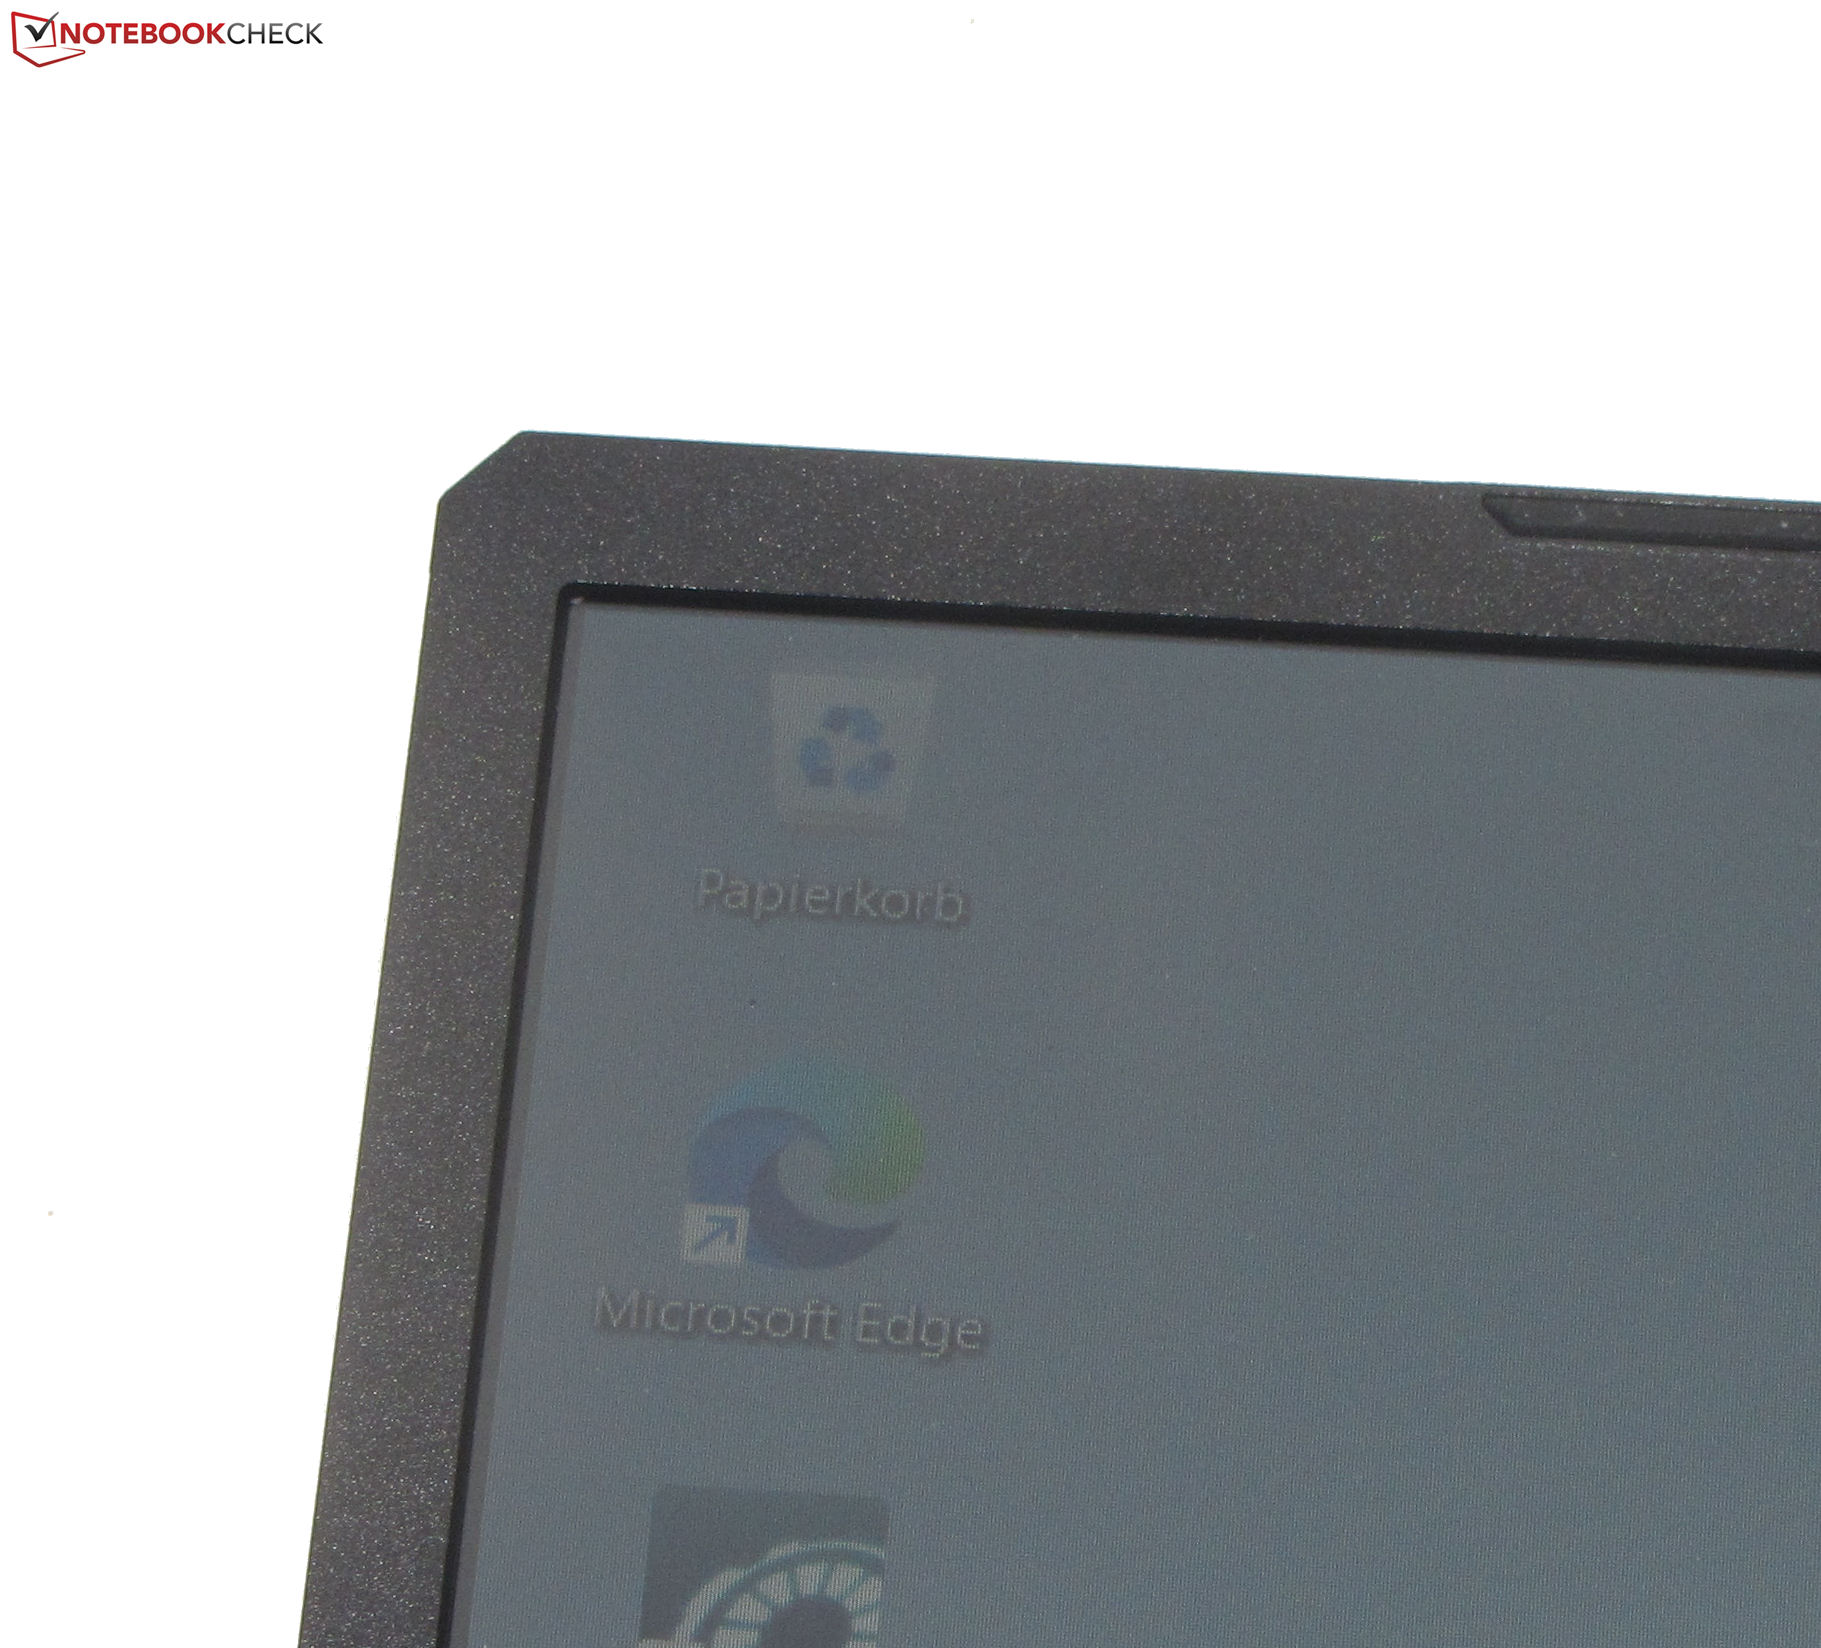
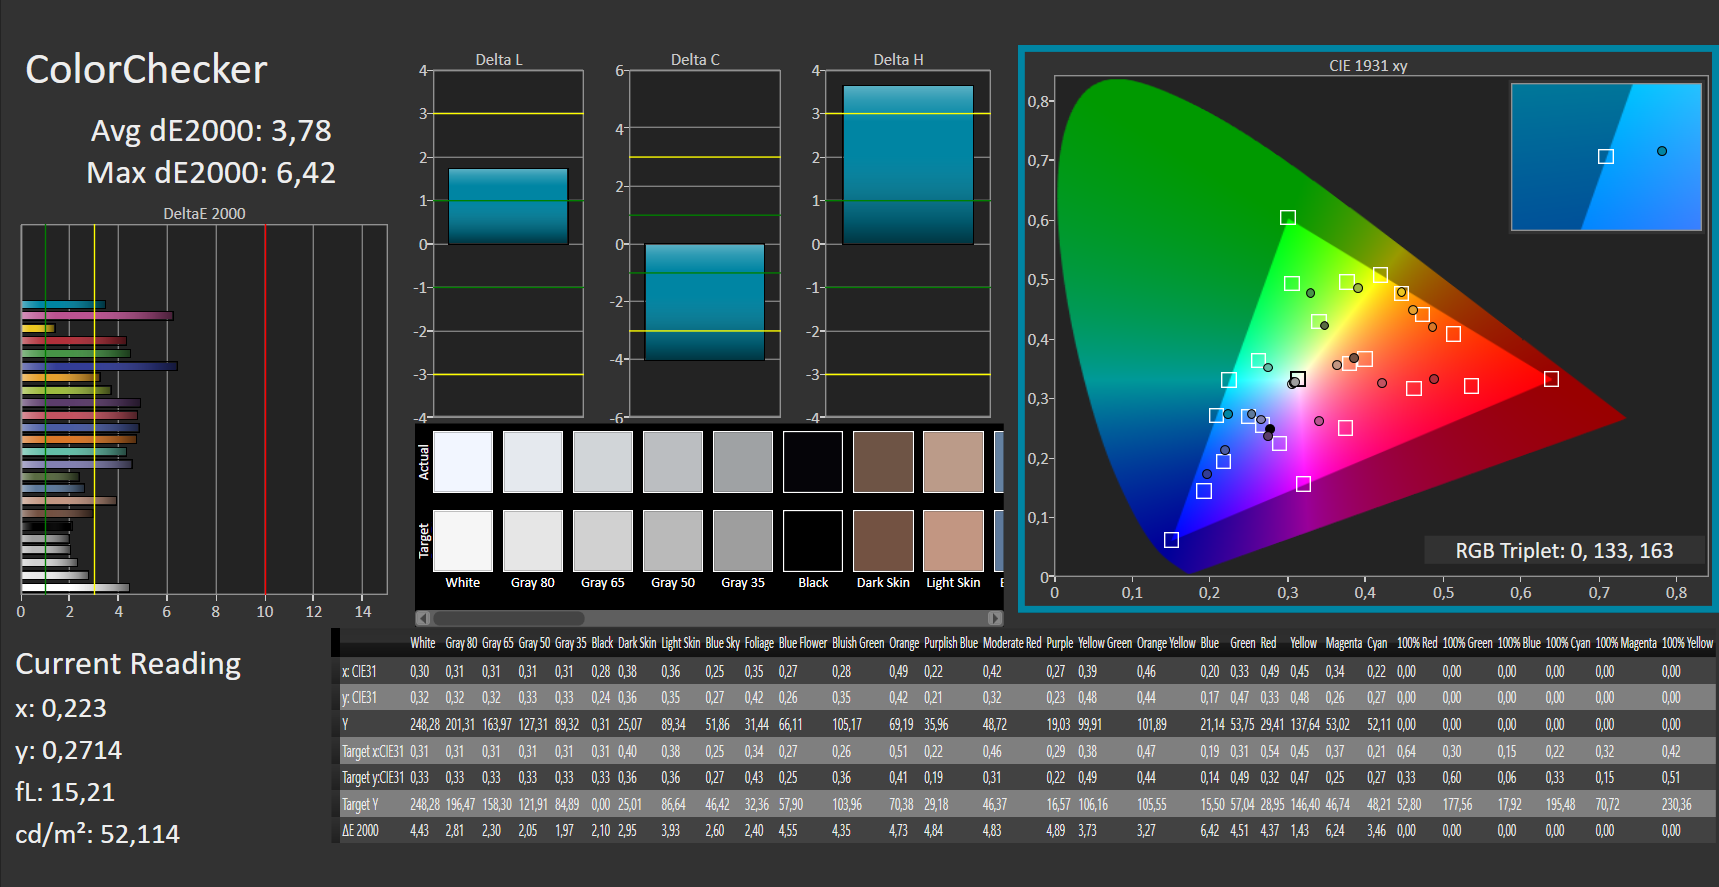
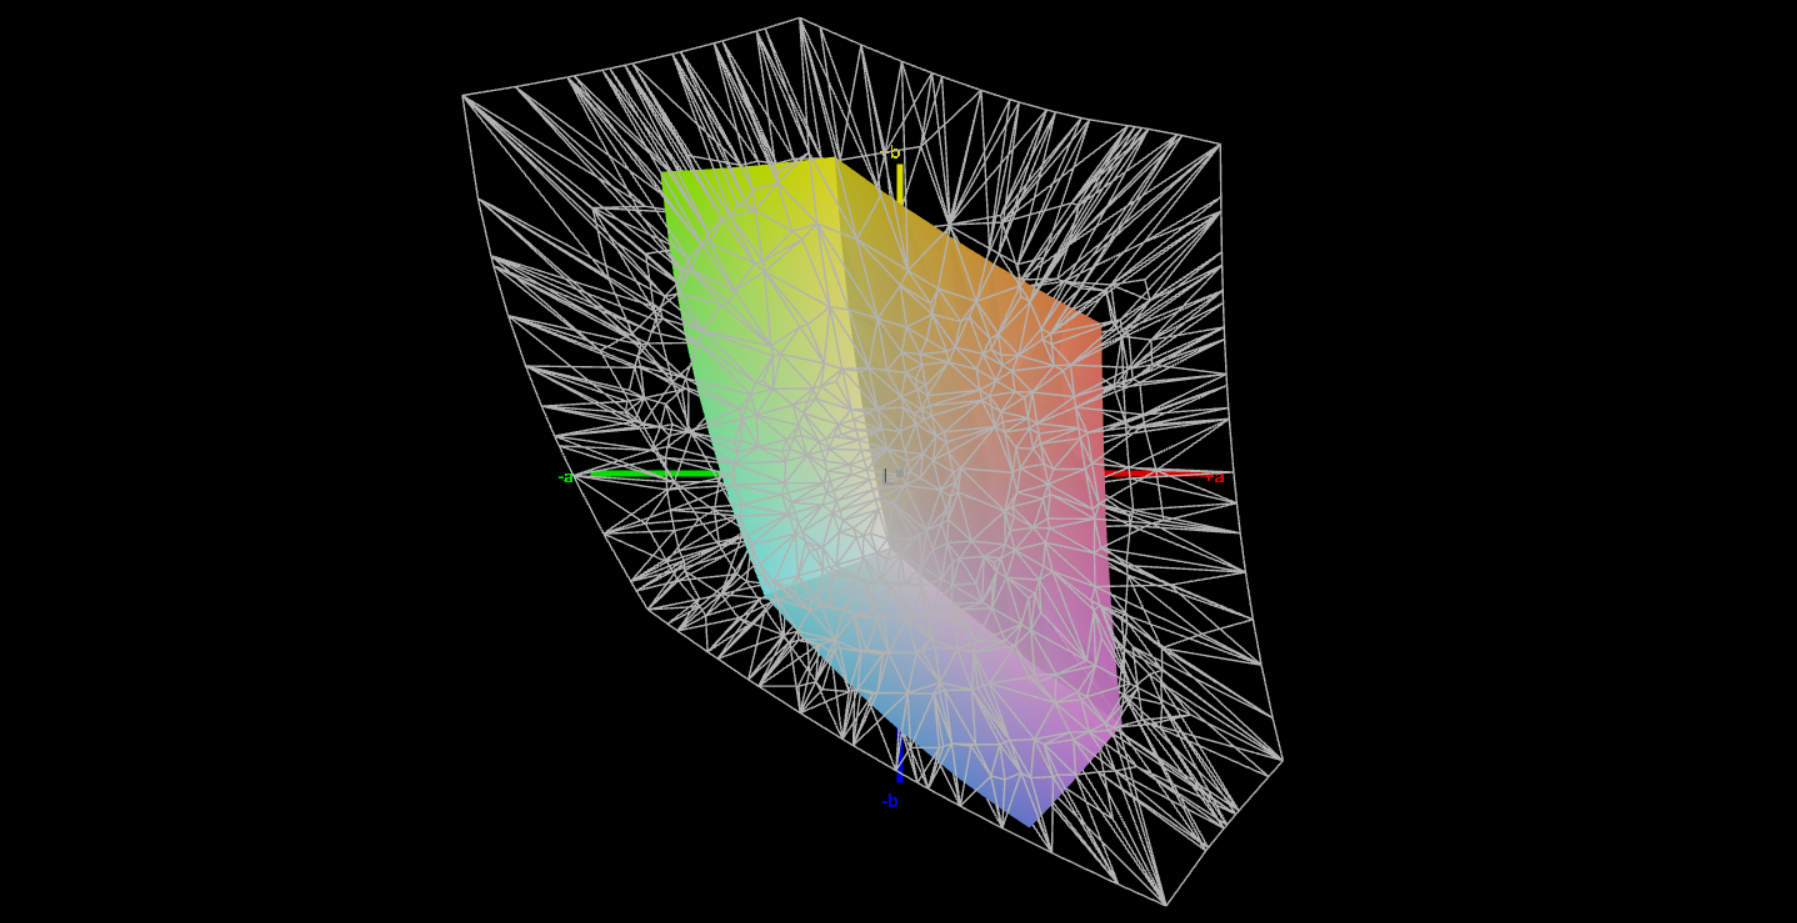
Display - Pannello FHD con copertura dello spazio colore ridotto

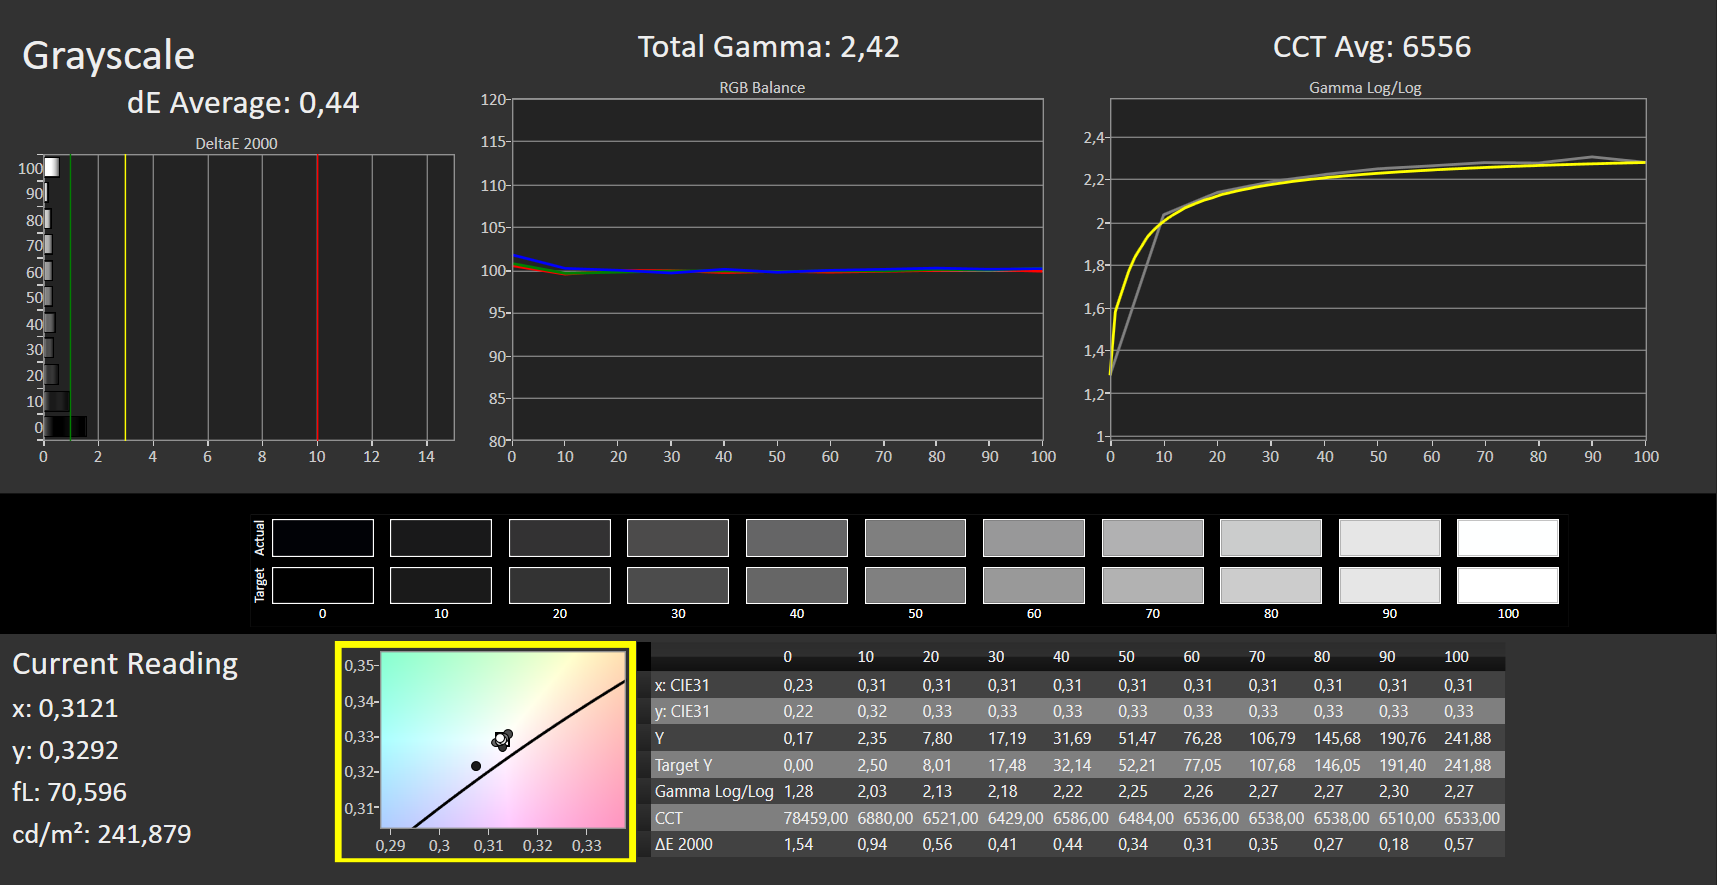
Il pannello a 144 Hz in formato 16:9 offre solo tempi di risposta mediocri. D'altra parte, il fatto che non mostri sfarfallio PWM a qualsiasi livello di luminosità è un punto positivo. La luminosità e il contrasto del display FHD opaco da 15,6 pollici non raggiungono i corrispondenti obiettivi di >1.000:1 e 300 cd/m² rispettivamente, anche se il contrasto si avvicina.
La concorrenza fa un lavoro migliore in questo senso e il resto dei dispositivi nel nostro campo di confronto ha display più luminosi.
| |||||||||||||||||||||||||
Distribuzione della luminosità: 89 %
Al centro con la batteria: 250 cd/m²
Contrasto: 988:1 (Nero: 0.25 cd/m²)
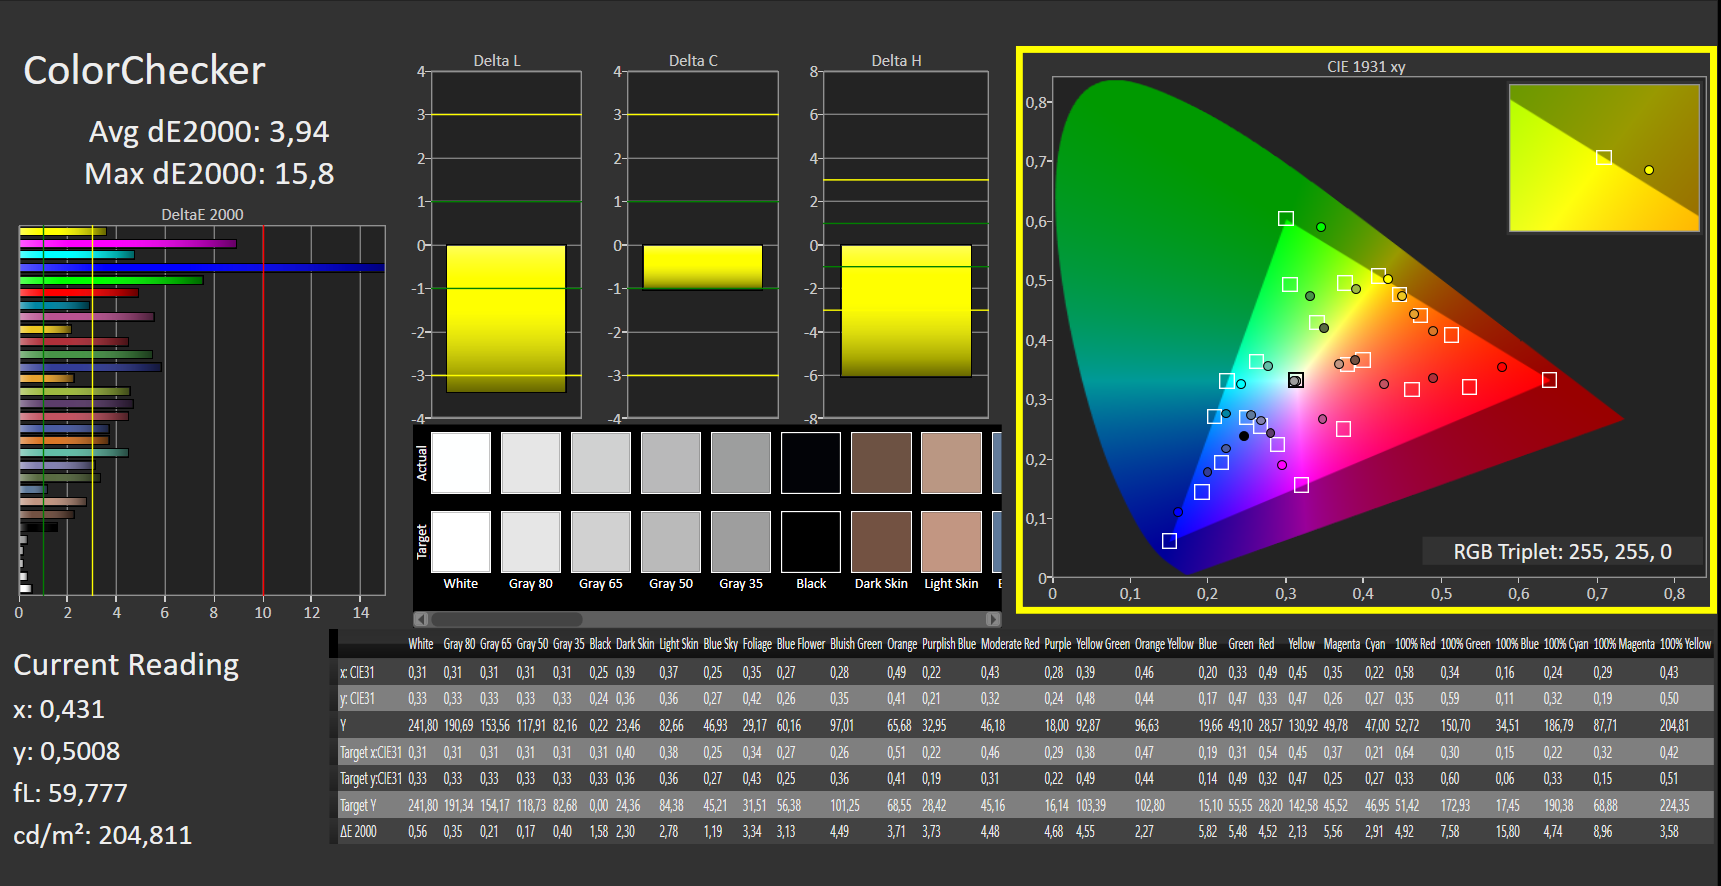
ΔE ColorChecker Calman: 3.78 | ∀{0.5-29.43 Ø4.73}
calibrated: 3.94
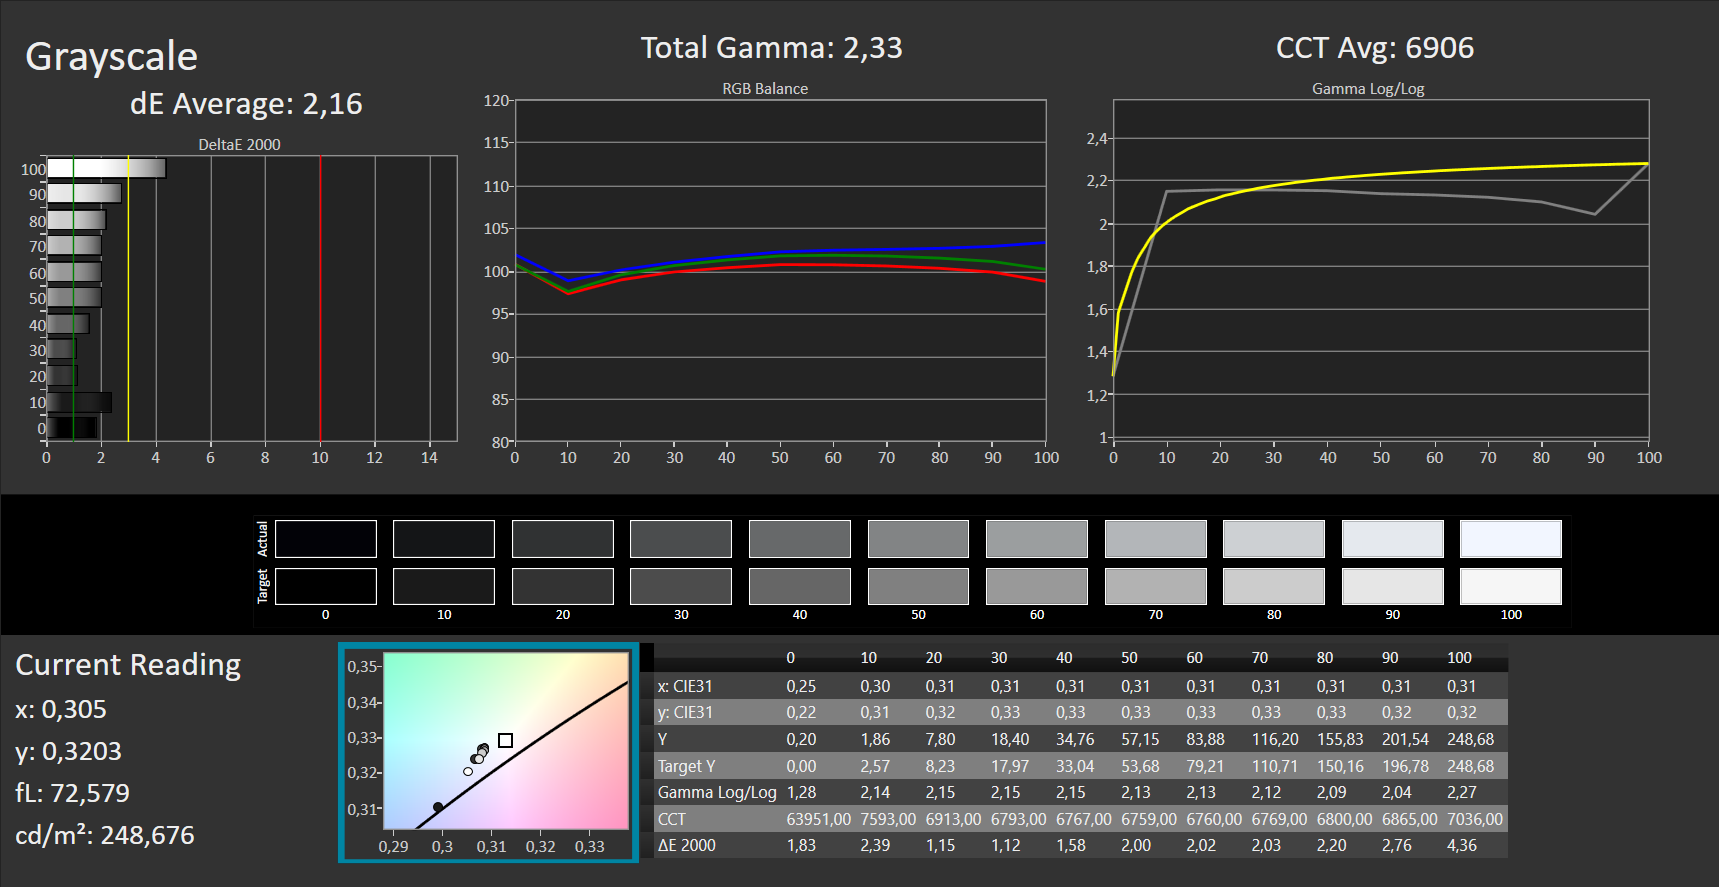
ΔE Greyscale Calman: 2.16 | ∀{0.09-98 Ø4.97}
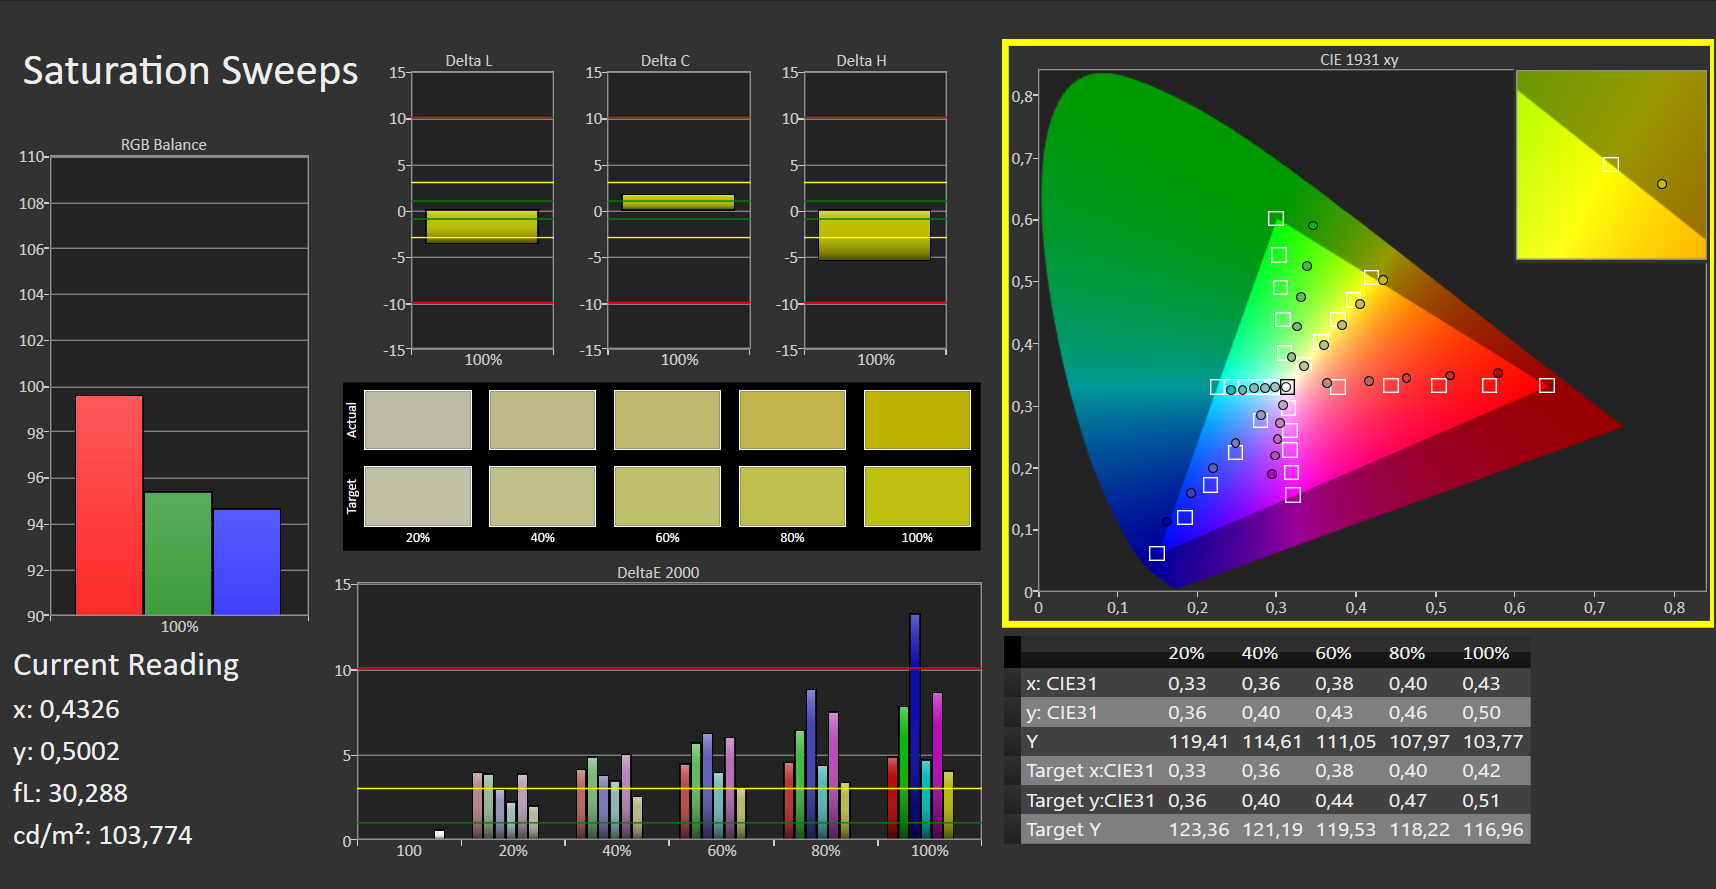
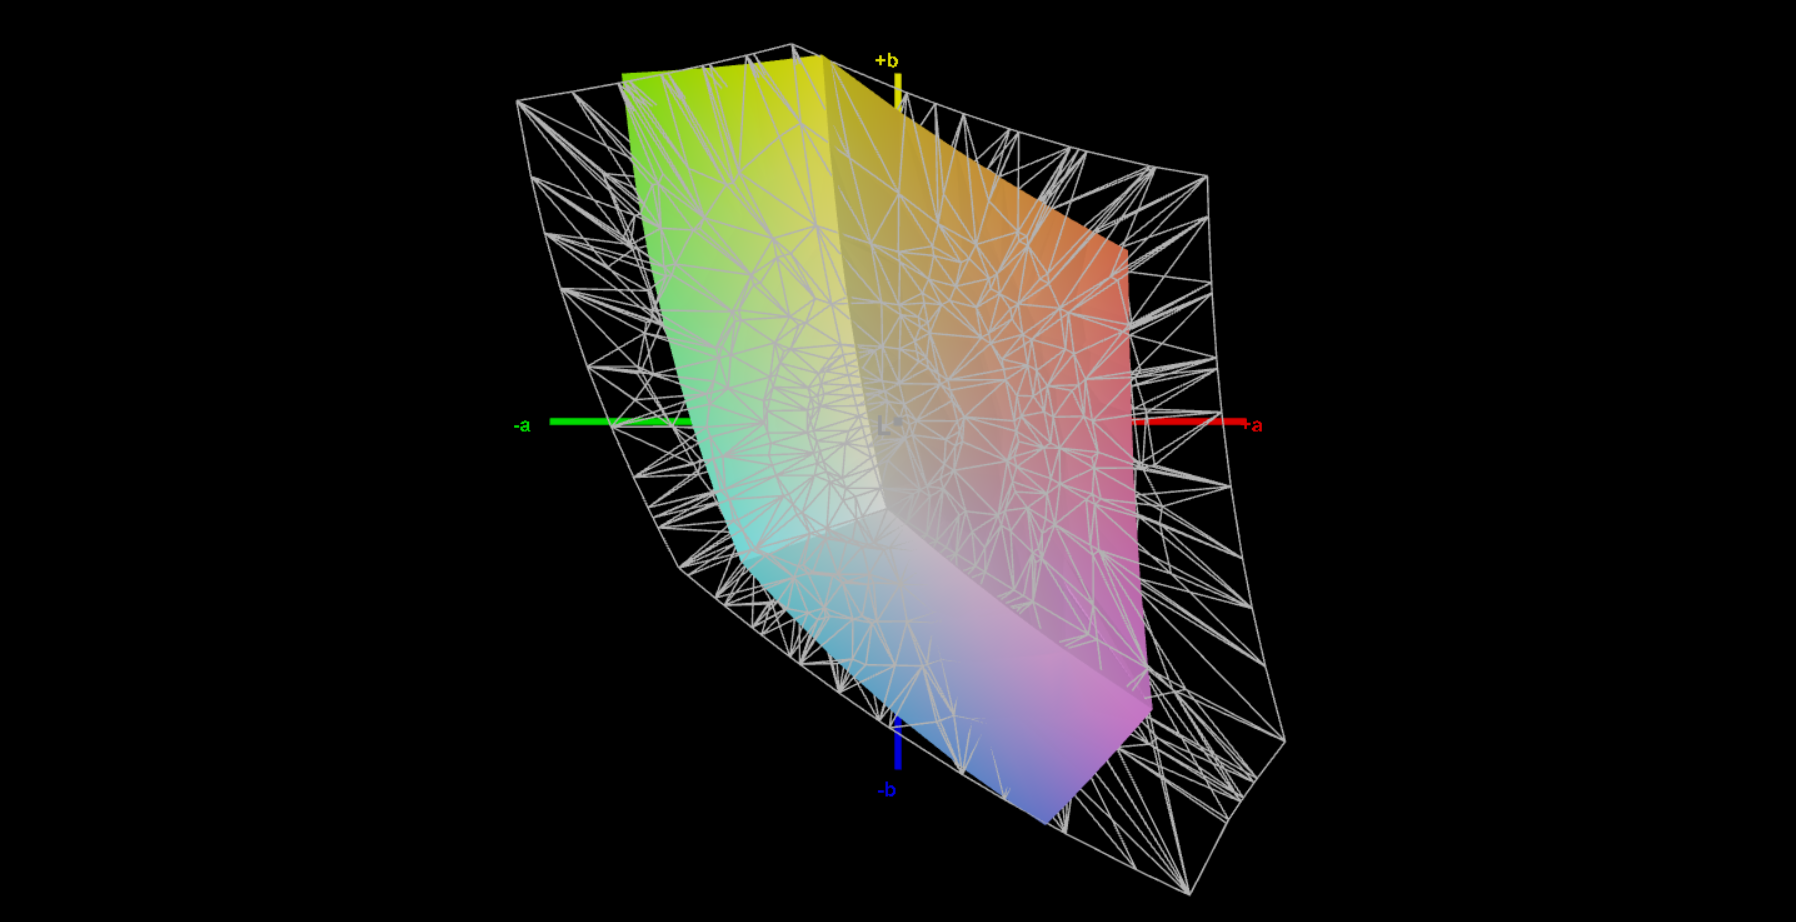
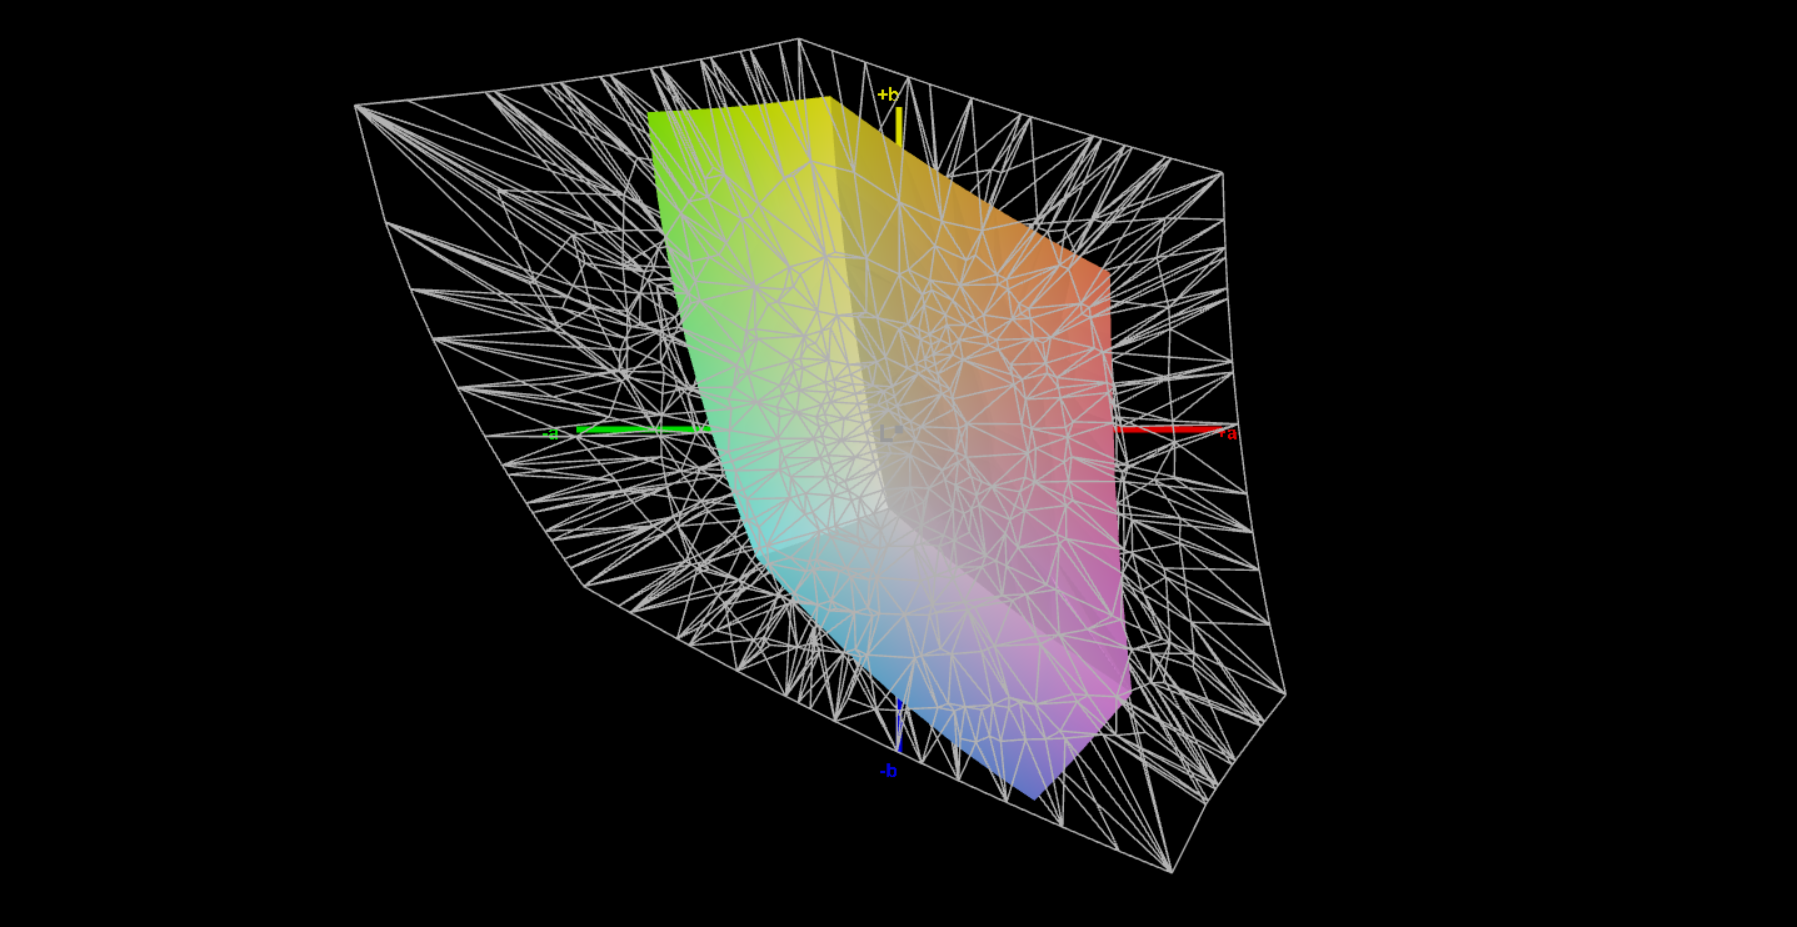
43.7% AdobeRGB 1998 (Argyll 3D)
62.6% sRGB (Argyll 3D)
42.3% Display P3 (Argyll 3D)
Gamma: 2.33
CCT: 6906 K
| MSI Cyborg 15 A12VF AU Optronics B156HAN15.1, IPS, 1920x1080, 15.6" | Asus TUF Gaming A16 FA617 NE160WUM-NX2 (BOE0B33), IPS-Level, 1920x1200, 16" | Aorus 15 XE5 Chi Mei N156KME-GNA, IPS, 2560x1440, 15.6" | Schenker XMG Fusion 15 (Mid 22) BOE CQ NE156QHM-NY2, IPS, 2560x1440, 15.6" | MSI Katana 15 B12VEK AUOAF90 (B156HAN08.4), IPS, 1920x1080, 15.6" | HP Victus 15 fa0020nr CMN1521, IPS, 1920x1080, 15.6" | |
|---|---|---|---|---|---|---|
| Display | 61% | 93% | 56% | -10% | -1% | |
| Display P3 Coverage (%) | 42.3 | 69.4 64% | 95.2 125% | 67.3 59% | 38.1 -10% | 42 -1% |
| sRGB Coverage (%) | 62.6 | 97.8 56% | 99.9 60% | 96.7 54% | 56.8 -9% | 62.7 0% |
| AdobeRGB 1998 Coverage (%) | 43.7 | 70.9 62% | 84.5 93% | 68.2 56% | 39.3 -10% | 43.4 -1% |
| Response Times | 26% | 37% | 49% | -84% | -77% | |
| Response Time Grey 50% / Grey 80% * (ms) | 22 ? | 17 ? 23% | 14.4 ? 35% | 11.6 ? 47% | 38.8 ? -76% | 35.2 ? -60% |
| Response Time Black / White * (ms) | 14 ? | 10.1 ? 28% | 8.6 ? 39% | 7 ? 50% | 26.8 ? -91% | 27.2 ? -94% |
| PWM Frequency (Hz) | ||||||
| Screen | 31% | 1% | -8% | -28% | -13% | |
| Brightness middle (cd/m²) | 247 | 308 25% | 336 36% | 326 32% | 261 6% | 284.3 15% |
| Brightness (cd/m²) | 234 | 293 25% | 316 35% | 303 29% | 258 10% | 262 12% |
| Brightness Distribution (%) | 89 | 90 1% | 89 0% | 89 0% | 92 3% | 87 -2% |
| Black Level * (cd/m²) | 0.25 | 0.23 8% | 0.34 -36% | 0.33 -32% | 0.19 24% | 0.17 32% |
| Contrast (:1) | 988 | 1339 36% | 988 0% | 988 0% | 1374 39% | 1672 69% |
| Colorchecker dE 2000 * | 3.78 | 1.47 61% | 3.36 11% | 2.73 28% | 5.57 -47% | 4.52 -20% |
| Colorchecker dE 2000 max. * | 6.42 | 2.98 54% | 6.67 -4% | 9.54 -49% | 20.6 -221% | 18.67 -191% |
| Colorchecker dE 2000 calibrated * | 3.94 | 1.02 74% | 0.74 81% | 1.36 65% | 4.63 -18% | 1.55 61% |
| Greyscale dE 2000 * | 2.16 | 2.2 -2% | 4.7 -118% | 5.2 -141% | 3.19 -48% | 4.1 -90% |
| Gamma | 2.33 94% | 2.228 99% | 2.244 98% | 2.074 106% | 2.45 90% | 2.3 96% |
| CCT | 6906 94% | 6228 104% | 6897 94% | 6911 94% | 6146 106% | 6529 100% |
| Media totale (Programma / Settaggio) | 39% /
37% | 44% /
26% | 32% /
14% | -41% /
-32% | -30% /
-19% |
* ... Meglio usare valori piccoli
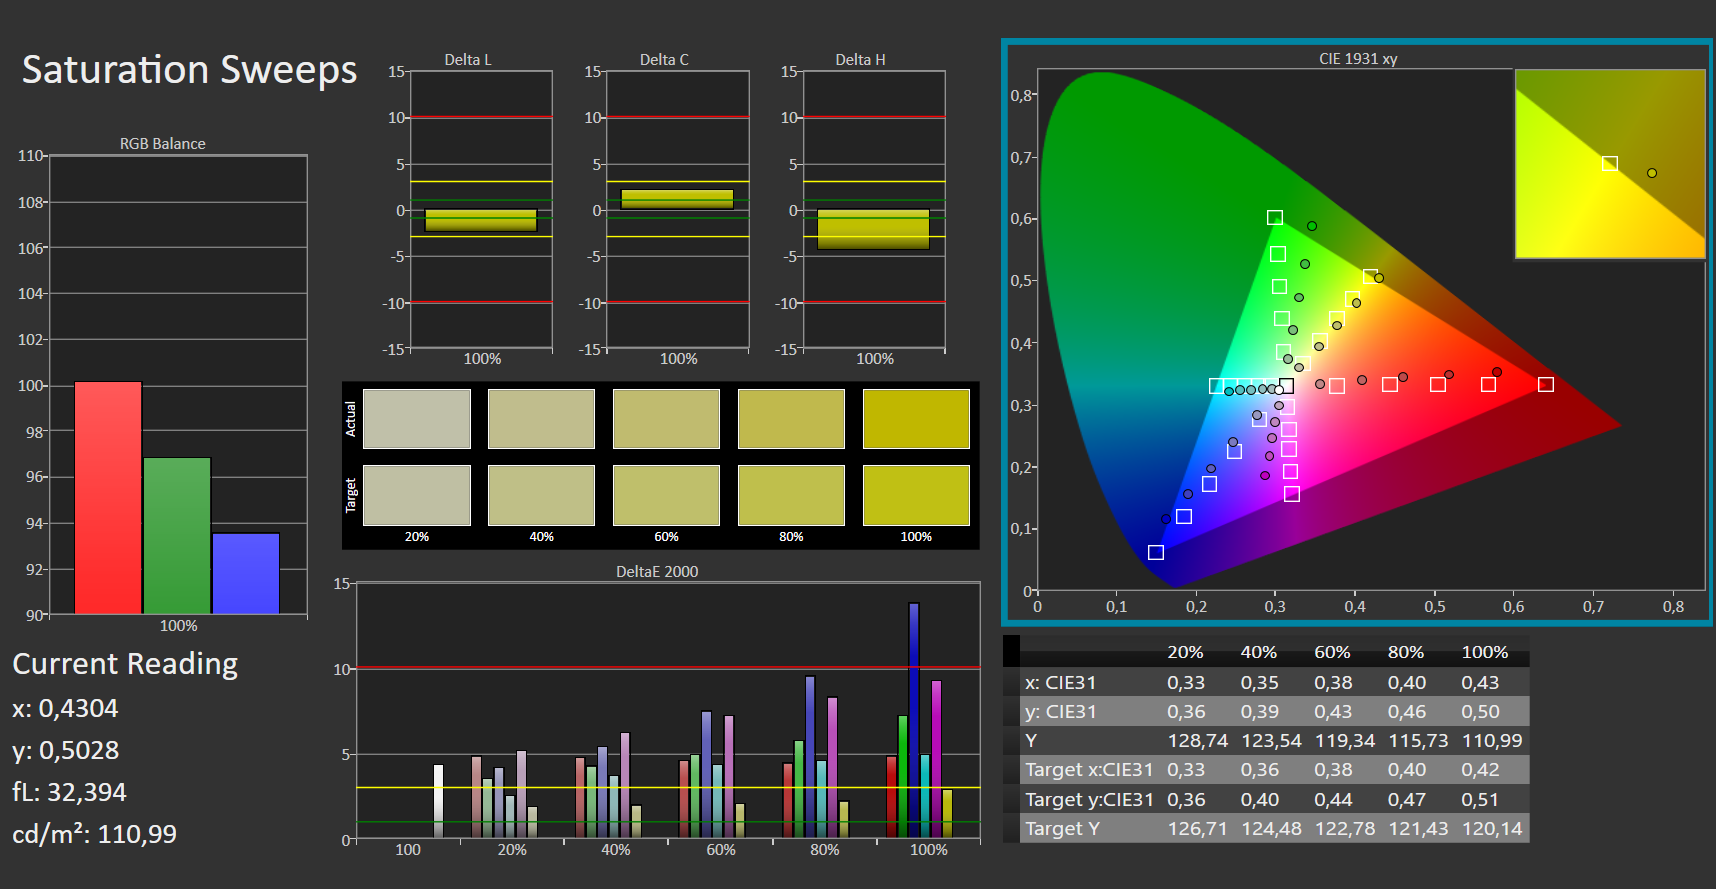
In fase di consegna, la riproduzione dei colori del display è molto discreta, con una deviazione di 3,8 che manca di poco l'obiettivo di DeltaE < 3. Sebbene la calibrazione aumenti la deviazione dei colori, garantisce anche una scala di grigi più equilibrata.
Il pannello non è in grado di coprire gli spazi colore AdobeRGB (44%), sRGB (63%) e DCI-P3 (42%). Non è quindi adatto a scenari applicativi che dipendono dalla precisione del colore. Concorrenti come il Asus TUF Gaming A16 FA617e XMG Fusion 15sono più adatti in questo caso e i loro display sono in grado di coprire lo spazio colore sRGB.
Tempi di risposta del Display
| ↔ Tempi di risposta dal Nero al Bianco | ||
|---|---|---|
| 14 ms ... aumenta ↗ e diminuisce ↘ combinato | ↗ 7 ms Incremento |  |
| ↘ 7 ms Calo | ||
| Lo schermo mostra buoni tempi di risposta durante i nostri tests, ma potrebbe essere troppo lento per i gamers competitivi. In confronto, tutti i dispositivi di test variano da 0.1 (minimo) a 240 (massimo) ms. » 34 % di tutti i dispositivi è migliore. Questo significa che i tempi di risposta rilevati sono migliori rispettto alla media di tutti i dispositivi testati (19.9 ms). | ||
| ↔ Tempo di risposta dal 50% Grigio all'80% Grigio | ||
| 22 ms ... aumenta ↗ e diminuisce ↘ combinato | ↗ 9 ms Incremento |  |
| ↘ 13 ms Calo | ||
| Lo schermo mostra buoni tempi di risposta durante i nostri tests, ma potrebbe essere troppo lento per i gamers competitivi. In confronto, tutti i dispositivi di test variano da 0.165 (minimo) a 636 (massimo) ms. » 33 % di tutti i dispositivi è migliore. Questo significa che i tempi di risposta rilevati sono migliori rispettto alla media di tutti i dispositivi testati (31.1 ms). | ||
Sfarfallio dello schermo / PWM (Pulse-Width Modulation)
| flickering dello schermo / PWM non rilevato |  | ||
In confronto: 52 % di tutti i dispositivi testati non utilizza PWM per ridurre la luminosita' del display. Se è rilevato PWM, una media di 7798 (minimo: 5 - massimo: 343500) Hz è stata rilevata. | |||
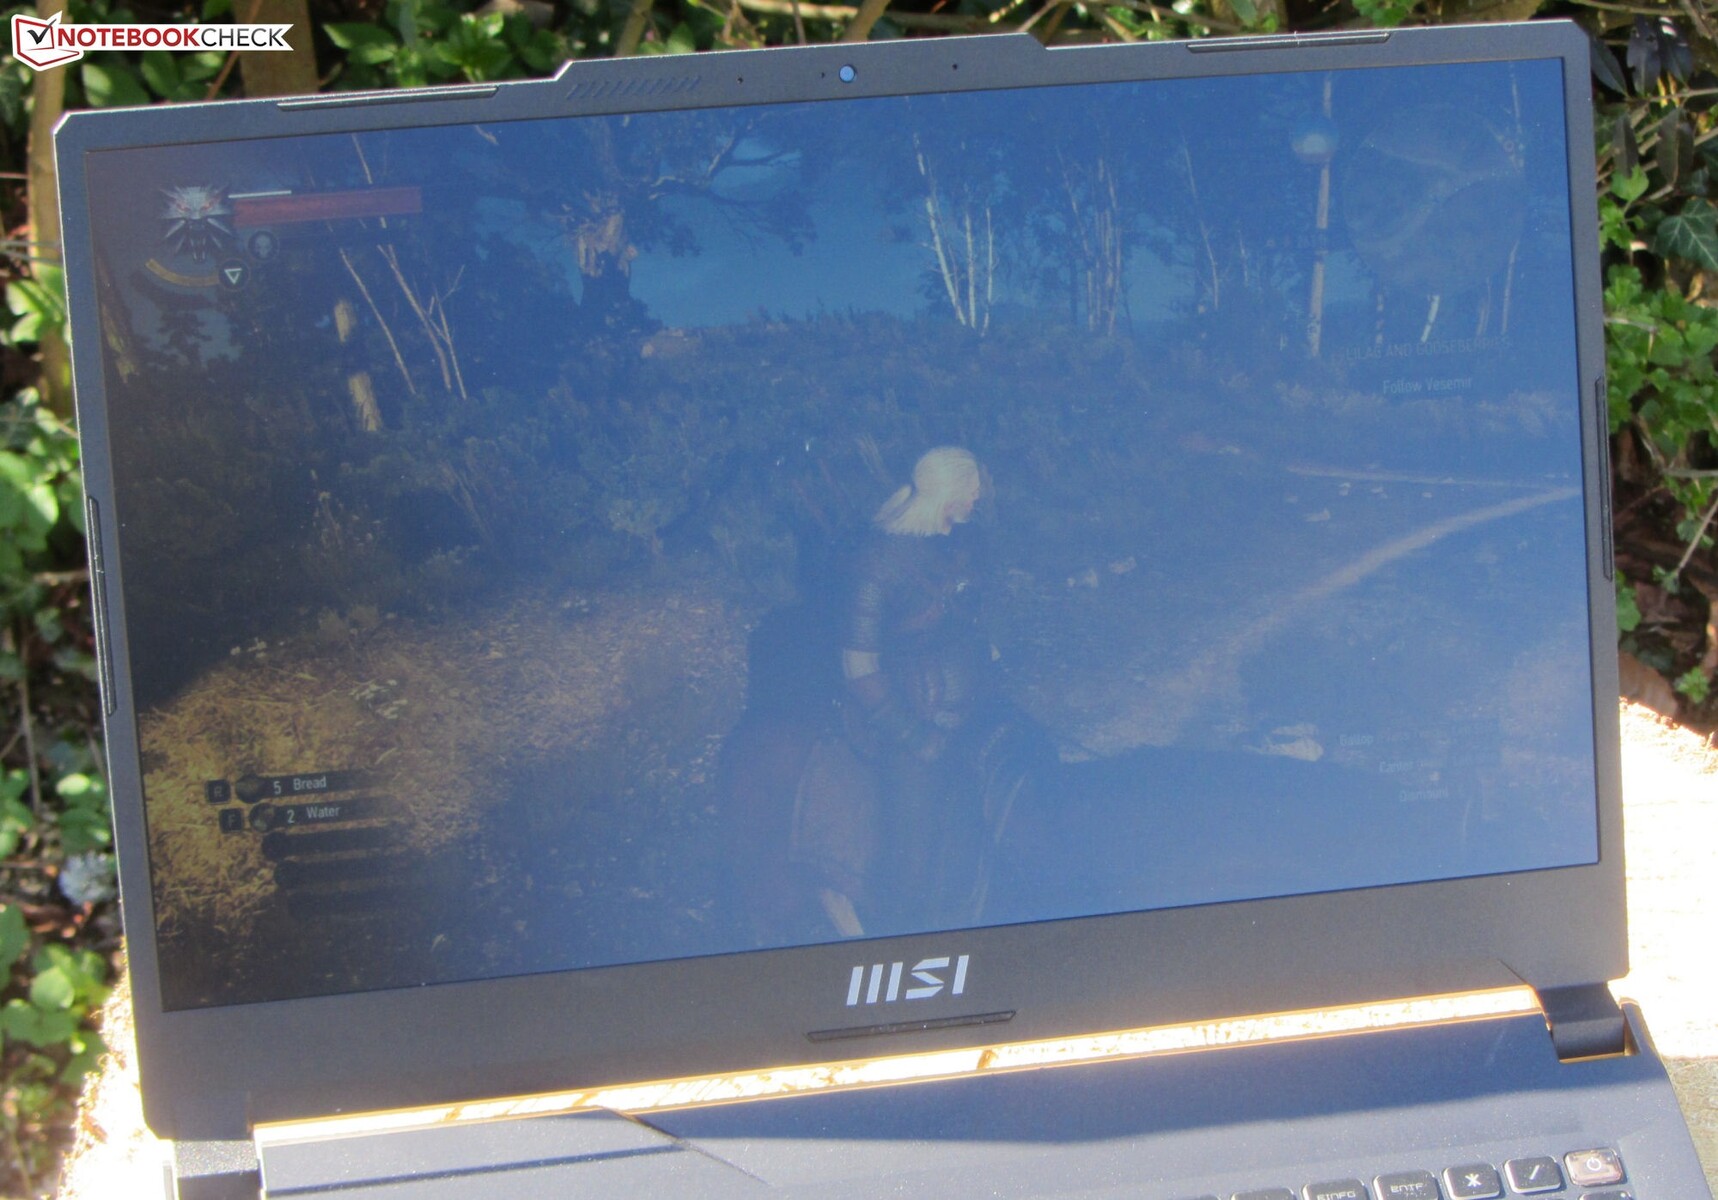
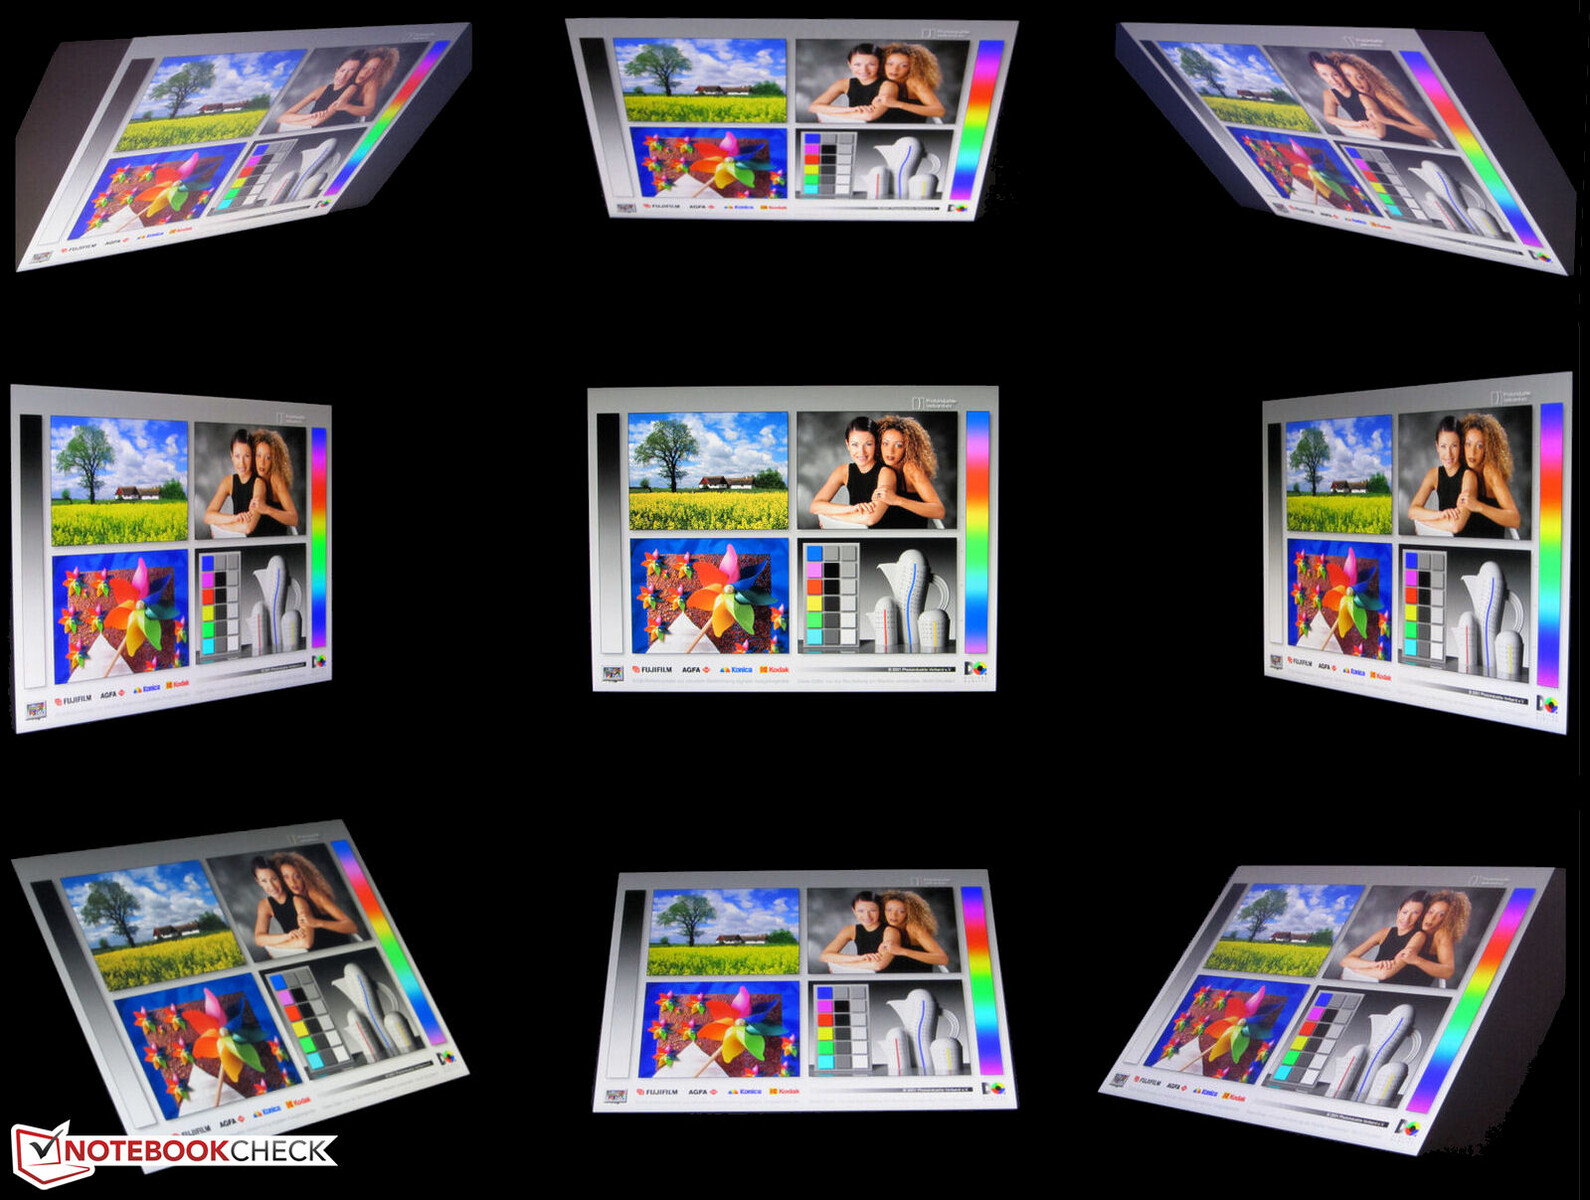
Gli angoli di visualizzazione del pannello IPS sono stabili e possono essere letti facilmente da qualsiasi angolazione. All'aperto, i contenuti del display sono leggibili anche quando il sole non è troppo forte.
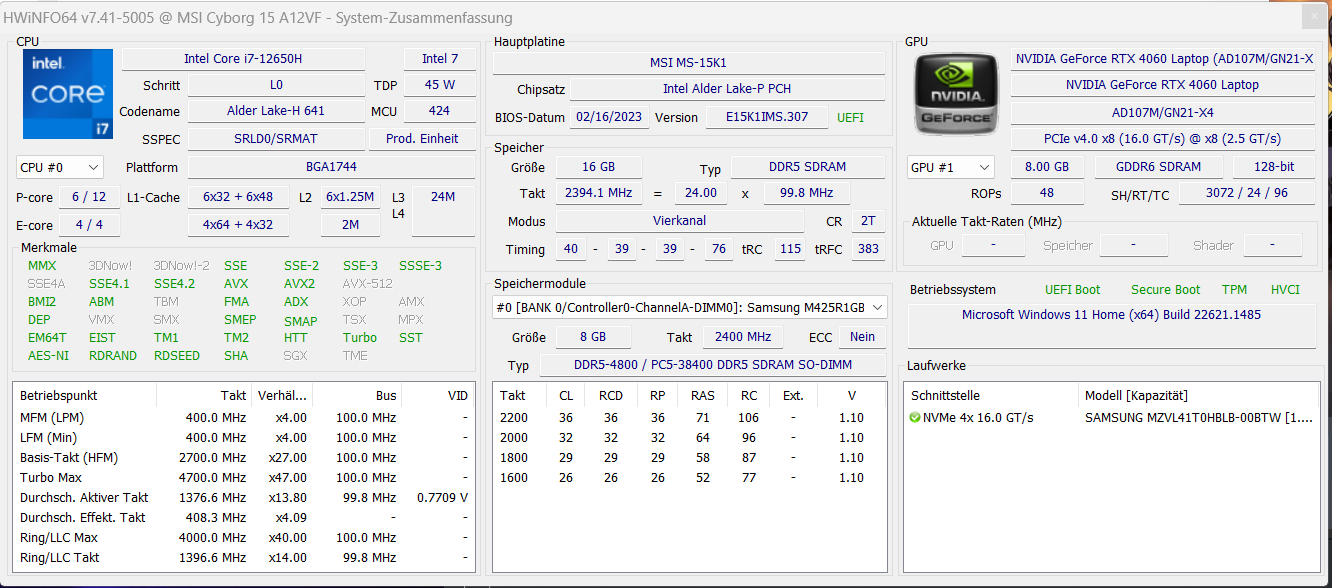
Performance - Alder Lake e Ada Lovelace al guinzaglio
Con la serie Cyborg 15 A12VF, MSI offre computer portatili per il gaming che utilizzano la scheda RTX 4060 GeForce RTX 4060 Laptopin una configurazione a basso consumo con un TGP di 45 watt. Il tutto è accompagnato dai processori Alder Lake di Intel. I prezzi dei modelli A12VF disponibili al momento di questo test si aggirano tra i 1.250 e i 1.800 euro (~$1.382 - $1.989). Il prezzo della nostra unità di prova si colloca all'estremità superiore di questa scala.
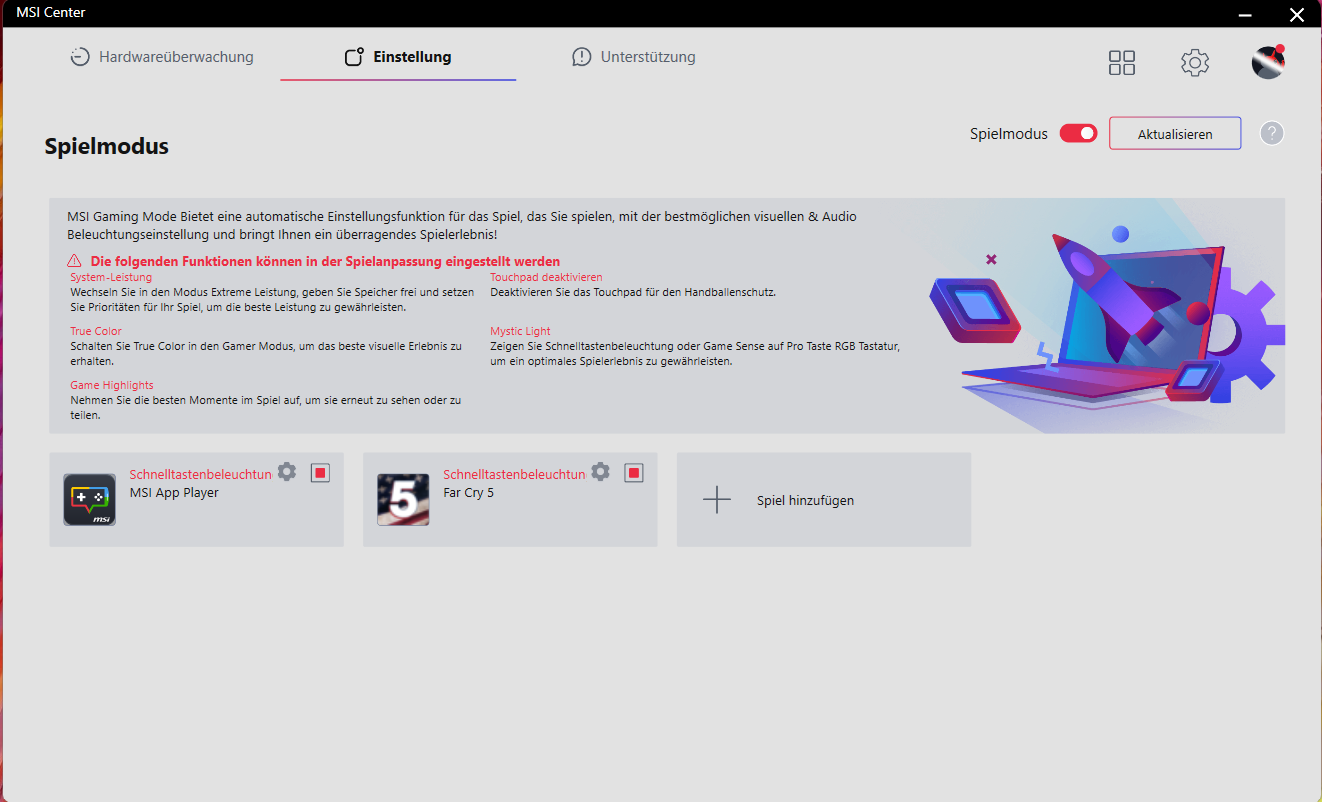
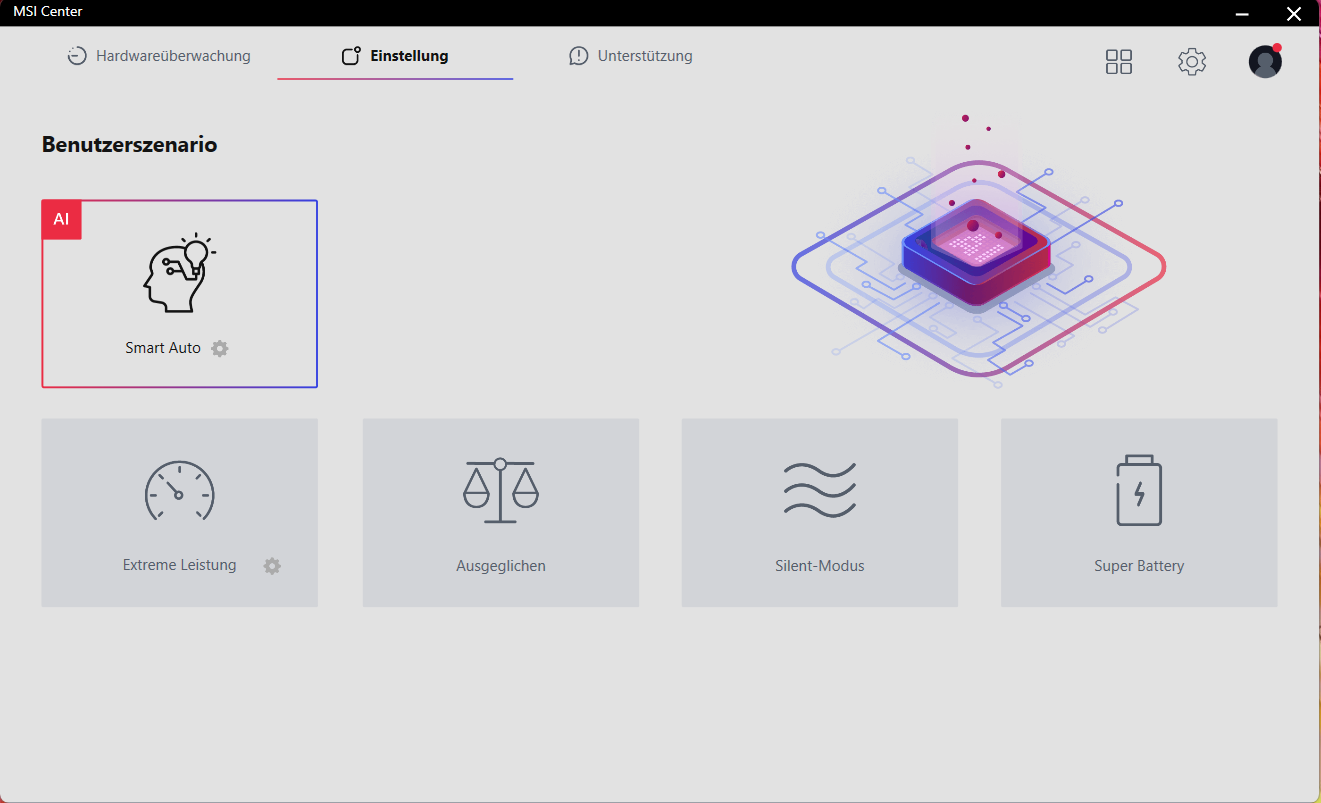
Condizioni di prova
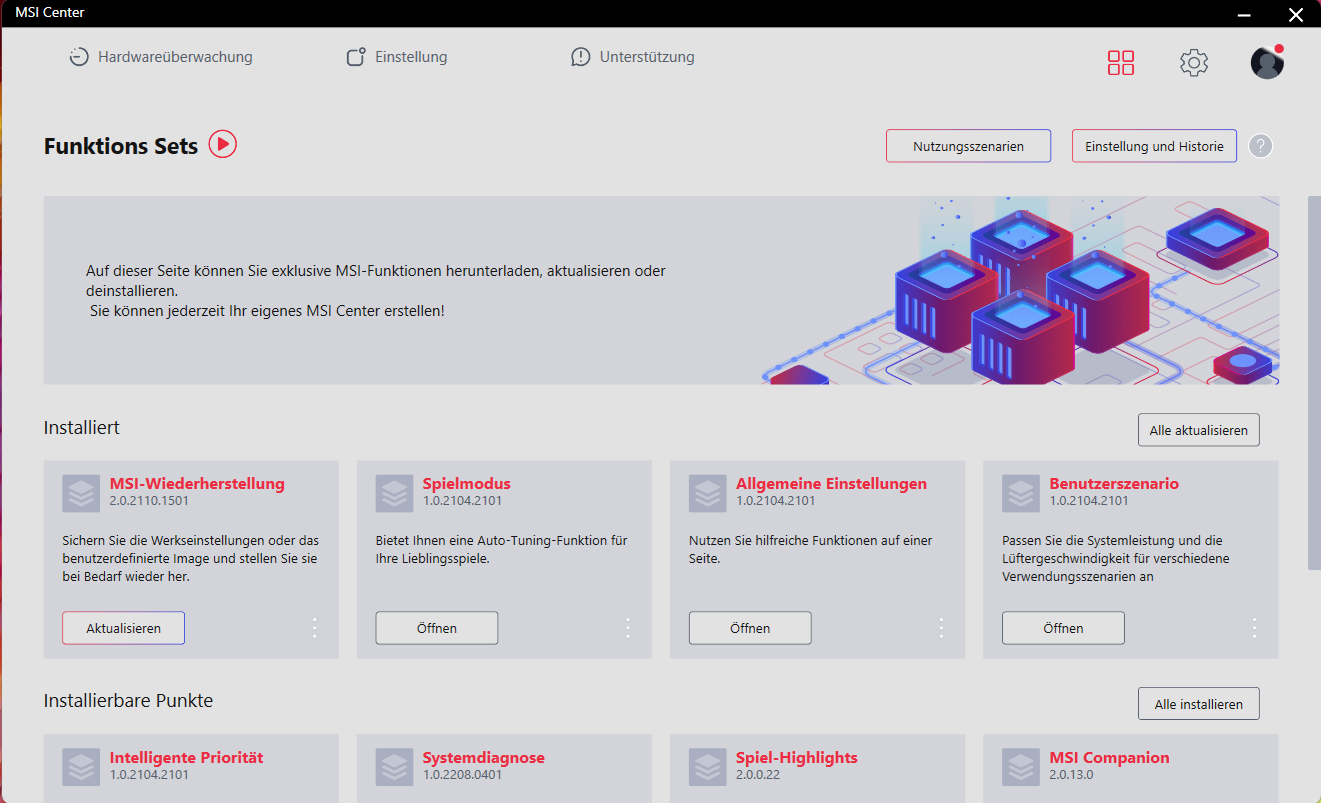
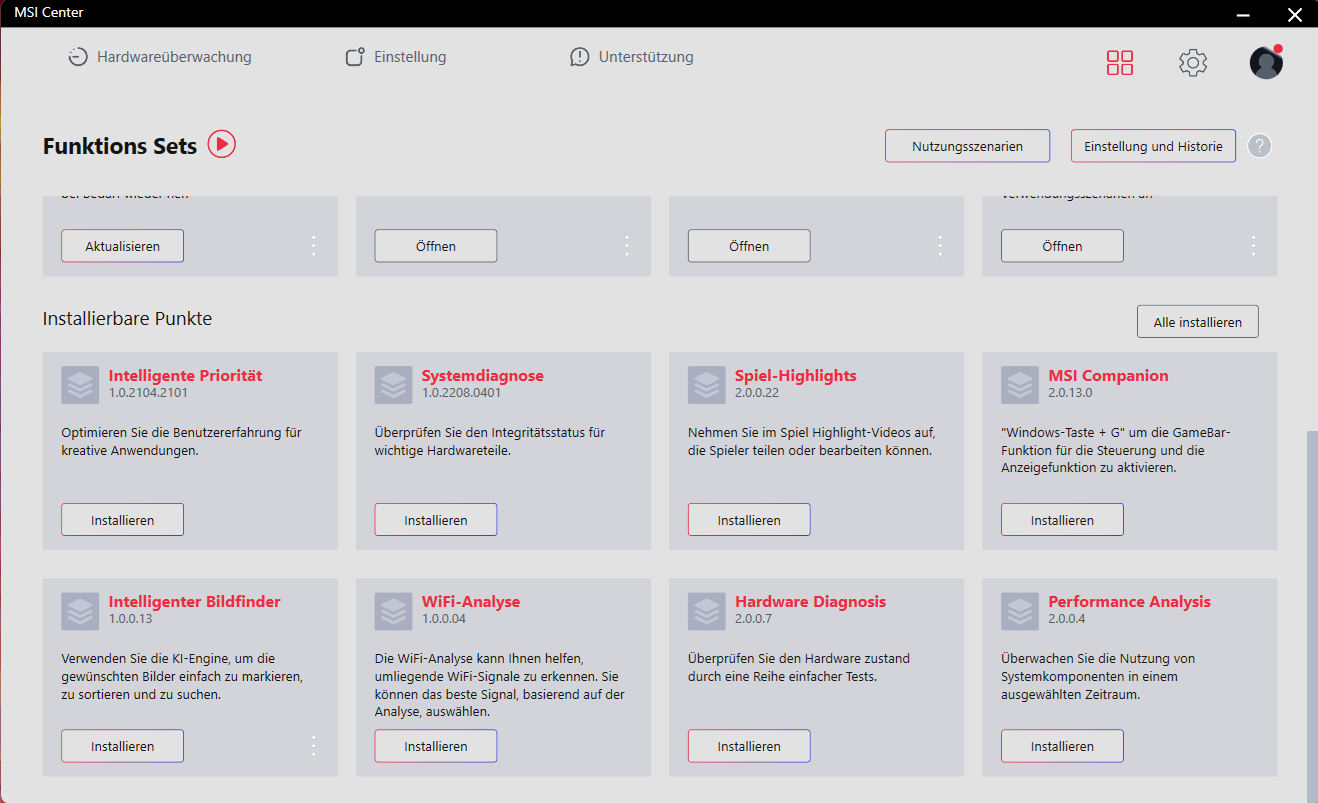
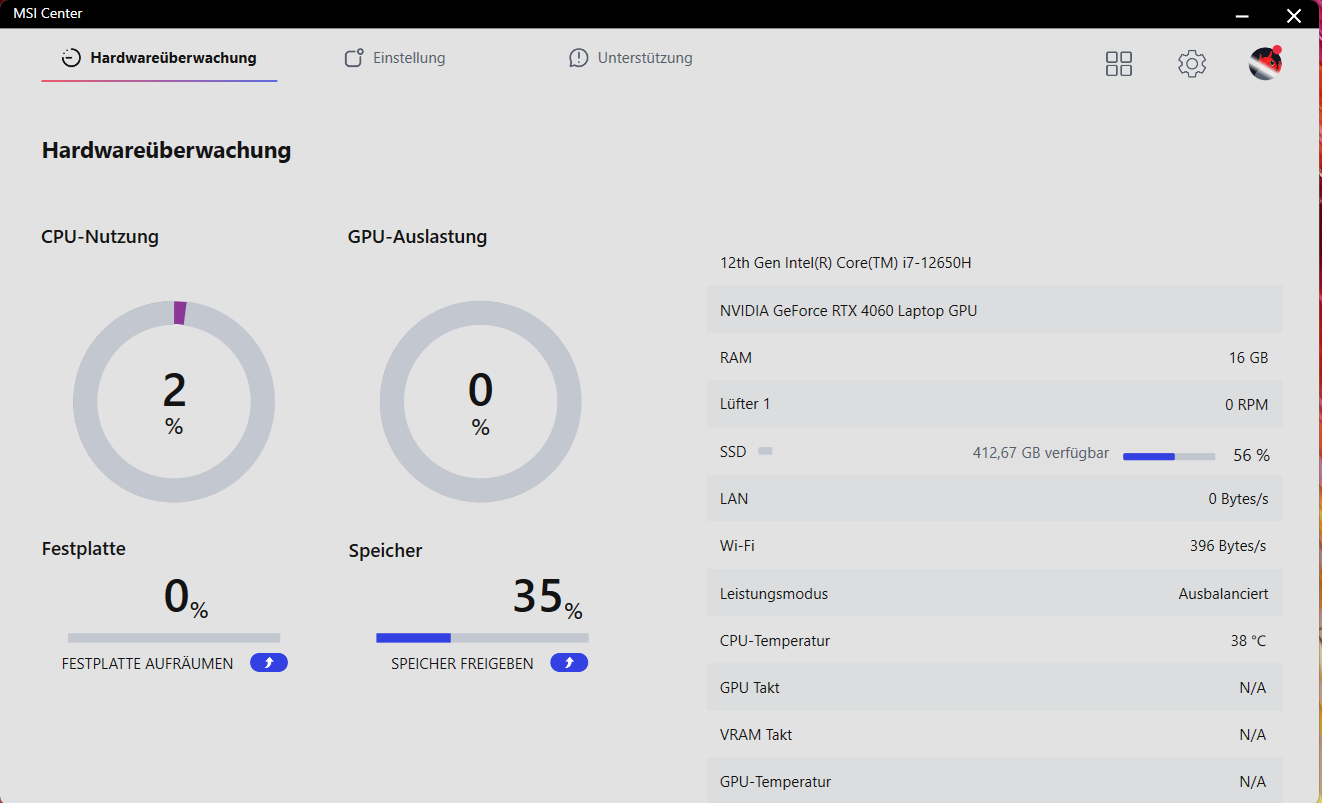
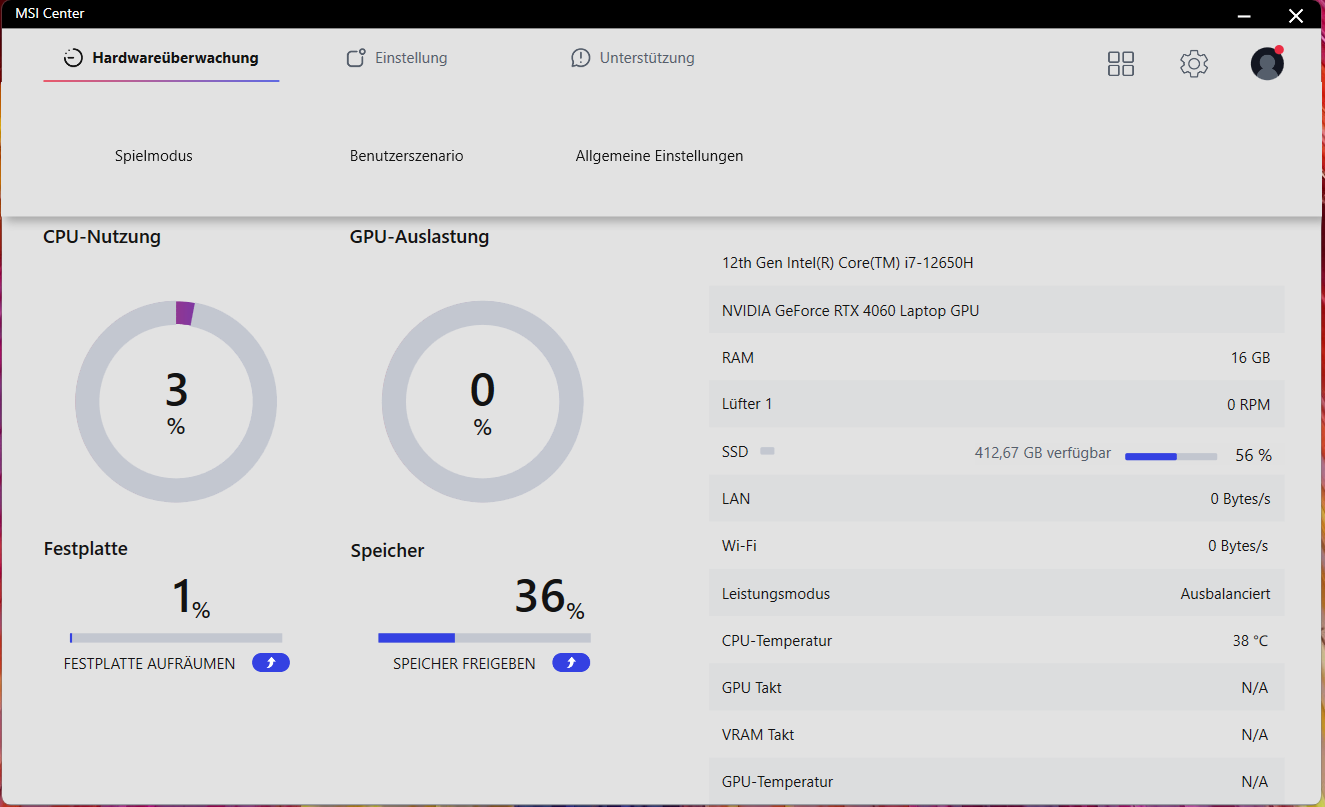
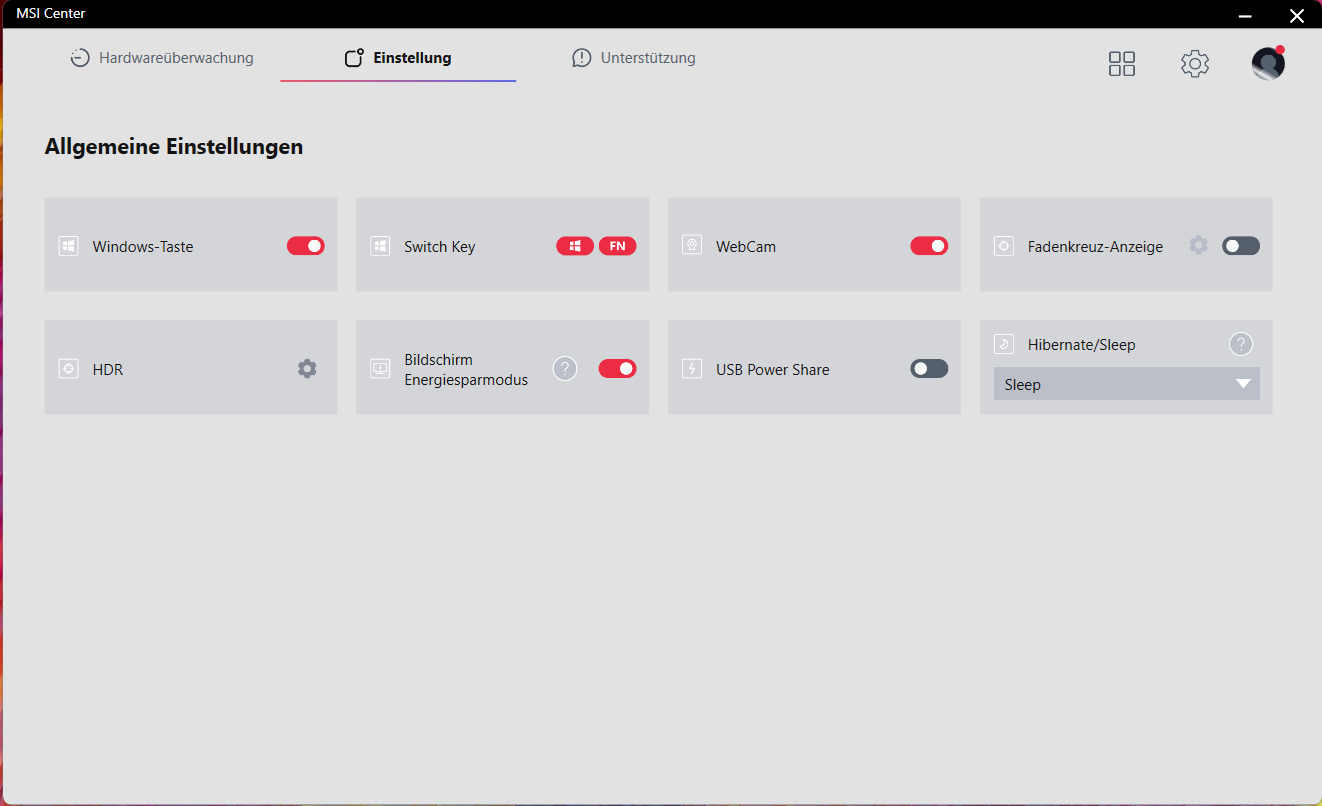
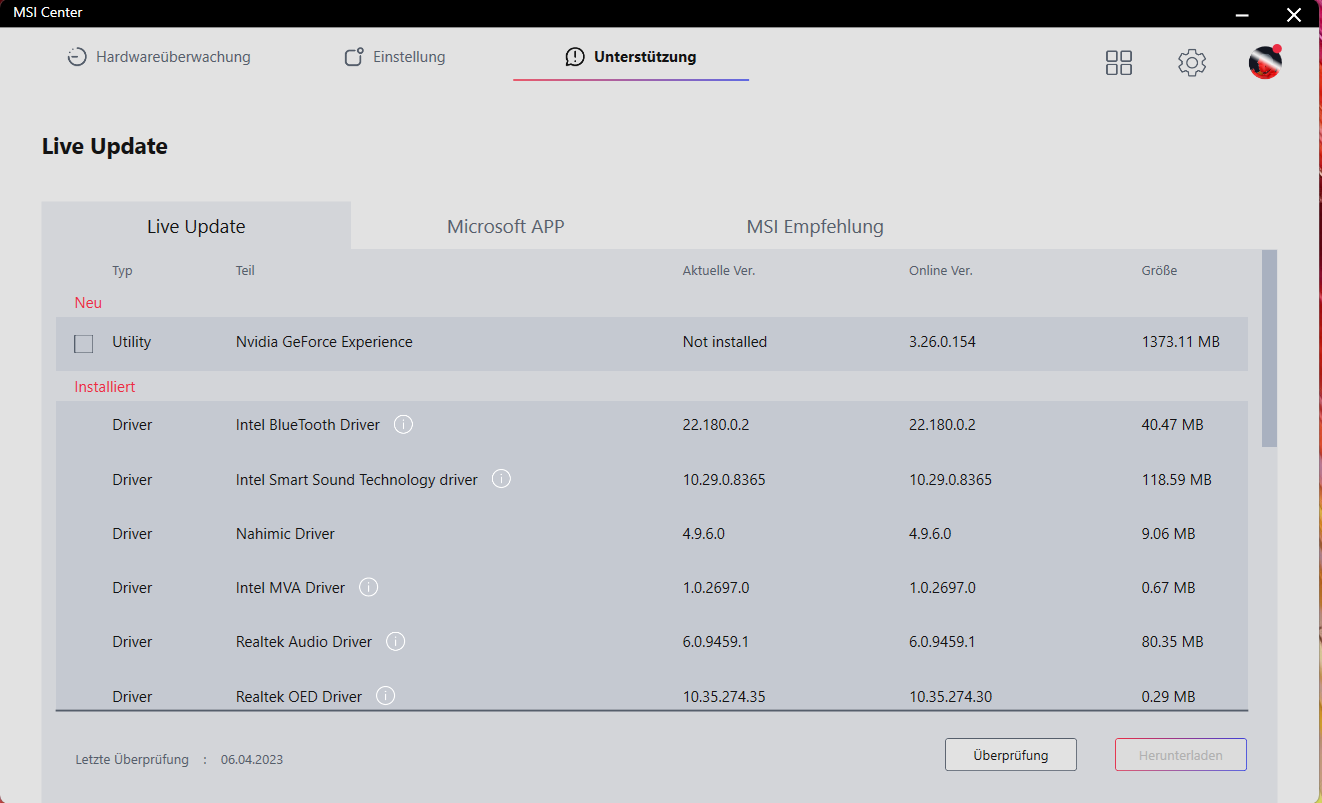
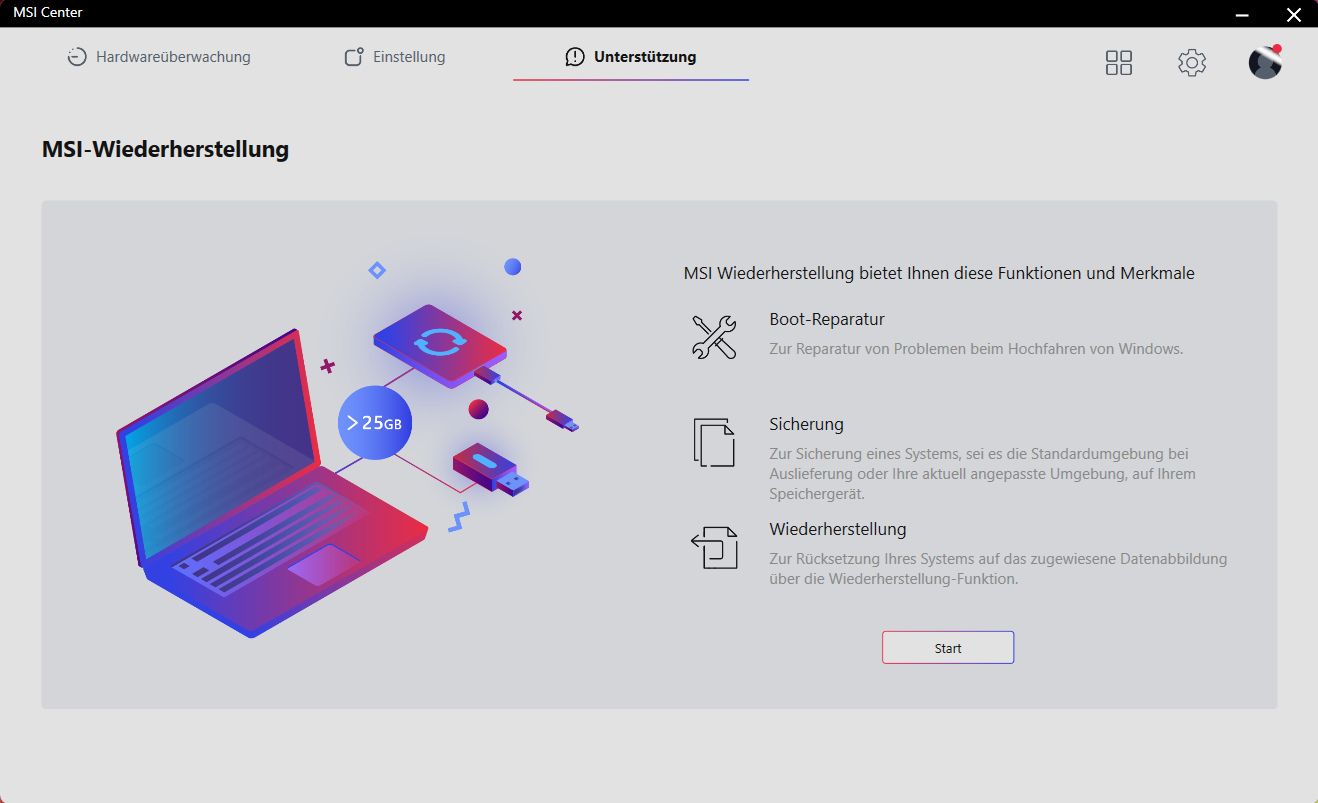
Il software MSI Center preinstallato (vedi immagini) o la combinazione di tasti "Fn" + "F7" consentono di passare da un profilo di prestazioni all'altro (vedi tabella sotto). Abbiamo utilizzato il profilo "Extreme Performance" per i benchmark e "Super Battery" per i test della batteria. In alternativa, è disponibile anche una funzione "Smart Auto" basata sull'intelligenza artificiale che seleziona automaticamente il profilo più adatto allo scenario di utilizzo corrente.
| Prestazioni estreme | Bilanciato | Modalità silenziosa | Super Batteria | |
|---|---|---|---|---|
| Limite di potenza 1 | 55 Watt | 45 Watt | 20 Watt | 15 Watt |
| Limite di potenza 2 | 78 Watt | 70 Watt | 20 Watt | 15 Watt |
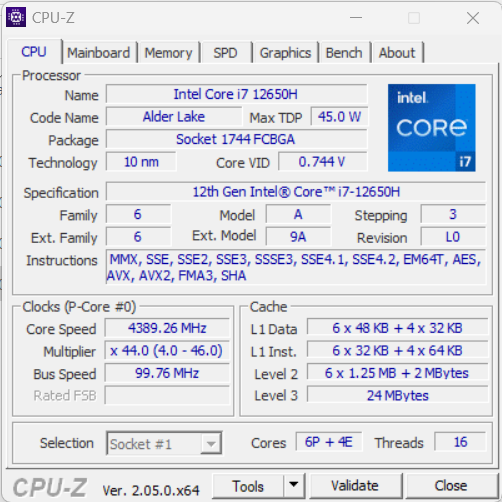
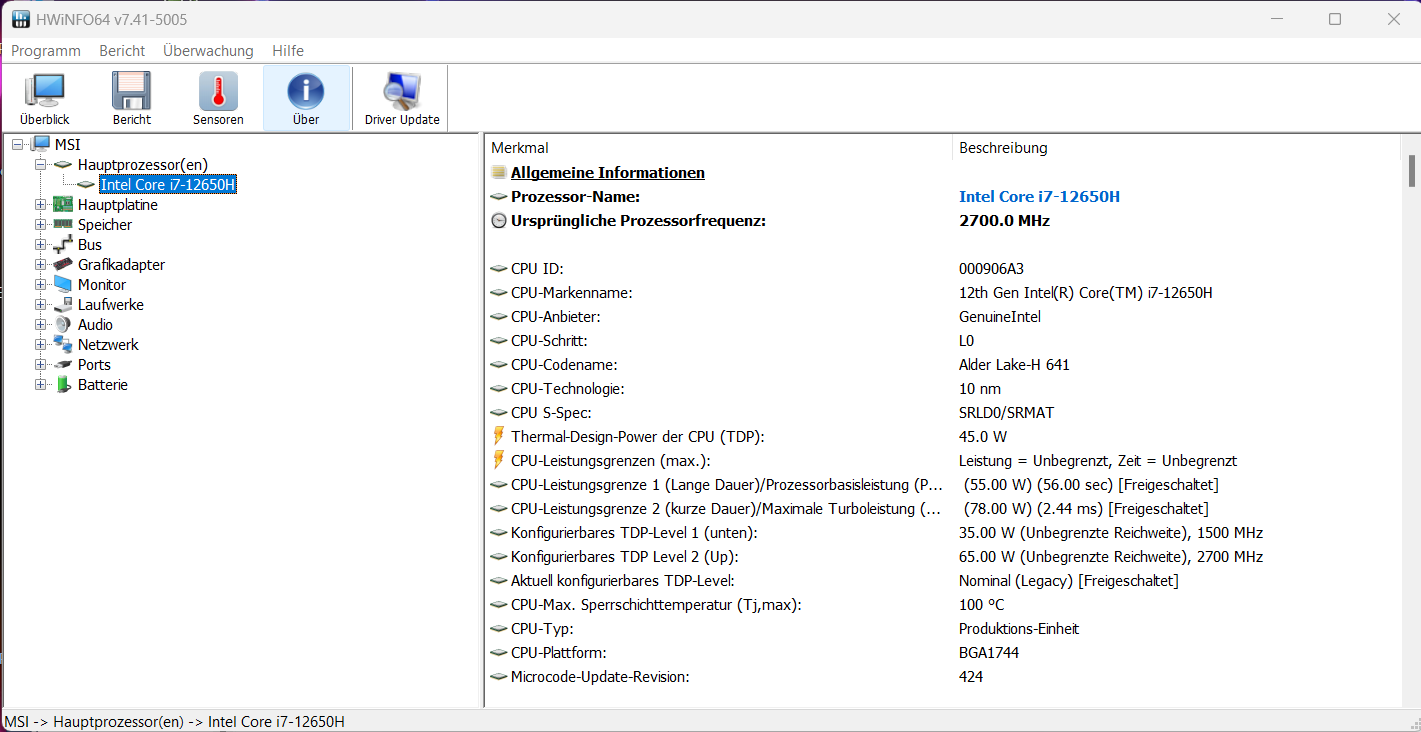
Processore
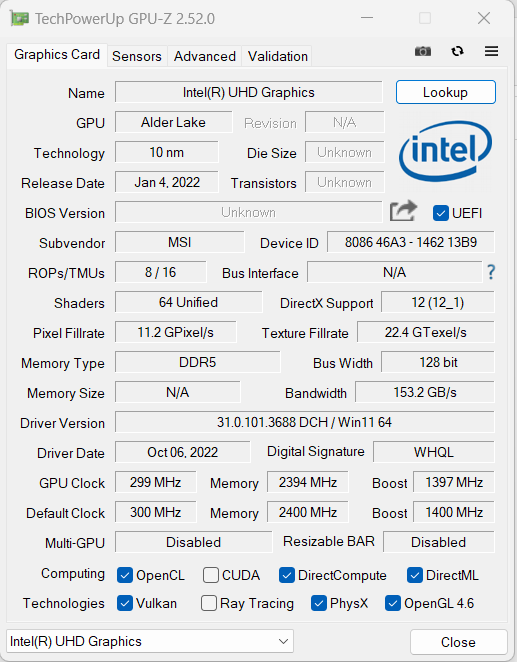
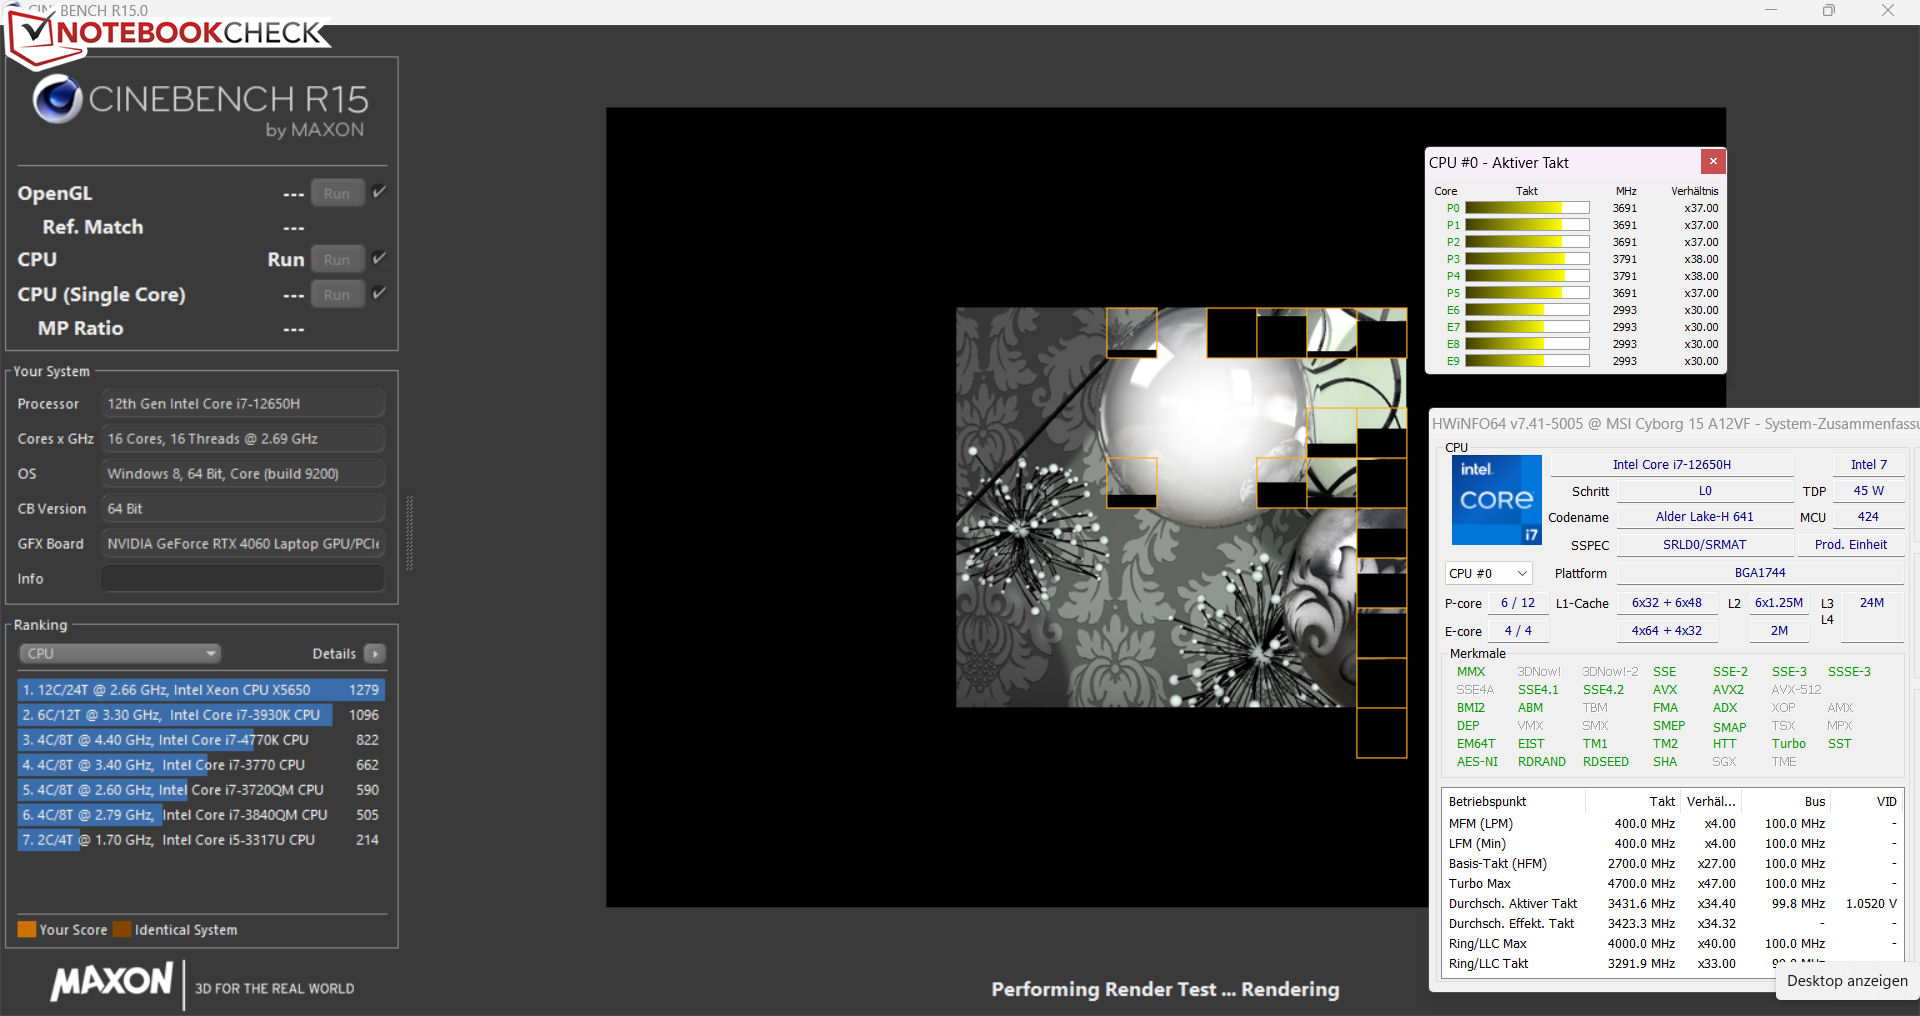
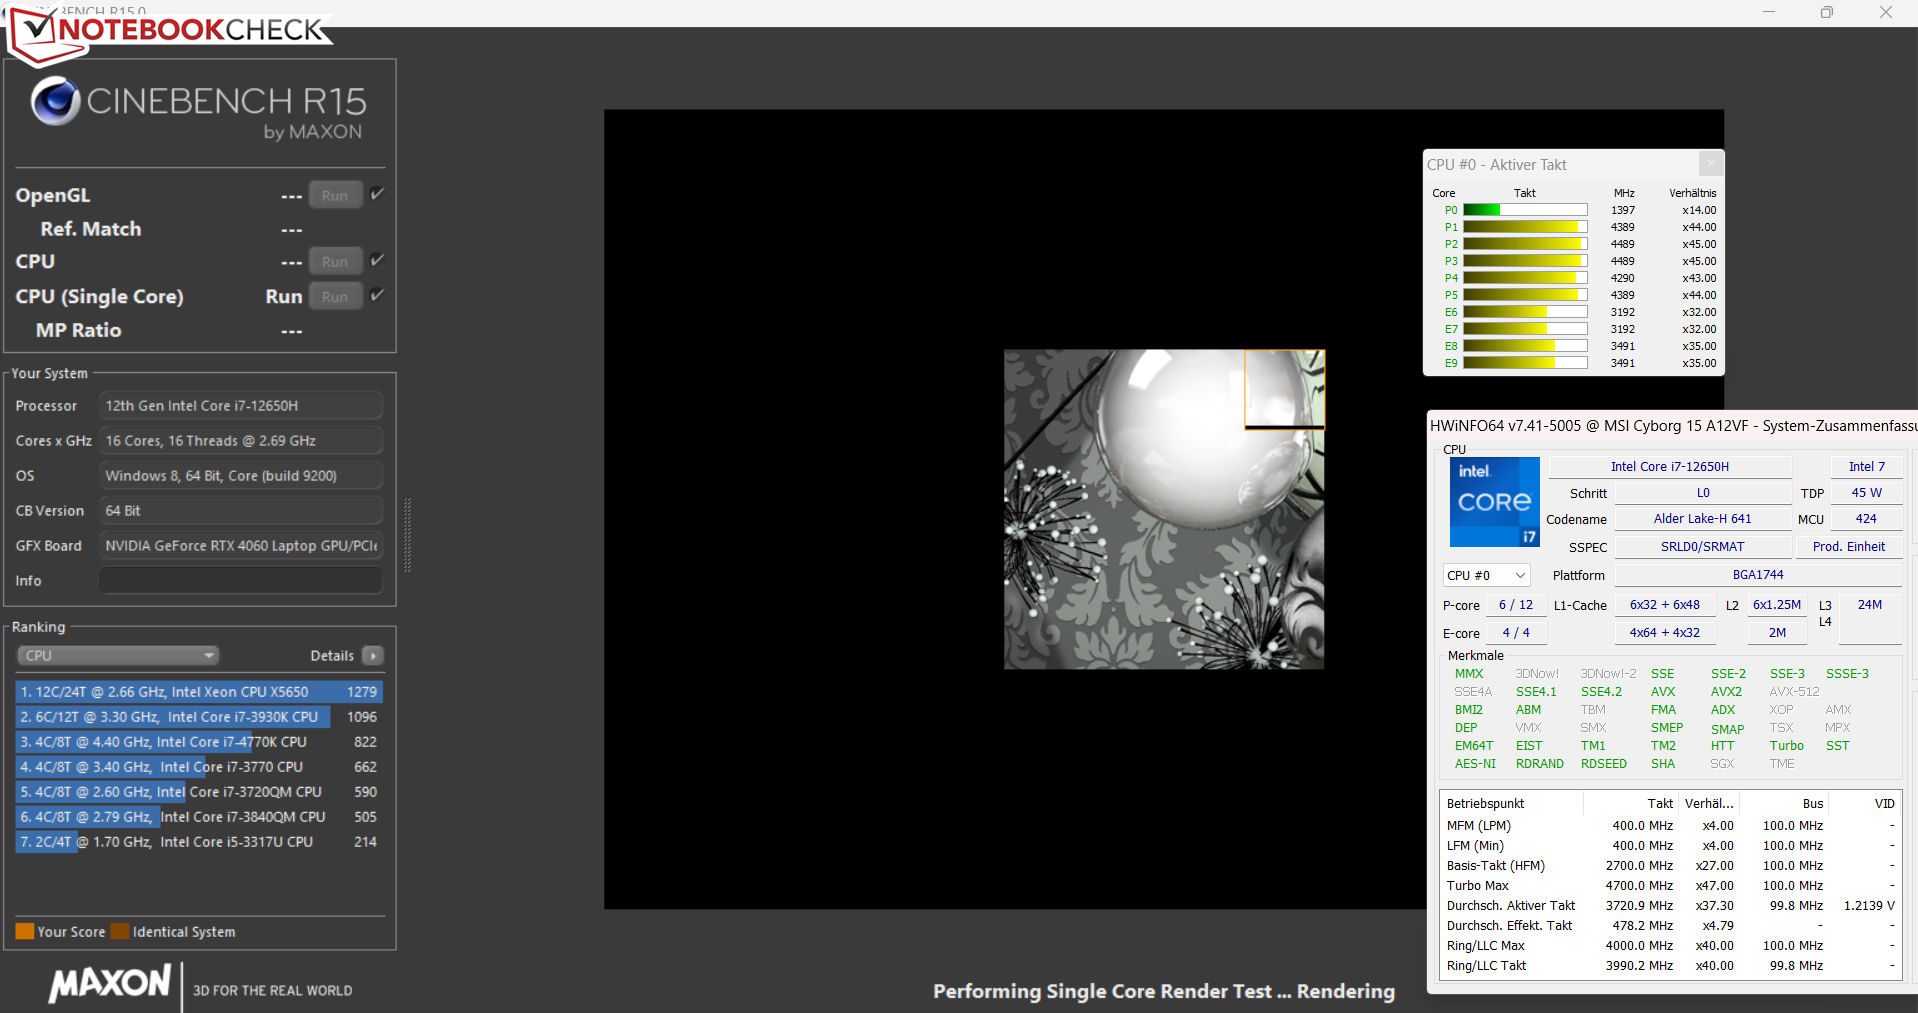
IlCore i7-12650Halder Lake è composto da sei core Performance (hyperthreading, da 2,3 a 4,7 GHz) e quattro core Efficiency (senza hyperthreading, da 1,7 a 3,5 GHz), per un totale di sedici core logici della CPU.
Nel funzionamento a rete, la CPU esegue i test del benchmark Cinebench R15 a velocità di clock medio-alte (multithread) e alte o massime (single-thread). Nel funzionamento a batteria, le prestazioni single-thread diminuiscono leggermente (205 punti), mentre quelle multithread diminuiscono in modo più significativo (994 punti). Nel complesso, i risultati del benchmark sono leggermente superiori alla media della CPU che abbiamo determinato finora.
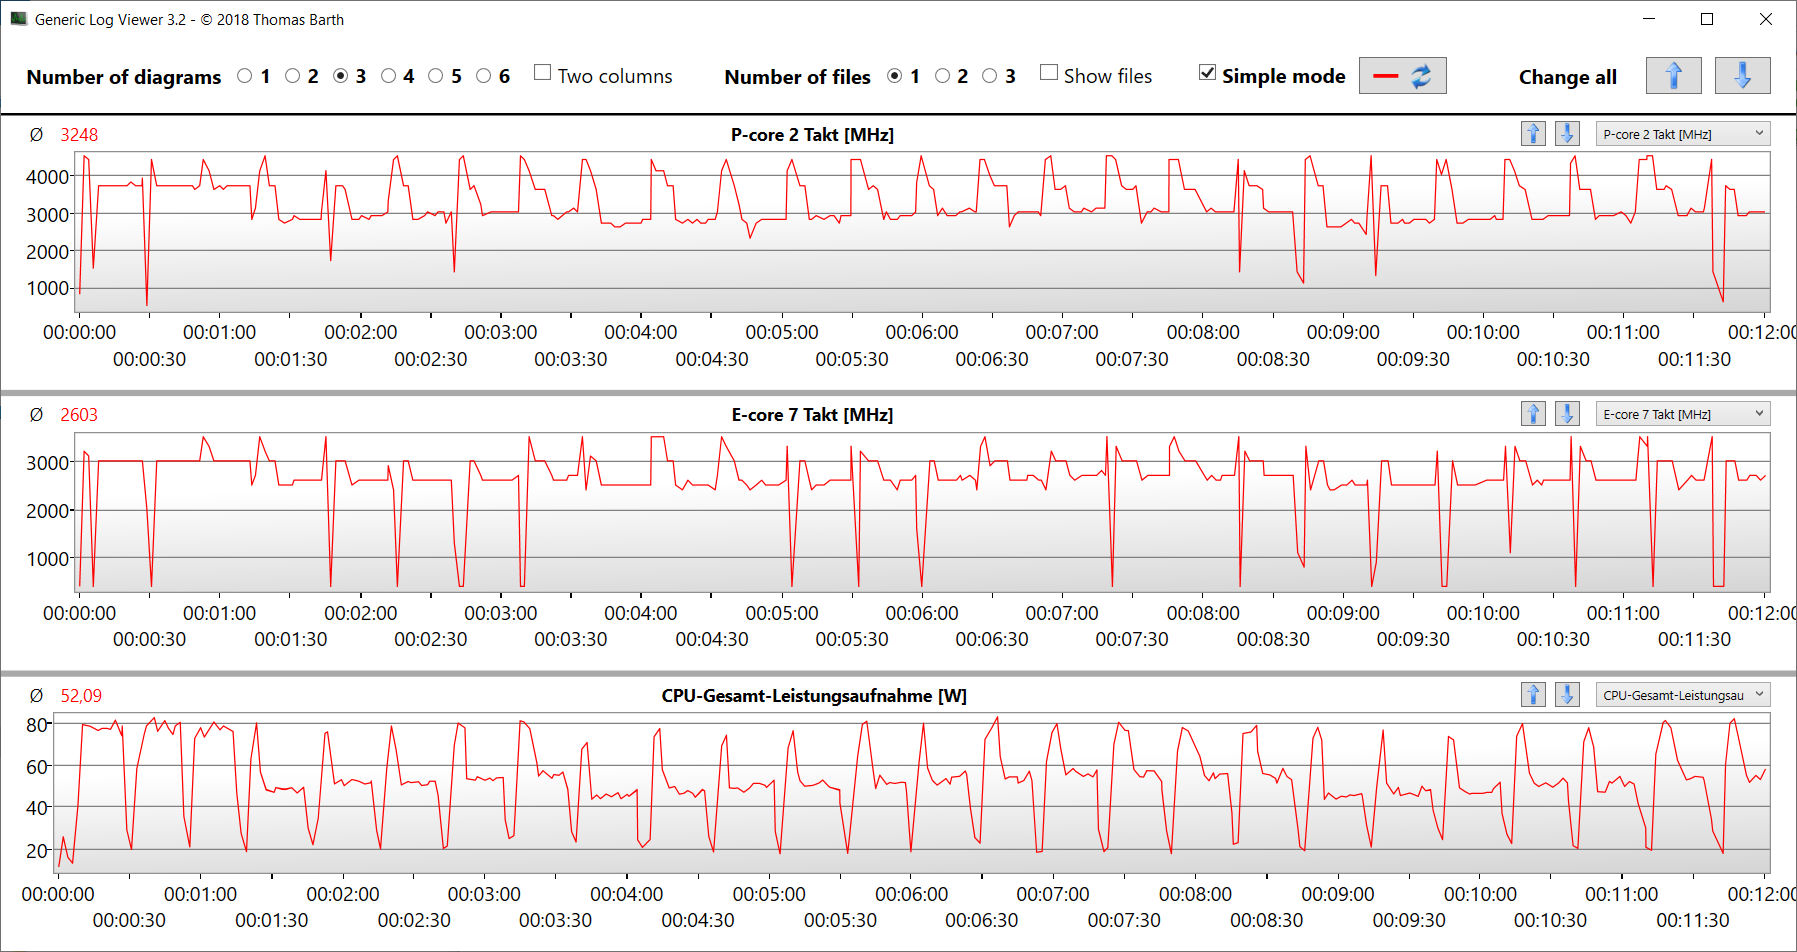
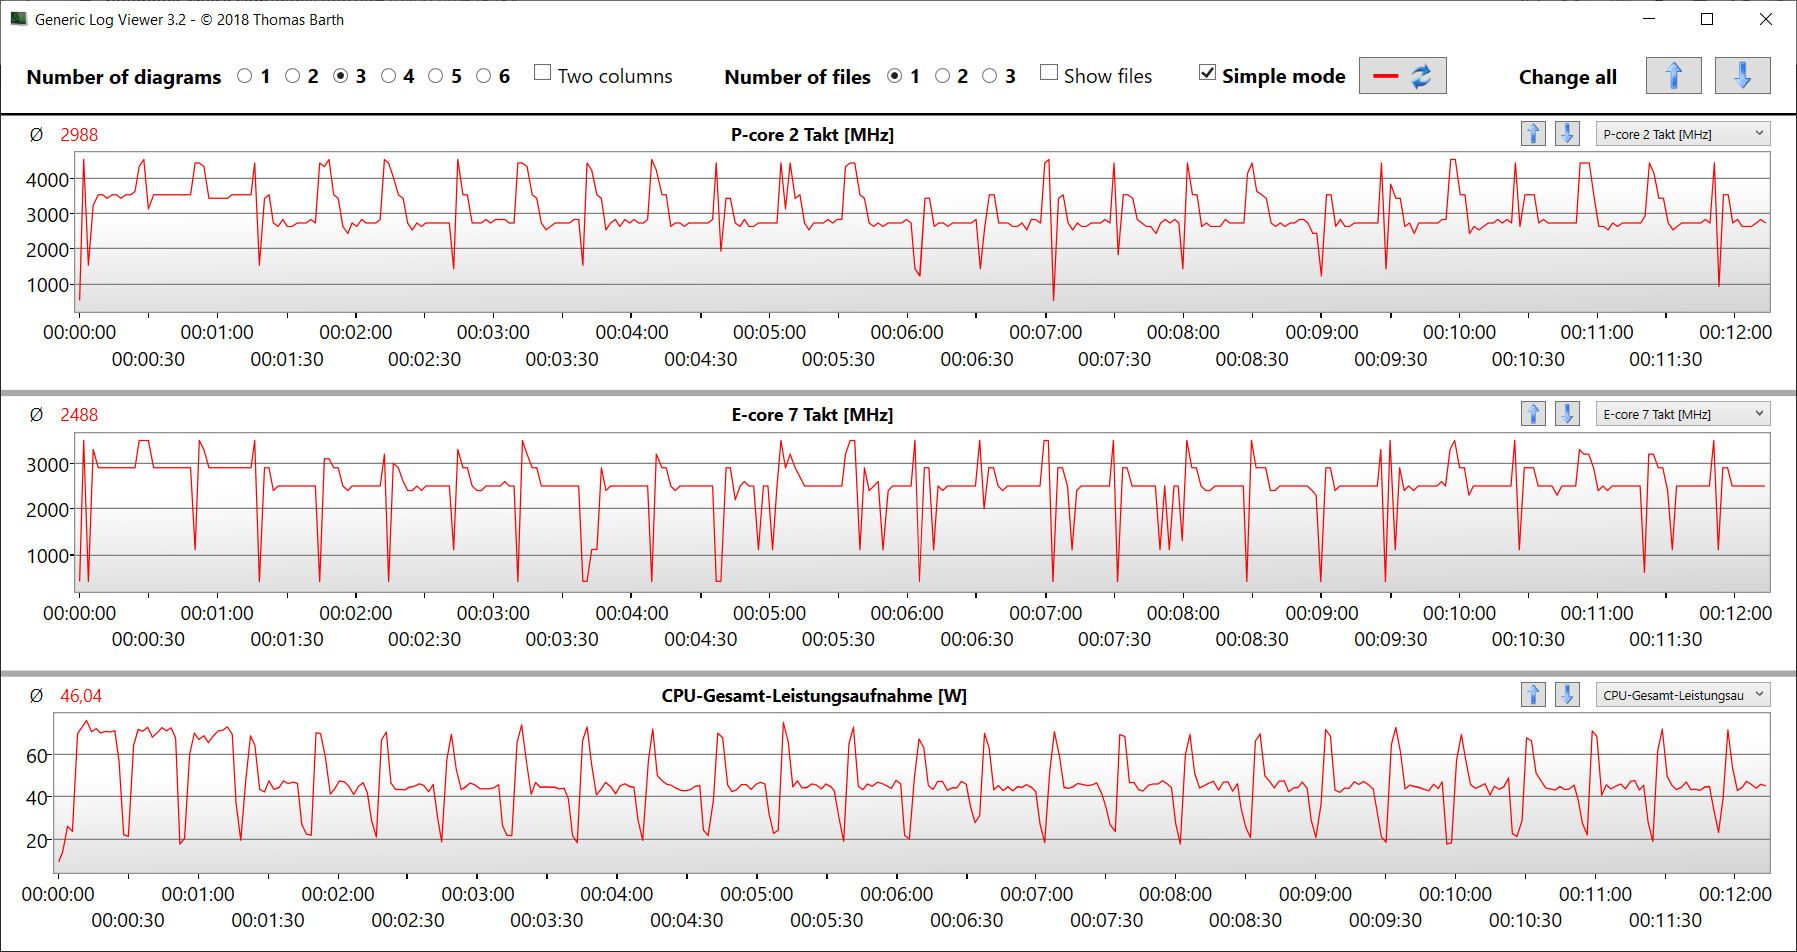
Il test del ciclo CB15 mostra che il carico costante del multithread causa un leggero calo della velocità Turbo dopo la seconda esecuzione e che il processore non è in grado di mantenere un livello costante.
Cinebench R15 Multi Constant Load Test

* ... Meglio usare valori piccoli
AIDA64: FP32 Ray-Trace | FPU Julia | CPU SHA3 | CPU Queen | FPU SinJulia | FPU Mandel | CPU AES | CPU ZLib | FP64 Ray-Trace | CPU PhotoWorxx
| Performance rating | |
| Media della classe Gaming | |
| Asus TUF Gaming A16 FA617 | |
| Aorus 15 XE5 | |
| Schenker XMG Fusion 15 (Mid 22) | |
| MSI Katana 15 B12VEK | |
| MSI Cyborg 15 A12VF | |
| HP Victus 15 fa0020nr | |
| Media Intel Core i7-12650H | |
| AIDA64 / FP32 Ray-Trace | |
| Media della classe Gaming (10227 - 85542, n=110, ultimi 2 anni) | |
| Asus TUF Gaming A16 FA617 | |
| MSI Katana 15 B12VEK | |
| Aorus 15 XE5 | |
| HP Victus 15 fa0020nr | |
| Schenker XMG Fusion 15 (Mid 22) | |
| MSI Cyborg 15 A12VF | |
| Media Intel Core i7-12650H (5422 - 15620, n=14) | |
| AIDA64 / FPU Julia | |
| Media della classe Gaming (51376 - 238426, n=110, ultimi 2 anni) | |
| Asus TUF Gaming A16 FA617 | |
| MSI Katana 15 B12VEK | |
| MSI Cyborg 15 A12VF | |
| Aorus 15 XE5 | |
| HP Victus 15 fa0020nr | |
| Schenker XMG Fusion 15 (Mid 22) | |
| Media Intel Core i7-12650H (26386 - 76434, n=14) | |
| AIDA64 / CPU SHA3 | |
| Media della classe Gaming (2180 - 9817, n=110, ultimi 2 anni) | |
| Schenker XMG Fusion 15 (Mid 22) | |
| Asus TUF Gaming A16 FA617 | |
| MSI Katana 15 B12VEK | |
| Aorus 15 XE5 | |
| MSI Cyborg 15 A12VF | |
| HP Victus 15 fa0020nr | |
| Media Intel Core i7-12650H (1479 - 3244, n=14) | |
| AIDA64 / CPU Queen | |
| Media della classe Gaming (49785 - 173351, n=101, ultimi 2 anni) | |
| Asus TUF Gaming A16 FA617 | |
| Aorus 15 XE5 | |
| HP Victus 15 fa0020nr | |
| MSI Katana 15 B12VEK | |
| Schenker XMG Fusion 15 (Mid 22) | |
| MSI Cyborg 15 A12VF | |
| Media Intel Core i7-12650H (59278 - 89537, n=14) | |
| AIDA64 / FPU SinJulia | |
| Media della classe Gaming (4424 - 33636, n=110, ultimi 2 anni) | |
| Asus TUF Gaming A16 FA617 | |
| Schenker XMG Fusion 15 (Mid 22) | |
| MSI Katana 15 B12VEK | |
| Aorus 15 XE5 | |
| MSI Cyborg 15 A12VF | |
| HP Victus 15 fa0020nr | |
| Media Intel Core i7-12650H (4690 - 8726, n=14) | |
| AIDA64 / FPU Mandel | |
| Media della classe Gaming (25115 - 128721, n=110, ultimi 2 anni) | |
| Asus TUF Gaming A16 FA617 | |
| MSI Katana 15 B12VEK | |
| Schenker XMG Fusion 15 (Mid 22) | |
| HP Victus 15 fa0020nr | |
| MSI Cyborg 15 A12VF | |
| Aorus 15 XE5 | |
| Media Intel Core i7-12650H (15001 - 37738, n=14) | |
| AIDA64 / CPU AES | |
| Schenker XMG Fusion 15 (Mid 22) | |
| Aorus 15 XE5 | |
| Media della classe Gaming (39258 - 247074, n=110, ultimi 2 anni) | |
| MSI Katana 15 B12VEK | |
| MSI Cyborg 15 A12VF | |
| Asus TUF Gaming A16 FA617 | |
| HP Victus 15 fa0020nr | |
| Media Intel Core i7-12650H (32702 - 92530, n=14) | |
| AIDA64 / CPU ZLib | |
| Media della classe Gaming (574 - 2531, n=110, ultimi 2 anni) | |
| MSI Cyborg 15 A12VF | |
| Asus TUF Gaming A16 FA617 | |
| MSI Katana 15 B12VEK | |
| Aorus 15 XE5 | |
| HP Victus 15 fa0020nr | |
| Media Intel Core i7-12650H (443 - 891, n=14) | |
| Schenker XMG Fusion 15 (Mid 22) | |
| AIDA64 / FP64 Ray-Trace | |
| Media della classe Gaming (5509 - 45446, n=110, ultimi 2 anni) | |
| Asus TUF Gaming A16 FA617 | |
| MSI Katana 15 B12VEK | |
| Schenker XMG Fusion 15 (Mid 22) | |
| Aorus 15 XE5 | |
| HP Victus 15 fa0020nr | |
| MSI Cyborg 15 A12VF | |
| Media Intel Core i7-12650H (3096 - 8448, n=14) | |
| AIDA64 / CPU PhotoWorxx | |
| Media della classe Gaming (12271 - 89891, n=110, ultimi 2 anni) | |
| MSI Katana 15 B12VEK | |
| MSI Cyborg 15 A12VF | |
| Aorus 15 XE5 | |
| Media Intel Core i7-12650H (22046 - 44164, n=14) | |
| Asus TUF Gaming A16 FA617 | |
| Schenker XMG Fusion 15 (Mid 22) | |
| HP Victus 15 fa0020nr | |
Prestazioni del sistema
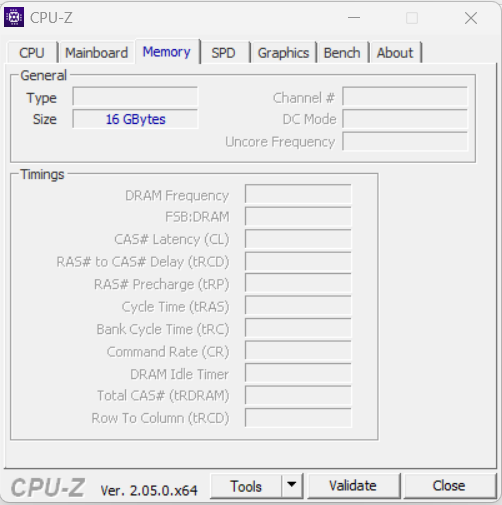
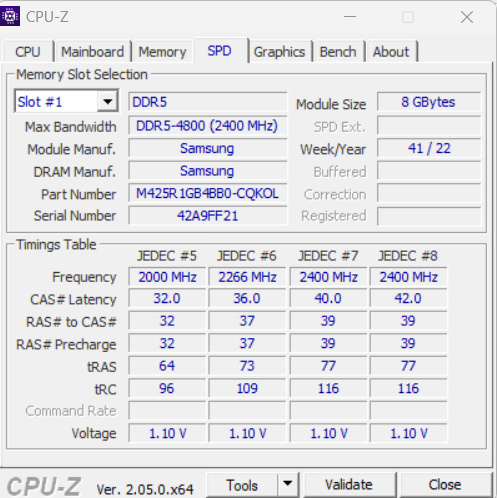
Non ci si può aspettare prestazioni estreme da questo sistema fluido, poiché si concentra maggiormente su altri aspetti come le dimensioni compatte, la mobilità e il basso consumo energetico. Tuttavia, l'hardware utilizzato è in grado di gestire aree applicative impegnative come il rendering, l'elaborazione video e i giochi. Le velocità di trasferimento della memoria di lavoro sono a un livello normale per una RAM DDR5-4800. Sono accompagnate da buoni risultati PC-Mark.
CrossMark: Overall | Productivity | Creativity | Responsiveness
| PCMark 10 / Score | |
| Media della classe Gaming (5828 - 11574, n=96, ultimi 2 anni) | |
| Aorus 15 XE5 | |
| Asus TUF Gaming A16 FA617 | |
| MSI Cyborg 15 A12VF | |
| Media Intel Core i7-12650H, NVIDIA GeForce RTX 4060 Laptop GPU (n=1) | |
| HP Victus 15 fa0020nr | |
| MSI Katana 15 B12VEK | |
| Schenker XMG Fusion 15 (Mid 22) | |
| PCMark 10 / Essentials | |
| Aorus 15 XE5 | |
| MSI Cyborg 15 A12VF | |
| Media Intel Core i7-12650H, NVIDIA GeForce RTX 4060 Laptop GPU (n=1) | |
| Media della classe Gaming (8810 - 12600, n=100, ultimi 2 anni) | |
| Asus TUF Gaming A16 FA617 | |
| HP Victus 15 fa0020nr | |
| MSI Katana 15 B12VEK | |
| Schenker XMG Fusion 15 (Mid 22) | |
| PCMark 10 / Productivity | |
| Media della classe Gaming (6845 - 18766, n=98, ultimi 2 anni) | |
| Aorus 15 XE5 | |
| MSI Cyborg 15 A12VF | |
| Media Intel Core i7-12650H, NVIDIA GeForce RTX 4060 Laptop GPU (n=1) | |
| MSI Katana 15 B12VEK | |
| Asus TUF Gaming A16 FA617 | |
| HP Victus 15 fa0020nr | |
| Schenker XMG Fusion 15 (Mid 22) | |
| PCMark 10 / Digital Content Creation | |
| Media della classe Gaming (7602 - 19657, n=98, ultimi 2 anni) | |
| Aorus 15 XE5 | |
| Asus TUF Gaming A16 FA617 | |
| HP Victus 15 fa0020nr | |
| MSI Cyborg 15 A12VF | |
| Media Intel Core i7-12650H, NVIDIA GeForce RTX 4060 Laptop GPU (n=1) | |
| MSI Katana 15 B12VEK | |
| Schenker XMG Fusion 15 (Mid 22) | |
| CrossMark / Overall | |
| Media della classe Gaming (1366 - 2409, n=98, ultimi 2 anni) | |
| Aorus 15 XE5 | |
| MSI Cyborg 15 A12VF | |
| Media Intel Core i7-12650H, NVIDIA GeForce RTX 4060 Laptop GPU (n=1) | |
| MSI Katana 15 B12VEK | |
| Schenker XMG Fusion 15 (Mid 22) | |
| HP Victus 15 fa0020nr | |
| CrossMark / Productivity | |
| Aorus 15 XE5 | |
| Media della classe Gaming (1386 - 2254, n=98, ultimi 2 anni) | |
| MSI Cyborg 15 A12VF | |
| Media Intel Core i7-12650H, NVIDIA GeForce RTX 4060 Laptop GPU (n=1) | |
| MSI Katana 15 B12VEK | |
| Schenker XMG Fusion 15 (Mid 22) | |
| HP Victus 15 fa0020nr | |
| CrossMark / Creativity | |
| Media della classe Gaming (1343 - 2729, n=98, ultimi 2 anni) | |
| Aorus 15 XE5 | |
| MSI Cyborg 15 A12VF | |
| Media Intel Core i7-12650H, NVIDIA GeForce RTX 4060 Laptop GPU (n=1) | |
| MSI Katana 15 B12VEK | |
| HP Victus 15 fa0020nr | |
| Schenker XMG Fusion 15 (Mid 22) | |
| CrossMark / Responsiveness | |
| Aorus 15 XE5 | |
| Media della classe Gaming (1226 - 2334, n=98, ultimi 2 anni) | |
| MSI Cyborg 15 A12VF | |
| Media Intel Core i7-12650H, NVIDIA GeForce RTX 4060 Laptop GPU (n=1) | |
| Schenker XMG Fusion 15 (Mid 22) | |
| MSI Katana 15 B12VEK | |
| HP Victus 15 fa0020nr | |
| PCMark 8 Home Score Accelerated v2 | 5364 punti | |
| PCMark 8 Work Score Accelerated v2 | 6432 punti | |
| PCMark 10 Score | 7098 punti | |
Aiuto | ||
| AIDA64 / Memory Copy | |
| Media della classe Gaming (21750 - 129946, n=110, ultimi 2 anni) | |
| MSI Cyborg 15 A12VF | |
| MSI Katana 15 B12VEK | |
| Media Intel Core i7-12650H (43261 - 69735, n=14) | |
| Aorus 15 XE5 | |
| Asus TUF Gaming A16 FA617 | |
| Schenker XMG Fusion 15 (Mid 22) | |
| HP Victus 15 fa0020nr | |
| AIDA64 / Memory Read | |
| Media della classe Gaming (22956 - 118858, n=110, ultimi 2 anni) | |
| MSI Katana 15 B12VEK | |
| MSI Cyborg 15 A12VF | |
| Aorus 15 XE5 | |
| Media Intel Core i7-12650H (47313 - 67412, n=14) | |
| Asus TUF Gaming A16 FA617 | |
| Schenker XMG Fusion 15 (Mid 22) | |
| HP Victus 15 fa0020nr | |
| AIDA64 / Memory Write | |
| Media della classe Gaming (22297 - 135096, n=110, ultimi 2 anni) | |
| Aorus 15 XE5 | |
| MSI Katana 15 B12VEK | |
| MSI Cyborg 15 A12VF | |
| Asus TUF Gaming A16 FA617 | |
| Media Intel Core i7-12650H (45617 - 59361, n=14) | |
| Schenker XMG Fusion 15 (Mid 22) | |
| HP Victus 15 fa0020nr | |
| AIDA64 / Memory Latency | |
| Media della classe Gaming (75.3 - 259, n=110, ultimi 2 anni) | |
| Aorus 15 XE5 | |
| MSI Katana 15 B12VEK | |
| Schenker XMG Fusion 15 (Mid 22) | |
| MSI Cyborg 15 A12VF | |
| Asus TUF Gaming A16 FA617 | |
| Media Intel Core i7-12650H (71.6 - 103.9, n=14) | |
| HP Victus 15 fa0020nr | |
* ... Meglio usare valori piccoli
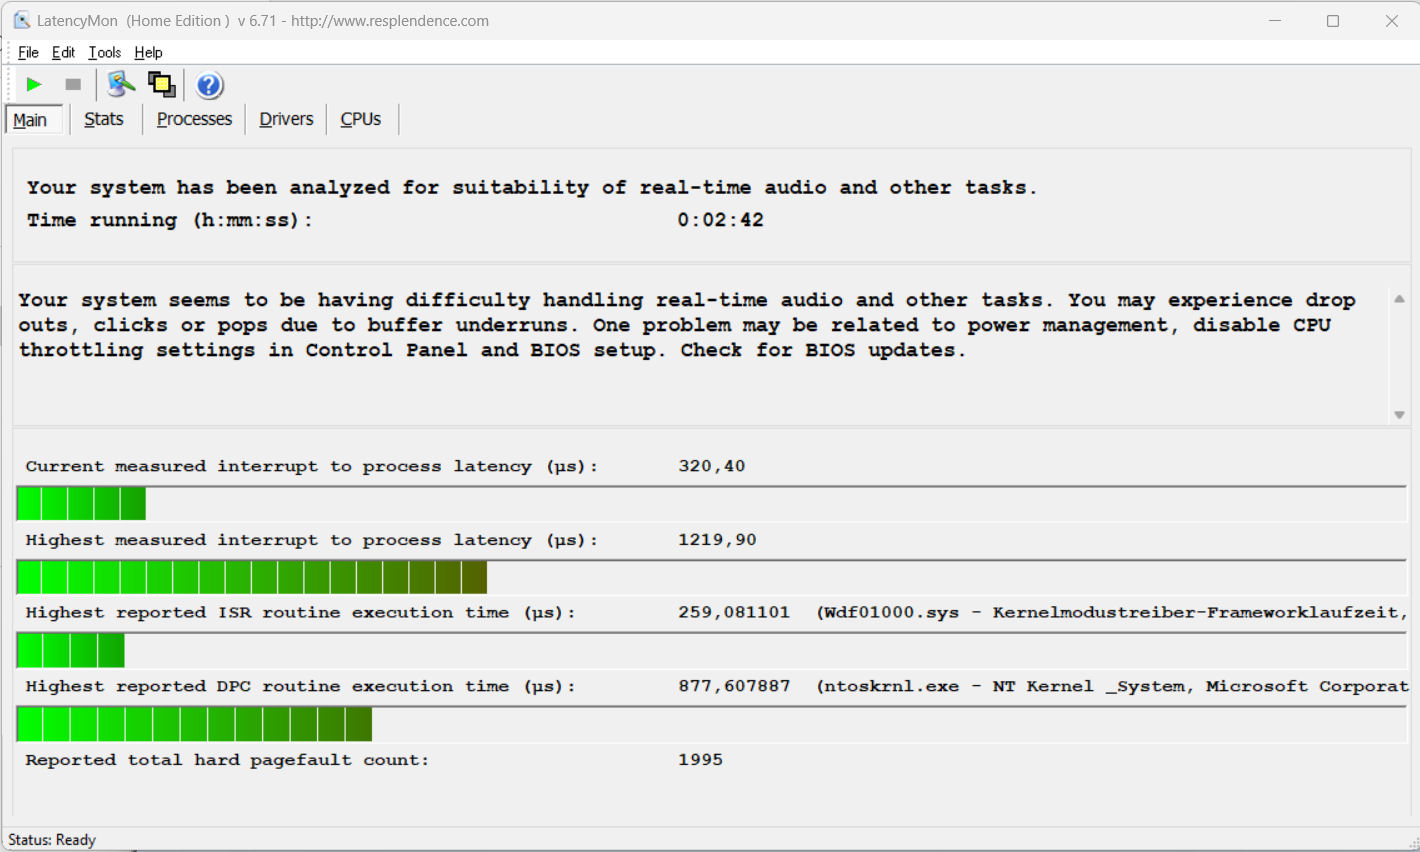
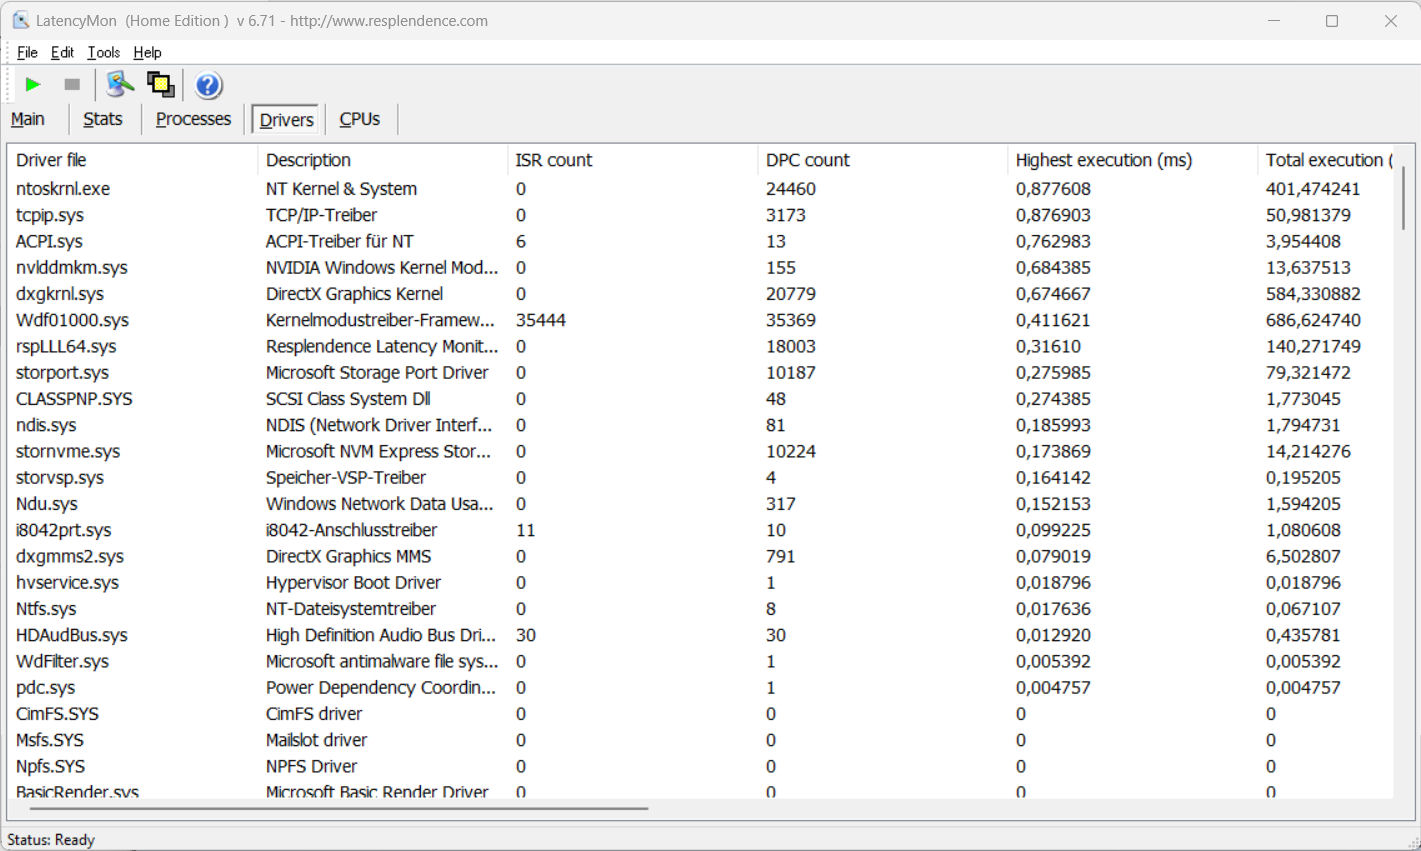
Latenze DPC
Il test standardizzato Latency Monitor (navigazione web, riproduzione video 4k, Prime95 ad alto carico) rivela alcune latenze evidenti e il sistema non sembra adatto all'elaborazione video e audio in tempo reale. I futuri aggiornamenti del software potrebbero portare a qualche miglioramento o addirittura peggiorare la situazione.
| DPC Latencies / LatencyMon - interrupt to process latency (max), Web, Youtube, Prime95 | |
| MSI Katana 15 B12VEK | |
| Schenker XMG Fusion 15 (Mid 22) | |
| HP Victus 15 fa0020nr | |
| MSI Cyborg 15 A12VF | |
| Aorus 15 XE5 | |
| Asus TUF Gaming A16 FA617 | |
* ... Meglio usare valori piccoli
Soluzione di stoccaggio
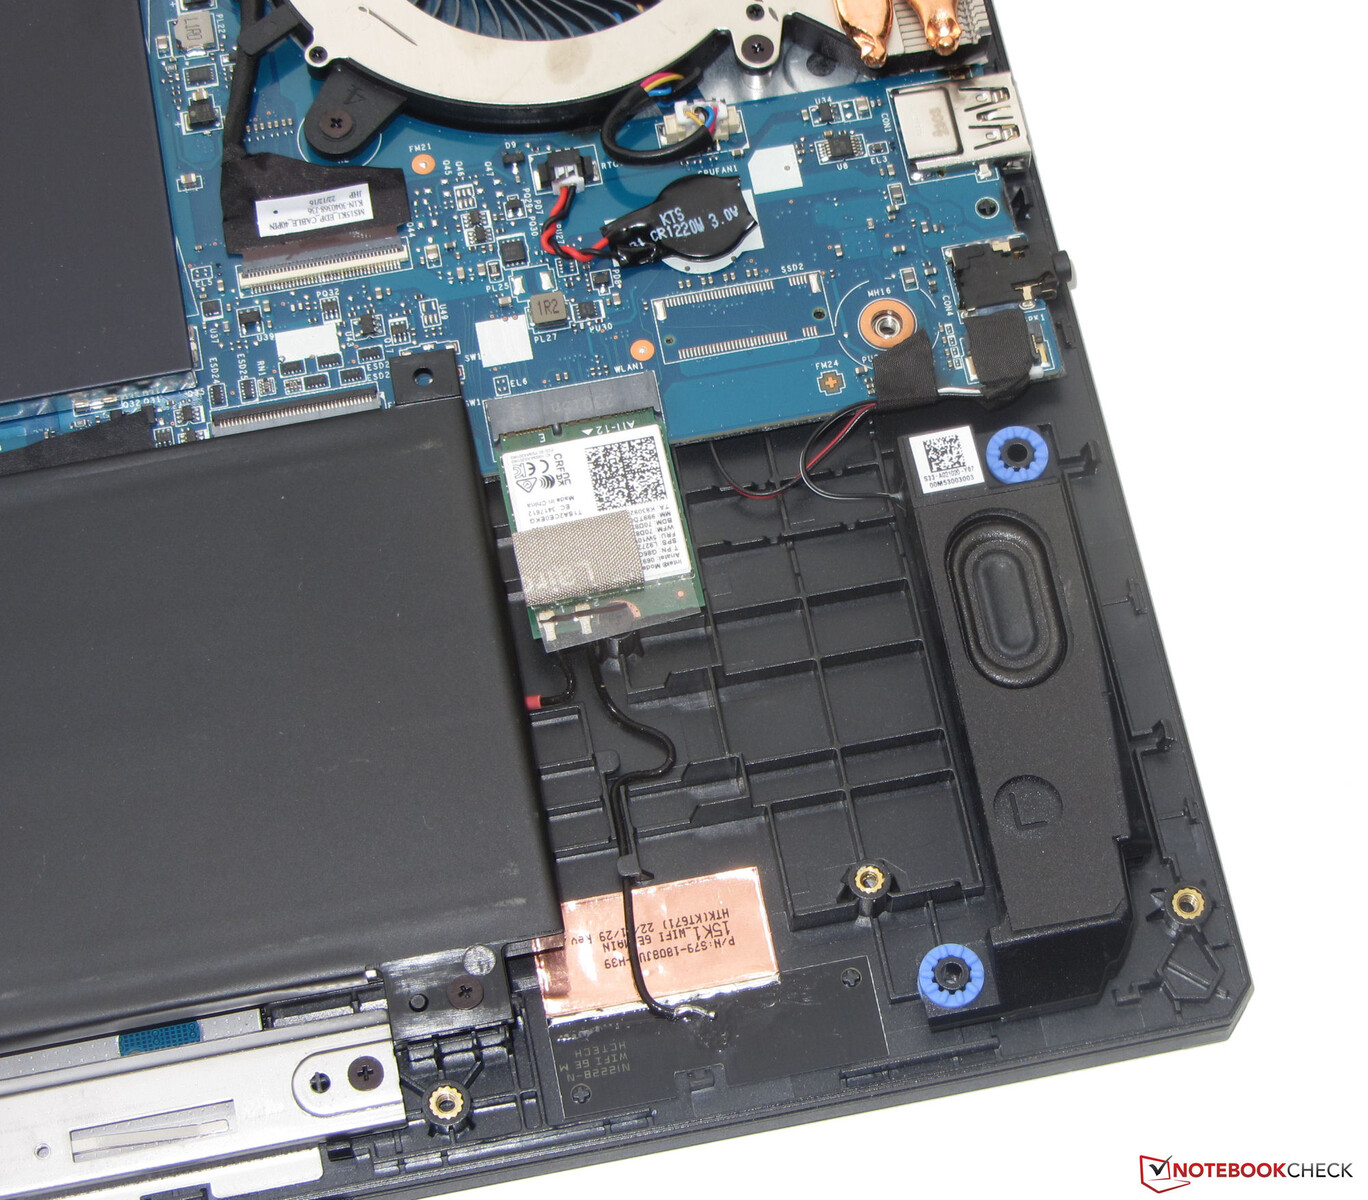
MSI ha equipaggiato il Cyborg con un SSD PCIe 4 (M.2-2280) di Samsung che offre una capacità di archiviazione di 1 TB. Anche se offre buone velocità di trasferimento, non è uno dei modelli di punta tra le unità SSD.
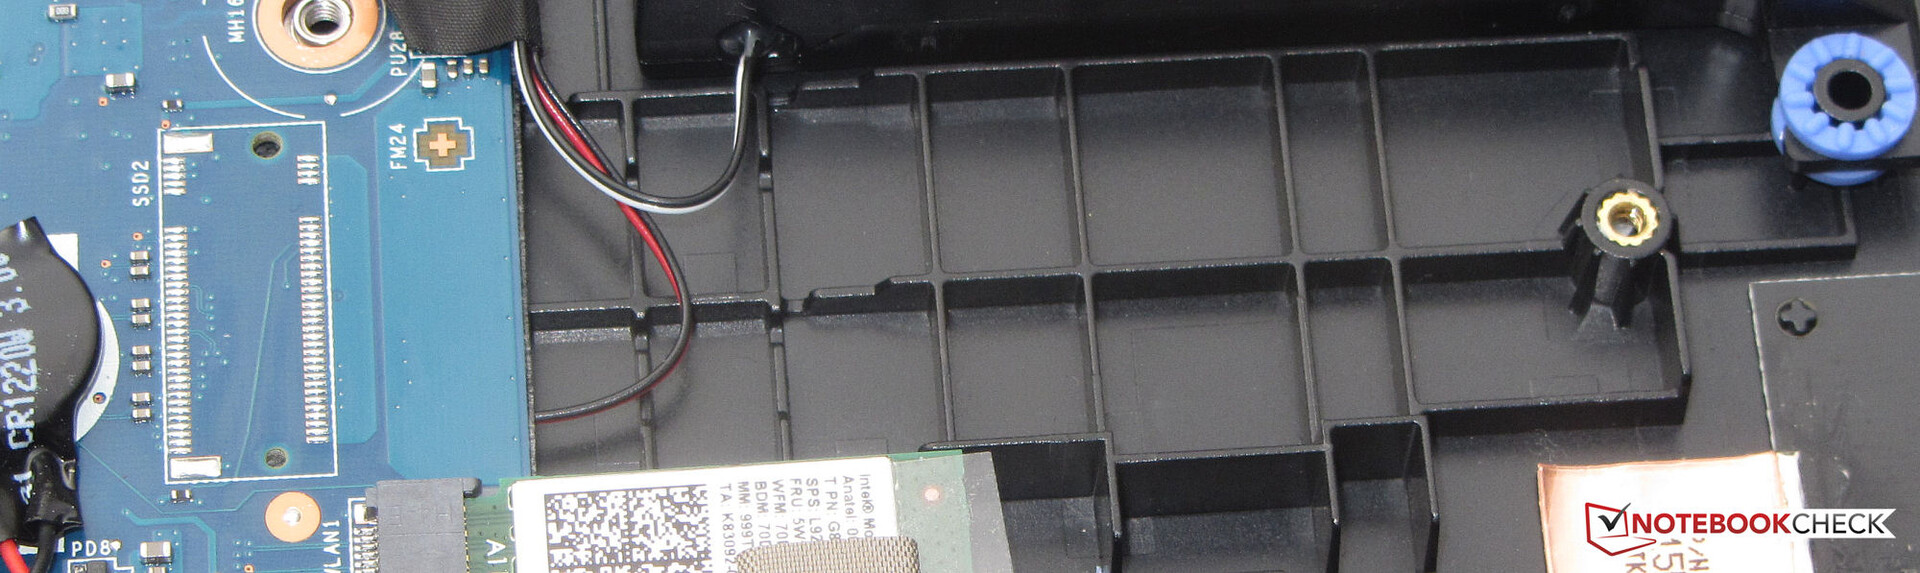
Sebbene ci sia spazio per un secondo SSD nel portatile, MSI risparmia lo slot necessario per collegarlo. Questa decisione è difficile da giustificare in un portatile di questa classe di prezzo. L'opzione di aggiungere un secondo modulo di archiviazione è diventata ormai uno standard, soprattutto per un portatile da gioco.

* ... Meglio usare valori piccoli
Disk Throttling: DiskSpd Read Loop, Queue Depth 8
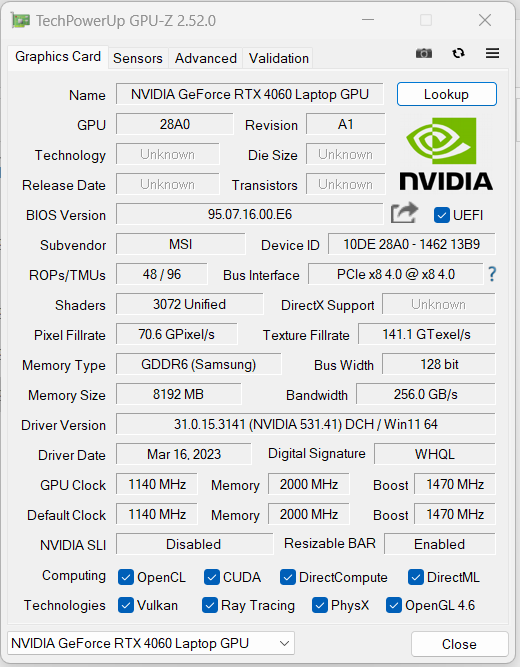
Scheda grafica
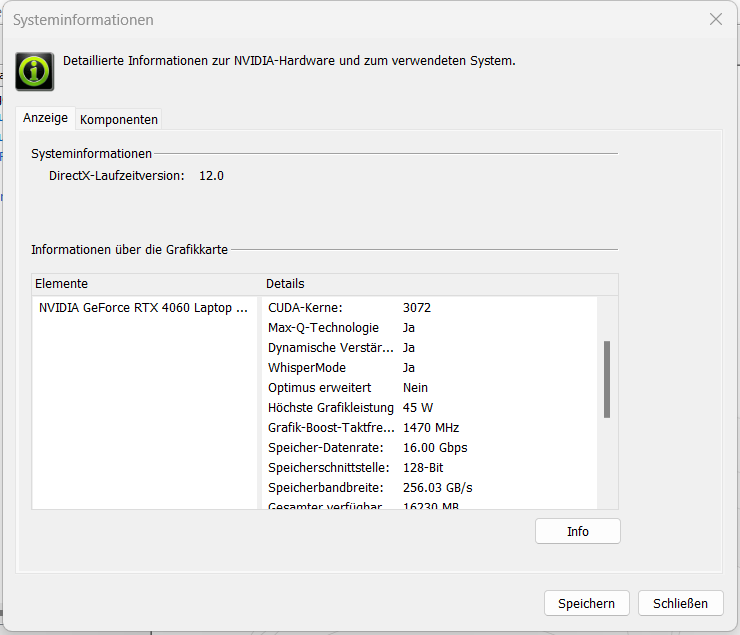
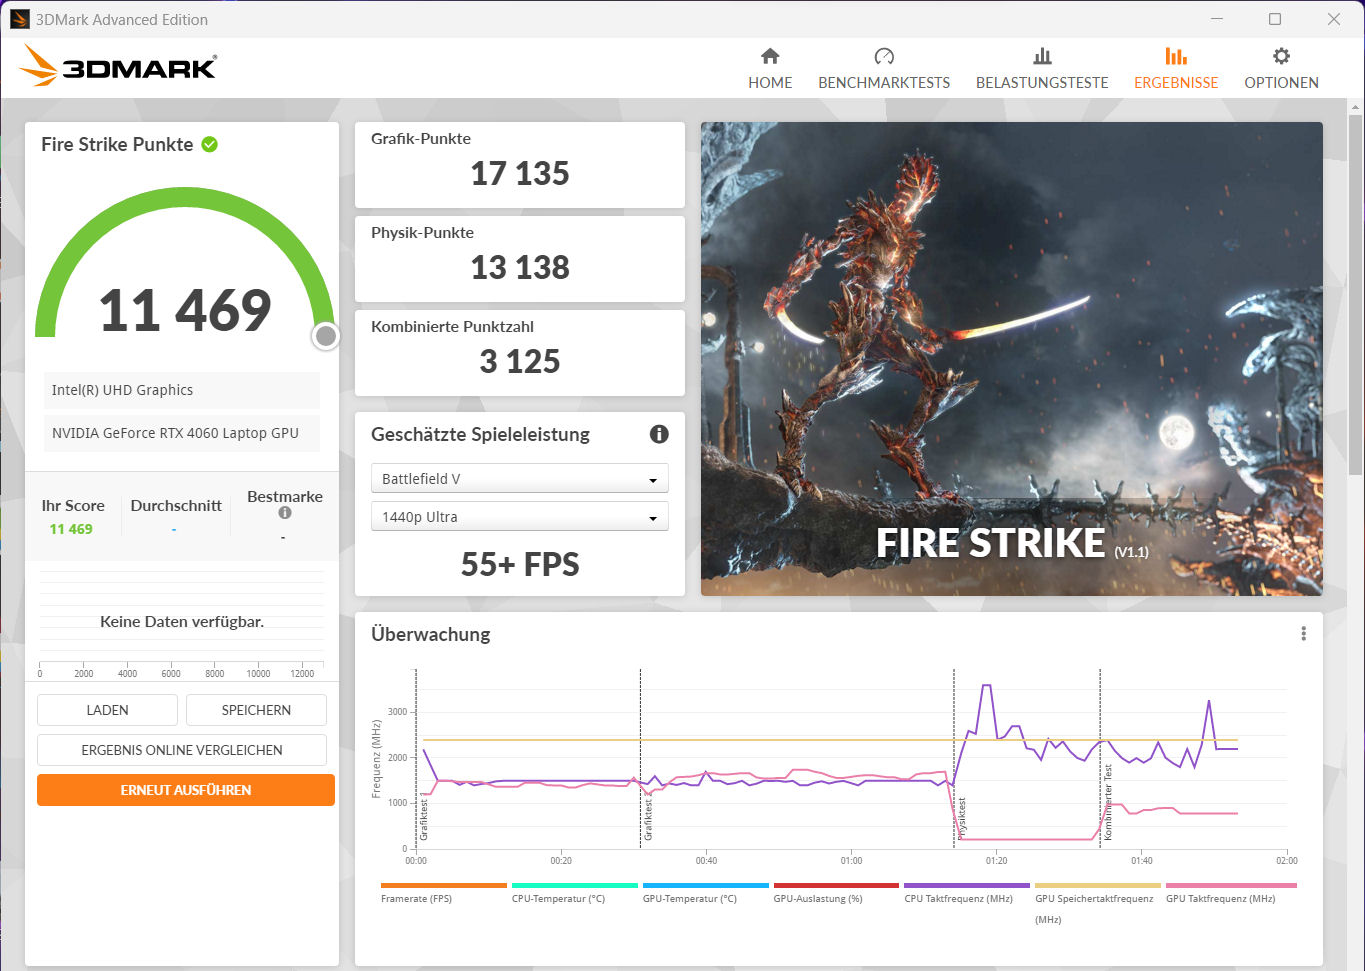
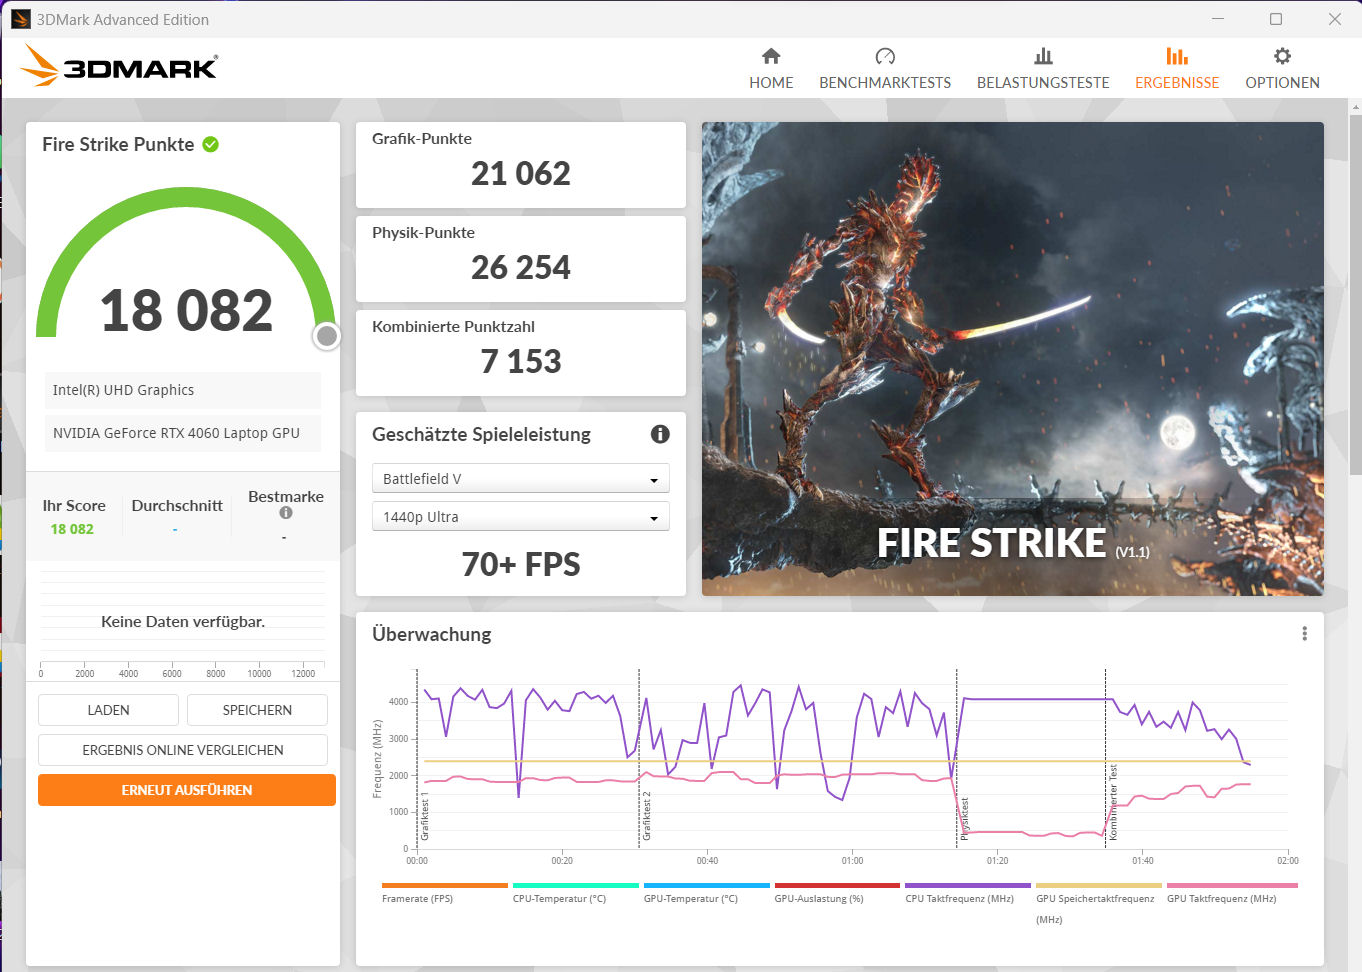
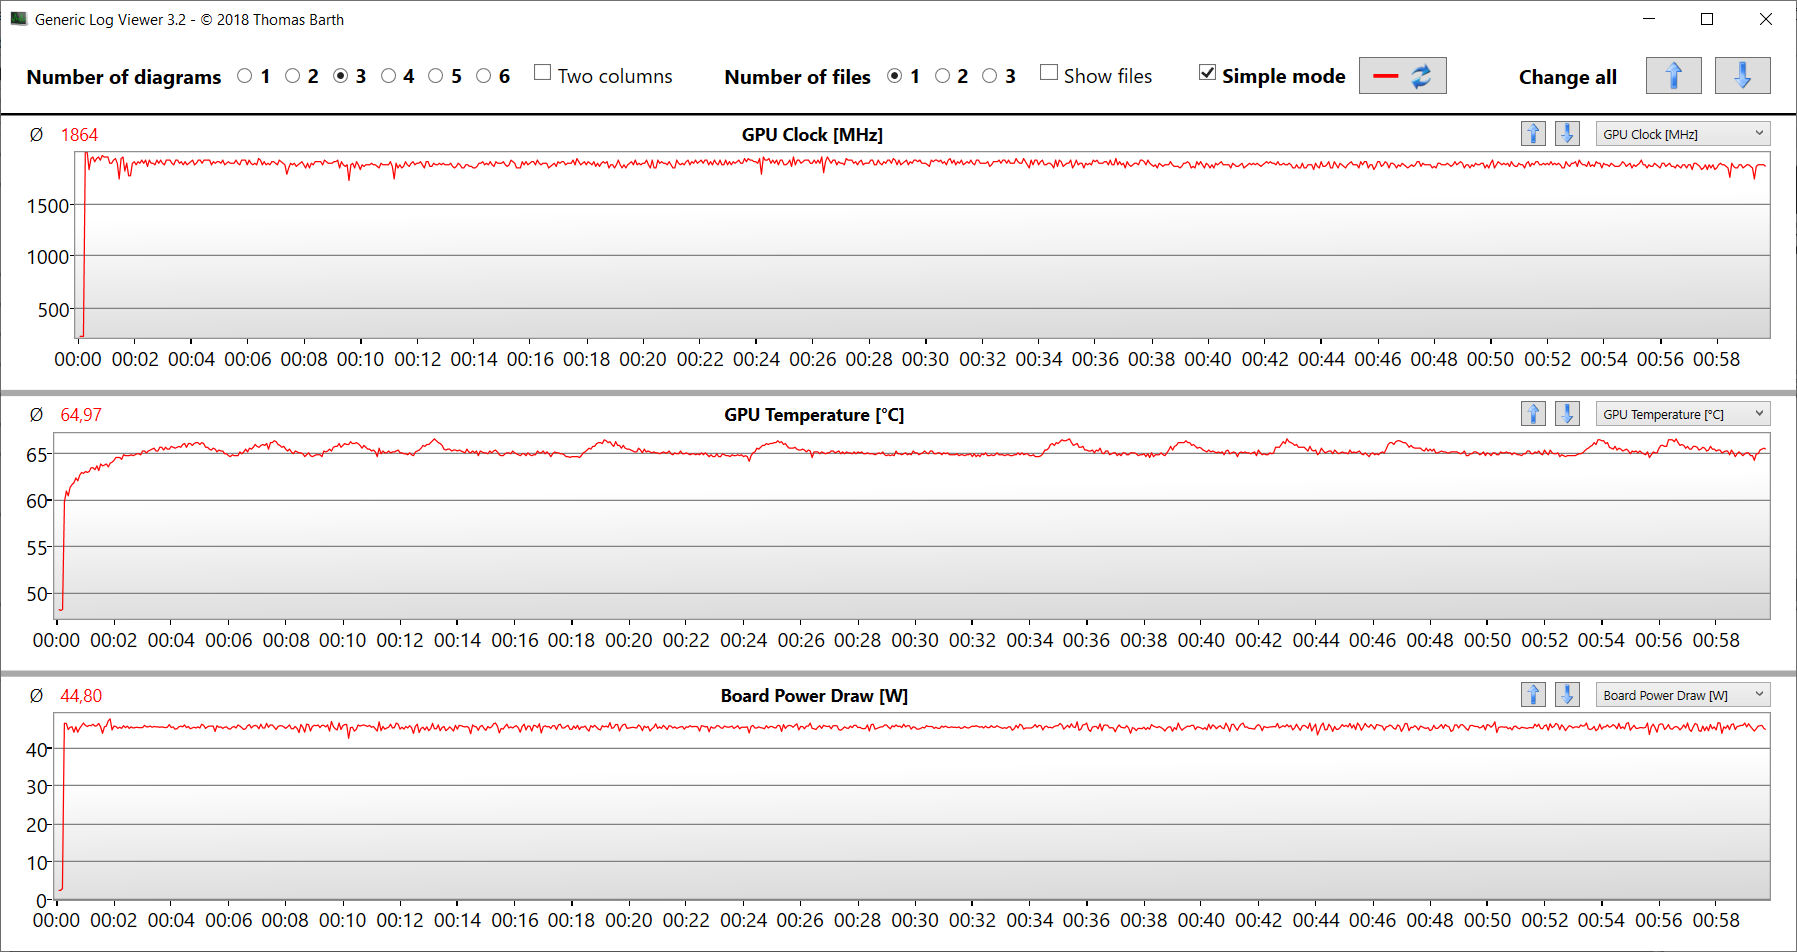
IlGeForce RTX 4060 Laptopoffre 3.072 shader, un bus a 128 bit e 8.192 MB di memoria GDDR6 veloce. MSI configura un TGP di 45 watt (35 watt + 10 watt dinamici), che è un valore al limite inferiore delle sue capacità. Ma almeno il TGP è pienamente utilizzato, secondo il nostro test The Witcher 3. Il portatile non offre una modalità dGPU.
Non sorprende che i risultati del benchmark siano inferiori alla media attuale delle GPU RTX 4060, ma dobbiamo considerarli in relazione al consumo energetico. Con un TGP più che doppio, la GPU RTX 4060 (TGP: 105 Watt) dell'MSI Katana 17ottiene risultati superiori in media "solo" del 30-40%. Ciò significa che la RTX 4060 da 45 Watt funziona in modo molto efficiente.
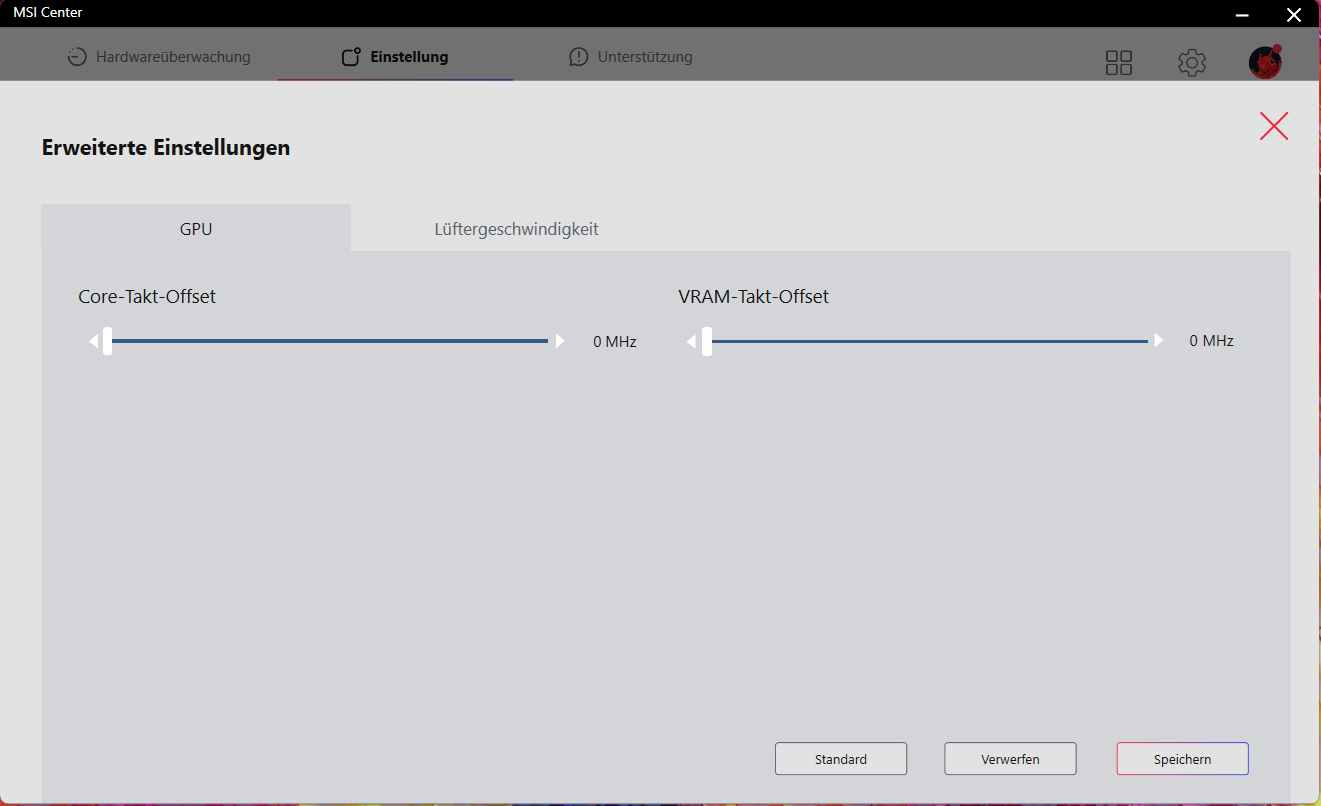
L'MSI Center offre opzioni di overclocking per la GPU e la memoria grafica, ma solo quando si attiva il profilo "Extreme Performance" (si deve cliccare sul simbolo dell'ingranaggio). L'uso di questa opzione è sempre a proprio rischio e pericolo e, in caso di problemi o instabilità, è necessario rimuovere l'overclocking.

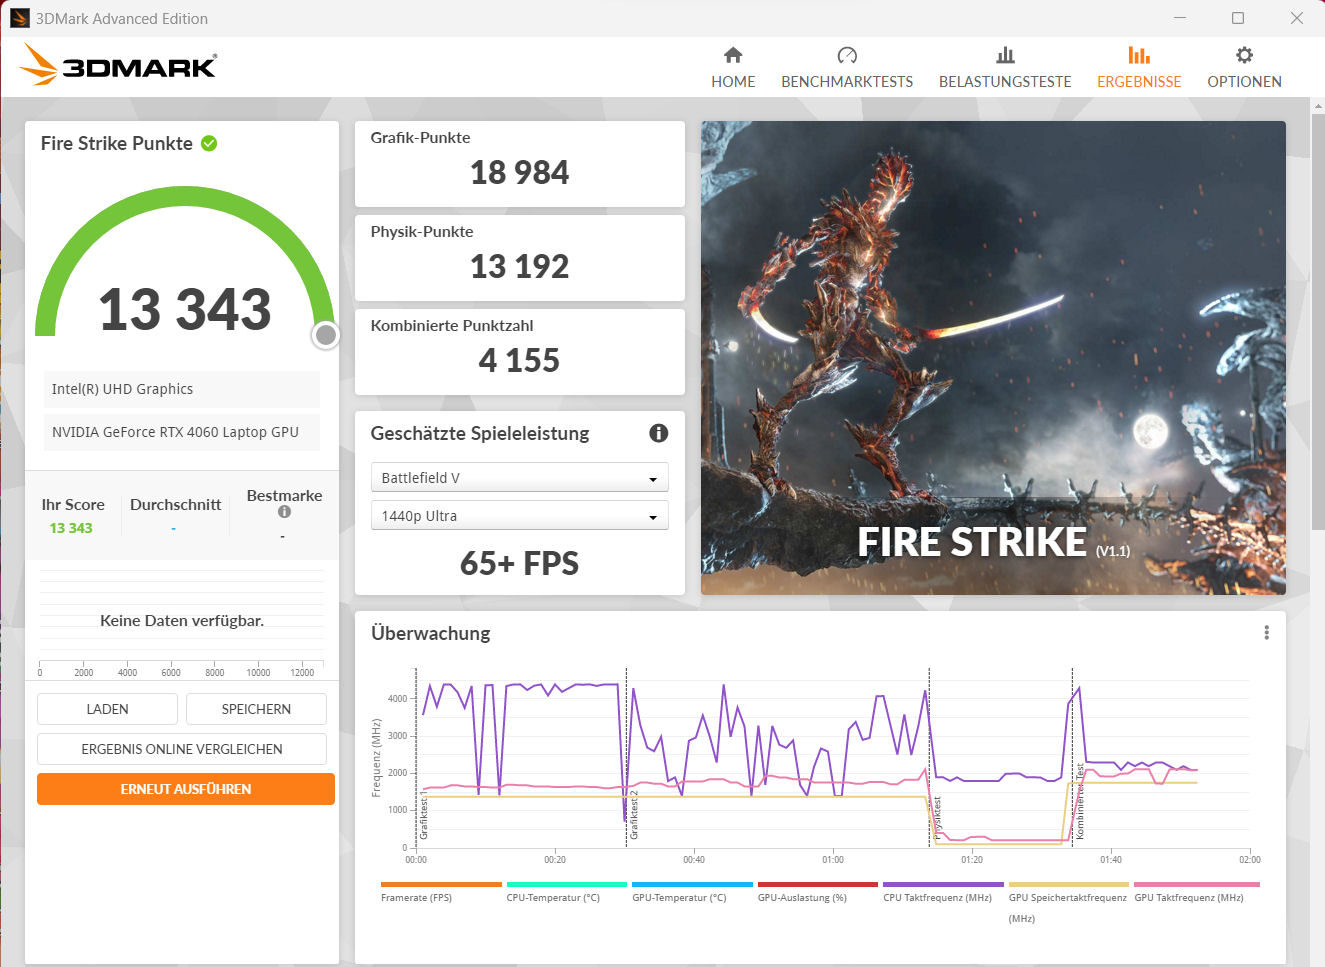
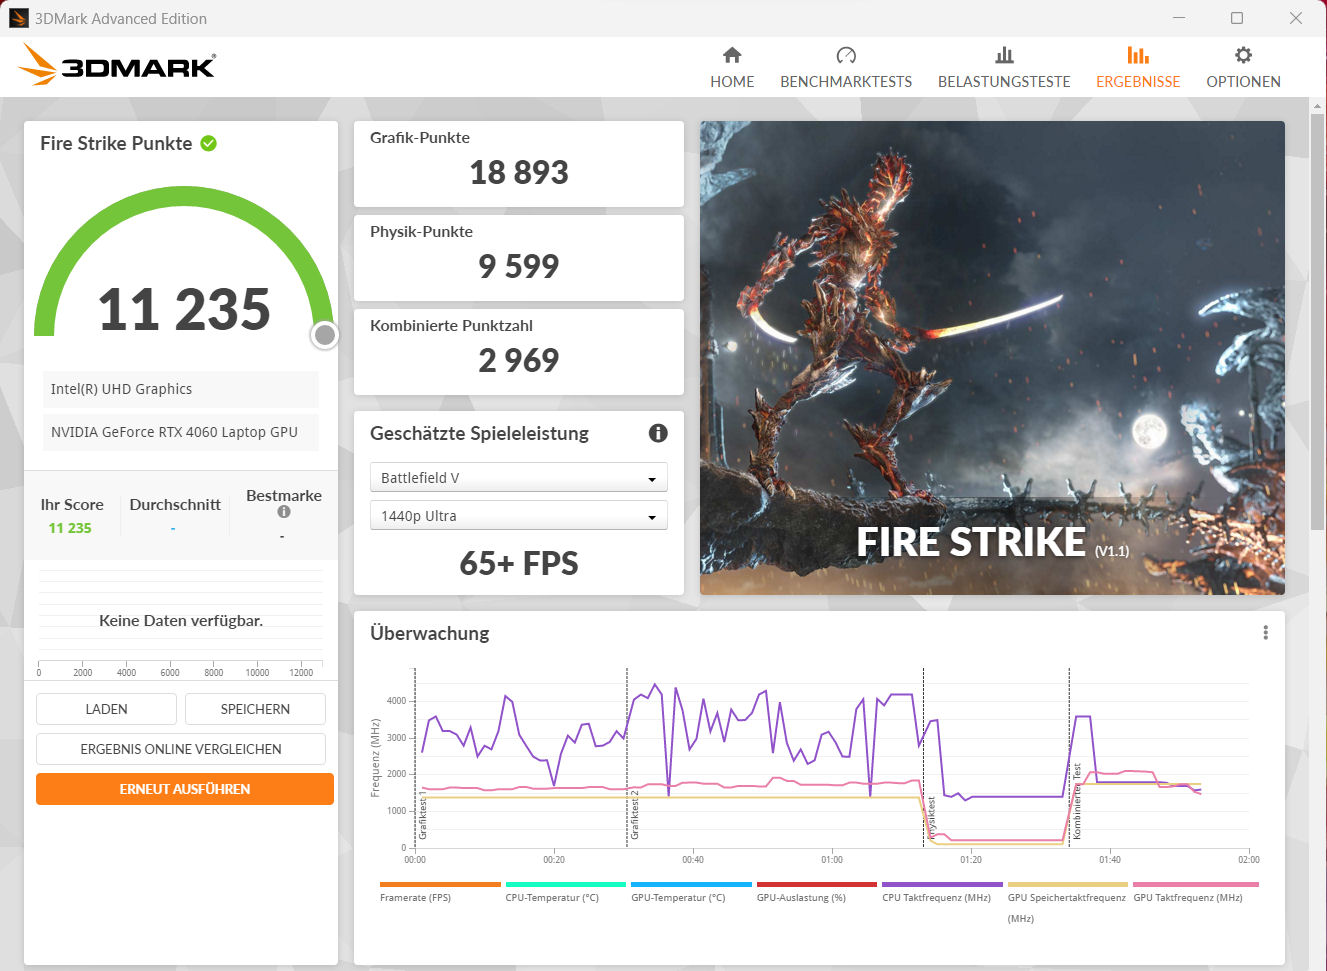
| 3DMark 06 Standard Score | 48240 punti | |
| 3DMark 11 Performance | 26146 punti | |
| 3DMark Cloud Gate Standard Score | 57304 punti | |
| 3DMark Fire Strike Score | 18086 punti | |
| 3DMark Time Spy Score | 7918 punti | |
Aiuto | ||
* ... Meglio usare valori piccoli
Prestazioni di gioco
Il portatile è progettato per i giochi in FHD con impostazioni elevate o massime. È possibile utilizzare risoluzioni più elevate se si collega il monitor corrispondente, ma solo con impostazioni parzialmente ridotte. I frame rate dei giochi che abbiamo testato sono inferiori alla media stabilita per le GPU RTX 4060.
| The Witcher 3 - 1920x1080 Ultra Graphics & Postprocessing (HBAO+) | |
| Media della classe Gaming (95 - 240, n=8, ultimi 2 anni) | |
| MSI Katana 17 B13VFK | |
| Media NVIDIA GeForce RTX 4060 Laptop GPU (77 - 159.7, n=42) | |
| Aorus 15 XE5 | |
| Schenker XMG Fusion 15 (Mid 22) | |
| Asus TUF Gaming A16 FA617 | |
| MSI Katana 15 B12VEK | |
| MSI Cyborg 15 A12VF | |
| HP Victus 15 fa0020nr | |
Per valutare se la frequenza dei fotogrammi rimane sostanzialmente costante per un periodo di tempo più lungo, abbiamo eseguito il gioco "The Witcher 3" per circa 60 minuti in risoluzione Full-HD e con le impostazioni di qualità massime. Il personaggio di gioco non viene spostato. Non notiamo alcun calo della frequenza dei fotogrammi.
The Witcher 3 FPS Chart
| basso | medio | alto | ultra | |
|---|---|---|---|---|
| GTA V (2015) | 185.8 | 181.5 | 164.9 | 89.3 |
| The Witcher 3 (2015) | 321.6 | 235.7 | 140.7 | 77.4 |
| Dota 2 Reborn (2015) | 161.7 | 152.6 | 140 | 135.4 |
| Final Fantasy XV Benchmark (2018) | 172.8 | 105.6 | 76.9 | |
| X-Plane 11.11 (2018) | 141.3 | 120.8 | 96.8 | |
| Far Cry 5 (2018) | 168 | 116 | 109 | 102 |
| Strange Brigade (2018) | 395 | 206 | 160.5 | 137.3 |
| God of War (2022) | 57.5 | 52 | 41.8 | |
| Rainbow Six Extraction (2022) | 186 | 145 | 141 | 108 |
| Cyberpunk 2077 1.6 (2022) | 88.5 | 72.3 | 63.5 | 57.9 |
| Ghostwire Tokyo (2022) | 114.4 | 113.7 | 112.7 | 108.4 |
| F1 22 (2022) | 169.8 | 162.3 | 124.7 | 48.7 |
| The Quarry (2022) | 116.9 | 88.1 | 72.7 | 57.2 |
| Uncharted Legacy of Thieves Collection (2022) | 71.1 | 70.3 | 67.7 | 65.6 |
| Call of Duty Modern Warfare 2 2022 (2022) | 103 | 93 | 70 | 68 |
| Spider-Man Miles Morales (2022) | 89.2 | 82 | 72.5 | 66.4 |
| The Callisto Protocol (2022) | 112.8 | 82.4 | 77.8 | 54.4 |
| Need for Speed Unbound (2022) | 104.9 | 92.6 | 74.9 | 65 |
| High On Life (2023) | 163.2 | 123 | 92.1 | 71.2 |
| The Witcher 3 v4 (2023) | 148.6 | 117.9 | 59.2 | 50.3 |
| Dead Space Remake (2023) | 62.8 | 61 | 53.7 | 53.3 |
| Hogwarts Legacy (2023) | 108 | 87.7 | 74.2 | 62.5 |
| Returnal (2023) | 84 | 80 | 72 | 62 |
| Atomic Heart (2023) | 133.9 | 103.3 | 62.8 | 49.6 |
| Company of Heroes 3 (2023) | 152.3 | 136.9 | 101.6 | 100 |
| Sons of the Forest (2023) | 78.2 | 61.5 | 59.5 | 58.5 |
| Resident Evil 4 Remake (2023) | 106.9 | 75.9 | 69.4 | 50.9 |
| The Last of Us (2023) | 74.6 | 62.5 | 55.4 | 45.2 |
Emissioni - Il portatile MSI si riscalda solo moderatamente
Livelli di rumore
L'hardware del Cyborg è configurato per un basso consumo energetico e, di conseguenza, per un basso sviluppo di calore. Sebbene ci si debba aspettare un sistema di raffreddamento silenzioso, troviamo un certo margine di miglioramento in questo senso.
In media, la rumorosità durante il gioco è moderata. Tuttavia, il portatile può diventare molto rumoroso in caso di carico massimo. In modalità "Extreme Performance", il livello di rumore massimo può aumentare fino a 56,3 dB(A). In termini di sviluppo del rumore, il profilo "Bilanciato" potrebbe essere consigliato.
Ciò che è più fastidioso è il comportamento durante il funzionamento in idle e nell'uso quotidiano (Office, Internet): La ventola continua a girare costantemente in un intervallo chiaramente udibile e si misurano livelli di rumore fino a 38 dB(A). Questo vale per tutti i profili di prestazioni, ad eccezione del profilo "Super Battery", che spesso mantiene la ventola spenta.
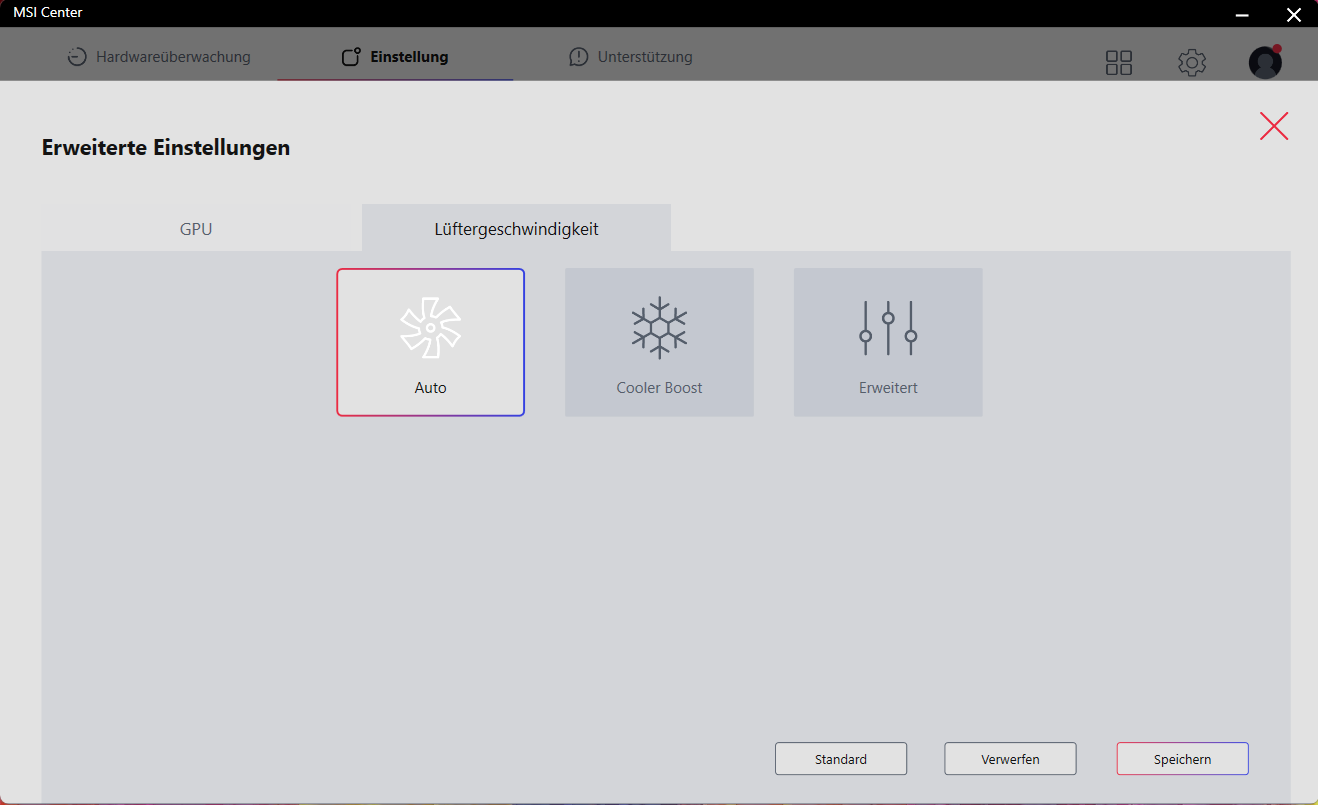
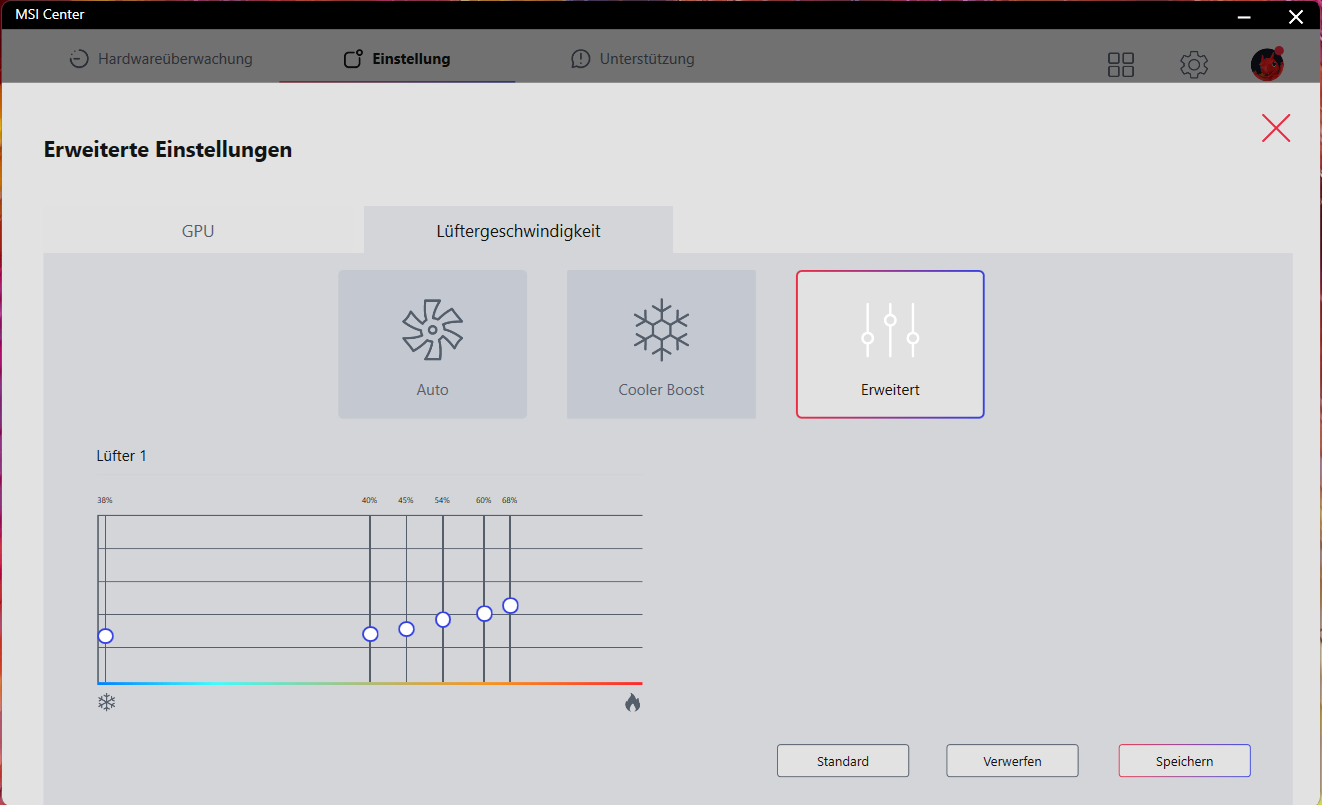
L'MSI Center consente un accesso limitato al controllo della ventola, ma solo con il profilo "Extreme Performance" attivato (bisogna cliccare sul simbolo dell'ingranaggio). Sono disponibili i profili "Auto" e "Cooler Boost" (con la ventola che gira costantemente alla massima velocità). Inoltre, è possibile regolare la curva della ventola.
Rumorosità
| Idle |
| 27 / 37.5 / 38 dB(A) |
| Sotto carico |
| 56.3 / 56.3 dB(A) |
 | ||
30 dB silenzioso 40 dB(A) udibile 50 dB(A) rumoroso |
||
min: | ||
| MSI Cyborg 15 A12VF GeForce RTX 4060 Laptop GPU, i7-12650H, Samsung PM9B1 1024GB MZVL41T0HBLB | Asus TUF Gaming A16 FA617 Radeon RX 7600S, R7 7735HS, Micron 2400 MTFDKBA1T0QFM | Aorus 15 XE5 GeForce RTX 3070 Ti Laptop GPU, i7-12700H, Gigabyte AG470S1TB-SI B10 | Schenker XMG Fusion 15 (Mid 22) GeForce RTX 3070 Laptop GPU, i7-11800H, Samsung SSD 980 Pro 1TB MZ-V8P1T0BW | MSI Katana 15 B12VEK GeForce RTX 4050 Laptop GPU, i7-12650H, Micron 2400 MTFDKBA1T0QFM | HP Victus 15 fa0020nr GeForce RTX 3050 Ti Laptop GPU, i7-12700H, Samsung PM9A1 MZVL2512HCJQ | |
|---|---|---|---|---|---|---|
| Noise | 20% | 14% | 14% | 22% | 20% | |
| off /ambiente * (dB) | 27 | 24 11% | 24 11% | 26 4% | 24 11% | 24.8 8% |
| Idle Minimum * (dB) | 27 | 24 11% | 26 4% | 26 4% | 24 11% | 26.2 3% |
| Idle Average * (dB) | 37.5 | 25 33% | 28 25% | 28 25% | 24 36% | 29.2 22% |
| Idle Maximum * (dB) | 38 | 28 26% | 30 21% | 31 18% | 24 37% | 29.4 23% |
| Load Average * (dB) | 56.3 | 42 25% | 48 15% | 45 20% | 37.71 33% | 29.9 47% |
| Load Maximum * (dB) | 56.3 | 50 11% | 52 8% | 48 15% | 54.55 3% | 45.5 19% |
| Witcher 3 ultra * (dB) | 50 | 52 | 46 | 45.75 | 41.1 |
* ... Meglio usare valori piccoli
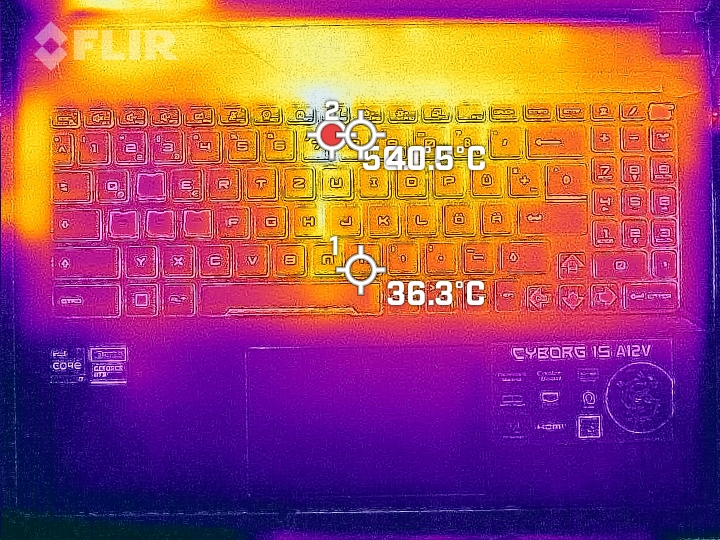
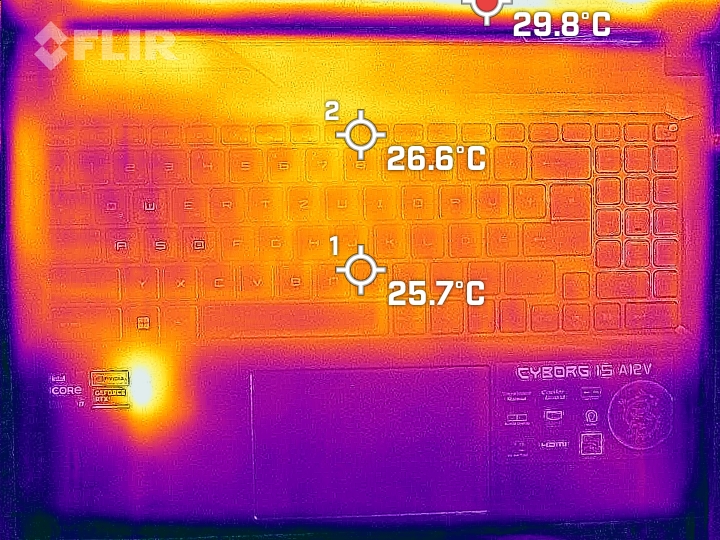
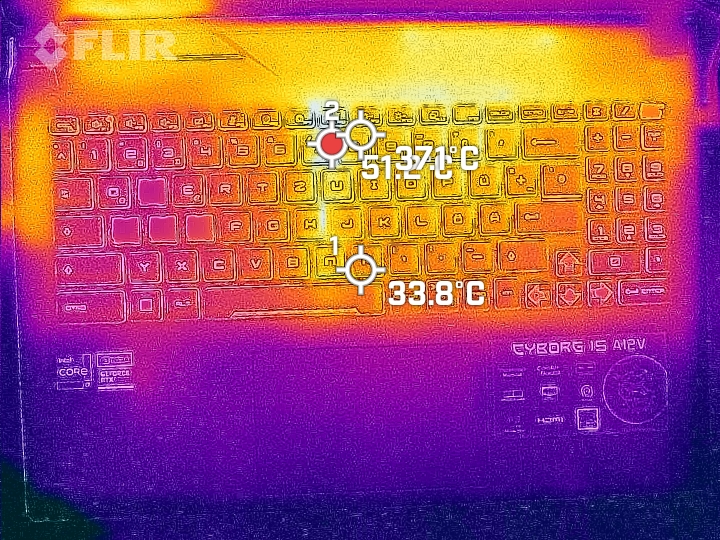
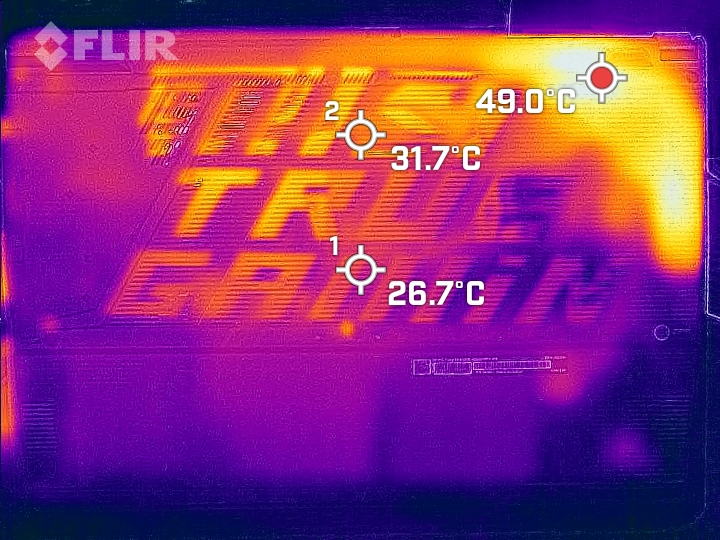
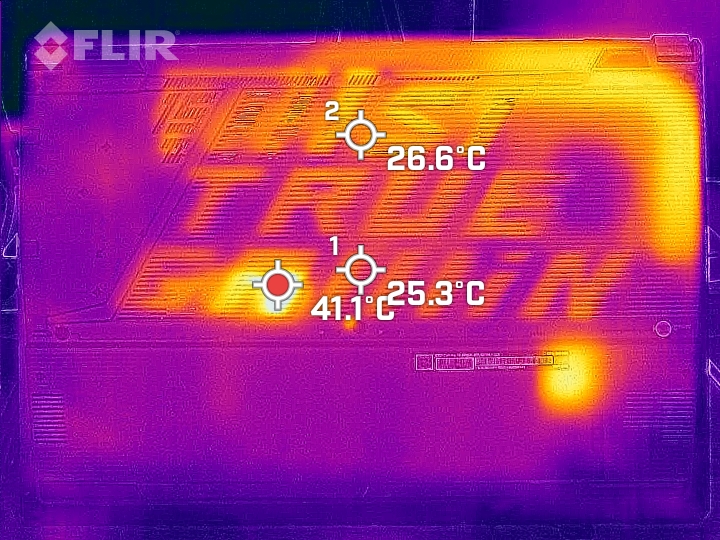
Temperature
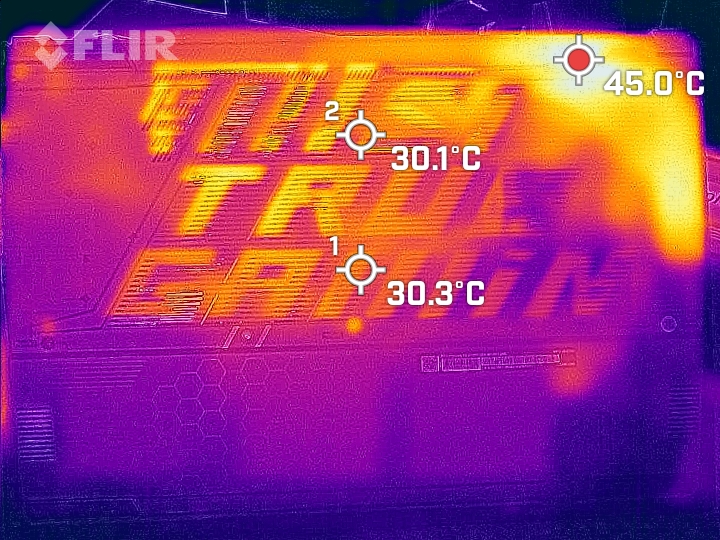
Nel migliore dei casi il portatile si riscalda moderatamente. Le temperature più elevate (da 40 a 47,5 °C, da 104 a 117,5 °F) vengono raggiunte in tre punti di misurazione durante lo stress test. Nel funzionamento quotidiano, le temperature rimangono all'interno dell'intervallo verde.
(-) La temperatura massima sul lato superiore è di 47.5 °C / 118 F, rispetto alla media di 40.4 °C / 105 F, che varia da 21.2 a 68.8 °C per questa classe Gaming.
(+) Il lato inferiore si riscalda fino ad un massimo di 35.5 °C / 96 F, rispetto alla media di 43.2 °C / 110 F
(+) In idle, la temperatura media del lato superiore è di 25.9 °C / 79 F, rispetto alla media deld ispositivo di 33.9 °C / 93 F.
(±) Riproducendo The Witcher 3, la temperatura media per il lato superiore e' di 35.6 °C / 96 F, rispetto alla media del dispositivo di 33.9 °C / 93 F.
(+) I poggiapolsi e il touchpad sono piu' freddi della temperatura della pelle con un massimo di 27.8 °C / 82 F e sono quindi freddi al tatto.
(±) La temperatura media della zona del palmo della mano di dispositivi simili e'stata di 28.8 °C / 83.8 F (+1 °C / 1.8 F).
| MSI Cyborg 15 A12VF Intel Core i7-12650H, NVIDIA GeForce RTX 4060 Laptop GPU | Asus TUF Gaming A16 FA617 AMD Ryzen 7 7735HS, AMD Radeon RX 7600S | Aorus 15 XE5 Intel Core i7-12700H, NVIDIA GeForce RTX 3070 Ti Laptop GPU | Schenker XMG Fusion 15 (Mid 22) Intel Core i7-11800H, NVIDIA GeForce RTX 3070 Laptop GPU | MSI Katana 15 B12VEK Intel Core i7-12650H, NVIDIA GeForce RTX 4050 Laptop GPU | HP Victus 15 fa0020nr Intel Core i7-12700H, NVIDIA GeForce RTX 3050 Ti Laptop GPU | |
|---|---|---|---|---|---|---|
| Heat | -32% | -34% | -37% | -22% | 16% | |
| Maximum Upper Side * (°C) | 47.5 | 54 -14% | 46 3% | 52 -9% | 47 1% | 37.2 22% |
| Maximum Bottom * (°C) | 35.5 | 47 -32% | 57 -61% | 63 -77% | 48 -35% | 35.4 -0% |
| Idle Upper Side * (°C) | 27.7 | 40 -44% | 38 -37% | 37 -34% | 35 -26% | 22.4 19% |
| Idle Bottom * (°C) | 29.5 | 40 -36% | 42 -42% | 38 -29% | 38 -29% | 22.6 23% |
* ... Meglio usare valori piccoli
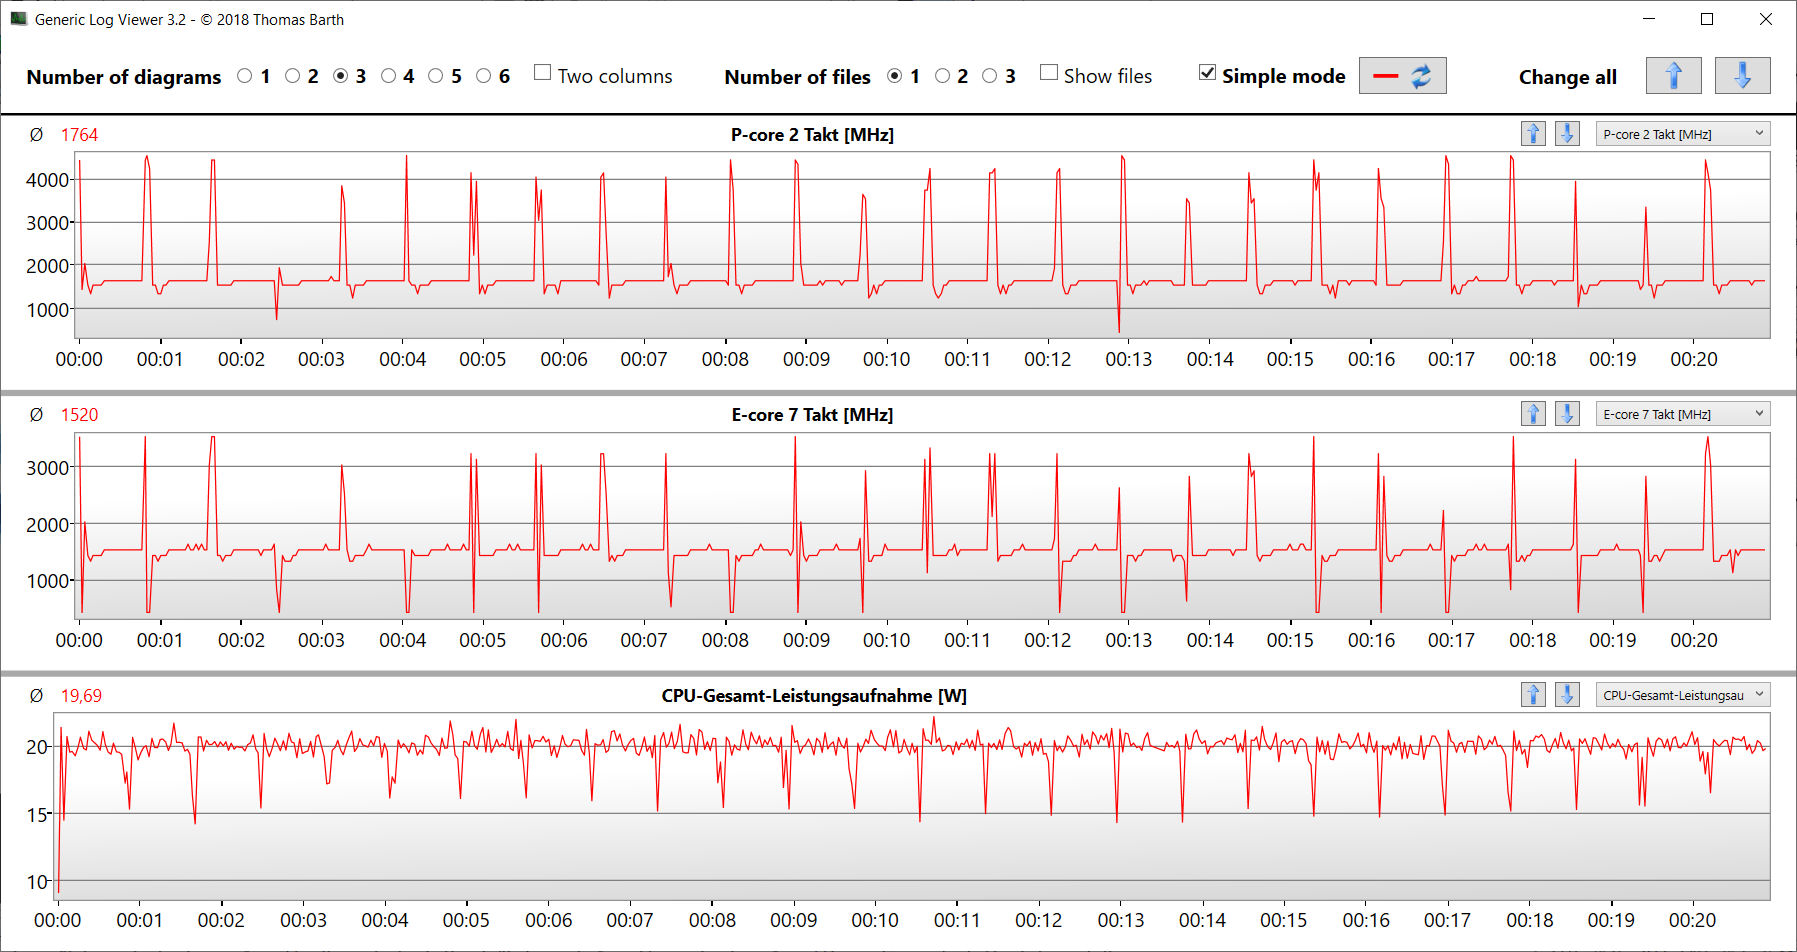
Stress test
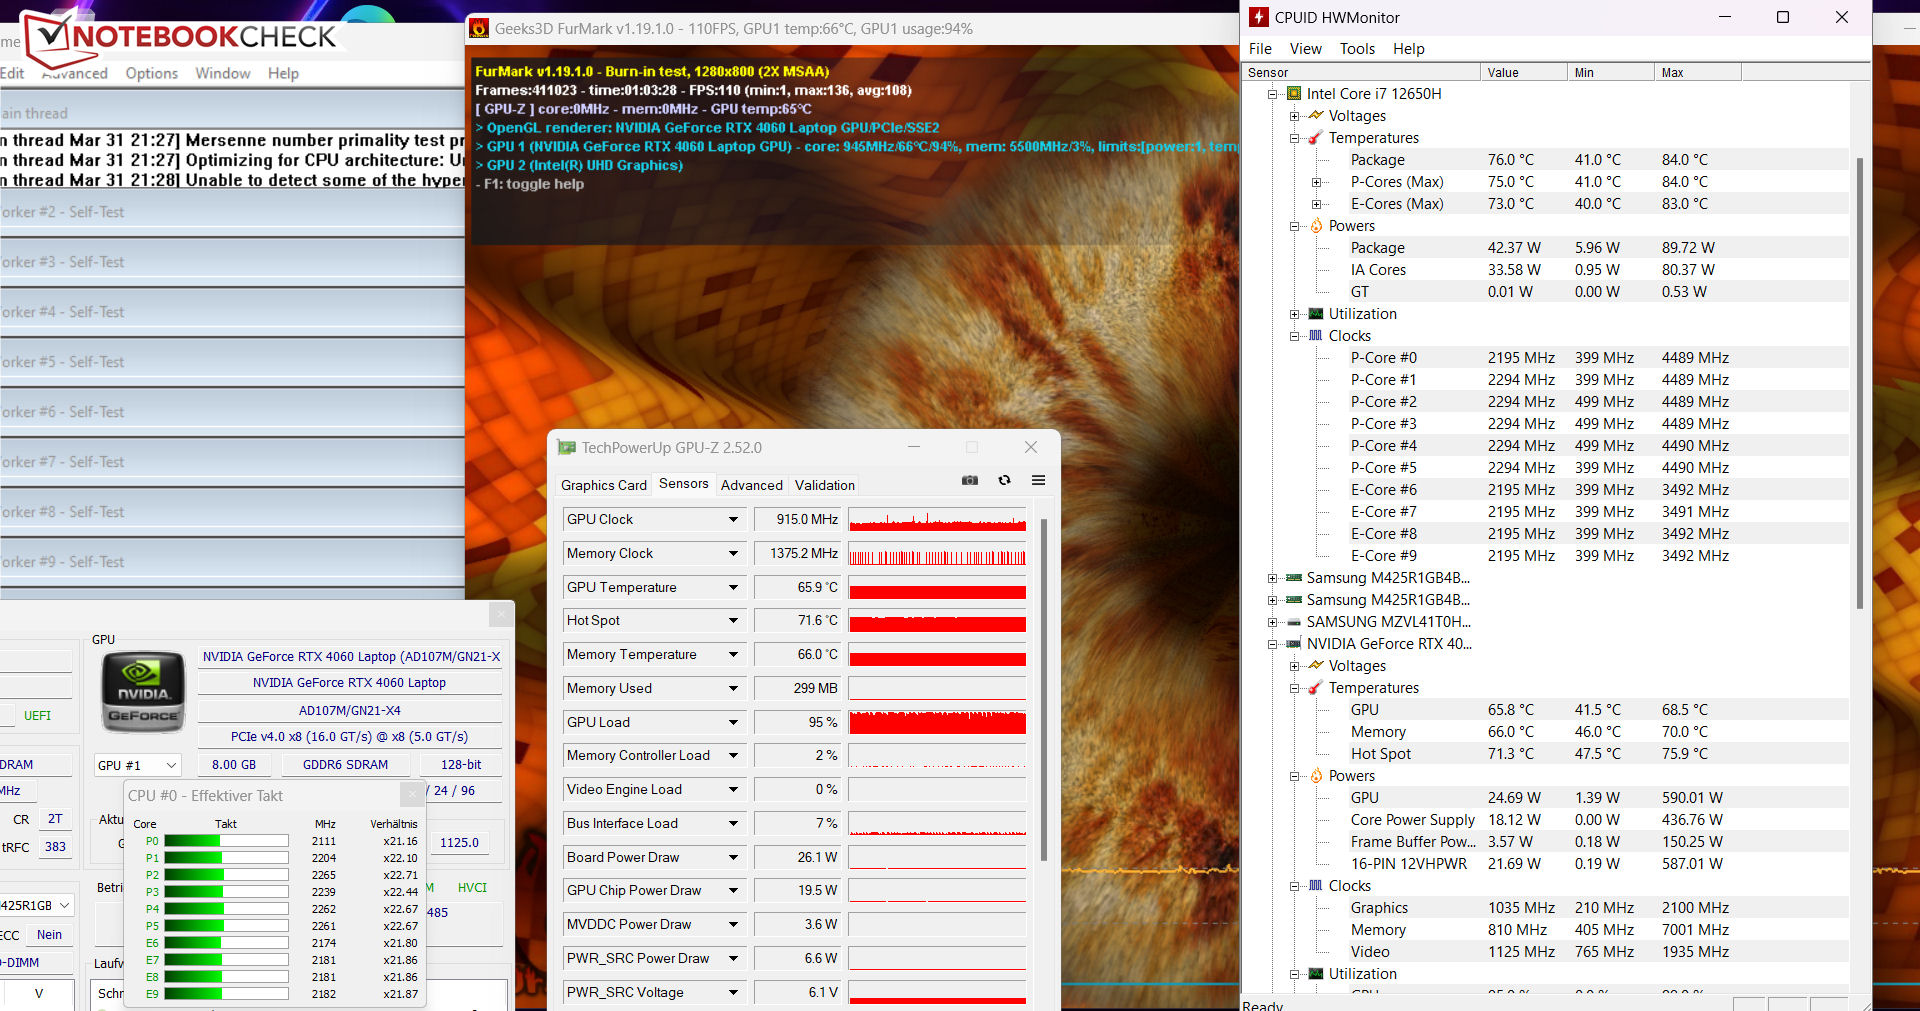
Lo stress test (con Prime95 e Furmark costantemente in esecuzione) rappresenta uno scenario estremo per valutare la stabilità del sistema a pieno carico. La CPU (P: 3,3-3,5 GHz, E: 2,8 GHz) e la GPU (1.000-1.500 MHz) iniziano il test a velocità di clock medio-alte, con valori che scendono nel corso del test.
Altoparlanti
Gli altoparlanti stereo producono un suono decente, ma con pochi bassi. Per un'esperienza sonora migliore, si consiglia di utilizzare cuffie o altoparlanti esterni.
MSI Cyborg 15 A12VF analisi audio
(±) | potenza degli altiparlanti media ma buona (77.79 dB)
Bassi 100 - 315 Hz
(-) | quasi nessun basso - in media 19.8% inferiori alla media
(±) | la linearità dei bassi è media (12.2% delta rispetto alla precedente frequenza)
Medi 400 - 2000 Hz
(+) | medi bilanciati - solo only 1.8% rispetto alla media
(+) | medi lineari (5% delta rispetto alla precedente frequenza)
Alti 2 - 16 kHz
(+) | Alti bilanciati - appena 4.2% dalla media
(+) | alti lineari (3.9% delta rispetto alla precedente frequenza)
Nel complesso 100 - 16.000 Hz
(+) | suono nel complesso lineare (14.2% differenza dalla media)
Rispetto alla stessa classe
» 25% di tutti i dispositivi testati in questa classe è stato migliore, 7% simile, 68% peggiore
» Il migliore ha avuto un delta di 6%, medio di 18%, peggiore di 132%
Rispetto a tutti i dispositivi testati
» 17% di tutti i dispositivi testati in questa classe è stato migliore, 4% similare, 79% peggiore
» Il migliore ha avuto un delta di 4%, medio di 24%, peggiore di 134%
Asus TUF Gaming A16 FA617 analisi audio
(+) | gli altoparlanti sono relativamente potenti (82 dB)
Bassi 100 - 315 Hz
(±) | bassi ridotti - in media 14.4% inferiori alla media
(±) | la linearità dei bassi è media (8.3% delta rispetto alla precedente frequenza)
Medi 400 - 2000 Hz
(±) | medi elevati - circa 6.5% superiore alla media
(+) | medi lineari (3.8% delta rispetto alla precedente frequenza)
Alti 2 - 16 kHz
(±) | alti ridotti - circa 6% inferiori alla media
(±) | la linearità degli alti è media (10.4% delta rispetto alla precedente frequenza)
Nel complesso 100 - 16.000 Hz
(±) | la linearità complessiva del suono è media (18.8% di differenza rispetto alla media
Rispetto alla stessa classe
» 62% di tutti i dispositivi testati in questa classe è stato migliore, 8% simile, 30% peggiore
» Il migliore ha avuto un delta di 6%, medio di 18%, peggiore di 132%
Rispetto a tutti i dispositivi testati
» 43% di tutti i dispositivi testati in questa classe è stato migliore, 8% similare, 49% peggiore
» Il migliore ha avuto un delta di 4%, medio di 24%, peggiore di 134%
Gestione dell'alimentazione - Laptop da gioco con una buona durata della batteria
Consumo di energia
Nel complesso, il portatile MSI si dimostra molto efficiente in termini di consumo energetico. In tutta la gamma di carichi, il consumo rimane inferiore a quello dei concorrenti. Il portatile supera i nostri test Witcher 3 e gli stress test con un consumo energetico relativamente costante. L'alimentatore è sufficientemente dimensionato a 120 watt.
| Off / Standby | |
| Idle | |
| Sotto carico |
|
Leggenda:
min: | |
| MSI Cyborg 15 A12VF i7-12650H, GeForce RTX 4060 Laptop GPU, Samsung PM9B1 1024GB MZVL41T0HBLB, IPS, 1920x1080, 15.6" | Asus TUF Gaming A16 FA617 R7 7735HS, Radeon RX 7600S, Micron 2400 MTFDKBA1T0QFM, IPS-Level, 1920x1200, 16" | Aorus 15 XE5 i7-12700H, GeForce RTX 3070 Ti Laptop GPU, Gigabyte AG470S1TB-SI B10, IPS, 2560x1440, 15.6" | Schenker XMG Fusion 15 (Mid 22) i7-11800H, GeForce RTX 3070 Laptop GPU, Samsung SSD 980 Pro 1TB MZ-V8P1T0BW, IPS, 2560x1440, 15.6" | MSI Katana 15 B12VEK i7-12650H, GeForce RTX 4050 Laptop GPU, Micron 2400 MTFDKBA1T0QFM, IPS, 1920x1080, 15.6" | HP Victus 15 fa0020nr i7-12700H, GeForce RTX 3050 Ti Laptop GPU, Samsung PM9A1 MZVL2512HCJQ, IPS, 1920x1080, 15.6" | Media NVIDIA GeForce RTX 4060 Laptop GPU | Media della classe Gaming | |
|---|---|---|---|---|---|---|---|---|
| Power Consumption | -42% | -222% | -84% | -30% | -40% | -72% | -104% | |
| Idle Minimum * (Watt) | 6 | 8 -33% | 31 -417% | 12 -100% | 8.5 -42% | 5.1 15% | 11.5 ? -92% | 13.3 ? -122% |
| Idle Average * (Watt) | 8.8 | 11 -25% | 35 -298% | 17 -93% | 10.2 -16% | 15.1 -72% | 16 ? -82% | 19 ? -116% |
| Idle Maximum * (Watt) | 11.9 | 16 -34% | 46 -287% | 24 -102% | 11.3 5% | 18.9 -59% | 20.3 ? -71% | 24.5 ? -106% |
| Load Average * (Watt) | 89 | 97 -9% | 120 -35% | 106 -19% | 84 6% | 114.5 -29% | 92.9 ? -4% | 108.1 ? -21% |
| Witcher 3 ultra * (Watt) | 90.3 | 161.5 -79% | 202 -124% | 159.9 -77% | 128 -42% | 113.9 -26% | ||
| Load Maximum * (Watt) | 99 | 168 -70% | 268 -171% | 208 -110% | 189 -91% | 165.8 -67% | 210 ? -112% | 254 ? -157% |
* ... Meglio usare valori piccoli
Power Consumption The Witcher 3 / Stress Test
Power Consumption With External Monitor
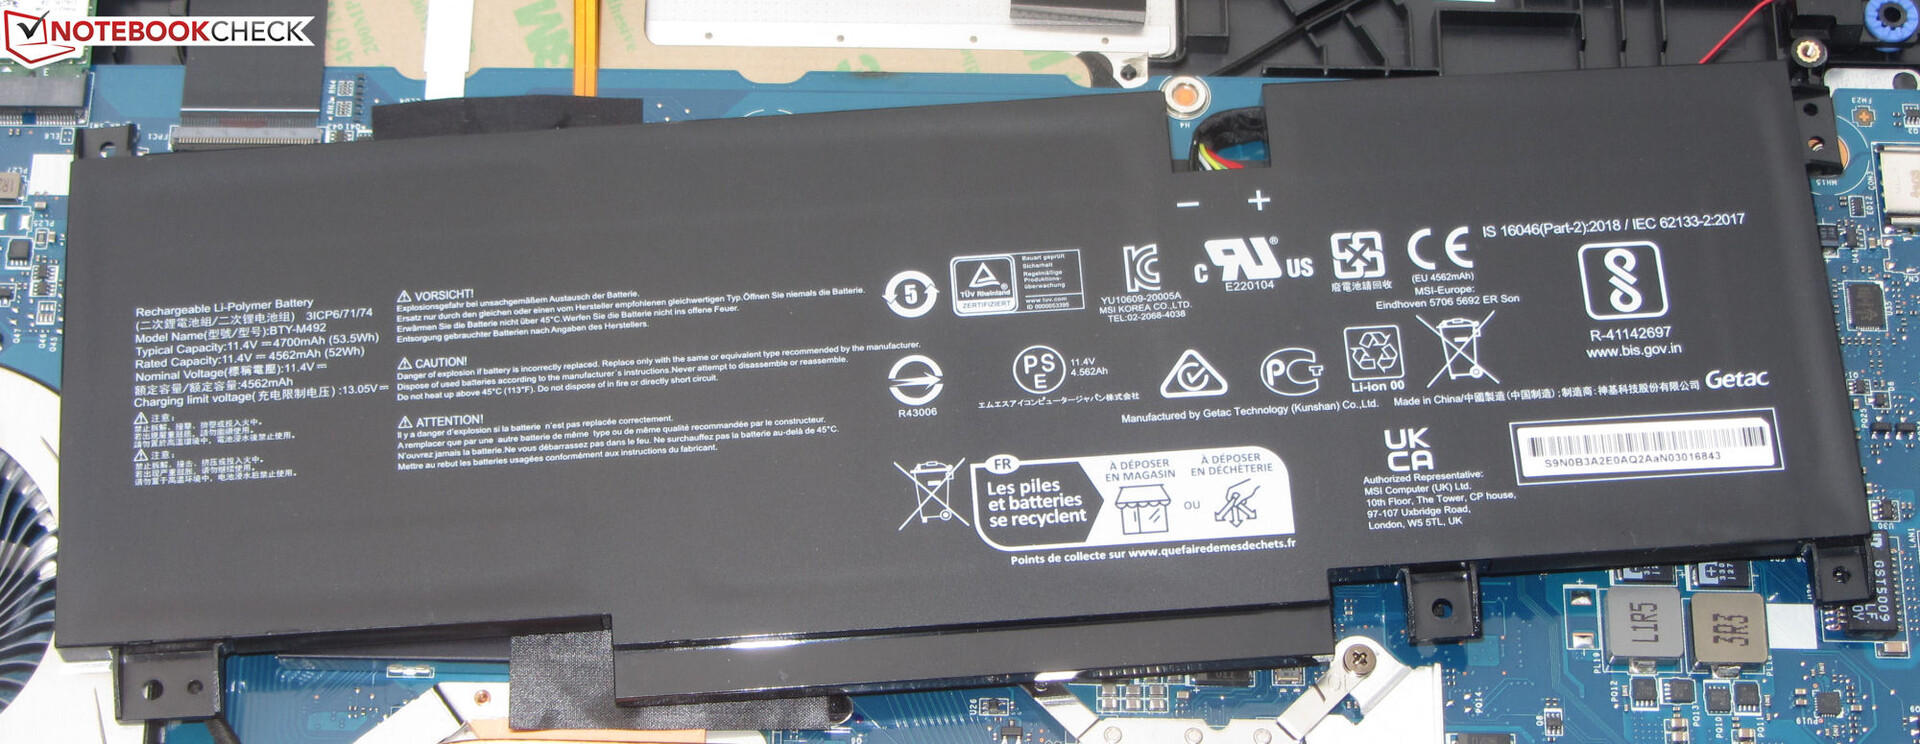
Durata della batteria
Nel test WLAN, in cui i siti web vengono caricati tramite script, e nel test video con il cortometraggio Big Buck Bunny (codifica H.264, FHD) in esecuzione in loop, il portatile da 15,6 pollici raggiunge tempi di esecuzione rispettivamente di 7:32 ore e 8:00 ore. Durante entrambi i test, le funzioni di risparmio energetico del portatile sono disattivate e la luminosità del display è ridotta a circa 150 cd/m². Per eseguire il test video, vengono disattivati anche i moduli di comunicazione wireless.
Il portatile MSI offre complessivamente una buona durata della batteria, nonostante la sua capacità relativamente ridotta di 53,5 Wh. Il fatto che non sia in grado di tenere il passo del TUF Gaming A16è dovuto alla combinazione di una grande batteria da 90 Wh e dell'efficiente APU AMD offerta da questo portatile. Se calcoliamo il tempo di esecuzione per ora d'acqua, il Cyborg è in vantaggio.
| MSI Cyborg 15 A12VF i7-12650H, GeForce RTX 4060 Laptop GPU, 53.5 Wh | Asus TUF Gaming A16 FA617 R7 7735HS, Radeon RX 7600S, 90 Wh | Aorus 15 XE5 i7-12700H, GeForce RTX 3070 Ti Laptop GPU, 99 Wh | Schenker XMG Fusion 15 (Mid 22) i7-11800H, GeForce RTX 3070 Laptop GPU, 93.48 Wh | MSI Katana 15 B12VEK i7-12650H, GeForce RTX 4050 Laptop GPU, 53.5 Wh | HP Victus 15 fa0020nr i7-12700H, GeForce RTX 3050 Ti Laptop GPU, 70 Wh | Media della classe Gaming | |
|---|---|---|---|---|---|---|---|
| Autonomia della batteria | 25% | -19% | -4% | -41% | -68% | -19% | |
| Reader / Idle (h) | 13.6 | 20.2 49% | 10 -26% | 15.5 14% | 2.6 -81% | 8.71 ? -36% | |
| H.264 (h) | 8 | 6.2 -22% | 7.5 -6% | 4.4 -45% | 8.26 ? 3% | ||
| WiFi v1.3 (h) | 7.5 | 12.1 61% | 6.8 -9% | 7.4 -1% | 4.3 -43% | 2.1 -72% | 7.01 ? -7% |
| Load (h) | 2.3 | 1.5 -35% | 1.9 -17% | 1.8 -22% | 1.5 -35% | 1.1 -52% | 1.47 ? -36% |
Pro
Contro
Verdetto - Laptop da gioco con un consumo energetico ridotto

L'obiettivo di MSI Cyborg 15 è un compromesso tra prestazioni, mobilità e consumo energetico. A causa delle impostazioni di prestazioni ridotte, il Core i7-12650He GeForce RTX 4060si comportano al di sotto delle loro capacità. Tuttavia, la loro potenza di calcolo è ancora sufficiente per giocare in FHD con impostazioni elevate o massime.
Sebbene il concetto di Cyborg 15 ci piaccia, la sua implementazione lascia ancora spazio a miglioramenti. Un'attuale GPU di fascia alta offre prestazioni sufficienti per i giochi in FHD anche con un TGP basso di 45 watt.
Il consumo energetico, che è basso per un portatile da gioco, può essere tradotto in una buona durata della batteria. Valori realistici di 7-8 ore sono ancora possibili, nonostante la capacità relativamente ridotta della batteria di 53,5 Wh. Purtroppo la porta USB-C non offre alcun supporto per Power Delivery, che sarebbe una caratteristica sensata nel caso del Cyborg.
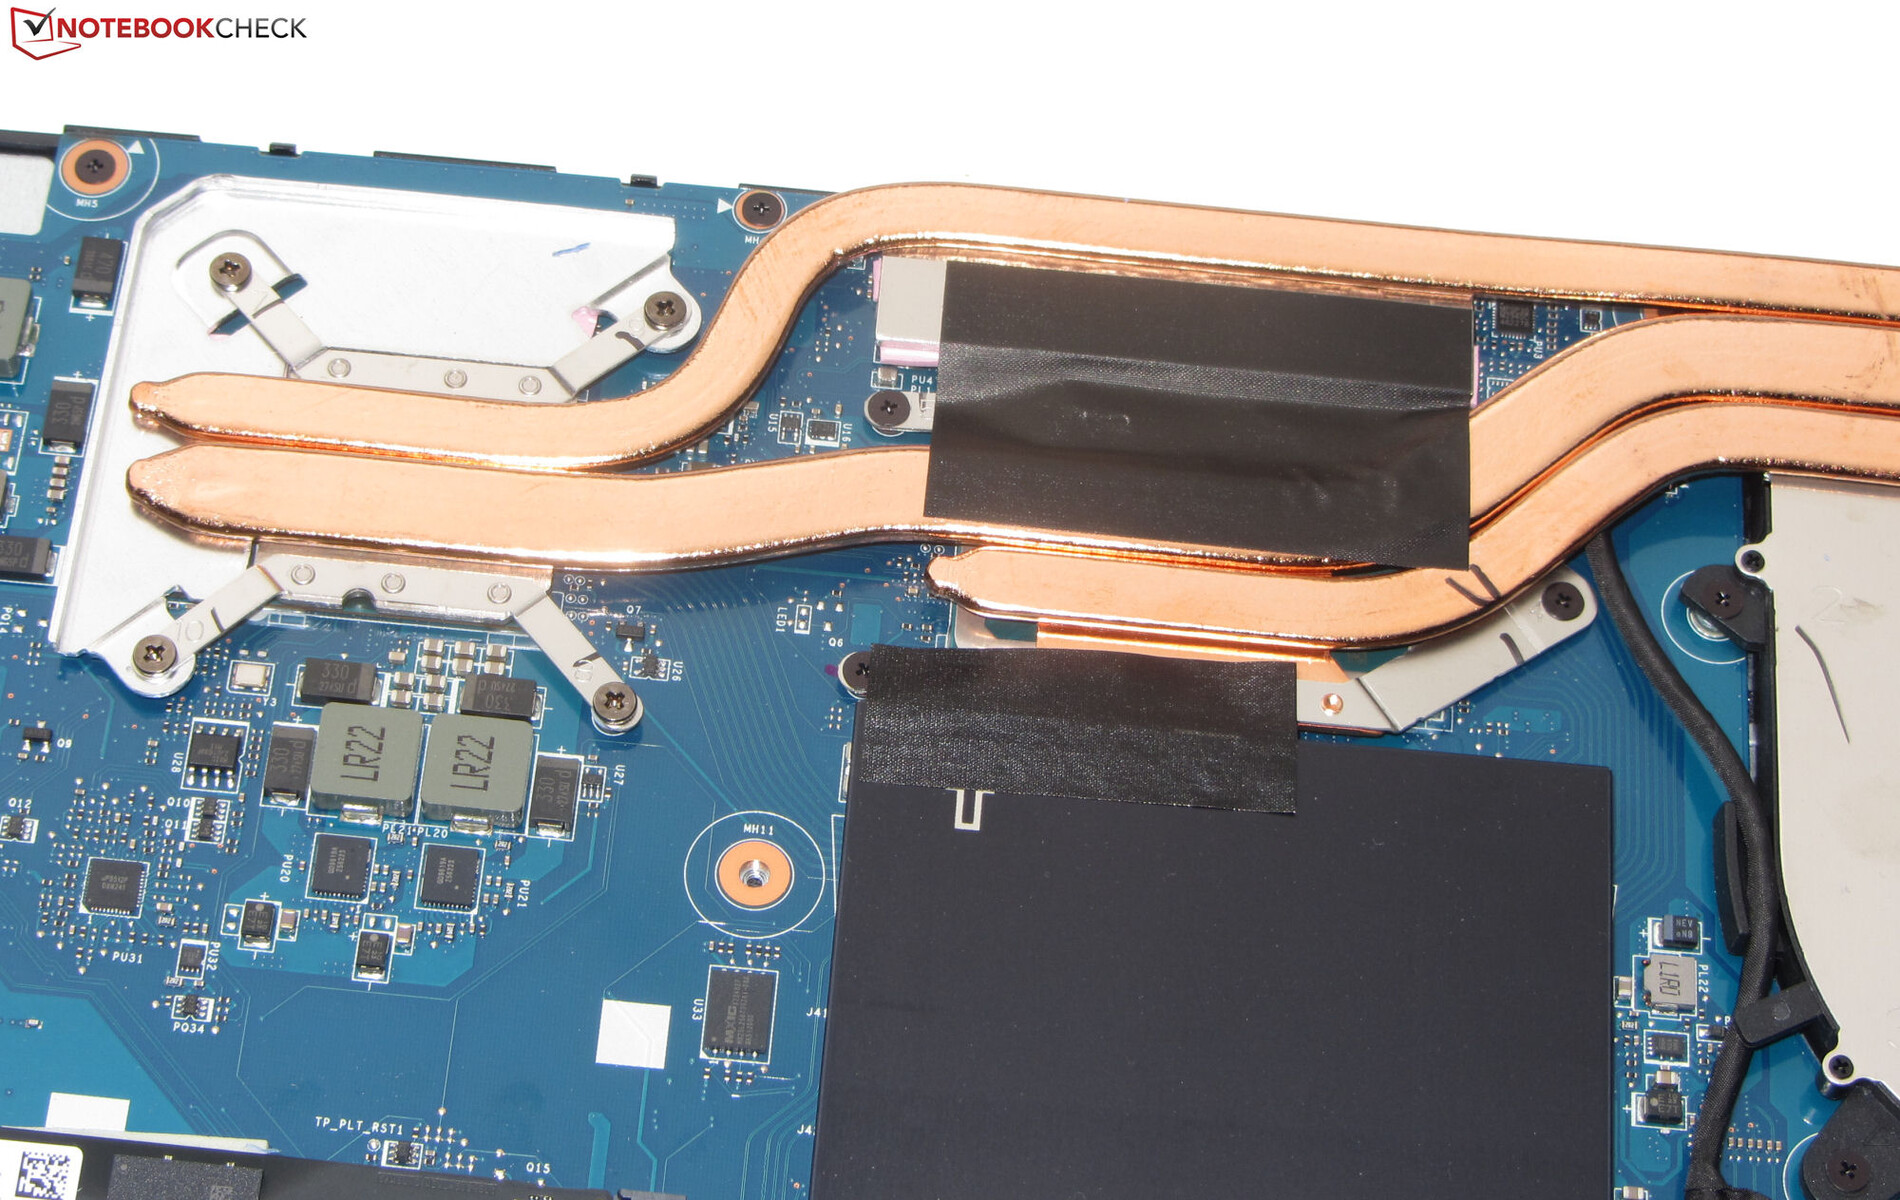
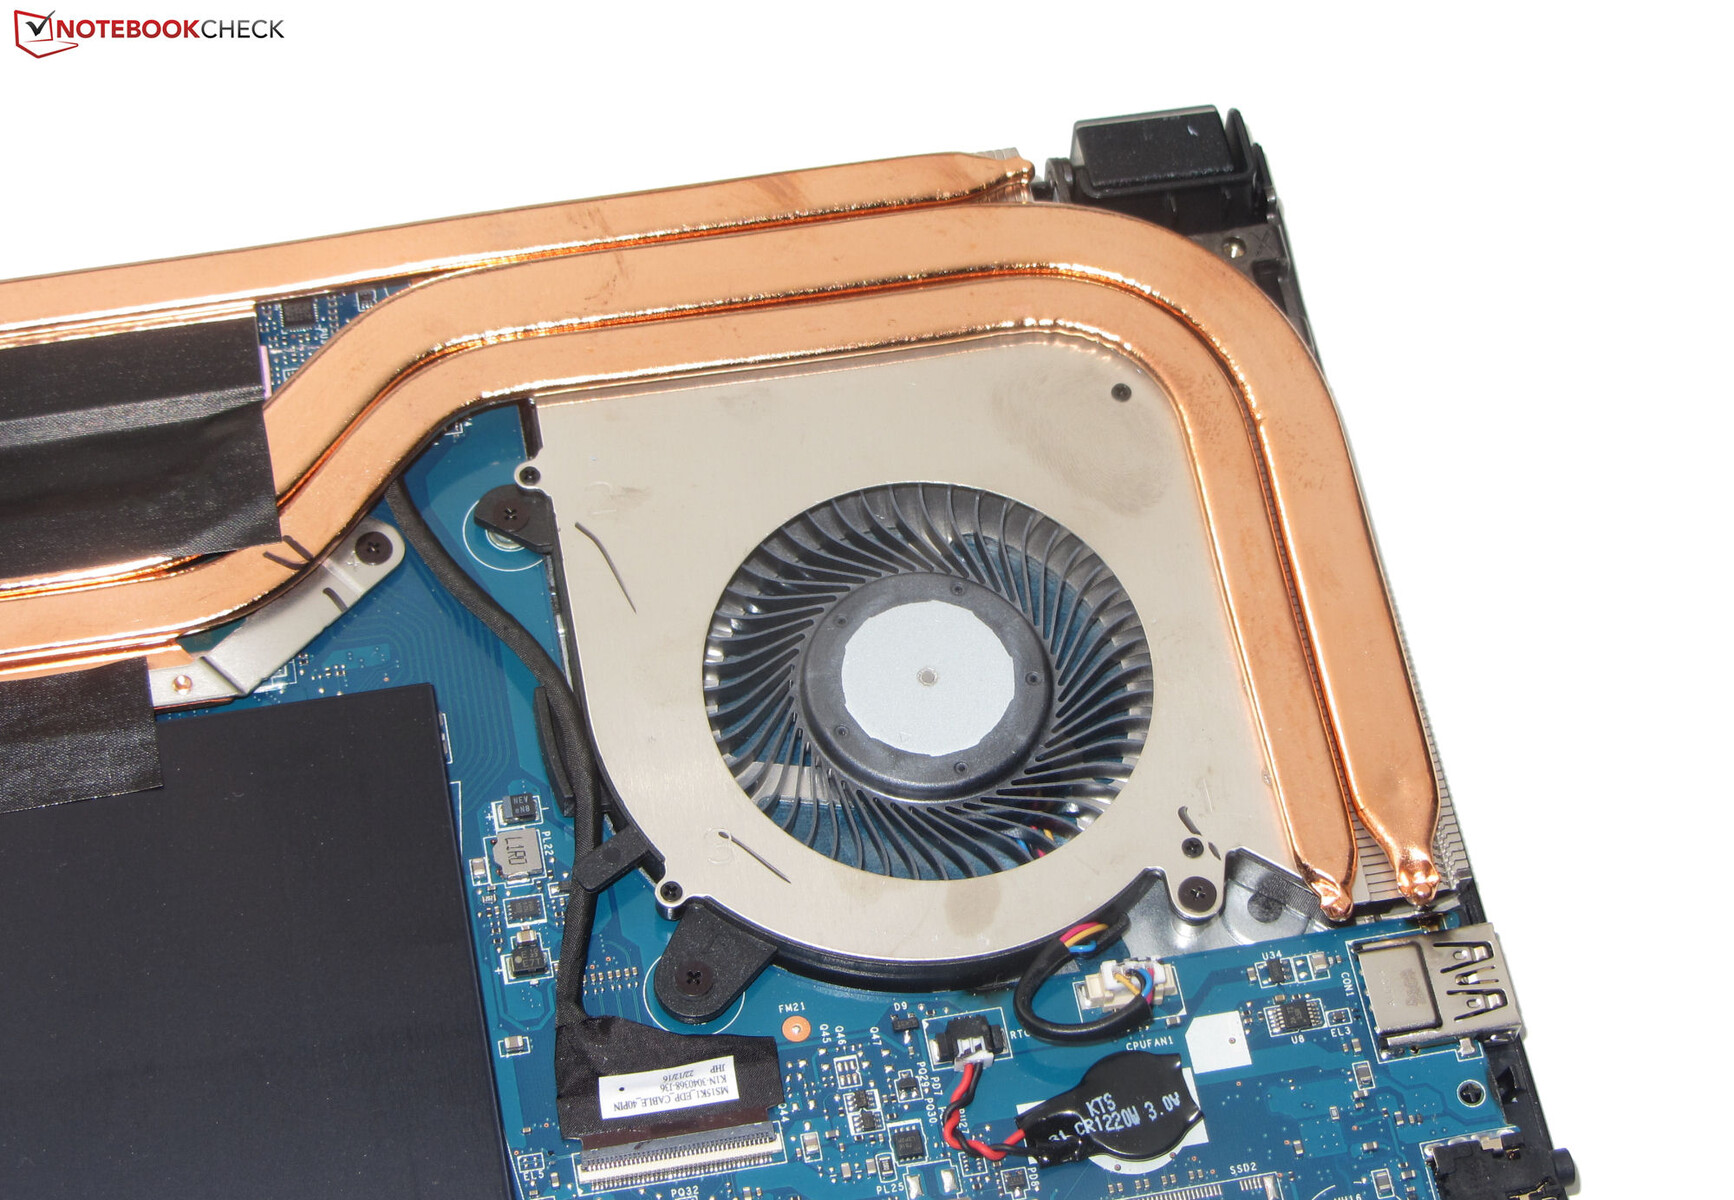
Sebbene il portatile non si scaldi particolarmente, il suo livello di rumorosità massima è al solito elevato per la categoria dei portatili. Inoltre, la ventola rimane costantemente udibile durante il funzionamento inattivo. Ci saremmo aspettati di più. Questo potrebbe essere il prezzo della rinuncia a una seconda ventola e alla relativa heat pipe. Oltre al sistema di raffreddamento, il display (FHD, 144 Hz, IPS) rappresenta un altro punto debole del portatile, con una luminosità e una copertura dello spazio colore troppo basse.
Un'alternativa potrebbe essere il Asus TUF Gaming A16 FA617. Offre prestazioni di calcolo paragonabili, ma vanta una durata della batteria significativamente più lunga, uno schermo migliore e uno sviluppo del rumore massimo inferiore. D'altra parte, questo portatile consuma molta più energia sotto carico rispetto al Cyborg 15.
Prezzo e disponibilità
MSI Cyborg 15 A12VF
- 04/09/2023 v7 (old)
Sascha Mölck
Transparency
La selezione dei dispositivi da recensire viene effettuata dalla nostra redazione. Il campione di prova è stato fornito all'autore come prestito dal produttore o dal rivenditore ai fini di questa recensione. L'istituto di credito non ha avuto alcuna influenza su questa recensione, né il produttore ne ha ricevuto una copia prima della pubblicazione. Non vi era alcun obbligo di pubblicare questa recensione. In quanto società mediatica indipendente, Notebookcheck non è soggetta all'autorità di produttori, rivenditori o editori.
Ecco come Notebookcheck esegue i test
Ogni anno, Notebookcheck esamina in modo indipendente centinaia di laptop e smartphone utilizzando procedure standardizzate per garantire che tutti i risultati siano comparabili. Da circa 20 anni sviluppiamo continuamente i nostri metodi di prova e nel frattempo stabiliamo gli standard di settore. Nei nostri laboratori di prova, tecnici ed editori esperti utilizzano apparecchiature di misurazione di alta qualità. Questi test comportano un processo di validazione in più fasi. Il nostro complesso sistema di valutazione si basa su centinaia di misurazioni e parametri di riferimento ben fondati, che mantengono l'obiettività.Price comparison

