Recensione del portatile HP Victus 15: Costoso per essere un dispositivo gaming economico
La serie Victus di HP consiste in computer portatili da gioco economici che si contrappongono alla serie Omen, di fascia più alta, del produttore. Per questo motivo, i modelli Victus hanno specifiche di fascia bassa e opzioni di configurazione limitate, al fine di mantenere i prezzi bassi e competitivi. Finora la serie è composta da due modelli: Victus 15 da 15,6 pollici e Victus 16 da 16,1 pollici Victus 16.
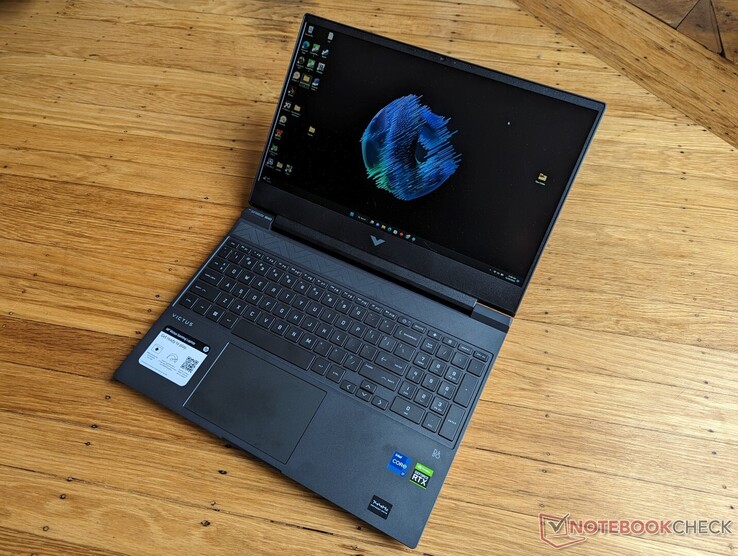
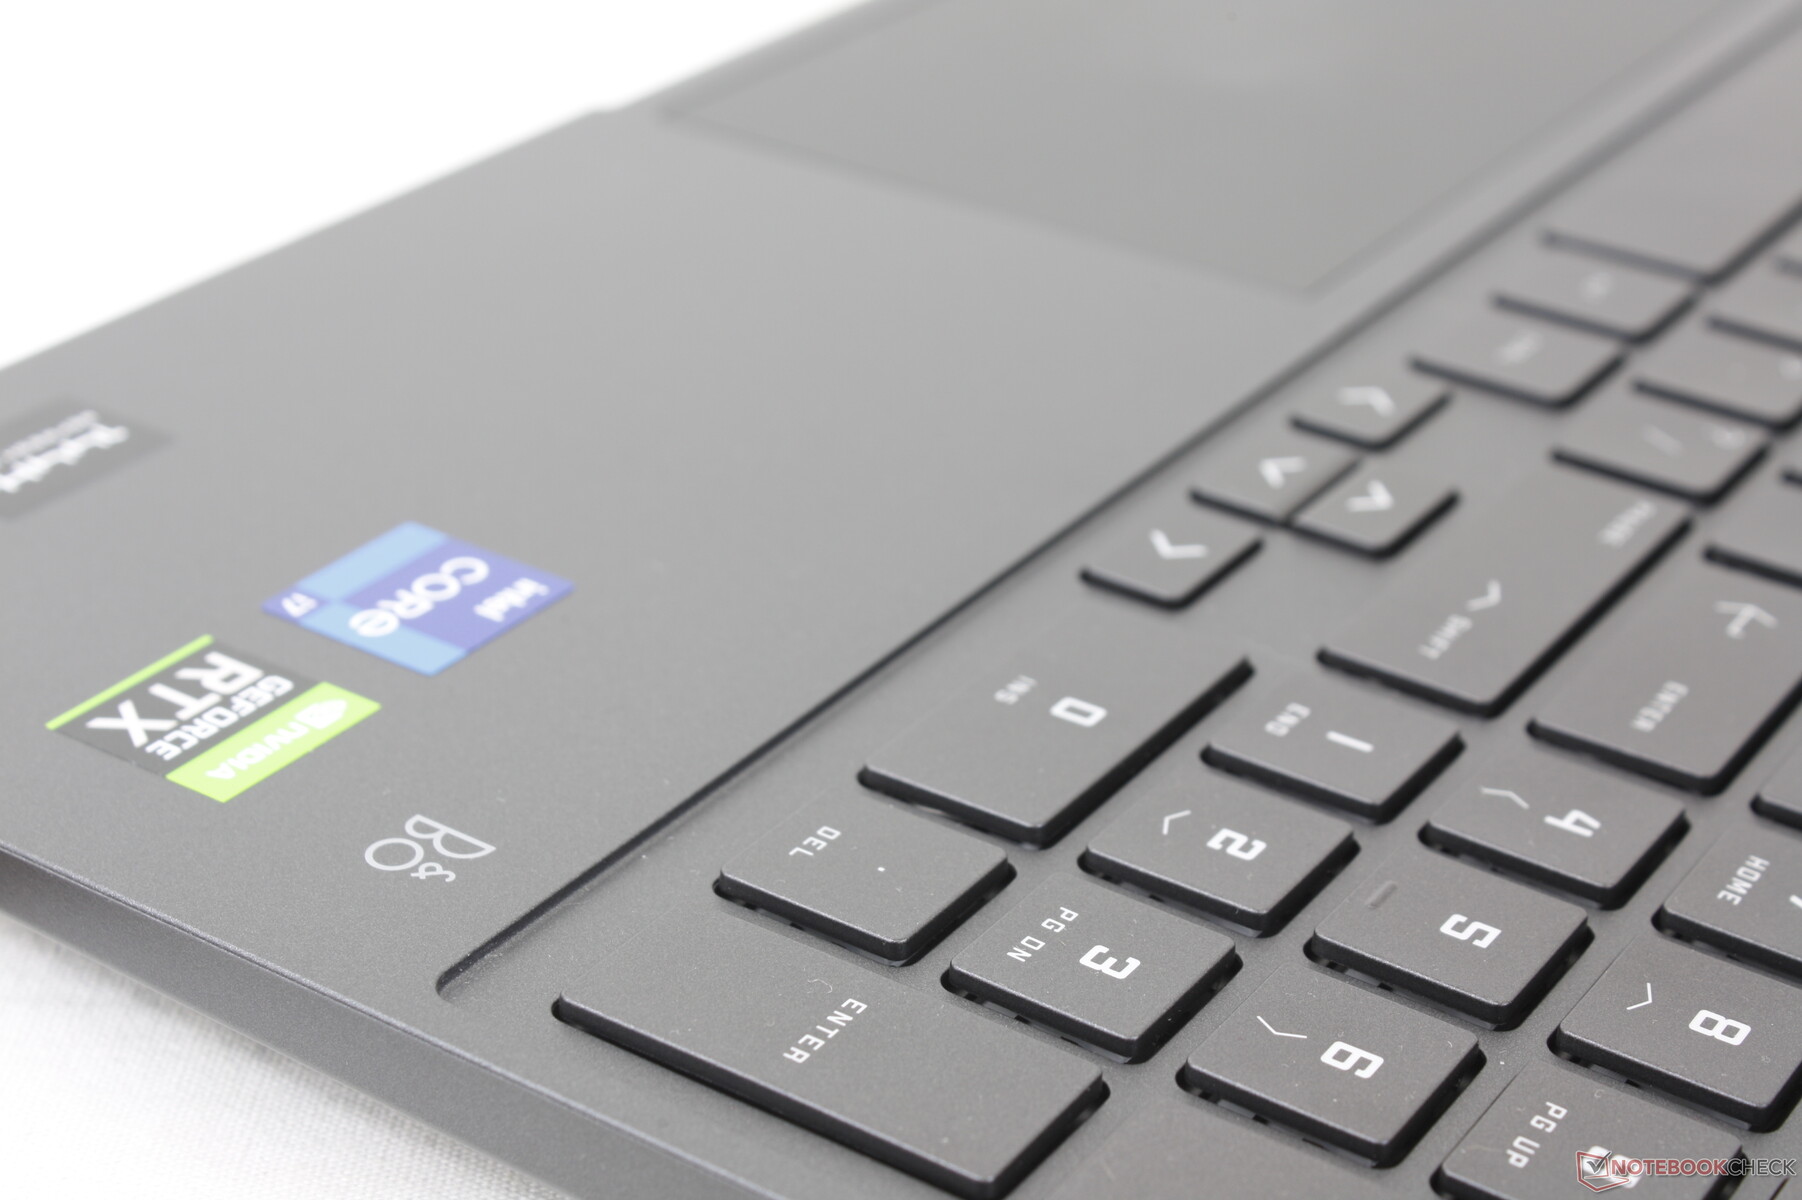
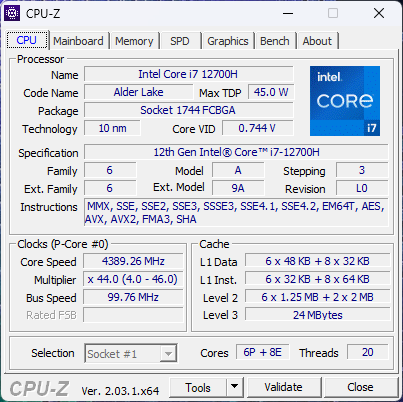
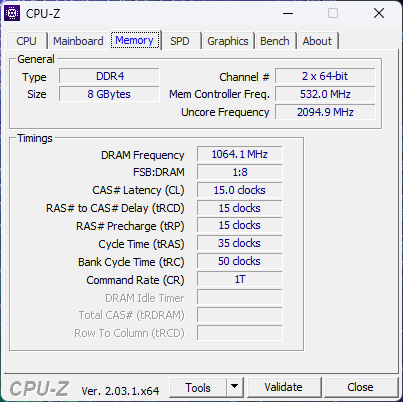
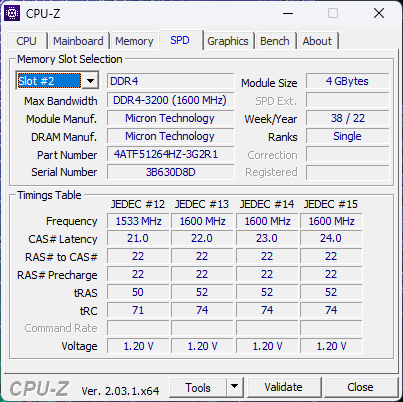
La nostra unità di prova è il Victus 15 dotato di CPU Intel Core i7-12700H di 12a generazione, GeForce RTX 3050 Ti, display IPS 1080p a 144 Hz e solo 8 GB di RAM per un prezzo al dettaglio di circa 1200-1300 dollari. Sono disponibili SKU inferiori con Core i7-12650H, AMD Ryzen 7 5800H, RTX 3050 o display 1080p a 60 Hz per diverse centinaia di dollari in meno, ma la nostra configurazione di CPU e GPU è la più alta per questo modello.
Tra i concorrenti del Victus 15 ci sono altri portatili da gioco da 15,6 pollici di fascia entry-level come i modelli Dell G5 15, Lenovo IdeaPad Gaming 3, MSI GF o Serie GPo la serie Asus serie TUF.
Altre recensioni di HP:
Potenziali concorrenti a confronto
Punteggio | Data | Modello | Peso | Altezza | Dimensione | Risoluzione | Prezzo |
|---|---|---|---|---|---|---|---|
| 81 % v7 (old) | 01/2023 | HP Victus 15 fa0020nr i7-12700H, GeForce RTX 3050 Ti Laptop GPU | 2.3 kg | 23.6 mm | 15.60" | 1920x1080 | |
| 82.8 % v7 (old) | 01/2021 | HP Omen 15-en0375ng R7 4800H, GeForce RTX 2060 Mobile | 2.2 kg | 23 mm | 15.60" | 1920x1080 | |
| 82.7 % v7 (old) | 10/2021 | Dell G15 5515 R7 5800H, GeForce RTX 3050 Ti Laptop GPU | 2.4 kg | 24.9 mm | 15.60" | 1920x1080 | |
| 84.9 % v7 (old) | 08/2022 | Asus TUF Dash F15 FX517ZC i7-12650H, GeForce RTX 3050 4GB Laptop GPU | 1.9 kg | 20.7 mm | 15.60" | 2560x1440 | |
| 78.2 % v7 (old) | 04/2022 | MSI Bravo 15 B5DD-010US R5 5600H, Radeon RX 5500M | 2.3 kg | 24.95 mm | 15.60" | 1920x1080 | |
| 87.5 % v7 (old) | 11/2022 | Lenovo Legion 5 15IAH7H 82RB i7-12700H, GeForce RTX 3060 Laptop GPU | 2.4 kg | 19.99 mm | 15.60" | 1920x1080 |
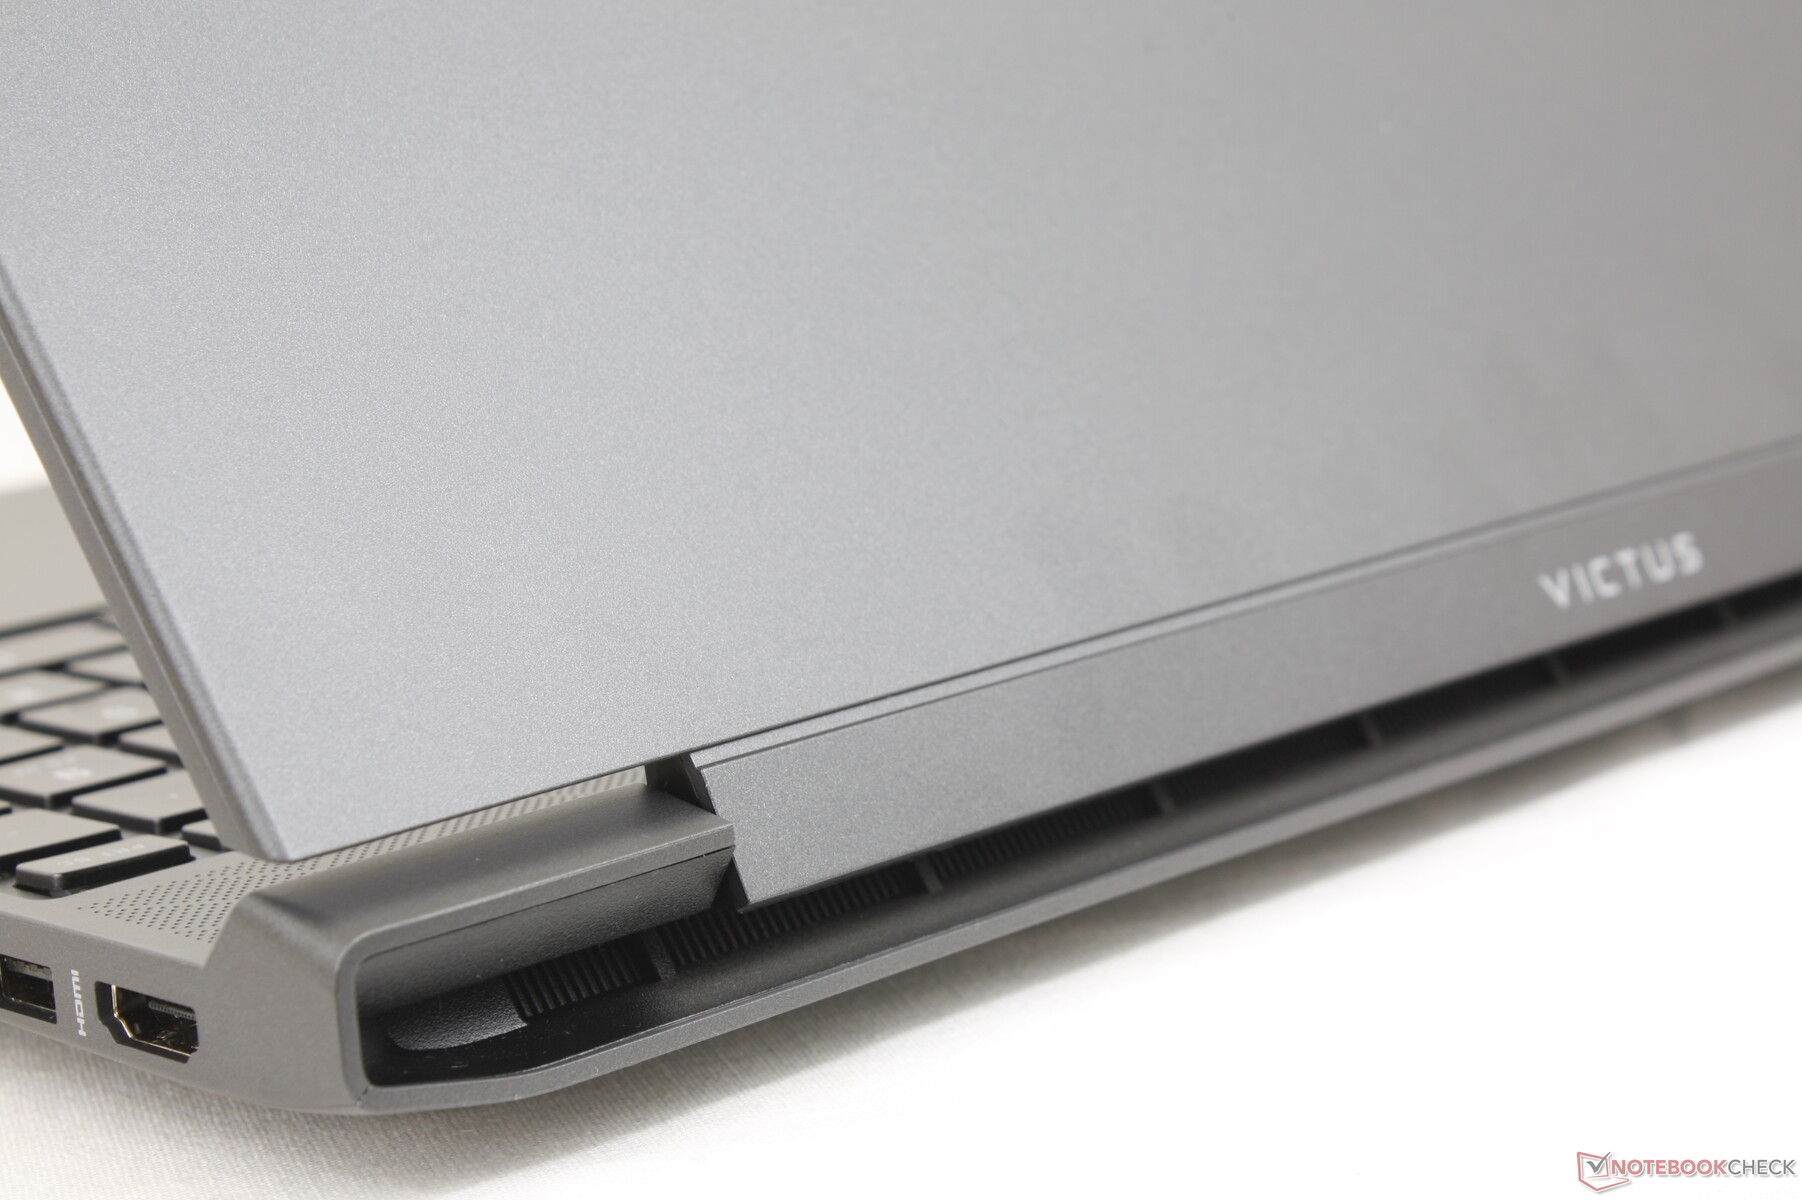
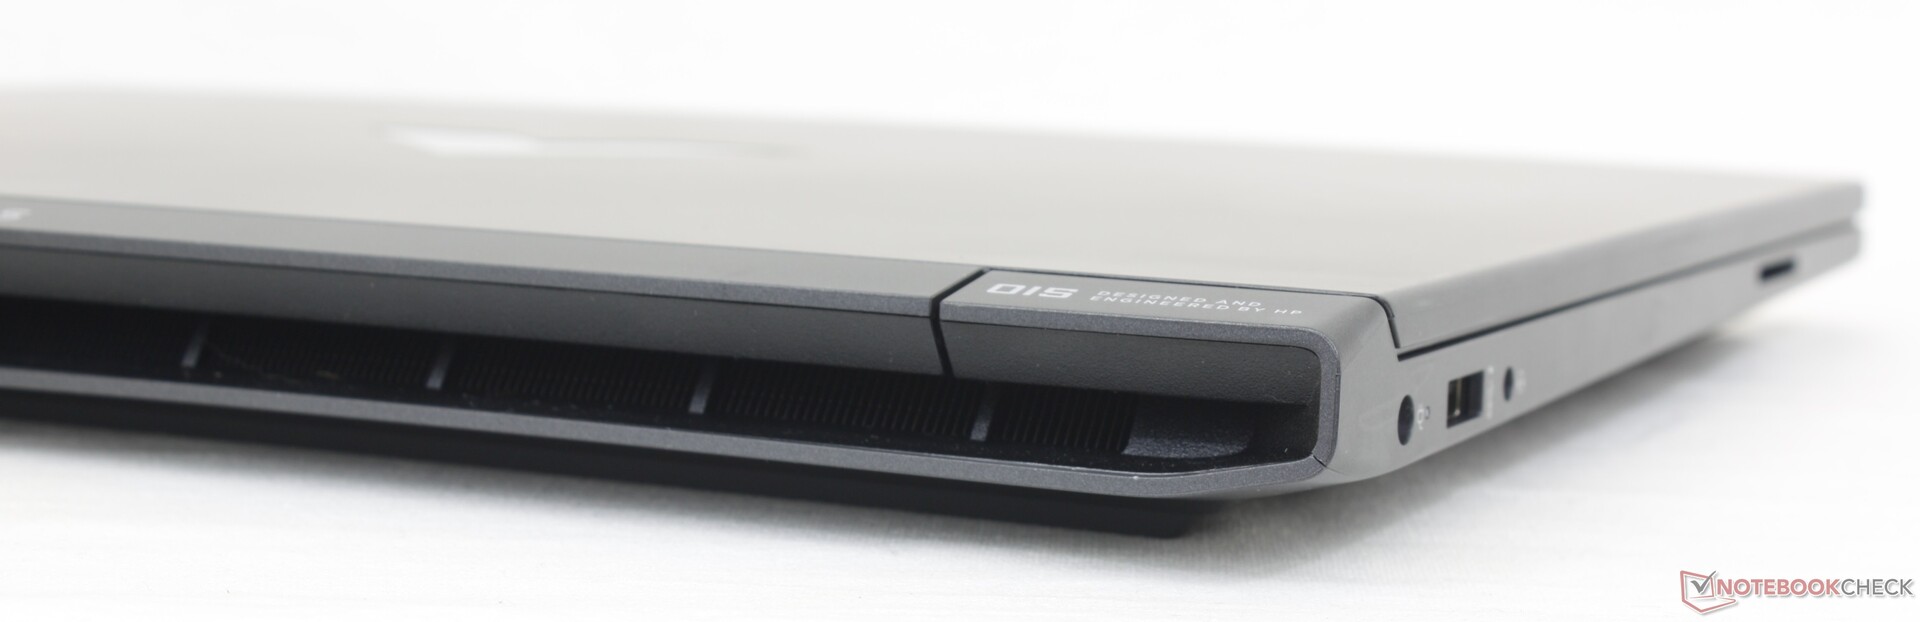
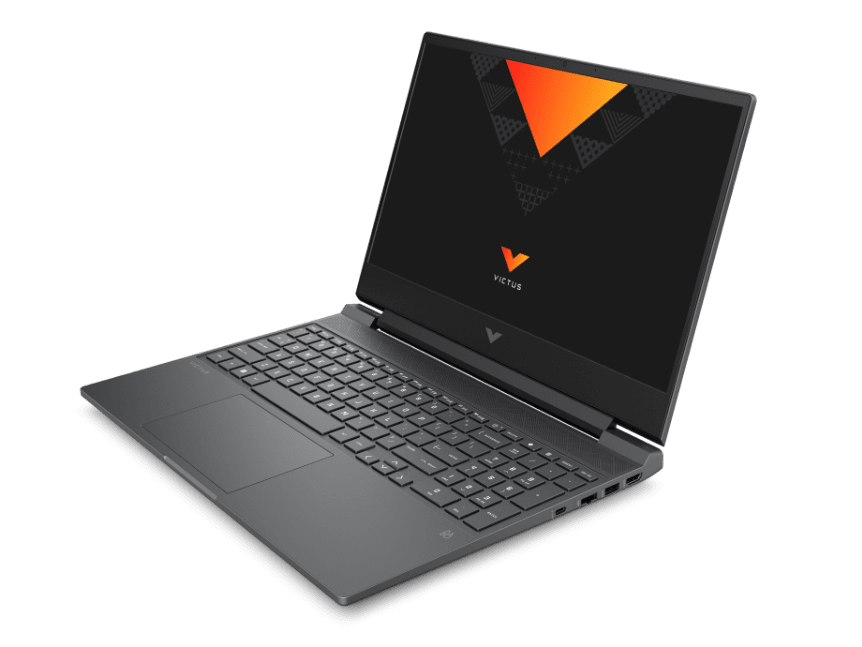
Case - Un bell'aspetto con un budget limitato
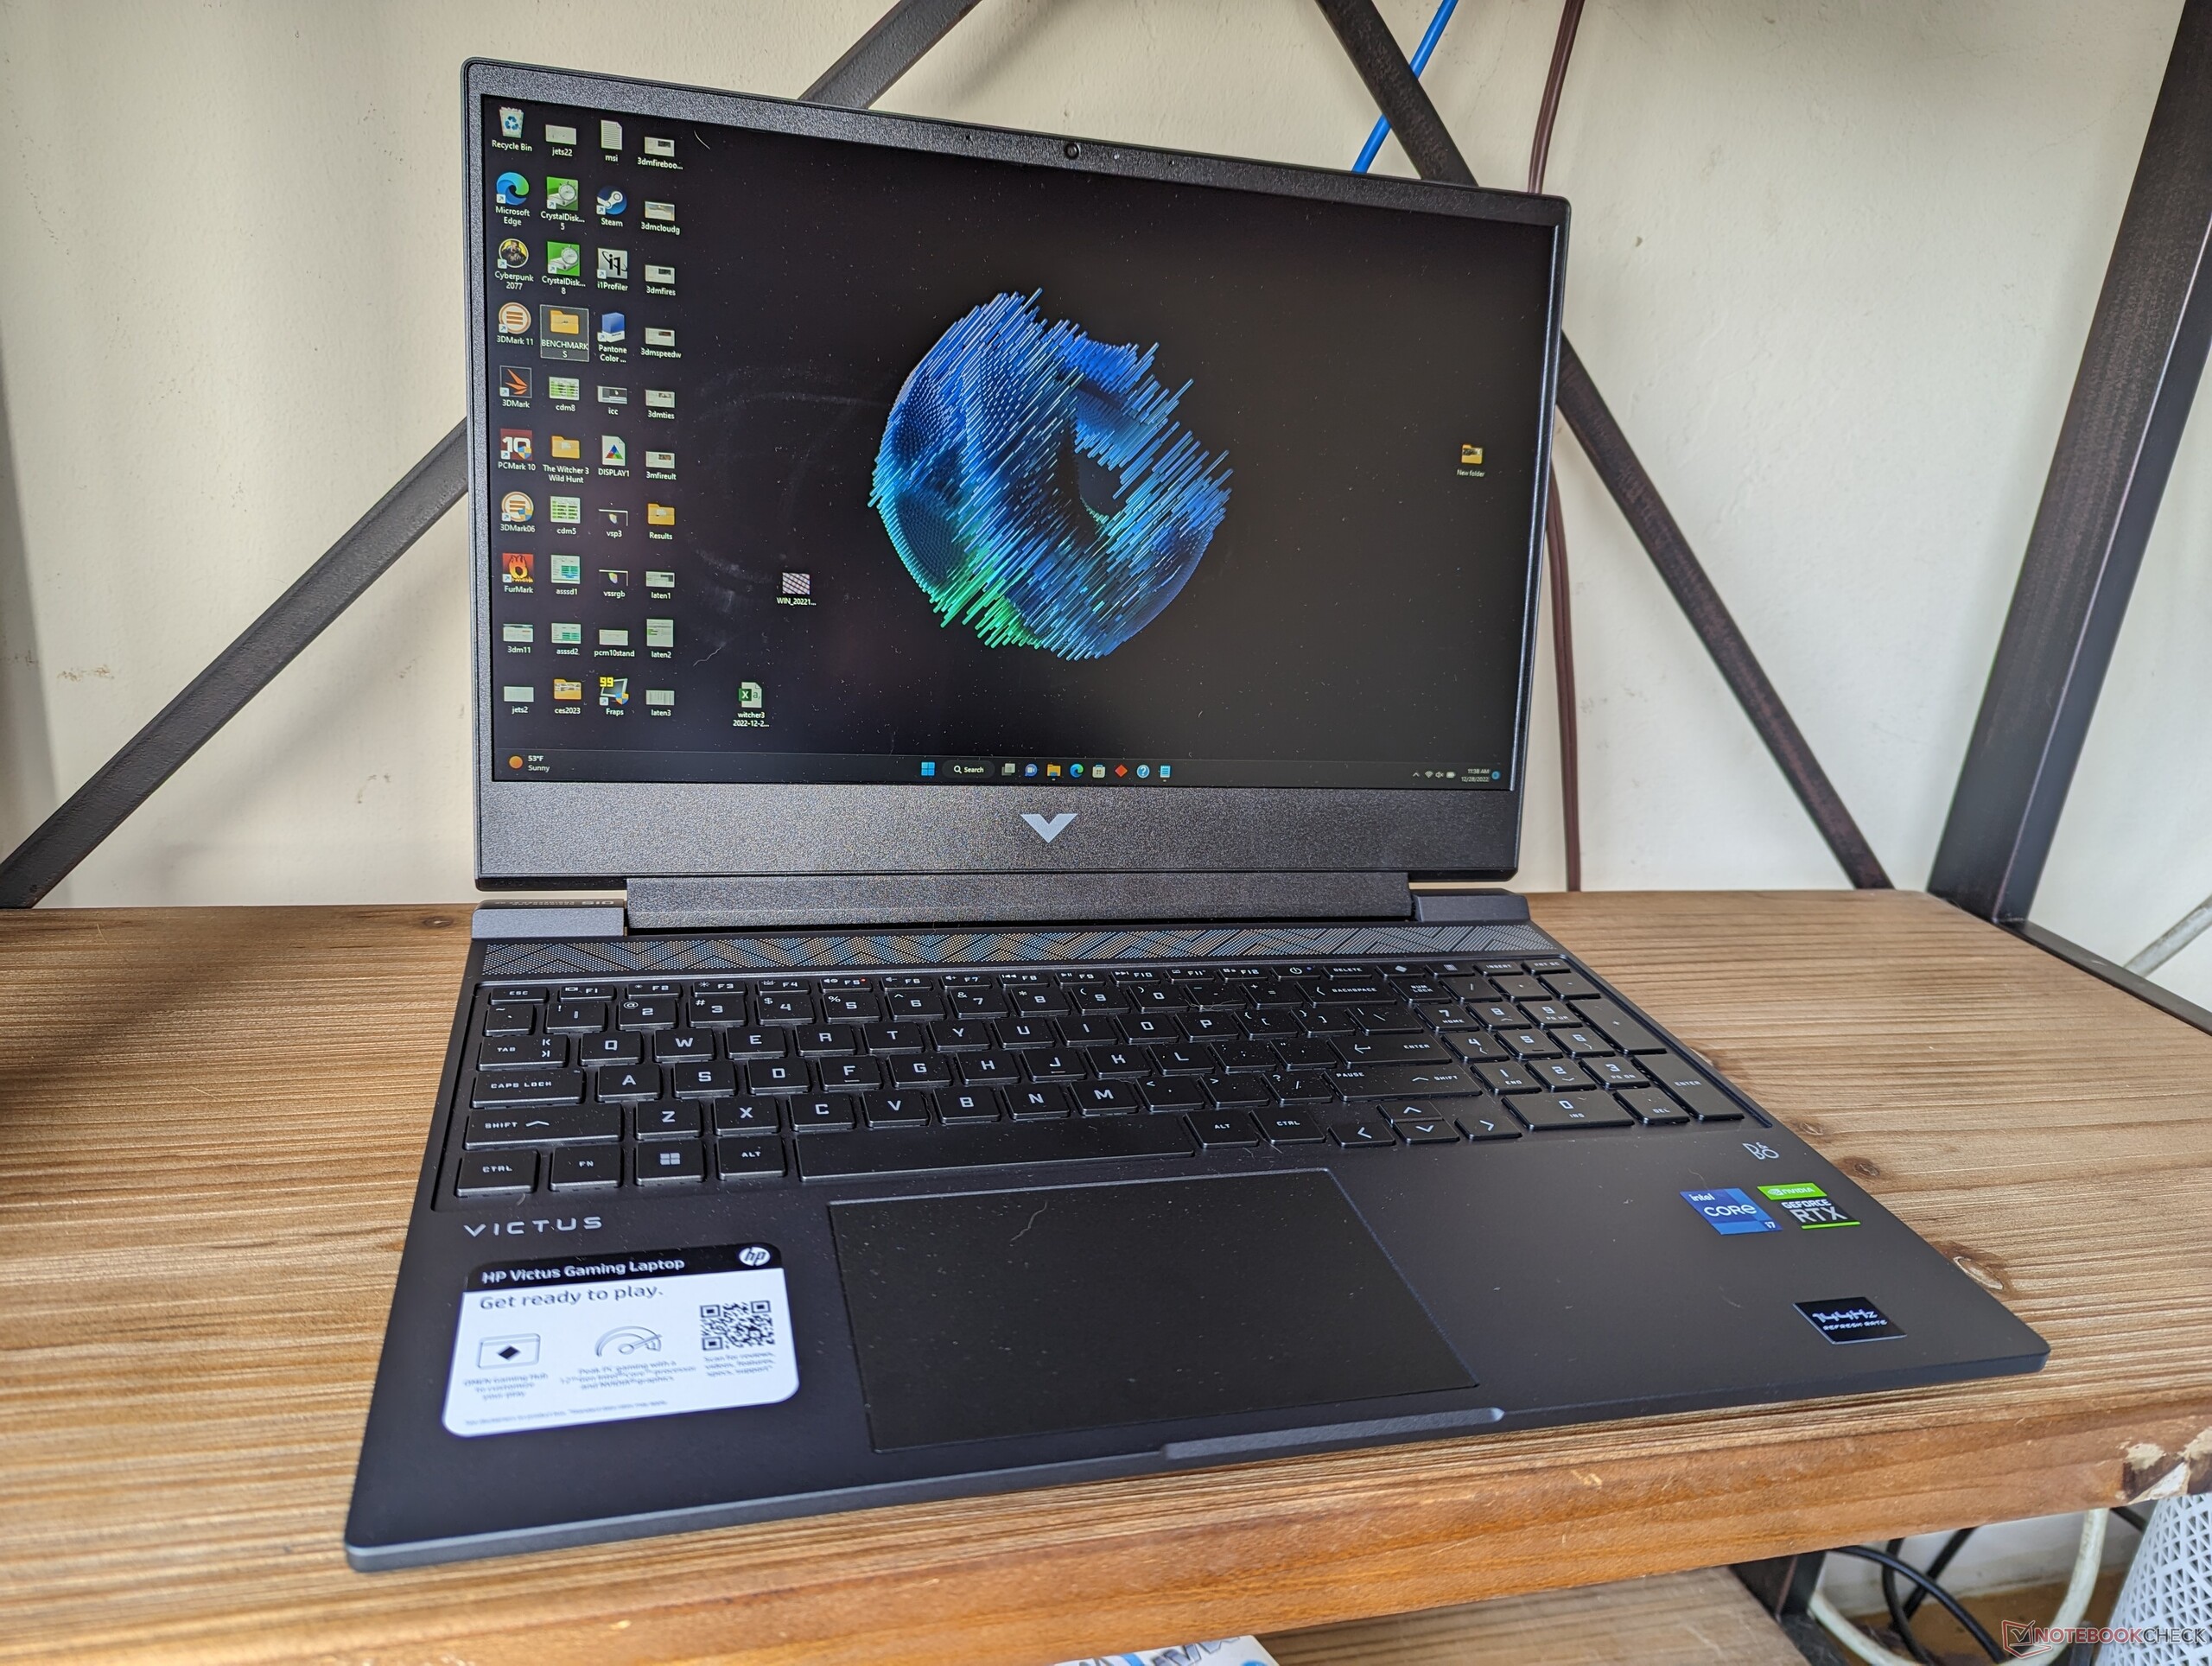
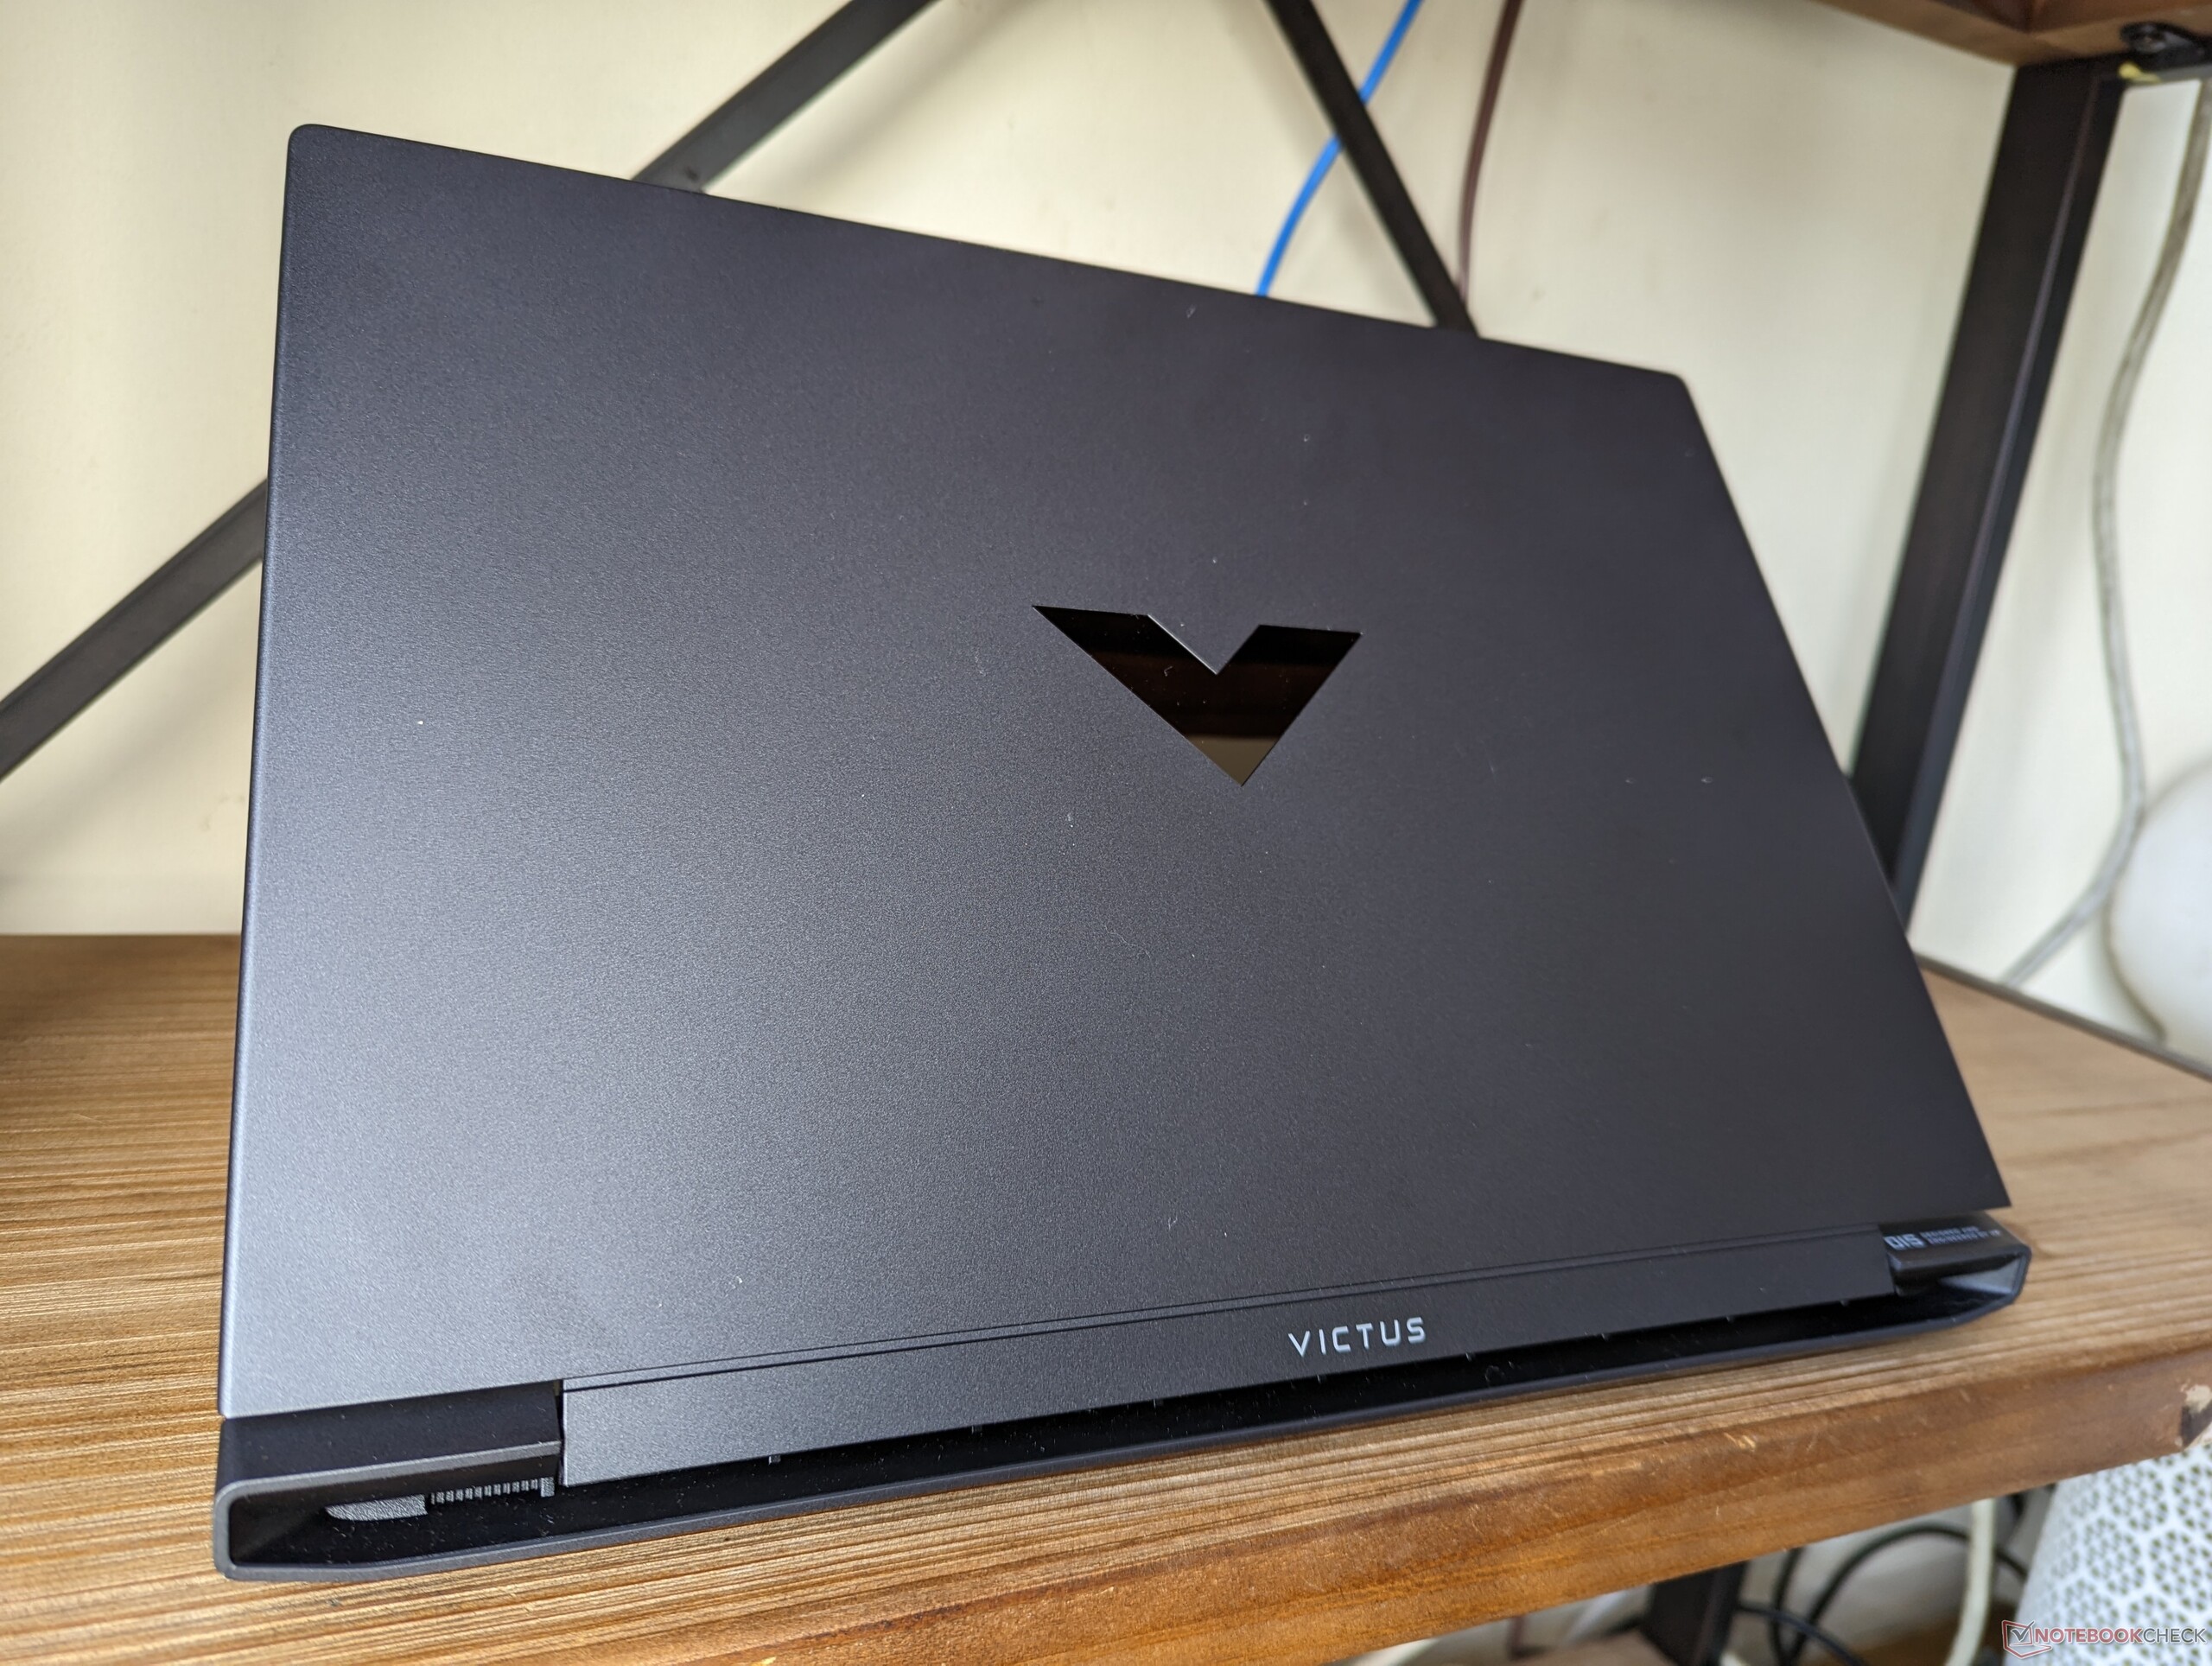
Lo chassis è caratterizzato da contorni più netti e da una parte posteriore più ampia, in contrasto con l'aspetto più semplice e squadrato dell' Omen 15 o 16. Si tratta di un design inoffensivo completamente nero, privo di accenti superficiali inutili o di un'evidente estetica "da giocatore" che altri portatili da gioco entry-level tendono ad avere.
La rigidità del telaio è un passo indietro rispetto alla serie Omen, soprattutto per quanto riguarda le cerniere. Il display tende a scricchiolare quando si regolano gli angoli e le cerniere non sembrano molto robuste quando vengono aperte completamente. Per il resto, la base è piuttosto buona per un sistema economico, con solo lievi deformazioni quando si cerca di ruotarla.
Il sistema è più grande e più pesante del più costoso Omen 15 anche se il Victus 15 è un portatile più lento. Fortunatamente non è così ingombrante come il concorrente Dell G15, ma è comunque pesante con i suoi 2,3 kg. Il Asus TUF Dash F15 è più leggero di diverse centinaia di grammi.
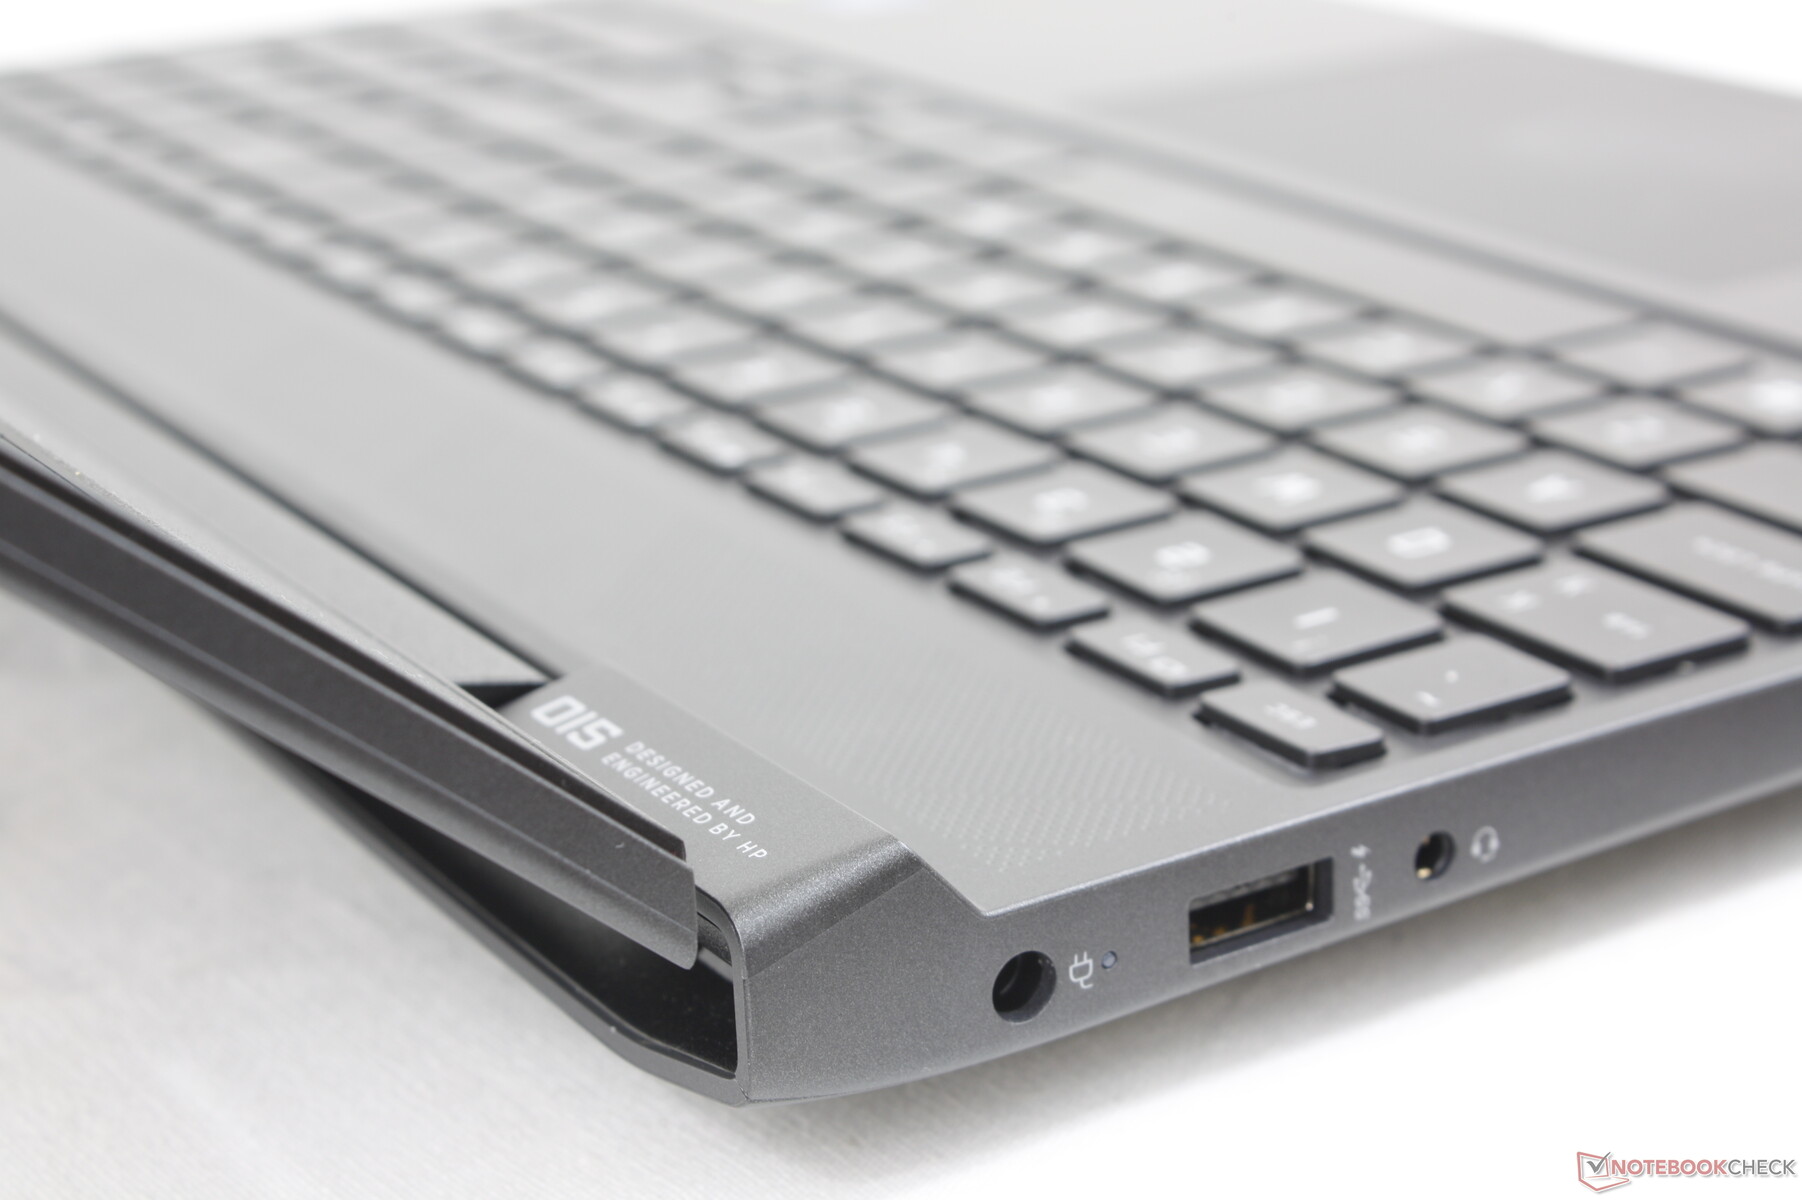
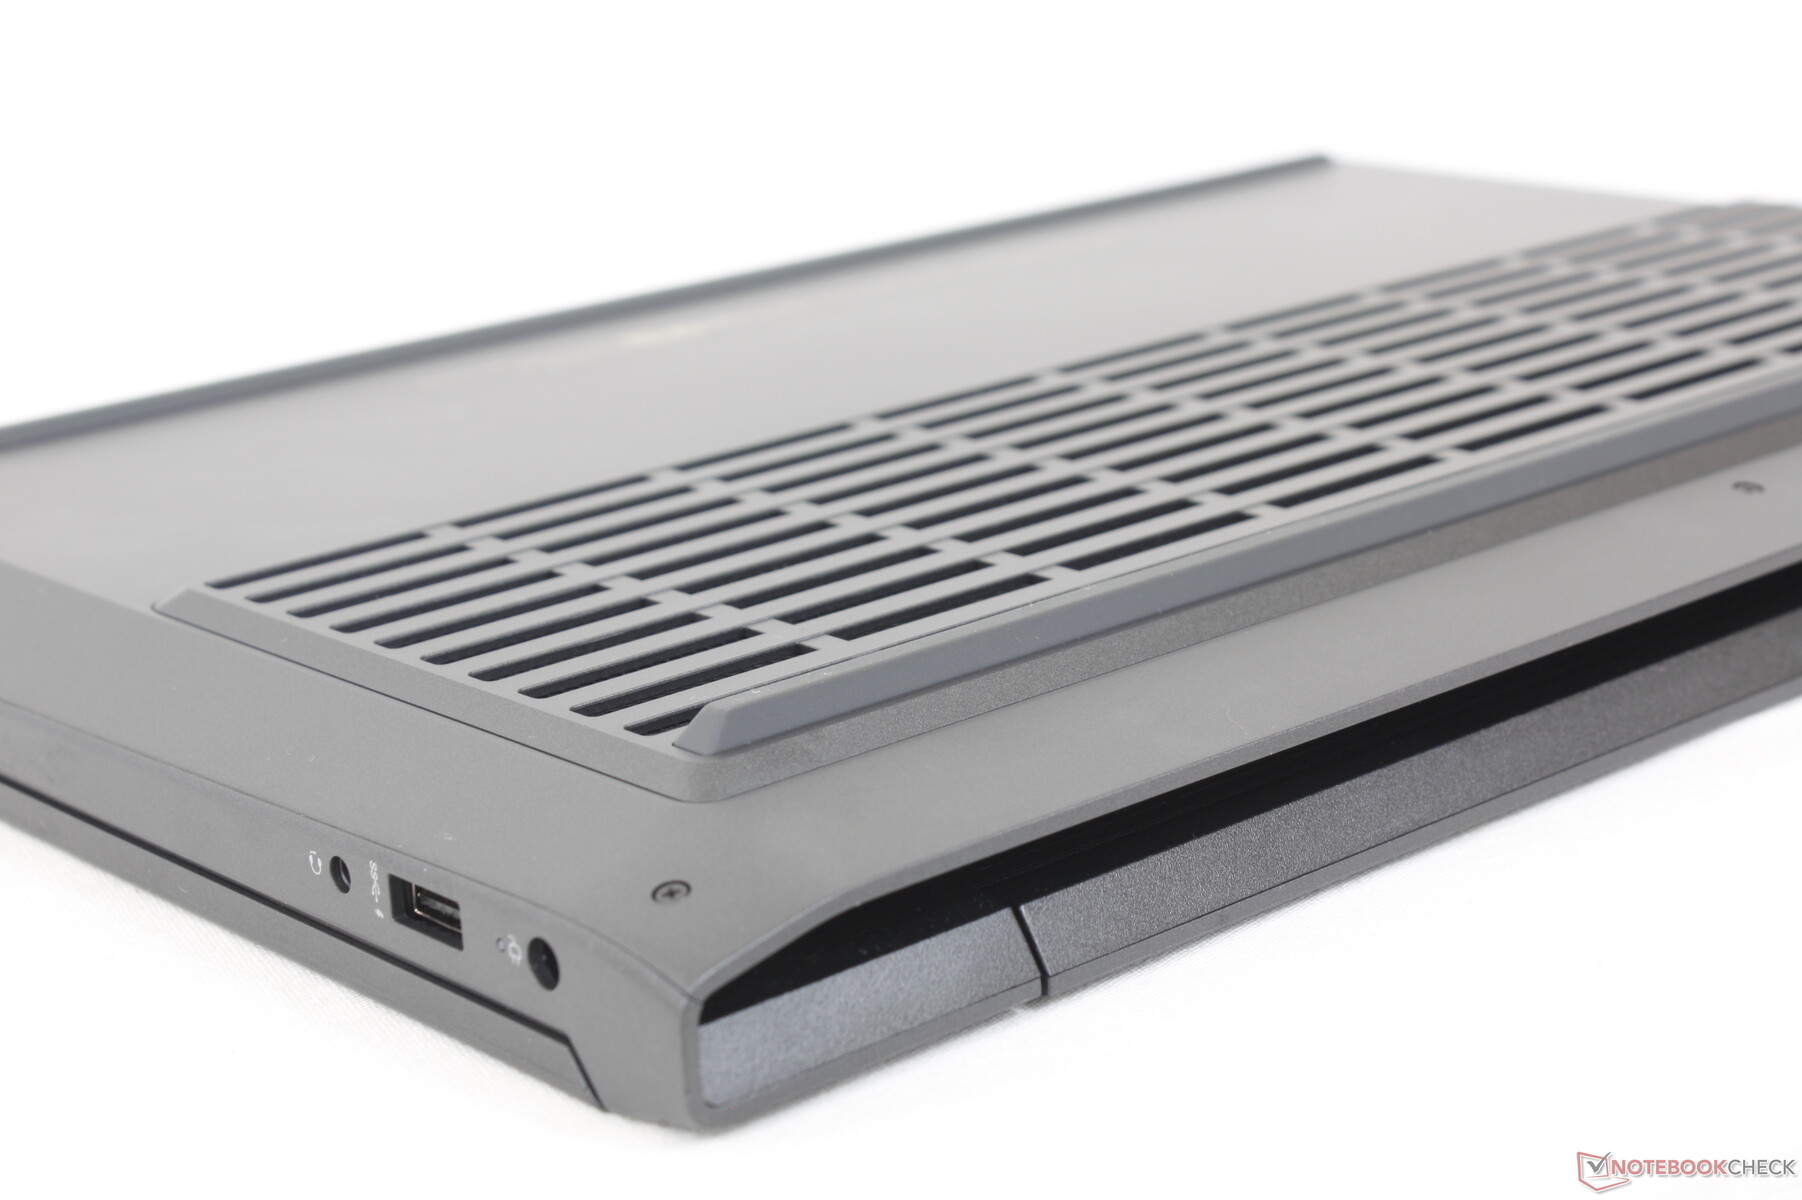
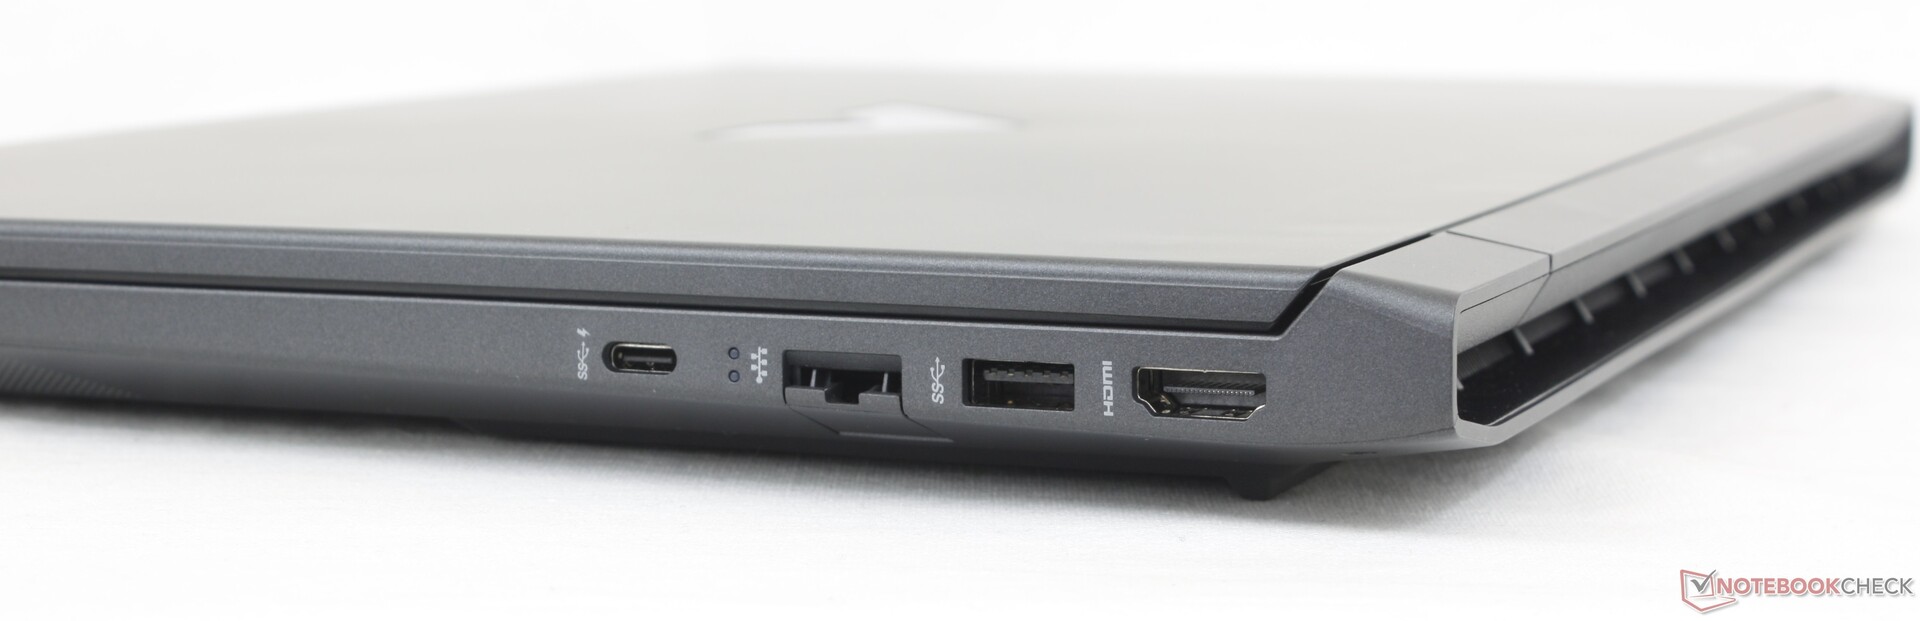
Connettività - Nessun supporto Thunderbolt
Tutte le porte dell'Omen 15 sono presenti sul Victus 15, ad eccezione di una porta USB-A. La porta Thunderbolt non è supportata, probabilmente per risparmiare sui costi.
Il posizionamento delle porte è probabilmente migliore rispetto a quello del Dell G15 o del Lenovo Legion 5 15 poiché non ci sono porte lungo la parte posteriore dell'HP per facilitarne il raggiungimento.
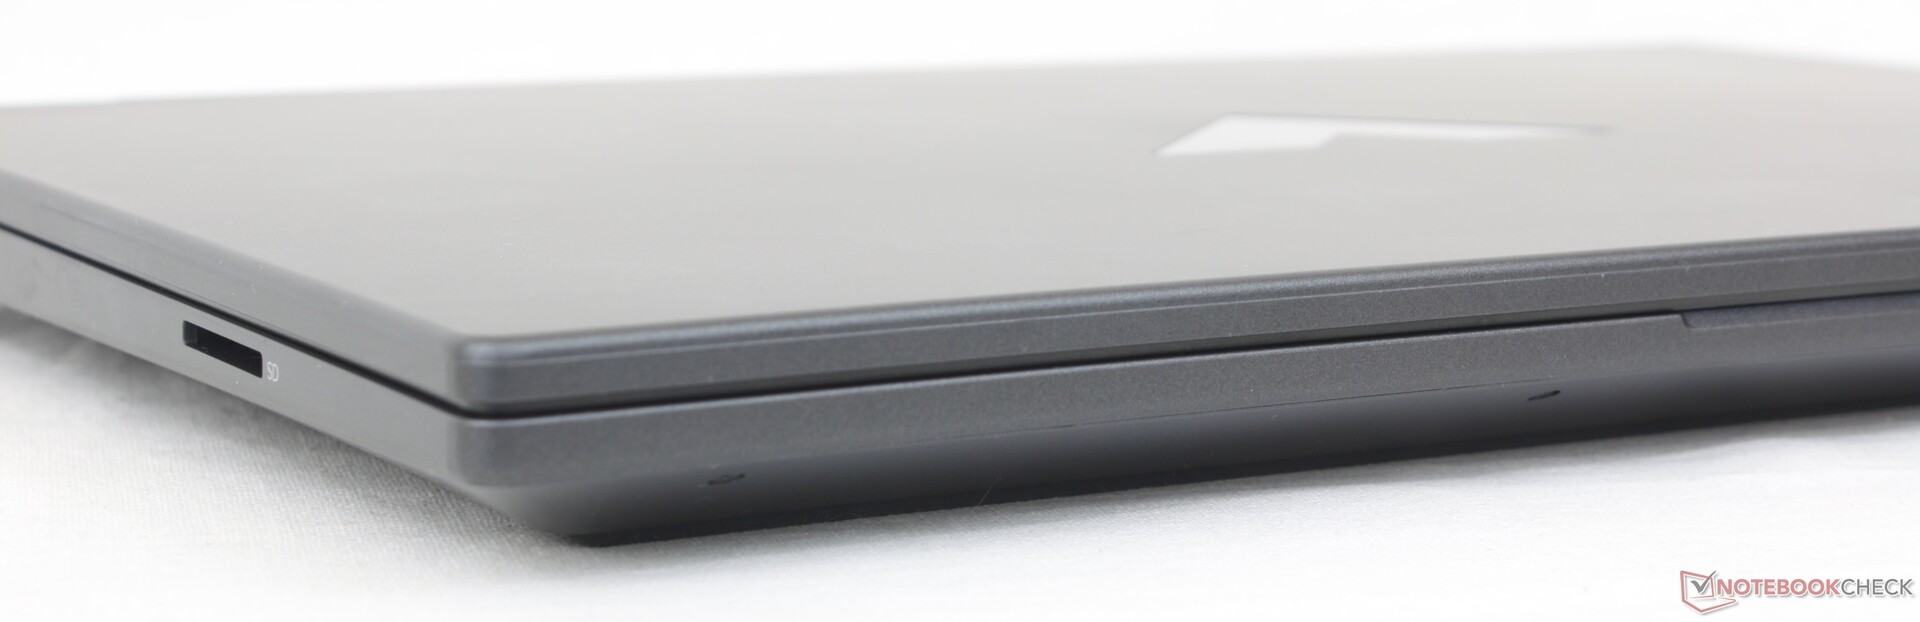
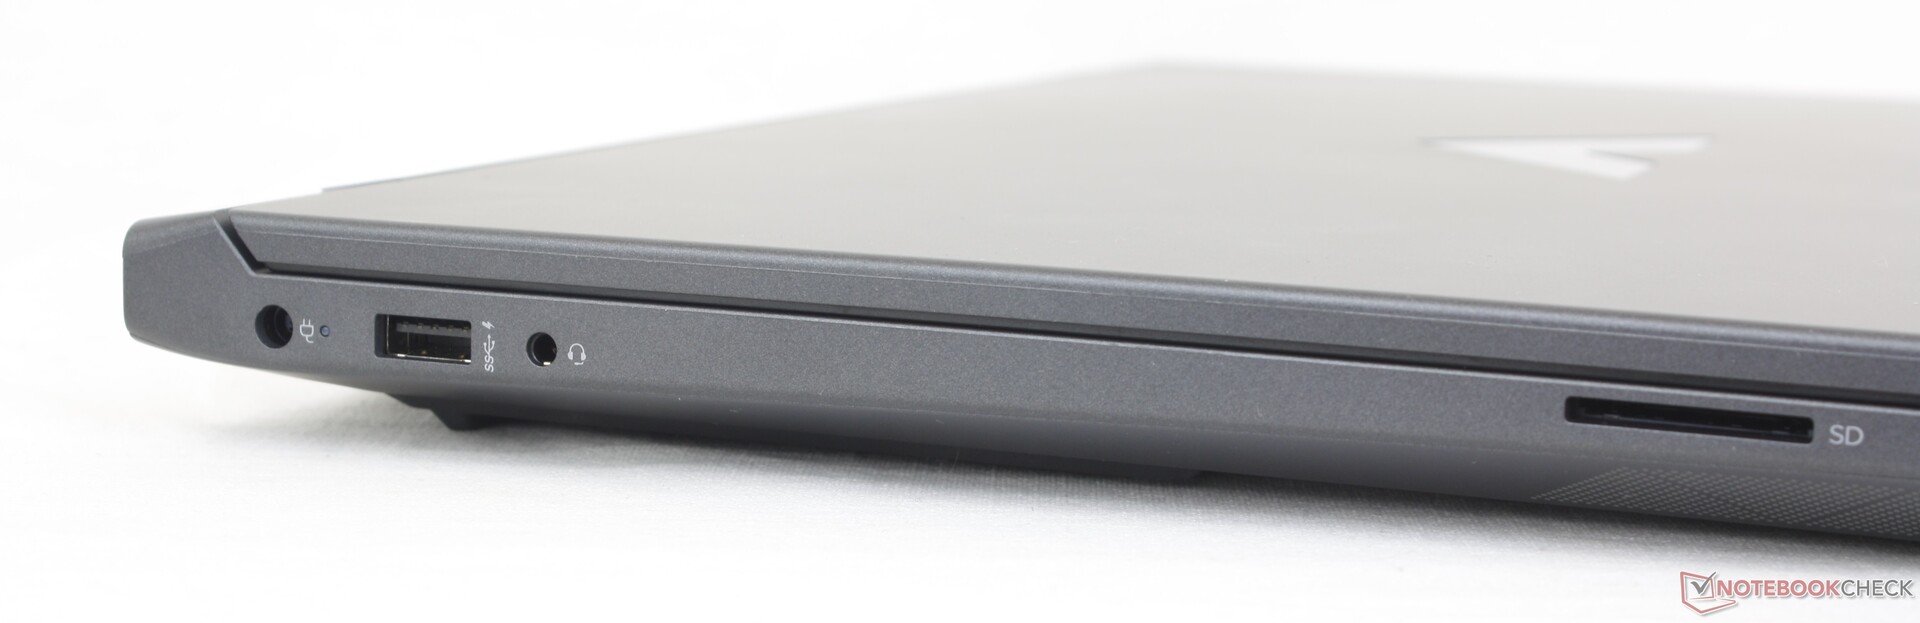
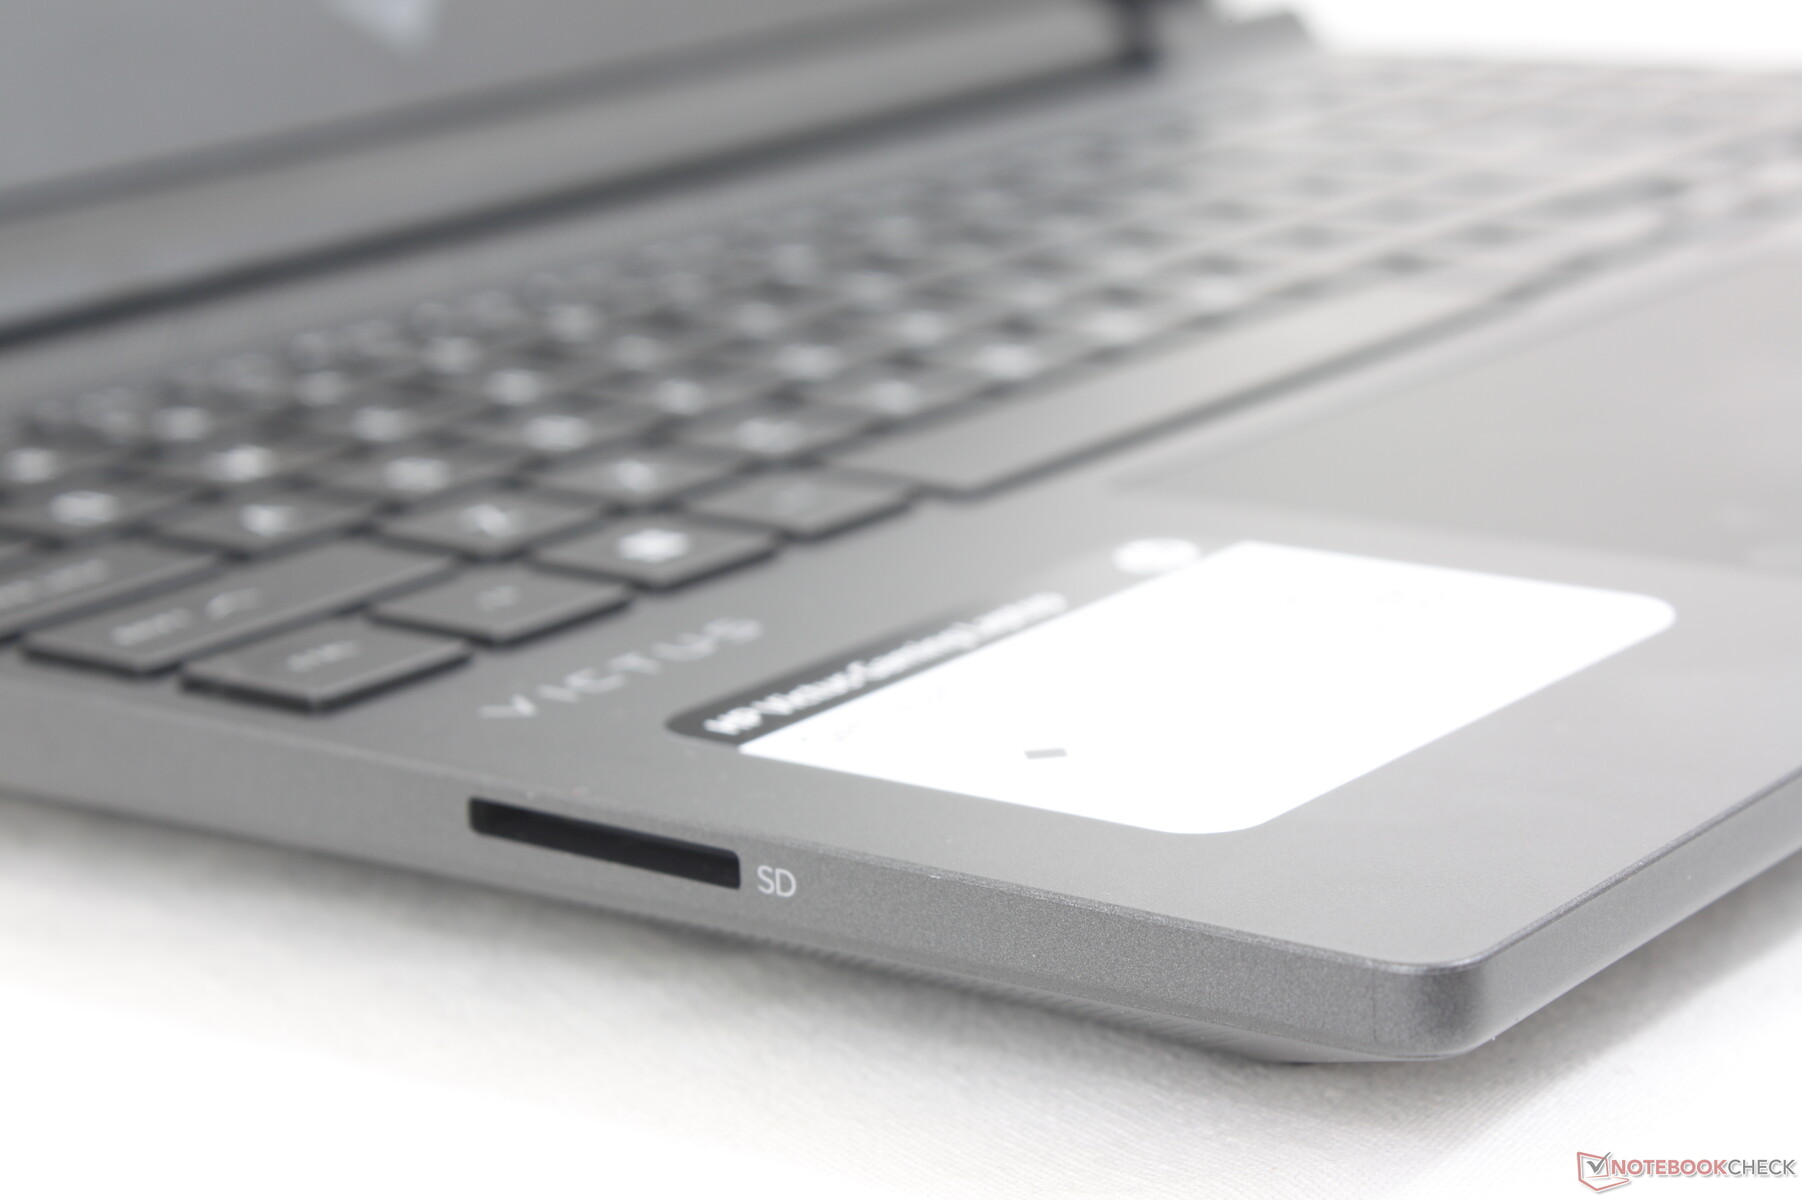
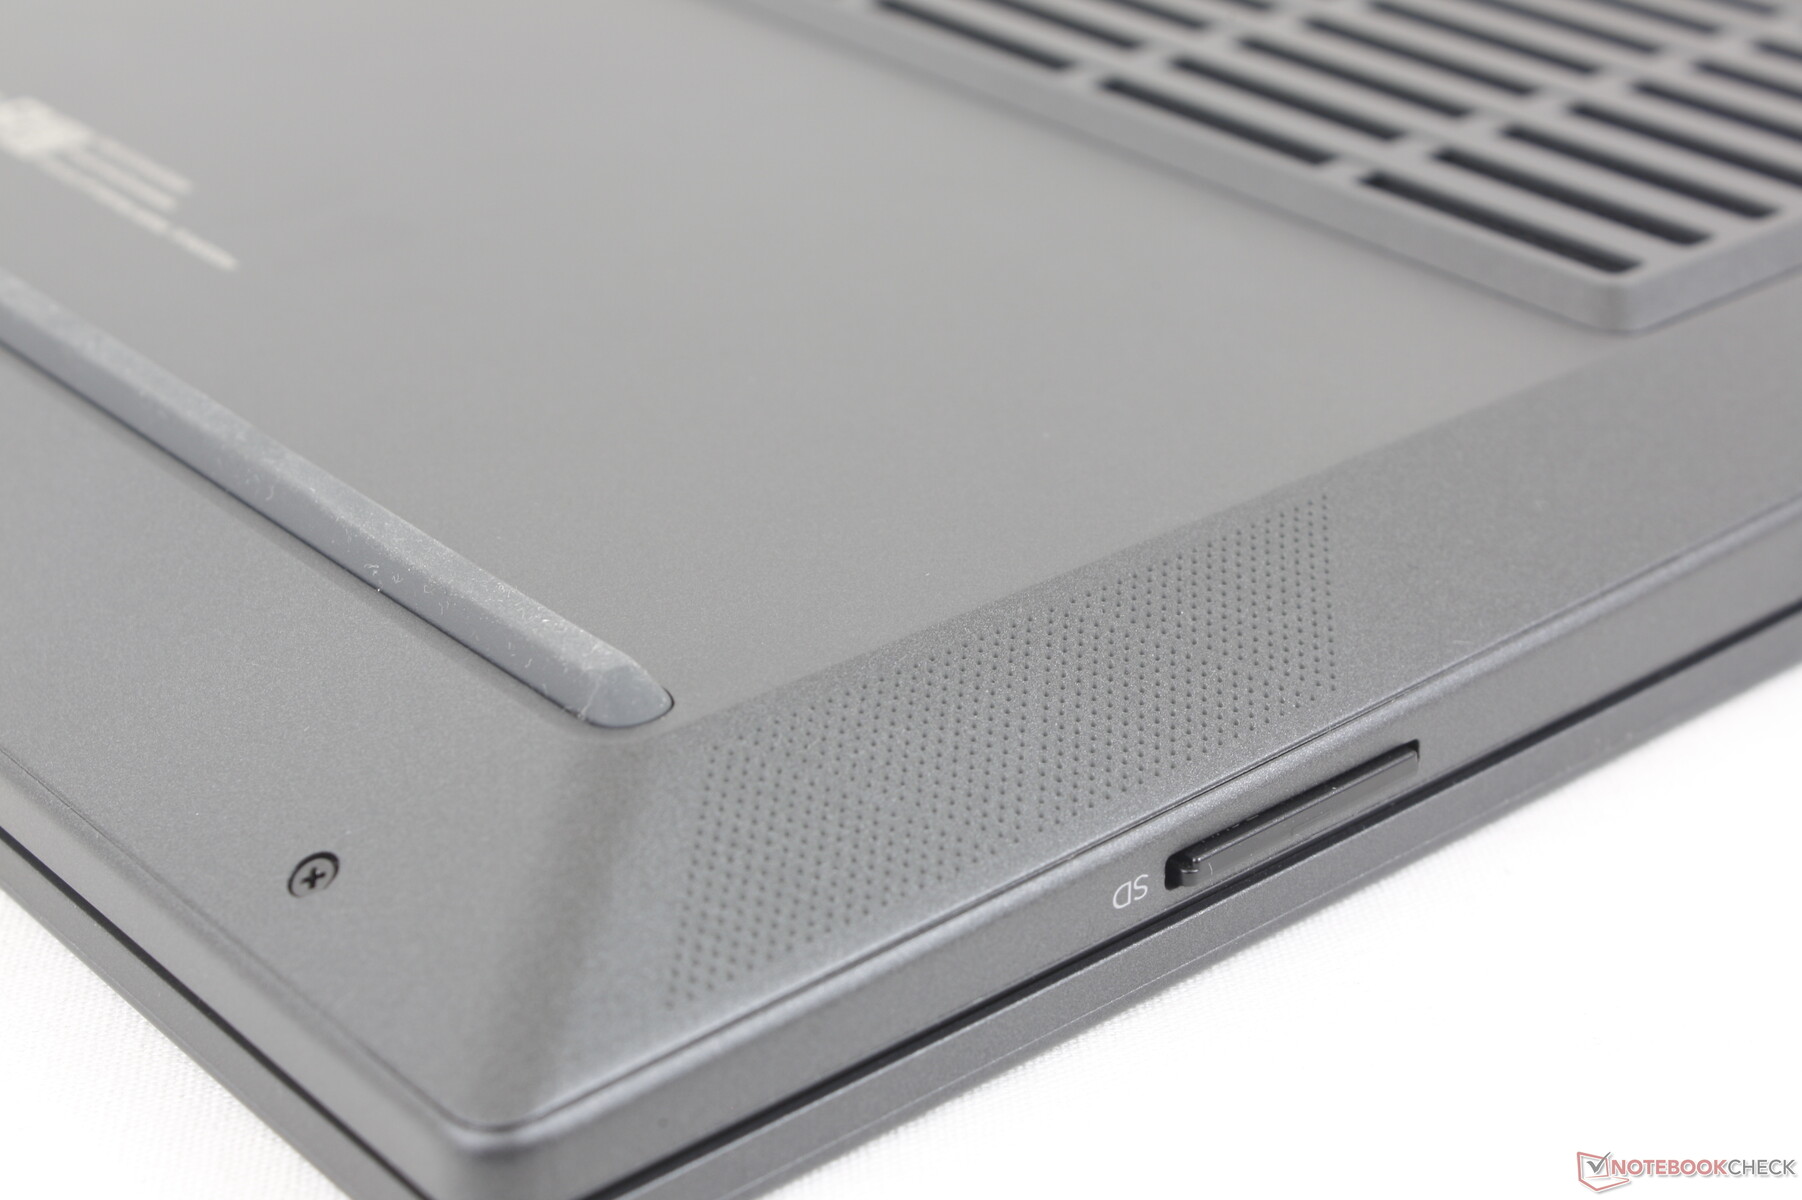
Lettore di schede SD
Siamo sorpresi di vedere un lettore di schede SD integrato, dato che molti portatili da gioco economici lo omettono. La velocità di trasferimento è pari solo alla metà di quella dei lettori di schede dell'Alienware x15 Alienware x15 o Razer Bladema è sempre meglio che non avere un lettore di schede.
| SD Card Reader | |
| average JPG Copy Test (av. of 3 runs) | |
| Alienware x15 R2 P111F (AV PRO microSD 128 GB V60) | |
| Razer Blade 17 (i7-12800H, RTX 3070 Ti) | |
| MSI GE67 HX 12UGS (Toshiba Exceria Pro SDXC 64 GB UHS-II) | |
| HP Victus 15 fa0020nr (Toshiba Exceria Pro SDXC 64 GB UHS-II) | |
| HP Omen 15-en0375ng (Toshiba Exceria Pro SDXC 64 GB UHS-II) | |
| HP Omen 15-ek0456ng (Toshiba Exceria Pro SDXC 64 GB UHS-II) | |
| maximum AS SSD Seq Read Test (1GB) | |
| Alienware x15 R2 P111F (AV PRO microSD 128 GB V60) | |
| Razer Blade 17 (i7-12800H, RTX 3070 Ti) | |
| HP Omen 15-en0375ng (Toshiba Exceria Pro SDXC 64 GB UHS-II) | |
| HP Victus 15 fa0020nr (Toshiba Exceria Pro SDXC 64 GB UHS-II) | |
| MSI GE67 HX 12UGS (Toshiba Exceria Pro SDXC 64 GB UHS-II) | |
| HP Omen 15-ek0456ng (Toshiba Exceria Pro SDXC 64 GB UHS-II) | |
Comunicazione
Un MediaTek MT7921 è incluso per la connettività Wi-Fi 6 2x2 e Bluetooth 5.2. Un Intel AX211 è opzionale a un costo aggiuntivo per il Wi-Fi 6E. Le velocità di trasferimento sono comunque costanti nei nostri test, anche se le prestazioni sono inferiori a quelle della maggior parte dei portatili con soluzione Intel AX.
| Networking | |
| iperf3 transmit AX12 | |
| Dell G15 5515 | |
| MSI Bravo 15 B5DD-010US | |
| HP Omen 15-en0375ng | |
| iperf3 receive AX12 | |
| Dell G15 5515 | |
| MSI Bravo 15 B5DD-010US | |
| HP Omen 15-en0375ng | |
| iperf3 receive AXE11000 6GHz | |
| Lenovo Legion 5 15IAH7H 82RB | |
| iperf3 receive AXE11000 | |
| Asus TUF Dash F15 FX517ZC | |
| Lenovo Legion 5 15IAH7H 82RB | |
| HP Victus 15 fa0020nr | |
| iperf3 transmit AXE11000 | |
| Asus TUF Dash F15 FX517ZC | |
| Lenovo Legion 5 15IAH7H 82RB | |
| HP Victus 15 fa0020nr | |
| iperf3 transmit AXE11000 6GHz | |
| Lenovo Legion 5 15IAH7H 82RB | |
Webcam
La webcam è un sensore di base da 1 MP, senza IR e senza otturatore privato. HP dispone di alcune delle migliori webcam per computer portatili, come si può vedere sul ultimo Spectre e EliteBook e quindi la webcam sfocata del nostro Victus è chiaramente una misura di riduzione dei costi.


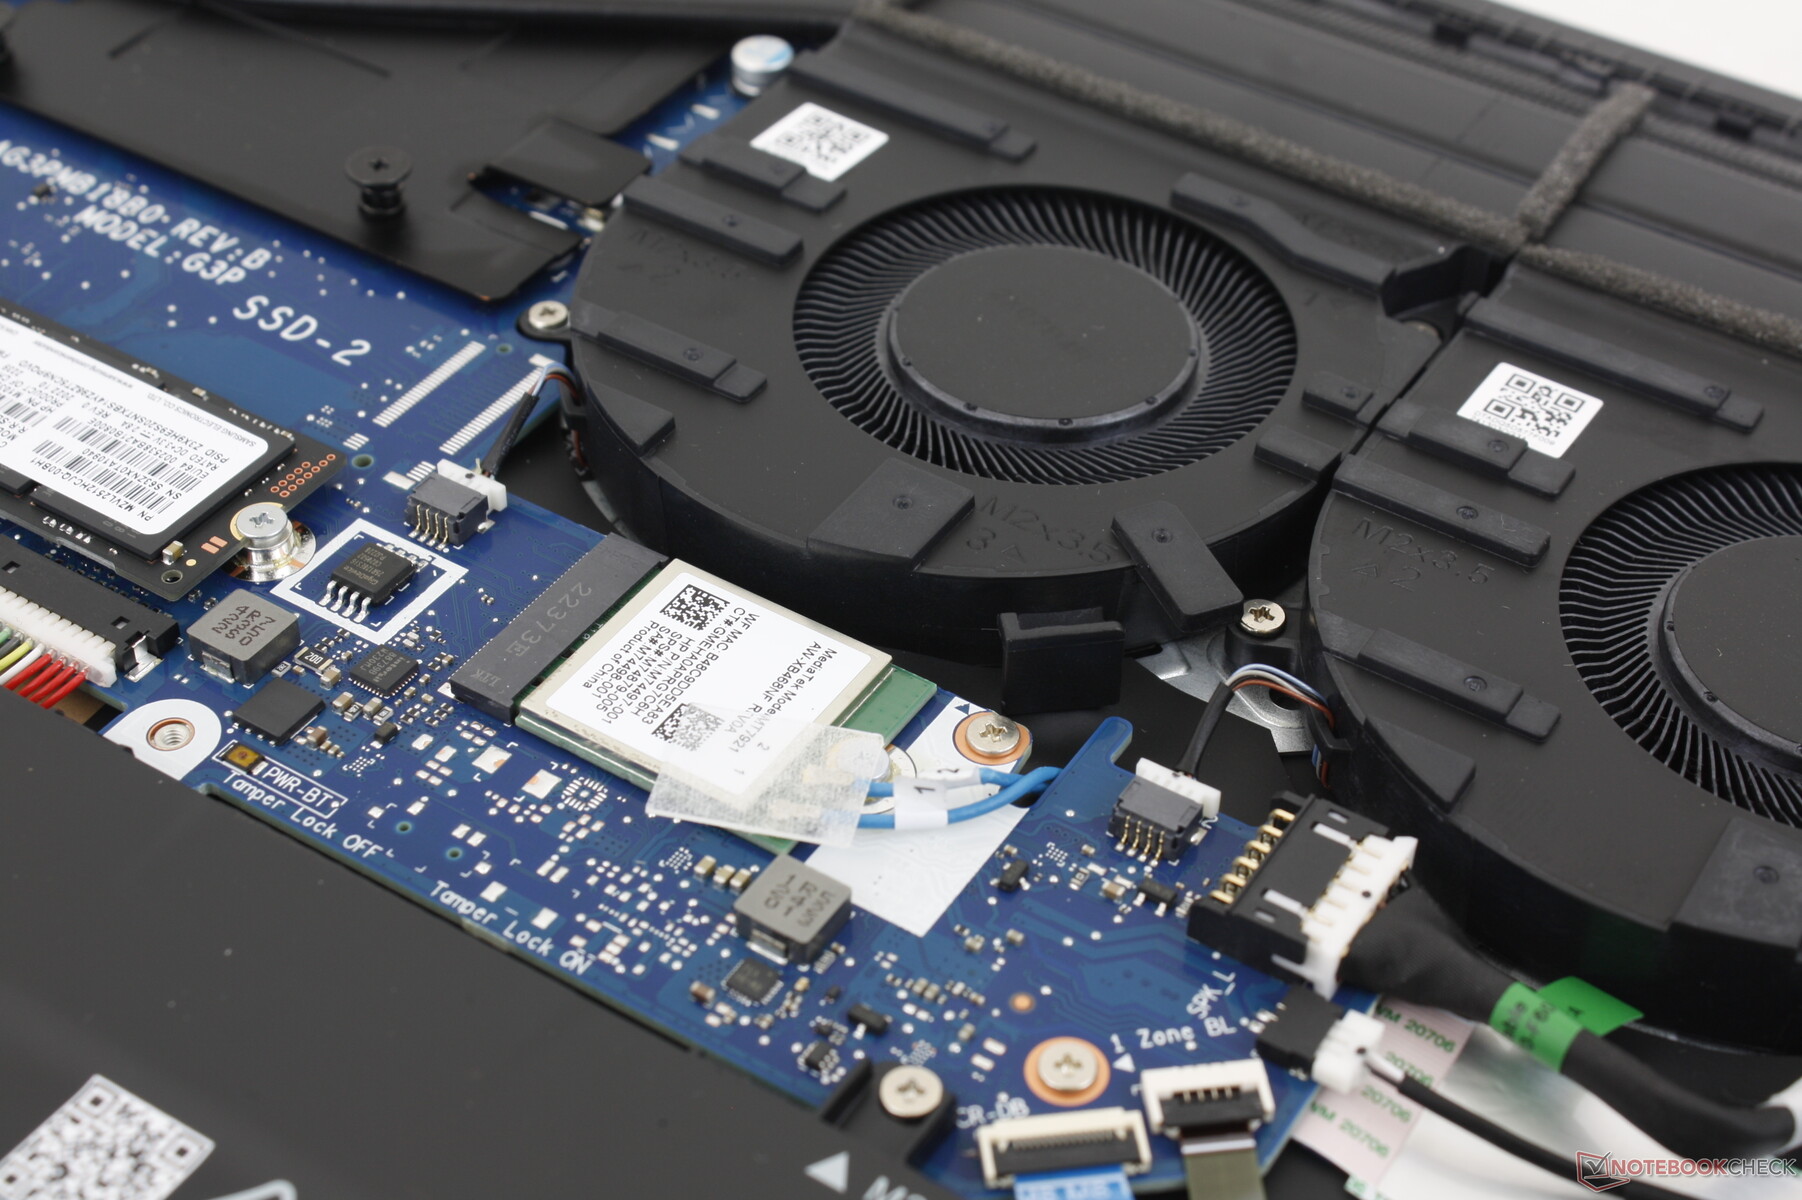
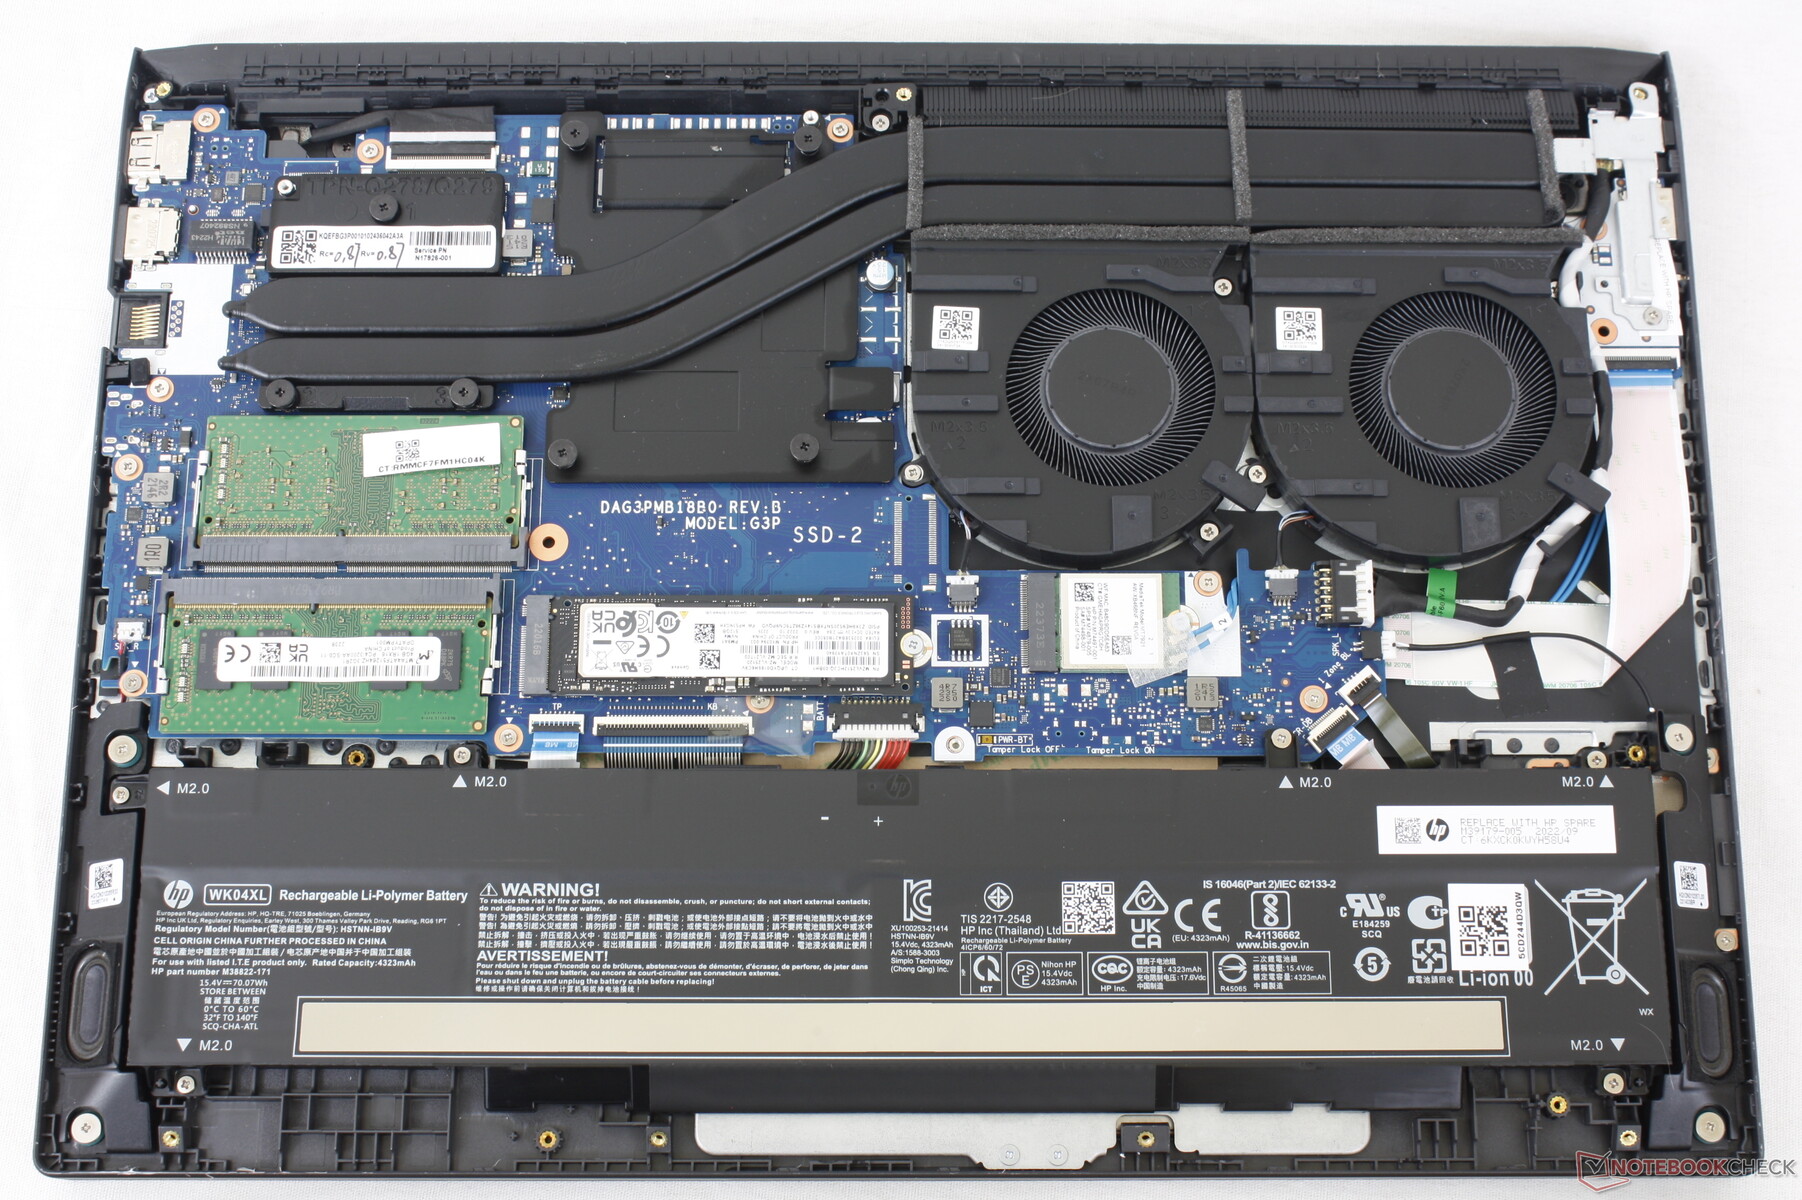
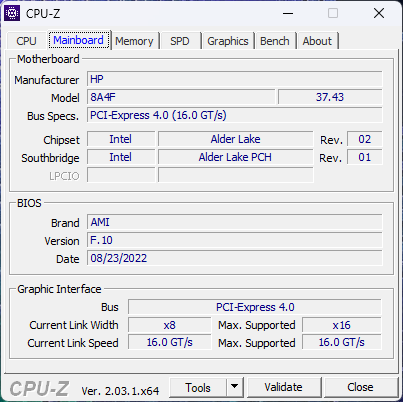
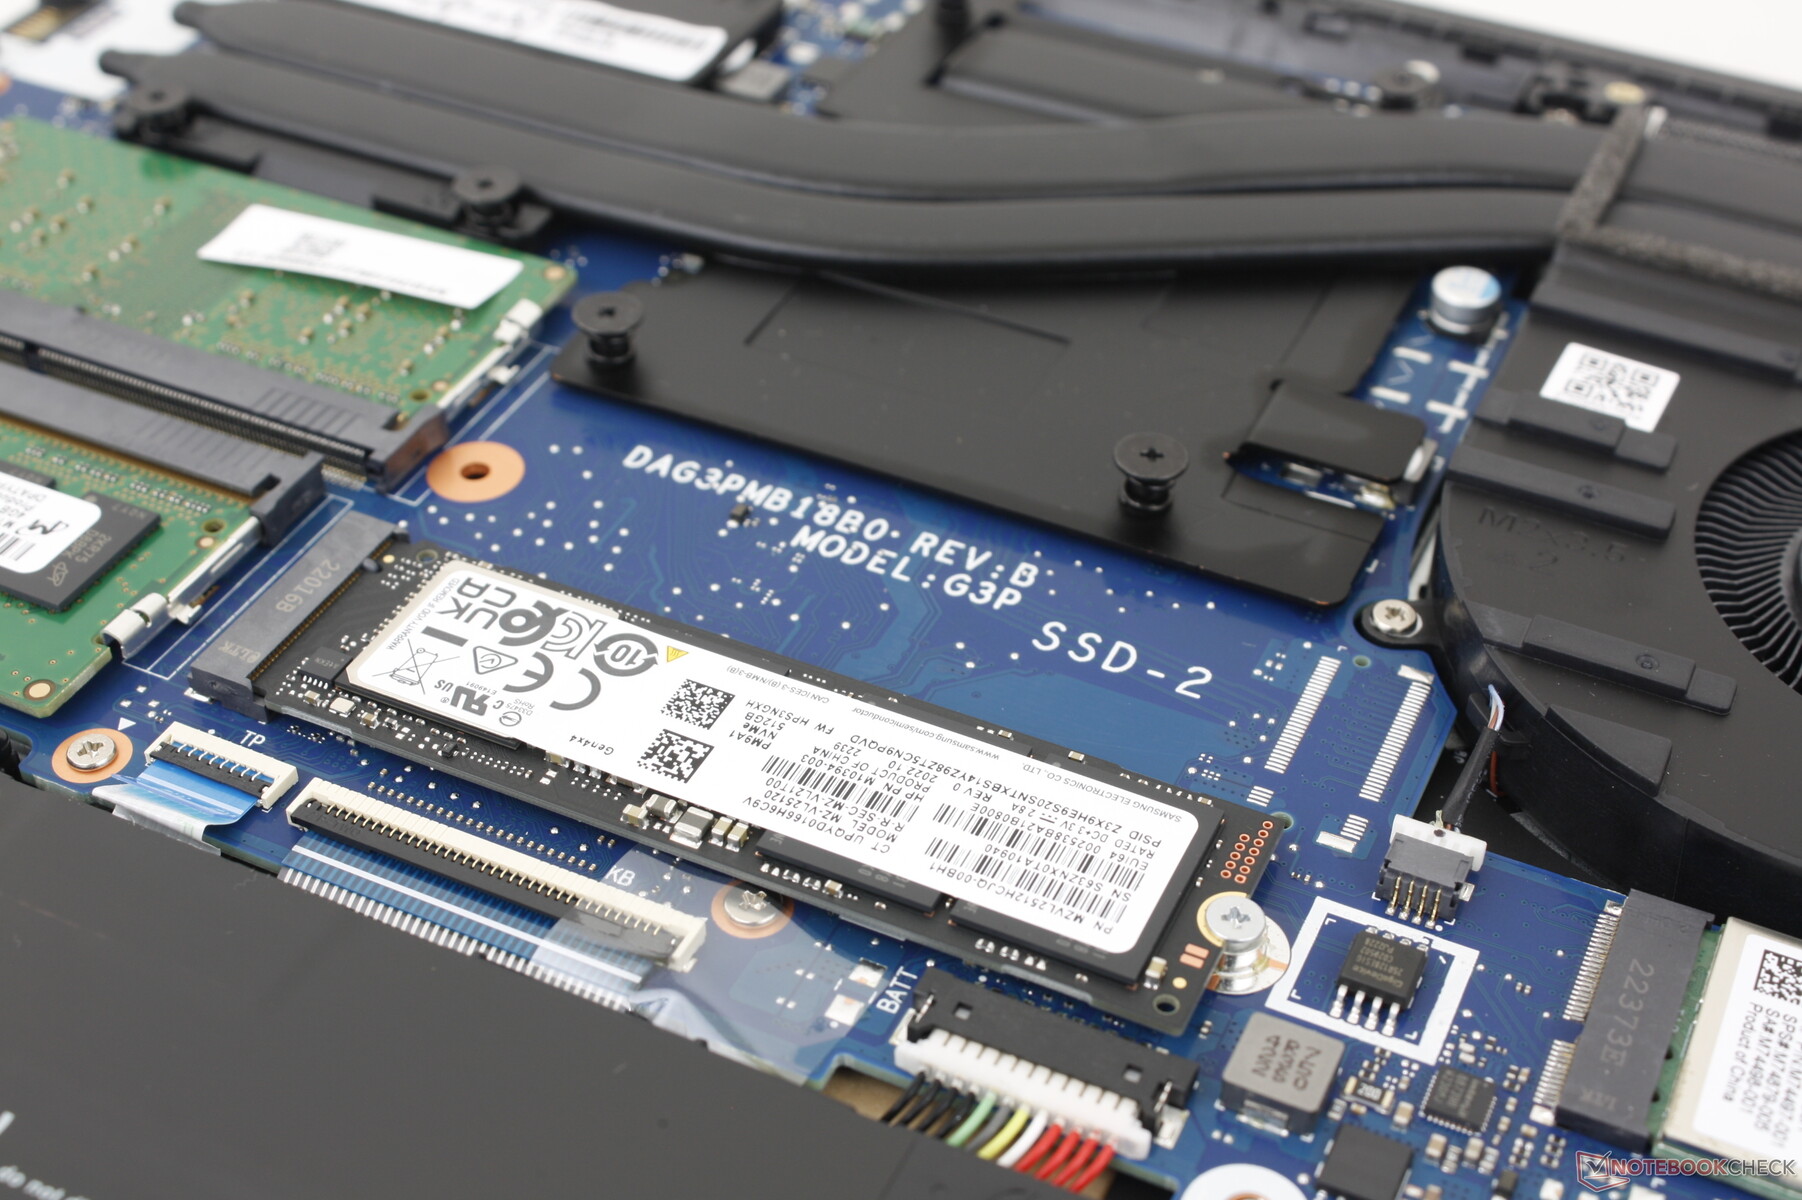
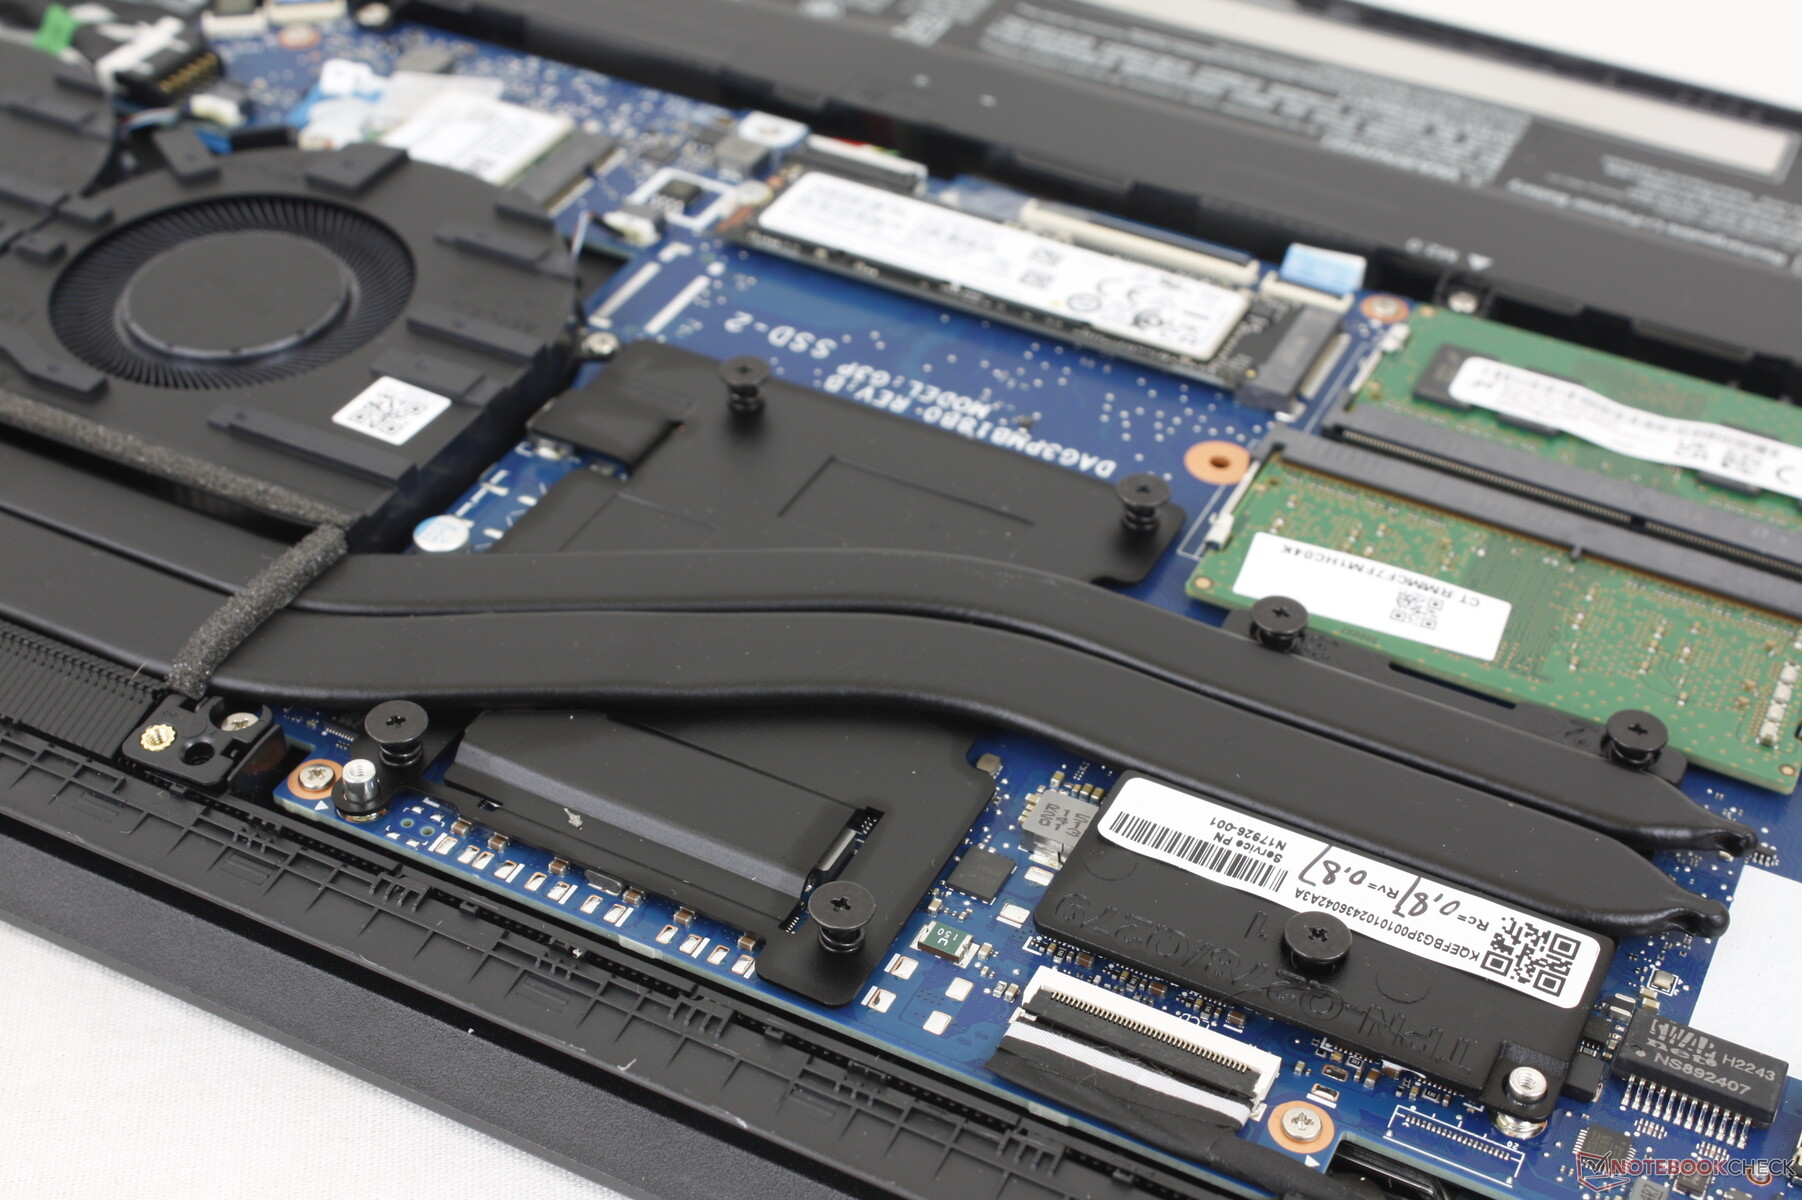
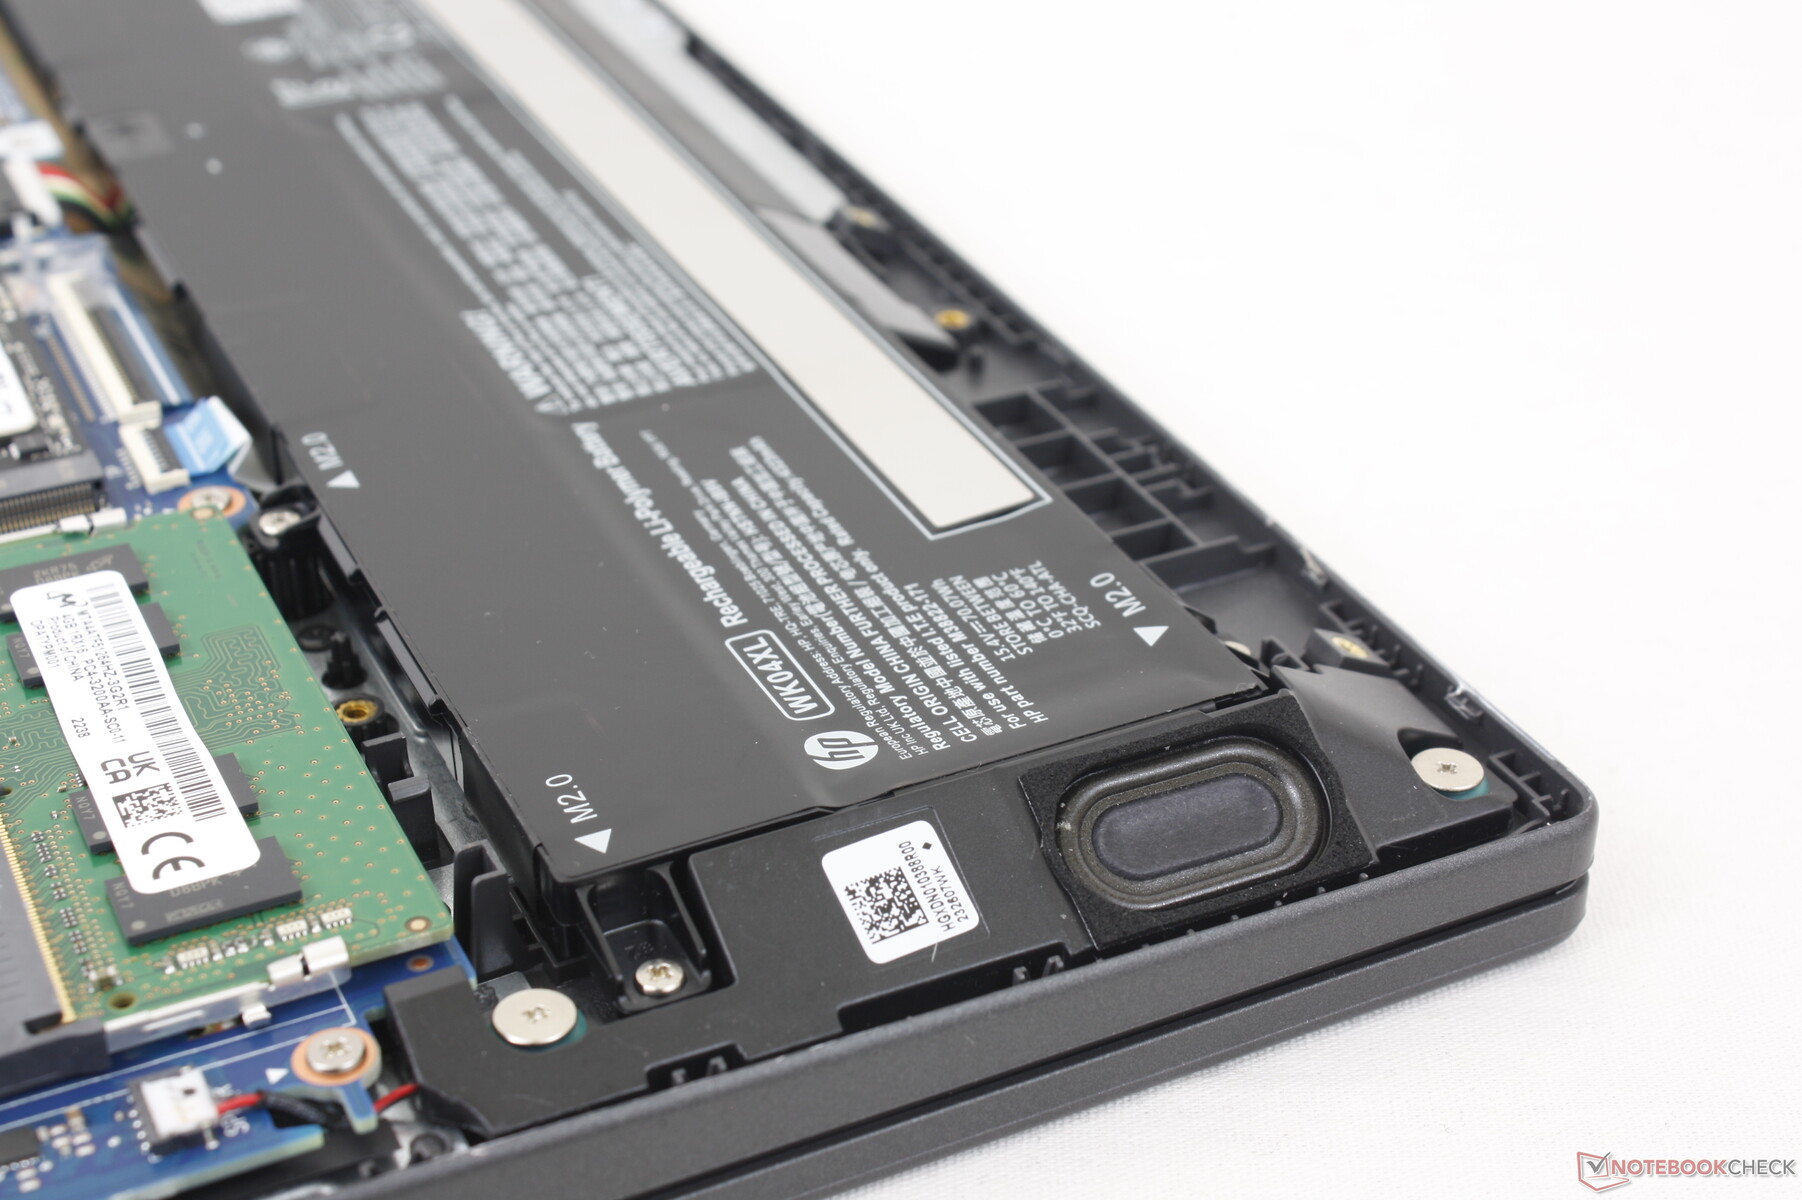
Manutenzione
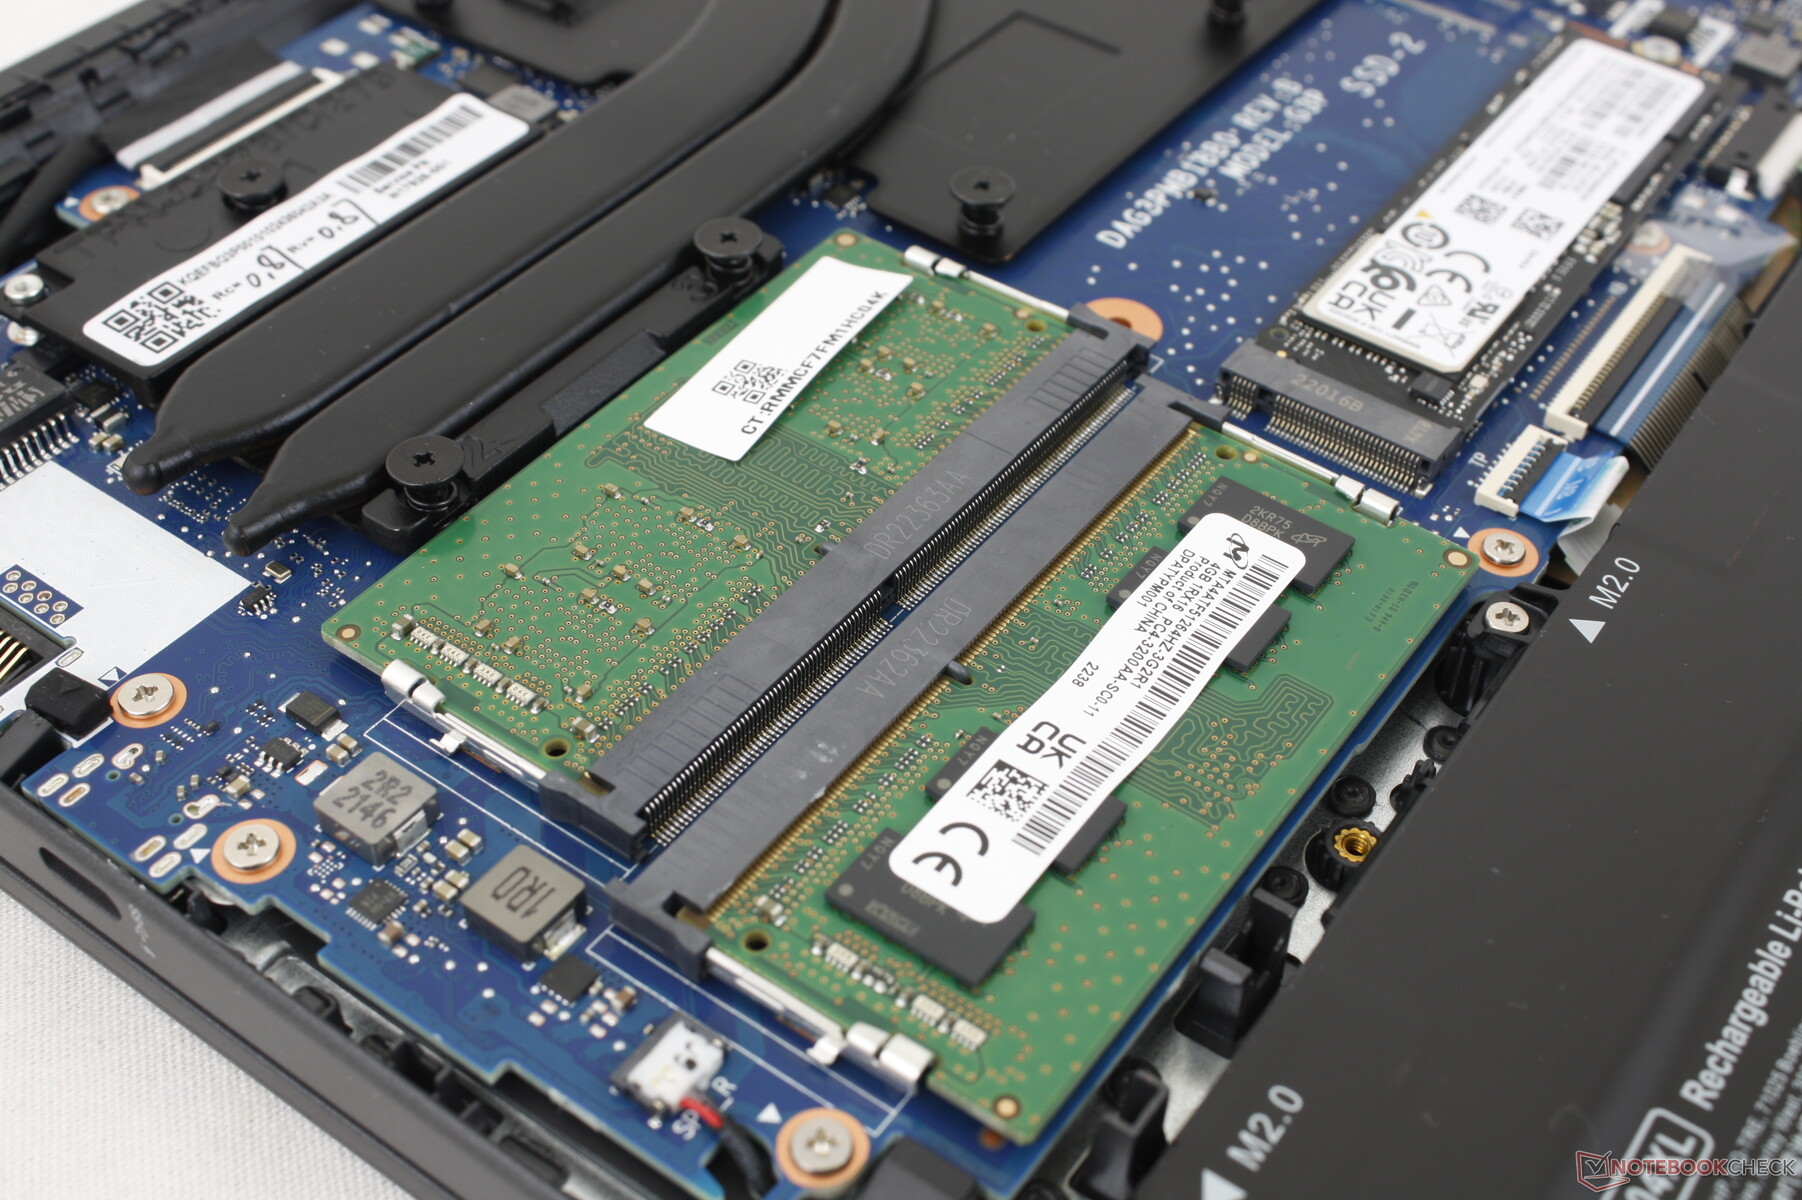
Il pannello inferiore è fissato da sette viti Philips per una manutenzione relativamente semplice. I proprietari hanno accesso diretto al singolo slot M.2 PCIe4 x4 2280, al modulo WLAN rimovibile e a due slot SODIMM. Il concorrente Asus TUF Dash F15 FX517ZC supporta fino a due unità SSD M.2, mentre il nostro HP ne supporta solo una.
Accessori e garanzia
La confezione non contiene altri extra oltre all'adattatore CA e alla documentazione. Se acquistato negli Stati Uniti, si applica la consueta garanzia limitata di un anno del produttore.
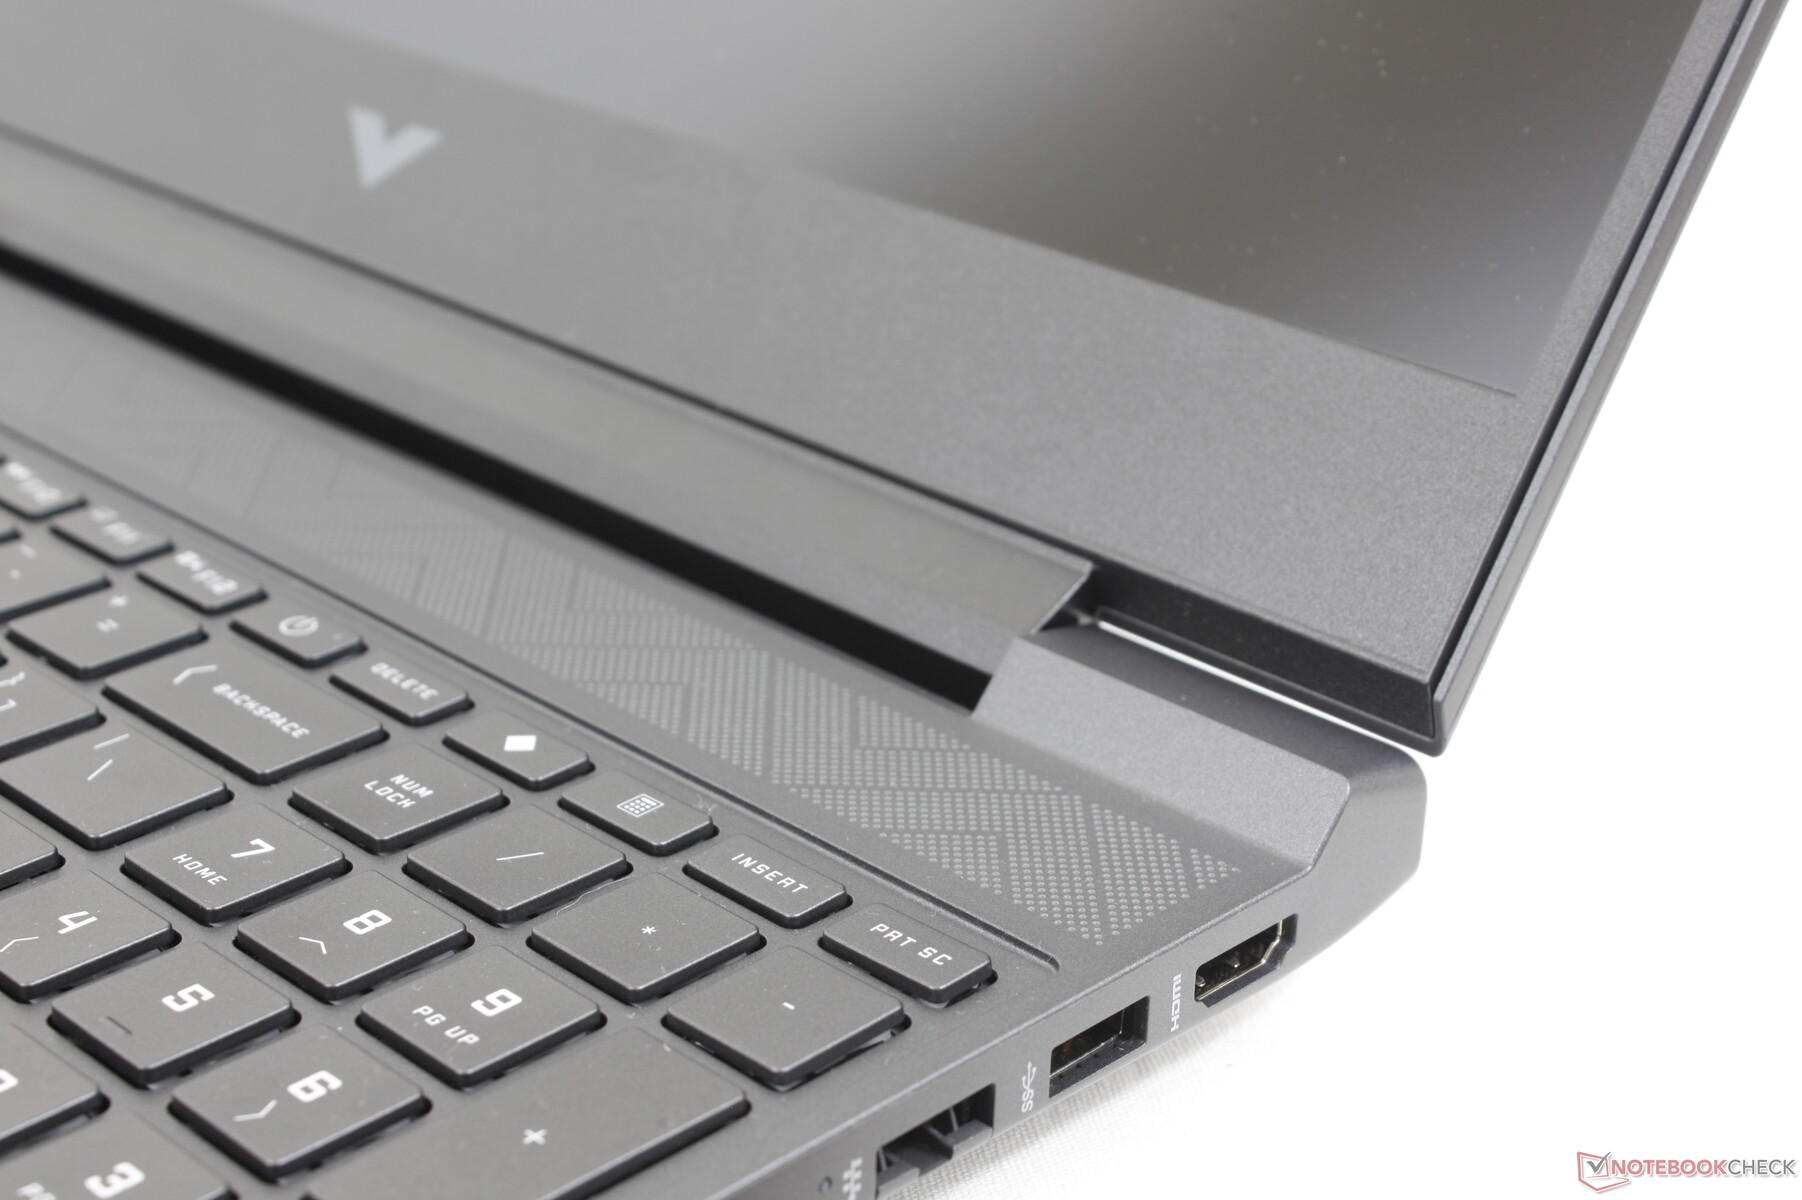
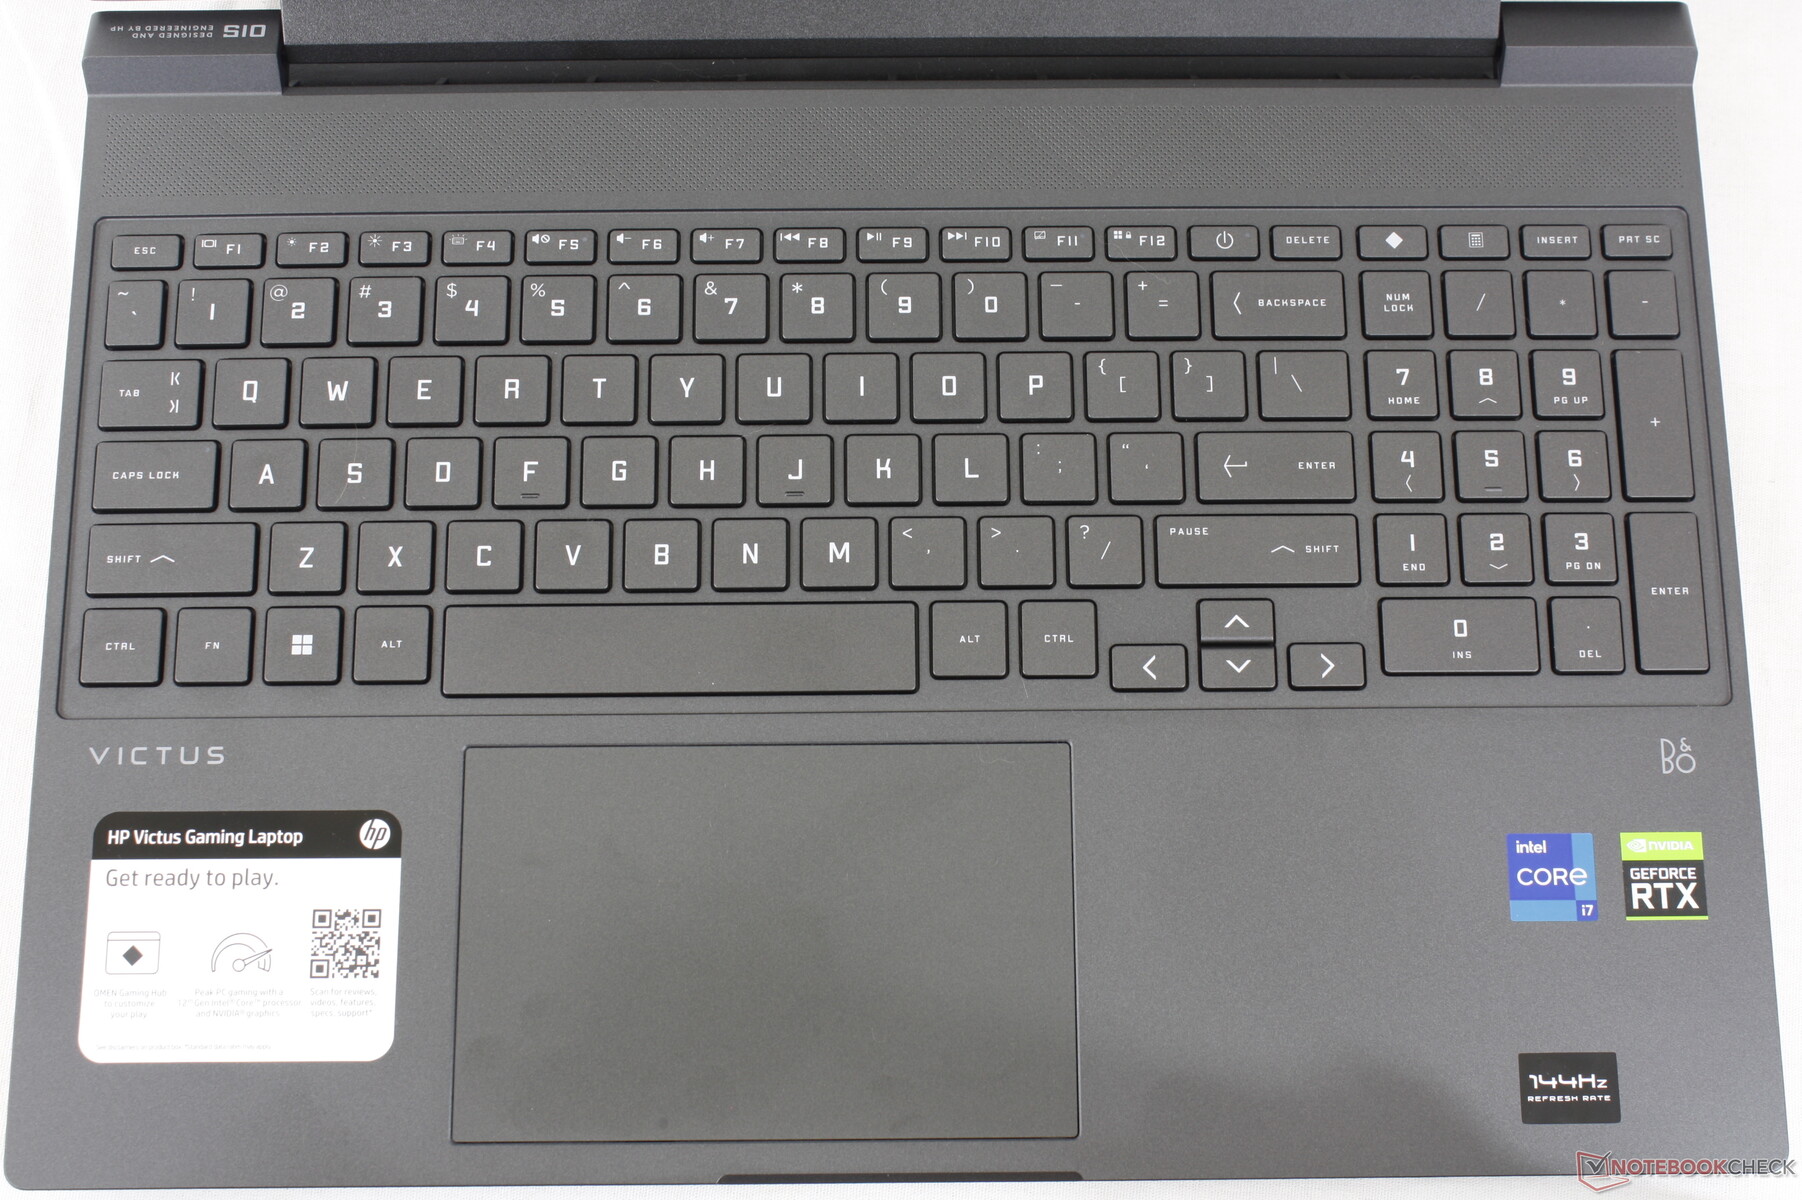
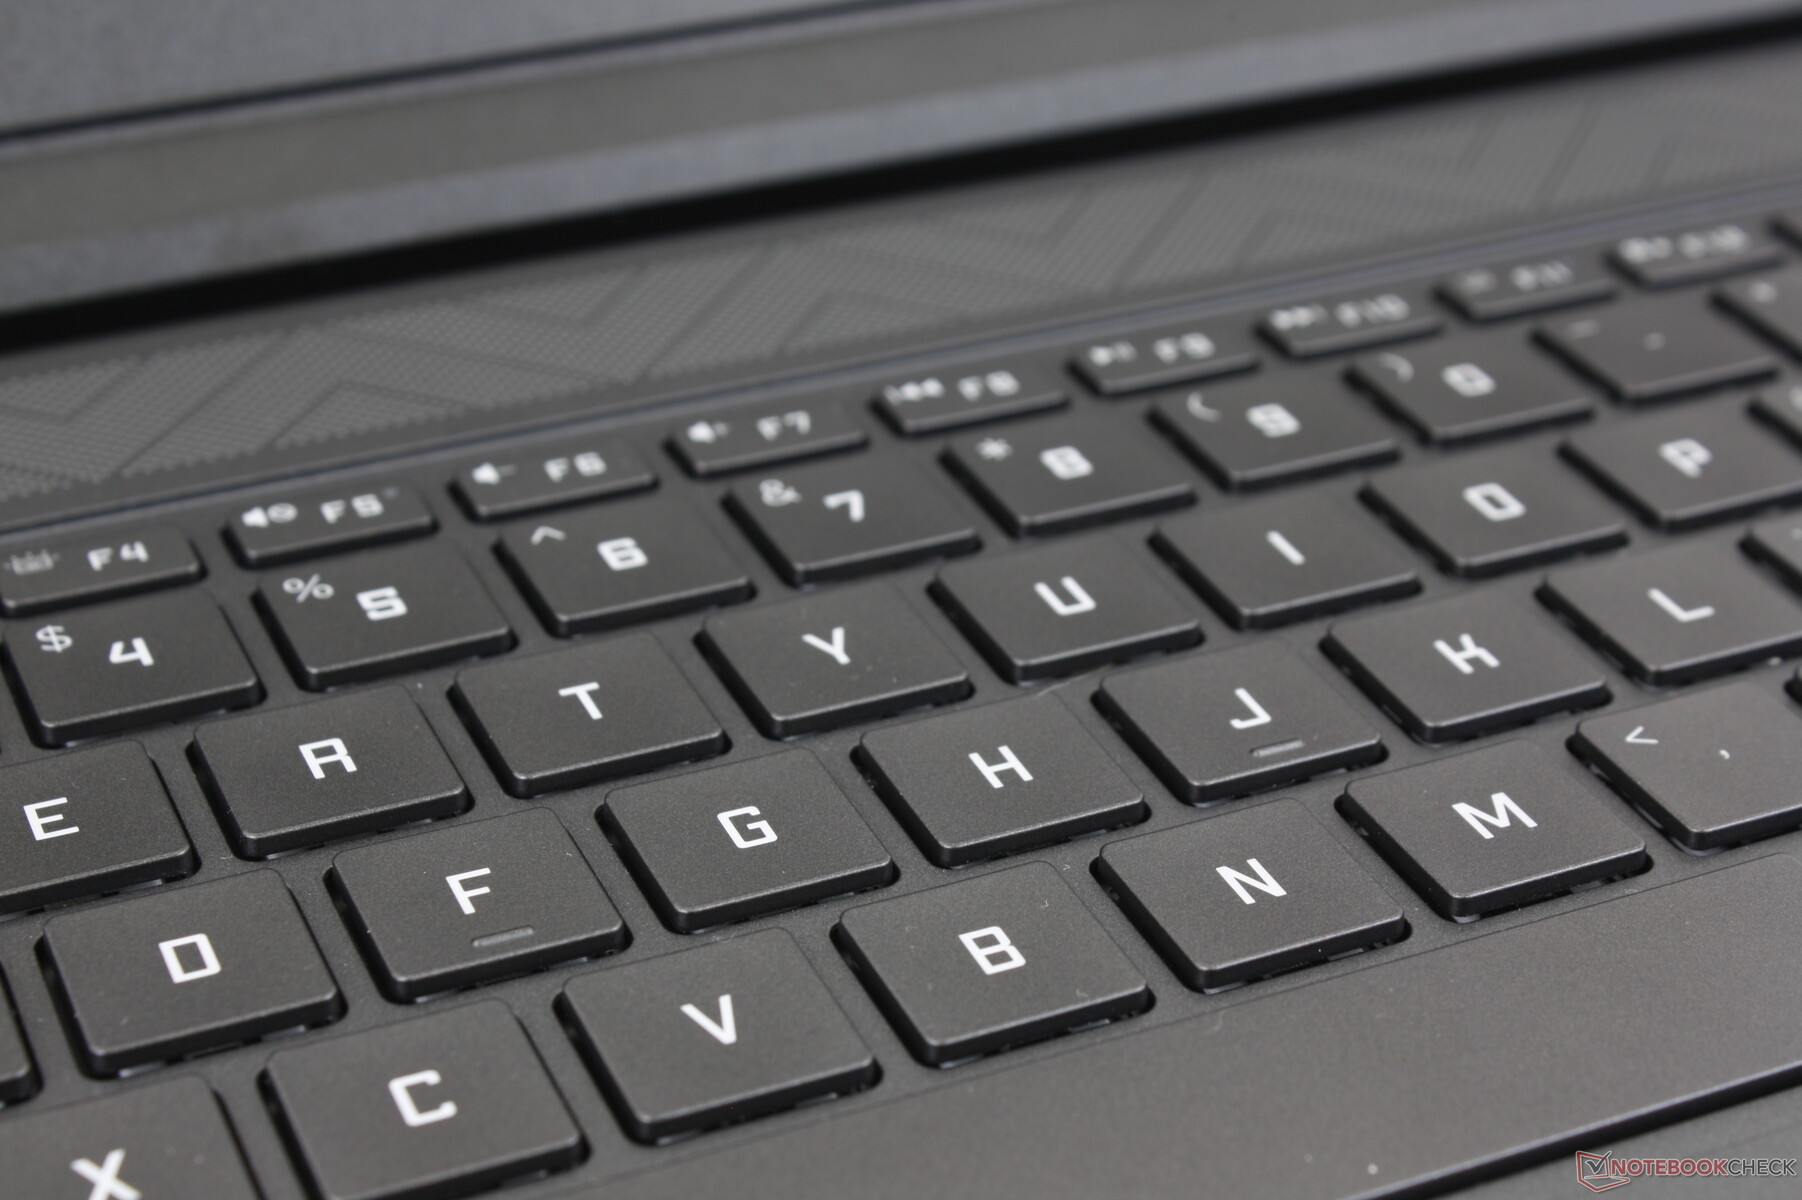
Dispositivi di input - Tastiera spaziosa e ClickPad
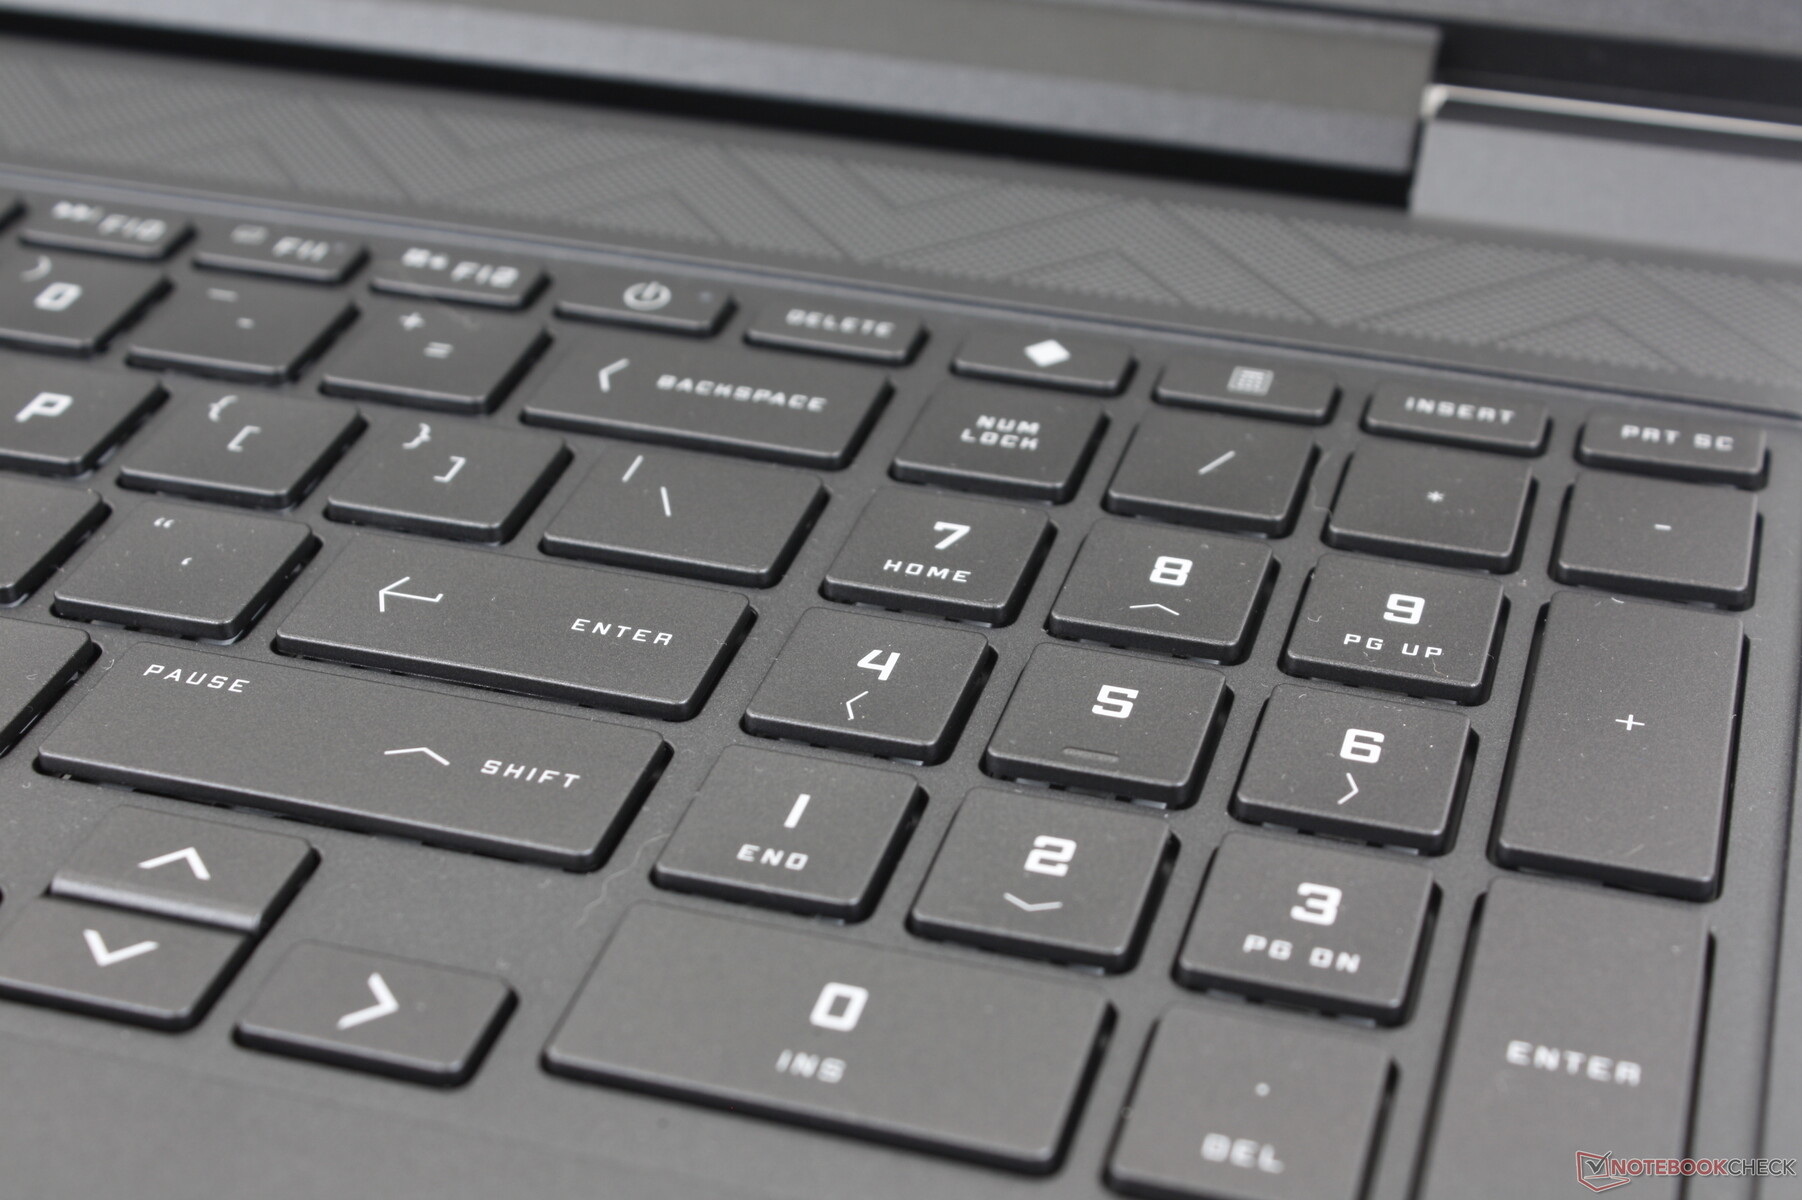
Tastiera
Sempre più portatili da gioco iniziano a integrare i numpad e il Victus 15 non fa eccezione. Apprezziamo in particolare il fatto che i tasti del tastierino numerico non siano più stretti dei tasti QWERTY principali, a differenza degli angusti tastierini numerici del Dell G15 o dell'Asus TUF Dash F15
Il feedback dei tasti durante la digitazione è leggermente più morbido e quindi più silenzioso sul Victus. I tasti Invio e Backspace, tuttavia, sono un po' troppo morbidi e avrebbero potuto beneficiare di un feedback più deciso.
La retroilluminazione bianca a zona singola è di serie per illuminare tutti i tasti e i simboli, mentre la maggior parte degli altri portatili da gioco dispone di opzioni RGB. Non c'è nemmeno un'impostazione della luminosità della retroilluminazione: o è accesa o è spenta, senza interruzioni.
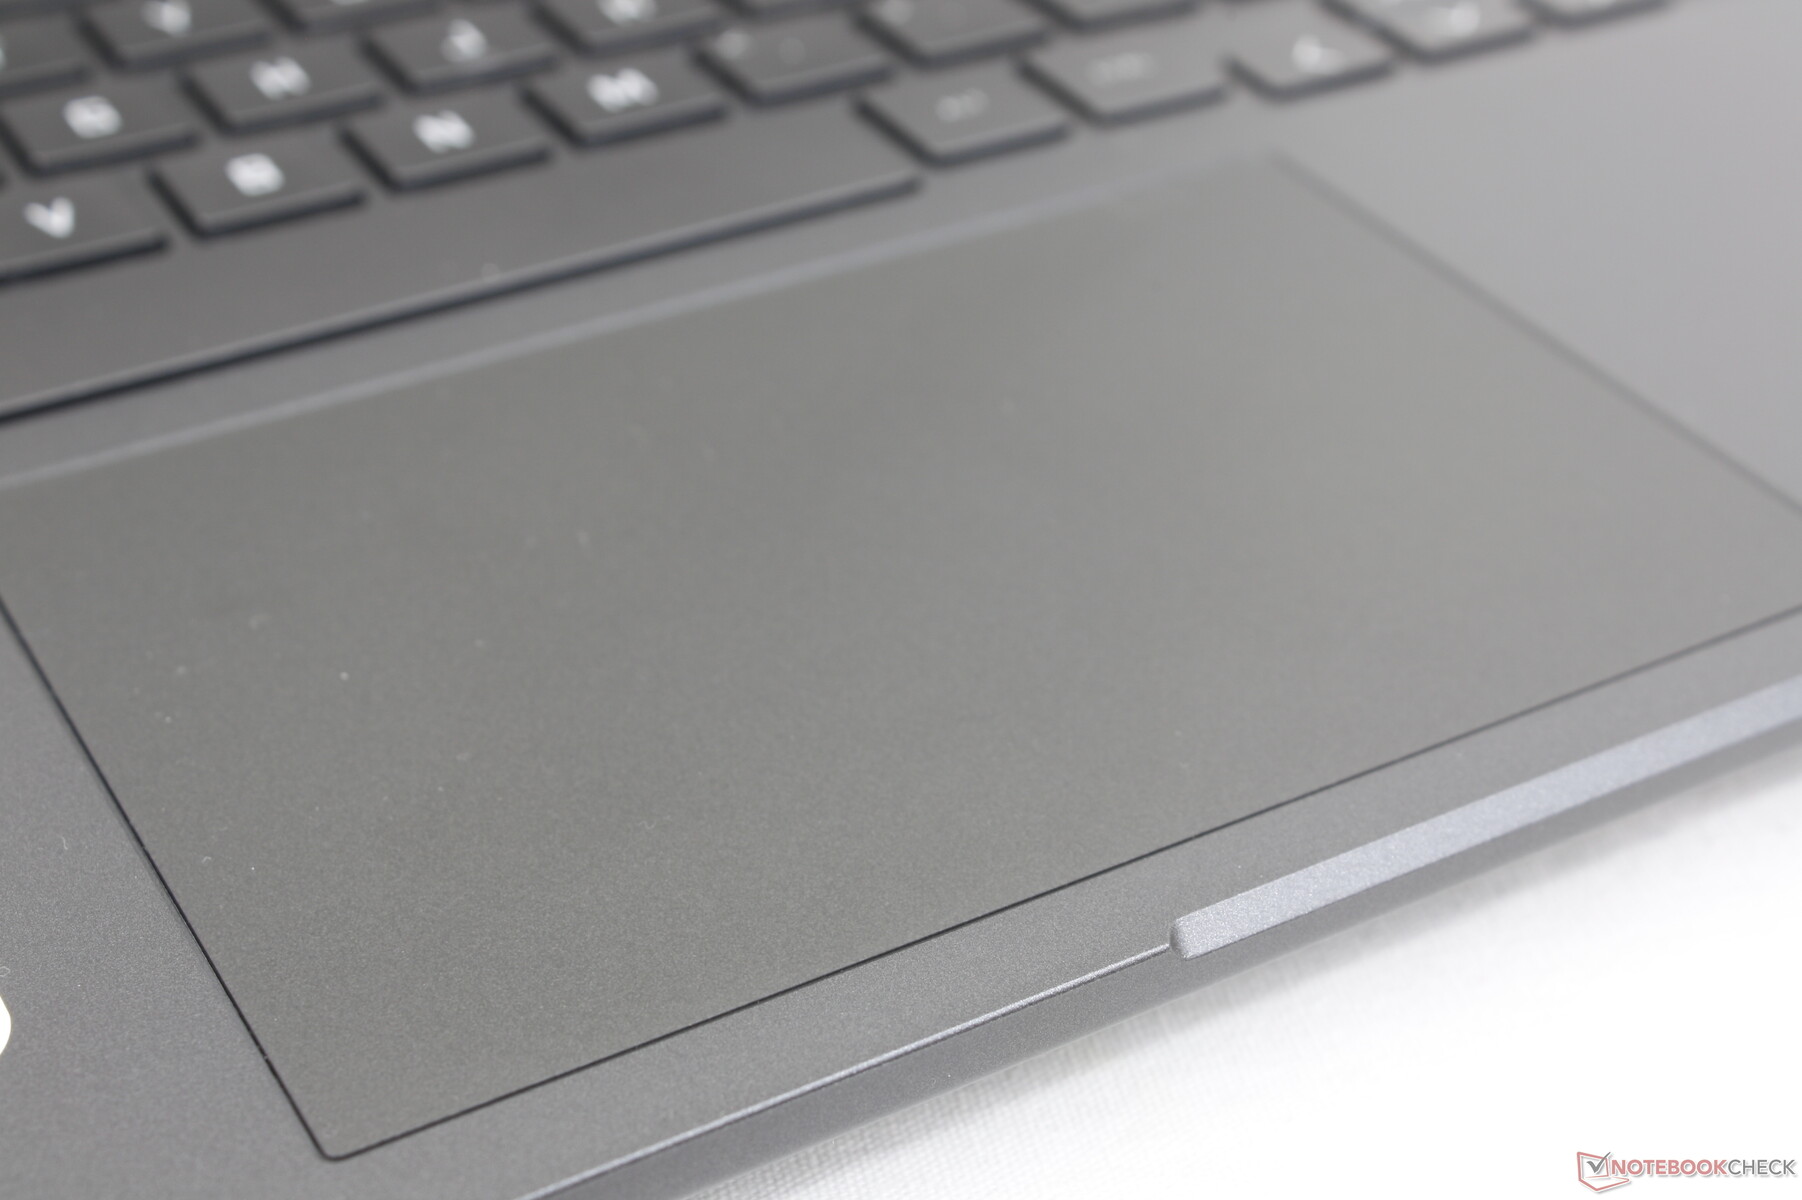
Touchpad
Lo spazioso clickpad è solo leggermente più grande di quello del Legion 5 15 (12,5 x 8 cm contro 12,5 x 7,5 cm). La trazione è fluida sulla superficie in plastica, con solo un po' di aderenza alle velocità più basse per gli input più precisi. I tasti integrati sono anch'essi scorrevoli e non troppo spugnosi.
I due maggiori svantaggi del clickpad sono il forte feedback quando viene premuto e la tendenza generale ad accumulare impronte digitali. Aspettatevi che i poggiapolsi, i tasti e il clickpad appaiano lucidi e unti in breve tempo.
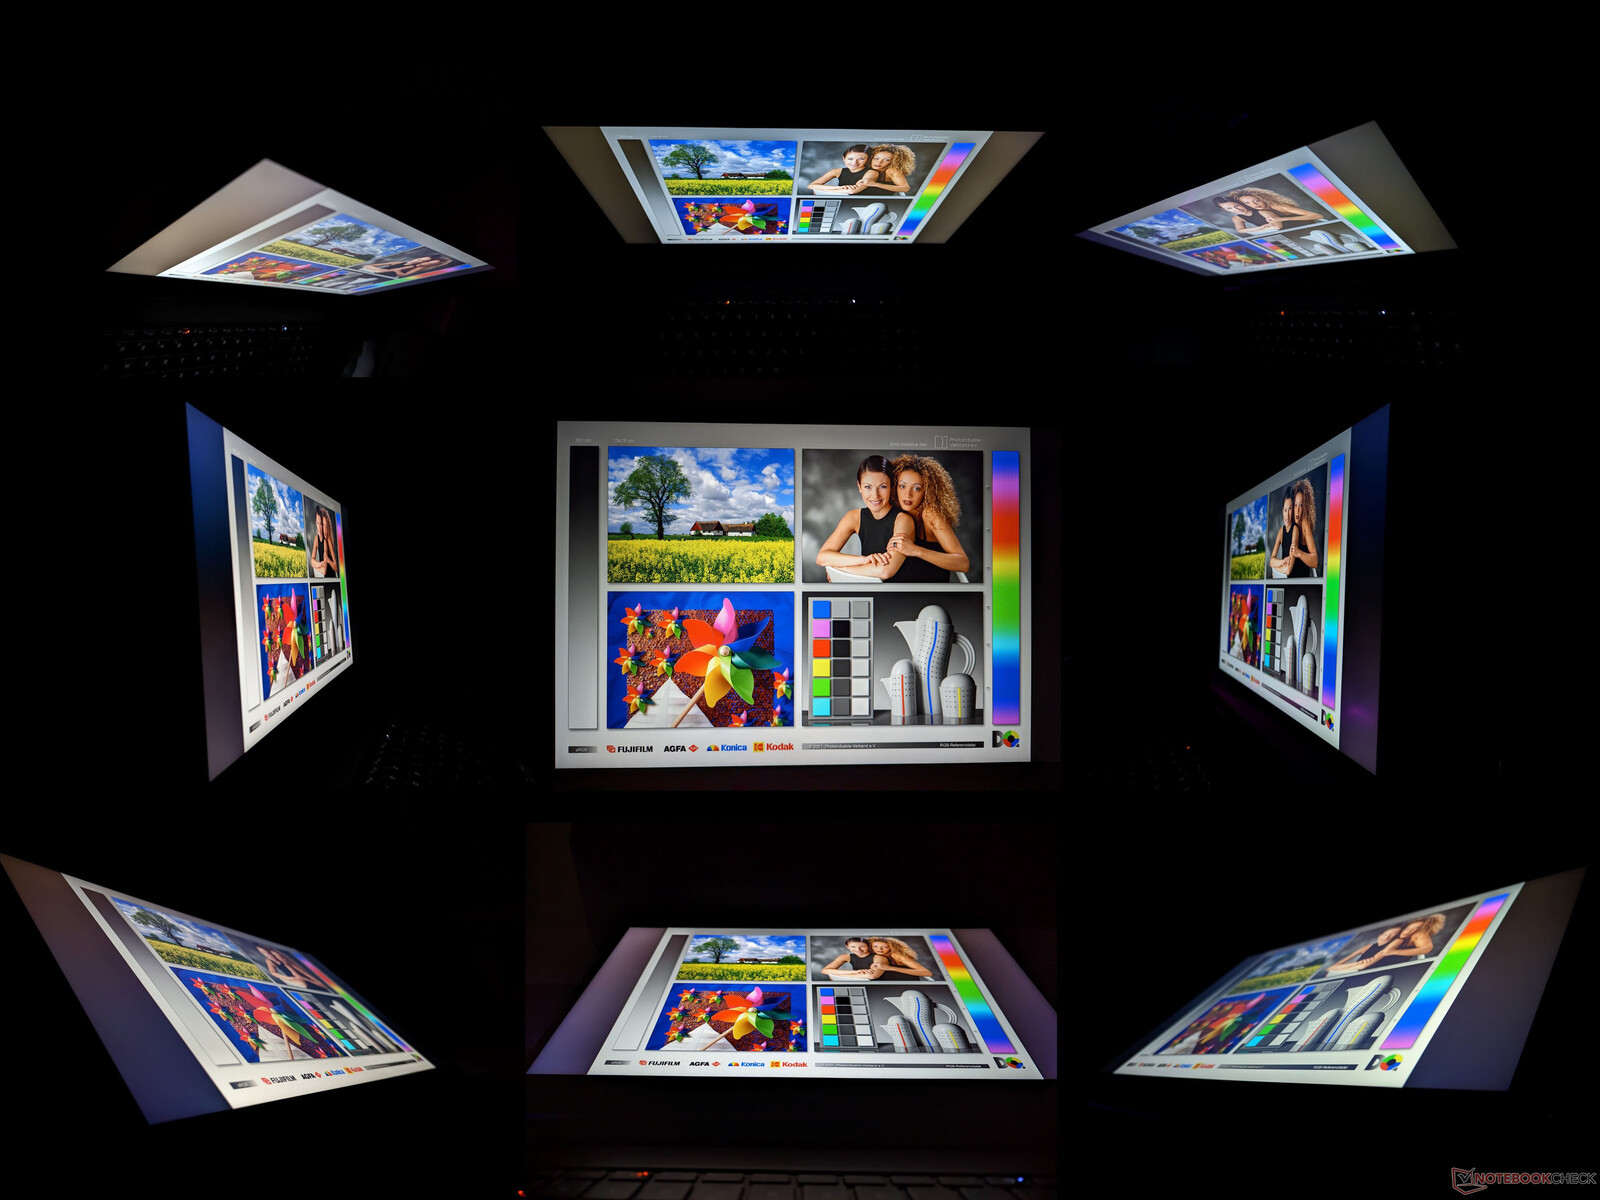
Display - Solo 1080p
Sono disponibili quattro opzioni di visualizzazione:
- 1920 x 1080, 60 Hz, 250 nits, TN
- 1920 x 1080, 60 Hz, 250 nits, IPS
- 1920 x 1080, 144 Hz, 250 nits, IPS
- 1920 x 1080, 60 Hz, 300 nits, IPS
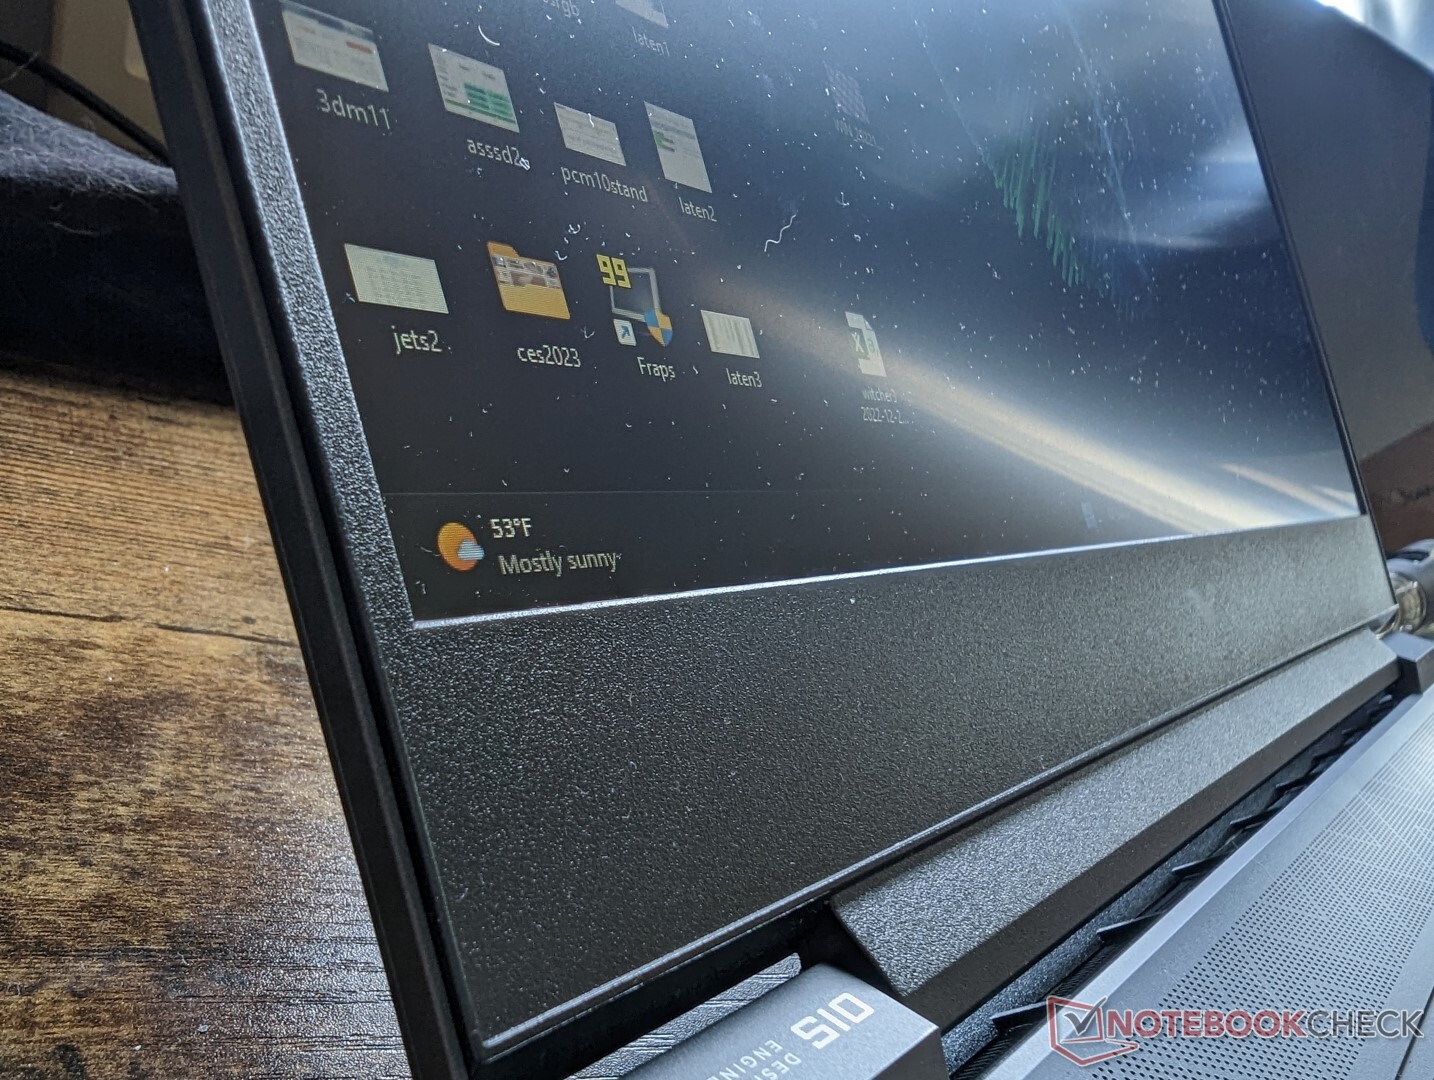
Tutte le opzioni sono opache e non è possibile scegliere tra pannelli OLED o ad alta risoluzione. La nostra specifica unità di recensione è dotata dell'opzione in grassetto per un'esperienza d'uso più fluida, ma i colori scadenti e i tempi di risposta medi sono i principali fattori di differenziazione che separano il Victus 15 da portatili da gioco più costosi con display migliori. La Serie Omen 16ad esempio, offre una copertura completa sRGB e tempi di risposta più rapidi.
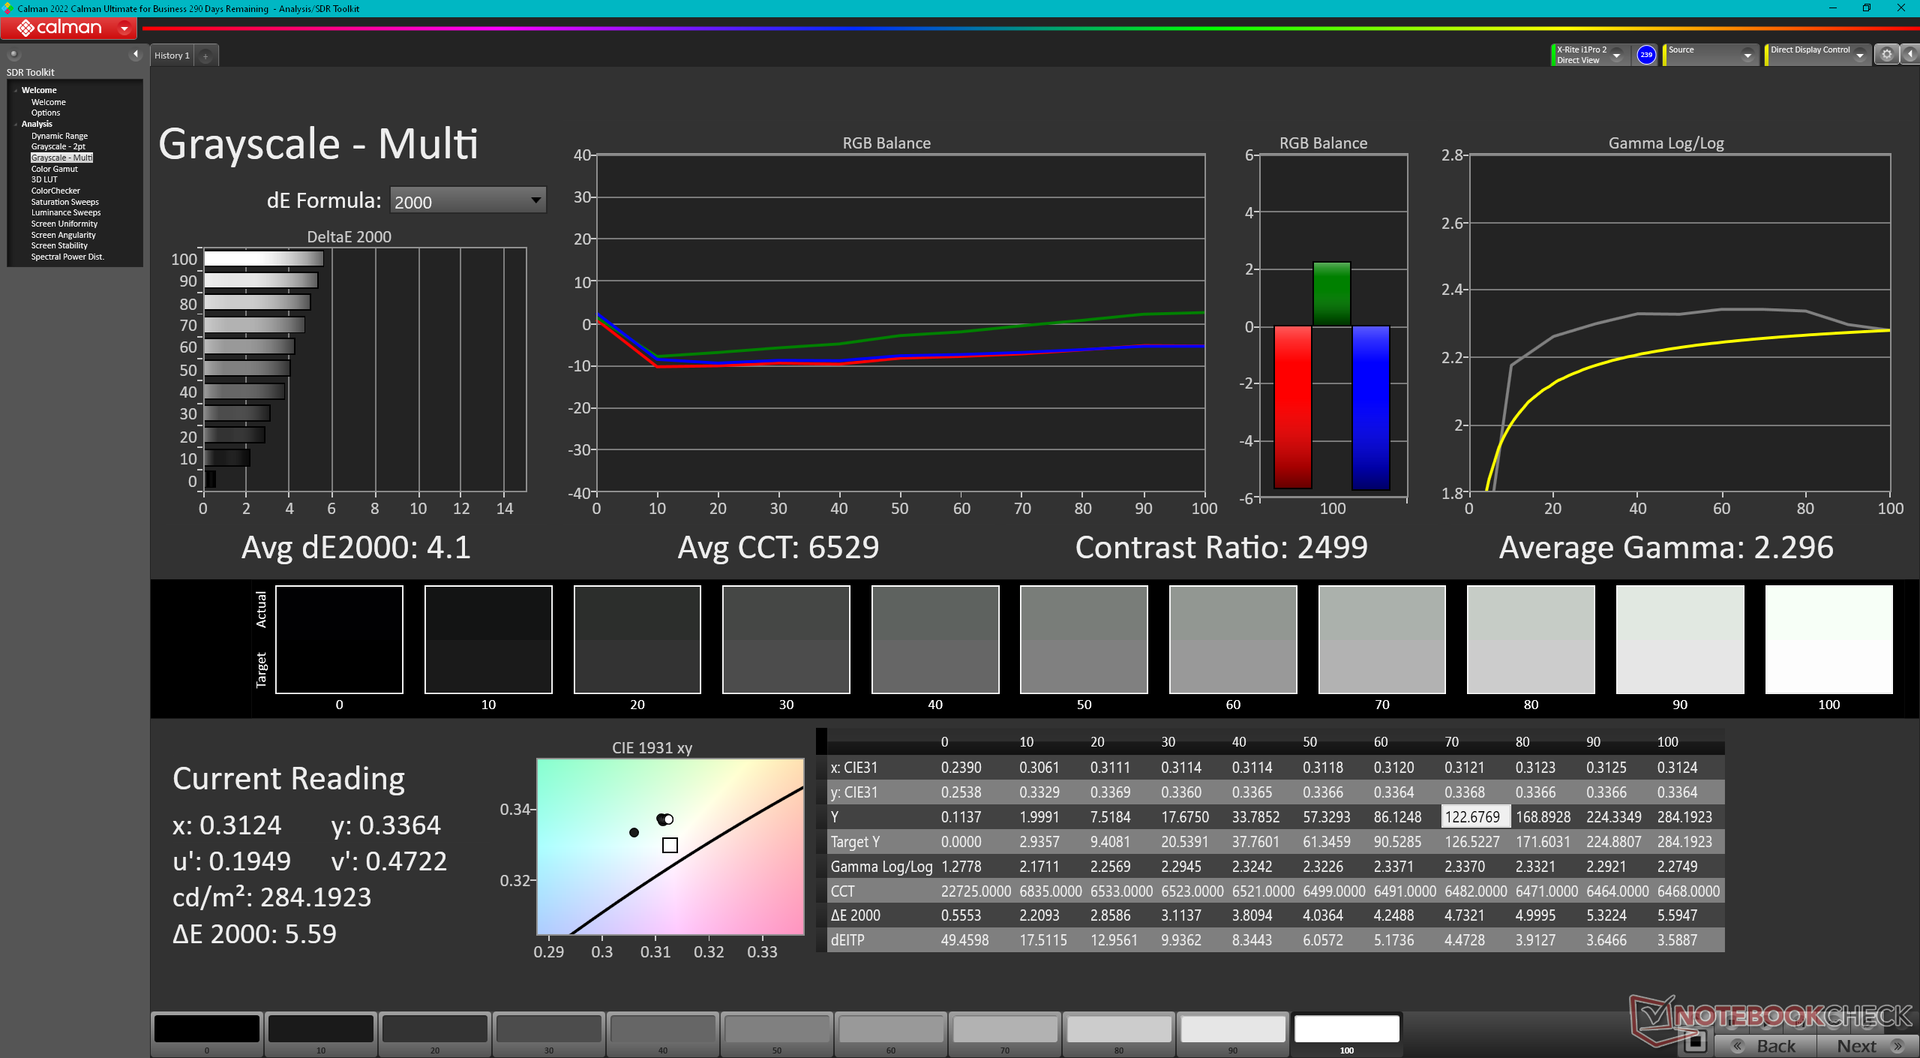
Il rapporto di contrasto è almeno molto buono per un portatile da gioco economico, con un valore di circa 1500:1. Tuttavia, i colori e i contenuti non sono brillanti a causa del gamut limitato del pannello.


| |||||||||||||||||||||||||
Distribuzione della luminosità: 87 %
Al centro con la batteria: 284.3 cd/m²
Contrasto: 1672:1 (Nero: 0.17 cd/m²)
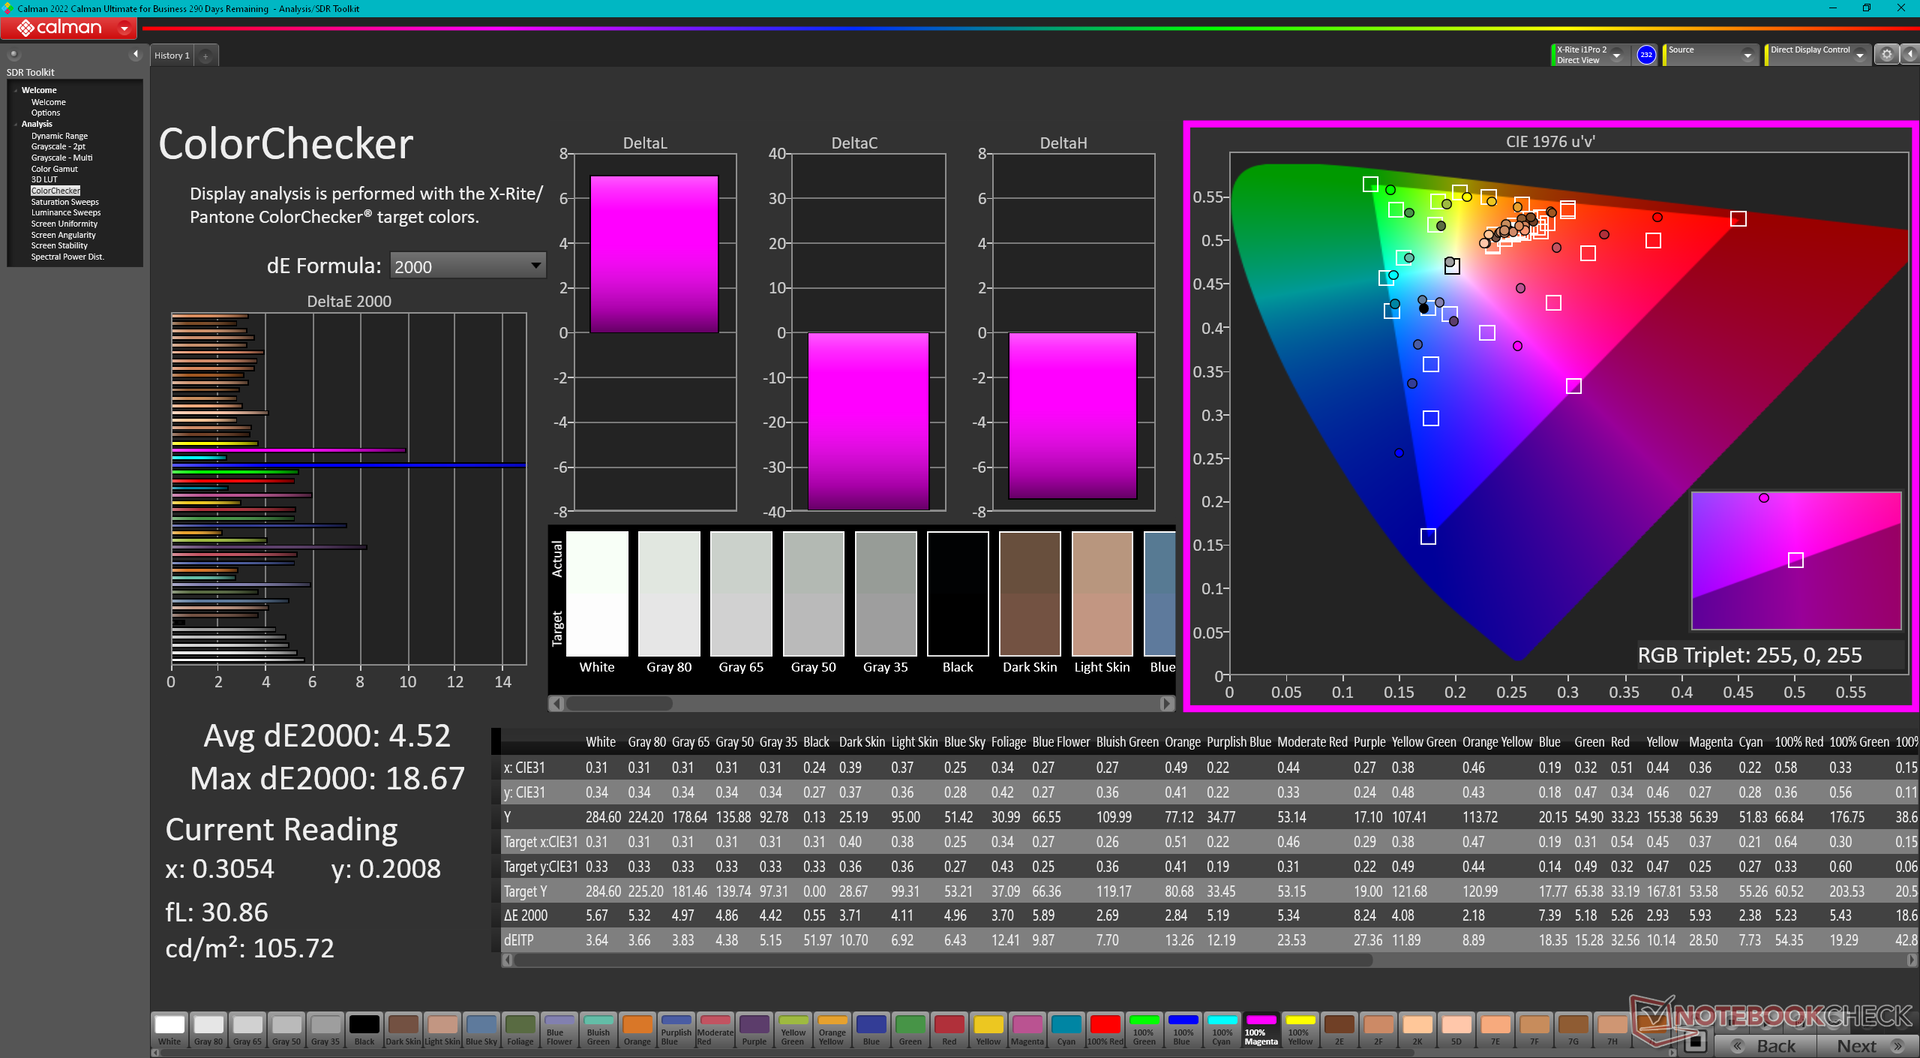
ΔE ColorChecker Calman: 4.52 | ∀{0.5-29.43 Ø4.71}
calibrated: 1.55
ΔE Greyscale Calman: 4.1 | ∀{0.09-98 Ø4.96}
43.4% AdobeRGB 1998 (Argyll 3D)
62.7% sRGB (Argyll 3D)
42% Display P3 (Argyll 3D)
Gamma: 2.3
CCT: 6529 K
| HP Victus 15 fa0020nr CMN1521, IPS, 1920x1080, 15.6" | HP Omen 15-en0375ng BOE0852, IPS, 1920x1080, 15.6" | Dell G15 5515 BOE092A, IPS, 1920x1080, 15.6" | Asus TUF Dash F15 FX517ZC BOE CQ NE156QHM-NY1, IPS, 2560x1440, 15.6" | MSI Bravo 15 B5DD-010US Chi Mei N156HRA-EA1, IPS, 1920x1080, 15.6" | Lenovo Legion 5 15IAH7H 82RB CSOT MNF601CA1-3, IPS, 1920x1080, 15.6" | |
|---|---|---|---|---|---|---|
| Display | -7% | -8% | 94% | 0% | 62% | |
| Display P3 Coverage (%) | 42 | 39.12 -7% | 39.1 -7% | 95.8 128% | 42.1 0% | 69.1 65% |
| sRGB Coverage (%) | 62.7 | 57.6 -8% | 56.9 -9% | 99.9 59% | 62.8 0% | 99.5 59% |
| AdobeRGB 1998 Coverage (%) | 43.4 | 40.42 -7% | 40.4 -7% | 85.1 96% | 43.6 0% | 70 61% |
| Response Times | 19% | 33% | 69% | 22% | 57% | |
| Response Time Grey 50% / Grey 80% * (ms) | 35.2 ? | 30.4 ? 14% | 25.2 ? 28% | 8.4 ? 76% | 25.6 ? 27% | 14.8 ? 58% |
| Response Time Black / White * (ms) | 27.2 ? | 20.8 ? 24% | 16.8 ? 38% | 10.4 ? 62% | 22.8 ? 16% | 12 ? 56% |
| PWM Frequency (Hz) | 200 ? | 200 ? | ||||
| Screen | -31% | -43% | -9% | -37% | -3% | |
| Brightness middle (cd/m²) | 284.3 | 297 4% | 278 -2% | 354.2 25% | 265.1 -7% | 363.5 28% |
| Brightness (cd/m²) | 262 | 275 5% | 262 0% | 330 26% | 245 -6% | 350 34% |
| Brightness Distribution (%) | 87 | 88 1% | 83 -5% | 88 1% | 87 0% | 89 2% |
| Black Level * (cd/m²) | 0.17 | 0.33 -94% | 0.36 -112% | 0.32 -88% | 0.35 -106% | 0.39 -129% |
| Contrast (:1) | 1672 | 900 -46% | 772 -54% | 1107 -34% | 757 -55% | 932 -44% |
| Colorchecker dE 2000 * | 4.52 | 4.54 -0% | 5.74 -27% | 4.06 10% | 4.68 -4% | 3.68 19% |
| Colorchecker dE 2000 max. * | 18.67 | 18.92 -1% | 19.63 -5% | 8.81 53% | 19.96 -7% | 8.92 52% |
| Colorchecker dE 2000 calibrated * | 1.55 | 4.66 -201% | 4.7 -203% | 3.7 -139% | 0.53 66% | |
| Greyscale dE 2000 * | 4.1 | 2.1 49% | 3.1 24% | 6.7 -63% | 4.5 -10% | 6.5 -59% |
| Gamma | 2.3 96% | 2.066 106% | 2.011 109% | 2.12 104% | 2.22 99% | 2.2 100% |
| CCT | 6529 100% | 6291 103% | 6207 105% | 6731 97% | 6632 98% | 5995 108% |
| Color Space (Percent of AdobeRGB 1998) (%) | 40 | |||||
| Color Space (Percent of sRGB) (%) | 58 | |||||
| Media totale (Programma / Settaggio) | -6% /
-19% | -6% /
-24% | 51% /
27% | -5% /
-21% | 39% /
19% |
* ... Meglio usare valori piccoli
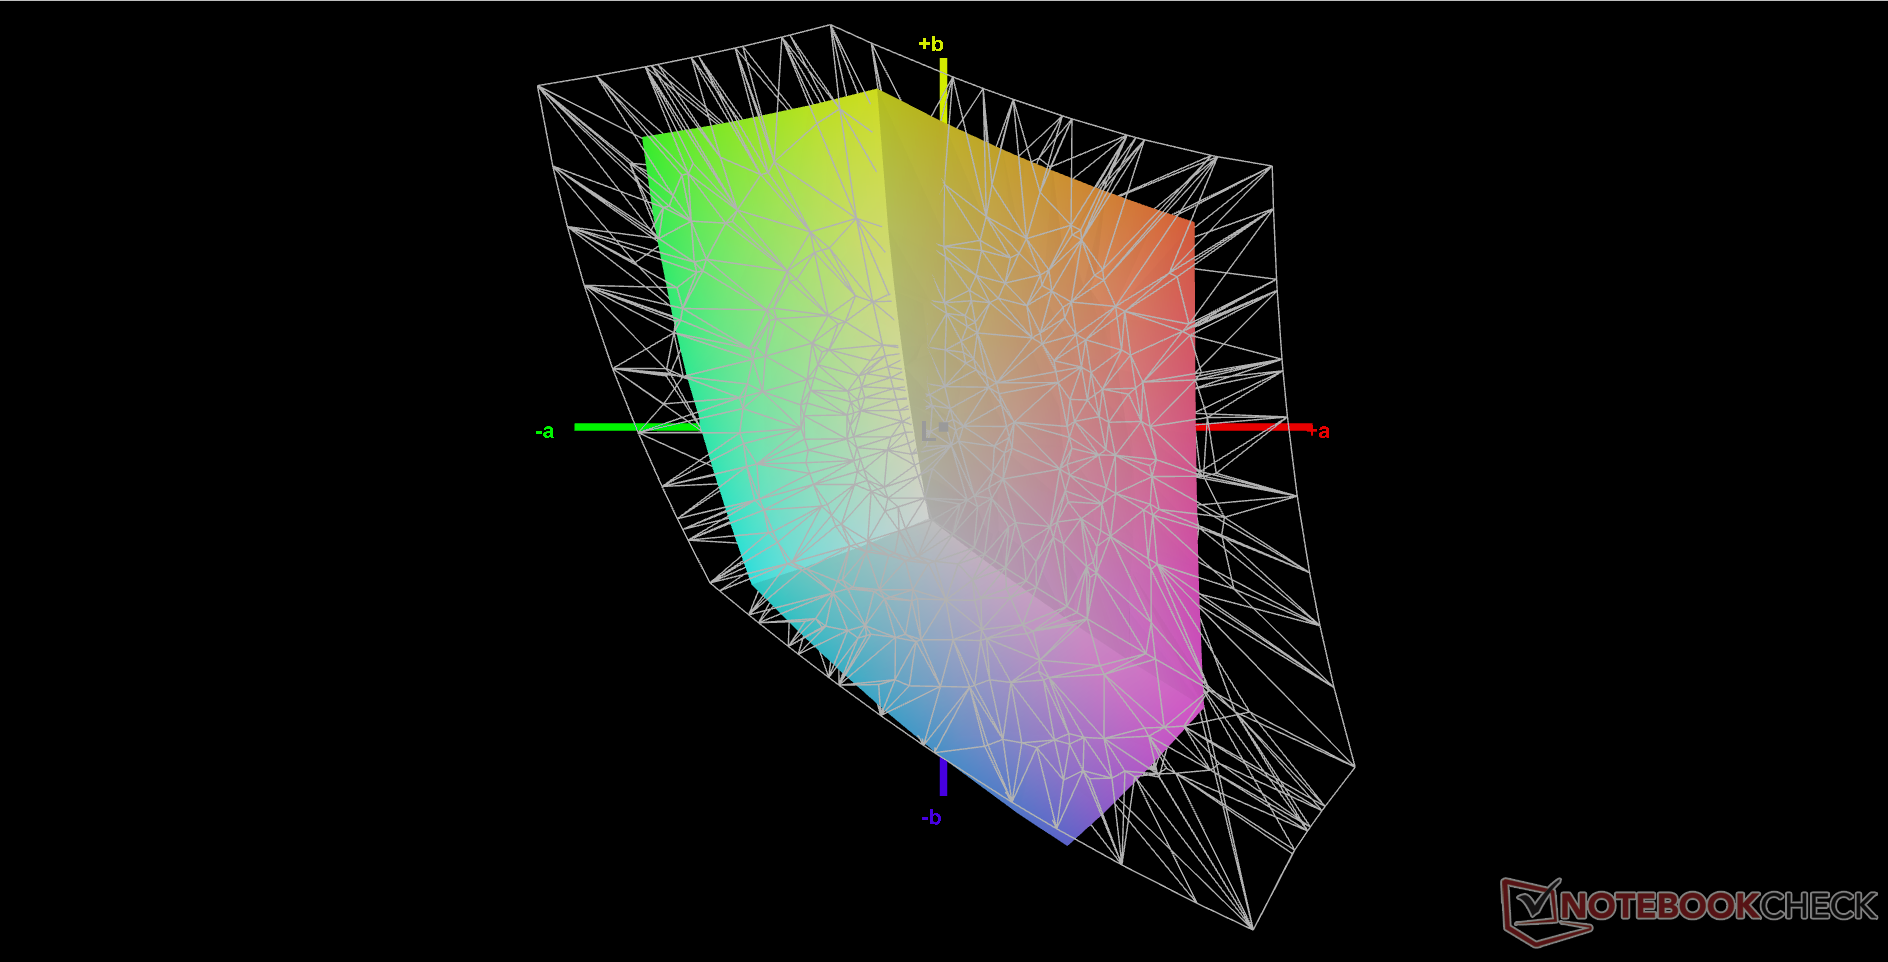
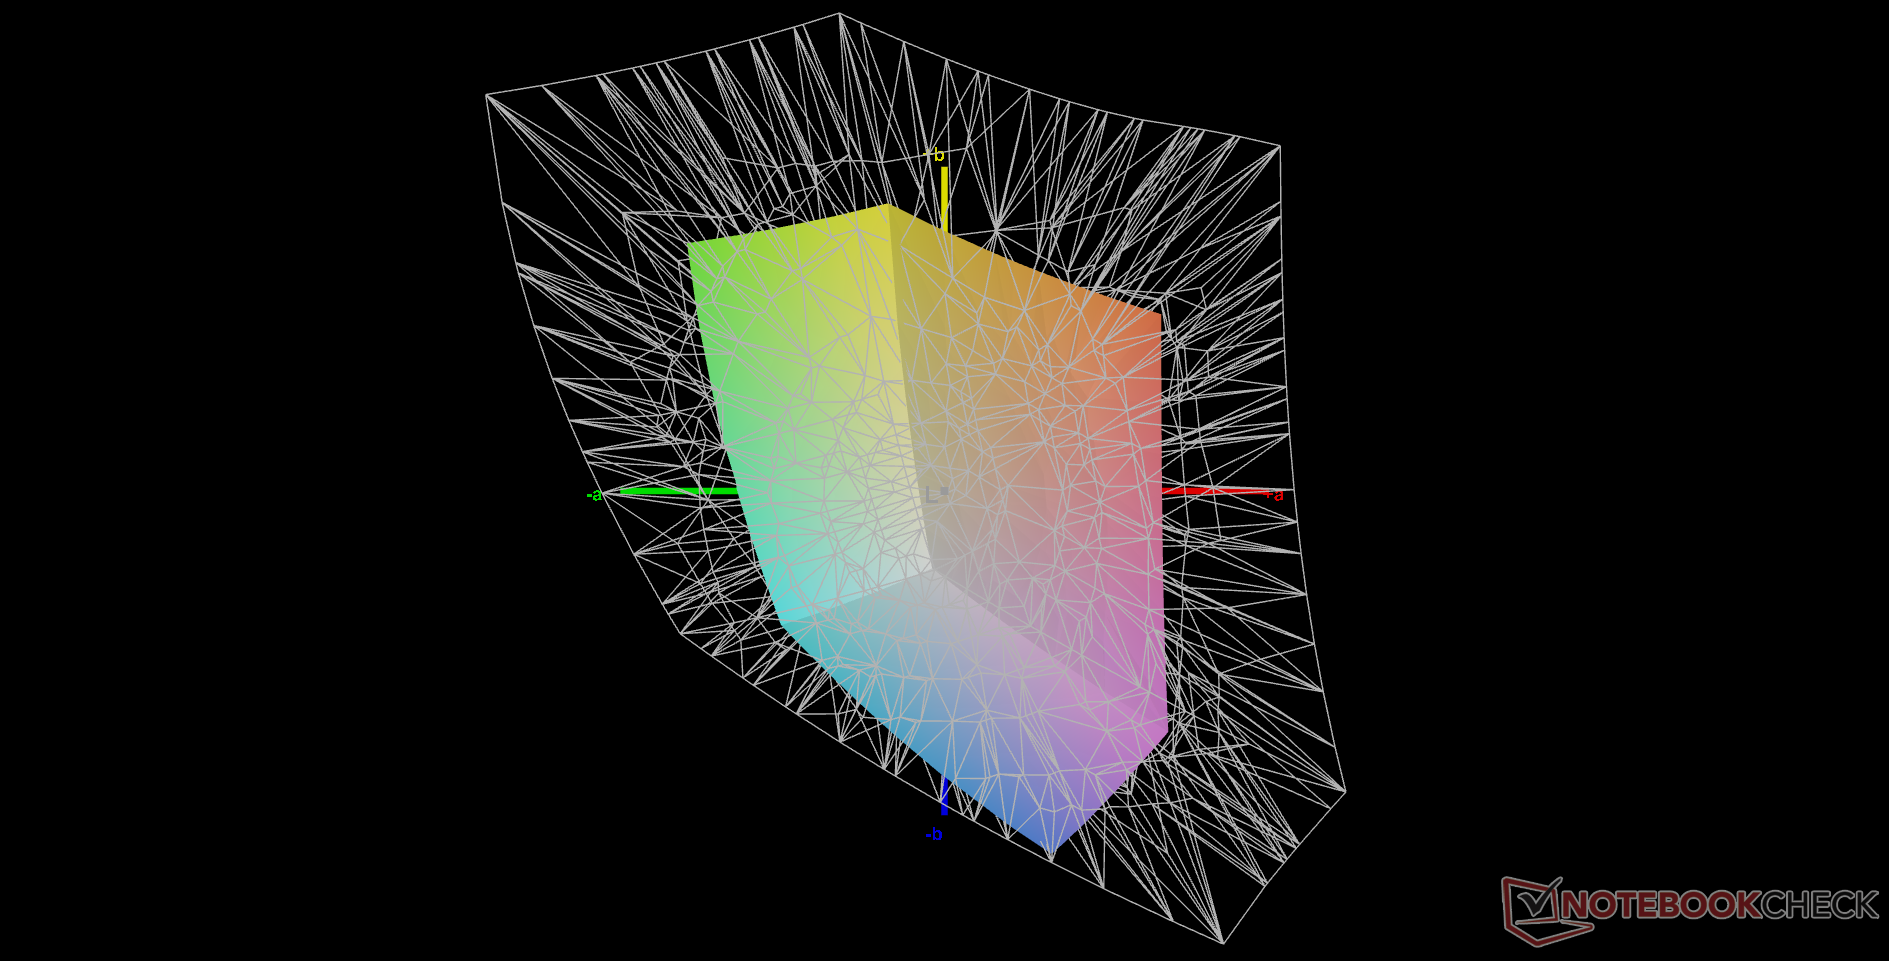
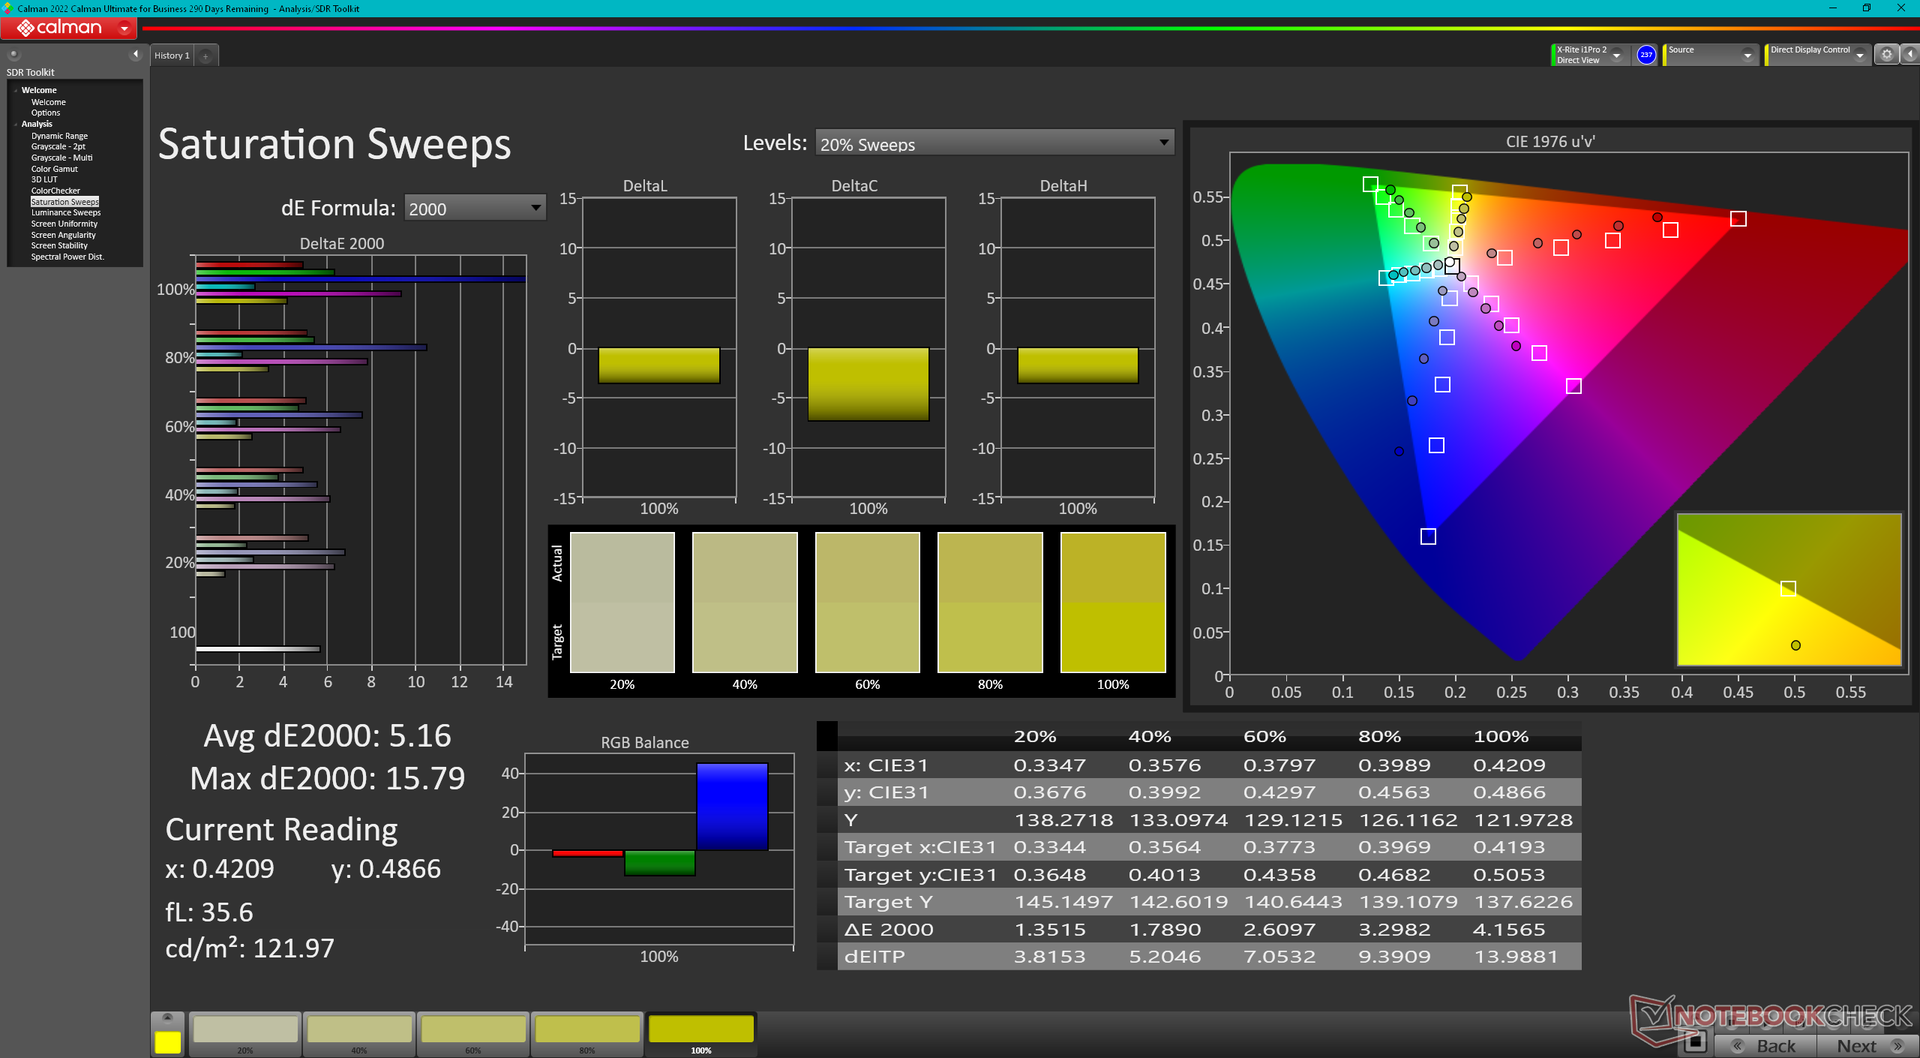
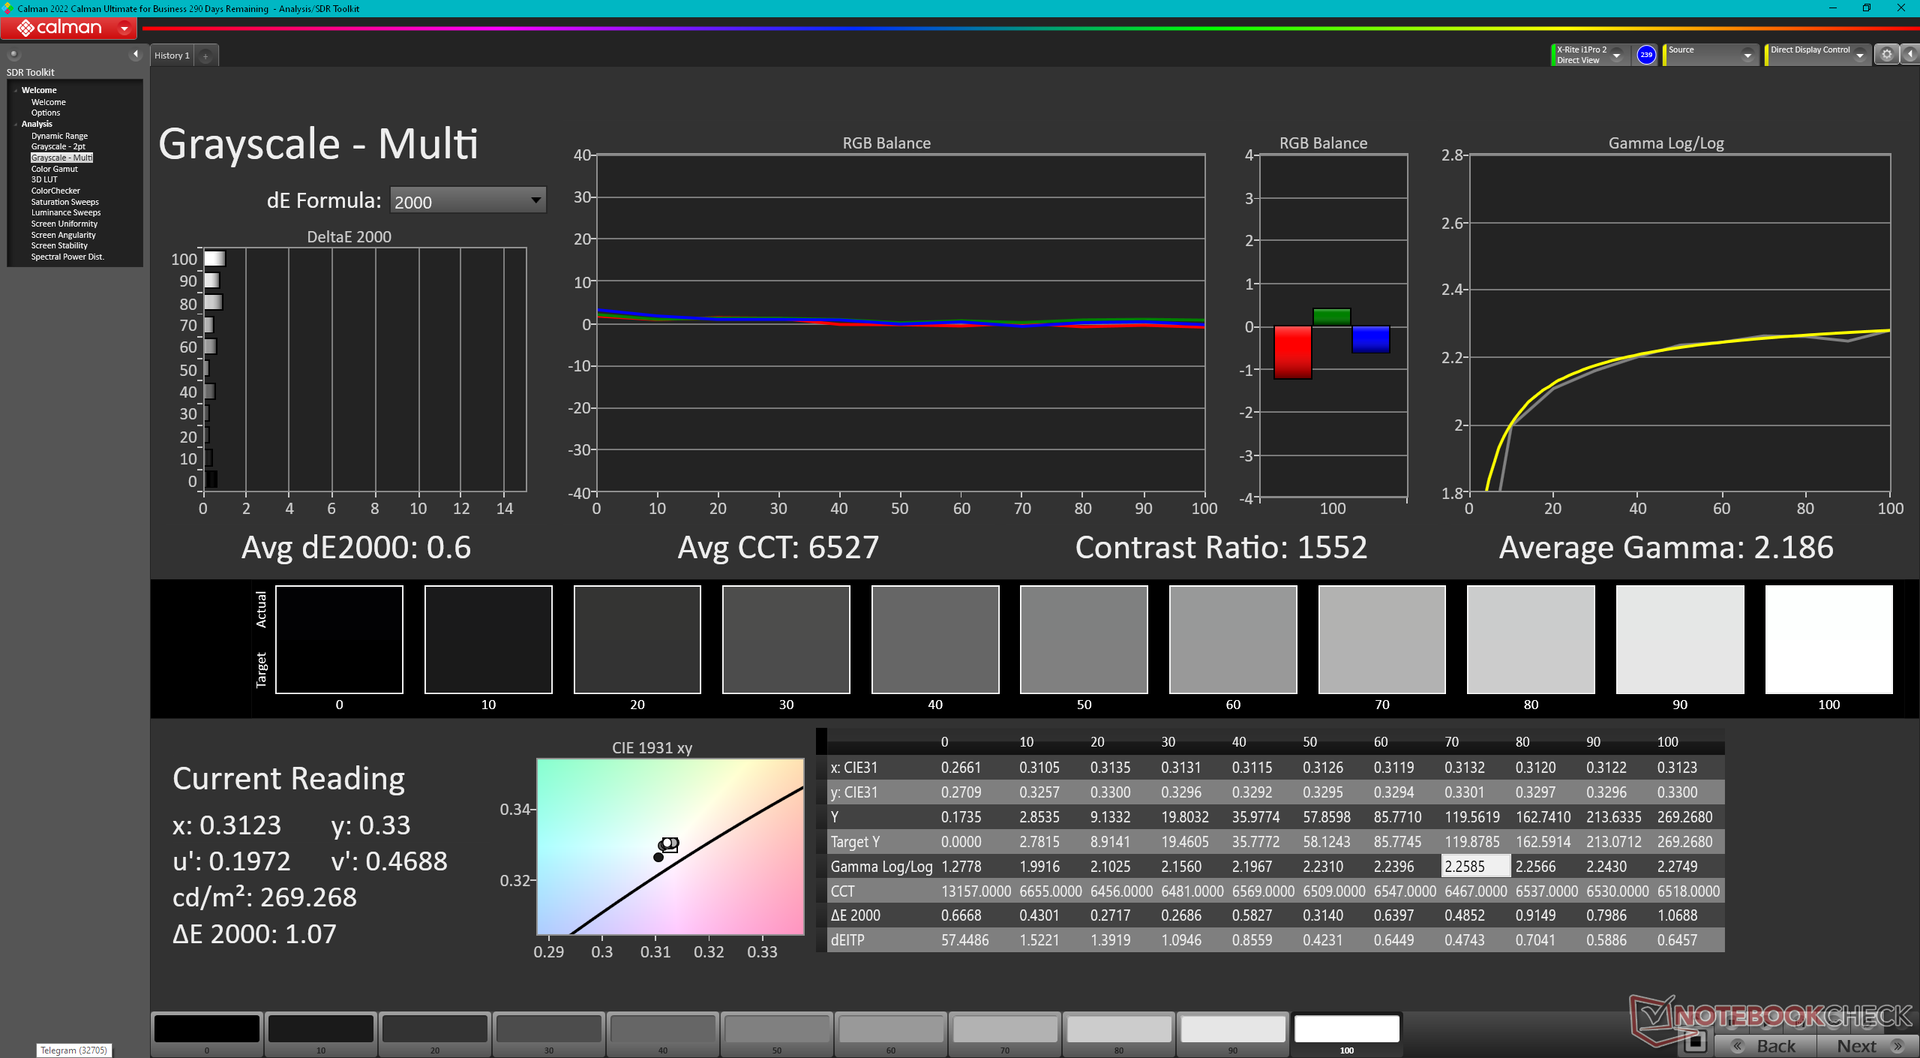
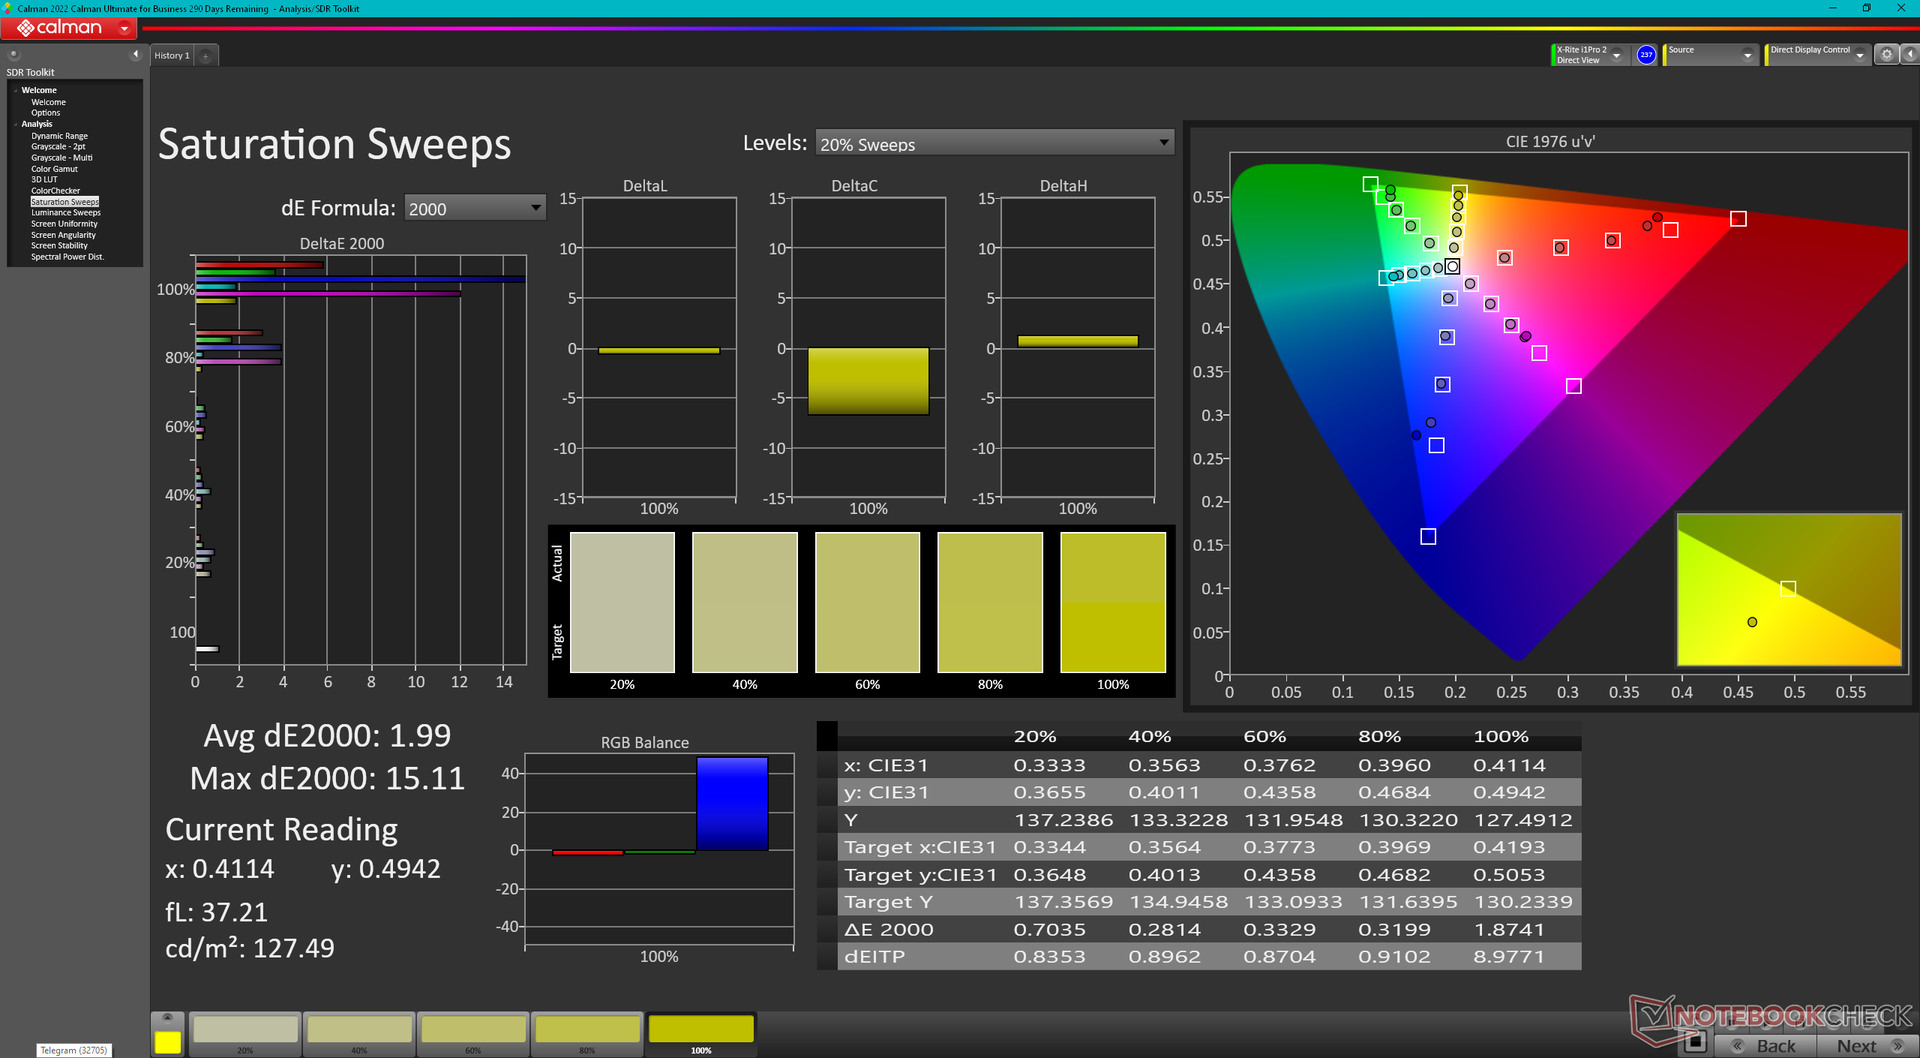
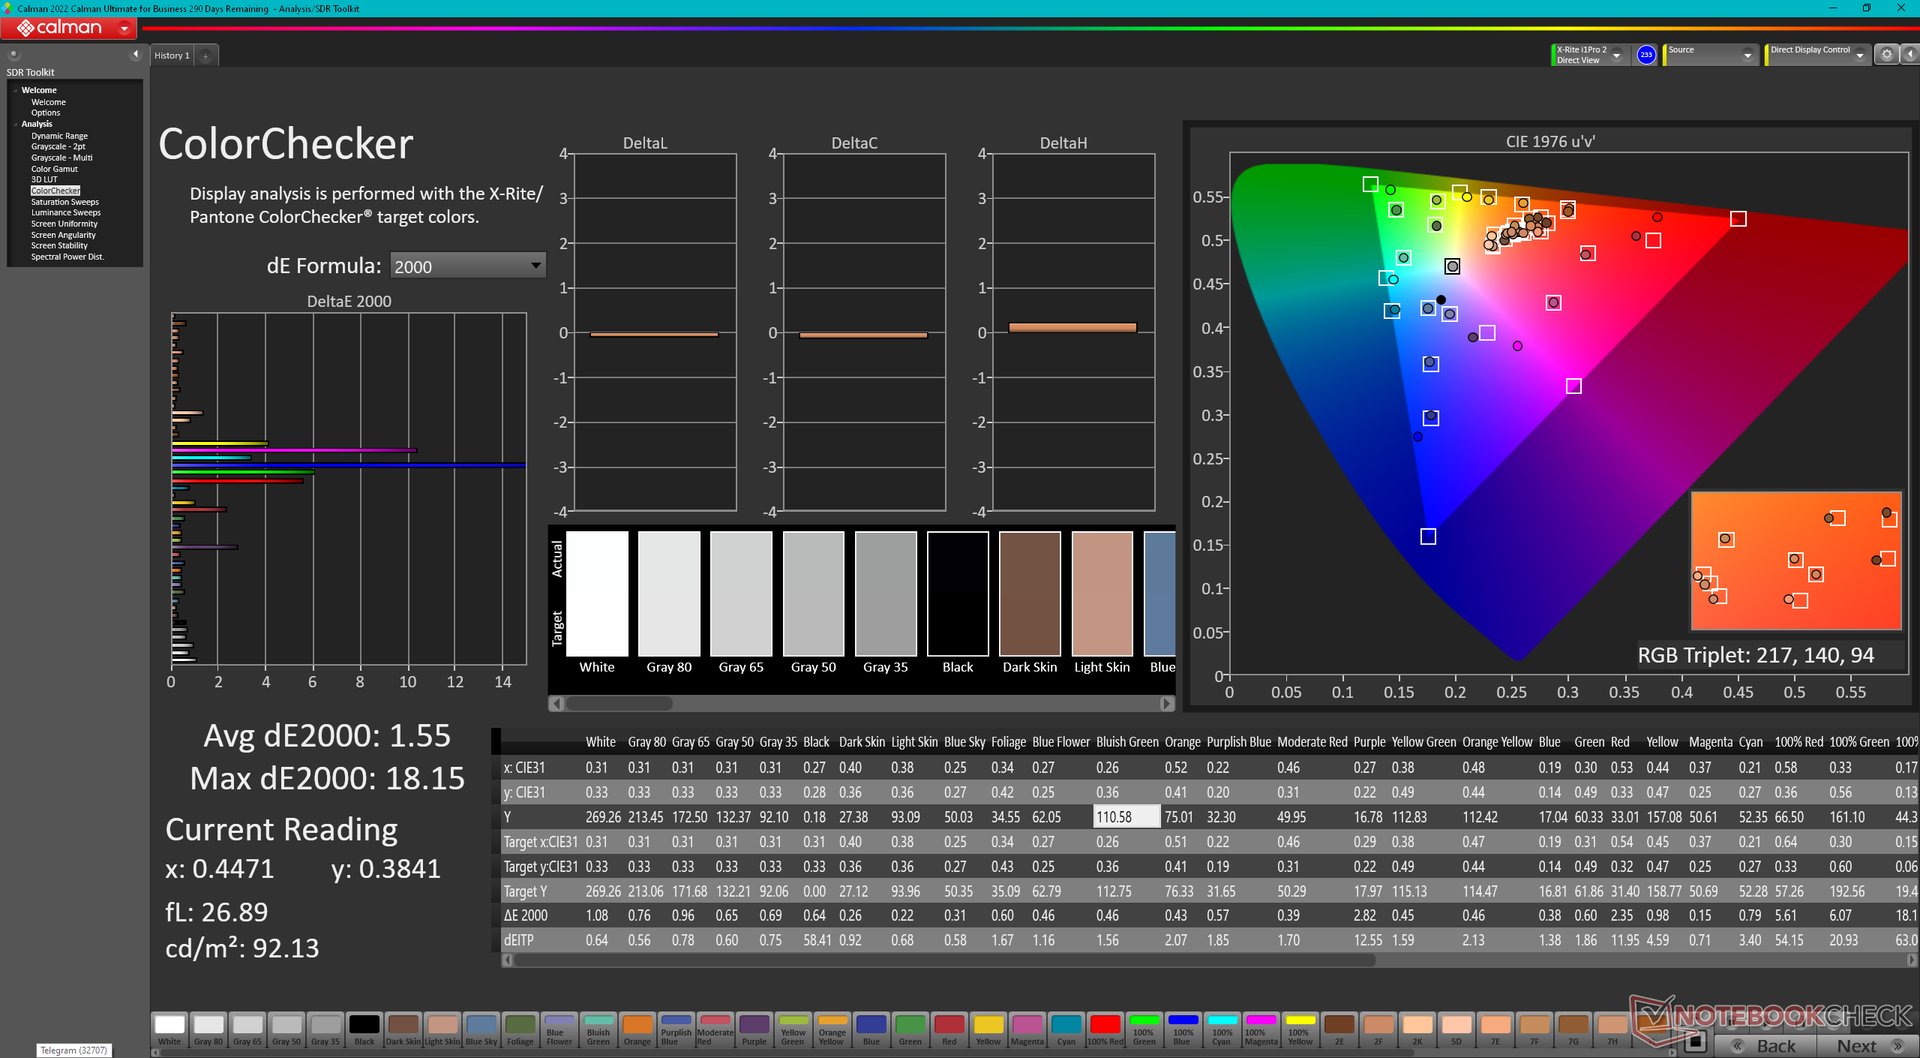
Il display non è calibrato, con valori medi di deltaE della scala di grigi e del colore di 4,1 e 4,52 rispettivamente. Calibrando il pannello da soli, questi valori scenderebbero rispettivamente a 0,6 e 1,55, ma i livelli di saturazione più elevati sono ancora molto imprecisi a causa della stretta copertura sRGB di cui sopra. I nostri screenshot Calman qui sotto mostrano che i colori blu e magenta in particolare sono molto più imprecisi di altri.
Consigliamo di applicare il nostro profilo ICM calibrato di cui sopra, che può contribuire a migliorare l'accuratezza dei colori a livelli di saturazione inferiori.
Tempi di risposta del Display
| ↔ Tempi di risposta dal Nero al Bianco | ||
|---|---|---|
| 27.2 ms ... aumenta ↗ e diminuisce ↘ combinato | ↗ 15.6 ms Incremento | 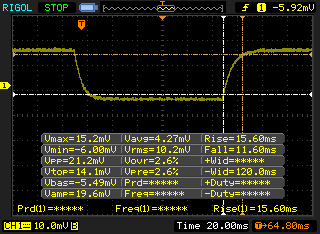 |
| ↘ 11.6 ms Calo | ||
| Lo schermo mostra tempi di risposta relativamente lenti nei nostri tests e potrebbe essere troppo lento per i gamers. In confronto, tutti i dispositivi di test variano da 0.1 (minimo) a 240 (massimo) ms. » 69 % di tutti i dispositivi è migliore. Questo significa che i tempi di risposta rilevati sono peggiori rispetto alla media di tutti i dispositivi testati (19.8 ms). | ||
| ↔ Tempo di risposta dal 50% Grigio all'80% Grigio | ||
| 35.2 ms ... aumenta ↗ e diminuisce ↘ combinato | ↗ 18 ms Incremento | 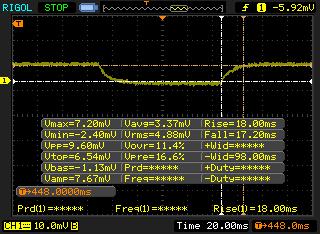 |
| ↘ 17.2 ms Calo | ||
| Lo schermo mostra tempi di risposta lenti nei nostri tests e sarà insoddisfacente per i gamers. In confronto, tutti i dispositivi di test variano da 0.165 (minimo) a 636 (massimo) ms. » 49 % di tutti i dispositivi è migliore. Questo significa che i tempi di risposta rilevati sono peggiori rispetto alla media di tutti i dispositivi testati (31 ms). | ||
Sfarfallio dello schermo / PWM (Pulse-Width Modulation)
| flickering dello schermo / PWM non rilevato | 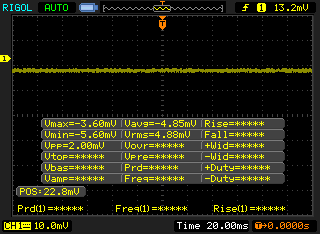 | ||
In confronto: 52 % di tutti i dispositivi testati non utilizza PWM per ridurre la luminosita' del display. Se è rilevato PWM, una media di 7747 (minimo: 5 - massimo: 343500) Hz è stata rilevata. | |||
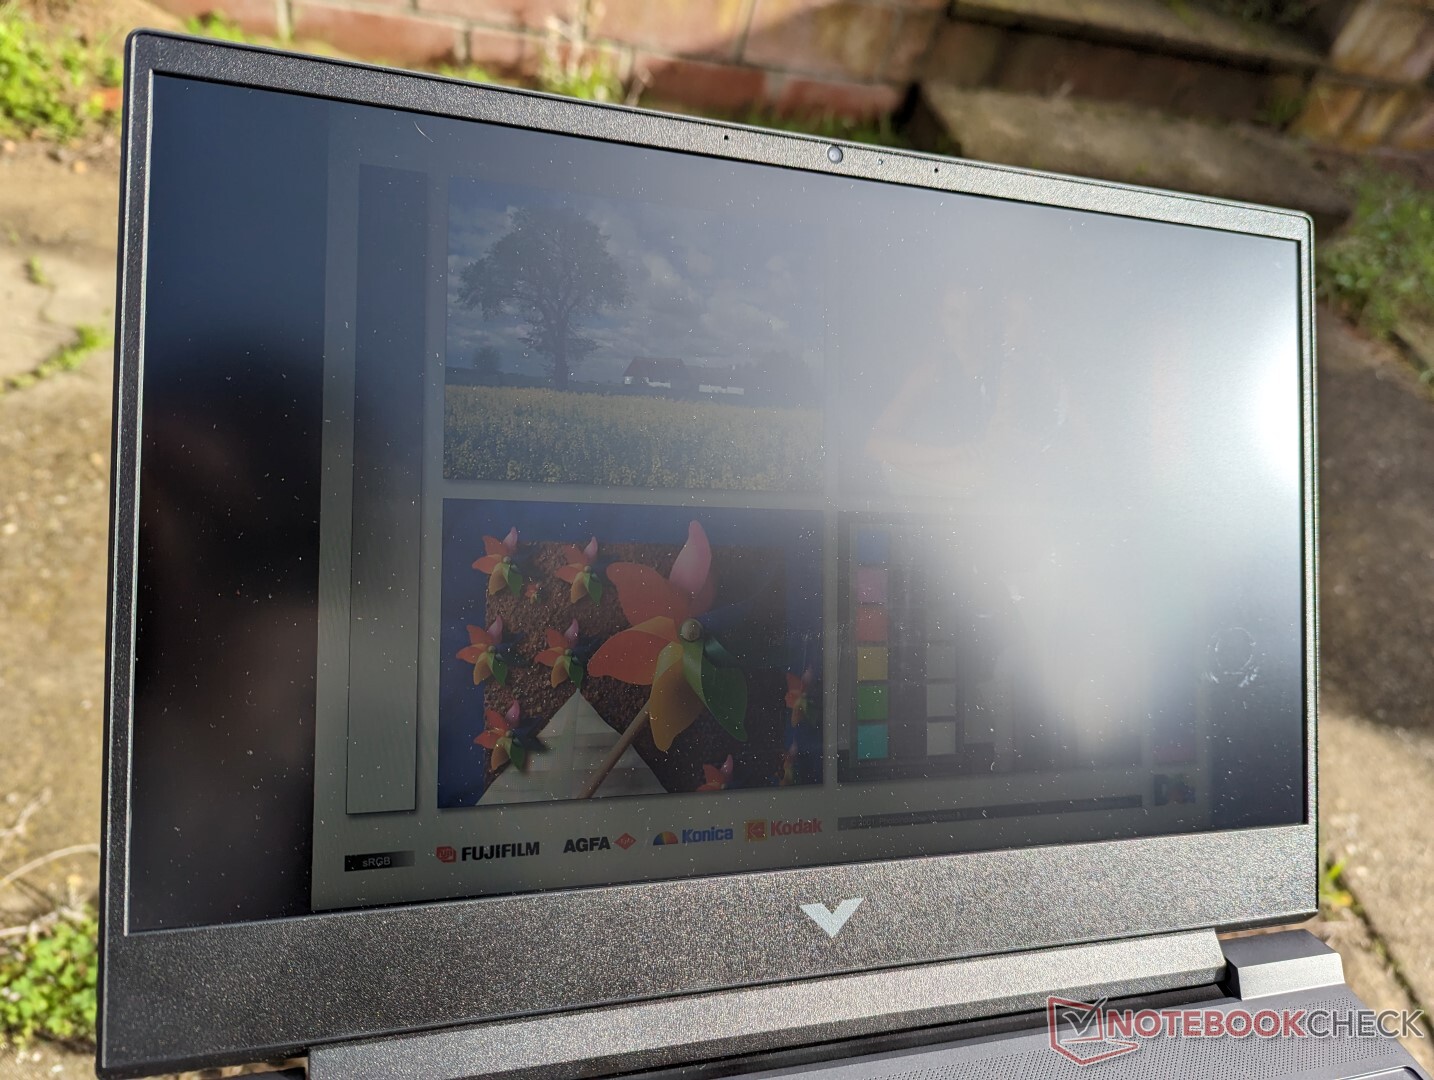
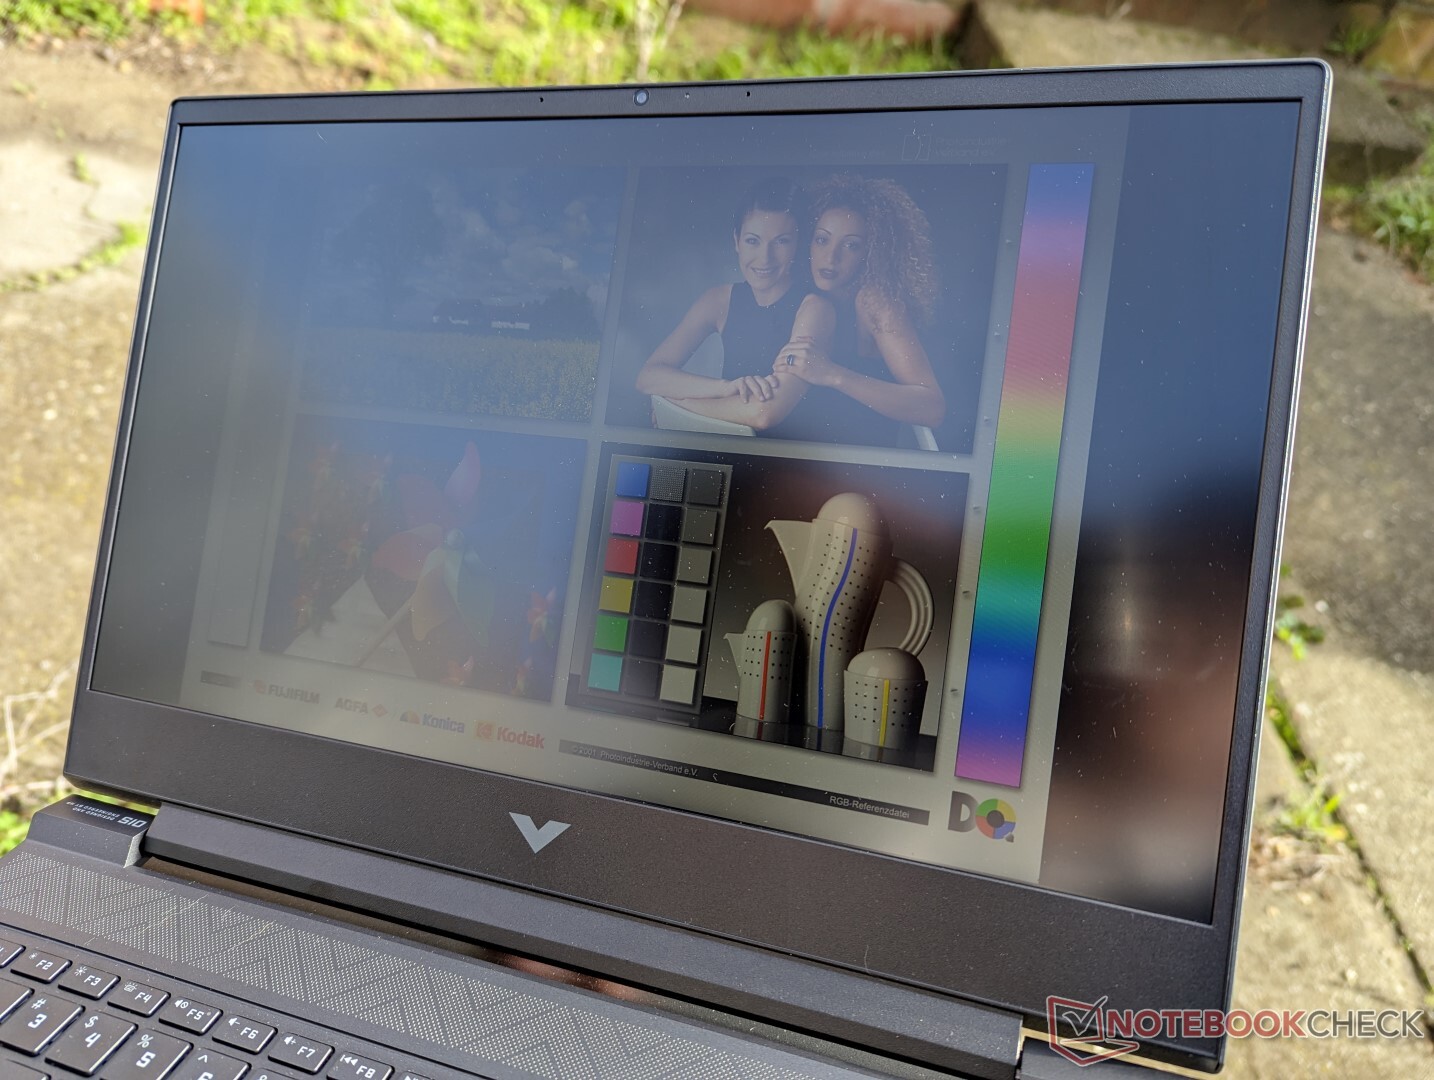
Il pannello opaco non è abbastanza luminoso per una visione confortevole all'aperto. I riflessi sono sempre presenti e i colori risultano sbiaditi. Dovrete investire in un portatile da gioco più costoso con display più luminosi come il Razer Blade 15 per una visione più agevole all'aperto.
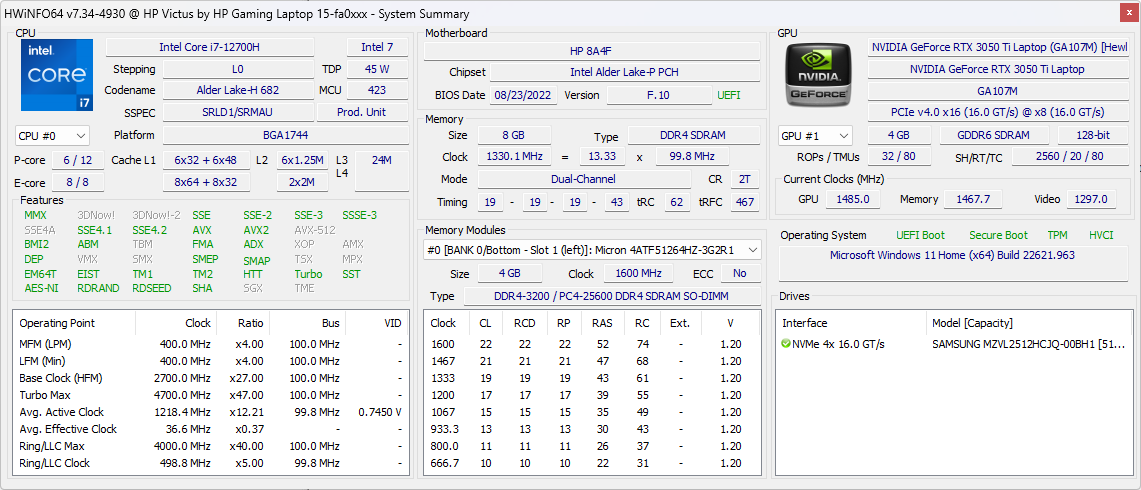
Prestazioni - Intel Alder Lake-H 12a generazione
Condizioni di test
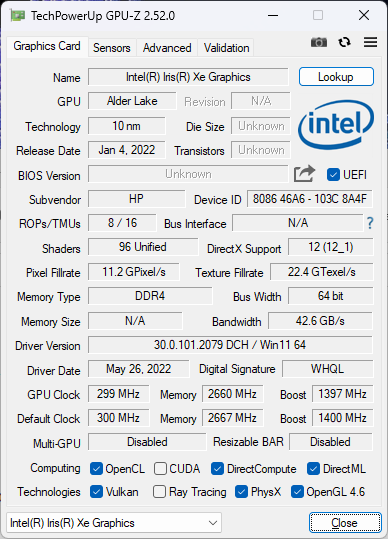
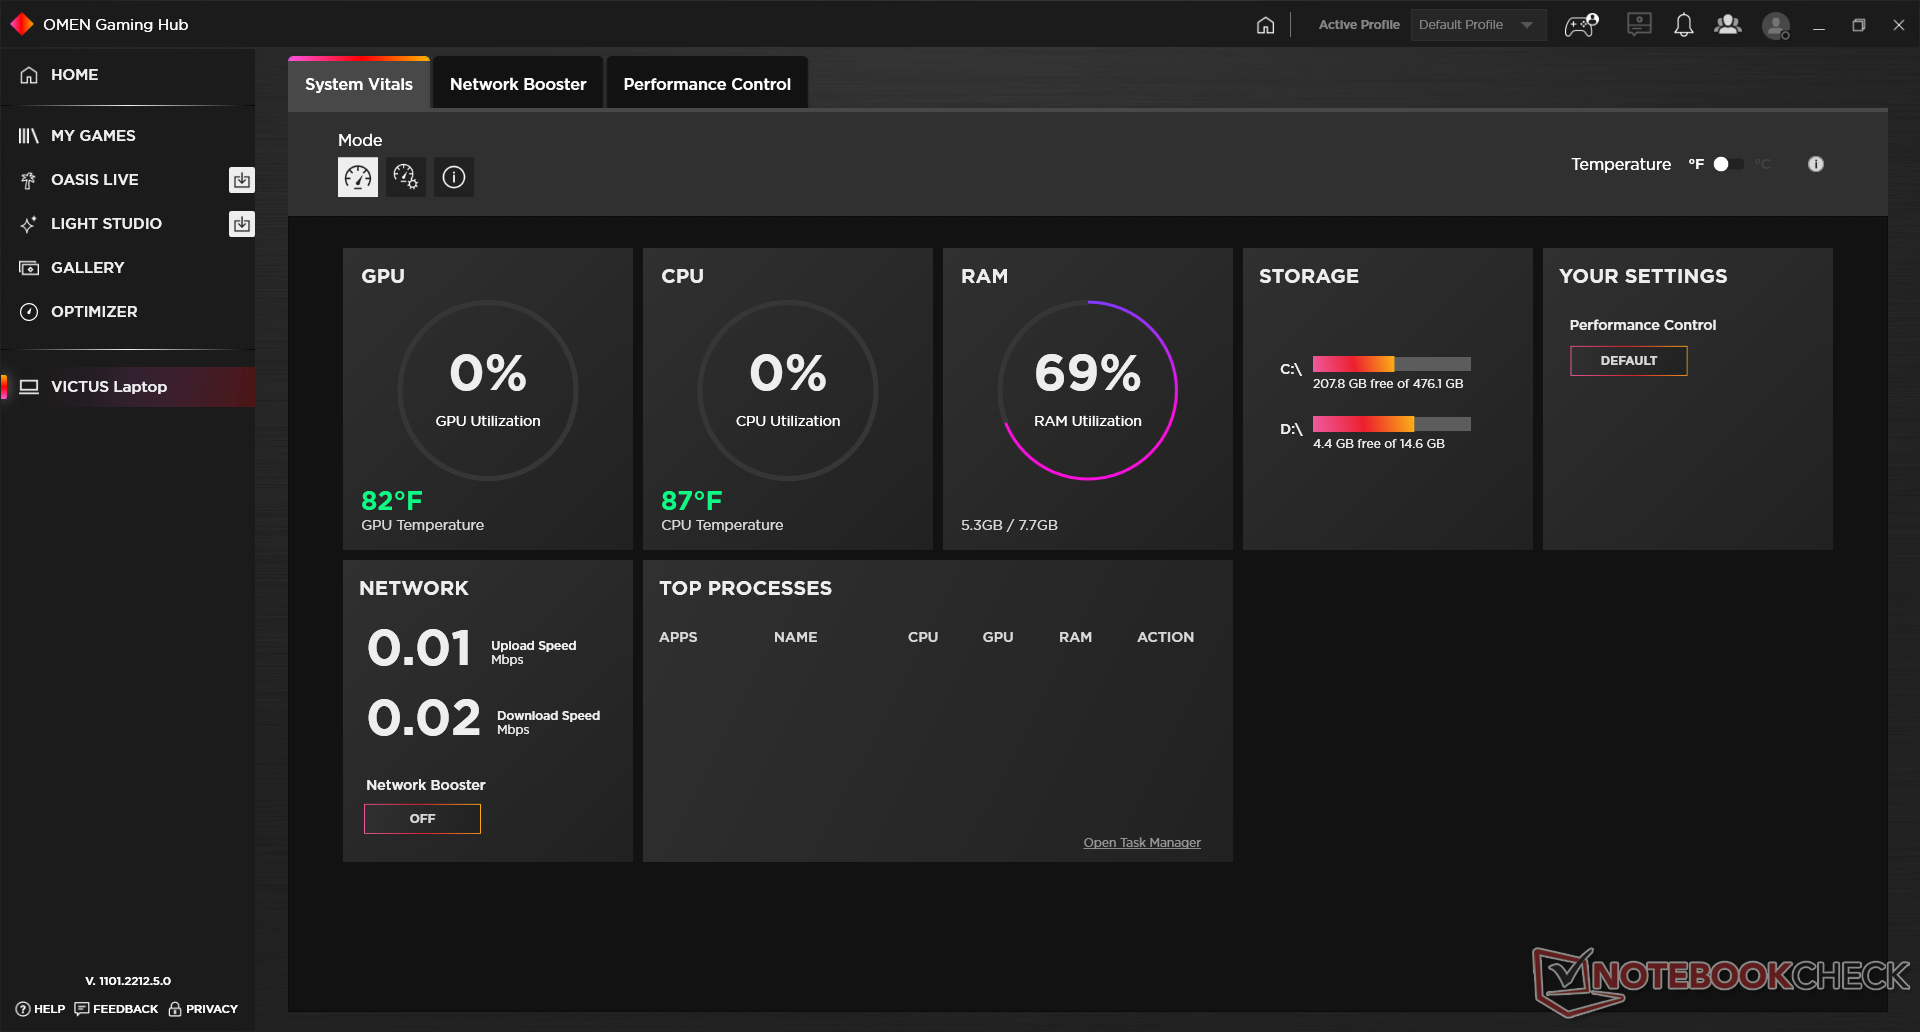
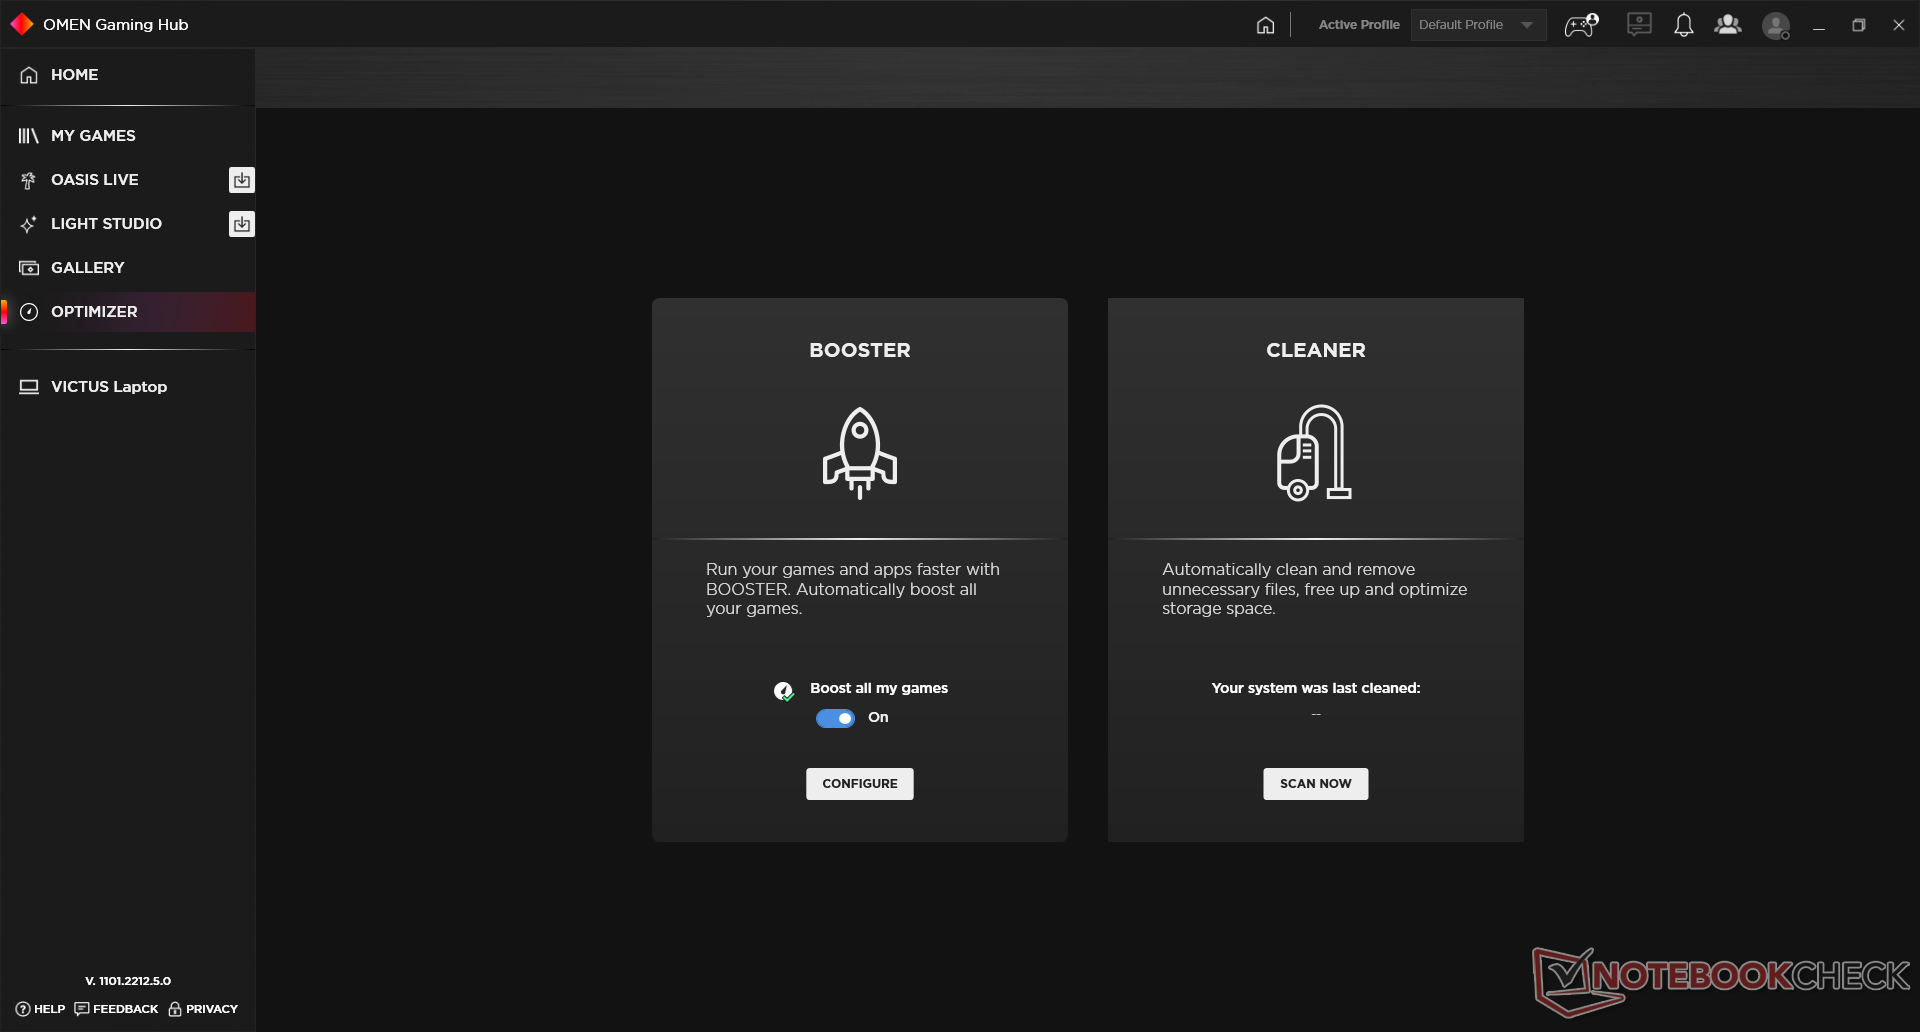
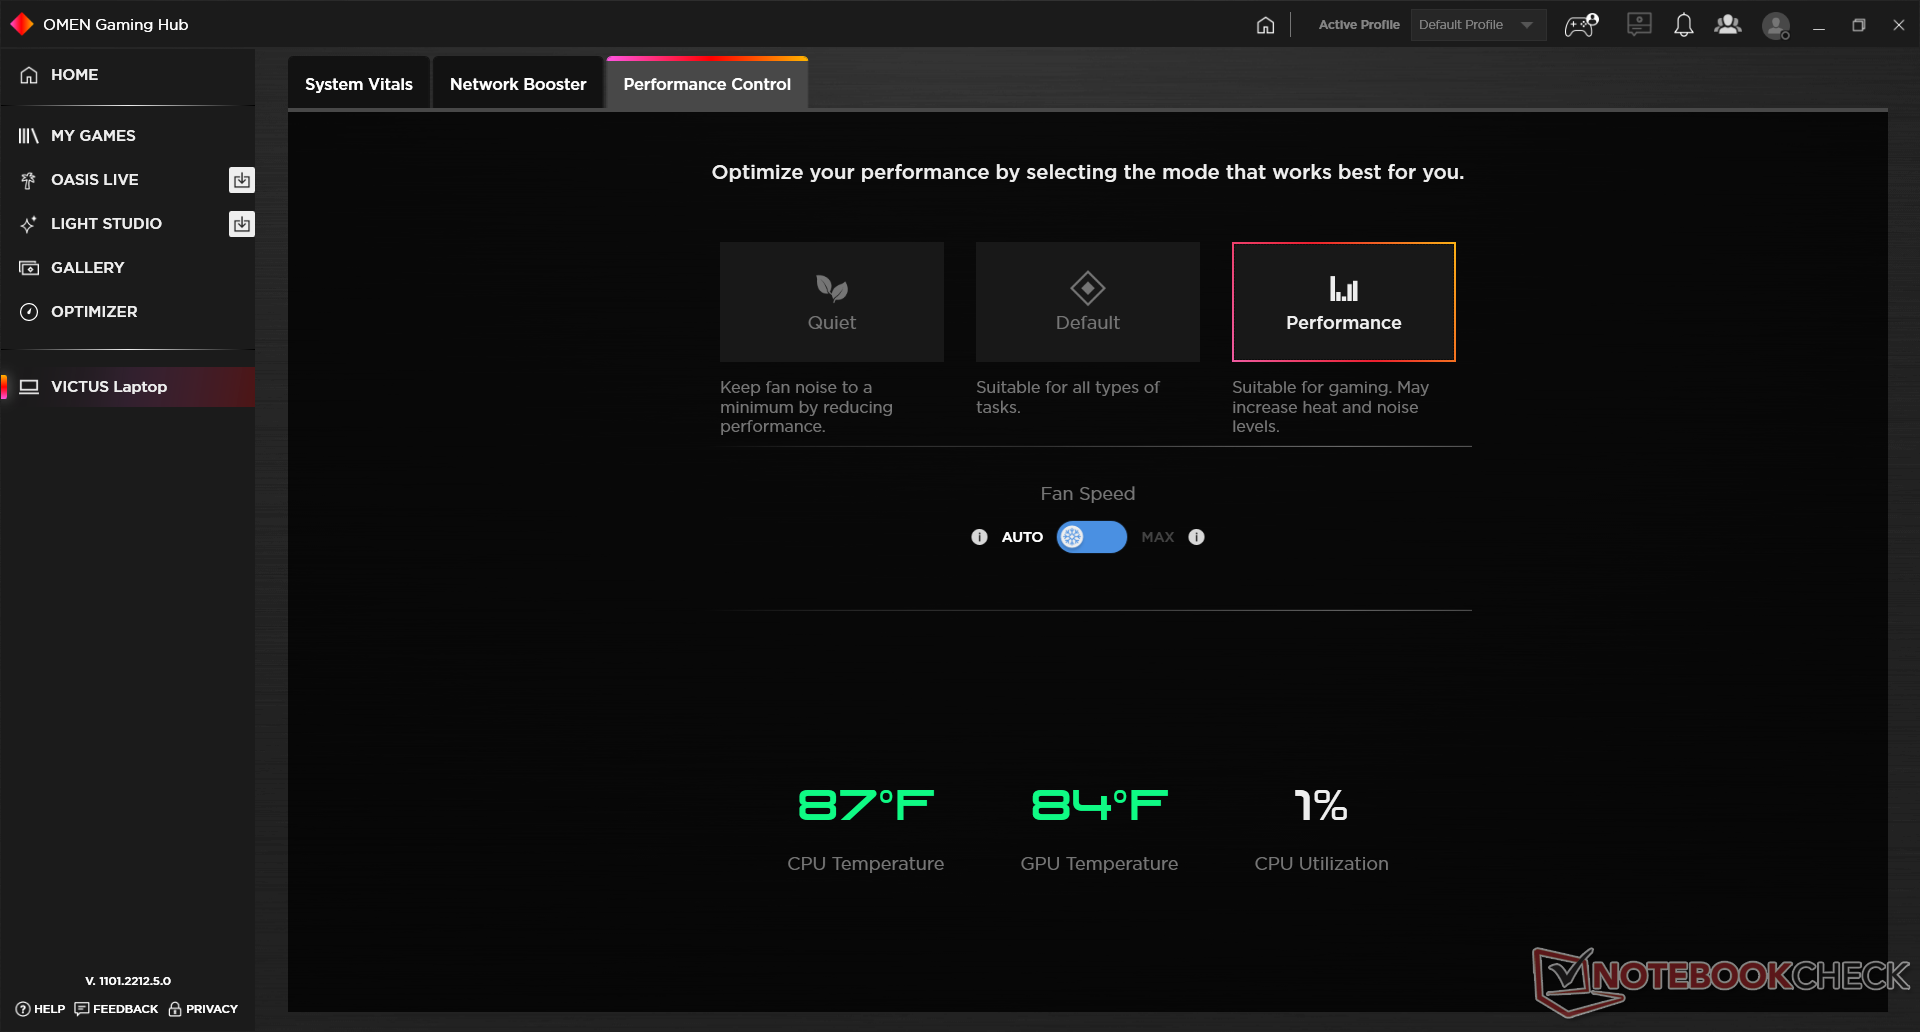
Abbiamo impostato la nostra unità in modalità Performance sia tramite Windows che tramite il software Omen Gaming Hub preinstallato prima di eseguire i benchmark qui sotto. Ci siamo anche assicurati di abilitare sia la modalità HP Boost che la GPU Nvidia, come mostrano gli screenshot qui sotto. Il fatto che ci siano così tante impostazioni individuali per l'alimentazione nascoste in diversi menu può essere frustrante, soprattutto se si passa continuamente da un livello di prestazioni più basso a uno più alto.

Processore - Turbo Boost limitato
Le prestazioni della CPU sono buone, ma la sostenibilità delle prestazioni potrebbe essere migliore. Le prestazioni calano fino al 28% quando si esegue CineBench R15 xT in loop, come mostra il grafico di confronto qui sotto. Questo calo si verifica anche quando il sistema è in modalità Performance con HP Boost attivo, il che è deludente da vedere su un portatile da gioco. Il Lenovo Legion 5 15che monta lo stesso Core i7-12700H Del Victus 15, è in grado di offrire prestazioni multi-thread più veloci del 46% perché la sua CPU non subisce un throttling altrettanto pesante.
Optando per il meno costoso AMD Ryzen 5800H Del Victus 15 comporterà un deficit di prestazioni di circa il 20-25% rispetto al nostro Core i7-12700H.
Cinebench R15 Multi Loop
Cinebench R23: Multi Core | Single Core
Cinebench R20: CPU (Multi Core) | CPU (Single Core)
Cinebench R15: CPU Multi 64Bit | CPU Single 64Bit
Blender: v2.79 BMW27 CPU
7-Zip 18.03: 7z b 4 | 7z b 4 -mmt1
Geekbench 5.5: Multi-Core | Single-Core
HWBOT x265 Benchmark v2.2: 4k Preset
LibreOffice : 20 Documents To PDF
R Benchmark 2.5: Overall mean
| HWBOT x265 Benchmark v2.2 / 4k Preset | |
| MSI GE67 HX 12UGS | |
| Lenovo Legion 5 15IAH7H 82RB | |
| Alienware x15 R2 P111F | |
| Media Intel Core i7-12700H (4.67 - 21.8, n=64) | |
| Razer Blade 17 (i7-12800H, RTX 3070 Ti) | |
| HP Victus 15 fa0020nr | |
| Asus ROG Strix G15 G513QY | |
| Dell G15 5515 | |
| Asus TUF Dash F15 FX517ZC | |
| HP Omen 15-en0375ng | |
| MSI Bravo 15 B5DD-010US | |
| HP Omen 15-ek0456ng | |
* ... Meglio usare valori piccoli
AIDA64: FP32 Ray-Trace | FPU Julia | CPU SHA3 | CPU Queen | FPU SinJulia | FPU Mandel | CPU AES | CPU ZLib | FP64 Ray-Trace | CPU PhotoWorxx
| Performance rating | |
| Lenovo Legion 5 15IAH7H 82RB | |
| Dell G15 5515 | |
| HP Omen 15-en0375ng | |
| Media Intel Core i7-12700H | |
| HP Victus 15 fa0020nr | |
| MSI Bravo 15 B5DD-010US | |
| Asus TUF Dash F15 FX517ZC | |
| AIDA64 / FP32 Ray-Trace | |
| Lenovo Legion 5 15IAH7H 82RB | |
| HP Omen 15-en0375ng | |
| Dell G15 5515 | |
| HP Victus 15 fa0020nr | |
| Media Intel Core i7-12700H (2585 - 17957, n=64) | |
| MSI Bravo 15 B5DD-010US | |
| Asus TUF Dash F15 FX517ZC | |
| AIDA64 / FPU Julia | |
| Dell G15 5515 | |
| Lenovo Legion 5 15IAH7H 82RB | |
| HP Omen 15-en0375ng | |
| MSI Bravo 15 B5DD-010US | |
| HP Victus 15 fa0020nr | |
| Media Intel Core i7-12700H (12439 - 90760, n=64) | |
| Asus TUF Dash F15 FX517ZC | |
| AIDA64 / CPU SHA3 | |
| Lenovo Legion 5 15IAH7H 82RB | |
| Media Intel Core i7-12700H (833 - 4242, n=64) | |
| Dell G15 5515 | |
| HP Victus 15 fa0020nr | |
| HP Omen 15-en0375ng | |
| MSI Bravo 15 B5DD-010US | |
| Asus TUF Dash F15 FX517ZC | |
| AIDA64 / CPU Queen | |
| Lenovo Legion 5 15IAH7H 82RB | |
| HP Victus 15 fa0020nr | |
| HP Omen 15-en0375ng | |
| Media Intel Core i7-12700H (57923 - 103202, n=63) | |
| Dell G15 5515 | |
| MSI Bravo 15 B5DD-010US | |
| Asus TUF Dash F15 FX517ZC | |
| AIDA64 / FPU SinJulia | |
| HP Omen 15-en0375ng | |
| Dell G15 5515 | |
| Lenovo Legion 5 15IAH7H 82RB | |
| MSI Bravo 15 B5DD-010US | |
| Media Intel Core i7-12700H (3249 - 9939, n=64) | |
| HP Victus 15 fa0020nr | |
| Asus TUF Dash F15 FX517ZC | |
| AIDA64 / FPU Mandel | |
| Dell G15 5515 | |
| Lenovo Legion 5 15IAH7H 82RB | |
| HP Omen 15-en0375ng | |
| MSI Bravo 15 B5DD-010US | |
| HP Victus 15 fa0020nr | |
| Media Intel Core i7-12700H (7135 - 44760, n=64) | |
| Asus TUF Dash F15 FX517ZC | |
| AIDA64 / CPU AES | |
| Lenovo Legion 5 15IAH7H 82RB | |
| Dell G15 5515 | |
| MSI Bravo 15 B5DD-010US | |
| Media Intel Core i7-12700H (31839 - 144360, n=64) | |
| HP Omen 15-en0375ng | |
| HP Victus 15 fa0020nr | |
| Asus TUF Dash F15 FX517ZC | |
| AIDA64 / CPU ZLib | |
| Lenovo Legion 5 15IAH7H 82RB | |
| Media Intel Core i7-12700H (305 - 1171, n=64) | |
| HP Omen 15-en0375ng | |
| HP Victus 15 fa0020nr | |
| Dell G15 5515 | |
| Asus TUF Dash F15 FX517ZC | |
| MSI Bravo 15 B5DD-010US | |
| AIDA64 / FP64 Ray-Trace | |
| Lenovo Legion 5 15IAH7H 82RB | |
| HP Omen 15-en0375ng | |
| Dell G15 5515 | |
| HP Victus 15 fa0020nr | |
| Media Intel Core i7-12700H (1437 - 9692, n=64) | |
| MSI Bravo 15 B5DD-010US | |
| Asus TUF Dash F15 FX517ZC | |
| AIDA64 / CPU PhotoWorxx | |
| Lenovo Legion 5 15IAH7H 82RB | |
| Media Intel Core i7-12700H (12863 - 52207, n=64) | |
| Asus TUF Dash F15 FX517ZC | |
| HP Omen 15-en0375ng | |
| MSI Bravo 15 B5DD-010US | |
| HP Victus 15 fa0020nr | |
| Dell G15 5515 | |
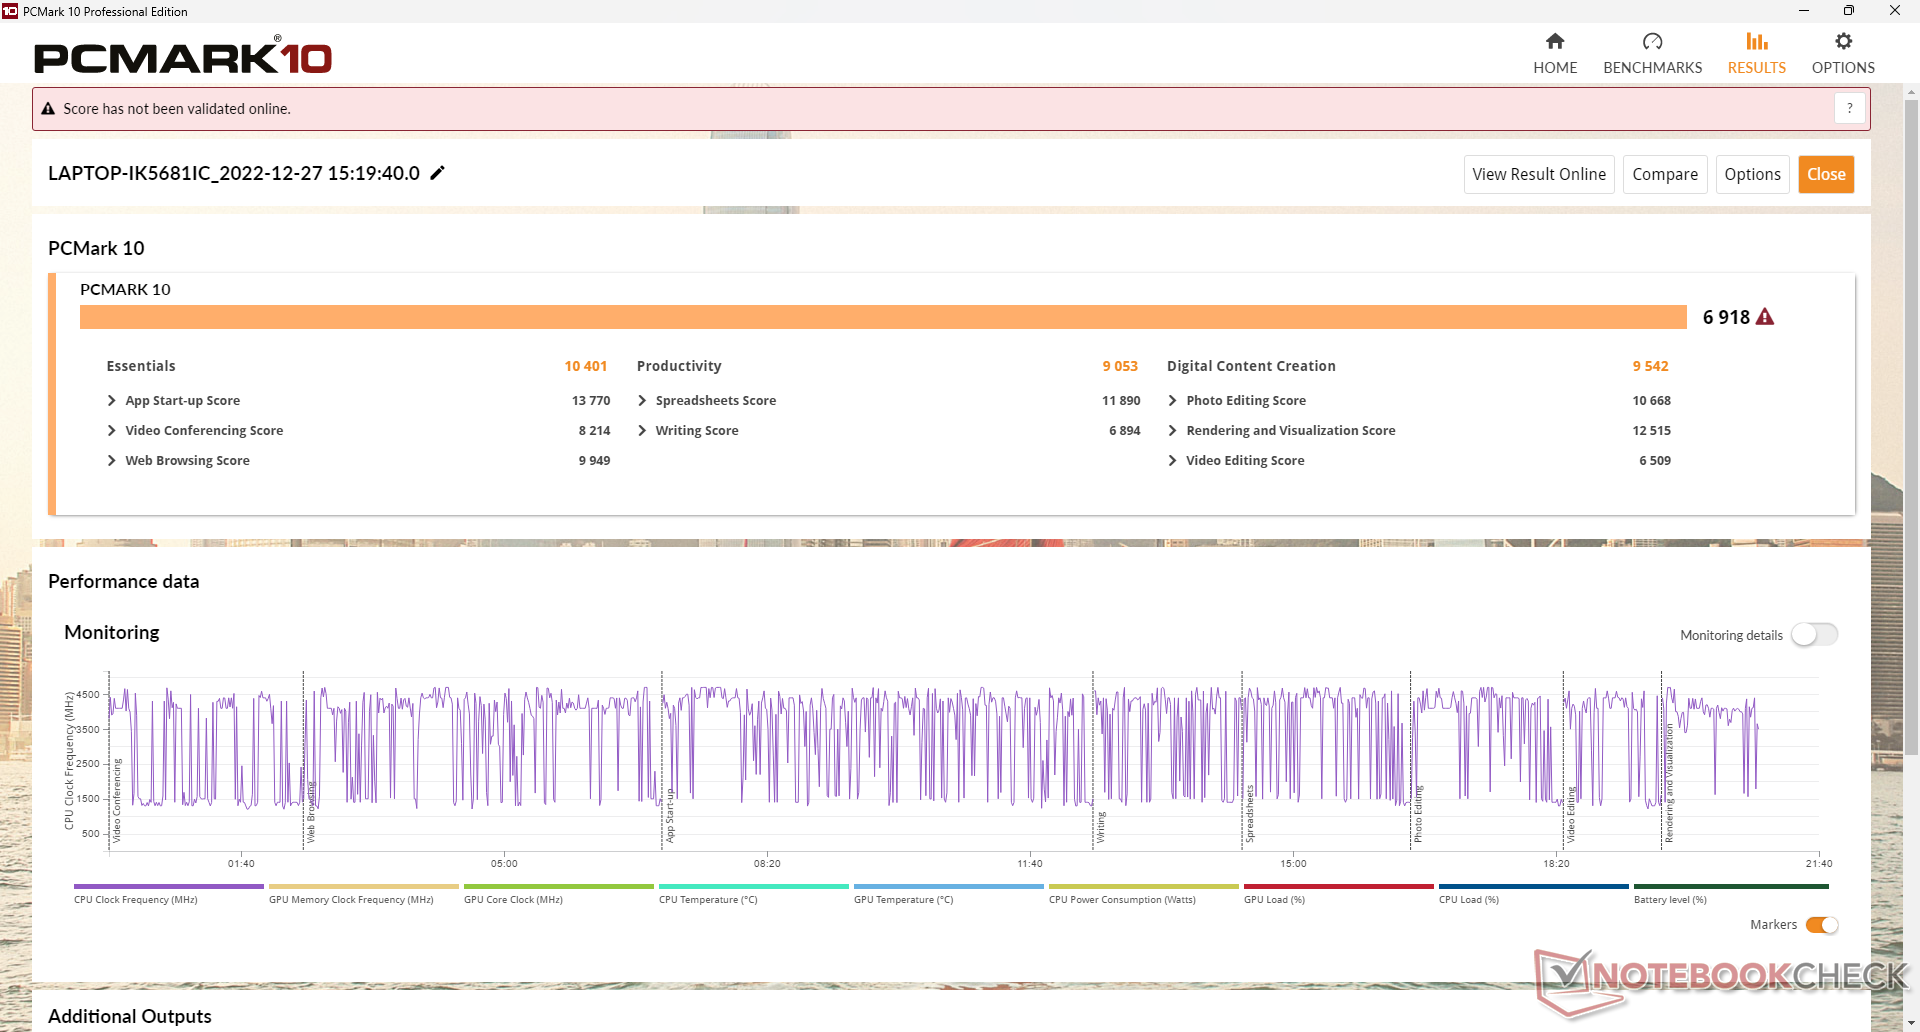
Prestazioni del sistema
I risultati di PCMark sono superiori a quelli di molti altri portatili da gioco più vecchi o economici, grazie alla CPU Intel di 12a generazione molto più veloce e all'SSD PCIe4 x4 NVMe. Ciononostante, rimane ancora indietro rispetto ai portatili con la più veloce GPU RTX 3060, come il Lenovo Legion 5 15.
CrossMark: Overall | Productivity | Creativity | Responsiveness
| PCMark 10 / Score | |
| Lenovo Legion 5 15IAH7H 82RB | |
| HP Victus 15 fa0020nr | |
| Asus TUF Dash F15 FX517ZC | |
| Media Intel Core i7-12700H, NVIDIA GeForce RTX 3050 Ti Laptop GPU (6623 - 7075, n=5) | |
| MSI Bravo 15 B5DD-010US | |
| Dell G15 5515 | |
| HP Omen 15-en0375ng | |
| PCMark 10 / Essentials | |
| Lenovo Legion 5 15IAH7H 82RB | |
| Asus TUF Dash F15 FX517ZC | |
| HP Victus 15 fa0020nr | |
| Media Intel Core i7-12700H, NVIDIA GeForce RTX 3050 Ti Laptop GPU (9540 - 10970, n=5) | |
| MSI Bravo 15 B5DD-010US | |
| Dell G15 5515 | |
| HP Omen 15-en0375ng | |
| PCMark 10 / Productivity | |
| Lenovo Legion 5 15IAH7H 82RB | |
| Asus TUF Dash F15 FX517ZC | |
| HP Victus 15 fa0020nr | |
| Media Intel Core i7-12700H, NVIDIA GeForce RTX 3050 Ti Laptop GPU (8530 - 9555, n=5) | |
| MSI Bravo 15 B5DD-010US | |
| Dell G15 5515 | |
| HP Omen 15-en0375ng | |
| PCMark 10 / Digital Content Creation | |
| Lenovo Legion 5 15IAH7H 82RB | |
| HP Victus 15 fa0020nr | |
| Media Intel Core i7-12700H, NVIDIA GeForce RTX 3050 Ti Laptop GPU (8855 - 9542, n=5) | |
| Asus TUF Dash F15 FX517ZC | |
| HP Omen 15-en0375ng | |
| MSI Bravo 15 B5DD-010US | |
| Dell G15 5515 | |
| CrossMark / Overall | |
| Lenovo Legion 5 15IAH7H 82RB | |
| Asus TUF Dash F15 FX517ZC | |
| Media Intel Core i7-12700H, NVIDIA GeForce RTX 3050 Ti Laptop GPU (1654 - 1872, n=5) | |
| HP Victus 15 fa0020nr | |
| CrossMark / Productivity | |
| Lenovo Legion 5 15IAH7H 82RB | |
| Asus TUF Dash F15 FX517ZC | |
| Media Intel Core i7-12700H, NVIDIA GeForce RTX 3050 Ti Laptop GPU (1595 - 1792, n=5) | |
| HP Victus 15 fa0020nr | |
| CrossMark / Creativity | |
| Lenovo Legion 5 15IAH7H 82RB | |
| Asus TUF Dash F15 FX517ZC | |
| Media Intel Core i7-12700H, NVIDIA GeForce RTX 3050 Ti Laptop GPU (1699 - 1993, n=5) | |
| HP Victus 15 fa0020nr | |
| CrossMark / Responsiveness | |
| Lenovo Legion 5 15IAH7H 82RB | |
| Asus TUF Dash F15 FX517ZC | |
| Media Intel Core i7-12700H, NVIDIA GeForce RTX 3050 Ti Laptop GPU (1383 - 1768, n=5) | |
| HP Victus 15 fa0020nr | |
| PCMark 10 Score | 6918 punti | |
Aiuto | ||
| AIDA64 / Memory Copy | |
| Media Intel Core i7-12700H (25615 - 80511, n=64) | |
| Lenovo Legion 5 15IAH7H 82RB | |
| Asus TUF Dash F15 FX517ZC | |
| MSI Bravo 15 B5DD-010US | |
| HP Victus 15 fa0020nr | |
| HP Omen 15-en0375ng | |
| Dell G15 5515 | |
| AIDA64 / Memory Read | |
| Lenovo Legion 5 15IAH7H 82RB | |
| Media Intel Core i7-12700H (25586 - 79442, n=64) | |
| Asus TUF Dash F15 FX517ZC | |
| MSI Bravo 15 B5DD-010US | |
| HP Victus 15 fa0020nr | |
| HP Omen 15-en0375ng | |
| Dell G15 5515 | |
| AIDA64 / Memory Write | |
| Lenovo Legion 5 15IAH7H 82RB | |
| Media Intel Core i7-12700H (23679 - 88660, n=64) | |
| Asus TUF Dash F15 FX517ZC | |
| HP Omen 15-en0375ng | |
| HP Victus 15 fa0020nr | |
| MSI Bravo 15 B5DD-010US | |
| Dell G15 5515 | |
| AIDA64 / Memory Latency | |
| Lenovo Legion 5 15IAH7H 82RB | |
| HP Omen 15-en0375ng | |
| HP Victus 15 fa0020nr | |
| Media Intel Core i7-12700H (76.2 - 133.9, n=62) | |
| Dell G15 5515 | |
| MSI Bravo 15 B5DD-010US | |
| Asus TUF Dash F15 FX517ZC | |
* ... Meglio usare valori piccoli
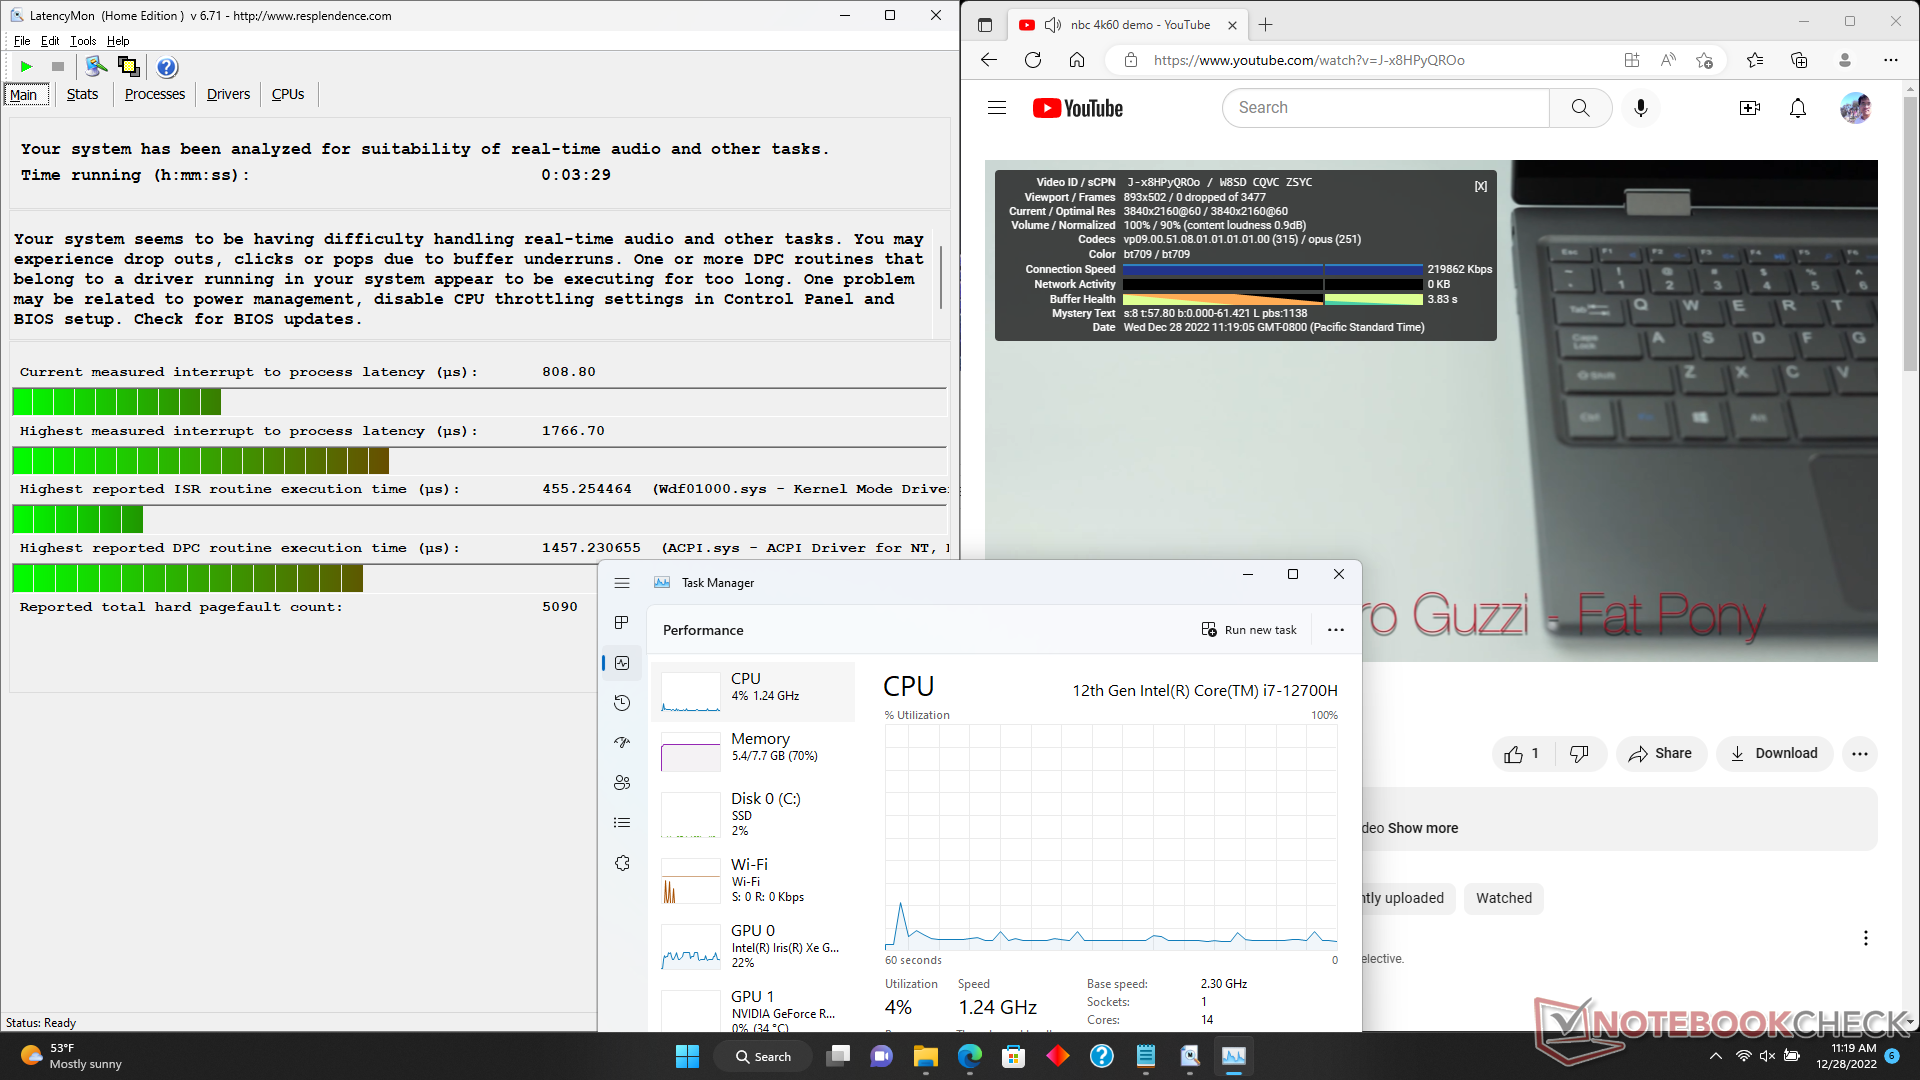
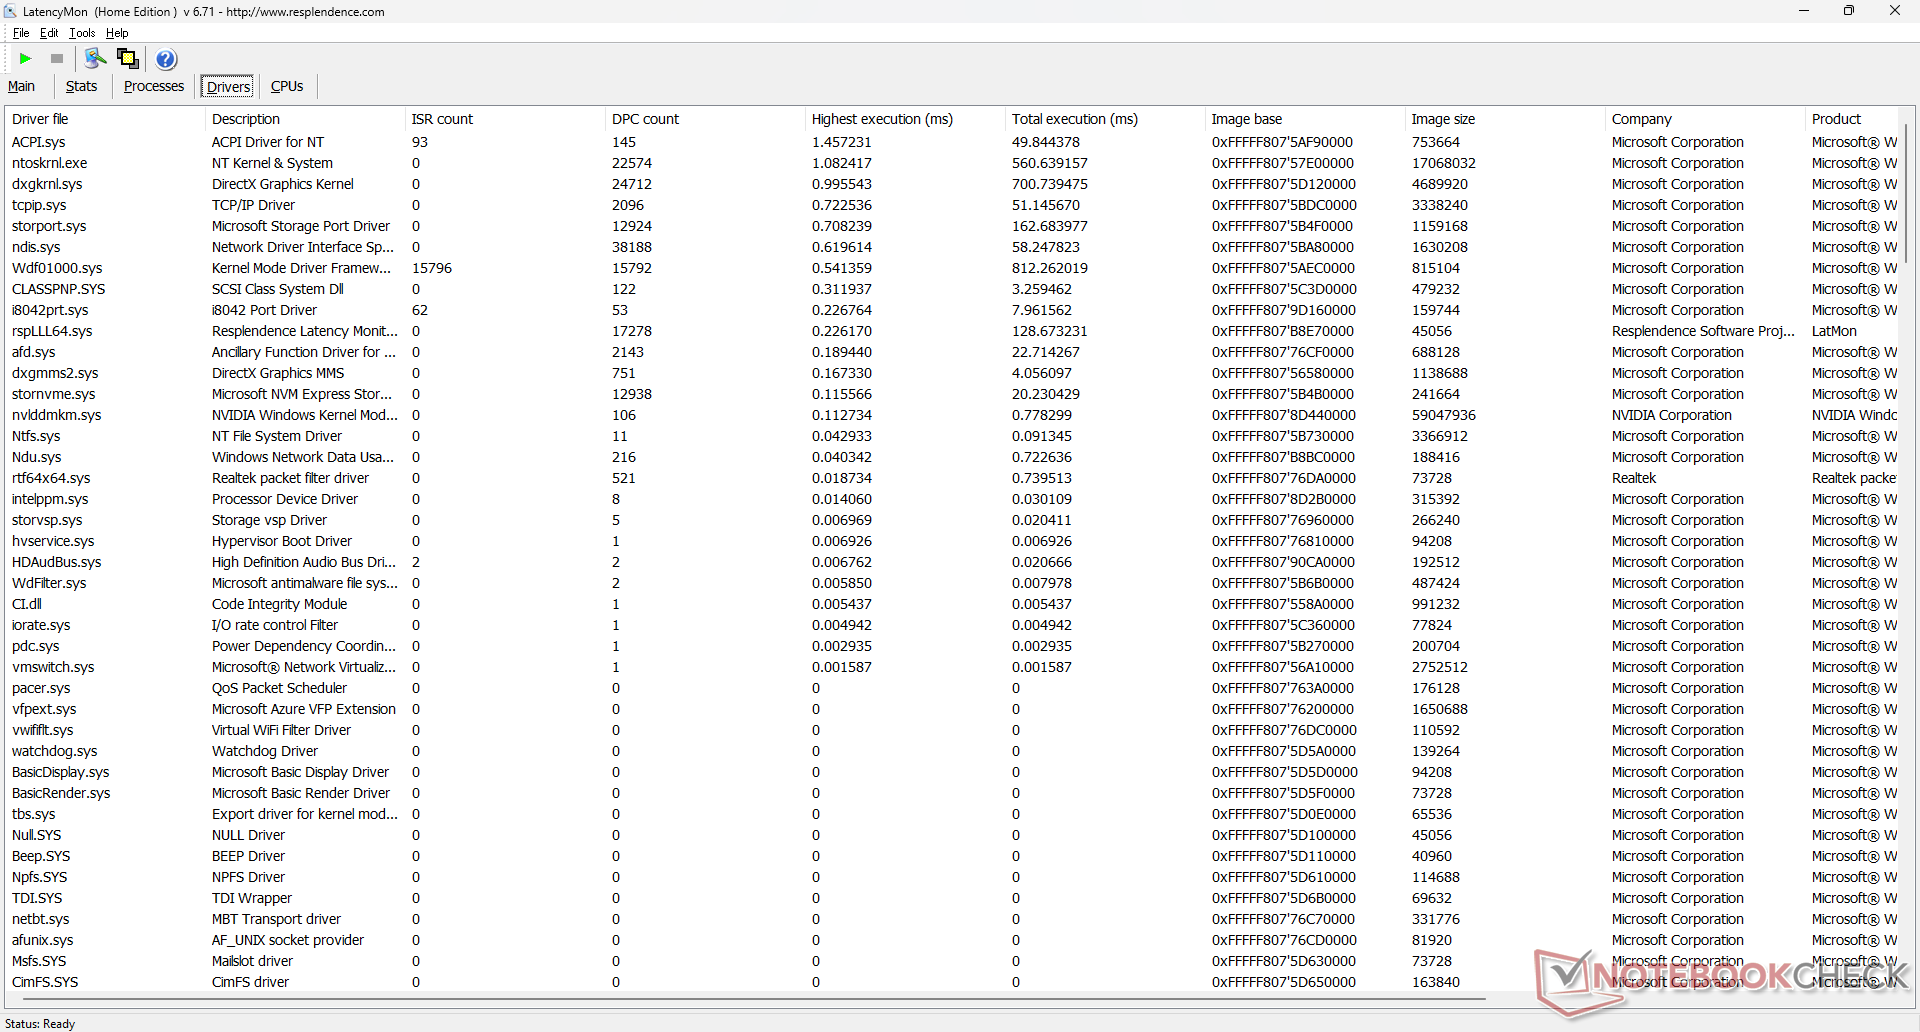
Latenza DPC
LatencyMon rivela problemi di DPC quando si aprono più schede del browser sulla nostra homepage. la riproduzione di video 4K a 60 FPS è invece perfetta e senza cadute di fotogrammi.
| DPC Latencies / LatencyMon - interrupt to process latency (max), Web, Youtube, Prime95 | |
| HP Victus 15 fa0020nr | |
| MSI Bravo 15 B5DD-010US | |
| Asus TUF Dash F15 FX517ZC | |
| Lenovo Legion 5 15IAH7H 82RB | |
| HP Omen 15-en0375ng | |
| Dell G15 5515 | |
* ... Meglio usare valori piccoli
Dispositivi di archiviazione - Solo un'unità
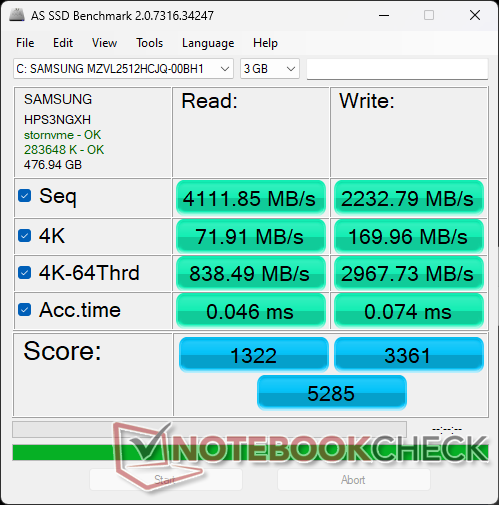
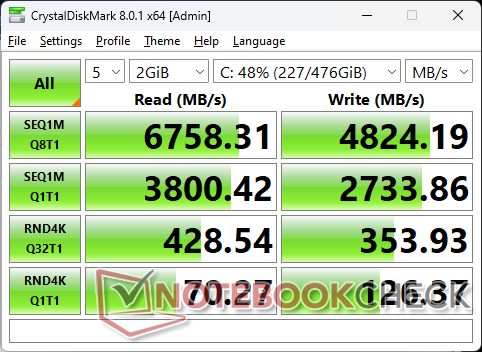
La nostra unità di prova comprende un veloce Samsung PM9A1 PCIe4 x4 NVMe che promette velocità di lettura e scrittura sequenziali fino a 6900 MB/s e 5000 MB/s, rispettivamente. Tuttavia, le prestazioni si riducono dopo circa 5 minuti di stress, come mostrano i risultati del test DiskSpd di seguito. Sebbene l'assenza di throttling sia preferibile, è improbabile che la perdita di prestazioni ritardata abbia un impatto sull'esperienza dell'utente.

| Drive Performance rating - Percent | |
| Lenovo Legion 5 15IAH7H 82RB | |
| HP Victus 15 fa0020nr | |
| HP Omen 15-en0375ng | |
| Asus TUF Dash F15 FX517ZC | |
| Dell G15 5515 | |
| MSI Bravo 15 B5DD-010US | |
* ... Meglio usare valori piccoli
Disk Throttling: DiskSpd Read Loop, Queue Depth 8
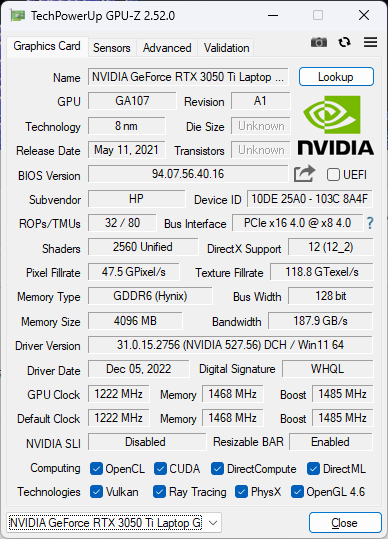
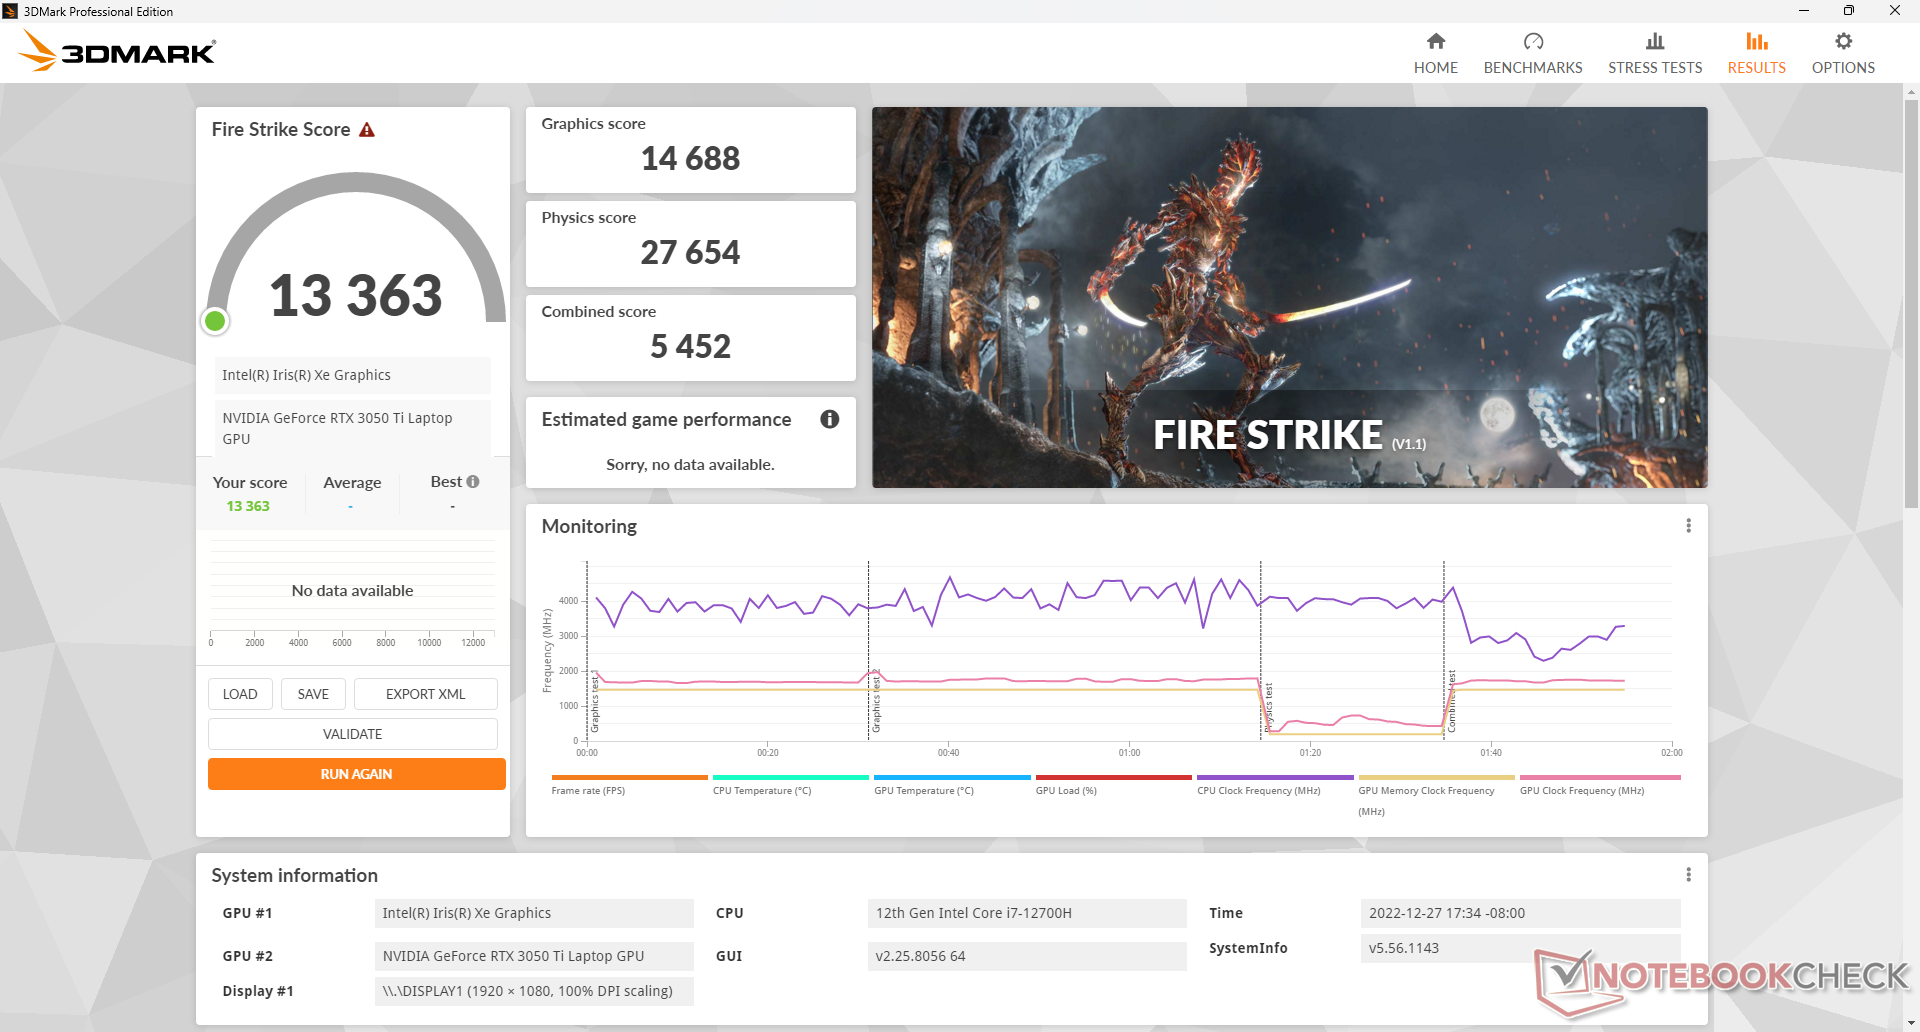
Prestazioni della GPU - 75 W TGP
Le prestazioni grafiche sono paragonabili a quelle della vecchia GeForce GTX 1660 Ti o rTX 2060 mobile mentre è circa il 10% più veloce della rTX 3050 mobile. La serie RTX 3050 è stata un po' deludente da quando la concorrente Radeon RX 6600M ha un prezzo di vendita più o meno uguale, ma con prestazioni fino al 50% superiori. Nonostante ciò, la maggior parte dei titoli rimane giocabile alla risoluzione nativa di 1080p, compreso Cyberpunk 2077.
Siamo sorpresi di constatare che la maggior parte dei giochi riesce a girare molto bene nonostante i nostri limitati 8 GB di RAM di sistema. I frame rate medi sono quelli che ci aspettiamo rispetto ad altri portatili con la stessa GPU, tranne che per i titoli molto impegnativi come Cyberpunk 2077, dove le prestazioni possono essere inferiori di circa il 10% se si utilizzano le impostazioni Ultra
Le funzioni grafiche avanzate come Optimus 2.0, G-Sync integrato o MUX non sono supportate da questo computer economico. Non ci sono GeForce RTX 3060 o superiore.
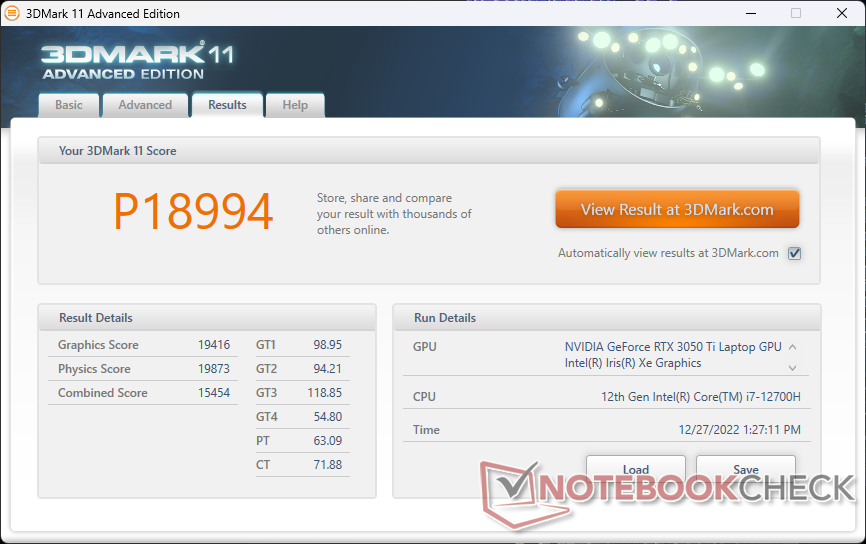
| 3DMark 11 Performance | 18994 punti | |
| 3DMark Cloud Gate Standard Score | 50957 punti | |
| 3DMark Fire Strike Score | 13334 punti | |
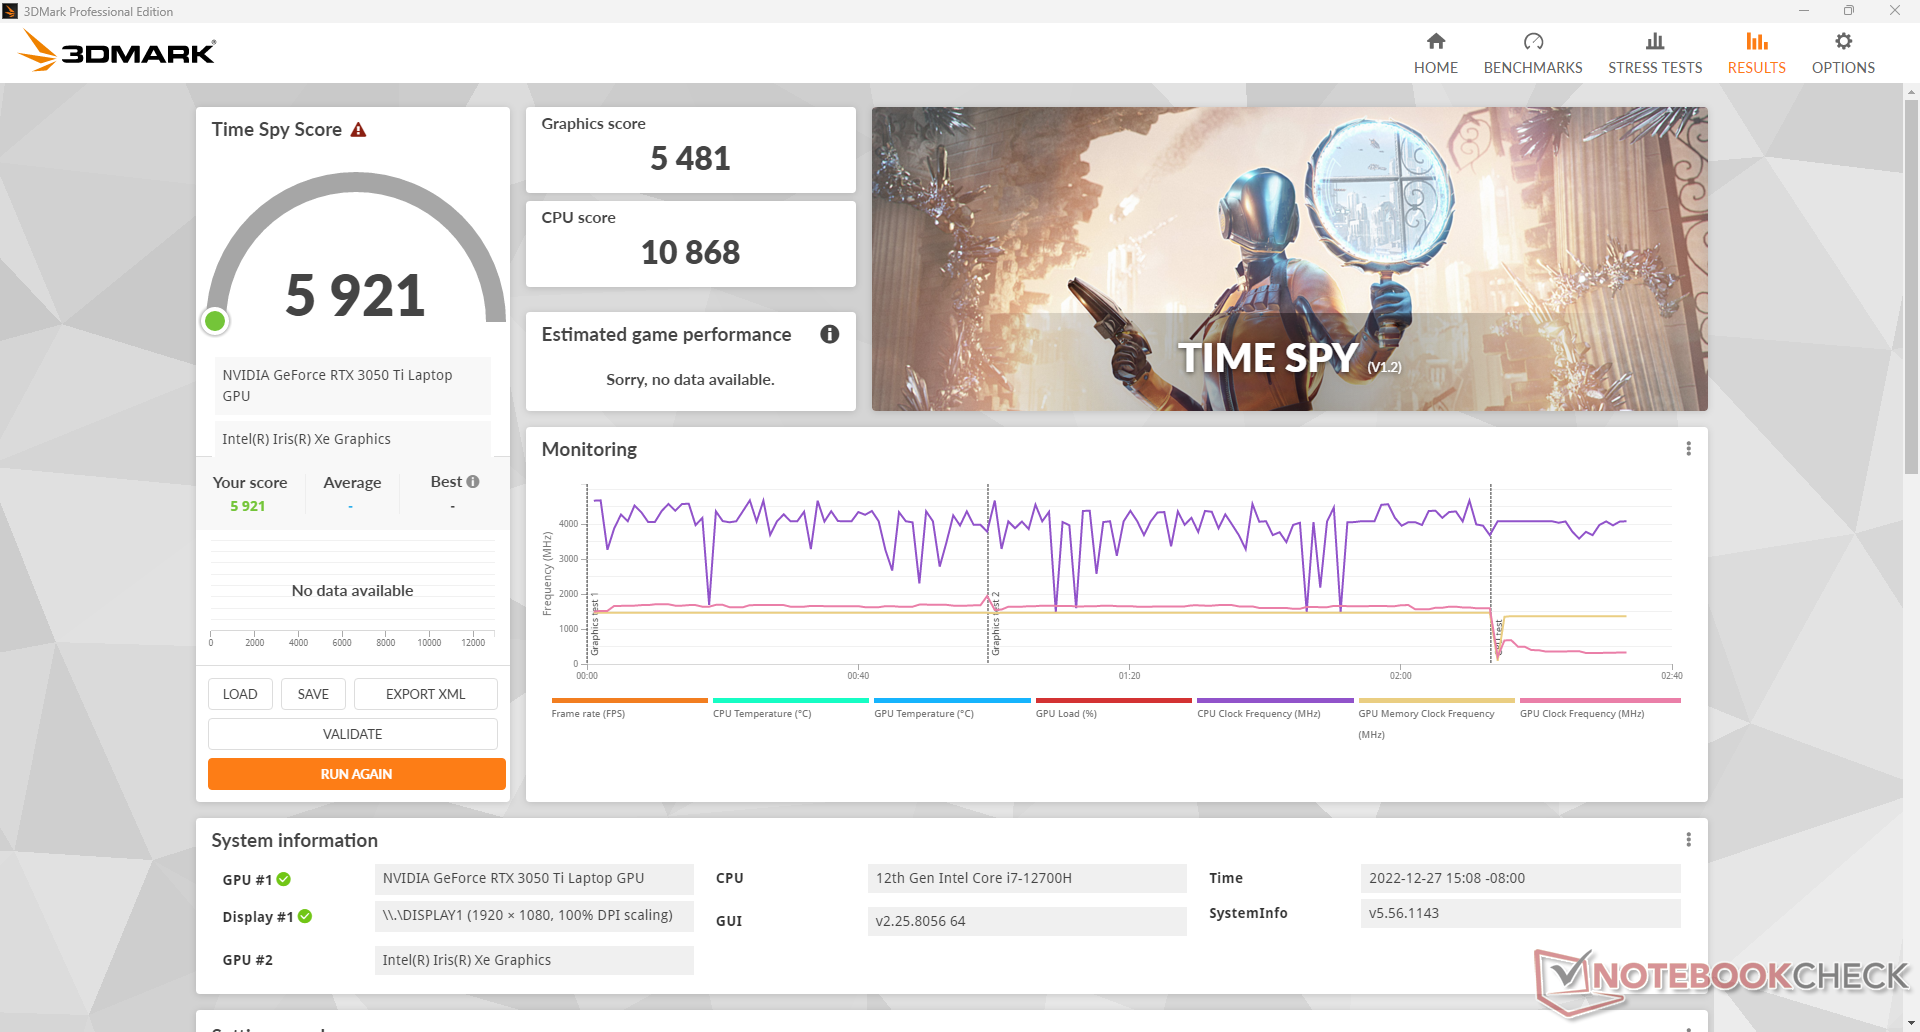
| 3DMark Time Spy Score | 5921 punti | |
Aiuto | ||
| Blender | |
| v3.3 Classroom OPTIX/RTX | |
| Media NVIDIA GeForce RTX 3050 Ti Laptop GPU (48 - 60, n=7) | |
| HP Victus 15 fa0020nr | |
| Lenovo Legion 5 15IAH7H 82RB | |
| v3.3 Classroom CUDA | |
| Media NVIDIA GeForce RTX 3050 Ti Laptop GPU (83 - 104, n=7) | |
| HP Victus 15 fa0020nr | |
| Lenovo Legion 5 15IAH7H 82RB | |
| v3.3 Classroom CPU | |
| Media NVIDIA GeForce RTX 3050 Ti Laptop GPU (379 - 557, n=7) | |
| HP Victus 15 fa0020nr | |
| Lenovo Legion 5 15IAH7H 82RB | |
* ... Meglio usare valori piccoli
| The Witcher 3 - 1920x1080 Ultra Graphics & Postprocessing (HBAO+) | |
| Media della classe Gaming (104.7 - 240, n=6, ultimi 2 anni) | |
| Media NVIDIA GeForce RTX 3060 Laptop GPU (58.2 - 91.5, n=48) | |
| Media NVIDIA GeForce RTX 2060 Mobile (50.6 - 74, n=40) | |
| HP Victus 15 fa0020nr | |
| Media NVIDIA GeForce RTX 3050 Ti Laptop GPU (19 - 58.5, n=29) | |
| Media NVIDIA GeForce RTX 3050 4GB Laptop GPU (31.5 - 55.8, n=21) | |
| Cyberpunk 2077 1.6 - 1920x1080 Ultra Preset | |
| Media NVIDIA GeForce RTX 3060 Laptop GPU (40 - 78.8, n=16) | |
| Media NVIDIA GeForce RTX 3050 Ti Laptop GPU (31 - 50.5, n=9) | |
| HP Victus 15 fa0020nr | |
| Media NVIDIA GeForce RTX 3050 4GB Laptop GPU (25.3 - 36.5, n=7) | |
Witcher 3 FPS Chart
| basso | medio | alto | ultra | |
|---|---|---|---|---|
| GTA V (2015) | 179.5 | 173 | 144.7 | 73.1 |
| The Witcher 3 (2015) | 284.4 | 186.2 | 106.5 | 54.7 |
| Dota 2 Reborn (2015) | 161.7 | 140.3 | 132.2 | 123.8 |
| Final Fantasy XV Benchmark (2018) | 138.1 | 81.7 | 54.7 | |
| X-Plane 11.11 (2018) | 127.1 | 115.6 | 92.9 | |
| Strange Brigade (2018) | 297 | 138.8 | 112.2 | 97.4 |
| Cyberpunk 2077 1.6 (2022) | 78.3 | 65.7 | 46.9 | 36.8 |
Emissioni
Rumore del sistema - Più forte in modalità silenziosa
Il rumore della ventola è legato alle tre impostazioni delle prestazioni HP: Quiet, Default e Performance. Stranamente, il rumore della ventola è più forte in modalità Quiet rispetto a Default (29,2 dB(A) contro 26,2 dB(A)) quando il sistema è al minimo sul desktop. In ogni caso, è deludente che le ventole siano sempre attive, indipendentemente dal carico sullo schermo, e quindi il sistema non è mai veramente silenzioso.
La buona notizia è che, mentre il rumore della ventola è relativamente forte durante i carichi più bassi, è più silenzioso di molti altri portatili da gioco quando si eseguono carichi più elevati come i giochi. Il rumore della ventola si stabilizza a poco più di 41 dB(A) quando si utilizza Witcher 3 in modalità Performance, rispetto ai 48 dB(A) e ai 44 dB(A) rispettivamente dell'HP Omen 15 e del Dell G5 15. Le ventole sono più letargiche e non hanno un'elevata potenza di calcolo. Le ventole sono più letargiche e impiegano più tempo ad aumentare.
La nostra unità di prova soffriva anche di un leggero fruscio della bobina o di rumori elettronici.
Rumorosità
| Idle |
| 26.2 / 29.2 / 29.4 dB(A) |
| Sotto carico |
| 29.9 / 45.5 dB(A) |
 | ||
30 dB silenzioso 40 dB(A) udibile 50 dB(A) rumoroso |
||
min: | ||
| HP Victus 15 fa0020nr GeForce RTX 3050 Ti Laptop GPU, i7-12700H, Samsung PM9A1 MZVL2512HCJQ | HP Omen 15-en0375ng GeForce RTX 2060 Mobile, R7 4800H, WDC PC SN730 SDBPNTY-512G | Dell G15 5515 GeForce RTX 3050 Ti Laptop GPU, R7 5800H, Samsung PM991a MZ9LQ512HBLU-00BD1 | Asus TUF Dash F15 FX517ZC GeForce RTX 3050 4GB Laptop GPU, i7-12650H, Intel SSD 670p SSDPEKNU512GZ | MSI Bravo 15 B5DD-010US Radeon RX 5500M, R5 5600H, Kingston OM8PCP3512F-AB | Lenovo Legion 5 15IAH7H 82RB GeForce RTX 3060 Laptop GPU, i7-12700H | |
|---|---|---|---|---|---|---|
| Noise | -12% | -6% | -11% | -9% | 1% | |
| off /ambiente * (dB) | 24.8 | 24 3% | 24 3% | 23.9 4% | 24.5 1% | 23.3 6% |
| Idle Minimum * (dB) | 26.2 | 24 8% | 25 5% | 24 8% | 24.5 6% | 23.5 10% |
| Idle Average * (dB) | 29.2 | 25 14% | 26 11% | 24 18% | 32.8 -12% | 23.5 20% |
| Idle Maximum * (dB) | 29.4 | 37 -26% | 30 -2% | 32.3 -10% | 32.8 -12% | 26.8 9% |
| Load Average * (dB) | 29.9 | 45 -51% | 44 -47% | 43.7 -46% | 34.5 -15% | 29.3 2% |
| Witcher 3 ultra * (dB) | 41.1 | 48 -17% | 44 -7% | 53.4 -30% | 42.5 -3% | 51.4 -25% |
| Load Maximum * (dB) | 45.5 | 51 -12% | 48 -5% | 53.6 -18% | 58.5 -29% | 53 -16% |
* ... Meglio usare valori piccoli
Temperatura
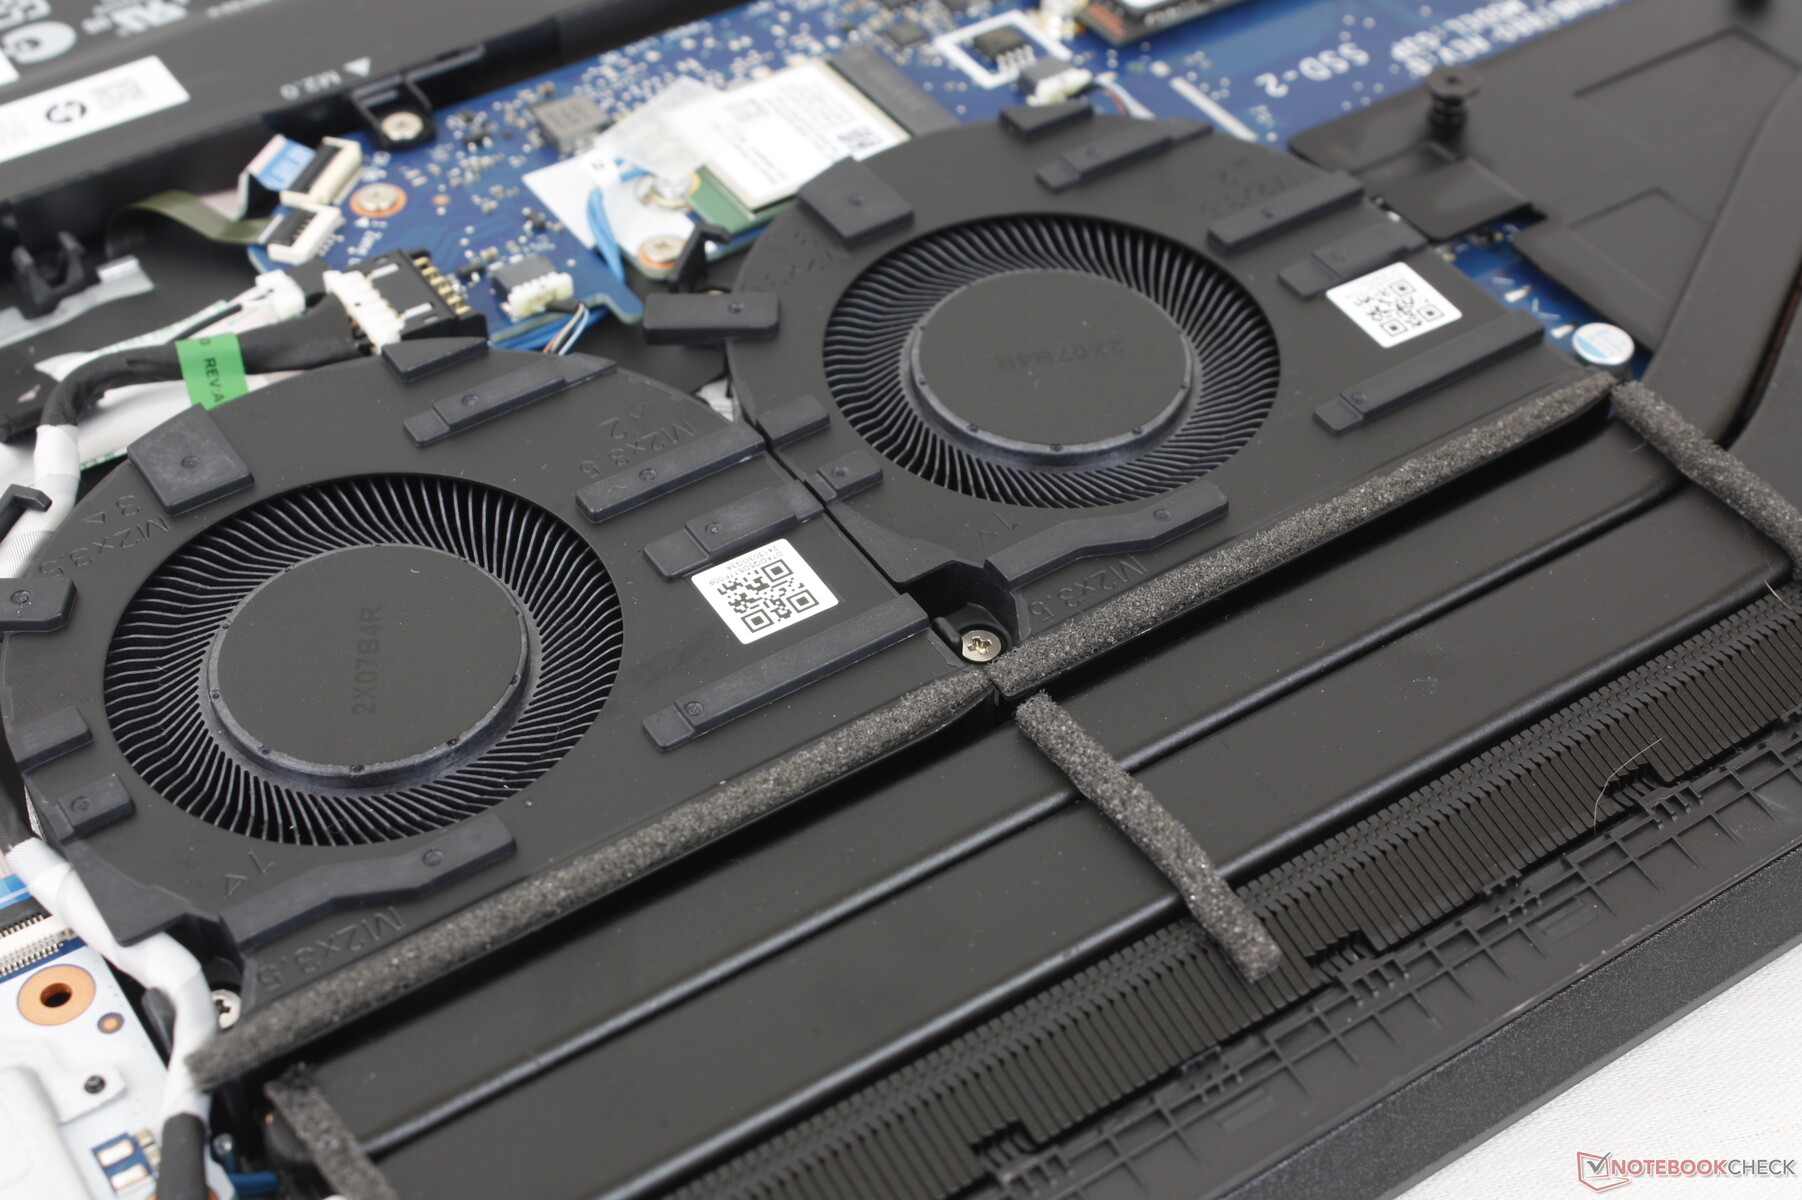
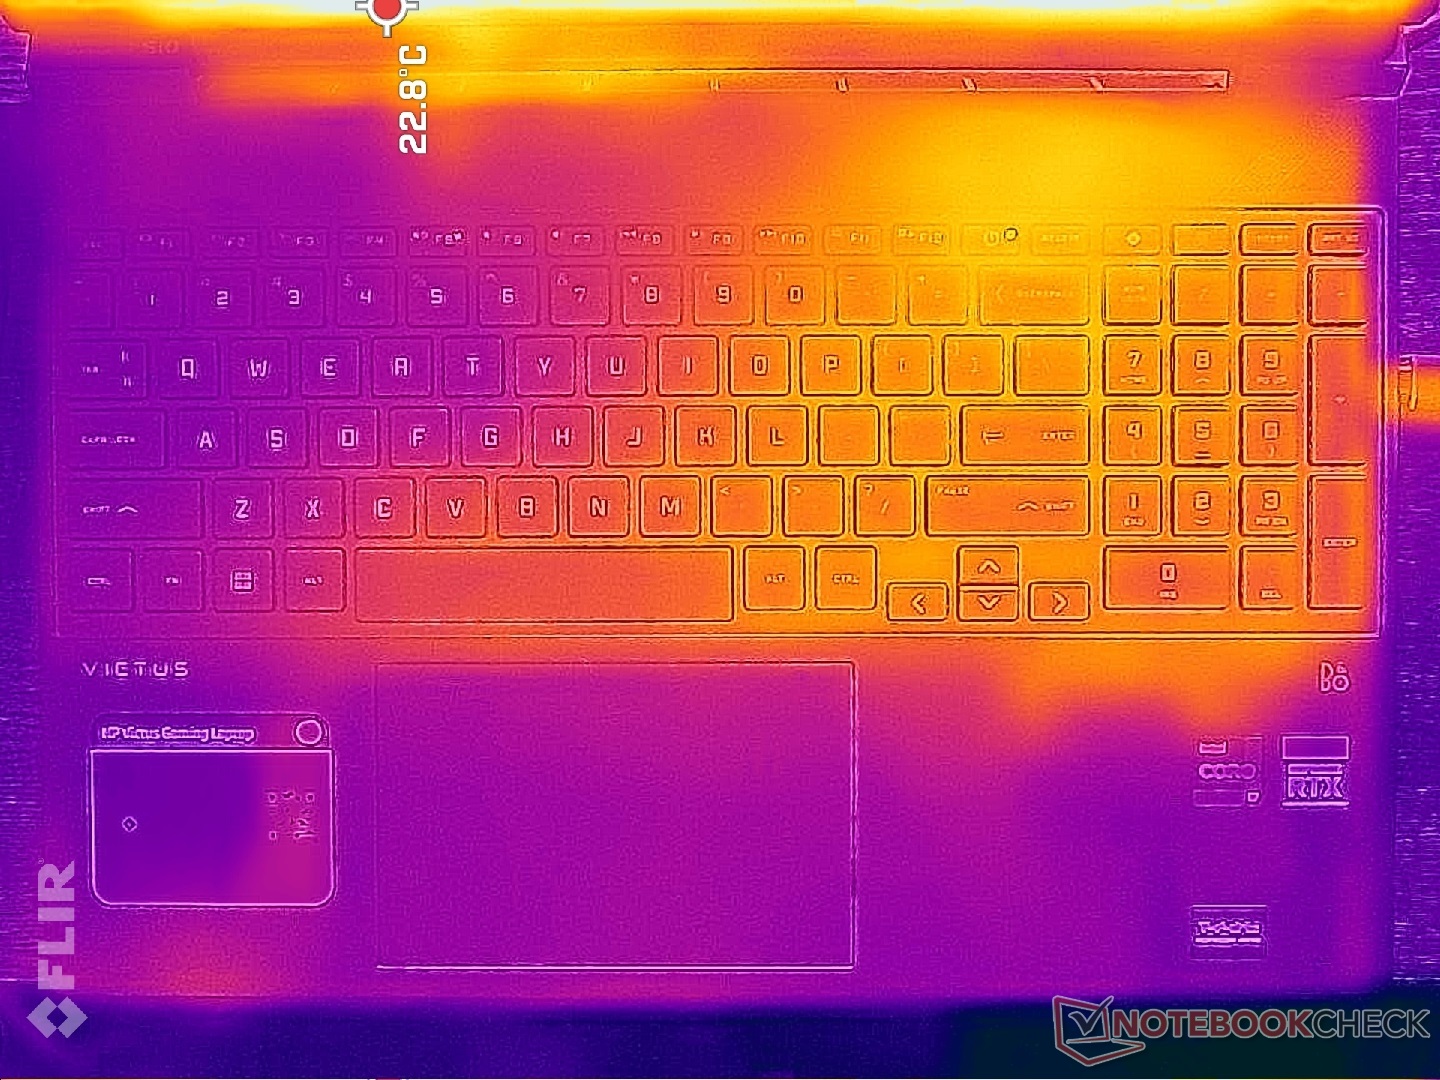
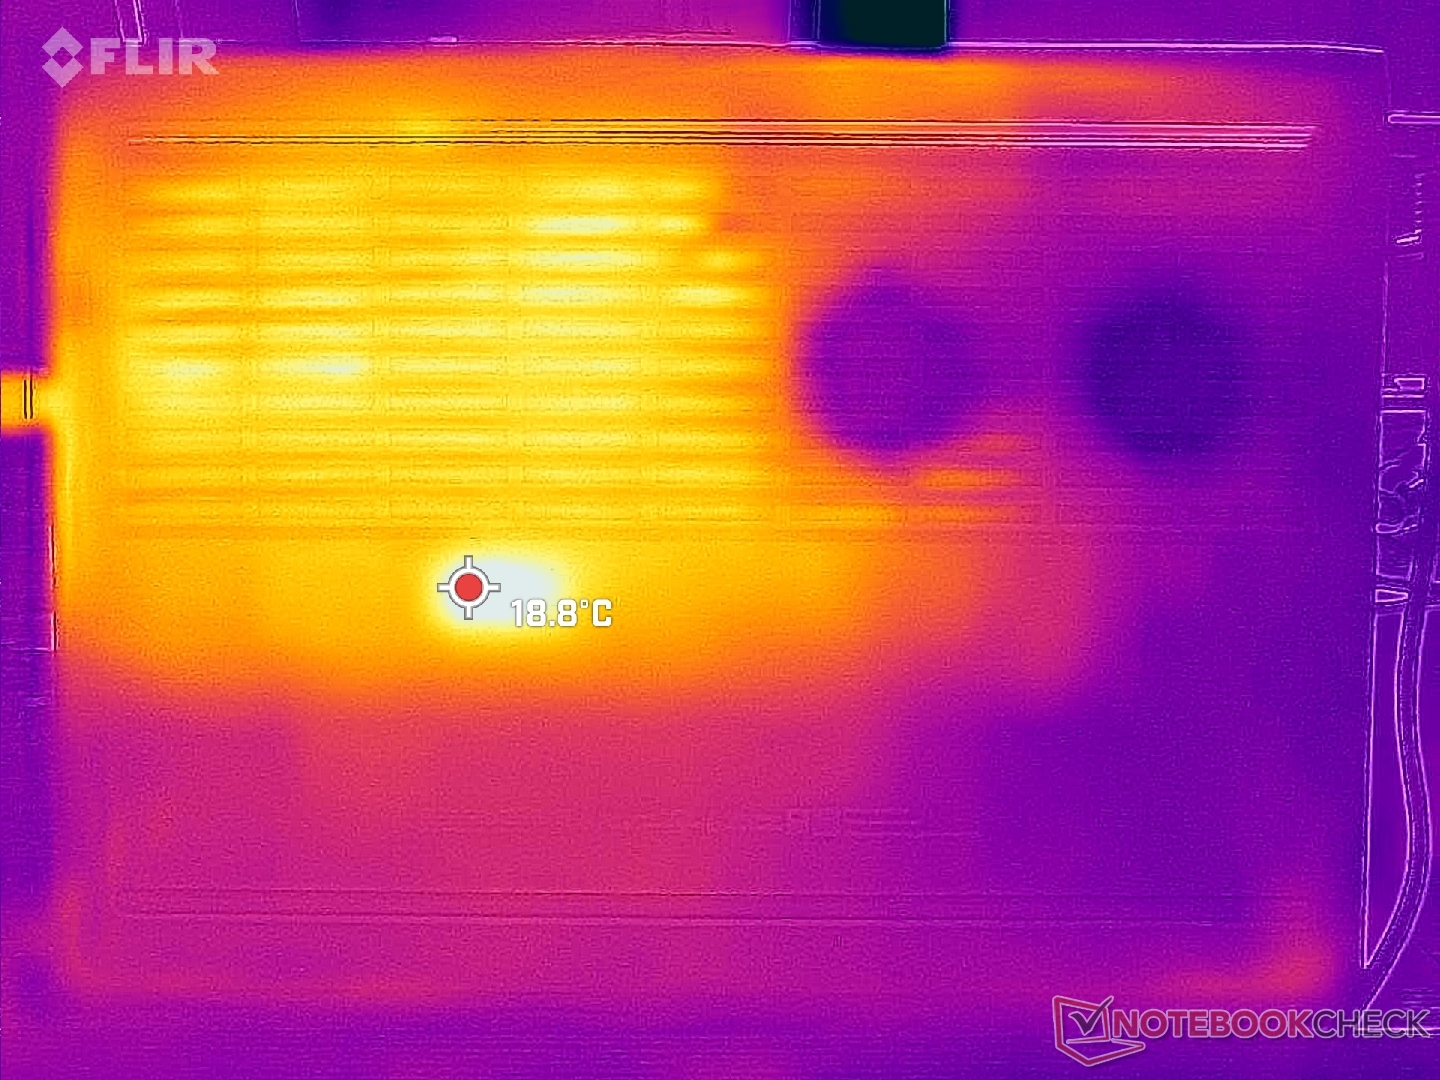
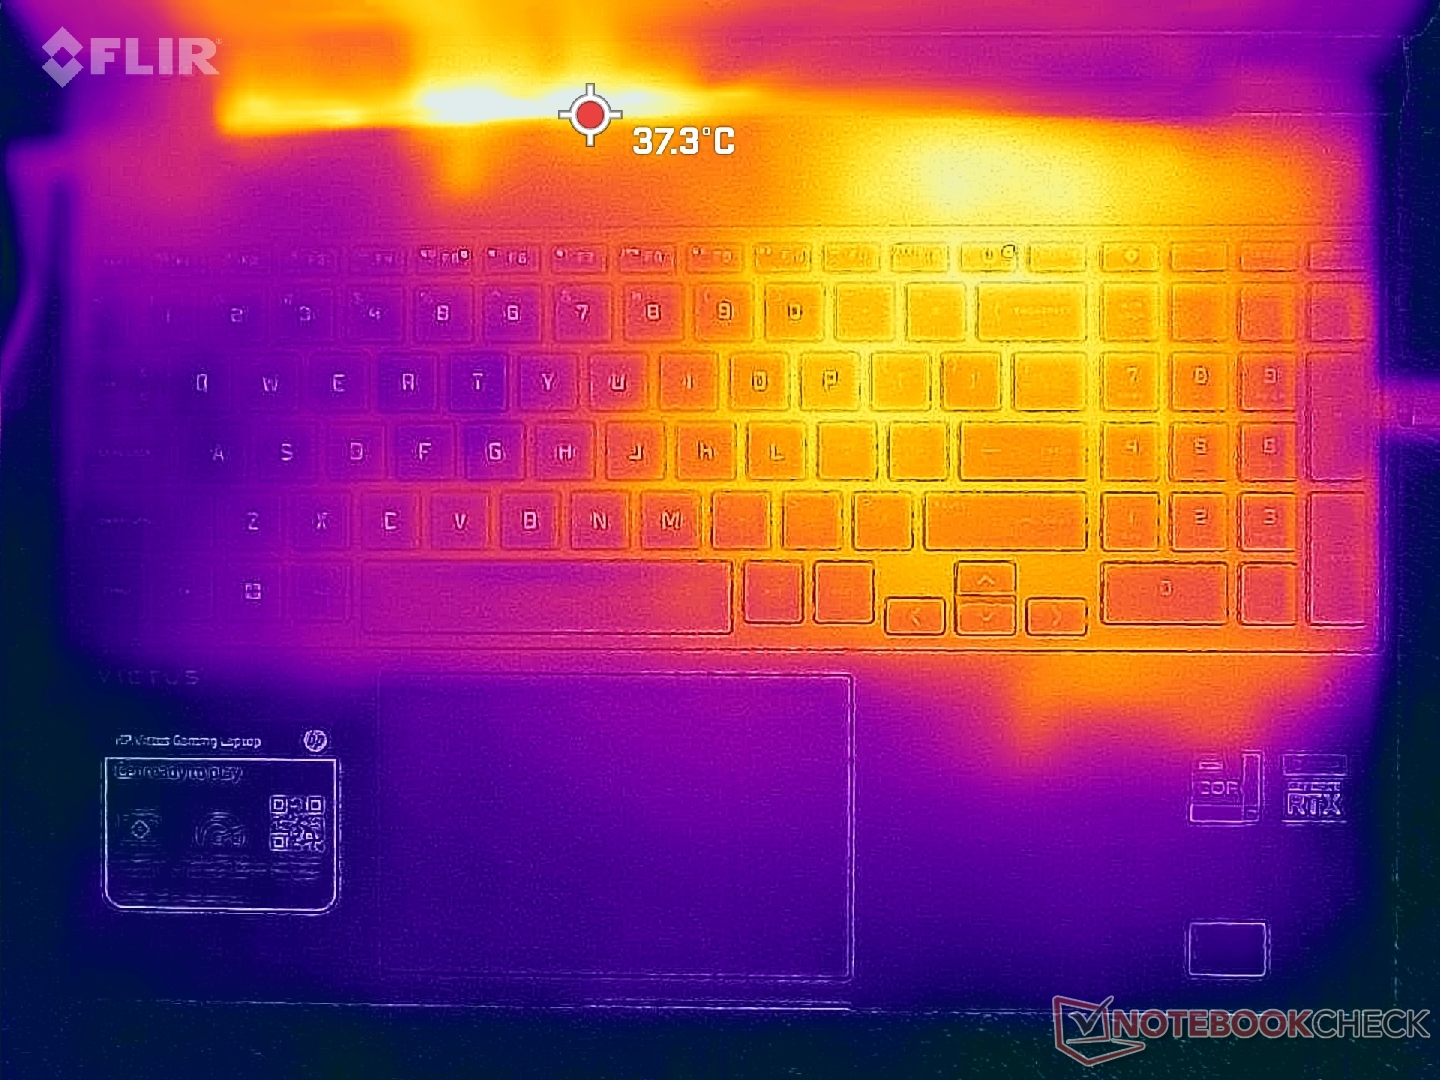
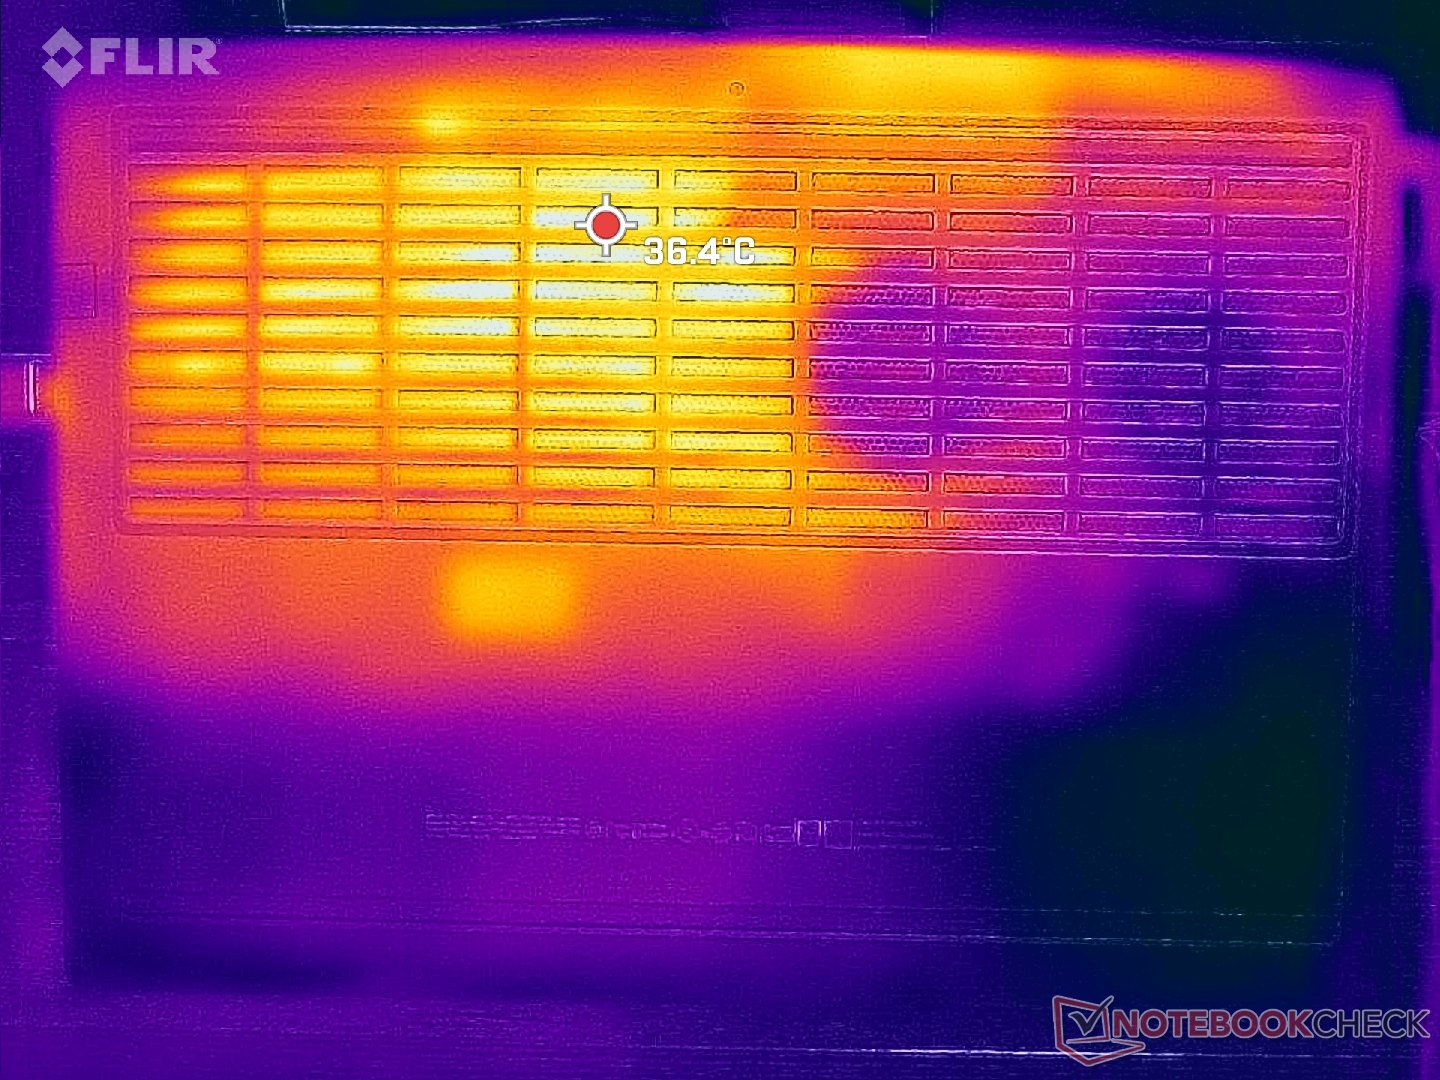
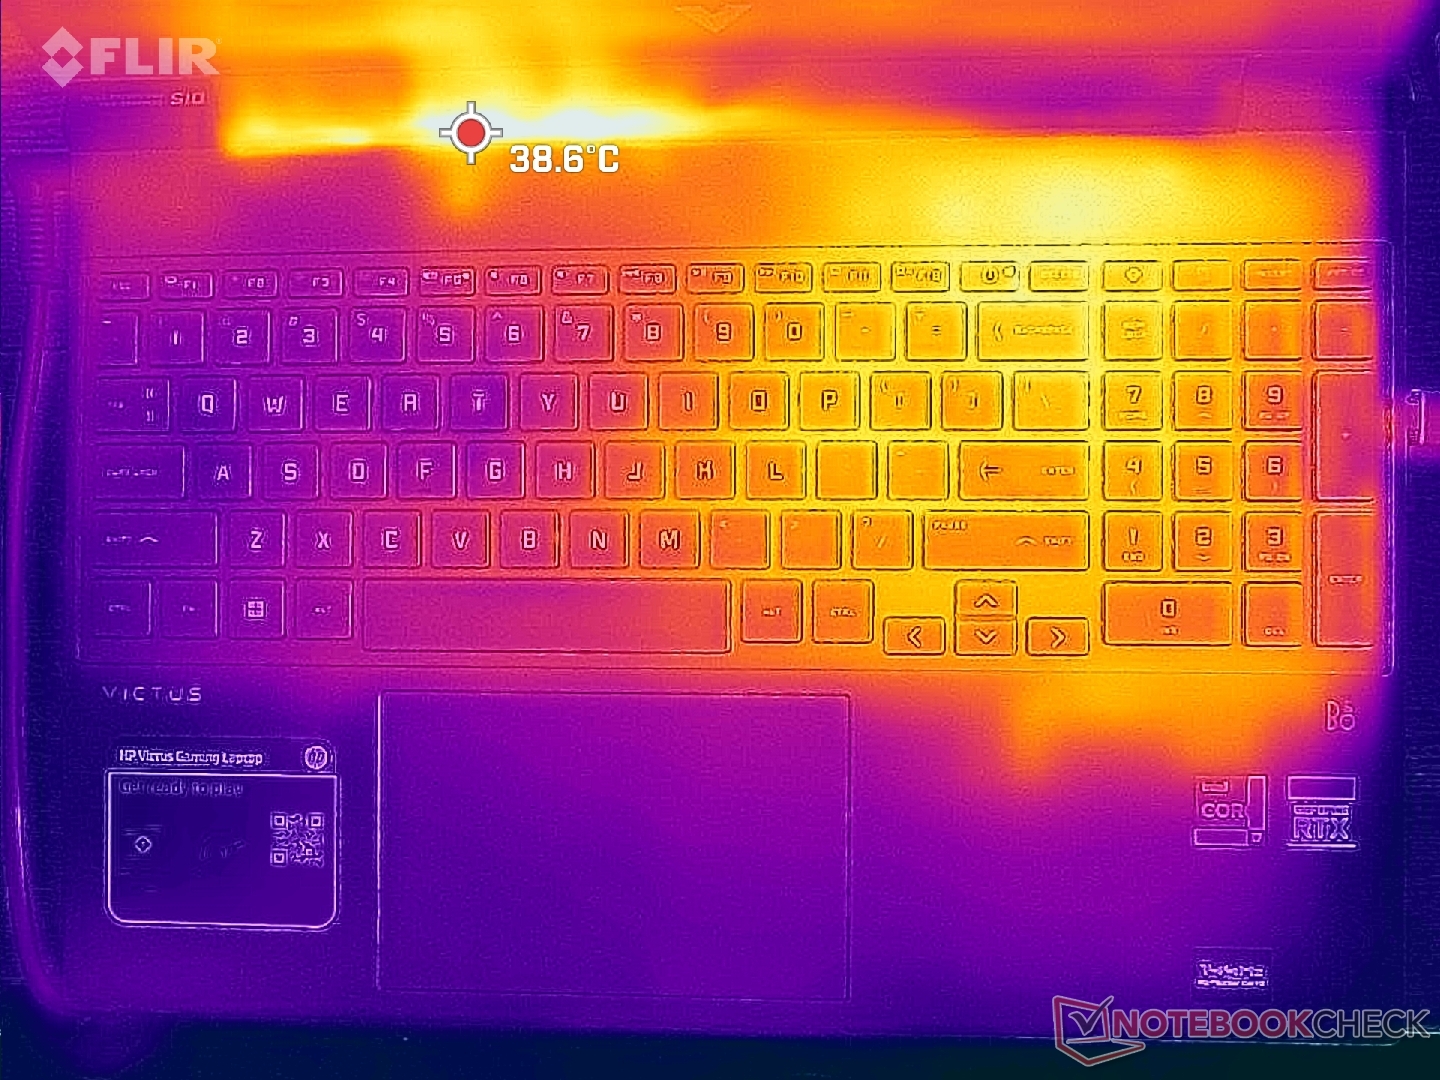
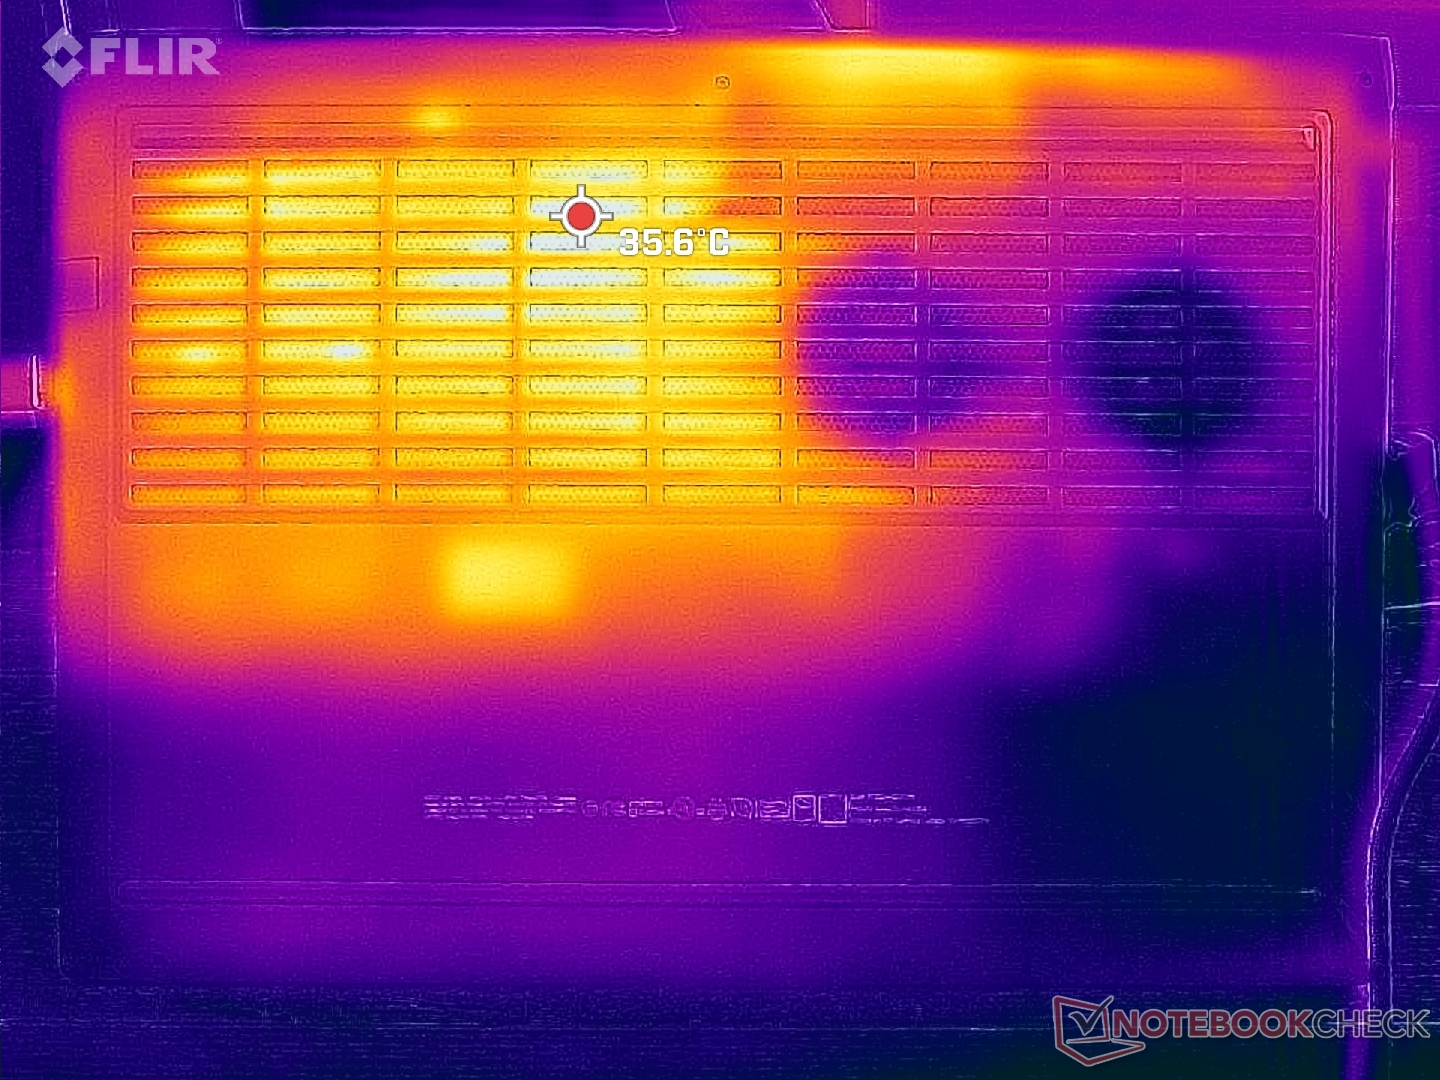
La soluzione di raffreddamento non è simmetrica, come nella maggior parte dei portatili da gioco. Pertanto, una metà dello chassis del Victus 15 sarà sempre più calda dell'altra metà, come mostrano le nostre mappe di temperatura qui sotto. I punti caldi, fortunatamente, non sono così gravi: poco più di 38 C nella parte superiore e 36 C in quella inferiore, rispetto ai quasi 50 C del Dell G5 15 Dell G5 15 dotato della stessa GPU Nvidia. I poggiapolsi e la metà sinistra della tastiera rimangono relativamente freschi, indipendentemente dal carico sullo schermo.
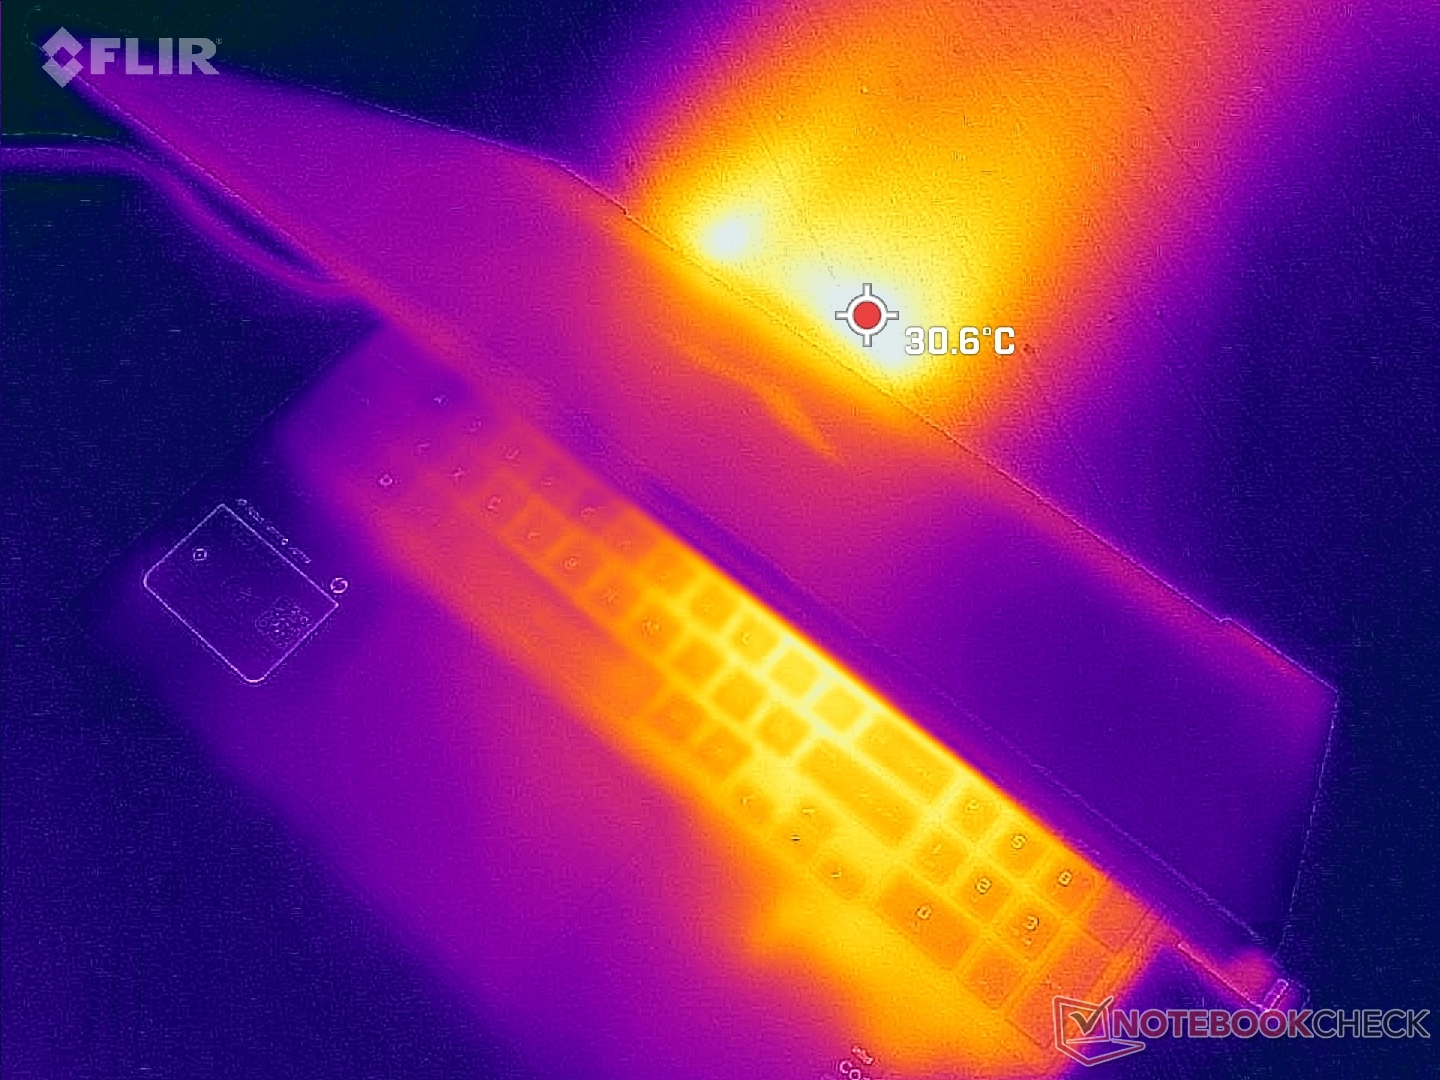
(+) La temperatura massima sul lato superiore è di 37.2 °C / 99 F, rispetto alla media di 40.4 °C / 105 F, che varia da 21.2 a 68.8 °C per questa classe Gaming.
(+) Il lato inferiore si riscalda fino ad un massimo di 35.4 °C / 96 F, rispetto alla media di 43.2 °C / 110 F
(+) In idle, la temperatura media del lato superiore è di 20.4 °C / 69 F, rispetto alla media deld ispositivo di 33.9 °C / 93 F.
(+) Riproducendo The Witcher 3, la temperatura media per il lato superiore e' di 27.2 °C / 81 F, rispetto alla media del dispositivo di 33.9 °C / 93 F.
(+) I poggiapolsi e il touchpad sono piu' freddi della temperatura della pelle con un massimo di 23.2 °C / 73.8 F e sono quindi freddi al tatto.
(+) La temperatura media della zona del palmo della mano di dispositivi simili e'stata di 28.8 °C / 83.8 F (+5.6 °C / 10 F).
| HP Victus 15 fa0020nr Intel Core i7-12700H, NVIDIA GeForce RTX 3050 Ti Laptop GPU | HP Omen 15-en0375ng AMD Ryzen 7 4800H, NVIDIA GeForce RTX 2060 Mobile | Dell G15 5515 AMD Ryzen 7 5800H, NVIDIA GeForce RTX 3050 Ti Laptop GPU | Asus TUF Dash F15 FX517ZC Intel Core i7-12650H, NVIDIA GeForce RTX 3050 4GB Laptop GPU | MSI Bravo 15 B5DD-010US AMD Ryzen 5 5600H, AMD Radeon RX 5500M | Lenovo Legion 5 15IAH7H 82RB Intel Core i7-12700H, NVIDIA GeForce RTX 3060 Laptop GPU | |
|---|---|---|---|---|---|---|
| Heat | -30% | -26% | -11% | -43% | -22% | |
| Maximum Upper Side * (°C) | 37.2 | 42 -13% | 50 -34% | 43.4 -17% | 52.2 -40% | 37.8 -2% |
| Maximum Bottom * (°C) | 35.4 | 54 -53% | 49 -38% | 44.4 -25% | 48.6 -37% | 51 -44% |
| Idle Upper Side * (°C) | 22.4 | 28 -25% | 26 -16% | 21.2 5% | 38 -70% | 25.8 -15% |
| Idle Bottom * (°C) | 22.6 | 29 -28% | 26 -15% | 24 -6% | 28.4 -26% | 28.8 -27% |
* ... Meglio usare valori piccoli
Stress test
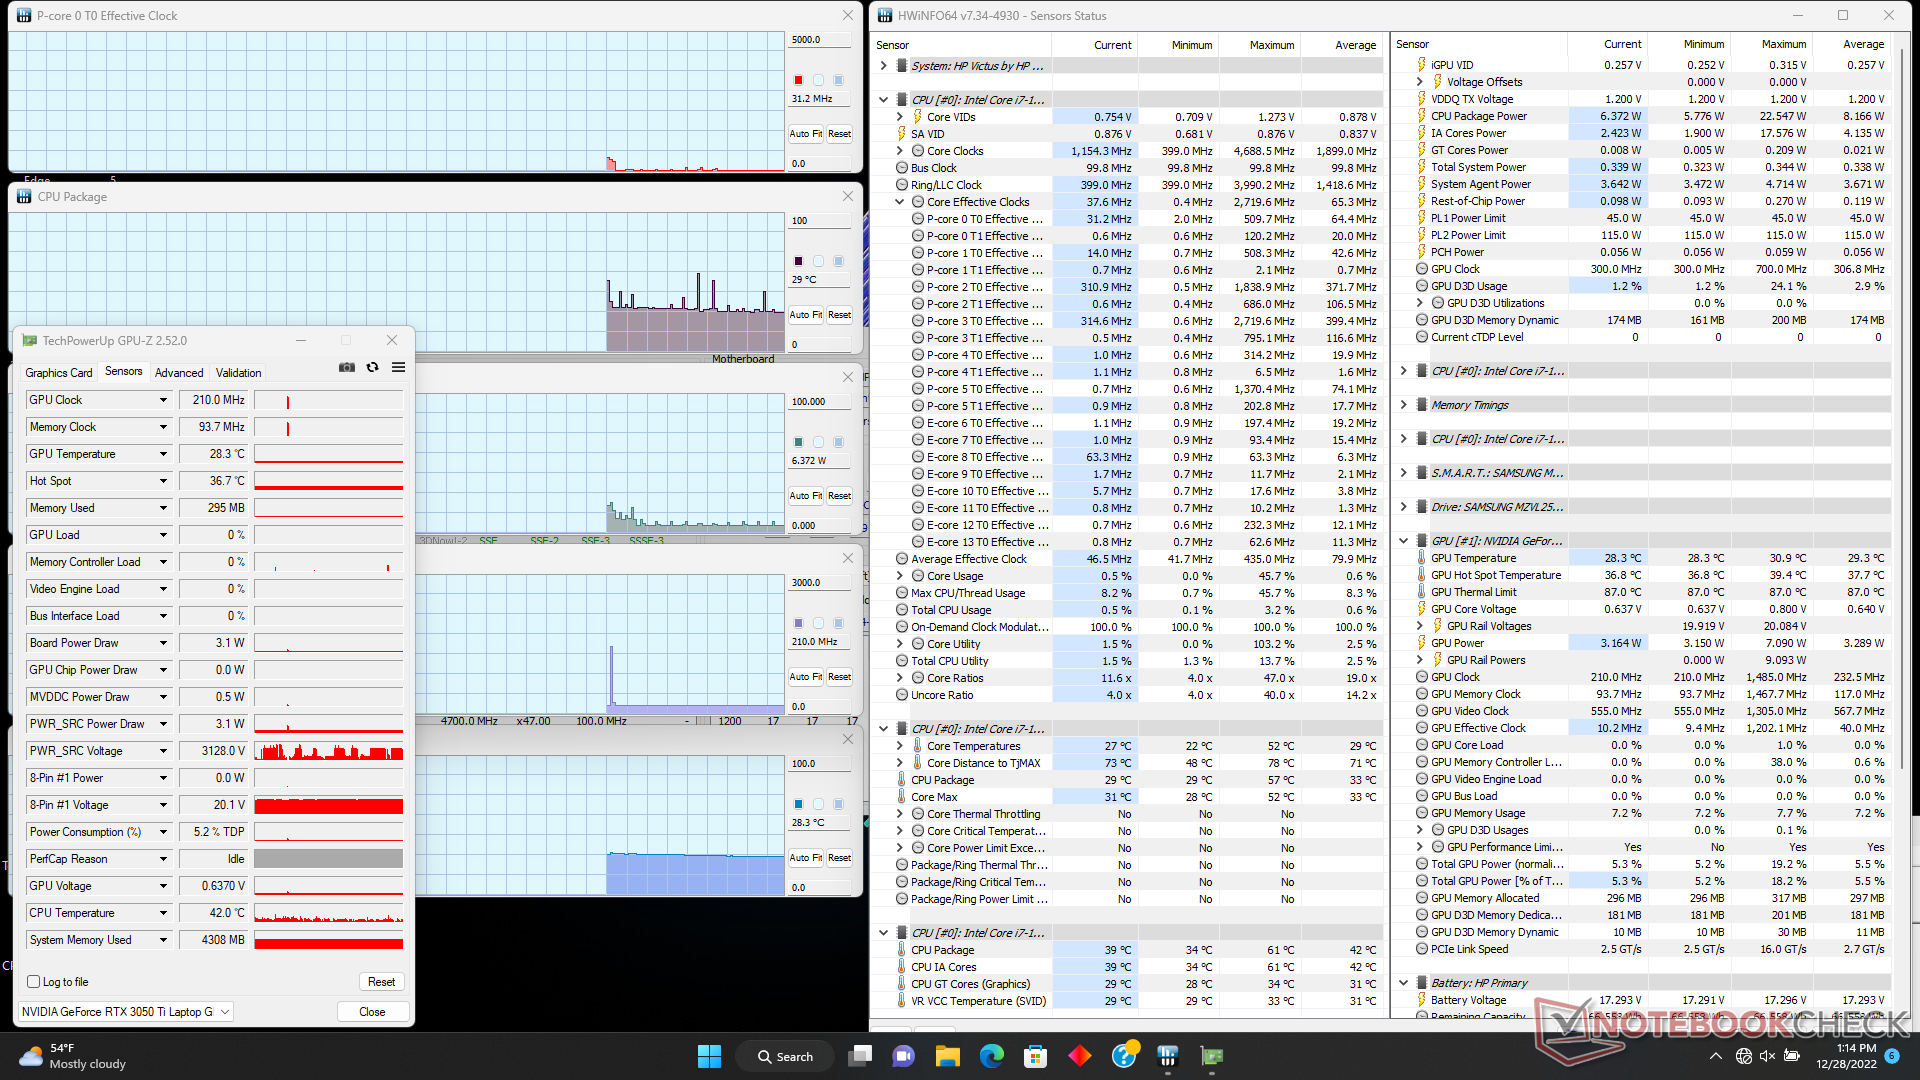
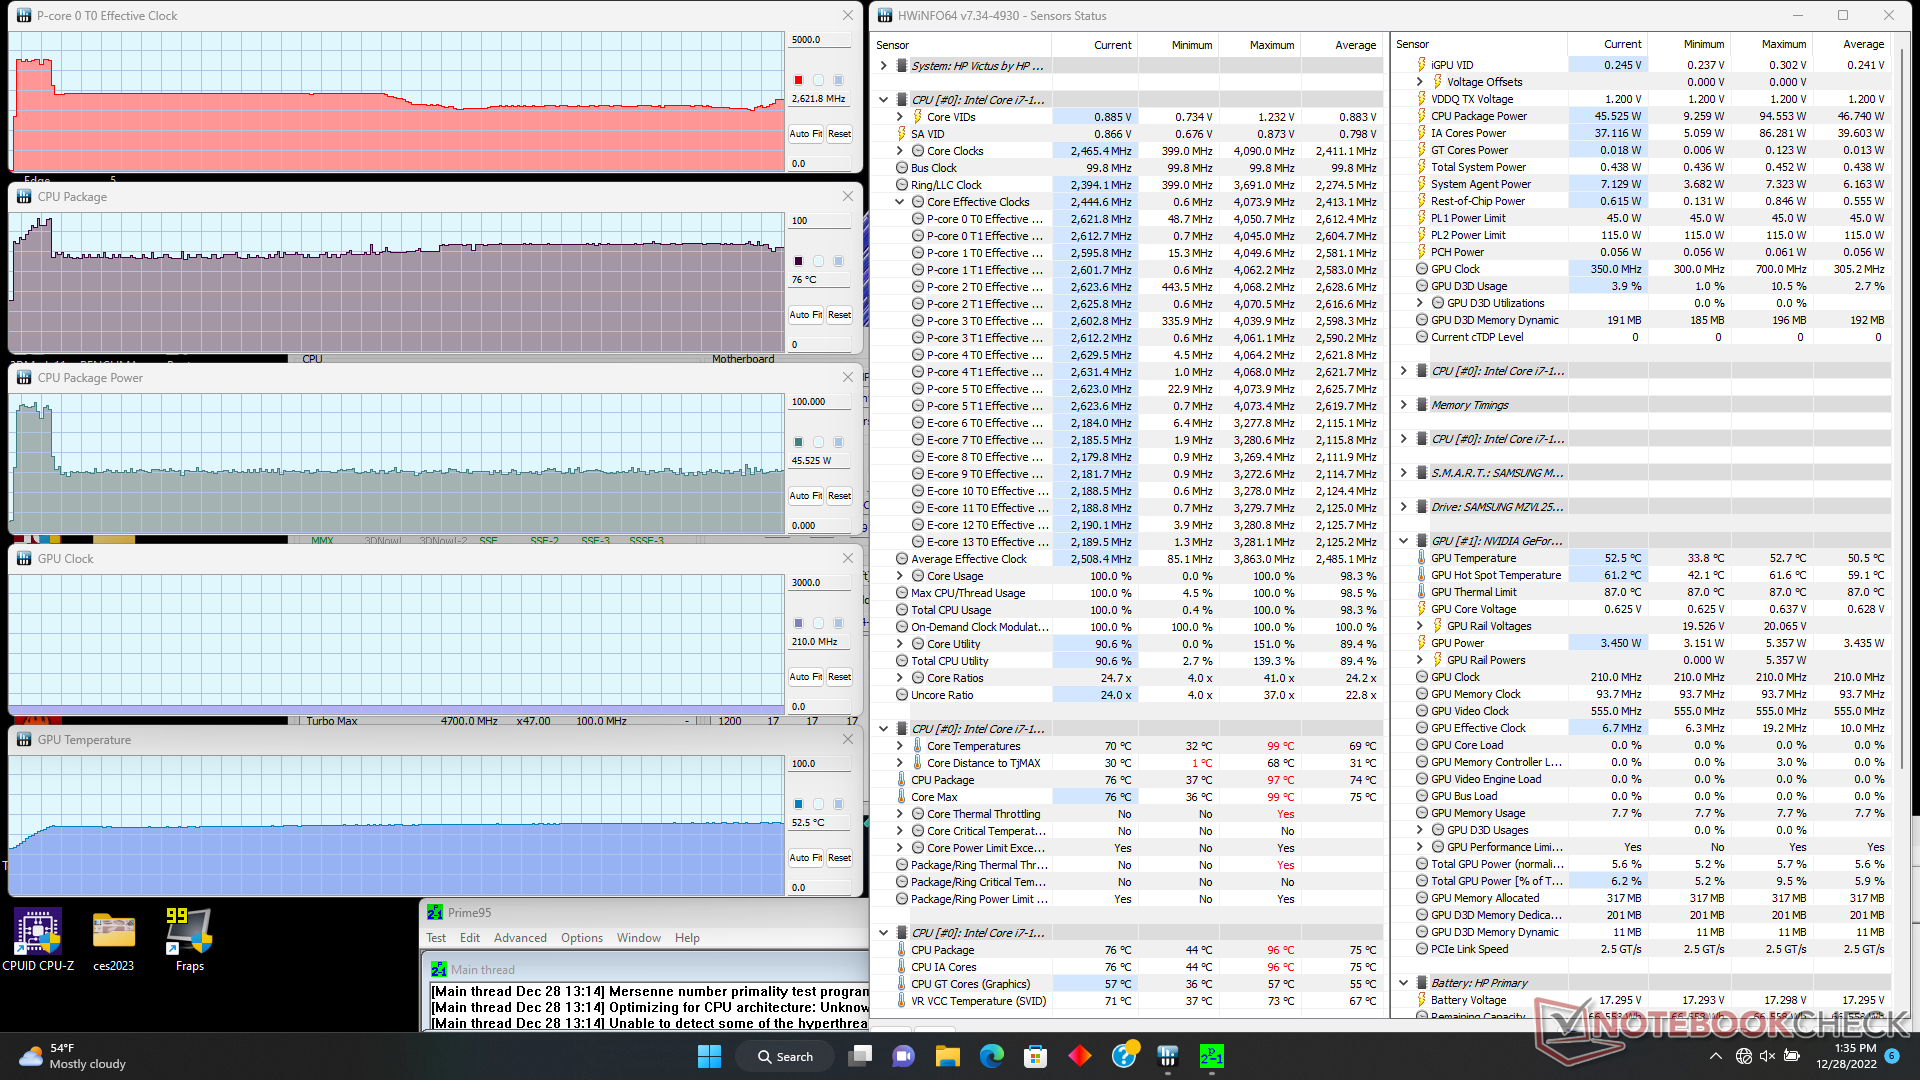
Quando si esegue Prime95 per stressare la CPU, si può osservare che le frequenze di clock e l'assorbimento di potenza della scheda aumentano fino a 4,1 GHz e 93 W, rispettivamente. Una volta che la temperatura del core raggiunge i 97 C circa 30 secondi dopo, tuttavia, le velocità di clock e l'assorbimento di potenza della scheda scendono rispettivamente a ~2,4 GHz e 45 W, al fine di mantenere una temperatura del core più fredda di circa 76 C. In confronto, ripetendo questo stesso test sulla scheda di Lenovo Legion 5 15 con la stessa CPU si otterrebbe una frequenza di clock stabile più veloce di 3,6 GHz e una temperatura del nucleo più calda di 97 C. Il Victus 15 sta quindi giocando in modo conservativo anche quando è impostato sulle sue prestazioni più elevate.
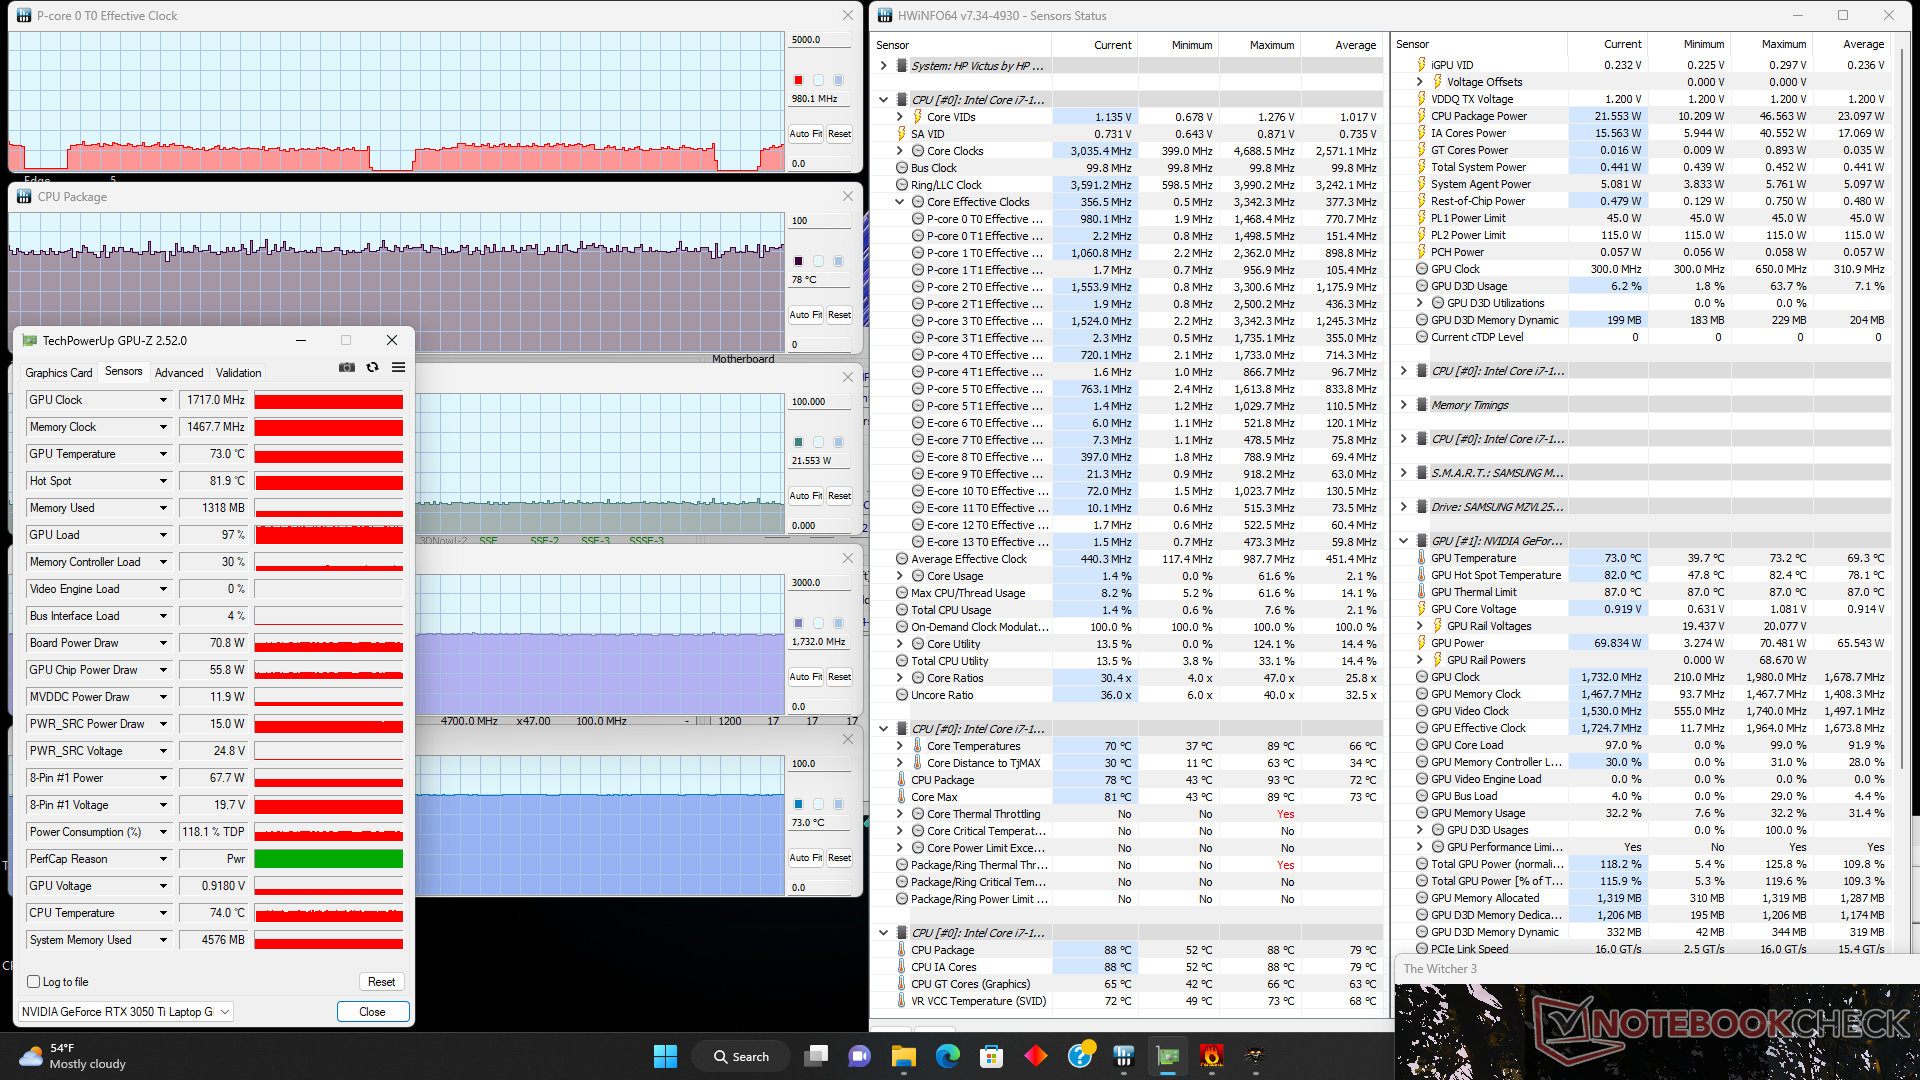
La velocità di clock della GPU, la temperatura e l'assorbimento di potenza della scheda si stabilizzerebbero rispettivamente a 1717 MHz, 73 C e 71 W, quando si esegue Witcher 3. Il TGP ha una potenza nominale di 75 W e quindi il consumo di 71 W del mondo reale è abbastanza vicino. Ripetendo questo test sul Dell G5 con la stessa GPU si otterrebbero valori leggermente superiori (1845 MHz di clock del core, 1500 MHz di clock della memoria, 79 C e 80 W di assorbimento). Le temperature generalmente più basse del core dell'HP quando è sotto carico contribuiscono alle temperature superficiali più basse di cui sopra.
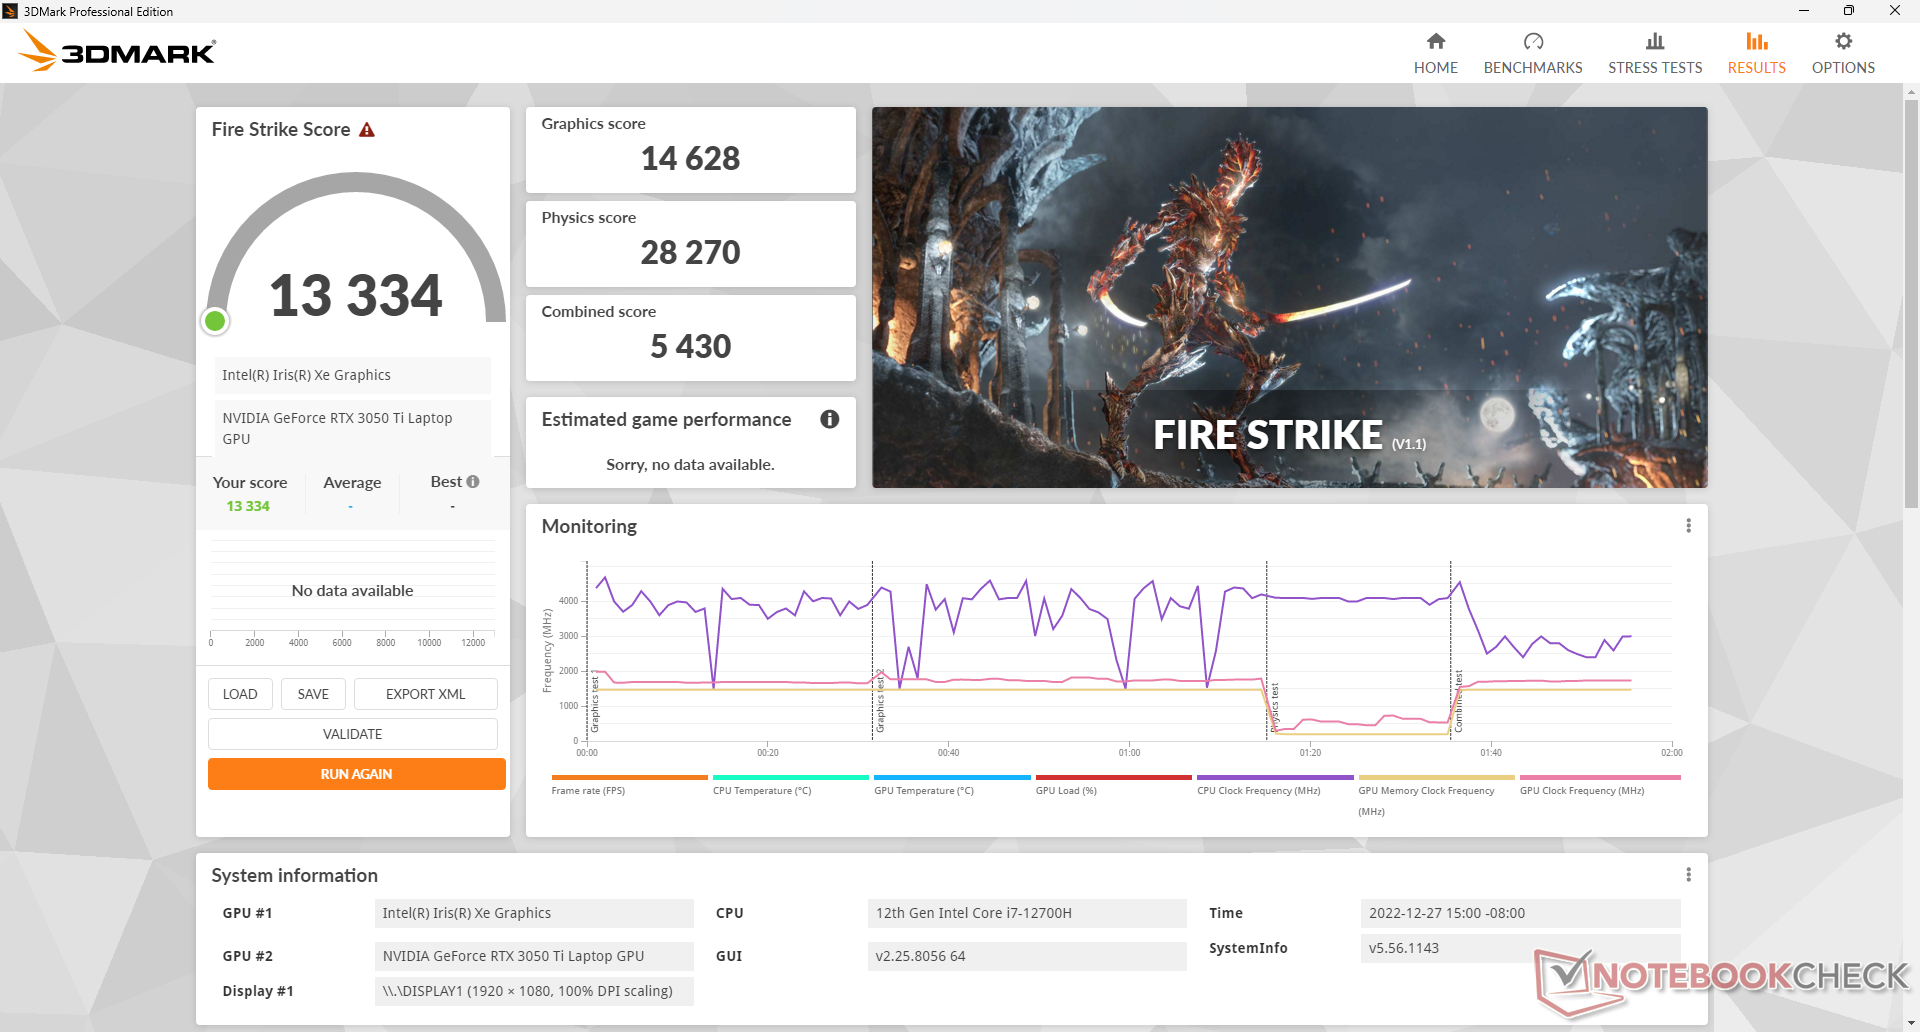
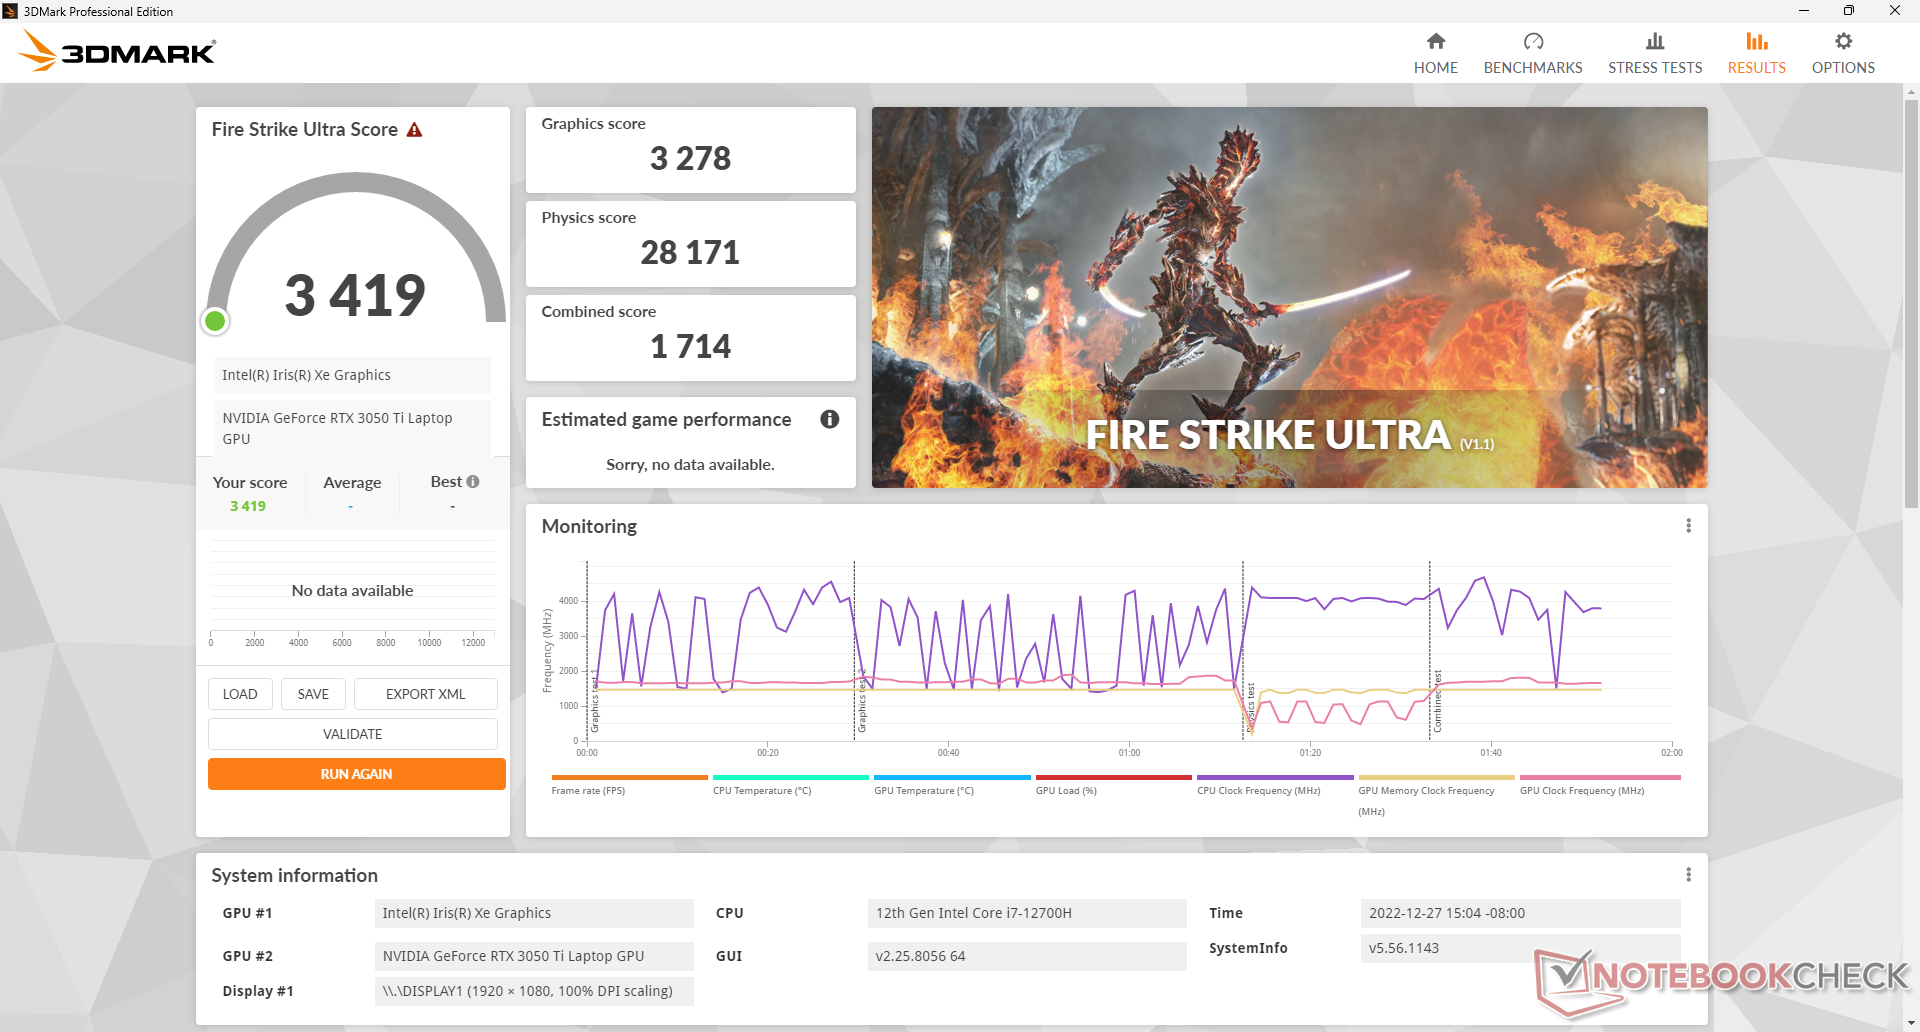
Il funzionamento a batteria limita le prestazioni. Un test 3DMark Fire Strike a batteria restituisce punteggi di Fisica e Grafica rispettivamente di 22703 e 9496 punti, rispetto a 28270 e 14628 punti con l'alimentazione a rete.
| Clock della CPU (GHz) | Clock della GPU (MHz) | Temperatura media della CPU (°C) | Temperatura media della GPU (°C) | |
| Sistema inattivo | -- | -- | 29 | 28 |
| Stress Prime95 | 2,2 - 2,6 | -- | 76 | 53 |
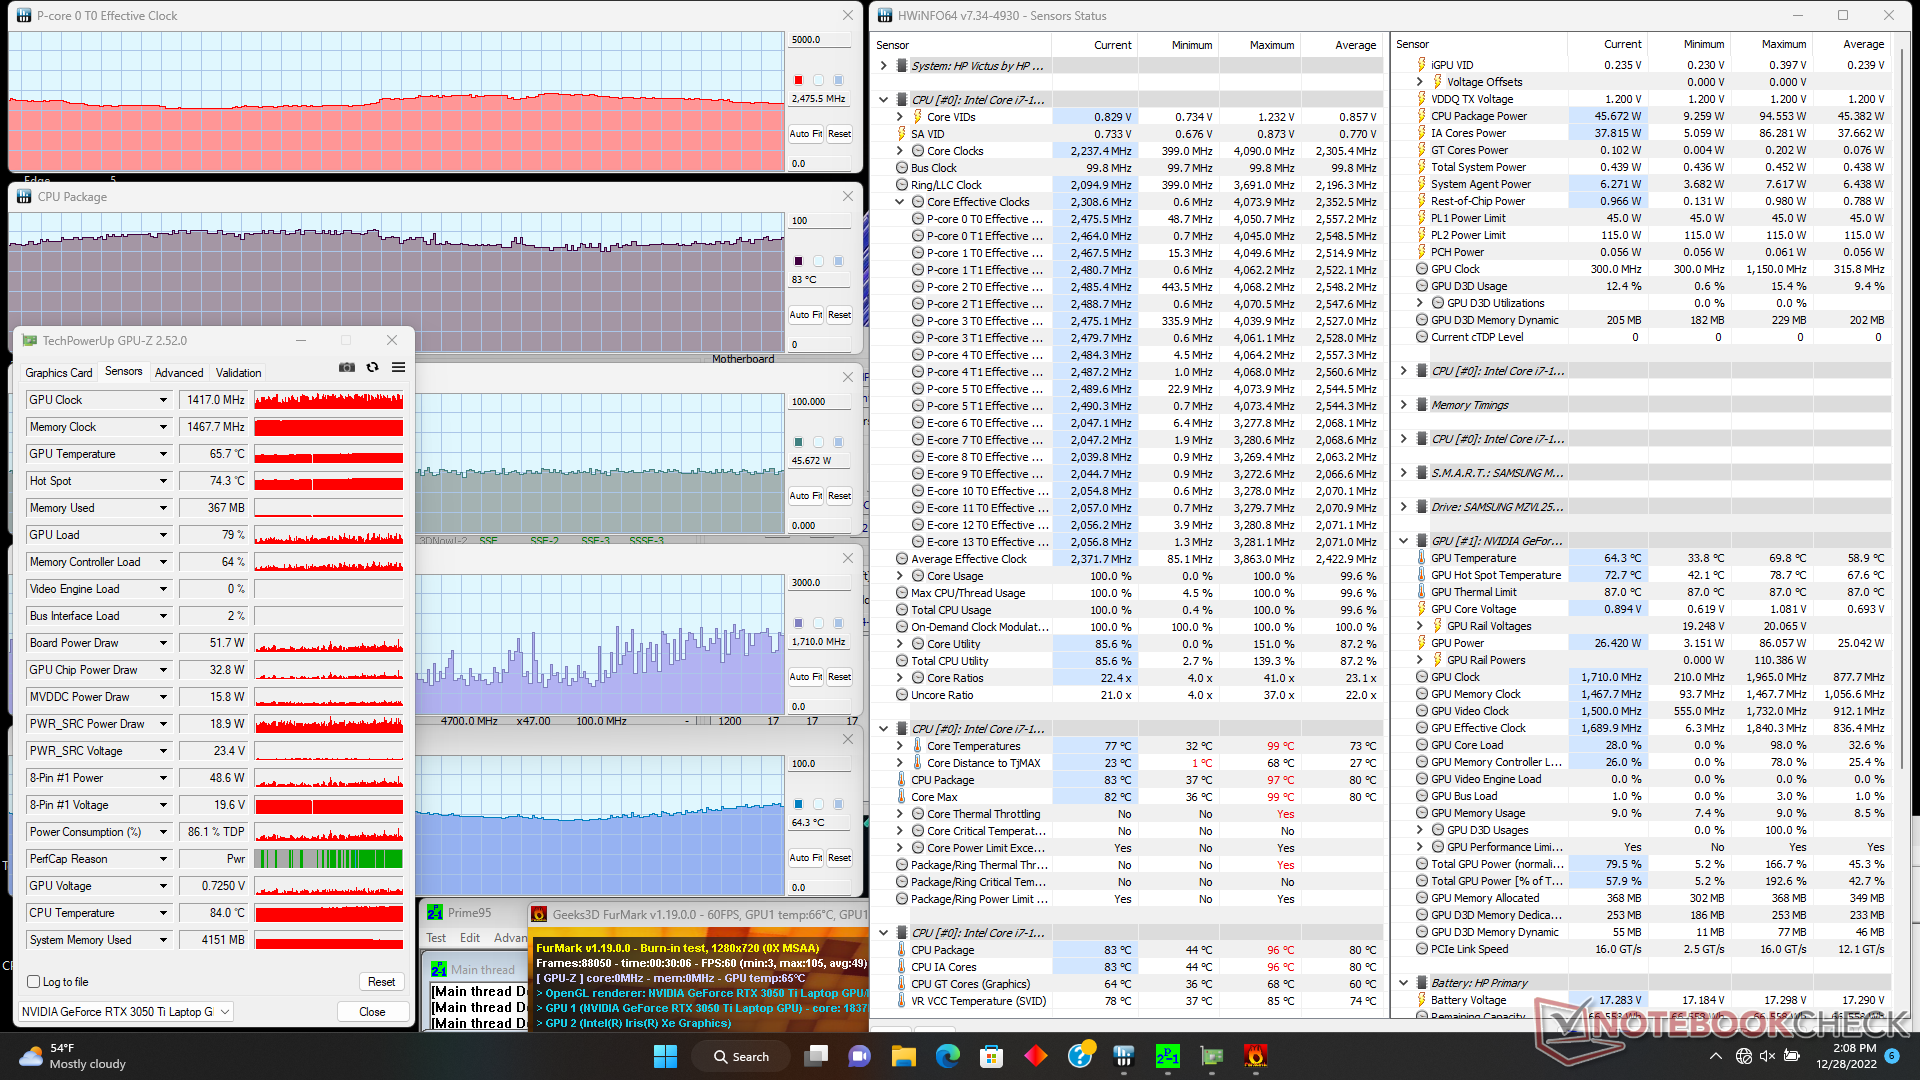
| Prime95 + FurMark Stress | 2,2 - 2,8 | ~1417 - 1710 | 70 - 90 | 54 - 69 |
| Witcher 3 Stress | ~1.0 | 1717 | 78 | 73 |
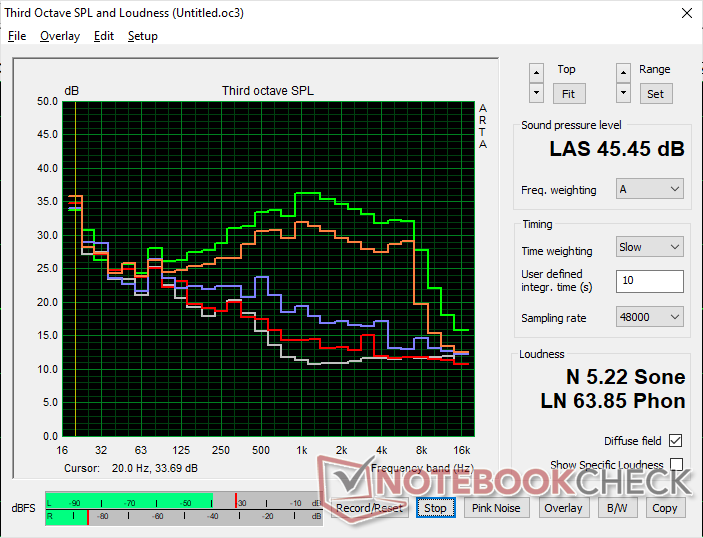
Altoparlanti
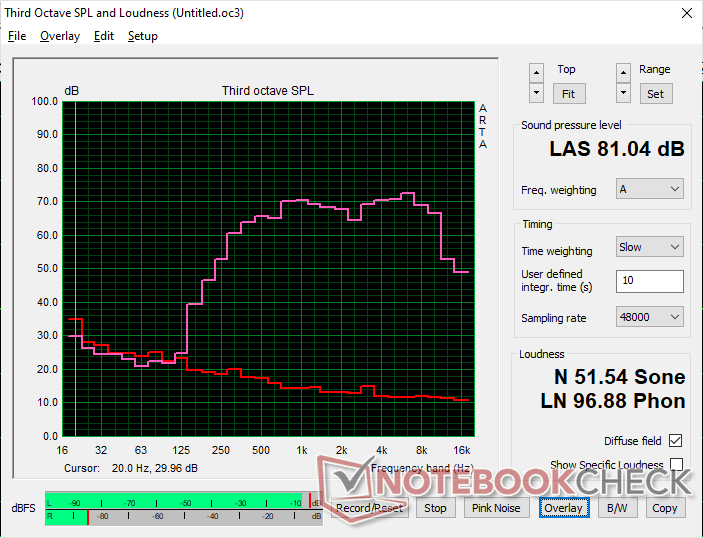
HP Victus 15 fa0020nr analisi audio
(±) | potenza degli altiparlanti media ma buona (81 dB)
Bassi 100 - 315 Hz
(-) | quasi nessun basso - in media 24.6% inferiori alla media
(±) | la linearità dei bassi è media (12.8% delta rispetto alla precedente frequenza)
Medi 400 - 2000 Hz
(+) | medi bilanciati - solo only 2.5% rispetto alla media
(+) | medi lineari (3.4% delta rispetto alla precedente frequenza)
Alti 2 - 16 kHz
(+) | Alti bilanciati - appena 3.7% dalla media
(+) | alti lineari (4.9% delta rispetto alla precedente frequenza)
Nel complesso 100 - 16.000 Hz
(±) | la linearità complessiva del suono è media (19.7% di differenza rispetto alla media
Rispetto alla stessa classe
» 69% di tutti i dispositivi testati in questa classe è stato migliore, 6% simile, 25% peggiore
» Il migliore ha avuto un delta di 6%, medio di 18%, peggiore di 132%
Rispetto a tutti i dispositivi testati
» 50% di tutti i dispositivi testati in questa classe è stato migliore, 7% similare, 43% peggiore
» Il migliore ha avuto un delta di 4%, medio di 23%, peggiore di 134%
Apple MacBook Pro 16 2021 M1 Pro analisi audio
(+) | gli altoparlanti sono relativamente potenti (84.7 dB)
Bassi 100 - 315 Hz
(+) | bassi buoni - solo 3.8% dalla media
(+) | bassi in lineaa (5.2% delta rispetto alla precedente frequenza)
Medi 400 - 2000 Hz
(+) | medi bilanciati - solo only 1.3% rispetto alla media
(+) | medi lineari (2.1% delta rispetto alla precedente frequenza)
Alti 2 - 16 kHz
(+) | Alti bilanciati - appena 1.9% dalla media
(+) | alti lineari (2.7% delta rispetto alla precedente frequenza)
Nel complesso 100 - 16.000 Hz
(+) | suono nel complesso lineare (4.6% differenza dalla media)
Rispetto alla stessa classe
» 0% di tutti i dispositivi testati in questa classe è stato migliore, 0% simile, 100% peggiore
» Il migliore ha avuto un delta di 5%, medio di 17%, peggiore di 45%
Rispetto a tutti i dispositivi testati
» 0% di tutti i dispositivi testati in questa classe è stato migliore, 0% similare, 100% peggiore
» Il migliore ha avuto un delta di 4%, medio di 23%, peggiore di 134%
Gestione dell'energia
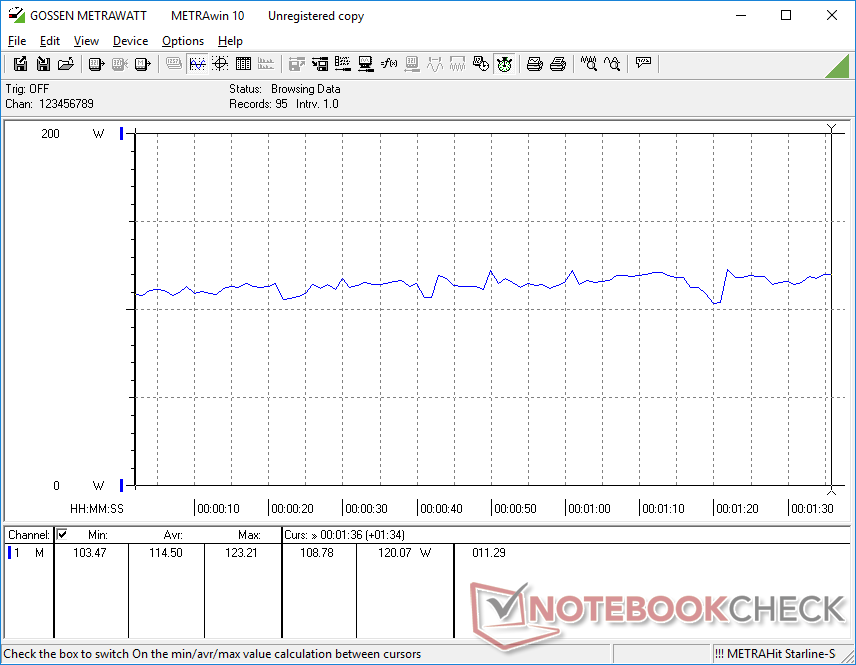
Consumo energetico - Simile a GeForce RTX 2060
Il funzionamento al minimo su desktop consuma tra i 5 W e i 19 W, a seconda del profilo energetico, del livello di luminosità e dell'impostazione Optimus. Quando si gioca, il consumo complessivo si avvicina molto a quello dell' Omen 15 con la vecchia RTX 2060. È deludente che le prestazioni per watt della RTX 3050 Ti non siano molto migliori di quelle della RTX 2060, nonostante siano di un'intera generazione e con livelli di prestazioni simili.
I portatili con la concorrente Radeon RX 6600M, come il modello MSI Alpha 15 possono consumare circa il 15% di energia in più rispetto al nostro HP quando giocano, ma l'apprezzabile guadagno del 30-50% nelle prestazioni grafiche lo rende un buon compromesso.
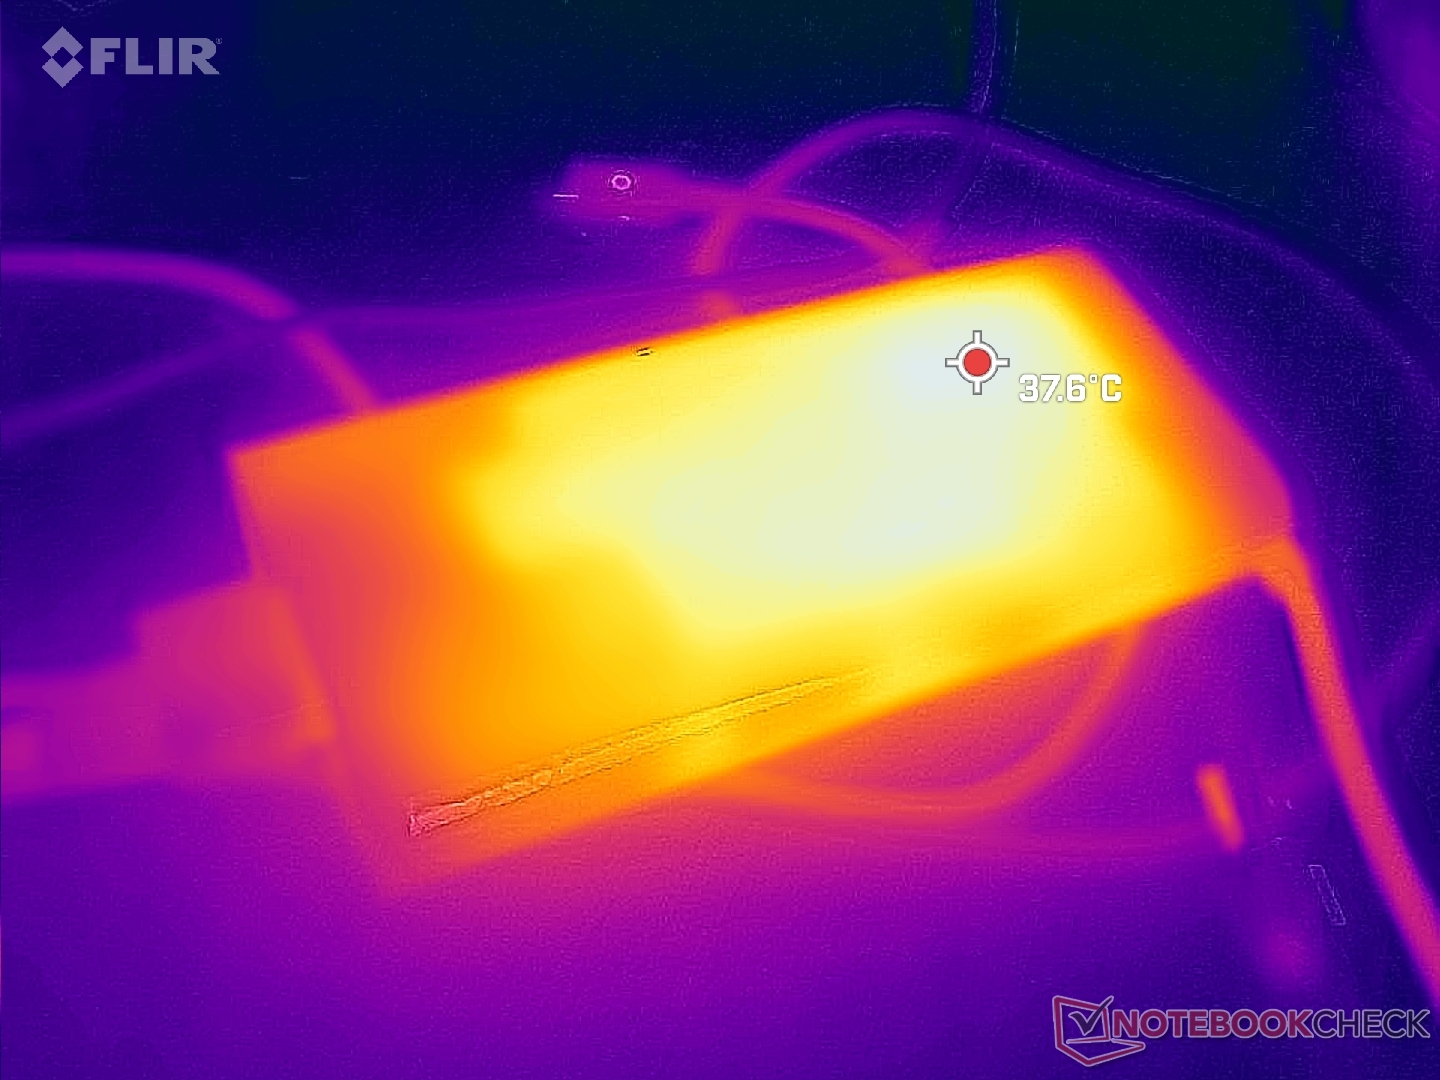
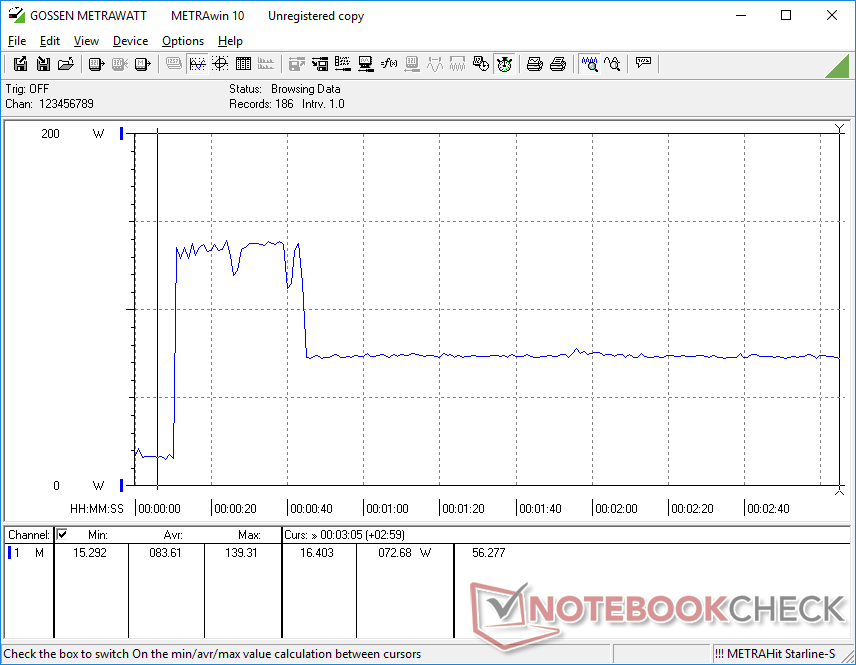
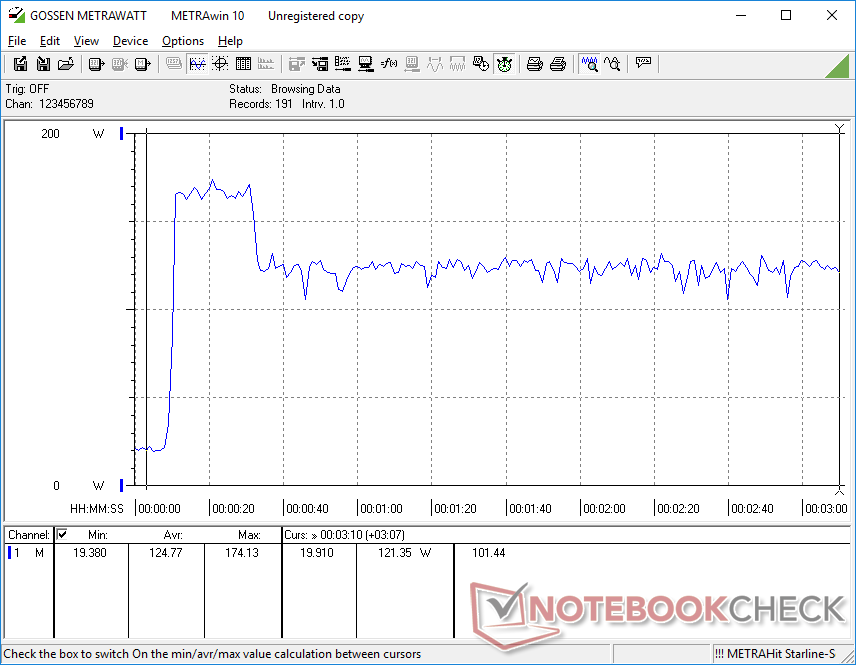
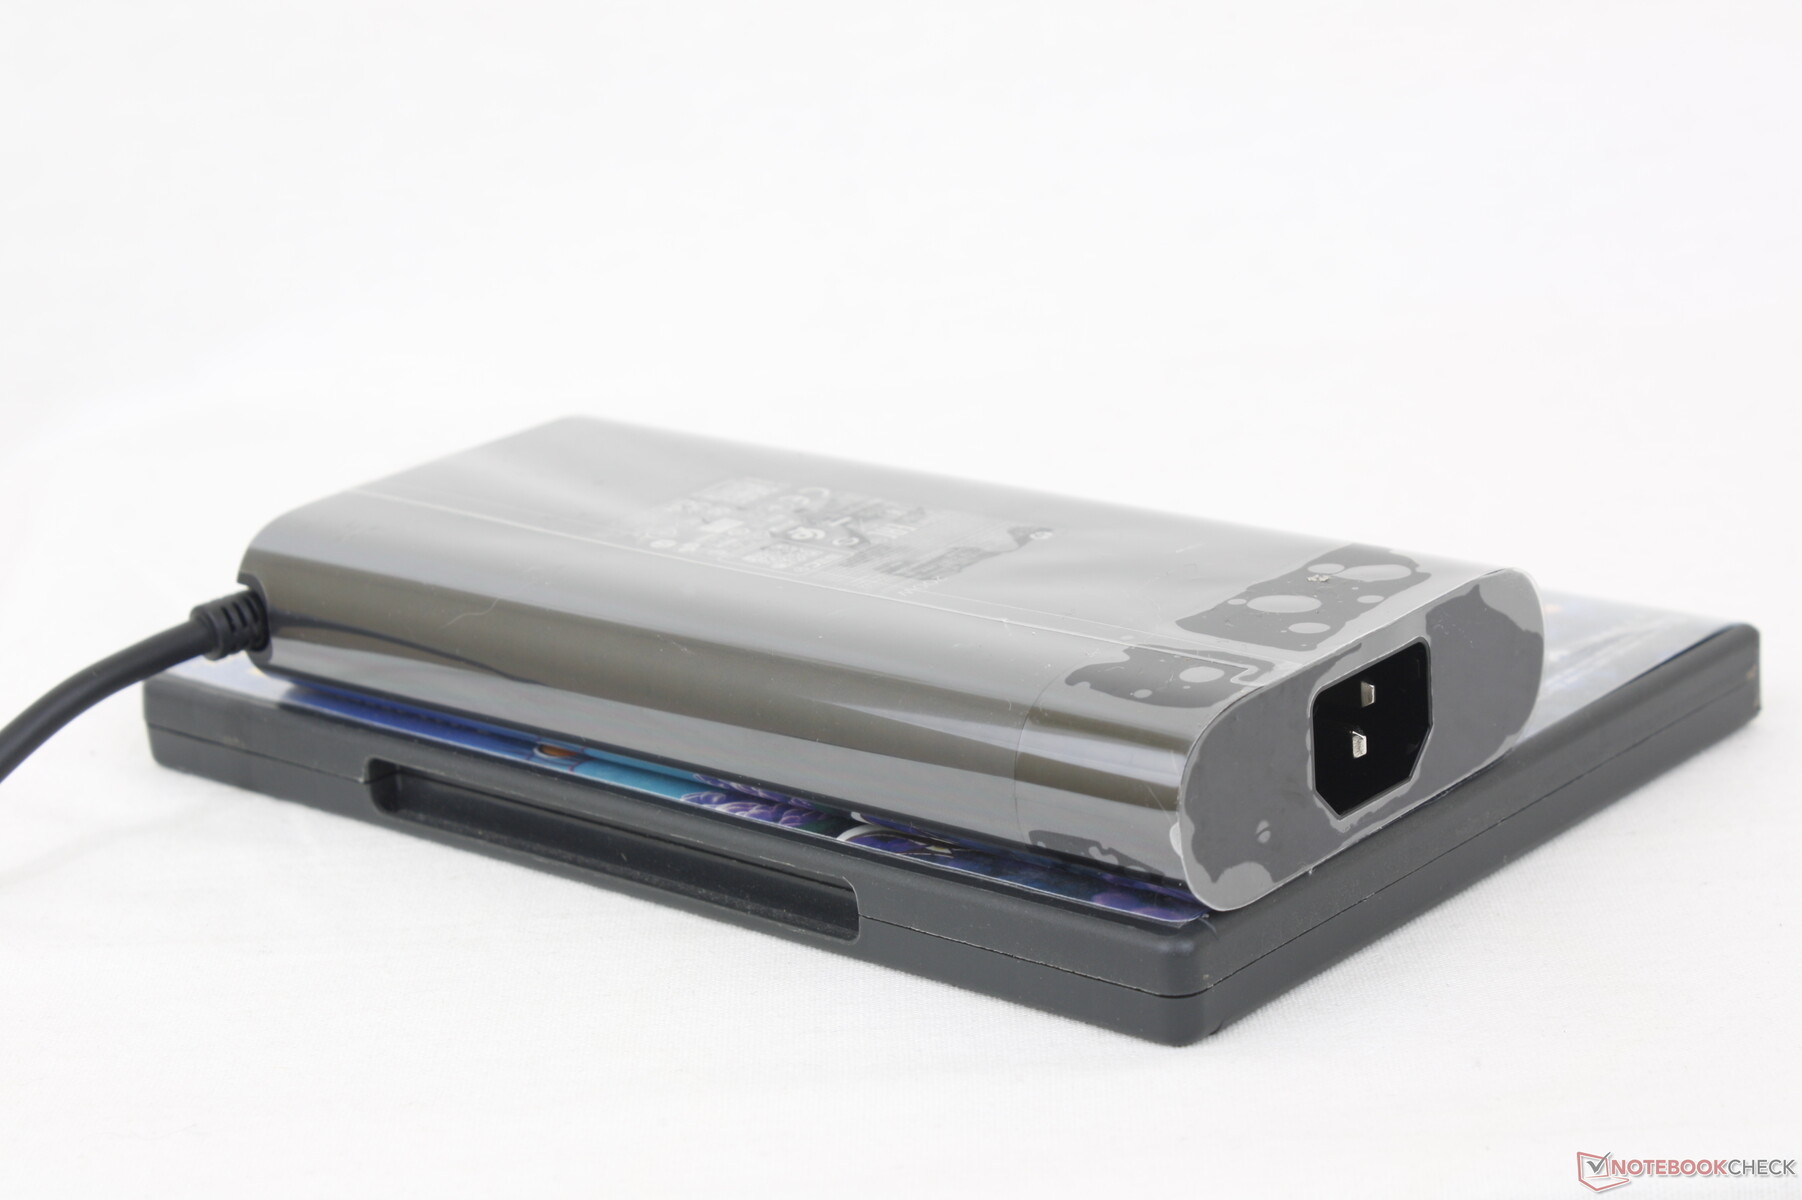
Siamo riusciti a misurare un consumo massimo di 175 W dall'adattatore CA da 200 W di medie dimensioni (~16,5 x 7,8 x 2,5 cm) quando è al massimo dell'utilizzo, come mostra lo screenshot qui sotto. Questo valore è temporaneo, poiché la soluzione di raffreddamento non è in grado di raffreddare sufficientemente la CPU per un utilizzo indefinito del Turbo Boost.
| Off / Standby | |
| Idle | |
| Sotto carico |
|
Leggenda:
min: | |
| HP Victus 15 fa0020nr i7-12700H, GeForce RTX 3050 Ti Laptop GPU, Samsung PM9A1 MZVL2512HCJQ, IPS, 1920x1080, 15.6" | HP Omen 15-en0375ng R7 4800H, GeForce RTX 2060 Mobile, WDC PC SN730 SDBPNTY-512G, IPS, 1920x1080, 15.6" | Dell G15 5515 R7 5800H, GeForce RTX 3050 Ti Laptop GPU, Samsung PM991a MZ9LQ512HBLU-00BD1, IPS, 1920x1080, 15.6" | Asus TUF Dash F15 FX517ZC i7-12650H, GeForce RTX 3050 4GB Laptop GPU, Intel SSD 670p SSDPEKNU512GZ, IPS, 2560x1440, 15.6" | MSI Bravo 15 B5DD-010US R5 5600H, Radeon RX 5500M, Kingston OM8PCP3512F-AB, IPS, 1920x1080, 15.6" | Lenovo Legion 5 15IAH7H 82RB i7-12700H, GeForce RTX 3060 Laptop GPU, , IPS, 1920x1080, 15.6" | |
|---|---|---|---|---|---|---|
| Power Consumption | 7% | 7% | -29% | 15% | -106% | |
| Idle Minimum * (Watt) | 5.1 | 4 22% | 5 2% | 9.2 -80% | 6.6 -29% | 19.8 -288% |
| Idle Average * (Watt) | 15.1 | 9 40% | 9 40% | 15.9 -5% | 9.8 35% | 26.2 -74% |
| Idle Maximum * (Watt) | 18.9 | 22 -16% | 20 -6% | 29.5 -56% | 10.8 43% | 48.2 -155% |
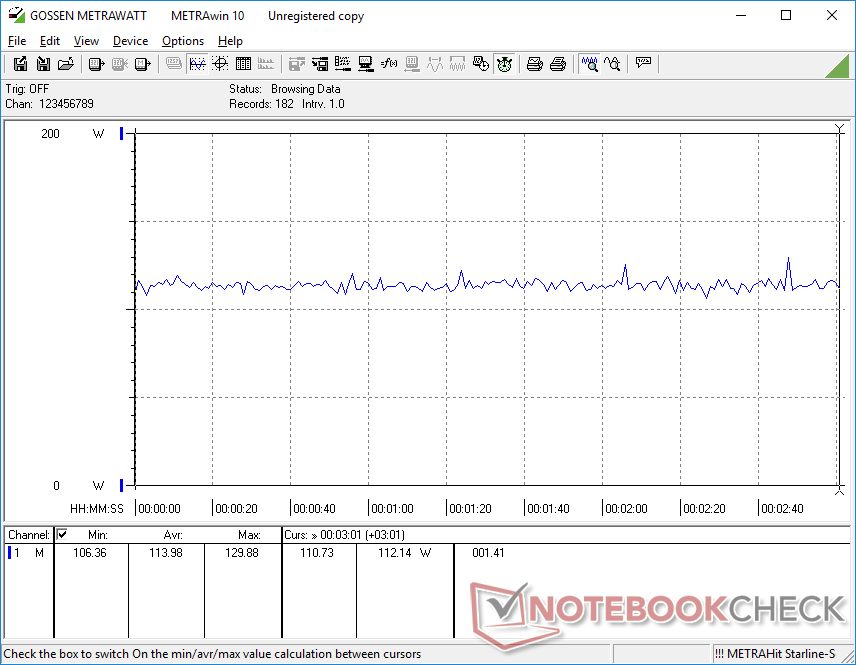
| Load Average * (Watt) | 114.5 | 102 11% | 94 18% | 124.8 -9% | 70.5 38% | 102.9 10% |
| Witcher 3 ultra * (Watt) | 113.9 | 119 -4% | 123 -8% | 129.2 -13% | 103.2 9% | 186.7 -64% |
| Load Maximum * (Watt) | 165.8 | 182 -10% | 172 -4% | 178.4 -8% | 175 -6% | 268 -62% |
* ... Meglio usare valori piccoli
Power Consumption Witcher 3 / Stresstest
Power Consumption external Monitor
Durata della batteria: scarsa su tutte le impostazioni
I tempi di esecuzione sono così scadenti che sospettiamo possa trattarsi di un bug software della nostra configurazione o del modello nel suo complesso. Siamo riusciti a spremere solo 2,5 ore di autonomia della batteria quando si è semplicemente inattivo sul desktop con l'impostazione di luminosità più bassa, con l'iGPU attiva e la WLAN disattivata. Abbiamo ripetuto il test per essere sicuri e i risultati non sono migliorati. Anche Task Manager non mostrava alcuna applicazione particolare che consumasse risorse. I concorrenti Dell G5 oMSI Bravo 15 possono durare diverse ore in più nonostante abbiano batterie interne più piccole
La ricarica da vuoto a pieno richiede da 1,5 a 2 ore. Il sistema non può essere ricaricato tramite USB-C.
| HP Victus 15 fa0020nr i7-12700H, GeForce RTX 3050 Ti Laptop GPU, 70 Wh | HP Omen 15-en0375ng R7 4800H, GeForce RTX 2060 Mobile, 70.9 Wh | Dell G15 5515 R7 5800H, GeForce RTX 3050 Ti Laptop GPU, 56 Wh | Asus TUF Dash F15 FX517ZC i7-12650H, GeForce RTX 3050 4GB Laptop GPU, 76 Wh | MSI Bravo 15 B5DD-010US R5 5600H, Radeon RX 5500M, 53 Wh | Lenovo Legion 5 15IAH7H 82RB i7-12700H, GeForce RTX 3060 Laptop GPU, 80 Wh | |
|---|---|---|---|---|---|---|
| Autonomia della batteria | 378% | 245% | 90% | 148% | 117% | |
| Reader / Idle (h) | 2.6 | 20 669% | 13.5 419% | 9.2 254% | 8.1 212% | |
| WiFi v1.3 (h) | 2.1 | 10.5 400% | 8 281% | 4 90% | 6.3 200% | 5 138% |
| Load (h) | 1.1 | 1.8 64% | 1.5 36% | 1 -9% | 1.1 0% | |
| H.264 (h) | 8.8 |
Pro
Contro
Verdetto: costoso e poco pratico
Per un prezzo compreso tra i 1200 e i 1300 dollari, l'HP Victus 15 non offre abbastanza per la sua fascia di prezzo. Il Lenovo concorrente Legion 5 15 è attualmente disponibile con la CPU AMD Ryzen 6800H e la GPU GeForce RTX 3060, molto più veloce, per 1280 dollari, il che fa vergognare il nostro modello HP. Per essere competitivo, il nostro modello HP dovrebbe essere venduto a un prezzo più vicino ai 1000 dollari o inferiore, soprattutto perché la RTX 3050 Ti di GeForce ha prestazioni simili alle vecchie RTX 2060 e GTX 1660 Ti.
L'HP Victus 15 sarebbe stato un solido portatile da gioco se fosse stato venduto a 1000 dollari o meno. Tuttavia, a partire da 1200 dollari, la GPU RTX 3050 Ti di GeForce non è all'altezza quando sono disponibili alternative RTX 3060.
Inoltre, i notevoli bug hanno compromesso la nostra esperienza complessiva anche dopo l'aggiornamento alle ultime versioni dei driver e del software HP al momento della pubblicazione. È più facile perdonare piccoli bug qua e là, ma aspetti cruciali come la durata della batteria e il rumore della ventola dovrebbero essere privi di problemi fin dall'inizio.
Ci sono alcune cose che il Victus 15 fa bene. Ad esempio, il suo design complessivo è visivamente accattivante, mentre l'aggiornamento dell'SSD e della RAM è relativamente semplice. Il tastierino numerico a grandezza naturale è ottimo e le temperature dei core sono piuttosto basse. Tuttavia, le scarse prestazioni per dollaro e i bug tolgono molto valore a un sistema altrimenti interessante.
Prezzo e disponibilità
HP Victus 15 fa0020nr
- 12/31/2022 v7 (old)
Allen Ngo
Price comparison

