Recensione del portatile HP Omen 16 2022: Debutto delle prestazioni della Radeon RX 6650M
Anche se la serie HP Omen 16 ha appena un anno di vita, l'ultimo modello 2022 è già un aggiornamento significativo rispetto all'originale, sia all'interno che all'esterno. La nuova versione aggiunge le opzioni CPU Intel 12th gen Alder Lake-H e AMD Zen 3+, le opzioni GPU GeForce RTX 3070 Ti e Radeon RX 6000M e diverse modifiche esterne.
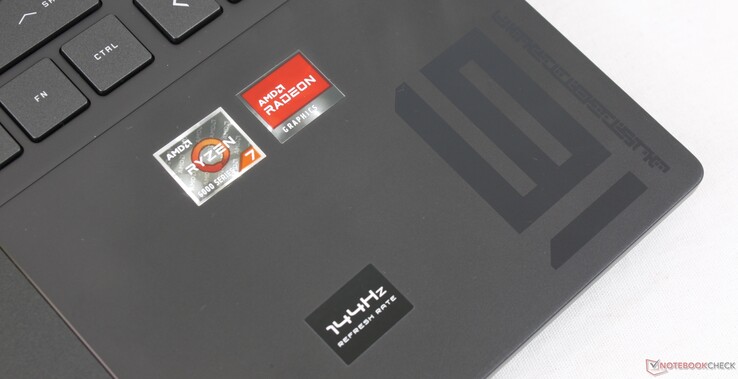
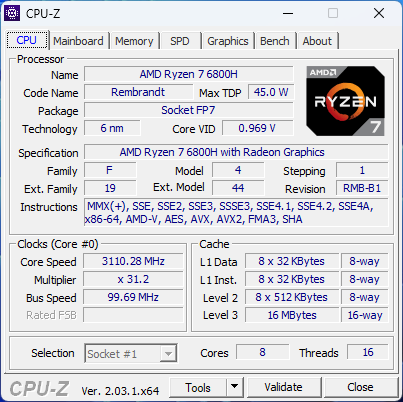
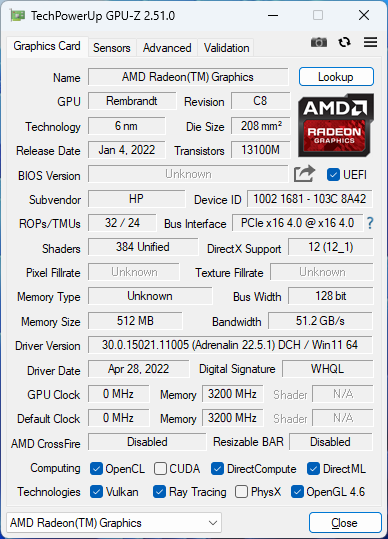
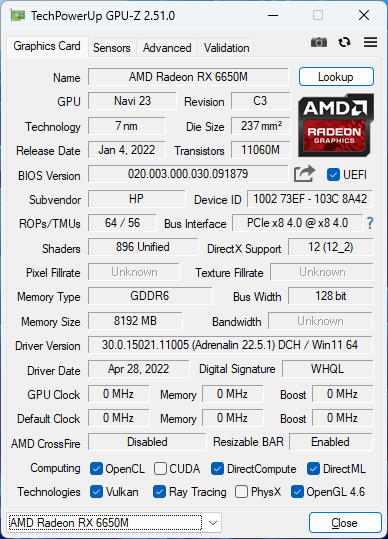
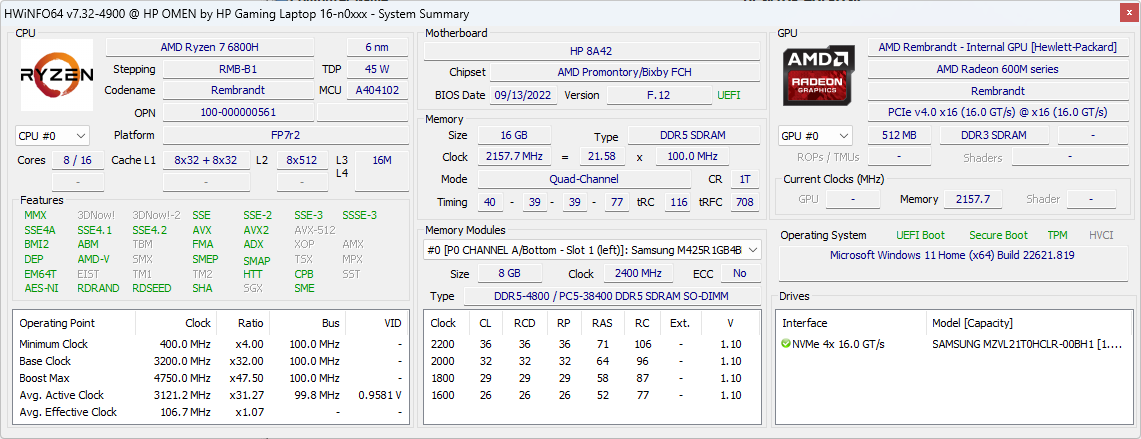
La nostra configurazione in esame è la SKU interamente AMD con Ryzen 7 6800H, Radeon RX 6650M da 105 W TGP e display IPS 1080p da 144 Hz al prezzo di circa 1600 dollari al dettaglio. Questo è anche uno dei pochissimi portatili con grafica Radeon RX 6650M.
L'Omen 16 compete direttamente con altri portatili da gioco da 16 pollici di fascia media come Dell G16 7620, Lenovo Legion S7 16, o Asus Zephyrus M16. Per un'alternativa più economica, gli utenti possono prendere in considerazione il modello di fascia bassa HP Victus 16.
Altre recensioni di HP:
Potenziali concorrenti a confronto
Punteggio | Data | Modello | Peso | Altezza | Dimensione | Risoluzione | Prezzo |
|---|---|---|---|---|---|---|---|
| 86.4 % v7 (old) | 12/2022 | HP Omen 16-n0033dx R7 6800H, Radeon RX 6650M | 2.4 kg | 22.6 mm | 16.10" | 1920x1080 | |
| 86.9 % v7 (old) | 09/2022 | HP Envy 16 h0112nr i7-12700H, GeForce RTX 3060 Laptop GPU | 2.3 kg | 19.8 mm | 16.00" | 3840x2400 | |
| 85.5 % v7 (old) | 05/2022 | HP Omen 16-b1090ng i7-12700H, GeForce RTX 3070 Ti Laptop GPU | 2.3 kg | 23 mm | 16.10" | 2560x1440 | |
| 82.3 % v7 (old) | 05/2022 | HP Victus 16-e0145ng R5 5600H, GeForce RTX 3050 Ti Laptop GPU | 2.4 kg | 23.5 mm | 16.10" | 1920x1080 | |
| 89.3 % v7 (old) | 01/2023 | Lenovo Legion S7 16ARHA7 R9 6900HX, Radeon RX 6800S | 2.2 kg | 16.9 mm | 16.00" | 2560x1600 | |
| 86.1 % v7 (old) | 10/2022 | Dell G16 7620 i7-12700H, GeForce RTX 3060 Laptop GPU | 2.6 kg | 26.9 mm | 16.00" | 2560x1600 |
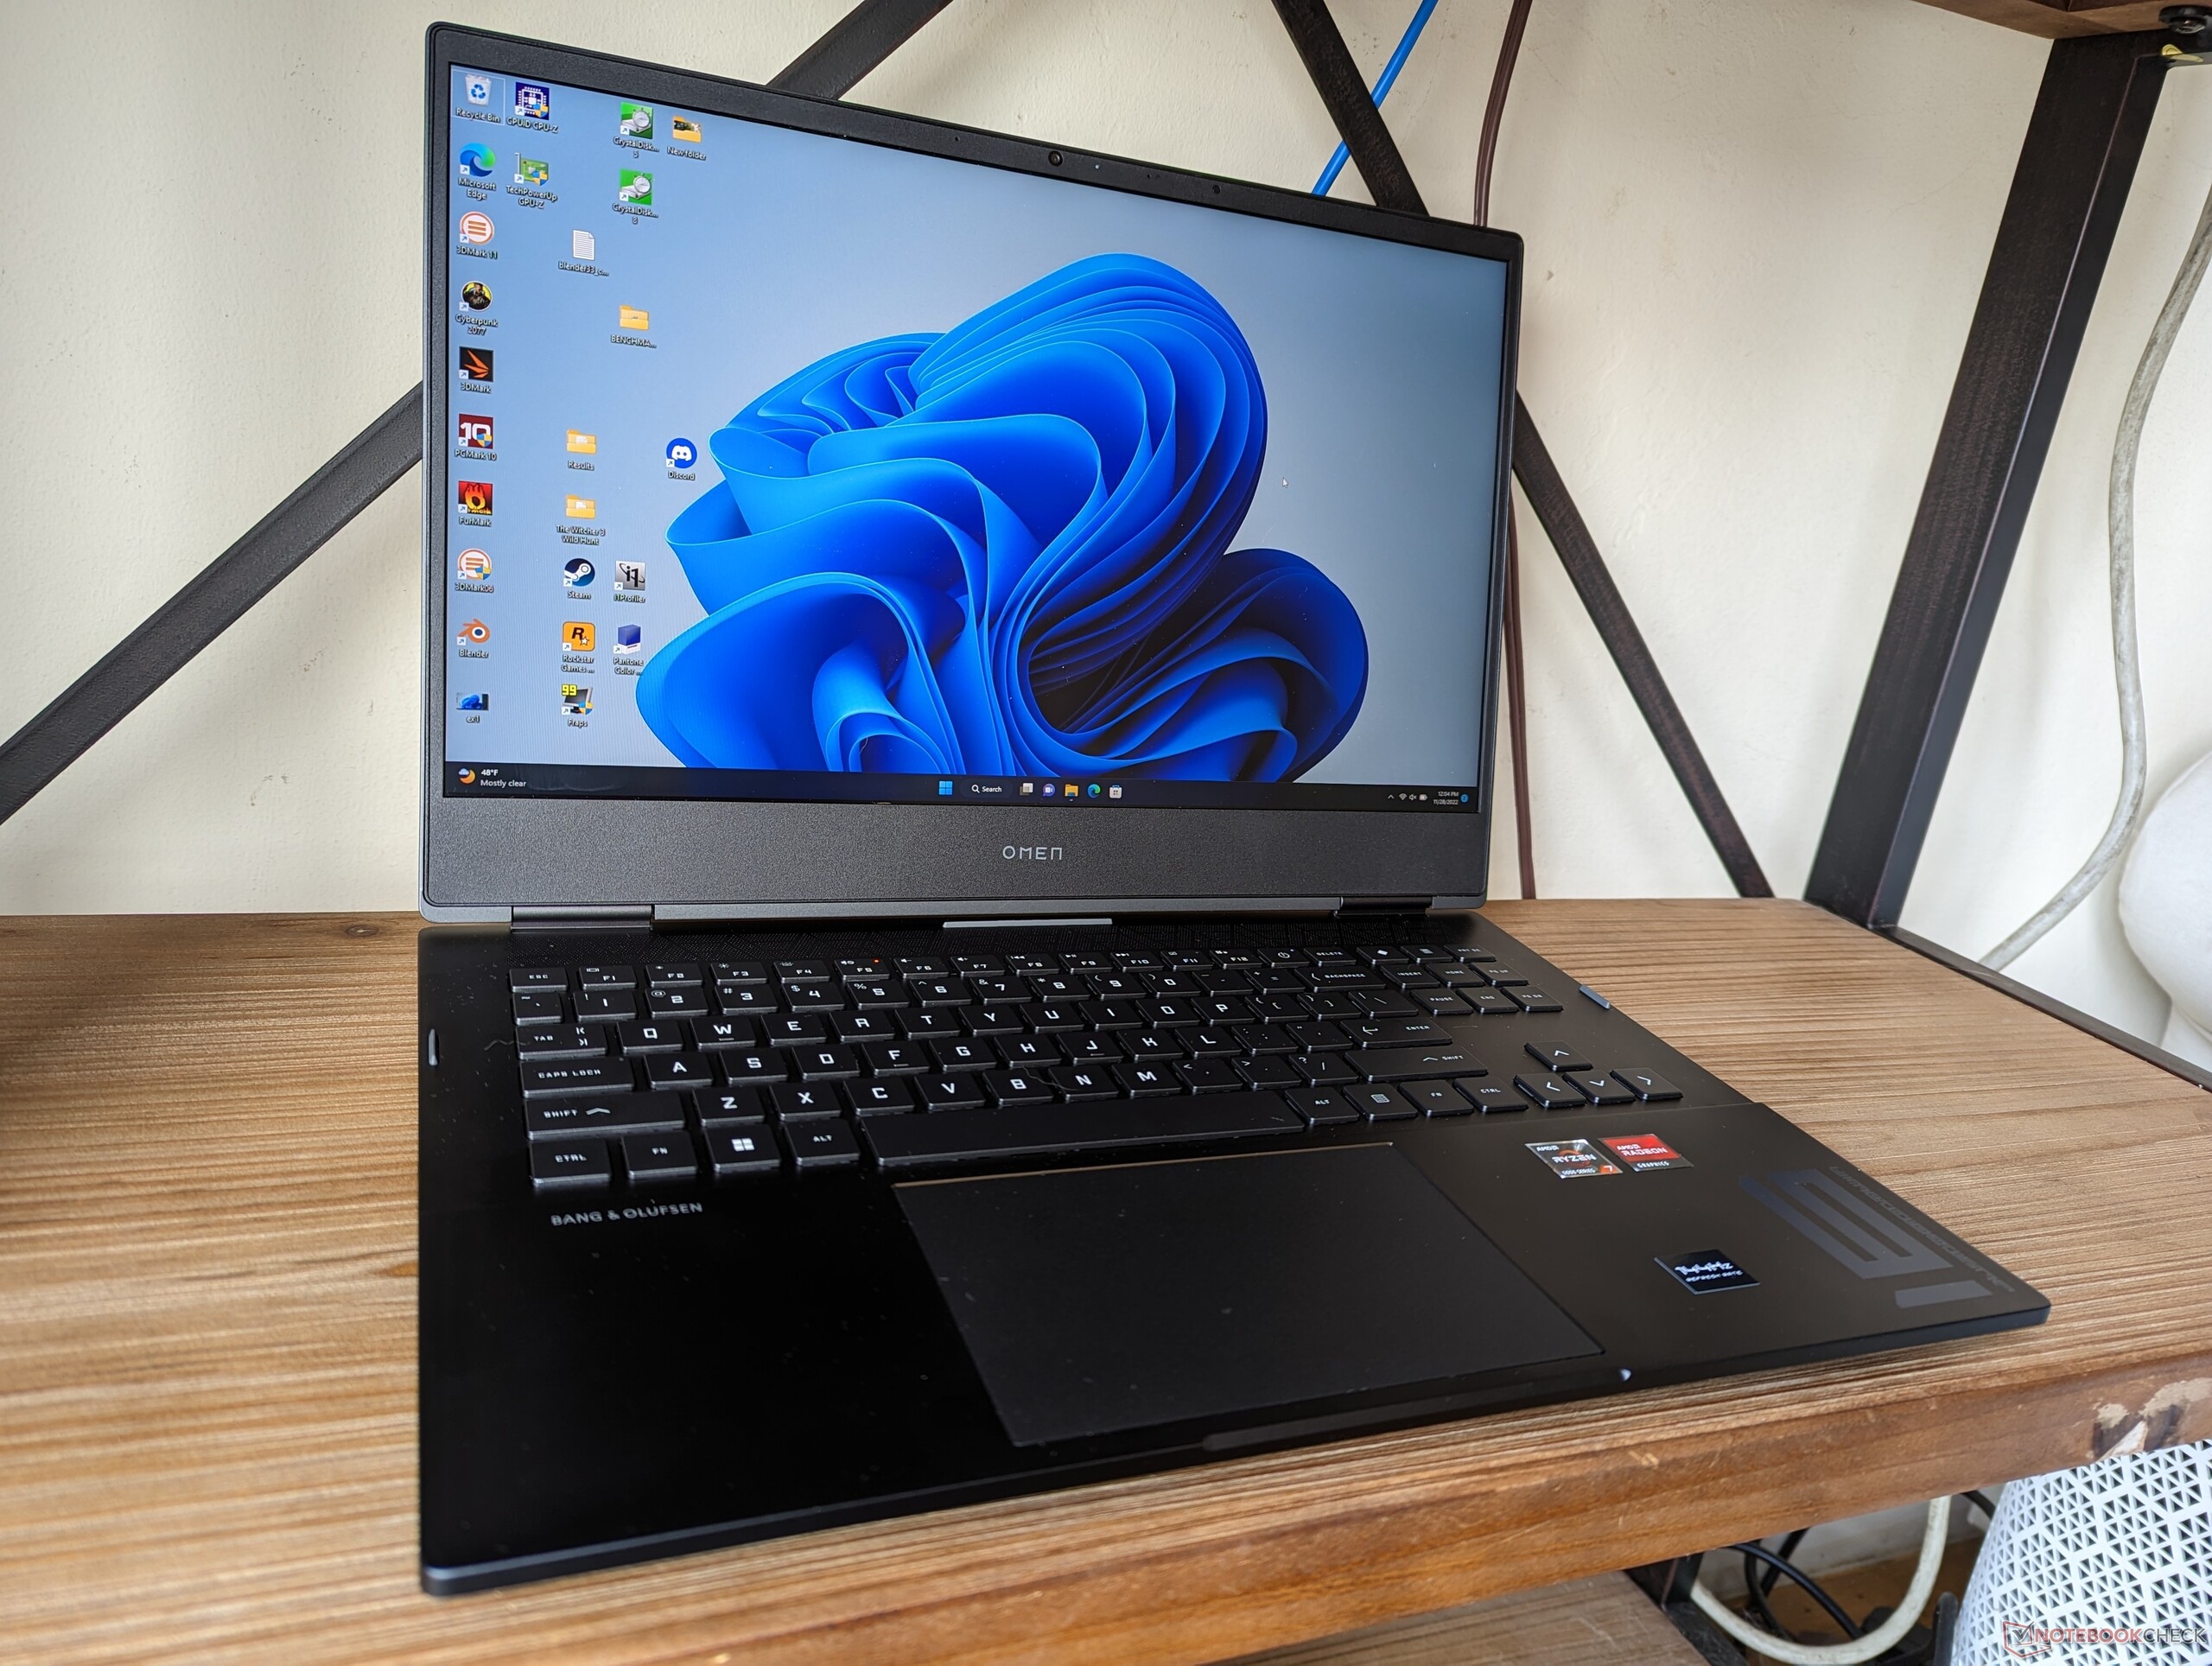
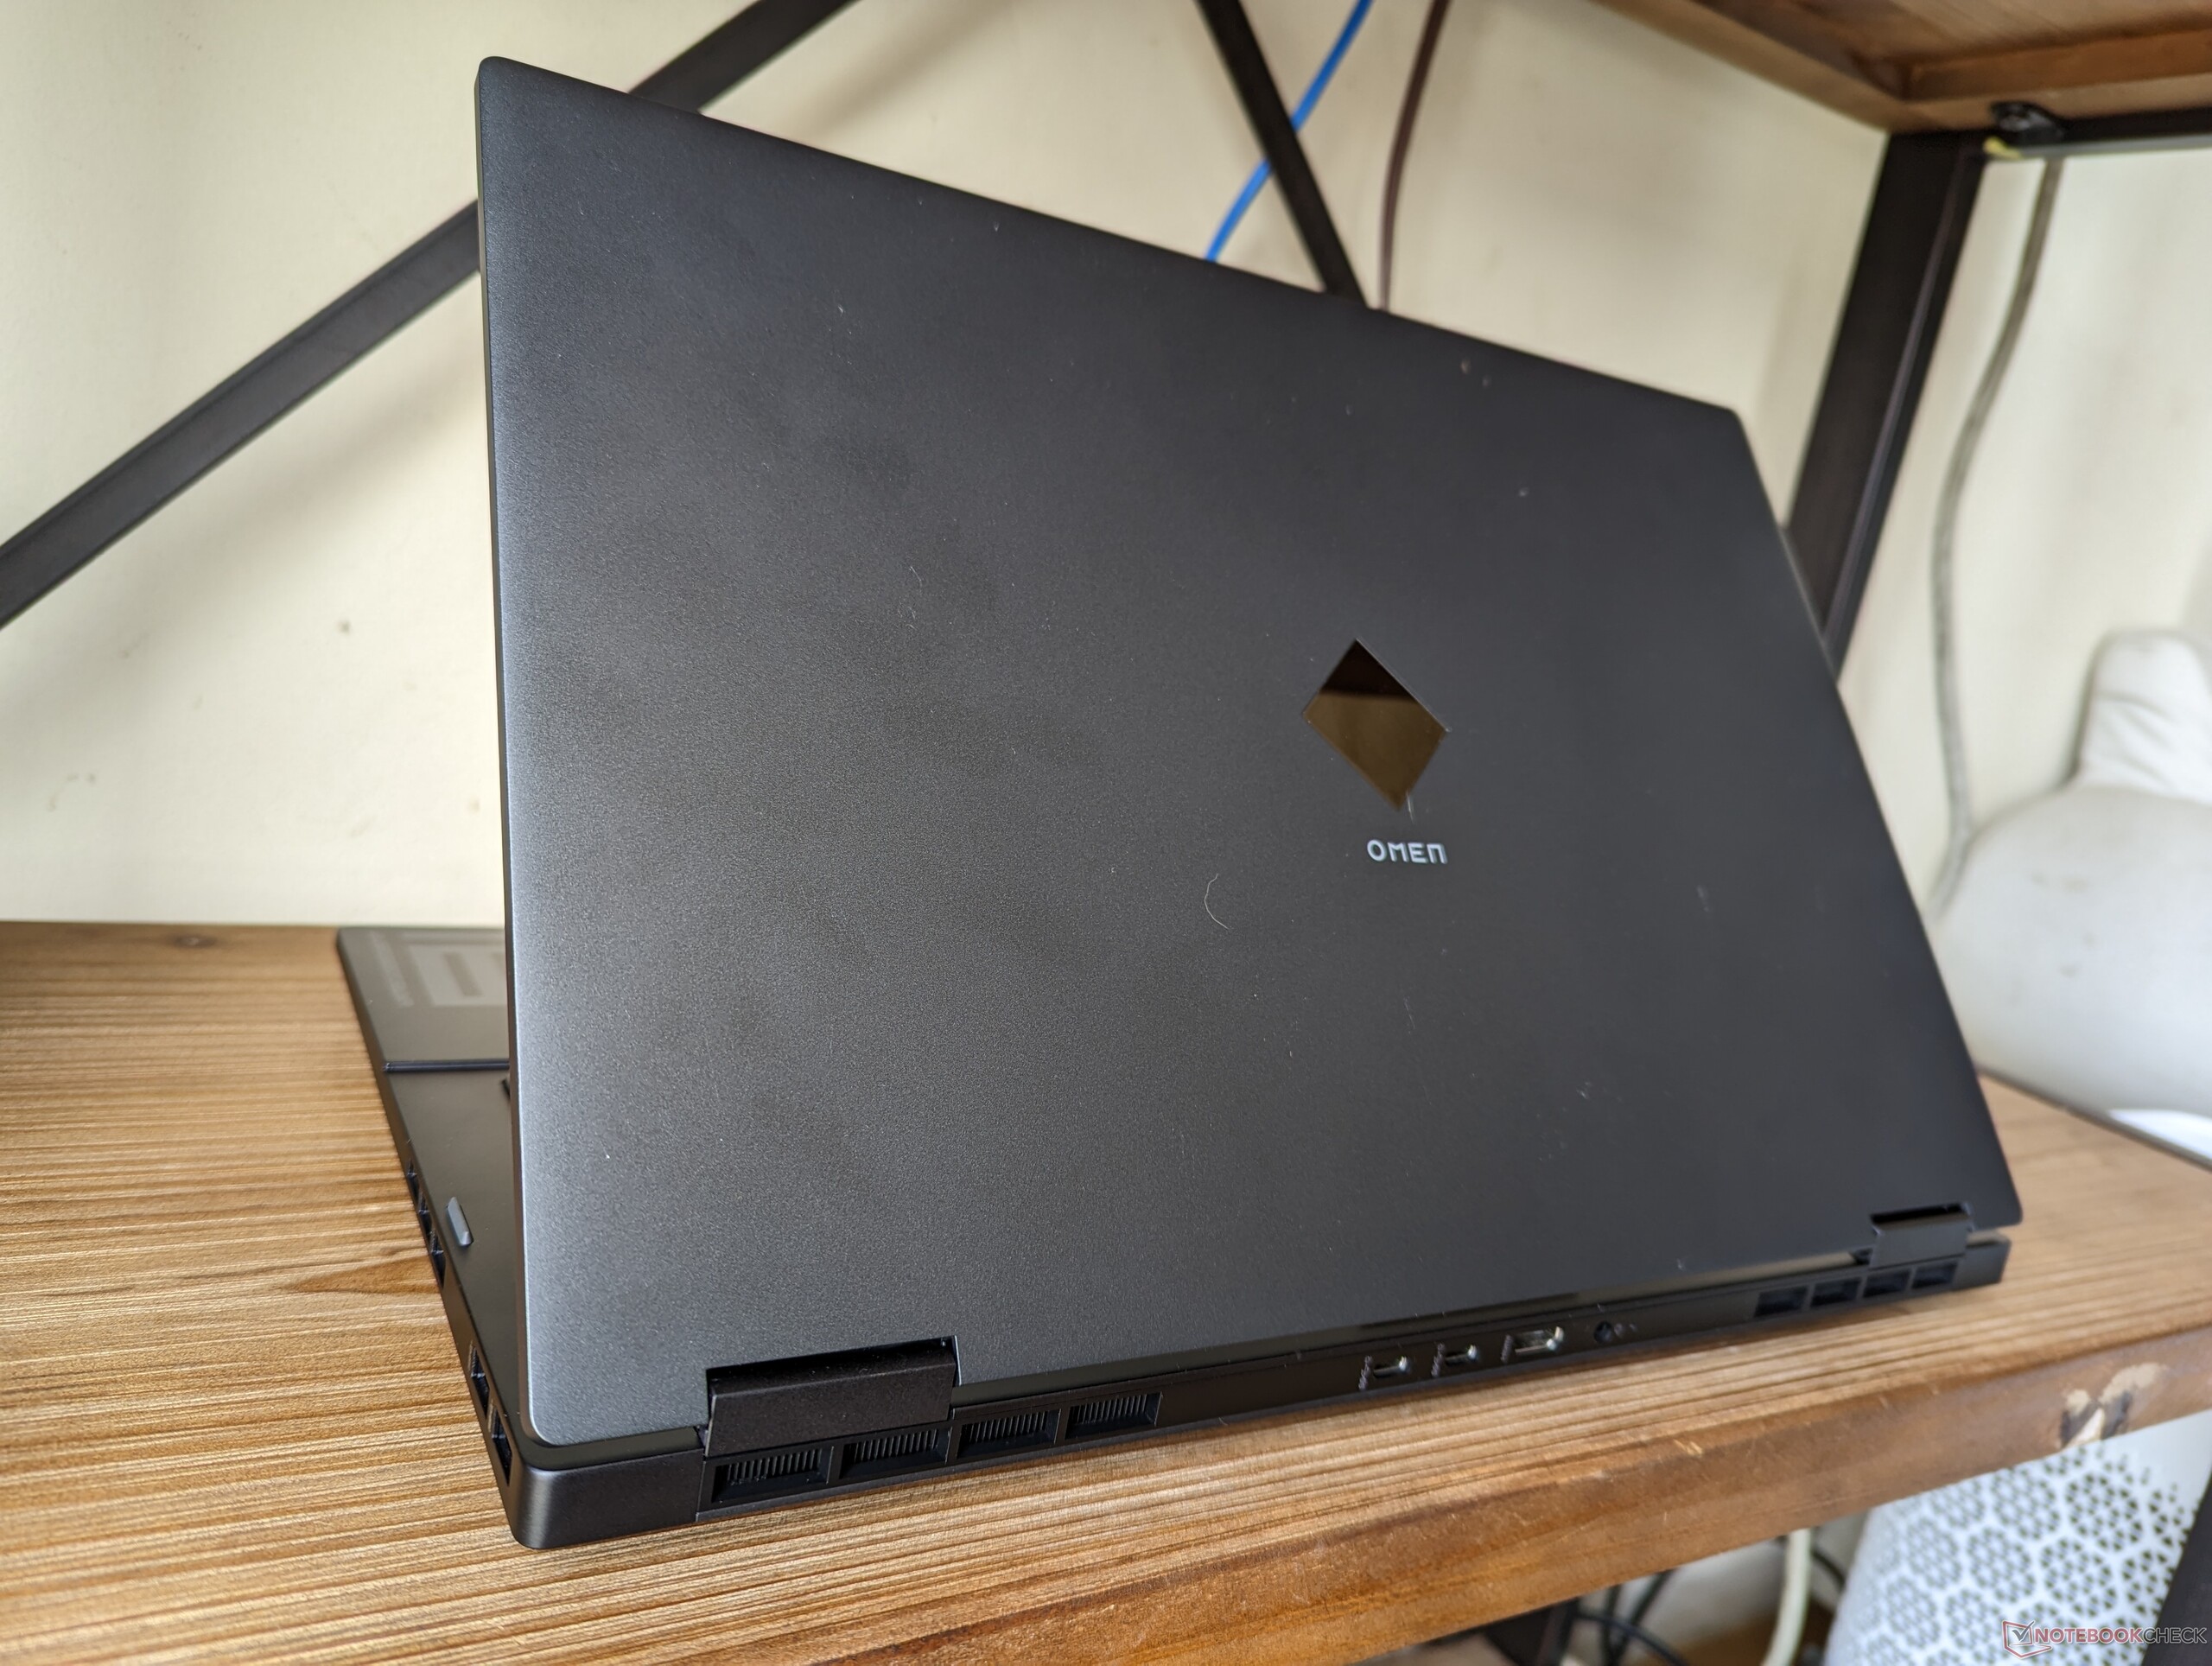
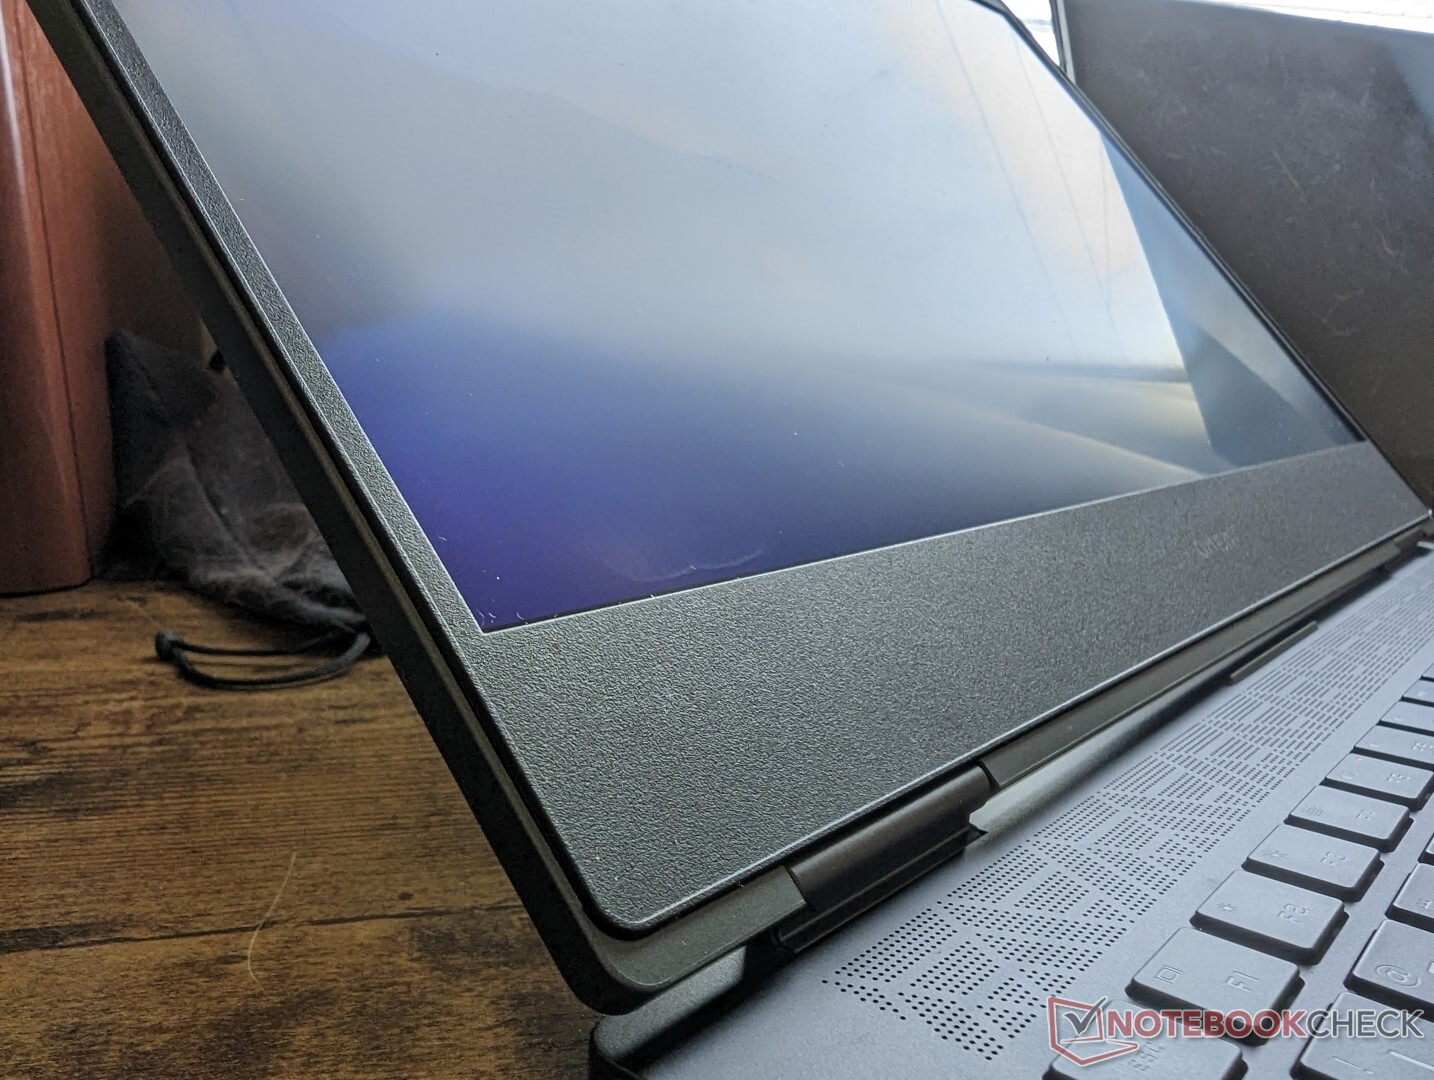
Custodia - Ispirata all'Envy 16
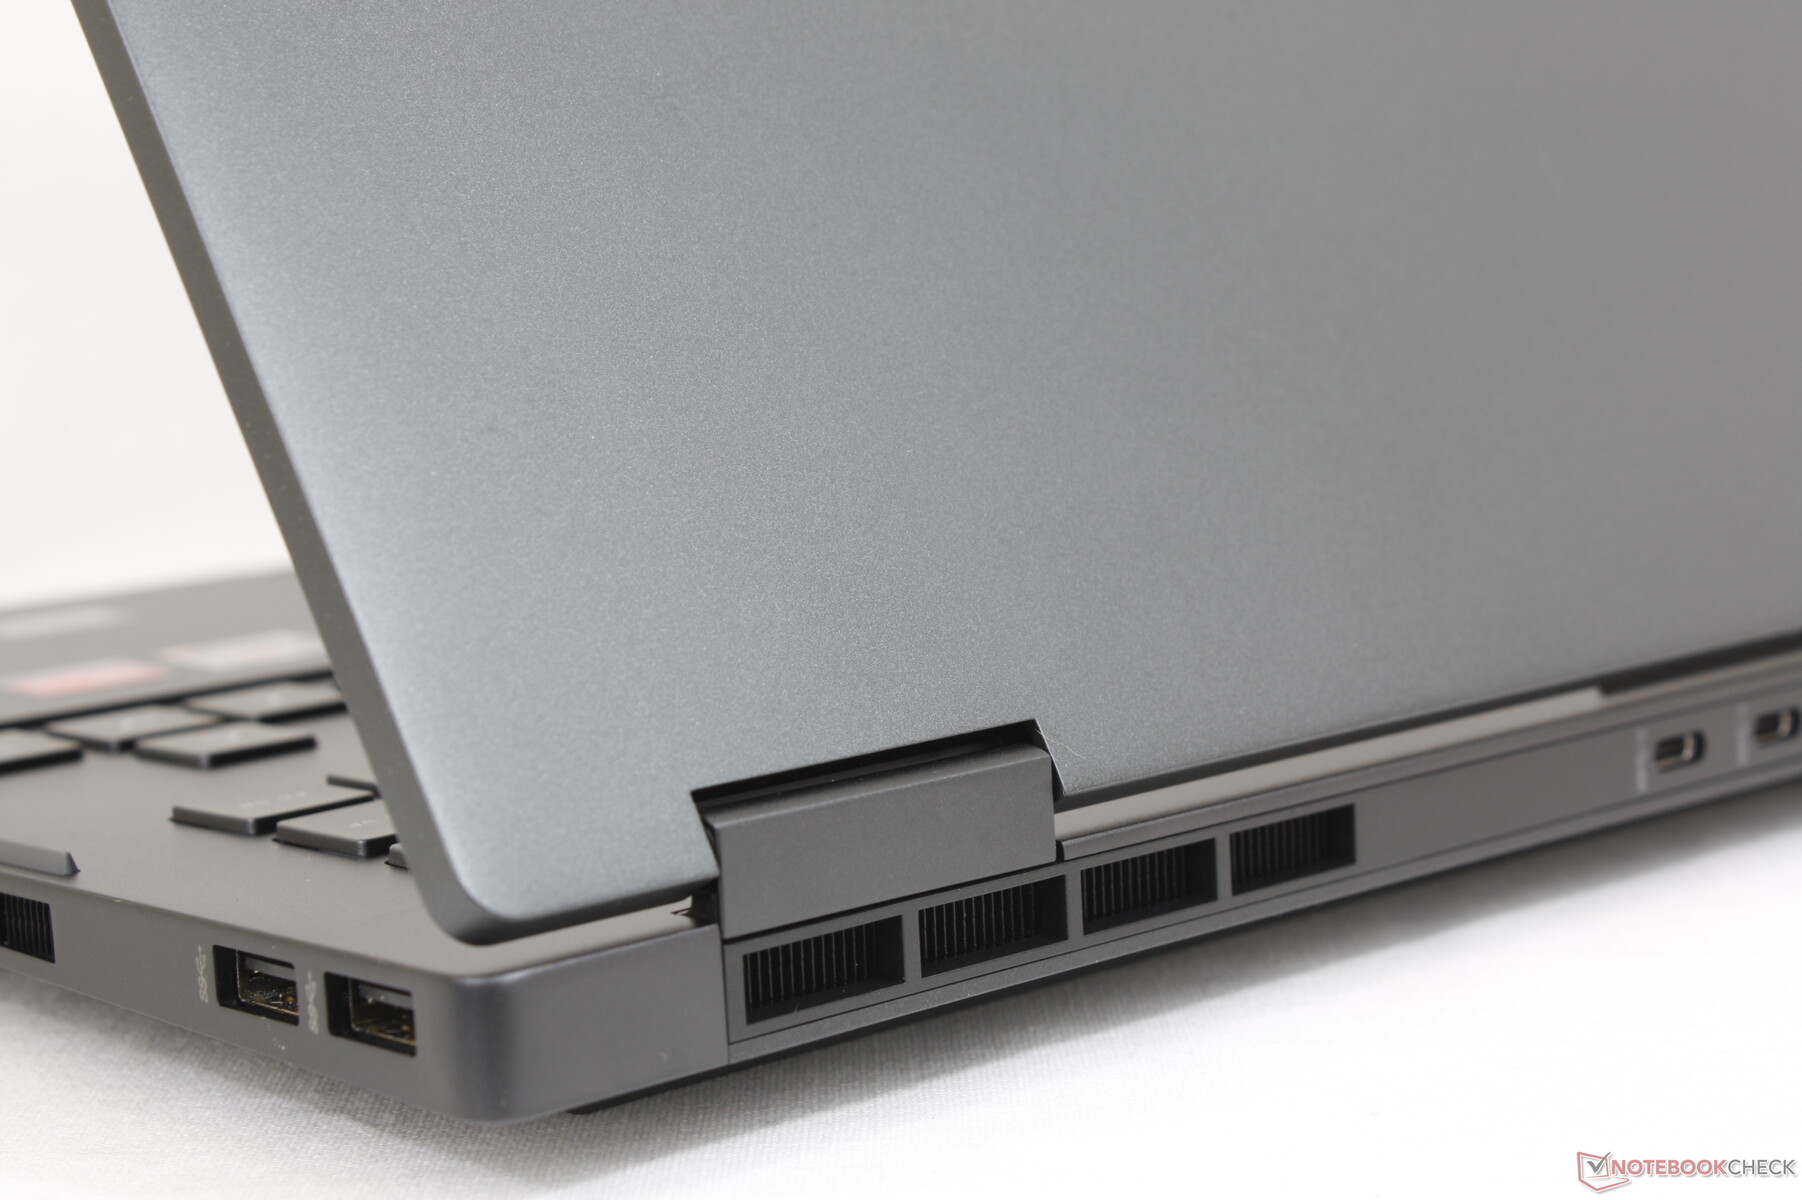
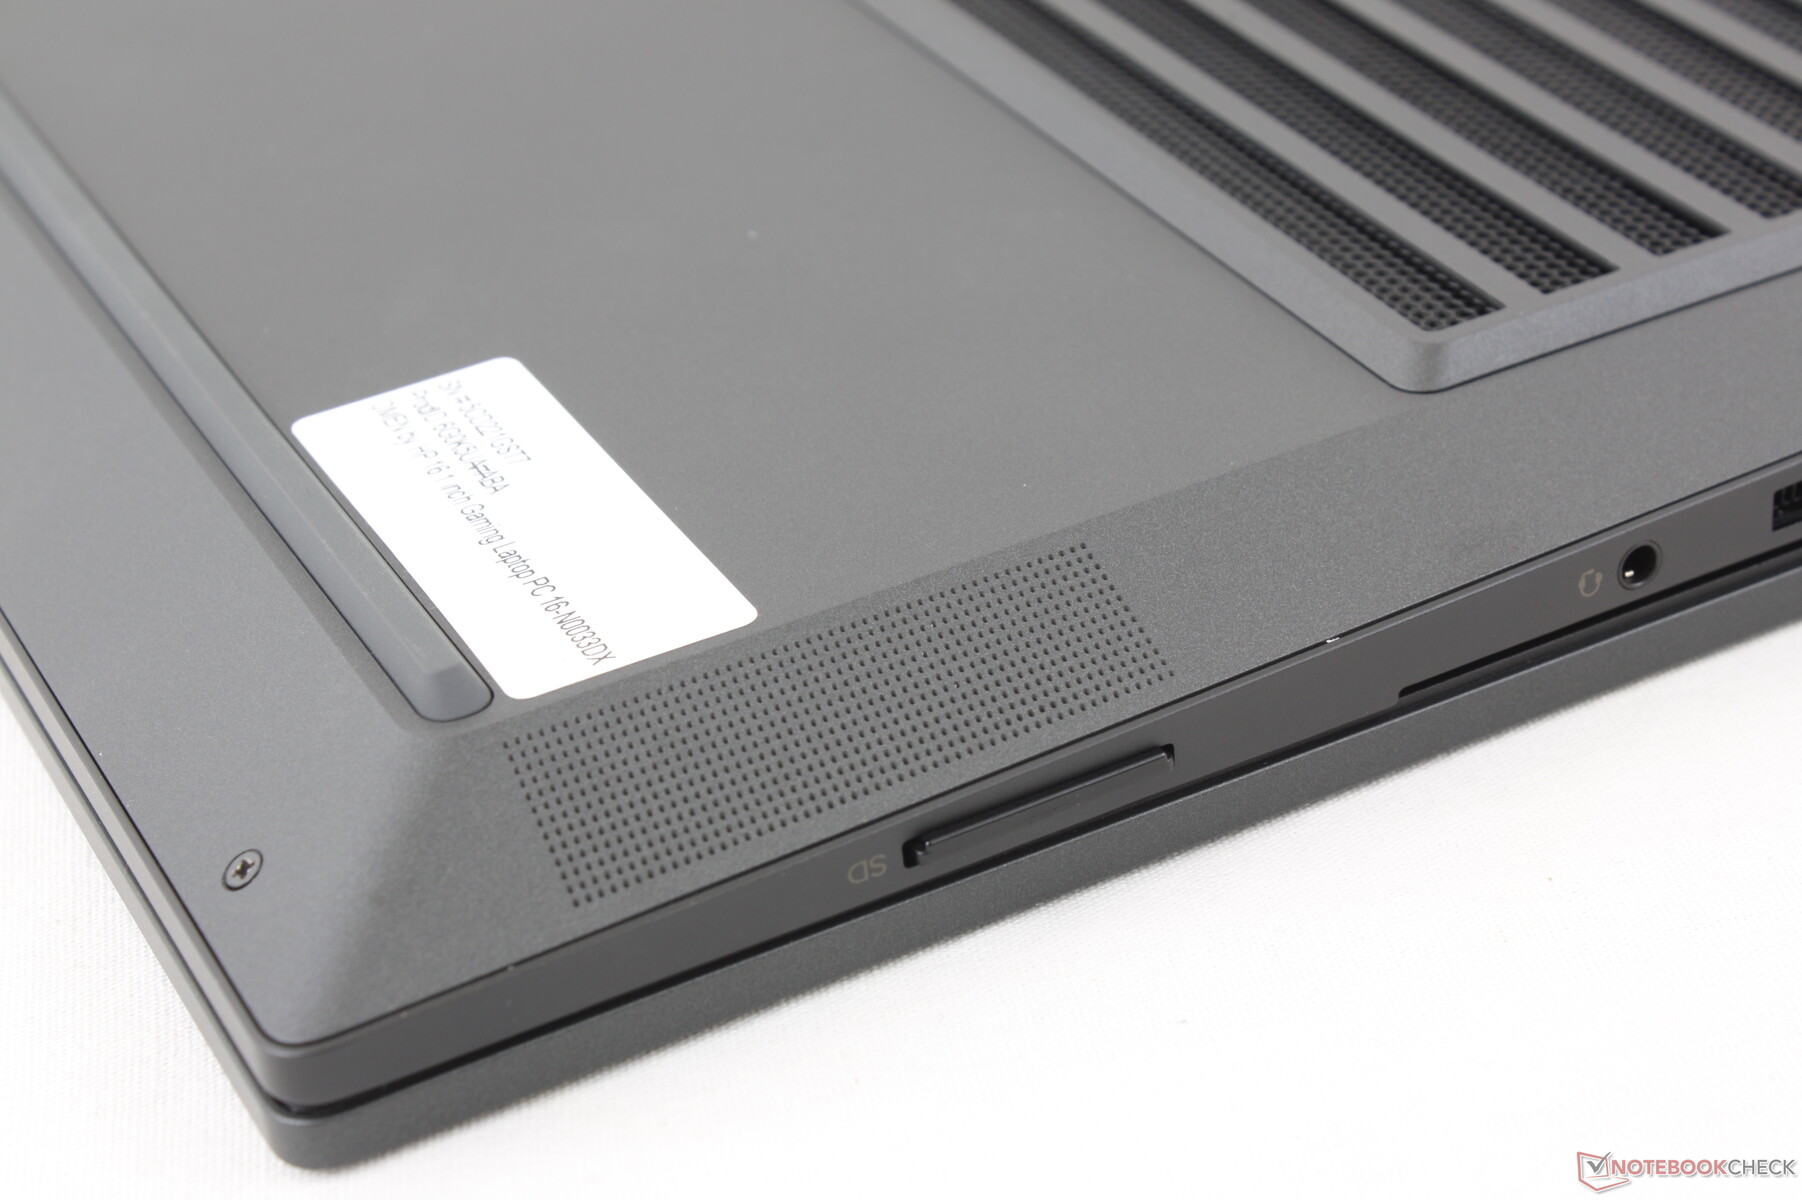
L'Omen 16 2022 è quasi identico al modello 2021 nella parte anteriore, ma i dettagli sul retro e sul fondo sono cambiati. Le porte non sono più al loro posto, ad esempio, mentre gli angoli posteriori sono ora più rotondi di prima. Anche le griglie di ventilazione e degli altoparlanti sono state ridisegnate e la piastra inferiore, in particolare, presenta una presa d'aria ancora più grande
Per il resto, i materiali dello chassis in metallo sono gli stessi del modello dell'anno scorso, per una sensazione e un'impressione simili. La base è ancora rigida e quasi simile all'Envy 16, ma il coperchio tende a traballare quando si regolano gli angoli. Anche le piccole cerniere sono soggette a rottura quando vengono aperte al massimo. Le cerniere del Dell G16 si sentono più forti in confronto.
Le dimensioni e il peso sono quasi invariati rispetto al modello dello scorso anno, nonostante tutti gli aggiornamenti esterni. Il modello si colloca comodamente tra il più sottile e leggero Lenovo Legion S7 16 e il più spesso e pesante Dell G16. Il Asus Zephyrus M16 è significativamente più leggero di mezzo chilo se gli utenti desiderano un portatile da gioco da 16 pollici più portatile.
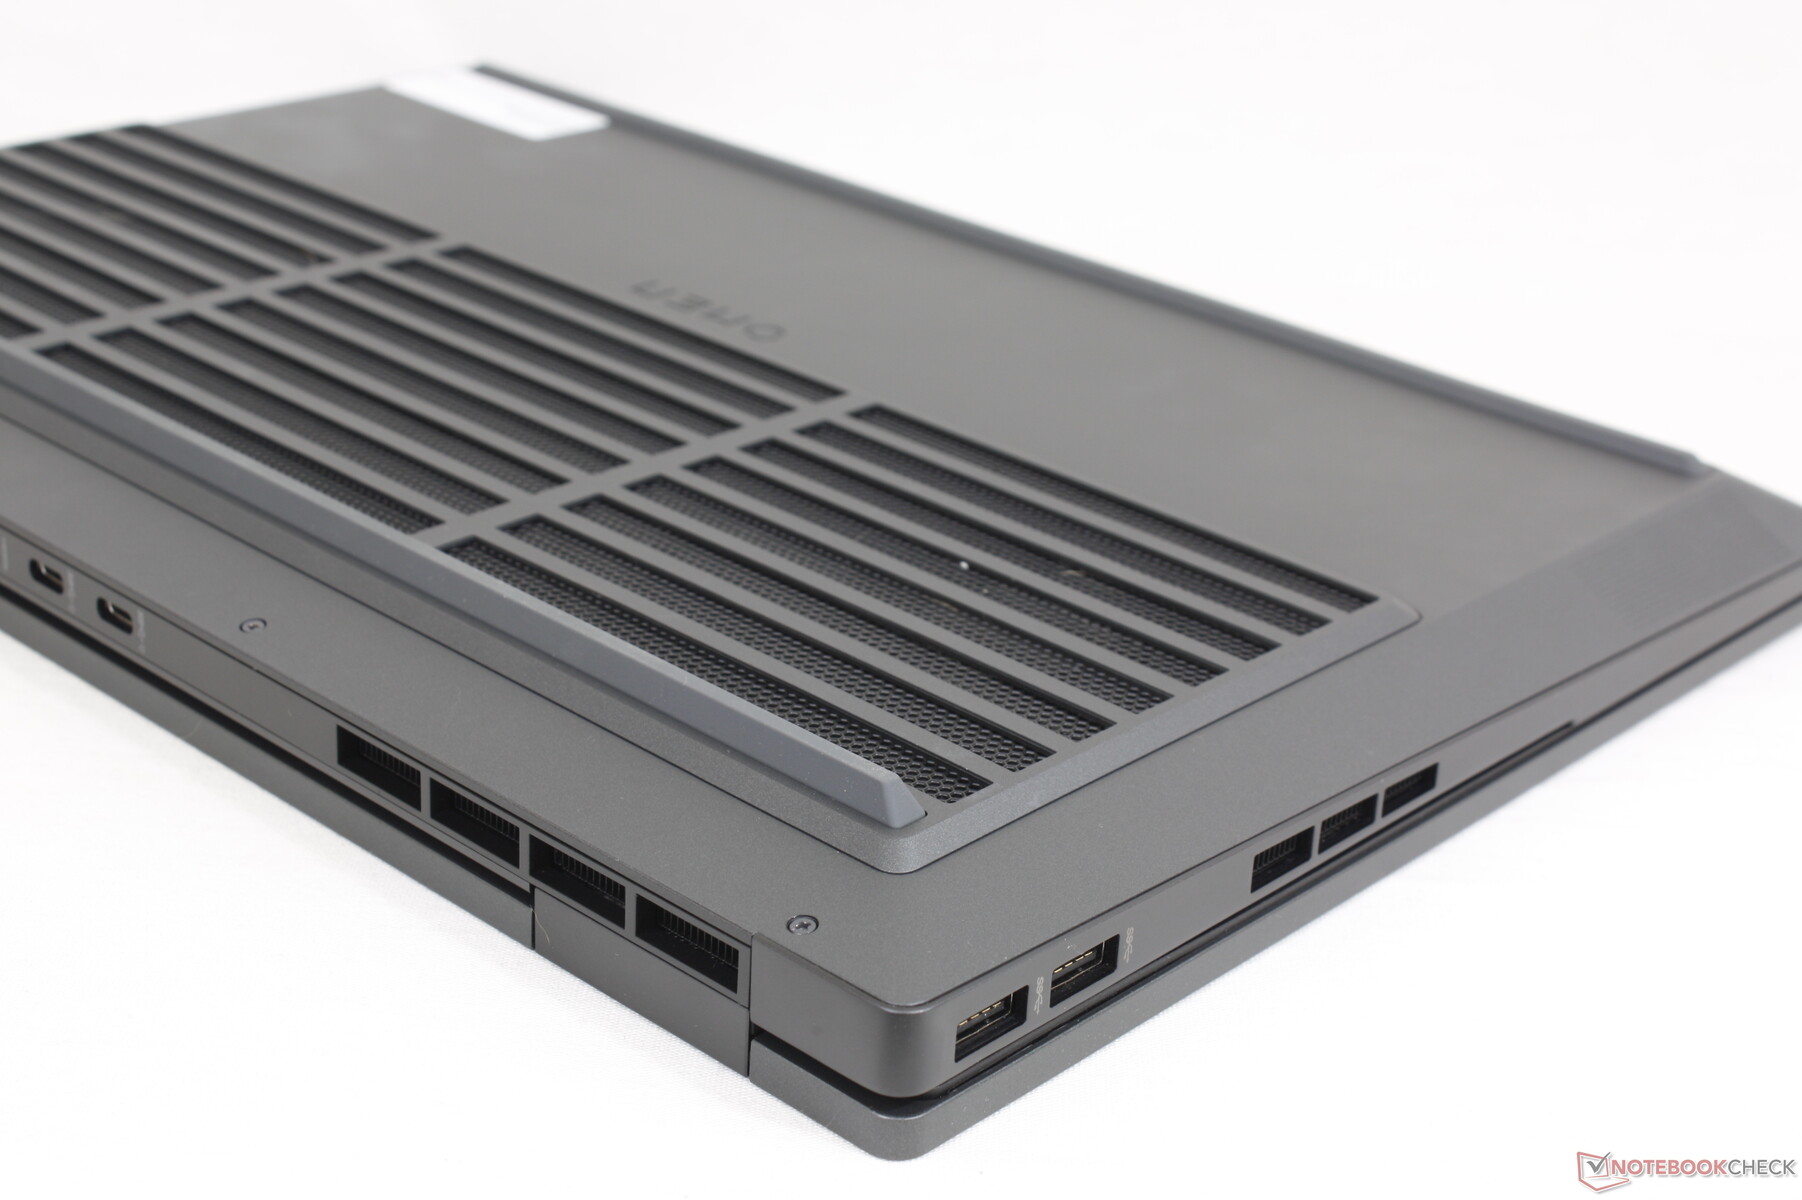
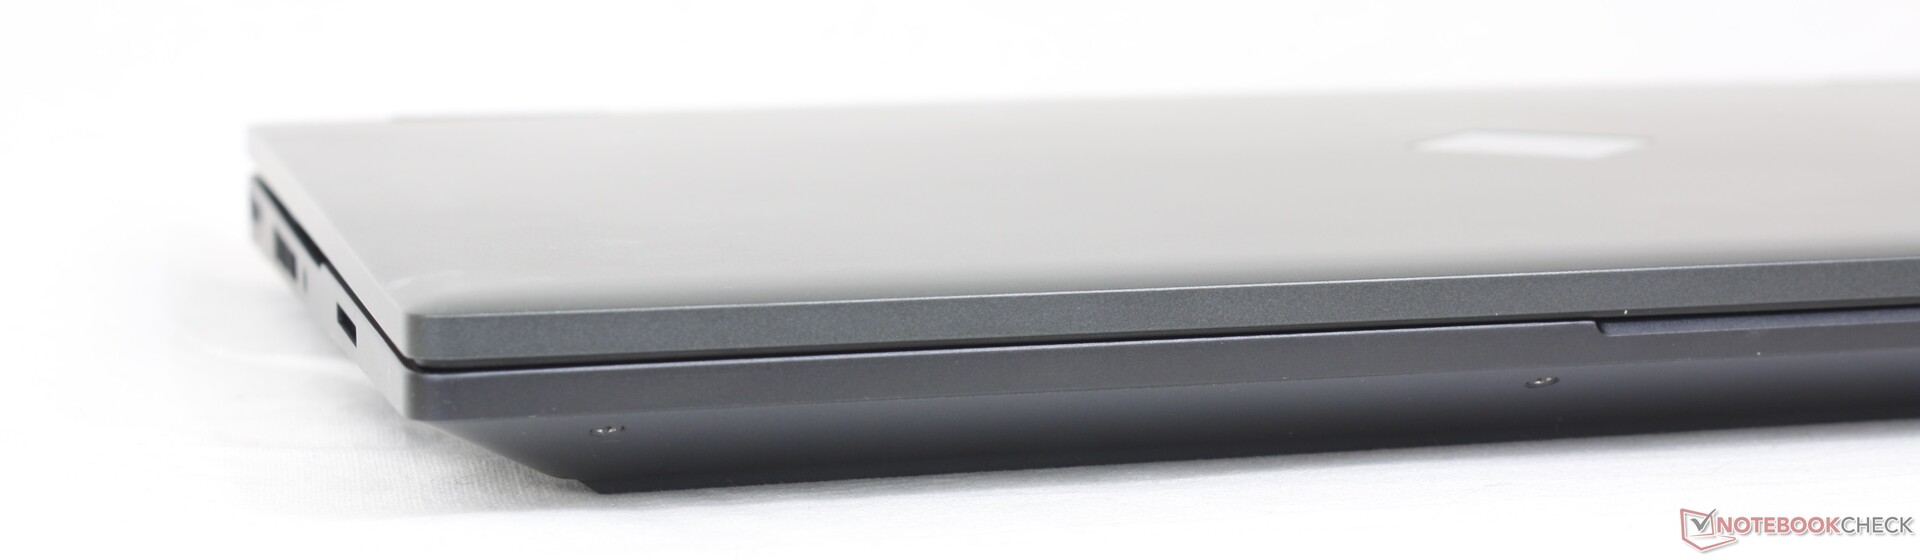
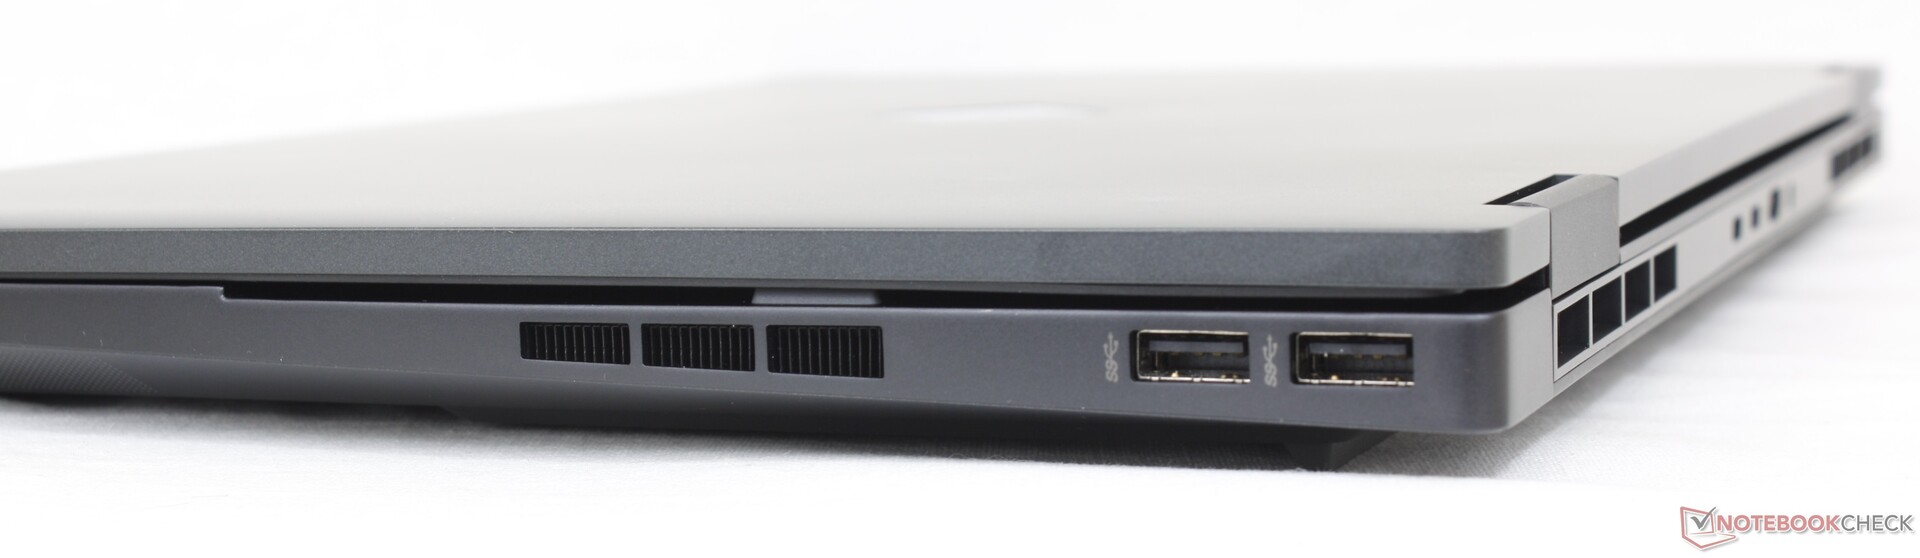
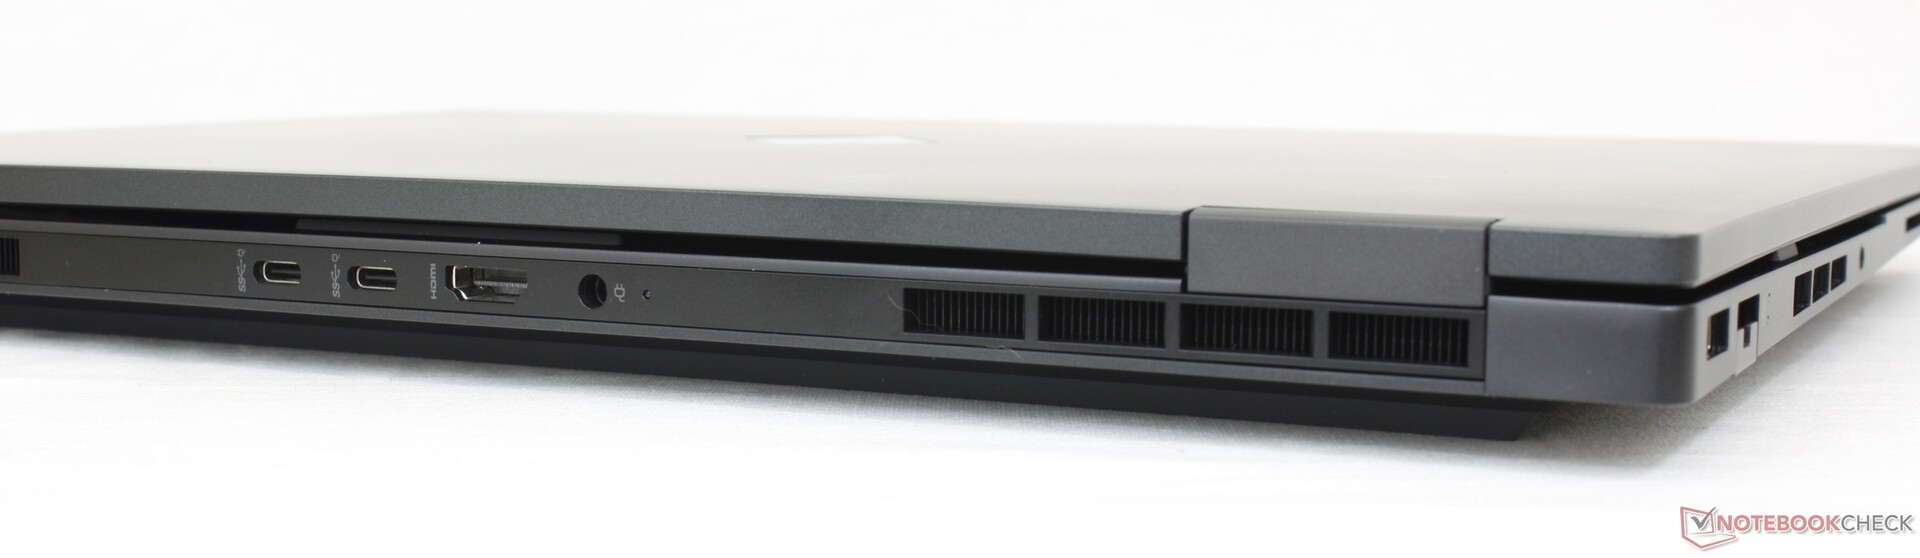
Connettività - Nessun supporto Thunderbolt
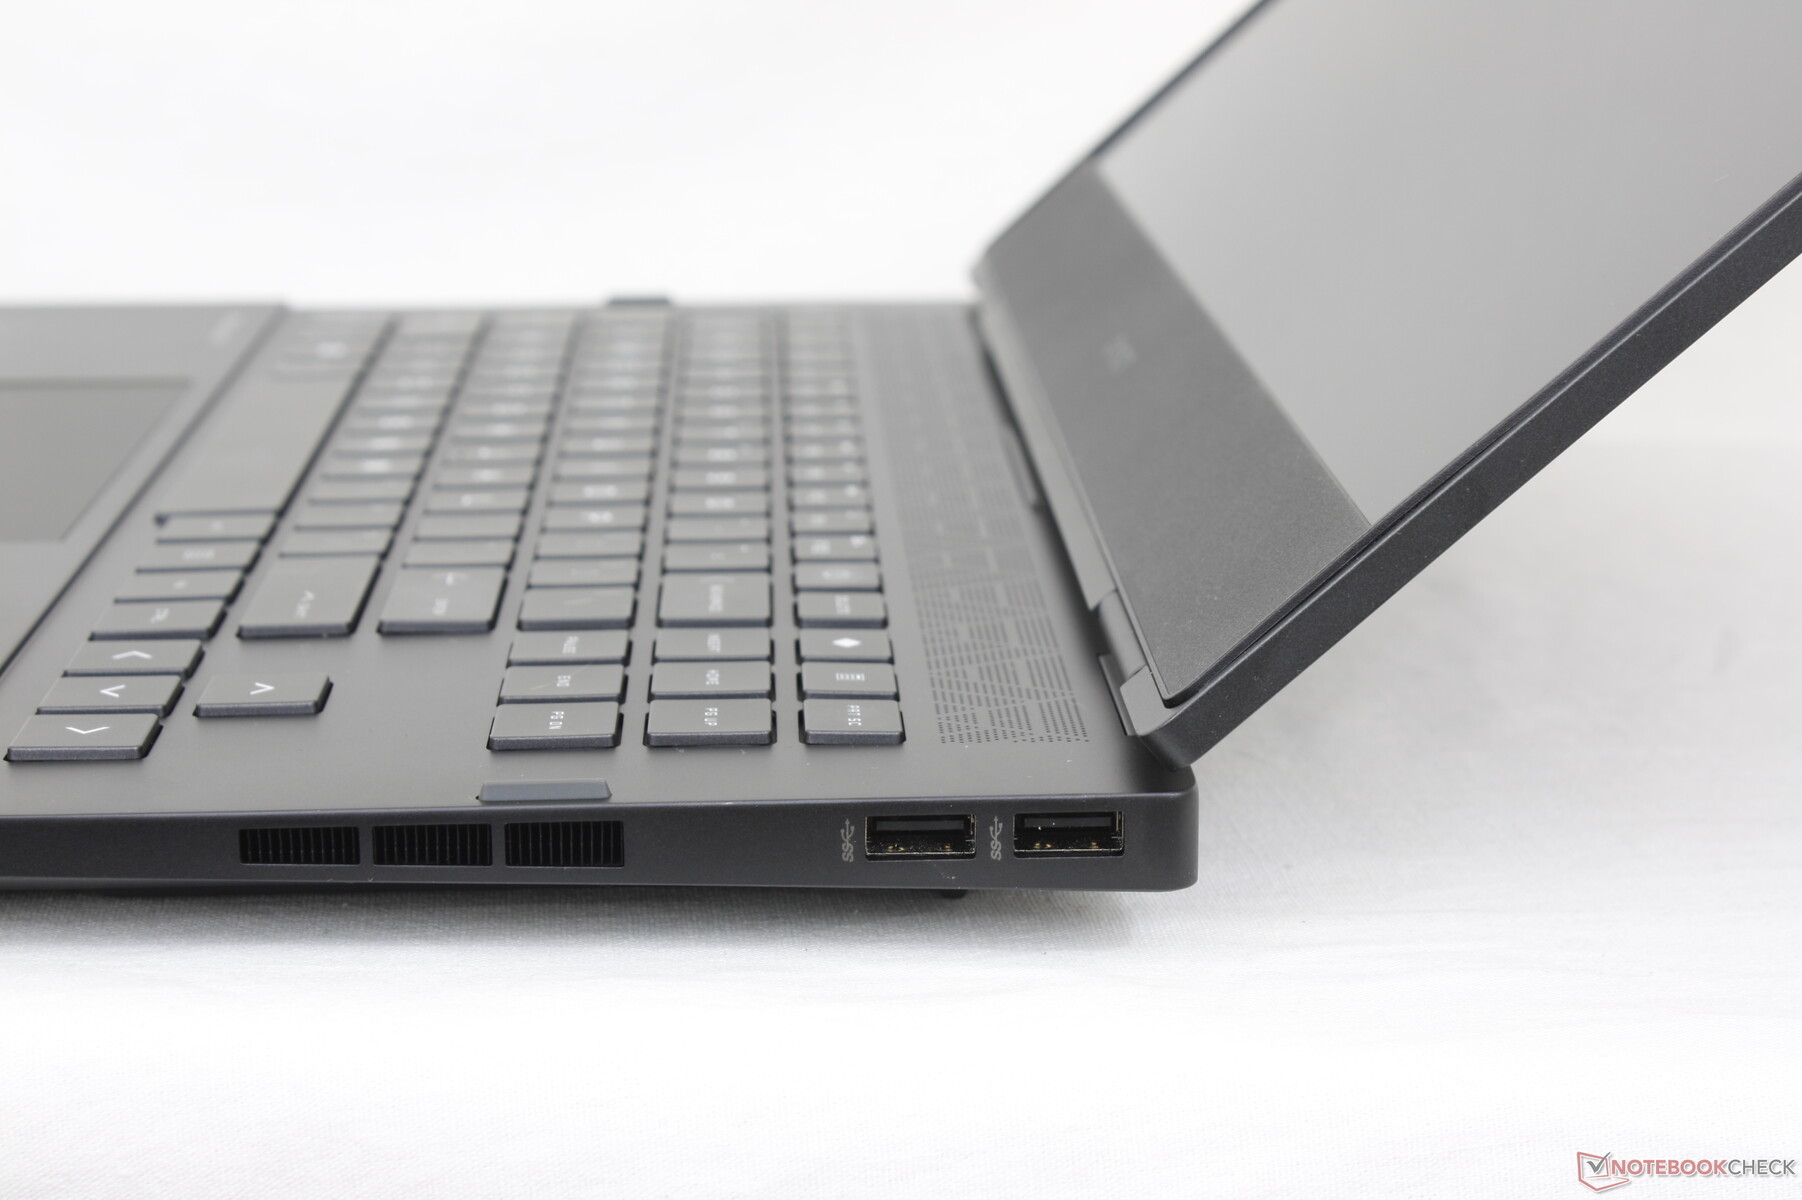
Rispetto al modello del 2021, il modello di quest'anno ha eliminato la porta mini-Display in favore di una seconda porta USB-C. Per il resto, le opzioni delle porte sono essenzialmente le stesse tra i due modelli
Il cambiamento più evidente rispetto all'anno precedente riguarda il posizionamento delle porte. Le porte del modello dello scorso anno erano troppo affollate lungo il bordo sinistro e quindi alcune sono state riassegnate al bordo posteriore. Sebbene non sia particolarmente ideale, questa soluzione è comunque preferibile a un numero inferiore di porte.
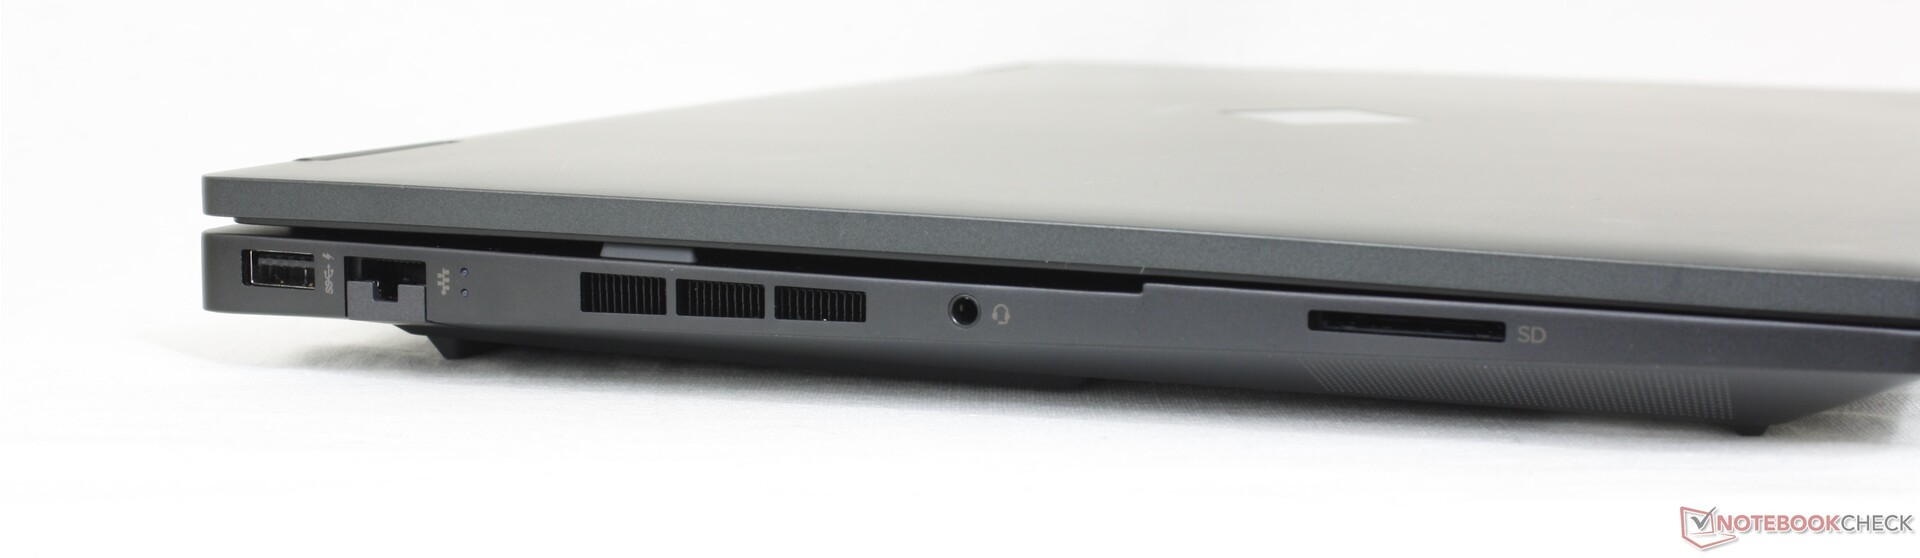
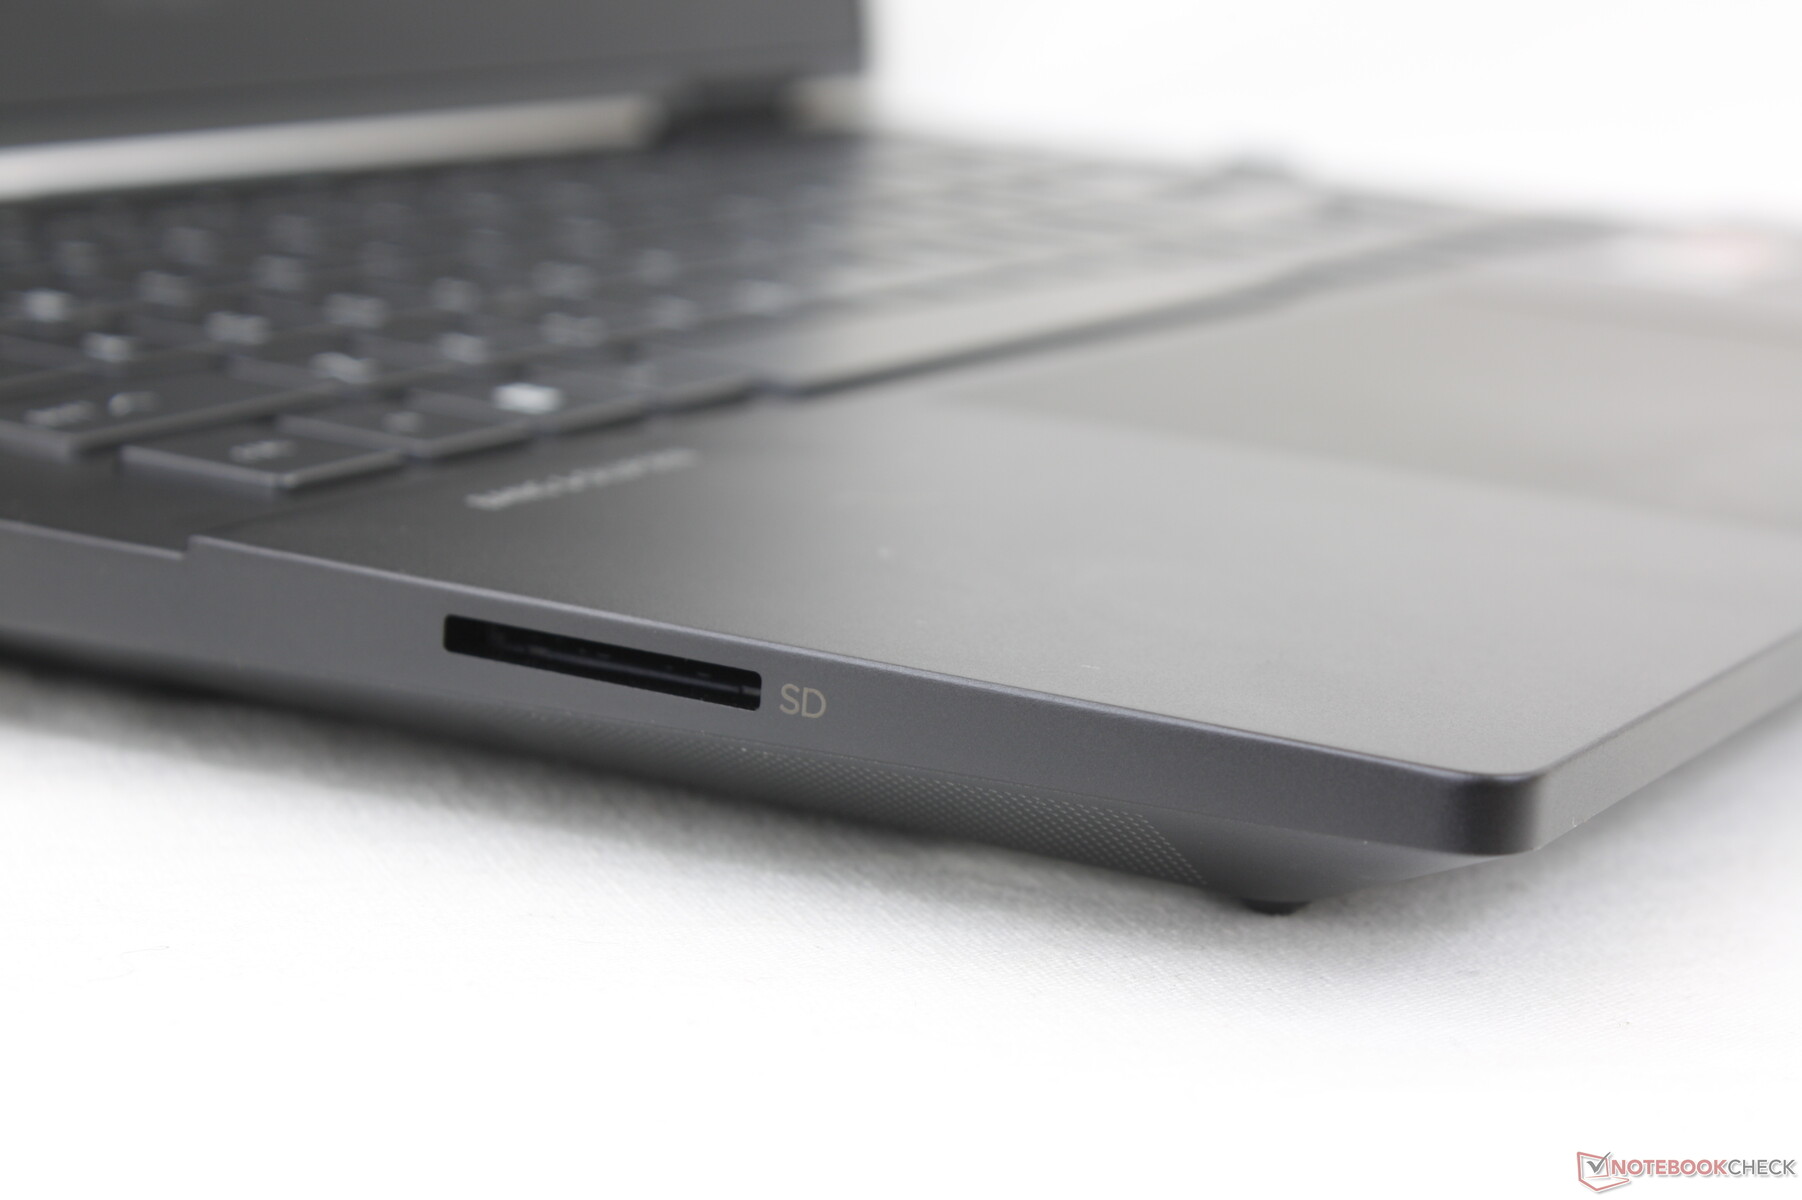
Lettore di schede SD
La velocità di trasferimento con il lettore SD rimane invariata rispetto al modello dello scorso anno. Molti portatili da gioco concorrenti, come il Dell G16, omettono completamente il lettore di schede. Nel frattempo, il lettore SD del Razer Blade 15 offre prestazioni due volte superiori.
| SD Card Reader | |
| average JPG Copy Test (av. of 3 runs) | |
| Lenovo Legion S7 16ARHA7 (AV PRO microSD 128 GB V60) | |
| HP Omen 16-n0033dx (AV PRO microSD 128 GB V60) | |
| HP Victus 16-e0145ng (AV PRO microSD 128 GB V60) | |
| HP Envy 16 h0112nr (AV Pro SD microSD 128 GB V60) | |
| HP Omen 16-b1090ng (AV PRO microSD 128 GB V60) | |
| maximum AS SSD Seq Read Test (1GB) | |
| Lenovo Legion S7 16ARHA7 (AV PRO microSD 128 GB V60) | |
| HP Omen 16-n0033dx (AV PRO microSD 128 GB V60) | |
| HP Envy 16 h0112nr (AV Pro SD microSD 128 GB V60) | |
Comunicazione
Il MediaTek MT7922 è fornito di serie per la connettività Wi-Fi 6E e Bluetooth 5.2. La maggior parte degli altri portatili per videogiochi monta invece la serie Intel AX201/210, ma la soluzione MediaTek è probabilmente l'opzione più conveniente. Le velocità di trasferimento sono eccellenti e senza problemi di prestazioni quando siamo connessi alla nostra rete a 6 GHz.
| Networking | |
| iperf3 receive AXE11000 6GHz | |
| Lenovo Legion S7 16ARHA7 | |
| HP Omen 16-n0033dx | |
| HP Envy 16 h0112nr | |
| iperf3 receive AXE11000 | |
| HP Omen 16-n0033dx | |
| Dell G16 7620 | |
| HP Omen 16-b1090ng | |
| HP Victus 16-e0145ng | |
| iperf3 transmit AXE11000 | |
| HP Omen 16-n0033dx | |
| HP Omen 16-b1090ng | |
| Dell G16 7620 | |
| HP Victus 16-e0145ng | |
| iperf3 transmit AXE11000 6GHz | |
| Lenovo Legion S7 16ARHA7 | |
| HP Omen 16-n0033dx | |
| HP Envy 16 h0112nr | |
Webcam
La webcam è deludente, con una risoluzione di soli 720p o 1 MP, mentre altri portatili da gioco come il Razer Blade 15 hanno webcam da 1080p o 2 MP. Inoltre, il modello non dispone di un otturatore per la webcam e di un sensore IR.


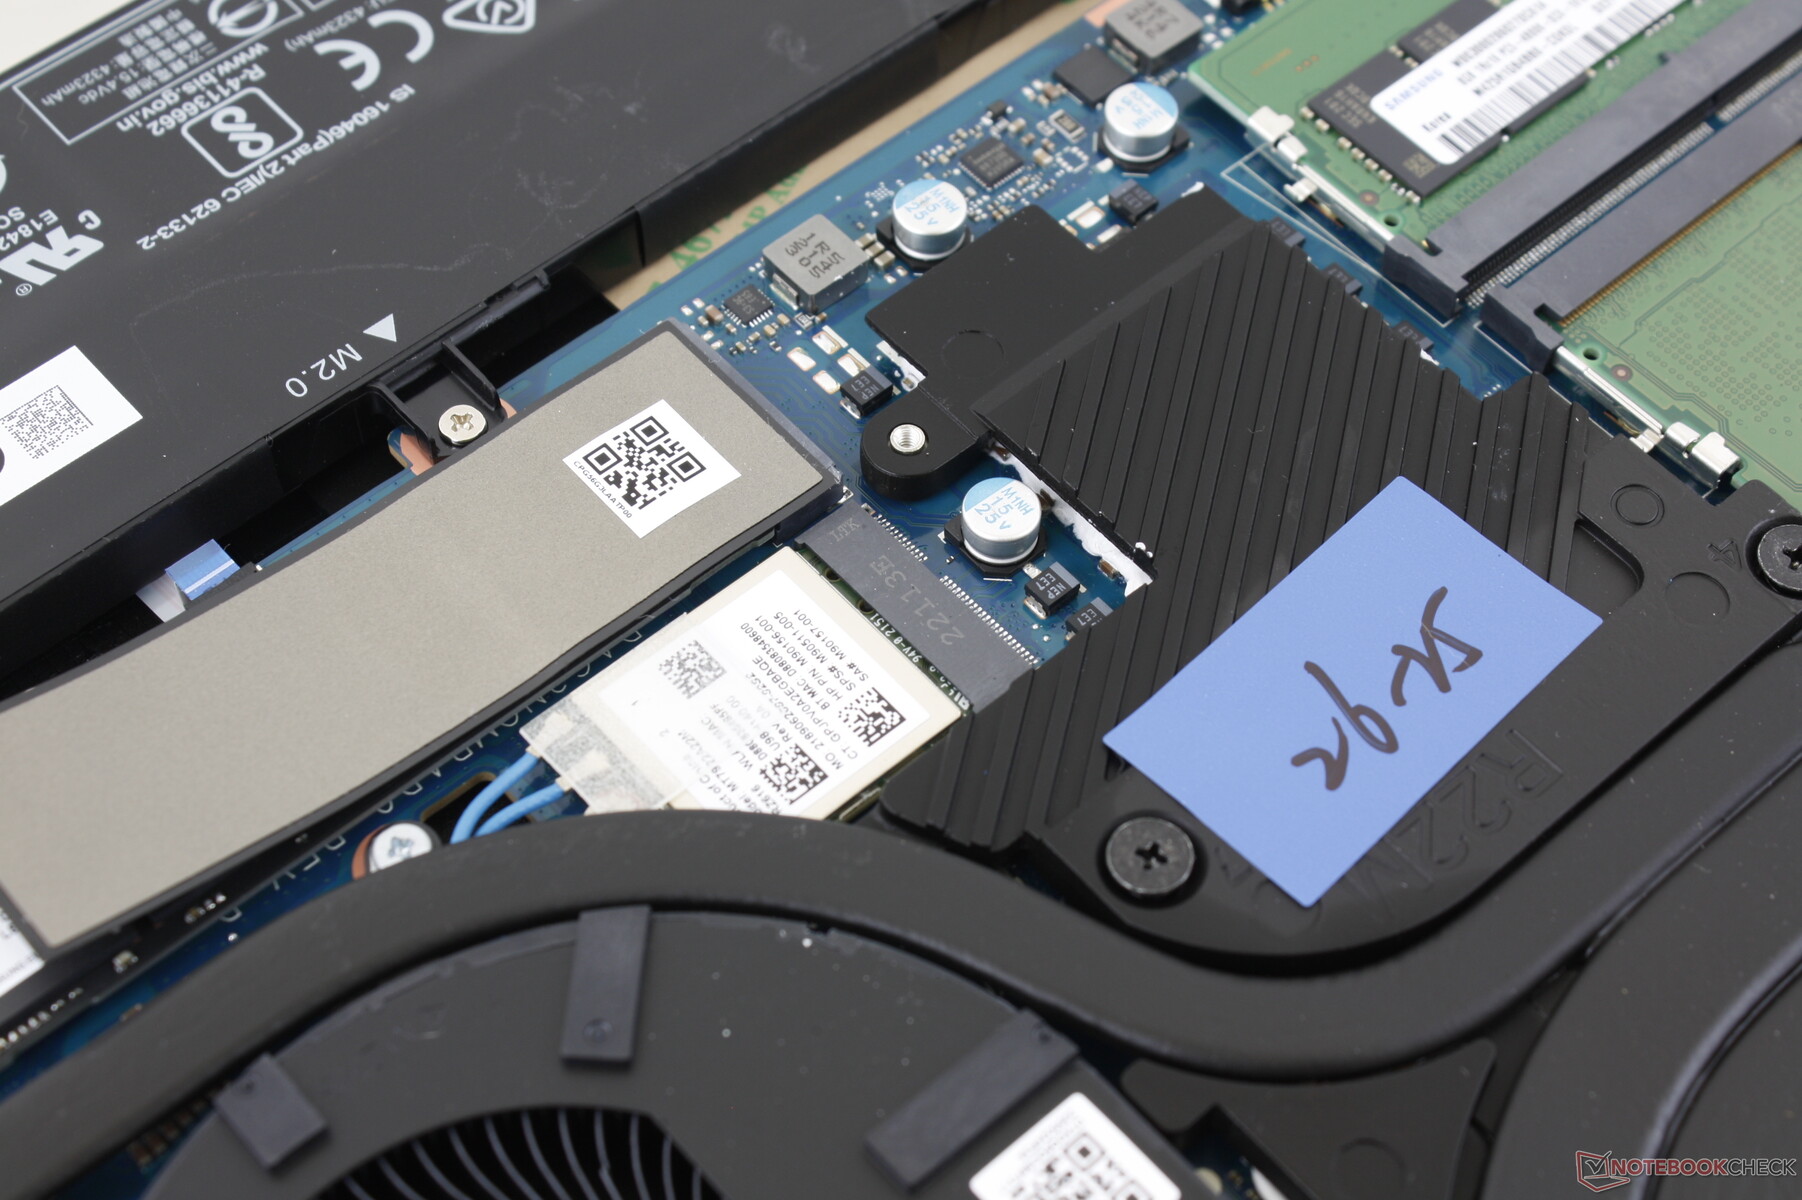
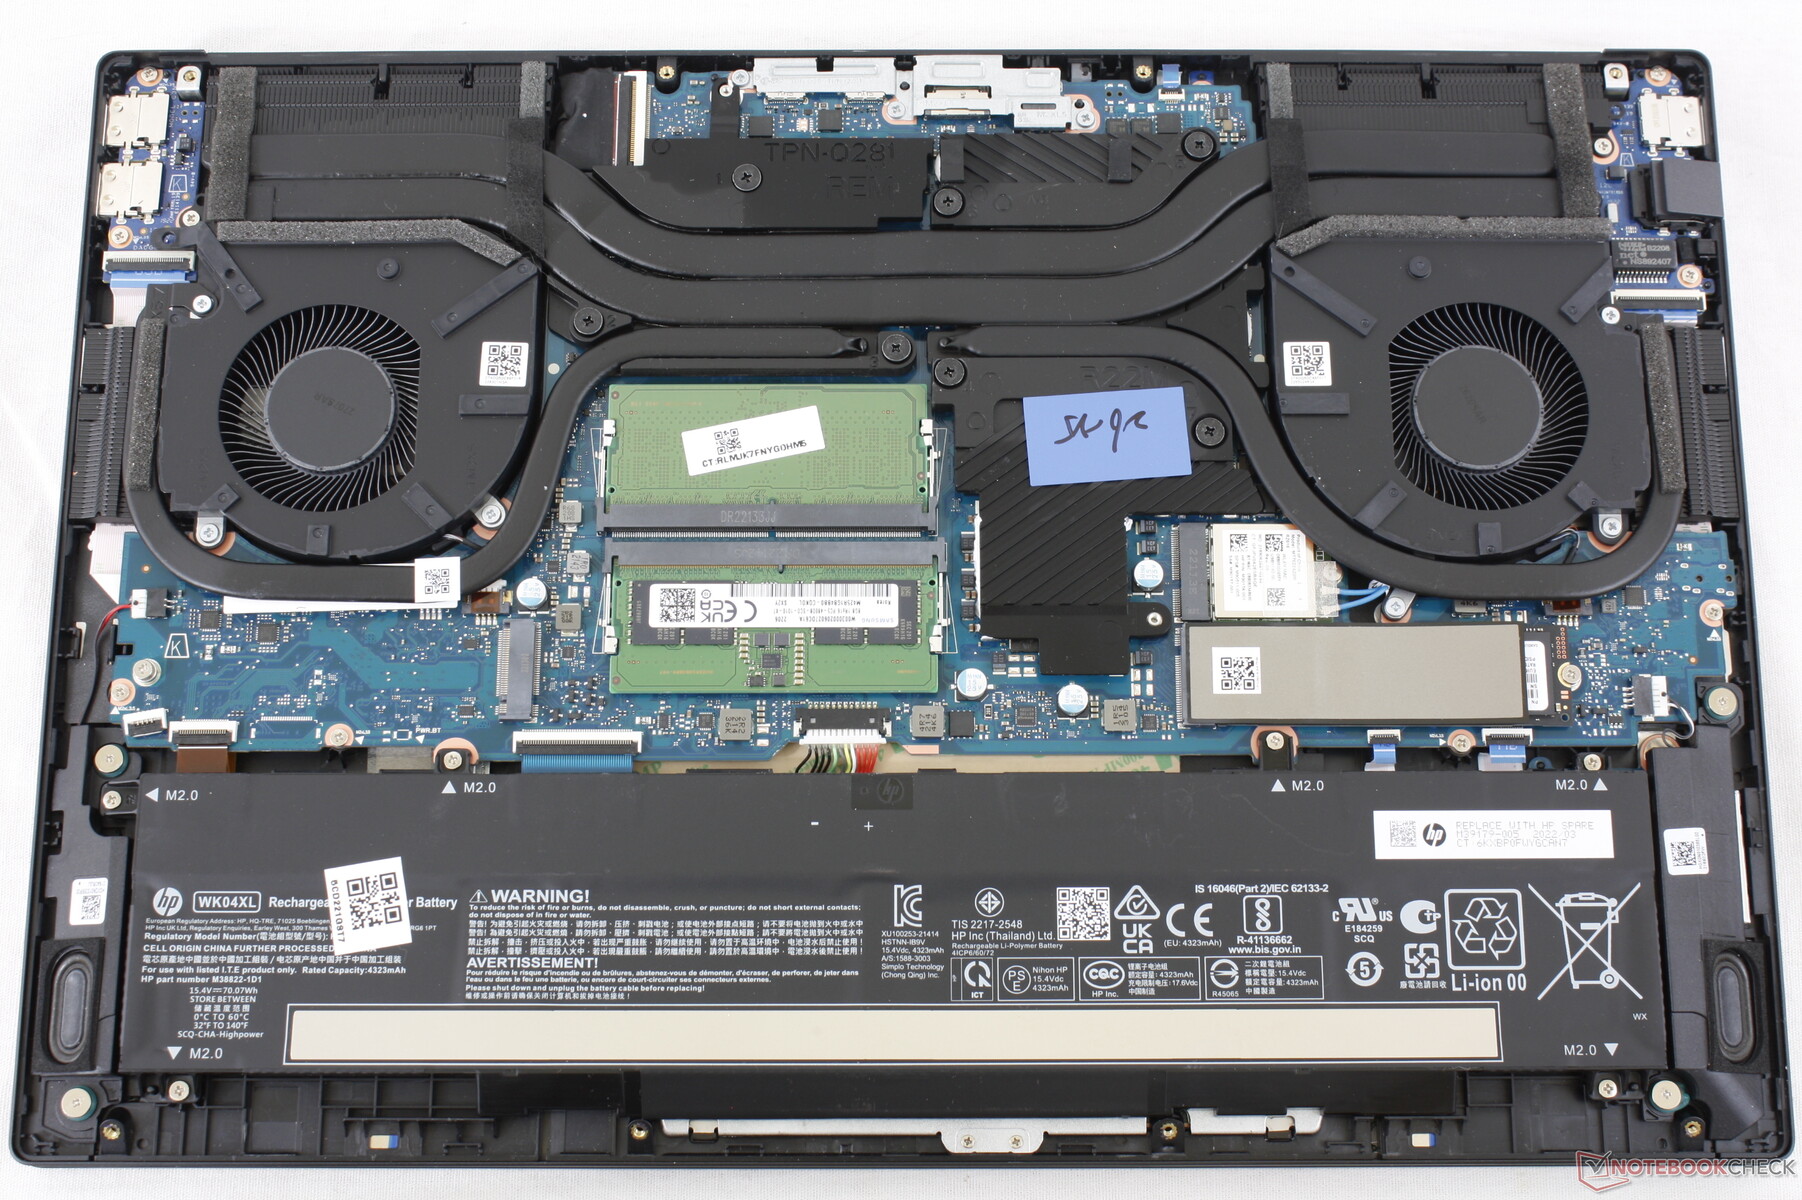
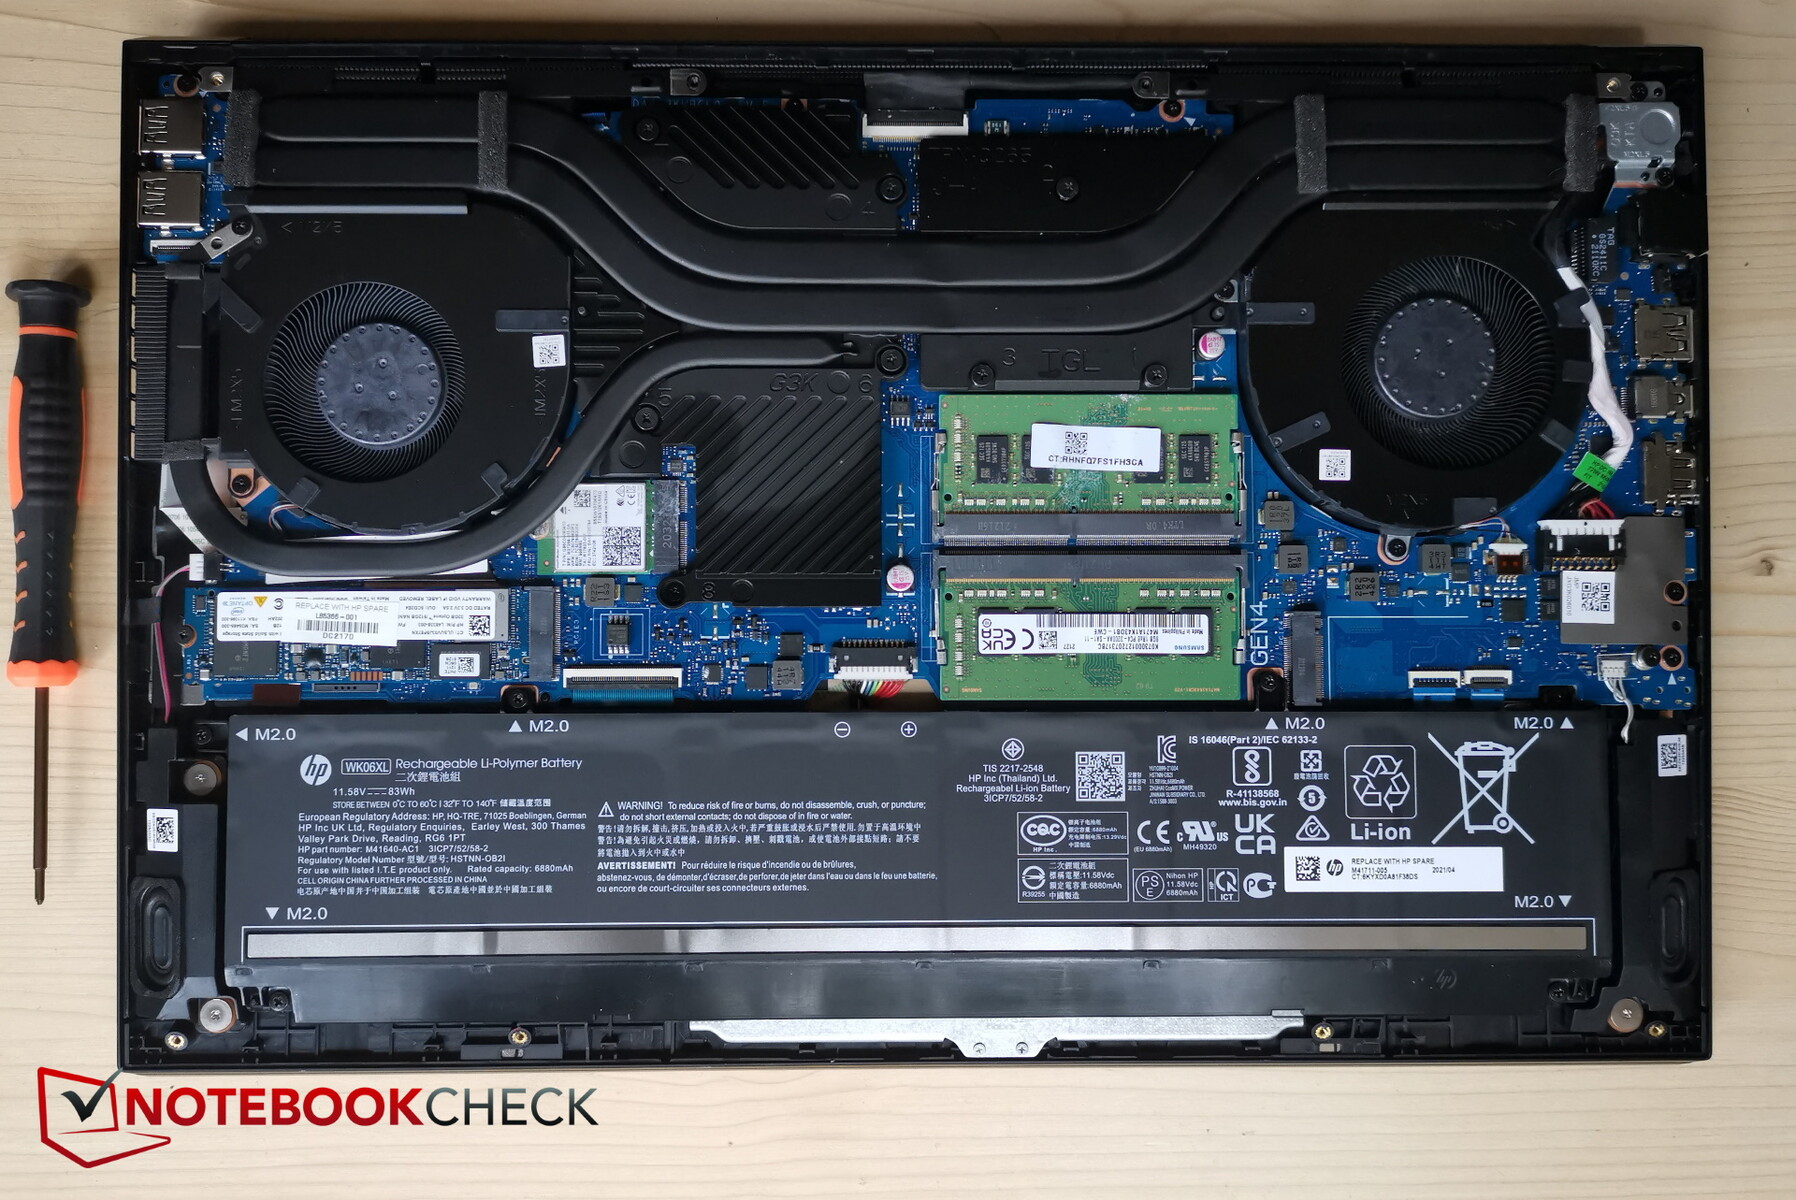
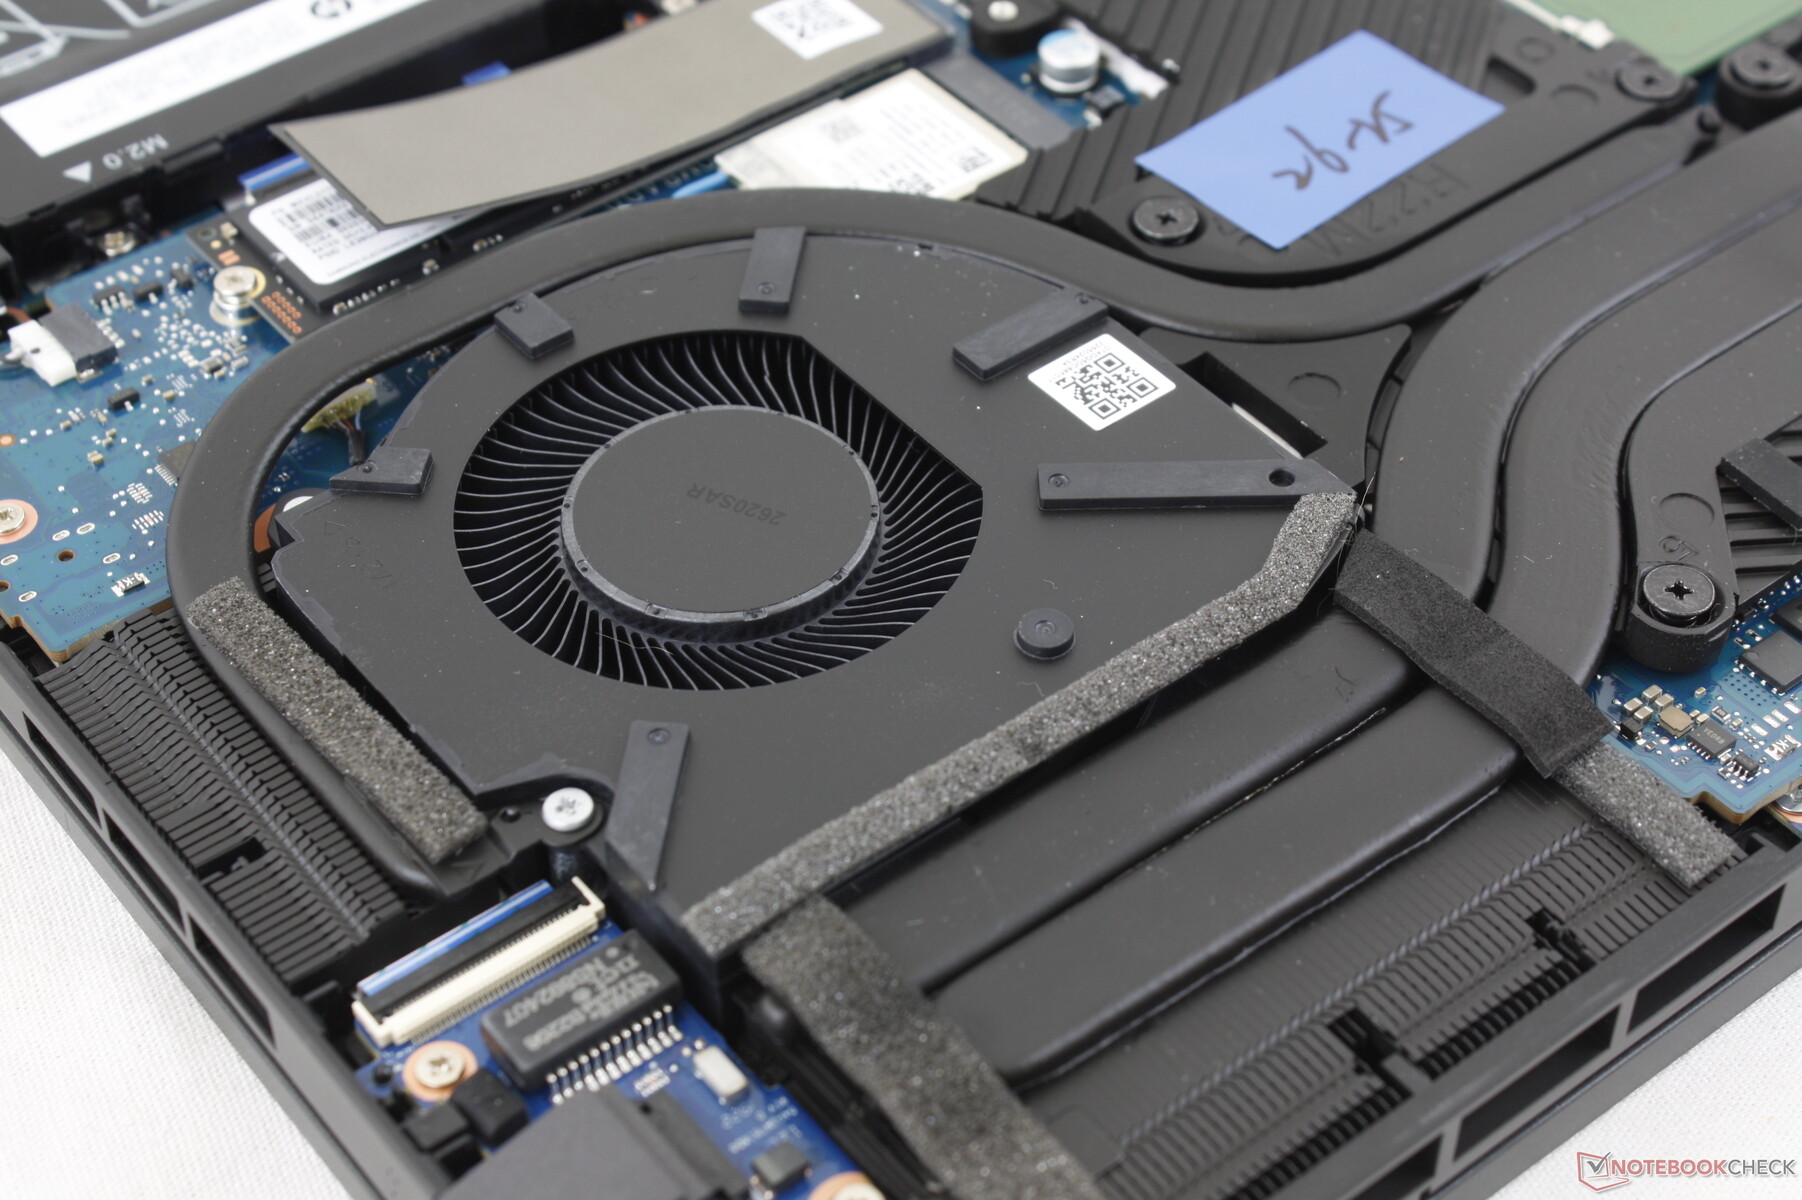
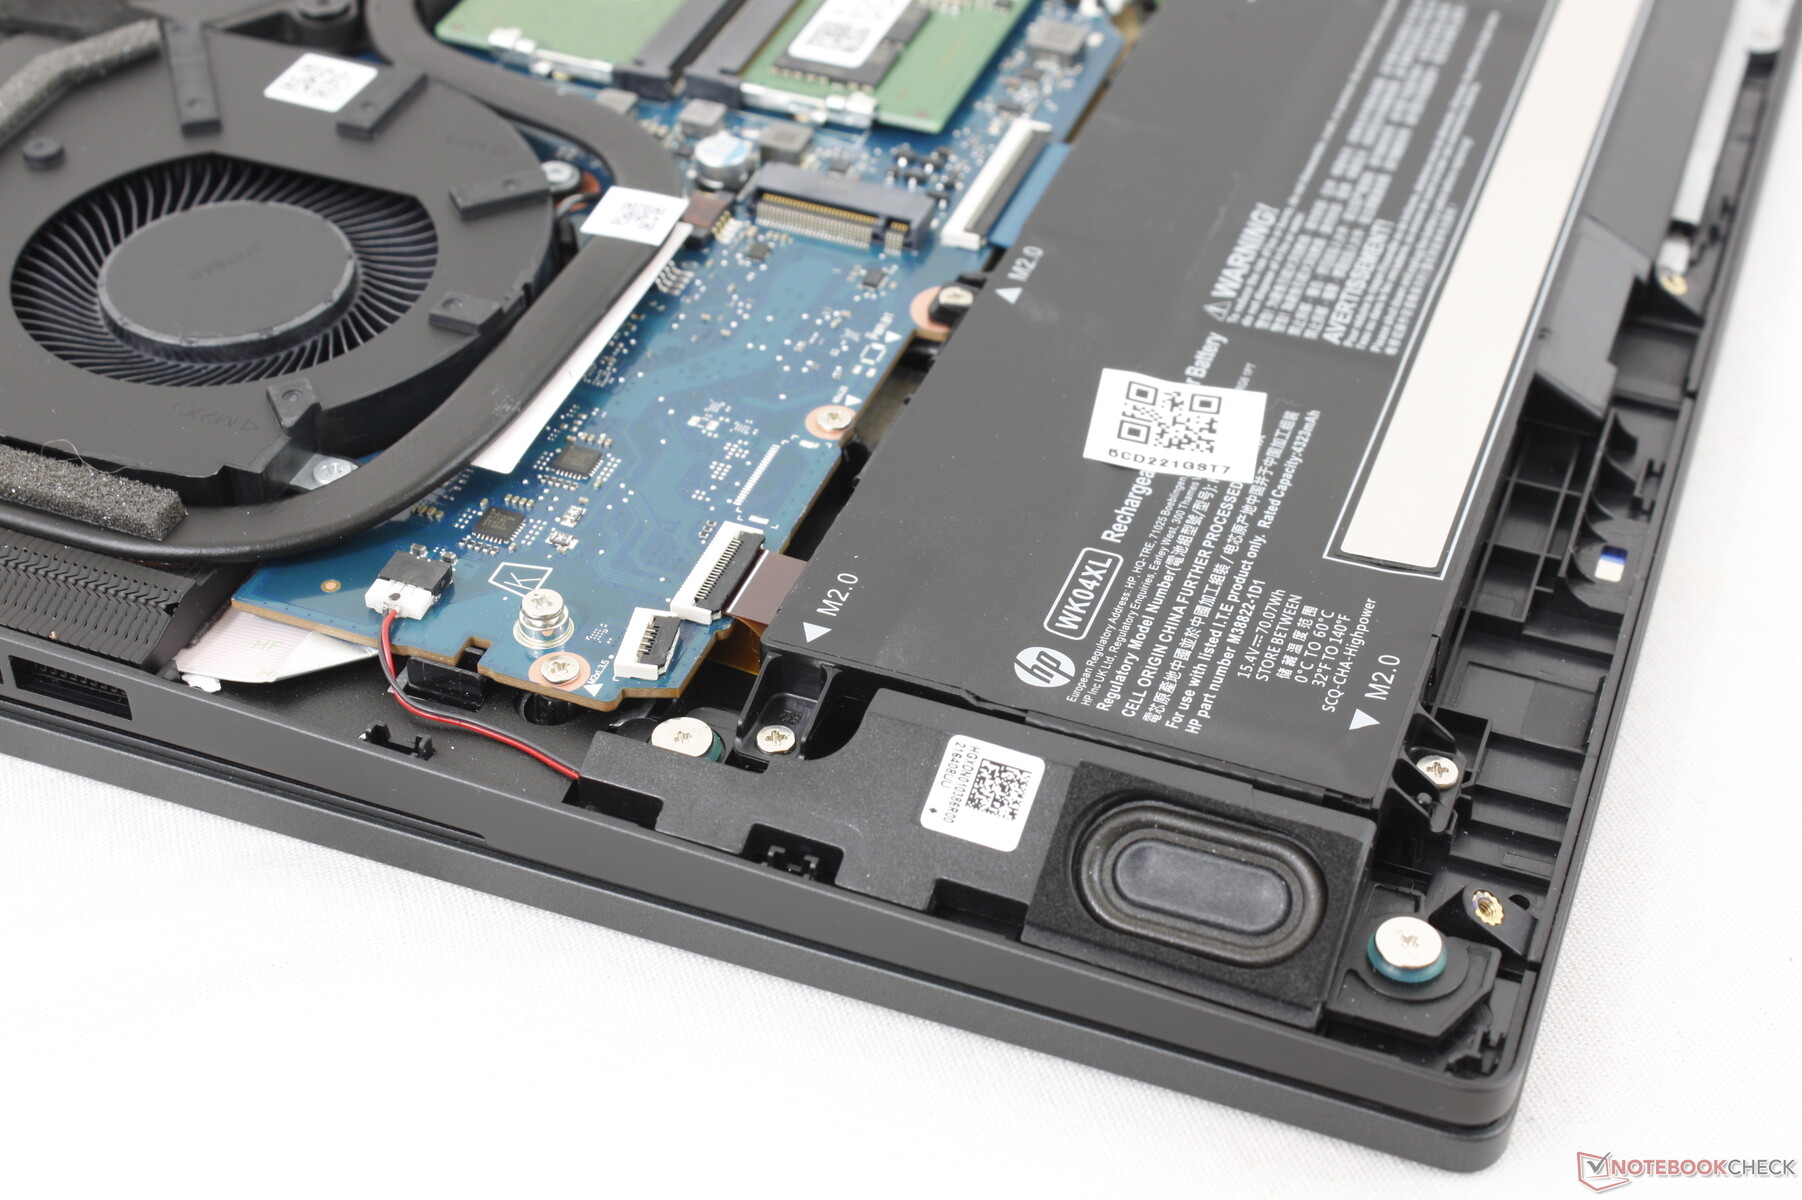
Manutenzione
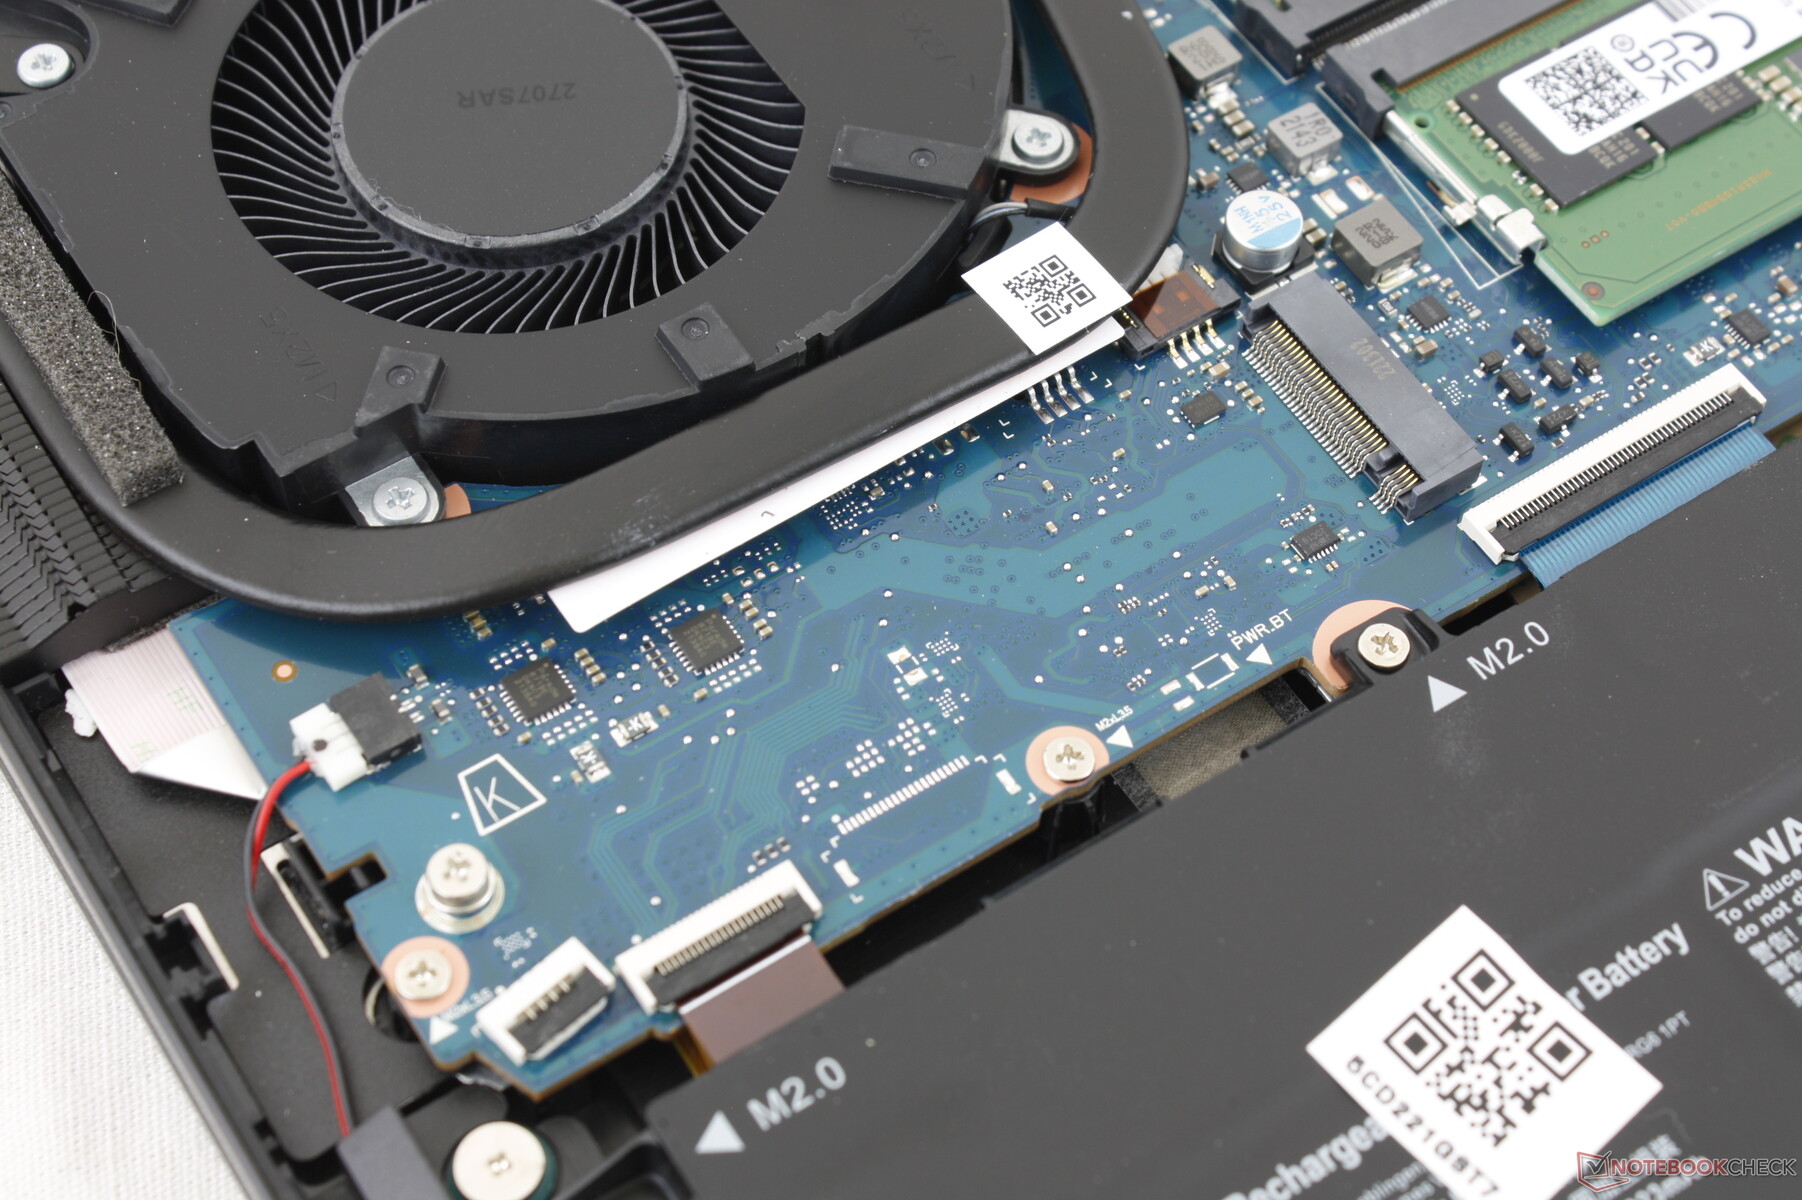
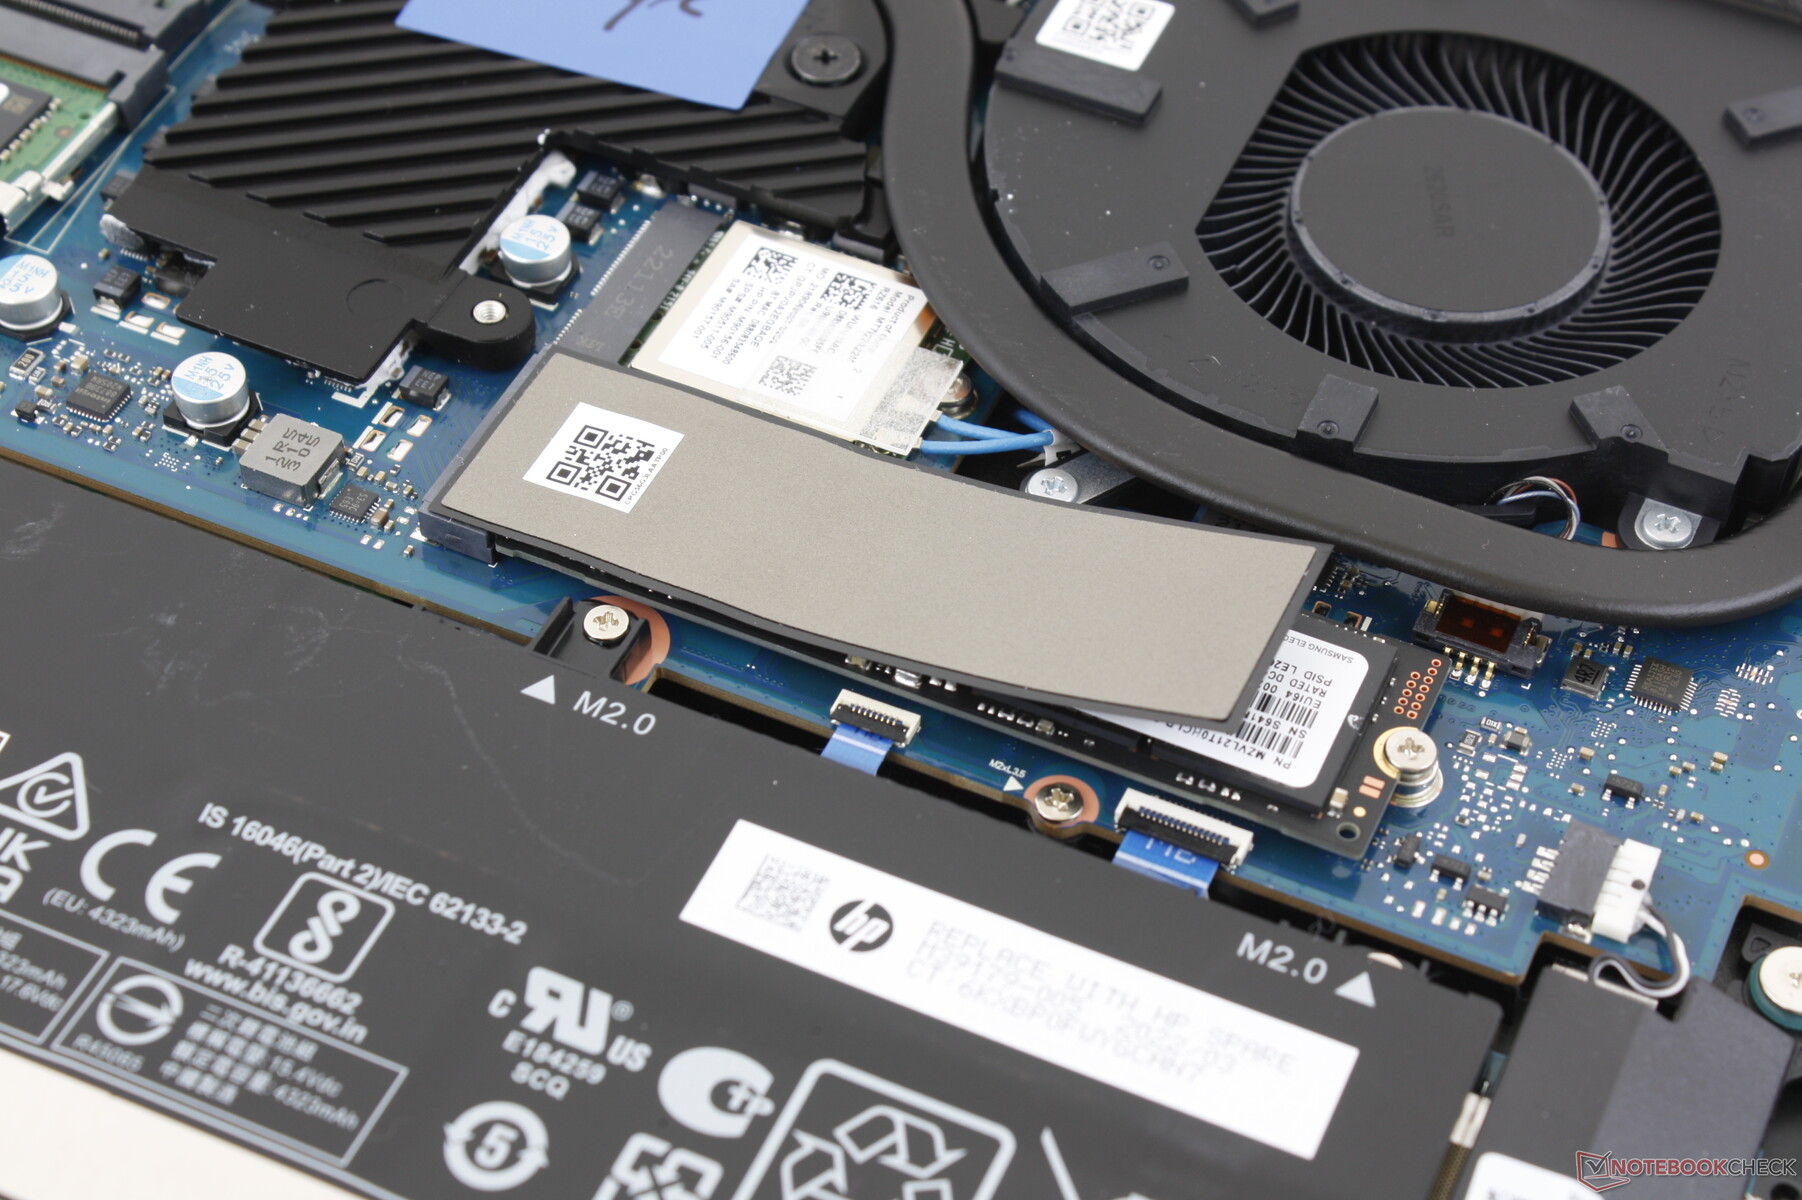
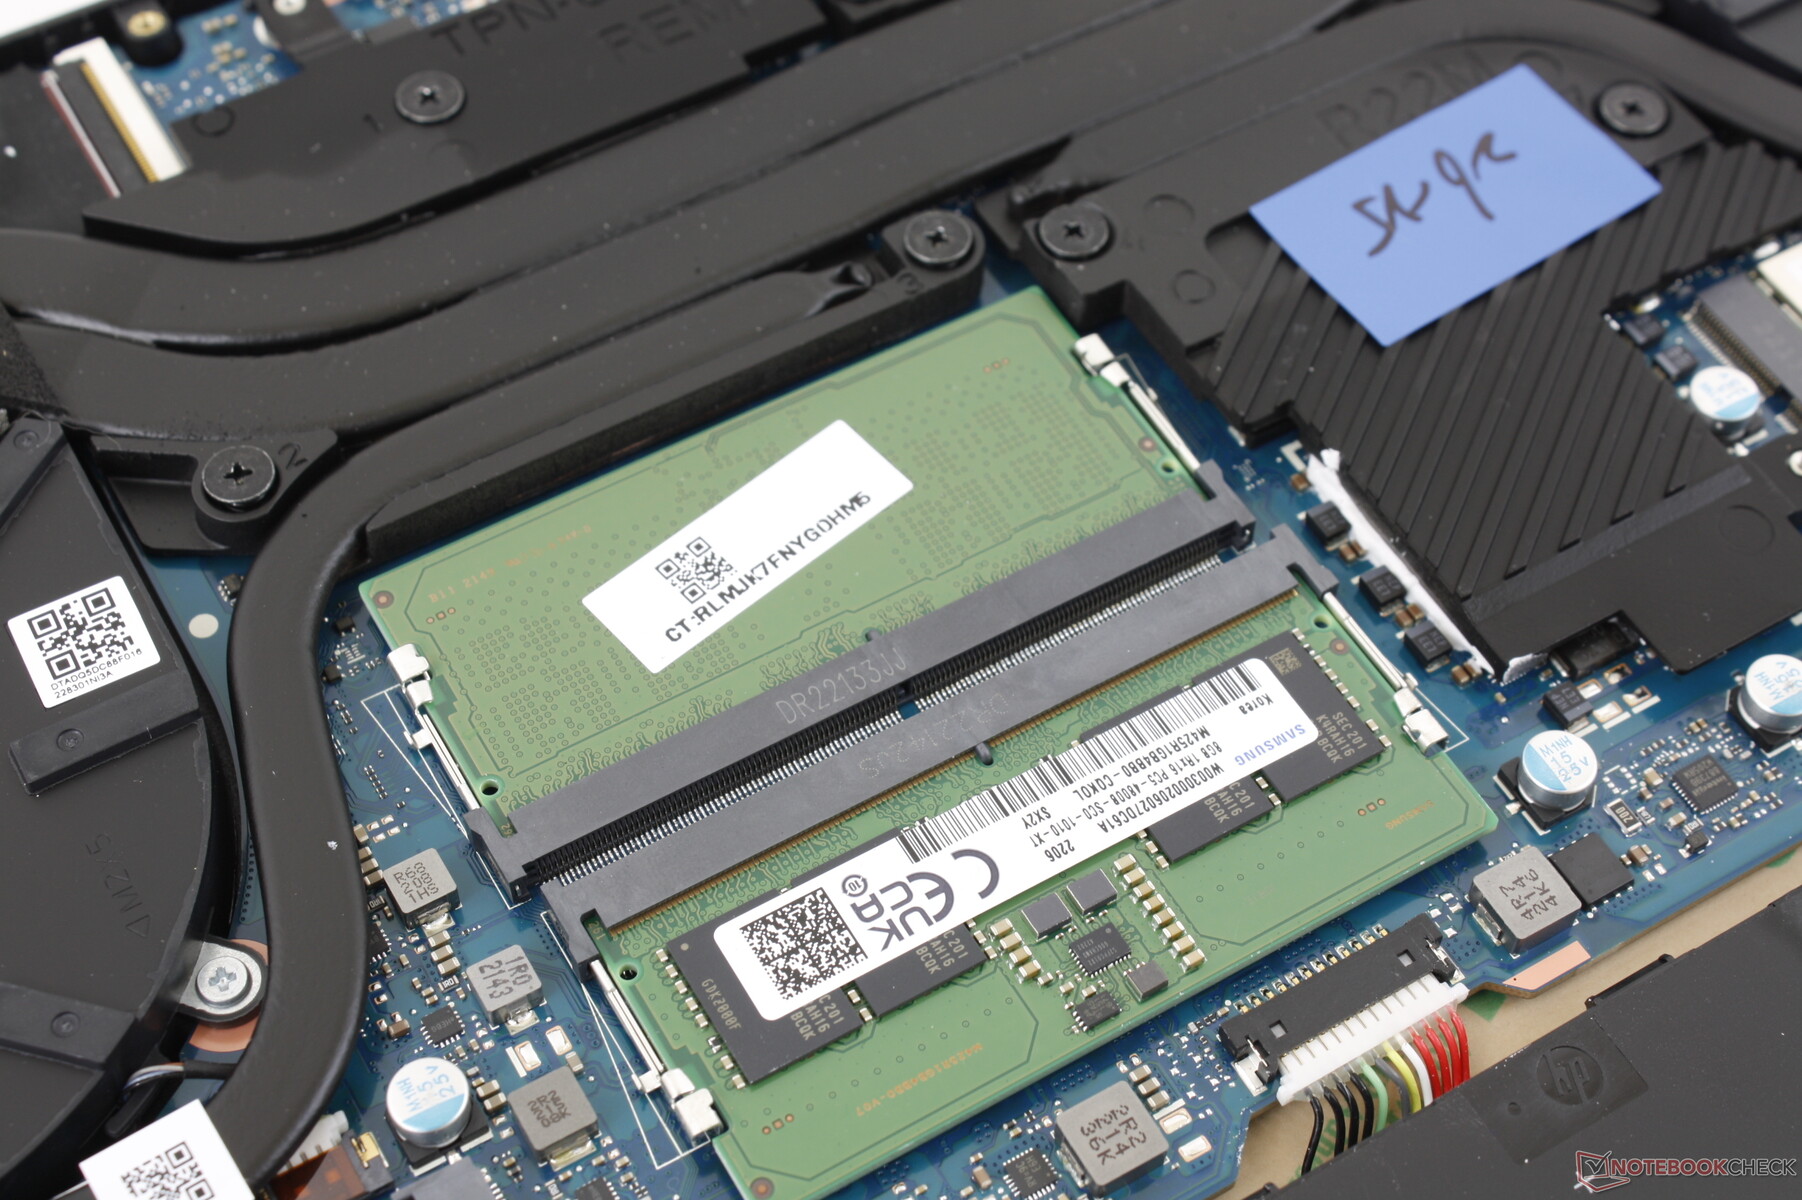
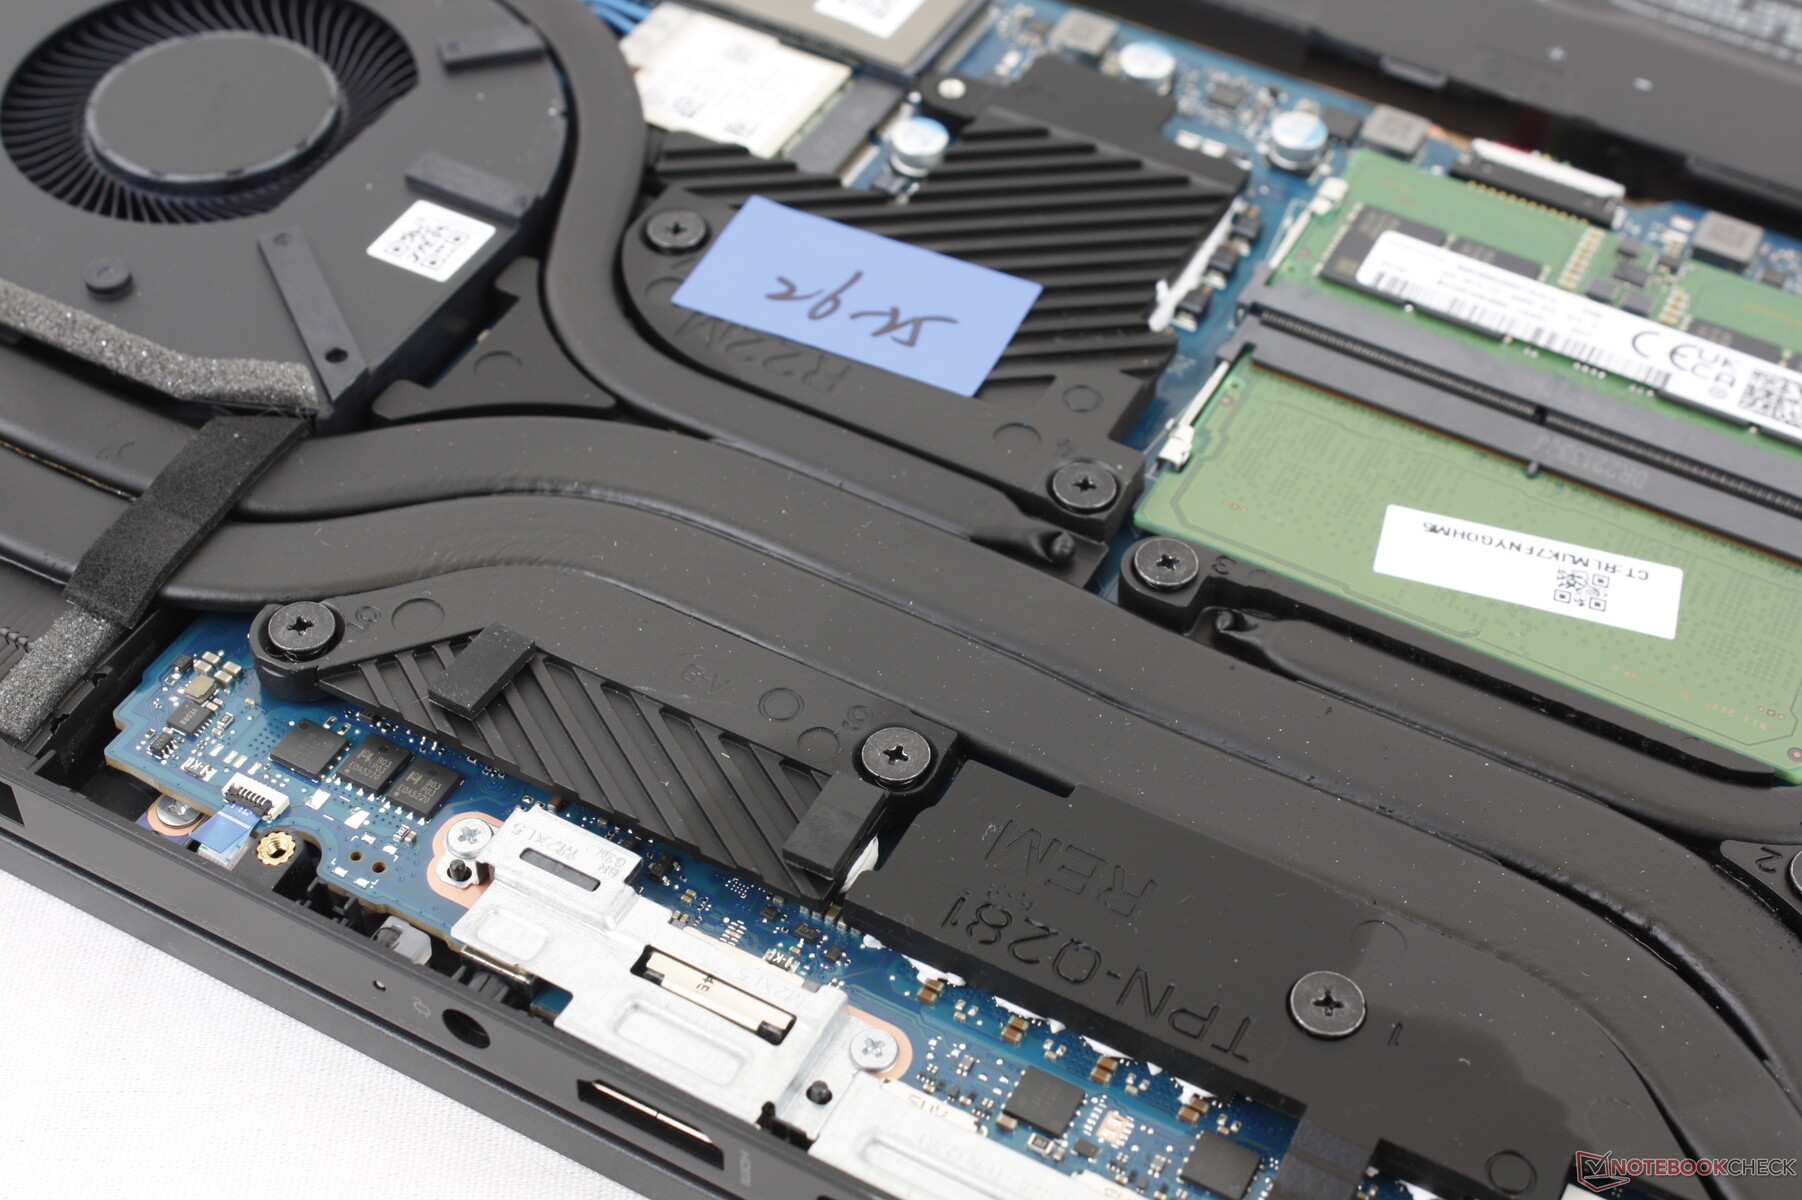
Il pannello inferiore è fissato da otto viti Philips per facilitare la manutenzione. Gli utenti hanno accesso diretto a 2 alloggiamenti M.2, 2 slot SODIMM DDR5, al modulo WLAN rimovibile e alla batteria principale.
Accessori e garanzia
La confezione non contiene altri extra oltre all'adattatore CA e alla documentazione. Si applica la consueta garanzia limitata di un anno.
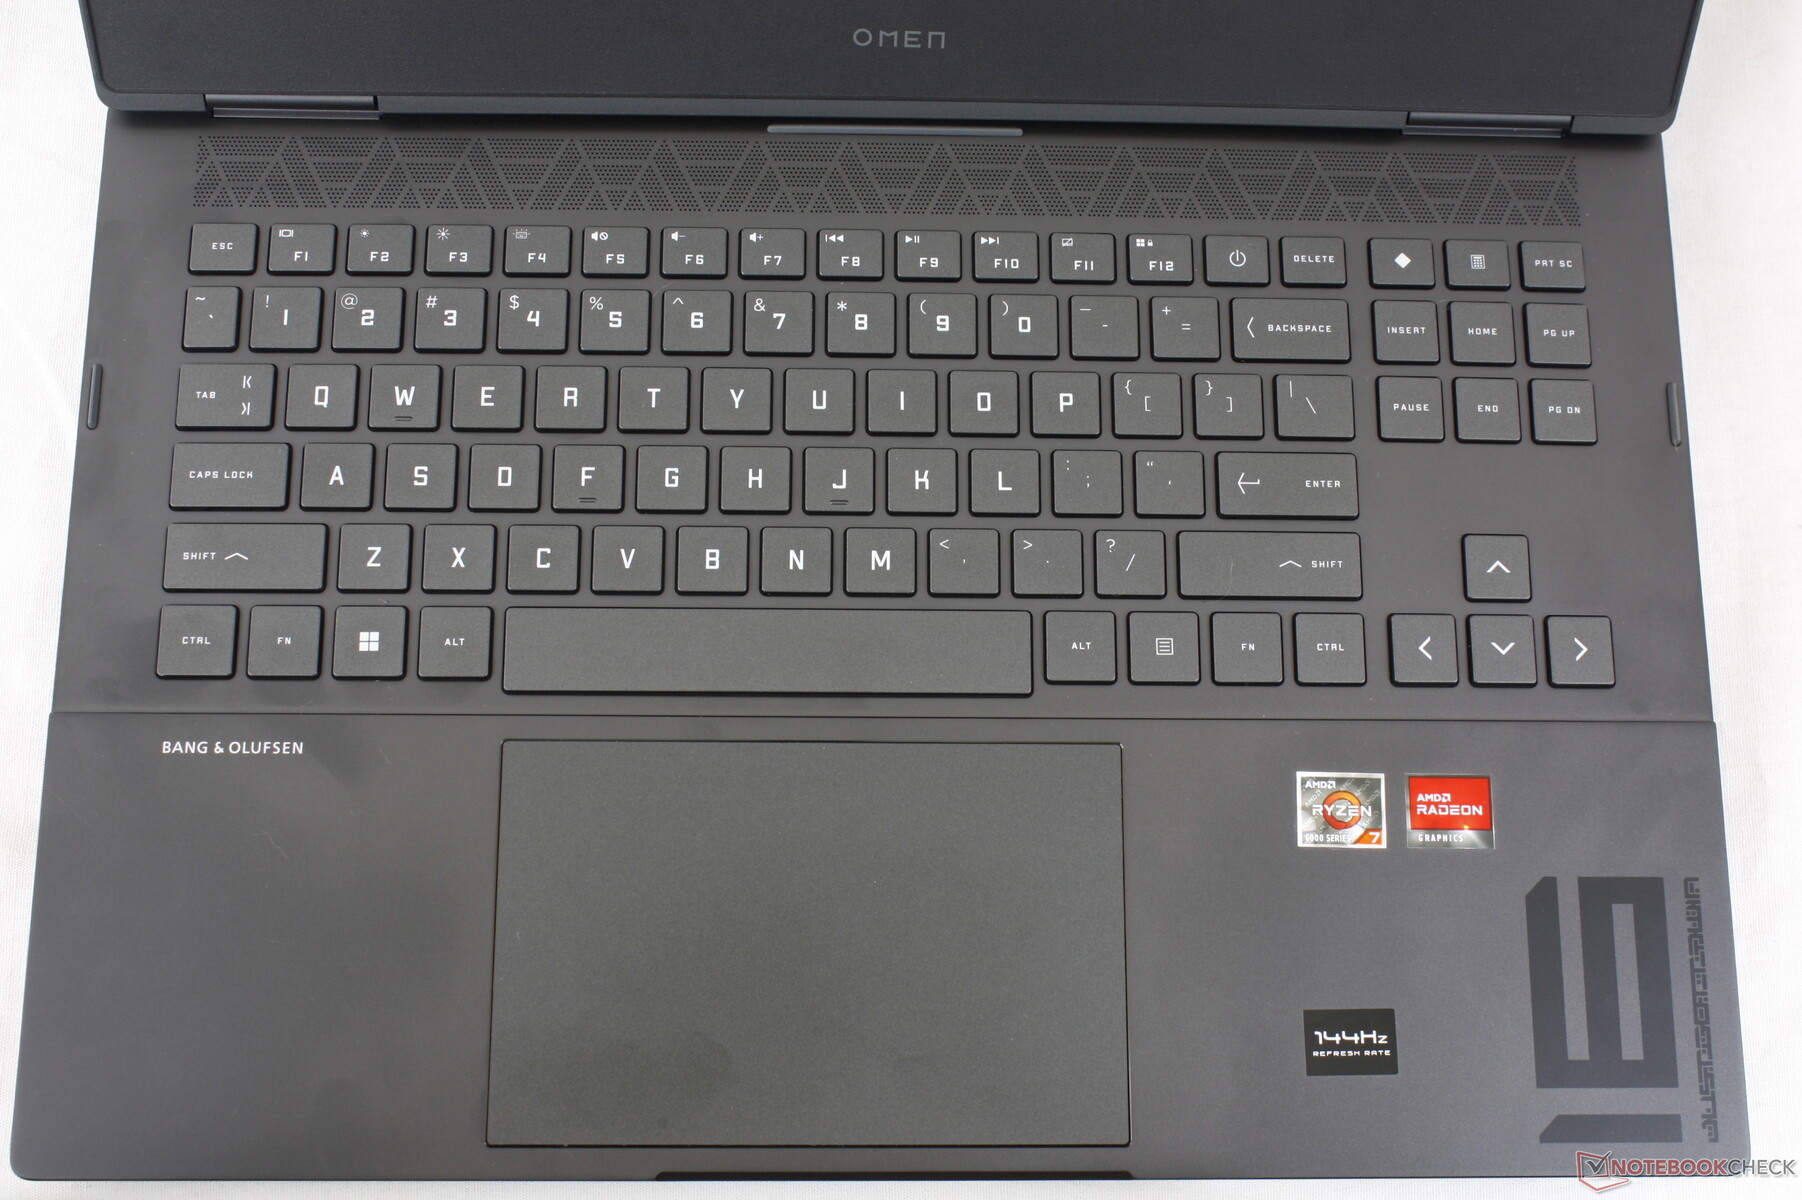
Dispositivi di input - Tastiera confortevole, Clickpad scomodo
Tastiera
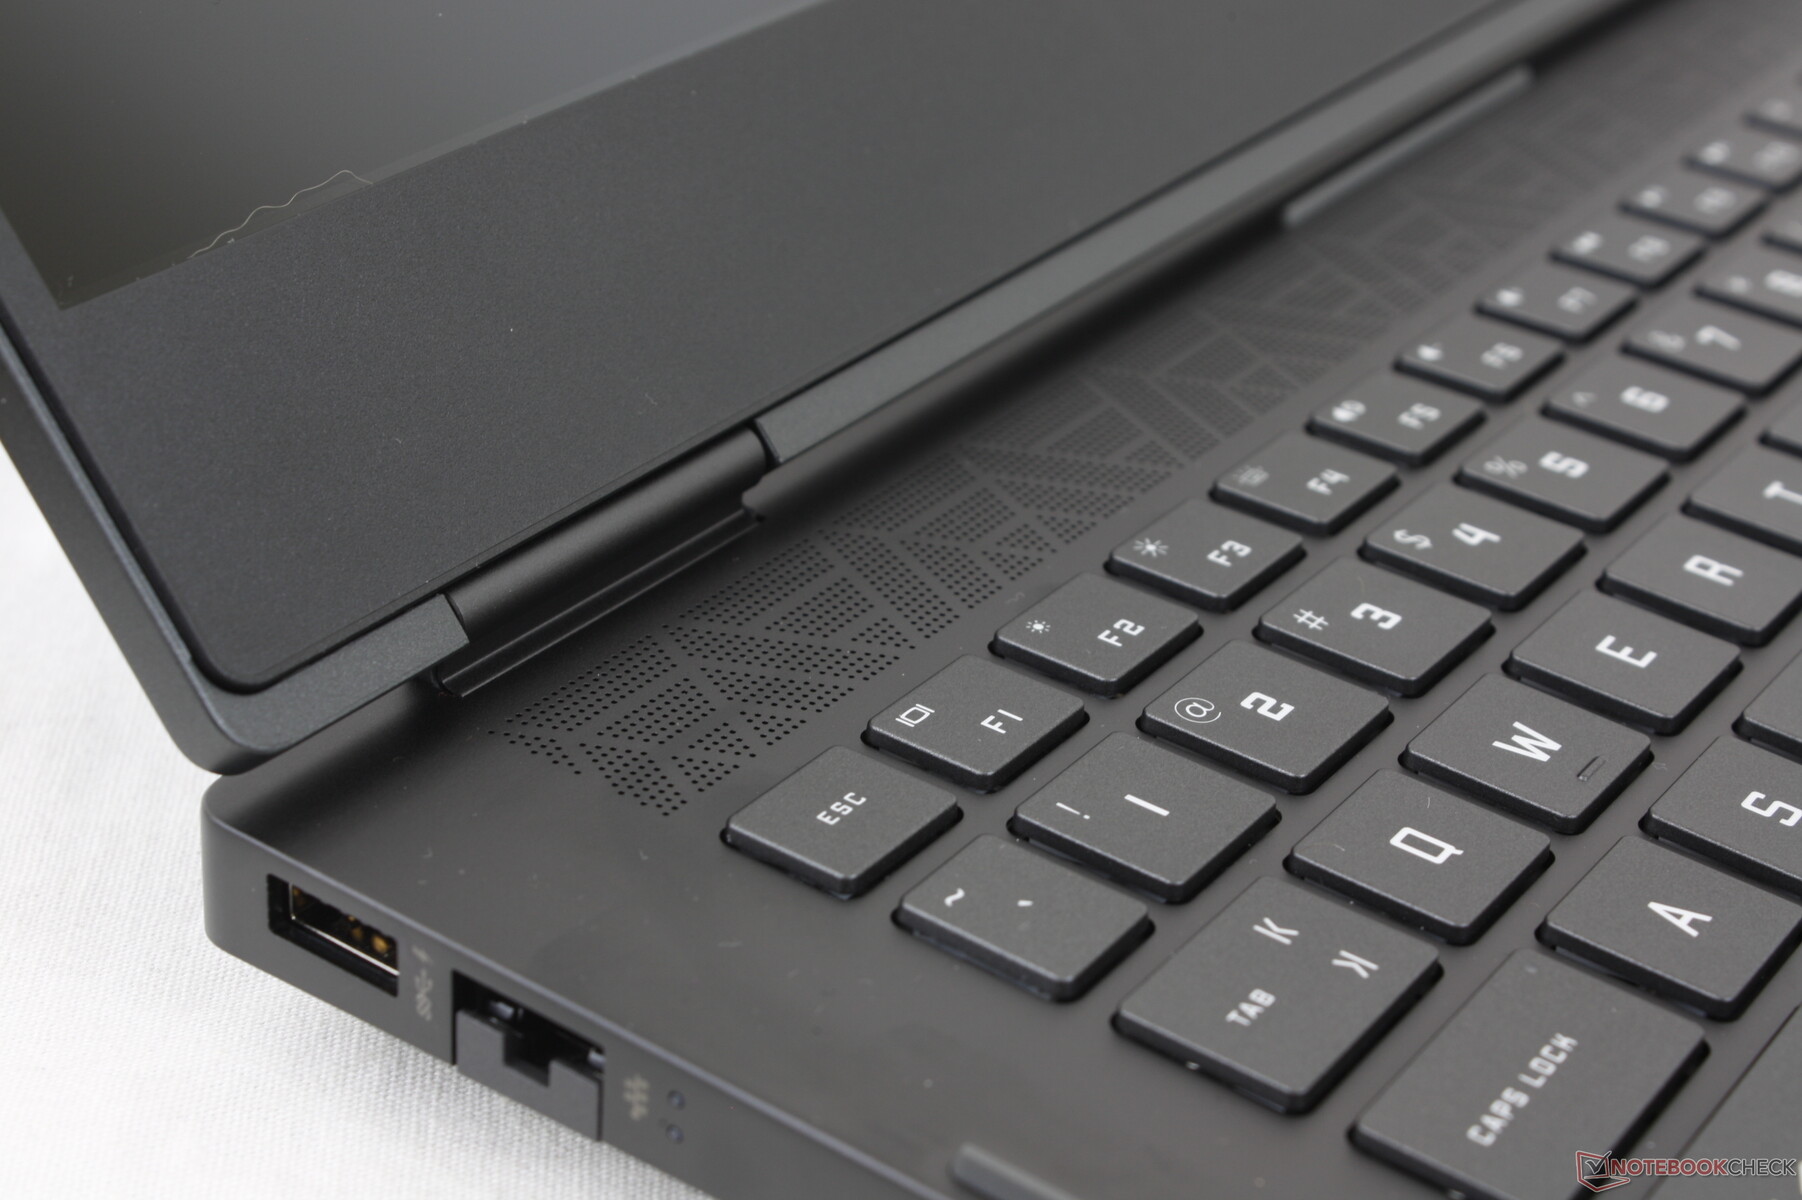
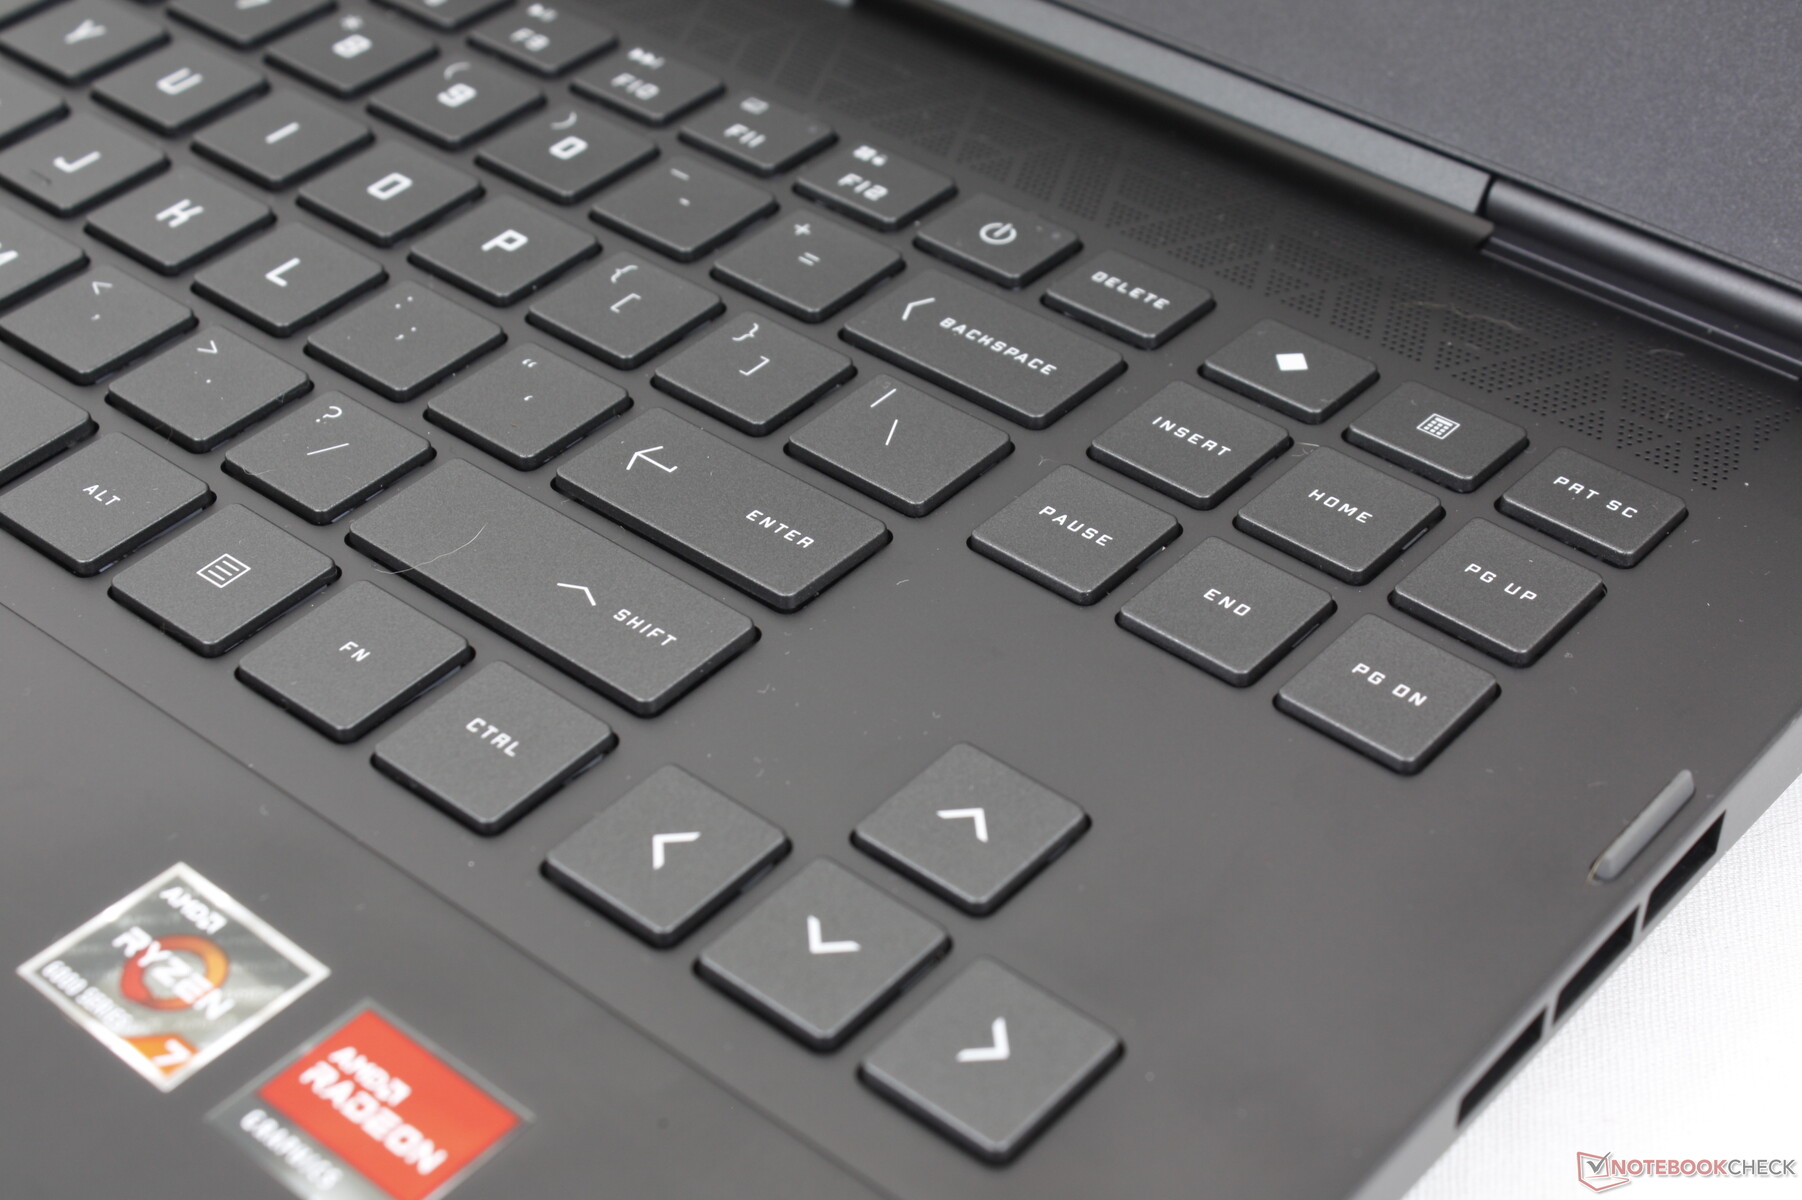
L'esperienza di digitazione rimane identica a quella dell'Omen 16 dello scorso anno, poiché la tastiera non ha subito modifiche. La corsa dei tasti è ridotta e simile a quella di un Ultrabook, ma il feedback deciso e il tasto Spazio extra-large compensano questa mancanza. Ci piacerebbe che il tasto Power venisse spostato in un altro punto delle prossime revisioni, poiché la sua posizione attuale, accanto ai tasti Backspace e Del, ne facilita la pressione accidentale.
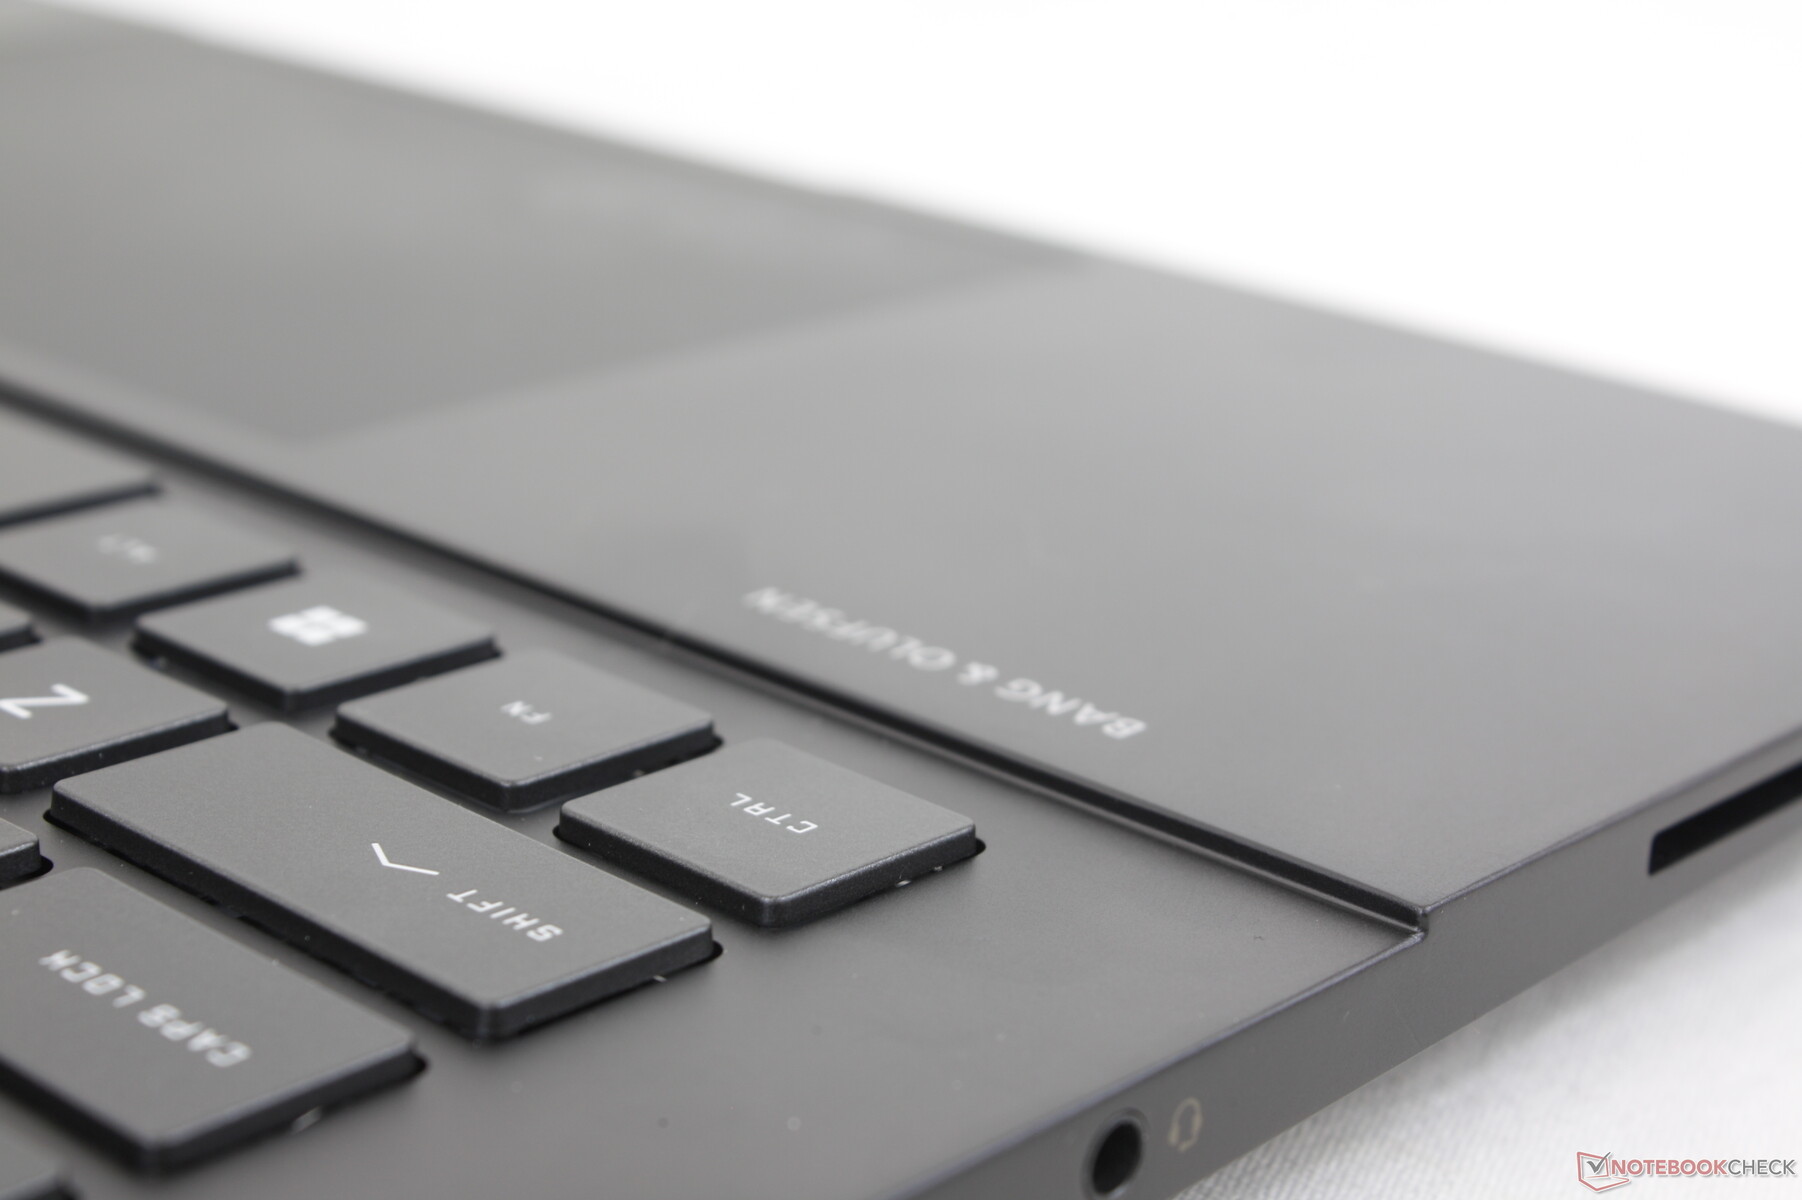
La retroilluminazione della tastiera è suddivisa in quattro zone diverse anziché in RGB per tasto, il che è deludente se si considera l'elevato prezzo e le prestazioni della Omen 16.
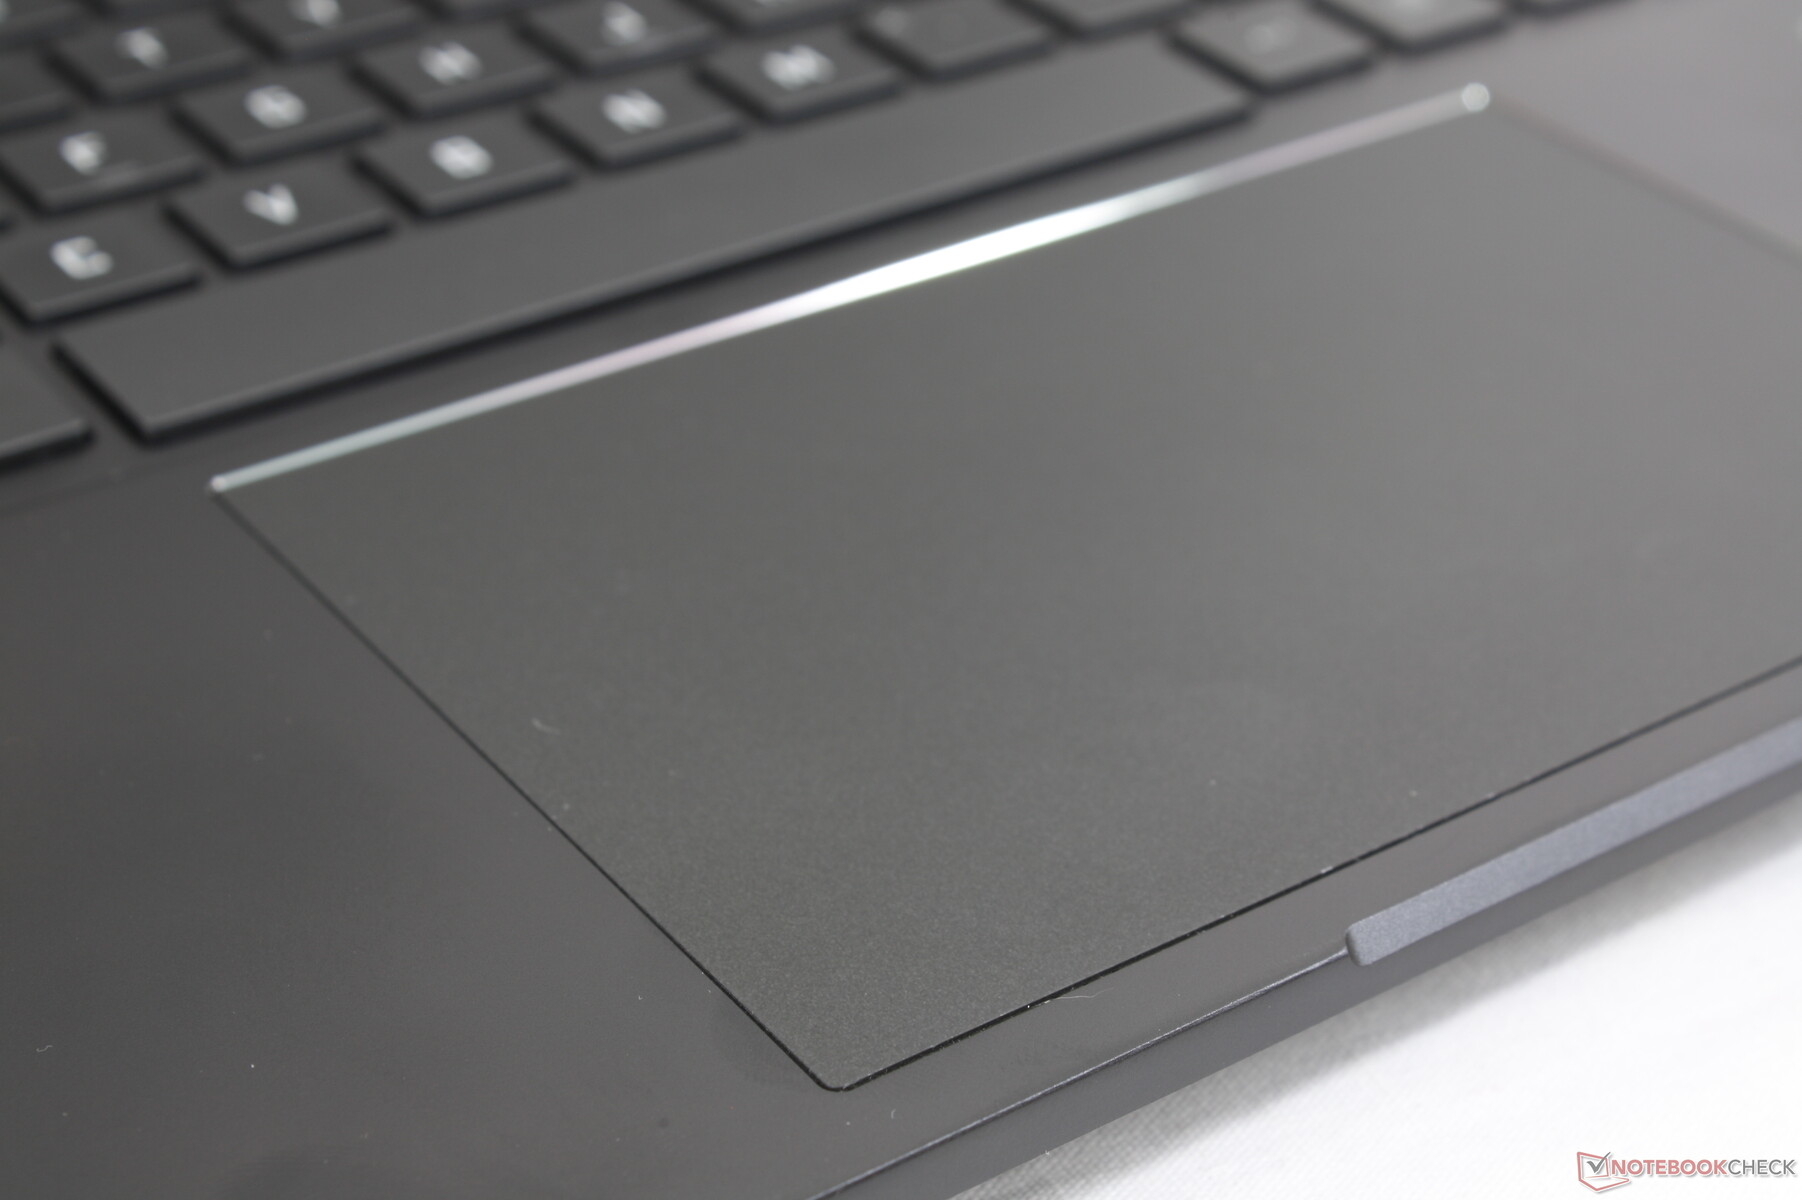
Touchpad
Il clickpad è molto più grande di quello del Dell G16 (13 x 8,6 cm contro 10,5 x 6 cm) per facilitare gli input multi-touch. La trazione è fluida e con un'aderenza minima, proprio come sul coperchio esterno o sui poggiapolsi circostanti
Purtroppo, uno dei principali svantaggi del clickpad è la sua eccessiva sensibilità alla pressione. Quando si scorre con un dito, ad esempio, diventa troppo facile inserire accidentalmente un clic, rendendo l'intero portatile molto fastidioso da usare senza un mouse esterno. I clickpad di altri portatili da gioco sono molto meno sensibili in confronto.

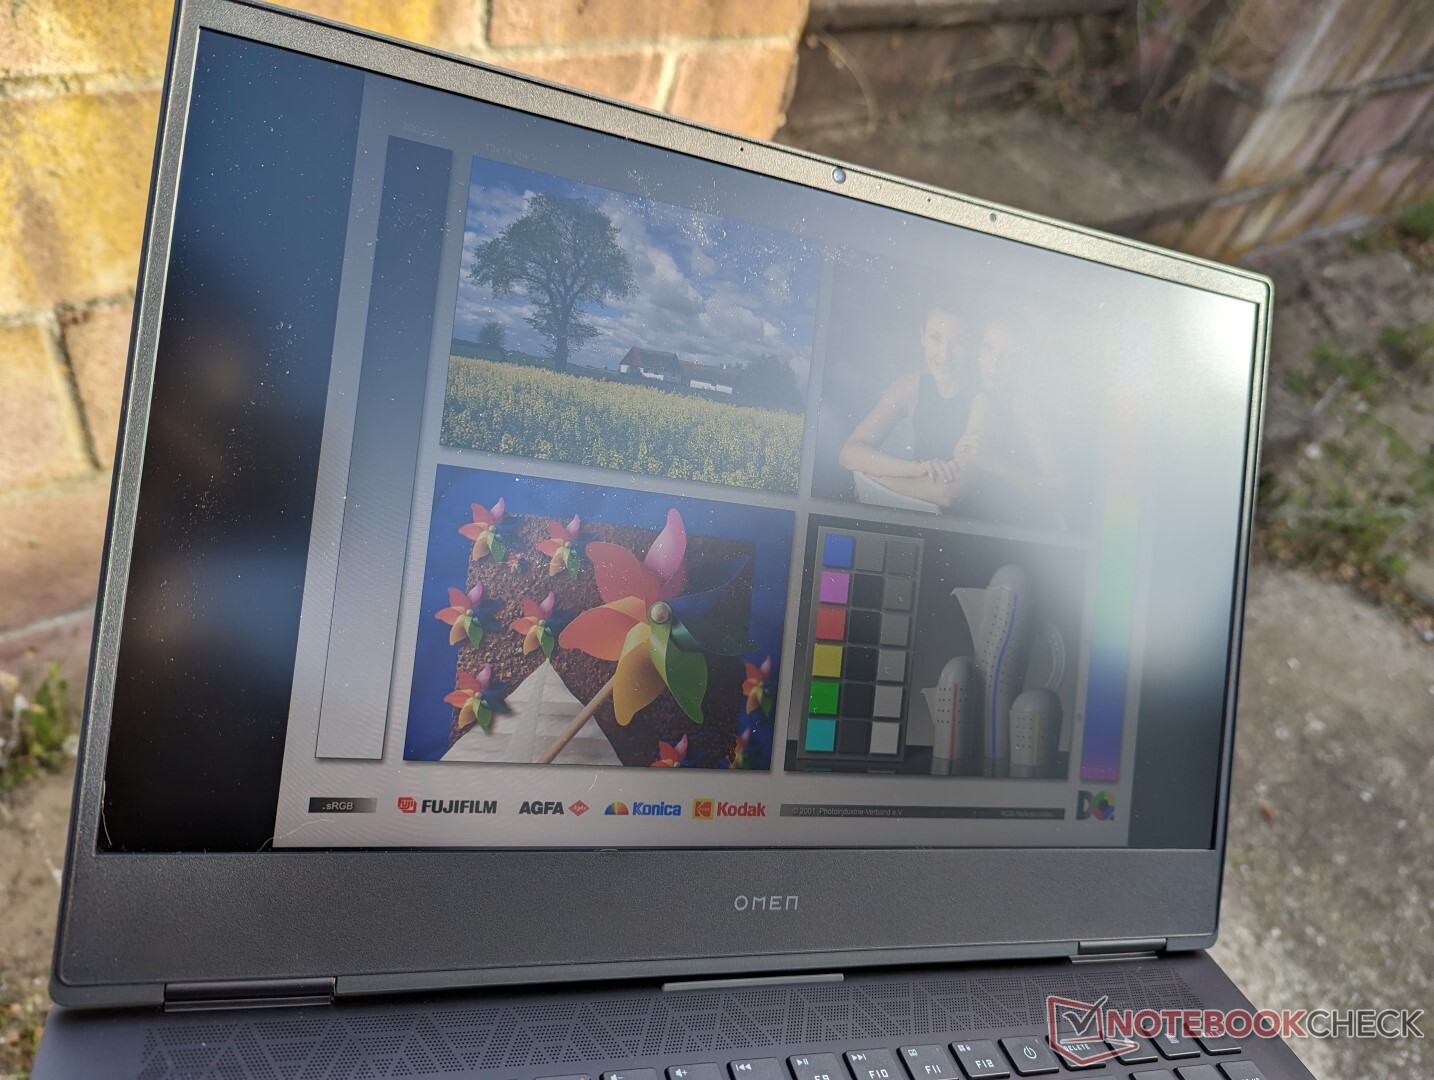
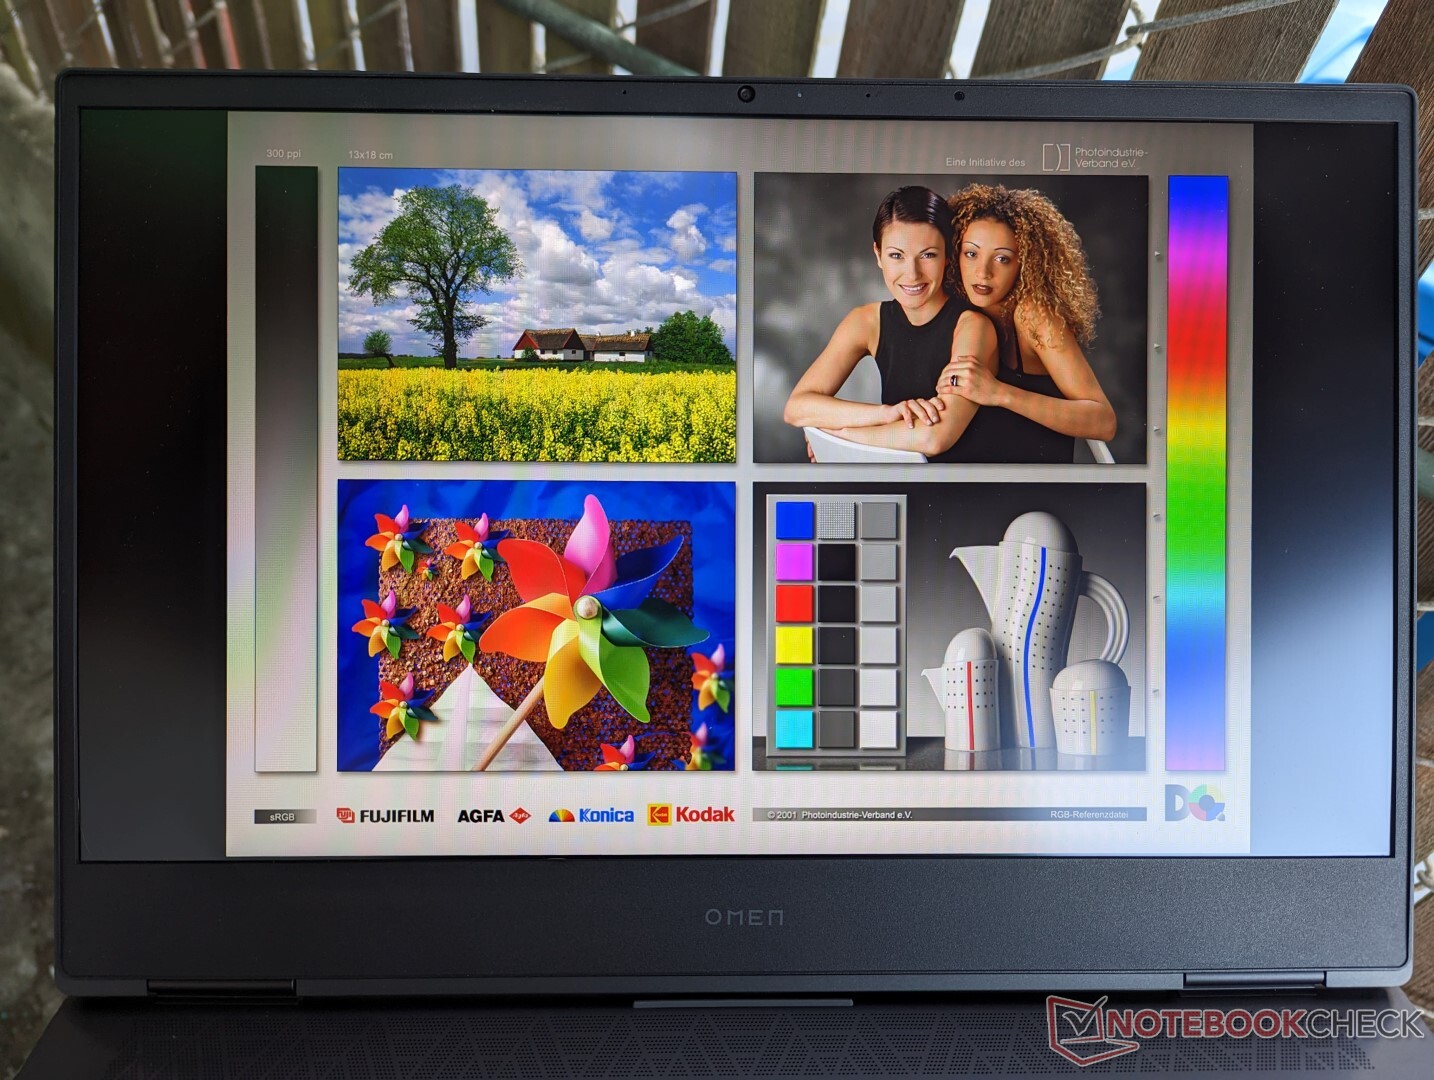
Display - FreeSync con 144 Hz e 100% sRGB
È possibile scegliere tra tre opzioni di visualizzazione:
- 1080p, 144 Hz, 250 nits
- 1080p, 144 Hz, 300 nits
- 1440p, 165 Hz, 300 nits
Le nostre misurazioni del display riflettono solo l'opzione in grassetto qui sopra. L'opzione di fascia alta a 165 Hz è disponibile su entrambe le SKU Omen 16 di Intel e AMD.
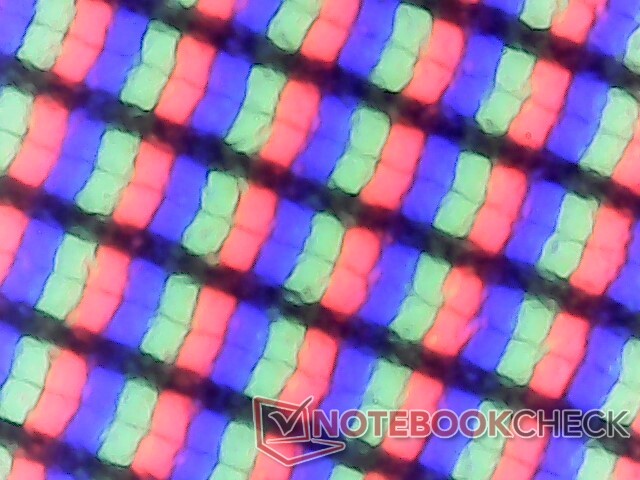
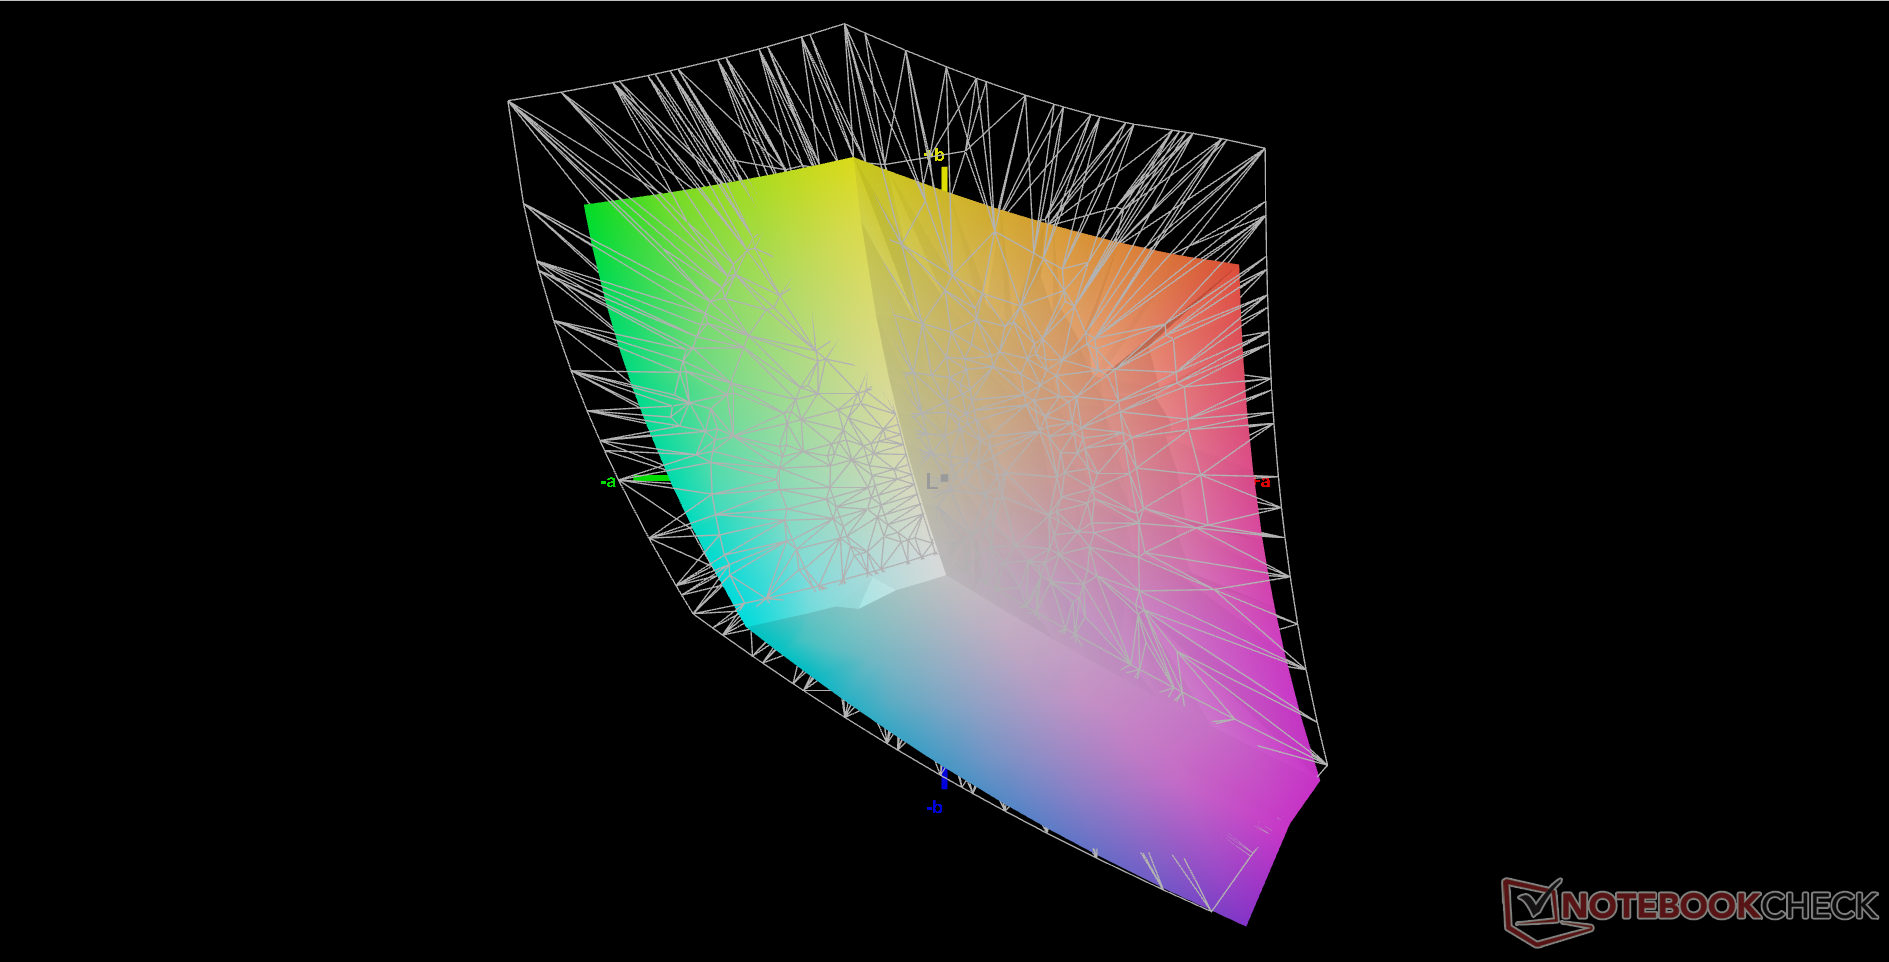
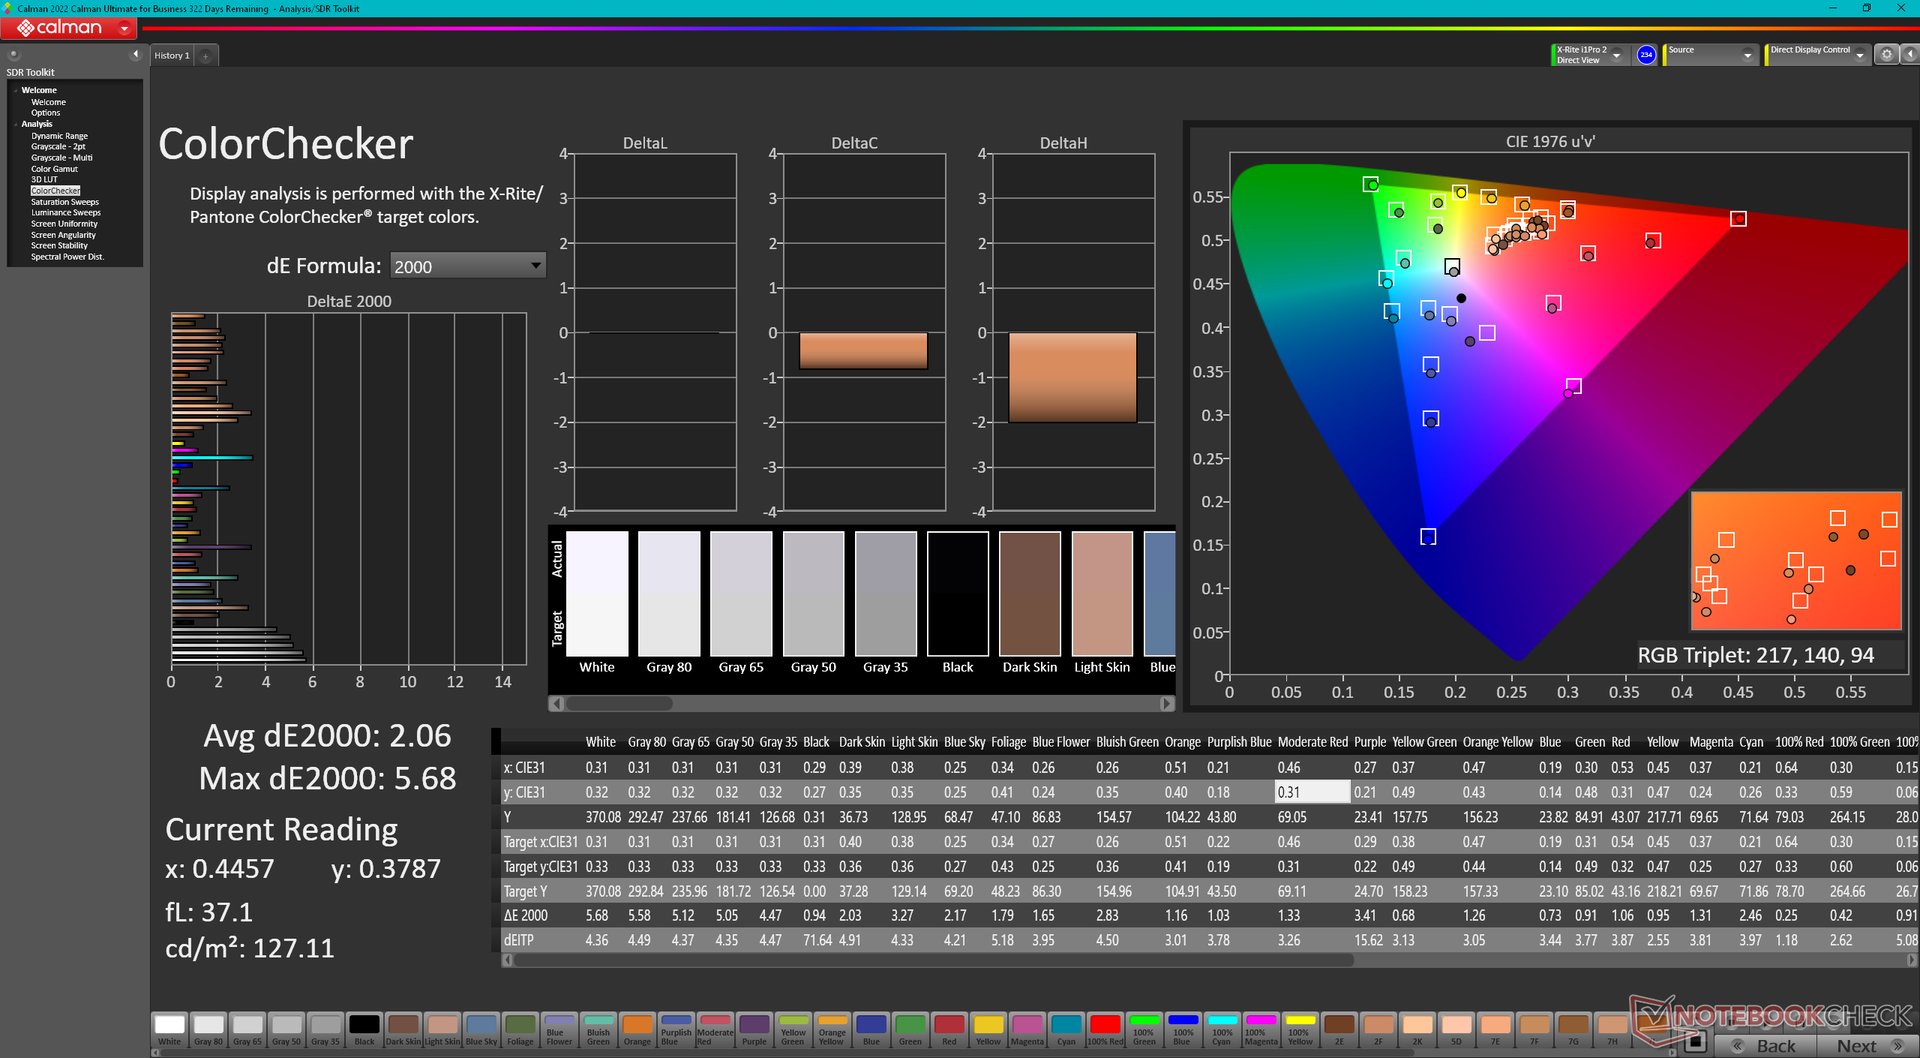
Il pannello IPS della nostra unità AMD è comunque molto buono, con una copertura sRGB completa, un rapporto di contrasto decente e tempi di risposta in bianco e nero adeguati. Secondo il nostro colorimetro X-Rite, anche la luminosità massima del display è superiore del 20% rispetto a quella pubblicizzata da HP. La qualità complessiva dell'immagine è significativamente migliore rispetto al meno costoso HP Victus 16, che utilizza un pannello Chi Mei molto più economico con colori peggiori e un effetto ghosting più evidente.

| |||||||||||||||||||||||||
Distribuzione della luminosità: 79 %
Al centro con la batteria: 373.3 cd/m²
Contrasto: 848:1 (Nero: 0.44 cd/m²)
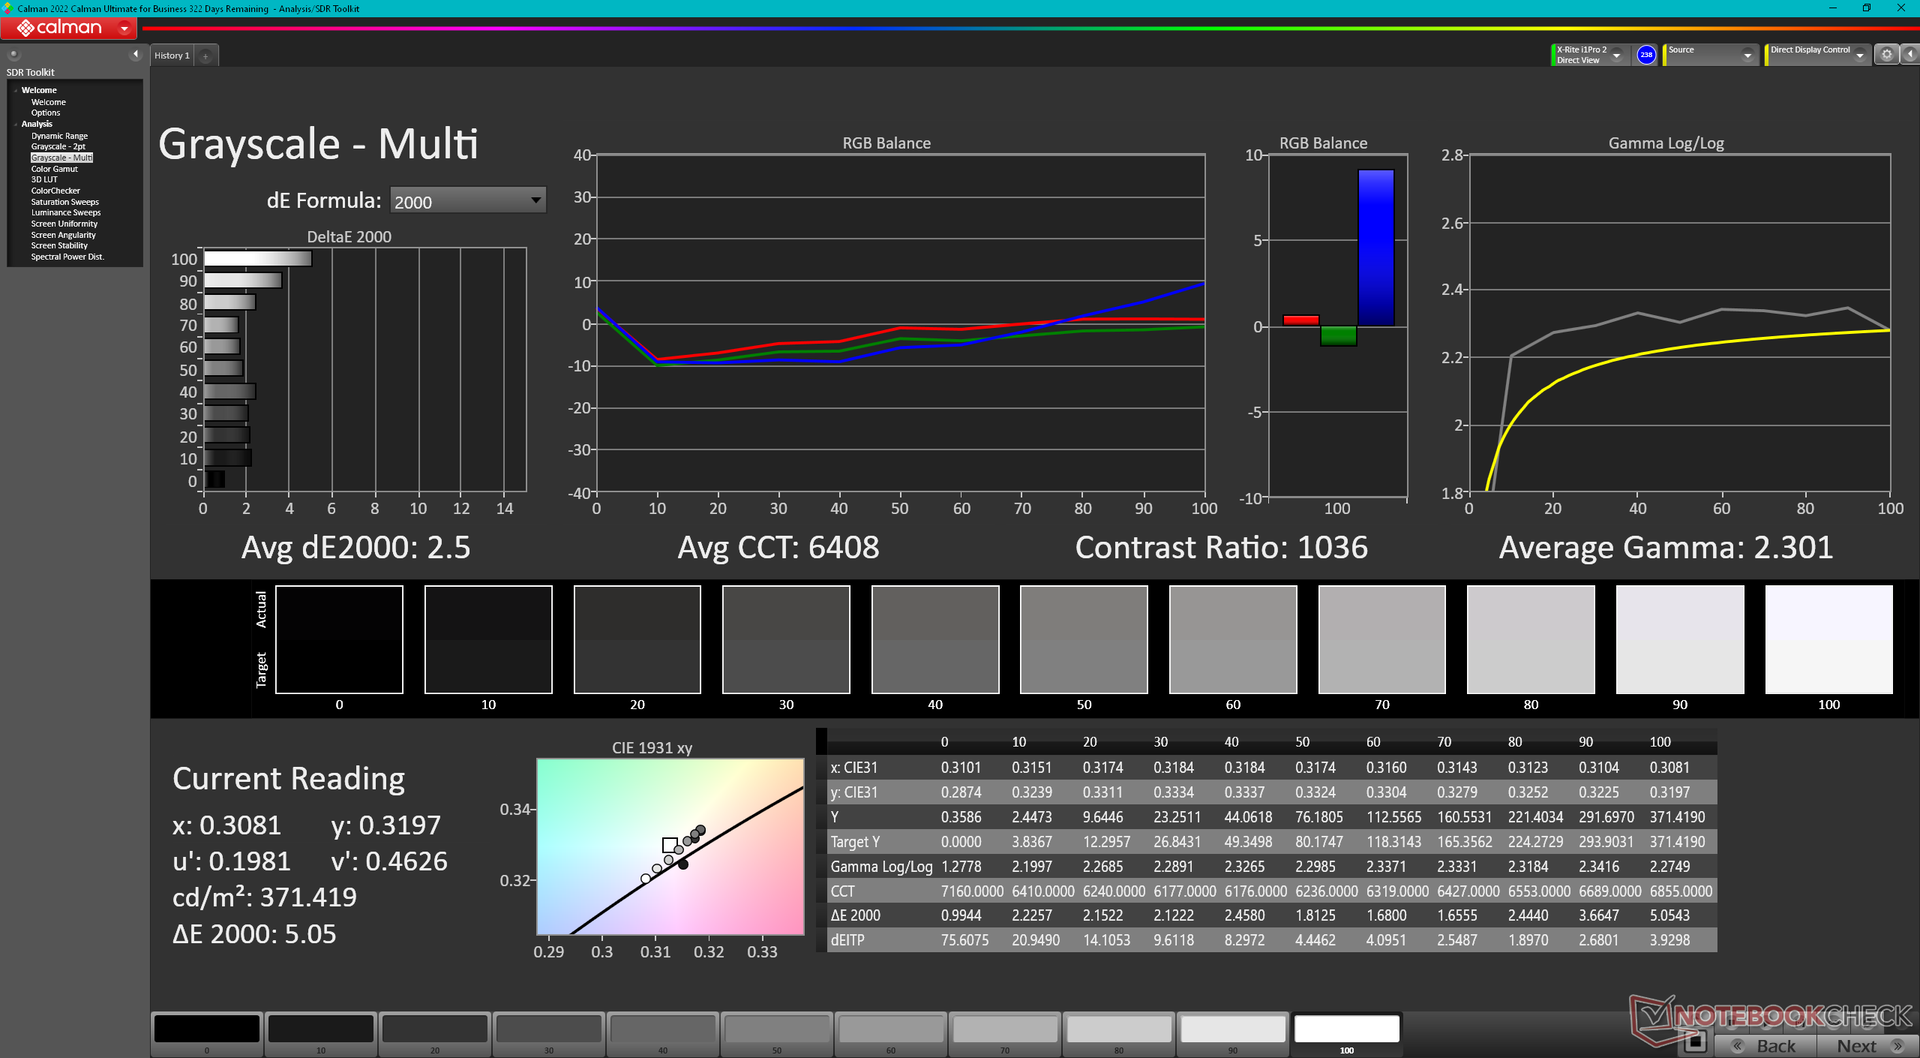
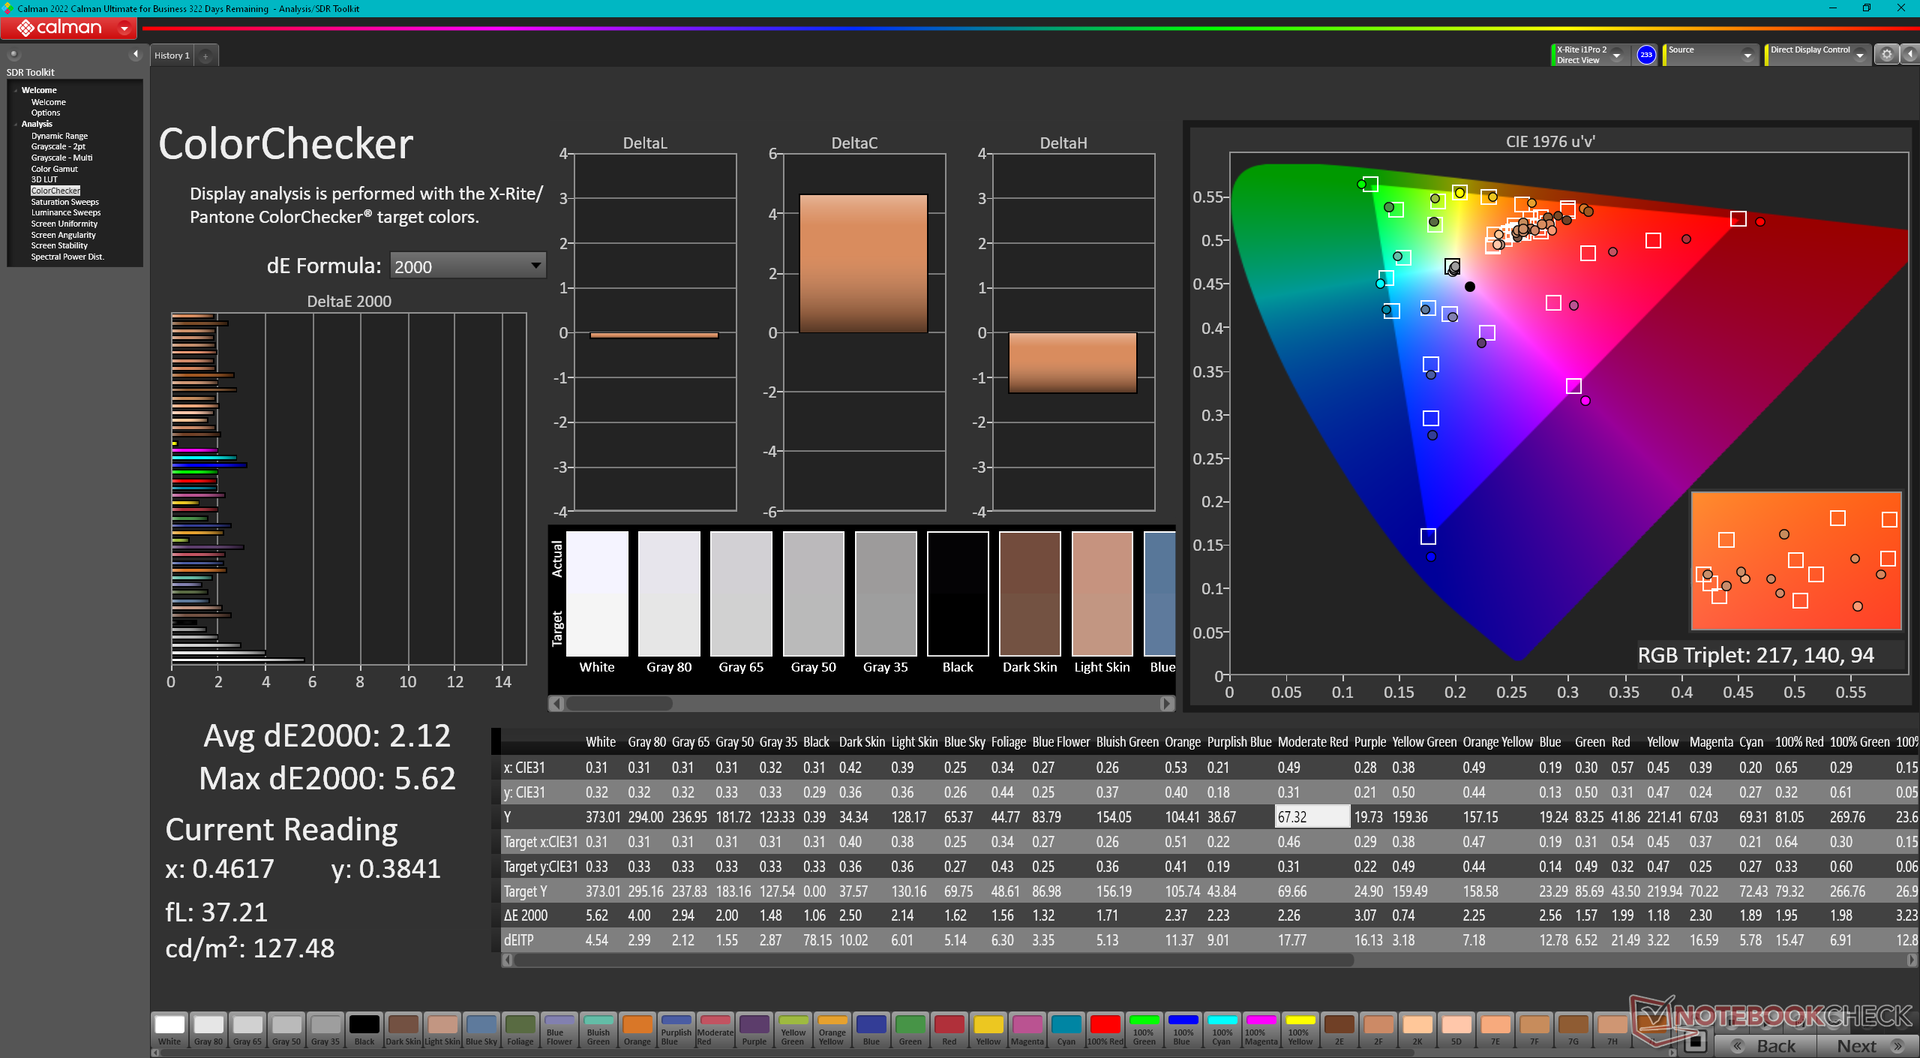
ΔE ColorChecker Calman: 2.12 | ∀{0.5-29.43 Ø4.71}
calibrated: 2.06
ΔE Greyscale Calman: 2.5 | ∀{0.09-98 Ø4.96}
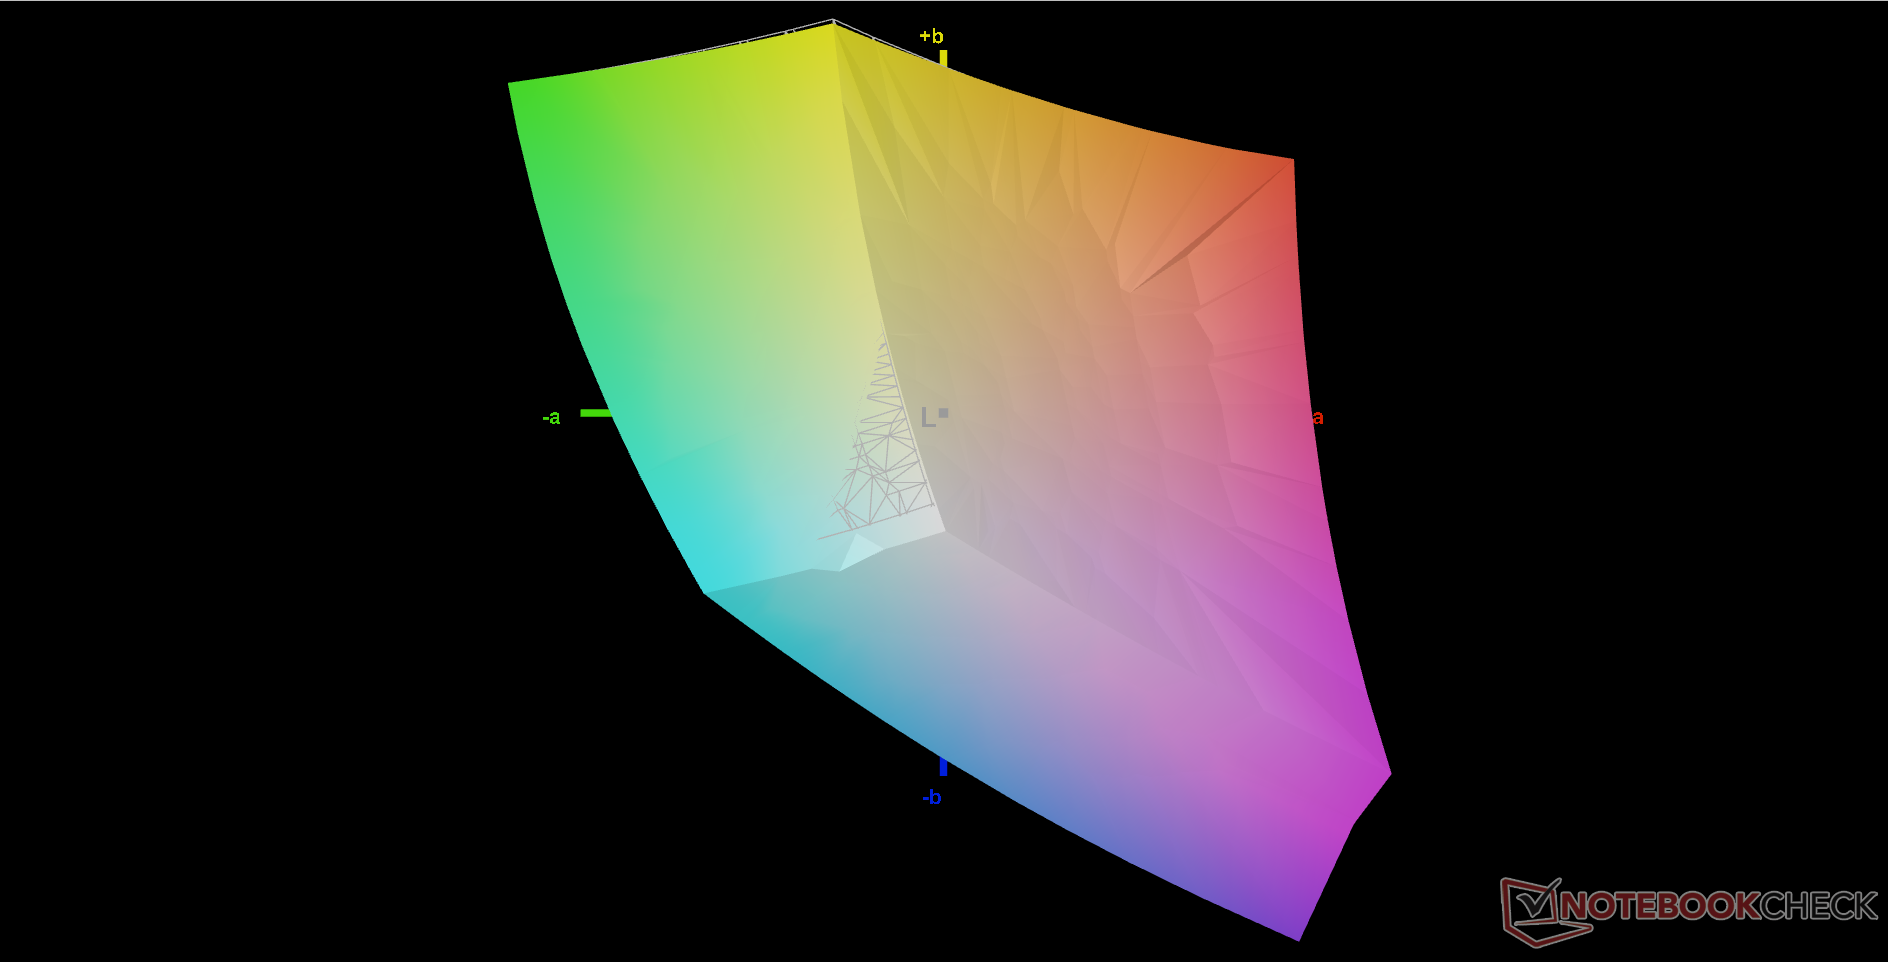
73.4% AdobeRGB 1998 (Argyll 3D)
99.2% sRGB (Argyll 3D)
74.4% Display P3 (Argyll 3D)
Gamma: 2.3
CCT: 6408 K
| HP Omen 16-n0033dx BOE0AAE, IPS, 1920x1080, 16.1" | HP Envy 16 h0112nr Samsung SDC4174, OLED, 3840x2400, 16" | HP Omen 16-b1090ng BOE09E5, IPS, 2560x1440, 16.1" | HP Victus 16-e0145ng CMN1609, IPS, 1920x1080, 16.1" | Lenovo Legion S7 16ARHA7 BOE CQ NE160QDM-NY1, IPS, 2560x1600, 16" | Dell G16 7620 BOE NE16QDM, IPS, 2560x1600, 16" | |
|---|---|---|---|---|---|---|
| Display | 18% | -2% | -41% | -3% | -4% | |
| Display P3 Coverage (%) | 74.4 | 99.3 33% | 71 -5% | 41.6 -44% | 69.8 -6% | 68.3 -8% |
| sRGB Coverage (%) | 99.2 | 100 1% | 97.9 -1% | 61.9 -38% | 98.1 -1% | 98 -1% |
| AdobeRGB 1998 Coverage (%) | 73.4 | 88 20% | 73.3 0% | 43 -41% | 71.9 -2% | 70.5 -4% |
| Response Times | 86% | 17% | -71% | 15% | 29% | |
| Response Time Grey 50% / Grey 80% * (ms) | 17.6 ? | 2 ? 89% | 14.5 ? 18% | 29.6 ? -68% | 10 ? 43% | 8.6 ? 51% |
| Response Time Black / White * (ms) | 11.2 ? | 1.9 ? 83% | 9.4 ? 16% | 19.4 ? -73% | 12.8 ? -14% | 10.4 ? 7% |
| PWM Frequency (Hz) | 240.4 ? | |||||
| Screen | 12% | -28% | -87% | 28% | 13% | |
| Brightness middle (cd/m²) | 373.3 | 328.8 -12% | 335 -10% | 257 -31% | 492.4 32% | 369.4 -1% |
| Brightness (cd/m²) | 361 | 332 -8% | 319 -12% | 239 -34% | 471 30% | 348 -4% |
| Brightness Distribution (%) | 79 | 97 23% | 90 14% | 88 11% | 90 14% | 83 5% |
| Black Level * (cd/m²) | 0.44 | 0.28 36% | 0.25 43% | 0.4 9% | 0.32 27% | |
| Contrast (:1) | 848 | 1196 41% | 1028 21% | 1231 45% | 1154 36% | |
| Colorchecker dE 2000 * | 2.12 | 1.53 28% | 4.38 -107% | 6.91 -226% | 1.9 10% | 1.78 16% |
| Colorchecker dE 2000 max. * | 5.62 | 6.04 -7% | 9.48 -69% | 22.27 -296% | 3.81 32% | 4.41 22% |
| Colorchecker dE 2000 calibrated * | 2.06 | 1.33 35% | 3.61 -75% | 0.99 52% | 1.22 41% | |
| Greyscale dE 2000 * | 2.5 | 1.3 48% | 7 -180% | 7.5 -200% | 1.7 32% | 3.2 -28% |
| Gamma | 2.3 96% | 2.18 101% | 2.103 105% | 2.125 104% | 2.36 93% | 2.2 100% |
| CCT | 6408 101% | 6362 102% | 6244 104% | 6025 108% | 6497 100% | 6750 96% |
| Media totale (Programma / Settaggio) | 39% /
27% | -4% /
-16% | -66% /
-75% | 13% /
20% | 13% /
11% |
* ... Meglio usare valori piccoli
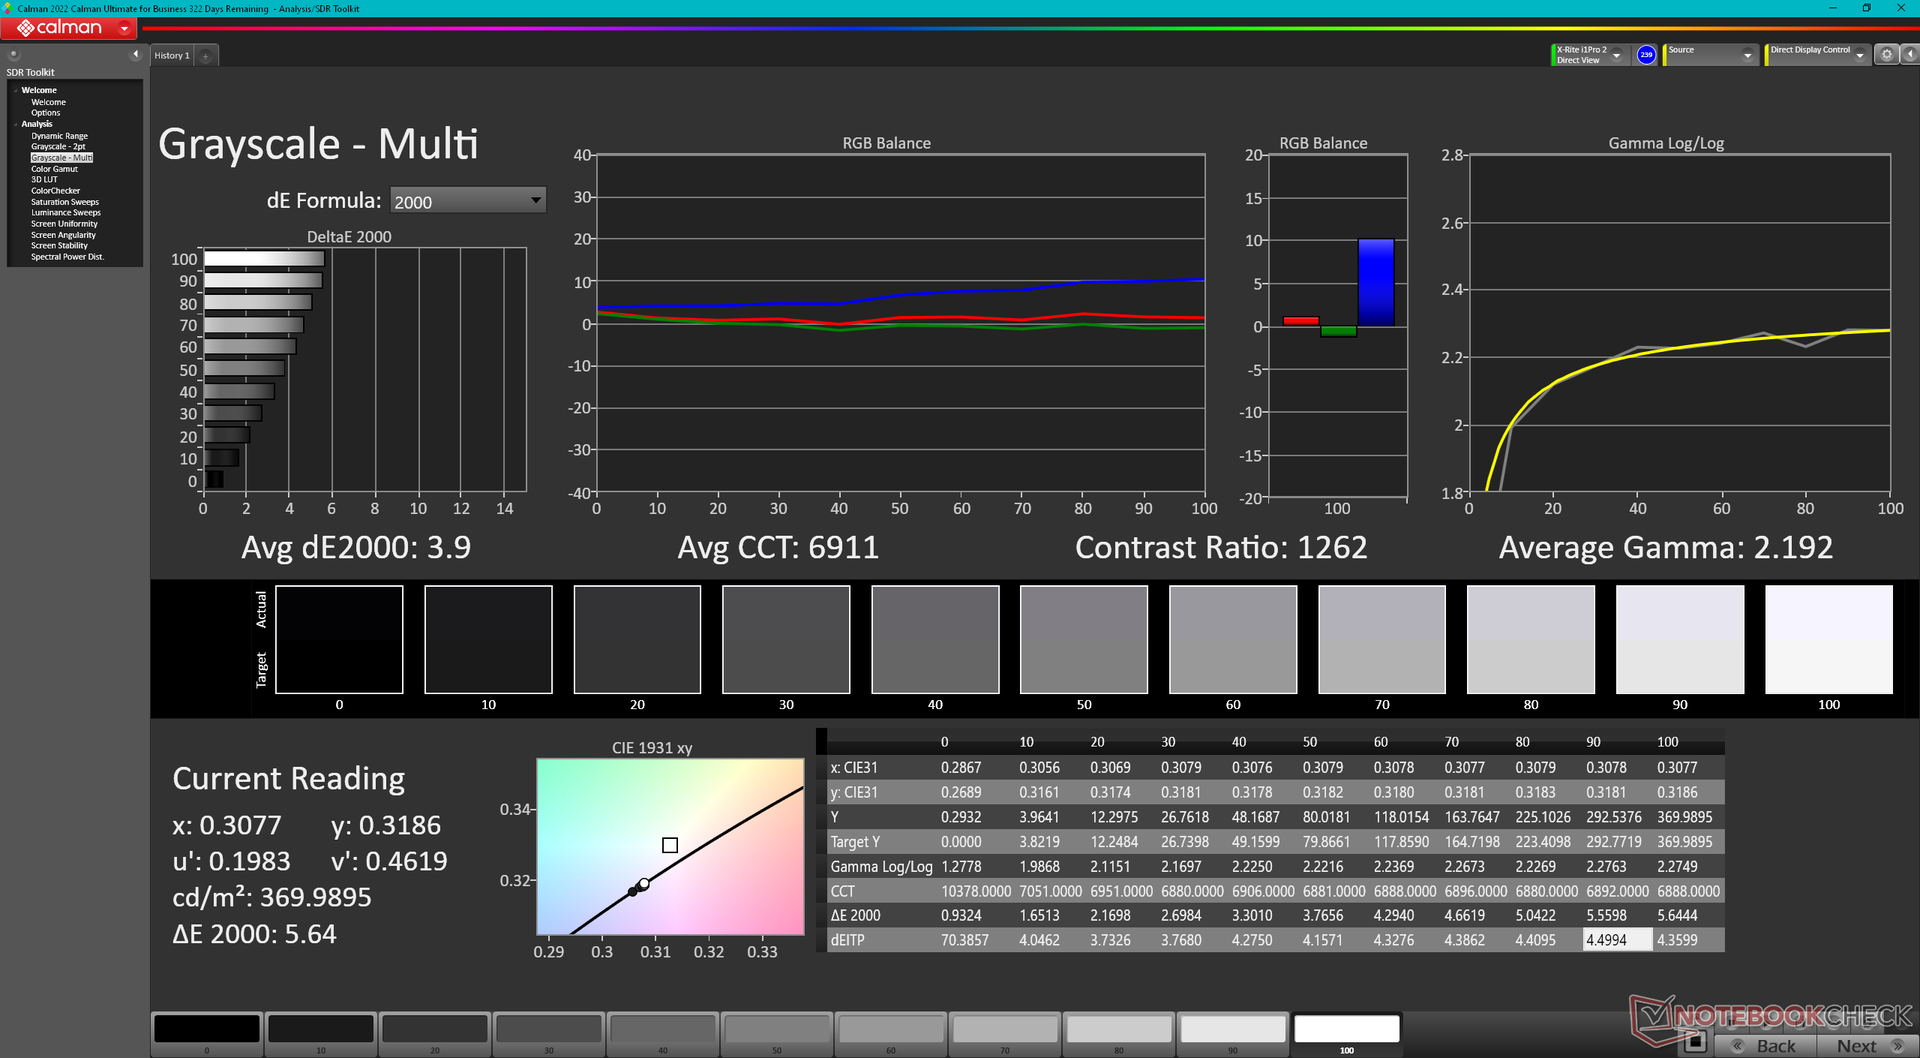
Il display è già decentemente calibrato, con valori medi di deltaE della scala di grigi e del colore di soli 2,5 e 2,12, rispettivamente. Il tentativo di calibrarlo ulteriormente con il nostro colorimetro X-Rite migliorerebbe leggermente i colori, ma non abbastanza da rendere essenziale la calibrazione da parte dell'utente finale.


Tempi di risposta del Display
| ↔ Tempi di risposta dal Nero al Bianco | ||
|---|---|---|
| 11.2 ms ... aumenta ↗ e diminuisce ↘ combinato | ↗ 6.8 ms Incremento | 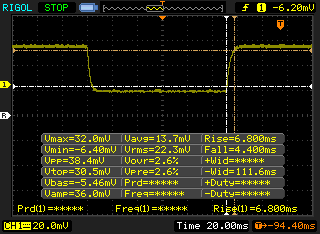 |
| ↘ 4.4 ms Calo | ||
| Lo schermo mostra buoni tempi di risposta durante i nostri tests, ma potrebbe essere troppo lento per i gamers competitivi. In confronto, tutti i dispositivi di test variano da 0.1 (minimo) a 240 (massimo) ms. » 30 % di tutti i dispositivi è migliore. Questo significa che i tempi di risposta rilevati sono migliori rispettto alla media di tutti i dispositivi testati (19.8 ms). | ||
| ↔ Tempo di risposta dal 50% Grigio all'80% Grigio | ||
| 17.6 ms ... aumenta ↗ e diminuisce ↘ combinato | ↗ 10 ms Incremento | 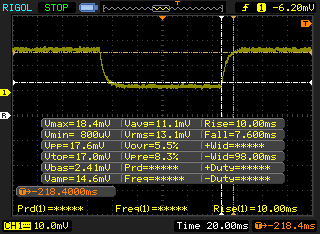 |
| ↘ 7.6 ms Calo | ||
| Lo schermo mostra buoni tempi di risposta durante i nostri tests, ma potrebbe essere troppo lento per i gamers competitivi. In confronto, tutti i dispositivi di test variano da 0.165 (minimo) a 636 (massimo) ms. » 32 % di tutti i dispositivi è migliore. Questo significa che i tempi di risposta rilevati sono migliori rispettto alla media di tutti i dispositivi testati (30.9 ms). | ||
Sfarfallio dello schermo / PWM (Pulse-Width Modulation)
| flickering dello schermo / PWM non rilevato | 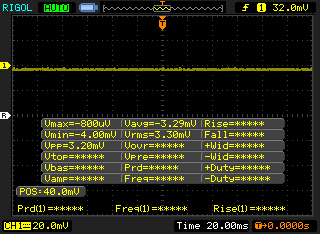 | ||
In confronto: 52 % di tutti i dispositivi testati non utilizza PWM per ridurre la luminosita' del display. Se è rilevato PWM, una media di 7741 (minimo: 5 - massimo: 343500) Hz è stata rilevata. | |||
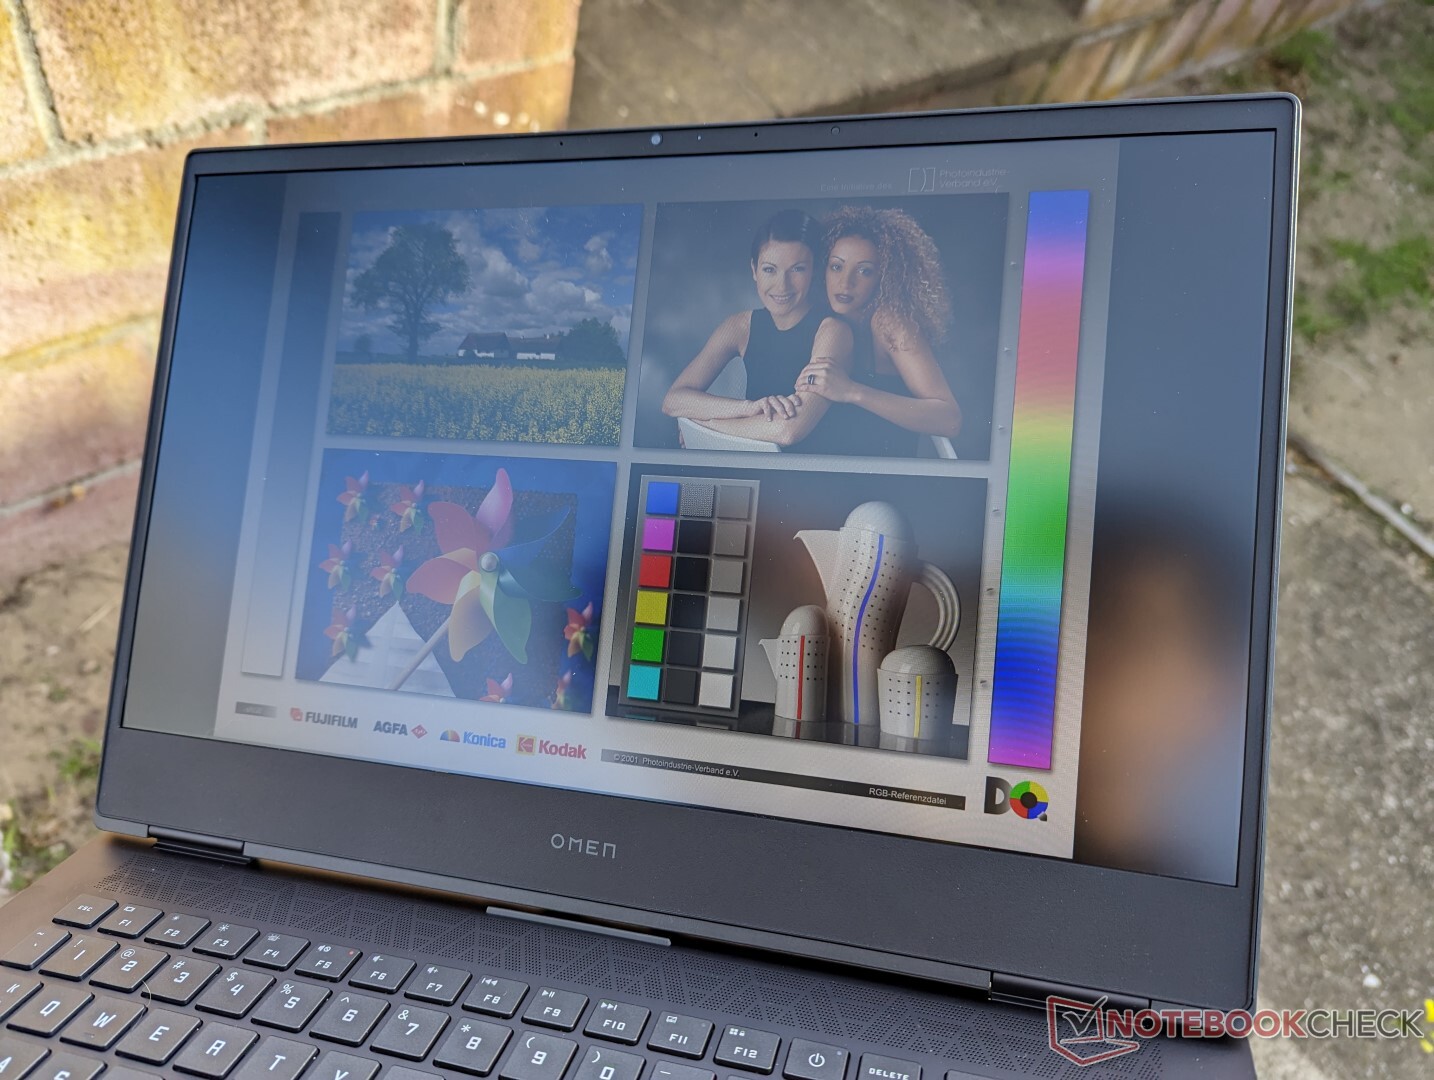
La visibilità all'aperto è buona in condizioni di ombra, mentre qualsiasi cosa più luminosa sbiadisce lo schermo. Il display del Lenovo Legion S7 16 può raggiungere quasi 500 nits rispetto ai soli 370 nits del nostro HP e rappresenta l'opzione migliore se la visibilità all'aperto è un problema. Assicurarsi di disabilitare AMD Vari-Bright sull'HP, altrimenti la luminosità massima si riduce automaticamente quando si utilizza la batteria.
Prestazioni
Condizioni di test
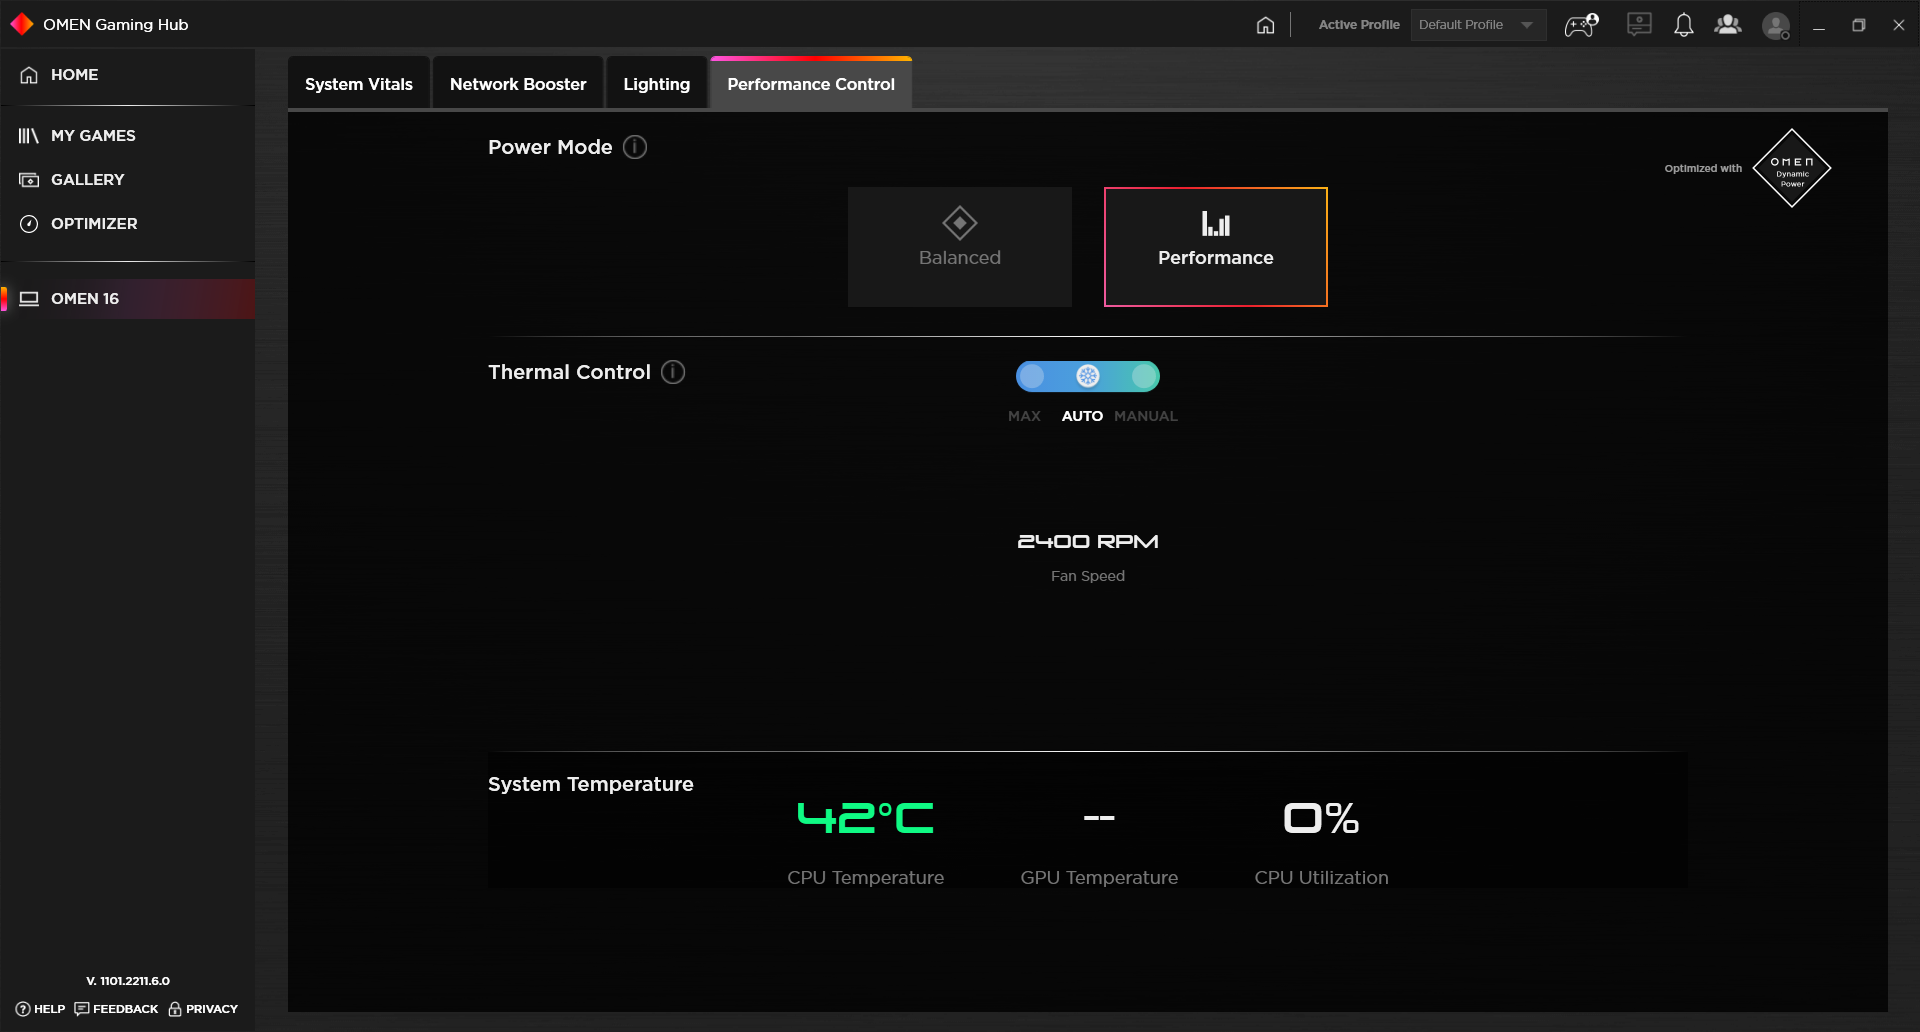
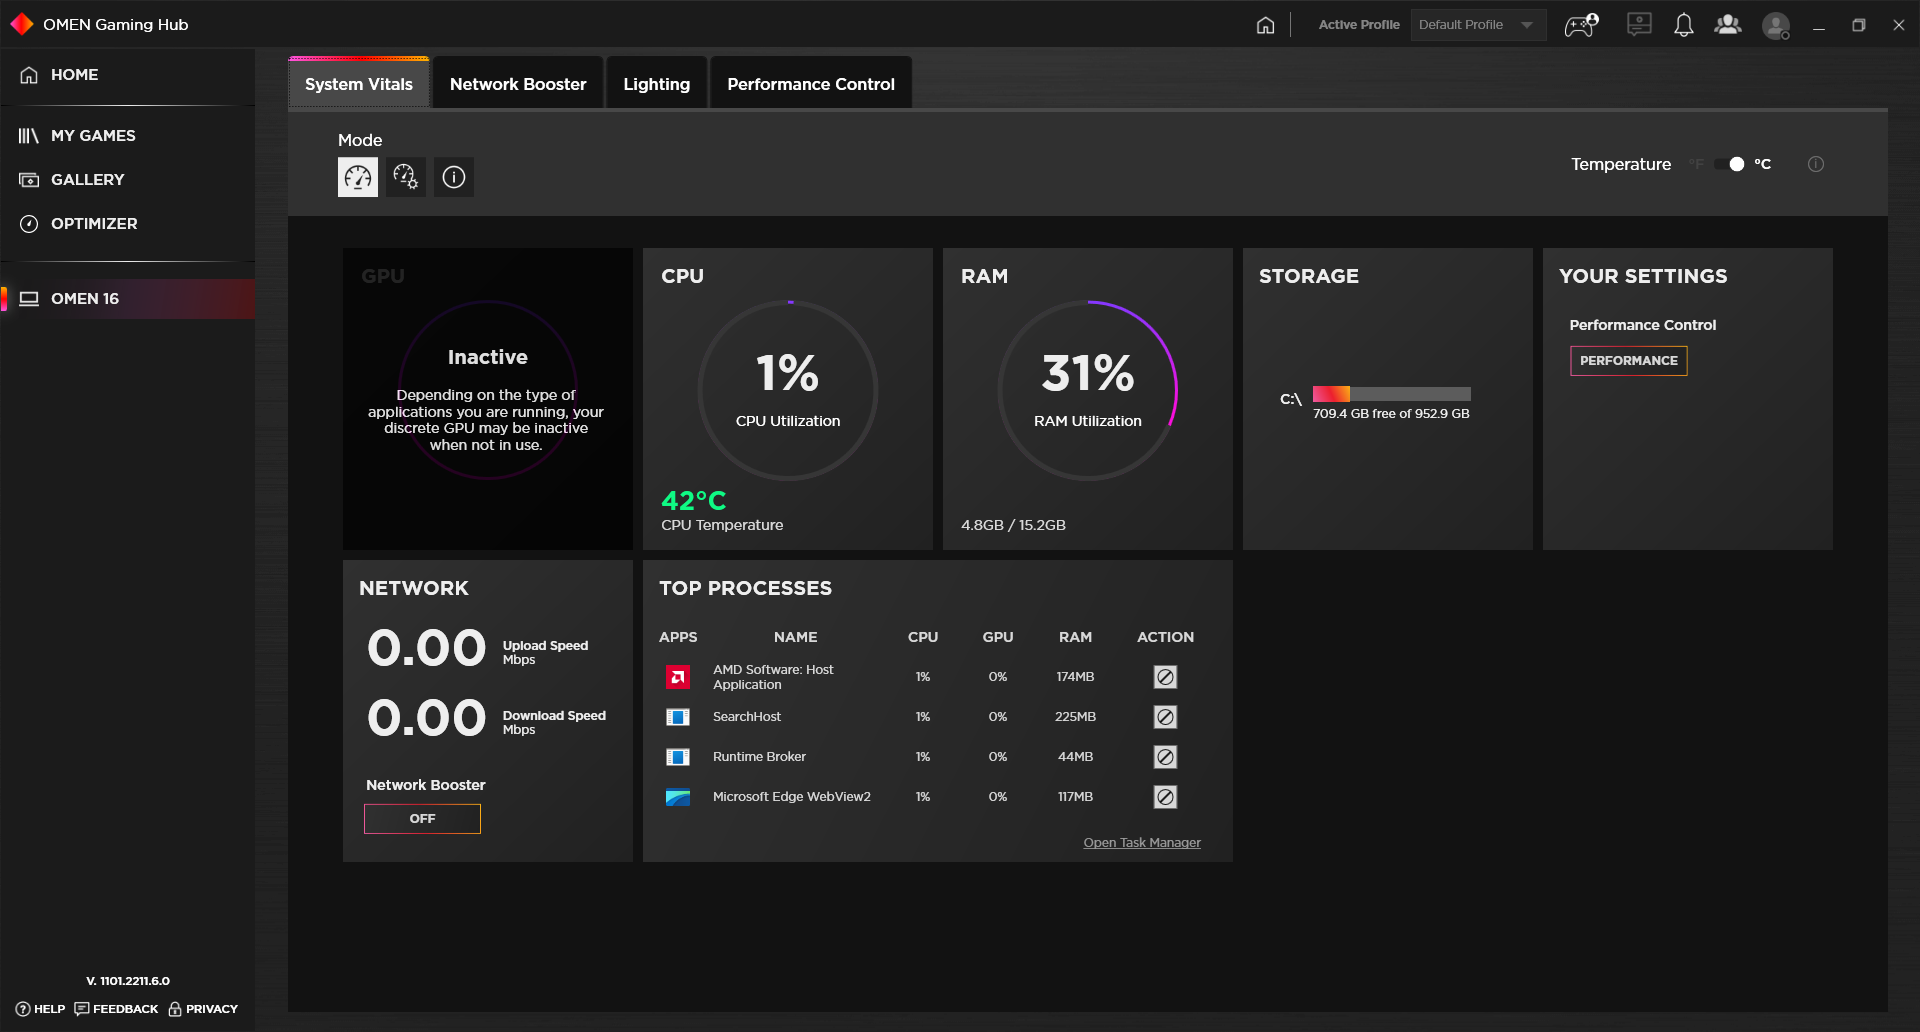
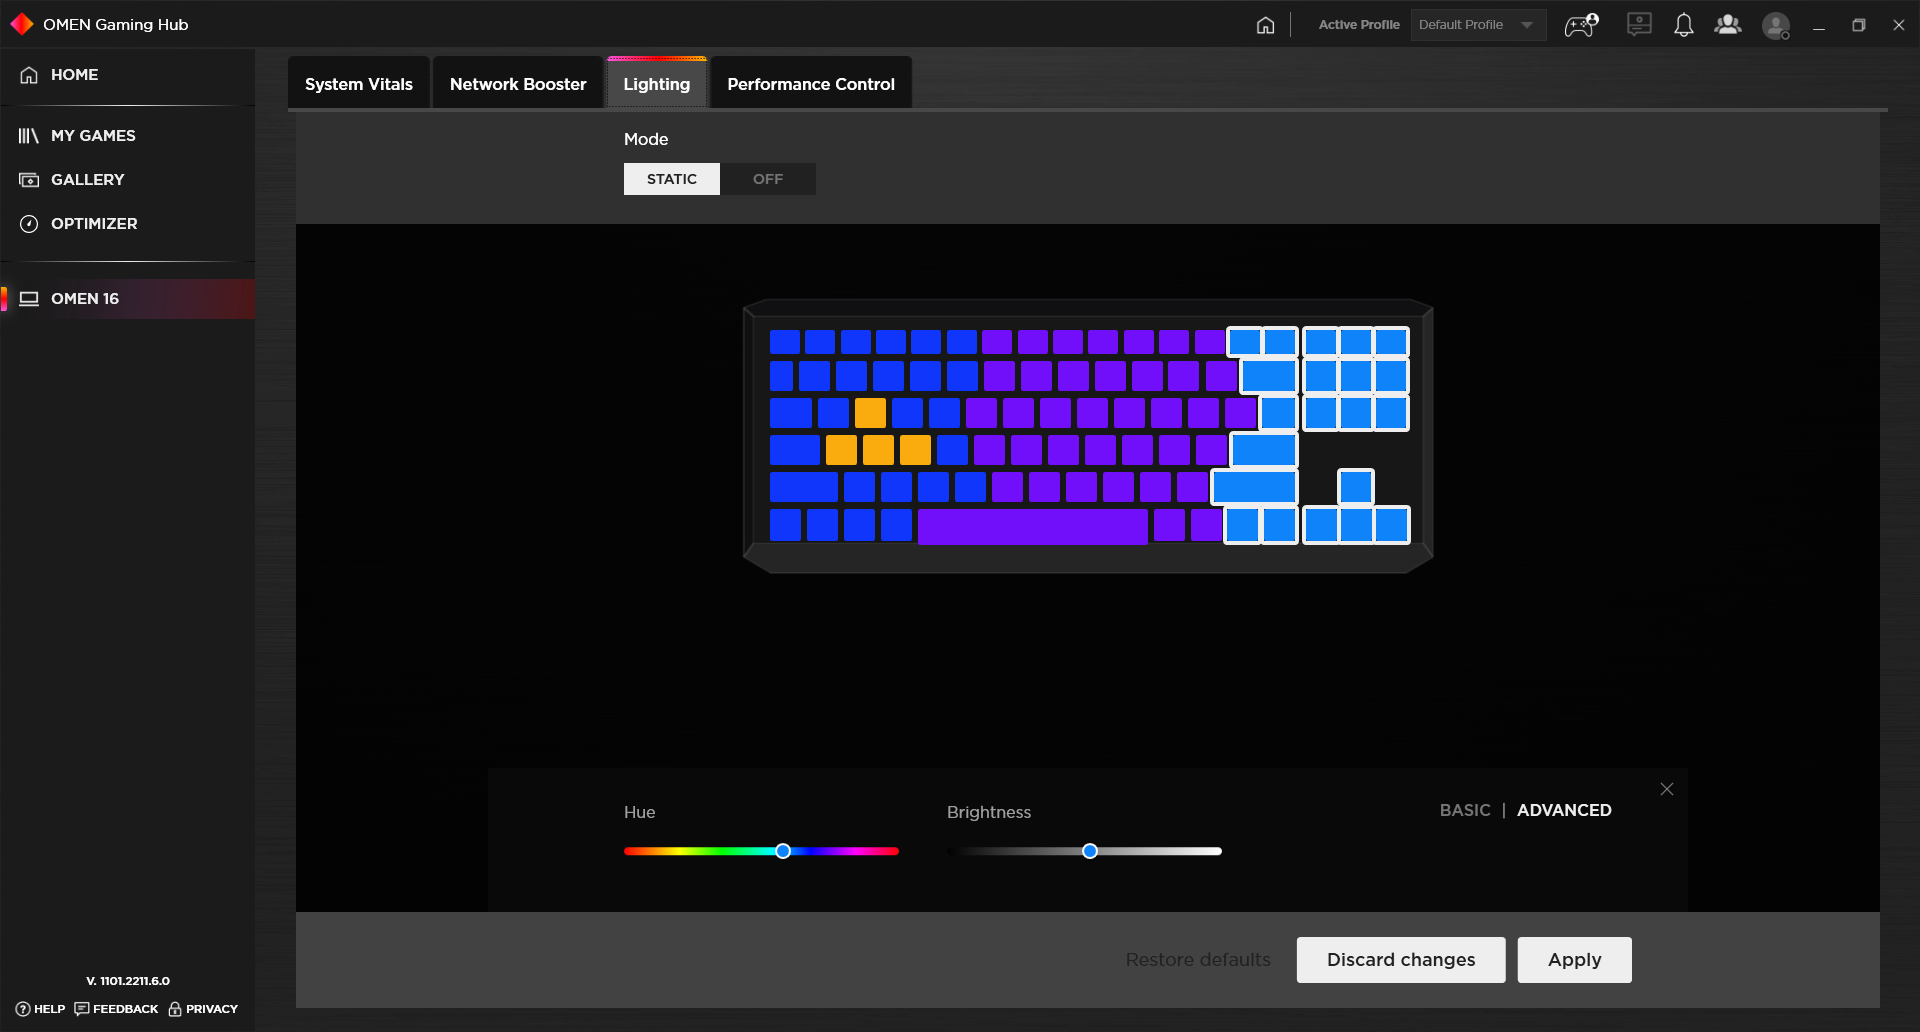
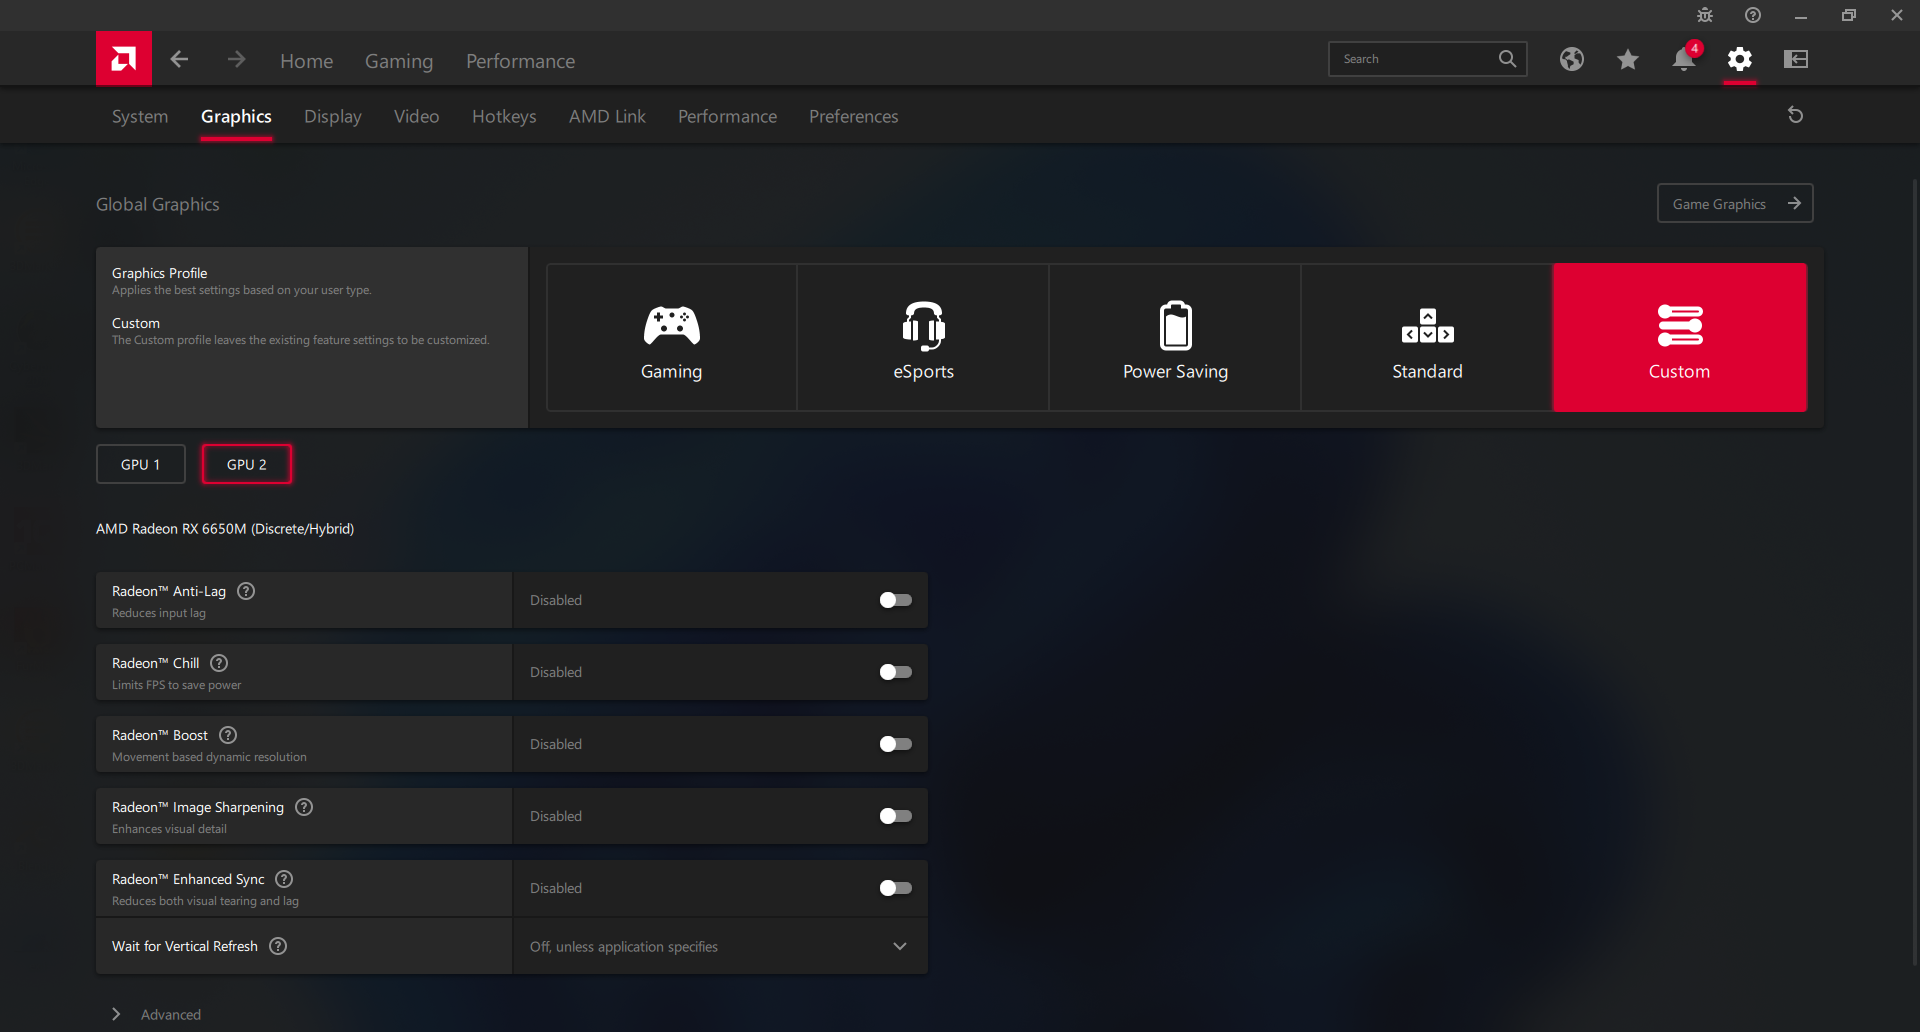
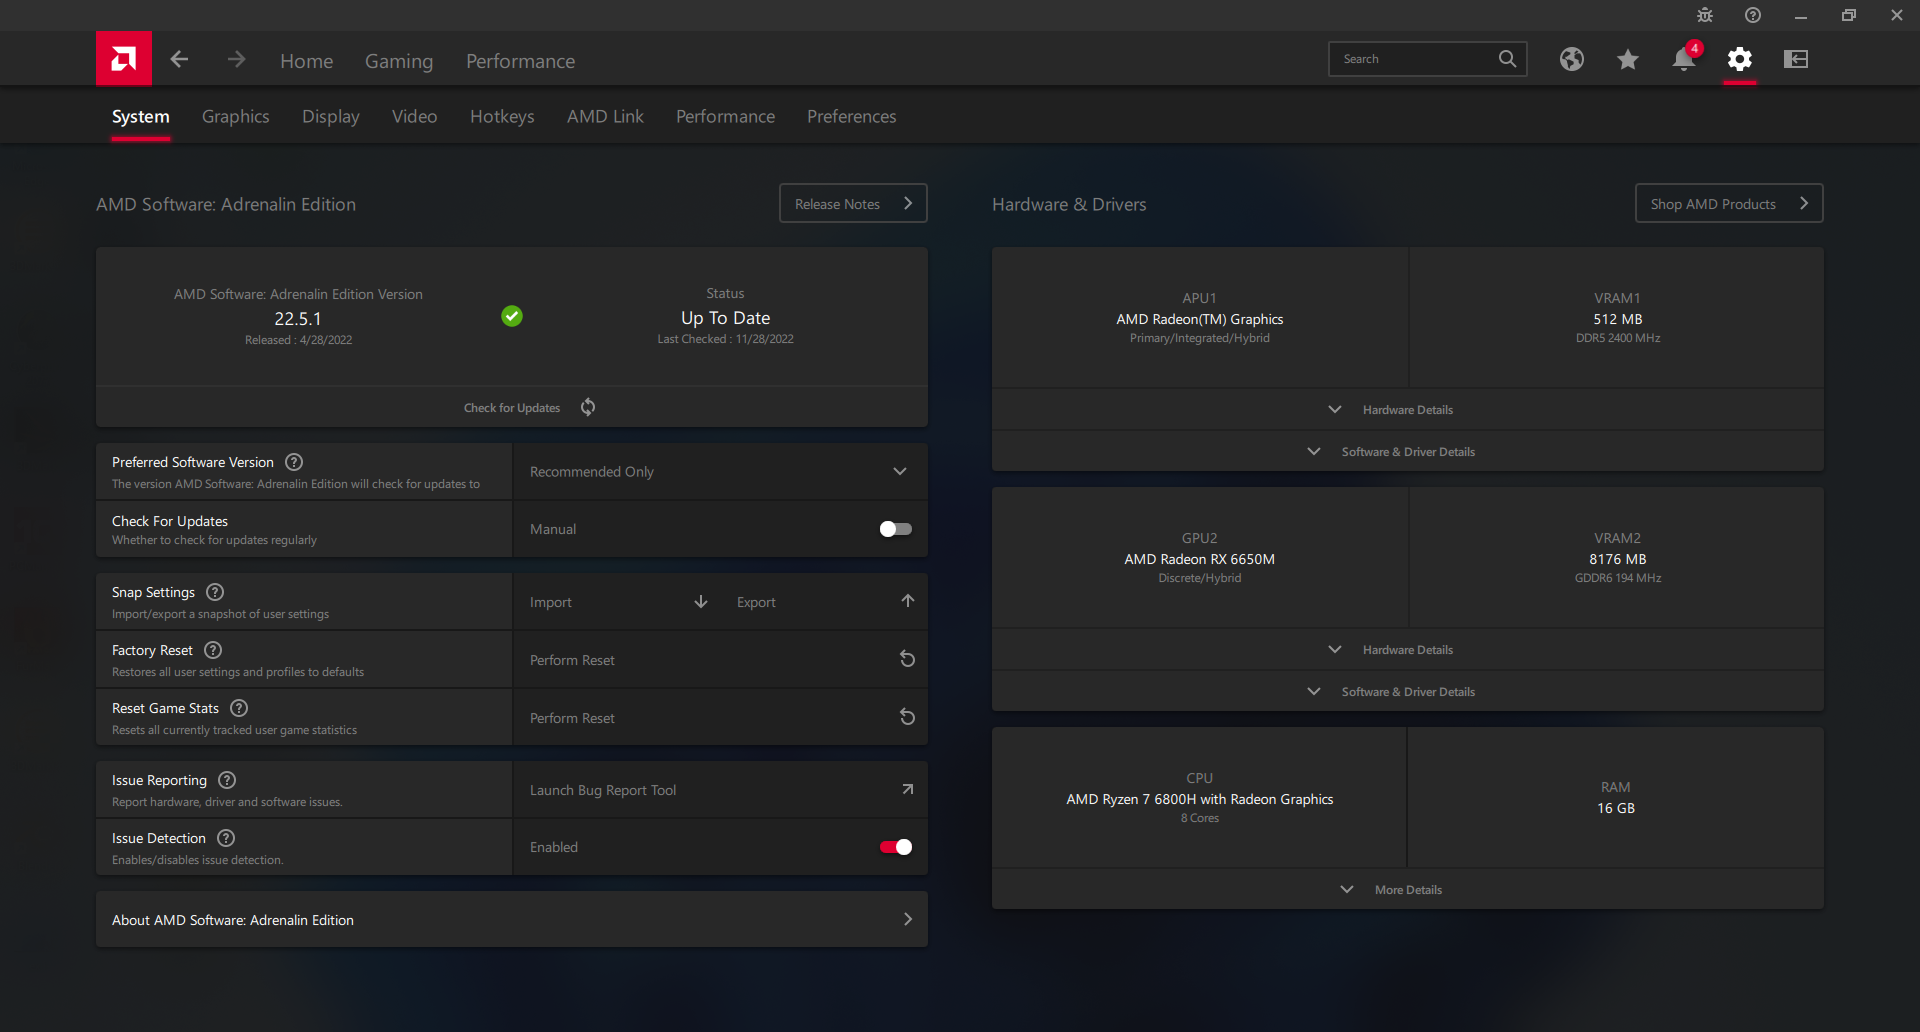
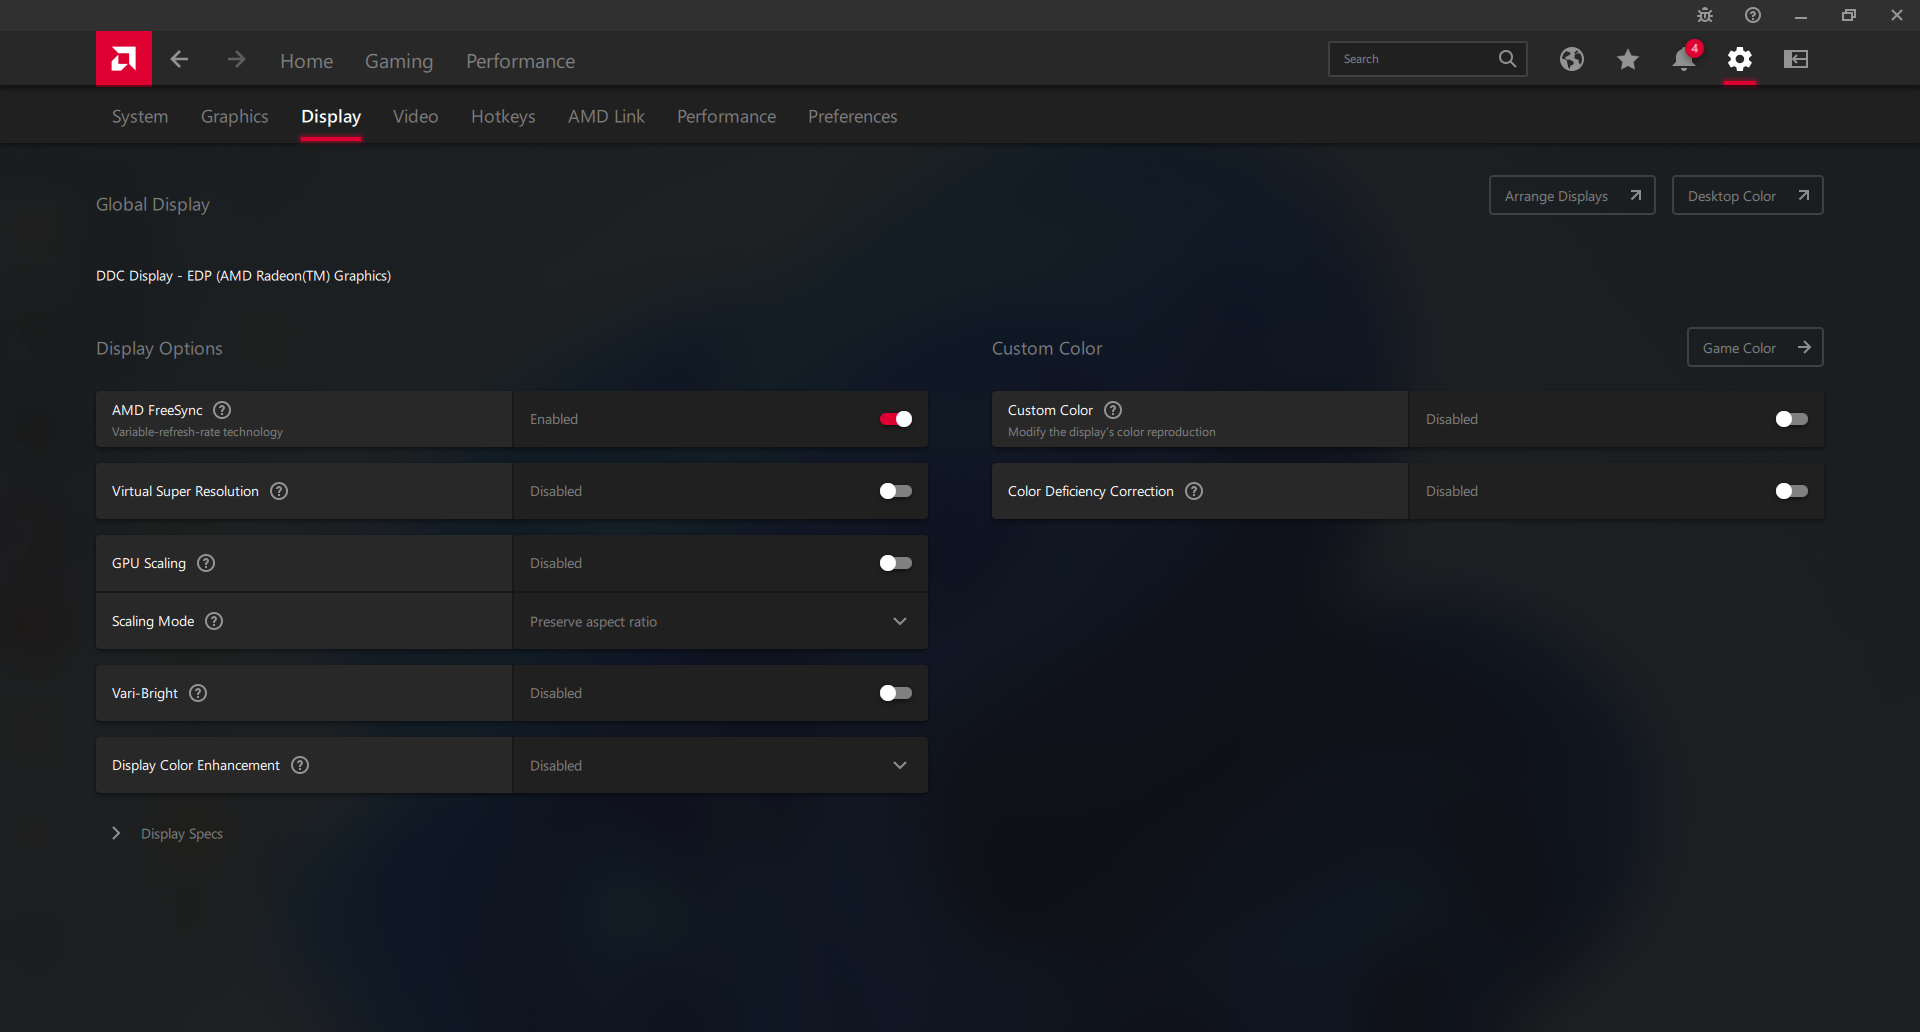
Abbiamo impostato la nostra unità in modalità "Migliori prestazioni" tramite Windows e in modalità "Prestazioni" tramite il software Omen Gaming Hub prima di eseguire i benchmark delle prestazioni riportati di seguito. Consigliamo vivamente di abituarsi a Omen Gaming Hub e alle applicazioni Radeon Adrenalin, in quanto sono entrambi hub di controllo per la regolazione dei profili di alimentazione, dell'illuminazione della tastiera, della sincronizzazione adattiva, di Vari-Bright e altro ancora, come mostrano gli screenshot qui sotto.
Non abbiamo trovato alcun interruttore MUX in nessun punto del portatile, né nella schermata del BIOS né nel software Omen Gaming Hub.
Processore
Le prestazioni della CPU grezza sono circa il 5% più lente rispetto alla media dei laptop del nostro database equipaggiati con lo stesso Ryzen 7H Ryzen 7 6800H ryzen 7 6800H. La nostra CPU è quindi solo il 10% più veloce del processore Ryzen 7 5800H e si tratta di un aggiornamento marginale rispetto all'anno precedente. La differenza maggiore tra i portatili Zen 3 e Zen 3+ risiede nelle soluzioni grafiche integrate, ma questo aspetto è quasi irrilevante nei portatili da gioco come l'Omen 16, poiché sono quasi sempre dotati di GPU dedicate più veloci.
Le prestazioni in single-thread e multi-thread sono più lente rispettivamente del 10% e del 25% rispetto al concorrente Core i7-12700H del Dell G16 7620. Optando per il più costoso Core i9-12900H Omen 16 aumenterebbe le prestazioni del 30-35% rispetto alla nostra SKU Ryzen.
Cinebench R15 Multi Loop
Cinebench R23: Multi Core | Single Core
Cinebench R15: CPU Multi 64Bit | CPU Single 64Bit
Blender: v2.79 BMW27 CPU
7-Zip 18.03: 7z b 4 | 7z b 4 -mmt1
Geekbench 5.5: Multi-Core | Single-Core
HWBOT x265 Benchmark v2.2: 4k Preset
LibreOffice : 20 Documents To PDF
R Benchmark 2.5: Overall mean
Cinebench R23: Multi Core | Single Core
Cinebench R15: CPU Multi 64Bit | CPU Single 64Bit
Blender: v2.79 BMW27 CPU
7-Zip 18.03: 7z b 4 | 7z b 4 -mmt1
Geekbench 5.5: Multi-Core | Single-Core
HWBOT x265 Benchmark v2.2: 4k Preset
LibreOffice : 20 Documents To PDF
R Benchmark 2.5: Overall mean
* ... Meglio usare valori piccoli
AIDA64: FP32 Ray-Trace | FPU Julia | CPU SHA3 | CPU Queen | FPU SinJulia | FPU Mandel | CPU AES | CPU ZLib | FP64 Ray-Trace | CPU PhotoWorxx
| Performance rating | |
| Lenovo Legion S7 16ARHA7 | |
| HP Omen 16-n0033dx | |
| Media AMD Ryzen 7 6800H | |
| Dell G16 7620 | |
| HP Envy 16 h0112nr | |
| HP Omen 16-b1090ng | |
| HP Victus 16-e0145ng | |
| AIDA64 / FP32 Ray-Trace | |
| Lenovo Legion S7 16ARHA7 | |
| HP Omen 16-n0033dx | |
| Media AMD Ryzen 7 6800H (12876 - 17031, n=8) | |
| Dell G16 7620 | |
| HP Envy 16 h0112nr | |
| HP Victus 16-e0145ng | |
| HP Omen 16-b1090ng | |
| AIDA64 / FPU Julia | |
| Lenovo Legion S7 16ARHA7 | |
| HP Omen 16-n0033dx | |
| Media AMD Ryzen 7 6800H (82673 - 105987, n=8) | |
| Dell G16 7620 | |
| HP Victus 16-e0145ng | |
| HP Envy 16 h0112nr | |
| HP Omen 16-b1090ng | |
| AIDA64 / CPU SHA3 | |
| Dell G16 7620 | |
| Lenovo Legion S7 16ARHA7 | |
| HP Omen 16-n0033dx | |
| Media AMD Ryzen 7 6800H (2886 - 3634, n=8) | |
| HP Envy 16 h0112nr | |
| HP Omen 16-b1090ng | |
| HP Victus 16-e0145ng | |
| AIDA64 / CPU Queen | |
| Lenovo Legion S7 16ARHA7 | |
| HP Omen 16-n0033dx | |
| Dell G16 7620 | |
| HP Envy 16 h0112nr | |
| HP Omen 16-b1090ng | |
| Media AMD Ryzen 7 6800H (75117 - 106322, n=8) | |
| HP Victus 16-e0145ng | |
| AIDA64 / FPU SinJulia | |
| Lenovo Legion S7 16ARHA7 | |
| HP Omen 16-n0033dx | |
| Media AMD Ryzen 7 6800H (11771 - 13120, n=8) | |
| Dell G16 7620 | |
| HP Omen 16-b1090ng | |
| HP Victus 16-e0145ng | |
| HP Envy 16 h0112nr | |
| AIDA64 / FPU Mandel | |
| Lenovo Legion S7 16ARHA7 | |
| HP Omen 16-n0033dx | |
| Media AMD Ryzen 7 6800H (45287 - 58327, n=8) | |
| HP Victus 16-e0145ng | |
| Dell G16 7620 | |
| HP Envy 16 h0112nr | |
| HP Omen 16-b1090ng | |
| AIDA64 / CPU AES | |
| Lenovo Legion S7 16ARHA7 | |
| HP Omen 16-n0033dx | |
| Media AMD Ryzen 7 6800H (67816 - 137383, n=8) | |
| HP Envy 16 h0112nr | |
| HP Omen 16-b1090ng | |
| Dell G16 7620 | |
| HP Victus 16-e0145ng | |
| AIDA64 / CPU ZLib | |
| Dell G16 7620 | |
| HP Omen 16-b1090ng | |
| Lenovo Legion S7 16ARHA7 | |
| HP Omen 16-n0033dx | |
| Media AMD Ryzen 7 6800H (732 - 901, n=8) | |
| HP Envy 16 h0112nr | |
| HP Victus 16-e0145ng | |
| AIDA64 / FP64 Ray-Trace | |
| Lenovo Legion S7 16ARHA7 | |
| HP Omen 16-n0033dx | |
| Media AMD Ryzen 7 6800H (6917 - 8980, n=8) | |
| Dell G16 7620 | |
| HP Envy 16 h0112nr | |
| HP Victus 16-e0145ng | |
| HP Omen 16-b1090ng | |
| AIDA64 / CPU PhotoWorxx | |
| HP Omen 16-b1090ng | |
| HP Envy 16 h0112nr | |
| Dell G16 7620 | |
| Media AMD Ryzen 7 6800H (26496 - 30360, n=8) | |
| Lenovo Legion S7 16ARHA7 | |
| HP Omen 16-n0033dx | |
| HP Victus 16-e0145ng | |
Prestazioni del sistema
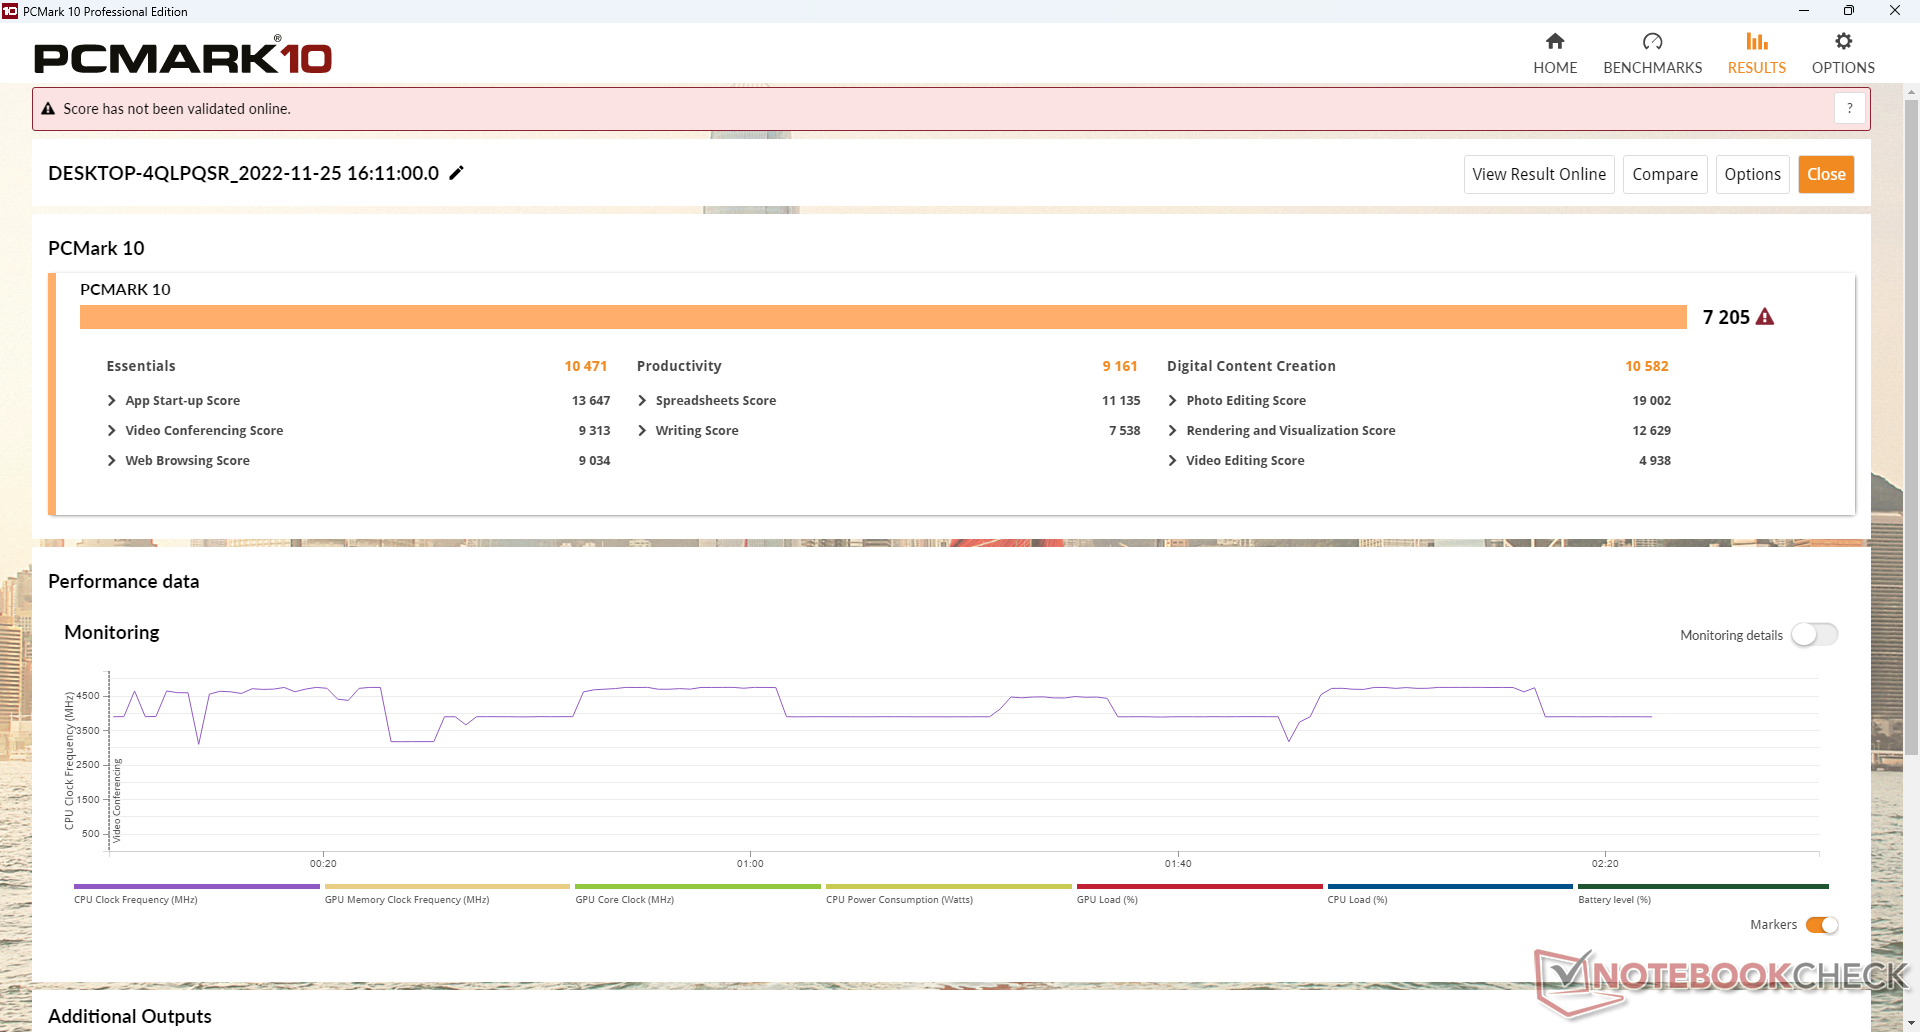
I punteggi di PCMark sono paragonabili a quelli dei più recenti laptop da gioco con CPU Intel di 12a generazione e GPU Nvidia GeForce RTX. I risultati sono costantemente superiori a quelli del Victus 16 che è una serie da gioco più economica di HP.
CrossMark: Overall | Productivity | Creativity | Responsiveness
| PCMark 10 / Score | |
| Lenovo Legion S7 16ARHA7 | |
| HP Envy 16 h0112nr | |
| HP Omen 16-b1090ng | |
| Dell G16 7620 | |
| HP Omen 16-n0033dx | |
| HP Victus 16-e0145ng | |
| PCMark 10 / Essentials | |
| HP Envy 16 h0112nr | |
| Lenovo Legion S7 16ARHA7 | |
| HP Omen 16-n0033dx | |
| Dell G16 7620 | |
| HP Omen 16-b1090ng | |
| HP Victus 16-e0145ng | |
| PCMark 10 / Productivity | |
| Lenovo Legion S7 16ARHA7 | |
| HP Omen 16-b1090ng | |
| HP Envy 16 h0112nr | |
| HP Omen 16-n0033dx | |
| Dell G16 7620 | |
| HP Victus 16-e0145ng | |
| PCMark 10 / Digital Content Creation | |
| Lenovo Legion S7 16ARHA7 | |
| Dell G16 7620 | |
| HP Omen 16-b1090ng | |
| HP Envy 16 h0112nr | |
| HP Omen 16-n0033dx | |
| HP Victus 16-e0145ng | |
| CrossMark / Overall | |
| HP Envy 16 h0112nr | |
| Dell G16 7620 | |
| Lenovo Legion S7 16ARHA7 | |
| HP Omen 16-n0033dx | |
| CrossMark / Productivity | |
| HP Envy 16 h0112nr | |
| Dell G16 7620 | |
| Lenovo Legion S7 16ARHA7 | |
| HP Omen 16-n0033dx | |
| CrossMark / Creativity | |
| HP Envy 16 h0112nr | |
| Dell G16 7620 | |
| Lenovo Legion S7 16ARHA7 | |
| HP Omen 16-n0033dx | |
| CrossMark / Responsiveness | |
| Dell G16 7620 | |
| HP Envy 16 h0112nr | |
| Lenovo Legion S7 16ARHA7 | |
| HP Omen 16-n0033dx | |
| PCMark 10 Score | 7205 punti | |
Aiuto | ||
| AIDA64 / Memory Copy | |
| HP Omen 16-b1090ng | |
| HP Envy 16 h0112nr | |
| Dell G16 7620 | |
| Media AMD Ryzen 7 6800H (48209 - 51186, n=8) | |
| Lenovo Legion S7 16ARHA7 | |
| HP Omen 16-n0033dx | |
| HP Victus 16-e0145ng | |
| AIDA64 / Memory Read | |
| HP Omen 16-b1090ng | |
| HP Envy 16 h0112nr | |
| Dell G16 7620 | |
| Lenovo Legion S7 16ARHA7 | |
| HP Omen 16-n0033dx | |
| Media AMD Ryzen 7 6800H (43828 - 51778, n=8) | |
| HP Victus 16-e0145ng | |
| AIDA64 / Memory Write | |
| HP Omen 16-b1090ng | |
| HP Envy 16 h0112nr | |
| Dell G16 7620 | |
| Lenovo Legion S7 16ARHA7 | |
| HP Omen 16-n0033dx | |
| Media AMD Ryzen 7 6800H (51116 - 55307, n=8) | |
| HP Victus 16-e0145ng | |
| AIDA64 / Memory Latency | |
| Dell G16 7620 | |
| HP Envy 16 h0112nr | |
| HP Omen 16-b1090ng | |
| Media AMD Ryzen 7 6800H (83.1 - 104.1, n=8) | |
| HP Omen 16-n0033dx | |
| Lenovo Legion S7 16ARHA7 | |
| HP Victus 16-e0145ng | |
* ... Meglio usare valori piccoli
Latenza DPC
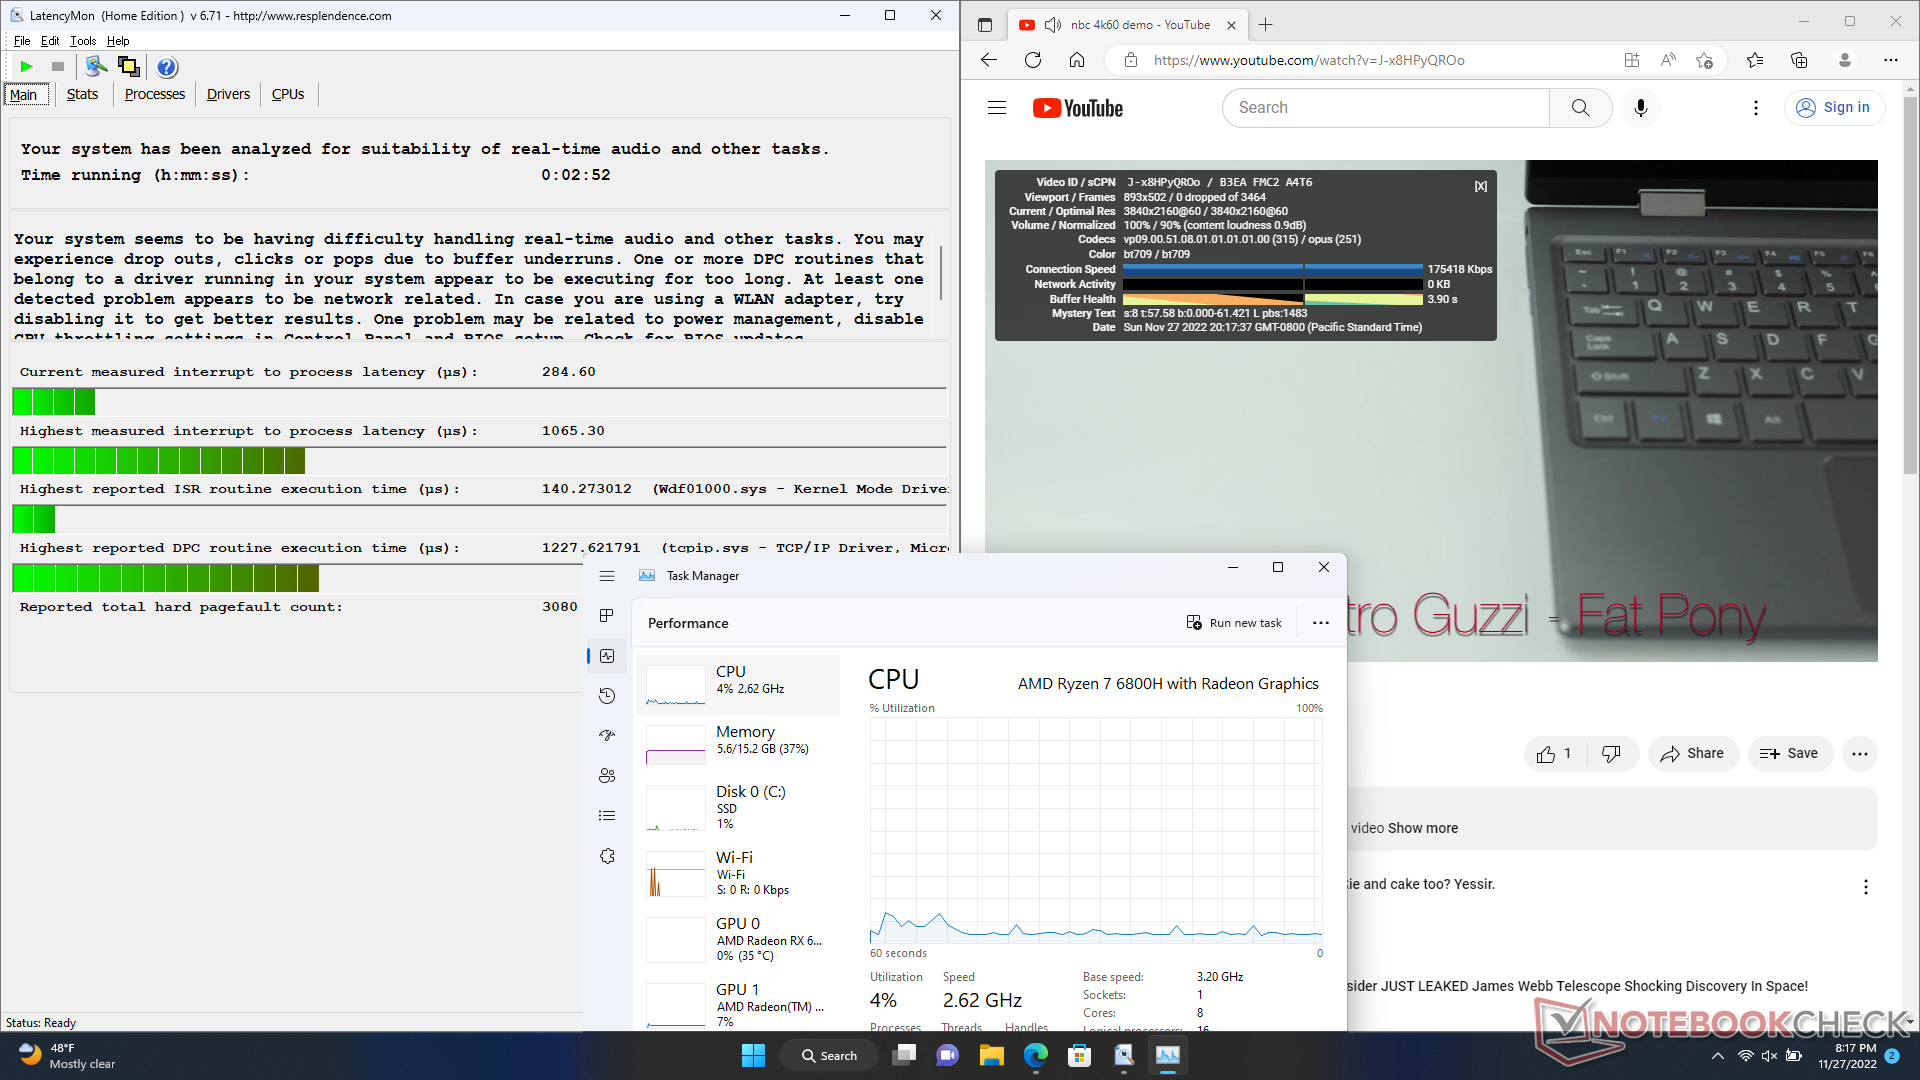
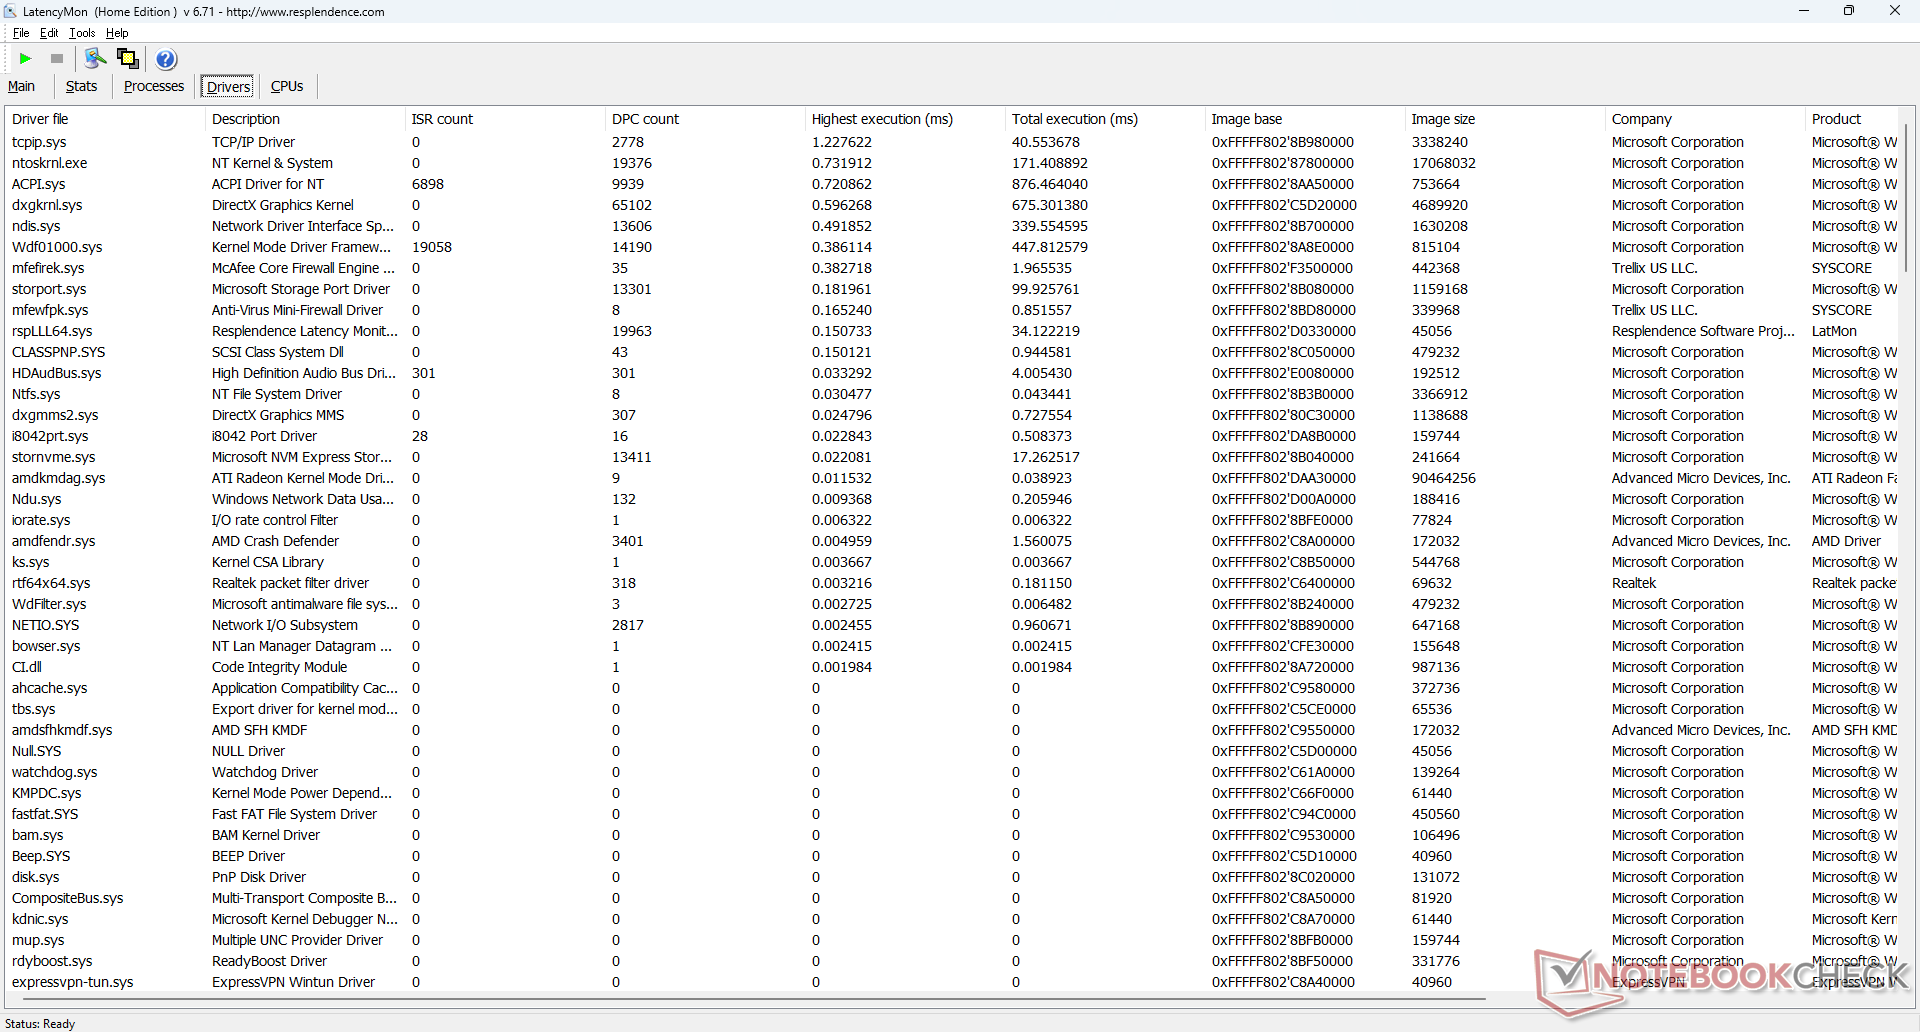
LatencyMon rivela problemi di DPC quando si aprono più schede del browser sulla nostra homepage. la riproduzione di video 4K a 60 FPS è invece perfetta, con un basso utilizzo della CPU/GPU e nessuna caduta di fotogrammi.
| DPC Latencies / LatencyMon - interrupt to process latency (max), Web, Youtube, Prime95 | |
| HP Omen 16-n0033dx | |
| Lenovo Legion S7 16ARHA7 | |
| Dell G16 7620 | |
| HP Victus 16-e0145ng | |
| HP Envy 16 h0112nr | |
| HP Omen 16-b1090ng | |
* ... Meglio usare valori piccoli
Dispositivi di archiviazione - Fino a due SSD PCIe4 x4 NVMe
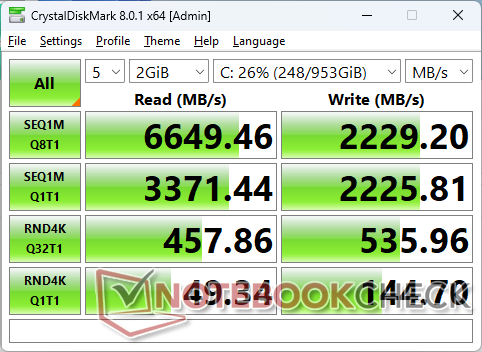
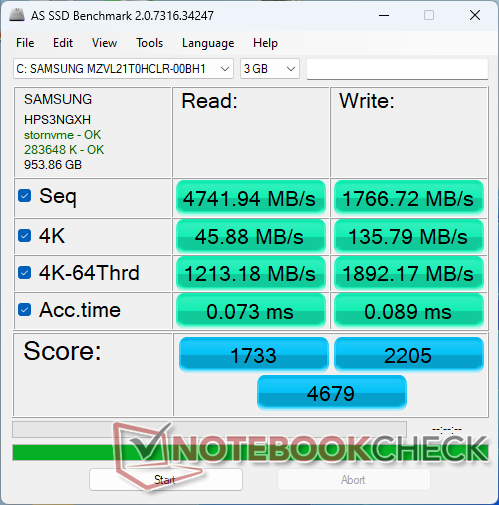
La nostra unità di prova viene fornita con un disco da 1 TB Samsung PM9A1 Che promette velocità di lettura e scrittura sequenziali di 7000 MB/s e 5100 MB/s, rispettivamente. Il sistema è in grado di mantenere una velocità di lettura reale di circa 6700 MB/s per un tempo indefinito, ma di tanto in tanto l'unità scendeva fino a 3000 MB/s prima di risalire, come dimostrano i risultati del nostro loop test qui sotto. Probabilmente si tratta di un bug del sistema e non di una misura di limitazione delle prestazioni. Ciascuno dei due slot M.2 2280 ha il proprio pad termico per dissipare il calore sul pannello inferiore in metallo e quindi il surriscaldamento dell'SSD non dovrebbe essere un problema.

| Drive Performance rating - Percent | |
| Dell G16 7620 | |
| HP Omen 16-b1090ng | |
| Lenovo Legion S7 16ARHA7 | |
| HP Envy 16 h0112nr | |
| HP Victus 16-e0145ng | |
| HP Omen 16-n0033dx | |
* ... Meglio usare valori piccoli
Disk Throttling: DiskSpd Read Loop, Queue Depth 8
Prestazioni della GPU - Meglio della RTX 3060 di GeForce
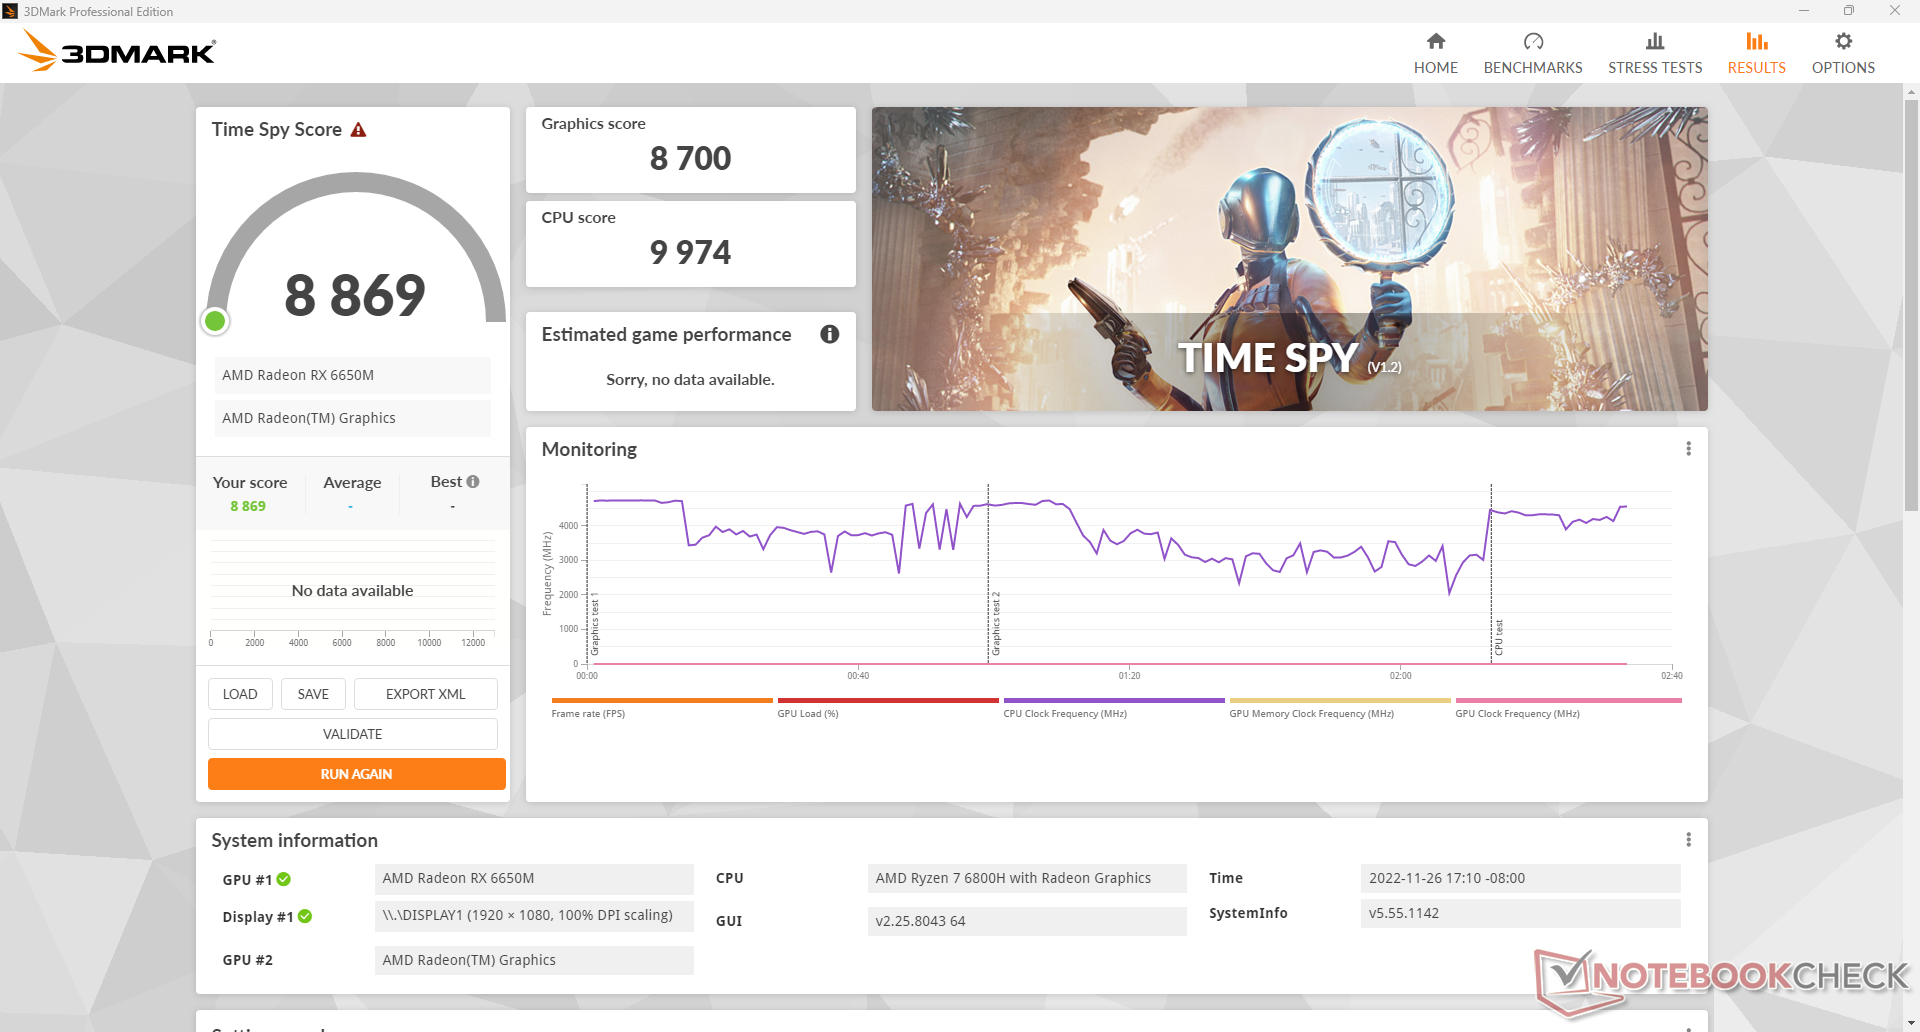
La Radeon RX 6650M si colloca tra le schede grafiche GeForce RTX 3060 mobile e GeForce RTX 3070 mobile quando si tratta di prestazioni. Purtroppo, però, è più vicina alla RTX 3060 che alla RTX 3070, per cui gli utenti dovrebbero aspettarsi frame rate superiori solo del 5-10% rispetto alla media dei laptop RTX 3060 quando giocano alla maggior parte dei giochi.
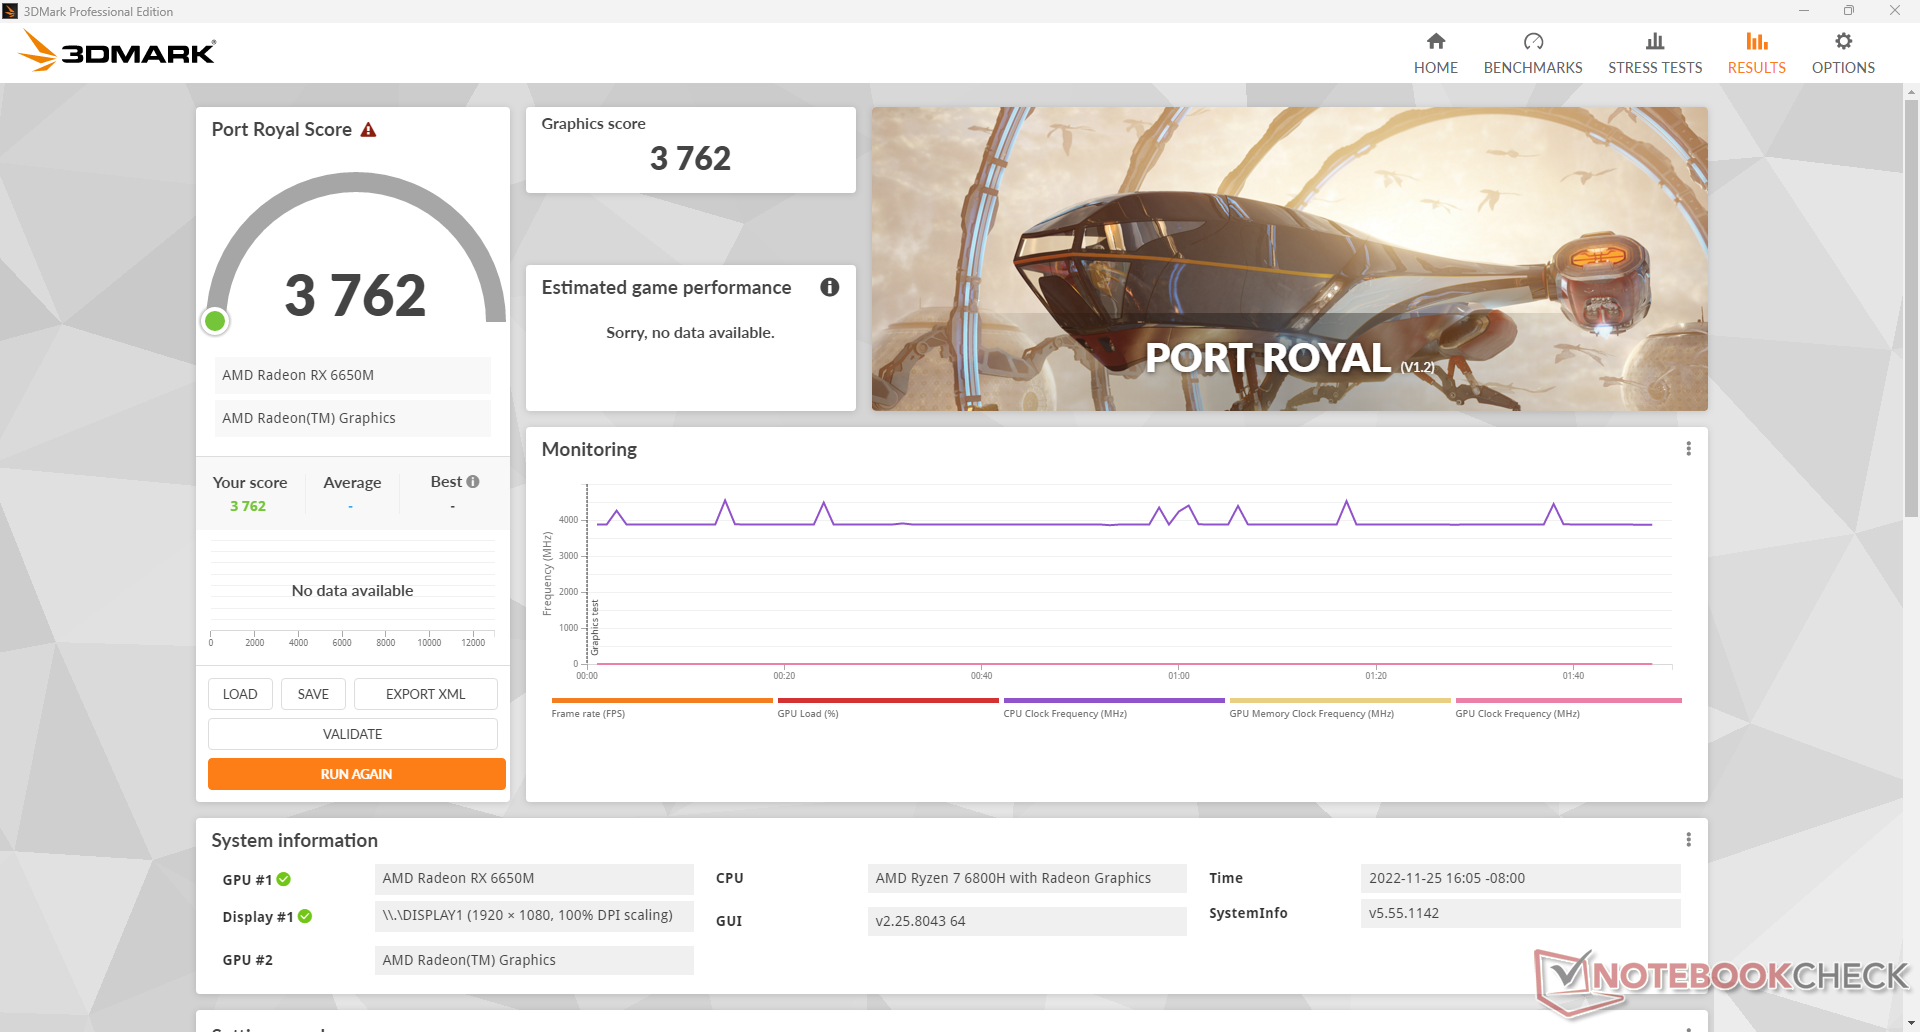
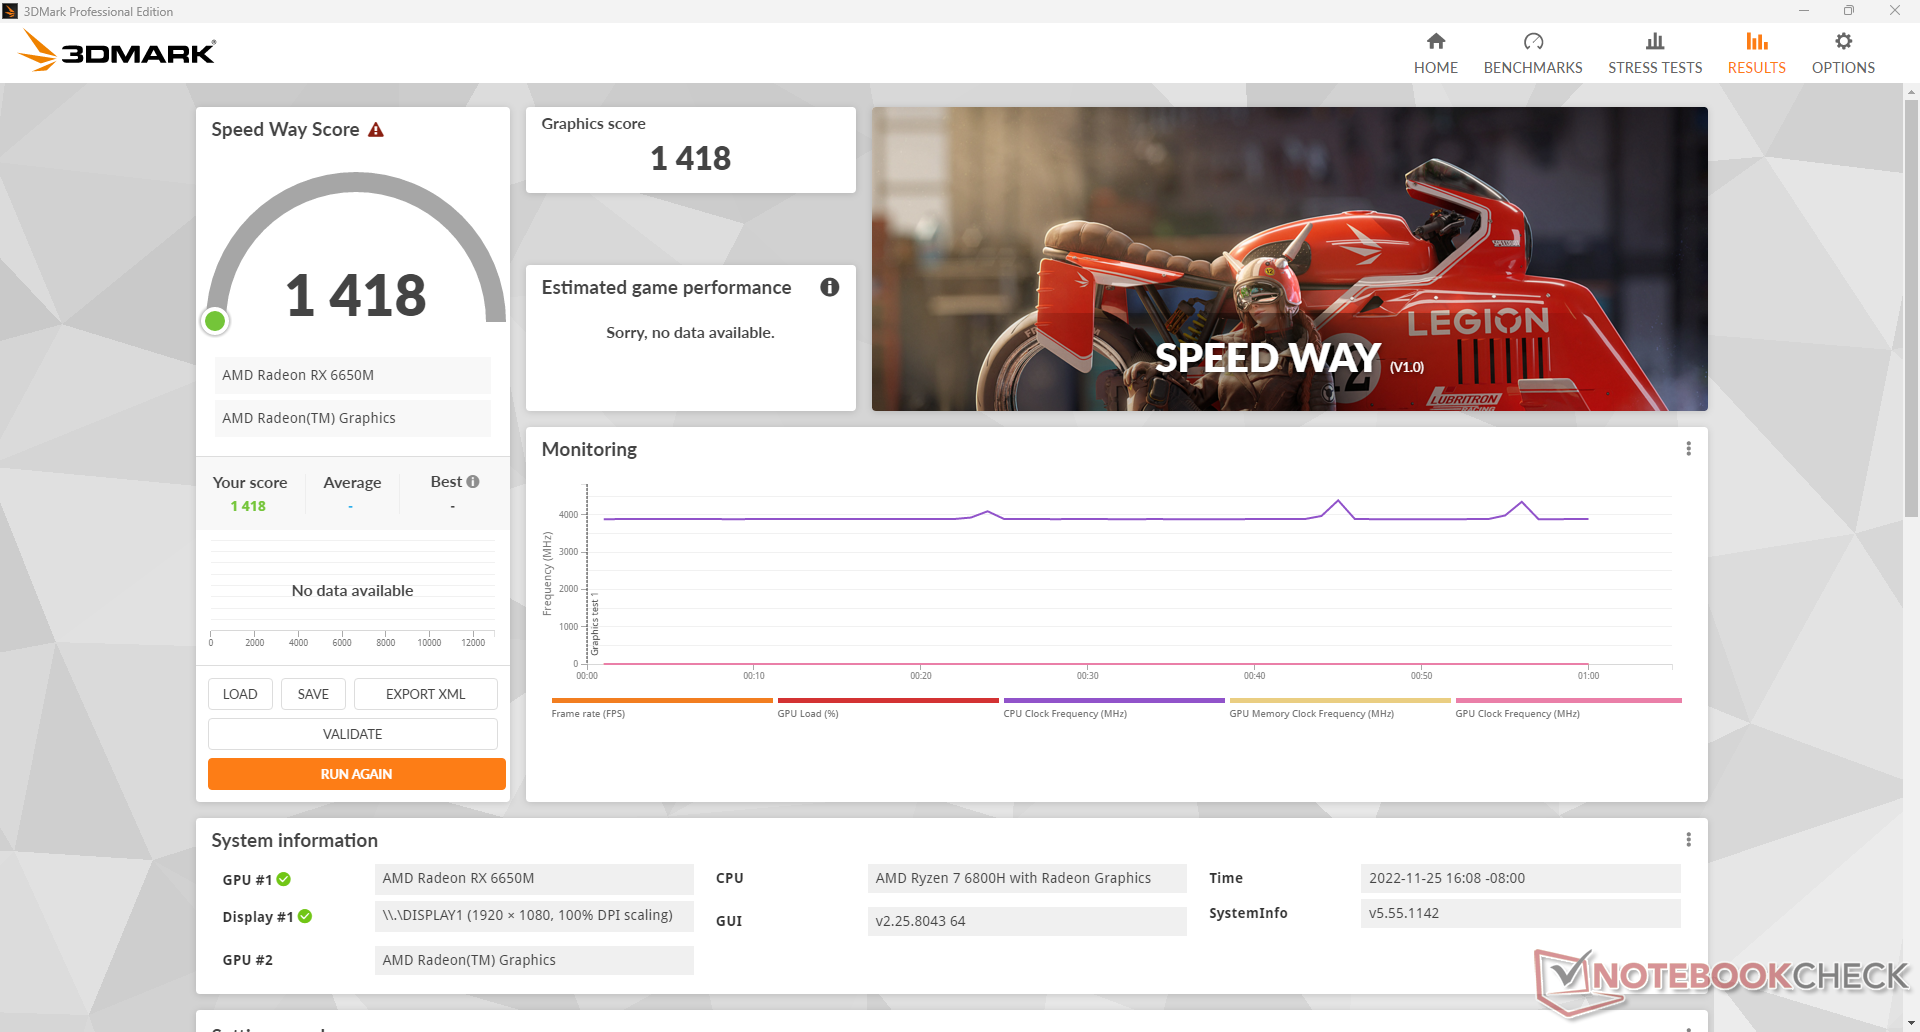
Sebbene la Radeon RX 6650M superi leggermente i laptop RTX 3060 per quanto riguarda le prestazioni di rasterizzazione, è significativamente più lenta quando si tratta di prestazioni di ray-tracing in tempo reale. i risultati di 3DMark Port Royal sono inferiori di quasi il 30% rispetto al Dell G16 con RTX 3060. Per testare questo dato su un gioco reale, abbiamo eseguito F1 22 a 1080p con e senza RT sul nostro laptop HP alimentato da AMD. Quando l'RT è disattivato, i frame rate sono costantemente superiori a quelli di qualsiasi laptop RTX 3060. Quando l'RT è disattivato, i frame rate scendono a circa il 15% in meno rispetto agli stessi laptop RTX 3060. Se le prestazioni RT sono importanti per voi, allora dovrete sicuramente prendere in considerazione una SKU Nvidia.
L'esecuzione in modalità Balanced anziché Performance riduce le prestazioni della GPU di circa l'11%.
Purtroppo la GPU non è esente da problemi. Il rendering di Blender HIP e Horizon Zero Dawn, ad esempio, hanno mandato in crash il programma e hanno avuto problemi di avvio, rispettivamente, nonostante l'utilizzo dei driver grafici più recenti al momento della recensione.
Ulteriori dettagli tecnici e benchmark sono disponibili nella nostra pagina dedicata alla Radeon RX 6650M qui.
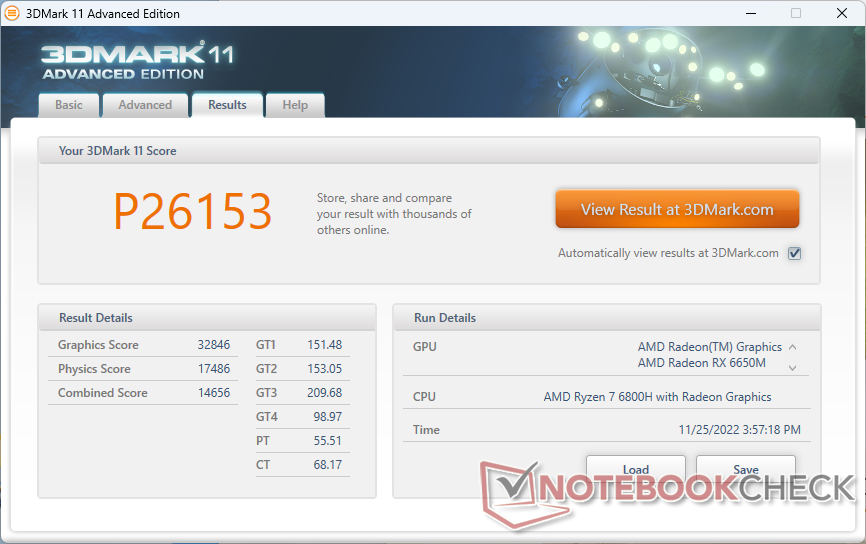
| 3DMark 11 Performance | 26153 punti | |
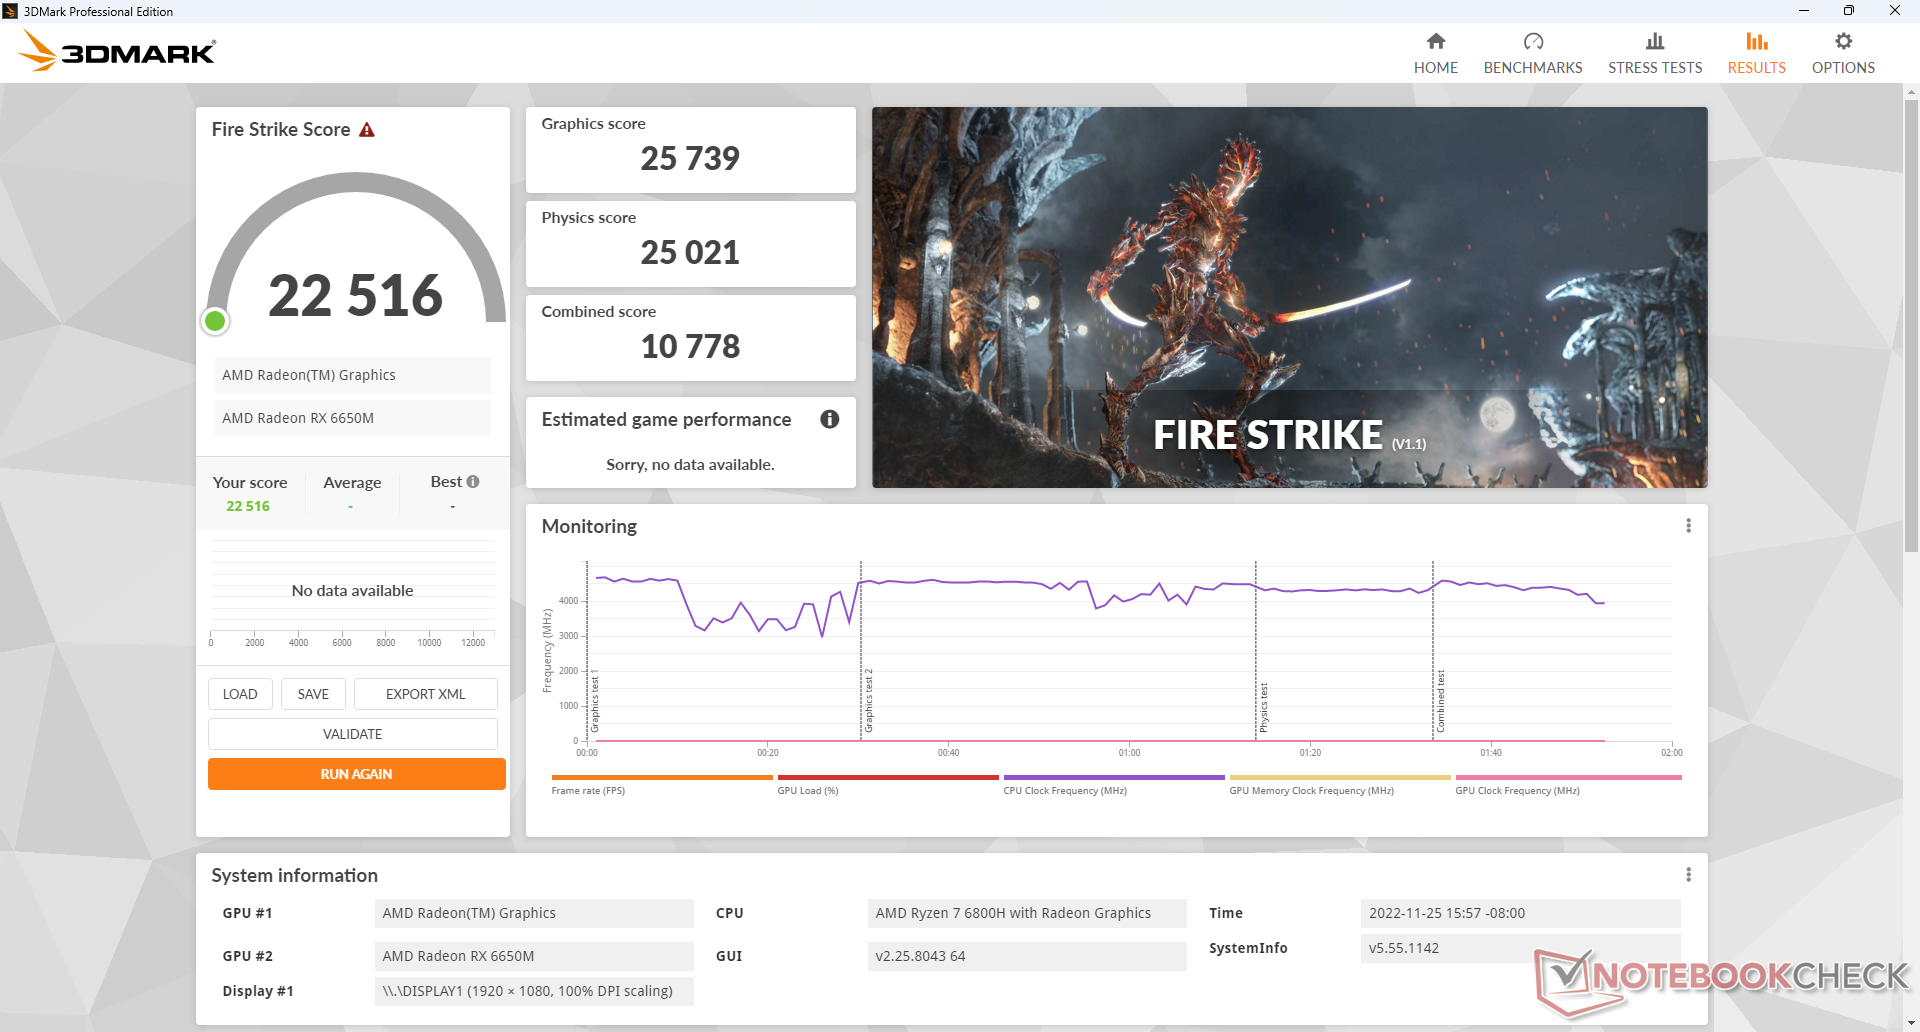
| 3DMark Fire Strike Score | 22516 punti | |
| 3DMark Time Spy Score | 8869 punti | |
Aiuto | ||
| Blender - v3.3 Classroom CPU | |
| HP Envy 16 h0112nr | |
| HP Omen 16-n0033dx | |
| Lenovo Legion S7 16ARHA7 | |
| Dell G16 7620 | |
| Lenovo Legion 7 16IAX7-82TD004SGE | |
* ... Meglio usare valori piccoli
Il frame rate al minimo su Witcher 3 è generalmente stabile, salvo un breve calo a 13 FPS. Questo potrebbe essere dovuto a un bug o a una scarsa priorità delle attività in background, simile ai cali di prestazioni osservati in precedenza durante lo stress test dell'SSD.
Witcher 3 FPS Chart
| basso | medio | alto | ultra | |
|---|---|---|---|---|
| The Witcher 3 (2015) | 276.5 | 217.4 | 167 | 90.1 |
| Dota 2 Reborn (2015) | 141 | 130.7 | 118 | 100 |
| Overwatch (2016) | 507.9 | 481.9 | 350.9 | 150 |
| Fortnite (2018) | 95.5 | 54.1 | 46 | 40.4 |
| Final Fantasy XV Benchmark (2018) | 164.7 | 113.3 | 83.2 | |
| X-Plane 11.11 (2018) | 66.4 | 52.7 | 46.4 | |
| Strange Brigade (2018) | 337 | 222 | 190 | 167.2 |
| Metro Exodus (2019) | 138.8 | 111.5 | 81 | 65.8 |
| Borderlands 3 (2019) | 110.4 | 95.9 | 85.2 | 67.4 |
| Gears Tactics (2020) | 162.8 | 205.9 | 124.2 | 100.4 |
| Watch Dogs Legion (2020) | 109 | 104 | 94 | 62 |
| Dirt 5 (2020) | 236.6 | 135.4 | 109.1 | 83.6 |
| Hitman 3 (2021) | 224.8 | 178.8 | 165.5 | 156.3 |
| F1 2021 (2021) | 315 | 247 | 216 | 100 |
| Far Cry 6 (2021) | 111 | 105 | 96 | 88 |
| Guardians of the Galaxy (2021) | 117 | 110 | 111 | 105 |
| God of War (2022) | 69.3 | 68.4 | 64.3 | 51.5 |
| Cyberpunk 2077 1.6 (2022) | 126.8 | 106.3 | 78.9 | 63.8 |
| F1 22 (2022) | 217 | 215 | 178.2 | 40.6 |
Emissioni
Rumore del sistema - Forte in modalità prestazioni
Le ventole interne sono sempre attive con un minimo di 27 dB(A) a fronte di uno sfondo silenzioso di 24 dB(A). Tuttavia, sono brave a rimanere silenziose per lunghi periodi di stress, quindi gli impulsi RPM si verificano molto meno frequentemente durante la navigazione web o lo streaming video.
Il rumore della ventola è legato al profilo di potenza quando si gioca. Eseguendo Witcher 3 in modalità Balanced, ad esempio, il rumore della ventola è di soli 39,4 dB(A) contro i 54,1 dB(A) della modalità Performance. La fascia media di 50 dB(A) è notevolmente più rumorosa di quella del Dell G16 in condizioni simili. Gli utenti devono sopportare le ventole molto più rumorose se desiderano far funzionare la GPU al suo massimo obiettivo TGP.
Rumorosità
| Idle |
| 27.4 / 27.4 / 28.9 dB(A) |
| Sotto carico |
| 32.3 / 57.6 dB(A) |
 | ||
30 dB silenzioso 40 dB(A) udibile 50 dB(A) rumoroso |
||
min: | ||
| HP Omen 16-n0033dx Radeon RX 6650M, R7 6800H, Samsung PM9A1 MZVL21T0HCLR | HP Envy 16 h0112nr GeForce RTX 3060 Laptop GPU, i7-12700H, Micron 3400 1TB MTFDKBA1T0TFH | HP Omen 16-b1090ng GeForce RTX 3070 Ti Laptop GPU, i7-12700H, WDC PC SN810 1TB | HP Victus 16-e0145ng GeForce RTX 3050 Ti Laptop GPU, R5 5600H, Samsung SSD PM981a MZVLB512HBJQ | Lenovo Legion S7 16ARHA7 Radeon RX 6800S, R9 6900HX, SK Hynix HFS001TEJ9X115N | Dell G16 7620 GeForce RTX 3060 Laptop GPU, i7-12700H, WDC PC SN810 512GB | |
|---|---|---|---|---|---|---|
| Noise | 3% | -13% | -6% | 11% | 3% | |
| off /ambiente * (dB) | 24.2 | 22.8 6% | 26 -7% | 26 -7% | 23.1 5% | 23.2 4% |
| Idle Minimum * (dB) | 27.4 | 22.9 16% | 30 -9% | 26 5% | 23.1 16% | 28.3 -3% |
| Idle Average * (dB) | 27.4 | 22.9 16% | 31 -13% | 28 -2% | 23.1 16% | 28.8 -5% |
| Idle Maximum * (dB) | 28.9 | 30.5 -6% | 33 -14% | 34 -18% | 23.1 20% | 28.9 -0% |
| Load Average * (dB) | 32.3 | 41.4 -28% | 49 -52% | 44 -36% | 31.4 3% | 32.4 -0% |
| Witcher 3 ultra * (dB) | 54.1 | 51.1 6% | 53 2% | 48 11% | 51.4 5% | 48.3 11% |
| Load Maximum * (dB) | 57.6 | 51.4 11% | 57 1% | 53 8% | 51.2 11% | 48.1 16% |
* ... Meglio usare valori piccoli
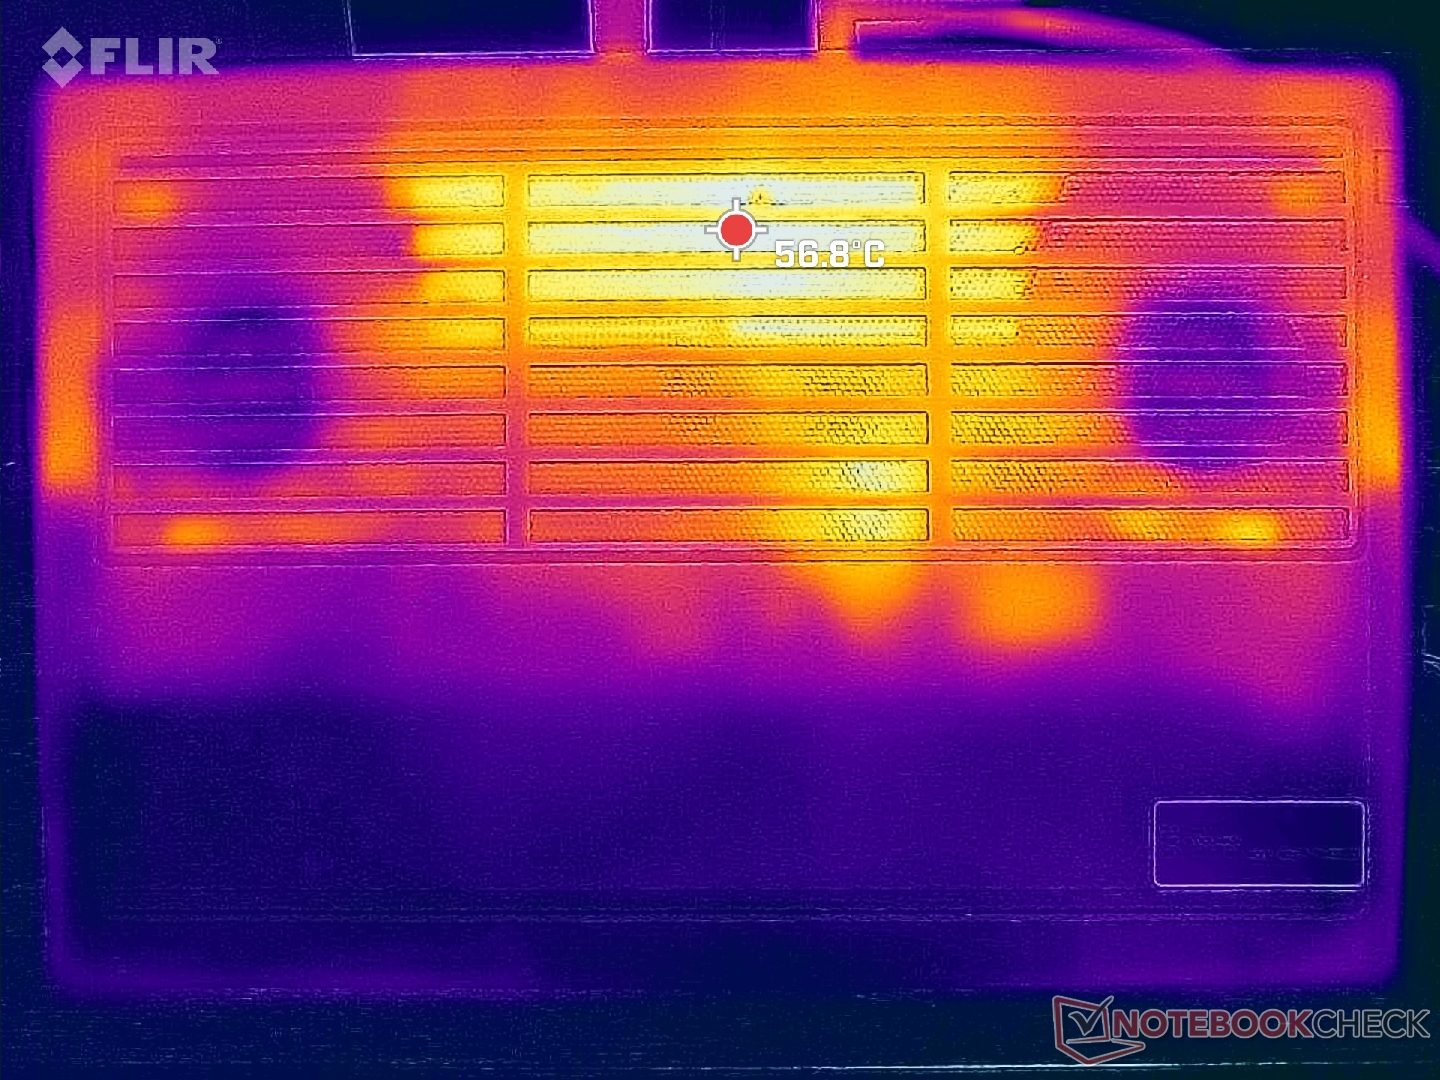
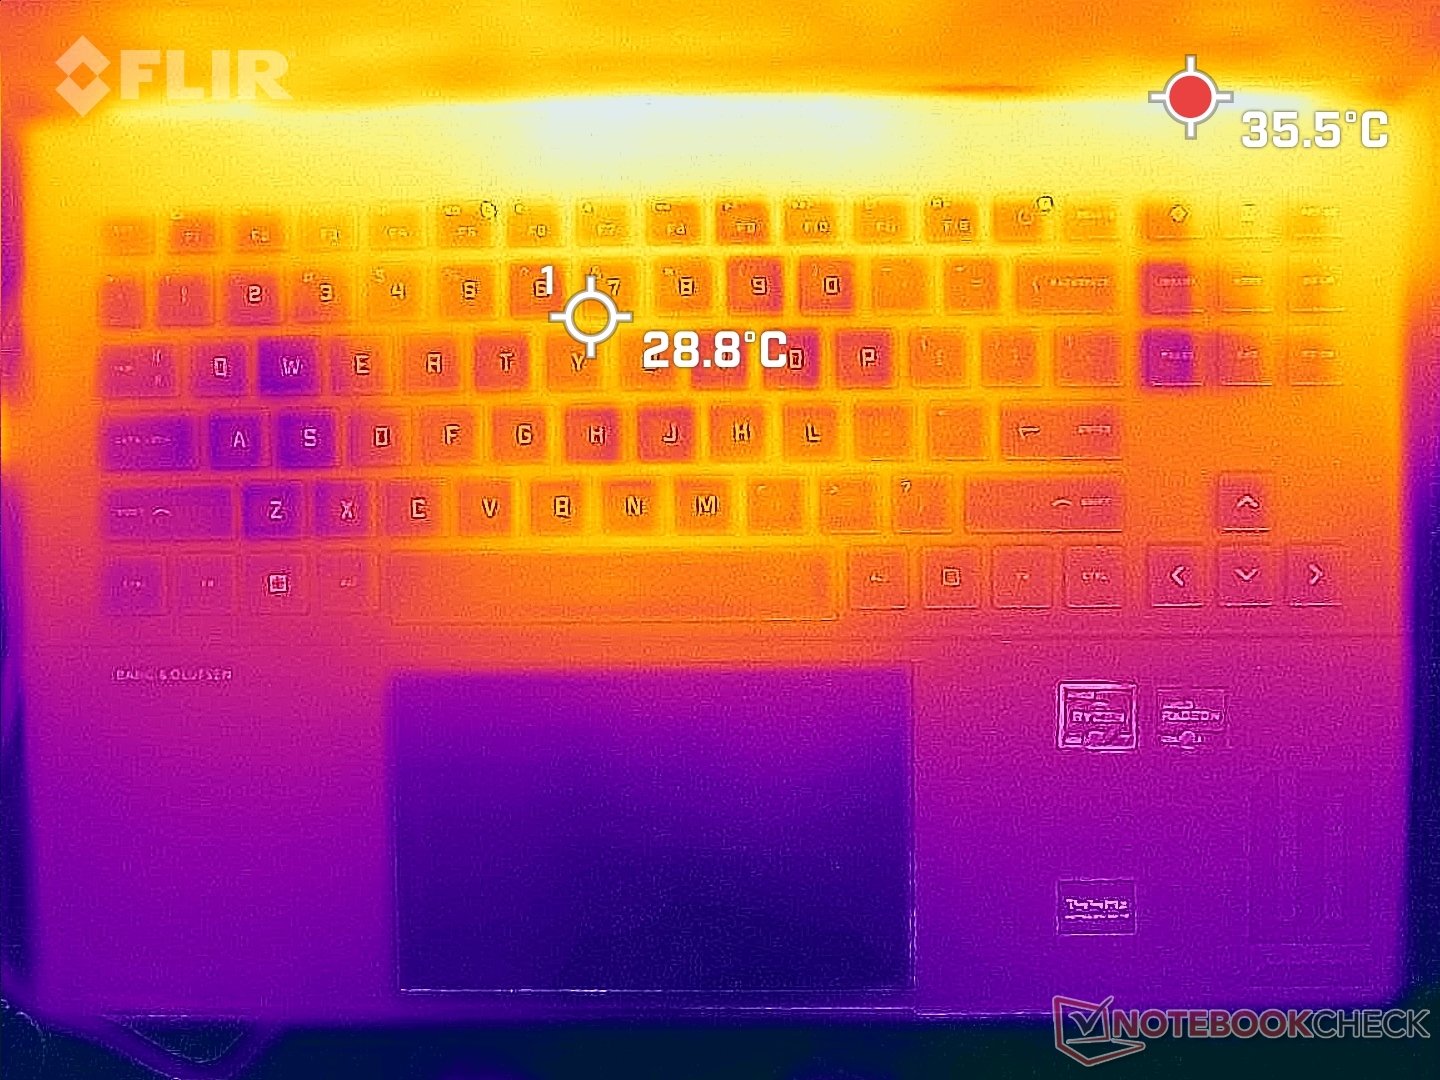
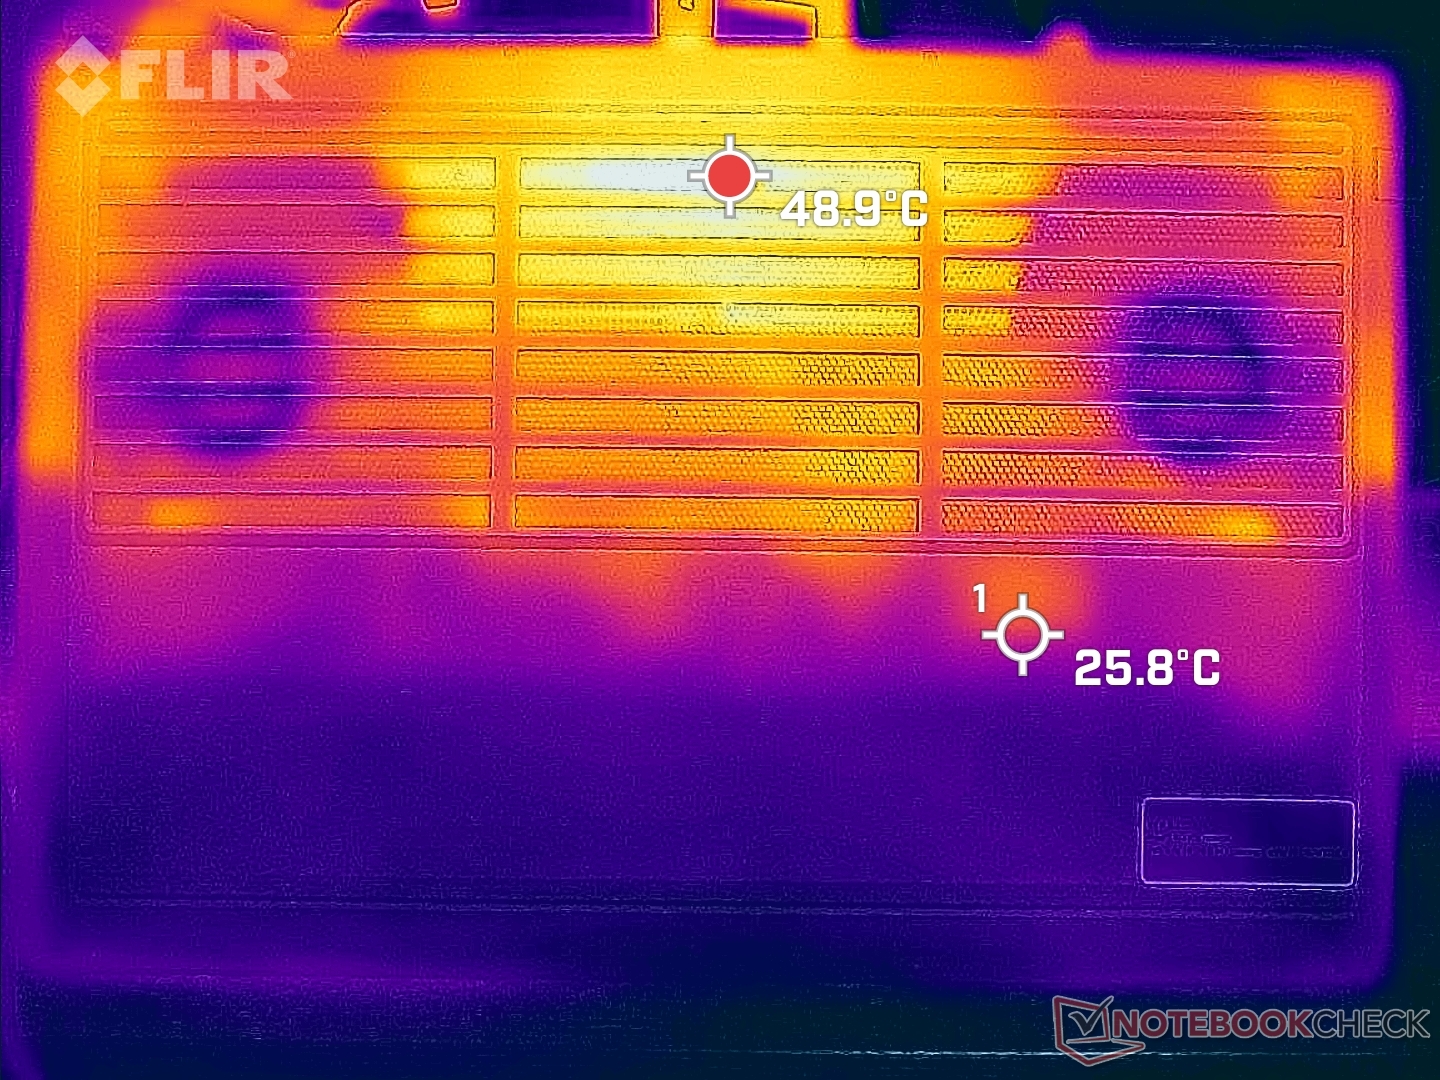
Temperatura
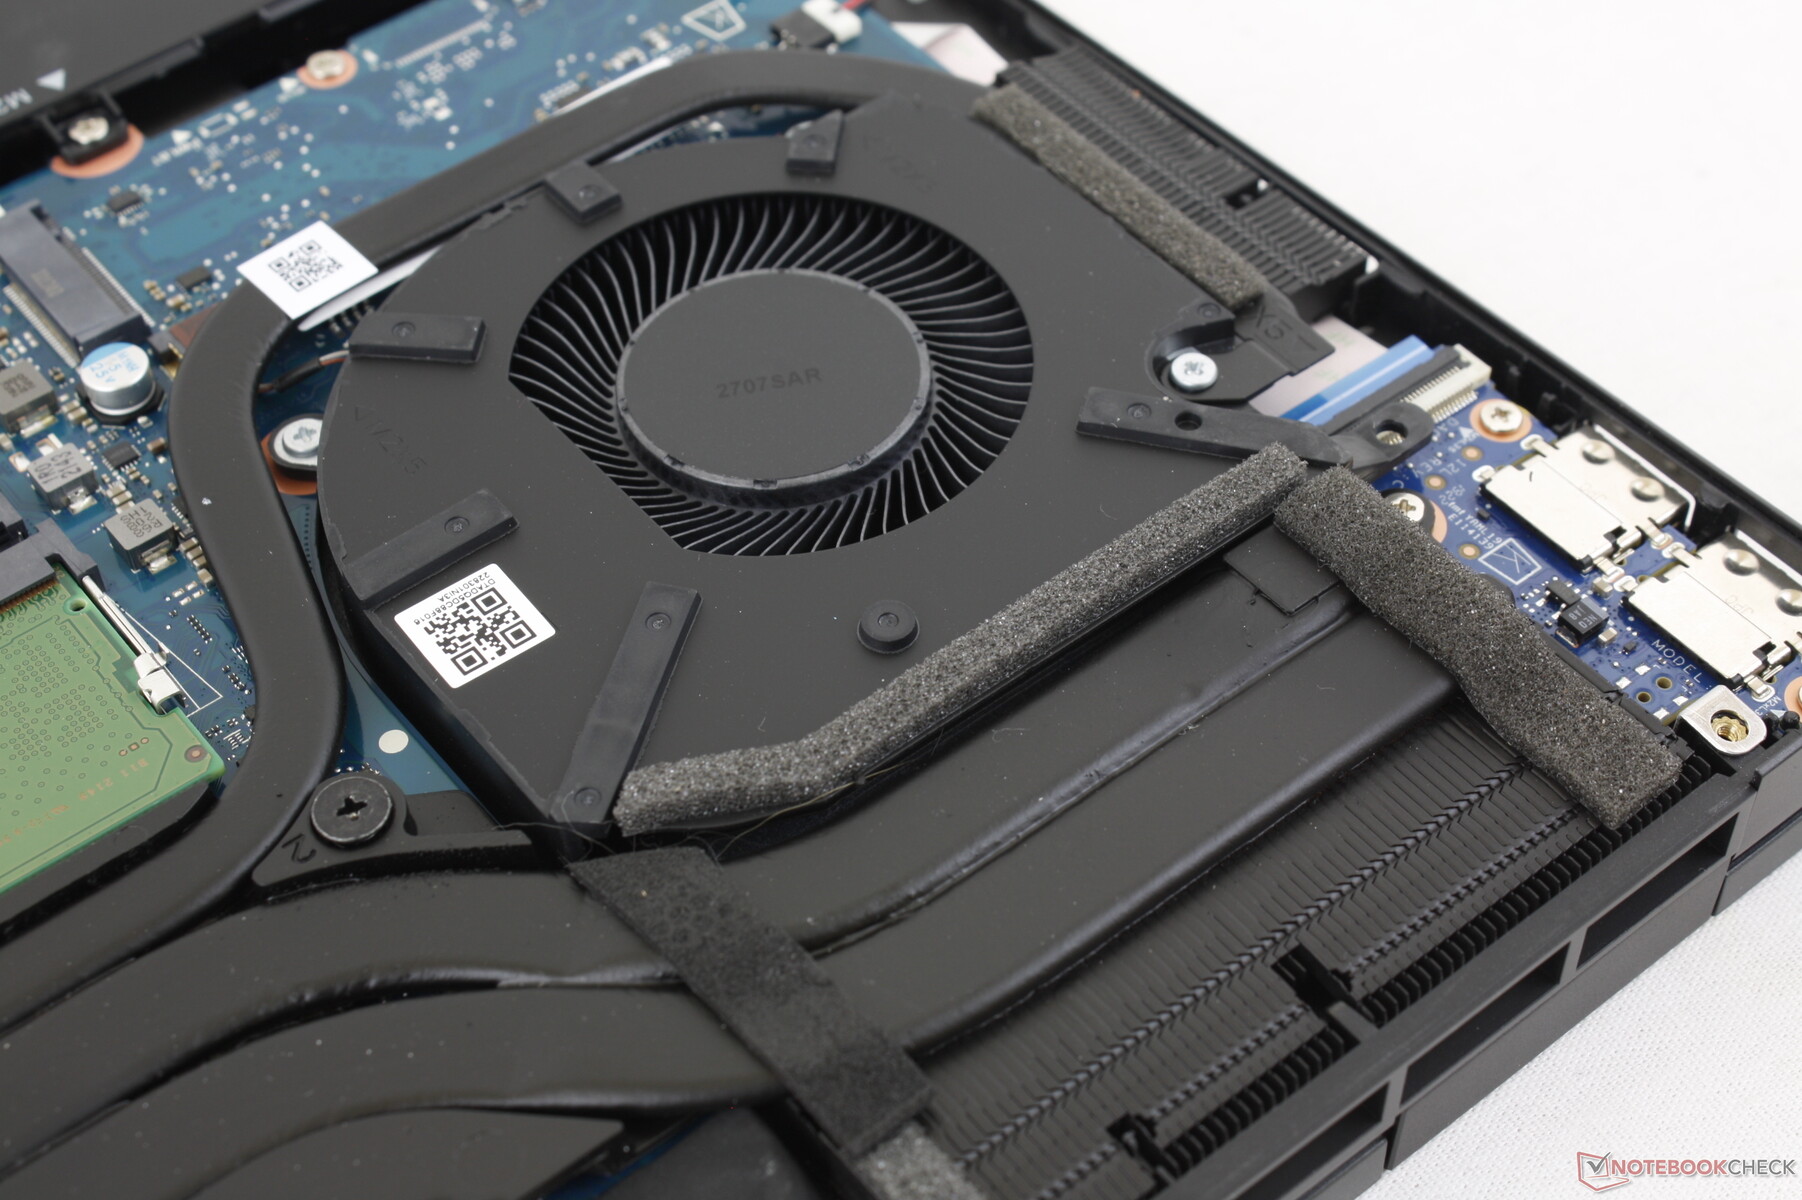
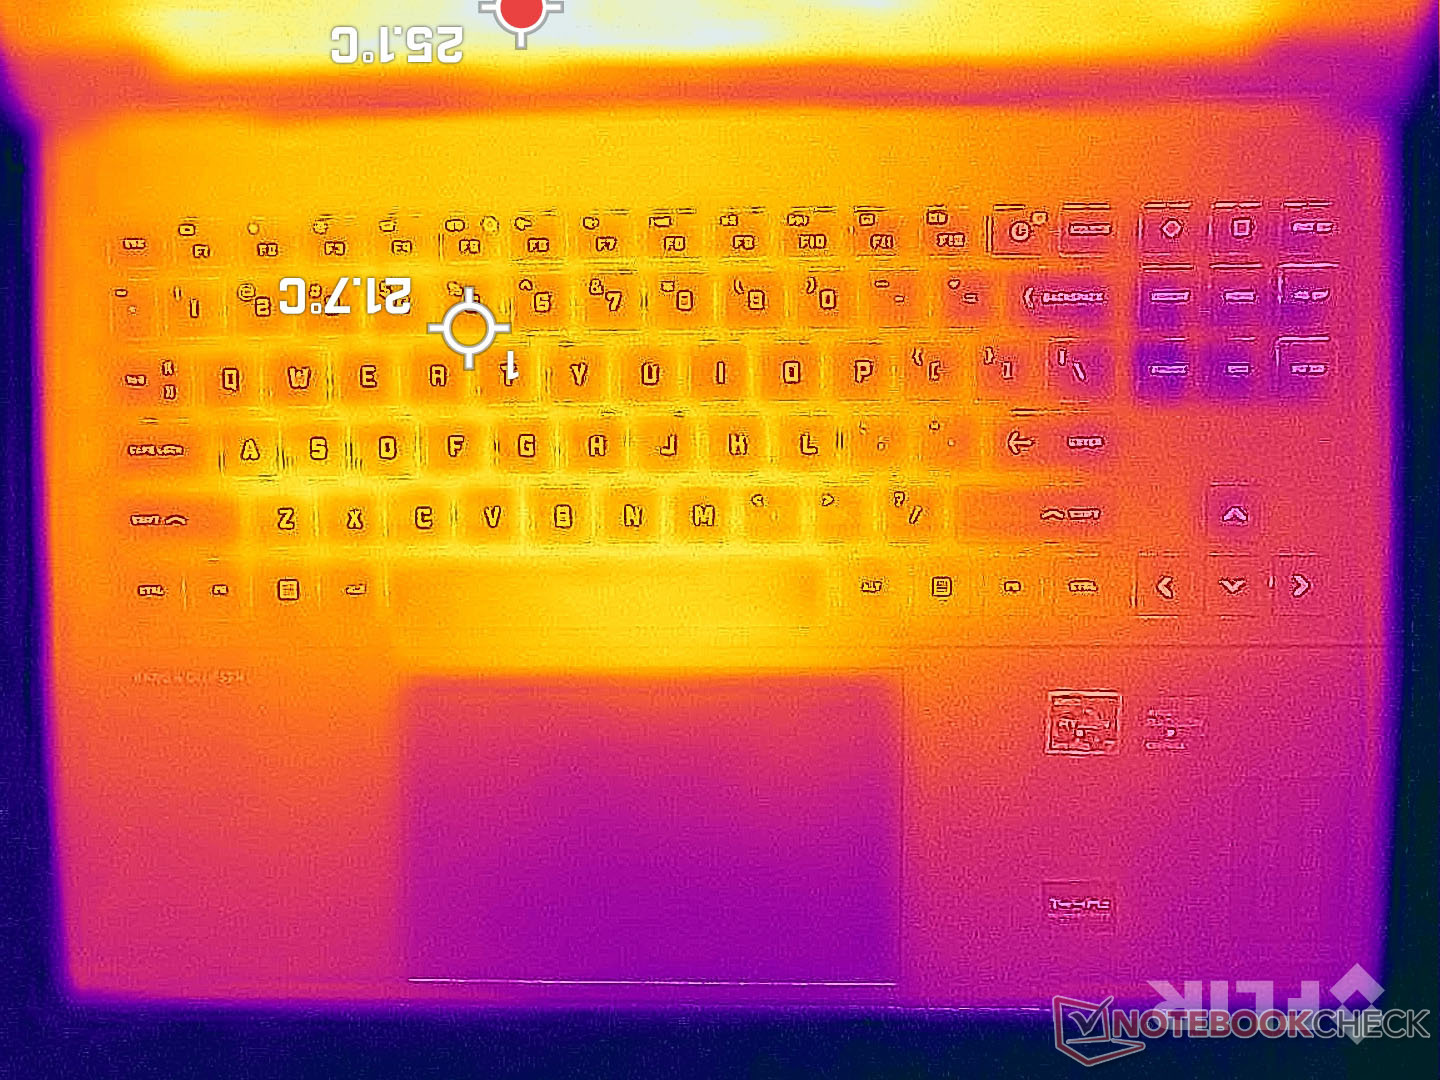
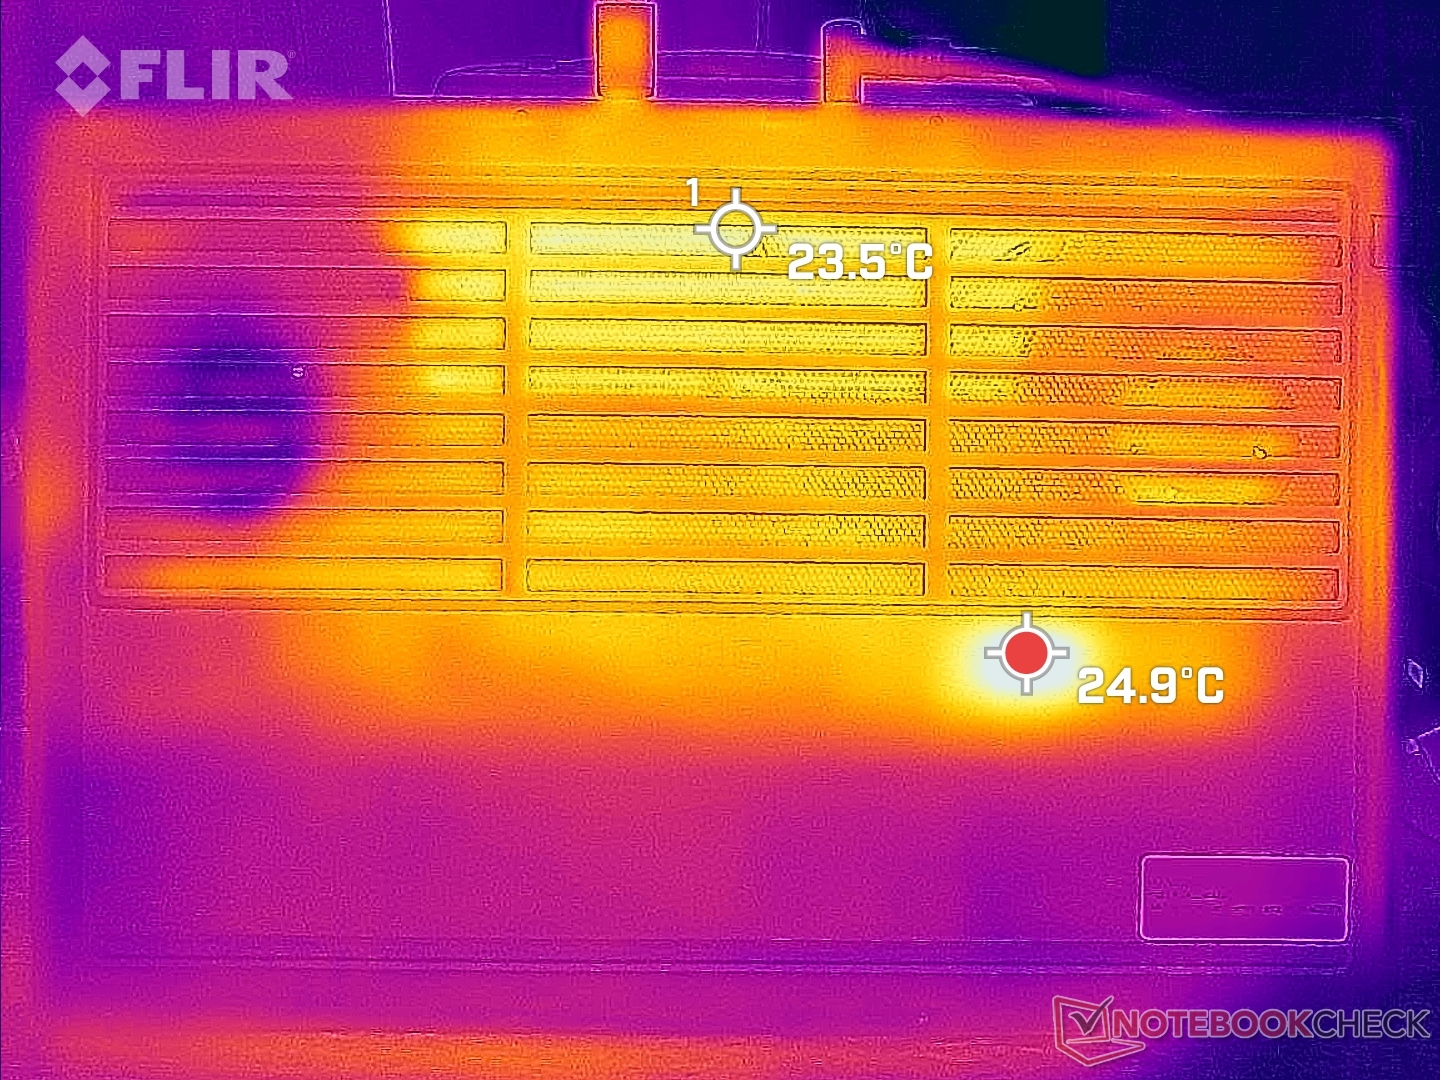
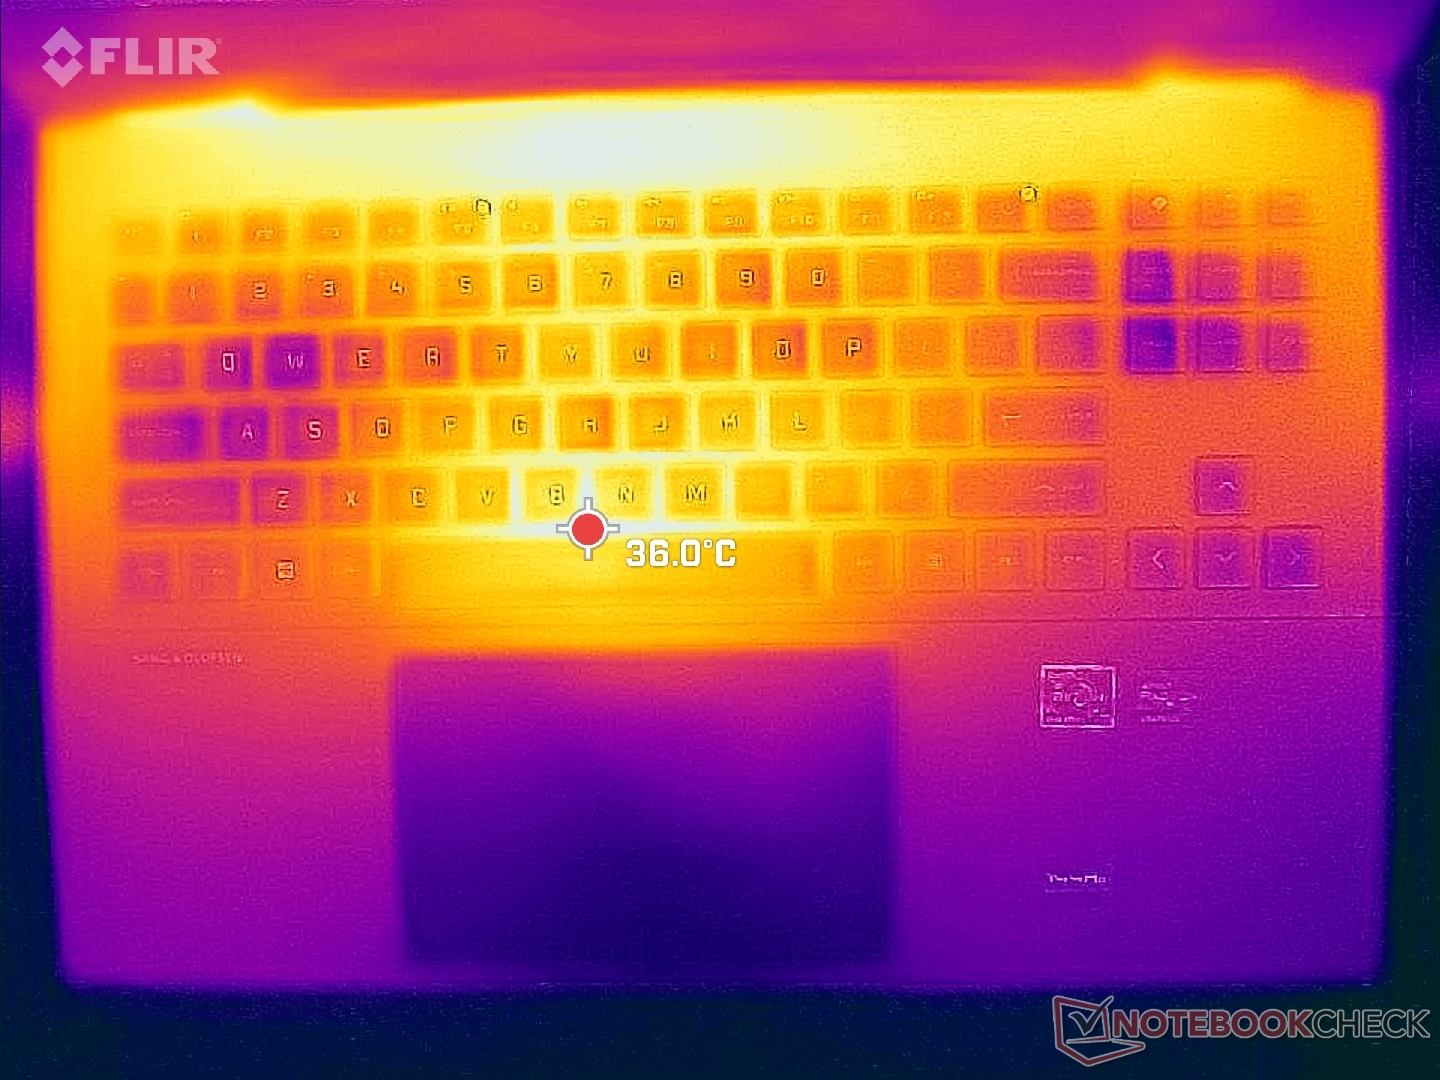
Le temperature superficiali sono molto più basse sul piano tastiera rispetto al piano inferiore. I punti caldi sulla parte superiore raggiungono circa 40 C quando si gioca, rispetto agli oltre 50 C della parte inferiore. Il Omen 16 con processore Intel può essere ancora più caldo, fino a 60 C in condizioni simili. Questi punti caldi si trovano verso la parte posteriore dello chassis, dove è improbabile che le dita e i palmi delle mani entrino in contatto.
Tenete presente che la maggior parte della parte inferiore e posteriore del modello è dedicata al raffreddamento. Se non si fa attenzione, è facile bloccare accidentalmente le griglie di ventilazione.
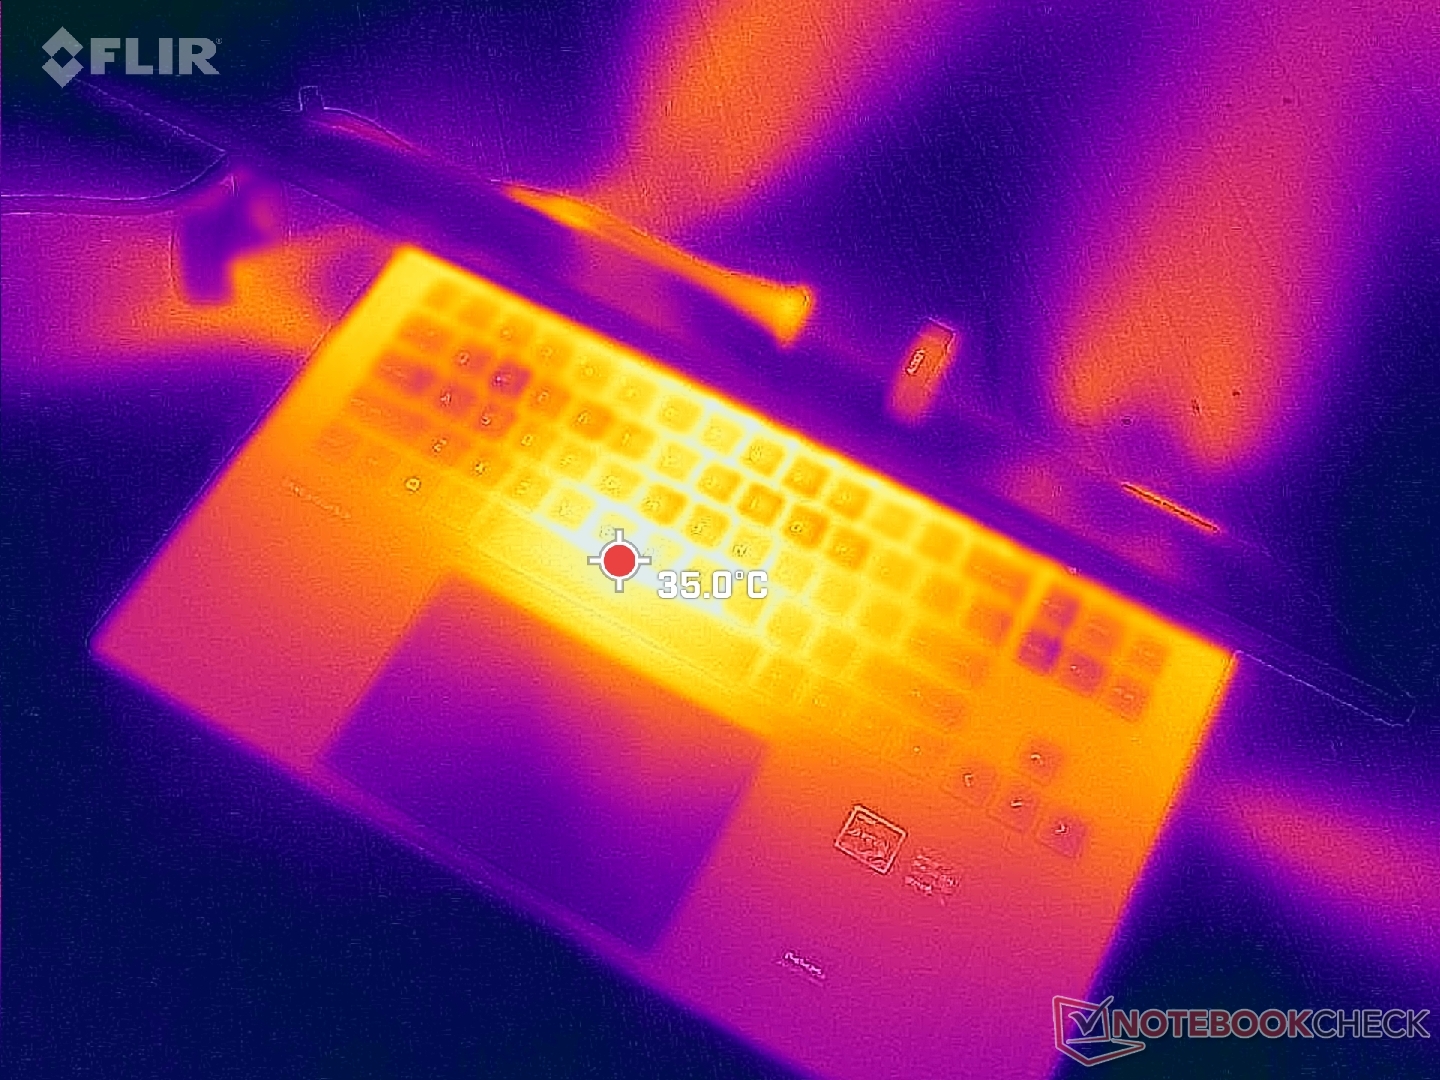
(±) La temperatura massima sul lato superiore è di 41.2 °C / 106 F, rispetto alla media di 40.4 °C / 105 F, che varia da 21.2 a 68.8 °C per questa classe Gaming.
(-) Il lato inferiore si riscalda fino ad un massimo di 53.2 °C / 128 F, rispetto alla media di 43.2 °C / 110 F
(+) In idle, la temperatura media del lato superiore è di 24.4 °C / 76 F, rispetto alla media deld ispositivo di 33.9 °C / 93 F.
(±) Riproducendo The Witcher 3, la temperatura media per il lato superiore e' di 32.3 °C / 90 F, rispetto alla media del dispositivo di 33.9 °C / 93 F.
(+) I poggiapolsi e il touchpad sono piu' freddi della temperatura della pelle con un massimo di 26.2 °C / 79.2 F e sono quindi freddi al tatto.
(+) La temperatura media della zona del palmo della mano di dispositivi simili e'stata di 28.8 °C / 83.8 F (+2.6 °C / 4.6 F).
| HP Omen 16-n0033dx AMD Ryzen 7 6800H, AMD Radeon RX 6650M | HP Envy 16 h0112nr Intel Core i7-12700H, NVIDIA GeForce RTX 3060 Laptop GPU | HP Omen 16-b1090ng Intel Core i7-12700H, NVIDIA GeForce RTX 3070 Ti Laptop GPU | HP Victus 16-e0145ng AMD Ryzen 5 5600H, NVIDIA GeForce RTX 3050 Ti Laptop GPU | Lenovo Legion S7 16ARHA7 AMD Ryzen 9 6900HX, AMD Radeon RX 6800S | Dell G16 7620 Intel Core i7-12700H, NVIDIA GeForce RTX 3060 Laptop GPU | |
|---|---|---|---|---|---|---|
| Heat | -9% | -2% | -22% | -2% | 2% | |
| Maximum Upper Side * (°C) | 41.2 | 45.2 -10% | 41 -0% | 54 -31% | 46.6 -13% | 47.6 -16% |
| Maximum Bottom * (°C) | 53.2 | 44 17% | 62 -17% | 47 12% | 50.8 5% | 54 -2% |
| Idle Upper Side * (°C) | 26.4 | 33.6 -27% | 25 5% | 41 -55% | 26.4 -0% | 23 13% |
| Idle Bottom * (°C) | 27.8 | 32.6 -17% | 26 6% | 31 -12% | 27.2 2% | 24.6 12% |
* ... Meglio usare valori piccoli
Stress test
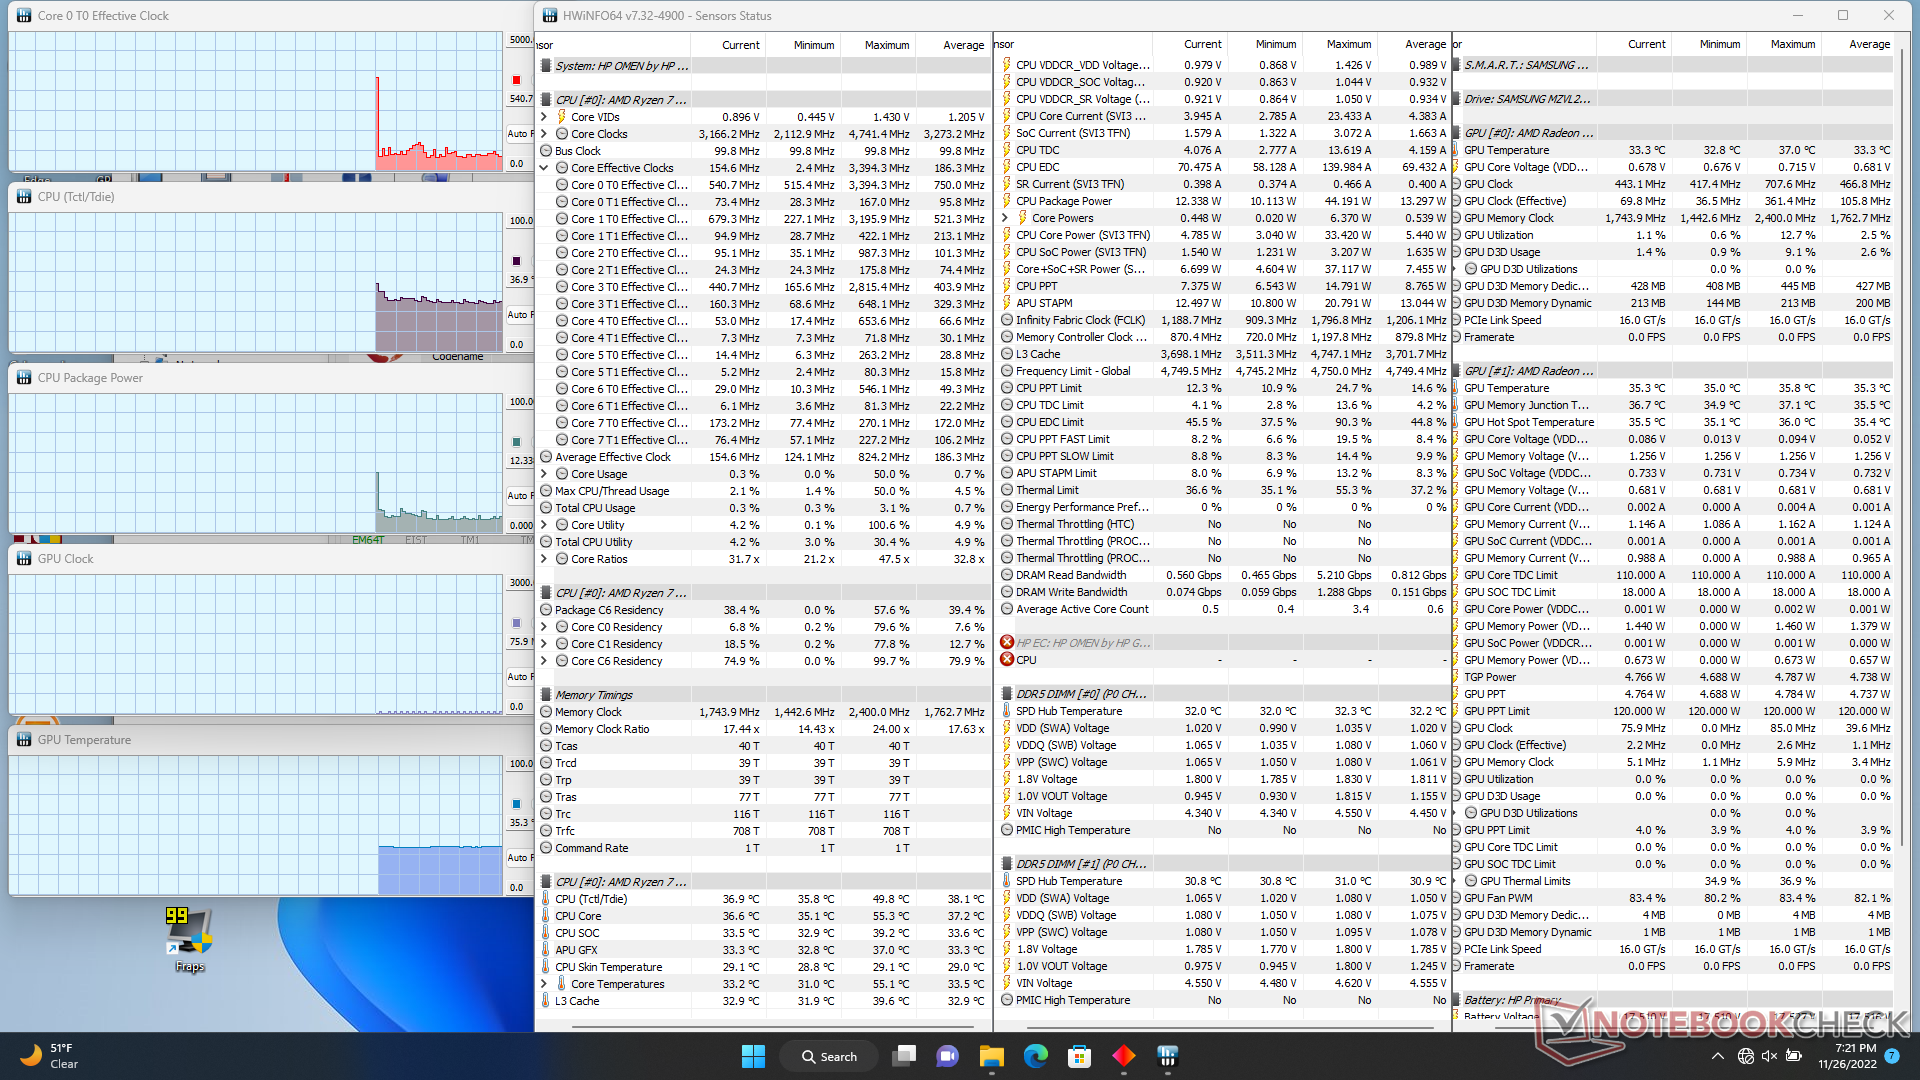
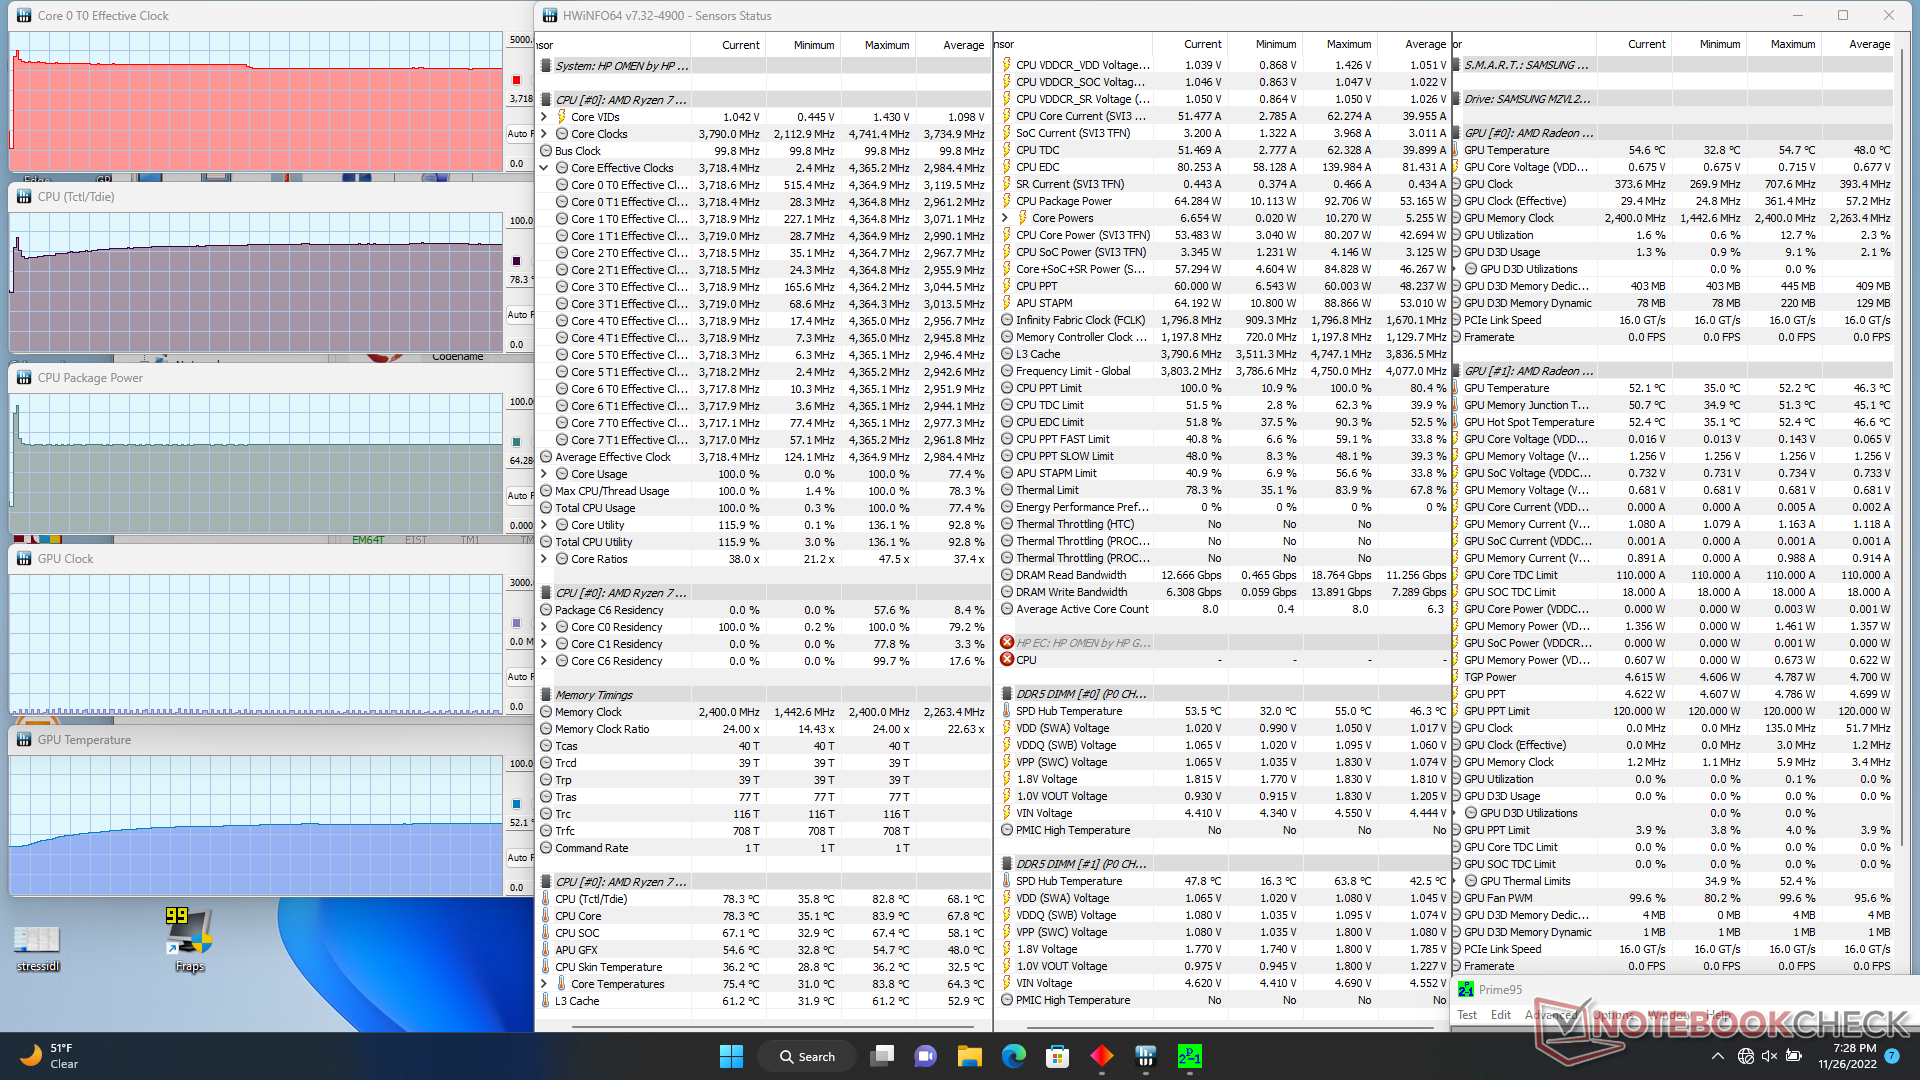
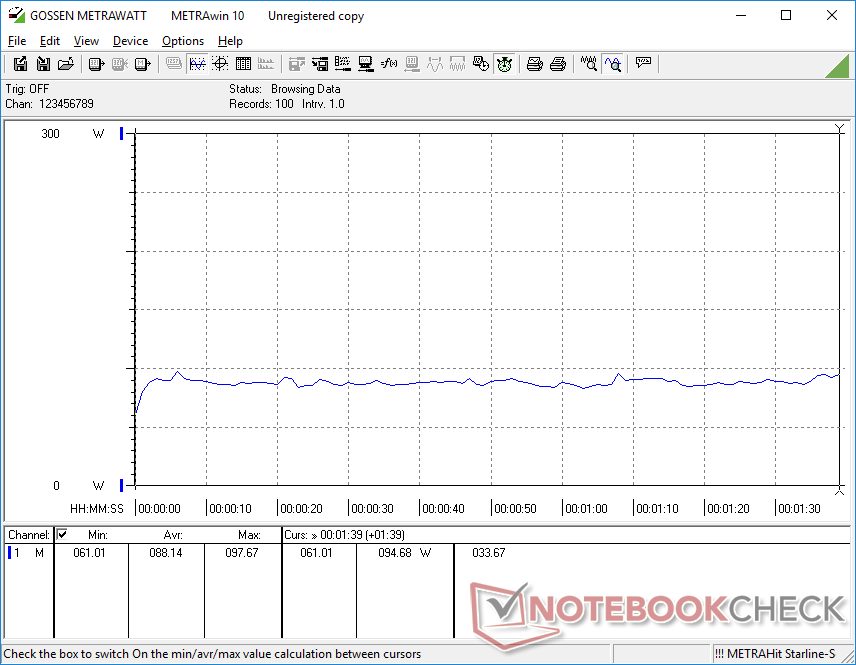
Quando è stata sottoposta a Prime95, la CPU ha raggiunto i 4,4 GHz e i 93 W per un paio di secondi, prima di scendere e stabilizzarsi a 3,7 GHz e 64 W. Le frequenze di clock massime sono quindi di breve durata sull'Omen 16. Ripetendo lo stesso test sulLenovo Legion 5 Pro Gen 7 con la stessa CPU Ryzen 7 6800H si otterrebbe una frequenza di clock stabile e una temperatura superiore, rispettivamente di 4,1 GHz e 93 C, rispetto ai soli 3,7 GHz e 78 C del nostro HP.
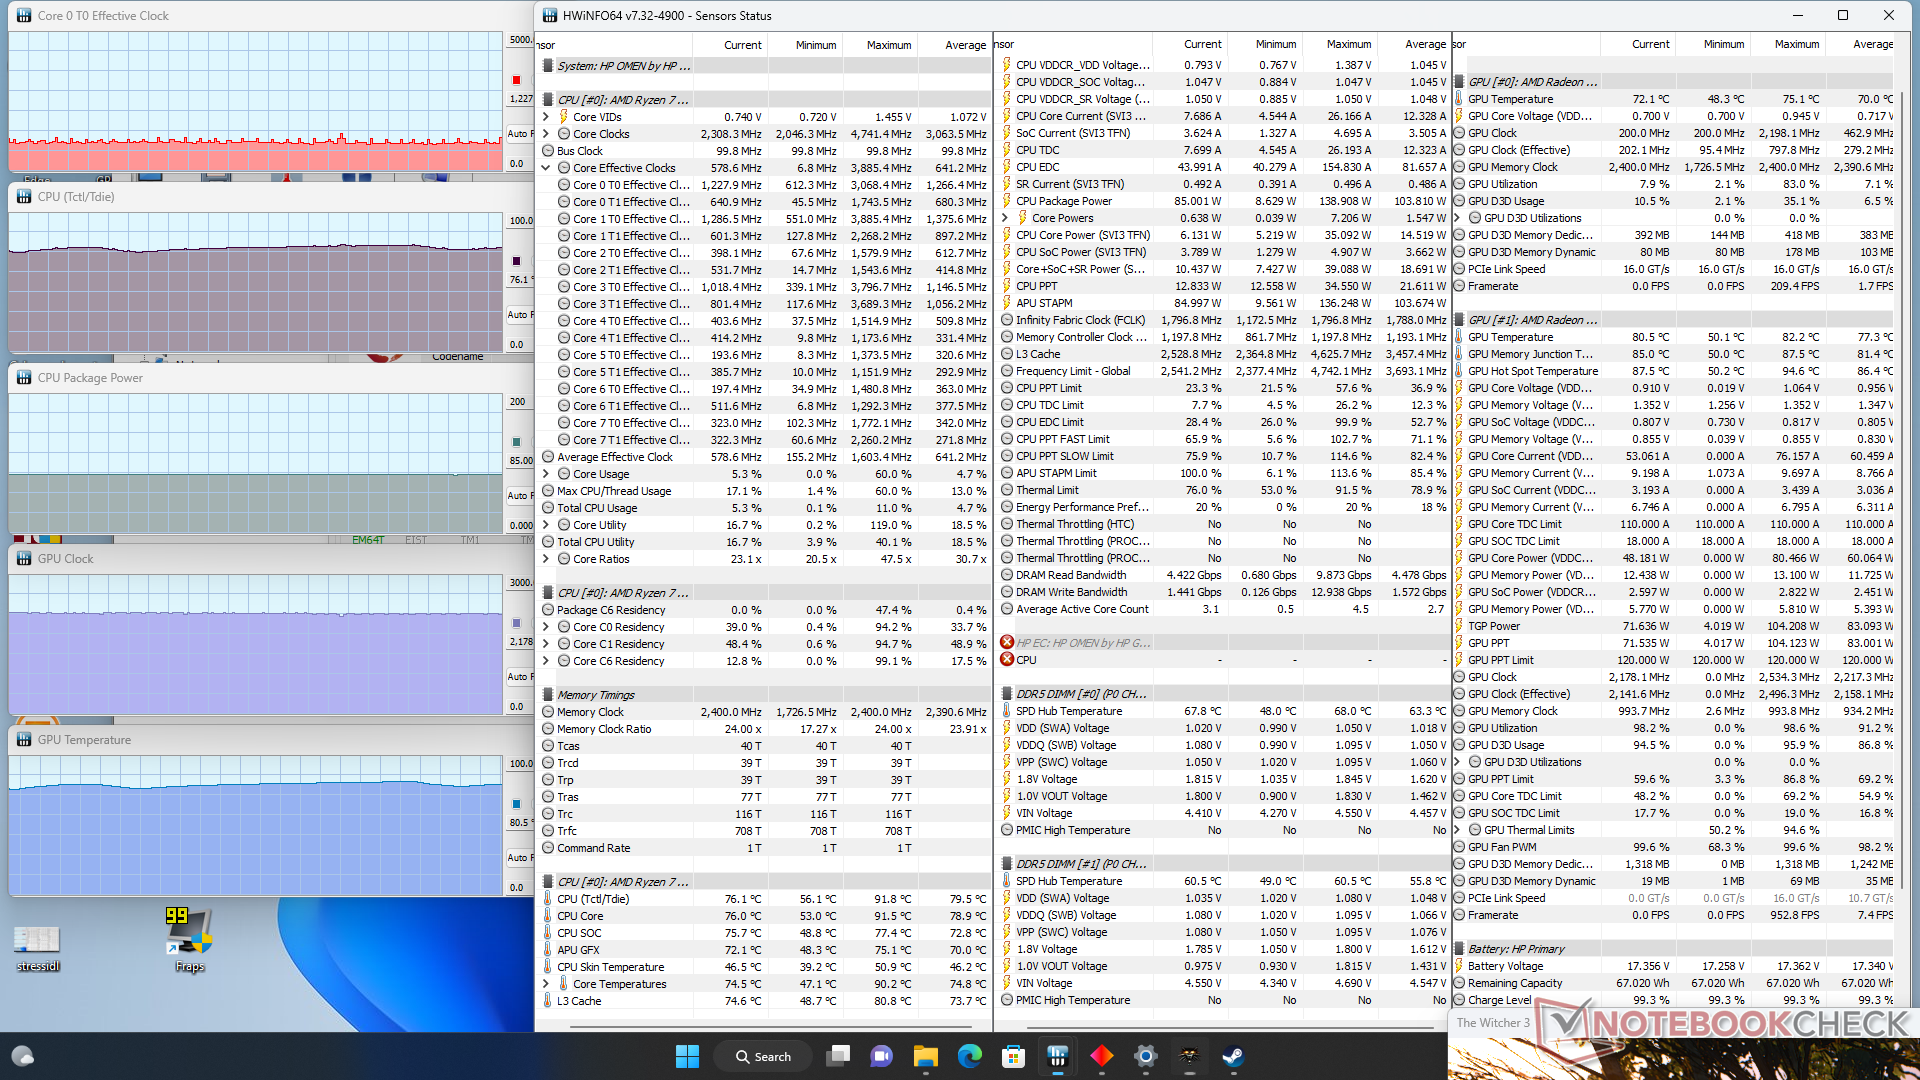
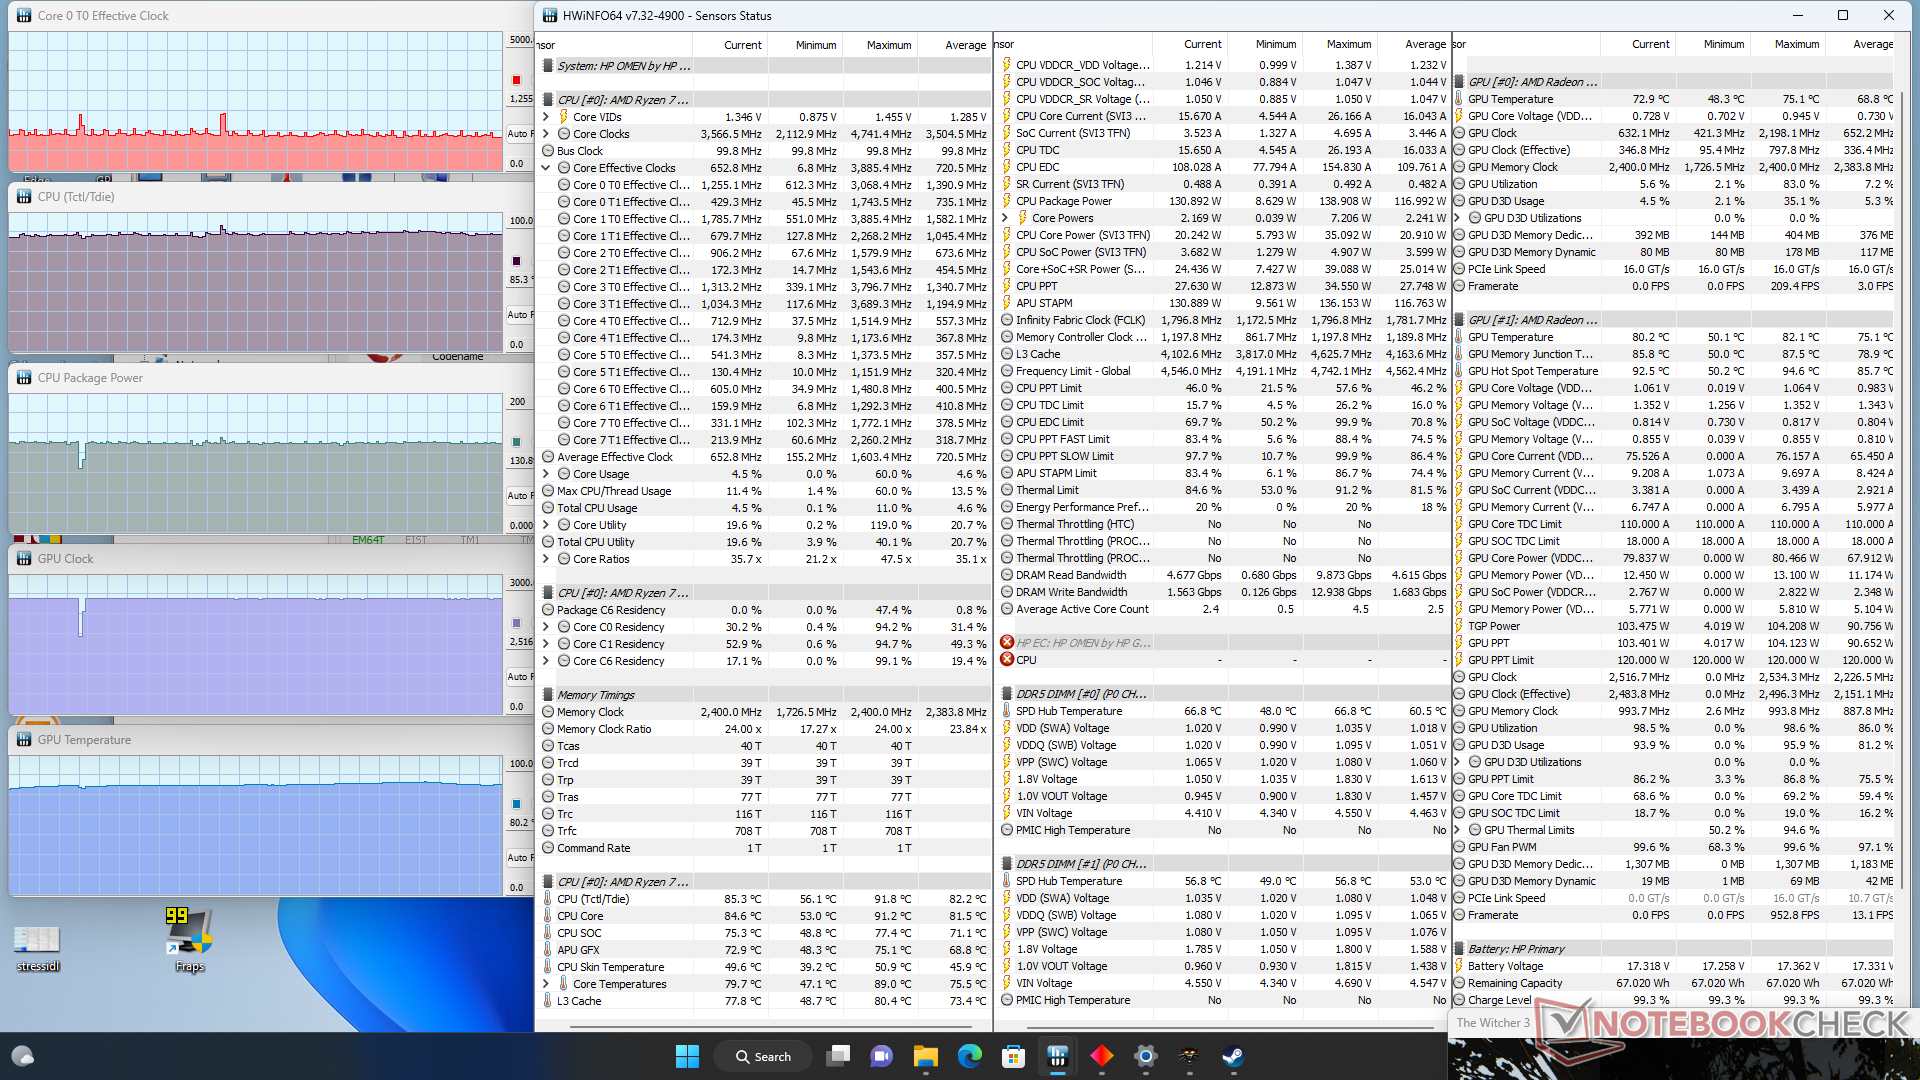
Quando si esegue Witcher 3 in modalità Performance, per rappresentare i carichi di gioco tipici, la GPU si stabilizzerebbe a 2516 MHz, 80 C e 103 W. Scendendo alla modalità Balanced si otterrebbe un clock della GPU più basso, pari a 2178 MHz, e un TGP più basso, pari a 72 W, ma senza cambiamenti significativi nella temperatura del core. Pertanto, gli utenti devono ricordare di attivare la modalità Performance tramite il software Omen Gaming Hub per poter sfruttare appieno la GPU.
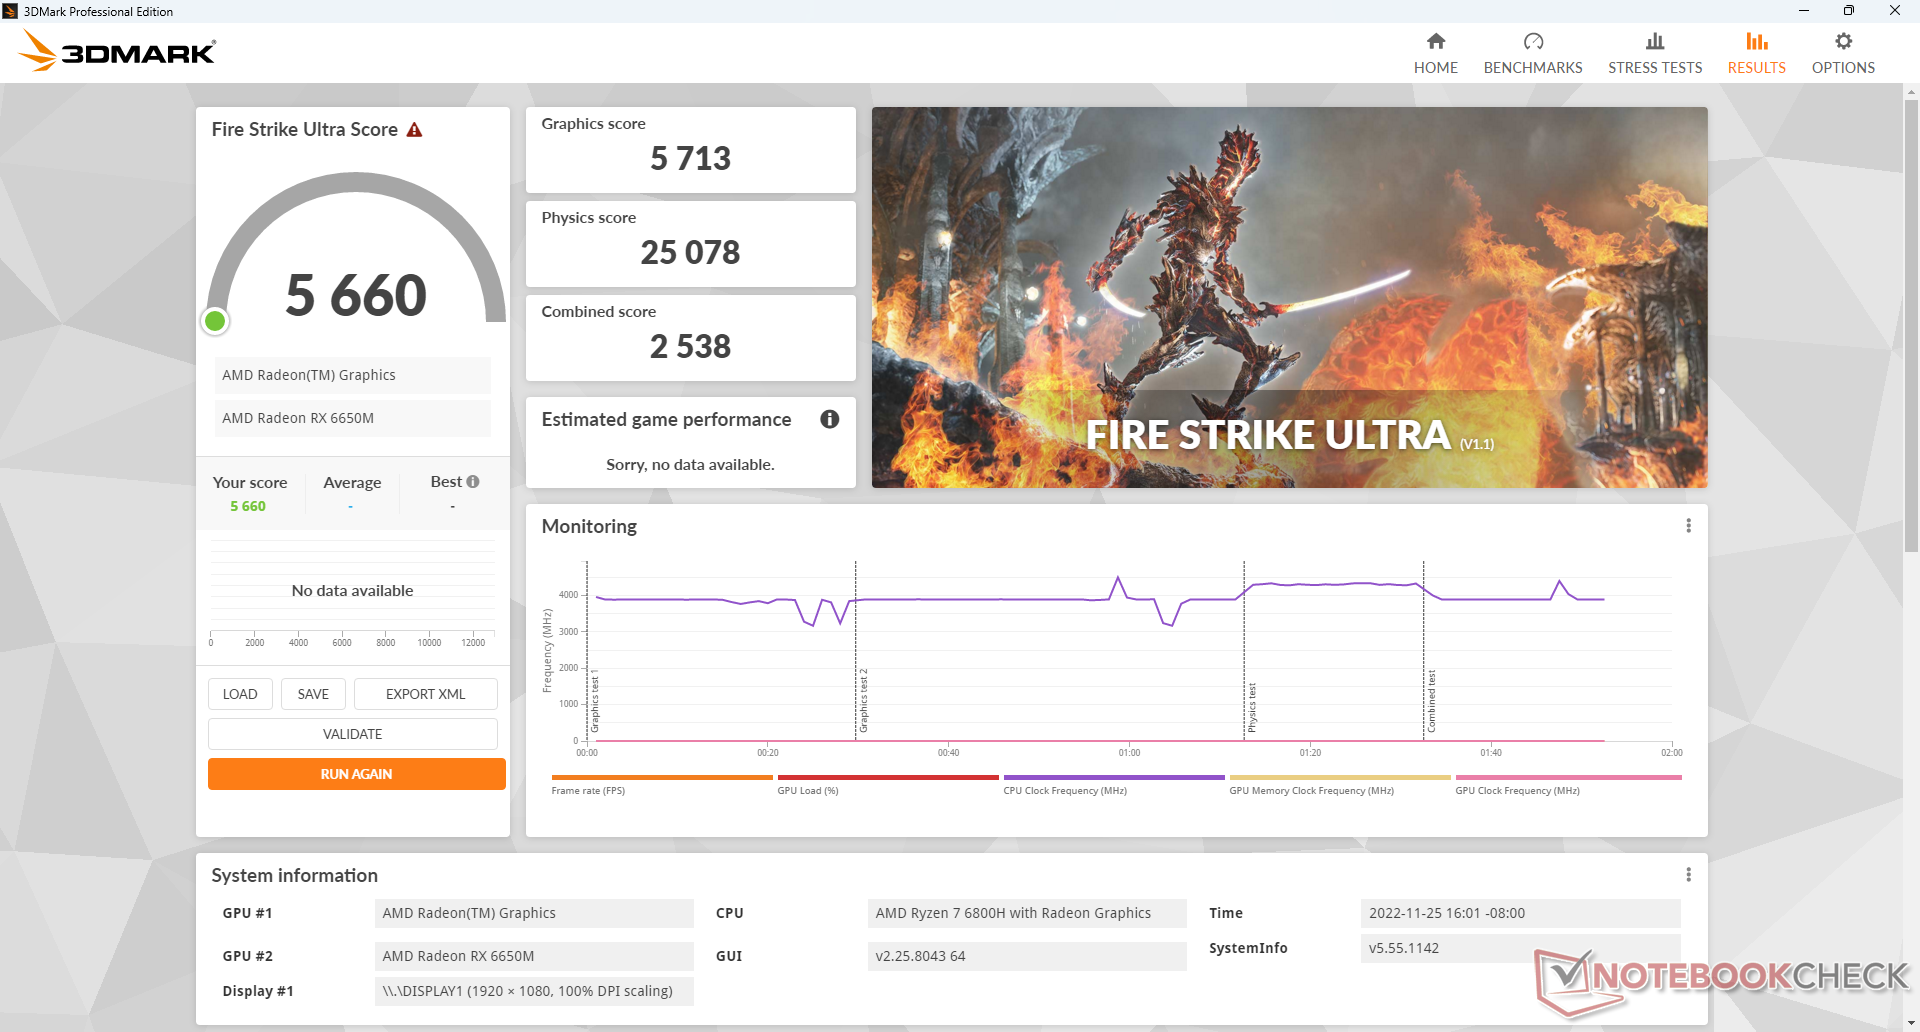
Il funzionamento a batteria limita le prestazioni. Un test di Fire Strike a batteria restituisce punteggi di Fisica e Grafica di soli 21063 e 5722 punti, rispettivamente, rispetto a 25021 e 25739 punti con l'alimentazione di rete.
| Clock della CPU (GHz) | Clock della GPU (MHz) | Temperatura media della CPU (°C) | Temperatura media della GPU (°C) | |
| Sistema inattivo | -- | -- | 37 | 35 |
| Stress Prime95 | 3,7 | -- | 79 | 52 |
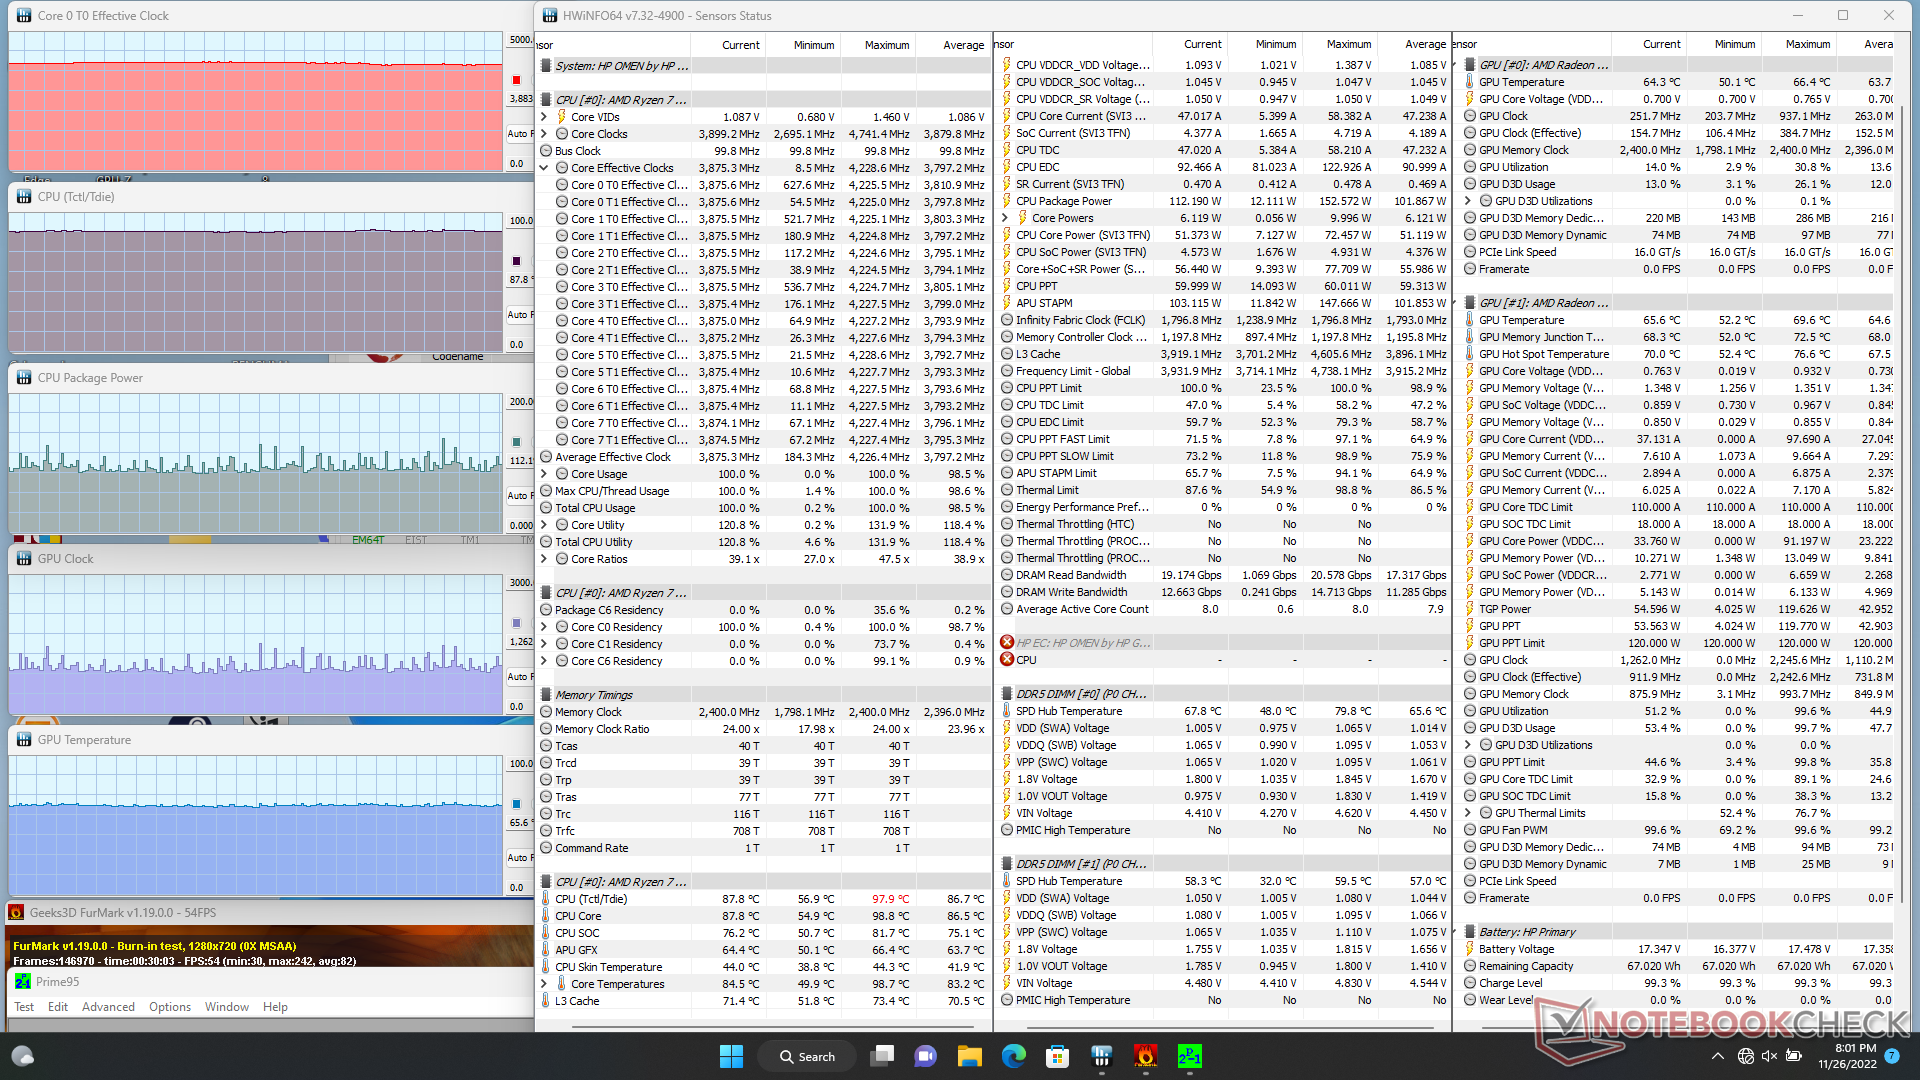
| Prime95 + FurMark Stress | 3,9 | ~1262 | 88 | 66 |
| Witcher 3 Stress (modalità bilanciata) | ~1,1 | 2178 | 76 | 81 |
| Witcher 3 Stress (modalità Performance) | ~1,1 | 2516 | 85 | 80 |
Altoparlanti
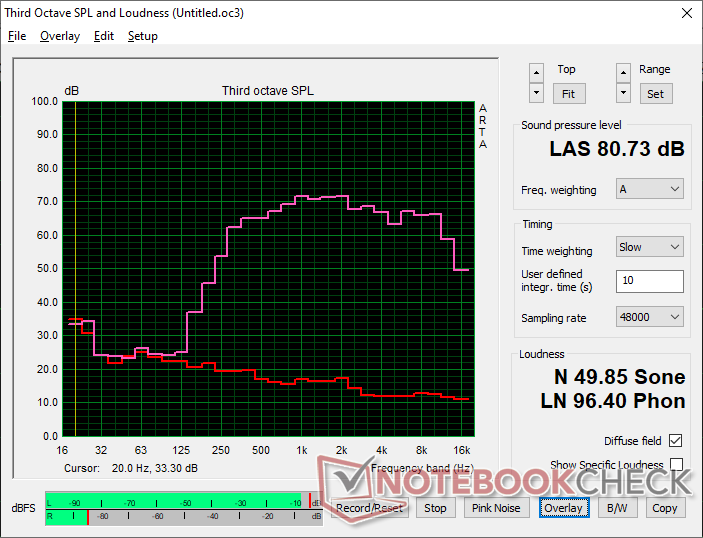
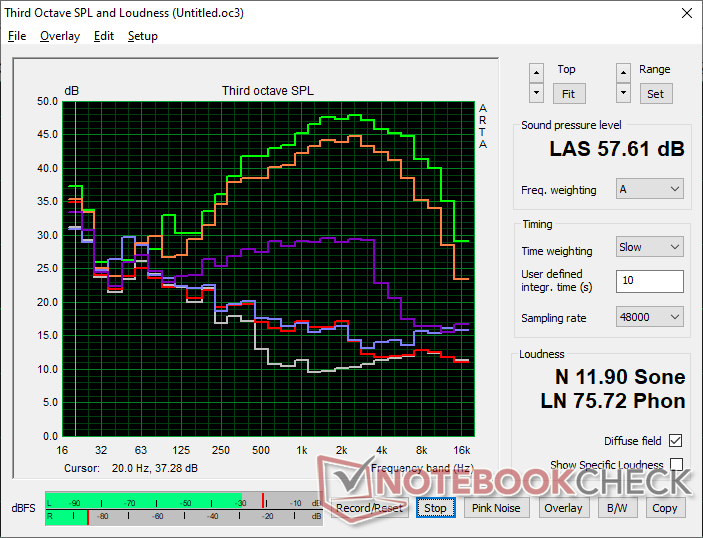
HP Omen 16-n0033dx analisi audio
(±) | potenza degli altiparlanti media ma buona (80.7 dB)
Bassi 100 - 315 Hz
(-) | quasi nessun basso - in media 24.7% inferiori alla media
(±) | la linearità dei bassi è media (13% delta rispetto alla precedente frequenza)
Medi 400 - 2000 Hz
(+) | medi bilanciati - solo only 3.4% rispetto alla media
(+) | medi lineari (2.8% delta rispetto alla precedente frequenza)
Alti 2 - 16 kHz
(+) | Alti bilanciati - appena 1.3% dalla media
(+) | alti lineari (4.4% delta rispetto alla precedente frequenza)
Nel complesso 100 - 16.000 Hz
(±) | la linearità complessiva del suono è media (19.3% di differenza rispetto alla media
Rispetto alla stessa classe
» 65% di tutti i dispositivi testati in questa classe è stato migliore, 8% simile, 27% peggiore
» Il migliore ha avuto un delta di 6%, medio di 18%, peggiore di 132%
Rispetto a tutti i dispositivi testati
» 47% di tutti i dispositivi testati in questa classe è stato migliore, 8% similare, 46% peggiore
» Il migliore ha avuto un delta di 4%, medio di 23%, peggiore di 134%
Apple MacBook Pro 16 2021 M1 Pro analisi audio
(+) | gli altoparlanti sono relativamente potenti (84.7 dB)
Bassi 100 - 315 Hz
(+) | bassi buoni - solo 3.8% dalla media
(+) | bassi in lineaa (5.2% delta rispetto alla precedente frequenza)
Medi 400 - 2000 Hz
(+) | medi bilanciati - solo only 1.3% rispetto alla media
(+) | medi lineari (2.1% delta rispetto alla precedente frequenza)
Alti 2 - 16 kHz
(+) | Alti bilanciati - appena 1.9% dalla media
(+) | alti lineari (2.7% delta rispetto alla precedente frequenza)
Nel complesso 100 - 16.000 Hz
(+) | suono nel complesso lineare (4.6% differenza dalla media)
Rispetto alla stessa classe
» 0% di tutti i dispositivi testati in questa classe è stato migliore, 0% simile, 100% peggiore
» Il migliore ha avuto un delta di 5%, medio di 17%, peggiore di 45%
Rispetto a tutti i dispositivi testati
» 0% di tutti i dispositivi testati in questa classe è stato migliore, 0% similare, 100% peggiore
» Il migliore ha avuto un delta di 4%, medio di 23%, peggiore di 134%
Gestione dell'energia - Giocatore esigente
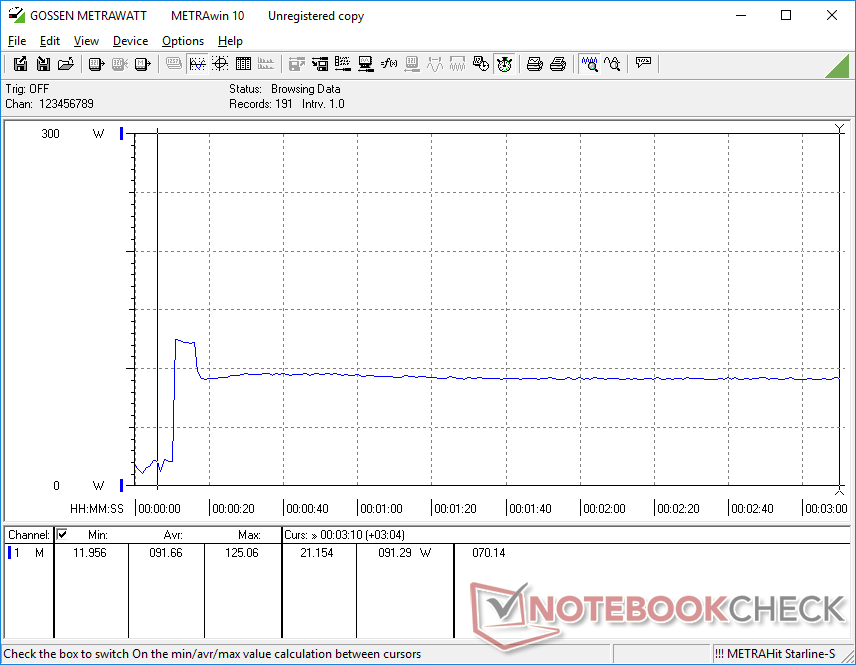
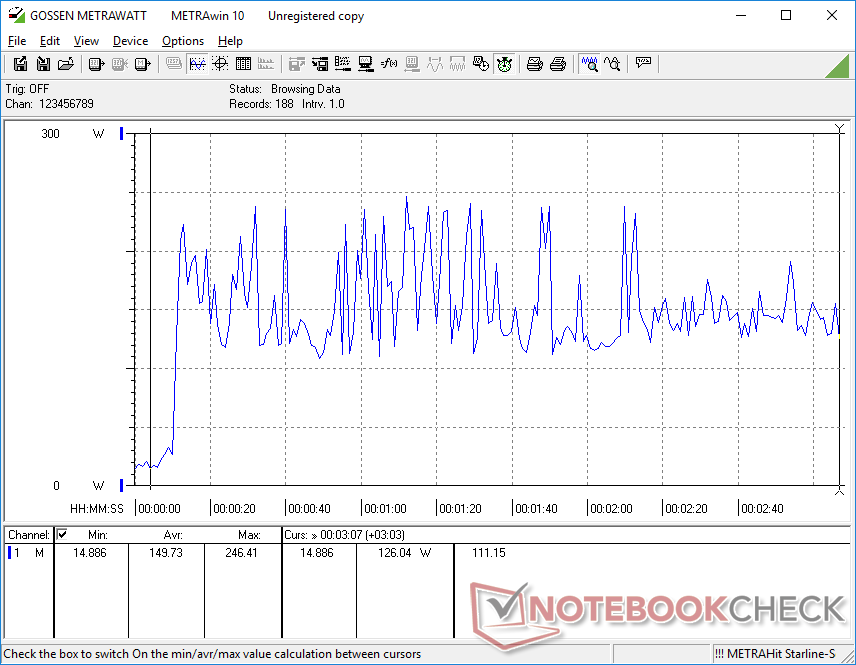
Consumo di energia
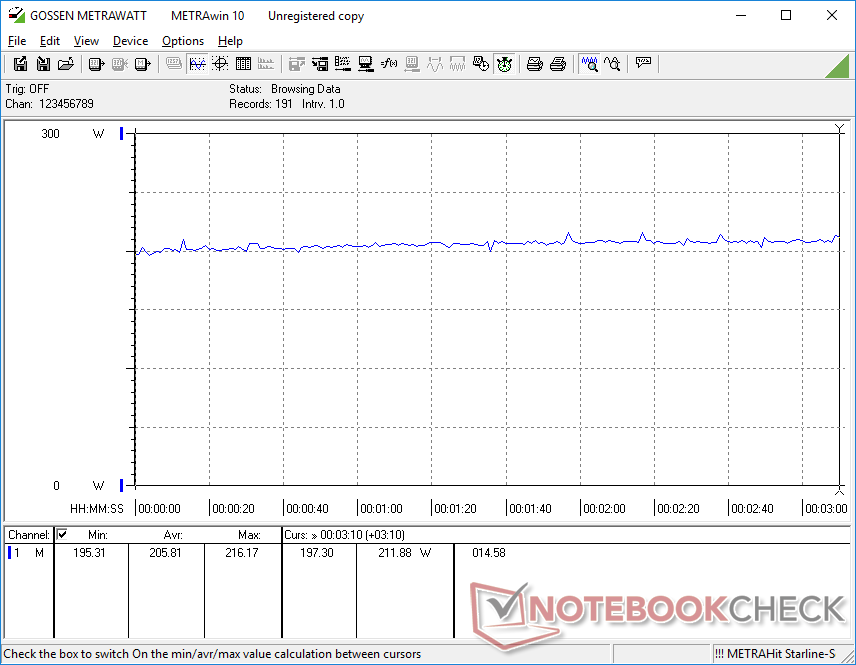
Poiché la Radeon RX 6650M è leggermente più veloce della RTX 3060, dovremmo aspettarci che anche il consumo medio di energia sia leggermente superiore. Sfortunatamente per AMD, la realtà è che il nostro Omen 16 può essere molto più assetato di energia rispetto alla maggior parte degli altri laptop RTX 2060 quando si gioca. In esecuzione Witcher 3ad esempio, richiede 206 W rispetto ai 177 W, 187 W e 155 W del Dell G16 con RTX 3060,Lenovo Legion 5 15e Lenovo Legion Slim 7 16, rispettivamente. Queste stesse alternative possono persino offrire prestazioni CPU più elevate grazie ai loro processori Intel di 12a generazione
Fortunatamente, il consumo energetico è paragonabile a quello di molti portatili Intel-Nvidia quando non si eseguono applicazioni impegnative. Ciò significa che la durata della batteria non sarà drasticamente inferiore a quella della maggior parte delle alternative Intel-Nvidia durante la navigazione web o lo streaming, nonostante il consumo energetico del portatile possa essere elevato durante i giochi
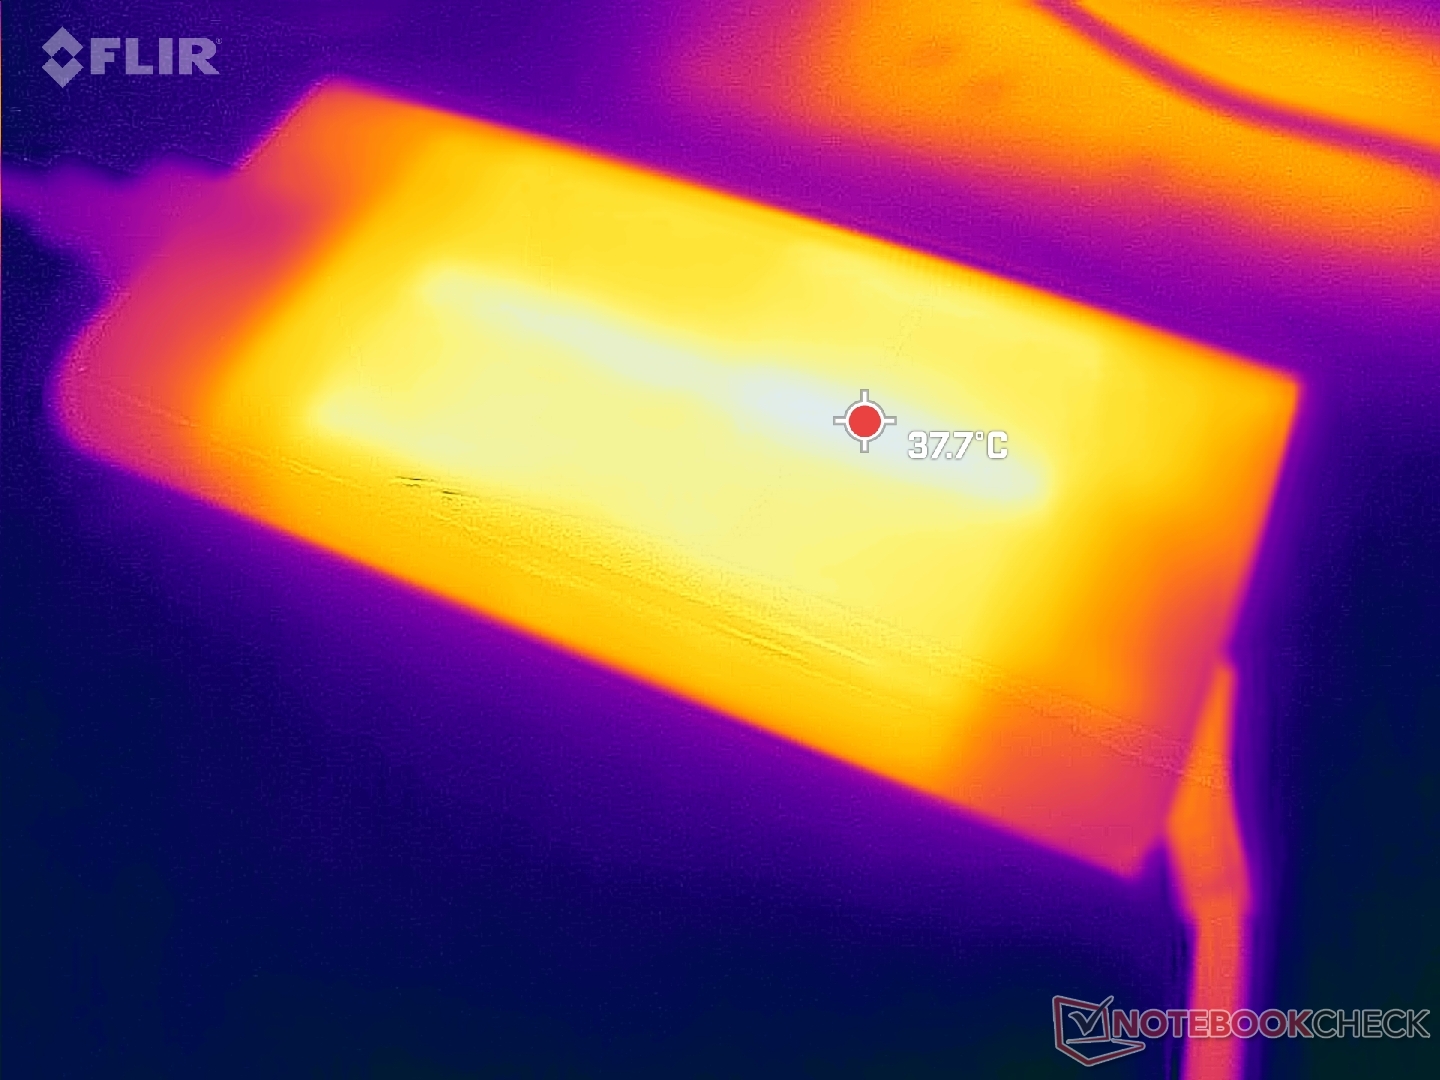
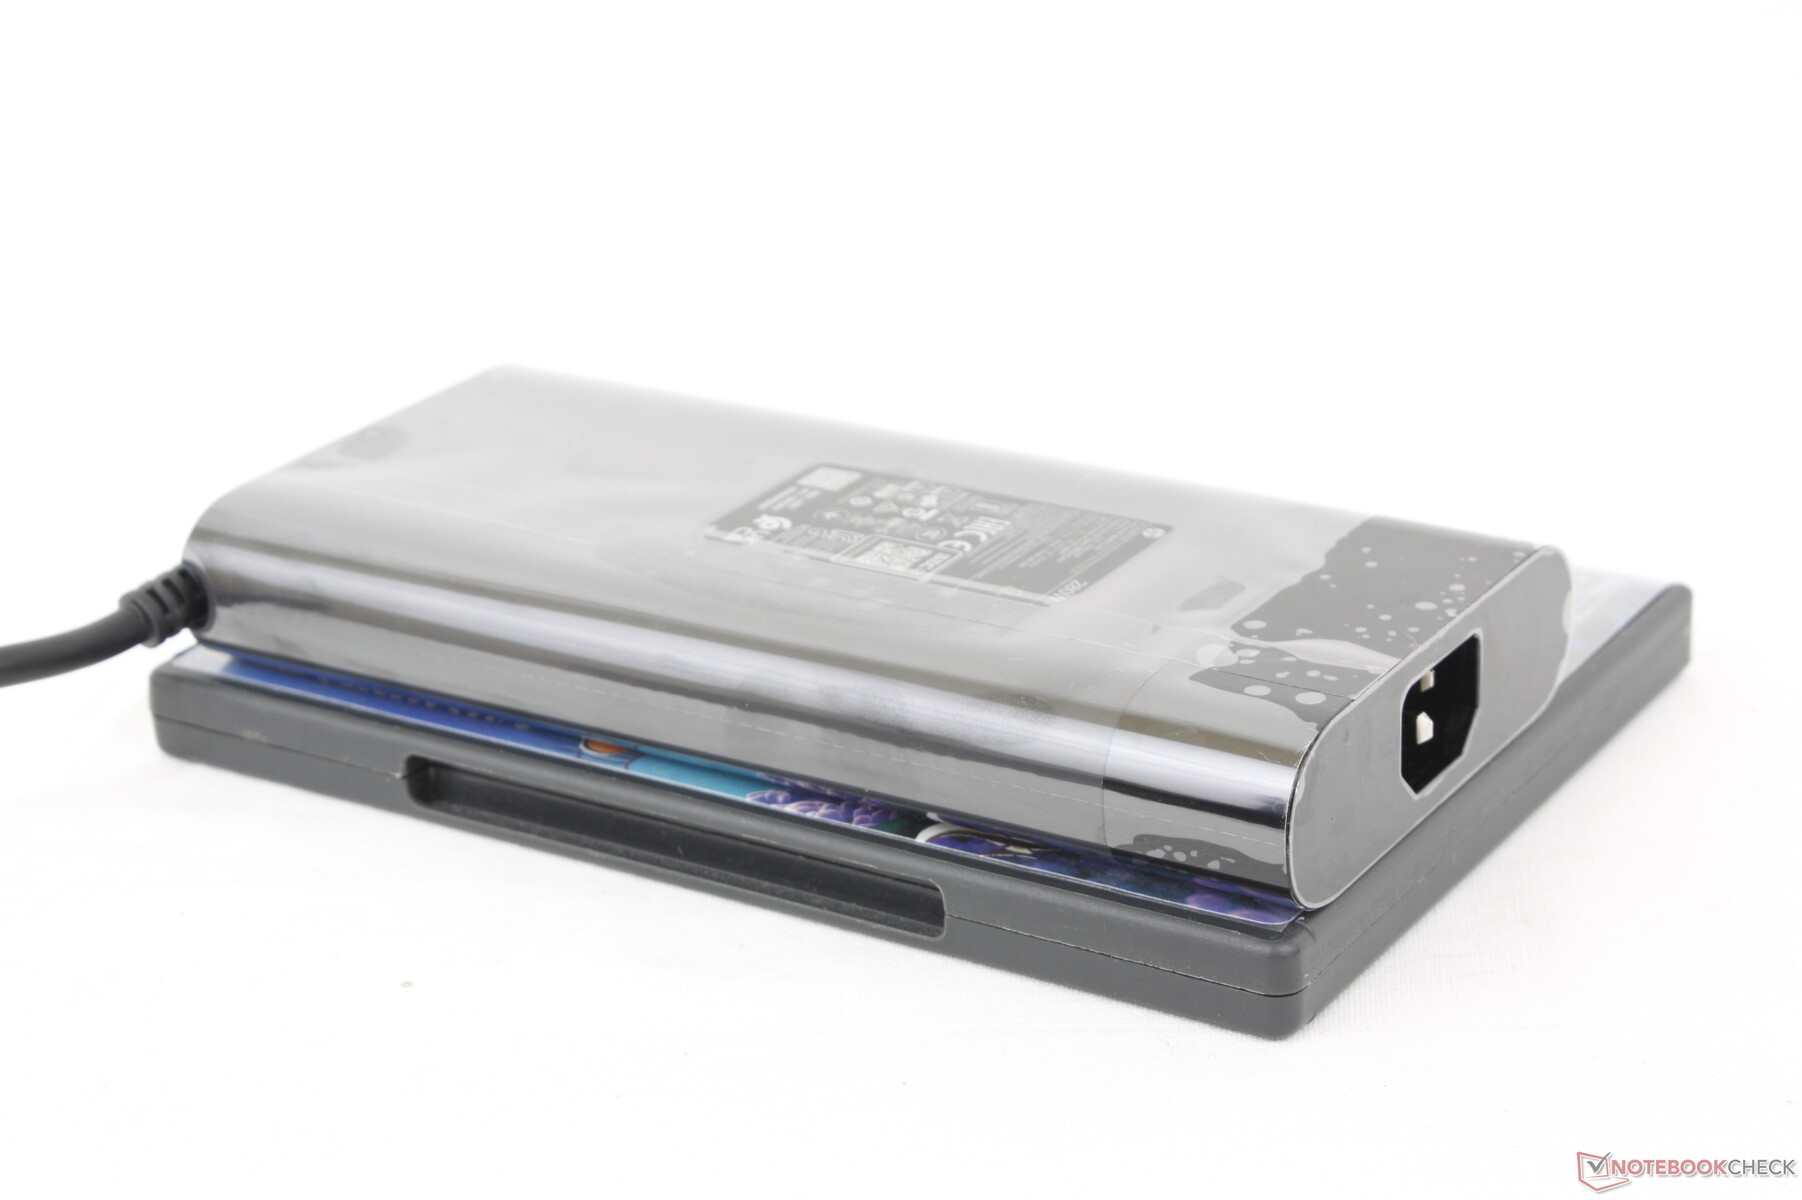
Siamo riusciti a registrare un consumo massimo temporaneo di 246 W dall'adattatore CA da 280 W di grandi dimensioni (~17,9 x 8,5 x 2,5 cm) quando sia la CPU che la GPU sono al 100% di utilizzo.
| Off / Standby | |
| Idle | |
| Sotto carico |
|
Leggenda:
min: | |
| HP Omen 16-n0033dx R7 6800H, Radeon RX 6650M, Samsung PM9A1 MZVL21T0HCLR, IPS, 1920x1080, 16.1" | HP Envy 16 h0112nr i7-12700H, GeForce RTX 3060 Laptop GPU, Micron 3400 1TB MTFDKBA1T0TFH, OLED, 3840x2400, 16" | HP Omen 16-b1090ng i7-12700H, GeForce RTX 3070 Ti Laptop GPU, WDC PC SN810 1TB, IPS, 2560x1440, 16.1" | HP Victus 16-e0145ng R5 5600H, GeForce RTX 3050 Ti Laptop GPU, Samsung SSD PM981a MZVLB512HBJQ, IPS, 1920x1080, 16.1" | Lenovo Legion S7 16ARHA7 R9 6900HX, Radeon RX 6800S, SK Hynix HFS001TEJ9X115N, IPS, 2560x1600, 16" | Dell G16 7620 i7-12700H, GeForce RTX 3060 Laptop GPU, WDC PC SN810 512GB, IPS, 2560x1600, 16" | |
|---|---|---|---|---|---|---|
| Power Consumption | -9% | 8% | 18% | -3% | -35% | |
| Idle Minimum * (Watt) | 7.9 | 10 -27% | 4 49% | 7 11% | 8.8 -11% | 14.4 -82% |
| Idle Average * (Watt) | 11.5 | 10.9 5% | 10 13% | 9 22% | 14.7 -28% | 17.8 -55% |
| Idle Maximum * (Watt) | 18.3 | 27.8 -52% | 19 -4% | 15 18% | 19.8 -8% | 31.5 -72% |
| Load Average * (Watt) | 88.1 | 116.4 -32% | 114 -29% | 93 -6% | 85.3 3% | 101.2 -15% |
| Witcher 3 ultra * (Watt) | 206 | 133.7 35% | 183.2 11% | 134.5 35% | 167.5 19% | 176.9 14% |
| Load Maximum * (Watt) | 246.4 | 209.8 15% | 221 10% | 185 25% | 230.7 6% | 242.9 1% |
* ... Meglio usare valori piccoli
Power Consumption Witcher 3 / Stresstest
Power Consumption external Monitor
Durata della batteria
La capacità della batteria è notevolmente inferiore rispetto alle versioni Intel del vecchio Omen 16 (68 Wh contro 83 Wh). Ciononostante, i tempi di esecuzione complessivi non sono significativamente più brevi sul nostro modello AMD. Siamo riusciti a registrare un'autonomia in WLAN di quasi 7 ore con il profilo di alimentazione bilanciato, che è superiore alla media per un portatile da gioco
La ricarica da vuoto a pieno regime con l'adattatore CA in dotazione è relativamente lenta: da 2 a 2,5 ore rispetto alle 1,5 ore della maggior parte dei portatili. Inoltre, il portatile non è compatibile con la maggior parte dei caricatori USB-C di terze parti. HP dichiara che il modello supporta USB-C Power Delivery, ma collegando il nostro adattatore CA USB-C da 100 W viene visualizzato il messaggio di avviso "L'adattatore CA non è compatibile con il sistema". In confronto, i portatili da gioco abilitati al PD di Razer, MSI o Asus funzionano con tutti gli adattatori CA USB-C testati.
| HP Omen 16-n0033dx R7 6800H, Radeon RX 6650M, 68 Wh | HP Envy 16 h0112nr i7-12700H, GeForce RTX 3060 Laptop GPU, 83 Wh | HP Omen 16-b1090ng i7-12700H, GeForce RTX 3070 Ti Laptop GPU, 83 Wh | HP Victus 16-e0145ng R5 5600H, GeForce RTX 3050 Ti Laptop GPU, 70 Wh | Lenovo Legion S7 16ARHA7 R9 6900HX, Radeon RX 6800S, 71 Wh | Dell G16 7620 i7-12700H, GeForce RTX 3060 Laptop GPU, 84 Wh | |
|---|---|---|---|---|---|---|
| Autonomia della batteria | 45% | 18% | 1% | -11% | -31% | |
| Reader / Idle (h) | 10 | 17.8 78% | 10.1 1% | 7.1 -29% | ||
| WiFi v1.3 (h) | 7 | 7.9 13% | 5.6 -20% | 7.1 1% | 6.2 -11% | 5 -29% |
| Load (h) | 1.1 | 1.6 45% | 1.9 73% | 0.7 -36% |
Pro
Contro
Verdetto - Una valida alternativa alla GeForce RTX 3060
Come la maggior parte dei laptop basati su AMD, l'AMD Omen 16 viene venduto a diverse centinaia di dollari in meno rispetto a un laptop equivalente con Intel Core i7 e GeForce RTX. Il Ryzen 7 6800H non può competere con le ultime CPU Core di 12a generazione in termini di prestazioni grezze, ma la Radeon RX 6650M tiene testa alla RTX 3060 meglio del previsto. Poiché la maggior parte dei giochi è legata alla GPU, il deficit di CPU tra Intel e AMD in questo caso conta molto meno quando si eseguono i giochi veri e propri. I possessori otterrebbero prestazioni di gioco leggermente superiori a quelle di una RTX 3060 per un prezzo sensibilmente inferiore, il che rappresenta l'attrattiva principale dell'Omen 16 di AMD.
Altri aspetti positivi sono la tastiera confortevole, l'ampia selezione di porte, il display di buona qualità a 144 Hz e lo chassis liscio simile a quello dell'Envy 16. Alcuni utenti potrebbero apprezzare l'assenza di LED o di disegni superficiali da gamer, a differenza della maggior parte delle alternative MSI o Asus.
L'Omen 16 di AMD offre prestazioni migliori per il prezzo rispetto alla maggior parte dei portatili dotati di GeForce RTX 3060. Tuttavia, se si apprezzano le prestazioni della CPU e il potenziale di ray-tracing, è meglio investire in una soluzione Intel-Nvidia.
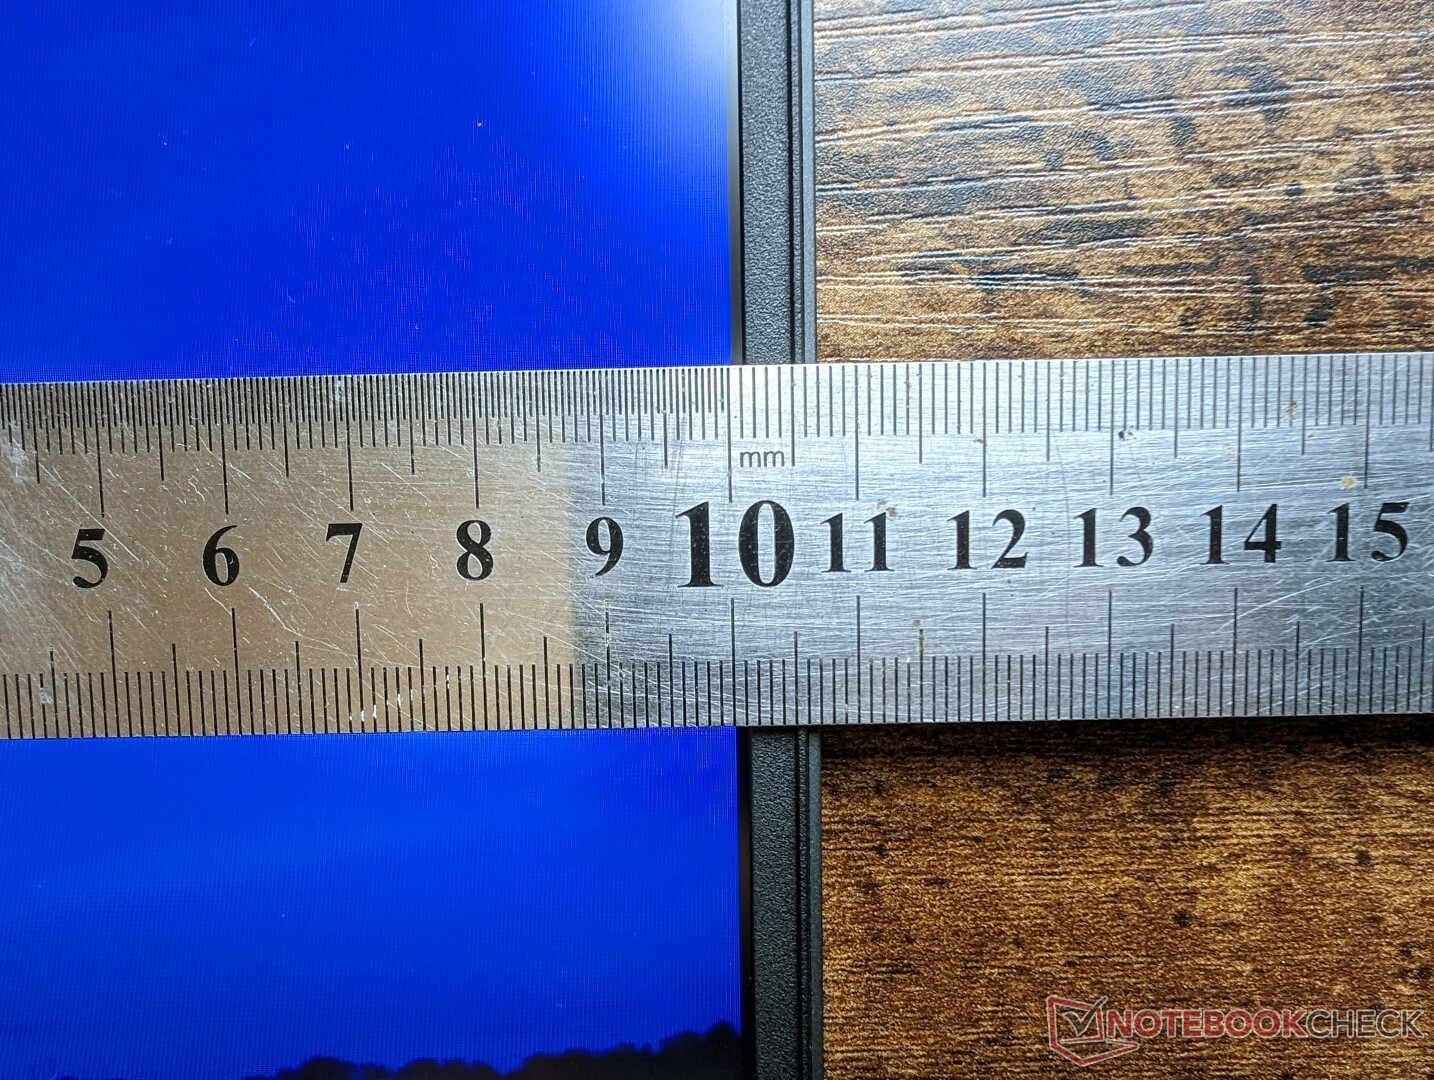
C'è comunque molto da migliorare. La cornice del display, ad esempio, è troppo spessa e comporta un ingombro e un peso maggiore rispetto a concorrenti come l'Asus Zephyrus M16.Asus Zephyrus M16 o Lenovo Legion S7. Il clickpad è troppo sensibile e le ventole sono ancora più rumorose della media se si attiva la modalità Performance. Gli utenti potrebbero prendere in considerazione di giocare in modalità Bilanciata per le ventole significativamente più silenziose, anche se questo comporta un leggero calo delle prestazioni.
Prezzo e disponibilità
L'unità da noi recensita, così come è stata configurata, è in spedizione presso Best Buy al prezzo di 1580 dollari. Tuttavia, HP ha in corso una vendita sulla stessa configurazione per a partire da 900 dollari USA al momento della pubblicazione. Anche le varianti Intel-Nvidia dell'Omen 16 sono ampiamente disponibili.
HP Omen 16-n0033dx
- 11/29/2022 v7 (old)
Allen Ngo
Price comparison

