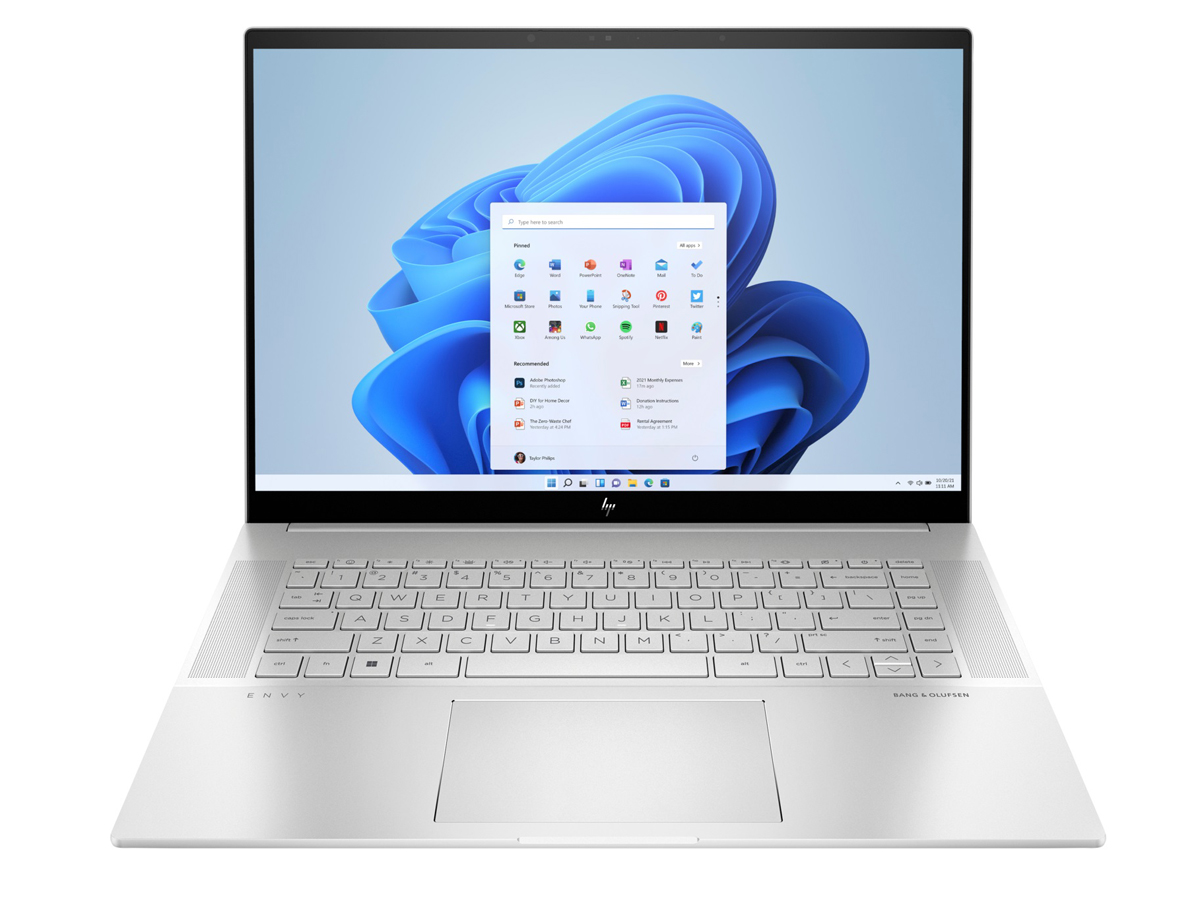
Recensione del portatile HP Envy 16 2022: Per il multimedia, i gamers, i creators e tutti gli altri
L'Envy 16 sostituisce l'Envy 15 da 6 pollici dello scorso anno 15.envy 15 da 6 pollici passando a un nuovo fattore di forma da 16 pollici insieme alle più recenti CPU Intel di 12a generazione e alle opzioni di grafica discreta Nvidia e Intel. A differenza della serie Pavilion, meno costosa, la serie Envy ospita modelli prosumer di fascia alta con prestazioni generalmente più elevate, meno plastiche e una migliore qualità costruttiva
La nostra configurazione specifica è una SKU di fascia alta con Core i7-12700H, GeForce RTX 3060 e schermo OLED touchscreen da 2400p per circa 1700 dollari. Sono disponibili altre configurazioni con il più lento Core i5-12500H, il più veloce i9-12900H, la grafica Intel Arc A370M o il display IPS da 1600p, con prezzi compresi tra 1180 e 2380 dollari
Le alternative all'Envy 16 includono altri computer portatili prosumer di fascia alta come la serie Dell XPS 15, MacBook Pro 16,Huawei MateBook 16so ilLG Gram 16.
Altre recensioni di HP:
Potenziali concorrenti a confronto
Punteggio | Data | Modello | Peso | Altezza | Dimensione | Risoluzione | Prezzo |
|---|---|---|---|---|---|---|---|
| 86.9 % v7 (old) | 09/2022 | HP Envy 16 h0112nr i7-12700H, GeForce RTX 3060 Laptop GPU | 2.3 kg | 19.8 mm | 16.00" | 3840x2400 | |
| 88.4 % v7 (old) | 09/2022 | Lenovo ThinkBook 16 G4+ IAP i7-12700H, GeForce RTX 2050 Mobile | 1.8 kg | 16.5 mm | 16.00" | 2560x1600 | |
| 83.7 % v7 (old) | 06/2022 | MSI Creator Z16P B12UHST i9-12900H, GeForce RTX 3080 Ti Laptop GPU | 2.4 kg | 20.4 mm | 16.00" | 2560x1600 | |
| 82.6 % v7 (old) | 11/2021 | Dell Inspiron 16 Plus 7610-MHJ8F i7-11800H, UHD Graphics Xe 32EUs (Tiger Lake-H) | 2 kg | 19 mm | 16.00" | 3072x1920 | |
| 93.2 % v7 (old) | 11/2021 | Apple MacBook Pro 16 2021 M1 Pro M1 Pro, M1 Pro 16-Core GPU | 2.2 kg | 16.8 mm | 16.20" | 3456x2234 | |
| 86.4 % v7 (old) | 07/2022 | Huawei MateBook 16s i7 i7-12700H, Iris Xe G7 96EUs | 2 kg | 17.8 mm | 16.00" | 2520x1680 |
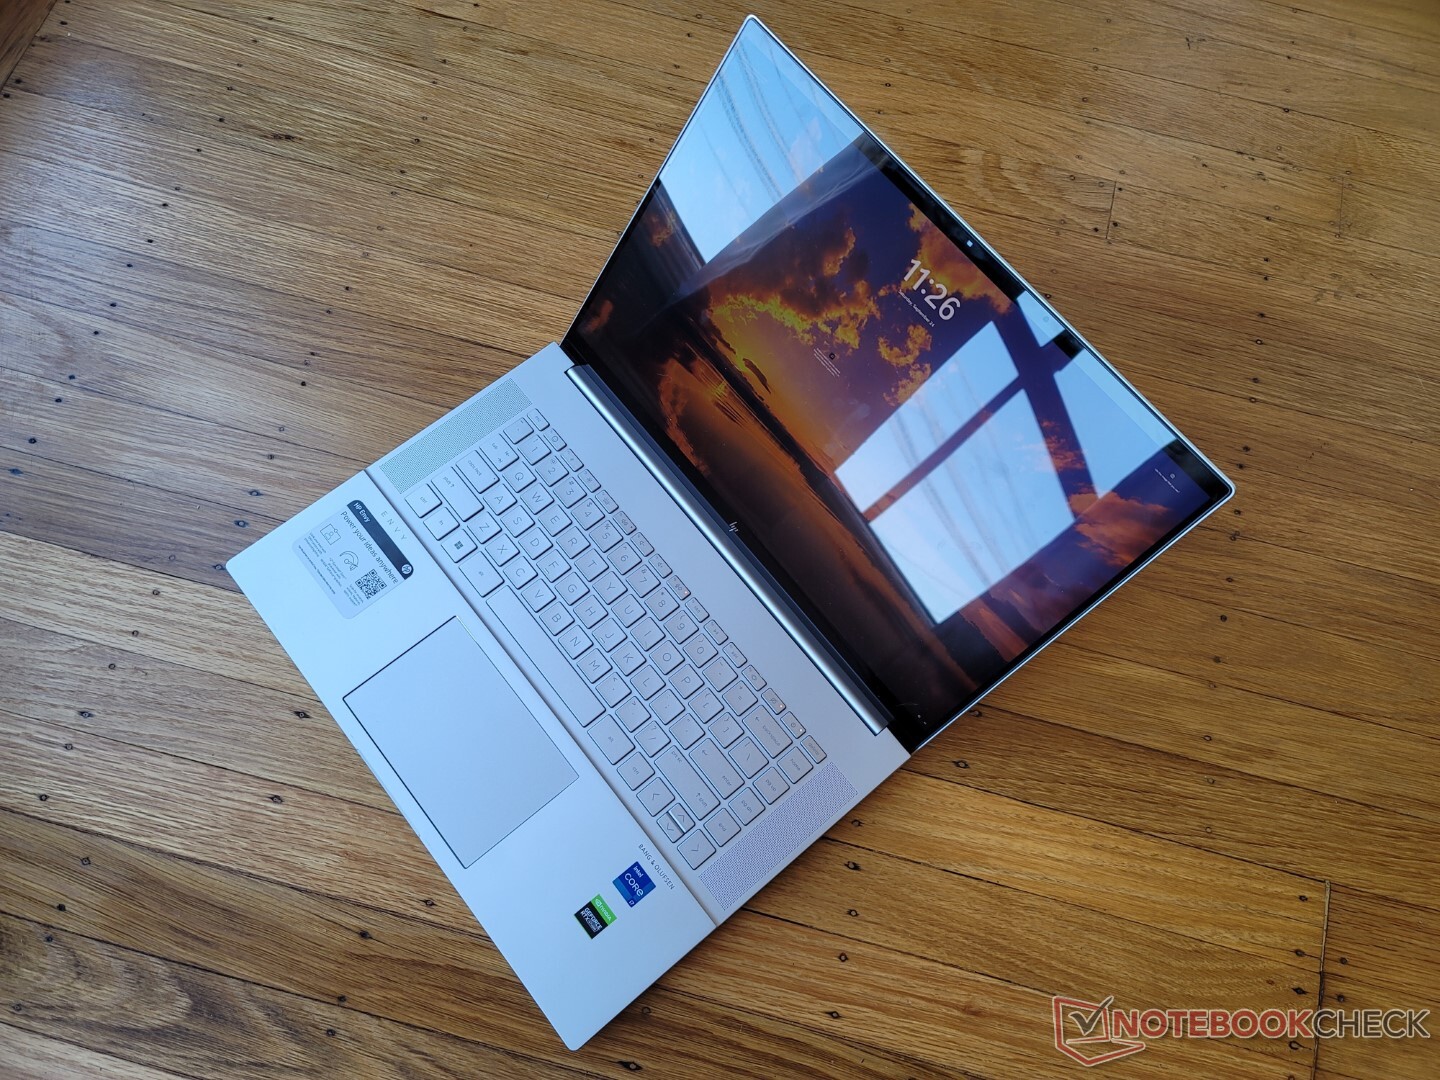
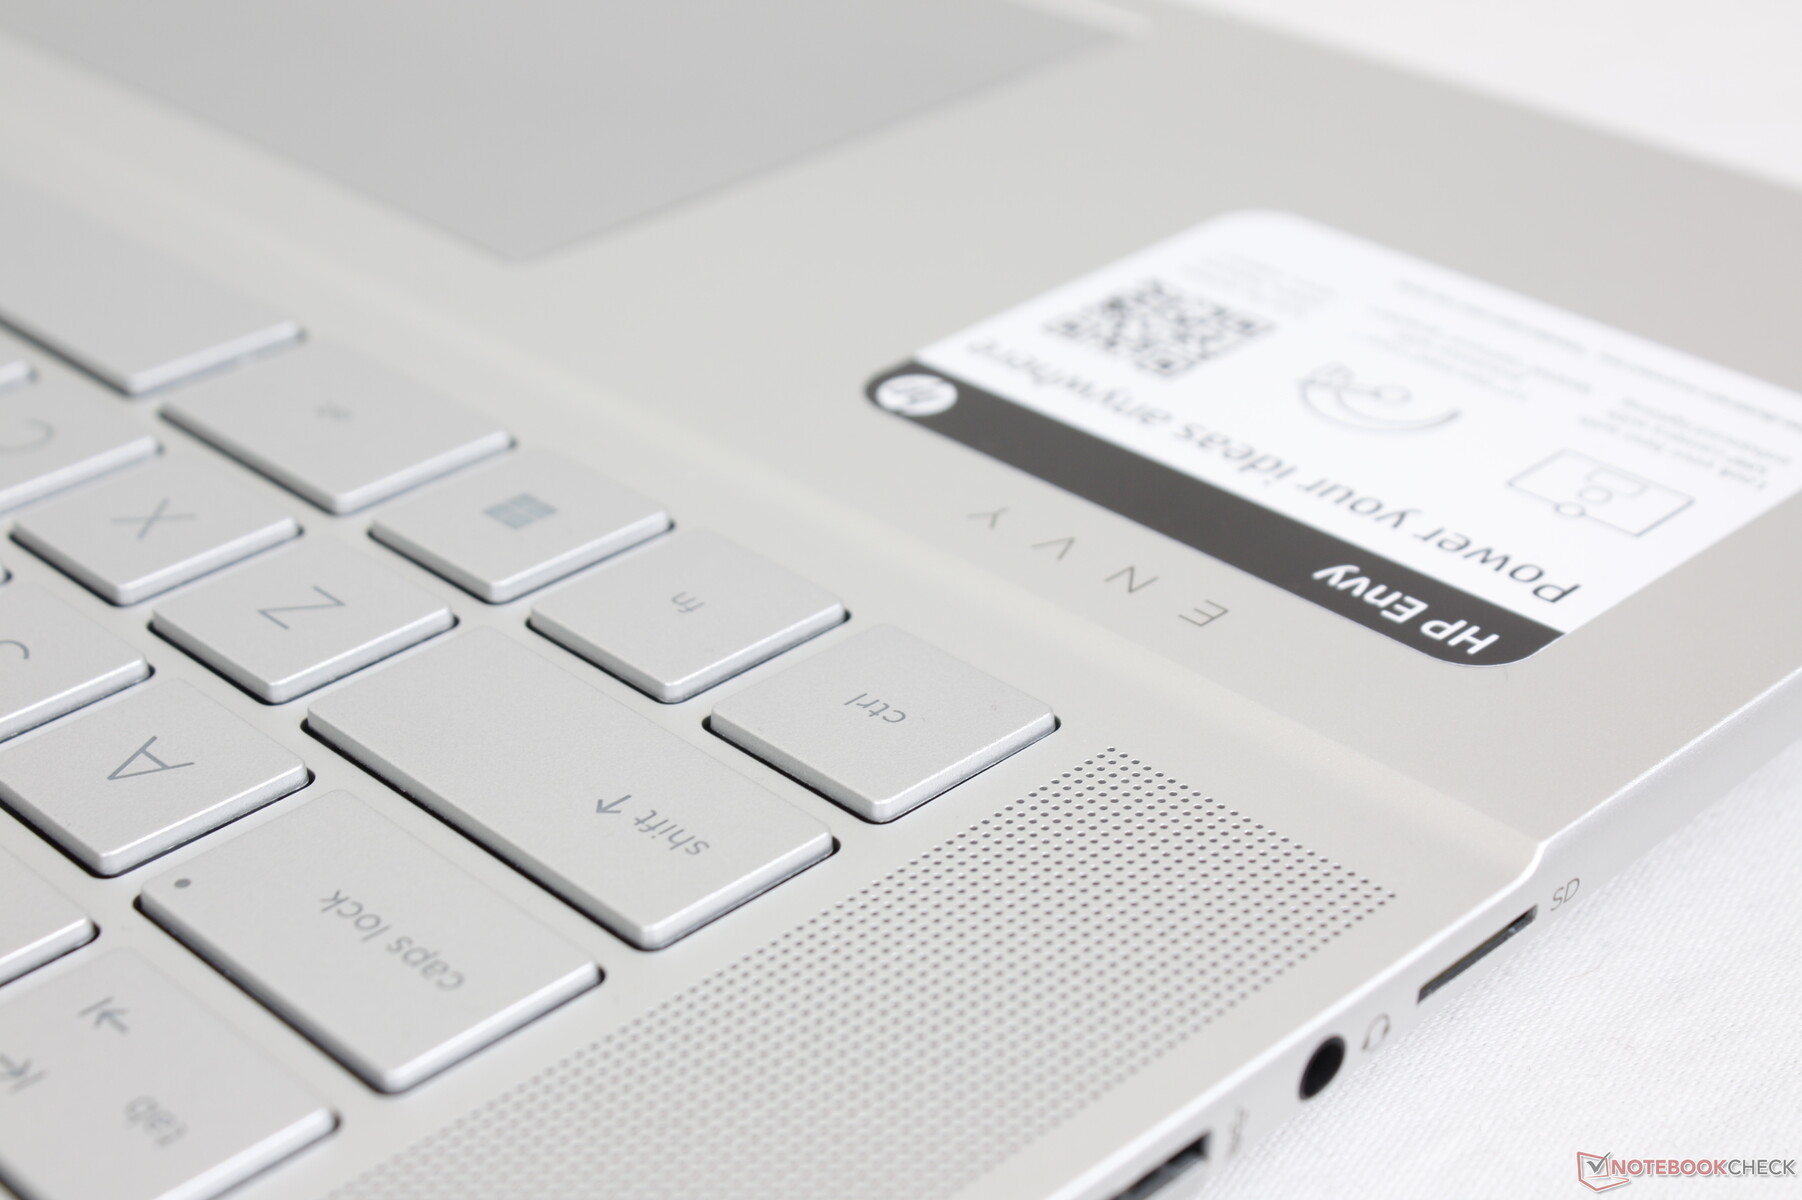
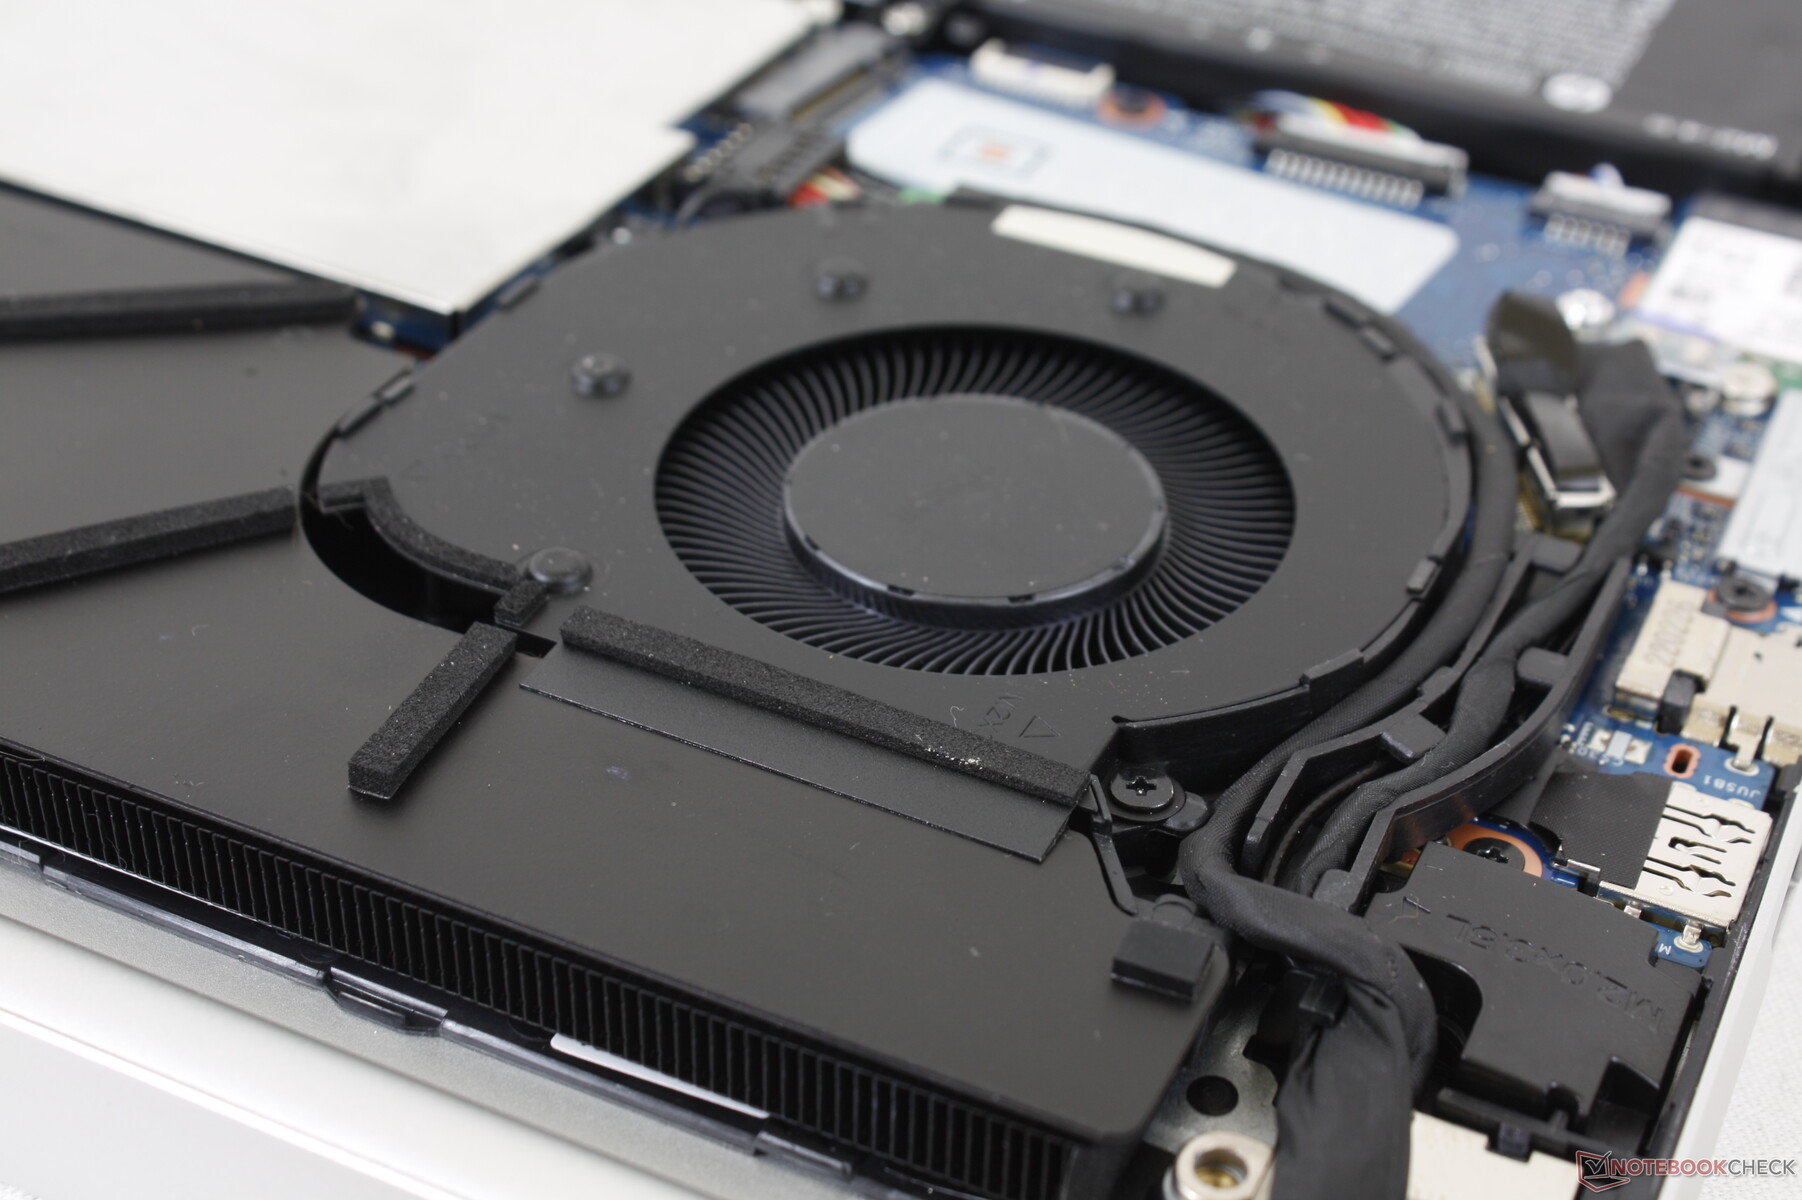
Caso: stessi colori con molte modifiche
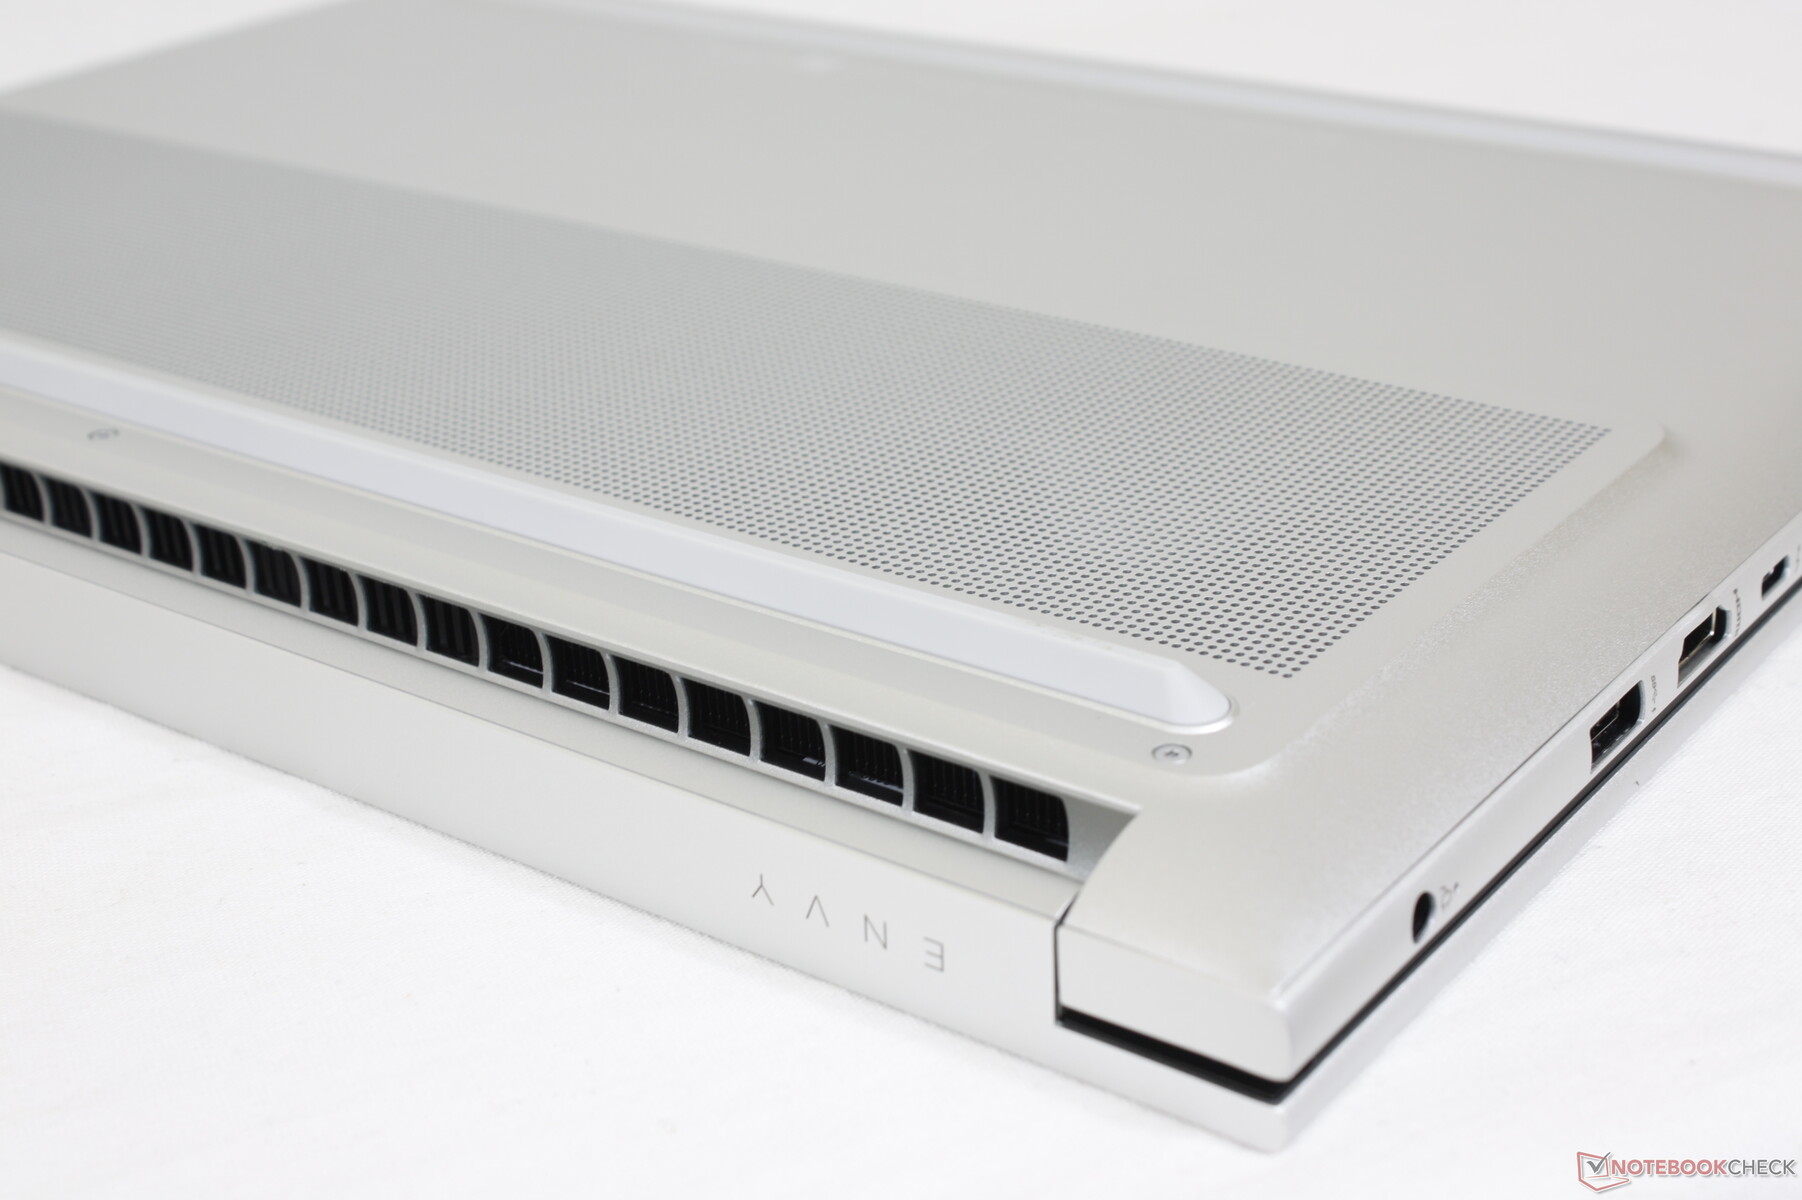
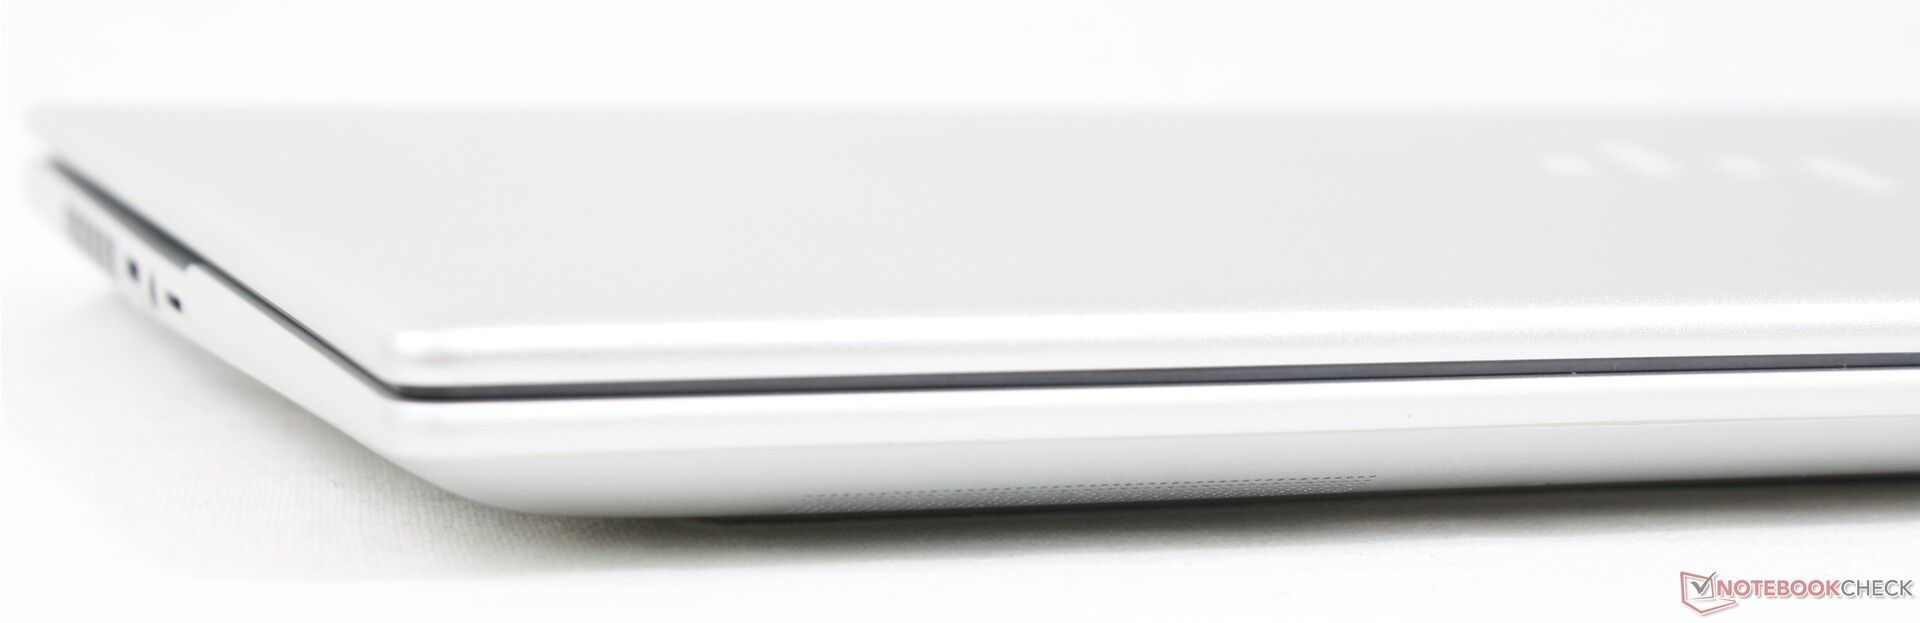
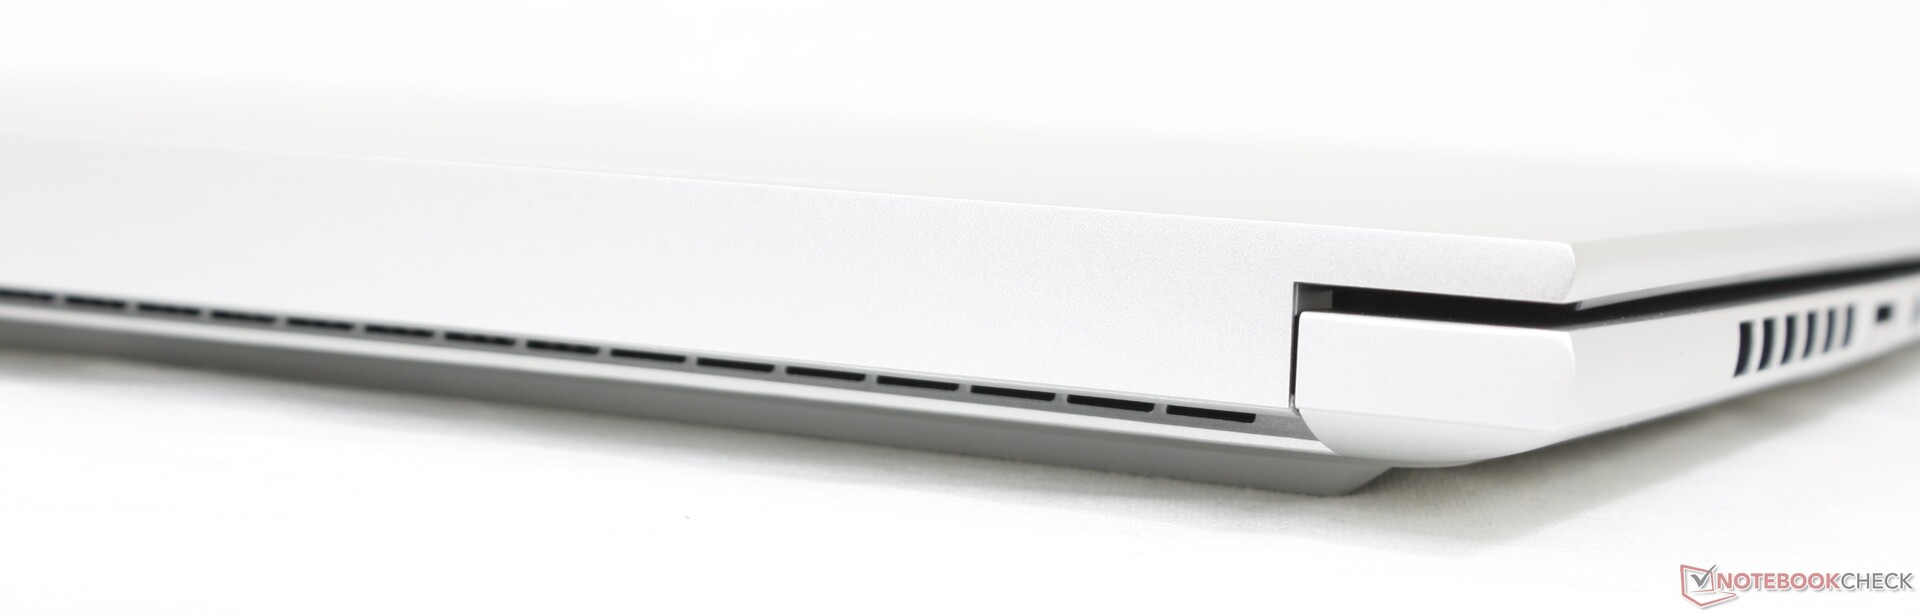
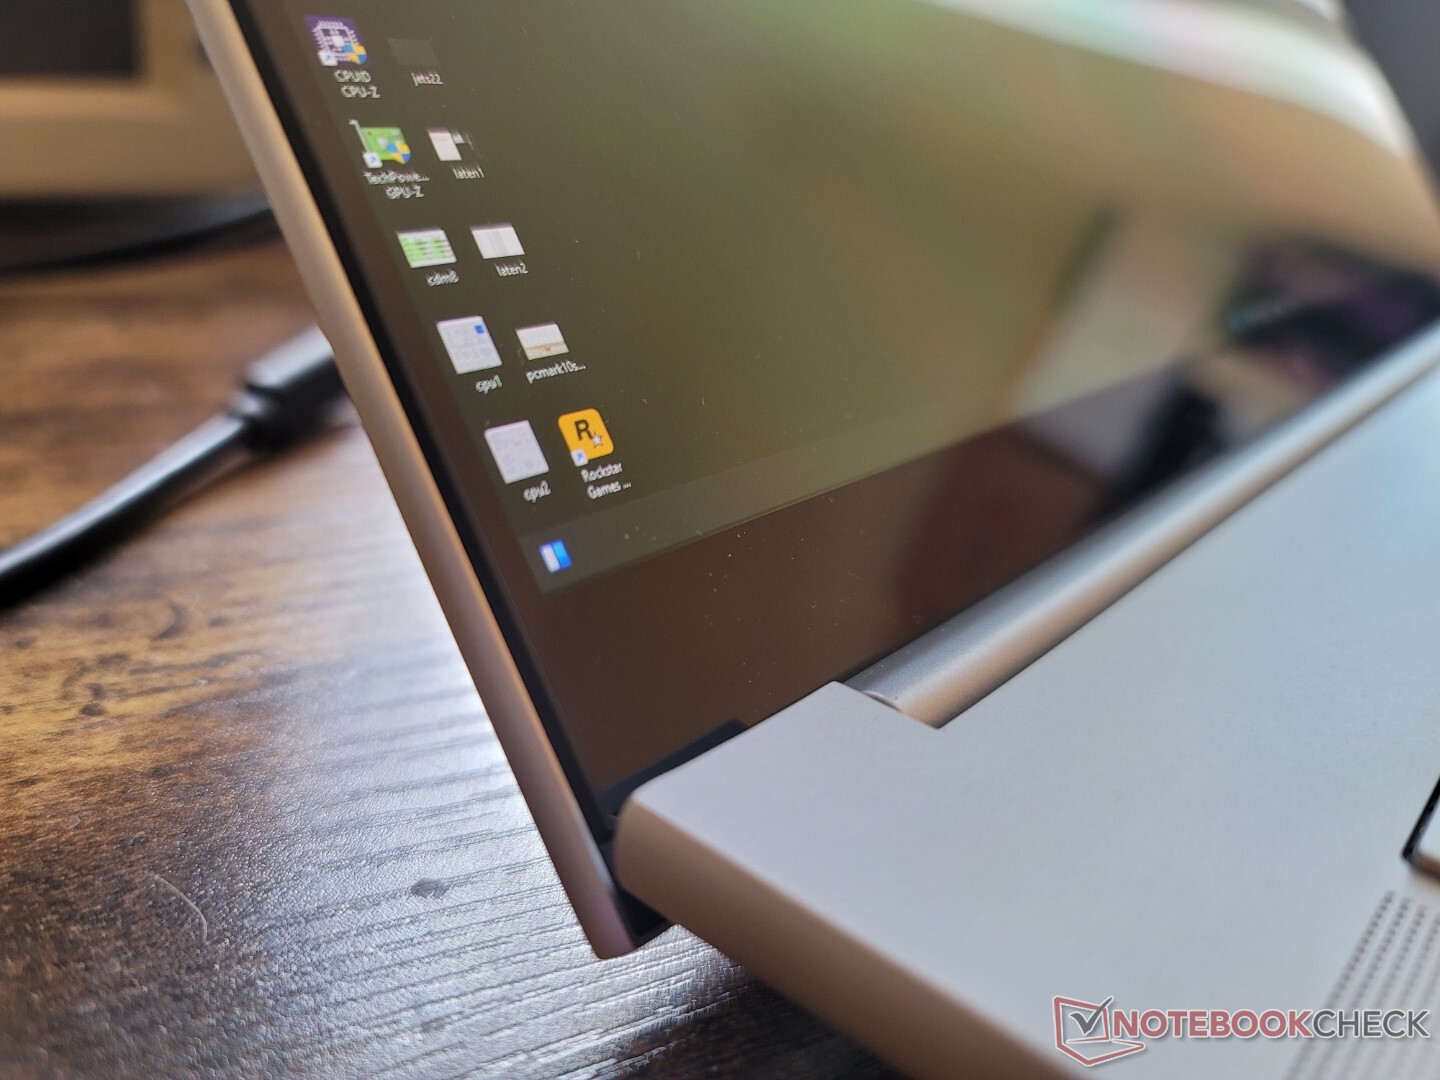
A prima vista l'Envy 16 può sembrare simile all'Envy 15 per via dei colori simili, ma in realtà ci sono numerosi cambiamenti sia all'interno che all'esterno. L'aspetto più evidente è che l'Envy 16 è più arrotondato lungo i bordi e gli angoli rispetto al design più piatto e affilato dell'Envy 15. Inoltre, la parte di ventilazione del pannello inferiore è rialzata anziché piatta, come si può notare dal design dell'Envy 15. Inoltre, la parte di ventilazione del pannello inferiore è rialzata anziché piatta, come mostrano le immagini qui sotto. Anche il piano poggiapolsi e le griglie degli altoparlanti sono stati ridisegnati. Alcune di queste modifiche sembrano essere superficiali, mentre altre dovrebbero migliorare le capacità di raffreddamento del modello.
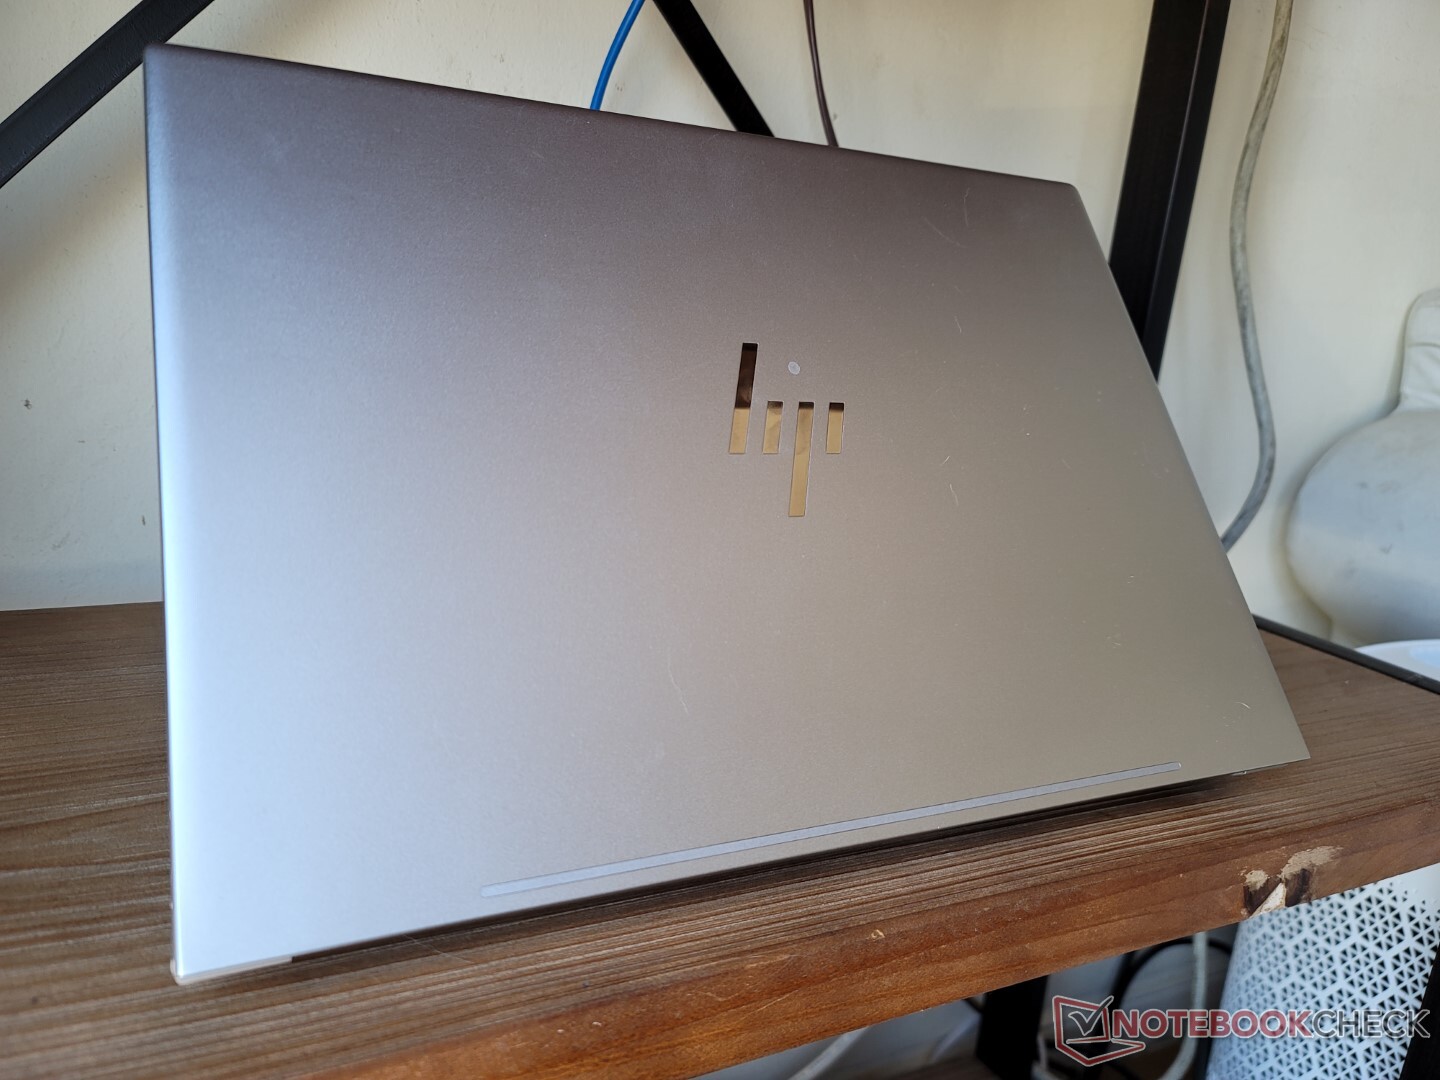
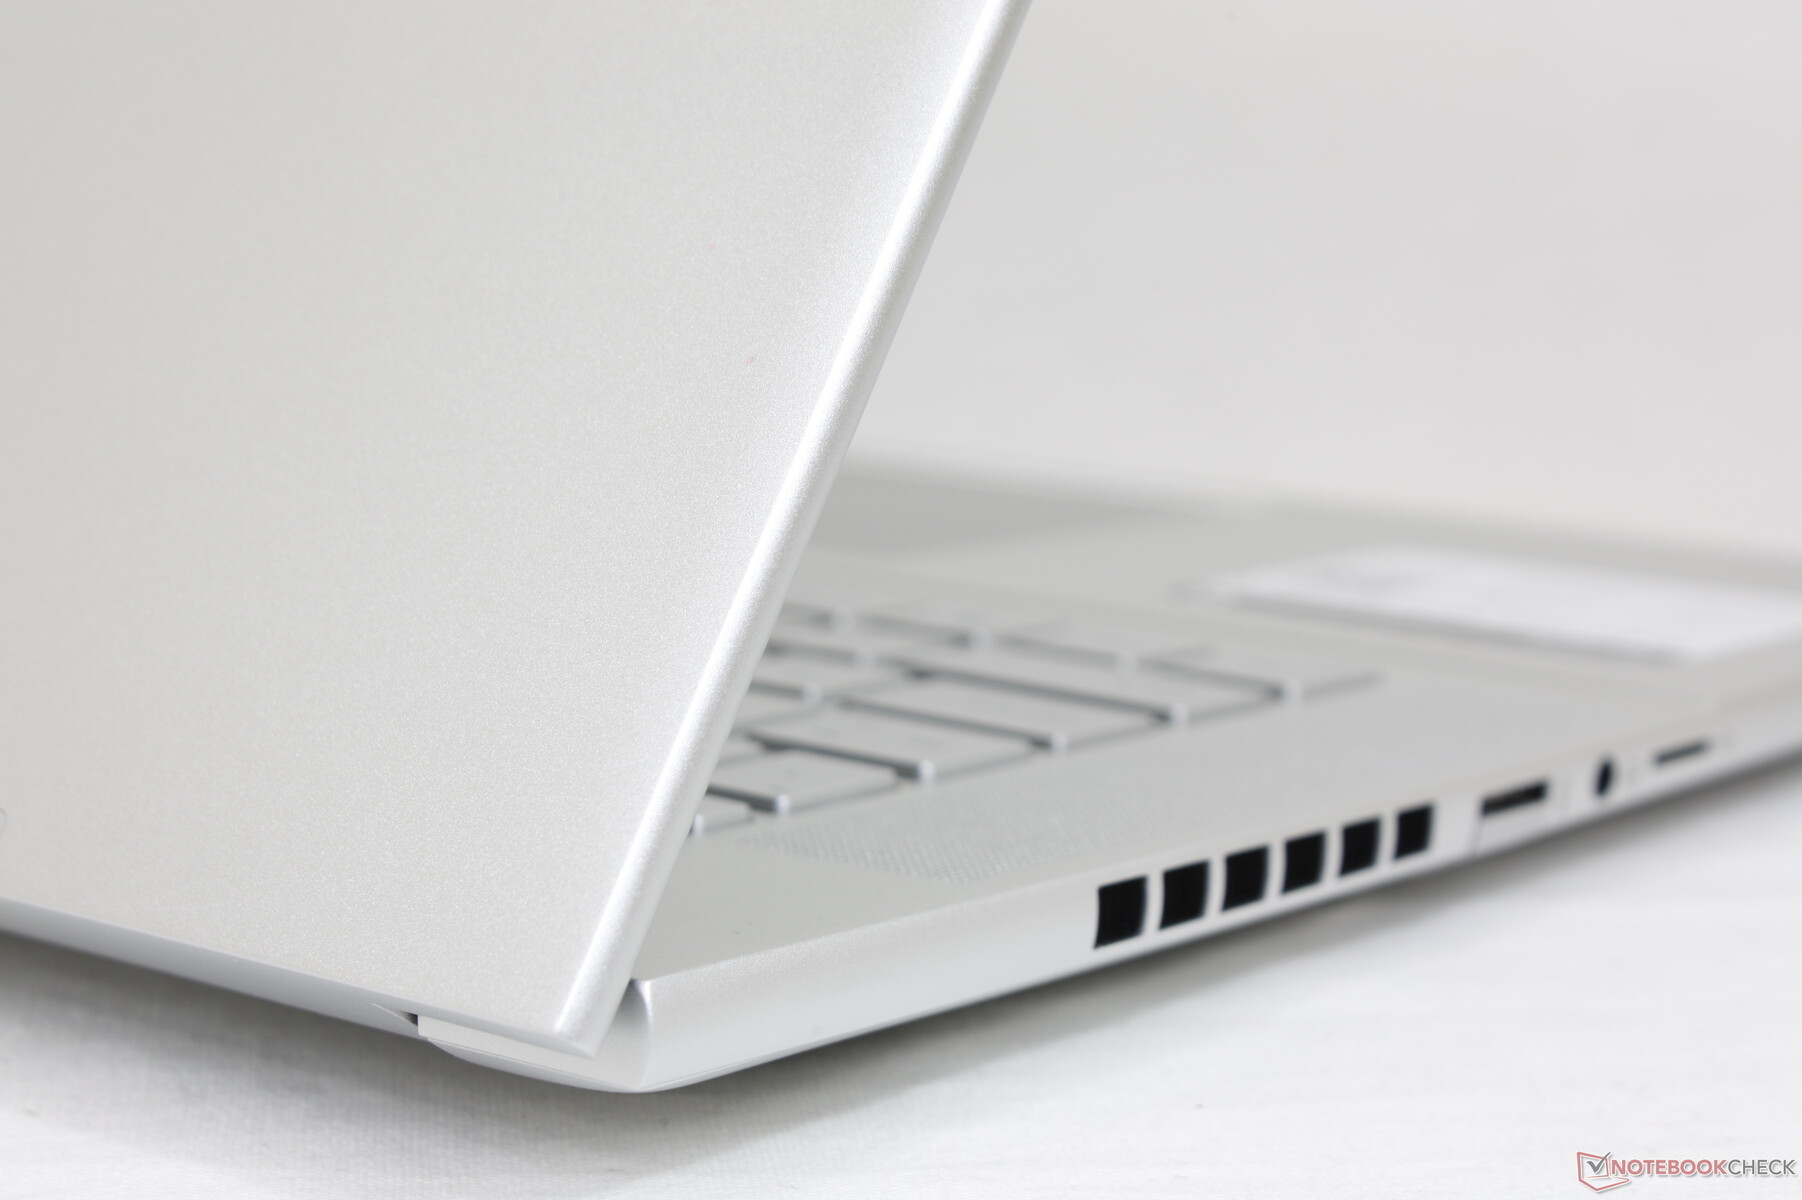
La qualità del telaio è rimasta invariata rispetto al modello envy 15 del 2020 nonostante l'aumento delle dimensioni. La base presenta solo lievi torsioni e deformazioni e il coperchio è abbastanza rigido grazie al vetro con bordo e al supporto in alluminio. Tuttavia, le cerniere avrebbero potuto essere più rigide, in quanto il coperchio traballa quando si regolano gli angoli, più che nello ZenBook Pro ZenBook Pro o del Razer Blade 15.
Il modello 2022 è più spesso, più pesante e più grande del modello 2020, come mostra il grafico di confronto qui sotto. Le dimensioni maggiori non sono forse inaspettate, visto il salto da un fattore di forma di 15,6 pollici a uno di 16 pollici. Tuttavia, l'HP è ancora leggermente più grande e più pesante di molti portatili multimediali da 16 pollici della concorrenza, come il MacBook Pro 16, il Huawei MateBook 16s o ilDell Inspiron 16 Plus 7610.
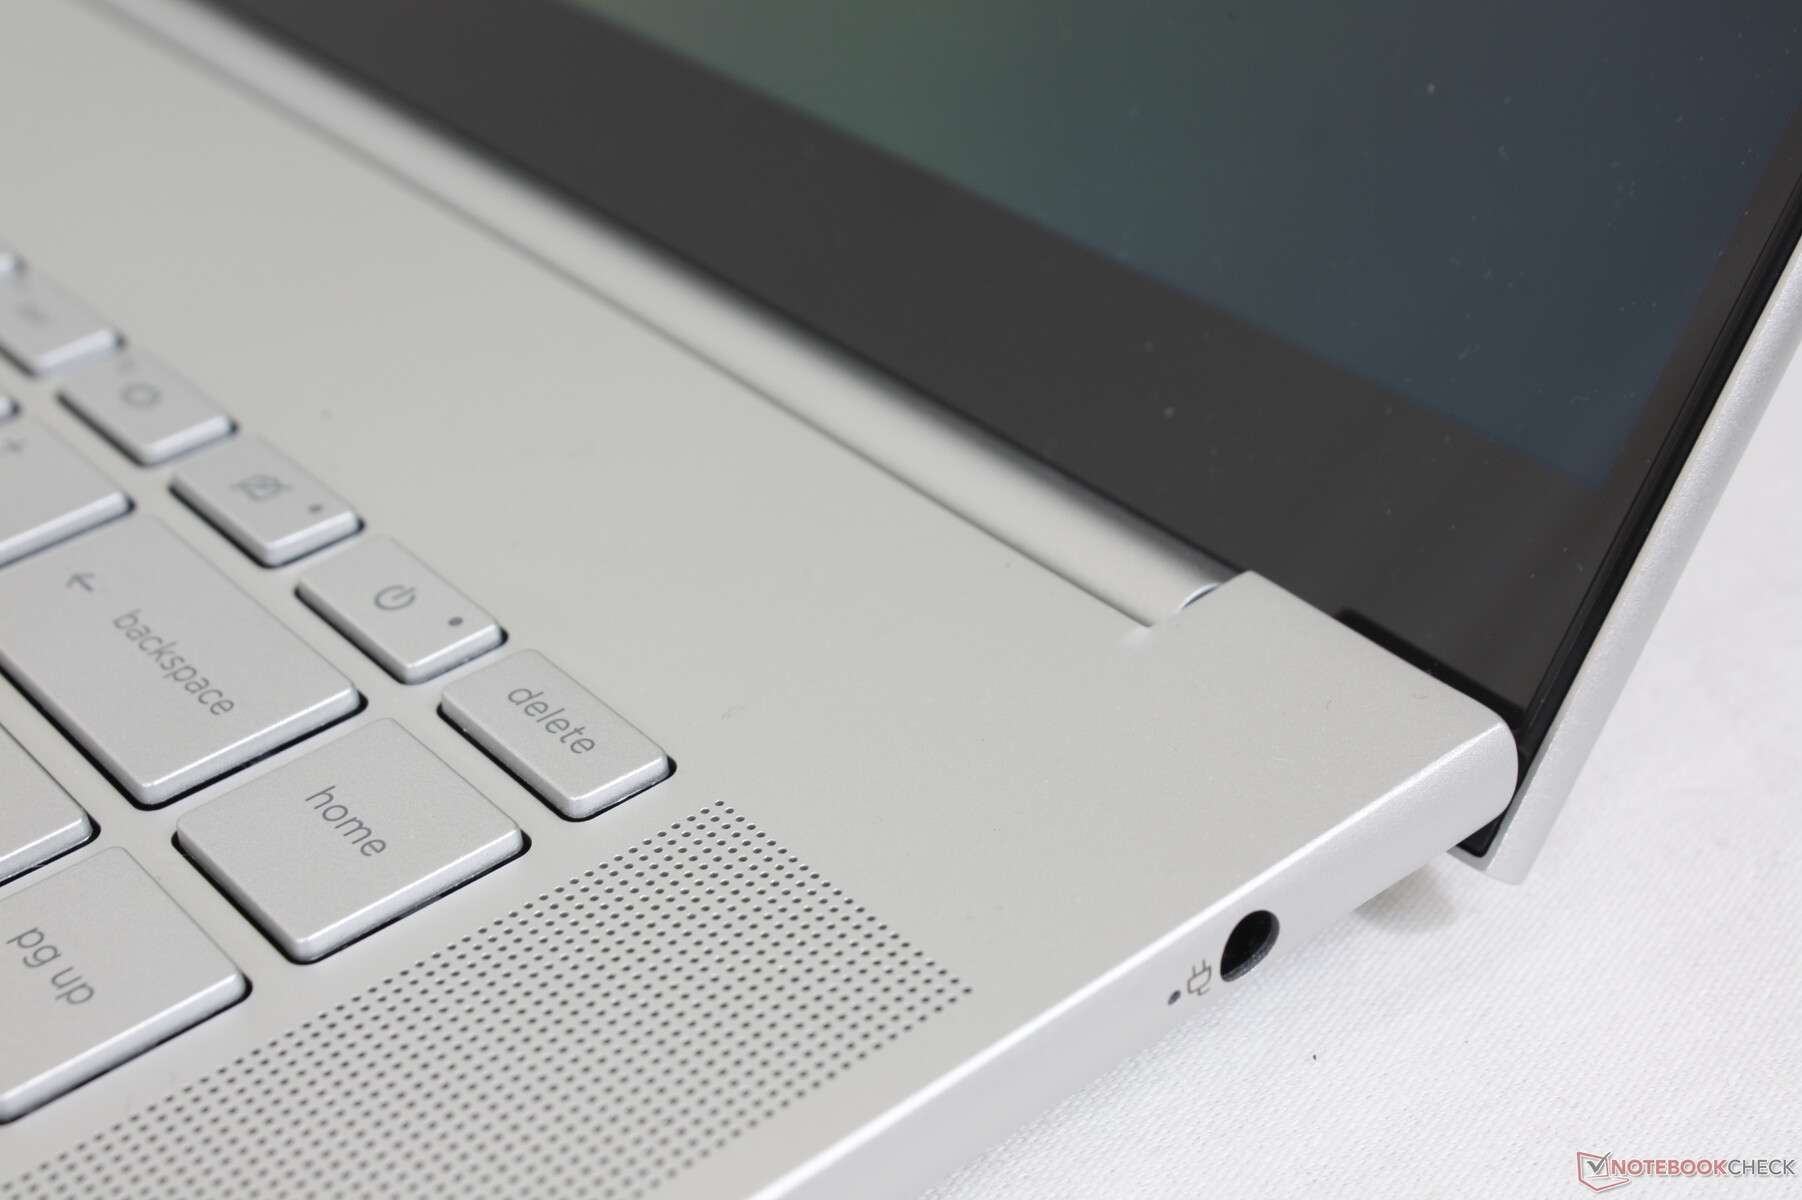
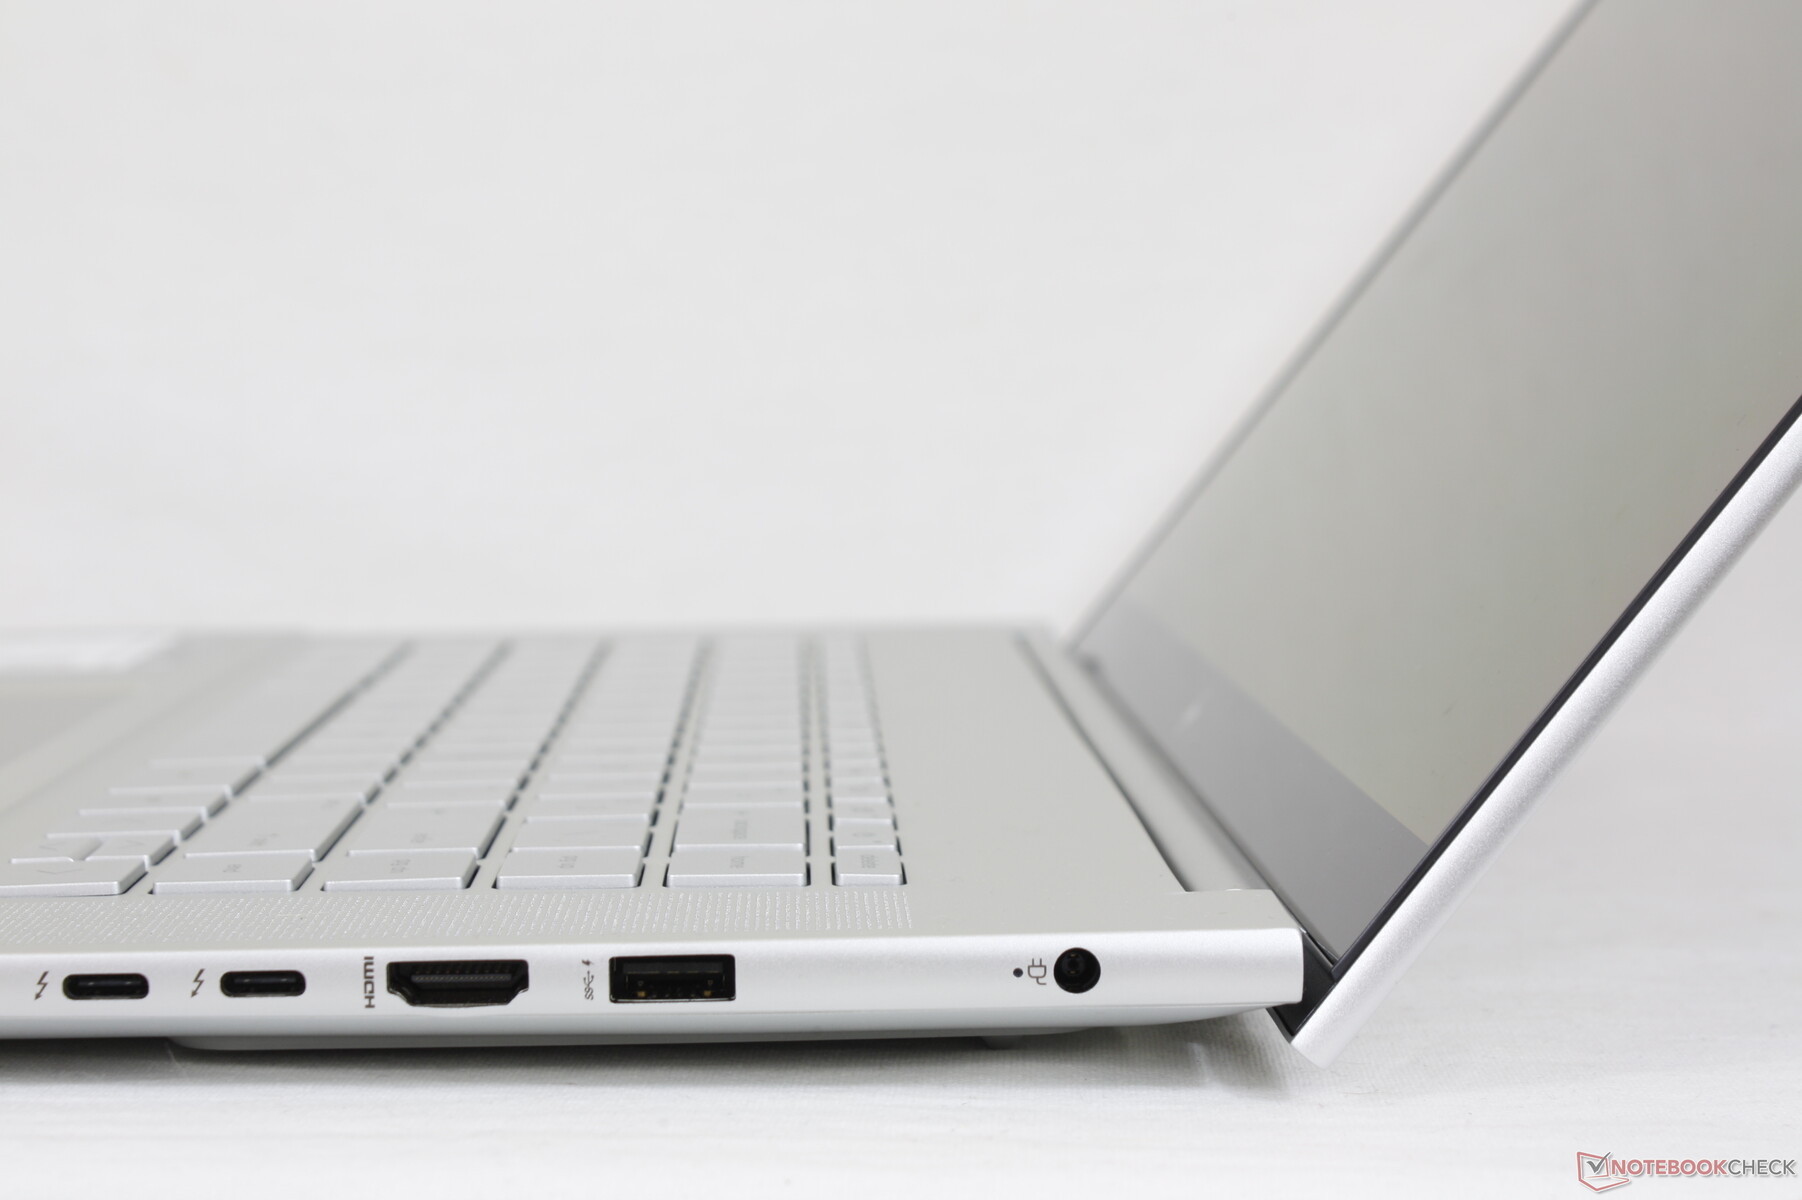
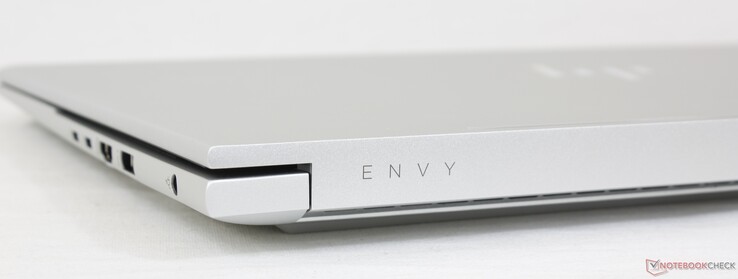
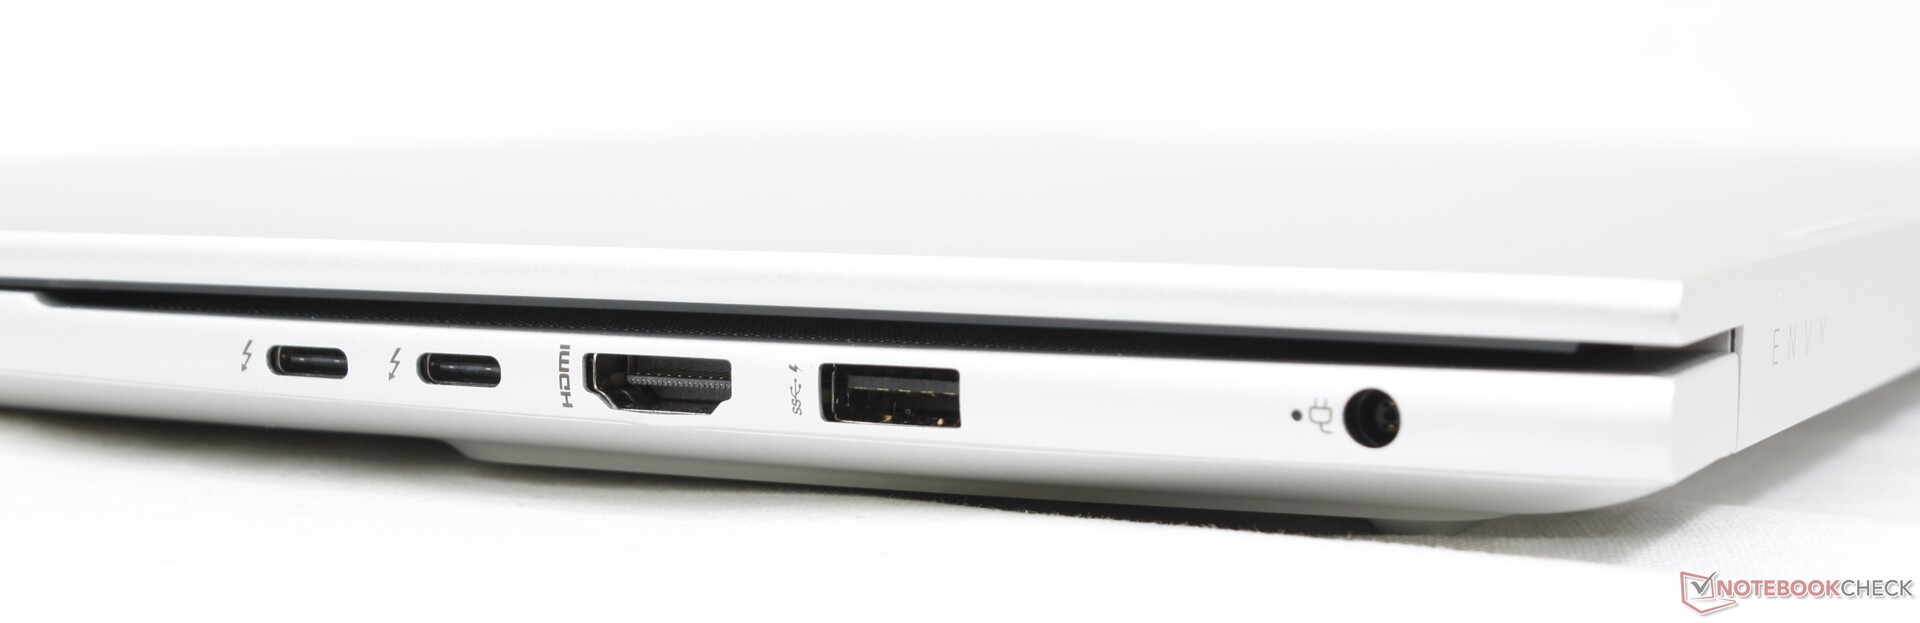
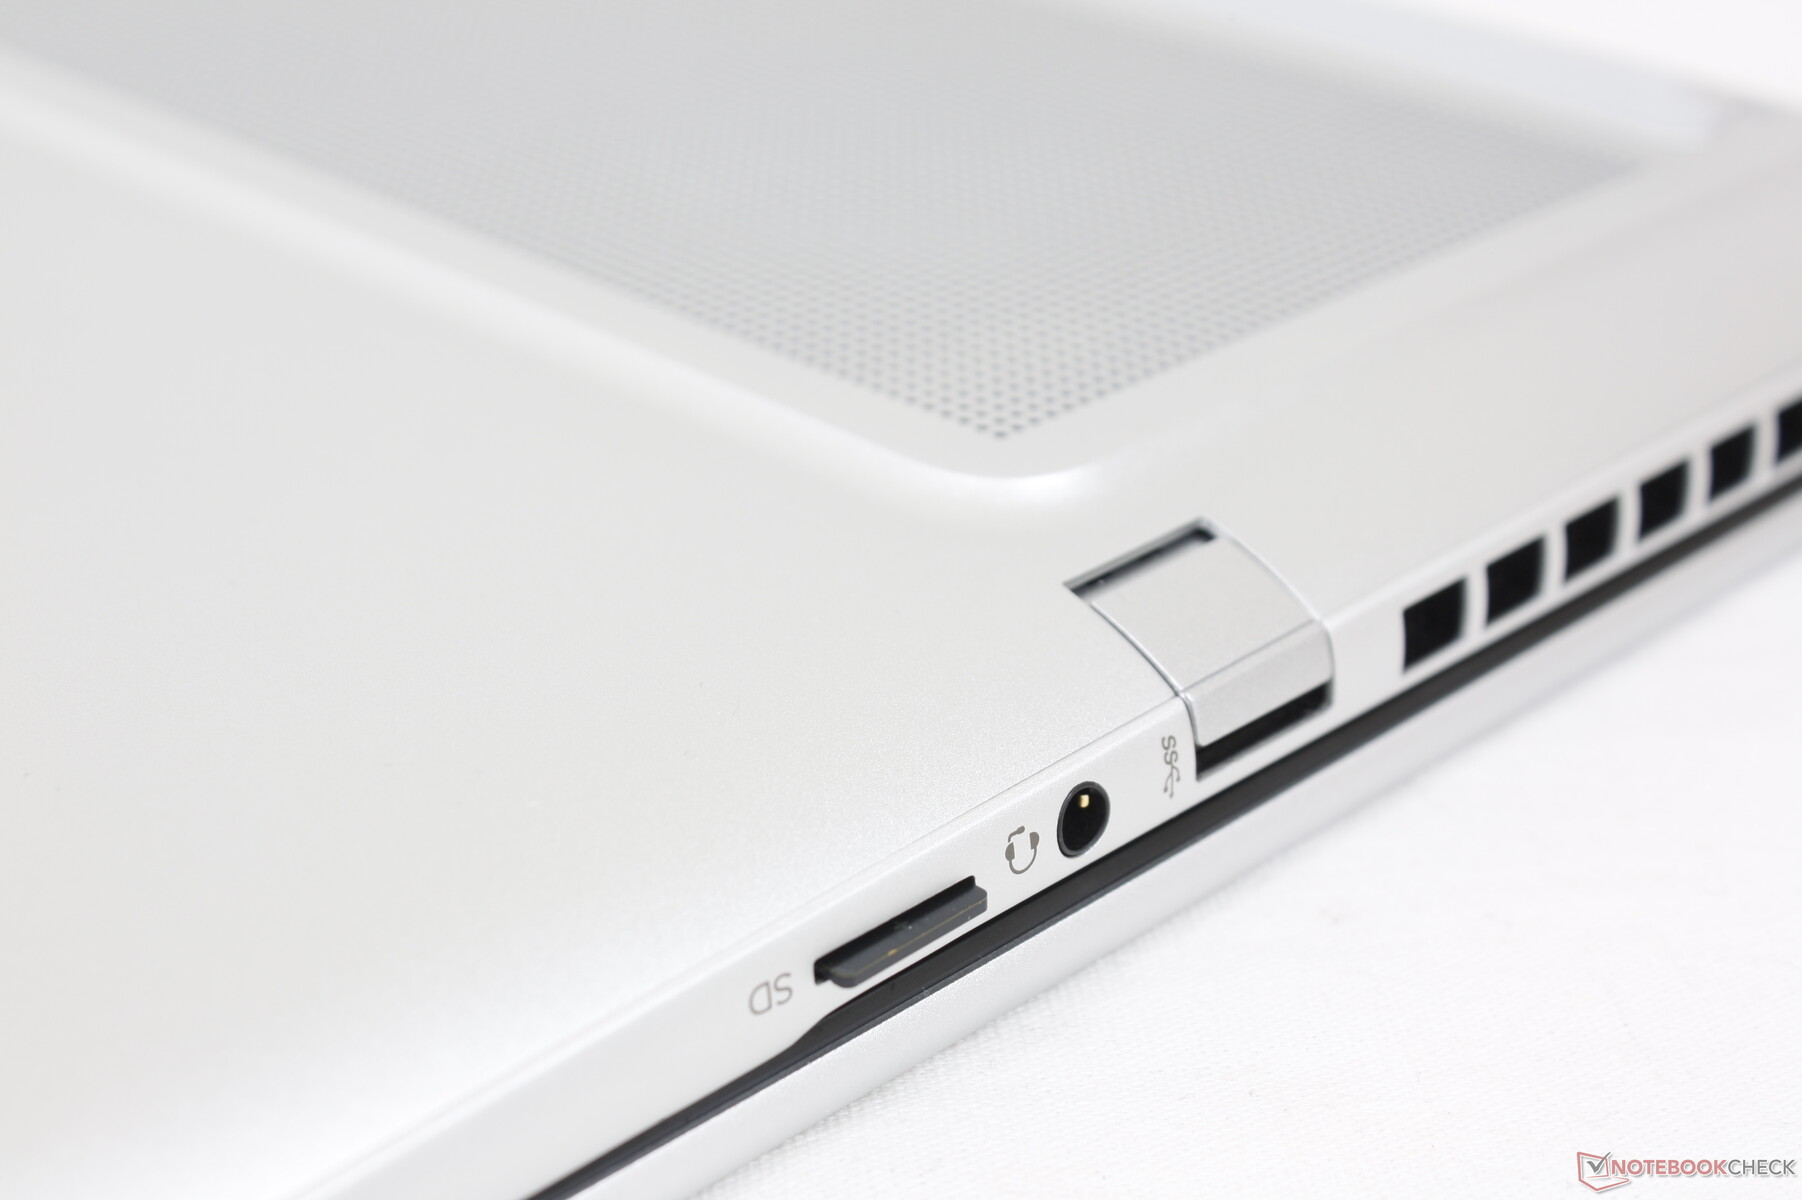
Connettività - Supporto Thunderbolt 4 standard
Tutte le porte dell'Envy 15 del 2020 sono tornate in questa revisione del 2022, anche se riorganizzate. La maggior parte delle porte si trova ora lungo il bordo destro dello chassis anziché a sinistra, nel bene e nel male. Purtroppo non c'è ancora lo slot per il lucchetto Kensington.
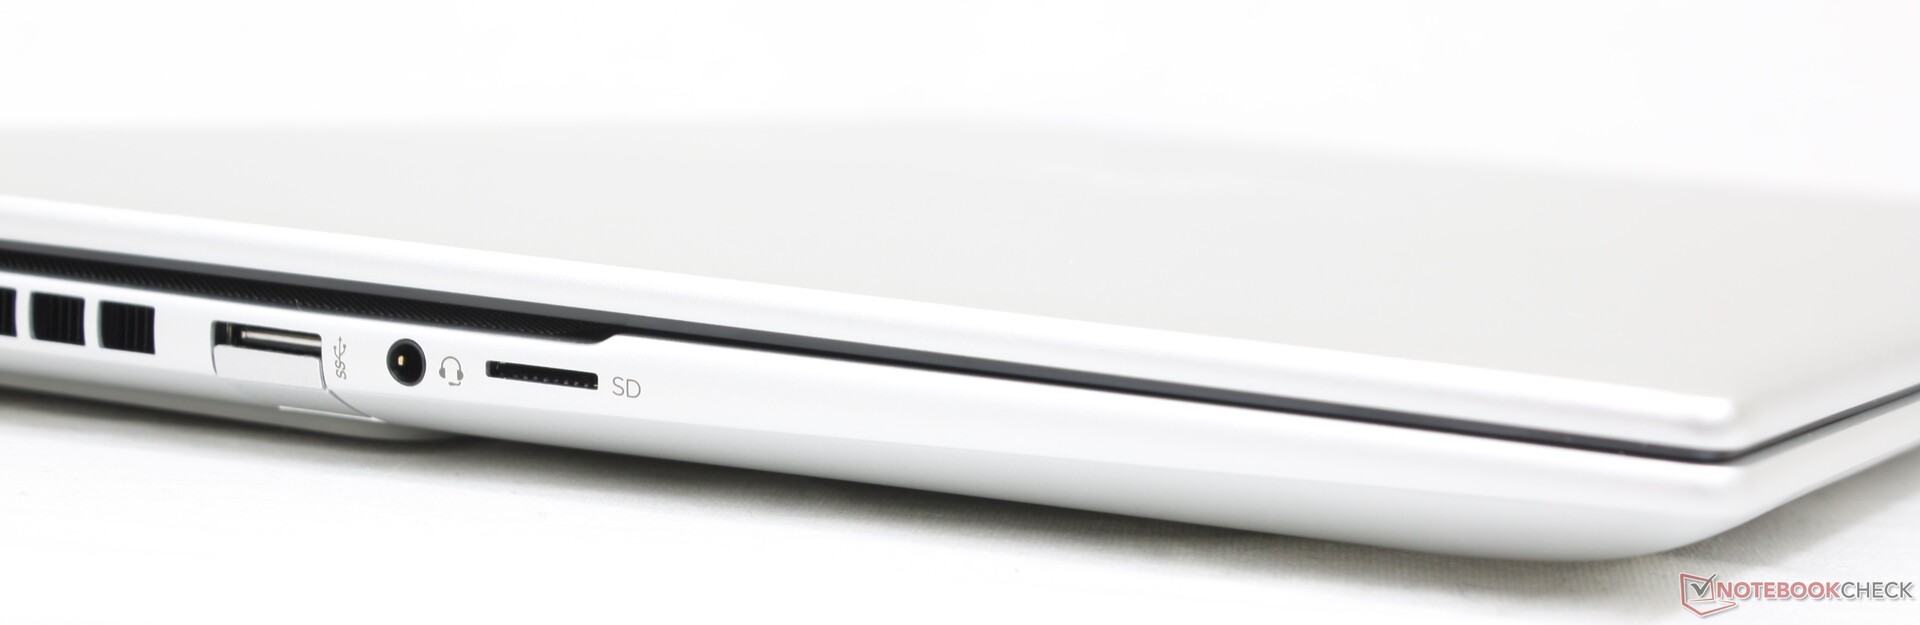
Lettore di schede SD
Le velocità di trasferimento dal lettore MicroSD integrato sono nella media. Lo spostamento di 1 GB di immagini dalla nostra scheda di prova UHS-II al desktop richiede circa 17 secondi.
| SD Card Reader | |
| average JPG Copy Test (av. of 3 runs) | |
| Apple MacBook Pro 16 2021 M1 Pro (Angelbird AV Pro V60) | |
| Lenovo ThinkBook 16 G4+ IAP (Angelbird AV Pro V60) | |
| MSI Creator Z16P B12UHST (AV PRO microSD 128 GB V60) | |
| HP Envy 16 h0112nr (AV Pro SD microSD 128 GB V60) | |
| Dell Inspiron 16 Plus 7610-MHJ8F (AV Pro SD microSD 128 GB V60) | |
| maximum AS SSD Seq Read Test (1GB) | |
| Lenovo ThinkBook 16 G4+ IAP (Angelbird AV Pro V60) | |
| HP Envy 16 h0112nr (AV Pro SD microSD 128 GB V60) | |
| Dell Inspiron 16 Plus 7610-MHJ8F (AV Pro SD microSD 128 GB V60) | |
Comunicazione
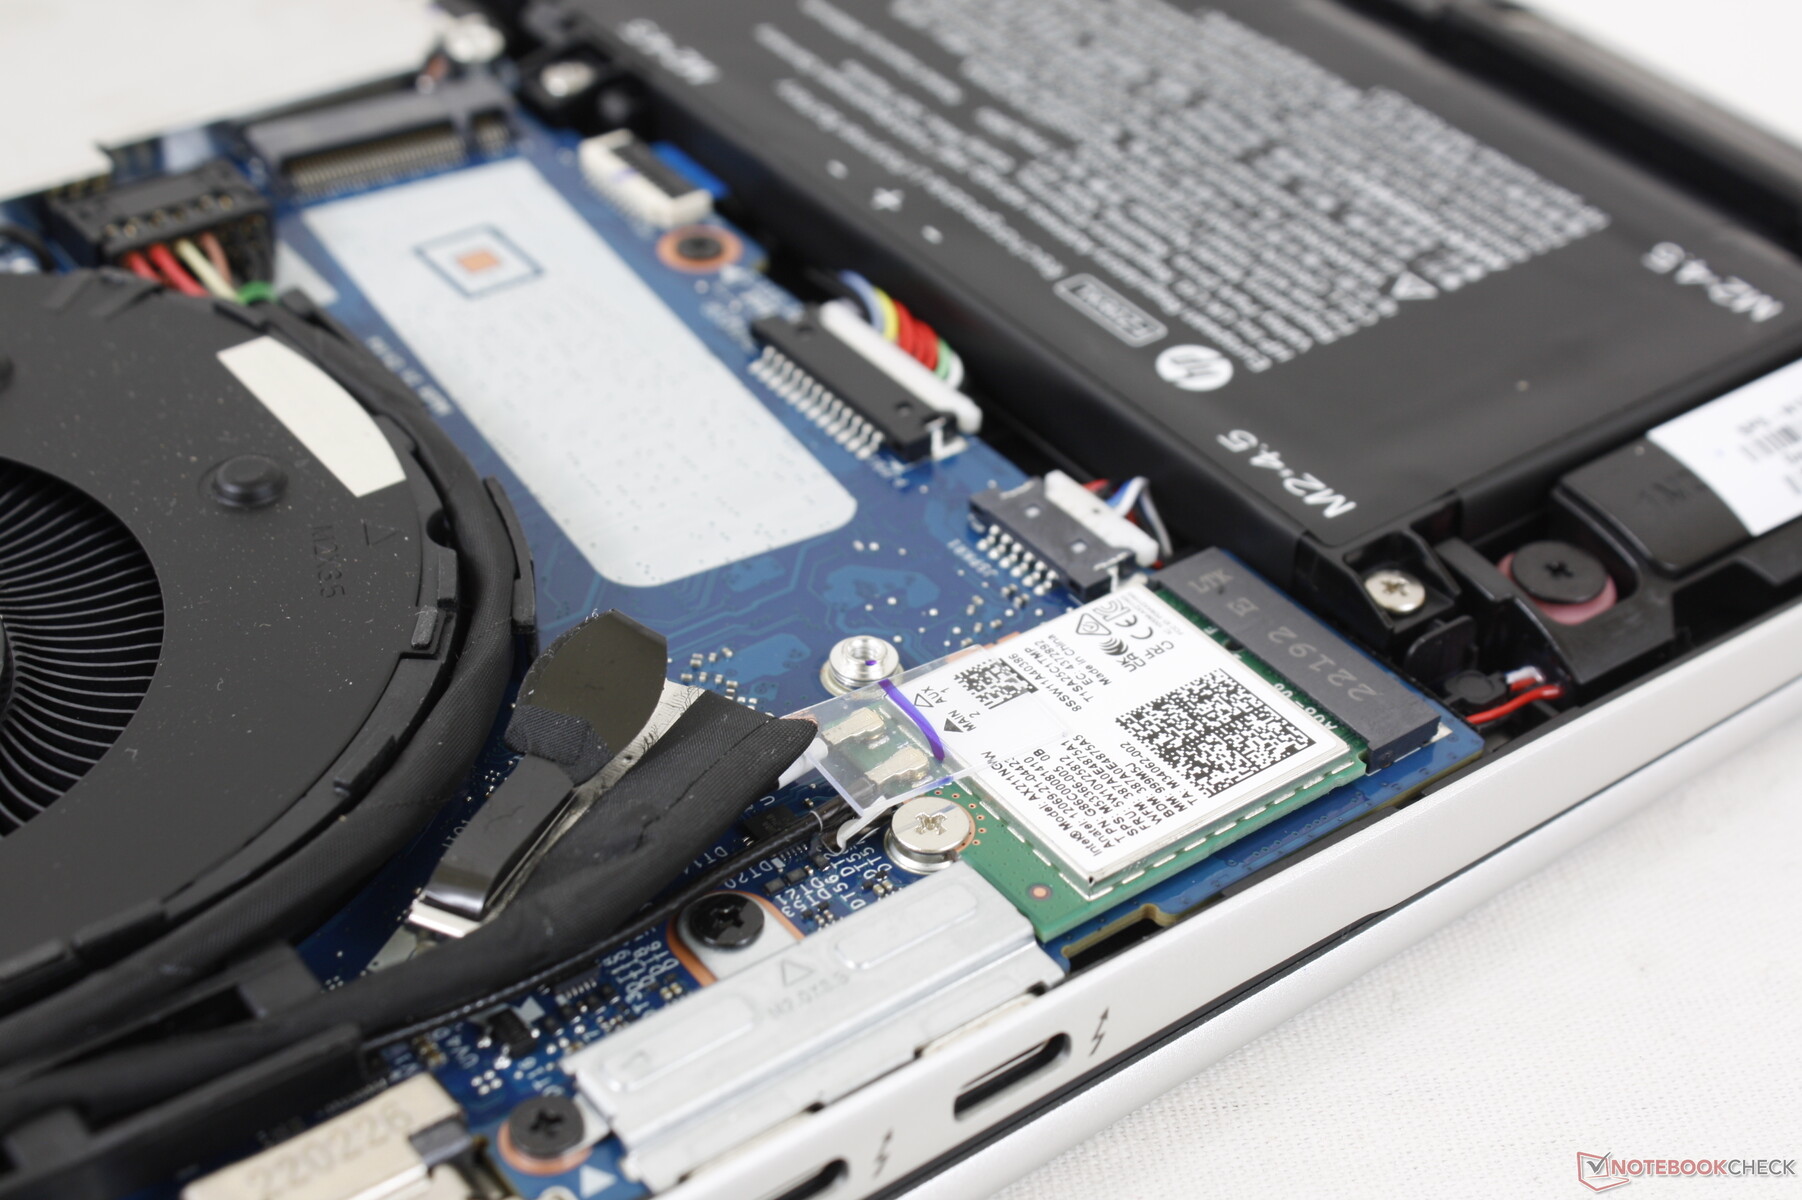
La connettività Wi-Fi 6E e Bluetooth 5.2 è garantita da un Intel AX211. Non abbiamo riscontrato problemi di affidabilità quando siamo stati accoppiati alla nostra rete a 6 GHz.
| Networking | |
| iperf3 transmit AX12 | |
| Dell Inspiron 16 Plus 7610-MHJ8F | |
| Apple MacBook Pro 16 2021 M1 Pro | |
| iperf3 receive AX12 | |
| Dell Inspiron 16 Plus 7610-MHJ8F | |
| Apple MacBook Pro 16 2021 M1 Pro | |
| iperf3 receive AXE11000 6GHz | |
| Huawei MateBook 16s i7 | |
| HP Envy 16 h0112nr | |
| iperf3 receive AXE11000 | |
| MSI Creator Z16P B12UHST | |
| Lenovo ThinkBook 16 G4+ IAP | |
| Apple MacBook Pro 16 2021 M1 Pro | |
| iperf3 transmit AXE11000 6GHz | |
| Huawei MateBook 16s i7 | |
| HP Envy 16 h0112nr | |
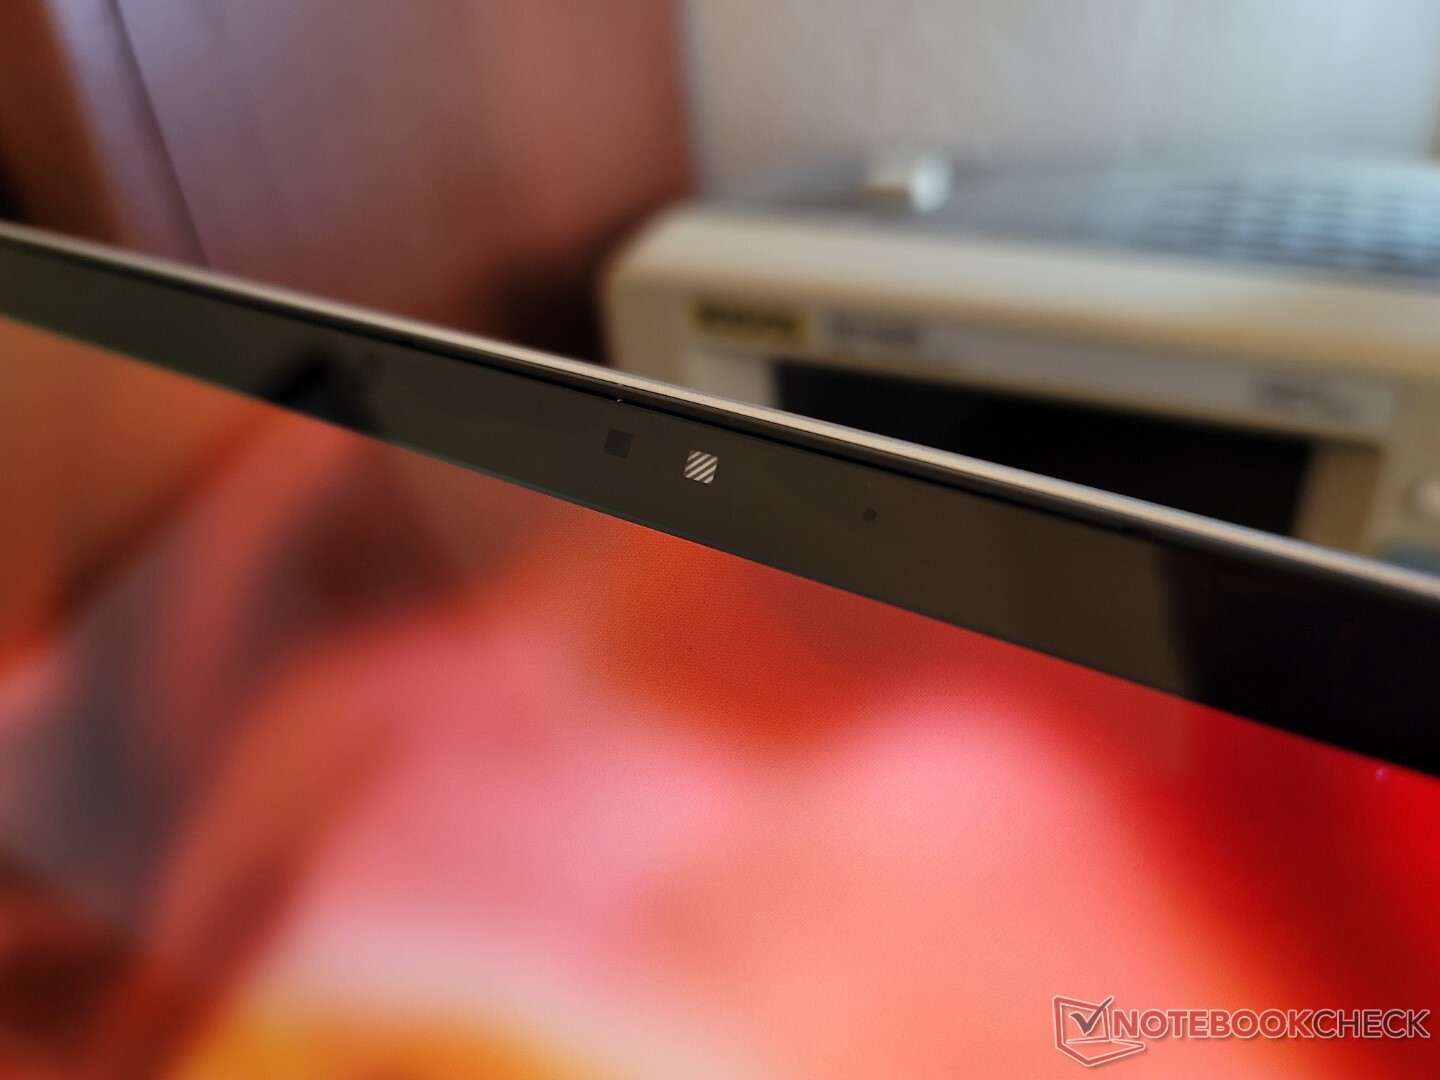
Webcam - 5 MP!
Il sistema integra una fotocamera da 5 MP simile a quella del più recente Spectre ed EliteBook. La qualità dell'immagine è notevolmente più nitida rispetto alla maggior parte degli altri computer portatili in cui le webcam da 1 e 2 MP sono ancora la norma.
L'otturatore della webcam è di serie, così come il supporto IR per Hello.


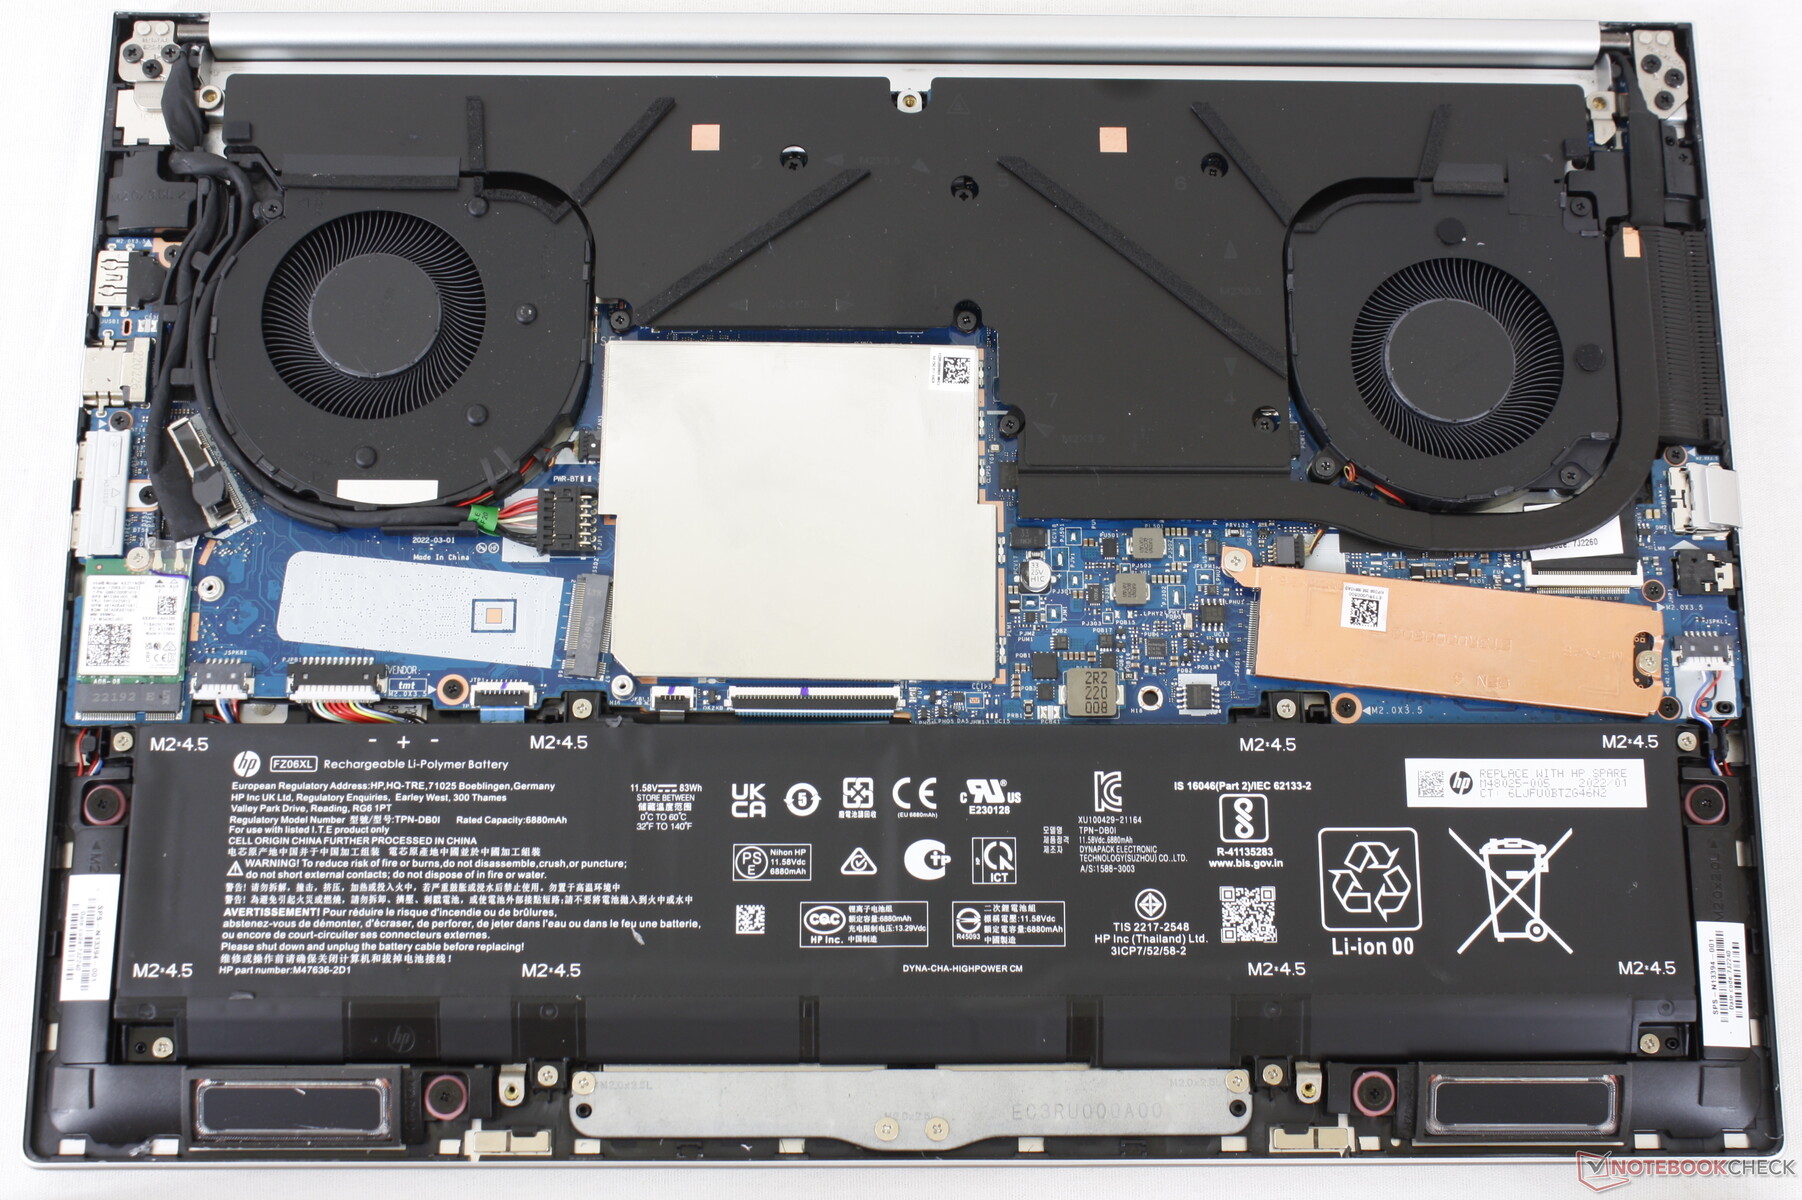
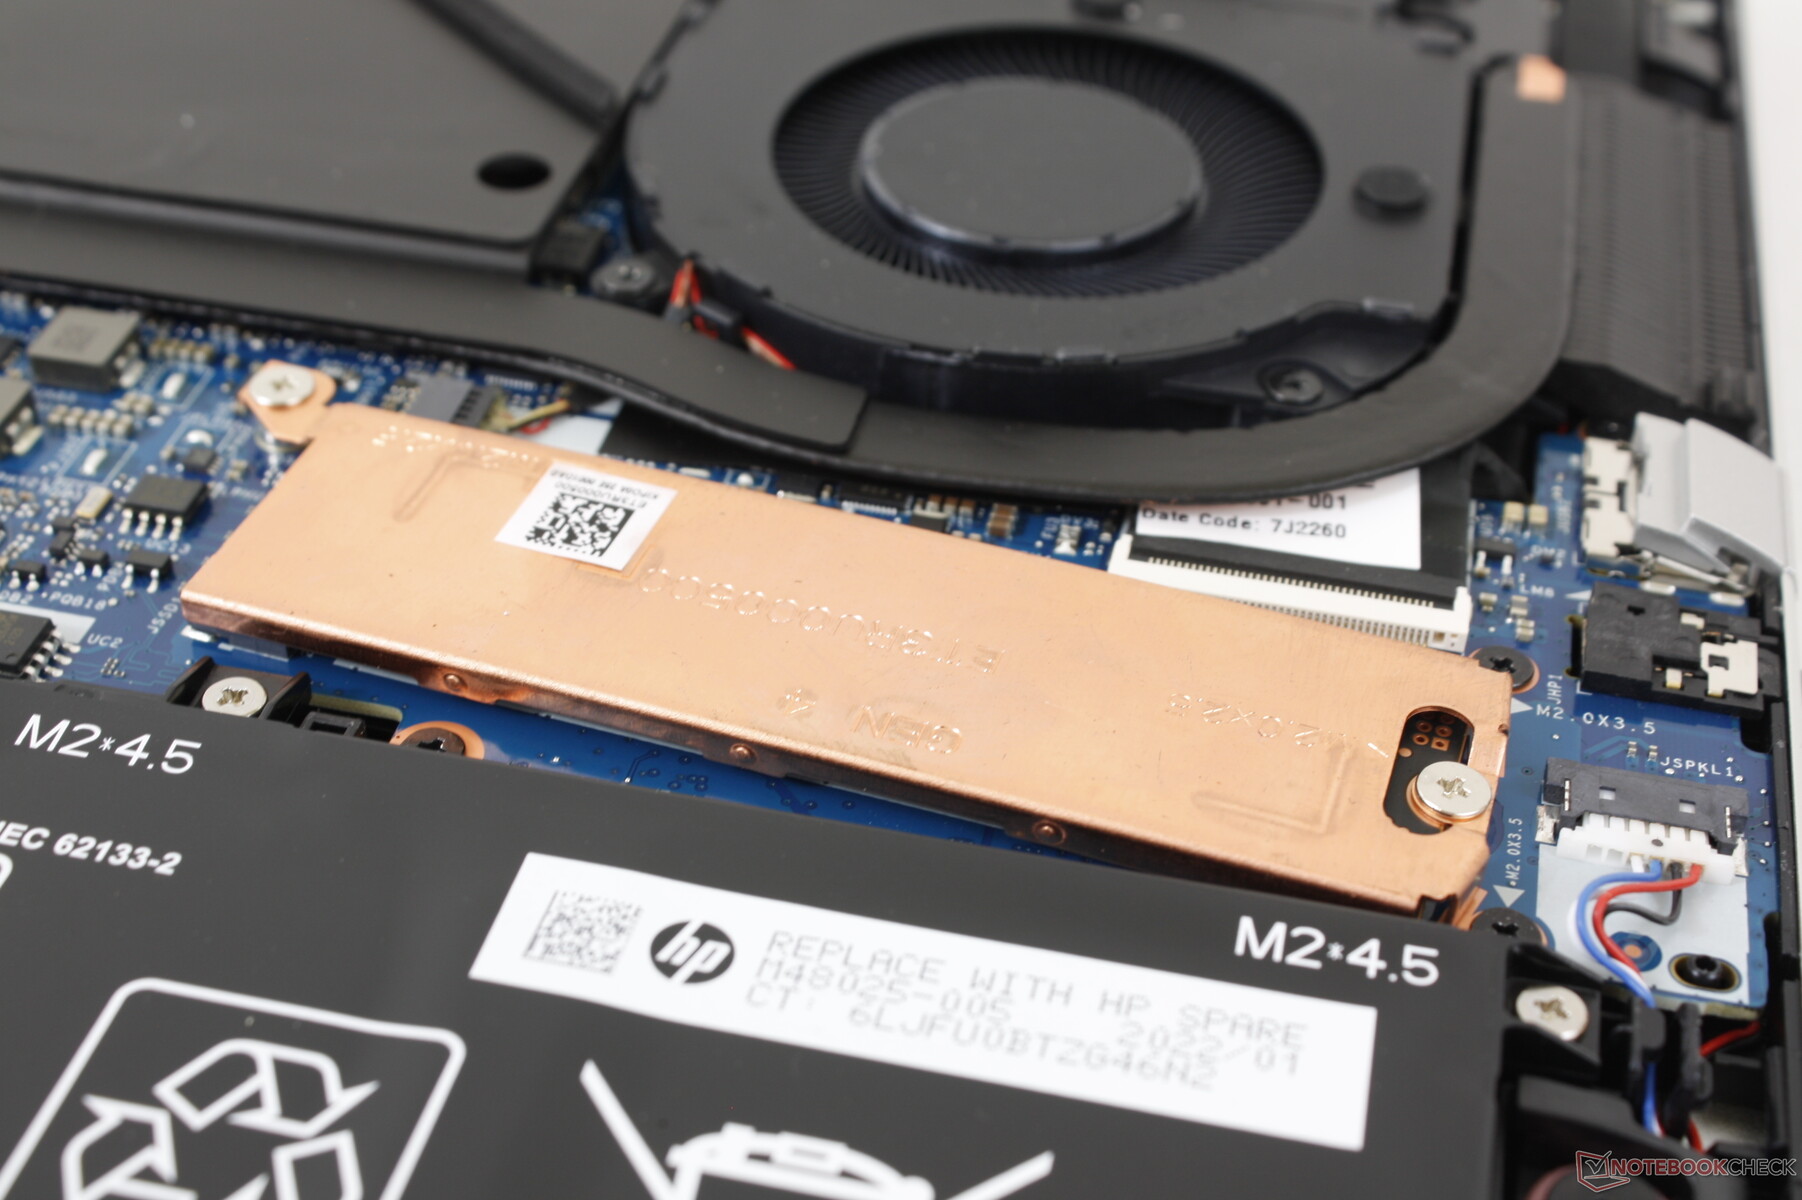
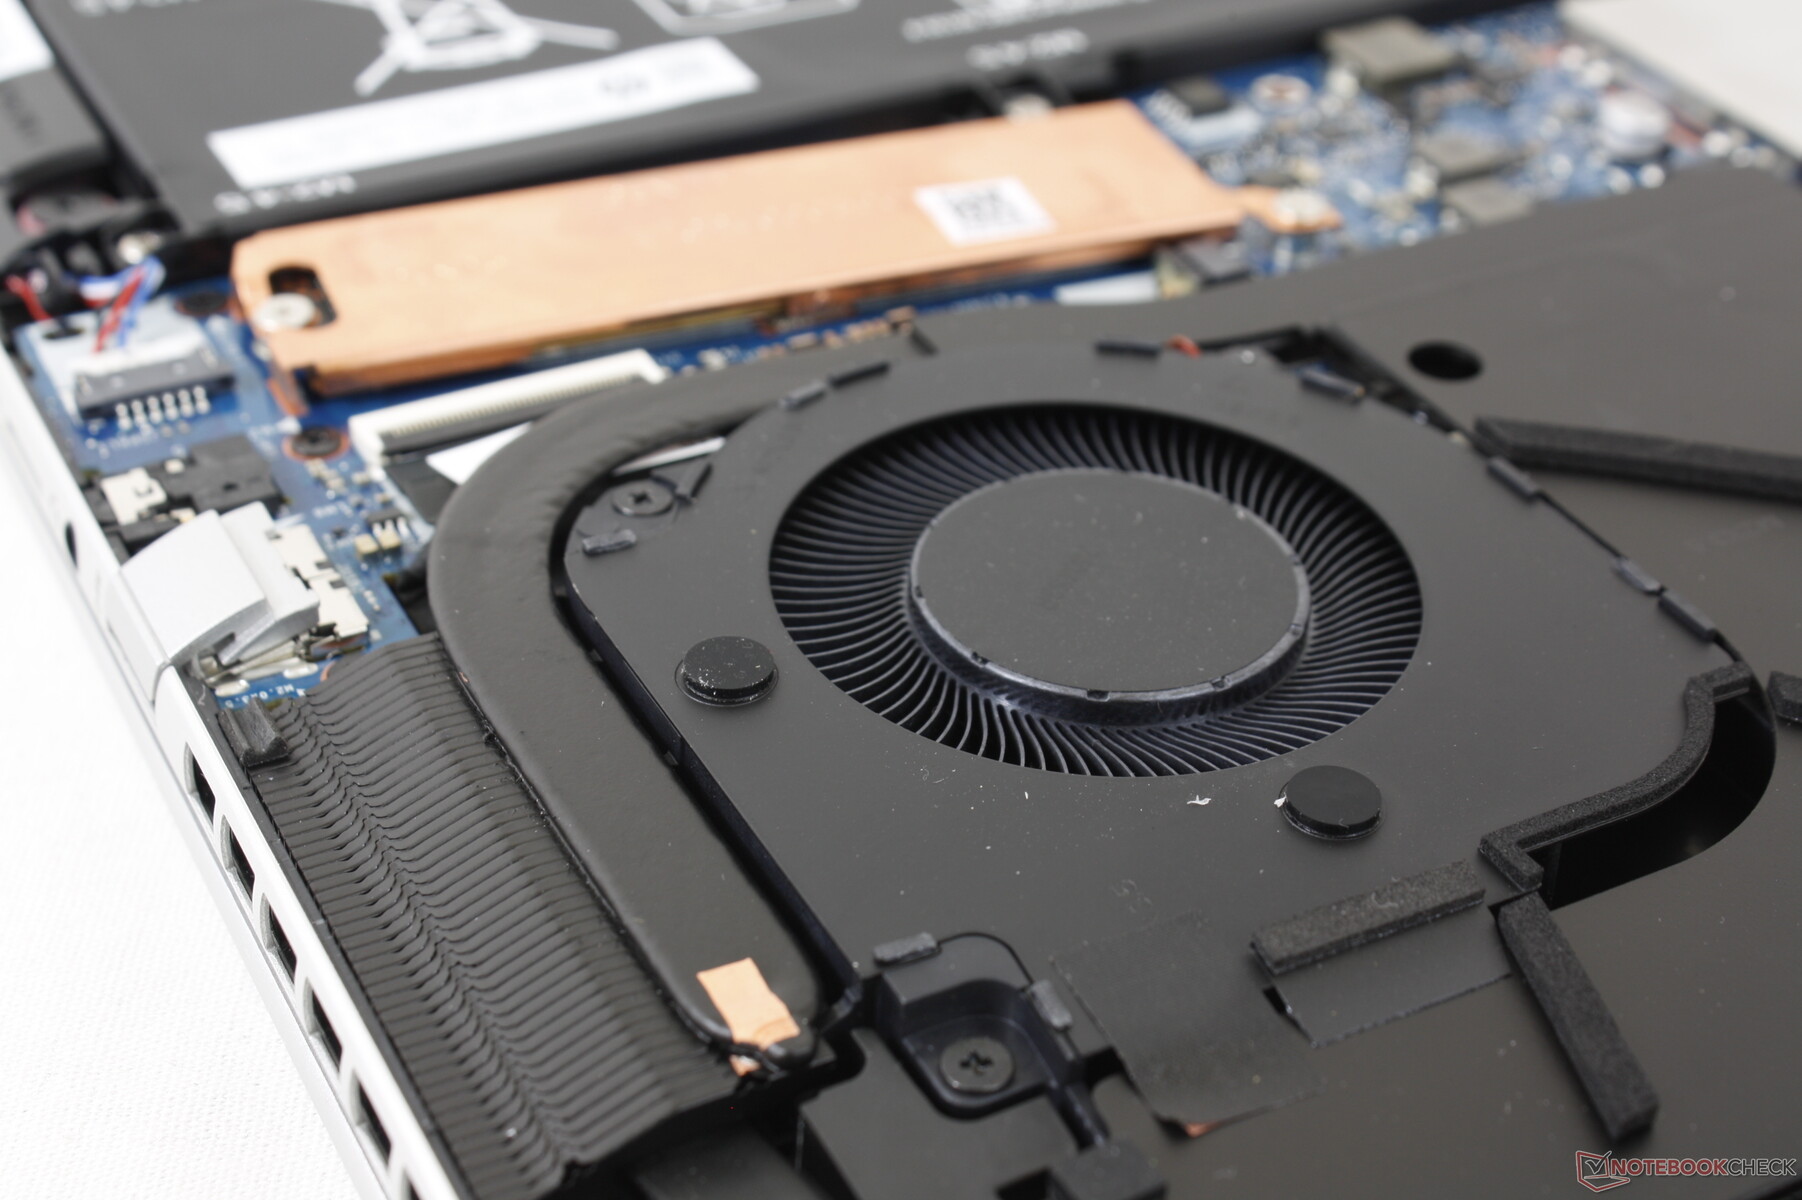
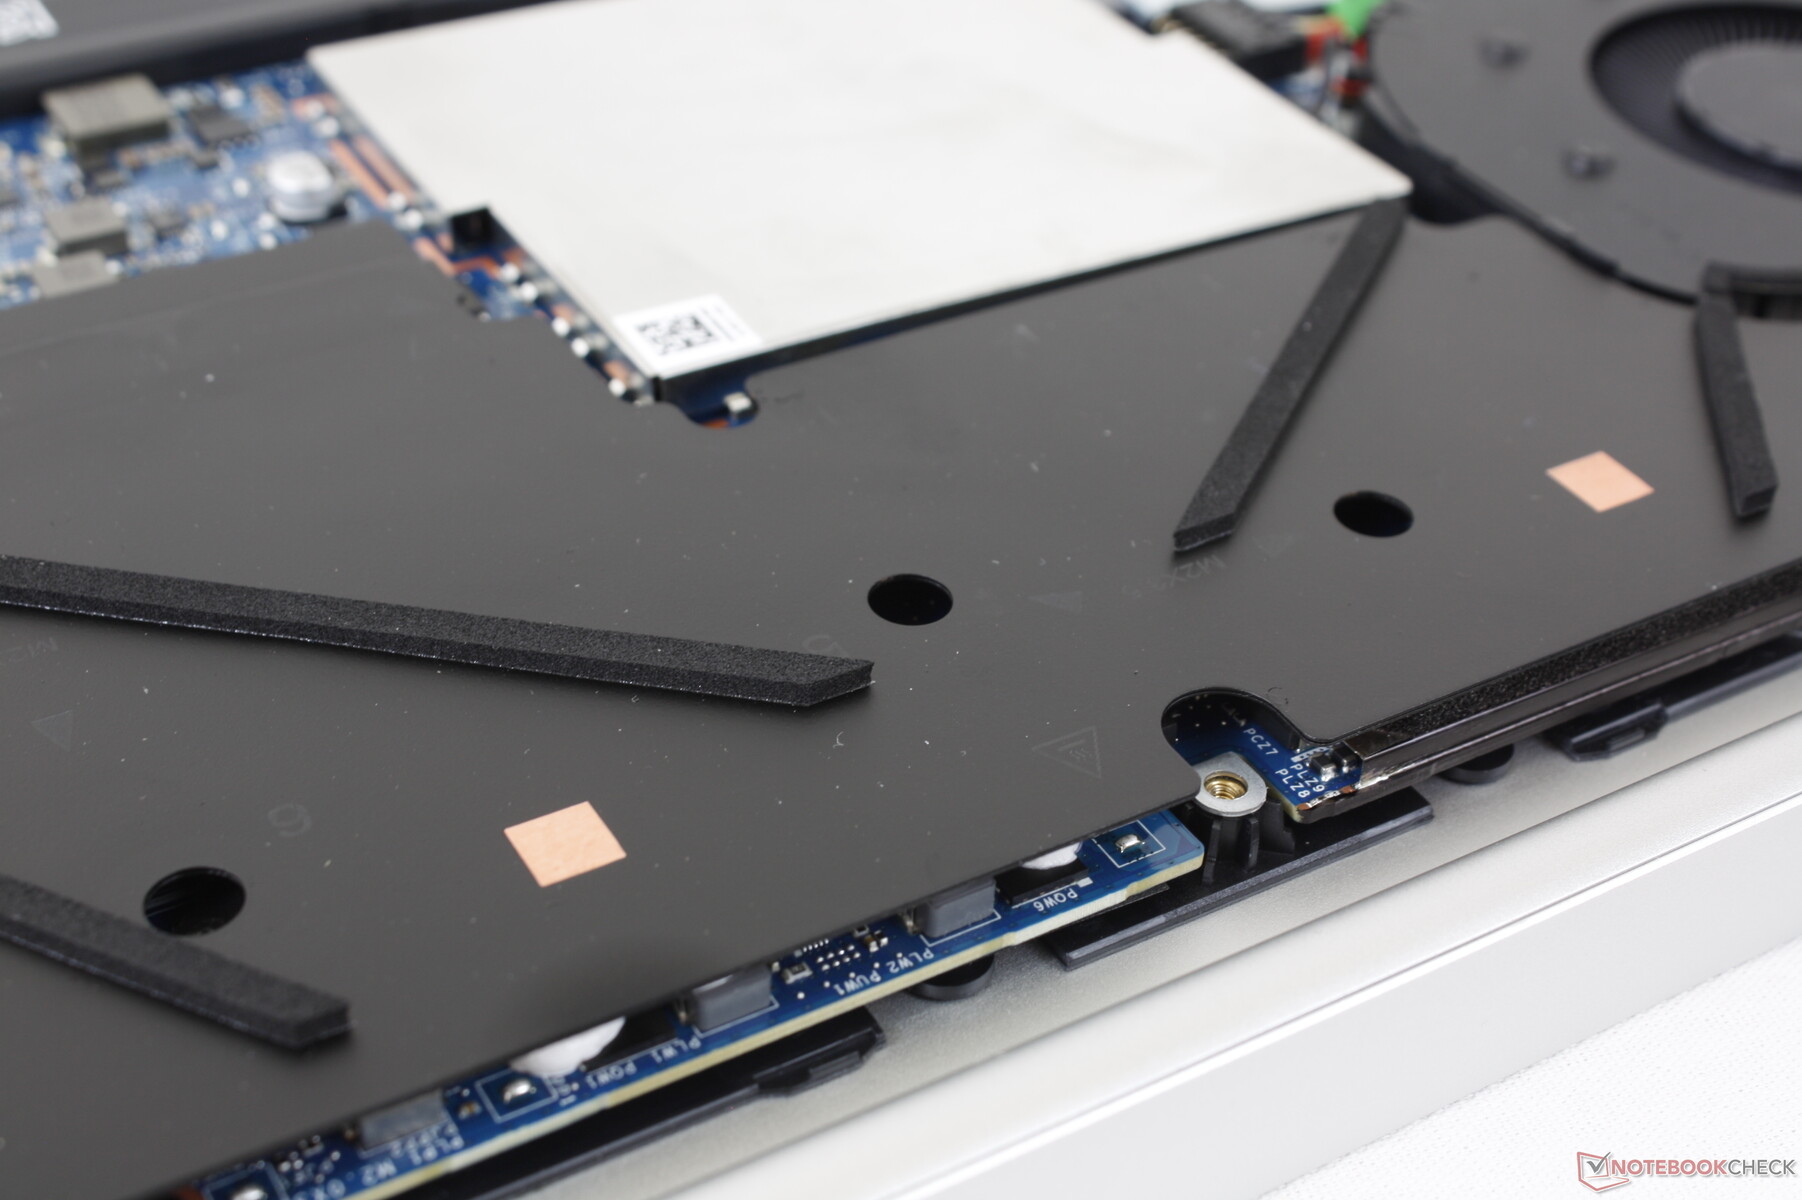
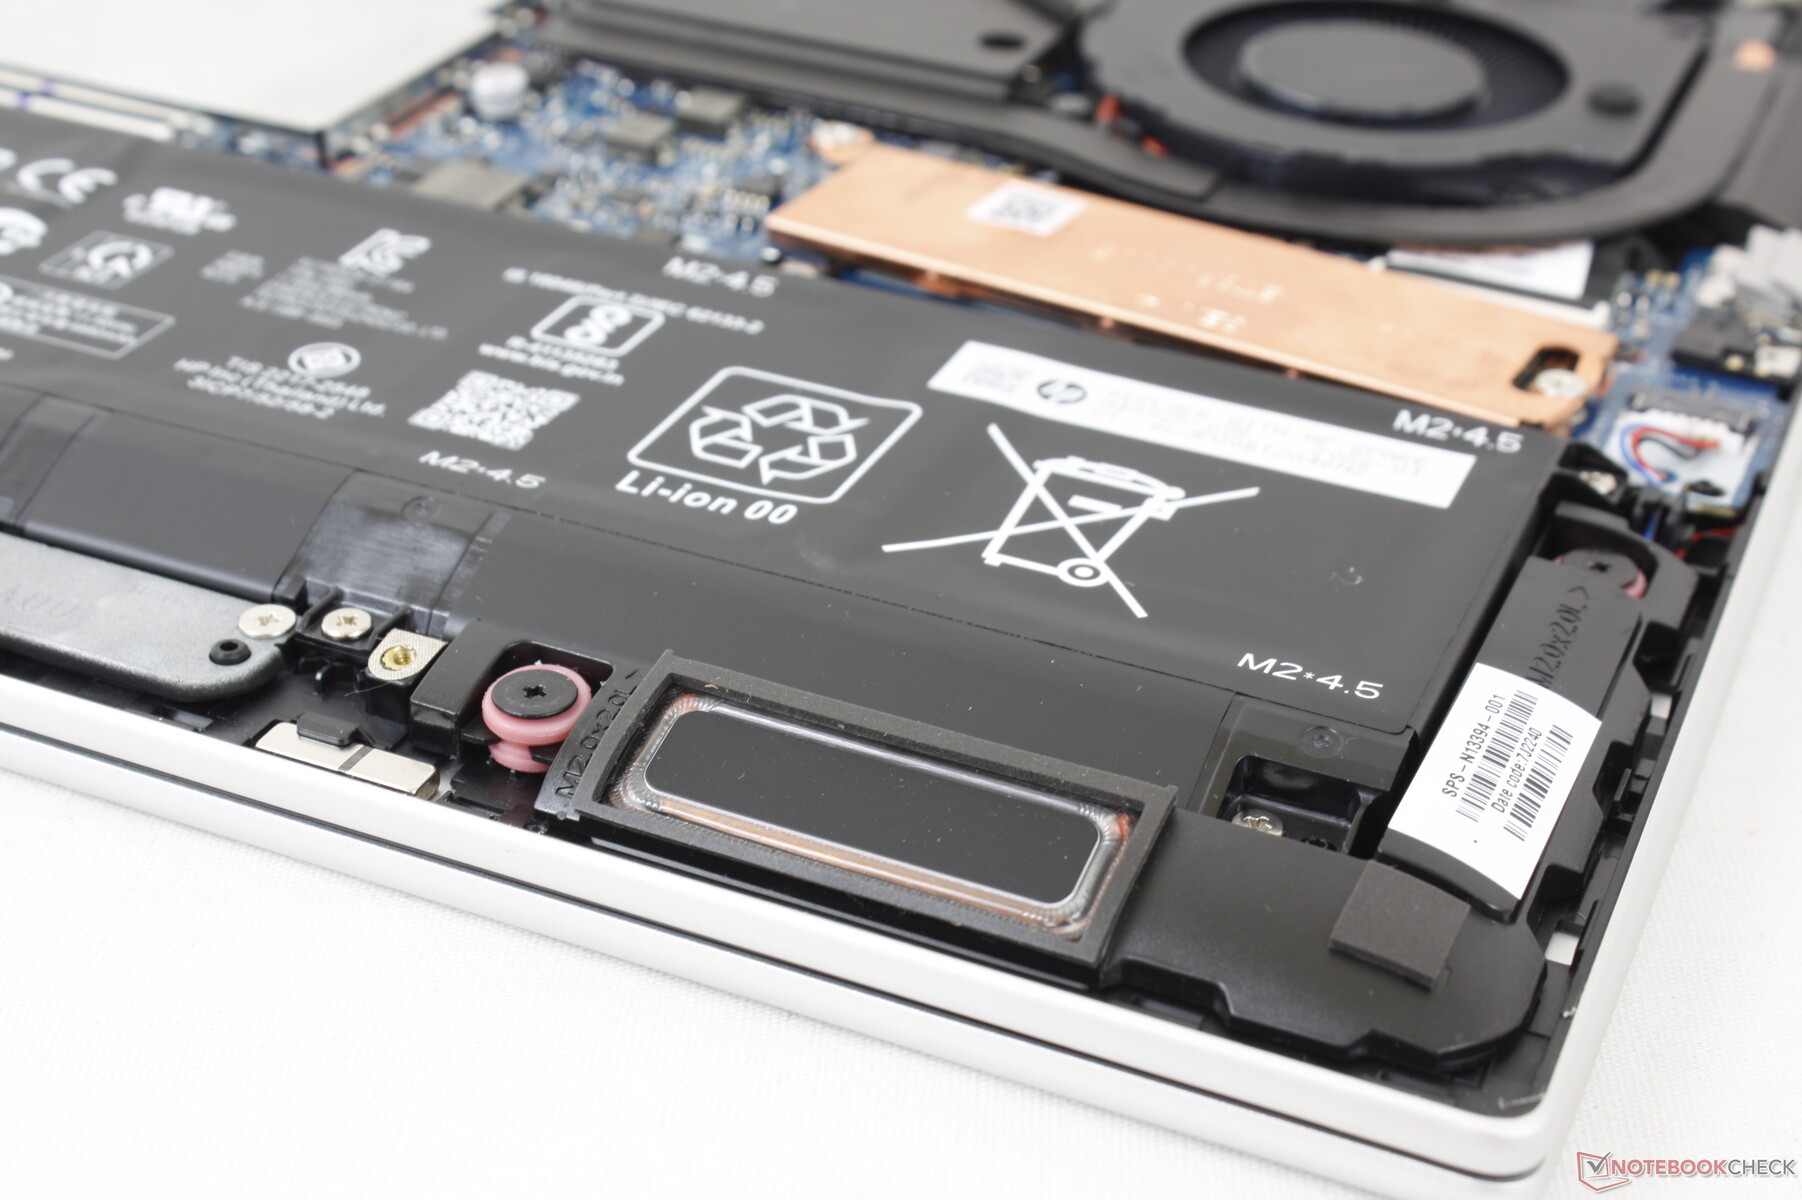
Manutenzione
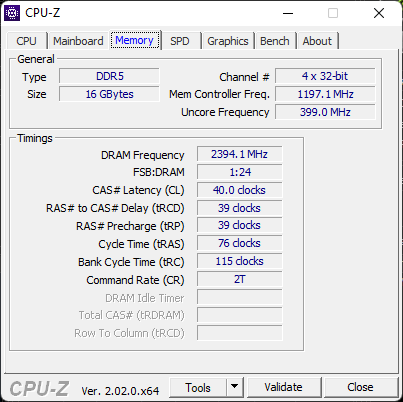
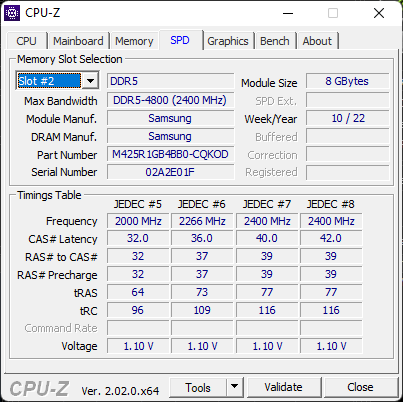
Il pannello inferiore è fissato con sole 5 viti Torx per facilitare la manutenzione. In effetti, HP ha pubblicato un video su YouTube all'indirizzo che spiega come smontare il portatile passo dopo passo su come smontare il portatile passo dopo passo. All'interno è possibile accedere a 2 slot SODIMM, 2 slot di memoria e al modulo WLAN.
Accessori e garanzia
La confezione non contiene altri extra oltre all'adattatore CA e alla documentazione. Se acquistato negli Stati Uniti, si applica la consueta garanzia limitata di un anno.
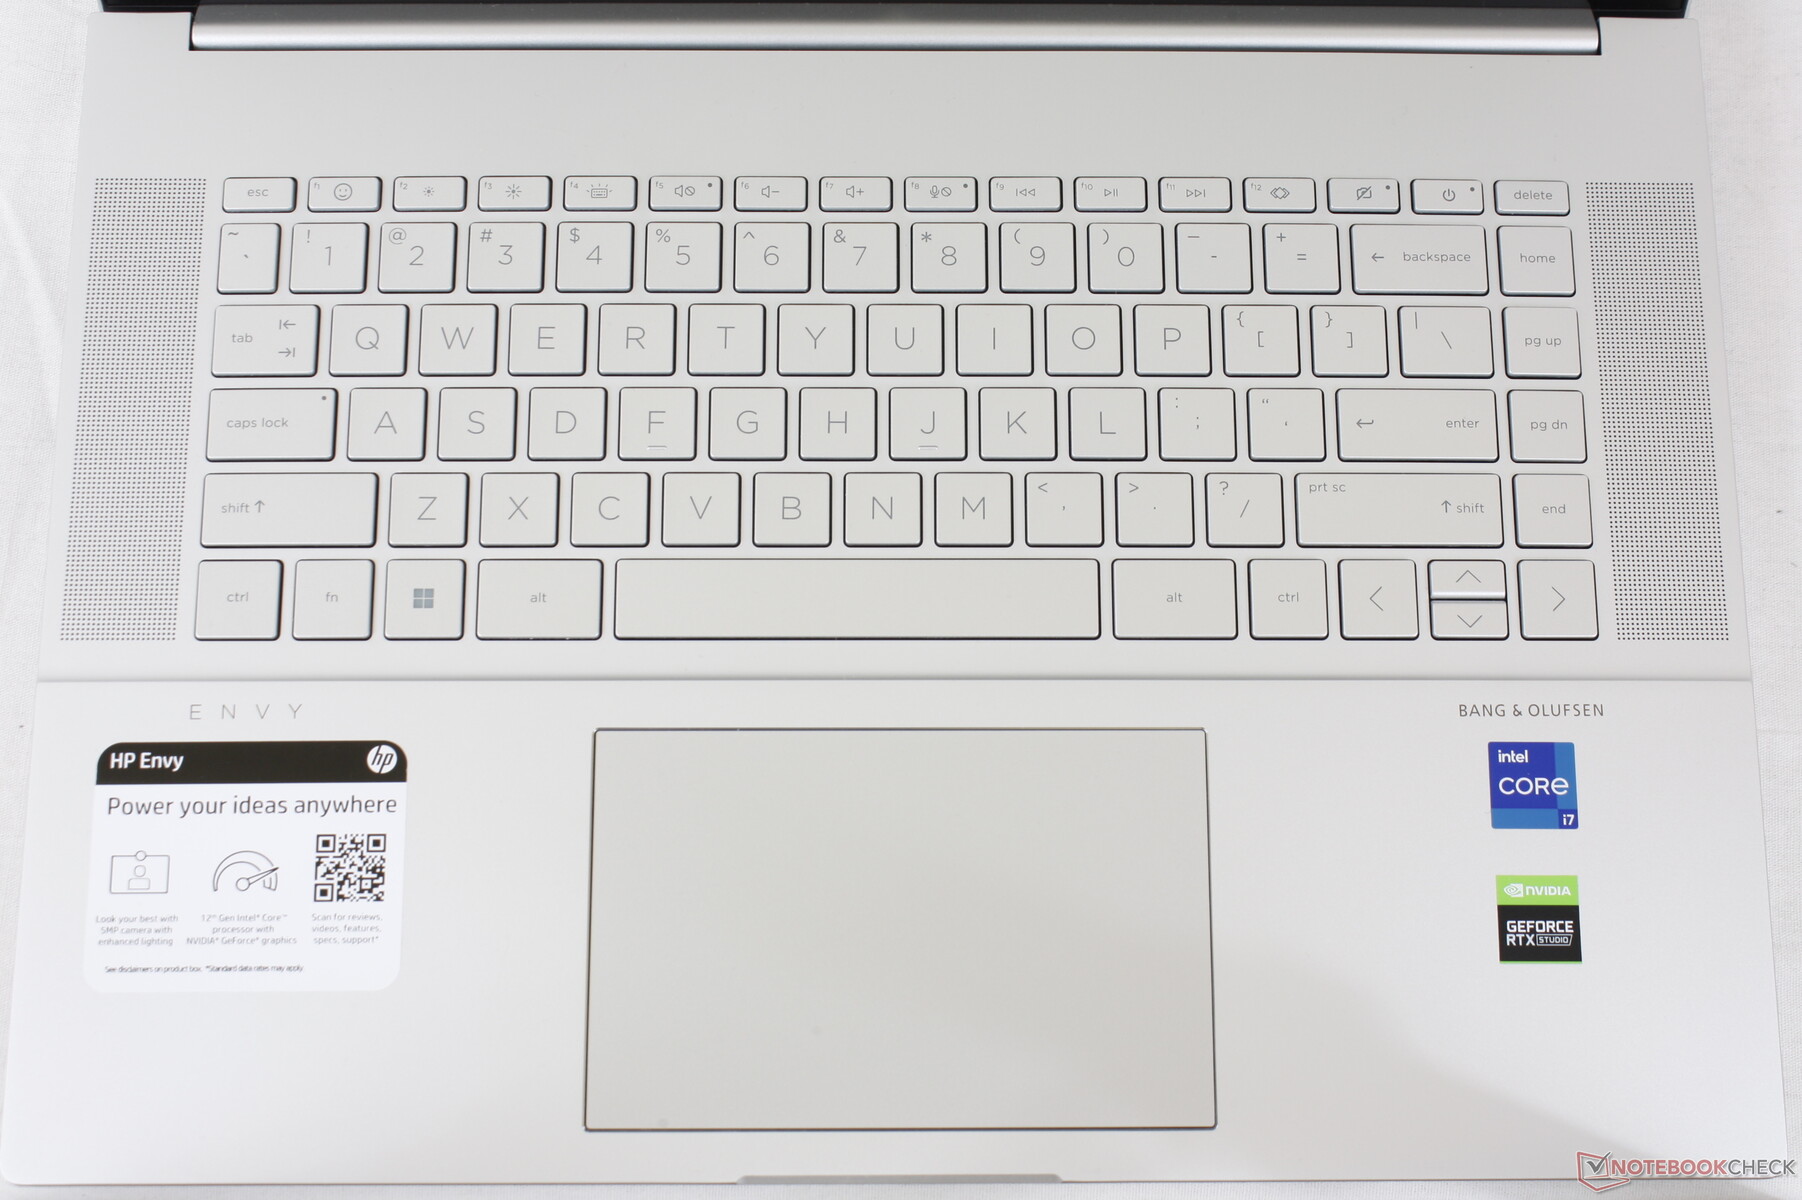
Dispositivi di input - Touchpad più grande, tastiera familiare
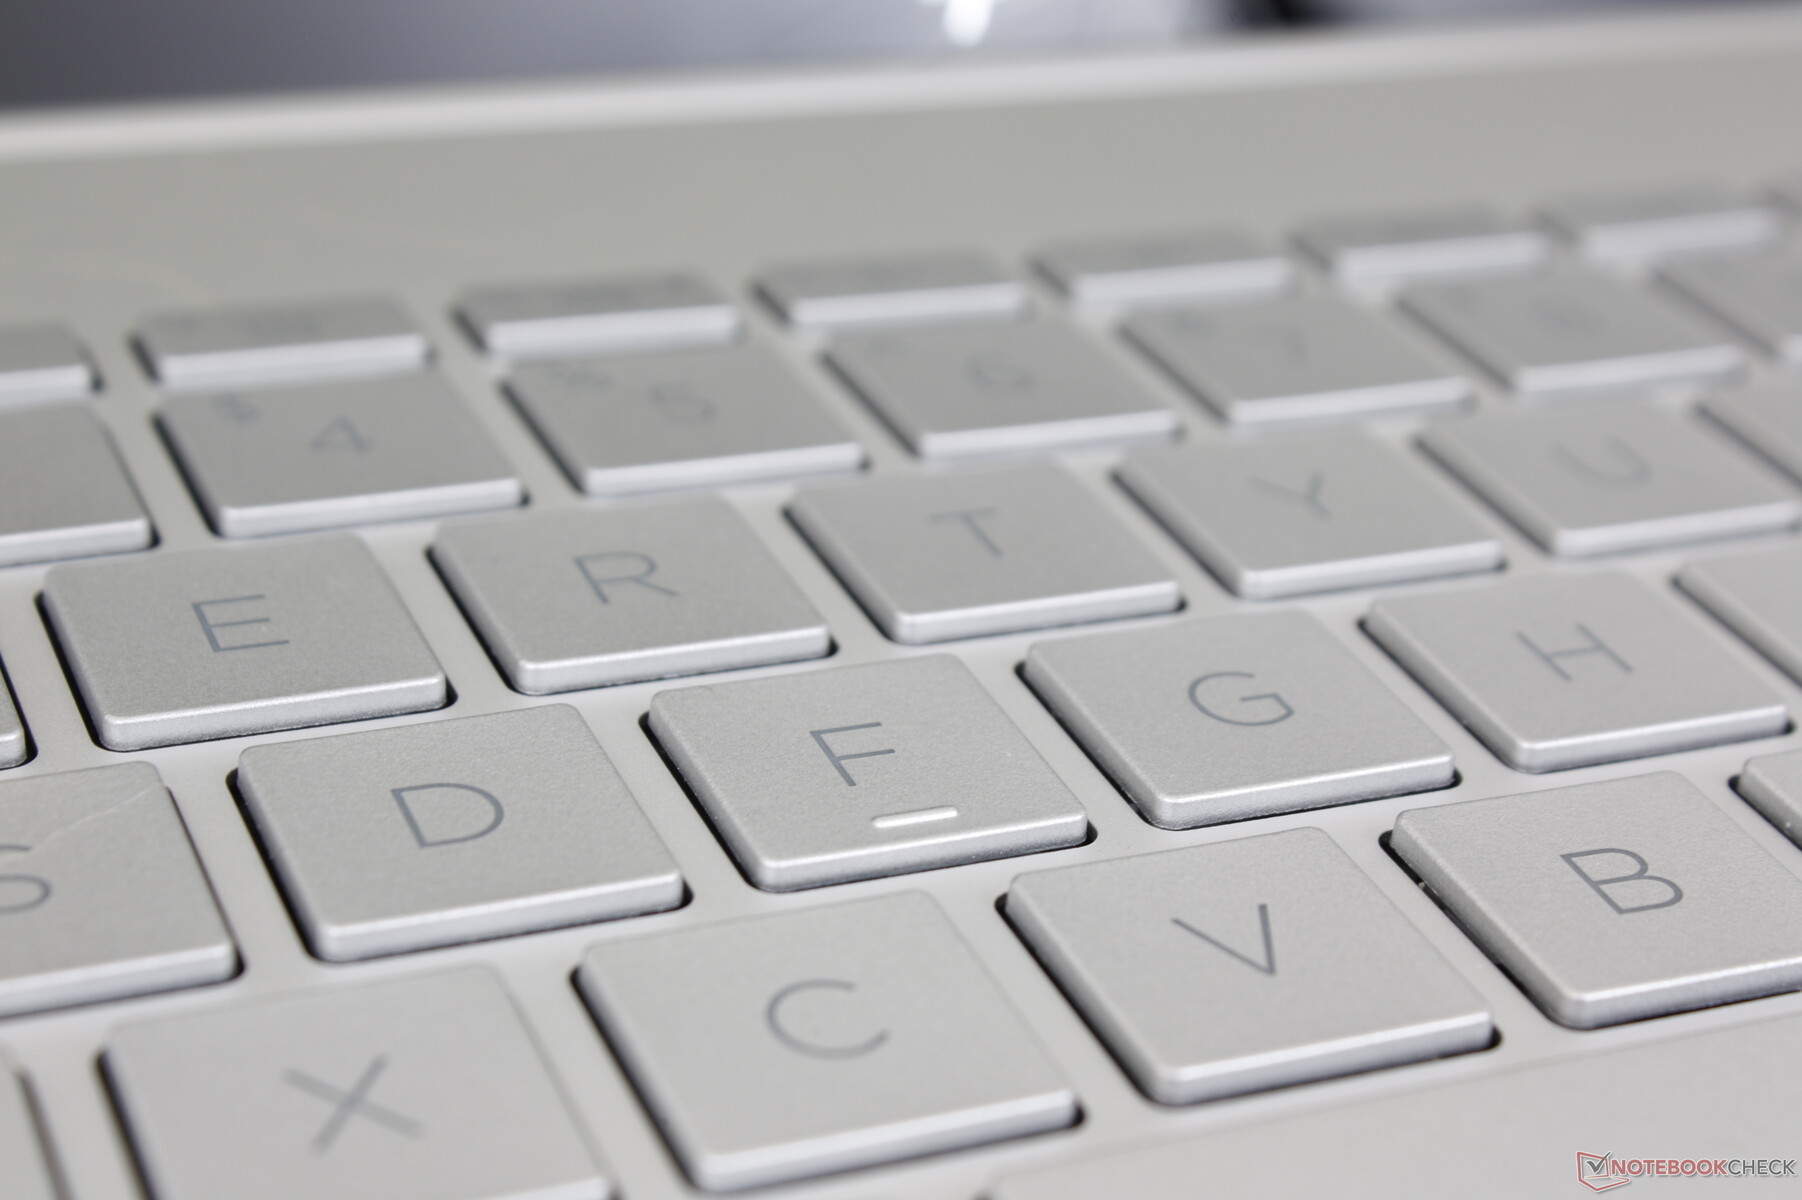
Tastiera
HP non ha apportato alcuna modifica al feedback o alla sensazione della tastiera rispetto all'Envy 15 del 2020. Da un lato, gli utenti abituati alle tastiere dell'Envy non avranno problemi, ma dall'altro avremmo preferito un'esperienza di digitazione più vicina ai tasti più solidi e soddisfacenti di uno Spectre 15 o di un EliteBook o di un modello EliteBook
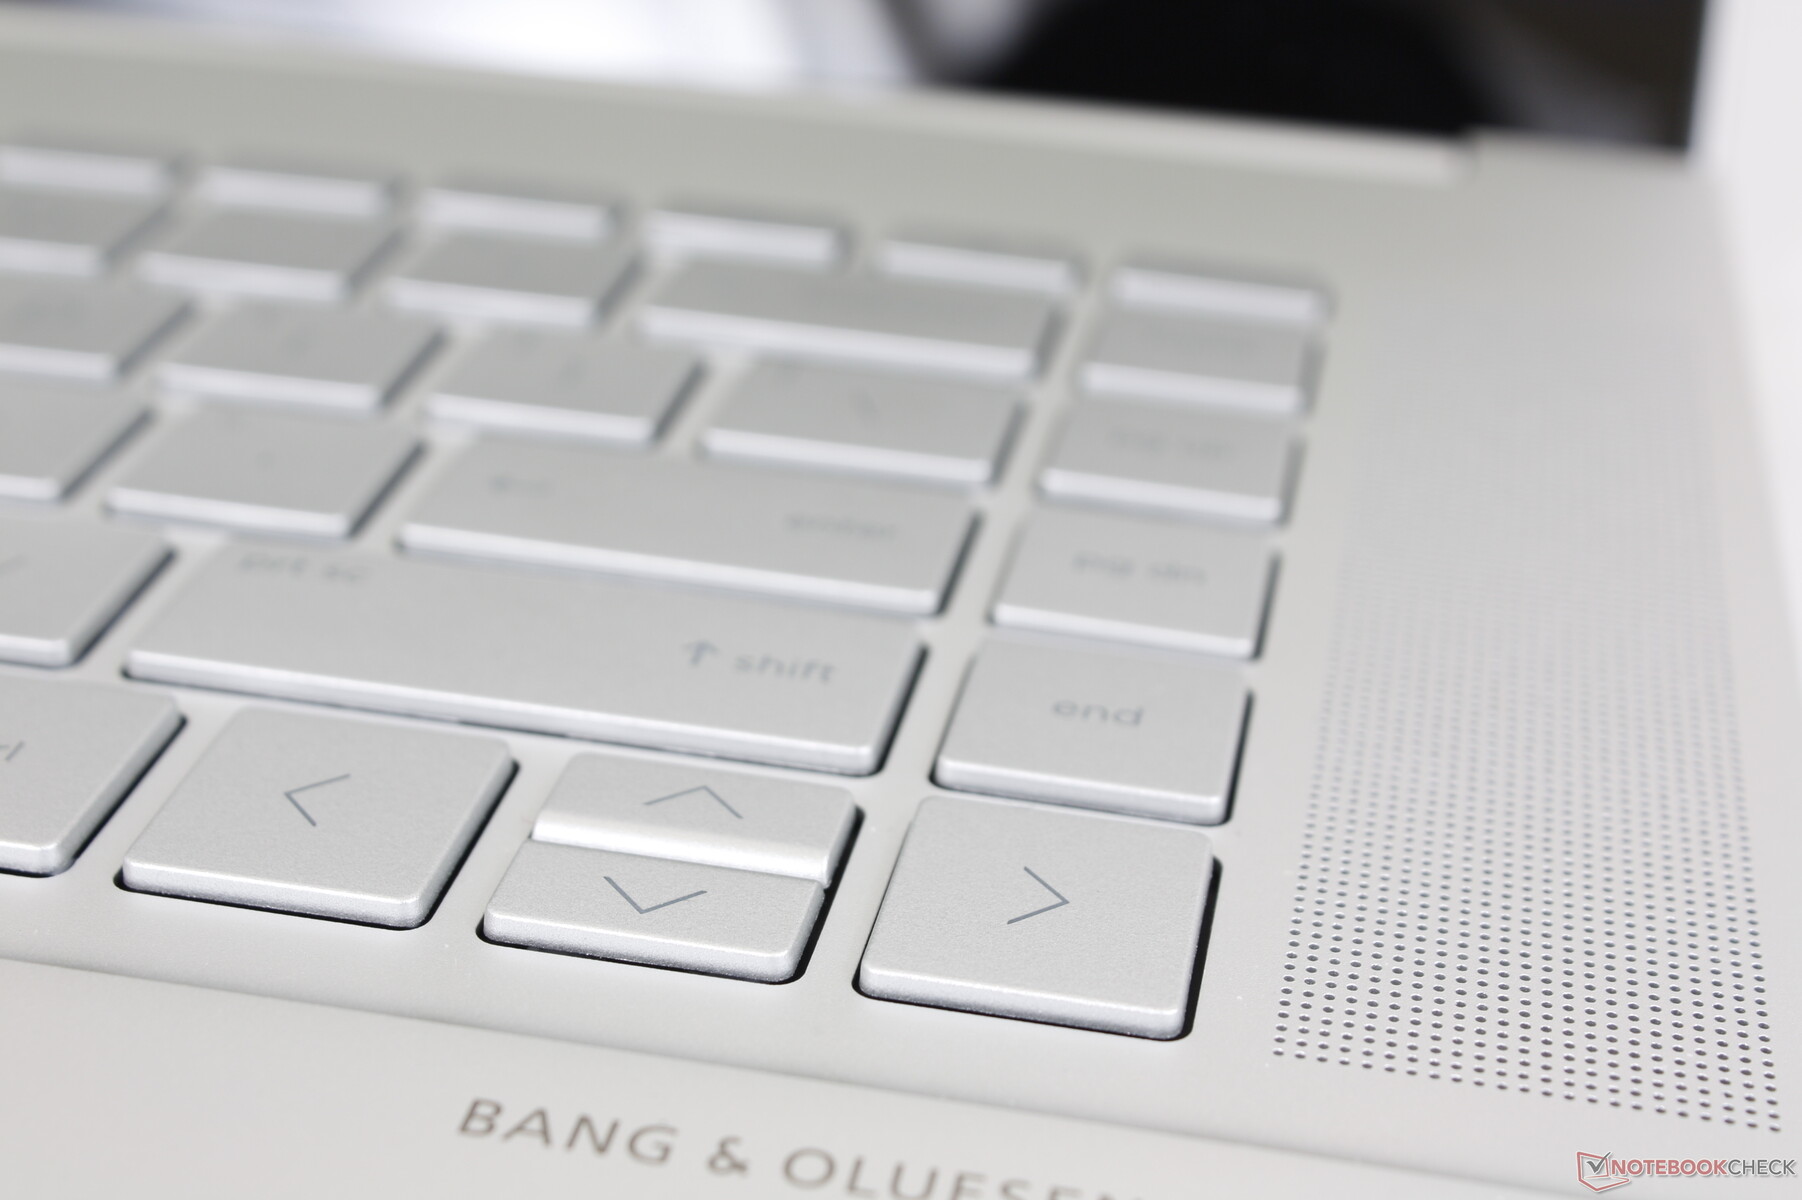
Ci sono due piccole modifiche superficiali che meritano di essere menzionate. La funzione secondaria del tasto F12 è stata cambiata in una funzione "System Event Utility", che è essenzialmente un tasto di avvio rapido per HP Command Center, Omen Gaming Hub, myHP e HP Palette. In secondo luogo, la funzione secondaria del tasto F1 lancia ora un popup per la selezione di emoji e GIF, proprio come nell'ultima versione di HP ultimo Pavilion.
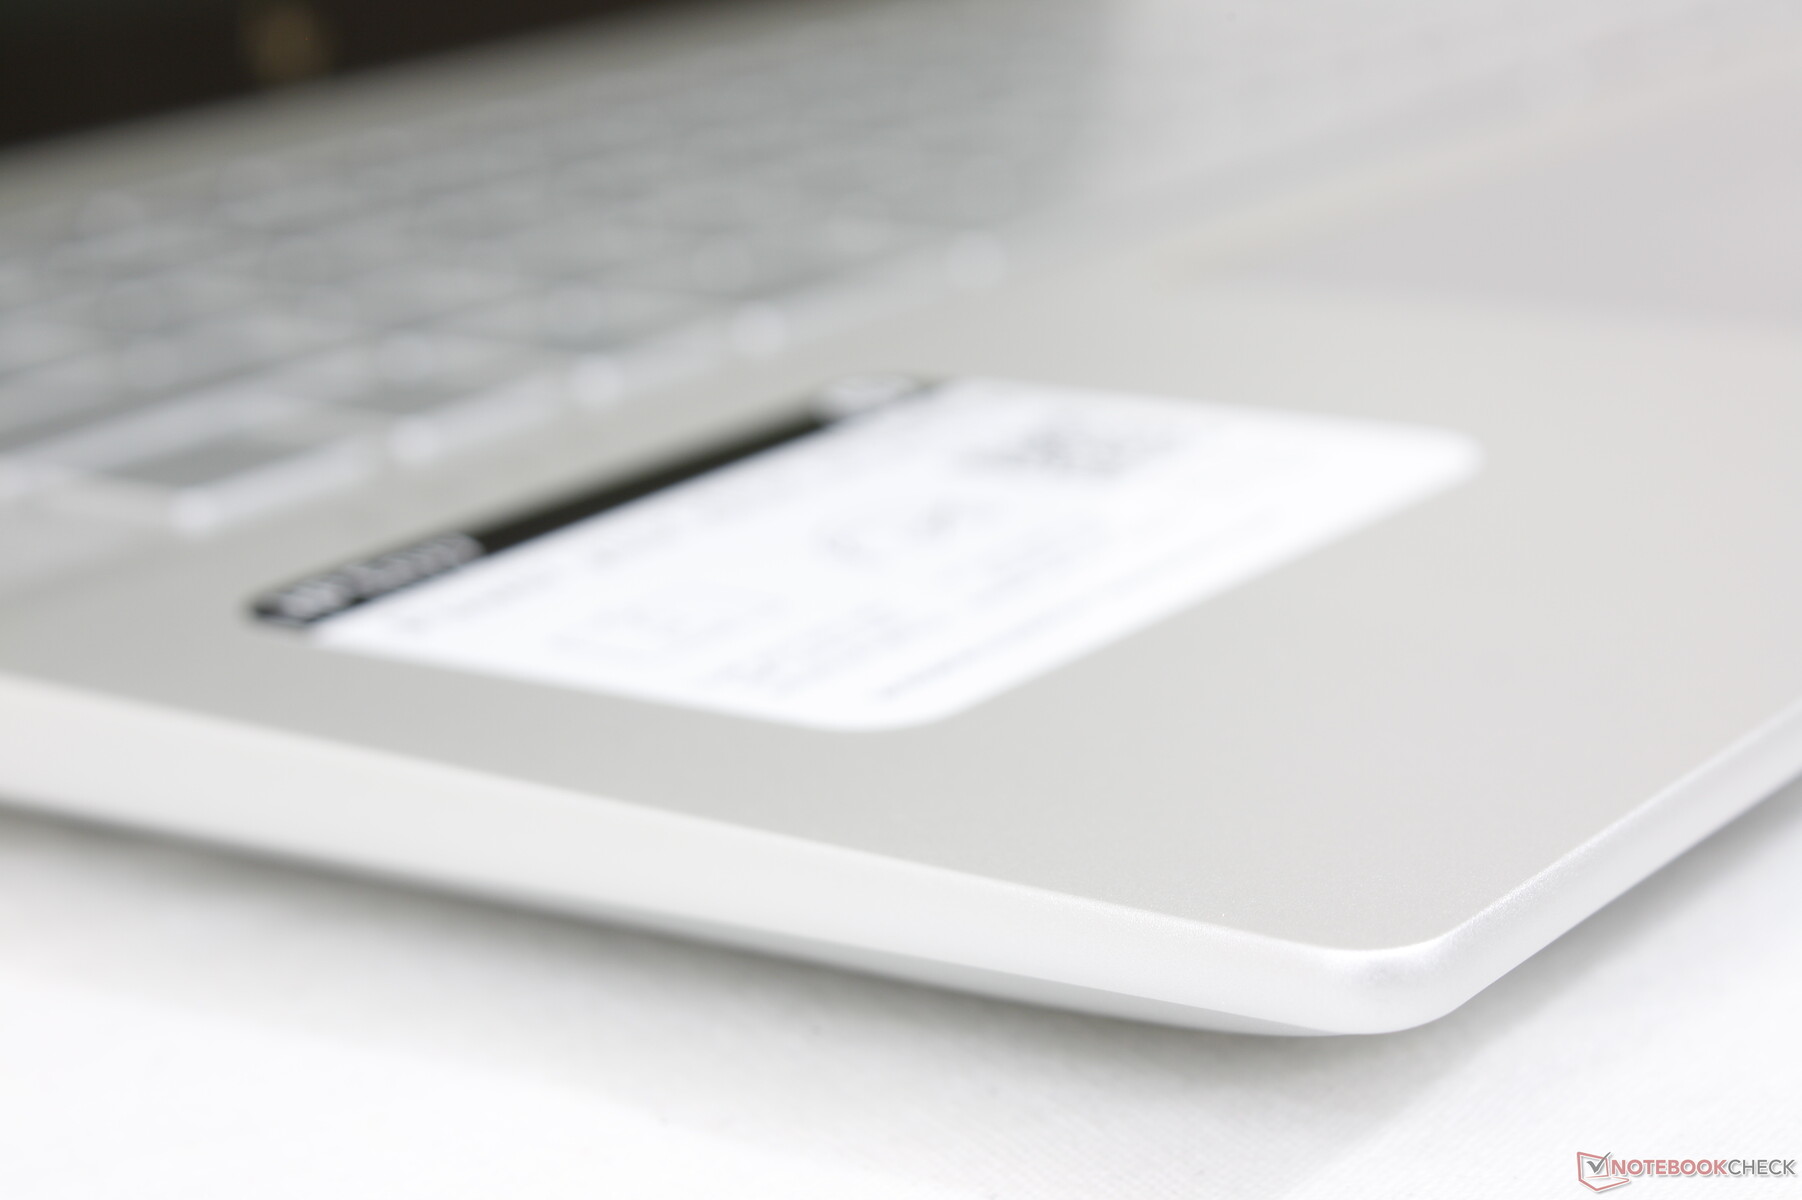
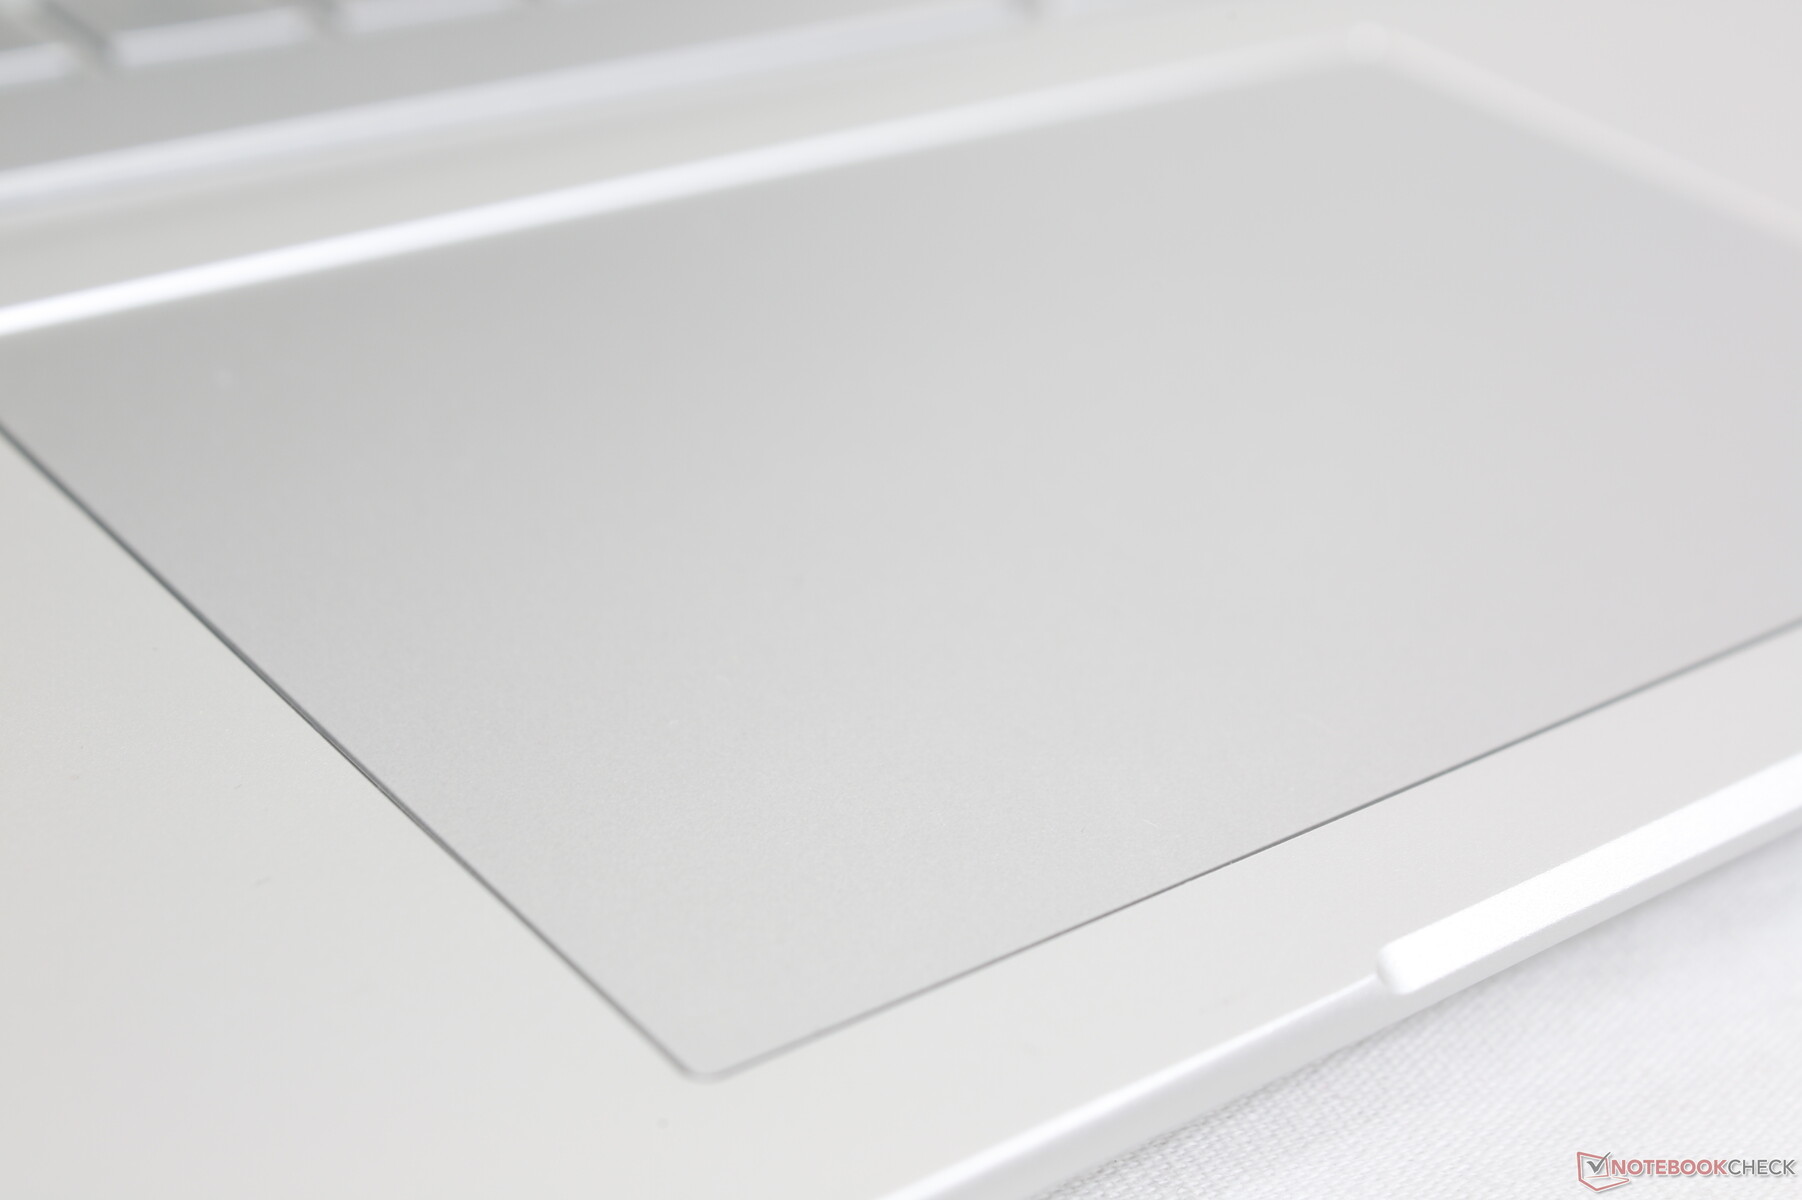
Touchpad
Il clickpad è più grande di quello dell'Envy 15 (12,5 x 8 cm contro 11,5 x 7,5 cm). La superficie è liscia e quasi priva di texture, con un'aderenza minima se si scivola a velocità ridotta per ottenere clic più precisi. Nel frattempo, il feedback quando si fa clic sul tastierino è relativamente morbido e silenzioso, con una sensazione spugnosa. Un clic più forte e soddisfacente avrebbe reso il clickpad più facile da usare.
Display - IPS o OLED?
Sono disponibili due opzioni di visualizzazione
- 2560 x 1600, 120 Hz, IPS, 100% sRGB
- 3840 x 2400, 60 Hz, OLED, 100% P3
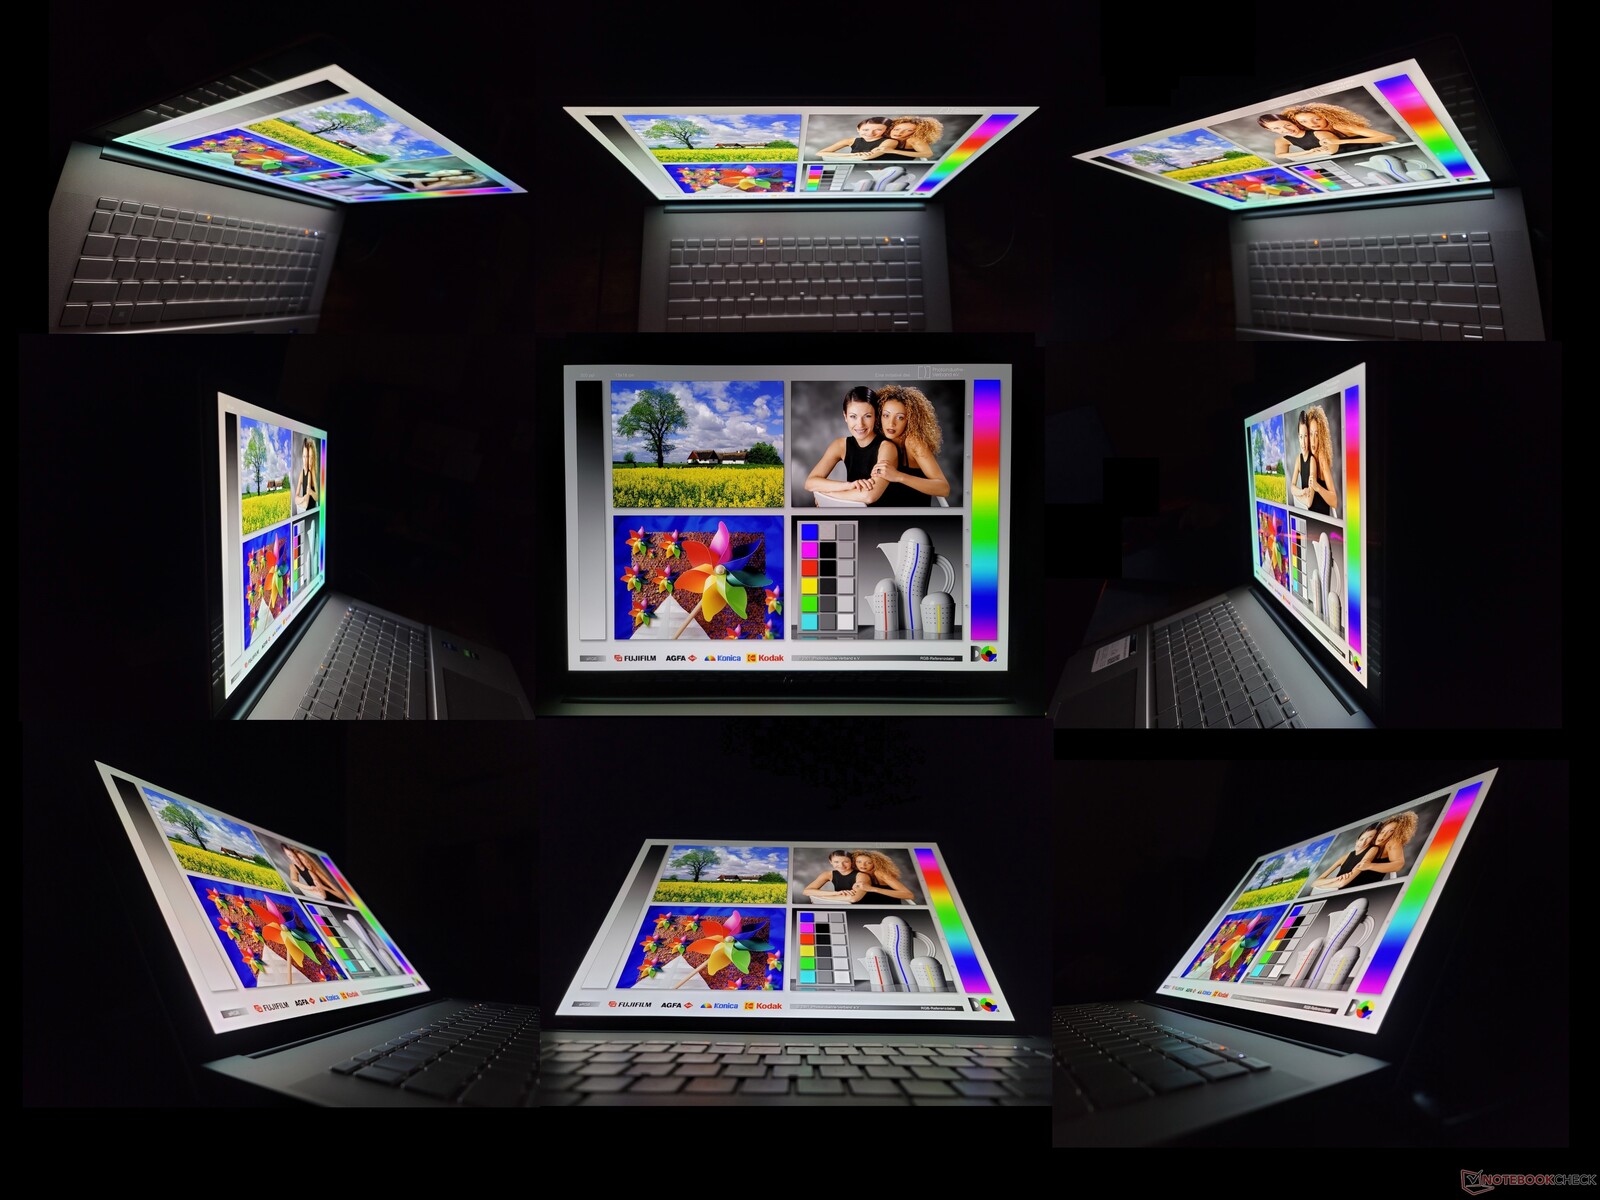
Le misurazioni riportate di seguito si riferiscono solo all'opzione OLED. I suoi principali vantaggi sono i colori più intensi, il rapporto di contrasto nero pece e i tempi di risposta in bianco e nero e grigio significativamente più rapidi rispetto all'IPS, al costo di un consumo energetico più elevato e di uno sfarfallio dello schermo che può interessare un piccolo sottoinsieme di utenti.
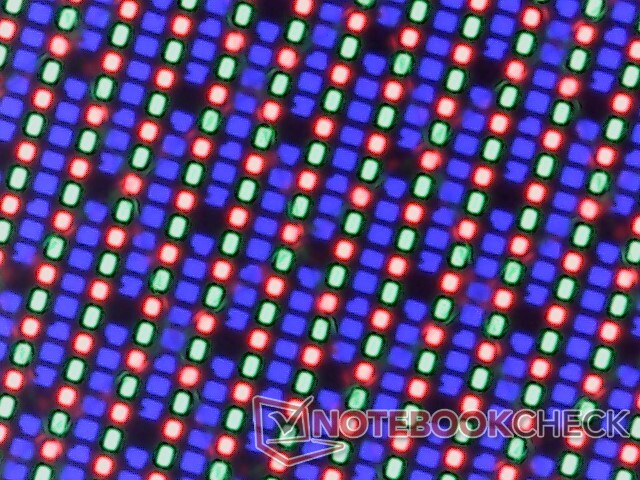
La qualità dell'immagine è nitida, ma con grane di colore evidenti che diventano più evidenti quando si visualizzano i colori bianchi ad alta luminosità. L'opzione IPS potrebbe essere preferibile per coloro che non necessitano di colori P3, poiché la frequenza di aggiornamento di 120 Hz offre un'esperienza molto più fluida.

| |||||||||||||||||||||||||
Distribuzione della luminosità: 97 %
Al centro con la batteria: 328.8 cd/m²
Contrasto: ∞:1 (Nero: 0 cd/m²)
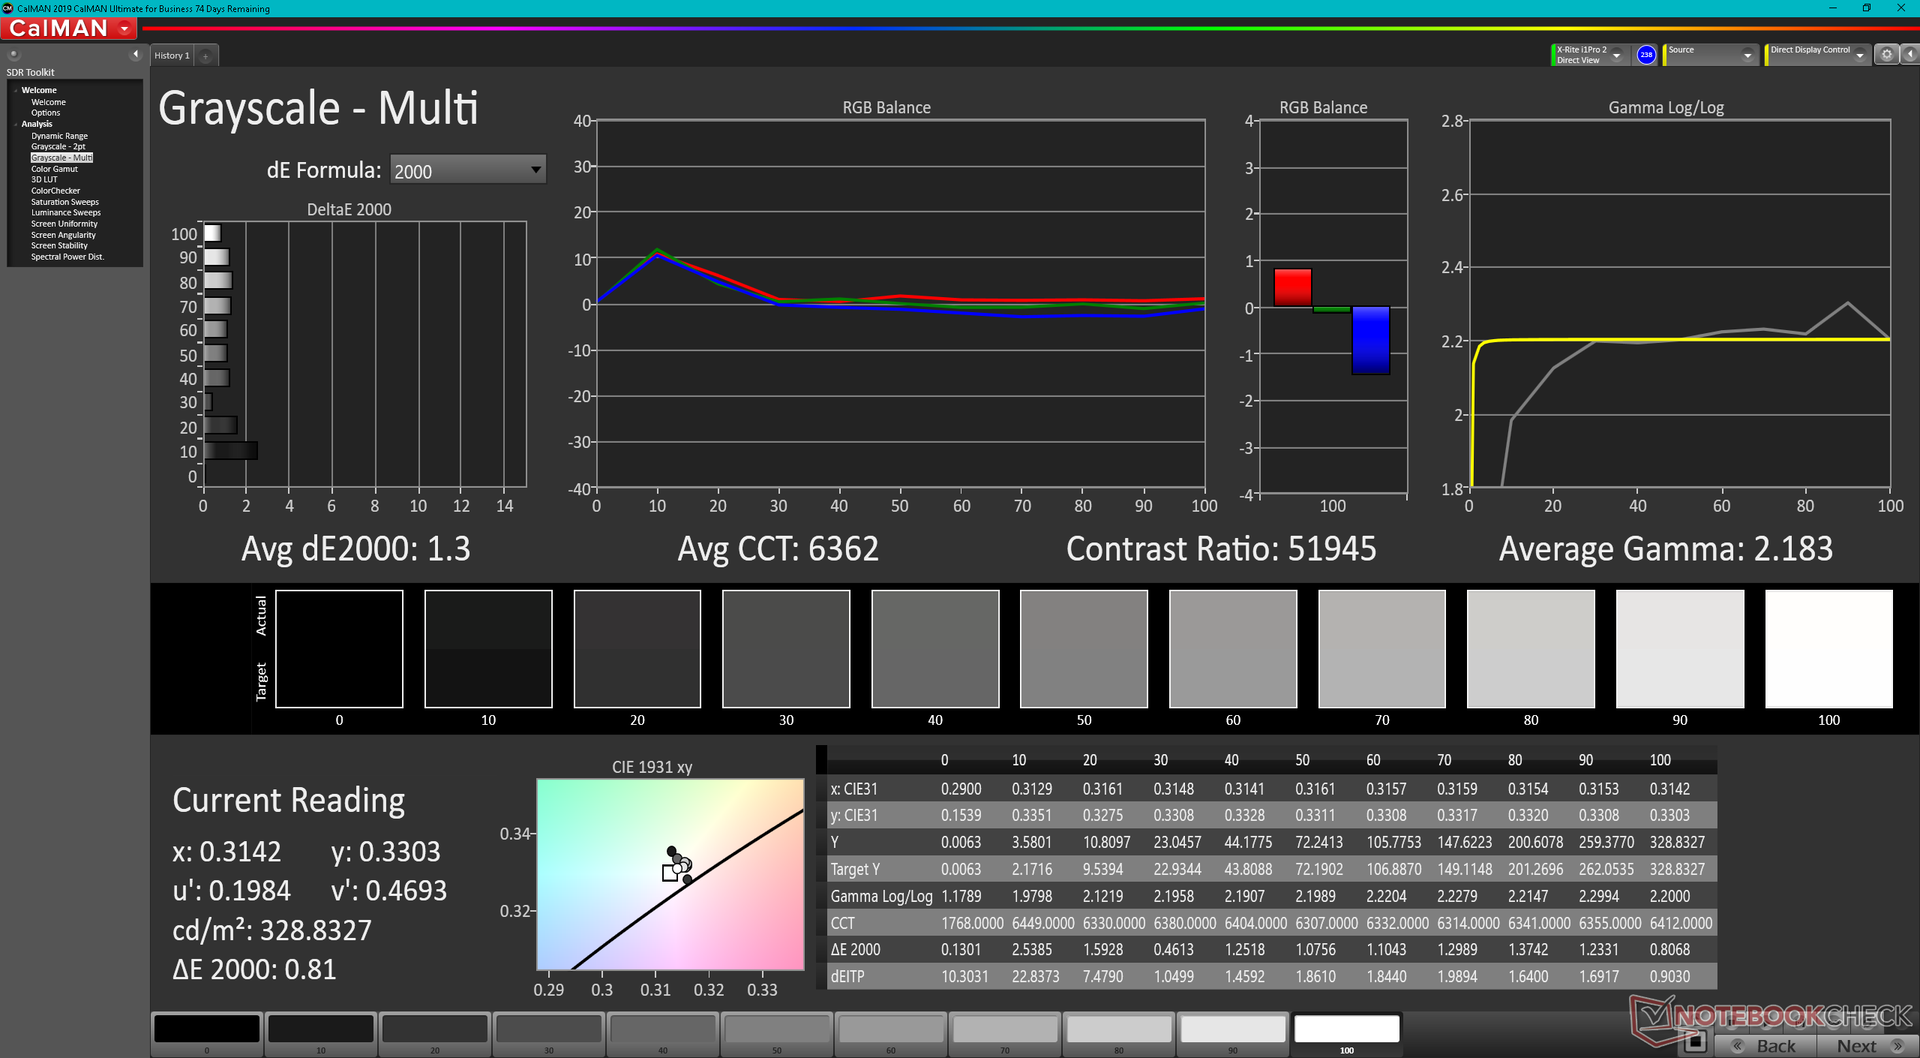
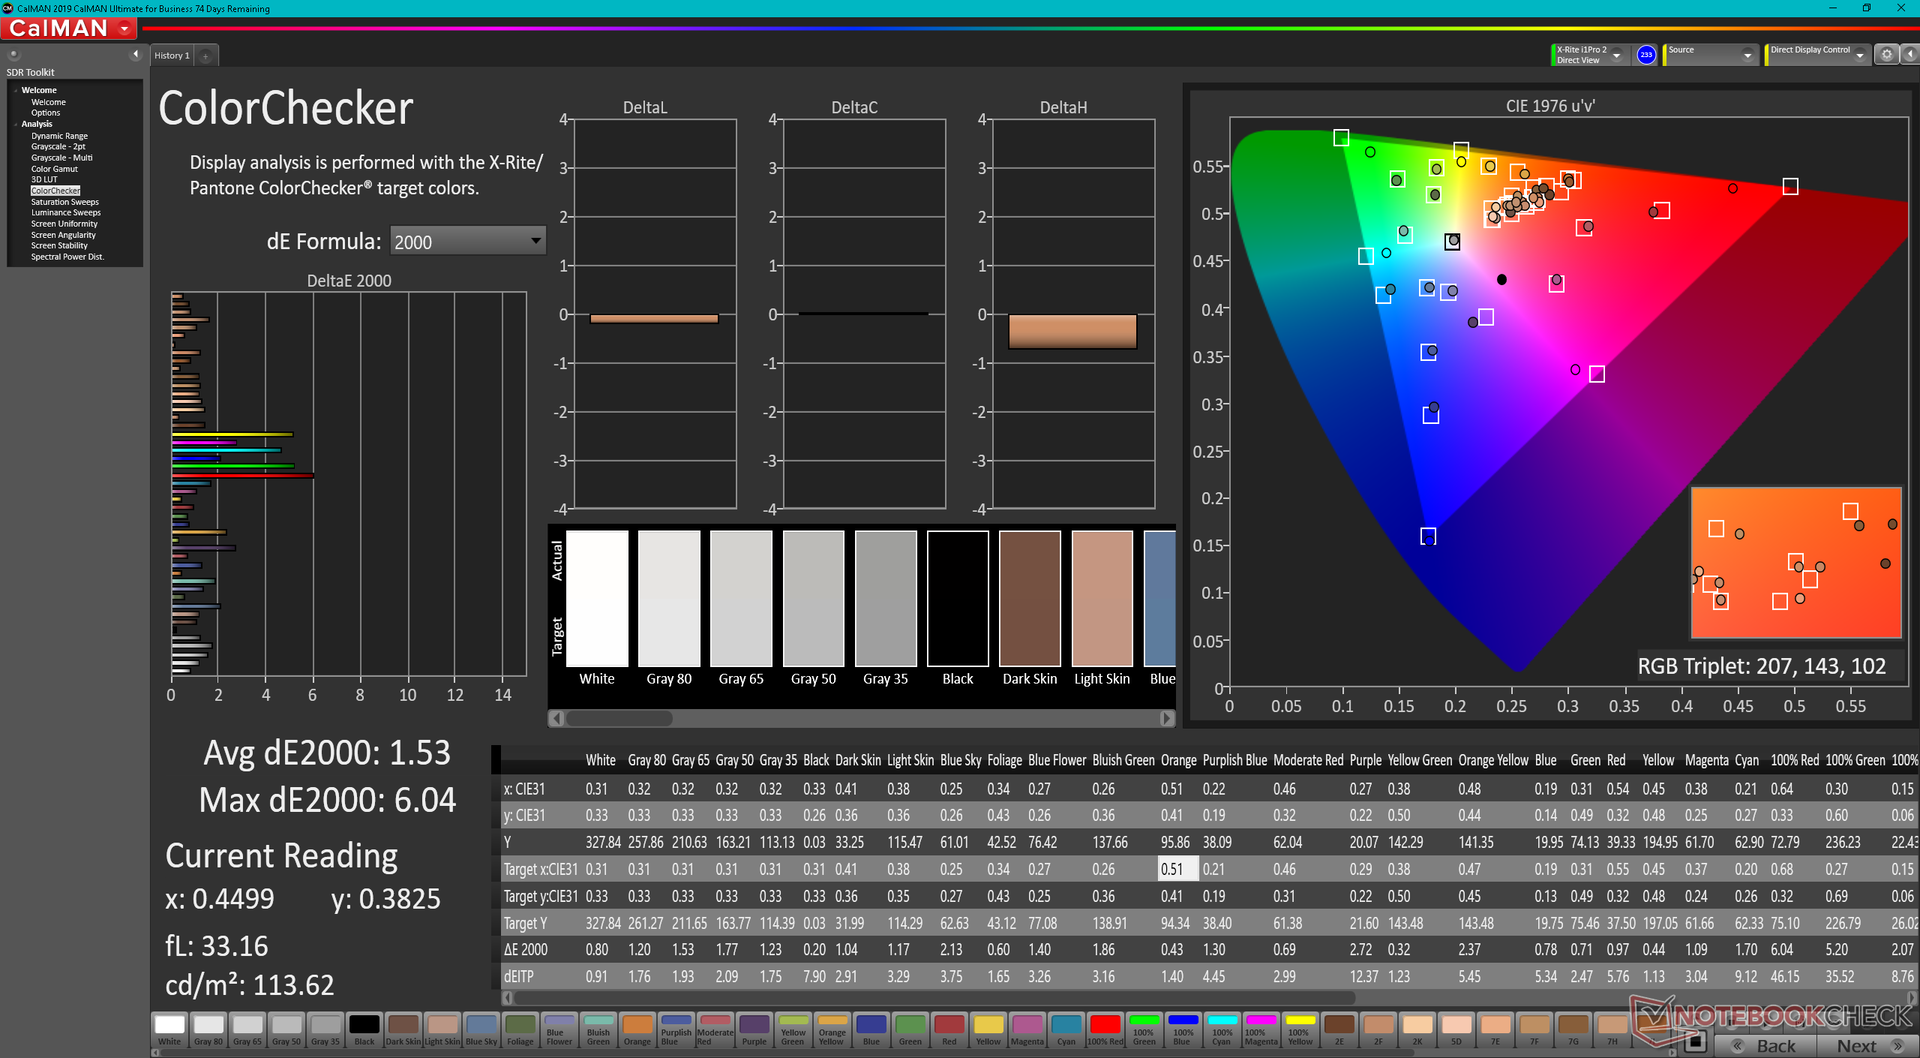
ΔE ColorChecker Calman: 1.53 | ∀{0.5-29.43 Ø4.71}
ΔE Greyscale Calman: 1.3 | ∀{0.09-98 Ø4.96}
88% AdobeRGB 1998 (Argyll 3D)
100% sRGB (Argyll 3D)
99.3% Display P3 (Argyll 3D)
Gamma: 2.18
CCT: 6362 K
| HP Envy 16 h0112nr Samsung SDC4174, OLED, 3840x2400, 16" | Lenovo ThinkBook 16 G4+ IAP LEN160WQXGA, IPS, 2560x1600, 16" | MSI Creator Z16P B12UHST AUOD298, IPS True Pixel (~100% DCI-P3), 2560x1600, 16" | Dell Inspiron 16 Plus 7610-MHJ8F AU Optronics B160QAN, AUO9F91, IPS, 3072x1920, 16" | Apple MacBook Pro 16 2021 M1 Pro Liquid Retina XDR, Mini-LED, 3456x2234, 16.2" | Huawei MateBook 16s i7 BOE XS TV160DKT-NH0, IPS, 2520x1680, 16" | |
|---|---|---|---|---|---|---|
| Display | -17% | -1% | -13% | 0% | -21% | |
| Display P3 Coverage (%) | 99.3 | 69.6 -30% | 97.6 -2% | 75 -24% | 99.1 0% | 64.5 -35% |
| sRGB Coverage (%) | 100 | 97.5 -2% | 99.9 0% | 100 0% | 100 0% | 96.7 -3% |
| AdobeRGB 1998 Coverage (%) | 88 | 71.7 -19% | 86.8 -1% | 76 -14% | 88 0% | 66.6 -24% |
| Response Times | -1160% | -391% | -2092% | -3381% | -1403% | |
| Response Time Grey 50% / Grey 80% * (ms) | 2 ? | 32.7 ? -1535% | 12.9 ? -545% | 54 ? -2600% | 42.8 ? -2040% | 35.7 ? -1685% |
| Response Time Black / White * (ms) | 1.9 ? | 16.8 ? -784% | 6.4 ? -237% | 32 ? -1584% | 91.6 ? -4721% | 23.2 ? -1121% |
| PWM Frequency (Hz) | 240.4 ? | 14880 | ||||
| Screen | -36% | -17% | -37% | 15% | 13% | |
| Brightness middle (cd/m²) | 328.8 | 371 13% | 428 30% | 290 -12% | 514 56% | 311 -5% |
| Brightness (cd/m²) | 332 | 357 8% | 394 19% | 285 -14% | 497 50% | 319 -4% |
| Brightness Distribution (%) | 97 | 91 -6% | 86 -11% | 88 -9% | 95 -2% | 91 -6% |
| Black Level * (cd/m²) | 0.23 | 0.42 | 0.21 | 0.02 | 0.17 | |
| Colorchecker dE 2000 * | 1.53 | 2.6 -70% | 1.67 -9% | 2.57 -68% | 1.4 8% | 1 35% |
| Colorchecker dE 2000 max. * | 6.04 | 4.4 27% | 5.71 5% | 4.78 21% | 2.8 54% | 1.7 72% |
| Greyscale dE 2000 * | 1.3 | 3.7 -185% | 3.1 -138% | 3.14 -142% | 2.3 -77% | 1.5 -15% |
| Gamma | 2.18 101% | 2.32 95% | 2.195 100% | 2.34 94% | 2.27 97% | 2.15 102% |
| CCT | 6362 102% | 7271 89% | 6498 100% | 6408 101% | 6792 96% | 6432 101% |
| Contrast (:1) | 1613 | 1019 | 1381 | 25700 | 1829 | |
| Colorchecker dE 2000 calibrated * | 1.3 | 0.71 | 1.89 | 0.8 | ||
| Media totale (Programma / Settaggio) | -404% /
-235% | -136% /
-81% | -714% /
-404% | -1122% /
-607% | -470% /
-254% |
* ... Meglio usare valori piccoli
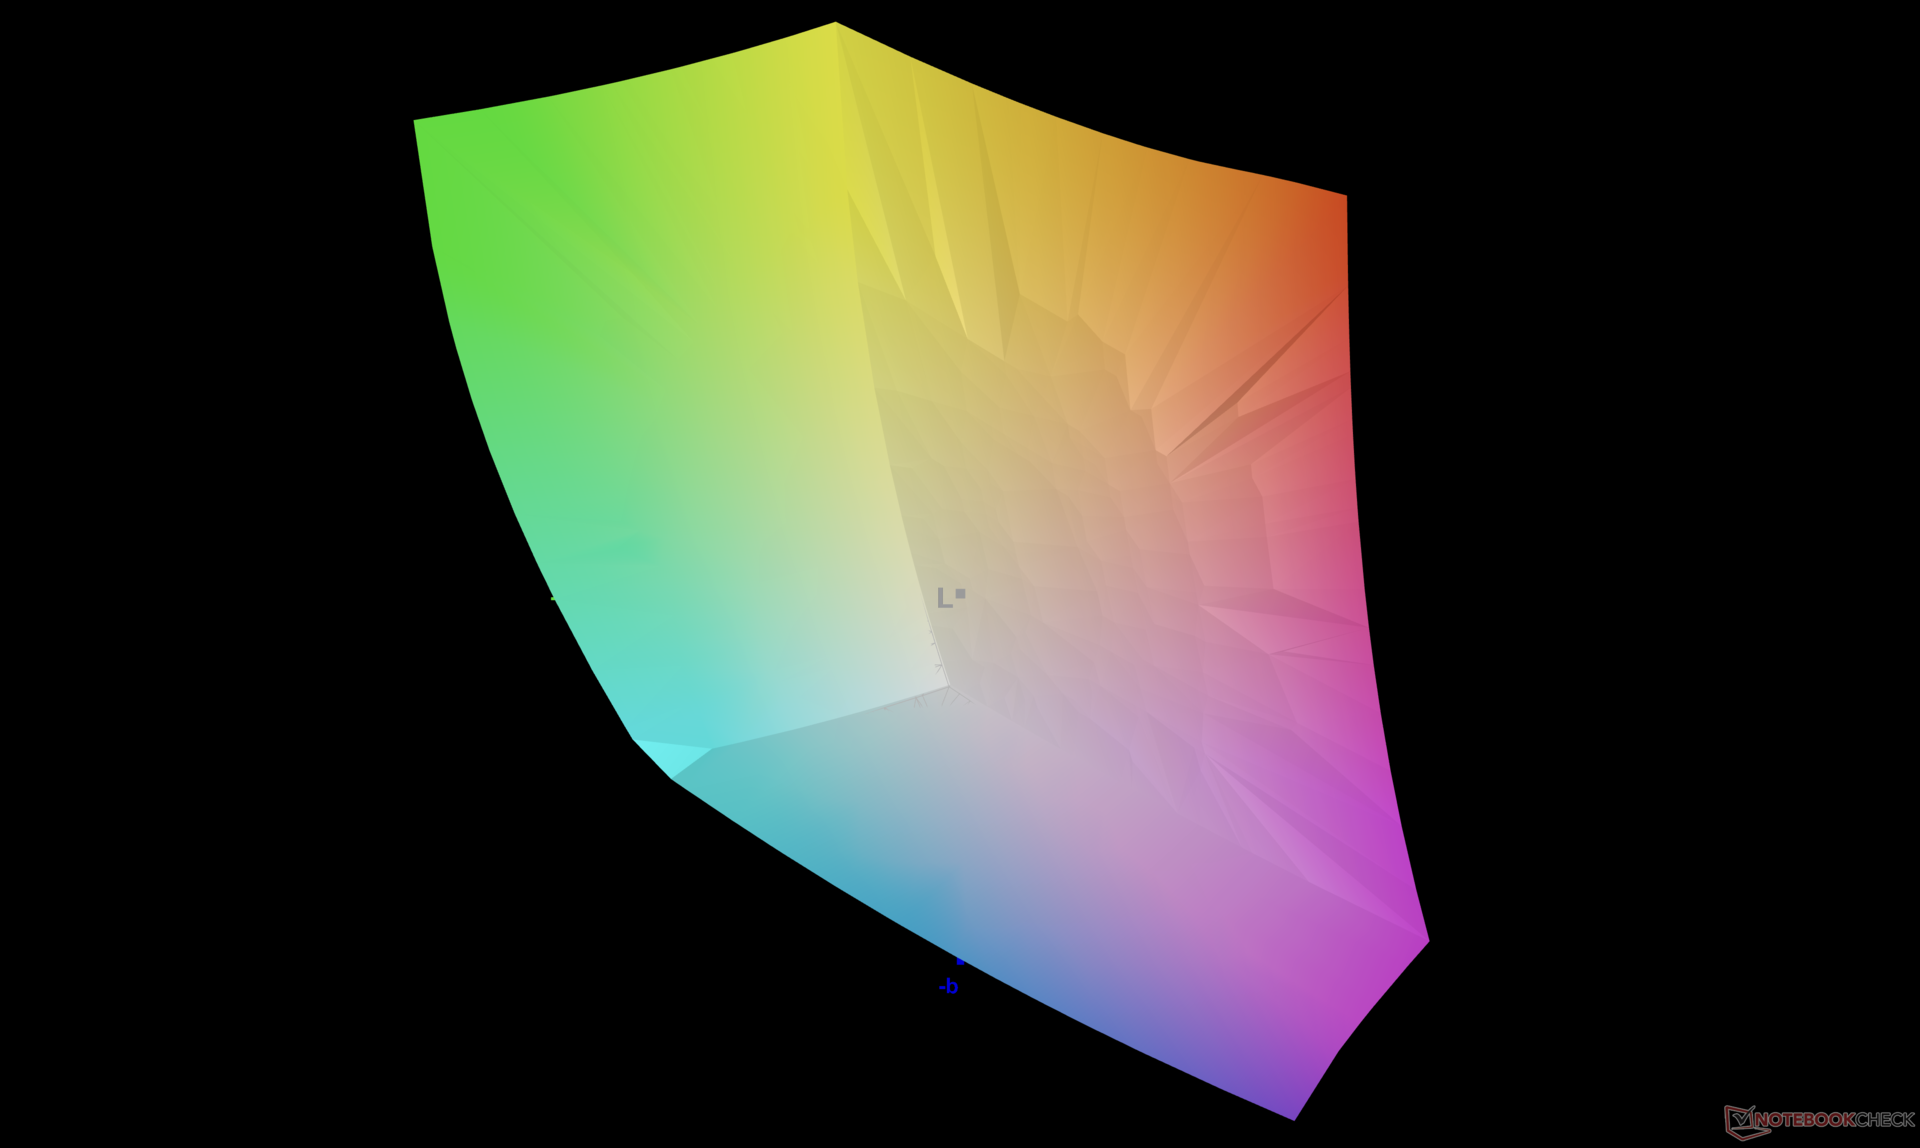
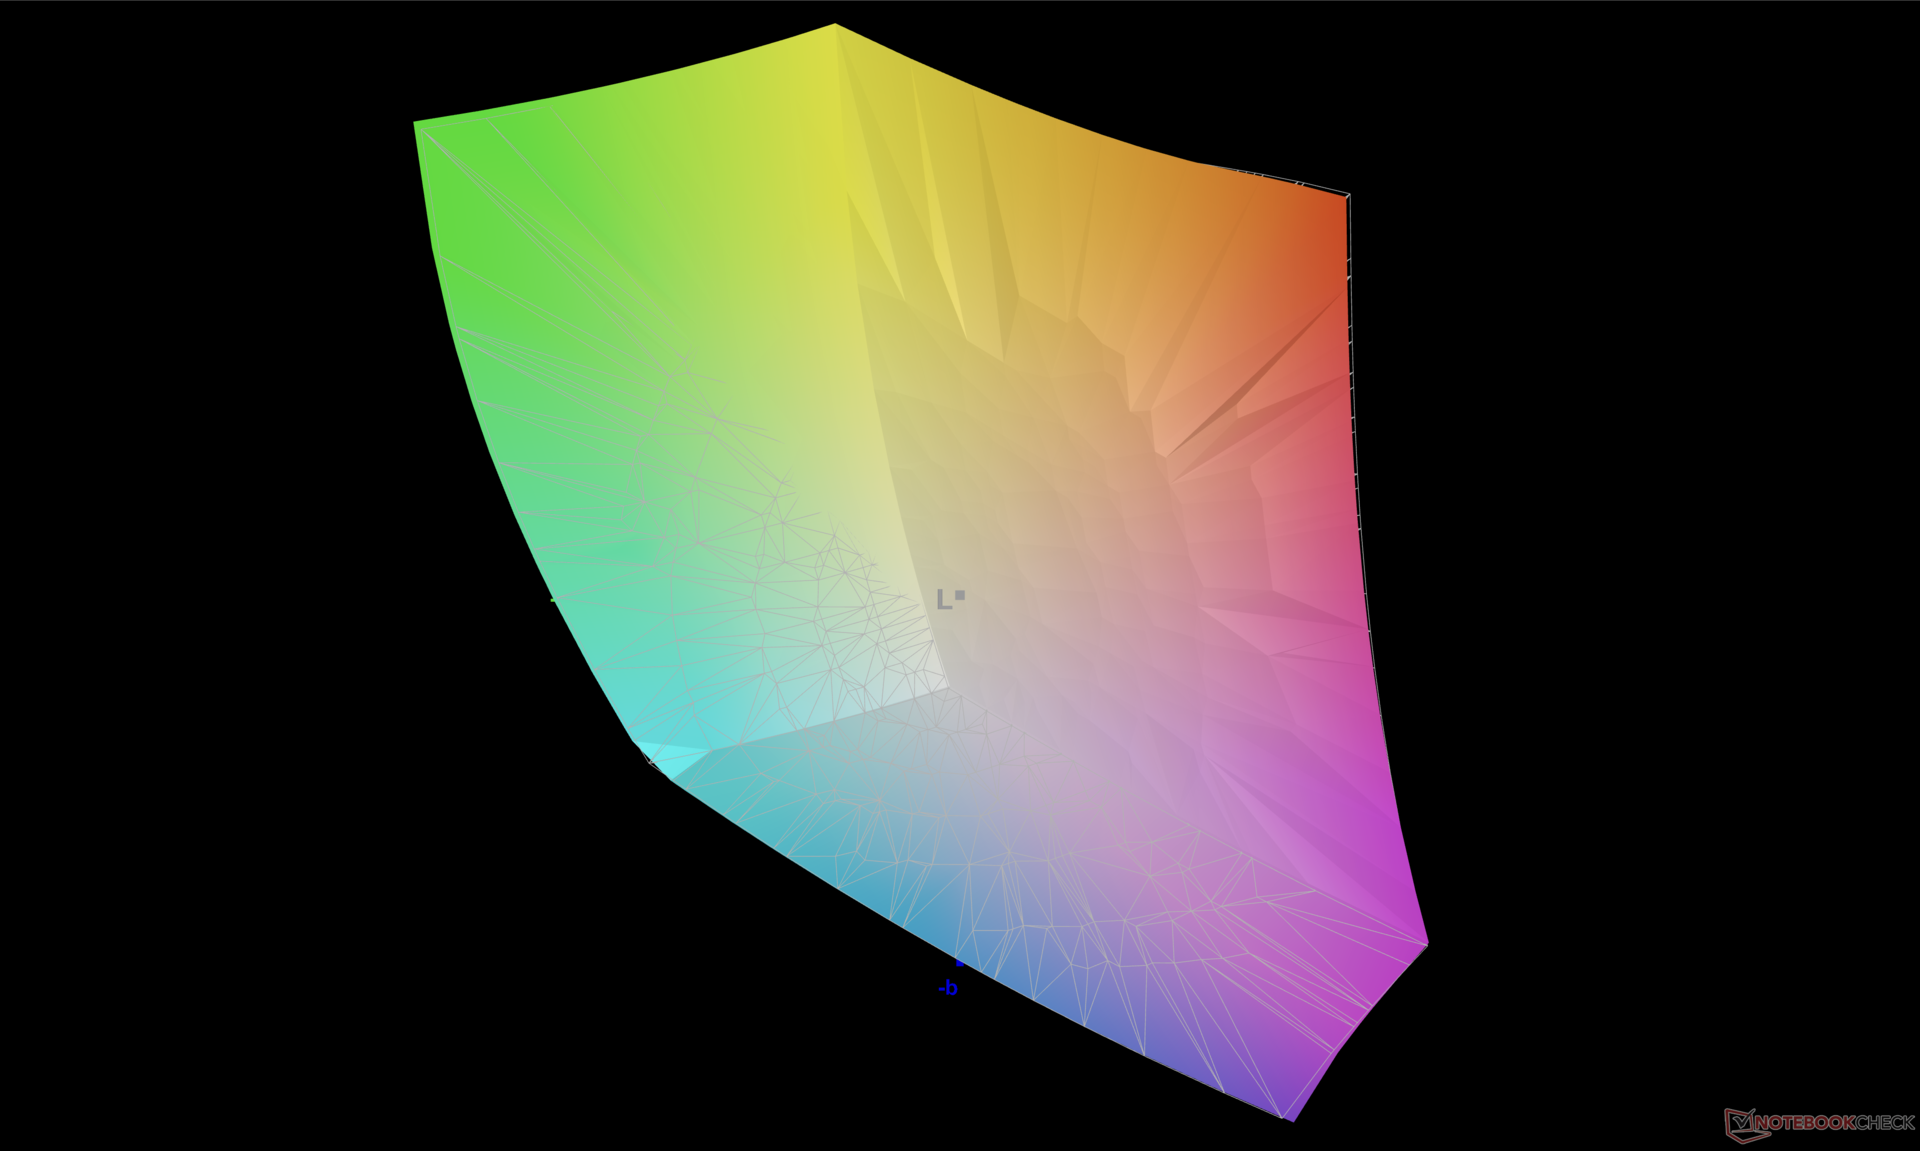
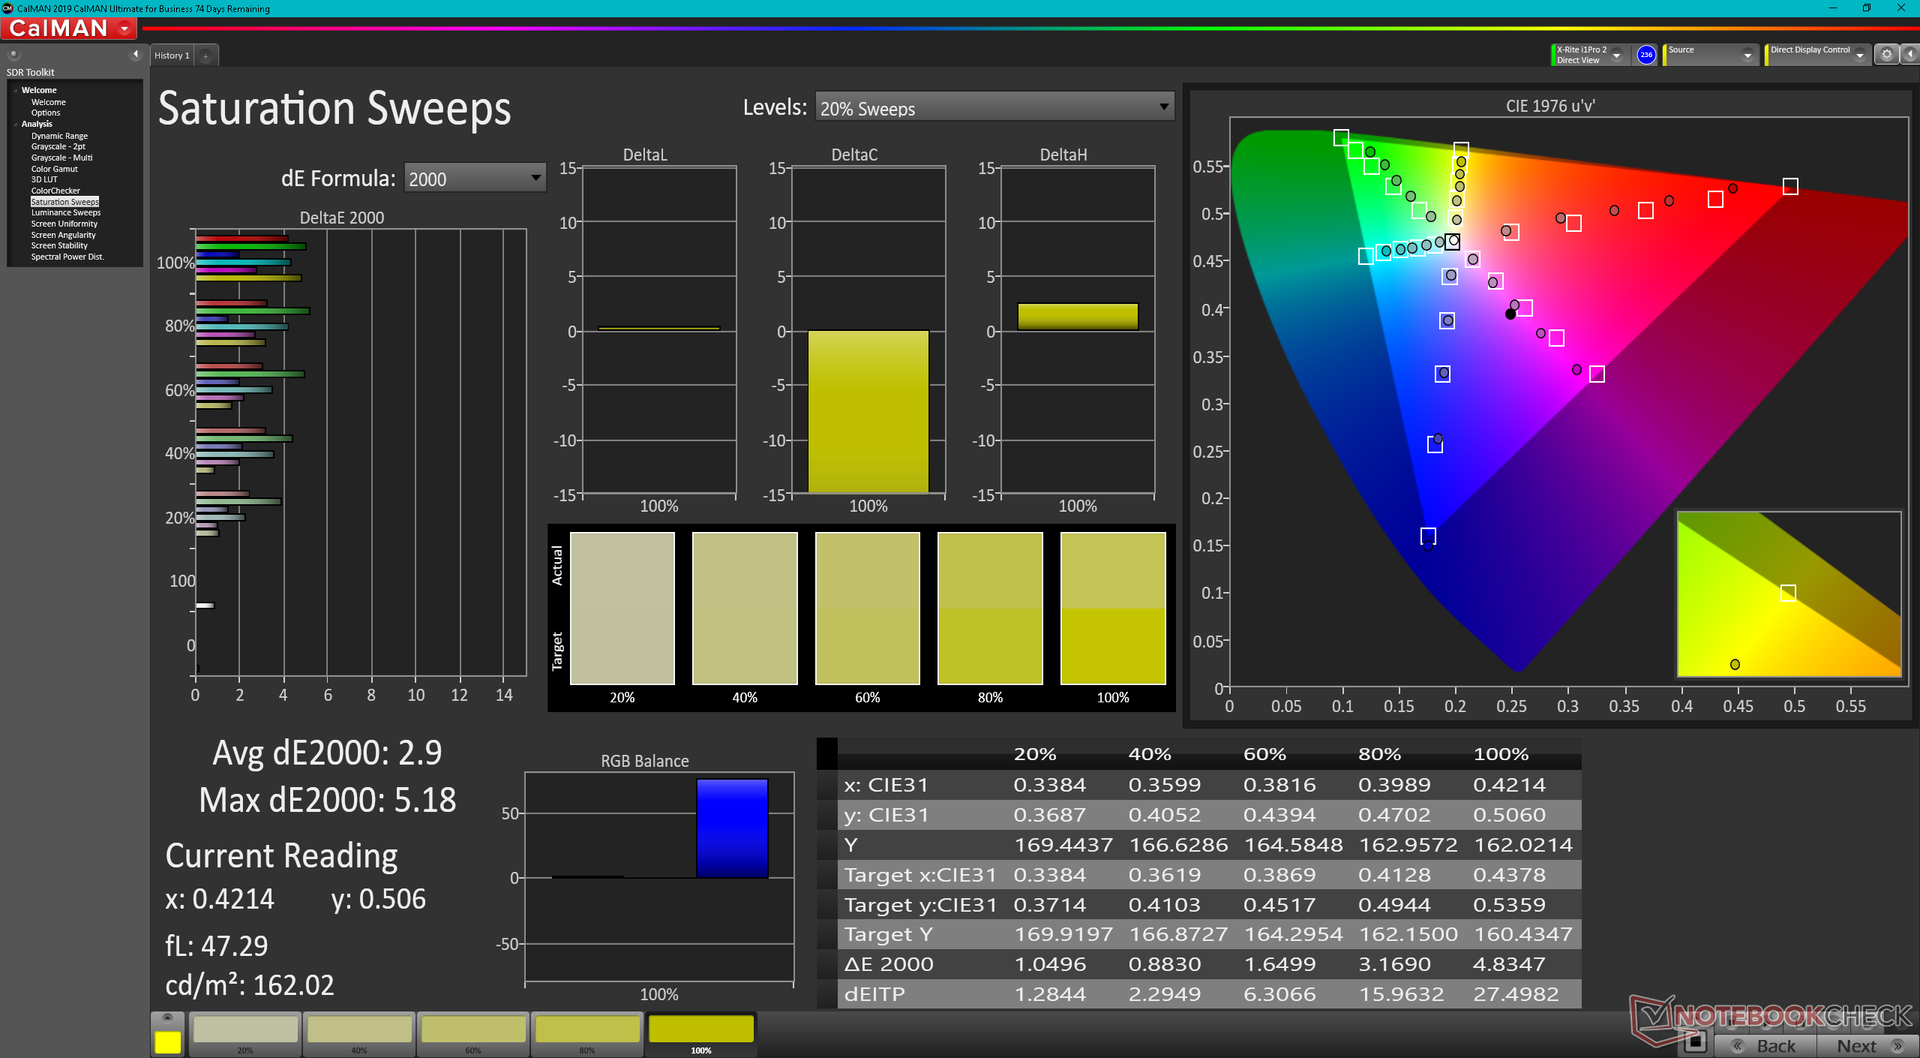
Il pannello è calibrato rispetto allo standard P3 con valori medi di DeltaE in scala di grigi e a colori di soli 1,3 e 1,53, rispettivamente. I colori sembrano essere più imprecisi a livelli di saturazione più alti che a livelli di saturazione più bassi.
Tempi di risposta del Display
| ↔ Tempi di risposta dal Nero al Bianco | ||
|---|---|---|
| 1.9 ms ... aumenta ↗ e diminuisce ↘ combinato | ↗ 0.8 ms Incremento | 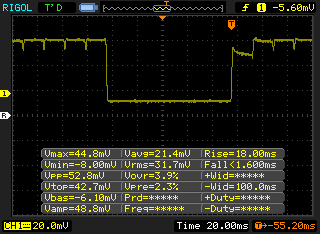 |
| ↘ 1.1 ms Calo | ||
| Lo schermo ha mostrato valori di risposta molto veloci nei nostri tests ed è molto adatto per i gaming veloce. In confronto, tutti i dispositivi di test variano da 0.1 (minimo) a 240 (massimo) ms. » 11 % di tutti i dispositivi è migliore. Questo significa che i tempi di risposta rilevati sono migliori rispettto alla media di tutti i dispositivi testati (19.8 ms). | ||
| ↔ Tempo di risposta dal 50% Grigio all'80% Grigio | ||
| 2 ms ... aumenta ↗ e diminuisce ↘ combinato | ↗ 1 ms Incremento | 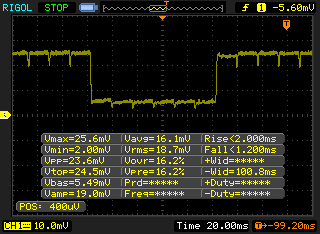 |
| ↘ 1 ms Calo | ||
| Lo schermo ha mostrato valori di risposta molto veloci nei nostri tests ed è molto adatto per i gaming veloce. In confronto, tutti i dispositivi di test variano da 0.165 (minimo) a 636 (massimo) ms. » 10 % di tutti i dispositivi è migliore. Questo significa che i tempi di risposta rilevati sono migliori rispettto alla media di tutti i dispositivi testati (31 ms). | ||
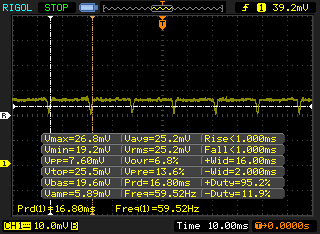
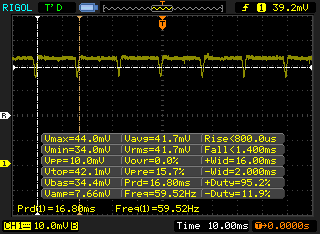
Sfarfallio dello schermo / PWM (Pulse-Width Modulation)
| flickering dello schermo / PWM rilevato | 240.4 Hz | ≤ 100 % settaggio luminosita' | 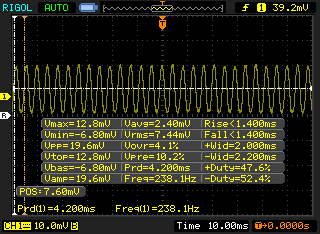 |
Il display sfarfalla a 240.4 Hz (Probabilmente a causa dell'uso di PWM) Flickering rilevato ad una luminosita' di 100 % o inferiore. Non dovrebbe verificarsi flickering o PWM sopra questo valore di luminosita'. La frequenza di 240.4 Hz è relativamente bassa, quindi gli utenti sensibili potrebbero notare il flickering ed accusare stanchezza agli occhi a questo livello di luminosità e a livelli inferiori. In confronto: 52 % di tutti i dispositivi testati non utilizza PWM per ridurre la luminosita' del display. Se è rilevato PWM, una media di 7757 (minimo: 5 - massimo: 343500) Hz è stata rilevata. | |||
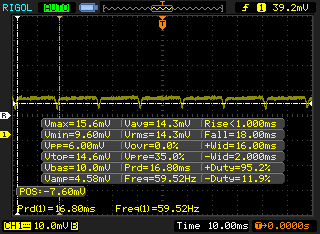
Lo sfarfallio o modulazione di ampiezza degli impulsi è presente a tutti i livelli di luminosità, come nei pannelli OLED dei più recenti VivoBook Asus VivoBook o ZenBook. La frequenza è di 240,4 Hz da 0 al 40% di luminosità e di 60 Hz dal 41 al 100% di luminosità.


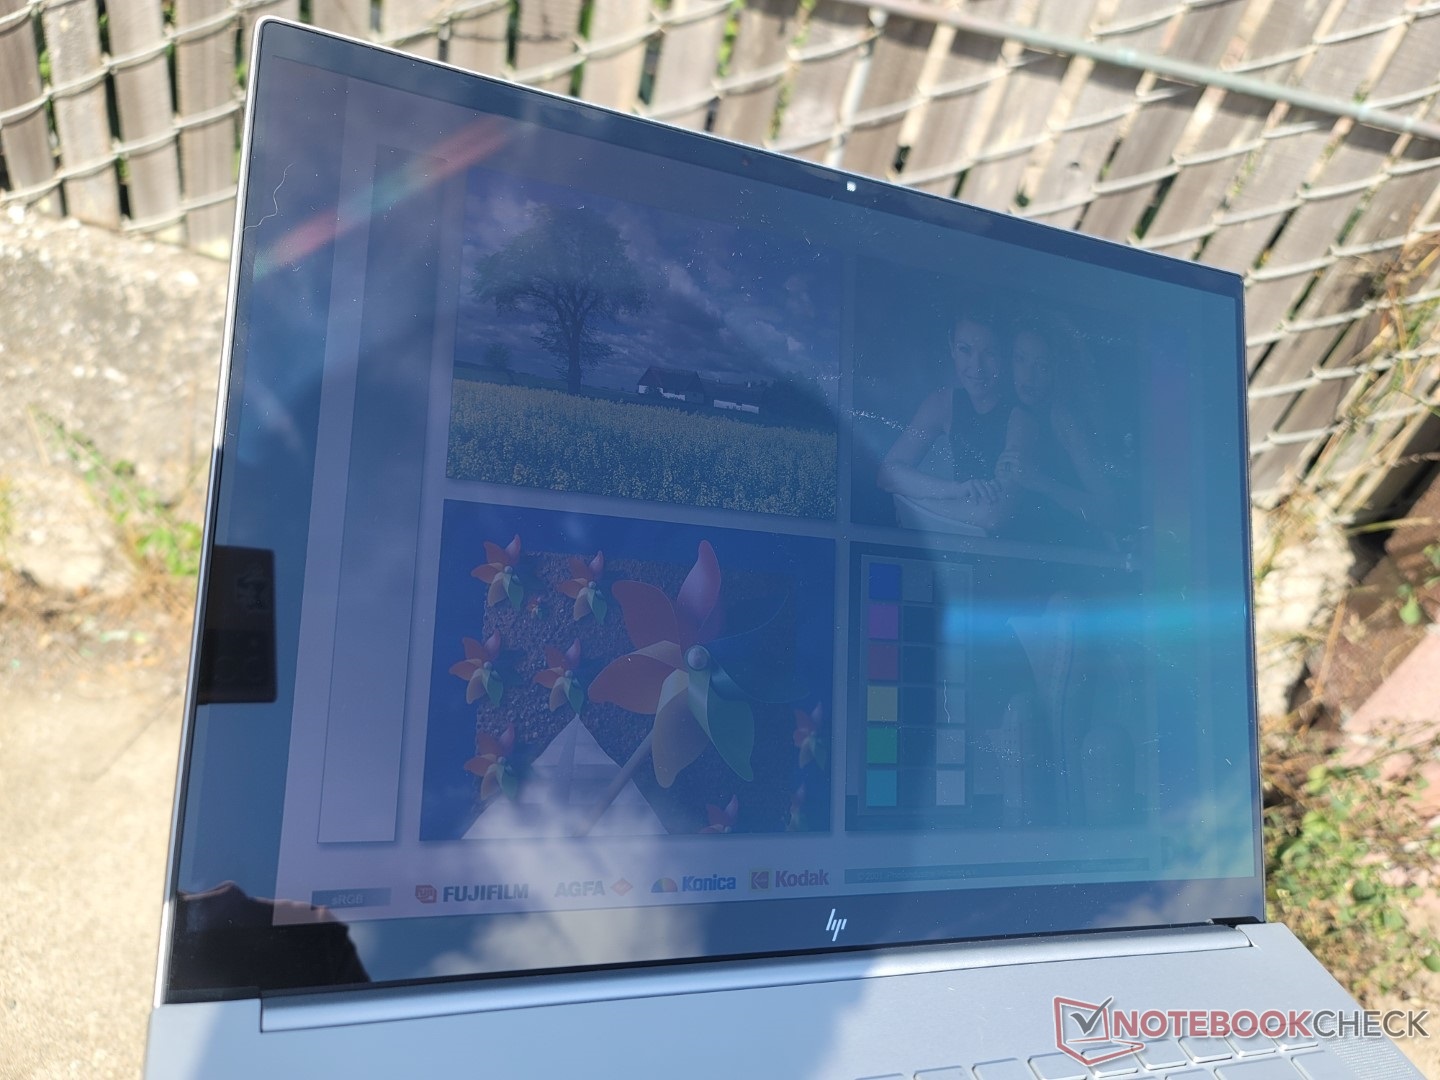
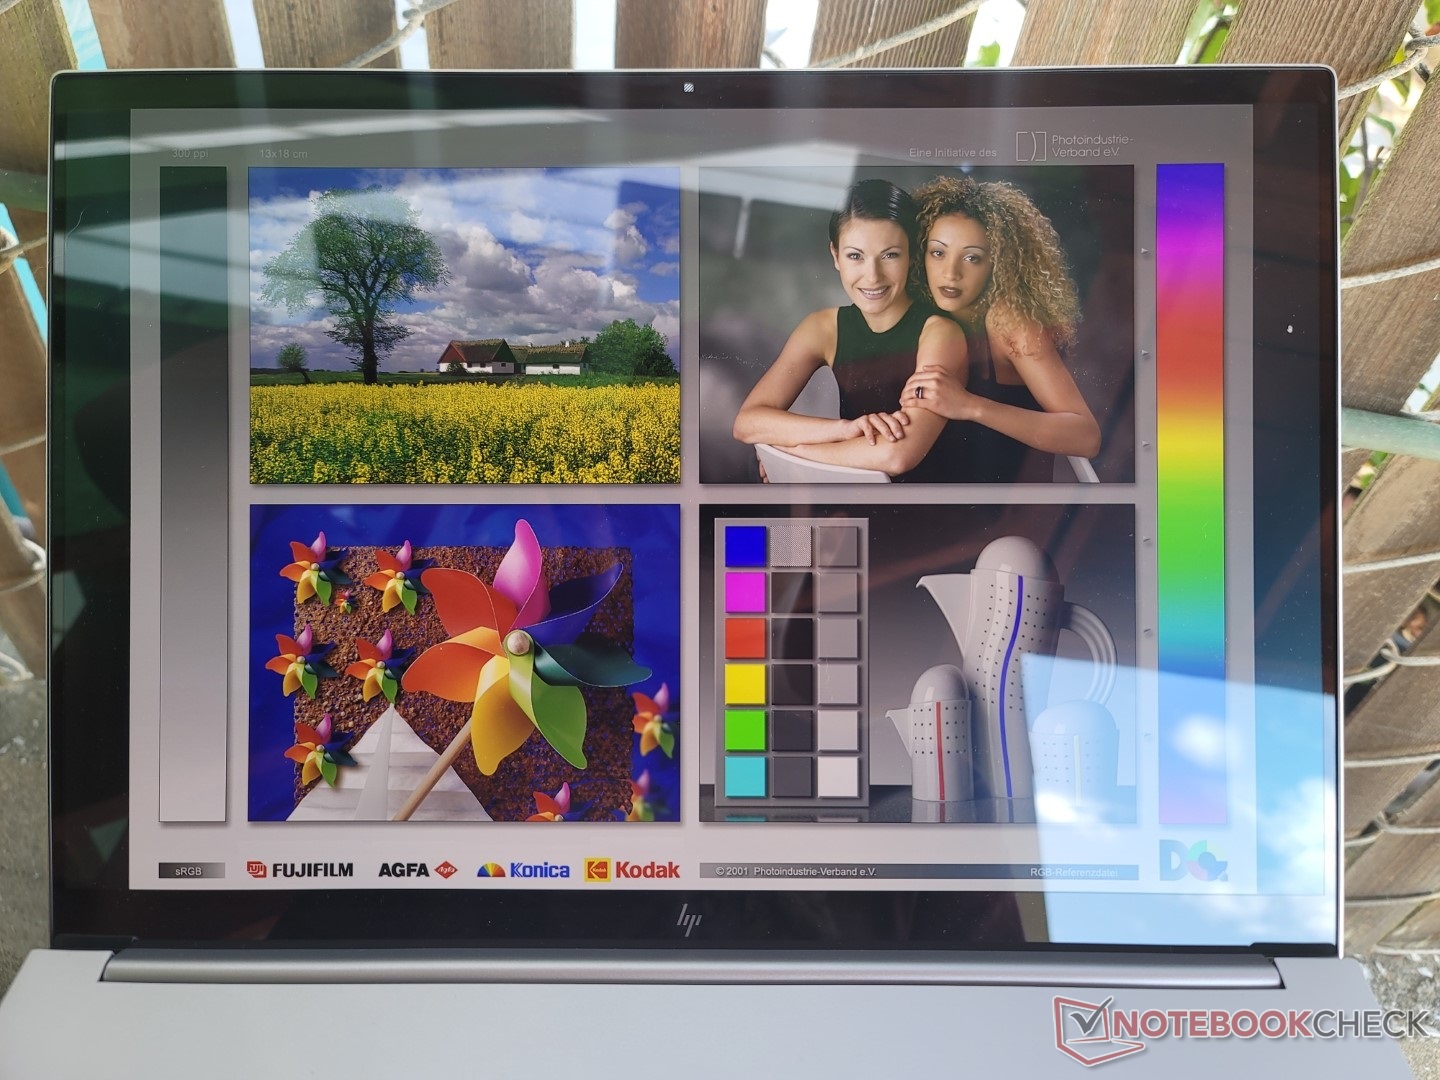
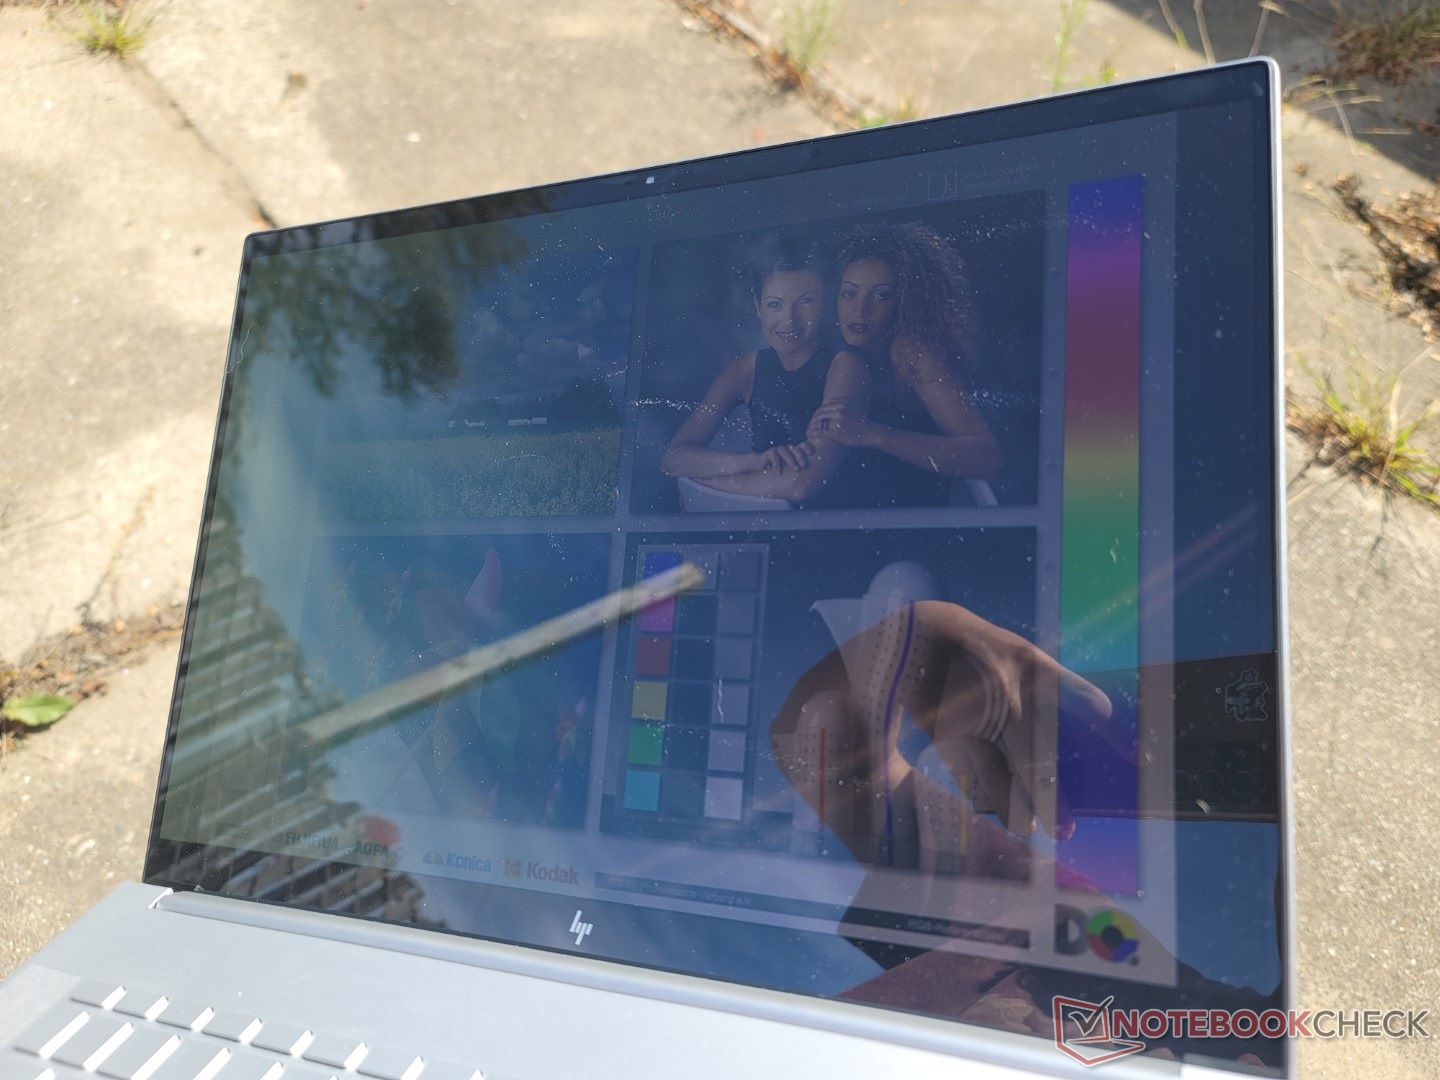
I riflessi sono inevitabili nella maggior parte delle condizioni esterne. Il display lucido non è altrettanto luminoso quanto quello del MacBook Pro 16. Con una luminosità massima di poco superiore a 320 nits, questo è uno dei pannelli OLED più scarsi sul mercato.
Prestazioni - Intel Core H di 12a generazione
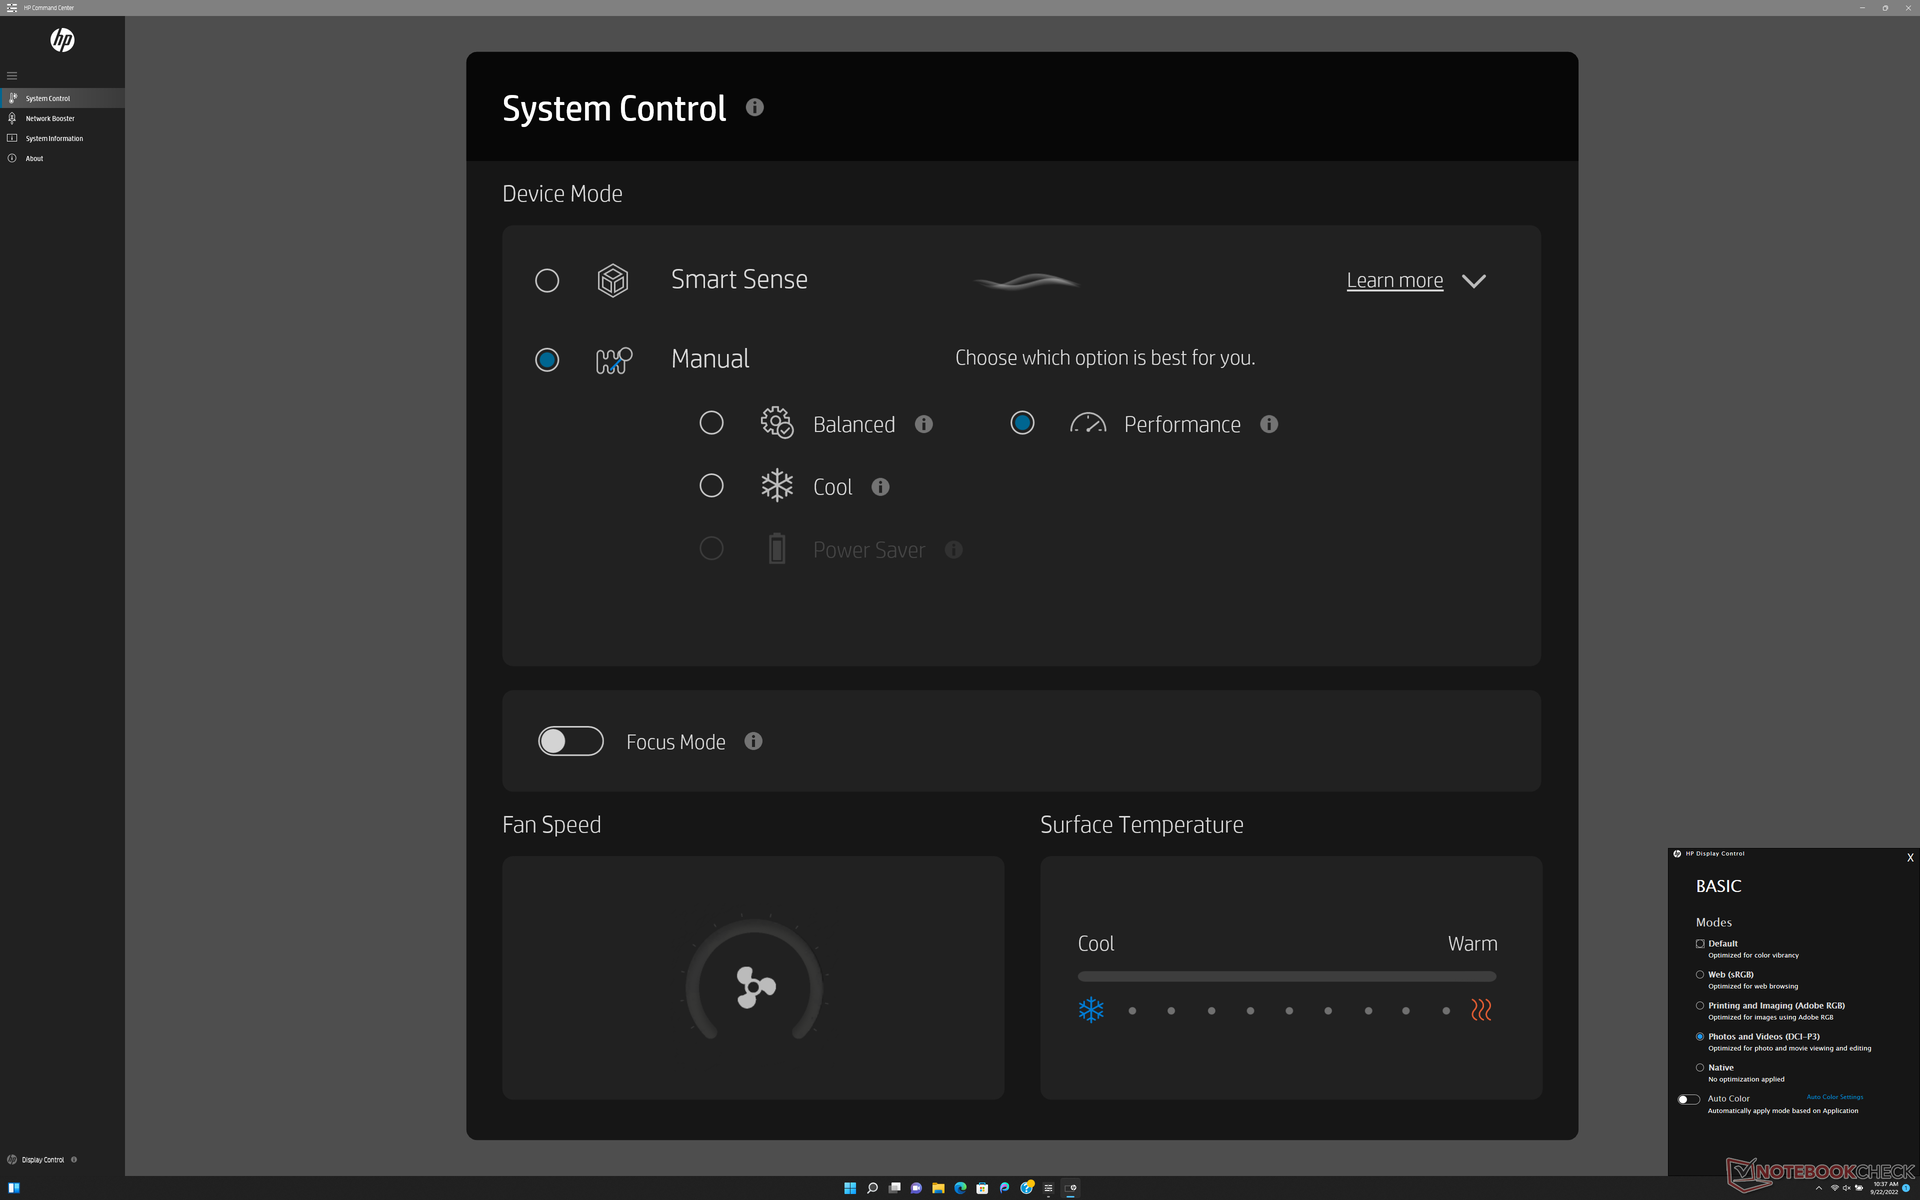
Condizioni di test
Abbiamo impostato la nostra unità in modalità Performance sia tramite Windows che tramite il software HP Command Center prima di eseguire i benchmark qui sotto. HP Command Center è l'hub per il controllo dei profili di alimentazione e dei colori del display, come mostra la schermata seguente.
Processore
Le prestazioni multi-thread sono circa il 15% più lente rispetto alla media dei laptop del nostro database equipaggiati con lo stesso Core i7-12700H CPU. Il Lenovo Legion Slim 7 16, ad esempio, è in grado di utilizzare lo stesso processore più velocemente anche dopo aver tenuto conto di qualsiasi throttling. Tuttavia, le prestazioni sono ancora significativamente migliori rispetto al Core i7-10750H di 10a generazione.Core i7-10750H del 2020 Envy 15 di circa il 60%
L'aggiornamento al Core i9-12900H Dovrebbe aumentare le prestazioni multi-thread del 30-40% rispetto al Core i7-12700H.
Cinebench R15 Multi Loop
Cinebench R23: Multi Core | Single Core
Cinebench R15: CPU Multi 64Bit | CPU Single 64Bit
Blender: v2.79 BMW27 CPU
7-Zip 18.03: 7z b 4 | 7z b 4 -mmt1
Geekbench 5.5: Multi-Core | Single-Core
HWBOT x265 Benchmark v2.2: 4k Preset
LibreOffice : 20 Documents To PDF
R Benchmark 2.5: Overall mean
Cinebench R23: Multi Core | Single Core
Cinebench R15: CPU Multi 64Bit | CPU Single 64Bit
Blender: v2.79 BMW27 CPU
7-Zip 18.03: 7z b 4 | 7z b 4 -mmt1
Geekbench 5.5: Multi-Core | Single-Core
HWBOT x265 Benchmark v2.2: 4k Preset
LibreOffice : 20 Documents To PDF
R Benchmark 2.5: Overall mean
* ... Meglio usare valori piccoli
AIDA64: FP32 Ray-Trace | FPU Julia | CPU SHA3 | CPU Queen | FPU SinJulia | FPU Mandel | CPU AES | CPU ZLib | FP64 Ray-Trace | CPU PhotoWorxx
| Performance rating | |
| Lenovo ThinkBook 16 G4+ IAP | |
| HP Envy 16 h0112nr | |
| MSI Creator Z16P B12UHST | |
| Media Intel Core i7-12700H | |
| Dell Inspiron 16 Plus 7610-MHJ8F | |
| Huawei MateBook 16s i7 | |
| AIDA64 / FP32 Ray-Trace | |
| Lenovo ThinkBook 16 G4+ IAP | |
| HP Envy 16 h0112nr | |
| Media Intel Core i7-12700H (2585 - 17957, n=64) | |
| Dell Inspiron 16 Plus 7610-MHJ8F | |
| MSI Creator Z16P B12UHST | |
| Huawei MateBook 16s i7 | |
| AIDA64 / FPU Julia | |
| Lenovo ThinkBook 16 G4+ IAP | |
| HP Envy 16 h0112nr | |
| Dell Inspiron 16 Plus 7610-MHJ8F | |
| Media Intel Core i7-12700H (12439 - 90760, n=64) | |
| MSI Creator Z16P B12UHST | |
| Huawei MateBook 16s i7 | |
| AIDA64 / CPU SHA3 | |
| Dell Inspiron 16 Plus 7610-MHJ8F | |
| Lenovo ThinkBook 16 G4+ IAP | |
| Media Intel Core i7-12700H (833 - 4242, n=64) | |
| MSI Creator Z16P B12UHST | |
| HP Envy 16 h0112nr | |
| Huawei MateBook 16s i7 | |
| AIDA64 / CPU Queen | |
| MSI Creator Z16P B12UHST | |
| Lenovo ThinkBook 16 G4+ IAP | |
| HP Envy 16 h0112nr | |
| Media Intel Core i7-12700H (57923 - 103202, n=63) | |
| Huawei MateBook 16s i7 | |
| Dell Inspiron 16 Plus 7610-MHJ8F | |
| AIDA64 / FPU SinJulia | |
| MSI Creator Z16P B12UHST | |
| Lenovo ThinkBook 16 G4+ IAP | |
| Media Intel Core i7-12700H (3249 - 9939, n=64) | |
| Dell Inspiron 16 Plus 7610-MHJ8F | |
| HP Envy 16 h0112nr | |
| Huawei MateBook 16s i7 | |
| AIDA64 / FPU Mandel | |
| Lenovo ThinkBook 16 G4+ IAP | |
| Dell Inspiron 16 Plus 7610-MHJ8F | |
| HP Envy 16 h0112nr | |
| Media Intel Core i7-12700H (7135 - 44760, n=64) | |
| MSI Creator Z16P B12UHST | |
| Huawei MateBook 16s i7 | |
| AIDA64 / CPU AES | |
| Dell Inspiron 16 Plus 7610-MHJ8F | |
| HP Envy 16 h0112nr | |
| MSI Creator Z16P B12UHST | |
| Media Intel Core i7-12700H (31839 - 144360, n=64) | |
| Lenovo ThinkBook 16 G4+ IAP | |
| Huawei MateBook 16s i7 | |
| AIDA64 / CPU ZLib | |
| MSI Creator Z16P B12UHST | |
| Lenovo ThinkBook 16 G4+ IAP | |
| Media Intel Core i7-12700H (305 - 1171, n=64) | |
| HP Envy 16 h0112nr | |
| Dell Inspiron 16 Plus 7610-MHJ8F | |
| Huawei MateBook 16s i7 | |
| AIDA64 / FP64 Ray-Trace | |
| Lenovo ThinkBook 16 G4+ IAP | |
| HP Envy 16 h0112nr | |
| Media Intel Core i7-12700H (1437 - 9692, n=64) | |
| Dell Inspiron 16 Plus 7610-MHJ8F | |
| MSI Creator Z16P B12UHST | |
| Huawei MateBook 16s i7 | |
| AIDA64 / CPU PhotoWorxx | |
| Huawei MateBook 16s i7 | |
| MSI Creator Z16P B12UHST | |
| Lenovo ThinkBook 16 G4+ IAP | |
| HP Envy 16 h0112nr | |
| Media Intel Core i7-12700H (12863 - 52207, n=64) | |
| Dell Inspiron 16 Plus 7610-MHJ8F | |
Prestazioni del sistema
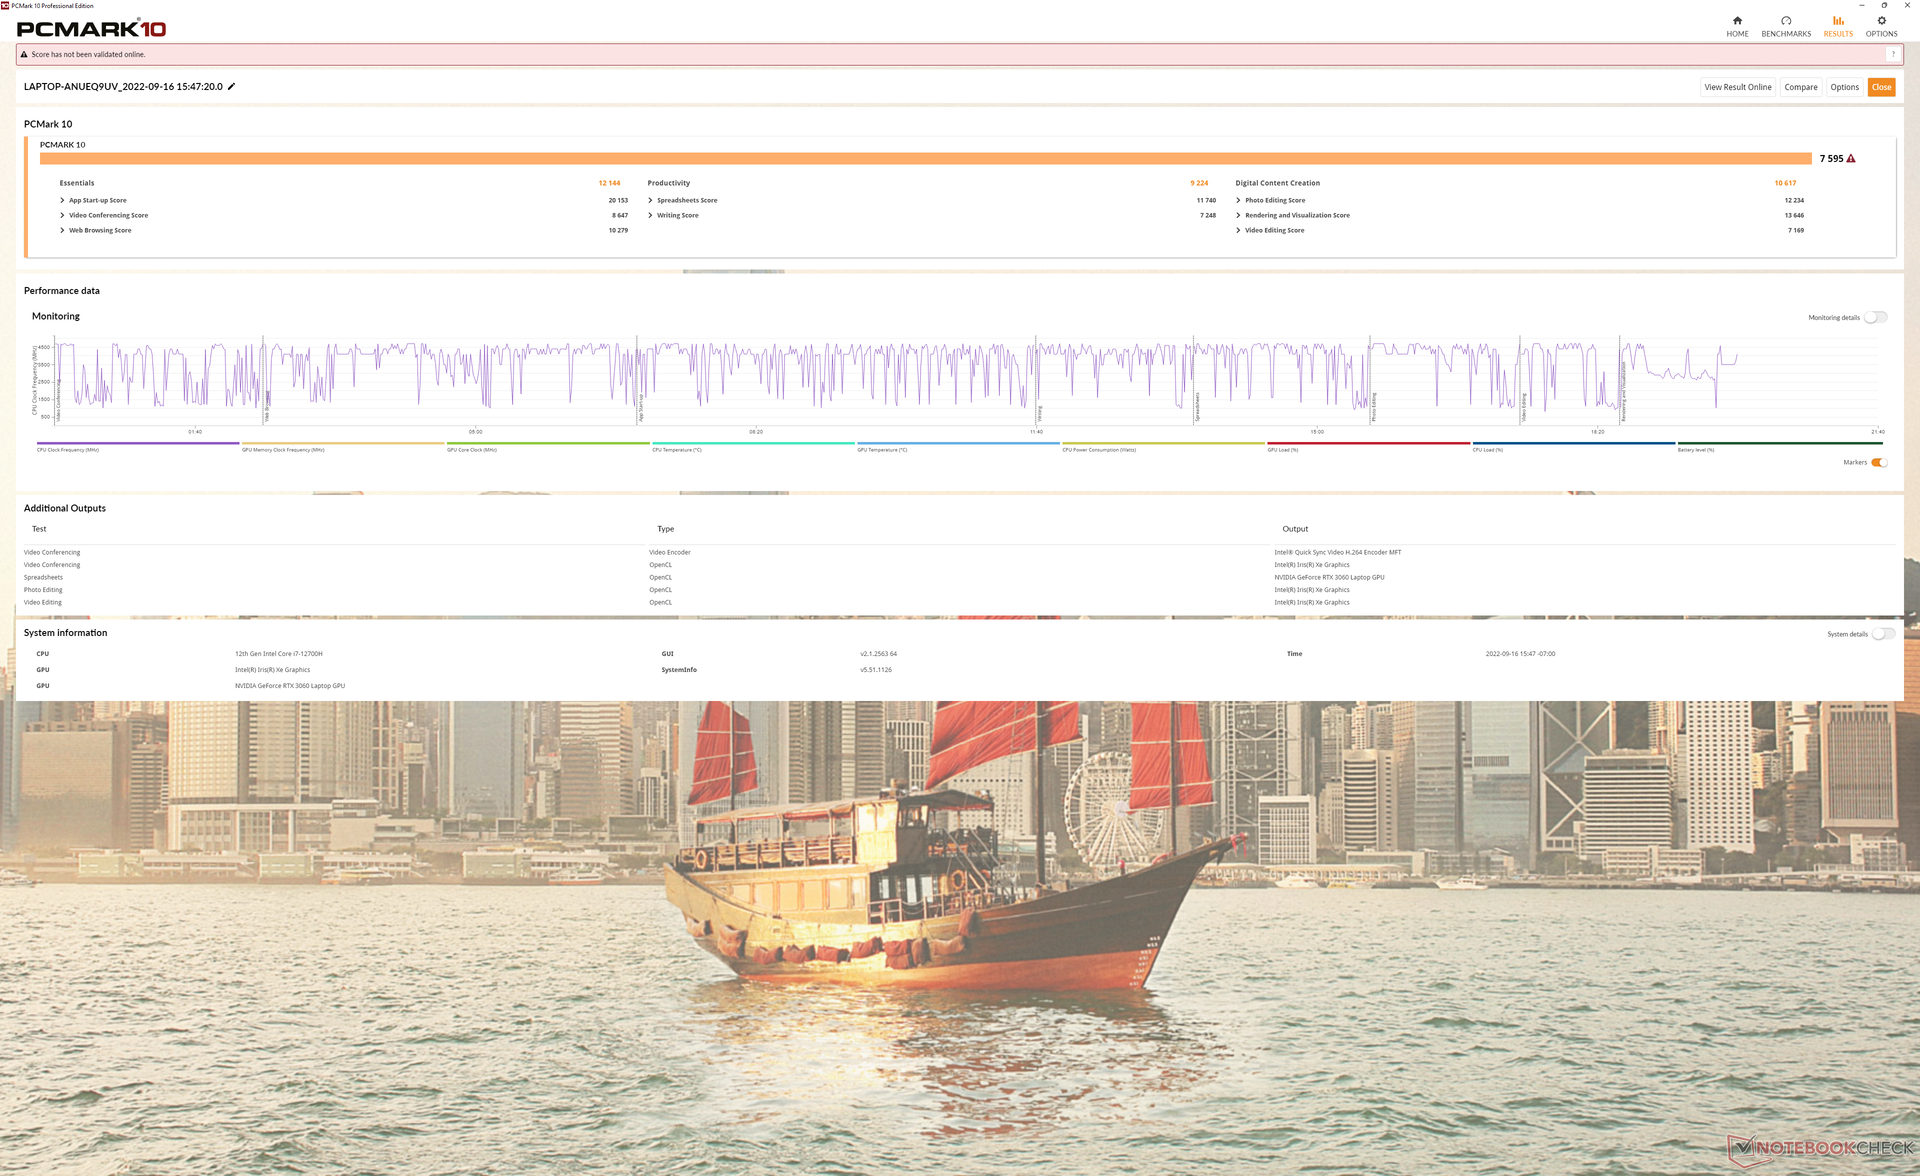
I risultati di PCMark sono costantemente superiori a quelli dell'Envy 15 2020 con ampi margini. Sospettiamo che l'abbandono di Intel Optane abbia avuto un ruolo importante nell'aumento dei punteggi.
CrossMark: Overall | Productivity | Creativity | Responsiveness
| PCMark 10 / Score | |
| MSI Creator Z16P B12UHST | |
| HP Envy 16 h0112nr | |
| Media Intel Core i7-12700H, NVIDIA GeForce RTX 3060 Laptop GPU (5986 - 8156, n=12) | |
| Huawei MateBook 16s i7 | |
| HP Envy 15-ep0098nr | |
| Dell Inspiron 16 Plus 7610-MHJ8F | |
| PCMark 10 / Essentials | |
| HP Envy 16 h0112nr | |
| Huawei MateBook 16s i7 | |
| MSI Creator Z16P B12UHST | |
| Media Intel Core i7-12700H, NVIDIA GeForce RTX 3060 Laptop GPU (9289 - 12144, n=12) | |
| Dell Inspiron 16 Plus 7610-MHJ8F | |
| HP Envy 15-ep0098nr | |
| PCMark 10 / Productivity | |
| MSI Creator Z16P B12UHST | |
| HP Envy 16 h0112nr | |
| Media Intel Core i7-12700H, NVIDIA GeForce RTX 3060 Laptop GPU (6161 - 10362, n=12) | |
| Huawei MateBook 16s i7 | |
| HP Envy 15-ep0098nr | |
| Dell Inspiron 16 Plus 7610-MHJ8F | |
| PCMark 10 / Digital Content Creation | |
| MSI Creator Z16P B12UHST | |
| Media Intel Core i7-12700H, NVIDIA GeForce RTX 3060 Laptop GPU (8950 - 12554, n=12) | |
| HP Envy 16 h0112nr | |
| Huawei MateBook 16s i7 | |
| HP Envy 15-ep0098nr | |
| Dell Inspiron 16 Plus 7610-MHJ8F | |
| CrossMark / Overall | |
| Huawei MateBook 16s i7 | |
| HP Envy 16 h0112nr | |
| Media Intel Core i7-12700H, NVIDIA GeForce RTX 3060 Laptop GPU (1649 - 2017, n=11) | |
| Lenovo ThinkBook 16 G4+ IAP | |
| Apple MacBook Pro 16 2021 M1 Pro | |
| CrossMark / Productivity | |
| Huawei MateBook 16s i7 | |
| HP Envy 16 h0112nr | |
| Media Intel Core i7-12700H, NVIDIA GeForce RTX 3060 Laptop GPU (1536 - 1958, n=11) | |
| Lenovo ThinkBook 16 G4+ IAP | |
| Apple MacBook Pro 16 2021 M1 Pro | |
| CrossMark / Creativity | |
| Apple MacBook Pro 16 2021 M1 Pro | |
| HP Envy 16 h0112nr | |
| Huawei MateBook 16s i7 | |
| Lenovo ThinkBook 16 G4+ IAP | |
| Media Intel Core i7-12700H, NVIDIA GeForce RTX 3060 Laptop GPU (1816 - 2084, n=11) | |
| CrossMark / Responsiveness | |
| Huawei MateBook 16s i7 | |
| Media Intel Core i7-12700H, NVIDIA GeForce RTX 3060 Laptop GPU (1210 - 2207, n=11) | |
| HP Envy 16 h0112nr | |
| Lenovo ThinkBook 16 G4+ IAP | |
| Apple MacBook Pro 16 2021 M1 Pro | |
| PCMark 10 Score | 7595 punti | |
Aiuto | ||
| AIDA64 / Memory Copy | |
| Huawei MateBook 16s i7 | |
| Lenovo ThinkBook 16 G4+ IAP | |
| MSI Creator Z16P B12UHST | |
| HP Envy 16 h0112nr | |
| Media Intel Core i7-12700H (25615 - 80511, n=64) | |
| Dell Inspiron 16 Plus 7610-MHJ8F | |
| AIDA64 / Memory Read | |
| Lenovo ThinkBook 16 G4+ IAP | |
| Huawei MateBook 16s i7 | |
| MSI Creator Z16P B12UHST | |
| HP Envy 16 h0112nr | |
| Media Intel Core i7-12700H (25586 - 79442, n=64) | |
| Dell Inspiron 16 Plus 7610-MHJ8F | |
| AIDA64 / Memory Write | |
| MSI Creator Z16P B12UHST | |
| Huawei MateBook 16s i7 | |
| HP Envy 16 h0112nr | |
| Lenovo ThinkBook 16 G4+ IAP | |
| Media Intel Core i7-12700H (23679 - 88660, n=64) | |
| Dell Inspiron 16 Plus 7610-MHJ8F | |
| AIDA64 / Memory Latency | |
| Lenovo ThinkBook 16 G4+ IAP | |
| Huawei MateBook 16s i7 | |
| Dell Inspiron 16 Plus 7610-MHJ8F | |
| MSI Creator Z16P B12UHST | |
| HP Envy 16 h0112nr | |
| Media Intel Core i7-12700H (76.2 - 133.9, n=62) | |
* ... Meglio usare valori piccoli
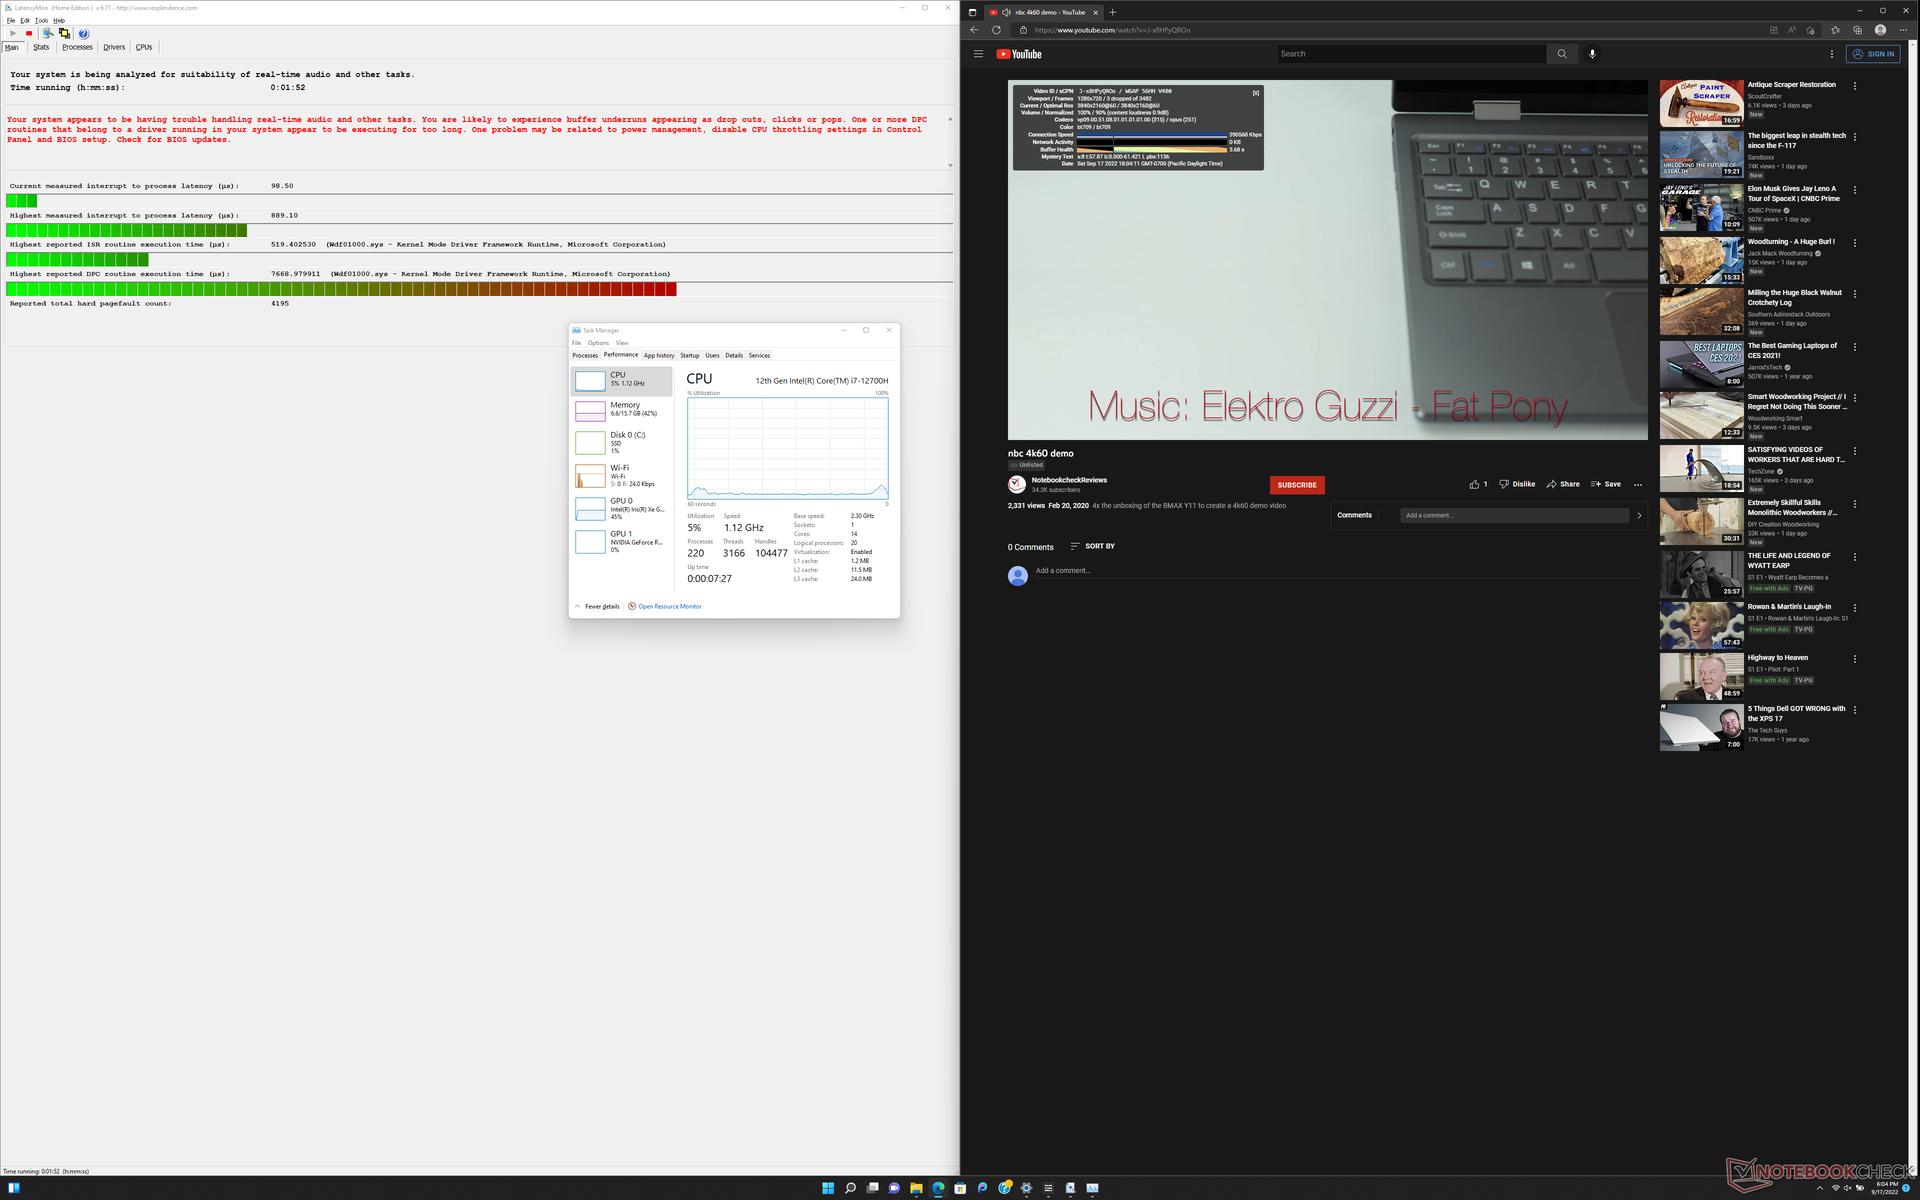
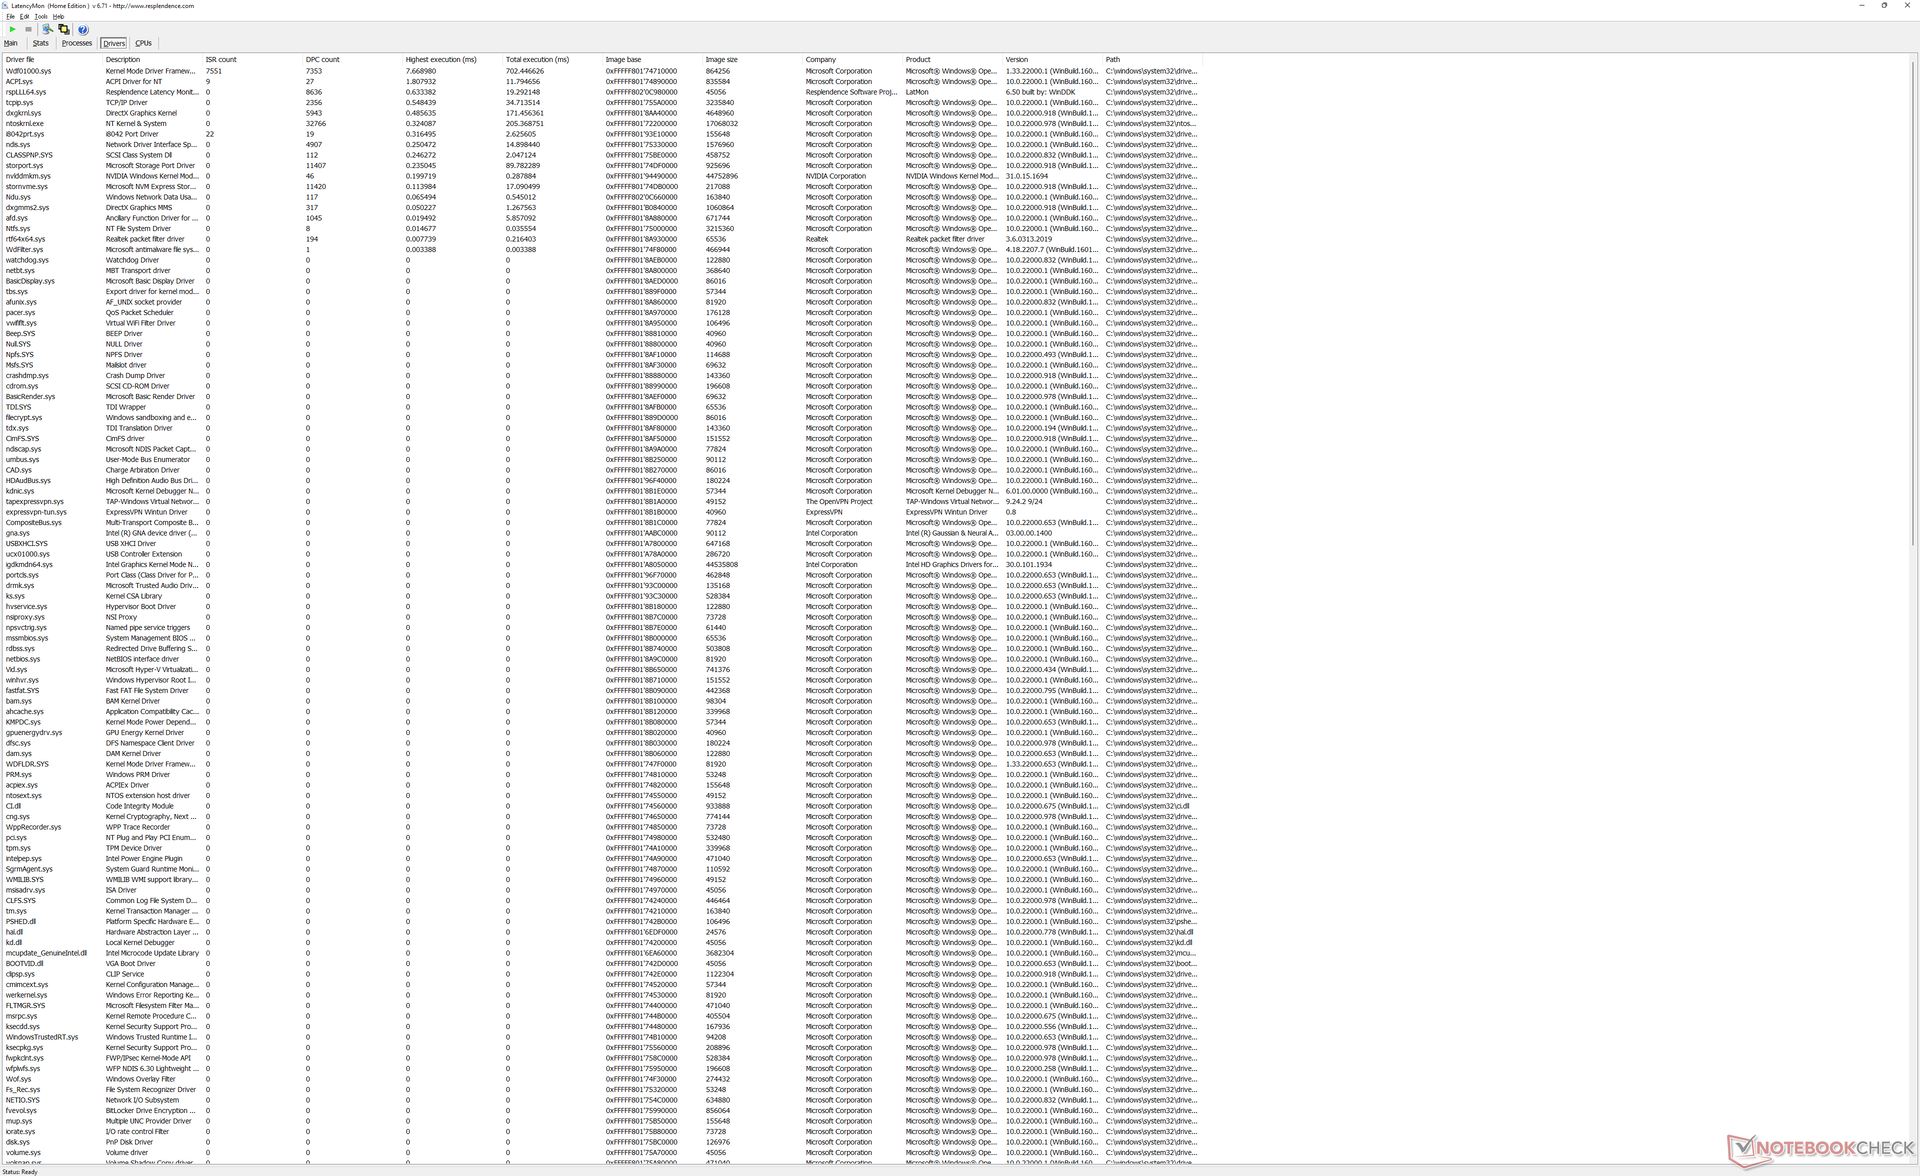
Latenza DPC
LatencyMon rivela problemi di DPC quando si aprono più schede del browser della nostra homepage. anche la riproduzione di video 4K a 60 FPS è imperfetta, con 3 fotogrammi caduti durante il nostro video di prova della durata di un minuto.
| DPC Latencies / LatencyMon - interrupt to process latency (max), Web, Youtube, Prime95 | |
| Lenovo ThinkBook 16 G4+ IAP | |
| HP Envy 16 h0112nr | |
| MSI Creator Z16P B12UHST | |
* ... Meglio usare valori piccoli
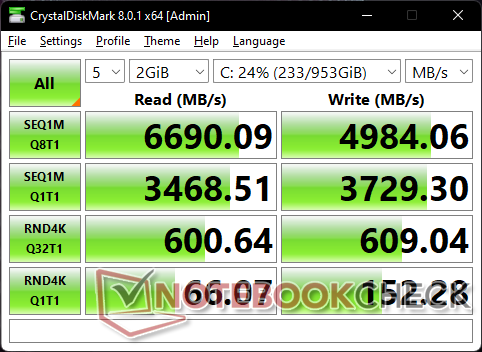
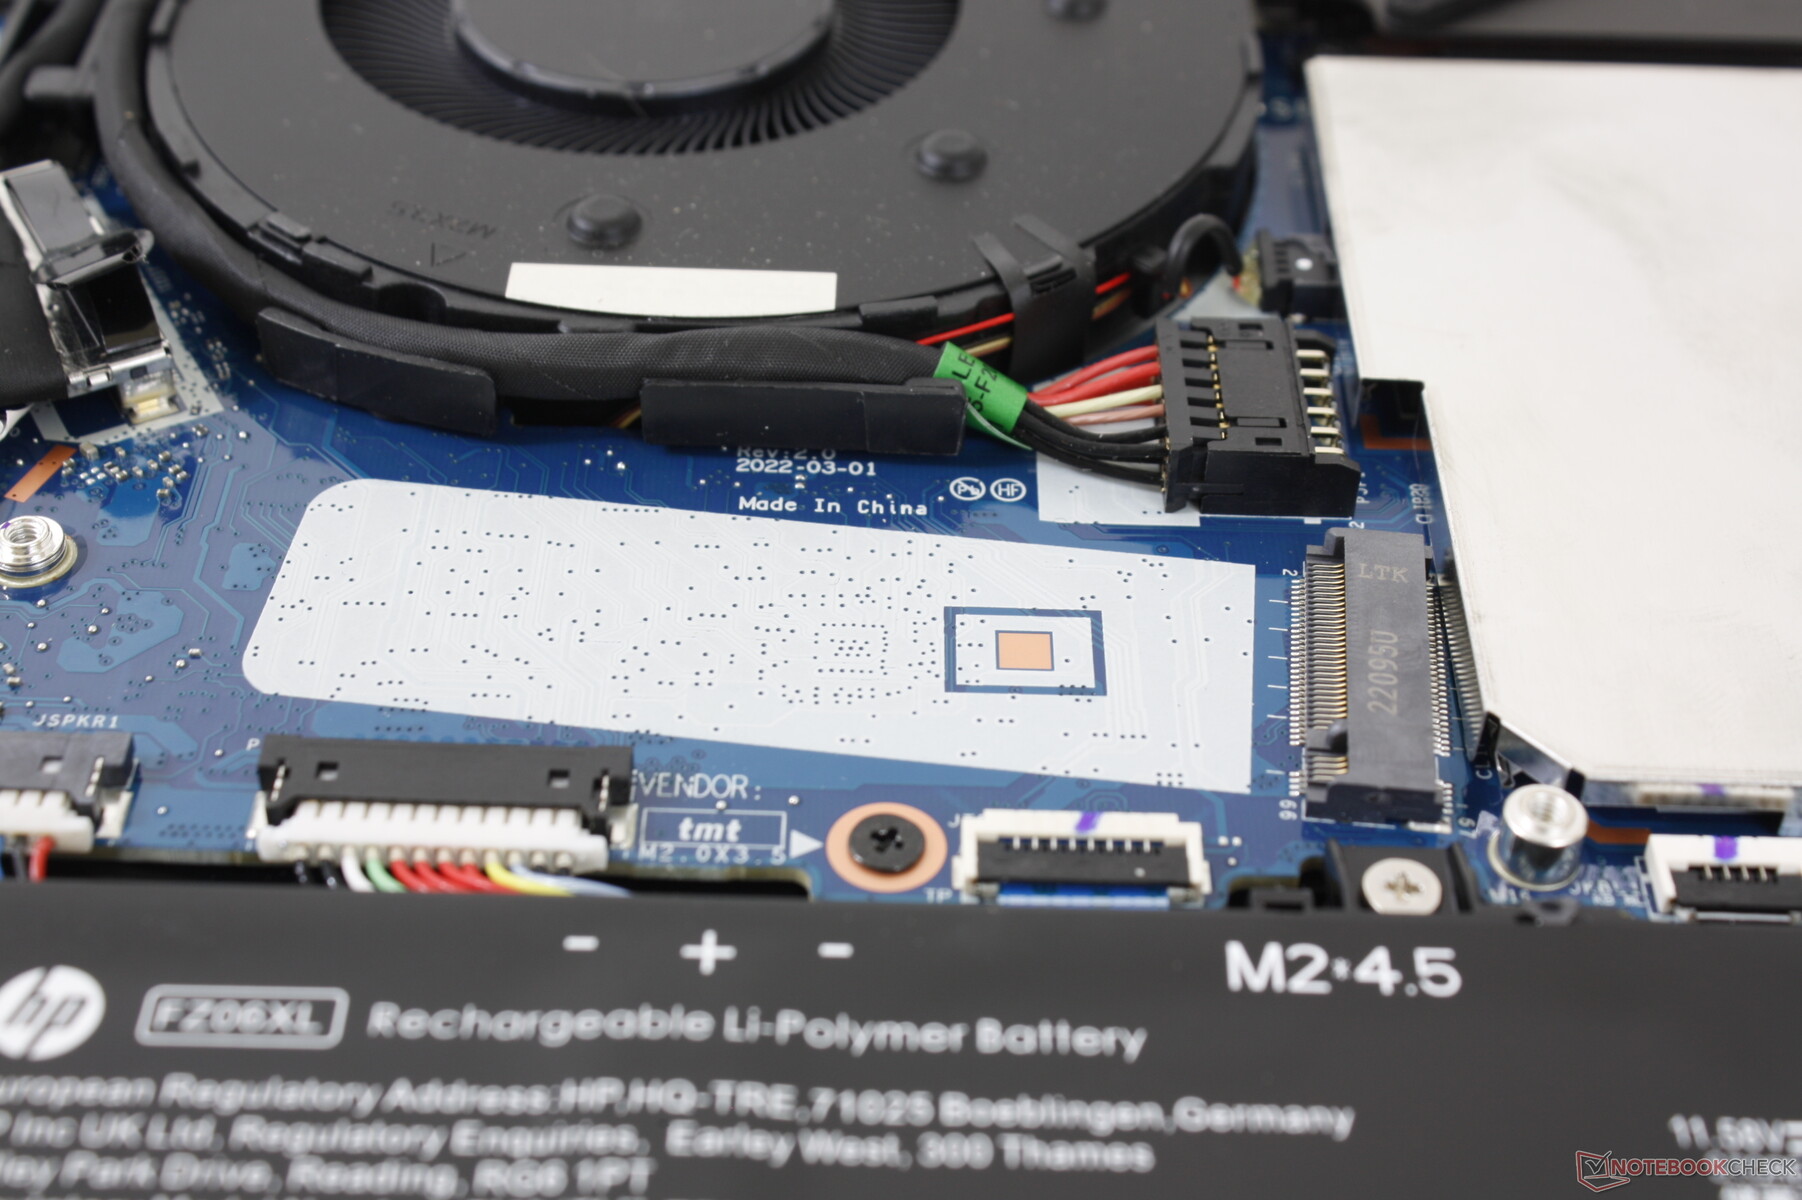
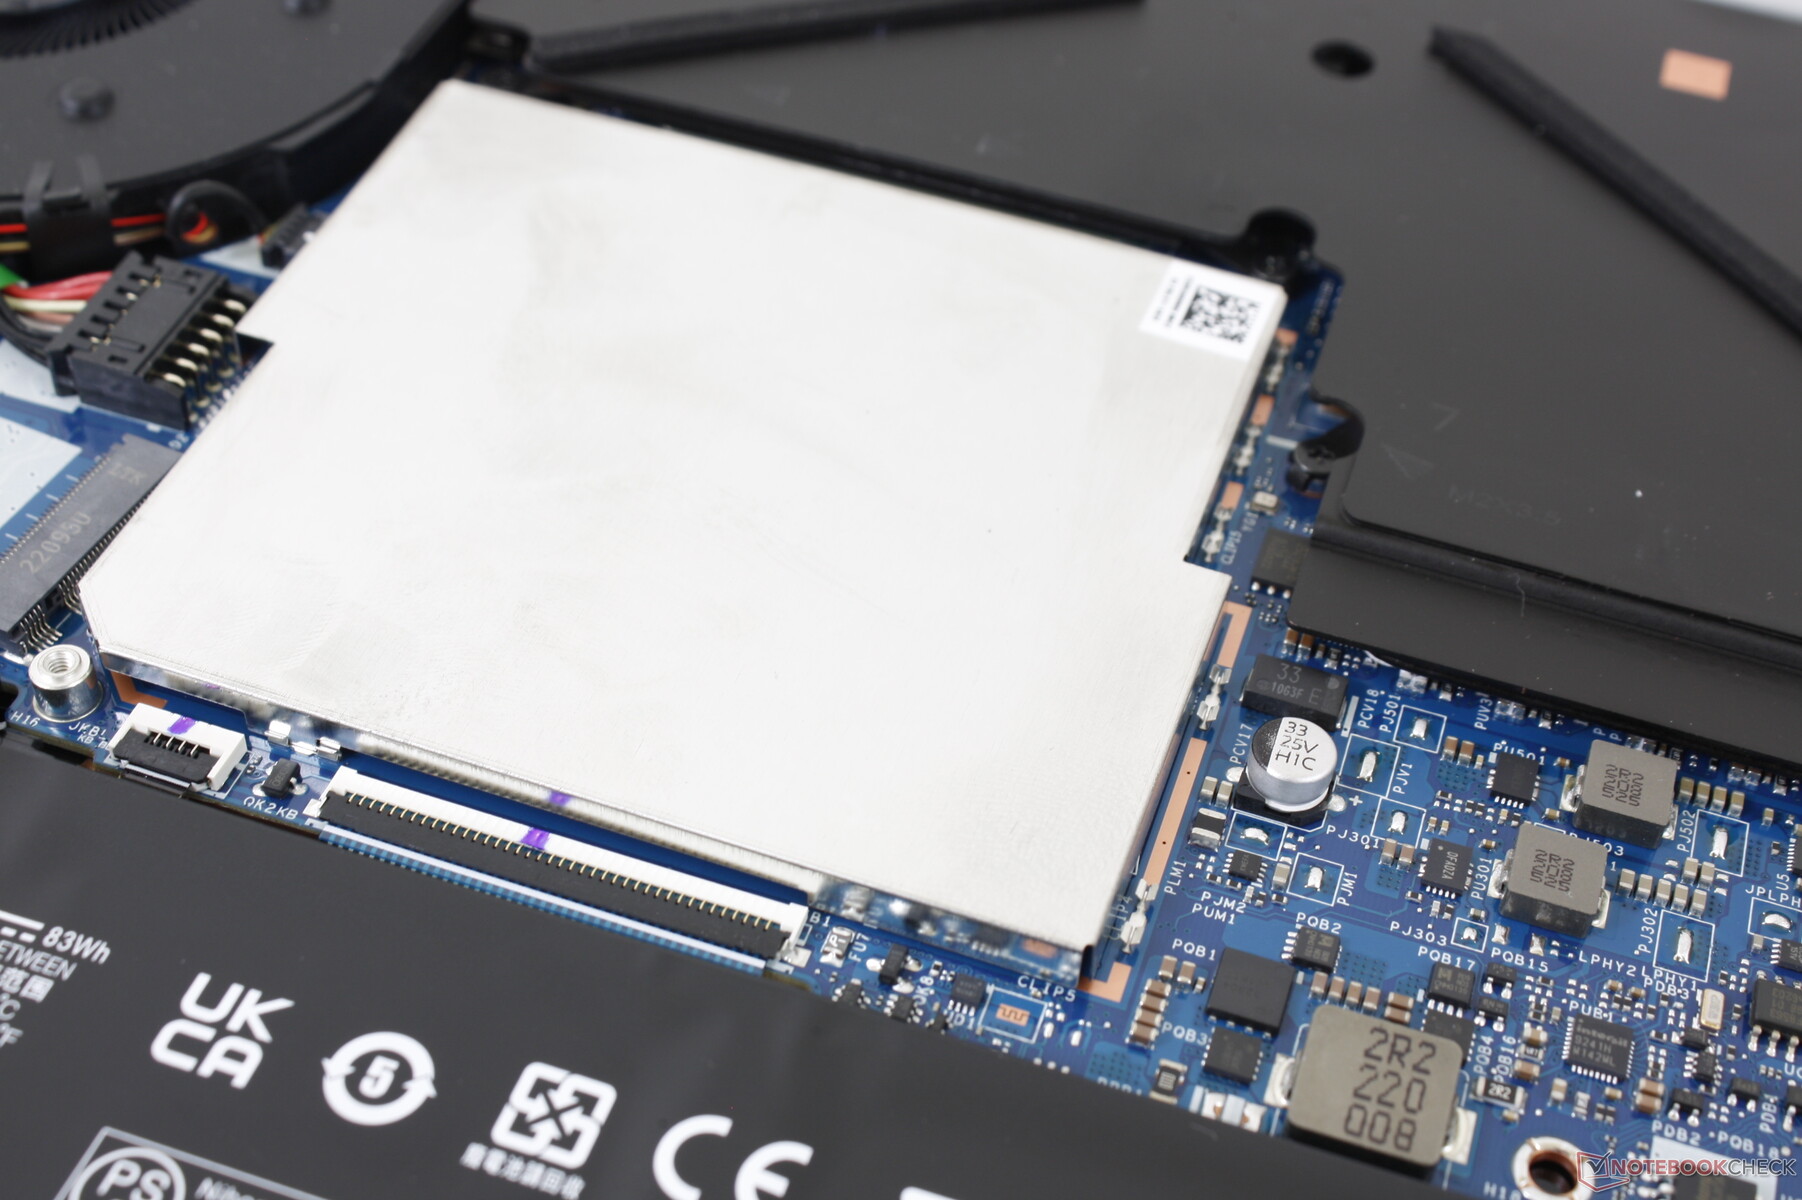
Dispositivi di archiviazione - Supporto RAID 0
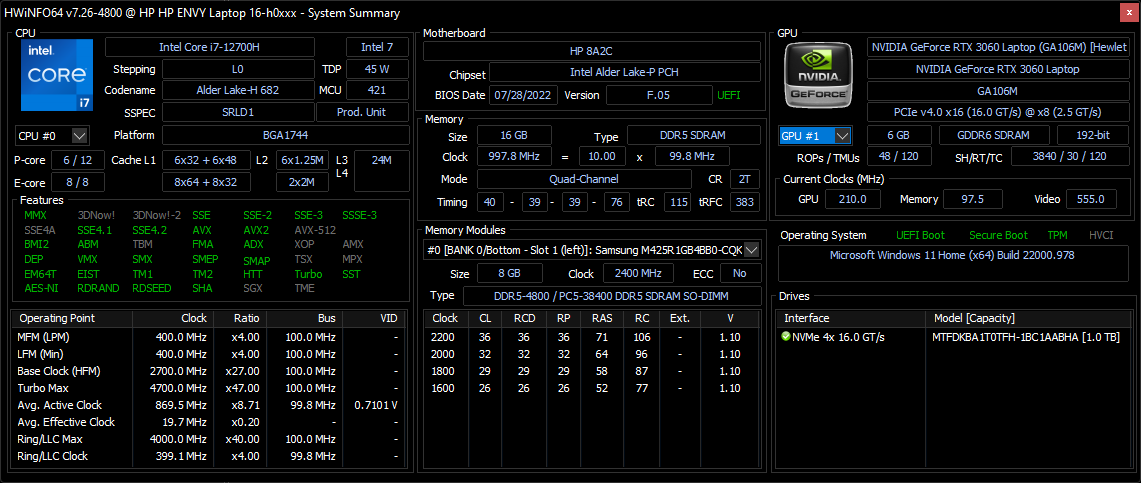
La nostra unità di prova viene fornita con lo stessoMicron 3400 PCIe4 x4 NVMe che si trova su molti altri sistemi di fascia alta, tra cui il modello MSI Stealth GS77 o HP Spectre x360 13,5. L'unità non presenta problemi di throttling sulla nostra unità di test, ma la velocità di scrittura non è paragonabile a quella della serie concorrente Samsung PM9A1.
HP include un solo coperchio per SSD nonostante la presenza di due slot per SSD. Se si prevede di installare una seconda unità, è probabile che questa funzioni a temperature più elevate.


| Drive Performance rating - Percent | |
| MSI Creator Z16P B12UHST | |
| HP Envy 16 h0112nr | |
| Huawei MateBook 16s i7 | |
| Lenovo ThinkBook 16 G4+ IAP | |
| Dell Inspiron 16 Plus 7610-MHJ8F -1! | |
* ... Meglio usare valori piccoli
Disk Throttling: DiskSpd Read Loop, Queue Depth 8
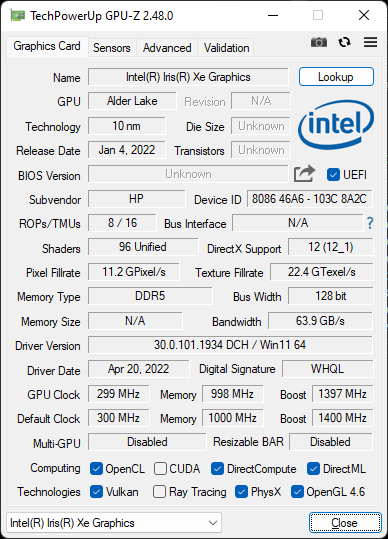
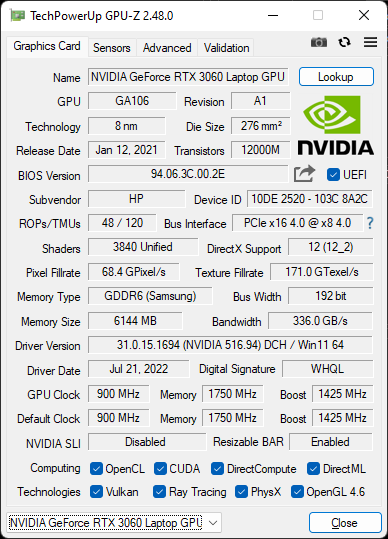
Prestazioni della GPU - 95 W TGP GeForce RTX 3060
Le prestazioni grafiche sono circa il 5% più lente rispetto alla media dei laptop del nostro database dotati della stessa GeForce RTX 3060. Il deficit è abbastanza ridotto che gli utenti difficilmente noteranno.
Passando dal modello inferiore Arc A370M alla RTX 3060 di GeForce gli utenti otterranno prestazioni grafiche due volte superiori.
L'utilizzo della modalità Bilanciata invece della modalità Prestazioni riduce le prestazioni grafiche del 6% a fronte di ventole molto più silenziose, come illustrato nella sezione Rumore del sistema.
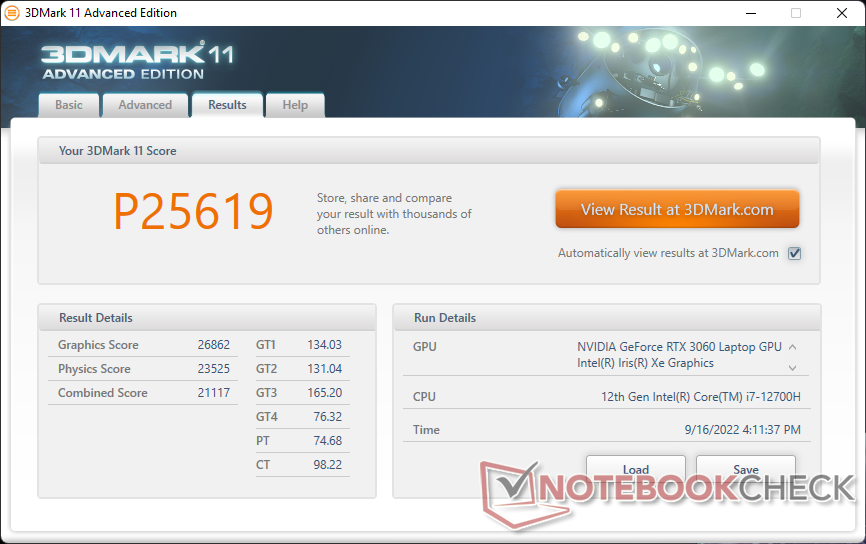
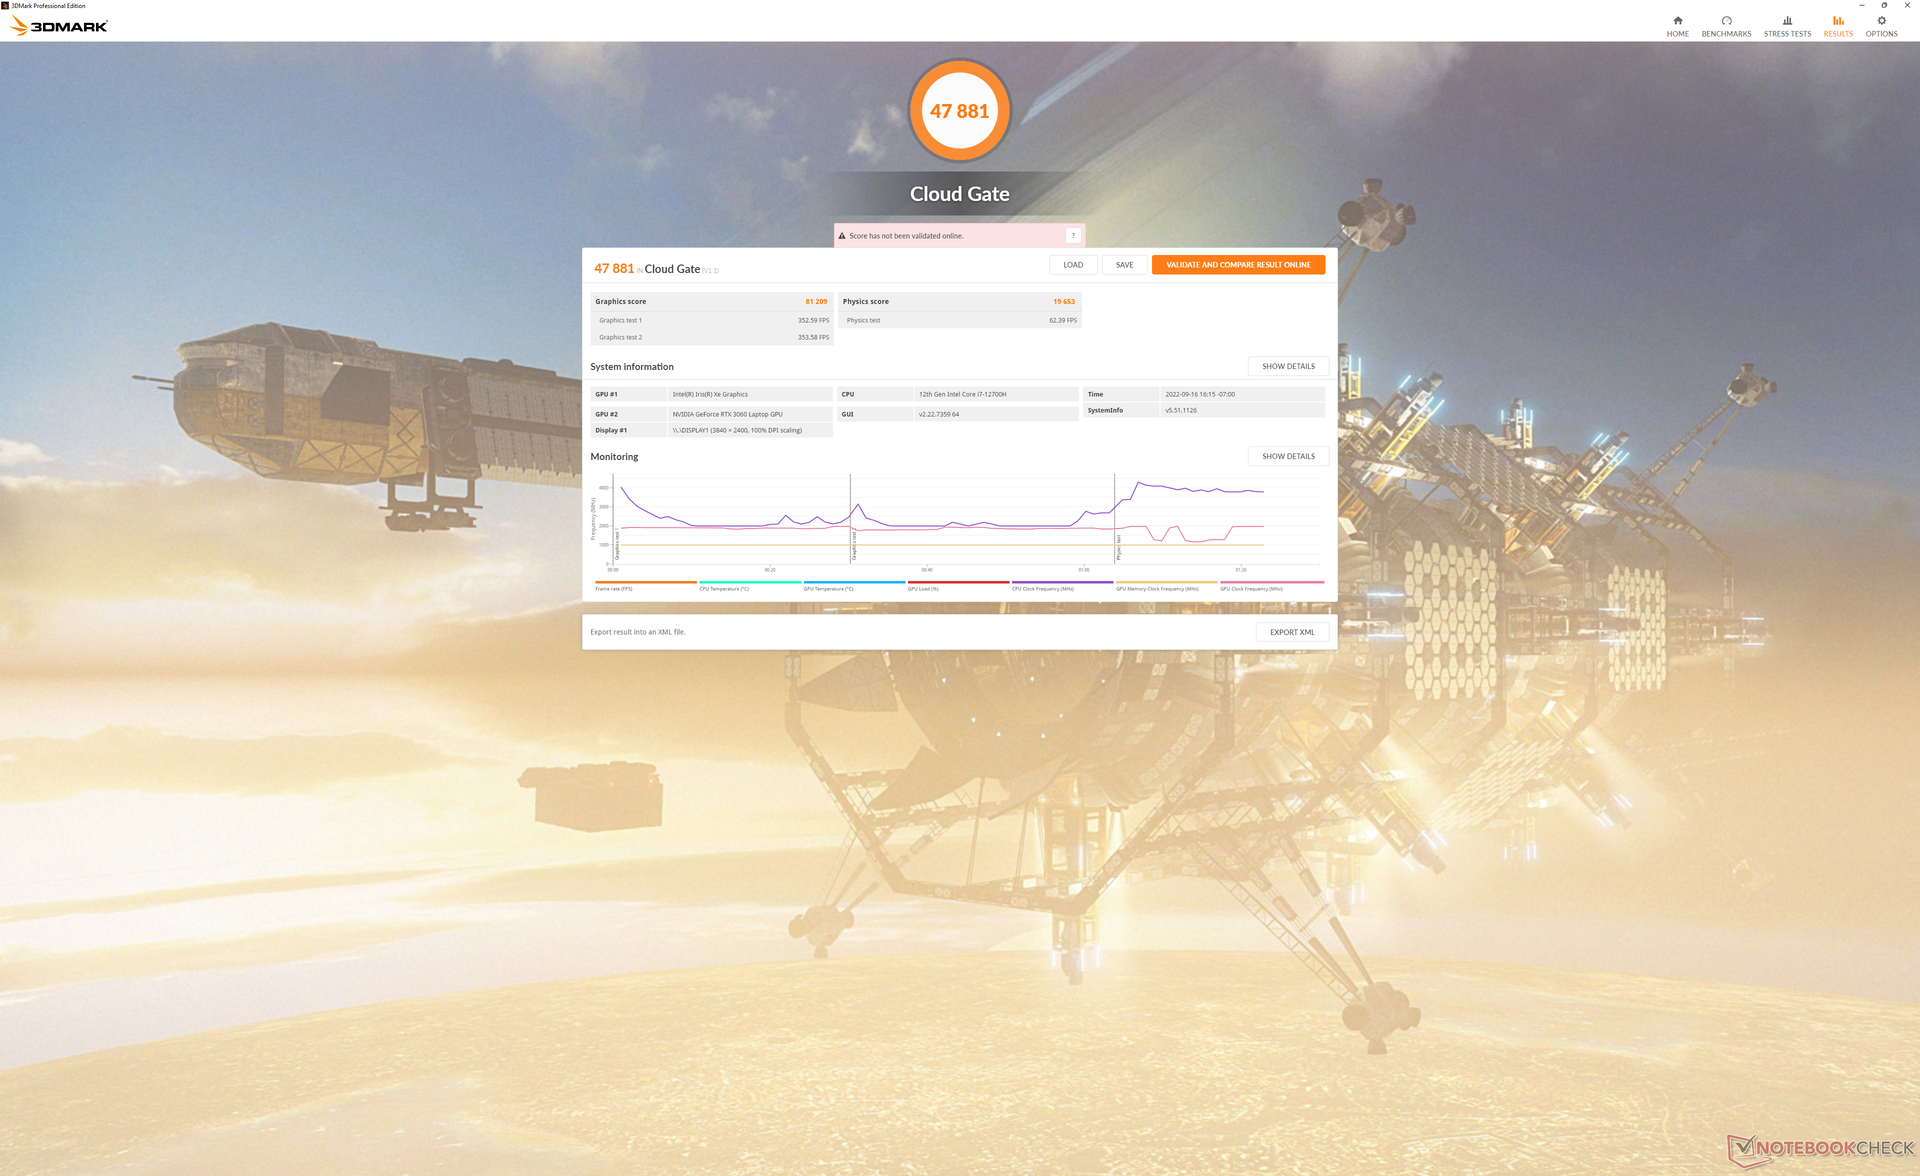
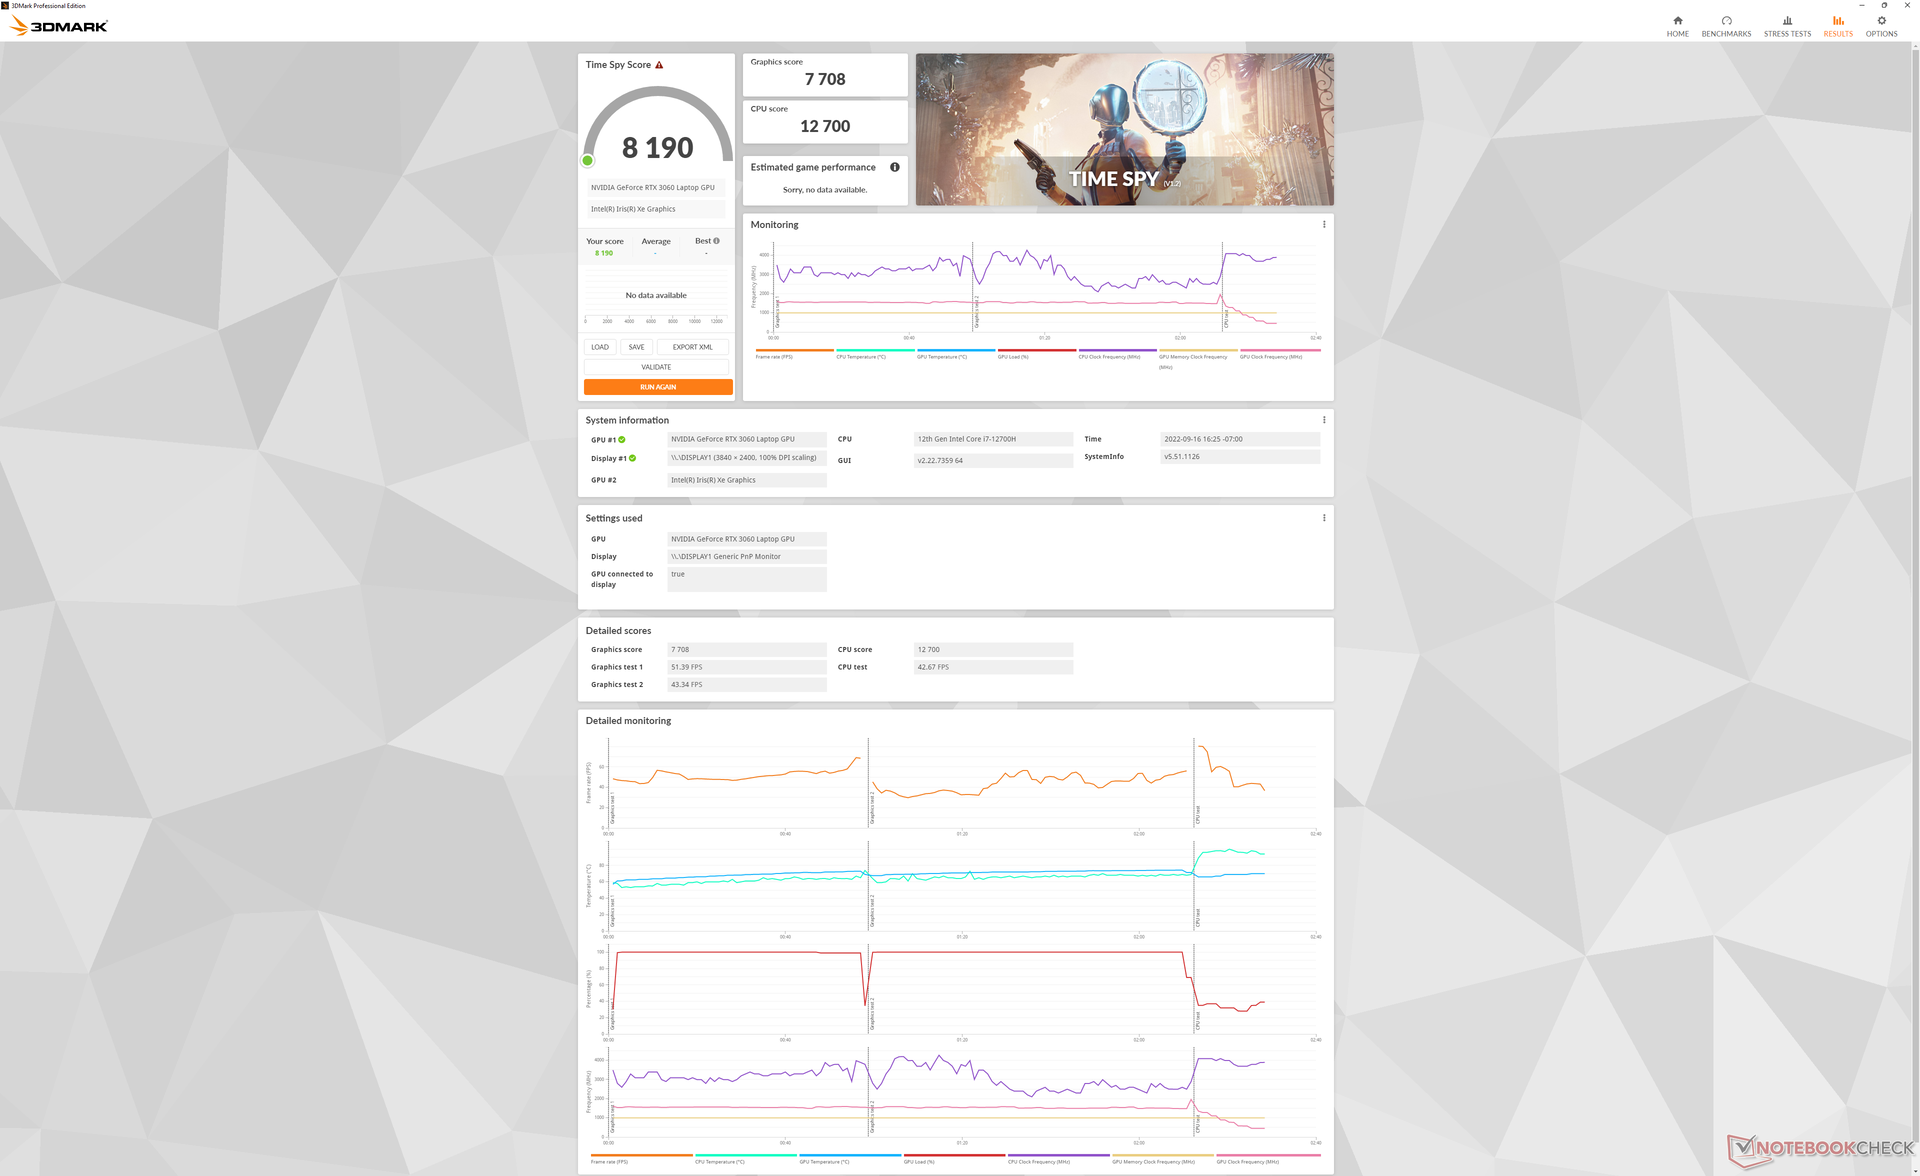

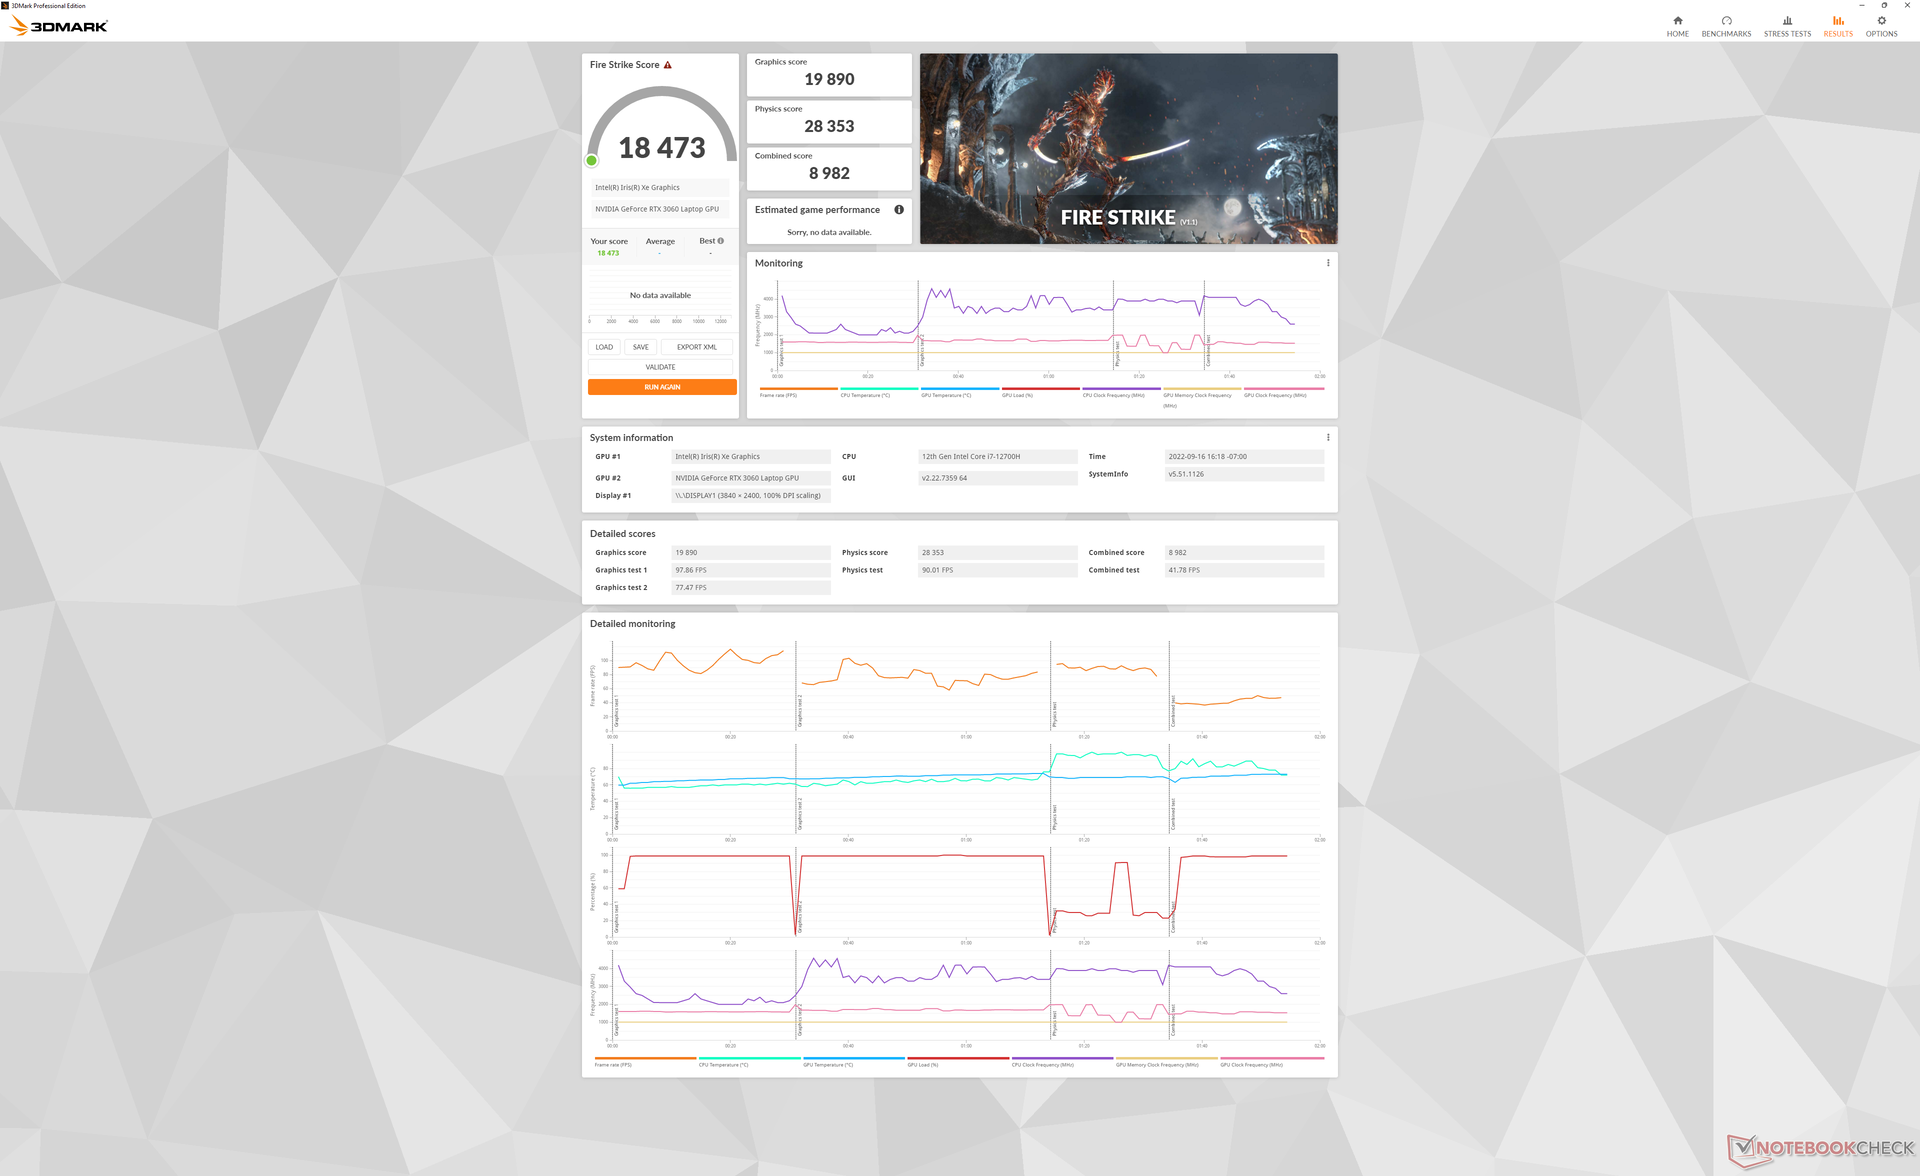
| 3DMark 11 Performance | 25619 punti | |
| 3DMark Cloud Gate Standard Score | 47881 punti | |
| 3DMark Fire Strike Score | 17118 punti | |
| 3DMark Time Spy Score | 8190 punti | |
Aiuto | ||
Witcher 3 FPS Chart
| basso | medio | alto | ultra | QHD | 4K | |
|---|---|---|---|---|---|---|
| GTA V (2015) | 185.6 | 181.2 | 174.1 | 103.3 | 76.7 | |
| The Witcher 3 (2015) | 402.3 | 264 | 161.2 | 82.8 | 55.1 | |
| Dota 2 Reborn (2015) | 180.6 | 164.8 | 149.1 | 139 | 46.9 | |
| Final Fantasy XV Benchmark (2018) | 177.2 | 111.7 | 83.9 | 62 | 34.6 | |
| X-Plane 11.11 (2018) | 140.3 | 127 | 103 | 60.5 | ||
| Strange Brigade (2018) | 418 | 202 | 162 | 140.4 | 103.5 | |
| Cyberpunk 2077 1.6 (2022) | 115.7 | 94.4 | 72.3 | 59.5 | 17.9 |
Emissioni
Rumore di sistema: forte come quello di molti portatili da gioco
Il rumore della ventola tende ad aumentare se si imposta il profilo di potenza Bilanciato o superiore. Le ventole oscillano tra i 30 e i 34 dB(A) a fronte di uno sfondo silenzioso di 22,8 dB(A) durante la navigazione in rete o la riproduzione di video. Altri portatili da 16 pollici come ilHuawei MateBook 16s o il MacBook Pro 16 sono in grado di rimanere più silenziosi rispetto all'Envy 16.
Le ventole possono raggiungere i 41 dB(A) durante l'esecuzione di 3DMark 06, rispetto ai soli 26 dB(A) e 34 dB(A) dei già citati Apple e Huawei, rispettivamente
Il rumore della ventola diventa ancora più forte, superando i 51 dB(A) quando si esegue Witcher 3 in modalità Performance. La rumorosità scende significativamente a 41,6 dB(A) se si utilizza invece la modalità Bilanciata, ma le prestazioni grafiche risulterebbero più lente di circa il 5-10%, come già detto. Nel complesso, si tratta di un portatile piuttosto rumoroso se si desidera sfruttarne le prestazioni.
Rumorosità
| Idle |
| 22.9 / 22.9 / 30.5 dB(A) |
| Sotto carico |
| 41.4 / 51.4 dB(A) |
 | ||
30 dB silenzioso 40 dB(A) udibile 50 dB(A) rumoroso |
||
min: | ||
| HP Envy 16 h0112nr GeForce RTX 3060 Laptop GPU, i7-12700H, Micron 3400 1TB MTFDKBA1T0TFH | Lenovo ThinkBook 16 G4+ IAP GeForce RTX 2050 Mobile, i7-12700H, Micron 2450 1TB MTFDKCD1T0TFK | MSI Creator Z16P B12UHST GeForce RTX 3080 Ti Laptop GPU, i9-12900H, Samsung PM9A1 MZVL22T0HBLB | Dell Inspiron 16 Plus 7610-MHJ8F UHD Graphics Xe 32EUs (Tiger Lake-H), i7-11800H, OM3PDP3-AD NVMe KDI 512GB | Apple MacBook Pro 16 2021 M1 Pro M1 Pro 16-Core GPU, M1 Pro, Apple SSD AP1024R | Huawei MateBook 16s i7 Iris Xe G7 96EUs, i7-12700H, Silicon Motion PCIe-8 SSD | |
|---|---|---|---|---|---|---|
| Noise | 1% | -5% | -1% | 10% | 9% | |
| off /ambiente * (dB) | 22.8 | 24.2 -6% | 26 -14% | 26.3 -15% | 24.7 -8% | 24 -5% |
| Idle Minimum * (dB) | 22.9 | 24.2 -6% | 27 -18% | 26.3 -15% | 24.7 -8% | 24 -5% |
| Idle Average * (dB) | 22.9 | 24.2 -6% | 29 -27% | 26.3 -15% | 24.7 -8% | 25.2 -10% |
| Idle Maximum * (dB) | 30.5 | 24.2 21% | 31 -2% | 24.7 19% | 27.2 11% | |
| Load Average * (dB) | 41.4 | 47 -14% | 43 -4% | 33 20% | 26.1 37% | 34.8 16% |
| Witcher 3 ultra * (dB) | 51.1 | 47 8% | 43 16% | 44 14% | 34.8 32% | |
| Load Maximum * (dB) | 51.4 | 47 9% | 46 11% | 49.2 4% | 37.4 27% | 39 24% |
* ... Meglio usare valori piccoli
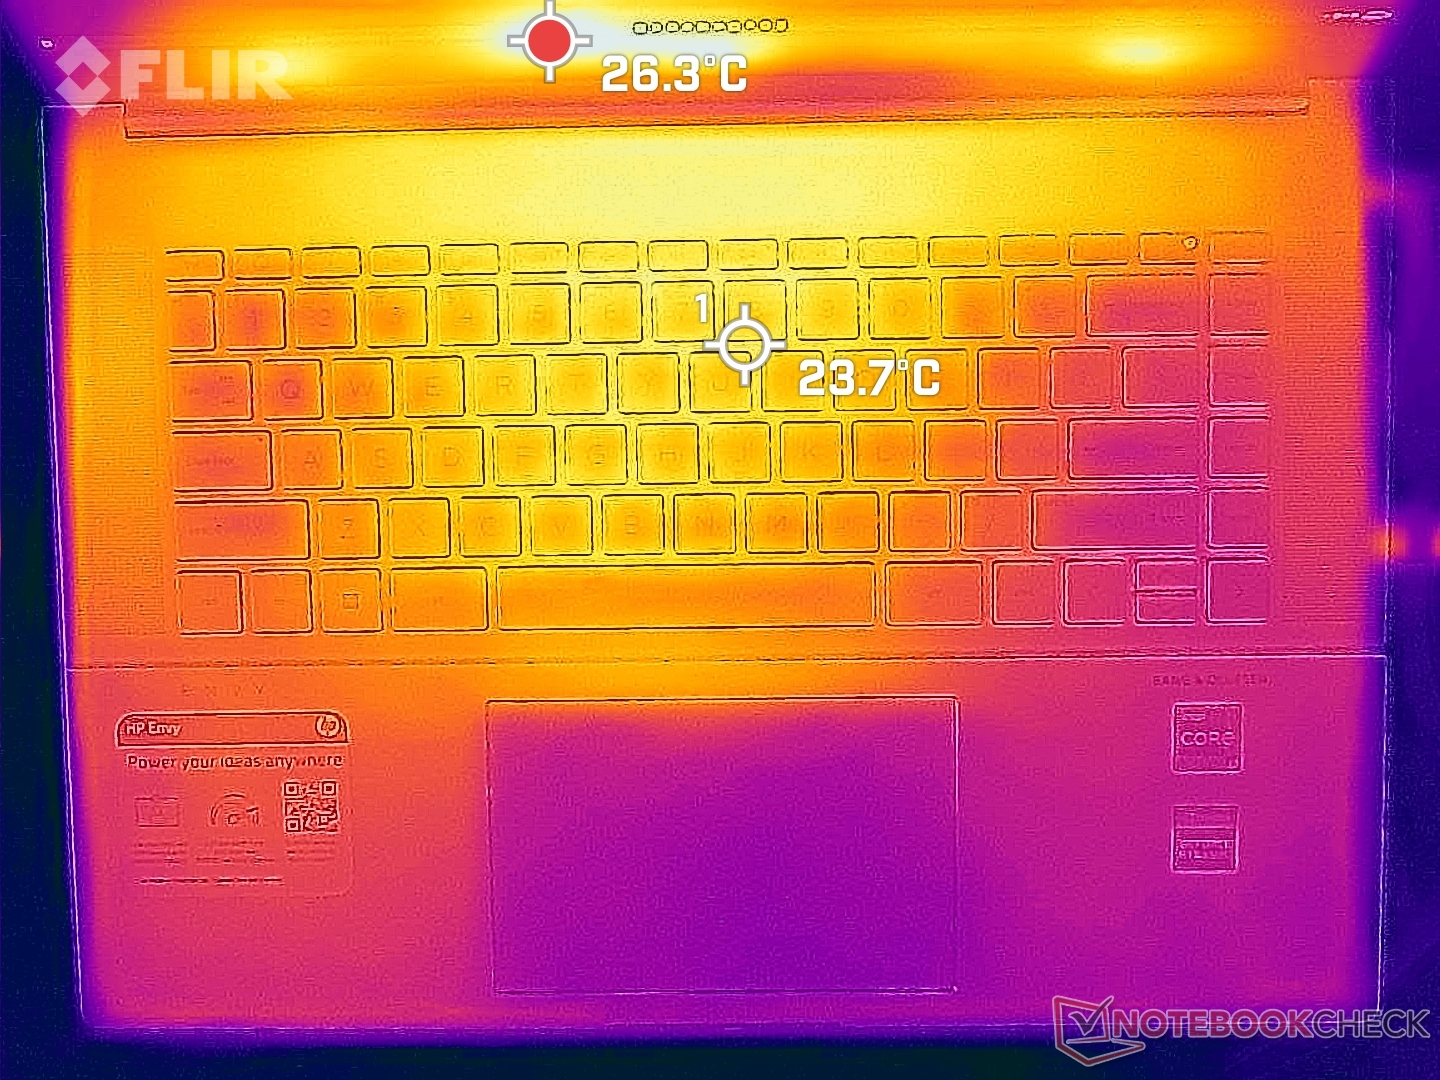
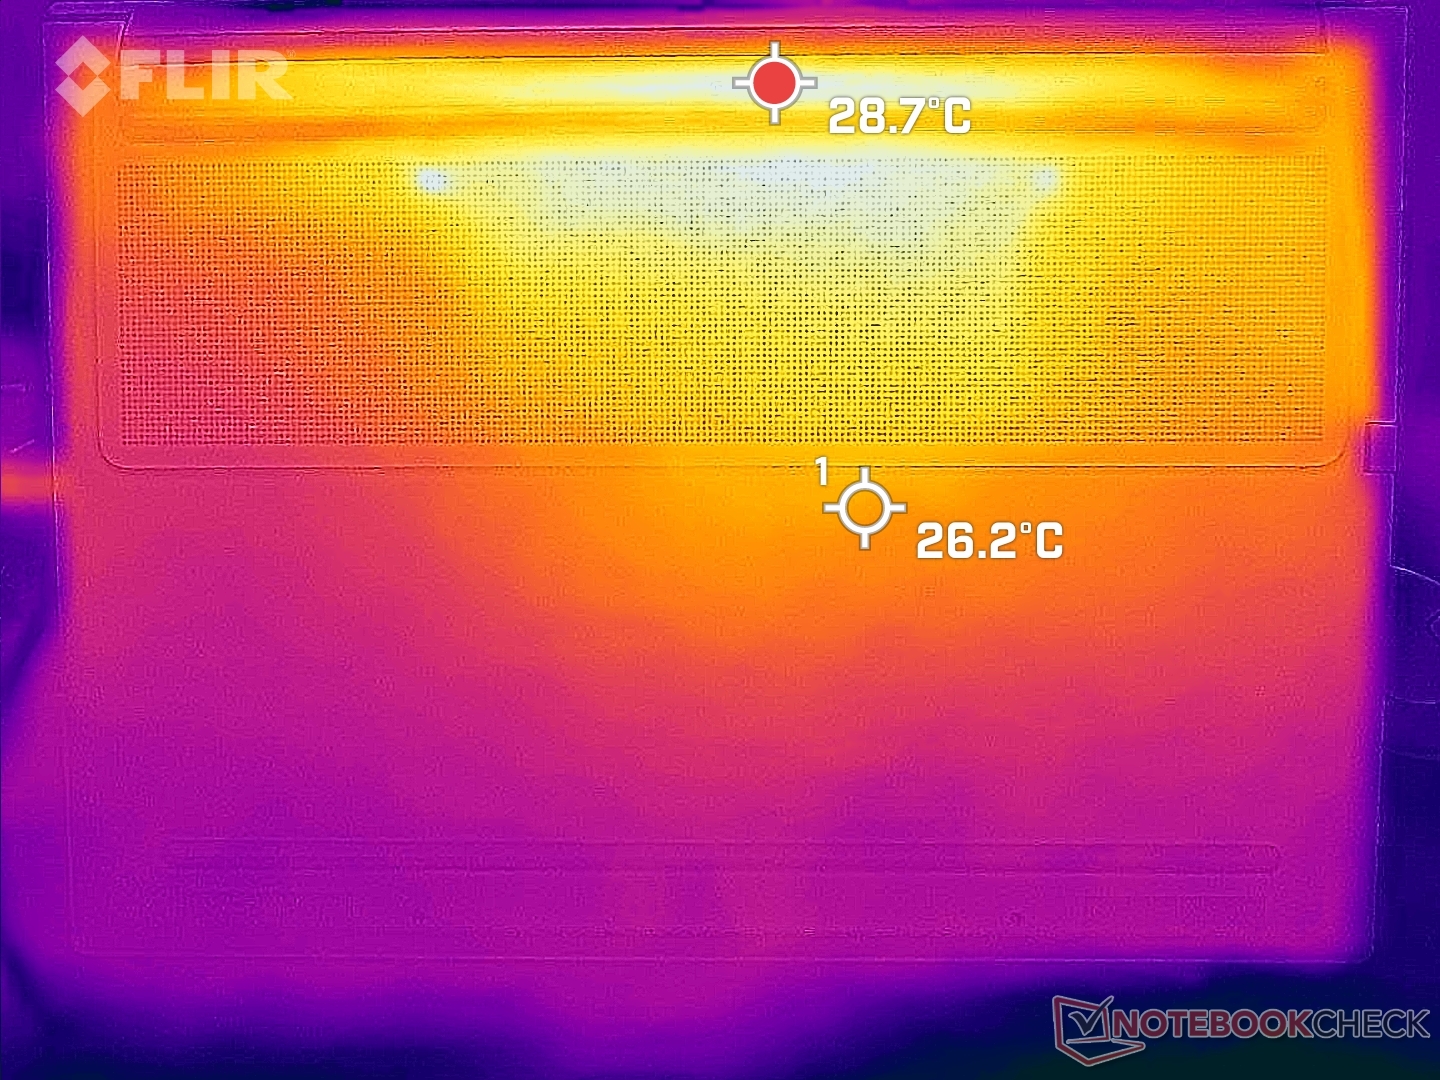
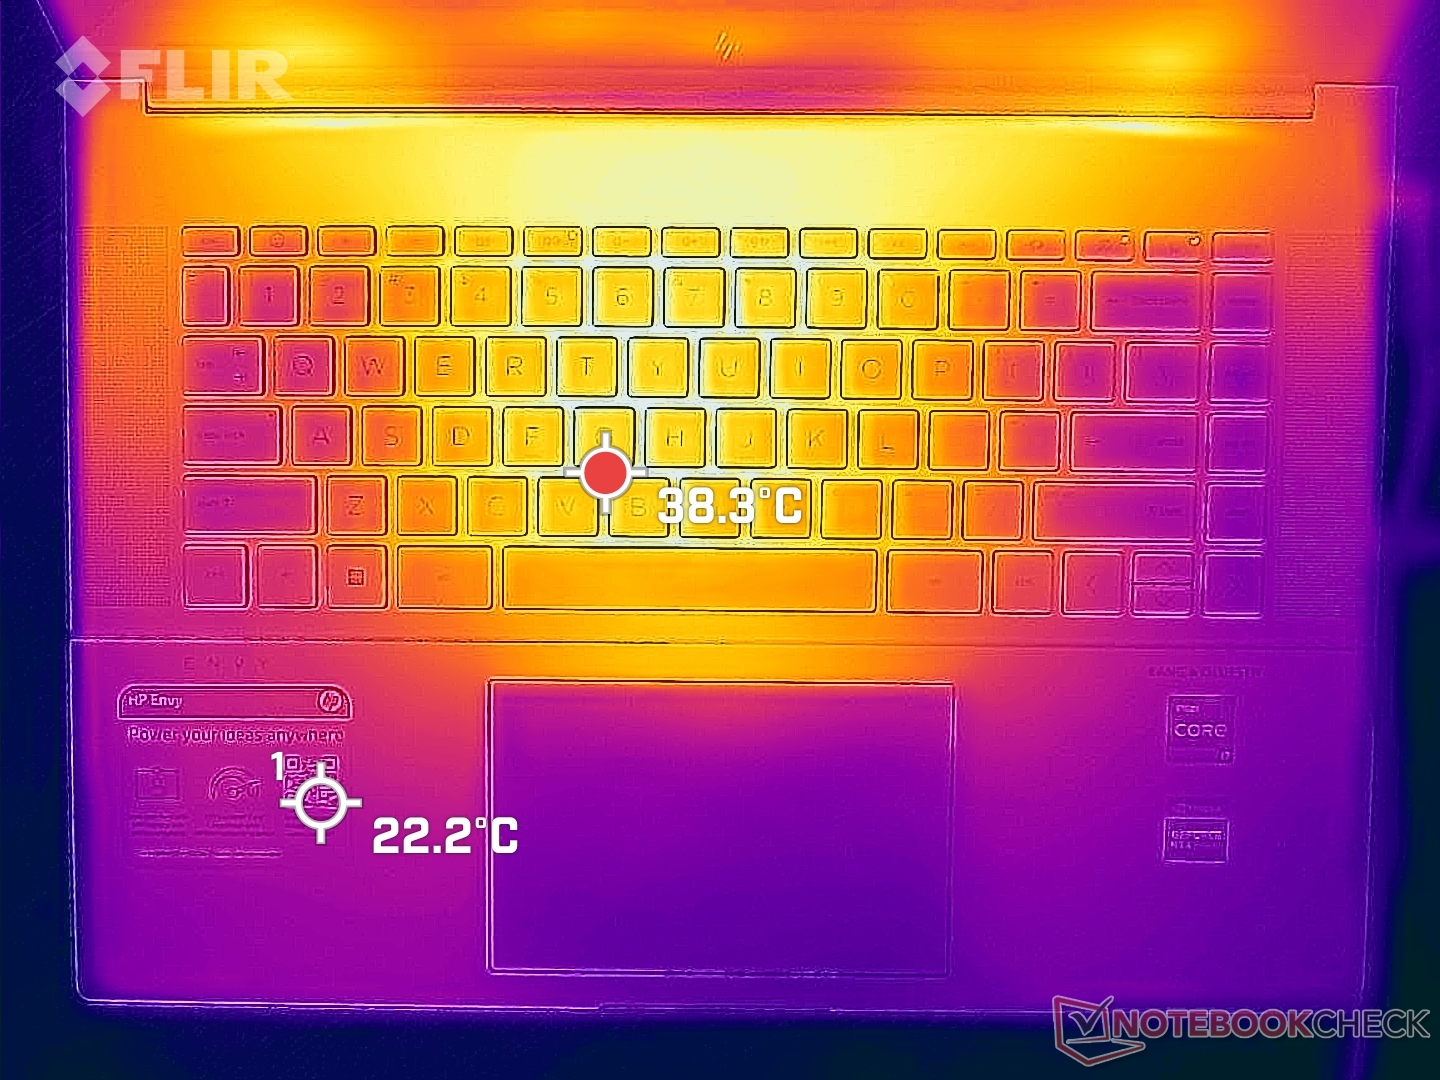
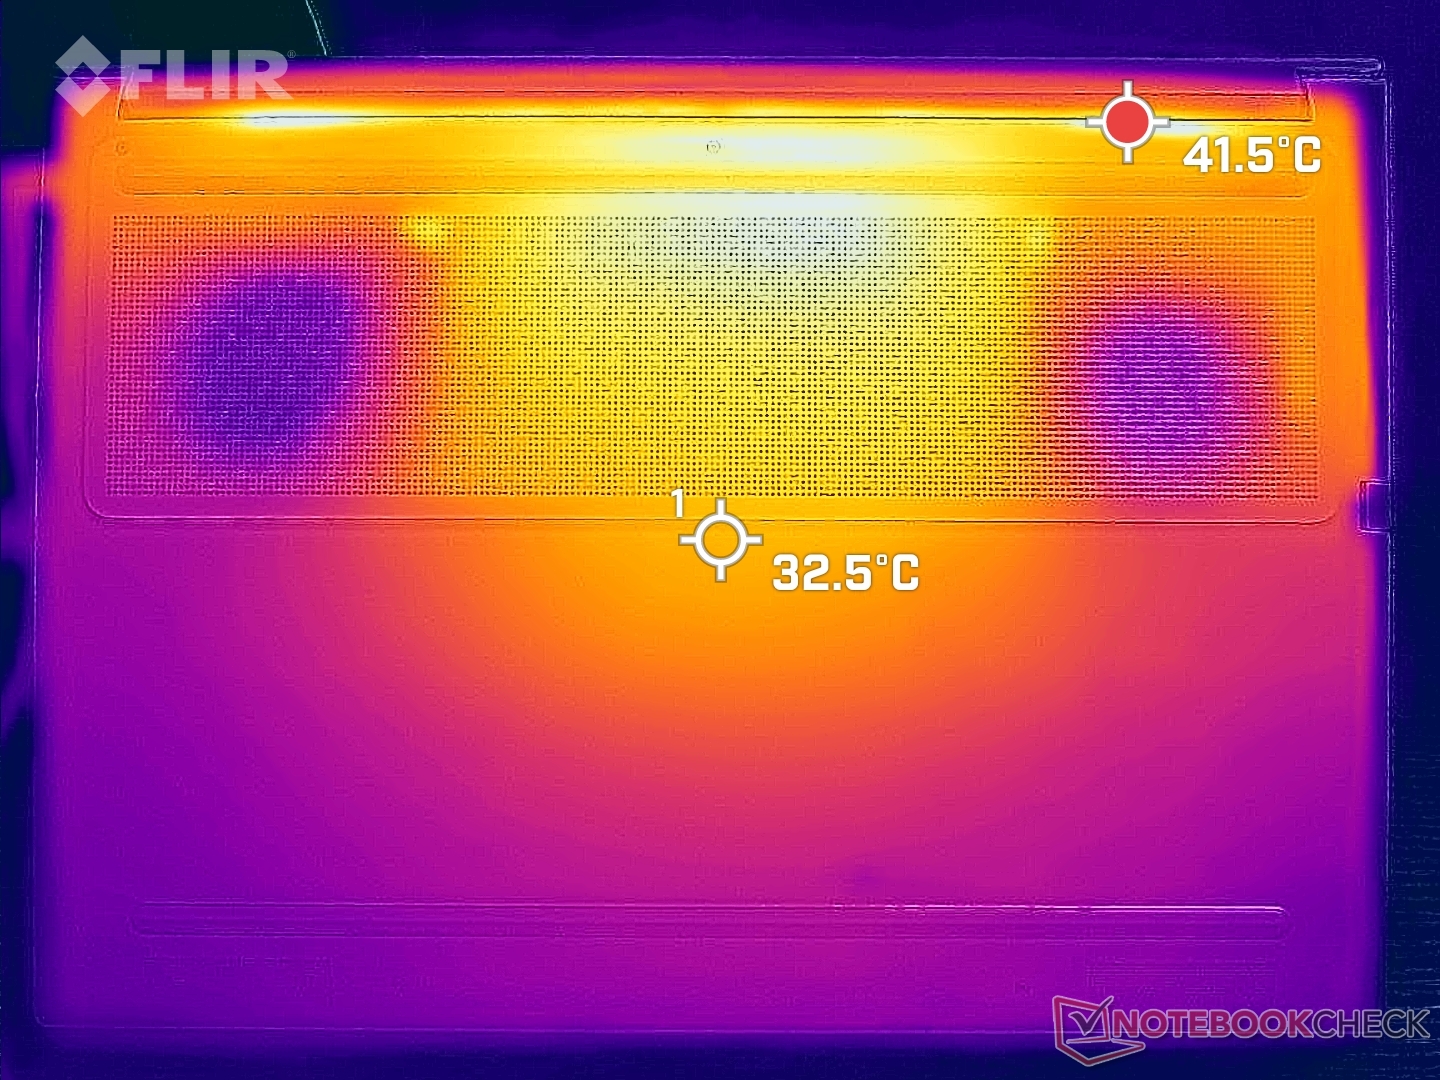
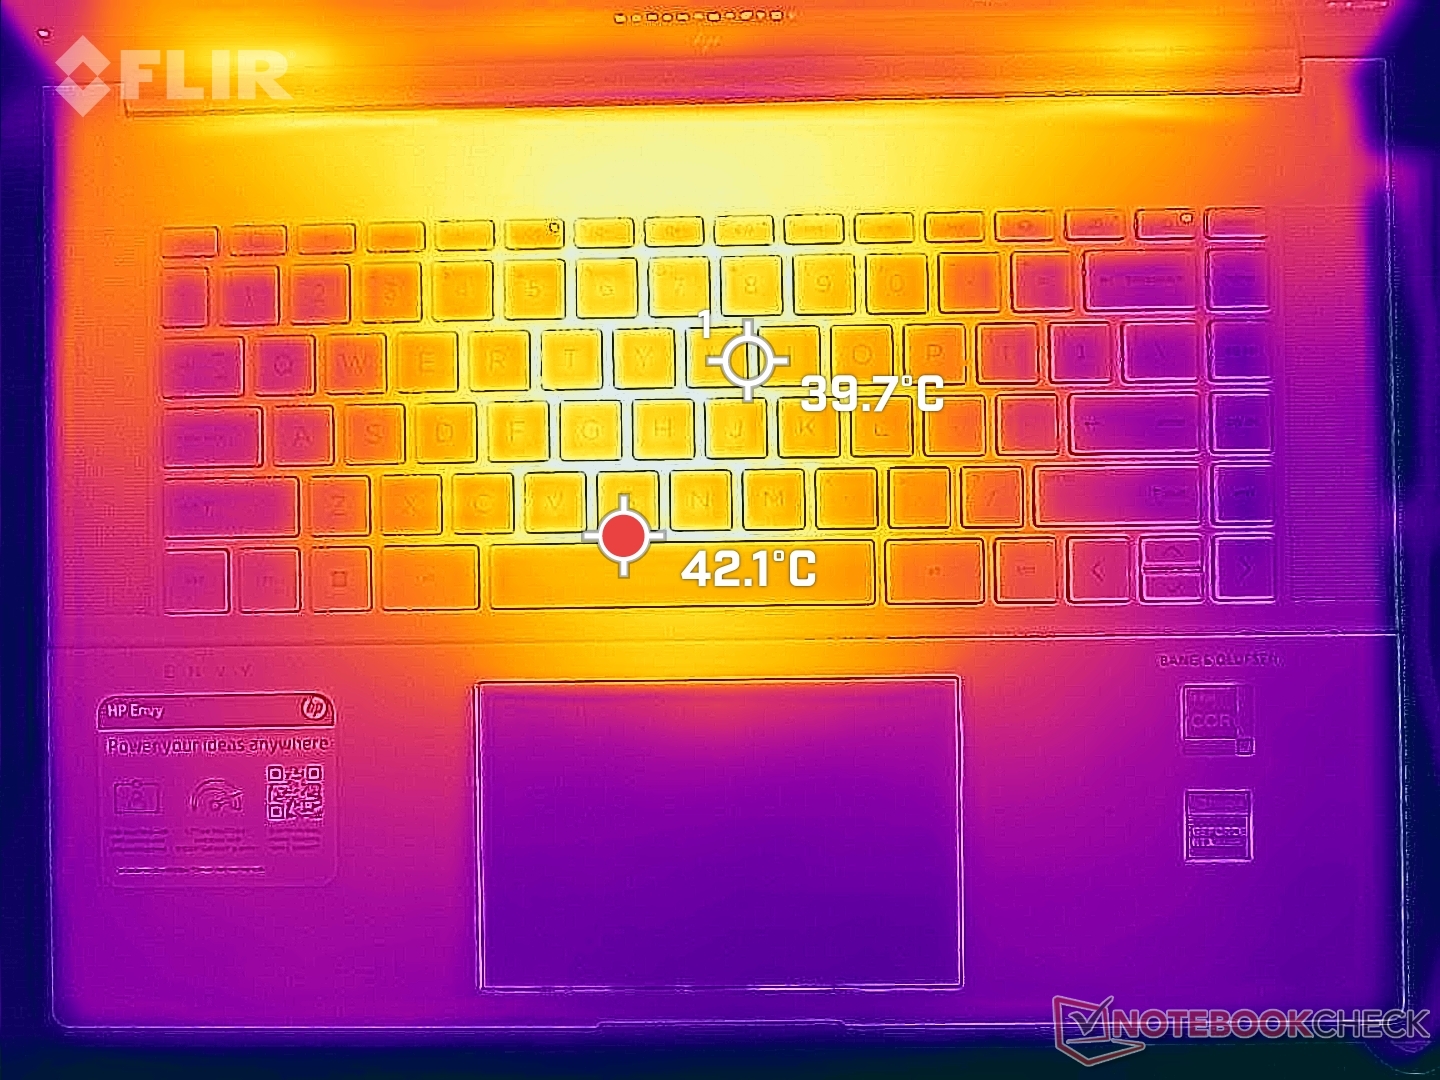
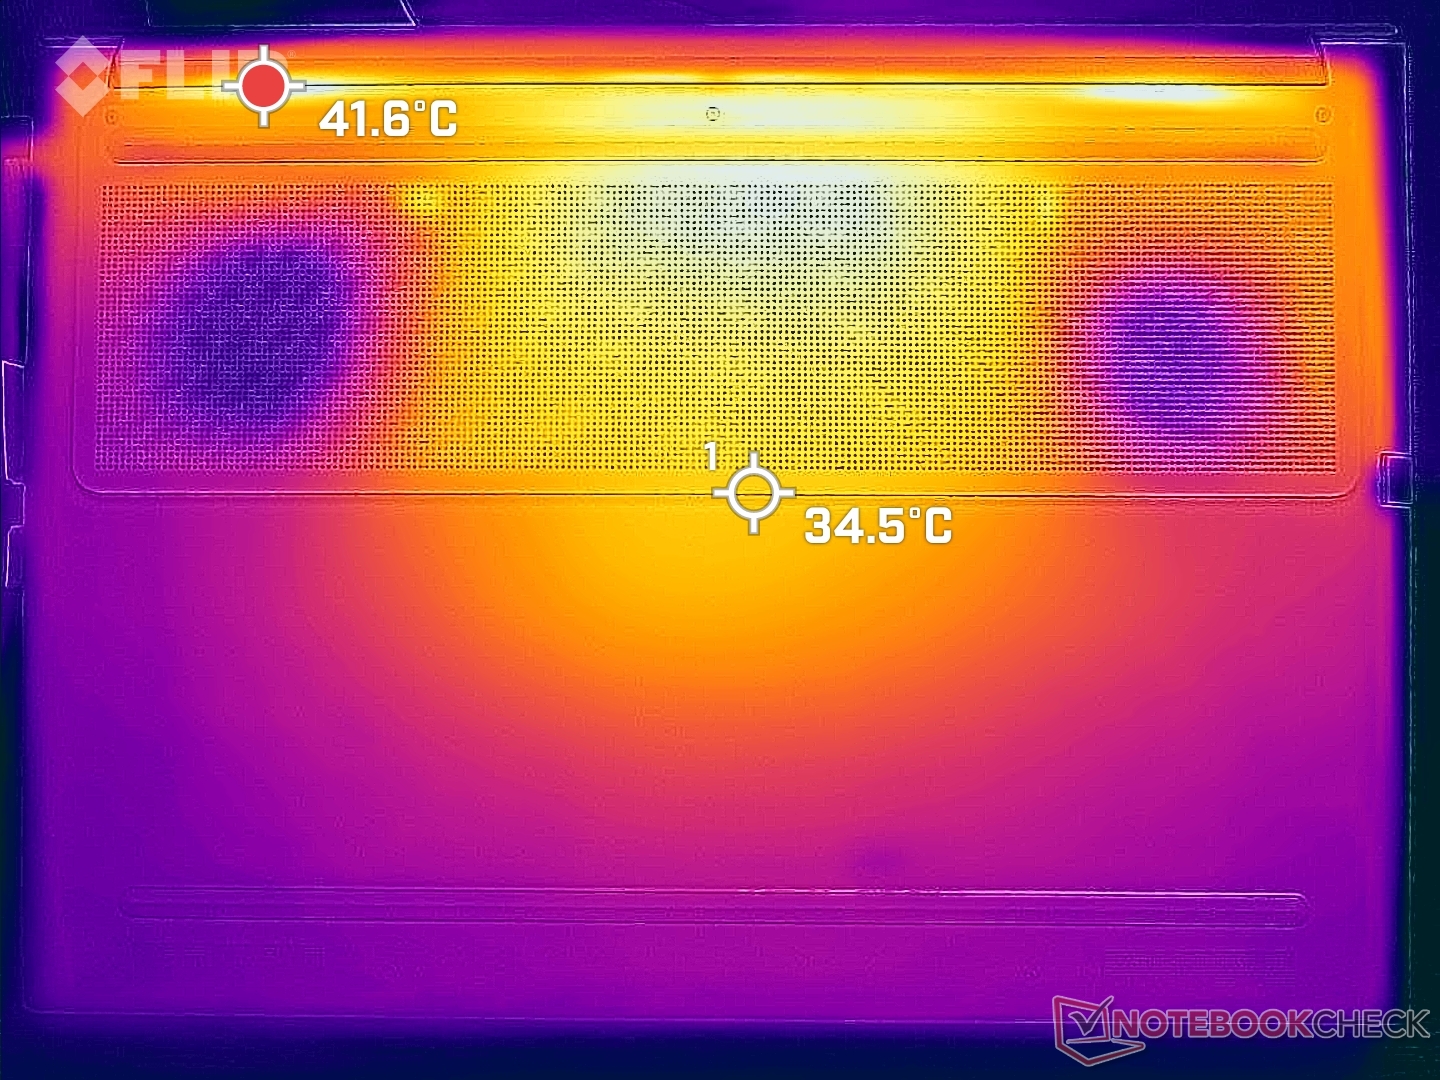
Temperatura
Le temperature di superficie sono piuttosto calde anche quando il computer è al minimo senza applicazioni in esecuzione. I punti caldi in queste condizioni possono raggiungere i 33 C sia sulla parte superiore che su quella inferiore, rispetto ai soli 26 C del ThinkBook 16 G4. Se si utilizzano carichi elevati, queste stesse aree possono raggiungere oltre 45 C. I poggiapolsi rimangono relativamente freschi, ma la parte inferiore può risultare fastidiosa per la pelle.
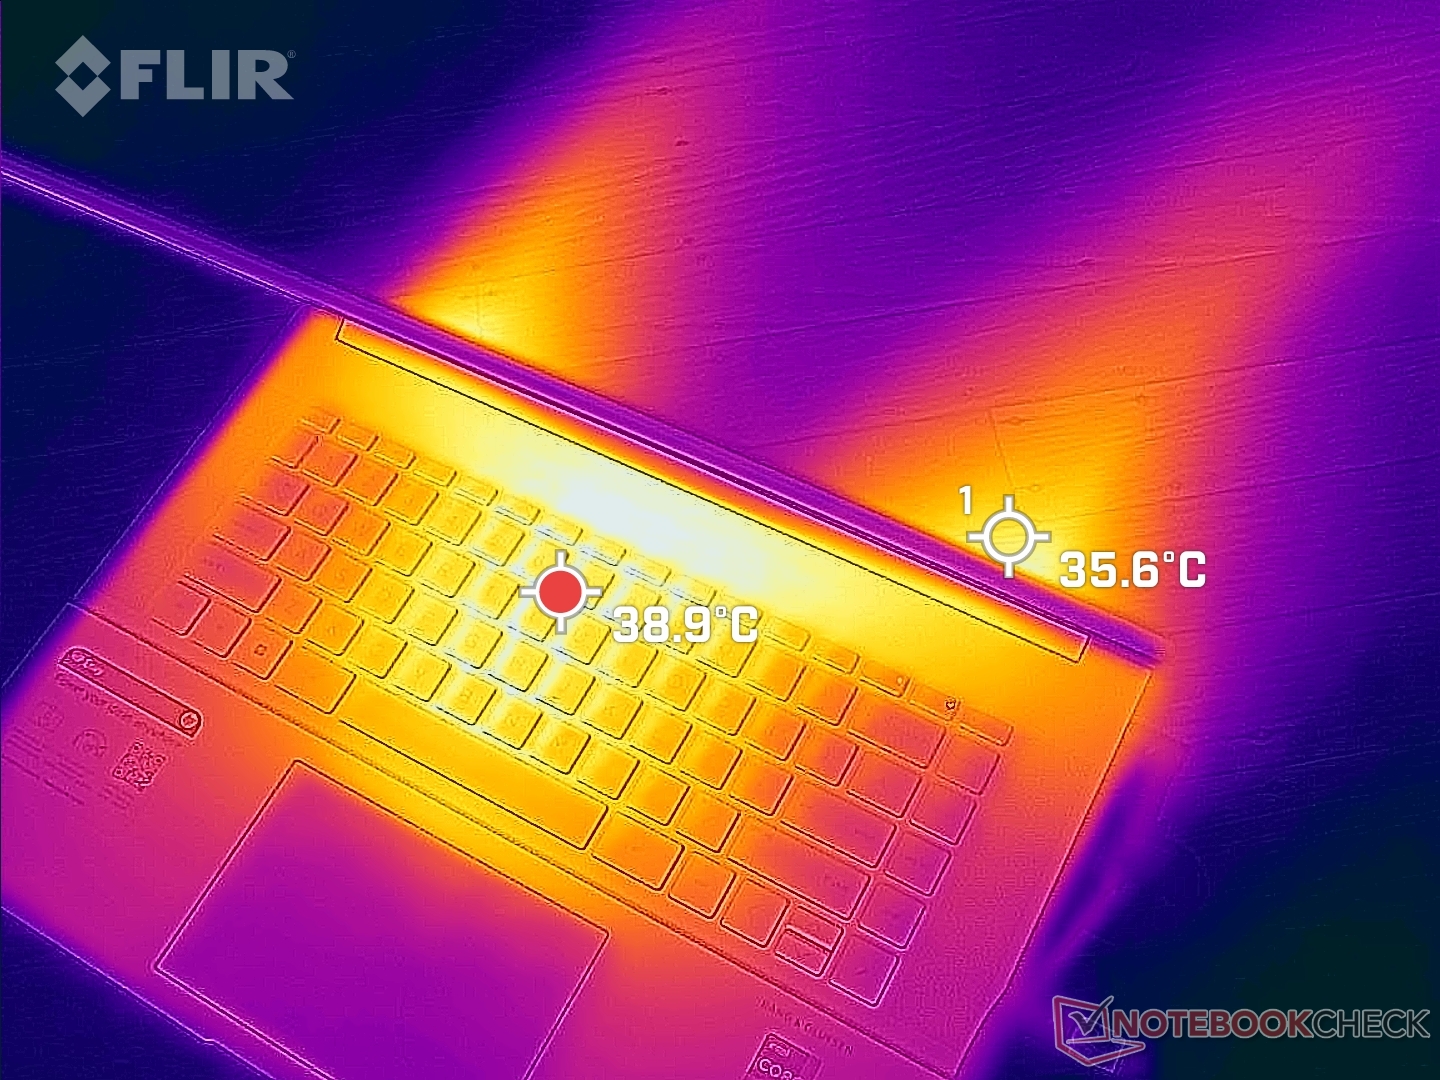
(-) La temperatura massima sul lato superiore è di 45.2 °C / 113 F, rispetto alla media di 36.8 °C / 98 F, che varia da 21 a 71 °C per questa classe Multimedia.
(±) Il lato inferiore si riscalda fino ad un massimo di 44 °C / 111 F, rispetto alla media di 39.1 °C / 102 F
(+) In idle, la temperatura media del lato superiore è di 31 °C / 88 F, rispetto alla media deld ispositivo di 31.3 °C / 88 F.
(±) Riproducendo The Witcher 3, la temperatura media per il lato superiore e' di 33.6 °C / 92 F, rispetto alla media del dispositivo di 31.3 °C / 88 F.
(+) I poggiapolsi e il touchpad sono piu' freddi della temperatura della pelle con un massimo di 29.8 °C / 85.6 F e sono quindi freddi al tatto.
(±) La temperatura media della zona del palmo della mano di dispositivi simili e'stata di 28.7 °C / 83.7 F (-1.1 °C / -1.9 F).
| HP Envy 16 h0112nr Intel Core i7-12700H, NVIDIA GeForce RTX 3060 Laptop GPU | Lenovo ThinkBook 16 G4+ IAP Intel Core i7-12700H, NVIDIA GeForce RTX 2050 Mobile | MSI Creator Z16P B12UHST Intel Core i9-12900H, NVIDIA GeForce RTX 3080 Ti Laptop GPU | Dell Inspiron 16 Plus 7610-MHJ8F Intel Core i7-11800H, Intel UHD Graphics Xe 32EUs (Tiger Lake-H) | Apple MacBook Pro 16 2021 M1 Pro Apple M1 Pro, Apple M1 Pro 16-Core GPU | Huawei MateBook 16s i7 Intel Core i7-12700H, Intel Iris Xe Graphics G7 96EUs | |
|---|---|---|---|---|---|---|
| Heat | 8% | -20% | 4% | 19% | 5% | |
| Maximum Upper Side * (°C) | 45.2 | 42.9 5% | 67 -48% | 43.4 4% | 41 9% | 40.9 10% |
| Maximum Bottom * (°C) | 44 | 50.6 -15% | 69 -57% | 45.1 -3% | 39 11% | 48.3 -10% |
| Idle Upper Side * (°C) | 33.6 | 26 23% | 29 14% | 30.6 9% | 24 29% | 29.2 13% |
| Idle Bottom * (°C) | 32.6 | 26.5 19% | 29 11% | 31.1 5% | 24 26% | 30.4 7% |
* ... Meglio usare valori piccoli
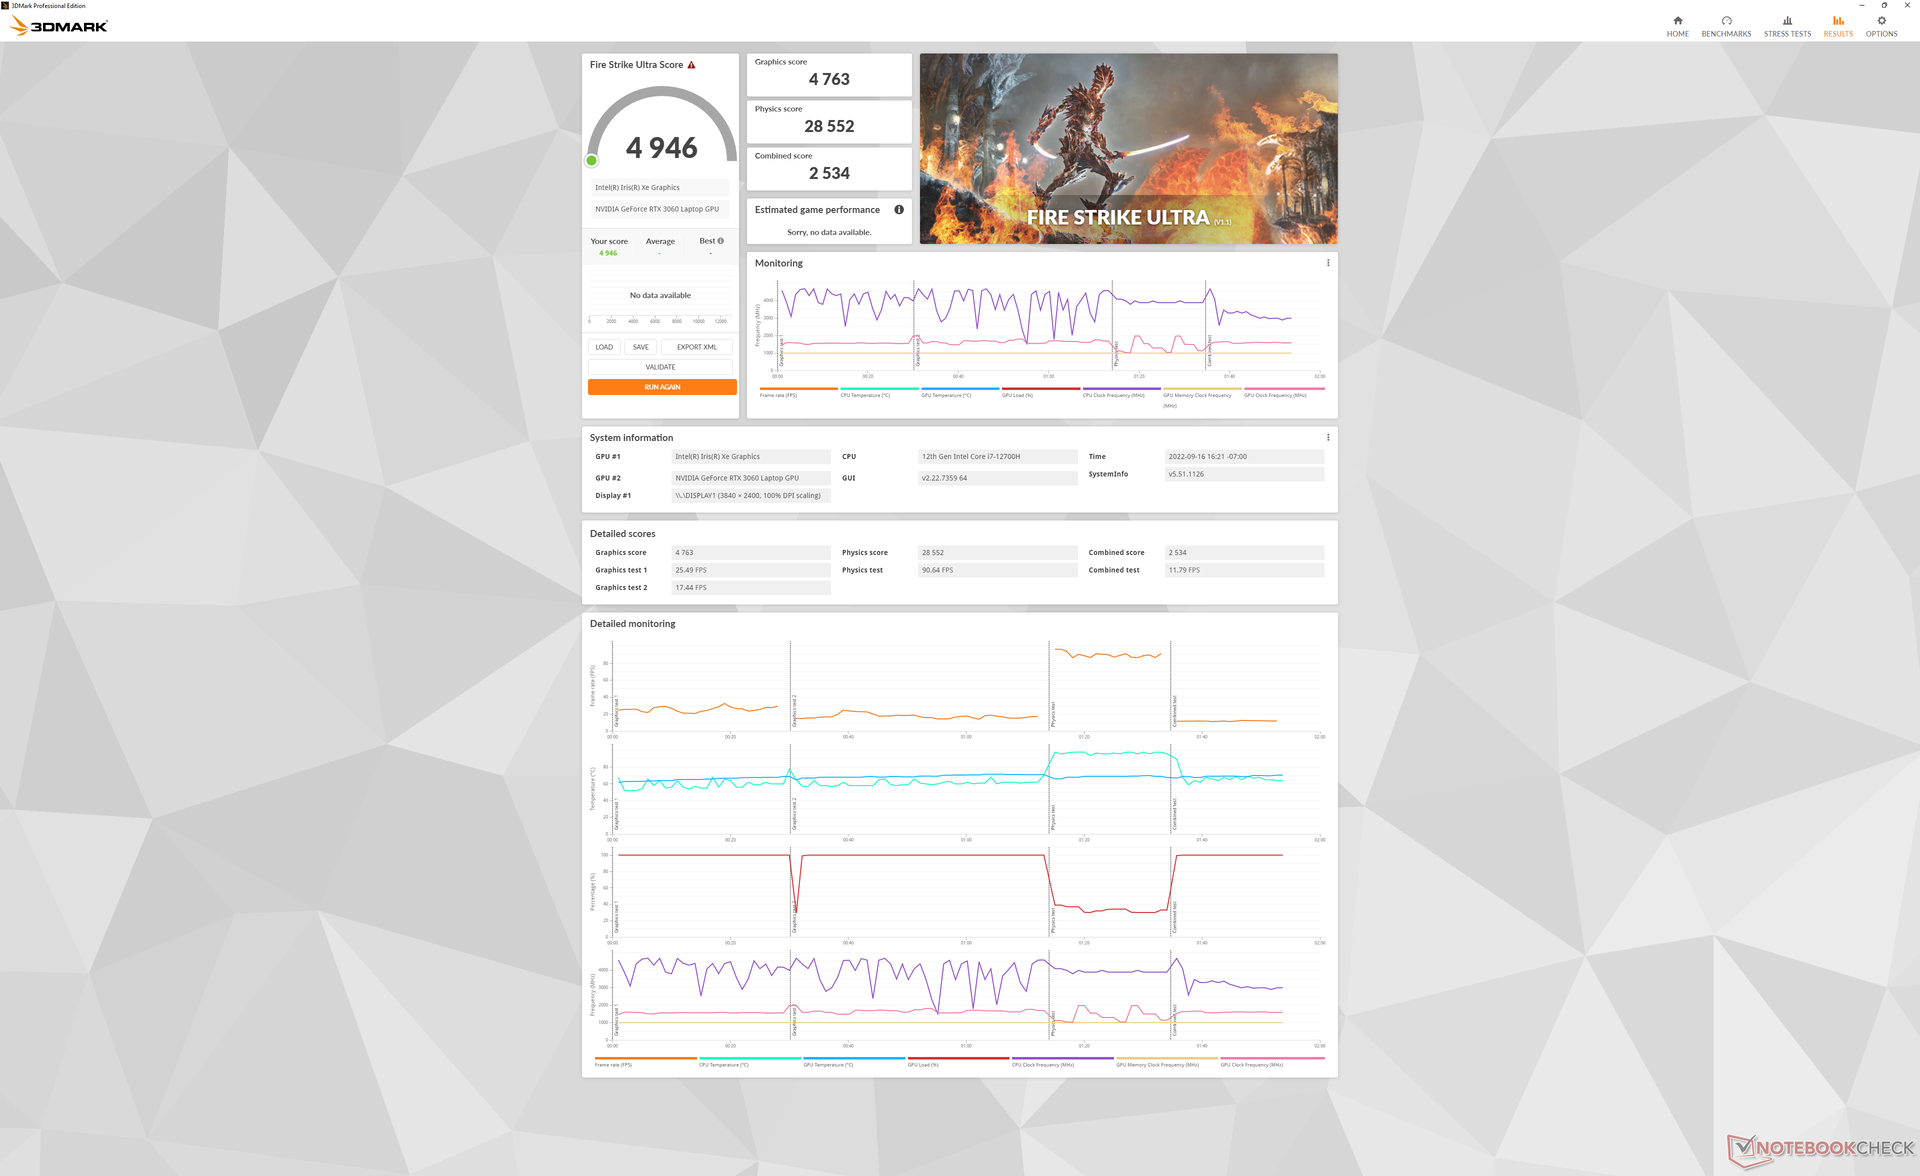
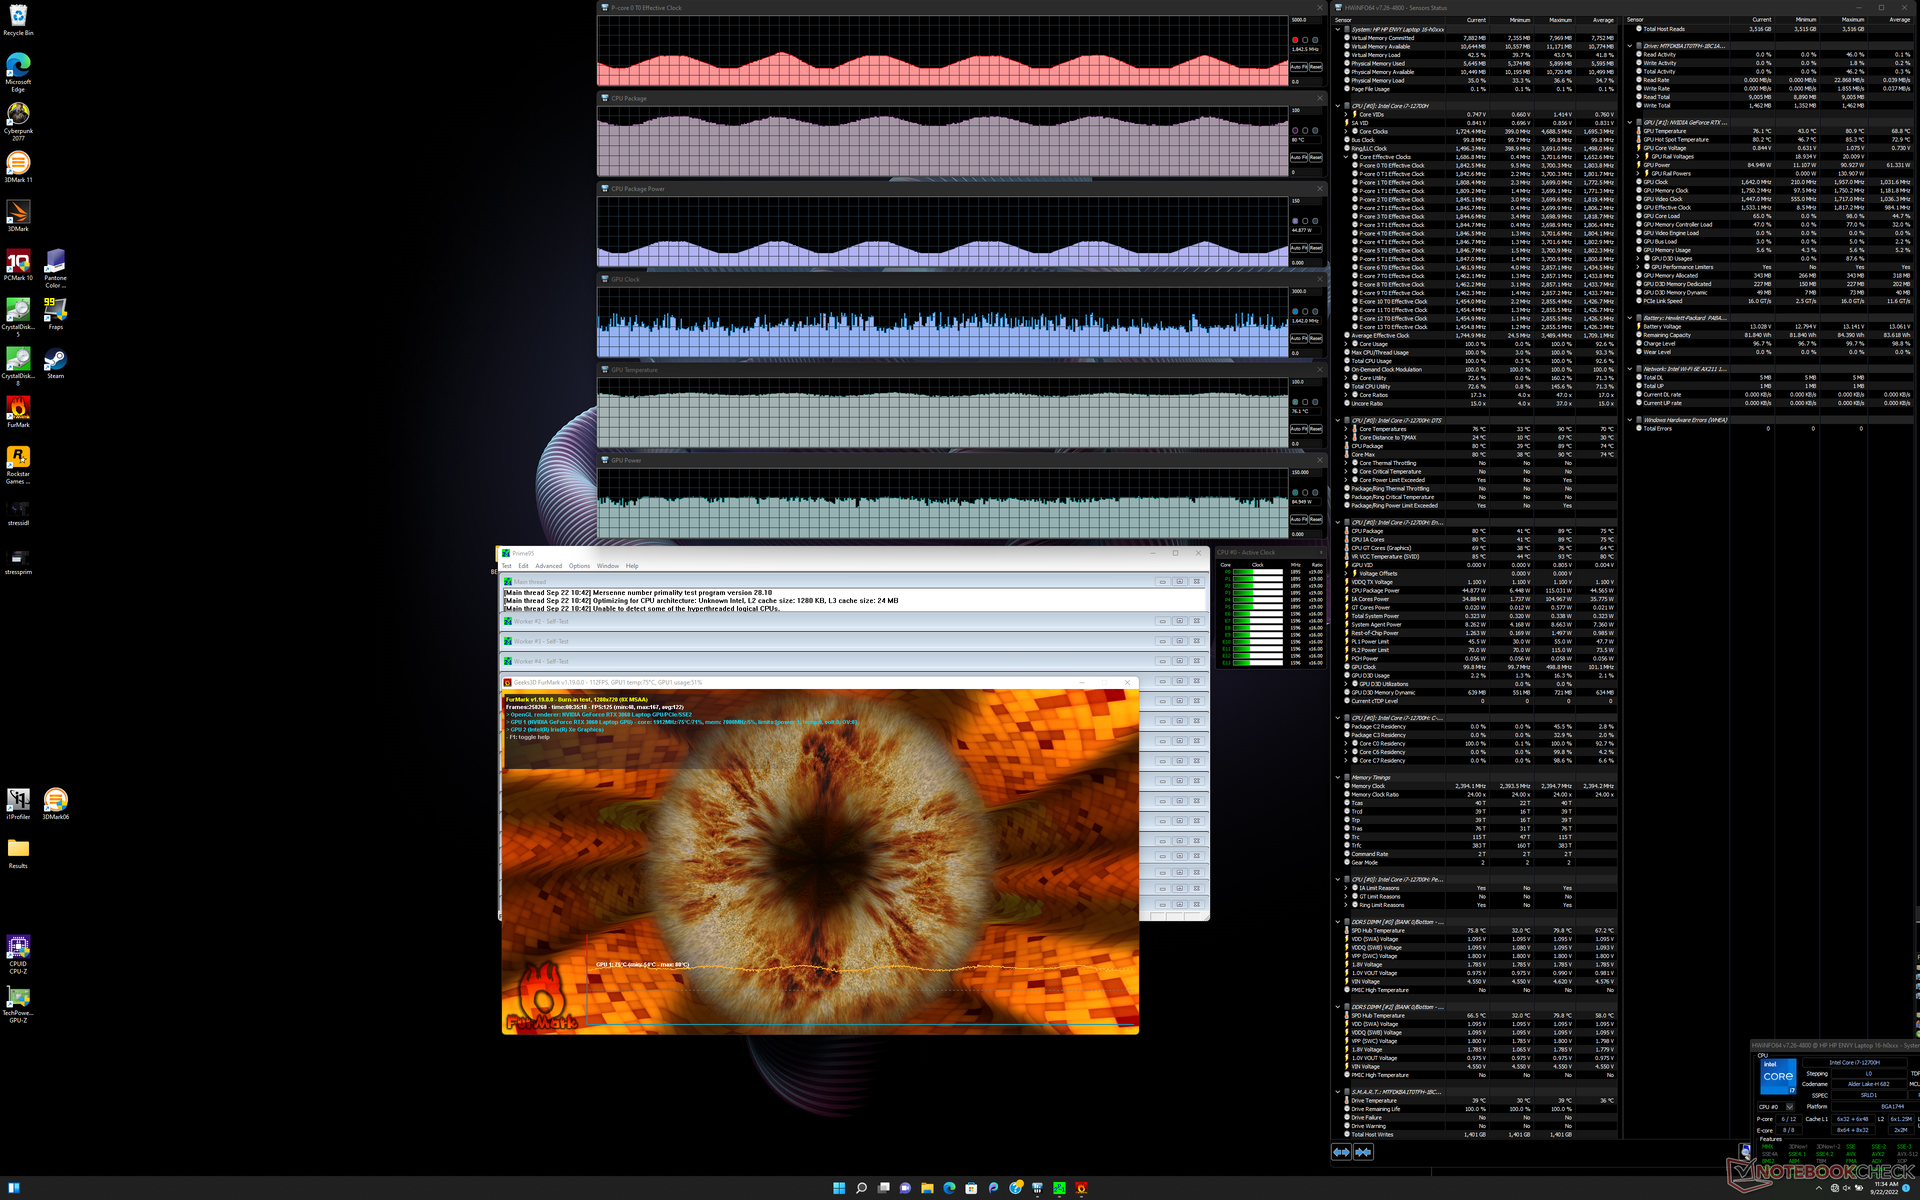
Stress Test - Turbo Boost limitato
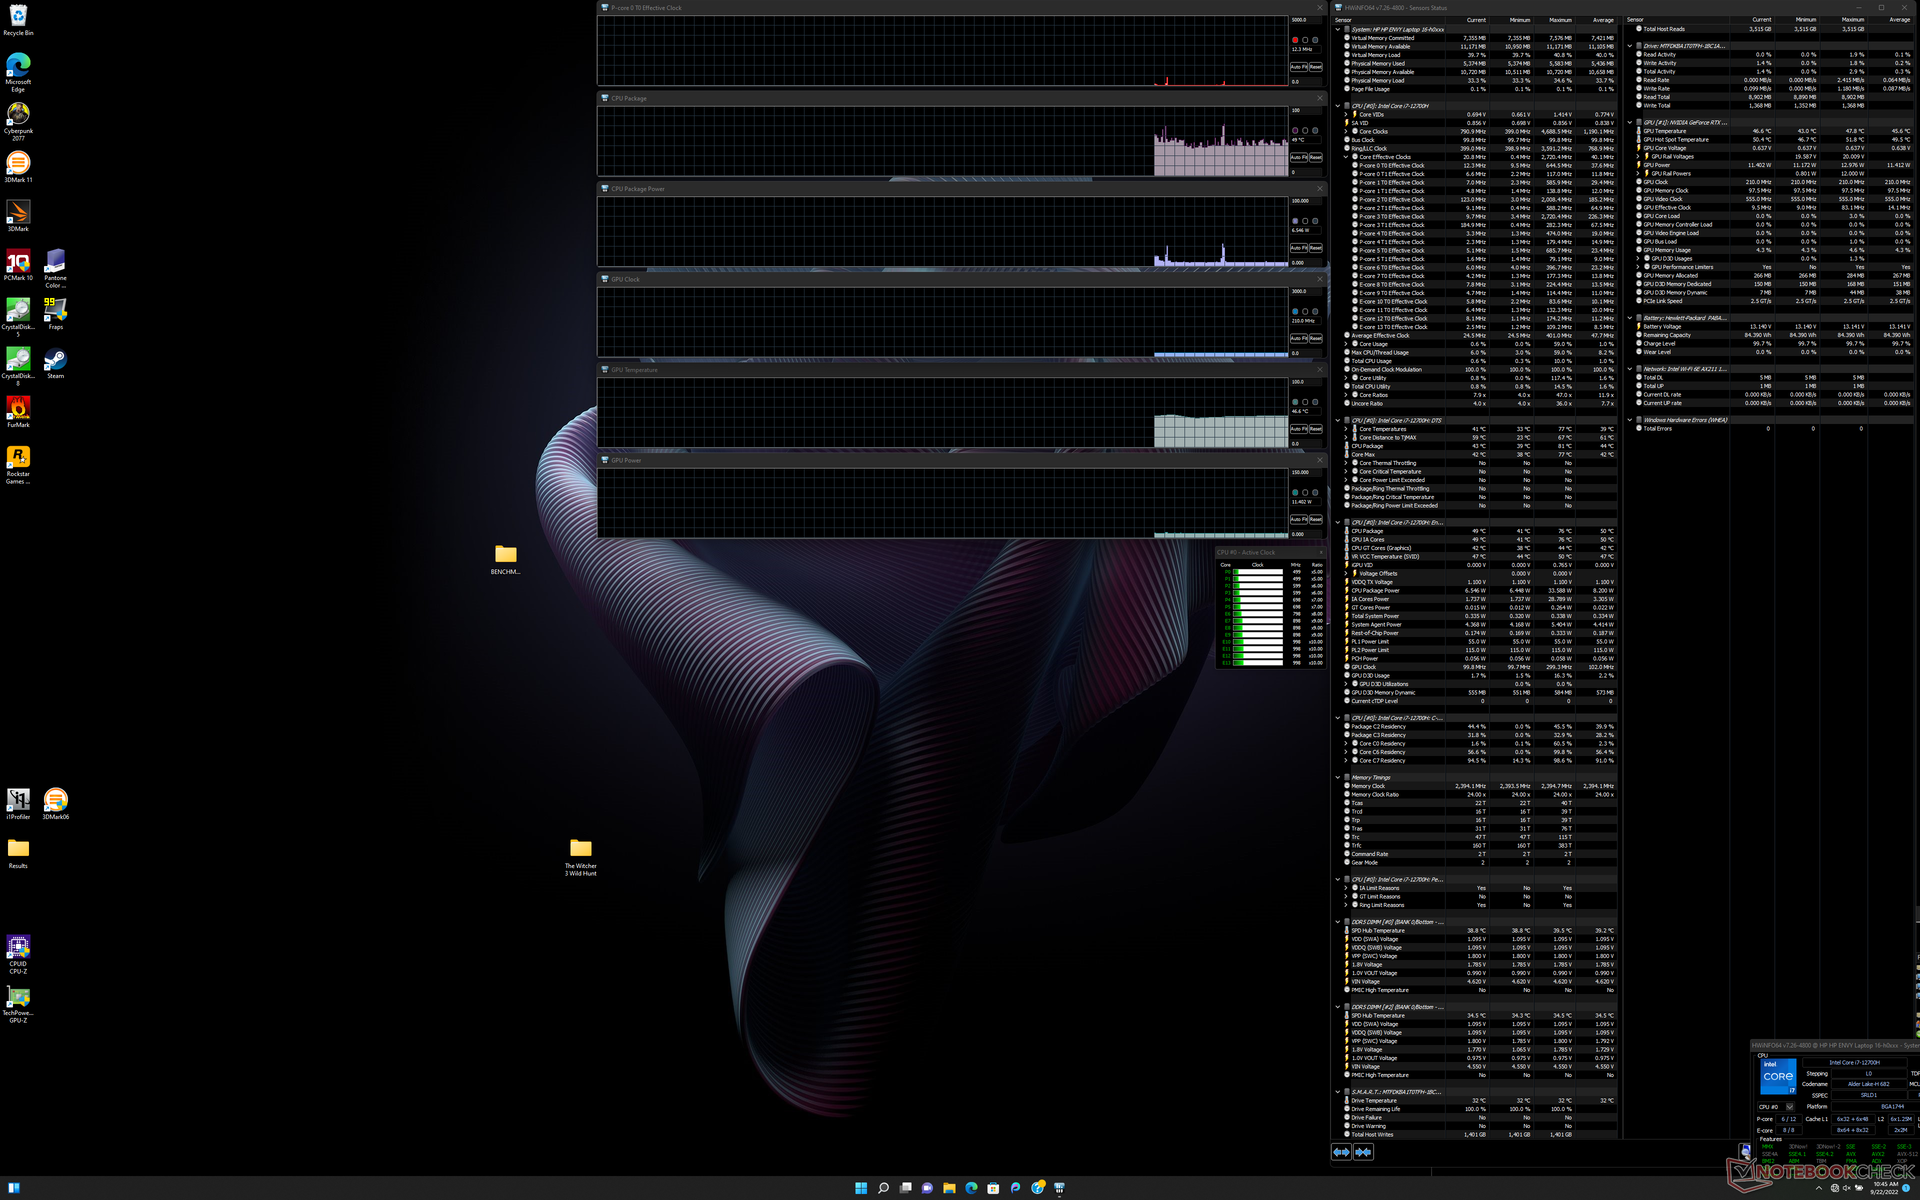
L'esecuzione di Prime95 provoca un'impennata della velocità di clock della CPU, della temperatura e dell'assorbimento di potenza della scheda, rispettivamente a 3,7 GHz, 80 C e 115 W, per una durata di circa 15 secondi. Successivamente, la CPU scendeva e si stabilizzava rispettivamente a 2,1-2,2 GHz, 66 C e 55 W. In confronto, lo stesso test è stato eseguito su MSI GS77 con la stessa CPU Core i7-12700H, si otterrebbero velocità di clock stabili più elevate e temperature del core rispettivamente di 2,7 - 3,0 GHz e 96 C. HP potrebbe seguire la strada più sicura con il suo Envy 16, eseguendo velocità di clock Turbo Boost più basse per mantenere le temperature più basse.
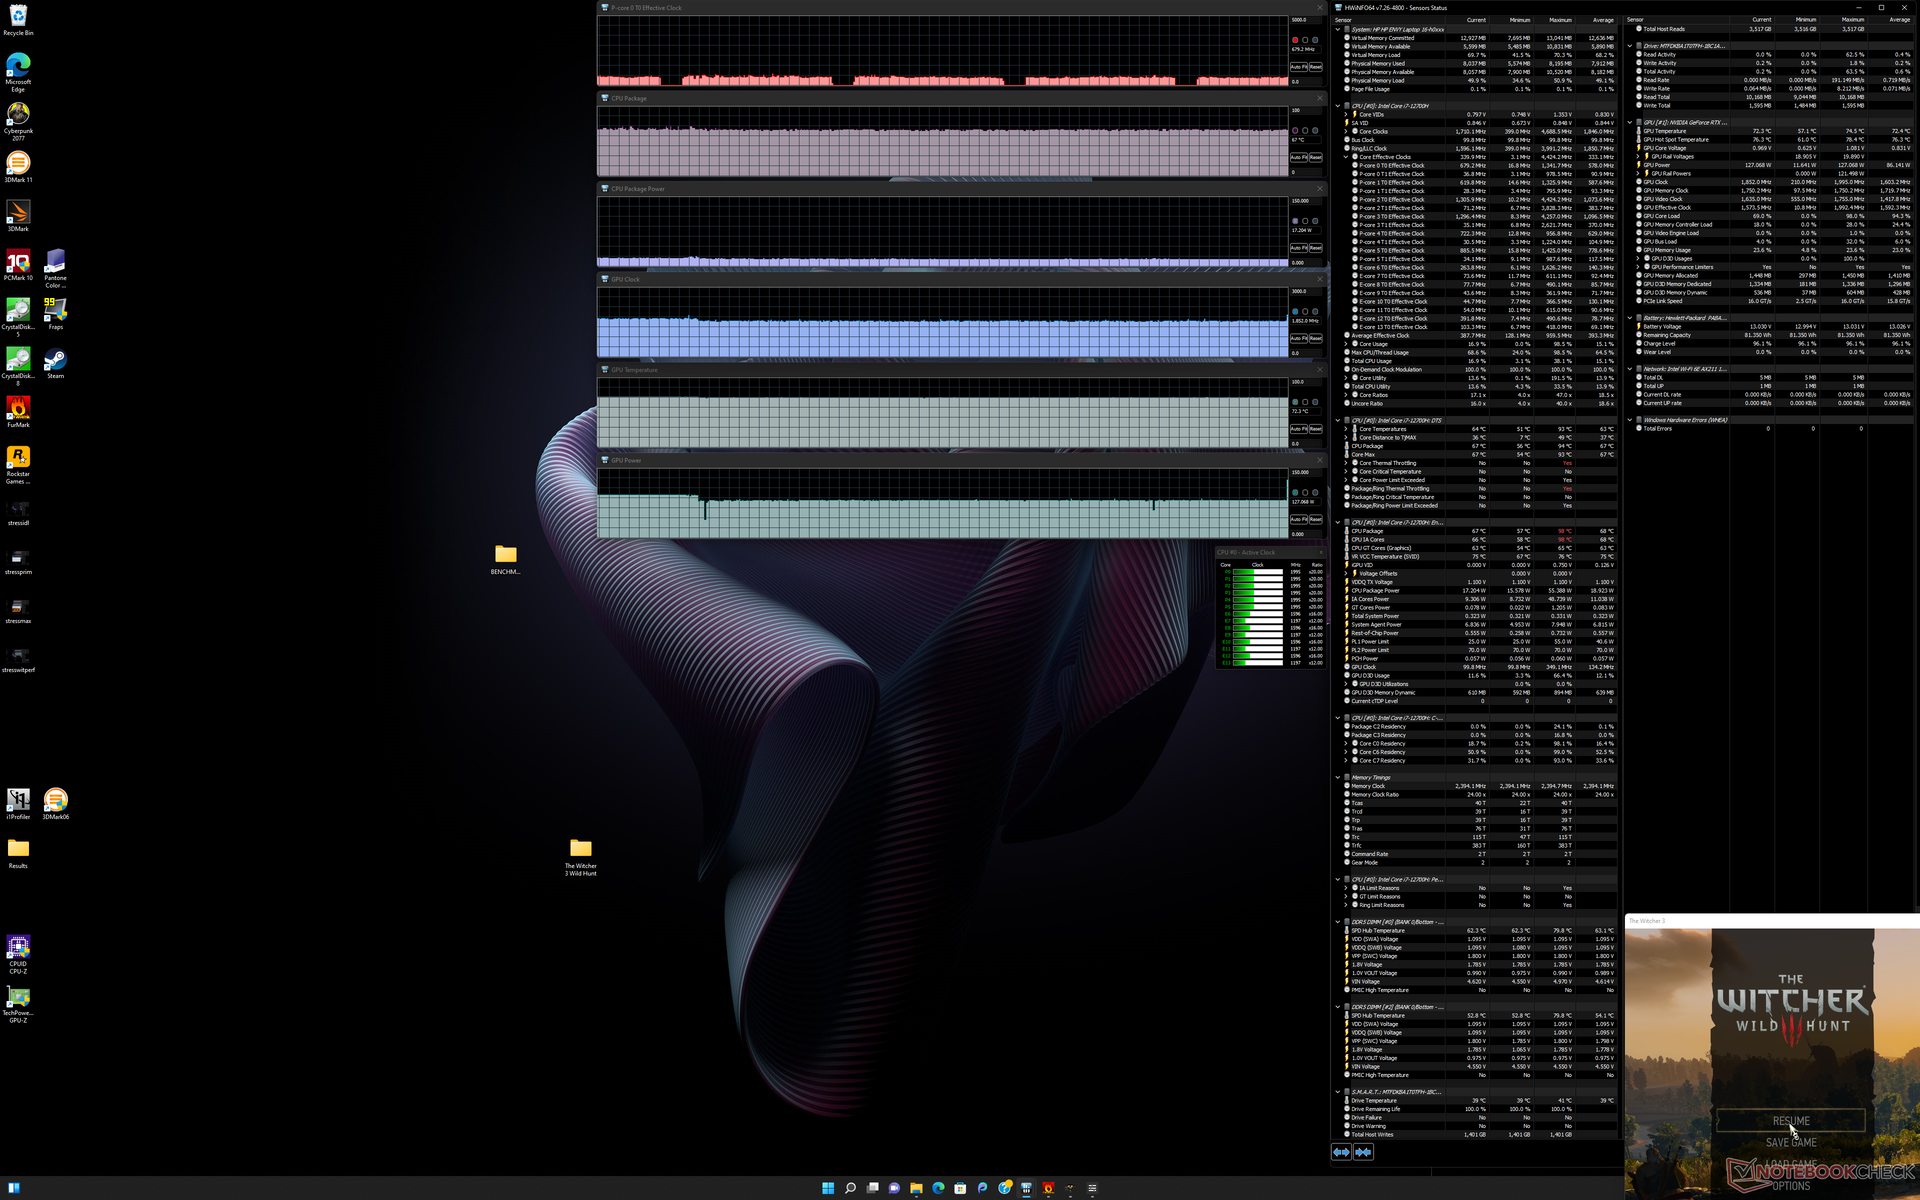
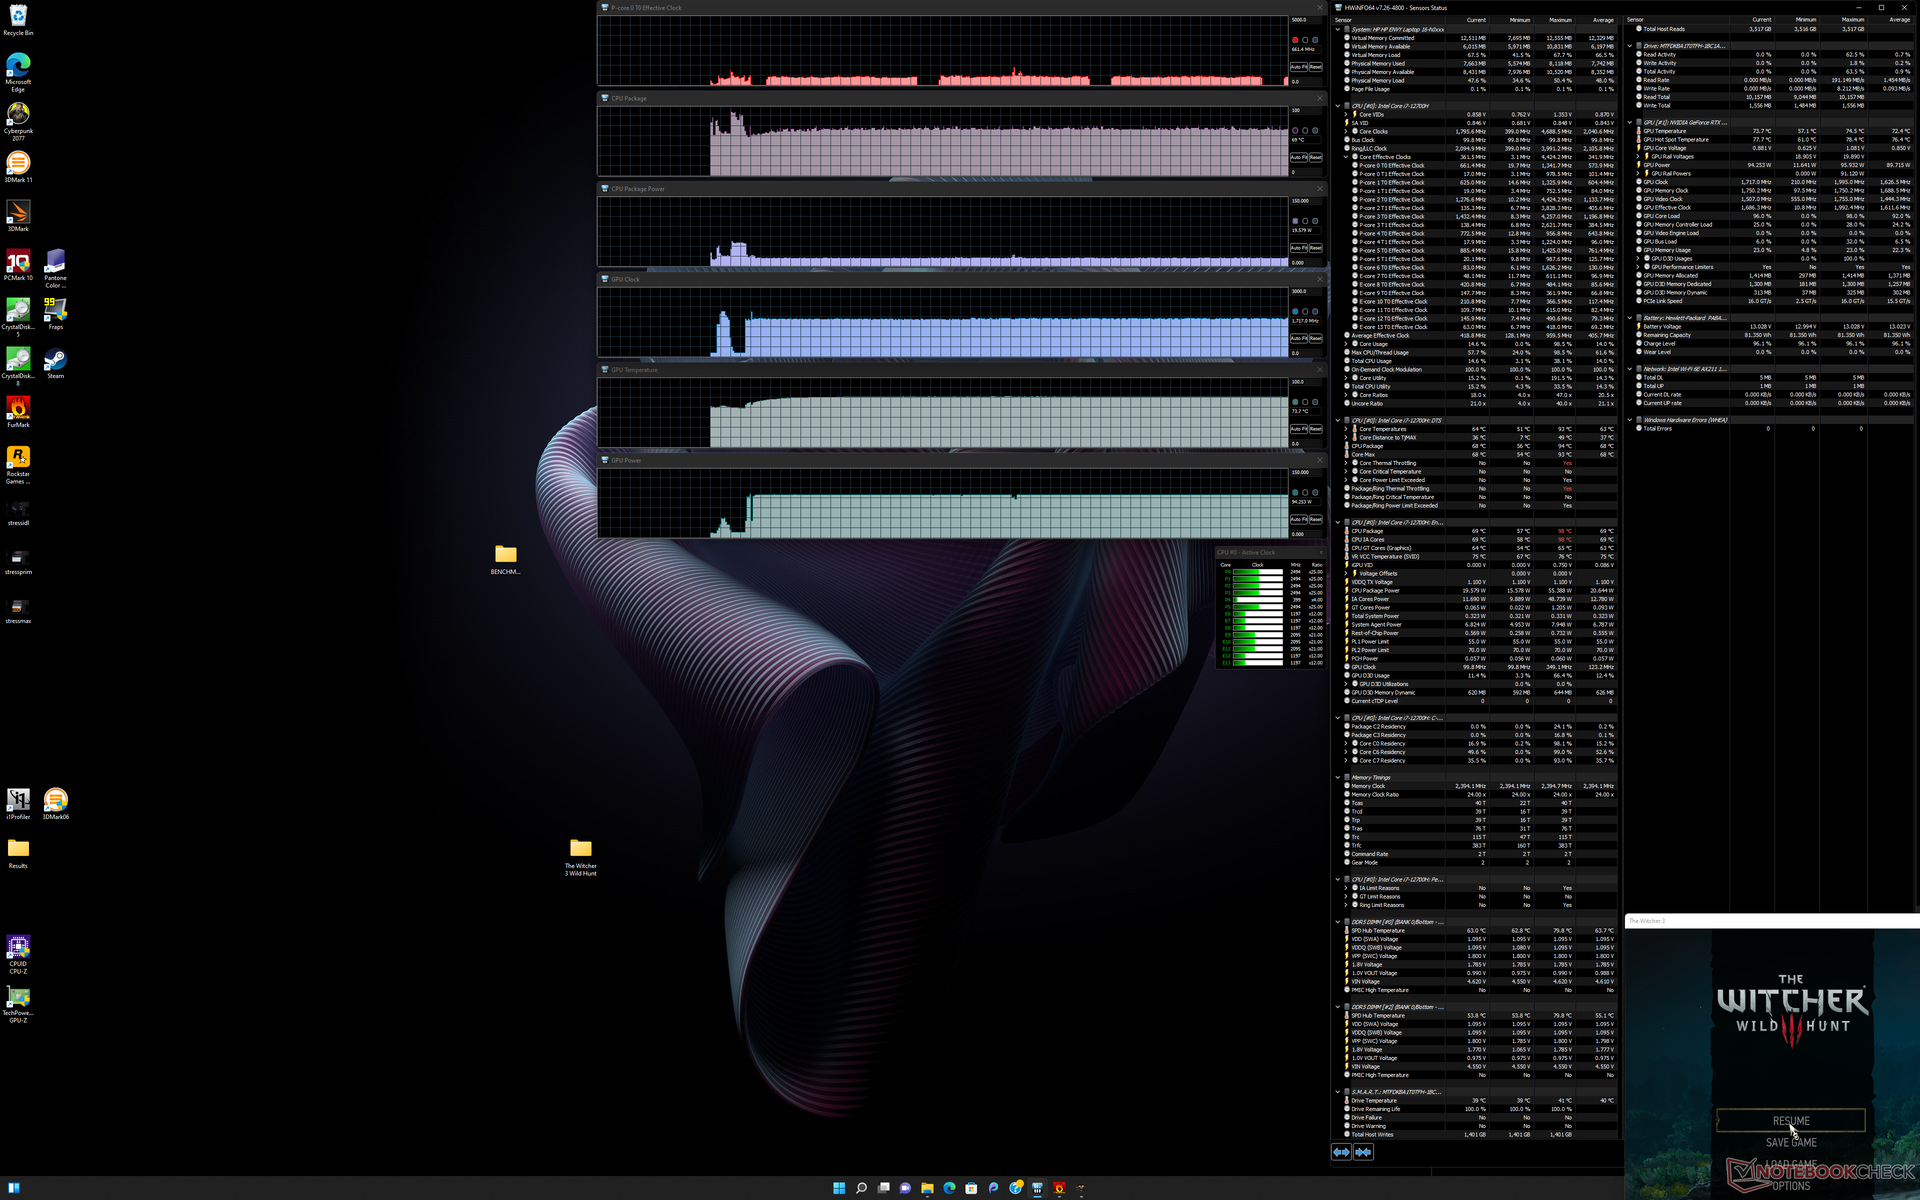
Le frequenze di clock della GPU, la temperatura e l'assorbimento di potenza della scheda si stabilizzerebbero rispettivamente a 1717 MHz, 74 C e 94 W quando si utilizza la modalità Performance Witcher 3 in modalità Performance. Si scende a 1542 MHz, 72 C e 80 W se si esegue il gioco in modalità Bilanciata. Gli utenti dovranno sopportare il rumore massimo della ventola del sistema se vogliono sfruttare al massimo la GPU.
Il funzionamento a batteria limita le prestazioni. Un test di Fire Strike a batteria restituirebbe punteggi di Fisica e Grafica rispettivamente di 17295 e 10572 punti, rispetto a 28353 e 19890 punti con l'alimentazione a rete.
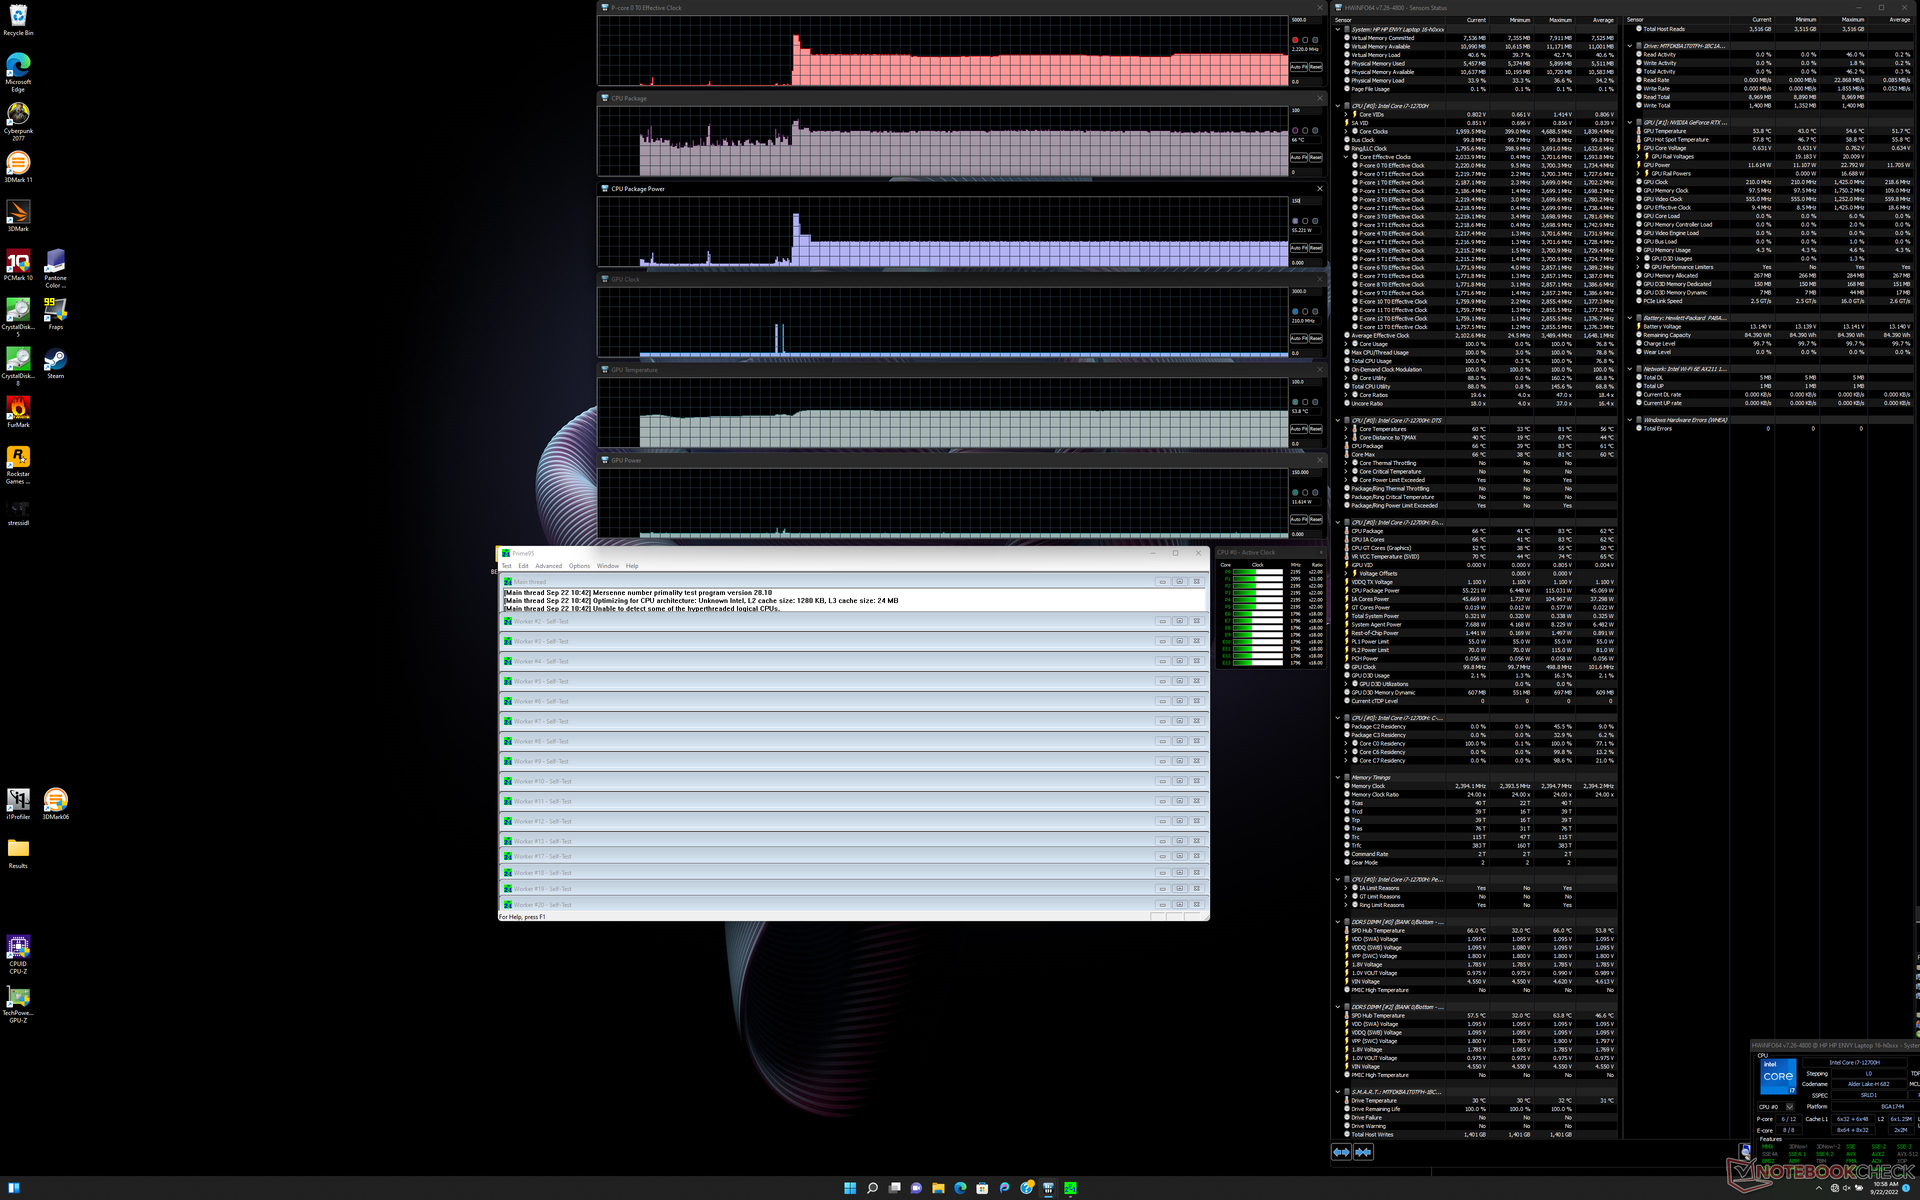
| Clock della CPU (GHz) | Clock della GPU (MHz) | Temperatura media della CPU (°C) | Temperatura media della GPU (°C) | |
| Sistema inattivo | -- | -- | 49 | 47 |
| Stress Prime95 | 2,1 - 2,2 | -- | 66 | 54 |
| StressPrime95 + FurMark | 1,2 - 2,2 | ~1642 | 74 - 87 | 76 |
| Witcher 3 Stress (modalità bilanciata) | 0,67 | 1542 | 67 | 72 |
| Witcher 3 Stress (modalità Performance) | 0,67 | 1717 | 69 | 74 |
Altoparlanti
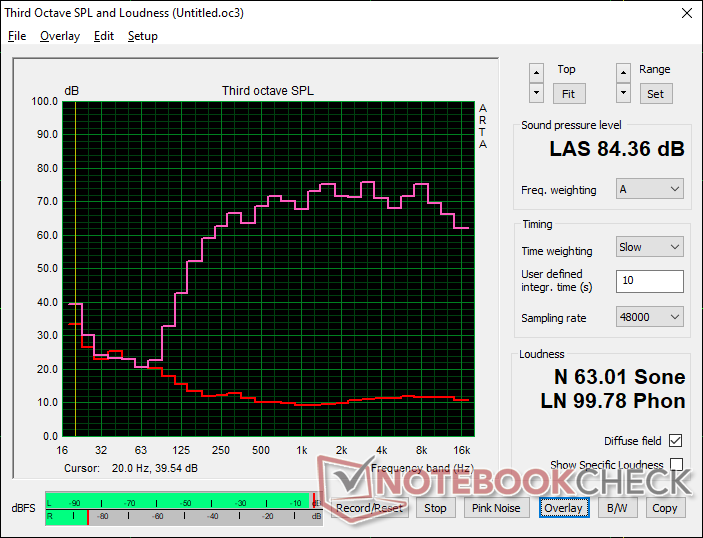
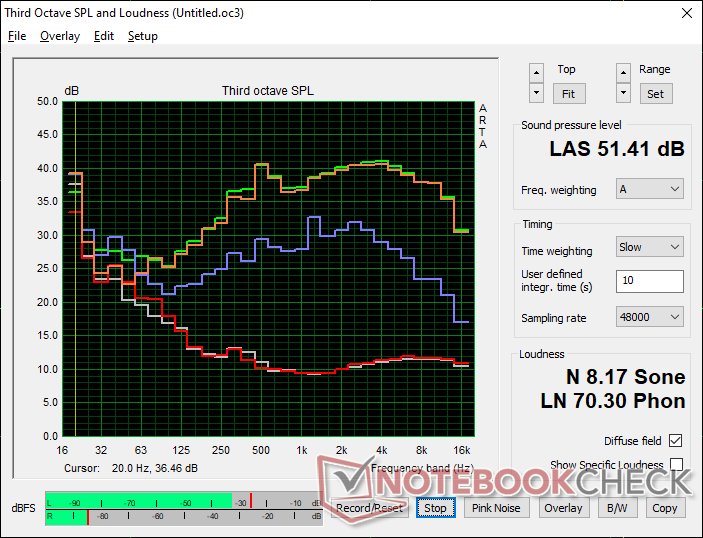
HP Envy 16 h0112nr analisi audio
(+) | gli altoparlanti sono relativamente potenti (84.4 dB)
Bassi 100 - 315 Hz
(-) | quasi nessun basso - in media 15.9% inferiori alla media
(±) | la linearità dei bassi è media (12.8% delta rispetto alla precedente frequenza)
Medi 400 - 2000 Hz
(+) | medi bilanciati - solo only 3.1% rispetto alla media
(+) | medi lineari (5.5% delta rispetto alla precedente frequenza)
Alti 2 - 16 kHz
(+) | Alti bilanciati - appena 3.4% dalla media
(+) | alti lineari (6.3% delta rispetto alla precedente frequenza)
Nel complesso 100 - 16.000 Hz
(+) | suono nel complesso lineare (12.1% differenza dalla media)
Rispetto alla stessa classe
» 22% di tutti i dispositivi testati in questa classe è stato migliore, 3% simile, 76% peggiore
» Il migliore ha avuto un delta di 5%, medio di 17%, peggiore di 45%
Rispetto a tutti i dispositivi testati
» 10% di tutti i dispositivi testati in questa classe è stato migliore, 2% similare, 88% peggiore
» Il migliore ha avuto un delta di 4%, medio di 23%, peggiore di 134%
Apple MacBook Pro 16 2021 M1 Pro analisi audio
(+) | gli altoparlanti sono relativamente potenti (84.7 dB)
Bassi 100 - 315 Hz
(+) | bassi buoni - solo 3.8% dalla media
(+) | bassi in lineaa (5.2% delta rispetto alla precedente frequenza)
Medi 400 - 2000 Hz
(+) | medi bilanciati - solo only 1.3% rispetto alla media
(+) | medi lineari (2.1% delta rispetto alla precedente frequenza)
Alti 2 - 16 kHz
(+) | Alti bilanciati - appena 1.9% dalla media
(+) | alti lineari (2.7% delta rispetto alla precedente frequenza)
Nel complesso 100 - 16.000 Hz
(+) | suono nel complesso lineare (4.6% differenza dalla media)
Rispetto alla stessa classe
» 0% di tutti i dispositivi testati in questa classe è stato migliore, 0% simile, 100% peggiore
» Il migliore ha avuto un delta di 5%, medio di 17%, peggiore di 45%
Rispetto a tutti i dispositivi testati
» 0% di tutti i dispositivi testati in questa classe è stato migliore, 0% similare, 100% peggiore
» Il migliore ha avuto un delta di 4%, medio di 23%, peggiore di 134%
Gestione dell'energia
Consumo di energia
Il funzionamento al minimo sul desktop consuma tra i 10 W e i 28 W a seconda del livello di luminosità, del profilo energetico e dell'impostazione Optimus, rispetto ai soli 9 W-18 W dell'Envy 15 2020, grazie al pannello OLED più esigente e alla CPU di 12a generazione. Tenete presente che alcuni colori richiedono più energia di altri su un pannello OLED, come spiegato qui dettagliato qui.
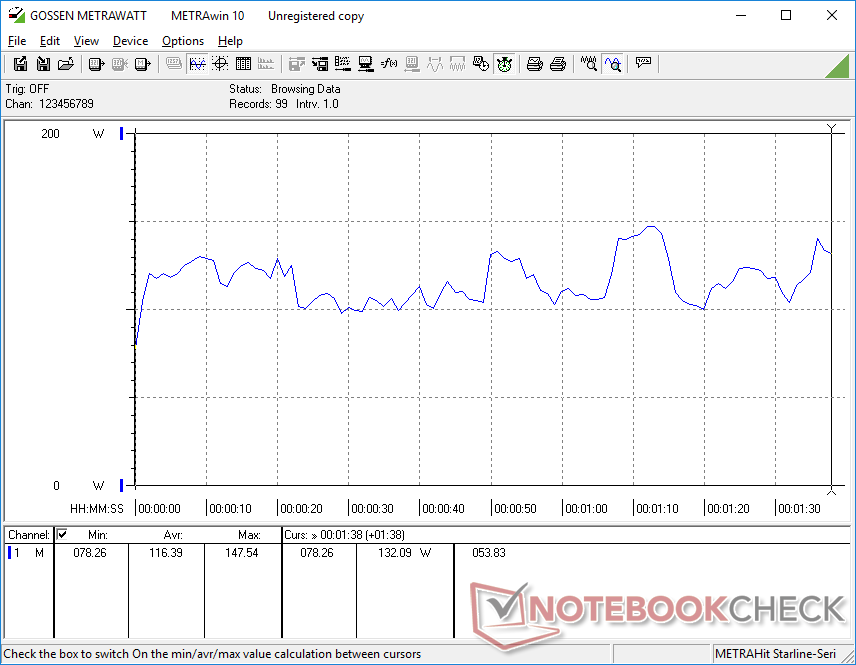
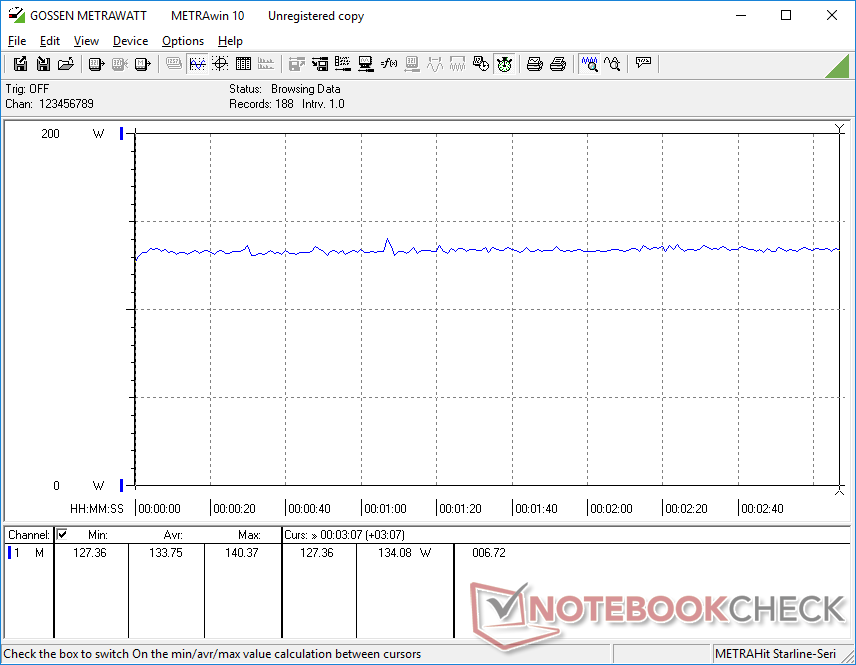
Il consumo energetico durante i giochi è elevato, circa 134 W, paragonabile a quello dell'MSI Creator Z16P.MSI Creator Z16P con la CPU Core i9-12900H più veloce e la GPU RTX 3080 Ti o al Lenovo Legion Slim 7 16 con la stessa CPU Core i7 e GPU. Se confrontato con l'Envy 15 2020, tuttavia, il consumo è superiore solo del 7% circa durante il gioco, nonostante le prestazioni grafiche più veloci del 20-30%, per prestazioni superiori per watt.
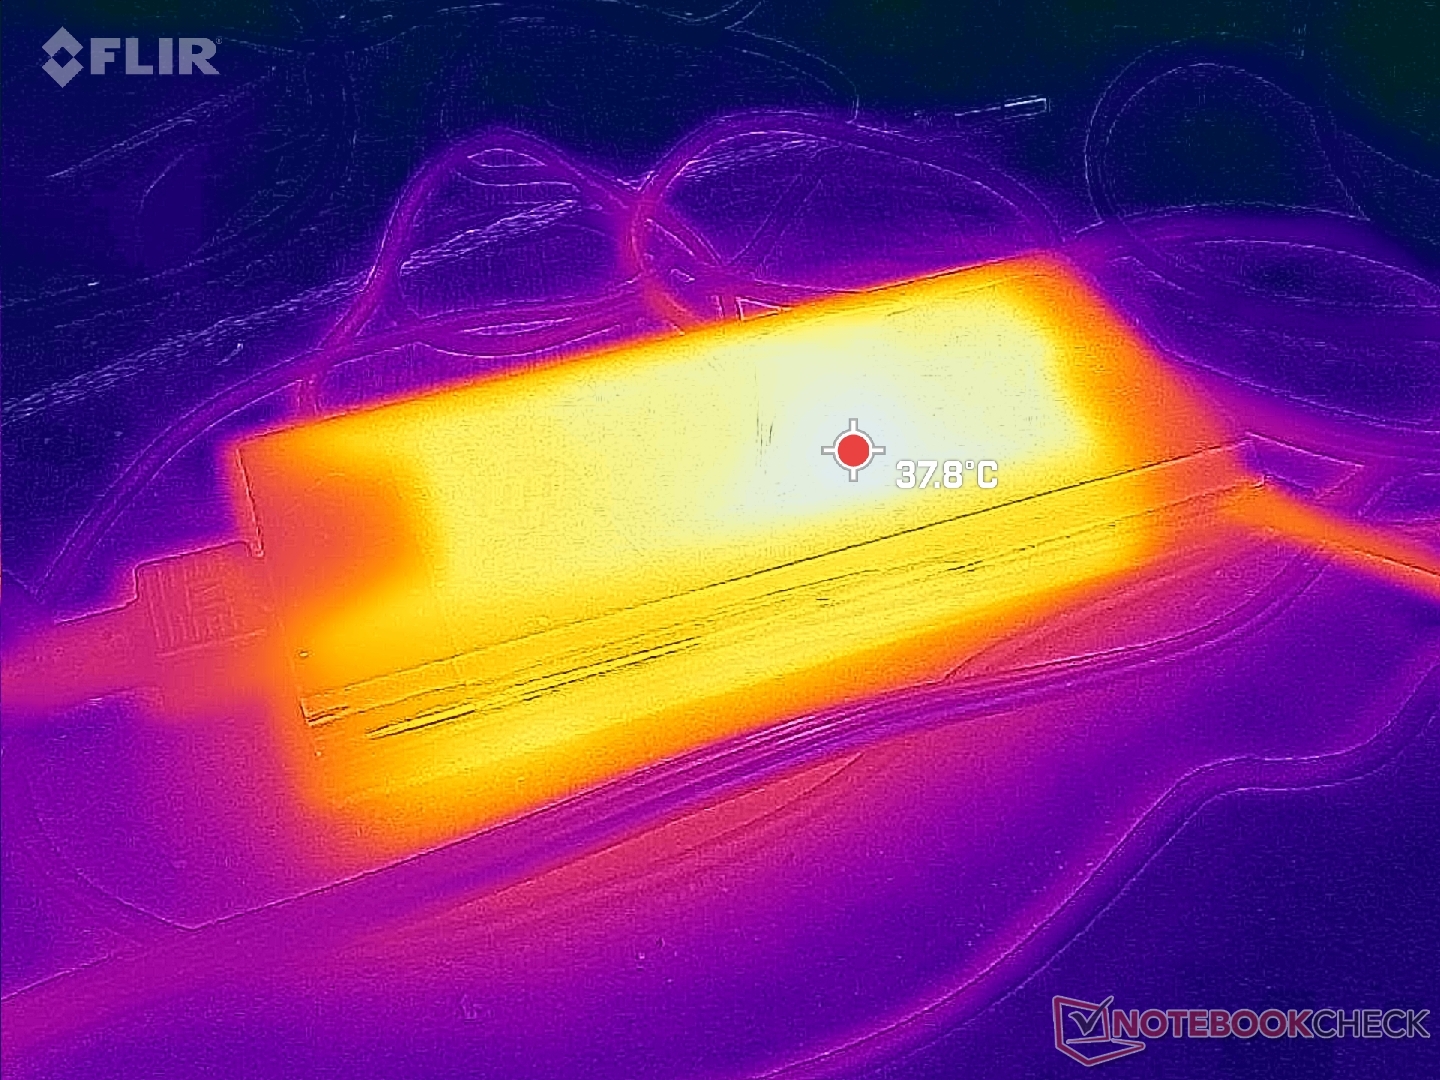
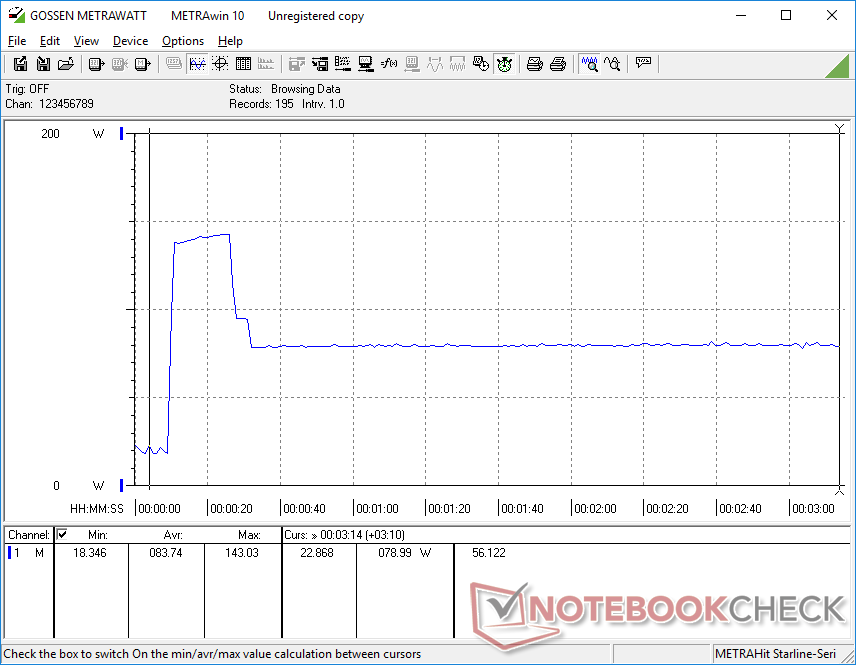
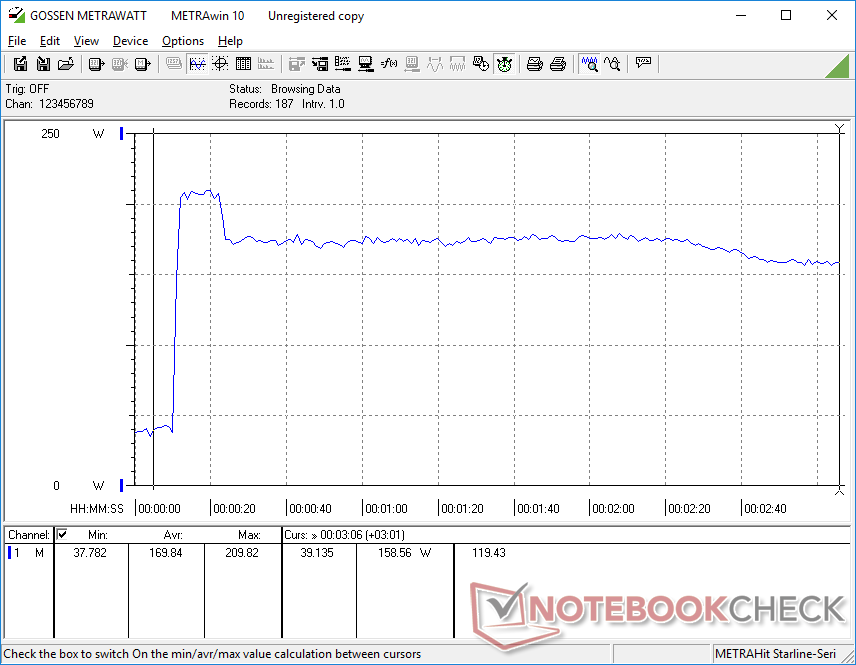
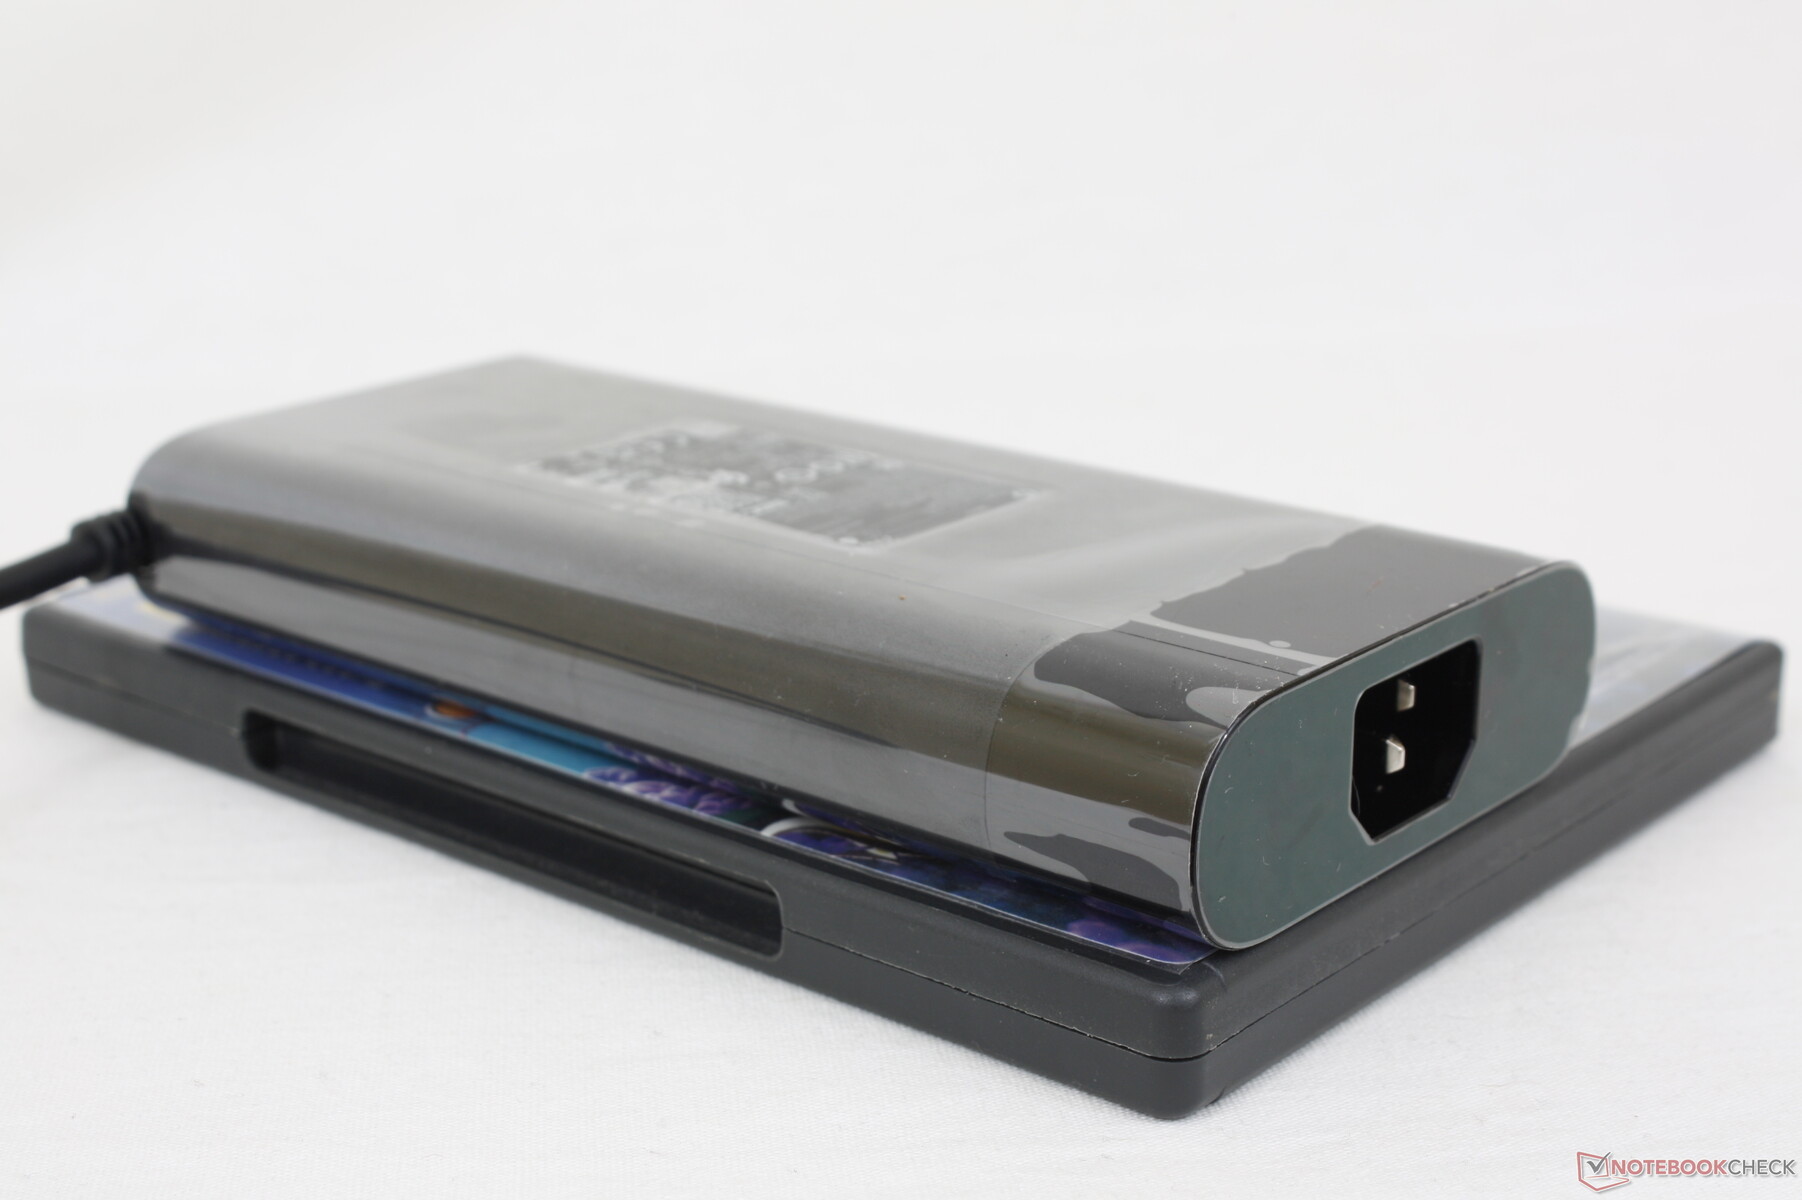
Siamo riusciti a misurare un consumo massimo temporaneo di 209,8 W dall'adattatore CA da 200 W di medie dimensioni (~16,5 x 7,8 x 2,5 cm) quando la CPU e la GPU sono utilizzate al 100%. Il consumo si stabilizza a circa 160 W con carichi estremi.
| Off / Standby | |
| Idle | |
| Sotto carico |
|
Leggenda:
min: | |
| HP Envy 16 h0112nr i7-12700H, GeForce RTX 3060 Laptop GPU, Micron 3400 1TB MTFDKBA1T0TFH, OLED, 3840x2400, 16" | Lenovo ThinkBook 16 G4+ IAP i7-12700H, GeForce RTX 2050 Mobile, Micron 2450 1TB MTFDKCD1T0TFK, IPS, 2560x1600, 16" | MSI Creator Z16P B12UHST i9-12900H, GeForce RTX 3080 Ti Laptop GPU, Samsung PM9A1 MZVL22T0HBLB, IPS True Pixel (~100% DCI-P3), 2560x1600, 16" | Dell Inspiron 16 Plus 7610-MHJ8F i7-11800H, UHD Graphics Xe 32EUs (Tiger Lake-H), OM3PDP3-AD NVMe KDI 512GB, IPS, 3072x1920, 16" | Apple MacBook Pro 16 2021 M1 Pro M1 Pro, M1 Pro 16-Core GPU, Apple SSD AP1024R, Mini-LED, 3456x2234, 16.2" | Huawei MateBook 16s i7 i7-12700H, Iris Xe G7 96EUs, Silicon Motion PCIe-8 SSD, IPS, 2520x1680, 16" | |
|---|---|---|---|---|---|---|
| Power Consumption | 36% | -11% | 50% | 33% | 35% | |
| Idle Minimum * (Watt) | 10 | 5 50% | 11 -10% | 5.4 46% | 5 50% | 6.8 32% |
| Idle Average * (Watt) | 10.9 | 11.2 -3% | 17 -56% | 9.8 10% | 15.1 -39% | 13.2 -21% |
| Idle Maximum * (Watt) | 27.8 | 11.6 58% | 26 6% | 14 50% | 15.5 44% | 13.8 50% |
| Load Average * (Watt) | 116.4 | 89.3 23% | 124 -7% | 44 62% | 54 54% | 75.2 35% |
| Witcher 3 ultra * (Watt) | 133.7 | 83 38% | 133.5 -0% | 44 67% | 56.1 58% | |
| Load Maximum * (Watt) | 209.8 | 102 51% | 212 -1% | 76.8 63% | 90 57% | 90.6 57% |
* ... Meglio usare valori piccoli
Power Consumption Witcher 3 / Stresstest
Power Consumption external Monitor
Durata della batteria
L'autonomia WLAN è paragonabile a quella del MateBook 16s i7 o del ThinkBook 16 G4+ IAP con circa 8 ore. La capacità della batteria rimane identica a quella dell'Envy 15 del 2020, nonostante il passaggio a uno schermo di dimensioni maggiori.
La ricarica da vuoto a pieno con l'adattatore a barile in dotazione richiede circa 1,5 ore. Il sistema non può essere ricaricato tramite USB-C, nonostante le specifiche ufficiali. Quando si collega un caricatore USB-C da 100 W, il sistema segnala semplicemente di utilizzare un caricatore di capacità superiore. Abbiamo contattato HP per avere chiarimenti e aggiorneremo questa sezione di conseguenza.
| HP Envy 16 h0112nr i7-12700H, GeForce RTX 3060 Laptop GPU, 83 Wh | Lenovo ThinkBook 16 G4+ IAP i7-12700H, GeForce RTX 2050 Mobile, 71 Wh | MSI Creator Z16P B12UHST i9-12900H, GeForce RTX 3080 Ti Laptop GPU, 90 Wh | Dell Inspiron 16 Plus 7610-MHJ8F i7-11800H, UHD Graphics Xe 32EUs (Tiger Lake-H), 86 Wh | Apple MacBook Pro 16 2021 M1 Pro M1 Pro, M1 Pro 16-Core GPU, 99.6 Wh | Huawei MateBook 16s i7 i7-12700H, Iris Xe G7 96EUs, 84 Wh | |
|---|---|---|---|---|---|---|
| Autonomia della batteria | -1% | -36% | 67% | 114% | 11% | |
| Reader / Idle (h) | 17.8 | 22.5 26% | ||||
| WiFi v1.3 (h) | 7.9 | 8.2 4% | 5.2 -34% | 9.5 20% | 16.9 114% | 8.1 3% |
| Load (h) | 1.6 | 1.5 -6% | 1 -37% | 4.1 156% | 1.9 19% | |
| H.264 (h) | 12.6 | 5.8 | 17.5 | 9.3 | ||
| WiFi (h) | 9.5 |
Pro
Contro
Verdetto - Come un MacBook Pro 16 economico
L'Envy 16 è ovviamente più veloce del vecchio Envy 15, ma alcuni degli inconvenienti che abbiamo menzionato per l'Envy 15 non sono ancora stati risolti. Le ventole rumorose, l'assenza del blocco Kensington, il clickpad spugnoso e le cerniere relativamente deboli sono un passo indietro rispetto ad alternative come il MacBook Pro 16 o Dell Inspiron 16 Plus. Il sistema è anche uno dei portatili da 16 pollici più grandi e pesanti sul mercato, il che potrebbe scoraggiare viaggiatori e studenti.
L'HP Envy 16 costa quasi 1.000 dollari in meno rispetto al MacBook Pro 16 di base, pur offrendo prestazioni e colori competitivi. Tuttavia, è un sistema piuttosto rumoroso e pesante.
Gli utenti che non si lasciano scoraggiare dal peso troveranno nell'Envy 16 un sistema versatile con prestazioni, dimensioni dello schermo e colori adatti al gioco e all'editing. Apprezziamo in particolare la facilità con cui è possibile aggiungere memoria o RAM in caso di necessità. Tuttavia, se le vostre attività non richiedono molta potenza, dovreste prendere in considerazione opzioni da 16 pollici molto più leggere come l'LG Gram 16 LG Gram 16 o Huawei MateBook 16s.
Prezzo e disponibilità
L'Envy 16 è ora disponibile presso i principali rivenditori tra cui Newegg, Best Buy, Costco, Micro Center e HP.com in varie configurazioni. La nostra configurazione specifica può essere trovata su Micro Center a 1.700 dollari, mentre le SKU Intel Arc A370M sono disponibili altrove.
HP Envy 16 h0112nr
- 09/24/2022 v7 (old)
Allen Ngo
Price comparison

