Recensione del portatile HP Elite Dragonfly G3 13.5: Design e prestazioni completamente nuovi
Il Dragonfly G3 succede direttamente al Dragonfly Max dello scorso anno Dragonfly Max (cioè il Dragonfly G2) con un nuovo hardware da cima a fondo. Oltre all'ovvio aggiornamento della CPU dall'undicesima generazione Tiger Lake-U alla dodicesima generazione Alder Lake-U, il G3 presenta un nuovo fattore di forma 3:2 e un display da 13,5 pollici che si contrappone al vecchio design 16:9 da 13,3 pollici. HP sostiene che tutti i cambiamenti apportati sono rivolti a una forza lavoro ibrida, fuori casa e dentro casa
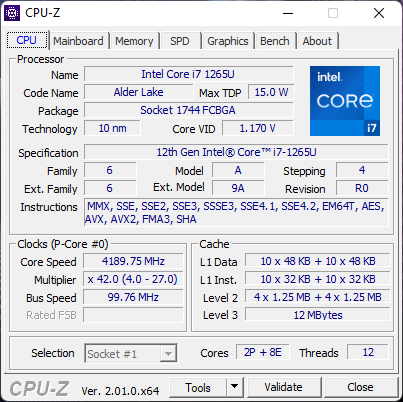
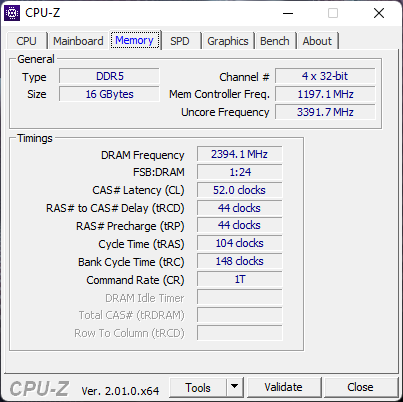
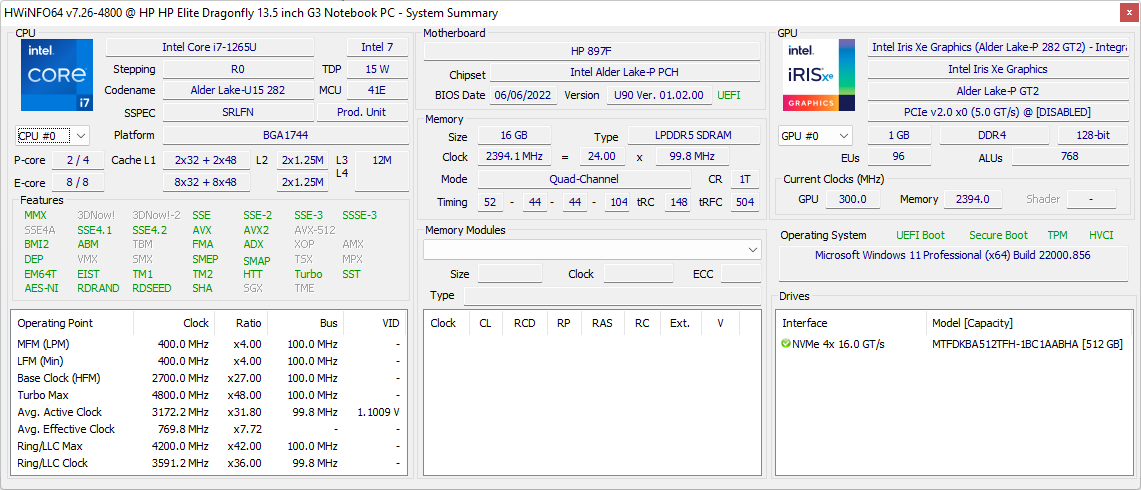
L'unità oggetto della nostra recensione è configurata con CPU Core i7-1265U vPro, display IPS a 1280p, WWAN 5G e SSD da 512 GB per circa 2.700 dollari. Sono disponibili altre configurazioni con il Core i5-1235U, più economico, fino a un touchscreen OLED, ma tutte le opzioni sono dotate di grafica Iris Xe integrata e almeno 16 GB di RAM LPDDR5
Tra le alternative al Dragonfly G3 ci sono altri portatili di punta da 13 pollici per l'ufficio o il business, come il modello Dell Latitude 13 7330, Lenovo ThinkPad X1 Yoga G1, MSI Summit E13o il Portatile Framework
Altre recensioni di HP
Potenziali concorrenti a confronto
Punteggio | Data | Modello | Peso | Altezza | Dimensione | Risoluzione | Prezzo |
|---|---|---|---|---|---|---|---|
| 91 % v7 (old) | 08/2022 | HP Elite Dragonfly G3 i7-1265U, Iris Xe G7 96EUs | 1.2 kg | 16.3 mm | 13.50" | 1920x1280 | |
| 89.4 % v7 (old) | 12/2020 | HP Spectre x360 14t-ea000 i7-1165G7, Iris Xe G7 96EUs | 1.3 kg | 17.2 mm | 13.50" | 1920x1280 | |
| 86.1 % v7 (old) | 08/2022 | Dell XPS 13 Plus 9320 i5-1240p i5-1240P, Iris Xe G7 80EUs | 1.2 kg | 15.3 mm | 13.40" | 1920x1200 | |
| 85.1 % v7 (old) | 07/2022 | Framework Laptop 13.5 12th Gen Intel i7-1260P, Iris Xe G7 96EUs | 1.3 kg | 15.85 mm | 13.50" | 2256x1504 | |
| 84 % v7 (old) | 08/2021 | HP EliteBook Folio 13.5-3G2L2EA SD 8cx Gen 2 5G, Adreno 680 | 1.3 kg | 16 mm | 13.50" | 1920x1280 | |
| 87.3 % v7 (old) | 04/2021 | Lenovo ThinkPad X1 Titanium Yoga G1 20QA001RGE i7-1160G7, Iris Xe G7 96EUs | 1.2 kg | 11.5 mm | 13.50" | 2256x1504 |
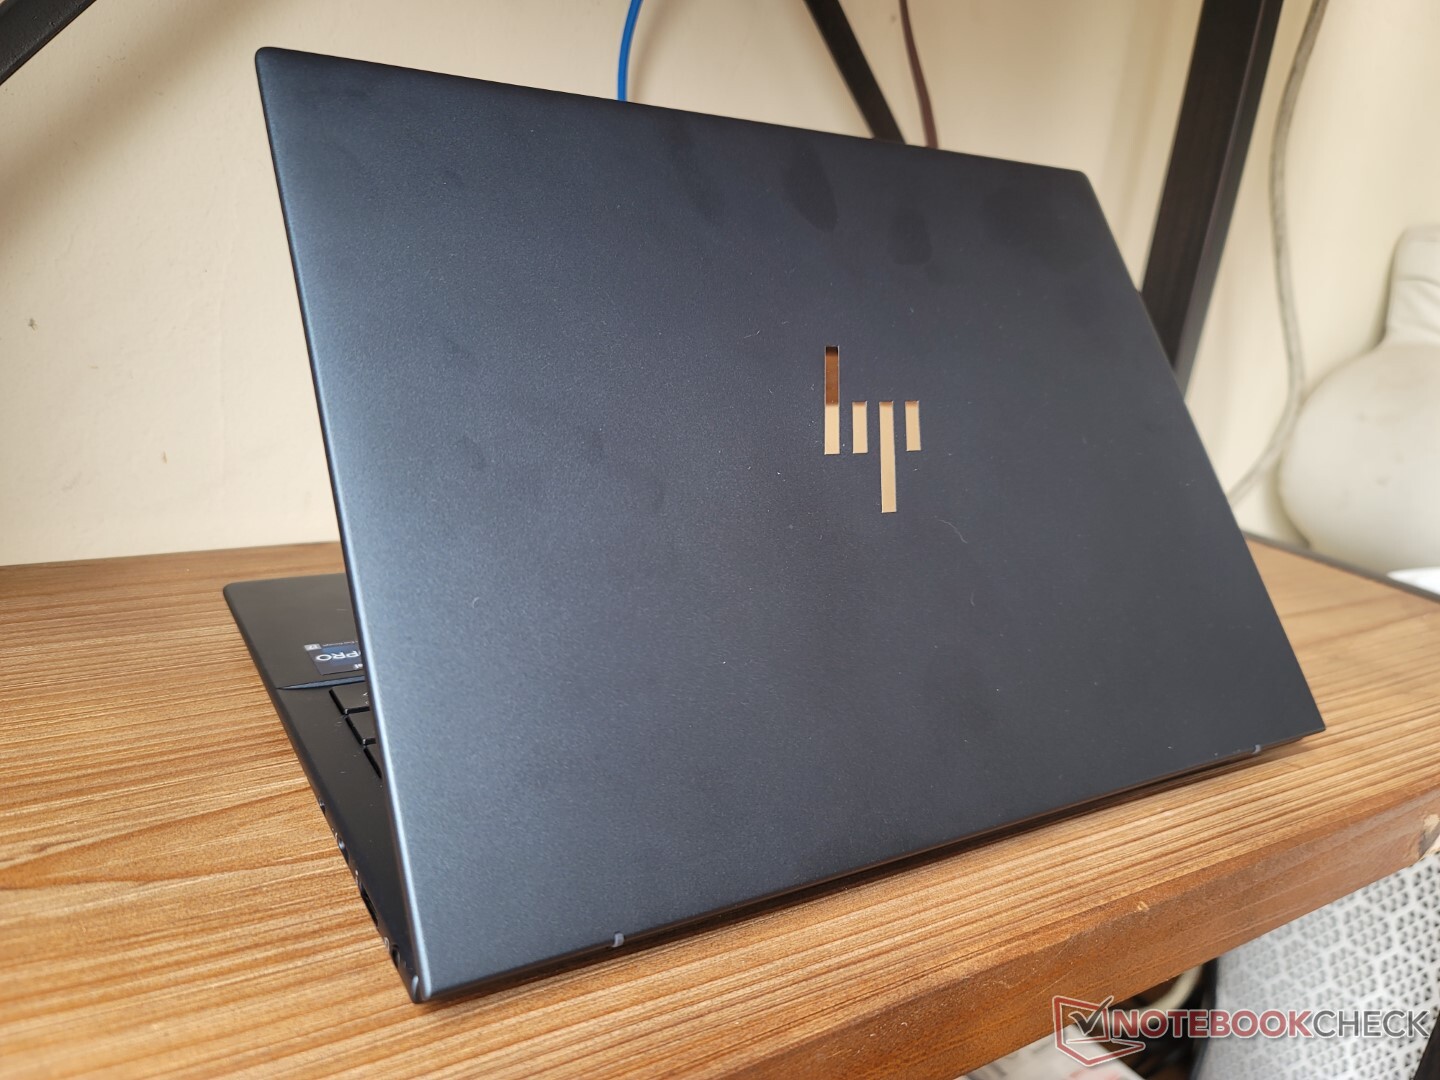
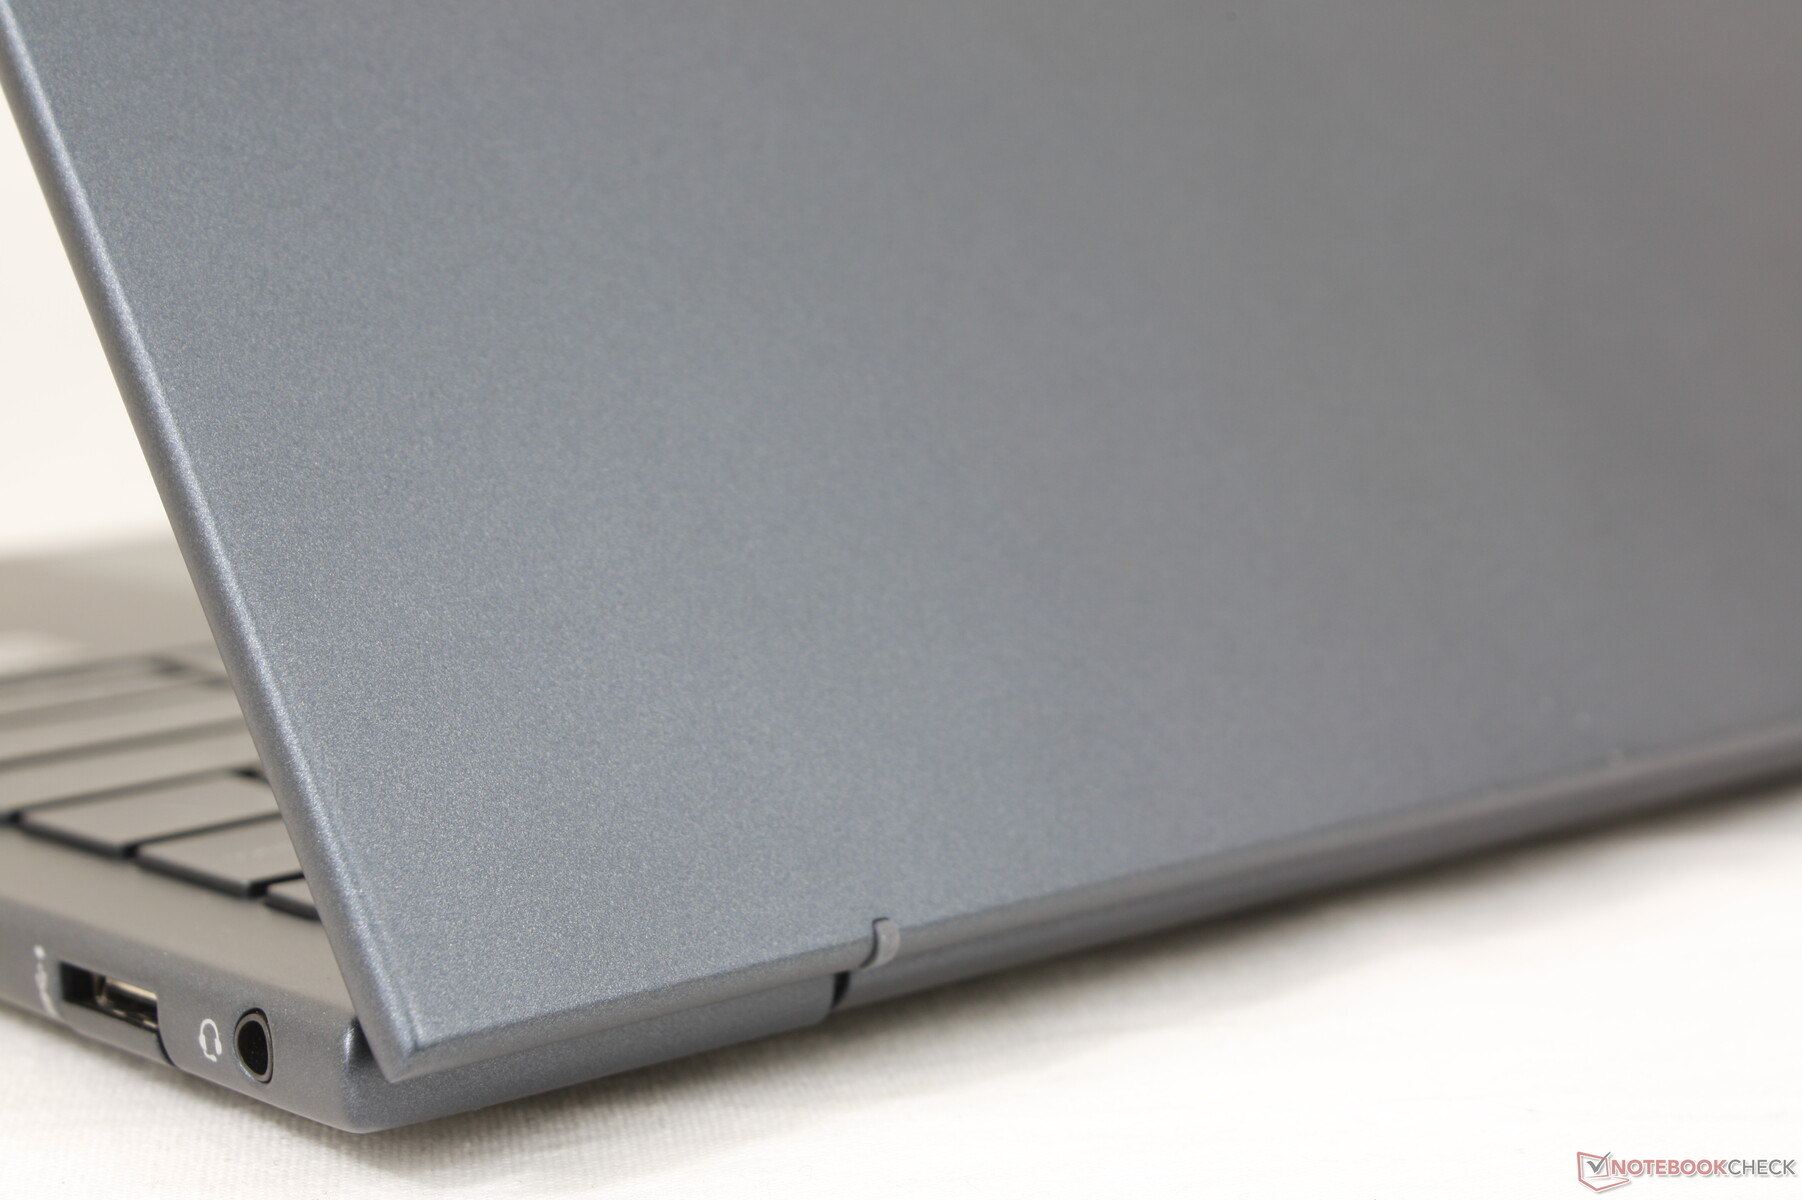
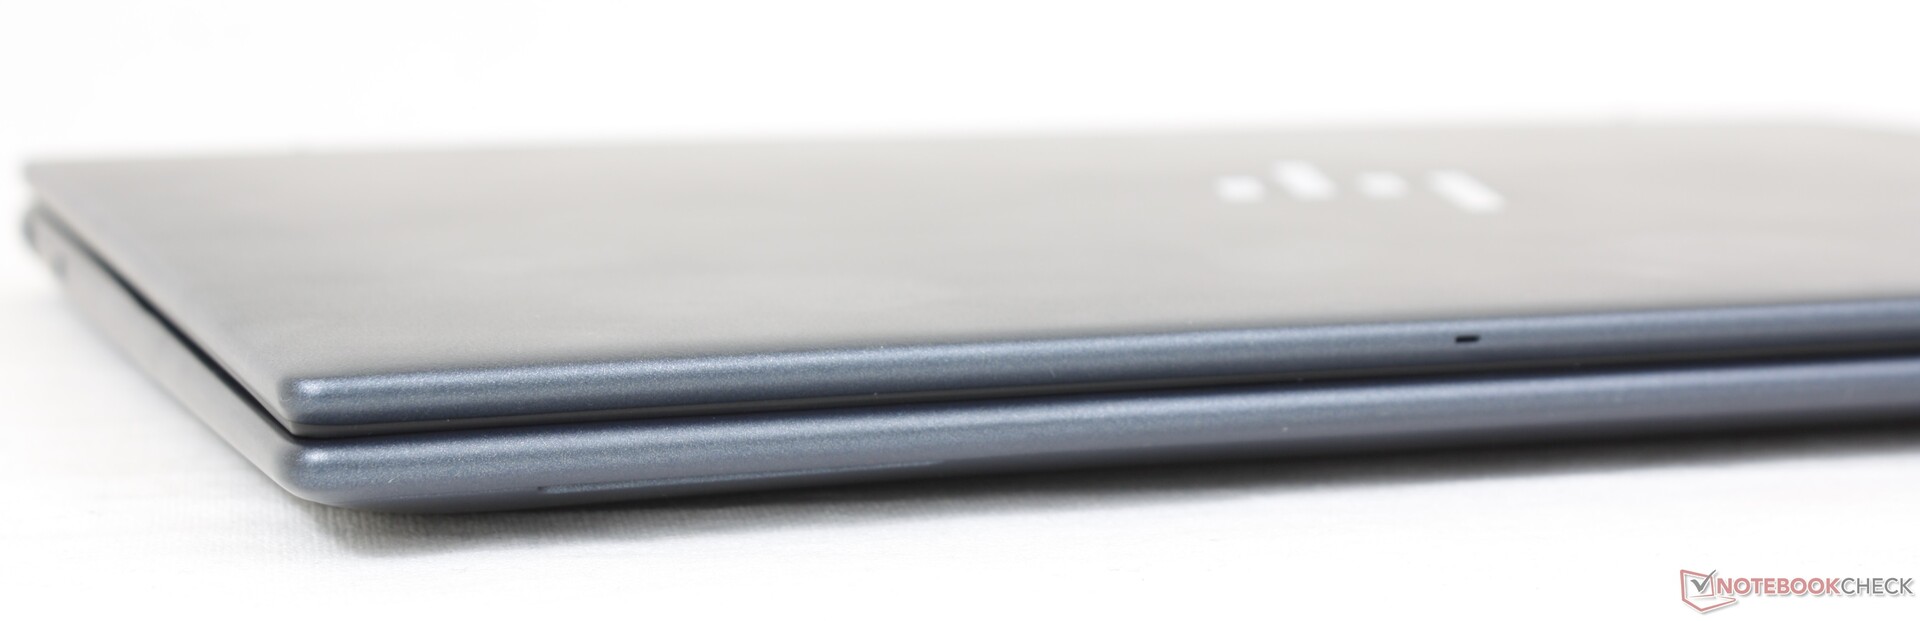
Cassa - Base forte, coperchio debole
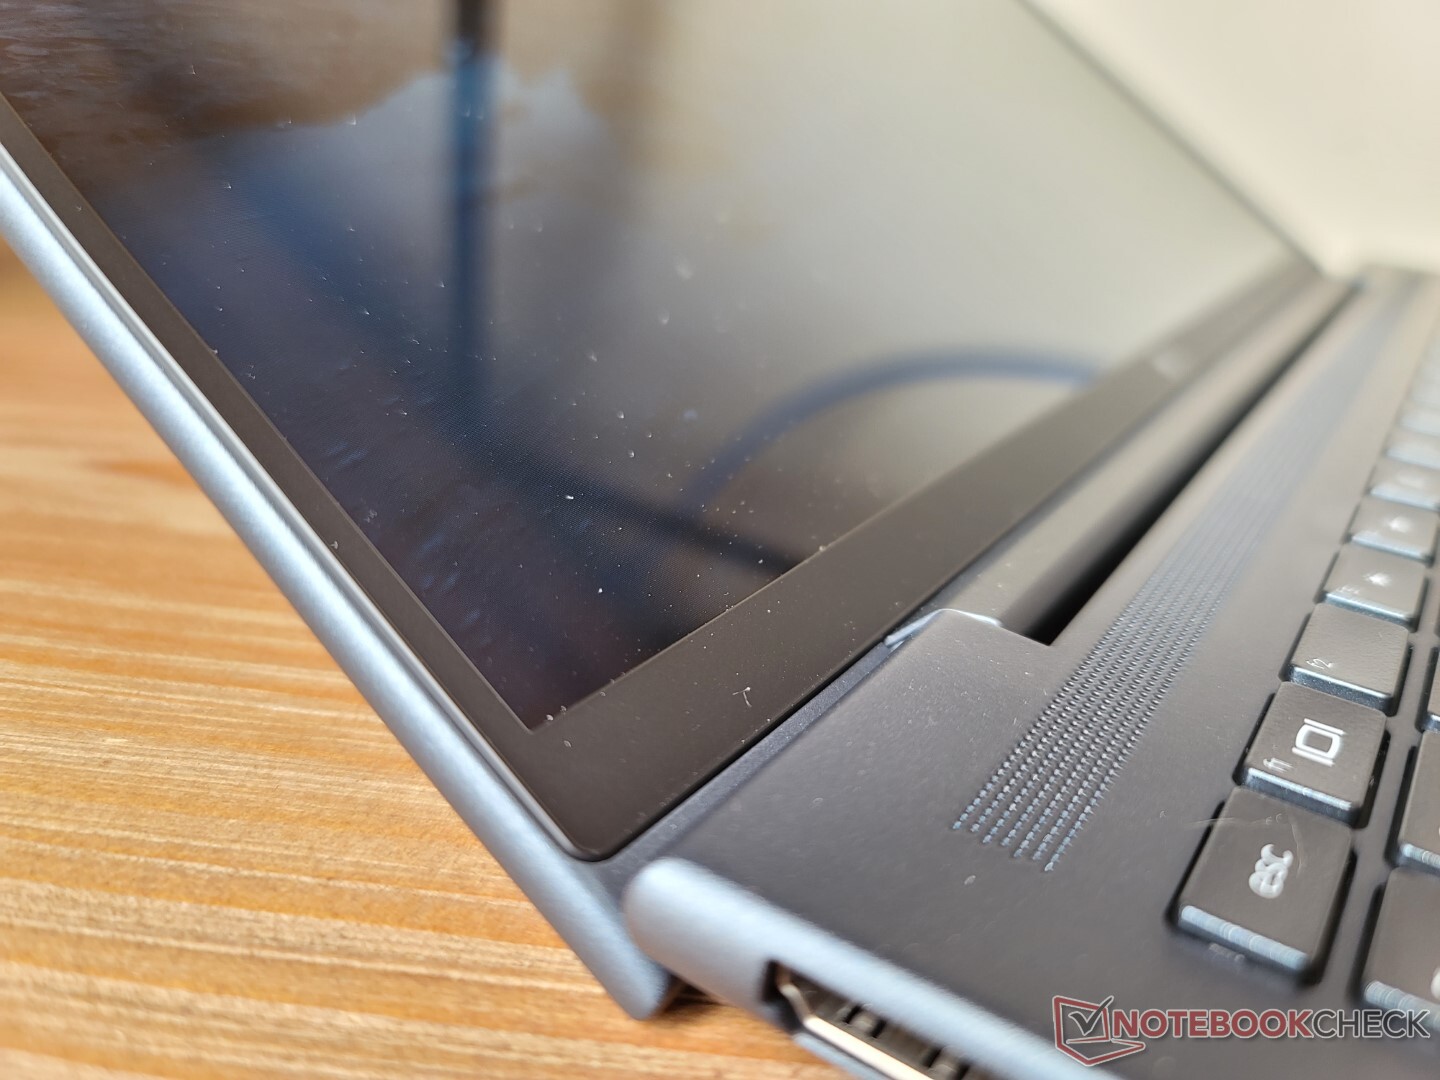
Lo chassis in metallo rimane forte e rigido intorno alla base e al centro della tastiera. Lo stesso non si può dire del coperchio, che si torce e si flette con la stessa facilità dei coperchi dei modelli LG Gram LG gram o Samsung Galaxy Book. Applicando una pressione al centro del coperchio esterno, la superficie si deforma più facilmente rispetto al coperchio dello Spectre. Il peso molto ridotto e la mancanza di un rinforzo in Gorilla Glass contribuiscono a rendere più debole il coperchio del Dragonfly G3.
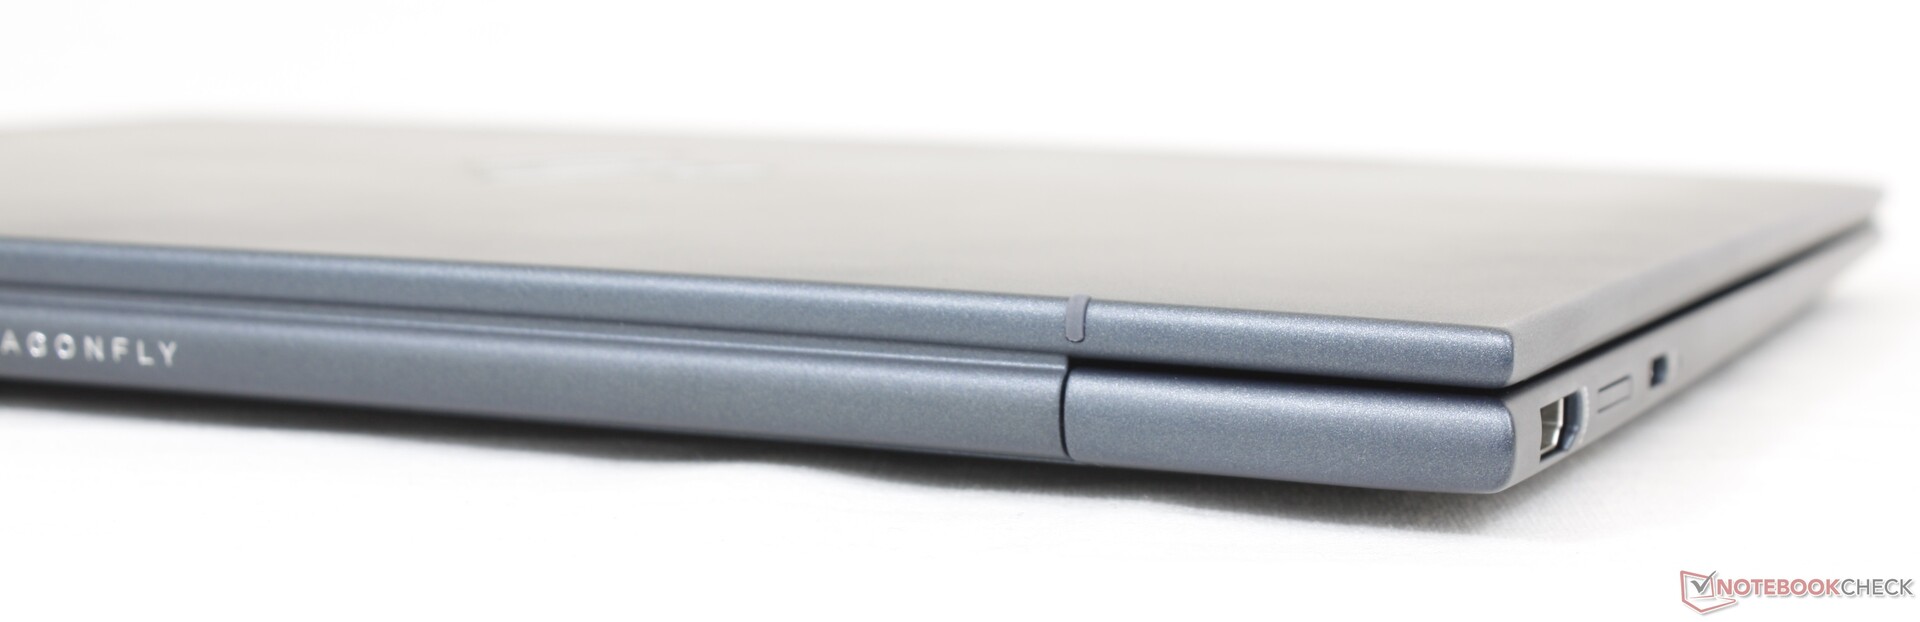
Vale la pena notare che il Dragonfly G3 non è disponibile in nessuna delle vivaci opzioni di colore che offriva il modello originale del 2020. Le nuove opzioni di colore sono diventate più opache e sterili. Per una serie chiamata "Dragonfly", i suoi colori stanno diventando troppo simili a quelli di un tipico modello EliteBook.
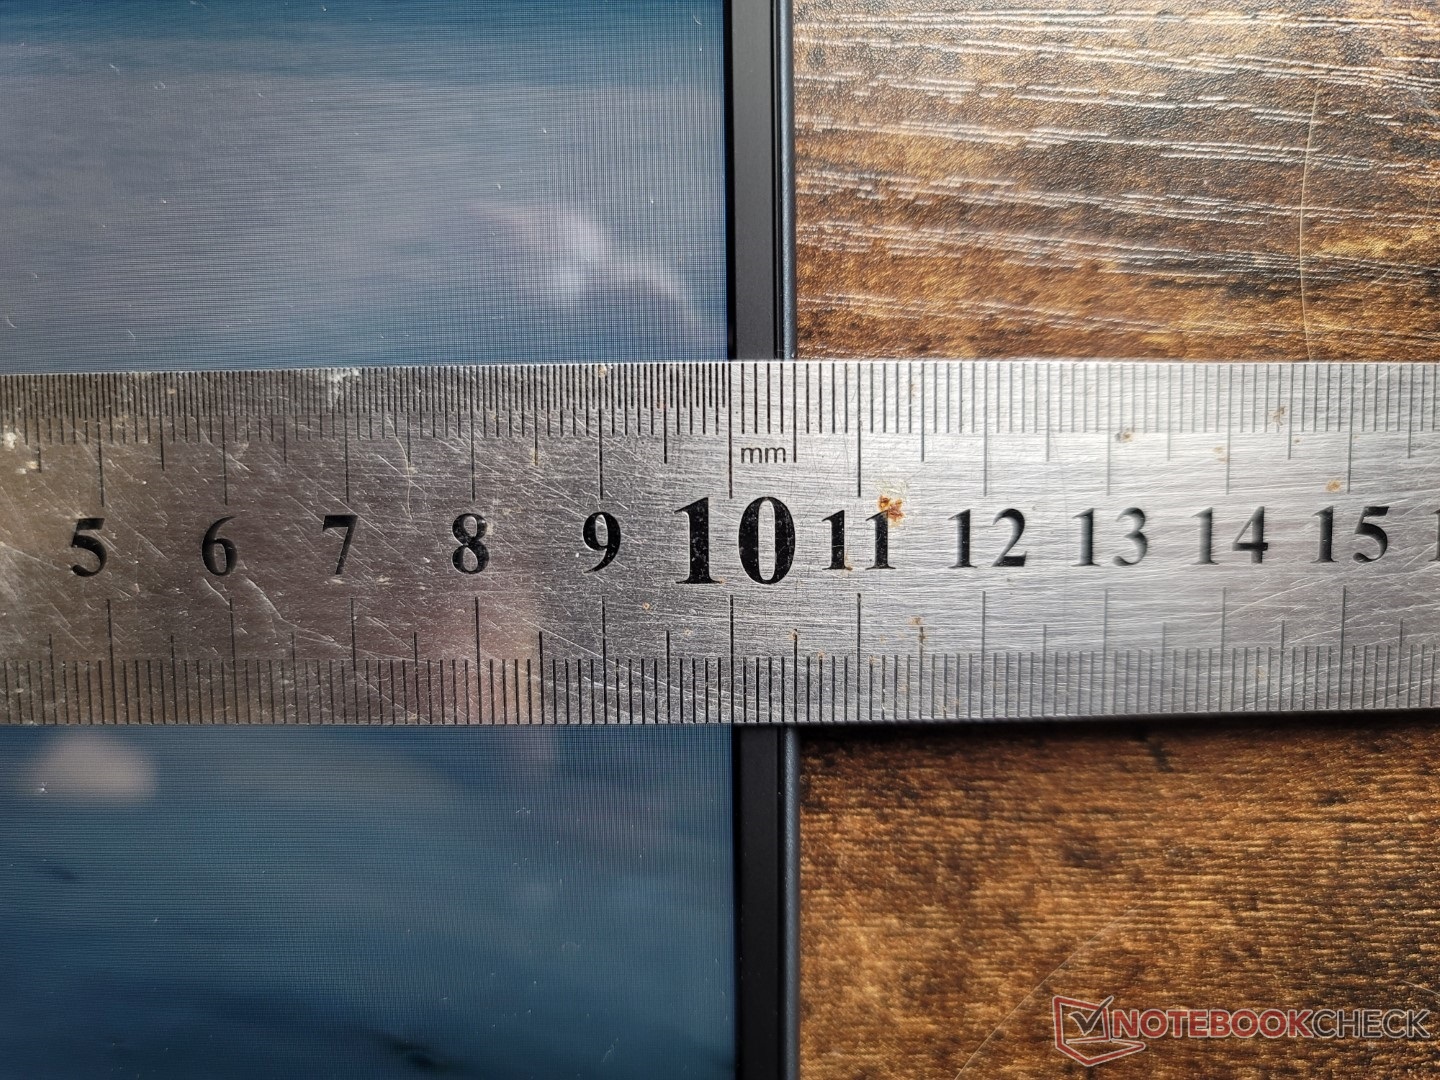
Il nuovo modello è più lungo del Dragonfly Max uscente di oltre 20 mm grazie al nuovo fattore di forma da 13,5 pollici, ma fortunatamente non è più pesante di 1,2 kg nonostante il volume maggiore. Forse non sorprende che le dimensioni siano quasi identiche a quelle del recente Spectre x360 13.5 pollici.
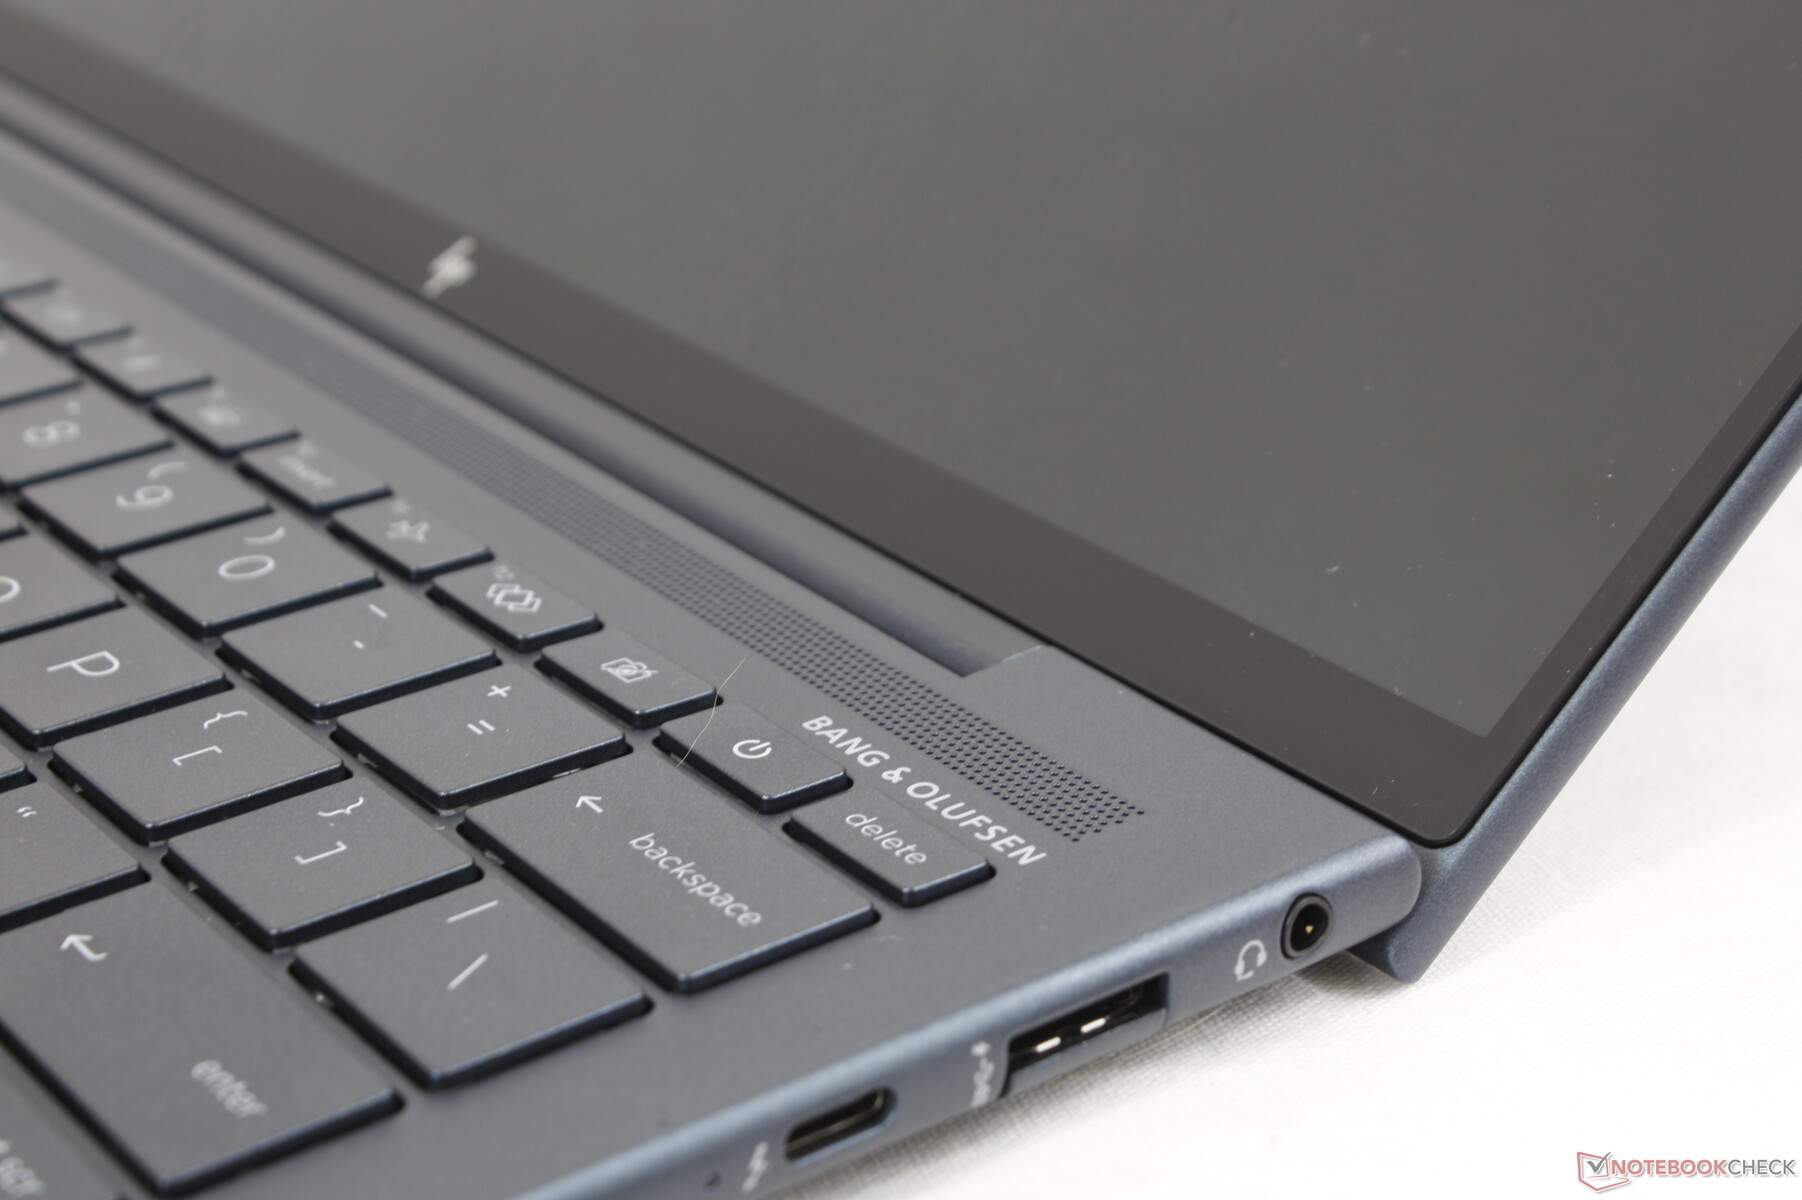
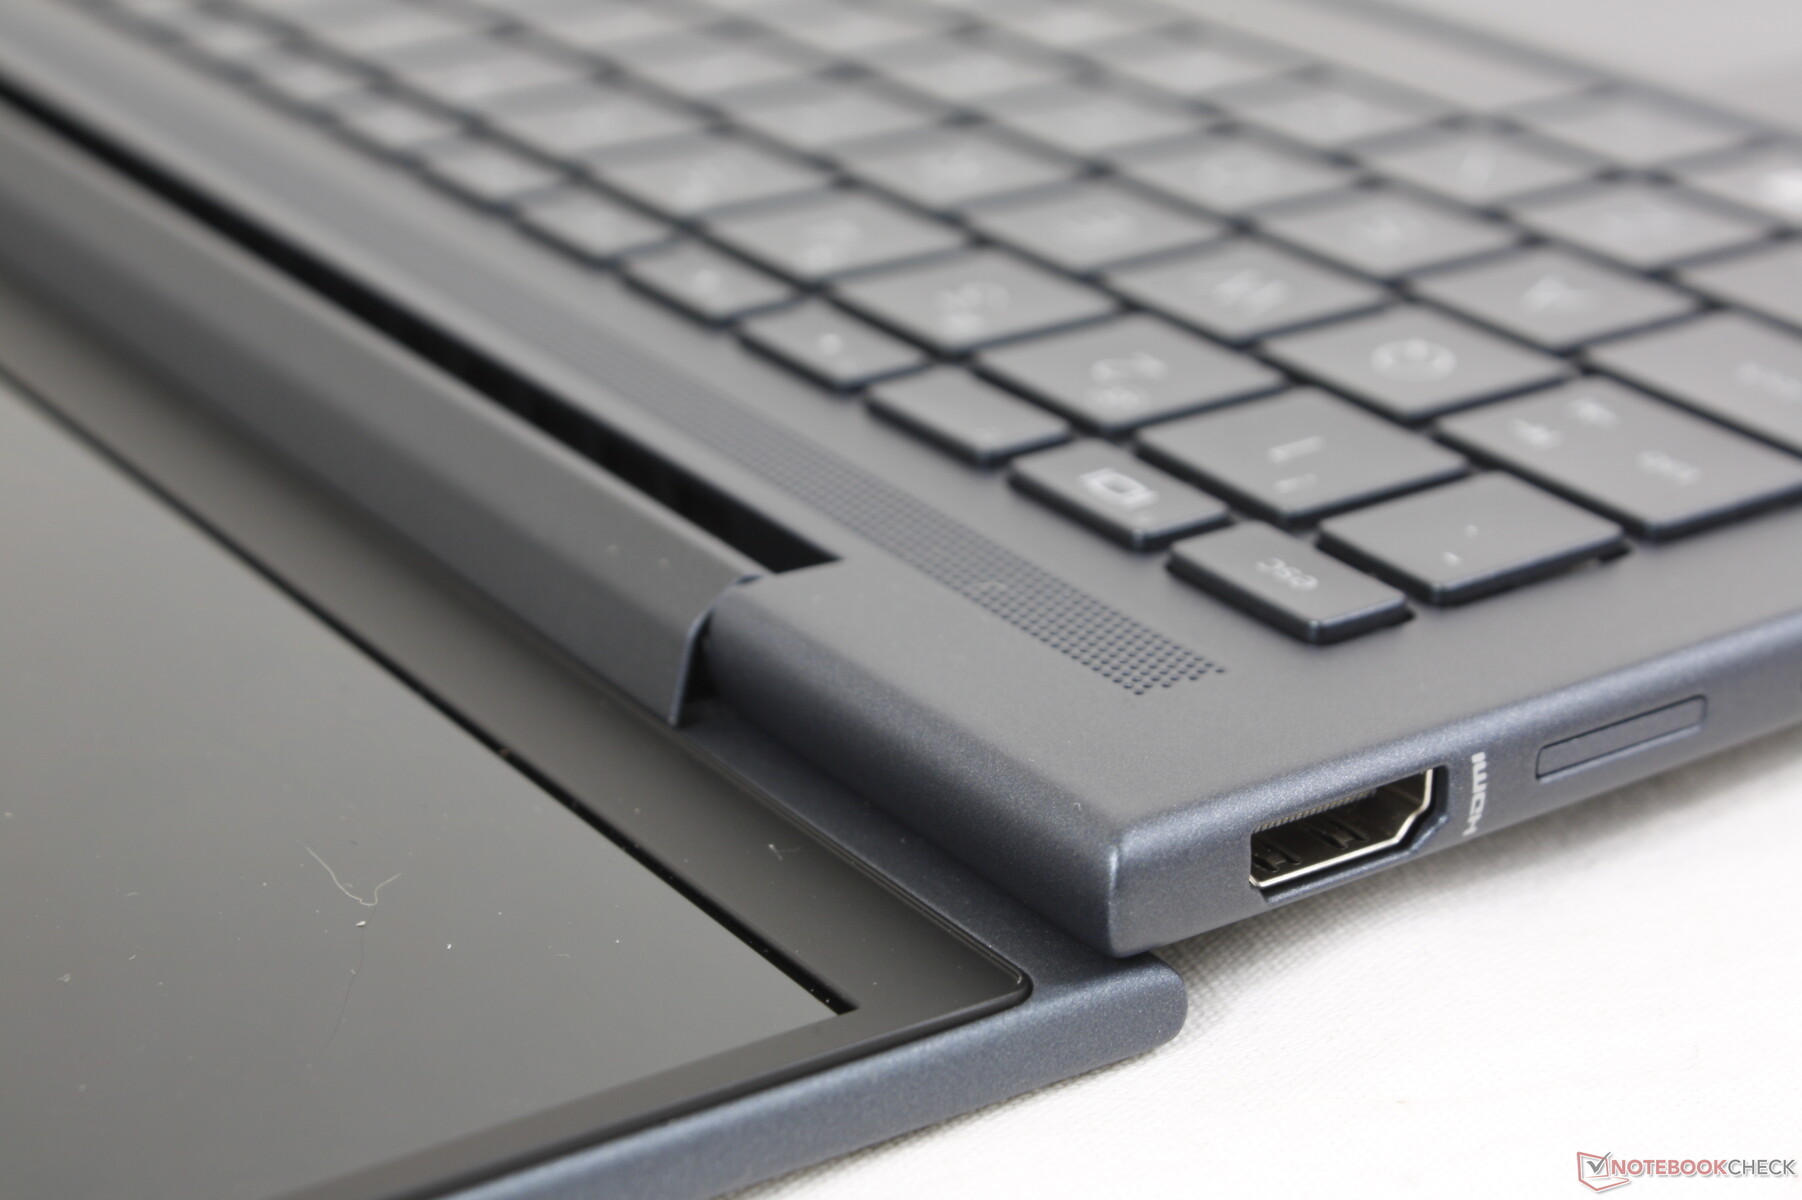
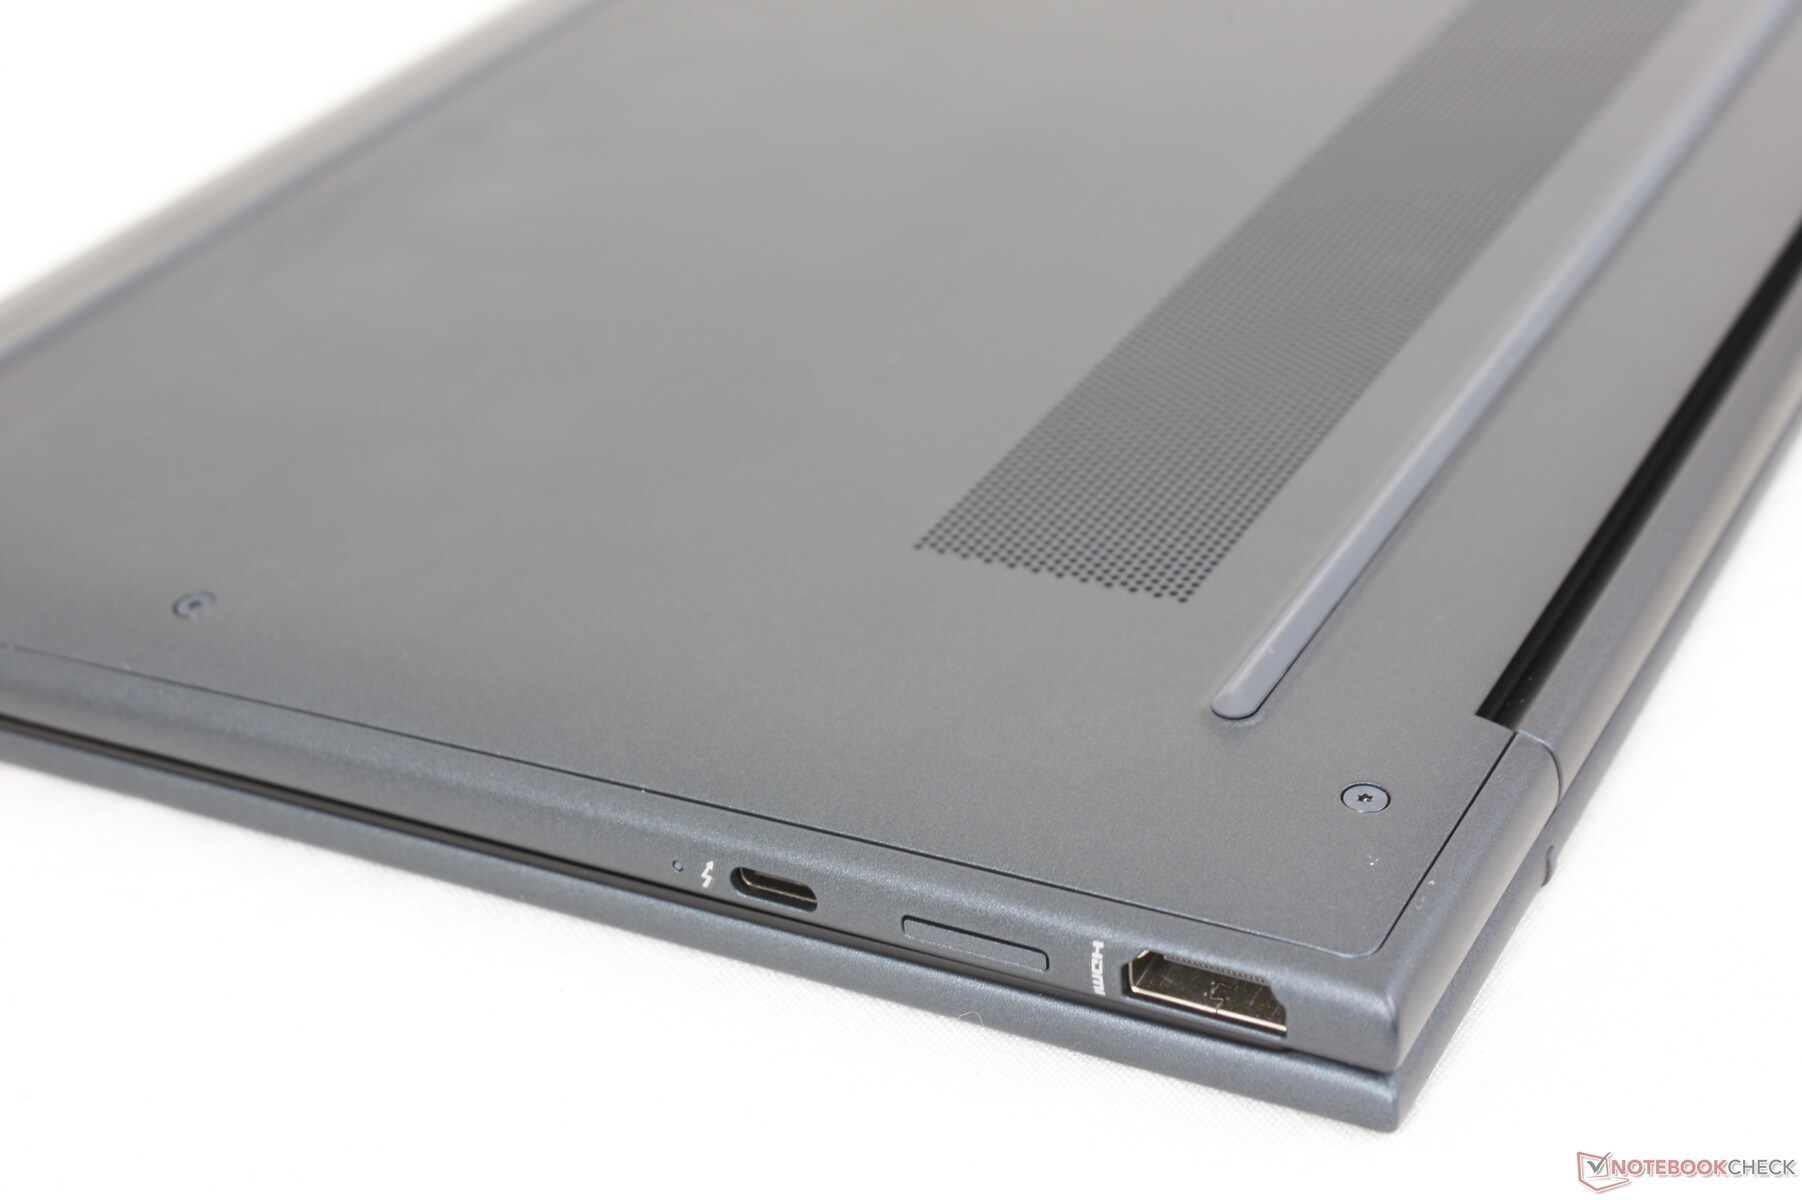
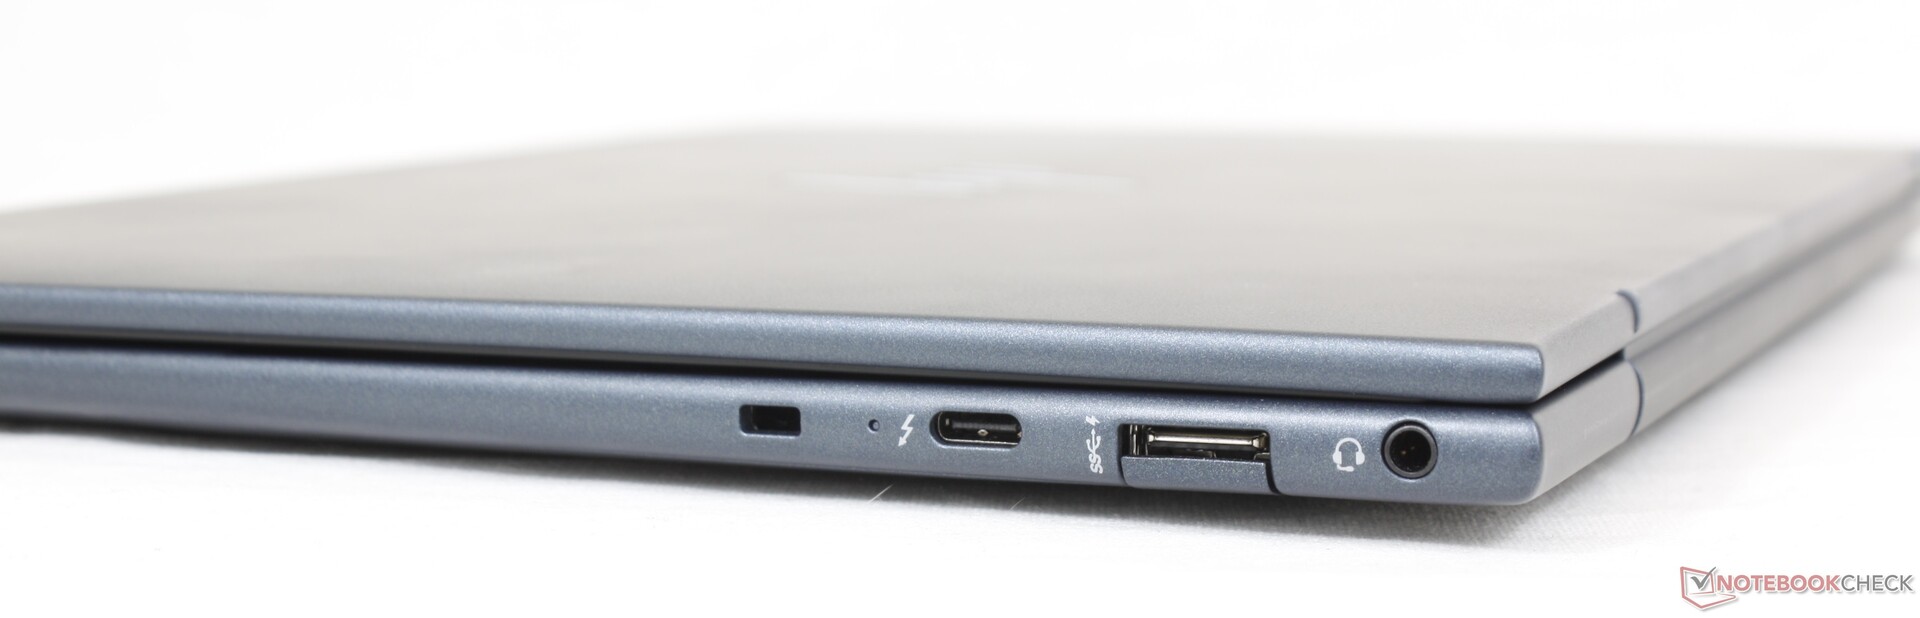
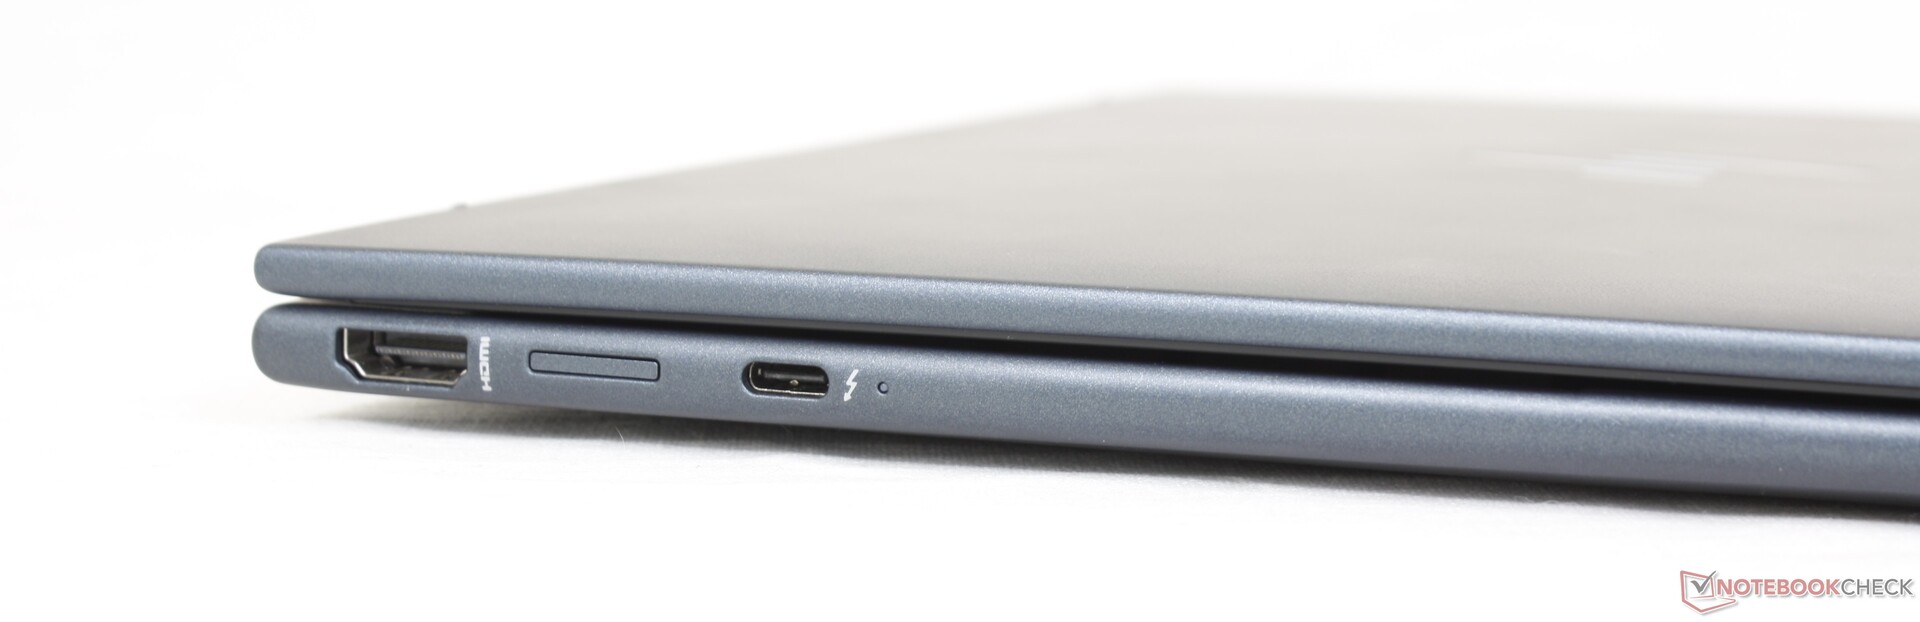
Connettività - Supporto Thunderbolt 4
Le porte sono essenzialmente le stesse del Dragonfly Max, ma riorganizzate in meglio. Le due porte USB-C, ad esempio, si trovano ora lungo i bordi destro e sinistro del portatile, anziché solo lungo il bordo destro, per consentire la ricarica su entrambi i lati del portatile.
Ancora una volta non c'è un lettore di schede SD integrato, perché HP sta spingendo la propria soluzione software wireless QuickDrop. QuickDrop funziona abbastanza bene per gli smartphone, ma gli utenti di fotocamere dedicate che si affidano alle schede SD non sono fortunati.
Comunicazione
La connettività Wi-Fi 6E e Bluetooth 5.2 è garantita da un Intel AX211 di serie. Abbiamo riscontrato un'eccellente velocità di trasferimento in ricezione quando siamo stati accoppiati alla nostra rete a 6 GHz, ma la velocità di trasmissione avrebbe potuto essere più costante
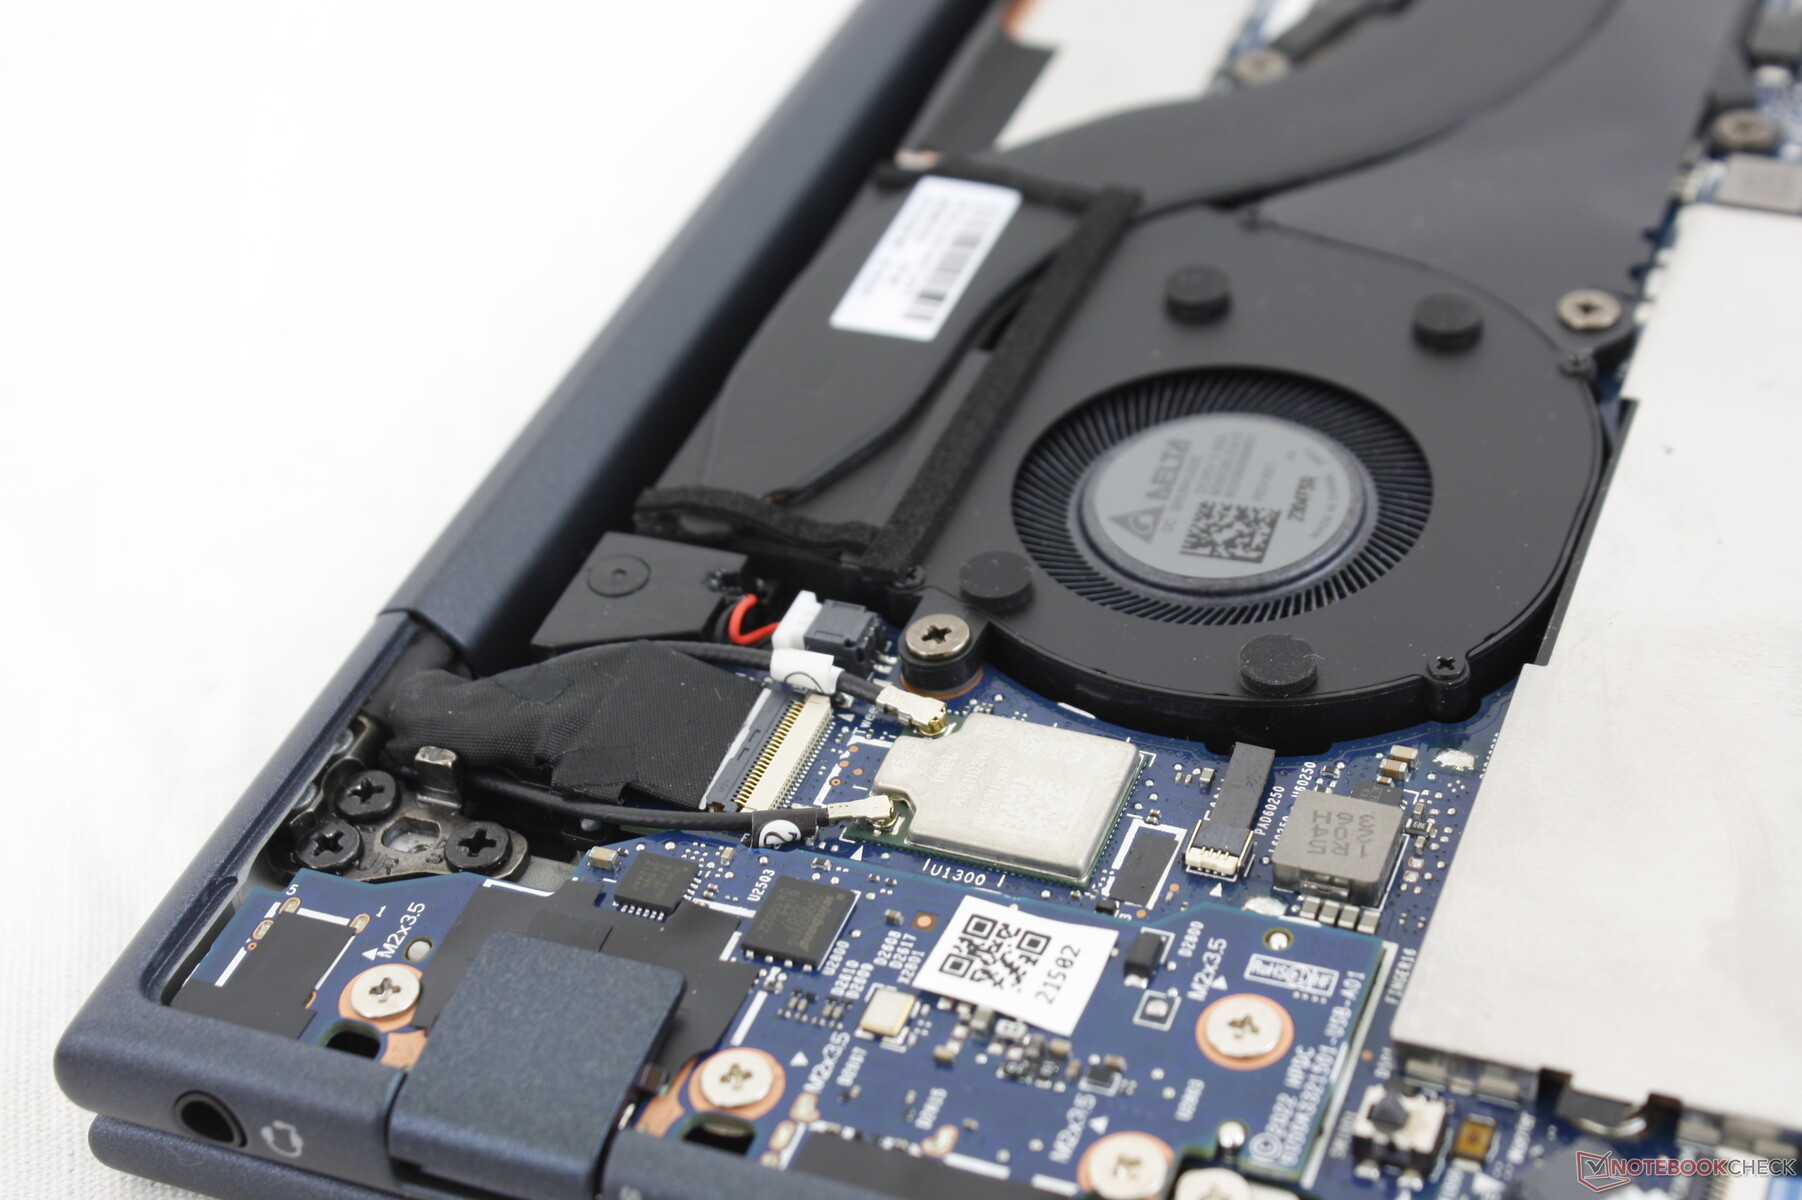
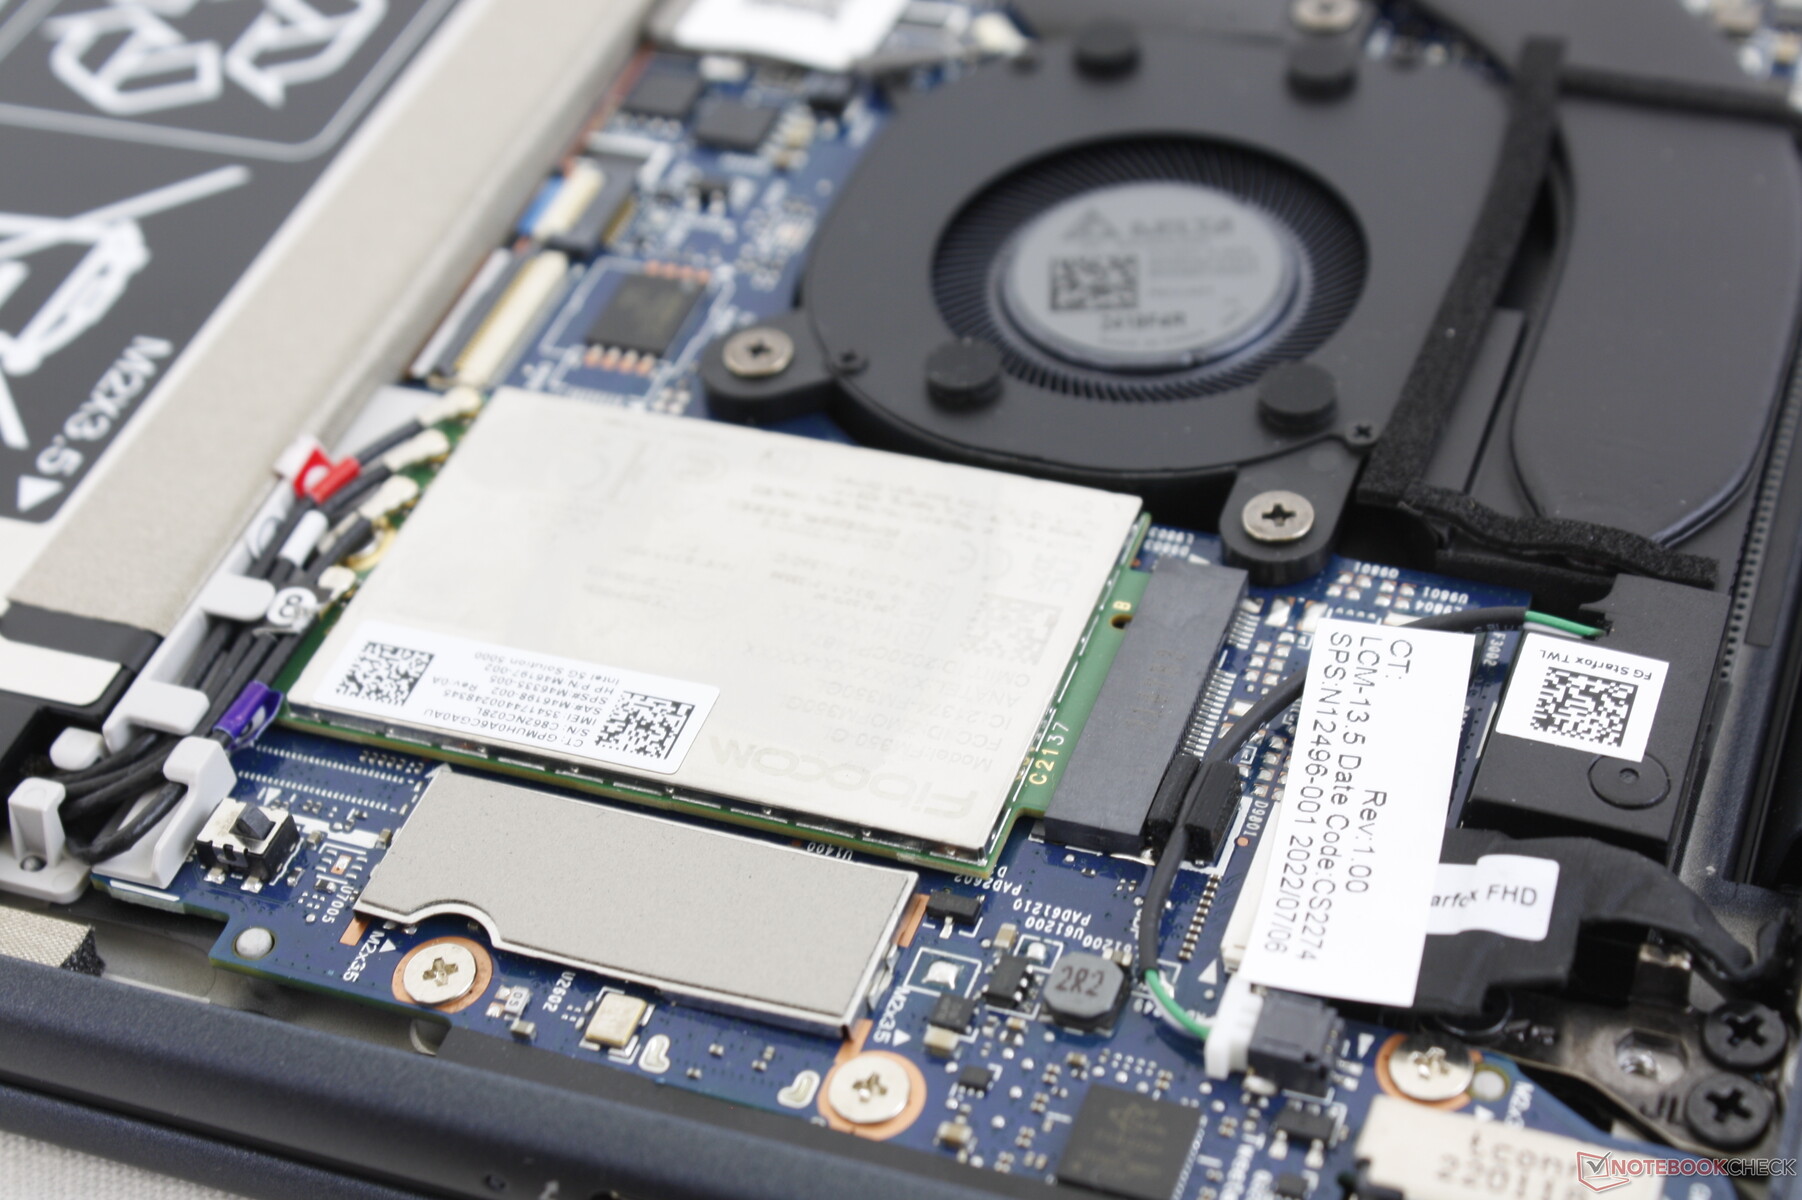
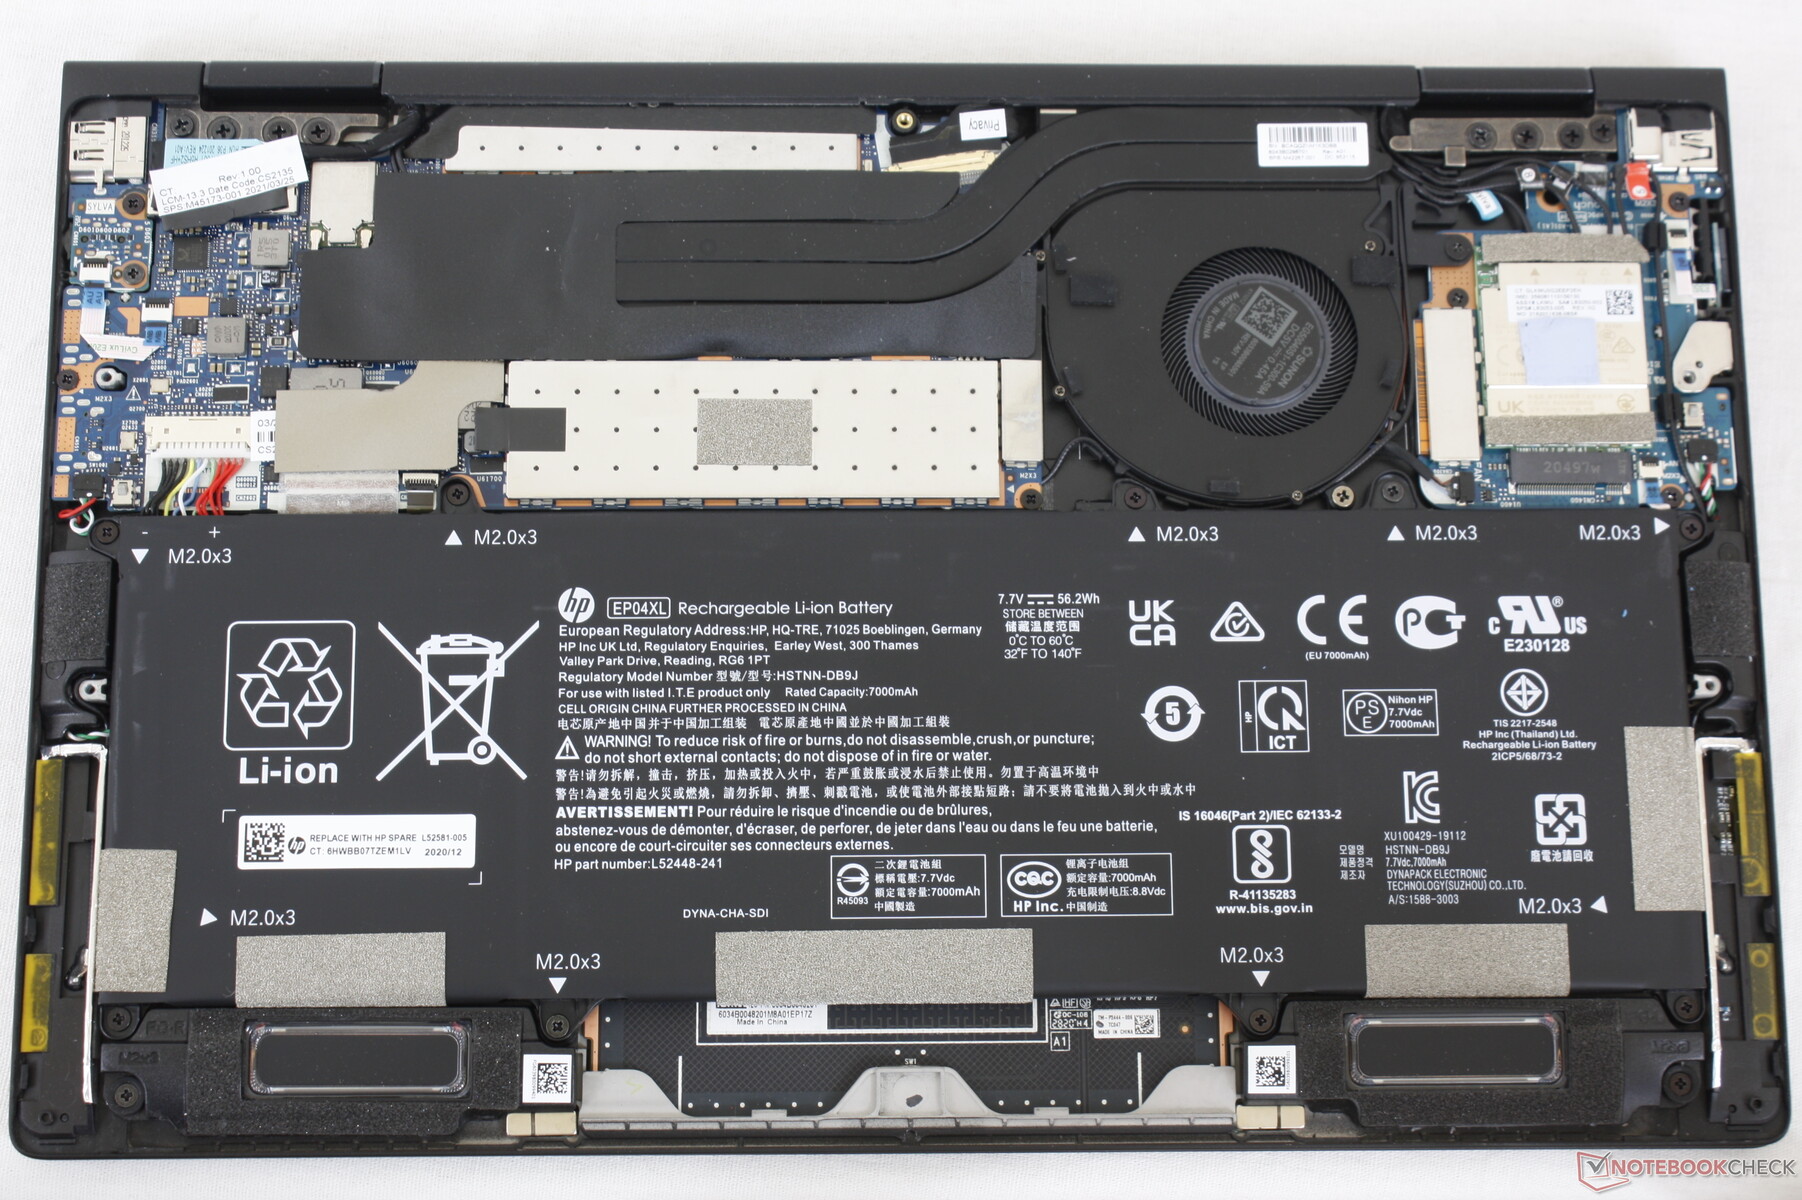
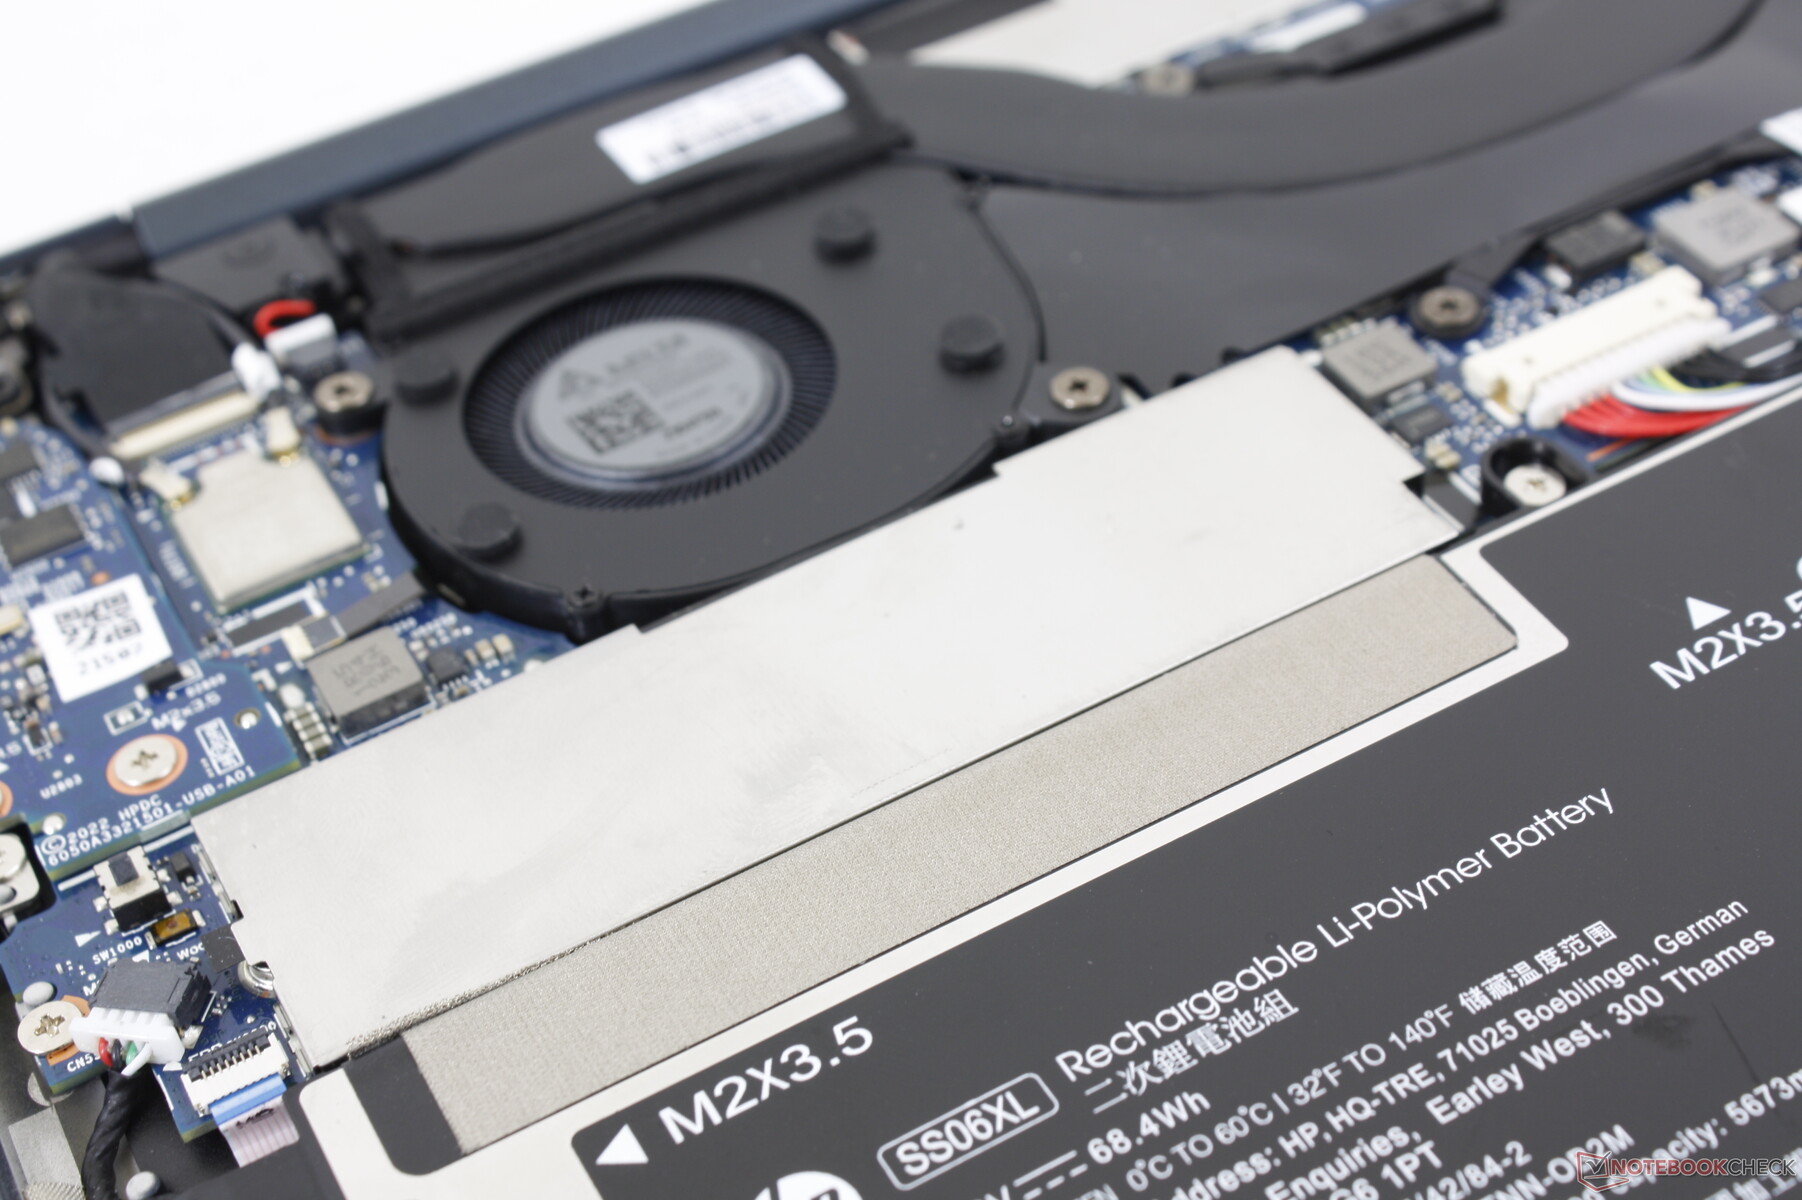
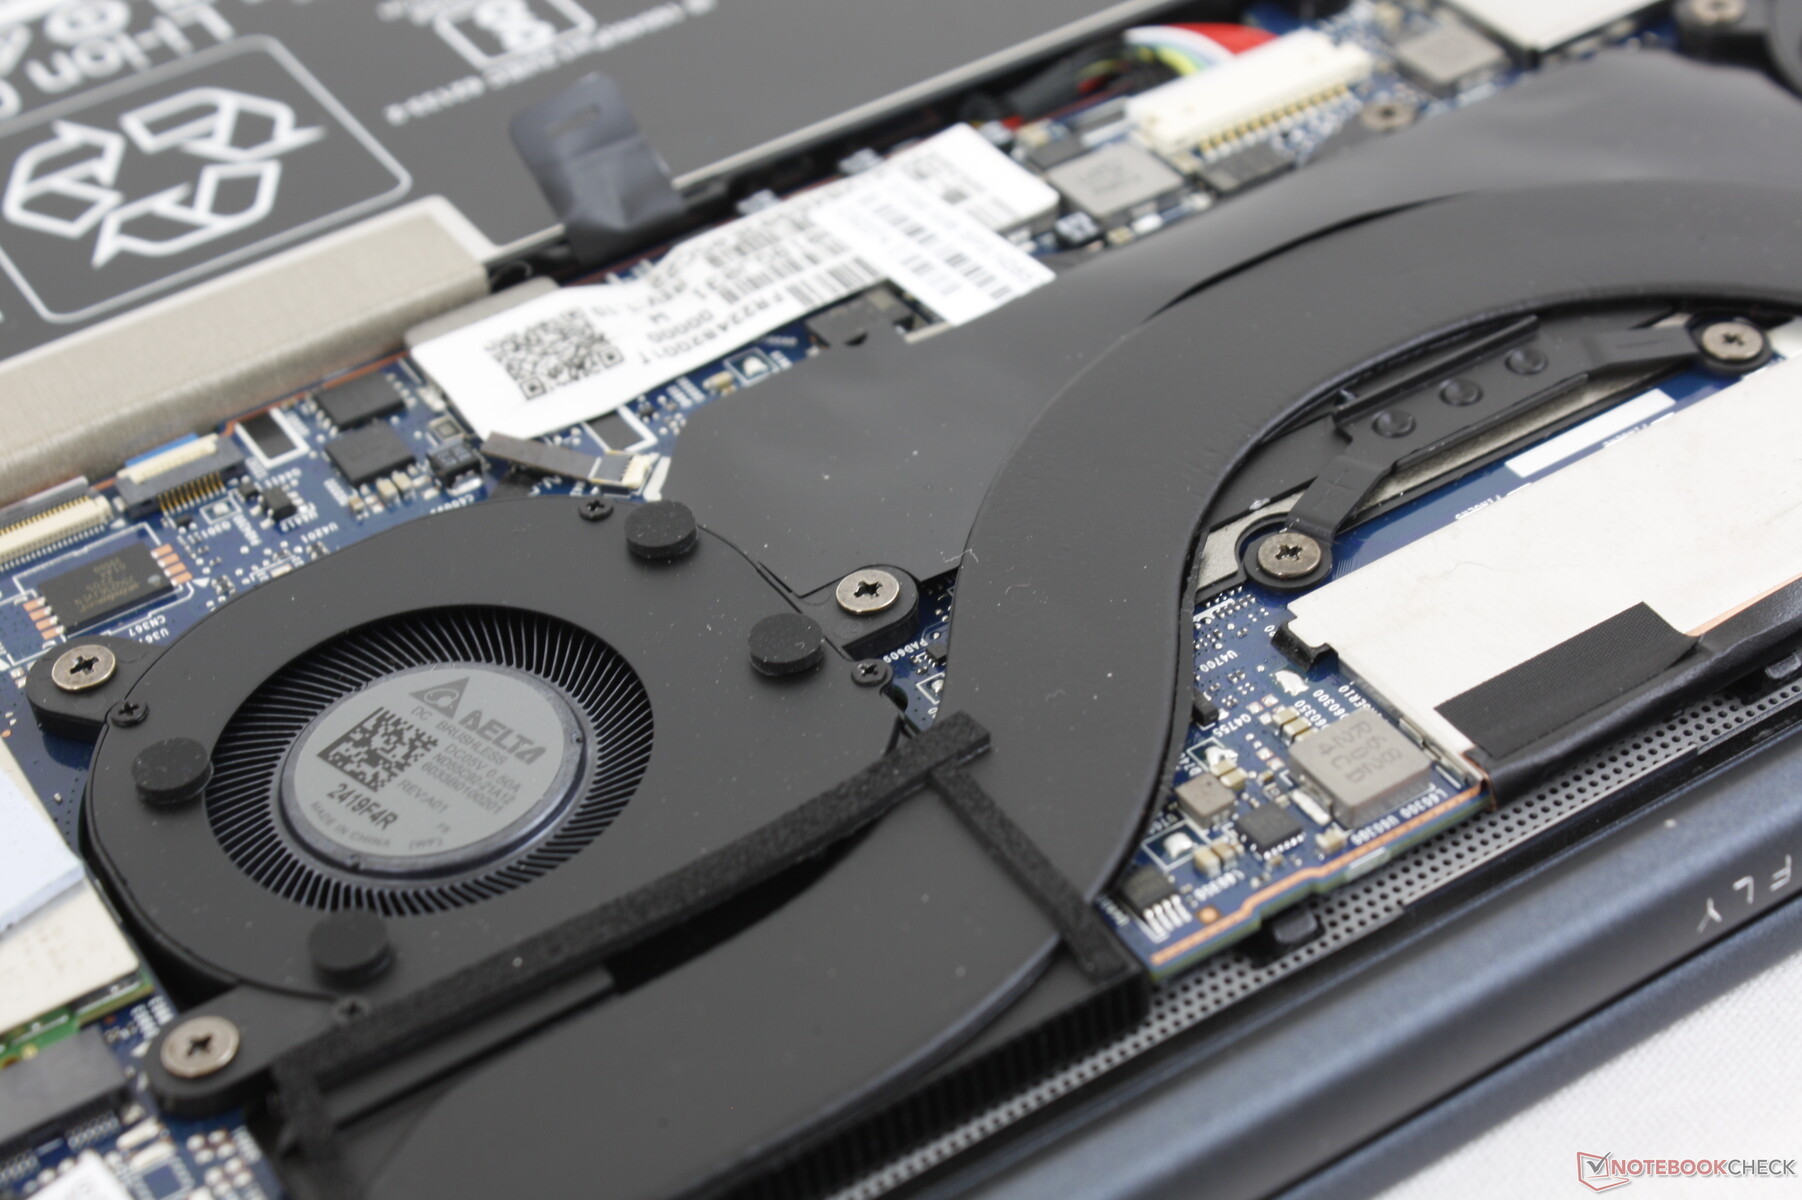
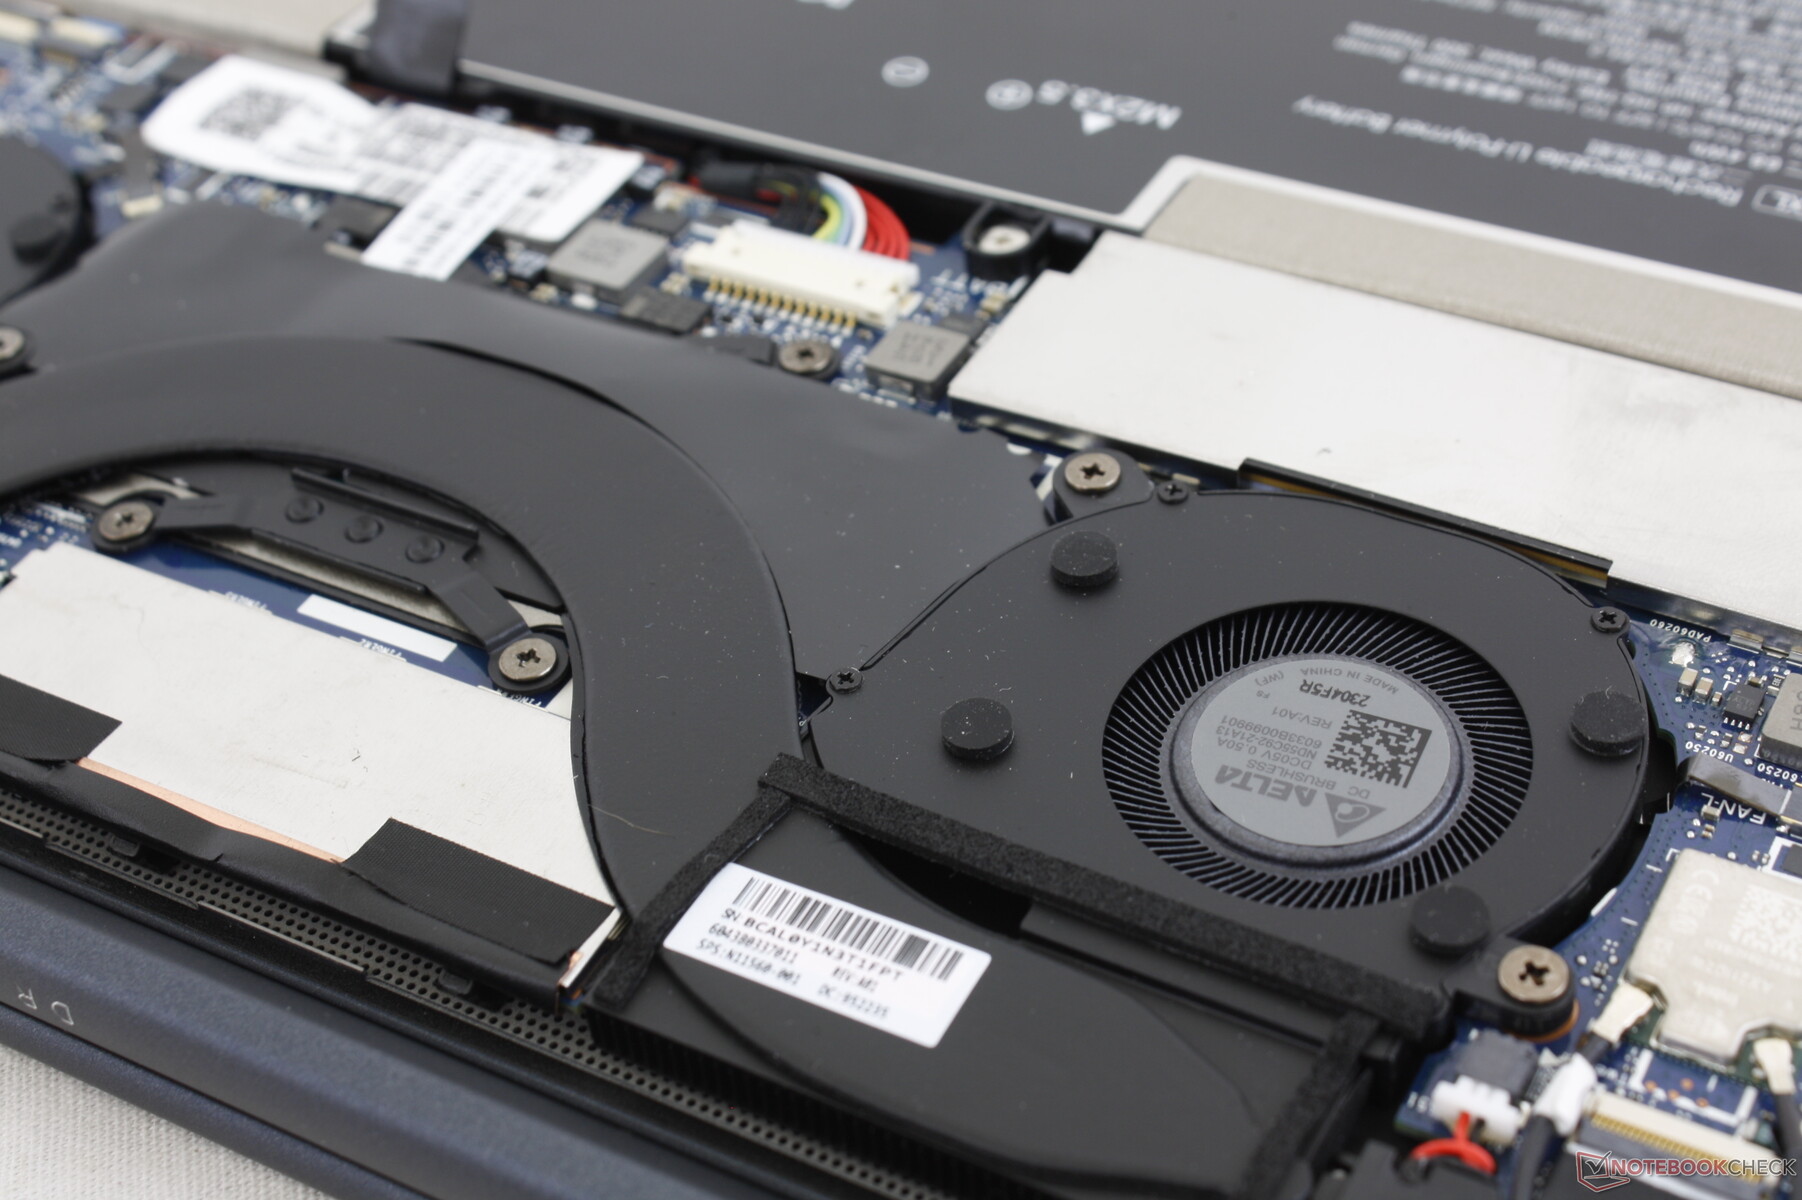
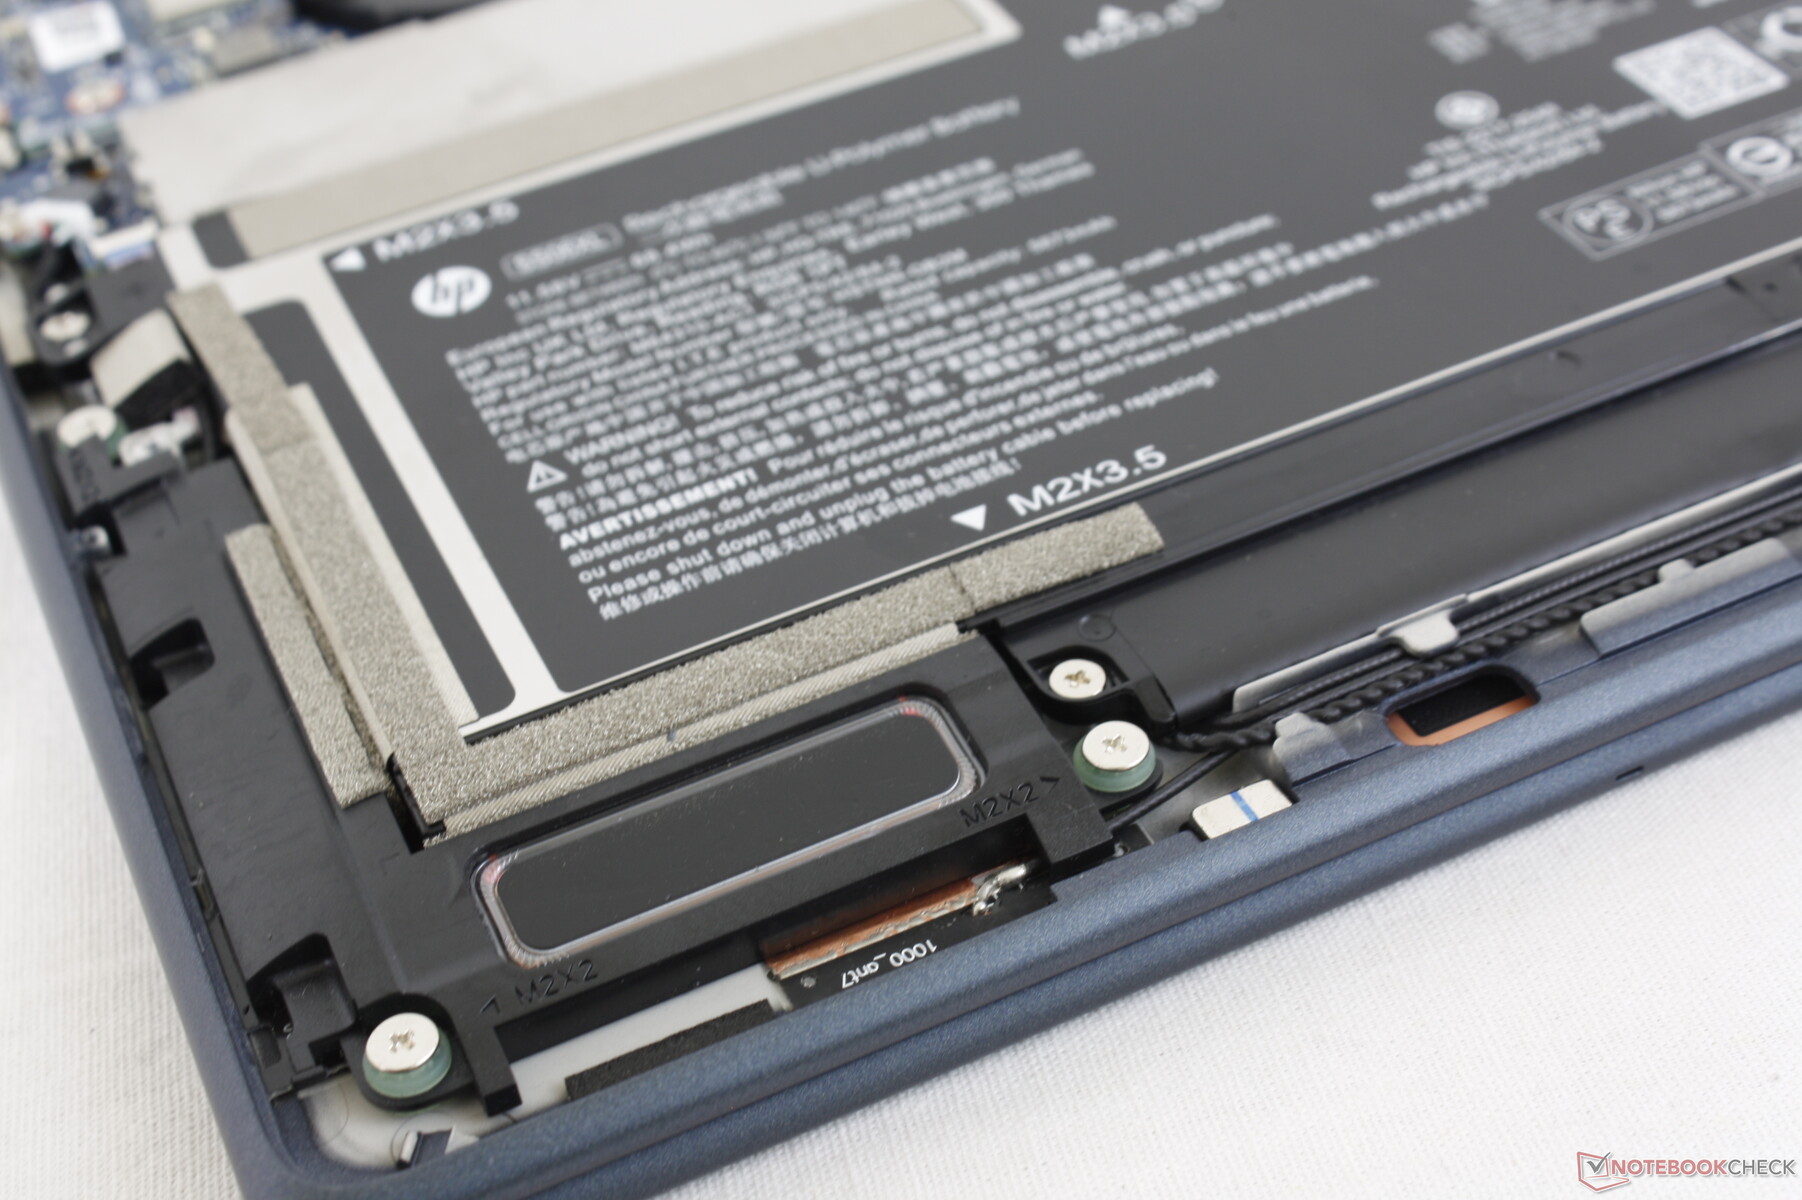
Un modulo WWAN Intel XMM 7560 R+ o 5G 5000 sono opzionali. Il modulo WWAN è rimovibile mentre il modulo WLAN non lo è, come mostrano le immagini qui sotto.
| Networking | |
| iperf3 transmit AX12 | |
| Lenovo ThinkPad X1 Titanium Yoga G1 20QA001RGE | |
| HP Spectre x360 14t-ea000 | |
| HP EliteBook Folio 13.5-3G2L2EA | |
| iperf3 receive AX12 | |
| Lenovo ThinkPad X1 Titanium Yoga G1 20QA001RGE | |
| HP Spectre x360 14t-ea000 | |
| HP EliteBook Folio 13.5-3G2L2EA | |
| iperf3 receive AXE11000 6GHz | |
| Dell XPS 13 Plus 9320 i5-1240p | |
| Framework Laptop 13.5 12th Gen Intel | |
| HP Elite Dragonfly G3 | |
| iperf3 transmit AXE11000 6GHz | |
| Framework Laptop 13.5 12th Gen Intel | |
| HP Elite Dragonfly G3 | |
| Dell XPS 13 Plus 9320 i5-1240p | |
Webcam - 5 MP Standard
Sebbene anche il Dragonfly Max dell'anno scorso fosse dotato di una webcam da 5 MP, quella del Dragonfly G3 è notevolmente più nitida e luminosa, tanto da essere una delle migliori webcam integrate che abbiamo visto su qualsiasi portatile, indipendentemente dalle dimensioni dello schermo. L'otturatore e l'IR sono presenti rispettivamente per la privacy e per il supporto di Hello.


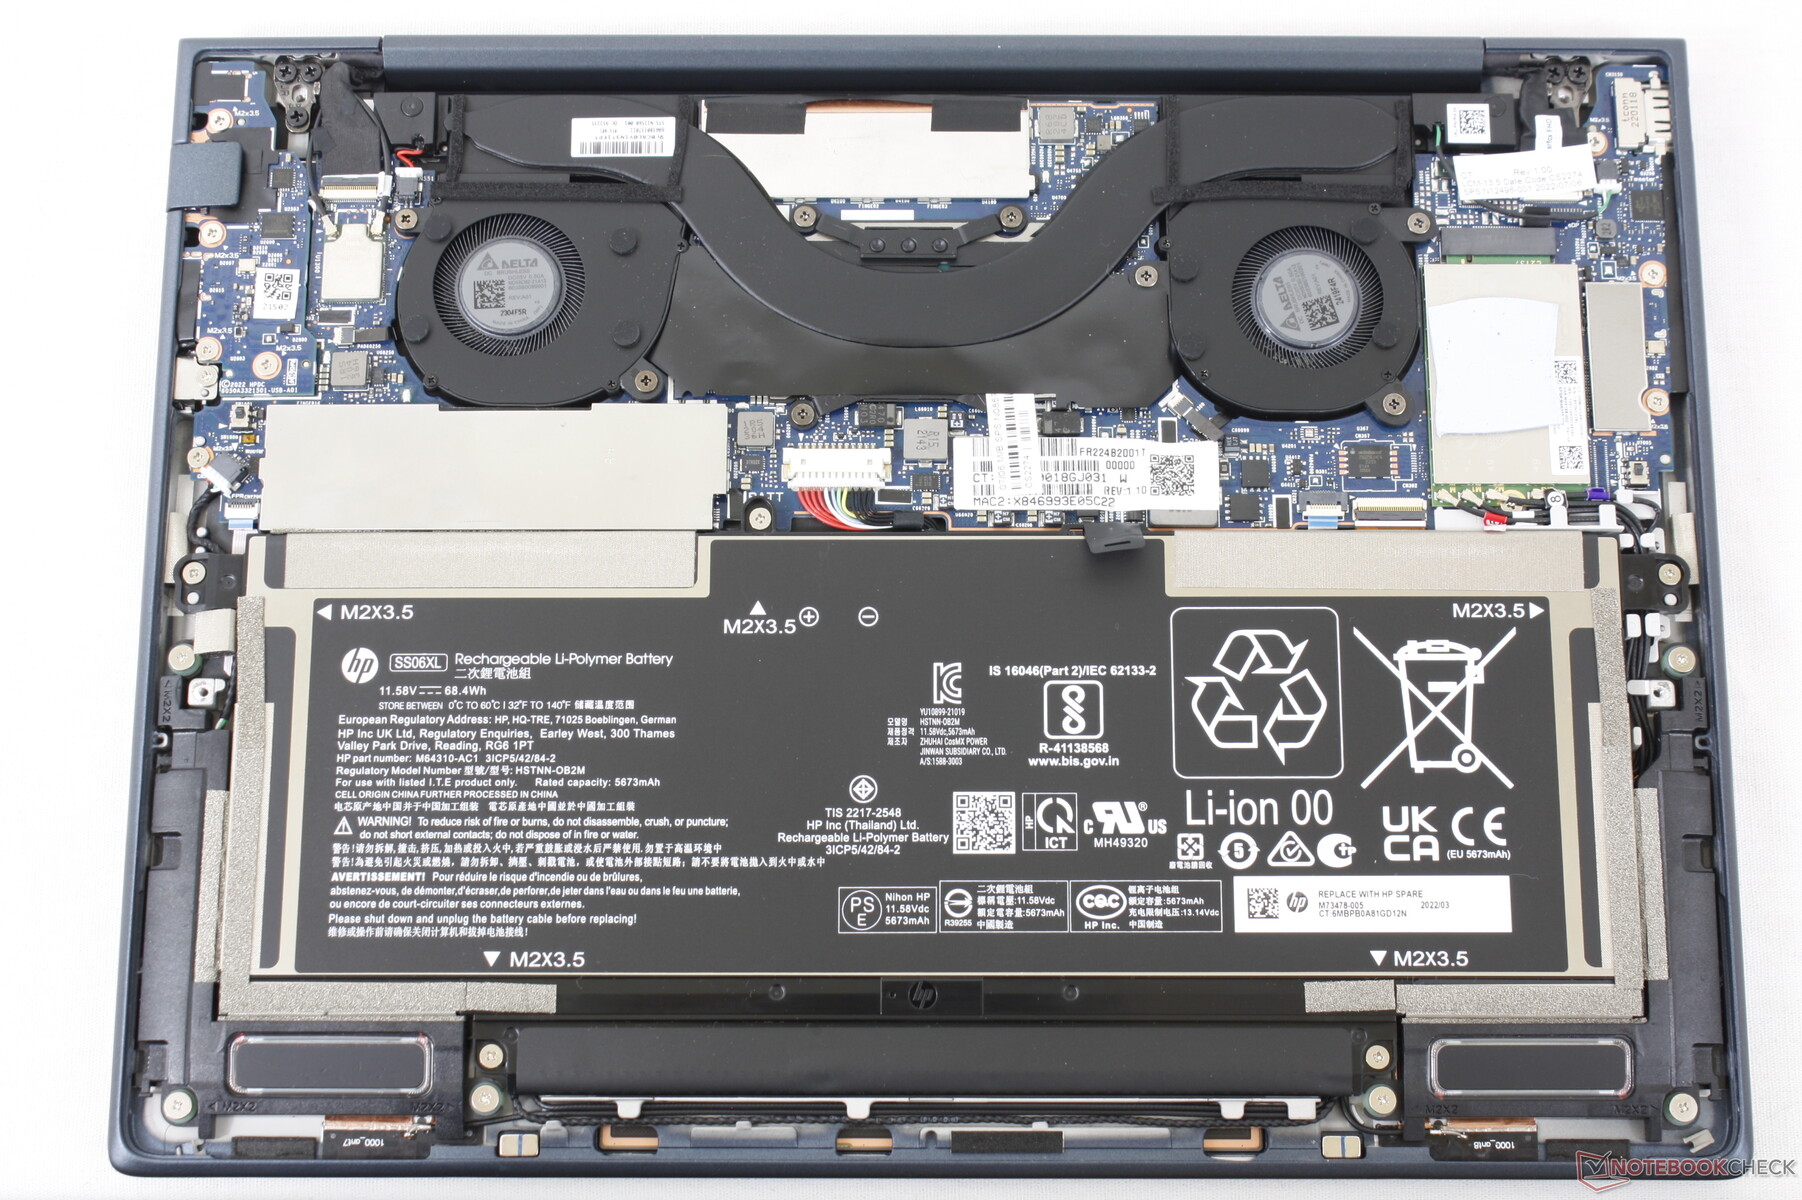
Manutenzione
Il pannello inferiore è fissato da quattro viti T5 Torx accessibili per facilitare la manutenzione. Gli utenti possono sostituire la batteria, la WWAN M.2 o l'SSD M.2 a seconda delle necessità, mentre i moduli RAM sono fissi.
Accessori e garanzia
Nella confezione non ci sono altri extra oltre all'adattatore CA e alla documentazione. Sarebbe stata gradita una custodia per il trasporto, simile a quella inclusa in alcuni modelli Spectre.
La garanzia limitata di un anno del produttore è standard se acquistata negli Stati Uniti. Riteniamo che ciò sia deludente, dato che il Dragonfly è uno dei portatili business di punta di HP, per il quale ci si aspetta una garanzia di base di 3 anni. Il Dell Latitude 7330, ad esempio, ha una garanzia di 3 anni senza costi aggiuntivi.
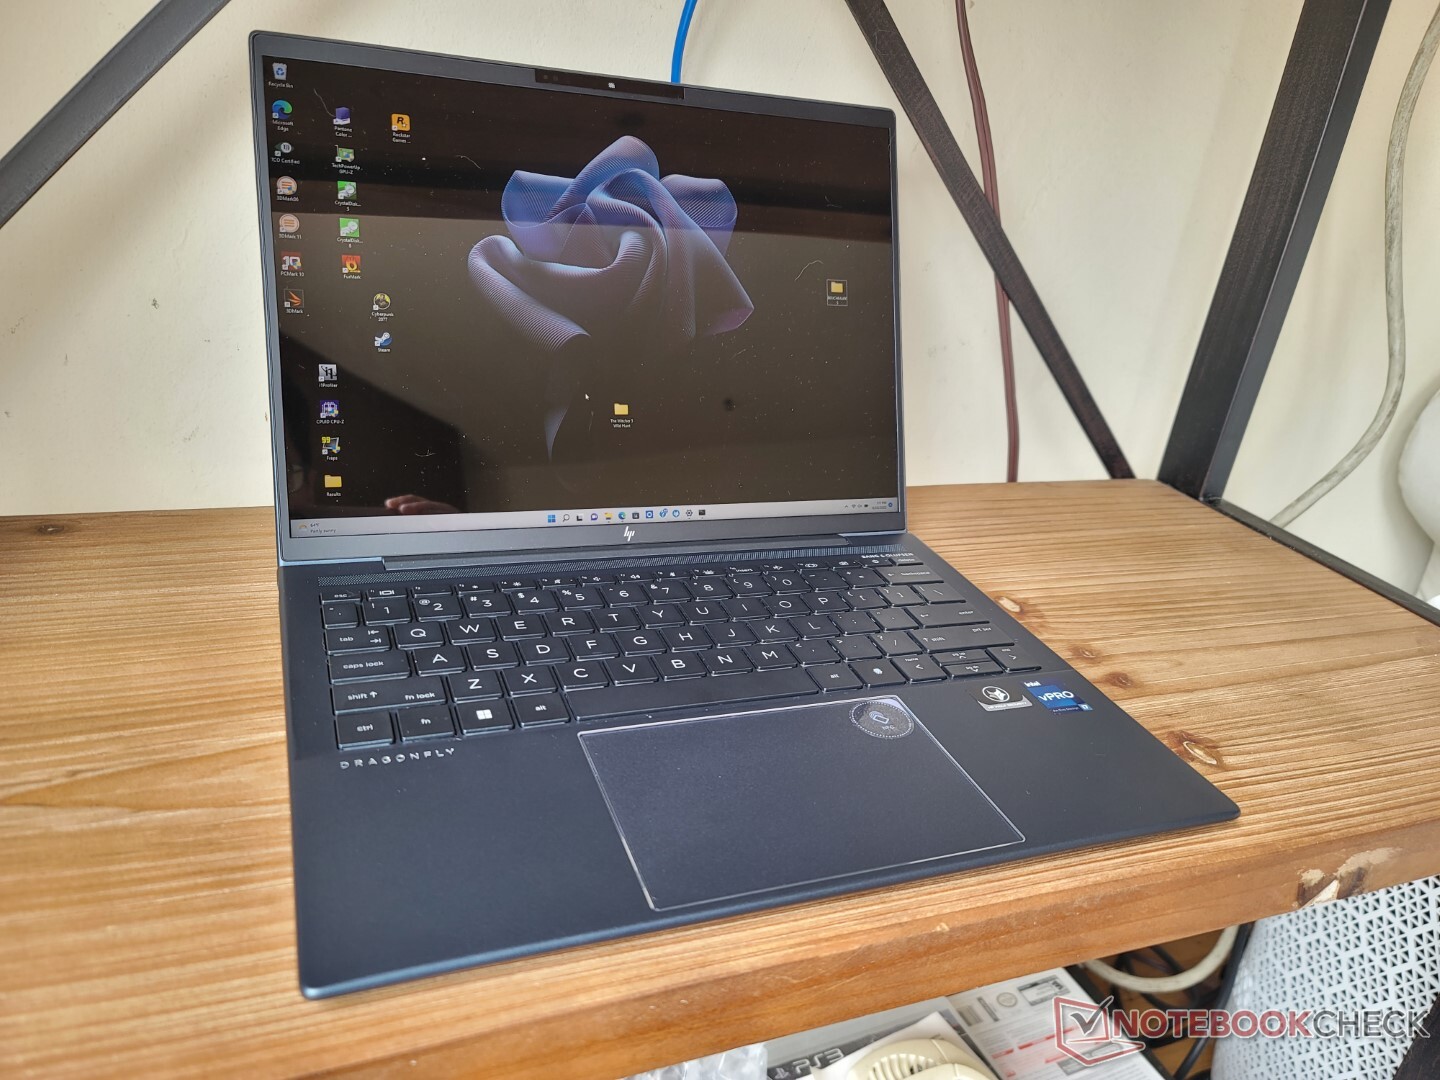
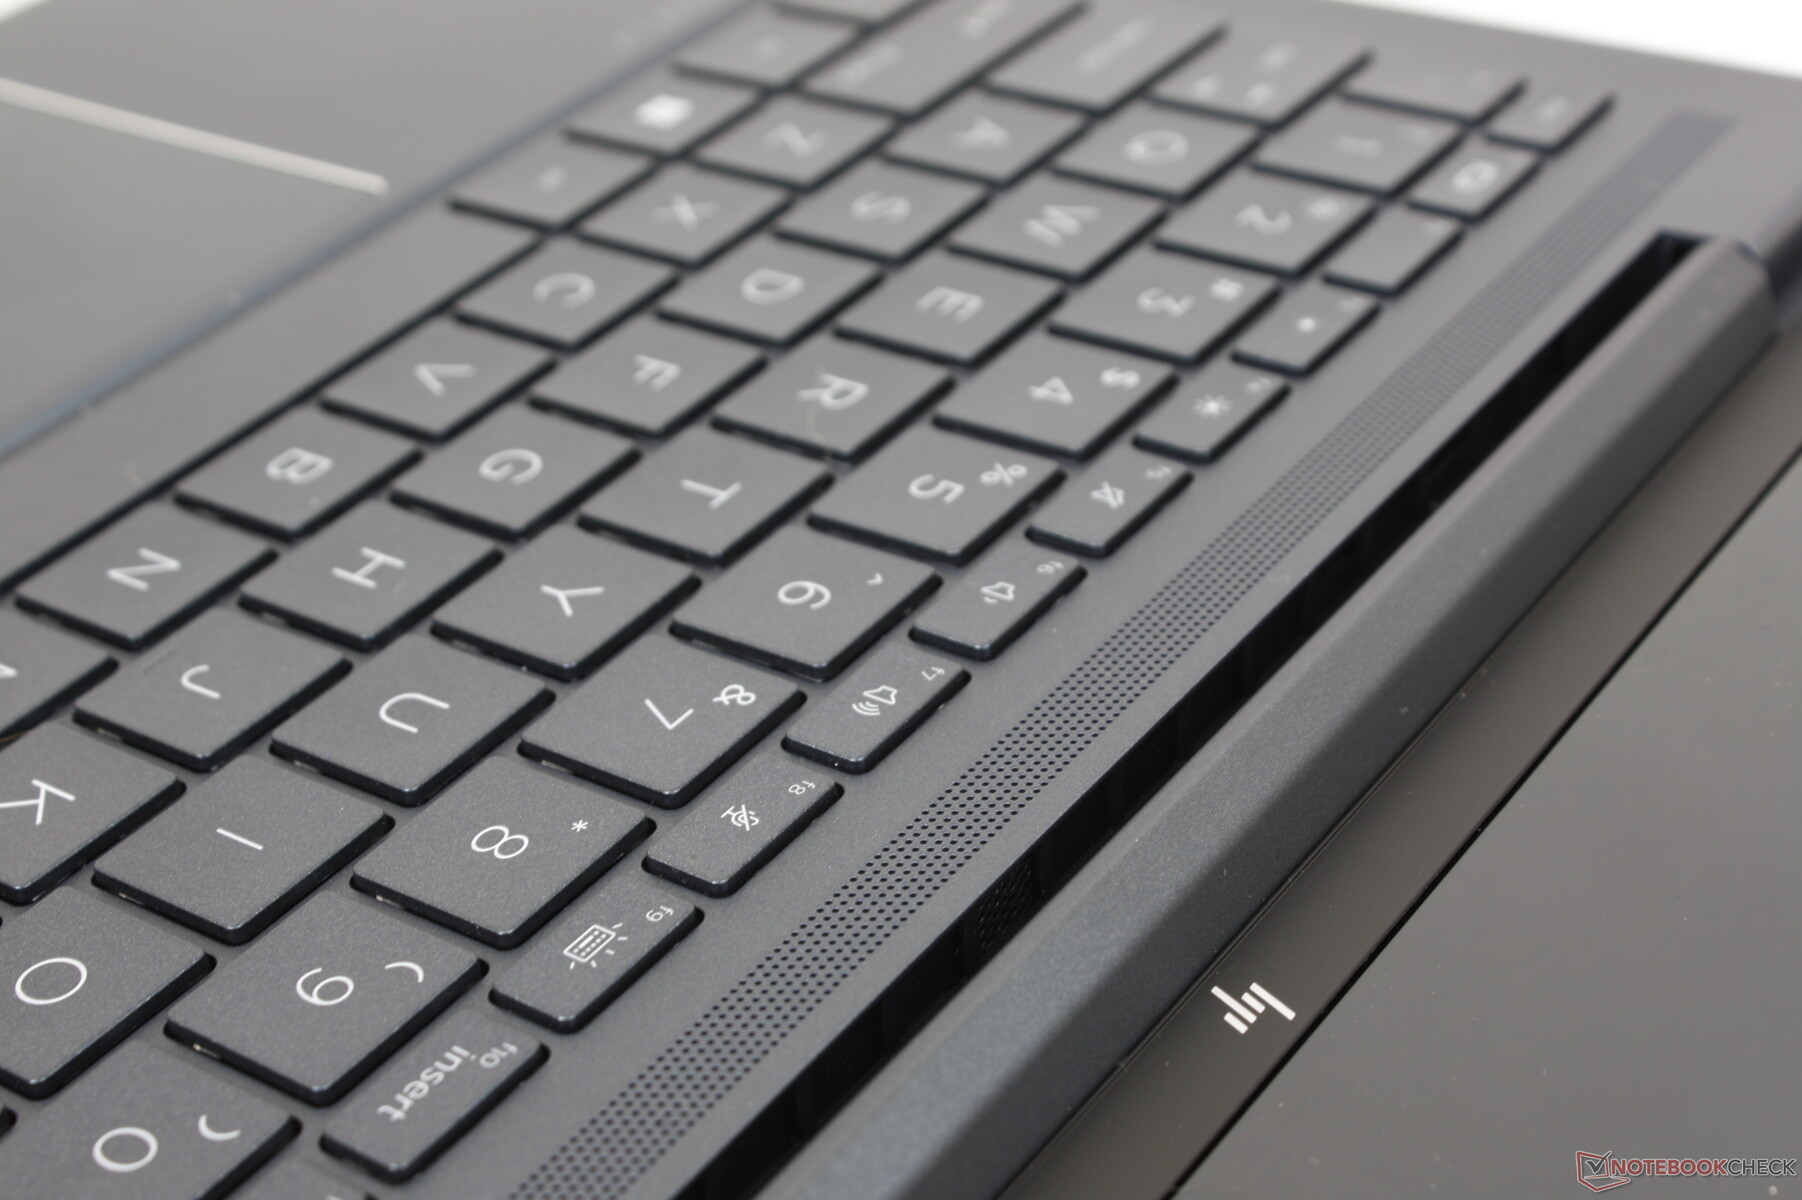
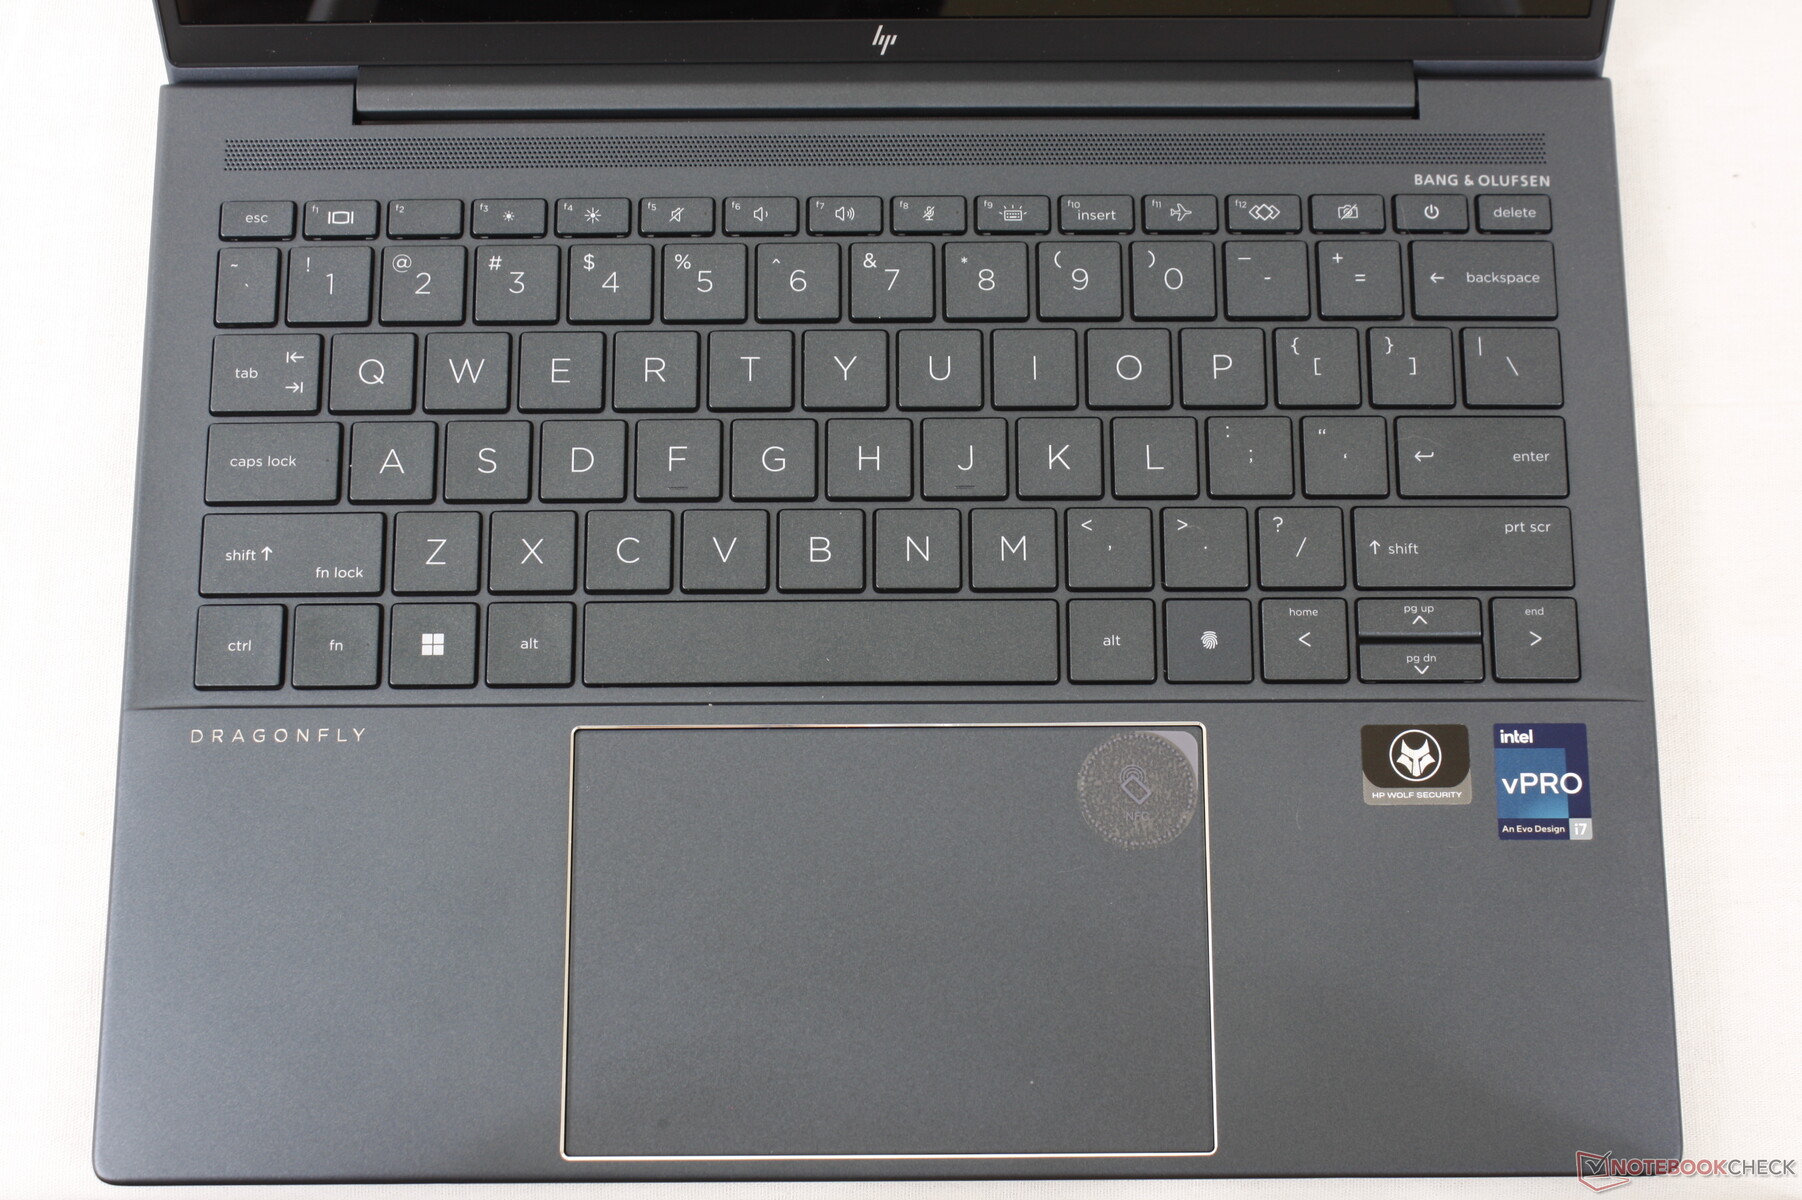
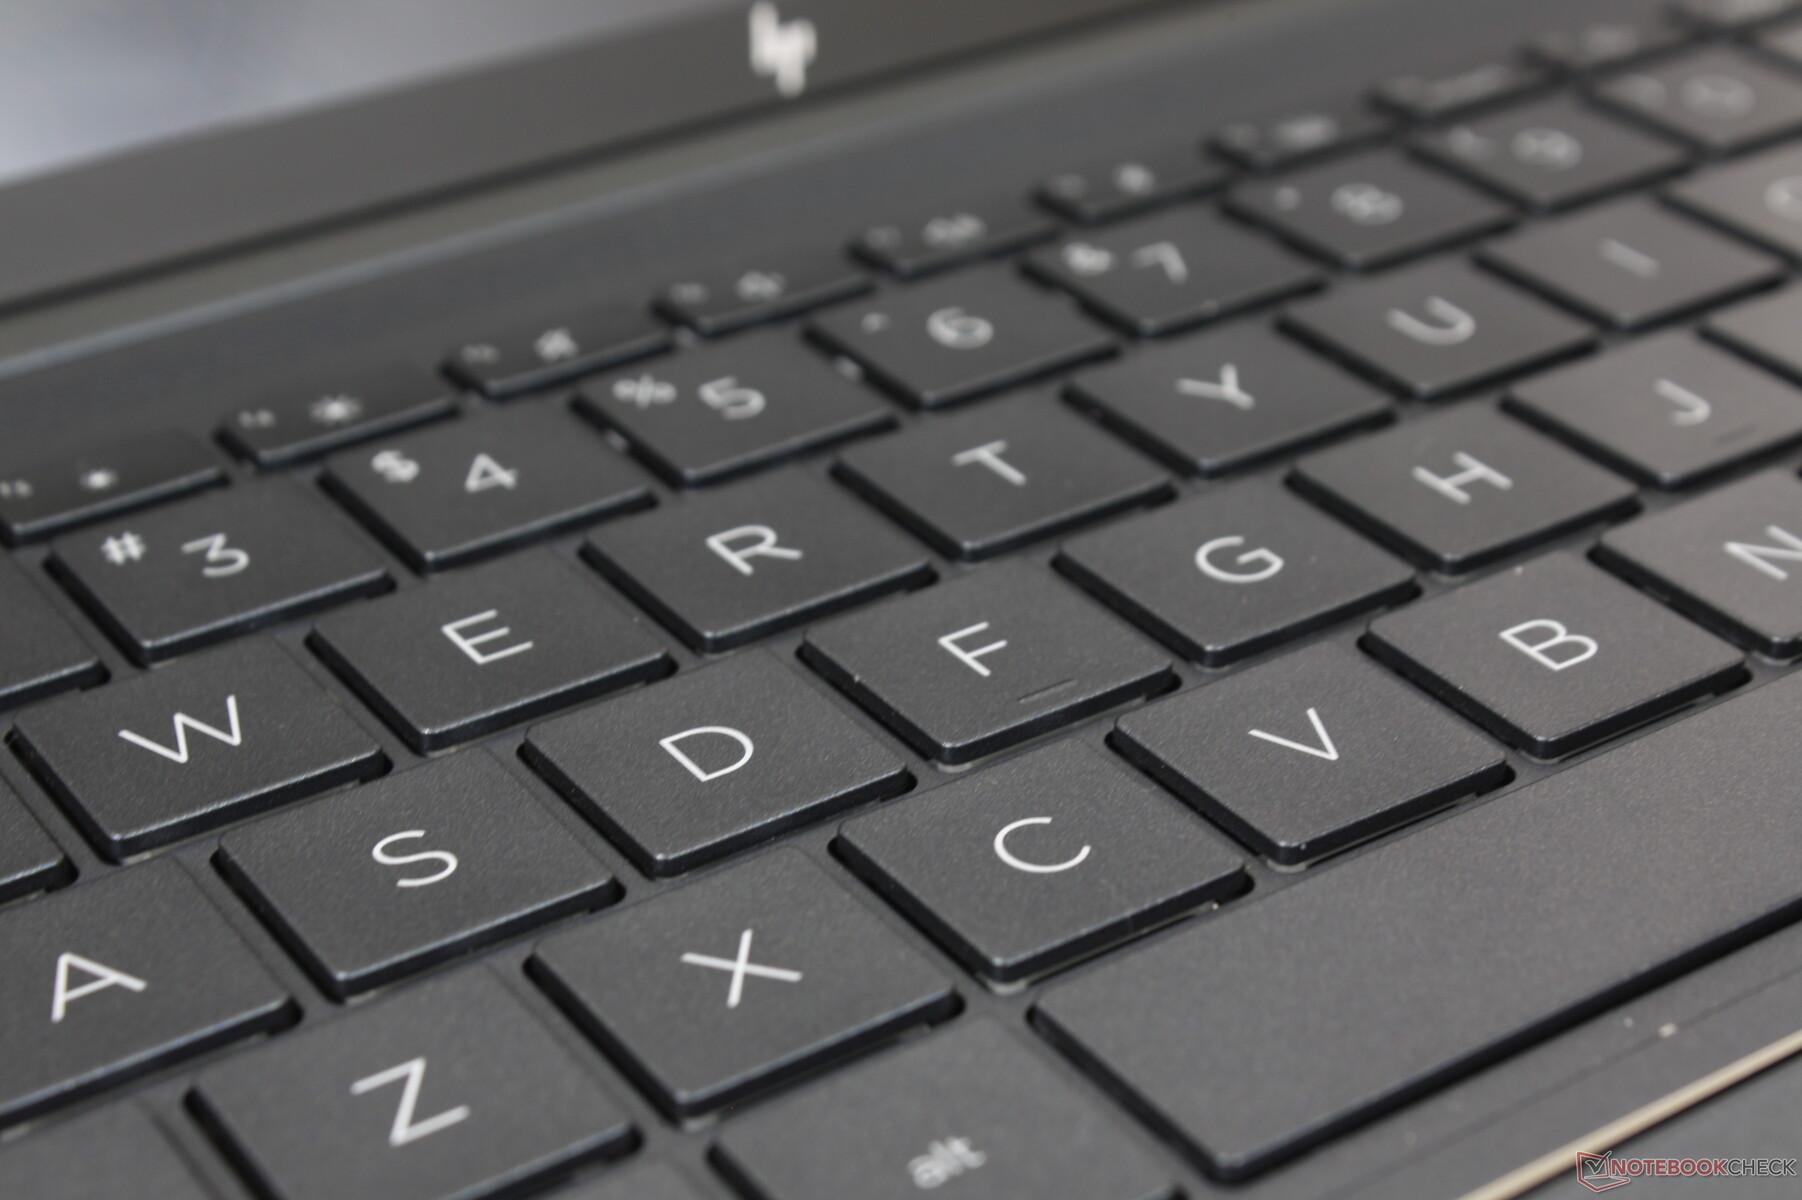
Dispositivi di input - Lettere più grandi, Clickpad più grande
Tastiera
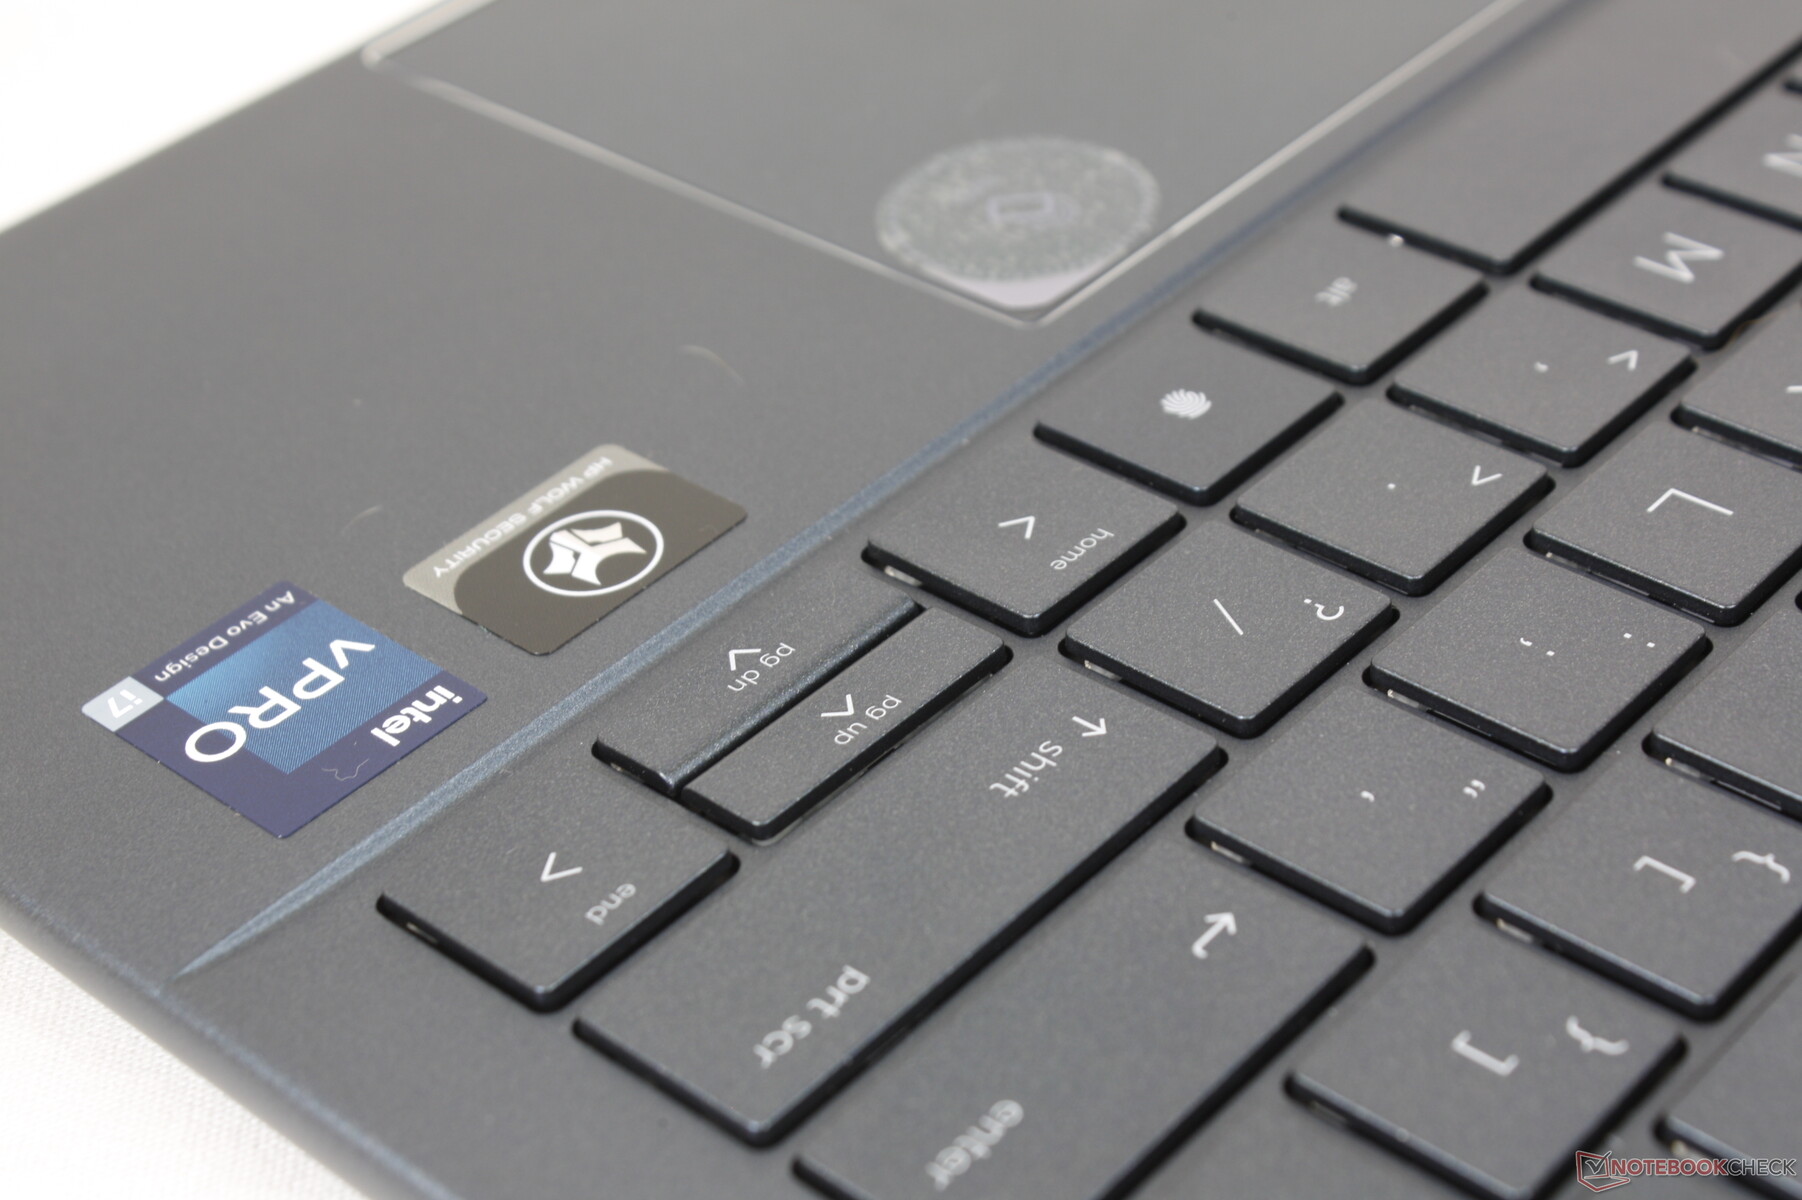
L'esperienza di digitazione tra i modelli Spectre ed EliteBook/Dragonfly è quasi identica. Se avete già digitato su un portatile Spectre, saprete cosa aspettarvi dal Dragonfly G3. Il feedback è nitido e con una corsa apparentemente più profonda rispetto al ThinkPad X1 Nano Gen 2. Gli angusti tasti Su e Giù sono la parte forse peggiore della tastiera.
Se configurato con Sure View, il tasto F2 presenta un'opzione di commutazione per il display. Altrimenti, il tasto non avrà alcuna funzione secondaria, come mostrato nell'immagine sottostante.
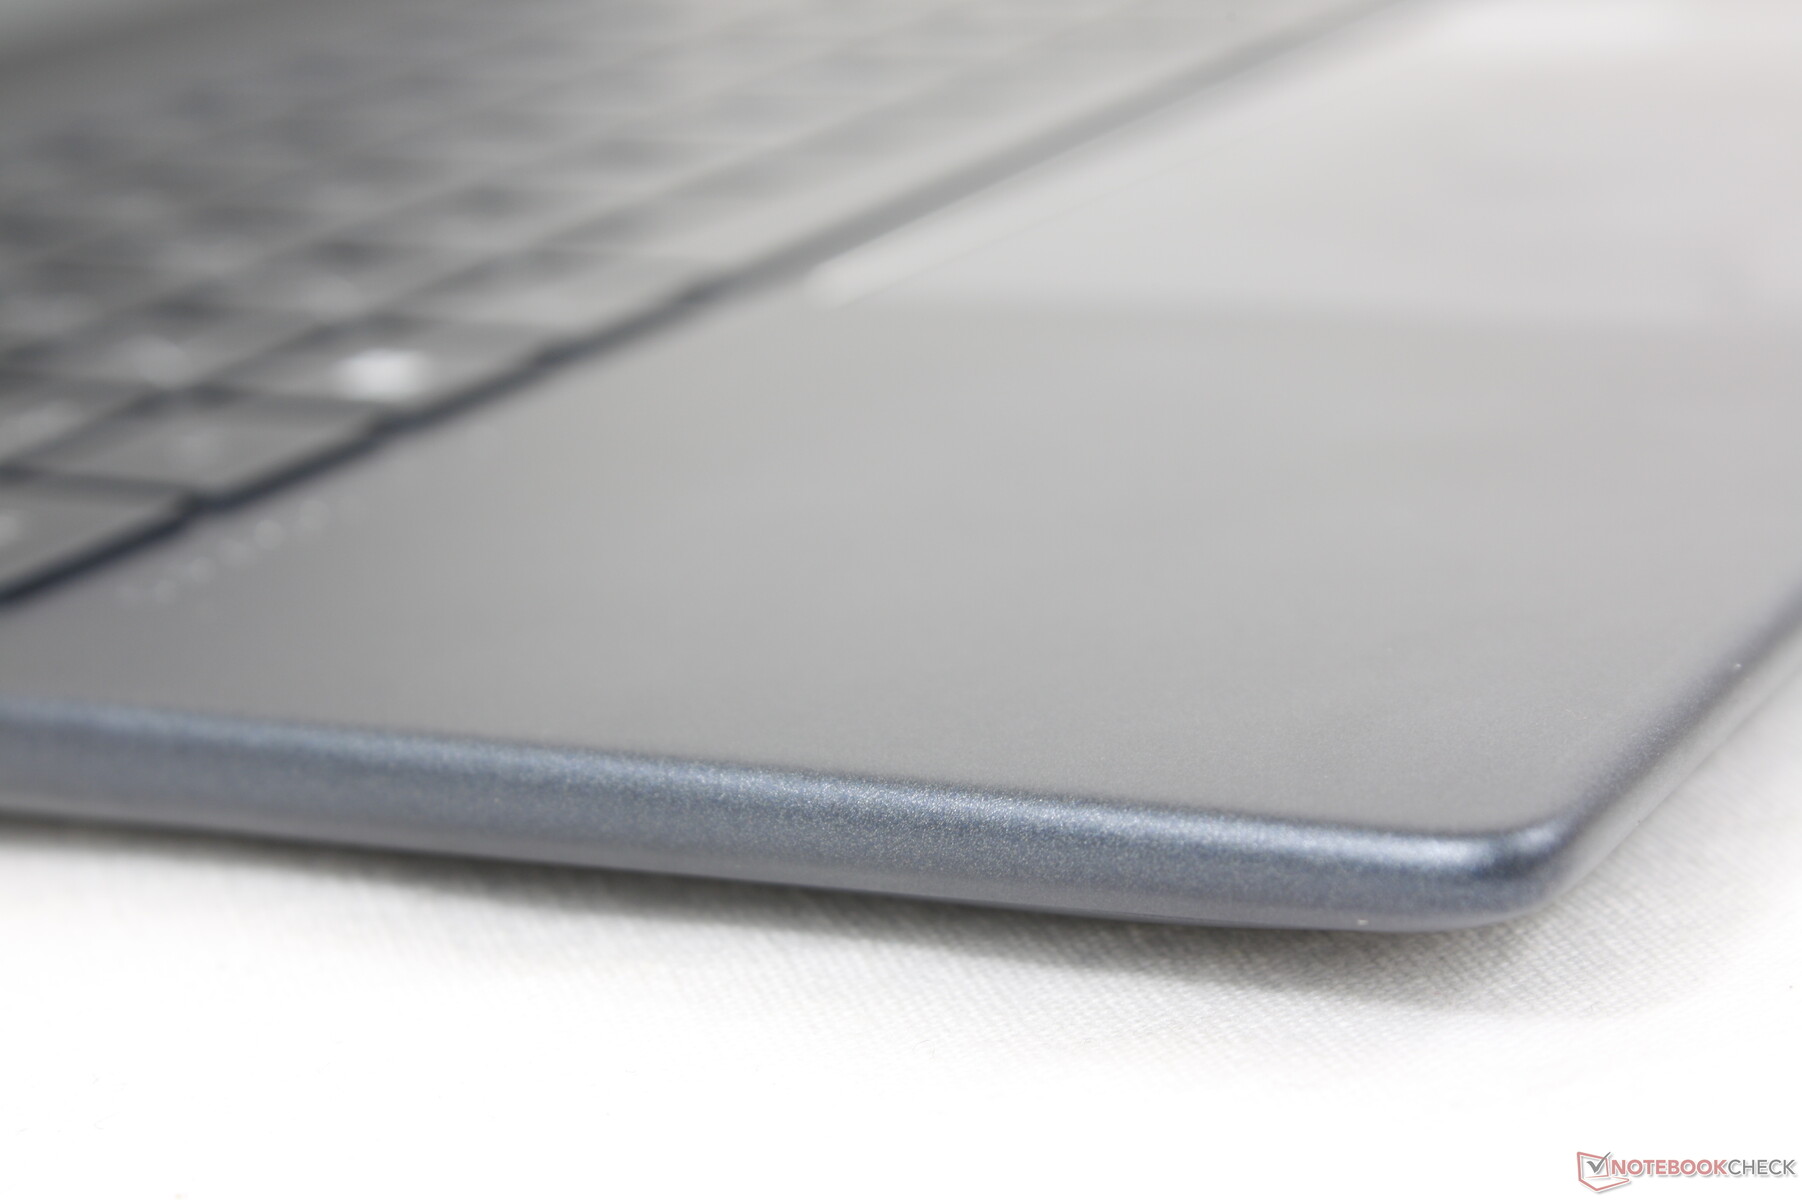
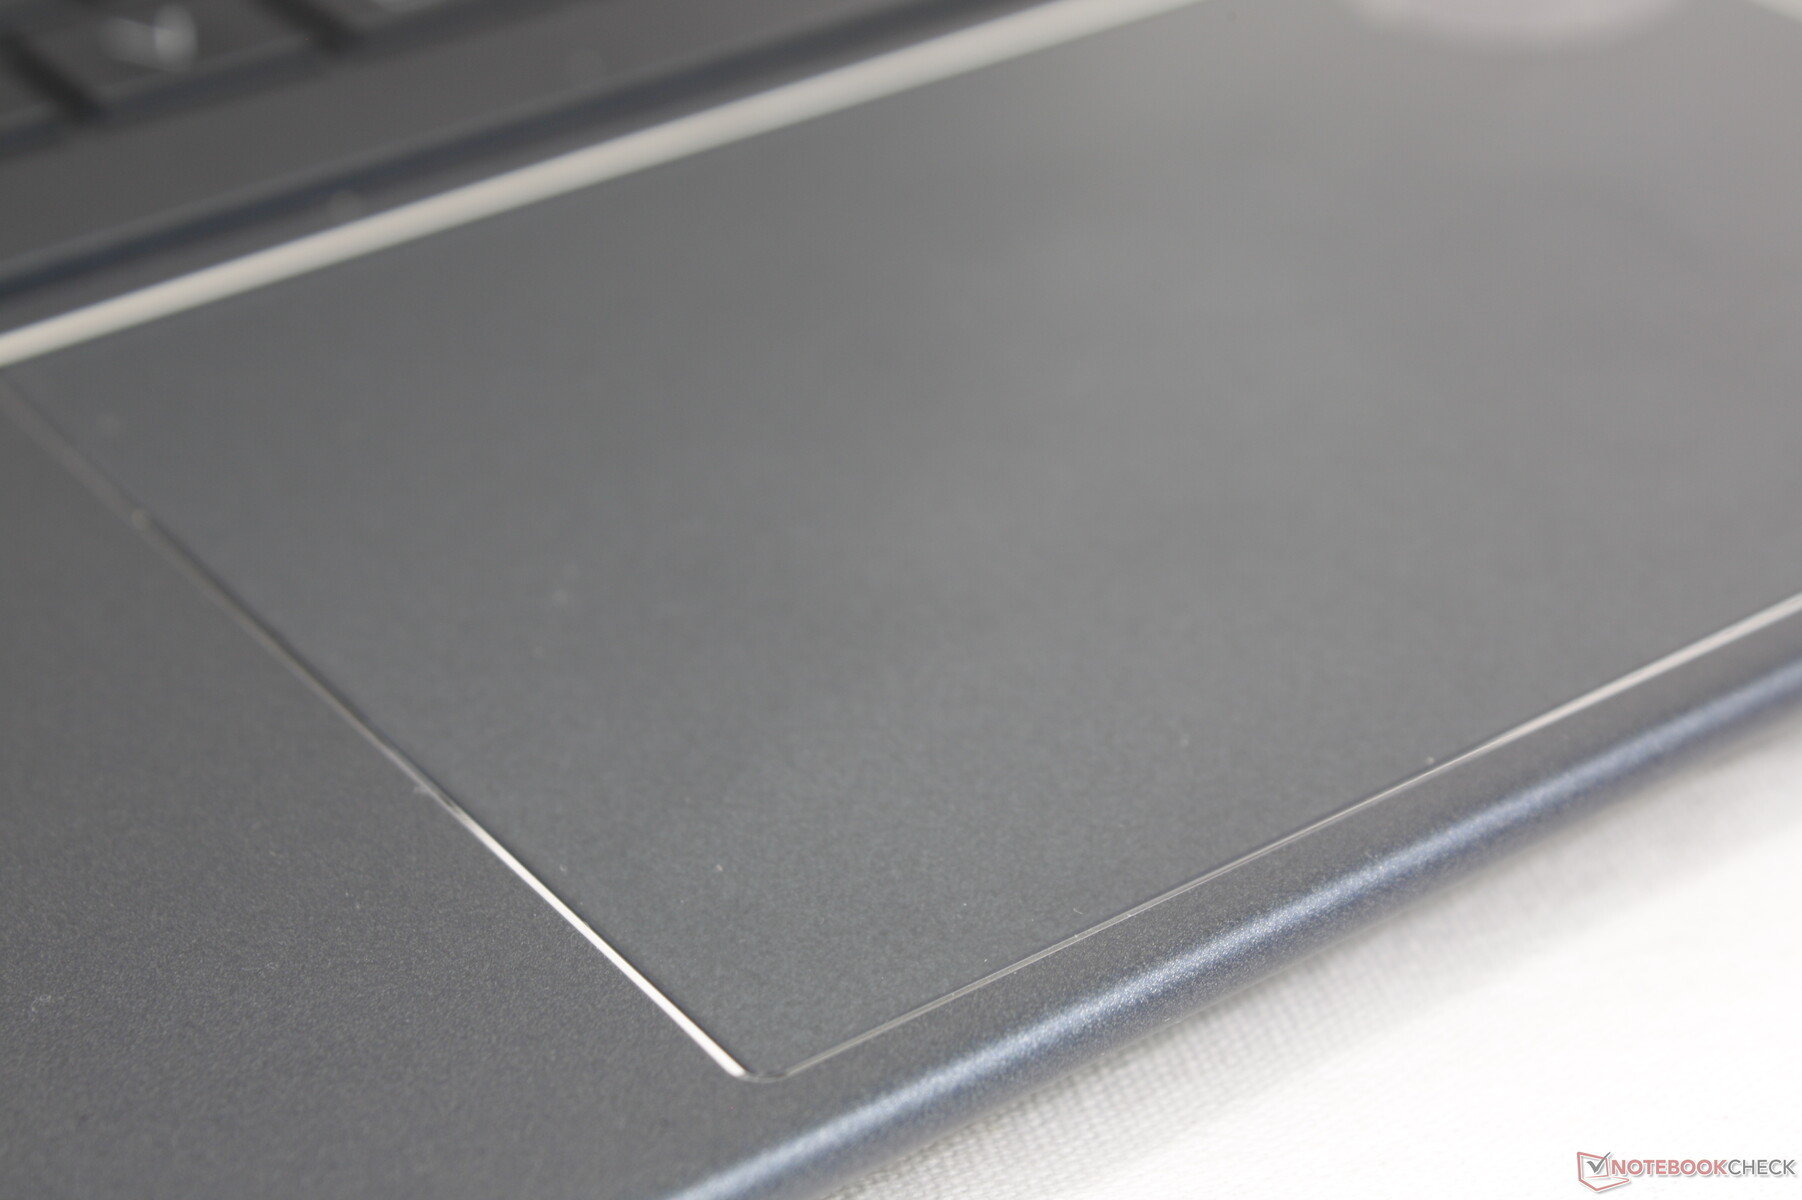
Touchpad
Il clickpad è più grande di quello del Dragonfly Max per facilitare il controllo del cursore (12 x 8 cm contro 11 x 6,5 cm). Il feedback quando si preme sul clickpad è poco profondo ma soddisfacente, nonostante il rumore più silenzioso del previsto.
Display - Molte opzioni
In totale sono disponibili sei opzioni di display da 13,5 pollici:
- 1920 x 1280, 400 nit, lucido, non touch, IPS
- 1920 x 1280, 400 nit, lucido, touch, IPS
- 1920 x 1280, 400 nit, opaco, touch, IPS
- 1920 x 1280, 1000 nit, Sure View, opaco, non touch, IPS
- 1920 x 1280, 1000 nit, Sure View, opaco, touch, IPS
- 3000 x 2000, 400 nits, lucido, touch, OLED
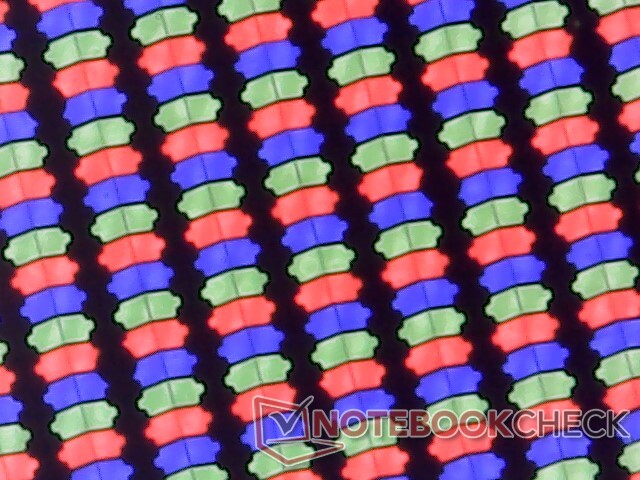
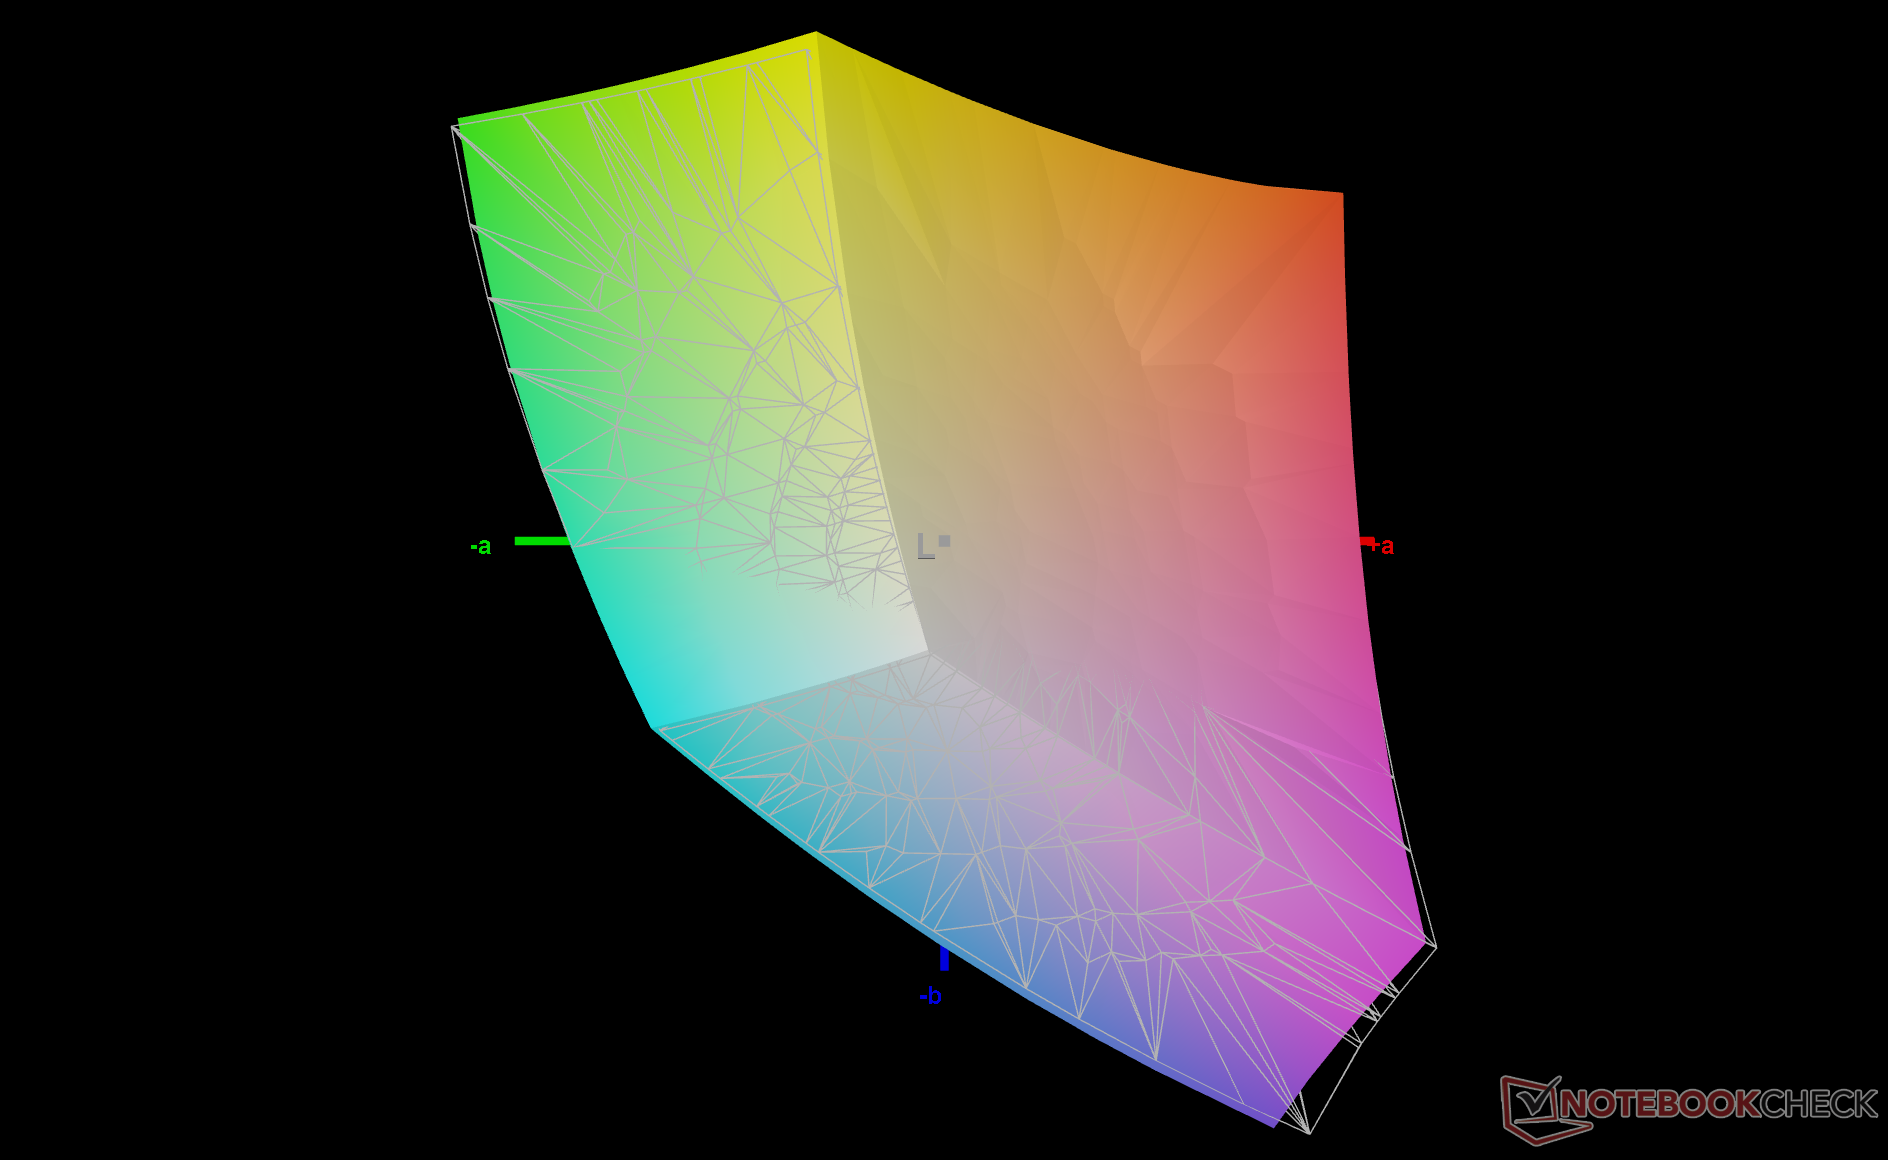
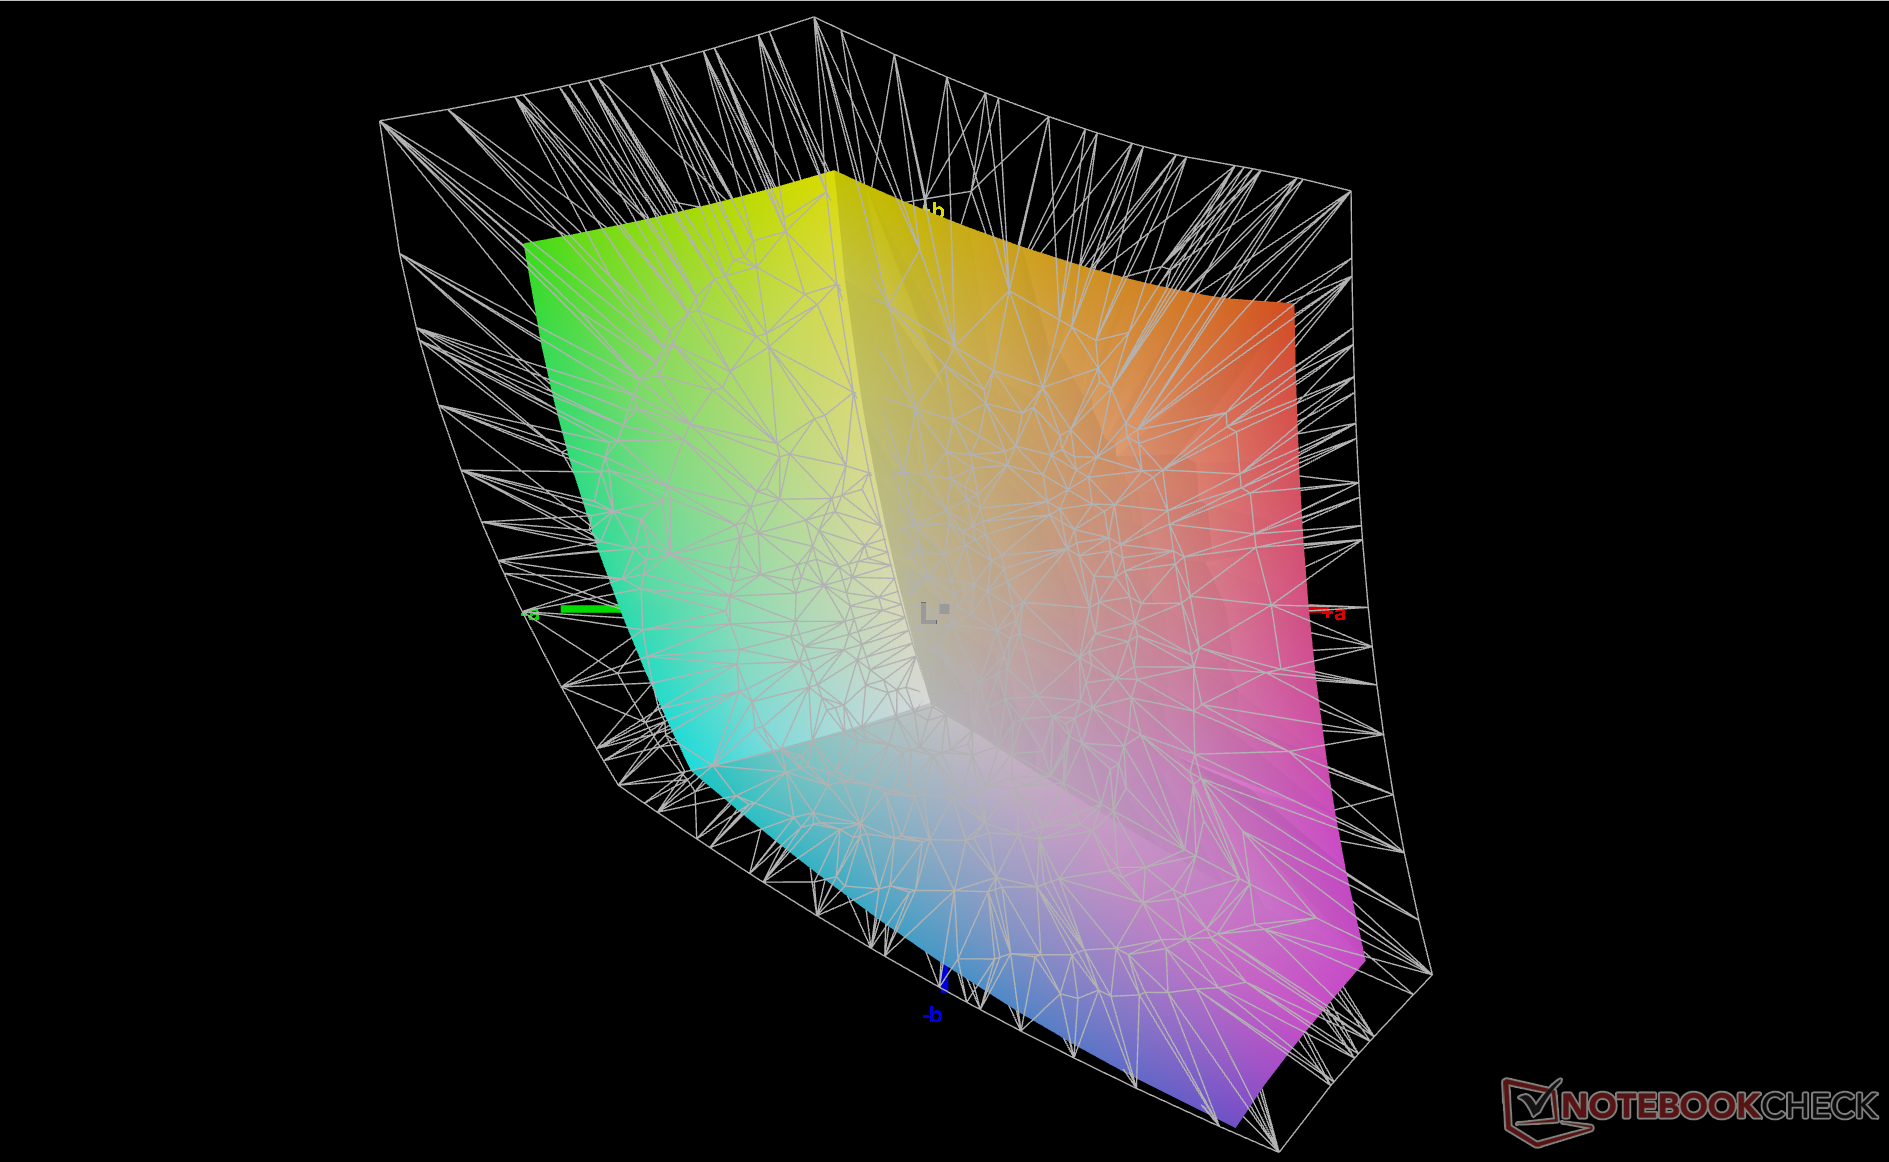
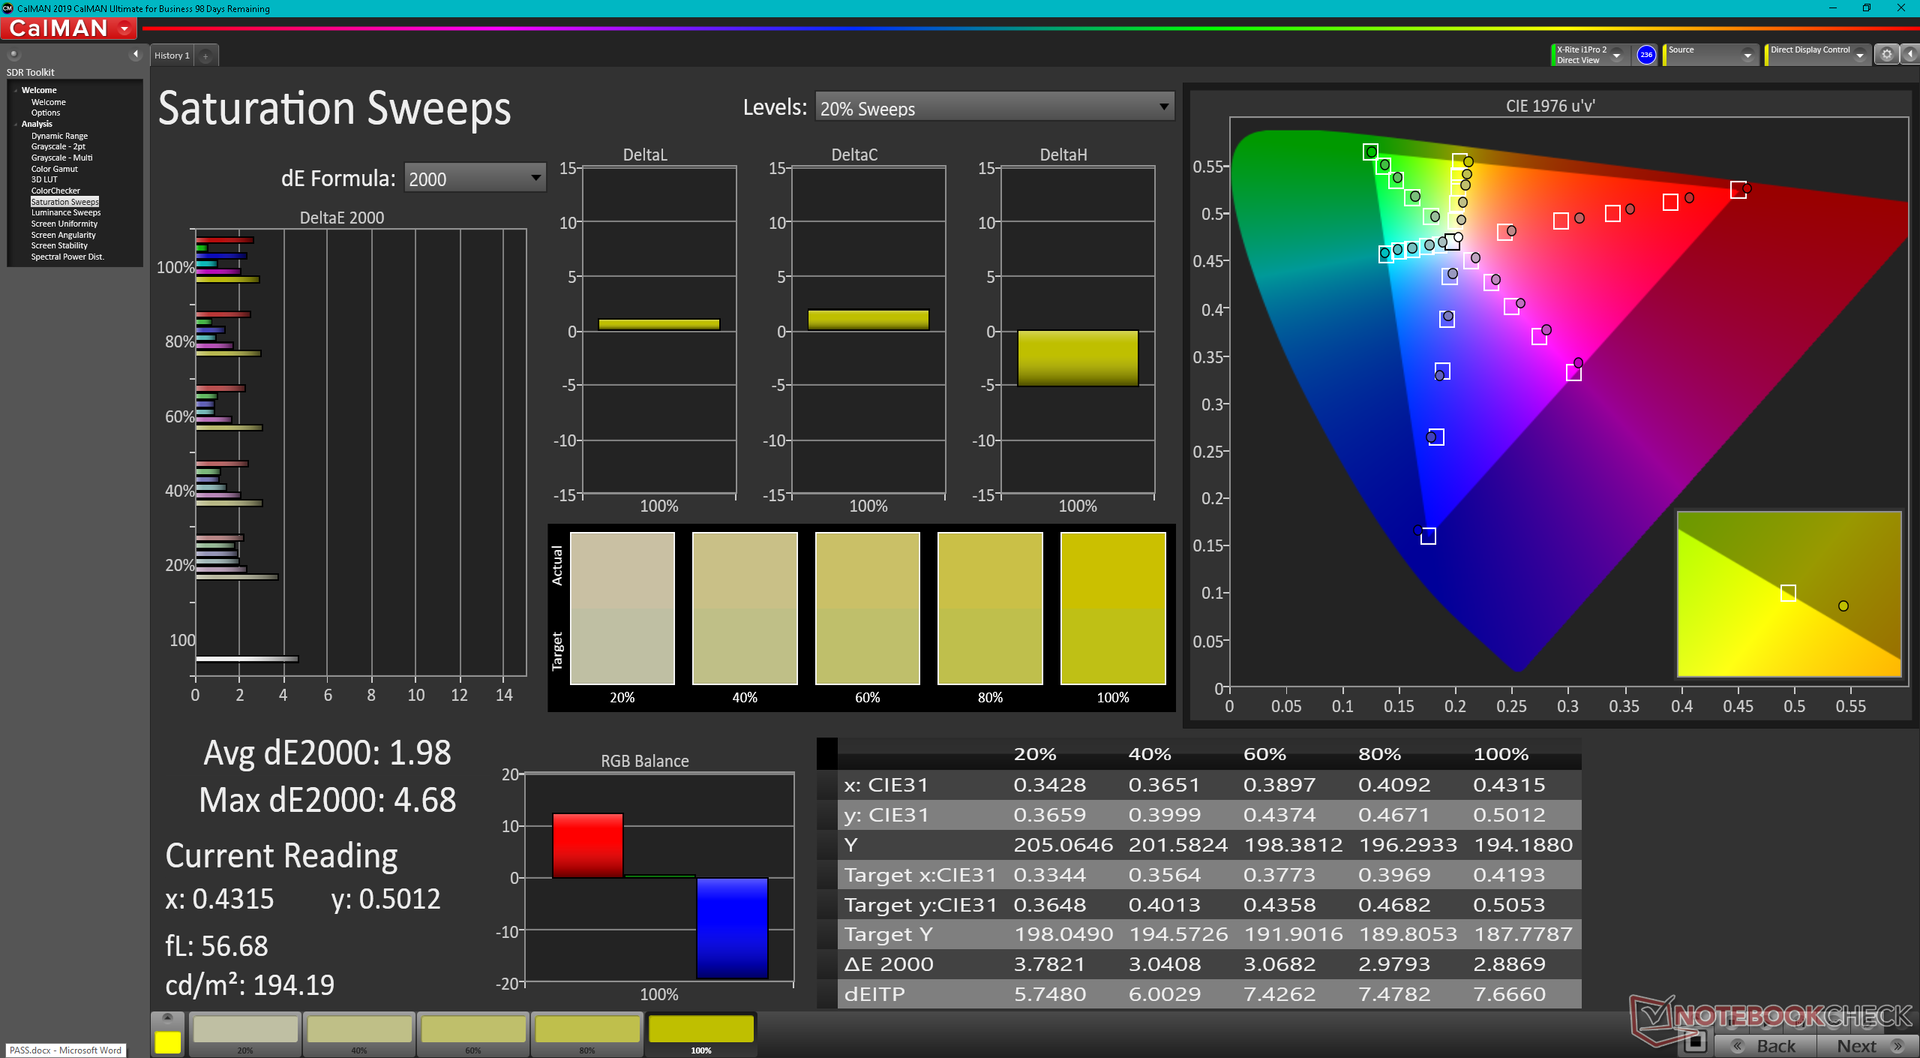
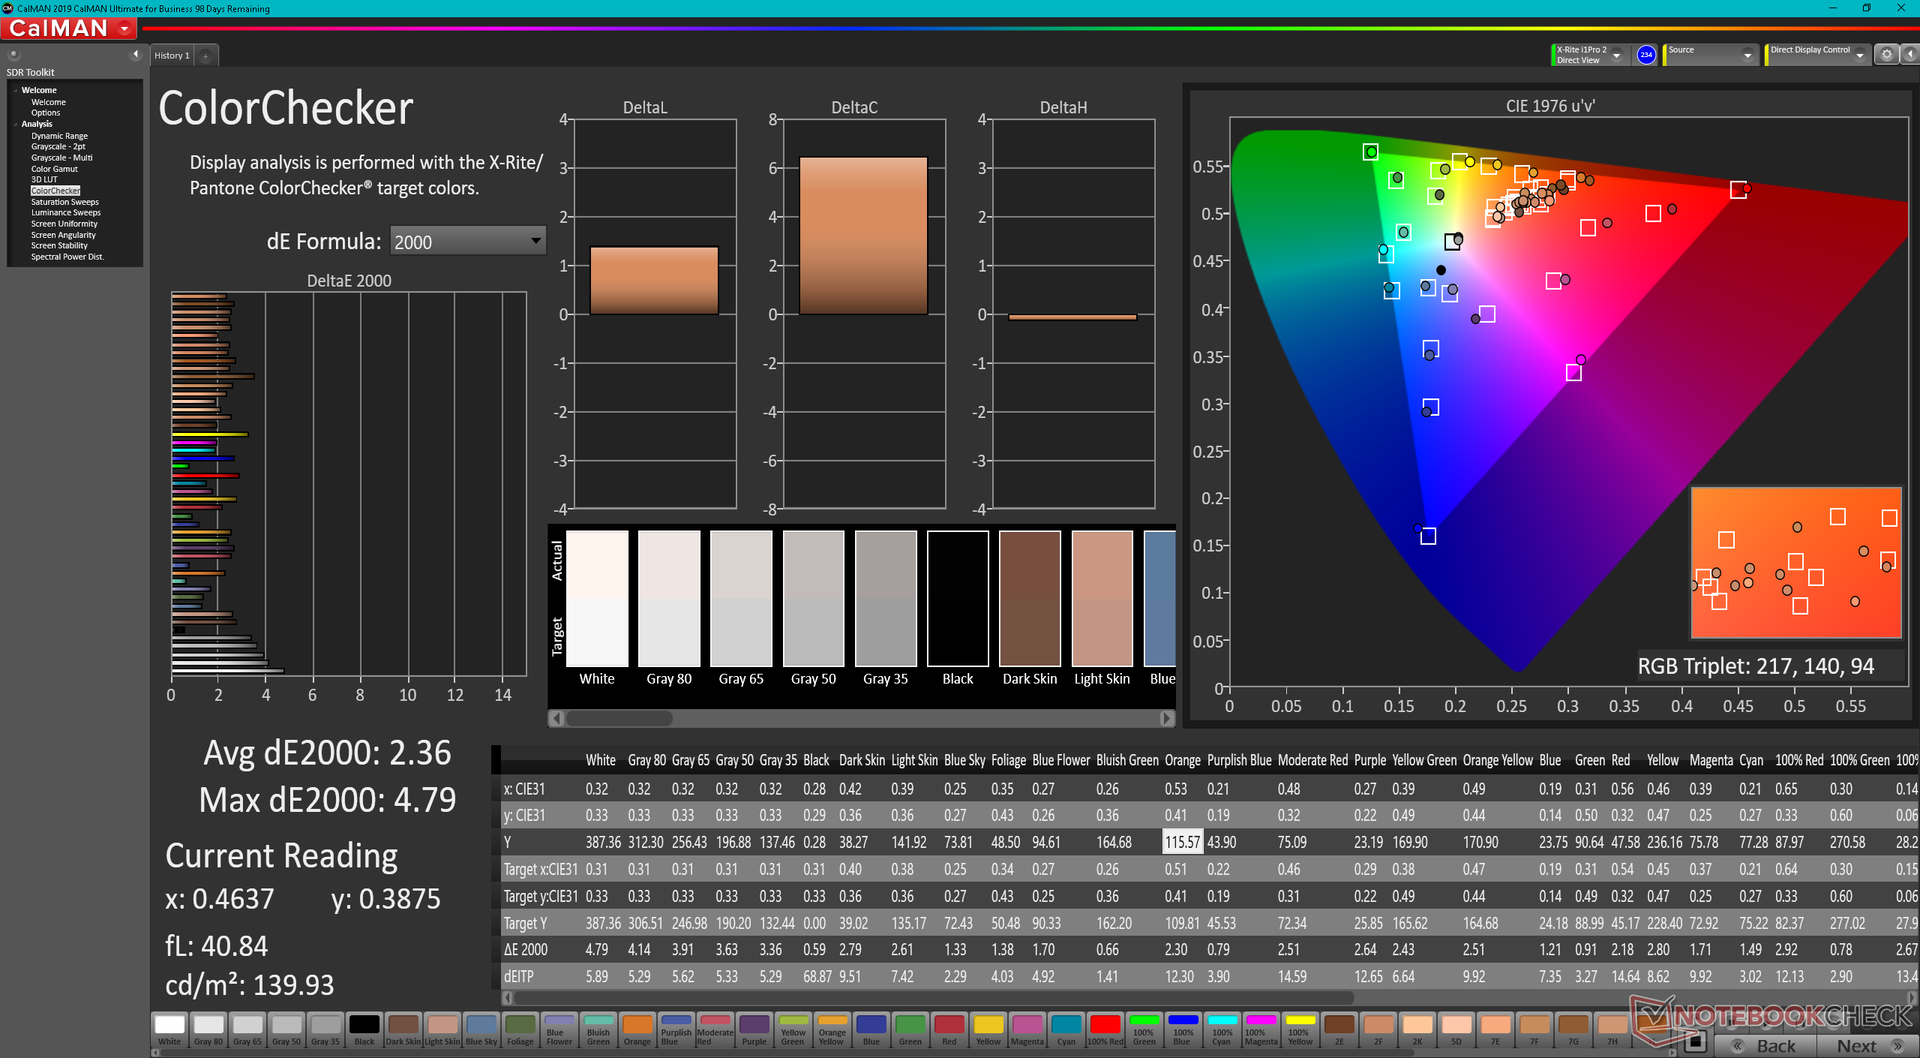
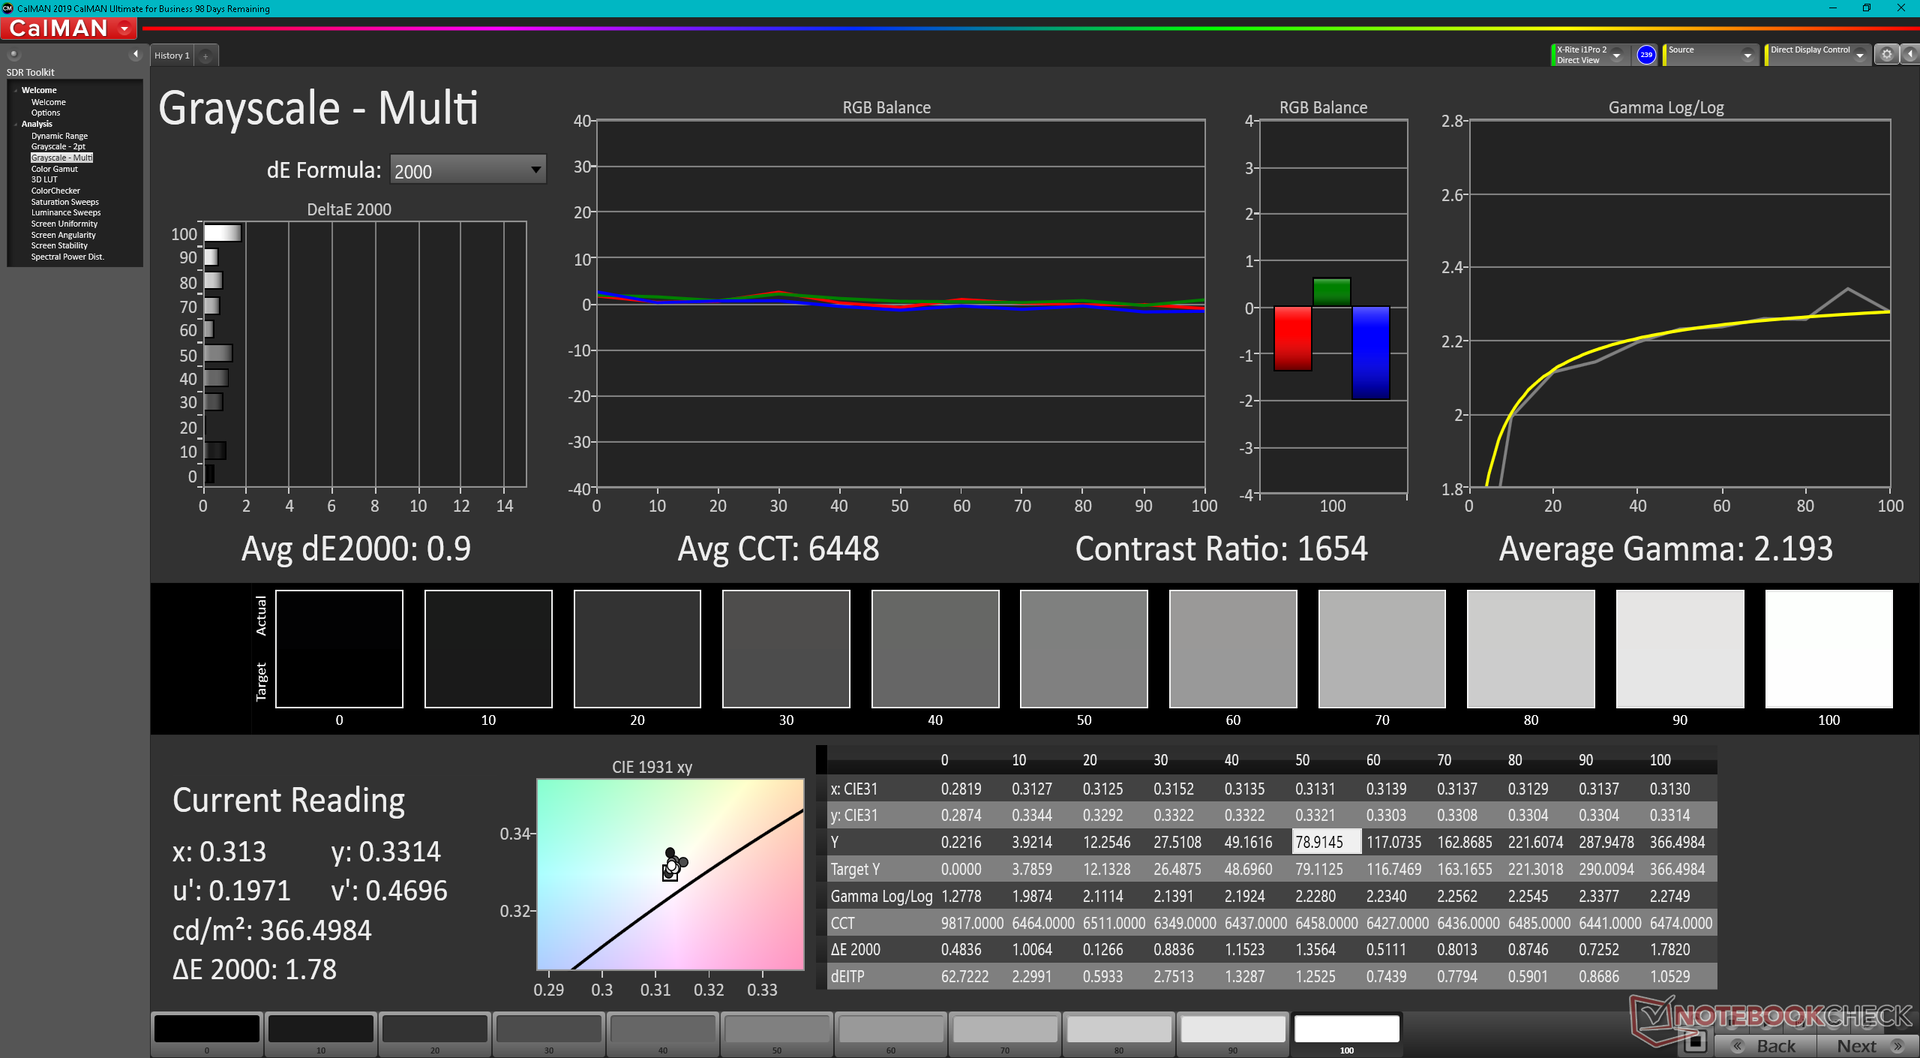
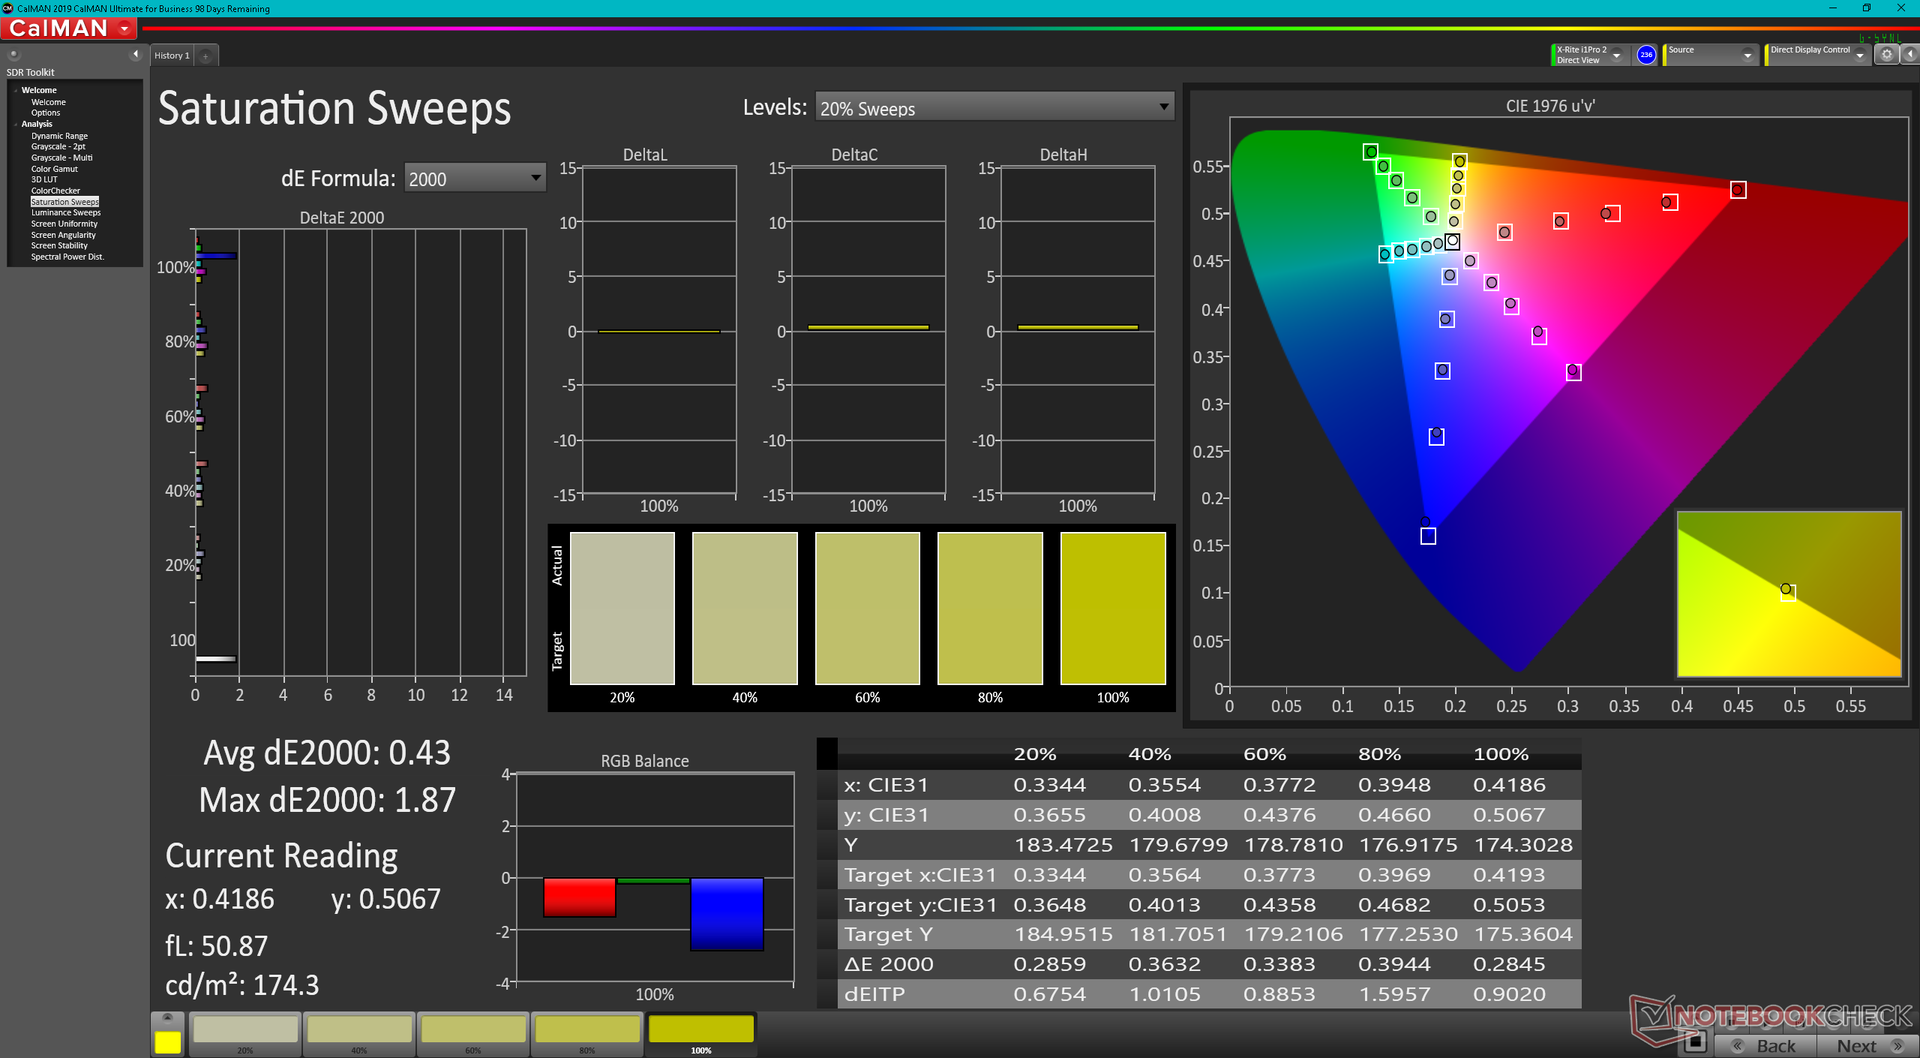
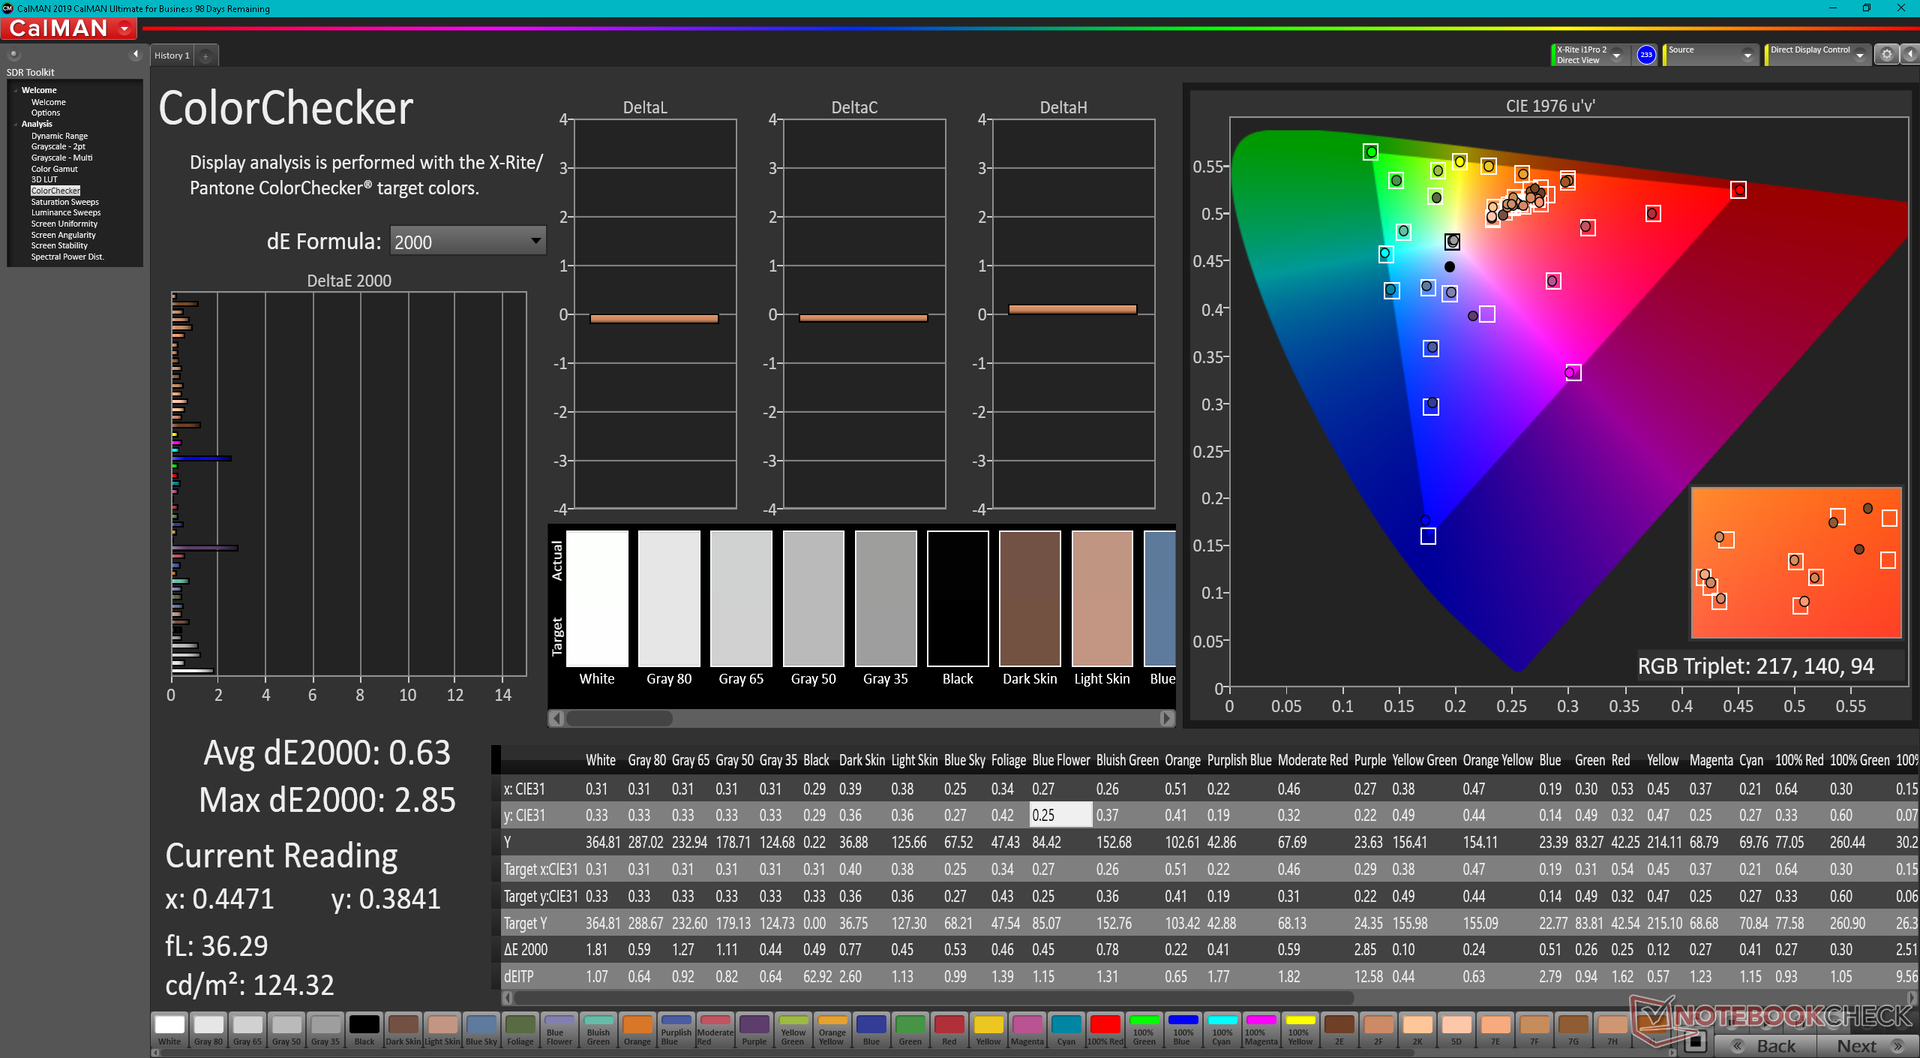
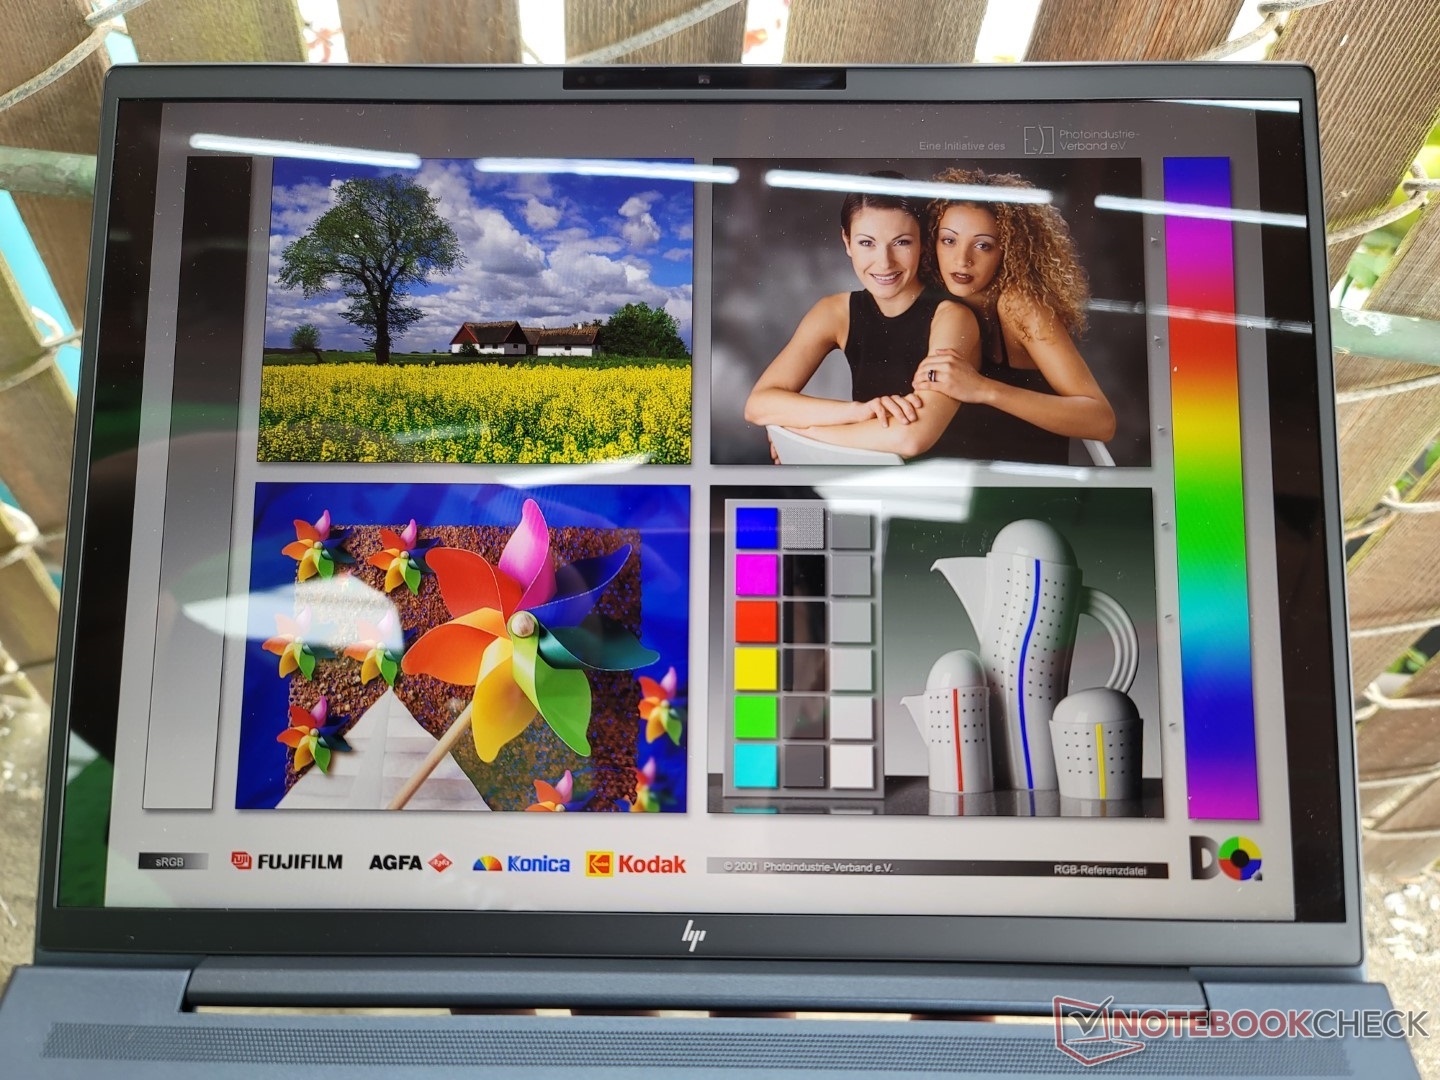
Le misure riportate di seguito riflettono solo la configurazione in grassetto. È interessante notare che la nostra unità utilizza un pannello Chi Mei invece del pannello LG Philips presente sullo Spectre x360 da 13,5 pollici, ma le caratteristiche principali sono quasi le stesse tra i due, compresa la copertura completa sRGB, l'elevato rapporto di contrasto di ~1500:1 e i tempi di risposta in bianco e nero e grigio molto lenti. Se si eseguono giochi ad alta velocità con il Dragonfly G3, ci si può aspettare un po' di ghosting. La qualità dell'immagine è nitida e vibrante anche con il display base dell'unità in prova. Per ottenere colori più intensi, sospettiamo che l'opzione OLED possa offrire una copertura P3 completa, come nel caso dello Spectre x360 13,5 2022.
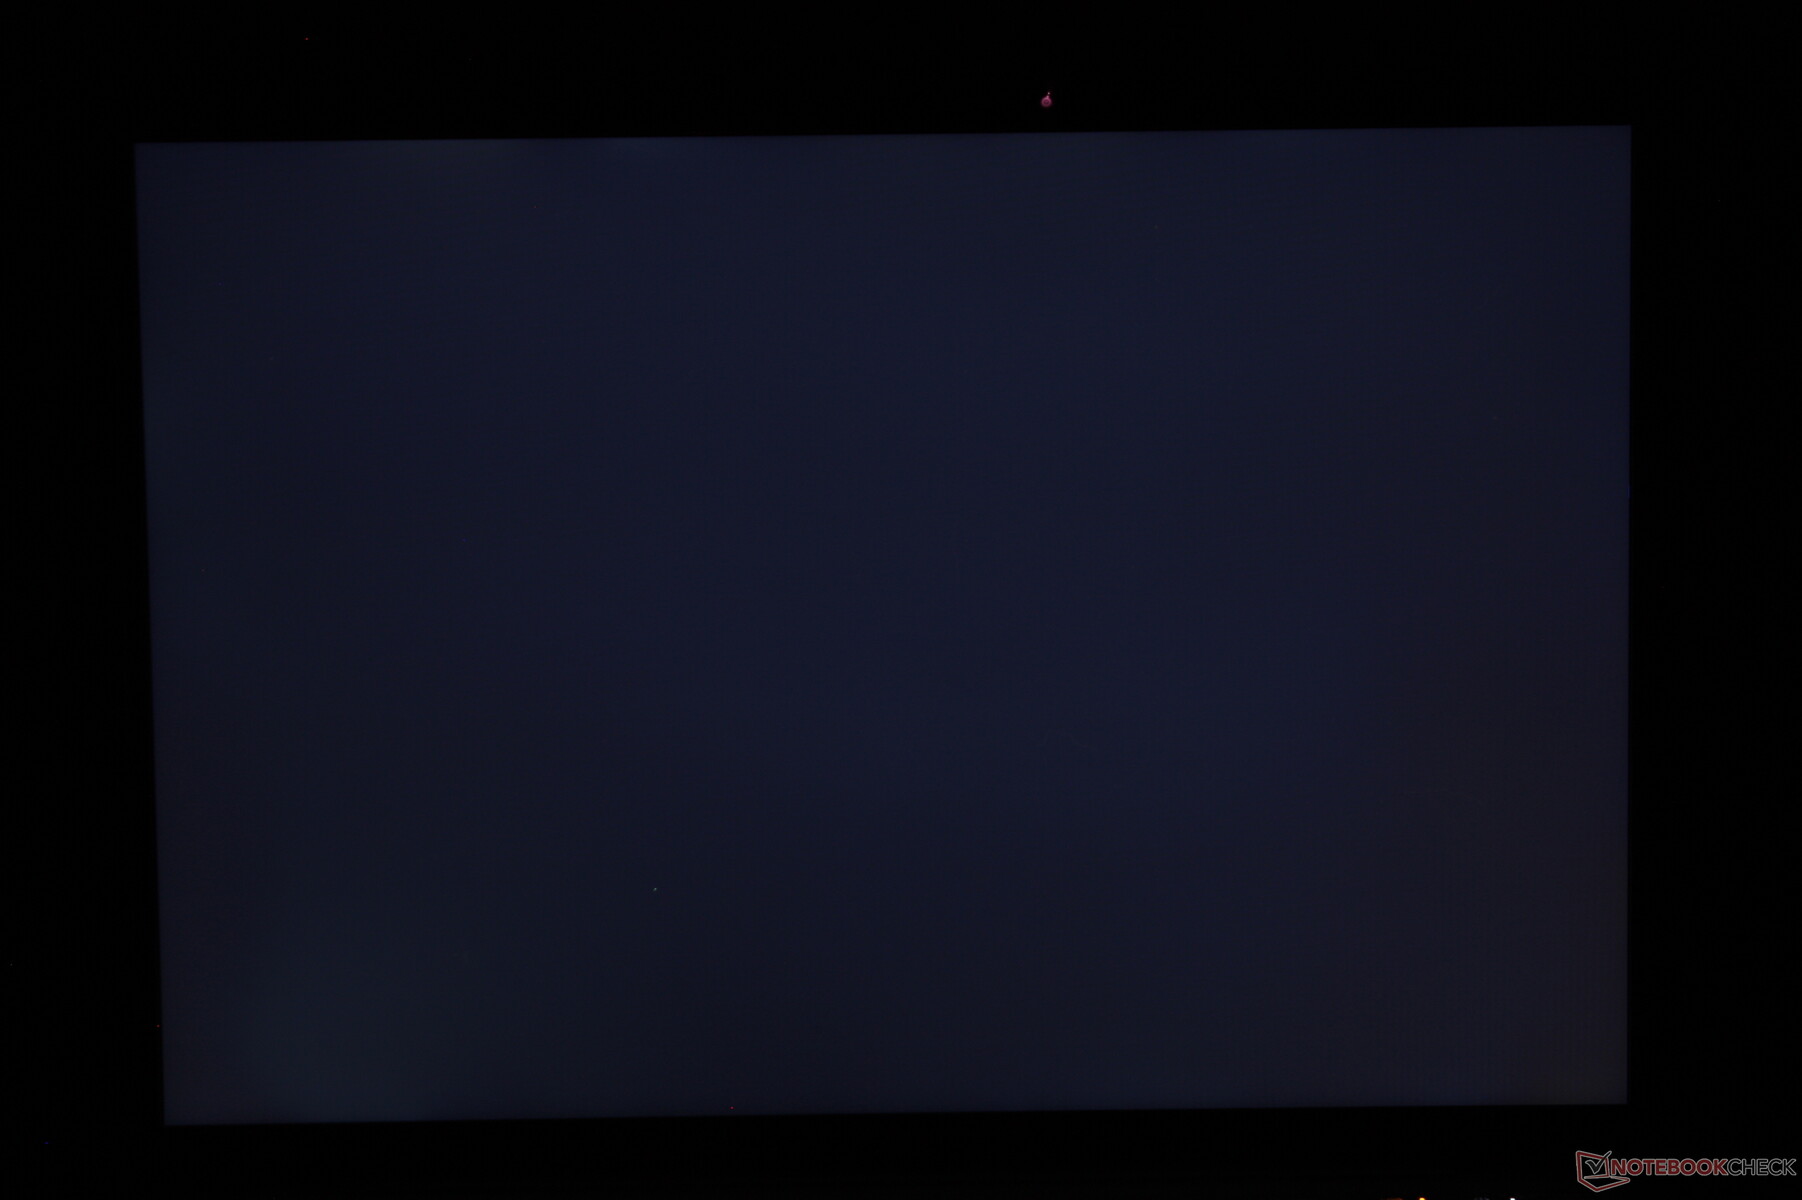
La distribuzione della luminosità potrebbe essere migliore. L'angolo in basso a sinistra del nostro schermo ha una luminosità di soli 314 nits, mentre l'angolo in alto a destra è di 389 nits, con una riduzione della luminosità da un angolo all'altro del 20%. Sebbene la differenza non sia fastidiosa durante l'uso regolare, ci aspettavamo di meglio da un portatile di fascia alta come questo.
| |||||||||||||||||||||||||
Distribuzione della luminosità: 80 %
Al centro con la batteria: 387.2 cd/m²
Contrasto: 1489:1 (Nero: 0.26 cd/m²)
ΔE ColorChecker Calman: 2.36 | ∀{0.5-29.43 Ø4.73}
calibrated: 0.63
ΔE Greyscale Calman: 3 | ∀{0.09-98 Ø4.97}
69.9% AdobeRGB 1998 (Argyll 3D)
98.3% sRGB (Argyll 3D)
68% Display P3 (Argyll 3D)
Gamma: 2.17
CCT: 6137 K
| HP Elite Dragonfly G3 Chi Mei CMN13C0, IPS, 1920x1280, 13.5" | HP Spectre x360 14t-ea000 LG Philips LGD0663, IPS, 1920x1280, 13.5" | Dell XPS 13 Plus 9320 i5-1240p Sharp SHP1548 LQ134N1, IPS, 1920x1200, 13.4" | Framework Laptop 13.5 12th Gen Intel BOE CQ NE135FBM-N41, IPS, 2256x1504, 13.5" | HP EliteBook Folio 13.5-3G2L2EA LGD0663, IPS, 1920x1280, 13.5" | Lenovo ThinkPad X1 Titanium Yoga G1 20QA001RGE LPM135M467, IPS, 2256x1504, 13.5" | |
|---|---|---|---|---|---|---|
| Display | -2% | 1% | 2% | |||
| Display P3 Coverage (%) | 68 | 65.8 -3% | 69 1% | 69.9 3% | ||
| sRGB Coverage (%) | 98.3 | 98.2 0% | 99 1% | 99.4 1% | ||
| AdobeRGB 1998 Coverage (%) | 69.9 | 67.9 -3% | 71 2% | 71.1 2% | ||
| Response Times | -18% | 26% | 27% | 18% | 13% | |
| Response Time Grey 50% / Grey 80% * (ms) | 50.8 ? | 62 ? -22% | 45 ? 11% | 34.7 ? 32% | 44 ? 13% | 53.6 ? -6% |
| Response Time Black / White * (ms) | 35.2 ? | 39.6 ? -13% | 21 ? 40% | 27.5 ? 22% | 27 ? 23% | 24 ? 32% |
| PWM Frequency (Hz) | ||||||
| Screen | -22% | -52% | -13% | -23% | 17% | |
| Brightness middle (cd/m²) | 387.2 | 443.5 15% | 498 29% | 449.6 16% | 250 -35% | 466 20% |
| Brightness (cd/m²) | 360 | 394 9% | 460 28% | 431 20% | 226 -37% | 454 26% |
| Brightness Distribution (%) | 80 | 78 -2% | 85 6% | 90 13% | 82 2% | 94 18% |
| Black Level * (cd/m²) | 0.26 | 0.17 35% | 0.53 -104% | 0.31 -19% | 0.215 17% | 0.23 12% |
| Contrast (:1) | 1489 | 2609 75% | 940 -37% | 1450 -3% | 1163 -22% | 2026 36% |
| Colorchecker dE 2000 * | 2.36 | 2.7 -14% | 3.65 -55% | 2.76 -17% | 3.59 -52% | 2.1 11% |
| Colorchecker dE 2000 max. * | 4.79 | 4.36 9% | 7.11 -48% | 7.96 -66% | 5.9 -23% | 4.5 6% |
| Colorchecker dE 2000 calibrated * | 0.63 | 2.61 -314% | 2.16 -243% | 0.58 8% | ||
| Greyscale dE 2000 * | 3 | 3.4 -13% | 4.25 -42% | 5.2 -73% | 3.99 -33% | 2.7 10% |
| Gamma | 2.17 101% | 2.09 105% | 2.45 90% | 2.23 99% | 2.98 74% | 2.08 106% |
| CCT | 6137 106% | 6144 106% | 6690 97% | 6475 100% | 6765 96% | 6210 105% |
| Color Space (Percent of AdobeRGB 1998) (%) | 62.1 | 61.1 | ||||
| Color Space (Percent of sRGB) (%) | 98.5 | 94.9 | ||||
| Media totale (Programma / Settaggio) | -14% /
-17% | -8% /
-29% | 5% /
-4% | -3% /
-15% | 15% /
17% |
* ... Meglio usare valori piccoli
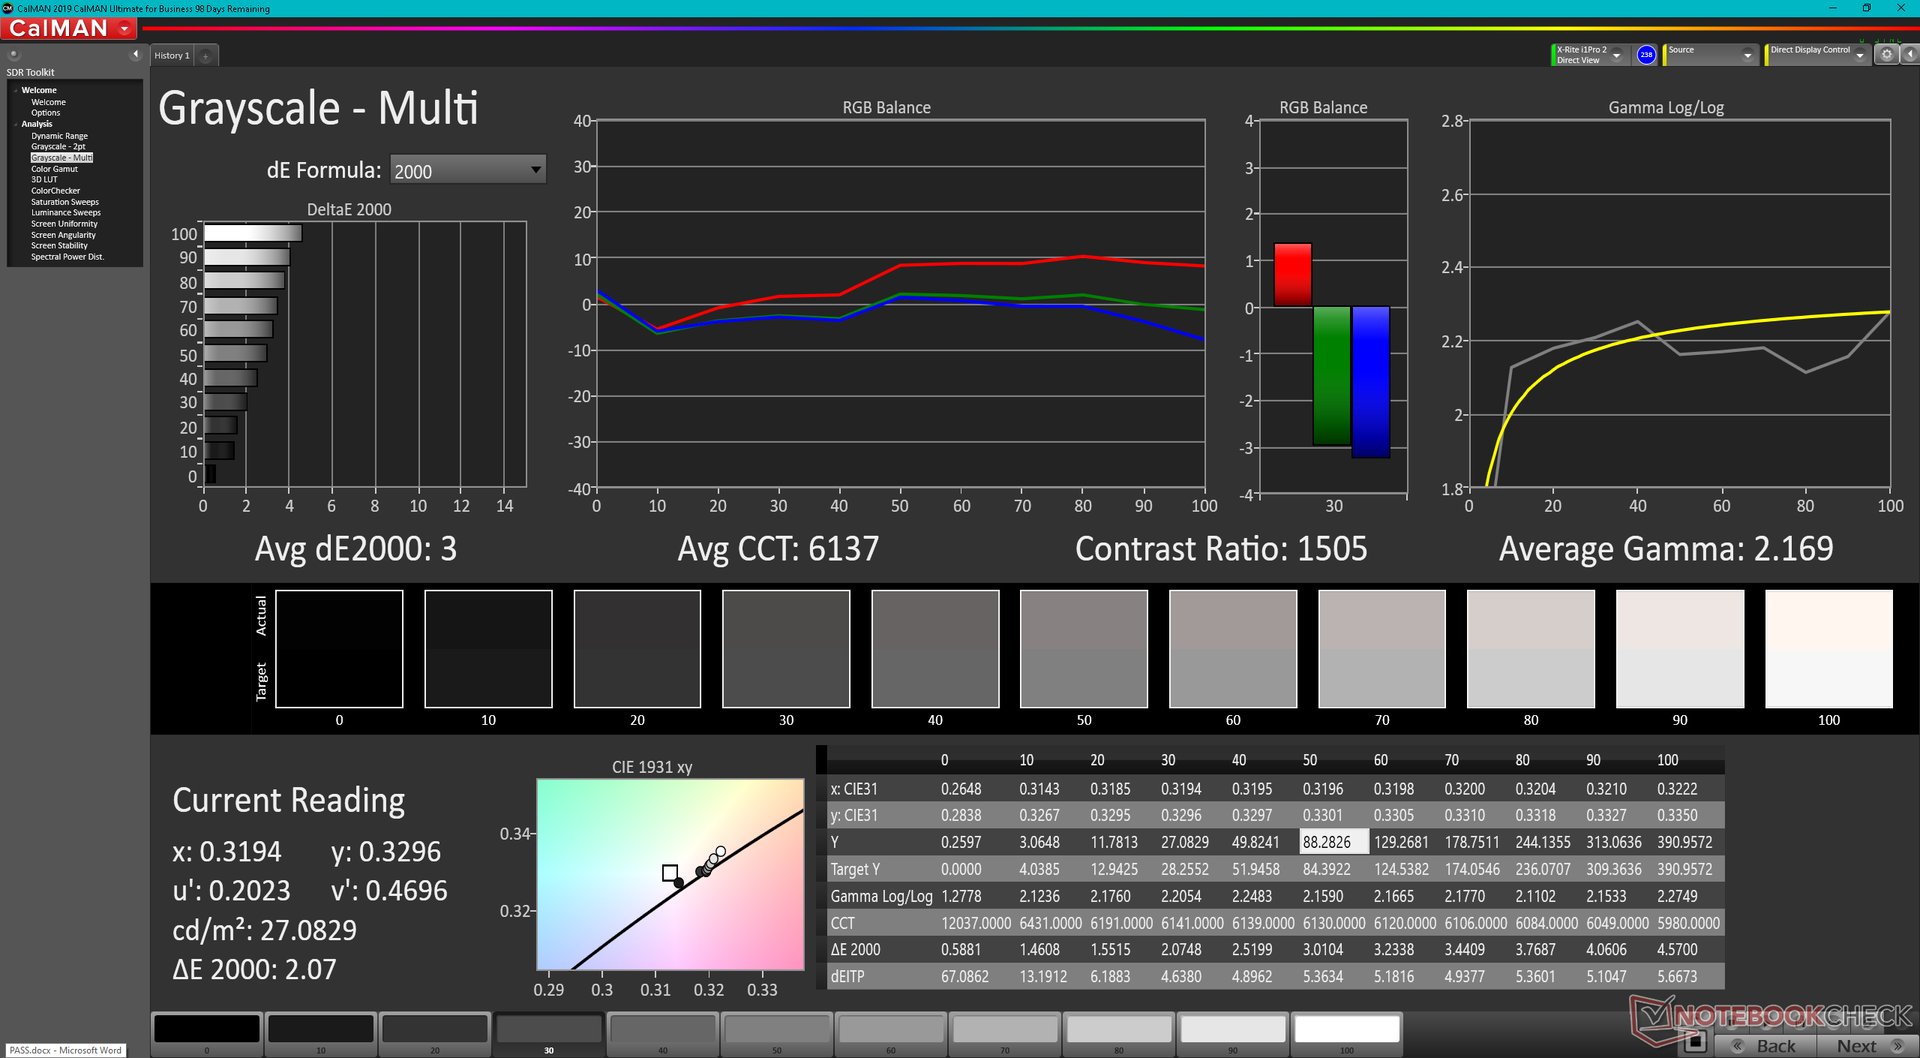
Il display è calibrato in modo decente, con valori medi di deltaE della scala di grigi e del colore pari a 3 e 2,36 rispettivamente. La calibrazione del display da parte nostra migliorerebbe ulteriormente i valori medi del DeltaE, portandoli a meno di uno.
Tempi di risposta del Display
| ↔ Tempi di risposta dal Nero al Bianco | ||
|---|---|---|
| 35.2 ms ... aumenta ↗ e diminuisce ↘ combinato | ↗ 18.8 ms Incremento | 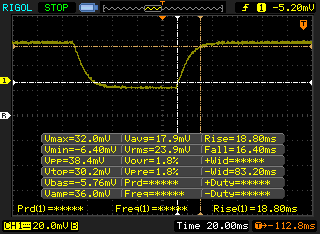 |
| ↘ 16.4 ms Calo | ||
| Lo schermo mostra tempi di risposta lenti nei nostri tests e sarà insoddisfacente per i gamers. In confronto, tutti i dispositivi di test variano da 0.1 (minimo) a 240 (massimo) ms. » 93 % di tutti i dispositivi è migliore. Questo significa che i tempi di risposta rilevati sono peggiori rispetto alla media di tutti i dispositivi testati (19.9 ms). | ||
| ↔ Tempo di risposta dal 50% Grigio all'80% Grigio | ||
| 50.8 ms ... aumenta ↗ e diminuisce ↘ combinato | ↗ 27.2 ms Incremento | 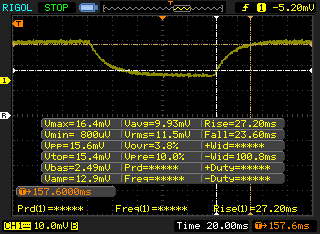 |
| ↘ 23.6 ms Calo | ||
| Lo schermo mostra tempi di risposta lenti nei nostri tests e sarà insoddisfacente per i gamers. In confronto, tutti i dispositivi di test variano da 0.165 (minimo) a 636 (massimo) ms. » 87 % di tutti i dispositivi è migliore. Questo significa che i tempi di risposta rilevati sono peggiori rispetto alla media di tutti i dispositivi testati (31.1 ms). | ||
Sfarfallio dello schermo / PWM (Pulse-Width Modulation)
| flickering dello schermo / PWM non rilevato | 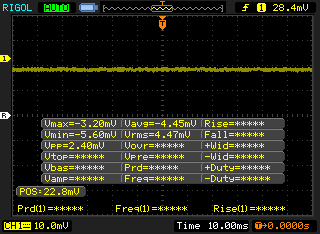 | ||
In confronto: 52 % di tutti i dispositivi testati non utilizza PWM per ridurre la luminosita' del display. Se è rilevato PWM, una media di 7794 (minimo: 5 - massimo: 343500) Hz è stata rilevata. | |||
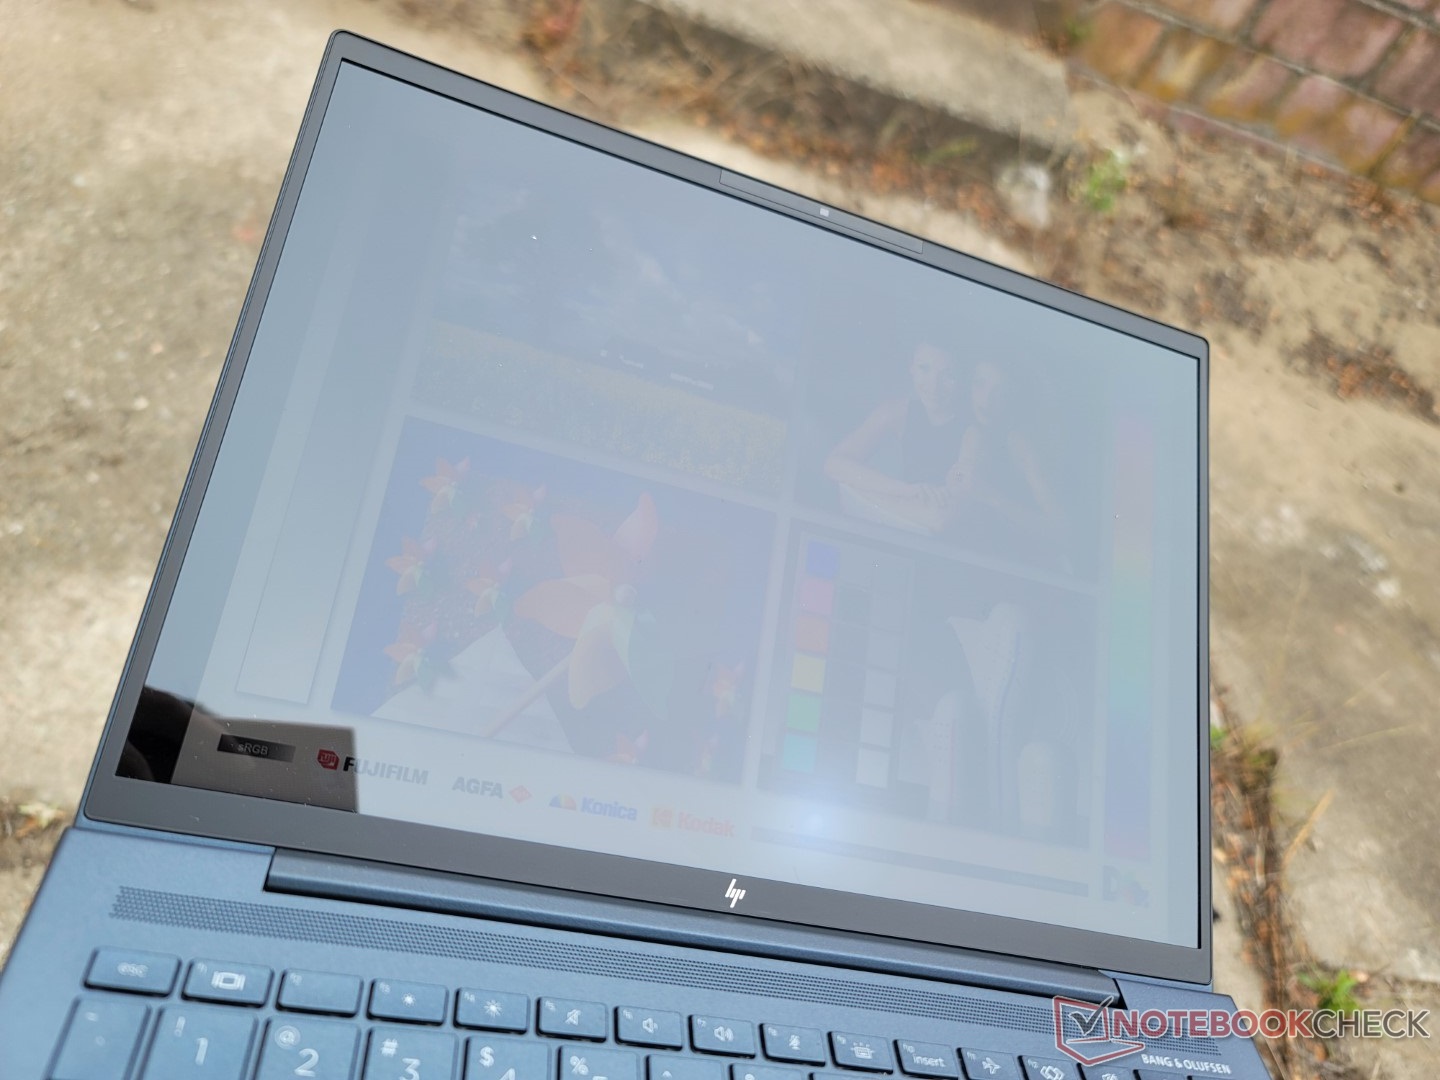
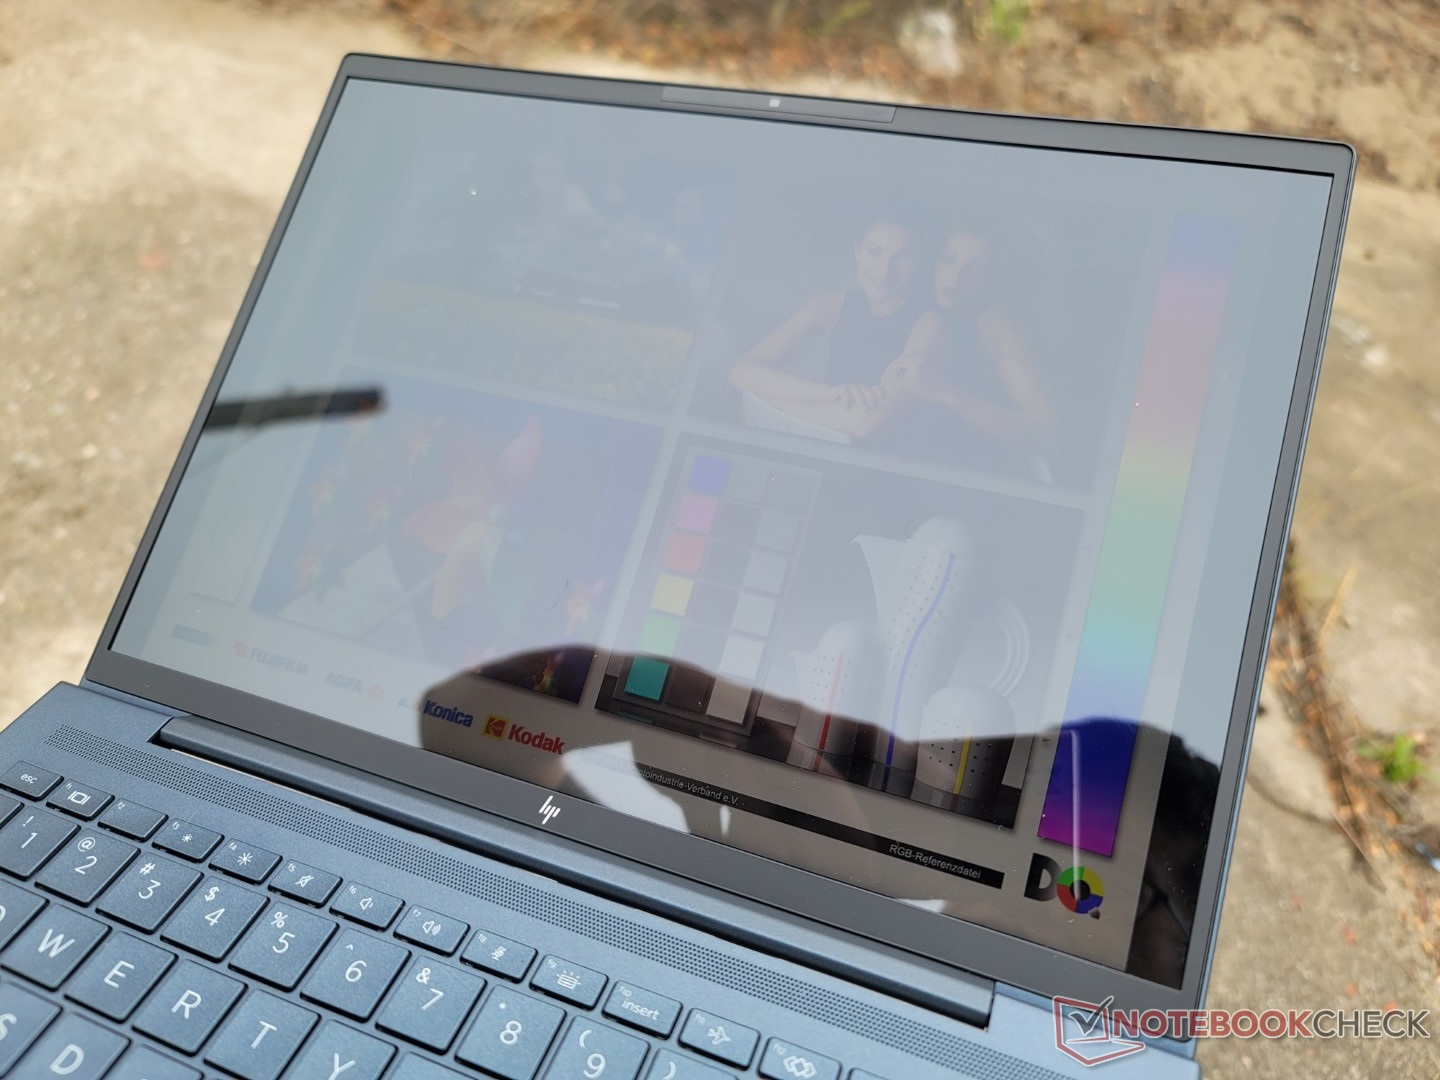
Lo schermo base da 400 nit è appena visibile nella maggior parte delle condizioni di illuminazione esterna. HP offre il suo pannello da 1000 nit come opzione per migliorare la visibilità all'aperto, ma purtroppo è legato a Sure View, che potrebbe essere indesiderabile per alcuni utenti per alcuni utenti.

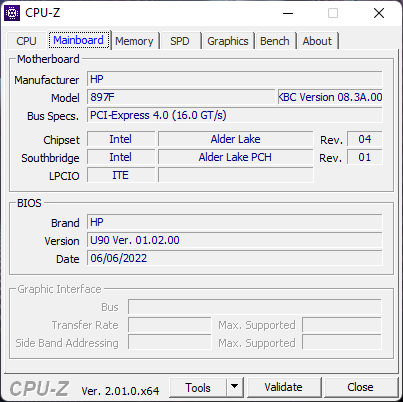
Prestazioni - Intel 12a generazione
Condizioni di test
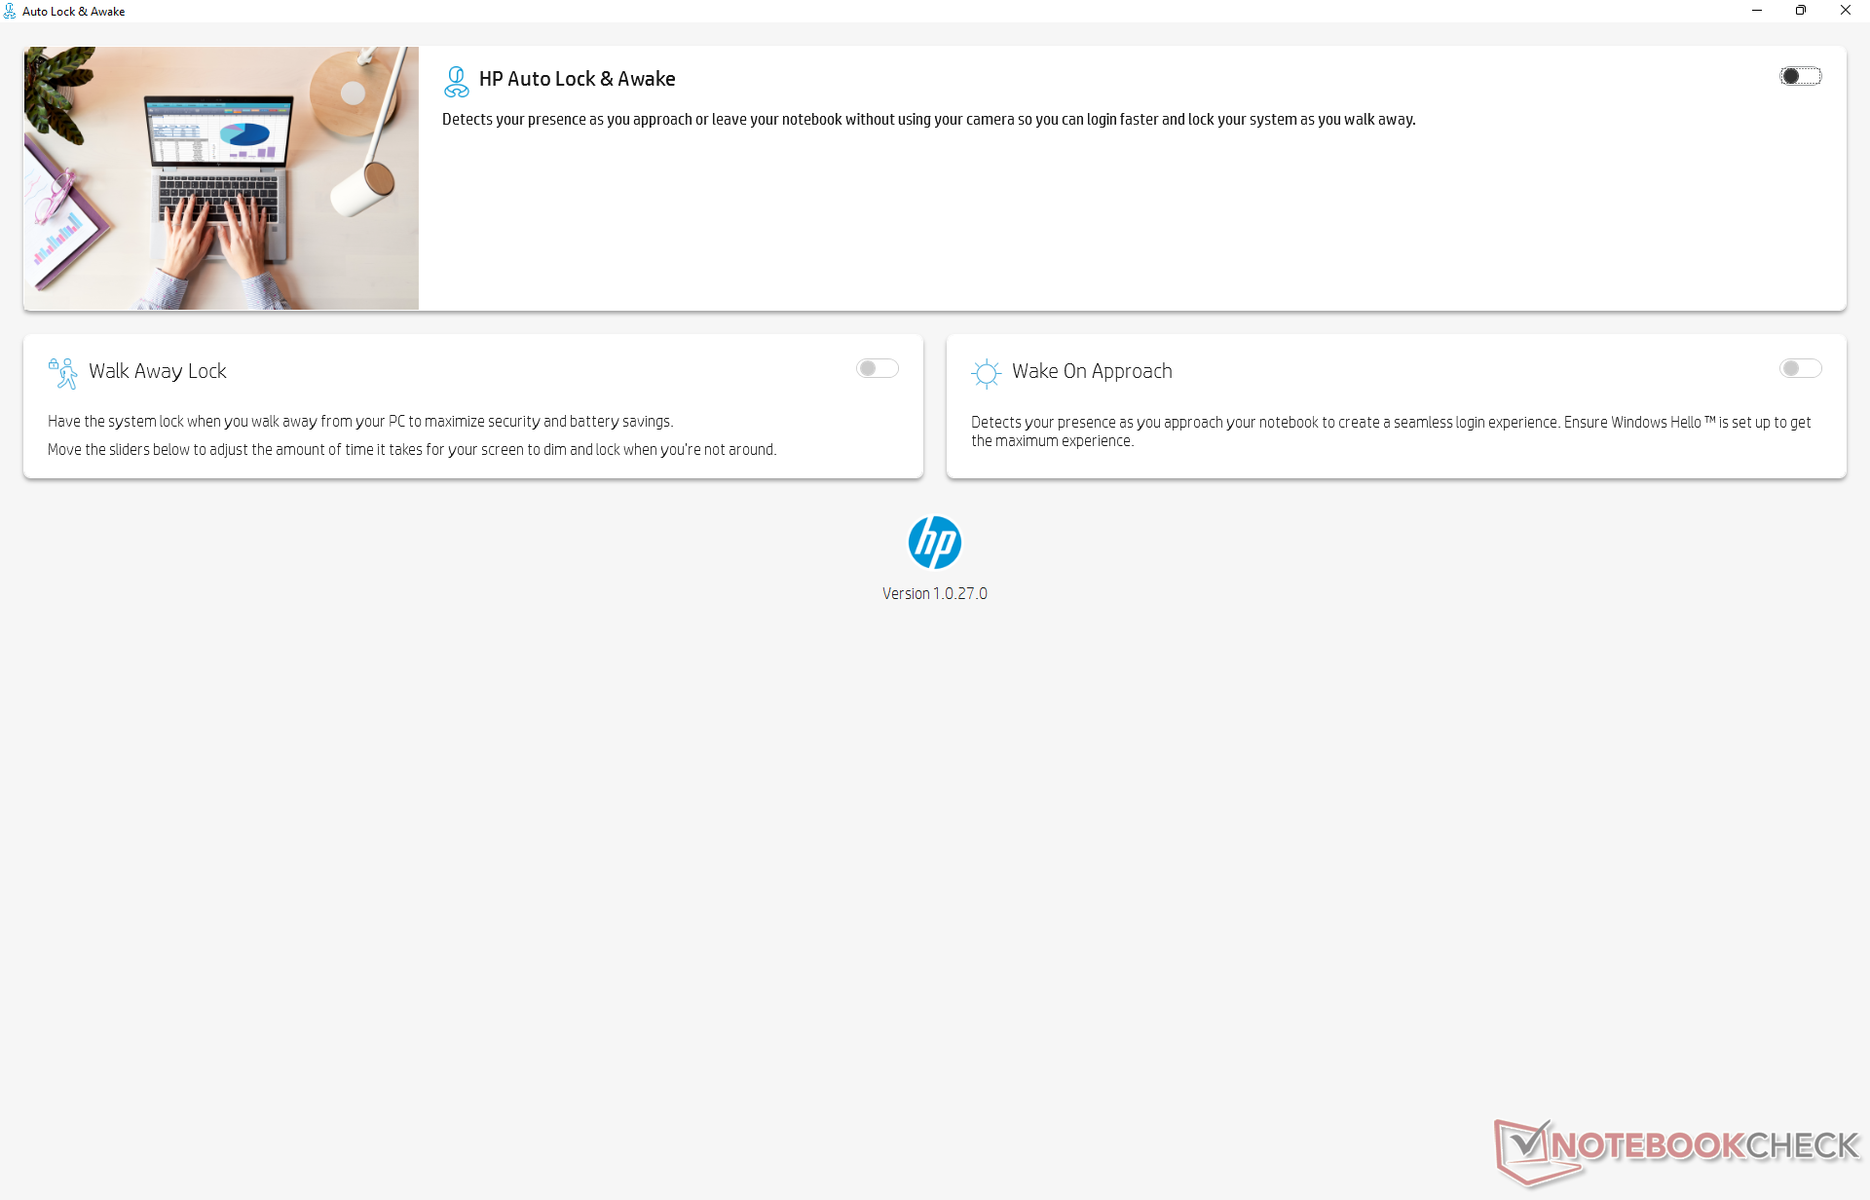
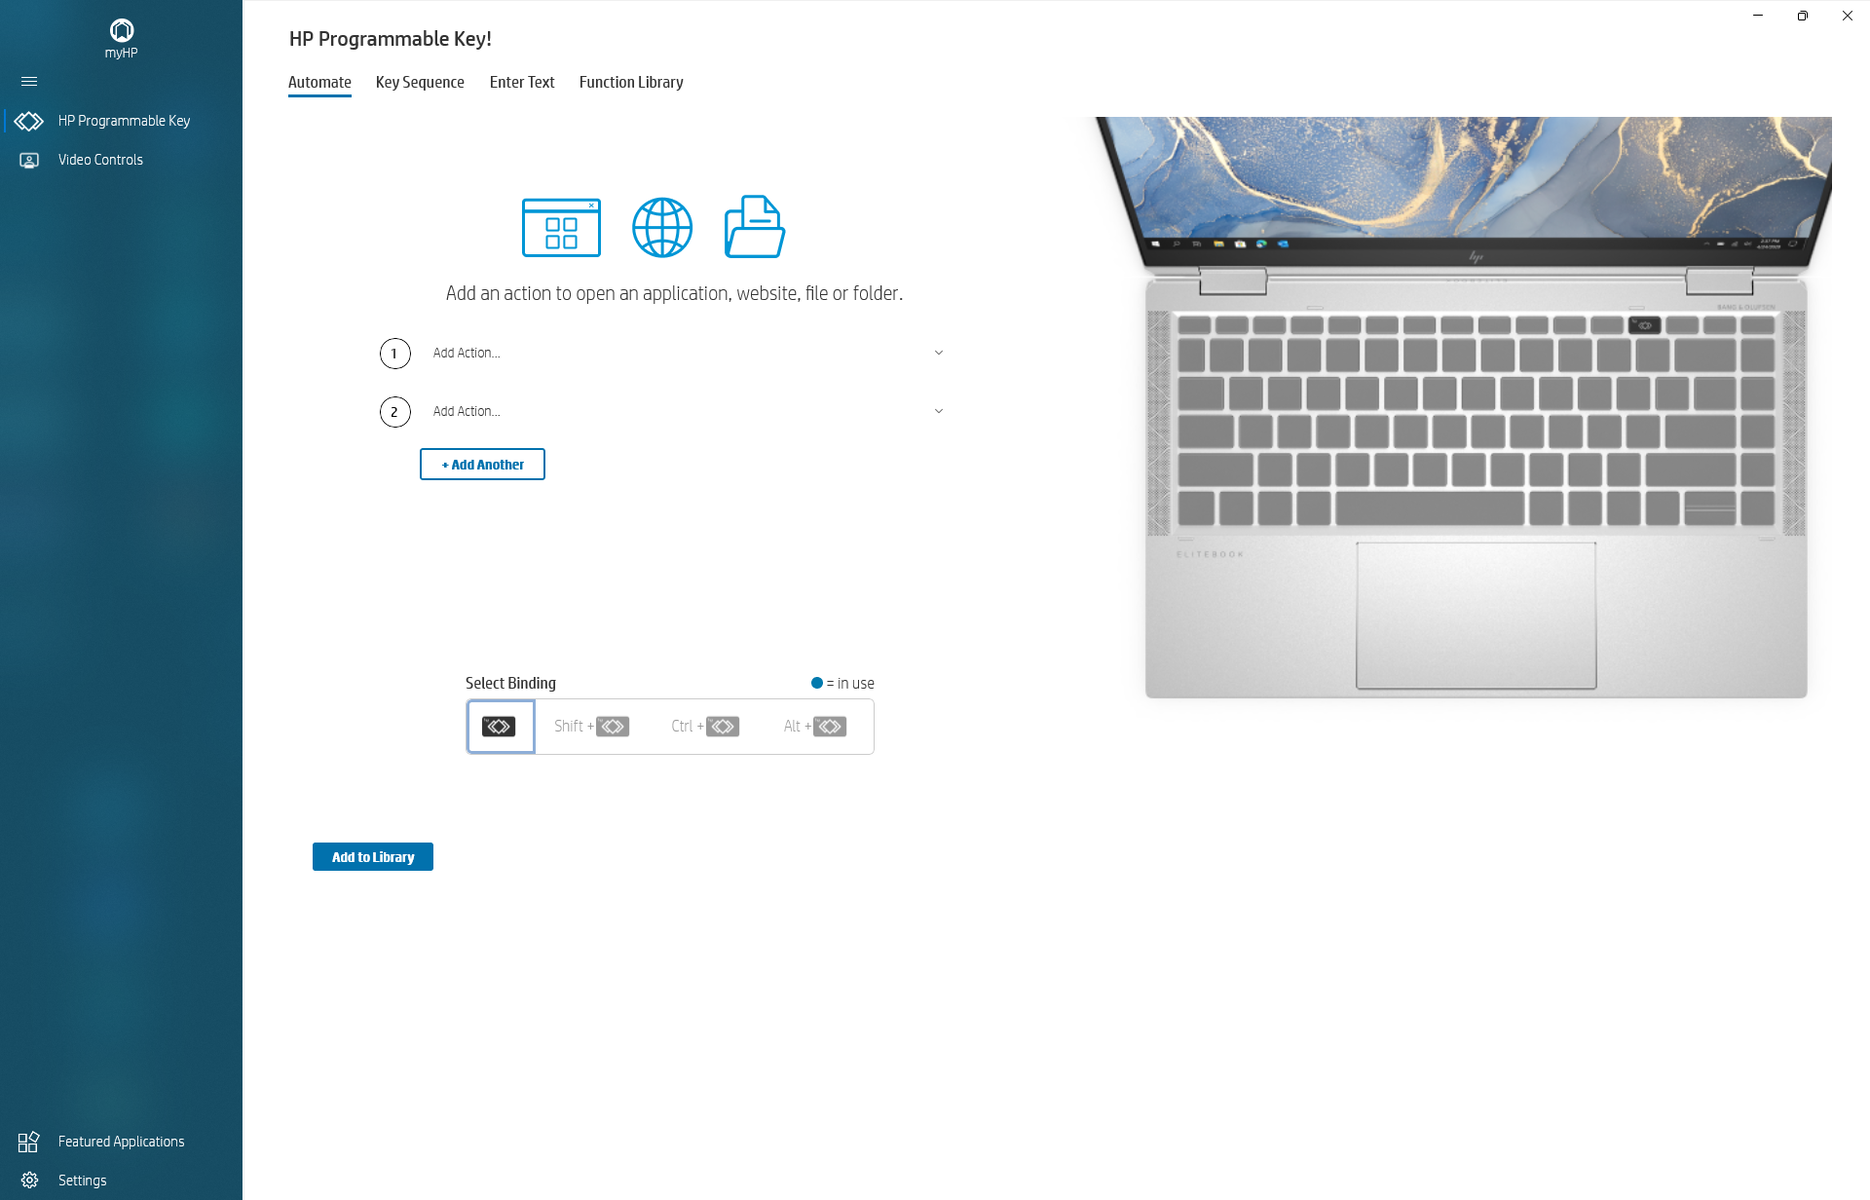
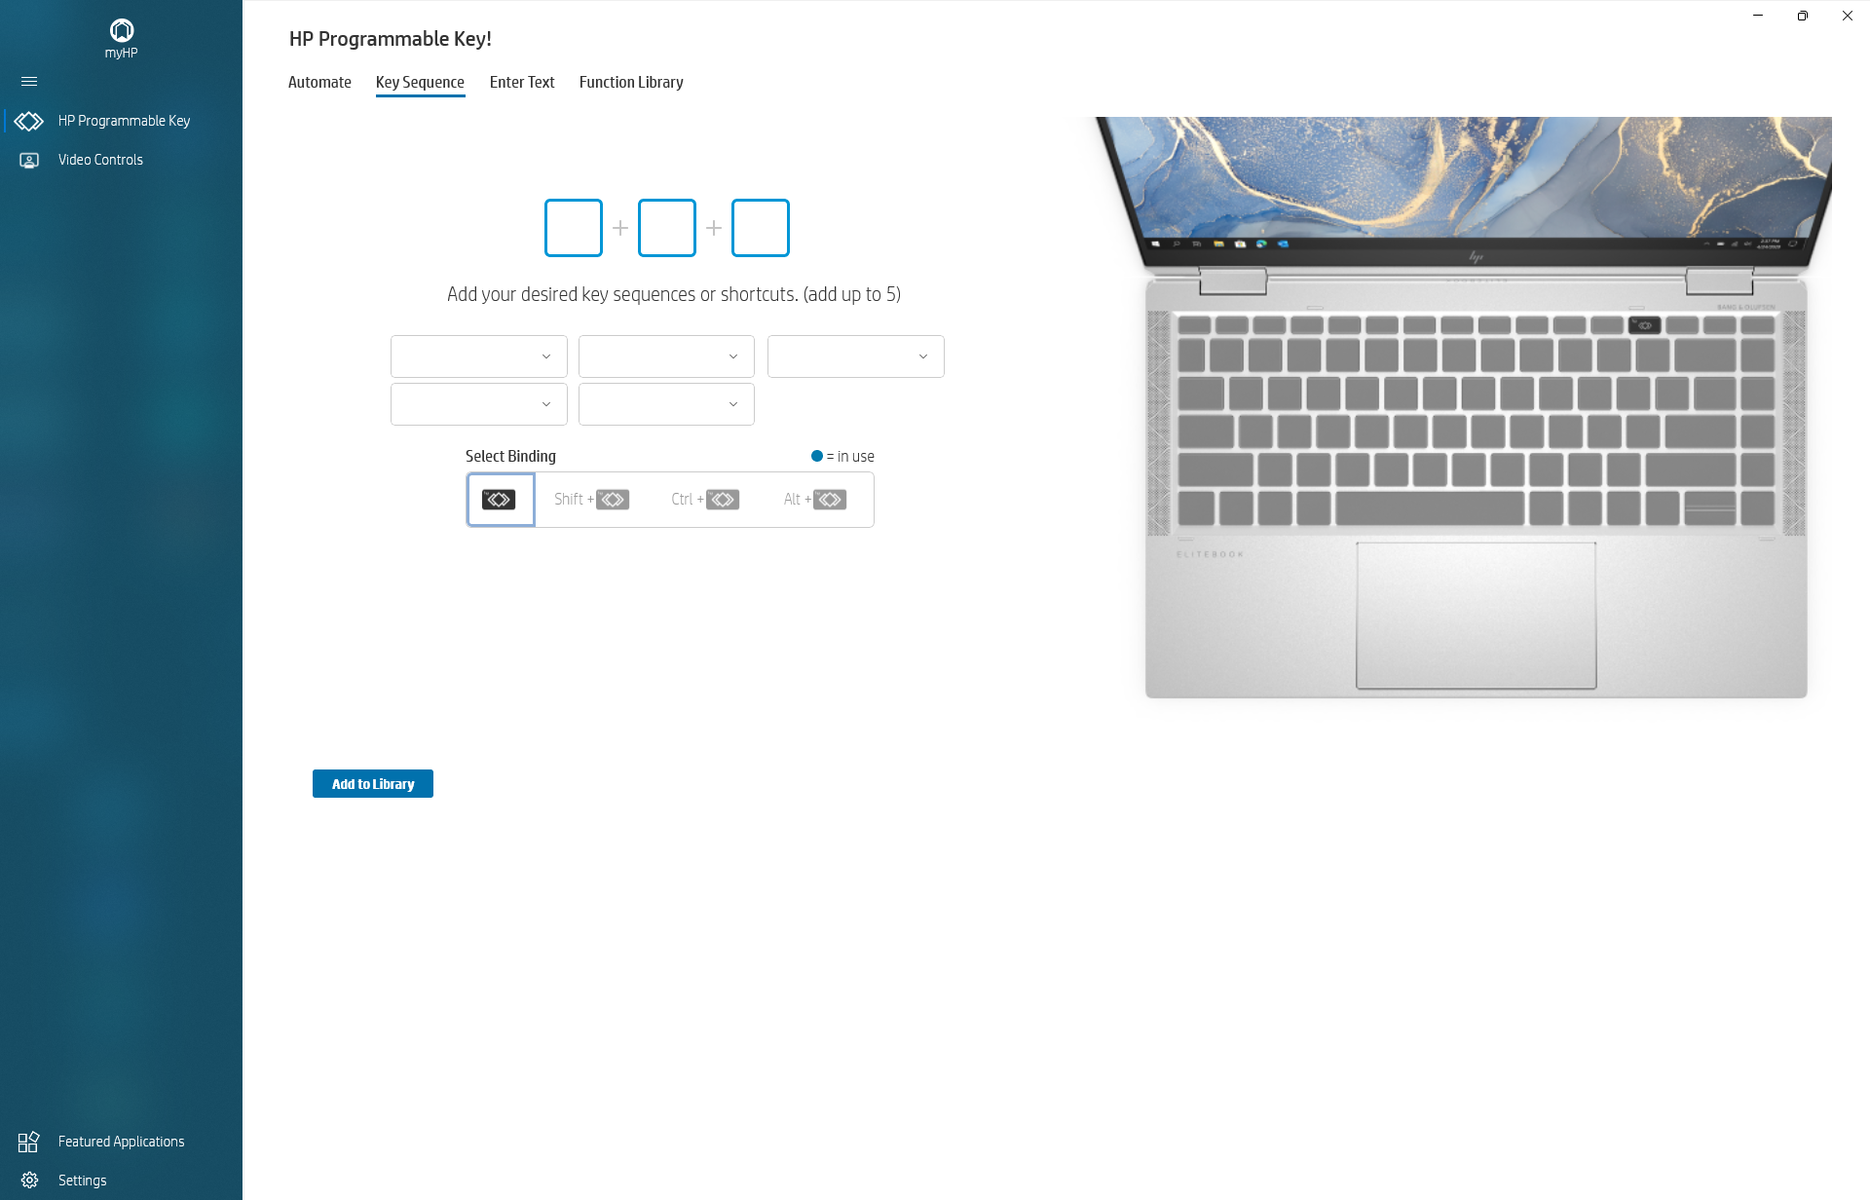
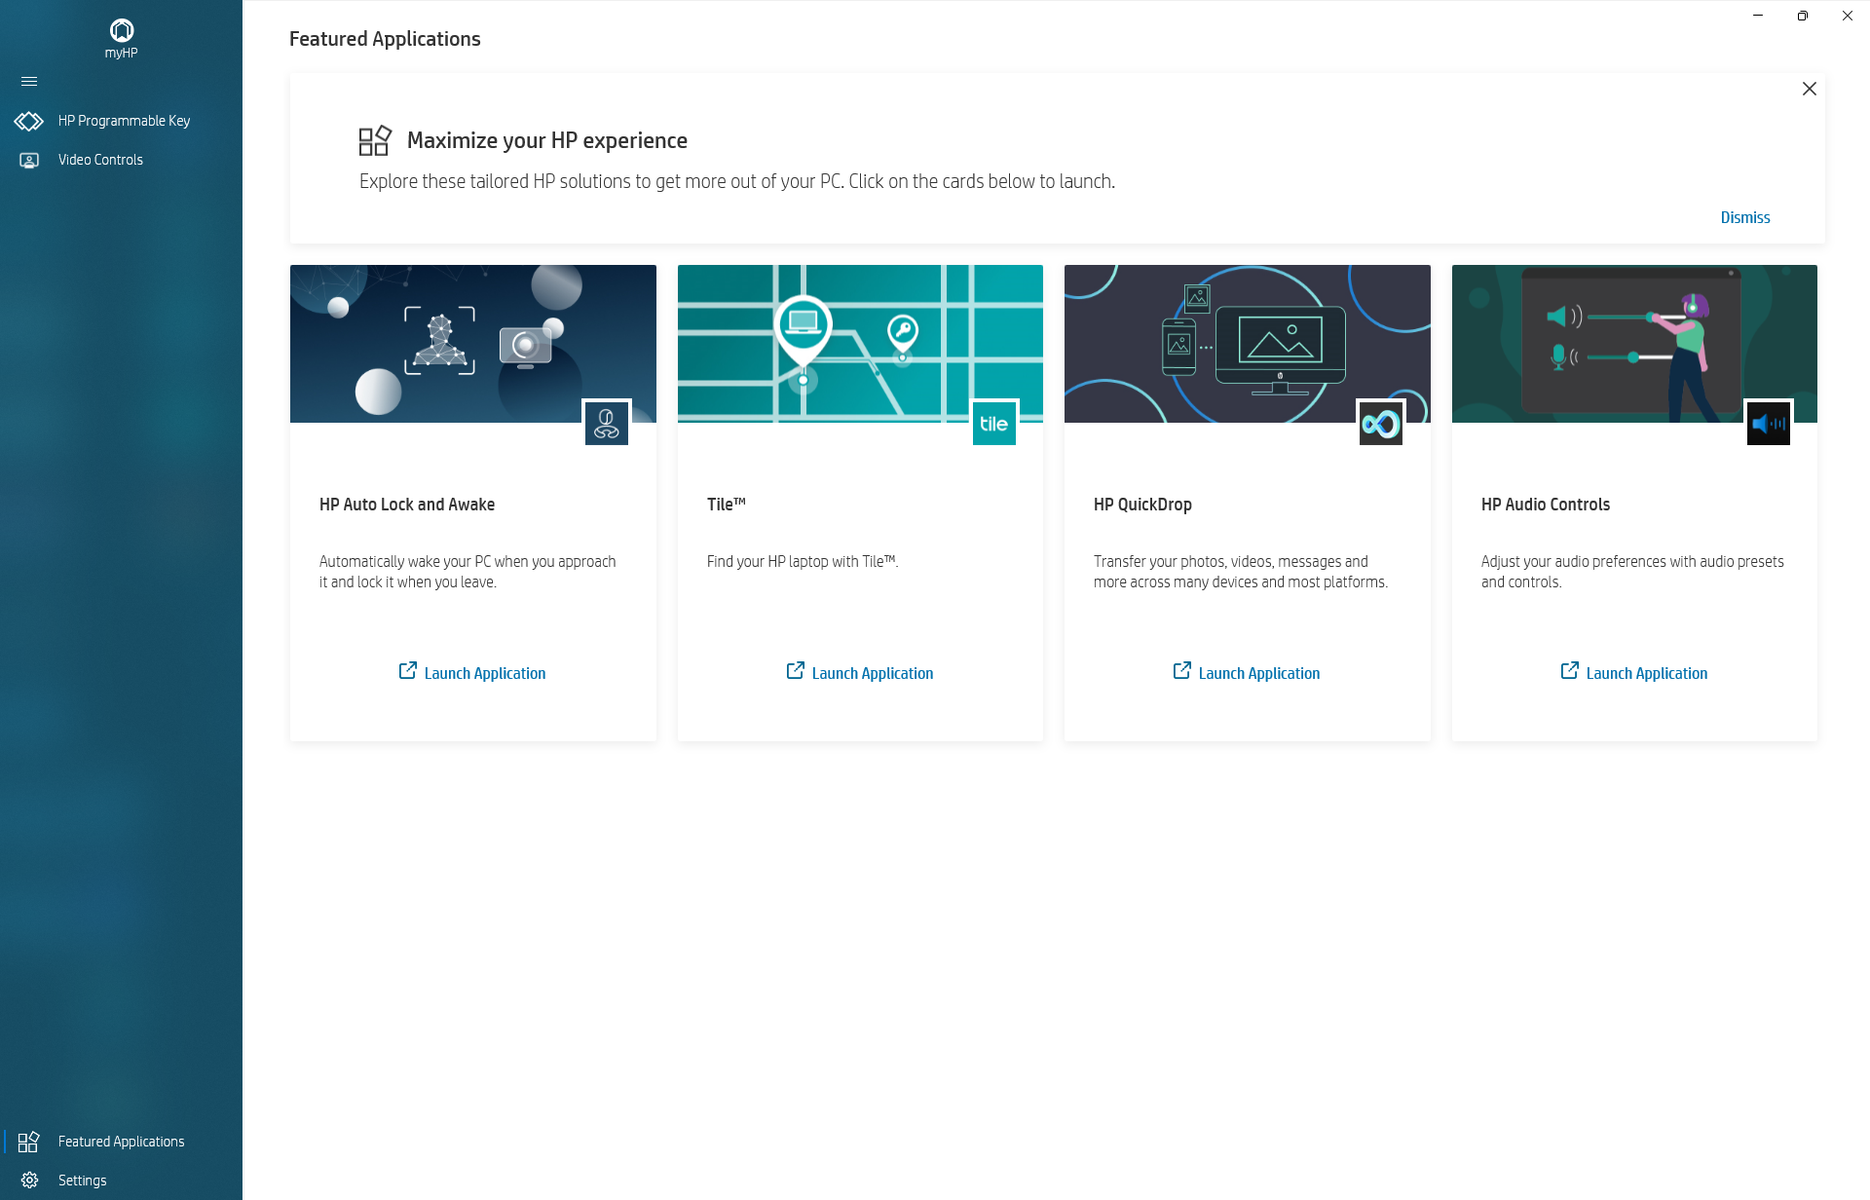
La nostra unità è stata impostata in modalità Performance tramite Windows prima di eseguire i benchmark qui sotto. HP Command Center, che è preinstallato sui portatili Spectre ed Envy, non è presente sul Dragonfly, un modello business-centrico. Il modello è invece dotato di HP Programmable Key, Auto Lock and Awake, Tile, QuickDrop e Audio Controls. Consigliamo di familiarizzare con il tasto programmabile e con il blocco automatico e la sveglia, in quanto sono le funzioni più utili per il lavoro quotidiano. Quest'ultima utilizza i raggi infrarossi per accedere o uscire automaticamente se rileva un utente davanti alla fotocamera, come nei modelli Dell Latitude di fascia alta. Di seguito sono riportate alcune schermate di alcuni programmi.

Processore
Dei tre computer portatili che abbiamo testato finora con il Core i7-1265Uil nostro Dragonfly G3 è il più lento con un buon margine. Il Core i7-1265U nel Dell Latitude 9430 2-in-1 supera il nostro HP rispettivamente del 20% e del 50% nei benchmark single-threaded e multi-threaded. In effetti, il Core i7-1255U del nostro Spectre x360 13.5 è più veloce del 40% rispetto al Dragonfly G3 con Core i7-1265U, anche dopo aver tenuto conto di eventuali limitazioni delle prestazioni
L'esecuzione di CineBench R15 xT in loop rivela un potenziale Turbo Boost limitato, poiché le prestazioni della CPU calano di circa il 19% dopo il primo loop. La stessa CPU del Latitude 7330 è in grado di mantenere punteggi più alti e quindi prestazioni più elevate più a lungo quando viene sottoposta allo stesso test in loop, come mostra il nostro grafico di confronto qui sotto
Il passaggio alla SKU Core i5-1235U dal nostro Core i7-1265U dovrebbe avere un impatto sulle prestazioni di circa il 25%.
Cinebench R15 Multi Loop
Cinebench R23: Multi Core | Single Core
Cinebench R15: CPU Multi 64Bit | CPU Single 64Bit
Blender: v2.79 BMW27 CPU
7-Zip 18.03: 7z b 4 | 7z b 4 -mmt1
Geekbench 5.5: Multi-Core | Single-Core
HWBOT x265 Benchmark v2.2: 4k Preset
LibreOffice : 20 Documents To PDF
R Benchmark 2.5: Overall mean
Cinebench R23: Multi Core | Single Core
Cinebench R15: CPU Multi 64Bit | CPU Single 64Bit
Blender: v2.79 BMW27 CPU
7-Zip 18.03: 7z b 4 | 7z b 4 -mmt1
Geekbench 5.5: Multi-Core | Single-Core
HWBOT x265 Benchmark v2.2: 4k Preset
LibreOffice : 20 Documents To PDF
R Benchmark 2.5: Overall mean
* ... Meglio usare valori piccoli
AIDA64: FP32 Ray-Trace | FPU Julia | CPU SHA3 | CPU Queen | FPU SinJulia | FPU Mandel | CPU AES | CPU ZLib | FP64 Ray-Trace | CPU PhotoWorxx
| Performance rating | |
| Framework Laptop 13.5 12th Gen Intel | |
| Dell XPS 13 Plus 9320 i5-1240p | |
| Media Intel Core i7-1265U | |
| HP Elite Dragonfly G3 | |
| Lenovo ThinkPad X1 Titanium Yoga G1 20QA001RGE | |
| AIDA64 / FP32 Ray-Trace | |
| Media Intel Core i7-1265U (2619 - 8178, n=10) | |
| HP Elite Dragonfly G3 | |
| Framework Laptop 13.5 12th Gen Intel | |
| Dell XPS 13 Plus 9320 i5-1240p | |
| Lenovo ThinkPad X1 Titanium Yoga G1 20QA001RGE | |
| AIDA64 / FPU Julia | |
| Media Intel Core i7-1265U (12909 - 41649, n=10) | |
| HP Elite Dragonfly G3 | |
| Framework Laptop 13.5 12th Gen Intel | |
| Dell XPS 13 Plus 9320 i5-1240p | |
| Lenovo ThinkPad X1 Titanium Yoga G1 20QA001RGE | |
| AIDA64 / CPU SHA3 | |
| Framework Laptop 13.5 12th Gen Intel | |
| Dell XPS 13 Plus 9320 i5-1240p | |
| Media Intel Core i7-1265U (824 - 2183, n=10) | |
| HP Elite Dragonfly G3 | |
| Lenovo ThinkPad X1 Titanium Yoga G1 20QA001RGE | |
| AIDA64 / CPU Queen | |
| Framework Laptop 13.5 12th Gen Intel | |
| Dell XPS 13 Plus 9320 i5-1240p | |
| Media Intel Core i7-1265U (63615 - 67065, n=10) | |
| HP Elite Dragonfly G3 | |
| Lenovo ThinkPad X1 Titanium Yoga G1 20QA001RGE | |
| AIDA64 / FPU SinJulia | |
| Framework Laptop 13.5 12th Gen Intel | |
| Dell XPS 13 Plus 9320 i5-1240p | |
| Media Intel Core i7-1265U (3105 - 5135, n=10) | |
| HP Elite Dragonfly G3 | |
| Lenovo ThinkPad X1 Titanium Yoga G1 20QA001RGE | |
| AIDA64 / FPU Mandel | |
| Media Intel Core i7-1265U (6967 - 20804, n=10) | |
| HP Elite Dragonfly G3 | |
| Framework Laptop 13.5 12th Gen Intel | |
| Dell XPS 13 Plus 9320 i5-1240p | |
| Lenovo ThinkPad X1 Titanium Yoga G1 20QA001RGE | |
| AIDA64 / CPU AES | |
| Framework Laptop 13.5 12th Gen Intel | |
| Lenovo ThinkPad X1 Titanium Yoga G1 20QA001RGE | |
| Dell XPS 13 Plus 9320 i5-1240p | |
| Media Intel Core i7-1265U (19489 - 42966, n=10) | |
| HP Elite Dragonfly G3 | |
| AIDA64 / CPU ZLib | |
| Framework Laptop 13.5 12th Gen Intel | |
| Dell XPS 13 Plus 9320 i5-1240p | |
| Media Intel Core i7-1265U (314 - 632, n=10) | |
| HP Elite Dragonfly G3 | |
| Lenovo ThinkPad X1 Titanium Yoga G1 20QA001RGE | |
| AIDA64 / FP64 Ray-Trace | |
| Media Intel Core i7-1265U (1473 - 4376, n=10) | |
| HP Elite Dragonfly G3 | |
| Framework Laptop 13.5 12th Gen Intel | |
| Dell XPS 13 Plus 9320 i5-1240p | |
| Lenovo ThinkPad X1 Titanium Yoga G1 20QA001RGE | |
| AIDA64 / CPU PhotoWorxx | |
| Lenovo ThinkPad X1 Titanium Yoga G1 20QA001RGE | |
| HP Elite Dragonfly G3 | |
| Dell XPS 13 Plus 9320 i5-1240p | |
| Media Intel Core i7-1265U (20213 - 47031, n=10) | |
| Framework Laptop 13.5 12th Gen Intel | |
Prestazioni del sistema
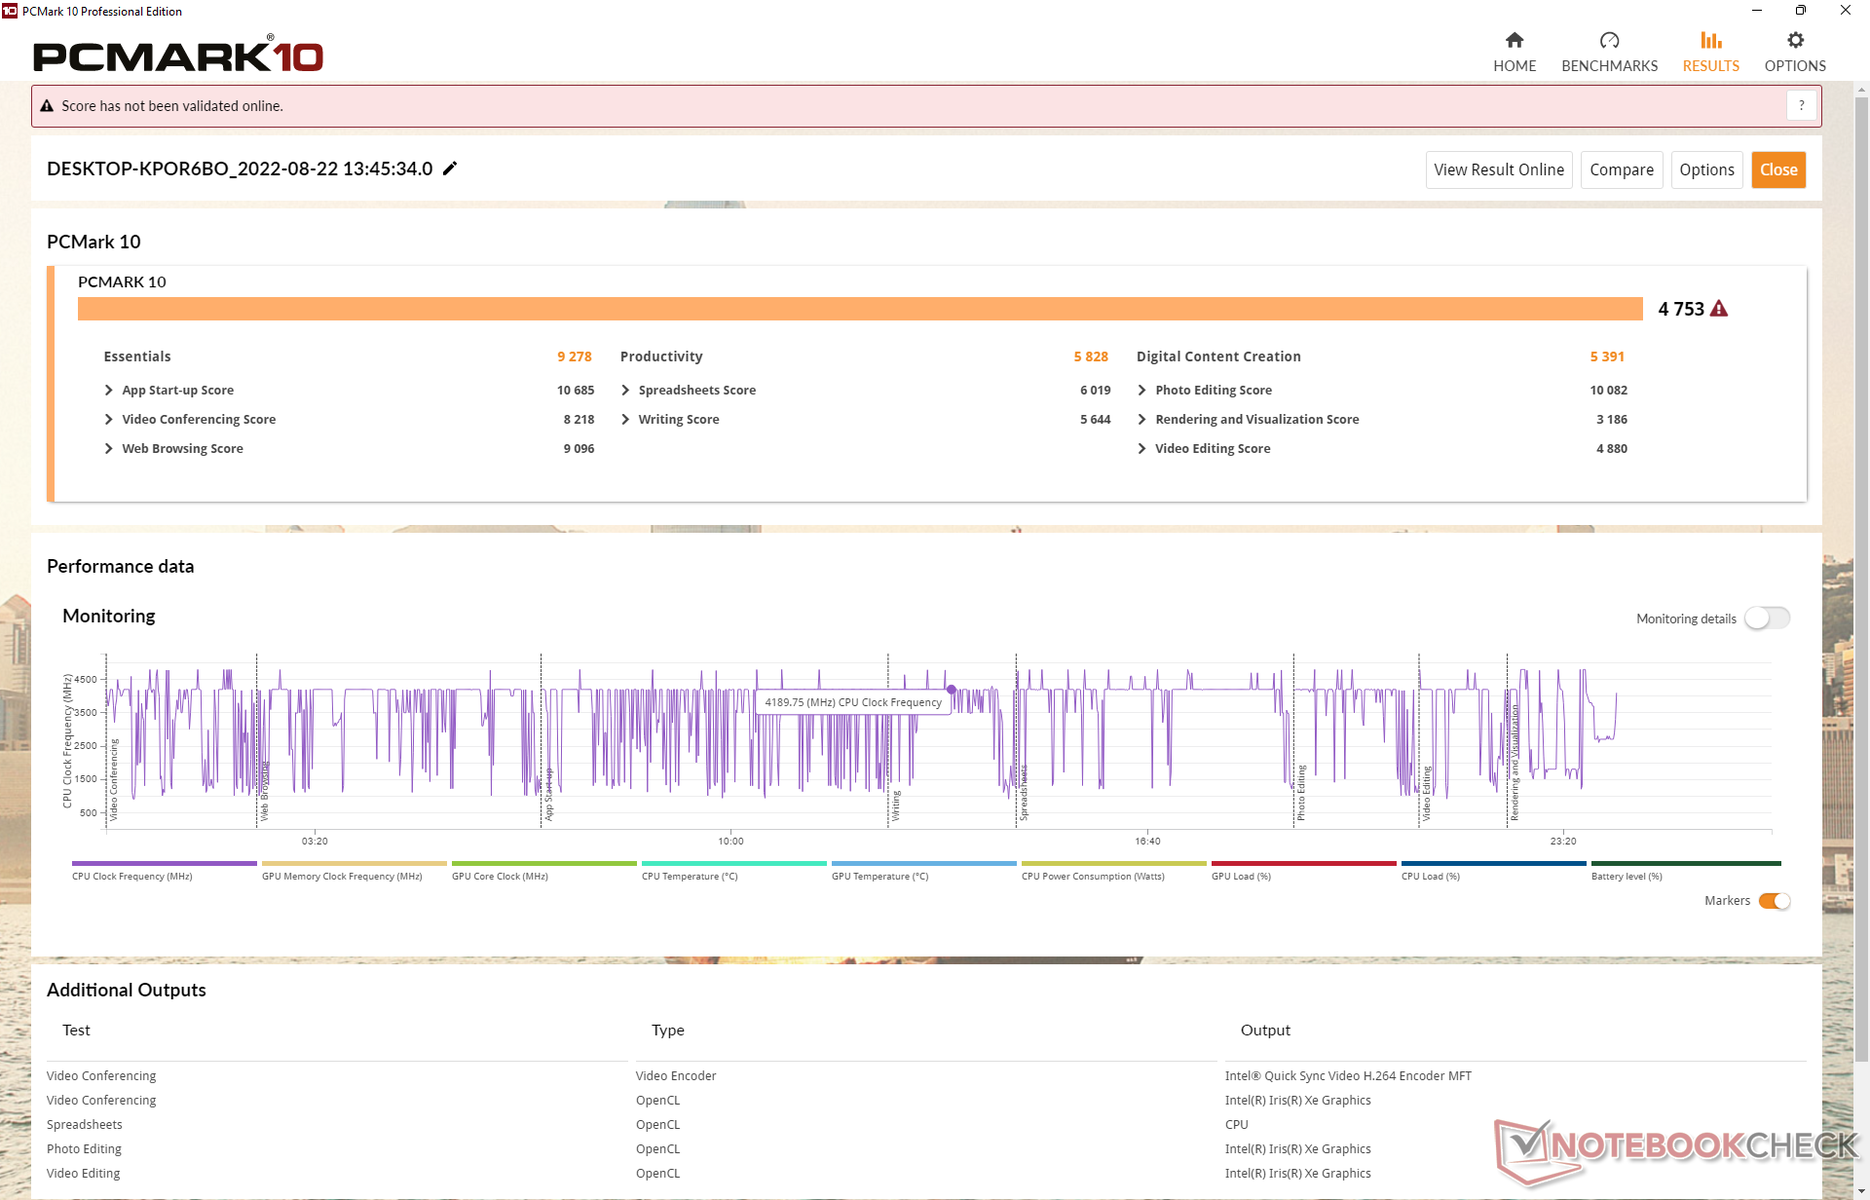
È interessante notare che i risultati di PCMark sono leggermente inferiori a quelli registrati sullo Spectre x360 14 dotato di CPU Core i7 di ultima generazione. Non aspettatevi che il Dragonfly G3 sia tangibilmente più veloce durante la navigazione, lo streaming video o l'esecuzione di altri carichi di lavoro non impegnativi.
CrossMark: Overall | Productivity | Creativity | Responsiveness
| PCMark 10 / Score | |
| Framework Laptop 13.5 12th Gen Intel | |
| Media Intel Core i7-1265U, Intel Iris Xe Graphics G7 96EUs (4753 - 5766, n=7) | |
| HP Spectre x360 14t-ea000 | |
| Dell XPS 13 Plus 9320 i5-1240p | |
| HP Elite Dragonfly G3 | |
| Lenovo ThinkPad X1 Titanium Yoga G1 20QA001RGE | |
| PCMark 10 / Essentials | |
| Framework Laptop 13.5 12th Gen Intel | |
| Media Intel Core i7-1265U, Intel Iris Xe Graphics G7 96EUs (9278 - 11418, n=7) | |
| Lenovo ThinkPad X1 Titanium Yoga G1 20QA001RGE | |
| HP Spectre x360 14t-ea000 | |
| HP Elite Dragonfly G3 | |
| Dell XPS 13 Plus 9320 i5-1240p | |
| PCMark 10 / Productivity | |
| Framework Laptop 13.5 12th Gen Intel | |
| HP Spectre x360 14t-ea000 | |
| Media Intel Core i7-1265U, Intel Iris Xe Graphics G7 96EUs (5828 - 7311, n=7) | |
| Lenovo ThinkPad X1 Titanium Yoga G1 20QA001RGE | |
| Dell XPS 13 Plus 9320 i5-1240p | |
| HP Elite Dragonfly G3 | |
| PCMark 10 / Digital Content Creation | |
| Framework Laptop 13.5 12th Gen Intel | |
| Media Intel Core i7-1265U, Intel Iris Xe Graphics G7 96EUs (5127 - 6330, n=7) | |
| Dell XPS 13 Plus 9320 i5-1240p | |
| HP Elite Dragonfly G3 | |
| HP Spectre x360 14t-ea000 | |
| Lenovo ThinkPad X1 Titanium Yoga G1 20QA001RGE | |
| CrossMark / Overall | |
| Framework Laptop 13.5 12th Gen Intel | |
| Media Intel Core i7-1265U, Intel Iris Xe Graphics G7 96EUs (1301 - 1615, n=7) | |
| Dell XPS 13 Plus 9320 i5-1240p | |
| HP Elite Dragonfly G3 | |
| CrossMark / Productivity | |
| Framework Laptop 13.5 12th Gen Intel | |
| Media Intel Core i7-1265U, Intel Iris Xe Graphics G7 96EUs (1230 - 1586, n=7) | |
| Dell XPS 13 Plus 9320 i5-1240p | |
| HP Elite Dragonfly G3 | |
| CrossMark / Creativity | |
| Framework Laptop 13.5 12th Gen Intel | |
| Media Intel Core i7-1265U, Intel Iris Xe Graphics G7 96EUs (1413 - 1706, n=7) | |
| Dell XPS 13 Plus 9320 i5-1240p | |
| HP Elite Dragonfly G3 | |
| CrossMark / Responsiveness | |
| Framework Laptop 13.5 12th Gen Intel | |
| Media Intel Core i7-1265U, Intel Iris Xe Graphics G7 96EUs (1193 - 1521, n=7) | |
| Dell XPS 13 Plus 9320 i5-1240p | |
| HP Elite Dragonfly G3 | |
| PCMark 10 Score | 4753 punti | |
Aiuto | ||
| AIDA64 / Memory Copy | |
| HP Elite Dragonfly G3 | |
| Dell XPS 13 Plus 9320 i5-1240p | |
| Media Intel Core i7-1265U (40212 - 72204, n=10) | |
| Lenovo ThinkPad X1 Titanium Yoga G1 20QA001RGE | |
| Framework Laptop 13.5 12th Gen Intel | |
| AIDA64 / Memory Read | |
| Dell XPS 13 Plus 9320 i5-1240p | |
| HP Elite Dragonfly G3 | |
| Lenovo ThinkPad X1 Titanium Yoga G1 20QA001RGE | |
| Media Intel Core i7-1265U (41808 - 69493, n=10) | |
| Framework Laptop 13.5 12th Gen Intel | |
| AIDA64 / Memory Write | |
| Lenovo ThinkPad X1 Titanium Yoga G1 20QA001RGE | |
| Dell XPS 13 Plus 9320 i5-1240p | |
| Media Intel Core i7-1265U (41382 - 76027, n=10) | |
| HP Elite Dragonfly G3 | |
| Framework Laptop 13.5 12th Gen Intel | |
| AIDA64 / Memory Latency | |
| HP Elite Dragonfly G3 | |
| Media Intel Core i7-1265U (74.6 - 112.4, n=10) | |
| Lenovo ThinkPad X1 Titanium Yoga G1 20QA001RGE | |
| Framework Laptop 13.5 12th Gen Intel | |
* ... Meglio usare valori piccoli
Latenza DPC
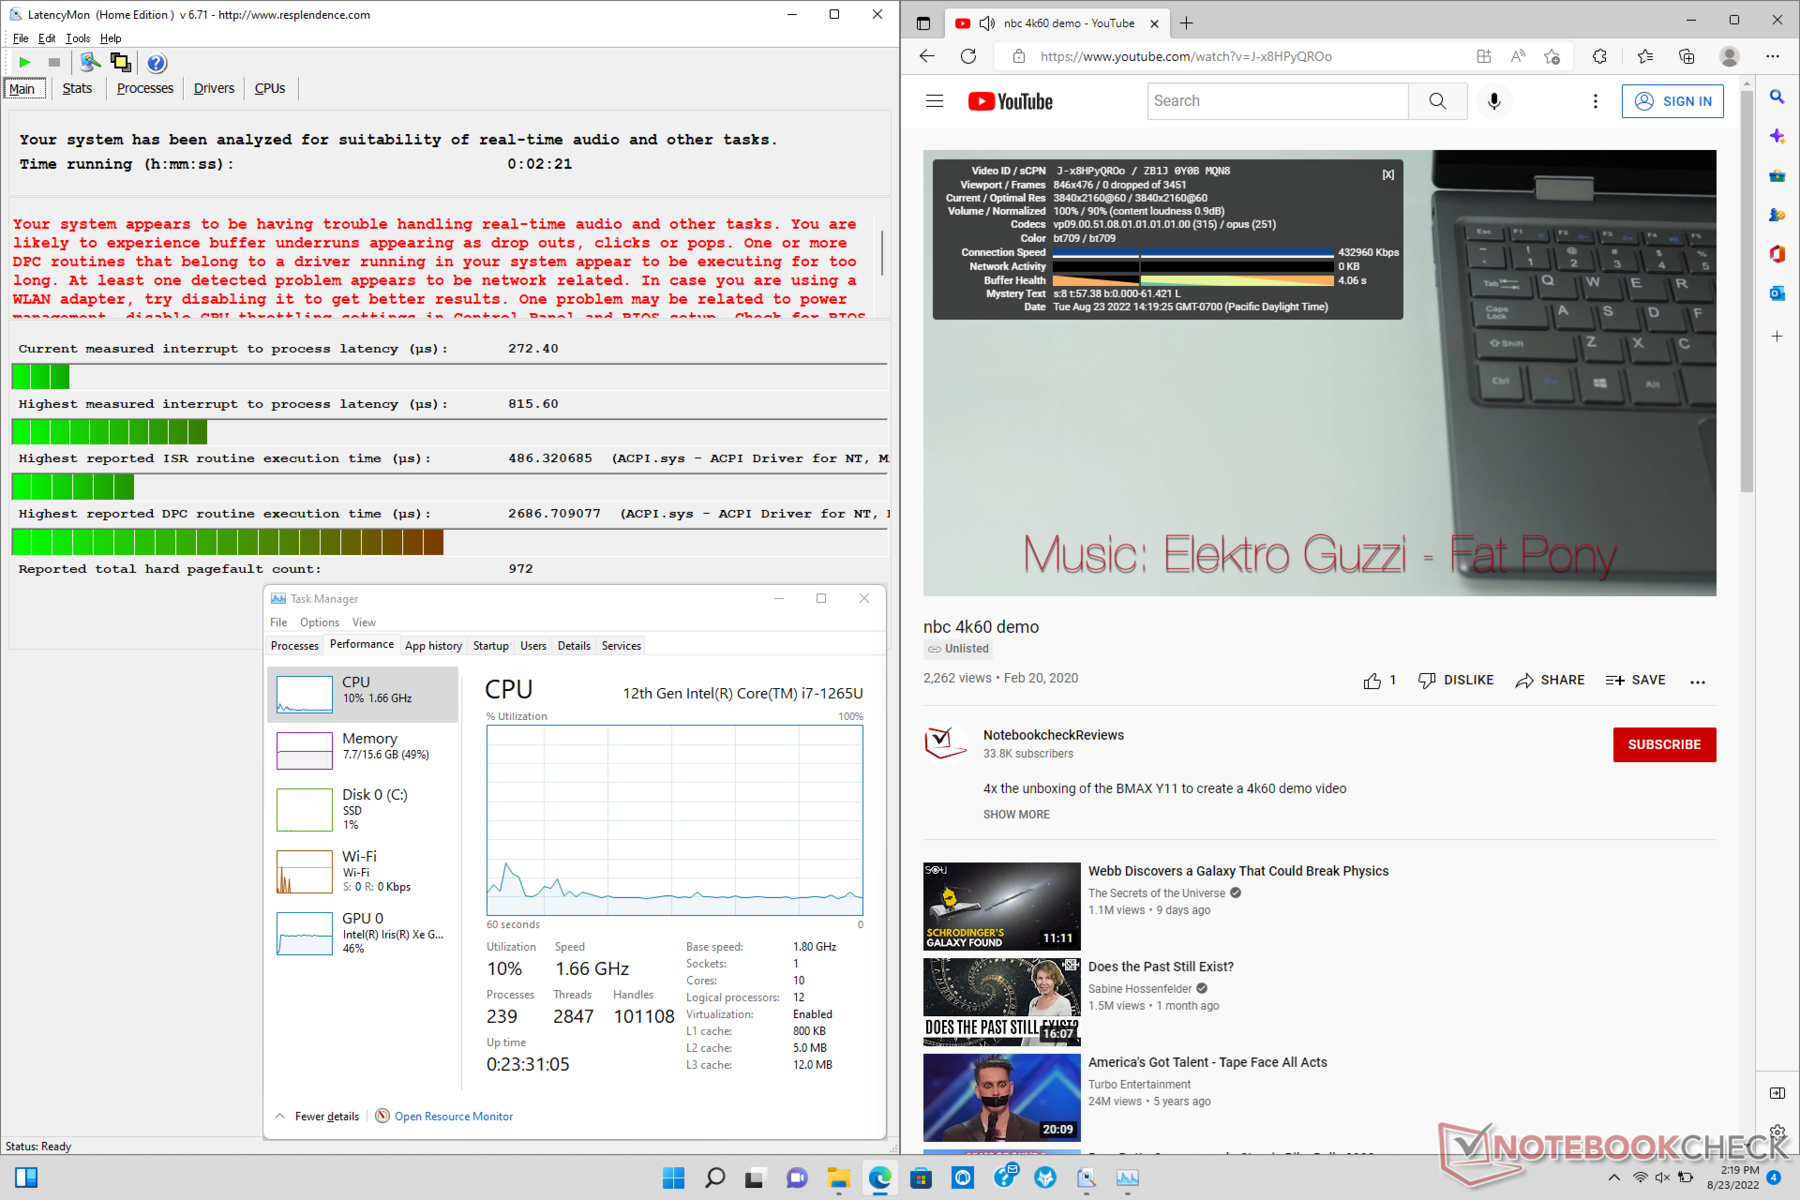
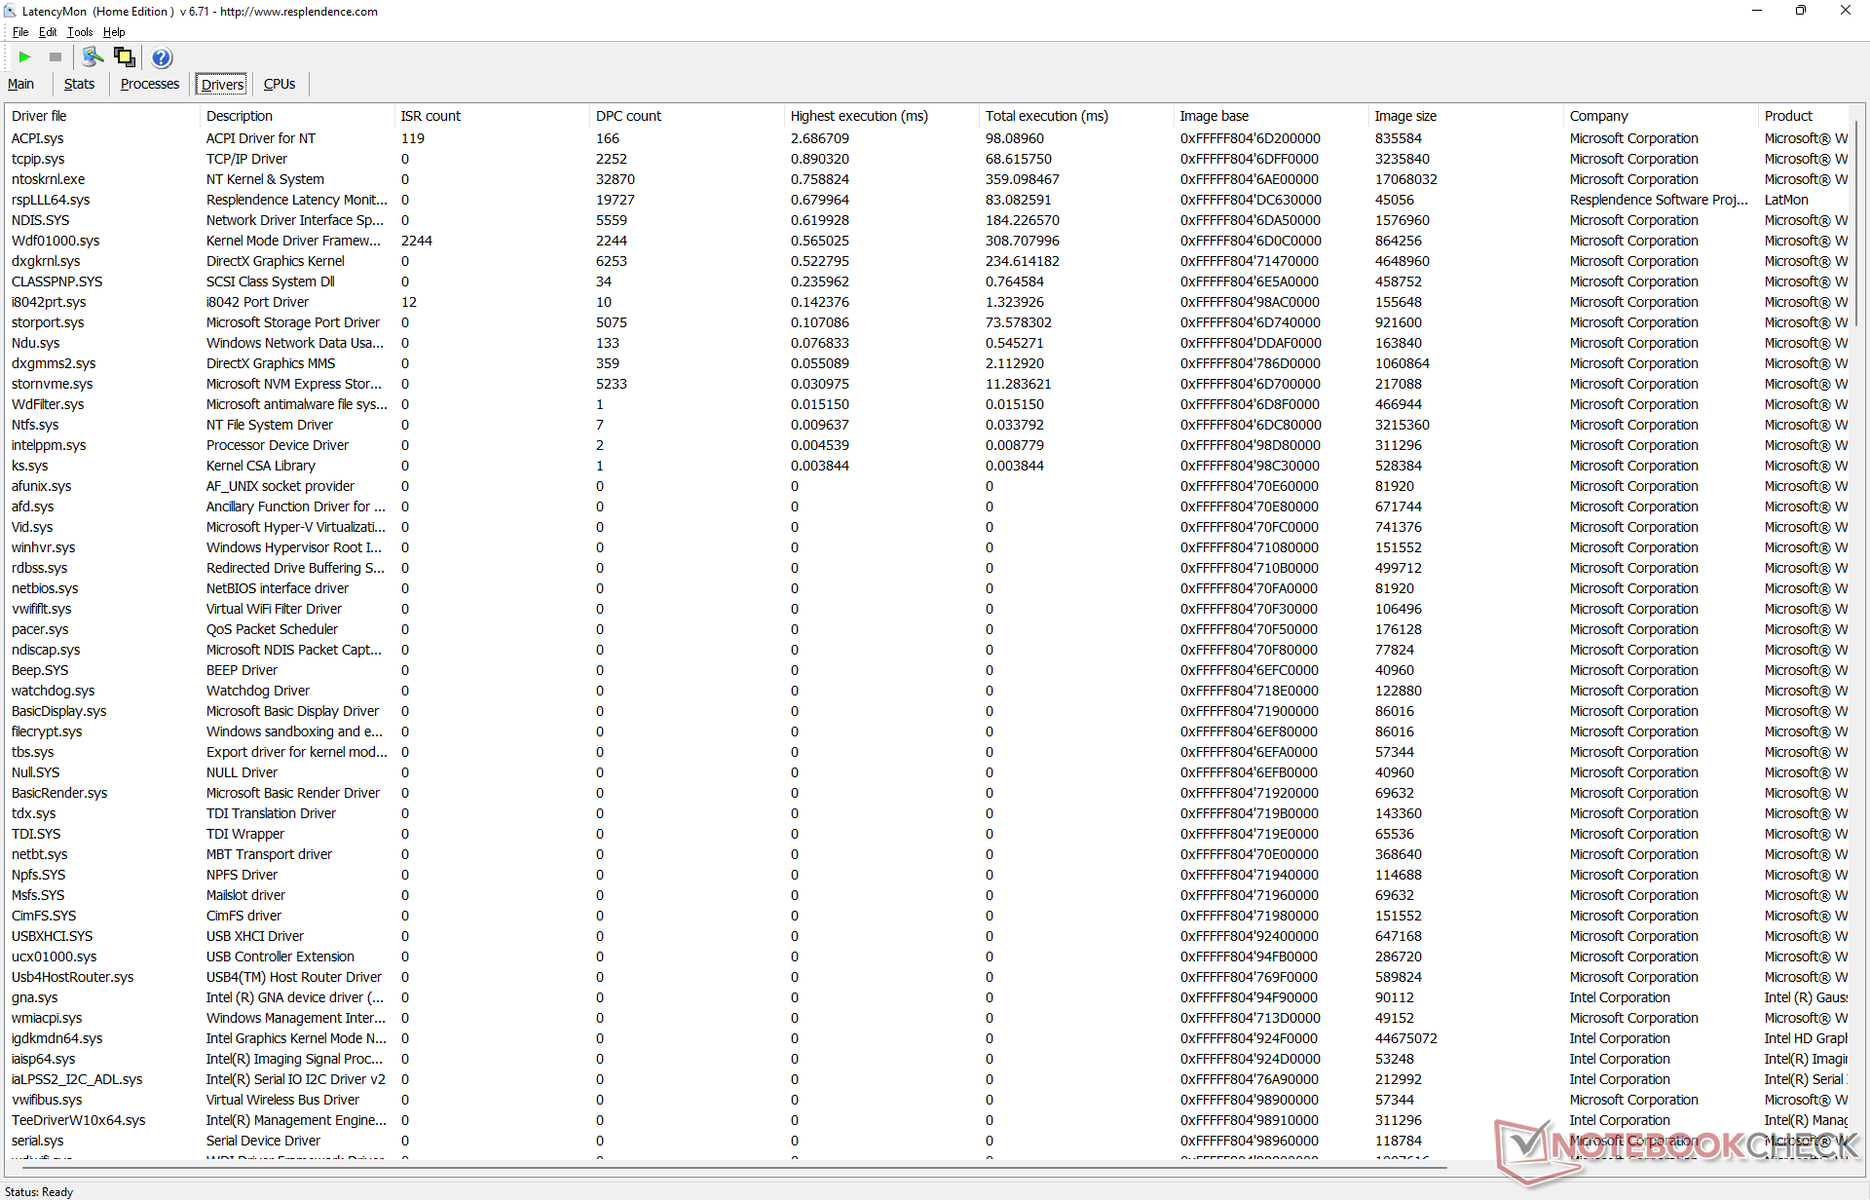
LatencyMon rivela problemi di DPC quando si aprono più schede del browser della nostra homepage. la riproduzione di video 4K a 60 FPS è invece perfetta, senza cadute di fotogrammi durante i nostri test.
| DPC Latencies / LatencyMon - interrupt to process latency (max), Web, Youtube, Prime95 | |
| Dell XPS 13 Plus 9320 i5-1240p | |
| HP Spectre x360 14t-ea000 | |
| Lenovo ThinkPad X1 Titanium Yoga G1 20QA001RGE | |
| Framework Laptop 13.5 12th Gen Intel | |
| HP Elite Dragonfly G3 | |
* ... Meglio usare valori piccoli
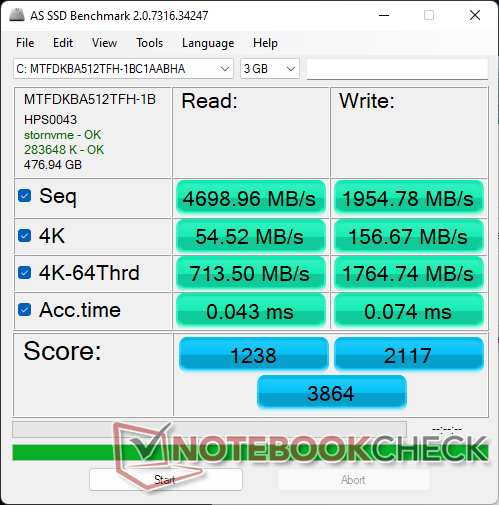
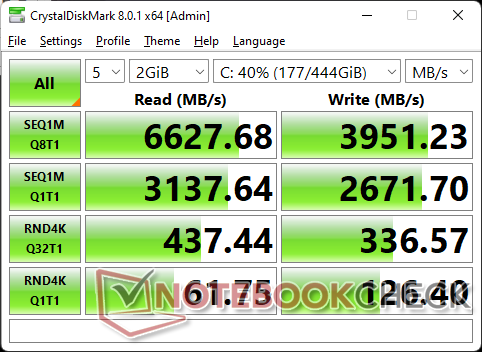
Dispositivi di archiviazione
HP offre opzioni di SSD che vanno da 256 GB a 1 TB OPAL2 NVMe. La nostra configurazione specifica è dotata di 512 GB Micron MTFDKBA512TFH SSD PCIe4 per velocità di lettura e scrittura sequenziali di circa 6500 MB/s e 4000 MB/s, rispettivamente. L'unità non presenta problemi di strozzatura delle prestazioni quando si esegue DiskSpd in loop.

* ... Meglio usare valori piccoli
Disk Throttling: DiskSpd Read Loop, Queue Depth 8
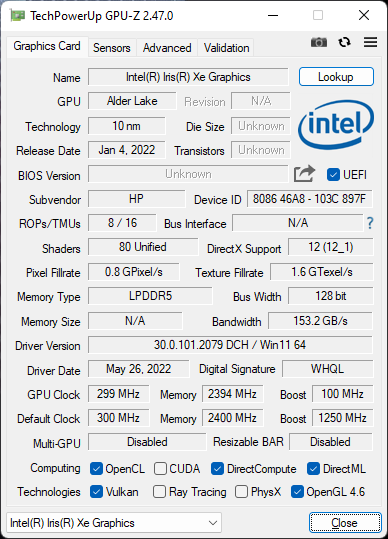
Prestazioni della GPU
Il sistema integrato Iris Xe 96 EUs integrata si comporta come ci aspettiamo rispetto ad altri portatili con la stessa GPU. Questo è ottimo perché significa che HP non ha limitato artificialmente le prestazioni grafiche in modo eccessivo, ma è anche deludente perché significa che gli utenti non dovrebbero aspettarsi alcun miglioramento significativo della GPU rispetto alla serie Core i7-1165G7 di ultima generazione.
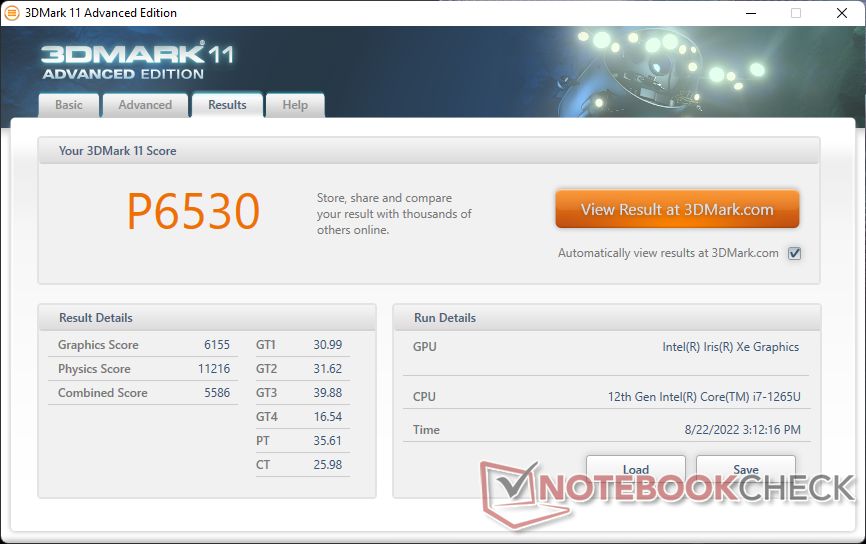
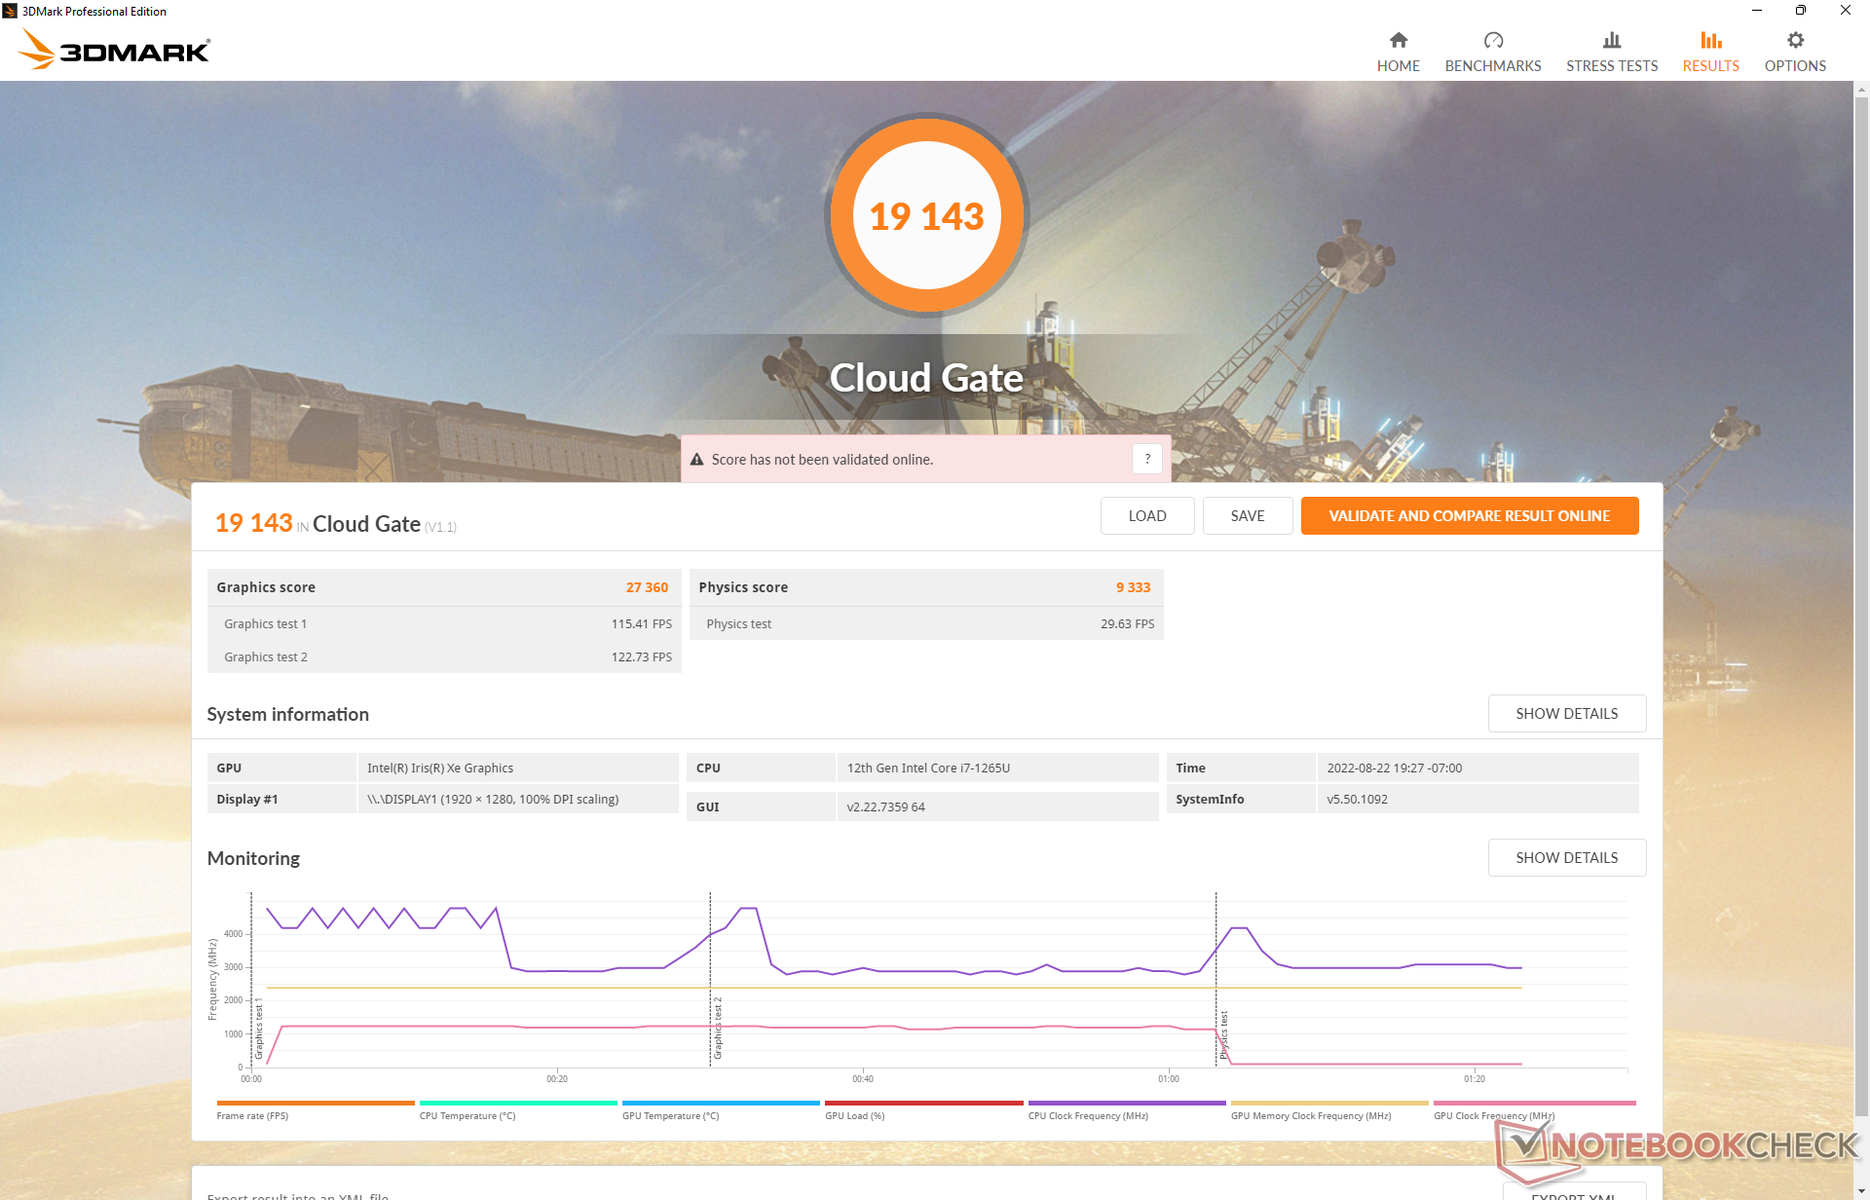
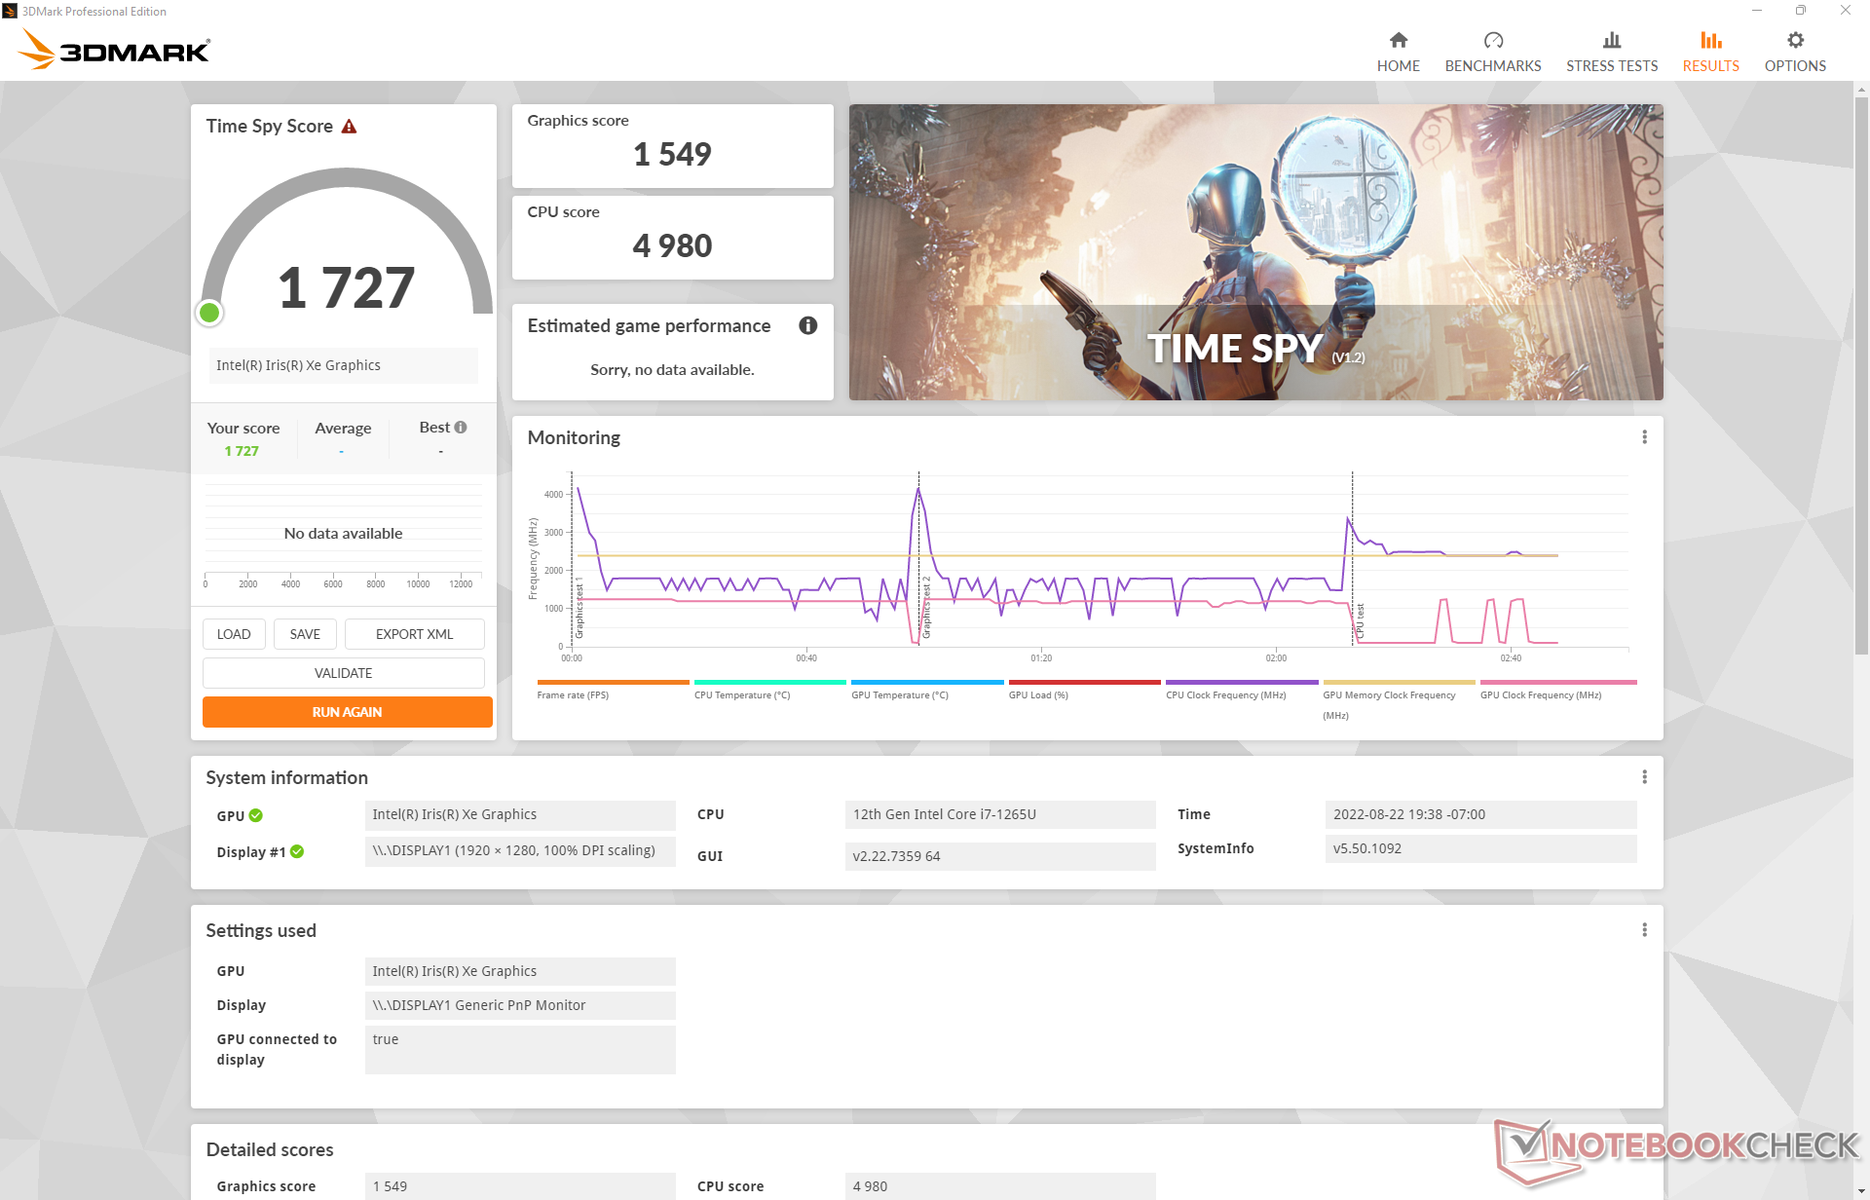
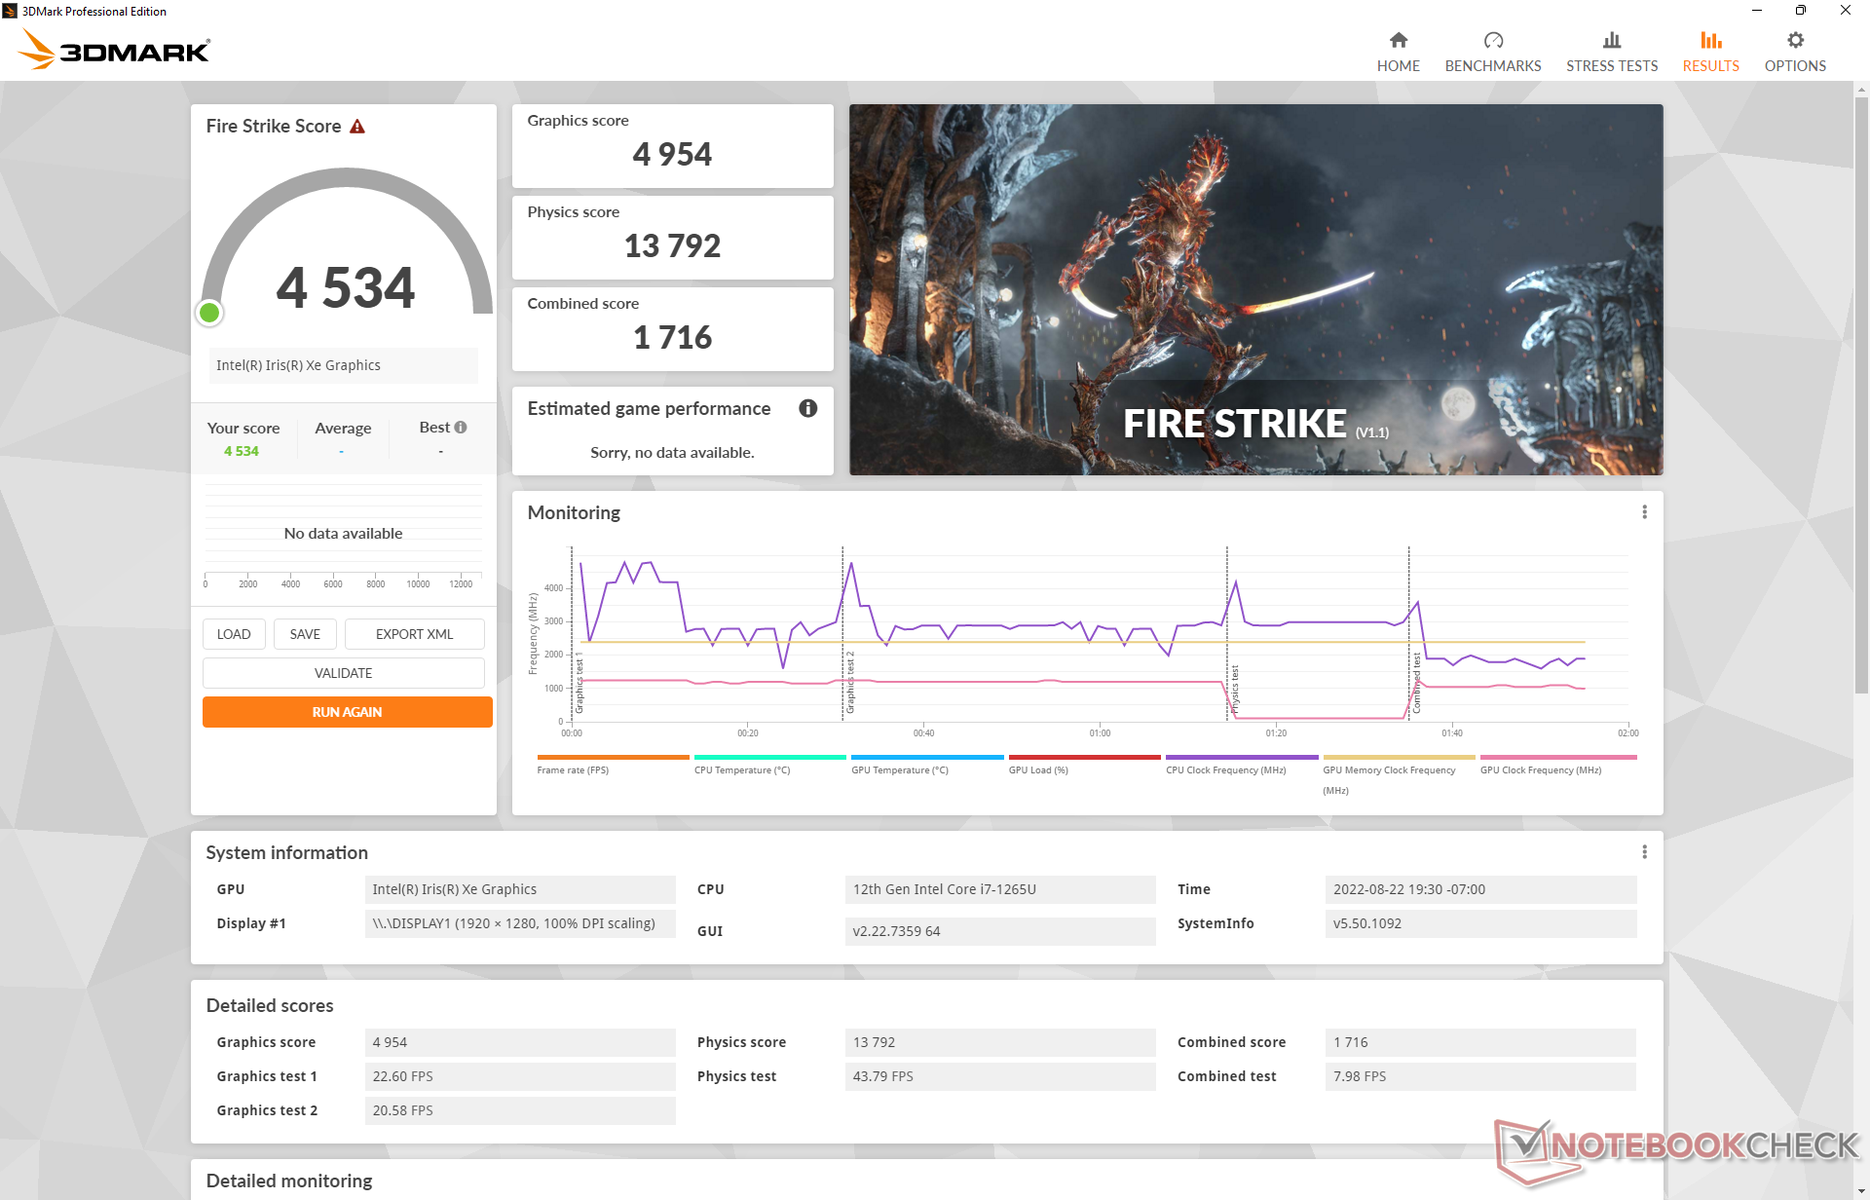
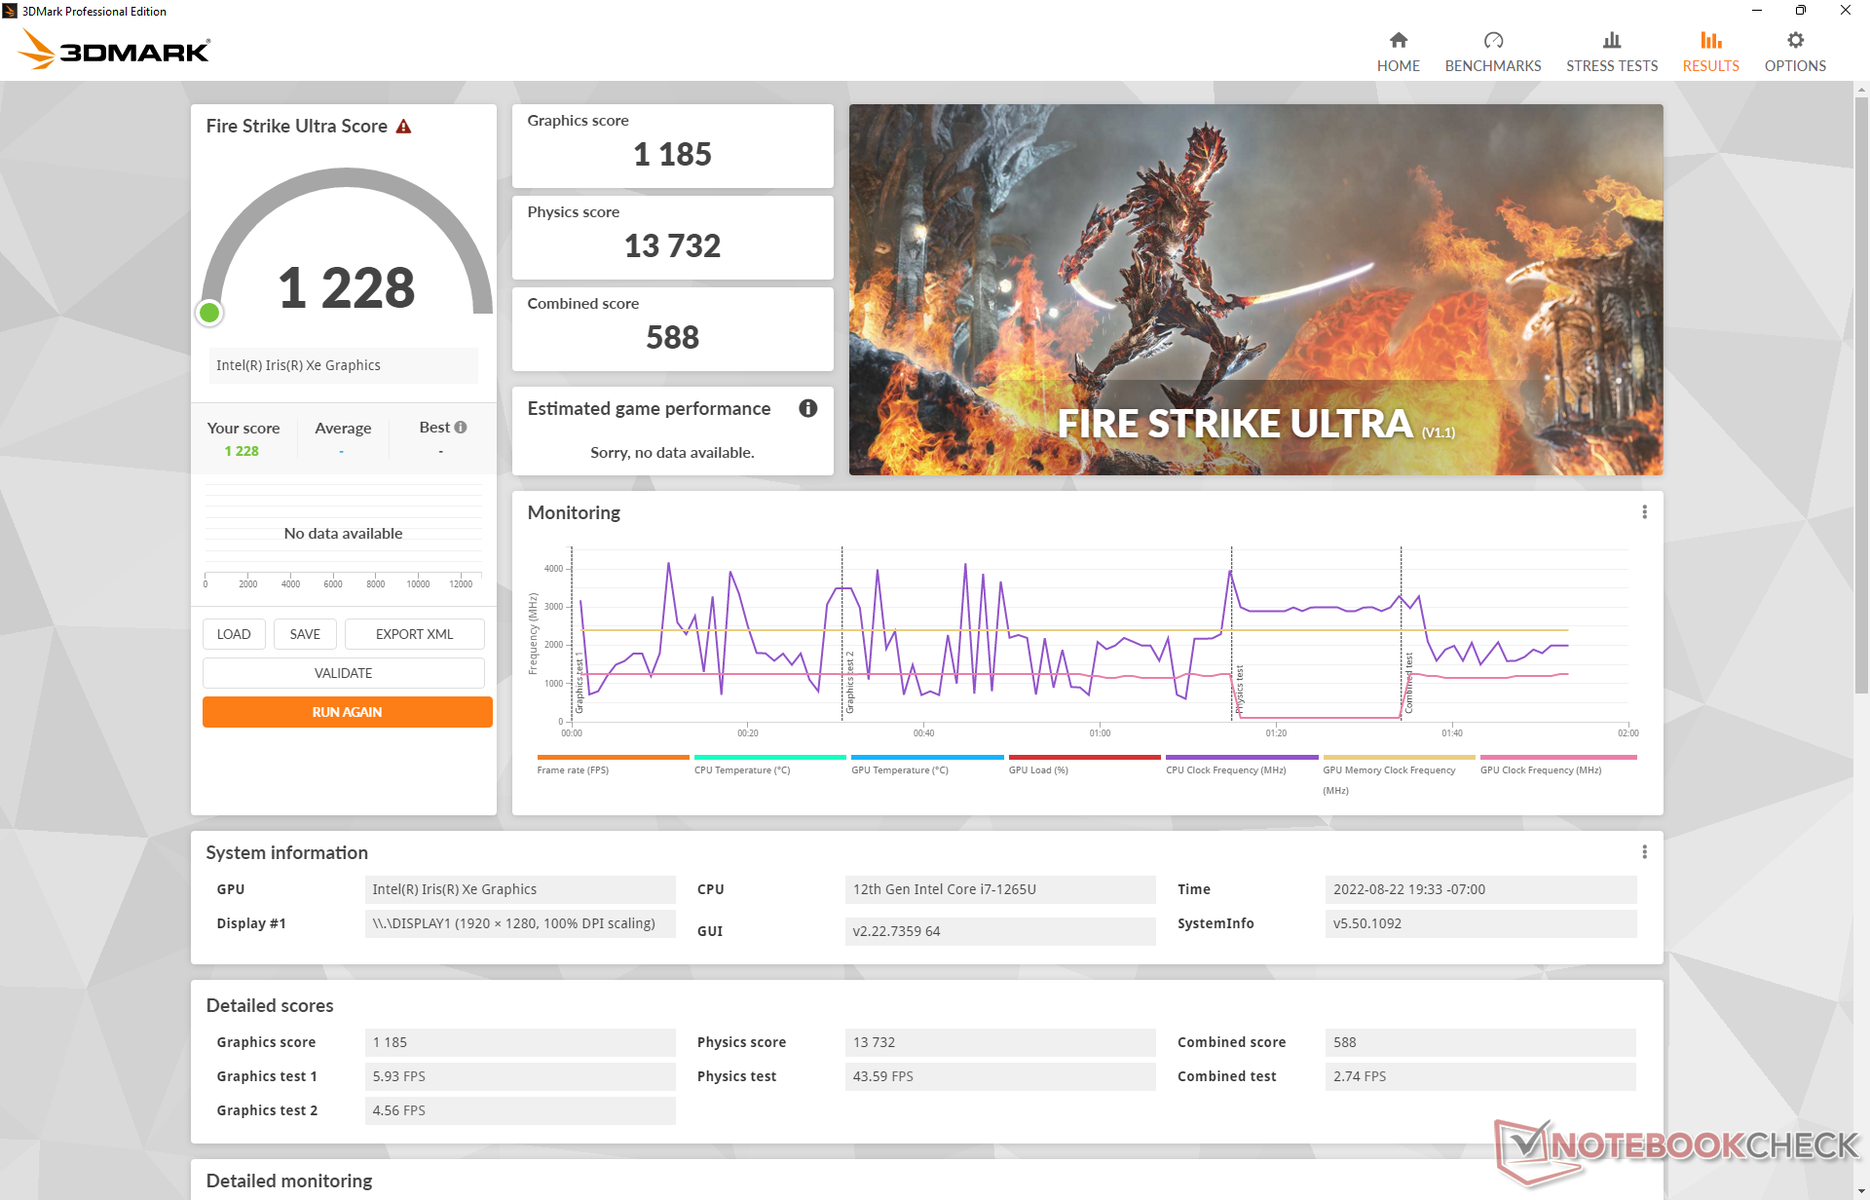
| 3DMark 11 Performance | 6530 punti | |
| 3DMark Cloud Gate Standard Score | 19143 punti | |
| 3DMark Fire Strike Score | 4534 punti | |
| 3DMark Time Spy Score | 1727 punti | |
Aiuto | ||
| Cyberpunk 2077 1.6 | |
| 1920x1080 Low Preset | |
| Framework Laptop 13.5 12th Gen Intel | |
| HP Elite Dragonfly G3 | |
| Media Intel Iris Xe Graphics G7 96EUs (13 - 25.9, n=42) | |
| 1920x1080 Medium Preset | |
| Framework Laptop 13.5 12th Gen Intel | |
| HP Elite Dragonfly G3 | |
| Media Intel Iris Xe Graphics G7 96EUs (10.8 - 21.7, n=37) | |
| 1920x1080 High Preset | |
| Framework Laptop 13.5 12th Gen Intel | |
| HP Elite Dragonfly G3 | |
| Media Intel Iris Xe Graphics G7 96EUs (9.8 - 16.9, n=34) | |
Witcher 3 FPS Chart
| basso | medio | alto | ultra | |
|---|---|---|---|---|
| GTA V (2015) | 90.6 | 79.2 | 23.3 | 10.2 |
| The Witcher 3 (2015) | 76.1 | 52 | 28.4 | 13.8 |
| Dota 2 Reborn (2015) | 97.4 | 71.1 | 57 | 50.9 |
| Final Fantasy XV Benchmark (2018) | 39.7 | 22.7 | 15.8 | |
| X-Plane 11.11 (2018) | 37.3 | 34.7 | 31.2 | |
| Strange Brigade (2018) | 84.9 | 39.3 | 31.4 | 25.4 |
| Cyberpunk 2077 1.6 (2022) | 19.8 | 16.8 | 12.8 | 10.2 |
Emissioni - Super silenzioso
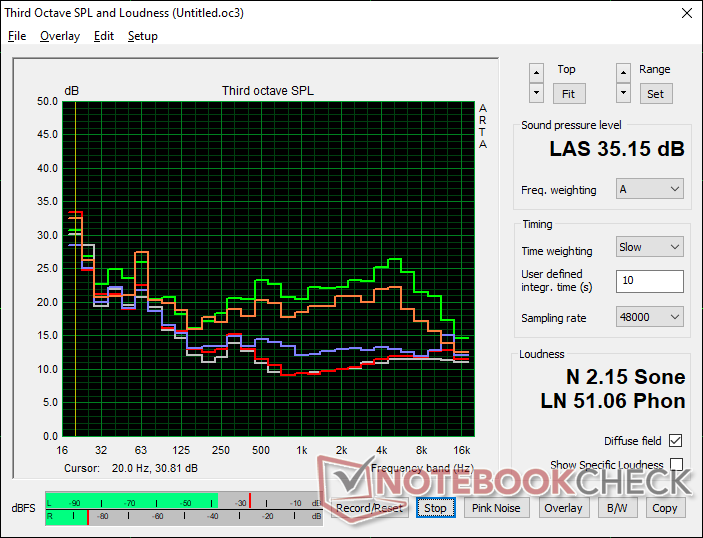
Rumore del sistema
Sul Dragonfly Max, il rumore della ventola è risultato più silenzioso della media, in linea con le prestazioni della CPU più lente della media. Questa tendenza continua con il Dragonfly G3, nel bene e nel male. Al massimo, siamo riusciti a registrare un rumore della ventola di soli 35 dB(A) rispetto ai 40 dB(A) o più dei modelli concorrenti, come mostra la tabella sottostante. Gli utenti che apprezzano le prestazioni della CPU potrebbero rimanere delusi, mentre quelli che apprezzano le ventole più silenziose potrebbero non preoccuparsi del processore più lento.
Rumorosità
| Idle |
| 23.2 / 23.2 / 23.2 dB(A) |
| Sotto carico |
| 25.1 / 35.2 dB(A) |
 | ||
30 dB silenzioso 40 dB(A) udibile 50 dB(A) rumoroso |
||
min: | ||
| HP Elite Dragonfly G3 Iris Xe G7 96EUs, i7-1265U, Micron 3400 MTFDKBA512TFH 512GB | HP Spectre x360 14t-ea000 Iris Xe G7 96EUs, i7-1165G7, Samsung SSD PM981a MZVLB512HBJQ | Dell XPS 13 Plus 9320 i5-1240p Iris Xe G7 80EUs, i5-1240P, Micron 3400 MTFDKBA512TFH 512GB | Framework Laptop 13.5 12th Gen Intel Iris Xe G7 96EUs, i7-1260P, WDC PC SN730 SDBPNTY-512G | HP EliteBook Folio 13.5-3G2L2EA Adreno 680, SD 8cx Gen 2 5G, Toshiba XG6 KXG60ZNV512G | Lenovo ThinkPad X1 Titanium Yoga G1 20QA001RGE Iris Xe G7 96EUs, i7-1160G7, Toshiba BG4 KBG40ZNT512G | |
|---|---|---|---|---|---|---|
| Noise | -12% | -23% | -25% | -11% | ||
| off /ambiente * (dB) | 22.8 | 25.8 -13% | 26 -14% | 22.8 -0% | 25.1 -10% | |
| Idle Minimum * (dB) | 23.2 | 25.9 -12% | 26.2 -13% | 23 1% | 25.1 -8% | |
| Idle Average * (dB) | 23.2 | 25.9 -12% | 26.2 -13% | 23 1% | 25.1 -8% | |
| Idle Maximum * (dB) | 23.2 | 25.9 -12% | 26.2 -13% | 23 1% | 27.1 -17% | |
| Load Average * (dB) | 25.1 | 26.4 -5% | 38.4 -53% | 47.3 -88% | 32.7 -30% | |
| Witcher 3 ultra * (dB) | 32 | 36.9 -15% | 47.3 -48% | 32.7 -2% | ||
| Load Maximum * (dB) | 35.2 | 41.5 -18% | 47.1 -34% | 49.8 -41% | 35.8 -2% |
* ... Meglio usare valori piccoli
Temperatura
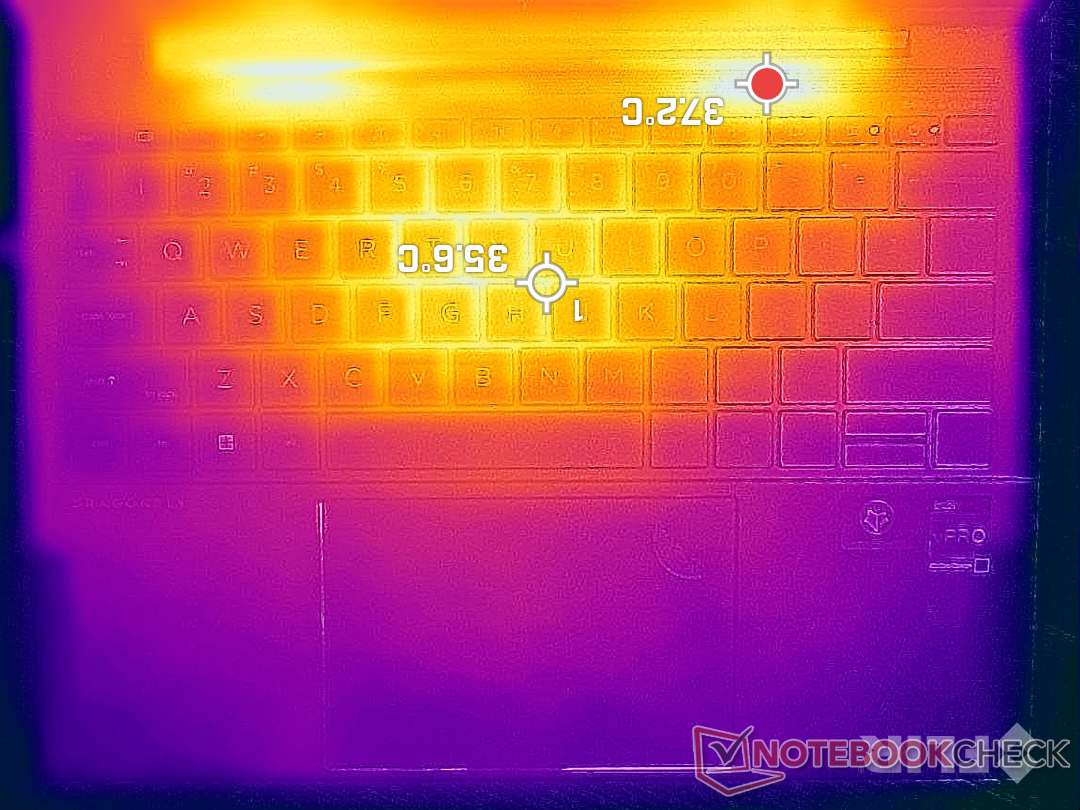
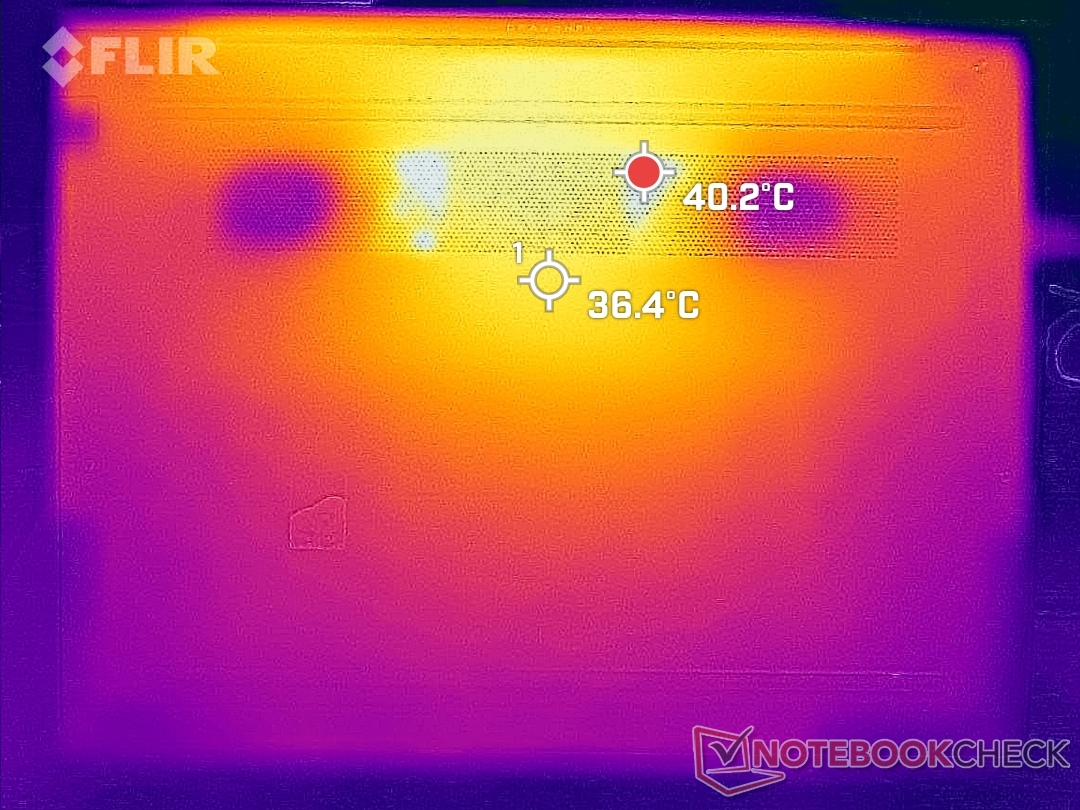
Il gradiente di temperatura superficiale è più simmetrico rispetto ai modelli più vecchi Libellula Max grazie alla nuova soluzione di raffreddamento. Ciò significa che il punto più caldo del Dragonfly G3 è quello più vicino al centro della tastiera invece che nella metà destra della tastiera. Queste aree possono raggiungere i 40°C se sottoposte a carichi elevati per periodi prolungati, ma fortunatamente si trovano verso la parte posteriore e non sono vicine ai poggiapolsi o al clickpad.
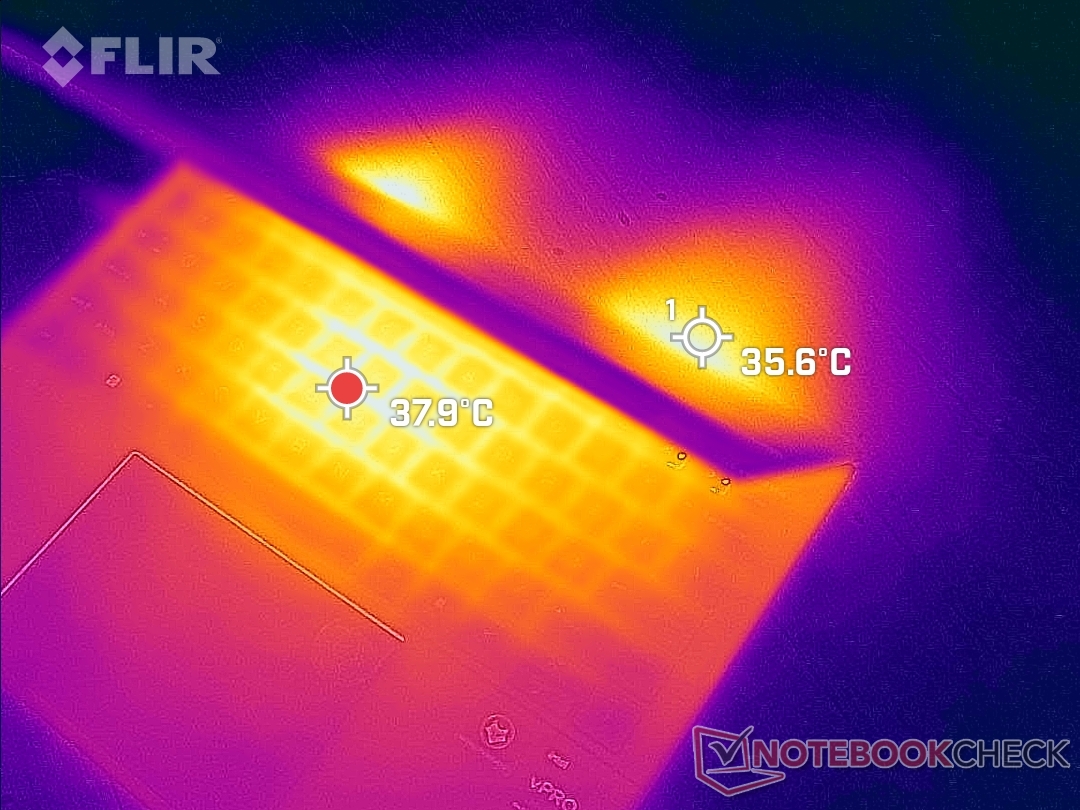
(+) La temperatura massima sul lato superiore è di 39 °C / 102 F, rispetto alla media di 34.3 °C / 94 F, che varia da 21.2 a 62.5 °C per questa classe Office.
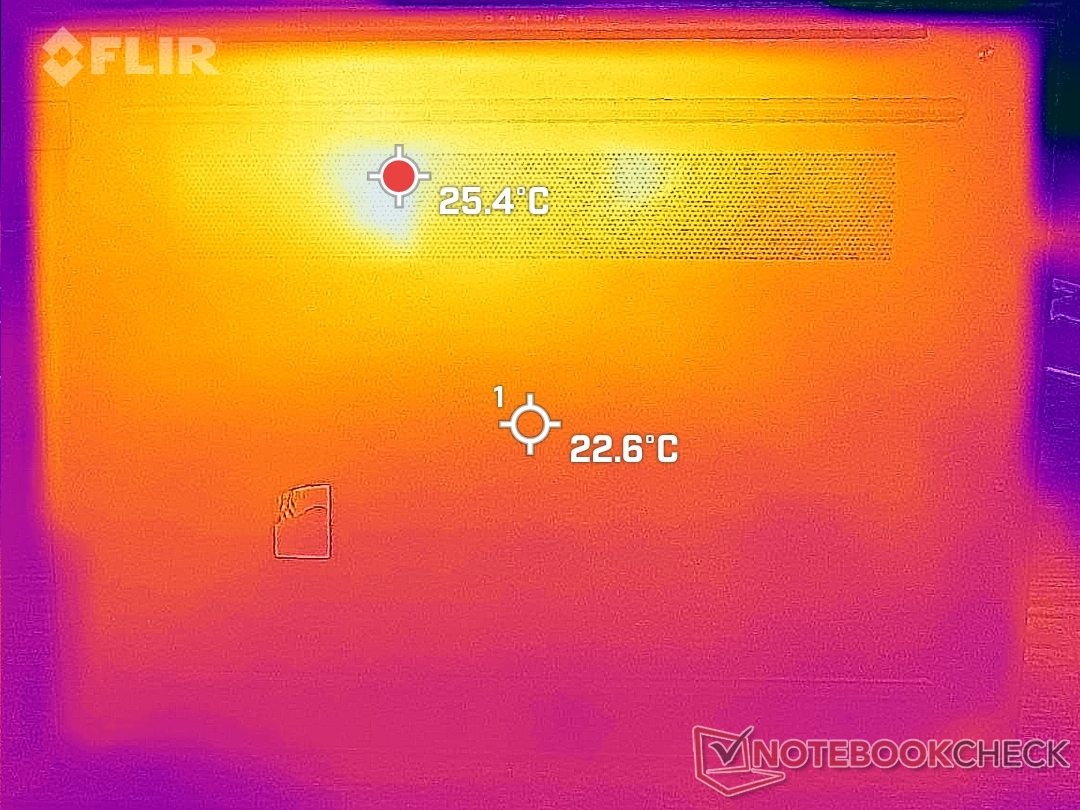
(±) Il lato inferiore si riscalda fino ad un massimo di 42.2 °C / 108 F, rispetto alla media di 36.8 °C / 98 F
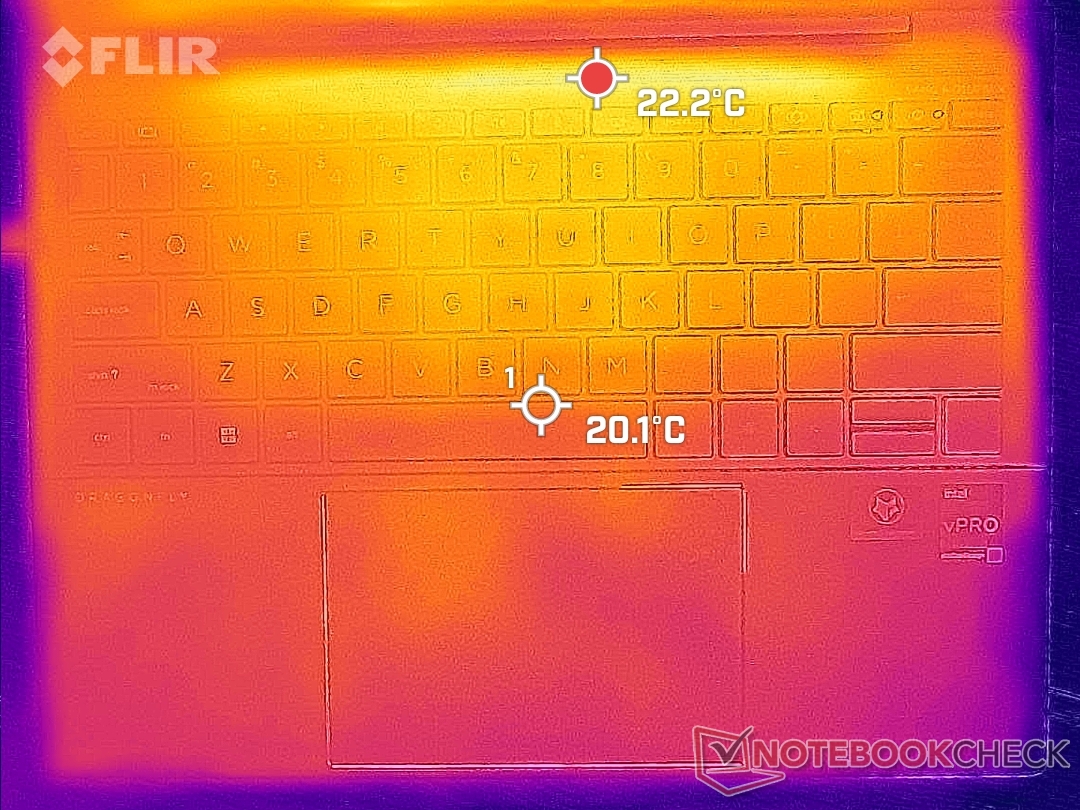
(+) In idle, la temperatura media del lato superiore è di 25.4 °C / 78 F, rispetto alla media deld ispositivo di 29.5 °C / 85 F.
(+) I poggiapolsi e il touchpad sono piu' freddi della temperatura della pelle con un massimo di 28.4 °C / 83.1 F e sono quindi freddi al tatto.
(±) La temperatura media della zona del palmo della mano di dispositivi simili e'stata di 27.5 °C / 81.5 F (-0.9 °C / -1.6 F).
| HP Elite Dragonfly G3 Intel Core i7-1265U, Intel Iris Xe Graphics G7 96EUs | HP Spectre x360 14t-ea000 Intel Core i7-1165G7, Intel Iris Xe Graphics G7 96EUs | Dell XPS 13 Plus 9320 i5-1240p Intel Core i5-1240P, Intel Iris Xe Graphics G7 80EUs | Framework Laptop 13.5 12th Gen Intel Intel Core i7-1260P, Intel Iris Xe Graphics G7 96EUs | HP EliteBook Folio 13.5-3G2L2EA Qualcomm Snapdragon 8cx Gen 2 5G, Qualcomm Adreno 680 | Lenovo ThinkPad X1 Titanium Yoga G1 20QA001RGE Intel Core i7-1160G7, Intel Iris Xe Graphics G7 96EUs | |
|---|---|---|---|---|---|---|
| Heat | -9% | -37% | 3% | 11% | -7% | |
| Maximum Upper Side * (°C) | 39 | 40.4 -4% | 47.6 -22% | 36.8 6% | 34.3 12% | 46.5 -19% |
| Maximum Bottom * (°C) | 42.2 | 52.8 -25% | 57 -35% | 42.4 -0% | 35.4 16% | 45.2 -7% |
| Idle Upper Side * (°C) | 26.8 | 27.2 -1% | 38.8 -45% | 24.2 10% | 25.7 4% | 27.3 -2% |
| Idle Bottom * (°C) | 28.2 | 29.2 -4% | 41 -45% | 29 -3% | 25.1 11% | 27.7 2% |
* ... Meglio usare valori piccoli
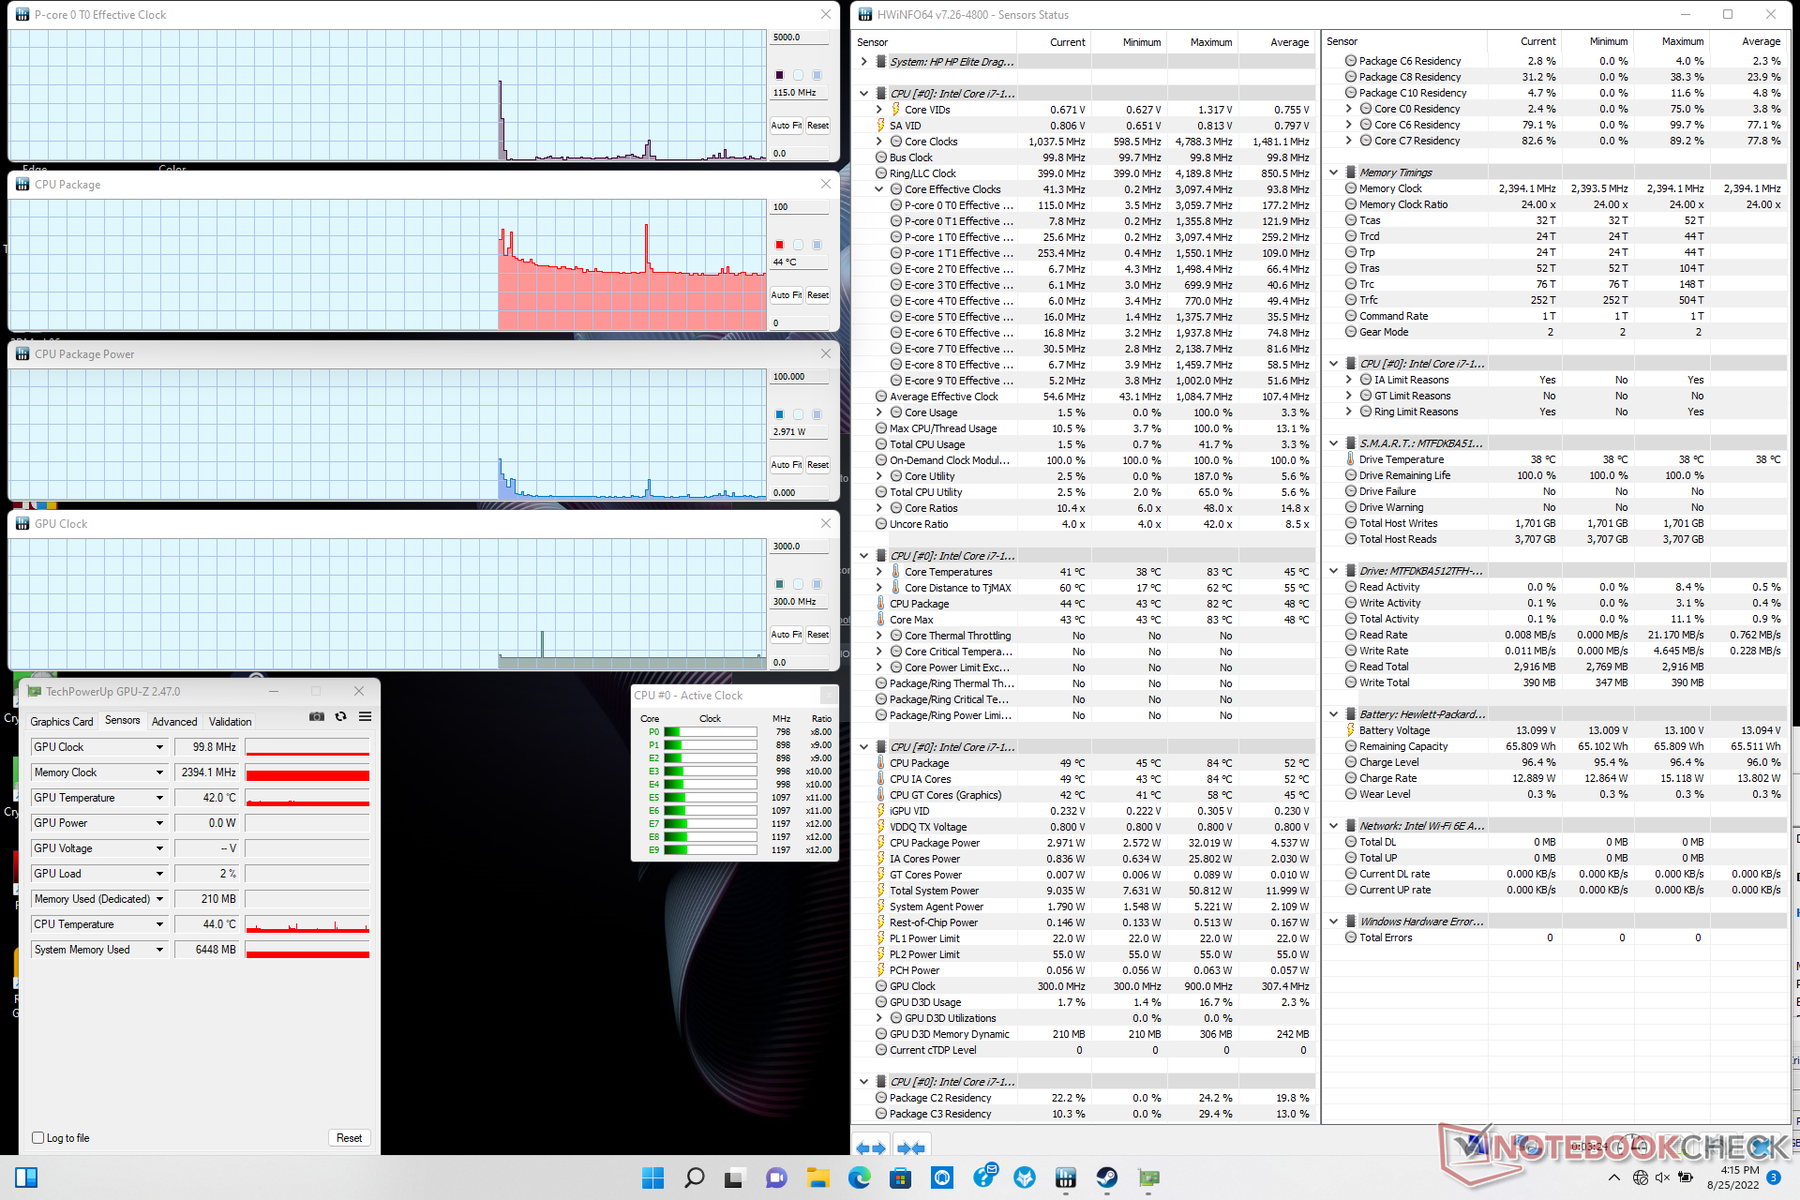
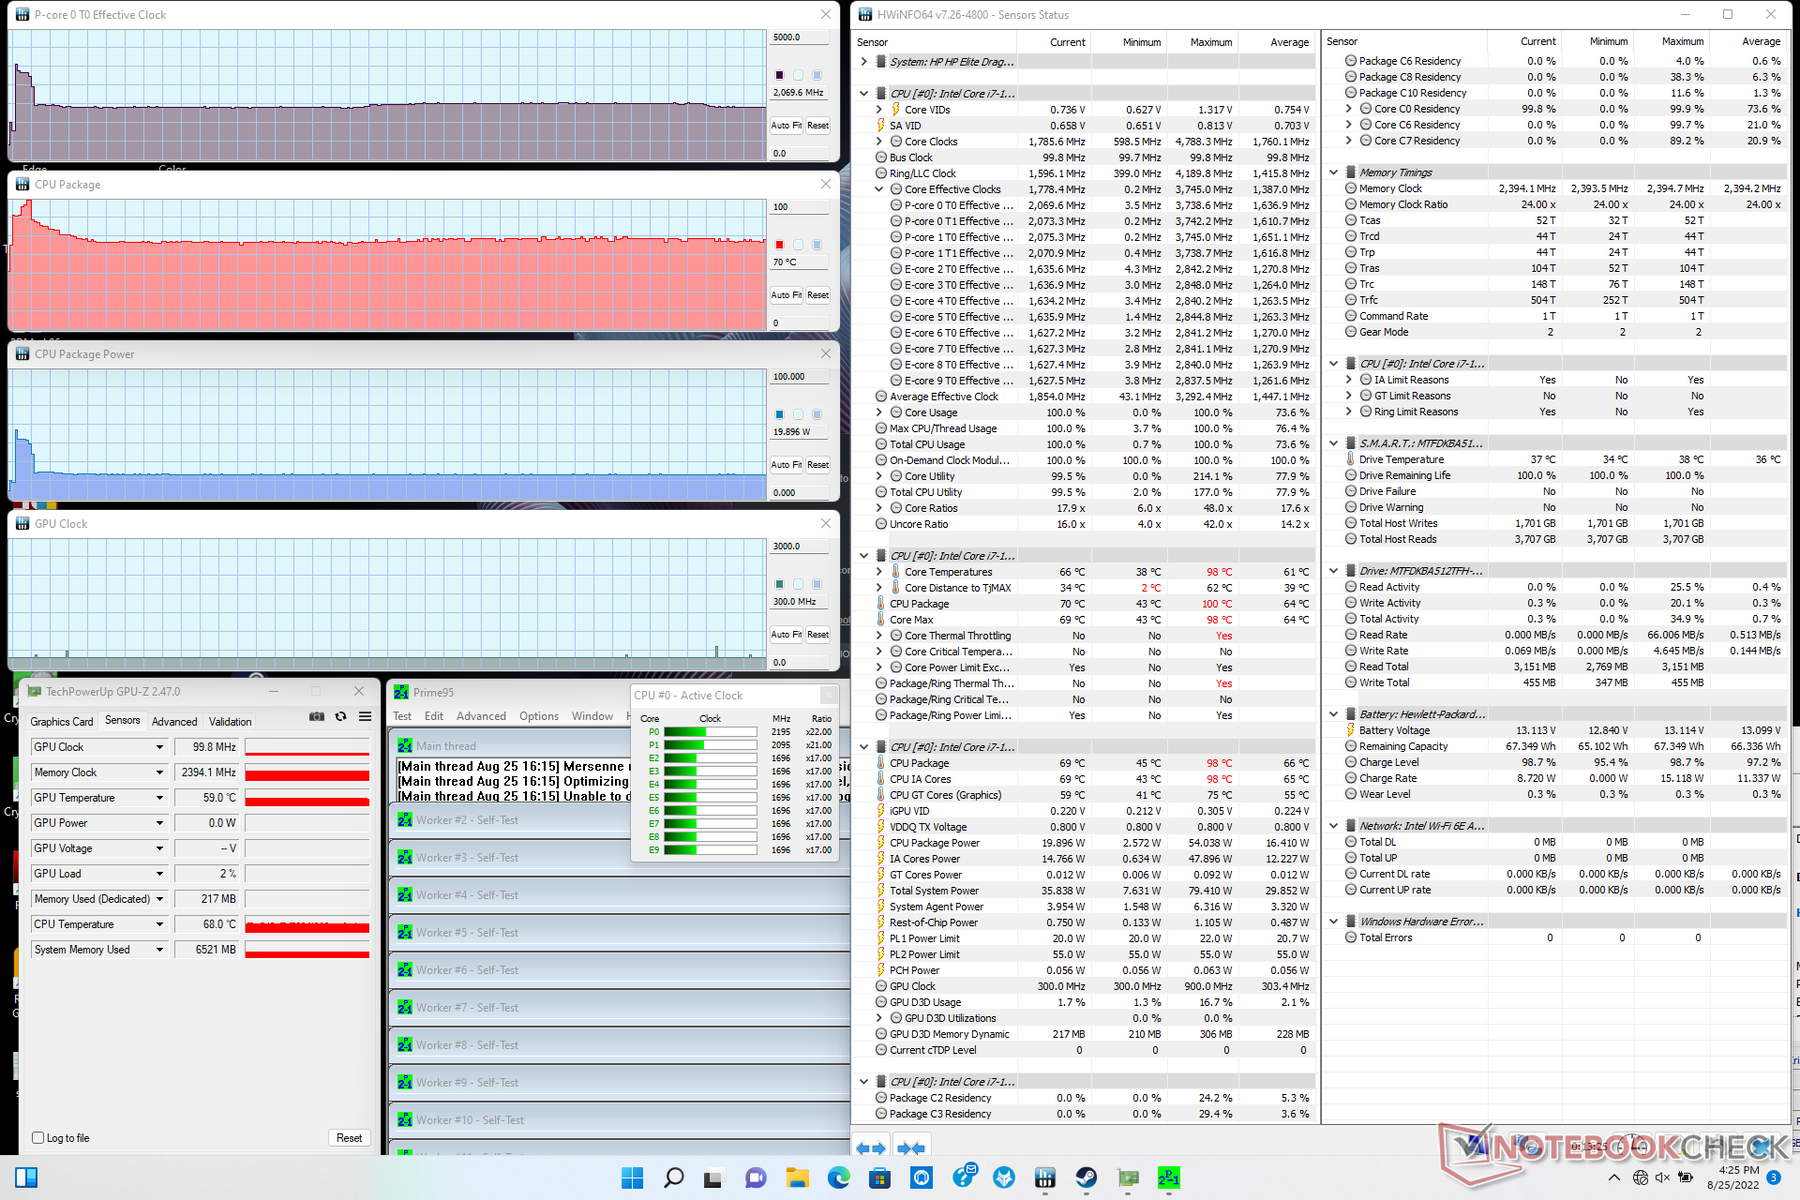
Stress test
La velocità di clock della CPU, la temperatura e l'assorbimento di potenza della scheda raggiungono rispettivamente 3,7 GHz, 100 C e 54 W quando si avvia lo stress Prime95. Dopo soli 10-15 secondi, tuttavia, le frequenze di clock e l'assorbimento di potenza della scheda si riducevano e si stabilizzavano rispettivamente a 2,1 GHz e 20 W, per mantenere una temperatura del core più gestibile di 70 C. Ripetendo questo stesso test sul dispositivo Dell Latitude 7330 con la stessa CPU Core i7-1265U, si sarebbero registrati tassi di clock stabili, temperature e consumi della scheda più elevati, rispettivamente di 2,4 GHz, >80 C e 25 W. HP utilizza il Core i7-1265U in modo più conservativo rispetto alla concorrenza.
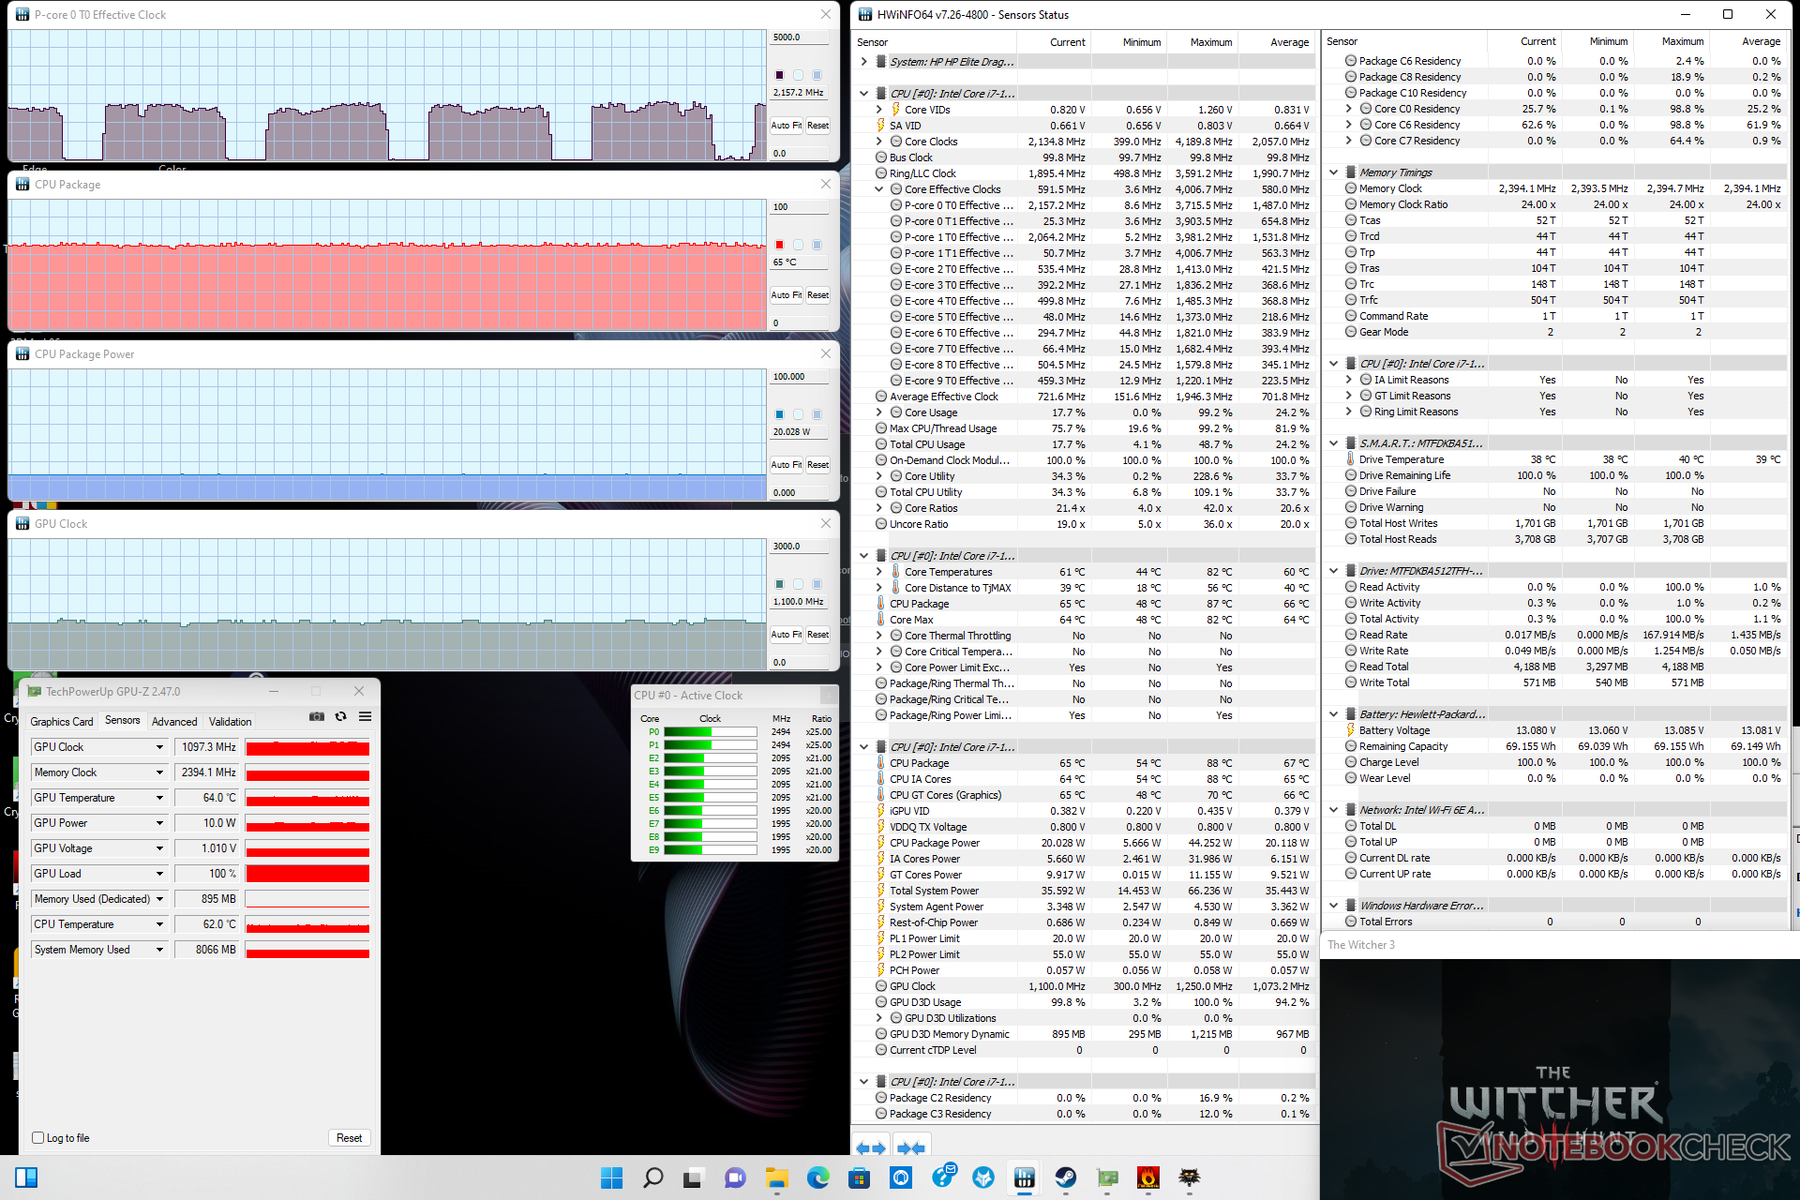
Quando si esegue Witcher 3 per rappresentare carichi impegnativi, la velocità di clock della GPU e la temperatura si stabilizzerebbero rispettivamente a 1097 MHz e 65 C, rispetto ai 1247 MHz e 83 C del Dell citato in precedenza.
Il funzionamento a batteria limita le prestazioni. Un test 3DMark a batteria restituisce punteggi fisici e grafici rispettivamente di 9619 e 5532 punti, rispetto a 11216 e 6155 punti con l'alimentazione a rete.
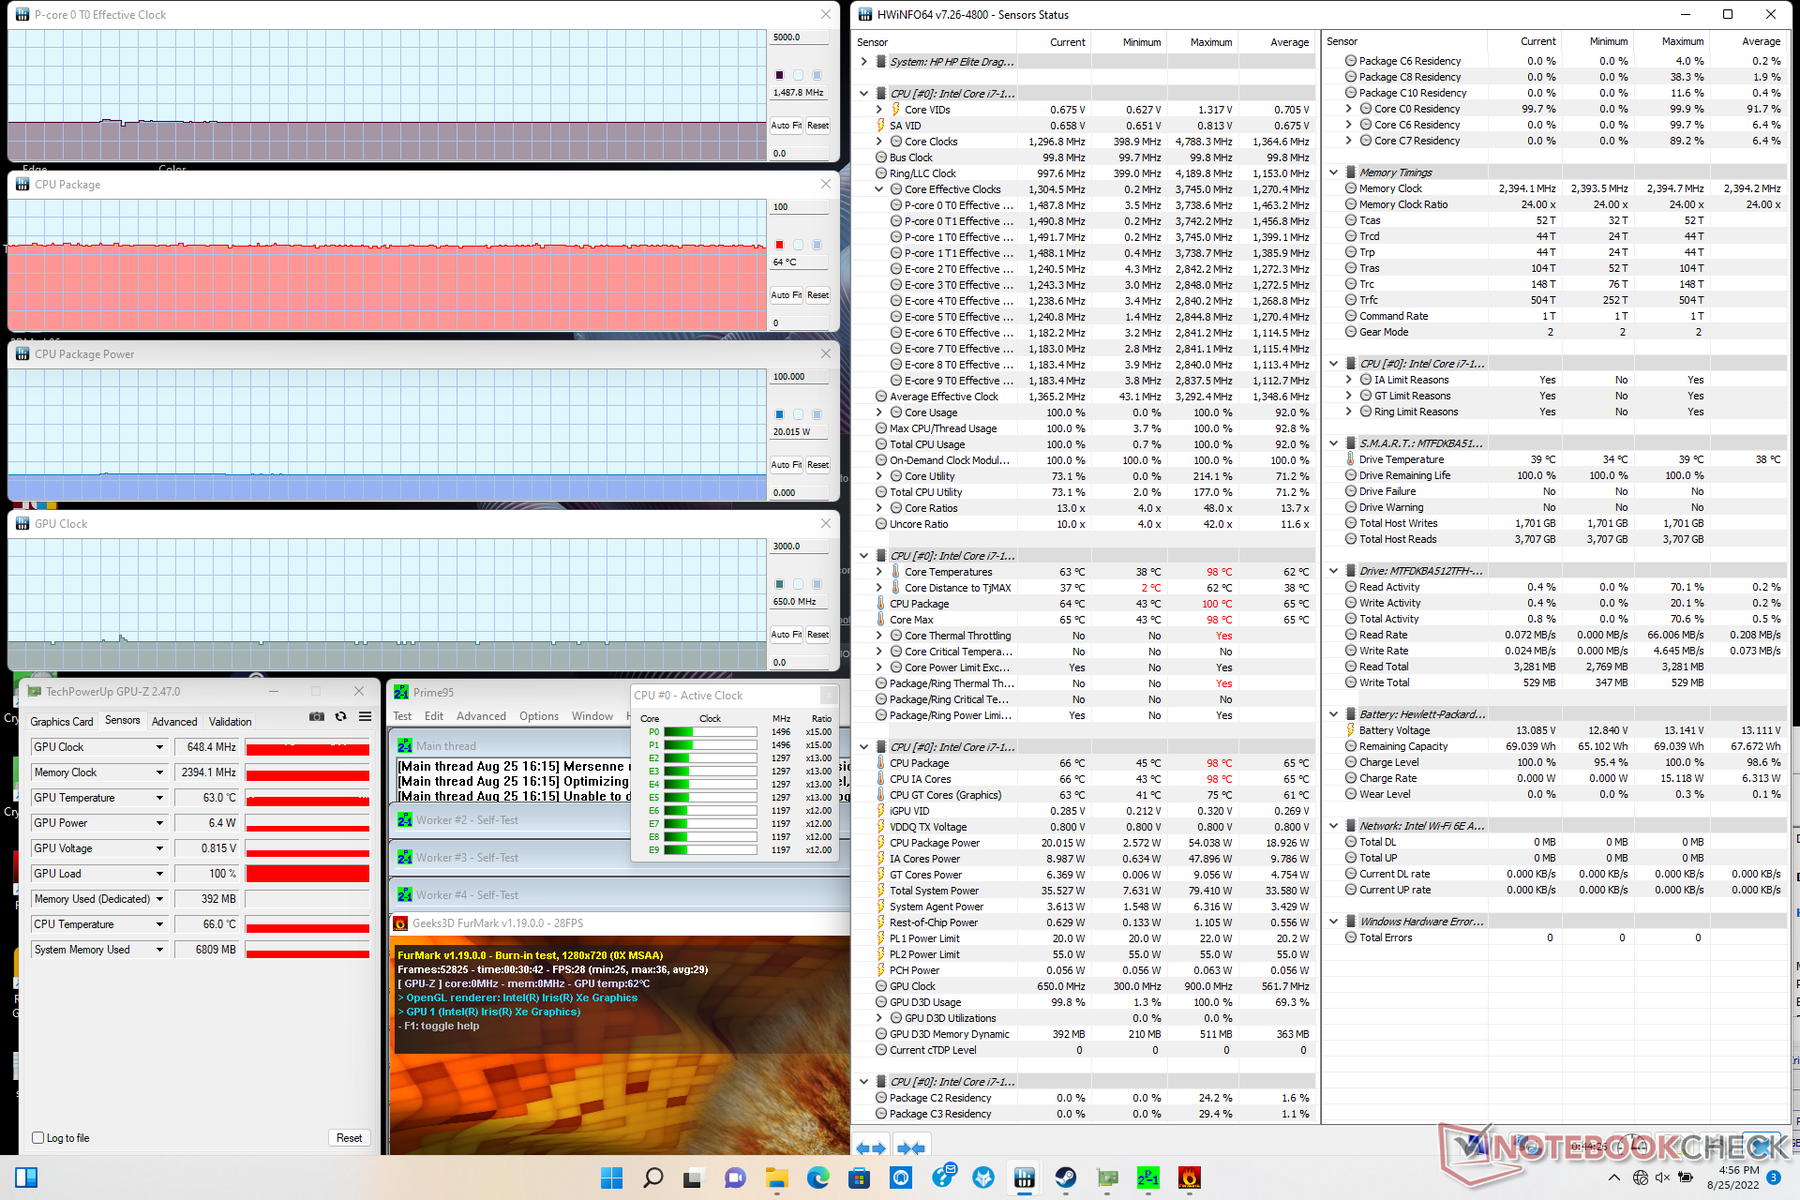
| Clock della CPU (GHz) | Clock della GPU (MHz) | Temperatura media della CPU (°C) | |
| Sistema inattivo | -- | -- | 2,1 |
| Stress Prime95 | 2,1 | -- | 70 |
| Prime95 + FurMark Stress | 1,5 | 648 | 64 |
| Witcher 3 Sollecitazione | ~2,1 | 1097 | 65 |
Altoparlanti
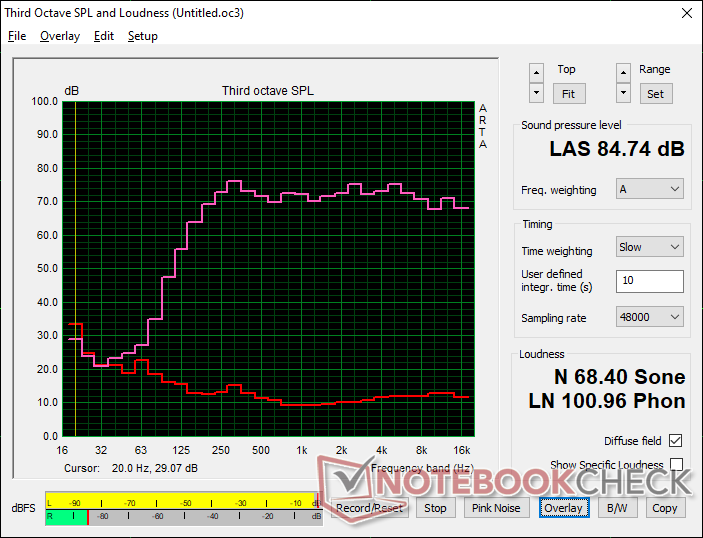
HP Elite Dragonfly G3 analisi audio
(+) | gli altoparlanti sono relativamente potenti (84.7 dB)
Bassi 100 - 315 Hz
(±) | bassi ridotti - in media 9.4% inferiori alla media
(±) | la linearità dei bassi è media (11.4% delta rispetto alla precedente frequenza)
Medi 400 - 2000 Hz
(+) | medi bilanciati - solo only 0.9% rispetto alla media
(+) | medi lineari (2.8% delta rispetto alla precedente frequenza)
Alti 2 - 16 kHz
(+) | Alti bilanciati - appena 2.1% dalla media
(+) | alti lineari (3.9% delta rispetto alla precedente frequenza)
Nel complesso 100 - 16.000 Hz
(+) | suono nel complesso lineare (6.6% differenza dalla media)
Rispetto alla stessa classe
» 0% di tutti i dispositivi testati in questa classe è stato migliore, 0% simile, 100% peggiore
» Il migliore ha avuto un delta di 7%, medio di 21%, peggiore di 53%
Rispetto a tutti i dispositivi testati
» 1% di tutti i dispositivi testati in questa classe è stato migliore, 0% similare, 99% peggiore
» Il migliore ha avuto un delta di 4%, medio di 24%, peggiore di 134%
Apple MacBook Pro 16 2021 M1 Pro analisi audio
(+) | gli altoparlanti sono relativamente potenti (84.7 dB)
Bassi 100 - 315 Hz
(+) | bassi buoni - solo 3.8% dalla media
(+) | bassi in lineaa (5.2% delta rispetto alla precedente frequenza)
Medi 400 - 2000 Hz
(+) | medi bilanciati - solo only 1.3% rispetto alla media
(+) | medi lineari (2.1% delta rispetto alla precedente frequenza)
Alti 2 - 16 kHz
(+) | Alti bilanciati - appena 1.9% dalla media
(+) | alti lineari (2.7% delta rispetto alla precedente frequenza)
Nel complesso 100 - 16.000 Hz
(+) | suono nel complesso lineare (4.6% differenza dalla media)
Rispetto alla stessa classe
» 0% di tutti i dispositivi testati in questa classe è stato migliore, 0% simile, 100% peggiore
» Il migliore ha avuto un delta di 5%, medio di 17%, peggiore di 45%
Rispetto a tutti i dispositivi testati
» 0% di tutti i dispositivi testati in questa classe è stato migliore, 0% similare, 100% peggiore
» Il migliore ha avuto un delta di 4%, medio di 24%, peggiore di 134%
Gestione dell'energia
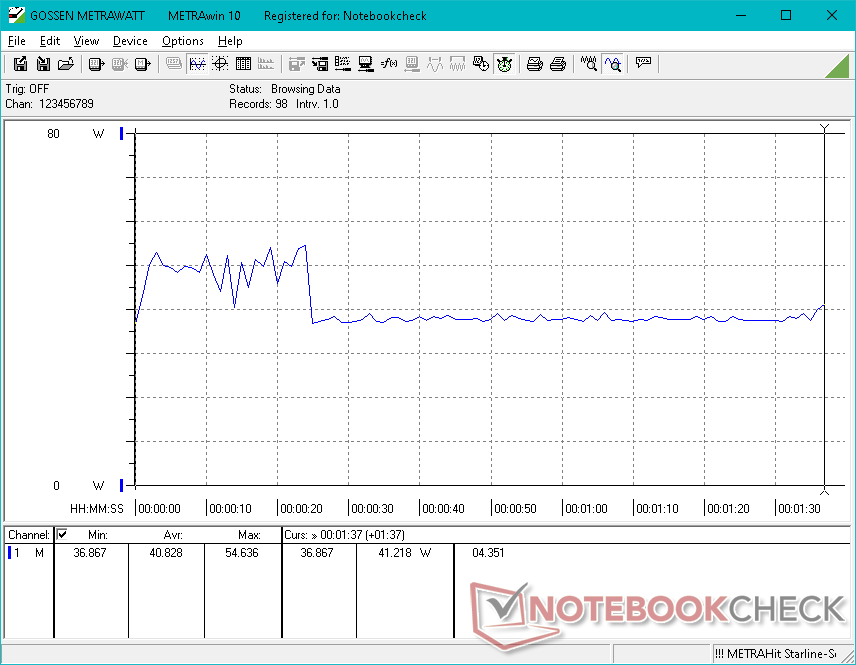
Consumo di energia
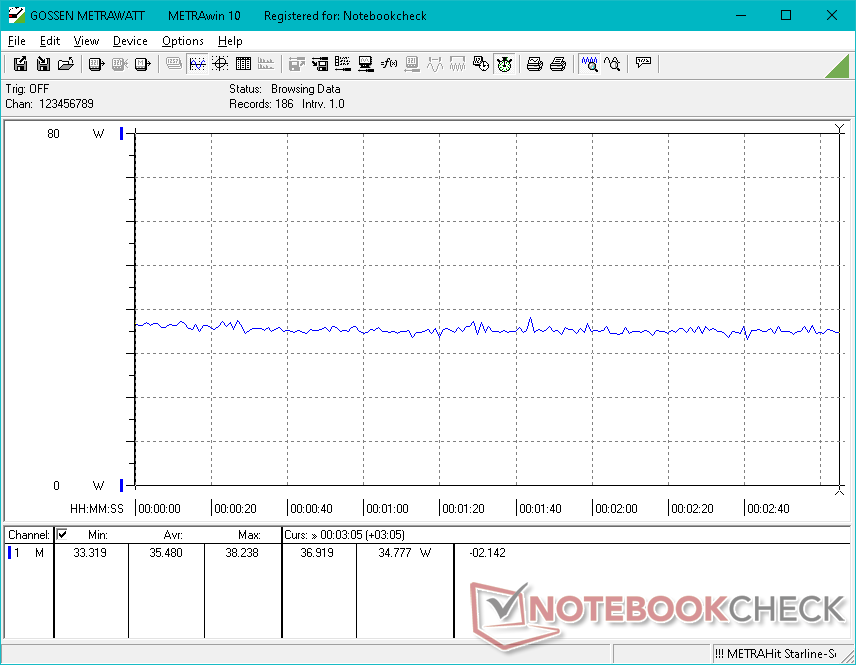
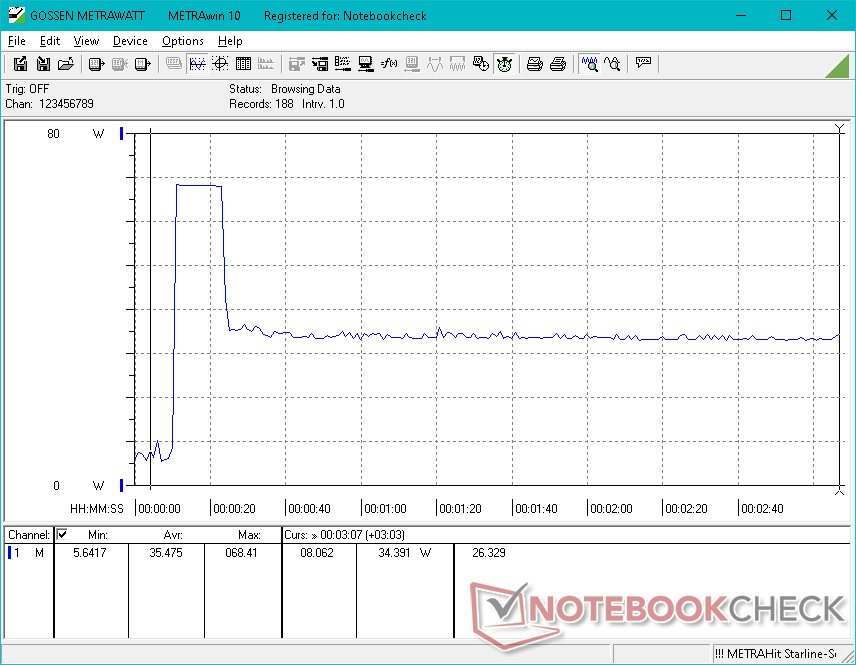
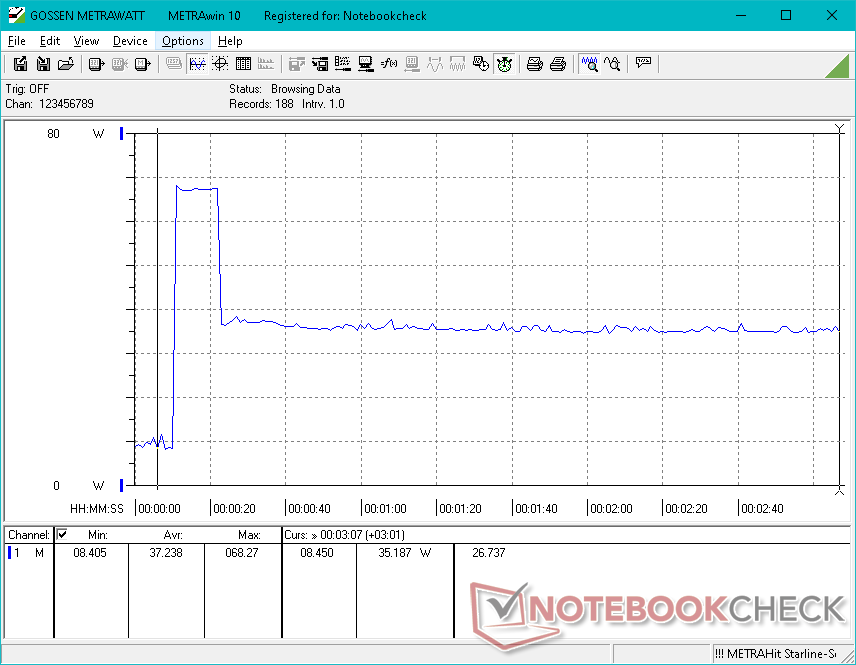
Il consumo energetico è quasi identico a quello del Dell Latitude 7330 dotato della stessa CPU quando si eseguono carichi poco impegnativi come la navigazione web o lo streaming video. Tuttavia, il sistema Dell è più esigente quando si eseguono attività ad alta intensità di CPU, in quanto è in grado di sostenere velocità di clock e livelli TDP più elevati per un periodo più lungo rispetto all'HP. Il consumo complessivo non è molto diverso da quello dello Spectre x360 14 con il Core i7-1165G7 di ultima generazione, nonostante l'aumento del 15-30% delle prestazioni multi-thread.
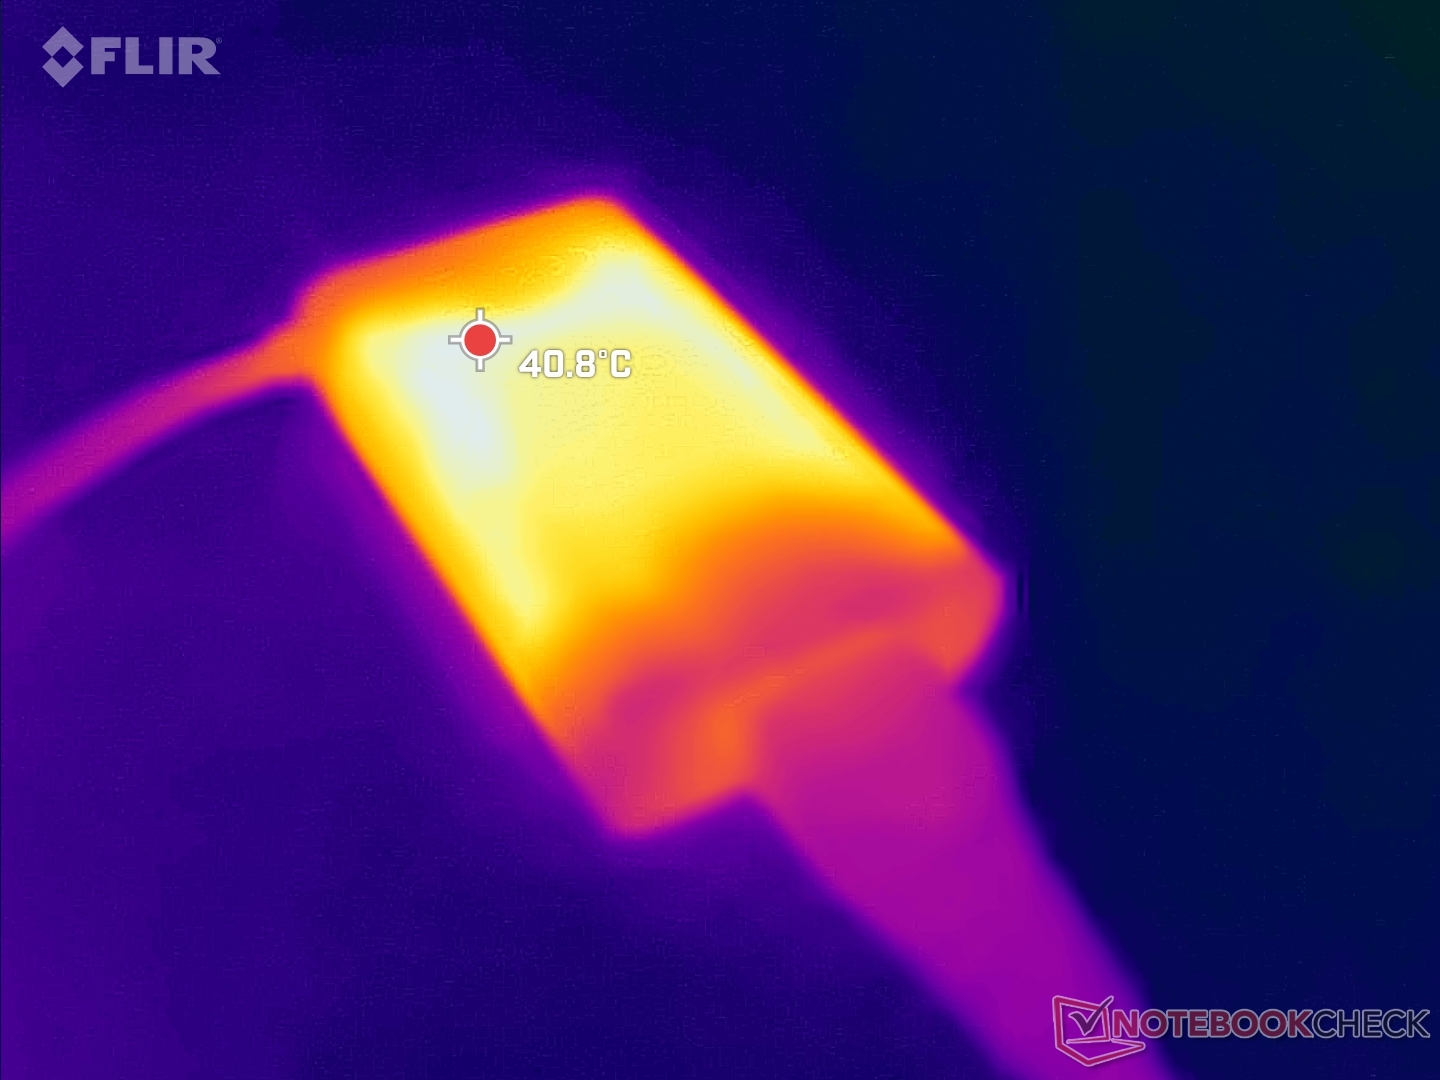
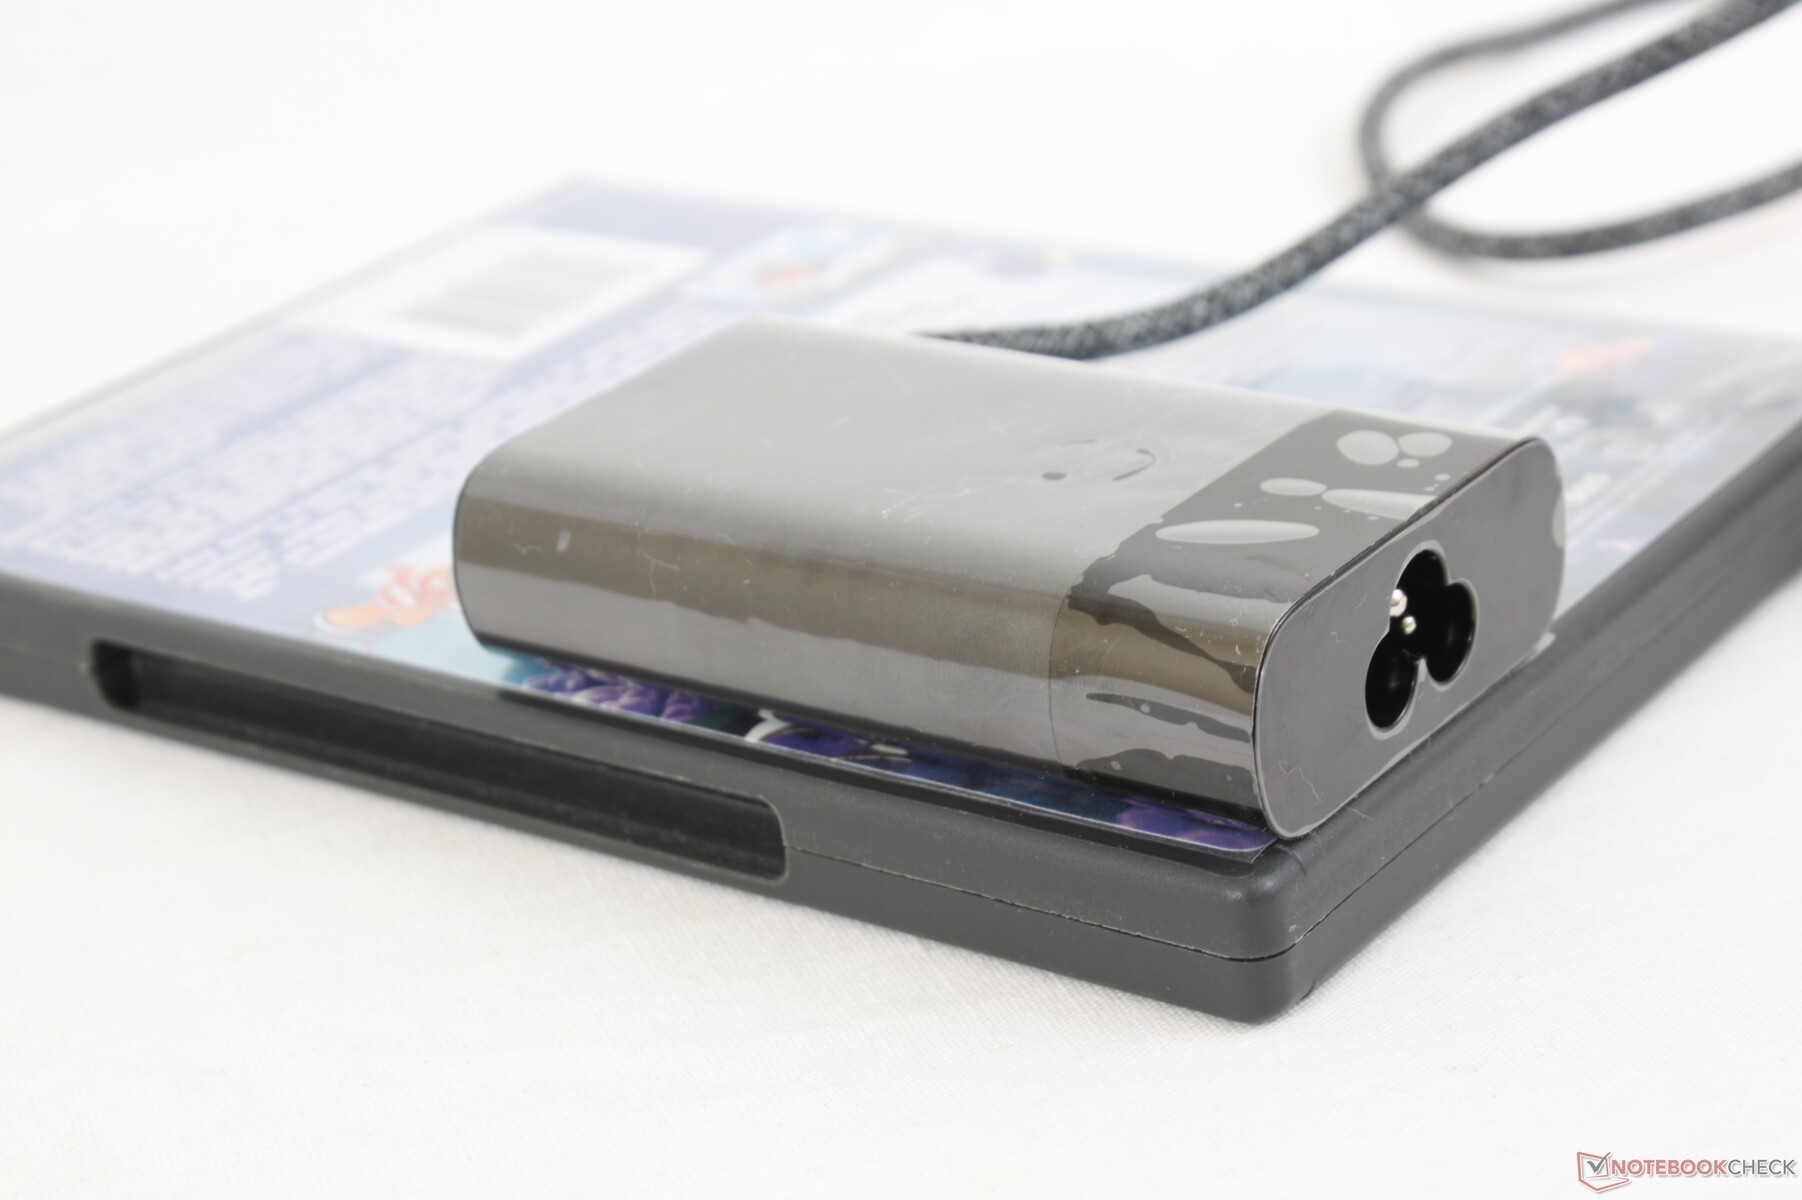
Siamo riusciti a registrare un consumo massimo temporaneo di 68,4 W dal piccolo (~8,8 x 5,3 x 2,1 cm) adattatore CA da 65 W quando la CPU è al 100% di utilizzo. Le limitazioni termiche impediscono alla CPU di funzionare alla massima velocità di clock Turbo Boost per periodi prolungati.
| Off / Standby | |
| Idle | |
| Sotto carico |
|
Leggenda:
min: | |
| HP Elite Dragonfly G3 i7-1265U, Iris Xe G7 96EUs, Micron 3400 MTFDKBA512TFH 512GB, IPS, 1920x1280, 13.5" | HP Spectre x360 14t-ea000 i7-1165G7, Iris Xe G7 96EUs, Samsung SSD PM981a MZVLB512HBJQ, IPS, 1920x1280, 13.5" | Dell XPS 13 Plus 9320 i5-1240p i5-1240P, Iris Xe G7 80EUs, Micron 3400 MTFDKBA512TFH 512GB, IPS, 1920x1200, 13.4" | Framework Laptop 13.5 12th Gen Intel i7-1260P, Iris Xe G7 96EUs, WDC PC SN730 SDBPNTY-512G, IPS, 2256x1504, 13.5" | HP EliteBook Folio 13.5-3G2L2EA SD 8cx Gen 2 5G, Adreno 680, Toshiba XG6 KXG60ZNV512G, IPS, 1920x1280, 13.5" | Lenovo ThinkPad X1 Titanium Yoga G1 20QA001RGE i7-1160G7, Iris Xe G7 96EUs, Toshiba BG4 KBG40ZNT512G, IPS, 2256x1504, 13.5" | |
|---|---|---|---|---|---|---|
| Power Consumption | 9% | -70% | -34% | 46% | 0% | |
| Idle Minimum * (Watt) | 3.4 | 3 12% | 10 -194% | 5.3 -56% | 2.3 32% | 3.9 -15% |
| Idle Average * (Watt) | 5.6 | 5.1 9% | 12.3 -120% | 8.4 -50% | 3.7 34% | 7.3 -30% |
| Idle Maximum * (Watt) | 8.4 | 6.4 24% | 15.5 -85% | 11.2 -33% | 5.6 33% | 10.3 -23% |
| Load Average * (Watt) | 40.8 | 39.6 3% | 43 -5% | 57.4 -41% | 13 68% | 30.6 25% |
| Witcher 3 ultra * (Watt) | 35.5 | 39.6 -12% | 43.1 -21% | 46.7 -32% | 25.5 28% | |
| Load Maximum * (Watt) | 68.4 | 56.2 18% | 62.8 8% | 61.2 11% | 25 63% | 57.1 17% |
* ... Meglio usare valori piccoli
Power Consumption Witcher 3 / Stresstest
Power Consumption external Monitor
Durata della batteria - Lunga autonomia
La capacità della batteria è aumentata da 56 Wh del Dragonfly Max a 68 Wh del Dragonfly G3. L'autonomia WLAN è comunque leggermente superiore, con quasi 12 ore.
La ricarica da vuoto a pieno richiede circa 90 minuti. L'adattatore CA USB-C può essere utilizzato per la ricarica rapida di altri dispositivi USB-C, tra cui smartphone e tablet.
| HP Elite Dragonfly G3 i7-1265U, Iris Xe G7 96EUs, 68 Wh | HP Spectre x360 14t-ea000 i7-1165G7, Iris Xe G7 96EUs, 66 Wh | Dell XPS 13 Plus 9320 i5-1240p i5-1240P, Iris Xe G7 80EUs, 55 Wh | Framework Laptop 13.5 12th Gen Intel i7-1260P, Iris Xe G7 96EUs, 55 Wh | HP EliteBook Folio 13.5-3G2L2EA SD 8cx Gen 2 5G, Adreno 680, 46 Wh | Lenovo ThinkPad X1 Titanium Yoga G1 20QA001RGE i7-1160G7, Iris Xe G7 96EUs, 44.5 Wh | |
|---|---|---|---|---|---|---|
| Autonomia della batteria | -12% | -43% | -36% | 22% | -38% | |
| Reader / Idle (h) | 37.8 | 36.4 -4% | ||||
| WiFi v1.3 (h) | 11.8 | 11.8 0% | 8 -32% | 7.5 -36% | 14.6 24% | 8.4 -29% |
| Load (h) | 3.5 | 2.4 -31% | 1.6 -54% | 4.2 20% | 1.9 -46% | |
| H.264 (h) | 11.4 |
Pro
Contro
Verdetto - Massima funzionalità, caratteristiche ed estetica
Il Dragonfly G3 risponde a una delle nostre maggiori lamentele nei confronti del modello Libellula G2 spostando la serie dal fattore di forma 16:9 a un rapporto di aspetto 3:2. il formato 16:9 funziona bene per i computer portatili di fascia consumer e per la maggior parte della riproduzione video, ma il formato 3:2 o 16:10 è solitamente più appropriato per il pubblico di utenti d'ufficio e professionisti.
A parte la revisione visiva, la webcam in particolare merita un elogio perché è una delle migliori che abbiamo visto su qualsiasi portatile. 5 MP possono sembrare miseri per gli utenti di smartphone, ma si tratta letteralmente di una risoluzione 5 volte superiore (!) a quella delle webcam presenti sulla maggior parte dei portatili di oggi. Se apprezzate la qualità video e fate molte videoconferenze, allora non cercate altro che il Dragonfly G3. Altri punti di forza sono le ventole più silenziose, il clickpad molto grande, le prestazioni veloci dell'SSD senza throttling delle prestazioni e l'eccellente qualità audio per la sua classe di dimensioni.
Il Dragonfly G3 ha un aspetto fantastico ed è ancora più piacevole da usare. Tuttavia, i cacciatori di prestazioni della CPU potrebbero voler guardare altrove, dato che gli obiettivi di TDP sono relativamente bassi per l'HP.
Il grande asterisco sul Dragonfly G3 riguarda le prestazioni del processore. Quando il concorrente Dell Latitude 9430 2-in-1 è in grado di utilizzare la stessa CPU Core i7-1265U con una velocità superiore del 50%, allora si sa che il modello HP non è in grado di sfruttare appieno i vantaggi della 12a generazione Intel. Il rumore della ventola è sicuramente più silenzioso, ma avremmo preferito un'opzione che permettesse di avere ventole più rumorose se questo avesse significato prestazioni più veloci per chi ne ha bisogno.
Per il modello del prossimo anno, ci piacerebbe che Sure View fosse separato dall'opzione del pannello a 1000 nit. A questo punto, se si configura l'uno o l'altro, è necessario accettarli come una coppia. Inoltre, opzioni di frequenza di aggiornamento dei display più elevate, come quelle presenti nella serie Asus ZenBook, migliorerebbero l'esperienza dell'utente. Un coperchio più rigido e una garanzia di base più lunga di 36 mesi contribuirebbero a migliorare rispettivamente la robustezza e la longevità.
Prezzo e disponibilità
L'HP Elite Dragonfly G3 non è ancora disponibile su Amazon, Best Buy o altri importanti punti vendita. Si consiglia di acquistare direttamente da HP per ottenere le opzioni più configurabili. Le configurazioni di base partono da 1999 dollari, mentre la nostra configurazione specifica viene venduta a poco meno di 2.700 dollari.
HP Elite Dragonfly G3
- 08/28/2022 v7 (old)
Allen Ngo
Price comparison

