Latitude 5320 in rassegna: Dell rovina la sostituzione del mouse

La serie Latitude 5000 di Dell è rappresentata da computer portatili business di fascia media. La nuova progenie si chiama Latitude 5320, è il successore del Latitude 5310 e quasi non è cambiato esternamente rispetto al predecessore. Dell sostituisce principalmente i processori Comet Lake con i modelli Tiger Lake. Tuttavia, ci sono anche cambiamenti significativi nella connettività, compresa la comparsa di Thunderbolt 4. Tuttavia, alcuni downgrade non piaceranno a tutti gli acquirenti. Parole chiave: clickpad e memoria di lavoro.
Il campo dei concorrenti tra 800 e poco più di 1000 euro è ampio. I ThinkPad di Lenovo della serie L sono i principali concorrenti per Latitude con equipaggiamento business. I ThinkBooks non offrono altrettanta connettività ma potrebbero essere un'alternativa per i clienti economici grazie ai prezzi più bassi. Può il Latitude 5320 tenere testa a questa dura concorrenza? Il nostro test fornisce la risposta.
Potenziali concorrenti a confronto
Punteggio | Data | Modello | Peso | Altezza | Dimensione | Risoluzione | Prezzo |
|---|---|---|---|---|---|---|---|
| 84.1 % v7 (old) | 03/2022 | Dell Latitude 5320-TM4V2 i5-1135G7, Iris Xe G7 80EUs | 1.3 kg | 17 mm | 13.30" | 1920x1080 | |
| 87.2 % v7 (old) | 12/2020 | Dell Latitude 5310-23VP6 i5-10310U, UHD Graphics 620 | 1.3 kg | 19.7 mm | 13.30" | 1920x1080 | |
| 87.8 % v7 (old) | Lenovo ThinkBook 13s G3 20YA0005GE R7 5800U, Vega 8 | 1.3 kg | 14.9 mm | 13.30" | 1920x1200 | ||
| 87.5 % v7 (old) | 03/2022 | Lenovo ThinkPad L13 Gen2-21AB000PGE R5 PRO 5650U, Vega 7 | 1.4 kg | 17.6 mm | 13.30" | 1920x1080 | |
| 85.6 % v7 (old) | 12/2021 | Lenovo ThinkPad L14 G2-20X1003WGE i5-1135G7, Iris Xe G7 80EUs | 1.7 kg | 19 mm | 14.00" | 1920x1080 | |
| 85.3 % v7 (old) | 01/2022 | Acer TravelMate P4 TMP414-51-59MR i5-1135G7, Iris Xe G7 80EUs | 1.4 kg | 17.9 mm | 14.00" | 1920x1080 | |
| 83.6 % v7 (old) | Lenovo ThinkBook 14 G2 ITL 20VDS02G00 i3-1115G4, UHD Graphics Xe G4 48EUs | 1.5 kg | 17.9 mm | 14.00" | 1920x1080 |
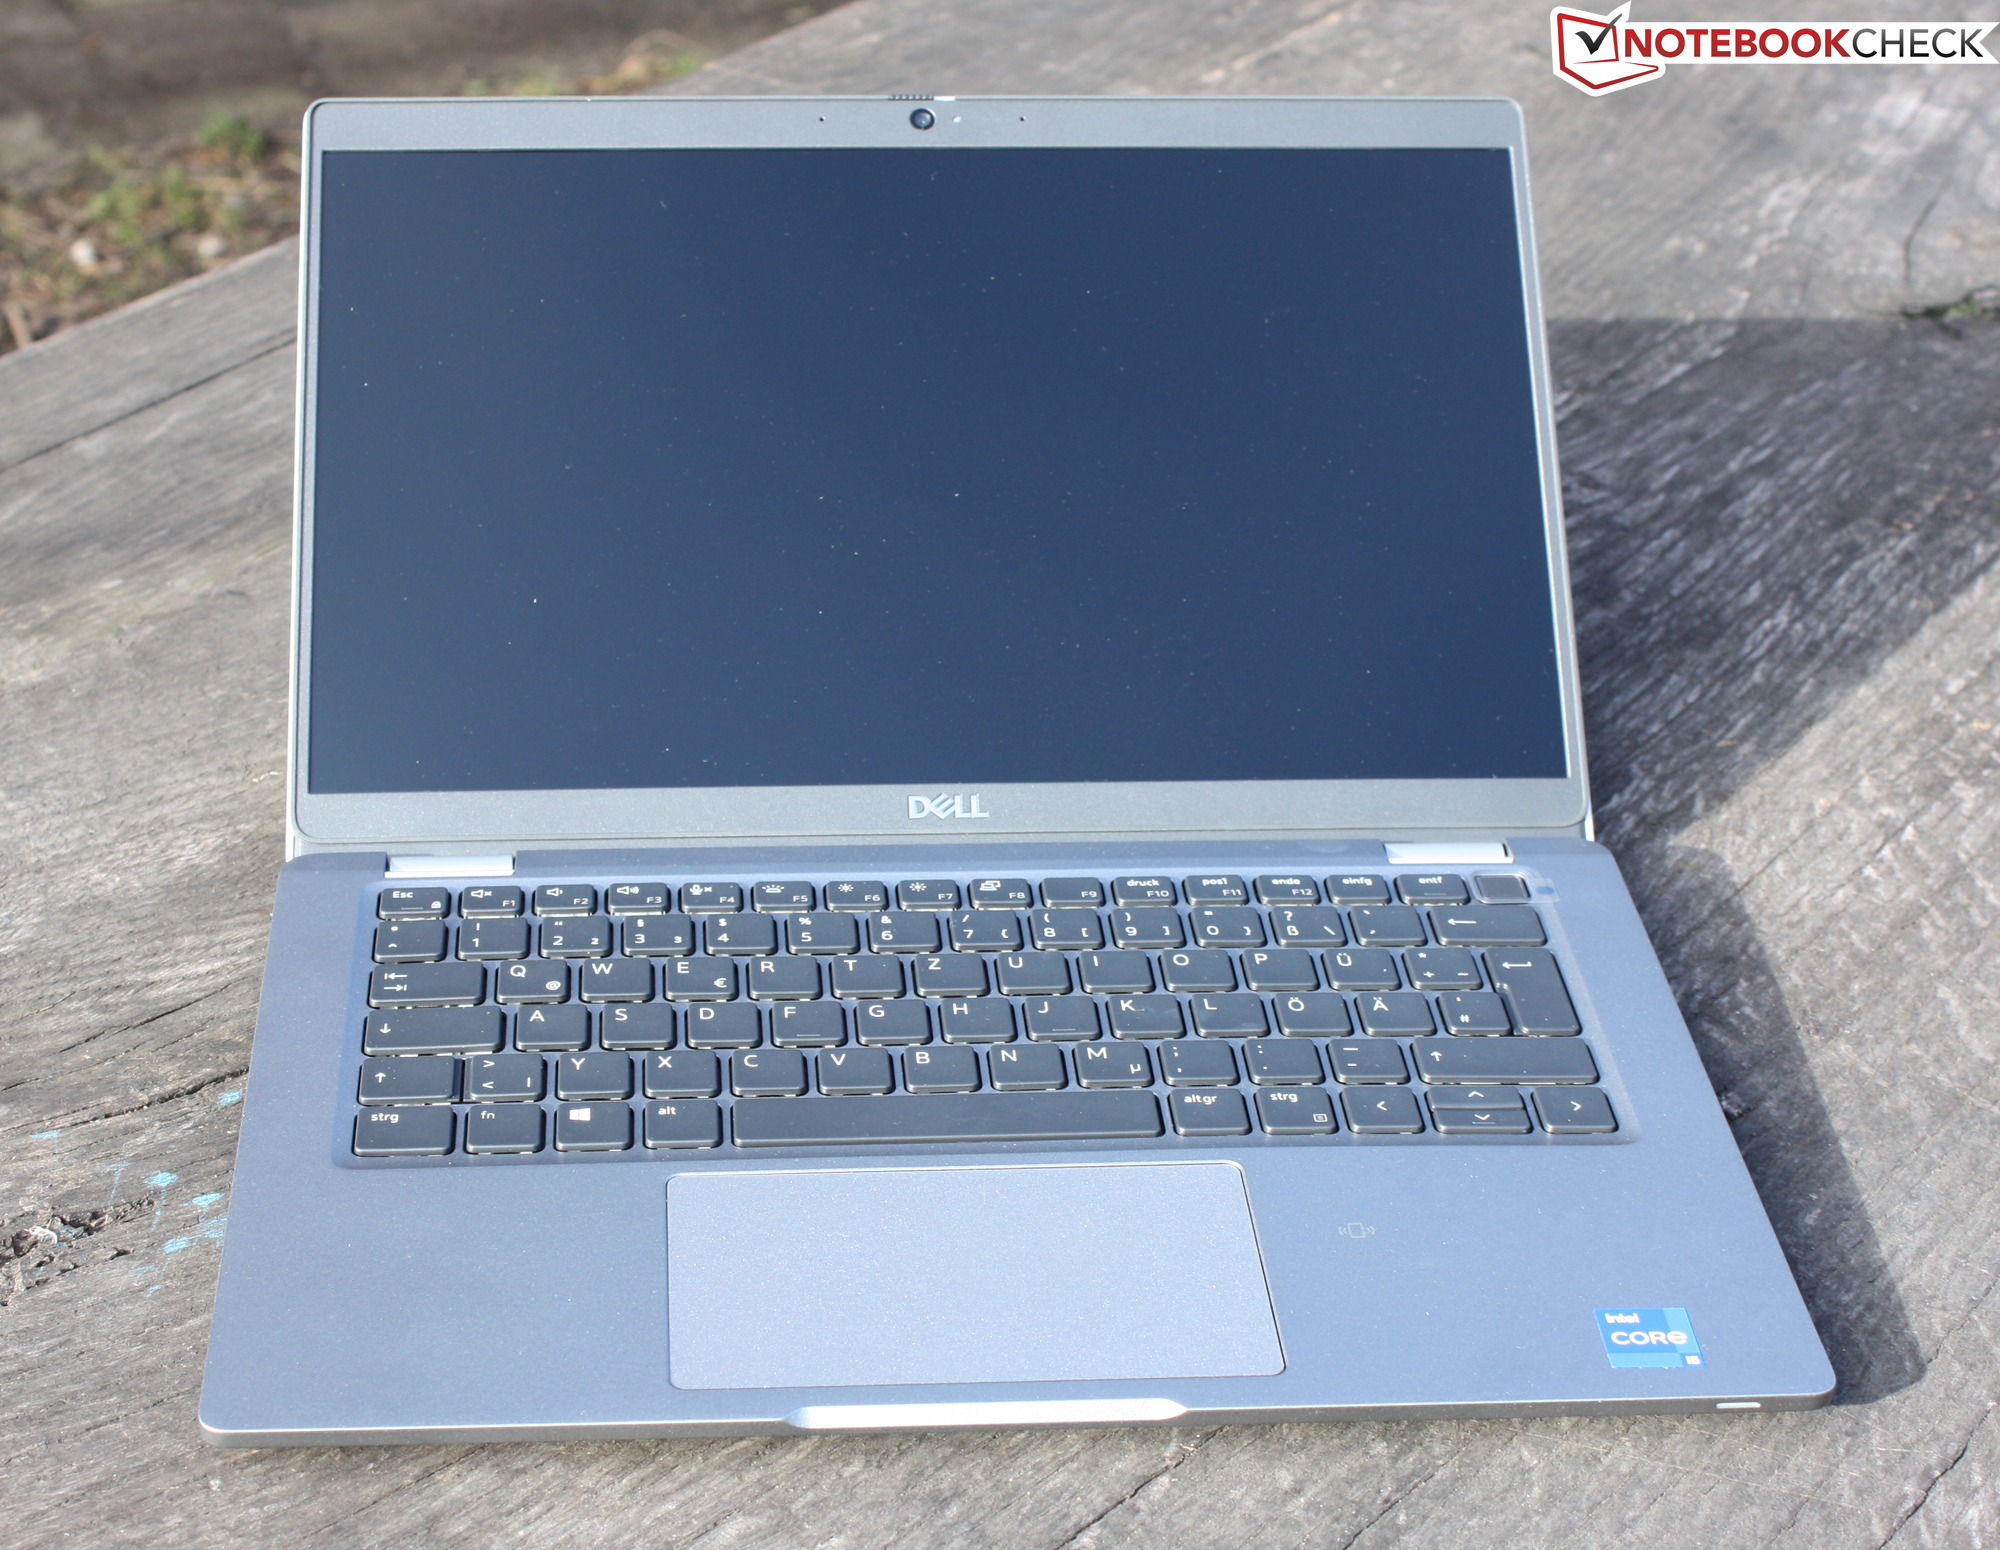
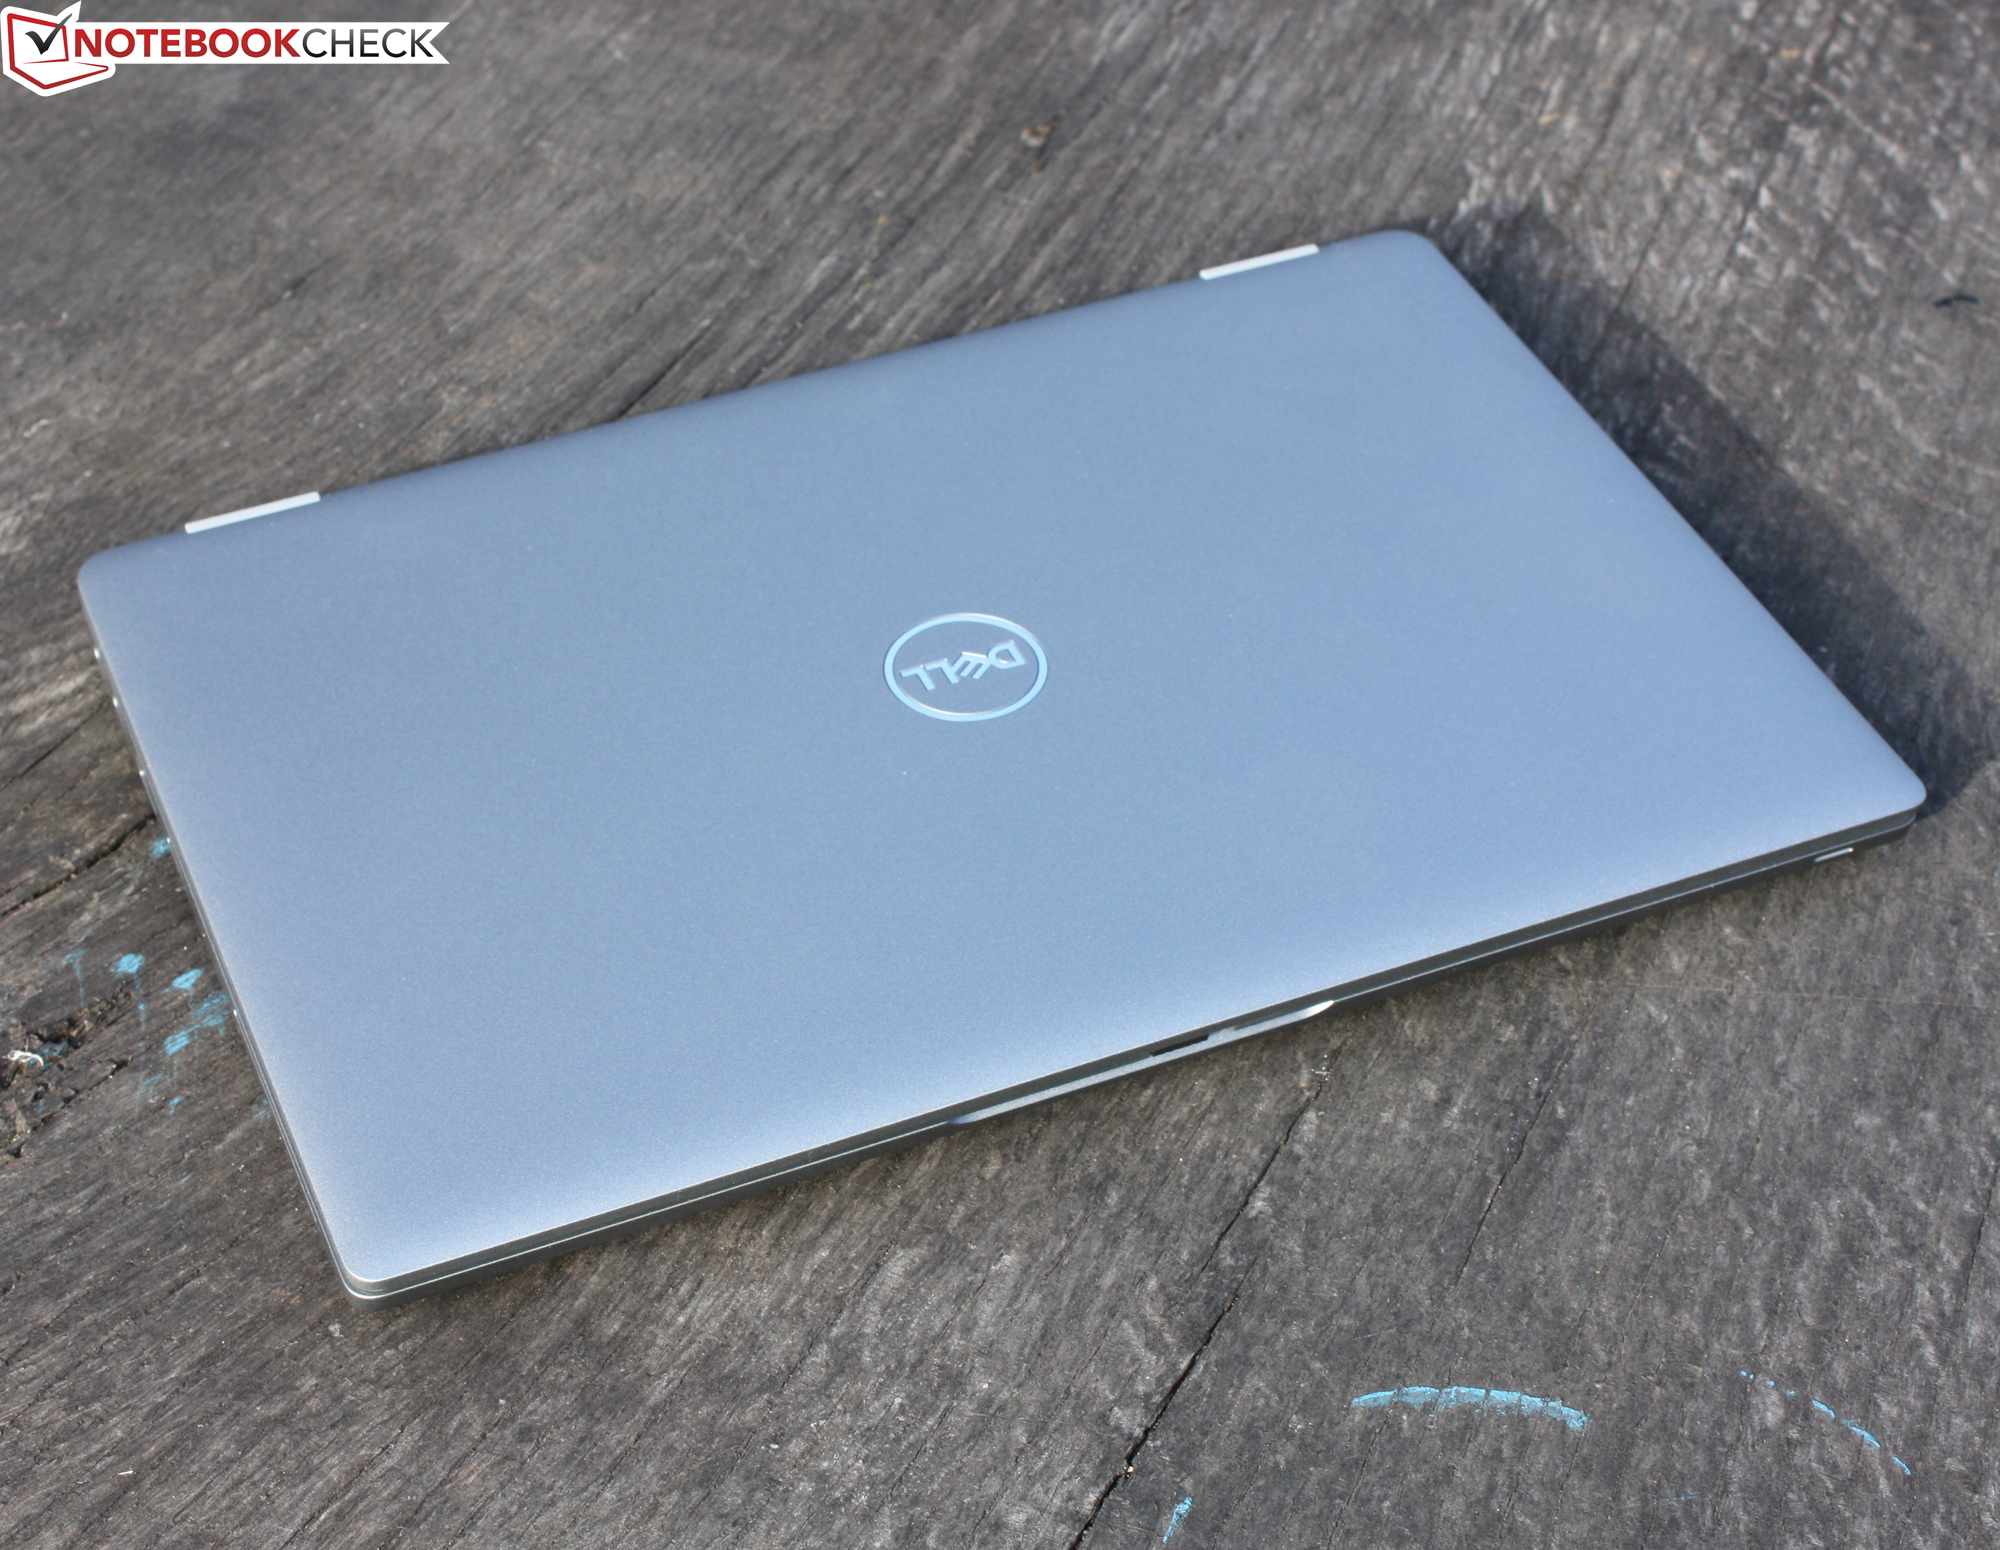
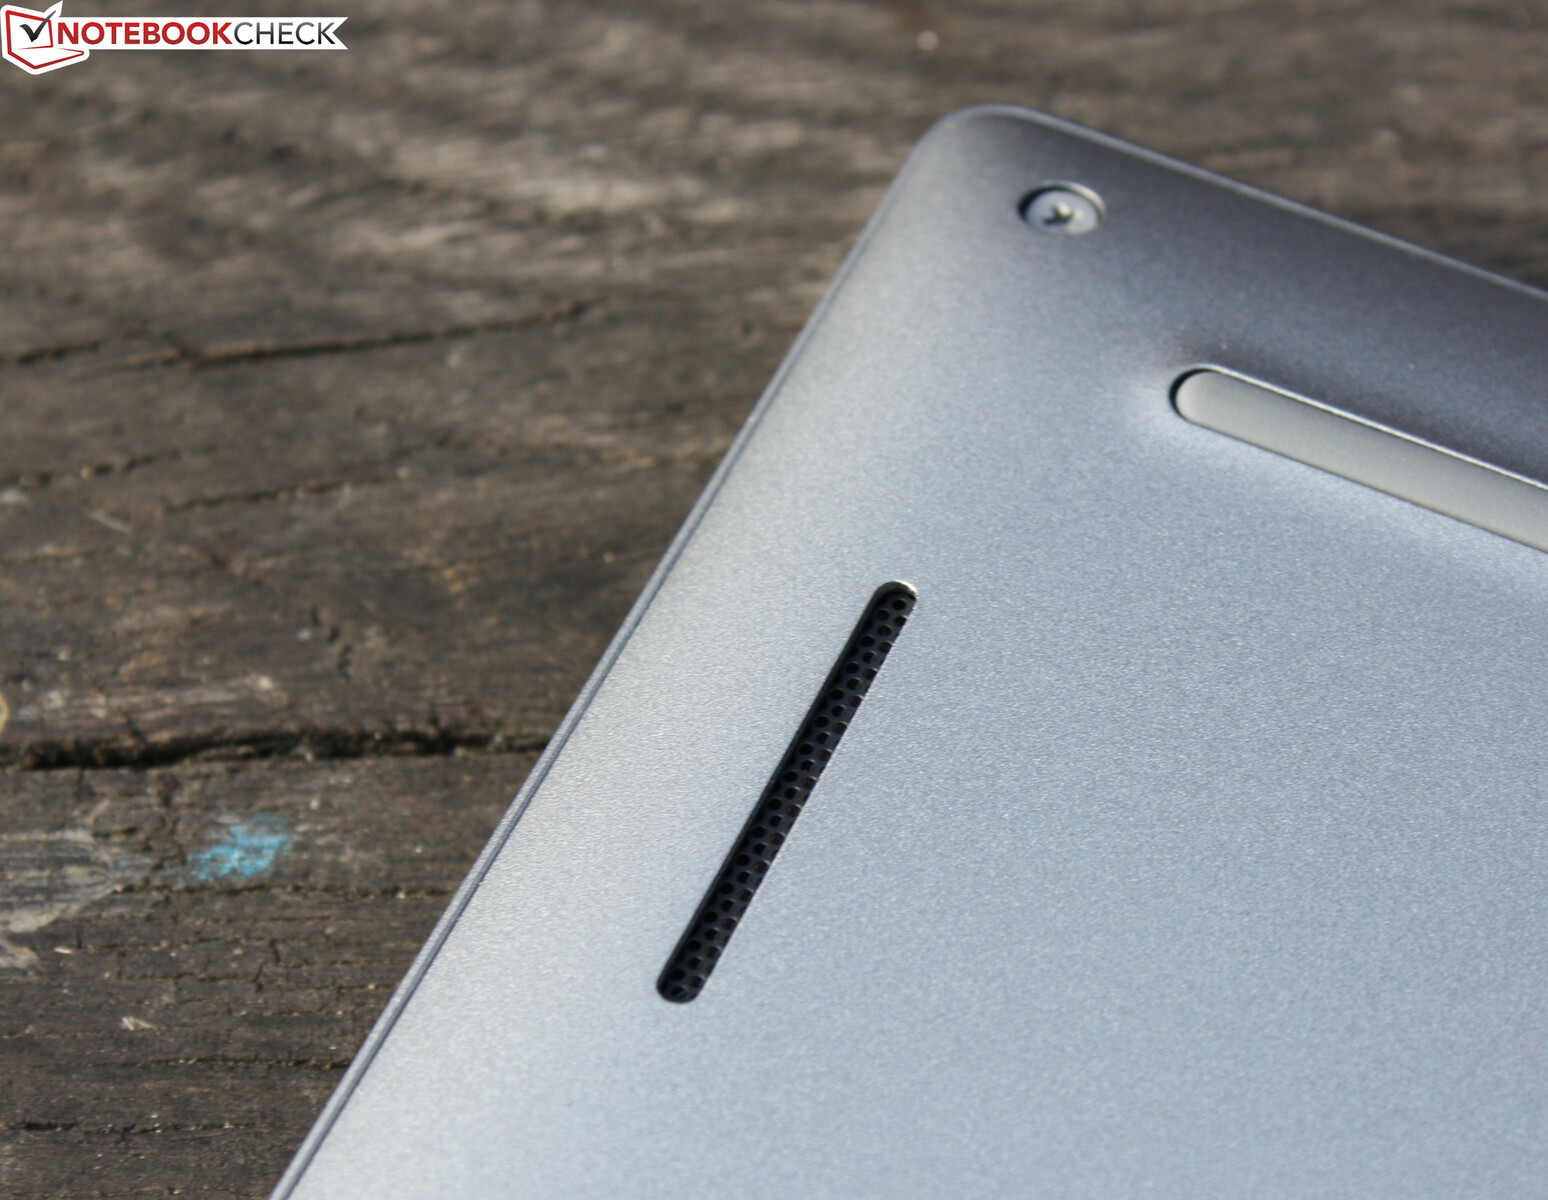
Custodia - La custodia del portatile potrebbe essere più stabile
La tecnologia del Latitude 5320 è stata impacchettata in un elegante involucro di metallo senza fronzoli. Lo chassis grigio-argento e il suo linguaggio di design sono identici al predecessore. Tuttavia, le porte sono state cambiate e il pulsante di accensione separato sull'unità base è stato omesso. La cornice nera del display è abbastanza larga nella parte superiore dove si trova la webcam, il risultato del display widescreen. Il labbro di gomma dura circonferenziale intorno alla cornice del display, che poggia in modo pulito sulla base, è ben fatto. Questo impedisce alla sabbia o allo sporco di entrare nella fessura durante il trasporto.
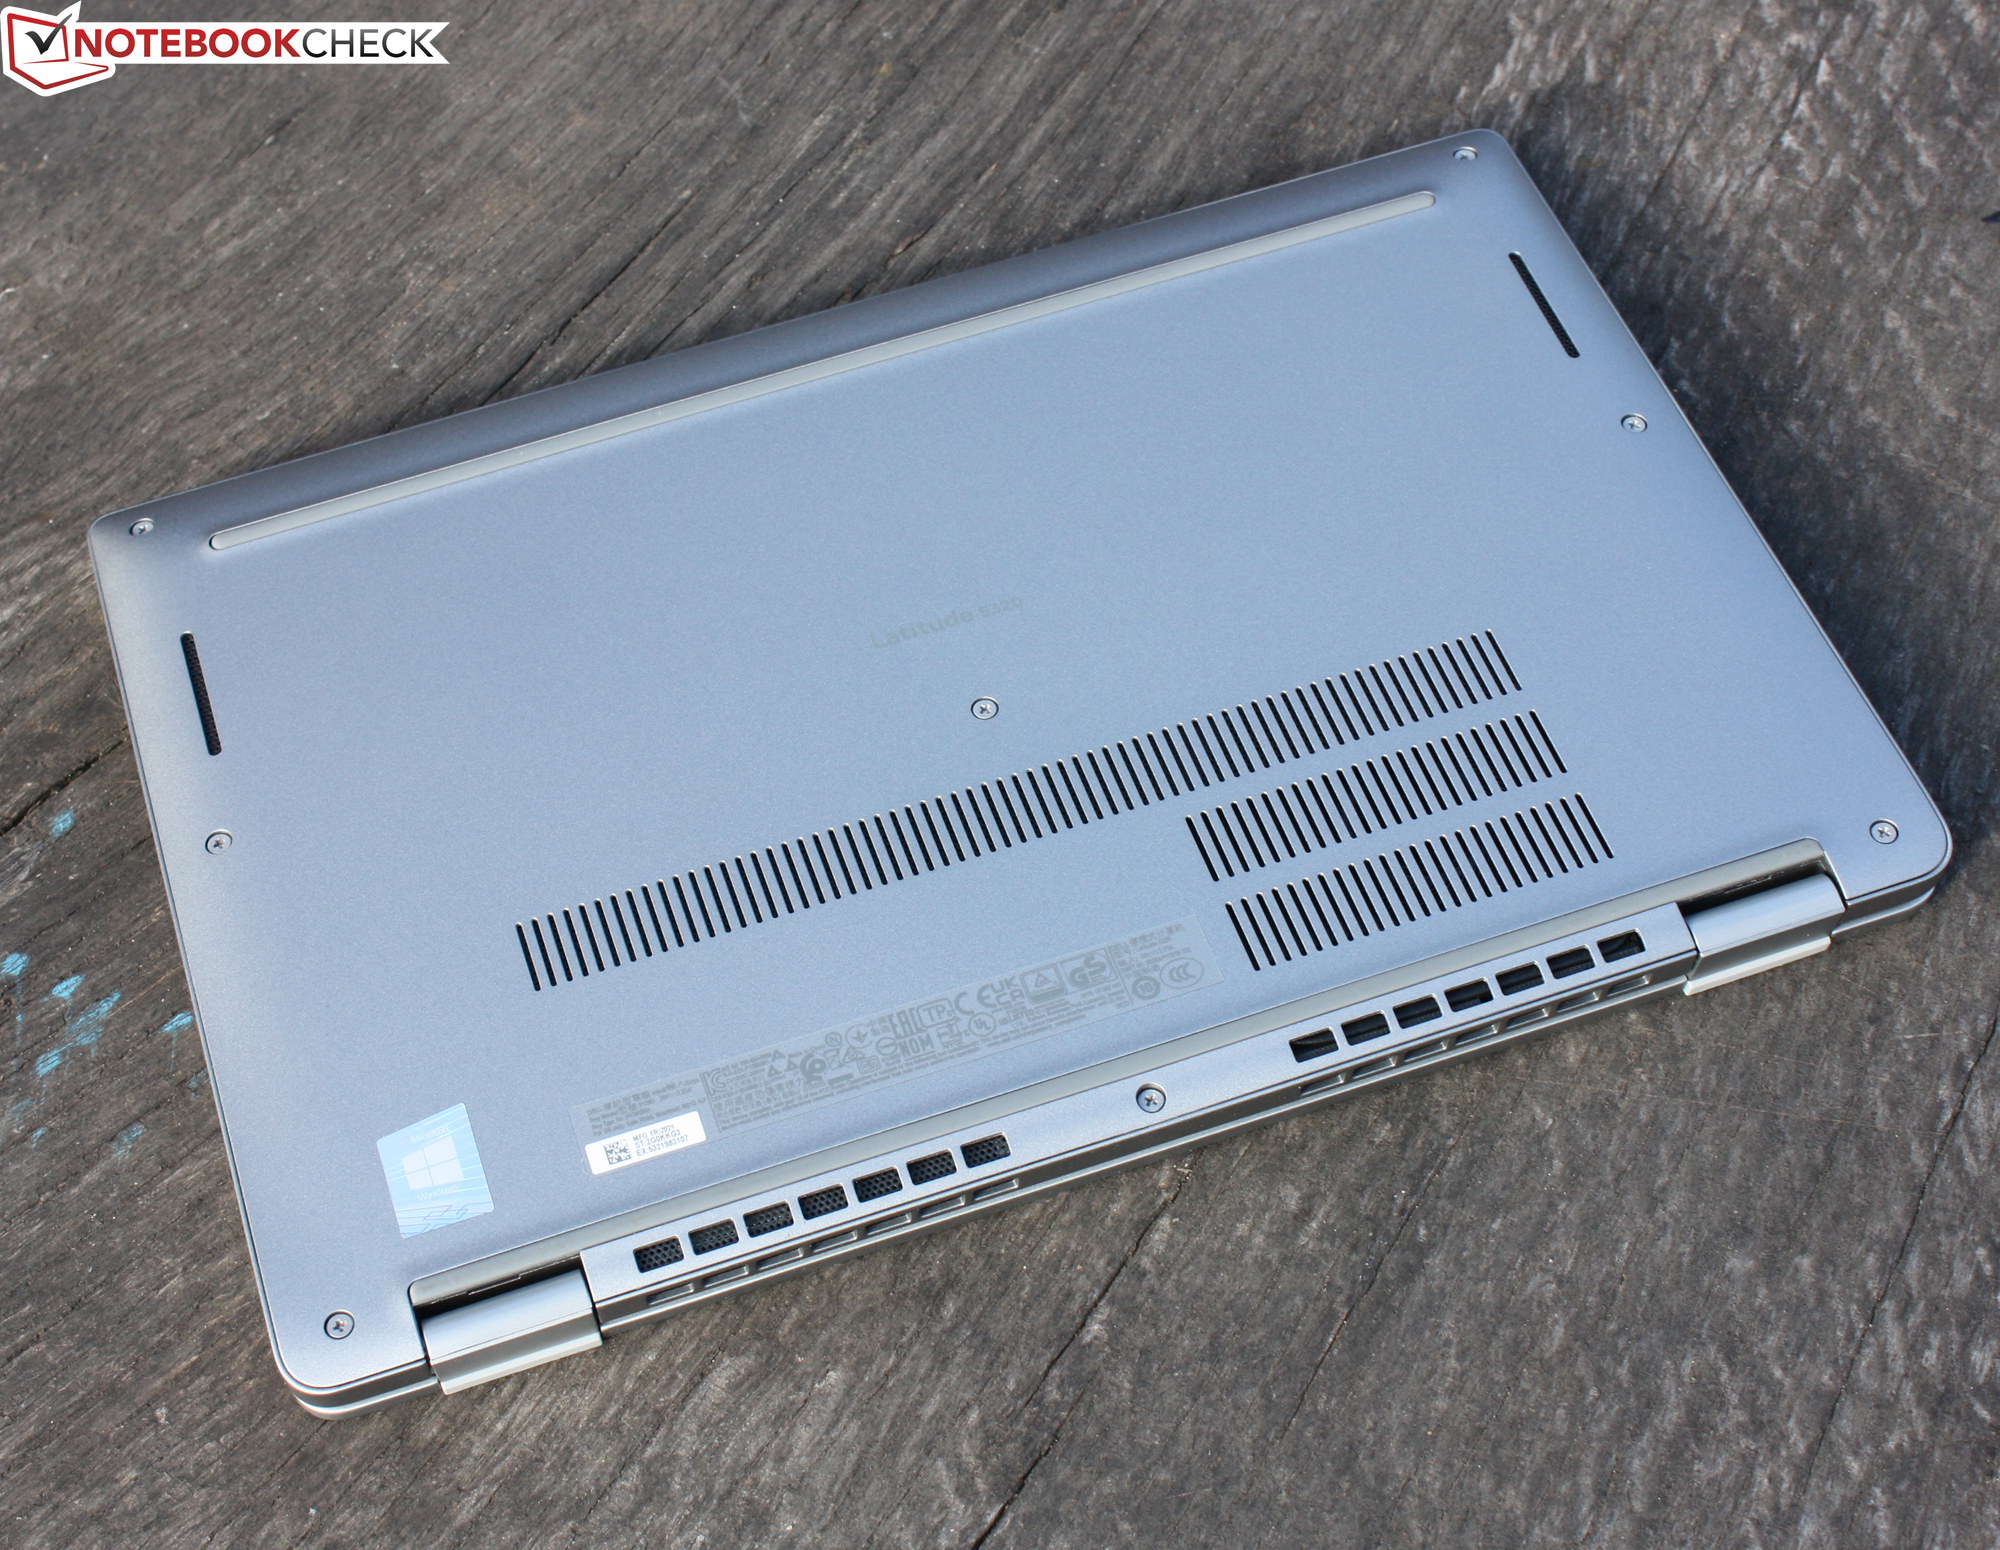
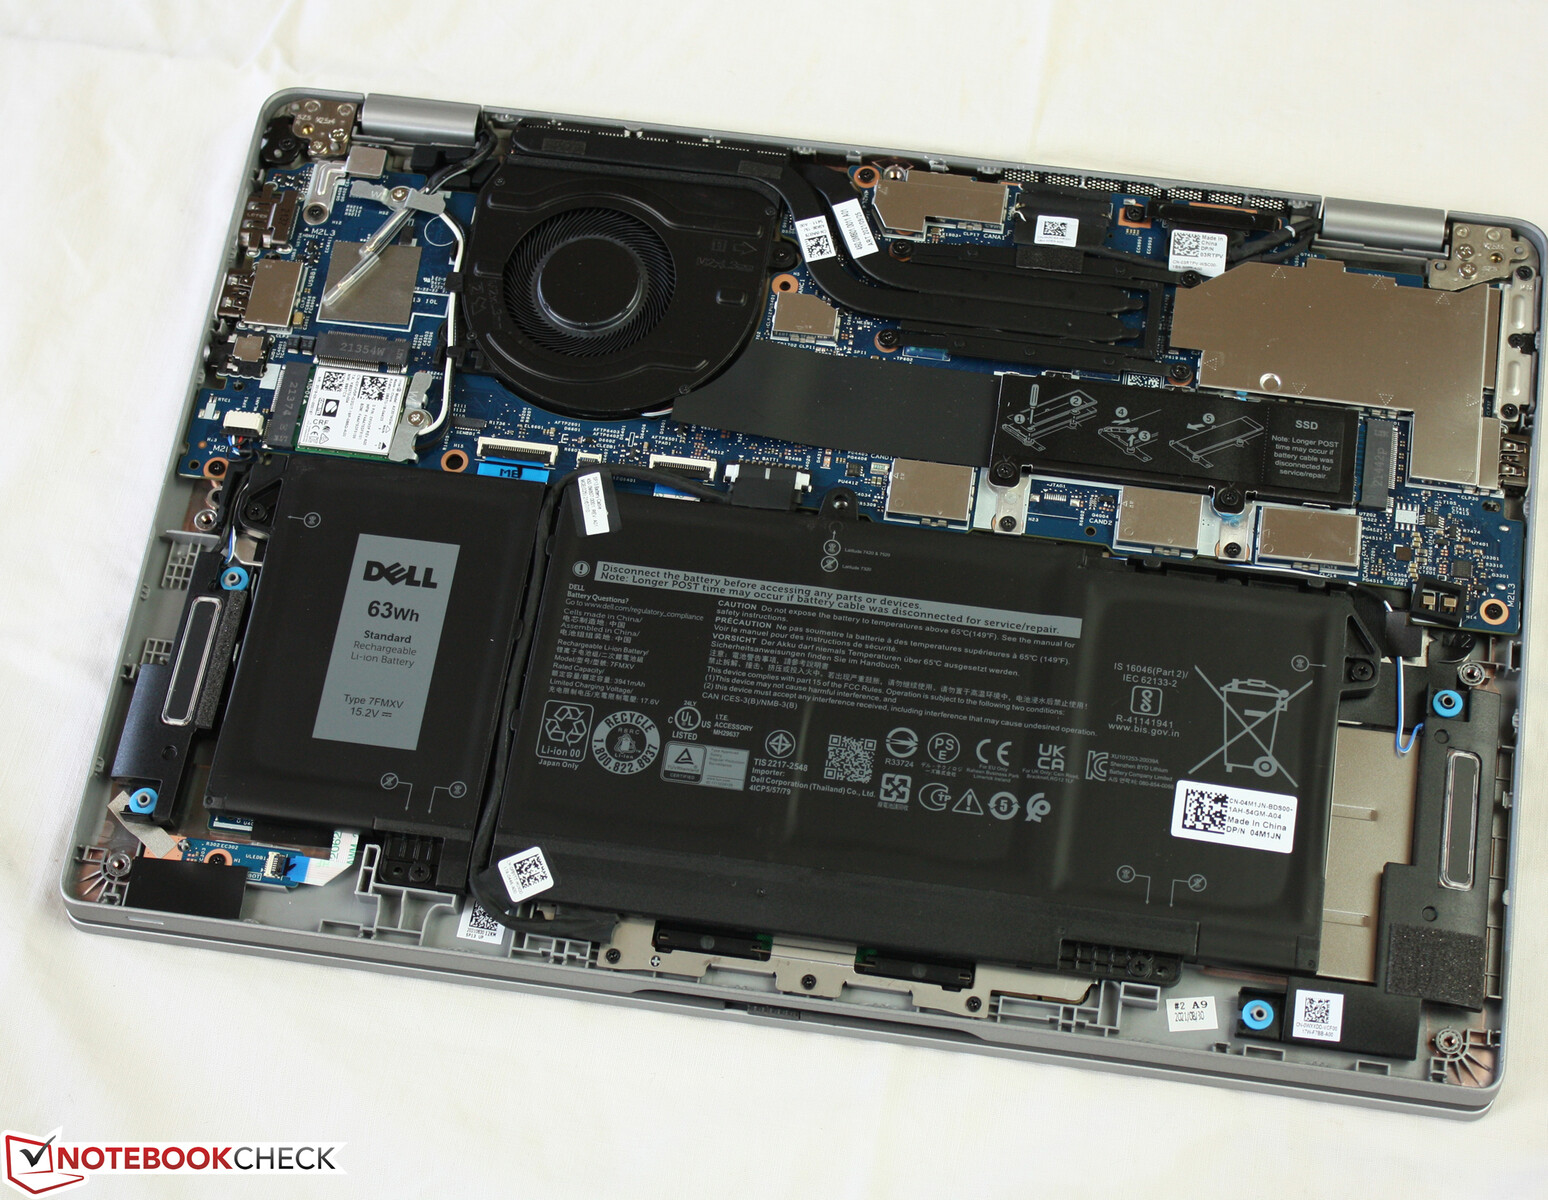
Dell si affida anche a superfici opache in tutto. Non c'è uno sportello per la manutenzione, la batteria è installata in modo permanente ma può essere sostituita. Si può accedere all'interno dopo aver rimosso il coperchio inferiore - più avanti ne parleremo.
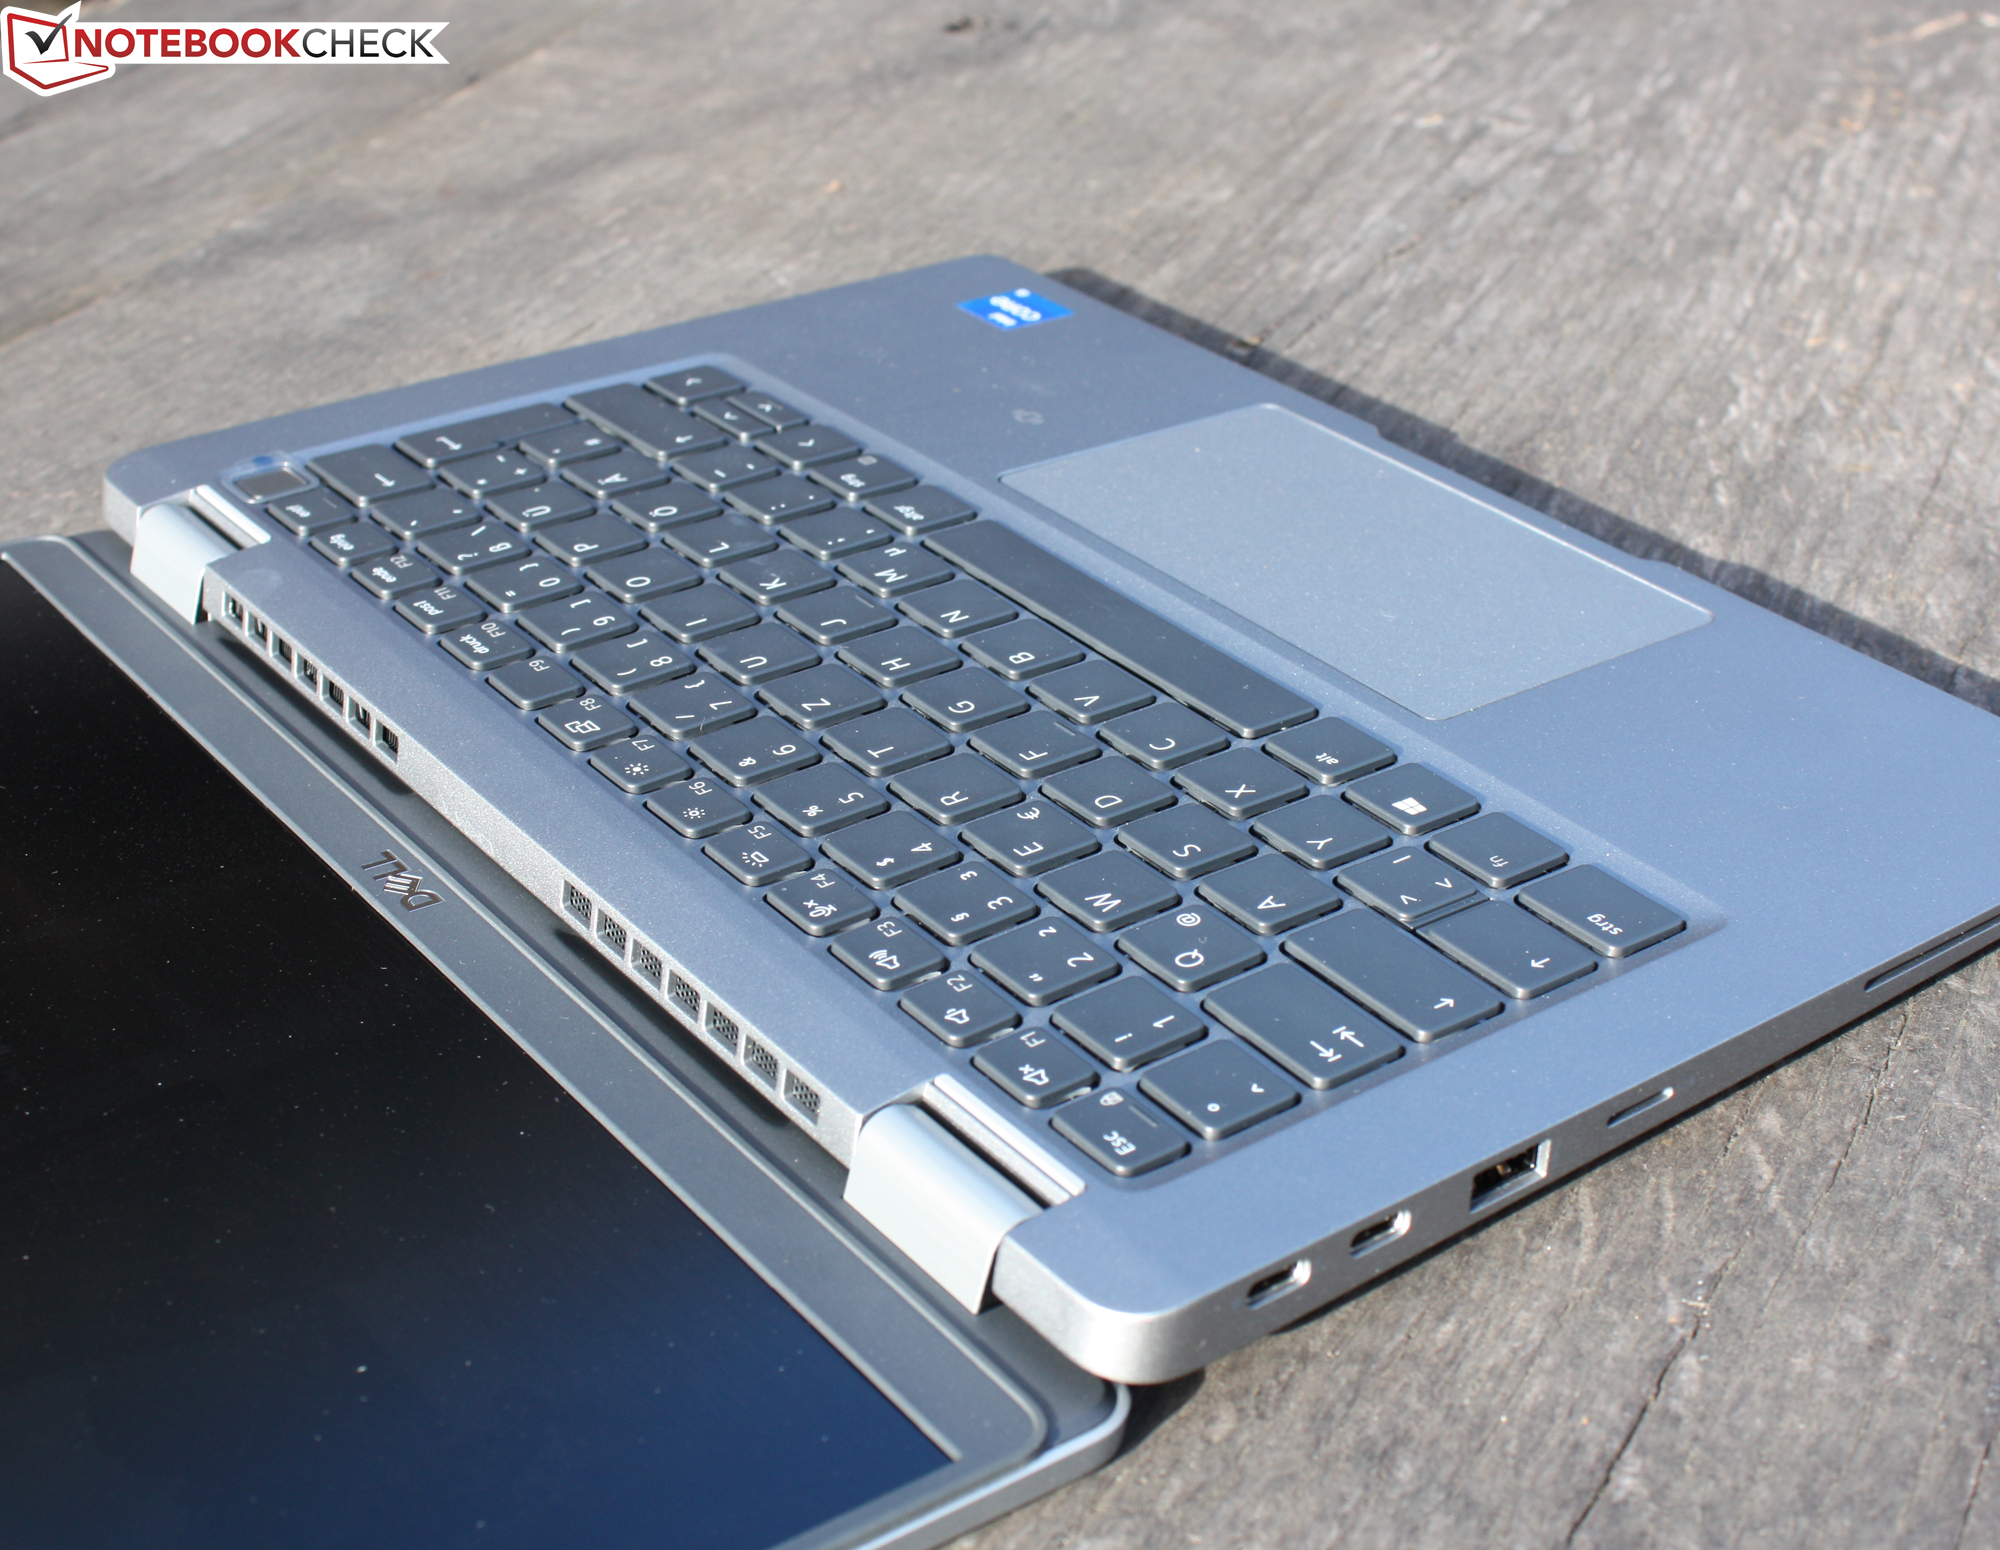
Il Latitude è ben costruito. Gli spazi sono corretti, non ci sono sporgenze di materiale o bordi taglienti. C'è spazio per migliorare in termini di stabilità. L'unità di base è rigida, ma può essere piegata fino a un certo punto, il che va a scapito della pretesa del premio. Riteniamo che il coperchio sia più stabile: i suoi bordi spessi forniscono un'elevata rigidità. La pressione sul retro non provoca alcuna increspatura sull'immagine.
Le cerniere estremamente strette mantengono il coperchio saldamente in posizione, ma l'apertura con una sola mano non è possibile. L'angolo massimo di apertura è di 180 gradi. Il coperchio solleva leggermente la base quando viene aperto e scivola sotto. Non si graffia perché i piedini di gomma sono attaccati al suo bordo inferiore.
Nel nostro campo di confronto, il Latitude è uno dei dispositivi più compatti. Il ThinkBook 13s e il Dell XPS 13 9305 sono alla pari, ma il 13s è ancora più sottile. In termini di peso, è ampiamente alla pari con la maggior parte dei rivali.
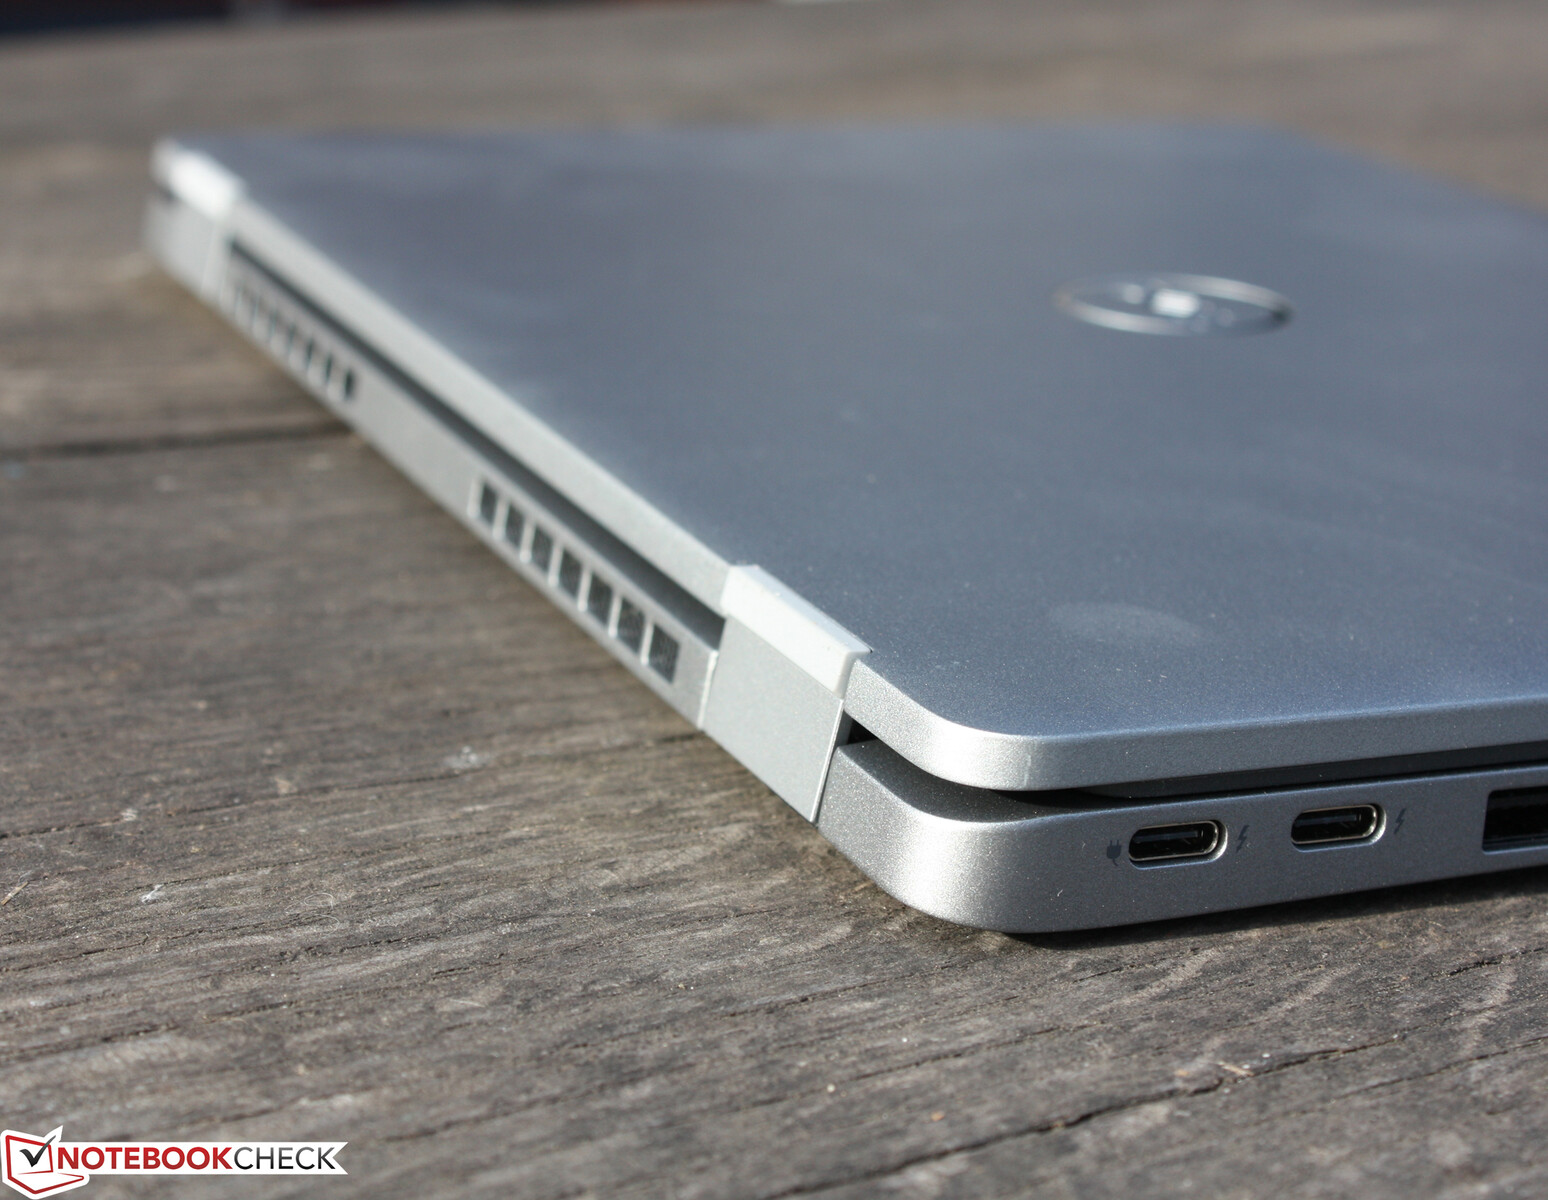
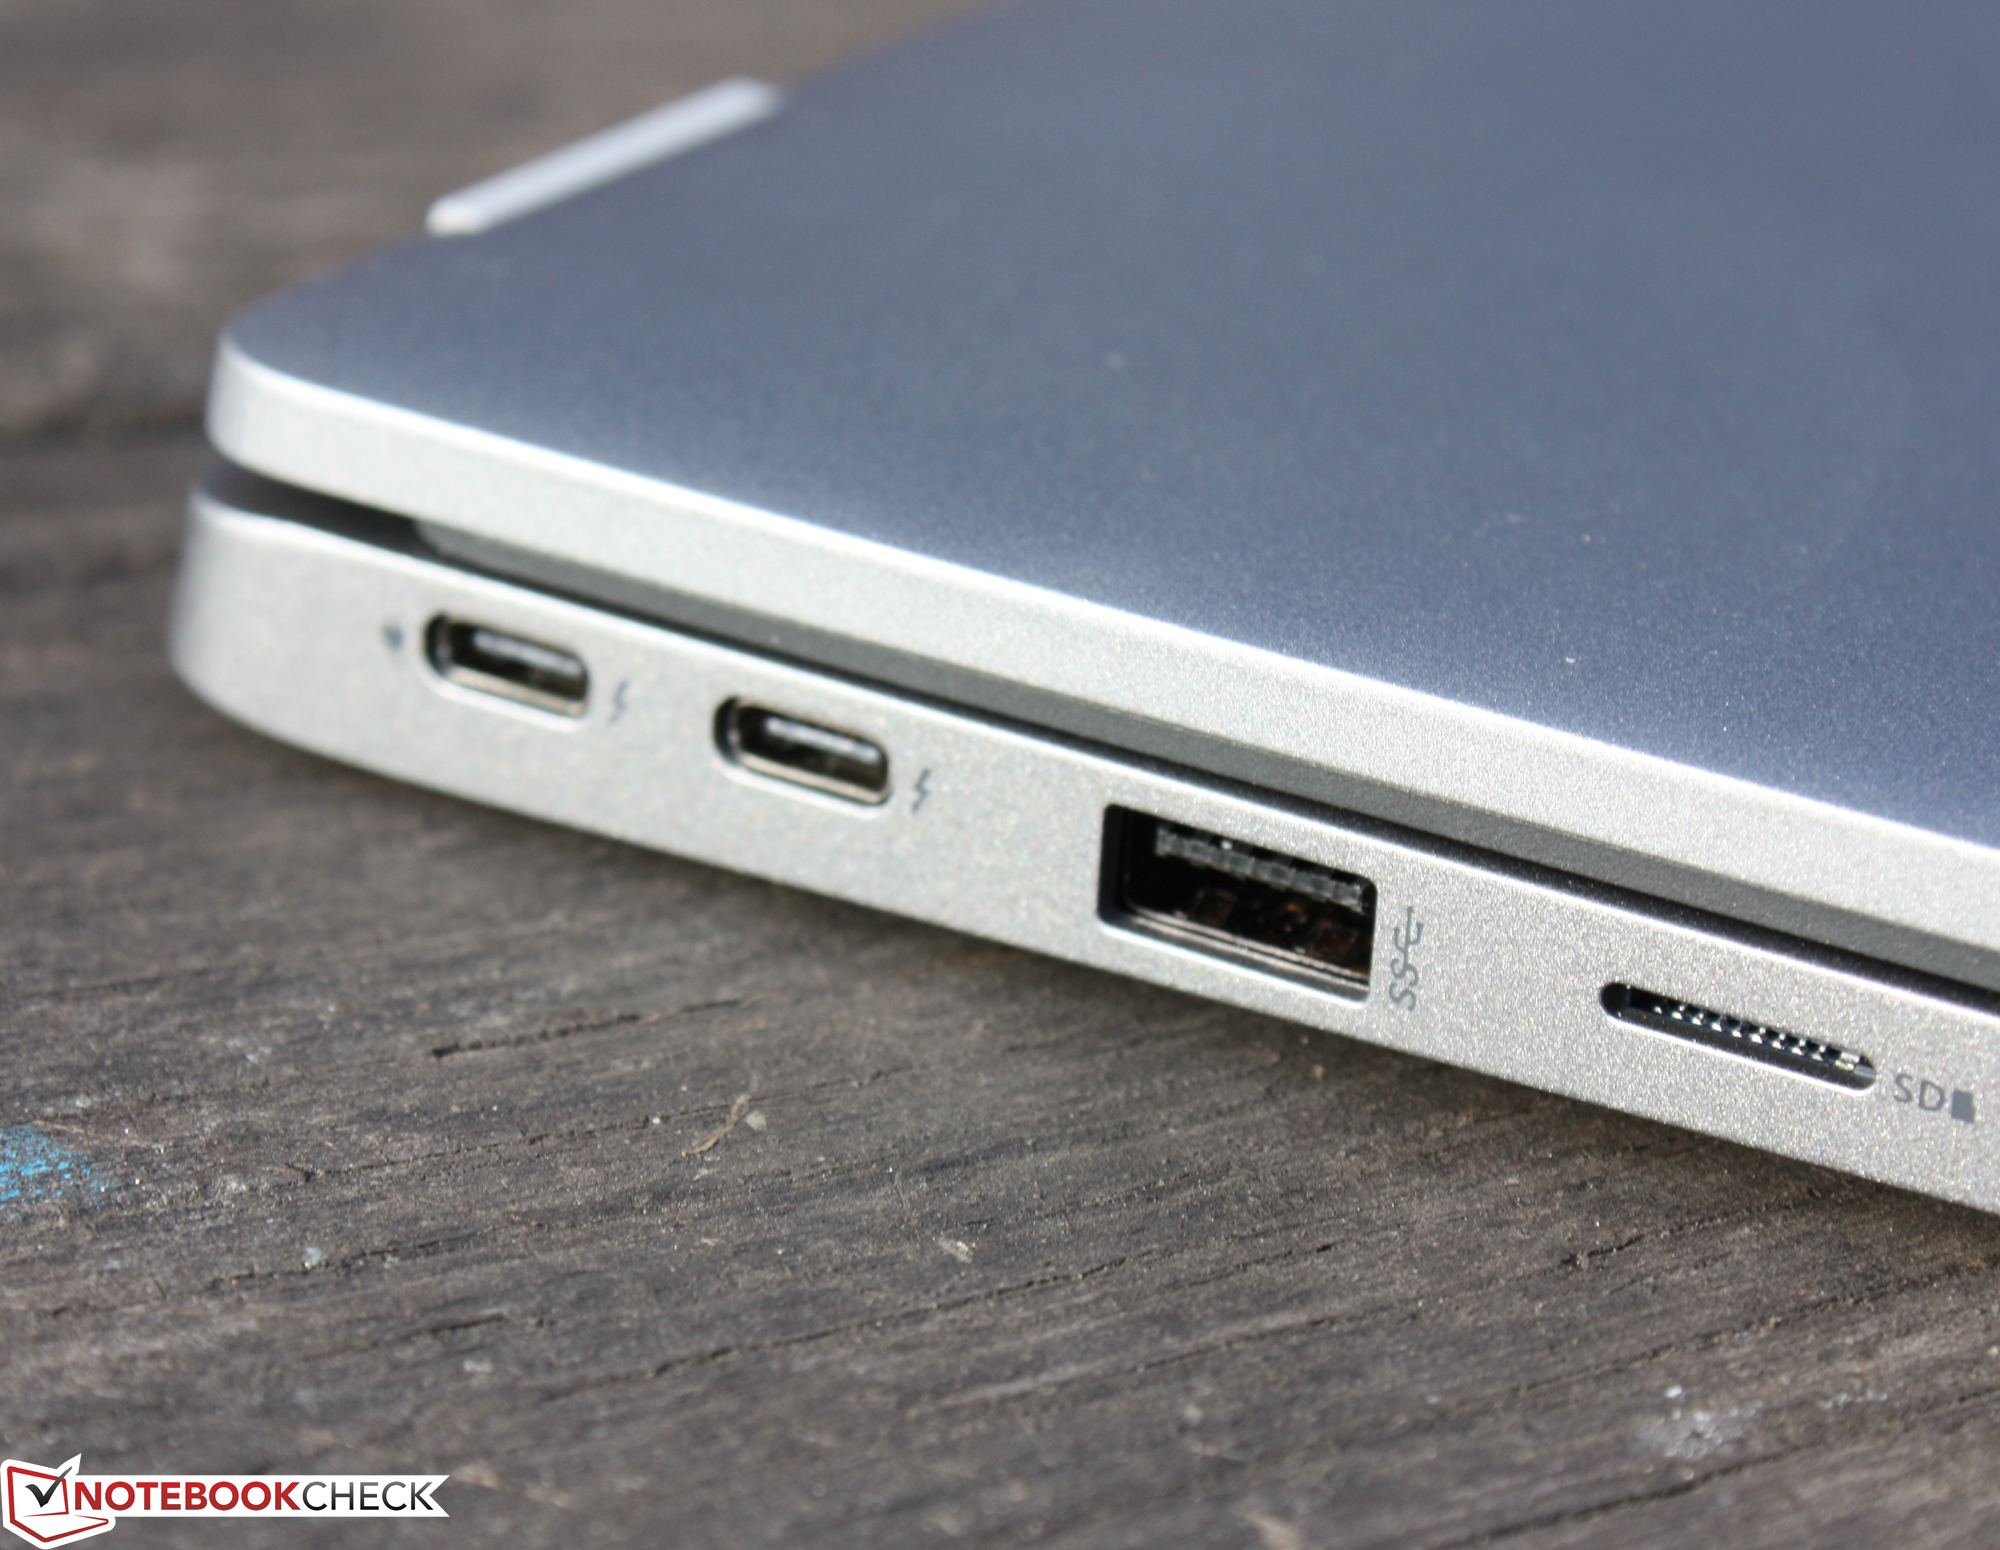
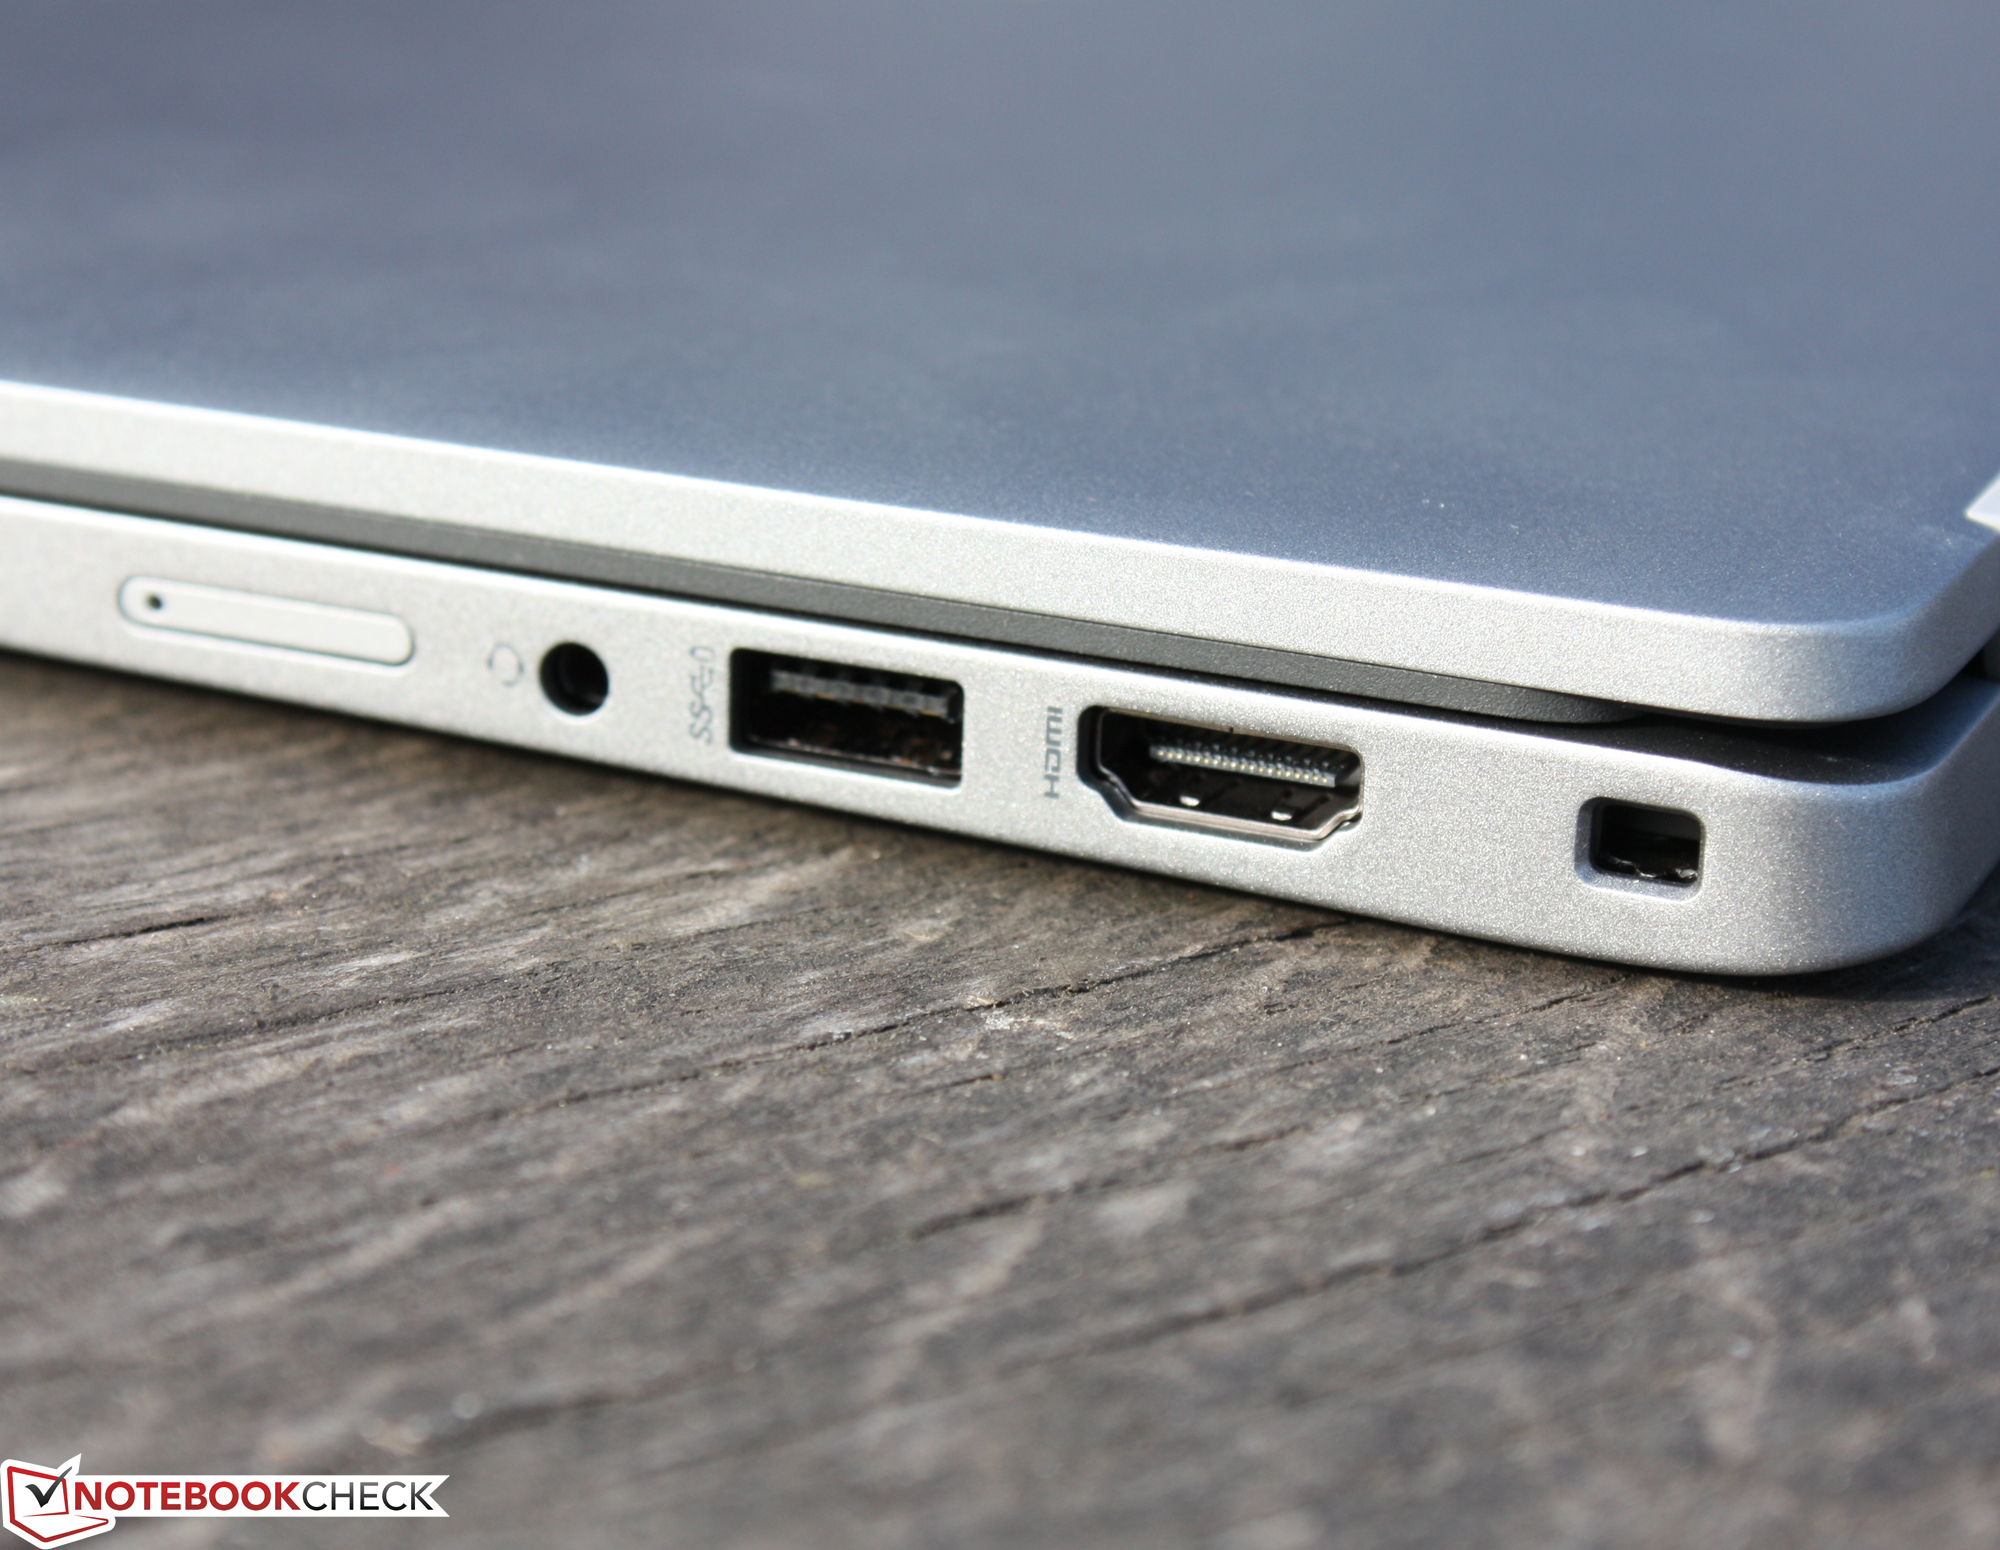
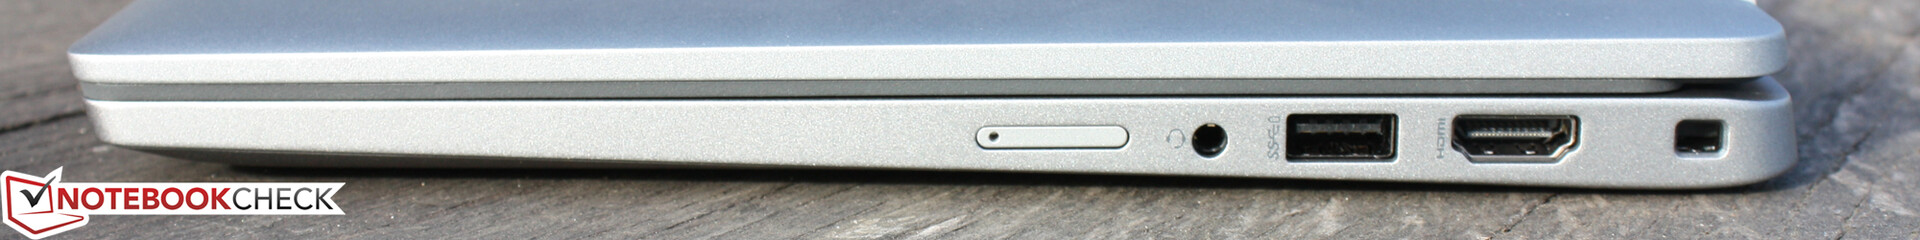
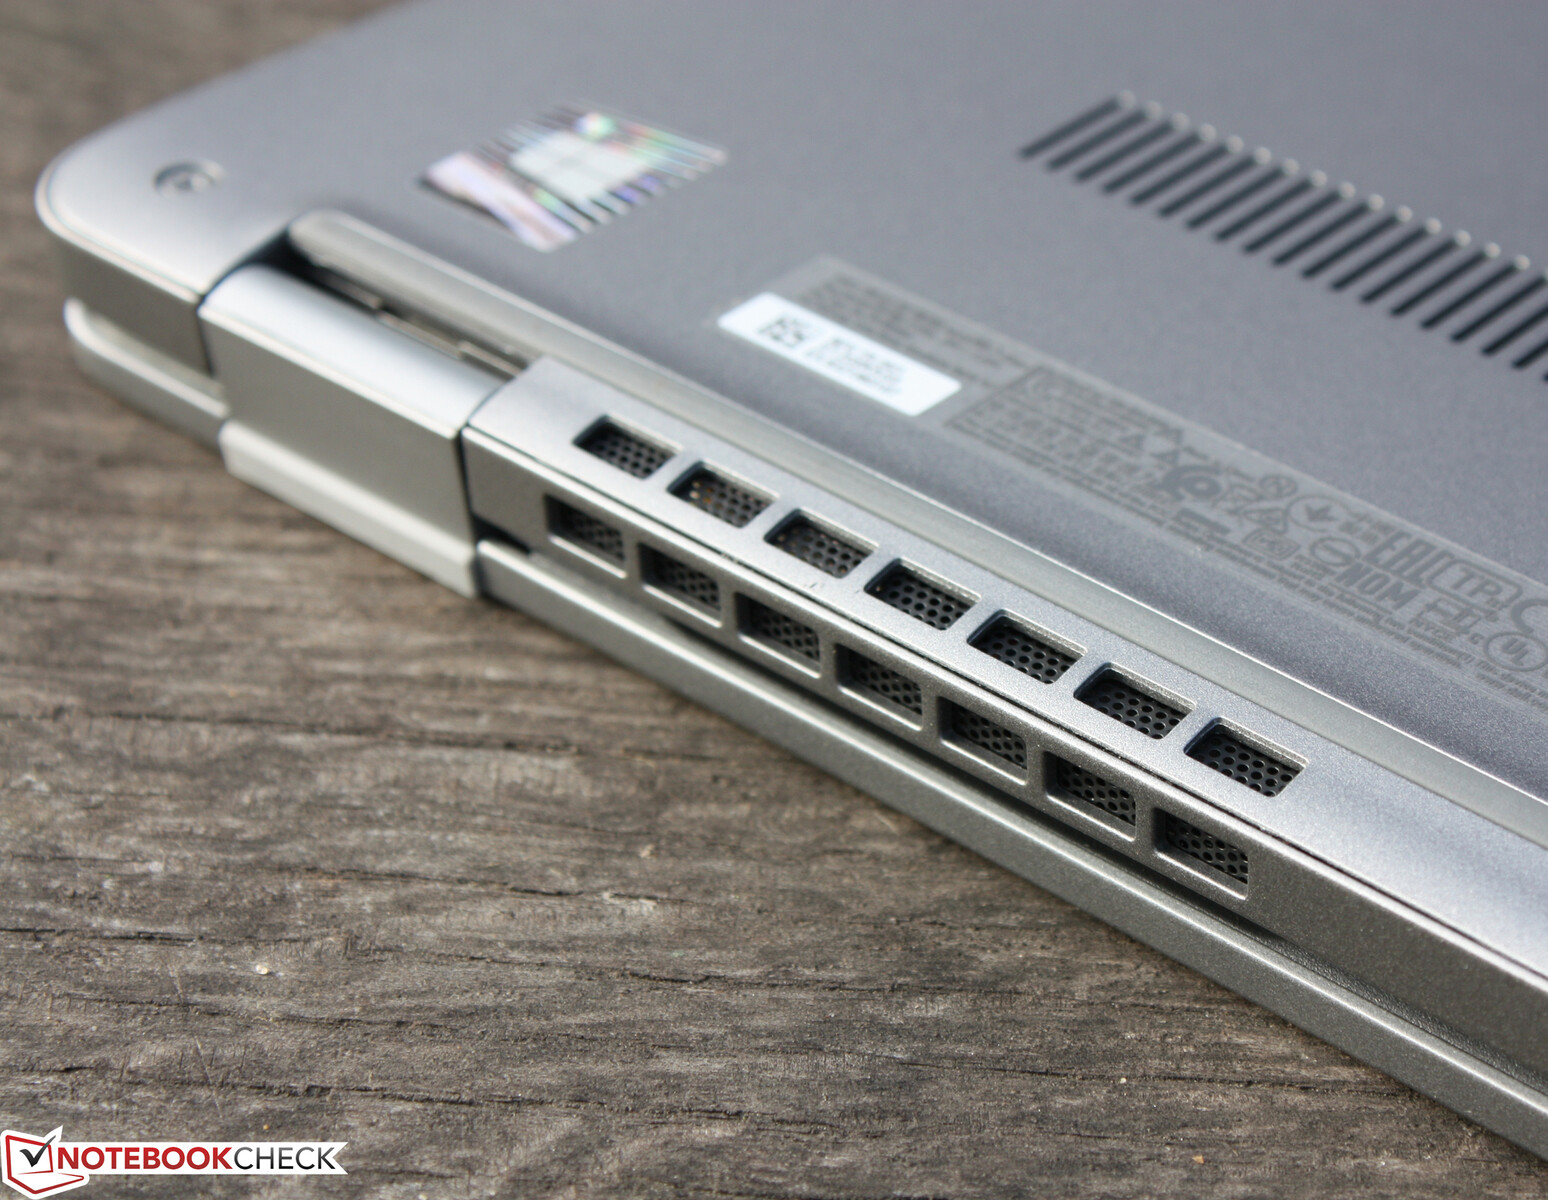
Equipaggiamento - 2x Thunderbolt 4 di serie
Rispetto al predecessore del 2020, ci sono cambiamenti significativi, come la rimozione del connettore di alimentazione hollow-jack in favore di USB Type-C con supporto Power Delivery. Inoltre, i tasti del mouse dedicati e la memoria di lavoro sostituibile sono omessi. Anche RJ45 Ethernet non è più disponibile, ma ci sono due porte Thunderbolt con USB 4.0 e DisplayPort. Una porta Thunderbolt 3 era opzionale prima, ma ora la TB4 è standard.
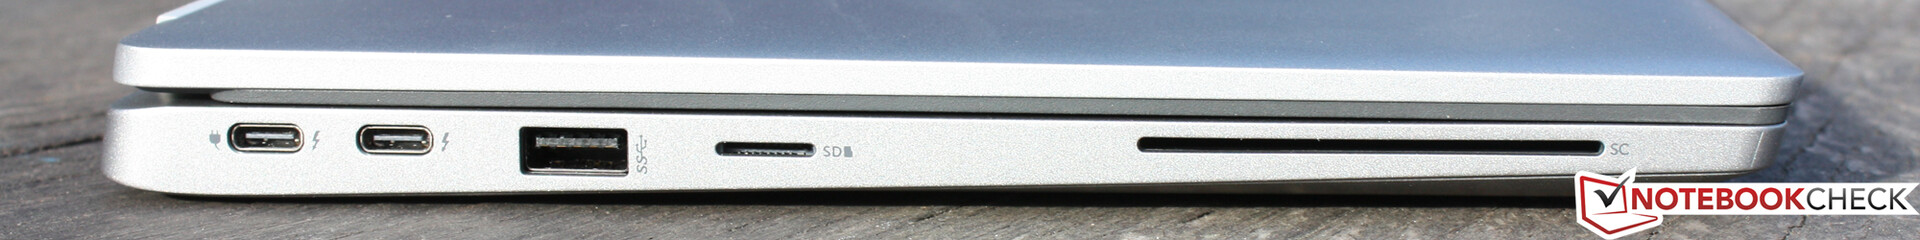
SD CardReader
Il lettore di schede microSD integrato è uno dei più veloci del suo genere, con velocità di trasferimento di 191 MB/s (copiando grandi blocchi di dati) e 205 MB/s (trasferendo 250 file di immagini jpg di circa 5 MB ciascuno). Abbiamo determinato le velocità di trasferimento dati utilizzando una scheda di riferimento (Angelbird AV PRO V60 microSD 128 GB).
| SD Card Reader | |
| average JPG Copy Test (av. of 3 runs) | |
| Dell Latitude 5320-TM4V2 (AV Pro SD microSD 128 GB V60) | |
| Dell XPS 13 9305 Core i5 FHD | |
| Media della classe Subnotebook (23.7 - 188, n=9, ultimi 2 anni) | |
| Lenovo ThinkPad L13 Gen2-21AB000PGE | |
| Lenovo ThinkPad L14 G2-20X1003WGE (AV Pro V60) | |
| Lenovo ThinkBook 14 G2 ITL 20VDS02G00 (AV Pro V60) | |
| Acer TravelMate P4 TMP414-51-59MR (AV Pro SD microSD 128 GB V60) | |
| maximum AS SSD Seq Read Test (1GB) | |
| Dell Latitude 5320-TM4V2 (AV Pro SD microSD 128 GB V60) | |
| Dell XPS 13 9305 Core i5 FHD | |
| Media della classe Subnotebook (24.9 - 195, n=8, ultimi 2 anni) | |
| Lenovo ThinkBook 14 G2 ITL 20VDS02G00 (AV Pro V60) | |
| Lenovo ThinkPad L13 Gen2-21AB000PGE | |
| Lenovo ThinkPad L14 G2-20X1003WGE (AV Pro V60) | |
| Acer TravelMate P4 TMP414-51-59MR (AV Pro SD microSD 128 GB V60) | |
Comunicazione
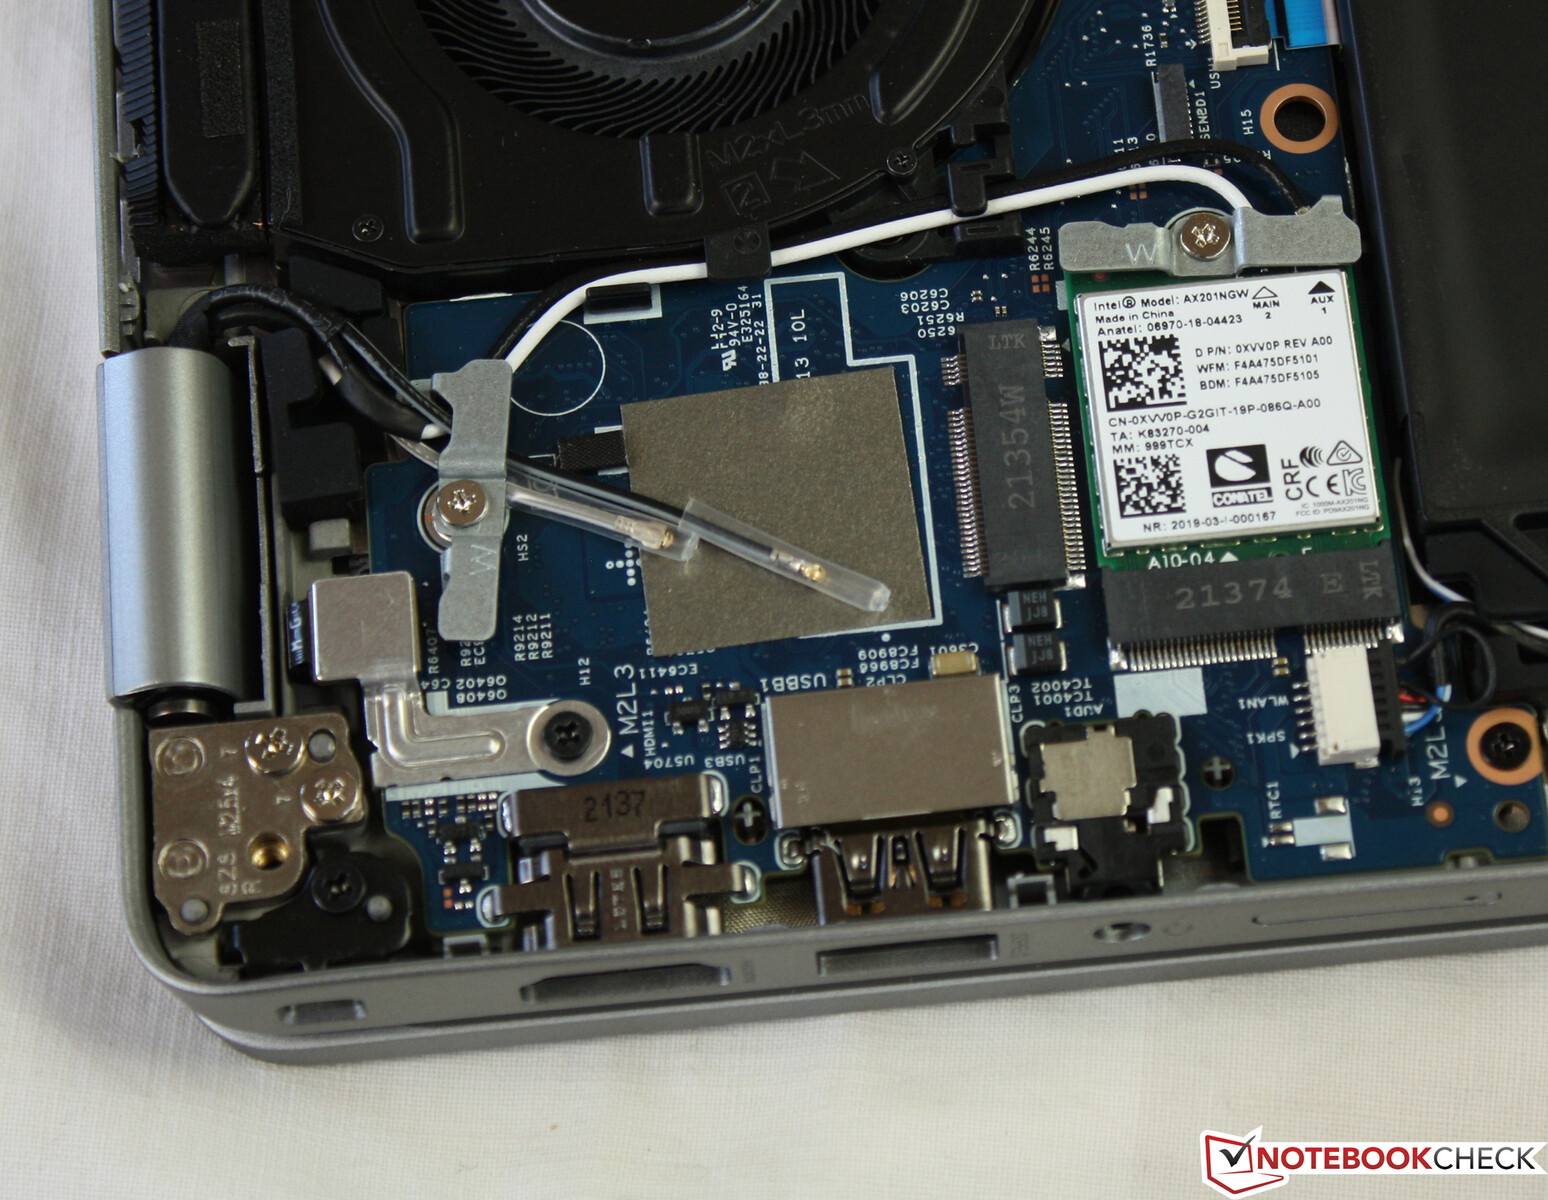
Il chip WLAN (Intel AX201) supporta gli standard WLAN 802.11a/b/g/n/ac/ax. Le velocità di trasmissione determinate in condizioni ottimali (nessun altro dispositivo WLAN nelle immediate vicinanze, breve distanza tra notebook e PC server) sono normali o eccellenti. In tutte le misure di controllo, si è verificato il calo indicato. Le connessioni di rete cablate non sono più possibili per la prima volta, il predecessore aveva ancora un RJ45 a scomparsa.
Dell offre un modem LTE opzionale per il Latitude - il nostro dispositivo di test viene fornito senza modem. Tuttavia, potrebbe essere montato a posteriori, sono disponibili antenne LTE e slot per schede SIM (eSim).
| Networking | |
| iperf3 transmit AX12 | |
| Lenovo ThinkBook 13s G3 20YA0005GE | |
| Media Intel Wi-Fi 6 AX201 (49.8 - 1775, n=324) | |
| Dell XPS 13 9305 Core i5 FHD | |
| Lenovo ThinkPad L14 G2-20X1003WGE | |
| Acer TravelMate P4 TMP414-51-59MR | |
| Lenovo ThinkPad L13 Gen2-21AB000PGE | |
| Dell Latitude 5320-TM4V2 | |
| Lenovo ThinkBook 14 G2 ITL 20VDS02G00 | |
| Lenovo ThinkBook 14 G2 ITL 20VDS02G00 | |
| iperf3 receive AX12 | |
| Dell XPS 13 9305 Core i5 FHD | |
| Dell Latitude 5320-TM4V2 | |
| Media Intel Wi-Fi 6 AX201 (136 - 1743, n=324) | |
| Lenovo ThinkBook 13s G3 20YA0005GE | |
| Acer TravelMate P4 TMP414-51-59MR | |
| Lenovo ThinkPad L13 Gen2-21AB000PGE | |
| Lenovo ThinkBook 14 G2 ITL 20VDS02G00 | |
| Lenovo ThinkBook 14 G2 ITL 20VDS02G00 | |
| Lenovo ThinkPad L14 G2-20X1003WGE | |
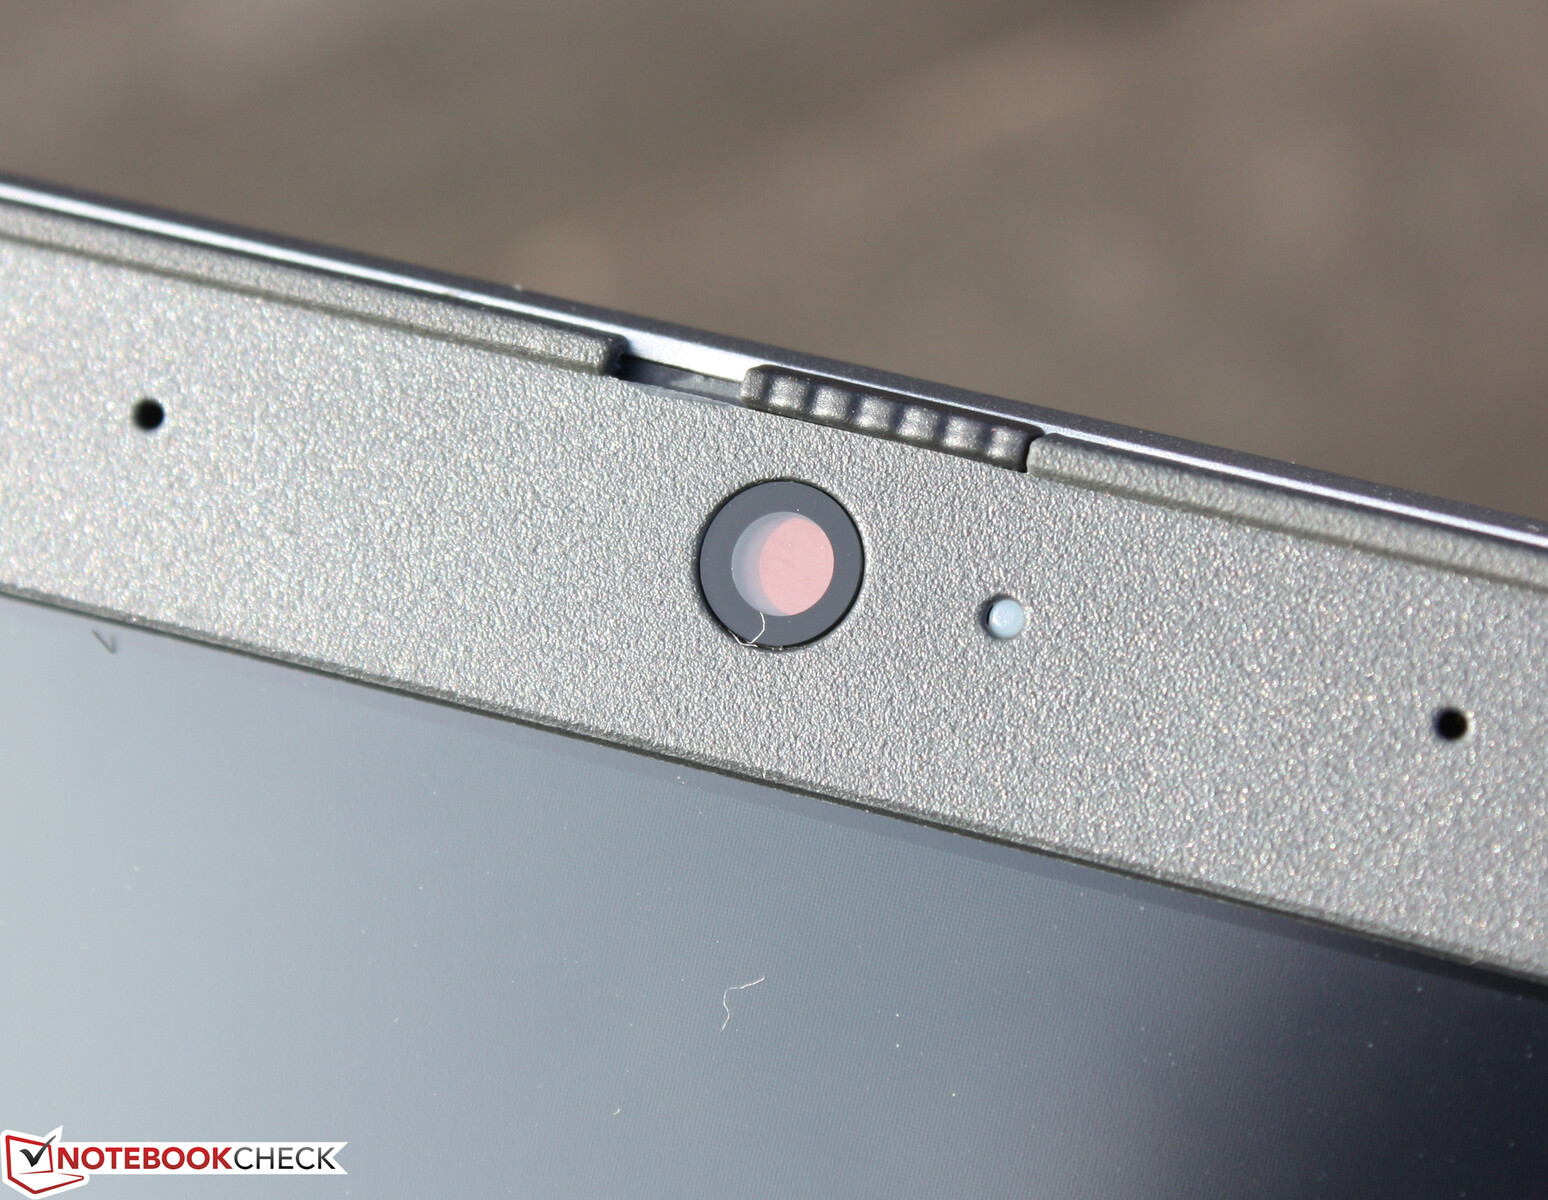
Webcam
La webcam (0.9 MP; max. 1280 x 720) non produce immagini convincenti - proprio come le fotocamere della concorrenza. Inoltre, la precisione del colore è carente. Con una deviazione di quasi 32, l'obiettivo (DeltaE meno di 3) è chiaramente mancato.


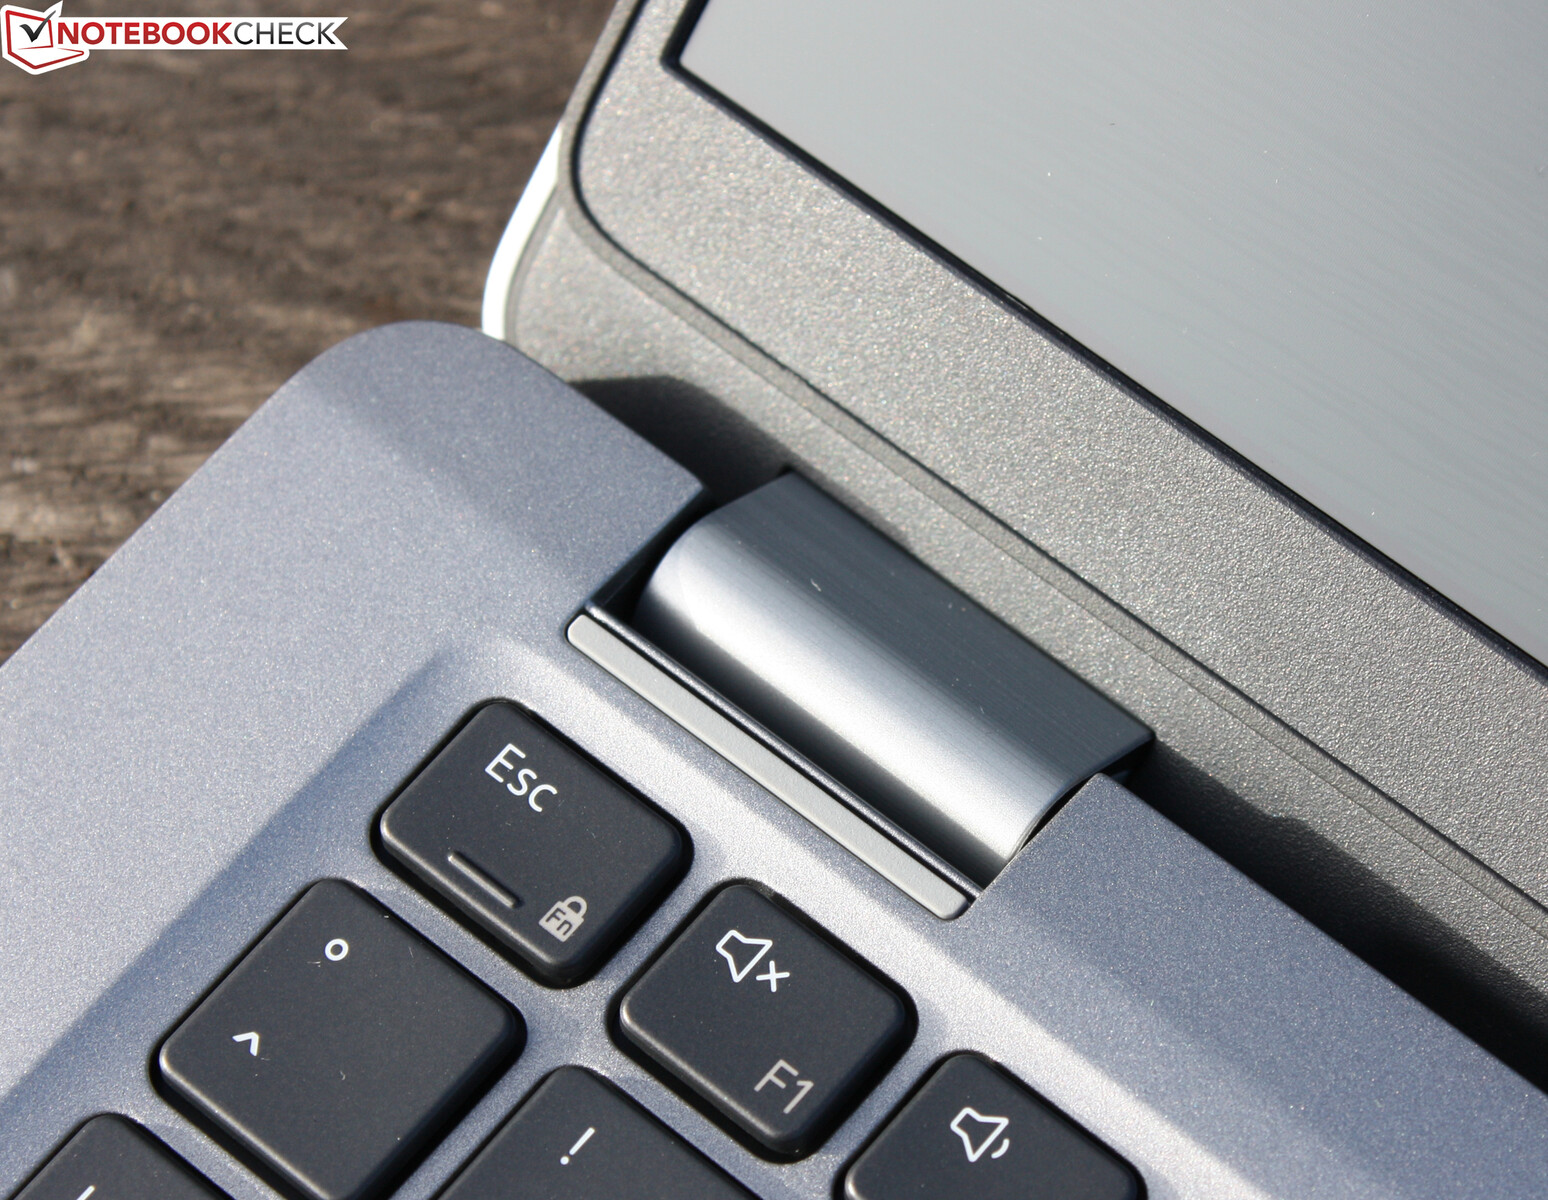
Sicurezza
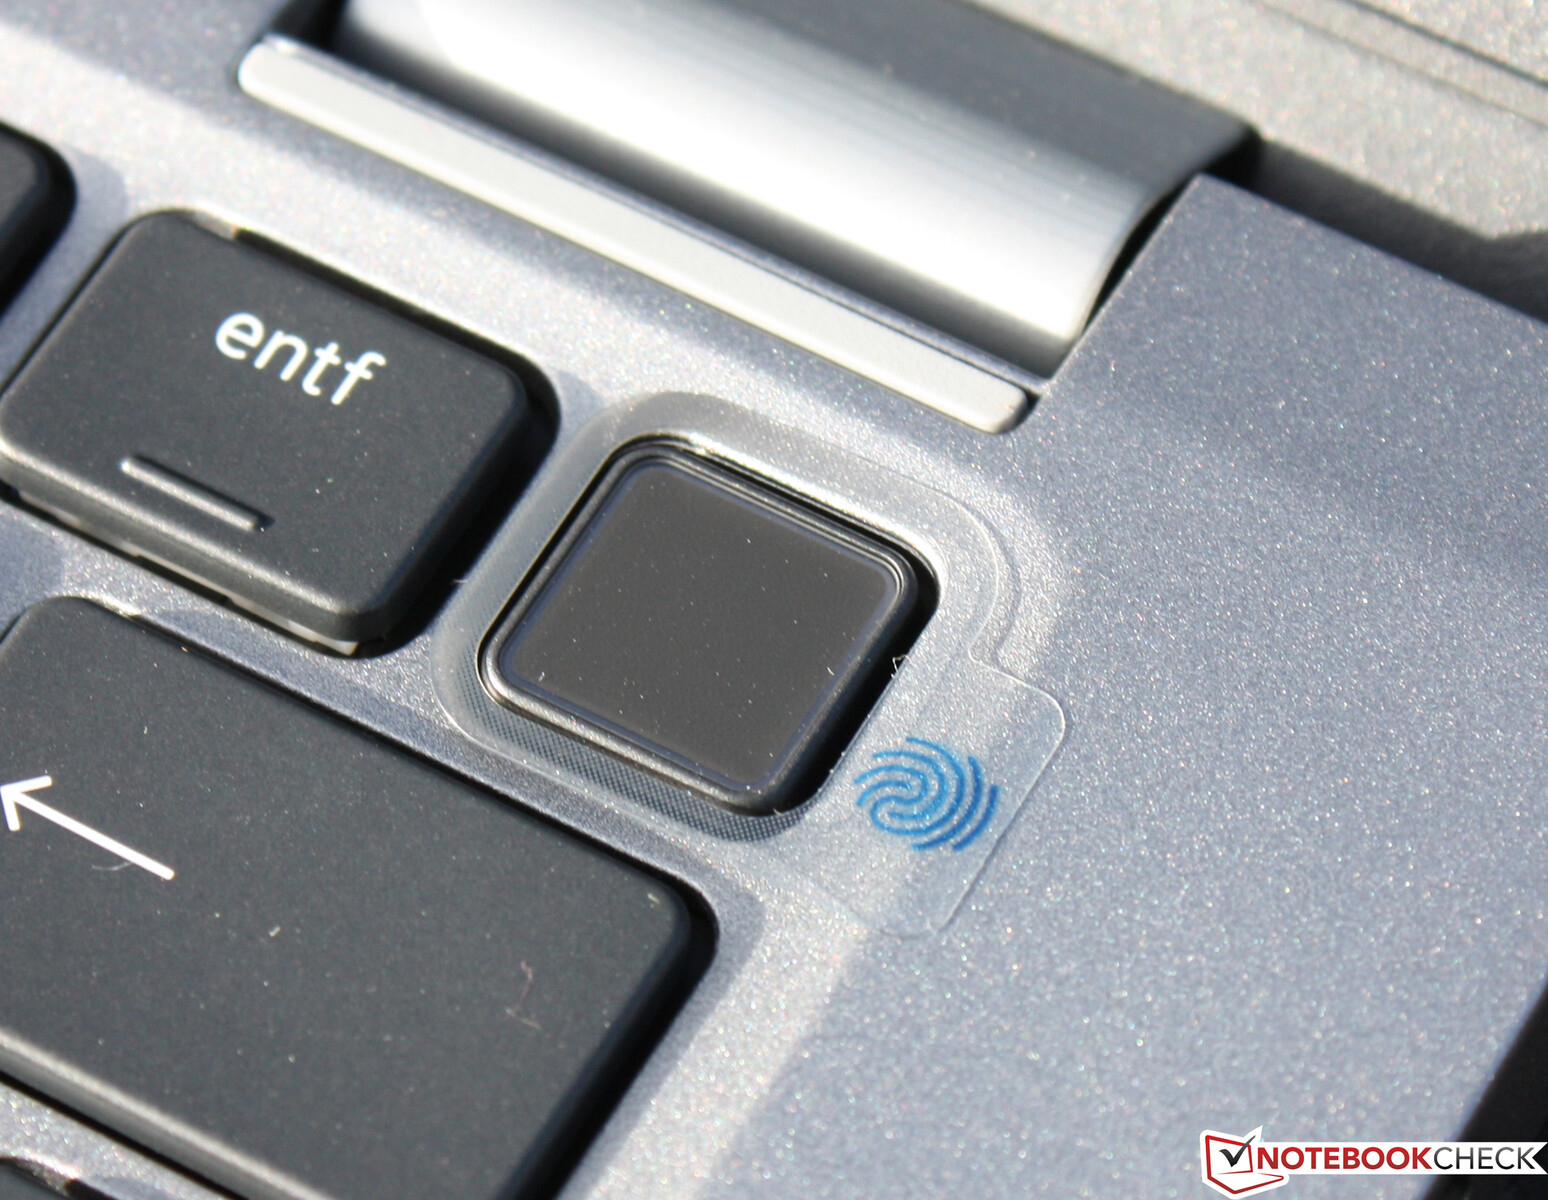
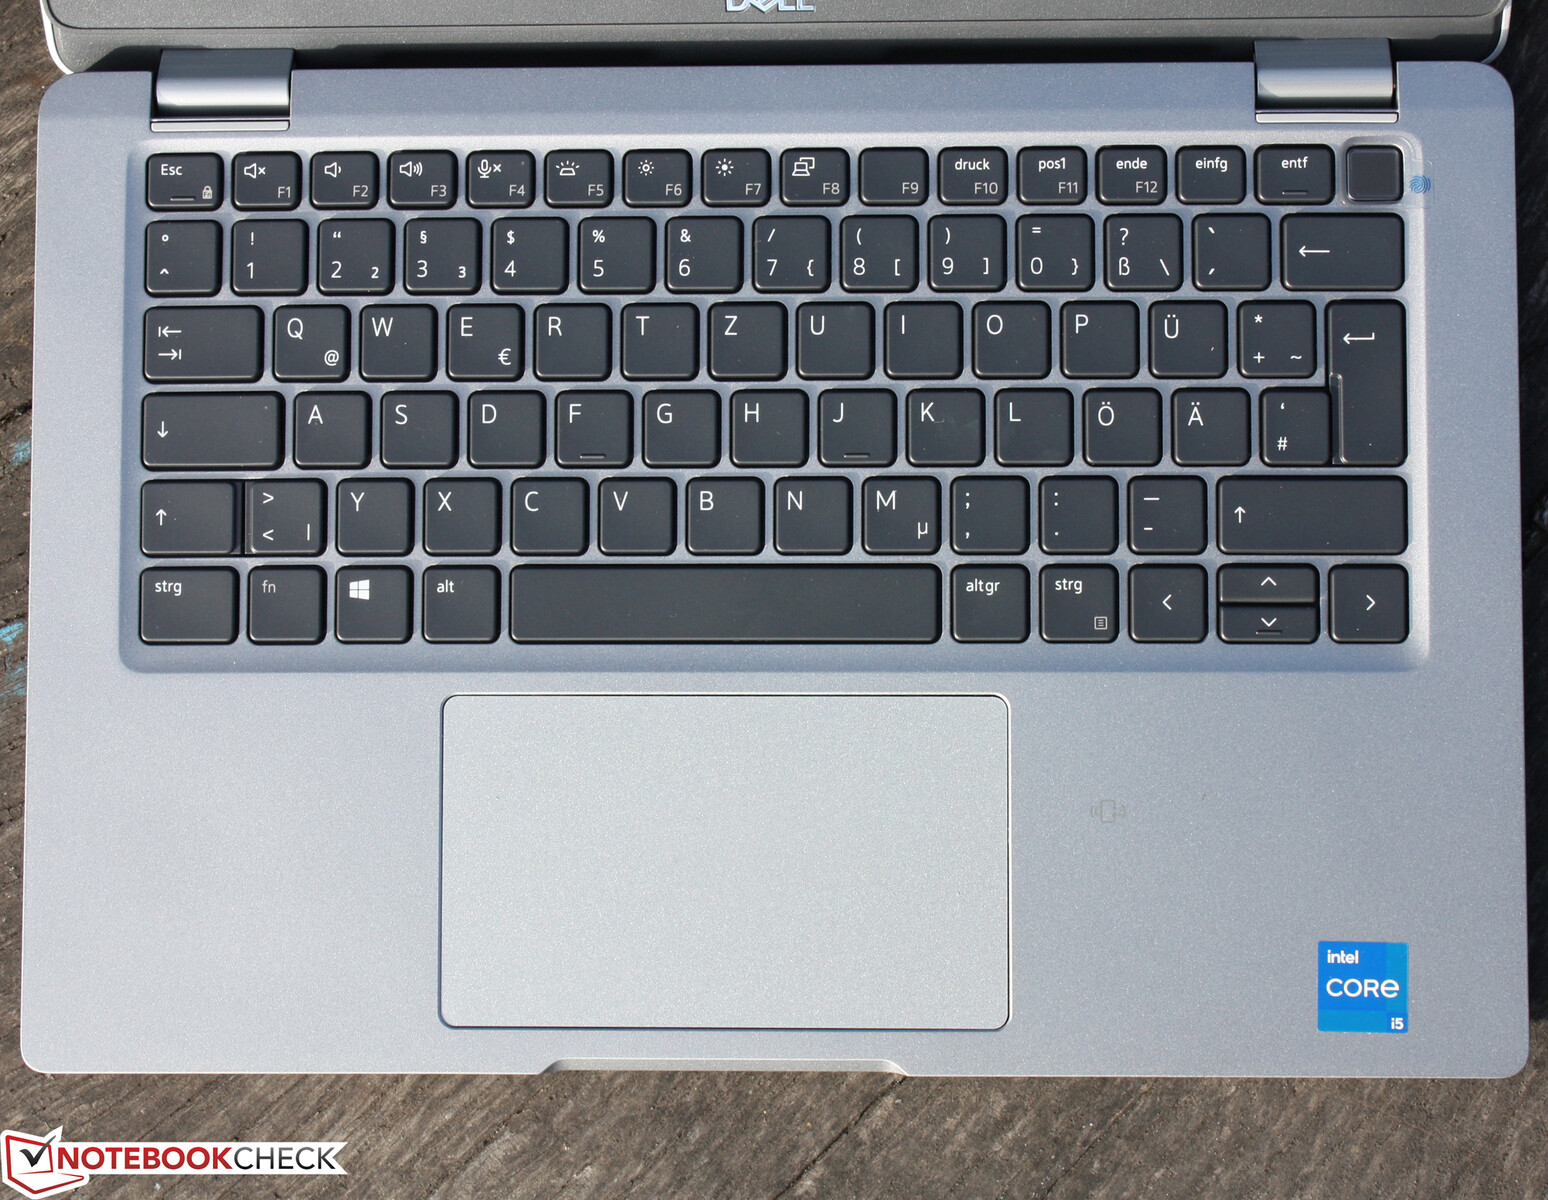
La nostra variante di configurazione è dotata di una smartcard e di un lettore di impronte digitali per la sicurezza dell'accesso biometrico. Il lettore di impronte digitali è incorporato nel pulsante di accensione, che si trova per la prima volta nel blocco della tastiera. La vicinanza al tasto di cancellazione comporta teoricamente il rischio di uno spegnimento involontario. Tuttavia, questo non è mai successo in pratica perché l'accensione richiede un punto di pressione più forte.
Accessori
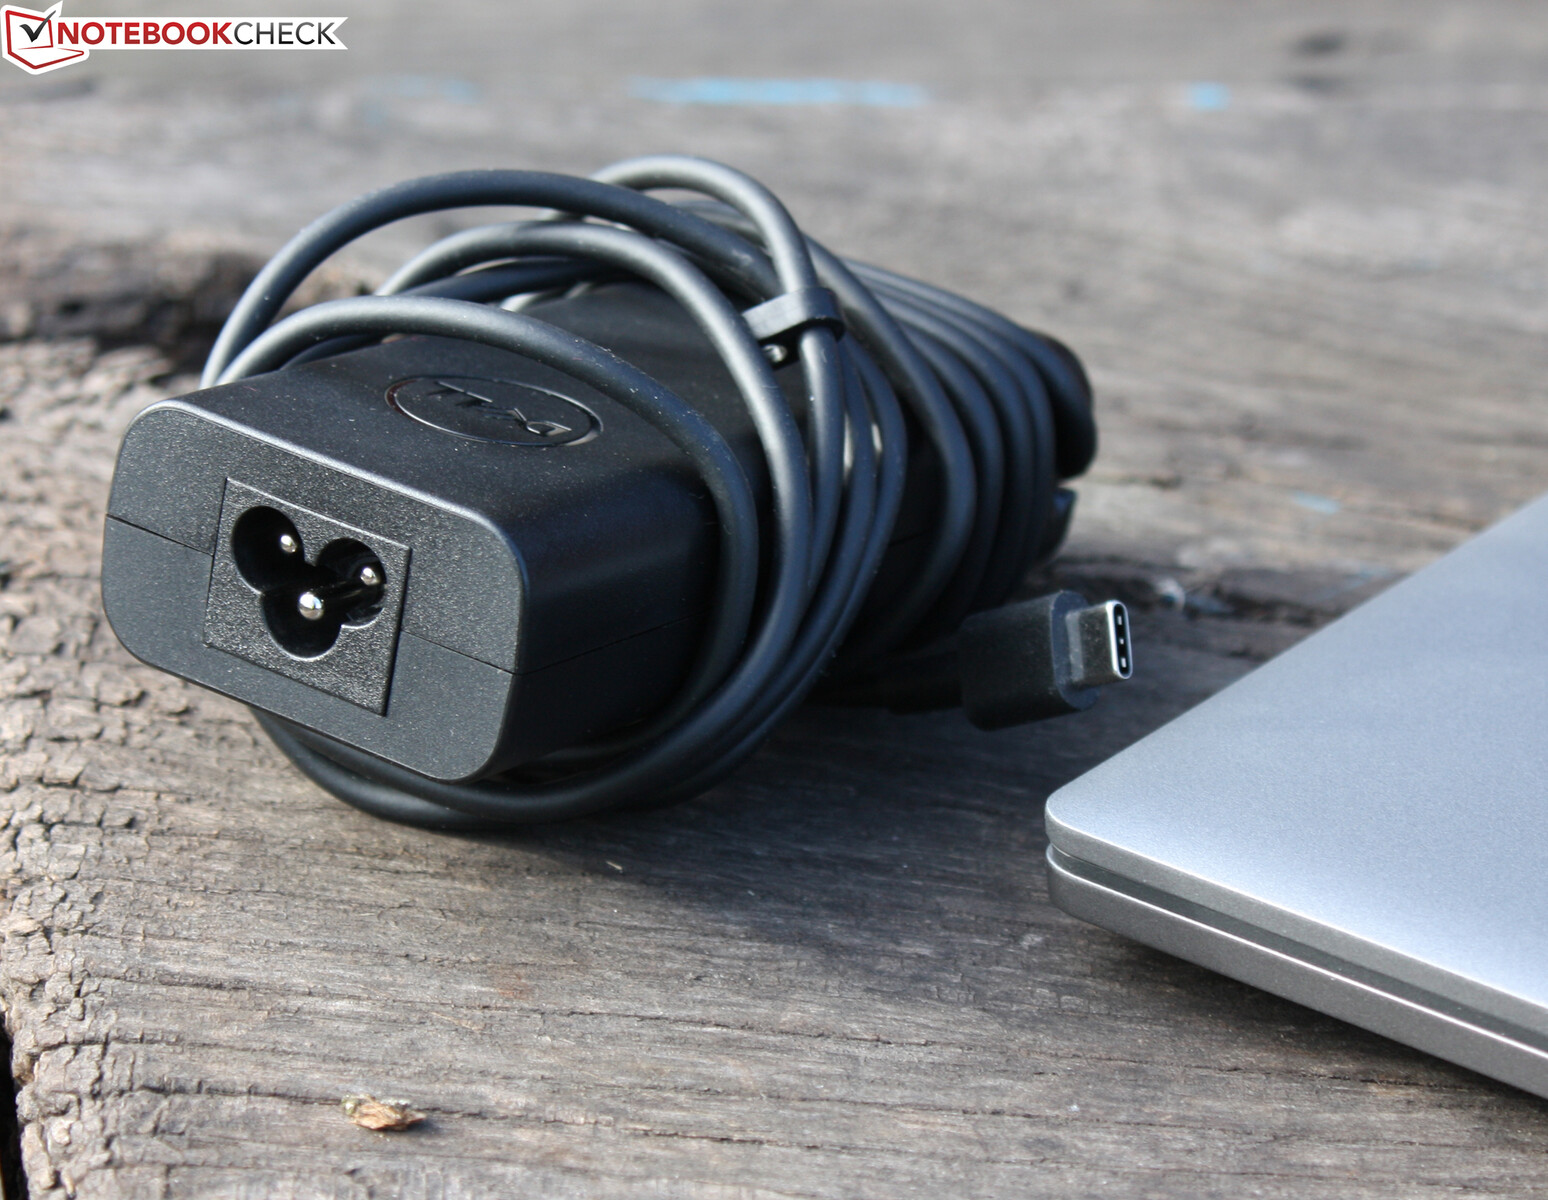
Il notebook viene fornito con i soliti documenti: una guida rapida e informazioni sulla garanzia. Inoltre, c'è un adattatore di alimentazione Type-C da 65 watt. Dell ha pronti degli accessori interessanti. I dock Thunderbolt WD19TBS o TB16 hanno molte porte sulla scrivania di casa e sono collegati al portatile con un unico cavo. Il portatile viene poi anche caricato tramite questo cavo.
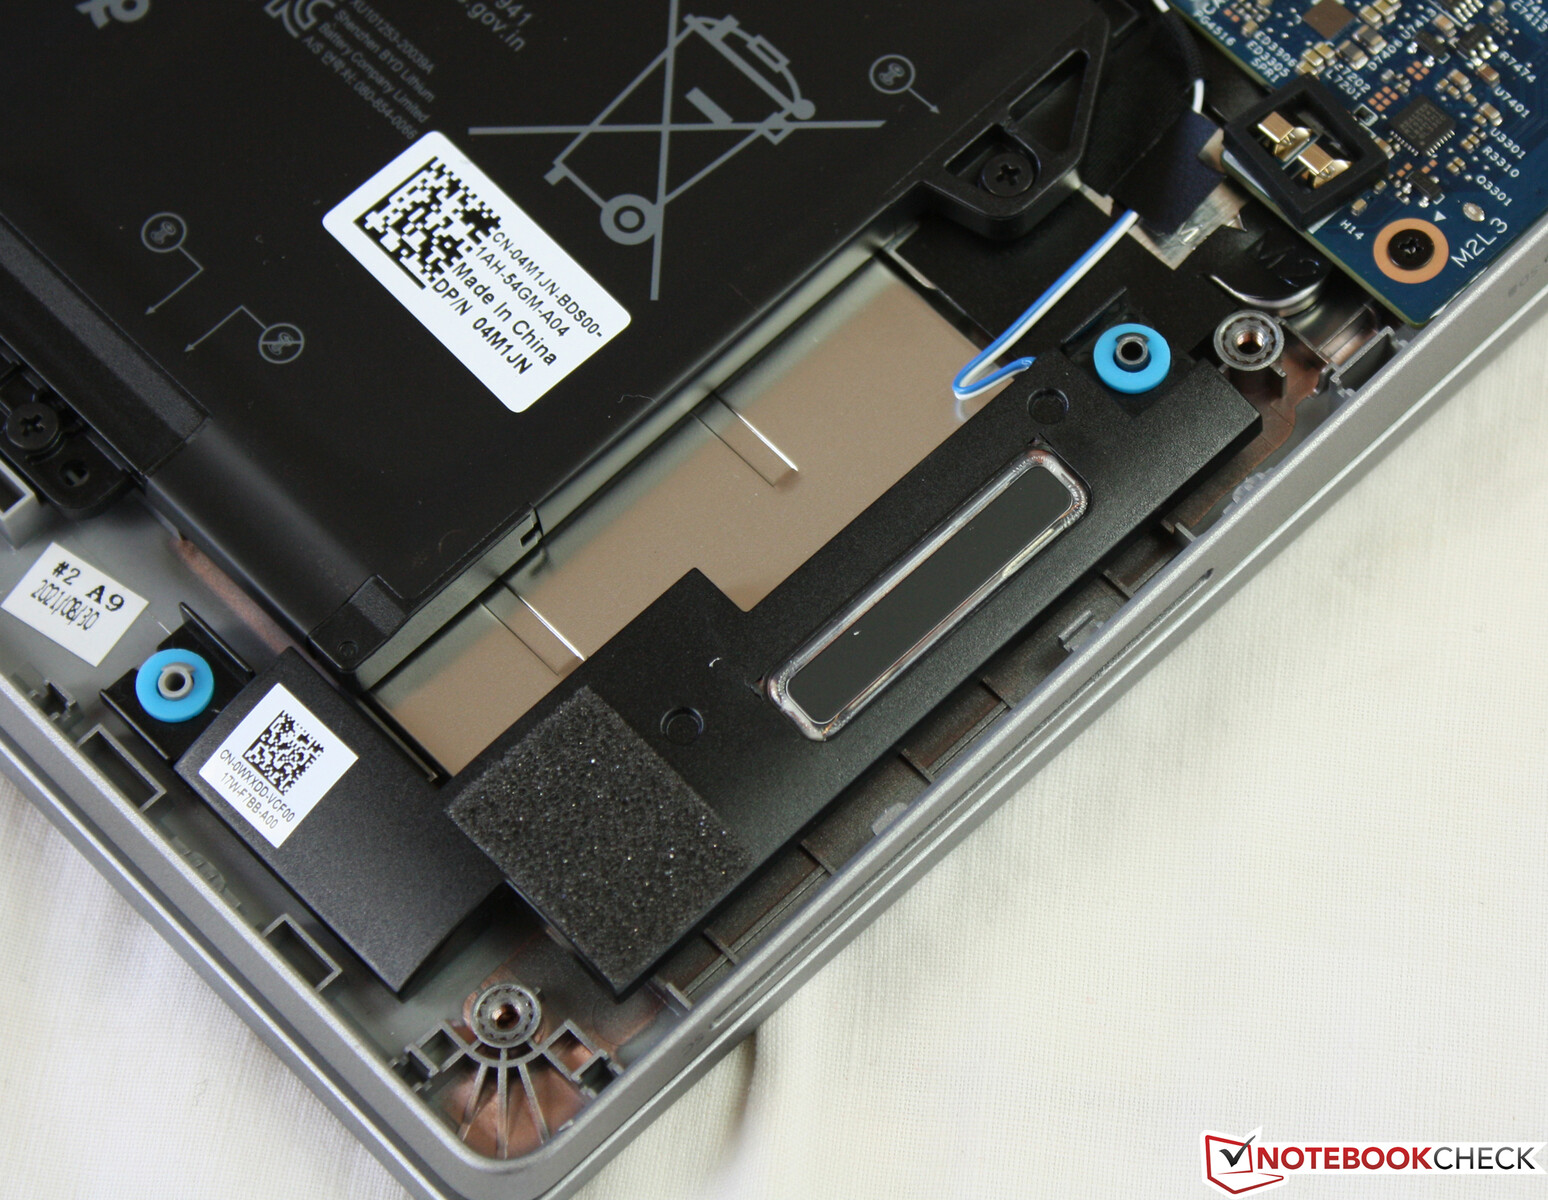
Manutenzione
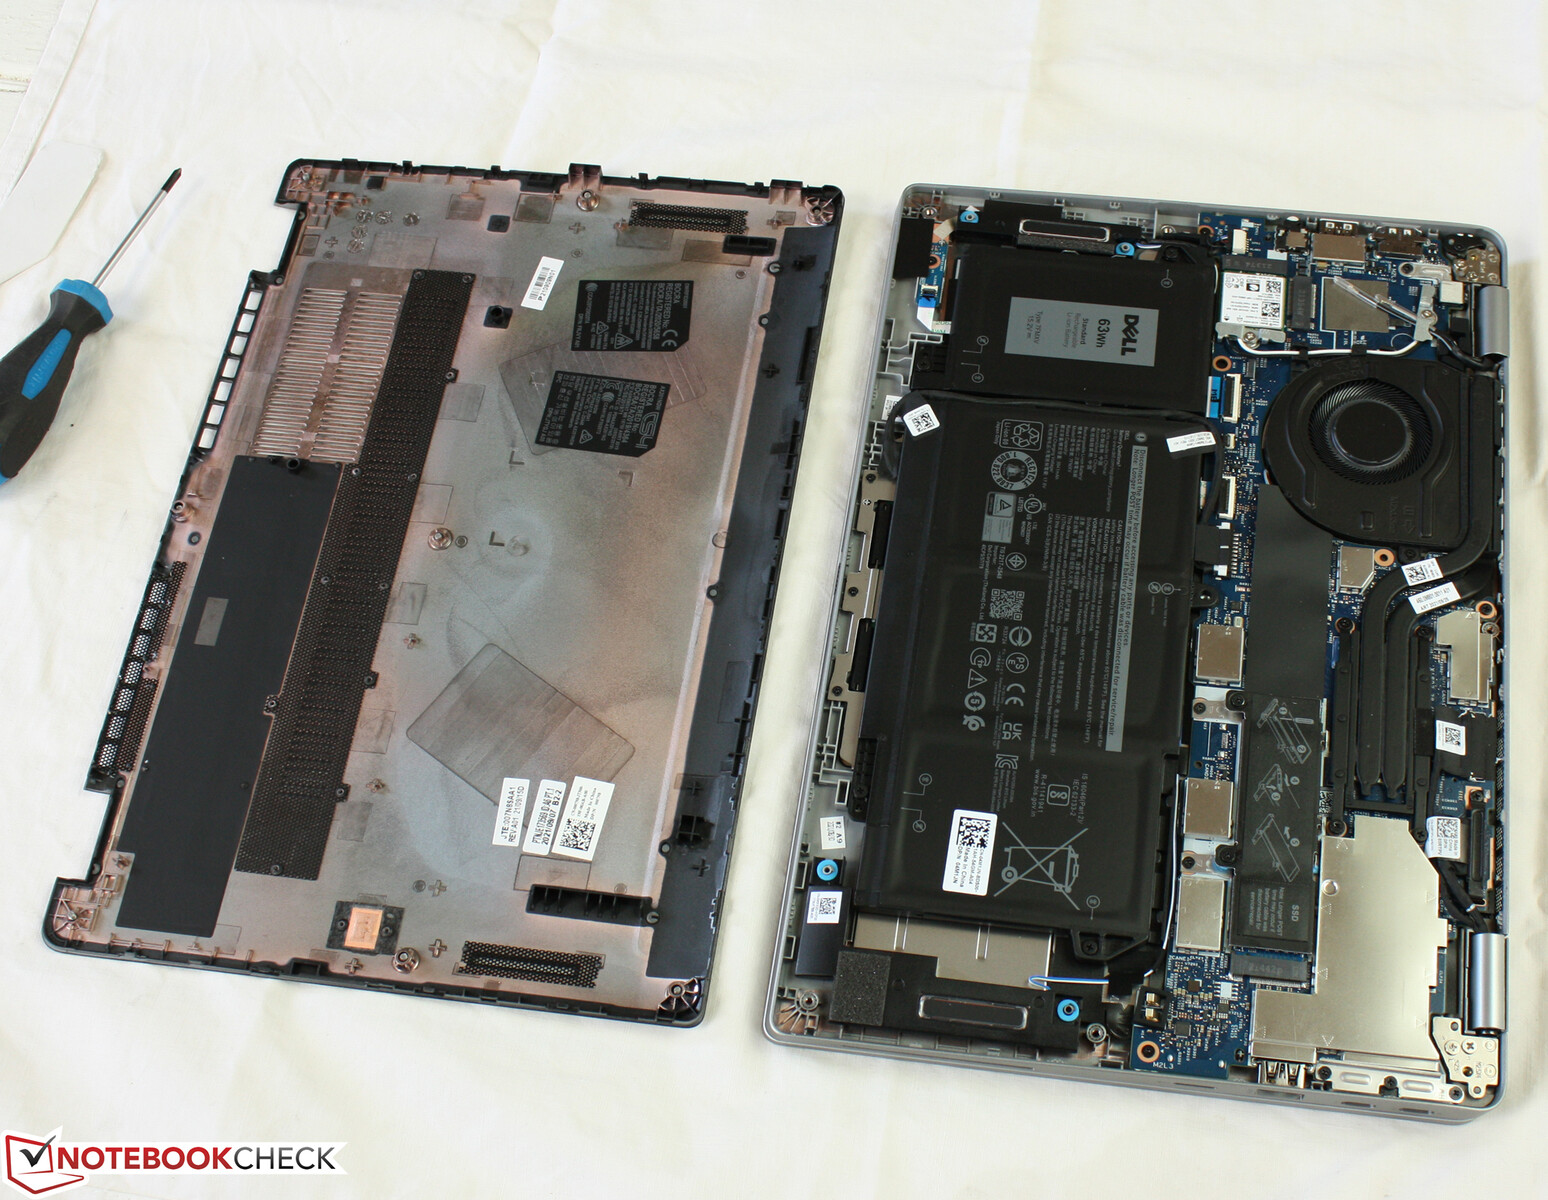
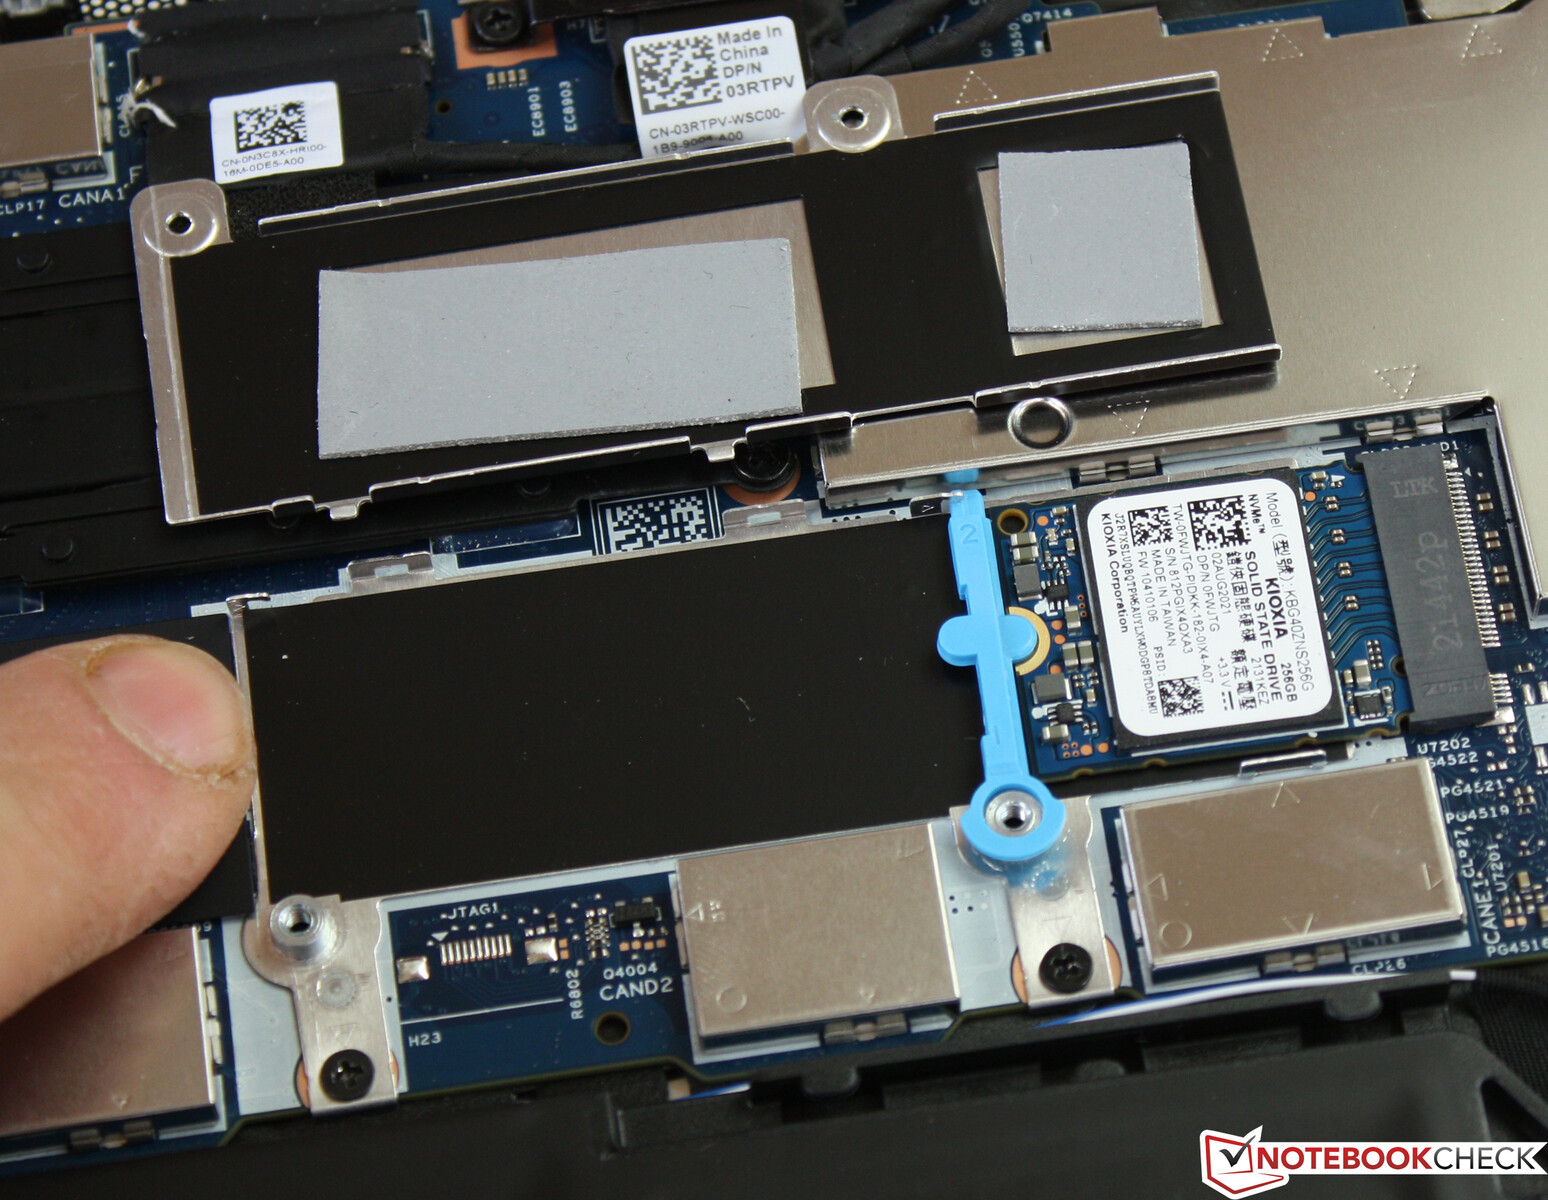
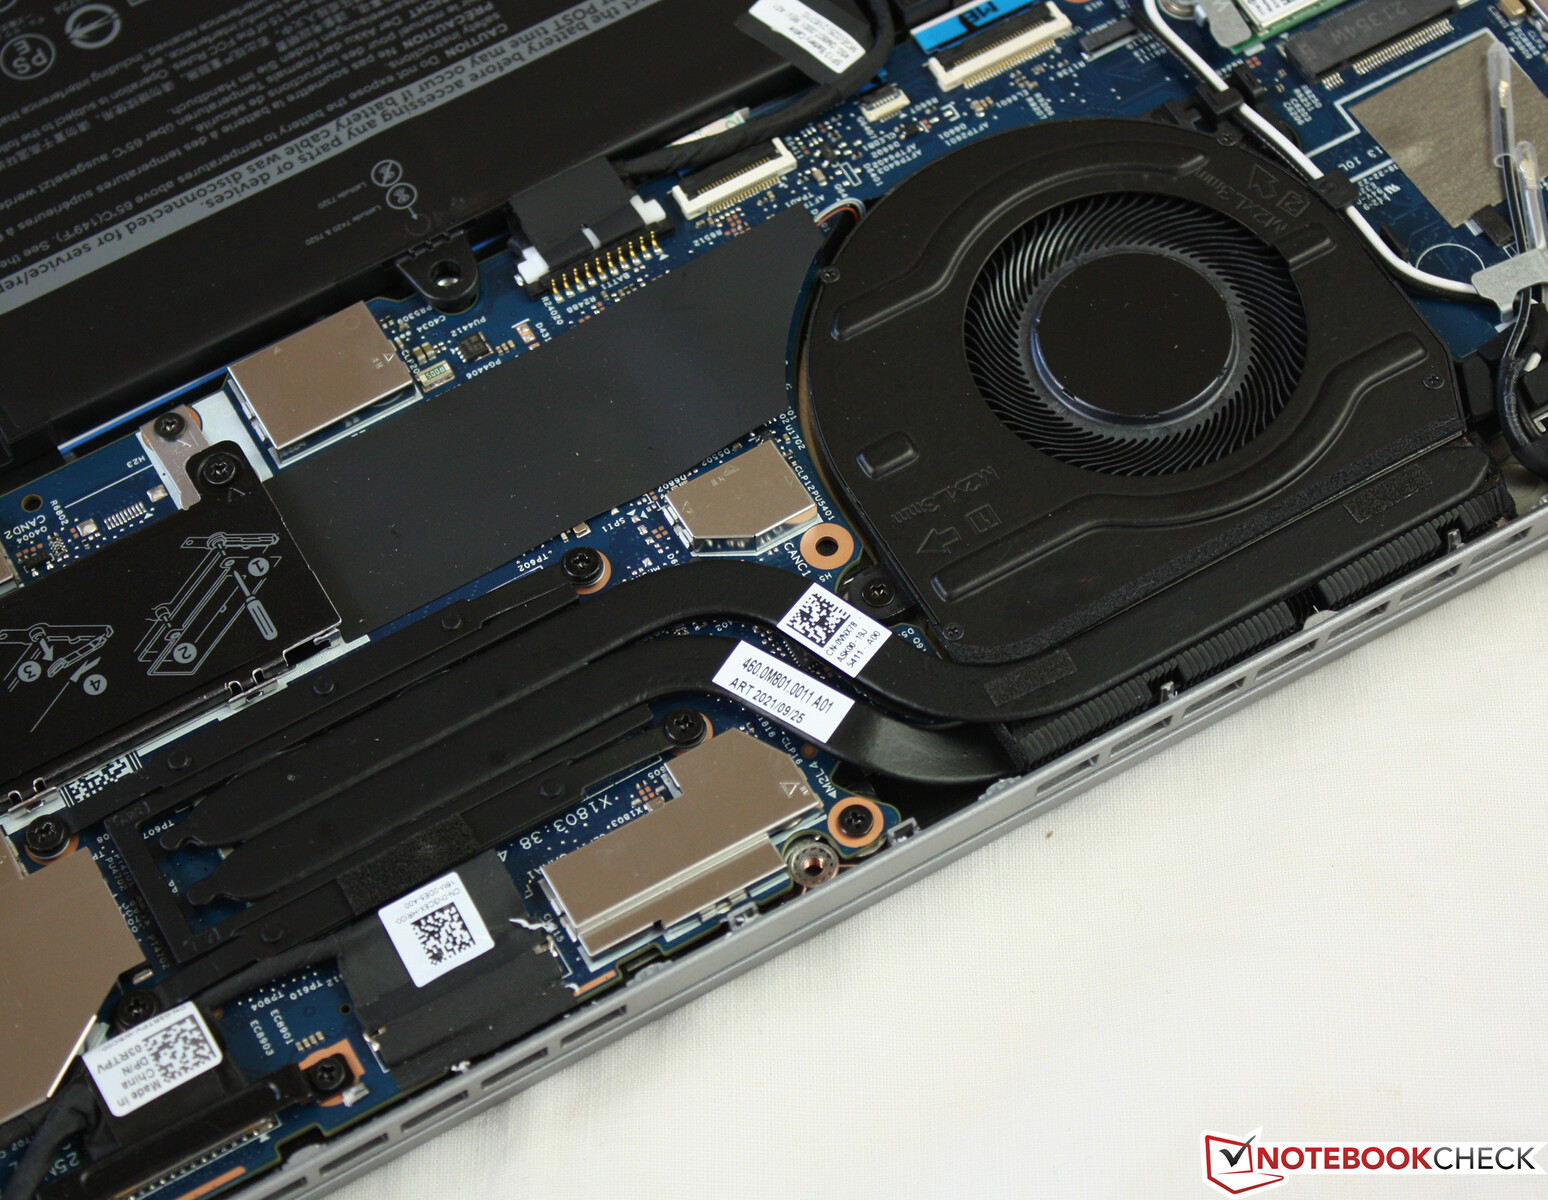
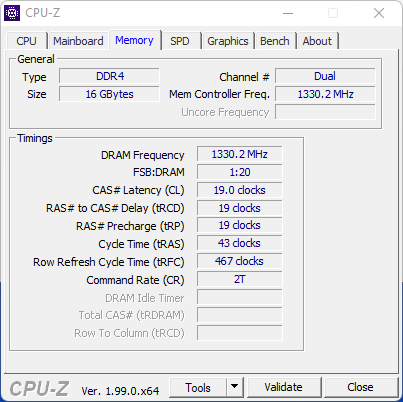
Si può accedere all'hardware dopo aver rimosso il guscio inferiore. Tutte le viti sul lato inferiore del dispositivo sono allentate. Quando si solleva il pannello, si dovrebbe iniziare dalla zona delle cerniere. Si ha quindi accesso all'SSD, alla batteria, al modulo WLAN, al modem LTE (opzione, preparato con antenne), e alla ventola. Non ci sono slot di memoria, la RAM è onboard.
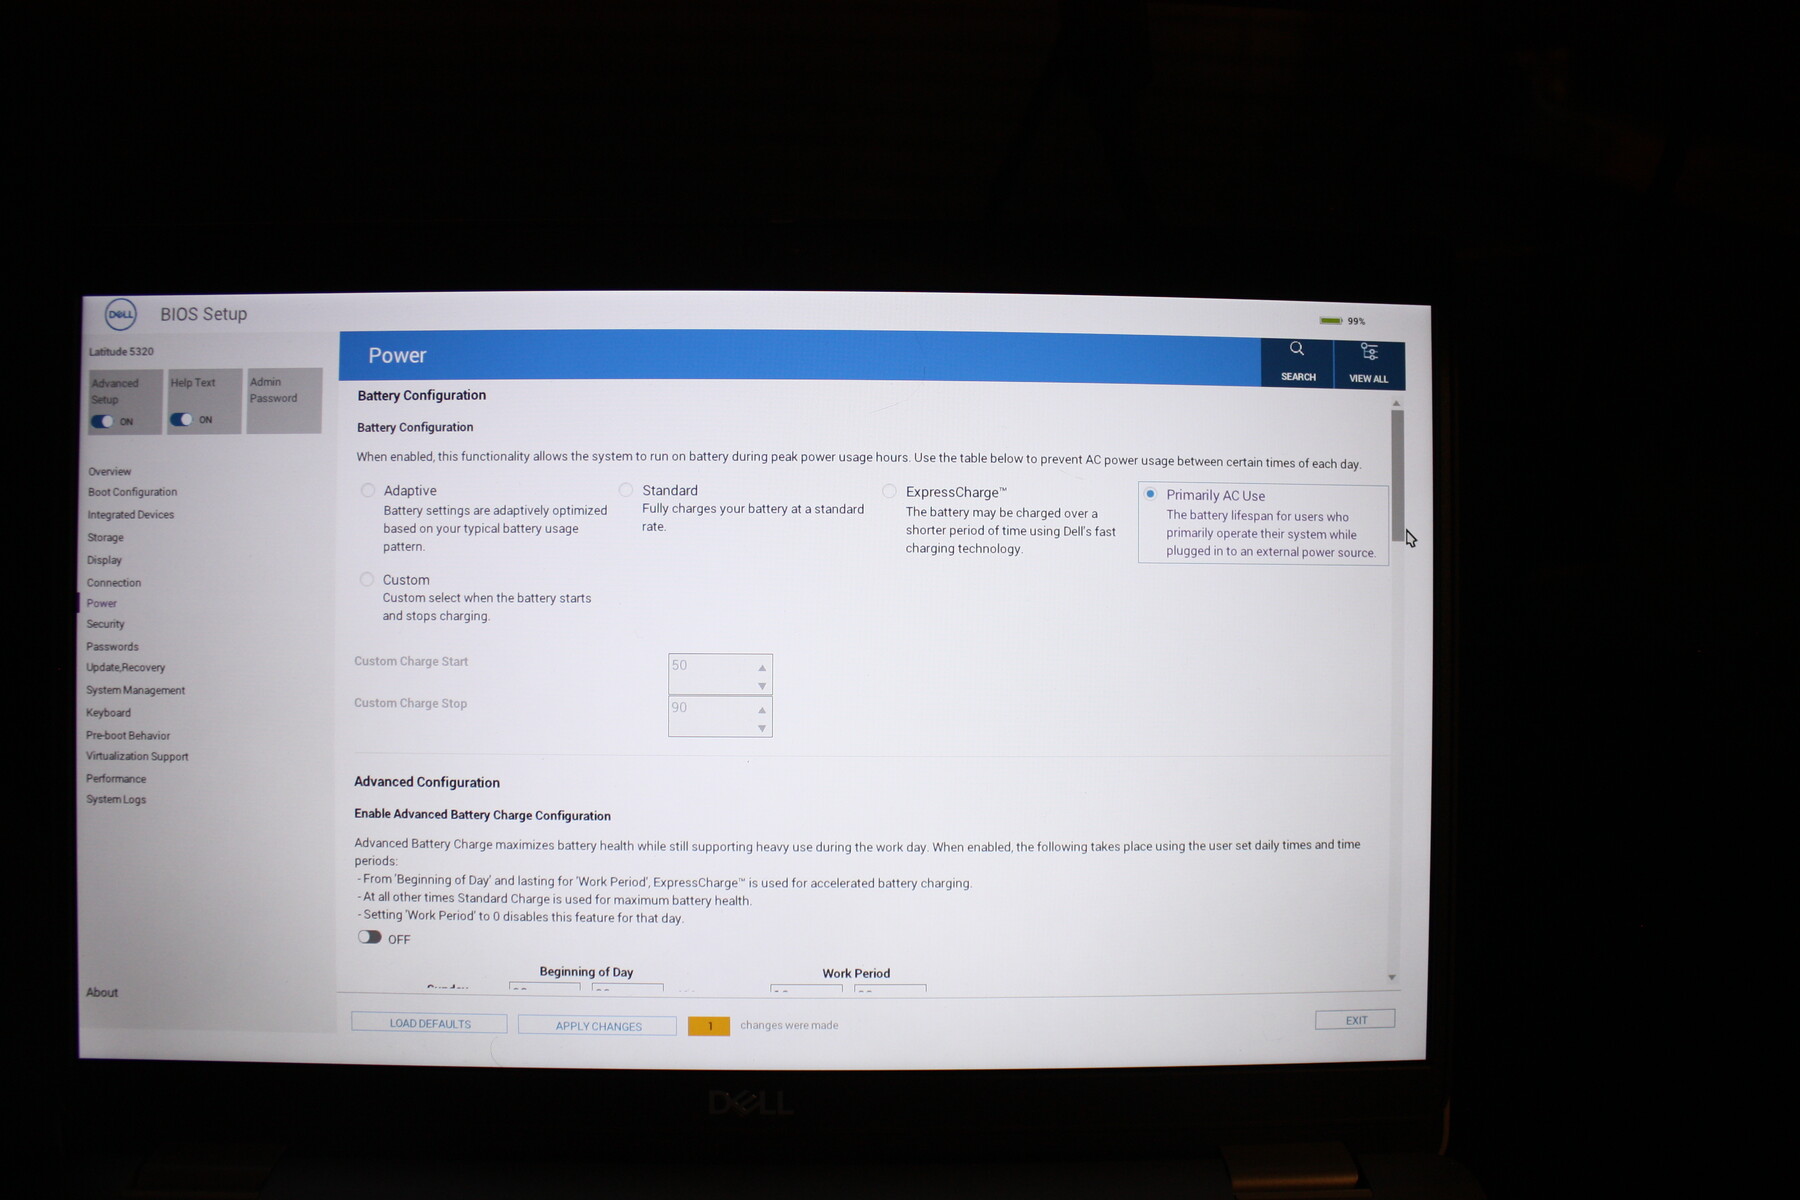
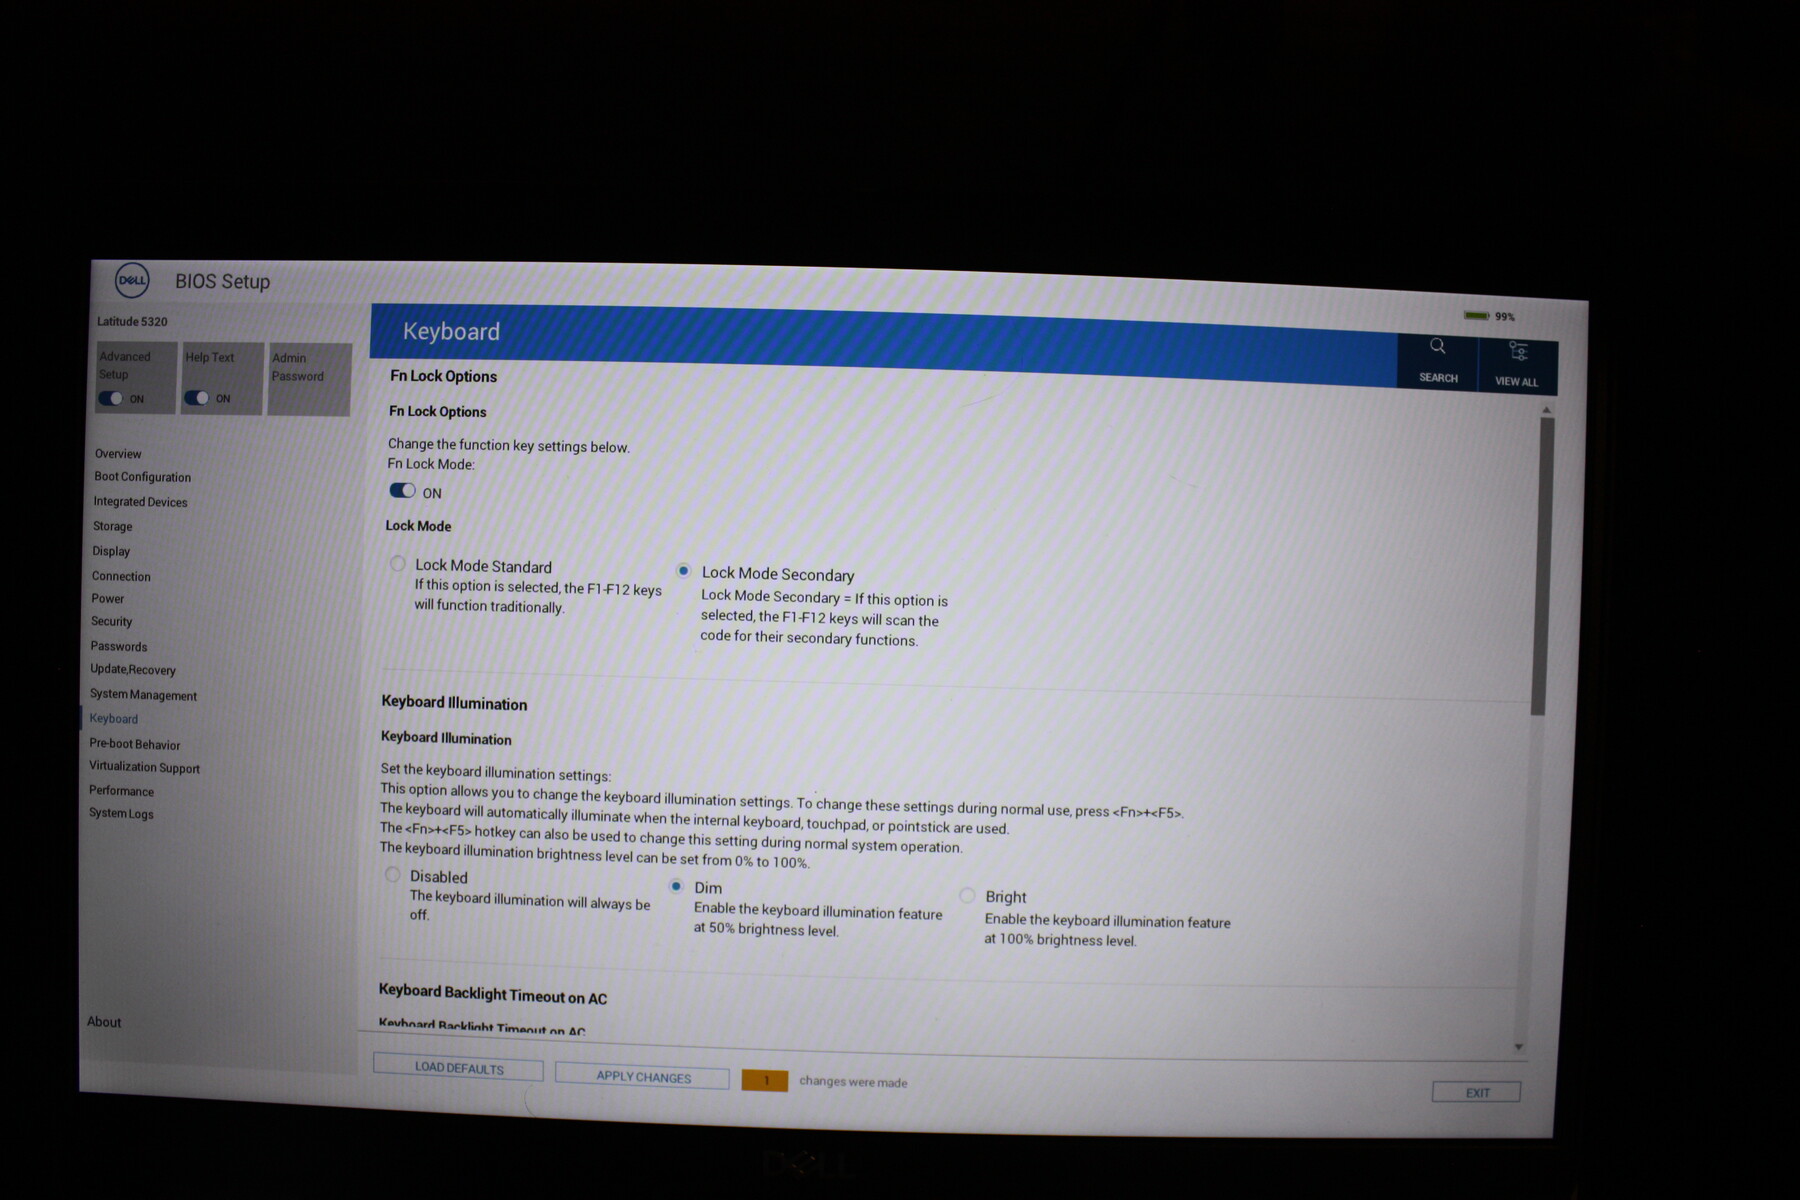
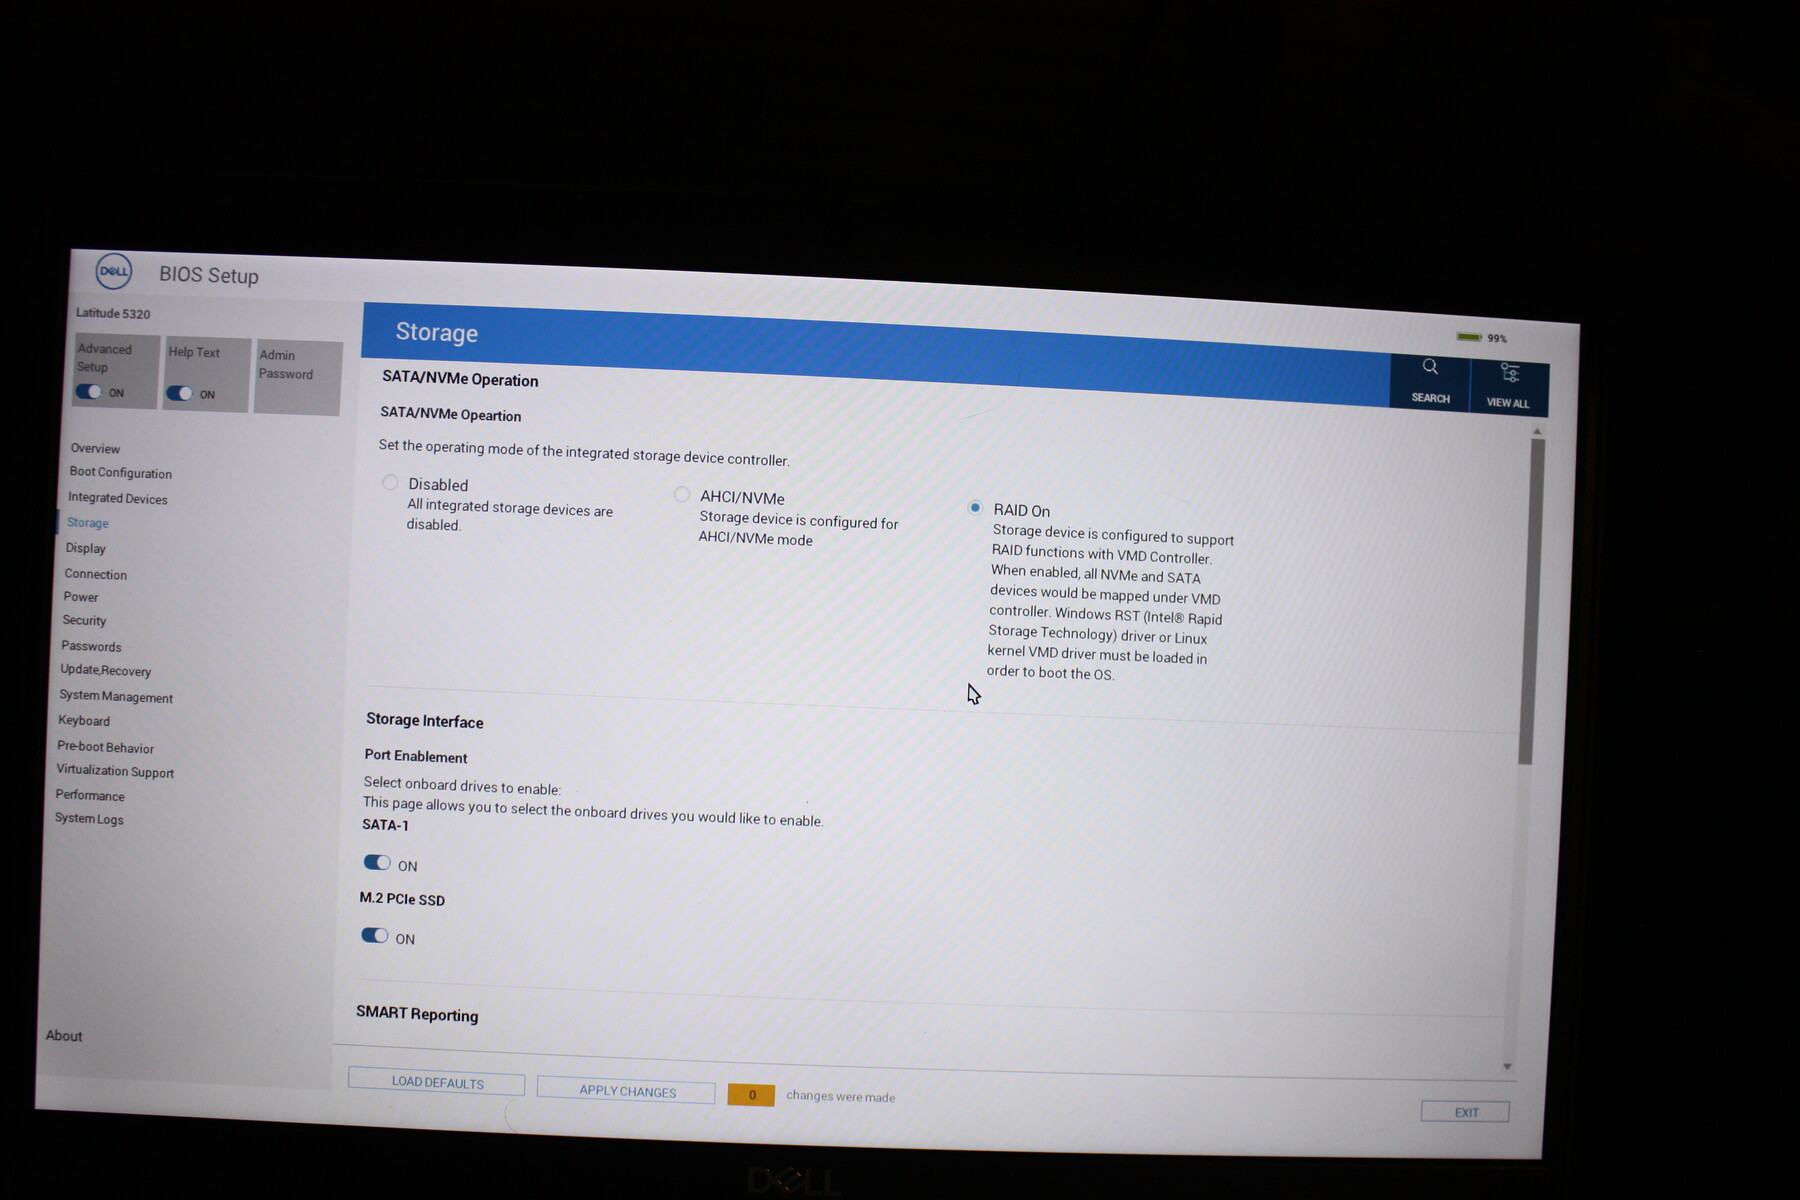
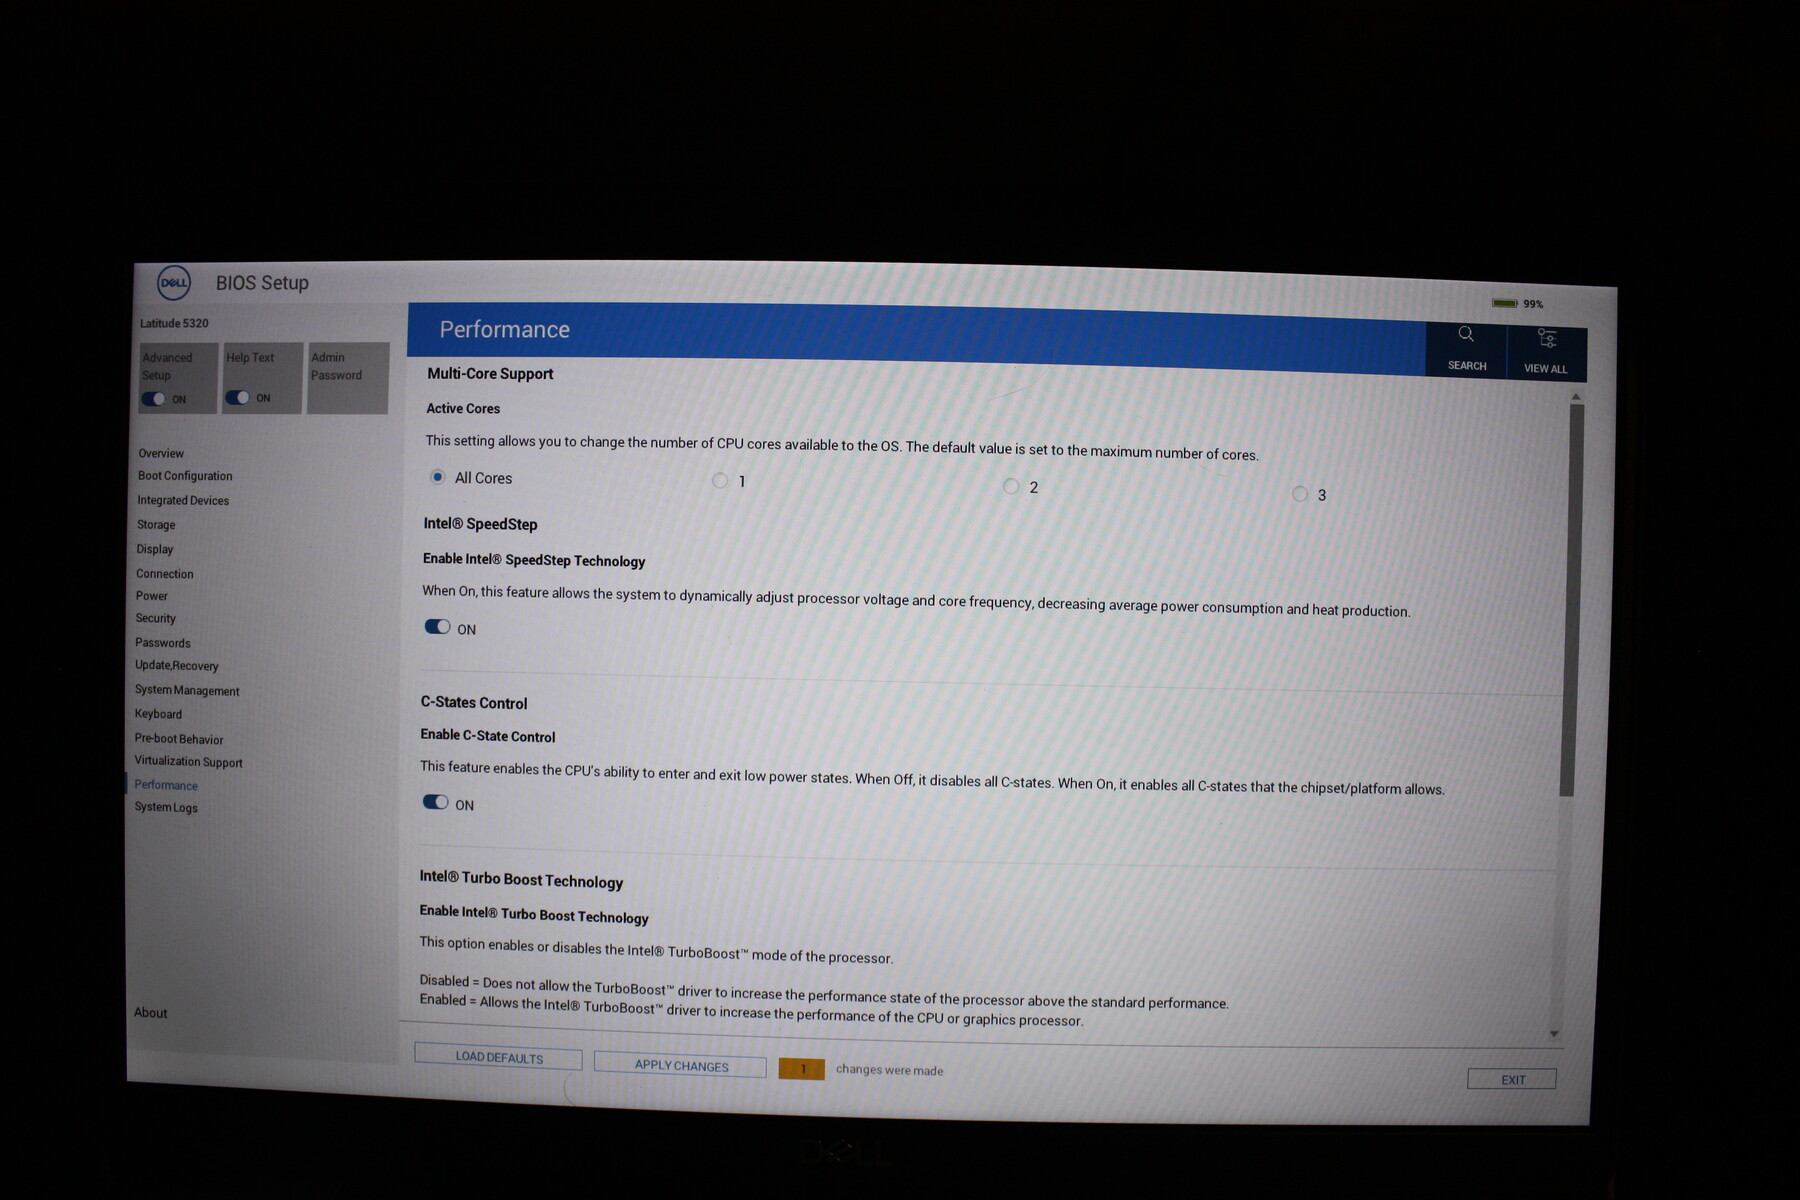
BIOS
Il BIOS del computer offre ampie opzioni di configurazione relative a sicurezza, gestione, hardware ed energia. Dettagli come il numero di core attivi della CPU possono essere impostati. È anche possibile impostare la luminosità massima del display sia per il funzionamento a rete che a batteria. Una funzionalità così ampia si trova raramente nei computer portatili.
Garanzia
Il Latitude viene fornito con un anno di garanzia on-site. Dell offre ampie opzioni di espansione. Per esempio, un supporto Pro di quattro anni con servizio on-site il giorno lavorativo successivo è disponibile per circa 370 euro.
Dispositivi di input - il notebook Dell non ha più i tasti del touchpad
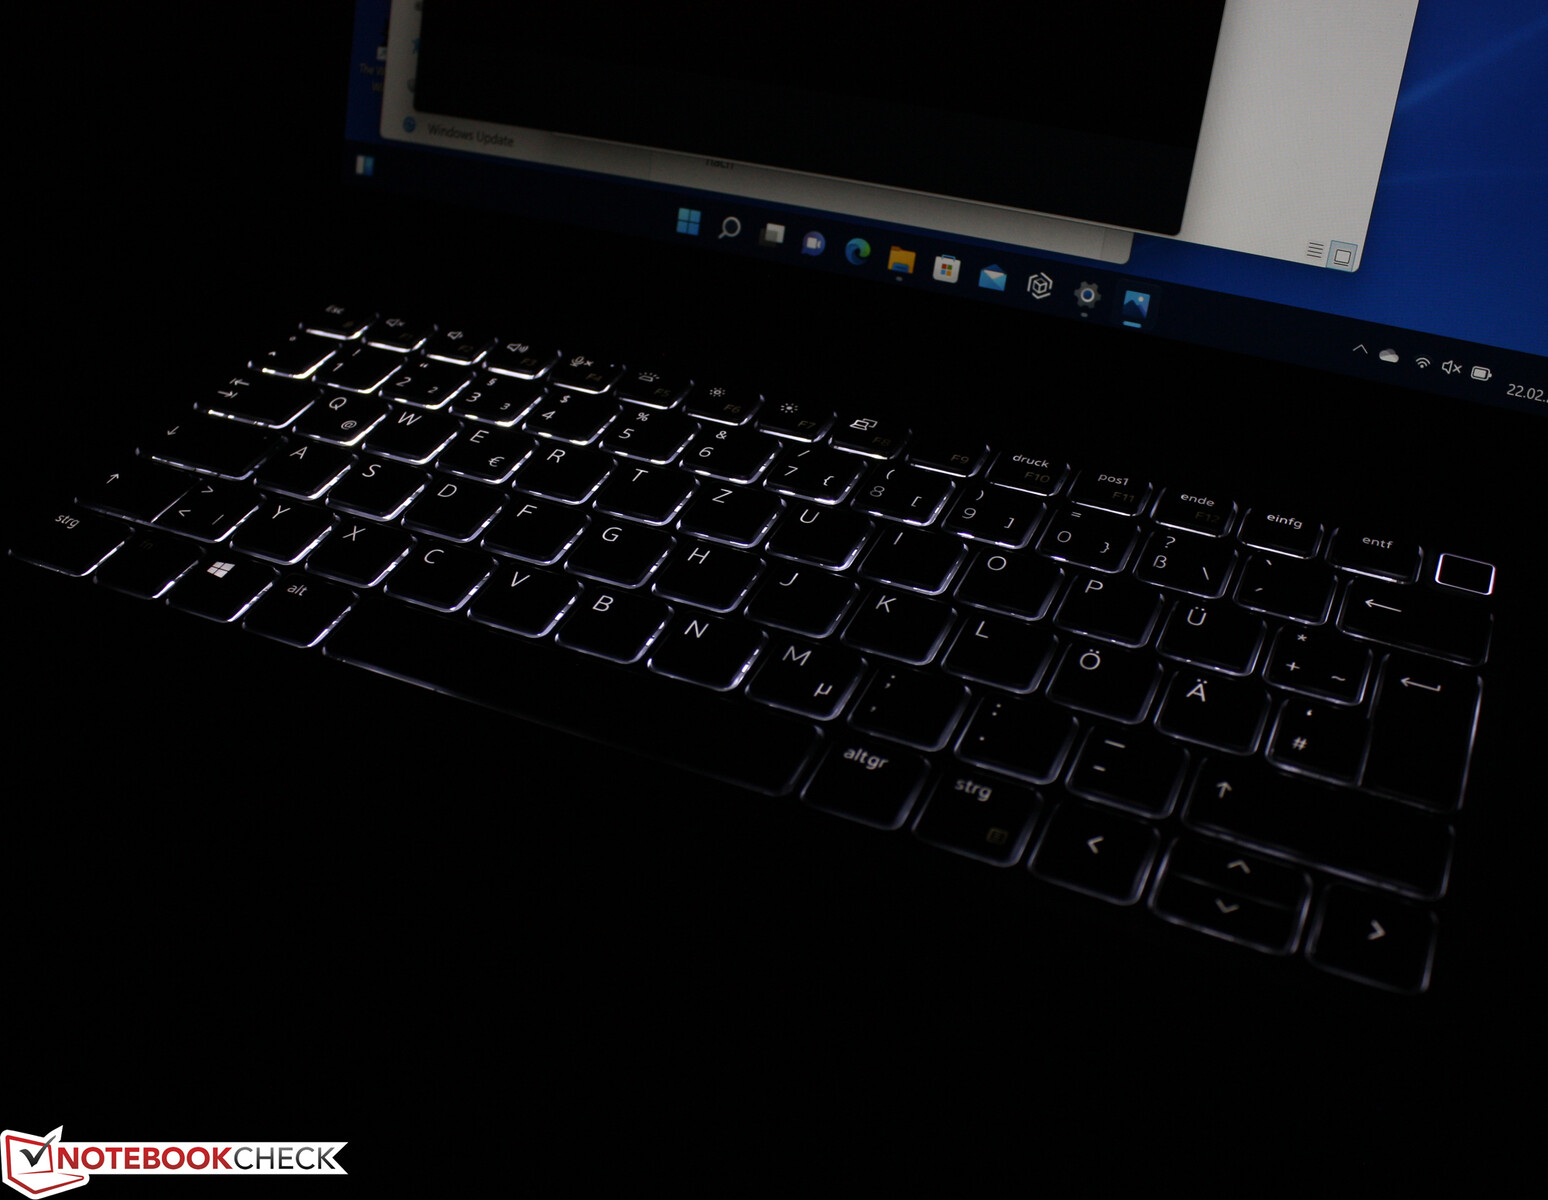
Dell equipaggia il Latitude con una tastiera illuminata. I tasti piatti e smussati offrono una corsa chiara e un punto di pressione distintivo. Questo è accompagnato da una piacevole resistenza dei tasti. La corsa è un misto di spugnosità e moderatamente ferma - il più grande svantaggio di questa tastiera.
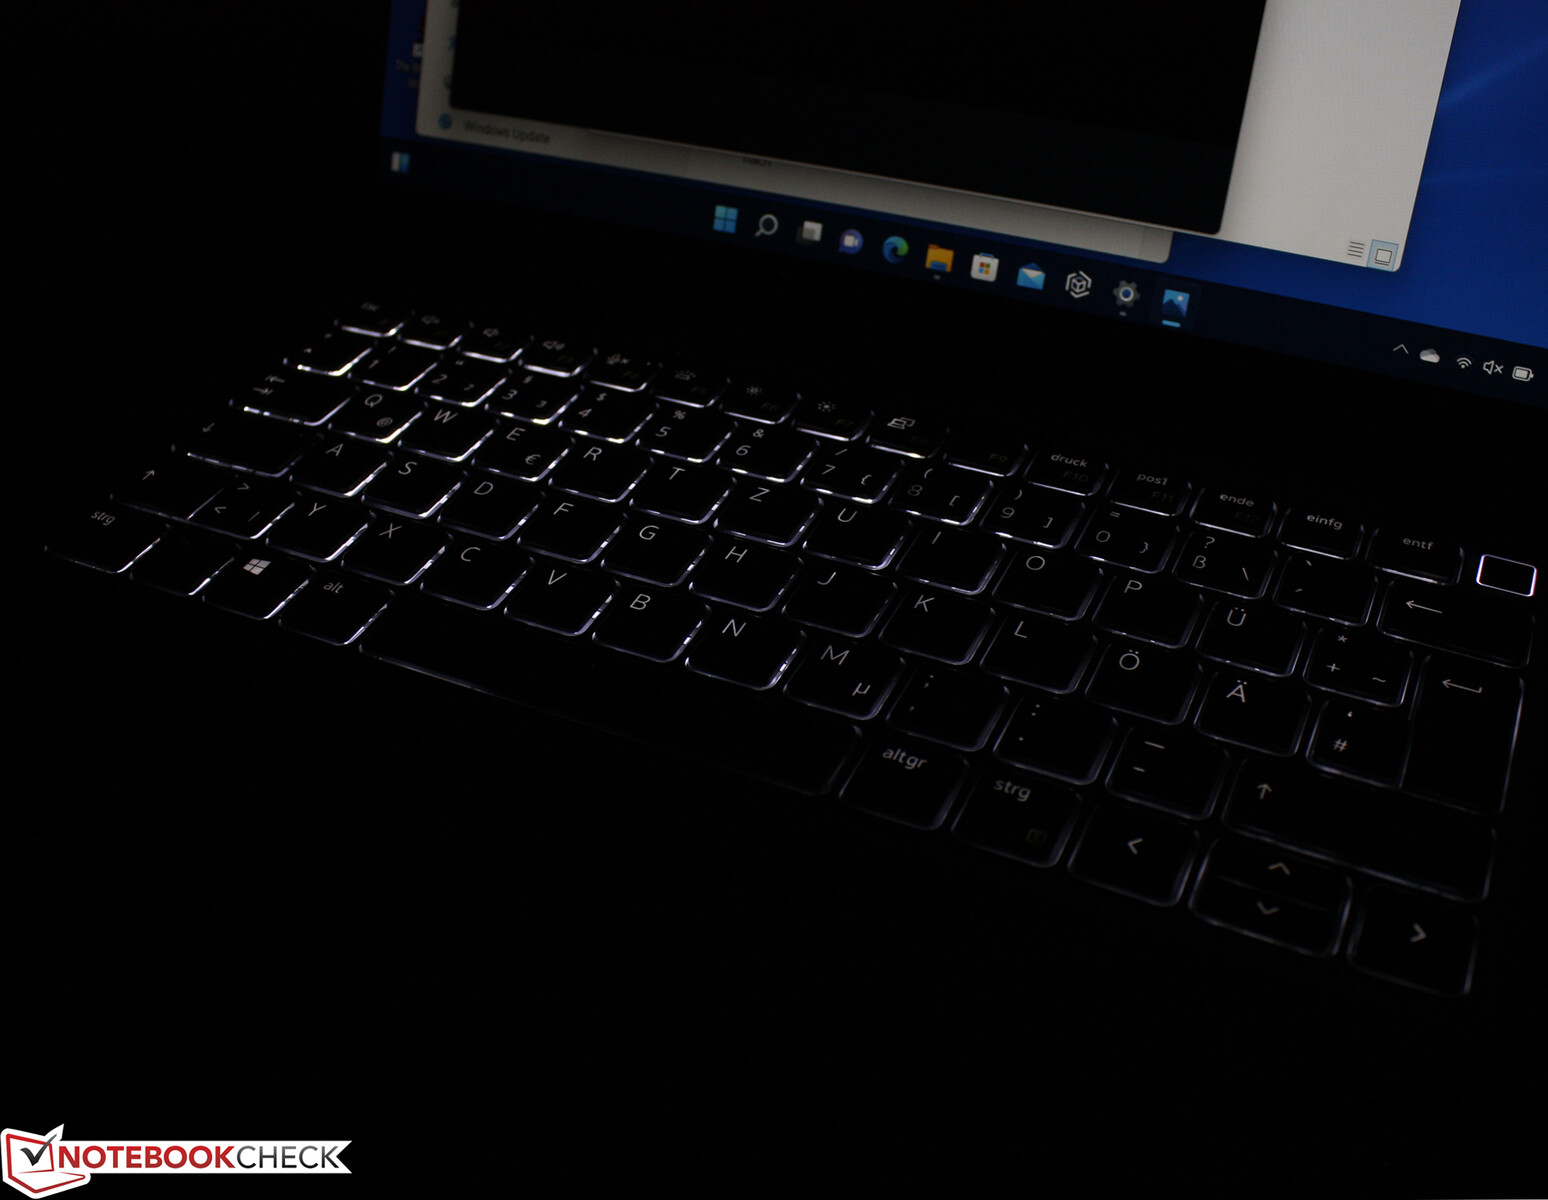
Tastiera
Durante la digitazione, la tastiera cede leggermente al centro e a destra. L'illuminazione dei tasti offre due livelli di luminosità che sono selezionati tramite un pulsante di funzione. Nel complesso, la tastiera ha lasciato una buona impressione, soprattutto a causa del buon feedback, che è assicurato da una ricca corsa e dal punto di pressione.
Touchpad
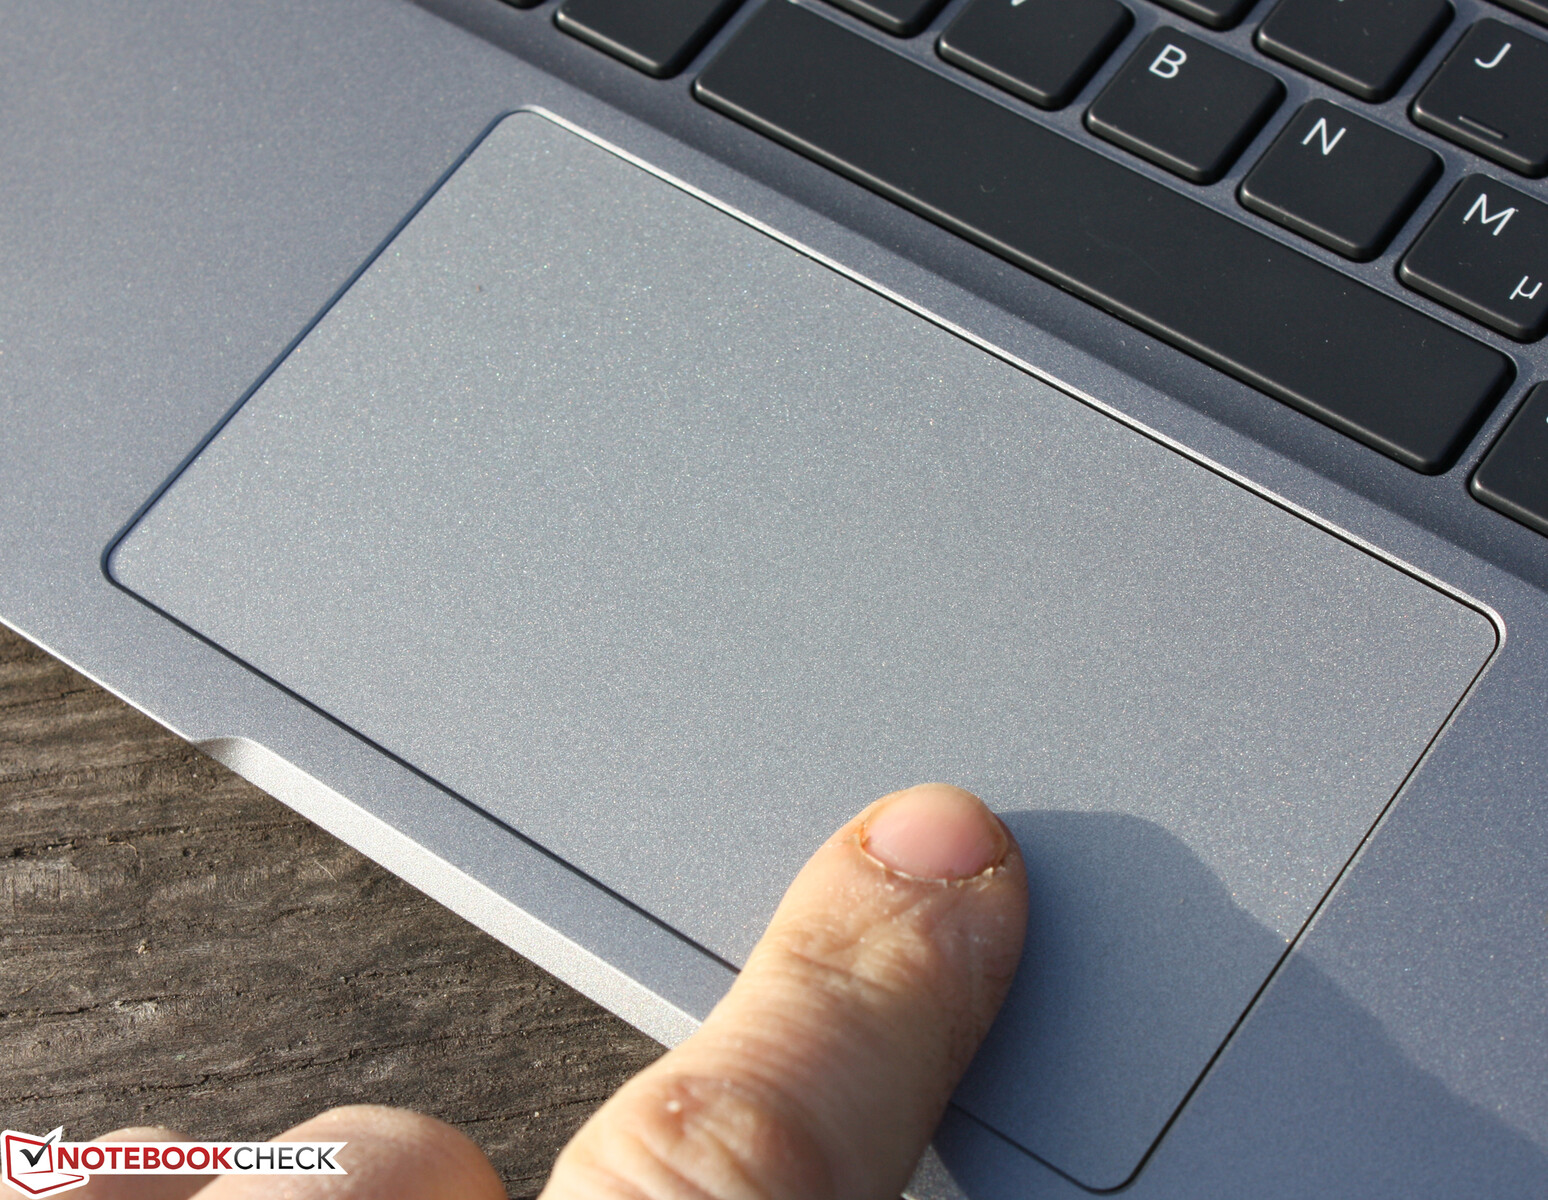
Un clickpad con capacità multitouch serve a sostituire il mouse e occupa un'area di circa 11,7 x 6,7 cm. Il touchpad dei tasti del 5110 era più piccolo. Così, molto spazio è disponibile per utilizzare il controllo dei gesti. Il pad risponde anche agli input negli angoli. La superficie è opaca, il dito ha sempre un notevole attrito.
Purtroppo, non c'è quasi nessuna corsa sul pad, il che si traduce in un punto di pressione insoddisfacente. Può essere una preferenza personale, il tester non ha gradito affatto il clickpad a causa dello scarso feedback, il funzionamento era quasi sgradevole. In ogni caso, Dell non si è fatta alcun favore omettendo i tasti fisici.
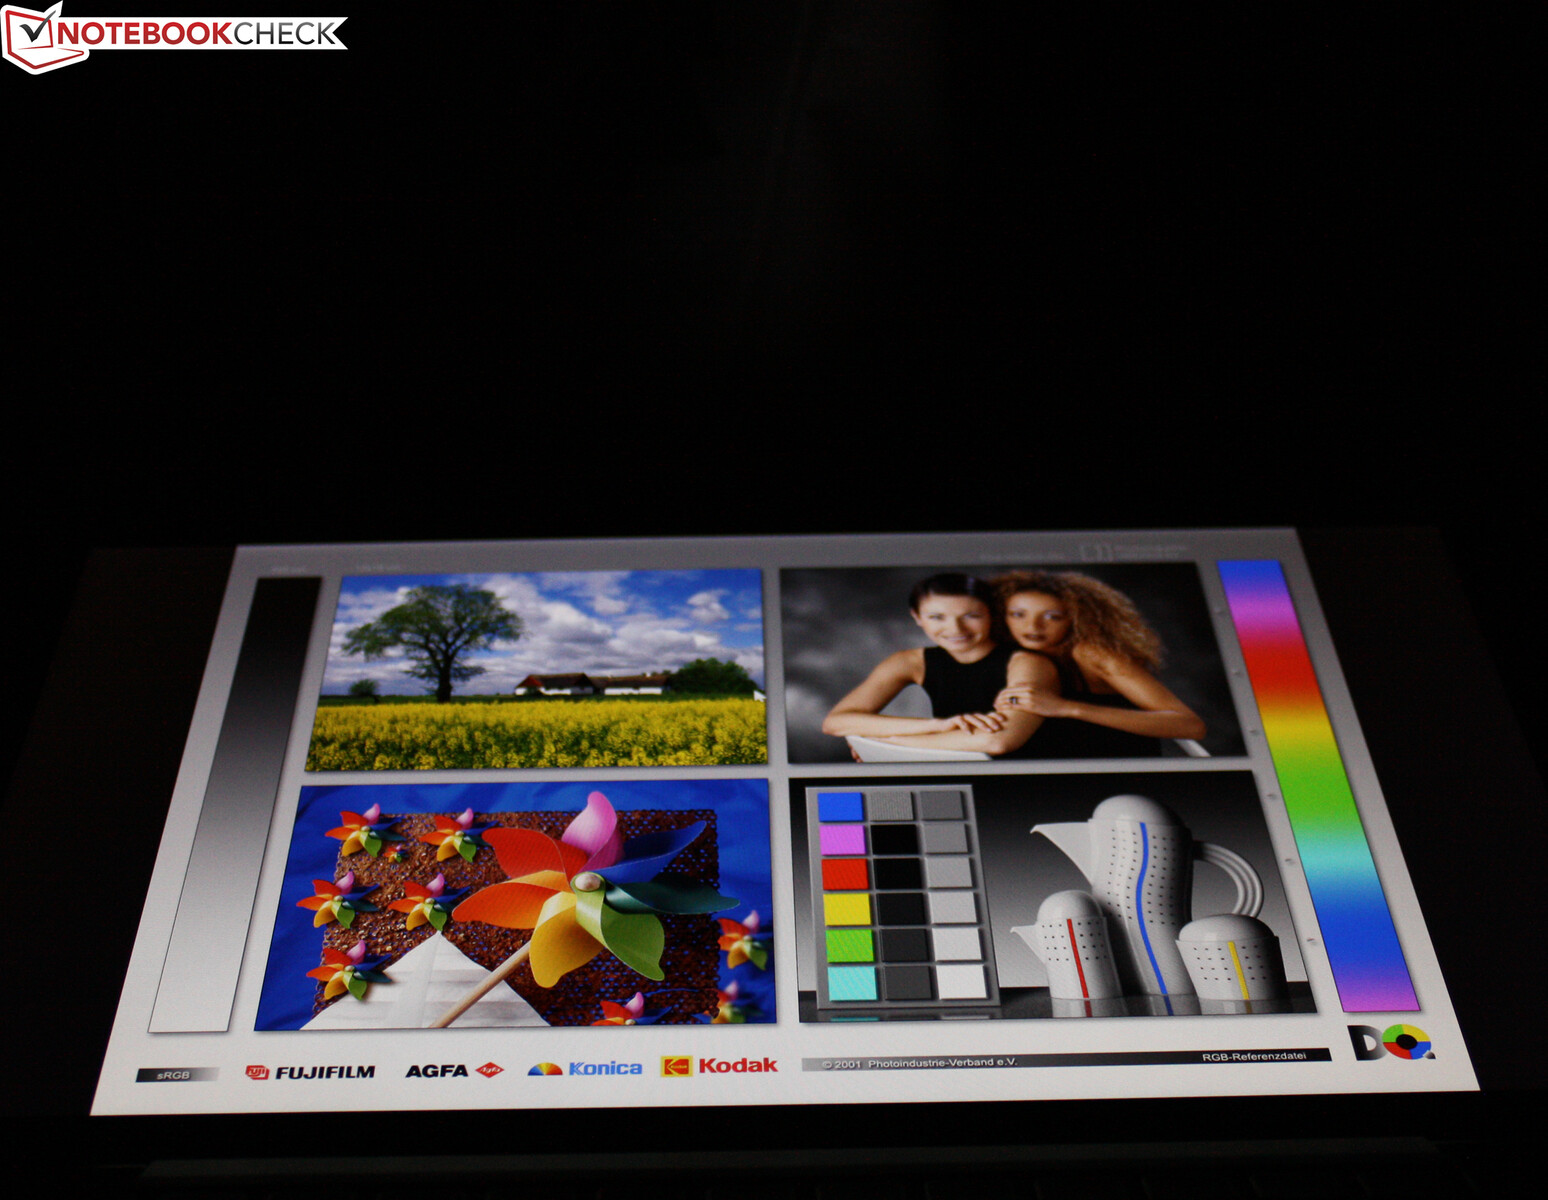
Display - Debolemente posizionato per il business dei display
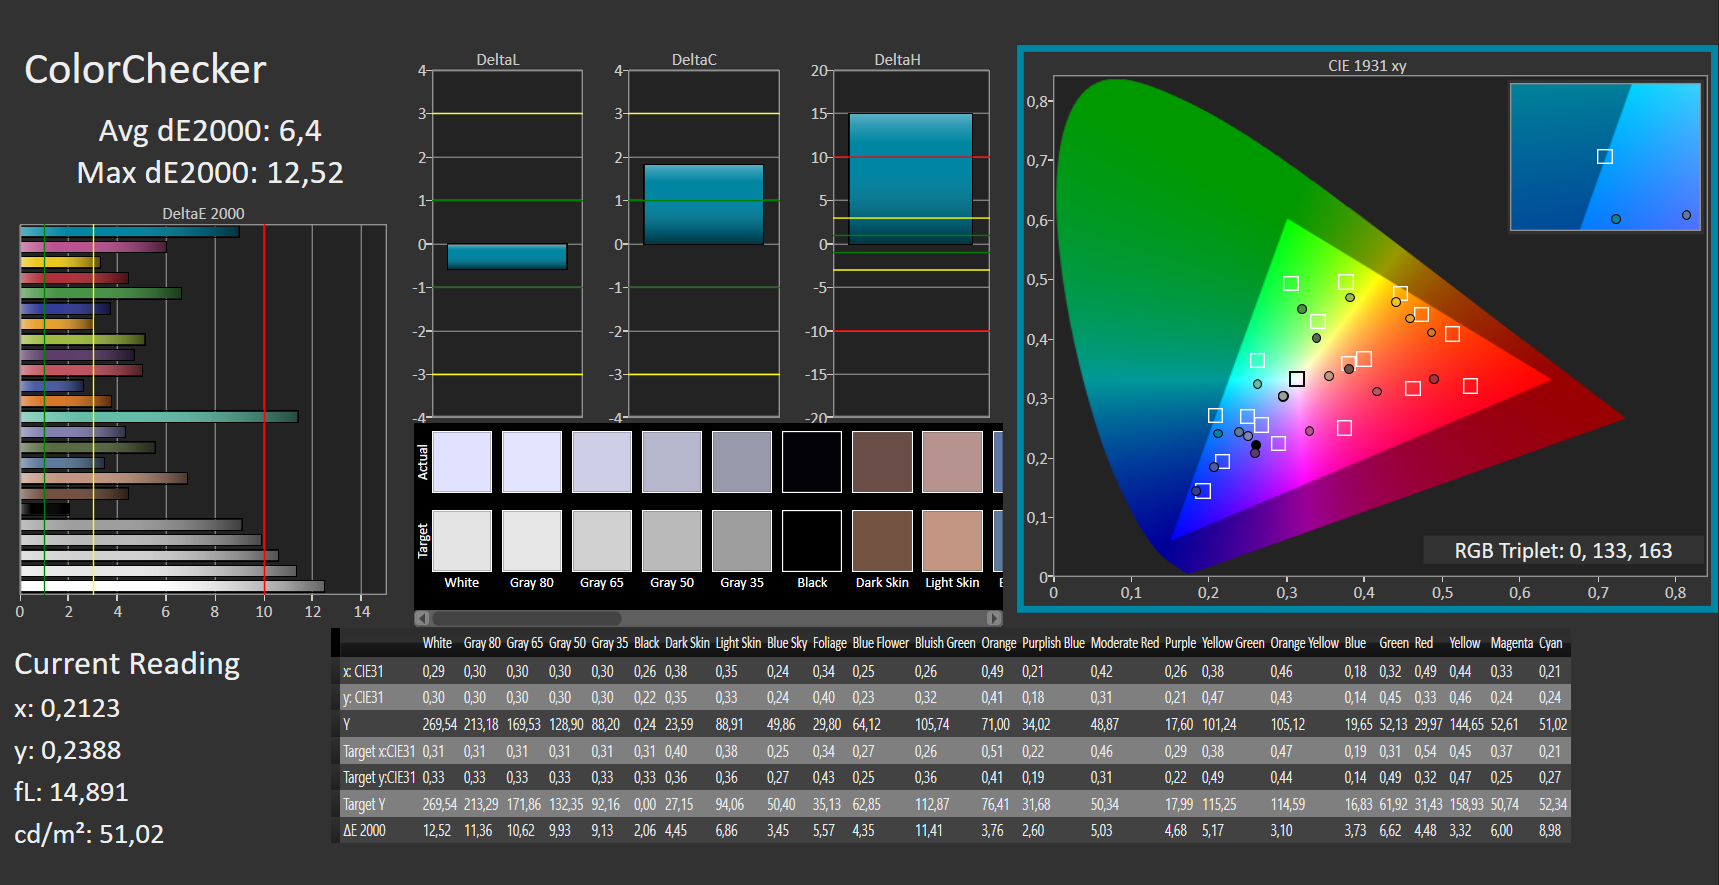
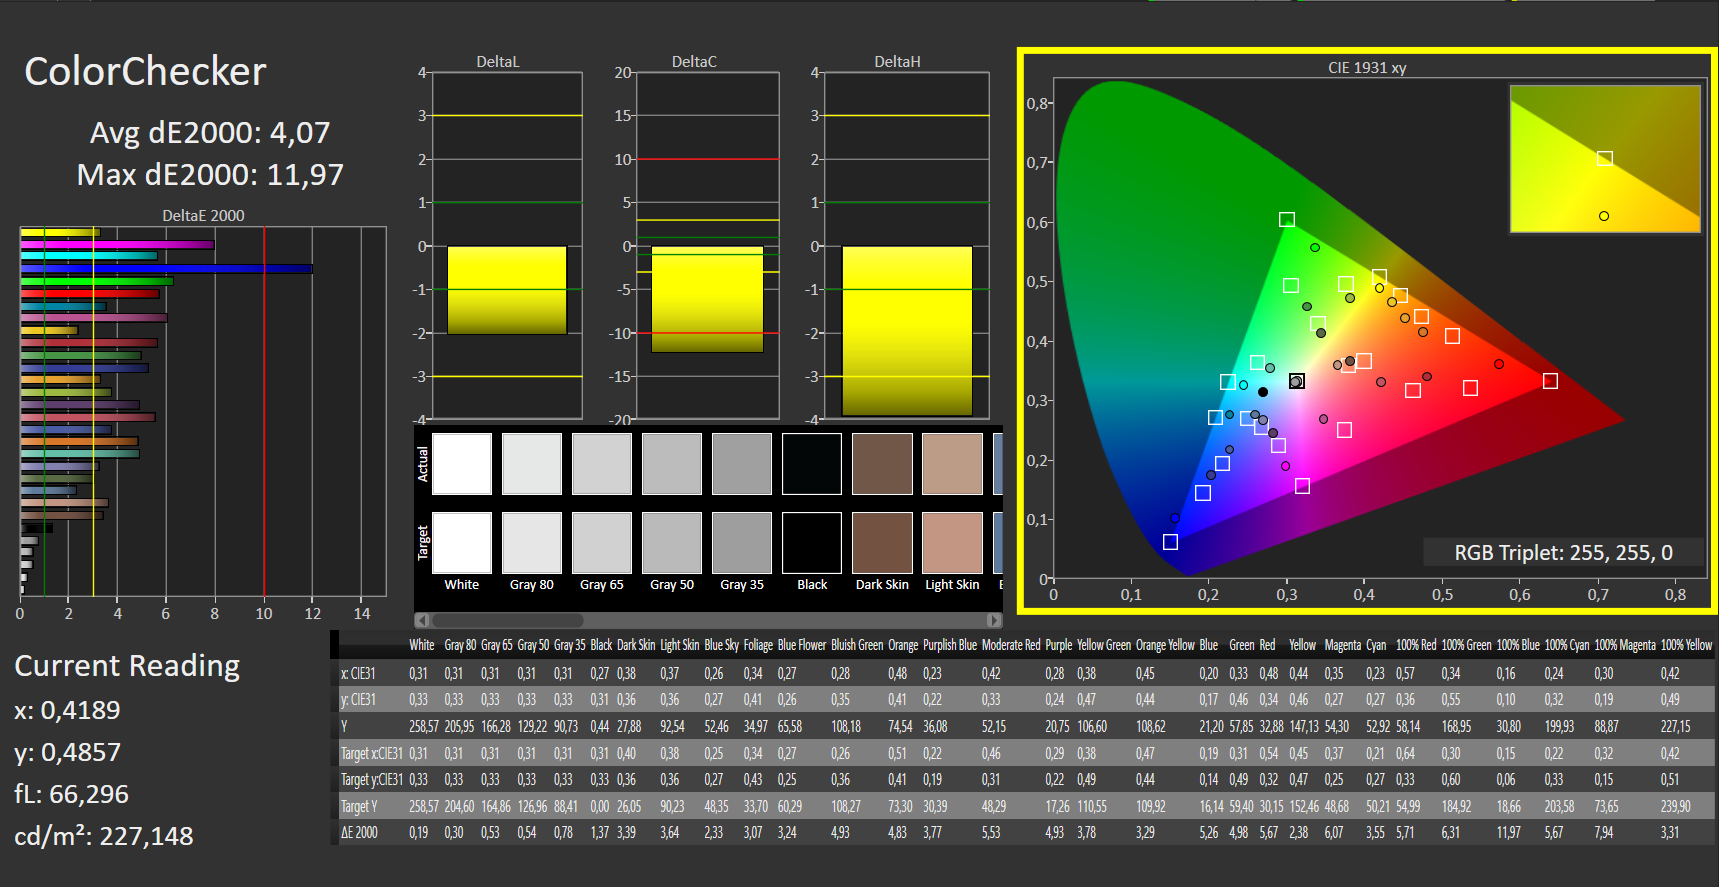
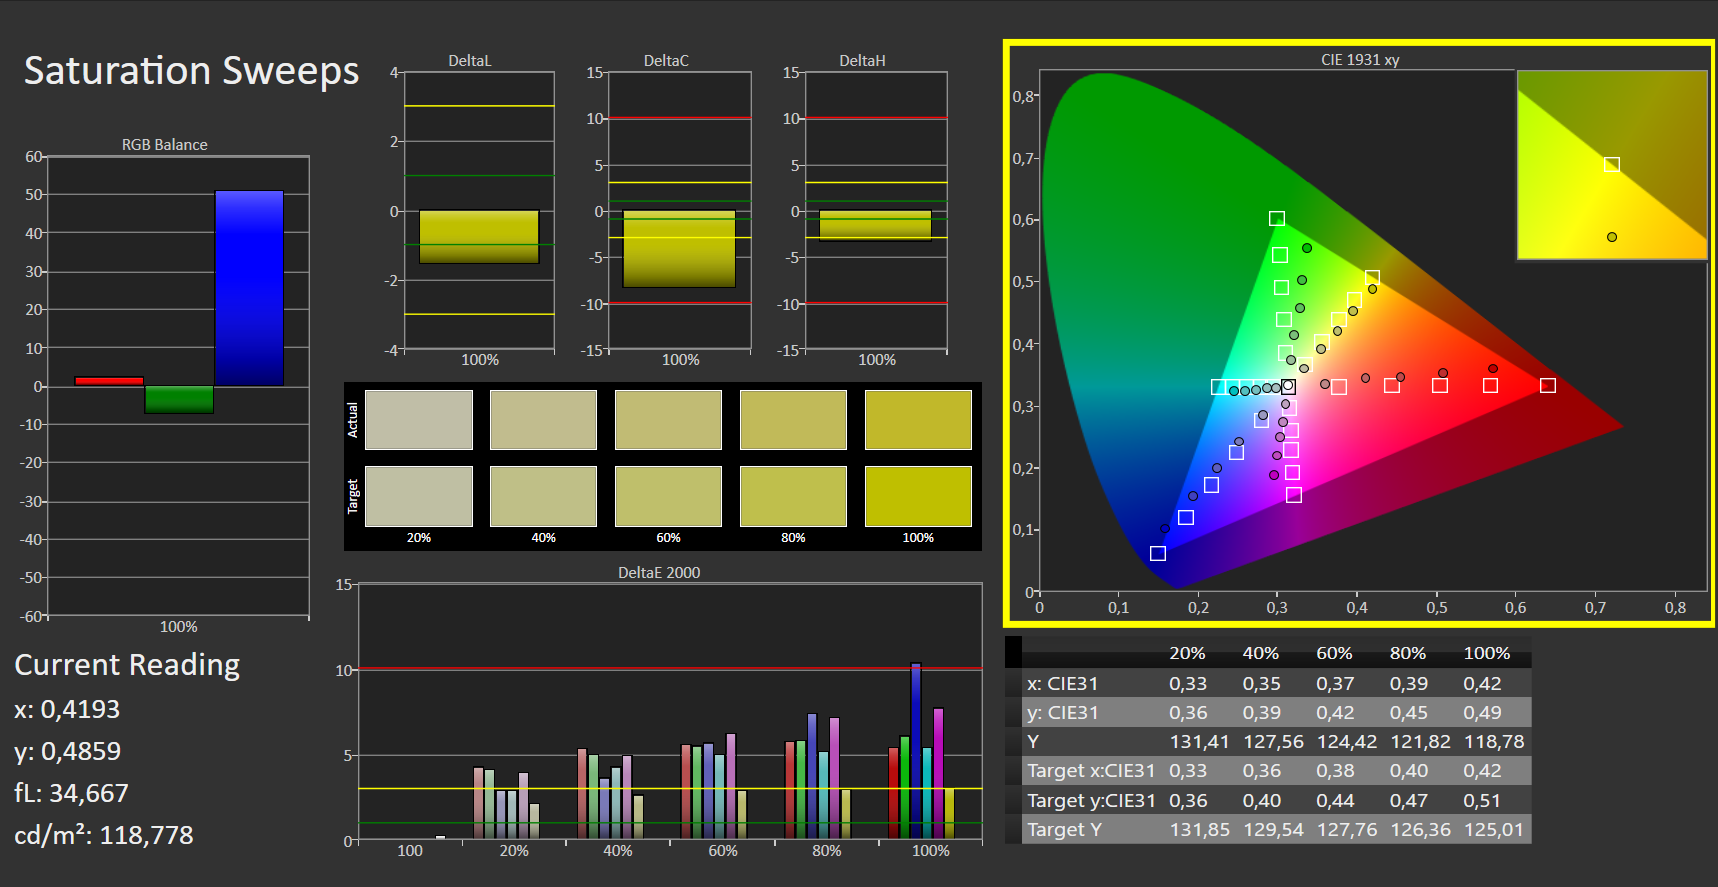
Lo schermo opaco da 13,3 pollici del Latitude funziona con una risoluzione nativa di 1920 x 1080 pixel. Il modello del pannello può essere letto solo come un prodotto Dell. La luminosità (248 cd/m²) e il contrasto (1.083:1) sono troppo bassi - tenendo conto del livello di prezzo del notebook. Consideriamo buoni i valori oltre 300 cd/m² e 1.000:1. I rivali hanno a bordo schermi più luminosi e spesso anche a maggior contrasto. Dell offre una variante multi-touch/non-glare dello schermo, che dovrebbe avere un livello di luminosità di 300 invece che 250 cd/m². Positivo: Il display non mostra PWM flickering in nessuna impostazione di luminosità.
| |||||||||||||||||||||||||
Distribuzione della luminosità: 97 %
Al centro con la batteria: 270 cd/m²
Contrasto: 1083:1 (Nero: 0.23 cd/m²)
ΔE ColorChecker Calman: 6.4 | ∀{0.5-29.43 Ø4.71}
calibrated: 4.07
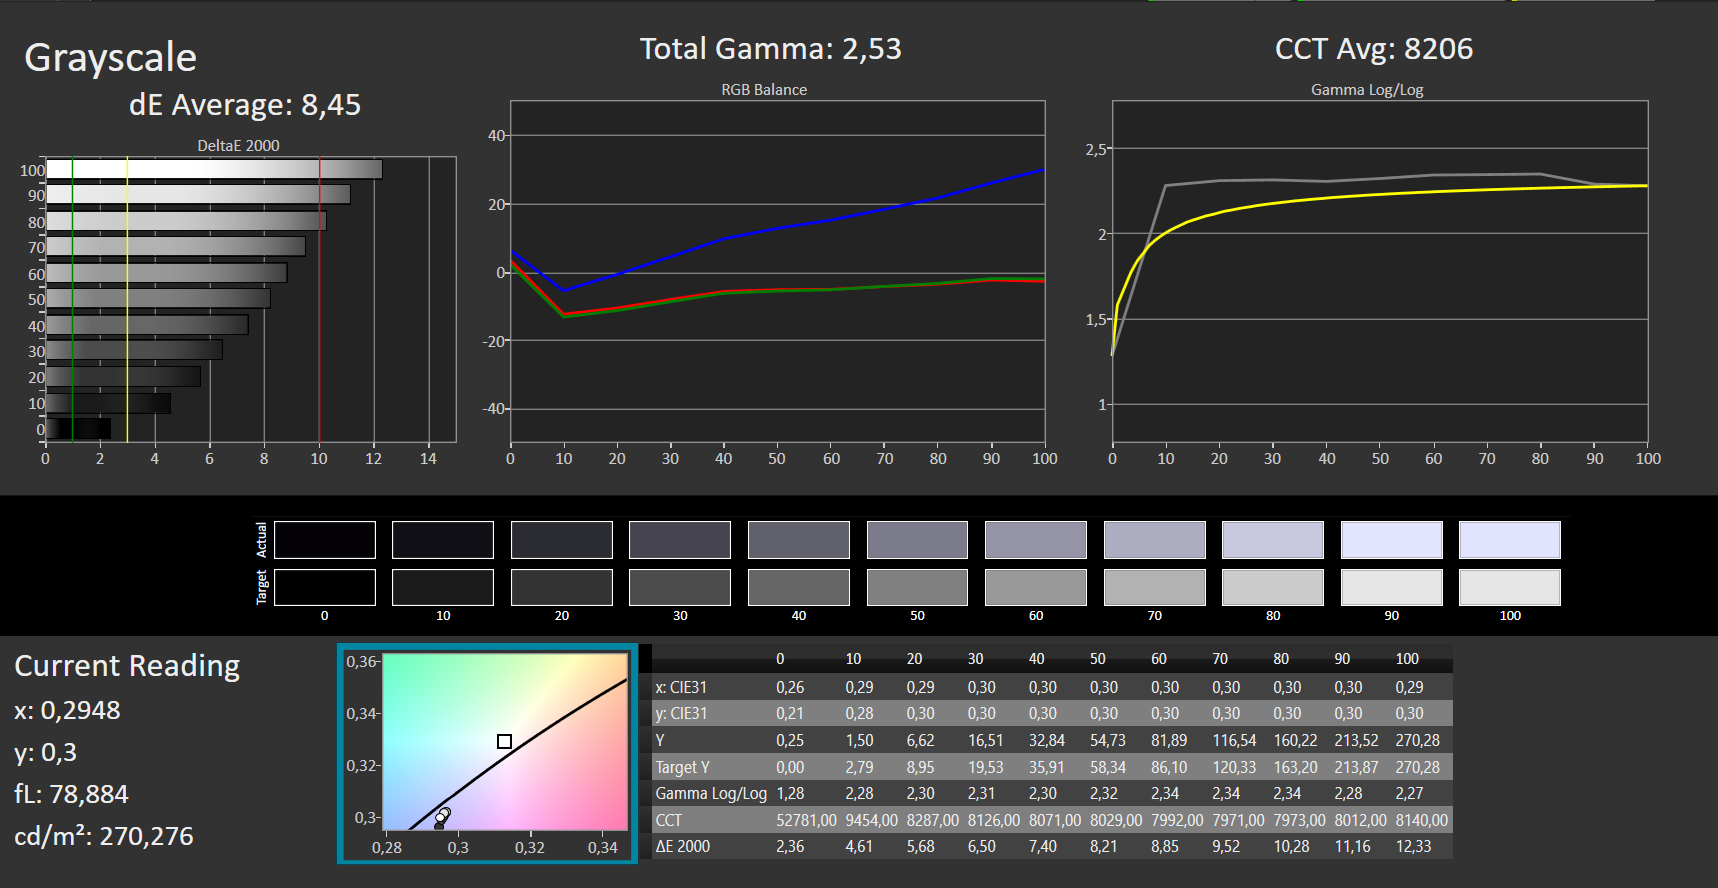
ΔE Greyscale Calman: 8.45 | ∀{0.09-98 Ø4.96}
40.6% AdobeRGB 1998 (Argyll 3D)
59.2% sRGB (Argyll 3D)
39.3% Display P3 (Argyll 3D)
Gamma: 2.53
CCT: 8206 K
| Dell Latitude 5320-TM4V2 Dell 1337L02, IPS, 1920x1080, 13.3" | Dell Latitude 5310-23VP6 Chi Mei CMN1382, IPS, 1920x1080, 13.3" | Lenovo ThinkBook 13s G3 20YA0005GE M133NW4JR0, IPS, 1920x1200, 13.3" | Dell XPS 13 9305 Core i5 FHD Sharp SHP14AE, IPS, 1920x1080, 13.3" | Lenovo ThinkPad L13 Gen2-21AB000PGE IVO M133NWF4 RA, IPS, 1920x1080, 13.3" | Lenovo ThinkBook 14 G2 ITL 20VDS02G00 AU Optronics B140HAN04.E, a-Si IPS LED, 1920x1080, 14" | |
|---|---|---|---|---|---|---|
| Display | 70% | 68% | 66% | -5% | -5% | |
| Display P3 Coverage (%) | 39.3 | 67.5 72% | 67.5 72% | 66.3 69% | 37.47 -5% | 37.2 -5% |
| sRGB Coverage (%) | 59.2 | 99 67% | 97.1 64% | 97.1 64% | 56.3 -5% | 55.5 -6% |
| AdobeRGB 1998 Coverage (%) | 40.6 | 69.2 70% | 68.8 69% | 67.1 65% | 38.7 -5% | 38.4 -5% |
| Response Times | 9% | -31% | -23% | -25% | -14% | |
| Response Time Grey 50% / Grey 80% * (ms) | 36 ? | 36 ? -0% | 53.2 ? -48% | 55 ? -53% | 49.2 ? -37% | 45.9 ? -27% |
| Response Time Black / White * (ms) | 29 ? | 24 ? 17% | 32.8 ? -13% | 27 ? 7% | 32.8 ? -13% | 29 ? -0% |
| PWM Frequency (Hz) | 2500 ? | 996 ? | ||||
| Screen | 37% | 49% | 40% | 20% | 8% | |
| Brightness middle (cd/m²) | 249 | 383 54% | 379 52% | 486 95% | 294 18% | 386 55% |
| Brightness (cd/m²) | 248 | 364 47% | 356 44% | 446 80% | 273 10% | 348 40% |
| Brightness Distribution (%) | 97 | 84 -13% | 88 -9% | 77 -21% | 87 -10% | 83 -14% |
| Black Level * (cd/m²) | 0.23 | 0.34 -48% | 0.23 -0% | 0.4 -74% | 0.275 -20% | 0.29 -26% |
| Contrast (:1) | 1083 | 1126 4% | 1648 52% | 1215 12% | 1069 -1% | 1331 23% |
| Colorchecker dE 2000 * | 6.4 | 2.24 65% | 1.6 75% | 2.54 60% | 3.81 40% | 6.3 2% |
| Colorchecker dE 2000 max. * | 12.52 | 3.32 73% | 2.7 78% | 4.34 65% | 6.22 50% | 18.3 -46% |
| Colorchecker dE 2000 calibrated * | 4.07 | 0.72 82% | 1 75% | 1.04 74% | 3.29 19% | 4.1 -1% |
| Greyscale dE 2000 * | 8.45 | 2.42 71% | 2 76% | 2.34 72% | 2.28 73% | 5.4 36% |
| Gamma | 2.53 87% | 2.65 83% | 2.25 98% | 2.28 96% | 2.48 89% | 2.55 86% |
| CCT | 8206 79% | 6776 96% | 6835 95% | 6864 95% | 6820 95% | 5894 110% |
| Color Space (Percent of AdobeRGB 1998) (%) | 56 | 62 | ||||
| Color Space (Percent of sRGB) (%) | 99 | 97 | ||||
| Media totale (Programma / Settaggio) | 39% /
40% | 29% /
42% | 28% /
37% | -3% /
8% | -4% /
2% |
* ... Meglio usare valori piccoli
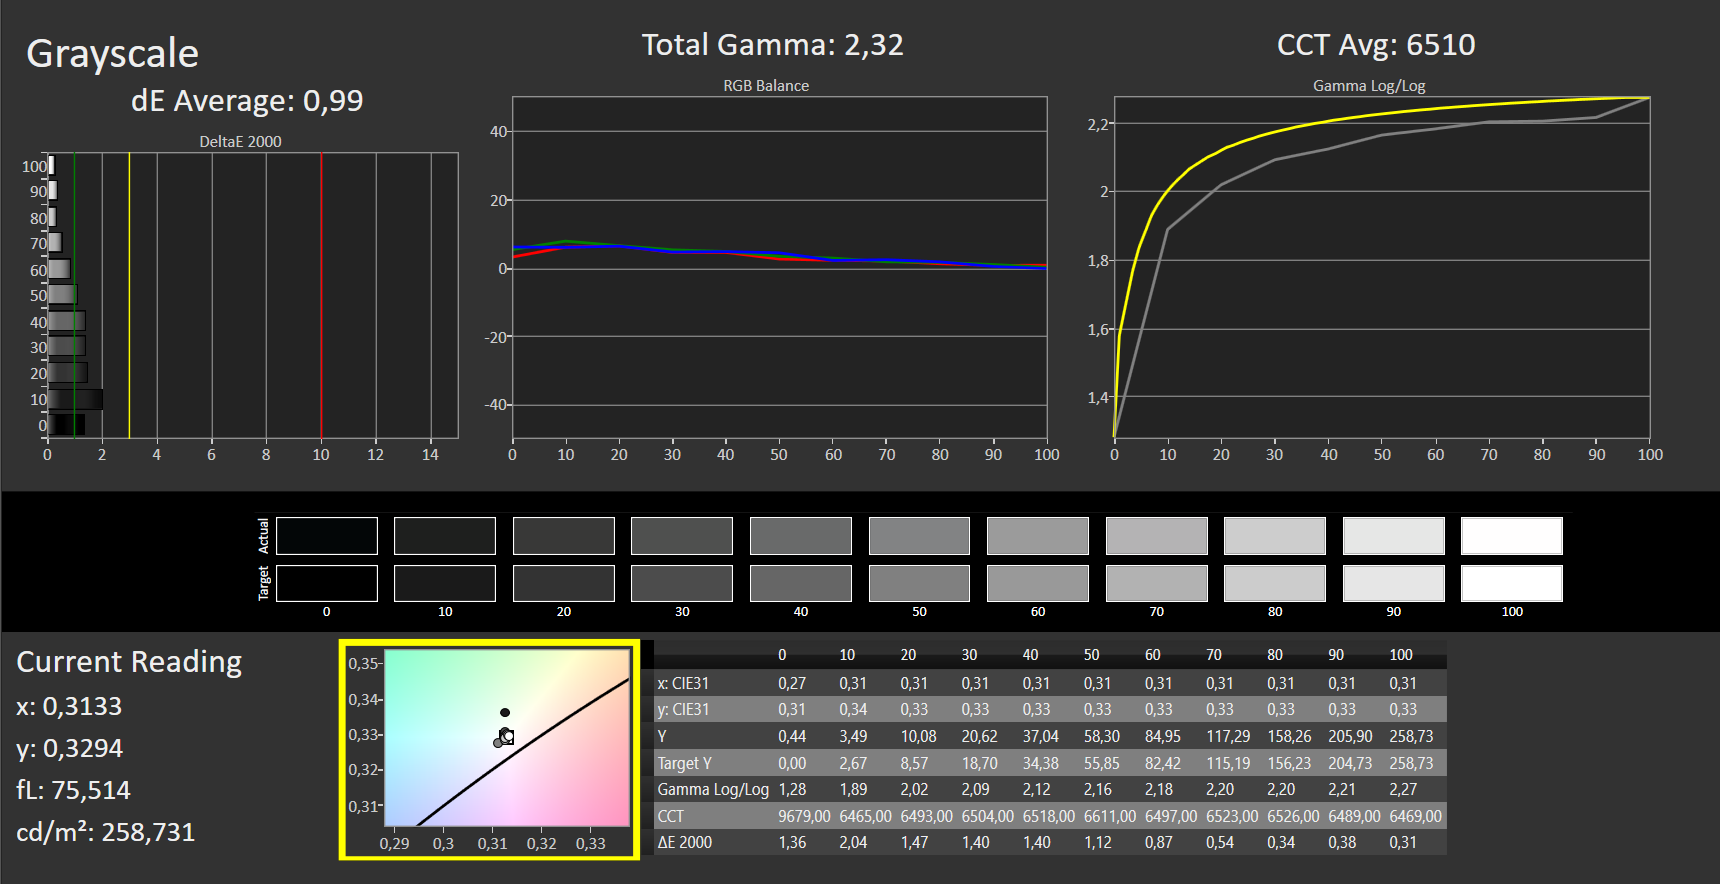
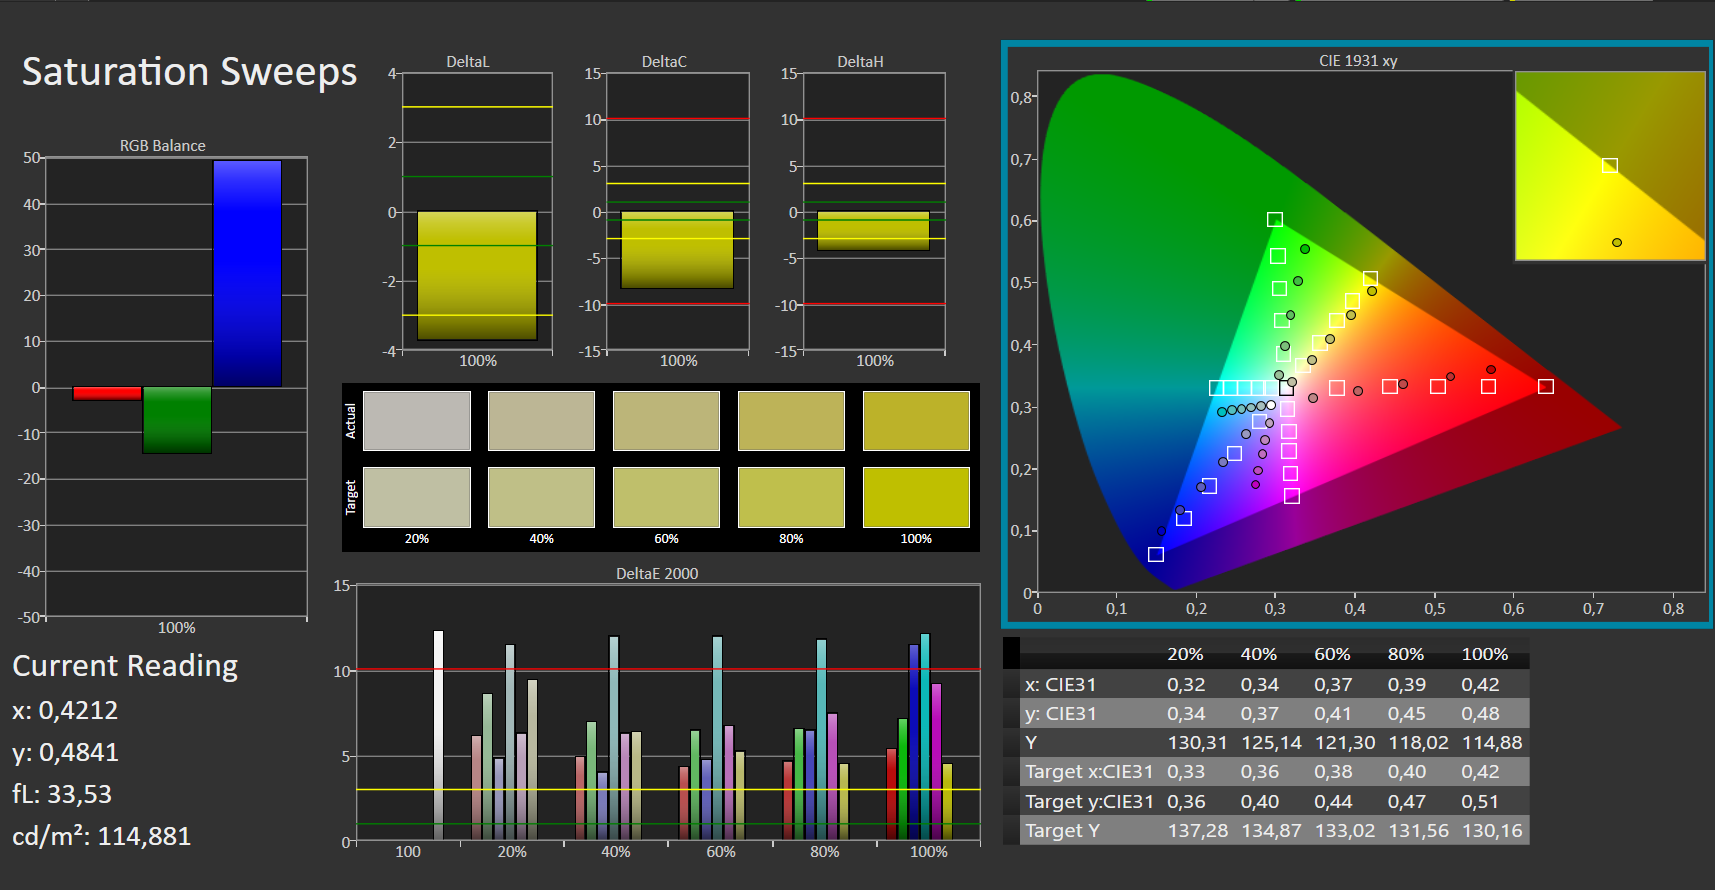
Lo schermo mostra una scarsa riproduzione del colore nel suo stato di consegna. Con una deviazione di colore DeltaE-2000 di 8, l'obiettivo (DeltaE inferiore a 3) è mancato. Almeno il povero DeltaE può essere eliminato attraverso la calibrazione, e il valore della scala di grigi è ridotto da 8 a 1 nel processo. Come proprietario di un 5320, potresti provare il nostro profilo colore collegato nel box sopra, così da ottenere colori più accurati anche senza un fotospettrometro. Per i colori, il DeltaE migliora solo da 6 a 4.
Il display non soffre di un cast bluastro, che non è più comune per i pannelli IPS. Gli spazi colore AdobeRGB (40%) e sRGB (59%) non sono completamente riprodotti. Il predecessore con il suo pannello Chi Mei aveva tassi molto migliori qui, e la luminosità era anche significativamente più alta. Questo è anche il caso di tutti gli altri contendenti, anche se in parte hanno spazi colore altrettanto poveri (ThinkPad L13 Gen2, ThinkBook 14 G2 ITL).
Tempi di risposta del Display
| ↔ Tempi di risposta dal Nero al Bianco | ||
|---|---|---|
| 29 ms ... aumenta ↗ e diminuisce ↘ combinato | ↗ 13 ms Incremento |  |
| ↘ 16 ms Calo | ||
| Lo schermo mostra tempi di risposta relativamente lenti nei nostri tests e potrebbe essere troppo lento per i gamers. In confronto, tutti i dispositivi di test variano da 0.1 (minimo) a 240 (massimo) ms. » 77 % di tutti i dispositivi è migliore. Questo significa che i tempi di risposta rilevati sono peggiori rispetto alla media di tutti i dispositivi testati (19.8 ms). | ||
| ↔ Tempo di risposta dal 50% Grigio all'80% Grigio | ||
| 36 ms ... aumenta ↗ e diminuisce ↘ combinato | ↗ 19 ms Incremento |  |
| ↘ 17 ms Calo | ||
| Lo schermo mostra tempi di risposta lenti nei nostri tests e sarà insoddisfacente per i gamers. In confronto, tutti i dispositivi di test variano da 0.165 (minimo) a 636 (massimo) ms. » 51 % di tutti i dispositivi è migliore. Questo significa che i tempi di risposta rilevati sono peggiori rispetto alla media di tutti i dispositivi testati (31 ms). | ||
Sfarfallio dello schermo / PWM (Pulse-Width Modulation)
| flickering dello schermo / PWM non rilevato |  | ||
In confronto: 52 % di tutti i dispositivi testati non utilizza PWM per ridurre la luminosita' del display. Se è rilevato PWM, una media di 7757 (minimo: 5 - massimo: 343500) Hz è stata rilevata. | |||
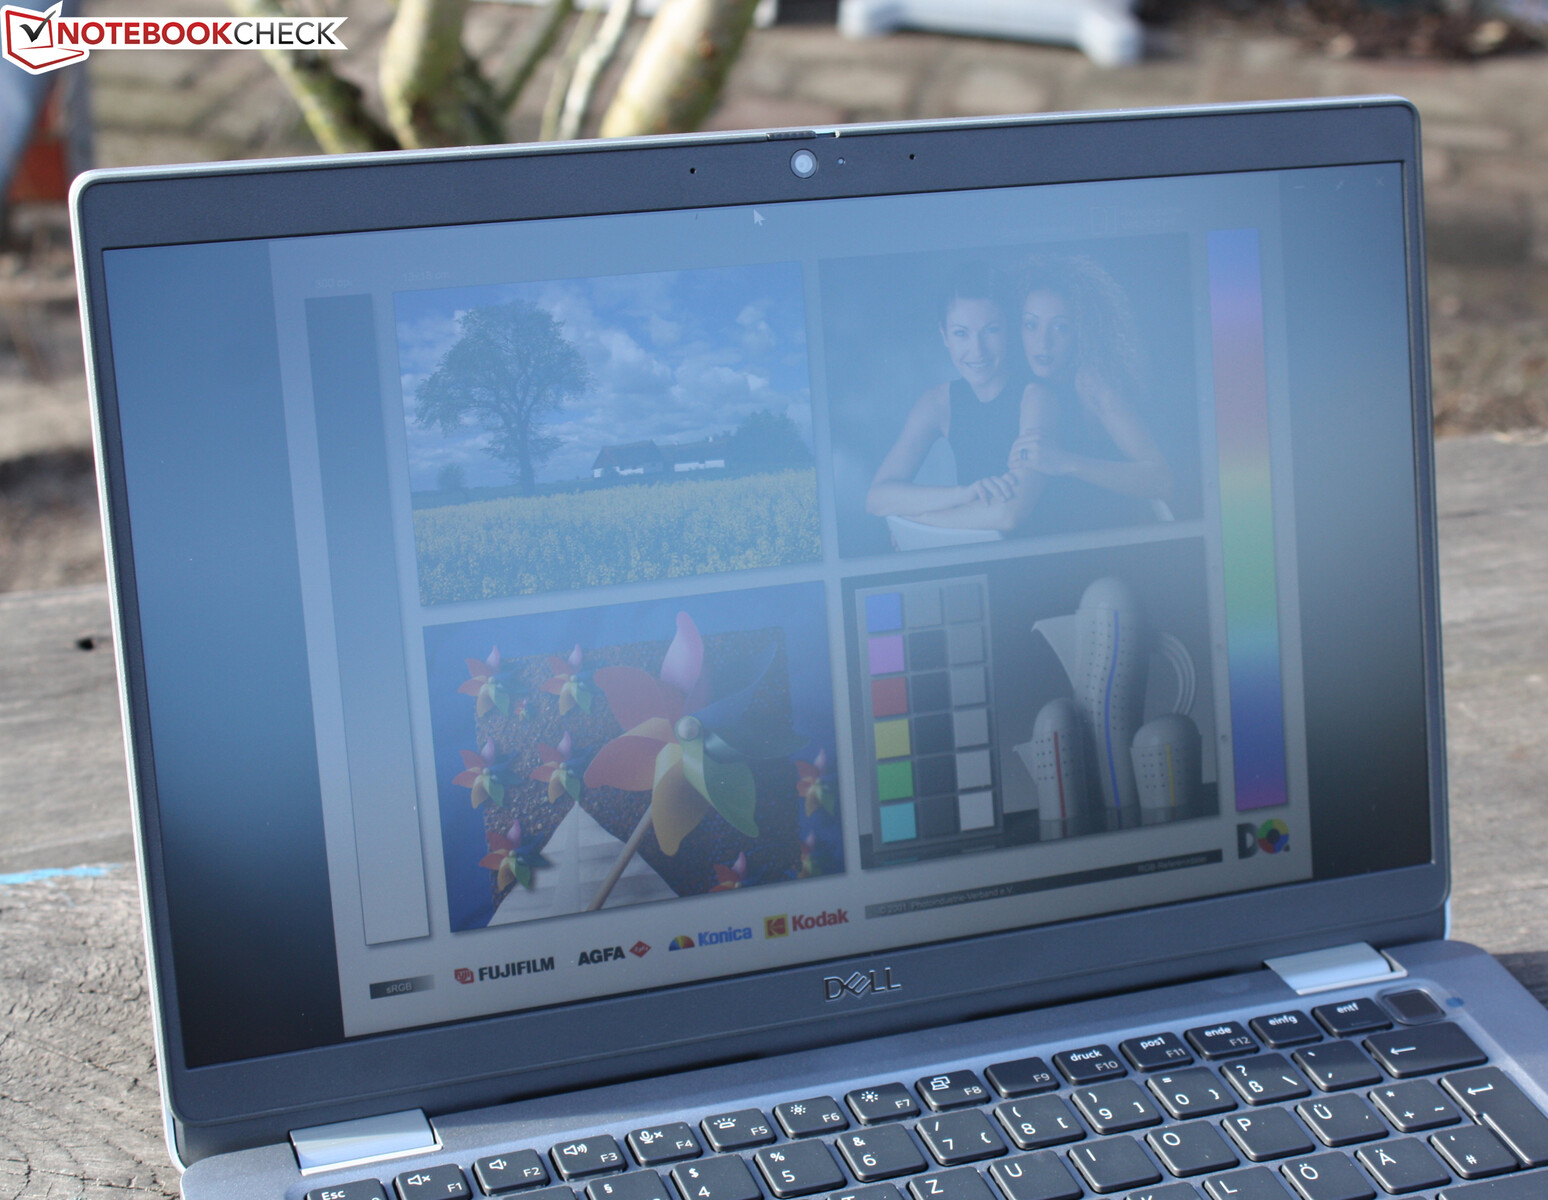
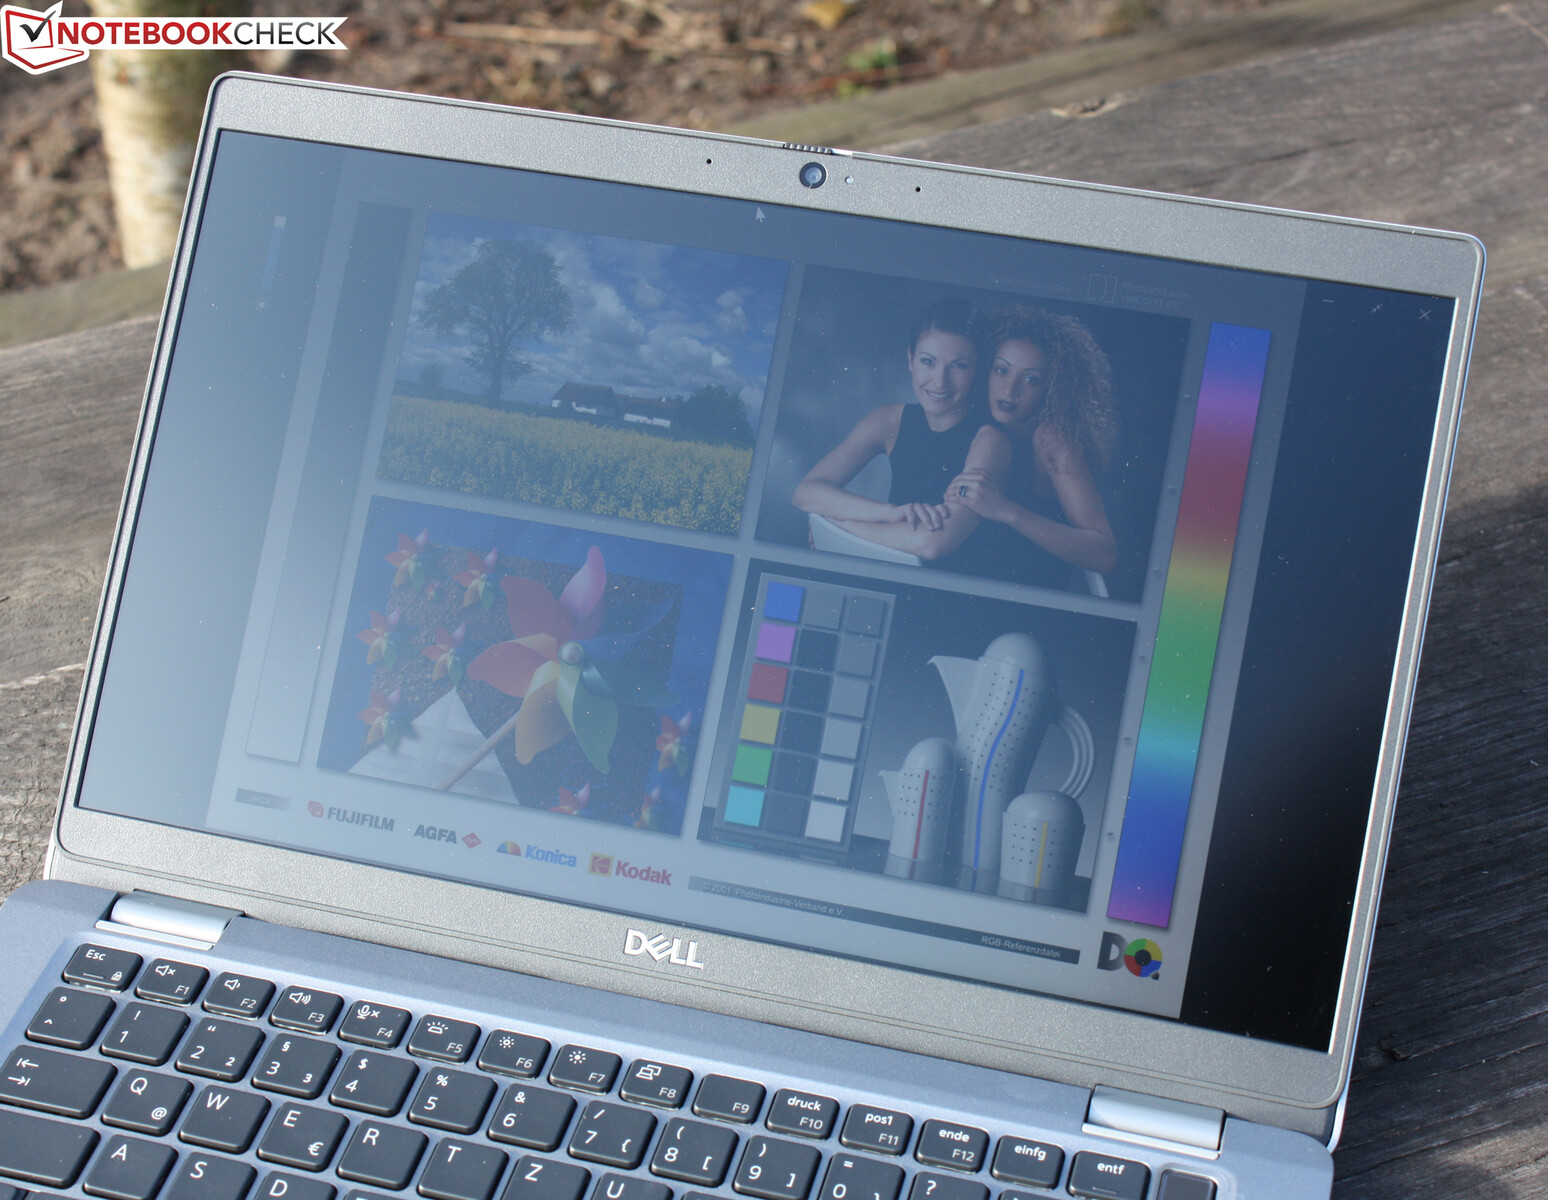
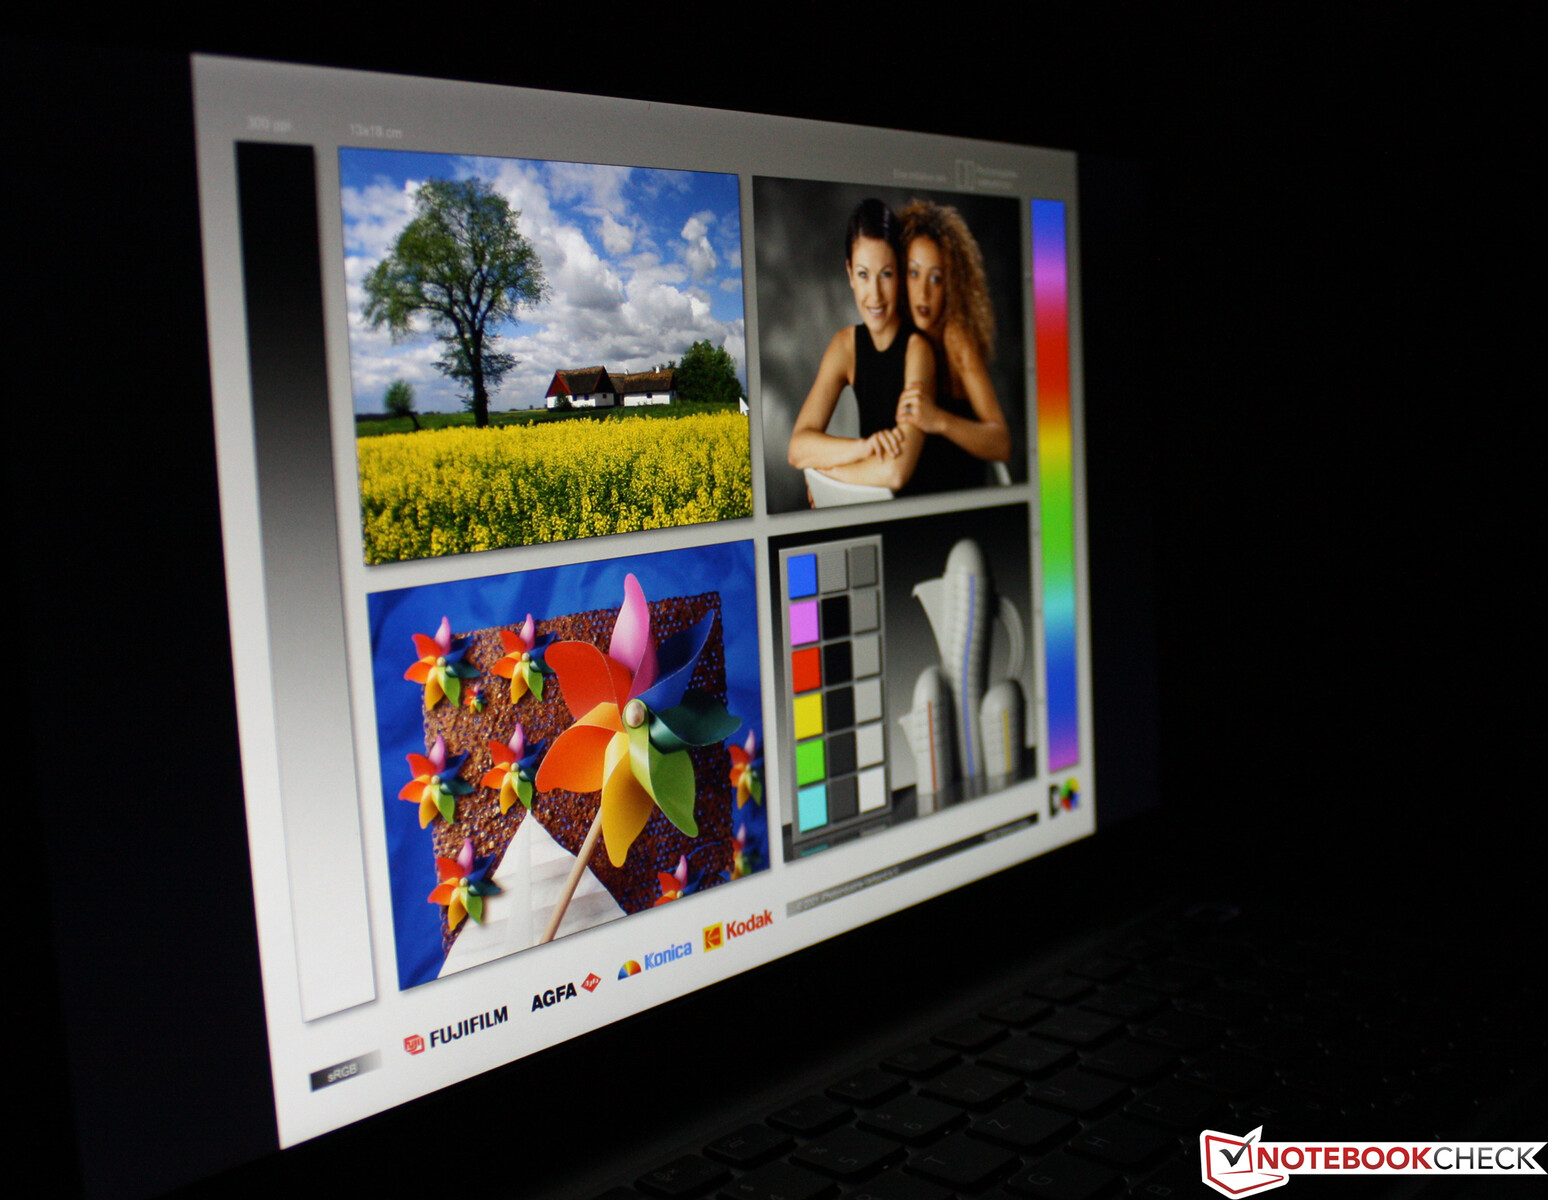
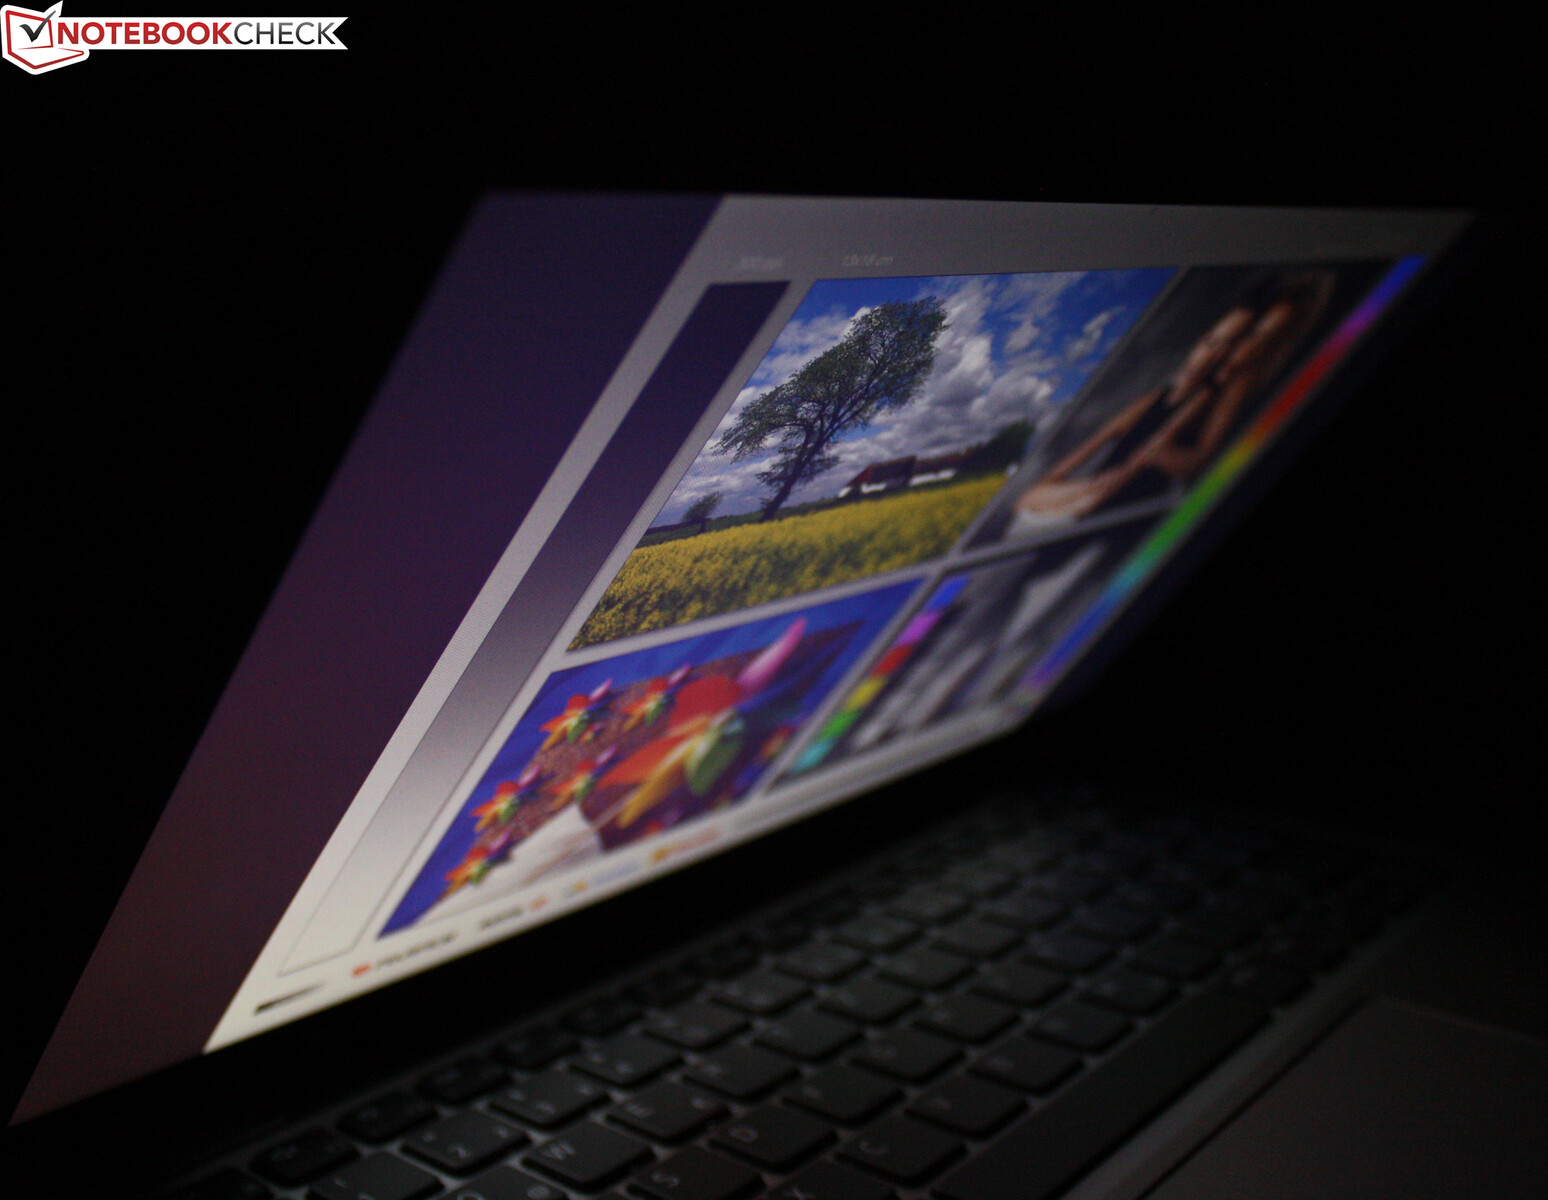
Dell equipaggia il 5320 con un pannello IPS che ha angoli di visualizzazione stabili. Così, lo schermo può essere letto da qualsiasi posizione. All'esterno, la lettura del display è un problema a causa della bassa luminosità, almeno quando il sole splende. Il rivestimento antiriflesso aiuta, ma la luminanza massima di 249 cd/m² al centro dello schermo è semplicemente troppo bassa per una buona leggibilità.
Prestazioni - Core i5 più lento del previsto
Dell'Latitude 5320 è uno dei notebook aziendali di fascia media. Il processore a basso voltaggio installato offre abbastanza potenza di calcolo per applicazioni d'ufficio e Internet. Il nostro dispositivo di test è disponibile in diverse configurazioni da 900 a 1250 euro. Il nostro modello con Core i5, piccolo SSD da 256 GB e non touchscreen è la configurazione più piccola. Colpisce: Dell non offre una versione Core i7 nei negozi, ma lo fa nel negozio interno (i7-1185G7).
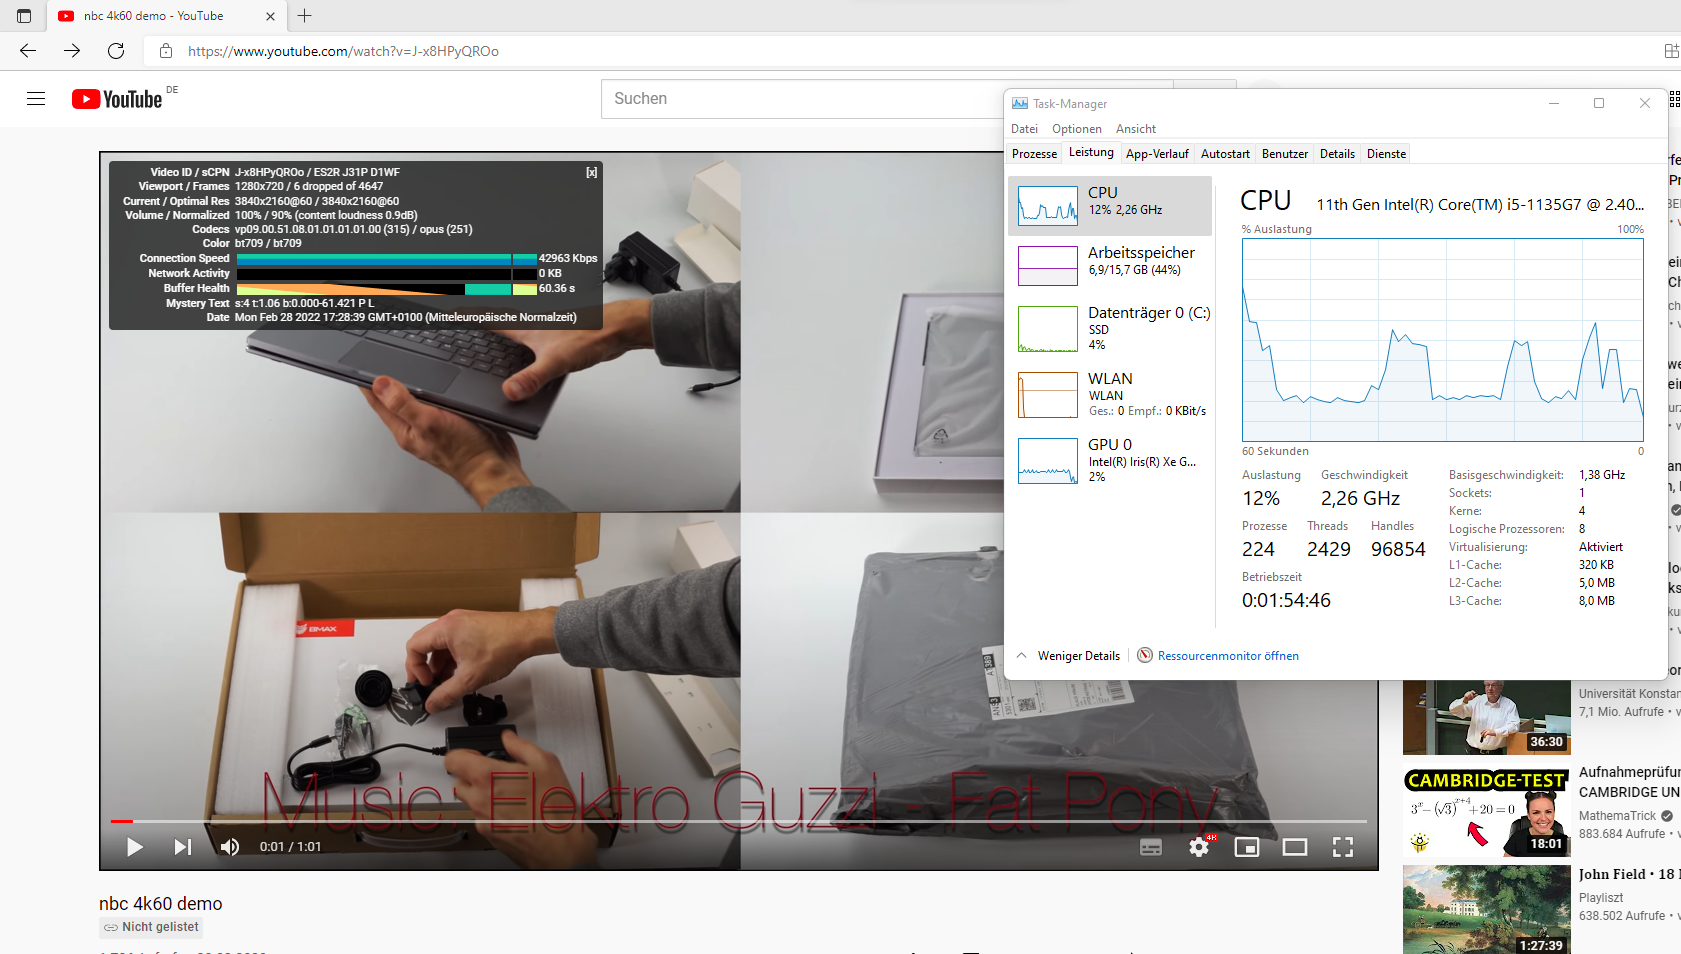
Condizioni di prova
Abbiamo eseguito tutti i benchmark in modalità Ultra Performance (Dell Power Manager/Temperature Management). Abbiamo usato la modalità Ottimizzata per i tempi di funzionamento della batteria e per le misurazioni della temperatura al minimo.
Processore
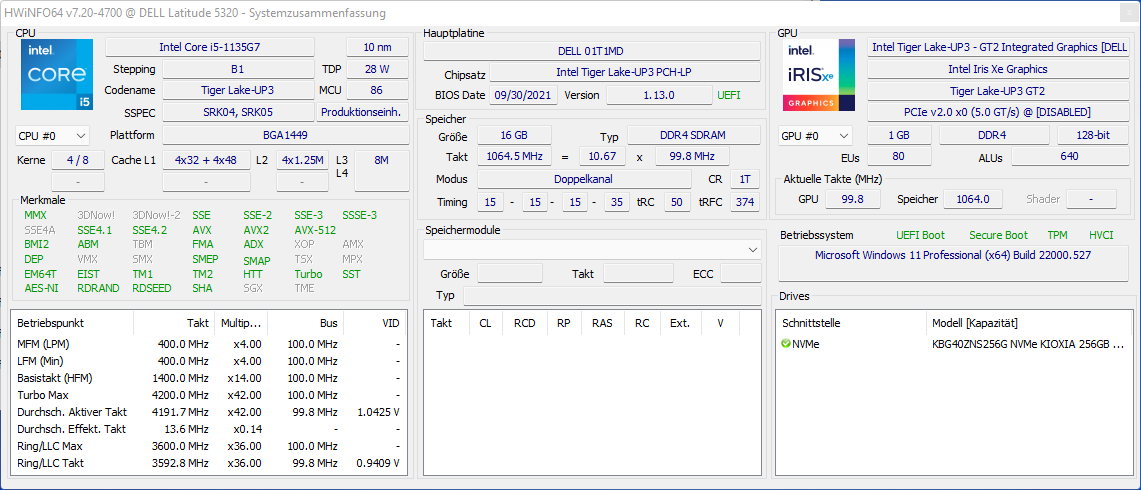
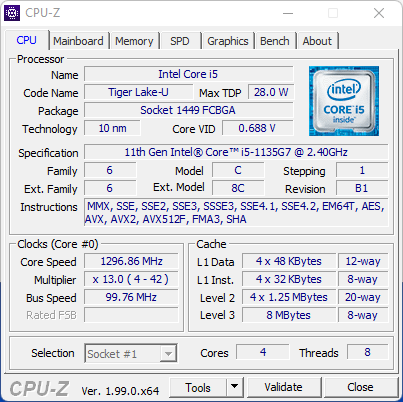
L'installato Intel Core i5-1135G7 è un processore quad-core della generazione Intel Tiger Lake con un clock di base di 2.4 GHz e un clock Turbo fino a 4.2 GHz. Le prestazioni sono dal 5 al 10% sotto il livello medio, come mostrano tutti i benchmark delle CPU.
Il fatto che il Core i5-1135G7 possa fare di più è dimostrato dal Lenovo ThinkPad L14 G2 877 punti invece di soli 660 nella prima esecuzione, e questo divario non diminuisce significativamente nel tempo.
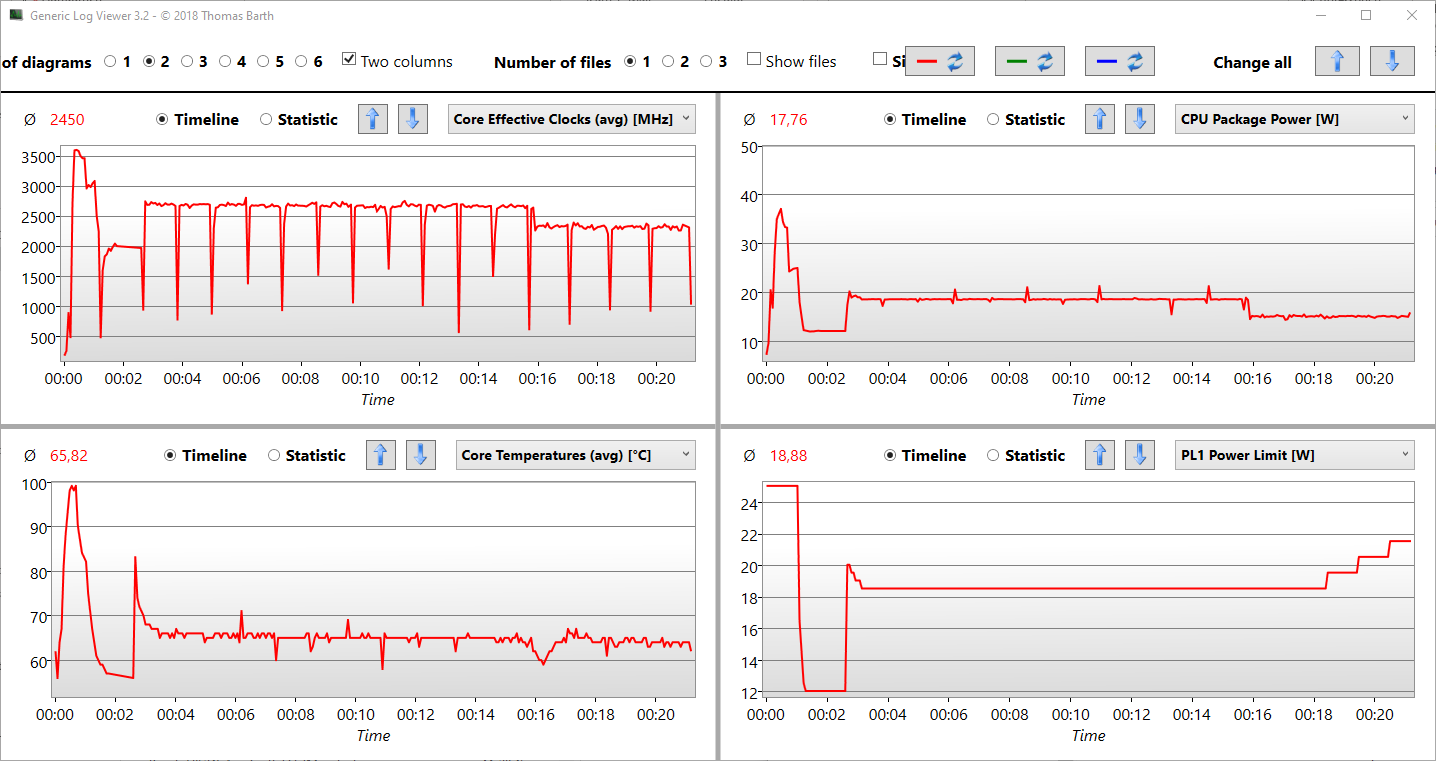
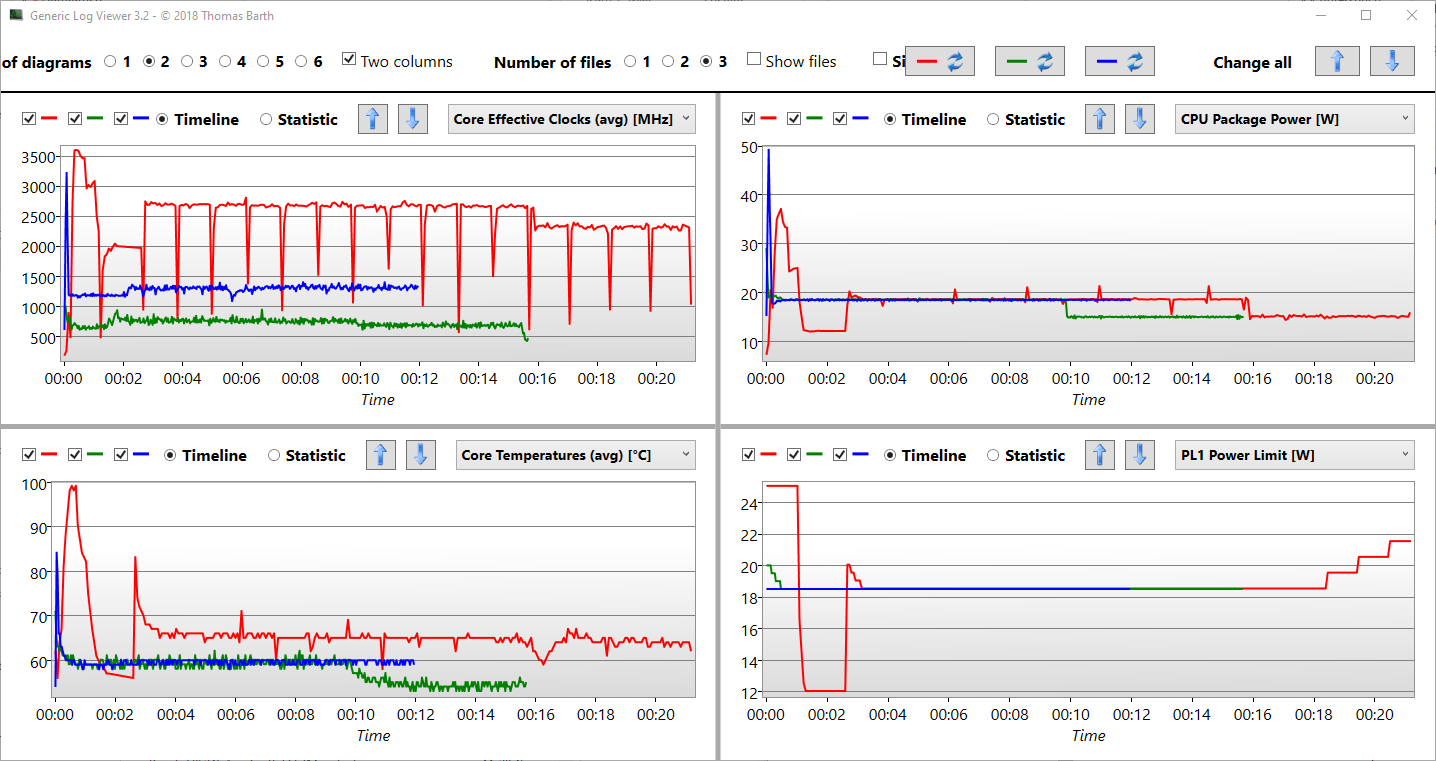
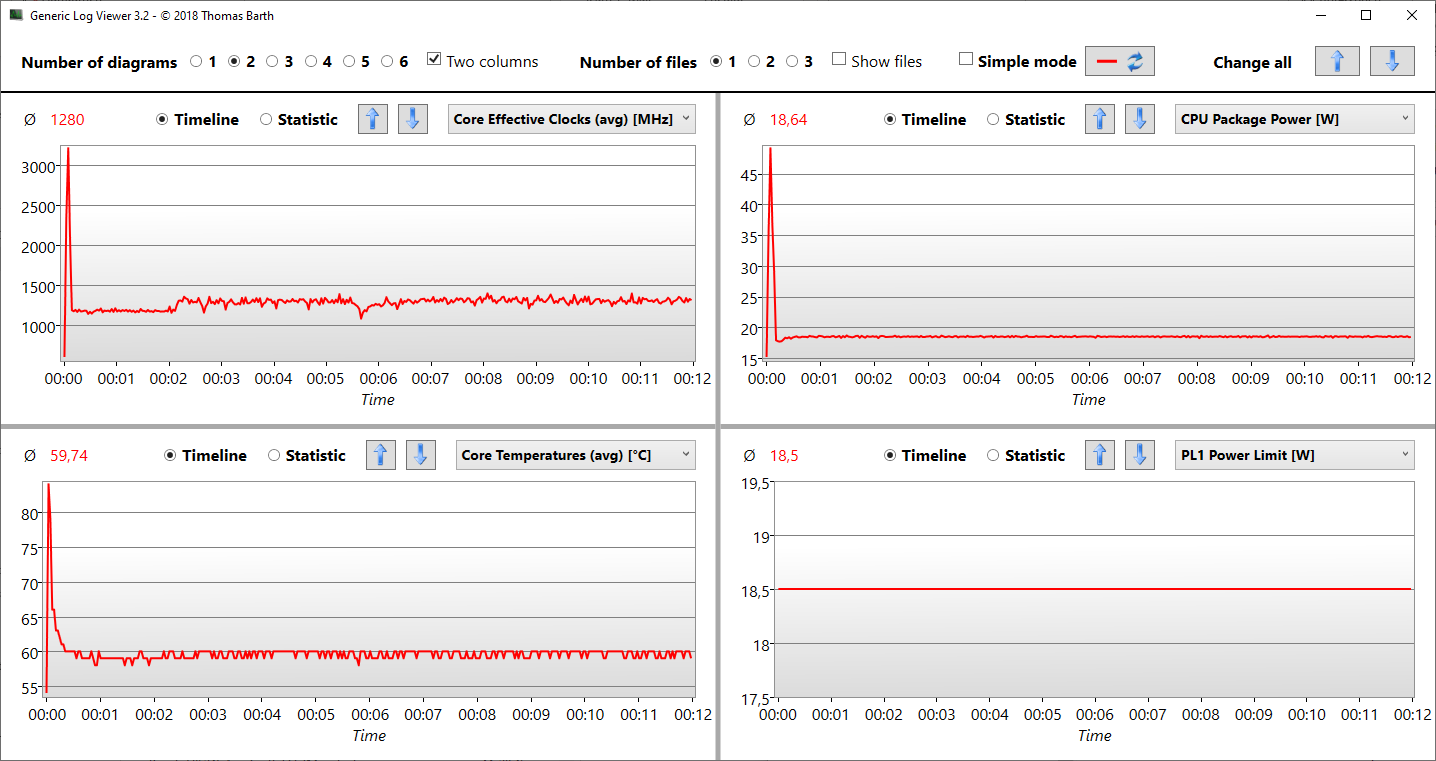
Il rendimento costante nel ciclo è impressionante. Tuttavia, il SoC si permette 3,6 GHz e quasi 100 gradi Celsius per alcuni secondi nella prima corsa. Dopo di che, il clock rallenta a 2,0 GHz, la temperatura scende significativamente, e rimane intorno ai 65 gradi Celsius per il resto della corsa. Il ciclo continua a 2,6 GHz costanti nel tempo.
Cosa fanno PL1 e PL2 sotto carico Cinebench su tutti i core? Mentre il pacchetto CPU si concede 37 watt per un tempo molto breve (pochi secondi) all'inizio, è un continuo 18 watt durante il corso del test (durata PL1).
Abbiamo staccato la spina dopo 15 minuti: la potenza del pacchetto scende a 16 watt, e la frequenza di clock scende a 2,3 GHz. Quindi, le prestazioni complete del processore non possono essere utilizzate in modalità batteria.
Se le prestazioni degli altri notebook possono tenere il passo qui può essere visto nella nostra Elenco di benchmark della CPU.
Cinebench R15 multi endurance test
Cinebench R23: Multi Core | Single Core
Cinebench R20: CPU (Multi Core) | CPU (Single Core)
Cinebench R15: CPU Multi 64Bit | CPU Single 64Bit
Blender: v2.79 BMW27 CPU
7-Zip 18.03: 7z b 4 | 7z b 4 -mmt1
Geekbench 5.5: Multi-Core | Single-Core
HWBOT x265 Benchmark v2.2: 4k Preset
LibreOffice : 20 Documents To PDF
R Benchmark 2.5: Overall mean
| CPU Performance rating | |
| Media della classe Subnotebook | |
| Lenovo ThinkBook 13s G3 20YA0005GE | |
| Lenovo ThinkPad L13 Gen2-21AB000PGE | |
| Lenovo ThinkPad L14 G2-20X1003WGE | |
| Media Intel Core i5-1135G7 | |
| Acer TravelMate P4 TMP414-51-59MR | |
| Dell XPS 13 9305 Core i5 FHD -2! | |
| Dell Latitude 5320-TM4V2 -1! | |
| Lenovo ThinkBook 14 G2 ITL 20VDS02G00 | |
| Dell Latitude 5310-23VP6 -2! | |
| Cinebench R23 / Multi Core | |
| Media della classe Subnotebook (1555 - 21812, n=60, ultimi 2 anni) | |
| Lenovo ThinkBook 13s G3 20YA0005GE | |
| Lenovo ThinkPad L13 Gen2-21AB000PGE | |
| Dell XPS 13 9305 Core i5 FHD | |
| Lenovo ThinkPad L14 G2-20X1003WGE | |
| Acer TravelMate P4 TMP414-51-59MR | |
| Media Intel Core i5-1135G7 (2786 - 6136, n=55) | |
| Dell Latitude 5320-TM4V2 | |
| Lenovo ThinkBook 14 G2 ITL 20VDS02G00 | |
| Cinebench R23 / Single Core | |
| Media della classe Subnotebook (358 - 2213, n=61, ultimi 2 anni) | |
| Lenovo ThinkBook 13s G3 20YA0005GE | |
| Acer TravelMate P4 TMP414-51-59MR | |
| Lenovo ThinkPad L13 Gen2-21AB000PGE | |
| Lenovo ThinkPad L14 G2-20X1003WGE | |
| Media Intel Core i5-1135G7 (1062 - 1373, n=53) | |
| Lenovo ThinkBook 14 G2 ITL 20VDS02G00 | |
| Dell XPS 13 9305 Core i5 FHD | |
| Dell Latitude 5320-TM4V2 | |
| Cinebench R20 / CPU (Multi Core) | |
| Media della classe Subnotebook (579 - 8541, n=57, ultimi 2 anni) | |
| Lenovo ThinkBook 13s G3 20YA0005GE | |
| Lenovo ThinkPad L13 Gen2-21AB000PGE | |
| Lenovo ThinkPad L14 G2-20X1003WGE | |
| Dell XPS 13 9305 Core i5 FHD | |
| Media Intel Core i5-1135G7 (979 - 2382, n=62) | |
| Acer TravelMate P4 TMP414-51-59MR | |
| Dell Latitude 5320-TM4V2 | |
| Lenovo ThinkBook 14 G2 ITL 20VDS02G00 | |
| Dell Latitude 5310-23VP6 | |
| Cinebench R20 / CPU (Single Core) | |
| Media della classe Subnotebook (128 - 832, n=57, ultimi 2 anni) | |
| Lenovo ThinkBook 13s G3 20YA0005GE | |
| Acer TravelMate P4 TMP414-51-59MR | |
| Lenovo ThinkPad L13 Gen2-21AB000PGE | |
| Lenovo ThinkPad L14 G2-20X1003WGE | |
| Lenovo ThinkBook 14 G2 ITL 20VDS02G00 | |
| Media Intel Core i5-1135G7 (375 - 527, n=62) | |
| Dell XPS 13 9305 Core i5 FHD | |
| Dell Latitude 5320-TM4V2 | |
| Dell Latitude 5310-23VP6 | |
| Cinebench R15 / CPU Multi 64Bit | |
| Media della classe Subnotebook (327 - 3345, n=57, ultimi 2 anni) | |
| Lenovo ThinkBook 13s G3 20YA0005GE | |
| Lenovo ThinkBook 13s G3 20YA0005GE | |
| Lenovo ThinkPad L13 Gen2-21AB000PGE | |
| Lenovo ThinkPad L14 G2-20X1003WGE | |
| Acer TravelMate P4 TMP414-51-59MR | |
| Media Intel Core i5-1135G7 (431 - 941, n=65) | |
| Dell XPS 13 9305 Core i5 FHD | |
| Dell Latitude 5320-TM4V2 | |
| Dell Latitude 5310-23VP6 | |
| Lenovo ThinkBook 14 G2 ITL 20VDS02G00 | |
| Cinebench R15 / CPU Single 64Bit | |
| Media della classe Subnotebook (72.4 - 322, n=57, ultimi 2 anni) | |
| Lenovo ThinkBook 13s G3 20YA0005GE | |
| Lenovo ThinkPad L13 Gen2-21AB000PGE | |
| Lenovo ThinkPad L14 G2-20X1003WGE | |
| Media Intel Core i5-1135G7 (141.4 - 205, n=61) | |
| Dell Latitude 5320-TM4V2 | |
| Lenovo ThinkBook 14 G2 ITL 20VDS02G00 | |
| Dell Latitude 5310-23VP6 | |
| Acer TravelMate P4 TMP414-51-59MR | |
| Blender / v2.79 BMW27 CPU | |
| Lenovo ThinkBook 14 G2 ITL 20VDS02G00 | |
| Dell Latitude 5310-23VP6 | |
| Media Intel Core i5-1135G7 (499 - 1044, n=60) | |
| Acer TravelMate P4 TMP414-51-59MR | |
| Dell XPS 13 9305 Core i5 FHD | |
| Dell Latitude 5320-TM4V2 | |
| Lenovo ThinkPad L14 G2-20X1003WGE | |
| Lenovo ThinkPad L13 Gen2-21AB000PGE | |
| Lenovo ThinkBook 13s G3 20YA0005GE | |
| Media della classe Subnotebook (159 - 2271, n=58, ultimi 2 anni) | |
| 7-Zip 18.03 / 7z b 4 | |
| Media della classe Subnotebook (11668 - 77867, n=57, ultimi 2 anni) | |
| Lenovo ThinkBook 13s G3 20YA0005GE | |
| Lenovo ThinkPad L13 Gen2-21AB000PGE | |
| Dell XPS 13 9305 Core i5 FHD | |
| Lenovo ThinkPad L14 G2-20X1003WGE | |
| Dell Latitude 5320-TM4V2 | |
| Acer TravelMate P4 TMP414-51-59MR | |
| Media Intel Core i5-1135G7 (14745 - 24873, n=62) | |
| Dell Latitude 5310-23VP6 | |
| Lenovo ThinkBook 14 G2 ITL 20VDS02G00 | |
| 7-Zip 18.03 / 7z b 4 -mmt1 | |
| Media della classe Subnotebook (2643 - 6699, n=59, ultimi 2 anni) | |
| Lenovo ThinkBook 13s G3 20YA0005GE | |
| Lenovo ThinkPad L13 Gen2-21AB000PGE | |
| Acer TravelMate P4 TMP414-51-59MR | |
| Media Intel Core i5-1135G7 (3924 - 4921, n=62) | |
| Lenovo ThinkPad L14 G2-20X1003WGE | |
| Lenovo ThinkBook 14 G2 ITL 20VDS02G00 | |
| Dell XPS 13 9305 Core i5 FHD | |
| Dell Latitude 5320-TM4V2 | |
| Dell Latitude 5310-23VP6 | |
| Geekbench 5.5 / Multi-Core | |
| Media della classe Subnotebook (2557 - 17218, n=48, ultimi 2 anni) | |
| Lenovo ThinkBook 13s G3 20YA0005GE | |
| Lenovo ThinkPad L13 Gen2-21AB000PGE | |
| Dell XPS 13 9305 Core i5 FHD | |
| Media Intel Core i5-1135G7 (3475 - 5472, n=58) | |
| Dell Latitude 5320-TM4V2 | |
| Acer TravelMate P4 TMP414-51-59MR | |
| Lenovo ThinkPad L14 G2-20X1003WGE | |
| Dell Latitude 5310-23VP6 | |
| Lenovo ThinkBook 14 G2 ITL 20VDS02G00 | |
| Geekbench 5.5 / Single-Core | |
| Media della classe Subnotebook (726 - 2224, n=48, ultimi 2 anni) | |
| Lenovo ThinkBook 13s G3 20YA0005GE | |
| Media Intel Core i5-1135G7 (1147 - 1428, n=58) | |
| Dell XPS 13 9305 Core i5 FHD | |
| Acer TravelMate P4 TMP414-51-59MR | |
| Lenovo ThinkPad L13 Gen2-21AB000PGE | |
| Dell Latitude 5320-TM4V2 | |
| Lenovo ThinkPad L14 G2-20X1003WGE | |
| Lenovo ThinkBook 14 G2 ITL 20VDS02G00 | |
| Dell Latitude 5310-23VP6 | |
| HWBOT x265 Benchmark v2.2 / 4k Preset | |
| Media della classe Subnotebook (0.97 - 25.1, n=57, ultimi 2 anni) | |
| Lenovo ThinkBook 13s G3 20YA0005GE | |
| Lenovo ThinkPad L13 Gen2-21AB000PGE | |
| Lenovo ThinkPad L14 G2-20X1003WGE | |
| Media Intel Core i5-1135G7 (3.57 - 7.6, n=57) | |
| Acer TravelMate P4 TMP414-51-59MR | |
| Dell Latitude 5310-23VP6 | |
| Lenovo ThinkBook 14 G2 ITL 20VDS02G00 | |
| LibreOffice / 20 Documents To PDF | |
| Dell Latitude 5310-23VP6 | |
| Dell XPS 13 9305 Core i5 FHD | |
| Dell Latitude 5320-TM4V2 | |
| Lenovo ThinkPad L13 Gen2-21AB000PGE | |
| Media della classe Subnotebook (39.9 - 220, n=56, ultimi 2 anni) | |
| Media Intel Core i5-1135G7 (44.2 - 62.9, n=60) | |
| Acer TravelMate P4 TMP414-51-59MR | |
| Lenovo ThinkPad L14 G2-20X1003WGE | |
| Lenovo ThinkBook 13s G3 20YA0005GE | |
| Lenovo ThinkBook 14 G2 ITL 20VDS02G00 | |
| R Benchmark 2.5 / Overall mean | |
| Dell Latitude 5310-23VP6 | |
| Lenovo ThinkBook 14 G2 ITL 20VDS02G00 | |
| Dell Latitude 5320-TM4V2 | |
| Dell XPS 13 9305 Core i5 FHD | |
| Lenovo ThinkPad L14 G2-20X1003WGE | |
| Media Intel Core i5-1135G7 (0.619 - 0.727, n=59) | |
| Acer TravelMate P4 TMP414-51-59MR | |
| Lenovo ThinkPad L13 Gen2-21AB000PGE | |
| Lenovo ThinkBook 13s G3 20YA0005GE | |
| Media della classe Subnotebook (0.4024 - 1.456, n=58, ultimi 2 anni) | |
* ... Meglio usare valori piccoli
AIDA64: FP32 Ray-Trace | FPU Julia | CPU SHA3 | CPU Queen | FPU SinJulia | FPU Mandel | CPU AES | CPU ZLib | FP64 Ray-Trace | CPU PhotoWorxx
| Performance rating | |
| Lenovo ThinkBook 13s G3 20YA0005GE | |
| Media della classe Subnotebook | |
| Lenovo ThinkPad L13 Gen2-21AB000PGE | |
| Media Intel Core i5-1135G7 | |
| Lenovo ThinkPad L14 G2-20X1003WGE | |
| Acer TravelMate P4 TMP414-51-59MR | |
| Dell Latitude 5320-TM4V2 | |
| Dell Latitude 5310-23VP6 | |
| Lenovo ThinkBook 14 G2 ITL 20VDS02G00 | |
| AIDA64 / FP32 Ray-Trace | |
| Media della classe Subnotebook (1135 - 32888, n=58, ultimi 2 anni) | |
| Lenovo ThinkBook 13s G3 20YA0005GE | |
| Lenovo ThinkPad L13 Gen2-21AB000PGE | |
| Media Intel Core i5-1135G7 (4313 - 7952, n=45) | |
| Acer TravelMate P4 TMP414-51-59MR | |
| Lenovo ThinkPad L14 G2-20X1003WGE | |
| Dell Latitude 5320-TM4V2 | |
| Dell Latitude 5310-23VP6 | |
| Lenovo ThinkBook 14 G2 ITL 20VDS02G00 | |
| AIDA64 / FPU Julia | |
| Lenovo ThinkBook 13s G3 20YA0005GE | |
| Media della classe Subnotebook (5218 - 123315, n=58, ultimi 2 anni) | |
| Lenovo ThinkPad L13 Gen2-21AB000PGE | |
| Media Intel Core i5-1135G7 (19402 - 32283, n=45) | |
| Lenovo ThinkPad L14 G2-20X1003WGE | |
| Dell Latitude 5310-23VP6 | |
| Acer TravelMate P4 TMP414-51-59MR | |
| Dell Latitude 5320-TM4V2 | |
| Lenovo ThinkBook 14 G2 ITL 20VDS02G00 | |
| AIDA64 / CPU SHA3 | |
| Media della classe Subnotebook (444 - 5287, n=58, ultimi 2 anni) | |
| Lenovo ThinkBook 13s G3 20YA0005GE | |
| Media Intel Core i5-1135G7 (1316 - 2172, n=45) | |
| Lenovo ThinkPad L14 G2-20X1003WGE | |
| Acer TravelMate P4 TMP414-51-59MR | |
| Dell Latitude 5320-TM4V2 | |
| Lenovo ThinkPad L13 Gen2-21AB000PGE | |
| Dell Latitude 5310-23VP6 | |
| Lenovo ThinkBook 14 G2 ITL 20VDS02G00 | |
| AIDA64 / CPU Queen | |
| Lenovo ThinkBook 13s G3 20YA0005GE | |
| Lenovo ThinkPad L13 Gen2-21AB000PGE | |
| Media della classe Subnotebook (10579 - 95002, n=49, ultimi 2 anni) | |
| Dell Latitude 5310-23VP6 | |
| Acer TravelMate P4 TMP414-51-59MR | |
| Lenovo ThinkPad L14 G2-20X1003WGE | |
| Media Intel Core i5-1135G7 (39000 - 46951, n=45) | |
| Dell Latitude 5320-TM4V2 | |
| Lenovo ThinkBook 14 G2 ITL 20VDS02G00 | |
| AIDA64 / FPU SinJulia | |
| Lenovo ThinkBook 13s G3 20YA0005GE | |
| Lenovo ThinkPad L13 Gen2-21AB000PGE | |
| Media della classe Subnotebook (744 - 18418, n=58, ultimi 2 anni) | |
| Dell Latitude 5310-23VP6 | |
| Acer TravelMate P4 TMP414-51-59MR | |
| Media Intel Core i5-1135G7 (3497 - 4445, n=45) | |
| Lenovo ThinkPad L14 G2-20X1003WGE | |
| Dell Latitude 5320-TM4V2 | |
| Lenovo ThinkBook 14 G2 ITL 20VDS02G00 | |
| AIDA64 / FPU Mandel | |
| Lenovo ThinkBook 13s G3 20YA0005GE | |
| Media della classe Subnotebook (3341 - 65433, n=58, ultimi 2 anni) | |
| Lenovo ThinkPad L13 Gen2-21AB000PGE | |
| Media Intel Core i5-1135G7 (12569 - 19635, n=45) | |
| Acer TravelMate P4 TMP414-51-59MR | |
| Lenovo ThinkPad L14 G2-20X1003WGE | |
| Dell Latitude 5320-TM4V2 | |
| Dell Latitude 5310-23VP6 | |
| Lenovo ThinkBook 14 G2 ITL 20VDS02G00 | |
| AIDA64 / CPU AES | |
| Lenovo ThinkBook 13s G3 20YA0005GE | |
| Lenovo ThinkPad L14 G2-20X1003WGE | |
| Acer TravelMate P4 TMP414-51-59MR | |
| Media Intel Core i5-1135G7 (28988 - 67977, n=45) | |
| Media della classe Subnotebook (638 - 96917, n=58, ultimi 2 anni) | |
| Lenovo ThinkBook 14 G2 ITL 20VDS02G00 | |
| Dell Latitude 5320-TM4V2 | |
| Lenovo ThinkPad L13 Gen2-21AB000PGE | |
| Dell Latitude 5310-23VP6 | |
| AIDA64 / CPU ZLib | |
| Media della classe Subnotebook (164.9 - 1379, n=58, ultimi 2 anni) | |
| Lenovo ThinkBook 13s G3 20YA0005GE | |
| Lenovo ThinkPad L13 Gen2-21AB000PGE | |
| Lenovo ThinkPad L14 G2-20X1003WGE | |
| Acer TravelMate P4 TMP414-51-59MR | |
| Dell Latitude 5310-23VP6 | |
| Media Intel Core i5-1135G7 (265 - 373, n=51) | |
| Dell Latitude 5320-TM4V2 | |
| Lenovo ThinkBook 14 G2 ITL 20VDS02G00 | |
| AIDA64 / FP64 Ray-Trace | |
| Media della classe Subnotebook (610 - 17495, n=58, ultimi 2 anni) | |
| Lenovo ThinkBook 13s G3 20YA0005GE | |
| Lenovo ThinkPad L13 Gen2-21AB000PGE | |
| Media Intel Core i5-1135G7 (2226 - 4291, n=45) | |
| Acer TravelMate P4 TMP414-51-59MR | |
| Lenovo ThinkPad L14 G2-20X1003WGE | |
| Dell Latitude 5320-TM4V2 | |
| Dell Latitude 5310-23VP6 | |
| Lenovo ThinkBook 14 G2 ITL 20VDS02G00 | |
| AIDA64 / CPU PhotoWorxx | |
| Media della classe Subnotebook (6569 - 85600, n=58, ultimi 2 anni) | |
| Media Intel Core i5-1135G7 (9004 - 45366, n=45) | |
| Dell Latitude 5320-TM4V2 | |
| Lenovo ThinkBook 13s G3 20YA0005GE | |
| Lenovo ThinkPad L13 Gen2-21AB000PGE | |
| Dell Latitude 5310-23VP6 | |
| Acer TravelMate P4 TMP414-51-59MR | |
| Lenovo ThinkBook 14 G2 ITL 20VDS02G00 | |
| Lenovo ThinkPad L14 G2-20X1003WGE | |
Prestazioni del sistema
Le prestazioni del sistema sono ad un livello inferiore alla media. La maggior parte dei concorrenti sono più veloci qui, specialmente quelli con AMD (+40%!). Il campione in esame è alla pari con un Lenovo ThinkBook 14 G2 ITL, che ha un Tiger Lake Core i3. Specialmente il campo della produttività è sotto la media per il Latitude 5320.
Nell'uso pratico, tutti i compiti quotidiani potrebbero essere completati quasi senza ritardi, non ci sono stati problemi. Quindi, si tratta di una sottoperformance misurabile, ma non tangibile.
CrossMark: Overall | Productivity | Creativity | Responsiveness
| PCMark 10 / Score | |
| Media della classe Subnotebook (4920 - 9939, n=45, ultimi 2 anni) | |
| Lenovo ThinkBook 13s G3 20YA0005GE | |
| Lenovo ThinkPad L13 Gen2-21AB000PGE | |
| Dell XPS 13 9305 Core i5 FHD | |
| Acer TravelMate P4 TMP414-51-59MR | |
| Media Intel Core i5-1135G7, Intel Iris Xe Graphics G7 80EUs (4026 - 4952, n=53) | |
| Lenovo ThinkPad L14 G2-20X1003WGE | |
| Dell Latitude 5320-TM4V2 | |
| Lenovo ThinkBook 14 G2 ITL 20VDS02G00 | |
| Dell Latitude 5310-23VP6 | |
| PCMark 10 / Essentials | |
| Media della classe Subnotebook (8552 - 11646, n=45, ultimi 2 anni) | |
| Lenovo ThinkBook 13s G3 20YA0005GE | |
| Lenovo ThinkPad L13 Gen2-21AB000PGE | |
| Dell XPS 13 9305 Core i5 FHD | |
| Media Intel Core i5-1135G7, Intel Iris Xe Graphics G7 80EUs (8149 - 9917, n=53) | |
| Dell Latitude 5320-TM4V2 | |
| Acer TravelMate P4 TMP414-51-59MR | |
| Lenovo ThinkBook 14 G2 ITL 20VDS02G00 | |
| Lenovo ThinkPad L14 G2-20X1003WGE | |
| Dell Latitude 5310-23VP6 | |
| PCMark 10 / Productivity | |
| Media della classe Subnotebook (5435 - 16606, n=45, ultimi 2 anni) | |
| Lenovo ThinkBook 13s G3 20YA0005GE | |
| Lenovo ThinkPad L13 Gen2-21AB000PGE | |
| Dell Latitude 5310-23VP6 | |
| Lenovo ThinkBook 14 G2 ITL 20VDS02G00 | |
| Acer TravelMate P4 TMP414-51-59MR | |
| Dell XPS 13 9305 Core i5 FHD | |
| Lenovo ThinkPad L14 G2-20X1003WGE | |
| Media Intel Core i5-1135G7, Intel Iris Xe Graphics G7 80EUs (5040 - 6619, n=53) | |
| Dell Latitude 5320-TM4V2 | |
| PCMark 10 / Digital Content Creation | |
| Media della classe Subnotebook (5722 - 13779, n=45, ultimi 2 anni) | |
| Lenovo ThinkBook 13s G3 20YA0005GE | |
| Lenovo ThinkPad L13 Gen2-21AB000PGE | |
| Acer TravelMate P4 TMP414-51-59MR | |
| Dell XPS 13 9305 Core i5 FHD | |
| Lenovo ThinkPad L14 G2-20X1003WGE | |
| Dell Latitude 5320-TM4V2 | |
| Media Intel Core i5-1135G7, Intel Iris Xe Graphics G7 80EUs (3548 - 5255, n=53) | |
| Lenovo ThinkBook 14 G2 ITL 20VDS02G00 | |
| Dell Latitude 5310-23VP6 | |
| CrossMark / Overall | |
| Media della classe Subnotebook (365 - 2356, n=60, ultimi 2 anni) | |
| Lenovo ThinkBook 13s G3 20YA0005GE | |
| Media Intel Core i5-1135G7, Intel Iris Xe Graphics G7 80EUs (1058 - 1293, n=11) | |
| Acer TravelMate P4 TMP414-51-59MR | |
| Dell Latitude 5320-TM4V2 | |
| Lenovo ThinkBook 14 G2 ITL 20VDS02G00 | |
| CrossMark / Productivity | |
| Media della classe Subnotebook (364 - 2277, n=60, ultimi 2 anni) | |
| Lenovo ThinkBook 13s G3 20YA0005GE | |
| Media Intel Core i5-1135G7, Intel Iris Xe Graphics G7 80EUs (1148 - 1332, n=11) | |
| Acer TravelMate P4 TMP414-51-59MR | |
| Lenovo ThinkBook 14 G2 ITL 20VDS02G00 | |
| Dell Latitude 5320-TM4V2 | |
| CrossMark / Creativity | |
| Media della classe Subnotebook (372 - 2743, n=60, ultimi 2 anni) | |
| Lenovo ThinkBook 13s G3 20YA0005GE | |
| Media Intel Core i5-1135G7, Intel Iris Xe Graphics G7 80EUs (895 - 1263, n=11) | |
| Dell Latitude 5320-TM4V2 | |
| Acer TravelMate P4 TMP414-51-59MR | |
| Lenovo ThinkBook 14 G2 ITL 20VDS02G00 | |
| CrossMark / Responsiveness | |
| Media della classe Subnotebook (312 - 1854, n=60, ultimi 2 anni) | |
| Media Intel Core i5-1135G7, Intel Iris Xe Graphics G7 80EUs (923 - 1320, n=11) | |
| Lenovo ThinkBook 13s G3 20YA0005GE | |
| Lenovo ThinkBook 14 G2 ITL 20VDS02G00 | |
| Acer TravelMate P4 TMP414-51-59MR | |
| Dell Latitude 5320-TM4V2 | |
| PCMark 10 Score | 4325 punti | |
Aiuto | ||
| AIDA64 / Memory Copy | |
| Media della classe Subnotebook (14554 - 131023, n=58, ultimi 2 anni) | |
| Media Intel Core i5-1135G7 (17443 - 63889, n=45) | |
| Lenovo ThinkBook 13s G3 20YA0005GE | |
| Lenovo ThinkPad L13 Gen2-21AB000PGE | |
| Dell Latitude 5320-TM4V2 | |
| Dell Latitude 5310-23VP6 | |
| Lenovo ThinkPad L14 G2-20X1003WGE | |
| Acer TravelMate P4 TMP414-51-59MR | |
| Lenovo ThinkBook 14 G2 ITL 20VDS02G00 | |
| AIDA64 / Memory Read | |
| Media della classe Subnotebook (15948 - 127174, n=58, ultimi 2 anni) | |
| Media Intel Core i5-1135G7 (19716 - 63705, n=45) | |
| Dell Latitude 5320-TM4V2 | |
| Lenovo ThinkPad L13 Gen2-21AB000PGE | |
| Lenovo ThinkBook 13s G3 20YA0005GE | |
| Acer TravelMate P4 TMP414-51-59MR | |
| Lenovo ThinkPad L14 G2-20X1003WGE | |
| Lenovo ThinkBook 14 G2 ITL 20VDS02G00 | |
| Dell Latitude 5310-23VP6 | |
| AIDA64 / Memory Write | |
| Media della classe Subnotebook (15709 - 135141, n=58, ultimi 2 anni) | |
| Media Intel Core i5-1135G7 (18722 - 66778, n=45) | |
| Dell Latitude 5320-TM4V2 | |
| Lenovo ThinkBook 13s G3 20YA0005GE | |
| Lenovo ThinkPad L13 Gen2-21AB000PGE | |
| Acer TravelMate P4 TMP414-51-59MR | |
| Lenovo ThinkPad L14 G2-20X1003WGE | |
| Dell Latitude 5310-23VP6 | |
| Lenovo ThinkBook 14 G2 ITL 20VDS02G00 | |
| AIDA64 / Memory Latency | |
| Lenovo ThinkPad L13 Gen2-21AB000PGE | |
| Lenovo ThinkBook 13s G3 20YA0005GE | |
| Dell Latitude 5310-23VP6 | |
| Media della classe Subnotebook (6.1 - 159.9, n=56, ultimi 2 anni) | |
| Lenovo ThinkBook 14 G2 ITL 20VDS02G00 | |
| Lenovo ThinkPad L14 G2-20X1003WGE | |
| Acer TravelMate P4 TMP414-51-59MR | |
| Dell Latitude 5320-TM4V2 | |
| Media Intel Core i5-1135G7 (68.3 - 107, n=51) | |
* ... Meglio usare valori piccoli
Latenze DPC
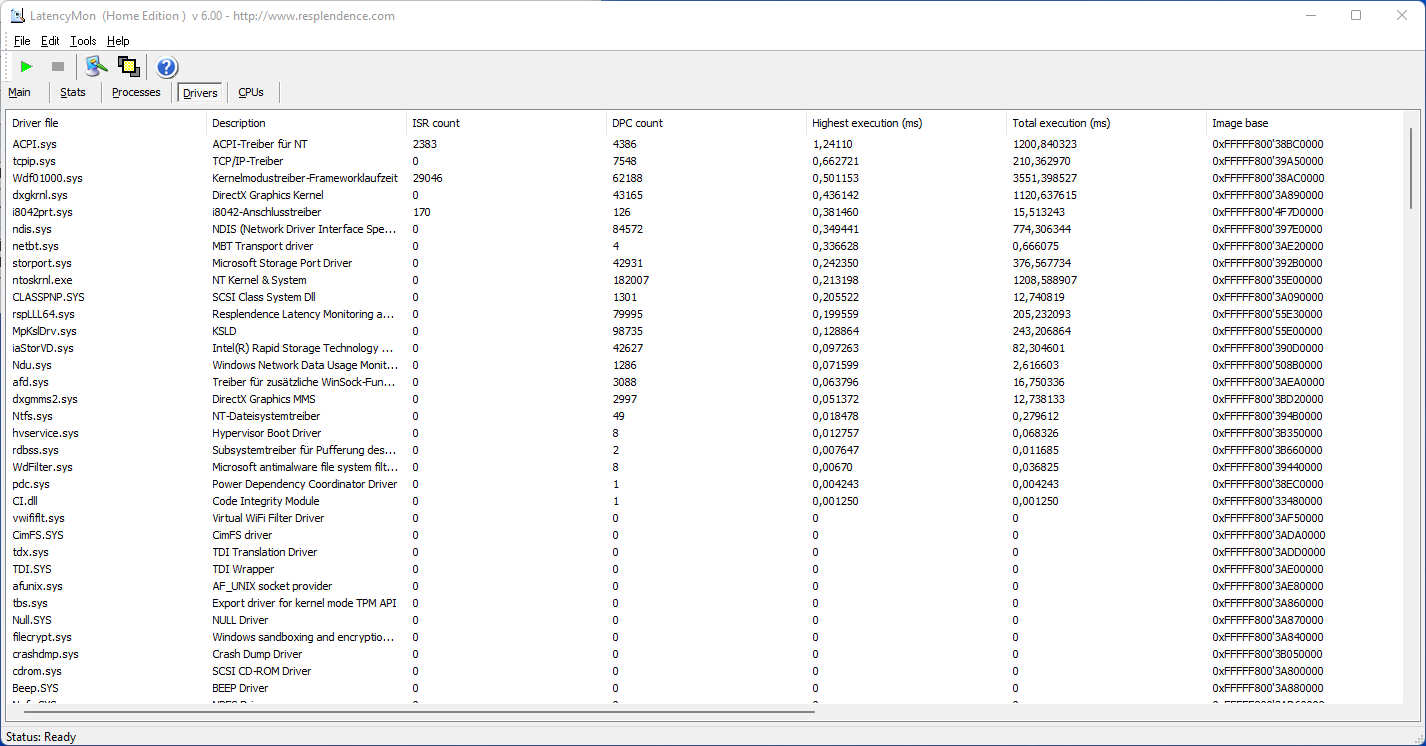
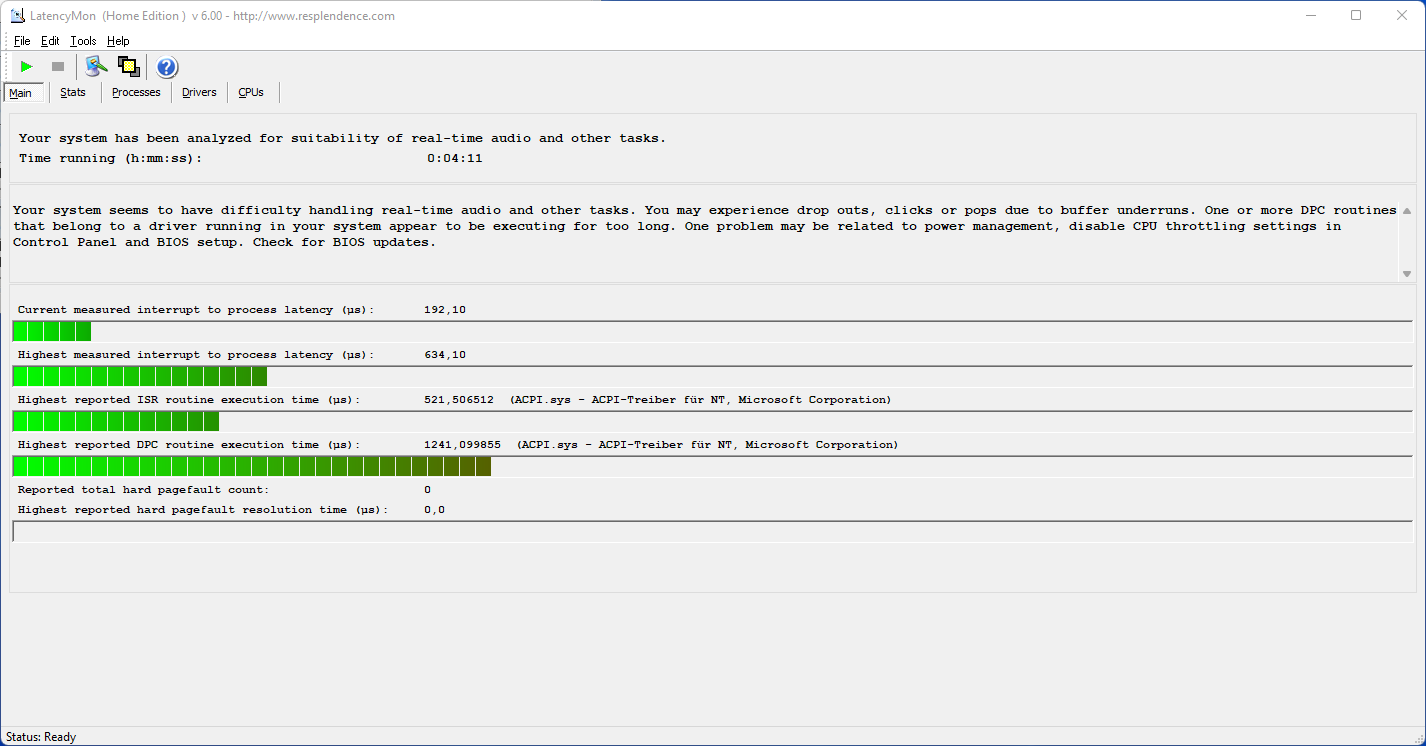
Abbiamo potuto determinare solo basse interruzioni nel test LatencyMon DPC con il nostro Latitude 5320. I driver ACPI del nostro dispositivo erano la ragione di questo. Il test DPC indica la configurazione attuale del driver.
| DPC Latencies / LatencyMon - interrupt to process latency (max), Web, Youtube, Prime95 | |
| Acer TravelMate P4 TMP414-51-59MR | |
| Lenovo ThinkBook 14 G2 ITL 20VDS02G00 | |
| Lenovo ThinkPad L14 G2-20X1003WGE | |
| Dell Latitude 5320-TM4V2 | |
| Lenovo ThinkPad L13 Gen2-21AB000PGE | |
| Lenovo ThinkBook 13s G3 20YA0005GE | |
| Dell XPS 13 9305 Core i5 FHD | |
* ... Meglio usare valori piccoli
Stoccaggio
L'unità di sistema nella nostra unità di recensione è un SSD da 256 GB di Kioxia (ex divisione SSD di Toshiba), che è collegato tramite l'interfaccia M.2 PCIe 3. Le prestazioni dell'SSD sono quasi il 40% al di sotto della concorrenza. Questa potrebbe essere la ragione del basso punteggio in PCMark 10.
Altri benchmark di questo e altri SSD sono disponibili nella nostra sezione tecnologia.

| Drive Performance rating - Percent | |
| Media della classe Subnotebook | |
| Lenovo ThinkPad L14 G2-20X1003WGE | |
| Dell XPS 13 9305 Core i5 FHD | |
| Lenovo ThinkPad L13 Gen2-21AB000PGE | |
| Lenovo ThinkBook 13s G3 20YA0005GE | |
| Lenovo ThinkBook 14 G2 ITL 20VDS02G00 | |
| Acer TravelMate P4 TMP414-51-59MR | |
| Media Toshiba KBG40ZNS256G NVMe | |
| Dell Latitude 5320-TM4V2 | |
* ... Meglio usare valori piccoli
Continuous load read: DiskSpd Read Loop, Queue Depth 8
Scheda grafica
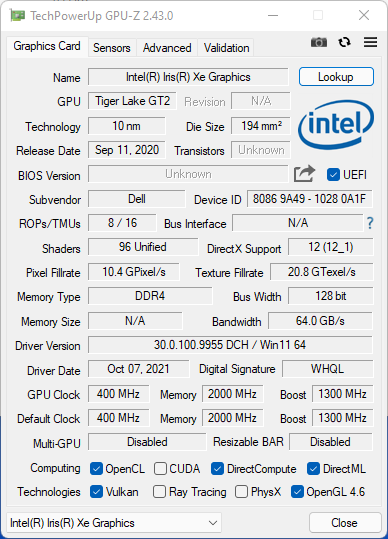
Dell si affida alla iGPU per la soluzione grafica Intel Iris Xe G7 iGPU con 80 UE. Le sue prestazioni dipendono dalla configurazione della memoria di lavoro installata e dall'efficacia della soluzione di raffreddamento. Le prestazioni sono medie o quasi medie nei test 3DMark.
| 3DMark Performance rating - Percent | |
| Media della classe Subnotebook | |
| Dell XPS 13 9305 Core i5 FHD | |
| Lenovo ThinkBook 13s G3 20YA0005GE | |
| Media Intel Iris Xe Graphics G7 80EUs | |
| Dell Latitude 5320-TM4V2 | |
| Lenovo ThinkPad L13 Gen2-21AB000PGE | |
| Acer TravelMate P4 TMP414-51-59MR | |
| Lenovo ThinkPad L14 G2-20X1003WGE | |
| Lenovo ThinkBook 14 G2 ITL 20VDS02G00 | |
| Dell Latitude 5310-23VP6 -2! | |
| 3DMark 11 - 1280x720 Performance GPU | |
| Media della classe Subnotebook (995 - 18489, n=55, ultimi 2 anni) | |
| Lenovo ThinkBook 13s G3 20YA0005GE | |
| Dell XPS 13 9305 Core i5 FHD | |
| Media Intel Iris Xe Graphics G7 80EUs (2246 - 6579, n=112) | |
| Dell Latitude 5320-TM4V2 | |
| Lenovo ThinkPad L13 Gen2-21AB000PGE | |
| Acer TravelMate P4 TMP414-51-59MR | |
| Lenovo ThinkPad L14 G2-20X1003WGE | |
| Lenovo ThinkBook 14 G2 ITL 20VDS02G00 | |
| 3DMark | |
| 1920x1080 Fire Strike Graphics | |
| Media della classe Subnotebook (832 - 16347, n=56, ultimi 2 anni) | |
| Dell XPS 13 9305 Core i5 FHD | |
| Media Intel Iris Xe Graphics G7 80EUs (1560 - 5398, n=114) | |
| Lenovo ThinkBook 13s G3 20YA0005GE | |
| Dell Latitude 5320-TM4V2 | |
| Lenovo ThinkPad L13 Gen2-21AB000PGE | |
| Acer TravelMate P4 TMP414-51-59MR | |
| Lenovo ThinkPad L14 G2-20X1003WGE | |
| Lenovo ThinkBook 14 G2 ITL 20VDS02G00 | |
| Dell Latitude 5310-23VP6 | |
| 2560x1440 Time Spy Graphics | |
| Media della classe Subnotebook (804 - 6288, n=55, ultimi 2 anni) | |
| Dell XPS 13 9305 Core i5 FHD | |
| Media Intel Iris Xe Graphics G7 80EUs (561 - 1576, n=111) | |
| Dell Latitude 5320-TM4V2 | |
| Lenovo ThinkBook 13s G3 20YA0005GE | |
| Lenovo ThinkPad L13 Gen2-21AB000PGE | |
| Acer TravelMate P4 TMP414-51-59MR | |
| Lenovo ThinkPad L14 G2-20X1003WGE | |
| Lenovo ThinkBook 14 G2 ITL 20VDS02G00 | |
| 3DMark 11 Performance | 5287 punti | |
| 3DMark Fire Strike Score | 3013 punti | |
| 3DMark Time Spy Score | 1274 punti | |
Aiuto | ||
Prestazioni di gioco
Il Latitude non è un notebook da gioco. Giocare agli attuali titoli AAA è in gran parte impossibile. Se volete comunque giocare sul dispositivo, potete collegare un display esterno e una eGPU attraverso le due porte Thunderbolt 4. Tuttavia, i benefici di una tale configurazione sono discutibili, perché non è possibile utilizzare tutte le prestazioni della scheda grafica integrata. Il collo di bottiglia non sarebbe Thunderbolt 4, ma il processore a basso voltaggio.
Nei giochi, l'iGPU si comporta ad un livello molto basso, ma medio per la sua costruzione. Se volete ottenere un po' di più - senza usare una dGPU - dovreste guardare i dispositivi con una Radeon RX Vega 8 come il Lenovo ThinkBook 13s G3.
Le prestazioni di altre schede grafiche testate da noi possono essere confrontate nella nostra lista di benchmark GPU.
| Final Fantasy XV Benchmark - 1280x720 Lite Quality | |
| Media della classe Subnotebook (21.4 - 129.8, n=55, ultimi 2 anni) | |
| Lenovo ThinkBook 13s G3 20YA0005GE | |
| Dell XPS 13 9305 Core i5 FHD | |
| Media Intel Iris Xe Graphics G7 80EUs (8.32 - 45.6, n=107) | |
| Dell Latitude 5320-TM4V2 | |
| Acer TravelMate P4 TMP414-51-59MR | |
| Lenovo ThinkPad L14 G2-20X1003WGE | |
| Lenovo ThinkBook 14 G2 ITL 20VDS02G00 | |
| Far Cry 5 - 1280x720 Low Preset AA:T | |
| Media della classe Subnotebook (36 - 104, n=24, ultimi 2 anni) | |
| Media Intel Iris Xe Graphics G7 80EUs (14 - 63, n=50) | |
| Lenovo ThinkPad L13 Gen2-21AB000PGE | |
| Dell Latitude 5320-TM4V2 | |
| God of War - 1920x1080 Low Preset | |
| Media Intel Iris Xe Graphics G7 80EUs (14 - 21.1, n=5) | |
| Dell Latitude 5320-TM4V2 | |
| Strange Brigade - 1920x1080 medium AA:medium AF:4 | |
| Media della classe Subnotebook (29.8 - 137.5, n=50, ultimi 2 anni) | |
| Dell XPS 13 9305 Core i5 FHD | |
| Media Intel Iris Xe Graphics G7 80EUs (6 - 48.8, n=86) | |
| Lenovo ThinkPad L13 Gen2-21AB000PGE | |
| Dell Latitude 5320-TM4V2 | |
| Acer TravelMate P4 TMP414-51-59MR | |
| Lenovo ThinkBook 14 G2 ITL 20VDS02G00 | |
| Dell Latitude 5310-23VP6 | |
| basso | medio | alto | ultra | |
|---|---|---|---|---|
| The Witcher 3 (2015) | 54.7 | 36.5 | 13.6 | |
| Final Fantasy XV Benchmark (2018) | 29.2 | 18 | 11.9 | |
| Far Cry 5 (2018) | 30 | 18 | 17 | |
| Strange Brigade (2018) | 62.6 | 25.1 | 20.8 | 17.4 |
| God of War (2022) | 15.7 | 14.6 |
Emissioni: il PC mobile di Dell è per lo più silenzioso
Emissioni di rumore
La ventola è spesso silenziosa in idle e a basso carico. Sotto carico, tuttavia, alza il volume e abbiamo misurato un impressionante 51 dB(A) all'inizio dello stress test. La modalità Ultra Performance di Dell gioca un ruolo qui - senza di essa, il raffreddamento non si alza così tanto. Il carico semplice d'altra parte è ragionevole a 38 dB(A) nella stessa modalità Temp.
Rumorosità
| Idle |
| 26 / 26 / 27.5 dB(A) |
| Sotto carico |
| 38 / 51 dB(A) |
 | ||
30 dB silenzioso 40 dB(A) udibile 50 dB(A) rumoroso |
||
min: | ||
| Dell Latitude 5320-TM4V2 Iris Xe G7 80EUs, i5-1135G7, Toshiba KBG40ZNS256G NVMe | Lenovo ThinkBook 13s G3 20YA0005GE Vega 8, R7 5800U, WDC PC SN530 SDBPNPZ-512G | Dell XPS 13 9305 Core i5 FHD Iris Xe G7 80EUs, i5-1135G7, Samsung PM9A1 MZVL2512HCJQ | Lenovo ThinkPad L13 Gen2-21AB000PGE Vega 7, R5 PRO 5650U, SK Hynix HFS512 GDE9X081N | Lenovo ThinkBook 14 G2 ITL 20VDS02G00 UHD Graphics Xe G4 48EUs, i3-1115G4, Samsung PM991A MZALQ256HBJD | |
|---|---|---|---|---|---|
| Noise | 1% | 9% | 1% | 5% | |
| off /ambiente * (dB) | 26 | 24.7 5% | 26 -0% | 25 4% | 24.6 5% |
| Idle Minimum * (dB) | 26 | 24.7 5% | 26 -0% | 25 4% | 24.6 5% |
| Idle Average * (dB) | 26 | 27 -4% | 26 -0% | 25 4% | 24.6 5% |
| Idle Maximum * (dB) | 27.5 | 29.8 -8% | 26 5% | 27.8 -1% | 26.7 3% |
| Load Average * (dB) | 38 | 42.4 -12% | 33.5 12% | 44.1 -16% | 38.9 -2% |
| Load Maximum * (dB) | 51 | 42.4 17% | 33.5 34% | 44.3 13% | 42.8 16% |
| Witcher 3 ultra * (dB) | 42.4 | 33.5 |
* ... Meglio usare valori piccoli
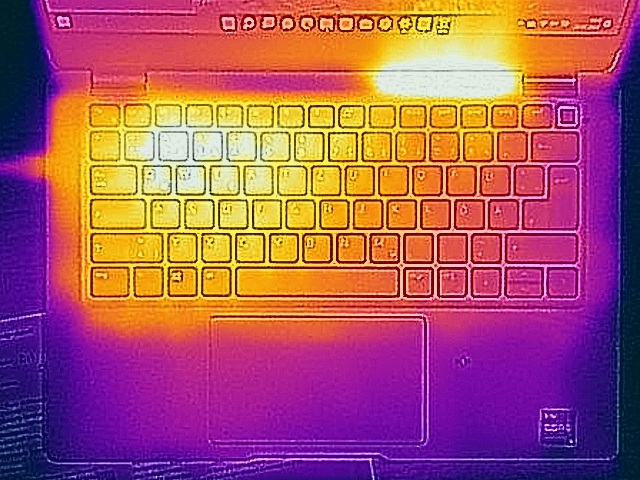
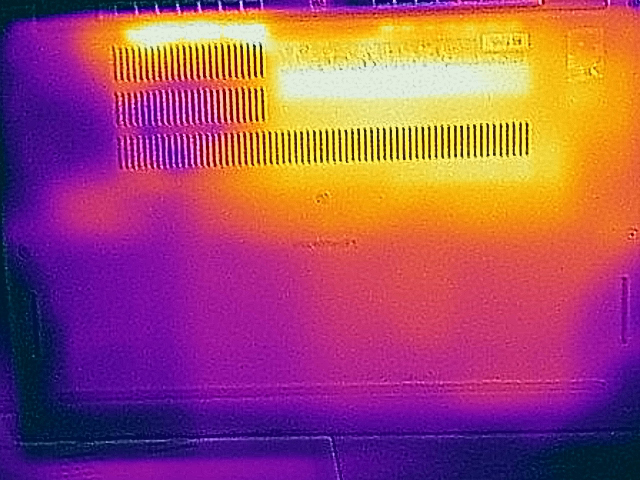
Temperatura
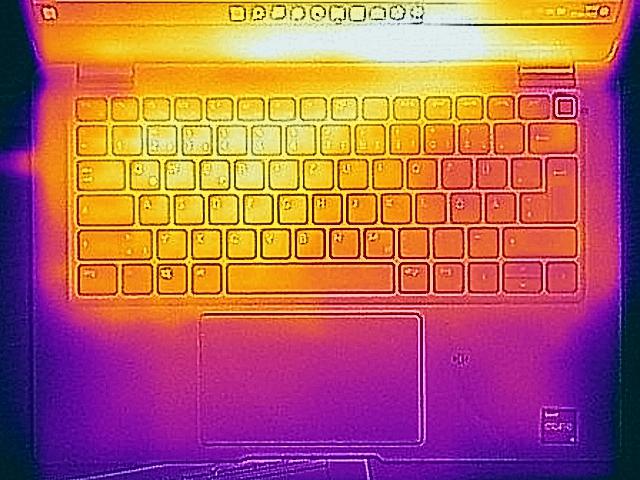
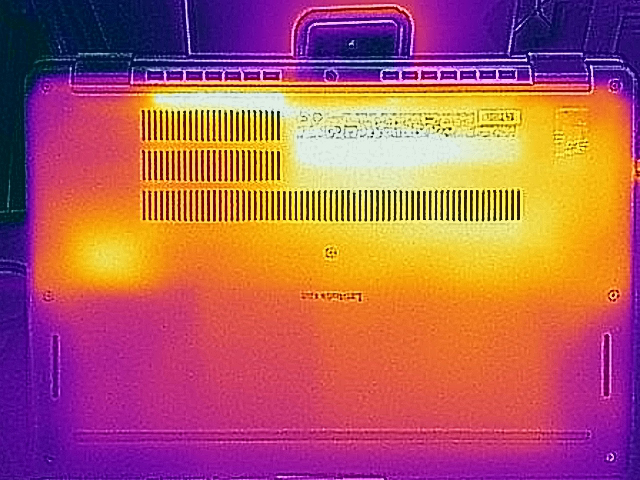
Il Latitude non si scalda eccessivamente nemmeno nello stress test. Nel frattempo, abbiamo registrato temperature di 43 gradi Celsius in alcuni punti di misurazione, ma solo selettivamente. Nell'uso quotidiano, i tassi sono costantemente all'interno della zona verde, raggiungendo solo 35 gradi in alcuni punti.
(+) La temperatura massima sul lato superiore è di 38.6 °C / 101 F, rispetto alla media di 35.9 °C / 97 F, che varia da 21.4 a 59 °C per questa classe Subnotebook.
(±) Il lato inferiore si riscalda fino ad un massimo di 42.9 °C / 109 F, rispetto alla media di 39.2 °C / 103 F
(+) In idle, la temperatura media del lato superiore è di 28.5 °C / 83 F, rispetto alla media deld ispositivo di 30.8 °C / 87 F.
(+) I poggiapolsi e il touchpad sono piu' freddi della temperatura della pelle con un massimo di 25.1 °C / 77.2 F e sono quindi freddi al tatto.
(+) La temperatura media della zona del palmo della mano di dispositivi simili e'stata di 28.2 °C / 82.8 F (+3.1 °C / 5.6 F).
| Dell Latitude 5320-TM4V2 Intel Core i5-1135G7, Intel Iris Xe Graphics G7 80EUs | Lenovo ThinkBook 13s G3 20YA0005GE AMD Ryzen 7 5800U, AMD Radeon RX Vega 8 (Ryzen 4000/5000) | Dell XPS 13 9305 Core i5 FHD Intel Core i5-1135G7, Intel Iris Xe Graphics G7 80EUs | Lenovo ThinkPad L13 Gen2-21AB000PGE AMD Ryzen 5 PRO 5650U, AMD Radeon RX Vega 7 | Lenovo ThinkBook 14 G2 ITL 20VDS02G00 Intel Core i3-1115G4, Intel UHD Graphics Xe G4 48EUs | |
|---|---|---|---|---|---|
| Heat | 18% | 8% | -1% | 14% | |
| Maximum Upper Side * (°C) | 38.6 | 36.5 5% | 43.5 -13% | 42.7 -11% | 35 9% |
| Maximum Bottom * (°C) | 42.9 | 39.6 8% | 44.8 -4% | 44.9 -5% | 38 11% |
| Idle Upper Side * (°C) | 35.3 | 24.5 31% | 26.2 26% | 32.6 8% | 28 21% |
| Idle Bottom * (°C) | 34.9 | 25 28% | 26.4 24% | 33.9 3% | 30 14% |
* ... Meglio usare valori piccoli
Test da sforzo
Il nostro stress test (Prime95 e Furmark eseguiti per almeno un'ora) elabora la CPU a 3,1 GHz per alcuni secondi. Poi la velocità scende a 1,2 GHz (CPU) e rimane a questo livello. La potenza del pacchetto scende da 47 watt a 18 watt per un breve periodo in questo test. Lo stress test è uno scenario estremo che non si verifica nell'uso quotidiano. Usiamo questo test per controllare se il sistema funziona stabilmente anche sotto pieno carico.
Altoparlante
Gli altoparlanti stereo hanno trovato il loro posto nella zona anteriore della parte inferiore del dispositivo. Producono un suono decente, ma non molto forte. Gli altoparlanti sono pesanti negli alti e nei medi, e i bassi sono trascurati. Il microfono dual-array accanto alla webcam fornisce registrazioni molto buone, indipendentemente dal fatto che l'oratore stia parlando a mezzo metro o a due metri di fronte al dispositivo. Una cuffia può essere collegata tramite la porta combo jack da 3,5 mm.
Dell Latitude 5320-TM4V2 analisi audio
(±) | potenza degli altiparlanti media ma buona (81 dB)
Bassi 100 - 315 Hz
(-) | quasi nessun basso - in media 21.7% inferiori alla media
(±) | la linearità dei bassi è media (14.2% delta rispetto alla precedente frequenza)
Medi 400 - 2000 Hz
(+) | medi bilanciati - solo only 3.2% rispetto alla media
(+) | medi lineari (5.1% delta rispetto alla precedente frequenza)
Alti 2 - 16 kHz
(±) | alti elevati - circa 5.2% superiori alla media
(+) | alti lineari (5.6% delta rispetto alla precedente frequenza)
Nel complesso 100 - 16.000 Hz
(±) | la linearità complessiva del suono è media (15.6% di differenza rispetto alla media
Rispetto alla stessa classe
» 36% di tutti i dispositivi testati in questa classe è stato migliore, 5% simile, 58% peggiore
» Il migliore ha avuto un delta di 5%, medio di 18%, peggiore di 53%
Rispetto a tutti i dispositivi testati
» 23% di tutti i dispositivi testati in questa classe è stato migliore, 5% similare, 72% peggiore
» Il migliore ha avuto un delta di 4%, medio di 23%, peggiore di 134%
Lenovo ThinkPad L13 Gen2-21AB000PGE analisi audio
(+) | gli altoparlanti sono relativamente potenti (82.4 dB)
Bassi 100 - 315 Hz
(-) | quasi nessun basso - in media 25.6% inferiori alla media
(±) | la linearità dei bassi è media (13.8% delta rispetto alla precedente frequenza)
Medi 400 - 2000 Hz
(+) | medi bilanciati - solo only 3.3% rispetto alla media
(+) | medi lineari (4.6% delta rispetto alla precedente frequenza)
Alti 2 - 16 kHz
(+) | Alti bilanciati - appena 4.1% dalla media
(+) | alti lineari (6.5% delta rispetto alla precedente frequenza)
Nel complesso 100 - 16.000 Hz
(±) | la linearità complessiva del suono è media (19% di differenza rispetto alla media
Rispetto alla stessa classe
» 58% di tutti i dispositivi testati in questa classe è stato migliore, 6% simile, 36% peggiore
» Il migliore ha avuto un delta di 5%, medio di 18%, peggiore di 53%
Rispetto a tutti i dispositivi testati
» 45% di tutti i dispositivi testati in questa classe è stato migliore, 7% similare, 48% peggiore
» Il migliore ha avuto un delta di 4%, medio di 23%, peggiore di 134%
Gestione dell'energia - laptop business con 10 ore di autonomia
Consumo di energia
Non c'è nessun problema in termini di consumo di energia. Abbiamo misurato il consumo massimo di 7,8 watt in idle, meno di qualsiasi altro modello nel campo dei test. Durante lo stress test (Prime95 e Furmark), il valore aumenta fino a 67 watts per alcuni secondi. La potenza nominale dell'alimentatore USB Type-C incluso è di 65 watt.
| Off / Standby | |
| Idle | |
| Sotto carico |
|
Leggenda:
min: | |
| Dell Latitude 5320-TM4V2 i5-1135G7, Iris Xe G7 80EUs, Toshiba KBG40ZNS256G NVMe, IPS, 1920x1080, 13.3" | Lenovo ThinkBook 13s G3 20YA0005GE R7 5800U, Vega 8, WDC PC SN530 SDBPNPZ-512G, IPS, 1920x1200, 13.3" | Lenovo ThinkPad L13 Gen2-21AB000PGE R5 PRO 5650U, Vega 7, SK Hynix HFS512 GDE9X081N, IPS, 1920x1080, 13.3" | Lenovo ThinkBook 14 G2 ITL 20VDS02G00 i3-1115G4, UHD Graphics Xe G4 48EUs, Samsung PM991A MZALQ256HBJD, a-Si IPS LED, 1920x1080, 14" | Media Intel Iris Xe Graphics G7 80EUs | Media della classe Subnotebook | |
|---|---|---|---|---|---|---|
| Power Consumption | -17% | 2% | -30% | -11% | -4% | |
| Idle Minimum * (Watt) | 3.4 | 5 -47% | 4.4 -29% | 6.3 -85% | 4.49 ? -32% | 3.76 ? -11% |
| Idle Average * (Watt) | 6 | 8.2 -37% | 7.6 -27% | 9.5 -58% | 7.4 ? -23% | 6.54 ? -9% |
| Idle Maximum * (Watt) | 7.8 | 9 -15% | 9.5 -22% | 10.4 -33% | 9.26 ? -19% | 7.89 ? -1% |
| Load Average * (Watt) | 41 | 45 -10% | 33 20% | 32.7 20% | 36.6 ? 11% | 42 ? -2% |
| Witcher 3 ultra * (Watt) | 37.9 | 45.1 -19% | 33.4 12% 33.3 12% | |||
| Load Maximum * (Watt) | 67 | 51.2 24% | 32.5 51% | 63.3 6% | 61.7 ? 8% | 64.8 ? 3% |
* ... Meglio usare valori piccoli
Power consumption Witcher 3 / Stresstest
Power consumption with external monitor
Durata della batteria
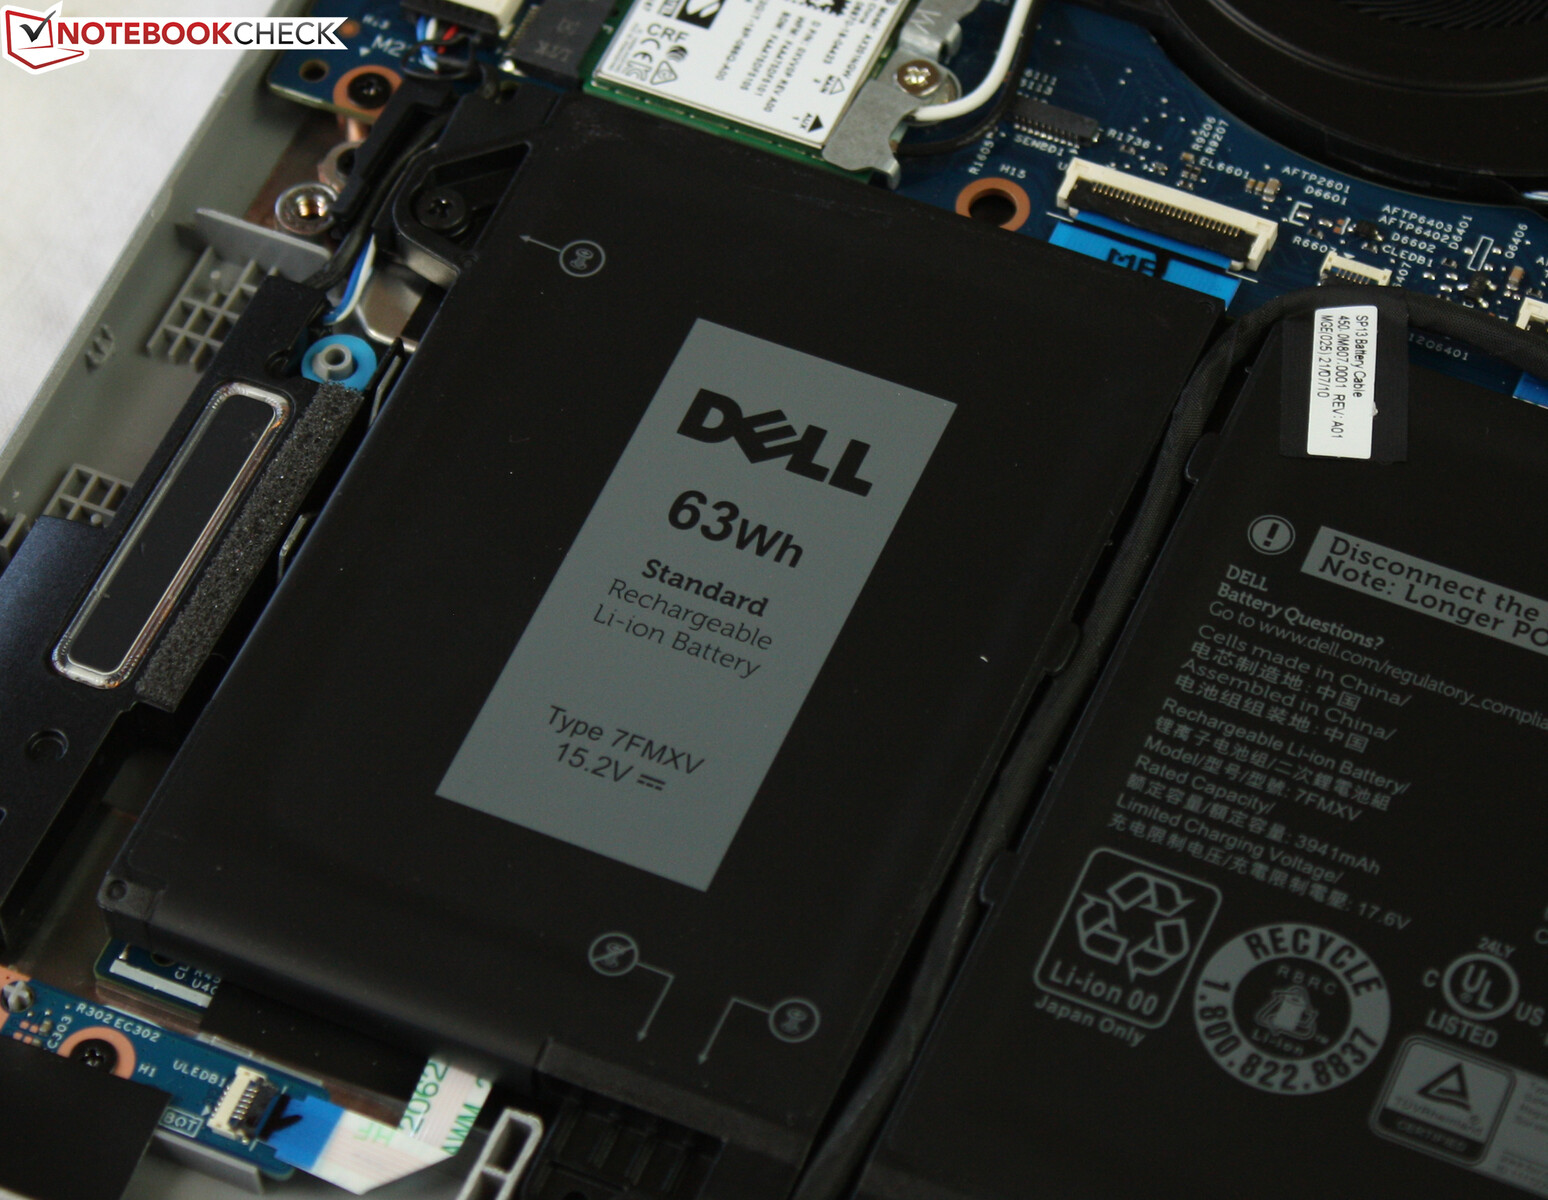
I 63 Wh di autonomia della batteria sono buoni. Il 13,3 pollici ha finito il nostro test WLAN (apertura di siti web tramite uno script) dopo dieci ore. Questo non è insolito per i notebook moderni, come mostra la concorrenza con due eccezioni. Interessante: il predecessore Latitude 5310 dura un'ora in più. Tuttavia, il vero contendente in termini di durata della batteria è il Lenovo ThinkPad L13 Gen2 con le sue undici ore, che l'AMD 13-incher gestisce con solo 46 watt-ora di batteria.
L'autonomia massima accertata è di poco più di 21 ore. Questo non è di utilità pratica perché la luminosità è stata ridotta al minimo e i moduli wireless sono stati disabilitati (inattivo, senza carico).
| Dell Latitude 5320-TM4V2 i5-1135G7, Iris Xe G7 80EUs, 63 Wh | Dell Latitude 5310-23VP6 i5-10310U, UHD Graphics 620, 60 Wh | Lenovo ThinkBook 13s G3 20YA0005GE R7 5800U, Vega 8, 56 Wh | Lenovo ThinkPad L13 Gen2-21AB000PGE R5 PRO 5650U, Vega 7, 46 Wh | Lenovo ThinkPad L14 G2-20X1003WGE i5-1135G7, Iris Xe G7 80EUs, 45 Wh | Lenovo ThinkBook 14 G2 ITL 20VDS02G00 i3-1115G4, UHD Graphics Xe G4 48EUs, 58 Wh | Media della classe Subnotebook | |
|---|---|---|---|---|---|---|---|
| Autonomia della batteria | 10% | 9% | -11% | -32% | -24% | 21% | |
| Reader / Idle (h) | 21.3 | 17.2 -19% | 13.2 -38% | 28.6 ? 34% | |||
| WiFi v1.3 (h) | 10.1 | 11.1 10% | 11 9% | 11 9% | 6.9 -32% | 7.6 -25% | 14 ? 39% |
| Load (h) | 2.2 | 1.7 -23% | 2 -9% | 1.969 ? -10% | |||
| H.264 (h) | 15.6 | 8.8 | 15.4 ? |
Pro
Contro
Verdetto - Il computer portatile Dell fa fiasco nello show

Il Latitude 5320 di Dell ottiene l'84% nella valutazione. Questo è un buon risultato, ma non può tenere il passo con i punteggi dei rivali di Lenovo (86-88%). Come può essere, dato che i tempi di esecuzione sono forti, c'è Thunderbolt 4, e le emissioni non potrebbero essere inferiori?
Il Latitude 5320 ha alcuni punti deboli che non avrebbero dovuto esserci e che costano al dispositivo punti importanti in totale
Queste sono le ragioni per il declassamento della valutazione: In primo luogo, siamo stati infastiditi dal ClickPad senza tasti fisici. Non c'è quasi nessun feedback aptico, il che si traduce in un punto di pressione appena percettibile. Non ci è piaciuto usare questo touchpad.
Altri punti deboli sono il display - rispetto al predecessore e alla concorrenza - che è debole sotto quasi tutti i punti di vista: spazio colore, luminosità e riproduzione dei colori - tutto deve essere migliorato. Infine, anche la RAM è onboard, un passo indietro rispetto al predecessore Latitude 5310.
Inoltre, il processore Tiger-Lake si comporta sotto la media, le termiche gli permettono solo una prestazione limitata. Così, la macchina Intel cade ancora più indietro rispetto ai portatili AMD
Si ottiene più display e migliori dispositivi di input se si prende il predecessore 5310, che attualmente si può ancora trovare nei negozi. Le prestazioni del processore di Comet Lake sono solo leggermente inferiori, e il tempo di esecuzione è addirittura un'ora più lungo.
Si ottiene più tempo di esecuzione e più prestazioni con il ThinkPad L13 Gen2 - ma il display non è molto meglio qui. Se le prestazioni e il display devono essere buoni, allora il ThinkBook 13s G3 potrebbe essere un'opzione: l'AMD Ryzen porta significativamente più prestazioni sul tavolo.
Prezzo e disponibilità
L'unità per la recensione Latitude 5320-TM4V2 è attualmente disponibile per 1.190 euro su Cyberport. Il Latitude 5320-TM4V2 è sugli scaffali a 1.000 euro presso notebooksbilliger.
Dell Latitude 5320-TM4V2
- 03/11/2022 v7 (old)
Sebastian Jentsch
Price comparison
